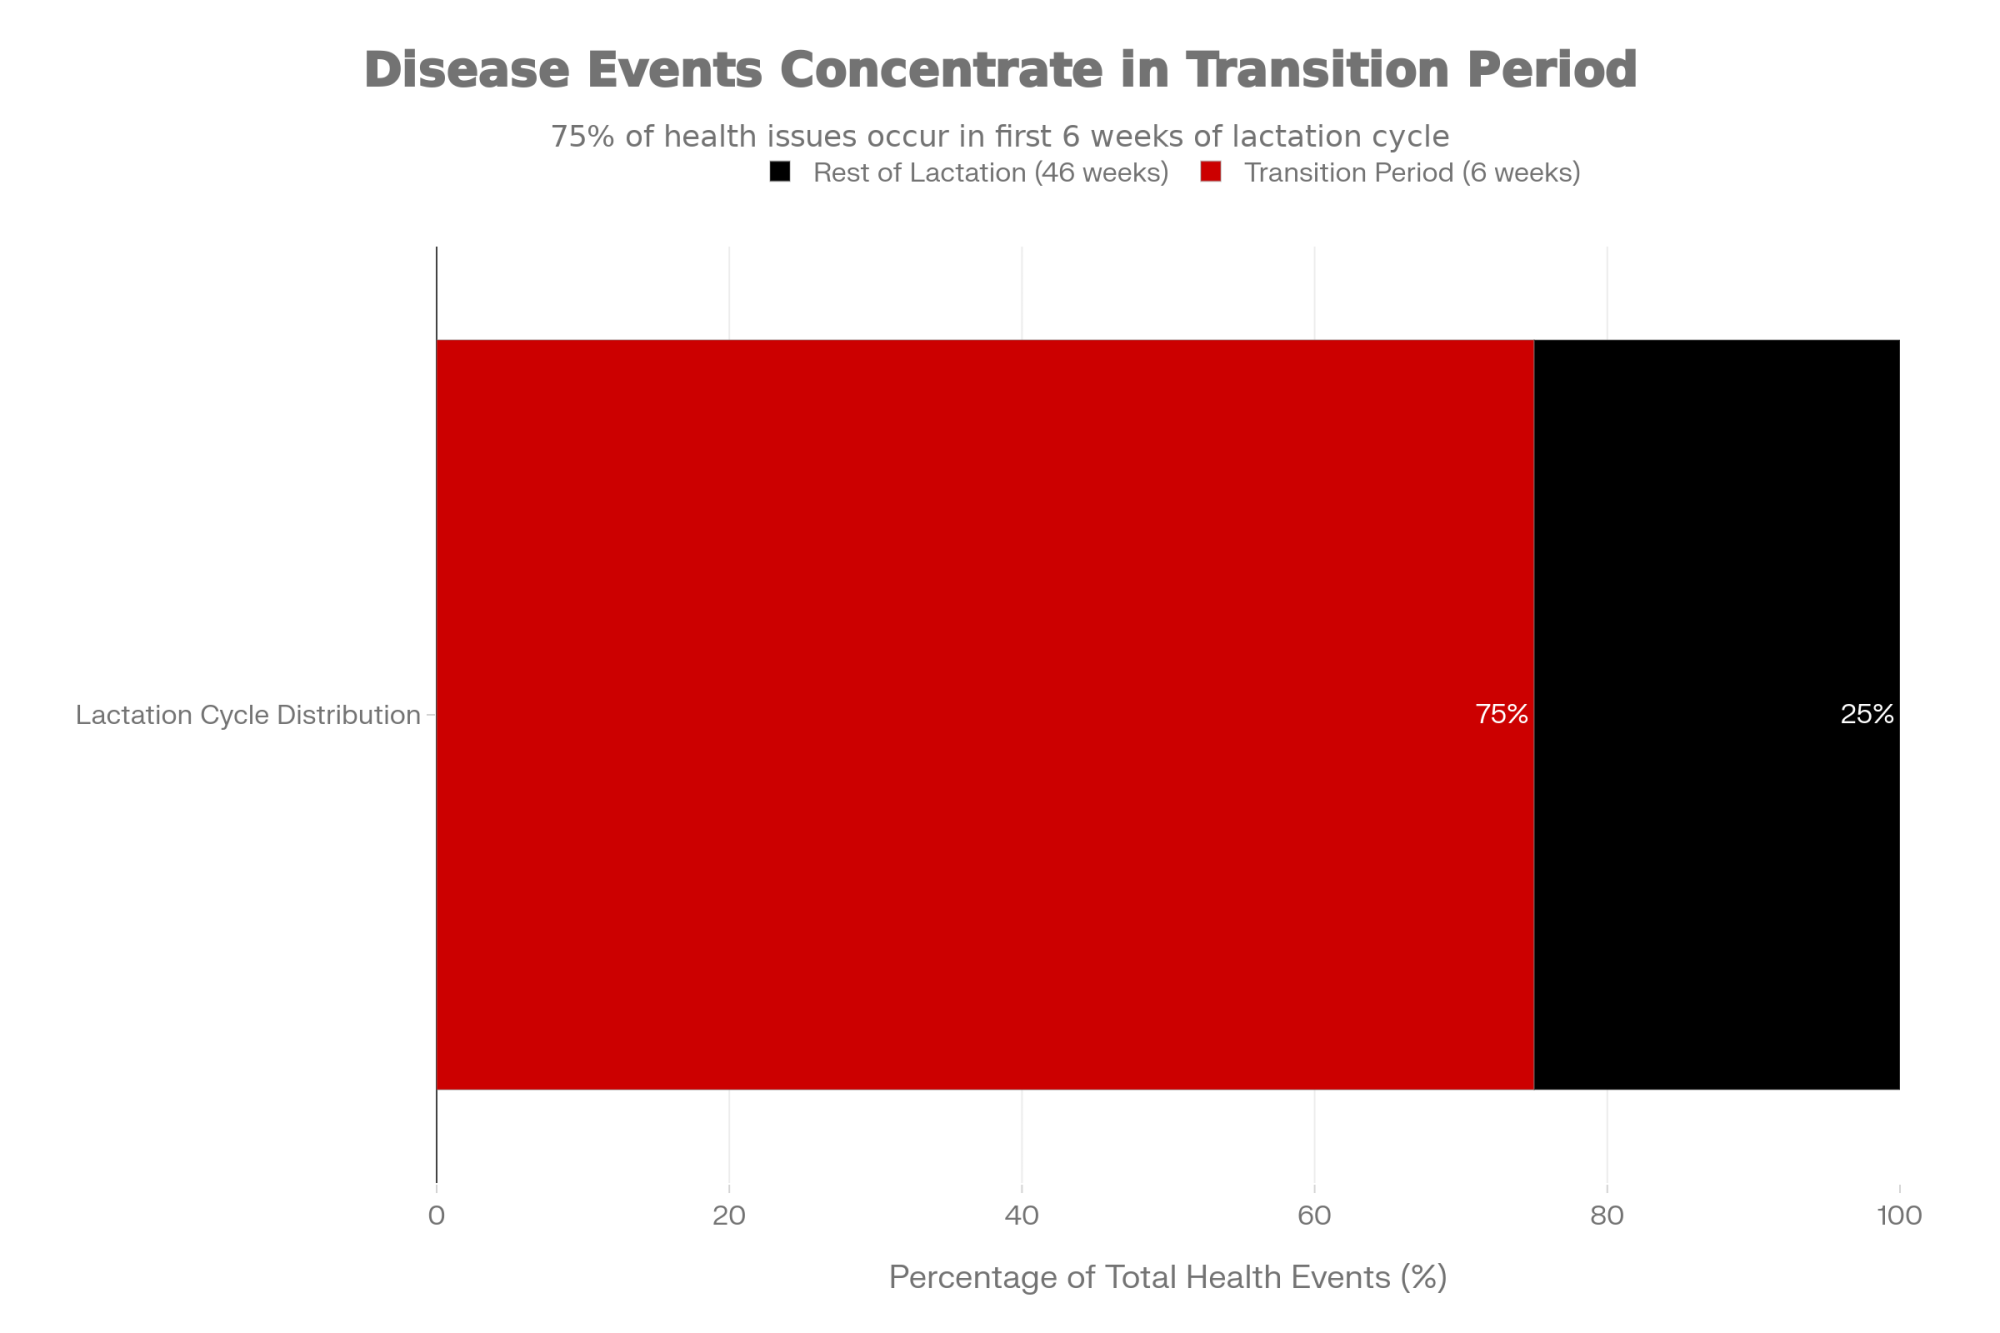
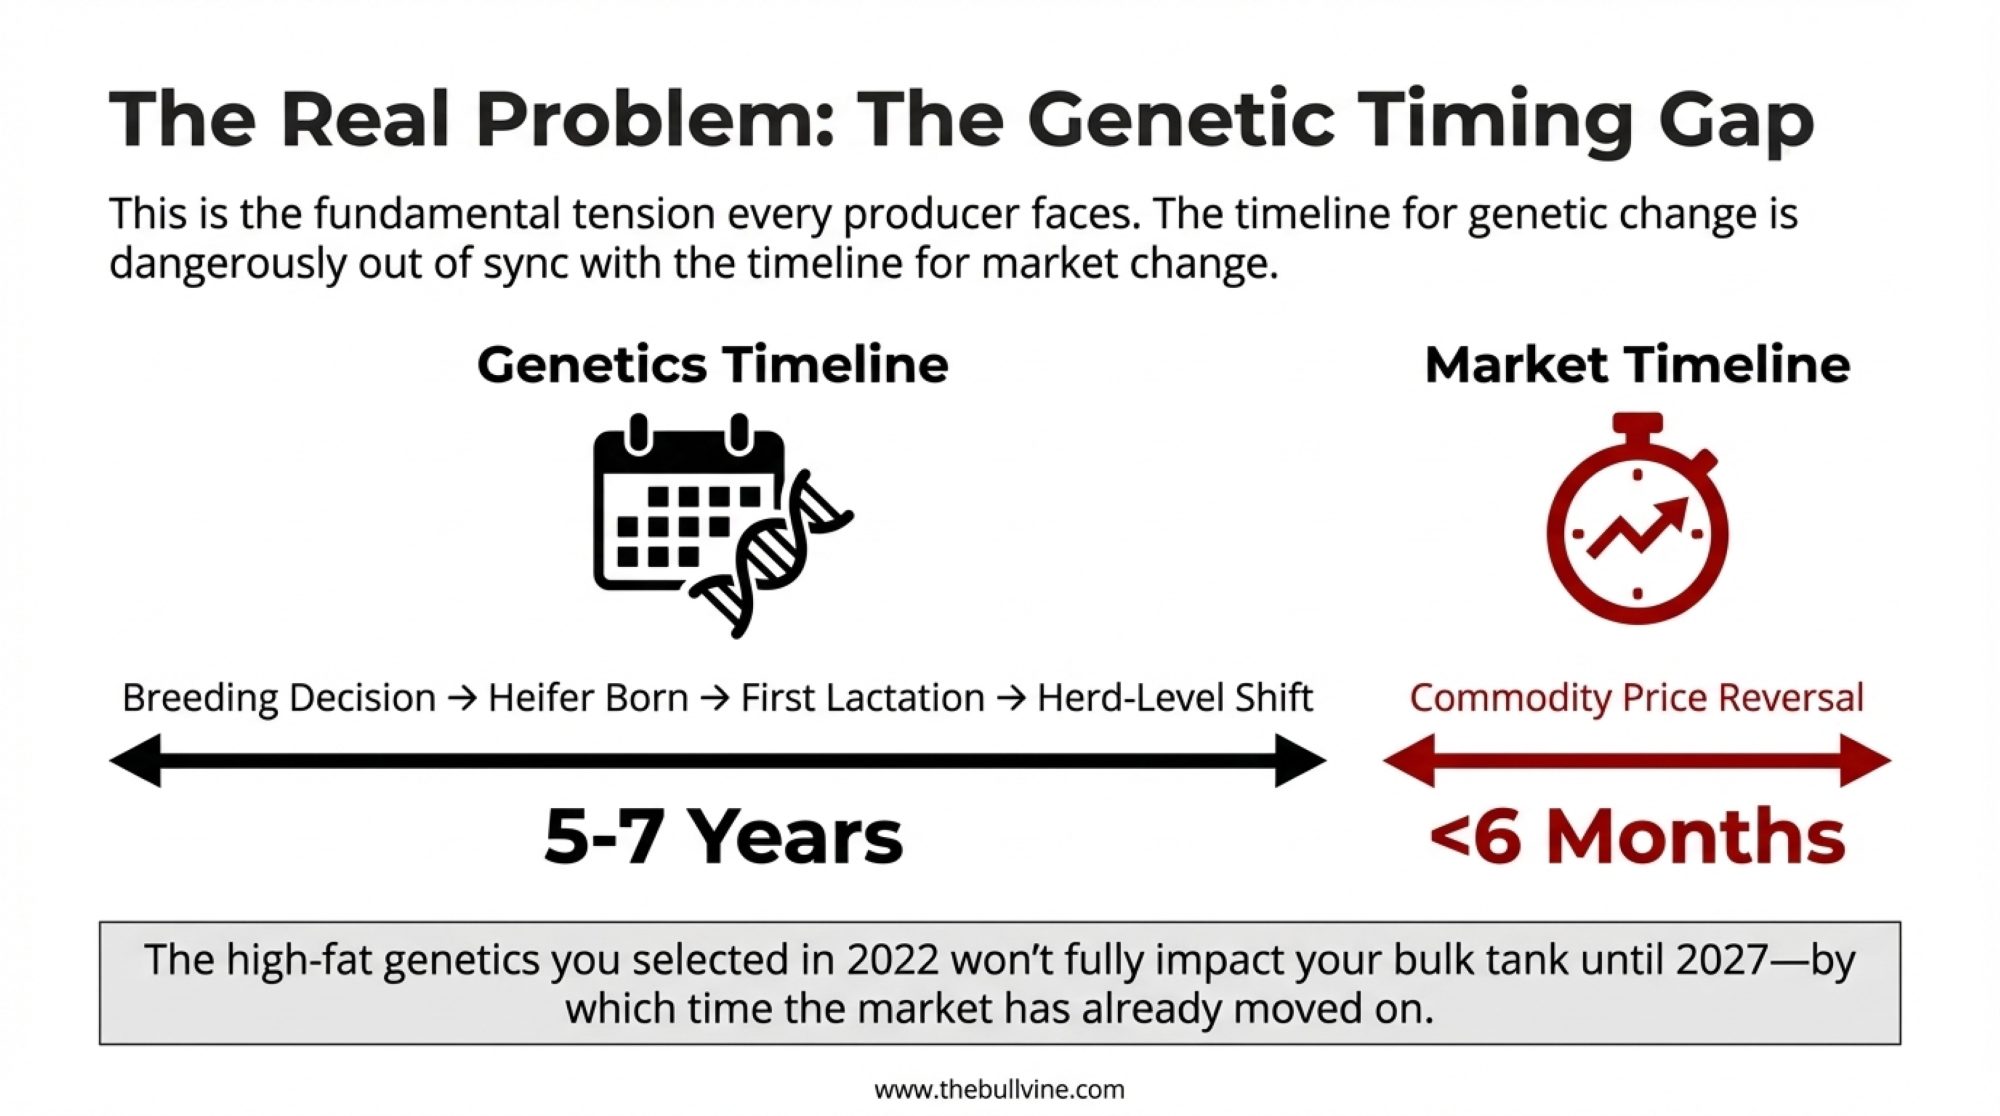
Canada’s top ten Jersey sires average 99th-percentile LPI and 47th-percentile Reproduction. That 52-point gap sired 29% of 2025 registrations — and never shows up on a single catalog page.
Jersey Canada’s record registration year produced a top ten sire group with elite LPI and conformation. Yet a look under the hood, and the Reproduction and Milkability subindexes tell a very different story for the future cows filling Canadian barns.
When I sat down in March 2026 with Jersey Canada’s 2025 registration data and Lactanet’s December 2025 genetic evaluations, I expected to see what the catalog pages were already shouting. Record registrations, up 9.74% over the previous high. Ten sires averaging Lifetime Performance Index (LPI) at the 99th percentile. Conformation at the 97th. Every bull A2A2. On paper, the Canadian Jerseys looked like they were winning on every front.
Then I pulled the LPI subindex profile on that same top ten group. The Reproduction Index (RI) across those bulls averaged the 47th percentile — below breed average. Five of ten fell below the median for fertility. The Milkability Index (MI), Lactanet’s subindex covering milking speed, temperament, and mammary milking traits, sat at the 34th percentile. And the Health & Welfare Index (HWI) — the one that captures Metabolic Disease Resistance, Mastitis Resistance, and Cystic Ovaries — averaged just the 59th percentile, with four bulls below the 50th.
Let me say this plainly: neither the breed associations nor the A.I. companies are publishing or promoting subindexes, and very little has been published on understanding or using them. After six decades of breeding cattle and working on dairy cattle improvement — including the original Dollar Difference Formula and Holstein Canada’s Type Classification overhaul in the 1980s — I’m still pushing the industry to look past the numbers it celebrates and toward the economically important ones it quietly ignores.
That’s not breeders failing to read the fine print. That’s a system that never printed it.
What Do Canada’s Top 10 Jersey Sires Actually Look Like Genetically?
Let’s start with which sires are actually driving the breed.
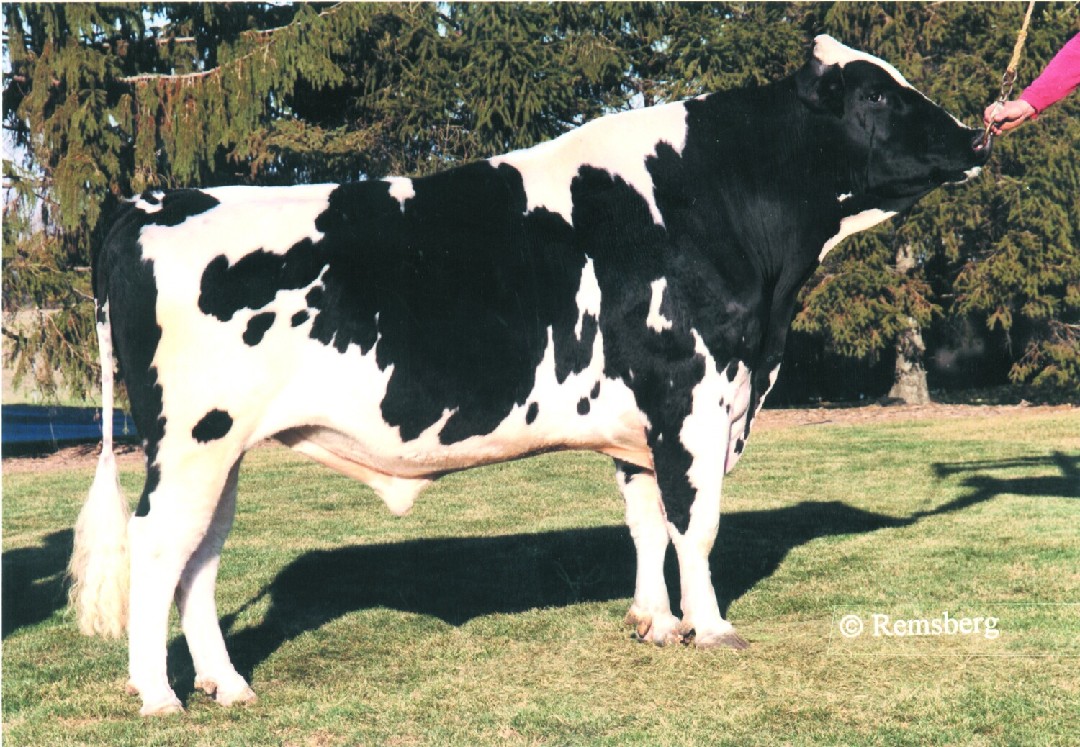
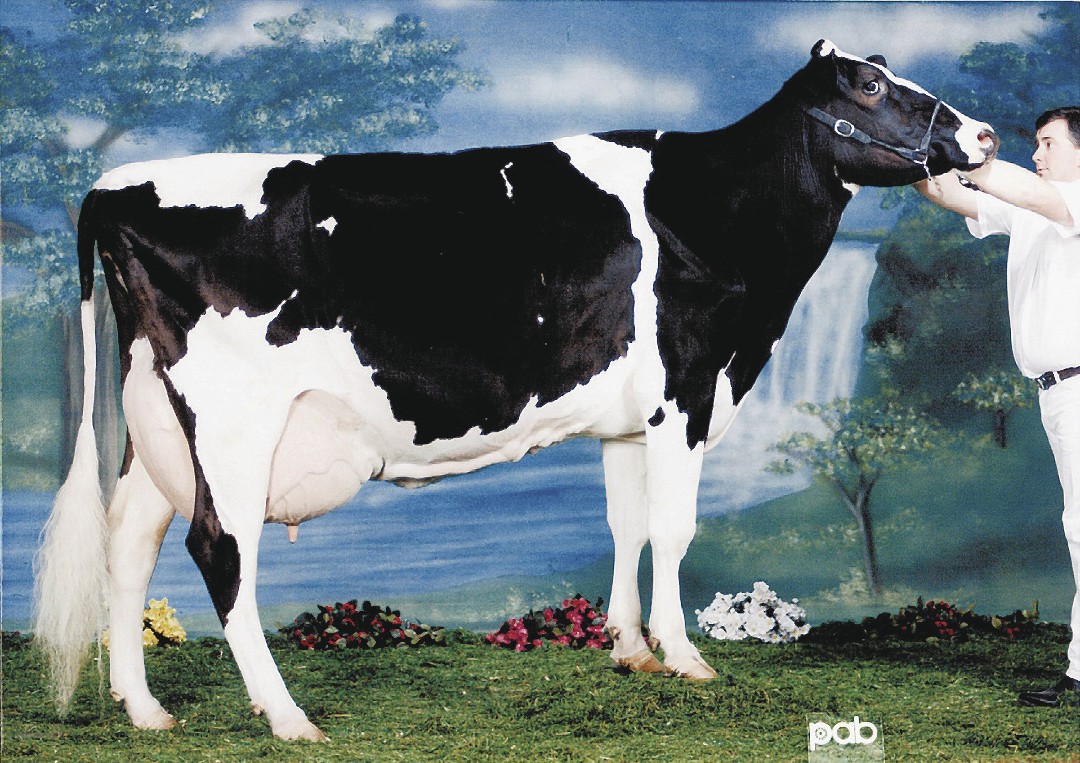
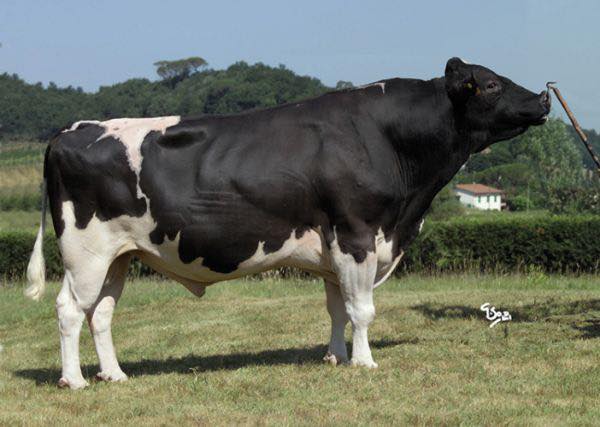
The ten bulls leading Jersey Canada’s 2025 registrations — ToBeFamous and Ghost tied at No. 1, followed by Victorious, Skyfall, Xenial, Artemis, Goldorak, Honeymoon, Cinnamon, and Tekashi — averaging 402 registered daughters each. Together, they sired 29% of all Jersey registrations in Canada that year. Eight of the ten were genomic sires when used, and those eight alone account for 81% of the group’s registered daughters.
When eight genomic bulls shape roughly one in four registered calves in a country, their genetic profile isn’t just interesting. It’s the trajectory of the breed.
Here’s how the Lactanet December 2025 evaluations stack up for that top ten:
Index
Average
Percentile Rank
Range
Bulls Below 50th
LPI
1,918
99th
39th–99th
1 of 10
Pro$
$1,542
~97th
—
—
Production Index (PI)
—
81st
56th–99th
0 of 10
Longevity & Type (LTI)
—
91st
21st–99th
1 of 10
Health & Welfare (HWI)
—
59th
17th–88th
4 of 10
Reproduction (RI)
—
47th
19th–84th
5 of 10
Milkability (MI)
—
34th
2nd–90th
5 of 10
Milk
358 kgs
50th
−121 to 1,071
6 of 10
Fat
49 kgs
79th
12–84
2 of 10
Fat %
+0.37%
—
0.07–0.83
0 of 10
Protein
25 kgs
60th
12–52
4 of 10
Protein %
+0.16%
—
0.07–0.31
0 of 10
Conformation (CONF)
+11.4
97th
−2 to +18
1 of 10
The gap between the 99th-percentile LPI and the 47th-percentile RI — 52 percentile points — might be the most revealing number in this dataset. It also never shows up on a sire card.
Why Don’t Breeders See the Fertility and Milkability Gap?
The short version: nothing in the current sire selection pipeline forces RI, HWI, or MI onto the table when you’re actually ordering semen.
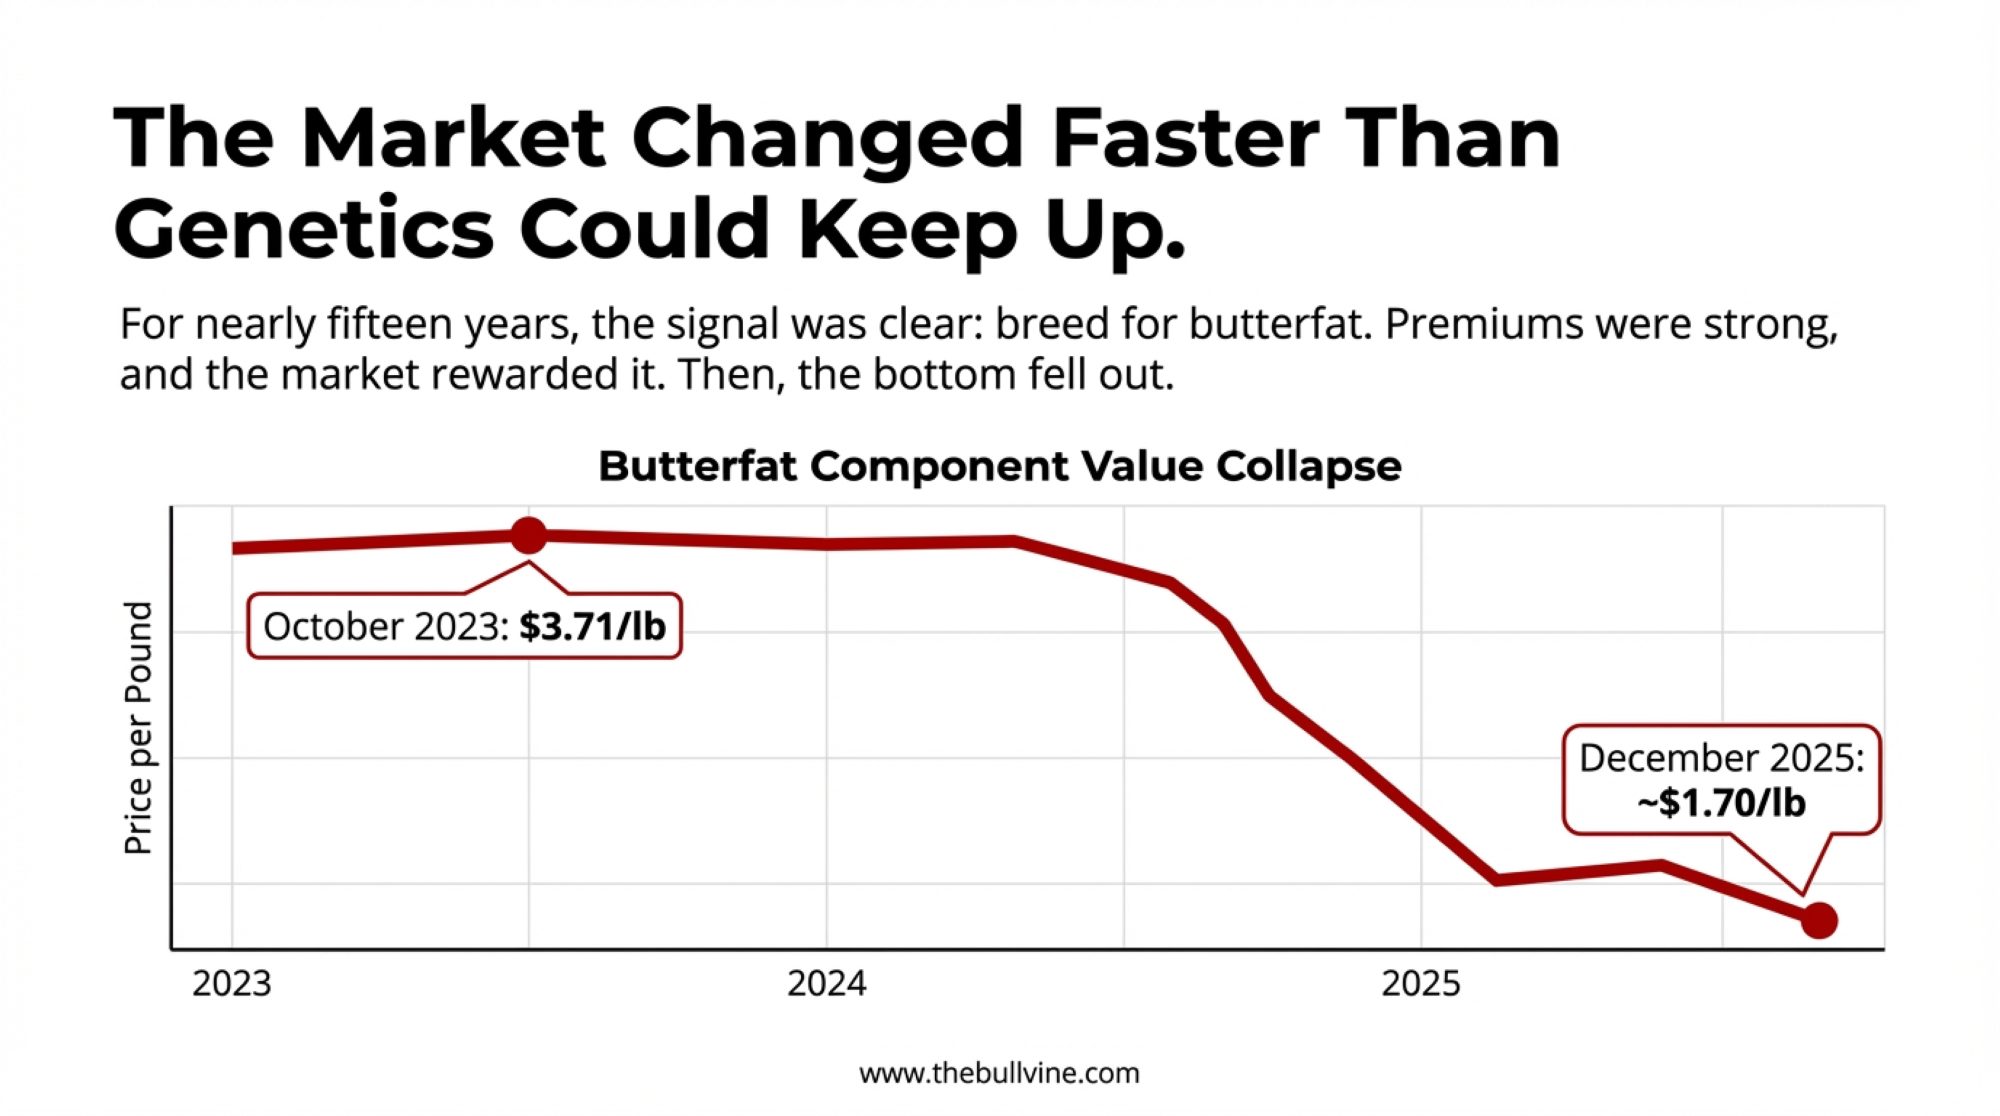
Fat percentage is loud. When a bull adds +0.83%F — the high end of this top ten’s range — the economic reward shows up on every milk settlement. The A2A2 and BB casein story works the same way: processors put a premium on paper, breeders respond, and by 2025, the breed hit 100% A2A2 and 90% BB kappa-casein among its most-used sires. That’s the market signal doing exactly what it’s supposed to do.
Fertility costs are quiet. When a cow takes an extra cycle or two to settle, the penalty spreads across the vet bill, the semen line, the replacement purchase, and a longer calving interval that drags down lifetime milk and drives up lifetime days dry. None of those line items show up with a bold “this is what 47th-percentile RI genetics cost you this month” stamped on them.
Timed AI programs like Double-Ovsynch and Presynch-Ovsynch deepen the blind spot. They override a cow’s own biology, delivering conception rates that hide genetic fertility deficits. The protocol works — but it costs more to maintain with every percentile point of genetic fertility you give away. More shots. Tighter labour timing. More resynchronization cycles.
The Milkability Index gap tells its own story. MI combines milking speed, temperament, and milking-related mammary traits — exactly the traits that determine how quickly and smoothly cows move through a parlour or a robot box. A 34th-percentile MI average means the daughters of the breed’s most popular sires are, on balance, below average for the traits that drive milking efficiency and robot throughput. That’s real money in labour and robot capacity, especially as more Canadian herds adopt automated milking.
Fat Gains Up, Fertility Drifting: Five Years of Jersey Genetic Trends
Zoom out to the five-year trend for the top ten registration sires from 2020 to 2025, and the selection pattern comes into focus:
Trait
Annual Gain (Top 10 Registration Sires, 2020–2025)
LPI
+44 points/year
Pro$
+$99/year
Milk Volume
−25 kgs/year
Fat Yield
+3 kgs/year
Fat %
+0.05%/year
Protein Yield
+1 kg/year
Protein %
+0.03%/year
Conformation
+0.8/year
Mammary System
+0.8/year
Dairy Strength
+0.90/year
Feet & Legs
+0.75/year
Rump
+0.66/year
Inbreeding
−0.28%/year
Milk volume is deliberately sliding while fat and protein percentages climb. That’s component pricing at work, and breeders are delivering exactly what processors reward.
What’s missing in that trend table are equivalent progress numbers for RI, HWI, or MI. The traits everyone tracks, publishes, and celebrates are the ones getting selected. The ones buried in PDF footnotes are drifting. The 47th-percentile RI average is a pretty good hint of which direction.
On the positive side, the inbreeding story is exactly what you’d hope to see. The average for the top ten drops from 9.77% in 2020 to 8.10% in 2025 — a reduction of 0.28% per year, with seven of ten bulls sitting under 9.0%. That proves something important: Canadian Jersey breeders can manage a trait that isn’t on the milk cheque when the industry makes it visible and gives them tools. It’s fair to ask why the same thing hasn’t happened for reproduction, health, and milkability yet.
The Barn Math Behind 47th-Percentile Fertility
Here’s where you can feel it in your own numbers.
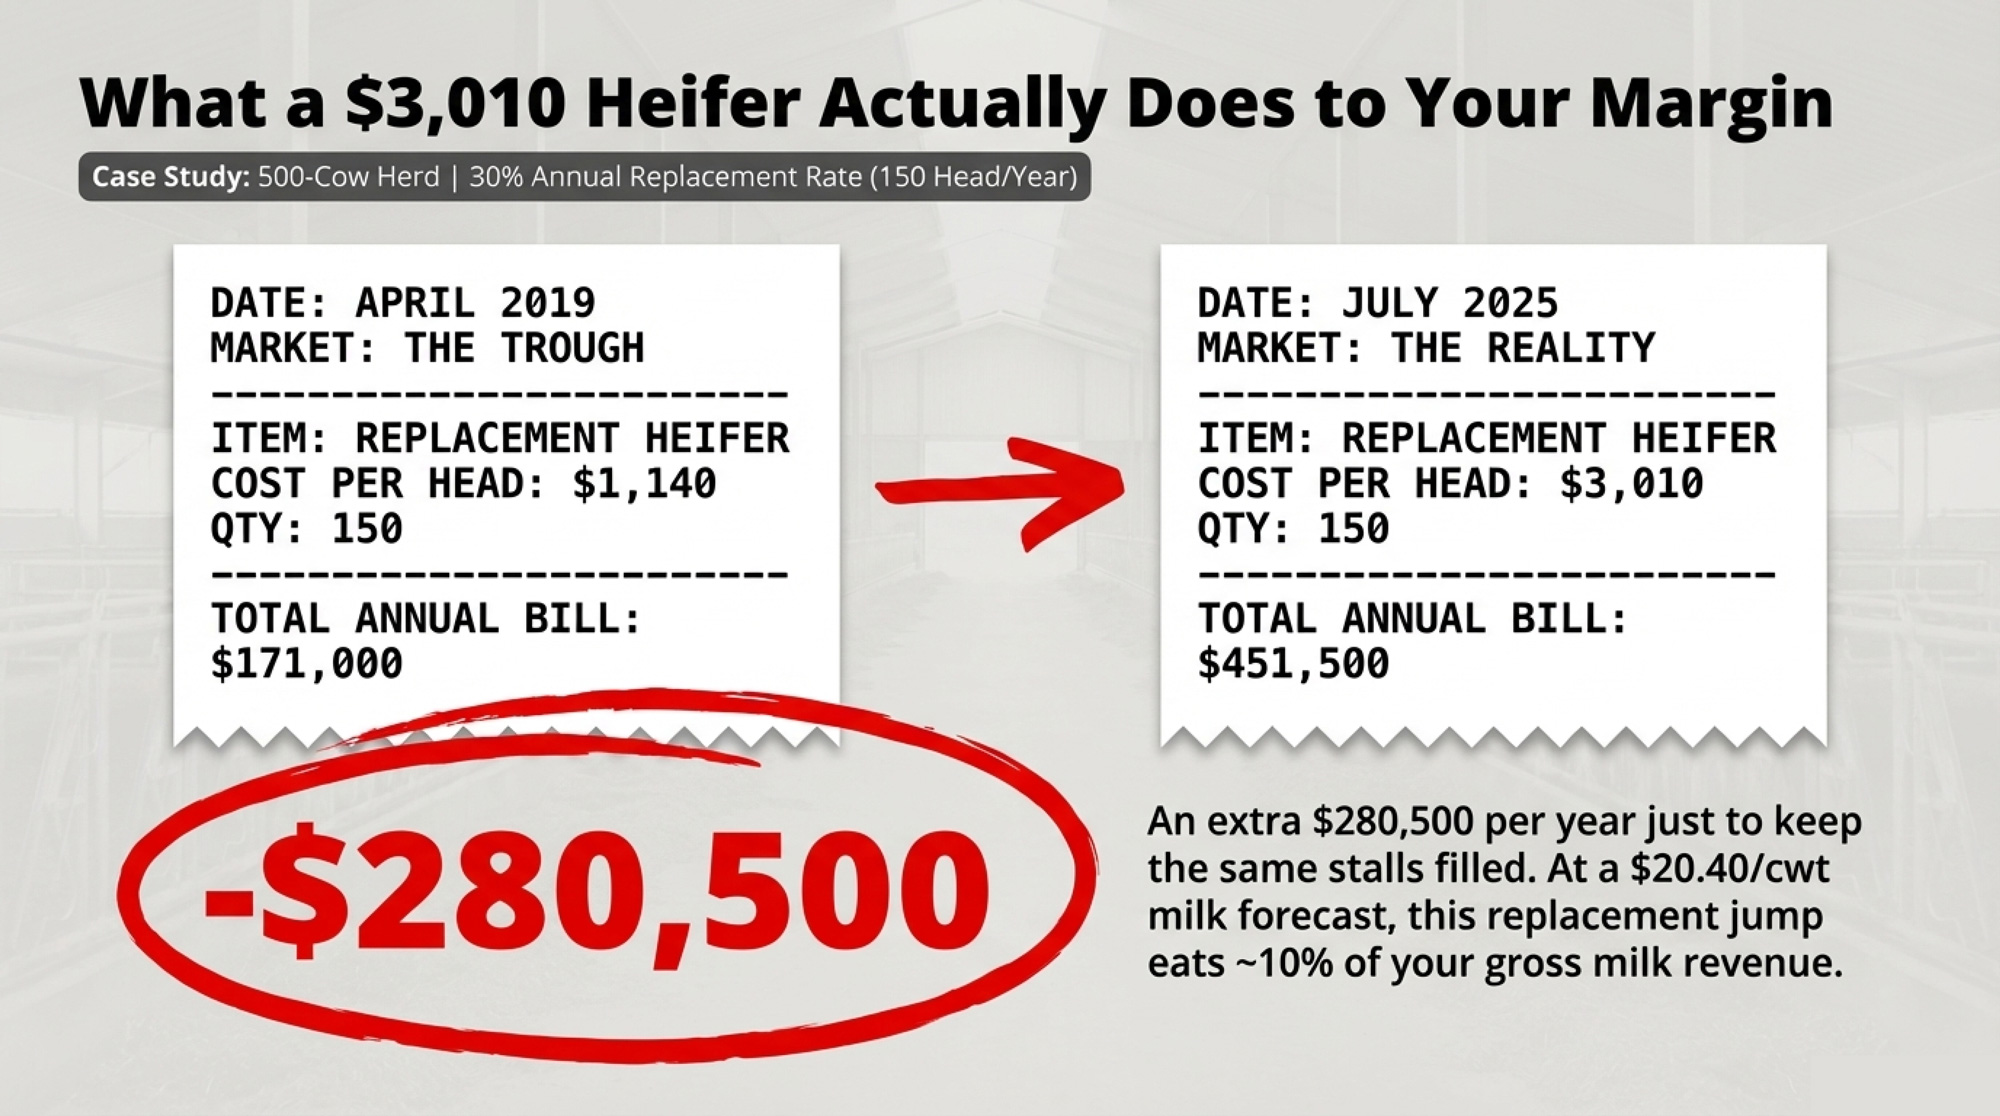
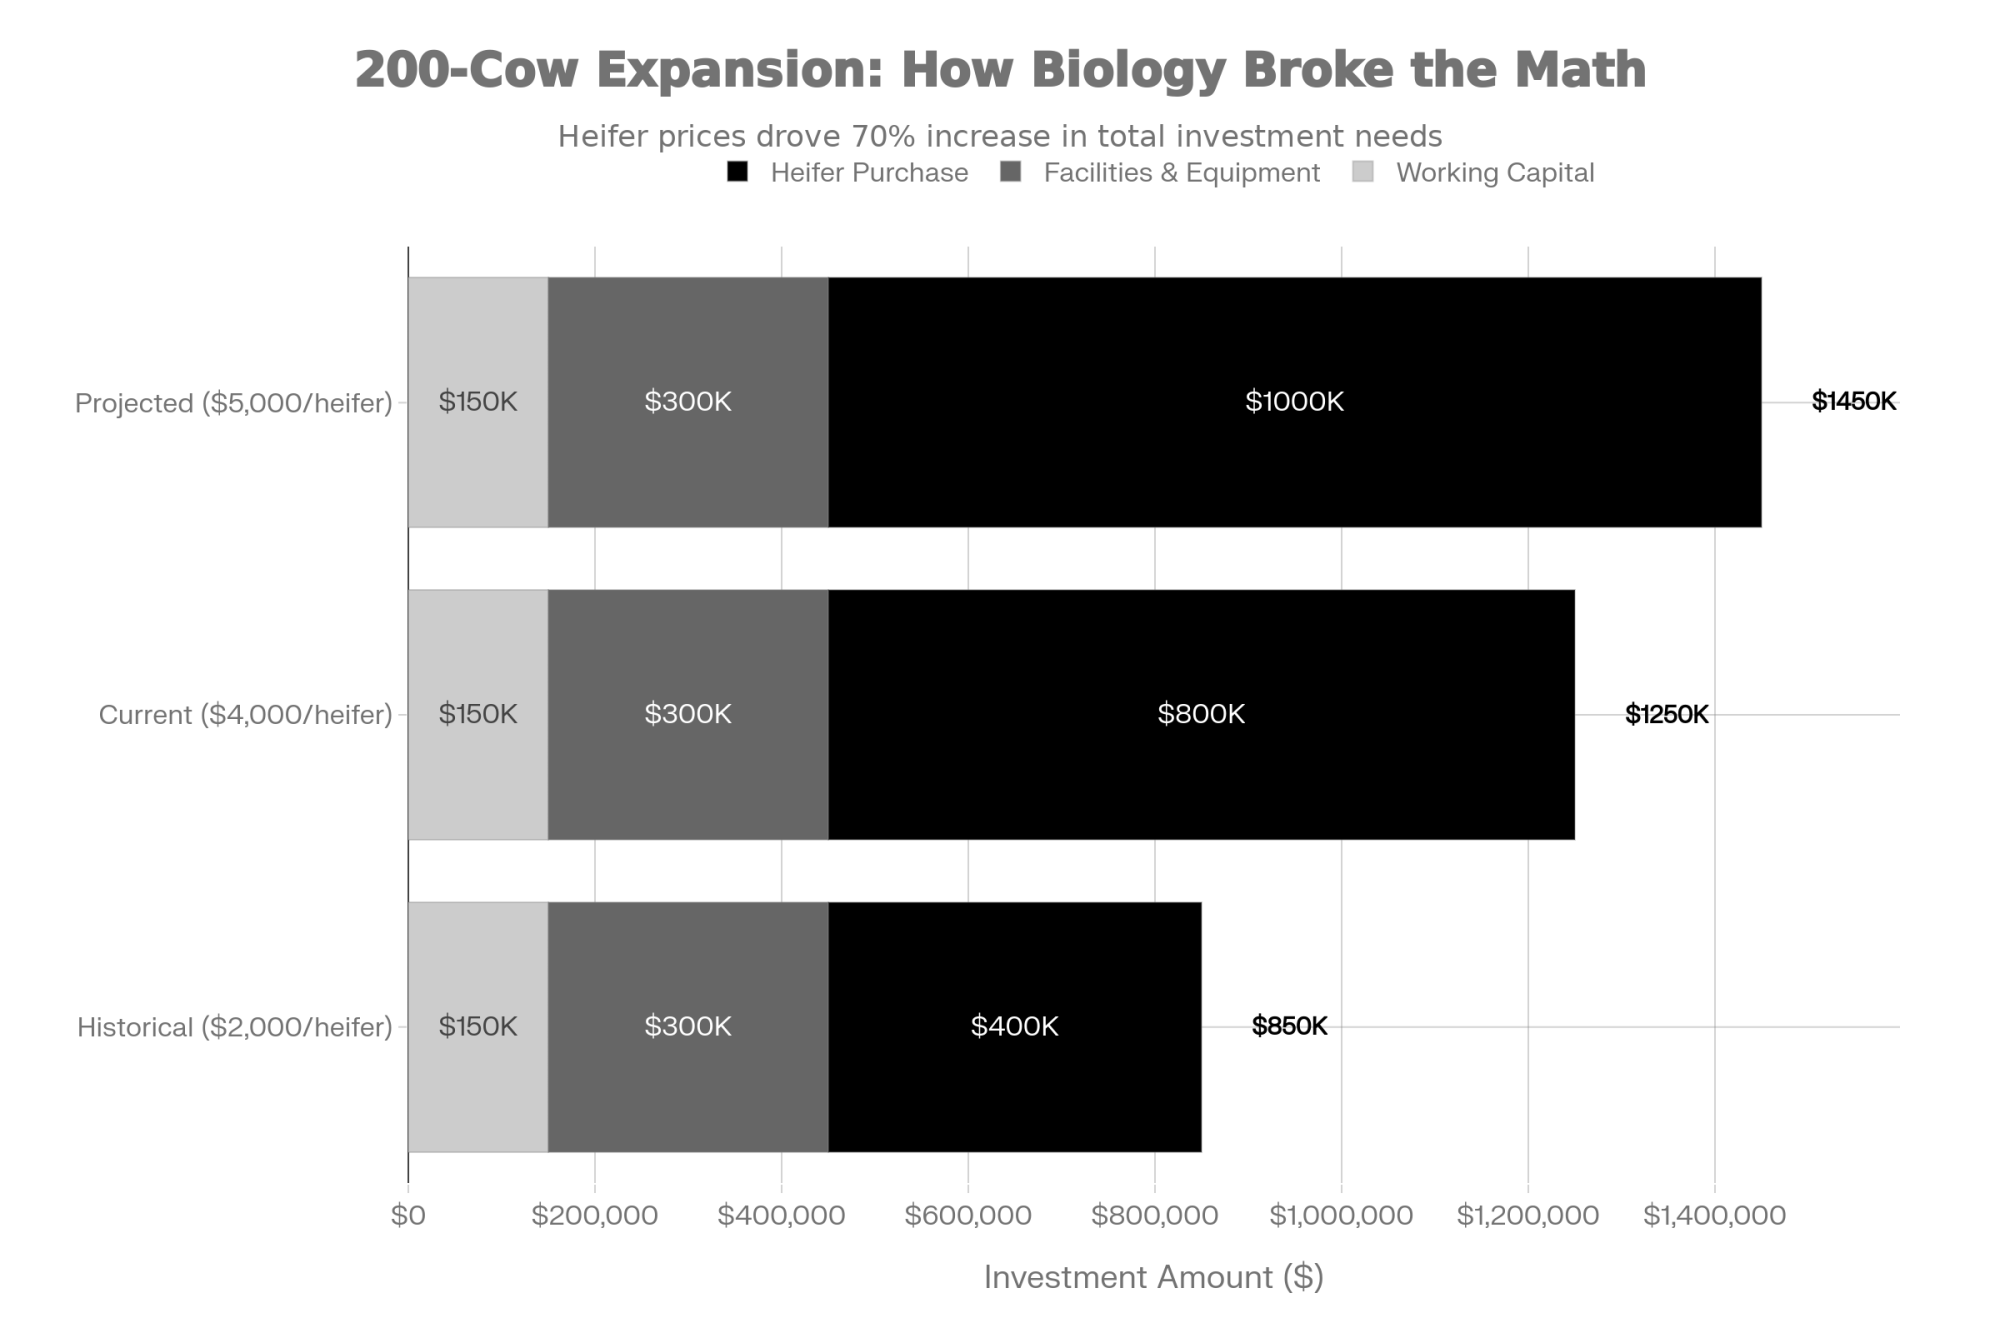
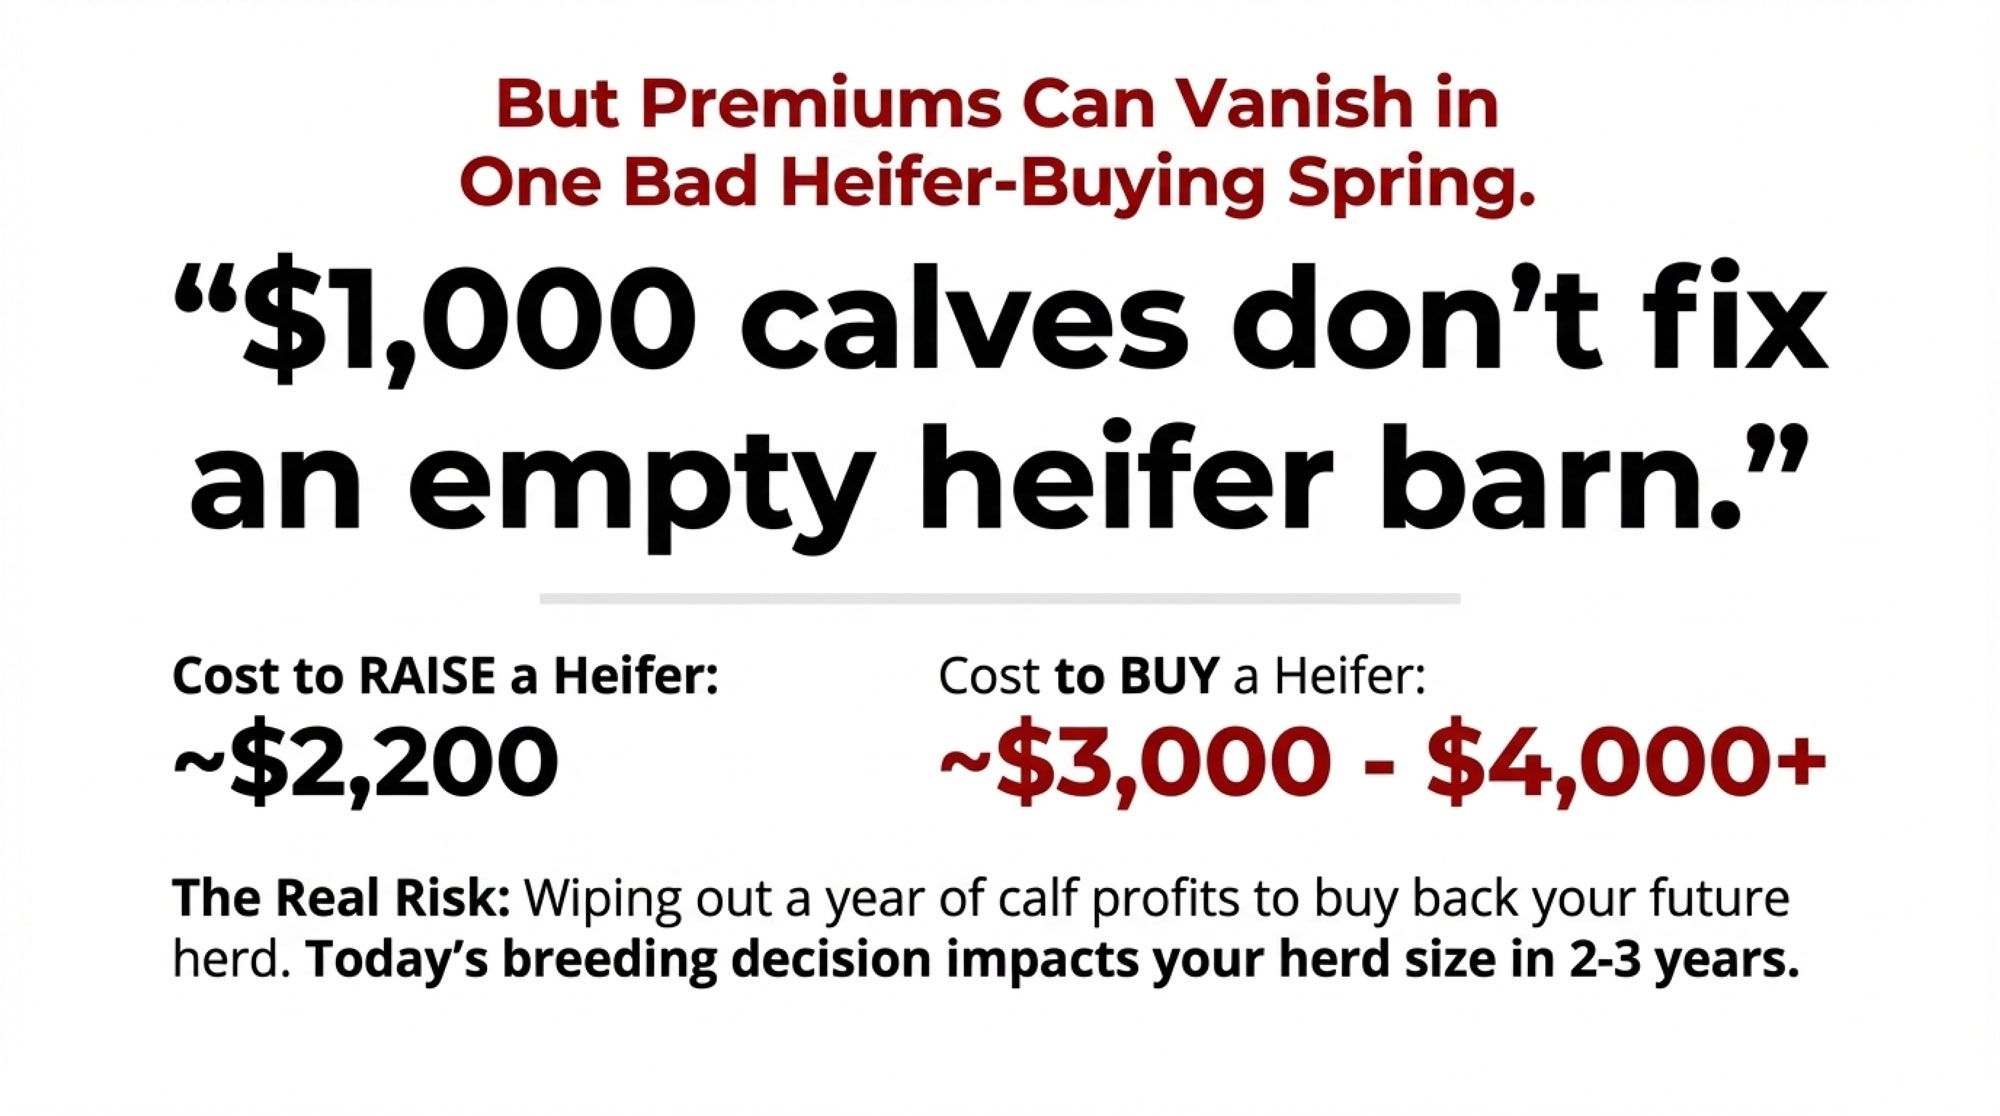
A 200-cow Jersey herd turning over 35% annually needs about 70 replacement heifers a year. That’s just barn math: 200 × 0.35 = 70.
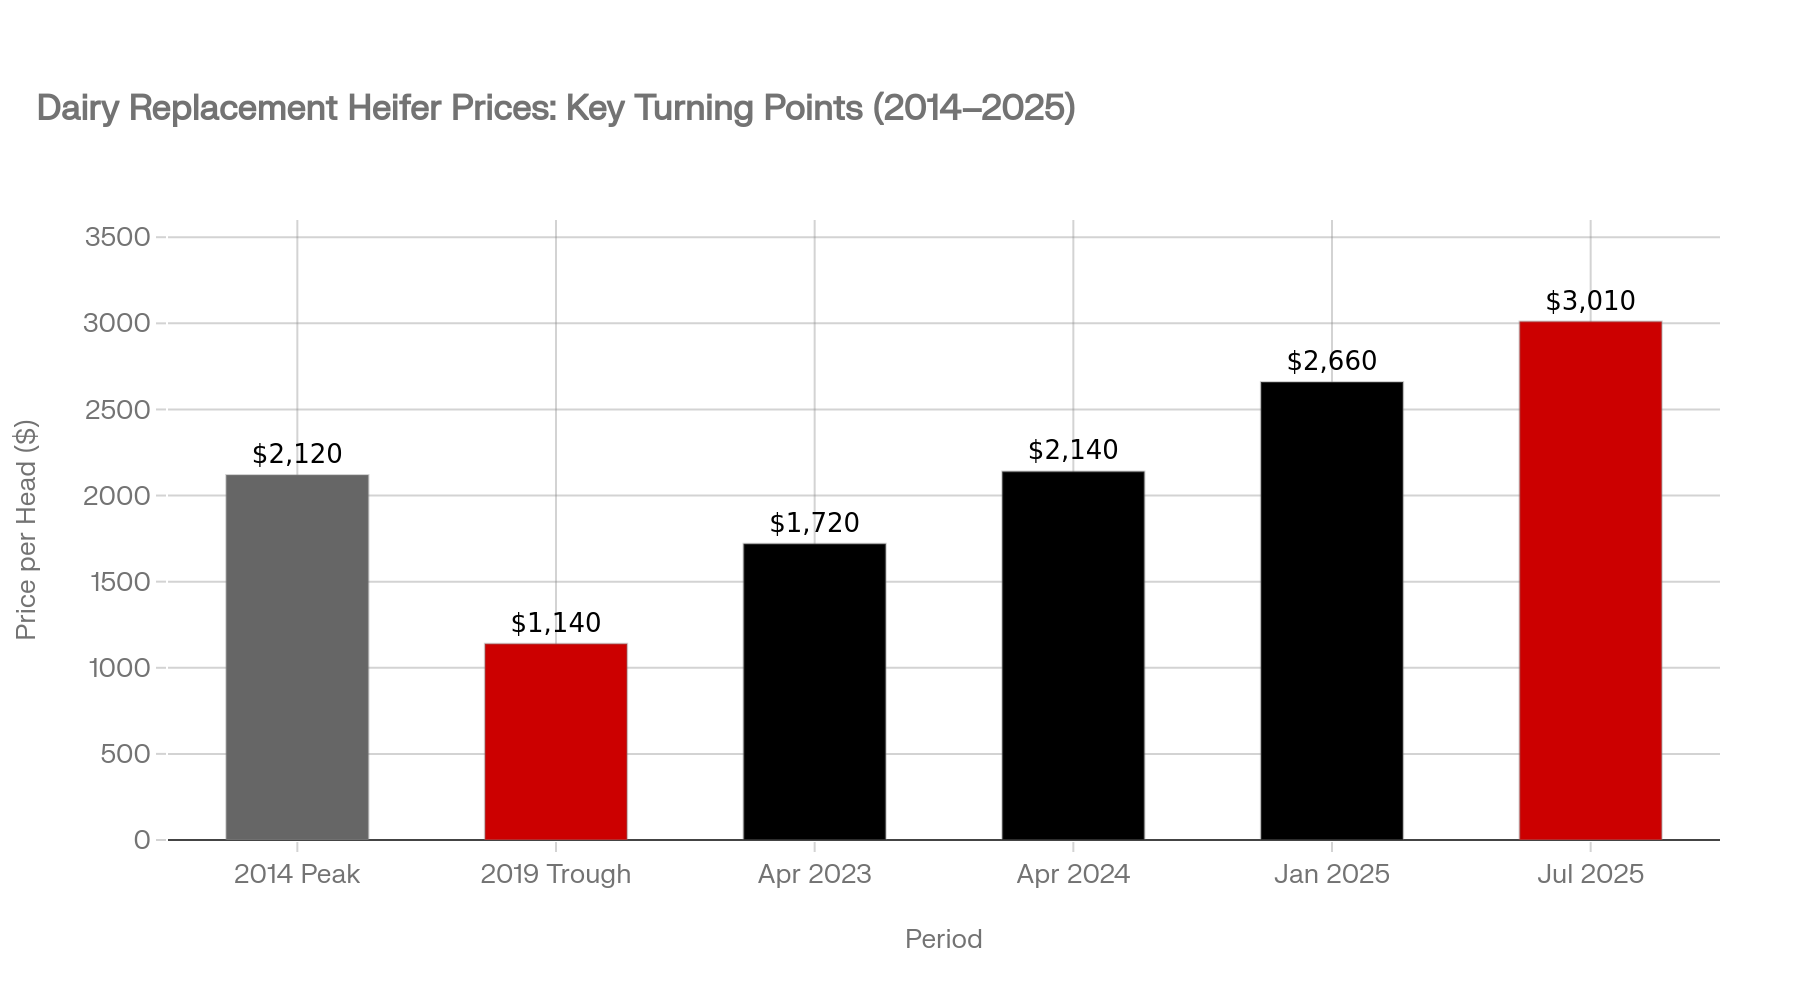
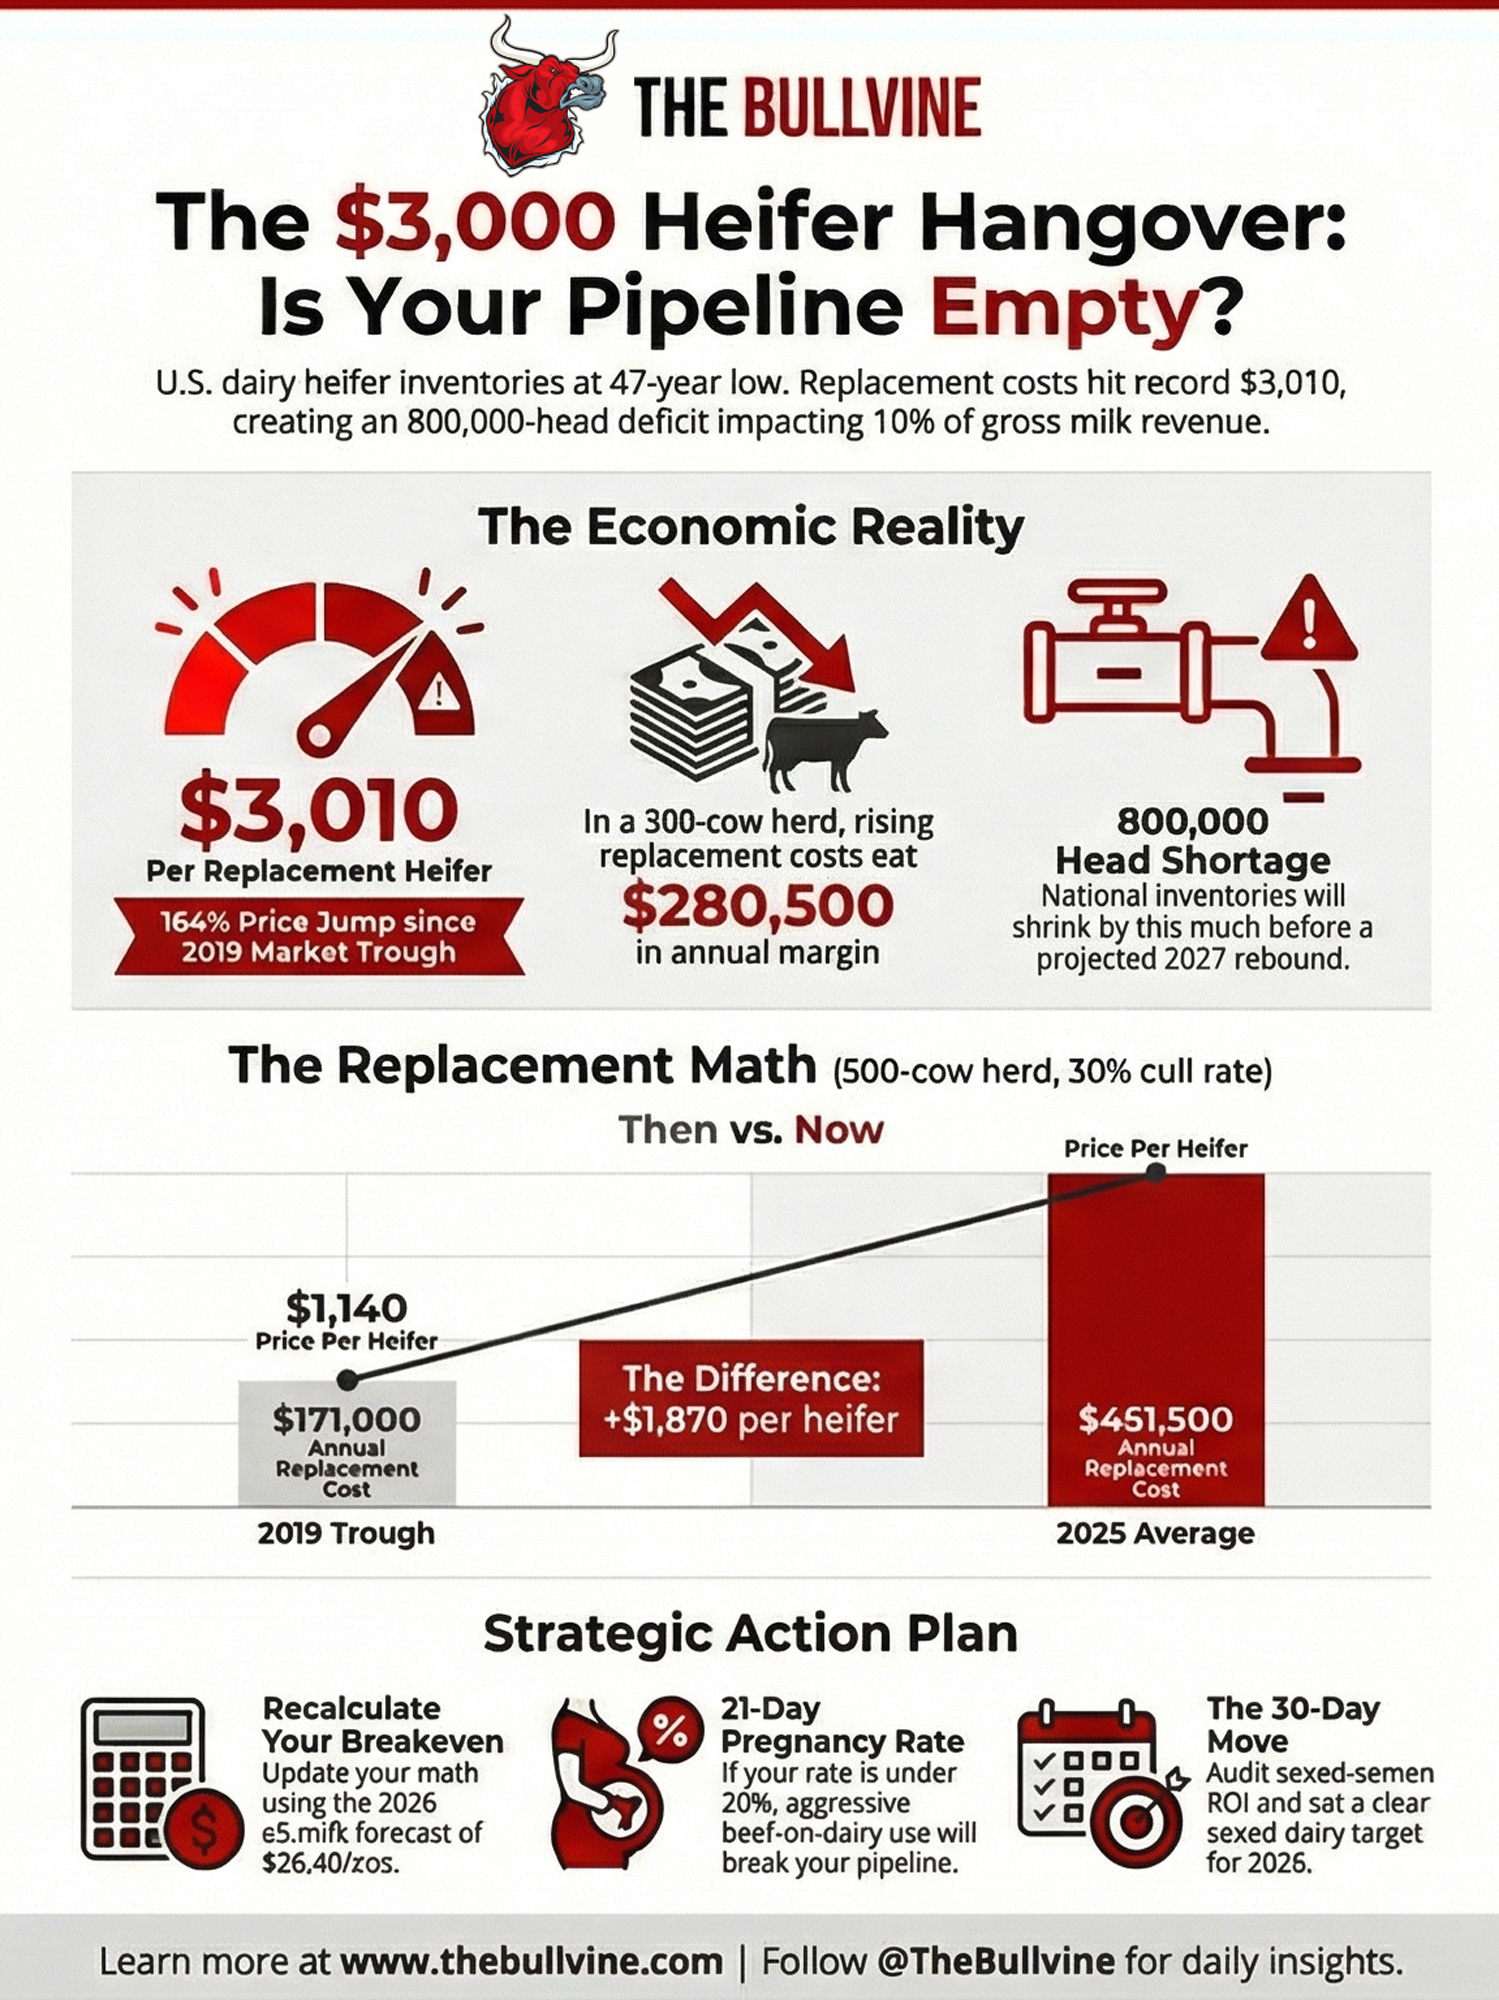
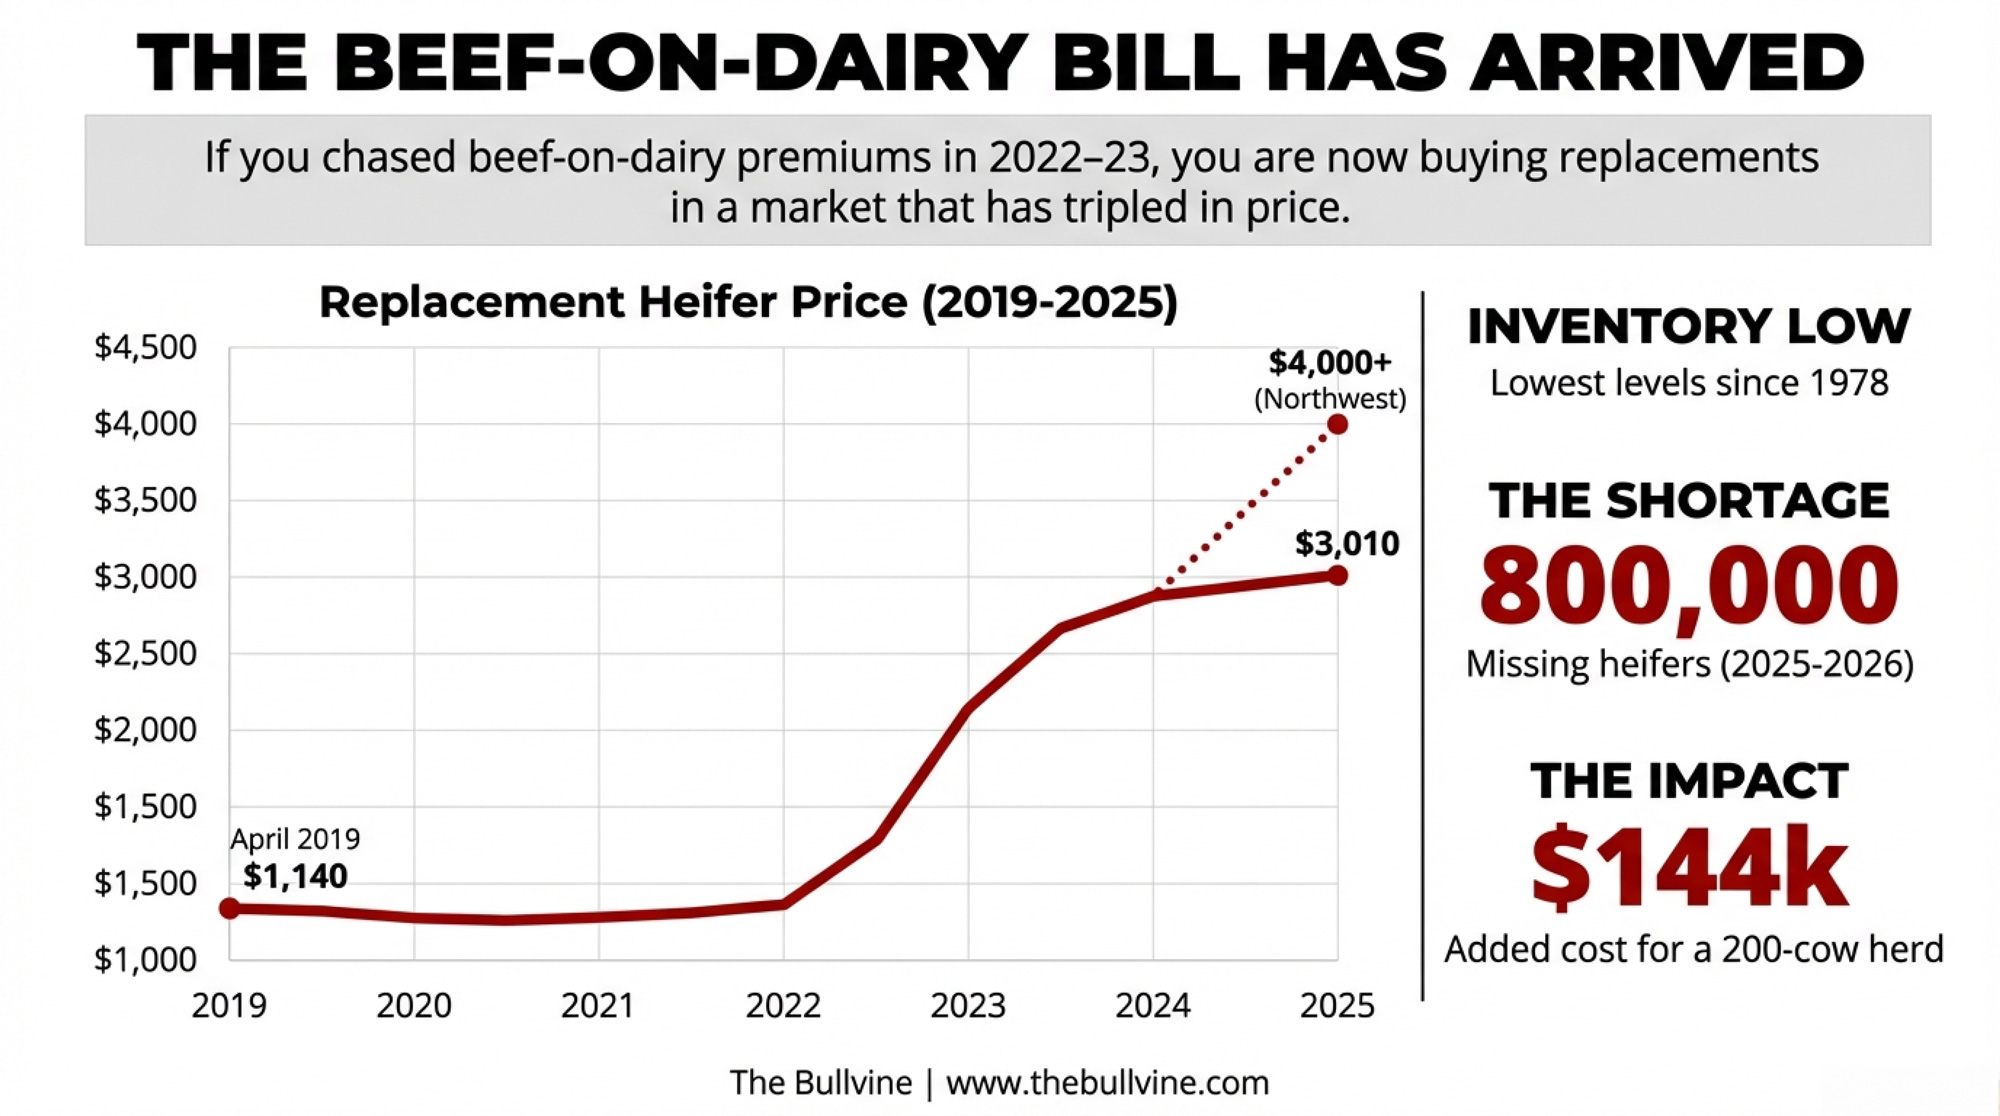
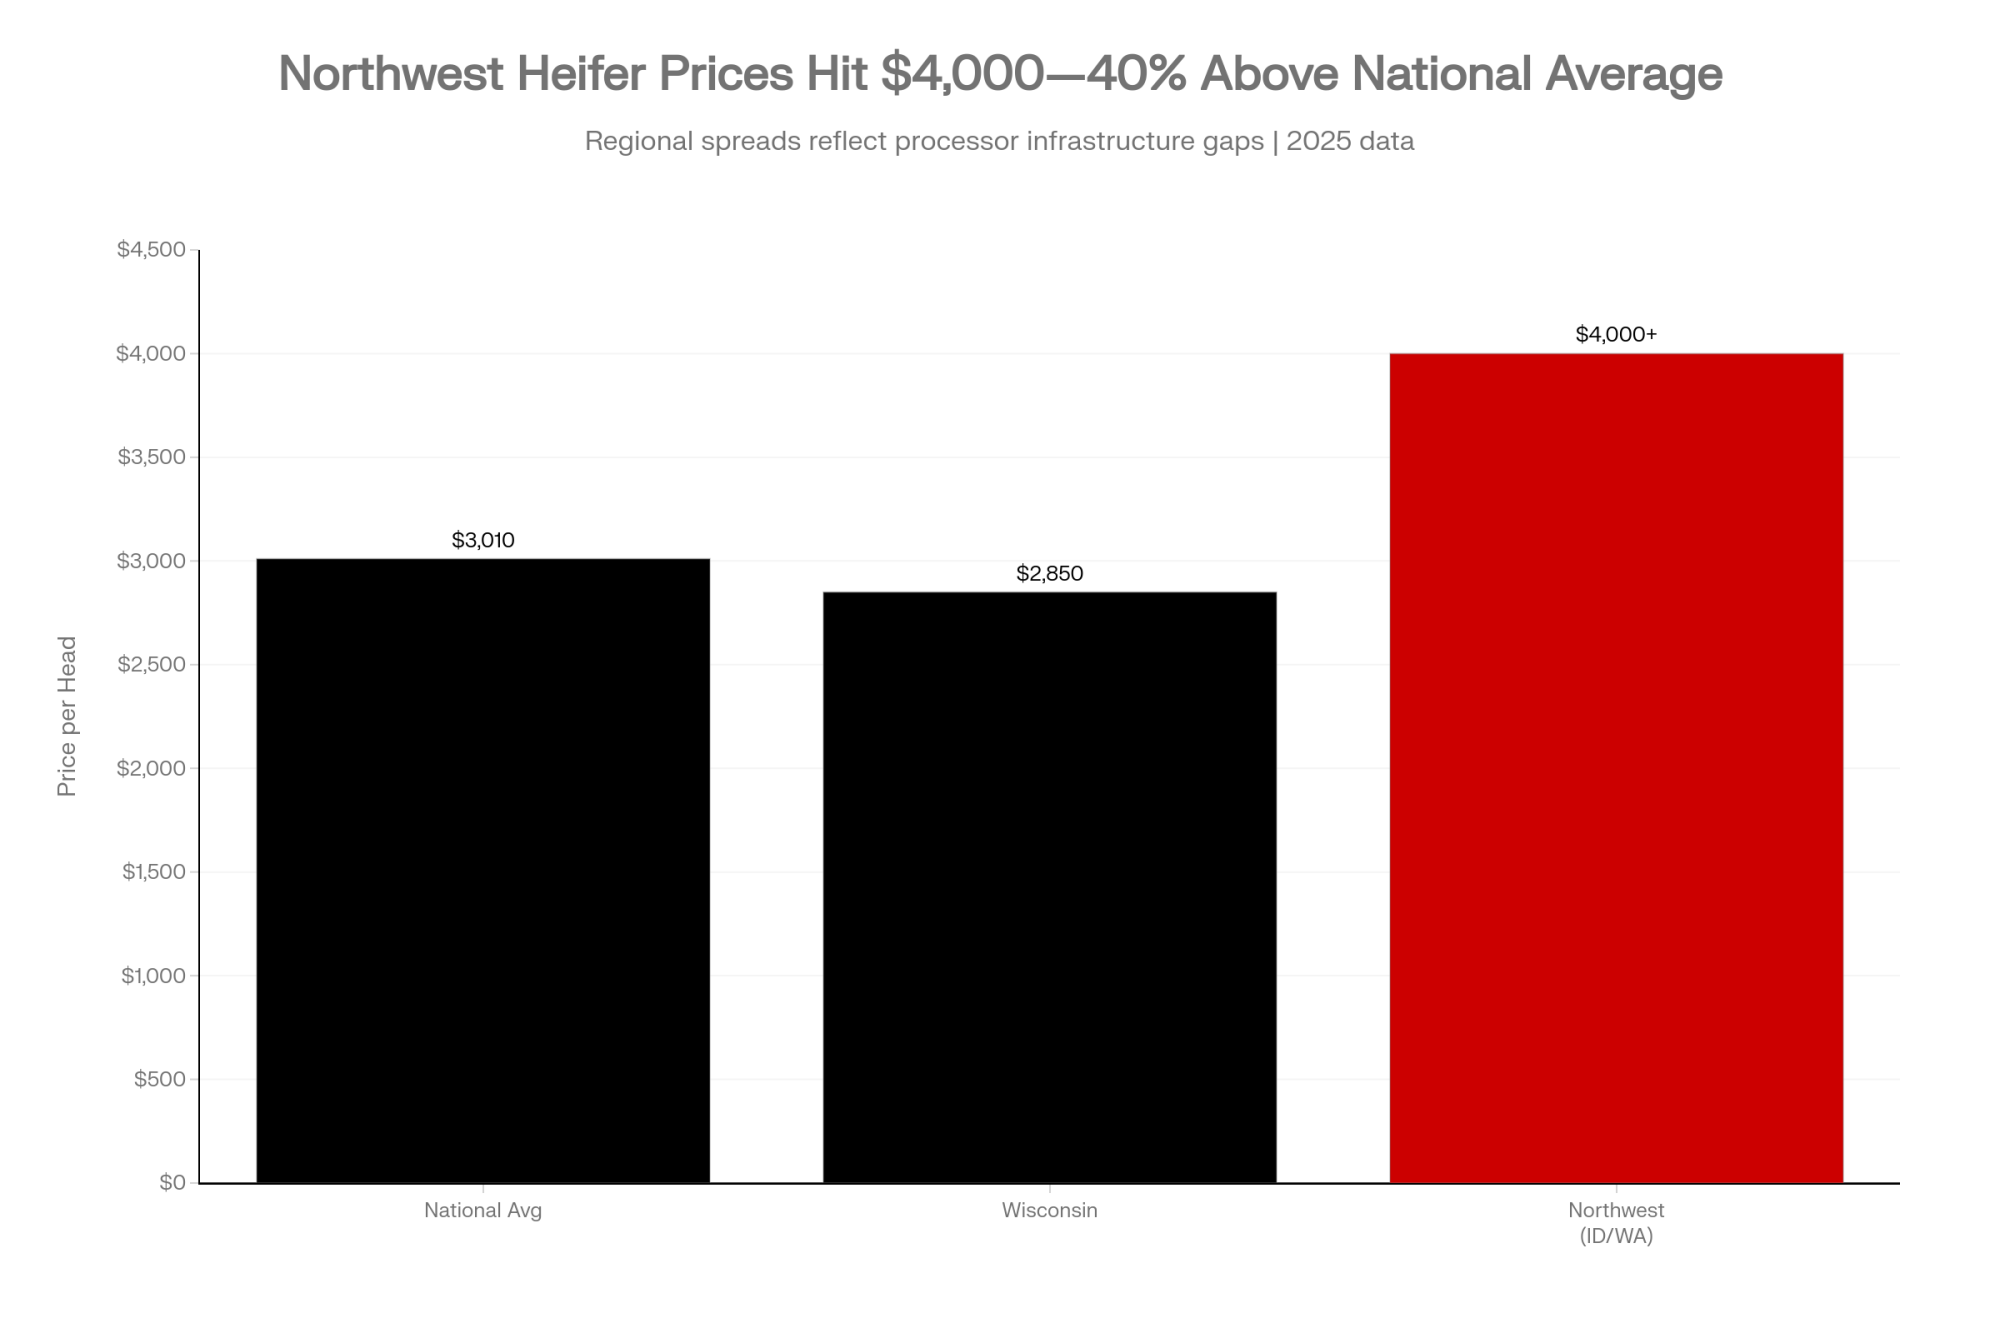
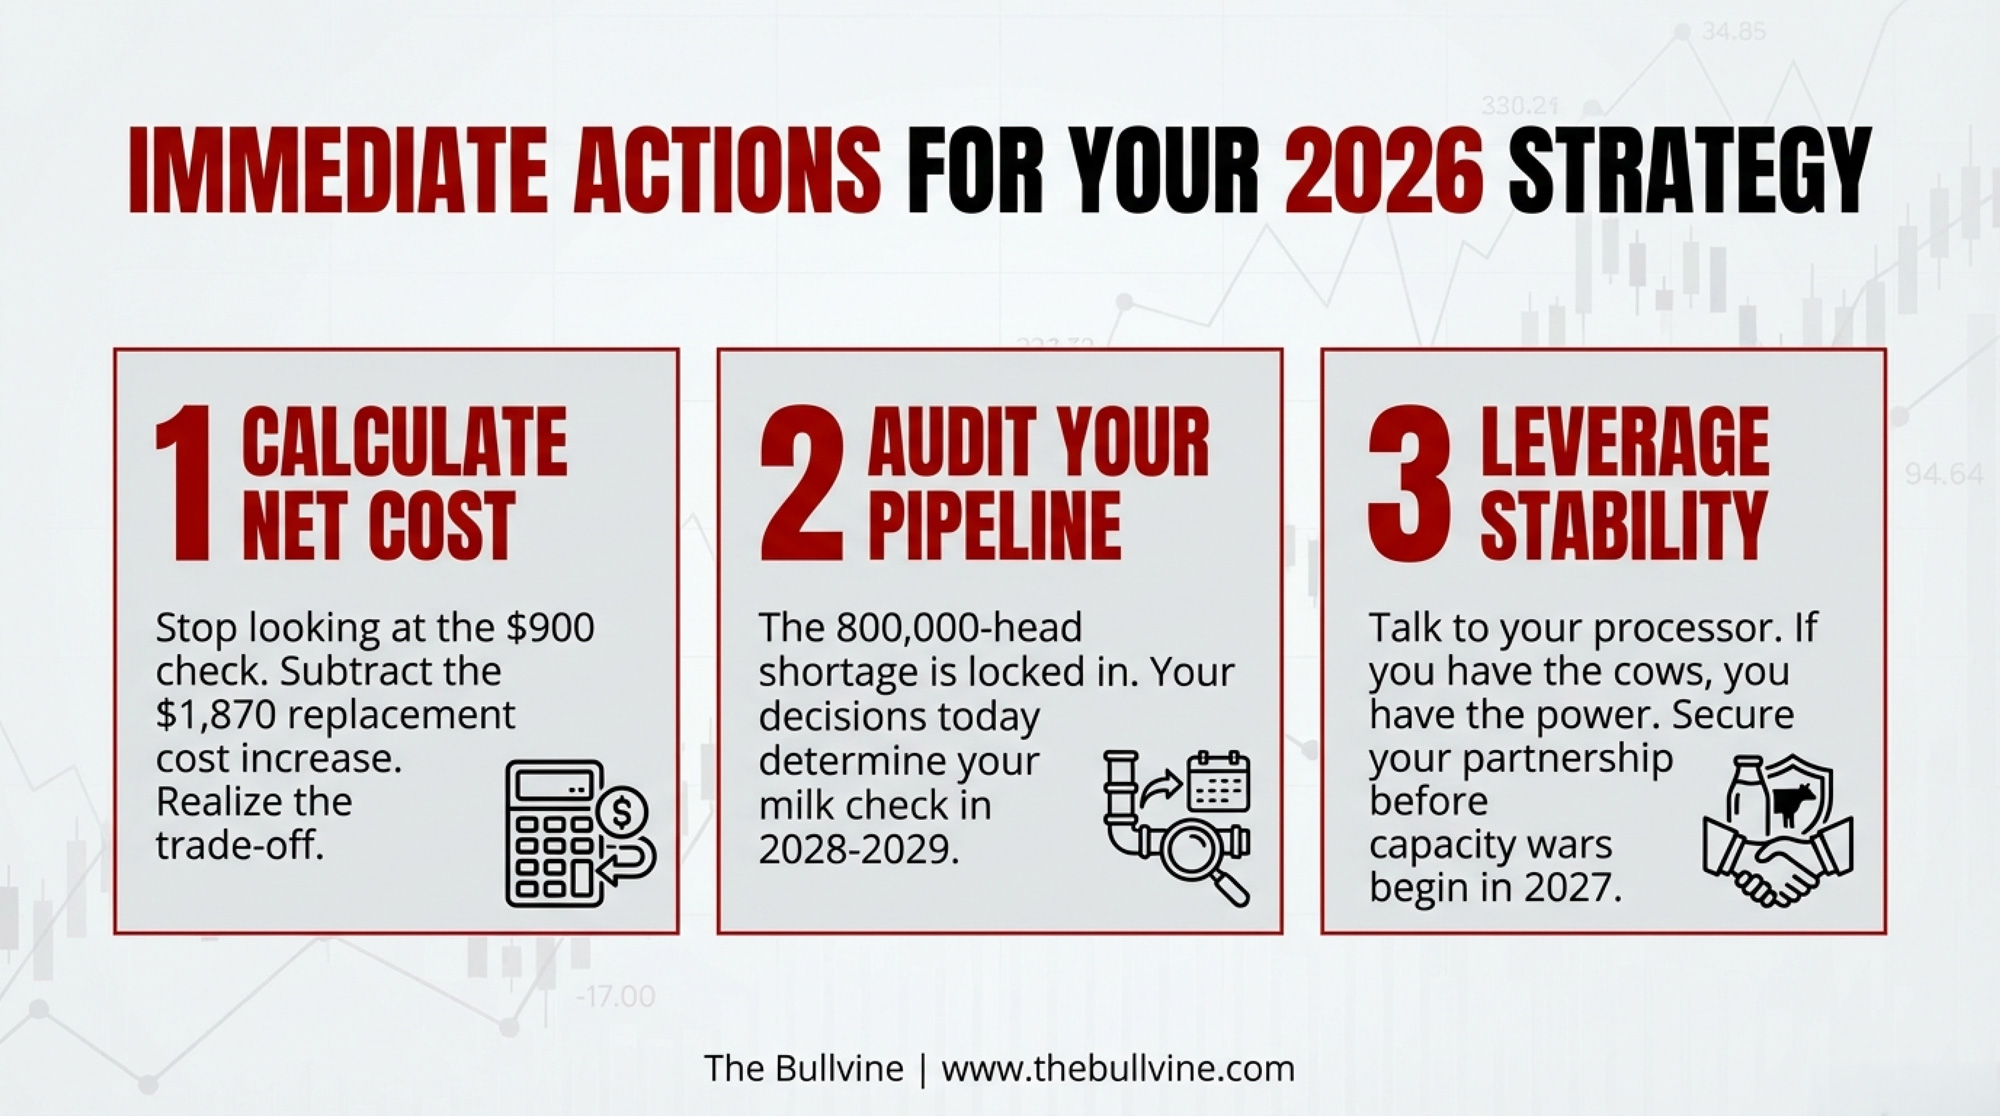
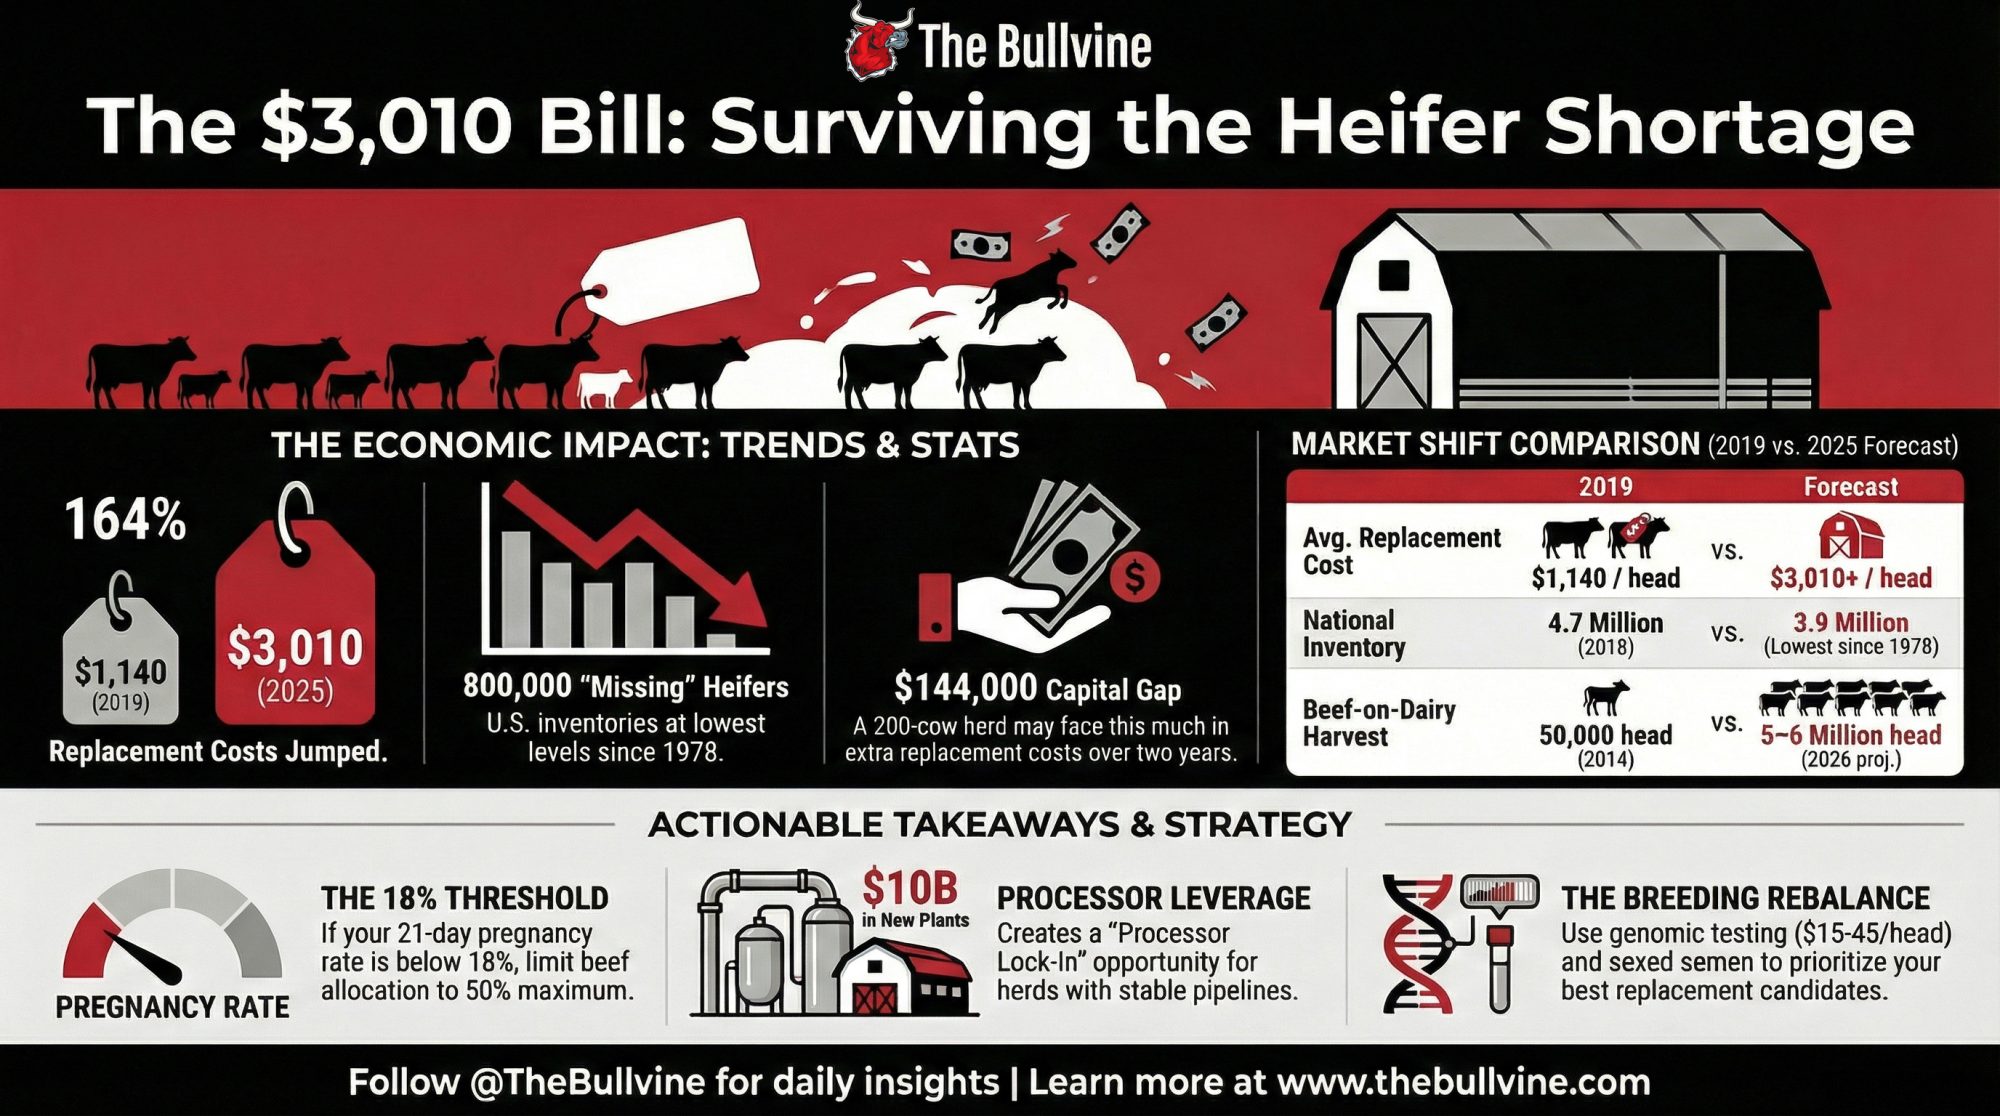
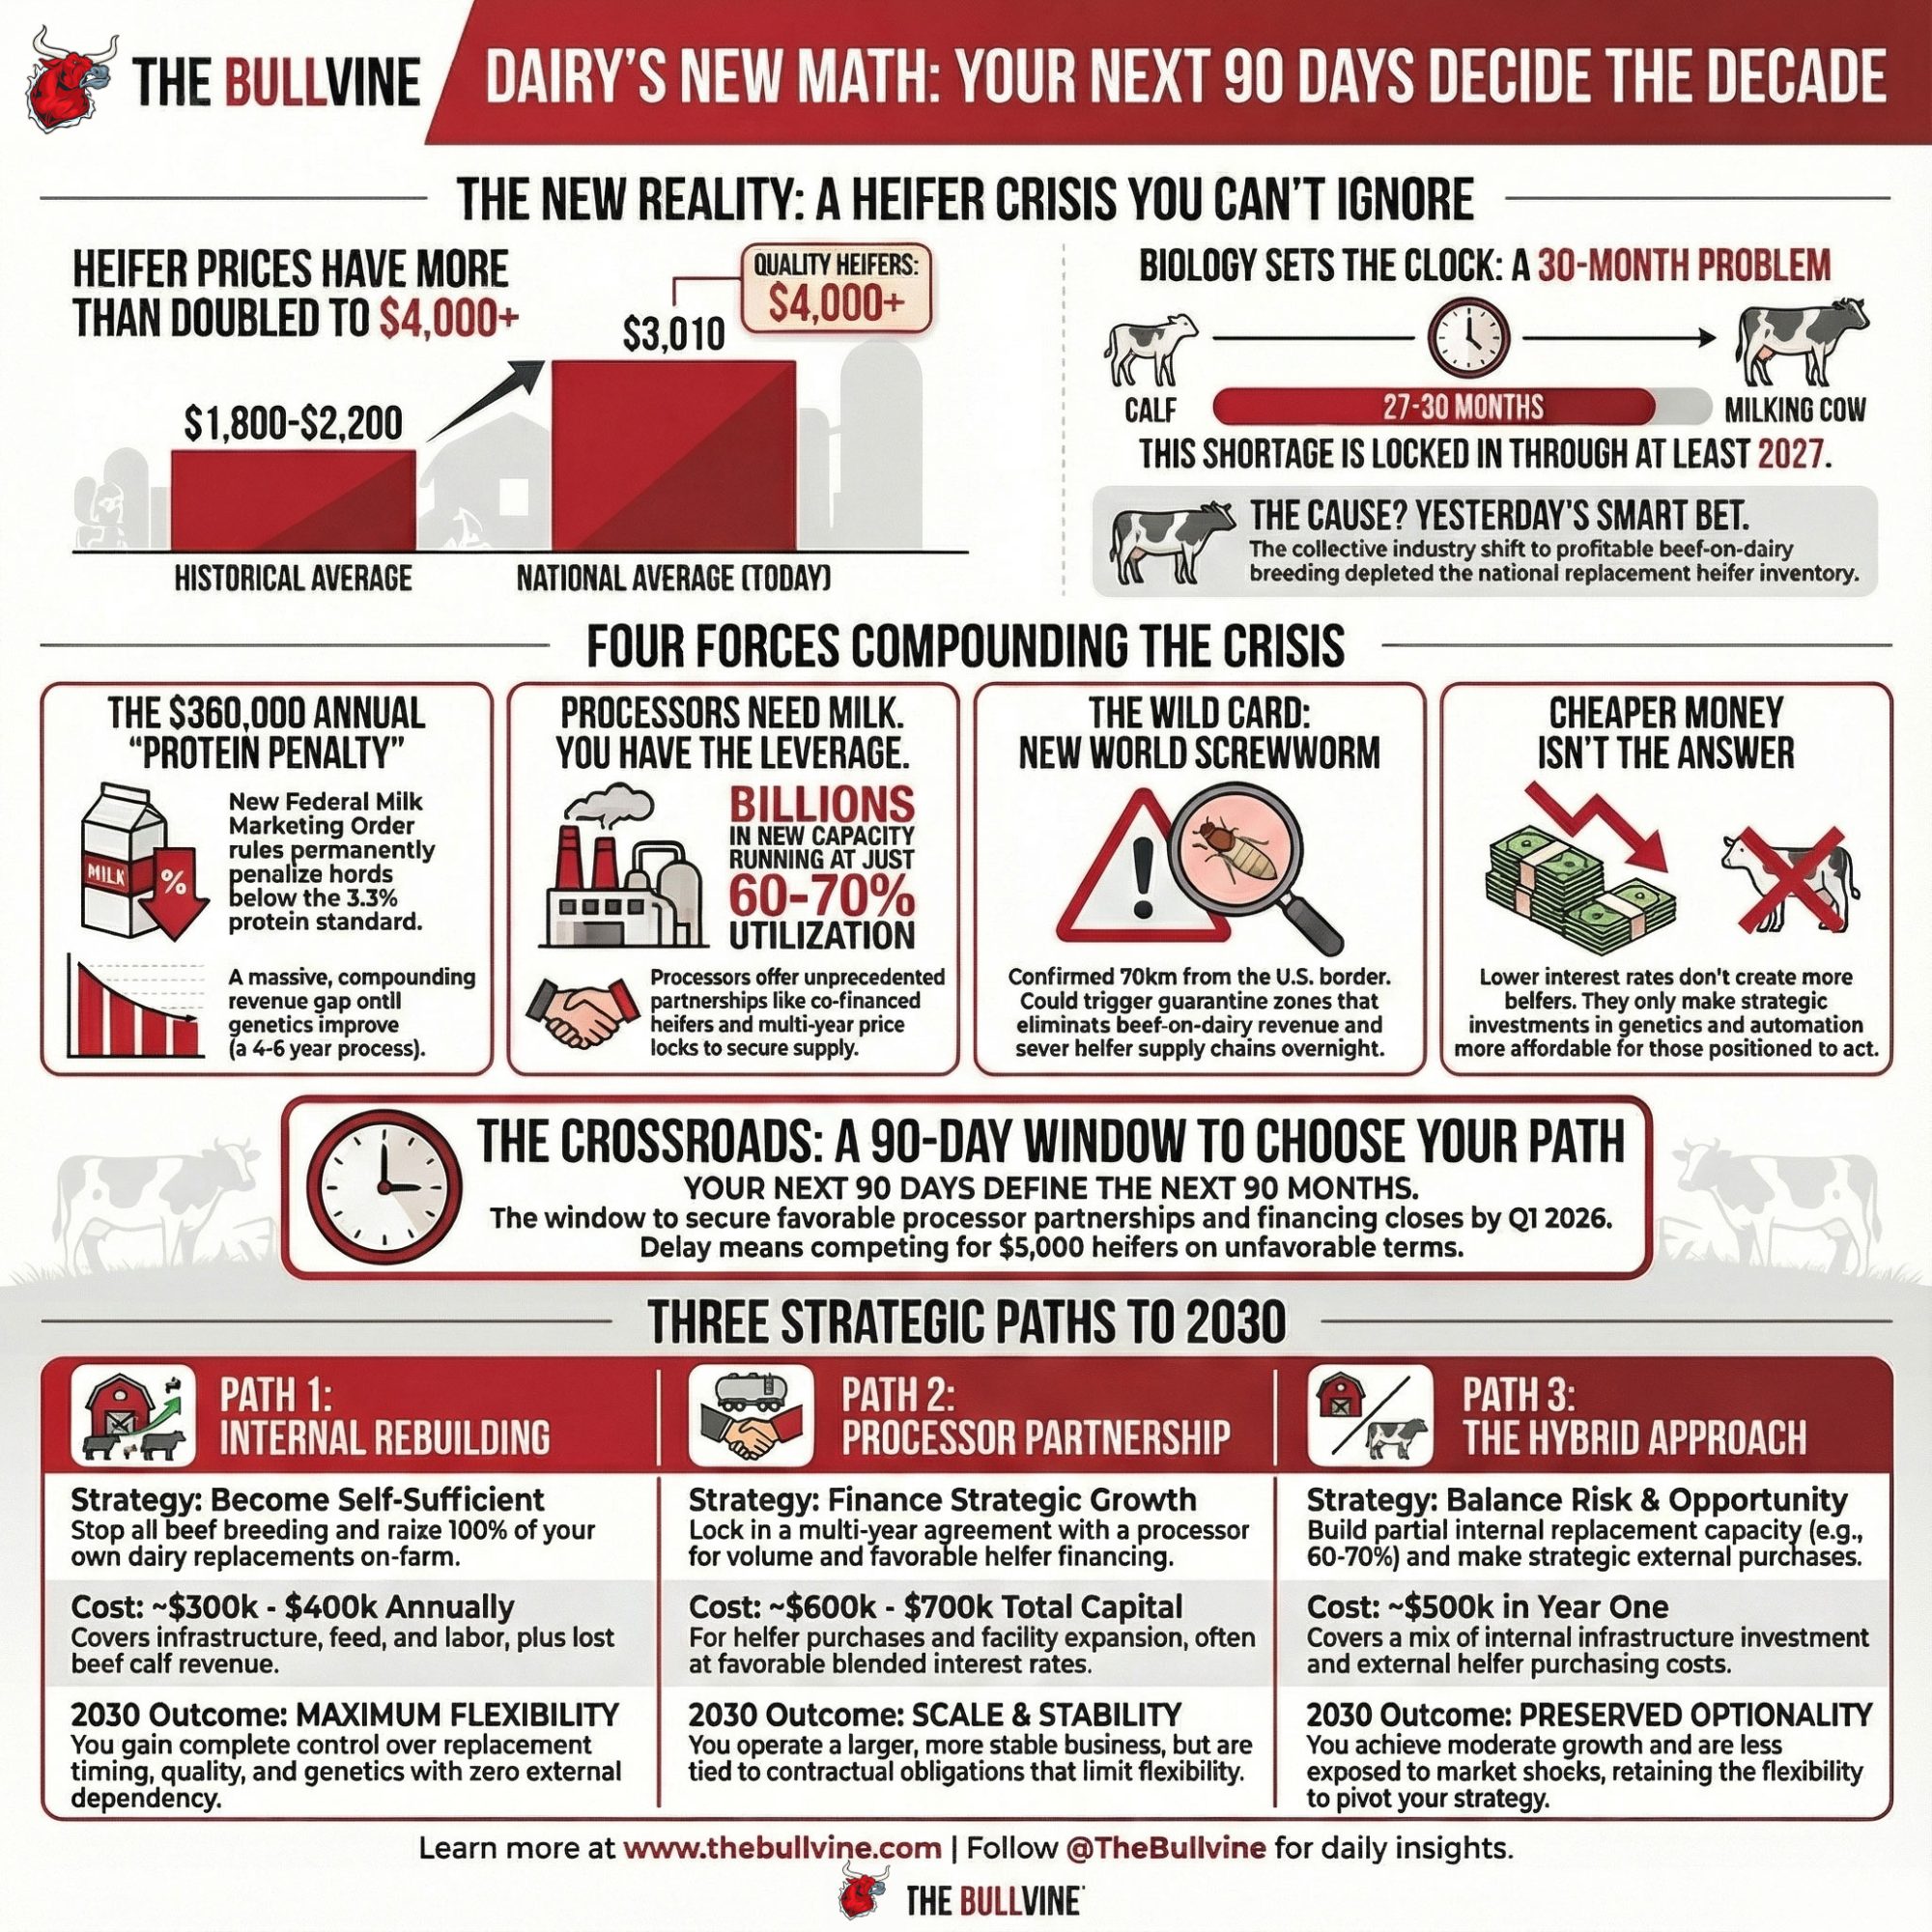
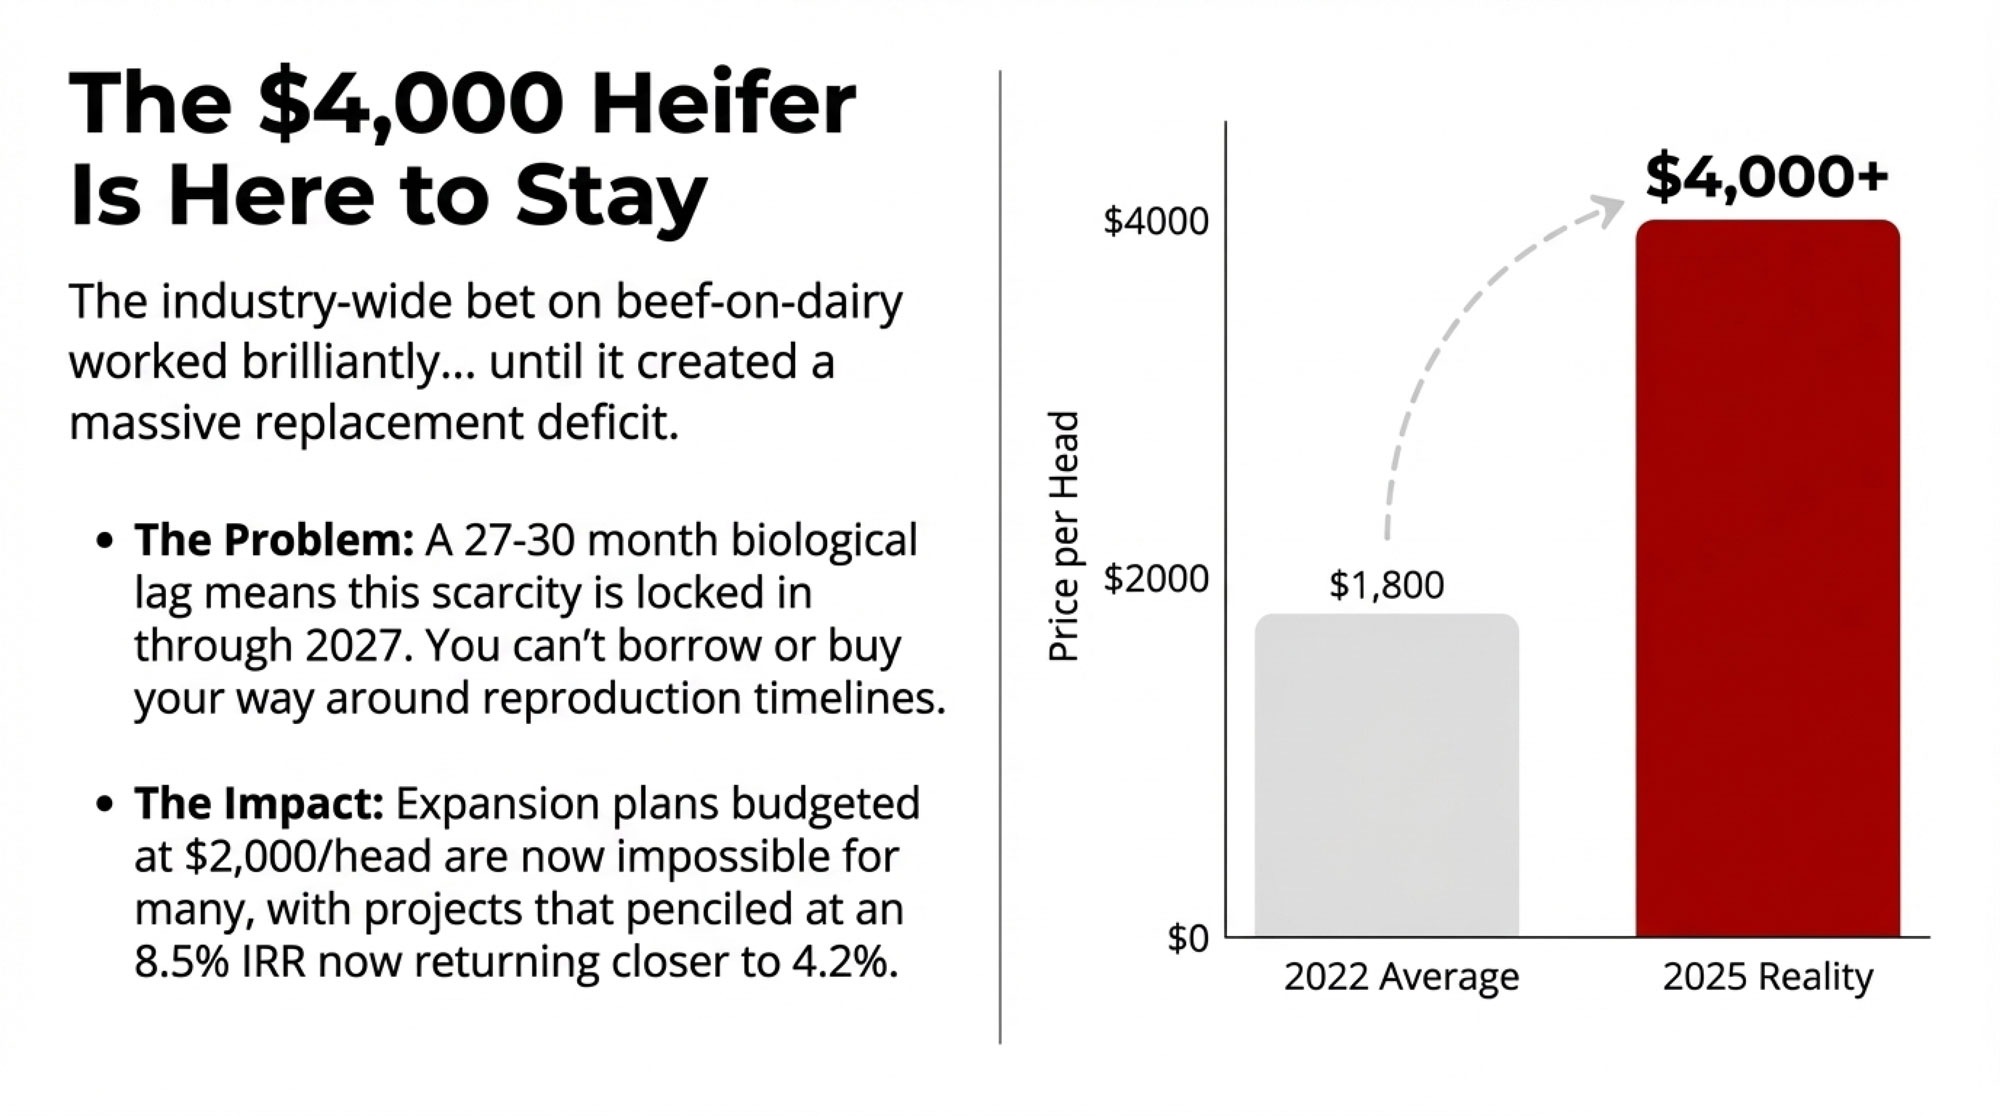
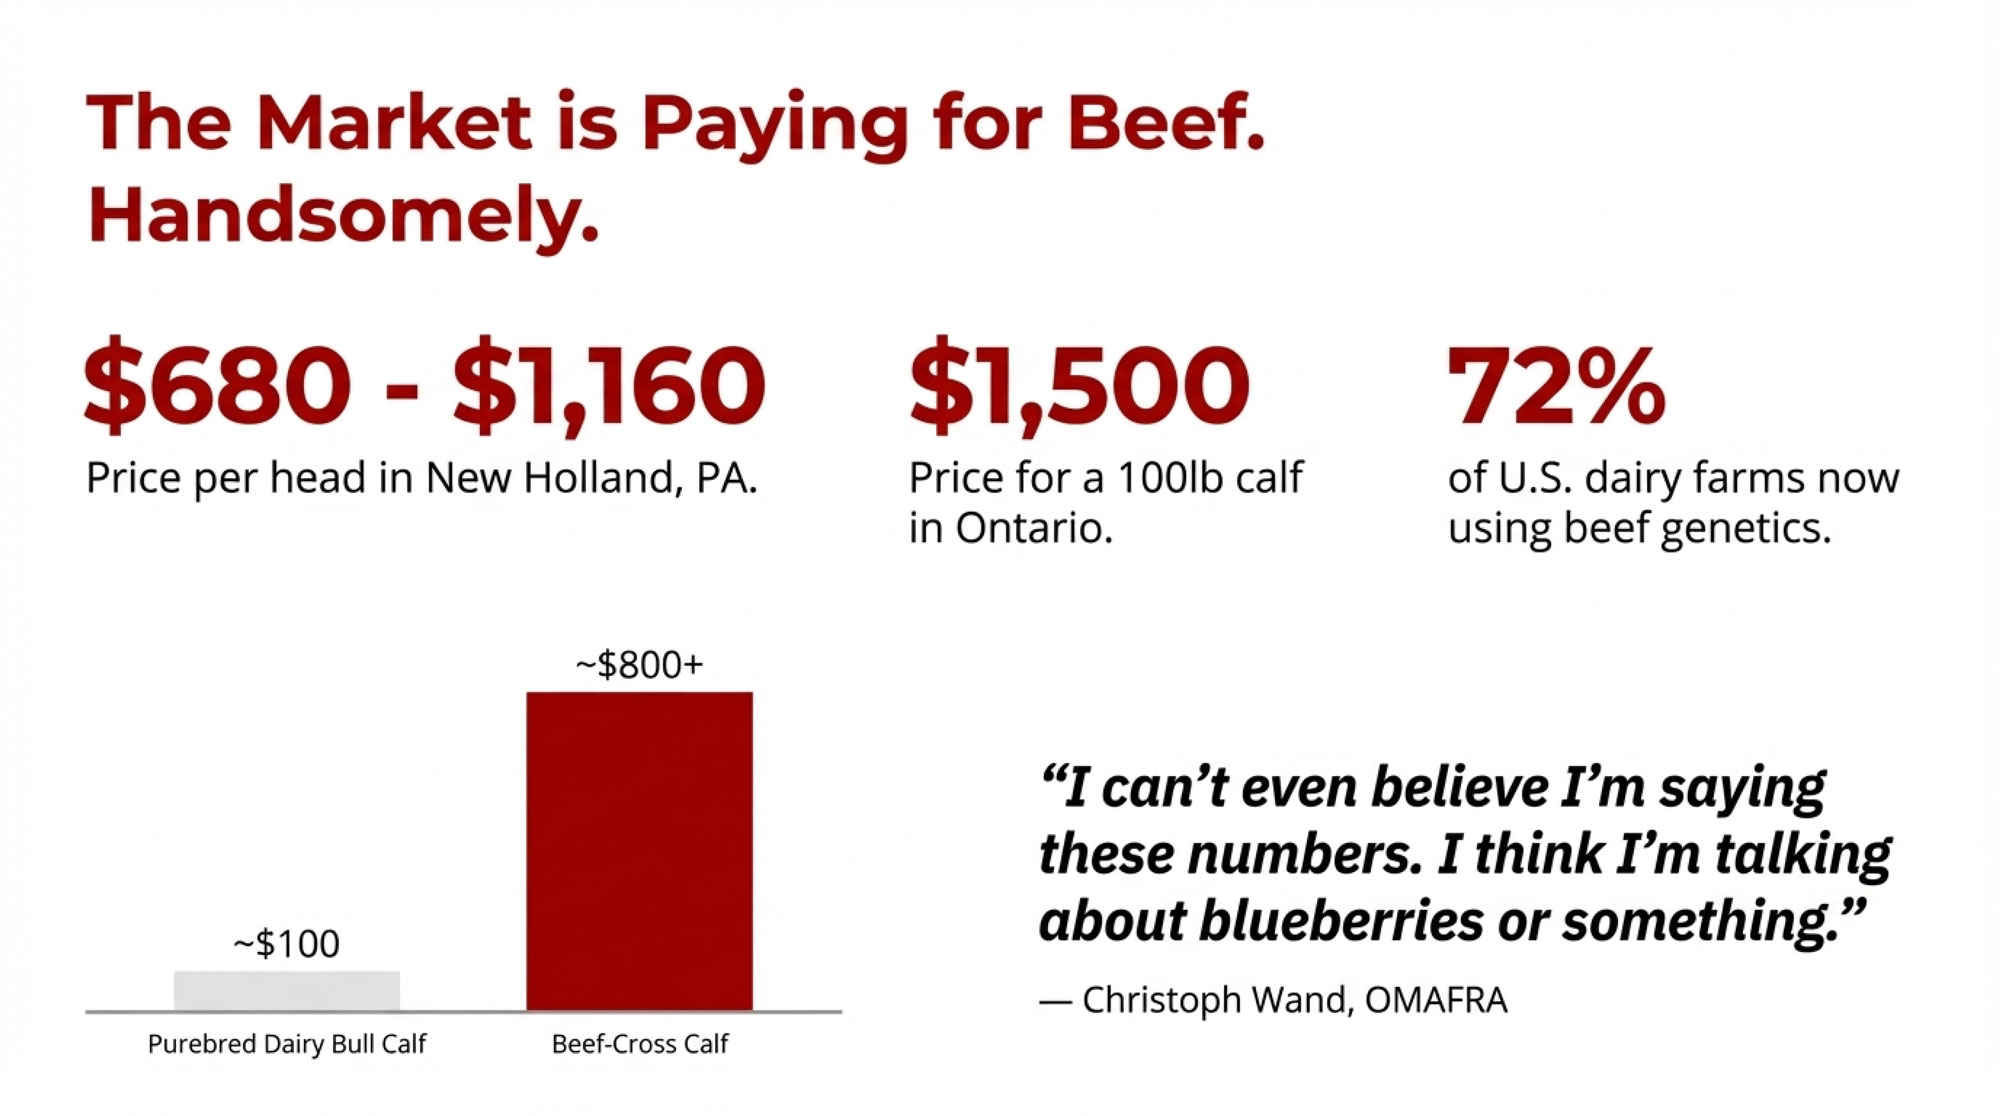
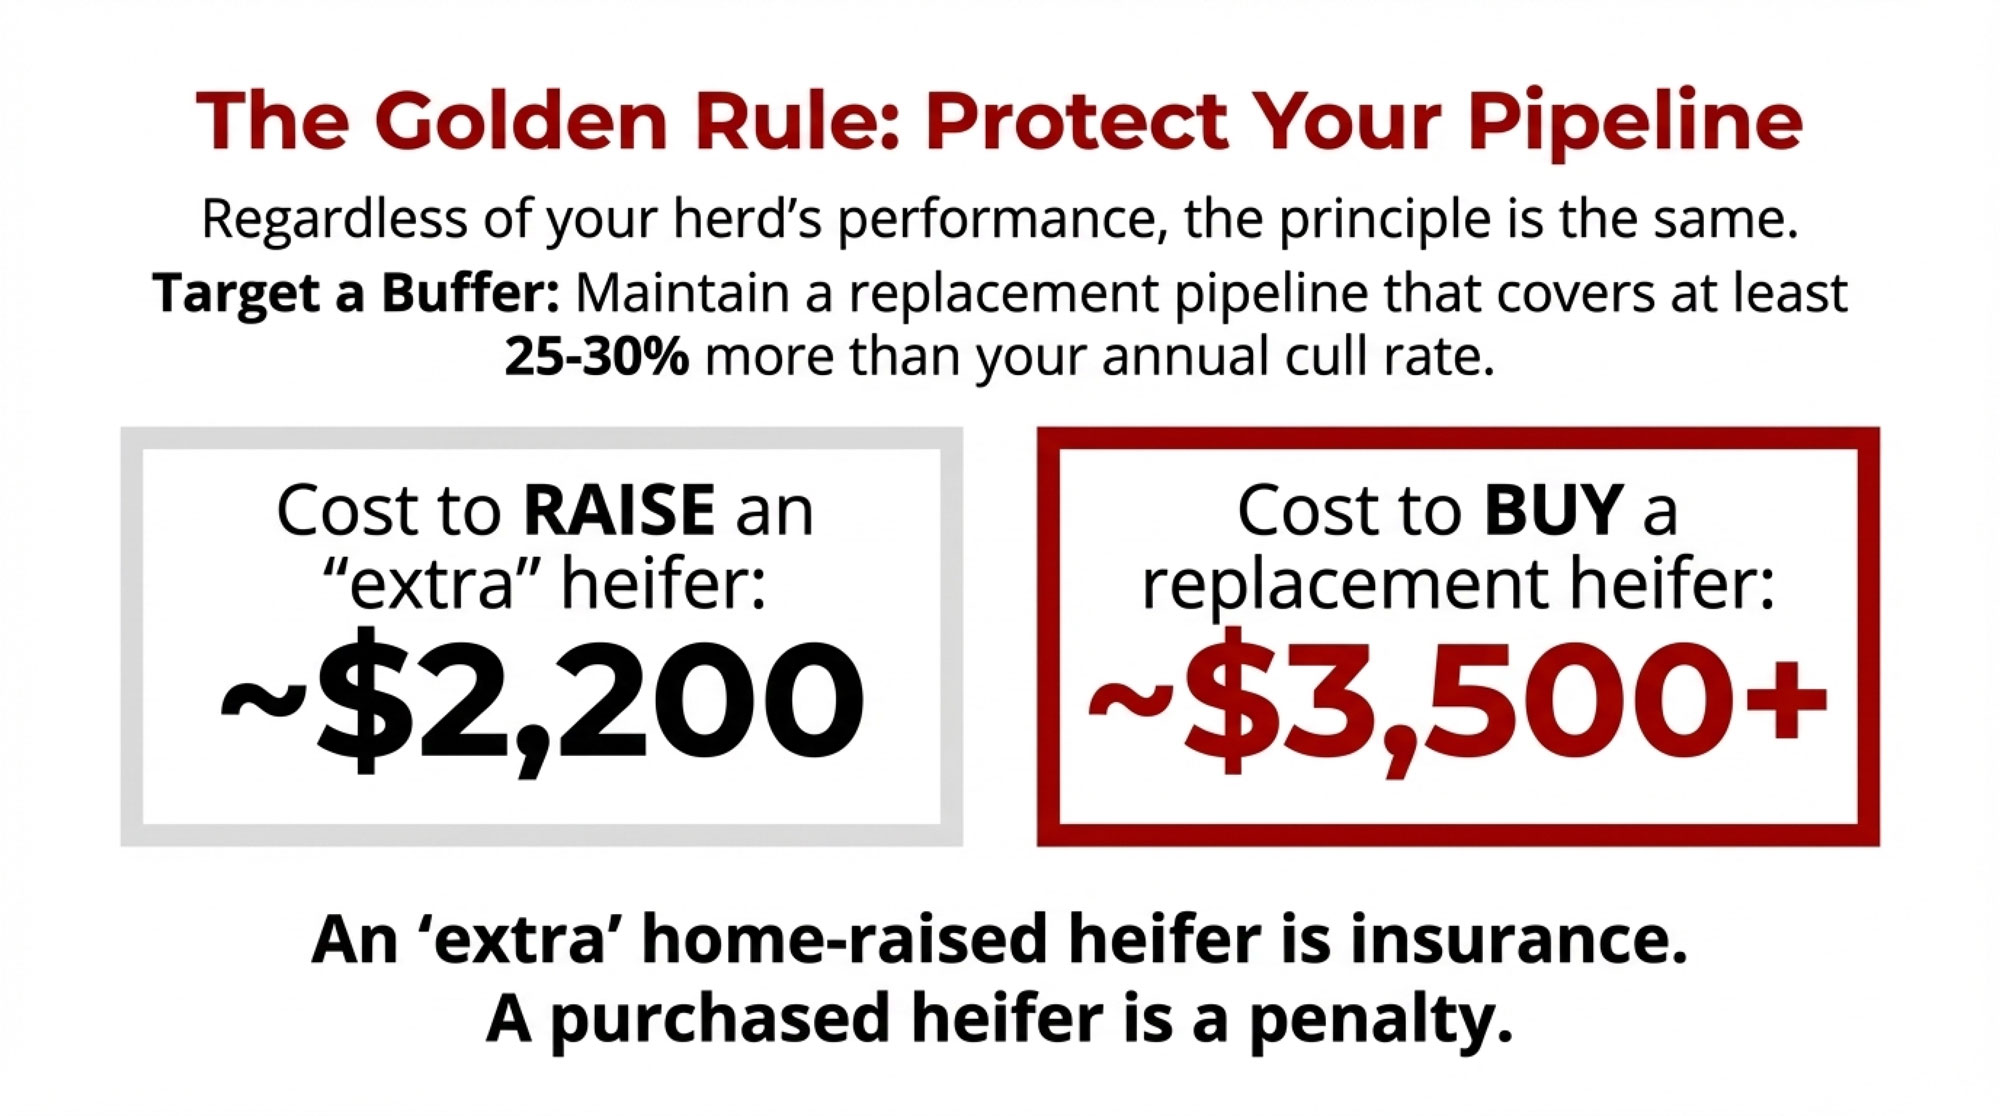
On the cost side, U.S. dairy replacement prices hit about $3,010 per head in July 2025, up 164% from the 2019 bottom of around $1,140, with top heifers bringing $4,000 or more in some auction barns. In Ontario, replacement heifers over 900 lbs were selling around $326–$328 per hundredweight at recent auctions — not the same absolute price, but the direction of travel is similar.
Now layer in genetics. If below-average RI bulls add even one extra service per conception across your dairy-bred matings, that’s more semen, more time open, and more risk that cows fall out of the dairy pipeline and into beef because they didn’t settle. It’s not just a $30–$50 sexed semen straw that didn’t stick. It’s a heifer that never existed, and a cow that probably gets bred to beef because everyone’s tired of missing her.
My read of the Production Index adds another twist. The PI averages the 81st percentile across the top ten — good, but notably lower than the LPI at the 99th and the LTI at the 91st.. In other words, the composite LPI for these bulls is being carried more by longevity and type than by yield. That raises a fair question: how much of that 1,918-point LPI reflects real lifetime profitability, and how much is the formula letting strong CONF and LTI paper override weak RI and MI?
Does 97th-Percentile Conformation Actually Drive Jersey Profitability?
On paper, this top ten group is a type breeder’s dream. The average conformation score sits at +11.4 — the 97th percentile — with a range from −2 to +18. Mammary system averages +8.9. Feet and legs average +8.5. Those are big numbers.
The real question is what those numbers actually buy you.
Canadian work from Agriculture and Agri-Food Canada on longevity found that udder depth and milking ease accounted for 84% of the total contribution of type traits to functional longevity, and that rear teat placement, udder depth, and udder texture had a significant influence on functional survival. Cows with tight, well-attached udders stayed in the herd longer.
Alcantara, Baes, de Oliveira Junior, and Schenkel (2022), in the Canadian Journal of Animal Science, put hard-dollar values on the type traits involved. Analyzing 9,351 proven Holstein bulls, they found heel depth had the strongest positive effect on Pro$ of any conformation trait, at +$79.13 per unit RBV increase.
In plain terms: heel depth pays you; extreme body depth costs you.
That same paper showed dairy capacity (especially body length) was also positive, at +$59.00 per unit RBV. More capacious, angular cows tended to stay productive longer. But body depth told the other side of the story: it had the largest negative effect on Pro$ at –$61.95 per unit RBV because deeper-bodied cows ate more, tended to lose condition more quickly after calving, and showed poorer fertility in later lactations.
The problem is that composite CONF rewards all of it. Stature, angularity, body capacity, and dairy character are assigned the same number as functional mammary and feet-and-legs traits. So, a bull could rank in the 97th percentile for CONF largely on height and style, while another sits in the 72nd percentile with rock-solid udders and feet. The composite score doesn’t tell you which one actually puts more money in your pocket over five lactations. And neither does the catalog page.
What Would a Balanced Jersey Sire Stack Look Like in 2026?
The 2025 data doesn’t say you need to blow up your sire list and start over. It says you need an index floor when selecting sires. And you need it on traits and subindexes where no one has put one to date.
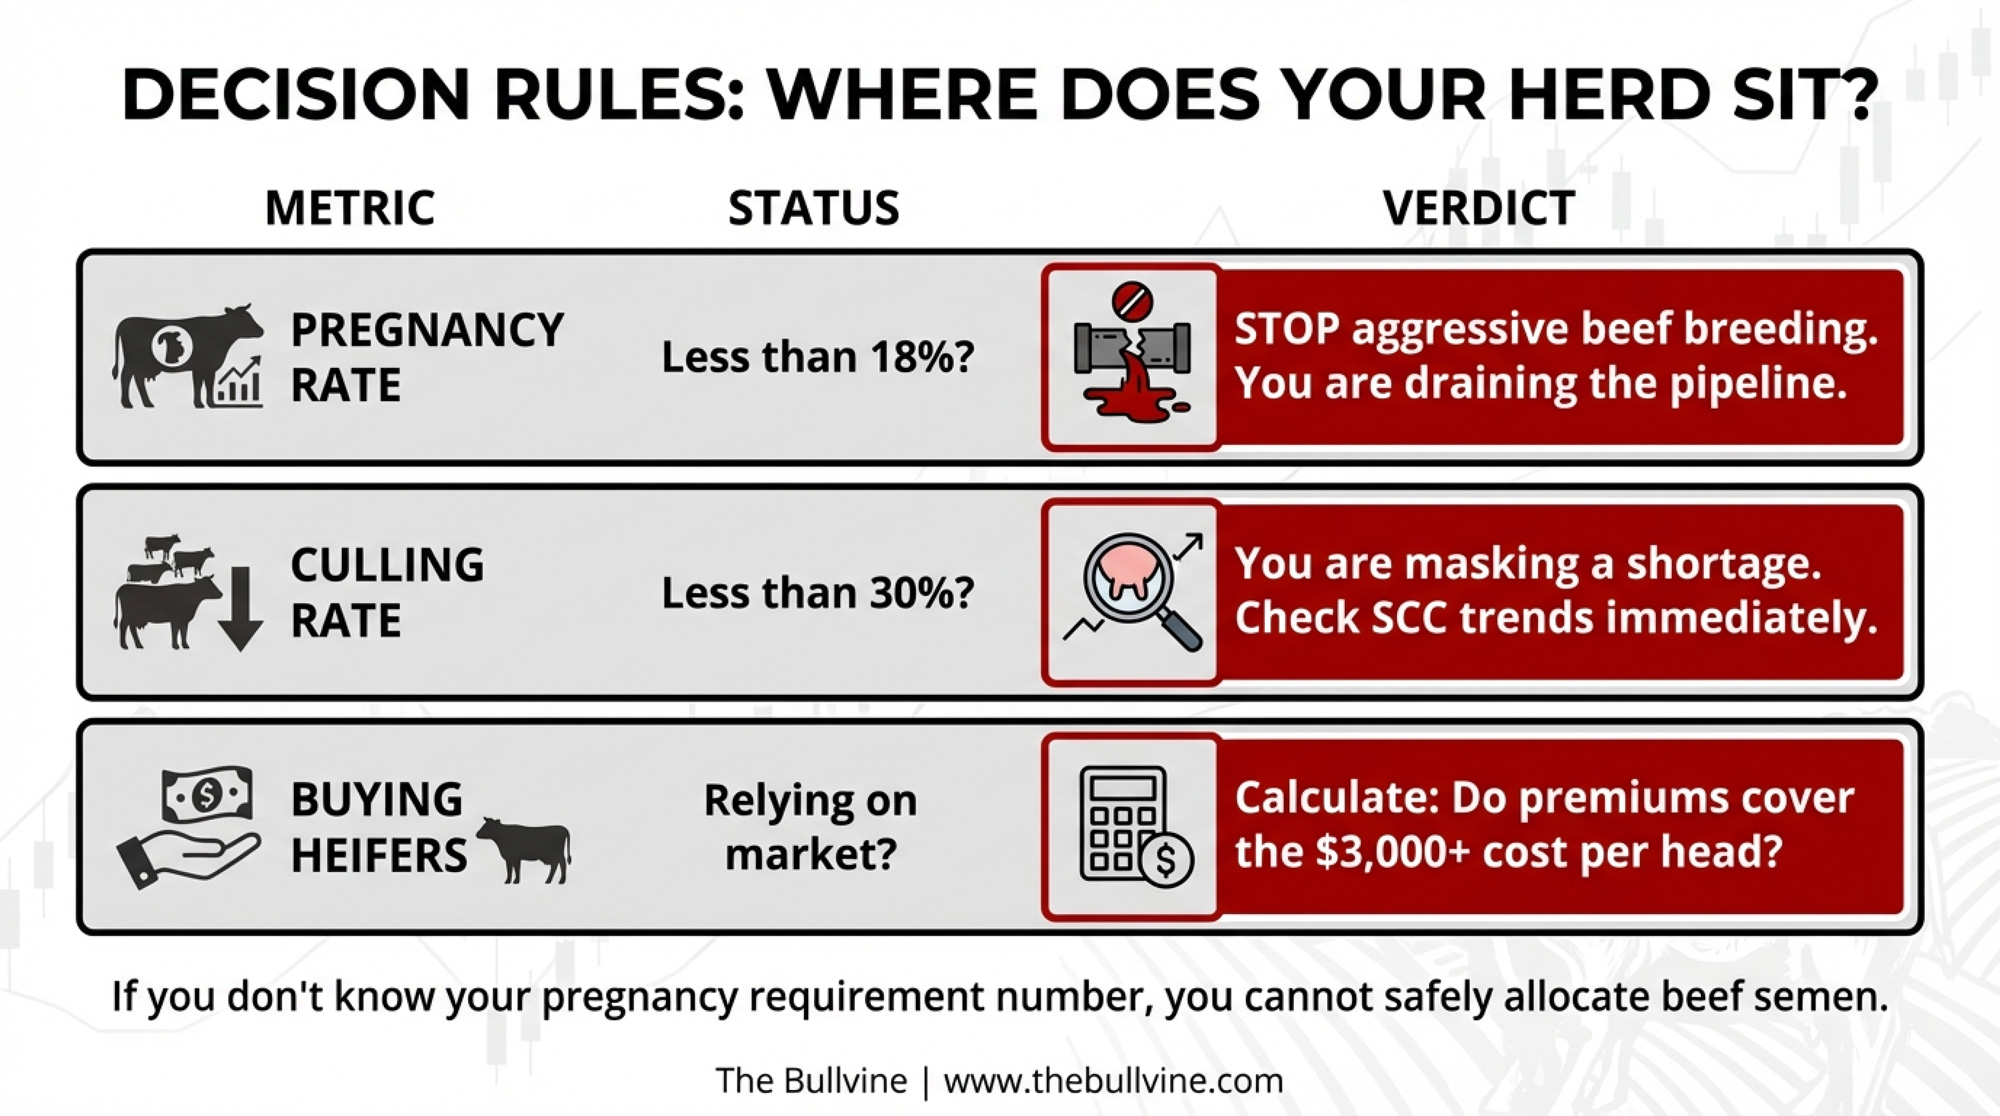
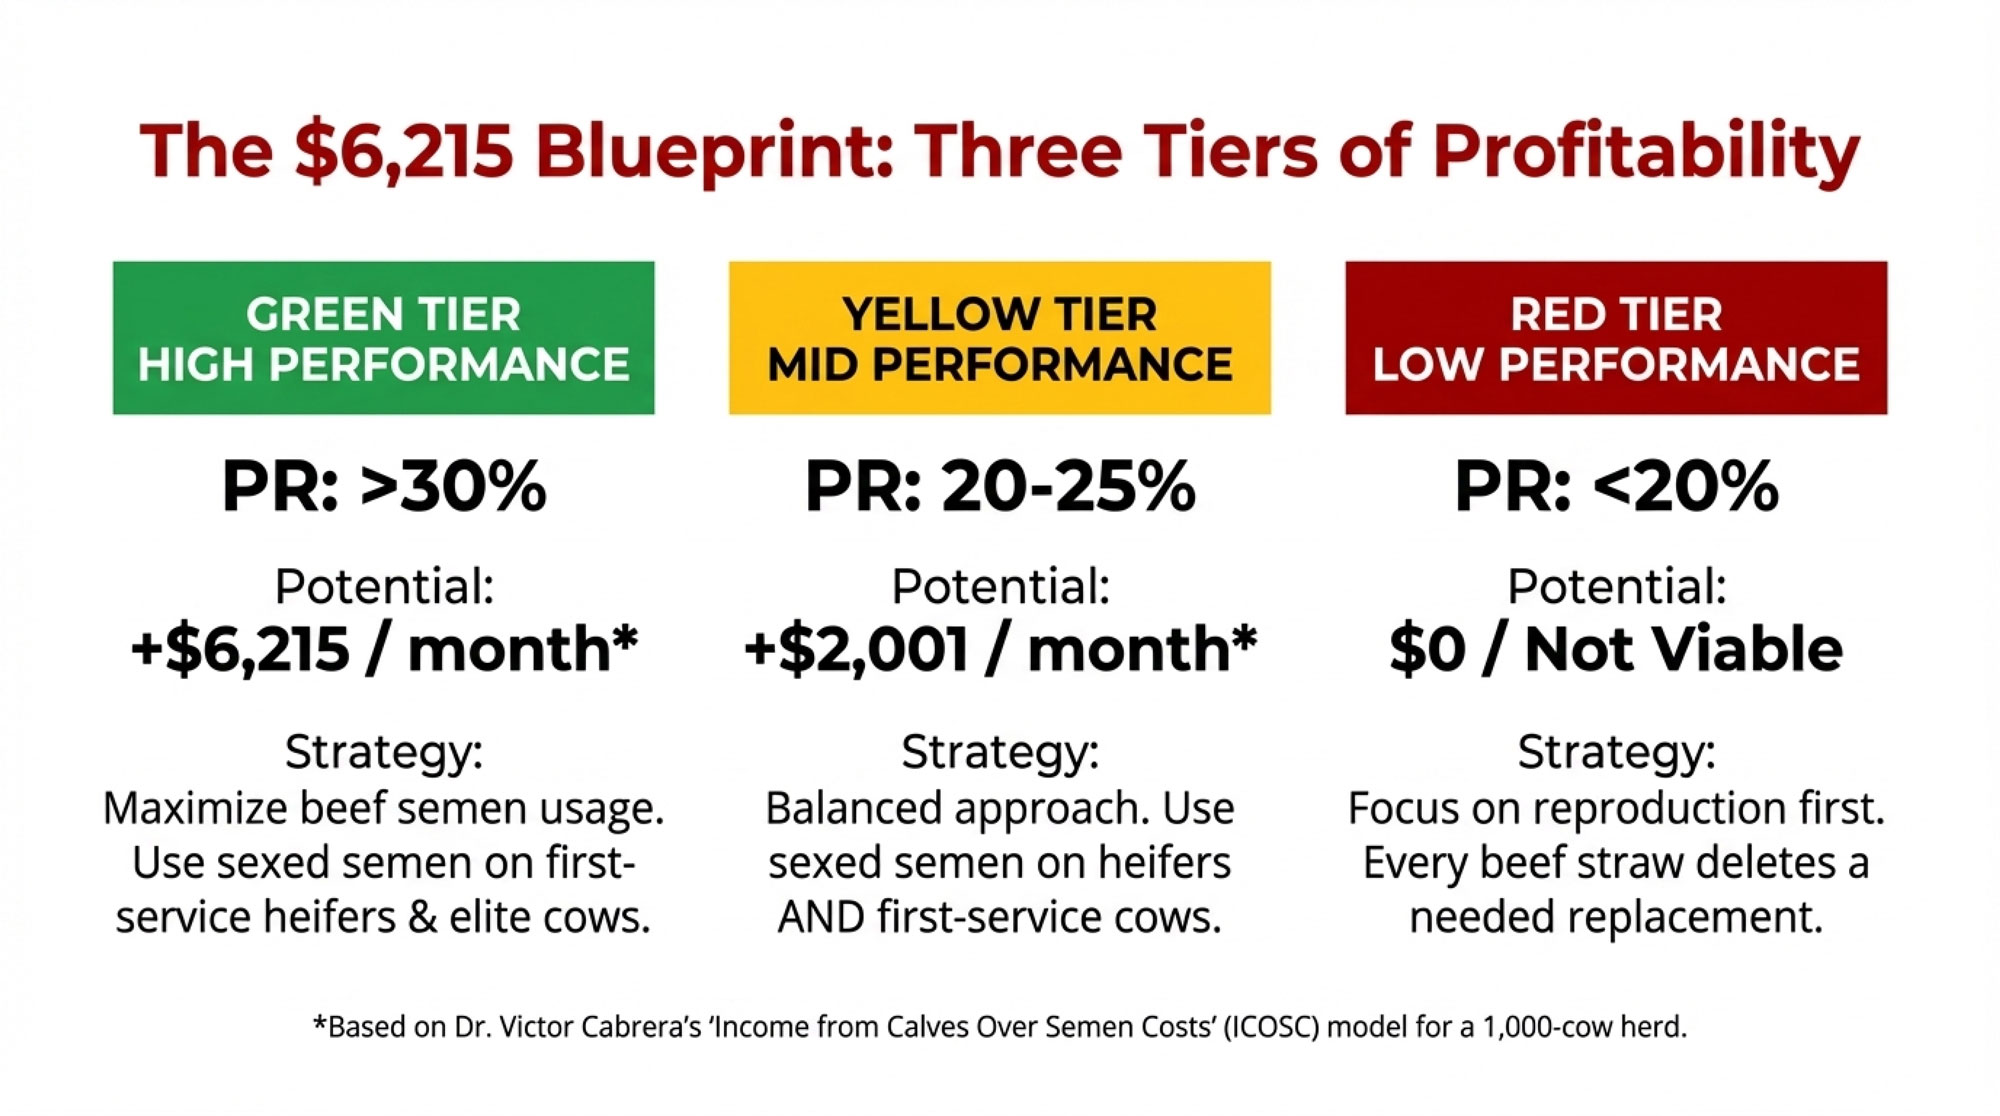
Set a hard RI minimum at the 50th percentile for every bull in your stack. That’s not aggressive — it just means refusing to use sires whose daughters carry below-average fertility genetics. Apply this filter to the current top ten, and five of the ten drop out immediately. If you actually want to improve fertility, not just stop the slide, aim for RI in the 65th percentile or better. This month, pull the Lactanet subindex breakdown for every sire in your current mating plan. If any bull sits below the 50th-percentile for RI, flag him for replacement or for use only on your most fertile cows.
Give HWI a seat at the table. The top ten average just the 59th percentile for the Health & Welfare Index, with four bulls below the median. HWI is where Metabolic Disease Resistance, Mastitis Resistance, and Cystic Ovaries live in the modernized LPI. A 55th percentile floor keeps you from actively weakening your health genetics; 65th and up start building a real health advantage into your replacements.
Use MI as a robot and labour filter. With a 34th-percentile average, MI is the weakest subindex for this top ten group. Suppose you’re milking with robots — or thinking about it — milking speed, temperament, and teat placement matter just as much as litres. Even in a parlour, slow or difficult milkers chew up labour. Set your own MI floor at the 45th percentile, so you’re not selecting against milkability. In a robot environment, you might want a higher percentile.
Cap CONF expectations and target the right pieces. Instead of chasing 97th-percentile CONF across your whole stack, think in a 65th–80th percentile window and focus on mammary and feet-and-legs sub-scores. The Alcantara et al. work backs this up: heel depth and dairy capacity drive Pro$, while body depth drags it down. Select accordingly.
Use high-LPI/low-RI sires as specialty tools, not blanket-herd bulls. A bull sitting at 99th-percentile LPI with poor subindex scores might still earn a place, on the 15–20% of cows with outstanding fertility and health backgrounds where you can safely chase an outcross, special pedigree, or type shot. He shouldn’t be breeding 80% of the herd.
Before your fall semen order (90-day action), write a simple sire selection protocol. One page. Minimum RI and HWI percentiles. Plus a desired MI floor. Target range for CONF with mammary and feet/legs priorities. Share it with your AI rep and your genetic advisor. If they can’t work within it, that’s a data point too.
By spring 2027 (365-day action), pull services-per-conception data by sire group from your own herd records. That’s where you’ll see RI genetics and timed AI protocols separate. A bull who looks fine on paper but needs 3.2 services per conception in your barn is telling you something your sire catalog won’t.
What This Means for Your Operation
You don’t have to be running a big registered show string for this to matter. If you’re milking Jerseys and buying semen in Canada, you’re already living with the top ten bulls’ subindex profile. The only question is whether you’re steering it or just going along for the ride.
Run the subindex numbers on your current sire stack. Pull RI, HWI, and MI for every active bull you’re using. Calculate the weighted averages across your stack. If RI or HWI sits below the 50th percentile, you’ve quantified your genetic risk for fertility and health.
Decide what you’re actually willing to tolerate. A 47th-percentile RI average is what you get if you follow the registration leaderboard without asking questions. The minute you set a hard floor — even just at the 50th — you’re back in control.
Look at your conformation priorities through an economic lens. How much of your type selection pressure is going into the mammary system and feet/legs, and how much is chasing body depth and stature that the research says doesn’t pay? Adjust your eye accordingly.
If you’re running robots, treat MI as a non-negotiable. A 34th-percentile MI stack is basically selecting against robot efficiency. Put a line in the sand. Then ask yourself how many of your current sires clear it.
Double-check your replacement economics. On your own numbers, what does it cost to buy a bred Jersey heifer, with profit potential, right now? What’s your actual replacement rate? How much room do you have to play with fertility genetics before you start buying more herd replacements than you’d like?
Ask your AI rep better questions. Before you talk pedigrees or price, start with: “What are the RI, HWI, and MI percentiles on your top five Jersey sires for my herd?” If the answers come quickly — with printed subindex charts — you’re dealing with someone who’s reading the full proof sheet. If not, you’ve learned something about whose problems are being solved by that catalog page.
Key Takeaways
If half of the ten most-used Jersey sires in Canada sit below breed average for reproduction, the problem isn’t that breeders don’t care about fertility — it’s that the system never put RI, HWI, and MI on equal footing with LPI and CONF. I’ve been making that argument in one form or another for years: the numbers the industry promotes are the numbers that get selected. The numbers it buries get ignored.
The A2A2 success story proves breeders respond fast when the signal is clear. Processors put a premium on paper; within a few proof runs, the top ten registration bulls went 100% A2A2 and 90% BB. There’s no reason the same can’t happen for RI and MI once those numbers get the same font size in sire marketing and herd discussions.
The inbreeding trajectory shows it can be done. Dropping from 9.77% to 8.10% in five years didn’t happen by accident. It happened because inbreeding became visible and manageable. RI, HWI, and MI are sitting where inbreeding was a decade ago — important, but underused.
The Milkability Index might be the quietest and most expensive number on the page for robot herds. A 34th-percentile MI stack means you’re effectively selecting against milking speed and temperament in a system where every extra minute per cow at the robot is lost throughput. That’s not a small leak.
If you can write your sire selection protocol on one page — with hard subindex floors and a clear role for each bull — you’re ahead of most of the industry. The herds that do that over the next five years will be the ones with the replacements, the robot-friendly udders, and the health genetics that give them room to experiment elsewhere.
Five years from now, the real test of whether this analysis mattered won’t be on a Bullvine page. It’ll be in your own Lactanet login when you pull up your 2030 sire stack and see where your RI, HWI, and MI averages landed. Pull that same screen up tonight. What’s your average RI percentile — and are you honestly okay living with that number for the next five years?
Learn More
The Profit Index Paradox: Choosing Dollars Over Rankings — Arms you with the $869-per-cow lifetime profit gap data needed to override generic sire rankings. Rebuild your selection filter to prioritize Net Merit over LPI and stop leaving thousands on the table.
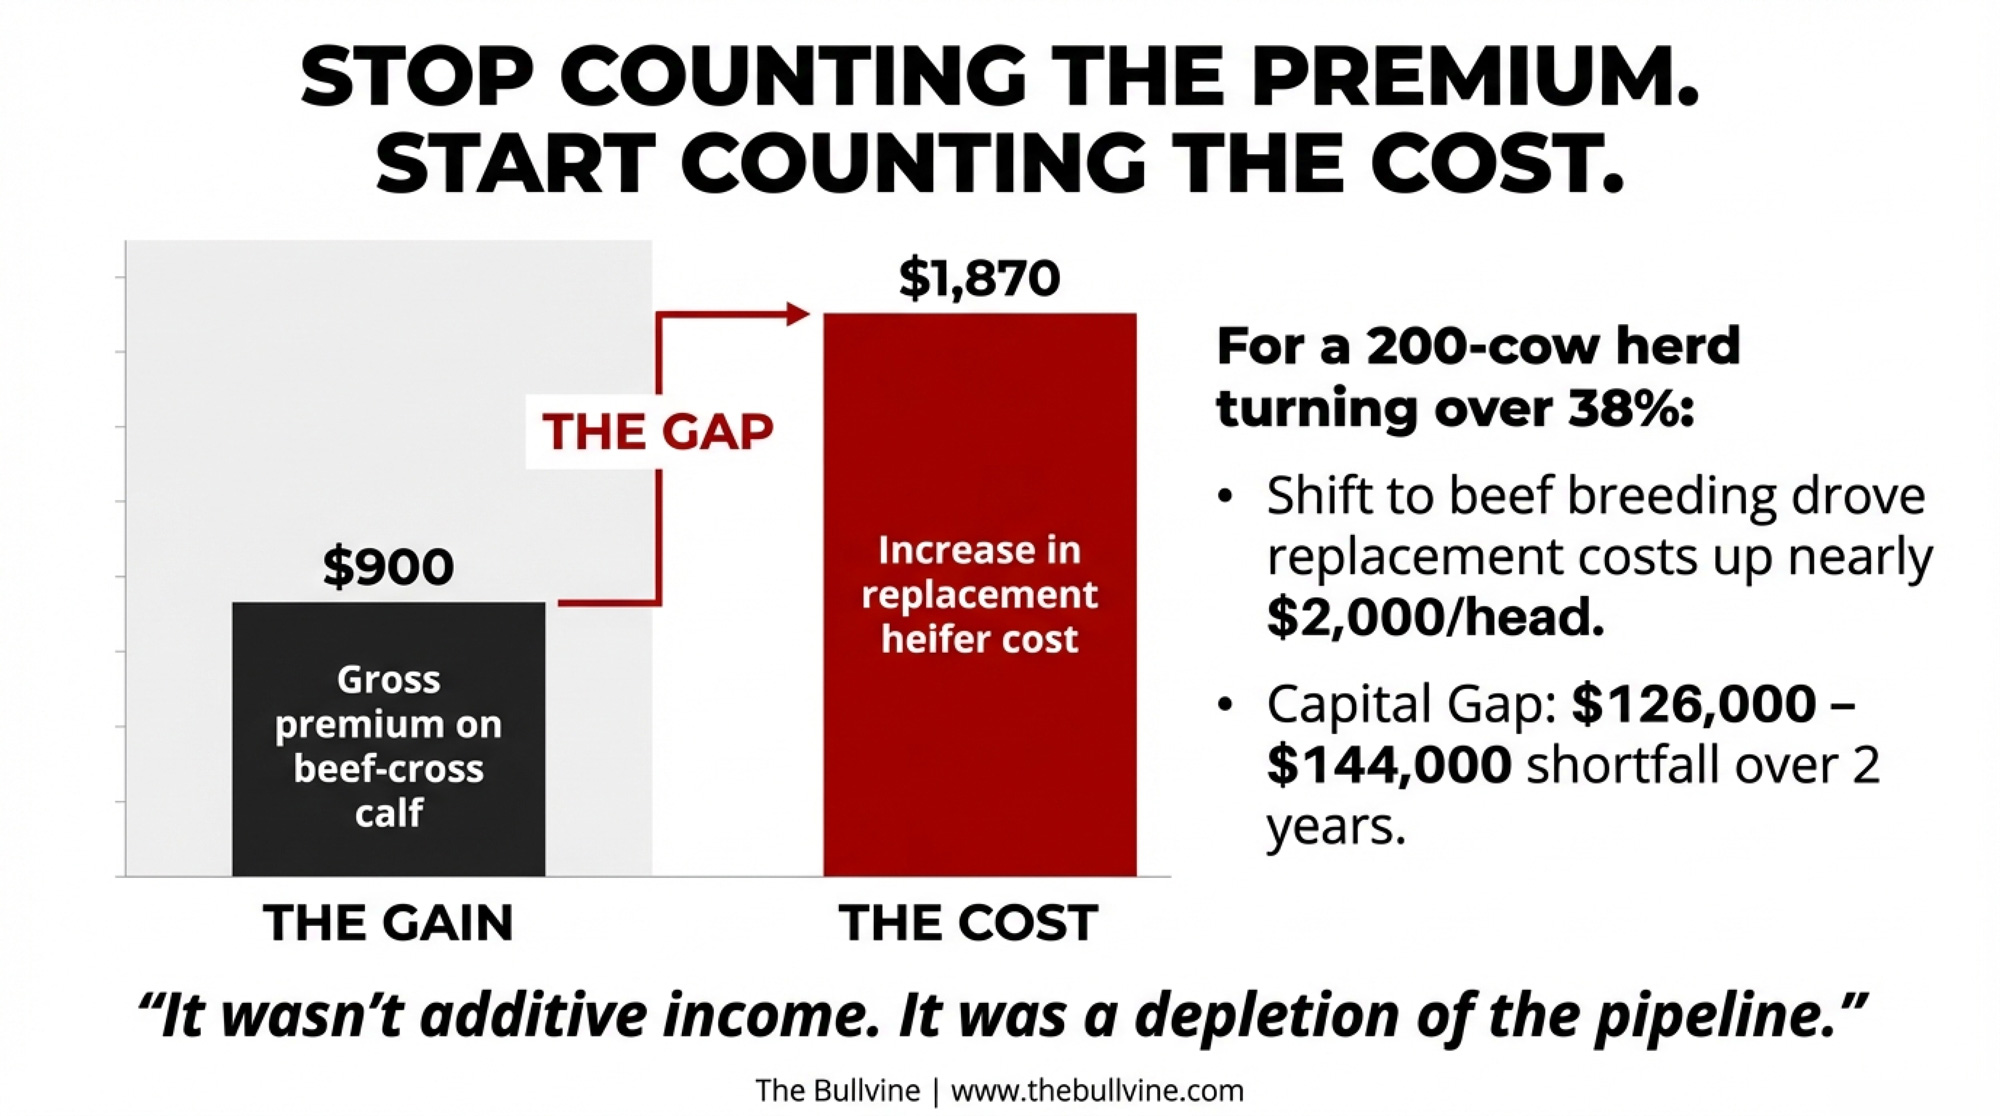
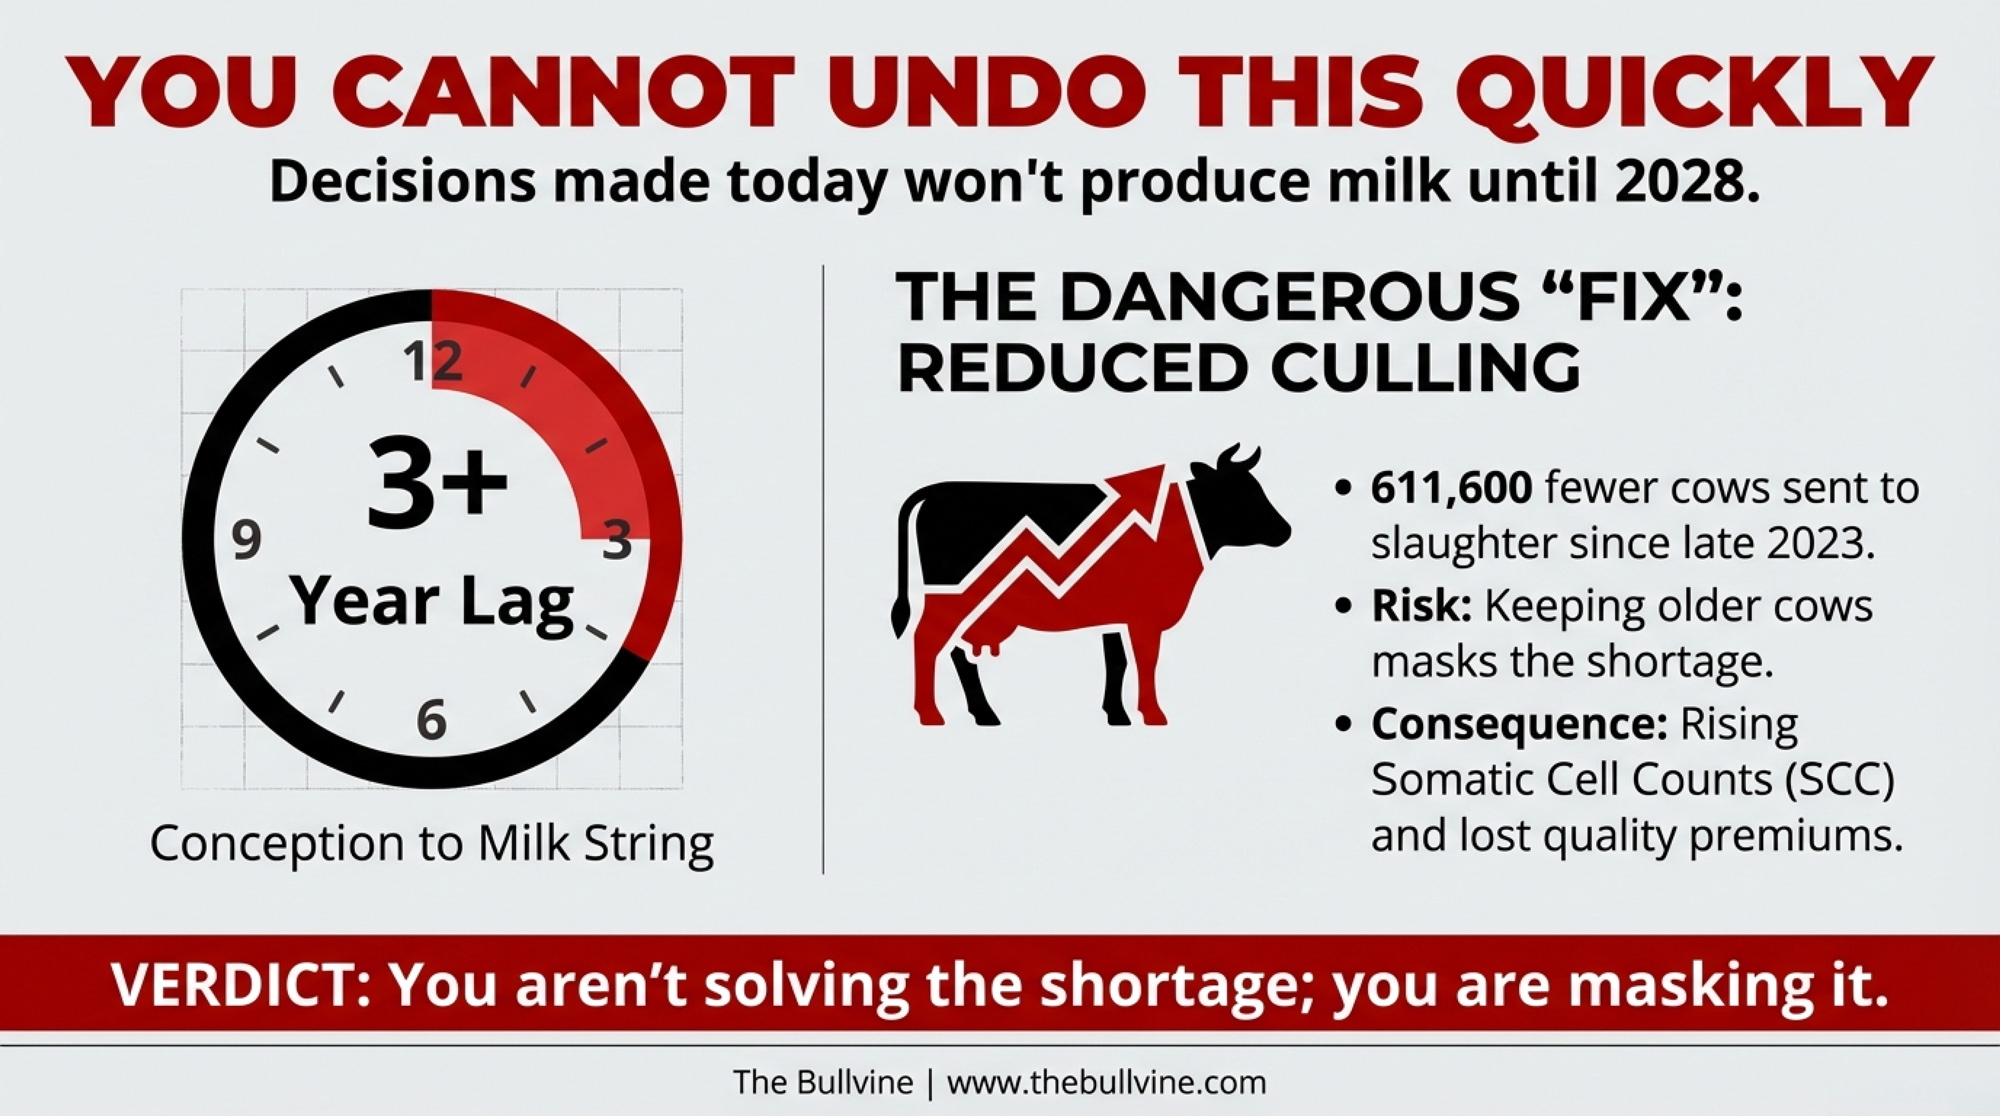
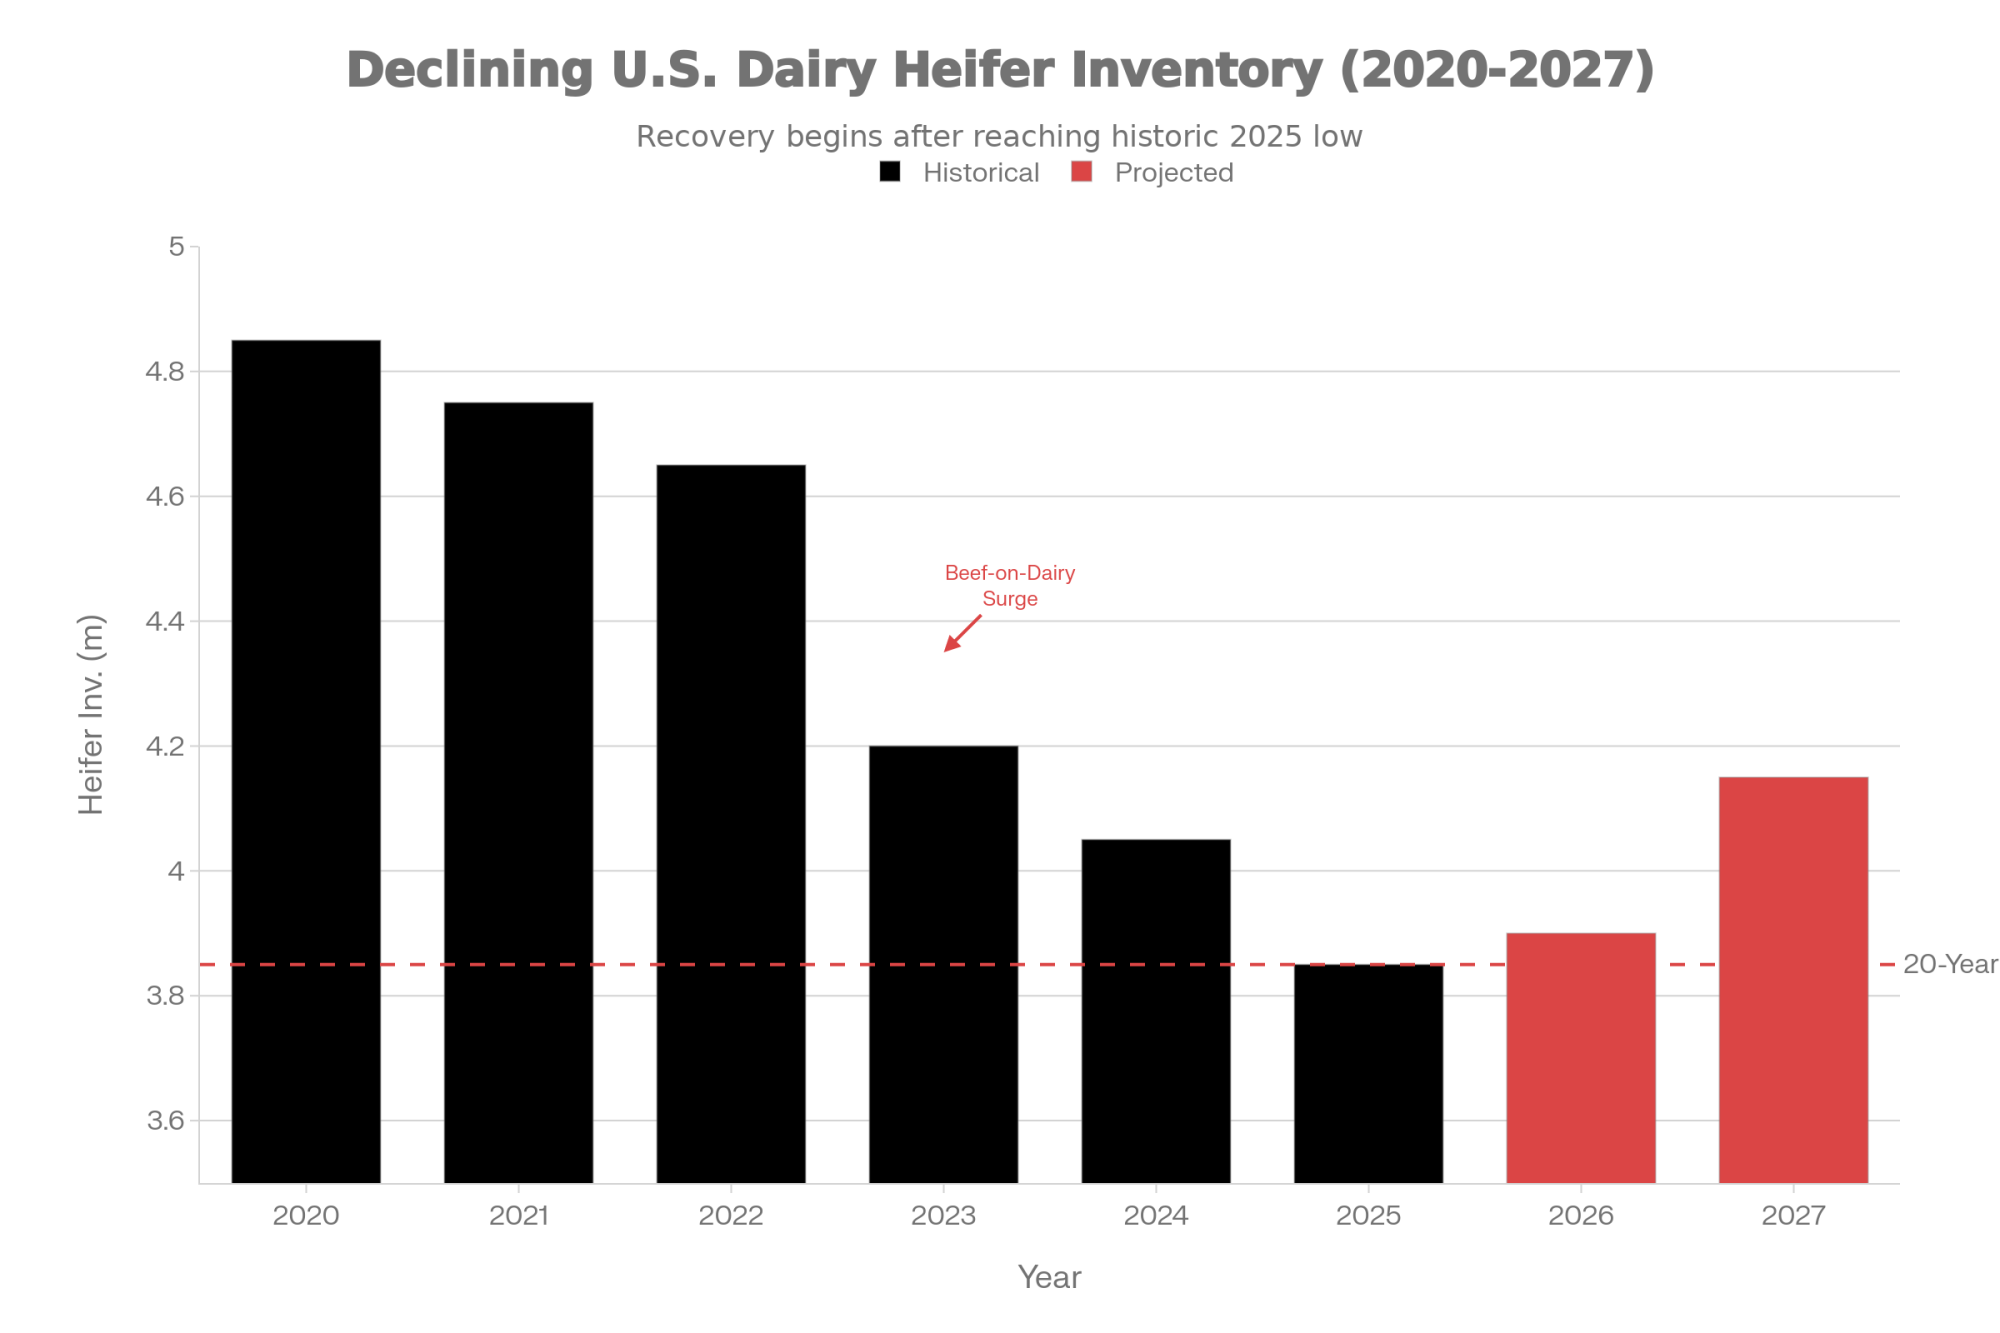
The Triple Cushion Trap: Why 2025’s Strong Margins Won’t Save You in 2026 — Dismantles the false security of 2025’s high margins by exposing the looming replacement heifer shortage. Prepares your operation for 2026 by mapping out critical moves for beef-on-dairy revenue and herd right-sizing.
Complete references and supporting documentation are available upon request by contacting the editorial team at editor@thebullvine.com.
The Sunday Read Dairy Professionals Don’t Skip.
Every week, thousands of producers, breeders, and industry insiders open Bullvine Weekly for genetics insights, market shifts, and profit strategies they won’t find anywhere else. One email. Five minutes. Smarter decisions all week.
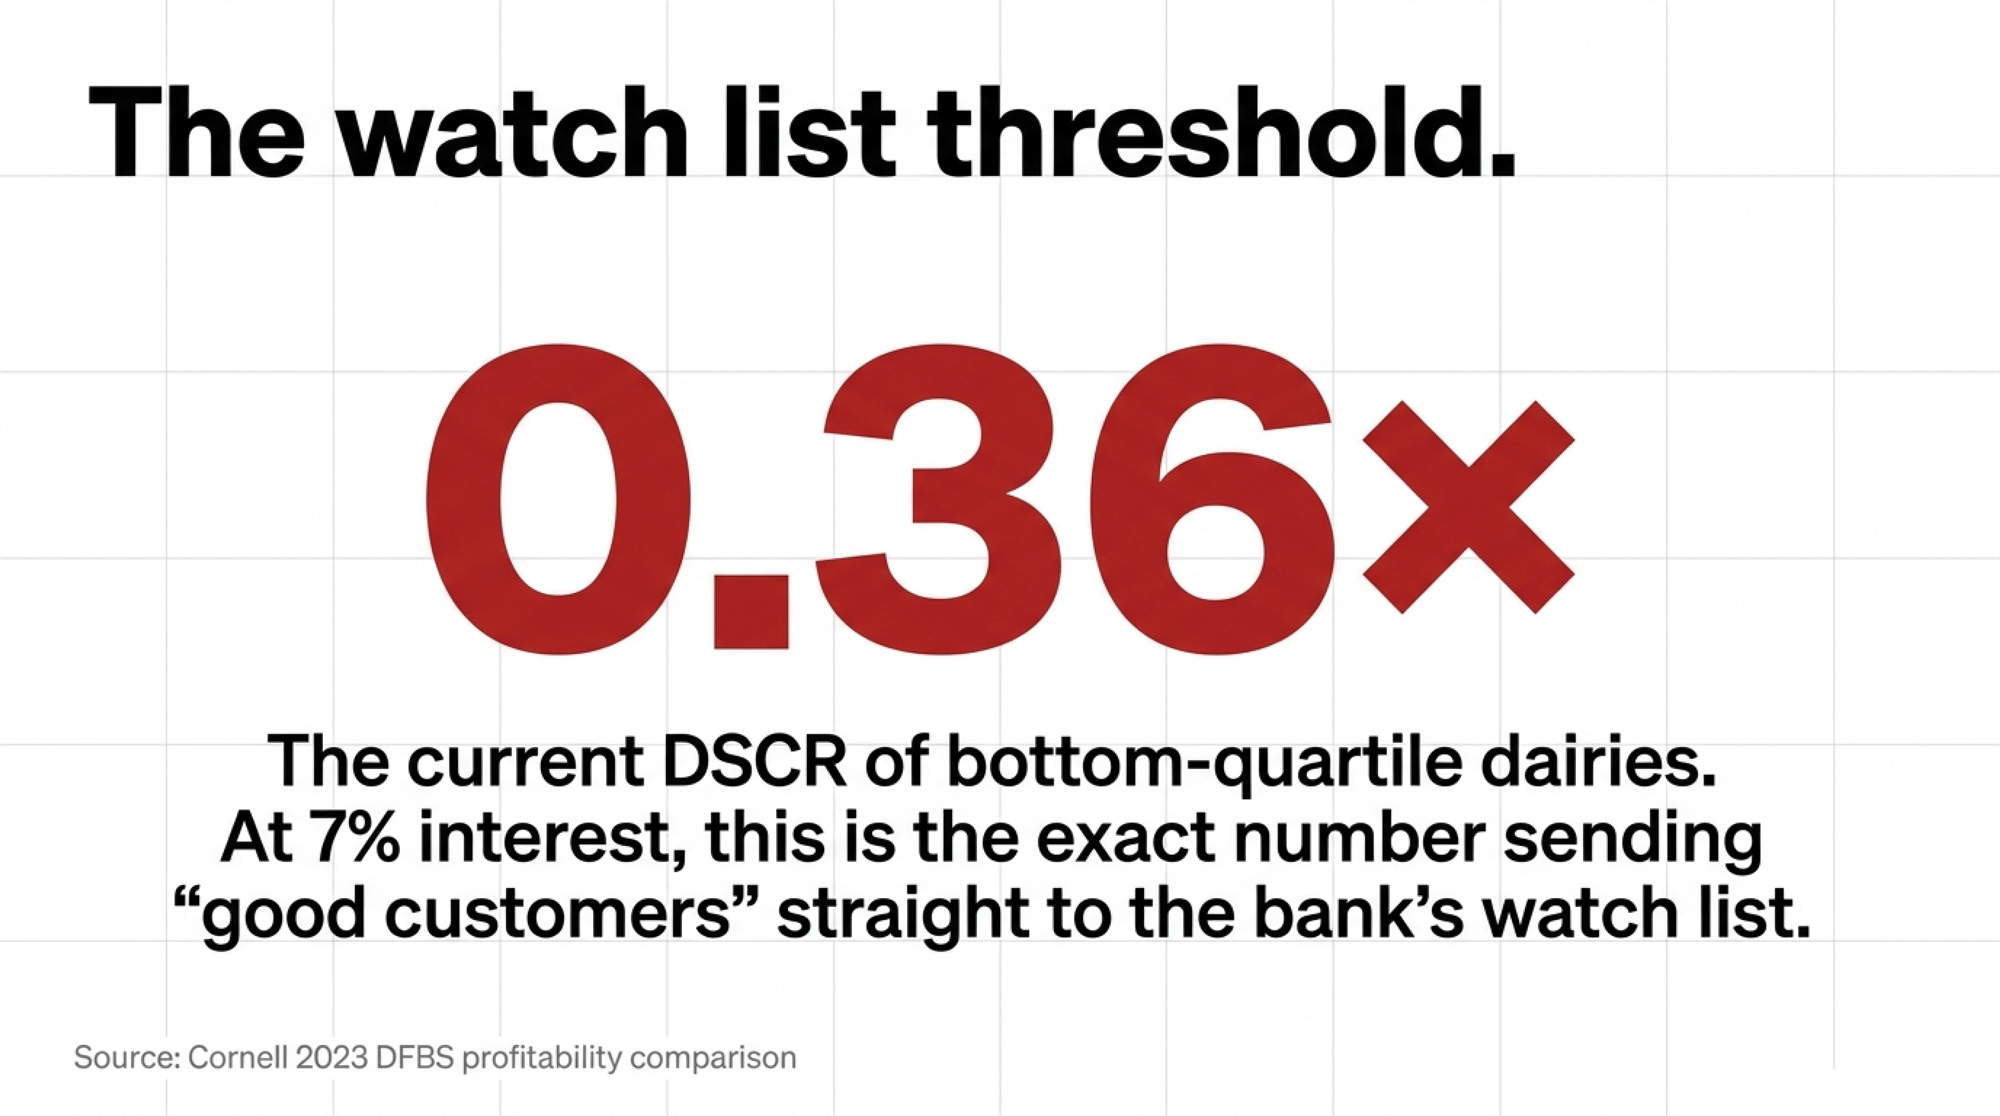
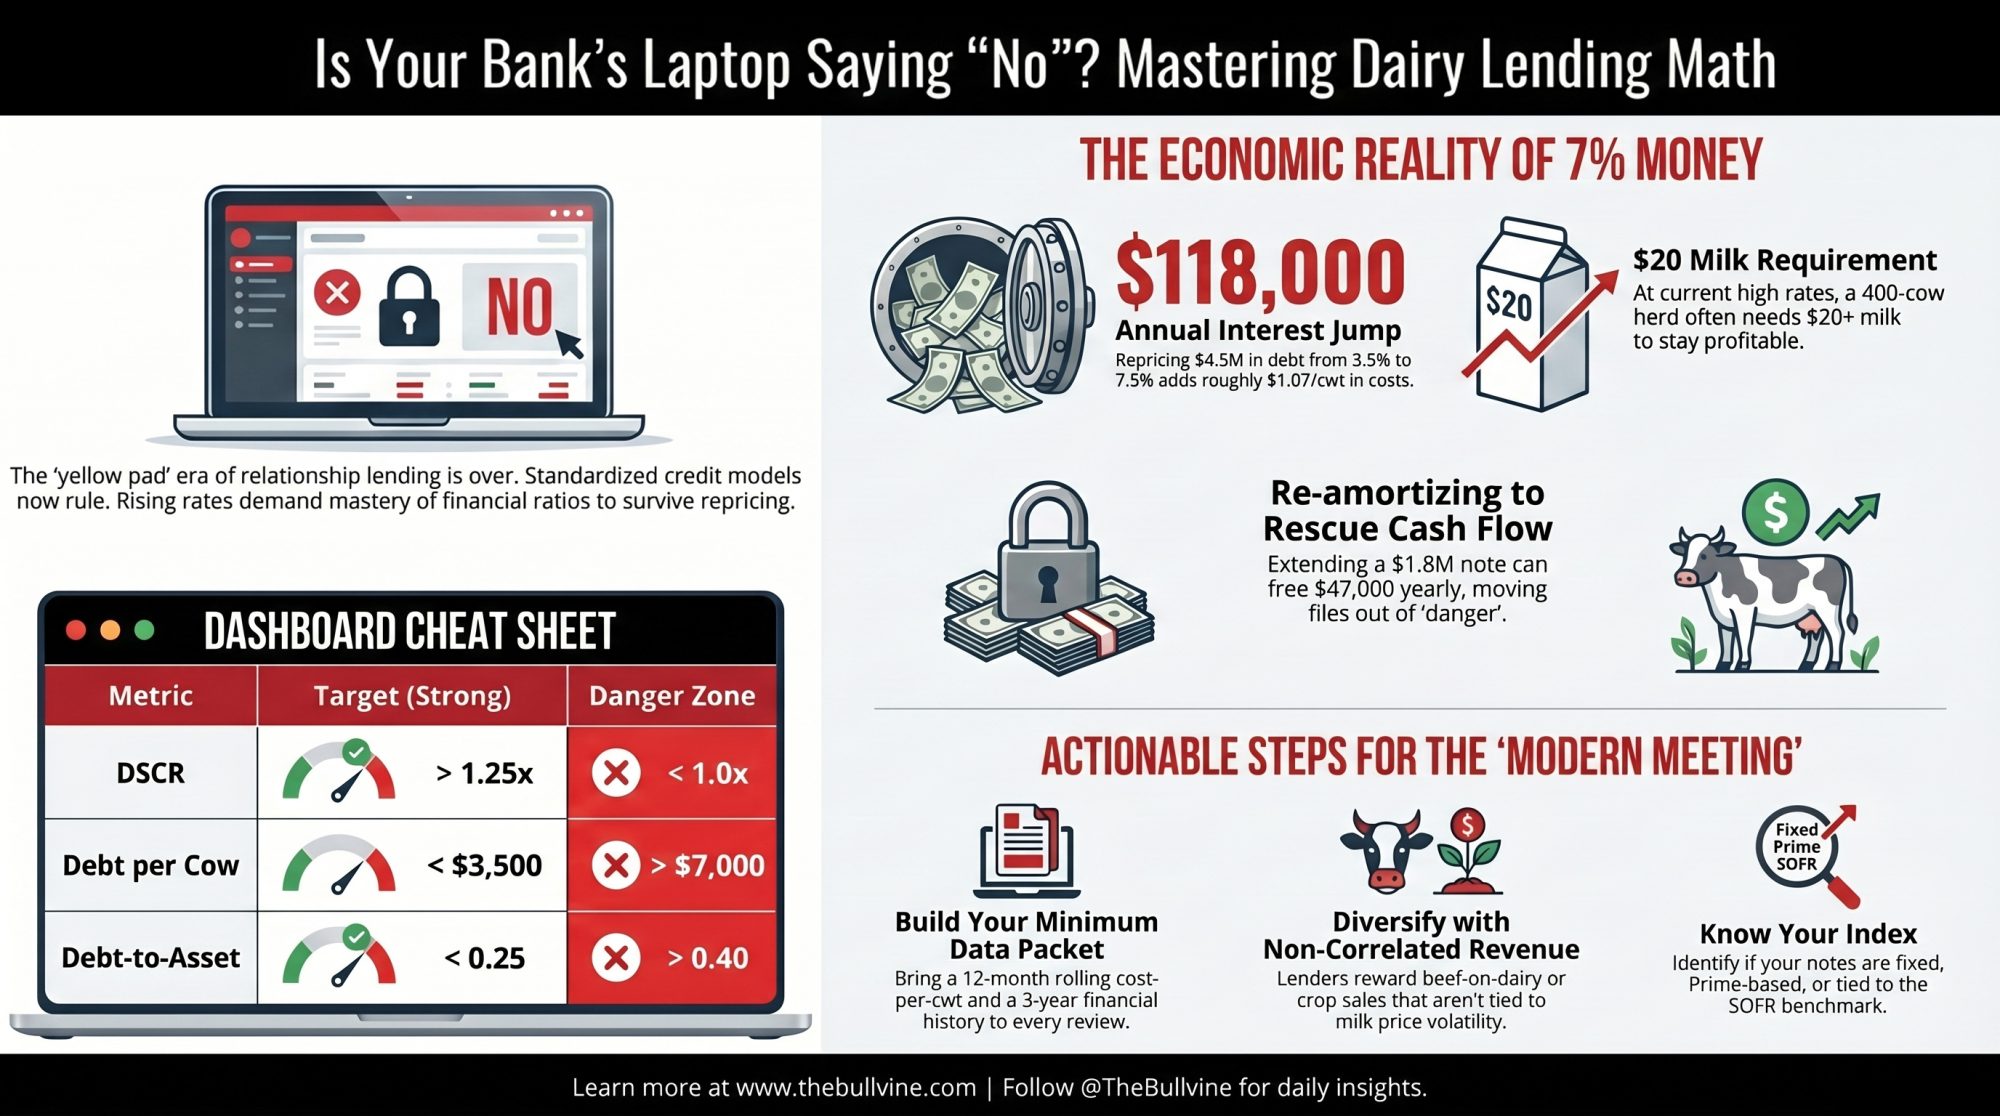
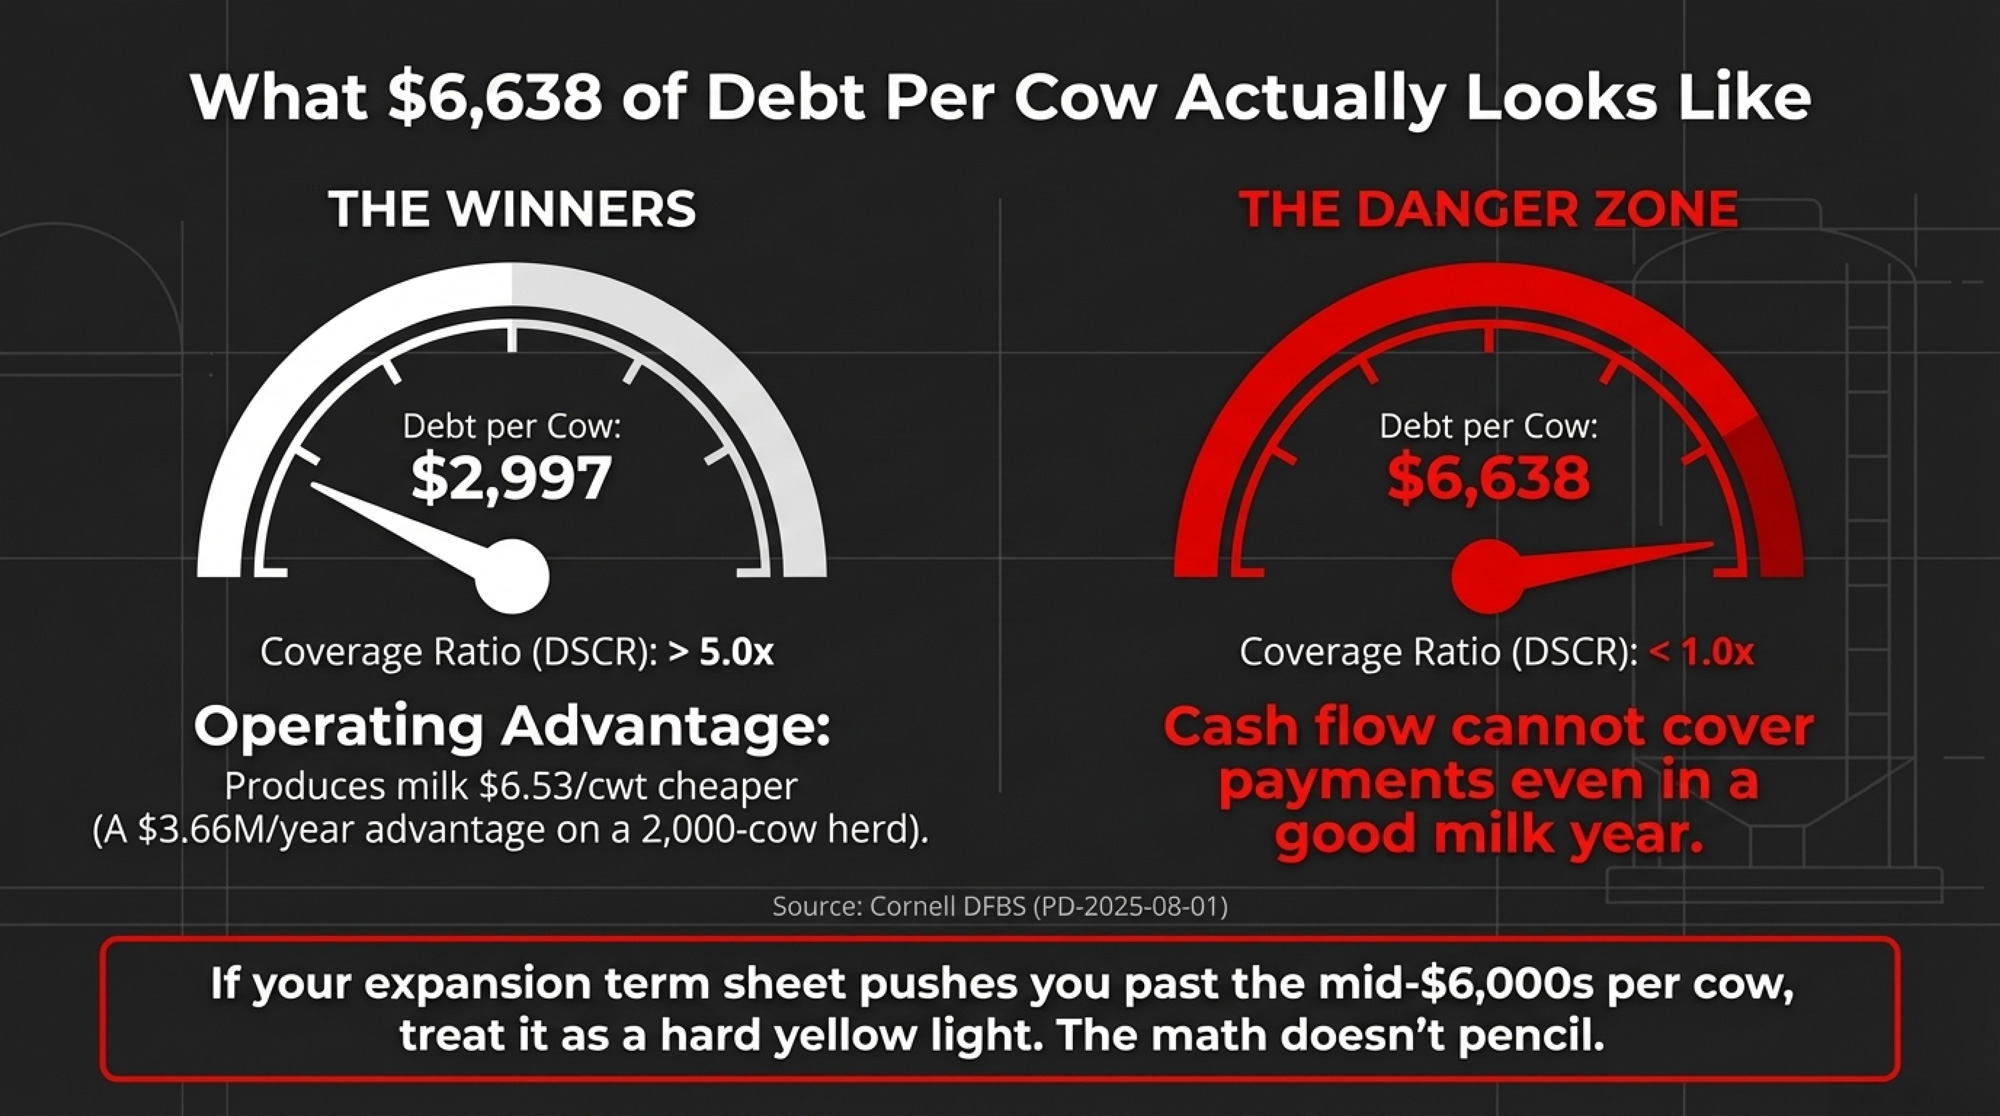
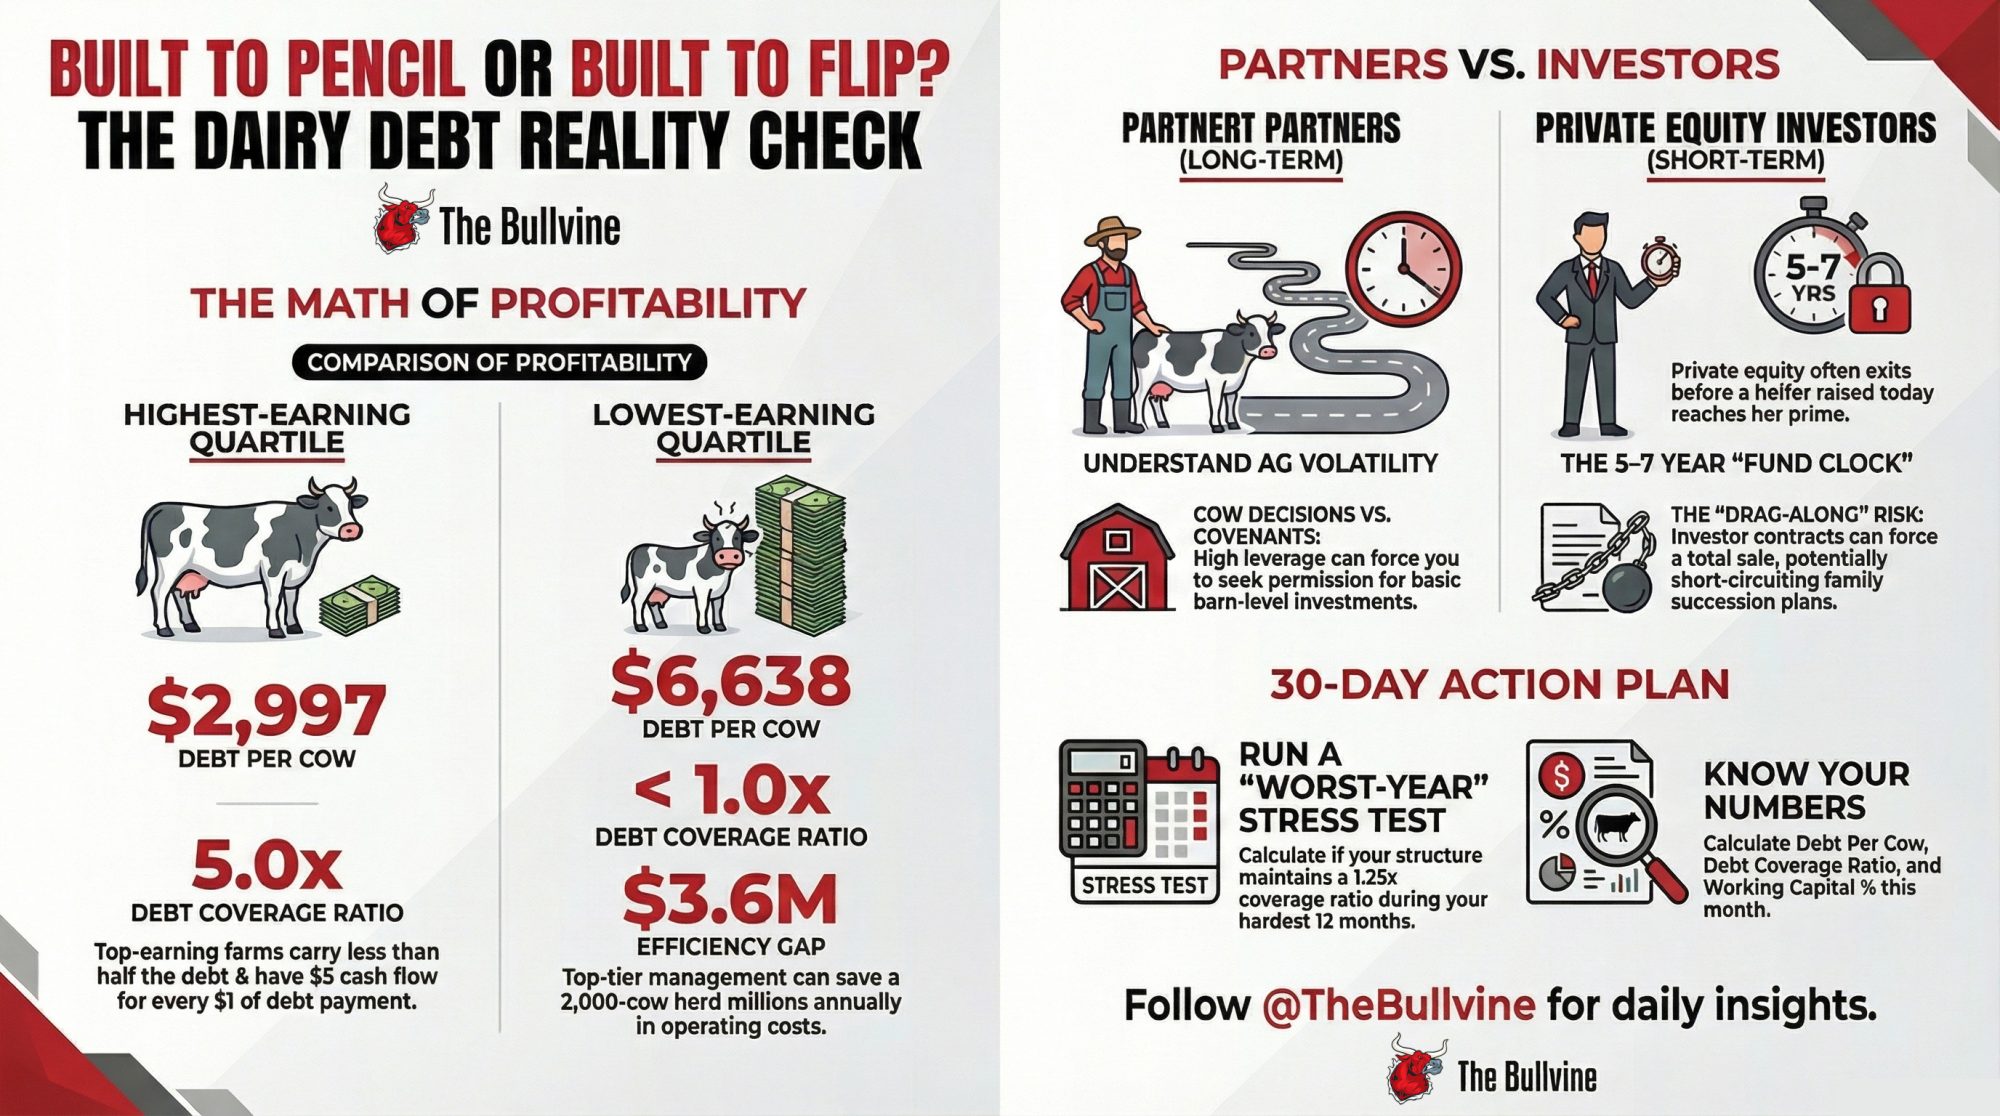
Cornell’s bottom‑quartile dairies sit at 0.36× DSCR. At 7% money on $4.5M of repriced debt, that’s about $118,000 more a year — and the reason your loan officer opened the laptop instead of the yellow pad.
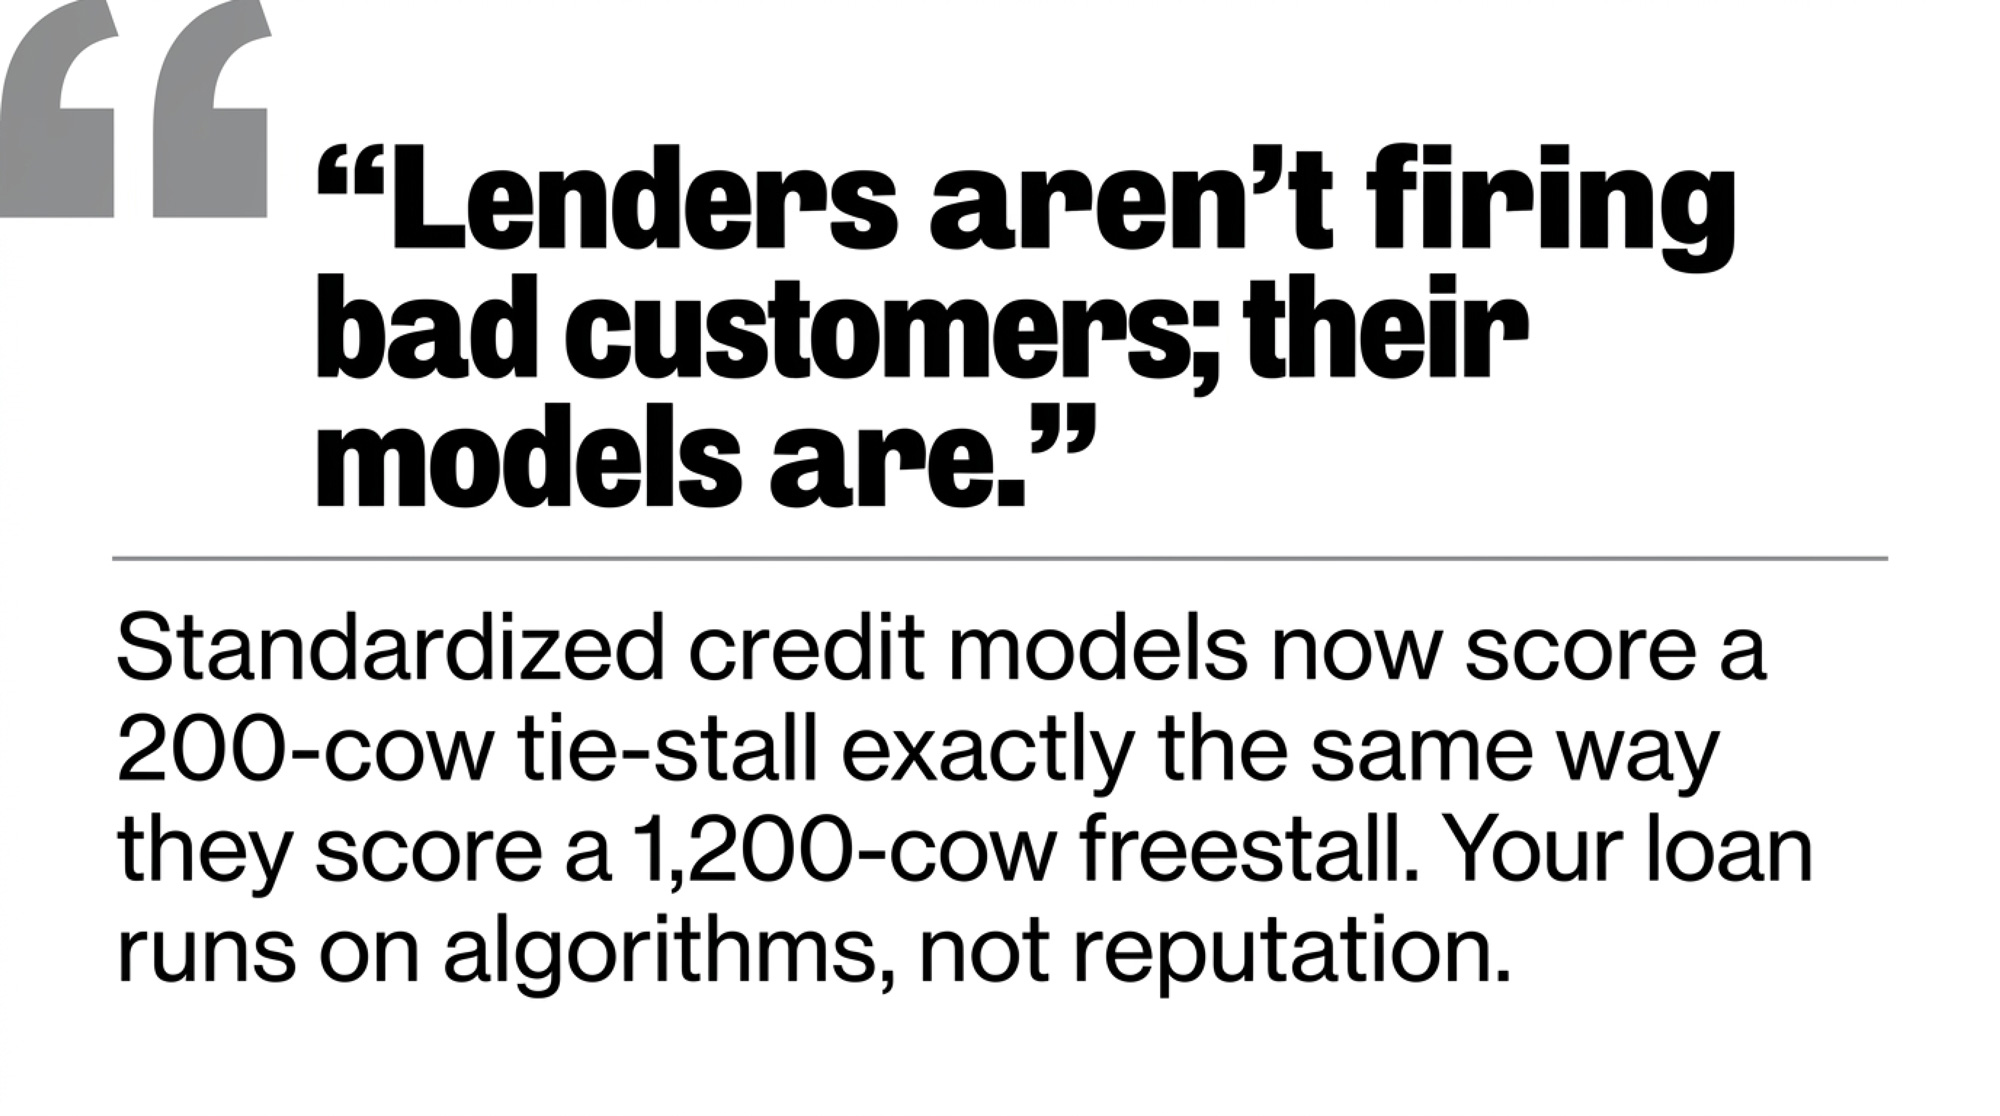
Executive Summary: Commercial ag operating rates sat in the mid‑7% range through late 2025 and early 2026, and Cornell’s 2023 DFBS shows the lowest‑profit quartile of New York dairies running a 0.36× DSCR — the exact number sending “good customer” files to the watch list. On $4.5M of repriced debt spread across real estate, equipment, and an operating line, the jump from 3.5–4% money to 7–8% adds roughly $118,000 a year in required payments, or about $1.07/cwt on a 400‑cow herd shipping 110,000 cwt. At USDA’s early‑2026 all‑milk forecast of $18.95/cwt, that same herd barely clears 1.0× DSCR; you need $20+ milk to breathe. Re‑amortizing a $1.8M parlor note from 14 to 25 years at 7.25% frees about $47,000 a year in cash flow — enough to pull a file out of the red, at the cost of more lifetime interest. Lenders aren’t firing bad customers; their models are. The farms getting flexibility walk in with a rolling 12‑month cost per cwt, their own DSCR math, a stress test at $17 milk, and at least one non‑correlated revenue line — beef‑on‑dairy, custom heifers, crop sales — that the dashboard can see. If your DSCR sits below 1.15× today and you can’t list every note and index on one page, your loan officer has more clarity on your risk than you do — and the next 30 days are when that changes.
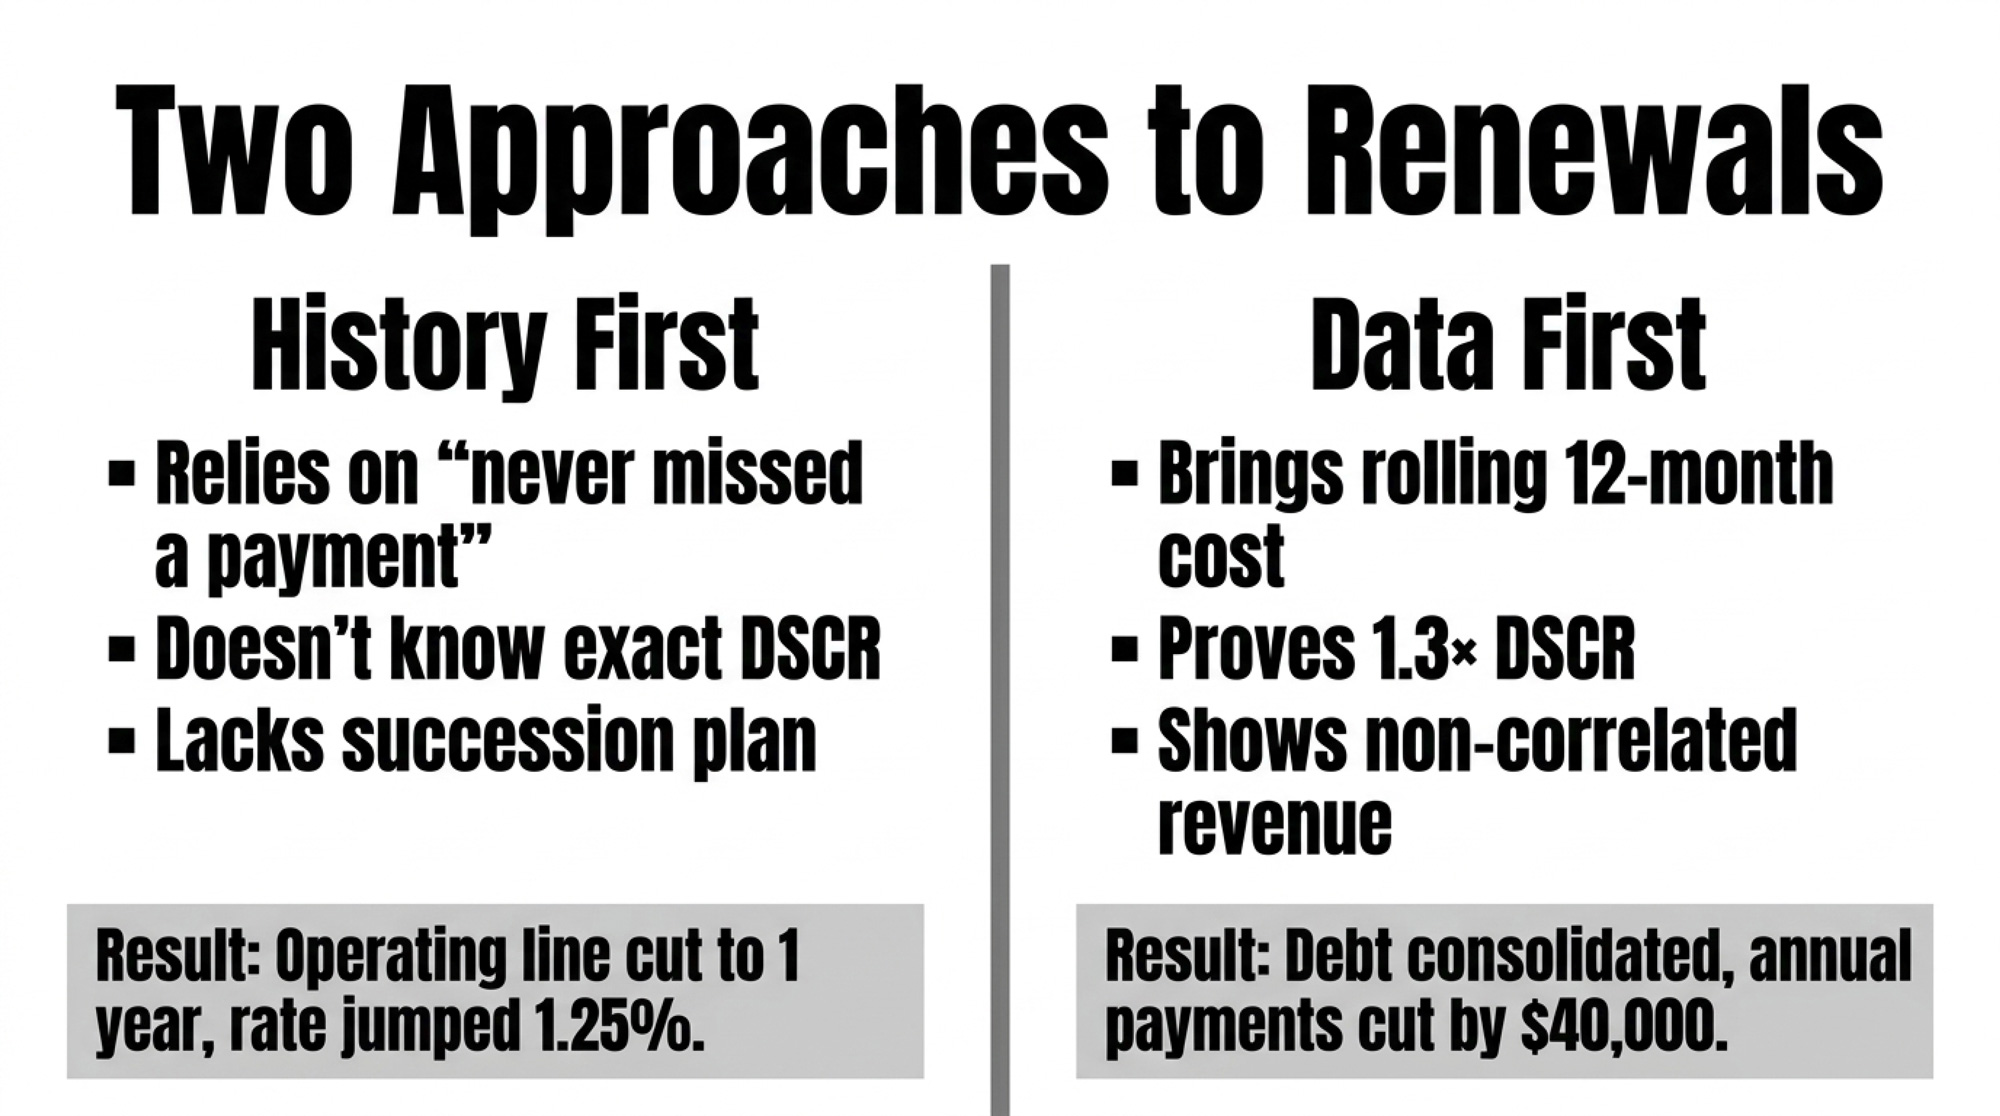
Picture a gray February morning in central Wisconsin. A third‑generation dairyman walks into his Farm Credit office carrying 30 years of loan statements and the quiet confidence of a guy who’s never missed a payment.
He’s expecting a handshake. A quick renewal. Maybe a short gripe about milk prices over bad coffee.
Instead, the loan officer — younger, laptop already open — pulls up a screen. The numbers don’t work the way they used to. Red on debt service coverage. Yellow on working capital. A projected breakeven that has jumped nearly two bucks a hundredweight after a batch of loans repriced. For a 380‑cow herd, that’s not an abstract “dairy lending 2026” headline. That’s the morning the computer says no — and a family decides whether to catch up to the bank’s math or let the bank decide their future.
A note on these stories: The three dairies described below are illustrative composites, not real operations. They’re built from 2023–2026 industry patterns in Cornell’s Dairy Farm Business Summary, Chicago and Kansas City Fed ag credit surveys, and Bullvine case work. The math and thresholds are real. The names, scenes, and dialogue are not attributed to any specific producer. Real named sources — Nathan Kauffman at the Kansas City Fed and David Oppedahl at the Chicago Fed — are quoted or paraphrased only from their own published commentary and reporting by outlets like Brownfield Ag News. If you’re a producer willing to share your DSCR restructure story on the record, reach out — future “Dairy Lender Files” installments will feature real named operations.
The Day the Screen Replaced the Yellow Pad
For a long time, your dairy loan ran on three things: reputation, collateral, and whether your lender thought you kept a tight ship. You’d sit across from someone who knew your family and your fields. They’d scribble on a yellow pad, ask how the year went, and if you’d always paid your bills, the renewal slid through.
That world hasn’t vanished. It now sits underneath something colder — standardized credit models that score a 200‑cow tie‑stall in Minnesota the same way they score a 1,200‑cow freestall in New York.
Between 2015 and 2021, a lot of dairy debt went on the books at roughly 3.5–4.5% for conventional ag loans. Some FSA‑backed notes sat even lower. Then cheap money disappeared. The Chicago Fed’s 7th District AgLetter has pegged operating‑loan rates in the mid‑7% range and farm real‑estate loans in the high‑6% range through late 2025 and into early 2026 — still about double what many dairies locked in during their last expansion.
Those are effective rates on recently booked loans reported by participating banks — a blend of fixed and variable product. New paper is increasingly written as variable, typically priced as a spread over Prime or a term SOFR benchmark. Ask your lender which index your next renewal tracks. On a $3M loan, a 100‑basis‑point drift is roughly $30,000 a year in added interest; closer to $50,000 on $5M.
As of early 2026, USDA direct FSA operating loans sat in the mid‑4% range and ownership loans in the mid‑5% range — well below the commercial market, but only for borrowers who qualify. Check the current month’s FSA rate notice before you assume you’re priced in.
Kansas City Fed economist Nathan Kauffman told Brownfield Ag News in late 2025 that most producers can still service existing debt, helped by strong land values, but working capital is tight and some have already restructured heading into 2026. Chicago Fed policy advisor David Oppedahl has been more pointed in recent AgLetter commentary: repayment rates on non‑real‑estate loans are slipping, problem loans are creeping up, and roughly half of surveyed ag bankers expect more forced liquidations ahead.
At the system level, it’s “stress, not crisis.” At your kitchen table, sitting at 1.0× DSCR with repriced loans, that distinction feels academic.
What Your Lender’s Dashboard Actually Sees
When your lender opens your file, the model behind the screen scores you on ratios that sound cold but boil down to barn math once you cut the jargon. Every farm should be able to pull this snapshot in under five minutes.
The Dashboard Cheat Sheet
Metric
Target (Strong)
Danger Zone
Where the Numbers Come From
DSCR
> 1.25×
< 1.0×
Cornell DFBS 2023: top group 2.95×, bottom 0.36×
Debt per Cow
< $3,500
> $7,000
Progressive Dairy “Dairy Dozen” benchmarks
Working Capital
> 25% of gross revenue
< 10%
OSU “15 Measures of Dairy Farm Competitiveness”
Debt‑to‑Asset
< 0.25
> 0.40
DFBS 2023 average 0.29; top group 0.21
Now the barn‑math version of each.
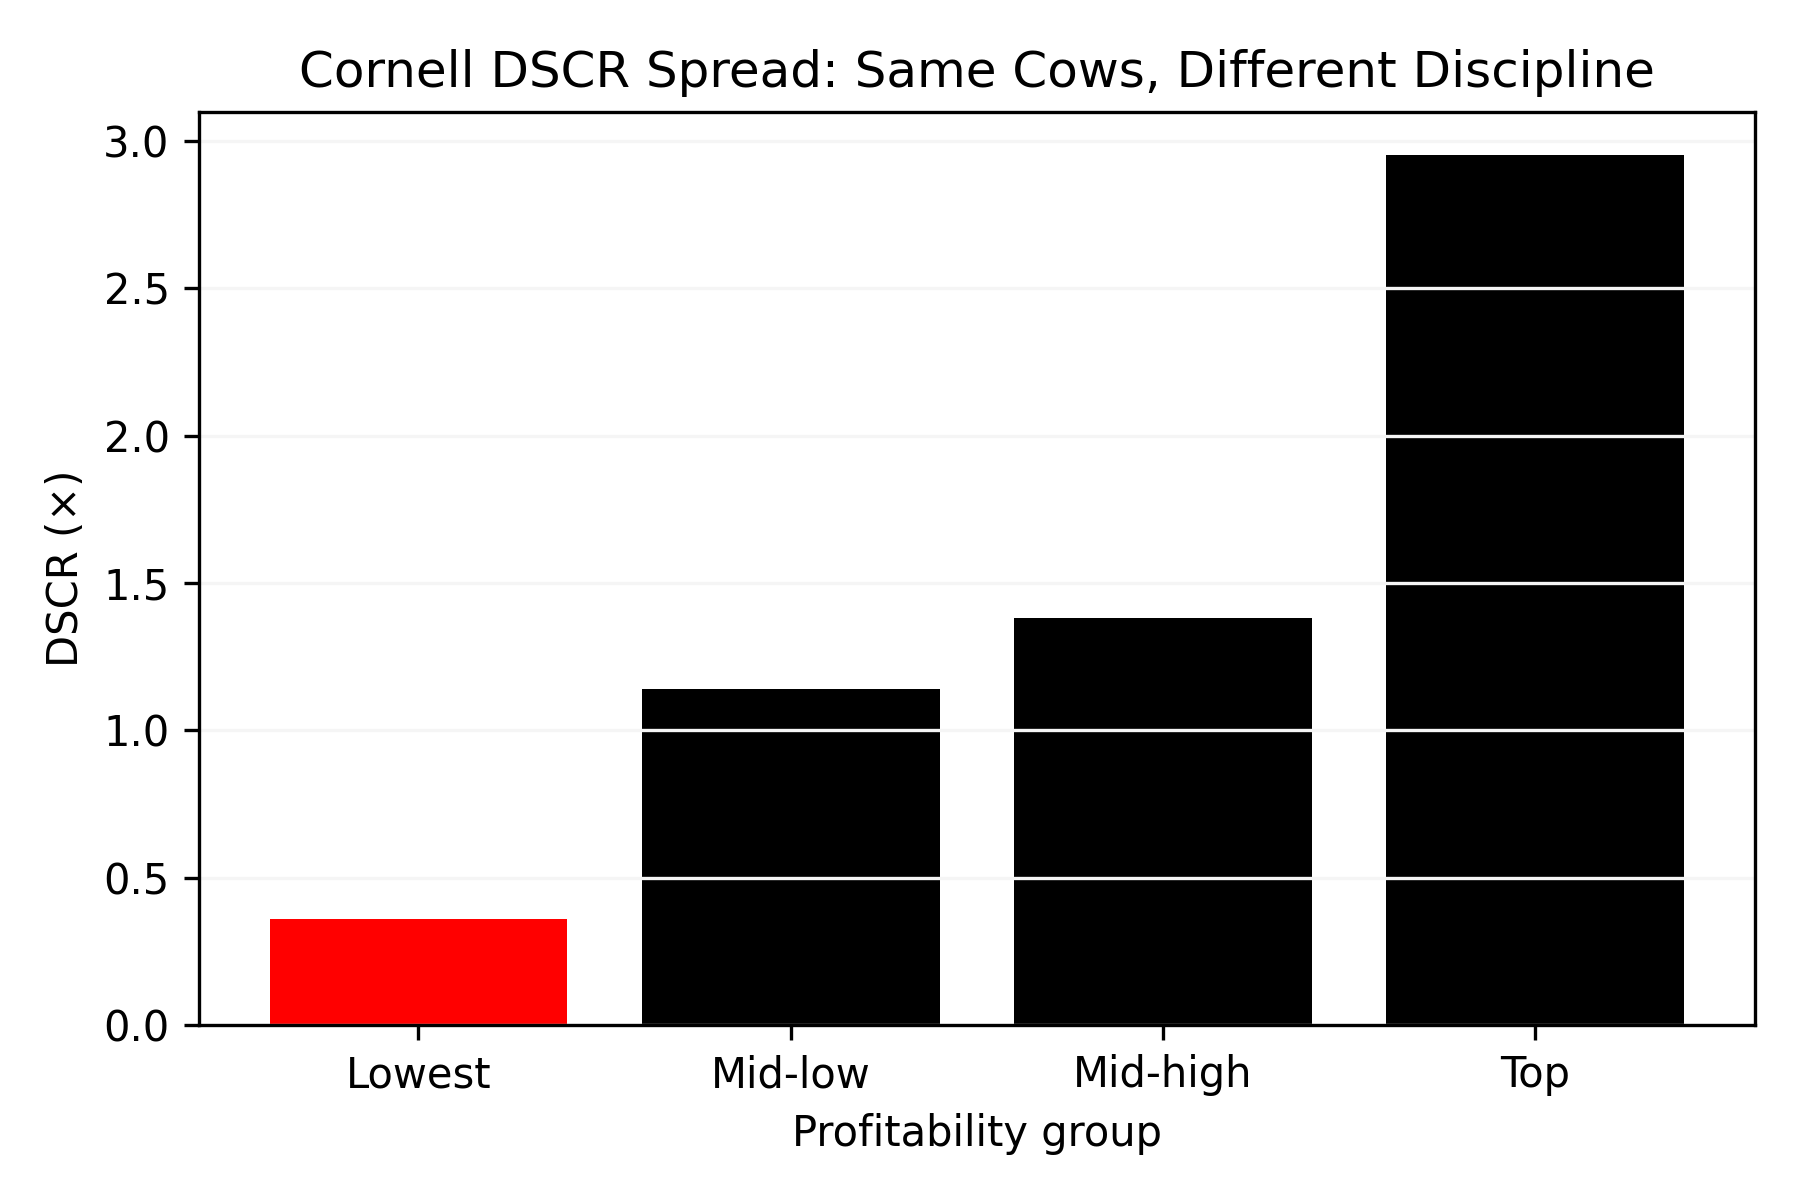
Debt service coverage ratio (DSCR). Net cash available for debt service divided by total annual principal and interest. A lot of lenders quietly target at least 1.25× as a comfort line. Cornell’s 2023 DFBS profitability comparison across 129 New York herds makes the spread vivid: the lowest‑profit group averaged just 0.36×, mid‑low hit 1.14×, mid‑high reached 1.38×, and the most profitable group sat at 2.95×. Below 1.0×, you’re not generating enough cash to cover your own debt.
Profitability Group
DSCR (×)
Lowest
0.36
Mid‑low
1.14
Mid‑high
1.38
Top
2.95
Working capital. Current assets minus current liabilities. Ohio State’s “15 Measures of Dairy Farm Competitiveness” calls anything above 25% of gross revenue competitive. In Brownfield’s 2025 coverage, Kauffman flagged working capital as the metric lenders are watching closest heading into 2026.
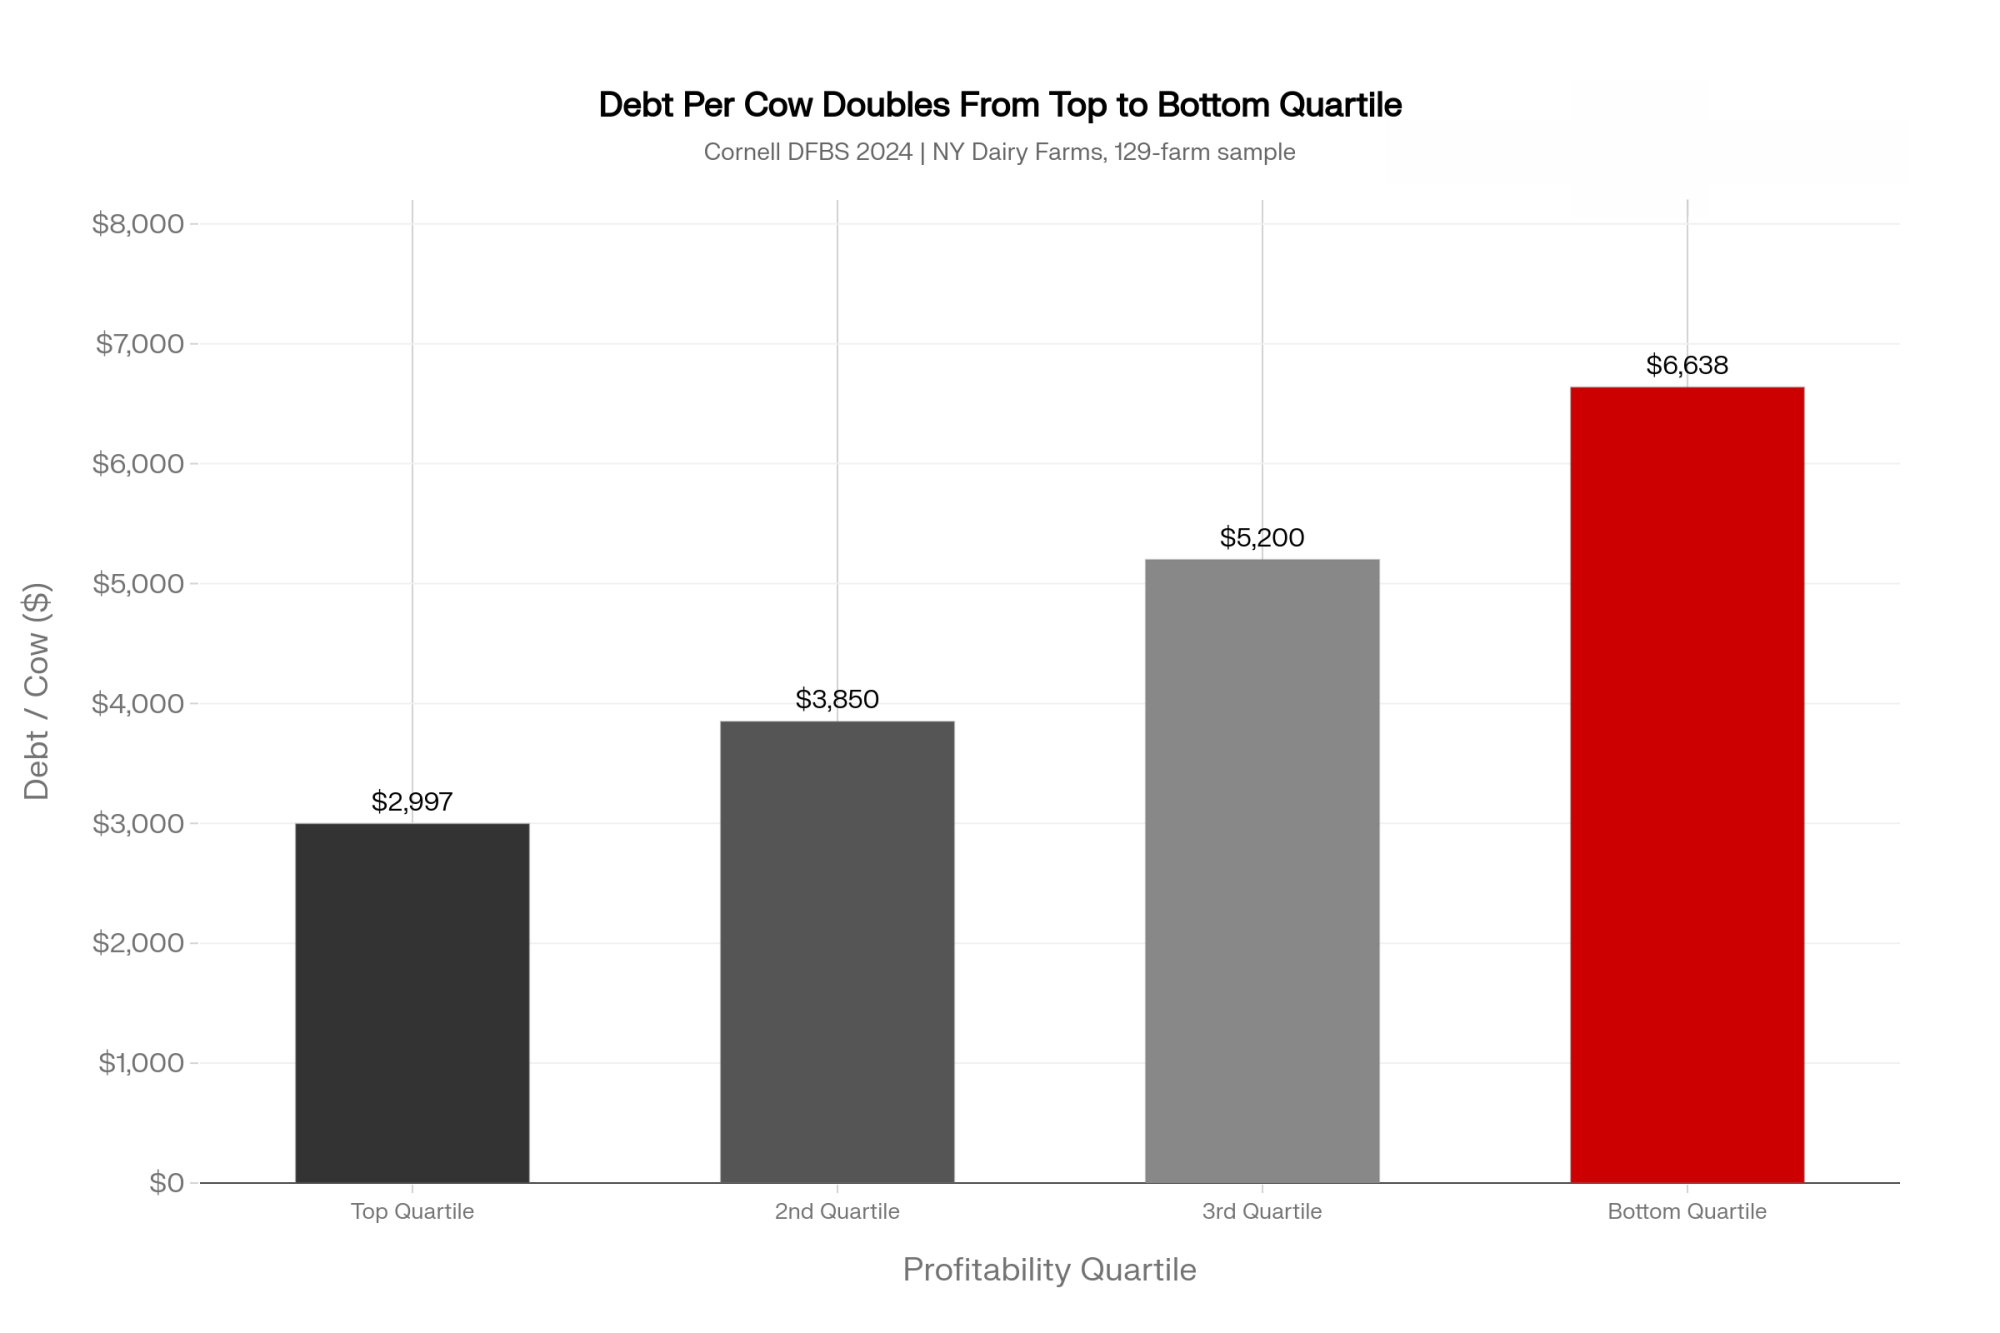
Debt per cow. Cornell’s lowest‑profit quartile carried about $5,007 of debt per cow versus roughly $3,097 for the top group — a gap of almost $1,900 per cow. Progressive Dairy’s “Dairy Dozen” benchmarks peg $3,000–$5,000 as manageable and flag $7,000 per cow as the point where servicing gets difficult.
Debt‑to‑asset ratio. The Cornell all‑farm DFBS average was 0.29 in 2023. Top‑profit farms ran about 0.21; the lowest‑profit group sat at 0.34. OSU flags anything above 0.30 as moving into higher‑risk territory.
Your grandfather knew these ratios. The difference? He had a year to fix them. You have a quarter.
The model pulls your numbers quarterly — sometimes monthly — and benchmarks them against thousands of farms in the bank’s footprint. Chicago Fed surveys through 2025 showed a rising share of 7th District banks reporting tighter collateral demands. If you’re not running these ratios yourself, your lender still is. You’re just not seeing the same screen.
Three Composite Farms, Three Outcomes
What follows are three composite dairy families — patterns, not people — built from 2023–2026 data in Wisconsin, New York, and Minnesota. Same industry, same rate environment. Very different results, depending on how they showed up at the bank.
A 380‑Cow Wisconsin Dairy: “Good Customer” Meets New Math
Call this composite a 380‑cow Holstein herd in a sand‑bedded freestall in central Wisconsin. Rolling herd average in the high 70s. In 2019, a farm with this profile might have expanded the parlor and housing, taking on roughly $1.8 million in new term debt at around 3.75%. Payments fit fine at the time.
Those loans repriced in late 2025 to just over 7%, right in line with Chicago Fed survey rates. Bullvine’s own rate analysis suggests repricing typical mid‑size dairy debt from the mid‑3s to the mid‑7s can add more than $100,000 a year in debt service on $3–4M of repriced debt. For a 380‑cow herd on this trajectory, breakeven jumps from the high‑$17s into the low‑$19s per cwt.
A herd like this often has never missed a payment. Land still pencils as strong collateral — Oppedahl has noted in the Chicago Fed AgLetter that rising 7th District land values give some stressed farmers the option to sell off a portion of land to support operations. Even so, this kind of file typically shows DSCR sliding from above 1.4× to around 1.1×. That moves it off autopilot and onto the watch list.
At annual review, instead of a quick signature, the conditions now look like this: monthly financials instead of quarterly, a cap on new capital spending, and a clear ask to show a path back to at least 1.25× DSCR inside 18 months.
The common turning point on farms like this: somebody — often a younger family member — pulls 12 months of milk checks and expense reports, sits down with an Extension farm business educator, and builds a cash‑flow projection with three paths. Hold steady and hope for $20+ milk. Trim tail‑enders and push extra cash into principal — exactly the kind of move Kauffman has pointed to as risk reduction. Or lean harder into components and beef‑on‑dairy genetics.
That last path matters more to the bank than many producers realize. Lenders reward revenue that isn’t tied to the Class III/IV roller coaster. Beef‑on‑dairy calves sell into the fed‑cattle market, not the milk market, so they’re effectively non‑correlated revenue — cash that keeps flowing when milk prices tank. On a working balance sheet, a pen of high‑value crossbred calves and short‑bred heifers carries more weight than straight Holstein bull calves, strengthening the working‑capital line the model pulls every quarter. That kind of balance‑sheet signal often translates into more flexibility at renewal.
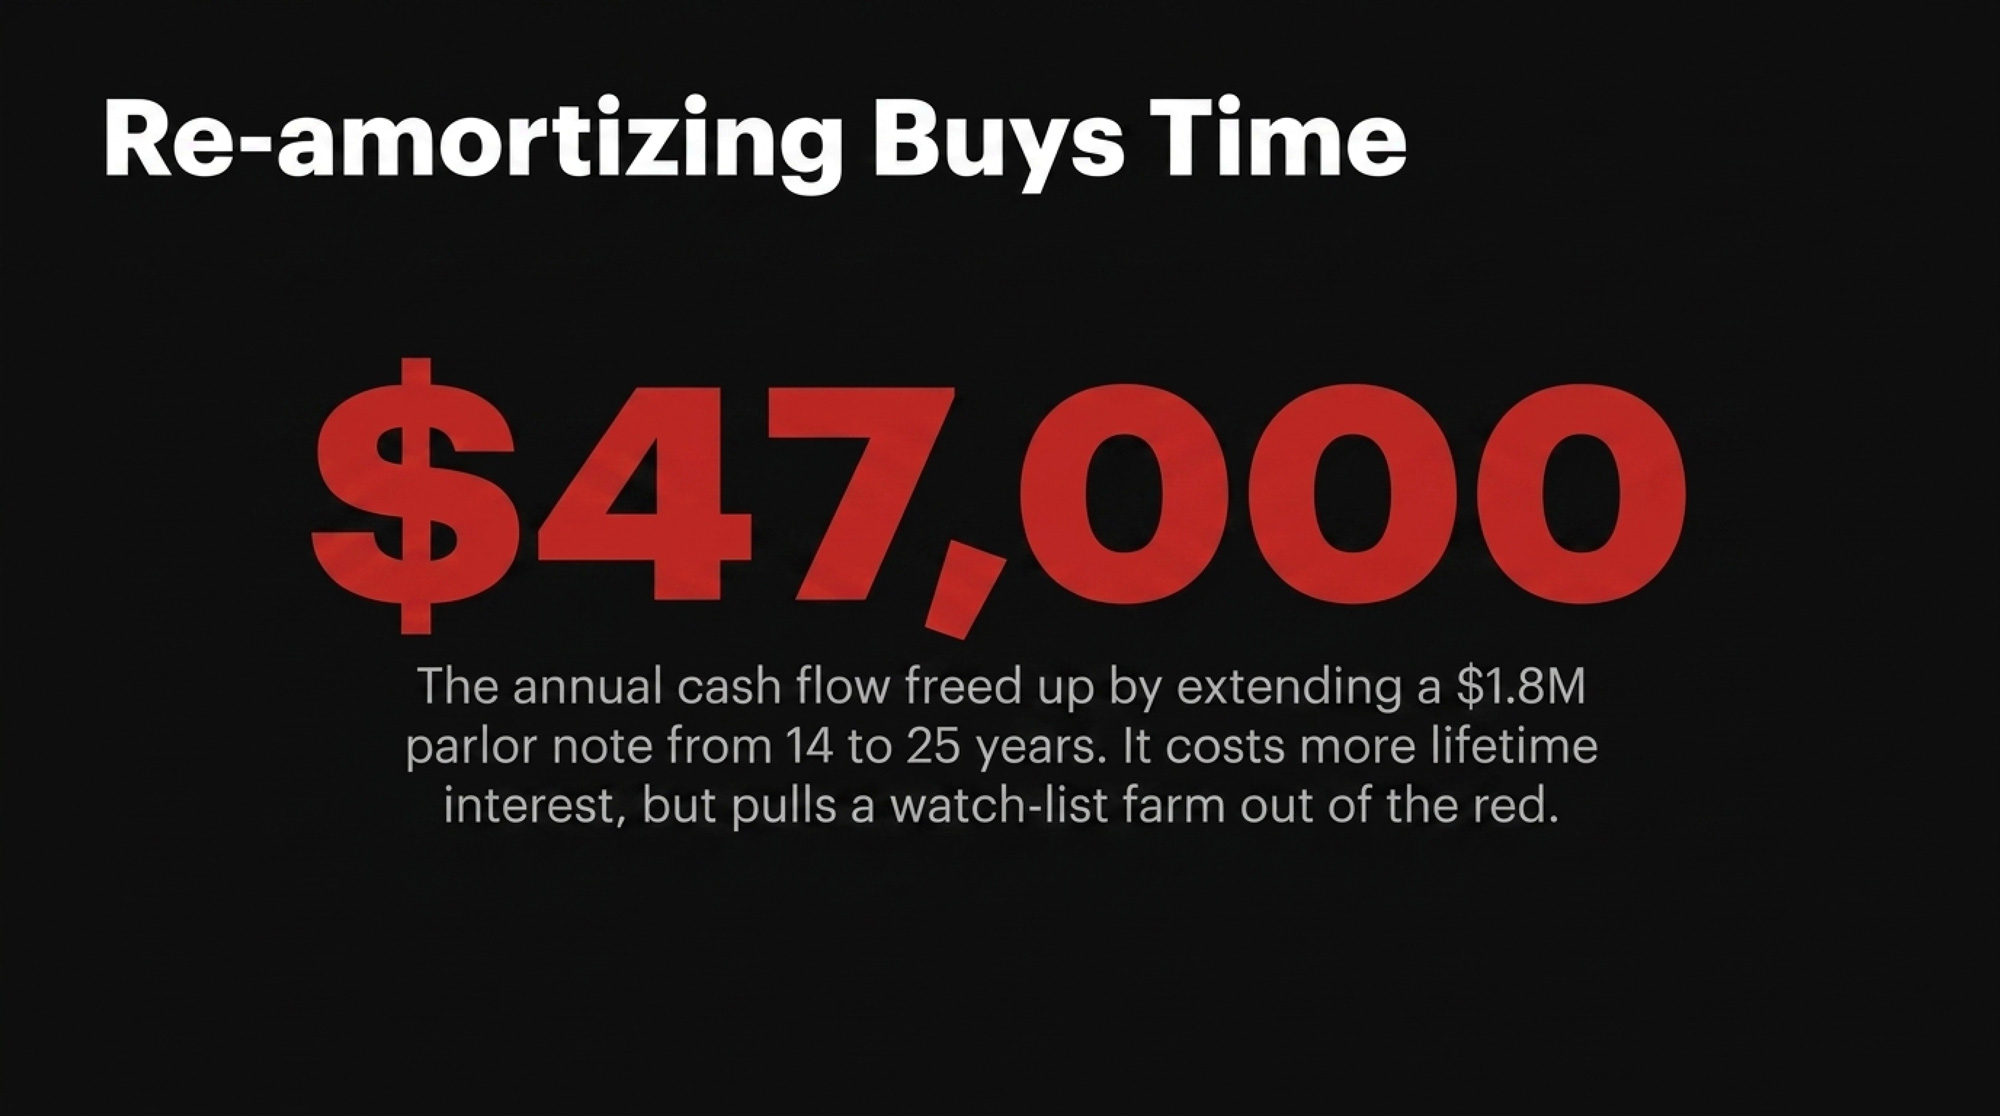
💡 The $47,000 Payment Gap On a $1.8M parlor note at ~7.25%, re‑amortizing from a 14‑year remaining term to a new 25‑year term drops annual P&I from roughly $203,000 to $156,000 — a gap of ~$47,000 per year. That’s the number in the headline. It’s also what often moves a watch‑list farm back into the “renewed” column. The trade‑off: more total interest over the life of the loan.
When a composite farm like this comes back to its lender with the same cows, same ground, same total debt, but a sharper story, the outcome typically shifts. A $47,000/yr payment drop nudges projected DSCR from about 1.14× into the low‑1.2× range. Not cushy. Out of the danger zone.
The relationship doesn’t carry farms like this. The data does.
Go deeper: “Profitable but Drowning: The Interest Rate Crisis Reshaping Mid‑Size Dairy” walks through the full repricing breakdown on herds in this exact position.
A 620‑Cow New York Dairy: Data Buys Better Terms
The second composite: a 620‑cow western New York dairy built from 200 over a decade by reinvesting profits and timing land buys around local retirements. Total debt near $6.8 million across a Farm Credit real‑estate package, a local bank equipment note, and an FSA‑guaranteed operating line. On paper, that leverage could make any lender twitch in a 7% rate world.
Files like this one earn the opposite reaction.
Operators on this trajectory track cost of production by month. Not just “feed, labor, other” — purchased feed per cow per day, hired labor per cwt, interest expense per cwt, repairs as a percent of gross. A rolling 12‑month cost around $16.80/cwt is plausible for a tightly run herd of this size. A 2023 Northeast Dairy Farm Summary reported a net cost of production of $22.64/cwt across member farms, so this composite would run well below the regional average. Cornell’s DFBS profitability comparison confirms the pattern from another angle: the highest‑profit group carried a debt coverage ratio of 2.95× versus 0.36× at the bottom.
A herd like this seeking $400,000 to upgrade manure storage under state rules would typically show DSCR holding in the high‑1.3× range even under a modeled $17 all‑milk year. Working capital comfortably positive. A simple written succession outline bringing a family member in over the next decade.
Rather than tightening terms, a lender looking for a reason to keep this file often goes the other direction — consolidating higher‑rate equipment debt into a longer real‑estate package. On the $1.2M chunk modeled here, stretching the term and picking up a better rate can cut annual debt service by roughly $40,000 (illustrative; exact savings depend on term and rate selected). That cash goes straight to working capital and strategic repairs.
The farm that walks in with a clear cost‑of‑production story gets the best tools when things get tight.
A 280‑Cow Minnesota Dairy: When “Good Customer” Isn’t Enough
The third composite: a 280‑cow tie‑stall in east‑central Minnesota. The cows do fine. The concrete, not so much.
No parlor, no robots, no big value‑added sideline. Total debt around $1.9 million, mostly land and building mortgages. A family farm like this often works with the same locally owned community bank for decades. The lender knows them by name and quietly rolls the operating line year after year.
Then, in 2024, that bank gets absorbed into a larger regional system — part of the wave of Midwest community‑bank consolidations over the last decade. When the file hits the new centralized risk model, three things flag: DSCR under 1.0× on recent tax returns (well below the Cornell all‑farm average of 1.84×), debt‑to‑asset ratio pushing 0.40 (versus the DFBS average of 0.29), and no documented succession plan. Kids with careers off‑farm.
That’s almost exactly the profile Kauffman has flagged in KC Fed commentary as most at risk — a producer who hasn’t built much land equity and carries heavier leverage on machinery or buildings.
Doors don’t slam on farms like this. The rules change. Operating line renewed for one year instead of three. Rate jumps about 1.25 percentage points, adding roughly $7,500 a year in added interest on a $600,000 line — on top of tighter covenants and a shorter renewal window. The bank asks for a formal transition or exit plan inside 12 months.
The typical next step on these files is a Minnesota Farm Business Management instructor — not to plan expansion, but to map an orderly wind‑down. A realistic three‑year exit: timing cow and equipment sales to avoid fire‑sale discounts, using Dairy Margin Coverage payouts and safety‑net checks to bridge cash flow, and listing land at current comparable values instead of waiting for a sheriff’s notice.
Bullvine’s own case work across several Midwest exits suggests families who planned 7–18 months ahead preserved roughly $400,000–$680,000 more equity than those pushed into forced liquidation. It isn’t the ending anyone dreams of. It beats letting the dashboard pick the date and the price.
▶ Next Step for Farms in This Position:Read “The 45‑Day Survival Guide for Mid‑Sized Dairy Operations” — the most logical playbook for operators whose DSCR is already under 1.0×.
What Happens to Your Milk Check When Your Interest Rate Jumps 1%?
Strip away the banker language and a big part of this shift is brutally simple: the same debt costs you a lot more than when you signed for it.
Take $2.5 million of term debt on a 20‑year amortization. At 6.5%, annual principal and interest runs about $223,700. Ship 100,000 cwt a year, and that’s roughly $2.24/cwt just to service that debt. At 7.5%, the payment climbs to about $241,700 — roughly $2.42/cwt. That’s about $18,000 more per year, or $1,500 less cash per month. (Standard amortization estimates; your exact number depends on payment structure and compounding.)
Interest Rate
Annual P&I (US$)
6.5%
223,700
7.5%
241,700
Now look at how that moves DSCR:
Net cash for debt service at $300,000 and a 6.5% payment: DSCR ≈ 1.34×.
Same cash, 7.5% payment: DSCR drops to about 1.24×.
If milk slides and net cash falls to $200,000 at the higher rate: DSCR ≈ 0.83×.
One percentage point of interest. One dollar of milk price. That’s the gap between “renewed with conditions” and “we need to talk about restructuring.”
How Much Does a Full Repricing Really Move Your Breakeven?
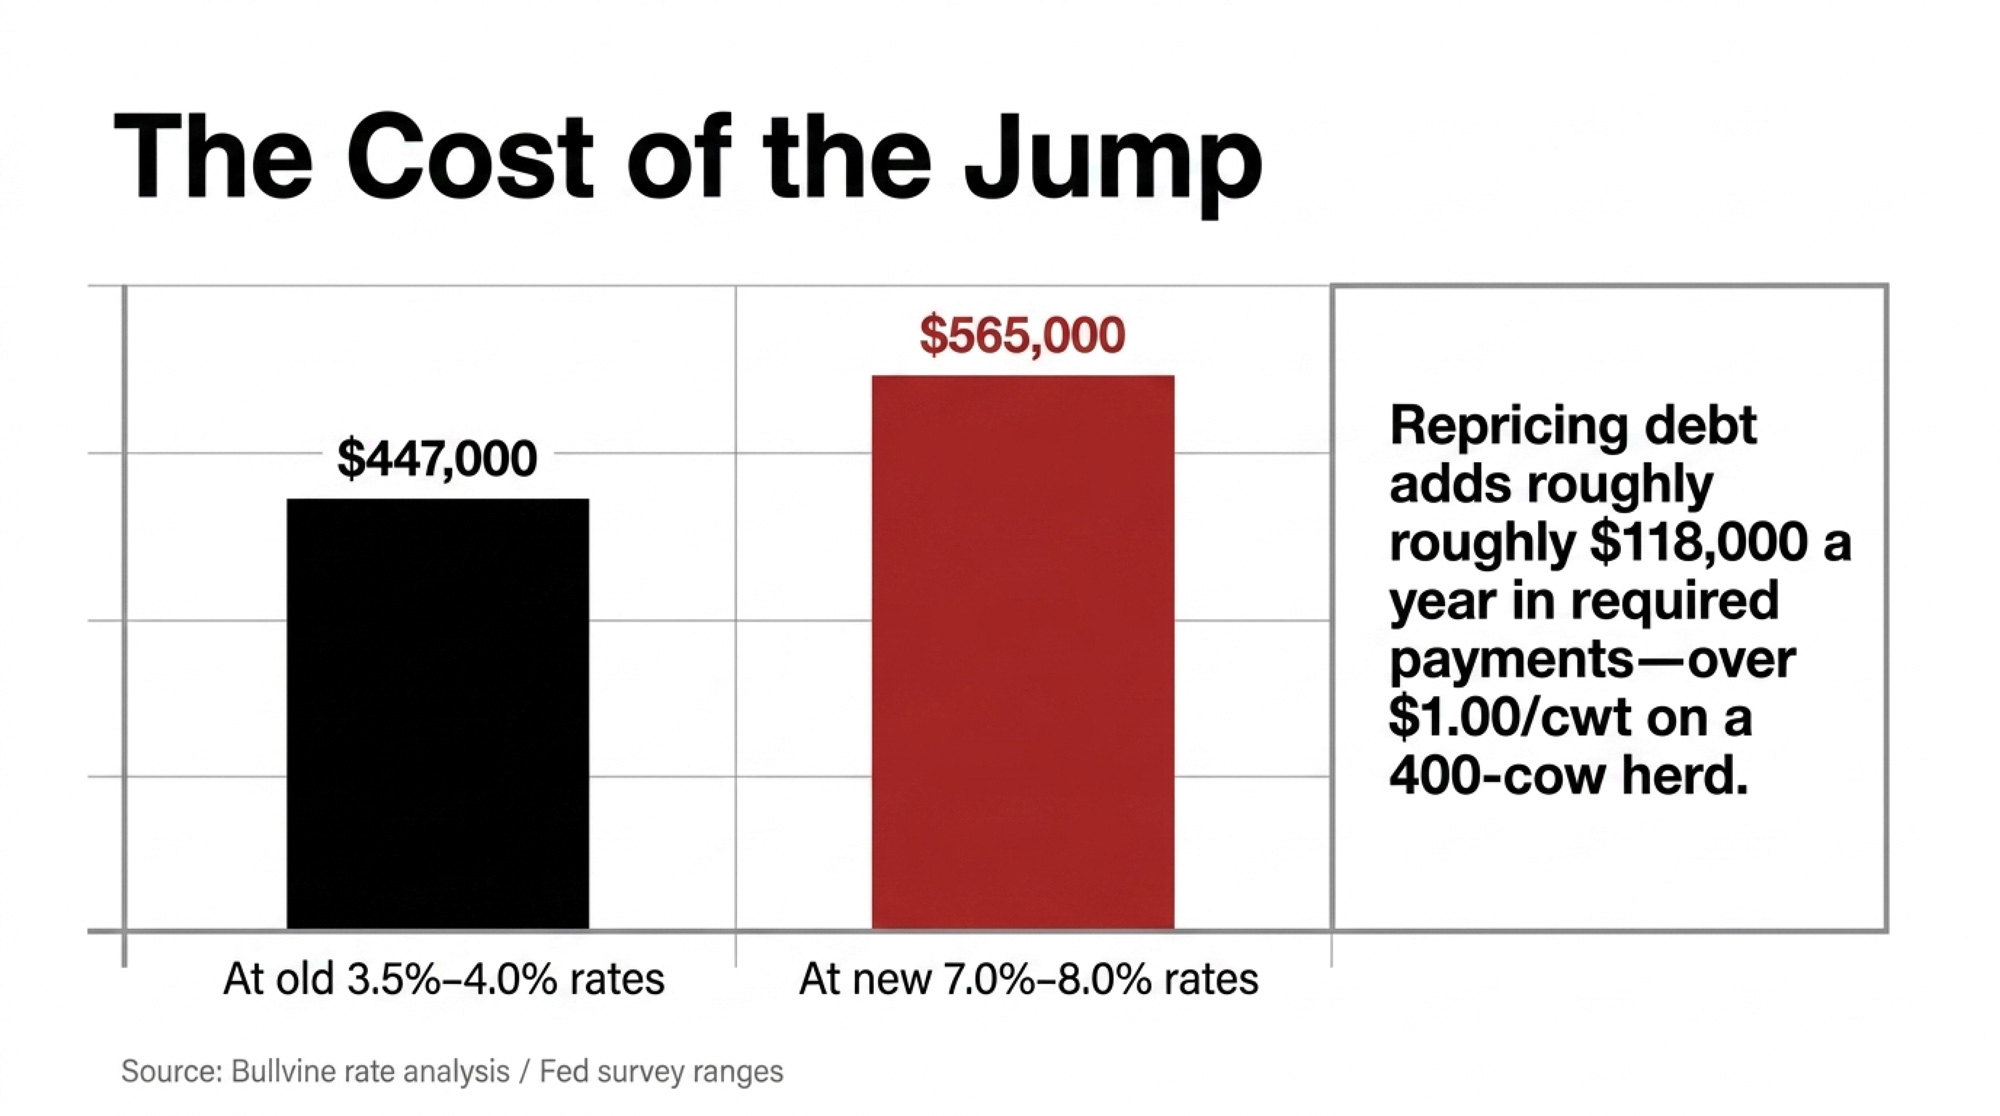
If you’re sitting on around $4.5 million in total debt, here’s what the repricing wave looks like using realistic chunks drawn from Fed survey ranges (standard amortization math, rounded for presentation):
Debt Type
Amount
Old Rate
New Rate
Old Annual P&I
New Annual P&I
Real estate (15‑yr)
$2.7M
3.5%
7.5%
~$232,000
~$300,000
Equipment (7‑yr)
$1.2M
4.0%
7.0%
~$197,000
~$217,000
Operating line (interest‑only)
$600K
3.0%
8.0%
$18,000
$48,000
Total
$4.5M
~$447,000
~$565,000
That’s about $118,000 more per year in required payments.
Spread across different herd sizes shipping milk:
Approximate Herd Size
Cwt Shipped
Added Cost (US$/cwt)
200 cows
55,000
2.15
280 cows
80,000
1.48
400 cows
110,000
1.07
The smaller you are, the bigger the per‑unit hit. And if your margin was only $0.50–$1.00/cwt to start with, that’s the whole ballgame.
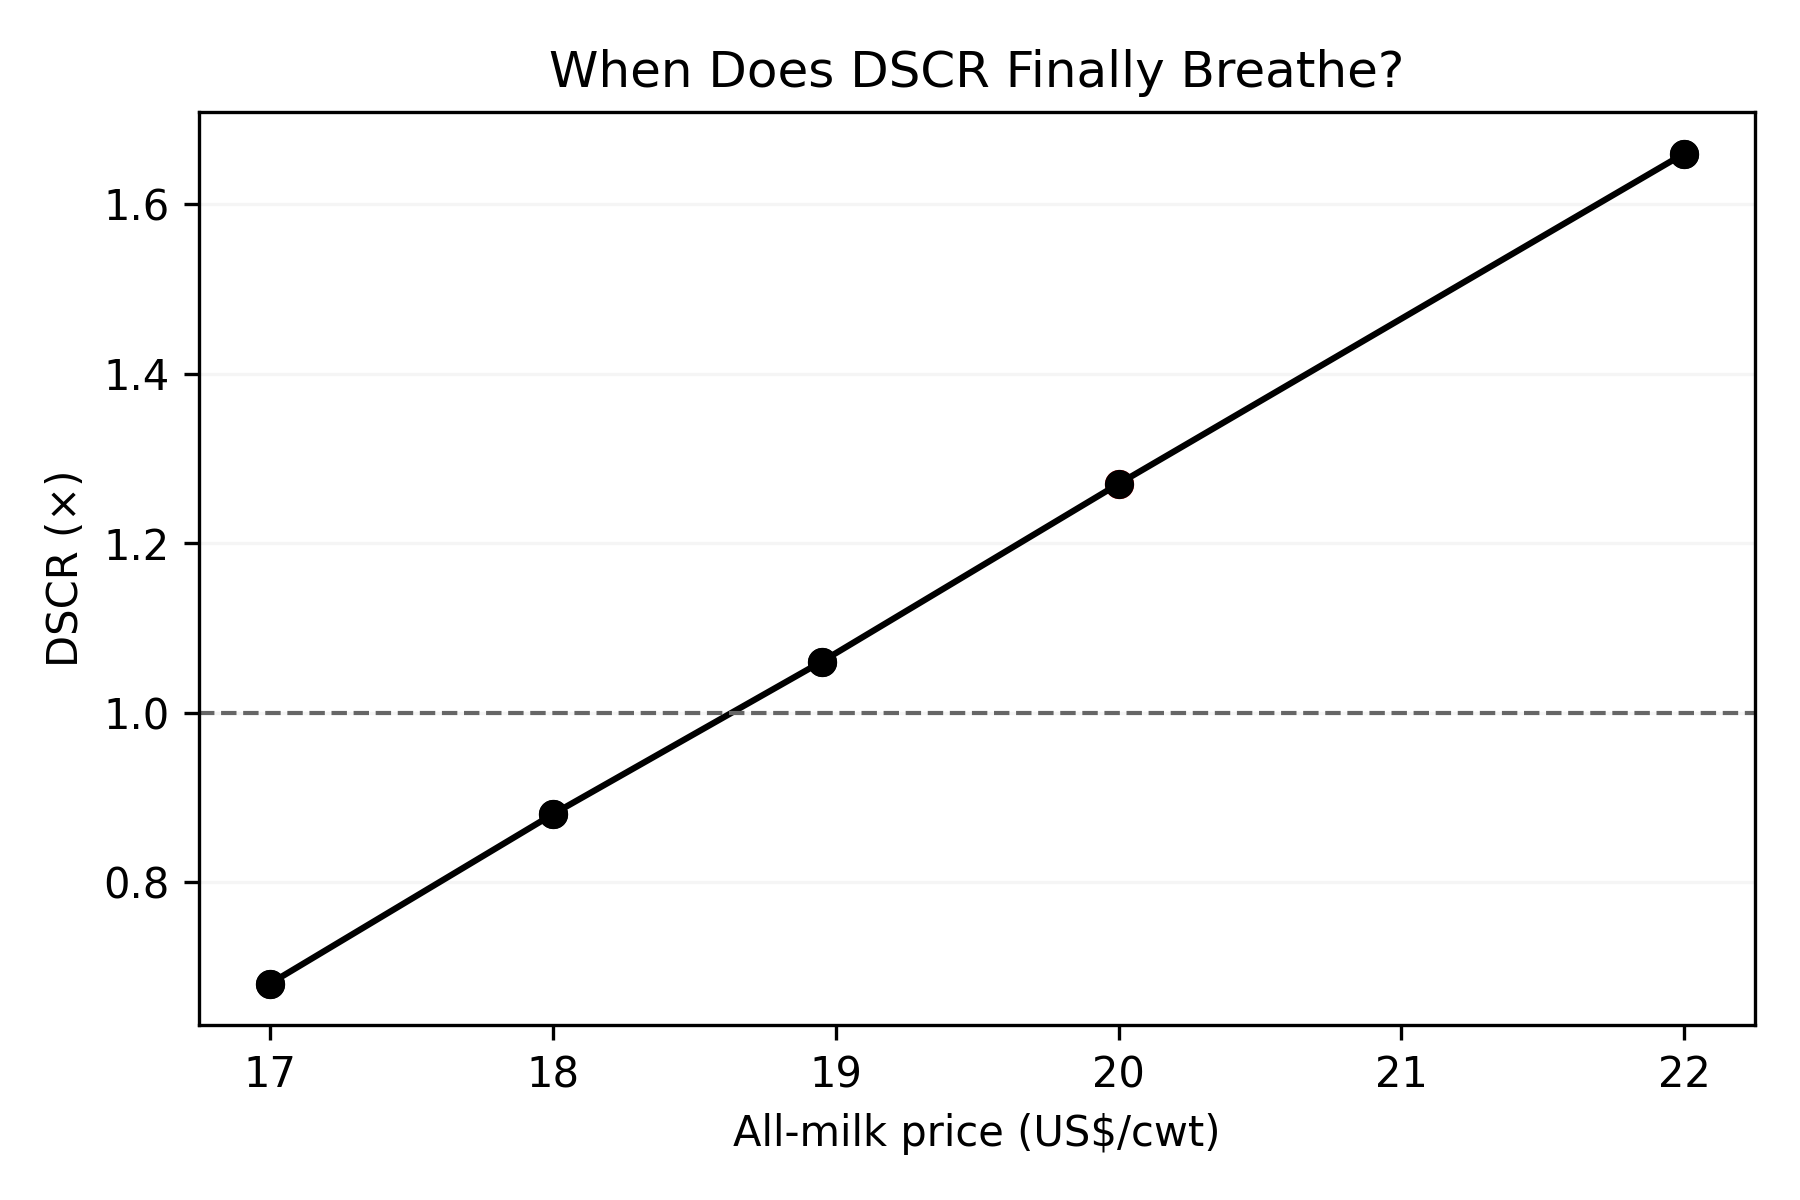
Now stress‑test DSCR for that 400‑cow, $4.5M‑debt scenario. Assume 110,000 cwt shipped and non‑debt cash operating costs around .50/cwt — efficient by Cornell’s standards, given that DFBS profitability data shows far higher averages across most farms. USDA’s early‑2026 WASDE pegged the all‑milk forecast at $18.95/cwt, down from a revised $21.17 for 2025.
WASDE updates monthly. If a newer report has landed between filing and publication, refresh both the all‑milk row and the DSCR column below.
All‑Milk Price
Gross Revenue (110k cwt)
Cash Costs (@ $13.50)
Net Cash for Debt
DSCR vs ~$565K P&I
How Your Lender Reads It
$17.00
$1,870,000
$1,485,000
$385,000
~0.68×
“We have a problem.”
$18.00
$1,980,000
$1,485,000
$495,000
~0.88×
Below 1.0× threshold
$18.95
$2,084,500
$1,485,000
$599,500
~1.06×
Barely above water
$20.00
$2,200,000
$1,485,000
$715,000
~1.27×
Comfort zone
$22.00
$2,420,000
$1,485,000
$935,000
~1.66×
Strong
At $18.95 milk, you barely clear 1.0×. You need $20+ to breathe.
And that $13.50/cwt cost assumption is efficient. A 2023 Northeast summary reported a net cost of production of $22.64/cwt across member farms. If your cost base runs closer to $16–$17, the DSCR in this table deteriorates fast.
Go deeper: “$18.95 Milk, $19.14 Costs: USDA’s 2026 Milk Price ‘Upgrade’ Still Leaves Your Dairy in the Red” runs the full margin math band by band.
What DSCR Do Banks Really Want from Dairy Farms?
You can’t control your lender’s internal model. You can understand the target it’s aiming at.
At its simplest: DSCR = net cash available for debt service ÷ total annual principal and interest. If your net cash is $400,000 and total payments are $320,000, your DSCR is 1.25× — the farm generates 25% more cash than it needs to make debt payments.
DSCR Band
Typical Bank View
What It Feels Like on Farm
Lender Response
Below 1.0×
Not covering debt from cash flow
Scrambling to make payments, no buffer
Conditions, collateral pressure, restructure or exit talks
1.0–1.15×
Thin, one bad month from trouble
Every breakdown or milk dip hurts
Short‑term tolerance only with a written plan
1.15–1.30×
“Okay, not great”
Can sleep, but watch weather and milk price
Floor for flexible terms, new money around 1.25×
> 1.30×
Strong performer
Can invest and handle volatility
More freedom on terms, structure, and covenants
Pulling from Cornell’s 2023 DFBS profitability comparison (129 New York herds):
Below 1.0×. Not generating enough cash to cover debt. The lowest‑profit group averaged 0.36×. Expect conditions, collateral calls, or hard conversations.
1.0–1.15×. One bad month of milk, a feed mistake, or a breakdown can push you under. Some lenders will sit here short‑term, but only with a written plan to climb out.
1.15–1.30×. Where a lot of mid‑size herds land when things are “okay, not great.” Many lenders treat 1.25× as the floor for new money or flexible terms. Cornell’s mid‑high profit group averaged 1.38×.
Above 1.3×. Strong. The top‑profit group ran at 2.95×. These farms tend to get more freedom on amortization schedules and covenant structures because the numbers back the story.
Here’s the catch. Your lender isn’t just running DSCR at today’s mailbox price. Chicago Fed data confirm that extensions and renewals on non‑real‑estate lending are increasing — a sign more borrowers are asking for extra time and banks are testing harder before granting it. If you walk in having only looked at your best‑case price, and the dashboard is staring at your worst‑case, you’re not even arguing over the same math.
Are You Giving Your Lender Enough Data to Fight for You?
A lot of good operators will quietly admit they’ve never walked into the bank with a real data packet. The lender knew them. The cows looked fine. Bills got paid.
In a dashboard world, being a good operator still matters — but mostly after the numbers clear the first screen. If you want your lender to push for you with a credit committee that’s never set foot in your parlor, you’ve got to hand them ammunition.
The Minimum Data Packet (200–1,500‑Cow Dairy)
For your next scheduled meeting — not an emergency — walk in with:
Last three years of financials. Tax returns (Schedule F), year‑end balance sheets, depreciation schedules.
Rolling 12‑month cost per cwt. At least broken into feed, labor, and “all other” operating costs.
Your current DSCR. Today’s loan balances, current interest rates, total annual payments.
Working capital snapshot. Current assets minus current liabilities — the metric Kauffman has specifically flagged as the one lenders are watching closest.
Leverage snapshot. Total debt divided by total assets. The DFBS average was 0.29 in 2023; know where you sit.
That alone puts you ahead of more farms than you’d guess.
What Actually Earns Better Terms
Three forward scenarios. Base case, a “$2/cwt lower milk” stress case, and a slightly better‑than‑today case.
A simple succession plan. Even a one‑page outline of who’s likely running the place in 5–10 years. Farm Credit and Extension communications increasingly treat succession as a formal credit factor, not just a family story.
Real‑time production data. Rolling herd average, butterfat/protein trends, voluntary cull rate — anything that shows you manage cows, not just cash.
A non‑correlated revenue story. Beef‑on‑dairy receipts, custom heifer raising, crop sales, on‑farm processing. Anything not priced off the milk check strengthens your current‑asset picture in the bank’s model.
Rate‑index awareness. Know whether your current notes are fixed, variable over Prime, or tied to term SOFR. If you can’t tell the loan officer which index prices your operating line, you’re arguing blind.
FSA awareness. Know whether you qualify for USDA direct loans — well below commercial markets — and whether FSA‑guaranteed lending could improve terms with your current bank.
Red Flags That Trip Wires Fast
Patterns that, from lender and Extension farm‑management conversations, tend to push files straight into the risk bucket:
No updated personal financial statement after the lender asked for one.
No honest cost‑of‑production number.
No forward cash‑flow projection, even a simple one‑pager.
Farm and household expenses so tangled the lender can’t separate them.
A flat refusal to discuss succession.
No idea whether your rate is fixed or floating — or over what index.
When your dashboard numbers are already thin, any one of these pushes a lender toward higher rates, tighter covenants, or a quiet “no.”
Options and Trade‑Offs for Farmers
You don’t control interest rates. You control how you show up in front of the dashboard over the next 12 months.
1. Upgrade Your Data Game (30‑Day Action)
Start here if you plan to keep milking at least 3–5 years, you’re not insolvent, but you honestly don’t know your DSCR or cost per cwt.
This month: Pull 12 months of milk checks and main expense categories. Build a rolling 12‑month cost per cwt using a simple spreadsheet or FINPACK template from Extension. Calculate your DSCR. Then book a meeting with your lender specifically to review your data — not to ask for money.
You walk in knowing where you stand instead of hoping. Your lender sees someone running toward the problem, not hiding.
The risk: You may not like that first DSCR number. But you can’t fix a ratio you won’t look at.
2. Restructure Before You’re Forced To
Move here if your DSCR is hovering near or just below 1.0×, you still have land equity, and your next big renewal is 6–24 months out.
What it takes: Map every loan on one page — balance, rate, index (fixed, Prime‑based, SOFR‑based), remaining term, payment. Model what happens if milk averages $2/cwt less than last year. Be open to extending terms on some debt or selling a non‑core asset. Oppedahl has pointed out in recent AgLetter commentary that some farms will need to sell land to help fund operations — it goes better if you initiate that conversation.
What you gain: Breathing room. A lender looking for a reason to keep you often will stretch a major note from 14 to 25 years, saving about $47,000 a year in payments on $1.8M at roughly 7.25% — enough to move DSCR out of the red.
What you give up: More total interest over the life of the loan. You’re buying flexibility today with future dollars. Move early and you help design the restructure. Wait, and somebody else does it for you.
3. Double Down on Margin, Not Size
This is the right path when you’re not set up to add cows cheaply, but there’s room to improve component premiums, beef‑on‑dairy revenue, or trim operating costs.
What it takes: Honest benchmarking of feed, labor, and machinery cost per cwt against peers. A focused 12‑month plan to raise butterfat/protein, add beef‑cross value, or shave specific costs. Cornell’s DFBS tells the story bluntly: the spread in debt coverage between the lowest‑profit group (0.36×) and highest (2.95×) wasn’t mainly about herd size or premiums — it was about cost discipline that drops straight to the DSCR line.
On a 600‑cow herd shipping 170,000 cwt, a $1.00/cwt cost reduction is worth $170,000 a year. Premiums help. Cost discipline changes your DSCR. A solid beef‑on‑dairy program gives the bank a revenue line that isn’t riding the Class III roller coaster.
The risk: Chasing premiums with extra labor or purchased feed can backfire if costs rise faster than the bonus. Measure tightly.
4. Plan an Exit While You Still Have Leverage
Consider this one when you’re past 60, heirs aren’t coming back, DSCR is under 1.0×, and you’re tired of wondering which letter from the bank is “the one.”
What it takes: A farm transition specialist or attorney. Early, blunt conversations with your lender about what a cooperative exit looks like. The willingness to say, “We might be better off leaving on our own terms.”
Across several Midwest cases, Bullvine’s analysis suggests strategic exits with 7–18 months of planning preserve roughly $400,000–$680,000 more family equity than forced sales — a margin close to the $480,000 equity gap between strategic exit and forced sale we’ve documented in prior case work. The difference between “retire with options” and “start over in town.”
The risk: Emotionally brutal. Some relationships fray. But the math usually gets worse, not better, if you delay.
Go deeper: “Only 12% of Dairy Farms Make It to Generation Three — Here’s What’s Different About the Ones That Do” is the companion read for families wrestling with this path.
Key Takeaways
If your DSCR sits below 1.15× today, treat it as a yellow light. Cornell’s lowest‑profit group averaged 0.36× — they didn’t get there in one quarter. Run your own stress test at $17 milk and talk with your lender before you drift under 1.0×.
If you can’t list your total annual debt payments on one sheet of paper, your lender has more clarity on your risk than you do. Within 30 days: list every note and operating line, add up annual P&I, calculate your DSCR.
If your plan assumes rates “go back to normal,” it’s not a plan. Commercial operating rates sat in the mid‑7% range through late 2025 and early 2026, and new paper is increasingly variable over Prime or term SOFR. Model your next two years at today’s rates and one notch higher.
If more than 90% of your revenue comes off the milk check, your balance sheet is more fragile than your lender’s model likes. Beef‑on‑dairy, custom work, or crop sales aren’t just extra cash — they’re non‑correlated revenue that strengthens how the dashboard reads your farm.
If you want your lender to fight for you in the credit committee room, hand them a story their dashboard can tell. A real cost‑of‑production number, a forward cash‑flow, and at least a rough succession outline.
The next time you sit across from your loan officer, the screen between you will quietly shape how hard they can push on your behalf.
You don’t control that dashboard. You do control whether it shows a fuzzy picture or a sharp one. For the deeper math — DSCR across five milk‑price bands, how Dairy Margin Coverage and FMMO changes interact with lender risk scoring, and the full cost‑of‑production playbook — watch for the next “Dairy Lender Files” installments in The Bullvine Weekly.
If the numbers are weighing on you, don’t carry it alone. Call or text 988 for the Suicide & Crisis Lifeline. For dairy‑specific support, reach out to Farm Aid at 1‑800‑FARM‑AID, your state farm‑mediation service, or your Extension farm management program.
Do you know your DSCR today? If not, the computer does. It’s time to see the same screen.
Complete references and supporting documentation are available upon request by contacting the editorial team at editor@thebullvine.com.
Learn More
The $19 Milk Trap: How 2026 Prices Quietly Drain a 400‑Cow Dairy’s Equity — Exposes the $144,000 annual equity drain facing mid-sized herds and delivers a high-stakes playbook to protect your balance sheet. Breaks down full-cost breakeven targets while providing the “action signals” needed to survive a $19.00 milk market.
Dairy farm economics 2026: pricing and margins — Reveals the structural reset hitting North American producers through FMMO modernization and the Canadian protein pivot. Arms you with the market intelligence to navigate the “higher-of” formula and identify the quiet margin leaks threatening long-term profitability.
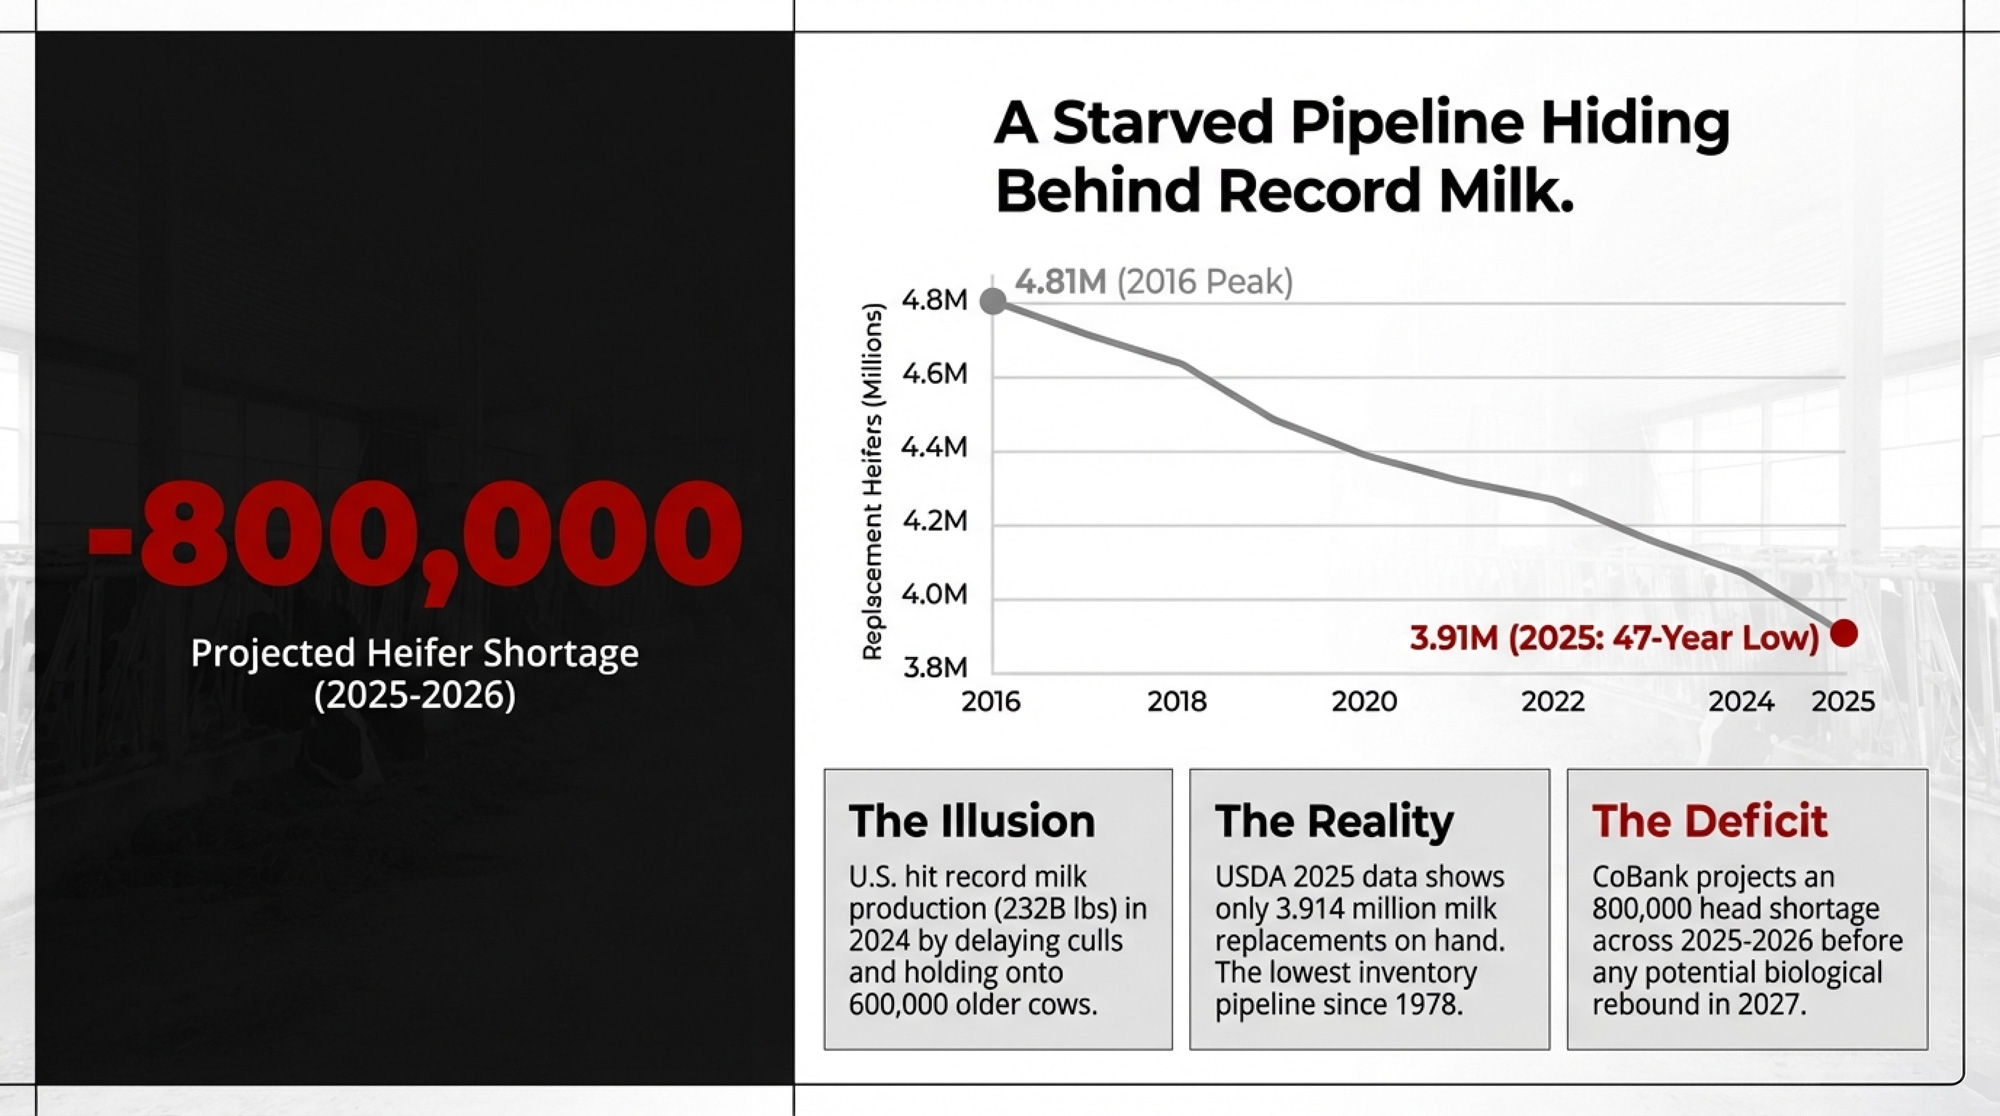
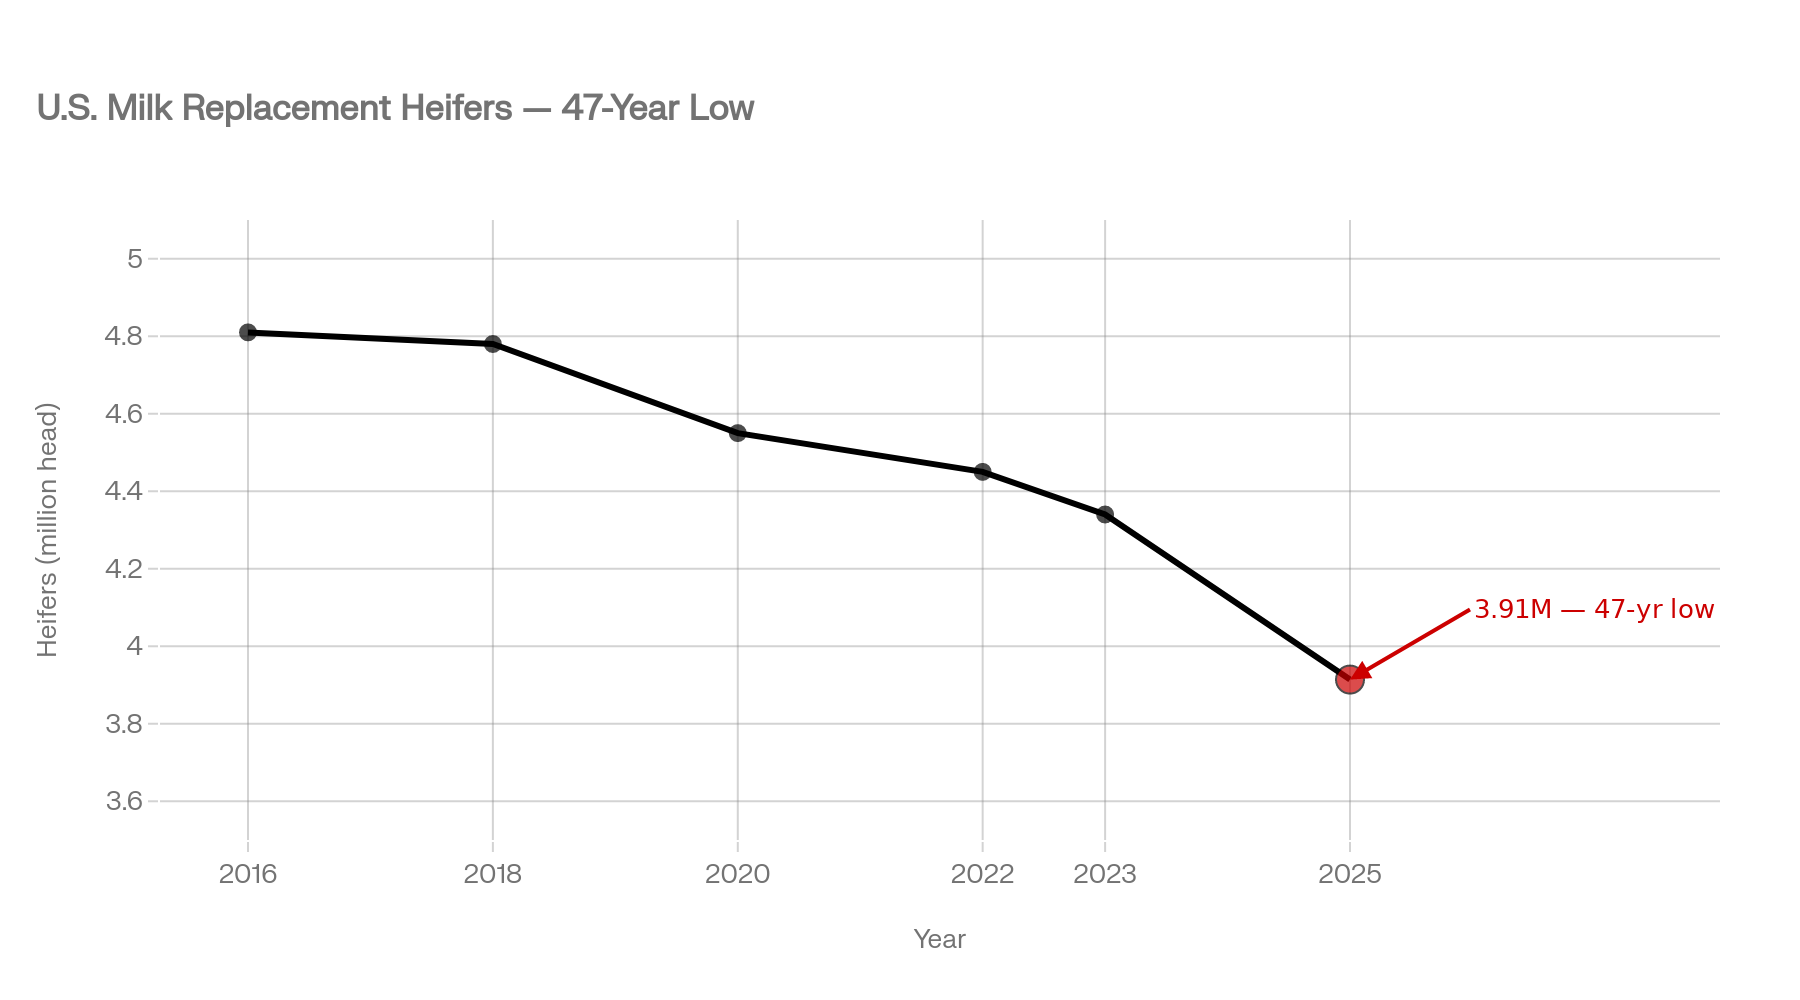
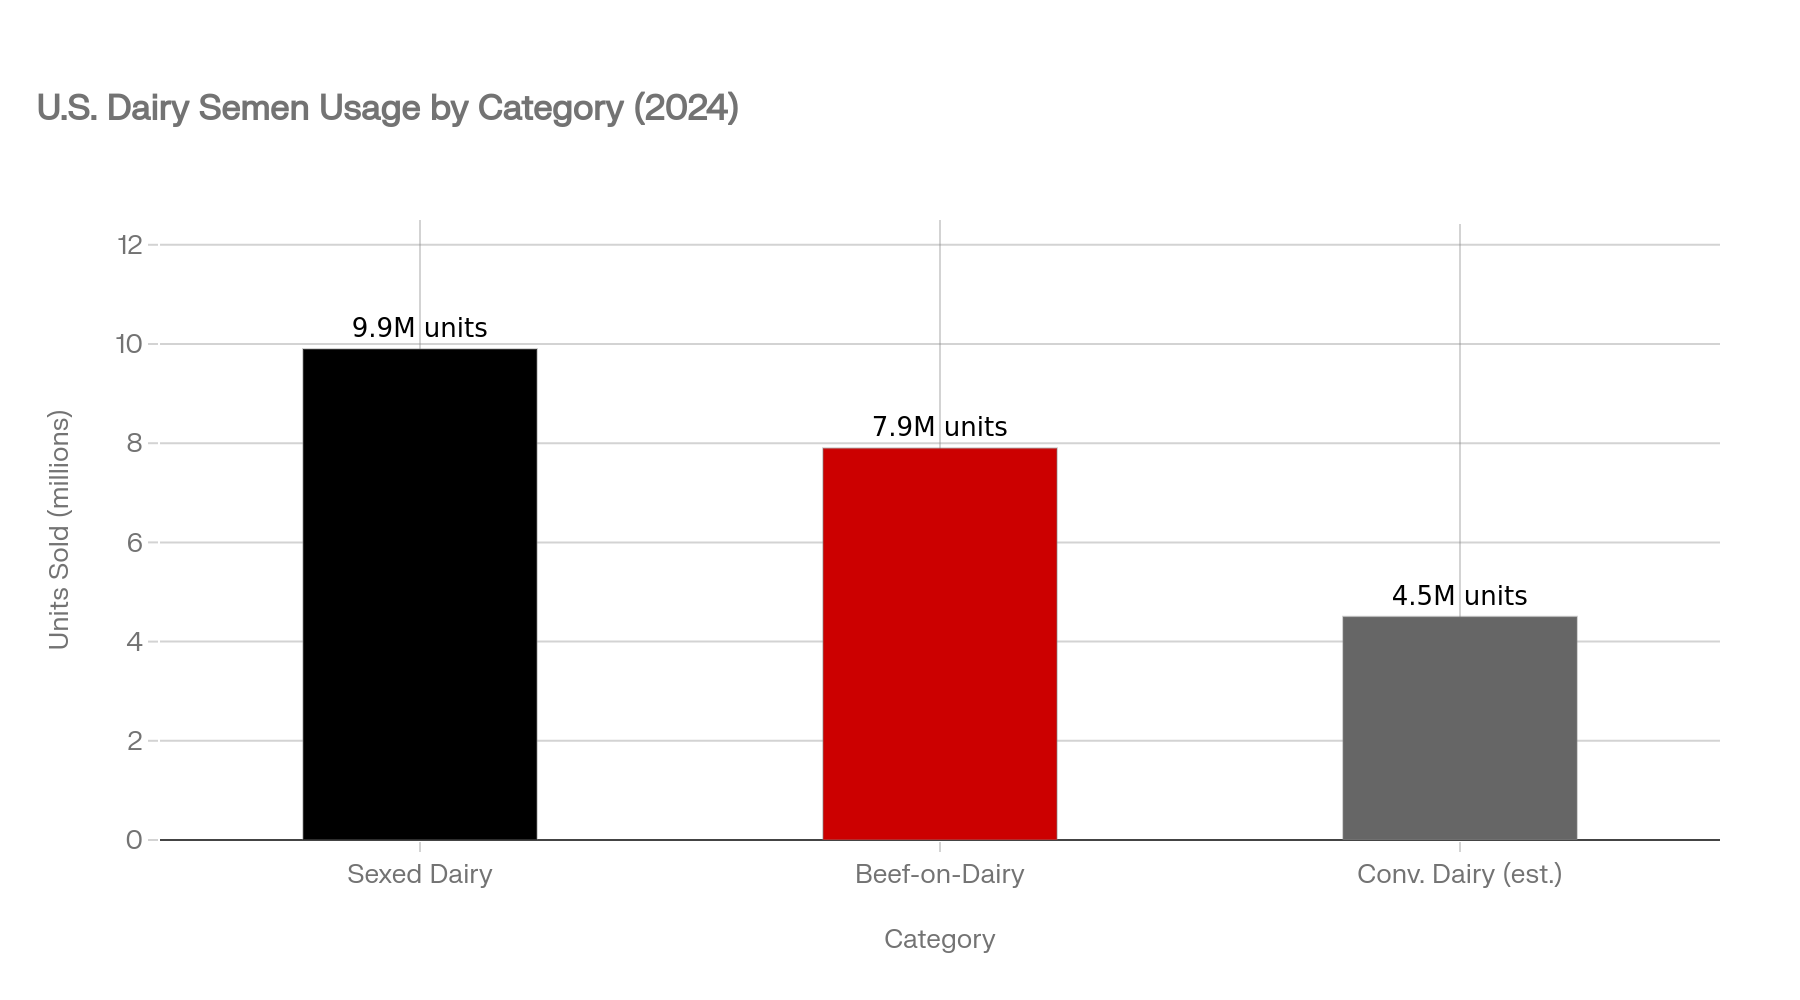
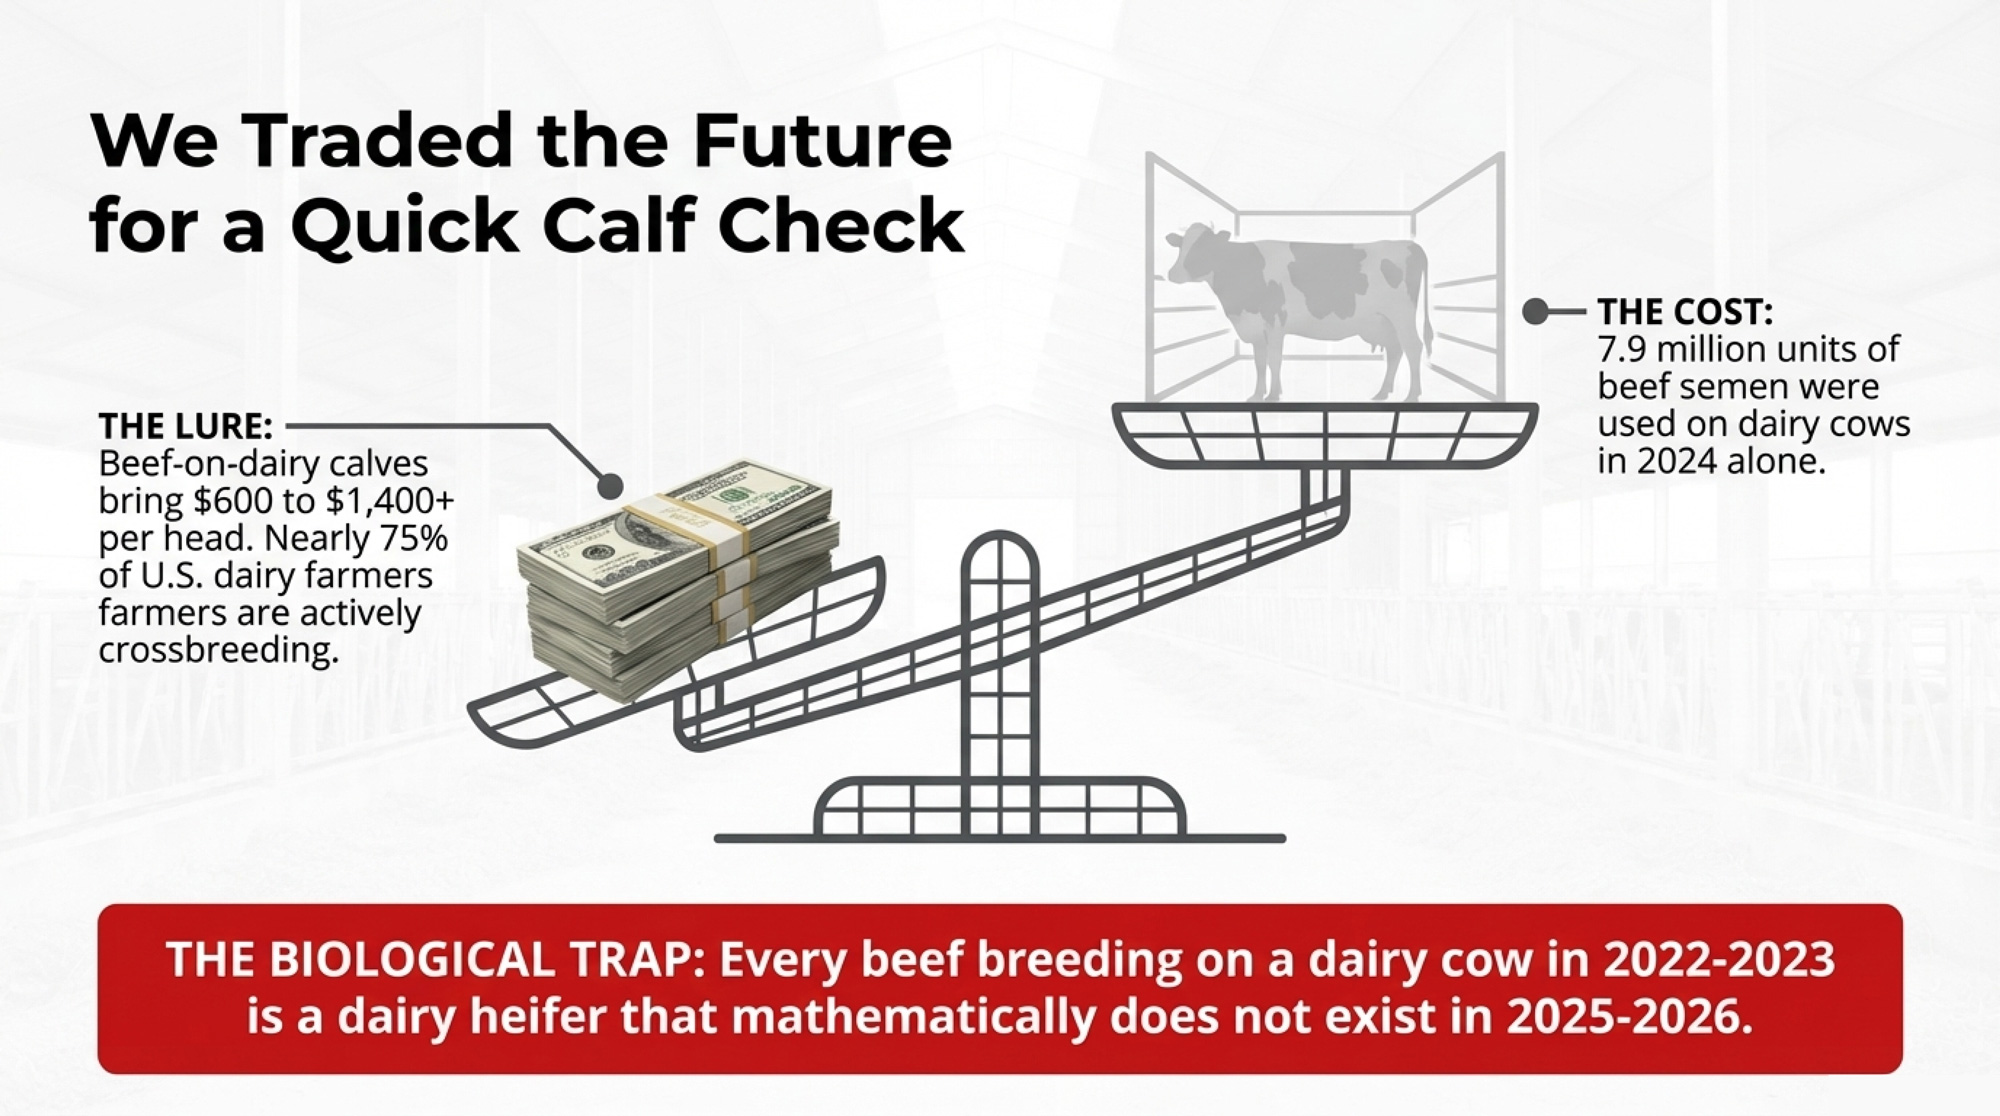
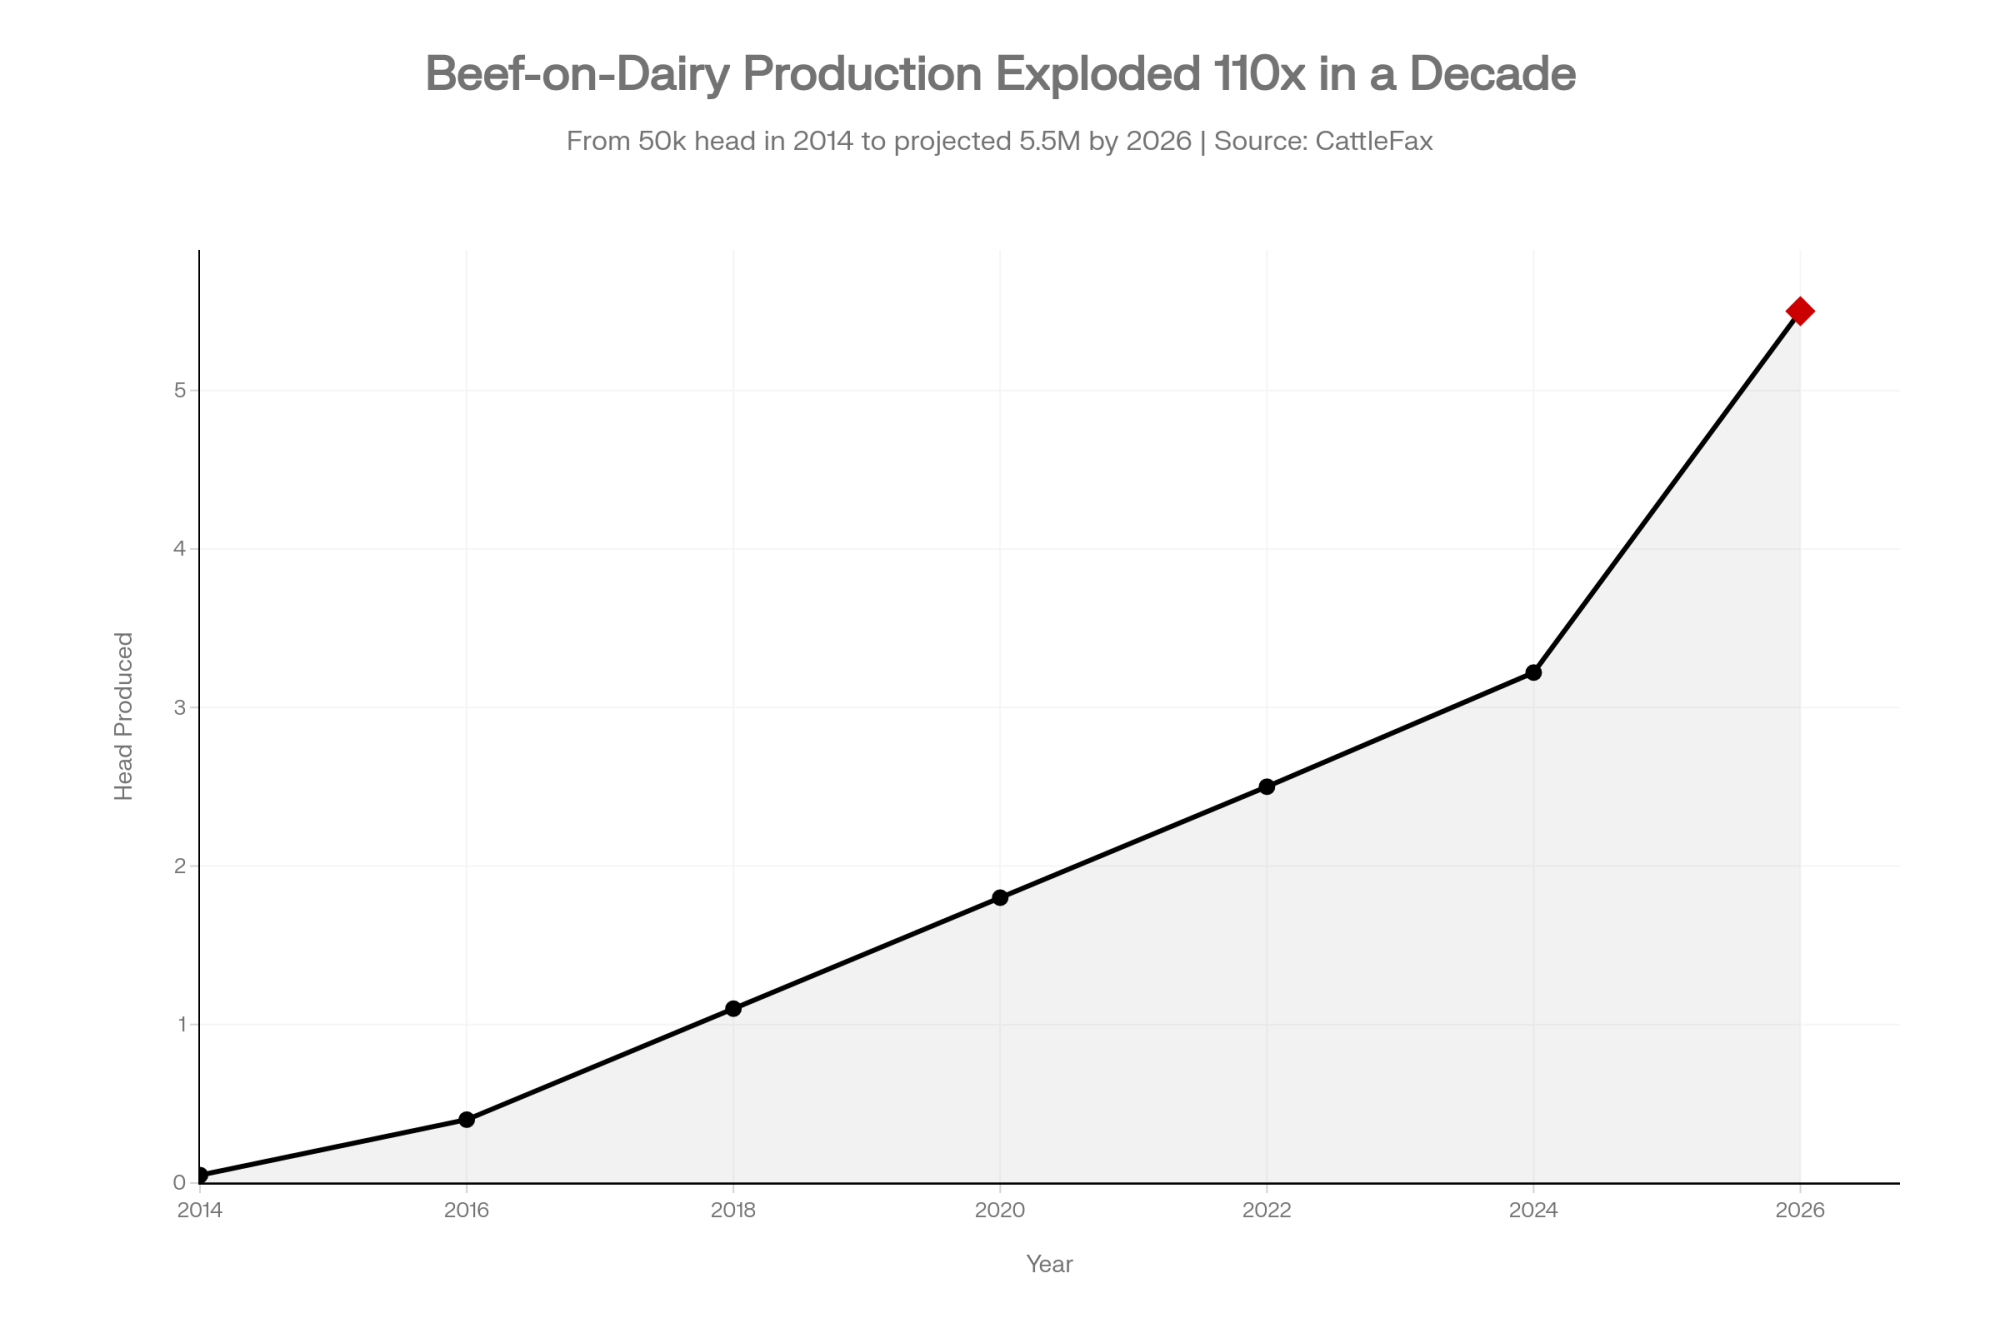
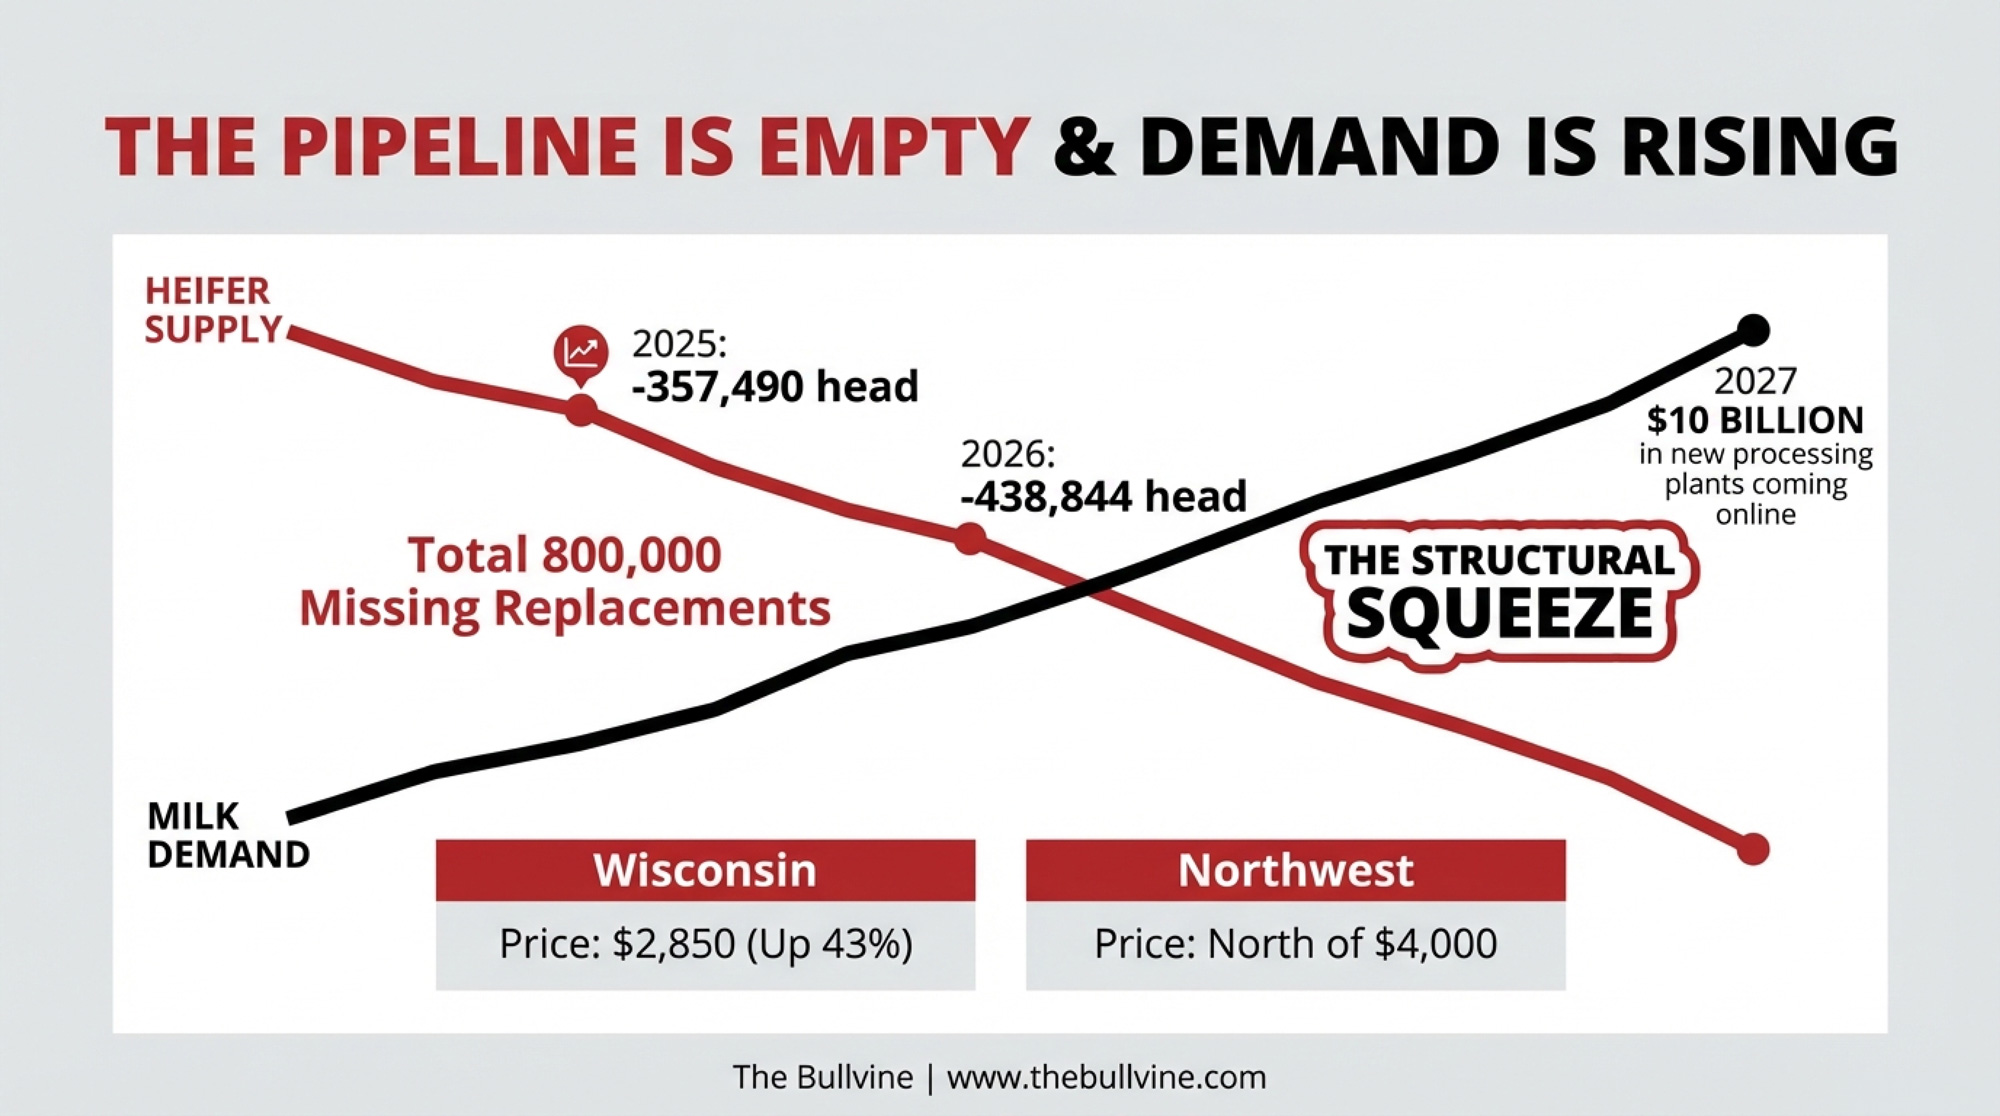
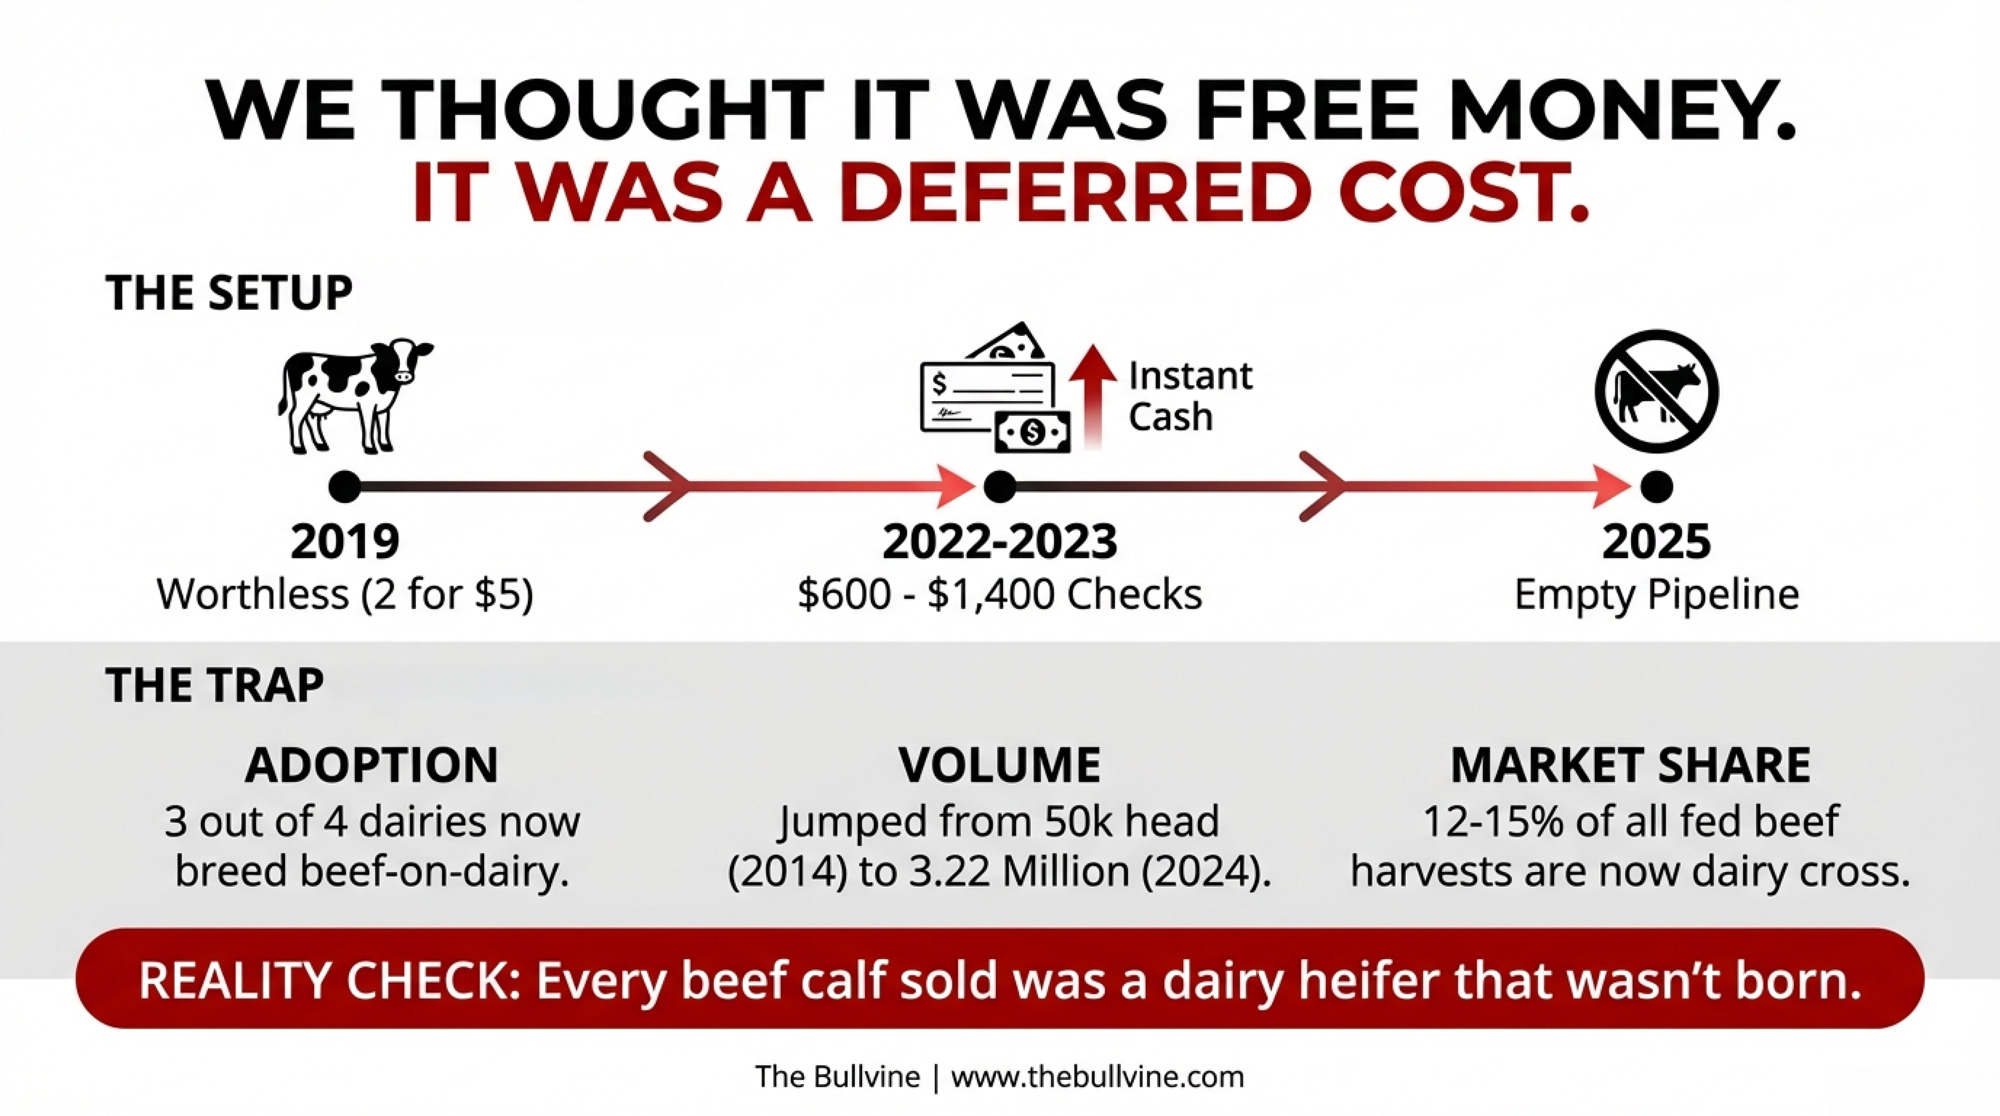
Beef-on-Dairy’s $3,000 Trap: 800,000 Missing Heifers and Who Pays the Bill — Dismantles the “cash-flow hero” myth of beef-on-dairy by exposing the looming 800,000-head heifer shortage. Follows the money on $3,000 replacement costs, revealing why high-reproduction herds are the only ones winning the genetic revenue gamble.
The Sunday Read Dairy Professionals Don’t Skip.
Every week, thousands of producers, breeders, and industry insiders open Bullvine Weekly for genetics insights, market shifts, and profit strategies they won’t find anywhere else. One email. Five minutes. Smarter decisions all week.
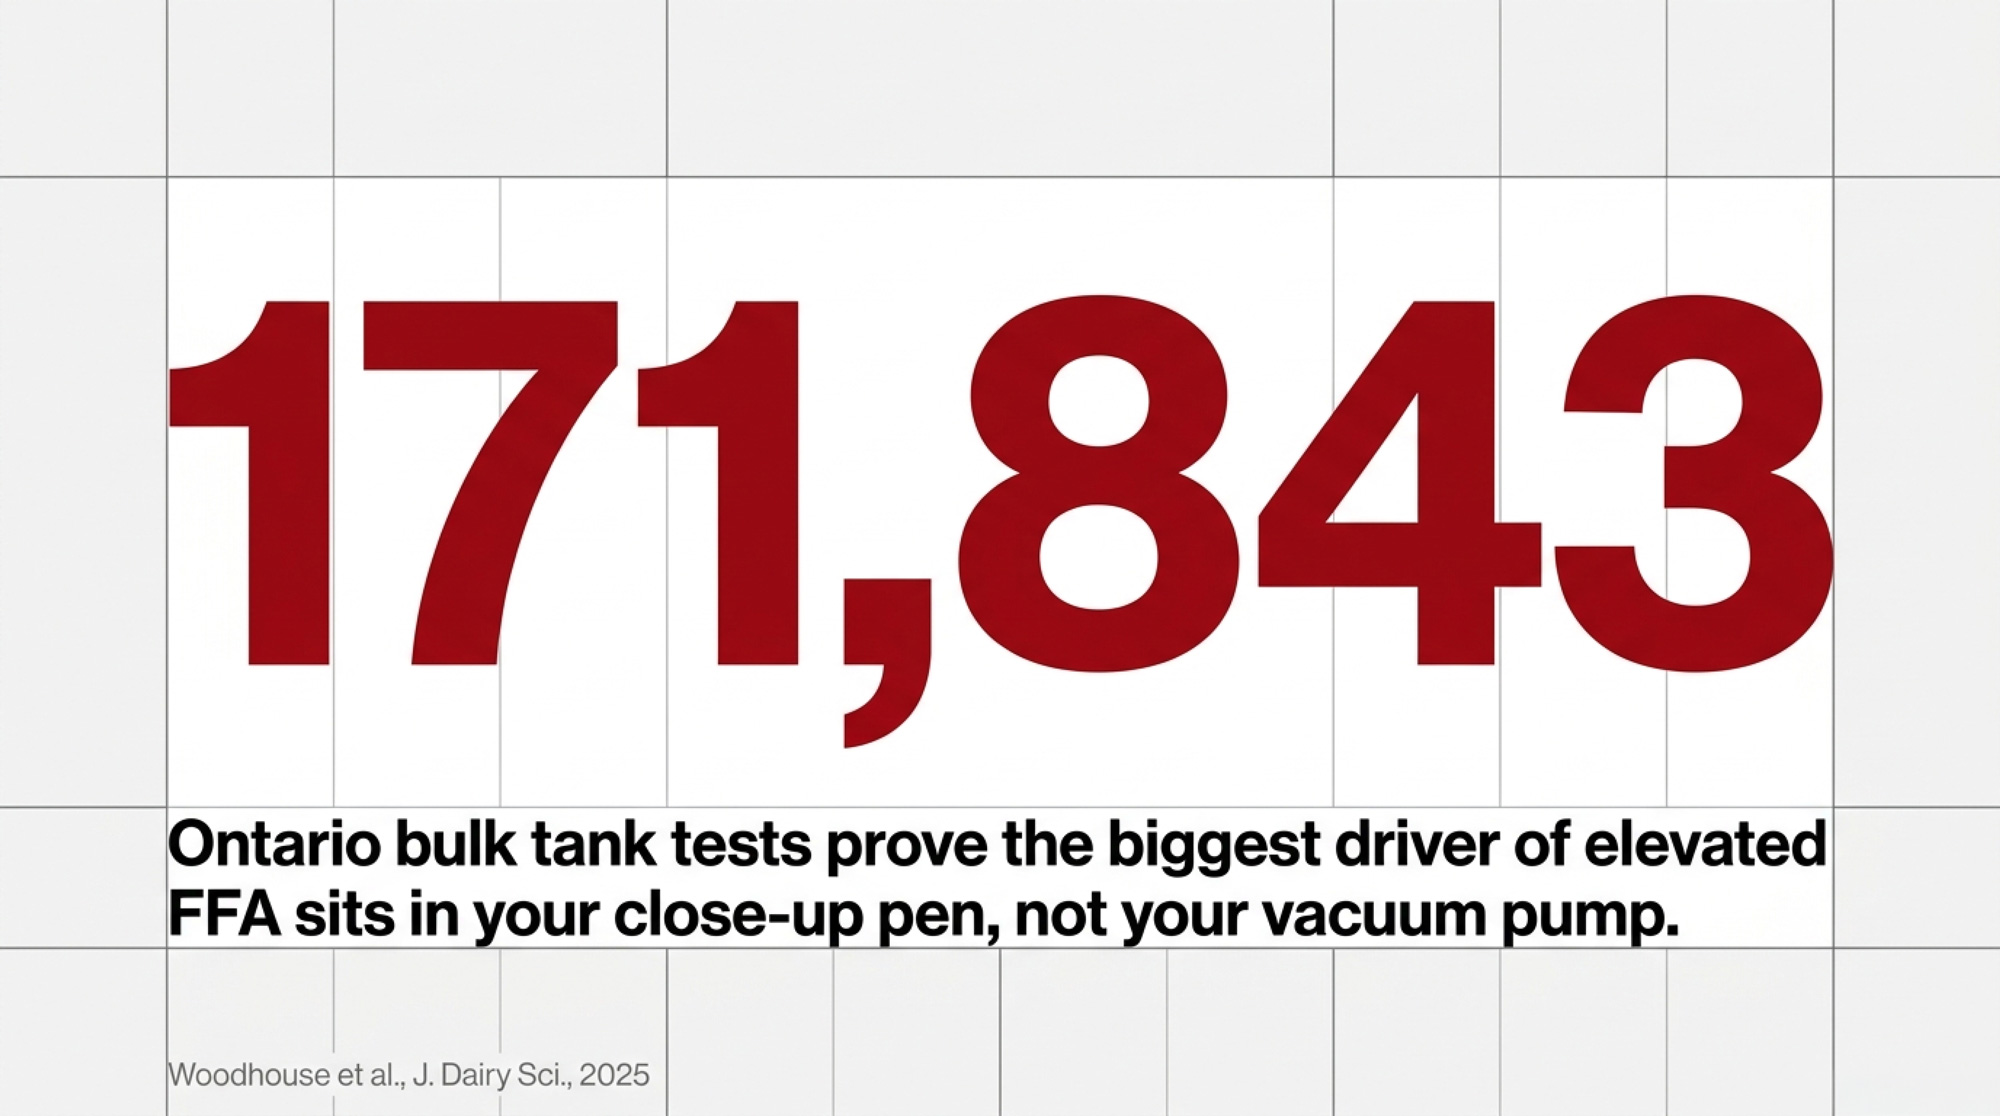
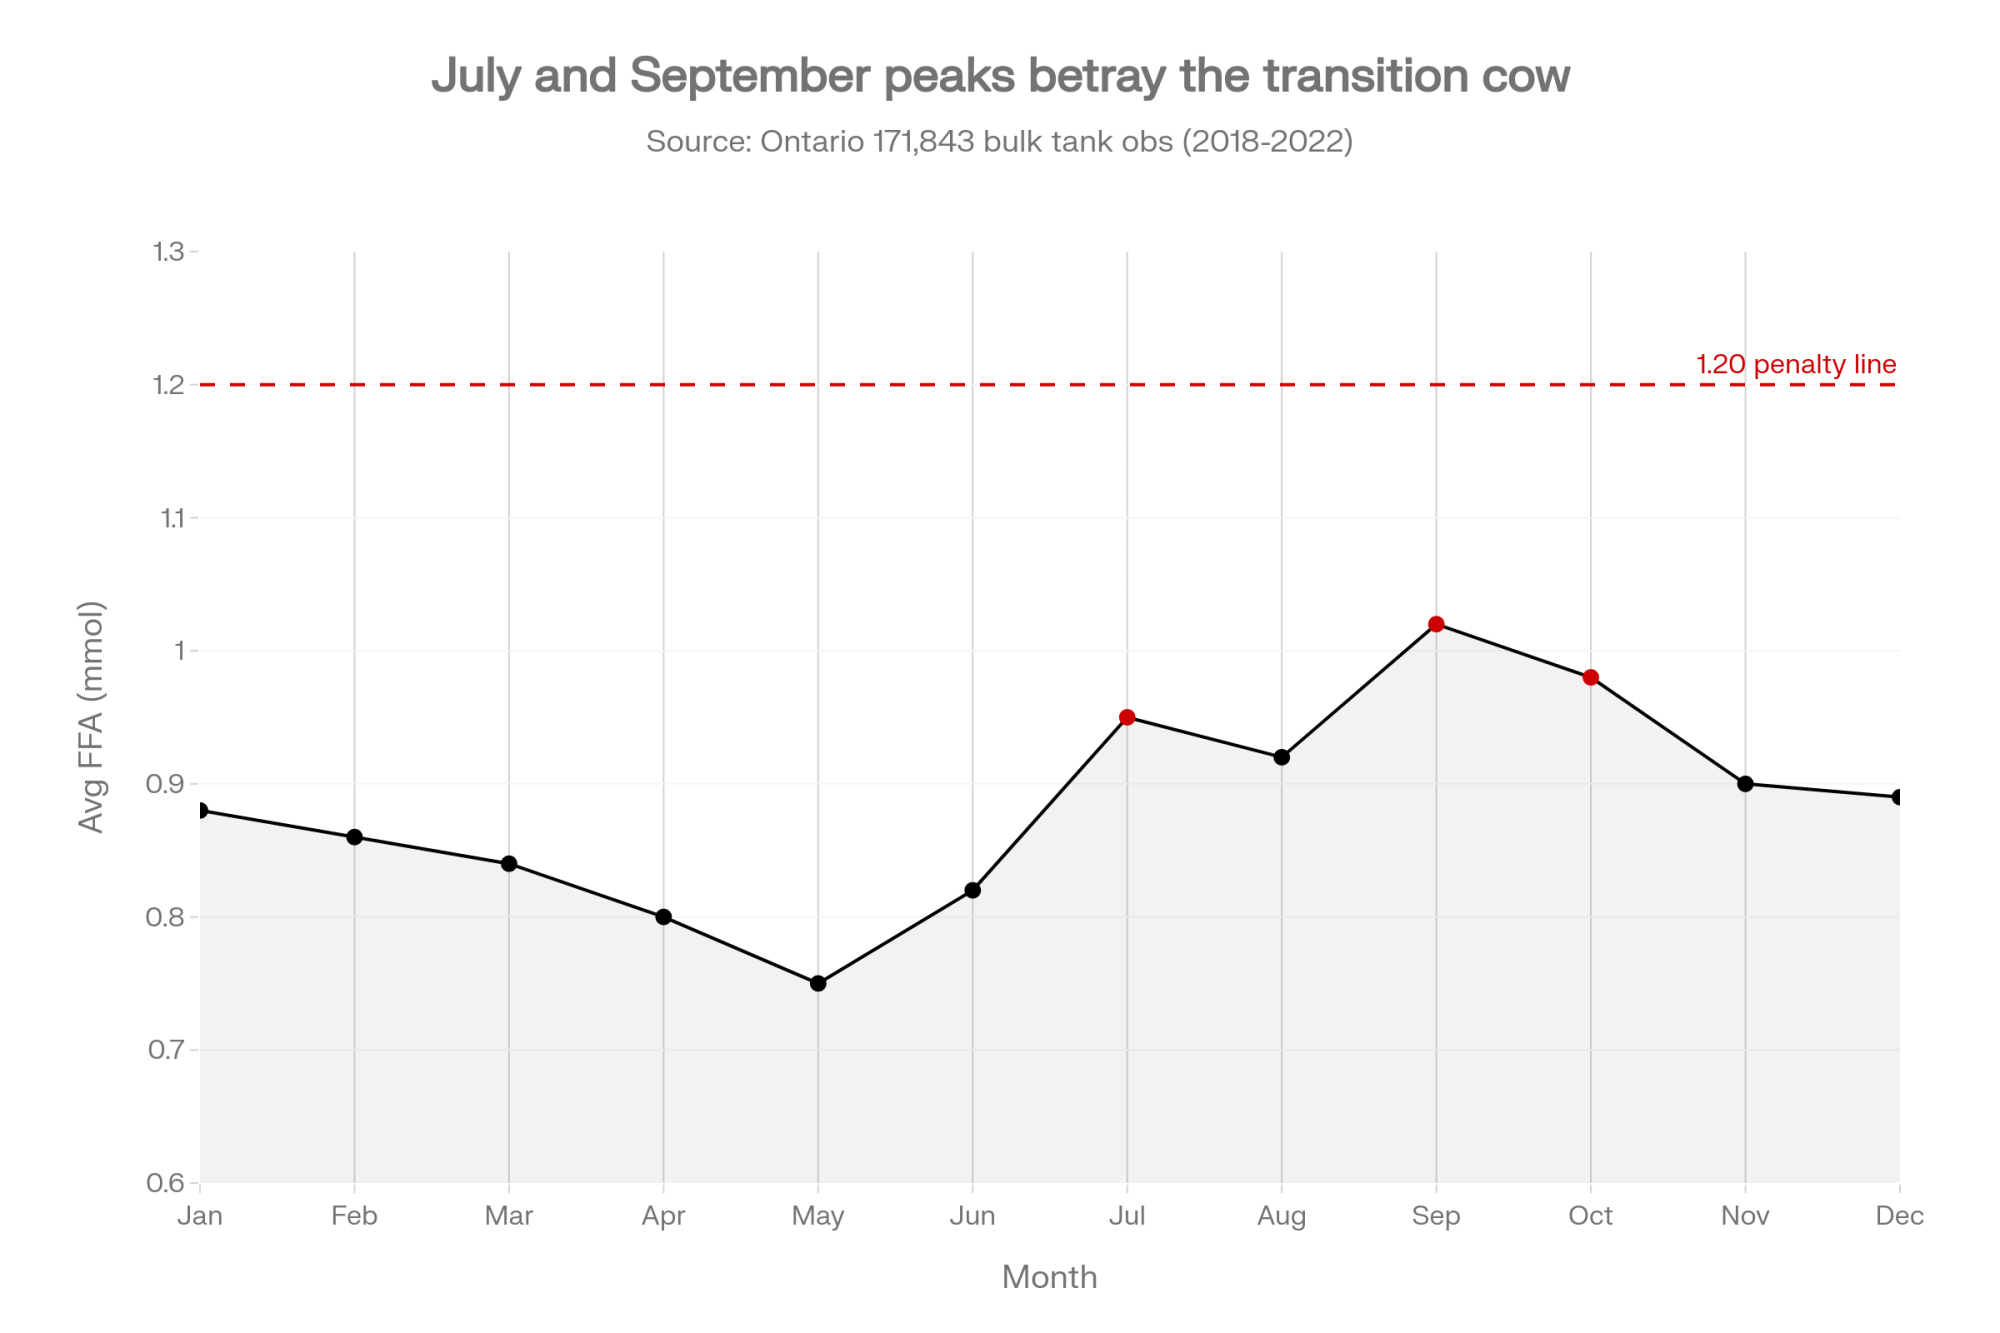
Guelph pulled 171,843 Ontario bulk tank tests and found the biggest FFA drivers weren’t your pump. They were your close-up pen, your ration, and three-incentive-day months.
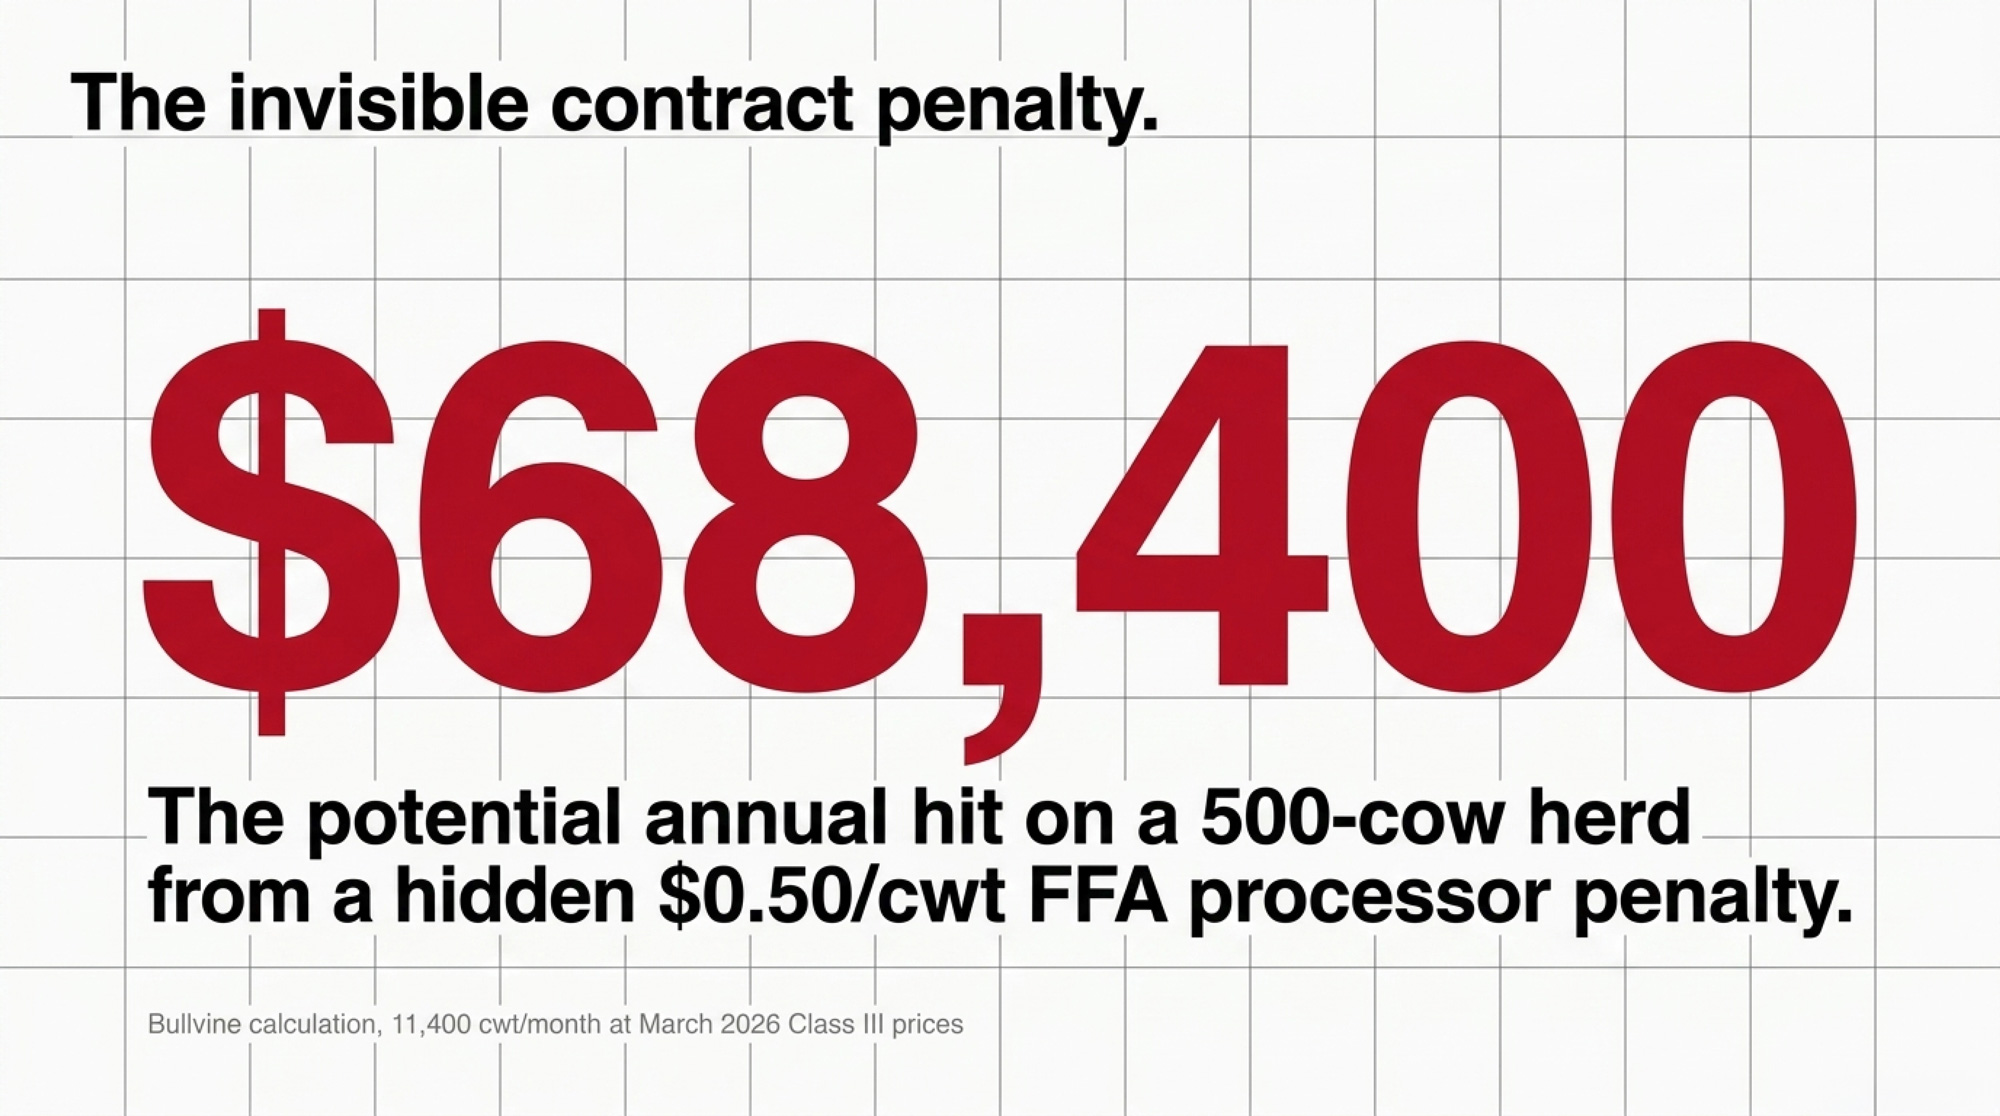
Executive Summary: Guelph researchers Hannah Woodhouse and Dr. David Kelton, working across 171,843 monthly bulk tank observations from every Ontario dairy farm over four years, have reframed the 1.20 mmol FFA sensory threshold as a transition-cow test, not a hygiene test — the significant predictors of an elevated month are lower bulk tank protein, non-parlor milking systems, three-incentive-day months, and higher bacteria counts, not your pump.¹ A companion 293-farm paper (J. Dairy Sci., Feb 2025) attached a 1.17 mmol/100g fat association to the tie-stall + ≥3×/day combination alone, and flagged that no operation in the 109-farm parlor freestall subsample posted a monthly average at or above 1.20.² The FFA penalty side lives almost entirely in the processor-specifications clause of your co-op supply agreement — BC Milk confirms FFA doesn’t affect provincial-pool pay, and no major North American processor posts its $/cwt FFA schedule publicly.³ On a 500-cow US herd producing 11,400 cwt/month at March 2026’s $16.16/cwt Class III, a $0.10–$0.50/cwt hit pencils at $13,680–$68,400/year, and FMMO reform’s 85–93¢/cwt Class-price reductions just tightened the margin in front of that number.⁴ The fastest intervention isn’t a facilities spend: plot FPR alongside FFA for six months, start fresh-cow BHBA testing at ≥1.2 mmol/L cutoff, move dry-off BCS into the 3.0–3.25 window, and layer in rumen-protected choline at the Arshad et al. (2020) dose.⁵ The demographic layer matters too — with US heifer inventories at a 20-year low and CoBank projecting 438,844 fewer dairy heifers in 2026, any parity-shift cull decision runs into $3,000+ replacement costs.⁶ The operator action: pull your last six bulk tank reports and your supply agreement this week, and get your co-op’s FFA penalty math in writing.
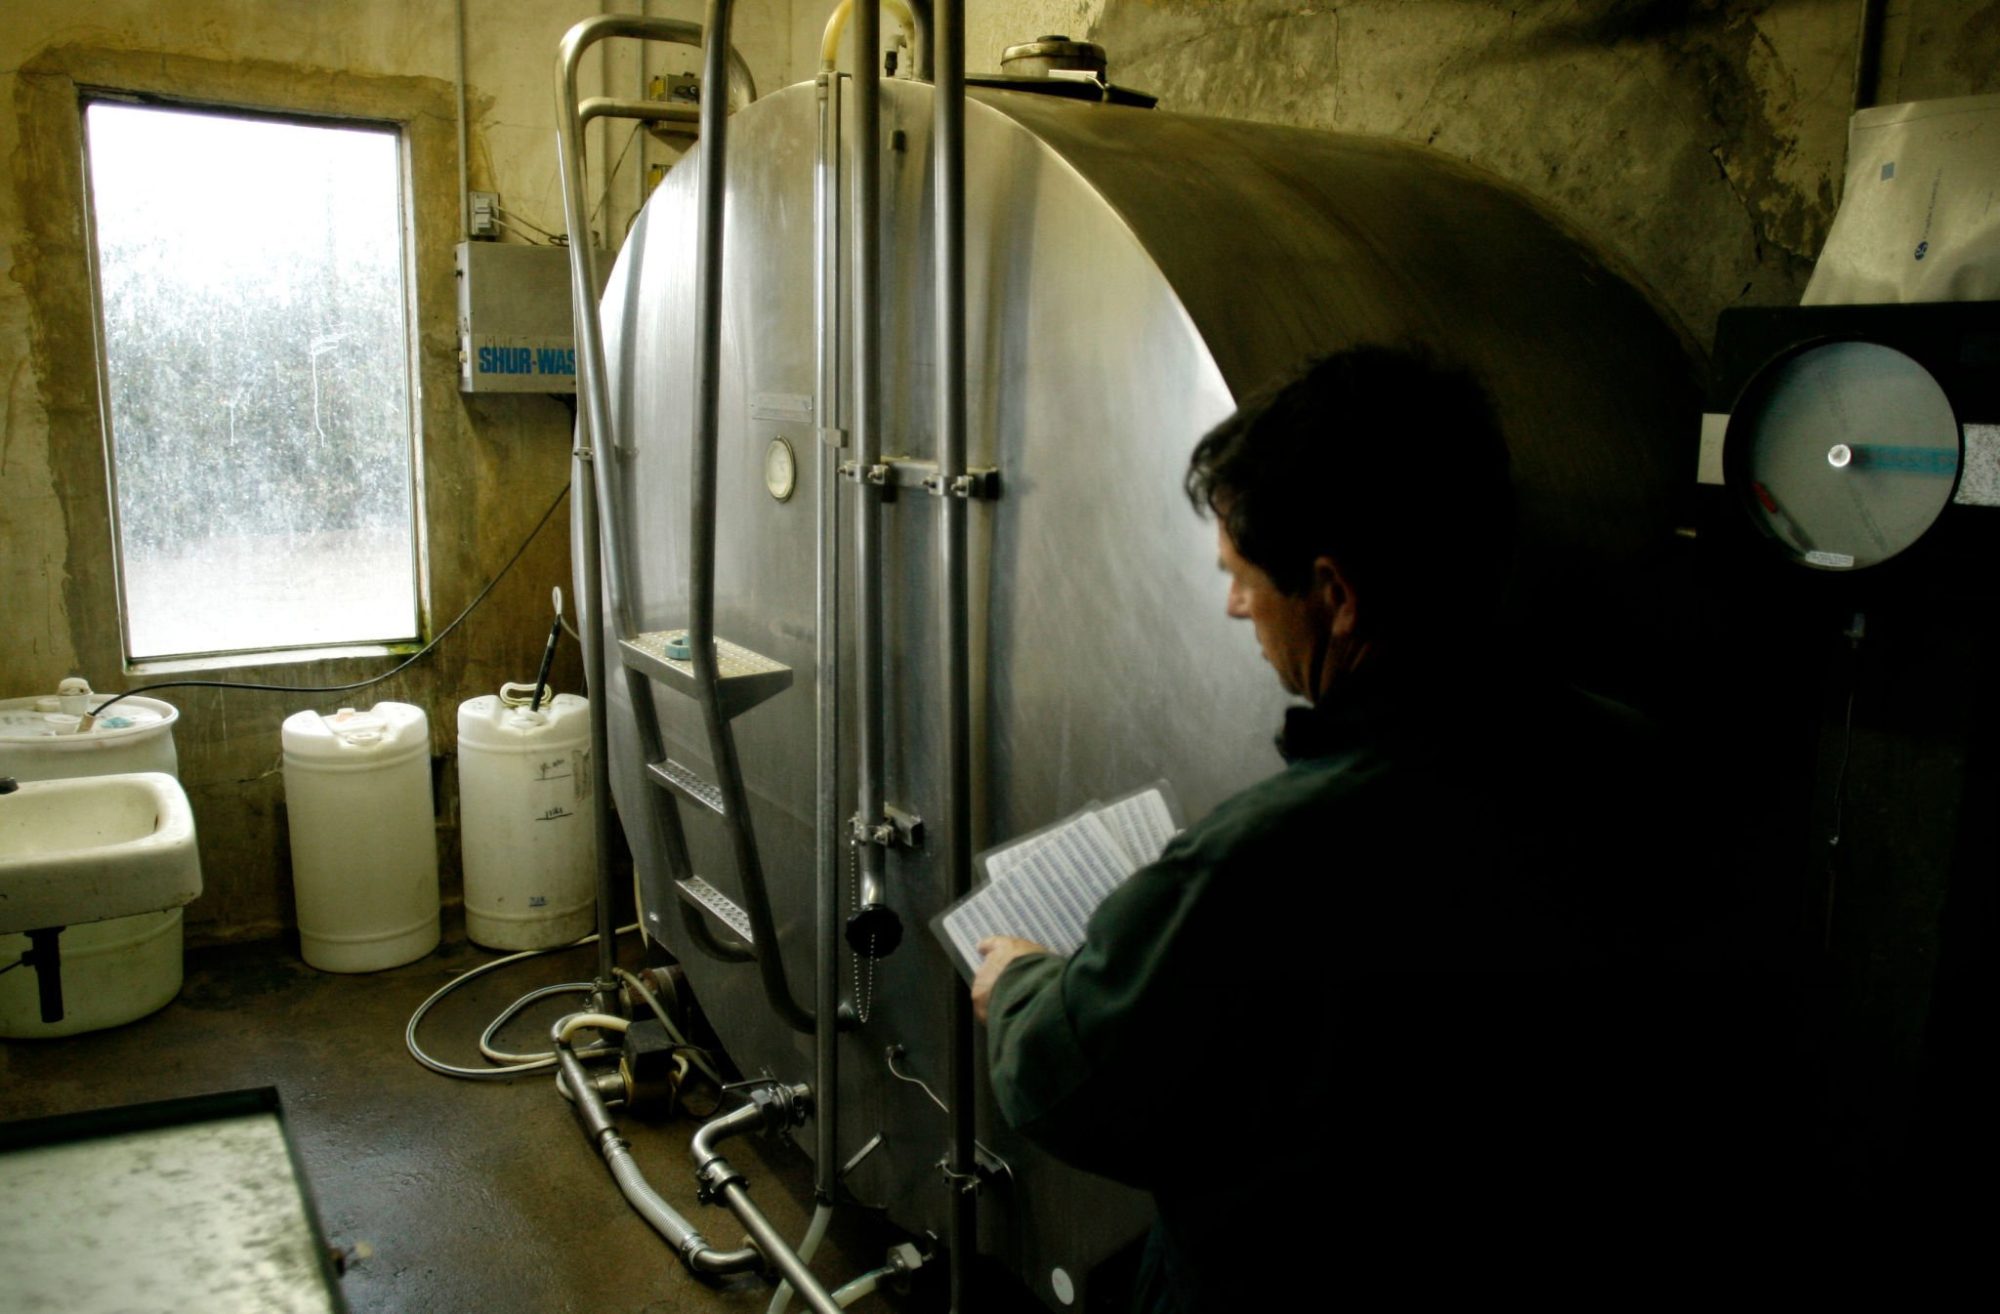
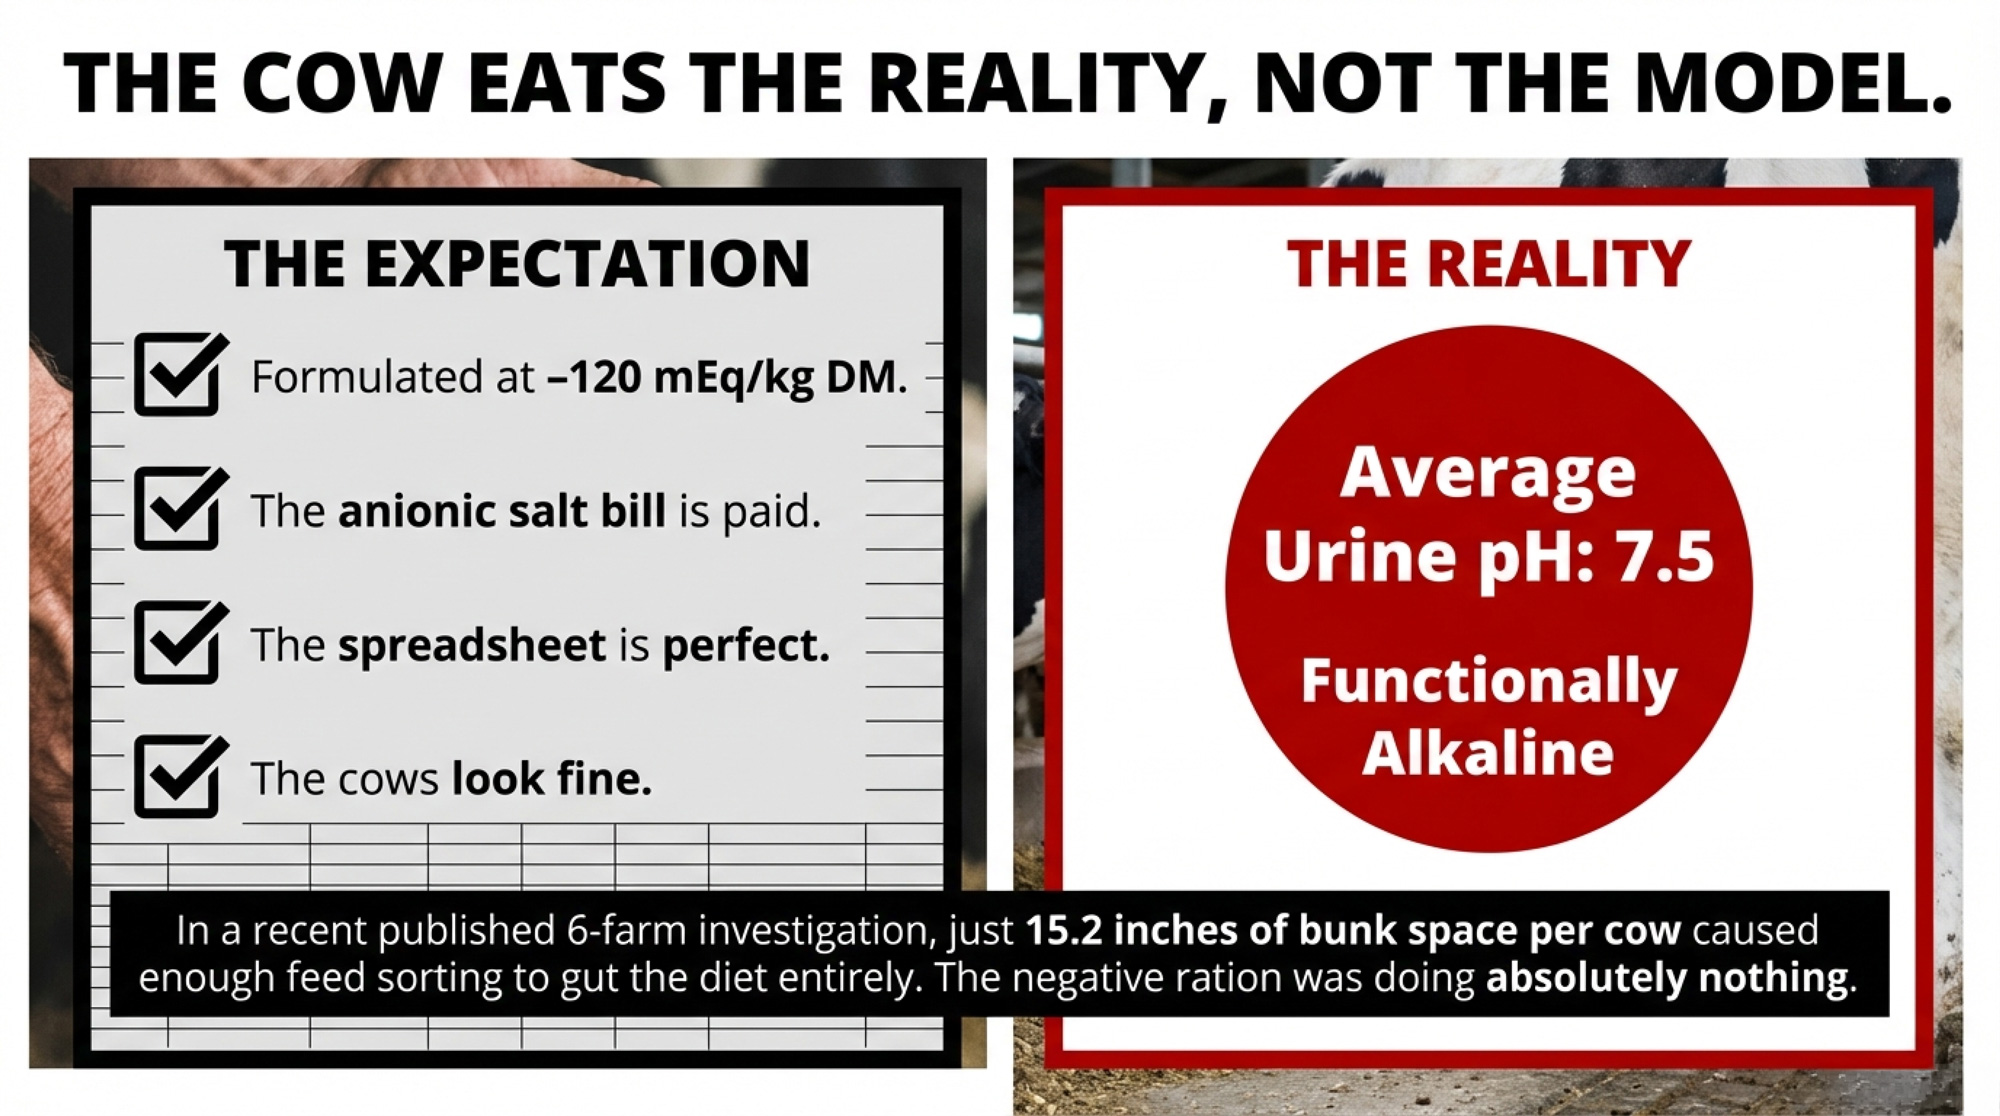
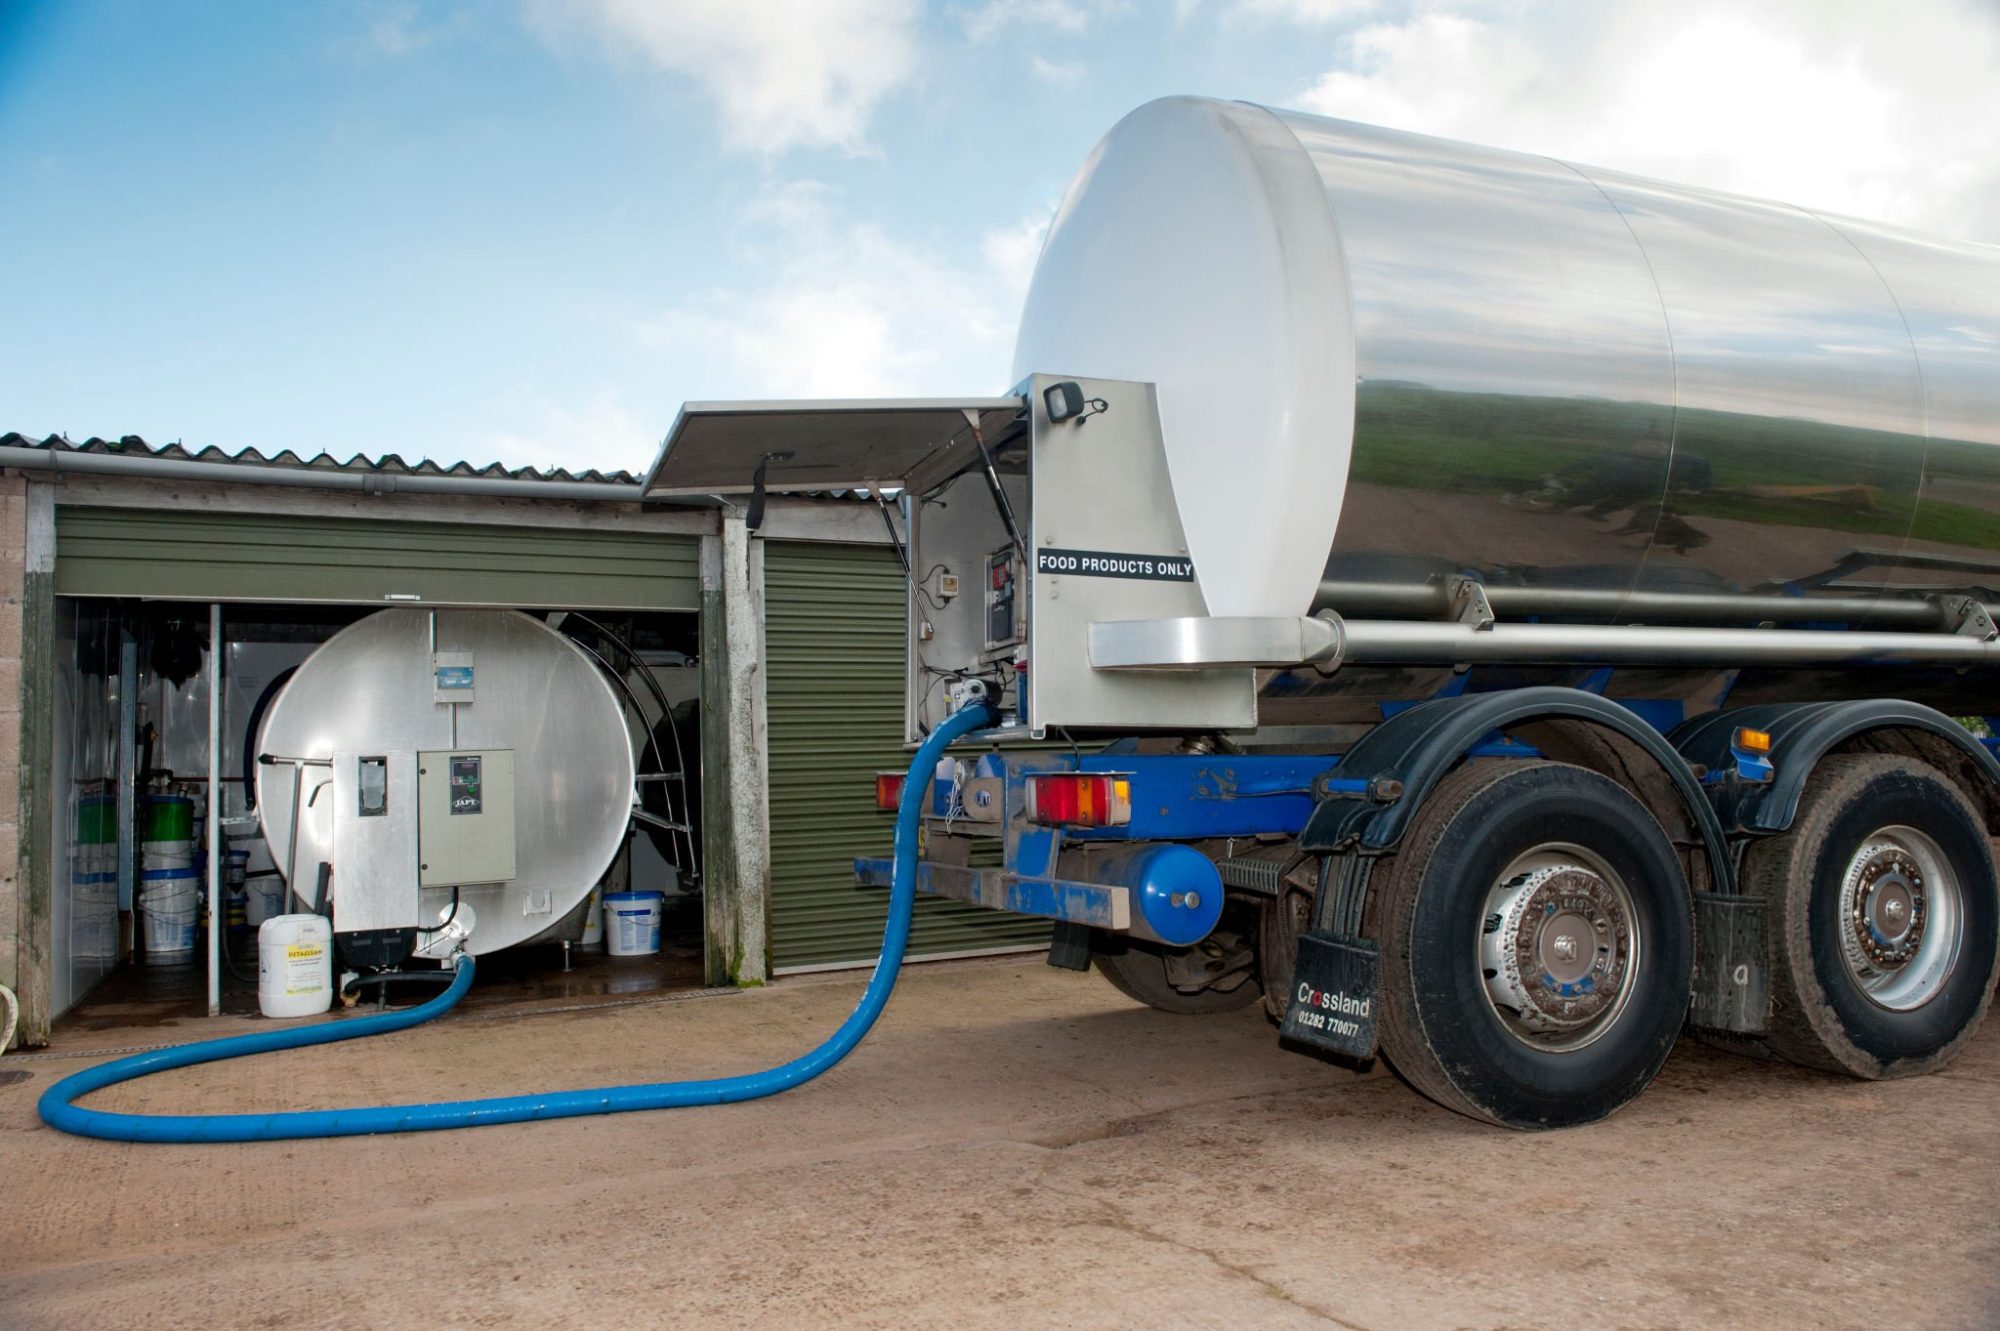
In January 2023, Dairy Farmers of Ontario field staff triggered an investigation on a 40-cow Holstein tie-stall that had averaged 1.32 ± 0.50 mmol FFA/100g fat across 752 samples between August 2018 and October 2022 — with more than 54% of samples at or above the 1.20 sensory threshold. The milking equipment tech had already been out. Vacuum fine. Liners fine. Filters changed at every milking, three times a day.
University of Guelph researcher Hannah Woodhouse and Dr. David Kelton walked into that barn and found what the data had been whispering all along: cracked milking unit claws with curdled milk inside, unequal milking intervals as short as three hours, and palm fat fed at 300 g/head/day with the dose pushed higher during fall DFO incentive months.¹ The equipment problems were real. But the ration, the intervals, and the calendar were doing most of the damage — and the equipment tech was never going to solve any of that alone.
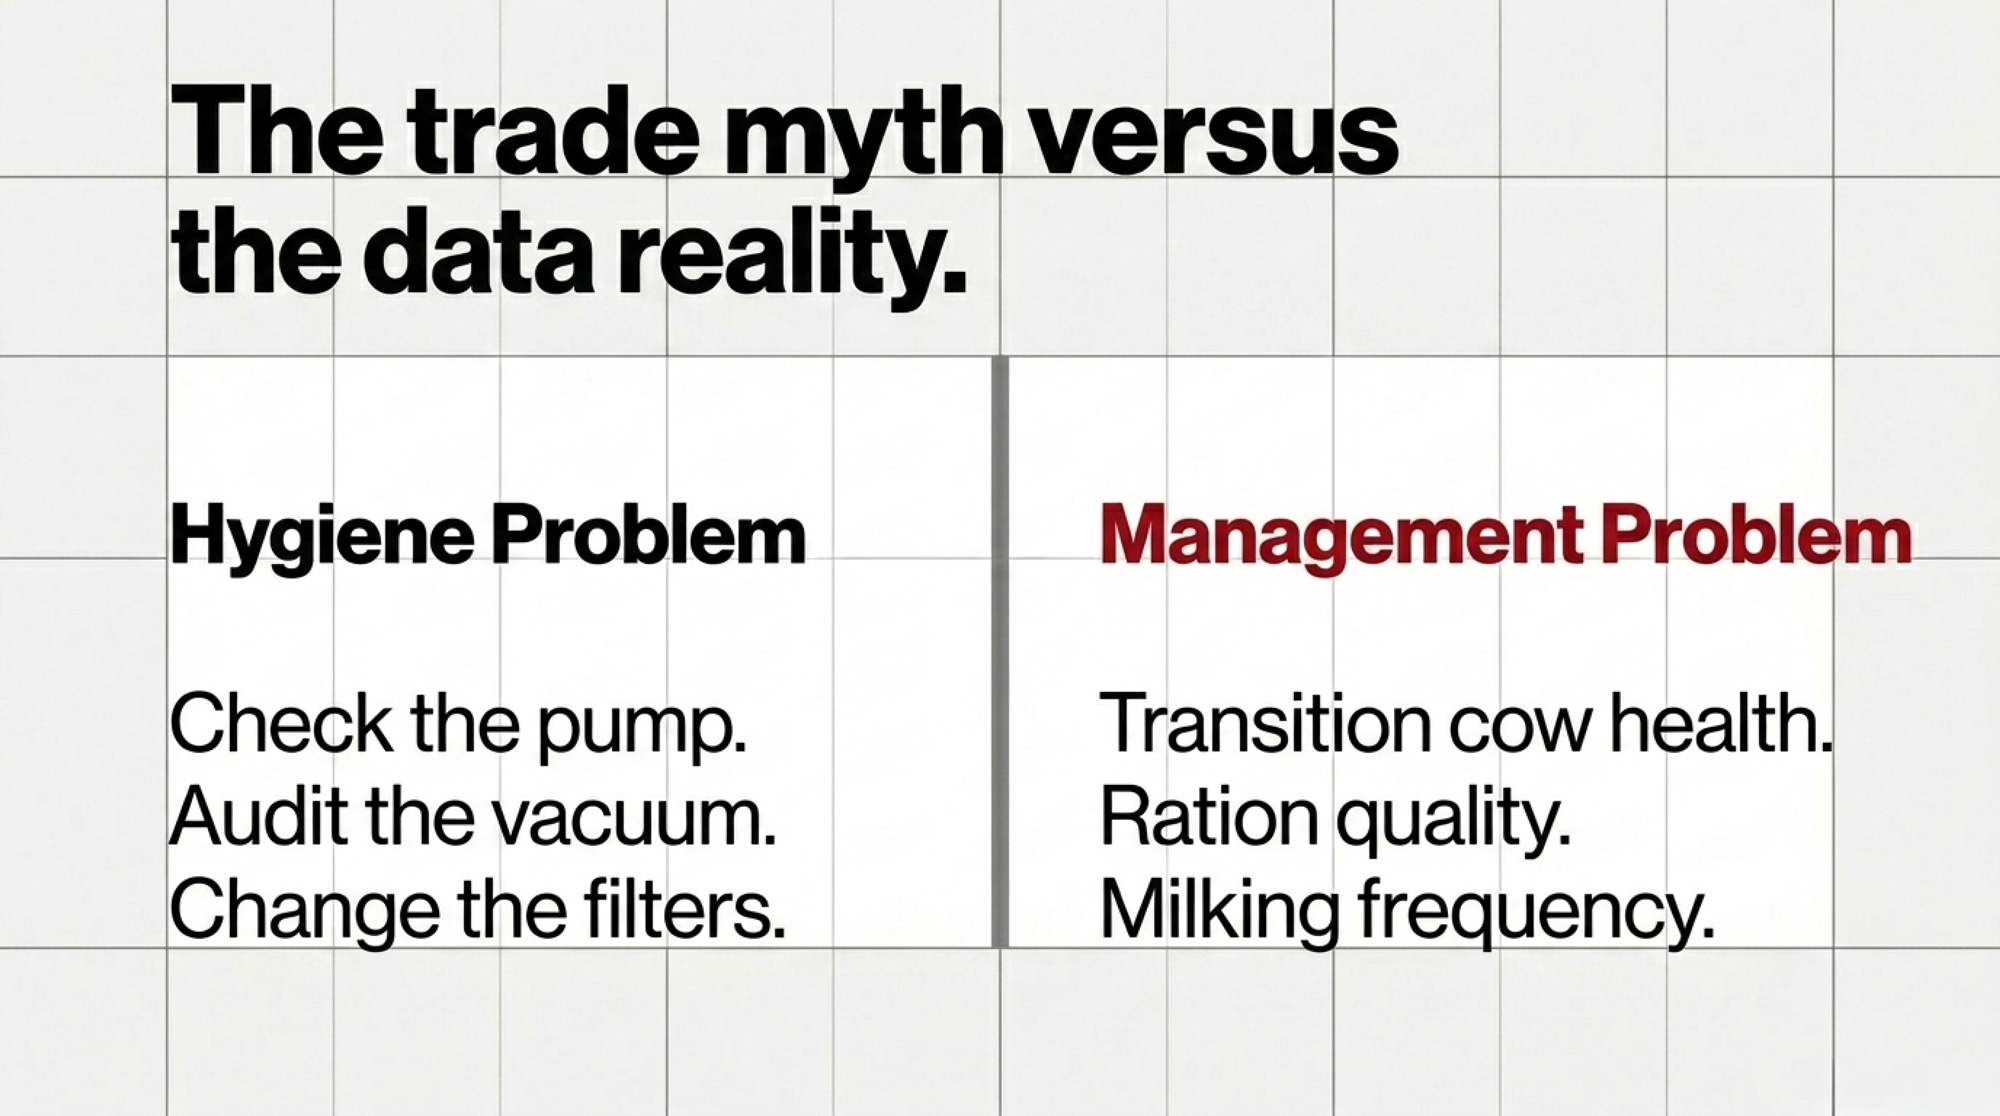
That anonymized case farm sits at the clinical end of a bigger story. A body of peer-reviewed Guelph work covering every Ontario dairy farm over four years has reframed the 1.20 mmol bulk tank free fatty acids line as a transition-cow and management test, not a hygiene test.¹,² And the penalty exposure that follows it isn’t on your pay statement — it’s in the “processor specifications” pass-through buried in your co-op supply agreement.
What the 1.20 Bulk Tank Free Fatty Acid Threshold Is Really Measuring
Start with what the 1.20 line does to milk. Above it, trained taste panels pick up rancid notes in butter and cheese, foam stability drops, and cheese-milk coagulation suffers.¹ That’s why processors penalize above threshold. And it’s why the trade spent a decade calling this a hygiene problem — check the pump, audit the vacuum, change the filters.
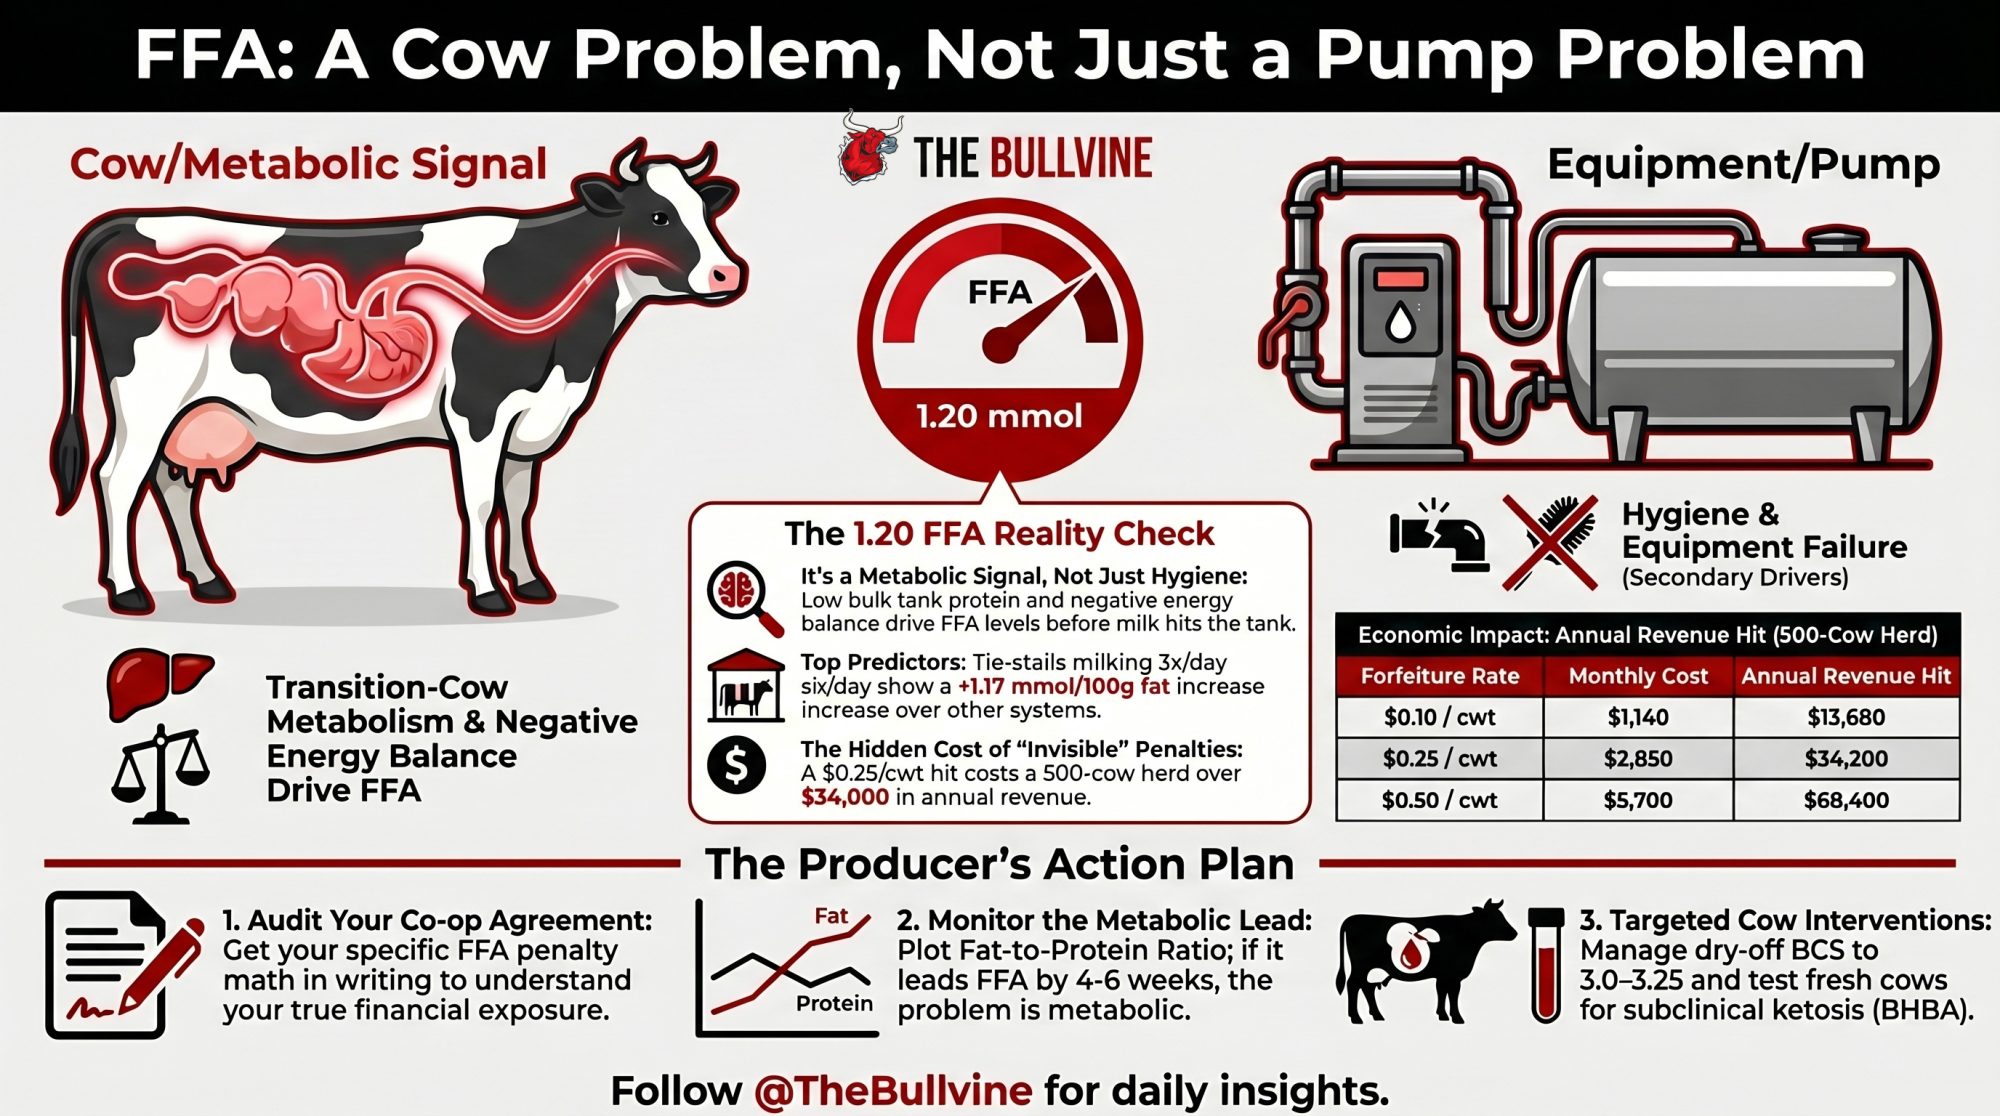
The Woodhouse et al. JDS Communications work tells a different story. Monthly bulk tank averages across all 3,771 Ontario dairy farms, August 2018 through December 2022, totaled 171,843 observations. Roughly 7% of those monthly averages sat at or above 1.20, and the significant predictors of an elevated month weren’t hardware — they were lower bulk tank milk protein, non-parlor milking systems, three-incentive-day months, and higher bulk tank bacteria counts.⁷
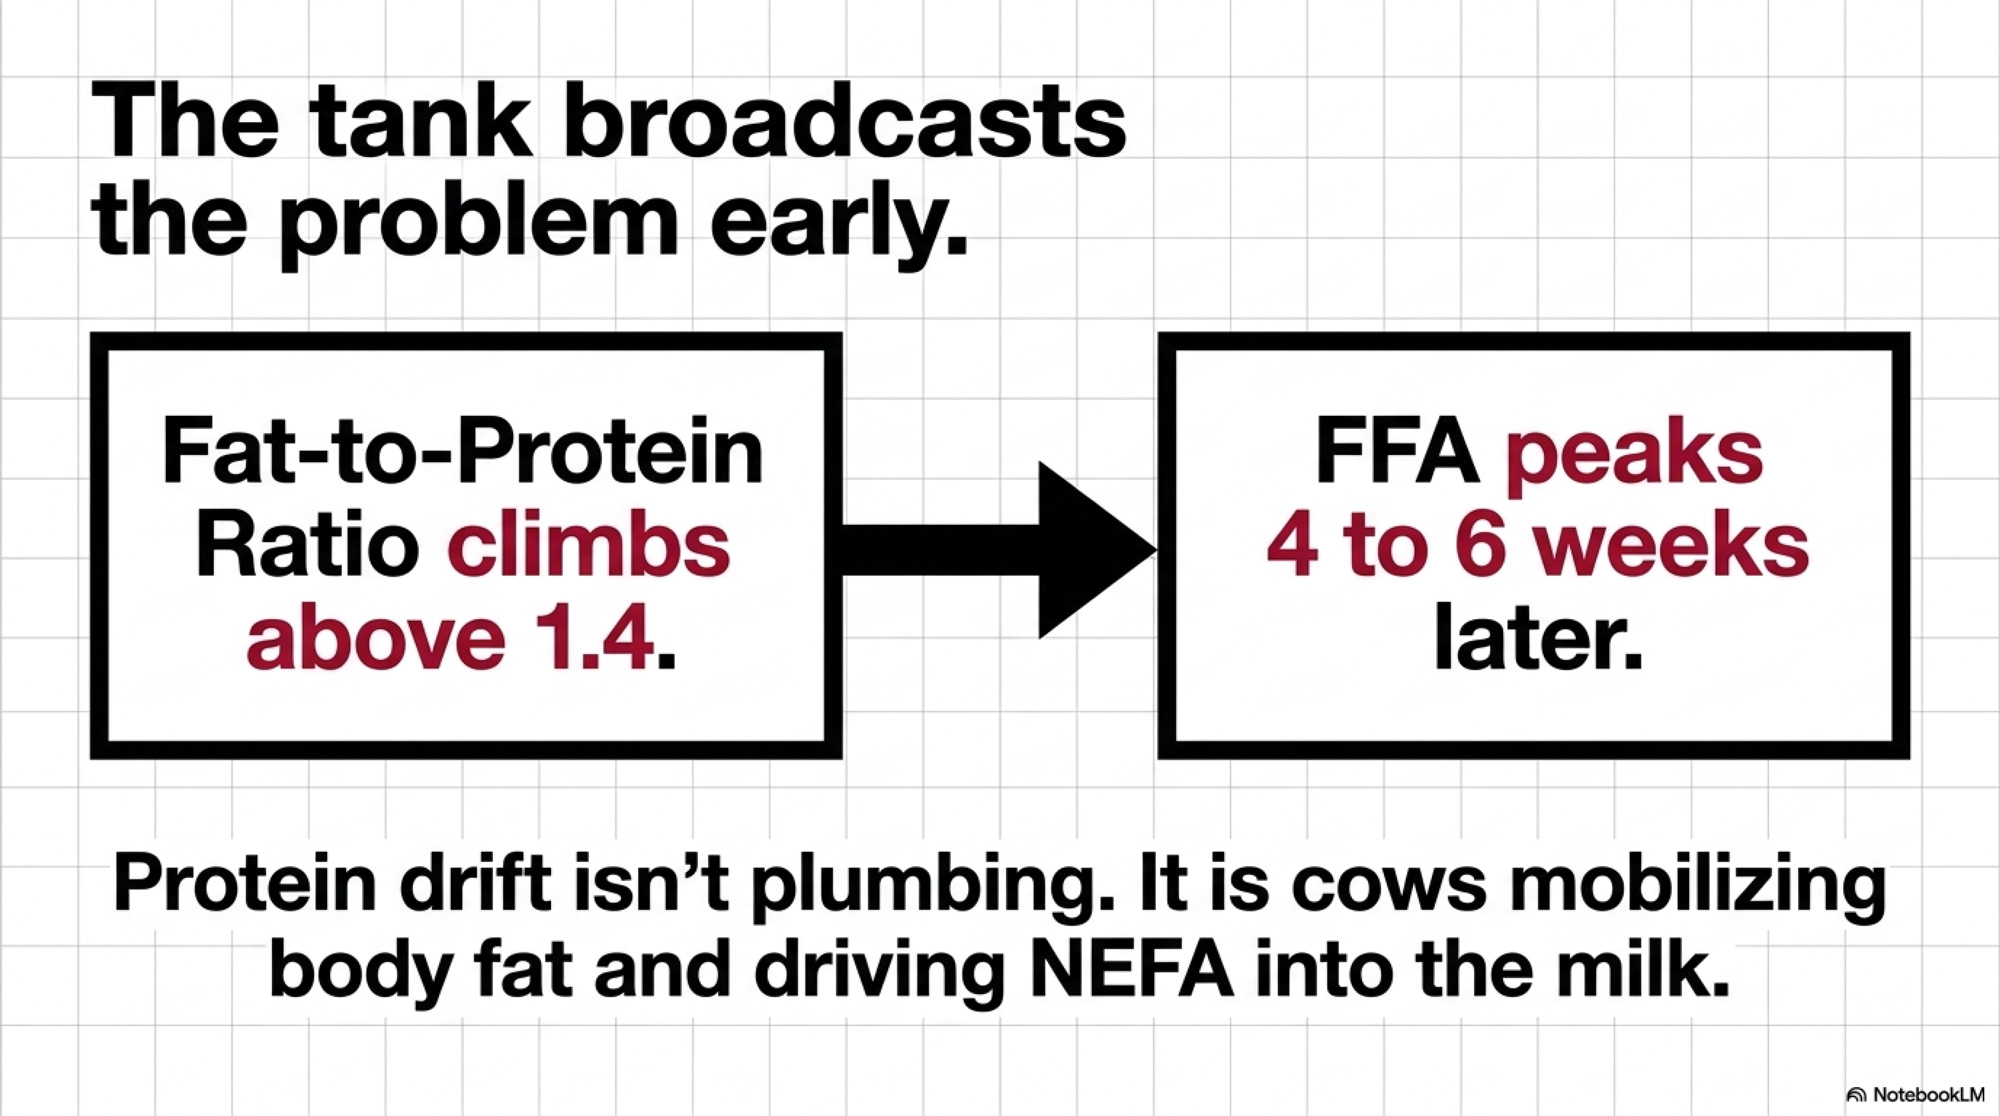
Protein drift in a bulk tank isn’t a plumbing signal. It’s a metabolic signal — cows in negative energy balance, mobilizing body fat, driving NEFA and lipase activity into milk that’s already biochemically compromised before it touches a single piece of stainless. The 1.20 line isn’t testing your milking system. It’s testing your transition cow program.
Writing for AgProud in September 2024, Woodhouse put it in producer-ready terms: dairy producers can manage individual cows, ration quality, milking frequency, and milk filter changes to reduce FFA levels.⁸ Cows and ration come first on her own list. Filters last. The paper’s predictor ranking points squarely in the same direction.⁷
Dimension
Old industry assumption
Guelph 2024-2025 evidence
Operator action
Primary cause
Pump/vacuum/liner wear
Transition-cow energy deficit (low BT protein)
Call vet first
Key predictor
Equipment age
Tie-stall + ≥3×/day (β=1.17)
Audit housing × milking freq
Filter protocol
Replace more often
Filter <2×/day adds only β=0.27
Keep, don’t over-weight
Seasonality driver
Summer heat on equipment
3-incentive-day months
Map incentives to FFA peaks
Parlor freestall herds ≥1.20
Common
0 of 109 farms
Benchmark target
Is This a Metabolic Problem or an Equipment Problem?
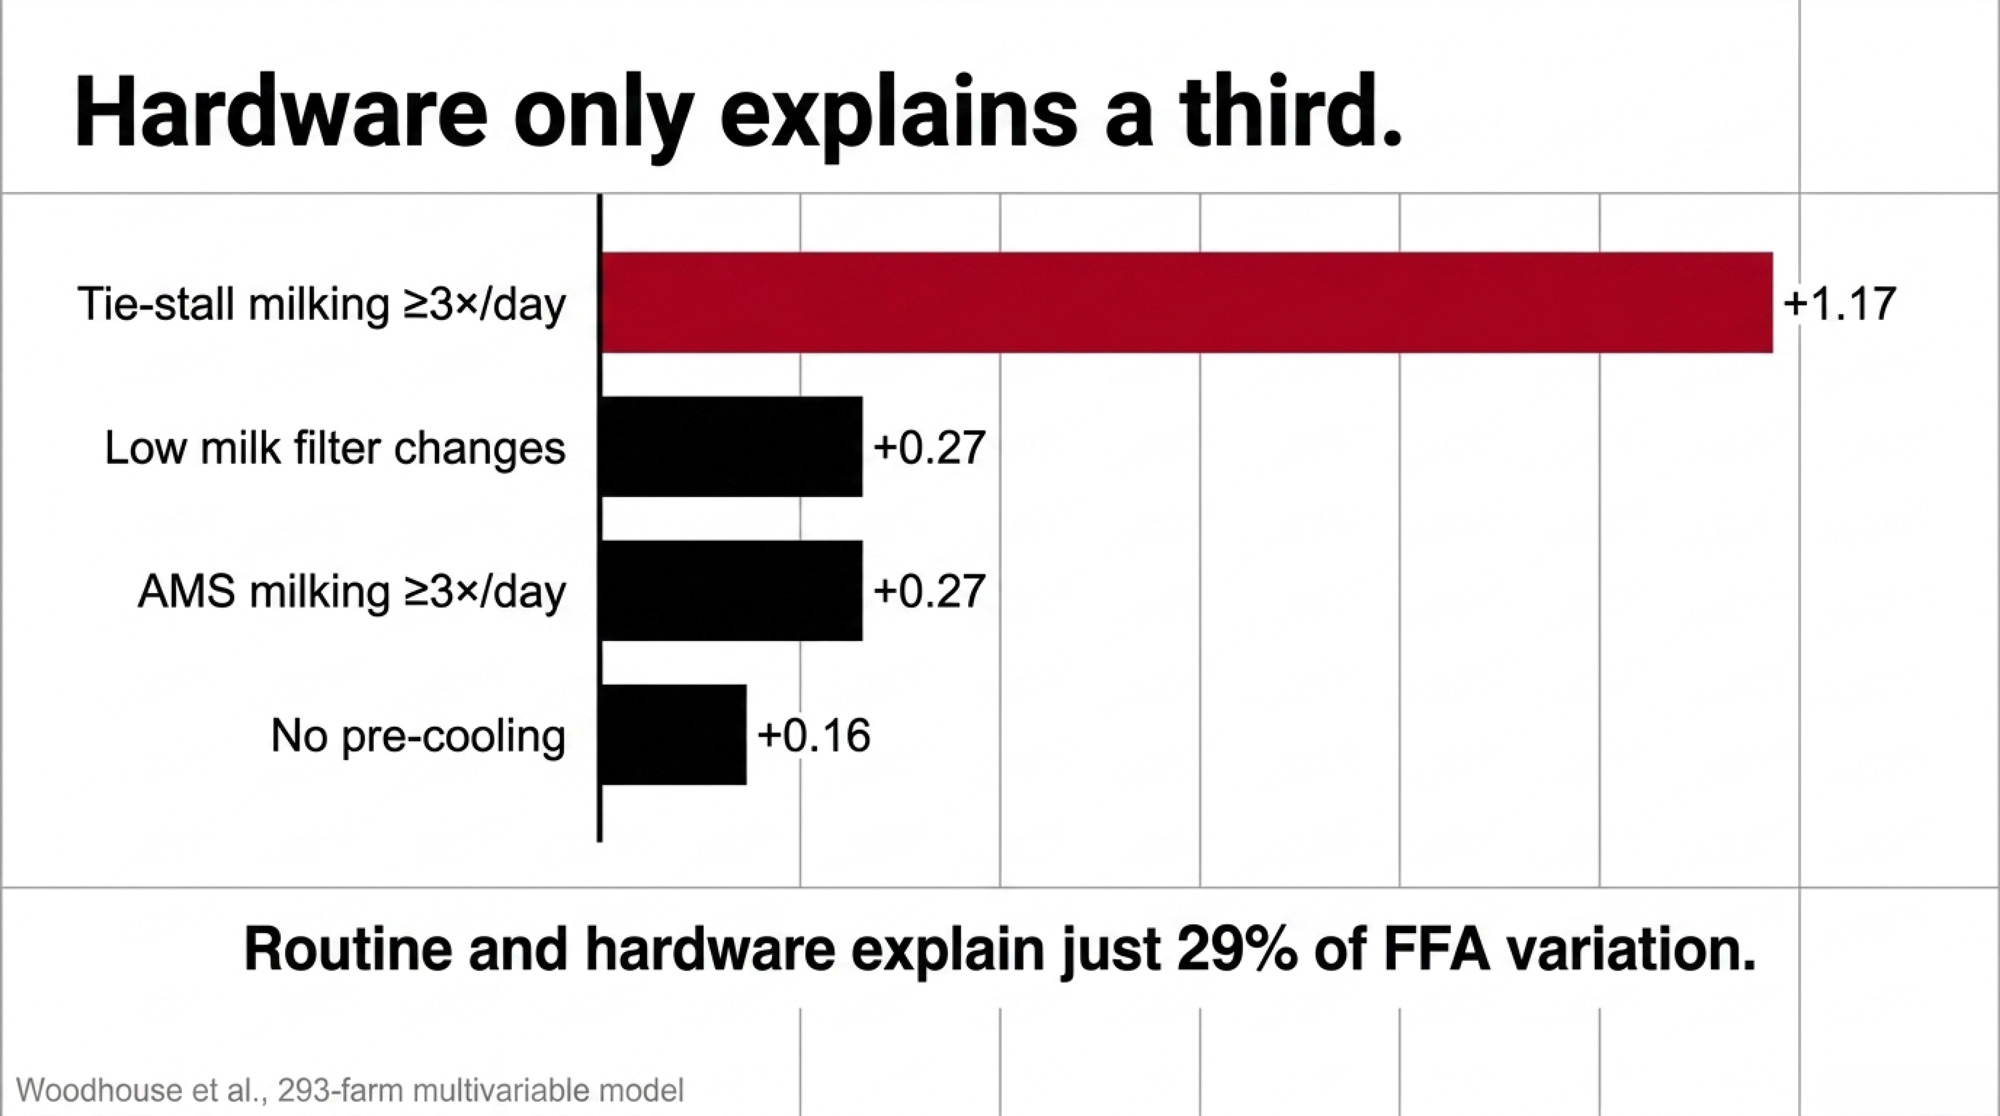
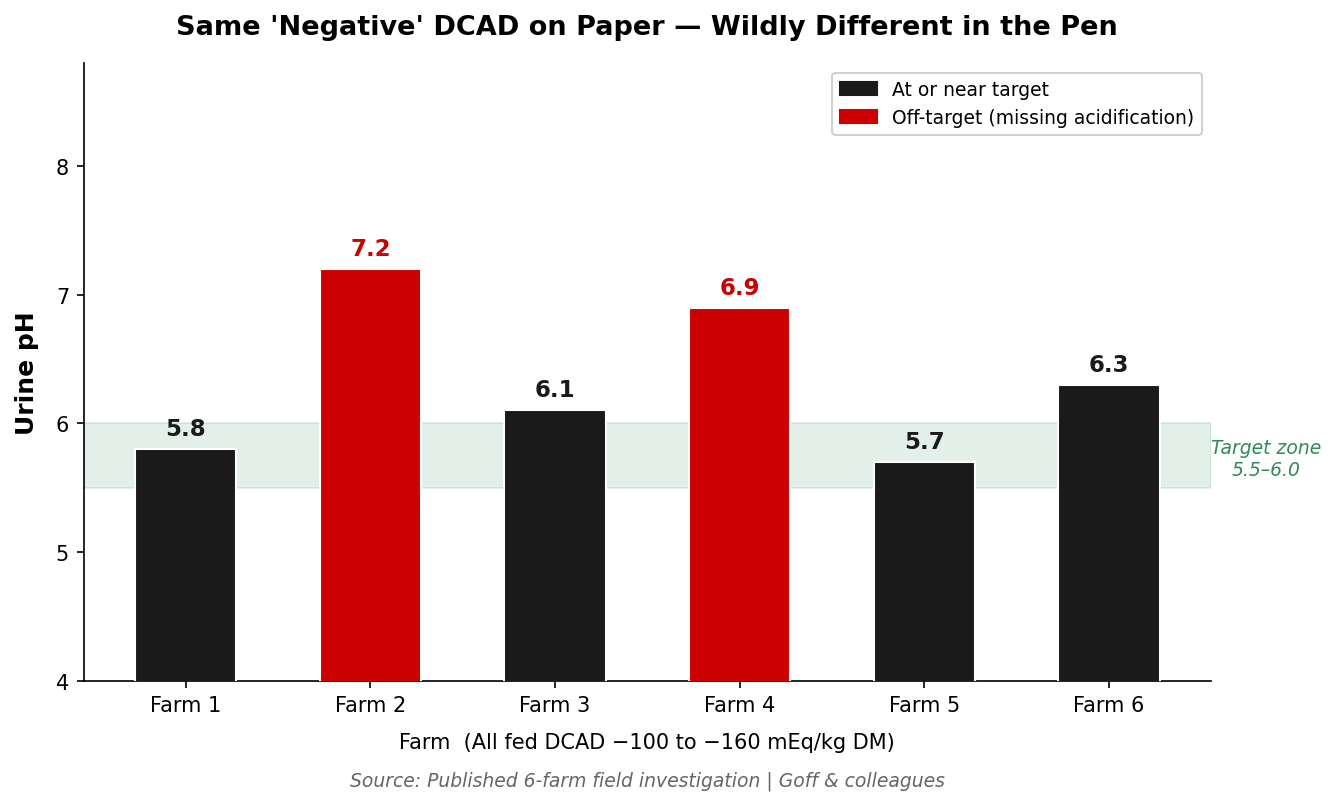
The Woodhouse et al. farm-factors paper (J. Dairy Sci., February 2025) put direct measurements on that question. It’s a cross-sectional study of 293 Canadian dairy farms — 238 in Ontario, 55 in British Columbia, split across 71 tie-stall, 109 parlor freestall, and 113 AMS freestall operations. Mean bulk tank FFA: 0.84 mmol/100g fat, SD 0.40, range 0.26–3.67. Ten percent of herds sat at or above 1.20.²
The final multivariable model is where the argument lands. Not in round numbers —in published beta coefficients:
AMS herds milking ≥3×/day: β = 0.27 (95% CI 0.12–0.41)
Not changing the milk filter at least 2×/day on ≥3×/d farms: β = 0.27 (95% CI 0.10–0.44)
No pre-cooling: β = 0.16 (95% CI 0.02–0.30)
And this one matters: **in the 109-farm parlor freestall subsample, no operation posted a monthly FFA average at or above 1.20 during the study window.**² That’s a snapshot, not a universal law. But it’s a loud snapshot.
The adjusted R² on the model was 29%, which is an honest way of saying hardware and routine only explain about a third of the variation — the rest sits in cows, rations, and calendars.² Ontario’s broader surveillance closes the loop: FFA lowest in May, highest in July and September, every year.⁷ Equipment doesn’t know what month it is. Transition cows do.
What’s the FFA Penalty Actually Worth on Your Herd?
Here’s where most coverage of this paper waves a dollar figure around and hopes you don’t check the schedule behind it. We’re not going to do that.
The Canadian disclosure landscape is thinner than it looks. DFO reports FFA back to every Ontario producer on every bulk tank load.¹ BC Milk has reported FFA back to producers since August 1, 2019 — but the BC Milk Marketing Board’s own Component & Quality Testing page explicitly states that FFA “does not factor into producer’s component or quality results and has no impact to a producer pay” at the provincial-pool level.³,⁹ That doesn’t mean there’s no penalty. It means the penalty, if any, flows through the processor-specifications clause of the individual producer agreement — which is not public.
On the US side, FMMO pooling doesn’t set FFA penalties at all. Those live entirely in co-op supply agreements and processor contracts, and we could not locate a single publicly posted $/cwt FFA penalty schedule from a major North American processor or co-op at publication. What is public is the penalty mechanism: above threshold, the plant either discounts the load, downgrades it out of cheese milk, or diverts it to a lower-value class. The dollar hit depends on your co-op, your plant, and your class mix.
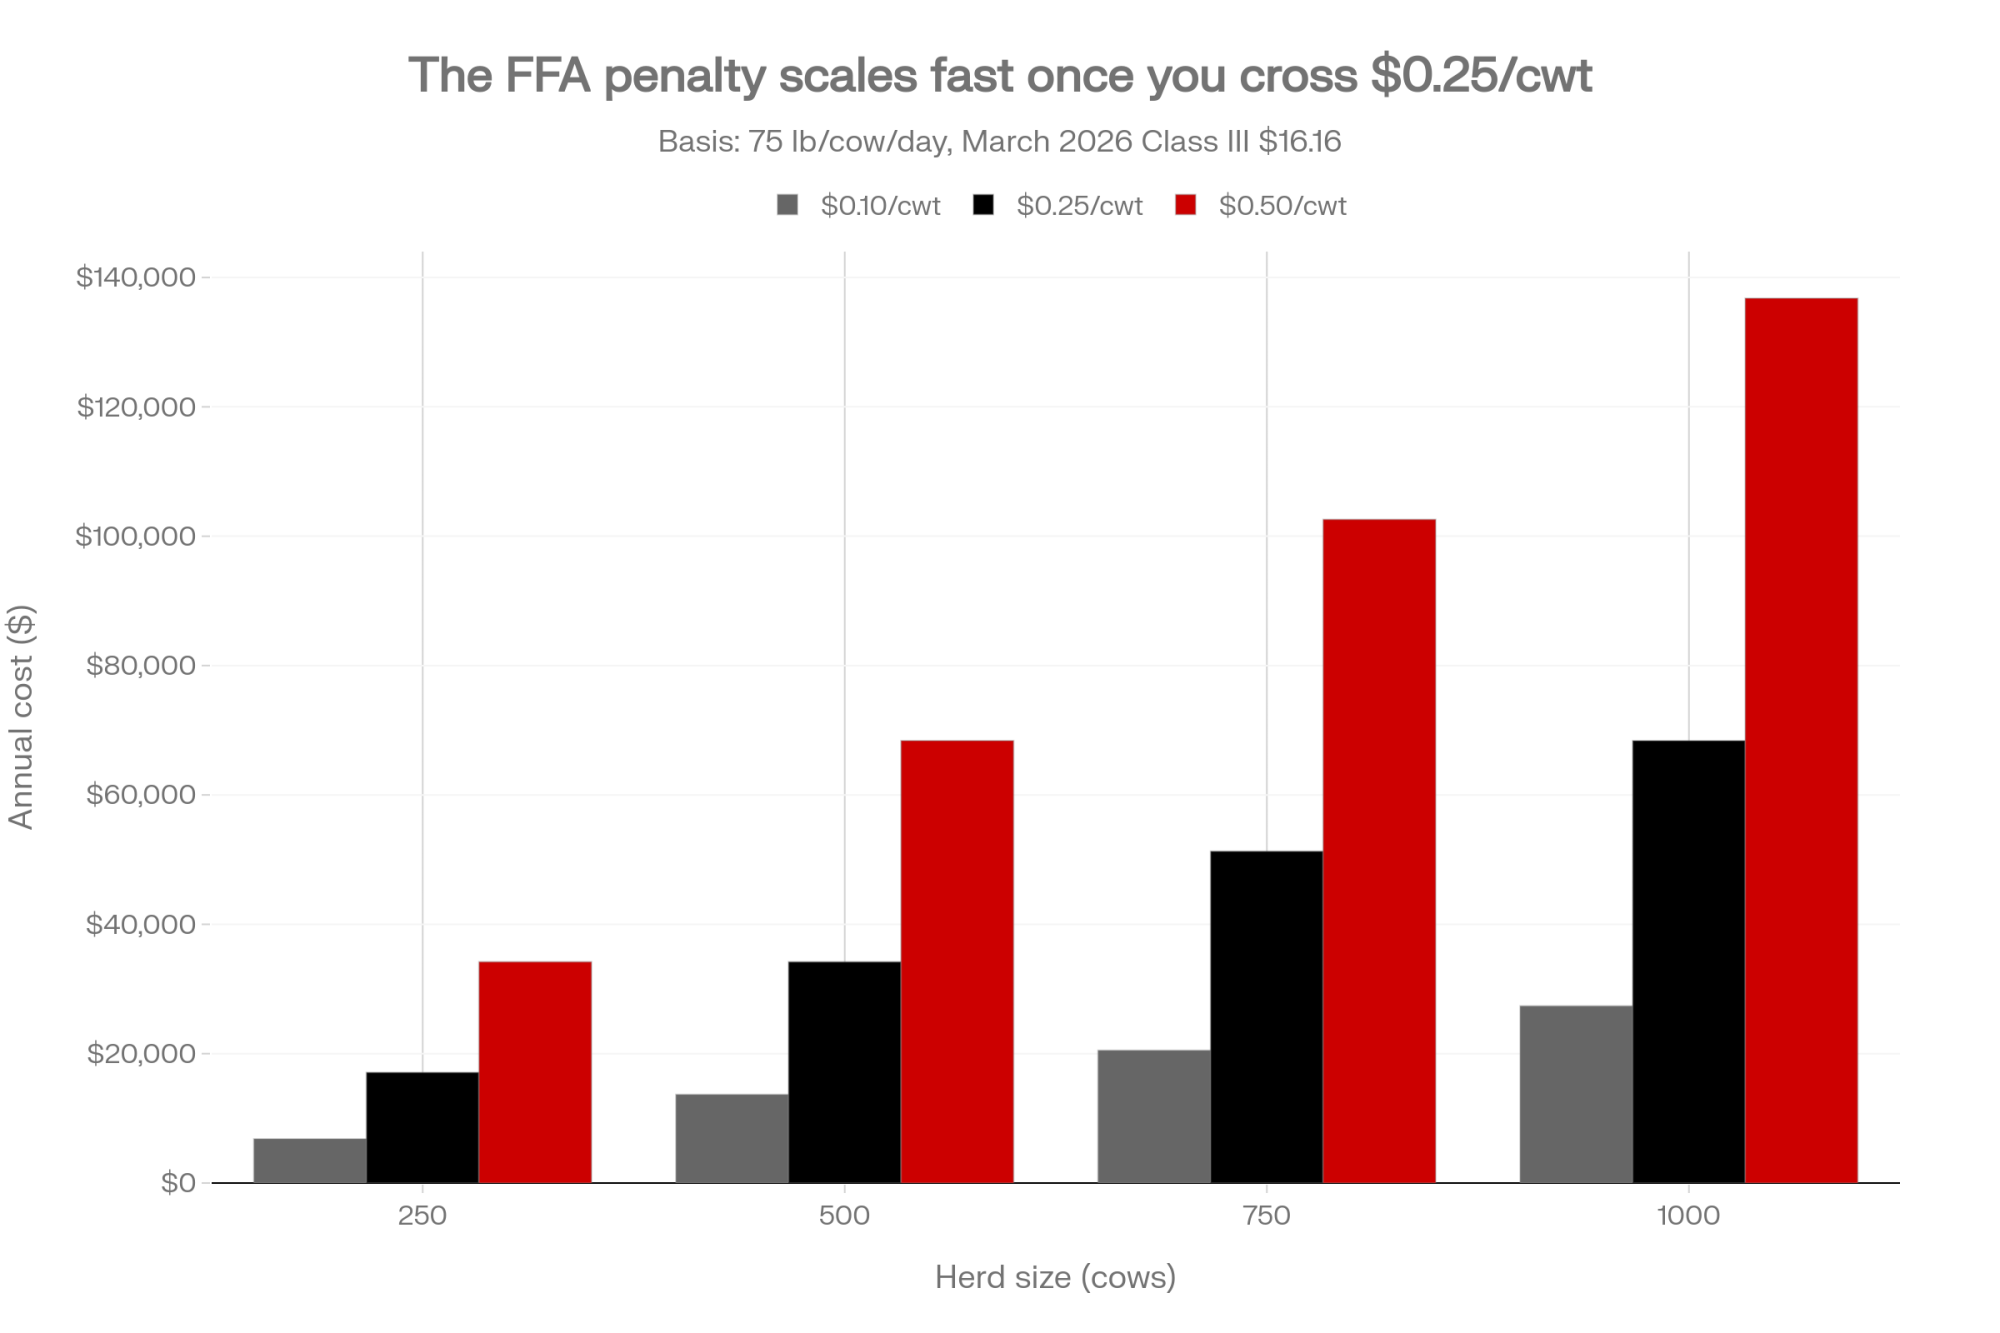
So the barn-math in this piece is a worked example with reader-supplied inputs, not a documented exposure. Here’s the frame for a 500-cow US herd:
At the USDA AMS-announced March 2026 Class III price of $16.16/cwt, gross milk value ≈ $184,224/month.¹⁰
Multiply 11,400 cwt by your own co-op’s FFA forfeiture ($/cwt) to size your exposure.
Illustrative $/cwt Forfeiture
v
Annual Cost
% of Annual Gross
$0.10/cwt
$1,140
$13,680
0.6%
$0.25/cwt
$2,850
$34,200
1.5%
$0.50/cwt
$5,700
$68,400
3.1%
Halve the herd to 250 cows at the same production and price and the middle line pencils at about $17,100/year. Whatever your co-op’s number is, it’s not a rounding error — and the only way you’ll know it is to pull the agreement. That’s the point of the contract-audit step in the next section.
Did FMMO Reform Make the US FFA Penalty Sharper?
Federal milk marketing order reform took effect June 1, 2025. The USDA AMS final rule, issued January 15, 2025, after a 49-day national hearing and producer referenda across all 11 orders, reshaped component pricing formulas and raised processor make allowances:¹¹
Product
New Make Allowance (per lb)
Cheese
$0.2519
Butter
$0.2272
Nonfat Dry Milk
$0.2393
Dry Whey
$0.2668
The butterfat recovery factor was adjusted to 91% (from 90%), and the composition factor upgrade — updating skim milk to 3.3% true protein, 6.0% other solids, 9.3% nonfat solids to reflect modern milk — was held back six months and took effect December 1, 2025.¹¹
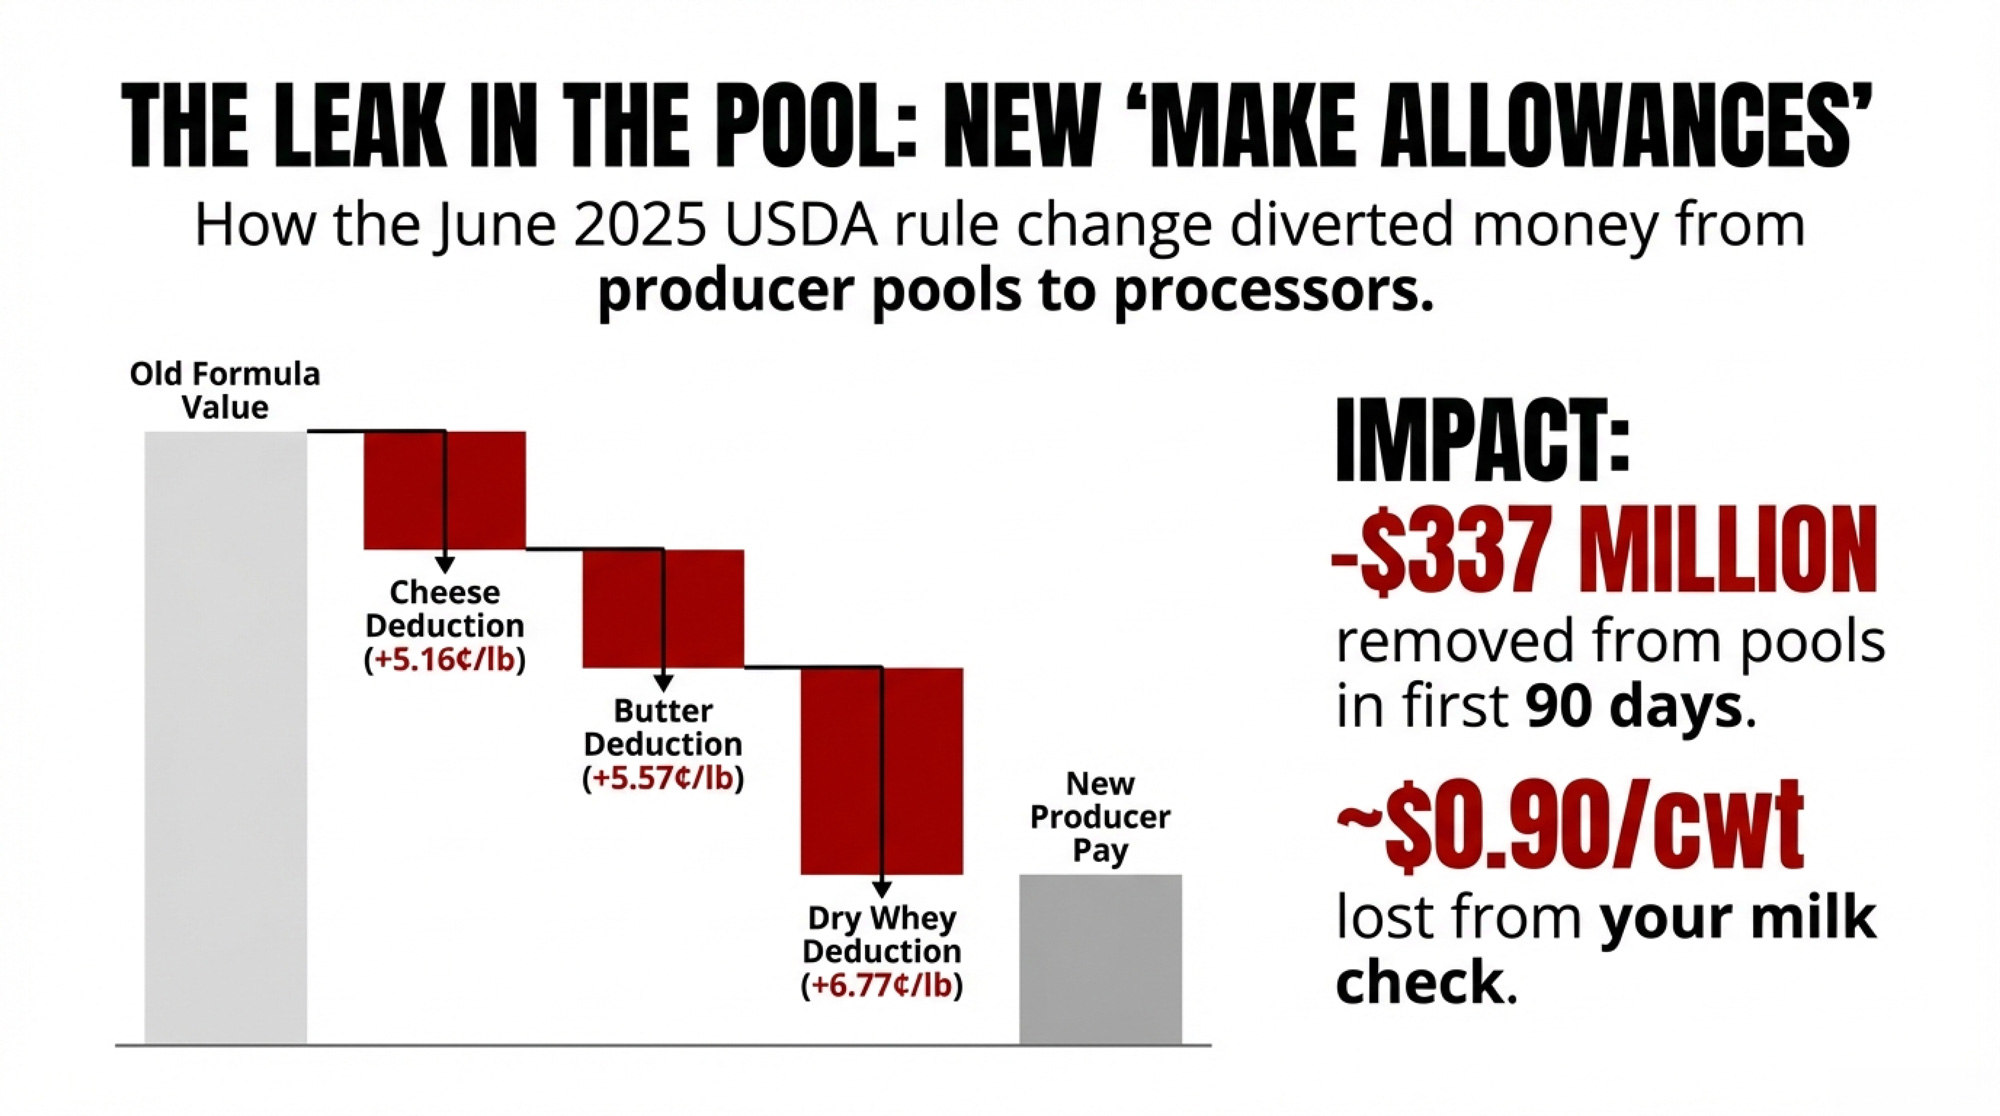
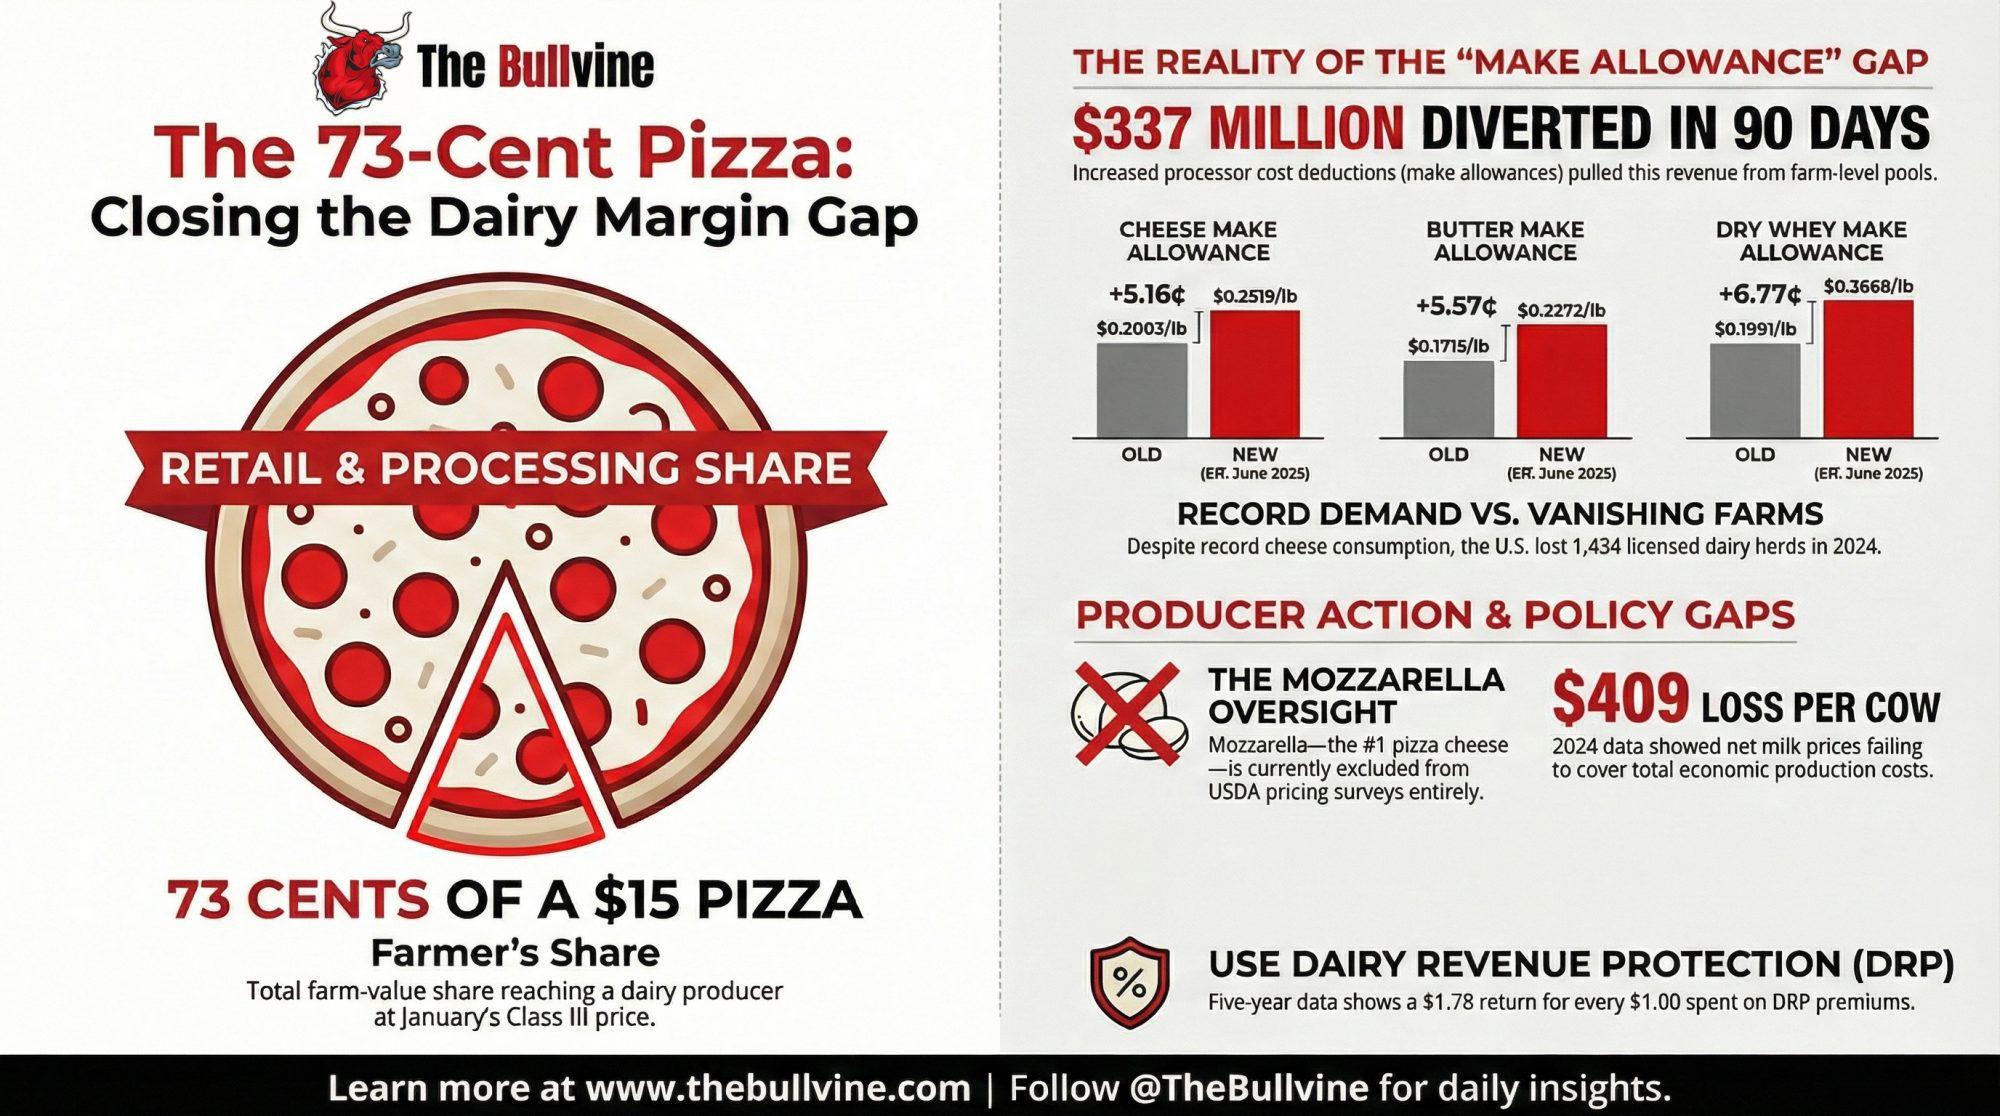
AFBF economist Daniel Munch put hard numbers on the gap in his September 22, 2025, Market Intel piece. Higher make allowances pulled $337 million from pool revenues in the first three months alone, with Class price reductions of 85–93¢/cwt, and the six-month composition-factor delay cost farmers roughly $100 million in compensationagainst what full reform would have delivered on the original timeline.¹²
Margin pressure pushes operators harder toward co-op production incentive signals. The Ontario analysis flagged three-incentive-day months as a significant predictor of elevated FFA.⁷ Fat supplements rise. Marginal cows get pushed. The quality penalty — whatever your agreement says it is — then bites exactly the milk you overproduced. Neither side of that loop appears as a line item on the pay statement.
The Fastest Intervention That Doesn’t Cost $50,000
Before spending a dollar on facilities, run the JDS finding backward. Pull three bulk tank reports. Calculate fat-to-protein ratio. Penn State Extension flags a herd-level FPR above 1.4 as an energy-deficit and subclinical-ketosis signal when more than about 40% of the measured group exceeds it.¹³ A validation study refined the individual-cow cut-off to >1.42 (sensitivity 92%, specificity 65%) for subclinical ketosis.¹⁴ Twenty-minute diagnostic. Zero dollars.
Then the protocol. Do these now, not next quarter:
This week: Pull your last six bulk tank FFA reports from your co-op quality lab and plot FPR on the same months. If FPR leads FFA by 4–6 weeks, that’s your metabolic signal.
This week: Pull your co-op supply agreement. Find the “processor specifications” or “quality” clause and the line that references FFA. Then email your quality manager and ask, in writing, for (a) the exact $/cwt or class-downgrade math the plant applies above 1.20, and (b) what share of your last six quality adjustments was attributable to FFA. Save both answers. This is the barn-math input only you can get.
This month: Score every cow going dry. Anything above BCS 3.5 goes into a limit-fed pre-dry pen; dry-off BCS in the 3.0–3.25 range minimizes post-calving NEFA mobilization.¹⁵ Costs labor, not capital. Tank effect lags 6–8 weeks.
This month: Start fresh-cow BHBA testing. Blood BHBA ≥1.2 mmol/L is the widely used subclinical-ketosis cutoff with balanced sensitivity and specificity in hand-meter field work; Oetzel’s ≥1.4 mmol/L threshold marks the jump in DA and clinical ketosis risk.¹⁶ Test days 3–5 and 10–14. At ~40 calvings a month and roughly $1.00/test, that’s about $80/month.
Within 60 days: Work rumen-protected choline into the close-up ration at the Arshad et al. (2020) meta-analysis dose of 60 g/cow/day at 25% active, from 21 days pre-calving through at least 28 days postpartum.⁵ That meta-analysis of 21 trials reported an average milk response of ~2.3 kg/day and ~0.08 kg/day fat, with substantial between-trial and between-herd variation.⁵ Balchem’s published summary of pooled ReaShure trials puts the sustained response at roughly 700 kg more milk over a standard 305-day lactation — real, but not uniform across herds.¹⁷ Ask your nutritionist for a per-cow-per-day cost based on current feed contracts; it will move with commodity markets and isn’t a single published number.
And the longer horizon:
90 days: Six months of FFA + FPR plotted; at least two fresh-cow BHBA cohorts logged; your co-op’s FFA penalty math on file in writing; a decision on which of the three paths below you’re actually taking.
365 days: Re-plot your fall FFA peak year-over-year against parity distribution and incentive-day calendar. Decide whether you can document a structural shift worth bringing to a co-op board meeting.
Filter changes still matter. The Woodhouse TTR follow-up paper (J. Dairy Sci., February 2026) found “milk too cold” alarms associated with an average FFA of 1.31 mmol/100g fat — the only alarm type with a significant increase over baseline — and more than 15% of alarm-associated samples already sat at or above 1.20.¹⁸ Real. Measurable. Worth doing. But changing the filter without fixing the transition cow problem is putting a new battery in the smoke alarm while the fire burns.
When Does an FFA Problem Become a Culling Decision?
Some FFA problems aren’t managerial. They’re demographic.
When the fall peak climbs year over year and herd average parity sits above 3.2, protocol upgrades blunt the problem but don’t solve it. Older multiparous cows carry more metabolically active visceral fat, mobilize NEFA faster, and compound ketosis risk at every subsequent calving. The Woodhouse/Kelton case farm added another wrinkle: late-lactation cows carry higher LPL activity, so extending lactation to fill quota can amplify lipolysis risk.¹
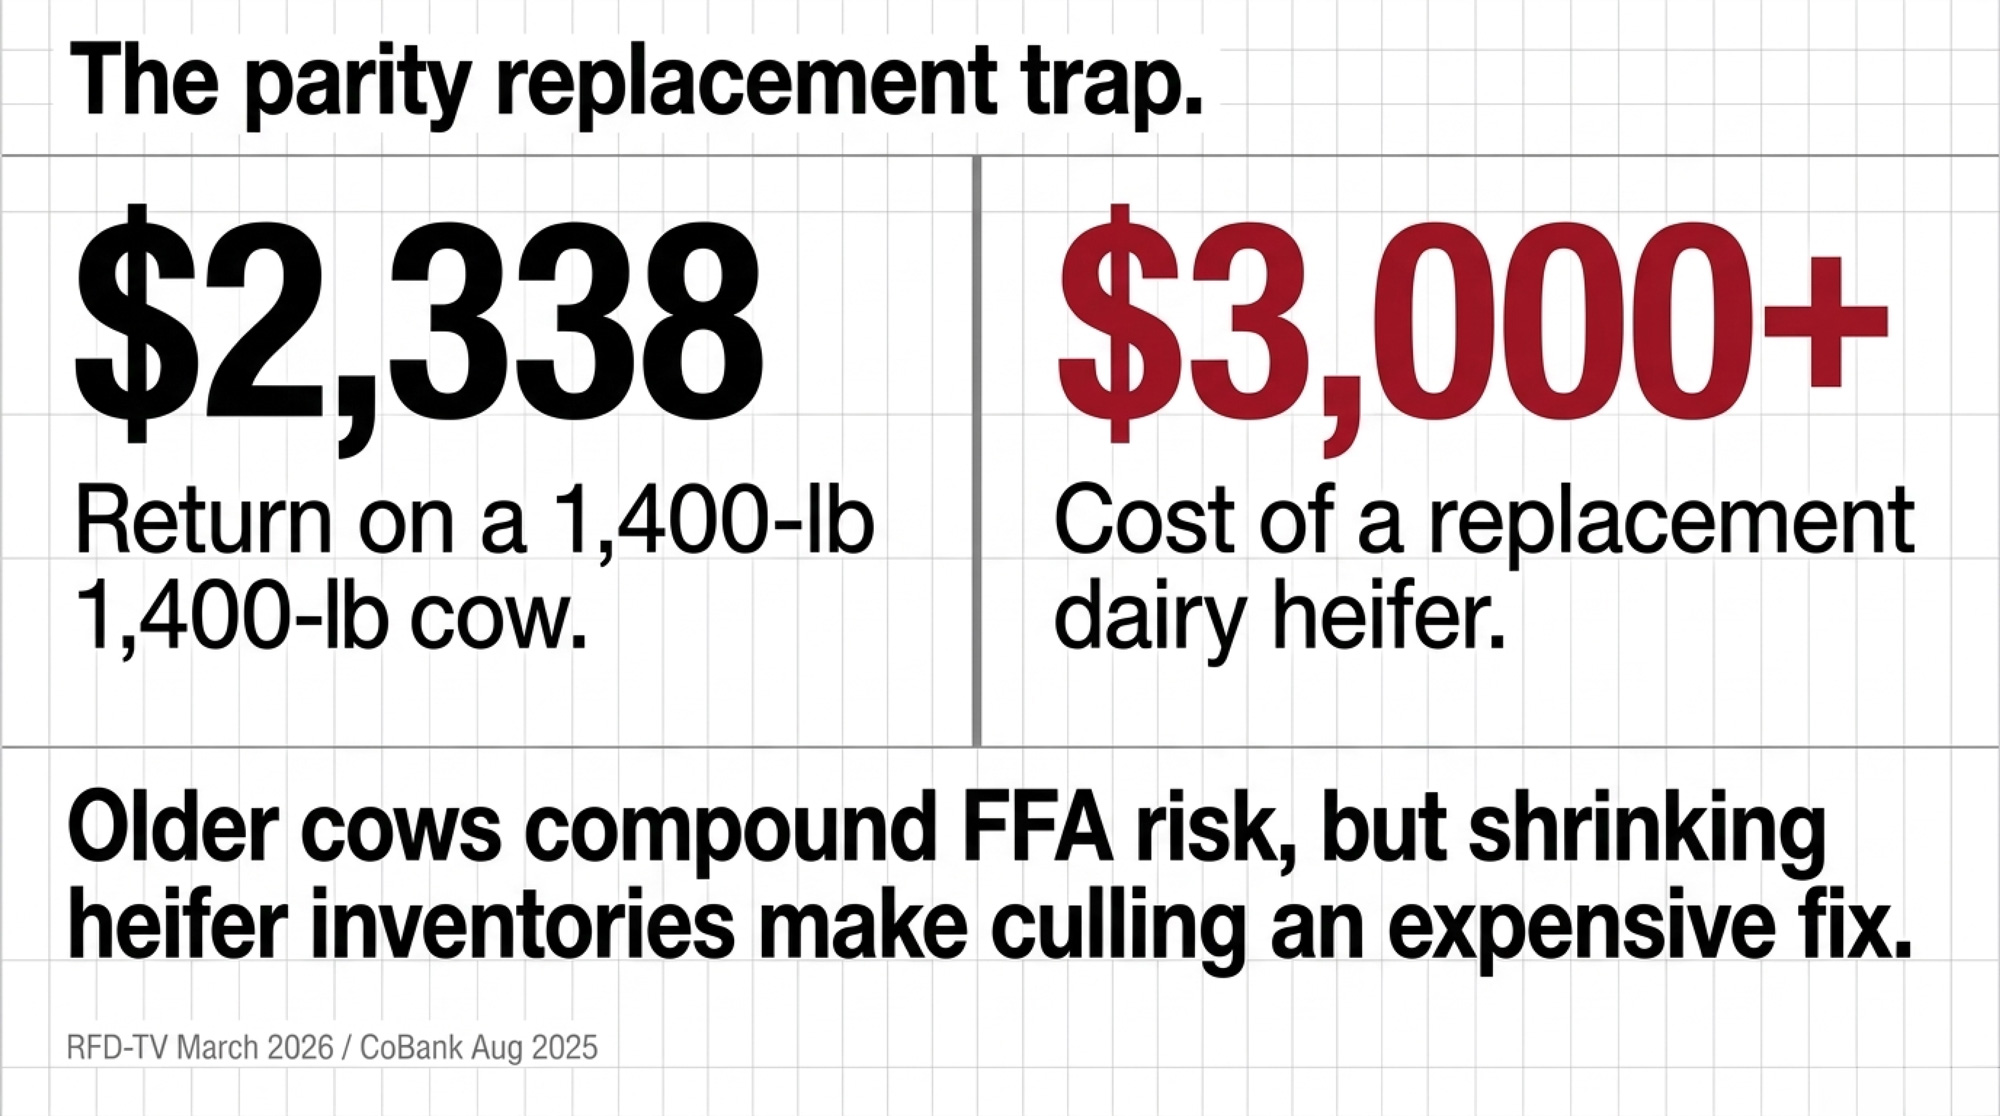
A working operator rule — Bullvine editorial rule-of-thumb, not a published threshold — if more than 30% of your parity 4+ cows test BHBA >1.4 mmol/L across two consecutive calvings, that cohort belongs on the voluntary cull list before the next dry-off. The cull market makes the call easier than it was two years ago: RFD-TV reported Southern Plains lean-cow (85–90%) auction prices at roughly $167/cwt in early March 2026, with bulls north of $200/cwt in parts of the South on tight supplies and strong grinding demand.¹⁹ A 1,400-lb parity 4+ Holstein at $167/cwt returns about $2,338 — real cash that partially funds her replacement.
But the replacement side is brutal. CoBank’s August 2025 Knowledge Exchange outlook put US dairy heifer inventories at a 20-year low, with a predictive model showing 438,844 fewer dairy heifers in 2026 versus 2025 — driven largely by ~398,925 more beef-on-dairy calves — and total replacement inventories expected to shrink by roughly 800,000 head before rebounding in 2027, with heifer prices potentially above $3,000/head.²⁰
Walking herd average parity from 3.2 to 2.8 in that market isn’t cheap or fast. Typical structural FFA correction through parity shift runs 18–24 months under normal replacement supply, closer to 24–30 months under today’s conditions — a Bullvine analytical projection based on typical parity-turnover mechanics, not a sourced forecast. But running RPC forever on a metabolic age that keeps escalating is more expensive, slower, and quieter.
Options and Trade-Offs for Your Operation
Path
Best-fit trigger
Core spend / year (500-cow)
Payback window
Backfire risk
30/60/90 protocol only
Seasonal pattern, parity ≤3.2, no YoY escalation
RPC ~60 g/cow/day + BHBA testing (~$960/yr)
6–9 months
Misdiagnosed demographic problem
Protocol + parity 4+ culling
Parity >3.2, YoY peak climb >0.15 mmol
Above + ~$3,000/head replacement cost
18–24 months
Heifer market ($3,000+/head, 438,844 shortfall)
Add contract audit
Any herd, any pattern
Operator time only
Immediate
Co-op refusal = your new baseline
Status quo
“Filters and hope”
$13,680–$68,400/yr penalty exposure
Never
Compounding margin loss under FMMO reform (85–93¢/cwt)
Three paths, depending on what your six months of data say:
Run the 30/60/90-day protocol only. Works when the pattern is managerial — seasonal, spring-recovering, no year-over-year escalation. RPC plus BHBA testing is the core spend. Backfires if you’ve misdiagnosed a demographic problem and your fall peak climbs again next October.
Run the protocol plus targeted culling of parity 4+ repeat-ketosis cows. Works when herd average parity tops 3.2 and year-over-year peaks escalate more than 0.15 mmol/100g fat. Pays out over 18–24 months. Backfires if you can’t source replacements at workable economics at CoBank’s projected heifer prices.²⁰
Run the contract audit alongside either path. Even a clean-FFA herd benefits from knowing exactly what the FFA threshold in its supply agreement says and what share of quality adjustments the co-op will attribute to FFA in writing. The answer — or the refusal — is your baseline for every future conversation.
DFO publishes the mechanics of its FFA reporting to every Ontario producer.¹ BC Milk publishes the framework while clarifying that FFA does not affect provincial-pool pay — any producer-level penalty flows through the processor-specifications clause of the individual agreement.³ Most US co-op supply agreements reference a processor-level FFA threshold but don’t publish the penalty math. That absence isn’t universal bad faith — some co-ops share full component and quality schedules with members on request. It’s the absence of a public, standardized FFA penalty framework across North America that makes this a contract-audit problem, not a headline problem.
What This Means for Your Operation
When FFA climbs, your first call is your transition-cow vet. The equipment tech is the second call. That’s the core reframe the Guelph data demands.⁷,²
If April readings stay above 1.10 after a winter-stress recovery window, you’re not looking at a seasonal problem. You’re looking at a structural one — a parity question, not a filter question.
If FPR leads FFA by 4–6 weeks in your own six-month data, your tank is broadcasting the metabolic signal before the sensory threshold catches it. Act on the FPR.
If more than 30% of your parity 4+ cows throw BHBA >1.4 mmol/L across two consecutive calvings, that cohort is carrying your fall FFA peak — and at $167/cwt lean-cow prices, the market is paying to move them.¹⁹
If your co-op’s incentive-day calendar sits 3–5 weeks ahead of every FFA elevation on your statement, you’ve documented exactly the mechanism the Ontario data flagged.⁷ That’s a specific conversation to have with your quality manager, in writing.
If your co-op can’t — or won’t — put the FFA portion of your last six quality adjustments in writing, that silence is your baseline. Everything you do next sits against it.
If the 30-day protocol pencils at low four figures a month and your contract-audit reveals a meaningful $/cwt FFA hit, the expensive fix is cheaper than the invisible one.
Key Takeaways
If bulk tank milk protein is drifting down, the odds of elevated FFA climb sharply in the Ontario data — call your vet before the equipment tech.⁷
If your herd is tie-stall and milking ≥3×/day, the Woodhouse farm-factors paper attaches a 1.17 mmol/100g fat association to that single combination — the single biggest lever in the model.²
If herd average parity is above 3.2 and fall FFA peaks are escalating year over year, you’re looking at a demographic problem the 30-day protocol alone won’t solve, in a heifer market projected to shrink by 800,000 head before rebounding in 2027.²⁰
If you don’t know your co-op’s FFA penalty math in writing, you don’t know your exposure. Period.
If you execute the 24-month plan and document the before/after, you’ve earned a governance argument, not just a management win.
The Question You’ll Face Next October
The Woodhouse/Kelton case farm ran 1.32 mmol FFA on average over four years, with 54% of samples elevated.¹ That’s not an outlier. It’s a data point with a mailing address. The research doesn’t cull the parity 4+ cow for you. It doesn’t pull your supply agreement. It doesn’t translate the processor-specifications clause the pay statement leaves out.
What it does — through exact betas, seasonal patterns, and 171,843 monthly bulk tank observations across every Ontario dairy farm — is prove that the margin test hiding inside every bulk tank FFA reading is measurable, attributable, and fixable on a timeline shorter than the opacity of the system suggests.
Here’s the harder question. An operator who fixes their FFA and says nothing lets the current arrangement continue as designed — program worked, producer responded, questions about disclosure never get asked. An operator who fixes their FFA and walks a documented before/after into a co-op board meeting — with their own supply agreement in one hand and AFBF’s $337 million pool-revenue analysis in the other — is doing something different. So what are you going to bring to your co-op board next October — your FFA numbers, or your silence?
Editor’s note: This article contains editorial analysis and opinion by The Bullvine. It describes general industry patterns and does not refer to any specific named co-operative, processor, or producer other than those expressly attributed. Specific contract terms, quality schedules, and regulatory frameworks vary by co-op and jurisdiction; producers should consult their own agreements and advisors.
Complete references and supporting documentation are available upon request by contacting the editorial team at editor@thebullvine.com.
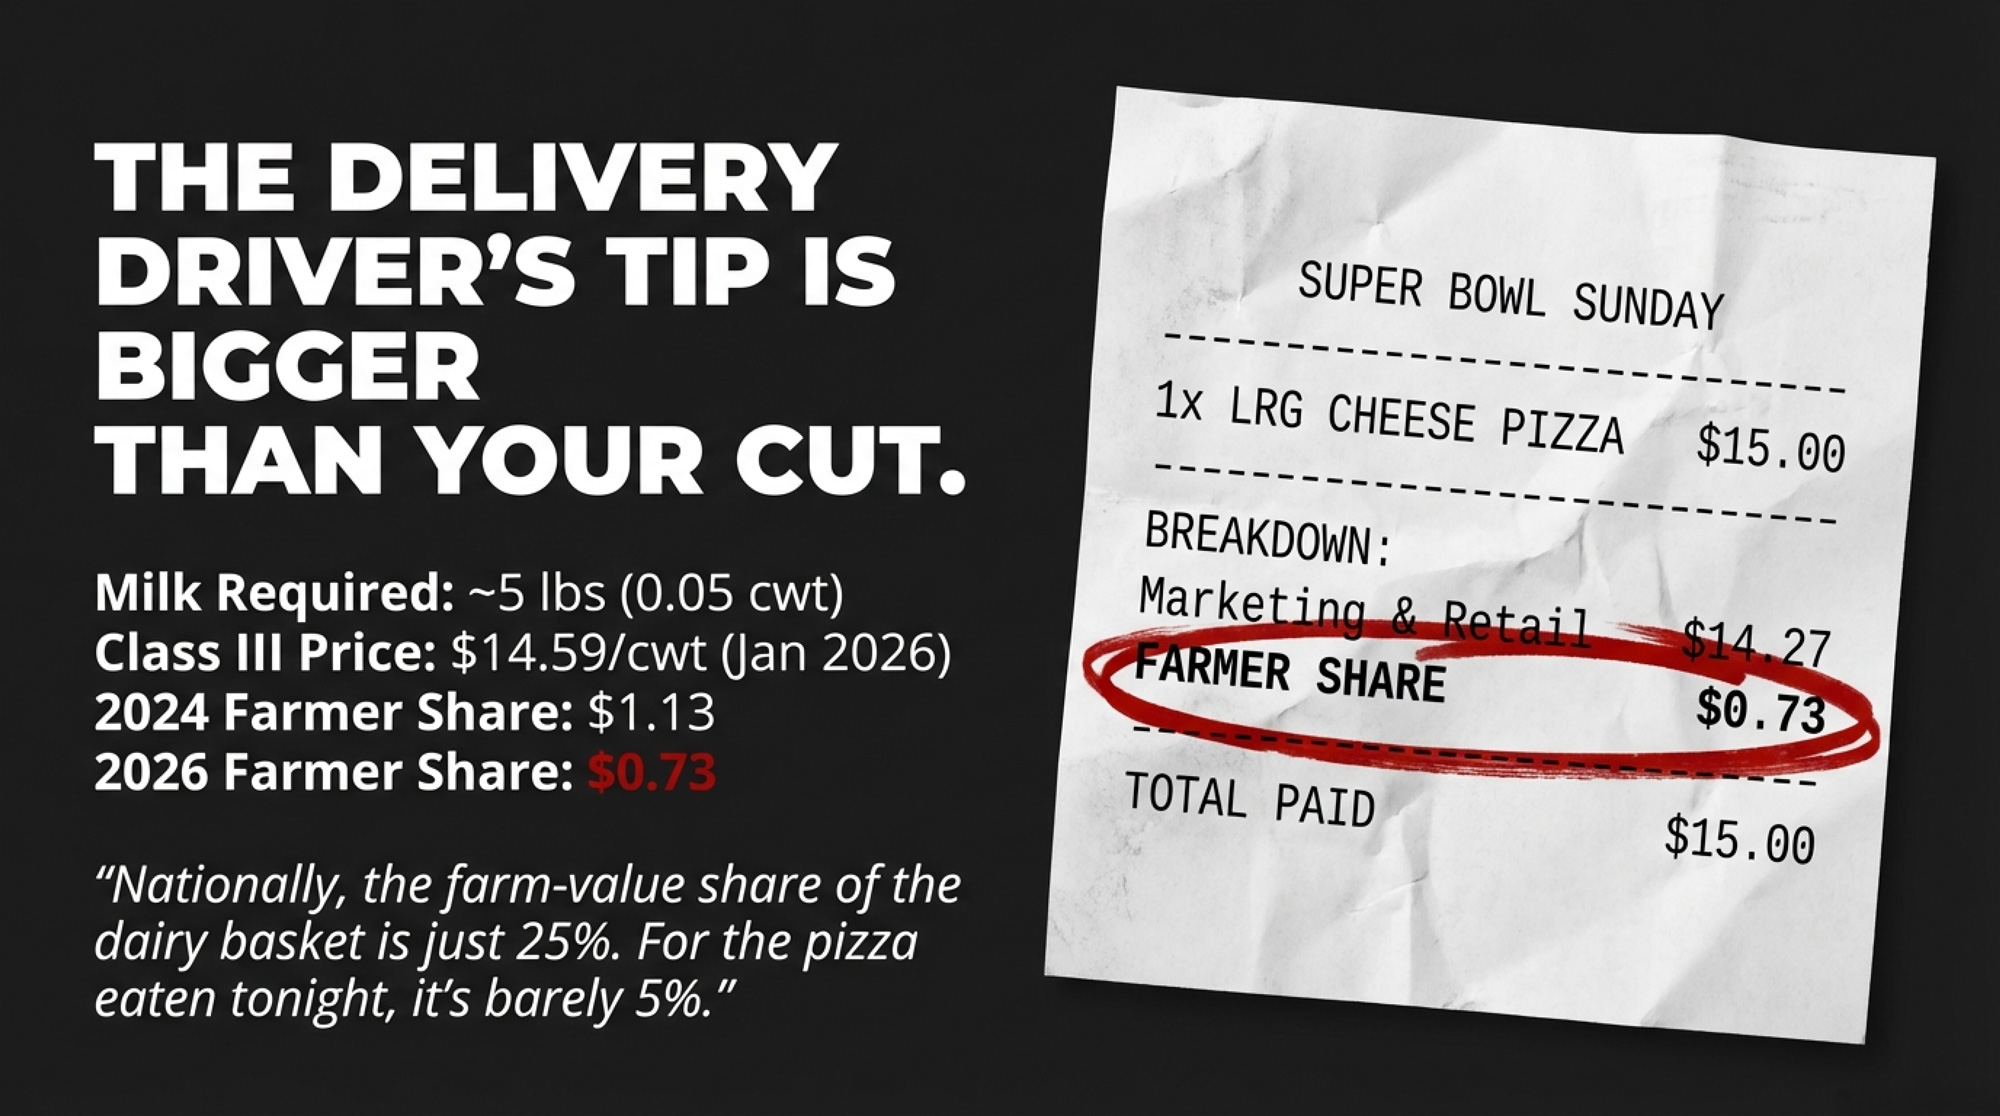
$15 Pizza. 73-Cent Milk Check. The Real Super Bowl Score for Dairy Farmers. — Follows the money on the June 2025 FMMO reform that diverted $337 million from producer pools to processors. This economic analysis arms you with specific calculations to recalibrate breakevens against widening farm-to-retail price spreads.
Every week, thousands of producers, breeders, and industry insiders open Bullvine Weekly for genetics insights, market shifts, and profit strategies they won’t find anywhere else. One email. Five minutes. Smarter decisions all week.
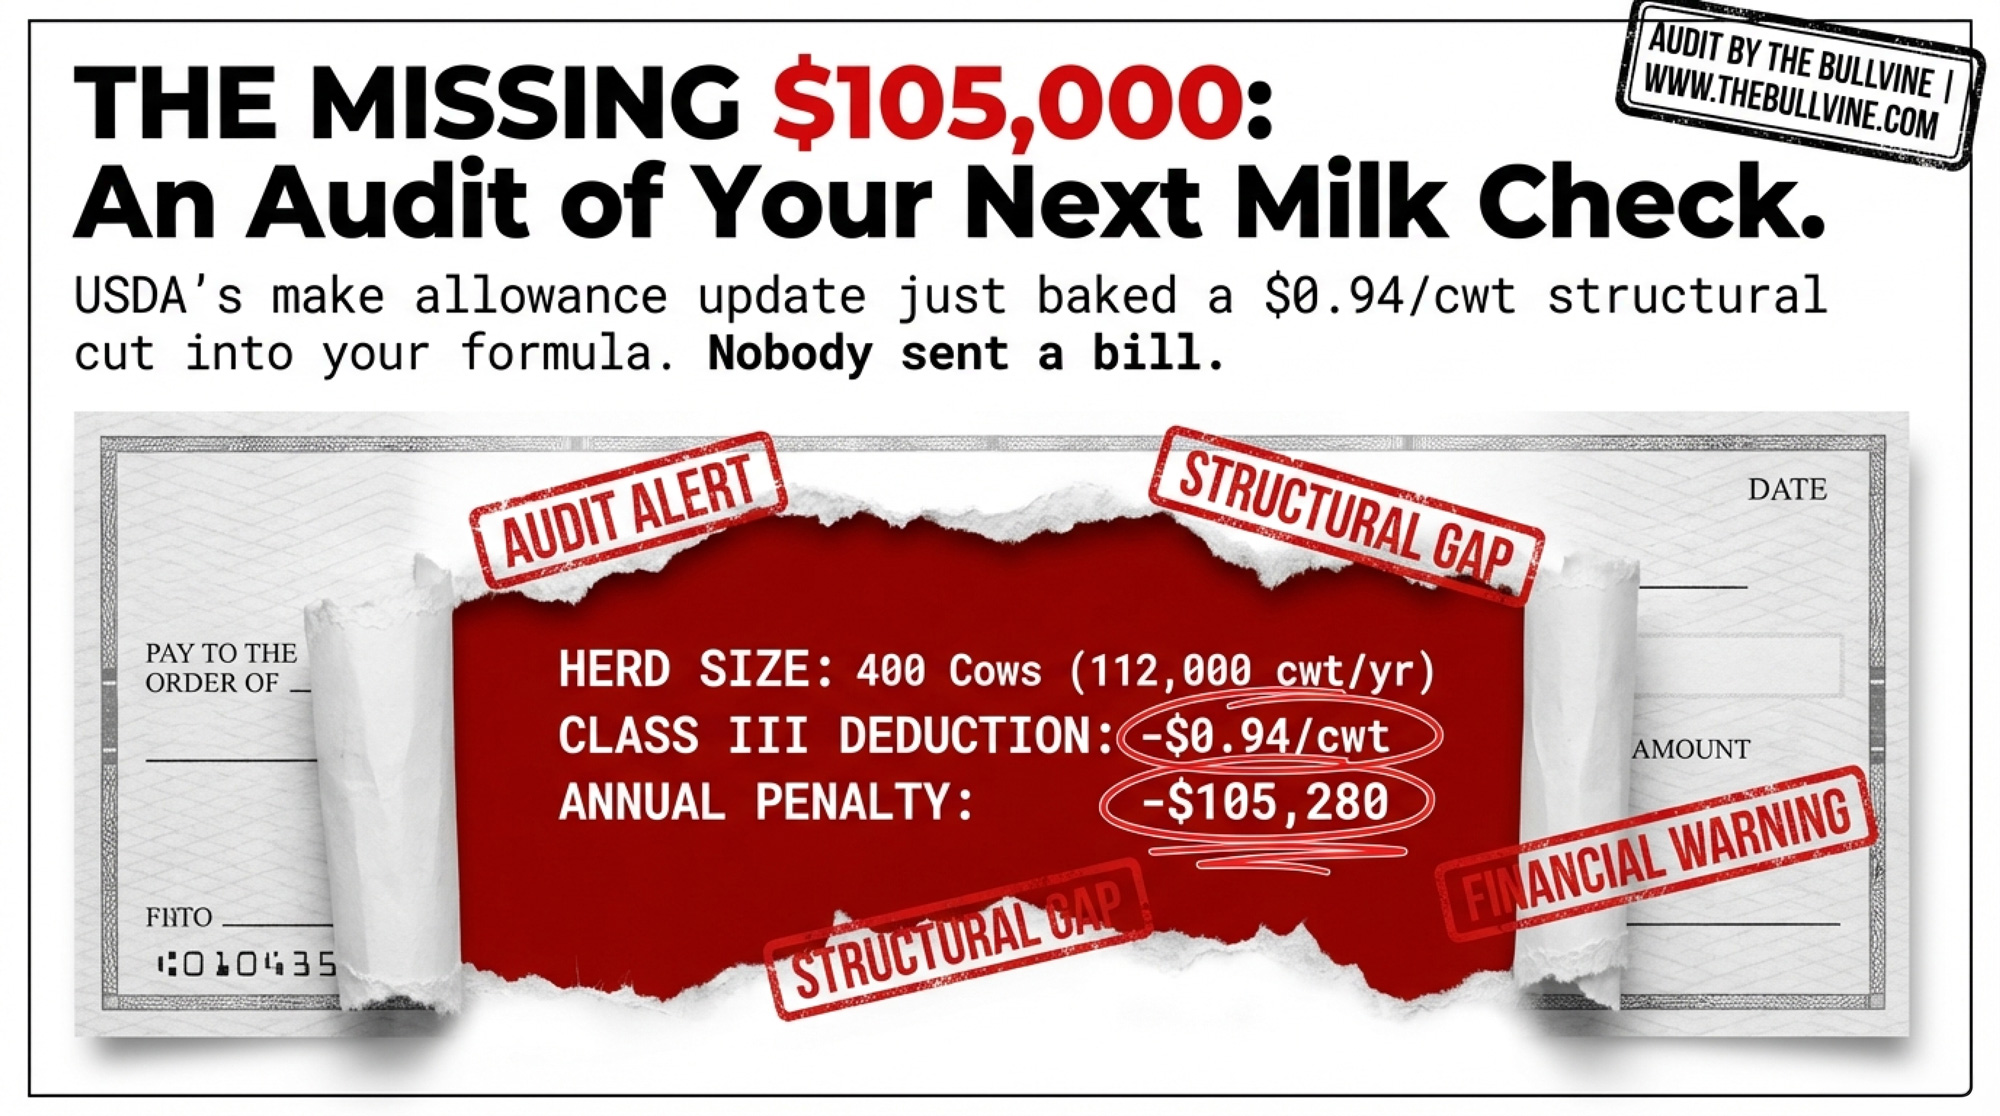
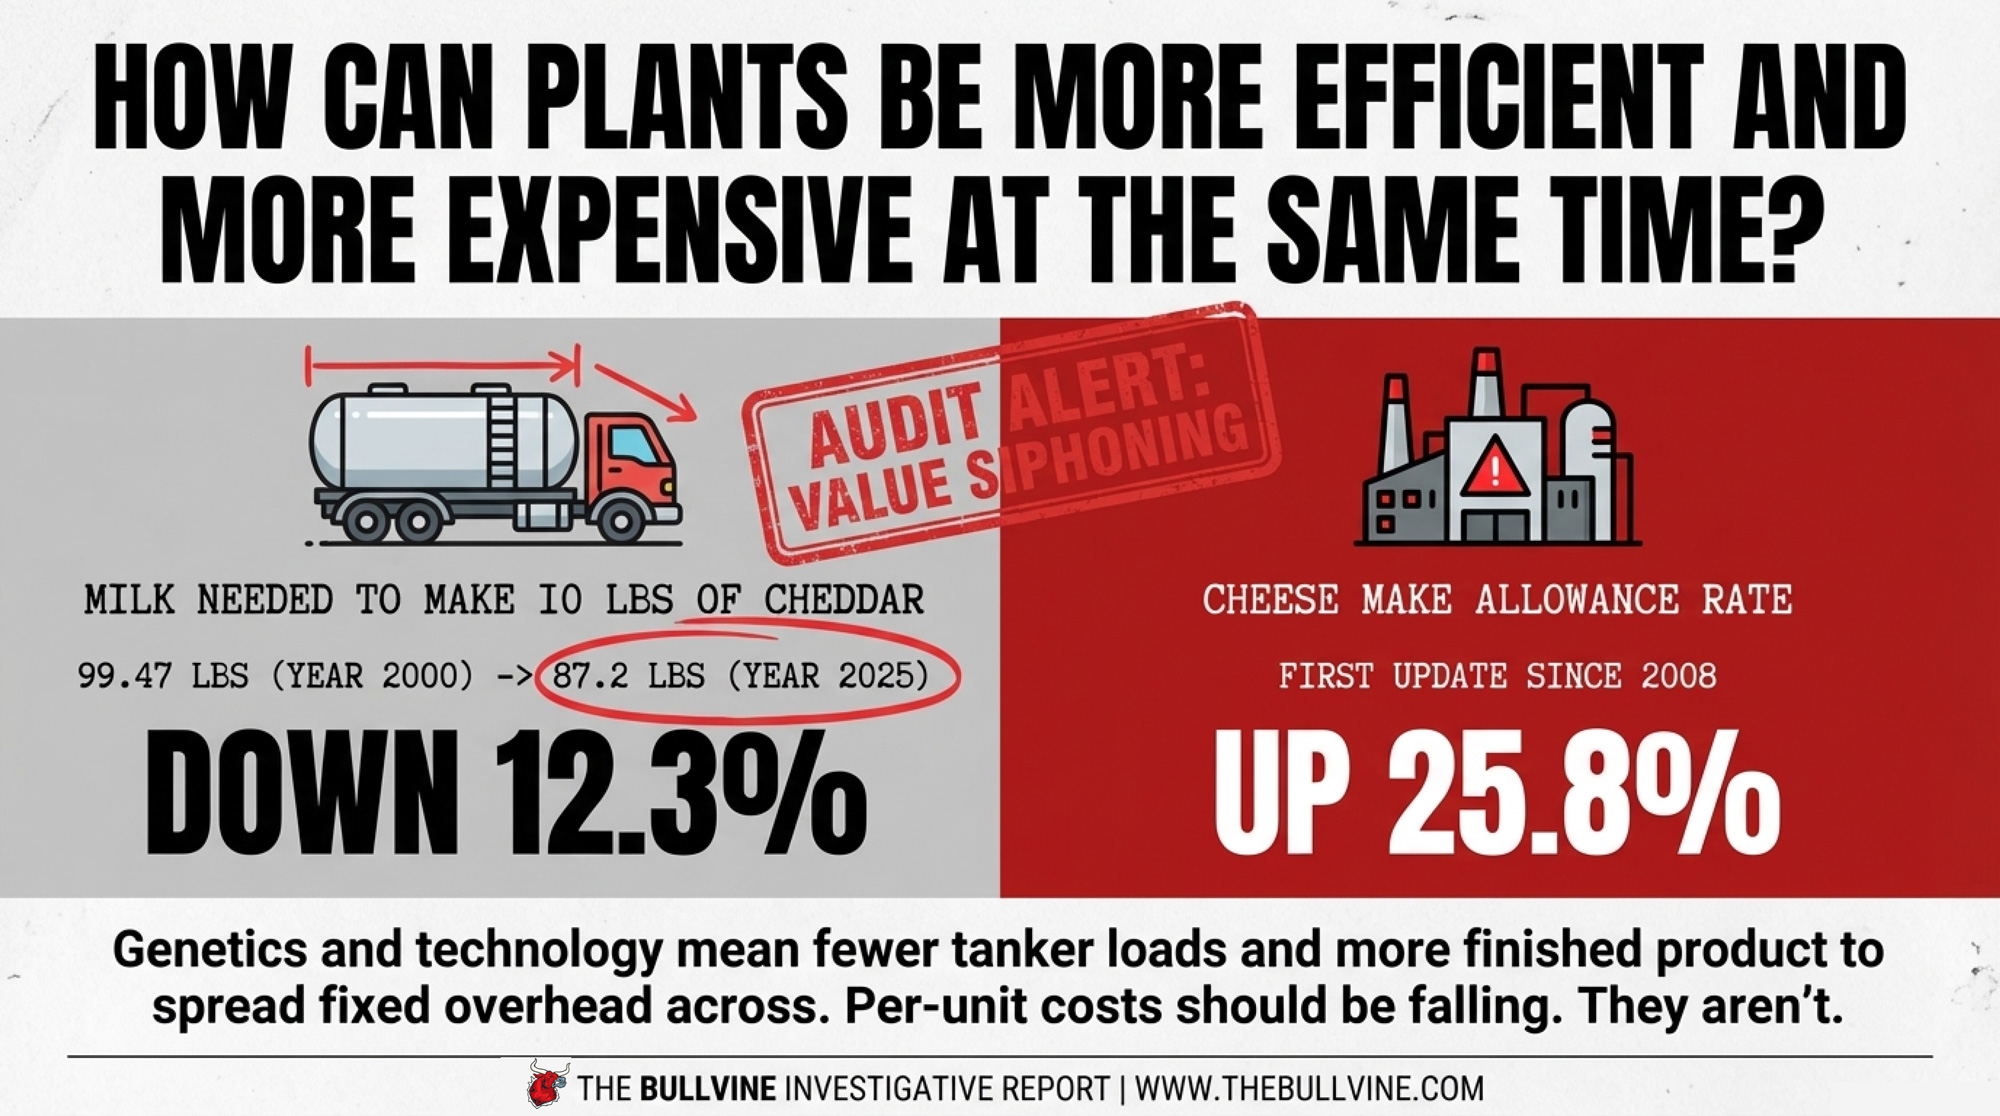
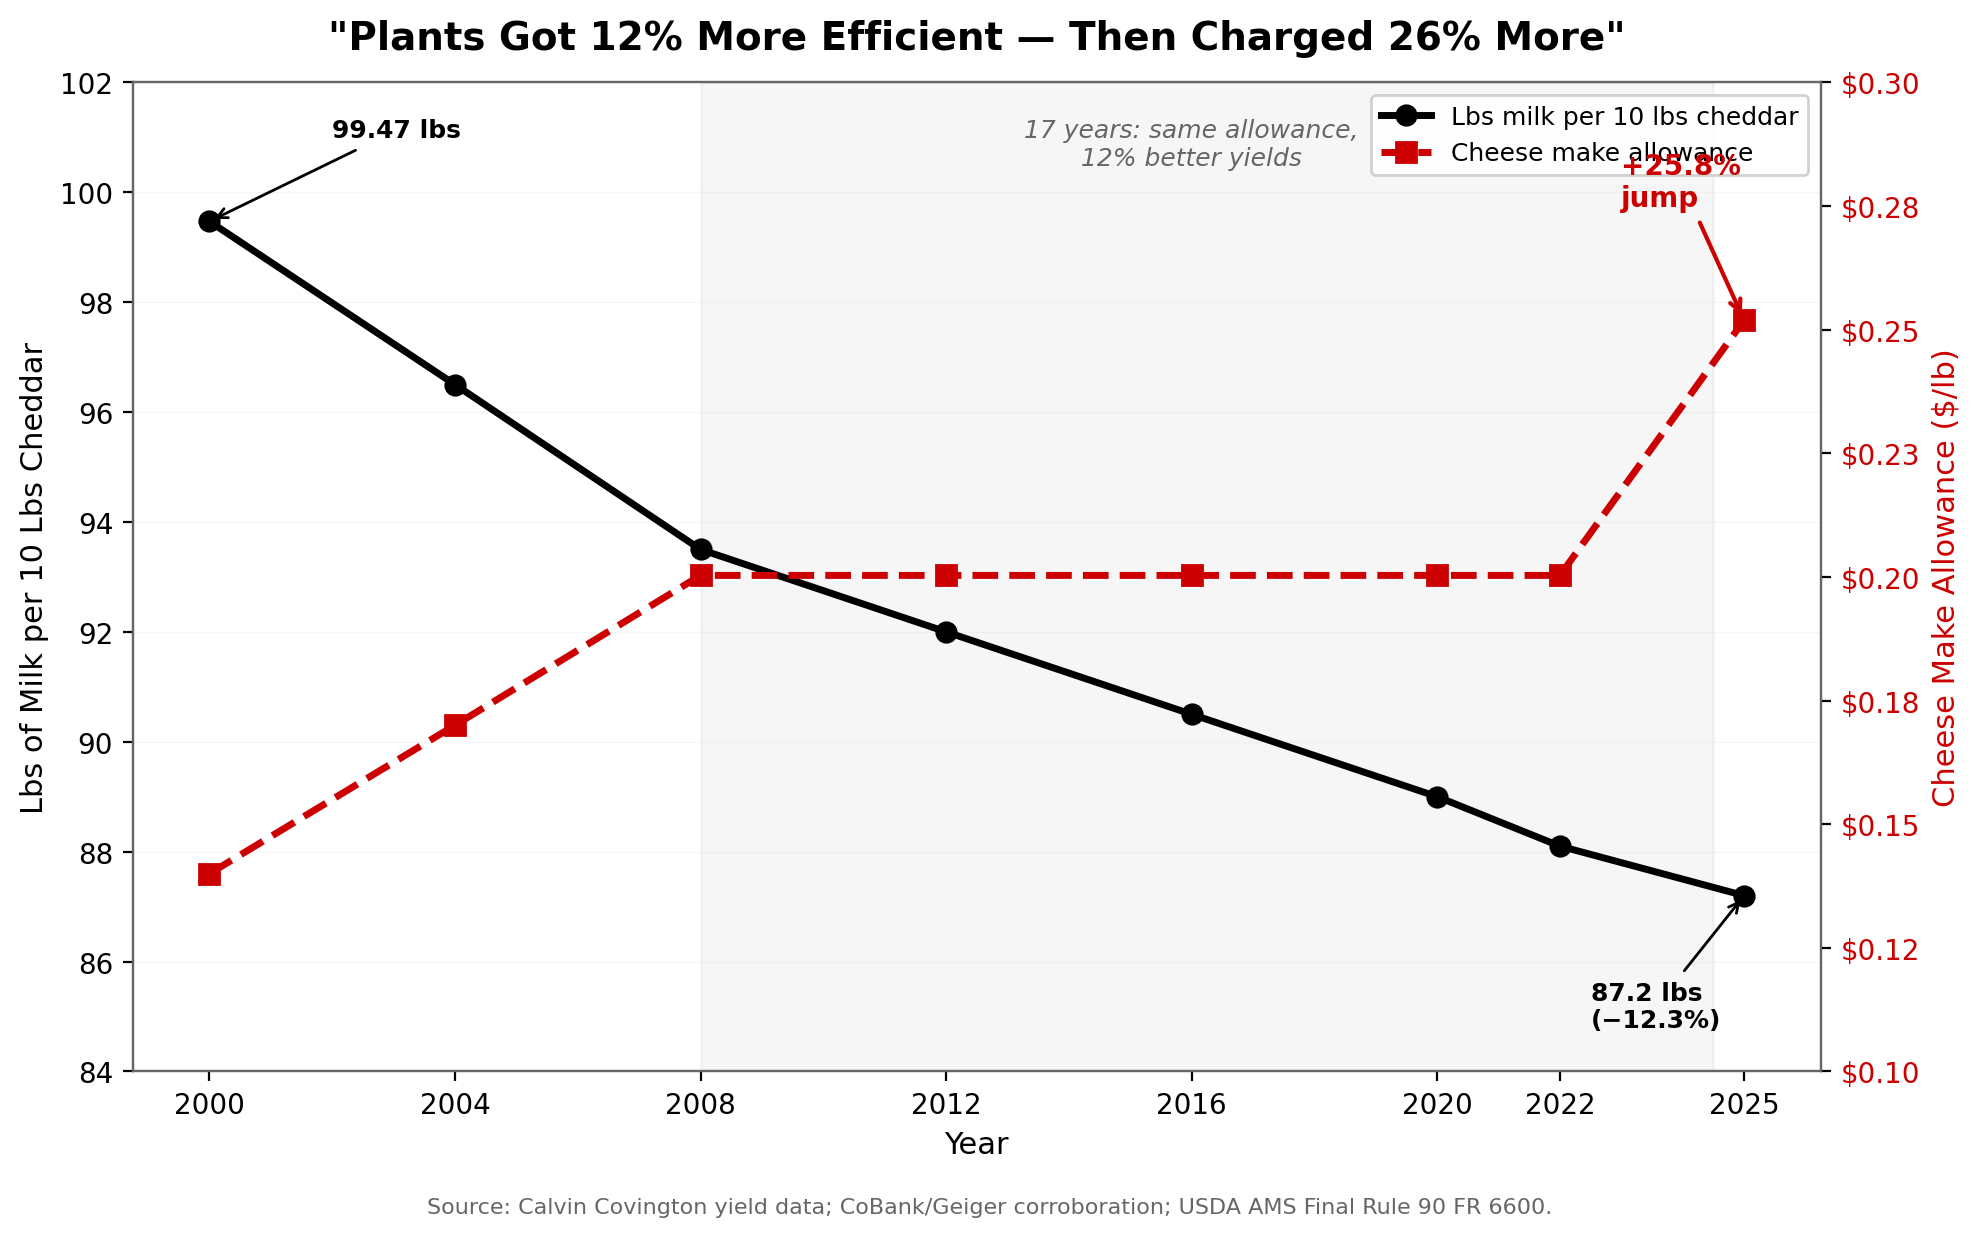
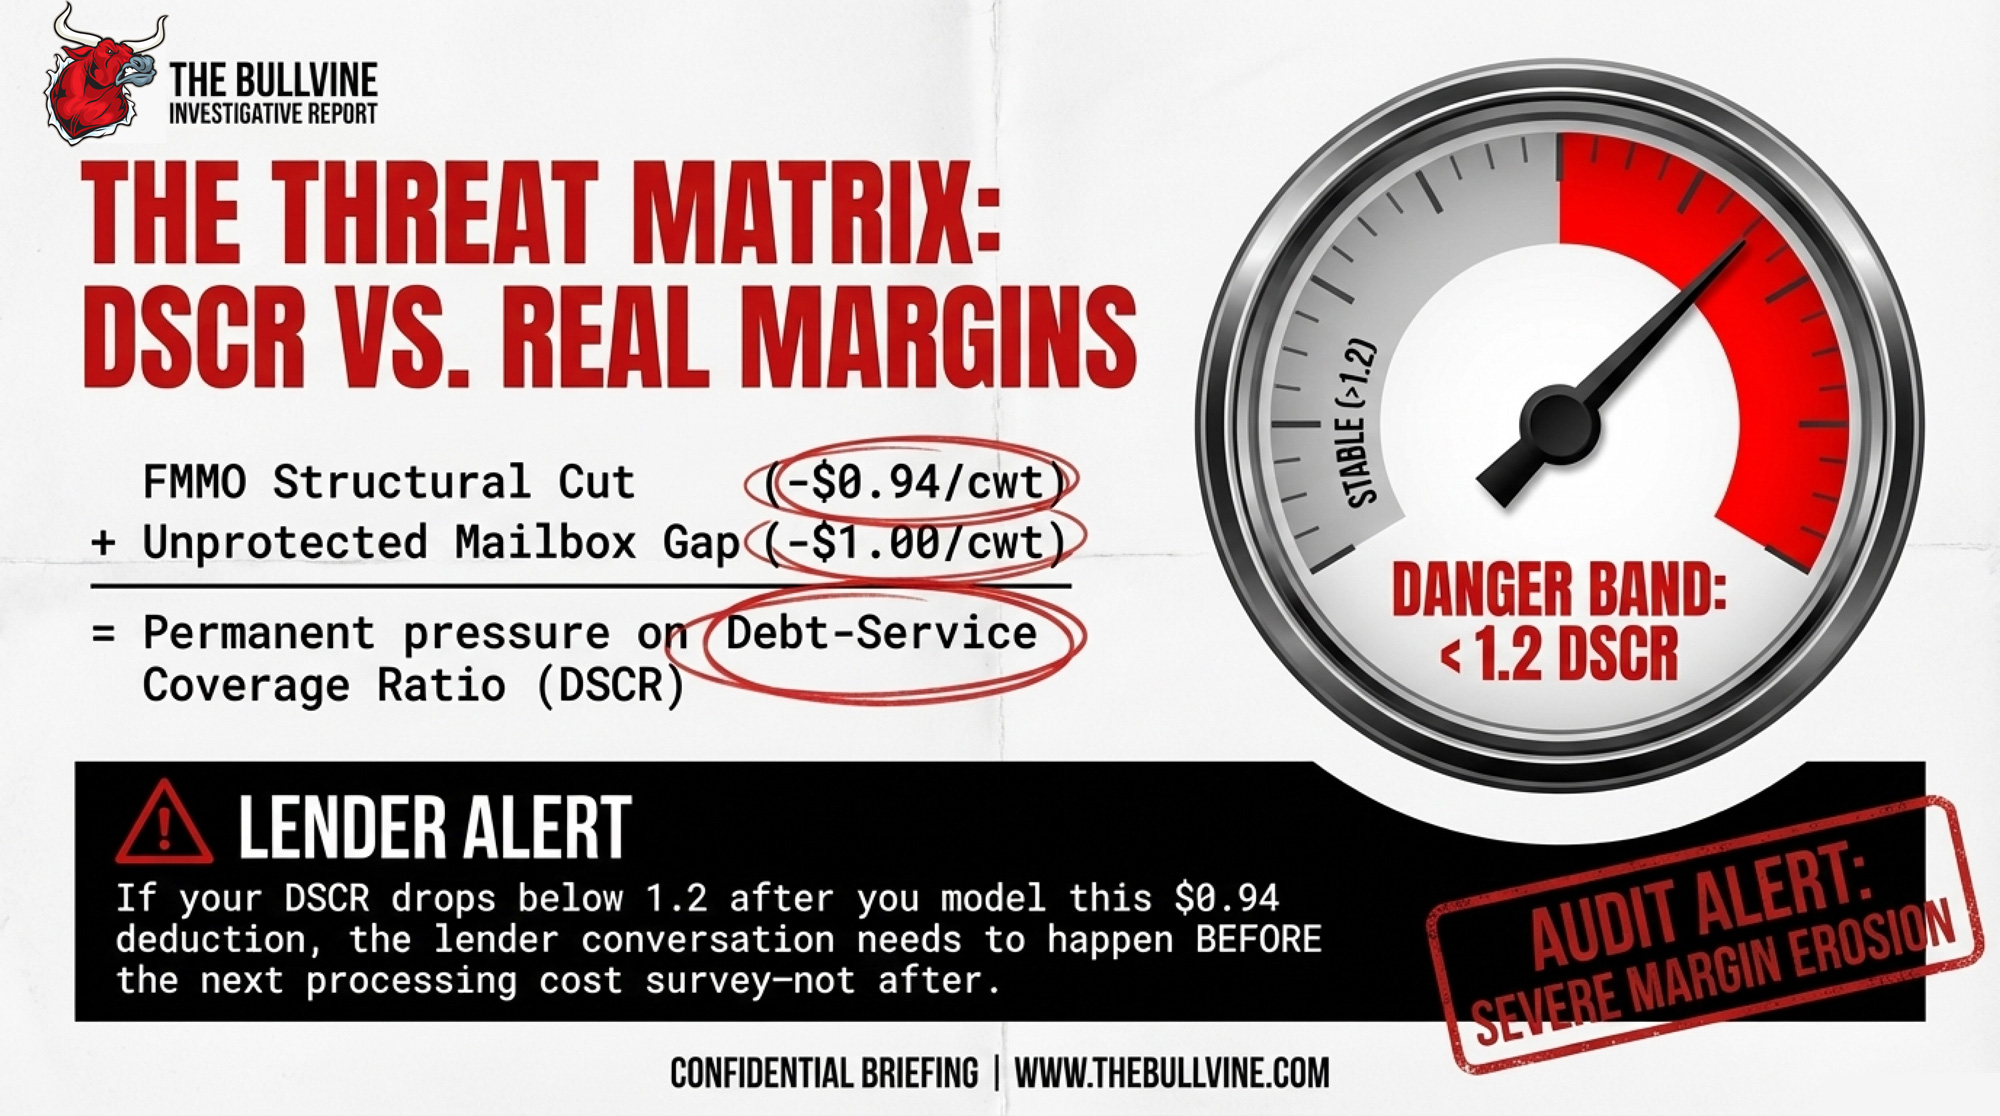
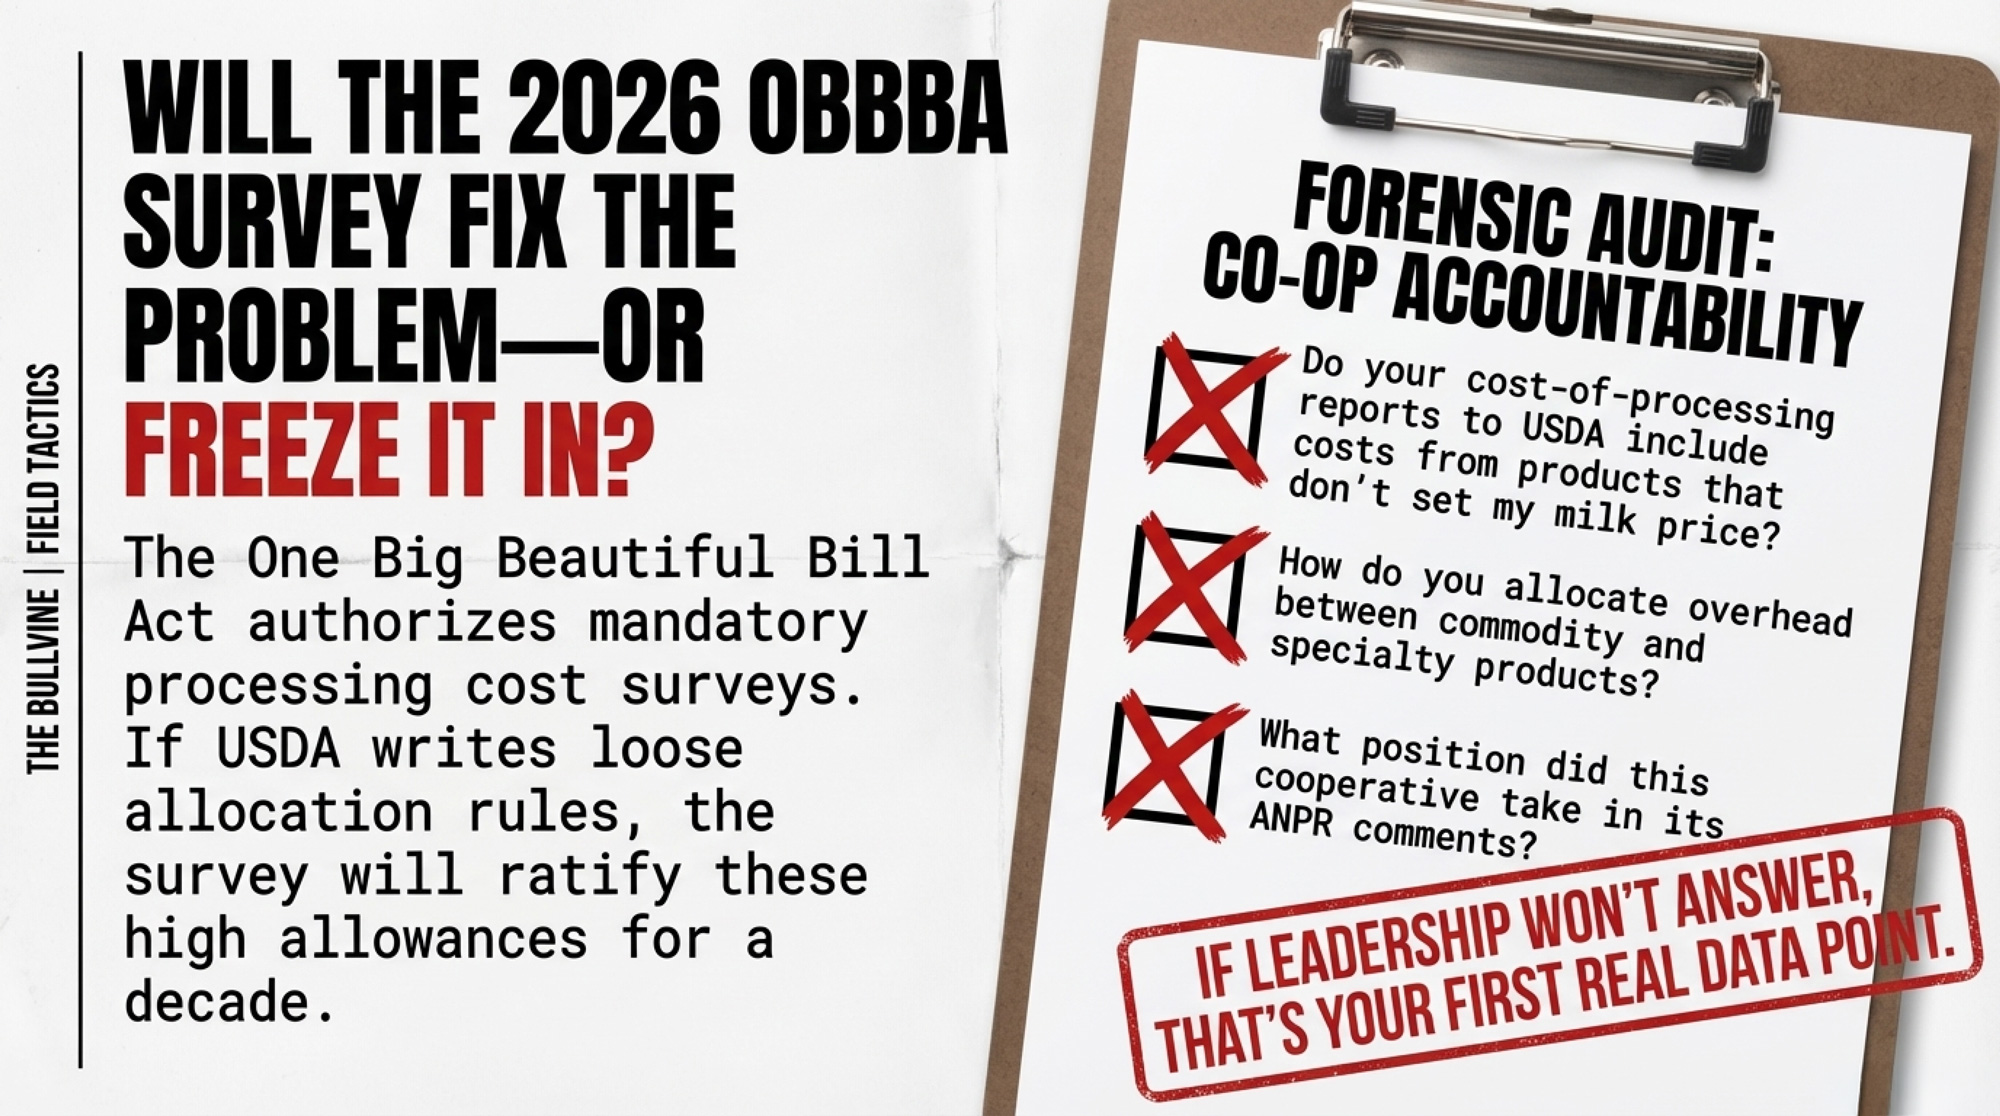
USDA’s make allowance update structurally cut Class III minimum prices by $0.94/cwt — and the mandatory survey that’s supposed to bring transparency could lock those numbers in for a decade.
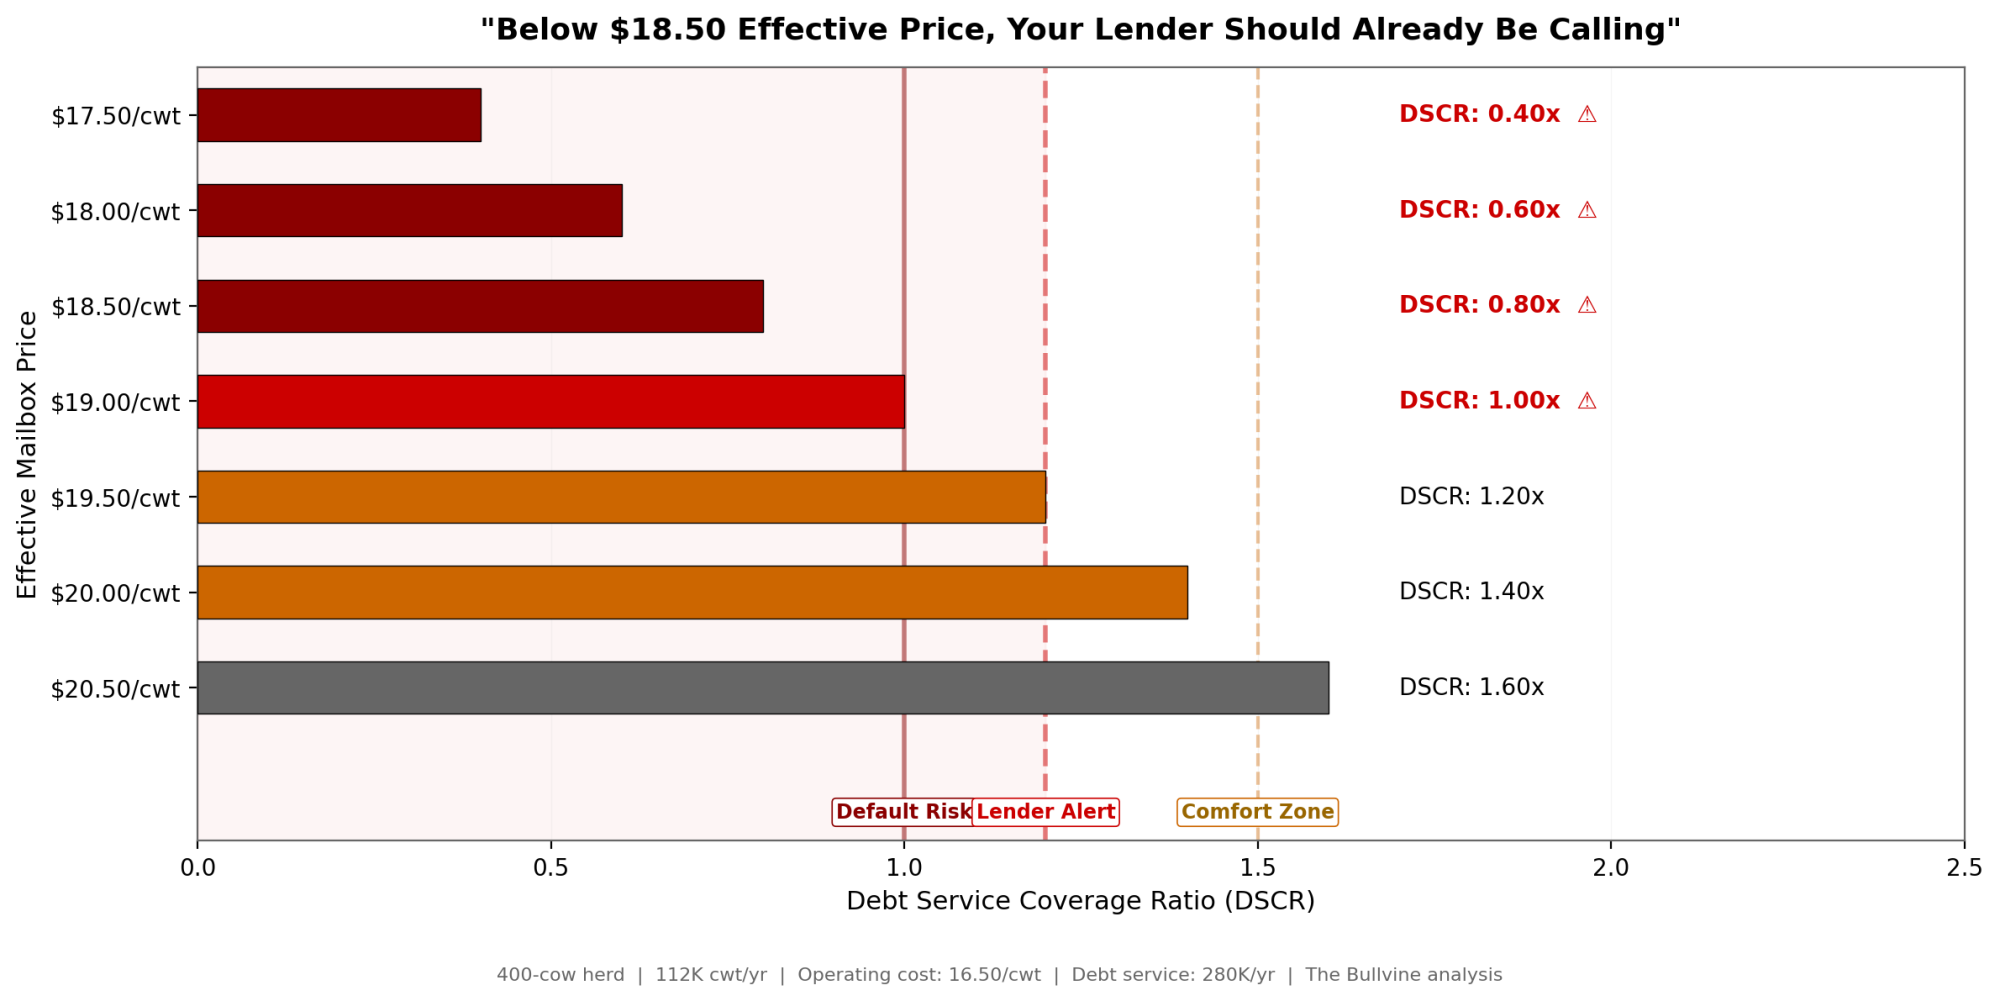
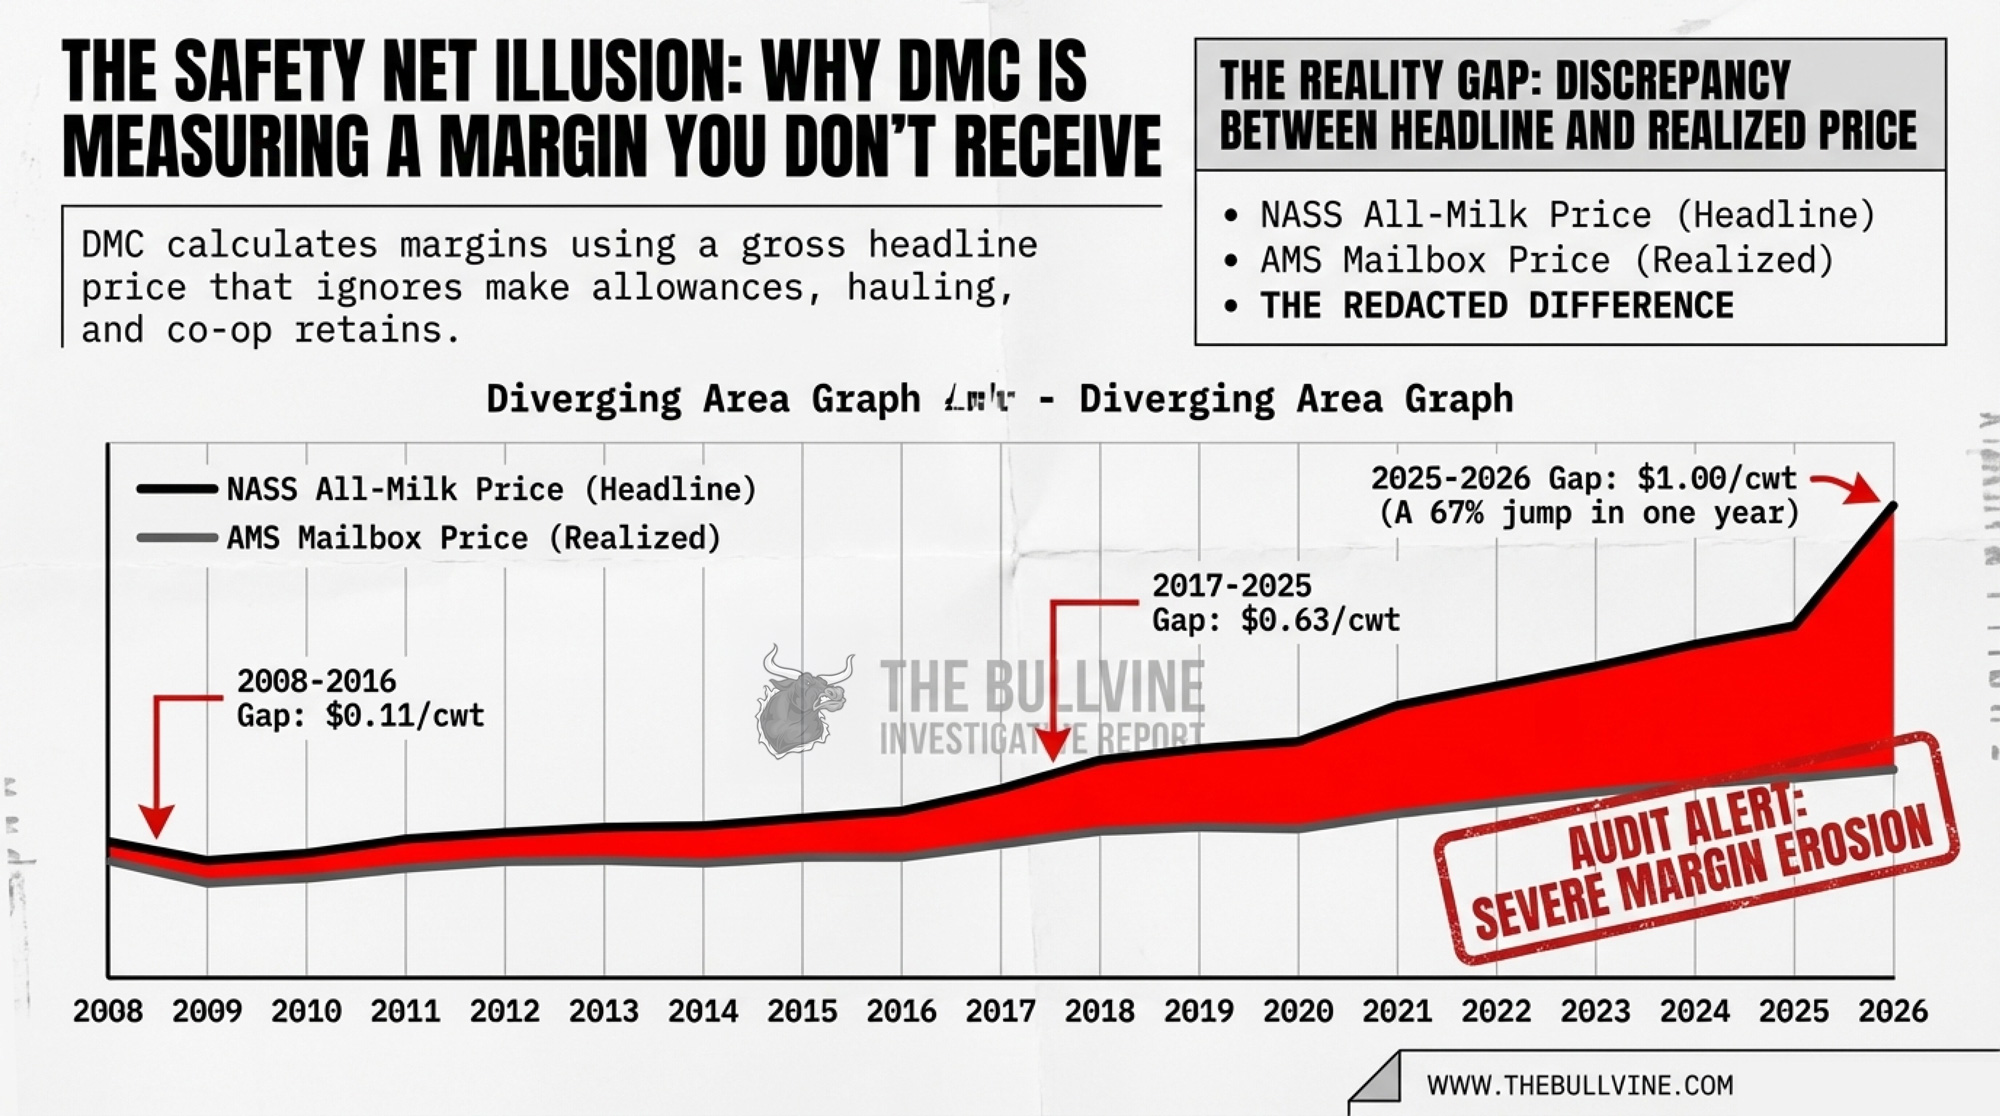
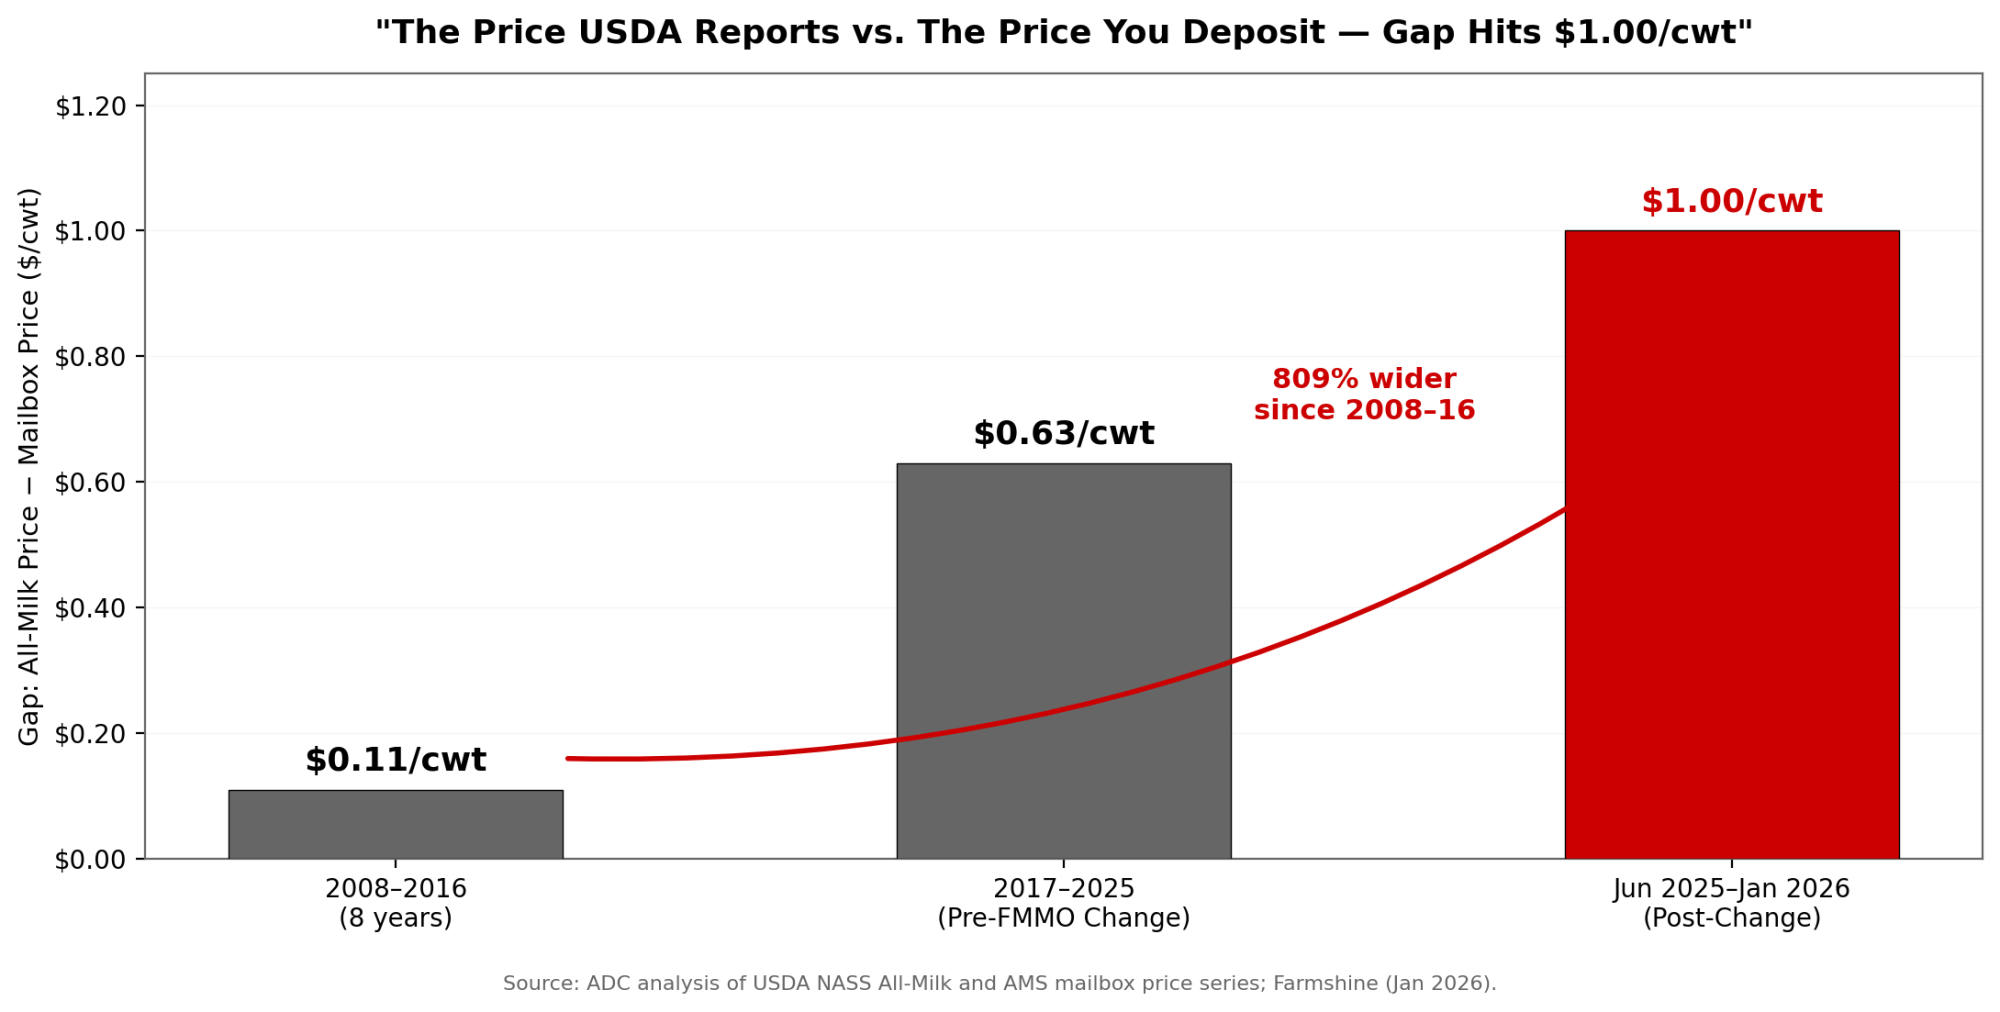
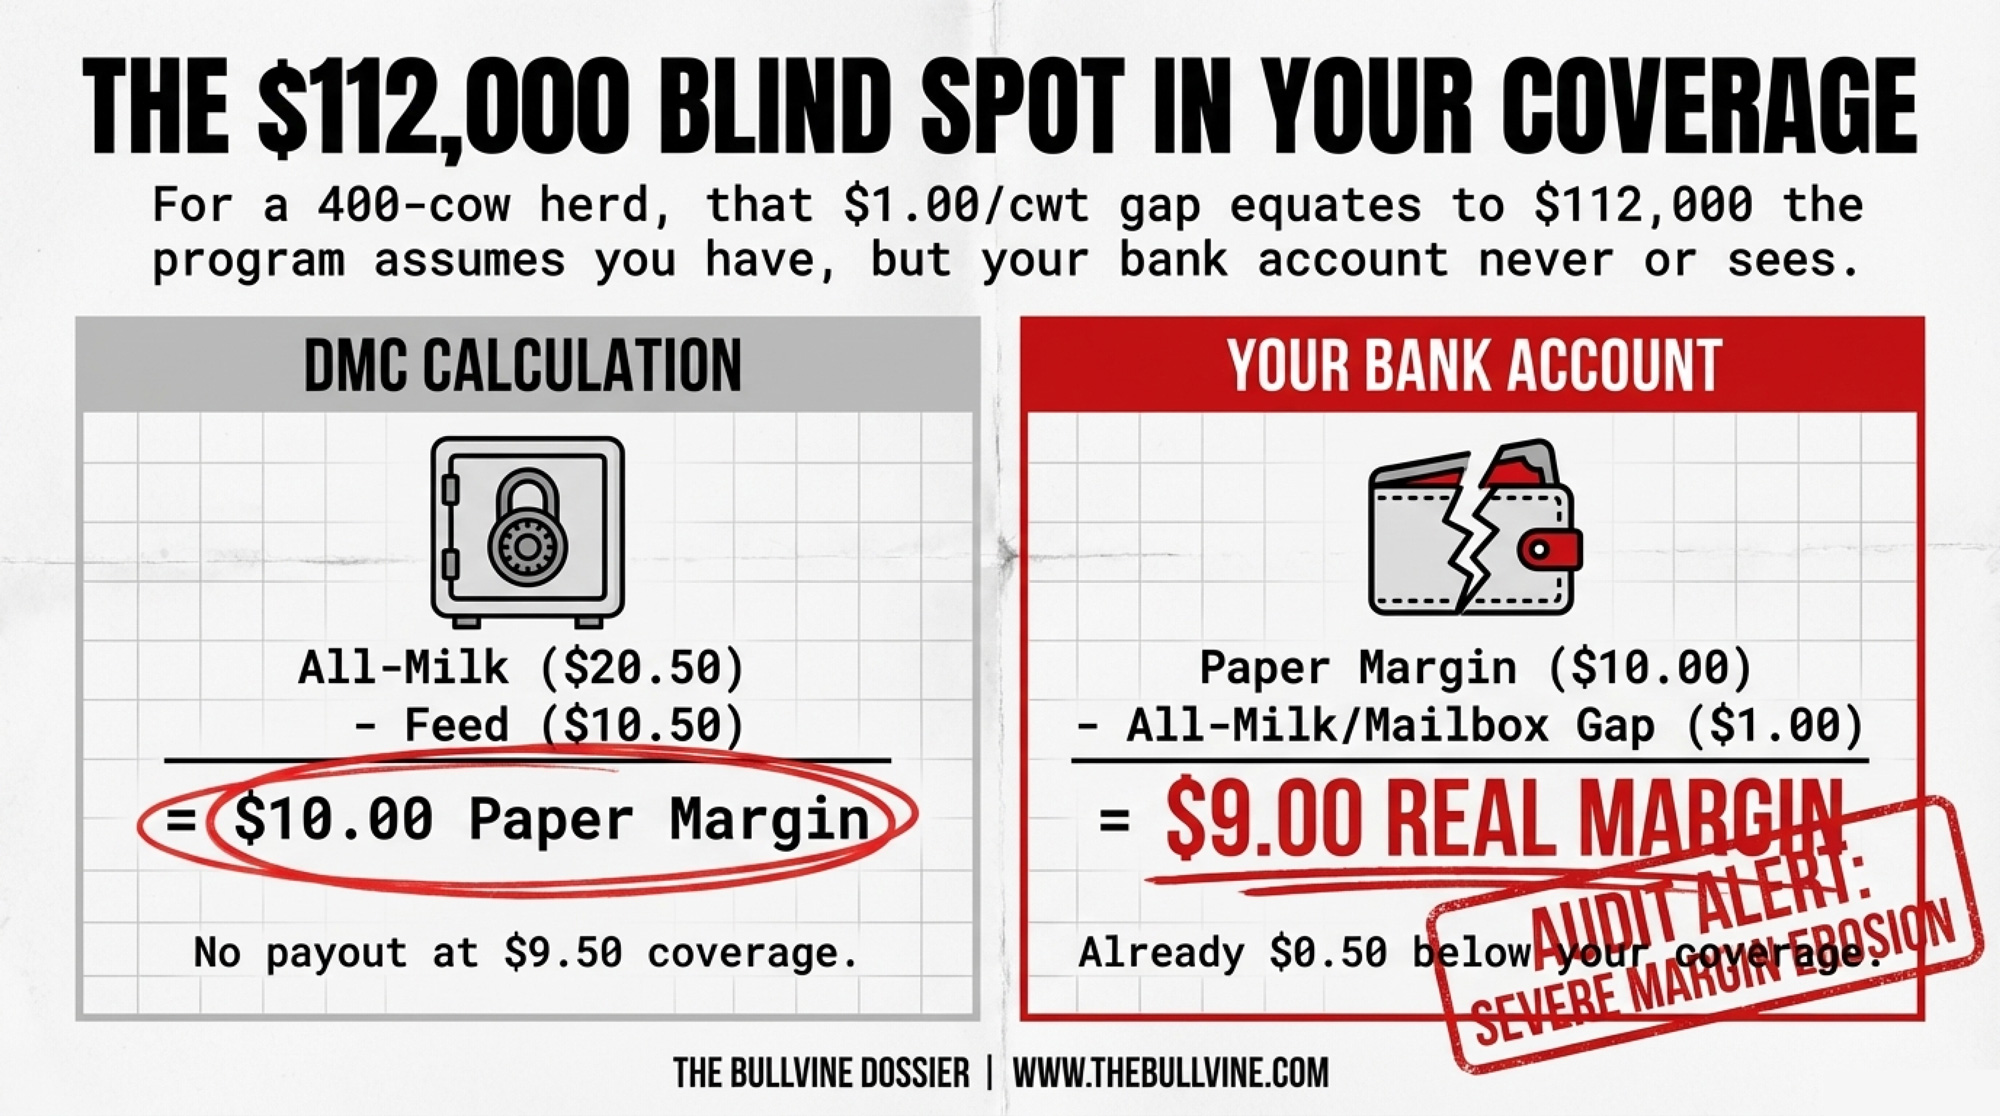
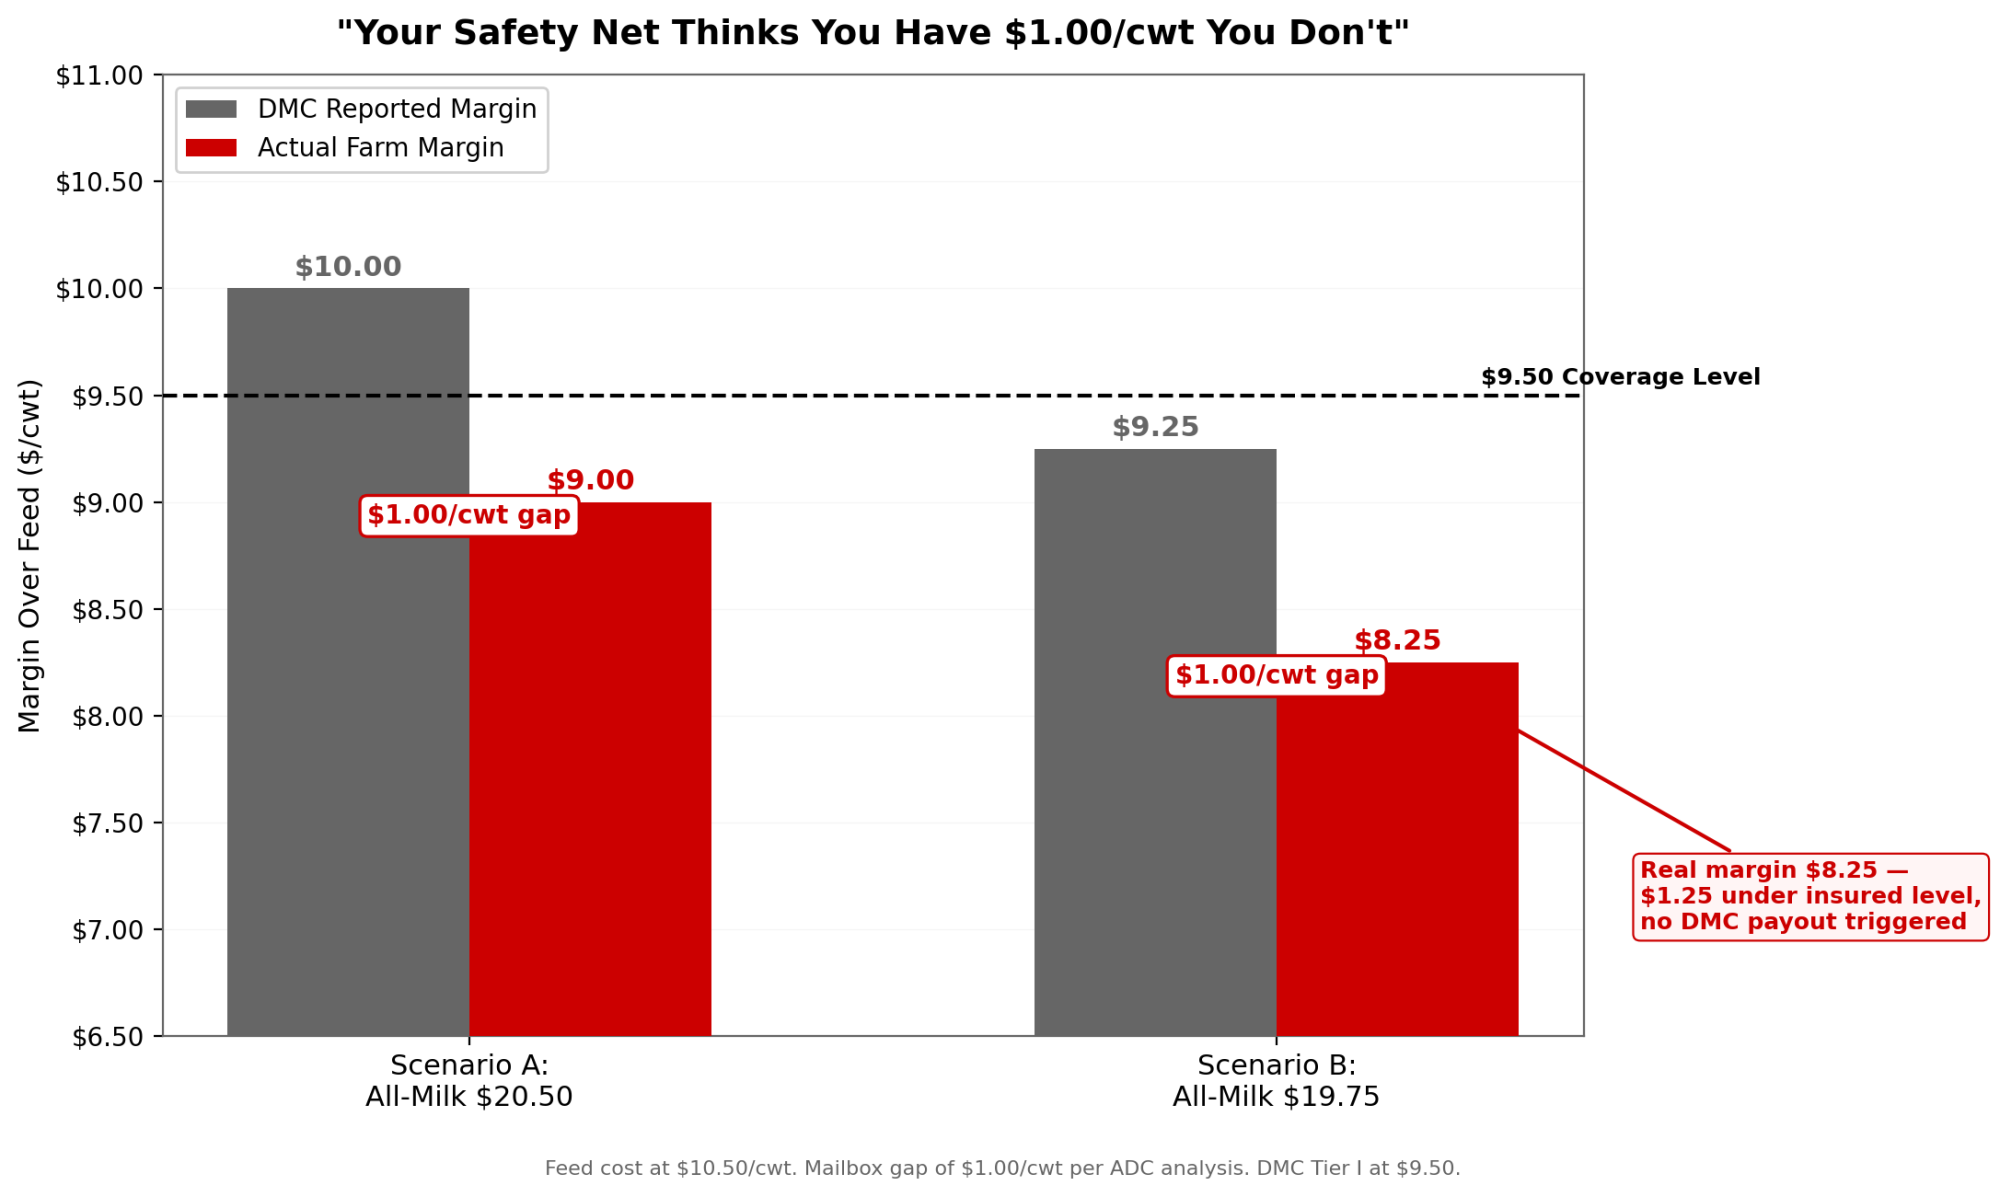
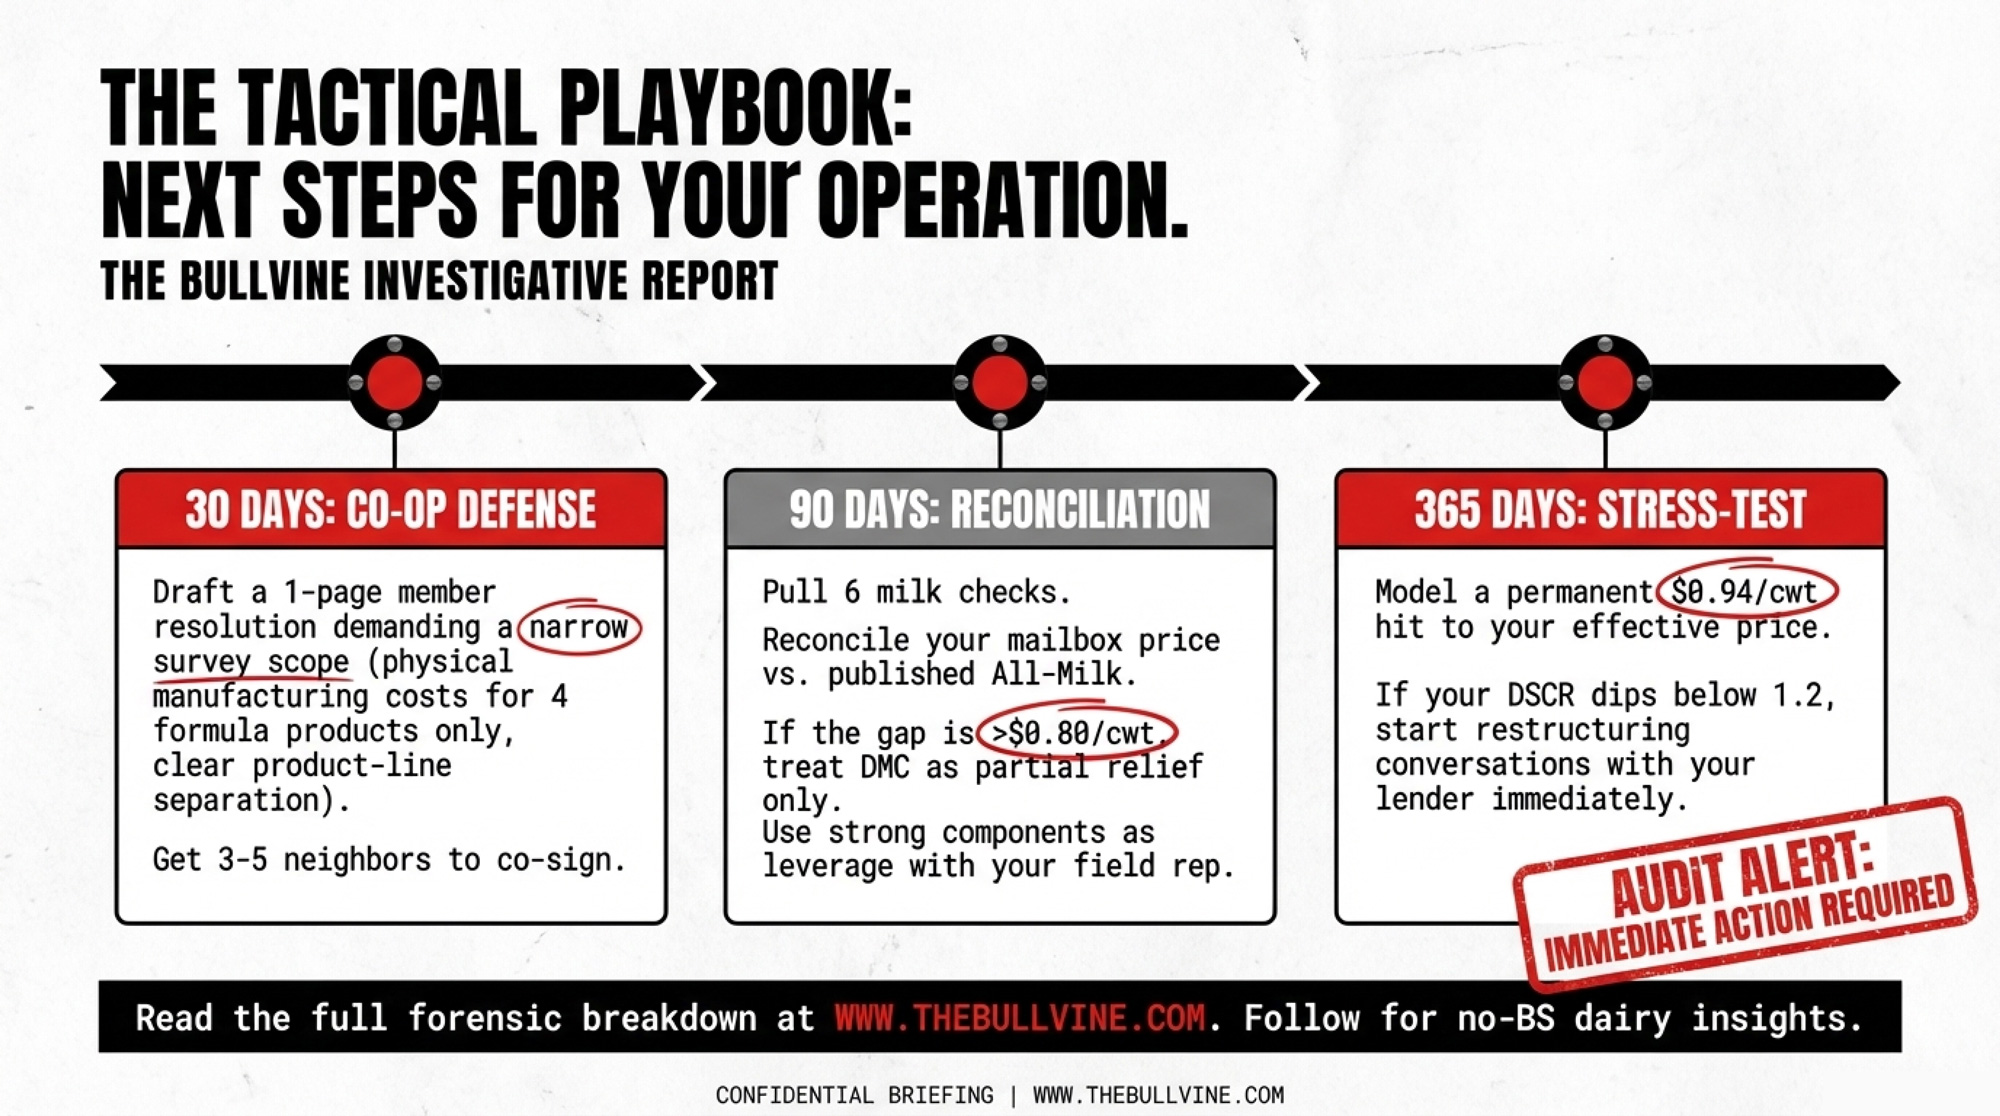
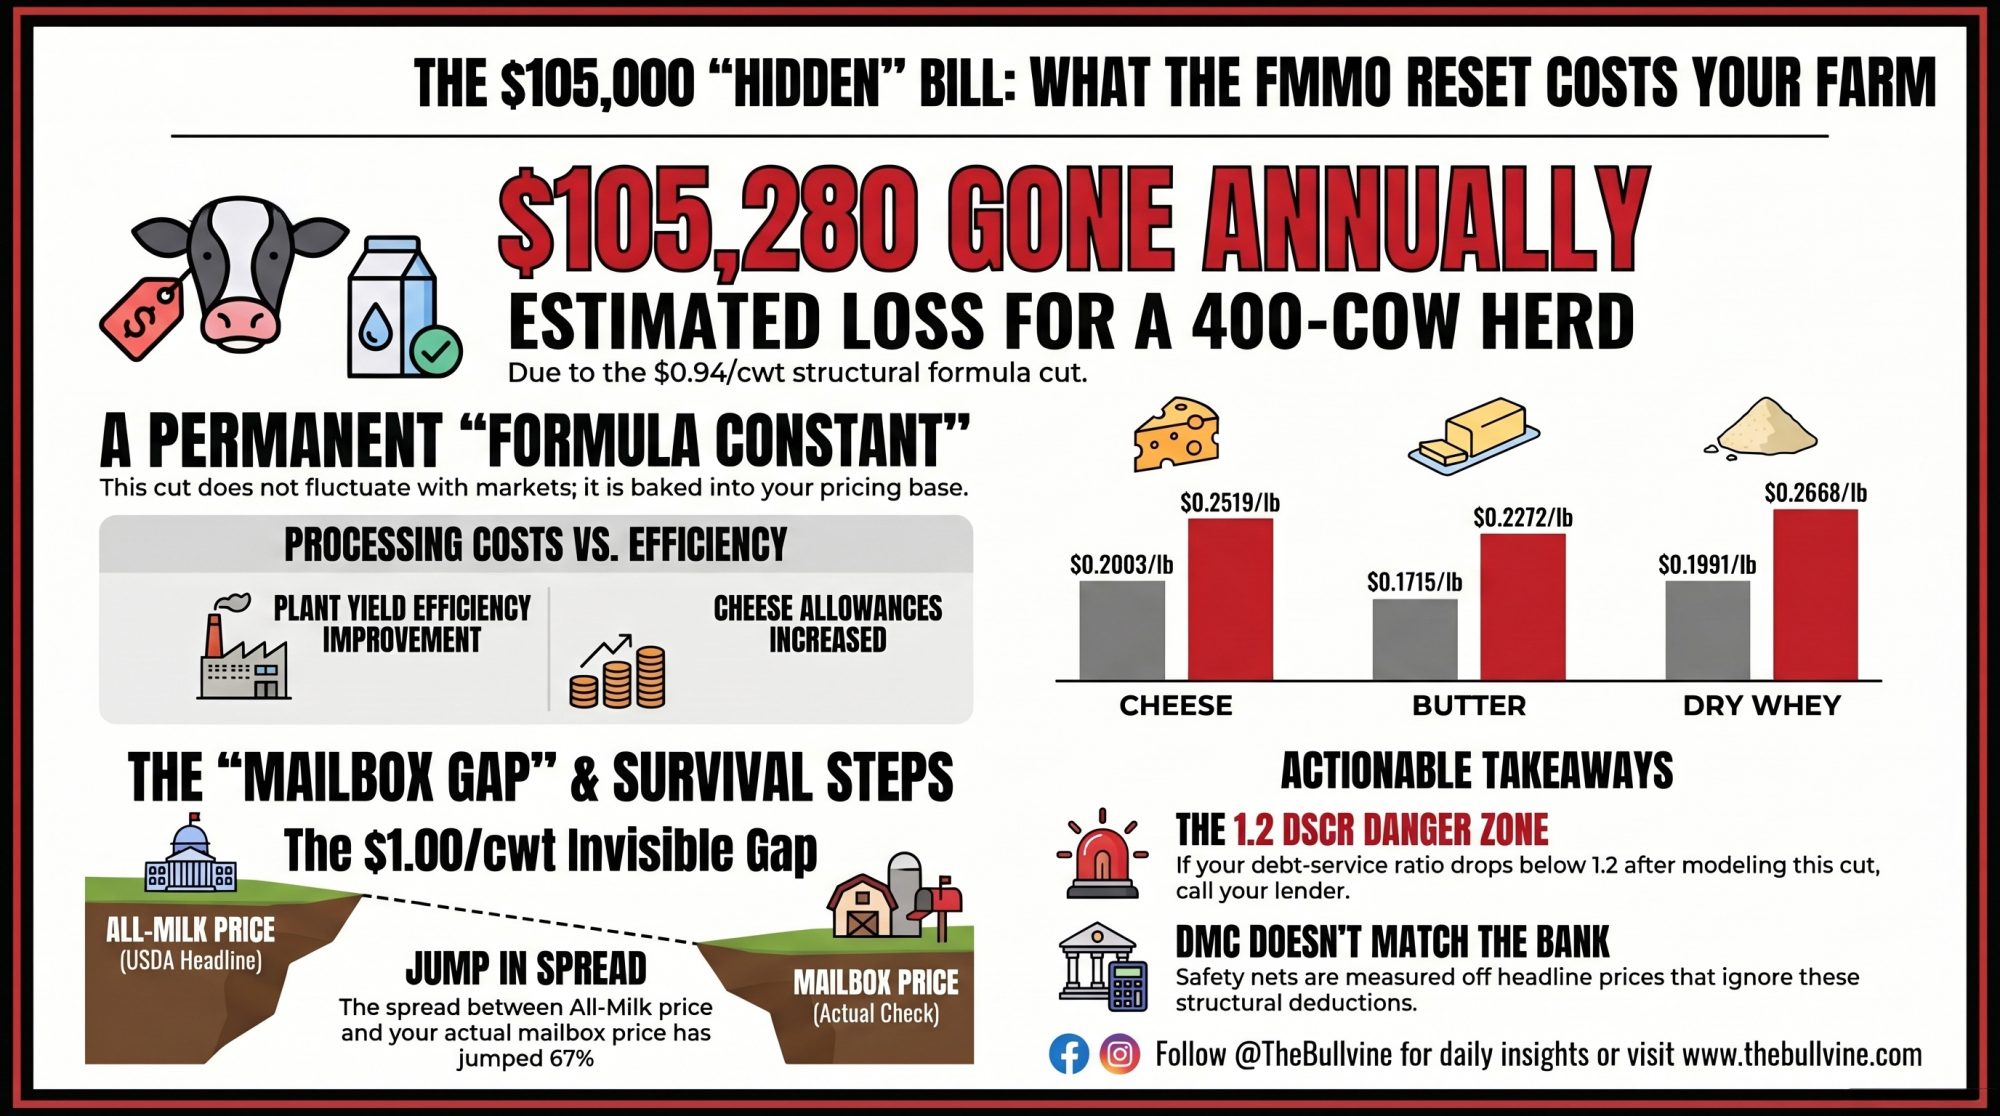
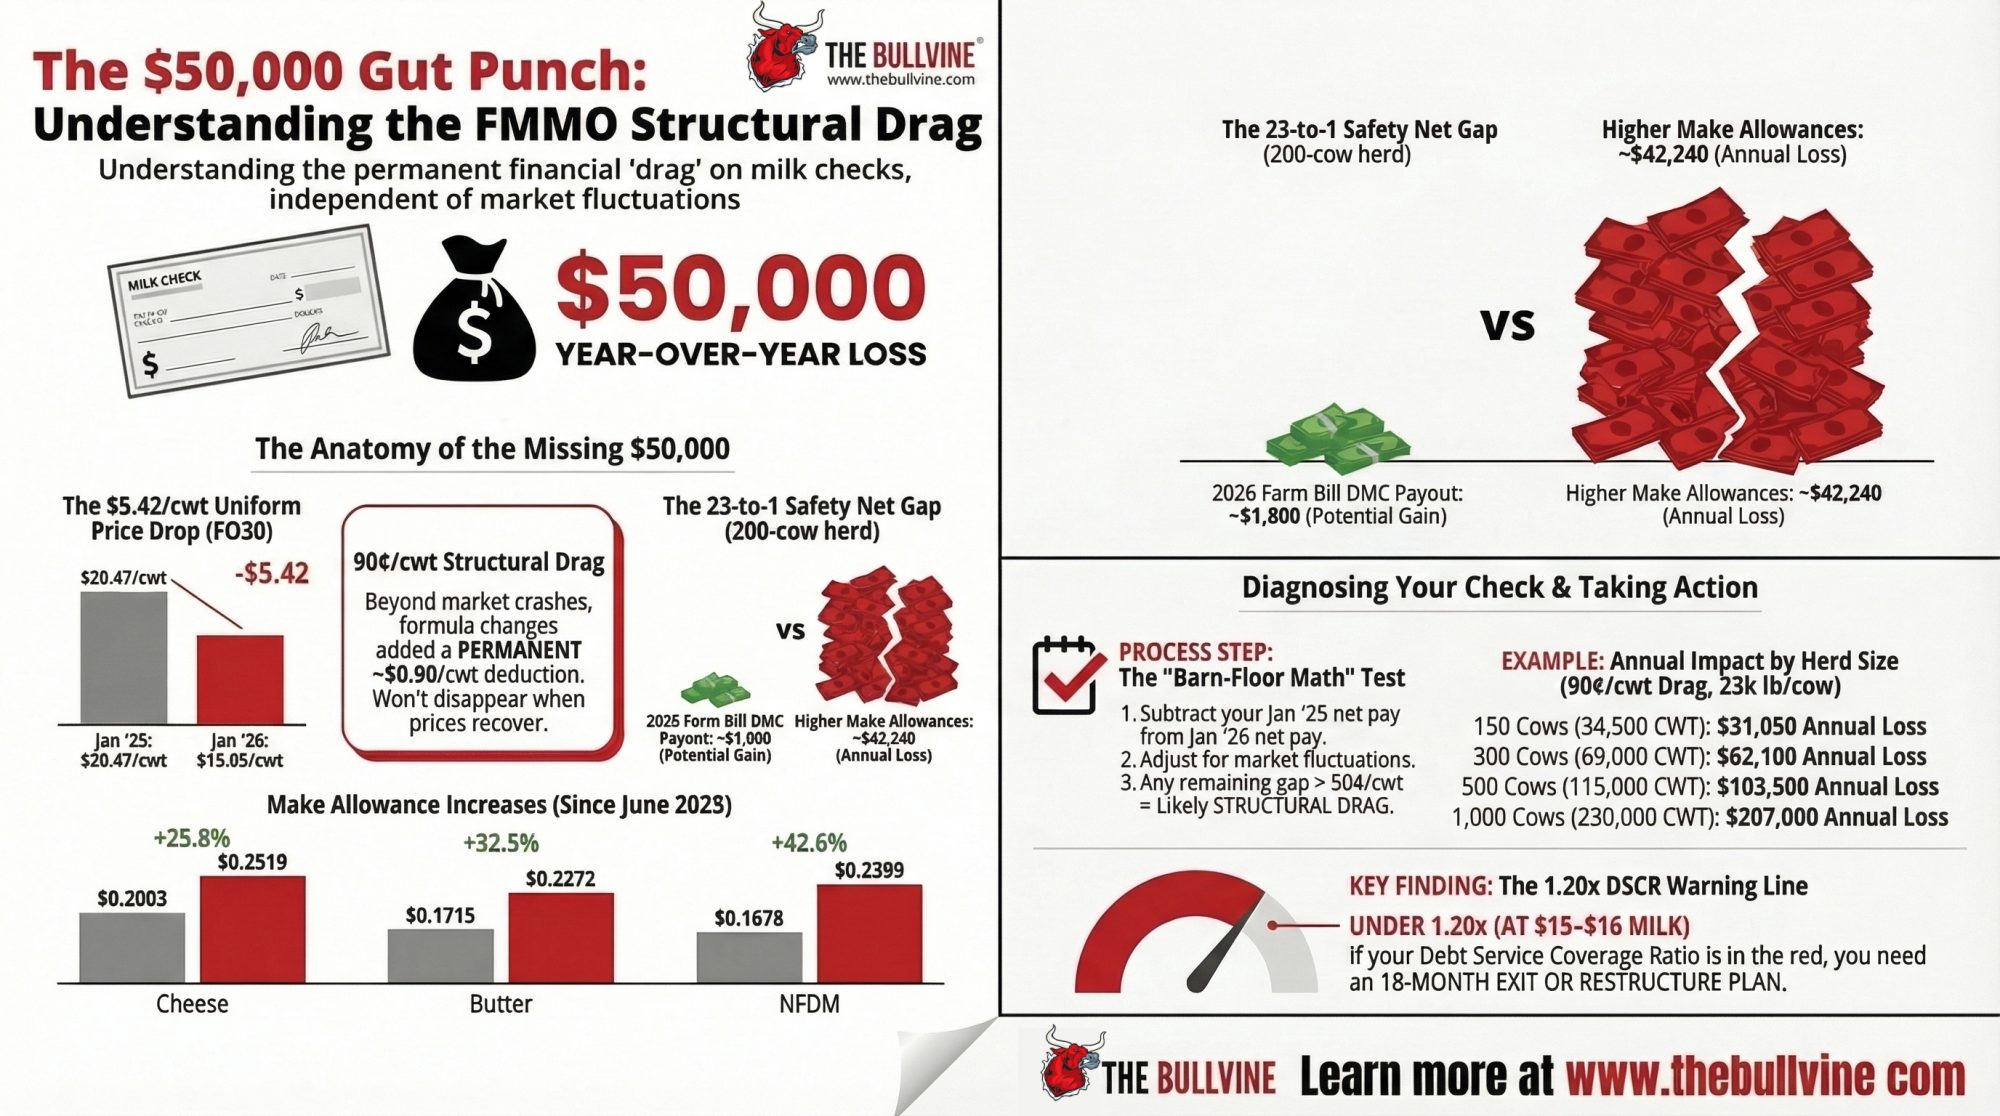
Executive Summary: USDA’s June 2025 make allowance increases baked a $0.94/cwt structural cut into every Class III milk check — not a market swing, a formula constant that hits at any commodity price. On a 400-cow herd, that’s $105,280 a year gone before your component values are even calculated. The cheese allowance alone jumped 25.8% — the first reset since 2008 — despite a 12% improvement in plant yield efficiency over that same stretch. Now add the All-Milk/mailbox gap, which has widened to roughly .00/cwt: DMC is measuring a margin your bank account doesn’t actually see. The real fight is the OBBBA’s mandatory processing cost survey, now in rulemaking, where USDA’s approach to cost categories will either audit these allowances down or lock them in for years. If your DSCR drops below 1.2 after you model this $0.94 deduction, the lender conversation needs to happen before the survey results — not after.
We ran the math ourselves — on the June 2025 FMMO change, month by month, through March 2026. Using USDA’s published pricing formulas and commodity prices from AMS Dairy Product Mandatory Reporting, The Bullvine calculated the make allowance impact independently.
The result: $0.94 per cwt stripped from every Class III milk check, and $0.87 per cwt from every Class IV check. Every single month. It doesn’t fluctuate with cheese or butter markets — it’s baked into the formula constants. For a 400‑cow Holstein herd shipping about 112,000 cwt a year, the Class III hit alone works out to $105,280 per year at standard component tests, and closer to $112,000 at actual pool test levels.
“Dairy farmers remain the only participants in the supply chain without the ability to set prices or recover costs through a built‑in mechanism,” says Laurie Fischer, CEO of the American Dairy Coalition. “In practical terms, that’s a multi-dollar deduction built into the pricing system on the front end.”
The comfortable story in 2025 was that FMMO modernization gave everyone something. The formula math says processors got a margin reset. Family herds got deeper into a hole.
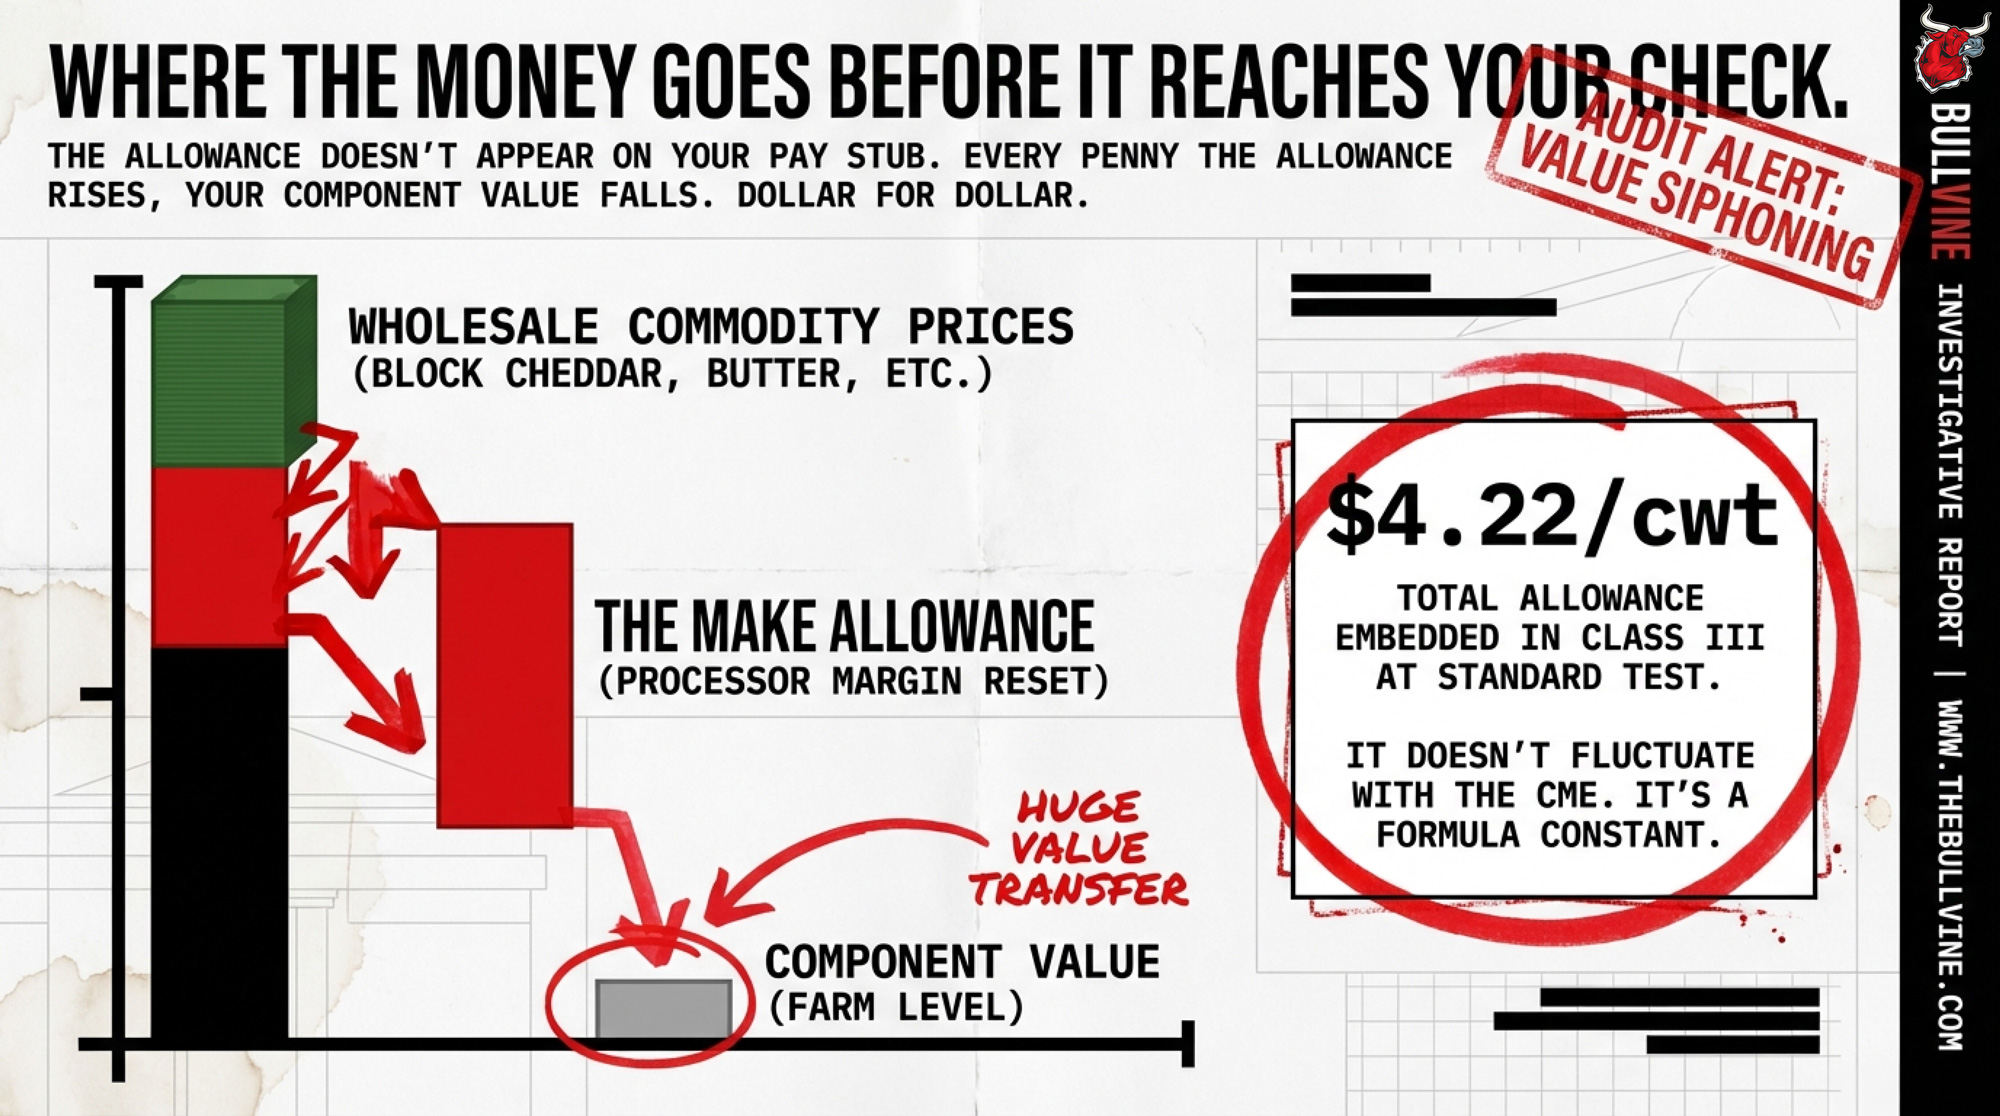
Where the Money Goes Before It Reaches Your Check
The allowance doesn’t appear on your pay stub. USDA starts with wholesale commodity prices — block cheddar, butter, nonfat dry milk, dry whey — then subtracts the make allowance before calculating component prices. Every penny the allowance rises, your component value falls. Dollar for dollar.
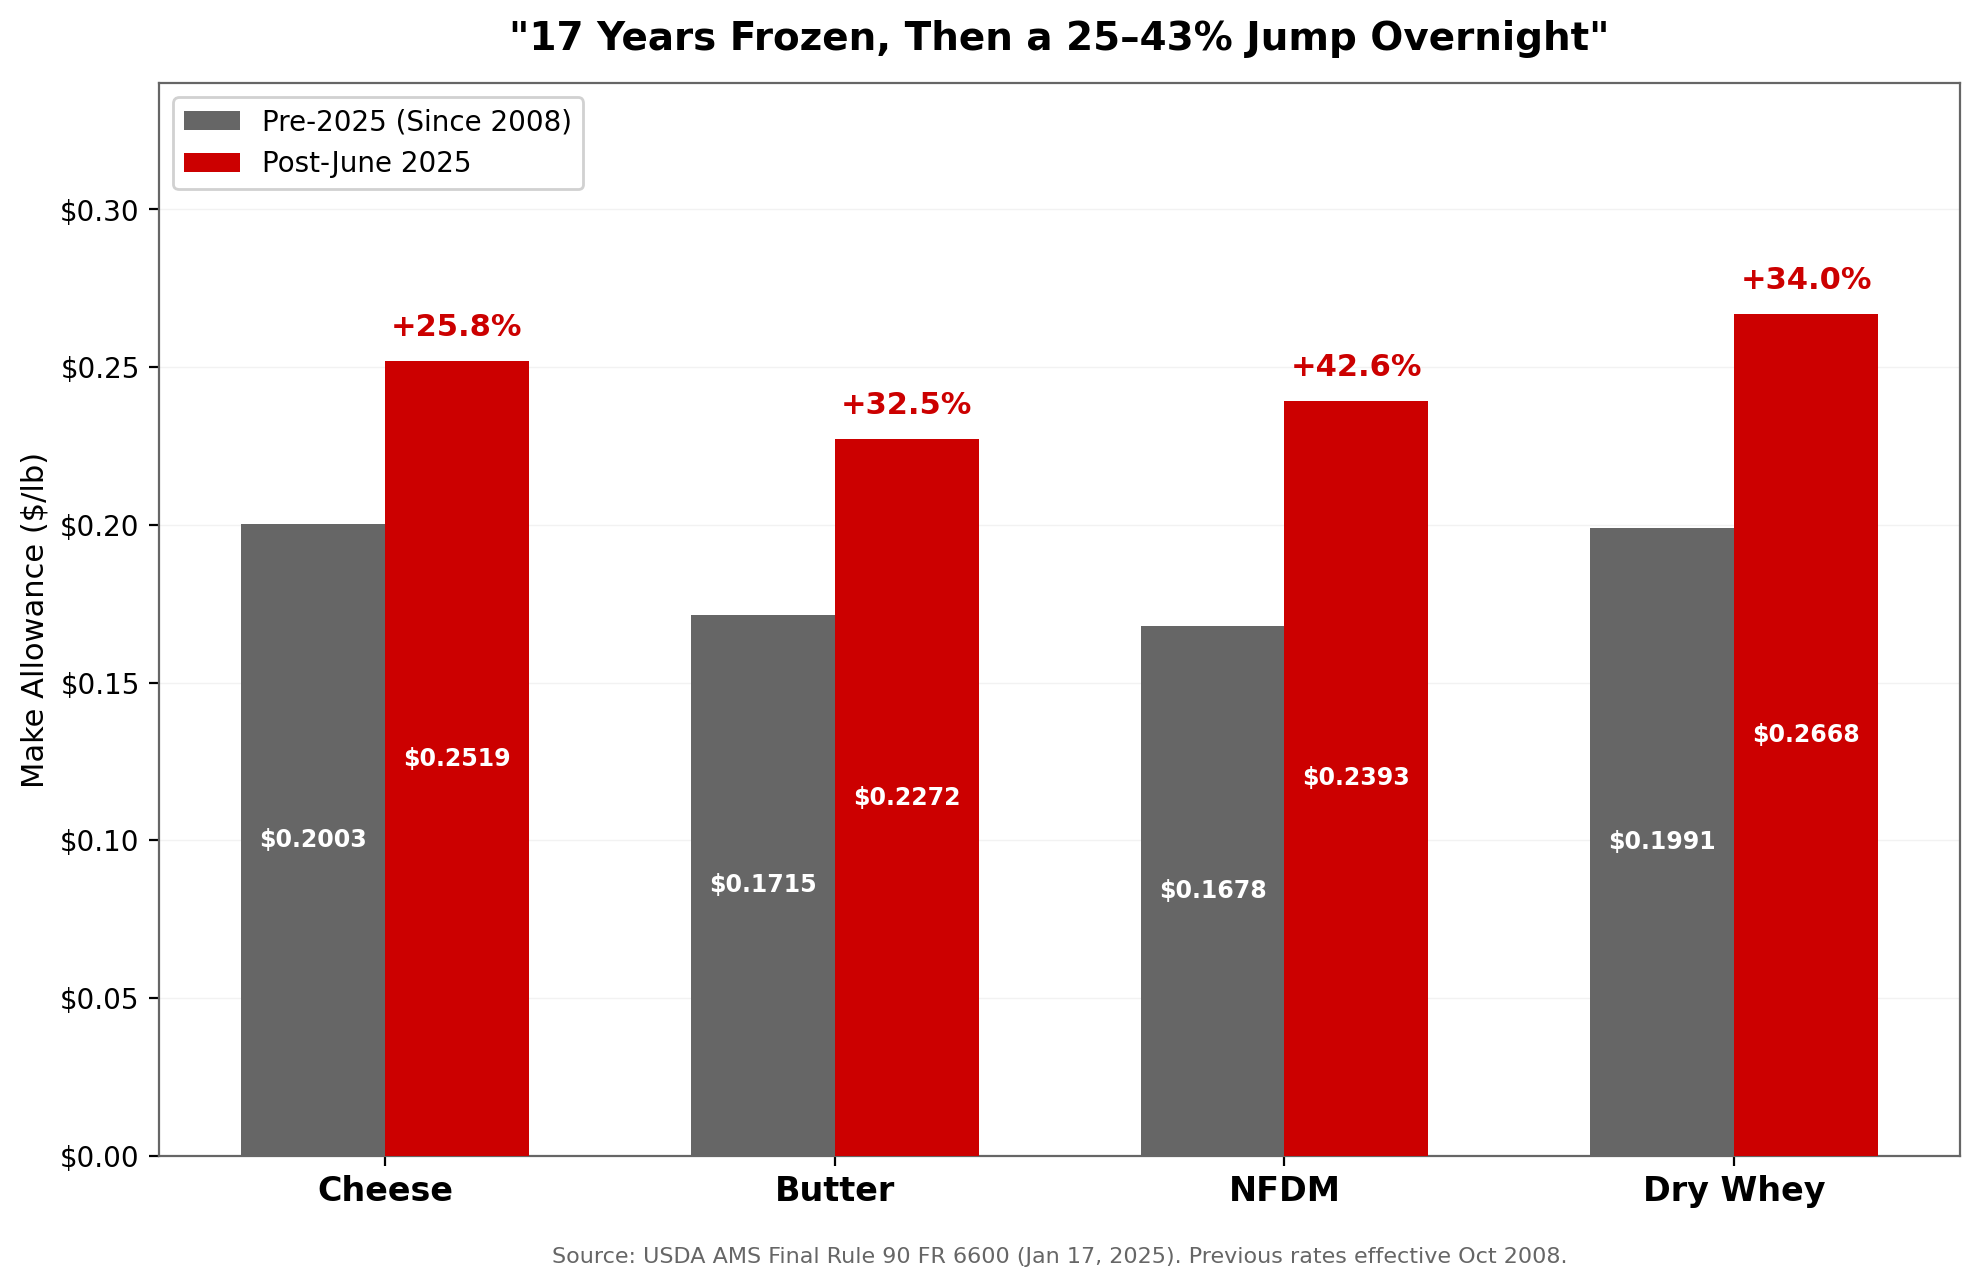
The June 2025 increases, finalized in rule 90 FR 6600 and effective across all 11 federal orders, were not pennies:
Product
Pre‑2025
Post‑2025
Increase
Cheese
$0.2003/lb
$0.2519/lb
+25.8%
Butter
$0.1715/lb
$0.2272/lb
+32.5%
Nonfat Dry Milk
$0.1678/lb
$0.2393/lb
+42.6%
Dry Whey
$0.1991/lb
$0.2668/lb
+34.0%
Source: USDA AMS Final Rule 90 FR 6600, January 17, 2025. Previous rates had been in effect since October 2008.
Run those rates through the published Class III and IV pricing formulas, and the total allowances embedded in Class III come to $4.22/cwt at standard test (3.5% BF, 3.3% protein), $3.09/cwt in Class IV. At actual pool component levels — butterfat running north of 4.0% nationally — those totals climb higher. ADC’s calculation, using published USDA NASS and AMS data at the pool-average test, puts the range at $3.22 to $5.04/cwt, directionally consistent with our independent figures.
What you feel on the farm: a protein price weaker than expected, a butterfat value that doesn’t track the CME board, and a blend that keeps missing your mental target. Almost none of it is labeled “make allowance.” All of it is influenced by it.
Who Held the Pencil — and Why It Matters Now
USDA set these allowances after a record‑long national hearing in Carmel, Indiana, from August 2023 into early 2024. The agency acknowledged it didn’t have mandatory, audited manufacturing cost surveys when it issued the final rule. It set allowances using voluntary and commissioned data, with full intent to backfill with better surveys later.
Processor groups have been clear about their side. IDFA and others warned that allowances set below actual manufacturing costs risk financial strain and potential plant closures, especially at aging facilities in high‑cost orders. Some pointed to episodes where co‑ops imposed production limits because plant capacity couldn’t keep pace — arguing that realistic make allowances were part of keeping plants open, modern, and able to accept all members’ milk. For producers in those orders, that’s not just a processor problem. A closed plant or a capped intake is a market‑access problem that lands right back on the farm.
The trade‑off is real: you gain plant stability and market access when allowances cover true manufacturing costs, but you give up milk price when those allowances overreach into specialty overhead. The formula math tells you which side of that line we’re on. Using the 2025 average Class III price of $18.01/cwt (from USDA AMS monthly class price announcements, CLS series), the $0.94/cwt structural increase represents a 5.2% reduction in the minimum regulated value of Class III milk. Under the old allowances, every one of those months would have paid producers $0.94 more per hundredweight — no commodity rally required.
How Can Plants Be More Efficient and More Expensive at the Same Time?
Calvin Covington — retired CEO of Southeast Milk and longtime pricing expert formerly with National All‑Jersey — compiled yield data that creates the sharpest contradiction in this fight.
In 2000, it took 99.47 pounds of milk to produce 10 pounds of 38% moisture cheddar. By 2025, that dropped to 87.2 pounds — a 12.3% improvement driven by genetics pushing components higher and decades of plant‑level technology. Independent analysis by CoBank’s lead dairy economist Corey Geiger, using USDA and FMMO data, corroborates this trend: cheese yield per hundredweight grew from 10.14 to 11.24 pounds between 2000 and 2022, a 10.8% gain. Extrapolating that trajectory through 2025’s record component levels — national butterfat averaged 4.15%, a new high — Covington’s endpoint falls well within the expected range. Fewer tanker loads. Less volume through receiving and storage. More finished products to spread fixed overhead across.
If per‑unit costs should be falling with those efficiency gains, why did the cheese make allowance jump 25.8%? NFDM, 42.6%?
Nobody’s arguing that plants haven’t seen real inflation in labor, energy, and compliance. The question is whether the mandatory survey will separate those costs from overhead tied to high‑margin specialty products — WPI, MPC, ultrafiltered milks — that don’t determine your milk price.
When a co‑op installs a new ultrafiltration line, that capital expenditure doesn’t appear on your check as “WPI overhead.” It shows up in the total plant cost. If overhead is allocated broadly across all product streams, some of it lands in the cheese and dry whey buckets that feed the FMMO formulas — even though WPI sells into a completely different, higher‑margin market.
ADC calls this “cost shifting.” Processors say their allocation methods follow current USDA guidance. That’s exactly why the survey definitions and allocation rules matter: what USDA writes now will determine which costs land in your make allowance for years.
⚠️ Lender Alert: The DSCR Threshold You Can’t Ignore
Before the playbook — one number that should stop you cold.
If your debt‑service coverage ratio stays above 1.5 after you model a $0.94/cwt hit from structural make allowance deductions, you’ve got room to absorb survey surprises. Below 1.2 — a level extension and lender materials commonly flag as a minimum comfort zone for leveraged dairies — you’re in a risk band that justifies a hard conversation with your lender before the next survey results lock in.
The 2025 allowances already shifted $0.94/cwt from every Class III check and $0.87/cwt from every Class IV check — permanently, at any commodity price level. Fischer sees a real possibility that if the new survey rules don’t narrow cost‑allocation practices, a future update could push allowances higher again.
That’s an outlook, not a guarantee. But your capital plan shouldn’t pretend it’s impossible.
Why DMC Is Measuring a Margin You Don’t Actually Receive
Dairy Margin Coverage calculates your margin by subtracting a formula feed cost from the NASS All‑Milk price — a gross number that ignores make allowance deductions, hauling, co‑op retains, and basis. Your actual realized price, the mailbox price, runs lower.
ADC compared published USDA NASS All‑Milk and AMS mailbox price series and found the gap has quietly widened: about $0.11/cwt in 2008–2016, $0.63/cwt in 2017–2025, and roughly $1.00/cwt from June 2025 to January 2026 — a 67% jump in one year. The most recent trend is corroborated by Farmshine’s January 2026 report, which confirmed that the USDA mailbox price had plummeted by $5.23 from a year earlier. For additional context, Covington’s own 2019 analysis of the same USDA mailbox data in Progressive Dairy showed the 2018 weighted national average mailbox price at $15.72/cwt — with NASS All‑Milk for that year averaging approximately $16.26/cwt, a gap of roughly $0.54/cwt that falls within ADC’s reported $0.63 average for the 2017–2025 window.
AFBF economist Daniel Munch notes that DMC has distributed roughly $2.7 billion in net support since 2019, but total production costs reached about $23.65/cwt in 2024 — meaning many producers were underwater even when DMC margins sat above trigger levels. OBBBA raised Tier I coverage from 5 million to 6 million pounds and created a 25% premium discount for multiyear enrollment (2026–2031), but it didn’t change the All‑Milk margin calculation itself.
Your safety net is being measured off a headline price that’s drifting farther from what actually hits your bank account. And the 2025 allowance changes are a big reason why.
What Does a $0.94/cwt Make Allowance Hit Mean for a 400‑Cow Herd?
Scenario: All‑Milk at $20.50/cwt, formula feed at $10.50/cwt
DMC sees a $10.00/cwt margin — no payment at $9.50 coverage.
But with a $1.00/cwt All‑Milk/mailbox gap:
Mailbox: ~$19.50/cwt → Real margin: $9.00/cwt — already $0.50 below your coverage
Annual unprotected gap: 112,000 × $1.00 = ~$112,000 the program assumes you have, but your bank account doesn’t
Tighten it. All‑Milk drops to $19.75, feed stays at $10.50:
DMC margin: $9.25/cwt → 25¢ indemnity at $9.50 coverage
Mailbox: ~$18.75 → Real margin: $8.25/cwt — a full $1.25 below the margin you insured
Same herd. Same feed. Same coverage. The only variable: the spread between a national headline price and what actually hits your account.
Will the OBBBA Survey Fix the Make Allowance Problem — or Freeze It In?
The One Big Beautiful Bill Act authorized mandatory surveys of dairy processing costs and yields under Section 10314. According to AFBF’s Munch, those surveys are supposed to be biennial to prevent another 17‑year gap between major resets.
In February 2026, AMS published an Advance Notice of Proposed Rulemaking in the Federal Register to outline the survey design. ADC requested a 60‑day extension; AMS didn’t grant it. Fischer’s team filed formal comments by the March deadline.
Producer groups want a narrow scope: physical conversion costs for four formula products, clear product‑line cost separation, and standardized allocation rules. Processors argue they need flexibility to reflect varied plant types and product mixes. “There is a real expectation that this survey will provide transparency,” Fischer says. “USDA needs to ensure that the expectation is met.”
If the categories and allocation rules come out too loose, the survey could ratify those high allowances and give them fresh, “audited” cover. That’s the real battleground of 2026.
Three Questions to Put in Front of Your Co‑Op Board
Many of the cost‑allocation choices that matter most occur within organizations that still call themselves farmer‑owned. For a 400‑cow member already $105,000 lighter from the formula change, your co‑op’s processing margin and your milk check draw from the same pool.
Ask — in writing:
“Do your cost‑of‑processing reports to USDA include costs from products that don’t set my milk price?”
“How do you allocate overhead between commodity and specialty products, and can members see that schedule?”
“What position did this cooperative take in its ANPR comments?”
If leadership won’t answer clearly, that’s your first real data point.
What Should Your Dairy Do in the Next 30, 90, and 365 Days?
Next 30 Days
Draft a one‑page member resolution calling for a narrow survey scope — physical manufacturing costs for four formula products only, clear product‑line separation, and standardized allocation methods. Get three to five neighbors to co‑sign and push your board to adopt it.
Ask for your co‑op’s ANPR position in writing. If management won’t share it, that tells you something.
Next 90 Days
Run your own All‑Milk/mailbox reconciliation. Pull six checks and compare your mailbox to the published All‑Milk for your state. If the gap averages more than $0.80/cwt, treat DMC as partial relief, not a margin backstop — and walk your lender through the math. If they’ve never heard the term “make allowance,” that conversation itself is the point.
Use strong components as leverage. If your butterfat and protein run well above pool, the make allowance bite is proportionally bigger — but so is your ability to negotiate component premiums. Bring those numbers to your next field‑rep meeting.
Next 365 Days
Stress‑test with your banker. What happens to your DSCR if your effective milk price drops another $0.94/cwt from structural deductions, even with decent futures? Below 1.2, start restructuring conversations now.
Be careful what you build on. If you’re penciling big projects on today’s over‑order premiums, stress‑test against a world where premiums get trimmed but structural deductions stay. Premiums are discretionary. Make allowance deductions held from 2008 to 2025.
What This Means for Your Operation
Make allowances are a structural risk line, not background noise. They reset your pricing base for years. You can’t hedge them with futures or negotiate them with your field rep.
The DMC printout doesn’t match your bank account. If your All‑Milk/mailbox gap is near $1.00/cwt, that gap needs to show up in every capital, coverage, and hiring decision you make.
Your co‑op voice matters right now. Once the OBBBA survey categories lock in, you live with those numbers in your milk check for the next cycle.
Get your lender on the same page early. A banker who understands the make allowance drag is more likely to work with you than one who only sees DMC margins on paper.
Key Takeaways
If your DSCR falls below 1.2 when you model a $0.94/cwt structural hit, you’re in the danger band — and lender conversations shouldn’t wait for the next survey round.
If your All‑Milk/mailbox gap has averaged $0.80/cwt or more over the last six months, your DMC coverage is quietly under‑insuring the margin you actually live with.
If your co‑op runs commodity and specialty lines, you have a direct financial stake in how it allocates overhead in survey responses — and a right to see that logic in writing.
Pull your last six milk checks. Find your mailbox price. Compare it to the All‑Milk number USDA published for those same months. That gap — not the futures board, not the co‑op newsletter, not the DMC margin printout — is the number that tells you how much of your income sits on the other side of formulas you didn’t write and still can’t fully audit.
Complete references and supporting documentation are available upon request by contacting the editorial team at editor@thebullvine.com.
Every week, thousands of producers, breeders, and industry insiders open Bullvine Weekly for genetics insights, market shifts, and profit strategies they won’t find anywhere else. One email. Five minutes. Smarter decisions all week.
Greg Bethard told a roomful of dairy operators he doesn’t want investors — he wants partners who know what a bad milk year smells like.
“We are looking for partners, not investors.”
That’s how Greg Bethard opened his talk at the 2025 MILK Business Conference. He’s the CEO and managing partner of High Plains Ponderosa Dairy near Plains, Kansas — a rotary‑parlor operation that ships milk to the Hilmar Cheese Co. plant in Dodge City and earned the 2025 Kansas Distinguished Dairy Award. Bethard has expanded without private equity, choosing people who already understand cows and volatility over funds that want out in five to seven years. Sitting beside him on the panel were TJ Tuls, a fourth‑generation Nebraska dairy farmer, and Hank Hafliger of Cedar Ridge Dairy in Filer, Idaho. Different herds, different structures, same basic bet: keep the timeline with the cows and the family, not the fund clock.
Nearly 4 in 10 U.S. dairy farms with off‑farm milk sales disappeared between 2017 and 2022. Cow numbers barely moved — still around 9.3–9.4 million head — but milk shifted hard into fewer, bigger herds. Those herds now face a blunt question: do you take fast capital and more leverage, or do you find slower money that lets you sleep at night?
The Fork Every Growing Dairy Hits
Any serious expansion now runs into the same wall: your own balance sheet.
USDA’s 2022 Census of Agriculture shows the number of dairy operations with off‑farm milk sales fell from 39,303 in 2017 to 24,082 in 2022 — almost 12,000 farms gone, roughly a 39% decline. Over that stretch, total cow numbers held near 9.3–9.4 million while milk volume climbed about 5%. Just over 2,000 herds with 1,000‑plus cows now produce about two‑thirds of the country’s milk by value, according to Census analysis and Rabobank estimates. PE funds look at that curve and see a defensive thesis. People still buy food in a downturn.
You know the other side of it. A heifer you raise this year won’t really pay back until her second or third lactation. You invest for years before you know whether genetics and cow‑care decisions actually worked. When you finance that biology with a five‑ to seven‑year buy‑grow‑flip model, something gives — either the cows, the capital, or your control.
Three Families, Three Very Different Paths
What made the MILK Business panel worth paying attention to wasn’t just that Bethard, Tuls, and Hafliger all said no to PE. It’s that each built a completely different alternative — and accepted the trade‑offs that came with it.
Operator
Capital Model
Structure
Geographic Anchor
Core Trade-Off
Exit Timeline
Greg Bethard— High Plains Ponderosa Dairy, KS
Patient ag-industry partners; no PE
Private partnership
Plains, KS → Hilmar Cheese, Dodge City
Slower growth; full cow-level decision control
None — family timeline
TJ Tuls — Nebraska, DARI Processing
Bank + infrastructure lenders for $165M greenfield plant
Family equity + bank debt; no outside shareholders
Multi-site family unified business
Filer, ID (moved from CA)
High people/alignment demands across kids and in-laws
None — family-controlled
PE-Backed Generic Model
Private equity fund; limited partners
Fund-controlled; DSCR covenants
Processor clusters; “packageable” geography
5–7 yr hold period; drag-along exit rights; covenant restrictions
5–7 years (fund clock)
TJ Tuls went vertical. His family is building DARI Processing at Nebraska’s Seward Rail Campus — reported in mid‑2025 coverage as the state’s first major greenfield dairy plant in more than six decades. Trade and state sources peg the project at about $165 million, designed to handle roughly 1.8 million pounds of milk per day, with groundbreaking in 2025 and start‑up targeted around 2027. When asked where he’d build a new dairy, Tuls didn’t hesitate: “Close to a milk plant.” His family decided to be the milk plant. Their capital partners are lenders and infrastructure‑focused entities, not limited partners, grading them on quarterly IRR.
The trade‑off is concentration. If DARI hits a rough patch — construction overruns, a slower ramp‑up, margin squeeze — every part of the family’s operation feels it. You swap processor dependency for execution risk. Not every family wants that exposure.
Hank Hafliger went structural. Cedar Ridge Dairy started in California before the family moved the operation to Filer, Idaho. Today, Hank owns it with three of his children and their spouses, running multiple dairy sites as a single unified business. No PE fund. No outside equity. Bank debt, retained earnings, and a family agreement that everything lands in one bucket. “By running them as one, we don’t have that ‘my dairy is doing better than yours’ conflict,” Hafliger told the crowd. “It’s about maturity, learning to relax and let things happen rather than trying to force them.”
That model asks a lot of people, not just paper. Not every family can operate three sites as one business without it fracturing. When it works, you get alignment across kids, in‑laws, and locations. When it doesn’t, the damage runs deeper than dollars.
Bethard went for patient partners with ag scars. High Plains Ponderosa has grown by bringing in people who already know what a bad milk year feels like — not financial sponsors planning a sale before the heifers from this year ever calve. He’s honest about the early expansion learning curve. “We have our 10,000 hours of experience now,” he said, borrowing Malcolm Gladwell’s mastery concept. “We’re going to screw stuff up. There are going to be bad days… But we keep going at it, and we’ll get it figured out.”
You don’t get to 10,000 hours if the business plan has a Year 6 expiration date.
What Does $6,638 of Debt Per Cow Actually Look Like?
Here’s where this stops being theoretical and starts hitting your spreadsheet.
Cornell’s July 2025 bulletin “Comparing New York dairy farm characteristics, costs, and returns by profitability, 2024” (PD‑2025‑08‑01) sorted 129 New York dairy farms into earnings quartiles. The patterns are stark. More profitable herds consistently carried less debt per cow, held stronger debt coverage ratios, and produced milk at a substantially lower cost per cwt than the least profitable group. In that dataset, the highest‑earning quartile averaged about $2,997 of debt per cow with a debt coverage ratio north of 5× — roughly five dollars of cash flow for every dollar of scheduled principal and interest. The lowest‑earning quartile? About $6,638 per cow, with coverage under 1×. Cash flow couldn’t cover the payments. And this was during a year when average net farm income per cow jumped sharply.
Even in one of the best income years in recent memory, the most leveraged herds couldn’t comfortably service their debt.
The cost‑of‑production gap runs parallel. Cornell’s public DFBS tables show top‑quartile farms producing milk several dollars per cwt cheaper than the bottom group — a function of better feed efficiency, labor productivity, and fixed‑cost absorption. Using a spread of roughly $6.53/cwt between the top and bottom quartiles, run that through a real herd: 2,000 cows shipping 280 cwt per cow per year gives you 560,000 cwt. Multiply by $6.53, and you’re looking at approximately $3.66 million per year in operating‑cost difference. Same milk prices. Same feed markets. Very different bank statements.
That’s New York data, not a national average — your region’s numbers will look different. But the pattern between top and bottom tends to hold across state farm‑business summaries. When any capital source — PE or otherwise — pushes you toward that $6,600‑per‑cow neighborhood before your earnings and cost structure say you belong there, the term sheet isn’t your biggest problem. The math is.
Is the Deal Built to Pencil — or Built to Sell?
This is the economic question you actually live with: can you still hit your numbers when things go sideways?
Highly leveraged structures — PE‑backed or just aggressive debt — usually come with tighter covenants than a traditional bank expansion. DSCR floors, restrictions on new borrowing, caps on capex, and sometimes approval requirements on major operational changes. None of that bites when milk is good, and feed is reasonable. It bites when you need breathing room.
You’ve probably had that year already. Health wreck, feed quality issue you chase for months, or a long run of heat that drags component tests. Your instinct says: slow expansion, keep youngstock, invest in a dry‑cow barn or fans, buy time to reset. Tight covenants can push in the opposite direction: freeze spending, delay maintenance, and more milk per stall. That’s the structural conflict Bethard described on the panel — not that PE is evil, but that the contract can force you to make the opposite call from what your gut and cows are telling you.
Then there’s drag‑along language. Many PE shareholder agreements give the fund the right to force a sale of the whole business when they exit. In corporate settings, that’s standard. On a family place, depending on how it’s written, it can short‑circuit a slow‑build succession plan. Cross‑industry family‑business research consistently reports that only about 30% of family businesses transition to the second generation, and fewer than 12–13% make it to the third. Contract provisions that accelerate a sale timeline don’t improve those odds.
Before you stare at the check size, it’s fair to ask: Is this structure built to pencil through your worst 12‑month stretch, or is it built to be easy to sell?
Can You Still Make Cow‑Level Decisions When Covenants Control the Budget?
This is the operational version of the same question.
Ask anyone who’s lived under tight covenants. The day‑to‑day pressure doesn’t feel like “capital structure.” It feels like arguing with your own spreadsheet about things you’d normally just do..
Do you need a lender sign‑off to build that fresh‑pen addition you know would take stress off transition cows? Does a board have to agree before you hang more fans, add a hoof‑trimming visit, or keep more heifers this year instead of selling? On paper, those are capital‑allocation decisions. In the barn, they’re cow‑care decisions that directly change milk, longevity, and cull rates.
Bethard was blunt on this point. When you pick partners, you’re also picking who sits at the table when there’s a tough quarter. He wants people who understand that holding onto extra heifers in a bad year can be the best long‑term move, even if it drags DSCR in the short run.
If a deal puts you in a position where every down‑cycle adjustment needs outside permission, you haven’t just sold equity. You’ve sold a chunk of how you manage cows.
Is Your Expansion Built to Stay — or Built to Flip?
Location exposes what you really believe about your time horizon.
Bethard told the audience that if he were siting a new dairy today, he’d look for “low environmental risk and a place without a lot of people.” Fewer neighbors, less legal risk, more room to run. Tuls’ answer was short: “Close to a milk plant.” For him, that means DARI — because that’s the anchor his family is building generations around.
Investors running a shorter‑term play often think about geography differently. They like production clusters that can be packaged with processing capacity and sold together: multiple herds within hauling distance of a plant, good roads, a neat story for the next buyer. That doesn’t automatically make a site wrong for a 40‑year plan. But it means you need to double‑check the long‑term water, permitting, and community story — not just the current land price.
Bethard noted you need a contract before you can even build now. That reality has pushed new capacity toward regions like western Kansas and the I‑29 corridor, where processors like Hilmar and Valley Queen are pulling milk into existence rather than chasing existing herds. If you’re choosing a spot for your grandkids to renew contracts in 2045, that’s a completely different filter than picking the easiest site to sell in 2032.
Options and Trade‑Offs for Farmers
You don’t need a PE term sheet on your desk for this to matter. Any expansion that stretches your balance sheet forces you to pick a path.
Expansion beyond bank capacity; multigenerational family
🟡 Yellow if partners want short-term return hurdles
3. Private Equity / PE-Style Equity
$4,500–$6,638+
May drop below 1.0× under covenants
Reduced — capex/hiring may require board approval
High — 5–7 yr hold, drag-along rights
Rapid roll-up, processing integration, very large facilities
🔴 Red if DSCR <1.0× in bad-year scenario
4. Slow-Build / Do Less, Better
<$3,500
Typically >1.5×
Full — sole-prop or tight family
None
Operations with sub-optimal cost structure needing reset
🟡 Yellow if facility is fundamentally inefficient
Path 1: Traditional Debt + Patient Partners
When it makes sense: You’ve got solid profitability, reasonable leverage, and a lender who understands your history. Your debt per cow sits closer to that top‑quartile DFBS band than the most leveraged group, and your coverage ratio stays above roughly 1.25× even when you run a bad‑year scenario.
What it requires: Clean financials, believable projections, and genuine working capital. In Cornell’s 2024 DFBS, the most profitable quartile held substantially more working capital relative to operating expenses than the least profitable group. You don’t need to match any specific benchmark exactly, but you need real cushion — not wishful thinking.
Risks and limits: You’re still exposed to milk price and interest‑rate swings. Size the project too aggressively relative to your earnings, and the “traditional” deal lands you in bottom‑quartile debt territory without a PE fund anywhere in the picture.
30‑day action: Pull your last 12 months of financials this month and calculate three numbers:
Debt per cow (total liabilities ÷ milking cows)
Debt coverage ratio (cash available for debt service ÷ scheduled principal + interest)
Working capital % ((current assets − current liabilities) ÷ annual operating expenses)
Then run your worst 12‑month stretch from the last five years through your next‑step plan. If this structure keeps DSCR above ~1.25× in that bad year, it stays on the table. If it drops below 1.0×, the red flag goes up.
Path 2: Strategic Partners Without a Fund Clock
When it makes sense: You need more capital than your bank will supply alone, but you want partners who’ll stay through cycles — family members, neighbors, or agribusiness investors who aren’t running a 5‑ to 7‑year fund. This is the space Bethard lives in, and it’s what Hafliger built with his kids and spouses across multiple Idaho sites.
What it requires: Hard conversations about control. Operating agreements that spell out who decides what: capex thresholds, hiring and firing senior managers, land purchases, and dividend policy. A common understanding that you’re building for 20–40 years, not dressing the place up for a sale.
Risks and limits: People risk. These deals fall apart when expectations around distributions, lifestyle, or succession were never put on paper. Even without PE, your partners may still want tighter covenants than a simple family sole‑prop structure.
Signals to watch: If a potential partner insists on sale or IPO timelines, short‑term return hurdles, or aggressive drag‑along rights, you’re drifting back into fund‑clock land. That’s not automatically wrong — but call it what it is.
Path 3: Private Equity or PE‑Style Outside Equity
When it makes sense: You’re chasing a very specific play: rapid multi‑site roll‑up, vertical integration into processing, or a large‑scale facility where the check size isn’t realistic any other way. Teams like Tuls’ on the processing side live near this territory, even if their specific capital stack isn’t classic PE.
What it requires: Exceptional cost of production, real management depth, and a story that sells in a boardroom as well as it does in the parlor. You need a cold‑eyed lawyer walking you through every clause: covenants, drag‑along, tag‑along, non‑competes, and reserved matters.
Risks and limits: The fund’s holding period is usually 5–7 years. That’s a heifer and a half. If milk prices and interest rates don’t cooperate, pressure to hit IRR targets can show up as stalled maintenance, pushed cows, or delayed people investments. At the family level, drag‑along language can force a sale on a timeline that doesn’t match the next generation’s readiness.
Forward‑looking signals: Where are interest rates headed over the next 3–5 years? How tight are current milk‑supply contracts in your region, and how long are they written for? Are lenders and investors pricing in environmental and labor risk — or assuming they’ll be gone by the time it matters?
What it requires: Patience. Relentless work on cost per cwt instead of headline herd size — feed efficiency, cow longevity, reproduction, labor efficiency. In DFBS data, the most profitable, lower‑debt farms didn’t just borrow less; they also produced milk several dollars per cwt cheaper. That combination is what gives them room to breathe.
Risks and limits: You may age out of opportunities if processors shift or neighbors move faster. And if your current facility is fundamentally inefficient, no amount of small tweaks fully fixes that.
Forward‑looking signals: Watch how processors tweak premiums in your area, what they say about components, and whether they start writing water‑ or sustainability‑linked clauses into contracts. That tells you how far a “do less, better” strategy can carry you where you sit.
Key Takeaways
If your expansion plan pushes debt past the mid‑$6,000s per cow, treat that as a hard yellow light.Cornell’s 2024 DFBS shows the lowest‑earning New York quartile at about $6,638 per cow with debt coverage under 1×, even in a strong income year. Top earners sat near $2,997 with coverage above 5×.
If one capital structure survives your worst recent 12‑month stretch and another fails the DSCR test, believe the math. Run both through your ugliest year. The structure that keeps coverage above roughly 1.25× when everything goes wrong is the one you can build on.
If you can’t approve cow‑comfort or youngstock spending in a down year without outside sign‑off, someone else is making your cow‑level calls. Any deal that pulls basic barn decisions into board or lender approval changes how you manage stress years.
If there’s drag‑along language, understand what it can force — and when. Cross‑industry benchmarks say only about 30% of family businesses survive to the second generation and fewer than 13% reach the third. You don’t want contract terms cutting those odds even further.
The Bottom Line
Hafliger’s grandkids are already counting cows. Bethard talks about 10,000 hours of expansion scars. Tuls is backing a $165 million plant with no exit date in the plan.
None of them got there quickly. All of them got there on terms they chose.
So here’s the question worth sitting with: five years from now, do you want to be explaining your decisions to a board — or to your kids?
We’re building the full debt‑per‑cow stress‑test model now — covenant math, leverage thresholds by herd size, and a PE‑vs‑partner calculator you can drop your own numbers into. Watch for it in The Bullvine Weekly and our follow‑up economics deep dive.
Source note: Quotes and panel insights are drawn from MILK Business Conference coverage in Dairy Herd Management. Financial patterns are based on Cornell’s 2024 Dairy Farm Business Summary bulletin, “Comparing New York dairy farm characteristics, costs, and returns by profitability, 2024” (PD‑2025‑08‑01).
Learn More
Squeezed Out? A 12-Month Decision Guide for 300-1,000 Cow Dairies – Secure your farm’s immediate future with this ruthless 12-month survival checklist. This guide breaks down labor costs by herd size and delivers specific “Action This Week” steps to protect your equity before the market decides for you.
Every week, thousands of producers, breeders, and industry insiders open Bullvine Weekly for genetics insights, market shifts, and profit strategies they won’t find anywhere else. One email. Five minutes. Smarter decisions all week.
When a Wisconsin dairy finally tested urine pH, their “negative” ration was doing exactly nothing — and the latest research says they’re far from alone.
Executive Summary: One herd in a published six-farm investigation was feeding negative DCAD at −100 to −160 mEq/kg DM and still averaged a urine pH of 7.2 — functionally alkaline — because 15.2 inches of bunk space caused enough sorting to gut the diet entirely. Goff’s 2025 meta-analysis (660 multiparous Holsteins across 9 studies) now provides parity-specific targets: 5.5–6.0 for 2nd–3rd lactation, 6.2–6.8 for 4th-plus cows, where dropping below 5.75 actually harms calcium status. The safety case for full acidification is stronger than the industry’s been acting — Graef’s trial put fully acidified cows at just 3.5 mmol/L urinary ammonium with blood pH steady at 7.39–7.41. SCH runs $125 to $226.46 per affected cow, depending on the model, and at 45–80% multiparous incidence, a 130-multiparous-cow herd faces $6,500 to $11,777 per year in avoidable drag. With the CDC’s 2.3% farmgate increase tightening input scrutiny in 2026, a 50-cent urine strip and 10 close-up cows will tell you whether your DCAD dollars are working in the cow or just living on the ration sheet.
You’re probably paying for a DCAD program you aren’t actually getting. In Wisconsin, the Schaefer family thought their −120 mEq/kg close‑up ration was bulletproof. The “Animate” bill was paid, the spreadsheet looked perfect, and the cows looked fine.
Then they finally dipped a 50‑cent urine strip. The average pH in their close‑up pen was 7.5. Their “negative” DCAD was doing exactly nothing. When they and their nutritionist rebuilt the ration actually to hit a 5.5–6.0 urine pH, their fresh‑cow list quietly shrank — fewer slow starts, fewer mild ketotics, and less time babysitting older cows in the first week fresh.
They’re not alone. In a published field investigation across six herds all feeding correctly formulated negative‑DCAD TMRs, one farm averaged a urine pH of 7.2 — not because the ration was wrong on paper, but because 15.2 inches of bunk space per cow caused enough sorting to neutralize the acidogenic diet entirely. The ration analyzed fine. The cows weren’t eating it the way the model assumed.
Here’s the twist the latest research adds: in fully acidified cows, the average urinary ammonium is just 3.5 mmol/L. That low ammonium number shows that low urine pH by itself does not equal acidosis danger. The real warning isn’t “don’t go too low.” It’s “stop being too timid” — because staying alkaline is what keeps subclinical hypocalcemia quietly chewing through your margins. With the CDC’s 2.3% farmgate price increase effective February 2026, pushing input scrutiny higher than ever, you can’t afford to keep writing checks for a program that isn’t actually working in the cow.
Why That 3.5 mmol/L Number Really Matters
In a recent trial led by Graef, Holsteins on a fully acidogenic pre‑fresh ration landed at a mean urine pH of 5.57 — squarely in the full‑acidification zone. The eye‑opener was their urinary ammonium.
At around 10 mmol/L, urinary ammonium is a reliable indicator of systemic acidification.
Once ammonium climbs above roughly 20 mmol/L, blood pH tends to drop by about 0.02 units — that’s where acid‑base safety becomes a real concern.
In the Graef work, cows never got close to either line at a urine pH most of us would call “aggressive.” Blood pH stayed in the 7.39–7.41 range, and serum bicarbonate sat at or near the lower edge of the typical 22–30 mmol/L window in related negative‑DCAD studies.
When your ration is properly balanced, full acidification (urine pH 5.5–6.0) operates safely within the cow’s compensation system. The danger zone isn’t “anything below 6.5.” It’s keeping cows alkaline because you’re afraid of numbers that the research says are actually safe.
How Low Is Too Low — And For Which Cows?
A 2025 meta‑analysis led by Jim Goff pulled together data from 660 multiparous Holsteins across nine studies to answer the question that really matters in the barn: which pre‑fresh urine pH ranges line up with better blood calcium after calving?
The answer changes with parity:
For 2nd‑ and 3rd‑lactation cows, the big step is just getting them out of the alkaline zone. Cows with prepartum urine pH below 7.75 had significantly better calcium status than those above that threshold, and driving pH lower within the acidified band didn’t provide much additional benefit.
For 4th‑lactation and older cows, the sweet spot is narrower. Cows with urine pH between 6.26 and 6.75 had the highest blood calcium nadirs, while cows above 7.25 or below 5.75 showed poorer calcium outcomes.
That moves you from a one‑size‑fits‑all DCAD target to a parity‑specific playbook.
Urine pH Targets by Parity
Cow Group
Target Urine pH
Blood Calcium Outcome
Key Threshold
Risk if Outside Range
2nd–3rd Lactation
5.5–6.0
Best Ca status; strong flux
pH must drop below 7.75
Staying alkaline (>7.75) impairs Ca
4th Lactation+
6.2–6.8
Peak Ca nadir in this band
Sweet spot is narrower
<5.75 harms Ca status
4th Lactation+
>7.25
Poor blood calcium nadir
Same group, high end
Alkaline = no DCAD benefit
Any parity — Danger
<5.5
Ca status trends wrong
Very low DCAD (~−220)
Uncompensated metabolic acidosis
If you’ve watched a mixed‑parity close‑up pen, you’ve likely seen this play out already. Second‑ and third‑calvers usually cruise on a hot close‑up ration. It’s the 4th‑ and 5th‑lactation cows that look duller, lose more condition, or keep showing up on the fresh‑cow problem list when the diet is pushed as hard as the youngsters’.
What Does “Safe” Full Acidification Actually Look Like?
Pull the DCAD research together, and the safety story is clearer than the coffee‑shop debates.
From recent trials and reviews:
Fully acidogenic diets drop urine pH into the 5.5–6.0 band, but blood pH hangs around 7.39–7.41, well above the 7.30 “start to worry” threshold for systemic acidosis.
In a 2022 JDS study, very low DCAD treatments reduced serum bicarbonate by about 8–9%, landing near the lower edge of the 22–30 mmol/L reference range; more moderate negative DCAD diets kept bicarbonate comfortably within normal limits.
In a Florida trial by Zimpel and colleagues, cows on a strong fully acidogenic program had urine pH around 5.4, but still carried ≈25 mmol/L bicarbonate — squarely normal.
The real trouble shows up in extremely negative DCAD experiments. A “very low DCAD” diet around −220 mEq/kg DM pushed cows into uncompensated metabolic acidosis with lower blood pH, depressed intakes, and clear metabolic strain. In a separate herd case, dry cows on a diet near −143 mEq/kg DM had urine pH in the 5.2–5.8 range; when the diet was adjusted to about −53 mEq/kg DM, postpartum blood calcium didn’t change — only the acid load and metabolic strain improved.
In practice, negative DCAD diets in roughly the −100 to −150 mEq/kg DM range, paired with adequate fiber and minerals, tend to put cows in a compensated metabolic acidosis zone — enough to prime calcium metabolism without pushing blood pH into dangerous territory.
The real‑world risk for most herds isn’t “too low” DCAD. It’s never getting low enough in the right cows, or pushing the oldest cows too far, because nobody ever checks a strip.
Biomarker
Normal Reference Range
Graef Trial (Urine pH 5.57)
Systemic Acidosis Threshold
Status
Blood pH
7.35–7.45
7.39–7.41
<7.30
✅ Normal
Serum bicarbonate (HCO₃)
22–30 mmol/L
~22–24 mmol/L (low-normal)
<18 mmol/L
✅ Within range
Urinary ammonium (NH₄)
—
3.5 mmol/L
>10 mmol/L (systemic marker)
✅ Far below threshold
Urinary ammonium (NH₄)
—
3.5 mmol/L
>20 mmol/L (blood pH drops)
✅ Far below threshold
Urine pH
—
5.57
Not a direct danger indicator
✅ Target achieved
How Much Is Subclinical Hypocalcemia Really Costing You?
Reviews and field surveys suggest SCH often hits 25–40% of first‑calvers and 45–80% of multiparous cows in high‑producing herds. That means roughly half or more of your older cows may be affected. Those are the ones that calve “fine,” then quietly drag around mild ketosis, metritis, DAs, and a few extra weeks open.
On the economics side:
A Progressive Dairy / University of Minnesota model built around a 1,000‑cow herd estimated SCH‑related losses — added disease, culling, and lost milk — at $67,938, or $226.46 per affected cow.
Prince Agri/Progressive analysis uses a more conservative $125 per SCH case and roughly $300 per milk fever case, while still accounting for both health and production impacts.
A 2022 study from North‑West Ethiopia estimated SCH losses at 3,026.25 ETB per cow per lactation, which the authors converted to about US$69.6 for their conditions.
Taken together, a realistic SCH cost range is around US$60 to US$ 226 per cow, depending on milk price, herd health, and how broadly you count ripple effects.
Micro barn math: what that looks like on your farm
Come back to a 200‑cow herd like the Schaefers, with 130 multiparous cows. Even if 40% of those multiparous cows are subclinically hypocalcemic — a conservative number given that 45–80% range — that’s 52 SCH cows in a year.
At the $125 per‑case estimate:
52 cows × $125 ≈ $6,500 per year in SCH‑linked losses.
The cost of SCH isn’t just in vet work and displaced abomasums. It’s also milk that never hits your bulk tank.
A series of trials looked at fully acidogenic pre‑fresh diets combined with higher dietary calcium— roughly 1.5–2.0% of diet DM — and followed cows through the first two months postpartum. Across those studies:
Cows on negative DCAD plus higher calcium showed stronger calcium flux around calving, maintained or improved pre‑fresh DMI, and had higher postpartum DMI than cows on low‑calcium acidogenic diets.
Those same cows produced more energy‑corrected milk (ECM) in early lactation than cows on positive DCAD or low‑calcium fully acidogenic diets.
Keep the barn math conservative. Say that program buys you 1 kg/day of ECM for the first 60 DIM in your multiparous cows. In that 200‑cow herd with 130 multiparous cows, that’s:
130 cows × 1 kg/day × 60 days = 7,800 kg of extra ECM.
Use the Ontario blend value of about $0.85/kg — based on DFO’s June 2025 average net of $87.96/hL after deductions — and you get:
7,800 kg × $0.85 ≈ $6,630 in extra milk revenue in the first two months of lactation.
(Note: these calculations use $0.85/kg based on Ontario’s June 2025 net blend; adjust to your local mailbox price. With the CDC’s 2.3% farmgate increase effective February 2026, your local number may now be slightly higher.)
Even if the real bump on your place is half that, you’re still talking several thousand dollars a year on top of avoided SCH‑linked disease. But you can’t tap any of that upside if the cows in front of you never actually reach the acidification zone you think you’re feeding for.
Is Your DCAD Program Actually Hitting Its pH Target?
The economic question underneath all of this is simple: Is your DCAD program working in the cows, or just on paper?
That published field investigation across six herds shows just how common the gap is. All six farms delivered TMRs that analyzed at a DCAD of −100 to −160 mEq/kg DM — right where they should be. All used the same commercial anionic product. But when urine pH was systematically collected from randomly selected multiparous cows over three days, not all farms met the 5.5–6.0 target. Farm 2 averaged 7.2 — functionally alkaline despite a correctly formulated ration. The culprit: 15.2 inches of bunk space per cow, which caused enough sorting and DMI disruption to neutralize the diet. Farm 4 had a similar miss tied to forage particle size and TMR mixing issues.
The lesson: DCAD value is a formulation number. Urine pH is what the cow is actually experiencing.
A practical monitoring protocol from Goff and others:
Sample at least 10 cows, or about 10% of the close‑up group, whichever is bigger.
Make sure they’ve been on the pre‑fresh ration for at least 48 hours, ideally 3–21 days before calving.
Catch urine 2–4 hours after cows get access to that ration, when pH is at its lowest and results are tightest.
Aim for around 80% of sampled cows to land in your target pH band.
Using the parity‑specific data:
2nd‑ and 3rd‑lactation cows: target urine pH 5.5–6.0 — full acidification, with safe blood pH and bicarbonate profiles supported by multiple trials.
4th‑lactation and older cows: target urine pH around 6.2–6.8, where Goff’s meta‑analysis saw the best calcium outcomes and a clear calcium decline below 5.75.
If your first audit comes back with an average of 7.2 — like Farm 2 in that field study — you don’t have “moderate DCAD.” You have a ration that isn’t acidifying those cows at all.
And if you see a string of older cows under 5.5, especially alongside intake or condition concerns, you’ve probably pushed anions too hard relative to fiber, magnesium, or overall palatability. That’s the edge where the very low DCAD work — down near −220 mEq/kg DM — tipped cows into uncompensated acidosis.
You can’t manage what you won’t measure. But you can buy a box of urine strips for less than a DA surgery — and a lot less than a weekend tied up in the hospital pen.
Are You Feeding Enough Calcium With Your Anions?
Old transition‑cow dogma said “never feed high calcium pre‑fresh.” Newer DCAD and mineral work says that, under a properly negative DCAD, high calcium plus anions is often where the payback is.
Across recent studies:
Cows on negative DCAD diets with 1.5–2.0% Ca in diet DM had stronger calcium flux, better postpartum DMI, and higher ECM than cows on low‑calcium fully acidogenic diets.
High‑calcium fully acidogenic diets did a better job of holding DMI than low‑calcium FAS diets, which showed bigger intake dips.
The chemistry catch is that calcium is alkalizing. When you bump dietary calcium — especially as carbonate — you usually have to adjust anion supply to hold the same urine pH. If you crank anions every time you bump Ca, and never check what cows are actually peeing, you’re back to guessing.
Too little anion with high Ca and high‑K forages, and you recreate the old “high‑potassium hay + high‑calcium close‑up” milk fever trap. Too much anion, especially in pens heavy with older cows, and you risk dragging that group below 5.5 pH, where Goff’s meta‑analysis saw calcium status trending the wrong way.
The sweet spot isn’t a single DCAD target on paper. It’s the balance between DCAD, calcium level, and who’s actually standing in your close‑up group.
Options and Trade‑Offs for Farmers
You’ve got four real ways to play this — none of them free, but all of them better than guessing.
1. 30‑Day Action: Audit Your DCAD in the Cows, Not on Paper
This is the low‑risk, high‑information starting point — the same move that exposed the problem in the Schaefer example and that documented field investigation.
Within 30 days, run a urine pH profile on your close‑up pen: at least 10 cows, or 10% of the group, 2–4 hours after feeding, on the ration for at least 48 hours.
Mark strips by parity (“P2–3” vs “P4+”) so you can see whether older cows live in a different pH band.
Sit down with your nutritionist and vet and compare those numbers to your calculated DCAD and your latest forage K analyses.
Patterns you’re likely to find:
Rations that look fully acidogenic on paper but leave cows at pH 7.0–7.8 because forage potassium came back higher than assumed — or, like Farm 2, because bunk space or mixing issues prevent cows from eating what you think they’re eating.
Older cows sit at 5.2–5.4, while younger cows hover near 5.8–6.0, and those same older cows are turning up too often on your “problem fresh” list.
This doesn’t fix the ration. It just tells you whether your main problem is being too timid overall, too aggressive with certain cows, or something as simple as bunk management.
2. Dial in Parity‑Specific Targets
If about a third or more of your close‑up pen is 4th lactation or older, Goff’s parity‑specific data says you shouldn’t chase the same pH for them as for your 2nd‑calvers.
In practice, that can look like:
Grouping by parity when barn design allows: a “mature‑cow close‑up” and a “younger‑cow close‑up.”
Running a parity‑specific mineral strategy: same base forage, slightly different DCAD and Ca levels by pen.
Re‑checking urine pH and, if you’re keen, spot blood calcium by group a couple of times a year.
You gain tighter support for the cows most likely to crash. You give up some simplicity and pen flexibility.
3. Strengthen Full Acidification + High Calcium Where It Fits
For herds with stable forage programs and a strong advisory team, leaning into full acidification plus higher calciumcan be a high‑return move.
Best fit when:
You’re already getting reliable mineral analyses back from your forage lab.
You’re willing to watch DMI, manure, and fresh‑cow health closely during any ration changes.
Your vet and nutritionist are aligned on DCAD targets and SCH benchmarks.
It demands:
Accurate DCAD math using up‑to‑date Na, K, Cl, and S lab numbers.
Dietary Ca in the 1.5–2.0% DM range.
Adequate magnesium and effective fiber to keep cows on feed.
Risks:
Over‑pushing anions to “fix” what’s really a forage‑testing problem, edging toward uncompensated acidosis.
Raising calcium without enough anion, which blunts the very calcium‑mobilizing system DCAD is designed to prime.
4. Stick With Partial Acidification — But Prove It
Some barns aren’t good candidates for full acidification: volatile forage potassium, no room to sort by parity, and limited labor.
In those systems, aiming for more moderate urine pH — often in the mid‑6s instead of around 8.0 — can still cut clinical milk fever risk compared with no DCAD program at all, even if you never push pH into the 5.5–6.0 band.
The key is honesty:
You likely won’t get the full SCH and ECM benefits seen in FAS + high‑calcium research.
You still have to test. A ration “designed” for pH 6.5 that yields pH 7.8 in the pen is cosmetic, not partially acidified.
As ingredient costs keep climbing, cosmetic programs are going to be harder to justify than well‑measured ones.
Key Takeaways
If you’re not pulling urine pH strips on your close‑up cows at least a few times a year, you don’t have a DCAD program — you have a DCAD expense. Start with a 10‑cow, 2–4‑hour post‑feeding sample and see if your cows are anywhere near your target pH.
If roughly a third or more of your close‑up group is 4th lactation or older, don’t chase 5.5 pH for everyone. Aim those cows around 6.2–6.8 and reserve the 5.5–6.0 band for 2nd‑ and 3rd‑calvers, where full acidification is both safe and effective.
If your SCH prevalence in multiparous cows is north of about 30% and you’re already paying for anionic salts, assume a verification gap before you decide “DCAD doesn’t work here.” Use the US$60–$226 per‑case range to ballpark what SCH might be costing you and whether a DCAD tune‑up pencils out.
If your ration DCAD is printed at −180 mEq/kg DM and your older cows are peeing at 5.2, you’ve probably gone past the point of diminishing returns. Back off anions until those cows’ urine pH and calcium status are closer to 6.5, then re‑check urine pH and calcium status instead of assuming “hotter” must be better.
The Bottom Line
You’re already writing checks for anionic salts and pre‑fresh minerals. It’s worth knowing whether those dollars are actually buying fewer SCH cows, more milk, and calmer fresh pens — or just living on a ration sheet. Start with that 30‑day urine pH audit. From there, you’ll know whether your next move should be more anion, more calcium, smarter grouping, or tighter forage testing.
If you want the deeper math — SCH calculators, DCAD formulation walkthroughs, or parity‑specific transition strategies — watch for the follow‑up playbooks and Bullvine Weekly breakdowns. Once you’ve seen your own pH strips, you won’t look at that “−120 mEq/kg” printout the same way again.
Complete references and supporting documentation are available upon request by contacting the editorial team at editor@thebullvine.com.
How 3D Printed Sensors Detect Subclinical Hypocalcemia in Cows Instantly – Stop the “silent thief” of calcium in its tracks using disruptive 3D-printed sensor technology. This emerging tool delivers a ten-second diagnostic advantage, allowing you to treat individual cows long before the clinical symptoms show.
The Sunday Read Dairy Professionals Don’t Skip.
Every week, thousands of producers, breeders, and industry insiders open Bullvine Weekly for genetics insights, market shifts, and profit strategies they won’t find anywhere else. One email. Five minutes. Smarter decisions all week.
On a 500‑cow herd, the jump from $1,140 to $3,010 per replacement eats $280,500 a year — roughly 10% of your gross. Have you recalculated your breakeven yet?
Executive Summary: Average U.S. replacement heifers just hit about $3,010 per head, and CoBank says the national pipeline will shrink by roughly 800,000 heifers before any rebound in 2027. USDA’s 2025 data shows 3.914 million milk replacements on hand — the lowest since 1978 — even as total milk climbed to 232 billion pounds on 9.50 million cows averaging 24,390 pounds each. For a 500‑cow herd replacing 30% annually, the jump from $1,140 to $3,010 per heifer adds about $280,500 a year in replacement cost, which is close to 10% of gross milk revenue at $20.40/cwt. Beef‑on‑dairy and heavy use of beef semen (7.9 million units on dairy in 2024) filled calf pens but quietly drained the heifer pipeline, especially in fast‑growing states like Kansas, South Dakota, Idaho, and Texas. The article walks through JDS modelling, NAAB semen data, and real farm examples to show when beef‑on‑dairy works, when it backfires, and how your 21‑day preg rate and semen mix determine whether you’ll have enough 2028 replacements. You’ll see three clear paths — lock the pipeline, choose margin over size, or push expansion — each with a 30‑day move you can take now so $3,000 heifers don’t quietly eat what’s left of your margin.
Record 2025 milk production was built on one of the thinnest heifer pipelines in decades — and over the next 12–18 months, herds from Kansas to the Upper Midwest will find out if their replacement math holds or breaks.
Ken McCarty of McCarty Family Farms still remembers trying to sell Holstein bull calves: “Two for $5” — with no takers. That kind of market teaches you not to count on calf checks to save the milk check. Fast‑forward to 2024–25, and beef‑on‑dairy calves are bringing $600, $1,000, even $1,400 a head in some barns. It feels like someone finally turned on a faucet that’d been stuck dry for years. (Read more: The McCarty Magic: How a Family Farm Became the Dairy Industry’s Brightest Star) But there’s a bill attached, and it’s landing in the form of four‑figure replacement heifers and a national heifer pipeline CoBank says will be roughly 800,000 head short of where it needs to be before a hoped‑for rebound in 2027.
If you milk cows in the U.S. right now — 150 stalls in Wisconsin, 1,500 in western Kansas, anything in between — your future herd is being shaped by the replacement math you run (or don’t run) in the next 90 days.
We traded our future for a quick calf check. Now the bill is coming due in empty stalls. That’s what the $3,000 hangover feels like when your heifer string is thin, and the sale barn is picked over.
Record Milk on a Starved Heifer Pipeline
USDA’s January 2025 Cattle report shows where the real squeeze is. On Jan. 1, 2025, there were 3.914 million milk replacement heifers, down from 4.34 million just two years earlier and roughly 4.78 million in 2018, and well below the 2016 peak of 4.81 million. Farm Progress put it plainly: dairy replacement heifers have tumbled to a 47‑year low.
CoBank’s August 2025 heifer report, built on those USDA inventories, projects the gap at 357,490 fewer dairy heifers in 2025 and another 438,844 fewer in 2026 — roughly 800,000 missing replacements across a two‑year window — before inventories begin to rebound sometime in 2027. As CoBank economist Corey Geiger put it: “We don’t see a rebound until 2027, and that will be up 285 thousand, but you’ve got to remember, that’s going to be after 800 thousand fewer heifers.”
Meanwhile, the top‑line production numbers look deceptively strong. USDA’s annual Milk Production summary, released February 20, 2026, puts 2025 U.S. milk production at 232.0 billion pounds, up 2.6% from 226.1 billion in 2024. The national milking herd averaged 9.50 million head for the year — up 153,000 from 2024. Milk per cow hit 24,390 pounds, up 218 pounds from 2024’s 24,172. Since 2016, total milk has climbed about 9%, while per‑cow output has risen roughly 7%.
Those extra pounds didn’t come from a lush crop of young cows behind the string. They came from hanging onto cows that, in any other cycle, would’ve been on a truck. CoBank’s analysis and slaughter data note dairy producers sent over 600,000 fewer cows to slaughter from late 2023 through 2024 as they tried to cover plant needs without the replacements to support normal culling. You bought time with older cows because the young stock to replace them either wasn’t there or wouldn’t pencil at current prices.
The industry celebrated record milk. It should’ve been counting heifers.
How Beef‑on‑Dairy Helped Create an 800,000‑Head Hole
The flip side of McCarty’s “two for five” story is the beef‑on‑dairy boom that followed. When Holstein bull calves couldn’t draw a bid, it made perfect sense to chase a calf check that finally moved the needle. By 2024–25, sale reports around the country had beef‑on‑dairy calves bringing $800, $1,100, even $1,400 — with some two‑ and three‑day‑old calves fetching about $1,000 in the Northwest, as Ever.Ag’s Mike North told Brownfield. That kind of money is hard to say no to when milk margins are thin.
A 2024 Purina survey found that almost three‑fourths of U.S. dairy farmers now actively crossbreed dairy cows or heifers with beef cattle, with another 16% considering it. NAAB’s 2024 year‑end semen report shows just how far the shift has gone: gender‑selected dairy semen hit about 9.9 million units, up roughly 1.5 million from the year before, while beef semen sales reached 9.7 million units, with 7.9 million of those used on dairy cows and heifers. Sexed dairy is now the largest semen category — and beef‑on‑dairy is firmly entrenched alongside it.
On paper, the strategy looks balanced: more sexed dairy on your best females, beef on the bottom end. On the national ledger, it didn’t balance out. CoBank’s “Dairy Heifer Inventories to Shrink Further Before Rebounding in 2027” lays it out: even with more sexed dairy semen in the mix, three straight years of aggressive beef‑on‑dairy use shrank the replacement pipeline heading into 2026.
And biology doesn’t rush. You’ve got conception, nine months of gestation, then roughly 22–24 months of rearingbefore a heifer freshens. Even if every dairy flipped to all‑dairy semen tonight, the first real wave of “correction” heifers wouldn’t be hitting parlors in bulk until late 2027 and into 2028 — right around the time CoBank expects inventories to begin rebounding.
Every beef breeding on a dairy cow in 2022–23 was a dairy heifer that doesn’t exist in 2025–26. You can’t dodge that math now.
What Does a $3,000 Heifer Actually Do to Your Check?
Here’s where the hangover shows up in plain numbers.
CoBank’s Geiger, using USDA Agricultural Prices data, traced the replacement arc across a decade. Dairy replacement values peaked at ,120 per head in October 2014, then fell nearly ,000 over five years to settle at ,140 by April 2019 — a price so low that those heifers were arguably worth more as beef than as future milk cows. It took almost a decade for prices to claw back. By April 2024, values had climbed to $2,140 — the same level as the 2014 peak — then pushed higher to $2,660 by January 2025 as tight inventories, not windfall milk margins, drove the move. By July 2025, Geiger says values hit an “unforeseen threshold” of $3,010 per head — a 164% jump from the 2019 trough and about 75% higher than the $1,720 reading in April 2023.
Those USDA averages still lag what some barns are seeing. Geiger notes “high‑quality Holstein replacement heifers have routinely fetched over $3,000 per head, with some premium heifers receiving over $4,000 per head in California and Minnesota auctions.” North told Brownfield that “some animals moving in the northwest last week were north of $4,000 an animal.” That’s not theory. That’s the check producers are writing today.
Now drop that onto a herd you can actually picture. Take a 500‑cow operation replacing 30% of its string annually — that’s 150 head a year. At the 2019 trough of $1,140 per head, your replacement bill sat around $171,000. At $3,010, it jumps to $451,500. That’s an extra $280,500 per year to keep the same number of stalls filled.
If you’re shipping about 75 pounds per cow per day, that 500‑cow herd moves roughly 13.7 million pounds of milk a year — about 136,900 cwt. At USDA’s 2026 all‑milk forecast of $20.40/cwt, gross milk revenue lands around $2.8 million. That replacement‑cost jump alone chews up roughly 10% of your gross.
USDA‑ERS cost‑of‑production benchmarks Bullvine has highlighted put full‑cost numbers for efficient large herds near $19.14/cwt. Against a $20.40 forecast, that’s about $1.26/cwt of breathing room — before replacements even enter the picture. You don’t have to be a spreadsheet person to see how fast $3,000 heifers chew through that.
Here’s the simple check you can run with your own numbers:
Replacement cost per cwt = (annual replacements × price per head) ÷ total cwt shipped.
If that number has more than doubled since 2019 and you haven’t updated your breakeven, your cash‑flow story and your actual economics are already out of sync.
Why Are Heifers So Scarce in the Growth States?
The heifer crunch isn’t spread evenly across the map. It’s piled up hardest in the same places that pushed U.S. milk to new highs.
State/Region
Cow Count Trend
Heifer Inventory Direction
Replacement Strategy
Risk Level
Kansas
Strong multi-yr growth
Shrinking — drawing from national pool
Primarily purchased heifers
🔴 High
South Dakota
+117% over 10 yrs (~215K head by 2025)
Under pressure from rapid expansion
Mixed raised/purchased
🔴 High
Idaho
Large gains — now #3 milk state
Tight; competes with Western demand
Primarily purchased
🔴 High
Texas
Rapid growth then cooling
Lost 10K heifers YoY (USDA data)
Purchased-heavy, margin-squeezed
🟠 Elevated
Wisconsin
Consolidation-led, steady output
Gained 10K heifers YoY
Raised, disciplined culling
🟢 Lower
Minnesota
Efficiency-led, steady
Stable — processor relationships strong
Raised, component-focused
🟢 Lower
Kansas has been one of the big growth engines. CoBank and regional coverage point to strong multi‑year expansion in Kansas milk output, driven by new barns and new processing plants in the southwest part of the state. Those cows have to come from somewhere, and more of them are being purchased rather than raised.
South Dakota is the poster child. Over the past decade, its dairy cow population has increased by about 117%, reaching roughly 215,000 head by 2025, fueled by expansions at processors like Valley Queen Cheese and Agropur and a concerted state‑level push to become a dairy corridor. Idaho added tens of thousands of cows and overtook Texas to become the No. 3 milk state, while Texas itself surged before weather and margin pressure cooled its growth.
Geiger warns that this draws on a thin heifer pool and, combined with roughly $10 billion in new U.S. dairy processing investments expected to come online through 2027, creates a looming pinch point for both farms and plants. Regions like Kansas, Texas, Idaho, and the I‑29 corridor are leaning hardest on a national heifer pool that’s at one of its lowest levels in nearly five decades. In some of those markets, bred heifers are bringing $3,000–$4,000 and still not covering all the demand.
The Upper Midwest has quietly taken a different path. USDA state numbers show Wisconsin and Minnesota together contributing a major share of national milk output, with growth coming mostly through consolidation and better performance per cow, not a rash of brand‑new mega‑barns. Wisconsin’s heifer inventory actually gained 10,000 headyear‑over‑year, while Texas lost 10,000, according to USDA data cited in Bullvine’s $3,010 analysis. That divergence comes down to processor relationships and infrastructure, not just breeding decisions.
In that Upper Midwest milkshed, processors and lenders talk constantly about quality and consistency. Compeer Financial’s Curtis Gerrits told Brownfield that Upper Midwest processors “are at a point where their farmers are doing such a great job and getting great high‑quality milk and a good amount of milk out of those animals that our processors are relatively full.” In a tight replacement market, those steady herds — strong components, disciplined culling, controlled expansion — often look better to lenders and plants than operations that depend heavily on debt‑financed growth and high‑priced purchased heifers.
Growth states chased cow numbers just as the replacement pipeline was thinning. Steady regions tightened up and let efficiency do more of the work.
What Does a $3,000 Heifer Do to Your 2028 Herd?
This is where your breeding sheet and the calendar slam into each other.
Every service you write this spring won’t show up in the parlor until late 2028 at the earliest. The heifers that will freshen in 2027 were mostly conceived in 2024–25, when beef‑on‑dairy was hottest and sexed semen use was still catching up. If your 2026–27 heifer crop already looks thin, you’re staring at decisions you made a couple of breeding seasons ago.
Economic modelling in the Journal of Dairy Science backs up what a lot of you can feel without a calculator. In one simulation of a 1,000‑cow Holstein herd, beef semen made the most economic sense when two things were true: beef‑cross calves were worth significantly more than dairy bull calves, and the herd’s reproductive performance stayed strong with targeted use of sexed dairy semen — 21‑day pregnancy rates in the 20–30% range, not in the low‑teens. When repro performance sagged, or sexed semen wasn’t used strategically, the more aggressive beef programs ran short on replacements, even though the calf income looked good on paper.
In Bullvine’s earlier coverage, one Minnesota producer’s allocation illustrated the hedging strategy many herds have adopted: 10% of cows bred to sexed Holstein and 90% to beef; for heifers, a 50/50 split between sexed dairy and beef. On the page, that sounds like a reasonable hedge — some calf revenue, some replacements. In the barn, that kind of allocation can leave one 300‑cow group with extra heifers and another group 20–30 heifers short. At $3,000 per head, that’s a $60,000–$90,000 swing in purchased replacements just from how you’re lining up semen today.
So the question isn’t “Is beef‑on‑dairy good or bad?” It’s “Does your current repro reality and semen strategy actually deliver the heifers you’ll need in 2028 — or are you penciling in daughters that don’t exist?”
Is Your 2026 Breeding Plan Already Two Years Behind?
If you spread your 2026 breeding sheet on the kitchen table tonight, would it set you up with more replacement options in 2028 — or fewer?
If your 21‑day pregnancy rate lives in the high‑teens or lower, that JDS modelling suggests you need to be very cautious about how much beef semen you’re putting on cows — especially if you’re not aggressive with sexed dairy on the right animals. You gain margin from beef‑cross calves today, but you give up flexibility down the road, particularly if you’re in a growth region where every neighbor is trying to buy heifers from the same thin pool.
The herds that will still have room to maneuver in 2028 are making deliberate choices right now:
Sexed dairy semen on the best animals — cows and heifers — where you actually want daughters.
Beef is reserved for the bottom end, or strictly for animals you’ve already decided won’t contribute replacements.
A hard count of how many home‑raised heifers that strategy should deliver each year — and how that compares to your real replacement needs over the next three years.
North told Brownfield he’s already seeing the inflection: “Some animals moving in the northwest last week were north of $4,000 an animal. That’s a pretty tall price, and so now, guess what? We’re seeing people starting to switch some of their breeding back to that replacement animal.” McCarty’s whiteboard this spring looks different from it did when his calves were going two‑for‑five. His family lived the downside of relying on calf checks to backstop the milk check — and at $3,000‑plus per replacement, the stakes on getting that breeding plan wrong have never been higher.
Three Paths — and the 30‑Day Move for Each
Let’s be blunt. You’re probably living one of these strategies already.
Strategy
Best For…
Key Risk
The “Must‑Do” Now
Path 1: Lock the Pipeline
Herds that want steady or modest growth and are willing to carry more youngstock
High heifer‑rearing cost and capital tied up in replacements if prices cool
Audit your sexed‑semen and heifer‑raising ROI at today’s $3,000‑plus values and set a clear sexed‑dairy target for 2026.
Path 2: Margin over Size
Stable or mid‑size herds in mature markets with solid processors
Missing upside if milk and premiums improve and plants chase volume
Push components and quality hard enough to be at the top of your plant’s sheet, and put a real ceiling on herd size in your plan.
Path 3: Push Expansion
New or expanding facilities tied to fresh processing capacity
Over‑leveraging debt into a market with $3,000–$4,000 heifers and export risk
Stress‑test your 3‑year plan at $19–$19.50 milk, $3,000 heifers, and tighter premiums before you pour more concrete.
Each column is a gut check. Where you land in that table matters more than what you tell your banker.
For Path 1, you’re choosing control over your replacement pipeline. That means more sexed dairy on your best females, a tighter culling list, and either an in‑house heifer program or a long‑term grower relationship that pencils at current feed and interest levels. The 30‑day move here is simple: sit down with your repro team and lender and decide how many sexed‑dairy pregnancies you actually need in the next 12 months to cover your 2028 replacement needs — then lock in how you’ll raise or contract those heifers at something close to today’s true cost.
For Path 2, you’re accepting a ceiling on cow numbers and choosing to compete on margin. That’s the path many Upper Midwest herds are already on — Compeer’s Gerrits described processors in that region as “relatively full” with high‑quality milk from their existing base. The key risks are missing upside if milk or premiums jump and plants start rewarding volume again, or getting sidelined if processors concentrate on a smaller number of mega‑suppliers. Your 30‑day move: update your breakeven and cash‑flow projections with current replacement and interest numbers — not 2022 figures — and sit down with your processor and lender to explain that holding or slowly shrinking cow numbers is a conscious survival strategy built around components and reliability.
For Path 3, you’re betting that your cost structure, processor relationship, and export demand can carry you through the heifer squeeze. Geiger points to roughly $10 billion in new U.S. dairy processing investments expected through 2027. U.S. dairy exports hit about $8.2 billion in 2024, one of the strongest years on record. That combination only works if export buyers keep writing checks, and your plant still needs every pound you can ship. Your 30‑day move is to run an honest stress test with your lender: what happens to your principal and interest coverage if all‑milk settles closer to $19–$19.50/cwt, replacement prices hold near $3,000 per head, and your base or premiums tighten by 10–15%? If those numbers don’t work on paper, they won’t work in the barn. In a $3,000+ market, remember: nobody sells their best two-year-olds. You are paying premium prices for the bottom half of someone else’s genetic progress.
Key Takeaways
If your replacement cost per cwt has more than doubled since 2019, recalculate your breakeven using today’s heifer values and the 2026 all‑milk forecast of $20.40/cwt — then take that updated math to your lender before the next renewal meeting.
If your 21‑day pregnancy rate is stuck in the high‑teens or lower, be cautious about how much beef semen you’re putting on cows; JDS modelling makes it clear that with weaker repro, aggressive beef strategies run short on replacements even when calf prices are strong.
If you’re buying replacements at $3,000‑plus and your total replacement cost per cwt is drifting toward $4.00 or more, you can’t stay on autopilot. Pick a path — pipeline, margin, or deliberate expansion — in the next 30 days instead of letting replacements “just happen.”
If you’ve already decided to hold herd size steady or shrink slightly, call your processor and lender within 90 days to explain that this is a strategy built around margin and reliability, not a slow slide — it changes how they look at your risk.
If your 2026 breeding sheet still looks like 2023, sit down this month and pencil out how many heifers it actually delivers by 2028. If the number comes up short of what you’ll need, adjust your sexed‑dairy vs beef allocation before this spring’s breeding season is in full swing.
The Bottom Line
The question worth putting on the whiteboard in your office this week isn’t “How much milk did we ship last year?” It’s “Where are our 2028 replacements coming from — and what happens to our cash flow if each one costs $3,000 or more?”
For some herds — especially the Upper Midwest operations that quietly tightened up while their neighbors chased growth — the answer is already baked in. For others in Kansas, South Dakota, Idaho, or Texas who built new capacity on the back of beef‑on‑dairy, the hardest conversations with bankers and processors may be right around the corner.
Which side of that line do you want to be on when CoBank’s projected 2027 rebound finally shows up — and how many stalls will you have to fill before it gets here?
If you want the deeper math — by herd size, region, and debt profile — Bullvine Weekly and an upcoming Tier 3 economics feature will break down the full herd‑flow replacement model. That’s where you’ll see per‑cwt cost curves and export‑shock scenarios. But the fork in the road starts here, with the numbers on your own whiteboard.
Complete references and supporting documentation are available upon request by contacting the editorial team at editor@thebullvine.com.
Learn More
Beef-on-Dairy’s $6,215 Secret: Why 72% of Herds Are Playing It Wrong – This breakdown reveals the exact 21-day pregnancy rate thresholds that make or break your beef-calf income. It delivers a concrete, performance-tiered roadmap to ensure your breeding mix actually adds to the bottom line without starving your future pipeline.
211,000 More Dairy Cows. Bleeding Margins. The 2026 Math That Won’t Wait. – This strategic deep dive exposes the structural reset currently hitting the industry, where $11 billion in new processing capacity meets record-low heifer inventories. It arms you with long-term positioning strategies to protect equity before the next market shift.
Every week, thousands of producers, breeders, and industry insiders open Bullvine Weekly for genetics insights, market shifts, and profit strategies they won’t find anywhere else. One email. Five minutes. Smarter decisions all week.
West River’s expansion near Morris could quietly cost every 500‑cow herd in the Upper Midwest shed $57,000–$86,000 a year — and the warning signs aren’t where you’d expect.
Executive Summary: Riverview’s proposed West River expansion near Morris, Minnesota, would take the site to 18,855 cows and add roughly 5.5 million cwt of milk a year into an already tight Upper Midwest processing shed. For a 500‑cow herd shipping 12,000 cwt a month, the article walks through how that single permit can realistically translate into a $0.40–$0.60/cwt hit on net mailbox price — about $57,600–$86,400 per year gone even if you don’t change a thing on your own farm. It shows how that pressure actually lands first in higher hauling charges, thinner component premiums, and quiet “market adjustment” lines, not in an obvious crash on the front of your milk check. Using current FO30 hauling data and Minnesota FBM debt‑service coverage ratios, it gives you a simple margin and DSCR stress test you can run on your last 12 months of milk checks. From there, it lays out a 30/90/365‑day playbook and three realistic lanes — scale, pivot to premium/efficiency, or plan a clean exit — with clear trade‑offs for each. The core takeaway: you can’t control Riverview’s 18,855‑cow bet, but you can decide now whether you’re treated as “core, flex, or fringe” before a $0.60/cwt drain quietly closes off your best options.
Riverview LLP wants to take West River Dairy near Morris, Minnesota, from 7,855 to 18,855 cows — 26,397 animal units on a single site in Synnes Township, Stevens County. The Minnesota Pollution Control Agency is taking public comments on the environmental assessment worksheet through April 9, 2026, after an administrative error forced the agency to re‑notice the EAW and extend the deadline.
If you’re milking 400–600 cows in that same marketing shed, the real question isn’t whether the permit gets approved. It’s what happens to your net mailbox price once roughly 5.5 million cwt of annual milk starts flowing from one driveway. Based on how hauling, premiums, and base programs have behaved in past long‑milk episodes across the Upper Midwest, a realistic band is −$0.40 to −$0.60/cwt. On a 12,000‑cwt monthly milk check, that’s $4,800–$7,200 per month gone without you changing a thing on your own farm.
When 26,397 Animal Units Land in a 280‑Cow State
If you’re running a 500‑cow herd in west‑central Minnesota, you don’t read that MPCA notice as abstract policy. You read it like a weather warning for your balance sheet. You’re already watching your debt‑service coverage ratio (DSCR), scanning every line on the milk check, and wondering if your kids will have a business to come home to.
West River’s expansion plan adds an 11,000‑cow dairy (15,400 AU) to the existing 7,855‑cow (10,997 AU) facility. The build includes a cross‑ventilated, total‑confinement freestall barn, covered clay‑lined liquid manure basins expanding storage from roughly 102 million to 250 million gallons, and about 13,200 acres of cropland in the manure application plan. Riverview is also seeking a water appropriation permit to pump up to 226 million gallons per yearfrom an off‑site well.
Environmental groups — Land Stewardship Project (LSP), Food & Water Watch, and others — are hammering away at water usage and watershed impact. That’s the whole point of the EAW process. Riverview, for its part, says its dairies are “designed and managed to meet or exceed strict environmental standards” and that this expansion “must comply with the state’s stringent permitting requirements.” The environmental fight will play out on its own track. For you, the more immediate issue is simpler and nastier: what does an 18,855‑cow barn do to hauling, base, and mailbox for a 500‑cow herd in a tight processing shed?
Minnesota’s average dairy herd has fewer than 280 cows, according to federal structure data cited by the Star Tribune in March 2026. West River comes in at more than 67 times that average. This isn’t about good vs bad, big vs small. It’s a capital signal. When regulators, lenders, and processors are being asked to sign off on a facility shipping more milk than dozens of family herds combined, the question shifts from “Am I efficient?” to “Where do I sit when plants and banks start ranking who matters most?”
Metric
Minnesota Average Dairy
Riverview West River (Proposed)
Gap
Herd Size (cows)
280
18,855
×67 larger
Animal Units
~392
26,397
×67 larger
Daily Milk (lb)
22,400
1,508,400
×67 larger
Annual Milk (cwt)
81,760
5,500,000
×67 larger
Manure Storage (gal)
~500,000
250,000,000
×500 larger
Water Use (gal/year)
~8,000,000
226,000,000
×28 larger
How Does an 18,855‑Cow Mega‑Dairy Hit 500‑Cow Mailbox Prices?
In public meetings and local coverage, Riverview partner Brady Janzen has argued that West River’s growth is a rational response to rising U.S. cheese demand. He points to USDA data showing per‑capita cheese consumption climbing from roughly 15 pounds in the mid‑1970s to around 40 pounds today. The logic is straightforward: if Americans keep eating more cheese, plants need consistent, high‑volume milk to stay efficient.
Riverview isn’t just adding cows. It’s also building the Stevens Milk Plant in Morris — an approximately 148,000‑square‑foot facility designed to process about 4 million pounds of milk per day into nonfat dry milk, skim milk powder, cream, and evaporated condensed skim milk, with roughly 65 jobs tied to it. The plant broke ground in mid‑2025 and is scheduled to start processing in November 2027, roughly the same timeline that LSP and local coverage expect for West River’s expansion to be fully online, if approved.
That timing matters. Riverview is building processing capacity alongside the new cows — not just dumping milk into a fixed system. But 4 million pounds of daily plant capacity absorbs only about 38% of West River’s expanded daily output at a conservative 80 lb/cow/day. The rest of the shed’s existing production still needs homes, and Riverview’s more than 125,000 cows in Minnesota already produce well over 10 million pounds each day.
Progressive Dairy’s 2024 “State of Dairy” series summed up the broader context: Upper Midwest processing capacity was “very tight”, milk was being hauled “crazy distances,” and switching processors often wasn’t an option. In that kind of shed, a new 18,855‑cow site doesn’t just “add supply.” It can help fill a new plant, yes — but it also reshapes every conversation about base, hauling, and which farms get treated as core vs expendable.
Renville County dairy farmer James Kanne sees the expansion through a very different lens. In LSP’s March 8, 2026, release, he argues that mega‑operations like Riverview’s have “glutted the market and tightened the stranglehold milk giants have on the industry,” pushing small and medium‑sized farms off the land. Whether you agree with that or not, his point matches what’s been happening when the Upper Midwest goes long: base programs kick in, over‑base milk gets discounted hard, and hauling plus “market adjustment” lines quietly bleed margin.
Family Dairies USA’s base program, rolled out in 2017, is one of the most transparent examples. The co‑op set a three‑month rolling production base plus a 1% cushion. Anything over that base wasn’t blocked, but general manager David Cooper shared that spot and over‑base milk often moved with $3–$4/cwt discounts, plus extra hauling and marketing costs, whenever the region was long.
At 80 lb/cow/day, an 18,855‑cow barn throws 1,508,400 lb of milk into the system daily — about 551 million pounds per year, or 5.5 million cwt, from a single site. That doesn’t guarantee your 500‑cow herd gets hammered. But it absolutely raises the odds that your shed crosses from “tight but manageable” into “structurally long,” where co‑ops lean harder on base, discounts, and balancing charges.
The $7,000 Monthly Leak Nobody Warns You About
Here’s the math you can actually run at your kitchen table.
Baseline 500‑cow scenario:
Herd: 500 cows.
Ship weight: 80 lb/cow/day.
Daily cwt shipped: 500 × 80 ÷ 100 = 400 cwt/day.
Monthly cwt (30 days): 12,000 cwt/month.
Plug your own herd and cwt into the same structure.
Step 1: Hauling — the small punch that still hurts
Once a mega‑site becomes a route anchor, haulers redraw for density. Long lanes get built around big barns. Smaller, out‑of‑the‑way farms pick up more deadhead miles.
A 2025 FO30 staff paper on Upper Midwest hauling charges found the weighted average hauling deduction jumped from $0.4202/cwt (May 2023) to $0.5033/cwt (May 2024) — a 19.8% increase in a single year, before West River’s expansion even comes online. Stevens County itself sits below that average because Morris is a processing magnet. But if you’re 30–40 miles out and not on the optimized path to a giant barn, you’re on the wrong side of those averages.
Period / Scenario
Hauling Charge ($/cwt)
Monthly Cost (12,000 cwt)
Annual Cost
Change
May 2023 (FO30 Weighted Avg)
$0.4202
$5,042
$60,508
—
May 2024 (FO30 Weighted Avg)
$0.5033
$6,040
$72,475
+19.8%
Stevens County (Current Est.)
$0.45
$5,400
$64,800
—
Your 500-Cow Scenario (Post-Expansion)
$0.55
$6,600
$79,200
+$1,200/mo
Use a conservative scenario: your hauling inching up by $0.10/cwt over a couple of route changes.
$0.10/cwt × 12,000 cwt = $1,200/month extra hauling.
That’s $14,400/year to get the same milk to a plant.
On its own, you can probably eat that. The real trouble is what shows up on the same check.
Step 2: Basis and premiums — where the real damage happens
When a shed goes long, and plants are full, the pain doesn’t show up in one big blood‑red line. It shows up in a bunch of small ones. Based on prior Upper Midwest long‑milk runs:
Quality/component premiums get trimmed, or their formulas reset, so the same butterfat and protein net $0.25–$0.75/cwt less.
Balancing and “market adjustment” charges take another $0.10–$0.25/cwt when milk has to move farther or into weaker outlets.
You don’t assume the full $3–$4/cwt spot‑load pain from Family Dairies USA across every pound. You assume you keep your core base, but your shed is now structurally long, and the weaker parts of the check start bleeding.
A realistic combined band: −$0.40 to −$0.60/cwt.
On 12,000 cwt per month:
$0.40 × 12,000 = $4,800/month → $57,600/year.
$0.60 × 12,000 = $7,200/month → $86,400/year.
That’s the $7,000‑ish leak. It doesn’t come all at once. It trickles out through hauling, weaker premiums, and quietly rising “market adjustments.”
How fast does your cushion disappear?
Minnesota dairy herds in the FBM program had a DSCR of 1.94:1 in 2024 — solid on paper. The year before, the dairy‑specific DSCR was 0.86:1. That means the average Minnesota dairy in that dataset couldn’t fully cover its debt service from operating income in 2023.
One year took DSCR from healthy to “eating equity.” Another year clawed it back. That’s how volatile the floor really is.
Now overlay the $0.40–$0.60/cwt shed hit:
If you’re sitting at 1.4–1.5 DSCR today and lose $0.50/cwt for 12–18 months, you’re skating very close to that 0.86 world again.
Once you drop below 1.0, every payment comes partly from your balance sheet, not just your milk.
That’s the part your lender will see before your family does.
Quick Margin Check: Your Shed, Your Numbers
Don’t guess. Pull your actual numbers and run this:
Grab your last 12 months of milk checks.
Calculate your average net mailbox price — that’s after hauling and all adjustments.
Subtract $0.40/cwt, then $0.60/cwt.
Multiply each by your average monthly cwt shipped.
Call your lender and ask: “If my net price dropped by that much for 12–18 months, what would my DSCR look like compared to 2023 dairy portfolios?”
If that math puts you under 1.0 — or even under 1.2 — you now know how much clock you actually have if your shed goes long.
The Turn: When the Check Still Looks Fine, But Your Options Don’t
For a while, your milk check still looks “okay.” Components haven’t crashed. Basis hasn’t blown out. There’s no single ugly line that screams “You’re in trouble.”
The early warnings show up in how people talk to you:
Your field rep shifts from “We need all the milk we can get” to “We really need everyone to hold production flat this year.”
A neighbor gets told the co‑op won’t take an extra Sunday load without a deep discount.
Someone else mentions getting a quiet warning: “If you add those heifers, you might land in a new over‑base bucket.”
On the check, you start seeing:
A new “market adjustment” line shaving $0.10–$0.20/cwt.
Component formulas tweaked so the same butterfat and protein pull in a bit less.
It’s death by a dozen small cuts.
The “Core vs Fringe” Reality Nobody Likes to Say Out Loud
Here’s the part you never see in a newsletter. When a shed goes long, who keeps base and who gets squeezed is only partly about SCC and components. It’s also about politics.
A Family Dairies USA federal order brief years ago described local producers as “intent on protecting their markets” and pushing for regulatory fences around who got pool access. That fight was about interstate pooling, but the same instincts show up inside a shed when base‑allocation gets tight. When managers sit down to decide who’s “core,” three things matter:
Volume. Bigger, consistent loads are easier to build routes and plant schedules around.
History. How long you’ve shipped, how you behaved in the last crunch.
Relationships. Whether your field rep goes to bat for you in that meeting.
SCC and components matter. But they’re not the whole story.
Instead of waiting for a base letter to officially label you, you can force that conversation early.
Sit down with your field rep with a one‑pager: 12‑month CWT, SCC, components, and a couple of years of history.
Ask three blunt questions:
“Today, are we core, flex, or fringe?”
“If you had to protect 60–70% of volume in a crunch, where would we land?”
“What two things in the next 12 months would move us closer to core?”
Then take that same one‑pager, plus your −$0.40 and −$0.60/cwt margin scenarios, to your lender.
Ask: “At these three margins — current, −$0.40, −$0.60 — where does my DSCR land? How many months could we tolerate each before my file starts to look like 2023 again?”
Most bankers will tell you straight:
About a year at a lower margin if it’s planned.
Two years start chewing equity.
Three years make expansion or refinancing a hard sell in the credit committee.
The myth you’ve got to drop is: “I’ll know I’m in trouble when my milk check tanks.” By the time that happens, your best options — core base protection, decent refinance terms, or a clean exit — are already narrowing.
The 30/90/365‑Day Playbook After a Mega‑Dairy Permit
You don’t control West River’s permit. You do control how your operation is positioned when 10,000‑plus cows show up in your shed.
30 Days: Own Your Numbers
Run your “minus $0.60/cwt” stress test. Use the quick margin check above. If your DSCR drops under 1.0, you’ve identified a structural risk, not a nuisance.
Get ahead of your lender. Bring three numbers: your actual margin and the two stress‑test margins. Ask for your last two years of DSCR trends. If 2023 already shows a dip, you know how thin the ice is.
Audit your contracts. Highlight:
Termination clauses and notice periods.
Base vs over‑base rules.
Who’s on the hook for hauling if a route changes?
Any “discretionary” premium language. If your contract says “market conditions” can trigger changes on 30–60 days’ notice, and premiums are at the buyer’s discretion, that’s a big red flag in a long‑milk shed.
90 Days: Clarify Your Status
Get your label from your buyer. Core, flex, or fringe. Don’t let it be a secret. Ask what specific changes would move you up a rung — better components, steadier volume, less drama on pickups.
Shop alternatives with real data, not promises. FO30’s 2024 weighted average mailbox price was $21.22/cwt, versus $21.80/cwt for all federal order areas. You’re starting $0.58 behind. A new buyer only makes sense if you can document at least +$0.25–$0.50/cwt net after hauling and with equal or better base security — and only if they can show you 12 months of real checks.
Tighten your quality profile. Cull chronic high‑SCC, low‑production cows that drag your herd average. Get yourself into your buyer’s top quality tier now, before they reset how premiums are paid when the shed goes long.
Scale Up, Pivot, or Get Out: Choosing Your Survival Lane
As MPCA works through the EAW and Rep. Kristi Pursell pushes for mandatory Environmental Impact Statements on 10,000‑AU feedlots, mega‑builds are formally on the table in Minnesota. You’ve got roughly a year to decide which game you’re playing.
Lane 1 — Scale:
You work with your lender on a 3–5-year plan to add cows, showing how you can reduce the fixed cost per cwt enough to offset a $0.40–$0.60 regional hit. Then you ask your buyer straight:
“If we grow to X cows by [year], does that move us into your core base or just make us a bigger flex farm?”
If the lender is nervous and the buyer can’t give you a clear path to core, scale probably isn’t your answer.
Lane 2 — Pivot to Premium/Efficiency:
You’re not going to out‑Riverview Riverview. But you can reduce how much any mega‑permit dictates your fate by:
Locking in premiums that depend on quality/components, not just volume.
Tightening your crop‑livestock loop to drop purchased feed cost per cwt.
Exploring specialty channels that sit outside FO30’s pure commodity stream.
If you can realistically push butterfat up 0.10–0.15% and protein up 0.05–0.10% at the same or lower feed cost, and your co‑op or plant pays decent component premiums, you can claw back a meaningful chunk of that $0.40–$0.60/cwt loss through your own cows instead of someone else’s permit.
Lane 3 — Planned Exit:
If your honest margin stress test shows your DSCR sliding back toward 2023’s 0.86 with no believable fix in sight, a 12–24 month exit while your balance sheet is still strong might be the smartest move on the table.
On a 500‑cow herd:
A $0.40/cwt hit costs about $57,600/year.
A $0.60/cwt hit costs about $86,400/year.
Stay in that position for three to five years, and you’re looking at $173,000–$432,000 in cumulative lost equity. That’s the difference between walking away with fuel for the next chapter — or walking away with just enough to pay off the last one.
What This Means for Your Operation
Don’t wait for the base letter. Treat any new 10,000‑plus permit in your shed as your starting gun for the 30/90/365‑day plan, not as something to file mentally under “policy news.”
Use $0.40–$0.60/cwt as your personal stress‑test band. If dropping your net price into that range for 12–18 months pushes your DSCR below 1.0 — or even under 1.2 — that’s a sign you need a structural answer, not small cost cuts.
Remember, your region starts behind. The FO30 Upper Midwest mailbox price is already $0.58/cwt below the all‑order average. You’ve got less margin to play with than your peers in richer orders.
Watch behavior, not memos. Field reps talking about “holding production,” routes being “optimized” around new big barns, and extra loads being refused are your real‑time indicators that your shed is tipping long.
Don’t move processors without proof. Don’t uproot a 500‑cow herd on a recruiter’s pitch alone. Ask for real mailbox data versus FO30’s weighted average and base terms in writing.
In the next 30 days, pick up the phone twice. Once to your field rep with that one‑pager and three blunt questions. Once to your lender, with your −$0.40/−$0.60 margins pencilled in, asking how many months your DSCR can live there.
Key Takeaways
If a mega‑dairy helps knock $0.40–$0.60/cwt off your net price, you’ve got roughly 12–24 months to either offset it or plan an exit before your balance sheet starts making decisions for you.
The real hit isn’t one big line on your milk check; it’s the combination of higher hauling, thinner premiums, and new “market adjustments” that add up to $60,000–$80,000 a year on a 500‑cow herd.
Your shed already sits $0.58/cwt below the national mailbox average, so the same shock that a Texas or Idaho herd can absorb might push a Minnesota herd back into 2023‑style DSCR territory.
“Core vs fringe” is political as well as technical. Volume, history, and relationships matter as much as your SCC when plants decide who they hold onto in a long‑milk year.
The Bottom Line
Riverview isn’t the villain here. They’re playing the game as it’s written — vertically integrated from cow to powder plant, scaling across six states, lining up processing for their expansion. The real question is whether you’re still playing the game you signed up for — or just waiting quietly for the clock to run out.
Complete references and supporting documentation are available upon request by contacting the editorial team at editor@thebullvine.com.
Every week, thousands of producers, breeders, and industry insiders open Bullvine Weekly for genetics insights, market shifts, and profit strategies they won’t find anywhere else. One email. Five minutes. Smarter decisions all week.
Jakob Stevens just sued Nutrien, Mosaic, CF Industries, Koch, and Yara. His math: 85% of the 2022 fertilizer spike wasn’t gas prices. It was them.
Executive Summary: Jakob Stevens sued the fertilizer giants: Nutrien, Mosaic, CF Industries, Koch, Yara, and Canpotex. Fire Creek Farms leads the class action alleging price collusion for 2021–2023. DOJ’s on it too. Texas A&M says natural gas drove 15% of the spike. The other 85% hit your 500‑cow dairy for $43,500 extra in 2022. That’s $0.35/cwt sneaking into your milk check. Test your manure this month. Recalibrate to MRTN. Time those buys right. The court might take years. Your pit’s got nitrogen now.
On March 7, 2026, New York farmer Jakob Stevens filed what may be the first class‑action lawsuit to put a number on what fertilizer price collusion costs U.S. farms. His family operation, Fire Creek Farms, is the lead plaintiff in Stevens et al v. Nutrien AG Solutions et al (No. 1:2026cv02585, U.S. District Court, Northern District of Illinois). The defendants: Nutrien AG Solutions, Mosaic Company, CF Industries, Koch Agronomic Services, Yara International, and the Canpotex export consortium. The complaint alleges their conduct pushed fertilizer prices above competitive levels during 2021–2023. All of the defendants deny wrongdoing or are expected to contest the allegations; none of these claims has been proven in court.
You don’t have to wait for a verdict to see what that window did to your own invoices.
University of Illinois farmdoc economists Gary Schnitkey, Nick Paulson, and Carl Zulauf tracked what happened in real time. In September 2021, total fertilizer cost on Illinois corn ground averaged $175 per acre. Twelve months later, it was $247 per acre. That $72‑per‑acre jump, applied to a 500‑cow Midwest dairy running 500 acres of corn silage and 300 acres of alfalfa, works out to roughly $43,500 in extra fertilizer in a single crop year — before you talk about fuel, interest, or labor.
What the Companies Made — and What You Paid
Start with the scoreboard the fertilizer giants filed themselves.
Nutrien reported $7.7 billion in net earnings in 2022. By 2024, full‑year net earnings had dropped to $700 million — still big, but less than a tenth of that peak. Mosaic booked $3.6 billion in 2022 net income, according to its year‑end SEC filing. CF Industries reported $3.35 billion in 2022 net earnings attributable to common stockholders, up from $917 million in 2021 on the same metric. Those are audited numbers, not allegations.
Company
2021
2022
2024
Nutrien
$2.1
$7.7
$0.7
Mosaic
$1.3
$3.6
$1.1
CF Industries
$0.9
$3.4
$1.2
Now look at your side of the ledger. In Illinois — a good stand‑in for Corn Belt pricing — anhydrous ammonia averaged $788 per ton on September 23, 2021. By September 22, 2022, it was $1,318 per ton. Earlier that year, prices blew past $1,600 per ton through April before easing. The previous record, set during the 2008 commodity spike, was $1,161 per ton. That record was already history by October 2021.
Benton County, Iowa, farmer Lance Lillibridge put his own numbers on it in a Brownfield Ag News interview. “In January, I was buying anhydrous ammonia for $490 a ton,” he said, talking about 2021. “In February of this year, ammonia was $850 a ton. The price difference in corn is about 20 cents less right now than it was in 2021.” Same product. Same acres. A very different risk.
Lillibridge raises corn and Red Angus cattle near Vinton, not dairy cows, but his math is your math if you grow your own feed. “When we’re jacking up prices of fertilizer 77% on a product that’s actually in the states right now and in warehouses because of something that’s happened half a world away, that’s not right,” he told Brownfield. He’s saying out loud what a lot of people only muttered at the counter.
How Much of Your 2022 Fertilizer Bill Was “Market” — and How Much Was Margin?
You heard the explanation at the time: Russia, Ukraine, natural gas, logistics. All real. All ugly. But not the whole story.
Texas A&M’s Agricultural and Food Policy Center (AFPC) took that story apart in a study commissioned by 21 state corn organizations. They tracked what portion of the anhydrous ammonia price spike from late 2020 through October 2021 could be pinned on its main input, natural gas. Their conclusion: natural gas accounted for only about 15% of the price increase.
Month
Anhydrous Ammonia ($/ton)
Henry Hub Natural Gas ($/MMBtu)
Sep 2020
$380
$2.10
Mar 2021
$490
$2.65
Sep 2021
$788
$5.15
Feb 2022
$1,425
$4.85
Apr 2022
$1,635
$6.80
Oct 2022
$1,318
$5.45
The total increase in anhydrous ammonia over that window was roughly $680–$688 per ton, depending on the exact date. Of that, only about $102 per ton traced back to higher natural gas costs. The remaining $580‑ish per ton — around 85% — reflected other factors: supply/demand shifts, capacity decisions, trade policies, and market power. “The suggestion that recent increases in the price of natural gas are the primary reason for increases in the prices of nitrogen products is highly suspect,” the AFPC report stated.
AFPC’s model farms saw nitrogen costs increase by $52.07 per acre. That’s not a Twitter hot take; it’s a land‑grant economist with a spreadsheet. And AFPC never said that 85% of the increase was collusion. They said natural gas explains only a small slice. In a market where a handful of firms dominate production, that disconnect is part of why farmers like the owners of Fire Creek Farms are now asking a federal judge to look harder at pricing behavior.
The Barn Math: Follow Your Own Invoice
Let’s walk through the numbers so you can run them on your own acres.
Assumptions (from farmdoc daily, September 2022):
500 acres of corn silage at 220 bu/acre yield potential
170 lbs of N per acre from anhydrous ammonia (MRTN rate)
DAP and potash are applied at maintenance rates
300 acres of alfalfa receiving P‑K applications
Illinois AMS fertilizer prices:
Input
Sept 2021 Price
Sept 2022 Price
Change
Anhydrous ammonia
$788/ton
$1,318/ton
+$530/ton
DAP
$633/ton
$947/ton
+$314/ton
Potash
$475/ton
$857/ton
+$382/ton
Corn fert/acre
$175/acre
$247/acre
+$72/acre
On your 500‑acre corn base, that $72/acre increase is $36,000. On 300 acres of alfalfa, a reasonable maintenance P‑K program under those price swings adds roughly $4,000–$7,500, depending on soil tests and removal.
Component
Sept 2021 ($/acre)
Sept 2022 ($/acre)
Nitrogen (anhydrous)
$95
$155
Phosphate (DAP)
$52
$78
Potash
$28
$14
Total
$175
$247
Total: $40,000–$43,500 in extra fertilizer spend.
Break it down per cow and per cwt for a 500‑cow herd:
500 cows shipping roughly 68 lbs/day each will ship about 12.5 million lbs per year — that’s 125,000 cwt.
At $0.35/cwt in additional costs, a cow producing 25,000 lbs/year is costing you $87.50 more just in fertilizer overhead — before she even hits the parlor.
Swap in your own acres, rates, and invoices, and you’ll get your number. A thirty‑five‑cent hit doesn’t sound like much until you lay it over a year where your margin is already thin. When your milk check is at $14.59, and your cost of production is over $20.50, an invisible $40,000 leak isn’t background noise. It’s a trap.
Who Really Controls Your Fertility Budget?
You’ve heard pieces of this before. When you see it all in one place, it hits different.
Between 1984 and 2008, the number of nitrogen‑producing firms in the U.S. fell from 46 to 13 — a 72% reduction. Over the same period, the count of active ammonia plants dropped from 59 to 22. By 2018, the four largest producers controlled about 75% of total U.S. ammonia output.
Metric
1984
2024
Number of nitrogen-producing firms
46
13
Active ammonia plants
59
22
CF Industries alone held 38.8% of domestic anhydrous ammonia capacity and 50.2% of UAN capacity in 2021, according to comments the American Soybean Association filed to USDA’s “Access to Fertilizer” docket. AFPC’s 2024 update put CF, Nutrien, Koch, and Yara‑USA at roughly three‑quarters of U.S. nitrogen production between them.
In potash, North American capacity is dominated by a couple of players, with Canada’s Canpotex consortium coordinating offshore sales by agreement. Mosaic petitioned for anti‑dumping duties on phosphate imports in 2020. CF filed petitions that led to preliminary anti‑dumping margins of up to 127.19% on Russian UAN and 63.08% on Trinidadian UAN in early 2022. Those cases were brought under U.S. law and upheld by trade authorities at the time.
Every one of those moves was legal. Taken together, USDA and AFPC analysts say they’ve contributed to a more concentrated market and less competitive pressure on the domestic prices farmers face. So when someone tells you your 2022 fertilizer bill was “just the market,” it’s fair to ask which market they mean — the global gas market, or a domestic nitrogen market where a small number of firms have outsized influence over how much ammonia gets produced and the price range it trades in.
If DOJ Wins, Do You Ever See a Check?
Short version: probably not in time to help your 2027 plan, and maybe not at all.
The best precedent is the potash price‑fixing litigation that’s been grinding through the same federal court in Chicago since 2008. Mosaic and Potash Corporation of Saskatchewan each paid $43.75 million, with Agrium adding $10 million, for a total of roughly $97.5 million. Russian and Belarusian producers contributed another $12.5 million. Between 3,000 and 5,000 potash buyers made up the class, mostly wholesalers and direct buyers.
Farmers who bought potash through co‑ops or retailers were “indirect purchasers.” Some recovered through separate state‑level settlements, but not much, and it took years.
And there’s another catch. Criminal antitrust fines go to the U.S. Treasury, not to you. Any direct farmer payout would come through the civil case. Antitrust damage claims typically carry a four‑year statute of limitations under Section 4B of the Clayton Act. The clock usually starts when the overcharge happens, though courts can extend it under the discovery rule or the “continuing violation” doctrine.
A lot of your biggest fertilizer checks for 2022 were written in the spring of that year. Four years from spring 2022 is spring 2026. That’s right now.
If you think your operation took an unusually large hit, talk to a U.S. lawyer who understands antitrust and class actions instead of assuming someone else’s case automatically covers you. The Stevens lawsuit and any DOJ or USDA actions are about alleged past behavior. They don’t fix your next fertilizer bill.
Here’s the turn nobody in the DOJ coverage is giving you: regardless of what any court decides, you’ve still got levers to pull on your own operation. The collusion question is interesting. But the nitrogen sitting in your manure pit right now is actionable.
Are You Getting Paid for the Nitrogen Already in Your Pit?
A 500‑cow dairy throwing off 2.5 to 3 million gallons of liquid manure a year is already sitting on a big chunk of its own nitrogen. Typical dairy slurry runs 25–35 lbs of total N per 1,000 gallons, with 40–60% of that plant‑available in year one. Spread across your corn ground, that’s roughly 50–100 lbs of plant‑available N per acre, with most herds falling in the 60–90 range.
If you’re only crediting 40 lbs of N per acre for manure in your plan — off a book value from an old extension table — and your manure is actually delivering 80, you’re buying about 40 lbs of nitrogen per acre that you don’t need. At 82% N in anhydrous, that’s about 49 lbs of product per acre, or 0.024 tons. At $850/ton — roughly where Lillibridge saw prices in early 2026 — that’s $20–$21 per acre, or $10,000–$10,500 across 500 corn acres.
That’s just from bad crediting. No collusion required.
Extension work from Virginia Tech and Ontario shows that injection can more than double plant‑available nitrogen recovery compared to splash‑plate or surface broadcast on the same gallons. At the 2022 peak nitrogen prices, that extra recovery pencils out to roughly $50–$62 per acre in fertilizer value on every field where you switch from broadcasting to injection.
The key is that your Nutrient Management Plan has to catch up. If you’re injecting but your plan still assumes broadcast losses, you’re leaving money on the table twice — overbuying fertilizer and under‑documenting your stewardship.
30‑day action: Before you plant another acre, pull a current manure sample and send it to a lab. Bring the results and your last two years of fertilizer invoices to your agronomist. Ask one question: “If we assume injection on my closest corn fields and use these lab numbers, how many pounds of purchased N can we cut — and on which fields?”
What Can You Actually Change in Your Nutrient Plan Before the 2027 Crop Year?
The Corn Nitrogen Rate Calculator that Schnitkey and his team helped build gives you a Maximum Return to Nitrogen (MRTN) rate for your soil region, at today’s corn and N prices. At a $5.50 corn price and $1,318 per ton anhydrous, the September 2022 Illinois conditions — MRTN rates ran from 157 lbs of N/acre in northern Illinois to 185 lbs in the south.
Farmdoc’s Precision Conservation Management data shows profit peaks right at those MRTN rates — not at the higher “just in case” rates a lot of us grew up with. Profits actually improve when you cut back to the university recommendation at current prices. On 500 acres at $850/ton ammonia, a 20‑lb/acre reduction saves roughly $5,200 in N without touching yield.
Nitrogen Rate (lbs/acre)
Yield (bu/acre)
Gross Revenue ($/acre)
Fertilizer Cost ($/acre)
Net Return ($/acre)
“Typical” Rate (180 lbs)
218
$1,199
$93
$1,106
MRTN Rate (160 lbs)
217
$1,194
$83
$1,111
But here’s the trade‑off: if you’ve got fields where yield is limited by drainage, soil type, or compaction, nitrogen isn’t the bottleneck. Cutting rates there won’t help. It’s a field‑by‑field question, not a blanket one.
90‑day action: Run the MRTN calculator for your state and soil region at current prices. Then ask your agronomist, “Why are we above this number?” If they can’t show you a clear, field‑specific reason, that’s a red flag.
And timing matters as much as rate. Farmdoc’s price series shows farmers who locked in anhydrous in late summer or early fall 2021 paid $700–$800 per ton. Many who waited until spring 2022 wrote checks for $ 1,400+. That’s a $600/ton spread. On a 500‑cow outfit using 50 tons of product, that’s a $30,000 timing mistake.
Track three numbers once a month: NOLA barge urea, Henry Hub natural gas, and your co‑op’s current quote vs where you locked last year. When urea and gas fall back toward long‑term averages, and your local quote follows, that’s your buy window.
365‑day action: Before fall 2026, decide what percentage of your 2027 N you’re comfortable locking at a threshold tied to gas and urea. Write that threshold down. Share it with your lender and supplier so emotion isn’t driving the call.
Key Takeaways
If your 2022 fertilizer cost per acre on corn was north of $247, you were above the Illinois state average at the peak. If you’re well above it, you owe yourself an “invoice autopsy” by field.
If your manure analysis is older than two years — or you’ve never done one — assume you’re either under‑crediting nutrients or over‑applying somewhere. A $40–$60 test can unlock $10,000+ in annual N savings at today’s prices.
If your agronomist can’t show you MRTN rates for your soils at current prices, you’re not having an economics conversation. You’re having a tradition conversation.
If you haven’t looked at when you buy — only what you buy — you’re leaving timing money on the table. In 2021–2022, that timing penalty was $600 per ton for some farmers on anhydrous.
If your 2021–2023 fertilizer documentation lives in a shoebox, you’re not ready if this class action or similar cases move forward. Courts and lenders both run on paper.
The Bottom Line
Whatever DOJ proves, and whatever happens to Nutrien, Mosaic, CF, Koch, Yara, and Canpotex in court, none of that writes the check that covers your 2027 crop. A U.S. judge might sign off on a settlement in 2030. Your lender wants to know what your fertilizer plan looks like at renewal this fall.
Before you make another purchase, ask yourself one hard question: If nitrogen jumps again — whether it’s war, weather, or something else — have you actually pulled every lever you control, or are you still just signing whatever shows up on the counter?
If you want the deeper margin modeling behind this, our breakdown of feed costs and hidden economics is the next stop. And keep an eye on The Dairy Trap Files: Input Costs — fuel and custom harvest are up next. Same pattern.
This article is based on publicly available information as of March 14, 2026, and is for general informational purposes only. It is not legal advice.
Complete references and supporting documentation are available upon request by contacting the editorial team at editor@thebullvine.com.
Learn More
MANURE TO MONEY: How Smart Dairy Farmers Are Turning Waste into Serious Profits – Slash thousands from your input bill by viewing your pit as a high-margin asset. This guide reveals how to transform manure from a liability into liquid gold, delivering the specific ROI benchmarks needed to reclaim your margins today.
$14.59 Milk, $20.54 Costs: The $182,850 Margin Trap Squeezing 500‑Cow Herds – Gain a clear-eyed framework for surviving the structural “deadly middle” that’s currently squeezing mid-sized herds. This report exposes the hidden market forces at play, arming you with the strategic clarity needed to protect your equity through 2027.
Why In-Season Manure Application Will Transform Your Dairy’s Bottom Line – Capture a 10-15% yield bump by disrupting your traditional nutrient cycles with emerging application tech. This analysis delivers the methodology for precision in-season delivery, allowing you to bypass price-gouging volatility and capture maximum nitrogen efficiency.
The Sunday Read Dairy Professionals Don’t Skip.
Every week, thousands of producers, breeders, and industry insiders open Bullvine Weekly for genetics insights, market shifts, and profit strategies they won’t find anywhere else. One email. Five minutes. Smarter decisions all week.
50K vanished from WI 300-cow dairy’s Jan check. Von Ruden blames FMMO make allowances. Yours?
Executive Summary: In January 2026, a 300-cow Wisconsin dairy watched $50,000 vanish despite shipping the same milk to the same plant under the same management. This massive revenue hemorrhage is the direct result of the FMMO’s new “make-allowance” deductions—a structural 90¢/cwt tax that processors now skim off the top before you see a dime. While the industry touts federal “safety nets,” the cold math reveals a brutal 23-to-1 gap where DMC pennies cannot stop formula-driven dollar losses. This is not a market anomaly; it is a fundamental wealth transfer from the barn to the plant that your own co-op likely bloc-voted into existence. To survive, producers must audit their statements, isolate their specific “hidden drag,” and demand immediate accountability from leadership before their equity evaporates. Your January check wasn’t just a disappointment—it was a warning shot for an 18-month fight for survival.
At the National Farmers Union’s 124th annual convention this March, Wisconsin Farmers Union president Darin Van Ruden stood up in a delegate session and dropped a number that stuck: about $50,000. That’s how much less a 300‑cow dairy operator in southwest Wisconsin received on his January 2026 milk check compared with January 2025, according to Van Ruden.
He told Brownfield Ag News this wasn’t a model herd or a spreadsheet example. It was a neighbor he’d spoken with the week before — 300 cows, southwest Wisconsin, same plant, same truck, roughly $50,000 gone in one month. The cows didn’t change. The formulas did.
From $20.47 to $15.05: What Changed in a Year
Before you argue about anyone’s $50,000, look at the numbers every FO30 producer faced.
The Upper Midwest FMMO (Order 30) statistical uniform price for January 2025 was $20.47/cwt. In January 2026, it was $15.05/cwt — a year‑over‑year drop of $5.42/cwt. That’s the base reality under every milk check in the order.
Commodity prices did plenty of damage. CME butter’s monthly average price slid from $2.6042/lb in January 2025 to $1.4266/lb in January 2026, down about $1.18/lb — roughly a 45% crash. Cheddar blocks dropped from $1.8954/lb to $1.4003/lb, a 26% hit. FO30’s January Class III price followed that slide, falling from $20.34/cwt in 2025 to $14.59/cwt in 2026 — off $5.75.
Product
Jan 2025 Price
Jan 2026 Price
Change
CME Butter
$2.6042/lb
$1.4266/lb
–$1.18/lb (–45%)
Cheddar Blocks
$1.8954/lb
$1.4003/lb
–$0.50/lb (–26%)
FO30 Class III
$20.34/cwt
$14.59/cwt
–$5.75/cwt (–28%)
FO30 Class I Util
7.7%
7.7%
No blend cushion
And FO30 is built to feel that pain harder than most. Class I made up just 7.7% of pooled producer milk in the order in 2025 — the lowest share of any federal order. Almost everything else is Class III and IV. When cheese and butter break, there isn’t much Class I volume to pull the blend up.
Handlers behaved exactly how you’d expect in that setup. In January 2026, FO30’s producer price differential was $0.46/cwt, and an estimated 2.6 billion pounds of eligible milk weren’t pooled — more than the 1.4 billion that stayed in the pool. When more milk sits outside the pool than inside it, you don’t have a healthy pricing system. You have a blender that’s barely plugged in.
Where the Missing 90¢/cwt Really Went
That $5.42/cwt drop in FO30’s uniform price is not all structure. A big chunk is just a miserable butter and cheese month. But there’s a permanent piece baked into your check now, and that’s the make‑allowance jump.
Make allowances are the manufacturing‑cost numbers USDA subtracts from surveyed cheese, butter, powder, and whey prices in the FMMO formulas. When those numbers go up, class prices go down by the same amount. USDA’s modernization package raised the allowances effective June 1, 2025:
Product
Old make allowance
New make allowance
Change
Cheese
$0.2003/lb
$0.2519/lb
+5.16¢ (25.8%)
Butter
$0.1715/lb
$0.2272/lb
+5.57¢ (32.5%)
NFDM
$0.1678/lb
$0.2393/lb
+7.15¢ (42.6%)
Dry whey
$0.1991/lb
$0.2668/lb
+6.77¢ (34.0%)
American Farm Bureau Federation economist Danny Munch ran those new allowances through 2020–2023 markets. His Market Intel analysis found that higher make allowances alone would have lowered average FMMO class prices by about $0.92/cwt for Class III, $0.85/cwt for Class IV, $0.89/cwt for Class I, and $0.85/cwt for Class II. That’s not worst‑case. That’s the average.
AFBF then looked at what that would have done to pool values. Over just three months — June through August — higher make allowances stripped about $337 million out of producer pools nationally, including roughly $64 millionfrom the Upper Midwest, $62 million from the Northeast, and $55 million from California. That’s money that would’ve been in milk checks under the old formulas.
Yes, USDA did throw some offsets into the same package. The final rule restores the “higher‑of” Class I mover, revises Class I differentials, and updates composition factors so higher‑solid milk gets recognized at 3.3% protein and 9.3 lb SNF instead of the old 3.1/8.7. But timing matters. Make allowances went up on June 1, 2025. The composition factor change didn’t kick in until December 1, 2025. For six months, producers received the full cost increase with no solid‑adjustment relief.
If you want the deeper class‑by‑class walk‑through, The Bullvine’s own FMMO Reset analysis uses AFBF’s numbers to show how that roughly 90¢/cwt drag plays out across orders and herd sizes. The short version: there’s now a structural discount sitting in your class prices that won’t disappear just because butter has a good month.
How Much Did the FMMO Rewrite Actually Cost Your January Milk Check?
Now let’s get close to home.
Take the herd Van Ruden talked about: 300 cows in southwest Wisconsin. If that operation is shipping about 85 lb/cow/day in January, that’s roughly 7,905 cwt in 31 days.
FO30’s statistical uniform price dropped $5.42/cwt from January 2025 to January 2026. The straight arithmetic on that herd looks like this:
7,905 cwt × $5.42/cwt = $42,845 less on the check, just from the change in the uniform price at test.
But FO30’s “at test” milk isn’t 3.5% butterfat. In January 2026, pooled butterfat averaged 4.52%, with protein at 3.42%. At the same time, the butterfat component price fell from $2.9487/lb in January 2025 to $1.4525/lb in January 2026 — a collapse of $1.4962/lb. That hits all the butterfat you’ve bred and fed for above 3.5%.
Layer in premium changes. Plants facing lower class prices and higher make allowances have every reason to trim or restructure volume incentives, quality bonuses, and over‑order payments. You don’t see those cuts in a USDA bulletin. You see them when your “other credits” line shrinks.
When you add the FO30 uniform‑price drop, the butterfat collapse on high‑component milk, and likely premium erosion, you’re suddenly right in the neighborhood of Van Ruden’s $50,000 example for a 300‑cow herd. The exact number belongs to that family. The order‑level math says the story is believable.
Now pull out the structural part. AFBF’s modeling suggests that higher make allowances alone cut FMMO class prices by roughly 90¢/cwt. Here’s what that looks like across herd sizes at 23,000 lb/cow annual production:
Herd size
Annual cwt
90¢/cwt drag/year
Monthly drag
150 cows
34,500
$31,050
$2,588
300 cows
69,000
$62,100
$5,175
500 cows
115,000
$103,500
$8,625
1,000 cows
230,000
$207,000
$17,250
That’s what “structural” means. Those dollars disappear off the table every year until formulas, cost surveys, or utilization change. Markets might add to or subtract from that. The drag itself stays.
And when you park that drag next to the Farm Bill safety net? The Bullvine’s GT Thompson 2026 Farm Bill pieceshows a 200‑cow herd gaining roughly $1,800/year in improved DMC payouts while losing about $42,240/year from higher make allowances. That’s a 23‑to‑1 gap. For every dollar DMC gives back, the formula takes twenty‑three.
How Much Did the Formula Change Actually Cost Your January Check?
Now it’s your turn.
Step 1: Put a real number on your January‑over‑January price.
Grab your January 2025 milk statement. Take net pay (after hauling, dues, and fees) and divide by total cwt shipped. Write that number down.
Do the same for January 2026.
Subtract 2025’s $/cwt from 2026’s $/cwt. That difference is your real‑world January drag.
Step 2: Separate what the market did from what the formula did.
Look at the same FO30 numbers Van Ruden’s neighbor faced:
Class III price: $20.34/cwt → $14.59/cwt (down $5.75).
Butter: about $2.60/lb → $1.43/lb (down roughly $1.18/lb).
If your $/cwt drop is roughly in line with those moves, most of your pain is “just” the butter and cheese crash. Whatever you can’t explain with those class‑price and butter moves is where the structural make‑allowance hit and co‑op decisions are hiding.
Step 3: Put a number on the “hidden” part.
If your unexplained gap sits under 30–40¢/cwt, your buyer might already be buffering some of the structural drag with premiums or patronage.
If it’s over about 50¢/cwt, especially in Class III‑heavy orders like the Upper Midwest and Central, you’re almost certainly feeling that ~90¢/cwt structural penalty from higher make allowances plus whatever your plant adjusted in premiums.
You don’t need an economist to tell you if Van Ruden’s neighbor is alone. That three‑step math will answer the question for your own barn.
Step
Calculation
Your Number
1
Jan 2026 net $/cwt – Jan 2025 net $/cwt
$ ______
2
FO30 uniform price drop (baseline: –$5.42/cwt)
–$5.42/cwt
3
Butterfat price collapse (–$1.50/lb on 4.52% avg)
~$ ______ /cwt
4
Unexplained gap (Step 1 minus Steps 2 + 3)
$ ______
5
If unexplained gap > 50¢/cwt: Structural drag + premium cuts likely
Can You Recapture 90¢/cwt Through Components, or Is This a Permanent Loss?
A lot of advisors will tell you the path is simple: “Just make it up on components.”
There’s truth in that — up to a point. FO30 herds have pushed components hard. Pooled butterfat averaged 4.52% and protein 3.42% in January 2026. The December 2025 composition factor change in the final rule now prices “standard” milk at 3.3% protein and 9.3 lb SNF, up from 3.1/8.7, so you finally get some formula credit for the progress you’ve already bred and fed.
If you’re behind that bar, there’s money on the table. Picking up 0.1–0.2% protein through sire selection, grouping, and ration tuning in a decent Class III month can add 20–25¢/cwt. That’s real.
But look at what happened to the underlying prices you’re stacking that on. In January 2026, the protein price in FO30 was $2.1768/lb, down from $2.9307/lb a year earlier. Butterfat went from $2.9487/lb to $1.4525/lb. You’re trying to outrun a 90¢/cwt structural haircut with component premiums that are themselves sitting on a lower base.
And the system still doesn’t pay you full world value for the fat you ship. In The Bullvine’s butterfat deep‑dive, we showed FMMO formulas paying around $1.71/lb for butterfat at a time when Global Dairy Trade butterfat equivalents were closer to $2.95/lb — a gap north of $1.20/lb. You can crank out more fat, but the pricing system captures barely half its export value for you.
What about DMC? The 2026 Farm Bill draft raises Tier I coverage to 6 million pounds — roughly 260 cows at 23,000 lb —, but anything you ship beyond that is in Tier II or uncapped. USDA and Progressive Dairy coverage show the program helping when margins collapse, but even in “tight” years, the realistic annual benefit is low thousands of dollars on a 200‑cow herd — against roughly $42,240/year lost to higher make allowances in the GT Thompson example. DMCs aren’t designed to track structural formula changes dollar-for-dollar. It’s a margin band‑aid.
So yes, push components. Yes, use DMC intelligently. Just don’t fool yourself into thinking you can component your way out of a 90¢ structural discount that hits every cwt you ship.
Options and Trade-Offs for Farmers
You can’t undo June 1, 2025, on your own. You can decide how you’re going to respond to what it did to your check.
Path 1: Stay Put and Force the Conversation (Your 30‑Day Move)
This path fits if your co‑op or buyer has generally been fair on hauling, basis, and access, and you’ve got some runway.
Here’s the 30‑day checklist:
Print your January 2025 and January 2026 milk statements.
Calculate your net $/cwt for each and the gap between them.
Highlight the part you can’t explain with Class III, Class IV, and butter moves.
Bring those pages to your next district or annual meeting and ask three straight questions:
How did we vote in the FMMO modernization referendum — yes, no, or bloc‑voted by the co‑op?
How much did higher make allowances cost our pool in 2025 and 2026, in dollars and cents per cwt?
What are we doing — via premiums, over‑order pricing, or patronage — to push some of that value back toward member checks?
The risk with this path is time. The FMMO hearing process that produced this package took years. Nobody should be promising a quick redo.
Path 2: Shop Quietly for a Better Milk Check
This path makes sense if you’re consistently 50–60¢/cwt behind neighbors shipping similar milk to another buyer, and you have leverage left — equity, cow quality, location.
You’d need to:
Compare net pay — after hauling, dues, and fees — with producers on other trucks.
Price out hauling, quality penalties, balancing charges, and contract fine print before you even hint at switching.
Equity factor that might get stranded if you leave a co‑op for a proprietary processor.
There’s real upside if another buyer structurally pays closer to class value. But you give up governance and some safety if milk markets get ugly. And in some regions, the “different” hauler still leads back to the same corporate plant.
If you want a sober look at how chasing a higher pay price can still leave you in a margin trap, pair this piece with The Bullvine’s coverage on $14.59 milk against $20‑plus/cwt cost of production — the DSCR math isn’t pretty.
Path 3: Model a Managed Exit While You Still Have Leverage
Nobody wants to be the one to say this, but here it is: some operations already know $15–16/cwt milk with a 90¢ structural drag, and current debt loads won’t pencil long term.
This path fits if:
Your DSCR is stuck under roughly 1.20× at $15–16 uniform prices, and you’ve been there more than a quarter.
You’re putting bills in a stack instead of paying them as they arrive.
Your lender has already started asking for more “updated” projections.
You’d need to:
Build an 18‑month cash flow projection at today’s price levels and at one or two “what if” scenarios.
Sit down with your lender now, not when covenants are already broken.
Price what a step‑back or exit looks like while cull cow and beef‑cross prices are still decent.
Selling cows into strength on your terms almost always preserves more equity than waiting until the bank’s credit committee decides you’re done. It’s ugly. It still beats pretending the structural drag doesn’t exist.
Path 4: Fight the Structural Battle Beyond Your Farm Gate
If the problem is structural, part of the solution has to live in D.C. hearing rooms and comment dockets.
This path fits if:
You can keep the wheels on long enough to care what FMMO 2030 looks like.
You’re angry enough to turn your drag number into testimony, not just coffee‑shop talk.
It looks like:
Submit written comments to USDA the next time pricing hearings or make‑allowance surveys open up, with your herd size, order, and real $/cwt drag front and center.
Pushing your state associations and co‑ops to take specific positions: mandatory processor cost surveys, automatic adjustments tied to verified costs, and a path for make allowances to come down if costs do.
Using Farm Bill touchpoints — like the GT Thompson draft — to argue that a $1,800/year DMC fix against a $42,240/year make‑allowance hit isn’t “modernization.”
You won’t see these efforts reflected in your next milk check. But if producers don’t show up with barn‑floor math, the only numbers on the table will come from people whose margins just got protected.
Key Takeaways
If your unexplained January‑over‑January gap is more than about 50¢/cwt after you factor in Class III, Class IV, and butter moves, treat that as structural drag — not just a bad month. That’s the make‑allowance change and premium structure, and it will hit every cwt you ship until something changes in the formulas or your contracts.
If your DSCR can’t stay above roughly 1.20× at $15–16/cwt uniform prices, you need a written 18‑month plan — not just hope for “better milk.” That’s the line where most lenders start looking harder at restructuring or collateral.
If your co‑op or buyer can’t explain how they voted on FMMO reform and what they’re doing to offset the drag in one clear conversation, treat that as a data point. You have every right to know how your volume was cast and where the money went.
If you missed the 2026 DMC sign‑up, don’t miss the 2027. Run the USDA or AFBF decision tools against your own margins at $15.05 blend and $14.59 Class III, then decide ahead of enrollment how much coverage is worth paying for.
Print the Statements Before Your Next Meeting
Somewhere in southwest Wisconsin, a 300‑cow operation walked into 2026 shipping milk to the same plant in an order where average butterfat hit 4.52% — and opened a January check roughly $50,000 lighter than the year before, if Van Ruden’s account is right. About 90¢/cwt of that hit came from the pricing formula changing underneath them. The rest came from a butter-and-cheese crash that FO30 is structurally exposed to. Only one of those problems is guaranteed to cycle back on its own. fb
Before your next co‑op or lender meeting, do the thing most people keep putting off. Print your January 2025 and January 2026 statements. Run your own $/cwt math. Circle the part you can’t explain with commodity moves. Then lay those pages on the table and ask:
“If this is what the new rules did to my milk check, what’s our plan to change that math?”
If you want to go past envelope math into full spreadsheets — region‑by‑region drag, component strategy, DSCR stress tests — The Bullvine’s FMMO Reality Check analysis and Farm Bill/DMC coverage are built for that deeper dive. Next month, we’ll run this same barn math on a 1,000‑cow Upper Midwest herd and see whether scale fixes the equation — or makes the hole bigger.
Complete references and supporting documentation are available upon request by contacting the editorial team at editor@thebullvine.com.
Learn More
More Milk, Fewer Farms, $250K at Risk: The 2026 Numbers Every Dairy Needs to Run – Stop guessing and start calculating with this essential 2026 playbook. It reveals how mid-size herds can close a $250,000 margin gap by sharpening culling and heifer programs, giving you the immediate tactical advantage to outrun negative cash flow.
Every week, thousands of producers, breeders, and industry insiders open Bullvine Weekly for genetics insights, market shifts, and profit strategies they won’t find anywhere else. One email. Five minutes. Smarter decisions all week.
One farm ET that barely penciled out. Four decades later, the bull from that flush shapes 60% of Select’s lineup — and your herd’s inbreeding curve.
To-Mar Blackstar EX-93-GM: the coal-black Chairman son from Marengo, Iowa, who topped the TPI list, sold 500,000 doses, and left a 15.8% relationship to every Holstein alive. Photo: Remsberg.
One pregnancy.
That’s what Randy Tompkins got from his first embryo transfer attempt in 1981. He flushed To-Mar Wayne Hay — a solid, unglamorous second-lactation cow producing 25,110 pounds, sired by Cal-Clark Board Chairman — and the vet packed up with a single viable embryo for the whole effort. Anyone who’s sweated through an ET flush knows what that arithmetic feels like: you’re standing in the barn doing the math before the vet’s boots are off, stacking the cost against what a bull calf might bring, wondering if you just torched money you didn’t have to spare.
For a working dairy in Marengo, Iowa — registered cattle alongside commercials, always watching corn prices, every decision measured against the milk check — that kind of return was a gut-punch.
That single embryo became a coal-black bull calf born May 17, 1983, and nothing about him said history. The Tompkins family named him To-Mar Blackstar, went back to milking, and didn’t think much more about it.
For about nine years.
The Cow Nobody Wrote Up
What keeps pulling me back to the Blackstar story is where it started. Not with a legendary dam, not with a calculated million-dollar mating — it started with a cow named Hanna.
Royal-Cedar Oak Hanna was Wayne Hay’s dam, and she was the kind of cow that experienced dairymen notice, but nobody puts on a cover. Tight udder. Sturdy frame. Deep through the heart girth in a way that told you she’d been converting feed into milk for years without drama, without a vet call, without anyone having to worry about her. She wasn’t winning banners. She was paying bills — quietly, reliably, lactation after lactation.
You know this cow. You’ve probably got three of her in your barn right now, and if you’re honest, she’s the one keeping your operation solvent while the flashy ones eat up your time and your treatment budget.
To-Mar Wayne Hay EX-90-USA — the cow nobody wrote up. She wasn’t winning banners; she was paying bills. One ET flush produced Blackstar. With five AI-sampled sons, she’d be a Holstein International Global Cow winner today. Photo: Pete’s Photo.
Wayne Hay inherited that durability. The Tompkins operation wasn’t Hanover Hill — this wasn’t a high-profile genetics program with deep pockets and a marketing department. This was an Iowa dairy where every decision had to pencil out, or it didn’t happen, and when Randy decided to try ET for the first time, flushing Wayne Hay to Board Chairman and coming away with exactly one pregnancy… that was real money on a real gamble that hadn’t paid off yet.
Why Did the Holstein Breed Need Blackstar in 1985?
To understand why this particular bull landed like a bomb, you need to remember what the Holstein breeding world looked like in the mid-1980s — because the show ring and the milk parlor had drifted dangerously far apart.
Bell daughters were flooding barns with milk nobody had seen before — +1,704 pounds predicted difference, over 30% of the cows on the Holstein Locator List by mid-decade — but they were falling apart structurally by second lactation. Small frames, weak substance, udders that couldn’t sustain the metabolic load they were built to carry. The Bullvine’s own analysis calls Bell “the worst best bull in Holstein history,” and that’s not hyperbole: producers who’d built their programs around Bell production were watching replacement rates climb, and herd life drop, and the smarter ones were getting nervous.
Meanwhile, up in Canada, Starbuck was emerging as the type answer — 70% of his daughters scored Good Plus or better, 200,000 daughters by the mid-’80s, and he’d collect 27 Premier Sire titles between ’86 and ’95. Beautiful cattle, showring dominance. But the production gap was real, and Starbuck was a type bull in an era when the milk check still decided who survived. (Read more: Hanoverhill Starbuck’s DNA Dynasty: The Holstein Legend Bridging 20th-Century Breeding to Genomic Futures)
Hanoverhill Starbuck with Carl Saucier at Mount Victoria Farm, Québec, 1994 — 15 years old and still in service at CIAQ. 685,000 doses. 27 Premier Sire titles. 200,000 daughters. He was everything the show ring wanted. Blackstar was what the milk check needed.
The breeders paying attention — and by the late ’80s, that was a growing number — knew the breed needed something else entirely. A bull that could improve conformation without sacrificing components; type married to production in the same proof sheet. Everyone wanted it, and nobody could find it.
The bull that delivered it was sitting in a barn in central Iowa, bred by a family that wasn’t trying to solve the industry’s identity crisis. They were trying to make a good cow a little better.
The Mystery of 7H1897
Blackstar’s first proof dropped in January 1989, and the numbers were unlike anything the industry had seen from one animal: +58 pounds fat, +63 pounds protein, and a +3.16 PTAT.
A PTAT above 3.0 from a bull who was also positive on components — in 1989, that combination was unicorn territory. You picked type bulls, or you picked production bulls, and that was the deal everyone had accepted. Getting both at this level from a first-time ET calf out of a cow nobody outside Iowa County had heard of wasn’t supposed to happen.
But the moment that really captures how Blackstar emerged isn’t about the proof sheet. It’s about Ron Long.
Long was at Select Sires, working through classification data from herds across the country — the way you tracked genetic quality before genomics made everything instant. He kept flagging one sire code, herd after herd, state after state, because daughters of this particular bull were classifying well above expectations, and the pattern was unmistakable. But the bull wasn’t on anybody’s radar.
“I do not know which bull is 7H1897,” Long told his colleagues, “but his daughters are actually classifying extremely well.”
7H1897 was Blackstar. Before the industry knew his name, before a single marketing dollar was spent, before anyone at Select Sires had built a campaign around him, his daughters were already proving him on concrete — in real barns, on real DHIA sheets, from the Midwest to the Southeast. The data was finding him, not the other way around.
How Blackstar Topped the TPI List in 1992
Then the phone started ringing.
Blackstar had just topped the TPI list at 1,256 points — at that point was the highest total performance index any Holstein sire had ever achieved — and in a pre-internet world where you secured semen by picking up the telephone and hoping the AI stud had inventory, that number set off something close to a stampede. At Select Sires, the switchboard was overwhelmed: international calls stacking up, wire transfers from Germany, the Netherlands, Australia, New Zealand, breeders on three continents competing for straws selling at hundreds of dollars each in 1992 money, when proven semen from a solid bull ran a fraction of that.
Jeff Ziegler, Select’s breeding manager, would later put the constraint in perspective: “From Blackstar, no more than 500,000 doses were sold, since our semen collection methods back then were very different.”
Half a million doses from one bull in an era when collection technology produced far fewer straws per session than modern methods allow. No bull before him had generated that kind of sustained, global demand.
The morning that the first proof sheet must have arrived at the Marengo farm — a Select Sires envelope, a page of numbers that looked like any other mailing — it’s hard to imagine Randy Tompkins understood he was holding the breeding industry’s next decade in his hands. By all accounts, he wasn’t a man who sought the spotlight. He’d bred one bull, and the bull was doing the rest. But by the summer of ’92, with international calls coming in before dawn and wire transfers landing from three continents, the distance between that single-embryo gamble in 1981 and what it had become must have felt impossible to bridge.
What His Daughters Proved on Concrete
You could spot a Blackstar daughter from across the free-stall alley, and not because she was flashy — it was the opposite. She looked right. Depth through the heart that meant genuine capacity, not the narrow, weedy frame, the show ring had been rewarding for a decade. Spring of rib that told you she could handle a heavy TMR load without burning through body condition in sixty days. And the udders — tight fore attachment, strong medial, teat placement that meant your milking crew wasn’t fighting her twice a day, and this was back when udder quality actually differentiated sires, before everyone’s proof sheet started looking the same.
The real proof, though, was in the bulk tank.
LA-Foster Blackstar Lucy 607, down in North Carolina, became world production champion in 1998: 75,275 pounds of milk with 1,738 pounds of fat and 2,164 pounds of protein in a single 365-day lactation. The Foster family described her the way any dairyman would understand: “She’s either at the feed bunk or at the water trough. She eats and eats and produces that milk!” Over 200 pounds a day, sustained for an entire year, without breaking down — and when corn’s at seven dollars, and your margins are measured in pennies per hundredweight, that kind of metabolic engine separates the operations making the payment from the ones having a difficult conversation with their lender.
Stookey Elm Park Blackrose EX-96-USA 3E GMD DOM — All-American at two and three. Grand Champion, 1995 Royal Winter Fair. 149,881 pounds lifetime. She wasn’t just a show cow or a production cow. She was a Blackstar daughter — and that was the whole point. Photo: Wolfhard Schulze.
Then there was Stookey Elm Park Blackrose — classified EX-96-USA 3E GMD DOM, one of the highest classification scores ever assigned to a Holstein female. Bred by Jack Stookey and purchased by Mark Rueth and the Schaufs from Indianhead Holsteins as a hiefer, they developed her into something genuinely rare: All-American Junior Two-Year-Old in 1992, All-American Junior Three-Year-Old in 1993, and then Grand Champion at the 1995 Royal Winter Fair, joining that exclusive club of American-bred cows to win Canada’s most prestigious show. At 5 years old, she posted 42,229 pounds of milk, with 1,940 pounds of fat and 1,433 pounds of protein, and her lifetime production reached 149,881 pounds over 1,609 days in milk. She wasn’t just a producer and a show cow — she became a foundation brood cow whose AI sons carried the Blackstar blueprint into herds across the continent, and whose descendants were still winning banners as recently as the 2016 Hokkaido Winter Fair in Japan. (Read more: When Financial Disaster Breeds Genetic Gold: The Blackrose Story That Changed Everything)
Lucy and Blackrose weren’t outliers — and that’s what mattered most to producers milking Blackstar daughters day after day. As a group, his daughters consistently showed above-average productivity and lower somatic cell counts, peaking in their fourth and fifth lactations rather than flaming out as two-year-olds. The kind of cow your milking crew mentions at year’s end because she never once showed up on the treatment list, the kind that lets you amortize rearing costs over six or seven years instead of two.
That profile — the one every sustainability conversation in this industry eventually circles back to — came from a cow named Hanna.
2,500 Sons and the Mistake Nobody Stopped
The AI industry sampled nearly 2,500 of Blackstar’s sons globally, representing roughly half the world’s total sampling capacity in any given year, poured into the offspring of a single sire. The results were spectacular, and the consequences were severe, but nobody hit the brakes.
MJR Blackstar Emory EX-97-GM — the crown jewel. Half his sons made proven sire. His son Blitz topped 1.52 million doses. The line from here runs straight into your semen tank. Photo: Remsberg.
MJR Blackstar Emory was the crown jewel — 50% of his sons achieved proven sire status, against an industry norm of about 10%. Among them, Fustead Emory Blitz became a super-millionaire at over 1.52 million doses sold, a record at Select Sires that still stands. Blitz sired Velvet-View KJ Socrates, and Socrates gave us Roylane Socra Robust — who died young, before anyone fully grasped what they had — and from Robust came Seagull-Bay Supersire, a massive milk transmitter whose son JoSuper carried that Blackstar blueprint into yet another generation of elite matings. If that lineage sounds familiar, it should — Walkway Chief Mark, the backup bull behind 7% of every Holstein cow alive today, sits in these same pedigree networks.
Through Etazon Lord Lily, a millionaire son in his own right, Blackstar genetics reached Vision-Gen Ozzie and eventually influenced Ransom-Rail Facebook Paris. Up in Quebec, the Comestar program took Blackstar’s impact in a different direction entirely: three daughters out of Comestar Laurie Sheik produced six AI sons, including Comestar Lee, Outside, and Lheros — all millionaire sires distributed worldwide through Semex. One cow family, one mating sire, and a genetic footprint that reshaped Canadian breeding for a decade.
Comestar Laura Black VG-87-CAN 24 — Blackstar × Laurie Sheik. Twenty-four brood cow stars. Her son Lee became a super-millionaire at 1.5 million doses; Lheros and Lartist went global through Semex. This is what happened when Blackstar met the right cow family. Photo: PAB.* (Read more: The Cow That Built an Empire: Comestar Laurie Sheik’s Unstoppable Genetic Legacy)
And then there’s the line that ties the whole modern breed together. Through Dixie-Lee Bstar Betsie — dam of Carol Prelude Mtoto, the Italian specialist whose improbable origin story we profiled last year — and then through Mtoto’s son Picston Shottle, Blackstar’s fingerprint reaches into virtually every elite Holstein pedigree walking the planet today. If you’ve used Shottle genetics in the last fifteen years, and you have, you’ve been using Blackstar genetics whether you knew it or not.
Carol Prelude Mtoto — the £40 “failure” out of Dixie-Lee Bstar Betsie, a Blackstar daughter. Born in Italy, 1993. His son Picston Shottle sold 1.17 million doses and sired 9,674 Excellent daughters. If you’ve used Shottle genetics in the last fifteen years — and you have — you’ve been using Blackstar genetics.
This global saturation wasn’t just a numbers game; it was a masterclass in pedigree dominance that reached into every major breeding powerhouse. While the Comestar family was cementing the line in Canada, the influence was echoing through the Netherlands and Italy via the Dutch-born Blackstar Betsy. A daughter of the foundation cow Prices Chiefs Bess, Betsy’s ET journey across the Atlantic eventually produced Carol Prelude Mtoto, the sire of Picston Shottle—widely considered one of the top ten most influential bulls in history. Meanwhile, the lineage was branching through “super-millionaire” Fustead Emory Blitz to Roylane Socra Robust, and eventually to Siemers Lambda, ensuring that whether a breeder was looking for high-type show winners or high-profit commercial producers, they were inevitably tapping back into the same Marengo, Iowa, source.
Jeff Ziegler estimates that more than 60% of Select Sires’ current bull lineup carries Blackstar in its pedigree.
Sixty percent. From one ET pregnancy on a farm cow in Iowa.
Now, somewhere in the late ’90s, a breeder whose promising young sire got buried under the Blackstar avalanche — sampled too late, overlooked because the sure thing was already proven and available — must have said exactly what plenty of us are thinking now. But nobody was listening. When you look at the four bulls who reshaped the entire breed, Blackstar’s concentration story fits a pattern the industry has repeated — and may be repeating.
15.8% of Every Holstein Alive
USDA Animal Genomics and Improvement Laboratory data, estimated with a 1960 base year, puts the cost of that concentration in numbers nobody can argue with: Blackstar has a 15.8% relationship to the current your herd, higher than Elevation at 15.2%, higher than Chief at 14.8%, higher than any individual sire in the breed’s documented history. A 1999 Journal of Dairy Science study by P.M. VanRaden found that Blackstar’s expected inbreeding of future progeny — the metric that captures how deeply a single animal is embedded in the breed — was 7.9%, the highest of any Holstein sire evaluated.
And the breed’s effective population size — the measure geneticists use for how much diversity actually exists, regardless of raw numbers? Multiple peer-reviewed studies using both pedigree and genomic methods have estimated it at somewhere between 40 and 70 animals for major Holstein populations, with a consistent downward trend accelerating since genomic selection began. For context, conservation biologists flag vertebrate species with an effective population size below 50 as at risk of inbreeding depression under IUCN guidelines. We’re talking about the most numerous dairy breed on earth, and its genetic base has collapsed to the equivalent of a small village.
We did this to ourselves.
AI companies would never again sample as many sons from one bull as they did from Blackstar — not because his genetics fell short, but because the wholesale use of his offspring meant other potentially great bulls never got their chance. Good genetics pushed to the margins, diversity sacrificed because the sure thing was right there, proven, in demand, and profitable to sell.
The rate of inbreeding per generation has increased since genomic selection was introduced — a 2022 Frontiers in Veterinary Science study of Italian Holsteins found an annual inbreeding rate at +0.27% by pedigree and +0.44% by genomic measures, corresponding to roughly +1.4% to +2.2% per generation. Better tools, faster concentration, different instrument, same mistake. We learned the lesson with Bell in the ’80s: the risk of concentration, lethal recessives, structural compromise. Then we learned it again with Blackstar in the ’90s. And the genomic era is running the same experiment a third time, at higher speed, with more data and less excuse for not knowing better.
The Lesson from Marengo
Blackstar was classified EX-93-GM — as good a specimen as he was a genetic force. During his long career at Select Sires, his semen was nearly continuously sold out, the demand outlasting trend after trend as the industry moved through the ’90s and into the 2000s.
The traits he stamped on the breed — components, functional type, udder quality, productive life — remain at the center of every modern selection index. Automated milking systems reward the kind of teat placement and udder depth his daughters were known for; feed efficiency research validates the metabolic capacity his genetics delivered. When processors push harder on environmental metrics, and they will, the ability to produce more from less across more lactations is exactly what survival looks like. Every time you walk through a robotic barn and see a cow whose udder sits perfectly for the machine, whose body condition holds through peak, whose SCC stays low without intervention — you’re looking at traits Blackstar helped build into the breed.
But the lesson of To-Mar Blackstar isn’t just “breed for function over fashion.” That part’s been obvious for thirty years. The deeper lesson — the one this industry learned through him and appears determined to learn a third time through genomics — is about what happens when you find something extraordinary and use it on everything.
Randy Tompkins flushed one cow and got one calf. He was trying to make a good bull from a good cow on a working dairy where every decision had to pencil out. The industry took that bull and built a genetic monopoly — 2,500 sons sampled, half a million doses sold, pedigrees saturated across six continents — and four decades later, the narrowed genetic base he helped create is one of the breed’s most pressing long-term vulnerabilities.
One pregnancy. One bull. A breed forever changed and permanently narrowed.
What Blackstar’s Legacy Means for Your 2026 Matings
The math on inbreeding depression isn’t abstract anymore. Research estimates the cost at approximately $22–$24 per cow per lifetime for every 1% increase in pedigree inbreeding, in 1999 dollars. Canadian Holstein data show 2024-born heifers averaging 9.99% genomic inbreeding, roughly triple that of 2014. At those levels, you’re looking at $200–$400 per cow in hidden lifetime losses: extra breedings, transition problems, productive cows culled too soon — costs that don’t appear on any single report but show up everywhere in your bottom line.
Here’s what you can do about it:
This month: Pull your herd’s average inbreeding coefficient from your genetic management software, breed association records, or CDCB query. Identify what percentage of your pedigree traces through Blackstar, Chief, and Bell lineages. If your average exceeds 8%, you’re already paying for it.
Before the April proof run: Build a sire portfolio using a minimum of 8–10 unrelated sires. No single bull should appear on more than 12–15% of your matings. Prioritize outcross lines on your bottom-third genomic females — that’s where concentration costs compound fastest.
Over the next year: Genomically test every replacement heifer and run mating programs that cap individual-sire inbreeding contribution. Track your herd’s F-coefficient quarterly rather than annually. Treat genetic diversity like feed inventory — monitor it before it runs out, not after.
Key Takeaways:
One ET calf on a commercial Iowa dairy became one of the most influential Holstein sires in history, with the USDA estimating that To-Mar Blackstar now has a 15.8% relationship to the US Holstein population.
His daughters combined high components, strong udders, and longer productive life, which drove roughly 500,000 doses sold and ~2,500 sons sampled worldwide, but also funneled a huge share of the breed’s genetics through a single sire line.
VanRaden’s 1999 work flagged Blackstar as the Holstein bull with the highest expected inbreeding of future progeny (7.9%), and more recent Italian Holstein data show that inbreeding is still climbing by about +0.27% to +0.44% per year in the genomic era.
Virginia Tech research pegs each 1% of inbreeding at $22–$24 in lost lifetime net income per cow (1999 dollars; roughly $43–$47 adjusted to 2026). At 2024-born Canadian heifer inbreeding levels of ~10%, that’s $430–$470 per cow in hidden lifetime drag.
For a working dairy, the punchline is simple: Blackstar genetics helped build the kind of cows you like to milk, but the article shows how to measure the inbreeding bill you’re paying and lays out a 30/90/365-day plan to diversify sires and protect profit.
The Bottom Line
The tension hasn’t changed since 1992: the best genetics concentrate the fastest, and managing that concentration is the cost of using them responsibly.
The next proof run is scheduled for April. Before you pick up the semen catalog, pull that inbreeding report and trace how much of it flows through a single bull from a farm where the family was trying to make the numbers work. Because somewhere in that catalog right now — ranking 300-something on TPI, priced at a premium nobody wants to pay, getting skipped for cheaper bulls with flashier numbers — is the next Blackstar. The next bull whose daughters show up every morning, breed back without complaint, and quietly outlast everything around them.
History says the cheap bulls with the big numbers don’t last.
Round Oak Rag Apple Elevation: The Bull of the Century – Explore the industry-shaping era of the “Bull of the Century,” whose balanced blueprint for production and type created the very world Blackstar was bred to improve, anchoring the pedigrees that define our modern breed.
Every week, thousands of producers, breeders, and industry insiders open Bullvine Weekly for genetics insights, market shifts, and profit strategies they won’t find anywhere else. One email. Five minutes. Smarter decisions all week.
A lower-test herd shipped $212,000 more than its 4.25% neighbor. If you’re chasing percentages, this barn math is your wake-up call.
Executive Summary: June 2025 FMMO reforms and the 2025 NM$ revision have flipped the script so that fat and protein pounds shipped, not test percentages, drive your milk check. A side‑by‑side model of two 500‑cow Upper Midwest herds shows the lower‑test herd (4.05% fat at 82 lbs) shipping $212,000 more fat and protein value per year than a 4.25% herd at 72 lbs, using the USDA’s NM$ planning prices. NM$ now gives 31.8% weight to fat and only 3.2% to volume, which means “percent‑only” bulls with negative Milk PTAs can quietly cut lifetime component revenue even when their proofs look good on fat percentage. On the ration side, C16:0 supplement programs that add +0.10 fat test often cost three to four times more than the extra fat is worth once you do the barn math at $0.65–$1.00/cow/day. Your federal order then decides how much of that value you actually see: the same 0.3‑point fat gain is worth roughly $94,500 in a Wisconsin MCP plant but closer to $54,700 in a fluid‑heavy Florida order. The article walks through these calculations step by step and finishes with a four‑point playbook — track CFP, cull on pounds, match spending to your order, and pick sires on component pounds — so you can stress‑test your own numbers instead of trusting what the bulk tank report says.
A 500-cow Upper Midwest dairy can leave $212,000 in combined fat and protein revenue on the table by chasing a higher bulk tank test instead of shipping more component pounds. That’s not a hypothetical — it’s what the math shows when you model two herds side by side using USDA’s own NM$ planning prices.
A nutritionist working with herds in the region described the pattern: a 500-cow operation watches butterfat climb from 3.9% to 4.1% over six months. Everyone celebrates. Then somebody runs the real numbers — 78 lbs/day at 3.9% versus 74 lbs/day at 4.1% — and realizes they’re shipping nearly identical fat pounds. The test improved. The milk check didn’t.
What June 2025 Changed — And What It Cost
USDA’s April 2025 Net Merit revision pushed butterfat to 31.8% relative emphasis in NM$ — up from 28.6% in 2021 (VanRaden et al., NM$8 and NM$9). Protein carries 13.0%. Milk volume? Just 3.2%. The economic values are blunter still: fat at $5.01 per PTA pound, protein at $3.33, volume at $0.022.
Then the FMMO reforms hit on June 1, 2025. AFBF economist Daniel Munch calculated that in the first three months, producers lost more than $337 million in combined pool value — class price reductions of 85 to 93 cents per hundredweight depending on the order (AFBF Market Intel, September 2025). As Munch told Brownfield Ag News, the higher make allowances “more than wipe out” the gains from other reforms.
Upper Midwest Order 30 absorbed the worst of it. Roughly 69% of pooled milk went to Class III cheese in October 2025, with just 11.3% to Class I fluid (FMMA30 Dairy News, November 2025). That heavy cheese utilization means component value flows directly to producers — but the make allowance increase hit just as directly.
And regional structure amplifies everything. A 0.3-point butterfat improvement on a 500-cow herd captures an estimated $94,500 annually in Wisconsin’s MCP system versus approximately $54,700 in Florida’s skim-fat system. Same genetics. Same nutrition. A $40,000 gap from the order structure alone.
How $212,000 Disappears Into a Better Bulk Tank Test
Two 500-cow herds, both running 305-day lactations, were modeled using NM$ 2025 planning prices of $2.90/lb fat and $2.08/lb protein (VanRaden et al., January 2025). These are multi-year forecast prices; USDA built the index on non-spot prices. Actual FMMO butterfat ran about $2.95/lb in January 2025 and fell to approximately $1.45/lb by January 2026. The pounds principle holds at any price level; the dollar gap moves with the market.
Metric
Herd A (High Test)
Herd B (High Volume)
Difference
Milk/Cow/Day
72 lbs
82 lbs
+10 lbs
Fat Test
4.25%
4.05%
−0.20 points
Protein Test
3.05%
3.05%
Same
Annual Fat Shipped
466,650 lbs
506,453 lbs
+39,803 lbs
Annual Protein Shipped
334,890 lbs
381,403 lbs
+46,513 lbs
Fat Revenue @ $2.90/lb
$1,353,285
$1,468,712
+$115,427
Protein Revenue @ $2.08/lb
$696,571
$793,317
+$96,746
Combined F+P Revenue
$2,049,856
$2,262,029
+$212,173
Herd B — the lower-test herd — ships nearly 40,000 more pounds of fat and over 46,500 more pounds of protein. At actual January 2025 FMMO prices ($2.95 fat, $2.33 protein), the gap widens to roughly $226,000 because protein is priced higher than the NM$ assumption.
Three Places the Trap Compounds Silently
Genetics. The 2025 NM$ penalizes “percent-only” bulls with deeply negative Milk PTAs. A bull posting +0.25% fat but −500 lbs Milk loses on all three lines — less volume means fewer total fat pounds, fewer protein pounds, and less volume revenue. A bull at +0.08% fat with +1,200 lbs Milk often ships more total component pounds per lactation. That’s exactly what the $5.01/lb and $3.33/lb economic values reward.
Nutrition. Research from Prof. Kevin Harvatine’s lab at Penn State found C16:0 palmitic acid boosts fat test by +0.30 to +0.50 percentage points at ~2% of diet DM (Dairy Global, November 2023). Michigan State’s de Souza lab (J. Dairy Sci., 2024) showed mid-lactation cows at 40–50 kg/day responded best. But supplements run $0.65–$1.00/cow/day, and the protein test can slip 0.02–0.03 points. If milk yield doesn’t climb with the fat test, the P&L can go negative while the bulk tank report looks great.
Culling. Cow 1 at 90 lbs/day and 3.8% fat ships 3.42 lbs fat/day. Cow 2 at 65 lbs/day and 4.3% ships 2.80 lbs. The “low test” cow delivers 0.62 more lbs of fat daily — about $550/year at $2.90/lb. If your cull list sorts by test instead of CFP (combined fat and protein pounds shipped), you may be shipping the wrong animals.
Does Chasing +0.1% Fat Actually Pay Under Component Pricing?
Full walkthrough: a program promising +0.10 points fat test on 500 cows averaging 75 lbs/day.
Break-even: about $0.22/cow/day. That’s three to four times below what any published C16:0 program costs. If a tenth of a point on fat test is the only gain — and you’re losing milk or protein in the process — the math is underwater.
The Shift: From Test Reports to Pounds Shipped
For herds getting ahead of this, the pivot starts with one change: they stop celebrating test and start tracking CFP per cow per day. Instead of “Our herd’s at 4.1% fat,” they’re asking: “How many pounds of fat and protein did we ship per cow today?”
That reframes every proposal — a new sire lineup, a nutrition tweak, or a cull list — around one question: does it raise CFP?
The Playbook: Four Ways to Manage for Pounds
1. Make CFP your primary metric. Calculate combined fat + protein pounds per cow per day, minimum monthly. 30-day action: pull last month’s data and establish your baseline. Trade-off: watching fat test flatten while CFP climbs feels wrong. It’s not.
2. Rebuild the cull list around CFP. Rank by shipped CFP first, then overlay fertility, health, and age. 90-day action: audit last quarter’s culls against CFP. Trade-off: you still need to watch for milk fat depression — tests aren’t irrelevant, just not the sorting metric.
3. Match spending to what your order actually pays. Order 30’s 69% Class III utilization means component value flows through relatively directly. In skim-fat orders with heavy Class I, the math is different. 30-day action: call your field rep and ask how much component value hits your check. Trade-off: even within the same order, different handlers deliver different capture.
4. Run genetics and nutrition on parallel tracks. Long-term: component-pound genetics (NM$, CFP). Short-term: nutrition for quick wins. 365-day action: rebalance your sire lineup at the next proof run using pound PTAs, not percentage PTAs. Trade-off: if component prices sag — January 2026 butterfat at ~$1.45/lb is a reminder — nutrition plays may need to scale back. The genetics keep compounding regardless.
What This Means for Your Operation
Run your own Herd A vs. Herd B table. Plug in your daily lbs, fat test, protein test, cow count, and your most recent FMMO component prices. If a lower-test scenario ships more pounds, you’ll need to decide.
The break-even for a +0.1% fat program is $0.22/cow/day. Published C16:0 costs range from $0.65 to $1.00. If you’re spending three to four times the break-even, the fat gain alone doesn’t cover it.
Audit your culls. Pull three to five cows you shipped for “low components” and check their CFP against cows you kept. If CFP sorts the list differently than test did, rebuild it.
Know your order structure. Order 30’s 69% Class III means the component value flows through. If you’re in a fluid-heavy order, your capture math is different — and so is every component investment decision.
Key Takeaways
If your success metric is fat test rather than fat and protein pounds shipped, you’re managing to the wrong number. The post-June 2025 FMMO system and the 2025 NM$ ($5.01/lb fat, $3.33/lb protein) both reward pounds.
The $212,000 gap is $115,427 from fat and $96,746 from protein at NM$ planning prices. At actual January 2025 FMMO prices, it’s closer to $226,000.
The 2025 NM$ penalizes percent-only bulls. Fat emphasis jumped from 28.6% to 31.8%, but milk volume still carries a positive value. A sire whose Milk PTA drags may produce daughters that ship fewer total component pounds.
Regional structure reshapes every component decision. A 0.3-point fat gain isn’t worth the same $94,500 in Wisconsin as it is in a fluid-heavy Southeast order.
The Bottom Line
The herds that come out of this stronger won’t necessarily be the ones with the prettiest bulk tank reports. They’ll be the ones that ran the barn math and were honest about what actually pays. So — where does your herd sit: managing for the number that feels good, or the pounds that move the check?
Complete references and supporting documentation are available upon request by contacting the editorial team at editor@thebullvine.com.
Learn More
$19.14 Costs vs. $18.95 Milk: Is Your Barn Tech Paying the Difference? – Stop leaving margin on the barn floor. This analysis exposes why you’re 19¢/cwt underwater and arms you with the specific ROI calculations to ensure your current technology actually pays for itself through increased efficiency.
Every week, thousands of producers, breeders, and industry insiders open Bullvine Weekly for genetics insights, market shifts, and profit strategies they won’t find anywhere else. One email. Five minutes. Smarter decisions all week.
Butter demand fell 25% and 113 loads still traded. The demand didn’t die — it moved overseas. Has your Q2 plan caught up with that math yet?
Executive Summary: U.S. butter looked bearish on the surface this week — November domestic disappearance fell 24.8% year over year and every CME dairy commodity finished lower — but 113 butter loads still traded and the price slipped just 0.5¢ to $1.7050/lb. The reason is redistribution, not collapse: ERS shows domestic butter use down sharply while USDEC data shows butter exports up 245% and anhydrous milkfat up 184%, so demand has shifted channels rather than vanished. Cheese followed the same pattern of misleading headlines, with an 8.5¢ block drop translating to only about $0.18/cwt on Class III once a flat barrel market is factored in — roughly $73/day, or $2,200/month, for a 500‑cow herd shipping 80 lb. In contrast, NDM near $1.60/lb and a roughly 34¢ gap over NDPSR averages have pushed U.S. powder about 23% above world prices, making $1.50 a critical spring flush line for whether Class IV at $18.10 proves rich or cheap. Dry whey at 72¢ quietly adds about $3.06/cwt to Class III, while USDA’s latest WASDE lifts the 2026 all‑milk price forecast to $18.95/cwt even as western snowpack sits at just 32–83% of normal, putting forage risk squarely on the 2026 balance sheet. Taken together, this week’s math argues for three concrete moves: stress‑test your Q2 hedge at $16.45 Class III against your true COP, set feed-buy alerts around $4.00 corn and $290 meal, and build a forage plan that assumes the West stays dry longer than anyone would like.
Every CME spot dairy commodity finished in the red for the week ending February 13, 2026. The simple read is bearish: butter down 0.5¢ to $1.7050/lb, blocks down 8.5¢ to $1.3875/lb, NDM down 4¢ to $1.6000/lb, dry whey down a penny to $0.7200/lb.
But that simple read is incomplete. USDA’s Economic Research Service published its updated “U.S. Dairy Situation at a Glance” on February 11, and the numbers tell a story the spot market can’t: domestic butter disappearance cratered 24.8% year over year in November — from 235.45 million pounds in November 2024, per the prior ERS release, to 177.15 million pounds.
That same month, butter exports surged 245% and anhydrous milkfat shipments jumped 184%, according to USDEC November 2025 U.S. Dairy Export Trade Data. The butter didn’t vanish. It went overseas. And that redistribution — demand shifting channels rather than evaporating — is the thread running through every commodity this week.
March Class III futures settled Thursday at $16.45/cwt; March Class IV landed at $18.10/cwt.
Butter: 113 Trades, Thin Stocks, and a Demand Map That’s Been Redrawn
Monday opened with a thud — down 8.5¢ to $1.6250/lb. Tuesday clawed back a penny. Wednesday added 1.75¢. Thursday blew the doors off with an 8.25¢ surge to $1.7350/lb, before Friday shaved 3¢ to close at $1.7050/lb. Half a cent lower on the week. A hundred and thirteen trades to get there.
Supply doesn’t look tight on the surface. Dairy Market News reports cream “widely available” and churns running strong. December 2025 butter production totaled 203.85 million pounds, up 2% from December 2024’s 199.75 million pounds, per ERS. But cold storage tells a different story: 199.3 million pounds on December 31, down 5% from November and 7% below year-ago levels.
The demand picture is where the “butter is in trouble” narrative falls apart. Domestic disappearance collapsed in November: 177.15 million pounds, down 24.8% from the year-ago 235.45 million pounds, per ERS. That’s the kind of number that should crater a market.
Except the same month saw butter exports up 245% and total U.S. dairy export value climb 14% to $801.7 million, per USDEC. November cheese exports rose 28%. The butter went overseas.
Retail sales in the East “continue to exceed last year,” according to DMN, supported by a 3.4% year-over-year decline in the butter CPI in December 2025, per ERS. Central retail is steady. Western retail is softer as buyers pulled back after the price run-up. Export demand for 82% butterfat product remains “tight” in the Central and Western regions.
As William Loux, senior vice president of global economic affairs at the National Milk Producers Federation, put it in January: butter and cheese prices “are the products that have the biggest influence on the milk check.” He’s right. And right now, butter is the hardest of those products to read — because the demand isn’t weak. It’s just somewhere else.
Cheese: The 8.5¢ Headline That Overstates the Damage
If butter’s story is demand moving overseas, cheese’s story is demand shifting from foodservice to retail and exports, with the headline overstating the hit.
Cheddar blocks stepped down every session Monday through Thursday before steadying on Friday. Close: $1.3875/lb, down 8.5¢ on 10 loads. Barrels didn’t flinch — $1.4400/lb all week, zero trades.
That barrel hold matters. Class III protein pricing uses the block–barrel average. Blocks fell 8.5¢; barrels held flat. The actual impact on the average: about 4.25¢, not 8.5¢. Through the protein formula, that’s roughly $0.18/cwt.
Run the barn math. A 500-cow herd shipping 80 lbs/cow/day moves 400 cwt daily. At $0.18/cwt, that’s about $73/day— roughly $2,200 over a month. Real money, but a different decision context than a panicked 8.5¢ headline suggests.
March Class III at $16.45/cwt puts gross milk revenue at about $13.16/cow/day at 80 lbs. With March corn at $4.3175/bu and soybean meal at $309.30/ton, purchased feed runs roughly $2.78/cow/day before forage, labor, and debt. There’s margin — but not much room for error. Jenny Wackershouser, a dairy marketing advisor with Ever.Ag, warned late last year that domestic demand hasn’t kept pace with the increased U.S. capacity to make more dairy products, and that cheese may need to price “sub-$1.30 to win” export business against European competition that has fallen to around $1.50/lb. At $1.3875, blocks aren’t there yet — but they’re closer than most producers would like.
Line Item
Unit
Value
Notes / Context
March Class III Price
$/cwt
$16.45
CME futures close Feb 13, 2026
Gross Milk Revenue
$/cow/day
$13.16
Based on 80 lb/cow/day production
Purchased Feed Cost
$/cow/day
$2.78
Corn $4.32/bu, SBM $309/ton (concentrates only)
Net Margin Before Forage/Labor/Debt
$/cow/day
$10.38
Tight cushion = hedge decision point
Monthly Margin (500-Cow Herd)
$/month
$155,700
$10.38/cow/day × 500 cows × 30 days
ERS shows November 2025 American cheese disappearance at 462.89 million pounds, up 5.4% year over year. Total cheese disappearance rose about 4.8% year over year.
But Loux’s observation about foodservice cuts deep: cheese “does better at food service than it does at home.” DMN backs that up — foodservice demand is “light” in the Central region and “weaker to start 2026” in the West.
So where’s the 4.8% growth coming from? Retail and exports. At $1.3875/lb, U.S. block Cheddar undercuts GDT Cheddar near the low $2.20s/lb — a competitive edge driving volume. November cheese exports were up 28% year over year, per USDEC. December production hit 1.28 billion pounds (American + other-than-American combined), up 6.7% year over year, while cold storage ended the year at 1.35 billion pounds — up just 1%. Balanced, not burdensome.
NDM at $1.60: Where the Redistribution Story Breaks Down
NDM is where the “demand is moving, not dying” narrative hits a wall. At $1.60/lb, U.S. powder isn’t being redistributed to new buyers — it’s being priced out of the global market entirely.
Monday dropped 3.5¢ to $1.6050/lb, followed by half-cent declines Tuesday and Wednesday, then quarter-cent recoveries Thursday and Friday. Close: $1.6000/lb, down 4¢ on 17 loads. The weekly average of $1.5995 is the highest CME spot weekly average since mid-2022, when NDM was still elevated from the post-pandemic rally.
The global math is brutal. GDT Event 397 on February 3 saw skim milk powder average $2,874/MT — roughly $1.30/lb. At $1.60, U.S. NDM carries about a 30¢/lb premium, a 23% markup over world price. DMN notes “higher prices are contributing to lighter export demand,” with Mexican buyer interest softer.
The Ever.Ag Insights team put it plainly in their February 2026 outlook: “The current rally has roots in real supply issues, as cheese plants and other avenues for skim solids keep milk out of dryers.” But they warned: “We will likely see more drying activity seasonally in the weeks ahead, and U.S. marketers will struggle to win exports at prevailing prices.”
Here’s the twist your check cares about. The NDPSR average for the week ending February 7 was $1.2604/lb — more than 33¢ below the CME close. Class IV futures reflect expectations the NDPSR hasn’t yet caught up to that reality.
Dryers aren’t running flat out. In the East, some plants operate at just 25–50% of capacity as skim gets diverted to bottling, ultrafiltered milk, and higher-value uses. December 2025 dry skim milk product output came in at 171.10 million pounds, down from 182.30 million pounds in December 2024 — a 6.1% decline, per ERS.
Spring flush is six to eight weeks away. If NDM can’t hold $1.50/lb through the flush, March Class IV at $18.10 will look expensive in hindsight. If it holds above $1.50, powder is genuinely tight, and component values stay supported. That $1.50 line is your main powder signal.
Dry Whey at 72¢: Quiet but Load-Bearing
Whey gave up a single penny on Tuesday and held — $0.7200/lb, one load. Don’t confuse quiet with irrelevant. At 72¢, whey contributes roughly $3.06/cwt to Class III through the other solids component. That’s quietly holding your check together while cheese protein drags it down.
DMN reports WPC and isolate lines running full, keeping dry whey supply limited. As long as consumer protein demand stays insatiable — and nothing suggests it’s slowing — tight raw whey supplies should keep propping up this floor.
Will Western Snow Drought Hit Your 2026 Feed Budget?
USDA’s February WASDE left the soybean balance sheet unchanged and raised Brazilian soybean output to a massive 180 million metric tons. The season-average corn price received by producers was held at $4.10 per bushel, and the soybean price stayed at $10.20 per bushel. On the dairy page, USDA raised all four product price forecasts for 2026 — cheese, butter, NDM, and whey — on recent prices, lifting the 2026 all-milk price forecast to $18.95/cwt.
Katie Burgess, director of risk management at Ever.Ag, set the margin context in January: milk prices are “quite low to kick off the year,” with DMC payouts projected above $1/cwt for January through April. For a lot of operations, that safety net matters.
The real wildcard is water in the West. NIDIS’s February 5 update shows record-low snowpack in Colorado and Utah, most basins below 60% of median snow water equivalent, and five Wyoming monitoring sites at record lows. A February 12 update puts the Humboldt Basin at just 32% of median and the Upper Colorado at its lowest since 1986.
Gary Stone, extension crops educator at the University of Nebraska–Lincoln, reported in early February that North Platte River reservoirs are at 32% to 53% capacity. Normal headwater runoff averages about 800,000 acre-feet — roughly matching irrigation demand — and Stone warned reduced water allocations are possible for 2026.
His UNL colleague Aaron Berger, extension beef educator in Kimball, Nebraska, isn’t sugarcoating the comparison. “That year was eerily similar,” Berger said, drawing a line to 2002, which devastated spring yields. “Then we had a very dry spring. It was terrible.” He pointed to late-season storms in 2023 that dropped over 10 inches in April and May as a reason to hope—but hope isn’t a forage plan.
AgWest Farm Credit’s February 2026 drought report noted snow water equivalent at just 53% to 83% across Idaho — the state’s third-largest dairy region — calling it a “snow drought.” If you’re running cows in the West, your back-half 2026 forage budget is at risk.
What This Means for Your Operation
This week’s price declines hit unevenly: butter barely moved, the cheese headline overstated the hit, NDM pulled back from export-killing highs, and whey held the floor. The real risk isn’t what happened on the spot board this week. It’s whether spring flush overwhelms an export-dependent demand structure while western water dries up underneath it.
Next 30 days:
Audit your Q2 hedge coverage. March Class III at $16.45 and Class IV at $18.10 aren’t disaster prices, but they don’t leave room for margin erosion. If those numbers cover your all-in cost of production, lock in at least part of your spring output. If your COP is above $17.00, the March Class III means you’re underwater before components.
Run your own cheese math. Blocks fell 8.5¢, but barrels held flat — the real protein hit is about $0.18/cwt. Know your number, not the headline.
Set feed price alerts. Corn below $4.00/bu or meal below $290/ton is a reasonable trigger to layer in fall/winter 2026 coverage.
Next 90 days:
Watch $1.50 NDM as your spring flush signal. Above $1.50 into the flush says dryers can’t keep up, and Class IV holds together. Below $1.50 by May says spring milk is overwhelming dryers. Track the NDPSR-to-CME gap ($1.26 vs. $1.60) — once it closes, the price action hits your check.
Reassess forage contracts if the western snowpack doesn’t improve by April. North Platte reservoirs at 32–53% full and Idaho at 53–83% median SWE aren’t forecasts. They’re current conditions.
Next 12 months:
Western producers: build your 2026 forage budget with a drought scenario. Price out emergency hay and alternative forages now, while sellers aren’t panicking.
Layer in feed coverage opportunistically. Brazil at 180 MMT of soybeans means the meal could soften. Having alerts in place lets you move when the market gives you an opening.
Key Takeaways
A 24.8% drop in November domestic butter disappearance didn’t kill demand; USDEC data shows butter and AMF exports jumped, so the product shifted overseas rather than disappearing at home.
The 8.5¢ block Cheddar slide translated to only about $0.18/cwt on Class III once flat barrels were averaged in — roughly $73/day, or $2,200/month, for a 500‑cow herd shipping 80 lb, so you need to run the block‑barrel math before reacting.
NDM near $1.60/lb and a roughly 34¢ gap over NDPSR averages put U.S. powder about 23% above world prices, making $1.50/lb your key spring flush trigger for whether $18.10 Class IV is worth locking in.
Dry whey at 72¢ is quietly adding about $3.06/cwt to Class III, which means your check is leaning heavily on other solids while cheese underperforms.
With USDA’s 2026 all‑milk forecast at $18.95/cwt and western snowpack stuck near 32–83% of normal, you should be stress‑testing Q2 hedges against a dry‑year forage budget, not just the board price.
The Bottom Line
The trade-off on all of this: locking in Q2 at $16.45/$18.10 buys certainty but surrenders upside if the flush disappoints and prices rebound. That’s the call you make with your own cost structure.
Pull up your March coverage next to your all-in COP. Does the math still work — and have you priced in a drought scenario for your forage line?
Complete references and supporting documentation are available upon request by contacting the editorial team at editor@thebullvine.com.
Every week, thousands of producers, breeders, and industry insiders open Bullvine Weekly for genetics insights, market shifts, and profit strategies they won’t find anywhere else. One email. Five minutes. Smarter decisions all week.
3 out of 4 dairies bred beef-on-dairy. Now 800,000 heifers are missing, and replacements are $3,010 a head. Where does your herd sit in that math?
Executive Summary: If you chased beef‑on‑dairy premiums in 2022–23, you’re now buying replacements in a world where heifer prices jumped from $1,140 in 2019 to $3,010 in mid‑2025 and often top $4,000 in high‑demand regions. At the same time, U.S. replacement inventories have dropped to their lowest level since 1978, leaving roughly 800,000 “missing” heifers across 2025–2026 and making it harder—and more expensive—to keep herds at size. For a 200‑cow herd turning over 35–38% per year, that shift alone can mean an extra $126,000–$144,000 in replacement capital over the next two years if you have to buy those animals instead of calving them in. This piece breaks your options into four concrete paths—breeding rebalance, reduced culling, strategic exit, and processor lock‑in—and spells out where each helps, where it backfires, and the thresholds (like an 18% pregnancy rate or culling below 30%) that should force a rethink. It also links your barn‑level math to the bigger picture: beef‑on‑dairy calves now account for 12–15% of fed beef harvests, and roughly $10 billion in new dairy plants are scheduled to come online by 2027, keeping processor demand for reliable milk flows high even as replacements stay tight. The goal is simple: give you enough numbers and clear decision rules to decide whether your 2026 breeding sheet keeps you in the group processors treat as long‑term partners—or in the group scrambling for $3,000+ heifers with everyone else.
Ken McCarty of McCarty Family Farms still remembers trying to sell Holstein bull calves: “Two for $5″—with no takers. That painful baseline explains why dairy producers didn’t hesitate when beef-on-dairy calves started bringing $600, then $1,000, then $1,400 per head. The math seemed obvious. The check was immediate.
But it wasn’t free money. It was a deferred bill. And that bill has arrived.
CoBank data shows replacement heifer prices climbed from $1,140 per head in April 2019 to $3,010 by July 2025—with top-quality animals in California and Minnesota auction barns commanding $4,000 or more. USDA’s January 30, 2026, cattle inventory report confirmed the national herd continues to contract. For operations that bred heavily to beef in 2022 and 2023, the pipeline is now empty. For those who maintained balance, a window is opening.
The Scale Nobody Predicted
The adoption curve was staggering. Beef semen sales into dairy herds grew from 1.2 million units in 2010 to 9.4 million units by 2023—roughly 84% of which went into dairy cows, according to a 2024 Purina survey. That same survey found almost three-fourths of U.S. dairy farmers are now actively crossbreeding using beef genetics, with another 16% considering it.
CattleFax puts the production numbers in starker terms: beef-on-dairy calf production jumped from 50,000 head in 2014 to 3.22 million in 2024, with projections reaching 5–6 million head by 2026. These crossbred cattle now account for 12–15% of fed beef harvests.
Every one of those calves was a dairy heifer that wasn’t born.
The Pipeline Math That’s Already Locked In
Sarina Sharp at the Daily Dairy Report flagged in early 2024 that dairy heifer inventories had declined for six consecutive years. USDA’s January 2025 snapshot put milk replacement heifers at 3.914 million head—the lowest since 1978, a full 18% below 2018 levels.
CoBank economist Corey Geiger quantified the gap in an August 2025 report: 357,490 fewer dairy heifers available in 2025, then 438,844 fewer in 2026. Add those up. That’s roughly 800,000 missing replacements across a two-year window. And as Geiger commented: “We don’t see a rebound until 2027, and that will be up 285-thousand, but you’ve got to remember, that’s going to be after 800-thousand fewer heifers”.
Regional variation tells its own story. Wisconsin replacement values jumped 43% year-over-year between October 2023 ($1,990) and October 2024 ($2,850), according to USDA data. Yet Wisconsin actually gained 10,000 heifers while Texas lost 10,000 head. “Watch” on the Northwest (Idaho/Washington), where prices have reportedly hit that $4,000+ “north of the border” threshold. That divergence comes down to processor relationships and infrastructure, not just breeding decisions.
The Beef-on-Dairy Miscalculation
Here’s what producers believed: beef-on-dairy premiums were an additive income. Extra revenue layered on top of normal operations without meaningful trade-offs.
Here’s what actually happened.
When beef-on-dairy calves climbed toward the $1,400 average that Purina’s Laurence Williams cited by 2024-2025, producers weren’t making a one-time decision. They were depleting a pipeline that takes three-plus years to rebuild. Every beef breeding looked like a $900 gain. What nobody penciled in was the replacement heifer that wouldn’t exist three years later—an animal that now costs $1,870 more than it did in 2019.
CoBank’s analysis is blunt: from conception to a cow in the milk string is a “three-plus year proposition”. You can’t undo aggressive beef breeding quickly.
And the 2024 NAAB semen sales data reveals how producers tried to have it both ways. Gender-sorted dairy semen surged 17.9%—an additional 1.5 million units. But beef semen held steady at 7.9 million units. No retreat.
How This Lands on Real Operations
When Mike North of Ever.Ag started seeing two-to-three-day-old beef-cross calves bringing $1,000, his framing captured the logic perfectly: “Why feed an animal for 18 months when the money’s sitting there at day three?”
But North also flagged the inflection point when the math flipped: “Some animals moving in the northwest last week were north of $4,000 an animal. That’s a pretty tall price, and so now, guess what? We’re seeing people starting to switch some of their breeding back to that replacement animal”.
One Minnesota producer’s current allocation illustrates the hedging strategy most operations have adopted: 10% of cows bred to sexed semen, while the rest go to beef; for heifers, 50% bred to sexed semen, while the other half go to beef. That’s not a correction—it’s a bet that partial measures will thread the needle.
Meanwhile, culling rates have collapsed. Dairy farmers have sent 611,600 fewer cows to slaughter since Labor Day 2023, according to CoBank’s analysis of USDA data. That keeps milk flowing but ages the herd.
Running the Numbers: Gross Premium vs. Net Replacement Cost
Here’s the full picture for a typical 200-cow Holstein operation in the Upper Midwest:
The spread:
Beef-cross premium over Holstein bull: ~$750-$1,200/head (2024-2025 market)
Incremental heifer cost increase (2019 vs 2025): ~$1,870/head at national averages
The math: If your replacement ratio means 1.5-2 beef breedings per “lost” heifer, and premiums average $900, you’ve captured $1,350-$1,800 in gross premium. But across the industry, the collective shift toward beef breeding drove replacement heifer costs up $1,870 per head. For a 200-cow operation needing 70-80 replacements annually (35-38% turnover), that gap represents $126,000-$144,000 in additional replacement capital over 24 months—if you can find animals to buy at all.
Metric
Value
Notes
Herd Size
200 cows
Typical Upper Midwest operation
Annual Replacement Rate
35-38%
70-76 replacements needed yearly
Beef-Cross Premium (2024-25)
$750-$1,200/head
Average $900 across regions
Gross Premium Captured
$1,575/replacement
Assumes 1.75 breedings per heifer @ $900
Heifer Cost Increase (2019-2025)
+$1,870/head
From $1,140 to $3,010 national average
Net Gap per Replacement
-$295/head
Premium didn’t cover cost inflation
Total Additional Capital (24 months)
$126,000-$144,000
For 140-152 replacements over 2 years
Critical Time Horizon
2026-2027
When depleted 2022-23 pipeline hits
And here’s the kicker: The $10 billion in new dairy plants are set to come online through 2027, meaning processor demand for milk will keep climbing even as replacement supply stays pinched.
Four Paths Forward—And Where Each Can Backfire
Chris Wolf’s Michigan State analysis of 14,824 farm records found that performance variation among small farms is 38% farm-related compared to only 15% for large farms. Your response to this crisis matters more at 200 cows than at 2,000.
Path 1: Breeding Rebalance
Path 2: Reduce Culling
Path 3: Strategic Exit
Path 4: Processor Lock-In
Best for
Herds that can still course-correct the pipeline
Healthy older cows; buys time
Monthly losses; owners near retirement
Stable herds that can prove supply
Requires
Genomic testing ($15-45/head); sexed dairy on top 35-40%
Transition management; accept lower avg production
Honest market assessment before values erode
Documented 24-month replacement pipeline
⚠️ Backfire risk
Below 18% pregnancy rate, can’t maintain pipeline AND premiums
Failing to deliver on the supply commitment damages the relationship
Key threshold
21-day pregnancy rate ≥20% for optimal beef allocation
Monitor herd age distribution and SCC quarterly
Compare current liquidation value vs. projected 2027 value
Can you document pipeline sustainability?
Path 1 is where the Journal of Dairy Science analysis matters most: beef semen becomes economically optimal when crossbred calf price hits at least 2x dairy calf price, AND herd achieves ~20% 21-day pregnancy rate. ⚠️ Below 18%, limit beef allocation to 50% maximum. Only about 10% of Florida producers use genomic testing, per University of Florida estimates—adoption rates vary significantly by region.
Path 2 carries a hidden cost. Retaining older cows often means rising somatic cell counts, which can erode quality premiums from your processor—compounding financial strain at exactly the wrong time. Worse, when a wave of retained cows exits simultaneously, you’ve traded a gradual shortage for a cliff.
Path 3 isn’t a failure. With beef cattle prices at record highs, liquidating today captures significantly more equity than waiting until the shortage resolves. ⚠️ Waiting preserves optionality but erodes equity if exit becomes forced rather than chosen.
Path 4 is the angle most producers haven’t considered. Strong signals suggest processors expecting 2-3% milk supply growth and getting 0.4% are becoming choosy about who they keep. If you can document pipeline sustainability, you may find yourself first in line for favorable contract terms as competitors struggle to guarantee supply.
Signals to Watch
Heifer inventory trajectory. CoBank projects inventories won’t normalize until 2027 at the earliest. Watch USDA semi-annual reports for evidence that national heifer numbers have stopped declining.
Regional price spreads. The gap between Wisconsin’s $2,850 and Northwest prices “north of $4,000” reflects infrastructure differences, not just supply. Where does your region sit?
Your own replacement math. How many dairy heifer pregnancies must you generate annually to maintain herd size at the target age structure? If you don’t know that number, you can’t evaluate your breeding allocation.
What This Means for Your Operation
Calculate the real cost, not the gross premium. The $900 beef-cross check was real income—but if replacement costs have jumped $1,500+ per head since 2022, determine whether premiums actually offset that increase or simply deferred it
Run your replacement pipeline projection: at current breeding allocation and reproductive performance, will you have the heifers you need in 2028?
If “hard to breed” or “lower producing” remain your primary beef allocation criteria, the room for instinct-based allocation has narrowed sharply
Check your culling rate—if you’ve dropped below 30%, you’re likely masking a shortage rather than solving it—and check your SCC trends while you’re at it
Ask your processor what they value. If you can demonstrate a documented 24-month replacement pipeline, you may be in a stronger negotiating position than you realize
Opportunity signal: Balanced breeding programs with adequate heifer inventory could mean more favorable processor contracts as competitors struggle to guarantee supply
Key Takeaways
The 800,000-head shortage is locked in through 2026. Breeding decisions made today won’t produce milking cows until 2028-2029. The next 18 months are about managing what’s already baked in.
Don’t confuse gross premium with replacement reality. Across the industry, the collective shift drove replacement costs up $1,870 per head. For operations now buying replacements, the premium captured doesn’t come close to covering the increase in costs.
The 18% pregnancy rate threshold matters. Below that level, aggressive beef allocation creates unavoidable replacement shortfalls regardless of premium levels.
$10 billion in new dairy plants through 2027 means processor demand for milk keeps climbing while replacement supply stays pinched. Processors are likely choosing partners rather than just buying milk.
The Bottom Line
The operations that survive this won’t be those who avoided beef-on-dairy—many of the largest, most sophisticated dairies bred heavily to beef. They’ll be the ones who tracked replacement pipeline math while capturing premiums, rather than assuming the check today wouldn’t create a bill tomorrow.
Where does your operation sit on that spectrum—and what does your 2026 breeding sheet say about the answer?
Complete references and supporting documentation are available upon request by contacting the editorial team at editor@thebullvine.com.
High-Value Crosses: The Next Phase of the Beef-on-Dairy Revolution – Breaks down advanced terminal crossbreeding strategies that maximize carcass value without sacrificing your herd’s future. It delivers the blueprints for “Elite Beef” programs that command significantly higher premiums than standard auction barn crosses.
The Sunday Read Dairy Professionals Don’t Skip.
Every week, thousands of producers, breeders, and industry insiders open Bullvine Weekly for genetics insights, market shifts, and profit strategies they won’t find anywhere else. One email. Five minutes. Smarter decisions all week.
America eats 29 million pounds of cheese today — and the FMMO make allowance ensures your share keeps shrinking.
EXECUTIVE SUMMARY: Americans are tearing into an estimated 29 million pounds of cheese today — six times normal daily volume — and the dairy farmer’s cut of a $15 Super Bowl pizza is 73 cents at January’s Class III price of $14.59/cwt. USDA’s June 2025 make allowance increases widened that gap, diverting an additional 85–93 cents per hundredweight from producer pools to processors and pulling $337 million from farm-level revenue in the first 90 days alone, per the American Farm Bureau Federation’s analysis. The demand story is real; the margin story isn’t. Illinois FBFM data shows dairy operations lost $409 per cow in 2024 on a total economic cost basis — even with per capita cheese consumption hovering near all-time highs. Wisconsin producer Mike Yager calculated the make allowance hit on his 275-cow Mineral Point operation at roughly $55,868 per year in value that now stays with the processor, and says no new premiums have materialized to offset it. If your cash costs are above $17.50/cwt and your order’s blend is anywhere near Class III, your working capital is eroding monthly — and tonight’s pizza binge won’t change that. The lever that matters now: ensuring USDA’s mandatory biennial processor cost surveys — authorized under the One Big Beautiful Bill Act signed July 4, 2025 — launch on a concrete timeline and include mozzarella, the dominant Super Bowl cheese, which is currently excluded entirely from USDA pricing surveys.”
Right about now, Americans are tearing into an estimated 29 million pounds of cheese. That’s the number Dairy Farmers of Wisconsin — the checkoff-funded marketing organization funded by farmers themselves — projects for Super Bowl Sunday, roughly six times what the country consumes on a normal day. Enough mozzarella, cheddar, pepper jack, and queso to top 12.5 million pizzas, fill millions of nacho platters, and anchor every cheese board from Seattle to Miami. Instacart’s 2026 Super Bowl data shows just how dairy-heavy the day has become: queso orders surged 196% and buffalo sauce — the stuff that goes on wings destined for ranch and blue cheese dip — jumped 201% during game week.
Here’s the kicker: the same farmers who pay into that checkoff fund to promote cheese are getting about $0.73 of farm value on a $15 pizza when January’s Class III sits at $14.59 per hundredweight. If February futures hold near $15.92, that climbs to about 80 cents. Either way, the delivery driver’s tip is almost certainly larger. The FMMO formula is supposed to connect consumer demand with farm-gate value. Super Bowl Sunday is Exhibit A for why it doesn’t.
The Demand Is Real — the Margin Isn’t
That volume translates to real dollars at retail — just not at the farm gate. Wells Fargo’s Agri-Food Institute pegs the average 10-person Super Bowl party spread at about $140 in 2026, up just 1.6% from last year — below the 2.4% food-at-home CPI. Frozen pizza prices actually fell 0.6% year over year. For consumers, dairy-heavy game-day food is a bargain.
Those party-spread prices reflect a deeper pattern. Per capita total cheese consumption hit a record 40.54 pounds in 2023 — the third straight record year, according to USDA ERS data published in late 2024. Then, in 2024, it slipped to the lowest level since 2021, per the ERS’s January 2026 update — the first year-over-year decline since at least 2013. Even at record or near-record consumption, the economics at the farm gate keep tightening.
A note on the 29-million-pound figure: this is a promotional estimate from a checkoff-funded organization, not an independently audited figure. It’s been used for at least the 2024 and 2025 Super Bowls; no 2026-specific update had been published at the time of writing. Treat it as a credible industry estimate, not a USDA-verified statistic.
Following 73 Cents from the Pizza Box to the Bulk Tank
A standard large pizza uses roughly half a pound of mozzarella. Industry yield runs about 10 pounds of milk per pound of cheese. One pizza, therefore, requires approximately 5 pounds of milk — or 0.05 hundredweight.
0.05 cwt × $14.59/cwt (January 2026 Class III, USDA AMS) = $0.73
At 2024’s all-milk price of $22.55 per hundredweight (USDA ERS annual data), that same pizza returned about $1.13 to the farm — still under 8% of the retail price. As of January 2026, Class III levels are barely 5%.
USDA ERS published its 2024 farm-to-retail price spread data in June 2025. Nationally, the farm-value share of the dairy product basket was 25 percent, up from 23 percent in 2023. For cheddar specifically, the farm value was $1.80 per pound against a retail price of $5.66 — a 32 percent farm share. Butter fared better at 57 percent. But cheese — which is what’s disappearing tonight — sits squarely in that one-quarter-to-one-third zone.
The farmer’s share of a $15 Super Bowl pizza: 73 cents. The delivery driver’s tip is almost certainly larger.
How the FMMO Make Allowance Sets Your Price Before Game Day
On June 1, 2025, USDA raised the make allowances embedded in all 11 Federal Milk Marketing Orders—the first update since the FMMO system was consolidated in January 2000. These are the processing cost deductions that come off wholesale commodity prices before any value reaches producers.
The American Farm Bureau Federation’s Danny Munch calculated the early damage: class price reductions ranging from 85 to 93 cents per hundredweight, pulling roughly $337 million out of combined producer pool values in just the first 90 days (AFBF Market Intel, September 21, 2025). As Munch told RFD-TV: “Dairy farmers were most concerned about the impact of increased make allowances because they reduce the price farmers receive, and were based on incomplete data during the hearing process”.
Product
Old Make Allowance ($/lb)
New Make Allowance ($/lb)
Increase (¢/lb)
Impact
Cheese
$0.2003
$0.2519
5.16¢
Directly hits Super Bowl cheese
Butter
$0.1715
$0.2272
5.57¢
Record high costs
Nonfat Dry Milk
$0.1678
$0.2393
7.15¢
Highest increase
Dry Whey
$0.1991
$0.2668
6.77¢
Wings & dip tax
Source: USDA Final Rule on FMMO Amendments, effective June 1, 2025
Take cheese at $1.60 per pound on the CME. Under the old formula, $1.3997 per pound flowed into Class III component values ($1.60 minus $0.2003). Under the new formula, only $1.3481 does ($1.60 minus $0.2519). That extra 5.16 cents per pound never hits the pool—it stays with the processor as cost recovery.
Here’s a detail that should land hard on Super Bowl Sunday: mozzarella — the single most consumed cheese in America, the cheese on every one of those 12.5 million pizzas tonight — is currently excluded from USDA’s pricing surveys and formula pricing entirely. The cheese-making allowance was set using cheddar processing cost data. Processors testified during the FMMO hearing that mozzarella processing costs differ from cheddar, yet the USDA doesn’t track them separately. The dominant game-day cheese is priced off a formula that doesn’t account for how it’s actually made.
Processor costs are genuinely higher than they were in 2000 — energy, labor, and packaging all climbed. But AFBF argues the adjustments “must be grounded in comprehensive, mandatory and independently audited surveys” and warns there is “some likelihood that USDA’s changes will unfairly penalize dairy farmers by overstating processing costs”. The data the USDA used were self-selected and self-reported by processors and were not independently verified.
So when 29 million pounds of cheese disappear tonight, every pound carries that larger deduction. And every hundredweight behind it pays the farmer less than it did a year ago — even if the block price on the CME hasn’t moved.
How Pizza Chains Lock In Their Price While You Ride the Cycle
Domino’s, Pizza Hut, and the major frozen pizza brands don’t buy mozzarella on the spot market in February. They negotiate supply contracts months in advance — typically locking prices or establishing cost-plus formulas that insulate them from short-term CME volatility.
Tonight’s Super Bowl surge was priced into processor order books weeks or months ago. The demand spike is real, but it doesn’t create upward spot-market pressure that would flow back through Class III into your milk check. By the time 29 million pounds of cheese hits the coffee table, the price was already set. And by the time Americans order those 12.5 million pizzas tonight, Yager’s January milk check was already settled.
You’re selling milk into a Class III formula that resets monthly based on USDA commodity surveys. If CME blocks rally in February, you might see a modest lift in your March check. If they don’t, you won’t — regardless of how many pizzas Americans ordered tonight.
Record Cheese, Vanishing Farms: The Demand Paradox
Americans have never eaten more cheese over a sustained period than they did from 2021 through 2023 — three consecutive record years, peaking at 40.54 pounds per capita in 2023. And yet U.S. dairy farms keep closing at an accelerating rate.
The numbers are stark. USDA NASS data shows the U.S. lost 1,434 licensed dairy herds in 2024 alone — a 5.5% decline in a single year, bringing the national total to 24,811 farms. That’s down from 44,809 just a decade earlier — a 45% loss since 2014. And 86% of the 2024 decline was concentrated in the Midwest and Eastern states: Wisconsin lost 400 herds, Minnesota and New York shed a combined 315, and Pennsylvania dropped another 90.
Region
Farms Lost (2024)
% of National Loss
Impact
Wisconsin
400
27.9%
Worst hit
Minnesota
180
12.5%
Severe
New York
135
9.4%
Severe
Pennsylvania
90
6.3%
Major
Other Midwest/East
429
29.9%
Critical belt
Western States
200
14.0%
Growing regions
Total U.S.
1,434
100.0%
5.5% decline
The Bullvine reported in October 2025 that 1,420 American dairy farms had exited in the prior year. If that pace continued or accelerated, The Bullvine estimated the 2025 total could approach 2,800 closures — though the actual figure depends on how many operations secured financing versus being forced out. Cornell’s Dr. Andrew Novakovic put it bluntly: “What took ten years then is happening in two or three now” (The Bullvine, November 2025).
Processing capacity, meanwhile, is expanding in the opposite direction. Hilmar Cheese opened a $600 million facility in Dodge City, Kansas, in March 2025, specializing in American-style cheese in 40-pound commercial blocks and employing nearly 250 people. Great Lakes Cheese announced a $185 million expansion in Abilene, Texas, in 2024. These plants are designed to run for decades. And every one of them operates under the wider make allowances that took effect last June.
The View from Two Federal Orders
Mike Yager milks 275 Holsteins and grows feed crops near Mineral Point, Wisconsin — squarely in Federal Order 30, the Upper Midwest. When the make allowance increases hit last June, he did his own calculation: that additional 90 cents per hundredweight amounts to roughly $55,868 per year for an average-sized Wisconsin dairy in value that now stays with the processor instead of reaching the bulk tank. To estimate your own hit: multiply your total hundredweight shipped per year by $0.90. A 500-cow herd shipping around 110,000 cwt annually loses roughly $99,000 in pool value.
Herd Size
Annual Shipment (cwt)
Annual Loss from Make Allowance
Monthly Impact
Mike Yager (275 cows)
62,076
$55,868
$4,656
Average WI (500 cows)
110,000
$99,000
$8,250
Large (1,000 cows)
220,000
$198,000
$16,500
Mega (5,000 cows)
1,100,000
$990,000
$82,500
“We as dairy farmers don’t see it on our milk checks. But via the new make allowances, we are losing out on 90 cents per hundredweight additional money that the processors are now receiving.” — Mike Yager, Brownfield Ag News, November 2025
For his operation, that deficit is roughly equivalent to an employee’s salary. And so far, he says, no added premiums have materialized to offset the loss.
The regional numbers vary, but no federal order escaped the hit. In the Northeast, the Milk Dealers and Distributors Industry Association warned during FMMO hearings that reduced minimum prices would be “particularly problematic” amid “widespread and accelerating exit of Northeast dairy farmers” — and could push the milkshed past a point of no return. Calvin Covington estimated Southeast orders will see the largest net benefit from updated Class I differentials — an average $1.42/cwt increase, but only on Class I volume. For Upper Midwest producers like Yager, where the blend skews heavily toward Class III, the make allowance hit lands harder, and the Class I differential cushion is thinner.
Illinois Farm Business Farm Management data tells the broader story. The 2024 numbers showed an average net milk price of $21.63 per hundredweight against total economic costs of $23.56 — a loss of $1.93/cwt, or negative $409 per cow for the year. Feed costs averaged $11.64/cwt, and nonfeed costs hit a record $11.92/cwt. SDA ERS’s January 2026 Livestock, Dairy, and Poultry Outlook forecasts the 2026 all-milk price at $18.25 per hundredweight, down from $21.15 in 2025 — a decline of nearly $3.00/cwt, or roughly 14% . That’s a wider drop than feed cost savings can absorb.” This is the single most important factual correction in this draft.
If you’re on a component order running 4.0% butterfat and 3.3% protein, there is a premium above the Class III floor — but it’s thinner than you might assume. At January 2026 component prices (butterfat at $1.4525/lb, protein at $2.1768/lb, other solids at $0.4448/lb — per USDA AMS), a hundredweight at those test levels returns roughly $15.53in component value (assuming 5.7% other solids, standard for Holstein herds), about $0.94 above the $14.59 Class III. That’s real money. But the make allowance still comes off the top of every component calculation before those prices are set. High components help. They don’t fix the formula.
What This Means for Your Operation
This isn’t a guilt trip. It’s a math problem — and the math has specific levers you can pull.
Pull your last 12 months of milk checks and calculate your true net effective price — not the blend, not the gross, but what actually hit your account after deductions, hauling, and co-op assessments. USDA ERS data shows the national dairy farm-value share was 25% of the retail dollar in 2024. If your net is more than $1.50 below the FMMO blend minimum published by your order, you need to understand why.
Know your breakeven in Class III terms. Illinois FBFM data pegged total economic costs at $23.56/cwt for 2024, with feed and cash operating costs at $17.43/cwt. Your costs vary by region, herd size, and feed situation — but if your cash costs are above $17.50/cwt and January’s $14.59 Class III is anywhere near your order’s blend, your working capital is eroding monthly. That’s the conversation to have with your lender this month, not in May.
Talk to your crop insurance agent about Dairy Revenue Protection for Q2 and Q3 2026. HighGround Dairy’s five-year analysis found that for every $1.00 spent on DRP premiums, producers received $1.78 in return on average — a net benefit of $0.23/cwt after premiums. Coverage booked three quarters out returned the highest average net benefit at $0.30/cwt, despite higher premiums. With February 2026 advanced cheese prices at $1.4078/lb and butter at $1.4201/lb (USDA AMS, February 4, 2026), markets are signaling continued softness — exactly the environment where DRP has historically paid off. The trade-off is real: DRP premiums are a cash cost that hits quarterly, whether you need the coverage or not, and if milk rallies above coverage levels, you’ve paid for protection you didn’t use. But at current futures, the odds favor the buyer. If you haven’t locked Q3 2026 yet, that window is still open.
Push USDA to launch mandatory processor cost surveys—and include mozzarella. Congress has already acted: the One Big Beautiful Bill Act, signed July 4, 2025, mandates biennial cost-of-production surveys covering cheese, butter, and nonfat dry milk processors, with $9 million appropriated for the program. But AFBF’s Danny Munch warns the timeline remains unclear. “They’re going to have to set up a methodology. They’re going to have to have staff and researchers set aside for this,” Munch told Brownfield Ag News at World Dairy Expo. “I don’t expect it to happen anytime soon”. And even when data comes in, there’s no automatic adjustment — a full FMMO hearing would still be required to change make allowances. The gap to push on: the survey covers cheese, butter, and NFDM, but does not explicitly name mozzarella — the single largest-volume cheese in America and the backbone of tonight’s pizza consumption. Push your co-op and trade organization to demand that mozzarella be included in the USDA’s survey methodology before it’s finalized. USDA’s FMMO modernization referendum was approved across all 11 orders in January 2025, with pricing amendments effective June 1, 2025.
Request one competitive price comparison from an alternative buyer. If you ship to a large co-op, call an independent or a smaller cooperative and ask what they’d pay for your components. Yager’s experience is telling: the fear of being dropped keeps many farmers from asking tough questions about premiums. You don’t have to switch — switching carries real risk, including loss of hauling routes, potential basis penalties during transition, and relationship capital that’s hard to rebuild. But knowing you have options strengthens every negotiation you stay in. And if you’re exploring farmstead cheese or on-farm retail, start with no more than 10–20% of your production; the capital and compliance costs catch more operations than the margins do.
The Three Numbers That Matter Monday Morning
73 cents — the farm share of a $15 Super Bowl pizza at January’s Class III. Your actual loss from the make allowance increase scales with production: multiply your annual hundredweight shipped by $0.90. Nationally, the farm-value share of all dairy products at retail was 25% in 2024.
29 million pounds of cheese was priced into processor contracts weeks ago. Game-day demand doesn’t create spot-market pressure that flows back to your bulk tank. The consumption is real; the price signal to producers is at best muted.
Mozzarella — tonight’s dominant cheese — isn’t even in the USDA pricing survey. The make allowance was set on cheddar data. Until the survey includes the cheeses that actually drive demand, the formula will keep underpricing your contribution to the products consumers want most.
Beyond the Final Whistle
Seventy-three cents on a fifteen-dollar pizza. That’s the current system’s answer to record demand. It matters that dairy farmers built what’s on every table in America tonight — and it matters more that the pricing formula doesn’t reflect it.
Yager’s math is blunt: the make allowance increase alone costs an average-sized Wisconsin dairy enough to fund a full-time employee — and so far, no premiums have shown up to replace it. In the Northeast, state industry groups have warned that continued milkshed contraction threatens the infrastructure supporting all small-scale agriculture in rural New England. Novakovic says the consolidation cycle is compressing a decade into two or three years. Whether the system changes fast enough to slow that compression is the open question — and 2,800 farms may not get to wait for the answer.
Pull your numbers this week. If your net effective price is more than $1.50 below the published FMMO blend, call your field rep before March—and then call the people who claim to speak for you and ask one specific question: what are they doing to ensure USDA’s mandatory processor cost surveys include mozzarella and launch before the next make-allowance fight. The gap between what consumers pay and what you receive won’t close on its own.
Complete references and supporting documentation are available upon request by contacting the editorial team at editor@thebullvine.com.
2,800 Farms Will Close in 2025: Here’s Why USDA’s ‘Golden Age’ Isn’t Saving Them – Expose the structural flaws driving record-breaking consolidation. This deep dive reveals why federal safety nets are failing to protect family-sized operations and helps you position your business to weather the industry’s most aggressive contraction cycle.
Same Milk, Different Payday: How Your Processor’s Product Mix Shapes Your Future – Stop shipping commodity milk and start targeting specific premiums. This breakdown reveals how aligning your herd’s genetic profile with your processor’s specific end-product mix creates a defensive margin advantage that FMMO make allowances simply cannot touch.
The Sunday Read Dairy Professionals Don’t Skip.
Every week, thousands of producers, breeders, and industry insiders open Bullvine Weekly for genetics insights, market shifts, and profit strategies they won’t find anywhere else. One email. Five minutes. Smarter decisions all week.
Hilmar, Leprino, and Valley Queen are pulling milk toward new regions. For producers in traditional dairy states, the math has changed—and so have the breeding goals.
Executive Summary: Since 2020, Hilmar, Leprino, and Valley Queen have committed $1.6 billion to cheese plants in Texas, Kansas, and the I-29 corridor—not chasing existing milk, but creating the conditions that pull production toward them. Wisconsin has lost 76% of its dairy farms since the mid-2010s, from over 15,900 operations to fewer than 6,000. You now face a three-path decision: scale to 1,000+ cows with a processor contract and debt-to-asset below 40%; pivot to premium markets (A2A2, organic, grass-fed) at under 300 cows with a buyer secured before transition; or execute a strategic exit while equity holds. The structural risks driving this migration—70% of the Texas Panhandle’s Ogallala aquifer potentially unusable by 2045, 51% of U.S. dairy workers foreign-born—are risks processors can diversify away from but you cannot. As Rabobank analyst Ben Laine notes: “Everything we know about dairy consolidation says it hasn’t shown any signs of slowing down.” Your genetics program must match your market destination: component sires for cheese contracts, A2A2 and grazing genetics for premium paths.
When Hilmar Cheese Company broke ground in Dalhart, Texas, in 2006, dairy consolidation was already reshaping American milk production. But nobody expected what came next. The surrounding region had a modest dairy presence. By 2014, the area’s herd had grown more than tenfold—not because producers chose Texas first, but because Hilmar created the conditions that pulled them in.
That pattern is repeating at scale. Since 2020, major processors have announced billions in new capacity across Texas, Kansas, and South Dakota—including Hilmar’s $600 million Dodge City facility and Leprino Foods’ $1 billion Lubbock complex.
If you’re weighing expansion in a growth state—or wondering how long to hold on where you are—the economics have shifted. Here’s the decision framework.
76% of Wisconsin’s dairy farms have disappeared since the mid-2010s—from over 15,900 operations to fewer than 6,000 today.
Processors Chose First. Producers Followed.
The conventional narrative frames this geographic shift as producer-driven: families chasing lower costs and friendlier regulations. The timeline tells a different story.
Hilmar’s CEO, John Jeter, explained the Dalhart decision by citing “a growing milk supply and a stable regulatory environment.” Note the word “growing”—not “large.” The company bet on the future supply it planned to create, betting that it would create the market for it.
When Hilmar announced the Dodge City plant in 2021, Kansas Dairy CEO Janet Bailey said it would “help the state’s industry expand” and “create incentives for producers to be innovative.” That’s future tense. The plant pulls production into existence rather than chasing milk that’s already there.
Leprino’s Lubbock facility follows the same script, with phases coming online through 2026. Industry analysts estimate the company targets $10.6 billion in economic impact for Texas over the next decade.
Processors aren’t following milk. They’re building gravity wells—and milk is flowing toward them.
The I-29 Corridor: A Third Path
Not all dairy expansion is heading to the Southwest. The I-29 corridor—running through South Dakota, Minnesota, and Iowa—has quietly become the fastest-growing dairy region in the country on a percentage basis.
“So that is Iowa, South Dakota, and Minnesota—there they are growing milk production, and they are growing processing capacity,” notes Sarina Sharp in the Daily Dairy Report. “New dairies are coming in, and it’s not just cows moving across state lines, it’s truly growth.”
Valley Queen’s expansion project expects approximately 25,000 additional cows in 2025 and 2026 alone. Evan Grong, Valley Queen’s sales manager, identifies three key drivers: “We attribute the current and projected growth in the I-29 region primarily to access to feed production, abundant groundwater, and dairy processing investments.”
Unlike the Ogallala-dependent Panhandle, the I-29 corridor offers better long-term water security. Unlike Wisconsin, it has processor capacity actively seeking milk. It’s a middle path—if you can get in.
The Growth-State Assumption Is Cracking
Here’s the story everyone tells: growth states offer competitive advantages that traditional regions can’t match. Lower costs, friendlier regulations, room to expand.
Here’s the problem: the two pillars holding up that story—water and labor—are shakier than most people realize.
The water math is brutal. The Ogallala Aquifer underlies the Texas Panhandle and western Kansas dairy expansion zones. According to USGS and Texas Water Development Board data, Texas accounts for 62% of total Ogallala depletion despite covering a fraction of the aquifer’s footprint.
A University of Texas Bureau of Economic Geology projection suggests up to 70% of the Texas Panhandle’s section could become unusable within 20 years at current pumping rates. That’s potentially mid-2040s—well within the debt horizon of a dairy built today.
The labor math is worse. According to NMPF research:
51% of all hired U.S. dairy workers are immigrants
Farms employing immigrant labor produce 79% of the national milk supply
When NMPF surveyed 1,223 dairy farms, 80% reported “low or medium” confidence in employment documents
In Wisconsin alone, a UW-Madison School for Workers survey found more than 10,000 undocumented workers perform about 70% of the state’s dairy labor.
Wisconsin’s Governor Tony Evers put it plainly: “If suddenly those people disappear, I don’t know who the hell is going to milk the cows.”
The Risk Sits Differently for You Than for Them
Leprino runs facilities across Colorado, California, Michigan, New Mexico, and now Texas. Hilmar has operations in California and Texas, with Kansas coming online. If water constraints or labor enforcement hits one region hard, they can shift volume elsewhere or exit with a write-down that stings but doesn’t kill the company.
A 4,000-cow dairy built in the Panhandle to supply a processor contract? Those wells, those barns, that debt—they’re all fixed in place.
Risk Factor
Texas Panhandle
Kansas (Western)
I-29 Corridor (SD/MN/IA)
Ogallala Depletion
70% potentially unusable by 2045(red)
Moderate-to-high stress, caps tightening(red)
Not Ogallala-dependent (better water security)
Labor Dependency
51% immigrant workers nationally(red)
51% immigrant workers nationally
51% immigrant workers nationally
Processor Diversification
Hilmar (CA, TX, KS), Leprino (CO, CA, MI, NM, TX)
Hilmar, Leprino multi-state
Valley Queen, regional processors
Producer Risk Exit
Fixed assets, debt horizon 15-25 years
Fixed assets, debt horizon 15-25 years
Fixed assets, debt horizon 15-25 years
NMPF modeling shows what a full labor disruption would mean nationally:
Over 7,000 dairy farms closed
2.1 million cows culled
48.4 billion pounds of milk lost
Retail prices are nearly doubling
For a 500-cow operation that loses 40% of its crew during a 30-day enforcement surge, the hit could run $20,000 or more in lost milk alone.
The Genetics Angle: Components Are King
Here’s what most geographic-shift analyses miss: where you farm increasingly determines what genetics you need.
These “gravity well” dairies feeding Hilmar and Leprino cheese plants are breeding hard for components—not volume. According to a March 2025 CoBank report, U.S. butterfat reached a record 4.23% nationwide in 2024, while protein reached 3.29%.
The April 2025 Holstein genetic evaluations saw the largest base change in history—a 45-pound rollback on butterfatand a 30-pound rollback on protein. Corey Geiger with CoBank explains: “That butterfat number’s almost double any number that’s taken place in the past.”
Why the shift? In cheese-focused markets, component pricing programs can place 80-90% of the milk check value on butterfat and protein—though this varies by Federal Order and utilization. Cheese plants pay for solids, not water.
For Wisconsin’s “premium path” operations, the genetics conversation looks different. A2A2 genetics, grass-fed programs, and high-type show cattle can command premiums in specialty markets. MilkHaus Dairy in Fennimore, Wisconsin, tests about 100 of their 360-head Holstein herd for A2 genetics, housing them separately to produce 12 cheese varieties sold nationwide.
The bottom line: Your sire selection should match your market destination.
Three Paths: Scale, Premium, or Exit
If you’re in a traditional region—or evaluating whether to build in a growth state—your decision comes down to three paths.
Strategy
Best For
Key Trigger
Primary Risk
Scale Up
1,000+ cow potential
Debt-to-asset < 40%, signed processor agreement
$24+ breakeven, no successor
Premium
< 300 cows
Signed specialty contract before transition
Limited market capacity
Strategic Exit
No successor
Equity eroding 3+ years
Forced liquidation timing
Path 1: Scale Up
Decision triggers:
You’re at 500+ cows with a realistic path to 1,000+
Debt-to-asset sits below 40%
You’re under 55 with a committed successor
You have a signed processor agreement—not a handshake
It requires significant balance-sheet capacity—often $15 million or more — for a 500-to-1,000-cow build-out. Plan for 24-36 months of tight margins during ramp-up.
Genetics focus: High-component sires. The cheese plants driving this expansion reward butterfat and protein, not volume. While butterfat has driven the recent surge, CoBank’s September 2025 report noted excessive butterfat levels can impact cheese quality – keep an eye on protein-focused sires as processors adjust.
Where it breaks: Your expansion needs $24+ milk to pencil out. You don’t have a written processor commitment. No one’s willing to run the expanded operation after you.
Path 2: Premium Positioning
Decision triggers:
Your herd is under 300 cows—ideally under 200
You’ve got pasture access at 2+ acres per cow
You can secure a processor contract before starting the transition
Someone in your operation wants to do the marketing work
It demands 36+ months of operating capital for organic transition. Maple Hill was moving to $40.86/cwt base by July 2025, with quality premiums pushing total pay toward $45/cwt for qualifying producers.
Genetics focus: A2A2 testing and segregation, Jerseys or crossbreeding for components, grass-efficient genetics. Most Holsteins run 50-60% A2 naturally—testing your herd first tells you how much work the transition requires.
Where it breaks: Premium markets absorb perhaps a few hundred operations annually at most. Wisconsin alone loses 400-500 farms per year, according to USDA data.
Path 3: Strategic Exit
Decision triggers:
You’re past 55 with no committed successor
Breakeven sits above $24/cwt with no clear path down
Equity has eroded three years running
Debt-to-asset has crossed 60% and keeps climbing
The gap between a well-planned exit and a forced sale can be substantial—potentially several hundred thousand dollars in recovered equity. Cull cow prices have been running strong in recent months.
One DFA executive put it this way: “For farms without succession plans, strong calf and cull prices offer a timely opportunity to exit the industry without incurring losses from prolonged milk prices.”
Signals Worth Watching
Immigration reform is moving. The Farm Workforce Modernization Act was reintroduced in May 2025 with bipartisan support. Senate Ag Chair John Boozman recently said: “We said we could not do reform because the border was not secure… it is secure now, then through visa programs you control the flow, but it’s time to do that.” If year-round ag visas open up by 2027-2028, the labor advantage in growth states shrinks.
Groundwater districts are tightening. Texas and Kansas conservation districts can implement pumping caps faster than the aquifer models update. Watch Dallam, Hartley, and Moore Counties in Texas, plus western Kansas districts.
Watch the processor contract terms. Are supply agreements getting shorter? Quality specs tightening? Water-efficiency clauses appearing? That tells you how processors are pricing in structural risk.
Component premiums may shift. CoBank’s September 2025 report noted that butterfat growth has significantly outpaced protein growth and that excessive butterfat levels can impact cheese quality. Protein may command higher premiums than fat.
What This Means for Your Operation
Know your real breakeven. Include unpaid family labor at $18-22/hour, depreciation at replacement cost, and management compensation. For most 300-500 cow herds, that number lands between $22-26/cwt.
If you’re looking at growth states: Run your water scenario for 2040, not today. What happens if pumping gets cut by 30-40%? Consider the I-29 corridor as an alternative with better water security.
If you’re eyeing premium markets, don’t start an organic transition without a signed contract. Test your herd’s A2A2 genetics first.
Audit your genetics program. Are you still breeding for volume while processors pay for components? The April 2025 base change proves the industry has moved.
If exit makes sense: Strategic beats reactive by a wide margin. That’s the difference between selling genetics as genetics versus a fire sale.
Red flag: Your 18-month cash flow shows cumulative losses exceeding 15% of equity.
Green light: You’re under 250 cows, have pasture, and a processor has put interest in writing at premium terms.
Herd Size
Real Breakeven (incl. unpaid labor)
Current Milk Price Range
Decision Trigger
100-200 cows
$25-28/cwt(red)
$20-22/cwt
Consider premium pivot or strategic exit(red)
300-500 cows
$22-26/cwt(red)
$20-22/cwt
Marginal viability; efficiency gains or exit(red)
500-1,000 cows
$20-23/cwt
$20-22/cwt
Viable if debt-to-asset < 50%; consider scale-up
1,000+ cows
$18-21/cwt
$20-22/cwt
Profitable; focus on component optimization
The Bottom Line
Processor confidence doesn’t validate producer expansion. Their bets pay off under scenarios where yours might not—they have optionality you don’t.
The three-path decision isn’t optional. Scale, premium, or exit. Staying the same size, doing the same things, hoping prices improve—that’s not a strategy. It’s a slow exit with worse terms.
Water, labor, and genetics are structural, not cyclical. These aren’t problems that fix themselves in the next price rally. Build them into your 10-year planning.
Chad Vincent of Dairy Farmers of Wisconsin captured the human weight of all this: “I think Wisconsin dairy is as strong today as it’s ever been, although it is sad to see the next generation not come back.”
Rabobank analyst Ben Laine summed up the trajectory: “Everything that we know about dairy consolidation says it hasn’t shown any signs of slowing down… I don’t see that changing.”
Wisconsin’s farm count peaked above 100,000 in the mid-20th century. Today, fewer than 6,000 remain—and production has nearly doubled. The milk keeps flowing. The communities that make it look nothing like they used to.
Where does your operation sit on that curve? And who’s making the call—you, or the next milk check?
Complete references and supporting documentation are available upon request by contacting the editorial team at editor@thebullvine.com.
Every week, thousands of producers, breeders, and industry insiders open Bullvine Weekly for genetics insights, market shifts, and profit strategies they won’t find anywhere else. One email. Five minutes. Smarter decisions all week.
Breeding 14,000 kg Holsteins but milking them in a 9,000 kg barn? Your genetics can’t outrun bad concrete.
Executive Summary: Canadian tie‑stall herds are heading into the 2027 Dairy Code with a brutal choice: spend roughly $480K on a retrofit or about $1.48M on a new robot barn for 60 cows. The article shows why the cheapest quote often isn’t the best bet once you price in cow‑flow, ventilation, fetch time, and mid‑life “correction” projects that can add $75,000–$100,000 back onto a tight retrofit. Using current Canadian Holstein averages — 11,364 kg in 305 days at 4.15% fat and 3.36% protein — it walks through how even a 5% drop in performance and an extra 275 hours of fetching per robot per year can erase a $200K saving over 15 years. Producers get three clear paths: minimal Code‑compliant upgrades to buy time, a serious long‑term retrofit for barns with good bones, or a full new robot barn for growth‑minded, multi‑generation herds. Along the way, it ties barn design back to labour, succession, and the ability to actually express the 14–15,000 kg Holstein genetics many Canadian breeders are already paying for. The core takeaway is simple: start your AMS decision with the building and your 15‑year horizon, or risk locking your robots—and your genetics—into bad concrete.
Here’s the picture. It’s a cold January morning in an older 60‑cow tie‑stall. The pipeline’s humming, the concrete’s polished from years of hooves and boots, and you’ve got a robotic milking quote on the table that says you can “go automated” for about $17,000 less per cow if you retrofit instead of building new. On paper, that looks like the easy choice.
But the calendar is louder than the quote. As of April 1, 2027, Canada’s updated Dairy Code of Practice says cows in existing barns can’t be tethered continuously through their production cycle anymore. Not long after that, new rules land for loose calving and stocking density, all while you’re staring at a seven‑figure gap between the cheapest retrofit and a purpose‑built robot barn — plus your own body, your family’s future, and your quota investment. If you’re milking in a Canadian tie‑stall in 2024–2026 and thinking about robots, you’re not just buying a machine. You’re deciding what kind of barn — and what kind of life — you want for the next 15 to 20 years.
The New Code, Real Money, and Real Cows
Recent Canadian analysis of automated milking system (AMS) costs after tie‑stalls pegs a green‑site robotic facility at about $24,718 per cow once you factor in everything. That breaks down to roughly $6,800 per cow for the milking equipment and $10,700 per cow for the barn and core infrastructure, plus handling, feed storage, and manure systems. For a 60‑cow herd, you’re looking at roughly $1.48 million tied up in that project.
In a retrofit, the robot cost doesn’t change much. A single box typically runs in the $150,000–$220,000 range and realistically serves about 55–60 cows, with a working life of 7-15 years, depending on usage and maintenance. The savings show up when you reuse concrete and steel that are already in the ground. In some Canadian retrofit case studies, the total invested cost is closer to $8,000–$14,000 per cow once you upgrade floors, ventilation, and electrical systems, while keeping the shell. On a 60‑cow herd, that’s roughly $480,000–$840,000.
Now add the Code pressure. The 2023 Dairy Code of Practice update — released by the National Farm Animal Care Council and rolled into Dairy Farmers of Canada’s timelines — lays out three big structural dates:
By April 1, 2027, cows in existing barns must not be tethered continuously throughout their production cycle.
By April 1, 2029, all calving must take place in loose housing that allows cows to turn around — pens, yards, or pasture — not in a tie‑stall.
By April 1, 2031, stocking density in freestall systems must not normally exceed 1.0 cow per stall, stepping down from earlier allowances of 1.2 then 1.1 cows per stall.
At the same time, reporting around the Code notes that nearly two‑thirds of Canadian dairy farms still use tie‑stall housing. Some of those barns already provide turnout or loose housing that help meet the new “freedom of movement” requirement, but there’s no national count of how many. If your barn is tired, your body’s tired, and you’re looking at robots anyway, the Code isn’t just a welfare document — it’s the shove that forces you to decide whether that building really deserves another 15‑year run.
You’re not just weighing a robot quote. You’re deciding whether to bolt a complicated, very expensive piece of automation onto something that might already be past its best‑before date — and how much that’s going to cost you in labour, milk, and sanity down the road.
Same Robot, Two Very Different Barns
What producers keep finding is pretty simple: the robot almost never lets you down. The barn design does.
Think about one of the better retrofits you’ve toured.
You walk into the old tie‑stall, and the first thing you notice is space. The family bit the bullet, dropped from 90 milking cows to around 60, and made the building fit one robot instead of trying to squeeze two into a footprint that couldn’t handle it. They tore out a row of stalls to carve out 15 to 20 feet of open approach in front of the robot, gave cows a clean exit lane that leads straight past fresh water, and built a small but functional separation pen for fresh, lame, and “special” cows.
Ceiling height is 10–12 feet instead of a tight 8. The foundation and posts checked out structurally, and there’s enough sidewall height to hang curtains and install big fans without blowing air into the beams instead of the cows. They didn’t try to force guided cow traffic into a shoebox. They went with free‑flow, grooved and leveled the floors so cows weren’t skating, and gave cows reasons to walk past the robot on their own — feed, water, and an easy path.
Startup was still messy — every AMS startup is. But once cows and people settled, fetch time landed in the “normal” range you see out of AMS field data: roughly 45–60 minutes per robot per day, depending on stage of lactation and season. Fetching is still work, but it feels like the system is on your side.
Now picture another barn you’ve walked into, where the quote looked great and the robot “fit” on paper.
The box is shoved into an end wall because that’s where it was easiest to cut concrete. There’s one narrow alley, maybe 8 feet wide, leading to it with a sharp corner around a post. Dominant cows love to stand there, blocking timid heifers and fresh cows. There’s no real waiting area and no proper separation pen because no one wanted to give up stalls. It technically fits. Practically? It’s a choke point.
Research on automatic milking systems has documented fetch time per robot anywhere from 5 minutes to 120 minutes per day, heavily influenced by barn layout, stocking density, and cow traffic design. In herds with bottlenecks like that second barn, the fetch list never really shrinks. In at least one AMS cow‑traffic study, increasing stocking density by just over ten percentage points made cows roughly one‑and‑a‑half times more likely to end up on the fetch list. That’s the difference between a quick pass through the barn and another hour and a half of “come on girl, let’s go.”
Ventilation amplifies it. When robots and robot rooms are tucked into sidewalls without thinking about inlets and outlets, they can block the main curtain area. Work using Canadian Holstein data and climate records has shown that heat stress hits production and components well before cows are visibly panting, especially in barns with weak air movement. In a retrofit where the robot approach is the hottest, stalest air in the barn, you’re literally asking cows to walk into a sauna to get milked. They’re not going to volunteer.
Component
Good Ventilation (Well-Designed)
Weak Ventilation (Compromised Retrofit)
Difference
Butterfat %
4.15%
4.00%
−0.15%
Protein %
3.36%
3.26%
−0.10%
Same robot. Two very different barns. And completely different lives for the cows and people inside them.
Metric
Good Layout
Compromised Layout
Difference
Daily fetch time per robot
45 min
90 min
+45 min
Annual fetch hours per robot
274 hrs
549 hrs
+275 hrs
Labour cost per hour (loaded)
$30
$30
—
Annual fetch labour cost
$8,220
$16,470
+$8,250
15-year cumulative labour cost
$123,300
$247,050
+$123,750
The Barn‑Design Math You Don’t See on the Quote
Here’s where the “cheapest option” can quietly turn into the most expensive barn you own.
For a 60‑cow herd, using the Canadian cost work above as a guide, the three basic options look like this:
Full new robotic build: About $24,718 per cow in total → roughly $1.48 million. Clean‑sheet layout, designed cow flow, new manure and ventilation systems.
Strategic retrofit with proper upgrades: Around $14,000 per cow → roughly $840,000. Serious spend on floors, air, robot area, and separation, but within the old shell.
Minimal retrofit (robot dropped into existing layout): As low as $8,000 per cow → roughly $480,000. Robot, basic wiring and plumbing, but little to no change to alleys or ventilation.
If you stop there, minimal retrofit wins every time. That’s why so many kitchen‑table conversations end at the quote.
But AMS economics don’t end at installation. They run for over 10–15 years.
AMS comparisons from several North American and European extension projects have reported labour savings of roughly 10–29%, depending on herd and system, when cow flow and stocking match the robot’s capacity. That’s the upside.
On the downside, the gap between a barn fetching 45–60 minutes per robot per day and one fetching 90–120 minutes per robot per day is enormous. If your retrofit ends up on the wrong side of that line, you’ve effectively given yourself a permanent labour tax:
Roughly 275 extra hours per robot per year of fetch time when you jump from 45 to 90 minutes a day.
At roughly $25–$35 per hour for fully loaded labour on many dairy farms today, that’s about $6,875–$9,625 per robot per year just to drag cows to the box.
Production is the other quiet killer. Recent Canadian Dairy Information Centre data show Holsteins averaging 11,364 kg in 305 days, 4.15% fat, and 3.36% protein in 2024. If a compromised layout and heat load cost you even 5% of that potential, you’re giving up around 570 kg of milk per cow per year, plus components. On 60 cows, that’s over 34,000 kg of milk a year gone.
Stretch that over a 15‑year robot life, and the real cost of that “cheap” retrofit starts to show itself. A project that saves a couple hundred thousand dollars on day one can easily give that back — and more over 15 years — through extra labour, lost milk, and the kind of “year eight correction” AMS designers warn about.
That correction cheque usually shows up when the compromises you thought you could live with stop being tolerable: tearing out and re‑pouring the main alley, moving a robot that was jammed into the wrong corner, cutting new curtain openings, or finally building the separation pens you knew you needed from day one. In some retrofits, those correction projects can easily reach$75,000–$100,000.
So you’re not really choosing between a $480,000 retrofit and a $1.48 million new barn. You’re choosing between:
A cheaper‑to‑build, potentially more expensive‑to‑operate barn that could lock you into chronic labour and production penalties.
A more expensive‑to‑build facility that, if designed right, is cheaper and saner to live with for the next 15–20 years.
Year
Minimal Retrofit
Strategic Retrofit
New Robot Barn
0
$480,000
$840,000
$1,480,000
5
$590,000
$920,000
$1,520,000
10
$730,000
$1,020,000
$1,570,000
15
$900,000
$1,140,000
$1,630,000
New construction isn’t automatically “right.” For some herds, the capital hit and land base requirements make it a non‑starter. But if you’re only looking at the quote and not the 15‑year picture, you’re flying blind.
Quick Comparison: Retrofit vs New Robot Barn
A lot of this comes down to how much risk you’re willing to carry — and for how long.
Path
Typical Investment (60 cows)
Labour Relief
Best For
Biggest Risk
Minimal Compliance(No Robot)
$50K–$150K(loose pens, ventilation, turnout)
None
<10 yrs to retirement, no successor, tight capital, already offer turnout
Cutting corners on air/flow turns it into a bridge you never leave
Bridge Retrofit(Robot Now, New Barn Later)
$480K–$600K(clean one-robot setup)
Moderate(temporary)
Next generation committed, need relief now, capital for Phase 2 coming
Bridge quietly becomes destination—Phase 2 never happens
Purpose-Built Robot Barn
$1.48M (clean-sheet design)
High (best layout)
Growth-minded, multi-generation, want 15–20 yrs of good cow-flow
Highest upfront cost—requires strong balance sheet and land base
Three Realistic Paths Between Now and 2027
If your tie‑stall barn still has decent bones, you’re not stuck between “retrofit now” and “build new now.” In practice, most serious Canadian producers are landing in one of three lanes.
Path A: Minimal Compliance, Maximum Optionality
This lane says, “I’ll get Code‑compliant by 2027, but I’m not ready to bet six or seven figures on robots yet.”
It fits when you already give cows turnout or pasture, or have loose pens for dry and close‑up cows, so you’re not continuous tethering today. It also fits when there’s no clear successor, or you’re within 10–12 years of stepping back. And it fits when debt capacity is tight, and a $500,000–$1 million project would stretch things uncomfortably.
On this path, you focus on making freedom‑of‑movement time real and defensible, upgrading or adding loose maternity pens well before the April 2029 deadline, and fixing obvious stall, bedding, and ventilation issues within your tie‑stall footprint to protect comfort and longevity. You watch AMS tech and neighbour experience, so when you do make a move, it’s on your terms—not because you panicked.
The trade‑off is straightforward: you guard flexibility and your balance sheet, but you don’t ease the daily labour grind much. If your body’s already telling you you’re done with twice‑a‑day pipeline milking, this path buys time — not relief.
Path B: Strategic Retrofit as Your Long‑Term Barn
Path B is for when you look at your barn and honestly say, “She’s got another 15 years in her — if we don’t cut corners.”
It fits when a structural engineer has reviewed the foundation, posts, and roof and given you the green light for robot pads and ventilation upgrades. You can carve out 15–20 feet of clear approach in front of the robot, plus a clean exit lane and at least one functional separation pen. Ceiling height is closer to 10–12 feet than 8, or you’re committed to opening up low loft space to gain headroom. Once you’ve made room for cow flow and separation, your stall count still matches realistic robot capacity — about 60 cows per box, not 80 or 90 forced through. And you don’t see yourself doubling cow numbers in the next decade.
Here’s where it gets uncomfortable: you may have to drop from 90 cows to 60. That means less quota in the main string and, on paper, less milk shipped. But if those 60 cows are closer to their genetic potential in a barn that flows, with a robot that isn’t choking on overstocking, your dollars per cow and dollars per labour hour can look a lot better than fighting 90 in a compromised setup. Run the margins both ways before you decide.
If you choose this lane, you have to mean it. Floors, air, cow‑flow, and separation are the engine room of your AMS system. If that’s where you decide to save money, you’re setting your future self up to write that correction cheque and wonder why you didn’t do it right the first time.
Here’s a rough rule of thumb barn planners talk about: if your strategic retrofit budget is climbing past about half of what a new barn would cost and you’re still compromising on cow flow and air, that’s your cue to run full‑build numbers side by side seriously.
Path C: Retrofit as a Bridge to the Next Barn
This lane is for families where the next generation is coming home, but the timing and capital for a full new build aren’t there yet.
It works when the current operator needs physical relief now — backs, knees, and shoulders are sore from tie‑stall milking. The next generation is committed to staying in dairy and sees future growth in cow numbers or robots. The existing tie‑stall can be turned into a solid one‑robot, 60‑cow barn with honest upgrades, but everyone agrees it’s not the 2040 barn.
Here, you retrofit cleanly for one robot and about 60 cows with good cow flow and air, knowing this is Phase 1. You use this barn as your AMS training ground — learning how your cows behave in free‑flow, how to manage data, feed tables, and alarms. You start planning the new build right away: land base, manure storage, feed layout, number of robots, and cow capacity. And you put a real-time frame on Phase 2 (even if it’s a range like 2030–2033) and build your capital plan around it.
The risk? The bridge quietly becomes the destination. A few years in, payments feel normal, the worst of the old problems are gone, and the push for a purpose‑built barn fades. That’s how you end up a decade later, still in a building you meant to use “for a while,” staring again at the same cow‑flow and expansion walls.
What This Means for Your Operation
Start with the building, not the robot. Before you call a single dealer, get a structural engineer and a barn/AMS designer to walk your place. If your foundation is suspect, ceiling height is under 9 feet across most of the barn, or you can’t find 15–20 feet of clear approach space for a robot, you’re not choosing between two good options. You’re choosing between a new barn and an AMS retrofit that may never work right.
Run 15‑year numbers, not 15‑month paybacks. Sit down with your lender or advisor and build three cash‑flow models—minimal compliance, strategic retrofit, and new build—out 15 years. Use realistic labour assumptions (including fetch time at $25–$35/hour) and plug in current Canadian Holstein production as a baseline, then model what happens if you’re 5% under that due to layout and air. The spreadsheet might tell a very different story than the quote.
Be brutally honest about herd size and quota. If a workable robot layout means dropping from 90 cows to 60, are you actually going to do it? Or are you planning to sneak cows back in until the barn is overstocked again? Be honest about how many cows your footprint can truly handle and how that lines up with robot capacity.
Use fetch time as a barn‑health metric. If you’re regularly spending more than about 90 minutes per robot per day fetching cows once the system is “broken in,” treat that as a warning sign. It’s not just a bad day — it’s your layout, stocking density, or air telling you something.
Separate “Code‑compliant” from “livable.” You may be able to meet the 2027 tethering rule with turnout, exercise yards, or loose housing for some groups without robots. That might be the right move if capital’s tight and you can still physically handle the pipeline. But if your body is already done, that’s just postponing the real decision.
Match your path to your horizon. If you’re a decade from retirement and no one’s stepping in behind you, a smart retrofit or even minimal compliance might be perfect. If your kids are already talking about 120 cows and two robots, your plan should focus on where you want to be in 2035, not just how to squeeze one more trick out of a 1970s barn.
Check if your barn matches your genetics. If your breeding decisions and proofs say 14–15,000 kg Holsteins and strong component genetics, ask yourself honestly whether your barn is built for that — or whether the concrete and air in front of your robot are still a 9,000‑kg design. Genetics can’t outrun a barn that holds them back.
Scenario
Realized Milk (kg/year)
Lost to Layout/Heat (kg/year)
Genetic Potential (kg/year)
Good Layout (New Barn)
11,364
0
11,364
Moderate Retrofit
10,796
568
11,364
Compromised Layout
10,296
1,068
11,364
Talk it through before you call the dealer. Sit down with your family and your lender, map each of these paths on paper, and make sure everyone’s aligned on which lane you’re actually in — before anyone falls in love with a shiny robot quote.
Watch your cows for a week before you draw lines on paper. Set the notebook and the quote aside and just watch. Where do cows hesitate? Where do they bunch up? Who owns which alleys? Any robot layout that fights their natural movement will cost you in fetch time, milk, and patience for as long as that concrete is there.
Key Takeaways
The robot is the cheap part. The expensive part is where you bolt it. If the cow flow and air are wrong, that box will spend 15 years amplifying every design mistake.
A $17,000‑per‑cow cost gap between a retrofit and a new build can disappear over 15 years if you’re burning an extra 30–60 minutes a day on fetching at $25–$35/hour and running 5% under your herd’s production potential.
Strategic retrofits work when the barn has genuinely good bones, your realistic future herd size lines up with about 60 cows per robot, and you’re willing to give up stalls and invest in floors, ventilation, and separation.
Minimal‑change “compliance only” strategies can buy you time on the Code and protect your borrowing capacity, but they don’t fix labour, ergonomics, or succession pressures.
Bridge‑style retrofits only make sense if everyone’s honest that Phase 2 — a true, purpose‑built robot barn — is coming, with a rough date and a financial plan. If that’s never going to happen, treat the retrofit as permanent and design it that way.
A well‑designed robot barn isn’t just about labour; it’s how you actually realize the ROI on your high‑LPI and genomic investment. You can’t breed for 14,000–15,000 kg and build for 9,000 kg and expect those proofs to show up on the milk sheet.
Cost Category
Minimal Retrofit
Strategic Retrofit
New Robot Barn
Initial Investment (60 cows)
$480,000
$840,000
$1,480,000
Robot & equipment
$200,000
$200,000
$200,000
Barn/infrastructure
$280,000
$640,000
$1,280,000
Hidden Operating Costs (Annual)
Extra fetch labour (vs. good layout)
+$8,250/yr
+$2,000/yr
$0
Lost production (5% vs. genetic potential)
+$8,500/yr
+$3,000/yr
$0
Mid-Life Correction Project (Year 8)
+$85,000
+$25,000
$0
15-Year Total (All-In)
~$900,000
~$1,140,000
~$1,630,000
Real 15-Yr Cost Gap vs. New Barn
−$730,000 (not −$1M)
−$490,000
Baseline
The Bottom Line
At the end of the day, you’re not just picking a milking system — you’re designing how every single day is going to feel in that barn in 2030 and 2035. The Code, the cost of concrete and steel, and the genetics you’ve already paid for are all going to meet in that alley. Before you chase the cheapest ticket into robotic milking, ask yourself one blunt question: when you’re walking that alley with a fetch list in year eight, will this still feel like a smart move — or just the move that cost the least on paper?
Complete references and supporting documentation are available upon request by contacting the editorial team at editor@thebullvine.com.
Learn More
Dairy Tech ROI: The Questions That Separate $50K Wins from $200K Mistakes – Gain a hard-nosed checklist for Monday morning that stops you from buying trade-show hype. This breakdown exposes the $27/hour labor threshold and armors your operation against the infrastructure failures that sink 62% of automation projects.
More Milk, Fewer Farms, $250K at Risk: The 2026 Numbers Every Dairy Needs to Run – Secure your farm’s 2026 viability by running the five mission-critical numbers lenders are watching. It delivers a risk-management playbook that shifts you from simply watching Class III prices to proactively protecting your regional processor contract.
Every week, thousands of producers, breeders, and industry insiders open Bullvine Weekly for genetics insights, market shifts, and profit strategies they won’t find anywhere else. One email. Five minutes. Smarter decisions all week.
Same cows, same milk, $15,000 apart. This spring, Class III won’t decide your future—your DRP and risk plan will.
Executive Summary: Class III and Class IV price swings are quietly putting five‑figure gaps between herds that look almost identical on paper. Using current USDA class prices and the latest 2026 milk production forecast, this piece shows how the same 500‑cow herd can end up roughly $10,000–$15,000 apart in a month, just on pooling and price exposure.It then sorts risk management into three simple lanes—defensive, balanced, and aggressive—with practical DRP and Class III options ideas, suggested coverage ranges, and clear cheese/Class III triggers for when to act. The article also walks through five numbers you’ll want on paper before you call your DRP agent: production, components, basis, utilization mix, and break‑even. If you’re planning for Spring 2026, it’s built to help you move from watching Class III to running a risk plan that actually fits your herd.
You know that feeling when Class III is up on the screen, but your milk check sure doesn’t look like it got the memo? You’re not alone. A lot of 400–800 cow herds are finding that when the Class III/Class IV spread opens up, two 500‑cow dairies with very similar cows, butterfat levels, and fresh cow management can still end up thousands of dollars apart each month, just because their milk is pooled and used differently.
What I want to walk through here is a simple, practical playbook for Spring 2026: three risk “lanes,” five numbers you need in front of you, and some Dairy Revenue Protection (DRP) timing and price triggers that actually help you decide, not just worry.
How the Class III/Class IV Spread Quietly Moves Your Milk Check
Let’s start with what the numbers really look like. USDA’s own class price reports make it pretty clear the spread between Class III and Class IV moves around more than most of us would like. For example, in February 2025, the USDA reported Class III and Class IV milk prices of 20.18 and 19.90 dollars per hundredweight, respectively. So in that month, Class III had a small edge.
By October 2025, those class prices had shifted again. USDA’s Announcement of Class and Component Prices shows a Class III price of 16.02 dollars per hundredweight and a Class IV price of 14.30 dollars per hundredweight, giving Class III about a 1.72‑dollar advantage. So the story isn’t “Class IV always wins” or “Class III always wins.” The point is that the relationship between the two can change within a year, and your pay price rides on how your milk is used.
Here’s an easy way to picture it. Say you’ve got a 500‑cow Holstein herd averaging about 60 pounds per cow per day. That’s roughly:
500 cows × 60 lb = 30,000 lb per day
30,000 lb × 30 days ≈ 900,000 lb per month
900,000 lb ÷ 100 = 9,000 cwt per month
Now imagine two different pools:
One is effectively 70% cheese (Class III) and 30% butter‑powder (Class IV).
The other is closer to 25% Class III and 75% Class IV.
If Class III is a couple of dollars higher than Class IV for a stretch, that cheese‑heavy pool is going to capture a lot more of that value. A 2‑dollar spread on 9,000 cwt is 18,000 dollars on paper. Even if only part of that makes it into your final mailbox price because of pooling and adjustments, you can see why it’s realistic for two similar 500‑cow herds, sitting in two different utilization situations, to be ten‑plus thousand dollars apart in some months. The cows don’t know it, but the blend sure does.
Uniform prices tell the same story in a different way. USDA’s 2025 uniform milk price tables show that the monthly uniform price at 3.5% butterfat can differ by more than a dollar per hundredweight between some Federal Orders, depending on class utilization and the month. Industry coverage of those uniform prices in late 2025 noted that when class prices fell together, all 11 orders saw lower uniform prices, but the actual level on the milk check still varied by order and utilization mix. On 9,000 cwt, a 1‑dollar uniform price gap is 9,000 dollars before you even talk about premiums or penalties.
And here’s something that’s easy to miss: the FMMO numbers are useful, but they’re still averages. Your co‑op’s monthly statement will often show how your specific pool and plant mix are behaving, and that’s the document you really want to study alongside the federal reports.
The bottom line: you don’t control the spread. You don’t control how your co‑op pools. But you do control how much of your business is exposed to that spread, and that’s where this risk “lane” idea comes in.
Three Risk Lanes: Which One Looks Most Like You?
What I’ve found, sitting at kitchen tables in Wisconsin and the Northeast, is that most herds don’t need a PhD in futures. They need an honest look at their balance sheet and a simple way to decide how much downside they can live with. When you do that, most 400–1,000 cow dairies fall into one of three lanes:
Defensive: “We really can’t afford a bad quarter.”
Balanced: “Let’s protect the downside, but don’t cap all the upside.”
Aggressive: “Feed’s lined up, equity’s good, we’ll ride more risk.”
Here’s an illustrative snapshot for that 500‑cow, 2.7‑million‑lb‑per‑quarter herd:
Strategy
Production Covered
Premium Commitment*
Floor Strength
Upside Exposure
Best Fits
Defensive
65–70%
Higher
Near sustainable break‑even
~30–35%
Tight cash, higher leverage
Balanced
40–50%
Moderate
Good, but not maximum
~50–55%
Moderate leverage, modest reserves
Aggressive
20–25%
Low
Disaster‑only
~75–80%
Strong equity, feed locked, higher risk
*Premium commitment here is total premiums over several months as a rough share of gross milk revenue, not a quote.
A quick way to check your lane:
Defensive herds have less than 6 months of cash cushion, debt-to-asset ratios around 50–60%, and a genuinely scary outlook if one quarter goes badly.
Balanced herds have six to twelve months of operating cushion, manageable debt, and enough breathing room to absorb a tough quarter without the banker reaching for the restructuring file.
Aggressive herds have strong equity, feed covered through the next harvest at tolerable prices, and enough cash flow to ride out a bad quarter or two without forced cow sales.
What’s interesting is that no lane is “right” or “wrong.” They just come with different trade‑offs. More coverage buys stability but trims upside. Less coverage keeps upside but magnifies the swings. In many cases, producers I work with aim to keep at least 15–20% of production covered with something—DRP, deep out‑of‑the‑money puts, or a mix—just as catastrophic protection. It’s the rest of the milk where the lane really shows up.
If You’re Defensive: “We Can’t Afford a Bad Quarter”
Let’s talk about the herd that’s built new facilities, maybe added robots, and is carrying more debt than they’re comfortable with. If one really bad quarter would have your lender asking hard questions, you’re in the defensive lane, whether you feel like a risk‑taker or not.
You probably recognize yourself if:
Your cash cushion is under six months of expenses.
Debt‑to‑asset is 50–60% or more.
Your sustainable break‑even is at least in the mid‑15‑dollar range, once you account for all costs.
A quarter of low prices isn’t just “tight,” it’s a survival issue.
In this lane, it generally makes sense to cover about 65–70% of your projected production. For that 500‑cow herd producing about 2.7 million pounds a quarter, that’s roughly 1.8–1.9 million pounds insured in some way.
A practical defensive toolkit often includes:
DRP at around 90% coverage using Class Pricing that leans toward Class III if your plant is largely cheese‑focused.
At‑the‑money or slightly out‑of‑the‑money Class III put options on part of that same milk to pull your effective floor closer to your sustainable break‑even once you factor in basis and component premiums.
The catch with going defensive:
DRP coverage is more expensive, net, at higher coverage levels because subsidy percentages are smaller.
You’re deliberately giving up some upside in exchange for a tighter floor.
You’ll feel the premium cost in a good year—but you’ll sleep better in a bad one.
What DRP materials and risk‑management guides consistently show is that premium subsidies are relatively larger at lower coverage levels and smaller at higher coverage levels, so an 80% policy usually has a larger subsidy share than a 95% policy. That’s why your out‑of‑pocket cost per insured hundredweight rises as you push coverage closer to 95%.
What I’ve seen in many Wisconsin and Minnesota operations is that herds who accept the premium cost and stick to a consistent DRP and options plan tend to have calmer conversations at the bank when cheese and class prices fall than those who keep riding everything on the cash market. The year might still be tough, but the floor does its job.
If that sounds like you, here’s what this means in practical terms:
Your main question isn’t, “Where’s Class III going?” It’s, “What’s the lowest mailbox price we can live with and still pay the bills and keep the lender comfortable?”
If your sustainable break‑even is around 16 dollars per hundredweight and a quarter, and a 14‑dollar Class III would put you in real trouble, then your structures need to focus on keeping realized prices above that danger zone, not chasing every rally.
Once Q2 Class III futures sit 1.50–2.00 dollars above your sustainable break‑even for a while, you can justify easing off new coverage on part of your milk and letting some upside run. Until then, your priority is staying in business, not maximizing upside.
If You’re Balanced: “Protect the Downside, Don’t Miss the Rally”
A lot of progressive herds fall into this middle lane. You’ve tightened costs, you know your numbers, and your debt and cash position give you room, but you’re not interested in gambling.
You’re probably here if:
You’ve got six to twelve months of operating cushion.
Debt service fits comfortably into your cash flow most years.
You accept that you won’t call the top or the bottom.
You want real downside protection, but also want to participate when Class III runs.
In this lane, covering about 40–50% of your projected production often makes sense. For that same 500‑cow example, that’s roughly 1.1–1.4 million pounds hedged, with 1.3–1.6 million pounds left open.
The balanced toolkit usually has two pieces:
Slightly out‑of‑the‑money Class III puts—say, in the mid‑15 to low‑16‑dollar range if Q2 futures are in the mid‑16s—on around one‑third to two‑fifths of your milk. That way, a 1.50–2.00‑dollar slide in Class III starts to trigger protection, but you still fully enjoy a strong rally.
DRP at 80–85% coverage on another slice of milk as a safety net. Because DRP subsidies are generally more generous at these coverage levels than at 90–95%, the net cost per hundredweight on that insured volume is more manageable.
In this setup, the options tend to do the heavy lifting for routine price swings, while DRP is there for the really ugly quarters.
For your herd, this lane means:
You’re trading moderate premiums for a decent floor and lots of upside.
A bad quarter still hurts, but it doesn’t put the whole operation at risk.
It helps to define a couple of simple triggers, so you’re not guessing in the heat of the moment:
If CME block cheddar sits under roughly 1.30–1.35 dollars per pound for several trading sessions, that’s usually a sign the cheese market is under real stress. In that situation, many balanced or aggressive herds add another 15–25% coverage via DRP or puts.
If front‑month Class III slips under about 15.00 dollars per hundredweight, that’s a reasonable point to shift your posture a little more defensive and protect more of your production.
If You’re Aggressive: “Feed’s Locked, We’ll Ride It”
Then there are the herds that have built equity and efficiency over time and are in a position to withstand more volatility. In these dairies, feed is often locked at a decent price, the cows are producing well, and the balance sheet can take a punch without panic.
You’re in this camp if:
Your equity position is strong, and leverage is modest.
Feed costs are locked in through the next crop year at levels that still leave a margin.
You can live through a bad quarter or two without emergency financing, forced cow sales, or putting off critical maintenance.
You genuinely think the current weakness in cheese and Class III is overdone and want more upside exposure.
In this lane, you’re often only covering about 20–25% of projected production, leaving 75–80% to float with the market. For our 500‑cow example, that’s around 500,000–700,000 pounds covered and 2 million pounds uncovered.
The typical aggressive toolkit:
A modest DRP policy at 80% coverage on a slice of milk as “disaster insurance.” Because this is the lowest coverage level, it tends to carry a smaller net premium per hundredweight and still gives you something if prices collapse.
Deep out‑of‑the‑money Class III puts—maybe around 14.50–15.00 dollars per hundredweight—that don’t cost much and only kick in if we get a serious wreck.
The trade‑off is pretty straightforward. You’re spending less on premiums, you’ve got maximum upside, but you’re also accepting that a routine 1‑dollar slide in Class III will hit you harder. That only works if your equity, cash flow, and feed position can legitimately handle that risk.
So it’s worth being blunt here: if your balance sheet isn’t genuinely strong, this lane isn’t a badge of honor, it’s just unnecessary risk. Plenty of good operators have gotten hurt by trying to be aggressive when the books said they should’ve been balanced or defensive.
If you are in a position to ride in this lane, it really pays to write down your “I’m wrong” lines:
Maybe you decide that if block cheese breaks 1.35 dollars per pound and stays below there for a week, you immediately add 20–25% more coverage.
Or you say that if front‑month Class III trades under 15.00 dollars per hundredweight, you’ll move yourself back toward a balanced posture and start building floors.
What’s encouraging is that when aggressive herds set those lines in advance and stick to them, they’re not just guessing. They’re managing risk, even if it’s a higher‑octane version.
DRP and Class III Options: Different Tools, Same Job
It’s easy to get stuck in debates about DRP versus futures and options, almost like it’s a philosophical choice. In practice, they’re just two tools in the same box. The real question is which mix fits your risk lane and your comfort level.
Dairy Revenue Protection is a USDA‑backed insurance program that lets you insure quarterly milk revenue. You pick a coverage level—anywhere from 80% to 95%—and choose between Class Pricing and Component Pricing. Under Class Pricing, your guarantee is based on a mix of Class III and Class IV futures, as you choose. Under Component Pricing, it’s based on futures‑derived butterfat and protein values and your declared component levels.
Those guarantees are settled against published quarterly revenue indexes specific to your state or region. And because DRP is a federal program, premiums are partially subsidized. The key thing the program documents and industry overviews agree on is that subsidy percentages are higher at lower coverage levels and smaller at higher coverage levels, which is why an 80% policy usually has a lower net cost per insured hundredweight than a 95% policy.
Class III put options are different. When you buy a put, you’re buying the right (but not the obligation) to sell Class III futures at your chosen strike. There’s no subsidy, and you need a futures/options account, plus some discipline around margin and position management. But the flexibility is hard to beat: you pick the strike, you pick the months, and on that hedged milk you keep all the upside above your floor.
So in many Midwestern dairies, the practical split looks like this:
Use DRP—particularly at 80–85% coverage—as relatively simple, subsidized, disaster‑style coverage on at least part of your milk.
Layer in Class III puts for the portion where you want a clear floor but don’t want to give up upside, especially in the balanced and aggressive lanes.
Five Numbers You Really Want in Front of You
Here’s something you probably know already from dealing with lenders and nutritionists: the better your numbers, the better the advice you get. Risk management’s no different. Before you call your DRP agent or broker, having these five numbers written down changes the conversation.
1. Projected Quarterly Production
Look back at the last three to six milk checks and average your monthly pounds shipped. Multiply by three to get a starting point for the next quarter. Then adjust for what’s actually happening on your farm:
Are you freshening more heifers?
Did you change your transition period management?
Are you switching to or from a dry lot system?
Is a new robotic box coming online?
You don’t need to be exact, but you do need an honest estimate.
2. Butterfat and Protein Averages
Pull your last several milk checks or DHIA tests and take the average butterfat and protein levels. If you’re considering DRP Component Pricing, those declared component levels should reflect the milk you actually ship. DRP resources make it clear that indemnities under Component Pricing are based on futures‑derived component values and your declared quantities, so over‑declaring components can come back to bite you if you don’t hit those numbers in the tank.
High‑component herds that consistently run above the regional average often like Component Pricing because it lets them insure the value they’re producing. Herds with more variable components often lean toward Class Pricing because they’re not betting on precise tests every quarter.
3. Basis to Class III or Class IV
Basis is one of those words that makes people’s eyes glaze over, but it’s just the difference between the futures‑based price (Class III or IV) and your mailbox price.
For each of the last few months:
Take your net milk pay and divide by pounds shipped, then divide by 100 to get your mailbox price per hundredweight.
Look up the USDA Class III and Class IV prices for that month.
Subtract Class III (or IV) from your mailbox price.
If your mailbox price has been running, say, about 0.30 dollars per hundredweight over Class III, and you buy puts with a 16.00‑dollar strike, your “real” floor before premiums and fees is closer to 16.30 dollars. That basis number helps you judge whether the protection you’re buying lines up with your actual risk.
4. Class III/Class IV Utilization Mix
This one’s easy to overlook, but it matters. In the U.S. marketing orders, different plants and co‑ops have different utilization mixes—some are heavily cheese‑weighted, others lean more toward butter‑powder. Federal Order documents and policy briefs on current and proposed marketing order reforms spell out just how different those mixes can be between areas.
A simple call to your co‑op or plant rep with a question like, “Roughly what percentage of our pooled milk ends up in Class III products versus Class IV?” can give you a ballpark figure. And just as important, take a good look at your co‑op’s own monthly statement; that’s often the clearest picture of how your actual milk is being used and paid for, beyond the FMMO averages.
If your herd is effectively 65% Class III‑driven and you structure DRP as if you were a 50/50 Class III/Class IV herd, the policy won’t track your milk check as well as it could.
5. Break‑Even Milk Price
Finally, you need at least a rough survival break‑even and a sustainable break‑even.
Survival break‑even covers feed, power, essential repairs, and the minimum debt service to keep the doors open.
Sustainable break‑even adds in full debt service, family living, and enough capital replacement that the operation can keep going long term.
Herd Scenario
Sustainable Break-Even ($/cwt)
$1.00/cwt Drop = Monthly Loss
$2.00/cwt Drop = Monthly Loss
$3.00/cwt Drop = Monthly Loss
300-cow herd, 36 lbs/cow/day
$16.25 (RED)
$16,200/month
$32,400/month (RED)
$48,600/month
500-cow herd, 60 lbs/cow/day
$15.75 (RED)
$27,000/month
$54,000/month (RED)
$81,000/month
800-cow herd, 68 lbs/cow/day
$15.00
$36,480/month
$72,960/month
$109,440/month
Industry Median Break-Even (2024 USDA ERS)
$15.50
$25,920/month
$51,840/month
$77,760/month
A quick back‑of‑the‑envelope calculation is to total your annual cash costs and divide by your annual production (in cwt). It’s not perfect, but if it shows your sustainable break‑even is around 16 dollars per hundredweight, you now know that a 14‑dollar Class III “floor” isn’t really protection. It’s just a more predictable way to lose money.
In DRP and risk management meetings across the Midwest, it’s common to hear agents say that the producers who walk in with these five numbers tend to walk out with coverage structures that fit their lane. The ones who don’t bring numbers usually end up talking about feelings, not risk.
Timing and Triggers: Managing Spring 2026 Without Staring at the Screen All Day
If there’s one thing many of us have learned the hard way, it’s that risk management is as much about timing as it is about tools. You don’t have to watch the market all day. But you do want a few dates and signals written down so you can act on your plan, not your emotions.
How DRP Sales Windows Actually Work
DRP isn’t like corn insurance, where you have one big sales closing date. According to the 2026 DRP Basic Provisions, coverage is sold during specific “sales periods,” and sales are suspended on days when major USDA reports, such as Milk Production and Cold Storage, are released. That means you can buy coverage at multiple points, but not every single day.
Practically speaking:
Q2 2026 endorsements (April–June milk) will mostly be written in the late‑January to March window, outside of those report days.
Q3 2026 endorsements (July–September milk) will mostly be written in the April–June window, again avoiding report days.
So instead of waiting for a single “deadline,” you’re better off deciding in January and April what your lane is, how much milk you want covered, and what coverage levels make sense. Then it’s just a matter of working with your agent during an open sales period.
Watching USDA Production and Stocks
It’s worth noting that USDA’s January 2026 WASDE forecast bumped expected 2026 U.S. milk production up to about 234.3 billion pounds, roughly 3.2 billion pounds more than 2025, which works out to about 1.4% growth. On paper, that doesn’t sound huge, but as many of us have seen, an extra 1–2% milk floating around in a flat demand environment can put real pressure on prices.
When you pair that with the monthly Milk Production report and the Cold Storage report—especially for cheese and butter inventories—you get a reasonable sense of whether the market is starting to back up or tighten. That can help you decide when to be more defensive and when you can afford to lighten up.
Simple Price Triggers That Help You Act
Most of the herds I talk to don’t want a complicated market model. They just want a few lines in the sand that tell them when it’s time to add coverage or lock in more upside. Here are three that can work as a starting point:
Signal / Trigger
Level (Approx.)
Market Condition
DEFENSIVE Lane Action
BALANCED / AGGRESSIVE Lane Action
CME Block Cheddar
< $1.30–$1.35/lb for 3+ sessions
Cheese market in real stress
ADD 15–25% coverage immediately via DRP or Class III puts. Do not wait.
Monitor closely; consider 10–15% extra coverage if sustained below $1.33/lb.
Front-Month Class III Futures
< $15.00/cwt
Cash market under heavy pressure
SHIFT POSTURE DEFENSIVE on 20–30% of unprotected milk.Add DRP or puts without delay.
Tighten stops; add 15–25% coverage. This is your warning line.
Front-Month Class III Futures
> $18.00/cwt for 2+ weeks
Rally is real and sustained
Monitor for profit-taking. Keep current coverage. Let upside run.
Lock in a slice of gains; protect half your upside with tight stops or modest puts. Consider locking 10–15% at high prices.
USDA Milk Production Forecast
1.5%+ YoY growth; cheese stocks rising
Oversupply building
Assume downside risk increases Q2–Q3; add 20–30% coverage now while prices near seasonal highs.
Add 10–15% defensive coverage on forward Q3 milk. Plan for lower Q3 prices.
These aren’t magic numbers. They’re practical guardrails. The real key is writing down, ahead of time, what each of those triggers will mean for you so you’re not trying to invent a plan on a bad Monday morning.
So What Does This Actually Mean for Your Dairy?
USDA’s current outlook, as summarized in late‑January 2026, is a year with a bit more milk and lower average prices than 2025. At the same time, the official class price series shows that the Class III/Class IV relationship can swing enough within a year to move your milk check by meaningful amounts, especially if your herd is tied heavily to cheese or butter‑powder.
You don’t get to choose whether that spread exists. But you do get to choose how much of your herd’s future you leave riding on it.
If you’re in the defensive lane, your job this spring is to:
Get those five numbers—production, components, basis, utilization mix, and break‑even—on paper.
Work with your DRP agent to price 85–90% coverage on 60–70% of your Q2 milk, using Class Pricing that matches your actual exposure.
Layer in near‑the‑money Class III puts on part of that volume, so your effective floor comes closer to your sustainable break‑even.
If you’re in the balanced lane, your focus is to:
Use DRP at 80–85% coverage on 20–25% of your production as disaster coverage.
Use slightly out‑of‑the‑money Class III puts on another 20–30%, so you’ve got a reasonable floor with upside.
Put your cheese and Class III price triggers in writing and decide, ahead of time, how much extra coverage you’ll add when those lines get crossed.
If you’re in the aggressive lane and your numbers truly support it, you can:
Keep coverage lighter—say 20–25% of production with DRP at 80% or deep out‑of‑the‑money puts—to guard against a real crash.
Be honest about your “I’m wrong” lines on cheese and Class III and commit—with your family or business partners—to changing lanes if those lines are crossed.
And just as important, make sure your balance sheet is strong enough that you’re not turning your livelihood into a bet you can’t afford to lose.
And there’s one more step that’s worth taking this week, no matter which lane you’re in:
Pull your last six months of milk checks and calculate your basic basis and break‑even.
Put a ten‑minute weekly price check (cheese, Class III, Class IV) on your calendar.
Talk through your lane with whoever else has a stake in the dairy—family, partners, key employees—so everyone understands the plan.
In a 2025–26 world where USDA expects higher milk production and lower prices, and where the Class III/Class IV spread can change direction more than once a year, hoping the market behaves isn’t a strategy. Your balance sheet—not your opinion of cheese—is what should pick your lane.
The goal isn’t to guess exactly where Class III will be in June. It’s to decide what you can live with now, set your floors accordingly, and make sure the market doesn’t get the final say on whether your dairy makes it through the next year.
Key Takeaways
Same cows, big gap: Class III/IV spread and pooling differences alone can put two similar 500‑cow herds $10,000–$15,000 apart in a single month.
Pick your lane: defensive herds should cover 65–70% of production, balanced herds 40–50%, and aggressive herds 20–25%—based on cash, leverage, and risk tolerance, not feelings.
DRP at 80–85% coverage offers the best subsidy‑to‑protection trade‑off for most operations; add Class III puts when you want a tighter floor with upside intact.
Know your numbers: projected production, component averages, basis, utilization mix, and break‑even should be on paper before you call your DRP agent.
Set triggers, not hopes: decide now what cheese price and Class III levels will make you add protection—so you’re acting on a plan, not reacting to a bad Monday.
Complete references and supporting documentation are available upon request by contacting the editorial team at editor@thebullvine.com.
Learn More
The Great Dairy Divide: Why Your Feed’s Cheap but Your Milk Check Still Hurts – Reveals how identifying high-protein genetics can capture $4.00/cwt premiums while locking in DRP at 95% coverage shields your income. It delivers the immediate, line-item tactics needed to protect margins when feed costs and milk prices disconnect.
Every week, thousands of producers, breeders, and industry insiders open Bullvine Weekly for genetics insights, market shifts, and profit strategies they won’t find anywhere else. One email. Five minutes. Smarter decisions all week.
Your 72-Hour Playbook—Generators, Fuel, Water, and the MLP Paperwork That Actually Pays Back
EXECUTIVE SUMMARY: Winter Storm Uri saw Texas dairies dump over 1,800 semi-loads of milk, resulting in $14 to $21 million in losses in a single week. For a 200-cow herd, three days without power means roughly $10,000 in dumped milk before equipment failures or dead animals add to the toll. The math is simple: $1,000 in diesel keeps your generator running; skipping it risks ten times that down the drain. This playbook covers the 72 hours before a major storm hits—generator sizing, fuel planning, water backup, cold-stress feeding, staffing decisions, and the H5N1 biosecurity realities now complicating neighbor-to-neighbor mutual aid. It also details the USDA Milk Loss Program paperwork (dates, volumes, written reasons) that can recover 75-90% of your losses—but only if records exist before the bulk tank overflows. From 70-cow Ontario tie-stalls to 2,000-cow Texas dry lots, the dairies that survive these storms aren’t lucky—they’re the ones who ran the numbers while the sky was still clear.
So here’s a question I’ve been asking farmers lately, and you know, most don’t have a great answer: how many days can your operation actually run if the grid goes down and stays down?
I bring this up because big winter storms aren’t rare “acts of God” anymore. They’re stress tests—of your barns, your people, and honestly, your balance sheet. When Winter Storm Uri slammed Texas in February 2021, agricultural economists with Texas A&M AgriLife Extension estimated initial losses at more than $600 million. And here’s what stuck with me: AgriLife Extension director Jeff Hyde, Ph.D., warned those costs could “plague many producers for years to come.” That wasn’t just a bad week. That was a structural blow to many good operations.
Let me bring that down to a scale we can actually picture. Say you’re milking 200 cows, averaging around 80 lb per cow per day. That’s 16,000 lb daily, or about 160 cwt. At 20 dollars per cwt—your number might be higher or lower depending on components and premiums—one day of completely dumped milk means roughly 3,200 dollars in gross revenue gone. Three days? You’re staring at nearly 10,000 dollars, and that’s before we even talk about butterfat levels or quality premiums you’re losing.
During Uri, Darren Turley—he’s the executive director of the Texas Association of Dairymen—told Brownfield Ag News that Texas dairies ended up dumping over 1,800 semi loads of milk in roughly a week. Plants couldn’t process it, trucks couldn’t move, and power and natural gas were just gone. Dairy market analyst Sarina Sharp, estimated the regional total at 2,000 to 3,000 loads. If you put even a conservative value of 7,000 dollars per load on that, we’re talking 14 to 21 million dollars of milk literally washed down the drain.
Here’s what’s encouraging, though: policy actually reacted. In 2023, USDA’s Farm Service Agency rolled out the Milk Loss Program—MLP for short—to compensate dairy operations for milk that got dumped or removed from commercial markets due to qualifying natural disasters. The program covers events from 2020, 2021, and 2022, and the rules are pretty specific: eligible dairies can claim up to 30 days of lost milk per year, with payments at 90 percent of the calculated loss for underserved producers and 75 percent for everyone else.
So looking ahead to the next named winter storm, the real question becomes: in the 72 hours before it hits, what can you do on your dairy—right here, with your labor, cash flow, and setup—to keep the next storm from erasing months of hard-won margin?
Key Numbers Worth Keeping in Your Head
Before we get into the details, here are the figures I’d jot on a notepad:
30–50 gallons/cow/day — typical water intake for lactating cows, according to Penn State Extension
2–4 gal/hour — approximate fuel burn for a 40 kW diesel generator, depending on load, per industry fuel consumption data
5–7 gal/hour — fuel consumption range for larger 100 kW units at working capacity
About 1% per °F — added maintenance energy demand once cattle drop below their lower critical temperature, per SDSU and NDSU Extension
2–25% — range of intake increases you might see in cold-stressed cattle when forage quality allows, again from SDSU
30 days — maximum MLP coverage per year
75% / 90% — MLP payment rates for standard producers versus underserved producers
$3.6 billion — estimated uncovered U.S. farm losses from 2020 natural disasters alone, according to American Farm Bureau Federation analysis
$21+ billion — crop and rangeland losses from 2022 severe weather events, per AFBF
A 10-Minute “If You Don’t Do Anything Else” Checklist
You know, what I’ve found talking to producers is that you don’t need a thick binder to be materially more ready. You need a few focused moves. If you only have ten minutes this week, I’d put them here.
Run the generator under real load. Start it, switch through the transfer switch, and put actual critical loads on it: vacuum pump, milk pump, cooling, one well pump, and key lights. Let it run 30–60 minutes. The true test—and every farm electrical guide will tell you this—is whether it can start and carry those motors without sagging or tripping. Running smooth with no load? That tells you almost nothing.
Know your fuel math, not just your tank size. Industry fuel consumption charts show that a 40-kilowatt diesel generator under decent load burns about 2–4 gallons of fuel per hour, while a 100-kilowatt unit typically requires 5–7 gallons an hour at working capacity. Run that 40 kW set at around 3 gal/hour for 72 hours straight, and you’re at roughly 215 gallons. At 4 dollars per gallon, that’s about 860 dollars of diesel. Now put that against one 25,000-liter load of dumped milk—around 700–800 cwt—at 20 dollars per cwt. That’s 14,000 to 16,000 dollars gone. Three days of fuel starts looking like pretty cheap insurance.
Stage three to five days of water access. Penn State Extension notes that lactating dairy cows typically drink 30–50 gallons of water per day, with most of that from drinking rather than from feed moisture. Use 35–40 gallons as a planning number, and that same 200-cow herd needs 7,000–8,000 gallons a day. Over three days, you’re north of 20,000 gallons. Nurse tanks, overhead storage, and extra troughs positioned now give you a buffer if lines freeze or a pump fails.
Walk every water line and heated waterer. In colder regions—and this is consistently shown in livestock water system bulletins from Ontario and the northern U.S. states—self-regulating heat cable rated for potable water is recommended for exposed or problem lines. It adjusts its output based on temperature and is considered safer than constant-wattage tape. Flip breakers, feel heaters, check thermostats, and look hard at elbows, risers, and any line you’ve “meant to insulate later.”
Look at rations through a cold-stress lens. SDSU Extension and NDSU both use a practical rule of thumb: once cattle are below their lower critical temperature, maintenance energy requirements rise by about 1% for every degree Fahrenheit below that point. They also report that cattle under cold stress often increase intake by 2 to 25 percent when forage quality allows, with the higher end of that range kicking in when effective temperatures drop below about 5°F. So if cows are effectively 18°F below LCT, you could be looking at around 18 percent more energy demand. On a 200-cow herd feeding 50 lb/head/day, that’s an extra 9 lb/head/day—1,800 lb of TMR daily. At 8 cents per lb of dry matter, that’s roughly 144 dollars per day. Over three days, call it 400–500 dollars in extra feed. Put that against the risk of losing 3–4 lb of milk per cow per day over three days—2,400–3,200 dollars at 20 dollars per cwt—and the math very clearly favors feeding for the cold.
Get brutally honest about who can actually reach the farm. Farm emergency planning tools in British Columbia and the Prairie provinces encourage mapping where employees live and how storms affect their routes. More dairies now designate one or two core people—often the owner and a key herdsman or herdswoman—as “on-farm no matter what,” and set clear thresholds beyond which staff farther away are told not to risk the roads. That clarity saves accidents and, indirectly, protects the herd.
Talk to your milk hauler and your co-op or processor. Brownfield’s coverage of Uri showed how chaotic those first days were for plants, haulers, and farms. Many processors in Texas, the Upper Midwest, and the Northeast now have more defined storm protocols. This is the time to ask, “If the plant is down or roads are closed for two days, what happens to my milk?” Their answer will tell you whether your real risk is a full tank or a dead tank.
Post an emergency contact sheet where everyone can see it. Vet clinic, hauler dispatch, field rep, electric and gas utilities, fuel supplier, FSA office, insurance agent, and a couple of neighbors—that’s the bare-bones list most farm emergency guides recommend. Tape it in the milk house. When phones die or get lost, that paper is still there.
Add bedding and wind protection for outside groups. Cold-stress articles from NDSU, Wisconsin, and others note that effective windbreaks and deep, dry bedding can substantially reduce energy requirements and help cattle maintain condition during severe cold. Straw, stalks, bale stacks, and panel lines are low-tech, high-ROI tools to stage before the weather hits.
Turn documentation into a habit, not a scramble. The MLP fact sheet emphasizes that producers must document dates and volumes of dumped or removed milk, provide marketing statements, and describe the qualifying event and how it prevented normal marketing. Similar documentation underpins the Livestock Indemnity Program, ELAP, and the Emergency Conservation Program. Jotting a quick note—”PM milking, Jan 10, ~150 cwt dumped, hauler cancelled, plant closed”—and snapping a photo can be worth thousands later.
If that’s all you manage before the next big system, you’re still a long way ahead of where many good dairies found themselves going into Uri or the big High Plains and Dakota blizzards.
72–48 Hours Out: Getting Real About Power and Water
Looking at post-storm reports across Texas, the High Plains, and eastern Canada, the pattern is pretty consistent: herds with even basic backup power and water plans had miserable days, but they stayed in the game. Herds with no plan? They jumped straight to crisis.
Sizing Backup Power for the Farm You Actually Run
In many Ontario tie-stalls and Wisconsin freestalls, as well as smaller parlors in New York and Vermont, backup power usually means a PTO generator or an older diesel tied into the parlor and one well. In larger dry lot systems in New Mexico or the Texas Panhandle, you’ll more often see big automatic units, but you know, many 500–1,000 cow herds still depend on PTO sets.
Generator sizing guides from provincial ministries and suppliers generally start the same way:
List your “must-run” loads: vacuum pump, milk pump, plate cooler or bulk tank compressor, at least one deep-well pump, and minimum lighting.
Convert motor horsepower and amps to kilowatts and total your running load.
In their worked examples, modest parlor setups often fall in the 25–40 kW range for true critical loads. Once you add larger parlors, multiple compressors, robot systems, sand separation, and more ventilation, those examples quickly move into the 75–150 kW band or higher, depending on what’s bolted to the floor.
And here’s the catch that bites a lot of people: motors don’t draw their running amps when they start. Electrical references and generator manuals consistently note that induction motors can draw 2 to 3 times their running current at start-up. That’s why most electricians and sizing tools push you to build serious headroom above that neat running-load number.
So if you and your electrician calculate a critical running load of about 60 kW, it’s common to recommend a generator in the 80–90 kW range to handle multiple motors starting without constant tripping. One pattern I keep seeing: when producers balk at the bigger unit, it’s usually because they’re thinking about “amps right now,” not “worst-case start-up” during a blizzard.
Tier & Critical Load
Est. kW Running
Recommended Gen Size
Typical Cost
Fuel/72hr @ $4/gal
What’s Covered
Tier 1: Parlor + Well + Cooling
25–40 kW
40–50 kW
$12,000–$18,000
$860–$1,440
Milking, water, bulk tank cooling
Tier 1+2: + Lighting + Manure
45–65 kW
75–90 kW
$20,000–$32,000
$1,440–$2,160
+ Alley lights, pump-out capability
Full Farm (Rare)
80–120+ kW
120–150+ kW
$35,000–$60,000+
$2,160–$3,600+
Everything except non-essential loads
Undersized (60 kW / no headroom)
60 kW listed
Often fails under real load
$15,000–$22,000
$1,080/72hr
Risk: motors trip/stall at startup
PTO Gen (Tractor-Driven)
Variable (20–40 kW typical)
Depends on tractor
$8,000–$15,000
Fuel from tractor tank
Limited to parlor + one well; no automatic failover
Put some dollars on this. Say upgrading from a marginal 60 kW unit to a properly sized 90 kW backup costs around 25,000 dollars. One full 25,000- to 30,000-liter load of dumped milk, at 20 dollars per cwt, is roughly 14,000–16,000 dollars. Two loads in a week and you’ve essentially burned the cost of that larger unit—without actually owning it.
One non-negotiable point: safety. Every electrical safety sheet from utilities and farm safety programs says the same thing—use a proper transfer switch that isolates your system from the grid when the generator runs. Backfeeding through improvised cords isn’t just illegal; it’s dangerous for line crews and for your own family.
For many small and mid-size herds, especially in the Northeast and Upper Midwest, the practical goal is tiered backup, not full-farm coverage. Farm emergency templates often describe it like this:
Tier 1: Milking system and one dependable water source.
Tier 2: Parlor and key alley lighting, one manure system, minimal fans in tight barns.
Tier 3: Calf housing and non-critical loads, only if capacity allows.
The farms that revisit this after a bad outage usually say the same thing: “We didn’t need everything backed up—we just needed Tier 1 rock-solid and Tier 2 clearly mapped.”
Fuel: How Long Can You Really Keep Running?
Here’s a question worth asking in a quiet moment: “If we had to run this generator almost continuously, how long would our fuel actually last?”
As we covered, a 40 kW diesel set under good load burns about 2–4 gallons an hour; a 100 kW unit typically requires 5–7 gallons an hour. At 3 gal/hour, 72 hours straight is roughly 215 gallons. At 4 dollars per gallon, you’re near 860 dollars in fuel.
Hours
40kW @ 3 gal/hr (500-gal tank)
40kW @ 3 gal/hr (800-gal tank)
100kW @ 6 gal/hr (500-gal tank)
0
500
800
500
24
428
728
356
48
356
656
212
72
284
584
68
96
212
512
(empty)
120
140
440
(empty)
Cold-climate extensions like NDSU often use a three- to five-day window for worst-case winter planning. Not every farm can or should store five days’ worth of diesel on-site—fire code and risk are real—but knowing you can cover at least three days, and that your supplier has an emergency plan with you, moves you from “wishful thinking” to “managed risk.”
The herds that treat “fuel days on hand” as seriously as “days of feed on the pit” tend to sleep a bit better when the lines start buzzing.
Water: The Other Utility You Can’t Fake
If there’s one thing every dairy nutritionist agrees on, it’s that water drives intake. Penn State’s “Value of Water” bulletin says lactating cows typically drink 30–50 gallons a day, with most of their requirement met through drinking water. And here’s the part that matters for storm planning: cows typically drink 30–50 percent of their daily water within an hour after milking, according to both Penn State and Michigan State. So if your waterers go down right after milking, you’re hitting them at the worst possible time.
For a 2,000-cow freestall herd, using that verified 30–50 gallons per cow per day just for drinking, total daily drinking water needs could range from 60,000 to 100,000 gallons—and that’s before accounting for wash water.
When it comes to water, most resilient farms lean on three basics:
Keeping lines from freezing. Adequate burial depth for your local frost line, insulation on exposed runs, and self-regulating heat cable on vulnerable sections are all standard recommendations in winter watering guides from Ontario, the Prairies, and northern U.S. states.
Keeping drinkers ice-free. Heated waterers, sheltered troughs, and constant-flow systems that use ground heat are among the winter advice from the extension offices in Ohio, Minnesota, and Wisconsin. Shielding tanks from wind and checking them more frequently can be as important as the hardware itself.
Having backup supply options. Nurse tanks on running gear, portable troughs, and valves that let you re-route water if a main line or pump fails are common suggestions in Purdue and similar extension resources.
In many Wisconsin and Ontario herds I’ve walked, the operations that ride out January cold best treat water almost like feed: they build in redundancy and know exactly where the weak points are.
48–24 Hours Out: Feed, People, and Communication
Once you’ve shored up power and water as best you can, the next day is really about three levers: how you feed through the cold, who’s actually going to be on site, and whether the right conversations have happened before the snow flies.
Feeding Cows Through Cold Without Trashing the Ration
You probably know this already, but the research backs it up nicely. SDSU Extension’s winter feeding guidance uses the rule of thumb we mentioned: once cattle are below LCT, maintenance energy needs increase by about 1% per degree Fahrenheit. And according to their data, cold-stressed cattle may increase intake anywhere from 2–25 percent if the ration allows it, with the lower end of that range (2–5%) occurring at milder cold (41–59°F), and the upper end (8–25%) kicking in once effective temperatures drop below about 5°F.
So let’s walk through the math. If cows are effectively 18°F below LCT, that guideline implies an additional 18 percentin energy demand. On a 200-cow herd feeding 50 lb/head/day, you might bump to 58–60 lb/head/day for a few days—an extra 1,600–2,000 lb of TMR daily. At 8 cents per lb of dry matter, that’s roughly 128–160 dollars per day. Over three days, call it 400–500 dollars in extra feed.
Scenario
Extra TMR/Day
3-Day Cost
Protected Milk Income
Net ROI
Do Nothing (18°F below LCT)
0 lb
$0
$0 (lose 3–4 lb/cow/day)
–$2,400–$3,200
Modest Bump (5 lb/head/day)
1,000 lb
$240
$2,400–$3,200
+$2,160–$2,960
Aggressive Bump (10 lb/head/day)
2,000 lb
$480
$2,400–$3,200
+$1,920–$2,720
Feed Waste Scenario (20% spoilage)
1,000 lb
$300 (with waste)
$2,400–$3,200
+$2,100–$2,900
If you avoid losing 3–4 lb of milk per cow per day across that period, you’re protecting roughly 2,400–3,200 dollars of milk. When you see it that way, feeding for the cold isn’t charity—it’s risk management.
What stands out in herds that ride these spells out well is a consistent pattern:
They consciously bump TMR for high groups during the worst cold—5–10 lb/head/day is common—and then dial back once temperatures normalize.
Their nutritionist adjusts energy sources, nudging rations toward more digestible forage and carefully managed by-products or fats, while keeping an eye on starch intake so it doesn’t wreck rumen health or butterfat levels.
They give extra attention to fresh cow management and cow comfort during the transition period, not just in mid-lactation pens, because those cows are already under stress.
On the calf side, calf welfare research and industry pieces in Hoard’s Dairyman note that dairy calves can begin experiencing cold stress at temperatures just below 50°F, especially in damp or drafty housing. That’s why jackets, deep straw packs, and draft control in hutches and calf barns are basically standard from late fall into spring in many Midwest and Northeast herds.
Staff and Family: Who Will Actually Be There?
Talking with producers from Vaughan across Ontario, through Wisconsin, and down into New Mexico, this is often where the conversation turns very real. It’s one thing to say “we all pitch in,” and another to say, “I don’t want my feeder on 45 minutes of black ice at 4 a.m.”
Farm emergency plans in British Columbia and Alberta encourage producers to structure staffing the way they structure power—deliberately and in tiers. Many dairies are doing something like this:
Identifying one or two core people—often a family member and the lead herdsman or herdswoman—who will be on-farm if conditions demand it.
Setting clear thresholds—snowfall, ice, visibility, road closures—beyond which staff who live farther away are told to stay home.
Defining “must do” vs “can wait” tasks, so limited labor can focus on milking, feeding, water, and fresh cows first.
What’s interesting is that when farms communicate this clearly, it tends to build—not erode—trust. People like knowing that their safety matters as much as getting the third milking in.
Communication and Mutual Aid
In the Upper Midwest and eastern Canada, you’re seeing more talk of mutual aid between farms. After big blizzards and ice storms, USDA field staff and co-op reps have noted that herds with pre-storm conversations about sharing capacity—tank space, generator power, even labor—had more options than those trying to negotiate in real time.
Those conversations usually revolve around questions like:
If a neighbor’s bulk tank fails, can anyone else take a load, subject to the processor’s rules and biosecurity requirements?
If one generator dies and another farm has spare capacity, is there a safe way to power a well or a small barn temporarily?
But here’s where things get more complicated in 2025 and 2026—and you probably know where I’m going with this. Biosecurity concerns have intensified dramatically since highly pathogenic avian influenza H5N1 was first detected in U.S. dairy cattle on March 25, 2024. The CDC confirmed that initial Texas case, and by late 2025, according to Dairy Reporter, the virus had spread to dairy herds across 16 or more states, with California hit particularly hard.
The European Food Safety Authority published a detailed assessment in December 2025, noting that transmission within farms is primarily driven by contaminated milk and milking procedures, while farm-to-farm spread is mainly linked to cattle movement and shared equipment.
What does that mean for mutual aid during a storm? A few practical realities:
Tank sharing is much trickier now. Mixing milk from different herds—even temporarily—creates traceability headaches and potential exposure to disease. Before you assume a neighbor can take your load, talk to your processor and your state or provincial veterinarian about what’s actually permitted. USDA’s Federal Order, effective April 29, 2024, requires that lactating dairy cattle receive a negative test for Influenza A virus at an approved laboratory before interstate movement.
Shared equipment is a known risk factor. EFSA’s assessment specifically identifies shared equipment and contact with external personnel as risk factors for between-farm spread of HPAI. If you’re borrowing a loader, a pump, or even a set of milking claws, the expectation now is that equipment gets properly cleaned and disinfected before it crosses property lines—something that’s harder to manage in the middle of a blizzard. If equipment must move between properties, ensure a 10-minute contact time with an EPA-registered disinfectant effective against Influenza A (H5N1) before it touches your driveway.
Isolation protocols matter more than ever. Biosecurity surveys have consistently found that many U.S. dairy operations lack formal quarantine facilities or protocols for introduced cattle—a gap that USDA and state veterinarians have identified as a significant risk factor for disease spread. The National Milk Producers Federation’s biosecurity guidance recommends isolating newly introduced or returning cattle for at least 30 days and limiting livestock movement. Their guidance also notes potential risk when feeding unpasteurized dairy products to cattle and recommends heat treatment or pasteurization of milk from sick cows to help inactivate H5N1.
None of this means mutual aid is dead—it just means the conversations need to happen earlier and with more detail. When a cluster of farms, their fieldman, and their hauler sit down in November instead of mid-January, and when they explicitly address biosecurity alongside logistics, it turns vague goodwill into usable options that won’t blow up in anyone’s face come spring.
And it’s worth noting that the American Farm Bureau Federation estimates farmers had at least 3.6 billion dollars in uncovered losses across all sectors from 2020 natural disasters alone, and more than 21.4 billion dollars in crop and rangeland losses from 2022 severe weather—losses not fully insured or compensated. Those numbers should make all of us a bit more interested in neighbors, paperwork, and plans—even when the rules around sharing have gotten stricter.
24–0 Hours: Animal Comfort and Final Checks
As the radar colors get louder and the start time firms up, you’re out of the “build new systems” phase and firmly in “put animals where they’ll cope best and tighten the loose ends.”
Understanding Cold Limits in Real Barns
Decades of extension work basically backs up what you already know: a mature cow with a dry winter coat and decent condition can tolerate surprisingly low air temperatures if she’s out of the wind and staying dry. A wet, wind-blasted cow at the same temperature is a different story entirely.
Livestock extension materials often use approximate LCT values around the high teens Fahrenheit for cattle in full winter coat, and much higher thresholds—mid-40s up toward about 59°F—for animals with wet or thin coats. The exact number doesn’t matter as much as the principle: wind and moisture move the goalposts.
From there, your tool kit is familiar but powerful:
Windbreaks that actually work. Barn walls, shelterbelts, trees, bale stacks, and panel/tarp setups can all reduce wind speed, lowering energy demand and helping cows maintain body condition.
Deep, dry bedding. Enough straw or stalks so cows can nest and stay off frozen concrete or mud. Producers on both sides of the border report better production and fewer sick cows when they treat bedding like feed during a cold snap.
Timing higher-energy feeding. Beef work from Kansas State and others has shown benefits from timing higher-energy feeding so peak fermentation and heat production align with the coldest period of the night. Dairy herds with some scheduling flexibility can apply the same concept to TMR delivery.
For calves, the margin is tighter, which is why jackets, deep straw, closing drafts, and sometimes bumping milk solids a bit in prolonged cold show up in calf-management guidance.
A Deliberate Walk-Through Before It Hits
In the last 12–24 hours, a lot of seasoned producers do a slow walk-through that looks a lot like a pre-flight check:
Start the generator, switch through the transfer switch, and listen and watch as motors start and stop.
Fill overhead tanks, nurse tanks, and portable troughs so a single pump hiccup doesn’t immediately turn into a water crisis.
Top up fuel in loaders, skid steers, and tractors so feed doesn’t stop when a machine runs out of fuel.
Look up at roofs, trees, and attachments near parlors, calf barns, and feed sheds for obvious ice-load or wind risks—something producers in the Northeast and Quebec remember all too well from past ice storms.
More farms are also adding one simple item to that checklist: “How and when are the people staying on-farm going to rest?” When you read post-storm write-ups in regional farm media, a surprising number of costly mistakes come down to fatigue, not a lack of knowledge.
During the Storm: Triage and the Milk That Might Not Move
Once the storm is fully on top of you, you’re not building resilience—you’re deciding what to protect first and what can wait without breaking the operation.
Most farm emergency plans—and a lot of producer stories—in the extension literature boil priorities down roughly like this:
People first. No extra scraping or third milking is worth a serious injury on ice or under a stressed roof.
Water and basic feed next. Cows handle dirty alleys better than empty bunks or dry waterers.
Milking frequency and fresh cows after that. In some storms, temporarily moving from 3x to 2x milking makes sense to protect staff and equipment. That’s a decision to make with your vet and adviser because it affects udder health, production, and butterfat performance.
Everything else, as conditions allow. Manure handling, bedding changes, and non-critical repairs are “do when it’s safe,” not “do at all costs.”
You can’t be everywhere, so many herds settle into a rhythm: quick checks every couple of hours on generator output, fuel, main waterers, bulk tank temperature, and vulnerable groups (fresh, hospital, calves), plus broader walks every four to six hours to look at feed access, drifting, and overall stress.
And if the milk has nowhere to go?
Uri made the picture painfully clear. Turley’s 1,800 dumped semi-loads in Texas and Sharp’s estimate of 2,000–3,000 dumped loads regionally weren’t projections—they were full tanks washed away. That’s exactly the kind of loss the Milk Loss Program was created to soften.
According to the FSA fact sheet, to claim MLP, you’ll need to file Form FSA-376, supply milk marketing statements from the month before and the month of the loss, and provide a written description of the qualifying event and how it prevented normal marketing.
Dumped milk daily: date, volume, cause (hauler cancel, processor closure)
Keep with farm records
Up to 30 days/year covered
Hauler/Processor Notice
Screenshot/save texts/emails from milk hauler and processor explaining disruption
Email or text, saved
Supports “prevented normal marketing” proof
Photo Documentation
Photos of generator running (if applicable), drifts blocking milk house, any visible stress or dead stock
Take during event
Visual evidence of qualifying disaster
FSA-376 Filing
Milk marketing statements (month before, month of loss); written description of event and impact
File with FSA within 60 days of loss
75% standard / 90% underserved producers
Claim Processing
FSA calculates loss based on milk price (announced price, not spot), volume, and payment tier
FSA review period ~60–90 days
Max claim: 30 days of milk loss per claim year
MLP Check Arrives
Payment issued; typically 75–90% of documented loss value
Processed after FSA approval
75–90% of loss recovered
So in the middle of the storm, if you’re forced to dump, two small habits make a big difference later:
Note the date, milking (AM/PM), and approximate volume dumped, plus the reason (no pickup, plant down, no power to tank).
Save any texts, emails, or written notices from haulers or processors explaining the disruption.
Those details are what convert a five-figure loss from “total write-off” into something MLP can at least partially cover.
After the Storm: Counting the Cost and Closing the Gaps
When the storm passes, and the lights stay on, the instinct is to jump straight into fixing. Some repairs can’t wait. But USDA disaster guidance and provincial emergency manuals keep returning to the same message: document first, then repair when you can.
On the documentation side, that usually means:
Taking photos of damaged barns, parlors, calf barns, feed sheds, and manure storage from multiple angles.
Recording equipment failures—generators, pumps, bulk tanks, robots, feeders—with make and model when possible.
Logging livestock losses with dates, numbers, and veterinary input when available.
Keeping a simple log of dumped milk: dates, milking times, approximate amounts, and reasons.
Those records are the backbone of claims not only for MLP, but also for the Livestock Indemnity Program (for eligible livestock deaths beyond normal mortality), ELAP (for certain feed and water-related costs), and the Emergency Conservation Program (for land, fence, and structure repair). They also give you numbers you can take to your lender and insurer.
Let’s circle back to the bigger math. That same 200-cow herd dumping a full 7,000-gallon load is losing something like 1,600 cwt of milk. At 20 dollars per cwt, that’s 32,000 dollars in gross revenue. Under MLP, a standard producer might recoup around 75 percent of that, about 24,000 dollars, assuming full eligibility and no caps. That still leaves roughly 8,000 dollars uncovered—and that’s before any building damage, dead cows, or feed spoilage.
The American Farm Bureau Federation’s analysis of 2020 disasters estimated at least 3.6 billion dollars in uncovered farm losses that year, and their 2022 assessment put crop and rangeland losses from severe weather at over 21.4 billion dollars—losses not fully covered by insurance or disaster programs. The takeaway is pretty clear: insurance and disaster programs matter, but they rarely make you whole. Planning and documentation are what turn “disaster” into “serious but survivable.”
Then there’s the debrief. A week or two after the dust settles, when you’re not running purely on adrenaline, is the time to ask with your family or team:
What worked the way we hoped?
What failed—or almost failed—and why?
If this exact storm hit again next winter, what would we want in place before it started?
Sometimes the answers are big—new generator, roof work, major drainage, or windbreak projects. More often, they’re a string of smaller but powerful changes: upping minimum fuel days on hand, adding one more nurse tank, tightening fresh cow protocols when storms are forecast, or agreeing that any dumped milk or unusual death gets logged the same way, every time. Those steady, unglamorous moves are what keep a bad week from becoming a bad year.
Four Decisions That Belong on Every Dairy’s List
So, from a practical standpoint, what moves belong on almost every dairy’s list? I’d argue at least these four:
Know your generator math. Work with your electrician to nail down your true Tier-1 load and the cost to back it up properly. Then calculate how many hours or days of fuel you can reliably cover.
Set a simple documentation standard. Decide that any dumped milk or unusual livestock loss gets a date, volume/count, reason, and a couple of photos recorded the same way every time. That’s your ticket into MLP, LIP, ELAP, and a more intelligent discussion with your lender.
Put your own number on a lost load. Use your current milk check—price, components, any premiums—and put a real dollar figure on one full lost load for your herd. Write that number at the top of your storm plan. It will change how you view fuel, backup power, and staff rest.
Pick one program to understand truly. Whether it’s MLP, LIP, ELAP, or the Emergency Conservation Program, spend 10–15 minutes on the phone with your local FSA office or provincial counterpart to clarify how it actually works and what records they need before you ever file a claim.
From Ontario to the Upper Midwest and down into the High Plains, resilience rarely comes from one big, dramatic project. It comes from stacking a series of honest conversations and incremental decisions: a better transfer switch here, an extra tank there, a cleaner staffing plan, a habit of writing things down. That’s how you end up on the right side of the $3.6 billion gap between disaster and survival.
The storms aren’t going away. The cows aren’t going to stop milking. The leverage for all of us, season by season, is making sure the systems and numbers around those cows are just a little more ready each time the sky turns that particular shade of winter grey.
What’s the one piece of equipment—or one decision—that saved you in the last big blow? Drop it in the comments. Whether it was a generator that finally paid for itself, a nurse tank you’d almost sold, or just having the right people on site, your experience might be exactly what another producer needs to hear before the next storm rolls in.
KEY TAKEAWAYS
Three days without power = ~$10,000 in dumped milk for a 200-cow herd—before equipment failures or dead animals add to the toll.
$1,000 in fuel or $10,000 down the drain. A 40 kW generator burns roughly 215 gallons over 72 hours. That’s a 10:1 return you can’t afford to gamble.
MLP recovers 75-90% of milk losses—but only with paperwork. Document dates, volumes, and reasons as you dump. No records, no payment.
H5N1 rewrote mutual aid rules. Since March 2024, sharing tanks or equipment carries real biosecurity risk—have those neighbor conversations now, not when the snow’s flying.
Survival isn’t luck—it’s math. Generator sizing, fuel reserves, water backup, and one simple documentation habit separate a tough week from a devastating year.
Complete references and supporting documentation are available upon request by contacting the editorial team at editor@thebullvine.com.
Learn More
Dairy Management in the Face of Adversity: Focus on What You Can Control – Safeguard your margins by mastering the variables within your fence line. This breakdown identifies critical management levers that minimize losses during volatility, ensuring your operation remains profitable regardless of the weather or market shocks hitting your neighbors.
The Future of Dairy Policy: Navigating Evolving Disaster Support – Arms you with the intelligence needed to navigate shifting federal disaster relief and insurance frameworks. Discover how evolving support structures provide new financial layers of protection, securing your operation’s longevity against increasingly frequent and severe climate events.
Off-Grid Resilience: Integrating Renewable Energy on the Modern Dairy – Delivers a blueprint for technical and financial independence through on-farm energy production. Explore how solar and biogas integration creates a resilient safety net, eliminating grid dependency while slashing long-term overhead and boosting your farm’s sustainability profile.
The Sunday Read Dairy Professionals Don’t Skip.
Every week, thousands of producers, breeders, and industry insiders open Bullvine Weekly for genetics insights, market shifts, and profit strategies they won’t find anywhere else. One email. Five minutes. Smarter decisions all week.
Sick calves can drain $27,000/year from your herd. By 2026, genomics will let you stop breeding them. Here’s the playbook.
EXECUTIVE SUMMARY: USDA research now confirms what many producers have long suspected: calf scours and respiratory disease are partly genetic—and by 2026, you’ll be able to select against them. The numbers are hard to ignore. Sick calves can drain $27,000 a year from a 1,000-cow herd, while wrong breeding calls leave another $30,000-plus on the table in missed beef-on-dairy premiums and wasted heifer slots. With replacements at a 20-year low, beef-cross calves topping $1,000, and heifers costing north of $2,500 to raise, every semen straw now carries real economic weight. This article lays out a five-step breeding playbook—genomic testing, rule-based beef-versus-dairy decisions, calf-health sire screening, calving-pressure management, and ongoing market adjustments—that forward-thinking herds are already putting to work. Producers who start now can realistically expect to shift $50,000 or more in annual herd economics within 18-24 months.
You know how the talk goes once the parlor’s washed down and the coffee’s on. Somebody mentions a nasty run of scours or a bunch of calves that just won’t quit coughing in the group pen, and five minutes later, you’re into genomics, beef‑on‑dairy, heifer prices, and whether some cows should ever see a dairy straw again. That’s not small talk anymore. That’s survival planning.
What’s interesting right now is that the genetics and the economics are finally lining up with what a lot of you have been seeing in your own hutches. Some cow families just throw tougher calves. Others seem to live in the treatment book every winter. And those sick calves quietly eat money long before they get a chance to show what they can really do on butterfat performance, fertility, or longevity.
At the same time, beef‑on‑dairy has turned into serious money in a lot of sale barns and contract deals, right when replacement heifers have slid to the lowest levels we’ve seen in about 20 years and gotten expensive to either raise or buy. A 2025 CoBank report describes US dairy heifer inventories as sitting at roughly a 20‑year low and projects they could tighten by as much as 800,000 head before gradually rebounding after 2027 as roughly 10 billion dollars of new processing capacity comes online and needs milk. Analysts used USDA Cattle Inventory data to show that the number of dairy heifers over 500 pounds dropped from about 4.76 million in 2018 to roughly 4.06 million by early 2024—almost a 15% decline in the pool of future milkers.
Put all of that together, and the question changes from “How do we get fewer sick calves?” to something a lot sharper:
Which calves do you actually want to be making in 2026—and which ones are you better off never creating in the first place?
Let’s walk through what the newest science says about calf‑health genetics, how it connects to beef‑on‑dairy money and replacement economics, and what a practical breeding plan looks like on real dairies.
Looking at This Trend: What the New Calf‑Health Genetics Actually Show
If you’re going to let genetics influence how you think about scours and pneumonia, the first question is simple: are these traits heritable enough to move the needle?
A 2025 paper in the Journal of Dairy Science from USDA’s Animal Genomics and Improvement Laboratory went straight at that. The team led by geneticists Babu Neupane, PhD, and John B. Cole, PhD, pulled producer‑recorded calf health data from the National Cooperator Database and built what’s probably the most comprehensive calf‑health dataset we’ve ever seen for North American Holsteins and Jerseys.
Here’s what they worked with:
207,602 calf records for diarrhea between 3 and 60 days of age.
681,741 records for respiratory disease between 3 and 365 days.
Calves born from 2013 to 2024, with about 97.5% of the data coming from Holsteins and Jerseys.
When they summarized those records, they found that 14.46% of calves had a recorded case of diarrhea in that 3‑ to 60‑day window, and 16.05% had a recorded respiratory case between 3 and 365 days. If you’ve ever watched a damp March wind whistle through hutches in Wisconsin or Ontario, those numbers probably sound about right. Scours tends to bully the youngest calves; as they get older, respiratory problems slowly take over.
On the genetic side, they estimated heritabilities of 0.026 (2.6%) for resistance to diarrhea and 0.022 (2.2%) for resistance to respiratory disease. That’s modest, but it’s right in line with what’s been reported for cow‑health traits like clinical mastitis, metritis, and ketosis that we already include in Net Merit, Pro$, and other indexes. In plain language: calf‑health traits behave like other health traits we’re already comfortable breeding for.
Trait
Heritability
Similar Industry Trait
Top 5% Sires (% Healthy Calves)
Bottom 5% Sires (% Healthy Calves)
Practical Implication
Diarrhea Resistance
2.6%
Clinical Mastitis (1.5%–3%)
88%
71%
17 percentage-point spread; top sires prevent ~200+ sick-calf events per 1,000 calves born
Respiratory Resistance
2.2%
Ketosis (1–2%)
88%
70%
Same order of magnitude; respiratory RBV predicts > 1 fewer pneumonia case per 10–12 calves
Cow Mastitis
1.5%–3%
Industry standard
~85%
~72%
Calf-health heritability is comparable to traits we’ve been selecting on for 20+ years
Genetic Correlations
0.0 to -0.1
Low cross-trait pull
N/A
N/A
Improving calf health does not sacrifice milk, fat, protein, or fertility gains
What’s encouraging is that when USDA‑AGIL ran genomic evaluations for these traits, the genomic predictions were noticeably more reliable than simple parent averages, particularly for young bulls with no daughter data yet. They also found that genetic correlations between calf‑health traits and most other traits—production, fertility, cow health—were low, with only a modest link between diarrhea and respiratory resistance and very little pull against milk or component traits. That matters. It means you can add calf‑health traits into a balanced index without giving up the gains you’re making in milk, fat, protein, or cow fitness.
USDA‑ARS and the Council on Dairy Cattle Breeding (CDCB) have been presenting this work through ICAR and industry meetings. The consistent message has been that these calf‑health traits are ready for inclusion in US national genetic evaluations for Holsteins and Jerseys as soon as data quality and validation milestones are met, with 2026 targeted as the window for implementation. The exact month depends on final testing and governance, but the direction is clear.
So, from a genetics point of view, we’re not talking about “maybe someday” anymore. These are real traits with real proofs coming.
What Sick Calves Really Cost: From $25 Per Case to $27,000 Per Year
You probably don’t need a scientist to tell you that sick calves are expensive, but it helps to put some hard numbers behind your gut feel.
A 2023 study in JDS Communications examined health costs at 16 certified organic Holstein dairies in the US. The researchers, including Laura C. Hardie, MSc, used on‑farm treatment records and standardized cost estimates for veterinarian time, medications, and producer labor.
On the calf side, they found average direct costs of:
25.21 dollars per case of scours.
56.37 dollars per case of respiratory disease.
Those figures are just what you can see on the invoice—vet visits, drugs, and some labor. They don’t include slower growth, extra days on milk replacer or starter, extra days to breeding, or the way a rough start can nibble away at first‑lactation milk and component performance. Reviews on calf health and heifer rearing, along with herd‑level calf‑health investigations, keep showing what many of you have already noticed: calves that get hammered early often lag behind, even when they survive and make it into the milk string.
So it’s reasonable—based on those cost estimates and the documented performance impacts—to say that a serious pre‑weaning disease episode can trim a few hundred dollars off a heifer’s lifetime economic value on many farms once you add up treatment, extra rearing time, and lost milk later on. The exact figure will move with your feed costs, labor rate, housing system, and milk price, but the order of magnitude is real.
If you want to see how that plays out across a herd, let’s do some simple math. Picture a 1,000‑cow dairy calving about 900 heifers a year. Say 15% of those calves—135 animals—have a significant scours or respiratory event. If you assign a conservative 200‑dollar economic hit per case, combining Hardie’s direct treatment costs with some allowance for long‑term performance losses, you end up at:
135 calves × 200 dollars ≈ 27,000 dollars per year in calf‑health‑related losses.
Cost Component
Amount (USD)
Percentage of Total
Direct Vet & Drug Costs
5,100
19%
Producer Labor (extra time)
4,050
15%
Slow Growth & Extended Rearing
8,100
30%
Lost First-Lactation Milk/Components
9,750
36%
Total
$27,000
100%
That’s not a published national average—it’s a realistic illustrative example built from current cost data and what we know about early‑life disease. On herds with higher disease burden, more expensive inputs, or longer rearing periods, that number can easily climb into the higher tens of thousands.
And that’s before you count the extra time and stress your team spends on repeated treatments and nursing fragile calves through bad weather.
So when we say calf health isn’t a “minor line item,” that it’s a major factor in your annual profit and loss, that’s the level of math we’re talking about.
Beef‑on‑Dairy and Tight Heifer Numbers: Why Every Calf Turned Strategic
Now layer the beef‑on‑dairy story and the heifer shortage on top of that.
On the beef side, you’ve watched this play out: the US beef cow herd has been slow to rebuild, and beef supplies have been tight enough that packers and feedlots are looking harder at dairy‑origin cattle, especially high‑health dairy‑beef cross calves. At the same time, dairy herds have become much more consistent with reproduction—timed AI, sexed semen, improved fresh cow management through the transition period—so you have more control over whether a given pregnancy is a “dairy heifer” or a “beef‑on‑dairy” calf.
Economists who work with both dairy and beef have been frank about the impact. In a 2025 interview, Mike North, an economist and risk‑management advisor with Ever.Ag, who works with many Midwest dairies, explained that beef‑on‑dairy breeding programs are generating “upwards of two and a half dollars per hundredweight in revenue back to the farm just in beef breeding” on some operations. In that same segment, he pointed out that in the current market environment, it’s not unusual to see a well‑bred, three‑day‑old dairy‑beef cross calf bring more than 1,000 dollars at certain sales, which really changes how that calf looks compared to a straight Holstein bull calf.
On the replacement side, CoBank’s 2025 heifer‑inventory analysis describes a sector at a “unique inflection point,” with dairy heifer numbers already at a 20‑year low and not expected to rebound until around 2027, as new processing plants draw more milk and heifer demand slowly pulls numbers up again. USDA Cattle Inventory reports shows that heifers over 500 pounds dropped from roughly 4.76 million in 2018 to 4.06 million in early 2024, while noting that stronger milk prices and processing expansion could drive replacement values higher. At the same time extension economists have pointed out that the total cost to raise a replacement heifer—from birth to first calving—often sits somewhere between 1,600 and 2,400 dollars under pre‑inflation conditions, with more recent budgets and Canadian/US benchmarking suggesting that on many units today, full economic rearing cost runs in the 2,300–3,000‑dollar range per head once you factor in feed, labor, housing, and overhead.
So across North America right now:
Dairy‑beef cross calves commonly bring a few hundred dollars more than straight Holstein bull calves at auction, with recent reports showing crossbred calves trading around 600–700 dollars in some Midwest sales while conventional bull calves lag behind.
In certain barns and weeks, especially in strong markets, three‑day‑old beef‑on‑dairy calves have topped 1,000 dollars.
Replacement heifers are scarce and expensive by historic standards, with multiple analyses pointing to rearing costs comfortably north of 2,000 dollars per head and market values for springers often pushing into the upper‑2,000 to 3,000‑dollar range in tight regions.
This development suggests that calves have shifted from “fill the hutches” to “shape the balance sheet.” Whether a pregnancy produces a dairy heifer or a dairy‑beef calf now has a direct and significant impact on both your future herd and your short‑term cash flow.
What Farmers Are Finding: A Five‑Step Breeding Framework That Actually Works
Looking at this trend across herds in Ontario, Wisconsin, California, and the Northeast, what I’ve noticed is that the operations making this work aren’t doing anything mystical. They’re just being very deliberate and consistent.
Most of them follow some version of a five‑step framework:
Use genomics to see which cow families are truly driving your herd.
Make a clear, rule‑based beef‑versus‑dairy decision for each breeding.
For dairy matings, add calf‑health genetics to your sire criteria as those proofs become available.
Factor in gestation length and calving pressure so you don’t overload high‑stress windows.
Re‑run the economics regularly as calf prices, heifer values, and milk markets move.
Let’s unpack that in barn‑level terms.
Step 1: Use Genomics to See Which Families to Grow—and Which to Let Go
Most herds that are serious about this are genomic‑testing their heifer calves, and some have also done a one‑time pass on younger cows to avoid missing high‑value animals that might be hiding behind older genetics.
A good real‑world example comes from a 5,000‑cow Holstein herd in the western US profile in 2024. The dairy, managed by veterinarian and producer Dr. Sergio Lopes, began genomic testing heifers in 2016 when they realized they were simply overrun with replacements and needed a better way to decide which heifers were truly worth raising.
Genomic results showed them a few things very quickly:
Some cows they had always considered “average” based on current production actually had very strong genetic merit.
Some of their highest‑producing cows were benefiting more from management and environment than genetics.
There were identification problems—wrong semen recorded, calves linked to the wrong dams—that genomics helped uncover and correct.
After a couple of years of working with the data, Lopes said they were confident enough to change their breeding strategy completely. They dropped conventional semen, used sexed dairy semen only on their best families, and bred the rest to beef. Today, they have a background of roughly 12,000 dairy‑beef cross animals tied to their 5,000‑cow dairy and partner herds, with beef calves and fed cattle now a major income stream alongside milk.
On a 300‑ to 600‑cow family herd—say a free‑stall in Wisconsin or a tie‑stall in Ontario—the same pattern shows up on a smaller scale. Producers genomic‑test their heifer calves, rank them on the index that matters most—Net Merit, TPI, Pro$, LPI, maybe with extra weight on health—and discover they have:
A top group, often the top 20–30%, they absolutely want to build daughters and granddaughters from.
A middle group they can flex up or down based on heifer inventory and cash flow.
A bottom group that’s tough to justify raising to calving when replacements are expensive, and barn space is tight.
Once you see your herd laid out like that, it becomes a lot easier to say, “These families deserve sexed semen and more daughters,” and “These cows can contribute better through beef‑cross calves than through more low‑merit heifers.”
Step 2: Make Beef‑Versus‑Dairy Decisions Simple and Rule‑Based
Once you’ve got a handle on your cow families, the next step is to stop making beef‑versus‑dairy calls on the fly in the parlor and start following a simple rule you can execute every week.
A rule that’s working on a lot of herds looks something like this:
First‑ and second‑lactation cows whose most recent heifer ranks in the top 40% of your genomic list get bred to dairy semen, often sexed.
Cows whose daughters fall below that line, plus older cows without strong family backing, get bred to beef.
When herds stick to that for a full year, they usually end up with roughly 30–40% of cows getting dairy semen and 60–70% getting beef. That mix often covers replacement needs—because dairy semen is concentrated on the right cows—while generating a steady stream of well‑bred dairy‑beef calves.
Here’s where the big math starts to bite in your favor. In many Midwestern markets right now, it’s common to see a beef‑on‑dairy calf sell for a few hundred dollars more than a straight Holstein bull calf. For example, in early 2024, it was reported that crossbred calves were selling for around 675 dollars per head in some US sales, while conventional Holstein bull calves lagged far behind, and noted that “beef on dairy” was becoming a “big money” factor in the heifer shortage conversation. If you take 150 matings that would have produced low‑merit dairy calves and, instead, flip them to beef‑on‑dairy matings with a 250‑dollar average premium, you’re looking at:
Even if you trim that for calf‑price volatility or the occasional calf that doesn’t quite hit the premium, you’re still talking about tens of thousands of dollars per year from one simple change in breeding policy.
And on the cost side, you’re not spending all the feed, bedding, labor, and barn space to raise heifers from those bottom families. Long‑term work out of places like Cornell, Penn State, and western Canadian benchmarking suggests that when you spread all the costs out, total rearing cost per dairy heifer—from birth to first calving—often sits in the 2,000–3,000‑dollar range once you include feed, bedding, labor, health, and overhead, with the exact figure depending on system (confinement, pasture, dry lot) and region. So not raising heifers that were never likely to pay you back is a big part of this story, too.
Step 3: Add Calf‑Health Genetics to Your Dairy Sire List
Now bring calf‑health genetics back into the picture.
We’ve already seen that calf diarrhea and respiratory disease are heritable and can be evaluated genomically. Canada gives us a clear preview of how those traits can look in practice.
In August 2025, Lactanet—the national genetics and data organization for Canadian dairy producers—launched a Holstein calf‑health genetic evaluation that combines recorded cases of respiratory disease from birth to 180 days and diarrhea from birth to 60 days. The new trait is expressed as a Relative Breeding Value (RBV) centered at 100 with a standard deviation of 5. Higher RBVs indicate sires whose daughters are more likely to stay free of recorded calf‑health events in that early‑life window.
Lactanet geneticist Colin Lynch, MSc, explained in that a five‑point increase in calf‑health RBV corresponds to about 5.4% more healthy calves with no recorded diarrhea or respiratory problems. Their analysis showed that, among proven sires, the top 5% for calf‑health traits had around 88% healthy daughters, while the bottom 5% averaged closer to 70–71% healthy daughters—depending on whether you’re looking at diarrhea or respiratory disease. In real‑world terms, that’s the difference between a family where “most calves just start and go” and one where you feel like you’re forever pulling buckets and syringes.
Sire Rank
% Calves NO Diarrhea
% Calves NO Respiratory Disease
Combined Healthy Rate (Est.)
Per 100 Calves: Sick Events
Economic Cost per Cohort (100 calves)
Top 5%
92%
90%
~88%
~12 sick calves
$2,400 in direct treatment + losses
Middle 50%
87%
84%
~80%
~20 sick calves
$4,000 in treatment + losses
Bottom 5%
82%
76%
~70%
~30 sick calves
$6,000+ in treatment + losses
Spread (Top vs. Bottom)
+10 pts
+14 pts
+18 pts
+18 more sick calves
+$3,600 annually per 100-calf cohort
Here’s how herds are starting to use that kind of information:
For heifers and first‑calf cows, they insist on bulls that meet their production and cow‑health criteria and also clear a minimum calf‑health RBV. Bulls with poor calf‑health scores simply don’t get used on young animals.
For older cows, calf‑health RBV becomes a tie‑breaker among bulls with similar milk, components, fertility, and cow‑health profiles.
In regions with tough winter respiratory seasons—Wisconsin, Minnesota, Quebec, Northern New York—some producers are deliberately matching higher calf‑health bulls to matings that will calve into late winter and early spring, when pneumonia risk is highest.
Of course, these evaluations live or die on the quality of the health records behind them. A 2023 Canadian Journal of Animal Science case study on calf respiratory illness and diarrhea recording in Ontario found that the share of milk‑recorded herds logging calf disease rose from 2.6% in 2009 to 11.1% in 2020, but also pointed out several places where data can be lost or misclassified between the farm and the national database. Neupane and Cole have likewise emphasized in USDA‑ARS communications that clear, consistent on‑farm recording of calf health is critical if we want reliable calf‑health proofs.
So one very practical step you can take this year—before US calf‑health numbers even hit your AI catalogs—is to tighten how you record scours and pneumonia. Sit down with your vet, agree on what counts as a case, and make sure those events get logged consistently in your herd software. That way, when calf‑health proofs land, you can trust them more and know your herd is contributing good data.
Step 4: Factor in Gestation Length and Calving Pressure
You don’t need a statistician to tell you that what you do with calving‑ease and gestation length can make or break certain months. Stack too many long‑gestation, big‑calf bulls on heifers or smaller cows that all calve in a tight two‑week window, and you’ll see it in stillbirths, tough pulls, exhausted staff, and shaky fresh cow performance through the transition period.
Most modern proofs include calving‑ease and stillbirth rates, and many now list gestation length as well. Genetic evaluation organizations like CDCB and Lactanet have been gradually building more of these functional traits into their indexes and tools. They may not be as glamorous as milk or fat numbers, but they matter a lot when you’re planning calving pressure.
What farmers are doing, once they’ve set beef‑versus‑dairy and calf‑health rules, is using calving‑ease and gestation length as the next filter:
In herds with heavy winter or early‑spring calving in the Northeast, Great Lakes, and Upper Midwest, producers keep a short list of easy‑calving, shorter‑gestation bulls for dairy matings that will calve into February and March, when calving barns and fresh pens are under the most stress.
In Western dry lot systems, where summer heat is the big enemy, producers avoid long‑gestation bulls on matings that would calve into the hottest weeks and lean instead on sires with moderate gestation and favorable calving‑ease profiles.
You don’t need a complicated spreadsheet to manage this. Just mark a handful of bulls as “tight‑window sires” based on calving‑ease, gestation length, and acceptable production and health traits, and use them where the calendar and weather suggest you can’t afford added calving problems.
Step 5: Keep Re‑Running the Math as Markets Move
The last step—and this is the one that never really ends—is to keep re‑checking whether your thresholds still make sense as markets and costs move around.
Calf prices rise and fall with the beef cycle. Replacement heifer values swing with inventory, feed costs, and interest rates. Milk prices and component premiums fluctuate with supply, demand, and processor product mix. The herds that keep these breeding strategies working don’t treat them as set‑and‑forget decisions.
In practical terms, that looks like:
Watching local calf prices at sale barns, through order buyers, and with any calf contracts, so you know the current spread between dairy bull calves and dairy‑beef calves.
Tracking replacement heifer prices through USDA Cattle on Feed and Cattle Inventory reports, CoBank and other industry analysis, and local auctions, and comparing those numbers against your estimated cost per raised heifer.
Adjusting your beef‑versus‑dairy cutoff as those numbers shift. When dairy‑beef calves are bringing strong premiums and replacements are expensive, a lot of herds are comfortable breeding only the top 30% of cows and heifers (by genomic merit) to dairy semen; if the spread shrinks or they need more replacements, they might widen that to 40%.
One helpful thing about the new calf‑health traits is that USDA‑AGIL has designed them to slot into the same kind of multi‑trait indexes we already use. Because genetic correlations between calf‑health traits and production or fertility are low, you can improve calf health without sacrificing milk, components, or cow survival, as long as you keep using balanced indexes instead of chasing single traits.
What Year One Really Feels Like on the Farm
On a PowerPoint slide, all of this looks tidy. On your own farm, Year One feels a little different.
At the start, it’s mostly invoices and extra work:
You’re genomic‑testing heifer calves, and the lab bills arrive long before any calves from your new breeding plan hit the ground.
You’re tightening up calf‑health recording with your vet and staff, which means training, more detailed entries, and a few evenings spent cleaning up your database.
You’re adjusting semen orders—more sexed semen on the top families, more beef semen on the bottom end, fewer “just in case” dairy breedings on cows that were never likely to give you high‑value daughters.
In the calf barn, nothing magical happens overnight. Your heifer pens still look full. Calf checks look familiar. It’s easy to wonder if the effort and expense are worth it.
By mid‑year, a few things usually start to shift:
You may find yourself selling or culling more lower‑merit heifers earlier—especially if you’re long on replacements—which frees up feed, bedding, and barn space.
Pregnancies conceived under the new beef‑versus‑dairy rules are in gestation, but only a handful of calves have actually hit the ground.
On paper, your breeding lists and heifer rankings make more sense. In the parlor and calf barn, daily routines feel largely unchanged.
Late in Year One and into Year Two is where most producers say they start to feel real differences:
Beef‑on‑dairy calves begin arriving as a more uniform, intentional group. You see stronger buyer interest, better feedback from feedlots, and often better average prices.
Your heifer pens gradually tilt toward a more consistent, higher‑index group instead of a random mix of stars and passengers. When those heifers freshen, you notice differences in how they come through the transition period and what they do in first‑lactation milk and components.
If you’ve matched genetics with solid colostrum management, good housing and ventilation, and steady fresh cow management, you often see calf treatment rates and pre‑weaning mortality start to trend in the right direction, similar to what regional calf‑health and barn‑fogging projects have reported when calf environments improve.
Producers highlighted in university extension projects tend to say the same thing: these strategies pay, but the payoff shows up over 18–24 months, not two pay periods. So if you’re going to go down this road, it really helps to think in years instead of months.
Looking Ahead: Getting Ready for Calf‑Health Proofs in the US
Looking at where this is heading, timing matters if you want to be ready.
The USDA‑AGIL work in the Journal of Dairy Science has already shown that calf diarrhea and respiratory traits can be evaluated at a national genomic scale, with usable heritabilities and low correlations with other key traits. USDA‑ARS publications and ICAR genetic evaluation reports have laid out the models and confirm that these calf‑health traits are being prepared for inclusion in US national evaluations for Holsteins and Jerseys.
The Council on Dairy Cattle Breeding has indicated, through meetings and industry communications, that the goal is to add calf‑health traits to the US genetic evaluation system in 2026, once data quality, validation, and governance steps are complete. The exact date will depend on final testing, but the intent is clear enough that seedstock suppliers and AI companies are already watching those traits closely.
Meanwhile, Canada is already using calf‑health RBVs in everyday breeding decisions. Lactanet launched the trait in 2025 and is working it into the Lifetime Performance Index (LPI) and other tools, so Canadian producers now see calf‑health expectations right alongside production, fertility, and cow‑health numbers when picking sires.
If you think about how quickly somatic cell score, daughter fertility, and cow‑health traits became “just part of the proof” once they were introduced, it’s reasonable to expect something similar with calf health. Early on, there will probably be bulls that are quietly excellent on calf‑health traits without a big semen price premium for that advantage. Over time, as more herds use those bulls and see calf‑barn results, market demand and pricing will adjust.
The herds that stand to benefit most from the early years of calf‑health proofs are the ones that:
Already genomic‑test most or all of their heifer calves.
Already have a written rule for which cows get dairy semen and which get beef.
Already work from weekly breeding lists and can easily add one more column when calf‑health numbers show up.
A Practical Game Plan for 2025–2026
If you’re thinking, “This all adds up, but what do I actually do next?”, here’s a straightforward plan you can take back to the office or kitchen table.
1. Build your information base.
Genomic‑test your next one or two calf crops so you can see how big the gap really is between your best and worst heifers on your preferred index.
Sit down with your veterinarian and team and define what counts as a reportable scours case and a pneumonia case on your farm, then make sure those cases are consistently recorded in your herd software.
2. Put a simple beef‑versus‑dairy rule on paper.
For example: “Only cows whose most recent heifer ranks in the top 40% genomically get dairy semen; the rest get beef.”
Plan to revisit that 40% threshold once a year based on calf‑price spreads, replacement heifer values, and your own heifer needs.
3. Talk with your AI and genetics partners about calf‑health traits.
Ask when they expect US calf‑health proofs to show up in their catalogs and computerized mating programs.
Identify a short list of bulls that fit your production and cow‑health goals and are also likely to be above average on calf‑health traits once those numbers are official.
4. Build a weekly breeding list.
Include cows eligible to breed, days in milk, parity, last calving date, and the genomic rank or index of their most recent heifer.
Mark each cow as “dairy” or “beef” based on your rule, then assign bulls from a short list that meet your criteria for production, components, fertility, cow health, calf health (once proofs are live), calving ease, and gestation length.
5. Track a few key metrics over the next 24 months.
Calf diarrhea and respiratory treatment rates, ideally by season.
Pre‑weaning mortality.
Age at first calving for heifers bred under the new system.
First‑lactation milk and component yield, and major health events in that first lactation.
Number and average sale price of beef‑on‑dairy calves.
Total heifer inventory and your best estimate of cost per raised heifer.
If you’re tracking those numbers, you’ll be able to tell whether genomics, beef‑on‑dairy, and calf‑health traits are actually changing the economics on your own farm—not just in theory, but in your barn with your markets.
Different Regions, Different On‑Ramps—Same Core Question
It’s worth saying that not every region, or every herd size, is going to use these tools in exactly the same way.
In Wisconsin, Minnesota, and the Upper Midwest, long winters and naturally ventilated barns make respiratory disease a constant battle. Research supported by the Northern New York Agricultural Development Program and Cornell PRO‑DAIRY has shown that improvements in ventilation, barn‑fogging protocols, and calf‑barn layout can significantly reduce respiratory problems, with scours most common early in the rearing period and pneumonia more common later. Producers there are now layering calf‑health genetics on top of these management changes.
In Ontario and Quebec, where Lactanet calf‑health RBVs are already available, and LPI updates have brought more health and functional traits into the mix, many herds are simply adding calf health to breeding programs that already lean heavily on genomics.
In Western dry lot systems, such as those in California and the Southwest, heat and dust are greater challenges than cold. Work comparing confinement, dry‑lot, and pasture‑based heifer systems has shown that dry‑lot and pasture can lower some costs but demand strong management of shade, airflow, and group size. Producers there are combining calf‑health genetics with shade structures, better airflow, and early‑detection technologies for respiratory disease, plus close relationships with beef buyers who value uniform, high‑health dairy‑beef calves.
On smaller family herds in the Northeast or Great Lakes region, the most realistic first step might be to genomic‑test one year’s worth of heifers, use those results to decide which families get sexed dairy semen and which get beef, and then let the AI company’s mating program start incorporating calf‑health traits as they come into US proofs.
Different barns. Different weather. Different processor relationships and quota setups. But underneath all that, the strategic question you’re trying to answer is the same.
The Bottom Line
When you strip the jargon away, here’s where all of this leads.
We now have solid data showing that calf diarrhea and respiratory disease are common, costly, and heritable enough to improve through genetics. The same infrastructure that gave us cow‑health traits in our indexes is being used to bring calf‑health traits into US proofs, with Canada already showing how calf‑health RBVs can fit alongside production, fertility, and cow‑health information on a bull card.
We also have economic work on calf health, heifer rearing, and calf markets, telling us that:
Direct treatment costs per sick calf stack up quickly.
Serious early‑life disease can pull heifers off their full potential in growth, age at first calving, and first‑lactation performance.
Dairy‑beef cross calves can be a bright spot in the check when milk prices soften.
Replacement heifers are expensive enough that raising the wrong ones is a luxury most farms can’t really afford right now.
The tools—genomics, beef‑on‑dairy, calf‑health proofs—are all coming together just as those pressures peak. And you don’t need a PhD to use them. A simple, consistent five‑step approach—test, sort, decide beef vs dairy, add calf health and calving‑ease filters, and keep re‑running the math—will get you most of the way there.
What I’ve noticed, looking at both the research and what’s happening in real barns, is that we’re moving from a world where calf health was “just management” to one where genetics, markets, and management are all pulling in the same direction.
So maybe the real question for 2026 isn’t “Should I genomic‑test?” or “Should I try beef‑on‑dairy?” Those are just tools.
The bigger question—the one that can easily swing tens of thousands of dollars a year on many dairies—is this:
Given your barns, your local markets, your cash‑flow reality, and the calf‑health genetics coming into proofs, which calves do you truly want more of—and which calves are you better off never making in the first place?
If your breeding plan can answer that clearly, and you’re willing to line up your genetics, your fresh cow management, and your calf program behind that answer, then the next few years offer a real chance to tilt the math of your dairy in your favor quietly.
KEY TAKEAWAYS
Calf-health proofs hit US genetics in 2026. USDA data on 680,000+ calves confirms scours and respiratory resistance are heritable—and selectable.
Sick calves drain $27,000/year from a 1,000-cow herd. That’s treatment, slower growth, and daughters that never reach their genetic potential.
The breeding math has changed. Beef-cross calves are topping $1,000. Heifers cost $2,500+ to raise. Replacements just hit a 20-year low. Every straw matters.
Five steps shift the money your way. Genomic-test heifers. Set a hard beef-versus-dairy rule. Screen bulls for calf health. Manage calving pressure. Re-check the economics quarterly.
Act now, bank returns in 18-24 months. Herds implementing this playbook today can realistically add $50,000+ to their bottom line.
Complete references and supporting documentation are available upon request by contacting the editorial team at editor@thebullvine.com.
Every week, thousands of producers, breeders, and industry insiders open Bullvine Weekly for genetics insights, market shifts, and profit strategies they won’t find anywhere else. One email. Five minutes. Smarter decisions all week.
89% tested positive. Only 20% showed signs. By the time you see H5N1, it’s already spreading—and testing alone won’t save you.
EXECUTIVE SUMMARY: Over 1,000 U.S. dairy herds have now tested positive for H5N1, and the numbers are brutal: one Ohio operation lost $950 per clinical cow and $737,500 total in a single outbreak. The hidden damage runs deeper—89% of cows tested seropositive while only 20% showed symptoms, meaning the virus spreads silently through milking equipment well before any test catches it. This forces a hard question: should your next biosecurity dollar go toward detection technology or prevention infrastructure? For most mid-size commercial dairies, the evidence is clear—prevention wins. Monitoring helps after H5N1 arrives, but cattle movements bring it in, and tighter gates beat better dashboards for reducing introduction risk. The practical playbook: strengthen sourcing controls, build real quarantine capacity, use bulk tank testing as a smoke detector, and reserve heavy tech investment for large operations or high-value genetics programs where herd size and asset value shift the math.
If you’ve been keeping up to date on the H5N1 situation at all, you’ve probably heard about Wisconsin’s first confirmed dairy case from late 2025. USDA and the Wisconsin Department of Agriculture, Trade, and Consumer Protection reported that a roughly 500-cow herd in Dodge County turned up positive after a bulk tank sample from the national milk surveillance program flagged highly pathogenic avian influenza.
Here’s what’s interesting about that case. The farm wasn’t seeing a barn full of crashing cows at that moment. State veterinarian Darlene Konkle noted in follow-up briefings that the D1.1 strain found in this herd matched what’s been circulating in Wisconsin waterways via migratory wildfowl—suggesting wildlife contamination around lagoons and feed rather than cattle-to-cattle spread from another dairy.
The lab caught it before anyone on the farm noticed a major production slump or clinical signs in the string.
And that kind of story gets talked about fast at the winter meetings. It leads to the same question I’m hearing from producers in Wisconsin, the High Plains, and the Central Valley: do you put serious money into high-end monitoring and more frequent testing to catch things early, or do you focus first on how cows come onto your place and how they move once they’re there?
What I’ve found, looking across the newest research and real herd experiences, is that the biggest payoff often isn’t where the shiniest technology is pointed.
How H5N1 Actually Behaves in Dairy Cows
Looking at this from the cow’s side first, the biology explains much of what we’re seeing.
When H5N1 first showed up in U.S. dairy cows in Texas and Kansas in early 2024, pathologists were struck by where the virus was turning up. Research published in Virulence and the Journal of Dairy Science’s “hot topic” papers described very high virus levels in milk and mammary tissue from affected cows, while nasal swabs were often negative or much lower.
USDA’s early epidemiological work reinforced this—they found no evidence of “virus actively replicating within the body of the cow other than the udder.”
In cows, this strain primarily behaves as a mammary pathogen rather than a classic respiratory virus.
Clinically, that’s exactly what many herd vets have been seeing. The Western Canadian Animal Health Network’s dairy summary describes the typical picture as a sudden drop in feed intake and rumination, an abrupt decrease in milk production, thick yellowish milk resembling colostrum in some cows, and more subtle changes in manure with secondary infections sometimes following.
Earlier outbreak reports from Texas and Kansas noted similar signs—off-feed cows, reduced rumination, sudden milk drop—sometimes with respiratory or neurologic symptoms, but with those mastitis-like milk changes front and center.
Here’s what makes that tricky. By the time you see obvious clinical signs, the virus may already be well into your milking string.
Hoard’s Dairyman reported that on infected Michigan dairies, many of these cows had already returned to normal temperatures by the time the drop in rumination or milk was noticed—the fever spike often comes first, then clears within hours.
Once you put that together with a modern freestall or dry lot parlor, the main within-herd transmission route starts to look uncomfortably familiar.
USDA’s investigation and multiple peer-reviewed papers emphasize that milking equipment and procedures—liners, claws, hoses, and other contact points—are the dominant pathways for cow-to-cow spread in affected herds, with respiratory spread playing a secondary role.
In plain terms, once an infected cow is in the string, your parlor can become the shuttle.
Why Testing Alone Won’t Save Your Herd
Now, you might expect all this to show up as a full-on train wreck in your fresh group. In practice, the data show the picture is more mixed—and that’s where many producers are tripped up by the “early detection fixes everything” narrative.
You know how it goes. A vendor comes in, shows you the monitoring dashboard, and suddenly it feels like you can see everything coming. But if your whole H5N1 plan is “we’ll just test more,” you’re betting against how this virus actually behaves in real barns.
A 2024 review in BMC Infectious Diseases on H5N1 in dairy cows notes that clinical morbidity has been estimated at 10–40 percent of lactating cows in some herds, but serologic evidence often reveals far more infections than clinical cases.
That’s exactly what we saw in the best-documented case so far: a big Ohio freestall herd that Cornell researchers studied in detail.
That Ohio operation milked about 3,876 adult cows in freestalls on a TMR—very typical of many North American herds. During the main outbreak window, 777 cows—about 20 percent of the herd—were classified as clinically affected based on clear signs like abrupt milk drop and abnormal, colostrum-like milk.
When researchers followed those clinical cows for 60 days, they found that each cow produced about 901 kilograms less saleable milk than expected based on her expected curve.
Economists working with that data estimated the direct economic loss at roughly $950 per clinical cow, accounting for milk loss, deaths, and early removals, for total losses of about $737,500 during the period studied. (The full study is publicly available through PMC for anyone who wants to dig into the methodology.)
That’s not a model. That’s a real herd, with numbers that look a lot like what many of us are budgeting against.
Here’s the part that sticks with me. When they tested blood samples from a subset of those cows, about 89 percent were seropositive for H5N1, and more than three-quarters of those seropositive animals had never been tagged as clinical cases.
Those subclinical cows still had smaller but real reductions in production.
The Cornell team cautioned that herd-level averages can mask those losses because low-producing cows are often culled and replaced, making bulk tank trends look better than individual cow records.
If you’re already running tight margins on feed and labor, that kind of hidden drag is exactly the sort of thing that shows up when you reconcile your milk check at year-end.
Herd Status
Cows Tested Seropositive
Cows Showing Clinical Signs
Hidden Economic Drag
What the data shows
89%
20%
Subclinical losses in 69% of herd
Ohio herd (3,876 cows)
~3,450 cows infected
777 cows clinical
2,673 cows with hidden production loss
Your 500-cow herd (projected)
~445 cows infected
100 cows clinical
345 cows quietly costing you money
Detection window
Virus present 7–14 days before bulk tank flags it
Clinical signs appear mid-outbreak
Losses already compounding
The Detection Gap: What “Early” Really Means
Given that picture, it’s no surprise that a lot of energy has gone into early detection. In April 2024, the USDA issued a federal order requiring lactating dairy cows to test negative for influenza A before interstate movement.
During the announcement, Agriculture Secretary Tom Vilsack explained: “The mandatory testing for interstate movement impacts and involves dairy cattle. We’re going to focus on lactating cows initially.”
Since then, USDA has developed a national milk-testing strategy that includes bulk-tank and retail-product sampling. States like Wisconsin have added their own layers—testing requirements for show cows, more routine tank testing—in an effort to see problems earlier.
At the same time, many herds have either adopted or expanded cow-level monitoring platforms that track milk yield, activity, rumination, and sometimes temperature. These systems were already proving their worth in fresh cow management and mastitis detection on large dairies before H5N1 ever showed up.
Now they’re being pitched as an extra set of eyes for catching H5N1-type patterns.
What farmers are finding is that those tools help, but they don’t change the basic rules of how fast this virus moves.
Transmission modeling from 2024 and 2025 suggests that spread within milking strings is relatively efficient once the virus is established—one infected cow tends to lead to at least one additional infection on average, though outbreak dynamics vary considerably depending on how the herd is managed and how quickly producers respond.
Over a couple of weeks in a large freestall or dry lot system, that steady growth can involve a sizable portion of the milking string.
On the detection side, recent work in mBio and JDS Communications, along with the FDA’s own method development, has looked at how bulk tank PCR results relate to within-herd prevalence.
Those studies show that the tank test works best once a substantial fraction of the herd is shedding virus into the milk that ends up in that bulk tank.
When only a small number of cows are infected, particularly in larger herds, the virus signal in the pooled sample can be intermittent—some draws positive, some negative—just based on which cows were milked when.
Weekly bulk tank testing, where many co-ops and labs have landed, is a good smoke detector. It’s very helpful to know when something is burning, but it won’t always catch the very first spark.
Moving to twice-weekly sampling, or tying bulk tank testing into cow-level monitoring that’s already watching for unusual drops in mid-lactation milk or changes in rumination, tends to bring the alarm forward by several days.
On herds that use these systems well, veterinarians report they’ve been able to act roughly one infection cycle earlier than they otherwise would have.
What those systems can’t do is erase the early window. There’s still going to be a period—often days, sometimes more than a week—where H5N1 is present and transmitting in the herd before any bulk tank result or dashboard alert clearly points to it.
The brutal timeline: H5N1 spreads silently for 7-14 days before any detection system catches it. By Day 7, the virus may have already infected 20-40% of your milking string. Prevention stops the clock at Day 0—before this timeline ever starts
That doesn’t make detection a waste of time or money. It just means that when we talk about catching it early… well, we have to be honest about what “early” really looks like for this virus.
Bird Flu Economics: The Real Cost to Your Dairy
So why does that timing nuance matter so much on a working dairy?
The short answer is: because the economics are unforgiving.
I talk to a lot of producers who are trying to figure out where to put their next biosecurity dollar, and honestly, the math is what cuts through all the noise.
The Ohio herd gives us real numbers, not just modeling, for what an outbreak can cost. In that freestall herd, clinical cows lost about 900 kilograms of saleable milk over 60 days, and the total losses were around $950 per clinical cow, for roughly $737,500 in direct costs during the outbreak.
That’s before you factor in the opportunity cost of cows that never reach their genetic potential afterward.
If we use those numbers as a planning tool—not a prediction, but a way to think about risk—for a 500-cow herd in the Midwest or Northeast, the math adds up quickly.
The real cost of H5N1: $950 per clinical cow, with milk loss representing only 72% of the total economic hit. The remaining costs—culling, death loss, vet bills, and subclinical drag—are largely NOT covered by USDA’s ELAP program
Imagine a big outbreak where 20 percent of cows go clinical: that’s 100 animals. If each one ends up costing about $950 in lost milk and associated impacts, you’re looking at about $95,000 in direct clinical losses.
You’ll also have subclinical losses in the rest of the herd, and likely some fresh cow and repro impacts that aren’t captured in that simple figure.
On the investment side, most of the herds I talk with are weighing two big buckets for where the next H5N1 dollar might go.
The Prevention-First Approach
This is the “tighten the gates” option, centered on sourcing and quarantine, plus some practical facility and testing upgrades.
Using current PCR pricing, extension-style building costs, and veterinarian fee schedules, a 500-cow herd can typically:
Set up a modest but real quarantine area for all incoming and returning cows, with its own fence, water, and tools
Make small changes in the hospital and isolation space so suspect cows can be handled with less cross-contamination
Run weekly bulk tank PCR testing as part of routine surveillance
Stock and consistently use appropriate PPE, disinfectants, and cleaning tools
USDA has offered some support here. APHIS announced up to $1,500 per premises to develop and implement a biosecurity plan, plus $100 for producers who purchase and use an in-line sampler for their milk system.
When you add up a simple quarantine structure, weekly bulk tank testing, additional vet consults, and supplies, the costs vary quite a bit depending on the infrastructure you’re starting with. Some herds are looking at relatively modest investments; others with more to build are looking at figures that push into six figures over several years.
Approach
Upfront Investment (3-Year Total)
What It Buys You
What It Doesn’t Change
Best Fit
Prevention-First
$35,000–$75,000
Quarantine facility, weekly bulk tank PCR, sourcing controls, PPE, vet protocols
Quarantine, bulk tank PCR, monitors on fresh/high-value groups only
Full-herd real-time visibility
Growing herds, export-focused dairies
The Containment-Heavy Tech Approach
This is more of a “build the cockpit” option, where you lean hard into detection and on-farm control:
Cow-level meters and sensors on most or all lactating cows
Expanded isolation and hospital capacity, with dedicated milking units and more robust waste-milk handling
More frequent bulk tank sampling, possibly multiple times per week
Additional veterinarian time and staff hours to manage a more complex alert and response system
There isn’t a single peer-reviewed price tag for this approach. But when you look at real vendor quotes for herd monitoring systems, construction costs, test fees, and labor, it’s not unusual for a 500-cow herd to be facing substantial investment—potentially several hundred thousand dollars over a multi-year implementation period, depending on herd size and system sophistication.
What Each Approach Actually Buys You
The containment-heavy approach can reduce the number of cows that get infected and the duration of an outbreak once H5N1 is already in the herd.
Modeling and the Ohio case both suggest that earlier action—changing milking order, isolating suspect cows, adjusting fresh cow management—can shave a noticeable number of cases off the top and reduce total losses.
That’s especially compelling in high-value genetic herds or very large operations where each day of delay involves hundreds of cows.
But none of that spending changes the probability that H5N1 ever shows up at your gate to begin with.
That risk is driven mostly by cattle movements, local herd density, wildlife contact, and the level of virus activity in your region.
The prevention-first approach, by contrast, is aimed squarely at those front-end risks. It can’t prevent every wildlife spillover—Wisconsin’s first case is a good reminder of that—but it can significantly reduce the odds that you invite the virus in on a trailer from a high-risk region or from a herd with unknown status.
So, before we even talk brands or product specs, one of the key questions to ask is: are you mostly insuring against H5N1 getting in, or against what it does after it’s inside?
Why Prevention Deserves Your First Dollar
What farmers are finding, as we get more data and more real-world experience, is that prevention has a surprisingly strong case.
A 2024 study published in Virulence and a 2025 comprehensive review both highlight the role of cattle movements in spreading the virus between states.
In particular, some infected herds in Michigan and Idaho had recently received cows from Texas, and genomic analyses linked those movements to local outbreaks.
A broader review of highly pathogenic avian influenza in North America concluded that the 2024 epizootic in dairy cattle and poultry was spread mainly through milking machinery and animal transport, with wild birds seeding some initial introductions.
That’s the backdrop for APHIS’ April 2024 federal order, which requires lactating dairy cattle to test negative for influenza A before crossing state lines and lays out detailed testing, reporting, and quarantine expectations for affected herds.
University extension groups have been remarkably consistent in their practical biosecurity advice:
Limit the number of source herds and favor those with transparent health status and lower H5N1 risk
Maintain a separate quarantine space for all new and returning animals for 21–30 days, with its own fence, feed, water, and manure-handling tools
Work with your herd veterinarian to test cows in quarantine at least once early and once near the end of that period, using approved influenza A tests
Keep good movement and health records so you can track which animals came from where and when problems started
When you look at the cost and hassle of those steps, they’re not small.
But compared to the cost of a major outbreak—or a full tech-heavy build-out—they’re often a very efficient use of the next biosecurity dollar for a 400–800 cow herd.
A 2024 editorial on H5N1 concerns noted that, in the absence of widely available vaccines for dairy cattle, tightening biosecurity around animal movements and focusing on milking hygiene are two of the most effective levers we have to reduce herd-level risk.
So, for many mid-size herds in the Midwest, Northeast, and Eastern US, a prevention-first core—sourcing, quarantine, basic facility upgrades, sensible surveillance—looks like the best place to put the next big dollar.
When Detection Technology Earns Its Keep
At the same time, it wouldn’t be accurate to say that detection technology belongs only in brochures.
In large Western herds, where 2,000–3,000 cows per site is common, and operations are often spread across multiple locations, cow-level monitoring has already become part of the management toolkit.
Recent articles have shown how these systems improved fresh cow health, mastitis detection, and reproduction long before H5N1 was on the radar.
A recent feature on what we’re learning about HPAI on dairies noted that using rumination, activity, and milk production data, individual cow effects can be easily observed—and on some large operations, monitoring platforms helped pick up unusual mid-lactation milk drops and activity clusters that prompted earlier investigation and testing.
When you add H5N1, the incremental benefit of those systems grows.
If you can spot a suspicious pattern a few days earlier and rearrange milking order, isolate suspect pens, and tighten parlor hygiene more quickly, the payoff on a 3,000-cow dry lot can be substantial—especially if you’re working with high-value genetics or a tightly contracted supply.
In high-value genetic herds—those selling embryos, bulls, or show cattle—the risk calculus shifts again.
Losing a handful of elite donors or sires in a single outbreak can dwarf the per-cow costs seen in the Ohio commercial herd.
Many of these operations are already at the front of the line in terms of fresh cow management, disease monitoring, and documentation. For them, tuning their existing systems to look for H5N1-type patterns and building a rapid-response protocol around those alerts can be a relatively small additional investment with outsized risk-reduction.
The Export and Processor Angle
There’s also a growing market dimension that many mid-size herds aren’t yet considering.
International buyers are paying close attention to how U.S. dairy manages H5N1 risk, including surveillance, testing programs, and biosecurity.
Dairy Global has reported that European authorities view the likelihood of H5N1 spread through dairy trade as low, but they’re closely watching U.S. controls and transparency.
Joint dairy organization statements in 2024 and 2025 have emphasized the industry’s commitment to biosecurity and surveillance, partly to reassure buyers and consumers.
If you’re shipping high-value cheese into EU or Asian export contracts, or selling to processors with premium-quality programs, enhanced monitoring and documentation may become more than a nice-to-have. They’re part of staying eligible for certain markets.
And finally, in regions where H5N1 has hit multiple herds—parts of Texas, New Mexico, Kansas, and California, for instance—producers are increasingly treating the virus as a recurring management challenge rather than a one-time event.
In that environment, spending more on tools that can shorten and soften each wave becomes easier to justify.
So the practical message isn’t “don’t buy technology.” It’s “build prevention first, then choose technology that pulls double duty” for your herd—supporting fresh cow management, butterfat performance, mastitis control, and H5N1 response—based on your size, genetics, and markets.
Pasteurized vs. Raw: What H5N1 Means for Milk Safety
This is probably the question I get most at producer meetings, and I understand why. It touches on everything from consumer confidence to how you handle waste milk on your own operation.
On the pasteurized side, the evidence to date has been reassuring.
During 2024, the FDA and USDA ran a national commercial milk sampling effort, testing an initial set of 297 retail dairy products—including fluid milk, cream, cottage cheese, and sour cream—from multiple states.
H5N1 viral RNA was detected by PCR in a fraction of those samples, particularly from regions with infected herds, but when PCR-positive samples were tested in eggs and cell culture, no infectious virus was found.
FDA then worked with academic partners to run pilot-scale HTST pasteurization studies using inoculated raw milk. Those experiments showed that standard commercial pasteurization conditions are likely eliminating at least 12 log10 of virus per milliliter—essentially complete inactivation under the tested scenarios.
In a September 2024 letter to the dairy processing industry, the FDA stated plainly: “The FDA and USDA are confident that pasteurization is effective at inactivating H5N1 in raw milk” and that pasteurized dairy products remain safe.
A joint statement from major U.S. dairy organizations in March 2024 made the same point: pasteurization kills pathogens, including influenza viruses such as H5N1.
Raw milk is another story.
Laboratory work published in 2024–2025 showed that H5N1 can remain infectious in refrigerated raw milk for days and that the virus or viral RNA can persist in cheeses made from contaminated raw milk, with only gradual declines during aging.
FDA and public health agencies in the U.S. and Canada have warned that consuming raw or unpasteurized milk from infected herds or regions with active outbreaks may pose a risk and have urged producers and consumers to understand the risks associated with raw milk.
There’s also the animal side to consider.
A U.S. study of H5N1 in dairy cattle and cats in Texas and Kansas documented that cats on affected farms became infected and, in some cases, died after exposure to contaminated environments and likely raw milk. The viruses in those cats were nearly identical to the viruses in cattle on the same farms.
That’s led many veterinarians to recommend rethinking waste milk feeding practices for calves, cats, and dogs, especially during and after outbreaks.
For dairy producers, the practical takeaway looks something like this:
Pasteurized milk from your herd, once it’s processed adequately through a commercial plant, remains safe based on current retail sampling and pasteurization studies
On-farm raw milk consumption, and how waste milk is handled, deserve careful consideration in areas with H5N1 activity or after a positive herd test
USDA Assistance: Helpful, But Not a Safety Net
Another question that comes up quickly in these conversations is: if we do get hit, how much can USDA actually help?
In June 2024, Agriculture Secretary Tom Vilsack announced that USDA would use the Emergency Assistance for Livestock, Honeybees, and Farm-raised Fish program—ELAP—to offset some H5N1-related milk production losses.
Under that expansion, eligible dairies with confirmed H5N1 infections can receive payments based on documented declines in milk production for affected cows over a defined window—up to 21 days at zero production and 7 days at 50 percent production—at 90 percent of the average milk price for the state or region.
CIDRAP’s coverage of that announcement noted that ELAP payments can significantly blunt the initial financial hit for clearly documented clinical outbreaks.
At the same time, ELAP is not designed to capture everything.
The program doesn’t fully account for subclinical production losses, longer-term impacts on fresh cow performance and reproduction, or the costs of higher culling and replacement that can ripple out over many months.
There’s also a timing gap; the milk check takes the hit right away, while ELAP payments arrive later.
So ELAP is an important part of the safety net, and it’s smart to understand how to document and apply it if you’re affected. But it’s not a reason to assume you can afford to be casual about prevention.
H5N1 Outbreak Cost
USDA ELAP Coverage
You Still Pay
Milk production loss (clinical cows)
90% of state avg milk price × up to 21 days at 0% + 7 days at 50%
10% co-pay + any losses beyond 28-day window
Subclinical production losses
Not covered
100% on you
Early culling & death loss
Not covered
100% on you
Veterinary diagnostics & treatment
Not covered
100% on you
Fresh cow performance drag (60+ days post-outbreak)
Not covered
100% on you
Reproduction impacts & delayed breeding
Not covered
100% on you
Labor overtime & management time
Not covered
100% on you
A Five-Step Framework for Your Herd
Given everything we’ve seen in the last two seasons—from those early Texas and Kansas herds, to the Ohio numbers, to movement-linked cases in other states, to Wisconsin’s wildlife-linked outbreak and the national milk testing work—what does a workable plan actually look like on farm?
Here’s a framework that’s starting to make sense for a lot of well-run dairies.
1. Lock In The Prevention Basics
Looking at this trend, the herds that are sleeping best at night are the ones that have tightened their basics rather than chasing every new gadget.
Sourcing and quarantine. Limit your source herds, favor operations and regions with transparent health status and lower known H5N1 activity, and quarantine all incoming and returning animals for 21–30 days in a truly separate space. That means its own fenceline, feed and water, and handling tools.
Testing new arrivals. With your herd veterinarian, set up a testing protocol for cows in quarantine—typically one influenza A test early on and another before they join the milking herd, using approved laboratory assays.
Hospital pen and parlor routines. Make sure your sick-cow handling doesn’t undo your good intentions. Simple changes like milking suspect cows last with clearly marked units, cleaning or changing liners between known suspect cows, and adjusting who moves between pens can make a difference.
2. Use Surveillance As A Smoke Detector
What farmers are finding is that surveillance is most useful as an early warning system, not as a guarantee.
Bulk tank PCR. Work with your processor or local lab to set up a weekly bulk tank PCR schedule for H5N1. In times of higher risk—after bringing in cows from affected states, during peak bird migration, or if a neighbor tests positive—you may choose to bump it to twice-weekly sampling for a while.
Interpreting results smartly. Treat a negative as “no obvious smoke,” not as proof that zero infection is present. Treat a positive or inconclusive result as a tripwire to move into your response plan.
3. Decide What You’re Really Insuring Against
This is where herd size, genetics, and region really reshape the math.
Mid-size commercial herds (say 300–800 cows). For many Midwest, Northeast, and Eastern US herds that ship to commodity markets, the primary goal is to reduce the risk of an outbreak and to prevent a rare one from wrecking the year. For these herds, a prevention-first core with sensible surveillance is often where the next dollar works hardest.
Large herds and genetics programs. For 2,000-cow dry lot systems in the Southwest or herds selling embryos and bulls, the stakes around repeated exposures or losing a few elite animals are much higher. In those cases, investing more in detection tools that also help with fresh cow management, mastitis, repro, and butterfat performance can pay off.
Being honest about what you’re insuring against—one big hit vs. multiple waves, commercial cows vs. elite genetics—helps you avoid buying the wrong insurance.
Herd Type
Herd Size
Primary Risk
First-Dollar Priority
When to Add Tech
Target Investment (3-Year)
Midwest/Northeast commercial
300–800 cows
Single large outbreak wrecks the year
Quarantine + sourcing + weekly bulk tank PCR
Only if expanding or adding high-value genetics
$35,000–$75,000
Western large commercial
2,000–5,000 cows
Repeated exposures, extended outbreak duration
Quarantine + bulk tank PCR, THEN cow monitors on fresh groups
Immediately—monitors pay for themselves in early containment
$150,000–$250,000
High-value genetics herd
Any size
Loss of elite donors/sires in single event
Full monitoring + quarantine + 2× weekly testing
From day one
$100,000–$350,000+
Export-focused dairy
500–1,500 cows
Buyer audits & market access requirements
Quarantine + documentation systems + weekly testing
When buyer contracts require it
$60,000–$120,000
4. Layer Technology Where It Does Double Duty
This is where technology really earns its keep.
Make better use of what you already have. If you’re already running cow-level monitoring, sit down with your data and your vet to figure out what H5N1-type patterns looked like in herds that have gone through it—clusters of sudden mid-lactation milk drops, unusual rumination dips, or patterns tied to a particular pen or fresh cow group. Then bake those patterns into your alert thresholds and standard operating procedures.
Ask hard questions of new systems. When a vendor is in your kitchen, ask for examples from herds like yours—including herds that have experienced H5N1. Ask, “How many days earlier did this system detect issues compared to bulk tank tests and farm staff?” and “What difference did that make in final case numbers and culling?” Good systems will have case studies; if they don’t, that’s telling.
5. Plan Your “Phone Call Day” Before It Happens
This is something I’ve heard over and over from both vets and producers.
Define your tripwires. Decide up front what events will trigger a higher-level response: a positive or inconclusive bulk tank result, a sudden cluster of cows with colostrum-like milk, or a confirmed H5N1 herd within your usual trucking radius.
Pre-plan your responses. For each tripwire, outline the next 24–72 hours: pausing non-essential cattle movement, shifting milking order, increasing PPE in the parlor, pulling individual samples from suspect cows, and calling your herd vet and processor.
Train your people. Make sure everyone, from the herdsman to the relief milker, knows those steps. The middle of a crisis is a tough time to write and teach a new protocol.
Where Your Next H5N1 Dollar Belongs
By late 2025, USDA surveillance confirmed that over 1,000 U.S. dairy herds across 19 states had been confirmed to have H5N1 infections.
The virus has moved from “that weird thing in Texas” to a background risk we all have to factor into feed decisions, labor planning, fresh cow management, and butterfat targets.
What’s encouraging is that we’re no longer flying blind. We have solid herd-level data from the Ohio case and others, better modeling on how the virus moves through milking strings, clear retail milk safety data, and a defined USDA framework around testing and assistance.
For many 500-cow commercial herds in the Midwest and Northeast US dairy regions, the weight of that evidence points pretty clearly in one direction: the next H5N1 dollar probably belongs in stronger gates, smarter cow flow, and steady surveillance before it goes into more screens in the office.
For larger Western herds, high-value genetics operations, and herds in regions where H5N1 has already become a repeated visitor, adding serious detection technology on top of that prevention foundation can absolutely make sense.
What I’ve consistently seen, talking with producers and veterinarians in different regions, is that the herds that feel best about their choices are the ones that started by tightening the basics, were realistic about their risk, and then chose tools—simple or sophisticated—that made the whole business better: fewer surprises in the fresh group, steadier butterfat performance, fewer mastitis flare-ups, and a clearer plan for the day the lab calls.
The Bottom Line
We still don’t know exactly how long H5N1 will keep pressuring dairy cows, or how the virus might evolve as more data come in. But we do know enough now to make smarter, calmer decisions—and that’s how you keep today’s choices from quietly undermining your herd’s future performance.
In a business built on thin margins, long memories, and a lot of early mornings, that’s a pretty important place to be.
If you do nothing else this month: pick one sourcing change, one quarantine upgrade, and one clear tripwire with your vet—and write them down.
KEY TAKEAWAYS
The damage is steep: One Ohio herd lost $950 per clinical cow and $737,500 total—in a single outbreak.
The spread is invisible: 89% tested positive, only 20% showed symptoms. By the time you see H5N1, it’s already everywhere.
Prevention beats detection: For most mid-size dairies, tighter gates outperform better dashboards.
Bulk tank testing is your smoke detector: Cheap and fast—but it only confirms the fire, not prevents it.
Large herds and elite genetics play by different rules: When exposure is constant, and asset values are high, monitoring tech starts earning its keep.
Complete references and supporting documentation are available upon request by contacting the editorial team at editor@thebullvine.com.
Every week, thousands of producers, breeders, and industry insiders open Bullvine Weekly for genetics insights, market shifts, and profit strategies they won’t find anywhere else. One email. Five minutes. Smarter decisions all week.
You can’t outbreed 70/25/5 by April. The only question is whether you fix your ration and cash flow before it costs $900/cow.
EXECUTIVE SUMMARY: Western Canada’s April 1, 2026, shift to a 70/25/5 payment ratio is the clearest signal yet that protein and solids‑non‑fat now drive far more of your milk cheque than they used to. Retail and utilization data show yogurt and cheese still growing, butter stocks at five‑year highs, and CDC Class 3(d) and 4(a) prices that put real money on protein, not just butterfat. For high‑fat, lower‑protein herds—think 4.5–4.7% butterfat and 3.0–3.1% protein—modeled scenarios with 2025 prices point to a possible $80,000–$100,000 annual hit on a 100‑cow herd under the new ratio, or roughly $900 per cow and 8.5–9.0 cents per litre. The problem is you can’t breed your way out of that by April, because even with genomics, shifting herd‑level components usually takes four to six years of consistent sire selection and culling. So the real play over the next 12–24 months is tightening up nutrition to add 0.10–0.20 points of protein, re‑aiming sire choices and genomic sorting toward balanced fat and protein kilos, and reworking cash‑flow with your lender before the lower cheques arrive. The article also walks straight into the succession conversation, since a 15‑point change in component weighting—and talk of more to come in 2027—forces families to rethink risk, investment, and what it really means to pass a quota‑based dairy to the next generation. And when you zoom out to U.S. Federal Order reforms, and EU forecasts that favour cheese over butter and powders, it’s clear this isn’t a one‑off Western policy quirk but part of a global shift toward paying harder for solids and yield.
If you sit down at a winter producer meeting in Western Canada right now, you don’t get too far into the coffee before the same topic comes up: that new component ratio change landing on April 1, 2026.
You probably know the basics already. The Western Milk Pool boards—BC Milk, Alberta Milk, SaskMilk, and Dairy Farmers of Manitoba—are moving from the long‑standing 85% butterfat / 10% protein / 5% other solids weighting to a new structure of 70% butterfat, 25% protein, and 5% other solids for allocating pool dollars to producers. That’s laid out clearly in BC Milk’s October 9, 2025, Notice to Producers, so it’s not rumour; it’s policy.
Component
Old Ratio (Until March 31, 2026)
New Ratio (From April 1, 2026)
Change
Butterfat
85%
70%
-15 points
Protein
10%
25%
+15 points
Other Solids
5%
5%
No change
What’s interesting here—and what I’ve noticed is really bothering people—is the timing. For years, most Western herds have been bred and fed for strong butterfat performance because that’s what the cheque rewarded. Now the rules shift with only a few months’ lead time, while herd genetics need several years to change direction.
So you’ve got policy moving on a six‑month clock and cows moving on a four‑to‑six‑year clock. That gap is where the uneasiness lives.
Looking at this trend, the aim here is pretty simple: make sense of why the ratio changed, what the data suggests about markets and pricing, and what practical levers you still have—nutrition, genetics, and finances—during this transition period.
Why the Ratio Changed: Following the Value Chain
If you read BC Milk’s explanation, they’re quite clear about the intent. The new 70/25/5 ratio is being introduced to support increased milk volume in the Western Milk Pool to meet industrial processing commitments—whole milk powder and other manufacturing uses—and to encourage butterfat tests to stabilize rather than keep climbing.
And when you look at the numbers across Canada, that story holds up.
In its September 2025 Markets Report, Dairy Farmers of Ontario summarized national retail sales for the 52 weeks ending August 2, 2025. Yogurt was the standout, up 6.5 percent year‑over‑year; butter was up 4.9 percent, cheese 3.1 percent, ice cream 4.0 percent, cream 1.2 percent, and fluid milk barely budged at 0.2 percent.
Product Category
YoY Growth (%)
Yogurt
+6.5%
Butter
+4.9%
Ice Cream
+4.0%
Cheese
+3.1%
Cream
+1.2%
Fluid Milk
+0.2%
The data suggests demand is still solid, but the real growth is coming from products that lean heavily on protein—like yogurt and many cheese types—rather than from plain fluid milk.
At the same time, stock levels tell another part of the story. That same DFO report showed butter stocks at 41,063 tonnes in July 2025—the highest level in five years—and cheese stocks at 108,038 tonnes, also historically high for that month.
Farmtario’s November 2025 analysis added that butterfat‑equivalent production in September 2025 was up 4.48 percent compared to a year earlier, while butterfat imports over the prior 12 months were up 10.18 percent. Put simply, the system isn’t short of fat.
Now layer in component pricing. The Canadian Dairy Commission’s 2025–26 component schedules show that in Class 3(d)—cheese and related products—butterfat is priced at $11.3565 per kilogram, protein at $9.7035, and other solids at $0.8921.
Component
CDC Class 3(d) Price ($/kg)
CDC Class 4(a) SNF Price ($/kg)
Payment Weighting (Old vs New)
Butterfat
$11.36
N/A (Class 4a is SNF)
85% → 70%
Protein
$9.70
~$2.82 (protein + OS)
10% → 25%
Other Solids
$0.89
Included in $2.82 SNF
5% → 5%
In Class 4(a) solids‑non‑fat, the protein and other solids price for fall 2025 sits around $2.82 per kilogram. And in the special Class 5 ingredient/export categories, both protein and butterfat carry strong values, enabling processors to compete internationally with powders and other products.
If we glance south, the pattern lines up. As part of Federal Milk Marketing Order modernization, USDA has been working with updated standard composition factors—roughly 3.3 percent true protein, 6.0 percent other solids, and 9.3 percent nonfat solids—to better match actual milk composition.
Recent USDA class and component price bulletins, summarized in outlets like Cowsmo and Hoard’s Dairyman, have shown months when Class III protein has been close to $3 per pound while butterfat has sat noticeably lower, often in the mid‑one‑dollar range per pound. Values move month to month, but the relationship has frequently favoured protein in cheese milk.
So this development suggests that the boards are trying to align the producer pay structure with where value is truly being created in the chain. Butterfat still matters—no one’s taking that off the table—but under 85/10/5, protein’s contribution was under‑recognized relative to what markets were paying for it.
It’s worth noting one more line in the BC Milk notice. They mention that, if required, a further change may be applied in 2027 to decrease component “densities” to accommodate growth in volume. That tells you this is not viewed as a one‑time tweak, but part of a longer journey in how milk is valued in the Western Milk Pool.
How 70/25/5 Shows Up on Your Milk Cheque
You know as well as anyone that ratios don’t feel real until you run them through a herd. So let’s walk through a simple, realistic example. This is a modeled scenario using typical Western Canadian component levels and current CDC values—not someone’s actual settlement, but it shows the direction.
Herd A: High Butterfat, Lower Protein
100 cows
About 10,500 litres per cow per year (10,500 hL shipped)
Components: 4.6% butterfat, 3.1% protein, ~5.8% other solids
About 11,000 litres per cow per year (11,000 hL shipped)
Components: 4.1% butterfat, 3.5% protein, ~6.0% other solids
Under 85/10/5, Herd A has been the star. As many of us have seen in Western DHI summaries, herds with butterfat levels of 4.5–4.7% have consistently ranked near the top of payout lists for years.
Under 70/25/5, when you apply those weights with current Class 3(d) values, Herd A still benefits from strong butterfat performance, but Herd B’s extra protein and slightly higher volume dramatically close the gap. In quite a few realistic price combinations, a balanced herd like B can edge ahead on net dollars per cow.
To put some rough numbers on it, advisors modeling real farms with similar profiles using recent CDC prices have seen cases where a high‑fat, lower‑protein 100‑cow herd’s annual milk revenue under the new ratio pencils out $80,000–$100,000 lower than under 85/10/5, while a more balanced herd might see only minor changes.
Herd B (Balanced: 4.1% BF / 3.5% Protein, 11,000 L/cow)
$0 (baseline)
-$5,000
-$5,000
If you spread a $90,000 hit over 100 cows, that’s about $900 per cow per year. On a per‑hectolitre basis for Herd A (10,500 hL), that’s roughly 8.5–9.0 cents per litre in modeled scenarios. Your exact numbers will differ, but the direction is clear: the further out on the “fat‑heavy/protein‑light” end your herd sits, the more exposed your cheque is.
What’s interesting here is that many of the herds most at risk are also some of the best‑run operations on butterfat. They did exactly what the previous payment structure encouraged. That’s the sting.
The Real Tension: Policy Moves in Months, Genetics in Years
Here’s where the frustration really surfaces when you talk with producers and geneticists.
Genomic selection has absolutely changed the game. Industry reports and peer‑reviewed work show that AI programs have shortened sire generation intervals from roughly 5–7 years to around 2–3 years, enabling much faster genetic gain in traits like fat and protein. Hoard’s Dairyman, for instance, has highlighted how these “unprecedented genetic gains” are driving record component levels even in periods when total milk volume flattens.
But on a commercial dairy, you live with herd structure and replacement rates. In practical terms, it looks more like this:
You breed a heifer to a more protein‑balanced bull this year.
She calves in roughly two years.
She reaches peak performance in the second lactation, another year out.
Her daughters start meaningfully influencing the bulk tank a couple of years after that.
University extension specialists and genetic advisors generally agree that it takes around four to six years of consistent sire selection and culling for a new breeding emphasis to show up clearly in bulk tank butterfat and protein levels. That lines up with what producers in Western Canada, the Upper Midwest, and the Northeast have seen when they’ve tried to shift components on their own herds.
Now set that against the policy timeline:
October 9, 2025: BC Milk and the other Western boards issue the notice announcing the shift to 70/25/5.
April 1, 2026: the new ratio takes effect.
So policy moved on a roughly six‑month timeline, while biology—through genetics—needs four to six years to respond fully. That’s the core tension farmers are feeling.
Timeline Type
Start
End
Duration
Policy Change (85/10/5 to 70/25/5)
October 2025
April 2026
6 months
Herd Genetic Shift (meaningful bulk tank change)
Breeding decision today
Bulk tank impact
48–72 months (4–6 years)
What farmers are finding is that the herds that look “fortunate” right now are often the ones that started nudging toward higher protein and more balanced components around 2021–2023. Some were watching Ontario’s solids‑non‑fat and SNF:BF policy adjustments in the P5 pool and realizing excessive butterfat relative to SNF could be penalized.
Others were paying attention to how often U.S. Class III prices were placing a premium on protein in cheese milk compared to butterfat. Their early decisions are walking into the parlour now, while many other herds are just beginning that pivot.
So the question becomes: if genetics is a four‑to‑six‑year lever, where can you still move the needle in the next 12–24 months?
Where You Still Have Levers to Pull in 2026
The good news is that genetics aren’t the only lever you have. Producers across Western Canada—and, honestly, across regions like Wisconsin and New York as well—are leaning hard on three major fronts: nutrition, breeding strategy, and financial planning.
Looking at Nutrition: Adding Protein Without Losing Butterfat or Fresh Cows
On the nutrition side, the question that keeps coming up is, “Can we pick up some protein without hurting butterfat performance or making fresh cow management riskier?”
Recent peer‑reviewed milk quality and nutrition reviews, along with university feeding trials, show that balancing key amino acids—especially methionine and lysine—can lift milk protein yield and often nudge protein percentage up by about 0.10–0.20 points when the base ration (forage quality, effective fibre, starch) is solid. That effect is strongest in early and mid‑lactation cows when energy balance is good.
In many Western rations this season, that’s translating into:
Adding rumen‑protected methionine and lysine and aiming for a metabolizable protein profile with a lysine: methionine ratio around 2.8–3.0:1, which is consistent with extension recommendations and controlled studies.
Budgeting typical costs in the range of 15–25 cents per cow per day for these protected amino acid products, which pencils out to roughly $5,500–9,000 per year for a 100‑cow herd based on common product pricing in North American ration budgets.
Seeing protein percentage gains in the 0.10–0.15 point range in many well‑managed herds, with some trials and field reports showing improvements up toward 0.20 points when all other ration basics are well aligned.
On top of that, nutritionists are re‑examining the balance between energy and fibre in high‑fat herds.
Where cows are sorting TMR or where there are signs of subacute rumen acidosis, it’s common to see underperformance in milk protein and, sometimes, unstable butterfat. Adjustments like moderating starch levels, improving forage chop consistency, and increasing the share of high‑quality legume or grass‑legume forage can improve rumen function and help cows convert dietary protein into milk protein more efficiently.
Western diets have long relied on canola meal as a rumen-degradable protein source, and research from Canadian and U.S. universities supports its positive effect on milk protein yield when used correctly in TMRs. Some producers are now fine‑tuning canola or expeller soybean meal levels in high‑producing groups to shore up protein without driving starch or unsaturated fat too high.
What’s encouraging is that none of these changes require blowing up the ration. The goal isn’t to tank fat just to chase protein. It’s to:
Keep butterfat performance stable and respectable.
Protect cow health and fresh cow management through this transition period.
Capture that 0.10–0.20% protein improvement that’s now worth more under 70/25/5.
To make it even more concrete: if a 100‑cow herd can sustainably move protein from 3.1% to 3.25% without sacrificing butterfat or health, that extra protein can easily be worth several thousand dollars a year under the new weighting, depending on exact prices and volumes. It’s not a silver bullet, but it’s real money.
Intervention
Cost per Cow per Day
Realistic Protein Gain (percentage points)
Annual Cost (100-Cow Herd)
Est. Annual Revenue Gain Under 70/25/5 (100-Cow Herd)
Rumen-Protected Methionine & Lysine
$0.15–$0.25
+0.10 to +0.20
$5,500–$9,000
$8,000–$15,000
Improved Forage Quality & TMR Balance
Variable (forage cost)
+0.05 to +0.10
Varies by operation
$3,000–$8,000
Canola/Soy Meal Optimization
$0.05–$0.10
+0.05 to +0.10
$1,800–$3,600
$3,000–$8,000
Combined Nutrition Strategy
$0.20–$0.35
+0.15 to +0.30
$7,300–$12,800
$12,000–$25,000
Looking at Genetics: Re‑aiming Without Erasing Past Gains
On the genetics side, most producers are rightly treating this as a course correction, not a full reset.
What farmers are finding is that a few clear rules of thumb help re‑aim the program:
Put more emphasis on protein kilos alongside fat kilos. Many Western and Upper Midwest herds are now setting minimums of +35–40 kg protein and +35–45 kg fat for bulls, then checking that daughters are projected to land around 3.4–3.5% protein and 4.0–4.2% butterfat at realistic production levels—profiles that align with both Canadian and U.S. component pricing trends.
Use indexes that reflect your market. In Canada, that often means putting more weight on LPI or custom indexes that emphasize protein and functional traits, rather than relying solely on Net Merit, which is calibrated to U.S. conditions. In Wisconsin and the Northeast, similar shifts toward protein‑friendly indexes have been observed as processors reward higher protein.
Use genomic testing as a sorting tool, not a luxury. At roughly $30–40 per head, genomic tests give a much clearer picture of which heifers and young cows carry the best combination of components, fertility, and health traits. Field data from AI organizations and extension programs show that herds using genomics this way can accelerate progress by:
Breeding the top 20–30 percent to sexed dairy semen to build the next generation.
Using conventional dairy or beef‑on‑dairy in the middle tier according to replacement needs.
Using beef semen on the lowest tier and planning to cull those lines more quickly.
I recently sat down with a producer in central Alberta—190 Holsteins, a mix of free‑stall and dry lot systems, managing about 2.3 kg of quota per day—who’s been working through this with his herd advisor, a licensed independent genetics and nutrition consultant.
He said, “We didn’t do anything wrong, breeding for fat when that’s what was being paid for. Now we just need to pivot, and we know that’s going to take a few years. The goal for us is not to panic, but to make sure every heifer we keep from here on out is pointed in the right direction.”
That mindset mirrors what geneticists with major AI organizations and extension specialists have been urging in recent conferences and webinars.
What’s interesting here is that similar thinking is already well established in high‑protein U.S. cheese regions. In Wisconsin operations, for example, herds supplying specialty cheese plants have deliberately moved toward sires with stronger protein and balanced fat, and those choices now show up in their bulk tank tests and pay statements. Western Canada is essentially being nudged toward that same “balanced components” zone by the 70/25/5 shift.
Looking at Finances: Turning a Shock into a Managed Transition
The third major lever—and it’s easy to overlook when we’re focused on cows—is how you manage the money through this transition period.
What lenders and farm financial advisors are recommending, in both Canadian and U.S. dairy regions, is remarkably consistent:
Build a realistic 12–24 month cash‑flow projection that reflects your current components under the new ratio. That means taking your actual DHI butterfat and protein tests, applying the 70/25/5 allocation, and using realistic price assumptions based on CDC component tables and board guidance to sketch how your milk cheque might look from April onward.
Sit down with your lender before the first reduced cheque shows up. Past experience with policy and price shocks—including recent farm‑gate price adjustments in Canada and supply‑driven squeezes in the U.S.—shows that producers who come in early, with numbers and a plan, have more options: interest‑only periods on term loans, temporary increases to operating lines, or adjusted covenant targets.
Be selective with big capital projects. In many operations, this may not be the year to stretch for a new loader or major barn expansion unless the balance sheet is very strong. At the same time, investments that clearly support cow performance—improved ventilation, transition cow facilities, repro tools—can still make sense if you can quantify the payback in milk and components, as multiple cost‑of‑production studies have shown.
Protect the investments that actually drive revenue. Economic work on dairy cost structures consistently shows that cutting corners on nutrition consulting, hoof care, repro programs, or fresh cow management often costs more in lost production and health problems than it saves in fees.
If you put some numbers to it, that modeled $80,000–$100,000 revenue impact on a 100‑cow high‑fat herd is roughly $6,500–$8,500 per month. Knowing that ahead of time lets you and your lender decide whether to make ration changes, temporary credit adjustments, capital deferrals, or some combination of all three to cover that gap.
In Ontario, Midwest, and Northeast operations, we’ve seen this pattern over and over: farms that do the cash‑flow homework and engage their lenders early tend to navigate policy and price changes with less long‑term damage. Western herds can draw on that same playbook here.
The Succession Question That’s Hard to Ignore
There’s another layer to this story that doesn’t appear in any price table: how the change intersects with succession.
In recent years, many Western farms had fairly clear succession timelines. A son or daughter was coming back from an ag diploma program, or a long‑time employee was gradually buying in. The underlying assumption was that while class prices might swing, the basic structure of producer payments wouldn’t change dramatically over a six‑month period.
Now, after a 15‑point swing in component weighting announced in October 2025 and effective in April 2026—and with the possibility of further adjustments mentioned for 2027—some families are re‑examining what they’re asking the next generation to commit to.
Farm transition specialists and lender‑side advisors have been increasingly explicit that policy risk needs to sit alongside debt and asset values in these conversations.
What farmers are finding in succession meetings this winter is that the most constructive approach is full transparency:
Share projected revenue scenarios under 70/25/5 using real component data and realistic price bands.
Explain the steps being taken in nutrition, genetics, and finance to adapt.
Be clear about debt levels, risk tolerance, and time horizon for the current generation.
Then let the next generation respond. Some will say, “I see the challenge, but I still want in.” Others may decide to build their careers in allied sectors—such as nutrition companies, genetics firms, lenders, or equipment dealers—while maintaining a more gradual or partial involvement in the farm.
Similar patterns have been observed in California (around water and environmental regulation) and in Wisconsin (during periods of extreme Class III price volatility), where policy and market risks shaped when and how the next generation entered ownership.
What’s encouraging, based on both research and experience, is that families who have these discussions early and honestly tend to land on more durable long‑term arrangements, whether that means full succession, shared ownership, or a different path altogether.
How This Fits Into the Bigger Dairy Picture
If you zoom out beyond Western Canada, the 15‑point shift is part of a broader pattern in how milk is being valued.
In the U.S., modernization of Federal Orders and ongoing debates over pricing formulas are aimed at aligning producer pay more closely with what plants actually make and what customers buy—cheese, powders, butter, and fluid products.
Recent analyses in Hoard’s Dairyman and Dairy Herd Management have highlighted that even when national milk volume softens, component levels—especially butterfat and protein—have continued to climb thanks to genetics and focused nutrition.
Globally, market reports from sources such as Dairy Global and DairyReporter show strong, steady demand for whole milk powder, skim milk powder, whey products, and cheese, with butter prices moving alongside a broader, solids‑driven landscape. The longer‑term trend has favoured higher solids and more flexible ingredient production, and Canada’s special class pricing is structured to help processors compete in that environment.
Here at home, the Western boards’ move to 70/25/5 is one regional expression of this bigger shift. It’s an effort to ensure that the signals producers see in their milk cheques are more closely aligned with retail demand, processing economics, and international market conditions.
Pulling It Together: What Producers Can Do Next
If we were standing in a barn alley or catching up at a conference, and you asked, “So what do I actually do with all of this?” here’s how it boils down:
The 70/25/5 shift is anchored in real market signals. Retail data points to strong growth in protein‑dense products like yogurt, stock levels show no shortage of fat, and component prices—both here and in the U.S.—have been rewarding protein in several key classes.
Breeding for butterfat under 85/10/5 wasn’t a mistake. Western herds that pushed butterfat performance were responding exactly to what the pay structure incentivized. The issue isn’t what those herds did; it’s that policy has now moved faster than herd genetics can keep up.
Genetics are a slower but powerful lever. Even with genomics, you’re looking at roughly 4 to 6 years of consistent sire selection and culling to shift herd‑level butterfat and protein levels materially. The bull decisions you make over the next couple of years are really about where you want your components to be around 2030.
Nutrition can help in the near term. Thoughtful use of rumen‑protected amino acids, good forages, balanced starch and fibre, and solid fresh cow management can often add 0.10–0.20 percentage points of protein in many herds. Under 70/25/5, that’s worth more than it used to be.
Balanced cows are your safest long‑term bet. Herds targeting both solid butterfat and solid protein, rather than extremes on either side, tend to be the most resilient when pricing formulas or markets change.
Financial planning matters as much as ration planning. Honest cash‑flow projections, early lender conversations, and disciplined choices about where to invest (and where to wait) can turn a sudden policy shock into a managed transition rather than a crisis.
Succession plans deserve a fresh, honest look. This isn’t about pushing the next generation away from dairy. It’s about making sure they understand both the opportunities and this newer layer of policy risk, where pricing structures can change faster than biology.
Your 90‑Day Playbook
If you’re wondering what to do between now and April, here’s a simple action list:
Pull your last 12 months of DHI component records and model your milk cheque under 70/25/5 using current prices.
Sit down with your nutritionist to set a realistic protein target and a stepwise plan to get there without hurting butterfat or fresh cows.
Re‑screen your sire list and adjust your selection criteria to favour balanced fat and protein kilos, plus health traits.
Book a meeting with your lender to walk through your modeled cash‑flow and discuss options for the transition period.
The Bottom Line
What’s encouraging, after looking at the data and talking with producers, advisors, and researchers, is that the tools needed to navigate this change are the same ones that have always mattered: good cows, good forages, thoughtful fresh cow management, disciplined breeding, realistic numbers, and open conversations at home and with your advisory team.
As many of us have seen—whether on Western Canadian freestall herds, Wisconsin tie‑stall dairies, or Northeast dry lot systems—dairy farmers are remarkably good at adapting when they understand the rules of the game.
This component shift is a big adjustment, no doubt. But with clear information, measured changes in how you feed and breed, and proactive financial planning, there’s every reason to believe Western herds can come through this transition and still be milking strongly when the next generation is the one hosting the coffee in the kitchen.
KEY TAKEAWAYS:
Protein just got 2.5× louder on your cheque: Western Canada’s 70/25/5 ratio takes effect April 1, 2026—what you ship in protein now matters almost as much as butterfat.
Top butterfat herds face the biggest hit: Modeled scenarios show a 100-cow herd at 4.6% fat / 3.1% protein could lose $80,000–$100,000/year under the new ratio—roughly $900/cow.
You can’t outbreed this by April: Genetics need 4–6 years to shift bulk-tank components materially; policy gave you six months.
Three levers to pull now: Dial in amino-acid nutrition for 0.10–0.20 pt protein gain, re-screen sires for balanced fat + protein kilos, and sit down with your lender before the smaller cheques arrive.
Succession plans need a policy-risk conversation: A 15-point swing—with 2027 changes floated—means the next generation deserves full transparency on what they’re really buying into.
Complete references and supporting documentation are available upon request by contacting the editorial team at editor@thebullvine.com.
Every week, thousands of producers, breeders, and industry insiders open Bullvine Weekly for genetics insights, market shifts, and profit strategies they won’t find anywhere else. One email. Five minutes. Smarter decisions all week.
Forget carbon credits. The real money is in your cull rate. Farms that dropped 7 points kept $210,000—and watched their emissions fall. No new tech. Just management.
EXECUTIVE SUMMARY: The farms with the lowest carbon footprints aren’t sacrificing profit—they’re the ones making more of it. University of Guelph research found low-carbon Ontario dairies earned C$1,200 more per cow, driven by feed efficiency and herd management rather than carbon credits or new tech. Replacement rate is where the big money hides: dropping from 35% to 28% on a 1,000-cow herd saves roughly $210,000 annually, while eliminating nearly two years of feed, manure, and methane from 70 heifers you no longer need to raise. Factor in mastitis averaging C$662/cow/year and feed accounting for 50-65% of production costs, and the efficiency gains compound quickly. This article delivers the research, the math, and a 90-day action plan that works whether you’re running a 70-cow tie-stall in Quebec or a 400-cow freestall in Wisconsin. The bottom line: emissions and margin aren’t competing goals—they respond to the same management decisions you’re already making.
Walk into any dairy meeting this winter, and you can almost bet carbon footprints, “Scope 3,” and net-zero targets will show up on the agenda before the coffee cools. Processors are publishing sustainability reports, retailers are promising climate-friendly shelves, and a lot of producers are quietly asking the same thing: “Alright, but how does any of this actually show up in my milk cheque?”
Here’s what’s interesting. When you get past the buzzwords and look at credible numbers, a pretty consistent story emerges. The same management decisions that bring down greenhouse gas emissions per kilogram of milk are often the ones that improve margin per cow. In Canada, the latest national life cycle assessment led by Groupe AGÉCO for Dairy Farmers of Canada shows that producing a litre of milk at the farm gate now generates about 0.94 kilograms of CO₂-equivalent—and that footprint fell by 9 percent between 2011 and 2021 as milk per cow rose and feed efficiency improved. What’s encouraging is that Canadian milk’s footprint per litre sits at less than half the global average of 2.5 kilograms, according to FAO data. That’s thanks largely to relatively high yields and solid feed and manure management across our systems.
On the profit side, a University of Guelph Alliance project took real numbers from Ontario dairy farms and found something that caught my attention. Lower-footprint herds weren’t sacrificing income at all. Research associate Dr. Susantha Jayasundara and greenhouse gas specialist Prof. Claudia Wagner-Riddle found that farms with a lower carbon footprint per unit of milk profited by more than C$1,200 per cow compared to higher-footprint farms in the same study. And the dominant drivers weren’t offsets or big infrastructure projects—they were productivity, feed efficiency, and herd management.
So what farmers are finding is this: when you manage the herd more efficiently, emissions per kilogram of milk tend to go down, and profit per stall often goes up. Replacement rate, feed efficiency, and health losses are doing more to shape both your footprint and your margin per cwt than any carbon program ever will.
What Low-Carbon Farms Are Actually Doing
It helps to pin down what “low-carbon” really means in practical terms. A life cycle assessment adds up all the greenhouse gas emissions associated with milk production on the farm—enteric methane from the cows, manure storage and spreading, feed production, and on-farm energy use—and divides that total by the amount of milk produced.
In Canada’s most recent LCA update from Dairy Farmers of Canada, the national average farm-gate footprint sits at 0.94 kilograms of CO₂-equivalent per litre of fat- and protein-corrected milk. The improvement since 2011 has mainly come from higher milk yield per cow, better feed efficiency, and improved manure and fertilizer management. And as many of us have seen in practice, livestock management plus feed production account for the great majority of a dairy farm’s greenhouse gas footprint.
South of the border, work presented through the American Dairy Science Association last year estimated average field-to-farm-gate carbon intensity in 2020 at about 1.3 kilograms of CO₂-equivalent per kilogram of milk. That analysis found that to reach greenhouse gas neutrality by 2050, the U.S. dairy sector would need to reduce its intensity to roughly 0.67 kilograms—nearly a 50 percent cut from current levels.
Now, the part that really matters in your barn is how those lower-footprint farms actually run. In the Ontario data set, the Guelph team didn’t find that low-footprint farms were defined by being huge or packed with state-of-the-art technology. The herds with lower footprints and higher profits tended to:
Rely heavily on homegrown feed, especially high-quality corn silage and alfalfa-grass hay, as the backbone of the ration
Use grouped feeding and well-designed total mixed rations to match nutrients to the stage of lactation and production level
Maintain shorter calving intervals and heifer programs that kept more stalls filled by third- and fourth-lactation cows—animals that usually have excellent feed efficiency and butterfat performance
As Prof. Wagner-Riddle summarized this work: “A lot of the improvement in carbon footprint has to do with feed efficiency and how producers are managing their herds.”
From what I’ve noticed across different regions, those traits keep showing up. Whether it’s a 70-cow tie-stall in Quebec, a 180-cow freestall in eastern Ontario, a 400-cow sand-bedded barn in Wisconsin, or a 2,000-cow dry lot system in California’s Central Valley, the herds that look good on both profit and footprint tend to be the ones that have been quietly tuning up forage quality, fresh cow management, and herd structure for years.
Replacement Rates: The Quiet Link Between Emissions and Margin
Replacement rate is one number that quietly connects the economic and environmental sides of the story. In many Holstein freestall herds in Ontario, the Northeast, and upper Midwest states like Wisconsin and Minnesota, annual replacement or culling rates around 36 percent are still common—Dr. Albert De Vries at the University of Florida has documented this extensively in his work on dairy production economics. Fertility, mastitis, and lameness remain the main reasons cows leave the herd.
A 36 percent replacement rate may be “normal” on paper, but that doesn’t mean it’s the profit-maximizing or emissions-smart choice for your herd. De Vries has shown that economically optimal cull rates often fall in the 25-27 percent range when heifer-rearing costs are significant and involuntary culling can be controlled. And when you run scenarios through whole-farm models, the answer is often “you can do better than that.”
System-level modeling studies in countries like Australia and New Zealand have demonstrated that cutting replacement rates—from, say, 35 percent down to 20–25 percent—reduces the greenhouse gas intensity per kilogram of milk solids. The reason is straightforward: you’re raising fewer non-productive heifers. One Australian analysis using graze-based dairy systems found that reducing replacement by around 15 percentage points lowered emissions intensity by roughly a kilogram of CO₂-equivalent per kilogram of milk solids.
The ideal target will vary. In quota systems like Canada, quota policy, land base, and forage capacity limit how fast you can push production per cow. In non-quota regions, like much of the U.S., cash flow, milk price volatility, and contracts with heifer growers come into play. But across systems, the data suggests that if you can reduce preventable culling and avoid replacing cows too soon, you’re often better off on both cost and emissions.
You probably know this already, but heifer economics are significant. Recent extension budgets from Penn State, University of Wisconsin, and University of Nebraska-Lincoln commonly estimate the cost to raise a replacement heifer from birth to first calving at roughly US$2,000–2,800 per head, depending on feed, labour, and housing. Bred heifer prices reported by USDA market services over 2023–2024 have ranged from around US$2,000 to over US$2,850 in Midwest auctions, with premium animals commanding even more in tight markets.
So, for the sake of discussion, consider a 1,000-cow freestall herd in Wisconsin running at a 35 percent replacement rate. That’s 350 replacements per year. If your all-in cost per heifer—whether raised or purchased—averages US$2,500–3,000, you’re tying up roughly US$875,000-US$1.05 million a year in replacement capital. If, over a couple of years, you improve fresh cow management, hoof health, and reproduction enough to bring that rate down to 28 percent, you’d need around 280 replacements. That’s 70 fewer heifers, which at US$2,500–3,000 each is on the order of US$175,000–210,000 less capital committed annually.
What Replacement Rate Controls
At 36% (Industry Avg)
At 28% (Optimized)
Hidden Impact
Heifer Capital Tied Up
$990,000 annually
$770,000 annually
$220,000 freed up
Non-Productive Animal-Years
720 heifer-years
560 heifer-years
160 animal-years eliminated
Mature Cow Share of Herd
Lower (more 1st-lactation)
Higher (more 3rd+ lactation)
Better feed efficiency & components
Emissions from Replacements
Higher methane load
Lower methane load
~2 years feed & methane saved
What’s interesting here is that the emissions picture moves in the same direction. Those 70 “missing” heifers represent nearly two years of feed, manure, and methane that don’t occur because you’ve kept more mature, efficient cows in the herd instead. Whole-system models, such as Agriculture and Agri-Food Canada’s Holos framework, consistently show that replacement heifers account for a meaningful share of total emissions in dairy herds precisely because they’re non-productive for an extended period.
I’ve noticed that when farms start documenting every cull for a couple of months, patterns emerge that weren’t obvious before. Often, you’ll see clusters of young cows leaving for transition-related problems that might respond to better fresh cow management, or repro culls that never had a full exam, or “low-milk” culls coming out of the same group where feed access or cow comfort is compromised. That’s where targeted changes can help both the milk cheque and the carbon story at the same time.
Feed Efficiency: Where Feed Costs and Carbon Meet
You don’t need anyone to tell you feed is your biggest cost. What’s worth emphasizing is that it’s also one of the biggest levers in your greenhouse gas footprint.
The DFC life-cycle assessment work shows that livestock management and feed production are the main sources of emissions on Canadian dairy farms. Feed production—including fertilizer and field operations—can account for around a third of farm-gate emissions, with enteric methane and manure management accounting for the rest.
International reviews of dairy systems are similar. FAO and academic analyses often estimate feed-related emissions at 30–40 percent of on-farm totals, depending on the system and region. And with feed taking 50–65 percent of production costs on many North American dairies—California operations often running at the higher end of that range—even meaningful improvements in feed efficiency show up fast on the cash flow.
Analysis from last year shows that moving from around 1.3 kg CO₂-equivalent per kilogram of milk down to roughly 0.67 by 2050 will require major improvements in feed efficiency and overall productivity, alongside emerging tools such as methane-reducing feed additives and improved manure systems. But the researchers stress that those new tools are complements, not replacements, for efficient feeding and strong herd management.
On farms in very different regions, the lower-intensity herds that also look good on cost tend to share some feed-related habits:
They consistently achieve strong milk per kilogram of dry matter across key groups—that reflects genetics, cow comfort, and rations tuned to production level and butterfat performance
They have forage programs that deliver. In Ontario and the Northeast, that often means high-digestibility corn silage and well-managed alfalfa-grass haylage. In Wisconsin and Minnesota, more grass and small-grain silages are part of the mix. In California’s Central Valley, high-quality corn silage and alfalfa hay are balanced against heat stress and water constraints.
They group and feed with intent. Instead of a single universal TMR, they adjust for fresh and high cows versus mid- and late-lactation cows and heifers, so each group gets what it needs without costly overfeeding.
A Canadian whole-systems analysis using the Holos model compared alfalfa-silage-based and corn-silage-based systems and found that differences in greenhouse gas footprint were driven more by system-wide factors—milk yield, stocking rate, nutrient balance—than by forage choice alone. That fits what many nutritionists see in practice: it’s the integration of crop rotation, ration design, feeding management, and manure handling that really drives cost and emissions.
Extension work from institutions like Cornell and Penn State has shown that better forage testing, tighter batching, and smarter grouping can often deliver meaningful feed cost savings, with payback periods typically measured in years rather than months. The opportunity will look different in a 70-cow tie-stall in Quebec than in a large dry lot system in California, but the underlying principle holds across systems.
On the genetics side, both Lactanet in Canada and USDA genetic evaluations in the U.S. are increasingly accounting for traits related to feed efficiency, fertility, and longevity, alongside production and type traits. As those traits get more weight in sire selection, herds gradually shift toward cows that convert feed into milk more efficiently, stay healthier, and remain in the herd longer.
From a carbon perspective, the logic is simple: when you produce more milk and components from roughly the same feed and manure base, emissions per kilogram of milk go down. What’s encouraging is that the management changes that improve feed efficiency are the same ones that help you ride out tight feed markets and lower your cost per hundredweight.
Health and Disease: The Hidden Emissions in Everyday Problems
Most producers already know that mastitis, lameness, and transition-period issues are expensive. The last decade of research has sharpened our understanding of just how expensive it is.
On the mastitis front, a 2018 study of Canadian dairy farms led by researchers at the University of Guelph and published in Frontiers in Veterinary Science estimated median mastitis-associated costs at about C$662 per cow per year, accounting for treatment, discarded milk, lost production, increased culling, and prevention costs. Earlier economic work from Europe estimated the cost of a generic clinical mastitis case at roughly US$200–300, depending on milk price, culling risk, and fertility impacts.
Lameness has a similar profile. Studies from Europe and North America show that lame cows produce less milk, have longer calving-to-conception intervals, incur higher treatment costs, and are more likely to leave the herd early, with per-cow annual costs often reaching several hundred dollars.
From an emissions point of view, European whole-farm models that incorporate disease incidence into greenhouse gas calculations have found that higher rates of mastitis and lameness can increase emissions per kilogram of milk by several percent—typically in the low- to mid-single-digit range—because more resources are going into maintenance and recovery and fewer into saleable milk. From a carbon standpoint, that sick cow is doing more harm than her treatment bill suggests: a chronically lame or mastitic cow in a freestall, tie-stall, or dry lot system still eats, still produces manure, and still emits methane, but often ships less milk and is more likely to be replaced early, adding heifer-rearing emissions into the mix.
What farmers are finding is that when they really lean into fresh cow management, udder health, and hoof care, the benefits show up in both the financial and emissions stories. Herds that focus on transition-period nutrition and cow comfort, maintain consistent milking routines and hygiene, and invest in regular hoof trimming and early detection tend to see fewer early-lactation problems, less discarded milk, more cows completing profitable later lactations, and lower replacement pressure. That pulls both cost per hundredweight and emissions per kilogram of milk in the right direction.
Carbon Intensity: Making an Abstract Metric Useful
“Carbon intensity” can sound like something dreamed up in an office far away from the parlour, but at its core, it’s just a ratio: total greenhouse gas emissions divided by total milk produced. If a farm emits 100 kilograms of CO₂-equivalent to ship 100 hundredweights of milk, its intensity is 1.0 kilogram of CO₂-equivalent per cwt. Simple enough.
At the U.S. national level, analysis reports a current average of 1.3 kg CO₂-equivalent per kilogram of milk and outlines how achieving roughly 0.67 kg CO₂-equivalent per kilogram would align the sector with climate-neutrality goals by 2050. For Canada, the DFC life-cycle assessment yields a farm-gate footprint of 0.94 kg CO₂-equivalent per litre of milk—among the lowest in the world on a per-litre basis.
Most of the calculators and tools being rolled out—whether by processors, co-ops, or government programs—break your intensity number into components you already recognize: animal numbers and age structure, milk yield and components, feed intake and ration makeup, manure storage and handling, fuel and electricity use.
When you see carbon intensity laid out that way, it’s not a mysterious figure anymore. It’s another way of looking at the same replacement decisions, feed efficiency, herd health, and energy use you already manage.
The Canadian LCA work, the Guelph Alliance project, and global reviews keep landing on the same message: farms that show lower emissions per kilogram of milk are usually the ones that already run a tight ship—they waste less feed, cull fewer cows prematurely, and move more milk through the same barns and milking systems.
Why Some Buyers Are Starting to Pay Attention
On the market side, some large buyers are starting to reflect this in how they work with suppliers. Companies like Danone have used tools such as the Cool Farm Tool to estimate farm-level emission factors and develop reduction plans with producers. And we’re seeing processors in Europe and North America begin testing practice-based sustainability programs—though program structures and payment levels vary significantly from one region and processor to the next. Early carbon marketplaces like Athian in the U.S. are exploring ways for verified on-farm emission reductions to generate credits that processors and branded products can purchase from participating farms.
Some lenders and co-ops are also beginning to consider environmental metrics as part of their risk and long-term resilience assessments—Farm Credit Services and some provincial programs have started incorporating sustainability factors into their conversations with producers. It’s early days, and there’s still a lot of uncertainty around how these programs will settle out, especially for smaller family farms and different contract structures. But the direction of travel seems clear: lower carbon intensity is increasingly seen not just as an environmental goal, but as a marker of an efficient, resilient dairy business.
You don’t need to sign a carbon contract tomorrow. But it’s worth noting that these programs are now rewarding the same efficiencies you already track.
Three Metrics Worth Watching on Your Farm
If you don’t want to spend your winter evenings diving into LCA spreadsheets but you do want to put your operation in a stronger position—both financially and in terms of footprint—here are three metrics worth watching. Many producers find it useful to review these monthly, then sit down with their vet, nutritionist, and financial advisor for a deeper review each quarter.
Replacement rate. Based on De Vries’s economic work at the University of Florida, economically optimal replacement rates often fall in the 25–27 percent range for herds with solid health and fertility programs—well below the 36 percent average he’s documented across North American Holsteins. The right target for your farm will depend on heifer-rearing cost, quota or non-quota status, land base, and whether you rear heifers on-farm or use custom growers. The evidence suggests that reducing involuntary culling and avoiding premature replacement can often improve both profit and emissions by increasing the share of mature, efficient cows in the herd.
Feed cost per cwt and milk per kilogram of dry matter. Alongside feed as a percentage of total cost, it’s valuable to track feed cost per hundredweight shipped and milk or fat-corrected milk per kilogram of dry matter in your major groups. Comparing those figures to benchmarks for similar herds in your region—freestall to freestall, tie-stall to tie-stall, pasture-based to pasture-based—can highlight where the biggest opportunities lie. The specifics will look different in a small tie-stall in Quebec than in a large dry lot system in California, but the underlying math is similar.
Disease-related losses. Instead of just counting cases, try putting a dollar figure on mastitis, lameness, and transition-period problems. That Canadian research suggests mastitis-related costs can reach around C$662 per cow per year when all factors are included. When you translate those numbers into dollars per cow and per hundredweight, investments in cow comfort, fresh cow monitoring, milking routine refinement, and hoof care often start to look more like solid investments than “extra costs.”
You don’t need a carbon calculator to track these metrics. But if you later plug your farm data into a footprint tool—whether through your processor, a co-op, or a government program—you’ll likely see that improvements in replacement, feed efficiency, and disease control show up as lower emissions per kilogram of milk as well.
A 90-Day, No-Capital Starting Plan
So, practically speaking, what can you do in the next 90 days without pouring new concrete or signing a lease on major equipment? Here’s a simple plan that herds in Ontario, the Prairies, the Northeast, and the Midwest have used as a starting point. Whether you’re milking 60 cows or 600, the basics scale up or down.
Put culling decisions under a 48-hour lens. For the next 60–90 days, before any cow leaves, have someone on your team fill out a basic cull review sheet: cow ID, lactation number, days in milk, primary cull reason, last three test-day yields and somatic cell counts, breeding history, and major health events in the last 90 days. And one question: “Is this realistically fixable inside 30 days, and what would it cost?”
This isn’t about keeping every marginal cow. It’s about making culling decisions with more context and then stepping back after two or three months to see what patterns emerge. De Vries’s research suggests that a meaningful share of removals are tied to issues that can be reduced with better fresh cow management, hoof care, and reproductive programs. If you looked back at your last year of culls with this lens, how many would fall into the “avoidable with better management” bucket?
Hold a weekly health huddle. Once a week, bring together the fresh cow team, the person who handles treatments, and whoever manages breeding to talk through how many calvings occurred and any difficult or high-risk calvings, fresh cow health events, new clinical mastitis cases and which pens or strings they’re in, new lameness cases and any common threads, and any recent changes in routines, pens, bedding, or rations that might be linked.
Herd-health research has shown that disease events often cluster in specific pens, time windows, or management situations rather than being random. A weekly “health huddle” is a simple way to catch those clusters early. It also signals to your team that their observations matter, which often improves reporting and early detection.
Run a basic feed efficiency check. Choose two groups of cows on the same ration—one from roughly the top third of the herd for milk or fat-corrected milk, one from the lower third, making sure cows are otherwise healthy and at similar days in milk. For about 30 days, track milk and component yields, body condition changes, any health events, and age and lactation distribution.
Then ask yourself: Is the lower group dominated by first-calf heifers and cows with a history of mastitis or lameness? If so, that points toward heifer development and health. Or is it a mix of ages and histories, suggesting issues with grouping, bunk access, or ration delivery?
At the end of the 90 days, sit down with your vet, nutritionist, and financial advisor to review what you’ve learned from these three exercises. In many herds, one or two clear priorities emerge—whether it’s fresh cow management, hoof care, grouping, or repro—which can then be tackled in a more structured way.
The Bottom Line
Looking across the research and on-farm experience, the message is fairly consistent. Emissions per kilogram of milk and profitability per stall aren’t pulling in opposite directions; most of the time, they’re reflecting the same core management decisions. High replacement rates, chronic health problems, weak fresh-cow management, and poor feed efficiency all drive up the cost per hundredweight and emissions per kilogram of milk. When you tighten those areas up, both lines tend to move in your favour.
What’s encouraging is that the herds showing up as “low-footprint” in Canadian and international work aren’t necessarily the biggest or the most high-tech. They’re the ones that have been steadily improving forage quality, feed efficiency, fresh cow management, hoof health, and culling strategies over time. The current focus on carbon intensity is simply putting a new lens on practices that already make economic sense.
There’s still a lot we’re learning—about methane-reducing feed additives, manure treatment technologies, and how carbon markets and processor programs will work for different farm sizes and regions. Those tools will matter, especially for larger supply chains trying to document in-value-chain emission reductions. But they’re likely to be add-ons to strong fundamentals rather than replacements for them.
In the next quarter, pick one of the three metrics—replacement rate, feed cost per cwt, or mastitis and lameness losses—and commit to measuring and improving it. Ask your team one simple question at your next herd meeting: “Where are we wasting cows, feed, or health in ways that don’t show up on our carbon report yet—but do show up in our bank account?”
The next time someone asks you about your “carbon number,” it might help to think of it as one more KPI alongside milk per cow, butterfat performance, pregnancy rate, and SCC. If you’re making progress on replacement rate, feed efficiency, and herd health, chances are good that both your cost per hundredweight and your emissions per kilogram of milk are moving in the right direction—even if the carbon program cheque hasn’t arrived yet.
KEY TAKEAWAYS
Low-carbon farms aren’t sacrificing profit—they’re making more. Guelph research found low-footprint Ontario dairies earned C$1,200 more per cow. The drivers? Feed efficiency and herd management—not carbon credits or fancy tech.
Your replacement rate is bleeding cash and carbon. Dropping from 35% to 28% on a 1,000-cow herd saves $210,000 annually—and cuts nearly two years of feed, manure, and methane from 70 heifers you won’t need to raise.
Feed efficiency pays twice. Feed takes 50-65% of your costs and 30-40% of your emissions. Tighten your rations, win on both lines.
Sick cows leak margin and carbon. Mastitis averages C$662/cow/year, and those cows keep eating and emitting while shipping less milk. That’s a double hit to your numbers.
90 days, no capital, clear direction. Document every cull, hold weekly health huddles, and run a basic feed efficiency check. The patterns will show you exactly where the money is hiding.
Complete references and supporting documentation are available upon request by contacting the editorial team at editor@thebullvine.com.
Every week, thousands of producers, breeders, and industry insiders open Bullvine Weekly for genetics insights, market shifts, and profit strategies they won’t find anywhere else. One email. Five minutes. Smarter decisions all week.
You’re bleeding $80/cow every month, and the industry just added 211,000 more cows to make it worse. 5 moves to make before spring.
Executive Summary: Every month you wait, you’re losing $80 per cow. Class III has crashed from $20 to $15.86 since spring—and the industry just added 211,000 cows to make sure it stays there. California’s rapid H5N1 recovery, surging EU production, and strong New Zealand output have created a global oversupply that isn’t easing anytime soon. Need replacements? Quality springers now cost $4,000-plus amid the tightest heifer pipeline in 20 years. Add $4.40 corn to the equation, and margins are getting crushed from every angle. Here’s what’s actually driving the squeeze—and five specific moves to protect your operation before spring.
The U.S. dairy industry just added 211,000 cows in 12 months—the largest herd since 1993, according to USDA NASS—at the exact moment Class III prices dropped from $20 to $15.86 per hundredweight. Meanwhile, anyone trying to expand is staring at $4,000 springers and the tightest heifer supply in two decades. That collision of forces is going to define 2026 economics for operations of every size, whether you’re milking 80 cows in Vermont or 8,000 in the Central Valley.
Let me walk through what the numbers actually show and what the producers who are navigating this successfully are doing differently.
The Production Surge Nobody Can Ignore
USDA NASS confirmed that November 2025 milk production in the 24 major states hit 18.1 billion pounds—a 4.7% jump from the prior year. Nationwide, we’re looking at 18.8 billion pounds, up 4.5% year-over-year. For context, that’s the kind of production growth that typically takes two to three years to accumulate. We got it in twelve months.
And California’s recovery has accelerated the math. After H5N1 hammered the state through late 2024 and into 2025—federal livestock program records indicate roughly 75% of commercial herds experienced infections at some point—production is now running more than 10% above year-ago levels. November 2024 represented a 20-year production low for California. The turnaround has happened faster than most analysts expected, and all that milk is flowing back into national markets.
Class III milk prices have collapsed from $20.50 to $15.30 per hundredweight in just 12 months—a 25% decline that’s costing dairy producers $80-90 per cow monthly across all operation sizes
Here’s what this means for your check: at $15.86 Class III versus $18.50 three months ago, that’s roughly $80-90 per cow per month in lost revenue for a typical Holstein operation. On a 200-cow herd, you’re looking at $16,000-18,000 less coming in between now and spring—assuming prices don’t drop further.
Herd Size
Monthly Loss ($80/cow)
Spring Loss (3 months)
Annual Impact
50 cows
$4,000
$12,000
$48,000
100 cows
$8,000
$24,000
$96,000
200 cows
$16,000
$48,000
$192,000
500 cows
$40,000
$120,000
$480,000
1,000 cows
$80,000
$240,000
$960,000
2,500 cows
$200,000
$600,000
$2,400,000
The Heifer Bottleneck Is Real
This is the constraint that will shape expansion decisions over the next three years, so let’s dig into it.
USDA data shows approximately 26.7 heifers expected to calve per 100 milk cows—the lowest ratio in at least two decades. Total dairy heifers expected to calve in 2025? Just under 2.5 million head, the lowest since USDA began tracking this metric.
The heifer-to-cow ratio has declined to a 20-year low of 26.7 per 100 cows, creating a replacement crisis that explains why quality springers now cost $4,000+ and why expansion-minded producers need to source animals immediately
The economics driving this aren’t mysterious. Ag Proud market reports show beef-cross calves bringing $1,100-1,400 at many auctions, sometimes higher for well-bred Angus or Limousin crosses. Straight dairy heifers? Often $300-500 unless they come from high-genomic programs with strong marketing. When beef-on-dairy creates that much value differential, producers make rational decisions about their breeding programs.
I was talking with a Wisconsin producer last month who’s running about 70% beef semen across his herd. His logic is straightforward: the premium on those crossbred calves more than offsets the cost of purchasing replacements when he needs them. For his operation and cash flow, that math works.
Metric
Beef-Cross Calf
Raise Own Dairy Heifer
Buy Springer
Calf Sale Value
$1,250
$400
N/A
Heifer Raising Cost (to calving)
$0 (sold)
$2,200
$0
Purchase Price (springer)
N/A
N/A
$4,000
Net Economics per Head
+$1,250
-$1,800
-$4,000
Value Differential
Baseline
-$3,050 vs beef
-$5,250 vs beef
A Northeast producer I know takes the opposite approach—she’s kept her replacement program intact because she doesn’t want to be buying springers at $4,000 when she needs them. Her calculation: the heifer she raises for $2,200 all-in is worth $1,800 more than the one she’d have to buy.
Both strategies can pencil out. The question is which matches your operation’s cash flow, facilities, and expansion timeline.
The practical implication: quality springer replacements now command $3,500-4,000 or more in many markets. If you’re planning any expansion over the next 18-24 months, heifer sourcing needs to be part of your planning conversation this month. The animals aren’t available in the numbers we’ve historically seen.
Global Oversupply Compounds the Problem
Four major dairy-producing regions are simultaneously flooding global markets with increased production—California up 10%, EU up 6%, U.S. overall up 4.7%, and New Zealand up 2.9%—creating synchronized oversupply that’s crushing milk prices worldwide
It’s not just U.S. production running hot. The latest AHDB market review shows EU milk deliveries jumped around 6% in September after the bloc worked through its bluetongue challenges. DairyNZ and LIC statistics show that New Zealand’s 2024/25 season finished with total milk solids production up 2.9% to 1.94 billion kilograms.
The Global Dairy Trade auctions have posted nine consecutive declines now, reflecting strong global supply meeting softer demand from key importing regions. If you’re shipping to a plant with export exposure—and that includes many operations in Wisconsin, Idaho, and the Southwest—those GDT results eventually flow back into your mailbox price.
For Canadian producers watching from across the border, the U.S. production surge creates its own dynamics. American oversupply tends to intensify pressure on USMCA access negotiations and affects cross-border pricing signals, even within the quota system.
California’s role amplifies these dynamics domestically. The state produces roughly 18% of U.S. milk, but here’s what really matters for price discovery: California Dairies Inc. alone churns over 480 million pounds of butter annually (about 23% of U.S. production), and the state manufactures the largest share of nonfat dry milk powder in the country. When California production swings, commodity pricing moves for everyone.
The Butter Paradox
Here’s something that looks like good news until you understand what’s actually happening.
USDEC data shows butter exports surged in 2025. January alone was up 41% year-over-year, and through the first nine months, total butterfat exports soared 149%.
Sounds great, right? Here’s the catch: U.S. prices had dropped enough to compete in markets we typically can’t reach. Brownfield Ag News reports CME spot butter trading around $1.375 to $1.40 per pound as we moved into January—a long way from the $3.00-plus prices we saw during the supply squeeze.
We were essentially selling butter globally because domestic prices made us competitive, not because we’d developed new market access. That’s fundamentally different from export growth driven by structural demand improvement. When global prices strengthen, that business disappears.
Cheese Exports: The Genuine Bright Spot
If you’re looking for actual strength in the dairy complex, cheese exports tell a legitimately positive story.
USDEC confirmed that August 2025 reached 54,110 metric tons—the highest monthly volume in the history of U.S. cheese exports. That’s 28% above year-ago levels, and the growth has come from multiple markets rather than depending on any single buyer.
Mexico remains our foundation, accounting for roughly a third of total U.S. cheese exports, according to USDEC trade data. But South Korea, Japan, and Australia all posted strong growth in the first half of 2025. The fundamentals here—growing global demand, improved U.S. product quality, established market relationships—look durable.
One constraint worth watching: USTR data shows USMCA quota utilization is still around 42%, suggesting meaningful upside if Canadian market access improves. That’s a trade policy question beyond any individual producer’s control, but it represents real unrealized potential.
The GLP-1 Demand Question
GLP-1 drugs have some dairy economists predicting significant demand shifts. The actual data tells a more nuanced story, concerning in specific categories but not the catastrophe some suggest.
Kaiser Family Foundation polling indicates about 12% of American adults have used a GLP-1 medication at some point, with roughly 6% currently taking one. That’s real market penetration.
Cornell University and Numerator recently published detailed grocery purchasing data on this population. Households with GLP-1 users reduced cheese purchases by 7.2% and butter by 5.8%. They cut sweet bakery items and cookies by 6-11% across categories.
Here’s how I’d frame this practically: it matters, but it’s not an existential threat—yet. The protein density of dairy actually positions products like Greek yogurt and cottage cheese favorably for consumers who are eating less but prioritizing nutrient-dense foods.
Where I’d watch more carefully is high-fat categories. If GLP-1 adoption reaches the 15-24% levels Morgan Stanley projects for the early 2030s, premium ice cream and butter-heavy applications could face meaningful headwinds. Worth factoring into long-term product mix thinking, but not a reason to panic about 2026.
Current Price Reality
Let’s be direct about where we are.
According to USDA’s official Class and Component Price announcements, December Class III came in at $15.86/cwt—January futures point to the low-to-mid $15 range. That’s the math when production expands as quickly as it has.
The Class III to Class IV spread has been particularly notable. December showed Class III at $15.86 versus Class IV at $13.64—a $2.22 gap favoring cheese markets over butter and powder. If you’re a Class IV shipper, you’ve felt that spread directly in your check. Geography and market assignment matter more than usual right now.
On the feed side, corn has been trading around $4.40 per bushel according to Trading Economics futures data. USDA projects an average farm price around $4.00 for the 2025/26 marketing year, which would provide some relief—but that’s not guaranteed.
What to Do Before Q2
Based on the data and the producer conversations I’ve been having, here are five moves worth considering before spring:
Run your break-even calculation this week. Know exactly what Class III price puts you underwater. If you haven’t updated this math since prices were $20, you’re operating blind. Have contingency triggers ready—what do you cut first at $15? At $14?
Audit your heifer pipeline now. Calculate your replacement availability for the 2027-2028 calving. If you’re below 28 heifers per 100 cows, start sourcing conversations immediately. Set a price ceiling before you need animals urgently—desperation buying at $4,500 in twelve months is a lot more expensive than planned purchasing at $3,800 today.
Evaluate your beef-on-dairy math quarterly. The premium calculation shifts with calf prices and heifer availability. A 70% beef semen strategy that worked at $1,400 crossbred calves might need adjustment if those prices soften. Don’t set-and-forget your breeding program.
Review feed cost protection. With corn at $4.40 and possible relief toward $4.00, evaluate whether forward contracts make sense for Q1-Q2 before spring planting volatility. Locking in $4.25 corn looks smart if prices spike; it looks expensive if they fall to $3.80. Know your risk tolerance.
Examine your processor relationship. If you’re Class IV-dependent and watching checks come in $2.20 below Class III equivalents, it’s worth exploring whether component shipping options or processor alternatives exist in your region. Not every operation has flexibility here, but some do and aren’t using it.
The Bottom Line
The operations that navigate the next 12-18 months successfully won’t be the ones waiting for prices to recover on their own. They’ll be the ones who used this window to lock in replacement animals before the shortage intensifies, controlled feed costs where possible, and knew their break-even to the penny.
Dairy has always been cyclical. Strong production, recovering global supply, and moderating prices—we’ve been through this pattern before. What’s different this time is the heifer constraint underneath it all. The industry can’t simply expand out of tight margins when replacement animals don’t exist.
That constraint will eventually support prices. But “eventually” might be 2027 or 2028. The question is whether your operation’s financial position lets you wait that long—and whether you’re taking the steps now that position you to expand when the cycle turns.
The fundamentals of dairy demand remain constructive. Protein consumption is growing. Convenience continues driving category growth. Despite years of plant-based competition, real dairy holds its market share.
Those realities matter. But so does the math of $15.86 Class III with $4.40 corn and $4,000 springers. The producers who acknowledge both—the long-term demand strength and the short-term margin pressure—are the ones making decisions right now that they won’t regret in 2027.
Key Takeaways
You’re bleeding $80/cow monthly — Class III crashed to $15.86; that’s $16,000 vanishing from a 200-cow herd before spring
211,000 cows added in 12 months — Largest U.S. herd since 1993; prices won’t recover until supply corrects
Springers hit $4,000+ — Tightest heifer pipeline in 20 years; replacement economics have flipped
Global milk keeps flooding in — California +10%, EU +6%, New Zealand +3%; no relief coming in 2026
5 moves to make now — Know your break-even, source heifers before desperation, reassess beef-on-dairy, lock feed, review your processor
Complete references and supporting documentation are available upon request by contacting the editorial team at editor@thebullvine.com.
Learn More
Beef-on-Dairy’s $6,215 Secret: Why 72% of Herds Are Playing It Wrong – Master the precise breeding ratiostop-tier herds use to thrive and secure an immediate cash flow advantage. This breakdown arms you with the math to capture $700 premiums per calf without sacrificing your future replacement pipeline.
The 90-Day Dairy Pivot: Converting Beef Windfalls into Next Year’s Survival – Convert fleeting beef premiums into long-term resilience before the 2026 market shift hits your balance sheet. This analysis delivers the component-focused economic strategy and processor relationship audit required for survival in a $17 milk environment.
Every week, thousands of producers, breeders, and industry insiders open Bullvine Weekly for genetics insights, market shifts, and profit strategies they won’t find anywhere else. One email. Five minutes. Smarter decisions all week.
1980: Farmers got 52¢ of every dairy dollar. 2024: Just 25¢. Farm prices dropped 11% last year. Retail prices? Barely moved.
EXECUTIVE SUMMARY: A Wisconsin farmer did the math: he gets $1.07 for the milk in a gallon, selling for $4.89. That $3.82 gap isn’t new—but it’s widening. Farm share of the retail dairy dollar has dropped from 52 cents in 1980 to just 25 cents today, and when farm prices fell 11% last year, retail prices barely moved. So where does the money actually go? European research offers a surprising answer: farmer organization may matter more than processor consolidation. German farmers, working through strong cooperative structures, capture 80-85% of price transmission; French farmers negotiating individually capture just 23%. For mid-size U.S. operations, three strategic paths emerge—efficiency optimization (where top performers capture $350,000-$550,000 more annually than average), strategic scaling or collaboration, and premium market positioning. With $11 billion in new processing investment flowing toward facilities that favor large-scale supply, the time to choose your path is now.
I spoke with Mark recently, a dairy farmer who has been milking cows in central Wisconsin for 31 years. Last Tuesday, he stopped at the Kwik Trip in Marshfield after dropping a load at the cooperative and watched a young mother put a gallon of whole milk in her cart. The price tag read $4.89.
His milk check that morning showed $20.90 per hundredweight—down from $23.60 just twelve months earlier. USDA’s National Agricultural Statistics Service released those August 2025 numbers in September, and you know how it is… standing in that convenience store aisle, Mark did what every dairy farmer eventually does: the math.
“I’m getting roughly a dollar-seven for the milk in that gallon,” he told me over coffee later that week. “She’s paying four-eighty-nine. Where’s the other three-eighty-two going?”
It’s a fair question. And thanks to some useful academic research coming out of Canada and Europe, we’re getting clearer answers—ones that have honestly changed how I think about dairy market dynamics.
The Dairy Dollar Has Shifted Over Time
Here’s what the historical data shows. And it’s worth understanding these numbers in context, because they tell us something important about structural changes in our industry.
Farm share of the retail dairy dollar has plummeted from 52 cents in 1980 to just 25 cents today—a 52% decline that reflects fundamental structural shifts in dairy market power, not temporary cycles
THE DAIRY DOLLAR: WHAT WE KNOW
For every $1.00 consumers spend on dairy products today:
Segment
2024 Share
Change Since 1980
Farm
$0.25
↓ from $0.52
Marketing & Distribution
$0.75
↑
The marketing share includes processing, retail margins, transportation, and packaging. USDA ERS tracks farm share but doesn’t publish detailed breakdowns of marketing components—which is itself part of the transparency challenge we’ll get to later.
Source: USDA Economic Research Service, Price Spreads from Farm to Consumer, 2024
Back in 1980, dairy farmers captured approximately 52 cents of every retail dollar spent on milk. By 1999, that share had dropped to 32 cents. USDA’s Economic Research Service has tracked this through its Food Dollar Series for decades, and the most recent numbers from its 2024 Price Spreads data put the farm share of the retail dairy product basket at roughly 25 cents on the dollar.
Now, some of that shift reflects legitimate changes in the supply chain—more sophisticated processing, extended cold chains, greater product diversity, and increased food safety requirements. These things cost money, and that cost shows up somewhere.
But here’s what caught my attention: when farm prices dropped 11.4% between August 2024 and August 2025, retail prices barely moved. Bureau of Labor Statistics data shows that the average gallon of conventional whole milk ranged from $3.99 to $4.32 during that period.
The margin had to go somewhere. Understanding where—and why—matters for how we think about pricing dynamics going forward.
What Academic Research Reveals About Price Transmission
This brings us to some research that deserves more attention in our industry. It’s the kind of work that helps explain howprice changes actually move through the supply chain—or don’t.
A study published in the Journal of Food Research by economists at the University of Guelph examined price transmission through Canadian agricultural supply chains. They compared supply-managed commodities like dairy with market-driven commodities like pork, and their findings raise some interesting questions for us.
What the Guelph researchers found:
In supply-managed dairy systems, price changes were transmitted relatively symmetrically—when farm prices rose, retail prices followed at roughly the same rate as when farm prices fell
In competitive pork markets, the pattern looked different: retail prices responded quickly when farm prices increased, but declined much more slowly when farm prices dropped
The researchers attributed this asymmetry directly to processor and retailer concentration
As they put it: “Because of processor and retailer concentration, consumer prices respond more quickly to upward than downward movements of farm prices.”
Why does this matter for U.S. dairy? Because our system shares some characteristics with that competitive model they studied. When input costs rise, those increases tend to move through the chain relatively quickly. When costs fall… well, the benefits don’t always flow back to producers at the same pace. Many of us have seen this play out firsthand.
The European Evidence
European research adds another dimension that I found genuinely surprising. A 2020 study from the EU’s VALUMICS project examined dairy value chains across Germany, France, and the United Kingdom, and what they found challenges some conventional thinking.
The key findings:
Germany and the UK showed 80-85% price transmission—meaning most price changes at the farm level eventually reached retail
France showed only 23% transmission—most farm-level price changes got absorbed somewhere in the middle of the chain
Here’s what’s interesting: the difference wasn’t primarily about processor consolidation
The key variable was the farmer organization—how collectively producers could negotiate
So Germany has relatively fragmented processing—many mid-sized processors and cooperatives competing for milk. France has more consolidated processing, with Lactalis and Sodiaal controlling over 20% of the national milk collection.
Country
Price Transmission %
Farmer Organization
Processor Structure
Germany
80-85%
Strong cooperative structures with collective negotiating leverage
Fragmented: many mid-sized processors competing
United Kingdom
80-85%
Strong cooperative frameworks backed by legal structures
Mixed competitive environment
France
23%
Individual farmer negotiation with limited collective leverage
Consolidated: Lactalis & Sodiaal control 20%+ of national milk
Conventional thinking might suggest German farmers would face more pressure in that competitive processor environment. But the data showed the opposite. Germany achieved 80-85% symmetric price transmission. France achieved 23%.
The researchers pointed to the farmer organization as the critical variable. Germany’s cooperative structure provides producers with collective negotiating leverage backed by legal frameworks. French farmers negotiate more individually with those consolidated processors.
I want to be careful not to overstate this—European dairy markets differ from ours in important ways, and correlation doesn’t establish causation. But the findings suggest that how farmers organize may matter as much as how processors consolidate. That’s worth thinking about.
Dr. Andrew Novakovic, who has studied dairy markets at Cornell University for decades, has made similar observations about collective bargaining mechanisms. Information alone doesn’t necessarily translate into better prices—farmers need ways to act on that information collectively.
What might that look like practically? Active participation in cooperative governance, engagement with FMMO hearing processes, and support for producer organizations that advocate on pricing issues. None of these offer quick fixes, but they represent the mechanisms through which farmers can influence market outcomes beyond their individual operations.
Regional Pricing Variation
One aspect of U.S. dairy pricing that merits discussion—and you probably already know this if you’ve ever compared notes with producers in other regions—is the variation in what farmers actually receive.
USDA Agricultural Marketing Service mailbox price data shows meaningful spreads between regions. The 2024 annual averages had Southeast states around $24.58 per hundredweight, while New Mexico averaged $19.96. That’s nearly a five-dollar difference for essentially the same product.
I recently spoke with a producer in California’s Central Valley who noted similar frustrations. “We’re watching cheese exports hit record levels,” she told me, “and our mailbox price doesn’t seem to reflect that demand.” It’s a sentiment I’ve heard echoed from Vermont to Idaho—the sense that global market strength isn’t translating into farm-level returns as producers expect.
Some of this reflects legitimate factors: Federal Milk Marketing Order formulas, transportation costs, local supply-demand balance, and plant proximity. The FMMO system was designed to ensure orderly marketing and prevent predatory practices when milk couldn’t travel far.
But the magnitude of regional differences raises questions worth exploring. I spoke with Dr. Mark Stephenson, recently retired director of dairy policy analysis at the University of Wisconsin-Madison, about this dynamic.
“The regional pricing system reflects historical infrastructure and political compromises as much as current economic realities,” he observed. “Whether it still serves farmers optimally is a legitimate question.”
For individual operations, the practical takeaway is straightforward: understand the dynamics of your specific FMMO region. USDA publishes monthly mailbox prices by state—tracking where you stand relative to other regions can inform marketing decisions.
Processing Sector Changes
Any discussion of dairy pricing should include what’s happening on the processing side. And the numbers tell a story of significant consolidation over the past several decades.
USDA Rural Development cooperative statistics show U.S. dairy cooperatives declined from 1,244 in 1964 to 118 by 2017. Today, the four largest dairy cooperatives market approximately 41% of all U.S. milk. The 2020 acquisition of 44 Dean Foods facilities by Dairy Farmers of America for $425 million represented a significant moment in this trend.
It’s worth noting that cooperatives themselves vary considerably in structure and function. Some focus primarily on bargaining and milk marketing—negotiating prices and finding homes for member milk without owning processing assets. Others operate significant cheese plants, bottling facilities, or ingredient manufacturing. Regional cooperatives often serve different functions than national organizations, and a producer’s relationship with a bargaining-only cooperative differs meaningfully from membership in a cooperative that processes your milk directly.
Understanding what your cooperative actually does, and how its structure affects your returns, matters more than ever in this environment.
Now, I think it’s important to understand the processor’s perspective here too. These are businesses operating in challenging conditions—thin margins, intense retail pressure, significant capital requirements, and increasing regulatory complexity around food safety and environmental compliance.
Mike Brown, senior vice president of economics at the International Dairy Foods Association, has explained the rationale pretty clearly: “Processing is a low-margin business. The investments we’re making in new capacity require a reliable, consistent supply to achieve the economies of scale that make modern processing viable.”
A cheese plant processing 4-5 million pounds of milk daily needs supply certainty. That’s a legitimate operational requirement. The question isn’t whether processors are making rational business decisions—clearly they are. The question is how the overall market structure affects outcomes across the dairy sector.
New Processing Investment and Export Growth
What’s encouraging is the investment flowing into the industry right now. The International Dairy Foods Association reports approximately $11 billion in new dairy processing investment across more than 50 facilities in 19 states. NMPF president and CEO Gregg Doud has called it unprecedented in American agricultural history.
Much of this investment is oriented toward export markets—cheese, butter, and milk powder destined for growing demand in Asia and other regions. U.S. dairy exports have grown substantially over the past decade, and this processing capacity positions the industry to capture more international market share.
That’s genuinely positive for the industry’s future. Expanded processing capacity creates new market opportunities for milk, and export growth provides demand beyond what domestic consumption alone can support.
The nuance worth noting: much of this new capacity appears oriented toward long-term supply agreements with larger operations—dairies that can provide consistent, high-volume supply year-round. For a 400-cow dairy in Michigan or a 600-cow operation in Pennsylvania, this raises practical questions about market access as the processing landscape evolves.
This isn’t cause for alarm, but it is cause for planning. Understanding where processing investment is flowing—and what supply characteristics those facilities seek—can inform strategic decisions.
Policy Developments
On the policy front, Senators Kirsten Gillibrand of New York and Susan Collins of Maine have introduced the Fair Milk Pricing for Farmers Act, that’s H.R. 295 in the House and S. 581 in the Senate. The bill would require processors to report production costs and product yields to the USDA every two years.
Senator Gillibrand framed the rationale in her February 2025 announcement: “Requiring manufacturers to report dairy processing costs on a biennial basis will give dairy producers, processors, and cooperatives the data they need to ensure that their prices accurately reflect the costs of production.”
This seems like a reasonable transparency measure, and it’s attracted bipartisan support from both producer and processor organizations.
That said, it’s worth understanding what the legislation does and doesn’t do. It creates baseline transparency—useful for FMMO hearing processes when make allowances and pricing formulas are adjusted. It doesn’t set minimum prices, mandate formula changes, or establish collective bargaining frameworks.
As the European research suggests, transparency is valuable but may not be sufficient on its own. It’s one piece of a larger puzzle.
Strategic Options for Mid-Size Operations
Given these market dynamics, what can mid-size operations actually do? After conversations with farm management specialists, agricultural economists, and producers across several regions, three strategic directions keep emerging.
$350K-550K annually (gap between average and top-quartile execution)
Low-Medium
Scale Expansion
$8M-12M per 1,000 cows (40% equity required: $3.2M-4.8M)
5-7 years
Scale-dependent; driven by per-cow efficiency at 2,000+ head
High (labor, capital, market access)
Premium Positioning (Organic/Farmstead)
$50K-150K + 36-month transition without premium income
3-5 years
$100K-300K annually (based on $20-30/cwt premium capture)
Medium-High (market, transition, certification)
Which path makes sense depends partly on where you are in the business cycle—and honestly, on generational considerations. An operation with a clear succession plan and incoming family labor faces different calculations than one where the next generation has moved on. The strategic choices you make today will shape what kind of operation exists in ten or fifteen years, whether that’s for family members to continue or for an eventual transition. That reality should inform which path you pursue.
Here’s what the numbers suggest: on a well-managed 500-cow dairy, the gap between average and top-quartile execution across efficiency measures could mean $350,000-550,000 annually. That’s the difference between surviving commodity cycles and building genuine equity. The three paths below represent different ways to capture that value.
Path One: Efficiency Optimization
For many operations, the most practical path is executing the fundamentals exceptionally well. And the performance gap between average and top-performing herds of similar size can be more meaningful than you might expect—Penn State Extension dairy specialists have documented income-over-feed-cost differences of $2.00-3.00 per cow per day between operations with similar herd sizes.
On a 600-cow dairy, that daily difference compounds to something significant over a year.
Where does that improvement come from? A few areas consistently matter:
Feed management remains the largest controllable cost. Most operations run TMR consistency at 4-8% variation; top performers achieve 2% or less. Testing every cutting—rather than assuming values carry over—adjusting rations weekly based on actual components, and managing bunk dynamics… these practices can reduce feed costs by $0.30-0.50 per hundredweight according to University of Wisconsin research.
Health monitoring has advanced considerably. Rumination and activity monitoring can identify mastitis and lameness 2-3 days before visual symptoms appear. Systems from SCR, Afimilk, Lely, and others typically run $50-100 per cow for basic monitoring, with more comprehensive systems at $150-250 per cow. The payback comes through earlier intervention, reduced treatment costs, and avoided production losses—particularly during the transition period when fresh cow problems tend to cascade.
Component optimization rewards attention to genetics and nutrition. Operations targeting butterfat levels of 4.0%+ can capture meaningful premiums. Montbéliarde crosses and select Holstein families have shown strong component performance, though results vary by management system and feeding program.
Beef-on-dairy programs have created new revenue streams that many of us didn’t have five years ago. Breeding 20-30% of the herd to beef bulls—Angus, Charolais, or Limousin, depending on your market—produces crossbred calves selling at $350-400 versus $80-100 for dairy bull calves. That’s meaningful additional revenue for operations with solid reproductive management.
This path suits operations with manageable debt, adequate working capital, and a genuine interest in data-driven management.
💡 BULLVINE INSIDER TIP: Efficiency Optimization
Based on what producers are actually seeing in 2025, here’s where the fastest returns are coming from:
What’s working right now:
AI-powered ration optimization software — Early adopters are reporting 5-10% feed cost reduction with ROI within 7-8 months, according to Lactanet’s herd analytics data. On a 500-cow dairy, that’s $50,000-100,000 annually to your bottom line.
Integrated health monitoring (not standalone sensors) — Systems that combine rumination, activity, and temperature data outperform single-metric monitors. Look for platforms that integrate with your existing herd management software rather than creating another data silo.
Smart calf monitoring — Operations using automated calf health systems are seeing significant reductions in mortality. One Dutch dairy documented a 19% improvement in calf survival within a single lactation cycle, with wearable sensors detecting illness 12+ hours before visual symptoms appeared. Payback typically runs under 12 months.
What to skip for now: Standalone activity monitors without integration capability. False-positive rates often create more work than they’re worth.
Path Two: Scale Expansion
Some operations have the capital position and management depth to expand to the scales preferred by new processing facilities. And I want to be honest about what this actually requires.
The economics are demanding. Expansion from 600 to 2,000+ cows typically requires $8,000-12,000 per cow in capital investment. For a 1,400-cow expansion, that’s $11-17 million. Most lenders currently require around 40% equity for dairy expansion—meaning $4.5-6.8 million just to reach the financing table.
When the numbers work, larger operations do show profitability advantages. University of Minnesota FINBIN data consistently shows per-cow returns increase with scale, all else equal.
But all else is rarely equal. Labor presents a genuine challenge—a 2,000-cow operation requires different workforce management than a family operation, and finding reliable dairy labor has become difficult in many regions. Geographic factors matter too: Idaho and parts of the Southwest still see active development, while the Upper Midwest and Northeast face higher land costs and tighter environmental constraints.
Here’s something worth considering, though: Collaborative scaling offers some of the benefits of scale without the full capital burden. Machinery-sharing cooperatives—common in Europe through what’s called the CUMA model—are now emerging in Ireland and parts of North America.
Actually, Ireland’s first farm machinery sharing cooperative was formed by members of the Kilnamartyra dairy discussion group in West Cork, according to Teagasc (Ireland’s agricultural authority). Their first joint purchase was a low-emissions slurry tanker—equipment that would’ve been uneconomical for individual operations but made sense when shared across several farms.
The CUMA model is widely used in France, where up to 50% of farmers are members of some type of machinery cooperative. Beyond equipment, some operations here are exploring multi-family partnerships or formal alliances for input purchasing, young stock raising, or even shared labor pools. Wisconsin’s dairy discussion groups and organizations, such as the Dairy Business Association, have facilitated some of these arrangements.
It’s not a full-scale expansion, but it captures some economies without the $11-17 million capital requirement. Worth exploring if you’re in that middle ground.
💡 BULLVINE INSIDER TIP: Scale Expansion
If you’re seriously exploring expansion or collaboration:
Before committing capital:
Map your processor relationships first — Talk directly with your co-op or processor about their 5-year capacity plans. Some are actively seeking mid-size suppliers; others are locked into large-operation contracts. Know before you build.
Explore collaborative structures — Contact your state’s dairy business association about machinery-sharing cooperatives or multi-family partnership models. The SARE (Sustainable Agriculture Research & Education) program has published practical guides on legal structures for equipment sharing that can help you avoid common pitfalls.
Run the labor math honestly — a 2,000-cow operation needs 8-12 full-time employees with skill sets different from family labor. If you can’t staff it reliably, the expansion economics fall apart regardless of milk price.
Geographic reality check: Expansion feasibility varies dramatically by region. Idaho, the Texas panhandle, and parts of Kansas still have processor demand for a new large-scale supply. Upper Midwest and Northeast markets are largely committed—expansion there often requires displacing existing supply relationships, which is a different game entirely.
Path Three: Premium Market Positioning
The third direction involves capturing more retail value through differentiation—such as organic certification, farmstead processing, or direct-to-consumer sales.
The economics genuinely shift here. Commodity milk at $20-22 per hundredweight captures about 25-49% of retail value, depending on the product—USDA data shows fluid milk’s farm share runs higher than cheese or butter. Farmstead cheese operations can realize $40-60 per hundredweight equivalent, capturing 60-70% of retail value, according to case studies from Penn State Extension and the Vermont Agency of Agriculture.
Market Position
Price ($/cwt equivalent)
Farm Share of Retail %
Market Access Reality
Commodity Milk
$20-22
25%
Immediate; established processor relationships
Organic Certified
$40-46 (varies by buyer; grass-fed premiums $36-52)
50-60%
36-month transition without organic premiums; buyer commitment required first
Farmstead Cheese/Processing
$50-65
60-70%
3-5 year market development; requires proximity to metro areas 100 miles or less
For organic specifically, the transition requires careful planning. USDA organic certification requires three years of chemical-free land management before milk can be sold as organic—and during that transition period, you’re bearing organic production costs without organic premiums. Capital requirements typically run $50,000-150,000, depending on your starting point.
What I’m hearing from certifiers and industry groups is that certification costs have risen notably for 2025—the new Strengthening Organic Enforcement rule has created additional paperwork requirements, and several certifiers have raised prices in response. Factor that into your projections.
Some operations have navigated the transition successfully by phasing it across their land base, but it requires 18-24 months of cash flow management without premium returns. Go in with your eyes open.
For farmstead processing, the requirements are significant. Penn State Extension notes that total costs for setting up a cheese enterprise “can easily total over $100,000” depending on scale and regulatory requirements. Vermont case studies show a wider range—$15,000- $40,000 for small-scale farmer-built facilities processing limited volumes, up to $150,000- $ 500,000 for commercial, licensed operations with turnkey equipment.
You generally need proximity to markets—within 100 miles of metro areas with appropriate demographics—and patience. Plan on 3-5 years before profitability.
Northeast operations have shown particular success with this model, given the region’s population density and consumers’ willingness to pay premiums for local products. But I’ve also seen successful farmstead operations in unexpected locations—sometimes it’s about finding the right niche rather than the perfect geography.
This path suits operations near population centers with a genuine interest in marketing and brand-building. It’s not for everyone, but it’s created viable businesses for producers with the right circumstances and inclinations.
Before committing to organic transition or farmstead processing:
Organic pathway:
Secure a buyer commitment first — Contact organic processors (Organic Valley, Maple Hill, regional buyers) about supply needs before starting the transition. Some regions are oversupplied; others are actively recruiting. NODPA’s September 2025 pay price survey shows grass-fed organic premiums ranging from $36/cwt to $52/cwt, depending on the buyer and certification level.
Budget for the paperwork — Certification costs are up for 2025 due to the Strengthening Organic Enforcement rule implementation, and record-keeping requirements have increased substantially. Factor in 4-6 hours weekly for compliance documentation.
Model the transition cash flow — You’ll carry organic production costs for 36 months before organic premiums kick in. Most successful transitions maintain conventional income on part of the operation during this period.
Farmstead processing pathway:
Start with farmers markets — Test your product and build a customer base before investing in full retail infrastructure. Many successful farmstead operations started selling 50-100 pounds of cheese weekly at local markets.
Connect with your state extension — Penn State, Vermont, and Wisconsin all offer farmstead dairy programs with technical assistance and business planning resources that can help you avoid costly mistakes.
Visit operating farmstead dairies — Nothing replaces seeing the daily reality of retail cheese production. Most farmstead operators are generous with their time for serious prospective producers.
The Bottom Line
Looking at these dynamics—the structural shifts, the research findings, the strategic options—what should producers do?
I don’t think there’s one right answer. Different operations face different circumstances, and what works for a 2,000-cow Idaho dairy won’t necessarily fit a 400-cow Wisconsin operation or a 200-cow Vermont farmstead. You know your situation better than any analyst does.
But I do think waiting for commodity markets to resolve these questions isn’t a strategy. Processing investments are being made now. Supply relationships are being established now. Operations are positioning for the next decade; decisions are being made now.
If you take three things from this analysis, make them these:
First, pull your operation’s income-over-feed-cost trend and compare it against Penn State Extension benchmarks for your herd size. Know where you stand before choosing a path. The gap between average and top-quartile performance is where hundreds of thousands of dollars hide on mid-size operations.
Second, have a direct conversation with your cooperative or processor about their capacity plans for the next five years. Are they seeking supply? Locked into large-operation contracts? Planning new facilities? This isn’t information that comes to you automatically—you have to ask for it.
Third, understand where processing investment is flowing in your region and what supply characteristics those facilities are seeking. IDFA tracks the $11 billion investment wave; your state dairy association can often tell you what’s happening locally.
These aren’t the strategic decisions themselves—they’re the foundation for making those decisions clearly.
The collective questions the research raises—cooperative governance, policy engagement, industry organization—matter too, though they operate on longer timeframes and require collective action. Showing up at cooperative meetings, engaging with your board, participating in industry organizations… these things feel distant from daily farm management, but they’re how farmers influence the structures that shape their prices.
The farms that will be thriving in 2035 won’t be the ones that waited for conditions to improve. They’ll be the ones that understood conditions clearly and positioned themselves accordingly.
Farm share of the retail dairy dollar has declined from 52% in 1980 to approximately 25% today, reflecting both legitimate supply chain costs and structural market dynamics
European research suggests that farmer organization and collective bargaining mechanisms may influence price transmission as much as processor market structure
$11 billion in new processing investment is reshaping the industry, with much of the capacity oriented toward export markets and large-scale supply relationships
On a well-managed 500-cow dairy, the gap between average and top-quartile execution could mean $350,000-550,000 annually—that’s the real opportunity in efficiency optimization
Mid-size operations face three viable strategic paths: efficiency optimization, collaborative or individual scale expansion, or premium market positioning
Strategic clarity and committed execution will distinguish operations that thrive through the next decade
Complete references and supporting documentation are available upon request by contacting the editorial team at editor@thebullvine.com.
Learn More
Tech Reality Check: The Farm Technologies That Delivered ROI in 2024 (And Those That Failed) – Reveals which automation tools actually pay for themselves and which are just expensive distractions. This data-heavy breakdown arms you with verified ROI timeframes, ensuring your next capital investment drives measurable margin improvement rather than just adding complexity.
Squeezed Out? A 12-Month Decision Guide for 300-1,000 Cow Dairies – Delivers a high-stakes roadmap for mid-size operations navigating the current structural squeeze. You’ll gain a clear framework for evaluating whether to scale, pivot to organic, or exit, helping you protect your family’s equity before market options narrow.
Every week, thousands of producers, breeders, and industry insiders open Bullvine Weekly for genetics insights, market shifts, and profit strategies they won’t find anywhere else. One email. Five minutes. Smarter decisions all week.
Congress just reversed the whole milk ban—$4.3 billion and 13 years after dairy farmers first called it out. But here’s the uncomfortable truth: the farms best positioned to profit aren’t the ones that fought for it. Your 90-day playbook to change that.
Executive Summary: Whole milk won—13 years and $4.3 billion too late. Congress reversed school milk restrictions in December 2025, finally acknowledging what a 28-study meta-analysis proved in 2020: children who drink whole milk have a 40% lower risk of obesity than those who drink skim. The catch for most producers: school contracts require 500+ gallons daily, effectively locking out two-thirds of U.S. dairy farms. But the opportunity is real if you know where to look—mid-sized operations should be pushing cooperatives toward whole milk school packaging lines, smaller farms can tap a $2.15 billion premium market where marketing fat as a feature beats hiding it, and component-focused genetics now align with both institutional and consumer demand signals. This playbook segments 90-day action steps by herd size because the market opportunity from this shift is unevenly distributed. The lesson that outlasts whole milk: surviving in dairy means building operations resilient enough to weather the years between when science proves you right and when policy finally catches up.
Thirteen years of watching kids push away skim milk cartons. $4.3 billion in estimated industry losses. Roughly one-third of U.S. dairy farms are gone.
And now, finally, whole milk is coming back to schools.
The U.S. Senate passed the Whole Milk for Healthy Kids Act by unanimous consent on November 20, 2025. The House followed on December 15. But before you celebrate, here’s the uncomfortable truth: the farms best positioned to capture this win aren’t necessarily yours—unless you’re running several thousand cows or you’ve already built direct consumer relationships.
So what can the rest of us actually do with this?
The Policy Shift at a Glance
2012 Restrictions
2025 Reversal
Flavored milk
Fat-free only
Whole and 2% permitted
Unflavored milk
Fat-free or 1% only
All fat levels permitted
Saturated fat rules
Milk counted toward weekly limits
Milk exempted from sat-fat caps
Scientific basis
1980s-era low-fat consensus
A 2020 meta-analysis showing 40% lower obesity risk with whole milk
Market access
Favors large processors
Still favors large processors
The Component Math: Why This Actually Matters to Your Milk Check
Let’s talk numbers—because this is where the policy shift translates into real economics.
Whole milk contains 3.25% butterfat. Skim milk? Essentially zero. That’s a 3.25-pound butterfat difference per hundredweight.
According to the USDA’s November 2025 component price announcement, butterfat is currently priced at $1.71 per pound. That means whole milk in school channels carries approximately $5.56 per cwt additional butterfat valuecompared to skim.
Milk Type
Butterfat %
Nov 2025 Value/cwt
Jan 2025 Peak Value/cwt
Skim milk
0.0%
Baseline ($0)
Baseline ($0)
1% milk
1.0%
+$1.71
+$2.95
2% milk
2.0%
+$3.42
+$5.90
Whole milk
3.25%
+$5.56
+$9.59
Here’s where it gets interesting: butterfat prices have been volatile this year. Earlier in 2025, butterfat ran as high as $2.95 per pound back in January, which would put that same differential at roughly $9.59 per cwt. Even at today’s lower prices, the component value difference is meaningful.
Quick ROI comparison—Premium Channel Economics:
Channel
Price per cwt
Annual Revenue (100 cows, 23,000 lbs/cow)
Commodity (Class III, Nov 2025)
~$17.18
~$395,140
Premium direct/organic (based on Intel Market Research organic grass-fed pricing, typically 2-3× conventional)
~$40-50
~$920,000-$1,150,000
Difference
$525,000-$755,000
The math explains why producers willing to build direct relationships are capturing fundamentally different economics—even if the transition requires significant upfront investment.
The Genetics Connection: Breeding for a Whole Milk Future
Here’s something worth considering for those of you making breeding decisions right now: the whole milk policy shift adds another data point to an already strong case for component selection.
According to CDCB, the April 2025 genetic base evaluation showed unprecedented gains—Holsteins improved by 45 pounds for butterfat and 30 pounds for protein. The butterfat number’s almost double any number that’s taken place in the past.
The drivers are clear: genomic testing has improved selection accuracy, and multiple-component pricing allocates the majority of milk check value to butterfat and protein—the two components that drive your check under current FMMO formulas. With 61% of all dairy semen sold in the U.S. now coming from sexed categories, producers can accelerate genetic progress by creating heifer calves from top-component females while using beef semen on the rest.
Industry analysts projects that genetic selection could push average butterfat content above 5% within the next decade if herd nutrition can keep pace with genetics.
The practical takeaway for breeding programs: The whole milk policy shift reinforces demand signals that already favor component-focused genetics. If you’re not already emphasizing butterfat and protein in your sire selection, the economics increasingly favor that direction. Top Holsteins are now adding 45 lbs butterfat per genetic base reset—that’s real money showing up in component checks.
How We Got Here
The original policy wasn’t arbitrary. When the Healthy, Hunger-Free Kids Act passed in 2010, policymakers were responding to real concerns—childhood obesity had tripled since the early 1970s, climbing from around 5% to 15% by 2000, according to CDC data.
And you know what? The people who designed these policies weren’t acting in bad faith. They were working within the scientific framework available at the time. The problem? That framework had blind spots that dairy farmers spotted immediately.
Kids stopped drinking the milk. Schools added sugar to improve palatability. The anticipated health benefits never materialized.
When we chatted with a producer who runs a 650-cow operation near Fond du Lac, Wisconsin—who is a third generation on his family’s farm—he put it to me pretty directly: “We knew something was off within the first year. You’d watch the trash cans fill up with barely-touched cartons. The nutritionists were telling us fat was the problem, but we could see with our own eyes that kids just wouldn’t drink the stuff. My dad used to say the same thing about the low-fat push in the ’80s—consumers know what tastes right.”
It’s a sentiment I’ve heard echoed across dairy country, from Vermont to California.
What the Research Actually Found
The turning point came in February 2020. Dr. Jonathon Maguire, a pediatrician at the University of Toronto’s St. Michael’s Hospital, led a meta-analysis published in the American Journal of Clinical Nutrition that encompassed 28 studies across seven countries.
The findings were striking:
Children drinking whole milk had 40% lower odds of being overweight or obese
Not a single study showed that reduced-fat milk is associated with a lower obesity risk
The biological mechanism makes intuitive sense: dietary fats support satiety; remove them, and kids end up consuming more calories elsewhere
What I found particularly frustrating in this research was the timing. A 2013 University of Virginia study had already pointed in this direction—preschoolers who drank 1% or skim milk had higher odds of being overweight than peers who drank whole milk.
That study came out just one year after the restrictions took effect. It took seven more years for the Toronto meta-analysis and five more for the policy reversal.
Which raises an uncomfortable question many of us have asked ourselves: how many farms might still be operating if the policy had responded to evidence more quickly?
The Economic Damage
The American Farm Bureau’s analysis documents the consumption collapse pretty clearly:
School milk use fell from 4.03 cartons per student per week (2008) to 3.39 (2018)—a 15% drop
Rate of decline accelerated 77% after the 2012 rule change compared to the years before
An industry analysis by The Bullvine estimated a total economic impact of around $4.3 billion (though, like any economic model, that involves assumptions about multiplier effects and competitive dynamics)
“A policy that takes 13 years to correct can put an operation out of business long before the evidence wins out.”
The farm-level damage has been severe. USDA analyses show licensed U.S. dairy farms have fallen by roughly one-third over the past decade. You probably know some of those families personally.
Wisconsin: Steady reduction throughout the decade, particularly among smaller herds
California: Fewer but larger operations capturing an increasing production share
Canadian producers operate under different economic conditions—quota systems insulate them from some commodity volatility but create constraints on fluid milk innovation. The whole milk policy shift is a U.S.-specific development, but Canadian producers watching cross-border trends should note the demand signals. If American consumers are increasingly seeking full-fat dairy products, that sentiment doesn’t stop at the border. Some Ontario and Quebec processors are already watching U.S. premium channel growth with interest, and there may be lessons here for Canadian direct-market producers positioning their own operations.
A third-generation Vermont producer who transitioned to organic during this period described the frustration I’ve heard from many in the region: the school milk situation was just one piece of the economic pressure, but it was the piece that felt most frustrating because producers could see with their own eyes it wasn’t working.
What the Reversal Actually Means for Markets
Here’s where we need to be realistic with each other.
The Farm Bureau projects whole milk could shift 2-3% of U.S. butter production into higher-value bottled milk channels. That’s meaningful volume—but it’s not transformational on its own.
The adoption timeline is going to stretch out:
Early 2026: Districts start releasing procurement RFPs
Spring 2026: Contract bids due
July 1, 2026: First-wave contracts begin
Year 1: Maybe 40-50% district adoption, realistically
Year 3: Perhaps 50-60% adoption
School milk procurement requires a minimum of 500 gallons per day and favors operations that can consistently meet volume and delivery demands. For herds under 300 cows—roughly two-thirds of remaining U.S. dairy farms—direct school contracts just aren’t realistic. The logistics don’t pencil out.
The “Missing Middle” Problem—And What to Do About It
If you’re running 300 to 1,000 cows, you’re in a tough spot. Too small for institutional school contracts. Too large (and too busy) for a farmers’ market stand on Saturday mornings.
But you’re not without options. And frankly, your cooperative’s board probably isn’t thinking about this as hard as you are. That’s your job to push them.
Pressure your cooperative to innovate. Farmers own their co-ops—you can sit on the board, attend meetings, and push for change. Major cooperatives, including DFA, Land O’Lakes, and California Dairies, all offer forward contracting and risk management programs for members. Land O’Lakes launched its Dairy 2025 Commitment, a sustainability and processing innovation initiative. Some specific asks worth raising at your next member meeting:
School-specific packaging lines for whole milk that your co-op can bid on district contracts
Higher-fat fluid product development—the demand signal from this policy shift is clear
Regional processing partnerships that keep more value closer to member farms
Consider cooperative processing arrangements. One Minnesota cooperative involving four farms with a combined 1,800 cows reports routing 25% of collective production through a small processing facility they financed together, according to a recent Bullvine analysis of mid-sized farm strategies. That portion generates roughly twice the commodity price. The remaining 75% continues through traditional channels, so they’re not betting the whole operation on one approach.
“We didn’t have the scale individually to make processing investment work,” one participating farmer explained. “Together we did.”
This isn’t quick or easy—figure 24-36 months for facility build-out and $200,000-$500,000 in shared investment. But for operations with geographic proximity and complementary goals, it’s worth having a feasibility conversation over coffee with neighboring farms.
What if you do nothing? Let’s run those numbers honestly. If you’re in the 300-1,000 cow range, shipping commodity milk at ~$17/cwt while premium channels deliver $35-50/cwt, every year of inaction leaves roughly $200,000-$400,000 on the table (depending on herd size and component production). Over a five-year window, that’s potentially $1-2 million in foregone revenue—capital that could have funded the very infrastructure needed to access premium markets. The cost of waiting isn’t zero, even if it feels safer in the short term.
Advocate for policy that helps mid-sized operations. The school milk win came from organized industry pressure sustained over the years. The same approach applies to FMMO reform, processing infrastructure grants, and cooperative development programs. Individual voices get lost; collective voices get heard.
Your 90-Day Action Checklist
For operations under 300 cows (direct-to-consumer potential):
[ ] Contact your state dairy promotion board about marketing support programs—Midwest Dairy, American Dairy Association Northeast, Southeast Dairy Association, and regional councils often have resources specifically for small-scale direct marketing
[ ] Research farmers’ market requirements and seasonal milk subscription models in your region
[ ] Calculate your break-even point for premium channel investment (licensing, packaging, refrigeration)
Direct school district contracts + institutional positioning
Contact cooperative about 2026 school RFPs; request school milk bid timeline; explore branded whole milk partnerships
Immediate (contracts start July 1, 2026); leverage existing volume
The Premium Opportunity: Marketing the Fat
Here’s where smaller operations have a genuine advantage—if they understand what’s actually working out there.
Market research from Intel Market Research estimates the U.S. organic grass-fed milk market at $2.15 billion in 2025, projected to reach $3.28 billion by 2032 at roughly 7.3% annual growth. Subscription-based delivery models grew 92% over the past year alone.
But here’s what I’ve noticed watching the producers winning in this space: they’re not just producing premium milk. They’re marketing the fat. That’s a meaningful distinction.
Take Painterland Sisters, a fourth-generation Pennsylvania organic dairy. According to a recent Forbes profile, co-founder Stephanie Painter puts it directly: “We aimed to change the narrative surrounding milk fat.”
Their skyr yogurt contains 6% milkfat—double cream. According to Dairy Processing, each 5.3oz container holds the equivalent of four cups of milk. The sisters have emphasized that those healthy fats are central to their product’s nutritional profile—it’s a feature, not something to minimize or apologize for.
The result? Over 6,000 stores in all 50 states, including Whole Foods, Sprouts, and Publix. Forbes’ “30 Under 30” list. The fastest-growing yogurt brand in the natural foods space.
Their insight is instructive: the whole milk vindication isn’t just about returning to what was—it’s about actively marketing fat as a feature.
“Our story is what sets us apart on the shelves,” they told in a recent interview. “Every detail on the cup is designed to tell a story, bridging the gap between the farm and the fridge.”
For farms considering this pathway: launching farmers’ market sales, subscription programs, or an on-farm store requires real investment in licensing, packaging, and refrigeration. Your state dairy promotion board or cooperative extension office can connect you with producers who’ve made similar transitions in your region.
The honest question to ask yourself: Do you have the temperament for direct customer relationships, the capital for infrastructure, and the patience to build a brand? It’s not for everyone—and that’s okay. But for farms that fit the profile, the whole milk story provides a ready-made narrative that consumers genuinely want to hear right now.
Why Policy Correction Takes So Long
Understanding this dynamic helps prepare for whatever comes next—methane regulation, climate requirements, antibiotic restrictions. There’s always something on the horizon.
Research published in 2022 in the journal Public Health Nutrition examined the Dietary Guidelines Advisory Committee. The finding: 19 of 20 members (95%) had at least one documented financial or professional relationship with actors in the food or pharmaceutical industries.
Now, this doesn’t mean committees are corrupt or that members are consciously biased. What it illustrates is something more structural: these committees naturally draw from pools of credentialed experts who’ve built careers within existing consensus frameworks. Challenging established positions carries professional risk. Confirming them is safer. The incentive structure doesn’t reward rapid revision, even when new evidence accumulates.
The result? A system that changes slowly, regardless of how compelling the contradicting evidence becomes.
For producers, the takeaway isn’t that experts can’t be trusted. It’s that policy timelines operate on a different clock than farm economics. Plan accordingly.
Practical Lessons for What Comes Next
Build flexibility into your revenue structure. The farms that survived the last 13 years weren’t entirely dependent on a single market channel. Diversification provides a cushion when policy shifts unexpectedly against you.
One California producer I spoke with recently—running about 2,200 cows in the Central Valley—described it as “not putting all your milk in one tank.” He’s got relationships with three different buyers, plus a small direct-sales operation his daughter runs. When one channel gets disrupted, the others absorb the shift. It’s not complicated, but it requires intentionality.
Consider your story as an asset. If you’ve been farming through these years, you have credibility with consumers who’ve grown skeptical of institutional guidance. A farm that can authentically say “we knew whole milk was nutritious when experts said otherwise” has differentiation that larger operations simply can’t replicate.
Engage policy discussions before consensus hardens. The dairy industry’s organized response to school milk restrictions gained real momentum only after substantial damage had already accumulated. For emerging issues—such as methane regulation and climate requirements—earlier engagement yields better outcomes.
Plan for policy timelines, not evidence timelines. You might be right about the science for years before policy catches up. Your operation needs to survive that gap. That means capital reserves, operational flexibility, and revenue diversification that doesn’t depend on regulatory environments being rational.
The Bottom Line
The immediate market impact from whole milk’s return will be modest—a few percentage points of butterfat utilization, phased in over several years as districts convert.
But the broader lessons apply to whatever comes next:
Policy corrections take longer than farm economics can absorb. Build flexibility to survive the gaps.
Being right doesn’t automatically translate to market benefit. Thousands of farms closed while dairy farmers were correct about whole milk.
Market opportunity distributes unevenly. Large operations win on institutional contracts; small operations can win on premium positioning; mid-sized farms need cooperative innovation or collective processing strategies.
Direct consumer relationships provide policy insulation. And marketing the fat—not just producing it—is what’s actually working in premium channels.
Genetics reinforce the direction. Component-focused sire selection aligns with both premium market demand and institutional whole milk needs—top Holsteins are now adding 45 lbs butterfat per genetic base reset, and that’s real money showing up in component checks.
And honestly, that’s what this whole 13-year story comes down to. The farms that thrive going forward will likely be those that learned from this experience: not just that whole milk was right, but that surviving in this industry requires building operations resilient enough to weather the gaps between when evidence emerges and when policy finally responds.
That’s the real lesson here. Not just vindication—preparation.
We’ll be tracking school district adoption rates and Class I utilization by FMMO region throughout 2026—watch for quarterly updates on how whole milk demand is actually showing up in producer checks.
KEY TAKEAWAYS
$4.3 billion too late: Whole milk won in December 2025—but one-third of U.S. dairy farms closed during the 13 years policy ignored the science that proved them right
School milk isn’t your opportunity (yet): Contracts require 500+ gallons daily, locking out two-thirds of farms. Push your cooperative to bid on school packaging—that’s how mid-sized herds access this market
Your 90-day move by herd size: Under 300 cows → premium direct channels (organic grass-fed is $2.15B, growing 7.3%). 300-1,000 cows → cooperative pressure + shared processing ($200K-$500K). 1,000+ cows → 2026 school RFPs start soon
Butterfat math favors whole milk: At $1.71/lb, whole milk carries $5.56/cwt more value than skim. Top Holsteins now add 45 lbs butterfat per genetic base reset—component breeding pays regardless of channel
Build resilience before the next policy fight: Thirteen years between science and policy correction is normal, not unusual. Methane rules, climate mandates, antibiotic restrictions—your operation needs to survive the next gap, not just celebrate this win
Complete references and supporting documentation are available upon request by contacting the editorial team at editor@thebullvine.com.
Learn More
Whole Milk is Back in Schools. Here’s Why Only 834 Dairy Farms Will Really Win. – Exposes the brutal administrative reality of school contracts and delivers a segmented ROI analysis. This breakdown arms you with specific volume thresholds to determine if institutional bidding actually pencils out for your specific herd size.
$2 Milk or $20 Milk: The Simple Testing Strategy Creating 1000% Premiums – Breaks down the unconventional testing protocols that allow smaller herds to unlock thousand-percent price premiums. It delivers a proven blueprint for transforming regulatory transparency into a high-margin brand that completely bypasses the commodity price squeeze.
The Sunday Read Dairy Professionals Don’t Skip.
Every week, thousands of producers, breeders, and industry insiders open Bullvine Weekly for genetics insights, market shifts, and profit strategies they won’t find anywhere else. One email. Five minutes. Smarter decisions all week.
Processors need milk. Heifers don’t exist. The 90-day window where you have leverage—not them—closes Q1 2026. Three strategic paths. Choose wrong, and you’re buying $5,000 heifers in 2027.
EXECUTIVE SUMMARY: The dairy industry just got repriced—not by markets, but by biology. Collective beef-on-dairy breeding depleted replacement inventories, pushing heifer prices from $1,800-2,200 to $3,010 nationally (USDA AMS), while 27-30 month biological timelines ensure scarcity persists through 2027. December’s Federal Milk Marketing Order component changes permanently widened revenue gaps to $360,000 annually for operations below 3.3% protein—a penalty that compounds each year until genetics improve. Processors who invested billions in new capacity now run plants at 60-70% utilization and are offering unprecedented partnerships: co-financed heifers, equipment subsidies, multi-year pricing locks. New World Screwworm confirmed 70 kilometers from the border could trigger quarantine zones that eliminate beef-on-dairy revenue and remove entire regions from heifer sourcing networks within weeks. Three strategic paths exist—internal rebuilding ($300K-400K annually), processor partnerships ($600K-700K total), or hybrid approaches ($500K first year)—but the 90-day window closes early 2026 when competitive advantages solidify for the rest of the decade.
The headlines coming out of 2025 paint a confusing picture, don’t they? Record export numbers alongside compressed milk prices, billion-dollar processing investments during a heifer shortage, and interest rate cuts that haven’t translated to expansion opportunities the way conventional wisdom suggested they would.
For those of us trying to navigate what comes next, the old playbook—watch milk prices, manage margins, wait for markets to normalize—seems to be missing something critical. And after spending considerable time examining what actually happened this year, from Federal Milk Marketing Order reforms to New World Screwworm biosecurity developments, a clearer picture emerges.
The dairy industry isn’t experiencing temporary market volatility that’ll self-correct by next year. We’re seeing a fundamental repricing of what constitutes competitive operations. And the binding constraint isn’t capital, processing capacity, or even milk demand. It’s replacement heifers.
Understanding why the heifer strategy has become the single most important decision for mid-to-large operations requires connecting dots that most market reports treat as separate stories. So let’s walk through what’s actually happening.
Why Everyone’s Beef-on-Dairy Bet Created a Heifer Crisis
You probably remember the breeding decisions many of us made during 2022-2024. They seemed perfectly rational at the time. Beef-on-dairy calves were commanding $1,200-$1,800 while dairy bull calves brought maybe $50 if you were lucky. So operations shifted aggressively toward beef genetics—Angus, Limousin, Wagyu crosses. Some farms bred 60-70% of their herds to beef bulls, capturing that premium calf revenue while still generating enough dairy replacements to maintain herd size.
The strategy worked brilliantly. Until everyone did it simultaneously.
USDA cattle inventory reports through 2025 show heifer numbers well below historical levels, and the market responded accordingly. Heifer prices, which historically averaged $1,800-2,200, spiked to an average of $3,010 nationally, according to mid-2025 USDA Agricultural Marketing Service livestock reports. Quality animals? You’re looking at $4,000 or more in many regions.
The Heifer Price Cliff: Biology Created a 150% Price Spike in 36 Months
Picture this scenario: a producer planning a 200-cow expansion with an initial budget assuming $400,000-440,000 in heifer purchases. When it actually came time to source them this fall, the requirement had jumped to $760,000-$800,000—and that’s before facilities, equipment, or working capital. The project fundamentals changed so dramatically that many lenders couldn’t approve at the revised numbers.
What sets this apart from typical commodity price volatility is the timeline. Say you recognize the shortage today and immediately shift to aggressive sexed semen protocols. You’re still facing a 27-30 month lag before those breeding decisions yield fresh cows entering the milking string. The biological constraint is absolute. You can’t negotiate faster gestation periods, you can’t pay a premium for accelerated heifer maturity, and you can’t borrow your way around reproduction timelines.
Agricultural economists studying dairy expansion economics have been clear about how this reshapes project viability. When expansion plans that looked viable at $2,000 heifers become questionable at $4,000 heifers, that internal rate of return you calculated at 8.5% might drop to 4.2%. If your lender wants a minimum of 6% for ag expansion loans—and many do in this rate environment—the expansion you’ve been planning just became impossible. Not because milk prices crashed, but because the biological input you need doesn’t exist at a price that makes the economics work.
Expansion Economics Shattered: Heifer Costs Doubled Total Investment Requirements
Billions in Processing Capacity Nobody Can Fill
While we were grappling with heifer scarcity, dairy processors made massive capital commitments based on different assumptions about milk supply growth.
Chobani’s investment in Twin Falls expansion and their new Rome, Georgia facility—we’re talking $1.7 billion total—will require roughly 6 billion pounds of milk annually when fully operational, according to company announcements and Idaho dairy industry projections. Hilmar Cheese Company’s Dodge City, Kansas, plant, which opened in 2024, was designed to process 6-8 million pounds per day at full capacity, according to Kansas Department of Agriculture assessments.
And it’s not just the big names. California Dairies Inc., Darigold, and other regional processors have added significant cheese processing capacity through 2025. USDA Dairy Market News tracking shows substantial infrastructure investment across multiple regions. Nebraska saw its first major fluid milk processing plant in more than 60 years—that’s how much capital has been flowing into dairy processing infrastructure.
These investments shared common modeling assumptions—that U.S. milk production would continue to grow 1.5-2% annually, as historical trends from 2010-2020 suggested, providing sufficient supply to fill new capacity while maintaining competitive procurement costs.
But biology created different outcomes. With replacement heifer inventories down and many of us keeping marginal cows longer rather than replacing them at $4,000/head, the sustainable milk supply growth processors modeled simply isn’t materializing at expected rates.
The numbers tell the story. USDA data shows weekly dairy cow slaughter trailed year-earlier levels for 98 of 106 weeks through mid-2025, with cumulative declines exceeding 556,000 head. Why? Because many operations chose to keep lower-producing cows rather than pay those premium replacement costs. This extended herd retention created a temporary production boost from increased cow numbers, but it’s constraining long-term genetic improvement and herd health optimization—something we’ll feel the effects of for years.
The capital mismatch this created is…well, it’s significant. Processors need plants running at 80-85% capacity to hit their ROI targets. Industry observers note concerns about whether new processing capacity is achieving the utilization rates needed for acceptable returns on these substantial investments.
Metric
Value
New Processing Capacity Added (2024-2025)
12-15 billion lbs/year
Milk Needed at Full Capacity
12-15 billion lbs/year
Current Utilization Rate
60-70%
Heifer Inventory vs. 2020 Baseline
-35% to -40%
Replacement Cost Increase
+67% ($2,000 → $3,010)
And this creates an unusual negotiating environment for producers. When processors face utilization challenges, the dynamics shift. Anecdotal reports suggest some processors may be offering enhanced contractual terms to secure committed supply, though specific arrangements are rarely publicized. The dynamic differs substantially from periods of milk oversupply when processors held most of the negotiating leverage.
What’s particularly noteworthy is that some processors are beginning to explore not just pricing adjustments but actual capital investment partnerships. We’re talking co-funding barn expansions or robotic milking systems in exchange for long-term volume commitments. For producers with consistent volume and quality, this represents a different kind of conversation than we’ve had in recent years—but only if you can deliver the growth processors need. And that circles right back to heifer availability.
The partnership dynamics vary substantially by region and processor structure. Northeast operations working with Dairy Farmers of America or Agri-Mark cooperatives navigate different leverage points than independent processors, where member ownership can influence capital partners’ willingness. Mountain West producers in Idaho and Utah working within Glanbia or Gossner supply chains may find processor partnership opportunities shaped by these companies’ growth trajectories and existing producer relationships. The core dynamic—processors needing committed supply growth they can’t otherwise secure—creates opportunity, but the specific terms reflect regional processor economics and competitive positioning.
December’s Component Rule Change Just Made It Permanent
While heifer dynamics played out, another structural shift many producers are still coming to terms with took effect on December 1: the Federal Milk Marketing Order changes.
The updated component factor standards—moving from 3.0% to 3.3% protein, 5.7% to 6% other solids, and 8.7% to 9.3% nonfat solids—represented more than technical adjustments in formulas. USDA Agricultural Marketing Service finalized these changes after extensive industry input throughout 2024-2025. What they did was permanently reprice what constitutes “standard” milk under federal pricing formulas.
The changes reflect actual component levels in the U.S. milk supply more accurately than standards last updated decades ago. And that’s fair enough from a policy standpoint. But it creates real winners and losers operationally.
For operations already producing above the new standards, the changes validated the genetic investment made over the years. Say your herd averages 3.5% protein—you’re now receiving credit for delivering 0.2% more protein than the formula assumes. Based on typical Class III component valuations from mid-2025, that’s roughly $0.50-$0.60 per hundredweight premium above producers hitting the 3.3% baseline.
But if you’re averaging 3.0% protein? The penalty widened. The spread between high-component and low-component operations increased from roughly $1.00-$1.10 per hundredweight under previous standards to $1.25-$1.50 under the new framework, depending on your butterfat and other solids performance.
To illustrate the economics: on a 1,200-cow operation producing 28.8 million pounds annually, that component differential represents approximately $360,000 in annual revenue variance compared to competitive operations. Every year. Permanently. Until genetics improve through breeding or herd replacement.
And the complication is that fixing genetics through breeding requires at least 4-6 years to see meaningful herd-average improvements. This reflects biological realities we can’t shortcut. Calves born from improved genetics in 2026 don’t enter the milking string until 2028, and it takes several more years of selective breeding and culling to shift overall herd composition significantly.
Take this example: an operation averaging 3.1% protein—not terrible by historical standards, but now sitting below the new baseline. Running the numbers on genetic improvement shows that purchasing high-component genetics would cost $2.1-2.9 million to replace 50-60% of a 1,200-cow herd at current heifer prices. That’s challenging capital to finance, given typical industry leverage positions.
University dairy management specialists studying genetic improvement economics note that hybrid approaches—combining strategic purchases with aggressive sexed semen protocols on top genetic performers—can spread costs over 5-7 years at roughly $135,000-160,000 annually. This makes the investment more manageable from a cash flow perspective, but you’re still facing a significant capital commitment over an extended timeline.
For producers in their late 50s or early 60s without clear successors, the timeline creates difficult questions. Will the investment pay back within your operational horizon? That’s a personal decision each operation has to make based on specific circumstances and succession planning.
What “Record Exports” Actually Tell Us About Supply
Trade headlines from 2024-2025 painted what looked like an optimistic picture. U.S. dairy exports totaled $8.2 billion, up 2% from 2023, with cheese exports reaching all-time highs and rallying 17% in key markets like Mexico and Central America. USDA’s Foreign Agricultural Service export-tracking documents these gains, and the numbers look impressive.
But we need to dig deeper into what those export figures actually mean for our operations.
USDA data shows U.S. milk production grew 4.2% year-over-year in mid-2025, driven primarily by per-cow efficiency gains and temporary increases in cow numbers as many of us retained marginal animals longer. Meanwhile, domestic consumption—based on food availability data and industry consumption tracking—increased by roughly 1-2% across the fluid milk, cheese, butter, and yogurt categories.
So what happened to that 2.2-3.2% production surplus? It needed export markets to absorb it and prevent domestic price collapse from oversupply.
What the data reveal is that “strong U.S. dairy exports” in this context really means we’re producing more milk than domestic markets want to consume at prevailing price levels. We needed export outlets to clear inventory. This is fundamentally different from demand-driven export growth, where global buyers actively seek U.S. dairy at premium prices to alternatives.
The distinction matters significantly for expansion planning, and it’s worth understanding the difference.
Mexico represents genuine structural demand. The country faces a dairy deficit of 25-30% annually—it simply cannot produce enough milk domestically to meet consumption needs. USDA Foreign Agricultural Service analysis confirms Mexico imports roughly 1 million metric tons of dairy products annually, with the U.S. supplying over 80% of that shortfall. Why? Proximity, trade agreement terms under USMCA, and established quality relationships.
As Mexican GDP grows and incomes rise, dairy consumption increases. This creates expanding structural demand that isn’t dependent on temporary price arbitrage or trade policy positions. You can reasonably factor this kind of export relationship into medium-term planning because the fundamentals are solid.
Supply-driven export growth looks different. U.S. whey powder and nonfat dry milk volumes shipped to China and other Asian markets throughout 2024 represented valuable outlets for commodity products that domestic markets couldn’t absorb at certain price points. But when China imposed retaliatory tariffs on U.S. dairy products in early 2025—starting at 10%, rising to 25%, and eventually reaching 125%—U.S. exporters scrambled to find alternative buyers at competitive prices.
New Zealand and European Union suppliers, not facing similar tariff barriers, stepped in to serve Chinese buyers. Our market share declined as price competitiveness evaporated under tariff pressure. It happened quickly.
Now, the November framework agreement between the U.S. and China—announced jointly on November 10—suspended those retaliatory tariffs and restarted facility registrations for U.S. infant formula plants. This was genuinely positive news that stabilized short-term market sentiment and reopened commercial channels.
But—and this is critical—the agreement serves as a framework for ongoing dialogue rather than a permanent resolution. The official language emphasized that parties agreed to “resolve trade tensions through continued engagement.” Translation: tariff suspensions could be reinstated if broader trade negotiations encounter difficulties or political circumstances shift.
So for those of us evaluating expansion decisions, the key point is this: plan growth around export markets only when the demand is structural, like Mexico’s import dependency. Don’t build expansion plans on opportunistic export relationships, such as China’s commodity markets, that depend on favorable tariff treatment. Those can disappear quickly, and expansion economics often can’t absorb such a sudden loss of market access.
How DMC Works Differently for Strong vs. Struggling Operations
The Dairy Margin Coverage program—extended through 2031 in recent legislation—plays different roles depending on who’s using it and how.
The program improvements included expanding Tier I coverage from 5 million to 6 million pounds, updating production history calculations to reflect 2021-2023 levels, and establishing a 25% premium discount for producers committing to multi-year enrollment. USDA Farm Service Agency documented these changes in program announcements.
For well-run operations with solid fundamentals, DMC functions as genuine catastrophic insurance. Think about a 600-cow operation in the Upper Midwest with strong genetics—3.4% protein, 4.2% butterfat—efficient production around 26,000 pounds per cow annually, and moderate leverage around 35% debt-to-asset ratio.
This operation might pay $11,000-13,000 annually for $9.50 per hundredweight margin coverage under current premium structures. In typical years, they might receive $25,000-35,000 in payments during minor margin squeezes when feed costs spike or milk prices soften temporarily. That creates a net cost of $10,000- $ 20,000 for insurance protection.
But in catastrophic years? That’s where the program shows its value. In 2023, DMC paid out $1.2 billion across 17,130 participating operations, according to USDA program data. For operations enrolled at high coverage levels, payments ranged from $120,000 to $ 180,000. For many producers, these payments represented the difference between maintaining debt service and covenant compliance versus facing foreclosure or forced asset sales.
Agricultural economists studying risk management note that producers who use DMC strategically view it as what it’s designed to be—catastrophic risk protection, not an operating subsidy. These operations manage their businesses assuming zero DMC payments. When payments arrive, they flow to debt reduction, capital reserves, or strategic investments—not covering routine operating expenses.
For operations with structural challenges, DMC serves a different function. During 2023’s severe margin compression, operations with below-average genetics, lower production per cow, and high leverage might have received substantial DMC payments that covered operating loan interest, partial property tax obligations, and minimum debt service—preventing immediate foreclosure.
This creates legitimate policy questions about whether farm programs should support operations that struggle to achieve profitability without government payments. There are thoughtful perspectives on both sides. From an economic efficiency standpoint, some argue that enabling operations that would otherwise consolidate delays industry rationalization. From a rural community perspective, others contend that preventing catastrophic forced liquidations allows gradual, managed transitions that preserve community stability.
What producers are finding is that DMC’s actual role depends entirely on underlying competitive positioning. Operations with strong fundamentals use DMC to protect downside while pursuing growth strategies. Operations with weak fundamentals sometimes use DMC to delay strategic decisions about succession or exit.
The practical takeaway: DMC is extended through 2031 with improved terms. The 25% premium discount for multi-year commitments makes long-term enrollment economically attractive. If you’ve got strong fundamentals, DMC represents genuinely inexpensive catastrophic insurance. If you’ve got weak fundamentals, DMC might be sustaining your operation, which requires an honest assessment of whether you’re building toward viable, long-term competitive positioning or simply postponing inevitable transitions.
The Supply Shock Nobody’s Pricing Into Heifer Strategy
While structural forces like heifer scarcity and component repricing unfold over years, New World Screwworm represents a different threat—a potential overnight disruption to the already-stressed heifer supply equation that most of us aren’t fully accounting for yet.
The parasitic fly was confirmed in Sabinas Hidalgo, Nuevo León—less than 70 miles from the U.S.-Mexico border—on September 18. USDA Animal and Plant Health Inspection Service guidance indicates this fly can kill a full-grown cow in 10 days if infestations aren’t treated aggressively. Mexican cattle imports to the U.S. have been completely closed since May after initial detections in southern Mexican states.
What makes the September detection particularly concerning for heifer markets: it occurred in a certified commercial feedlot in northern Mexico, and the infected animal had recently moved from southern Mexico. USDA situation reports documented this. What it demonstrates is that the fly moved northward despite extensive surveillance—8,000 monitoring traps deployed across Mexican states, more than 13,000 screening samples processed, and sterile fly releases attempting biological suppression.
Veterinary specialists note that the parasite’s movement pathway is particularly challenging to control because animals can be infected without showing obvious symptoms initially, and commercial livestock operations regularly move cattle across regions as part of normal marketing processes.
Here’s how this connects to heifer availability: if NWS establishes in the U.S.—and veterinary epidemiologists consider it a real possibility given proximity to current infestations and biological pressure during favorable spring and summer conditions—the cascade affects both supply and cost structures simultaneously.
Timeline
Event
Risk Level
Action Window
Beef-on-Dairy Revenue at Risk
Sept 2025
Confirmed 70km from border
Medium
6 months
$0
Dec 2025
Winter containment window
Medium-High
3 months
$0-200K
Jan-Mar 2026
Critical decision period
High
90 days
$600K-800K
Apr-Jun 2026
Spring expansion season
Critical
Closing
$600K-800K
Q3 2026+
Potential establishment
Catastrophic
Too late
$600K-800K
Looking at historical patterns from the 1950s eradication efforts, establishment typically follows a predictable sequence: Detection occurs on a commercial operation. Within 24-48 hours, livestock markets within 200-300 miles stop accepting cattle from affected regions because buyers anticipate quarantine zones. Feeder cattle prices decline $2-5 per hundredweight in affected regions within the first week.
USDA announces quarantine zones—typically 300 kilometer radius around confirmed detections—within 7-14 days. Movement restrictions require veterinary inspection and negative testing for any cattle transport. State veterinary authorities implement interstate movement protocols.
For those running operations integrated with beef calf production—which many became during 2022-2024’s beef-on-dairy premium period—the impact compounds the heifer shortage. Calves already in affected feedlots can’t move or be sold during quarantine periods. You’re looking at 30-90 days of feeding costs with no revenue pathway. New calves have no placement options because feedlots restrict intake from quarantine regions.
That beef-on-dairy revenue stream, many operations built into financial models—$1,500-2,000 per calf, potentially generating $600,000-800,000 annually for larger operations—can disappear within weeks of detection. This forces immediate return to dairy genetics for replacement production, putting additional pressure on an already-constrained heifer market. Operations that delayed rebuilding internal replacement capacity suddenly compete for the same limited external heifer supply.
The supply shock dynamic: quarantine zones don’t just restrict the movement of infected animals. They effectively remove entire regions from the heifer sourcing networks for months. An operation in California that routinely sources heifers from Arizona feedlots suddenly loses that supply channel if quarantine zones are established. The remaining unaffected regions see immediate price spikes as buyers compete for shrinking available inventory.
If you’re operating in southern or southwestern regions—such as south Texas, Arizona, New Mexico, or southern California—this risk is immediate. Even operations in the Southeast (Georgia, North Carolina) and the Mountain West (Idaho, Utah) should monitor developments, given how quickly commercial cattle movements can spread infestations beyond initial detection zones. Secure commitments from alternative feedlots 300+ miles from potential quarantine zones now, while supply relationships remain flexible. Discuss covenant flexibility with your agricultural lender before potential quarantine scenarios eliminate options and heifer costs spike further.
The June sterile fly program aircraft accident in Mexico—confirmed in USDA reports—highlighted operational vulnerabilities in biological control efforts. Continuous aircraft operations are essential for maintaining sterile fly releases that suppress wild populations. Any extended disruption creates gaps that can allow infestations to expand rapidly.
NWS is currently about 70 kilometers from the U.S. border. Spring 2026 brings ideal conditions for northward movement. For operations already navigating $4,000 heifer costs and limited availability, a quarantine-driven supply shock could push heifer acquisition from difficult to impossible. We’ve perhaps got a few months to develop contingency plans before this potential scenario compounds the heifer mathematics further.
Why Lower Interest Rates Don’t Fix the Heifer Problem
Federal Reserve rate cuts, bringing the federal funds rate to the 4-4.25% range during late 2025—documented in committee meeting statements—created conventional wisdom that cheaper money equals expansionary times.
But for most of us facing current heifer constraints and component economics, that conventional wisdom doesn’t quite align with reality. This is where the fundamental repricing becomes clear: when biology sets the constraint rather than markets, traditional financial levers like interest rates can’t solve the core problem.
The expansion math still doesn’t work at 5% financing if heifers cost $3,800-4,000, and biological availability caps how many you can actually procure. Lower rates make challenging economics slightly less challenging—but that doesn’t transform value-destroying investments into profitable ones. You can’t finance your way around a 27-30 month gestation and development timeline, and you can’t borrow replacement animals that simply don’t exist at any reasonable price.
Where rates do create genuine strategic advantage is in specific applications that align with the structural positioning you’ve already built.
Genetic improvement programs, for example. To illustrate the economics: a $675,000- $ 900,000 investment over 6 years to improve component performance through genomic testing, sexed semen protocols, and strategic culling incurs different financing costs depending on interest rates. At 8% rates, carrying costs add roughly $360,000 over the program timeline based on standard agricultural loan amortization. At 5% rates, carrying costs drop to approximately $202,500. That’s $157,500 in savings—about a 15% reduction in total cost.
For operations where component improvement barely pencils out at higher rates—specifically, operations at 3.1-3.2% protein trying to reach 3.3-3.4% where the revenue benefit is meaningful but not enormous—that 15% financing cost reduction can shift ROI from slightly negative to modestly positive over the investment horizon.
Processor partnerships represent another area where current rates create opportunities. Some processors, facing underutilized plants, are exploring capital partnerships to secure committed milk supply growth. These arrangements might include co-financing heifer purchases at preferred rates, subsidizing genetic improvement programs, or guaranteeing multi-year milk pricing.
At current interest rates, processors can potentially finance heifer purchases at 4-5%—representing their typical cost of capital from corporate debt markets—and pass through 5-6% terms to producers. That’s more favorable than many of us could secure through traditional agricultural lenders for livestock purchases.
To illustrate how this might work in practice: picture a scenario where a processor needs committed volume to improve utilization at a new facility. They could co-finance heifer purchases at 5.5%, lock in milk pricing for 36 months, and both parties improve their economics. From the processor’s perspective, moving plant utilization from the low 60s to the mid-70s percentage range creates substantial value from relatively modest heifer financing commitments.
Automation and labor-replacing technology benefits from the current rate environment in practical ways. Robotic milking systems costing $500,000-700,000 installed can reduce labor requirements 40-60% according to manufacturer data and university research. These systems historically required payback periods of 5-7 years.
The economics shift with interest rates. At 8% financing, a $600,000 robotic system carries roughly $54,000 annual debt service using typical 10-year agricultural equipment loan terms. If labor savings amount to $40,000-45,000 annually—achievable by eliminating 1-1.5 full-time milking positions—the system runs at a cash flow deficit during the financing period.
At 5% financing, annual debt service drops to approximately $30,000 for the same system, creating positive cash flow from installation. In a heifer-constrained environment where biological limitations cap herd expansion, automation becomes the primary lever to increase production per operation. Lower rates make that lever financially viable.
The strategic window appears to be now through early spring. Heifer prices have stabilized at current elevated levels, but could spike further as more producers recognize that scarcity persists. Processors remain actively recruiting committed milk supply. Interest rates are at recent cycle lows.
If you can coordinate heifer strategy development, processor relationship negotiations, and favorable financing arrangements over the next few months, you may lock in structural advantages that competitors attempting similar moves later won’t be able to access at comparable terms.
Three Strategic Paths for the New Heifer Reality
Every structural force we’ve examined—biology, components, processing capacity, trade relationships, interest rates, biosecurity risks—flows through a single bottleneck: the replacement heifer strategy.
The heifer shortage caps the potential for expansion regardless of other favorable conditions. You simply cannot grow beyond what biological replacement availability allows.
Heifer sourcing determines your negotiating leverage with processors. If you can deliver growth with certainty—through internal heifer programs or strategic arrangements—you can potentially negotiate better terms. If you’re purchasing heifers on open markets competing with every other buyer, you’ve got minimal differentiation.
Heifer genetics determine component position for years into the future. Those December 1 component standard changes aren’t temporary policy positions. If you’re producing below 3.3% protein, you’re facing ongoing revenue penalties. Fixing genetics requires years through breeding programs or substantial capital through strategic purchases.
For those of us facing these realities, there are essentially three distinct paths, each with different capital requirements, timelines, and suitability profiles. Understanding where each path positions you five years out helps clarify which aligns with your operational objectives and constraints.
The first path focuses on rebuilding internal heifers through breeding. You stop beef breeding, raise all replacements on-farm through dairy genetics, and build self-sustaining heifer production capacity that eliminates external purchase dependency.
Factor
Internal Rebuilding
Processor Partnership
Hybrid Approach
Initial Investment
$300K-400K/year
$600K-700K total
$500K Year 1
Timeline to ROI
4-6 years
2 years
2-3 years
5-Year Total Cost
$1.2M-1.6M
$800K-1M
$900K-1.2M
Heifer Independence by 2030
100% self-sufficient
Still dependent
60-70% self-sufficient
Processor Commitment Required
None
Multi-year volume lock
Minimal
Strategic Flexibility
Maximum
Limited
High
Best For
Over-leveraged ops with facility capacity
Strong fundamentals, moderate leverage
Moderate leverage, uncertain succession
Based on typical industry cost structures, annual investment runs approximately $300,000-400,000 for heifer-raising infrastructure, feed, labor, and veterinary protocols over a 3-4 year buildout period. The opportunity cost includes lost beef calf revenue—potentially $200,000+ annually for operations that had built significant beef-on-dairy programs.
Timeline extends 4-6 years to achieve full replacement capacity. This reflects biological realities: breeding decisions made in early 2026 produce calves later that year, which don’t enter the milking string until 2028, with several additional years required to build surplus capacity.
Five-year positioning: By 2030, you’re a self-sufficient heifer self-sufficient with complete control over replacement timing, quality, and genetics. You’ve foregone roughly $1 million in cumulative beef calf revenue, but you have zero external heifer dependency and can potentially generate revenue selling surplus animals. Your operational flexibility is maximum—no processor commitments limiting strategic options, no exposure to heifer market price spikes. The trade-off: you’ve allocated significant capital and operational capacity to heifer raising rather than milk production optimization.
This path works best if you’re over-leveraged and need to reduce external heifer cash outlays, have facility and labor capacity to absorb heifer-raising operations, and can weather 3-4 years of beef calf opportunity cost without a cash flow crisis.
The second path builds on processor relationships through strategic partnerships. You lock multi-year agreements with specific volume commitments, potentially secure favorable terms for heifer acquisition, and commit to modest but certain herd expansion.
Using typical financing structures, total capital deployment runs in the $600,000-700,000 range, including heifer purchases, facilities for expanded capacity, and working capital. Financing might be split between traditional bank equipment loans and processor participation, creating blended rates in the low 5% range.
Based on standard dairy economics, the return timeline could show a substantial annual margin benefit by the second year as the expanded herd produces incremental milk revenue at locked pricing.
Five-year positioning: By 2030, you’re operating an expanded herd with processor capital deployed in your infrastructure and multi-year pricing agreements providing revenue stability. Your scale has increased meaningfully, and locked pricing has protected margins during volatile periods. The trade-off: contractual volume commitments limit strategic flexibility. If you want to exit, scale back, or shift to different markets, processor agreements may constrain options. You’re still dependent on external heifer markets for replacement animals, though potentially at preferential terms negotiated through processor relationships.
This path works best if you’ve got strong fundamentals, including components at or above new standards and efficient production, existing processor relationships where conversations about future supply are already underway, moderate leverage that allows expansion financing, and operational capacity to absorb growth. The approach is particularly relevant where processor partnerships align with regional dynamics—whether that’s working with cooperative structures in the Northeast or independent processors in growth markets.
The third path combines internal development with strategic purchases in a hybrid approach. You build modest internal replacement capacity by reducing beef breeding, potentially finance some external heifer purchases, and pursue moderate herd growth that doesn’t overextend capital or operational capacity.
Using typical cost assumptions, first year investment runs around $500,000, including internal heifer-raising infrastructure, any external purchases, and modest facility expansion. The return timeline could show a meaningful annual benefit by the second year, as combined internal heifer capacity and strategic growth create incremental margin.
Five-year positioning: By 2030, you’ve achieved moderate herd growth while building partial heifer self-sufficiency. You’re producing perhaps 60-70% of your replacement needs internally, purchasing the balance externally. Strategic flexibility remains high—you’re not locked into major processor commitments, but you’ve also not committed all resources to heifer production. You maintain exposure to external heifer-market pricing for 30-40% of your replacement needs, but that exposure is manageable rather than existential. The approach offers flexibility: you can accelerate toward full self-sufficiency if heifer markets deteriorate further, or pursue processor partnerships from a position of partial independence.
This path works best if you’ve got moderate leverage that limits aggressive expansion but allows measured growth, want to build long-term heifer sustainability while maintaining flexibility, and have some uncertainty about long-term farm viability that makes preserving multiple strategic options valuable.
Why the Next 90 Days Matter More Than the Next 90 Months
The reality we’re facing: there’s about a 90-day window for implementing heifer strategies that’ll determine competitive positioning through the rest of this decade.
This is the essence of how biology repriced dairy. Markets respond to supply and demand signals within weeks or months. But biological constraints—gestation periods, heifer development timelines, genetic improvement programs—operate on multi-year cycles that can’t be accelerated with capital or policy changes. The strategic decisions you make during this narrow window will either position you to thrive within these biological realities or leave you competing for increasingly scarce resources on unfavorable terms.
Beyond the first quarter of 2026, several factors may narrow options. Processor recruitment efforts could ease as milk supply gradually stabilizes. Interest rate trajectory may shift as the Federal Reserve approaches the terminal rate. Heifer market competition could intensify as more producers recognize that supply scarcity extends well into the future. Processor relationships already established by other operations reduce available partnership opportunities.
The producer who acts in January or February, when processors genuinely need committed supply growth, may have more leverage than someone approaching the same conversations next fall.
For operations with strong fundamentals—components with protein at or above 3.3%, efficient production, and moderate leverage—the next few months represent a genuine strategic opportunity. Consider locking multi-year processor agreements with specific volume commitments where appropriate. Evaluate whether modest expansion or automation investments make sense with current financing terms. View DMC as inexpensive catastrophic insurance and maximize coverage.
For operations facing component challenges—protein below 3.2% and substantial revenue penalties—an honest assessment of the genetic improvement timeline against succession plans is essential. If you’ve got ten-plus years ahead and a successor engaged with the operation, a hybrid heifer strategy with a genetic improvement focus could position you competitively for the next generation. If you’re within five years of planned retirement and have no identified successor, a genetic improvement investment may not yield adequate payback within your ownership timeframe.
For all of us, regardless of current positioning: Heifer strategy isn’t optional or something we can defer. It’s the binding constraint determining competitive viability. Choose your path—internal rebuilding, processor-financed growth, or hybrid approach—deliberately based on leverage position, succession timeline, and relationships.
Don’t wait for heifer markets to normalize. Industry analysis and biological modeling consistently indicate that replacement constraints persist well into the future.
If you’re operating in regions vulnerable to NWS establishment, map biosecurity risk now. Secure alternative cattle sourcing contingencies and discuss covenant flexibility with lenders before potential quarantine scenarios eliminate options and compound the heifer supply shock.
When evaluating export opportunities, distinguish structural demand relationships, such as Mexico’s import dependency, from opportunistic trade situations that depend on favorable tariff treatment.
The fundamental shift: Dairy economics no longer reward volume production alone. The new competitive framework rewards component quality and operational efficiency, strategic processor relationships that provide pricing stability, and heifer program sustainability that enables predictable growth or replacement.
Operations optimized for the previous competitive environment—maximizing pounds, managing commodity pricing cycles, treating heifer purchases as routine input procurement—face structural disadvantage against operations aligned with current economics that prioritize components, efficiency, strategic relationships, and biological sustainability.
The window to reposition strategically is measured in weeks rather than years. What separates operations that strengthen competitive position from those that consolidate won’t be milk price timing or hoping that structural forces reverse. It’ll be whether we recognized the fundamental repricing happening right now and acted decisively while options remained open and terms were favorable.
That’s the heifer math that’ll determine which operations thrive through 2028. The equation is clear. The variables are defined. The only remaining question is whether we’ll solve it proactively during the next few months or whether market forces will solve it for us on less favorable terms as the decision window closes.
Note: Financial examples throughout this article represent illustrative calculations based on typical industry cost structures and financing terms. Actual results vary by operation, region, and specific circumstances.
KEY TAKEAWAYS
Biology sets the pace, not capital — Heifer scarcity ($3,010 average, $4,000+ for quality) persists through 2027 due to 27-30 month replacement timelines. You can’t negotiate faster gestation or borrow around biological constraints.
$360K annual revenue gap—compounding permanently. Operations below December’s new 3.3% protein baseline face widening penalties every year until genetics improve through 4-6-year programs costing $135K-160K annually.
Processors have the capital; you have the leverage — New plants running 60-70% capacity are offering unprecedented partnerships: co-financed heifers at preferred rates, equipment subsidies, multi-year pricing locks. But only while they’re desperate.
New World Screwworm could eliminate your Plan B — NWS confirmed 70km from the U.S. border threatens quarantine zones that simultaneously kill beef-on-dairy revenue ($600K-800K annually) and remove entire regions from heifer sourcing within weeks.
Three strategic paths, 90-day decision window — Internal rebuilding ($300K-400K/year), processor partnerships ($600K-700K total), or hybrid approach ($500K first year). Early 2026 timing locks advantages; delay means competing for $5,000 heifers with closed partnerships.
Complete references and supporting documentation are available upon request by contacting the editorial team at editor@thebullvine.com.
Learn More
Beef-on-Dairy’s $6,215 Secret: Why 72% of Herds Are Playing It Wrong – Stops the bleeding on your breeding program by exposing the exact math behind the winners. Analyzes the pregnancy rate thresholds that determine if you’re generating $6,000 in monthly premiums or silently burning cash on a strategy your herd performance can’t support.
Every week, thousands of producers, breeders, and industry insiders open Bullvine Weekly for genetics insights, market shifts, and profit strategies they won’t find anywhere else. One email. Five minutes. Smarter decisions all week.
When thousands of farmers from across Europe shut down the EU capital, they weren’t just protesting a trade deal. They were raising questions that dairy producers on both sides of the Atlantic would do well to consider.
EXECUTIVE SUMMARY: On December 18, 10,000 farmers from 25 European countries blocked the streets of Brussels and forced a delay of the EU-Mercosur trade agreement—the largest in EU history. The deal would open European markets to 99,000 tonnes of South American beef and 30,000 tonnes of cheese produced at costs 40-60% below EU operations. Here’s why that matters if you’re milking cows in Wisconsin or shipping from Ontario: displaced European production will intensify competition in export markets where North American dairy sells—Mexico, North Africa, Southeast Asia. The timing is challenging. U.S. consolidation continues to accelerate, with 65% of the national herd now on 1,000+ cow operations, and farm numbers falling from 39,000 to 24,000 in five years. European farmers won a postponement until January 2026, but the structural pressures behind both the protest and the consolidation aren’t slowing down. Now is the time to reassess your operation’s exposure to global market dynamics.
There’s something about the sight of hundreds of tractors blocking a major European capital that cuts through the usual trade policy noise. You know how it goes: trade negotiations happen behind closed doors, and by the time farmers hear the details, the framework is already set. But on December 18, 2025, that dynamic shifted in Brussels.
What struck me about last week’s protest wasn’t just its scale—Copa-Cogeca estimated around 10,000 farmers showed up, with some news reports putting the number closer to 20,000. It was the composition. French dairy farmers standing alongside Dutch cattle producers. Polish grain growers are coordinating with Italian beef operations. German dairy cooperatives are working in lockstep with Spanish agricultural unions. Copa-Cogeca pulled off something genuinely rare: unified, cross-border agricultural action.
The target? The EU-Mercosur free trade agreement—25 years in negotiation, and now potentially weeks away from ratification.
What’s Actually in This Deal
Let’s walk through the numbers, because they explain why farmers drove their tractors into the heart of European governance.
Product Category
Mercosur Annual Quota (tonnes)
Total EU Production (tonnes)
Quota as % of EU Production
Beef
99,000
7,800,000
1.3%
Poultry
180,000
15,500,000
1.2%
Cheese
30,000
11,200,000
0.27%
Milk Powder
10,000
1,850,000
0.54%
The EU-Mercosur agreement would create the world’s largest free trade zone, spanning roughly 780 million consumers across 31 countries. For European agriculture, the provisions are substantial. According to European Commission factsheets released in late 2024, the deal grants Mercosur producers access to EU markets for:
99,000 tonnes of beef annually at reduced tariffs
180,000 tonnes of poultry
30,000 tonnes of cheese duty-free, plus significant milk powder quotas
These aren’t trivial volumes. What stands out here is that the challenge isn’t really the percentage of total EU consumption these imports represent. It’s that they’ll compete directly in commodity beef and dairy segments where European producers already operate on tight margins. The displacement effects tend to concentrate rather than spread evenly across the market.
Understanding the Cost Differential
Here’s where the economics become challenging for European producers—and where North American dairy farmers might recognize some familiar dynamics.
The International Farm Comparison Network tracks dairy production costs across more than 100 countries, and their data helps explain why European farmers view Mercosur competition with such concern. EU production costs typically run somewhere in the €40-50 per 100kg range, while South American producers often operate at costs 40-60% lower. That’s not a gap you can close through better feed efficiency or tighter fresh cow management alone.
The differential is structural. Brazilian and Argentine cost advantages don’t stem from superior efficiency or management practices that European farmers could readily adopt. They reflect fundamental input cost differences.
Region
Production Cost per 100kg Milk (EUR)
Cost vs. EU Average
Primary Cost Drivers
Netherlands
€48
+14%
Land costs, environmental compliance, labor
Germany
€45
+7%
Animal welfare standards, energy costs
France
€42
Baseline
Regulatory compliance, farm wages
Brazil
€22
-48%
Low land costs, minimal regulation, cheaper labor
Argentina
€20
-52%
Currency advantage, export infrastructure, scale
Uruguay
€24
-43%
Grass-based systems, lower input costs
Land costs tell part of the story. Prime dairy land in the Netherlands or Denmark is many times more expensive than comparable land in Argentina’s dairy regions. I recently spoke with a Dutch producer who’d done the math on expanding his operation—the land costs alone made the numbers nearly impossible to justify.
Labor compounds the picture. EU dairy farm wages, including mandatory benefits and social contributions, are significantly higher than South American dairy labor costs. We’re talking multiples, not percentages.
Then there’s regulatory compliance. Environmental regulations, animal welfare requirements, and food safety standards significantly increase European milk production costs. These are standards that European consumers broadly support—but they entail costs that Mercosur competitors largely don’t bear. Keep in mind, this isn’t about one system being right or wrong; it’s about the competitive implications when different regulatory environments meet in the same marketplace.
Voices from the Protest
The frustration was evident in Brussels. Belgian dairy farmer Maxime Mabille, speaking to reporters during the protest, put it directly:
“We’re here to say no to Mercosur.”
He accused the European Commission leadership of seeking to “force the deal through,” and sharply criticized the decision-making process.
That frustration is real, and it runs deep among producers who feel caught between rising compliance costs and changing market protections. As many of us have seen in our own markets, when farmers feel unheard through normal channels, they find other ways to make their voices carry.
The sentiment echoed across the protest. Farmers from France, Poland, Italy, and beyond raised similar concerns: they’re being asked to compete on price with operations that face fundamentally different cost structures. Whether you agree with their position or not, it’s a question worth taking seriously.
The Enforcement Question
European Commission officials have pointed to “mirror clauses” in the agreement—provisions requiring Mercosur products to meet EU standards—as the answer to farmer concerns. French President Macron has championed these clauses as a means of ensuring fair competition.
Many farmers remain skeptical. And their caution has some historical grounding worth examining.
The USMCA dairy dispute between the United States and Canada offers an instructive parallel—a case study in how trade agreement enforcement can play out differently than expected.
Here’s the background, and you probably know some of this already: When USMCA replaced NAFTA in 2020, U.S. dairy organizations celebrated provisions granting access to 3.6% of Canada’s dairy market through tariff-rate quotas. The U.S. Dairy Export Council projected meaningful market gains once fully implemented.
What actually happened? Canada restructured its quota allocation system in ways that technically complied with USMCA language while producing practical outcomes different from those U.S. negotiators anticipated. The U.S. Trade Representative filed a formal dispute. A USMCA panel ruled in January 2022 that Canada had violated the agreement. Canada was directed to revise its system within 45 days.
Canada complied—by implementing a new allocation methodology. The U.S. filed a second dispute. In November 2023, that panel ruled 2-1 in Canada’s favor, finding the revised system technically compliant.
The result? According to USDA Foreign Agricultural Service data and industry analysis, U.S. exporters have filled just 42% of their allocated Canadian dairy quotas since USMCA implementation—not because of a lack of supply, but because of how the allocation system functions.
Now, reasonable people can disagree about whether Canada acted within its rights or circumvented the agreement’s intent. What’s less debatable is that the outcome differed from what U.S. dairy exporters expected when the agreement was signed. European farmers see potential parallels with Mercosur mirror clauses—standards get written, implementation gets negotiated, and outcomes can diverge from initial expectations. Whether that concern proves warranted remains to be seen.
The View from South America
Something I keep coming back to when analyzing trade disputes: every story has more than two sides. Brazilian and Argentine dairy farmers aren’t operating in some agricultural paradise, even with their cost advantages.
Brazilian agricultural economists note that the dairy sector faces significant infrastructure challenges. Transportation costs to ports can erode much of the production cost advantage. Currency volatility makes planning difficult—the real has moved considerably against the dollar in recent years. And domestic consumption absorbs most production. Brazil isn’t necessarily positioning to flood global markets; they’re working to meet their own growing demand.
Argentina’s situation may be even more challenging. Recent economic reforms have significantly affected Argentine export economics. Argentine farmers face their own structural pressures—just different ones than their European counterparts.
This doesn’t change the competitive dynamics European farmers face. But it’s a useful reminder that agricultural economics rarely produce clear winners, even in seemingly advantageous markets. Dairy farming presents challenges everywhere. The specific difficulties just vary by geography. That’s something producers worldwide can relate to, regardless of which side of any trade agreement they’re on.
The Processor Perspective
Here’s the thing about trade debates—they rarely split cleanly along obvious lines. Not everyone in the European dairy sector views Mercosur with concern. Some processor members of the European Dairy Association see potential opportunities—particularly in sourcing ingredients for value-added products or accessing Mercosur consumer markets for European specialty cheeses.
This split between farmer and processor interests isn’t unique to Europe. North American dairy has long navigated similar dynamics, where processor priorities around ingredient sourcing and market access don’t always align perfectly with producer concerns about farmgate prices. If you’ve sat through cooperative meetings where these tensions surface, you know exactly what I mean—the coffee gets cold while those debates run long. It’s a dynamic worth watching as the Mercosur debate continues, and worth remembering that “the dairy industry” isn’t monolithic in its interests.
Implications for North American Dairy
So what does a European trade fight mean for farmers milking cows in Wisconsin, California, Ontario, or Alberta? More than you might initially think.
The direct exposure isn’t Mercosur products flooding North American markets—tariff structures and USMCA provisions limit that pathway. The indirect effects are more subtle and potentially more meaningful over time.
Consider the dynamics: When Mercosur beef and dairy fill European market demand, that production potentially displaces EU output that previously served those markets. But European dairy infrastructure doesn’t simply shut down. Instead, that displaced production seeks alternative export destinations—the same destinations where U.S. and Canadian dairy currently competes.
Export Market
US Dairy Exports 2024 (million USD)
EU Dairy Exports 2024 (million USD)
Market Growth Rate 2024-25
Mexico
$1,680
$420
5.2%
Algeria
$245
$890
8.1%
Egypt
$198
$754
6.7%
Saudi Arabia
$156
$423
4.3%
Indonesia
$134
$89
9.4%
Philippines
$112
$67
7.8%
Rabobank’s Q4 2025 Global Dairy Quarterly identified the key contested markets:
North Africa, particularly Algeria and Egypt, which import significant cheese and milk powder volumes currently supplied by EU, U.S., and New Zealand exporters
Southeast Asia, with growing demand for cheese, whey protein, and infant formula
Mexico, which remains the largest single export destination for U.S. dairy
The Middle East, with its premium dairy markets
When EU exporters facing domestic market pressure redirect to these regions at competitive prices, American and Canadian exporters face a choice: match prices or accept volume adjustments.
For large California operations running thousands of cows with thin margins and significant Class IV exposure, shifts in export market prices can mean the difference between profitability and loss on substantial production volumes. I’ve talked with producers in the Central Valley who watch GDT auction results as closely as their bulk tank readings. Smaller Midwest family operations may feel less direct exposure, but the pricing ripples eventually reach everyone through regional market dynamics.
We’re already seeing some of this in auction data. The final Global Dairy Trade auction of 2025 showed the ninth consecutive price decline, with the GDT Price Index down 4.4% overall. Whole milk powder, skim milk powder, and cheese have all softened from earlier 2025 levels. While many factors influence these prices, the supply-demand balance appears to be shifting.
Month
GDT Price Index
Change from Peak (%)
Jan 2025
3,520
0.0
Mar 2025
3,480
-1.1
May 2025
3,390
-3.7
Jul 2025
3,310
-6.0
Sep 2025
3,240
-8.0
Nov 2025
3,180
-9.7
Dec 2025
3,040
-13.6
The Consolidation Picture
Whatever happens with Mercosur specifically, the broader consolidation trend in dairy continues on both sides of the Atlantic. This affects all of us, regardless of where we’re milking cows.
The USDA’s 2022 Census of Agriculture documented that 65% of the U.S. dairy herd now lives on operations with 1,000 or more animals. The number of U.S. dairy farms fell from approximately 39,000 in 2017 to roughly 24,000 in 2022, even as total milk production continued growing. If you’ve watched neighbors exit over the past decade, these numbers won’t surprise you.
Year
Total Farms (thousands)
Herd Share: 1,000+ Cows (%)
Herd Share: Under 500 Cows (%)
2012
51
48
52
2017
39
57
43
2022
24
65
35
2025
21
68
32
European dairy follows a similar pattern with a time lag. Eurostat data shows EU dairy farm numbers declining 3-4% annually, with production increasingly concentrated in larger, more specialized operations.
Year
Number of Farms (thousands)
Average Herd Size (cows)
2010
850
28
2012
780
32
2014
710
36
2016
640
42
2018
570
48
2020
510
54
2022
460
61
2025
420
68
What concerns me—and I think many of you share this—is how consolidation tends to accelerate during periods of margin pressure. Industry analysts have projected that U.S. dairy farm numbers could decline further by 2030 under sustained price compression scenarios.
The mid-size operator—somewhere in that 200 to 700 cow range—faces a particularly challenging structural position. Often, it is too large to capture premium pricing through direct marketing and niche positioning. Sometimes, it is too small to achieve the cost efficiencies that larger operations rely on during thin-margin periods. I was talking with a Wisconsin producer running about 400 cows last month, and he described it perfectly:
“We’re in no-man’s land—too big to be boutique, too small to be bulletproof.”
That segment may undergo significant change in the years ahead.
The Canadian Calculus
Canada’s supply management system provides some insulation but hasn’t prevented domestic consolidation. Research from Dalhousie University’s Agri-Food Analytics Lab, led by Dr. Sylvain Charlebois, projects that Canadian dairy farm numbers will decline from approximately 11,000 today to around 5,500 by 2030—a 50% reduction, even under supply management.
The calculus for Canadian producers is complicated. Quota values represent significant wealth—but also significant debt loads for younger operators looking to expand or enter the industry. Succession planning gets thorny when the next generation looks at those numbers and wonders whether the investment makes sense over a 20-year horizon. And there are real questions about whether the regulatory framework will hold steady through USMCA review cycles.
Canadian producers I’ve spoken with are weighing these factors carefully. The protection supply management offers is real, but it’s not a complete shield against the structural pressures reshaping dairy worldwide. While projections always involve uncertainty, the directional trend appears clear.
Approaches That Are Working
Against this challenging backdrop, certain operational models are demonstrating resilience. They’re worth understanding, even recognizing they don’t apply to every situation.
Value-added processing continues showing strong economics for farms with appropriate geography and capital access. Research on dairy farm diversification consistently finds that operations producing cheese rather than selling commodity milk can capture substantially higher margins per hundredweight. Those combining processing with direct marketing channels—farmers markets, farm stores, local restaurant accounts—often add further value.
For operations seriously exploring this path, facility investment typically ranges from €200,000 to €310,000 or morefor licensed cheese or bottling operations. In the U.S., USDA Value-Added Producer Grants can cover up to $250,000 in eligible costs for working capital, meaningfully improving the feasibility of qualifying operations. The timeline to breakeven generally runs 18-24 months for well-executed transitions—not quick, but achievable with solid planning and realistic expectations.
The key constraint? Geographic proximity to consumers. Direct-to-consumer channels generally work best within 90-120 minutes of significant population centers. Rural operations distant from metropolitan markets face more limited diversification options. A Vermont producer I spoke with last year captured it well:
“Location isn’t everything, but it’s probably 60% of whether value-added pencils out.”
Beef-on-dairy programs are expanding rapidly, particularly in North America. By breeding lower-genetic-merit dairy cows to beef sires, operations generate crossbred calves with meaningfully higher market values than dairy bull calves—while focusing replacement heifer production on their top genetics. Industry observers estimate the segment could produce over 3 million calves annually, as growing acceptance from feeders and packers continues. It’s not a complete solution to margin challenges, but it represents additional revenue without requiring new infrastructure or marketing channels. And for herds with solid reproductive programs already in place, the implementation is relatively straightforward.
Organic and grass-fed specialization maintains premium capture for farms that can meet certification requirements and access appropriate markets. University of Vermont research tracking organic dairy profitability over a multi-year period found that organic farms generated greater net farm revenue than comparable conventional operations in 4 of 5 years studied. The key requirements are geographic access to consumers willing to pay premiums and the management capacity to meet certification standards—which, as anyone who’s gone through organic transition knows, involves a considerable learning curve and attention to detail in pasture management, dry cow protocols, and treatment record-keeping.
None of these represent universal solutions. They require specific combinations of location, capital, management capacity, and market access. But they illustrate that operational choices still create meaningful differences, even in challenging structural environments.
Where Things Stand Now
The December 18 mobilization succeeded in forcing a postponement of the EU-Mercosur vote until at least January 2026. That represents real political achievement—thousands of farmers blocking the EU capital creates attention that decision-makers can’t easily dismiss.
But postponement isn’t resolution. The underlying political dynamics remain largely unchanged. Germany’s industrial sector—automobiles, machinery, chemicals—wants Mercosur market access. Spain and Portugal see export opportunities. The European Commission’s trade directorate remains committed to the agreement.
The real question: Can farmers convert this tactical delay into lasting structural changes?
What farmers achieved is time. How they use that time will determine whether this mobilization produces a lasting impact or merely delays an eventual outcome. The next few months will likely include European Council discussions, parliamentary committee reviews, and continued negotiations over the details of the mirror clause. Those watching closely should pay particular attention to French parliamentary positions—France has been the most vocal opponent, and its stance will significantly shape what happens next.
Copa-Cogeca has announced plans for continued engagement through the winter and spring. National farmer organizations in France, Italy, and Poland are coordinating advocacy efforts. Whether agricultural constituencies can maintain focus and unity long enough to achieve meaningful changes to the agreement—or whether momentum fades and ratification proceeds largely as drafted—remains uncertain. History suggests maintaining coalition unity across months is the harder challenge.
Considerations for Dairy Producers
For European farmers: The Brussels demonstration showed that coordinated agricultural action can still capture political attention. The January 2026 timeline creates a defined window for continued engagement. Maintaining coalition alignment across sectors and borders will likely determine outcomes.
For North American producers, the EU-Mercosur dynamics may create export-market pricing pressure regardless of direct import effects. Planning that accounts for potential commodity price adjustments in contested markets through 2027 seems prudent. Operations with significant export market exposure face the most direct implications.
For all dairy operations: The structural consolidation trend continues. Operations in the 200-700 cow range face particularly complex economics under sustained margin pressure. Strategic decisions made in the next 18-24 months—whether toward scale, toward differentiation, or toward well-planned transition—will shape outcomes for the coming decade.
Questions worth sitting with:
What percentage of your operation’s economics depends directly or indirectly on export market pricing?
Does your geography realistically support value-added or direct-to-consumer diversification?
If pursuing scale, what’s your realistic timeline for achieving those economics?
If neither scale nor differentiation fits your situation, what does thoughtful transition planning look like while asset values remain supportive?
These aren’t easy questions. But current conditions make them worth serious consideration.
The Bottom Line
The farmers who gathered in Brussels understand something important: this isn’t really about one trade deal or one protest. It’s about whether agriculture maintains sufficient standing to influence the policies shaping its future meaningfully. What happens in the coming months will affect European farming for a generation—and offers relevant lessons for agricultural communities watching from elsewhere.
KEY TAKEAWAYS:
10,000 farmers just bought time: The December 18 Brussels blockade forced an EU-Mercosur postponement until January 2026. What happens next depends on whether that coalition holds.
The cost gap can’t be managed away: South American producers operate at costs 40-60% below EU operations. That’s structural—land, labor, regulatory burden—not an efficiency problem.
North American dairy feels this indirectly but meaningfully: Displaced EU production will compete harder in Mexico, North Africa, and Southeast Asia. Those are your export markets, too.
Decision time for mid-size operations: With 65% of U.S. cows on 1,000+ head dairies and farm numbers down 40% since 2017, the next 18-24 months will shape outcomes for a decade. Scale, differentiate, or transition—but don’t wait.
Complete references and supporting documentation are available upon request by contacting the editorial team at editor@thebullvine.com.
Learn More:
The Beef-on-Dairy Wake-Up Call: What Some Farms Are Still Missing – This tactical guide reveals how to deploy genomic testing and build specific buyer relationships to turn your lowest-merit cows into high-margin profit centers, providing a practical roadmap for surviving current price compression.
The Wall of Milk: Making Sense of 2025’s Global Dairy Crunch – Provides a strategic deep-dive into the “global supply collision” and the 24-month biological trap, helping producers understand why current market corrections are slower than usual and how to protect margins through 2026.
Every week, thousands of producers, breeders, and industry insiders open Bullvine Weekly for genetics insights, market shifts, and profit strategies they won’t find anywhere else. One email. Five minutes. Smarter decisions all week.
64-year low in beef cows. $1,100 dairy-cross calves. 2.5 million replacement heifers. Do the math.
You know how these conversations unfold at producer meetings. Walk into a barn office in Jefferson County, Wisconsin, and somebody’s showing you a $1,100 average on their Angus cross calves. Drive an hour north, and another producer’s working through why he came up short on replacement heifers last spring.
The difference between those two outcomes usually comes down to whether the breeding strategy actually fits the herd’s reproductive performance. That’s precisely what Dr. Victor Cabrera and his team at the University of Wisconsin-Madison have been quantifying—and more recent industry data confirms just how significant this opportunity has become for operations that approach it thoughtfully.
What the Wisconsin Research Reveals
Dr. Cabrera published foundational research in JDS Communications that developed a decision-support model to calculate what he calls “income from calves over semen costs.” His team tested 30 different breeding strategies across three levels of reproductive performance. The results tell you exactly where your herd stands:
High Performance (~30% pregnancy rate): $6,215/month Using sexed semen on first-service heifers, then beef semen on adult cows. Produces adequate replacements while generating substantial calf income for a 1,000-cow herd.
Mid Performance (~20% pregnancy rate): $2,001/month. Requires more sexed semen deployment—on heifers and first-service primiparous cows—before safely shifting to beef semen elsewhere. Still meaningful, but the economics shift considerably.
Low Performance (<20% pregnancy rate): $0 — Not Viable. No economically viable strategy for the use of beef semen exists at this level. These herds struggle to produce enough replacements even under conventional breeding.
The $6,215 performance gap: Wisconsin research reveals high-performing herds (30%+ pregnancy rate) generate 3x more monthly beef-dairy income than mid-tier operations—while low performers can’t viably deploy beef semen at all
That last finding doesn’t get enough attention. It’s not meant to discourage lower-performing herds—it points toward where to focus first. Reproductive fundamentals lay the foundation for beef-on-dairy strategies.
How Widespread Has Adoption Become?
The pace of change since that 2021 research has been remarkable. According to the National Association of Animal Breeders data, domestic beef semen sales to dairy operations reached 7.9 million units in 2023—representing 31% of total semen sales to dairy. A 2024 survey conducted by Purina found that 80% of dairy farmers now receive a premium for beef-on-dairy calves, with reported revenues of $350 to $700 per head above purebred dairy calves.
Farm Bureau data indicates that 72% of dairy farms are now using beef genetics on at least part of their herd—a dramatic shift from just a few years ago. Ohio State University economists estimate that beef-on-dairy could account for 15% of total cattle slaughter by 2026, up from essentially zero a decade ago.
What’s interesting is how this has evolved from an experimental strategy into standard practice for many operations. The question isn’t really whether to participate anymore—it’s how to do it without compromising your replacement pipeline.
Current Market Context
What’s shifted dramatically since the foundational research is the magnitude of the calf price premium. Dr. Cabrera’s original model used a baseline of $225 for beef-cross calves. Current conditions look quite different.
New Holland (PA): $680 to $1,160 per head for beef-cross calves at 60-100 pounds, according to USDA-verified auction reports.
Wisconsin markets: $680 to $1,100 per head for comparable calves.
Ontario: approximately $15 per pound—or $1,500 for a 100-pound calf, as reported by Christoph Wand, OMAFRA’s Livestock Sustainability Specialist, at Ontario Dairy Days earlier this year.
“I can’t even believe I’m saying these numbers,” Wand remarked. “I think I’m talking about blueberries or something.”
Why such strong premiums? The U.S. beef cow herd hit a 64-year low in early 2025 according to USDA data, and industry analysts don’t expect a meaningful recovery before 2028. Feedlots need calves, and beef-on-dairy crossbreds are filling that supply gap.
A recent analysis in Choices Magazine notes that crossbred calves achieve higher quality grades than traditional dairy steers, increasing profitability at the feedlot level and supporting premium pricing for dairy producers.
Markets cycle. These premiums won’t last forever. But the structural dynamics—a multi-year timeline for beef herd rebuilding—suggest the opportunity window remains open for operations ready to act on it.
The Replacement Question
This is where thoughtful planning separates sustainable programs from cautionary tales. A Wisconsin producer who’s been running beef-on-dairy for three years now shared an observation that stuck with me: “The premiums are great, but you can give it all back in one bad heifer-buying spring.”
The Wisconsin model calculated that under optimal conditions (high reproductive performance with strategic sexed-beef deployment), a 1,000-cow herd produces just one extra replacement heifer per month beyond what’s needed to maintain herd size. That’s not much cushion.
Industry consultants generally recommend keeping at least 25-30% of breedings allocated to replacement production. The specific number depends on your culling rate, heifer survival, and how much risk you’re comfortable managing. But the principle holds: protecting your replacement pipeline matters more than maximizing beef-cross production in any single year.
The heifer situation is already critical. USDA data shows dairy heifer inventories expected to calve dropped to 2.5 million head as of January 2025—the lowest level since the agency began tracking this metric. That tightening supply makes the replacement question even more consequential.
One example shared in industry coverage illustrates the risk. A tie-stall operation reportedly shifted too heavily toward beef breedings without accounting for their actual replacement needs. When spring arrived, and heifer prices spiked, the cost to maintain herd size ate significantly into their calf premium gains.
It’s a mistake that’s understandable when you’re looking at $1,000 calves. But the replacement pipeline operates on an 18-24 month lag, and that timeline catches operations who haven’t planned ahead.
Matching Strategy to Your Operation
What makes the Wisconsin research particularly valuable is its recognition that different herds need different approaches. This isn’t one-size-fits-all guidance.
For Higher-Performing Herds (30%+ Pregnancy Rate)
Operations at this level have the most flexibility. The research indicates you can deploy beef semen on most adult cow breedings after using sexed semen on first-service heifers, and you’ll still produce adequate replacements.
Here’s the underlying logic: high reproductive performance typically means you’re already producing surplus dairy heifers under conventional breeding. Many producers in this category know the feeling of watching heifer inventory accumulate or selling springers at less-than-ideal prices. Strategic sexed-beef deployment redirects that surplus into premium beef-cross calves.
This is also where genomic testing—running about $40-50 per head—starts paying dividends. You can identify lower-genetic-merit animals for beef breedings while keeping your best genetics in the replacement pool. Some operations have built this into their standard protocol, and the ROI makes sense when you’re already managing tight replacement margins.
For Mid-Range Herds (20-25% Pregnancy Rate)
A more measured approach makes sense here. The Wisconsin model suggests you’ll need sexed semen on heifers and first-service primiparous cows before shifting later services to beef.
This is where many solid operations sit—not struggling, but without the reproductive cushion that allows aggressive beef semen deployment. Worth remembering that sexed semen typically achieves about 80% of conventional conception rates, so the fertility trade-off factors into replacement planning.
For Herds Working on Fundamentals (Below 20% Pregnancy Rate)
The research points toward a different priority: improving reproductive efficiency first. Each percentage point of improvement in the pregnancy rate expands future opportunities to capture beef-cross premiums.
This is really about sequencing. Focus on transition cow management, fresh cow protocols, and reproductive fundamentals. The beef-on-dairy opportunity will still be there once the herd performance supports it.
Strategy Component
High Performance (30%+ PR)
Mid Performance (20-25% PR)
Low Performance (<20% PR)
Sexed semen on heifers (1st service)
Yes
Yes
Focus on reproduction first
Sexed semen on primiparous cows
No – can skip
Yes (1st service)
Focus on reproduction first
Beef semen on adult cows
Yes – most breedings
Yes – later services only
Not viable
Replacement allocation minimum
25-30%
30-35%
All breedings
Genomic testing ROI
High – target low-merit
Moderate – selective use
Not priority
Monthly net calf income (1000-cow herd)
$6,215
$2,001
$0
What’s Working in Practice
Several patterns keep emerging in conversations with producers successfully implementing these strategies.
Genomic-guided breeding decisions have become increasingly common. At $40-50 per head, genomic testing provides concrete data for targeting beef breedings rather than guessing about genetic merit. One producer described it as “taking the emotion out of breeding decisions”—and there’s something to that.
Protocol consistency matters more than protocol sophistication. Operations that capture full premiums aren’t necessarily complicated—they do the same thing every week. Written protocols, consistent execution, and regular review.
Buyer relationships are evolving. Packers and feedlots increasingly want traceable genetics and documented health records, paying premium prices. Operations that provide vaccination records, colostrum protocols, and weight documentation are building relationships that hold value when markets tighten.
Regional Considerations
Market premiums vary by region, and that variation affects strategy. Pennsylvania’s New Holland market shows some of the strongest beef-cross prices, driven partly by veal demand and feedlot connections. Upper Midwest markets in Wisconsin and Minnesota have been solid but show more week-to-week variability.
California operations have also seen significant adoption, with California Dairy Magazine recently covering emerging data on the value beef-dairy crossbreds bring to the supply chain. The state’s large-scale operations have been early adopters of systematic breeding protocols.
Texas has been particularly notable—according to Texas A&M AgriLife and USDA data, the state recently added 50,000 dairy cows, with complementary beef-on-dairy programs contributing to strong production gains. The Southwest’s integration with regional feedlot infrastructure creates natural marketing channels.
Producers closer to feedlot concentrations in the Central Plains sometimes see slightly lower premiums but more consistent demand. If you’re running a smaller operation, understanding your local market dynamics helps calibrate how aggressively to deploy beef semen.
Geography matters: Ontario leads at $1,500 per calf, while Pennsylvania’s New Holland market delivers the widest U.S. range ($680-$1,160)—regional feedlot connections and veal demand drive the spread
Putting the Numbers in Perspective
Under 2021 baseline prices ($225 beef-cross calves), the Wisconsin model showed breakeven prices of just $69 per head for high-performing herds and $100 per head for medium-performance herds. Current prices running $700-1,100 sit well above those thresholds.
That margin provides some comfort. Even if beef-cross premiums decline by 50% from current levels, the economics still favor strategic use of beef semen in herds with adequate reproductive performance.
The research team’s sensitivity analysis found that optimal strategies remained consistent across most feasible market scenarios. What changes isn’t whether to use beef semen, but how much and on which animals.
Before Your Next Breeding Cycle
Critical Decision Point
What 72% Are Doing
What Wisconsin Research Says
The Gap
Pregnancy rate baseline
Guessing or using targets
Actual rolling 12-month 21-day PR
Most overestimate by 5-8%
Replacement allocation
15-20% of breedings
25-30% minimum to protect pipeline
Leaves zero margin for error
Beef semen deployment
“As much as possible”
Strategic by service number & cow type
Burn through replacements
Calf pricing strategy
Take spot market price
Build feedlot/packer relationships
Leave $150-$300/head on table
Genomic testing
Skip it – too expensive
$40-50/head pays dividends at scale
Miss precision breeding gains
Breakeven awareness
Assume current premiums last
Know exact threshold ($69-$100)
Vulnerable to market cycles
Review your actual calf sale data. What premium are you actually receiving for beef-cross versus straight dairy? If it’s below $350 per head, it’s worth investigating whether it’s pricing, timing, or buyer relationships.
Calculate your current pregnancy rate honestly. Use your actual rolling 12-month 21-day pregnancy rate—not your target. This single number largely determines which strategies fit your operation.
Run your replacement pipeline numbers. Count heifers by age group and compare against your culling rate. Are you producing 25-30% more replacements than you need? If not, be conservative on beef semen deployment.
With 72% of dairy farms now using beef genetics, according to Farm Bureau data, the practice has shifted from innovative to expected. Current premiums reflect a beef supply situation that won’t resolve quickly—the smallest cow herd in 64 years doesn’t rebuild overnight.
The producers succeeding with beef-on-dairy share a common approach: they matched their strategy to their actual reproductive performance, protected their replacement pipeline, and built buyer relationships that hold value beyond the current premium cycle.
The market is paying you to be smart, but it will punish you for being short. Run your numbers through the DairyMGT.info calculator before your next breeding setup—because $1,000 calves don’t fix an empty heifer barn.
Key Takeaways
Know your tier. Wisconsin research tested 30 strategies: 30%+ pregnancy rate = $6,215/month. 20-25% = $2,001/month. Below 20% = not viable.
Protect the pipeline. Heifer inventories are at record lows (2.5M head). Keep 25-30% for replacements—$1,000 calves don’t fix an empty heifer barn.
Margins are historic—for now. Beef-cross calves are selling for $680-$1,160, vs. a breakeven of $69-$100. Even a 50% price drop works for high performers.
Three numbers determine your strategy: the actual 21-day pregnancy rate. Replacement allocation (25-30%). Genomic cutoff for beef breedings ($40-50/test).
Run the math. Free DairyMGT.info calculator shows which strategy fits your herd before you commit.
EXECUTIVE SUMMARY
Beef-cross calves are selling for $680-$1,160, and 72% of dairy farms have jumped into beef-on-dairy, but University of Wisconsin research reveals most are flying blind. Dr. Victor Cabrera’s team tested 30 breeding strategies and found the economics split sharply: herds at 30%+ pregnancy rate can generate $6,215 monthly in net calf income, while herds below 20% pregnancy rate have no viable beef semen strategy at all. The margin for error is vanishing. The U.S. beef cow herd sits at a 64-year low, dairy heifer inventories hit a record low of 2.5 million head, and one aggressive breeding cycle can erase a year of calf premiums in a single heifer-buying spring. The research points to one approach: know your pregnancy rate, protect your replacement pipeline, and run your numbers through the free DairyMGT.info calculator before your next setup. The market is paying for precision—$1,000 calves don’t fix an empty heifer barn.
The underlying research (Cabrera, 2021) was published in JDS Communications and is available through PubMed Central.
Complete references and supporting documentation are available upon request by contacting the editorial team at editor@thebullvine.com.
Learn More:
The Beef-on-Dairy Wake-Up Call: What Some Farms Are Still Missing – Reveals why holding onto “Holstein purity” is costing herds thousands and details how to implement a genomic testing protocol to accurately identify the bottom 30% of cows for terminal beef breeding.
Every week, thousands of producers, breeders, and industry insiders open Bullvine Weekly for genetics insights, market shifts, and profit strategies they won’t find anywhere else. One email. Five minutes. Smarter decisions all week.
What if your transition disease rate isn’t 20%—it’s 35%? That measurement gap costs $42K/year. Worse: your best cows pay the genetic price.
EXECUTIVE SUMMARY: Most dairy operations estimate their transition disease rate at 20%—but farms that actually measure often find it’s closer to 35%. That gap represents roughly $42,000 in annual losses on a 400-cow dairy: lost milk, extra treatments, reproductive delays, and elite cows that never reach their genetic potential. The research points to a clear fix. Work from Guelph, Minnesota, Ohio State, and Wisconsin Extension consistently shows that risk-stratified protocols outperform blanket approaches—intensive care for high-risk mature cows, reduced spending on heifers who don’t need it. The numbers back it up: $500 per disease case, $1,000 for multiple diseases, and subclinical hypocalcemia hitting 73% of mature cows at $150 each. For operations investing in superior genetics, every cow that struggles through transition is a cow whose breeding value may never reach the bulk tank—or produce the next generation of your herd’s best females. The research-backed first step? Stop bolusing first-lactation heifers and redirect those resources where they’ll actually make a difference.
Here’s something that catches a lot of producers off guard. Walk into almost any dairy operation—doesn’t matter if it’s a 200-cow tie-stall in Vermont, a 3,000-cow freestall in California’s Central Valley, or a grazing operation in New Zealand—and ask about fresh cow disease rate. You’ll probably hear something like “Oh, we’re running around 20%, maybe 22%.” Reasonable estimate. Feels about right based on what they’re seeing day to day.
But when farms actually start measuring… well, that’s when things get interesting.
I’ve heard from producers who decided to track every single fresh cow event for 90 days—metritis cases, DAs, milk fever, ketosis treatments, all of it—and discovered their numbers were way off. One Wisconsin dairyman figured he was running about 23%. His actual number? North of 34%. And he’s not alone. When farms start systematically tracking every treatment event, every cow that doesn’t quite hit her stride in early lactation, that 20% estimate often turns out to be closer to 30% or higher.
Farm Type & Region
Producer’s Estimate
Actual Measured Rate
Disease Rate Gap
Annual Cost Gap (400-cow herd)
200-cow tie-stall, Vermont
20%
34%
+14 percentage points
$39,200
400-cow freestall, Wisconsin
22%
35%
+13 percentage points
$36,400
800-cow freestall, Minnesota
18%
31%
+13 percentage points
$72,800
3,000-cow freestall, California
21%
33%
+12 percentage points
$252,000
600-cow grazing operation, New Zealand
19%
29%
+10 percentage points
$42,000
Dr. Eduardo de Souza Ribeiro, over at the University of Guelph, puts it pretty directly: cows with a poorer transition produce less milk, take longer to get pregnant, and are more likely to lose a pregnancy or be culled from the herd. That adds up to substantial economic losses. And here’s what’s sobering—his review of the research, published in Dairy Global, found that roughly one-third of dairy cows in Western herds experience at least one disease process in the first three weeks after calving. That’s not outliers. That’s typical across the industry.
So what does that cost? Work by Carvalho and colleagues back in 2019 tried to put a price tag on it, estimating about $500 for a single postpartum disease case and around $1,000 when a cow has multiple problems during that critical window. On a 400-cow dairy, it doesn’t take many extra disease cases to add up to tens of thousands of dollars in lost milk, extra treatments, and reproductive delays—even if the exact number varies by herd and region.
What’s interesting—and honestly, a bit frustrating—is that the research showing how to cut those disease rates significantly has been accumulating for over two decades. The barrier isn’t knowledge. It’s how that knowledge moves (or doesn’t) from research journals to actual farm practice.
“You can have the best genetics in the world, but if your cows can’t get through transition healthy, you’ll never see that potential expressed in the bulk tank or the breeding program.”
The Measurement Gap Nobody Talks About
The foundation of any improvement starts with a surprisingly basic question: What’s your actual disease rate?
You know, most dairies have never systematically answered this. They track individual treatments, sure. They know when a cow develops metritis or throws a DA. But calculating an overall incidence rate—the percentage of cows experiencing any metabolic or reproductive disease in the first 21 days—that’s different. And without that number, you’re essentially flying blind.
Why does this matter so much? Multiple sources—University of Maryland Extension, Dairy Global, research published in Frontiers in Veterinary Science—all point to the same finding: about 75% of health problems in dairy cows occur during the transition period. That’s the window from roughly two weeks before calving to four weeks after. Three-quarters of your health challenges, concentrated in about six weeks. That’s a massive concentration of risk in a pretty short timeframe, whether you’re running a confinement operation in the Midwest or a pasture-based system in the Southeast.
When farms start systematically tracking, many discover their disease rates are higher than they’d estimated. A 2019 study in the Journal of Dairy Science looked specifically at barriers to successful transition management and found that variation in both farmer attitude and veterinarian involvement significantly affects outcomes. One of the key barriers they identified? Simply not having a clear picture of what’s actually happening. Hard to fix a problem you haven’t quantified.
Now, break down the disease by parity, and the picture gets even clearer. This is where it gets really practical for protocol decisions. Field data and NAHMS surveys consistently show that disease risk climbs with parity—first-lactation animals typically have substantially lower rates of metabolic and reproductive disease than third- and fourth-lactation cows. Research showed subclinical hypocalcemia affecting around 47% of second-or-greater lactation cows but only about 25% of first-lactation heifers. Clinical milk fever follows the same pattern—it’s far more common in older cows than in first-lactation animals.
Disease Type
First-Lactation Heifers
Second-Lactation Cows
Third+ Lactation Cows
Risk Multiplier (3rd+ vs. 1st)
Subclinical Hypocalcemia
25%
54%
73%
2.9×
Clinical Milk Fever
2%
6%
12%
6.0×
Hyperketonemia (elevated BHB)
8%
15%
22%
2.8×
Displaced Abomasum
3%
5%
9%
3.0×
Metritis
12%
18%
25%
2.1×
Average Treatment Cost/Cow
$82
$156
$247
3.0×
Here’s what that tells us: many operations treat all fresh cows identically—same calcium bolus protocol, same propylene glycol regimen, same monitoring intensity. But different animals have dramatically different risk profiles. And the research is pretty clear that they respond differently to interventions too. So why are we treating a first-calf heifer the same as a fourth-lactation cow? That’s the question worth asking.
What the Research Actually Shows
The scientific literature on transition cow management has reached a level of maturity that’s frankly unusual in agricultural research. We’re not talking about preliminary findings or single studies here. We’re talking about meta-analyses combining decades of data from operations across North America, Europe, and beyond.
On calcium supplementation: Research consistently shows multiparous cows benefit significantly from calcium support, while first-lactation heifers show minimal response. A 2024 review in the journal Animals noted that dairy cows are at considerable risk for hypocalcemia at the onset of lactation, when daily calcium excretion suddenly increases from about 10 grams to 30 grams per day. Think about that—tripling calcium output almost overnight. But—and this is important—that risk concentrates heavily in mature cows, not heifers.
Dr. Luciano Caixeta at the University of Minnesota has noted that subclinical hypocalcemia (the kind you don’t see clinically but still causes problems) has been reported to affect as many as 73% of dairy cows in third or higher lactations, costing an average of about $150 per case. Researchers at the University of Guelph found that herds with a higher incidence of subclinical hypocalcemia experienced an 8.36-pound reduction in milk production on the first test day and a 30% reduction in the odds of pregnancy on the first AI. That’s real money—and real reproductive performance—left on the table.
Dr. Mark van der List, a veterinarian with Boehringer Ingelheim who’s spoken at numerous industry events on this topic, explains the supplementation approach this way: administering an oral calcium supplement to cows at calving, and again 12 hours later, provides much-needed calcium when blood levels are at their lowest. He also cautions about reading product labels carefully—watch out for products containing calcium carbonate, which is limestone. It’s the cheapest form of calcium, but it’s too slowly absorbed to really make a difference when you need rapid uptake.
On negative DCAD diets: This is one where the research is really solid. University of Wisconsin Extension confirms that feeding a negative DCAD diet during the pre-fresh dry period—that last 21 days before calving—successfully increases blood calcium levels before and immediately after calving. The result is a lower incidence of both clinical and subclinical milk fever.
Meta-analyses and field trials show that properly formulated negative DCAD diets can cut the risk of clinical milk fever by well over half. Some studies report relative risks in the 0.2-0.4 range compared with neutral DCAD diets. That’s substantial protection for your high-risk animals.
But here’s the nuance that matters for your operation—and this is where a lot of folks are spending money they don’t need to spend. The same Wisconsin Extension research notes that while negative DCAD diets can benefit heifers in some ways, studies have shown their impact on productive performance has been either neutral or negative. Heifers have a much lower risk of developing milk fever than multiparous cows, so feeding them a negative DCAD diet is likely unnecessary. That’s a cost you can redirect elsewhere.
On propylene glycol: A 2025 study published in Frontiers in Veterinary Science demonstrated that a targeted propylene glycol protocol effectively decreased ketosis incidence from 33.3% in control cows to 6.7% in treated cows at 14 days postpartum. The research confirms propylene glycol’s efficacy—but notice that word “targeted.” When used appropriately and aimed at cows that actually need it, rather than blanket-treating everyone, the results are strong.
What’s emerging from all this research is a consistent pattern: targeted, risk-stratified protocols generally outperform blanket treatment approaches, both economically and in terms of animal outcomes. Treat the cows that need treatment. Don’t treat the ones that don’t. Seems obvious, but it requires knowing who falls into which category.
Body Condition: The Early Warning System Many Farms Miss
This is where things get really practical—and where, honestly, a lot of farms are leaving money on the table.
Kirby Krogstad at Ohio State has been doing some fascinating work on the connections between body condition score, hyperketonemia, and downstream health outcomes. His research, published in the Journal of Dairy Science, tracked approximately 900 cows and found some pretty compelling relationships that should inform how we manage transition cows.
Here’s what stood out: cows who lost more than 0.375 BCS in early lactation were nearly five times more likely to lose their pregnancy. Five times. That’s not a subtle effect—that’s a flashing warning sign. And mature cows—third lactation and beyond—testing above 1.2 mmol/L of BHB produced about 11.8 pounds less milk per day than their non-hyperketonemic counterparts. On a 400-cow dairy with even modest prevalence of hyperketonemia in older cows, that adds up fast.
BCS Loss (units)
Milk Production (lbs/day)
Pregnancy Rate (%)
0.0
86
45
0.25
82
42
0.375
78
38
0.5
74
32
0.75
68
26
1.0
62
22
Key Benchmarks (Krogstad, Ohio State): Target ≤10% of 2nd-lactation cows and ≤20% of 3rd+ lactation cows with elevated BHB in week one. Exceeding these thresholds signals protocol problems.
What’s particularly useful is Krogstad’s benchmark recommendations for the first week in milk. He suggests that 10% or less of second-lactation cows should show elevated BHB, and 20% or less of third-plus lactation cows. If your herd exceeds these thresholds, that’s a signal worth paying attention to. It’s a simple metric you can track that tells you whether your transition protocols are working.
Dr. Ribeiro at Guelph recommends that body condition scoring at dry-off should be moderate—3.0 to 3.25 on a 1-to-5 scale—and maintained through calving. The intervention point, importantly, is 100-plus days before calving, not at calving itself. By the time a cow reaches the close-up pen, overconditioned, you’re already playing catch-up. The time to manage body condition is back in late lactation, not when she’s three weeks from freshening.
I’ve heard from California producers who started scoring every cow at 200 DIM and adjusting rations for the overconditioned ones. Several report noticeable drops in fresh cow disease within a couple of lactation cycles. Not because they were doing anything fancy at calving—they were just preventing the problem from developing in the first place. That kind of proactive approach works whether you’re in a dry lot system in the Southwest or a freestall barn in the upper Midwest.
Why This Matters for Your Elite Genetics
Here’s something that doesn’t get talked about enough in the transition cow conversation: the genetic implications.
If you’re investing in elite genetics—whether that’s genomic-tested heifers, embryo transfer calves from proven cow families, or semen from high-ranking sires—transition disease can undermine that entire investment. A cow from an exceptional dam line who struggles through her first lactation due to ketosis or metritis may never express her true genetic potential. Worse, she might get culled before she ever gets a chance to prove herself or contribute daughters to the herd.
Think about it this way: that heifer calf from your best cow family represents years of breeding decisions. She carries genetics for high components, longevity, fertility—whatever traits you’ve been selecting for. But if she hits the fresh pen and immediately battles subclinical hypocalcemia followed by a DA, her first lactation becomes a salvage operation rather than a showcase of her genetic merit.
The research from Guelph on subclinical hypocalcemia showed a 30% reduction in the odds of pregnancy at first AI. For a cow you’re counting on to produce the next generation of your herd’s genetics, that reproductive hit is devastating. You need her pregnant early to get that next heifer calf. You need her healthy to produce enough milk to justify keeping her. Transition disease compromises both.
Dr. Ribeiro’s point about cows with poor transitions being “more likely to get culled from the herd” hits especially hard when you’re talking about animals carrying superior genetics. Every elite cow that leaves the herd early due to transition-related complications represents not just lost milk revenue but lost genetic progress. Her potential replacement heifers never get born. Her genomic contribution to your herd’s improvement disappears.
This is why getting transition management right matters beyond just the immediate economics. It’s about protecting your genetic investment and ensuring your best animals live long enough, and stay healthy enough to reach their potential and pass those genetics forward.
Building Momentum: The First Move That Actually Works
For operations looking to bridge the gap between current practice and what research supports, the question becomes practical: where do you actually start?
The answer, based on both research and what we’re seeing on progressive farms from the Northeast to the Pacific Northwest, might surprise you. Rather than overhauling everything at once (which rarely sticks anyway), the highest-confidence first move is often the simplest: stop bolusing first-lactation heifers while maintaining supplementation for multiparous cows.
The economics here are modest but illustrative. A 400-cow dairy with 33% heifer rotation spends roughly $1,300 to $1,500 annually on heifer calcium boluses. Research suggests this spending produces minimal benefit because heifers face naturally low hypocalcemia risk—remember that Wisconsin Extension finding about neutral or negative performance impacts? You’re spending money for essentially no return.
But more valuable than the direct savings is what this change accomplishes organizationally:
It’s reversible. If heifer disease somehow increases—unlikely based on research, but possible—you restart the protocol immediately. No permanent commitment required.
It’s measurable. Track the heifer disease rate before and after. You’ll have concrete evidence of whether it works for your specific operation, your genetics, and your facilities.
It builds collaborative relationships. Approaching your vet with “Can we try this as a 60-day test?” creates a partnership rather than conflict. You’re not challenging their expertise; you’re inviting them into an experiment.
It establishes a template. Successfully implementing one evidence-based change creates permission—and confidence—for the next.
Dr. van der List emphasizes this collaborative approach: ask your veterinarian about blood calcium testing, he suggests. They can help you evaluate the results and develop the right supplementation strategies for your herd. That kind of data-driven partnership is exactly what makes protocol changes stick long-term.
The farms achieving the best transition outcomes didn’t get there through revolutionary overnight changes. They built systematic improvement through sequential small wins. One protocol adjustment at a time, measuring as they went.
The Three-Tier Framework: How It Works in Practice
Operations that have successfully reduced fresh cow disease often employ some version of risk stratification. The basic principle is straightforward: different animals get different protocols based on their probability of developing disease. Here’s how one common framework breaks down.
Tier 1 (Low Risk): First-lactation heifers and multiparous cows with body condition under 3.5 and no disease history
Standard dry cow nutrition without DCAD manipulation
No calcium supplementation at calving
Propylene glycol only if clinical signs emerge
Standard monitoring protocols
These are your low-maintenance animals. They don’t need aggressive intervention, and providing it anyway just costs money without improving outcomes.
Tier 2 (Moderate Risk): Multiparous cows with normal body condition (3.0-3.5) or single-episode disease history
Negative DCAD diet for the final 21 days prepartum
Single calcium bolus at calving
Propylene glycol is based on ketone testing, not blanket treatment
Enhanced daily observation during the fresh period
This is probably your largest group numerically. They need targeted support, based on what we know works.
Tier 3 (High Risk): Overconditioned cows (BCS above 3.5), fourth-plus lactation cows, or those with multiple disease episodes
Controlled-energy ration beginning at 150 days in milk (because you’re managing body condition early)
Aggressive DCAD protocol for 21-plus days prepartum
Multiple calcium boluses (at calving and 12 hours post-calving)
Tier 3: High Risk (BCS >3.5, 4th+ lactation, disease history)
DCAD Diet (Prepartum)
Standard dry cow ration
Negative DCAD for final 21 days
Aggressive negative DCAD for 21+ days
Calcium Supplementation
None at calving
Single bolus at calving
Multiple boluses (calving + 12 hrs post)
Propylene Glycol
Only if clinical signs emerge
Based on ketone testing, not blanket
Protocol from day -7 to +21
Body Condition Management
Standard monitoring
Monitor at dry-off and calving
Controlled-energy ration starting 150 DIM
Monitoring Intensity
Standard fresh cow checks
Enhanced daily observation
Blood ketone testing days 5–9; intensive daily monitoring
Estimated Annual Cost/Cow
$18
$62
$147
Target Disease Rate
<8%
<15%
<25% (vs. 45%+ without intervention)
These are your problem children—the cows you know are going to struggle if you don’t get ahead of it. They deserve the intensive protocols because, for them, it actually pays off. And if these happen to be your highest-genetic-merit animals in their fourth or fifth lactation, protecting them through transition protects your breeding program.
The ROI Snapshot: Tier 3 cows receive significantly more intervention, but overall spending frequently decreases because low-risk animals no longer receive unnecessary treatment. You’re reallocating resources, not adding them.
A note on infrastructure: Implementing this kind of stratification does require some basic capabilities. Lactanet’s housing guidelines for dry and transition cows note that well-designed facilities are built with a transition and calving management strategy in mind, addressing factors such as management group sizing, cattle movement, and health needs for different groups.
At minimum, you’ll want the ability to separate close-up cows into at least two groups—or clearly identify high-risk individuals within a mixed group—plus access to DCAD ration formulation through your nutritionist and either cow-side ketone testing or a protocol with your vet for blood work.
Now, I know what some of you are thinking: “We don’t have separate pens for that.” Fair enough. Operations without separate close-up pen capacity can still implement modified stratification by identifying and flagging high-risk individuals for enhanced monitoring and intervention. Some farms use colored leg bands. Others use separate feeding times or headlock sorting. Robotic milking operations sometimes leverage their existing cow identification systems to trigger different supplement protocols. It’s not as clean as separate pens, but it works. The principle matters more than the specific implementation.
A note on seasonality: If you’re running a seasonal calving operation—spring calving in the Upper Midwest, fall calving in parts of the South—you’ll want to think about how heat stress or cold stress might compound transition challenges. The tier assignments don’t change, but your monitoring intensity during environmental stress periods probably should. Summer calvings, in particular, tend to have elevated disease rates even in otherwise healthy cows.
An example scenario for a 400-cow herd might look something like this:
Approach
Annual Intervention Cost
Disease Events
Disease Cost
Total Cost
Blanket Protocol
~$12,000
~140
~$70,000
~$82,000
Stratified Protocol
~$10,000
~60
~$30,000
~$40,000
Potential Annual Savings
~$42,000
Your actual numbers will depend on your baseline disease rate, local costs, milk price, and specific herd conditions. But the general principle holds: targeting resources toward high-risk cows while reducing unnecessary interventions in low-risk animals tends to improve both outcomes and economics. It’s not magic—it’s just matching the intervention to the animal that needs it.
Quick Reference: Key Benchmarks
BHB targets (Krogstad, Ohio State, Journal of Dairy Science):
≤10% of 2nd-lactation cows with elevated BHB in week 1
≤20% of 3rd+ lactation cows with elevated BHB in week 1
Body condition targets (Ribeiro, University of Guelph):
3.0-3.25 BCS at dry-off (1-5 scale)
Maintain through calving; intervene at 200 DIM if needed
Disease cost estimates (Carvalho et al., 2019):
~$500 per single disease case
~$1,000 for multiple diseases in the same cow
Subclinical hypocalcemia cost (Caixeta, University of Minnesota):
~$150 per case
Affects up to 73% of 3rd+ lactation cows
DCAD timing (University of Wisconsin Extension):
Final 21 days prepartum for multiparous cows
Generally unnecessary for first-lactation heifers
When Good Enough Is Good Enough: Knowing Your Optimization Limit
One finding worth noting: operations that substantially reduce their disease rates often shift their optimization focus. Rather than continuing to push on disease reduction, many move toward production and reproduction metrics.
This makes economic sense when you think about it. Some level of transition disease is simply unavoidable—due to genetics, environment, and factors unrelated to nutrition. Retained placenta and certain cases of metritis aren’t fully preventable with nutritional protocols alone. More than 35% of all dairy cows have at least one clinical disease event during the first 90 days in milk, as Dr. Caixeta at Minnesota has noted. Some of that is just the biology we’re working with. You can optimize, but you can’t eliminate.
The research frontier is increasingly focused on inflammation management and precision monitoring technologies. There’s growing evidence that we’ll have more refined best management practices in the coming years—approaches that address dry matter drop, metabolic stress, and inflammation together, because all three are interconnected. Penn State and other extension programs are actively working in this space. It’s worth watching.
The return on investment for moving from high disease rates down to more moderate levels is typically substantial—that’s the $40,000 or more we’ve been discussing. But at some point, the economics of further disease optimization start to diminish relative to improvements in production and reproduction. You’ve reached a point of diminishing returns in disease prevention, and your attention is better directed elsewhere.
What progressive operations tend to optimize once they’ve addressed the big disease issues:
Early lactation production—targeting 80-plus pounds per day at first DHI test
Days to conception—pushing below 80 days versus the industry standard of around 100
Heifer development—getting fresh heifers producing at 90-plus percent of mature cow potential within the first few months
These become your next frontiers once transition health is reasonably controlled.
Why Knowledge Transfer Takes So Long
Perhaps the most thought-provoking aspect of transition cow research is how long it takes proven practices to reach widespread adoption. Negative DCAD feeding was demonstrated to be effective in the late 1980s. More than three decades later, many dairies still don’t use it consistently. Why is that?
That 2019 Journal of Dairy Science study on barriers to successful transition management found something interesting: the lack of a single definition of the transition period emerged as one barrier to improvement. Everyone’s talking about “transition cows,” but not everyone means the same timeframe or the same priorities. And barriers varied significantly across farms, suggesting that a tailored approach is required to achieve meaningful change. There’s no one-size-fits-all solution here—which makes extension work and consulting more challenging.
A 2025 study of Ontario dairy veterinarians published in the Journal of Dairy Science found that trust and communication emerged as critical components of veterinarian-client relationships—and it was acknowledged that these relationships take time to build. The researchers noted that veterinarians observed that proactive producers who implemented preventive strategies achieved better outcomes, whereas others exhibited greater resistance to change, often shaped by multigenerational traditions and economic constraints.
And you know what? None of these dynamics reflect bad intentions. They reflect the practical reality that changing established practices requires more than just evidence—it requires aligned incentives, collaborative relationships, and operational systems that support implementation. A protocol that works great in theory but doesn’t fit your labor situation or facility layout won’t actually be implemented.
What seems to accelerate adoption, based on what we’re seeing across the industry:
Producers who measure baseline disease rates and calculate their own economics (hard to argue with your own numbers)
Veterinarians who engage with current literature on transition research
Nutritionist partnerships focused on outcomes rather than product volume
Peer networks where successful protocol changes get shared and validated (sometimes the neighbor’s experience is more convincing than any research paper)
The operations achieving the best transition outcomes typically share a common characteristic: they’ve developed collaborative relationships with their advisory team where data-driven protocol adjustments are welcomed rather than resisted. It’s not adversarial—it’s problem-solving together.
Practical Takeaways
Start with measurement. Before changing any protocol, establish your actual disease rate by parity. The exercise takes about 60 days and requires only consistent tracking. Many operations discover rates higher than they’d estimated—and that discovery itself often motivates change.
Consider the parity difference. First-lactation heifers face fundamentally different metabolic challenges than fourth-lactation cows. The research is clear that treating them identically often leaves money on the table. Match your protocols to your animals.
Begin with low-risk changes. Discontinuing calcium supplementation for first-lactation heifers represents one of the lowest-risk, highest-confidence first moves. Frame it as a 60-day test with your veterinarian. Collect data. See what happens.
Collaborate rather than confront. Successful protocol changes typically emerge from partnerships between producers and their advisors. Come with data and questions rather than demands. As the Ontario veterinarian research found, trust and communication are the foundation.
Assess your infrastructure honestly. Stratified protocols work best with separate close-up pen capability, but modified approaches can work with careful individual-cow identification even in mixed groups. Don’t let perfect be the enemy of good.
Protect your genetic investment. Your best cows—the ones carrying the genetics you’ve spent years developing—deserve protocols that keep them healthy through transition. A cow that can’t get through the fresh period without complications may never show you what she’s capable of producing or passing on.
Calculate your specific economics. The general principle—that targeted protocols tend to outperform blanket approaches—is well-supported by the research. Your specific numbers will vary, but they’re worth calculating. It’s hard to prioritize what you haven’t quantified.
There’s a real gap between what the research shows and what’s actually happening on many farms—and that gap represents opportunity. The knowledge is there. The economics generally work out. What remains is finding the right starting point for your operation and building from there.
For operations willing to invest the time in systematic measurement and collaborative protocol development, the research suggests meaningful improvement is available—not through revolutionary change, but through thoughtful, evidence-based adjustments applied consistently over time. Small wins, stacked up, become significant results.
The Bullvine brings dairy producers research-backed insights for informed decision-making. For detailed guidance on transition cow protocols, consult with your herd veterinarian and review resources from university extension programs, including University of Wisconsin, Penn State, University of Minnesota, and University of Guelph.
Every week, thousands of producers, breeders, and industry insiders open Bullvine Weekly for genetics insights, market shifts, and profit strategies they won’t find anywhere else. One email. Five minutes. Smarter decisions all week.
German butter at €0.77. U.S. milk at $15. The math is already done—now it’s decision time.
Executive Summary: German butter crashed to €0.77—down 35% in five months—and that price signal typically reaches North American milk checks within 90 days. Class III futures have already fallen to $15.50-$16.50/cwt for early 2026, leaving most mid-size dairies $2-3/cwt underwater. At a 1.3x Debt Service Coverage Ratio, you still control your options; wait until 1.0x, and your lender starts making the calls. That timing gap alone can cost a farm family $200,000 to $400,000. The operations surviving this squeeze share three things: component-focused genetics (U.S. butterfat hit 4.4% this year, up from 3.7% two decades ago), peer accountability groups, and the willingness to make structural decisions while flexibility remains. The signals are clear—what matters now is what you do with them.
You know what catches my attention when I’m scanning global dairy markets? It’s not always the headline numbers. Sometimes it’s a farmer walking through a grocery store and doing math in his head.
A dairy producer in Lower Saxony—runs about 85 cows outside Cloppenburg—told Agrarheute this month that he saw butter priced at €0.77 per 250g block at his local Aldi. Down from €1.19 just five months ago. He knows what that kind of retail movement typically means for his milk check come February or March. “When retail goes this low for this long, we feel it,” he said. And based on what economists have been tracking, he’s probably right.
German butter prices crashed 35% in five months—from €1.19 to €0.77. This price signal typically reaches North American milk checks within 60-120 days. Understanding this global transmission is the difference between proactive decisions and reactive scrambling.
That farmer’s instinct aligns with patterns that agricultural economists have been documenting across European markets. Here’s what I find interesting for those of us watching from Wisconsin, California, or the Northeast: Germany’s butter aisle may offer something more valuable than headlines. It’s essentially a 3-6 month preview of the financial pressure that often works its way through global supply chains.
How Retail Price Wars Travel Back to the Farm Gate
Let me walk through how this mechanism typically works, because once you see the pattern, it becomes easier to spot in your own markets.
Germany’s grocery market operates differently than what most North American producers experience. Discount retailers—led by Aldi and the Schwarz Group (which owns Lidl and Kaufland)—account for over 36% of German grocery retail sales, according to USDA Foreign Agricultural Service data. When they drop butter prices—as they did dramatically this fall—competitors tend to follow within days.
Dr. Holger Thiele at the ife Institute for Food Economics in Kiel calls this “retail-driven margin compression.” His analysis shows that butter retailing at €0.77 per 250g implies a wholesale equivalent of roughly €3,080 per tonne—while actual wholesale butter was trading around €4,150 on European exchanges. Retailers are absorbing over €1,000 per tonne in losses on butter alone.
Why would retailers accept losses on butter?
Butter is what retail analysts call a traffic driver. Shoppers notice butter prices. A €0.77 price point gets customers through the door, and they leave with €80 in groceries. The loss on butter becomes a customer acquisition cost.
Here’s where it connects to farm economics. Sustained retail price drops typically show up in farmgate milk contracts 60-120 days later, depending on cooperative payment structures. German milk prices declined meaningfully in late 2024, according to AMI Agrarmarkt Informations-Gesellschaft data. Meanwhile, Arla Foods reported a net profit of €401 million in 2024, up 5.5% from €380 million the year before. The margin didn’t disappear—it shifted upstream, away from farmers.
The Global Connection: Why Wisconsin Feels Berlin
Step
Market Event
Typical Timeframe
Impact on You
1
German retail butter crashes (€1.19 → €0.77)
Immediate
Retail price wars begin
2
European wholesale butter softens (€7,200 → €4,150/tonne)
2–4 weeks
Processors adjust buying
3
Global Dairy Trade auctions reflect weakness
4–6 weeks
NZ/AU prices drop
4
U.S. Class III/IV futures decline ($18 → $15.50/cwt)
6–8 weeks
Your risk management window
5
Your milk check drops
60–120 days
$2-3/cwt below breakeven
What keeps me watching these markets closely is how quickly price signals travel internationally:
European butter and powder prices influence Global Dairy Trade auction results in New Zealand
GDT results affect Fonterra’s farmgate payments
Fonterra prices set informal benchmarks that ripple through Australian and American contract negotiations
Dr. Mark Stephenson, who directs Dairy Policy Analysis at the University of Wisconsin-Madison, has tracked this transmission mechanism for over a decade. His November 2025 Dairy Situation and Outlook report noted that European market softness is putting downward pressure on U.S. Class III and Class IV prices, with a typical lag of 60-90 days.
Class III futures are pricing early 2026 milk at $15.50-$16.50/cwt. Breakeven for mid-size Midwest dairies: $18-$19/cwt. The math is broken—and waiting won’t fix it. Farms at DSCR 1.3x still have options. Farms shipping milk underwater for six months don’t.
Current Market Snapshot:
Market
Current Level
Context
German retail butter
Below €1/250g
Down ~33% from summer peaks
European wholesale butter
€4,150/tonne
Down from €7,200+ in early 2024
Australian farmgate milk
A$8.00-$9.00/kg MS
Rabobank/Dairy Australia 2025-26 forecast
U.S. Class III futures
$15.50-$16.50/cwt
Below the USDA’s $17.50 December WASDE projection
For context, University of Wisconsin extension cost-of-production benchmarks put average COP at $18-19/cwt for mid-size Midwest dairies. That gap between market prices and production costs is where the financial stress lives.
The Genetics Response: Why Component Breeding Matters More Now
Here’s something worth considering for those thinking about breeding decisions in the current environment. When fluid milk prices soften, operations that have invested in high-component genetics tend to weather the storm better.
Why? Because Class III and Class IV pricing formulas reward butterfat and protein by the pound—not by volume. As Kevin Jorgensen, senior Holstein sire analyst at Select Sires in Ohio, explained to Dairy Global: “We try to strike a balance. We select for the highest possible combined fat and protein in the milk without sacrificing fertility and health.”
The numbers tell an encouraging story for producers who’ve been making component-focused breeding decisions:
Butterfat has climbed dramatically: From 3.7% in February 2005 to 4.4% in February 2025, according to USDA AMS data and 2024 was the first year U.S. milk averaged above 4.0% butterfat for every single month in recorded history
Protein continues rising: From 3.04% in 2004 to 3.29% in 2024, based on Federal Milk Marketing Order data cited by CoBank
Genetic progress is accelerating: The April 2025 Holstein base change rolled back 45 pounds on butterfat—nearly double any previous adjustment in the breed’s history, per Council on Dairy Cattle Breeding data
Pro Tip: Component Math in a Soft Market
Twenty years of consistent genetic progress: U.S. butterfat has climbed from 3.7% (2005) to 4.4% (2025). In a $15 milk market, component-focused genetics aren’t a luxury—they’re margin insurance. Every tenth of a percent matters when Class III compresses.
When Class III prices drop from $18 to $16/cwt, a cow producing 4.4% butterfat versus 3.7% butterfat can mean the difference between covering costs and falling short. Every tenth of a percent matters more when base prices compress.
Within about 5 years, the average Holstein milk fat percentage has grown from 3-3.5% to about 4%. There is now a wide variety of ‘higher-fat Holstein bulls’, and whether the customer is buying semen or embryos, nobody wants low-fat genetics.
Emily Bosch, senior communications manager at Holstein Association USA, expects this trend to continue: “The genetic trends for milk, fat, and protein production are extremely favourable for Holstein cattle, so we expect to see these increases to continue in the future.”
For operations evaluating their breeding programs during this margin squeeze:
Prioritize combined fat and protein (CFP) over milk volume in sire selection
Consider the updated Net Merit (NM$) index weightings released in 2025
Balance component emphasis with fertility and health traits—as Jorgensen notes, “The balanced cow is what we should be striving for.”
Review your herd’s current component averages against regional benchmarks
The CoBank Knowledge Exchange research suggests butterfat could pass 5% within the next decade if genetic selection continues at the current pace. Operations positioned for that future may find themselves better insulated against volatile prices.
Financial Warning Signs: What to Watch
I’ve been talking with producers and ag lenders over the past few months, and a pattern keeps emerging. Farmers know their numbers are tight. What many aren’t tracking as closely is where they sit relative to the specific thresholds that tend to determine financing options 12-18 months down the road.
Debt Service Coverage Ratio (DSCR) — the single most important number your lender watches:
DSCR Range
Status
What It Typically Means
Above 1.5x
Healthy
Multiple strategic options available
1.25-1.5x
Acceptable
Lenders generally remain flexible
1.15-1.25x
Caution
New financing becomes difficult
Below 1.15x
Constrained
Restructuring conversations likely
Below 1.0x
Crisis
Income can’t service existing debt
Debt-to-Asset Ratio — your leverage position:
D/A Range
Status
Practical Implication
Below 30%
Strong
Expansion financing available
30-50%
Acceptable
Standard lending terms
50-60%
Caution
Limited flexibility
Above 60%
Constrained
One bad year erodes equity fast
Current Ratio — can you meet obligations due within 12 months?
Current Ratio
Status
What It Means
Above 2.0x
Strong
Solid seasonal buffer
1.5-2.0x
Adequate
Can weather normal volatility
1.2-1.5x
Vulnerable
Seasonal stress likely
Below 1.2x
Pressure
Near-term liquidity concerns
Key Insight from Extension Educators
The difference between making proactive decisions at 1.3x DSCR versus reactive decisions at 1.0x DSCR can be $200,000 to $400,000 in family wealth, based on farm exit data over the past five years.
A Pattern Worth Recognizing
Here’s something I’ve noticed in conversations with producers across different regions, and I think it’s worth naming because awareness can help.
Dr. David Kohl at Virginia Tech, who’s studied farmer financial decision-making for over 40 years, calls it “cycle-based thinking.” Farmers who’ve survived previous downturns—2009, 2015-2016, 2020—have learned that prices eventually recover. That creates a reasonable expectation that current pressure is temporary.
The basic dynamic:
Farmers anchor to the highest prices they’ve experienced
When Class III hit $23/cwt in 2022, that became the psychological reference point
Current prices feel like temporary deviations rather than potential new baselines
This isn’t a criticism—it’s how human cognition works under uncertainty. But it can create a gap between when stress becomes visible in metrics and when farmers act.
Neither approach is guaranteed right or wrong. But having a clear framework for when you’ll act tends to produce better outcomes than deciding in the moment.
What’s Working: Farms Finding Margin
MoDak Dairy, South Dakota: Greg Moes runs a 500-cow operation that started building its beef-on-dairy program in 2023—before milk prices softened. Moes explained: “Beef-on-dairy carried us when milk prices were low. We’re getting $800-$1,000 per calf on those crosses, and that income doesn’t care what Class III is doing.”
High-Performing Australian Operations: Dairy Australia’s Focus Farm program findings show top-quartile farms share common characteristics:
Pasture utilization rates above 80%
Concentrate feeding below 2.5 tonnes per cow
Focus on profit per hectare over production volume
15%+ return on assets
Metric
Top-Quartile Farms
Average Farms
Pasture Utilization Rate
>80%
60–70%
Concentrate Feeding
<2.5 tonnes/cow
3.0–3.5 tonnes/cow
Return on Assets (ROA)
15%+
5–8%
Profit Focus
Per hectare
Per cow (volume)
Fertility/Health Emphasis
High (balanced breeding)
Moderate (volume-first)
Multi-Generational Wisconsin Dairies: The operations that have maintained stability through multiple downturns tend to treat succession not as a single event but as a continuous business infrastructure. Active next-generation involvement typically starts 5-10 years before formal transition.
Building Accountability: What Peer Groups Look Like
One of the most effective tools I’ve encountered for maintaining financial discipline is structured peer accountability. The Farmer-to-Farmer Education Act, reintroduced by Senators Luján and Moran in May 2025, is based on USDA research showing that over 50% of producers sought business education from other farmers rather than traditional extension services.
Effective peer group structure:
4-6 farms in similar situations (size, region, production system)
Quarterly meetings with a neutral financial analyst
Each farm brings actual numbers: DSCR, debt-to-asset ratio, current ratio, IOFC
Group discusses trajectories honestly; farms commit to specific decisions
Why This Works
Extension educators who’ve run these programs report that farms that stay accountable to a peer group tend to make structural decisions 6-12 months earlier than farms that rely solely on individual analysis. That timing difference is often the gap between restructuring on your terms versus your lender’s terms.
Understanding the Lender Perspective
Agricultural lenders continuously monitor DSCR, debt-to-asset ratios, and liquidity. The American Bankers Association’s November 2025 agricultural lending survey found that only 52% of farm borrowers are expected to remain profitable in 2025, with “credit quality deterioration” flagged as lenders’ top concern.
This isn’t villainy—it’s fiduciary responsibility. But it does mean farmers need their own early warning systems built around farmer interests, not lender portfolio management.
A 90-Day Framework
If you’re at DSCR 1.3x or lower—or if current market conditions would push you there—here’s a practical framework:
Days 1-30: Establish Financial Clarity
Get a clean, accrual-based financial statement (not just tax returns)
Calculate DSCR, debt-to-asset ratio, and current ratio
Document your breakeven milk price under the current cost structure
If breakeven exceeds $17/cwt with futures at $15-$16, that gap needs attention now
Days 31-60: Evaluate Strategic Options
Model three scenarios:
Scale: What would expansion require to achieve meaningful per-unit cost advantages?
Specialize: Could you restructure toward pasture-based, beef-on-dairy, or component-focused premium markets?
Transition: What does a planned exit look like while you still have equity?
Days 61-90: Commit and Build Accountability
Choose one direction and document a 24-month plan with milestones
Form or join a peer accountability group
Schedule your first peer meeting with real numbers on the table
What This Means for Your Operation
German butter below €1 is a signal. Class III futures in the $15- $16 range are a signal. These aren’t just interesting data points—they’re telling us something about where margins are heading over the next 6-12 months.
How you interpret those signals is your decision. You can read them as background noise or as useful information for checking your numbers while you have options.
The farms that remain viable through industry transitions tend to establish clear decision frameworks, build accountability systems, and act when indicators suggest action—rather than waiting for certainty that never quite arrives.
If you’re at DSCR 1.3x right now, your decision window is measured in quarters, not years. That’s not meant to create panic—it’s meant to be useful information for planning.
The math of farm finance isn’t complicated. The decisions it implies are rarely easy. But at DSCR 1.3x, those decisions are still substantially yours to make. That’s worth protecting.
For farmers seeking financial benchmarking resources: University extension dairy programs in most states offer confidential farm financial analysis. The Center for Dairy Profitability at UW-Madison publishes annual benchmarking studies. Many regional cooperatives now offer member financial planning services. The key is to engage these resources while your financial position remains flexible.
Key Takeaways
90-day signal: German butter crashed 35%—U.S. milk prices typically follow within 3 months
The math is broken: Class III at $15.50 vs. $18+ breakeven puts most dairies underwater
DSCR 1.3x is your window: Act now or lose $200K-$400K in family wealth waiting until 1.0x
Components beat volume: 4.4% butterfat is margin insurance when prices compress
Build accountability: Farms in peer groups make hard decisions 6-12 months faster
Complete references and supporting documentation are available upon request by contacting the editorial team at editor@thebullvine.com.
Learn More:
The 18-Month Window: Why Your Lender Knows Your Dairy’s in Trouble Before You Do – This tactical guide explores the specific financial indicators and “red flag” metrics lenders monitor. It provides producers with the knowledge needed to initiate restructuring conversations while they still hold significant equity and operational control.
Every week, thousands of producers, breeders, and industry insiders open Bullvine Weekly for genetics insights, market shifts, and profit strategies they won’t find anywhere else. One email. Five minutes. Smarter decisions all week.
Bred for $3 fat. Paid $2.50. The 5-year genetic timing gap just got real—and the smartest dairies are already adapting.
Executive Summary: October 2024 delivered record U.S. butterfat at 4.30%—genomic selection is doing exactly what it promised. The problem is timing: those genetics were chosen when fat topped $3.00 per pound, and today’s market pays $2.50. This 5-7 year gap between breeding decisions and bulk tank reality is dairy’s toughest planning challenge, made more complex by an April 2025 Net Merit $ revision that increased butterfat emphasis just as prices softened. Factor in heifer inventories at 20-year lows—CoBank projects 800,000 fewer replacements through 2027—and record cheese exports making protein the processing bottleneck, and genetic strategy looks different than it did three years ago. The producers navigating this well are leaning on economic indices rather than chasing premiums, building health traits into their programs, and treating extended productive life as the new margin strategy. The window for assessing your positioning runs through 2026—before current selections fully express into whatever market awaits.
You know what struck me when I was looking at the October milk production numbers? That month delivered the highest butterfat production in U.S. dairy history. We’re talking 1.947 billion pounds at 4.30% concentration—that’s straight from USDA’s November report. By any measure, genomic selection delivered exactly what it promised. The science worked.
But here’s what’s interesting. Those genetics trace back to breeding decisions made in 2021-2022, when butterfat was running north of $3.00 per pound on CME spot markets. Some of you probably remember that October 2022 peak at $3.18. Farmers making aggressive butterfat selections back then were doing exactly what the numbers told them to do. Made perfect sense at the time.
Now those genetics are expressing into a market paying $2.50-2.80 per pound. That’s just how it played out.
And look, this isn’t about second-guessing anyone. It’s about understanding something we all have to work with: genetic cycles run on 5-7-year timelines, while commodity markets… well, you’ve seen how fast those can shift. That timing mismatch creates challenges, no matter how sound the original thinking was.
QUICK TAKE: The Numbers That Matter
4.30% butterfat — October 2024’s record test, up from 4.08% five years ago
0.77 protein-to-fat ratio — Below the 0.82-0.84 optimal range for cheese plants
$3,000-$4,000 — Current replacement heifer prices (75% increase since April 2023)
508,808 metric tons — Record U.S. cheese exports in 2024, first time exceeding 1 billion pounds
800,000 head — Projected dairy heifer inventory decline through 2026-2027
Let me walk through the data, because there’s a nuanced story here worth understanding.
U.S. dairy cows hit 4.30% butterfat in October—up from 4.08% just five years back.
That 5.4% increase in concentration doesn’t sound like much until you multiply it across 9.36 million cows producing roughly 226 billion pounds of milk a year. That’s a real shift in what’s going into bulk tanks nationally.
Now, it’s worth noting that October typically shows higher butterfat tests anyway—fall milk tends to run richer than summer production due to temperature effects on cow metabolism and feed intake patterns. But even accounting for seasonal variation, we’re seeing a structural increase that goes beyond normal fluctuation. The trend line has moved.
Protein’s held pretty steady at 3.30%, which brings us to what might be the most telling metric:
The protein-to-fat ratio has dropped to 0.77 — and that matters more than it might seem at first glance.
If you’ve spent any time around cheese operations—and many of you have—you know processors generally like to see that ratio closer to 0.82-0.84 for optimal standardization and yield. Dr. David Barbano over at Cornell has published extensively on this in the Journal of Dairy Science, and his milk standardization work documents these ranges pretty clearly.
When milk comes in heavy on fat relative to protein, plants have to adjust. Dr. John Lucey at the Center for Dairy Research in Madison describes it as “real operational adjustments at the plant level—not unmanageable, but it affects processing economics in ways that eventually work back through the value chain.”
I’ve heard similar things from cooperative procurement managers in the Upper Midwest. One large regional co-op’s field services director told me their standardization costs have increased noticeably over the past two years, which is starting to factor into component premium structure discussions at the board level. The genetic decisions we made five years ago are genuinely showing up in plant economics today. It’s worth being aware of.
The Timing Question—And the Ironic Twist in the 2025 Index Update
The Timing Trap: How Genetic Decisions Lag Market Reality by 5-7 Years
Here’s something I’ve been thinking about a lot lately. Genetic selection success depends heavily on when decisions get made—not just what traits you’re selecting for.
And here’s where it gets really interesting—even our selection tools were caught in this timing paradox.
The April 2025 Net Merit $ revision, documented in USDA-AGIL’s technical report, actually increased emphasis on butterfat and decreased emphasis on protein compared to the 2021 formula. Why? Because NM$ economic weights are based on recent price trends—specifically, the previous three-year average. Butterfat prices from 2021-2024 averaged $2.88 per pound, well above the $2.10 forecast used in the 2021 index. Meanwhile, protein prices averaged only $2.27, below the $2.60 that had been projected.
The Ironic Index Trap: How April 2025’s NM$ Formula Emphasized Butterfat Just as Prices Fell
So the index that’s supposed to help us hedge against market uncertainty was itself responding to high butterfat prices—just as those prices were beginning to soften. The 2025 NM$ formula now places 31.8% relative emphasis on fat and only 13% on protein for Holsteins. There’s a certain irony in that timing.
This doesn’t mean NM$ is broken—far from it. The 2025 and 2021 formulas correlate at 0.992, meaning most animals rank similarly. But it does illustrate how even our best tools reflect backward-looking price data. Nobody’s crystal ball works perfectly.
Consider two groups of producers who approached genomics differently.
The early adopters—those who started genomic testing between 2010 and 2015—were operating in a different world entirely. Back then, reliability scores for production traits in young animals ranged from 41% to 50%. That’s from VanRaden’s foundational work in the Journal of Dairy Science. Better than parent average, sure, but with enough uncertainty that most folks spread their selection emphasis across multiple traits almost by necessity.
I was talking with a producer in southwest Wisconsin not long ago—a third-generation operation running about 650 Holsteins. “We started genomic testing in 2012 and were pretty conservative about it,” he told me. “The reliability numbers just weren’t high enough to justify betting heavy on any single trait. We focused on steady progress across the board.”
That approach, whether he planned it that way or not, positioned his herd well for different market scenarios. Including this one.
The more recent selectors—those making decisions in 2021-2023—faced different conditions. Genomic reliability had improved to 70-78% on young animals according to CDCB documentation. The tools were more precise. And butterfat prices were at historic highs. The economic signals seemed pretty clear.
Dr. Kent Weigel at UW-Madison, who’s done as much genomic selection research as anyone, puts it this way: “When you’re looking at butterfat premiums that high, and you’ve got genomic tools with that kind of reliability, the math seems obvious. The challenge is that nobody can reliably predict commodity prices five to seven years out. The genetics will do what the genetics do. Markets are another matter.”
Both approaches made sense given what people knew at the time. That’s important to acknowledge.
The Breed Diversity Conversation
There’s been more discussion lately about genetic diversity in Holsteins, and it deserves thoughtful consideration. Not alarm, not dismissal—just honest assessment.
The breed has achieved remarkable progress. CDCB’s periodic genetic base adjustments document substantial merit increases. That’s a real achievement, and we shouldn’t lose sight of it.
But that progress has come alongside increasing genetic concentration. Dr. Chad Dechow at Penn State has researched this extensively—his work in the Journal of Dairy Science shows Holstein inbreeding levels around 8% on average now, with young bulls running somewhat higher at 9-10%.
“What we’re seeing is the natural consequence of intense selection on a relatively narrow genetic base,” Dr. Dechow explains. “The bulls ranking highest on TPI and NM$ tend to be related to each other, so when everyone selects from the top of the list, inbreeding accumulates. It’s not a crisis yet, but it’s a trend worth monitoring.”
The Hidden Cost of Genetic Progress: Why Inbreeding Now Costs $23 Per Percentage Point Per Cow
It’s worth noting that we’re not alone in grappling with this. Dairy industries in New Zealand and across the EU have been addressing similar questions about genetic diversity within their own populations. The Dutch, in particular, have invested significantly in maintaining broader genetic bases in their Holstein-Friesian herds, and there’s been interesting research coming out of Wageningen on balancing selection intensity with diversity preservation. Different systems, different approaches—but the underlying challenge is universal when you’re selecting intensely from elite genetics.
The practical effects show up gradually. Published research from several groups—Pryce’s team in 2014 and Smith’s in 2019, both in the Journal of Dairy Science—has documented that each percentage point of inbreeding correlates with roughly 0.2-0.3 additional days in the calving interval. Not dramatic on its own. But it compounds over time, as many of us have seen.
What’s encouraging is that tools now exist to proactively manage this. CDCB publishes Expected Future Inbreeding scores through uscdcb.com that help identify high-merit genetics with less relationship to your existing herd. Several AI organizations have built mating programs around this. These are practical solutions for folks who want to stay ahead of the trend.
What Seems to Be Working
I’ve had a lot of conversations with producers and consultants across the Midwest and Northeast over the past year. Some patterns keep coming up among operations that seem to be navigating current conditions well.
Letting Economic Indices Do the Heavy Lifting
The operations that appear best positioned aren’t chasing whatever component pays best this month. They’re using economic indices—particularly Net Merit $—as their primary guide.
What makes NM$ useful is that USDA updates those economic weights periodically based on current conditions. Yes, those updates lag the market somewhat—as the April 2025 revision illustrates—but over time, the adjustments provide more systematic hedging than trying to guess where prices will be in five years.
A producer I know in Sheboygan County, Wisconsin—400-cow operation—made this shift about three years back. “We used to lean into whatever component was paying well,” he said. “Now we focus on NM$ and let the index handle the economic weighting. Our genetic progress has actually been more consistent.”
You hear variations of this story across different regions. California, Upper Midwest, Northeast—the specifics vary, but the principle holds.
Rethinking Replacement Economics
Here’s something that’s changed the math for a lot of operations—and it ties directly to one of the biggest structural shifts in our industry.
With heifer prices sustained at $3,000-$4,000 across many markets, herd turnover economics look dramatically different than they did five years ago. USDA data shows a 75% increase in heifer prices from April 2023 to mid-2025, moving from $1,720 per head to over $3,000—reaching unprecedented levels.
The driver? The beef-on-dairy trend has fundamentally reshaped our replacement pipeline. According to CoBank’s August 2025 analysis, dairy replacement heifer inventories have fallen to a 20-year low and could shrink by an estimated 800,000 head through 2026-2027 before beginning to recover. The National Association of Animal Breeders tracked the shift: of 9.7 million units of beef semen sold in 2024, 7.9 million went to dairy farmers—up from 5 million of 7.2 million units in 2020.
The Replacement Reckoning: How 800,000 Missing Heifers Reshape Genetic Strategy
The Financial Reality
Any genetic strategy conversation has to acknowledge what most of us are actually dealing with. Dairy farms generally run on tight margins with real debt service obligations. That’s just the reality.
Annual summaries consistently document substantial debt across dairy operations. When milk prices run in that $22-23 per cwt range—roughly where USDA forecasts have pointed for early 2025—margins support current operations but don’t leave much cushion for experiments.
Dr. Weigel acknowledges this: “You have to be realistic about financial constraints. The best genetic strategy doesn’t matter if it creates a cash flow problem. For most operations, the answer is gradual adjustment—incorporating diversity and health traits incrementally while maintaining production genetics that support current obligations.”
What seems to work is matching the strategy to your actual situation:
If you’ve got some balance sheet flexibility: Consider incorporating Expected Future Inbreeding scores in selection. Explore health trait emphasis. Build reserves that give you room to adjust.
If margins are tighter: Focus first on extending herd life to reduce replacement costs. Use economic indices rather than chasing component premiums. Address refinancing conversations while conditions are favorable.
Both approaches make sense—they just align with the circumstances.
The calculation that keeps coming up: extending herd average from 2.2 to 2.5 lactations through improved fertility and health genetics can reduce heifer purchases by 10-15%. On a 500-cow operation, that potentially keeps $100,000-$150,000 annually in the business rather than flowing out for replacements.
The genetic tools to support this exist. Productive Life and Livability carry reasonable genomic reliability. The daughter pregnancy rate directly influences how long cows stay productive. It’s a different way of thinking about genetic investment—through cost reduction rather than just chasing more production.
Taking Health Traits Seriously
This is one area where the tools have really improved. Modern genomic evaluations include predictions for health traits that weren’t reliably measurable a decade ago. CDCB documentation shows mastitis resistance predictions now achieving around 40% reliability. Lower than production traits, sure, but meaningful enough for selection purposes.
Research from Canadian dairy genetics programs—including University of Guelph work in the Journal of Dairy Science—has documented that herds emphasizing health traits can achieve substantially lower lifetime antibiotic use alongside improved productive life. The economic benefit often runs $150-200 per cow annually when you factor in reduced vet costs and culling.
Dr. Filippo Miglior at Lactanet Canada sees this as the emerging opportunity: “Health traits are where I think we’ll see the most practical progress over the next decade. The genomic tools have become reliable enough for meaningful selection, and the economic payback is real even when it’s harder to see on individual milk checks.”
That resonates with what I’ve seen on farms.
The Export Picture—And Why Protein Is Becoming the Bottleneck
One more piece worth understanding, because it adds important context to the milk composition discussion.
U.S. cheese exports are on a historic run. According to the U.S. Dairy Export Council, 2024 set a new record at 508,808 metric tons—the first time ever exceeding 1 billion pounds. That’s 17% above the previous record set in 2022. As USDEC president Krysta Harden noted, “U.S. suppliers posted record-high cheese exports, strengthened their presence across Latin America, lifted U.S. dairy export value, and demonstrated their commitment to global markets.”
U.S. suppliers set records in several key markets in 2024, including Mexico, Central America, South America, and the Caribbean. Strong demand continues across Asia, particularly in Southeast Asian markets.
Here’s why this matters for milk composition: cheese production is protein-limited, not fat-limited. When we’re shipping record volumes of cheese overseas—and new processing capacity keeps coming online—protein becomes the bottleneck. Our current high-fat, relatively lower-protein milk actually creates challenges for exporters trying to maximize cheese output.
So while we’ve been genetically optimizing for butterfat premiums, the export market that’s driving so much of our growth needs protein. That’s not to say fat doesn’t matter—it absolutely does, especially for butter exports, which rebounded strongly in 2024 with AMF shipments more than doubling year-over-year according to USDEC data. But it does suggest that balanced milk composition may have more strategic value than we’ve been pricing in.
Dr. Mark Stephenson at UW-Madison, who directs dairy policy analysis, notes that “the export growth reflects genuine U.S. competitiveness on price and quality. Maintaining that position long-term depends partly on genetic resources—having flexibility to produce milk that meets diverse market specifications.”
As we compete globally, our ability to produce milk suited to different end uses becomes a competitive factor. Our genetic flexibility—or lack of it—shapes what market opportunities we can pursue.
Some Questions Worth Asking Yourself
As genetics selected in 2023-2024 move toward full expression in 2026-2028, there’s time to evaluate where you stand.
What’s happening with inbreeding in your herd? CDCB provides coefficients at uscdcb.com, and AI organizations often do herd-level analysis. If you’re trending toward 8-9%, it might be worth a conversation with your genetic advisor.
How balanced is your selection emphasis? Heavy concentration in any single area creates market exposure. Looking at where you stand across production, health, and fertility gives a useful perspective.
What’s your replacement rate telling you? Elevated involuntary culling often signals underlying fertility or health issues that compound over time. Sometimes it’s worth addressing root causes at the genetic level.
How dependent is your milk check on specific premiums? Understanding what happens if butterfat premiums compress further helps inform genetic emphasis going forward.
Looking Ahead
Timing matters as much as trait selection. That 5-7 year expression cycle means today’s decisions meet future conditions we can’t fully predict. October’s record butterfat illustrates this pretty clearly.
Even index formulas chase prices. The April 2025 NM$ update increased butterfat emphasis based on recent high prices—just as those prices were softening. It’s a reminder that all our tools are, to some degree, backward-looking.
Economic indices still offer systematic hedging. Despite their limitations, NM$ balances multiple trait values and adjusts as conditions change. Generally beats trying to forecast commodity prices years out on your own.
Breed diversity warrants attention. Progress has been remarkable, and tools exist to balance improvement with diversity maintenance. Expected Future Inbreeding scores make this practical.
The heifer shortage is real and structural. With replacements at 20-year lows and 800,000 fewer heifers projected through 2026-2027, extending productive life through genetics has never been more valuable.
Protein matters more than we’ve been pricing. Record cheese exports mean protein is increasingly the bottleneck. Balanced composition may have strategic value beyond what component premiums currently reflect.
Assessment time is now through 2026. Genetics selected will fully express in a few years. Evaluating your positioning while there’s time for adjustments makes sense.
The Bottom Line
Today’s genomic tools are genuinely more capable than anything we’ve had before. What experience keeps teaching us is that effective use requires careful consideration of timing, market uncertainty, and the development of genetic flexibility that works across different conditions. The producers who seem to navigate these cycles best tend to balance ambition with appropriate humility about what any of us can actually predict.
For ongoing coverage of genetic trends, market analysis, and practical strategies, visit www.thebullvine.com.
Resource Note
CDCB offers several free tools at uscdcb.com—Expected Future Inbreeding scores, individual inbreeding coefficients, and genetic evaluations across production, health, and fertility. Your AI rep can help interpret these for your situation. Most organizations can also pull a herd-level inbreeding trend report that shows where you’ve been heading over the past several breeding cycles.
Key Takeaways:
Timing beats genetics: The $3 butterfat genetics you selected in 2021-2022 are now producing into a $2.50 market—the 5-7 year cycle creates risk no breeding decision can fully hedge
Even the indices lag: April 2025’s Net Merit $ revision increased fat emphasis based on recent high prices—just as those prices softened. All tools look backward.
Productive life is the new ROI: Heifer inventories at 20-year lows and 800,000 fewer replacements through 2027 mean extending herd life now pays faster than chasing production gains
Protein is the emerging bottleneck: Record 2024 cheese exports—first year over 1 billion pounds—mean processors need balanced composition more than current component premiums suggest
Your window is now through 2026: Genetics selected today will fully express by 2028-2030. Assess your herd’s positioning while adjustment time remains.
Complete references and supporting documentation are available upon request by contacting the editorial team at editor@thebullvine.com.
Learn More:
2025 Genetic Reset: How Rigid Bull Selection Could Cost Your Herd $147,000 – This tactical guide provides a five-step checklist for recalibrating sire benchmarks post-April 2025. It demonstrates how to use adaptive thresholds and breed-specific Z-scores to avoid the costly inbreeding and production losses caused by outdated selection rules.
The 800,000-Heifer Shortage Reshaping Dairy: Why Some Farms Will Thrive While Others Exit – This strategic analysis explores the economic fallout of the historic 20-year low in replacement inventories. It provides essential frameworks for understanding how component-focused “fortress farms” are securing their future while navigating structural expansion constraints and plant capacity shifts.
2025 Dairy Year in Review: Ten Forces That Redefined Who’s Positioned to Thrive Through 2028 – This review highlights emerging solutions to the industry’s most pressing challenges, including the “27-month supply trap” and the revolutionary shift in culling math. It reveals how progressive operators are using precision genetics to convert heifer constraints into long-term capital efficiency.
The Sunday Read Dairy Professionals Don’t Skip.
Every week, thousands of producers, breeders, and industry insiders open Bullvine Weekly for genetics insights, market shifts, and profit strategies they won’t find anywhere else. One email. Five minutes. Smarter decisions all week.
Three things propping up your dairy. All temporary. The window to reposition closes in weeks, not months.
Executive Summary: Three temporary forces are keeping mid-size dairies profitable: beef-on-dairy premiums, cheap feed, and strong margins. All three face pressure by late 2026. Here’s the structural problem underneath: the U.S. herd has grown to 9.58 million head—highest since 1993—while only 2.5 million heifers are expected to calve in 2025, the lowest in 22 years of USDA tracking. Producers are stretching the cow productive life to cover the gap. That strategy has a ceiling, and we’re approaching it. When the cushions deflate, operations with costs above $20/cwt face margin compression that could erase six figures annually. The window to act—contract review, strategic herd adjustment, revenue diversification—is weeks, not months.
Something unusual is happening in U.S. dairy right now. Mid-size operations are stacking up real financial advantages from multiple directions at once—beef-on-dairy premiums, cheaper feed, and risk management support all landing in the same year. We haven’t seen this kind of alignment since around 2014.
That’s the good news.
Here’s what should concern you: three temporary economic cushions are masking a structural transformation that will reshape this entire industry. The producers who understand what’s actually happening—and position now—will come out ahead. Those who don’t may find out the hard way that 2025’s profits were a trap.
The Three Cushions (And Why They Won’t Last)
Cushion #1: Beef-on-Dairy Revenue
The beef-cross breeding revolution has fundamentally changed calf economics. Market experts like Mike North of Ever.Ag report some beef-on-dairy calves bringing close to $1,000 just a few days after birth—a world away from the often double-digit prices traditional dairy bull calves have brought in many markets over the years.
For a 500-cow operation running a meaningful percentage of beef breedings, that’s tens of thousands of dollars in additional annual revenue that simply didn’t exist five years ago.
“Those beef calves are paying my property taxes and then some.” — Wisconsin dairy producer
Why do these premiums exist? Simple supply and demand. USDA’s January 2025 Cattle Inventory Report shows total cattle at 86.7 million head—the lowest since 1951. Beef cows were at about 27.9 million, the fewest since 1961. When feeder cattle supplies are this tight, dairy-beef crosses fill a real gap.
The part that can sneak up on you: Canadian and U.S. cattle market outlooks in 2025 point to the early stages of beef herd rebuilding, with some analysts expecting modest beef cow number increases to start showing up in 2026. When that happens, feeder prices will likely soften. Your high-value beef calves may not stay quite so high-value.
Cushion #2: Cheap Feed
What’s encouraging on the cost side: USDA’s August 2025 DMC calculations showed feed costs at $9.38 per hundredweight—the lowest since October 2020. Corn’s been averaging around $4.00 per bushel based on the USDA’s recent estimates. That puts feed at roughly 45% of the milk check versus the 50-55% range that usually squeezes margins hard.
As recent USDA-based reports have highlighted, premium alfalfa has ranged from about $175 per ton in Idaho to around $380 per ton in Pennsylvania, depending on region and quality. If you’re in a favorable feed region, you’re feeling some real breathing room right now.
What could change: Any return to $5.00-plus corn—and remember, we saw that as recently as 2022—would add meaningful cost back to your operation. For a mid-size dairy, we’re talking six figures in additional annual expense. Weather remains the wildcard nobody can predict.
Feed costs are low—until they aren’t. Corn at $4.00/bushel in 2025 feels stable, but the 2021–22 spike above $6.50 cost a 350-cow operation over $120,000 in additional annual expense. The window to build working capital reserves closes fast when everyone realizes the risk at the same time.
Cushion #3: DMC Payments
Dairy Margin Coverage provided solid support through 2024 and into early 2025. With margins now above the $9.50 trigger at standard coverage levels, payments have become more intermittent.
Worth remembering: DMC is insurance, not income. When margins compress, the safety net helps—but it won’t save an operation that’s structurally unprofitable at the cost levels it’s running.
The Paradox: How Do You Grow a Herd While Running Out of Replacements?
Here’s what should keep you up at night.
The U.S. dairy herd has grown to about 9.58 million head according to the USDA’s October 2025 Milk Production Report—the highest since 1993. Meanwhile, replacement heifer inventory has fallen to 3.914 million head, the lowest since 1978.
The Replacement Crisis: Record Herd, Historic Low Heifers
And the number that really matters: only 2.5 million heifers are projected to calve in 2025—the lowest in the 22-year history of USDA tracking this metric.
The math doesn’t work long-term. Producers everywhere are extending cow productive life to cover the gap—keeping older, proven cows in the milking string rather than cycling through replacements. USDA reports replacement cow prices up 29% year-over-year to $2,660 per head in January 2025.
That strategy has a ceiling. We’re approaching it.
Real Numbers From a Working Operation
Meet “Heartland Family Dairy”—a composite I’ve put together based on conversations with producers across Wisconsin and Pennsylvania. 350 cows, second-generation, parents approaching retirement.
Metric
Their Numbers
Milk revenue
$1.65 million/year at $20.50/cwt
Beef-cross calf revenue
$35,000-40,000
Operating costs
$20.48/cwt
Annual debt service
$175,000
Working capital
6-8 weeks
On paper, they’re breaking even. The cushions are keeping them viable.
The question: What happens when beef premiums slip? When feed costs spike? When milk prices compress?
If multiple cushions deflate at once—and that’s entirely plausible for 2026-2027—operations running costs above $20/cwt are going to feel real pressure. The kind of pressure that forces hard decisions.
The Benchmarks That Separate Survivors From Everyone Else
Jason Karszes, the dairy farm management specialist with Cornell University’s PRO-DAIRY program, has been studying profitability patterns for years. His finding that sticks with me most:
A well-managed 150-cow dairy in the top profitability quartile often earns more annual profit than a poorly-managed 500-cow dairy in the bottom quartile—sometimes by $100,000 or more.
Scale matters. Management matters more. That’s actually encouraging if you think about it.
Where Do You Stand?
Survivor Zone
Danger Zone
Operating costs below $18.50/cwt
Operating costs above $20.00/cwt
Labor efficiency 50+ cows/FTE
Below 45 cows/FTE
Production 26,000+ lbs/cow
Below 24,000 lbs
Cull rates 30-33%
Above 38%
Debt-to-asset below 50%
Above 60%
Working capital 6+ months
Below 3 months
Component optimization matters too. USDA’s November 2025 data shows butterfat at $1.71 per pound, protein at $3.01 per pound. Butterfat has come down from the highs we saw in late 2023, but current component prices still reward higher butterfat and protein performance. Top-component herds consistently see a noticeably higher milk check per cow than herds running average components—money that doesn’t depend on base milk price.
Performance Tier
Butterfat %
Protein %
Annual Revenue/Cow
Average herd
3.80%
3.05%
$4,510
Above-average herd
4.10%
3.25%
$4,685
Top-quartile herd
4.40%
3.50%
$4,875
Operations hitting these benchmarks can weather significant margin compression. Those falling short face difficult decisions regardless of herd size. That’s the terrain we’re all working with now.
Three Moves to Make Before Year-End
The coming weeks offer a window for strategic repositioning. Here’s what I’m hearing from advisors, lenders, and producers who’ve navigated tough cycles before.
Move #1: Get Your Milk Contract Reviewed
Cost: $1,500-$3,000 for a professional review. ROI: Avoiding liability exposure that could cost you many times that amount.
Before December 31, verify:
Written volume guarantees with clear pricing formulas
Liability caps at reasonable levels
Termination provisions with 60-90 day notice minimums
Whether coordinating with neighbors creates negotiating leverage
Verbal understandings don’t hold up when things get tight. An agricultural attorney familiar with dairy contracts will spot issues you’ll miss.
Move #2: Run the Numbers on Strategic Herd Reduction
This feels counterintuitive. Hear me out.
Cull cow prices are near record levels—USDA-based forecasts suggest 2025 average prices around $145 per cwt, following a record annual average near $127 per cwt in 2024. Replacement heifers averaging $2,660 per head. A 400-cow operation reducing to 300 head can generate substantial cull revenue while improving per-cow profitability and labor efficiency.
A producer in Pennsylvania described it to me as “right-sizing rather than downsizing.” She dropped from 280 to 220 cows. Net income actually improved because labor costs fell faster than revenue.
This isn’t a retreat. It’s repositioning—setting yourself up to rebuild selectively when heifer prices moderate, probably sometime in 2027-2028 if current trends continue.
Move #3: Diversify Revenue Streams
Operations capturing additional value through beef genetics contracts, component premiums, and quality programs are building resilience that pure commodity producers don’t have.
Options worth exploring:
Direct relationships with feeders for documented-genetics calves (premium pricing for known sires and health records)
Component value pricing from processors paying separately on butterfat and protein
Quality premiums through SCC management and milk quality certifications
For Heartland Family Dairy, executing two of these three moves could shift their position from “surviving on cushions” to “sustainable regardless of market conditions.”
The Performance Factor Nobody Talks About
Here’s something the spreadsheets miss: you can’t manage a 500-cow herd effectively if you’re burning out.
Research led by Dr. Andria Jones-Bitton at the University of Guelph has documented that farmers experience significantly elevated stress, anxiety, depression, and burnout compared to the general population. The 3 a.m. payment worries, the strain on marriages, the guilt about whether to encourage the kids toward this business or away from it—this isn’t just personal. It’s a management problem.
Burned-out operators make worse decisions. They miss the cull that should have happened. They defer maintenance. They don’t catch the fresh cow problem early enough. Mental health directly impacts the benchmarks that determine whether your operation survives.
The business case for planned transitions: Farm transition specialists consistently report that families who plan their exits while they still have equity and control over timing preserve significantly more wealth than those forced into distressed sales. The difference can be substantial.
Both staying and exiting can be the right choices. The wrong choice is drifting into a decision you didn’t make.
The Industry in 2030
The direction is reasonably clear, even if the exact numbers aren’t. Continued consolidation. Larger operations are capturing a larger share of production. Southwest and Northern Plains are gaining ground. Traditional dairy regions in the Upper Midwest and Northeast are under ongoing pressure.
Operations that can consistently cash flow in the high teens per hundredweight generally have far more flexibility than those needing $20-plus milk just to break even—especially in a more volatile pricing environment.
Bottom Line
For operations committed to long-term dairy:
Audit costs against survivor benchmarks. Sub-$18.50/cwt is the target.
Get contracts reviewed before year-end
Build 12-18 months working capital
Run the strategic herd reduction numbers
For operations weighing options:
Strong cull prices and land values favor orderly transitions now
Have the succession conversation before a crisis forces it
December 2025 positioning beats mid-2026
For everyone:
The industry is restructuring, not just cycling
Decisions made in the next few months shape outcomes for years
Make an active choice before circumstances choose for you
The cushions won’t last. The question isn’t whether the industry restructures—it’s whether you’ll be positioned favorably when it does.
For families like Heartland Family Dairy, the next few months matter more than usual. The decisions aren’t easy. But they’re a lot easier to make while you still have choices.
“Heartland Family Dairy” is a composite based on producer conversations across Wisconsin, Pennsylvania, and other traditional dairy regions. Financial scenarios reflect real conditions facing mid-size operations in late 2025. Work with your own advisors for decisions specific to your situation.
Key Takeaways
Three cushions. All temporary. Beef premiums, cheap feed, and strong margins—all face pressure by late 2026
The paradox nobody’s solving: Biggest U.S. herd since 1993. Fewest heifers to calve in 22 years. The math has an expiration date.
Know your cost. Operations above $20/cwt face real pressure when cushions deflate. Where do you stand?
Three moves before December 31: Contract review. Herd right-sizing numbers. Component premium strategy.
Weeks, not months. Reposition now while you still have choices—or react later when you don’t.
Complete references and supporting documentation are available upon request by contacting the editorial team at editor@thebullvine.com.
Learn More:
The 90-Day Dairy Pivot: Converting Beef Windfalls into Next Year’s Survival – Provides a tactical roadmap for “stacking” beef-on-dairy premiums, cull revenue, and component bonuses to capture an additional $266 per cow, detailing specific moves to execute while the current profitability window remains open.
Every week, thousands of producers, breeders, and industry insiders open Bullvine Weekly for genetics insights, market shifts, and profit strategies they won’t find anywhere else. One email. Five minutes. Smarter decisions all week.
Metritis Day 5 = Dry pen Day -45. Elite dairies know this. Average dairies pay $70K/year, learning it the hard way. Which are you?
Executive Summary: That fresh cow disease you’re treating today started 6 weeks ago in your dry pen. Research from Barry Bradford at Michigan State and Jessica McArt at Cornell confirms that immune suppression begins around Day -35 and hits bottom at calving—by the time metritis appears on Day 5, the conditions were established on Day -45. This timing gap costs average 400-cow dairies $50,000-$70,000 annually in treatment, lost milk, and reproductive failure. Elite operations running disease rates below 10% have figured this out: instead of reacting to fresh cow problems, they invest upstream in negative DCAD diets (-100 to -150 mEq/kg), dry pen density management, and teat sealants that cut infection rates by 52-70%. Farms making this shift typically see disease rates drop from 35-40% to under 20% within a year. The dry period isn’t downtime between lactations—it’s where your transition success or failure gets decided.
The farms with the best fresh-cow outcomes aren’t doing more in the fresh pen—they’re obsessing over the dry pen.
I know that feels backwards. We pour so much energy into treating ketosis, monitoring for metritis, and dealing with fresh-cow problems after they show up. But here’s what the research keeps telling us: by the time you see disease in the fresh pen, the damage was done 4-6 weeks earlier. That metritis case on Day 5? It started around Day -45.
Work from Cornell and other land-grant universities puts the cost of preventable fresh-cow disease at $50,000 to $70,000 annually for a 400-cow dairy. Elite operations running disease rates below 10% capture that value. Average operations? They’re paying what amounts to a “mediocrity tax” every single year.
So what are the top performers actually doing differently? That’s what we’re digging into.
Disease Rate Category
Fresh Cow Disease Rate
Annual Cases (400 cows)
Cost per Case
Total Annual Loss
Elite Performance
10%
40
$450
$18,000
High Performance
15%
60
$450
$27,000
Industry Average
35%
140
$450
$63,000
Poor Performance
40%
160
$450
$72,000
The Real Cost—It’s Bigger Than You Think
Garrett Oetzel at Wisconsin has documented how transition costs cascade, and the numbers are worth understanding. Treatment for metritis, mastitis, and clinical ketosis runs $80-$150 per case. But that’s just the visible part.
Lost milk hits harder. Jessica McArt’s research team at Cornell found that subclinical ketosis (BHBA ≥1.2 mmol/L) decreased milk production by 0.5 kg/day during the first 30 days of lactation. And here’s what caught my attention: each 0.1 mmol/L increase in BHBA also raised the risk of displaced abomasum and early culling. That’s not a sick cow for a week—that’s damage following her through the entire lactation.
Reproduction takes a hit, too. Research from Overton’s group at Cornell showed cows with elevated NEFA or BHBA had 13-19% lower pregnancy probability within 70 days of the voluntary waiting period. At roughly $4 per day open, you can see how the math compounds pretty quickly.
Mortality clusters early. Industry data consistently shows dairy cow deaths are disproportionately concentrated in the early lactation period, with transition complications as a leading cause.
When you add it all up, the total cost per case of transition disease ranges from $300 to $700, depending on severity and what else goes wrong downstream.
Here’s a quick way to see what this might mean for your operation:
The difference: over $41,000 in recoverable value—not theoretical savings.
The $115 treatment you see vs the $385 in damage you don’t.
“Most producers don’t calculate these costs because they’re scattered across multiple categories,” Tom Overton at Cornell has observed. “The treatment expense is visible. The lost milk shows up gradually. The impact of reproduction doesn’t surface for months. But when you put it all together, transition disease is often the single largest controllable cost on the dairy.“
That’s worth sitting with for a minute.
The Biology: What’s Actually Happening
Here’s where things get interesting—and where the conventional approach starts to look incomplete.
Barry Bradford (now at Michigan State) and Lorraine Sordillo have mapped the immune trajectory around calving in considerable detail. The timeline matters more than most of us realized.
The Immune Suppression Timeline
Timeframe
What’s Happening
Day -35 to -21
Inflammatory responses triggered by rapid fetal growth begin suppressing immune function
Day -21 to -7
Metabolic stress intensifies as the cow shifts into negative energy balance; feed changes disrupt rumen microbiota
Day -7 to calving
Environmental stressors peak—overcrowding, pen moves, and heat stress all compound the immune suppression
Day 0 to +3
Immune function hits its lowest point—this is when infections take hold
Day +5 to +14
Clinical disease appears—but the conditions were set weeks earlier
As Bradford explains it: “The inflammatory cascade that compromises immune function starts with fetal cortisol release and metabolic changes that happen well before we see clinical signs. By the time a cow develops metritis on Day 7, the conditions that allowed that infection were established three to four weeks earlier.“
By the time you’re treating disease, immune collapse happened 10 days ago.
The implication is pretty clear: you can’t fix fresh-cow disease in the fresh pen. You prevent it in the dry pen.
From what I’ve observed across Midwest and Northeast operations, average farms dedicate 60-70% of transition attention to fresh cows and maybe 25-35% to dry cows. The elite performers? They often flip that ratio entirely.
What High Performers Actually Do
When you talk to veterinarians, nutritionists, and managers at farms achieving consistently strong transition outcomes, certain patterns keep showing up.
Measurement Discipline
The biggest difference between average and elite isn’t fancy technology—it’s measurement.
Top farms track fresh-cow disease weekly by condition. They compare the first DHI test against genetic expectations. They run BHBA blood tests to catch subclinical ketosis before it becomes clinical. They review days open monthly with their vet team.
Average farms? Most can’t tell you their actual disease rate. They’re estimating. And you probably know this already, but without measurement, it’s nearly impossible to know if you’re improving—or to identify which interventions are actually working.
“The farms that turn this around always start the same way,” Jessica McArt has observed. “They commit to measuring outcomes systematically before they change anything else. You need that baseline, or you’re just guessing.“
Written Protocols
This sounds almost too simple, but elite operations develop written disease definitions and treatment protocols with their veterinarians. Exact criteria for each condition. Standardized treatments. Clear escalation triggers.
Why does this matter so much? Consistency. It doesn’t depend on who’s working that day. It’s a repeatable process that survives staff turnover—and staff always turns over eventually.
Dedicated Monitoring Time
Here’s where commitment becomes tangible. High-performing farms dedicate 1.5-2 hours daily specifically to fresh-cow monitoring. Structured screening with documented results—not casual observation while doing other tasks.
The daily routine typically includes appetite assessment, attitude evaluation, discharge observation, udder examination, and locomotion scoring. Results get to the manager each morning for same-day decisions.
Catching subclinical ketosis on Day 3 rather than clinical ketosis on Day 7 changes outcomes dramatically. But you can’t catch what you’re not systematically looking for.
Dry-Period Investments That Pay Forward
Farms achieving elite transition outcomes share common approaches to dry-period management. This is where the real leverage exists—and where I often see the widest gap between what farms think they’re accomplishing and what’s actually happening.
Nutrition Fundamentals
Negative DCAD diets for close-up cows—most commonly targeting -100 to -150 mEq/kg—keep calcium metabolism on track through calving. Jose Santos’ 2019 meta-analysis of 42 experiments in the Journal of Dairy Science found that negative DCAD significantly reduces hypocalcemia, retained placenta, and metritis while improving postpartum feed intake and milk yield in multiparous cows.
DCAD Program Element
Target Range
Monitoring Method
Frequency
Out-of-Spec Consequence
Dietary DCAD
-100 to -150 mEq/kg
Ration analysis
Monthly
Inadequate calcium mobilization
Urine pH (Holstein)
5.5 to 6.0
pH strips or meter
Weekly (10-12 cows)
Program not working – adjust immediately
Urine pH (Jersey)
5.8 to 6.2
pH strips or meter
Weekly (10-12 cows)
Higher target than Holsteins – breed difference
Vitamin E
2,000-3,000 IU/day
Supplement audit
Weekly
Immune function compromised
Selenium
0.5-1.0 mg/day
Supplement audit + blood test
Weekly audit / Quarterly blood
Retained placenta risk increases 35%
Some operations target more aggressive levels (-150 to -200 mEq/kg), particularly in higher-risk multiparous cows. The key is monitoring urine pH weekly to verify cows are responding appropriately—target urine pH of 5.5-6.0 for Holsteins indicates the program is working. Assumptions about ration performance tend to drift from reality over time.
Vitamin E and selenium supplementation (2,000-3,000 IU vitamin E daily; 0.5-1.0 mg selenium) supports immune function heading into calving. Cost: $2- $5 per cow, monthly.
“The mineral piece is where I see the biggest gap between what farms think they’re doing and what’s actually happening,” Bill Weiss at Ohio State has noted. “Testing forage mineral content and adjusting supplementation—it sounds basic, but most farms don’t do it consistently.“
Density Management
Overcrowding during the dry period—exceeding 100-110% of bunk space and lying area—creates chronic stress that suppresses immune function. Research from Rick Grant at the Miner Institute shows cows in overcrowded dry pens eat less, have elevated cortisol, and reduced lying times.
Regional considerations matter here. Heat stress complicates close-up management significantly in the Southeast, where summer humidity compounds the metabolic burden. Large Western operations face different scale challenges around pen design and monitoring logistics. Upper Midwest farms deal with seasonal extremes in both housing and nutrition.
The fundamentals stay consistent, but the application requires regional adaptation.
Teat Sealants at Dry-Off
One of the highest-ROI interventions that’s still underutilized on many farms.
Meta-analyses in Animal Health Research Reviews show that internal teat sealants reduce new intramammary infections during the dry period by 52-70% when used with proper technique. Simon Dufour’s 2019 analysis showed a 52% reduction in risk compared with untreated controls.
The math: $10-$20 per cow prevents infections costing $300-$500 to treat post-calving.
A Wisconsin producer managing about 1,200 cows shared a story I’ve heard many times: “We fought teat sealants for years because we’d tried them early and had problems. Turned out we were just rushing through, not being careful enough about prep. Once we committed to proper technique and gave people enough time, our fresh cow mastitis dropped by half within a year.“
That pattern—initial frustration followed by success after protocol refinement—repeatedly shows up in conversations with producers who eventually embraced the practice.
💡 PRO TIP: How Cohort Grouping Changes the Math
Instead of continuous cow flow through transition pens (animals entering and leaving daily), consider moving to weekly cohort systems. All cows due within a 7-14 day window group together and move as a unit.
Why this works:
Reduces social disruption from constant pen changes
Allows thorough cleaning between groups
Matches capacity to actual weekly calving numbers rather than random peaks
Example: A farm averaging 20 calvings weekly but peaking at 28 needs capacity for 28 under continuous flow. With cohort grouping, the same pen accommodates 20 at near-full utilization, then empties and refills. You often end up with better per-cow space during actual occupancy.
Some farms discover that adjusting herd size to match facility capacity actually improves profitability. A 350-cow dairy at 15% fresh-cow disease may generate better returns than a 400-cow operation struggling with 40% disease in undersized facilities. That’s not always comfortable math to confront, but it’s worth examining honestly.
When Other Priorities Make Sense
I should acknowledge something important here: not every operation is positioned to make transition management their primary focus right now. Farms managing heavy debt, facing generational transitions, or operating in severely compressed markets may reasonably direct capital elsewhere.
A California producer I spoke with recently put it plainly: “We know transition matters, but right now we’re dealing with water costs that threaten our whole operation. First things first.”
That’s a legitimate constraint that deserves respect rather than dismissal.
The question isn’t whether transition management matters—it clearly does—but whether it’s the highest-return use of limited capital for your operation at this specific moment. That’s a calculation each farm needs to make, honestly.
But don’t assume you’re in that category by default. Many farms have more room to improve without major capital investment than they initially think. The first steps—measuring baseline disease rates, writing down protocols, restructuring time allocation—require commitment more than cash.
Realistic Timelines
For producers ready to pursue meaningful improvement, understanding realistic timelines helps maintain momentum when progress feels slow.
Months 1-3: Foundation Baseline measurements, written protocols, daily screening, BHBA testing, and close-up nutrition review. Realistic outcome: Disease drops from 35-40% to 25-30%. Investment: Approximately $5,000-$8,000.
Months 4-12: Optimization Protocol refinement based on emerging data, facility adjustments, and staff training for consistency. Realistic outcome: Disease reaches 18-24%.
Year 2+: Building Culture Transition metrics integrated into regular management review. Genetic selection for health traits. Facility improvements where economically justified. Best performers: 10-15% disease. Most committed: Single digits—but that typically takes 3-5 years of sustained focus.
Phase
Timeline
Management Actions
Investment Required
Expected Disease Rate
Baseline
Week 1
Measure current disease rate by condition – this is non-negotiable
$500 (records + BHBA testing)
35-40% (typical average)
Foundation
Months 1-3
Written protocols, daily screening, DCAD nutrition review, teat sealants
$5,000-$8,000
28-32% (visible progress)
Optimization
Months 4-12
Protocol refinement, facility adjustments, staff training for consistency
System becomes self-sustaining, continuous improvement mindset embedded
Ongoing operational cost
<10% (elite – single digits)
The Labor Reality
Here’s something that deserves honest discussion: sustainable transition improvement requires dedicated labor.Farms that try adding monitoring to already-full staff schedules typically see the effort erode within a few months.
A dedicated fresh-cow monitoring position runs approximately $35,000-$42,000 annually, including benefits. That’s substantial, particularly for smaller operations.
But consider the math differently. Prevented disease losses of $30,000-$50,000 annually often justify the expense within the first year. Add better reproduction and longer productive life, and the investment calculation shifts considerably.
Farms that can’t make this commitment may still achieve meaningful improvement through protocol discipline alone—perhaps reaching 25-28% disease incidence rather than 35-40%. Understanding those realistic ceilings helps set appropriate goals for your situation.
“I tell producers to think about it as an investment decision, not an expense decision,” Tom Overton suggests. “Would you spend $40,000 to capture $50,000 in value? Most would say yes. But when it’s framed as ‘hiring another person,’ suddenly it feels impossible.”
That reframing is worth considering.
Quick Self-Assessment
Before wrapping up, it might be useful to reflect on a few questions:
Do you know your actual fresh-cow disease rate by condition? Or are you estimating?
What percentage of your transition attention goes to the dry period versus the fresh period?
Are treatment protocols written down—or do they depend on who’s working that day?
When did you last verify your DCAD program with urine pH testing?
If you use teat sealants, are you giving staff adequate time for proper technique?
There’s no judgment in these questions—just an invitation to consider where opportunities might exist.
The Bottom Line
The transition period is where money is made or lost. Farms that measure outcomes, implement protocols, invest appropriately in monitoring, and recognize that the dry period determines fresh-cow success are capturing $30,000-$50,000 in value that average operations leave on the table every year.
The top performers stopped seeing fresh-cow disease as an inevitable form of bad luck. They started seeing it as a management outcome they can actually influence.
The dry period isn’t a holding pattern between lactations. It’s the foundation for everything that follows.
You’re leaving money in the dry pen. Run the numbers this week—or keep paying the “average dairy” tax.
The choice is yours.
Key Takeaways:
The timing is backwards: That metritis case on Day 5 started on Day -45. Fresh cow disease begins in the dry pen—not the fresh pen.
The cost is massive: Average 400-cow dairies lose $50,000-$70,000 annually to preventable transition disease. Elite herds running <10% disease rates capture that value instead.
The solution is upstream: Negative DCAD diets (-100 to -150 mEq/kg), dry pen stocking under 110%, and teat sealants that cut new infections by 52-70%.
The results are proven: Disease rates typically drop from 35-40% to under 20% within Year 1. Top performers reach single digits by Year 3—with first-year investments of $5,000-$8,000 returning $30,000-$50,000 in prevented losses.
Complete references and supporting documentation are available upon request by contacting the editorial team at editor@thebullvine.com.
Every week, thousands of producers, breeders, and industry insiders open Bullvine Weekly for genetics insights, market shifts, and profit strategies they won’t find anywhere else. One email. Five minutes. Smarter decisions all week.
The ‘System Cow’ won’t win a banner. But she might save you US$180,000 a year.
When a replacement heifer costs US$3,000, you can’t afford to lose her in Lactation 2. The era of the “disposable cow” is over, and the rise of the “System Cow” has begun.
Walk into a well‑run 1,200‑cow freestall today, and the cows might look different than what many of us grew up admiring. They’re not especially tall or razor‑sharp. They probably wouldn’t turn many heads in the championship ring.
But here’s what matters—they’re the ones quietly paying the bills.
With replacement heifers routinely bringing US$2,800–$3,000 or more, and top lots in California and Minnesota pushing toward US$4,000 at mid‑year 2025 according to CoBank’s latest analysis, the economics of “the ideal cow” have fundamentally shifted.
From Affordable to Alarming: Replacement Heifers Have Nearly Doubled in Five Years
I recently spoke with a producer running about 1,400 cows in the Central Valley who put it simply: the most profitable animal on his dairy isn’t the “prettiest” cow or even the highest single‑day producer. It’s the cow that stays in the system, stays out of trouble, and sticks around long enough to actually pay off her rearing cost.
“The most profitable animal isn’t the prettiest. It’s the one that stays out of trouble.”
The cow bred to fit the way his farm actually runs—not just the breed ideal on paper.
Why Big Herds Need a Different Kind of Cow
Looking at this trend across North America, three pressures keep surfacing in conversations with producers and advisors alike.
First, there’s the replacement cost and the heifer supply situation.
Most of you are living this already, but the numbers bear repeating: we’re in genuinely uncharted territory with heifer values.
CoBank’s August 2025 report pegged dairy replacements at US$3,010 per head nationally, and their modeling suggests heifer inventories won’t meaningfully recover until 2027. High Ground Dairy’s January 2025 numbers showed heifers expected to calve at their lowest level since they started tracking the data.
This isn’t a temporary blip. It reflects years of lower heifer retention and heavy beef‑on‑dairy use catching up with the industry.
Second, there’s the scale and labor reality that large operations face daily.
Once you’re running 700 to 3,000 cows, it becomes nearly impossible for human eyes and hands to catch every fresh cow slip, every mild lameness case, or every quiet heat—particularly given current labor challenges.
A cow requiring special fresh cow management, repeated treatments, or extra handling is simply harder to justify in a high‑throughput freestall or dry lot than she might be in a 60‑stall tie barn where you’re seeing her ten times a day.
Third—and this is where the economics get interesting—productive life calculations are shifting.
Al De Vries, PhD, professor of animal sciences at the University of Florida, has done some of the most thorough work on longevity economics. His 2020 symposium review in the Journal of Dairy Science really changed how many producers think about this.
His analysis, factoring in today’s heifer‑raising costs, cull values, and genetic gains, suggests that the economically optimal productive life in high‑producing systems is often around 5 years, or roughly 4 to 5 lactations. Not two or three.
“When heifers get expensive, keeping good cows longer makes more economic sense.” — Al De Vries, PhD, University of Florida
Most commercial operations still average 2.5–3.5 lactations, with cows leaving early due to transition disease, fertility issues, or lameness. In 2018, data showed that U.S. dairy cows averaged just 35.3 months of productive life.
There’s still a meaningful gap between what’s economically optimal and what’s actually happening in barns across the country.
Now, this doesn’t suggest smaller or grazing herds are doing anything wrong. A 120‑cow pasture‑based operation in New Zealand or Ireland may absolutely want lighter‑framed cows that walk well over long distances and fit seasonal calving patterns.
Different systems, different priorities. But for high‑input, high‑cow‑traffic freestall and dry lot operations, the economics are nudging breeding goals toward a different type of animal.
The Economics of One More Lactation
Why have so many 1,000‑cow dairies started talking about “system cows” rather than “super cows”? The math tells the story.
Research consistently shows that cows don’t really hit their stride until later lactations—yet many herds turn them over before they get there.
The total cost of rearing a heifer from birth to first calving commonly runs in that US$2,000–$2,800 range, depending on feed, labor, and housing system. University of Nebraska‑Lincoln’s 2024 analysis used US$2,500 as a reasonable working figure.
Mature third‑lactation‑plus cows can produce significantly more milk and components than first‑calvers—often 20–25% higher mature‑equivalent yield, along with more stable butterfat performance once they’ve grown into the ration and facility.
Lactation Number
Milk Production (% of Mature Equivalent)
Annual Cost to Raise/Replace
Typical % of Herd
Economic Optimal %
1st Lactation
80-85%
$2,660
35-40%
25-30%
2nd Lactation
90-95%
$2,660 (if culled)
25-30%
25-30%
3rd Lactation
100%
$2,660 (if culled)
15-20%
20-25%
4th+ Lactation
100-105%
$2,660 (if culled)
10-15%
20-25%
Here’s what that looks like in a 1,000‑cow herd:
At a 35% replacement rate (fairly typical): 350 cows leave each year
350 replacements × US$2,660 = US$931,000/year just on replacements
At a 28% replacement rate (achievable with system-fit breeding): 280 cows leave each year
280 replacements × US$2,660 = US$745,000/year on replacements
Annual savings: ~US$180,000
Replacement Rate
Annual Cost
Savings vs 35%
35%
$931,000
$0
32%
$851,000
$80,000
28%
$745,000
$186,000
25%
$665,000
$266,000
That’s before counting the extra milk and components from a higher proportion of mature cows, plus the labor saved by not raising as many heifers.
Reducing the replacement rate from 35% to 28% saves roughly US$180,000 per year in a 1,000-cow herd.
There’s still a valid argument—particularly in seedstock or high‑end genomic programs—for faster turnover to accelerate genetic progress. Some estimates suggest genetic gain per year can be 1–2% higher when generation intervals are shorter.
If you’re selling embryos, bull contracts, or show heifers, that business model makes sense for your operation.
But for a commercial 1,200‑cow freestall milking into a volatile commodity market, the data increasingly suggest that getting cows to stick around for one more productive lactation may offer better returns than pushing a few more pounds of daily milk from animals that leave the herd early.
From “Dairy Triangle” to “Power Rectangle”
On the cow side, one of the clearest visual changes in these herds is a shift in body type—and it’s more than cosmetic.
The “Dairy Triangle”: Tall, angular, sharp. Extreme dairy character. The classic show-ring ideal.
The “Power Rectangle”: Moderate frame, wide chest, strong heart girth, plenty of barrel. Built for capacity and durability.
There’s solid genetic research supporting this shift. A study published in the Czech Journal of Animal Science found negative genetic correlations between stature and longevity traits—in practical terms, tall cows tended to have poorer longevity, especially poorer functional longevity.
A 2021 review in Frontiers in Genetics confirmed this pattern across multiple Holstein populations.
What producers are finding on the ground is that a cow standing in a moderate frame range—but with a wide muzzle, strong heart girth, and plenty of barrel—often fits the system better:
She lies and rises more comfortably in standard stall sizes (reducing hock and knee injuries)
She handles high‑forage rations better thanks to rumen capacity and lung room
She competes well at the feed bunk without being so large that she overloads the flooring or parlor platforms
I’ve heard about operations in Europe that deliberately pulled back from extreme stature in the early 2000s because their tallest cows were over‑represented in the cull list for lameness, calving difficulty, and metabolic issues.
They didn’t stop caring about type—they just shifted toward a balanced, “strong but not towering” cow that fit their cubicles and fresh cow program.
The “Power Rectangle” cow may never win a show, but she pays the bills.
If you’re running a grazing herd in Ireland, New Zealand, or parts of Canada, your ideal shape will naturally look different. Lighter bodyweight, good locomotion on long walks, and the ability to hold condition on grass will rank higher.
The common thread across systems is the same, though—breeding for the cow that fits your operation’s daily work, not simply the tallest cow in the catalog.
Characteristic
“Dairy Triangle” (Traditional Show Ideal)
“Power Rectangle” (System Cow)
Frame Size
Large to Very Large
Moderate
Stature
Tall (often 58+ inches)
Moderate (54-56 inches)
Body Depth
Extreme depth
Strong, balanced
Chest Width
Narrow to moderate
Wide
Heart Girth
Moderate
Strong, wide
Rumen Capacity
Moderate
High – handles forage
Stall Fit (Standard 48″)
Often oversized
Excellent fit
Lameness Risk
Higher (research-backed)
Lower (longevity data)
Avg. Productive Life
2.5-3.0 lactations
4.0-5.0 lactations
Show Ring Success ⚠
High – wins banners
Low – rarely places
System Durability ⚠
Lower – early culling
High – pays bills
Lameness: The Hidden Profit Leak and Labor Drain
This is one area where research and barn experience align uncomfortably well. Lameness costs more than most of us would like to acknowledge, it’s more common than casual observation suggests, and it’s hard on both cows and people.
The real cost per case:
Penn State Extension’s 2023 analysis: US$336.91 average per case
University of Calgary’s bioeconomic model: €307.50 (US$330)
Simpler estimates: US$90–$300 range
Once you factor in treatment, milk loss, reproductive impact, and increased culling risk, the comprehensive numbers tend to land in the US$300–$350 range.
Cost Category
Conservative Estimate
Research-Backed Estimate
Notes
Treatment & Labor
$90
$110
Hoof trimming, NSAID, bandages, extra handling time
Lame cows 2-4× more likely to be culled vs. sound cows
TOTAL Per Case
$300
$337
Penn State 2023: $336.91 avg | U Calgary: $330 equivalent
Jan Shearer, DVM, MS, professor emeritus at Iowa State University—who has probably done more work on cattle lameness than anyone in North America—has observed that lameness remains the most important welfare and economic issue affecting dairy cattle.
Part of the challenge? So many cases go undetected until they’re advanced.
The detection gap is real:
Farmers typically estimate single‑digit lameness prevalence
Trained observers doing formal locomotion scoring identify 20–30% of cows as clinically lame
Iowa State’s extension data shows industry prevalence averaging 20–25%
A large German cross‑sectional study found farmers catching only 24–45% of their lame cows
An Australian study found farmers estimating 5% when systematic scoring showed 19%
Farmers catch only about one in four lame cows compared to systematic scoring.
What’s particularly noteworthy is that the most expensive cows often aren’t the obvious “three‑legged” ones. They’re the cows at locomotion score 2 or 3—just off enough that they eat fewer meals, take longer to get in calf, and show up more often in the trim chute—but not so obviously lame that they get flagged early.
The labor burden nobody talks about:
Every cow needing extra fetching to the parlor, careful handling in the trim chute, or repeated NSAID and bandage checks draws time from staff who are already stretched thin.
In a 1,000‑cow herd, even a modest reduction in lameness incidence—say, from 25% to 18%—translates to roughly 70 fewer lameness cases per year.
That means fewer hospital‑pen days, fewer after‑hours treatments, and less burnout for your best people.
That’s why many large herds are paying closer attention to feet and leg composites, direct claw health indexes where available, and wellness indices that include lameness risk alongside mastitis, metritis, displaced abomasum, and ketosis.
Making Better Use of Indexes, Not Throwing Them Out
With all this focus on system fit, some producers wonder where that leaves long‑standing tools like Net Merit and TPI.
What’s encouraging is that the indexes themselves are evolving to reflect much of this thinking.
Net Merit 2025 updates (per USDA ARS):
Still weights milk, fat, and protein yields heavily
Now includes feed saved, fertility, productive life, somatic cell score, and calving ability
Applies a negative weight on body weight composite—nudging selection toward moderate‑sized cows
CDCB confirmed body weight composite received more negative emphasis in this revision
TPI balances production and type with functional traits and gets updated periodically as new traits come online.
Beyond these established indexes, commercial health or wellness indices—bundling mastitis, lameness, metritis, retained placenta, DA, and ketosis into a single economic value—have shown promise in identifying animals likely to incur lower lifetime health costs.
What I’m seeing producers do with this toolbox:
Start with Net Merit or TPI as a broad profitability filter
Layer on a health or wellness index for pens where mastitis, lameness, or transition disease have been expensive
Apply a “no knockout traits” rule—if a bull is extreme for stature, negative on daughter fertility, or weak on feet and legs, he comes off the list regardless of overall rank
In very large herds, geneticists sometimes build custom indexes that assign specific economic weights based on each farm’s cost structure.
The key shift: from “index rank is everything” to “indexes are tools we adapt to our system.”
If you’re in the seedstock or show world, some of those weights will obviously look different. And that’s entirely appropriate—many commercial dairies buying genetics from seedstock programs are increasingly asking for durable, system‑fit animals.
There’s a market for both approaches.
Beef‑on‑Dairy and Sexed Semen: Funding the Shift
A question that comes up frequently: “How do we afford genomic testing, sexed semen, or more selective heifer‑rearing while waiting for genetic changes to show up in the parlor?”
Here, the rapid growth of beef‑on‑dairy has proven to be more than a passing trend.
The premium is real:
Farmers Forum (March 2025): Dairy‑beef crossbred calves commanding ~US$15 per pound
Straight Holstein bull calves: ~US$10 per pound
That’s a 50% premium
Industry analysis shows premiums of US$350–$500 on beef‑cross calves
Some Midwest herds report US$370 more per head on crosses
Metric
Holstein Bull
Dairy-Beef Cross
Price per Pound
$10
$15
Total Value (80 lbs)
$800
$1,200
Premium
Baseline
+50% / +$400
With heifer inventories low and replacement heifers expensive, dairies have a strong incentive not to raise every dairy heifer calf by default—especially when some come from lower‑merit matings.
What many herds are doing in practice:
Sexed Holstein semen on the top 30–40% of heifers and younger cows (best productive life, fertility, health, and structural traits) to generate the next wave of “system cows.”
Beef semen (often Angus or Simmental) on remaining cows, especially later‑lactation animals or those whose daughters have historically been harder to keep
The beef‑cross checks arriving nine months from now can help fund the genomic tests and sexed semen bills shaping the herd you’ll be milking three years down the road.
Cow Category
Semen Type
Expected Heifer Calves
Expected Beef Calves
Annual Calf Revenue Premium
Top 30% Genomic Merit (Heifers + Young Cows)
Sexed Holstein (Premium Bulls)
~210 (70% × 30% × 1000)
~90
+$0 (baseline)
Middle 40% (2nd-3rd Lactation, Good Health)
Conventional Holstein
~200 (50% × 40% × 1000)
~200
$0 (standard)
Bottom 30% (4th+ Lactation or Health Issues)
Beef (Angus/Simmental)
0 (terminal crosses)
~300
+$120,000 (300 × $400)
TOTAL
Mixed Strategy
~410 heifers
~590 beef calves
+$120,000/year
Smaller herds can apply these same principles on a different scale. A 200‑cow family dairy in Ontario or Wisconsin might genomic‑test heifers in one age group, use sexed semen only on the top half, and breed bottom‑tier cows to beef strictly as terminal matings.
The specific percentages matter less than the underlying approach—breeding intentionally for the number and kind of replacements you actually need.
Getting Started: Metrics and Questions That Change the Conversation
For many producers, the hardest part of this transition is simply knowing where to begin. You don’t need to overhaul your entire breeding plan overnight.
Some of the most meaningful mindset shifts start with monitoring a few additional numbers and asking different questions.
Four Metrics That Indicate Whether Longevity Is Improving
Local heifer prices, labor costs, and facility designs vary considerably—what’s “good” in California’s Central Valley may look different than in Wisconsin or the Maritime provinces. Consider these directional guides:
Replacement rate: Industry snapshots show commercial herds in the low‑to‑mid‑30% range. Herds with strong fresh cow management and longevity‑focused breeding sometimes sustain mid‑20s.
Percentage of 3rd‑lactation and older cows: Herds with more mature cows—provided they’re healthy—achieve higher lifetime milk and component yields.
Early‑lactation culls: How many cows leave before 60 or 100 days in milk? High rates signal transition management, lameness, or reproductive issues.
Lameness prevalence from locomotion scoring: Even periodic scoring can reveal lameness rates much higher than those from casual observation. Track over time.
Five Questions to Ask Your Genetics Supplier This Year
“If we cap stature and avoid weak feet and legs, which sires remain on the list?”
“Which bulls offer the best mix of productive life, daughter fertility, and health traits at a size fitting my freestalls?”
“How can we use Net Merit, TPI, and a health index together rather than relying on just one number?”
“Based on our pregnancy rate, what’s a realistic split between sexed dairy, conventional dairy, and beef semen?”
“Can we review our last three years of culling reasons and identify which genetic levers reduce the most expensive exits?”
This approach scales to any operation size. A 90‑cow tie‑stall herd can ask the same questions—just with different facility constraints in mind.
The Bottom Line
Several practical lessons emerge from the research and from large herds that have pursued this direction.
Longevity is becoming a front‑seat economic driver. With replacement heifers valued in the upper US$2,000s and higher, reducing the replacement rate by even a few percentage points can free up six‑figure capital in a 1,000‑cow herd.
The ideal “system cow” is moderate, sound, and low‑maintenance. She may never see a classifier or show ring, but she walks well on concrete, responds predictably to rations, handles fresh cow transitions smoothly, and breeds back without drama.
Lameness is both a hidden cost and a hidden labor drain. Building hoof health and locomotion into sire selection helps protect both profit and staff time.
Indexes remain valuable, but how we use them is evolving. They work best when combined and filtered through each farm’s specific constraints.
Sexed semen and beef‑on‑dairy are becoming key financial tools. By carefully selecting which cows produce replacements and which produce beef‑cross calves, herds are funding more selective breeding programs.
Instead of asking, “What’s the most impressive cow I can breed?”—more producers are asking, “What kind of cow can thrive in my barns, on my ration, with the people I realistically have?”
That’s not as glamorous as a banner on the wall. But in a world of US$3,000 heifers, tight labor markets, and demanding commodity conditions, it may be one of the most important questions a modern dairy can ask.
Key Takeaways
The economics shifted: US$3,000+ heifers and tight supplies through 2027 make longevity a profit driver, not an afterthought
The savings are real: Dropping the replacement rate from 35% to 28% saves ~US$180,000/year in a 1,000-cow herd
Shape predicts survival: Research links tall “Dairy Triangle” cows to shorter productive lives—moderate “Power Rectangle” builds last longer
Lameness bleeds quietly: US$300+ per case, farmers detecting only 1 in 4—it’s the profit leak nobody budgets for
Breed for your system: Combine Net Merit with health indexes, cap extreme stature, and let beef-on-dairy fund the genetics that stay
Executive Summary:
The prettiest cow on your dairy might be your most expensive one. With replacement heifers hitting US$3,000+ and CoBank projecting tight supplies through 2027, commercial dairies are rethinking the “ideal cow”—moving from the tall, angular “Dairy Triangle” toward a moderate-framed “Power Rectangle” built for durability, not ribbons. The math supports the shift: reducing replacement rate from 35% to 28% saves roughly US$180,000 annually in a 1,000-cow herd. University of Florida research suggests an optimal productive life is around 5 years, yet most operations average just 2.5–3.5 lactations—with lameness alone (often undetected in 3 of 4 cases) quietly draining US$300+ per incident. Forward-thinking producers are responding with a practical playbook: combine Net Merit with health indexes, cap extreme stature, and let beef-on-dairy premiums fund more selective breeding. She won’t win shows, but she pays her bills—and in this market, that’s exactly the cow you need.
Complete references and supporting documentation are available upon request by contacting the editorial team at editor@thebullvine.com.
Every week, thousands of producers, breeders, and industry insiders open Bullvine Weekly for genetics insights, market shifts, and profit strategies they won’t find anywhere else. One email. Five minutes. Smarter decisions all week.
They told him he was wasting his time. A dairy farmer painting hay bales? That’s not how you change federal policy. Washington doesn’t listen to guys on tractors. Nelson Troutman painted anyway. Six years later, Congress voted unanimously—every single member—to put whole milk back in America’s schools.
Executive Summary: Whole milk just won—unanimously. On December 14, 2025, the U.S. House passed the Whole Milk for Healthy Kids Act without a single opposing vote, torching 13 years of misguided policy and sending a landmark bill to President Trump’s desk for signature. Schools nationwide can finally serve whole and 2% milk again—a shift that could pour 45-66 million pounds of butterfat back into fluid markets each year—and dairy farmers owe this victory to Nelson Troutman’s painted hay bales, the relentless 97 Milk movement, and New York champions Duane Spaulding, Anne Diefendorf, and Jay Hoyt, who refused to stop fighting until Congress had no choice but to listen.
This isn’t just policy—it’s redemption. And it happened because dairy farmers rolled up their sleeves and made it happen themselves.
The Grassroots Movement That Changed Everything
Picture this: 2019, central Pennsylvania. Dairy farmer Nelson Troutman looks out at his field, frustrated by years of watching federal regulations restrict whole milk from schools based on outdated science. Instead of grumbling about it over coffee at the local diner, he grabbed a paintbrush and wrote “97% Fat-Free Milk” on his hay bales.
That simple act sparked something nobody expected. People driving past those bales started asking questions—wait, whole milk is 97% fat-free? They realized they’d been misled for years. Whole milk isn’t the dietary villain it was made out to be. The 97 Milk movement was born, creating a grassroots nonprofit dedicated to educating consumers and bringing choice back to school cafeterias (97Milk.com).
What’s interesting here is how a visual message on rural roadsides cut through all the noise that expensive lobbying campaigns couldn’t penetrate. I’ve noticed that the most effective agricultural advocacy often starts exactly like this—not in Washington conference rooms, but in fields and barns where farmers get fed up enough to do something unconventional.
“All the volunteers everywhere helped move this forward,” said Bernie Morrissey, Chairman of the Grassroots Pennsylvania Dairy Advisory Committee and 97 Milk. “We got attention on the school milk issue that most people didn’t even know about. We stuck with it, and our train kept getting longer as more jumped on board”.
The New York Trio Who Carried the Torch
In New York, three dairy farmers became the face of this movement in the Northeast: Duane Spaulding, Anne Diefendorf, and Jay Hoyt—the team behind “3 Farmers Who Care.” These folks didn’t just advocate from a distance; they lived and breathed this campaign, often at significant personal cost during some tough years for Northeast dairy.
“It all began six years ago when a Pennsylvania dairy farmer painted ‘97% fat-free milk’ on a hay bale,” Spaulding explained in a video documentary about the movement. That grassroots effort “works to educate consumers, support dairy farmers, and bring whole milk back to schools, while connecting farmers, families, and communities along the way” (YouTube/Facebook, 97 Milk Documentary, October 2025).
Jay Hoyt, who grew up in Vermont and moved to New York, put it plainly when asked why he kept pushing: “I guess I love farmers. I guess that’s why I stayed with it.” Their dedication—spending their own money and time away from their farms during critical seasons like first cutting and fall harvest—helped carry this movement across the finish line.
What farmers are finding is that this kind of peer-to-peer advocacy resonates in ways that polished industry campaigns sometimes don’t. When Spaulding or Diefendorf showed up at a school board meeting, they weren’t lobbyists in suits—they were neighbors who milk cows. That authenticity mattered.
What This Bill Actually Does
Let’s cut through the noise and look at what the Whole Milk for Healthy Kids Act actually changes. The legislation, formally H.R. 649 in the House and S. 222 in the Senate, does several critical things (Congress.gov, H.R. 649):
Expands Milk Options: Schools can now serve flavored and unflavored whole, reduced-fat (2%), low-fat (1%), and fat-free milk—giving kids the same choices they have at home. This development suggests a major shift in how federal nutrition policy treats dairy fat.
When you eliminate whole milk, skim and low-fat options surge—not because kids prefer them, but because choice vanishes. The 2015 bar shows zero whole milk: a regulatory impossibility in a real market. By 2027, with choice restored, composition rebalances toward what consumers actually select. The lesson? Markets don’t lie—policy does.
Removes the Saturated Fat Penalty: Here’s the technical piece that matters for school food service directors—milkfat is now exempted from saturated fat calculations for school meals. Previously, offering whole milk would push meals over saturated fat limits, creating a regulatory headache that discouraged participation (House Report 119-142).
Simplifies Parent Requests: Parents can now provide written requests for non-dairy alternatives instead of requiring a doctor’s note—common sense that should have been policy years ago.
Optional, Not Mandatory: And this is worth emphasizing for anyone worried about forced changes—schools aren’t required to do anything differently. They can choose what works for their students, their budgets, and their communities. The bill permits, not mandates.
The Science That Washington Finally Acknowledged
Here’s what makes this victory so satisfying for anyone who’s followed the research: the science has been on whole milk’s side for years, but federal nutrition policy stubbornly ignored it.
Health/Nutrition Metric
Whole Milk
2% Reduced-Fat
1% Low-Fat
Key Finding
Obesity Risk (vs. baseline)
−40% lower risk
Baseline/Higher
Baseline/Higher
Meta-analysis of 28 studies, 21,000 children (Vanderhout et al., AJCN 2019)
Essential Nutrients per 8oz
13 essential
13 essential
13 essential
Same micronutrients; fat-soluble vitamin absorption REQUIRES dietary fat
Fat-Soluble Vitamin Absorption
Optimal (A, D, E, K)
Reduced uptake
Minimal uptake
Dietary fat critical for calcium & vitamin D utilization in growing bodies
Childhood Dairy Compliance
Higher participation
Lower than whole
Lowest participation
68–94% of U.S. children miss dairy targets; whole milk drives consumption
A comprehensive meta-analysis published in The American Journal of Clinical Nutrition examined 28 studies involving nearly 21,000 children and found that kids who drank whole milk had 40% lower odds of being overweight or obesecompared to those who drank reduced-fat milk (Vanderhout et al., American Journal of Clinical Nutrition, December 2019). That finding flies directly in the face of the 2012 regulations that banned whole milk from schools, supposedly to combat childhood obesity.
Looking at this from a nutritional standpoint, it makes sense. Whole milk provides 13 essential nutrients—calcium, vitamin D, potassium, protein, and more—critical for developing bodies and brains. The fats in whole milk support vitamin absorption (vitamins A, D, E, and K are fat-soluble), brain development, and provide sustained energy that keeps kids focused through afternoon classes (National Milk Producers Federation).
The consumption data tells an equally compelling story. Between 68% and 94% of school-age children fail to meet recommended dairy intake levels, depending on age group and region. When you ban the milk kids actually want to drink, they don’t switch to skim—they just don’t drink milk at all. I’ve seen this pattern repeatedly in school nutrition data.
School milk consumption dropped 37.4% overall when flavored and full-fat options were removed in 2012, with kids selecting fewer cartons and wasting more of what they did take.
The 2012 whole milk ban destroyed school milk participation—down 37.4% by 2024. But this bill opens the door to recovery. Even modest adoption could pour 45–66 million pounds of butterfat back into fluid markets annually. The chart proves it: policy failure is reversible when farmers stop asking permission and start demanding change.
“Since whole and 2% milk were banned from school meals menus more than a decade ago, meal participation has declined while food waste has climbed, meaning children are consuming fewer essential nutrients,” said Michael Dykes, D.V.M., president and CEO of the International Dairy Foods Association.
When’s the last time you saw Congress agree unanimously on anything related to nutrition policy? That alone tells you something significant shifted in how lawmakers view dairy fat.
House Agriculture Committee Chairman Glenn “GT” Thompson (R-PA), who championed this legislation from day one, didn’t mince words after the vote: “I have worked for a decade to restore whole milk to our school cafeterias, which have been limiting healthy choices for students, but that changes today” (House Education and Workforce Committee Press Release, December 14, 2025).
The bill enjoyed backing from the Trump Administration, with USDA Secretary Brooke Rollins and HHS Secretary Robert Kennedy Jr. both publicly supporting whole milk in schools. Kennedy’s focus on making school meals healthier and questioning outdated nutritional guidelines aligned perfectly with this effort.
What This Means for Dairy Operations
Now let’s talk about what dairy farmers actually care about—the market implications. School milk represents about 7-8% of total U.S. fluid milk demand. That’s not the majority of anyone’s milk check, but it’s far from trivial—and more importantly, it’s one of the few fluid milk channels where consumption can actually grow rather than continue its decades-long decline.
The butterfat implications are where this gets interesting for producers focused on components. From 2013 to 2024, whole milk sales grew 16% at retail while skim and reduced-fat options continued their slide. Whole milk now represents 42% of retail fluid milk sales—the highest share since 2001 (The Bullvine, November 2025).
Whole milk back to 2001 levels despite 13-year school restriction
2025+
42%+
34%–
22%–
Schools can FINALLY follow consumer preference (no longer fighting market)
Giving schools the option to serve what consumers actually want could shift 45 to 66 million pounds of butterfatannually into fluid milk channels, depending on adoption rates (American Farm Bureau Federation Market Intel, November 2025). For context, that’s meaningful additional demand for butterfat at a time when component values significantly impact milk checks across the country.
“Even modest gains in school milk sales strengthen fluid milk markets, boost butterfat utilization, and improve returns to farmers,” explained Daniel Munch, economist at the American Farm Bureau Federation (Farm Bureau, November 2025).
For operations that have been breeding and managing for butterfat performance—and that’s most progressive dairies at this point—this creates incremental demand pull in exactly the direction the market has been heading anyway. It won’t transform anyone’s operation overnight, but predictable demand in a category that’s been hemorrhaging volume for decades? That’s worth something.
Operation Type
Butterfat Focus
Typical Herd Size
Primary Margin Driver
Whole Milk Market Fit
High-Component Specialists
Yes—core breeding goal
50–150 cows
Component premiums
EXCELLENT—aligned to trend
Grazing-Focused Dairies
Often elevated naturally
30–80 cows
Grass-based/brand premium
VERY GOOD—premium fluids
Regional Cooperatives
Member-variable
100–5,000+ cows
Volume + component leverage
MODERATE—depends on co-op
Commodity/Volume Players
Not primary focus
500+ cows
Scale + milk volume
LIMITED—needs commodity volume
Artisanal/Direct-to-Consumer
Very high (premium products)
20–60 cows
Brand + direct sales
NICHE—select opportunities
The Road Ahead
President Trump is expected to sign the bill quickly, making it law (Bloomberg Government, December 2025). But here’s the reality check: implementation won’t happen overnight. USDA will need to write the rules, states will need to adjust their school nutrition programs, and individual districts will need to update their procurement contracts and meal planning.
Some schools will jump at the chance to serve whole milk—particularly in dairy-heavy regions like Wisconsin, New York, and Pennsylvania, where this has been a community issue for years. Others will move more cautiously, constrained by existing contracts, food service infrastructure, or entrenched habits. The bill doesn’t force change; it permits it. That distinction matters for how quickly you’ll see this show up in school cafeterias near you.
Processors serving the school milk market will need to adjust their bids and product offerings. Schools will need to request whole milk options specifically—it won’t just appear automatically. And the grassroots volunteers who made this happen? They’re already looking at what comes next.
“Education doesn’t stop here. We have to keep it going with more volunteers,” said GN Hursh, Chairman of 97 Milk.
Jackie Behr, a livestock nutritionist who helped design the 97 Milk educational platform, surveyed parents years ago and found “widespread questions and misconceptions about milk and dairy farming.” That education mission continues, because changing policy is one thing—changing minds takes longer.
A Win Worth Recognizing
Nelson Troutman could have complained about regulations over coffee. Instead, he painted hay bales. Duane Spaulding, Anne Diefendorf, and Jay Hoyt could have stayed focused solely on their own operations during some brutal years for Northeast dairy. Instead, they built a movement.
“The long wait is over! Whole milk is coming back to schools!” Dykes declared after the House vote. “Today’s House passage marks a defining victory for children’s health and for the dairy community that has fought for more than a decade to restore whole and 2% milk for our nation’s students” (International Dairy Foods Association Press Release, December 2025).
Rep. Tim Walberg (R-MI), Chairman of the House Education and the Workforce Committee, summed it up well: “Good nutrition is the foundation of a child’s life, including his or her ability to learn and grow” (House Education and Workforce Committee, December 2025).
For once, common sense, good science, and farmer advocacy aligned to produce real change. Kids will get better nutrition. Parents will have more choices. Dairy farmers will see stronger demand in a channel that desperately needed it.
That’s the kind of dairy industry story we need more of.
Key Takeaways
Unanimous. Not a single vote against. The House passed the Whole Milk for Healthy Kids Act on December 14, 2025, with zero opposition. The Senate did the same in November. When’s the last time Washington agreed on anything? They agreed on whole milk.
Whole and 2% are back in schools. First time since 2012. Flavored milk stays. Milkfat no longer counts against saturated fat limits. Thirteen years of questionable nutrition policy just got overturned.
The market impact is real. 45-66 million pounds of butterfat could shift into fluid channels annually. School milk is 7-8% of U.S. fluid demand. Whole milk already drives 42% of retail sales—now schools can finally follow the consumer.
Farmers won this. Not lobbyists. Nelson Troutman painted hay bales in Pennsylvania. Duane Spaulding, Anne Diefendorf, and Jay Hoyt refused to quit in New York. The 97 Milk movement turned grassroots persistence into federal law.
Your next move. Trump signs within days. USDA writes implementation rules. Talk to your processor about school milk opportunities. Contact your local school district. Make sure they know the options are coming—and that you’re ready to supply them.
Every week, thousands of producers, breeders, and industry insiders open Bullvine Weekly for genetics insights, market shifts, and profit strategies they won’t find anywhere else. One email. Five minutes. Smarter decisions all week.
Dec 15: Germany’s butter -9.3%. Chicago cheese at 18-month low. NZ powder is falling. Every dairy market crashed the same week—despite record exports. What broke, and what’s next for your operation
Executive Summary: Record dairy exports should lift prices—instead, every global market crashed simultaneously the week ending December 15, 2025, revealing that fundamental pricing mechanisms have broken. U.S. cheese shipments hit all-time highs while CME prices fell to 18-month lows; European butter dropped 5.8%; powder weakened globally. The paradox persists because cheap feed costs ($4.40 corn) enable production growth despite distressed milk prices—the normal supply response isn’t working. Worse, processors worldwide are simultaneously shifting from butter into cheese, creating concentrated inventory that will mature in Q2 2026 precisely when the spring flush arrives—a collision that could severely pressure spot milk prices. This signals a structural reset, not a cyclical downturn: operations must rebuild for sustained viability at $15-16 milk through cost efficiency, component optimization, balance sheet strength, and strategic feed hedging. The industry emerging from this transition will operate under fundamentally different economics than those of the past decade.
You probably felt it in your milk check before you saw it in the data. But here’s what actually happened the week ending December 15, 2025: butter futures crashed 3.6% in Leipzig to €4,314. EU physical butter dropped 5.8% to €4,313. Whole Milk Powder on the Global Dairy Trade fell to $3,230 per metric tonne. And CME Cheddar blocks hit $1.345 per pound—the lowest since July 2023. When every major commodity tanks simultaneously across every major exchange, we’re not looking at another rough patch. We’re watching the global dairy industry reset itself in real time.
Market/Product
Price (Week of Dec 15)
Weekly Change
Significance
German Butter
€4,150/tonne
-€425 (-9.3%)
Steepest weekly crash
EU Physical Butter (avg)
€4,313/tonne
-€251 (-5.8%)
18-month low
CME Cheddar Blocks
$1.345/lb
-4.1%
Lowest since July 2023
Global Dairy Trade WMP
$3,230/tonne
-3.8%
Sustained weakness
Dutch Butter
€4,070/tonne
-€250 (-5.8%)
Export benchmark falls
EEX Butter Futures (Leipzig)
€4,314/tonne
-3.6%
Futures signal no recovery
EU Young Gouda
€2,961/tonne
-34.3% YoY
Near five-year lows
EU Mild Cheddar
€3,248/tonne
Just €4 above 5-yr low
Testing historical floor
Here’s the part that should really get your attention: U.S. cheese exports hit 116.5 million pounds in September—up 34.5% from the previous year and representing the highest daily average on record, according to the U.S. Dairy Export Council. Record exports should be lifting prices, not coinciding with an 18-month low. That mechanism just broke, and understanding why matters for every decision you’re making about 2026.
Month
U.S. Cheese Exports (Million lbs) – Left Axis
CME Cheddar Blocks ($/lb) – Right Axis
Mar 2025
95.2
$1.62
Apr 2025
98.7
$1.58
May 2025
102.3
$1.54
Jun 2025
107.8
$1.49
Jul 2025
110.5
$1.46
Aug 2025
113.2
$1.41
Sep 2025
116.5
$1.38
Dec 2025
118.8 (est)
$1.345
A Brief Look Back: Context for What We’re Seeing
Before diving into current dynamics, it’s worth understanding that synchronized global dairy price collapses of this magnitude are relatively rare. The last time we saw coordinated weakness across multiple regions and products simultaneously was during the 2014-2016 period, when a combination of Russian import bans, a slowdown in Chinese demand, and the removal of European quotas created a global surplus that took nearly two years to work through. That episode saw U.S. Class III milk drop from over $24/cwt in 2014 to under $14 in 2016.
What eventually resolved that situation was a combination of weather-driven production disruptions (the 2016 New Zealand drought), gradual demand recovery in Asia, and ultimately, many smaller farms exiting the industry entirely. The recovery wasn’t quick, and the industry that emerged on the other side looked structurally different—more consolidated, more efficient, and arguably more vulnerable to the kind of dynamics we’re seeing today.
When the Safety Valves Stop Working
For as long as most of us have been in this industry, global dairy markets have operated with a kind of built-in equilibrium. When prices drop in one region, traders buy there and sell elsewhere, which lifts the cheap market and cools the expensive one. If a U.S. product is discounted, exports surge until domestic prices align with international benchmarks. It’s the arbitrage mechanism that keeps regional markets from getting too far out of whack.
What’s striking about mid-December is how that mechanism appears to have stopped functioning.
Looking at the data from European exchanges, German physical butter crashed by €425 in a single week—that’s a 9.3% drop—settling at €4,150. The weekly EU dairy quotations showed Dutch butter at €4,070, down €250. Yet French butter actually firmed €200 to €4,720. So you’ve got a €650 per tonne spread between French and Dutch butter, which shouldn’t persist in an integrated market.
At the same time, the Singapore Exchange was seeing pressure across its dairy complex despite solid trading volumes of 18,915 tonnes for the week. And back in the States, CME Cheddar blocks are sitting at $1.345 per pound—the lowest we’ve seen since summer 2023.
When these markets all move down together like this, it tells you the buyers are either already full or they’re waiting for even lower prices. That’s a fundamentally different dynamic than we’re used to seeing. What we’re watching is the global dairy complex running out of capacity to absorb current production levels at anything close to recent historical prices.
Why Production Keeps Growing Despite Terrible Prices
In a typical cycle, you’d expect falling prices to trigger pretty predictable responses. Farmers cull marginal cows, dial back feed inputs where it makes sense, and overall production gradually contracts. That supply reduction creates scarcity, and prices eventually recover. It’s the classic pattern the industry has relied on for generations.
That’s not what’s happening, and here’s why it matters.
The USDA’s December World Agricultural Supply and Demand Estimates held 2025 U.S. milk production steady at 115.70 million tonnes—still up 2.4% from 2024. They lowered the 2026 projection slightly, from 117.15 to 117.05 million tonnes, citing reduced dairy cow inventory offsetting per-cow production gains. But even with that downward revision, we’re still looking at 1.2% growth in 2026.
Think about that for a minute. Even with prices at distressed levels across multiple product categories, American milk production is forecast to keep expanding.
And if you want to understand why, take a look at what’s happening in feed markets. The December USDA grain outlook shows March 2026 corn futures trading around $4.405 per bushel, with projected ending stocks of 2.03 billion bushels. That’s the highest level in seven years and 32% greater than last season. The agency actually raised its corn export forecast to 3.2 billion bushels—that’s up 12% from last year’s record—yet domestic supplies remain massive. Soybean meal closed the week at $302 per ton, down $5.40.
What this creates is production that stays high because historically cheap feed costs insulate producers from the full pain of low milk checks. When you run the income-over-feed-cost calculations—and I know most of you do this weekly if not daily—many operations can still pencil out positive margins even with Class III in the mid-$15s. That math keeps marginal cows in the herd even when finished product prices are screaming oversupply.
I was looking at numbers from a 500-cow Wisconsin operation recently that illustrates this perfectly. With corn at $4.40, their feed costs are down 18% from last year. That keeps their IOFC positive at $16.50 milk, even though that’s $3 below what they budgeted for 2025. So the economic signal telling them to cut back gets overwhelmed by the reality that they’re still cash-flow positive on a monthly basis.
Period
Feed Cost
Other Costs
Milk Price
IOFC Margin
Q4 2023
$10.20
$7.50
$19.80
$9.60
Q1 2024
$9.80
$7.60
$18.50
$8.70
Q2 2024
$9.20
$7.70
$17.90
$8.70
Q3 2024
$8.90
$7.80
$17.20
$8.30
Q4 2024
$8.40
$7.90
$16.80
$8.40
Q1 2025
$7.80
$8.00
$16.20
$8.40
Q4 2025
$7.20
$8.10
$15.90
$8.70
Here’s something else worth noting: the USDA report mentions explicitly that winter weather isn’t the constraint it used to be, particularly in the Midwest. Modern housing systems mean operations in Wisconsin, Michigan, and Minnesota can maintain high production levels regardless of what’s happening outside. Better ventilation, more sophisticated environmental controls—which is great for consistency and animal welfare, but it also makes production less responsive to price signals.
The Export Picture Gets Complicated
Here’s where things get really interesting, and why the volume numbers deserve a closer look.
September numbers from the U.S. Dairy Export Council showed cheese exports up 34.5% year-over-year to 116.5 million pounds—the highest daily average shipments on record. Butter exports were 2.7 times larger than the previous year. Whey powder exports hit their highest level since March 2023, up 8.3%.
You’d think those export numbers would support domestic prices. When foreign buyers aggressively purchase U.S. products, that should create competition for available inventory. But that’s not what we’re seeing. Strong export volumes are coinciding with some of the weakest domestic prices in years.
What this tells you is that the industry is exporting what it has to produce to keep processing plants running at capacity. These modern cheese plants have massive fixed costs and debt service obligations. You can’t afford to run at 70% capacity—your cost per unit skyrockets. So you run full-throttle and discount product to move volume into export channels.
And here’s where the story gets more nuanced. While cheese exports are at record levels, nonfat dry milk exports collapsed 18.5% year over year in September, hitting an eight-month low. Even sales to Mexico—and Mexico has been one of our most reliable powder markets—dropped 17.3%. When you can’t move powder to Mexico, that tells you demand is genuinely soft across categories.
The cheese export story breaks down in interesting ways by region. Mexico remains the dominant market, which makes sense given proximity and trade relationships. But what’s notable is that Australia has become the third-largest destination for U.S. cheese. USDEC data shows Australia has already imported more U.S. cheese in 2025 than in any previous year on record, and we’ve still got three months of shipments to count.
This matters because it represents a shift in the Australian dairy sector. Chronic drought conditions and herd contraction have pushed Australia from being a dairy-surplus nation to one that’s increasingly dependent on imports. U.S. cheese is essentially backfilling the gap left by shrinking Australian milk production.
The challenge with this dynamic is sustainability. Mexico is buying finished U.S. cheese because, at current prices, it’s cheaper than importing powder and manufacturing cheese themselves. Australia is buying because they don’t have enough domestic milk. Neither situation represents organic demand growth driven by expanding consumption—they’re opportunistic purchases driven by price dislocations and supply shortfalls elsewhere.
When those conditions change—and at some point they will—it raises legitimate questions about where all that U.S. cheese production capacity is directed.
Europe’s Markets Fragment Under Pressure
The European physical spot markets during the week of December 10 showed how extreme stress can break down normally efficient trading systems, and it’s worth understanding these dynamics because they affect global price relationships.
The weekly EU dairy quotations showed the aggregate butter index down 5.8% to €4,313. But that overall number hides some significant regional variations. German butter crashed €425 per tonne in a single week—that 9.3% decline—settling at €4,150. Dutch butter, which tends to serve as a key pricing benchmark for export markets, fell €250 to €4,070. Yet French butter actually firmed €200 to €4,720.
So you’ve got a €650 per tonne spread between French and Dutch butter. That’s roughly a 16% price difference for essentially the same commodity in neighboring countries with no trade barriers. Under normal circumstances, traders would move product to capture that arbitrage opportunity, and the spread would compress.
The persistence of this spread likely reflects panic selling in the German and Dutch markets—processors liquidating inventory to generate cash flow—while France’s unique regulatory structure (particularly the Loi EGalim laws that protect farmer margins) and strong domestic preference for high-quality branded butter with protected designations create price support that can’t be easily arbitraged away.
Meanwhile, the European cheese complex is testing historical support levels. The EEX European Weekly Cheese Index shows Mild Cheddar trading at €3,248—just €4 above its five-year low. Cheddar Curd sits at €3,221, €27 above its five-year floor. Young Gouda has fallen to €2,961, down 34.3% year-over-year.
When you’ve got multiple cheese varieties simultaneously trading within pennies of multi-year lows during what should be a seasonally firm period—pre-holiday demand, typically lower winter milk production—it signals fundamental oversupply rather than temporary weakness. The market is grinding against production costs, and may already be below them for higher-cost operators.
The Strategic Pivot Creating Future Pressure
One pattern emerging from the data that has real implications for 2026 is a simultaneous shift by processors across multiple countries away from butter production and toward cheese.
UK production statistics from DEFRA for October 2025 tell the story: butter production down 15.4% year-over-year while cheese production increased 0.6%, with Cheddar specifically up 4.0%. You’re seeing similar dynamics in U.S. processing facilities—milk diverted from volatile butter markets into cheese vats.
The logic makes sense on paper. Butter is highly price-sensitive and difficult to store long-term without incurring significant cold-storage costs. Cheese, particularly aged varieties like Cheddar, can sit in inventory for 6 to 12 months as it matures. From a processor’s perspective, cheese acts as a kind of financial buffer—you can convert today’s surplus milk into a solid commodity and hope that by the time it’s ready for market, prices will have improved.
The complication is that when processors in the U.S., UK, and EU all make the same decision simultaneously, they shift oversupply in time and concentrate it into a single product category.
All that cheese being produced right now in December 2025 will mature and need to move to market in mid-2026—right around the time the Northern Hemisphere spring flush begins, bringing another seasonal surge in milk production. If export warehouses in key markets like Mexico and Australia are already well-stocked from late 2025’s record shipments, buyer demand could slow just as supply peaks.
Month
U.S. Cheese Production
EU Cheese Production
UK Cheese Production
Total Industry Production
Oct 2025
520
380
45
945
Nov 2025
540
395
47
982
Dec 2025
565
410
52
1,027
Jan 2026
580
415
53
1,048
Feb 2026
590
420
54
1,064
Mar 2026
605
435
48
1,088
Apr 2026
630
455
50
1,135
May 2026
655
475
52
1,182
Jun 2026
670
485
53
1,208
This creates what you might call borrowed demand—the cheese you’re making today to avoid the butter price collapse will need to clear the market in six months. If prices haven’t recovered by then, given the volume being produced across multiple regions, you’ve delayed the problem and possibly intensified it by concentrating everyone’s surplus into the same product at the same maturity window.
What Futures Markets Are Signaling
Despite the physical market’s weakness, there’s a notable divergence in how futures markets are pricing the outlook for different milk classes, and it’s worth understanding what that spread reveals about traders’ expectations.
CME Class III futures for December 2025 fell 12 cents during the week to settle at $15.90 per hundredweight. But deferred 2026 contracts showed some resilience. The market seems to be betting that somewhere around the $15.50-16.00 range represents something close to a floor—that at these levels, demand will kick in enough and production will slow enough to stabilize things.
Class IV futures—driven by butter and nonfat dry milk prices—remain stuck in the mid-$13s through early 2026. The futures curve doesn’t show Class IV climbing above $14 until March at the earliest.
This spread reveals how traders are thinking about clearing mechanisms for different product categories. They’re betting that cheese can be cleared through aggressive export pricing, despite concerns about inventory. The record U.S. shipment volumes support that view. But they see no similar clearing mechanism for butter and powder, where domestic consumption is relatively fixed, and export competition from New Zealand and Europe remains intense.
Month
Class III Futures
Class IV Futures
Dec 2025
$15.90
$13.45
Jan 2026
$15.75
$13.50
Feb 2026
$15.65
$13.60
Mar 2026
$15.80
$14.05
Apr 2026
$16.10
$14.20
May 2026
$16.35
$14.40
Jun 2026
$16.55
$14.65
Jul 2026
$16.75
$14.85
Another factor supporting Class III that is often overlooked is the relative strength in the dry whey market. While butter and cheese prices are under serious pressure, whey is showing some resilience. The EU weekly quotation showed whey firming €15 to €989 per tonne, now up 12.6% year-over-year—making it the only major dairy commodity showing positive year-over-year performance in European markets. U.S. whey powder exports jumped 8.3% in September, with strong sales to China and Vietnam.
Because the Class III formula includes both cheese and whey components—specifically cheese price times 9.6 plus whey price times 5.9—the strength in whey provides a mathematical floor that Class IV doesn’t have. Even if cheese prices stay depressed, firm whey values help support the overall Class III calculation.
The question is whether futures traders are correctly assessing the inventory risk. If those strong cheese export numbers reflect stockpiling by buyers taking advantage of low prices rather than genuine ongoing consumption demand, then the apparent clearing mechanism could weaken in Q2 2026, just when the spring flush and all that aged cheese hit the market simultaneously.
The Feed Cost Variable Worth Watching
While most market signals point toward continued pressure through early 2026, there’s one variable that could shift the equation, and it’s worth keeping on your radar: what happens in grain markets.
The current dairy situation is enabled by historically low corn and soybean meal prices. As long as those input costs stay depressed, the income-over-feed-cost margins for many operations remain positive enough to justify maintaining production even with low milk prices.
But grain markets can turn quickly. The USDA is forecasting massive corn ending stocks, but those projections assume reasonably normal weather conditions. If drought develops in Brazil or Argentina during their growing season—December through March—grain prices could spike. The soybean complex, in particular, is trading with skepticism about Chinese demand. U.S. commitments to export soybeans through early November were running 40% lower than the prior year.
If China steps back into the market aggressively, or if South American weather turns problematic, soybean meal could rally from current levels near $300 per ton to $350 or higher fairly quickly. That kind of move would change the feed cost equation that’s currently supporting milk production despite low prices.
A grain rally might trigger a supply response driven by economics rather than operational necessity. If feed costs spike while milk prices stay low, you’d see the cull rate accelerate. That would tighten milk supplies before the spring flush, which might prevent some of the more challenging scenarios being discussed for Q2.
The complication, of course, is that this kind of adjustment through higher input costs isn’t exactly a rescue—it would address the oversupply by further pressuring margins. But it might be one of the few mechanisms left that can trigger a meaningful supply response.
Looking Ahead to Spring 2026
As we look toward the next few months, there are several scenarios worth considering, and I think it’s important to think through both the optimistic case and the more challenging possibilities.
The optimistic case would be that export demand continues absorbing U.S. cheese at roughly current volumes, European production contracts modestly as various forecasts suggest, New Zealand’s season ends normally, and the market finds a new equilibrium at these lower price levels without major disruption. Farmers who can operate profitably at Class III in the $15-16 range continue; those who can’t gradually exit through normal business cycles. It’s a slow grind, but it avoids a crisis.
The challenge with that scenario is that it assumes multiple things align favorably simultaneously, and it doesn’t fully account for the inventory dynamics building in the cheese complex.
A more complete assessment acknowledges that we’re heading into Q2 2026 with several risk factors converging. The spring flush will bring seasonal increases in production—that’s biology; you can’t avoid it. Cheese produced in late 2025 and early 2026 will be maturing and needing to move to market. And if export warehouses in key markets are already well-stocked from late 2025’s record shipments, buyer demand could slow as supply peaks.
In that scenario, cold storage space becomes a limiting factor. Processors would face pressure to either move product into lower-value channels—such as converting aged cheese into processed cheese ingredients—or implement supply management measures. Spot milk prices could come under significant pressure in some regions.
Whether these dynamics develop into a more serious situation depends on variables we can’t yet fully predict—export demand patterns, weather affecting production, and policy responses. But the risk is substantial enough that operations should plan for various scenarios rather than assume conditions will improve on their own.
What This Means for Your Operation
So, where does all this leave us? I think there are some practical considerations worth thinking through, and they vary depending on your role in the industry.
For Producers:
The evidence suggests we’ve moved beyond a typical cyclical downturn. Relying on historical price recovery patterns to guide current decision-making carries real risk.
The most important focus right now is cost structure. In a market where establishing a lower baseline price, efficiency matters more than production volume. A realistic assessment of your operation’s true breakeven point is critical. If your business model requires $18-19 milk to be profitable, fundamental changes may be necessary because the market is signaling that $15-16 could be the range for extended periods.
Component quality is becoming increasingly important in compressed markets. When commodity prices are under pressure, the premiums for high-protein, high-fat milk become proportionally more valuable. Fresh cow management, ration formulation, and genetic selection decisions that maximize components—all of this can add meaningful value when the base price is low. I’ve seen operations in the Upper Midwest boost their component checks by 80 cents to a dollar per hundredweight through focused attention to butterfat and protein levels, and that differential matters more than ever in this environment.
Focus fresh cow management; optimize rations for fat/protein; select genetics for components
Add $0.80-1.20/cwt to milk check
High Priority
Balance Sheet Resilience
Build working capital reserves; defer non-critical capital projects; restructure high-interest debt
Survive 6-12 months low prices
Critical Action
Feed Cost Management
Forward contract 50-60% of corn/soy needs through summer 2026 at current lows ($4.40 corn)
Lock controllable cost advantage
High Priority
Risk Management Tools
Implement Dairy Revenue Protection or LGM; set minimum price floors for Q2-Q3 2026
Protect against worse-case scenarios
Recommended
Balance sheet resilience will be critical heading into 2026. Operations with stronger working capital and lower debt service obligations will be better positioned to navigate extended low prices. This may not be the optimal time for major expansion projects or capital spending that increases fixed costs. I know that’s difficult advice when you’ve got planned improvements or a son or daughter wanting to come back to the farm, but timing matters.
Feed cost management deserves attention. With corn and soybean meal at multi-year lows, locking in favorable input costs for at least a portion of needs provides one of the few controllable variables in the current environment. Even partial coverage—50-60% of expected needs—can provide meaningful protection if grain markets rally. Some Northeast operations I’m familiar with are forward contracting corn through summer 2026 to remove at least that uncertainty from their planning.
For Processors:
Inventory management has moved from routine practice to strategic necessity. The industry-wide shift toward cheese production requires realistic planning for when and where that inventory will clear. Frank conversations with customers about forward commitments and careful evaluation of speculative inventory positions are warranted, given uncertainty about the timing of price recovery.
Export channel diversification matters more in volatile markets. Heavy reliance on one or two markets—particularly those that may be engaging in stockpiling rather than steady consumption—creates vulnerability if buying patterns shift.
Processing flexibility offers strategic advantages. Assets that can shift between products as market conditions change provide more options than single-purpose facilities in volatile environments. I recognize that’s easier said than done when you’ve got specialized equipment and a trained workforce, but it’s worth considering in future capital planning.
For the Broader Industry:
The synchronized weakness across global markets raises questions about coordination and supply discipline. Without mechanisms to better align supply with realistic demand expectations, these boom-bust cycles may become more frequent and severe. This doesn’t necessarily mean government intervention, but it might involve processors implementing more structured base-excess programs or cooperatives taking stronger action to manage supply.
Export infrastructure and market development will become increasingly critical if the U.S. continues to position itself as a large-scale global supplier. This means sustained investment in logistics, market access, technical assistance to importing countries, and trade relationships that can reliably absorb substantial volumes.
Better market intelligence and information sharing could help prevent simultaneous strategic pivots that amplify imbalances. If processors in different regions had better visibility into global production decisions, they might make different product-mix choices. Industry associations and market data services have a role in providing that transparency.
The Bottom Line
The week of December 15, 2025, may mark a transition point—when global dairy markets shifted from familiar cyclical volatility into something more structural and challenging to navigate.
The traditional mechanisms that historically dampened these cycles are evolving. Smaller farms that used to exit during downturns and help tighten supply represent a declining share of production. Regional markets that operated somewhat independently are increasingly interconnected and moving together. Feed costs, which tend to move inversely with milk prices and provide a natural hedge, are currently low, removing that counterbalance.
What’s emerging is a more consolidated, more efficient production system that responds to price signals differently than in previous decades. Large operations with modern facilities and low per-unit costs can remain profitable at price levels that would have historically triggered widespread exits. That’s economically efficient in many ways, but it also means markets may need to fall further and stay low longer to trigger the supply response needed to rebalance.
For all of us navigating this transition, the fundamental challenge is to build operations and business models that remain viable at these new baseline prices rather than relying on assumptions of a return to historical averages. The traditional wisdom that low prices eventually cure low prices still holds. The cure is working—you can see it in the data. But the adjustment period may be longer than in previous cycles required.
These are sending clear signals about the current supply-demand balance. The question facing every operation is how to adapt business strategies and risk management approaches to this evolving reality while maintaining the flexibility to capitalize on opportunities as they develop.
Market data referenced in this analysis comes from the European Energy Exchange (EEX), Singapore Exchange (SGX), Global Dairy Trade platform, CME Group, USDA World Agricultural Supply and Demand Estimates (WASDE), U.S. Dairy Export Council (USDEC), UK Department for Environment, Food & Rural Affairs (DEFRA), and European Commission weekly dairy quotations for the period ending December 15, 2025.
Key Takeaways:
The Export Paradox: Record U.S. cheese exports (+34.5%) met 18-month price lows as every global dairy market crashed simultaneously the week of December 15—revealing fundamental pricing mechanisms have broken.
Why Supply Won’t Self-Correct: Cheap feed ($4.40 corn, $302 soy meal) keeps income-over-feed-cost positive at $15-16 milk, preventing the production cuts that normally cure oversupply.
Q2 2026 Inventory Collision: Processors globally are shifting from butter to cheese simultaneously. This inventory matures in spring 2026, precisely when the flush hits—creating a potential crisis for spot milk prices.
This Is a Reset, Not a Cycle: Class III holding near $16 while Class IV languishes in mid-$13s signals new baseline economics. Operations must be built for sustained viability at these levels, not temporary survival.
Immediate Producer Priorities: (1) Cost structure over production volume, (2) Maximize component premiums—they matter most in compressed markets, (3) Strengthen balance sheets before spring, (4) Lock feed costs now via forward contracting.
Complete references and supporting documentation are available upon request by contacting the editorial team at editor@thebullvine.com.
Every week, thousands of producers, breeders, and industry insiders open Bullvine Weekly for genetics insights, market shifts, and profit strategies they won’t find anywhere else. One email. Five minutes. Smarter decisions all week.
Every major dairy region is producing more milk—at the exact same time. That almost never happens. And prices are showing it.
Executive Summary: The world is awash in milk. The U.S., Europe, New Zealand, and South America are all growing production simultaneously—a rare alignment that almost never occurs and has crushed the Global Dairy Trade index by 4.3%, with butter plunging 12.4% in a single auction. U.S. cheese exports are setting records, yet spot cheddar sits at just $1.35/lb; America has become the world’s bargain supplier. RaboResearch analysts don’t see meaningful price recovery through 2026, given relentless production growth. But here’s the structural twist worth watching: CoBank reports dairy heifer inventories at 20-year lows, with an 800,000-head deficit baked into the system from beef-on-dairy breeding decisions made in 2022-2023. Biology may ultimately accomplish what price signals haven’t. For farmers navigating this extended trough, the priorities are clear: cost control, component premiums, and cash reserves.
Something unusual is happening across the global dairy landscape right now—every major milk-producing region on earth is growing production at the same time. That almost never happens. And it’s reshaping price expectations heading into 2026.
Typically, when American parlors are running full, New Zealand deals with drought. When Europe expands, South American margins collapse. But as we close out 2025, that natural counterbalancing act has broken down entirely—and the market is feeling it.
“Milk output is growing in all key exporting regions, which is not common,” explained Lucas Fuess, senior dairy analyst at RaboResearch, in a December 2025 analysis. “Typically, at least one part of the world is dealing with a limiting factor that is reducing milk growth—either weather, disease, margins, or something else. Now, the U.S., EU, New Zealand, and South America are all seeing growth—simultaneously.”
What this means practically is that the usual relief valves aren’t working. When everyone’s producing, someone has to buy—and right now, demand simply isn’t keeping pace.
For the first time since 2018, all four major exporting regions are growing production simultaneously. Historically, drought in New Zealand or margin collapse in South America provided natural relief valves. Not this time. South America’s relentless 3.2% growth (red line) combined with New Zealand’s seasonal surge is flooding global markets—and that’s before we factor in the U.S. becoming the world’s discount cheese supplier.
Global Dairy Trade: What the December Numbers Show
The Global Dairy Trade price index fell 4.3% at the most recent auction, with most product categories posting declines. Butter took the hardest hit—down 12.4% in a single event. Only cheddar (+7.2%), lactose (+4.2%), and buttermilk powder (+1.8%) managed gains.
While the headline GDT index dropped 4.3%, the December auction revealed massive divergence: butter collapsed 12.4% in a single event, extending a five-month slide from May highs, while cheddar actually firmed +7.2%. This matters because it signals where global buyers see value—and where they don’t.
What strikes me about these numbers is the divergence between commodities. Butter has been sliding since May, when it reached five-year highs. Meanwhile, cheddar actually firmed at the latest auction. That kind of split tells you something important about how global buyers are thinking—they’re not avoiding dairy, they’re just getting selective about where they source it and what they’re buying.
Why U.S. Butter Became the World’s Bargain in 2025
Here’s something that deserves more attention: U.S. butter prices have sat well below European and New Zealand prices throughout all of 2025. That gap created an opportunity that global buyers noticed—and acted on.
“The US butter price has been well below the EU and NZ price throughout all of 2025,” Fuess noted. “This has driven global buyers to procure product from the US instead of other regions to recognize the value in US product.”
John Hallo, procurement business partner at Maxum Foods, offered additional context on the New Zealand correction: “New Zealand pricing had been running at a premium from the USA/EU for four months, so I could argue their price was overinflated. Along with peak season supply of NZ fat, we have inevitably seen the correction.”
The practical implication? That American price advantage is narrowing as global prices converge downward. Farmers who’ve been benefiting indirectly from strong export demand should watch these spreads closely heading into 2026.
U.S. Dairy Exports 2025: Record Cheese Volumes Meet Softening Spot Prices
The American export picture presents an interesting paradox. CME spot cheddar blocks closed the week of December 8-12 at $1.35 per pound, with butter averaging $1.4785/lb. Class III futures for December settled around $15.88/cwt, with Class IV hovering in the mid-$13s—hardly inspiring numbers for the milk check. (Daily Dairy Report, December 12, 2025)
And yet, U.S. cheese exports are having a record year. September shipments jumped 35% year-over-year, putting year-to-date volume at 453,076 metric tonnes. That’s already more cheese shipped abroad in nine months than in any full calendar year except 2024. The U.S. Dairy Export Council projects we’ll likely top 600,000 MT for the full year. (USDEC, December 11, 2025)
What I find telling is that we’re moving record cheese volumes at the exact moment spot prices are hitting 18-month lows. That disconnect reveals how global buyers think—they’re responding to relative value, not absolute price levels. When an American product is cheap compared to alternatives, they buy American. Simple as that.
U.S. cheese exports are on track to exceed 600,000 MT in 2025—a record—while spot cheddar sits at $1.35/lb, down nearly 30% from mid-2024 peaks. This isn’t competitive excellence; it’s competitive desperation. Global buyers are choosing American cheese because we’re cheap, not because we’re better.
Katie Burgess, dairy market advising director with Ever.Ag raised an important concern at the Oregon Dairy Farmers Convention earlier this year: “If we can’t get the cheese exported, and we’re making a lot of it, it means we’re going to need to eat a lot more cheese.”
What University Research Is Showing About Milk Solids
Leonard Polzin, dairy markets and policy outreach specialist at the University of Wisconsin-Madison, has been tracking something important: production efficiency gains are outpacing headline milk volume. Despite modest total production growth, calculated milk solids production has increased more substantially because butterfat and protein tests keep climbing. (UW Extension Farms, 2025 Dairy Situation and Outlook)
For context, back in 2020, the average butterfat test was 3.95% and the protein test was 3.181%. Today’s tests are running notably higher than usual. This matters because it means the industry can meet demand for milk solids more quickly than raw production numbers suggest—processors get more usable product per hundredweight than they did five years ago.
Additionally, UW-Madison research highlights that Federal Milk Marketing Order reforms taking effect are expected to decrease the All Milk Price by approximately $0.30/cwt, with a more pronounced impact on Class III prices. (UW Extension Farms, February 2025) That’s not a dramatic hit, but it’s another headwind for margins already under pressure.
The Heifer Constraint Nobody’s Talking About Enough
Here’s what makes the current situation genuinely unusual: despite soft milk prices, there’s a structural ceiling on how fast production can actually grow. Talk to producers across the Upper Midwest, and you hear the same story—replacement heifers are scarce and expensive.
According to CoBank’s August 2025 sector analysis, U.S. dairy replacement heifer supplies have fallen to their lowest levels in twenty years. The research projects heifer inventories will shrink by approximately 800,000 head over the next two years before beginning to recover in 2027. (CoBank/Wisconsin Ag Connection, August 2025)
CoBank’s research reveals an 800,000-head deficit already baked into the system—the direct result of beef-on-dairy breeding decisions made during 2022-2023’s high beef prices. Here’s what makes this genuinely different: even if milk prices doubled tomorrow, you can’t breed your way out of a heifer shortage when the calves weren’t born three years ago.
That 800,000-head deficit is already baked into the system based on breeding decisions made during 2022 and 2023 when beef-on-dairy crossbreeding surged. Biology dictates timing here—you can’t simply buy your way out of a heifer shortage when the calves weren’t born.
What this means practically: even if milk prices rose tomorrow and every producer wanted to expand, the replacement animals aren’t there to support rapid growth. It’s one reason why the supply response to current low prices may be slower than historical patterns would suggest—and why some analysts see eventual price support emerging from the supply side rather than demand.
The Bullvine Breeder’s Takeaway
The 800,000-head heifer deficit changes the math on your genetic inventory. Here’s what that means for breeding decisions:
Your heifer pen is now a gold mine. Verified high-genomic females will likely command premium prices through 2026 as processors compete for milk to fill new capacity.
Stop culling lightly. With replacements at 20-year lows, that “marginal” cow might be worth keeping for one more lactation.
Inventory as asset class. Heifers are no longer just a cost center—they’re increasingly liquid assets in a supply-constrained market.
Rethink beef-on-dairy. If you swung 70%+ to beef semen in 2023, review your genetic strategy immediately. The market is signaling a need for replacement purity, and premiums for verified dairy replacements are likely within 12 months.
European Dairy 2025: Less Milk, More Cheese
The EU situation offers its own set of complexities. USDA GAIN reports forecast milk deliveries at 149.4 million metric tonnes in 2025—down 0.2% from 2024. Low farmer margins, environmental regulations, and disease outbreaks continue pushing smaller producers out.
But here’s the nuance that matters: European processors are deliberately prioritizing cheese over butter and powder. EU cheese production is forecast to rise 0.6% to 10.8 million metric tonnes, even with less total milk available. They’re making a strategic choice about where to allocate their milk supply—and cheese is winning.
For American producers competing in export markets, this means European cheese will remain a competitive threat even as their overall milk production contracts.
New Zealand and Fonterra: Strong Collections, Cautious Outlook
New Zealand’s dairy sector continues performing well, though Fonterra’s latest forecast signals caution about where prices are heading. The cooperative narrowed its 2025/26 farmgate milk price range from NZ$9.00-$11.00 per kgMS down to NZ$9.00-$10.00 per kgMS in late November, with the midpoint dropping from NZ$10.00 to NZ$9.50. (Fonterra, November 25, 2025)
At the same time, Fonterra increased its milk collection forecast for the 2025/26 season from 1,525 million kgMS to 1,545 million kgMS—reflecting strong on-farm production conditions. Season-to-date collections through October were running 3.8% above last season. (Fonterra Global Dairy Update, November 2025)
CEO Miles Hurrell noted the cooperative has seen strong milk flows this season, “both in New Zealand and other milk-producing nations,” resulting in seven consecutive price drops at recent Global Dairy Trade events. Fonterra’s cooperative structure provides some insulation from spot-market volatility that investor-owned processors don’t enjoy, but its price guidance suggests it’s not expecting quick relief from current conditions.
China: Modest Import Recovery on the Horizon
After a brutal 17% decline in dairy imports through the first eight months of 2024, Rabobank forecasts Chinese dairy imports will improve by 2% year-on-year in 2025. Chinese farmgate milk prices have fallen to near 10-year lows, forcing herd reductions and farm exits that are constraining domestic supply. (Tridge/Rabobank, November 2024)
That said, a 2% increase helps at the margins but won’t fully absorb the global surplus on its own. The AHDB notes that most import growth is expected in the latter half of 2025 as domestic stocks weaken. (AHDB, February 2025) It’s a positive signal, not a rescue.
Feed Costs 2025: The One Clear Bright Spot
There’s genuinely good news on the cost side. March corn futures settled around $4.405/bu in mid-December, while January soybean meal closed near $302/ton. These represent meaningful relief for ration costs heading into 2026.
The catch—and there’s always a catch—is that feed savings don’t help if milk revenue falls faster. Margins are being compressed from the revenue side right now, not the cost side. Strong feed conversion efficiency and component production matter more than ever when the milk check is lean.
Cost/Revenue Component
Mid-2024 Average
Dec 2025 Average
Change per Cow/Year
Corn ($/bu)
$4.85
$4.41
-$96 (savings)
Soybean Meal ($/ton)
$365
$302
-$142 (savings)
Total Feed Cost per Cow/Year
$3,420
$3,182
-$238 (savings)
Milk Price per Cwt (Class III avg)
$18.20
$15.88
-$522 (loss)
Annual Milk Revenue per Cow
$4,368
$3,811
-$557 (loss)
Net Margin Impact (Revenue – Feed)
—
—
-$319 per cow
The Price Signal That Hasn’t Triggered Supply Response
What farmers are finding, according to Fuess, is that milk prices simply haven’t dropped far enough to trigger the supply response markets typically need.
“Milk prices have declined in the US, but total dairy farmer income likely remains higher than the cost of production for most farmers, meaning there has not yet been a strong enough price signal to tell farmers to cull cows or cut production.”
This creates a frustrating dynamic. Prices are low enough to hurt, but not low enough to force the contraction that would eventually support recovery. We may be stuck in this uncomfortable middle ground for a while—though the heifer shortage could ultimately do what price signals haven’t.
2026 Dairy Price Outlook: What Analysts Are Watching
Both Rabobank and Maxum Foods expect Europe to slip into a meaningful contraction next year, which should help ease the current oversupply.
“For the EU, there is a lag in falling farmgate price and reduction in milk production,” Hallo explained. “Coming off the back of good market conditions for farmers, the farms still produce good quantities despite falling commodity prices. This may look to correct itself mid-2026.”
For U.S. producers, Fuess offered a more sobering assessment: “While volatility is never gone from the market, it is unlikely that US milk prices will see significant growth in 2026 due to the continually growing production.”
Practical Considerations for Your Operation
Every farm faces different circumstances, but several themes emerge from the current market environment:
Cost management becomes your primary lever. With corn affordable and milk prices soft, feed efficiency and labor productivity matter enormously. Every dollar saved drops directly to the bottom line. This isn’t the time for sloppy ration management or deferred maintenance.
Component premiums over raw volume. High-protein, high-butterfat milk commands better prices at most plants. The Pennsylvania Dairy Producer Survey found that “increasing milk components” ranked among the highest-rated priorities across the state’s dairies in 2025. (Center for Dairy Excellence/Penn State Extension, 2025 Survey Results)Chasing volume into a surplus market amplifies the problem for everyone.
Beef-on-dairy revenue remains strong. With beef prices at historic highs, strategic terminal breeding can supplement dairy income while managing replacement inventory. The sustained strength in beef has made this supplementary income stream increasingly important to overall farm profitability—though it’s worth remembering that heavy beef breeding during 2022-2023 contributed to the heifer shortage now constraining expansion.
Build cash reserves for an extended trough. Futures markets suggest sub-$16 Class III and sub-$14 Class IV through early 2026. That’s not a dip—that’s a prolonged soft period. Make sure your balance sheet can absorb six more months of tight margins, because the market isn’t signaling quick relief.
One important caveat: margin pressures vary significantly by region and operation size. Upper Midwest operations face different feed cost structures than Western dry-lot dairies, and component premiums differ by processor. What works for a 150-cow grazing operation in Vermont won’t necessarily apply to a 3,000-cow confinement dairy in Texas. Consult your nutritionist, your lender, and your local extension economist about your specific situation.
The Bottom Line
The global dairy market is sending a clear message: there’s more milk than buyers need right now, and sustained low prices will likely be required to rebalance supply and demand. Some analysts believe we’re approaching a floor. History suggests inflection points are notoriously difficult to call.
What’s interesting is that biology may ultimately accomplish what price signals haven’t—the 800,000-head heifer deficit documented by CoBank creates a hard ceiling on expansion that capital alone can’t override. By 2027, when $10 billion in new processing capacity needs filling, the cows to supply it may simply not exist.
Operations focused on efficiency, component quality, and cost discipline will be best positioned to weather this period—and to capitalize when conditions eventually turn.
Margin Strategy
Estimated Impact per Cow/Year
Implementation Difficulty
Works Best For
What this means
Component premium focus
+$180-$320
Medium
All herd sizes
“Non-negotiable. Volume into a surplus is suicide.”
Feed efficiency optimization
+$140-$220
Low-Medium
Herds >100 cows
“Low-hanging fruit. Audit your ration immediately.”
Strategic beef-on-dairy
+$250-$400
Low
Herds with replacement flexibility
“Beef prices won’t save you, but they’ll soften the blow.”
Heifer inventory as asset
+$150-$500
High
Herds with genomic programs
“Your heifer pen is now a gold mine. Stop culling verified genetics.”
Cash reserve building
N/A (protects survival)
Medium
All farms
“Six months operating capital. Non-negotiable for 2026.”
Cull rate discipline
+$80-$180
Low
Herds facing heifer shortage
“That ‘marginal’ cow is worth one more lactation.”
Editor’s Note:Market data in this analysis comes from CME Group, Global Dairy Trade platform, USDA FAS reports, University of Wisconsin-Madison Extension, Penn State Extension, CoBank sector research, and industry analyst commentary from RaboResearch, Maxum Foods, and Ever.Ag (December 2025). National and regional averages may not reflect your specific operation’s circumstances. Feed and milk prices vary significantly by region, management practices, and market access.
Key Takeaways
Rare synchronized surplus: U.S., Europe, New Zealand, and South America are all growing milk production simultaneously—a phenomenon that almost never occurs and is crushing prices globally
December market snapshot: GDT index down 4.3%, butter plunged 12.4% in one auction, spot cheddar at $1.35/lb, Class III futures hovering near $15.88/cwt
America’s export paradox: U.S. cheese exports are setting records precisely because we’ve become the world’s cheapest supplier—though that advantage narrows as global prices converge
The 800,000-head constraint: Dairy heifer inventories have hit 20-year lows; this structural deficit from beef-on-dairy breeding may eventually limit supply when price signals alone haven’t
2026 outlook and action items: RaboResearch sees no meaningful recovery until European contraction mid-year; prioritize cost control, component premiums, and cash reserves to weather an extended trough
Complete references and supporting documentation are available upon request by contacting the editorial team at editor@thebullvine.com.
Learn More:
Is Beef-on-Dairy causing America’s Heifer Shortage? – Reveals the structural root of today’s replacement crisis, detailing how the aggressive shift to beef-on-dairy created a biological lag that no amount of capital can quickly reverse.
Every week, thousands of producers, breeders, and industry insiders open Bullvine Weekly for genetics insights, market shifts, and profit strategies they won’t find anywhere else. One email. Five minutes. Smarter decisions all week.
Trump’s $12B went to grain farmers. Dairy’s much-needed big relief check isn’t coming. Your lender’s review is. You’ve got 30 days to get ahead.
Executive Summary: Trump just handed farmers $12 billion. Dairy didn’t make the cut. The Farmer Bridge Assistance Program announced on December 8 sends $11 billion to row crops—corn, soybeans, wheat—while dairy gets shuffled into a vague $1 billion reserve with no timeline and no check in the mail. After two years of Class III prices swinging $9 per hundredweight, that’s not the relief dairy families needed. With lender portfolio reviews hitting in February, producers have 30 days to get clear on their real numbers: true break-even, actual debt-service coverage, and competitive position. Three paths forward exist—expand, restructure, or exit strategically—and the farms still milking in 2030 won’t be the ones waiting for Washington to save them.
December 8 came and went. Row crop farmers got a $12 billion lifeline. Dairy farmers got a press release mentioning a billion-dollar reserve “for other commodities”—no details, no timeline, no checks. Most producers will receive some bridge payments—often $70,000 to $90,000 for a 300-cow operation. But after this week’s announcement, we now know that this fall’s check is likely the last one you’ll see for a long time. That changes the math. You didn’t just get a bonus; you got a severance package. The question is: What are you doing with it?
Some folks deposited the check, caught up on the feed bill, and went back to managing their transition cows and monitoring bulk tank components. Others paused. They asked a harder question: What am I actually going to do differently with this breathing room?
Use of Funds
Short-Term Relief (0-3 months)
Long-Term Impact (12+ months)
Best For (DSCR)
Result
Pay down feed bill/operating debt
High – immediate pressure reduced
Low – resets cycle but doesn’t change trajectory
Above 1.25 (temporary squeeze)
Buys time, doesn’t change math
Catch up equipment payments
High – stops late fees, preserves credit
Low – unless part of turnaround plan
Above 1.5 (isolated issue)
Fine if part of bigger strategy
Invest in diagnostic analysis ($2-5K)
Low – feels like spending during crisis
Very High – clarity drives right decisions
ALL levels (knowledge is power)
BEST investment – $5K buys $450K saved
Bank it (emergency fund)
Medium – no immediate benefit
Medium – cushion for next volatility
1.0-1.5 (need flexibility)
Smart for uncertainty, boring but wise
Down payment on expansion
Low – commits to larger expense
High or Catastrophic (depends on execution)
Above 1.75 only
Only if you already had financing lined up
Premium market certification (organic transition)
Low – costs continue during transition
High if markets materialize, costs recovered
1.25+ with 3-year horizon
Requires sustained commitment, not desperate pivot
Labor improvements (housing, wages)
Medium – retention benefits take time
High – turnover reduction = $155K savings
1.25+ with retention crisis
Retention pays dividends, but takes 12-18 months
A fourth-generation Wisconsin dairyman put it simply: “That check bought me time. But time for what? That’s the part I hadn’t really thought through.”
Mark Stephenson at the University of Wisconsin–Madison, who has served as Director of Dairy Policy Analysis and Director of the Center for Dairy Profitability, has been tracking these financial dynamics for years. What the data consistently shows is sobering but won’t surprise most of us. For operations running tight margins, that kind of payment might cover a few months of cash-flow pressure—but it doesn’t fundamentally change the long-term trajectory.
The difference between how farmers use that breathing room may well determine which operations are still shipping milk in 2030.
The Financial Reality We’re Living With
You probably know this already, but it bears repeating: U.S. dairy has been facing structural profitability challenges since at least 2015. This isn’t just bad luck or one tough year strung after another.
USDA Economic Research Service cost-and-return data and farm business summaries from land-grant universities tell a consistent story. Many commercial dairies have operated with thin margins over the past decade—often leaving only a small cushion after covering operating expenses and debt service. Ag lenders generally consider a debt-service coverage ratio above 1.25 “adequate” and above 1.75 “strong,” according to Farm Credit lending materials. Many operations haven’t seen those stronger numbers consistently in years.
Why does this matter so much right now? Volatility.
USDA Agricultural Marketing Service Class III price data clearly tells the story. In 2023, prices ranged from a low of $13.77 in July to $19.43 later in the year. Then, in 2024, it swung even wider—from $15.17 to $23.34 in September. That’s the kind of $4-plus per hundredweight annual swing that’s become almost routine.
Class III milk prices swung $9.57 between July 2023’s crisis low ($13.77/cwt) and September 2024’s peak ($23.34/cwt)—representing $31,200 in annual revenue volatility for a typical 300-cow operation. This isn’t bad luck; it’s the new normal forcing strategic decisions you can’t avoid.
For a 300-cow herd shipping around 65,000 pounds monthly, a $4 swing represents roughly $30,000 in annual revenue. That’s the difference between upgrading your cooling system and wondering how you’ll make the equipment payment.
A $4/cwt price swing—routine in today’s market—costs a 300-cow operation $31,200 annually. That’s not margin erosion; that’s the difference between upgrading equipment and wondering how you’ll make the payment. Small operations can’t absorb this volatility without fundamental changes. Find your herd size. Feel the impact.
You can’t plan around that kind of volatility. You can only build systems—financial and operational—that survive it.
What Lenders Actually See
When your lender reviews your file, they’re looking at a handful of key ratios. Here’s what those numbers mean from their perspective, based on Farm Credit and Compeer Financial lending benchmarks:
Current Ratio (current assets ÷ current liabilities)
Above 2.0: Breathing room. You can handle surprises.
1.2 to 1.5: Functional but vulnerable. One bulk tank rejection, one compressor failure, one key employee quitting—and you’re scrambling.
Below 1.0: Crisis. You can’t cover short-term bills without new borrowing.
Debt-to-Asset Ratio
Under 50-60%: Comfortable. You have options.
60-70%: Refinancing gets harder. Lenders watch you closer.
Above 70%: Difficult territory. Conversations change.
Debt-Service Coverage Ratio (net income available ÷ total debt payments)
Above 1.25: Adequate coverage with cushion for bad months.
1.0 to 1.15: Making payments, but zero margin for error.
Below 1.0: Farm income can’t cover debt. Something has to change.
When margins run this tight, a price drop or feed cost spike doesn’t just reduce profits. It triggers cascading stress that takes years to recover from. I’ve seen operations that looked solid on paper in January find themselves in workout discussions by August because one thing went sideways and there was no cushion.
Government support programs address immediate pressure. They don’t change the underlying cost structures or market dynamics that created the margin compression.
Getting Honest About Your Numbers
This is where things get practical—and where most farm families haven’t done the math as precisely as they probably should.
The Center for Dairy Excellence in Pennsylvania coordinates a Dairy Decisions Consultant program connecting dairies with experienced advisors. What their work consistently reveals is that many operators overestimate profitability because they don’t accurately capture all costs.
Cost Category
Typical $/cwt
Often Underestimated?
Why It Matters
Feed (homegrown at market value)
$9.50
✓ YES (many use cost-of-production not market value)
Homegrown hay worth $180/ton? That’s your cost, not $0
Labor (including family)
$4.20
✓✓ YES (family labor valued at zero or minimum wage)
Your time has value – $45K/year minimum or you’re paying to work
Repairs & Maintenance
$1.80
✓ YES (deferred maintenance not counted)
Deferred = future crisis. Include realistic annual average
Utilities (electric, water, fuel)
$1.40
No (usually accurate)
Usually captured accurately in most analyses
Insurance & Property Taxes
$1.20
✓ YES (property tax increases forgotten)
Increasing property values = rising taxes many forget to model
Interest on Debt
$2.10
No (debt service is visible)
Interest is painful but at least it’s visible in statements
Equipment Depreciation
$1.60
✓✓ YES (many skip or undervalue)
Equipment wears out. $500K parlor ÷ 15 years = $33K/year real cost
Family Living Draw (realistic)
$2.50
✓✓✓ MOST MISSED (survival wages vs actual need)
Can your family ACTUALLY live on what you draw? Be honest.
Penn State studies: Most farmers underestimate by $3-5/cwt
Three numbers matter most:
Your true break-even milk price. This isn’t just operating expenses divided by production. It’s everything: feed, including homegrown forages valued at market rates; labor; utilities; repairs; interest; insurance; property taxes; a realistic family living draw—not survival wages, but what you’d actually need—and equipment depreciation. Penn State Extension cash-flow tools consistently show that once you include family living, full depreciation, and opportunity costs, many dairies discover their true cost of production runs noticeably higher than their mental estimates.
Your actual DSCR. Net farm income available for debt service is divided by total annual payments. This tells you whether profitability is genuine or depends on favorable price cycles. Here’s a useful exercise: model your DSCR using the 10-year average milk price instead of current levels. If it drops below 1.0, you’re more vulnerable than the good months suggest.
Your competitive position. How does your cost of production compare to similar operations? USDA’s Agricultural Resource Management Survey and state dairy business summaries group herds by cost percentile. There’s a clear top tier of low-cost producers, a large middle group, and a smaller segment of high-cost operations struggling at commodity prices regardless of market conditions.
What’s revealing—and this comes from conversations with consultants across the Upper Midwest—is how often farmers discover they’re in a different position than they assumed. Operations that undergo formal financial analysis often find that their actual situation differs materially from their intuitive sense of how things are going.
Three Paths Forward
Once you have accurate numbers, strategic options come into focus. Research from Iowa State’s Beginning Farmer Center and Wisconsin’s Center for Dairy Profitability points to three main directions. None is universally right. All require honest assessment.
The Expansion Path
For operations with strong debt-service coverage and genuine competitive advantages—exceptional genetics, reliable labor, favorable land costs, proximity to processing—expansion into the 1,000-plus cow range may offer scale economics needed to remain competitive.
But here’s the reality check. Recent lender case studies and construction bids suggest that taking a 300-cow dairy into that range can require several million dollars in new facilities, equipment, and working capital. At current commercial interest rates—often running 7-8% for expansion financing through private lenders according to Federal Reserve district surveys—payback periods approaching a decade aren’t unusual unless margins run consistently strong.
A Minnesota lender framed the key question this way: Can your operation achieve profitability at the 10th percentile milk price for your region? If expansion only pencils out when prices are above average, the risk profile may be too aggressive.
That said, for the right operation with strong management depth, disciplined financial oversight, and realistic timelines, expansion remains viable. The farms succeeding at scale typically share those characteristics—it’s not just about cow numbers.
The Restructure Path
For DSCR values between 1.0 and 1.25, there’s a middle path. Stay near the current scale while fundamentally improving profitability through efficiency gains or market repositioning.
What’s working for farms pursuing this approach?
Premium market access. Organic certification can add meaningful dollars per hundredweight according to USDA Agricultural Marketing Service organic price reports, though the three-year transition demands careful cash-flow planning. A2 programs and grass-fed premiums offer smaller but real improvements for operations with appropriate genetics and infrastructure.
Cost structure improvement. Feed efficiency typically offers the largest opportunity—improving pounds of milk per pound of dry matter intake flows to the bottom line across every cow, every day. Labor efficiency through better scheduling and reduced turnover comes next. Genetic selection emphasizing productive life and component yield rather than type traits rounds out the practical options. For herds averaging 4.0% butterfat versus 3.5%, component premiums can add $0.50 to $1.00 per hundredweight to your mailbox price—that’s real money across a full year of production.
Cooperative positioning. Farmer-owned cooperatives often provide better price transparency than commodity channels, though this varies by region. Edge Dairy Farmer Cooperative in the Upper Midwest has been active on contract transparency. For some operations, the right co-op relationship provides stability worth as much as a premium.
This path typically requires 3-5 years of focused execution. It works best when the next generation has a genuine interest and developing capability.
The Exit Path
Let’s be clear: Exiting isn’t quitting. It’s preserving equity.
Burning $450,000 of family wealth just to say you hung on for three more years isn’t pride—it’s poor management. And I’ve watched too many families learn that lesson the hard way.
For operations with DSCR persistently below 1.0 or structural losses that relief payments mask rather than resolve, a strategic exit often preserves more family wealth than continued operations.
Same farm. Same family. Same equity—until timing changed everything. Strategic exit at month 8-10 preserved $480K. Waiting for forced liquidation at month 18 left $100K. That $380,000 difference? It’s not theory. It’s a real Wisconsin dairy, documented by Cornell researchers. It’s the literal cost of hoping things will turn around when the math says they won’t. Courage isn’t staying—sometimes it’s knowing when to preserve what three generations built.
Farm transition research from Cornell’s Dyson School frames the arithmetic starkly: A farm losing $150,000 annually that delays exit by three years destroys $450,000 in equity—plus the psychological toll on everyone involved. An orderly exit preserves substantially more equity than forced liquidation, in which lenders set the timeline and distressed sales become unavoidable.
That’s not a small difference. That’s the difference between retiring with dignity and starting over with nothing.
Farm transition specialists across Wisconsin and Minnesota consistently report that families preserve substantial wealth—often $100,000 or more—by making decisions earlier and executing deliberately rather than waiting until a crisis removes options.
A retired dairyman in central Wisconsin shared something that stuck with me: “The hardest part was admitting it to myself. Once I did that, the actual process wasn’t that bad. And my kids thanked me for not making them watch it fall apart.”
Exit isn’t failure. For many families, it’s the decision that preserves generational wealth and allows the next generation to build lives that match their actual interests. Sometimes the bravest thing you can do is know when to stop.
Factor
Expansion Path
Restructure Path
Strategic Exit
Minimum DSCR
Above 1.75
1.0-1.25
Below 1.0
Capital Required
$3-5M+
$50-150K
Consultant fees only
Timeline
5-7 years to payback
3-5 years
8-10 months
Risk Level
Very High
Moderate
Low (preserves equity)
Success Rate
<5% access financing
30-40% achieve goals
100% preserve wealth
Next Generation?
Strongly committed
Interested, developing
Free to choose their path
Best Case Outcome
1,000+ cows, economies of scale
Profitable niche, sustainable
Preserve $400K-$680K equity
Worst Case Outcome
Crushing debt at 7-8% interest
Margin improvement insufficient
Wait too long, lose $450K
Andrew’s Reality Check
Only works for top-tier operations. Most can’t get financing.
Requires discipline and premium market access. Not a miracle cure.
Not failure—it’s strategy. Preserves generational wealth.
Different Stakeholders See This Differently
Farmers, processors, cooperatives, and lenders view consolidation through different lenses. Understanding those perspectives helps explain why solutions remain elusive.
From the processor perspective, consolidation creates efficiencies. The International Dairy Foods Association has noted that larger, more consistent milk supplies reduce collection costs and enable capital investment in specialized processing. The trend toward fewer, larger farms isn’t something most processors resist—their infrastructure investments often assume it continues.
Cooperatives occupy more complicated ground. Organizations like Dairy Farmers of America represent both large farms that benefit from consolidation and mid-sized operations that struggle against it. That tension surfaces in policy debates, pricing decisions, and governance questions.
Lenders are segmenting portfolios more deliberately. Operations with strong metrics receive competitive rates and expansion financing. Those in the middle face cautious credit and frequent reviews. Those showing deterioration get workout discussions—sometimes before the farm family has acknowledged the trajectory.
The Kitchen Table Conversation
Whatever path makes financial sense, research on farm transitions reveals something important: Most failed successions trace back to communication and expectations more than financial impossibility.
Farm transition educators at Manitoba Agriculture and Penn State Extension report this pattern consistently. Families carry different assumptions about what should happen—and unspoken expectations compound into problems that could have been addressed years earlier.
What seems to work:
Before the family meeting, each person answers hard questions individually. Senior generation: Can I genuinely step back and let the next generation make different choices? What income do I actually need in retirement? Is this operation viable for the next generation without ongoing relief? For the next generation: Do I actually want to farm, or am I carrying an obligation? Can I earn a reasonable living from this operation as structured?
During the meeting, a neutral third party presents actual financial data—an accountant, extension educator, or consultant without an emotional stake —presenting facts rather than perceptions.
After the meeting, document whatever’s decided. Not from distrust. Because written agreements prevent the “I thought you meant…” conversations that later fracture relationships.
The Labor Reality
For operations choosing to stay and optimize, labor management has become as critical as milk price management.
Texas A&M research confirms what many of us have seen firsthand: immigrant labor accounts for about 51% of all dairy workers nationally. And turnover remains a persistent challenge—the FARM Workforce Development program found average turnover approaching 40% across participating dairies. For a 300-cow operation needing three or four milkers, that means potentially replacing more than one person every year.
At 38.8% annual turnover, a typical 20-worker dairy operation loses nearly $155,200 every year to workforce churn. That’s not just an HR problem—it’s production poison. Studies show high turnover triggers 1.8% decrease in milk production, 1.7% increase in calf losses, and 1.6% spike in cow mortality. You’re literally losing cows and calves because you can’t keep people.
Michigan State University Extension research shows the total cost of losing and replacing a dairy employee can reach 100-150% of annual wages—accounting for recruiting, training, productivity loss, and learning-curve mistakes. For a full-time milker earning $38,000-$45,000, that’s potentially $40,000 or more every departure.
What are farms with strong retention doing?
Housing makes a real difference. University of Wisconsin and Cornell Extension case studies describe dairies that added on-farm housing, resulting in dramatic declines in turnover—some reporting waiting lists for positions.
Total compensation matters more than hourly rate. Consistent year-round hours often retain people better than higher wages with unpredictable schedules. Health insurance moves the needle on retention.
Career pathways change the equation. Paying for certifications, creating advancement from milker to lead to herd manager—these transform dairy work from a temporary job to a career worth building.
Robotic milking can make sense, but the investment is larger than sometimes expected. Industry benchmarks from Hoard’s Dairyman put individual robots at $150,000 to $275,000 before construction. Three or four units with barn modifications can climb well past a million dollars. The math works when operations are financially solid, and labor genuinely constrains options. It often doesn’t work when you’re already stressed—adding fixed costs to situations that need flexibility.
Regional Realities: Why Your Location Changes Everything
Region
Typical “”Mid-Size””
Key Advantage
Major Challenge
What Success Looks Like
Upper Midwest (WI, MN)
300-500 cows
Cheese market infrastructure, cooperative network, land costs moderate
Winter feed costs, labor housing in rural areas, consolidation pressure
DSCR 1.5+, feed efficiency >1.5, co-op loyalty for price stability
Everything discussed applies most directly to Upper Midwest operations—the Wisconsins and Minnesotas, where cheese-focused production dominates. The framework translates elsewhere, but the specifics shift considerably.
California and the Southwest operate at entirely different scales—a “mid-sized” Central Valley dairy might milk 2,000 cows. Water costs that barely register in Wisconsin can run $50,000-plus annually in California. Compliance with manure management adds layers of expense. I talked with a Tulare County producer last year who said his regulatory costs alone would bankrupt most Midwest operations his size.
The Northeast offers stronger local market access and premium opportunities—fluid milk still dominates, and proximity to population centers creates options. But land costs can run three to four times those in the Upper Midwest, and fragmented processing means fewer outlets. A Vermont organic producer told me his premium market access is the only reason he’s still viable at 120 cows.
The Southeast operates with grazing-based systems, creating fundamentally different cost structures. Heat-stress management and forage systems look nothing like those in Upper Midwest production. Fluid milk focus means different price exposure than cheese-market operations.
The framework—understand your numbers, choose a path, have family conversations, address labor strategically—applies everywhere. But the thresholds and viable options vary considerably. Your local extension dairy specialist can help translate.
What to Do in the Next 30 Days
For the producer who just received government support: Before allocating it all to operations, invest a small portion in understanding your actual position.
A diagnostic assessment from a qualified dairy consultant typically runs $2,000 to $5,000, depending on scope and region. What you receive: actual DSCR compared to benchmarks, true break-even determination, competitive position assessment, and honest conversation about realistic options.
Why January matters: Most lenders conduct annual portfolio reviews in late winter. Getting your analysis done now—before those reviews, before spring planting decisions lock in cash flow, and with time to implement changes before peak production season—gives you maximum flexibility. If your lender identifies concerns in their February review and you haven’t done your homework, you’re reactive. If you’ve already got a plan and the data to support it, you’re in a much stronger position. Wait until March, and you’ve lost two months of runway.
Where to start: County Extension offices often provide free initial consultations. In Wisconsin and the Upper Midwest, the Center for Dairy Profitability at UW-Madison offers farmer-focused analysis at cdp.wisc.edu. The Center for Dairy Excellence coordinates approved consultants across Pennsylvania and neighboring states at centerfordairyexcellence.org. Farm Credit associations offer analysis as part of lending relationships.
Questions worth asking: Where do I actually stand financially? How do I compare to similar operations in my region? What’s my true break-even? Based on these numbers, what options make sense?
Schedule it now. The farmer who gets clarity in January makes better decisions in March—and has time to act on them before the year gets away.
Week
Action Item
Who to Contact
What You’ll Learn
Cost
Week 1 (Jan 6-12)
Gather financial documents
Your accountant/bookkeeper
Actual liabilities, assets, cash flow
$0
Week 1 (Jan 6-12)
Calculate actual DSCR
Extension office (free tools)
Where you REALLY stand (not where you hope)
$0-200
Week 2 (Jan 13-19)
Contact dairy consultant
Center for Dairy Profitability / local consultant
What diagnostic analysis costs ($2-5K)
$0-500
Week 2 (Jan 13-19)
Run break-even analysis
Consultant + your actual production data
True cost per cwt including ALL costs
$2,000-5,000
Week 3 (Jan 20-26)
Schedule family meeting
Spouse, next generation, key family
Whether expectations align across generations
$0
Week 3 (Jan 20-26)
Model 3-path scenarios
Consultant or extension advisor
Which path makes financial sense for YOUR numbers
Included
Week 4 (Jan 27-Feb 2)
Meet with lender (proactive)
Your ag lender (Farm Credit, etc)
Their view of your operation BEFORE formal review
$0
Week 4 (Jan 27-Feb 2)
Decide & document plan
Attorney if exit, consultant if expand/restructure
Commitment to action or need to pivot
$500-2,000
Government support provides breathing room. What dairy families do with that breathing room—pursue honest assessment and deliberate decisions, or extend the status quo—will shape which operations remain viable.
The farms navigating this successfully share one trait: they got clear on their actual position early enough to still have options.
That’s not pessimism. That’s strategy.
Key Takeaways
Relief payments buy time—not a future. Use this cash to understand your true position, not just pay down the feed bill.
Below 1.25 DSCR? You have no cushion. Model your numbers at 10-year average milk prices. If it drops below 1.0, you’re exposed.
Three paths exist: expansion, restructuring, or strategic exit. All are valid. None work can be done without an honest financial assessment first.
Waiting costs more than deciding. Cornell research shows that delaying exit by three years destroys $450,000 in family equity. Exiting isn’t failure—it’s strategy.
January clarity beats March panic. Lenders review portfolios in late winter. A $2K-$5K diagnostic now gives you leverage before those conversations start.
Every week, thousands of producers, breeders, and industry insiders open Bullvine Weekly for genetics insights, market shifts, and profit strategies they won’t find anywhere else. One email. Five minutes. Smarter decisions all week.
The same genomic tools that delivered record milk components are now prompting producers to rethink how they approach breeding decisions—and the lessons extend well beyond butterfat.
Executive Summary: Butterfat prices dropped from $3.71 to $1.50 per pound in two years—but the genetics selected during the boom won’t fully express until 2027. That timing gap is the real story here. Producers who invested in high-fat genetics weren’t making bad bets; they were responding rationally to a decade of strong market signals. The problem is structural: genomic selection moves in 5-year cycles while commodity markets can reverse in 5 months. Now, with protein commanding higher premiums in many Federal Orders and replacement heifers at their lowest since 1978, breeding decisions made this season will shape herd economics through 2030. The operations that thrive won’t be those who predicted the protein shift earliest—they’ll be producers who built enough genetic flexibility to perform whether butterfat, protein, or neither pays the premium.
For about fifteen years, the playbook seemed pretty clear. Butterfat was the component everyone wanted more of. Global shortages, strong butter demand, and Federal Order component prices that reached $3.71 per pound in October 2023 made aggressive selection for high-fat genetics look like a solid strategy. Producers who pushed their herds from 3.7% to 4.2% butterfat watched their milk checks respond accordingly.
Then things shifted faster than most of us anticipated.
By late 2024, average butter prices had dropped to $2.65–$2.70 per pound—still workable for most operations, but a significant change from those earlier highs. And the adjustment continued from there. By December 2025, USDA Agricultural Marketing Service reports showed CME butter around $1.50 per pound, with butterfat component values near $1.70—a correction that surprised even some seasoned market watchers.
What changed more fundamentally was the relationship between butterfat production and butterfat value. Processors who struggled to source cream in previous years were now describing 2025 as “a buyer’s market” for butterfat-based products.
What makes this situation worth examining—beyond the price movement itself—is what it reveals about how genomic selection interacts with commodity markets. For producers making breeding decisions right now, there are some genuinely practical lessons here.
How We Got Here
To understand the current landscape, it helps to recall why butterfat became so valuable in the first place.
In the early 2010s, global butterfat supplies were genuinely constrained. The European Union was working to phase out milk quotas, causing production disruptions across the continent. New Zealand faced drought conditions. Meanwhile, consumer preferences were shifting—full-fat dairy products were regaining favor after decades of low-fat messaging.
The U.S. responded by importing increasing quantities of butter and anhydrous milkfat. USDA Foreign Agricultural Service data shows imports climbed from about 10 million pounds in 2011 to over 100 million pounds by 2021—then jumped to 172 million pounds by 2023. The signal to American dairy producers was clear: butterfat demand was outpacing domestic supply.
Genomic selection, which arrived around 2008–2009, gave producers the tools to respond effectively. With the ability to evaluate animals at birth and make breeding decisions based on predicted genetic merit, the industry could achieve in five years what once required fifteen or more.
The production response tells the story. Between 2011 and 2023, U.S. milk production increased about 15%—while butterfat production climbed roughly 28%, according to USDA data analyzed by CoBank economist Corey Geiger. The industry essentially doubled the rate of butterfat improvement relative to overall milk output. By 2024, national milkfat levels had reached 4.23%.
One Wisconsin producer put it to me this way: “We did exactly what the market told us to do. The premiums were there, the genetics were available, and it penciled out.” And he’s right—producers responded rationally to clear economic signals. Those were logical business decisions given the information available at the time.
Geiger has emphasized that U.S. producers responded exceptionally to butterfat demand—and that supply growth has shifted the market from tightness toward relative balance. By April 2025, Holstein genetics had improved so significantly that the Council on Dairy Cattle Breeding rolled back the butterfat genetic base by 45 pounds—almost double any previous adjustment in the breed’s history.
The Timing Challenge Every Producer Faces
Here’s where things get particularly instructive for anyone evaluating their breeding program.
There’s a fundamental tension in dairy genetics that this butterfat cycle illustrated clearly: the timeline for genetic change doesn’t align with the timeline for market change. Not even close.
Timeline Stage
Genetic Expression Timeline
Market Cycle Timeline
Initial Decision
Evaluate genomic young sires, select matings
Respond to current component prices
Early Phase
Breeding + gestation (0-24 months)
Prices can shift 20-40% in 6-12 months
First Expression
Heifers enter lactation (24-36 months)
Market conditions completely different
Herd-Level Impact
Genetic shift reaches 50%+ of herd (48-84 months)
8-16 complete market cycles have occurred
Full Expression
Total timeline: 5-7 years
Total reversal possible: 6 months
Extension data from Penn State, University of Wisconsin-Madison, and industry genomic selection studies. Market cycle data from USDA Agricultural Marketing Service CME component pricing.
When you’re evaluating a genomic young sire and making a breeding decision today, the consequences of that decision won’t fully appear in your bulk tank for at least 3 to 4 years. Meaningful herd-level shifts? Those generally take five to seven years to materialize—that’s standard extension guidance from places like Penn State and Wisconsin. Meanwhile, component prices can move 30% or more in six months. We just watched butterfat drop from $3.71 to $1.70 in about two years.
Dr. Chad Dechow, associate professor of dairy cattle genetics at Penn State, has written extensively about this dynamic in the Journal of Dairy Science. His research has documented how genomic selection has accelerated genetic change to the point where market conditions sometimes shift before the genetics fully express in production.
What this means in practical terms: A producer who selected aggressively for butterfat in 2021 and 2022, responding to then-strong prices, won’t see those genetics fully express until 2025–2027. By then, market conditions will have already evolved—and the genetic direction will be largely set.
You know, this creates a challenging planning environment. Producers are essentially making long-term commitments based on market conditions they can’t fully predict. When those decisions align with where markets ultimately go, results are excellent. When they don’t, adjustments take time.
“U.S. producers did an exceptional job responding to butterfat demand. For 10 years, the market couldn’t supply enough of it, and now there’s a relative balance—it’s almost too much of a good thing.” — Corey Geiger, Lead Dairy Economist, CoBank
What This Looks Like Across Different Operations
For farms that followed market signals and invested in high-butterfat genetics, current conditions present real considerations. But the impact varies meaningfully depending on operation size, financial structure, and regional market.
Consider a typical Upper Midwest cheese milk producer with 800 to 1,200 cows who increased herd butterfat from 3.8% to 4.2% over the past decade. At peak butterfat prices, component calculations suggest that improvements could have added six figures to the milk check annually. The exact amount varies by market and pricing formula, but the direction was consistently positive during the premium period.
Many of those operations reasonably invested in facility improvements, purchased replacement heifers, and structured financing around component premiums that appeared sustainable. Those were logical business decisions given the information available.
Mark Stephenson, director of dairy policy analysis at the University of Wisconsin-Madison, has tracked these dynamics in his monthly Dairy Situation and Outlook reports. He’s observed that Upper Midwest cheese plants face different economics than fluid milk processors in the Southeast or butter-powder operations in the West—so the regional experience varies considerably.
What’s also important to recognize: some operations that emphasized butterfat genetics timed things well. Farms that built equity during 2018–2023 and maintained manageable debt loads are navigating this transition reasonably. The greater pressure tends to fall on operations that expanded more recently with higher leverage.
As one California producer explained to me: “Every cycle looks obvious in hindsight. The question is always whether you’re positioned to handle the turn when it comes.”
The Export Development
One factor that’s helped absorb domestic butterfat supply is significant growth in U.S. dairy exports.
According to the U.S. Dairy Export Council, through the first three quarters of 2025, U.S. butterfat export value reached almost $400 million—surpassing the previous full-year record of $351 million set in 2013. The U.S. has essentially shifted from a consistent butter importer to a competitive exporter.
This export growth has provided meaningful market support. But some context is helpful.
Much of the growth reflects price competitiveness rather than permanent structural demand. In late 2024, U.S. spot butter was around $2.65 per pound, versus $3.17 in New Zealand and $3.60 in the EU—roughly 30% below European suppliers’ prices. That price differential attracts buyers, though it may not represent a permanent market position.
Trade policy considerations also matter. The American Farm Bureau Federation noted in mid-2025 that “dairy’s trade balancing act” remains sensitive to geopolitical developments affecting markets like Canada, Mexico, and Asia.
The practical implication: exports help balance supply, but building a long-term strategy for export markets requires careful attention to factors beyond domestic control.
The Protein Discussion
As butterfat values have moderated over the past 18 months, protein has emerged as the more valuable component in several Federal Milk Marketing Orders—a shift from the pattern of recent years.
Year
Butterfat Value ($/lb)
Protein Value ($/lb)
Premium Winner
Advantage ($/lb)
2021
$2.85
$2.12
Butterfat
+$0.73
2022
$3.45
$2.38
Butterfat
+$1.07
2023
$3.20
$2.55
Butterfat
+$0.65
2024
$2.25
$2.40
Protein
+$0.15
2025
$1.70
$2.65
Protein
+$0.95
Federal Order component pricing basis. Actual values vary by region and specific co-op formulas. For a typical Holstein producing 24,000 lb milk annually at 4.0% fat (960 lb) and 3.2% protein (768 lb), this swing represents significant per-cow value shifts.
So what’s driving this? Several factors are worth watching.
Growth in GLP-1 weight loss medications like Ozempic and Wegovy appears to be influencing dairy consumption patterns. Circana research found that consumers using these medications often increase protein intake to preserve muscle mass—with Danone reporting roughly 40% growth in yogurt sales among GLP-1 users based on that data. Greek yogurt and other high-protein dairy products are showing measurable gains among this demographic.
The broader high-protein trend also continues. The International Food Information Council’s national consumer surveys show that the percentage of Americans actively trying to increase protein intake rose from 59% in 2022 to 71% in 2024, then settled at 70% in their 2025 survey.
And with well over half of U.S. milk flowing into cheese production according to USDA utilization data, processors continue to value milk with favorable protein-to-fat ratios for optimal yields.
This naturally raises a question: Could the butterfat experience repeat with protein?
The dynamics differ somewhat. Protein has biological constraints that limit how quickly it can increase. Extension specialists like Dr. Kent Weigel at the University of Wisconsin-Madison have noted that protein percentage is more physiologically constrained than butterfat and tends to improve more gradually, even under strong selection pressure.
That said, the basic market structures—selection indices that primarily reflect current prices, commercial incentives that favor trending traits—haven’t fundamentally changed.
What this suggests: responding to protein market signals makes sense, while the butterfat experience offers a useful perspective on building flexibility into longer-term genetic planning.
Thinking Differently About Breeding Decisions
For producers making breeding decisions this season for heifers that won’t enter the milking string until 2028 or 2029, what approaches are worth considering?
Conversations with producers who’ve thought carefully about this reveal some common themes.
Consider scenarios rather than single predictions. Rather than optimizing entirely for current market conditions, there’s value in selecting genetics that perform reasonably well across multiple possible futures. This isn’t about being overly cautious—it’s about acknowledging genuine uncertainty about what component values will look like in 2029.
In practice, this might mean maintaining some genetic diversity even when current prices favor a particular trait. Keeping 25–30% of replacement genetics in “non-premium” lines might cost 1–2% in near-term milk check value while providing meaningful flexibility if conditions shift. Think of it as a relatively inexpensive form of insurance.
Align genetics with processor requirements. This consideration sometimes gets overlooked. Commodity prices fluctuate considerably quarter to quarter. But your cheese plant’s preferred protein-to-fat ratio? That tends to be fairly stable over multi-year periods.
Different cheese types have different optimal compositions. Mozzarella plants typically target protein-to-fat ratios around 0.95 to 1.05 for optimal stretch and yield. Cheddar operations often prefer ratios in the 0.85-0.90 range. If your milk goes to a specific plant, selecting toward that specification may make more sense than following monthly component price movements.
Cheese Type
Optimal Protein:Fat Ratio
Target Protein %
Target Fat %
Why It Matters
Mozzarella
0.95 – 1.05
3.3 – 3.5%
3.4 – 3.6%
Too much fat = poor stretch & oil-off; too little = rubbery texture
Cheddar
0.85 – 0.90
3.1 – 3.3%
3.6 – 3.8%
Lower ratio optimal for aging; high protein reduces yield
Swiss
0.90 – 0.95
3.2 – 3.4%
3.5 – 3.7%
Balance critical for eye formation; ratio affects gas production
Cream Cheese
0.40 – 0.50
2.8 – 3.0%
6.0 – 7.0%
High fat essential for texture; protein secondary consideration
Parmesan/Asiago
0.95 – 1.00
3.4 – 3.6%
3.5 – 3.7%
Long aging demands protein; low fat reduces rancidity risk
Optimal ranges vary by specific plant equipment, cultures, and product specifications. Contact your field representative for your plant’s specific targets. Component ratios shown are protein:fat on a percentage basis.
Having a conversation with your fieldman or co-op representative about end-user requirements over the next five years is time well invested. Useful questions include: What’s your target protein-to-fat ratio? Are anticipated product mix changes expected to shift component preferences? What component levels create operational challenges for your plant?
Use financial tools alongside genetic planning. Programs like Dairy Margin Coverage and Dairy Revenue Protection, along with component futures, can help manage margin volatility regardless of herd genetic composition.
DMC enrollment for 2026 coverage is approaching—evaluating whether current coverage levels match your risk profile makes sense given margin trends. USDA’s Farm Service Agency offers enrollment details and decision tools through local offices and at farmers.gov.
Monitor genetic diversity metrics. Holstein inbreeding has accelerated under genomic selection. Average inbreeding for Holstein females reached 8% by 2020, with young genomic bulls averaging 13.7%. The trend has continued upward, with average female inbreeding rising each year since 1981.
Beyond fertility and health considerations, genetic similarity increases collective exposure when market conditions or disease pressures change unexpectedly.
Evaluating a sire’s expected inbreeding contribution alongside his PTAs reflects recognition that diversity has practical value in uncertain environments. Inbreeding data is available on CDCB’s website at uscdcb.com, and most AI companies include this information in sire catalogs and mating programs.
Regional and Operational Considerations
A few additional factors for producers working through these decisions:
Regional context matters. Upper Midwest cheese milk producers face different dynamics than Southeast fluid milk shippers or California producers selling into butter-powder markets. The component value discussion plays out differently depending on your market channel. Understanding your specific situation helps calibrate how national trends apply to your operation.
Scale affects flexibility. Larger operations generally have more capacity to maintain diverse genetic lines within their herd. Smaller operations may need different approaches—perhaps breeding group strategies or working with AI representatives to build diversity into mating programs with fewer animals.
Financial structure shapes options. Operations with lower leverage and stronger equity positions can more readily weather margin compression while genetic adjustments work through the herd. Operations with recent expansion debt face different calculations. Honest assessment of your situation helps identify which strategies fit best.
The replacement market is constrained. USDA’s January 2025 inventory report showed dairy replacement heifers at 3.914 million head—the lowest since 1978. CoBank’s August 2025 analysis reported average heifer prices around $3,010 per head, with top heifers at California and Minnesota auctions reaching $4,000 or more.
If your approach involves significant culling and replacement, current heifer market conditions meaningfully affect the economics. This makes breeding decisions on your existing herd inventory more consequential when outside replacements are both expensive and limited.
The Bottom Line
The butterfat boom is over, but the lesson is permanent: Chasing the hot market of the moment is a slow-motion gamble.
Genomic selection delivered exactly what it promised—unprecedented genetic progress toward the traits producers selected for. The problem wasn’t the tool. The problem was selecting into a market environment that proved more temporary than the genetic changes themselves.
The winners in 2030 won’t be the ones who chased today’s milk check. They’ll be the ones who bred for the cow that works in any market.
That means building herds with enough flexibility to perform when butterfat pays, when protein pays, and when neither pays particularly well. It means matching genetics to processor needs rather than spot prices. It means treating diversity not as a compromise but as a genuine competitive advantage.
The operations that thrive through the next cycle—and there will always be a next cycle—will be those that learned this lesson now, while the butterfat correction is still fresh.
The question for every producer making breeding decisions today is simple: Are you building a herd for this year’s premium, or for the decade ahead?
Key Takeaways:
The timing gap is structural and permanent. Breeding decisions take 5-7 years to express; markets can reverse in months. Build for multiple scenarios, not today’s price sheet.
Chasing butterfat wasn’t a mistake—the signals were real. The lesson isn’t to ignore markets; it’s to avoid over-concentration in any single trait when you can’t predict what pays in 2030.
Protein now commands higher premiums, but the same mismatch applies. Don’t repeat the butterfat pattern by going all-in on the next hot component.
Your processor’s requirements beat spot prices for planning. Cheese plants have stable protein-to-fat targets (mozzarella: 0.95-1.05; cheddar: 0.85-0.90). Align genetics to your actual market channel.
Diversity is insurance with a cheap premium. Maintaining 25-30% of replacements in balanced genetics costs 1-2% short-term but provides real optionality when—not if—markets shift again.
Complete references and supporting documentation are available upon request by contacting the editorial team at editor@thebullvine.com.
Learn More:
CDCB Unveils Net Merit 2025: Updating Dairy Genetic Selection – Deep dive into the specific trait adjustments in the new 2025 index, explaining how the increased emphasis on livability and butterfat directly impacts your sire selection strategy for the next genetic cycle.
Every week, thousands of producers, breeders, and industry insiders open Bullvine Weekly for genetics insights, market shifts, and profit strategies they won’t find anywhere else. One email. Five minutes. Smarter decisions all week.
To provide the best experiences, we use technologies like cookies to store and/or access device information. Consenting to these technologies will allow us to process data such as browsing behavior or unique IDs on this site. Not consenting or withdrawing consent, may adversely affect certain features and functions.
Functional
Always active
The technical storage or access is strictly necessary for the legitimate purpose of enabling the use of a specific service explicitly requested by the subscriber or user, or for the sole purpose of carrying out the transmission of a communication over an electronic communications network.
Preferences
The technical storage or access is necessary for the legitimate purpose of storing preferences that are not requested by the subscriber or user.
Statistics
The technical storage or access that is used exclusively for statistical purposes.The technical storage or access that is used exclusively for anonymous statistical purposes. Without a subpoena, voluntary compliance on the part of your Internet Service Provider, or additional records from a third party, information stored or retrieved for this purpose alone cannot usually be used to identify you.
Marketing
The technical storage or access is required to create user profiles to send advertising, or to track the user on a website or across several websites for similar marketing purposes.
To provide the best experiences, we and our partners use technologies like cookies to store and/or access device information. Consenting to these technologies will allow us and our partners to process personal data such as browsing behavior or unique IDs on this site and show (non-) personalized ads. Not consenting or withdrawing consent, may adversely affect certain features and functions.
Click below to consent to the above or make granular choices. Your choices will be applied to this site only. You can change your settings at any time, including withdrawing your consent, by using the toggles on the Cookie Policy, or by clicking on the manage consent button at the bottom of the screen.
Functional
Always active
The technical storage or access is strictly necessary for the legitimate purpose of enabling the use of a specific service explicitly requested by the subscriber or user, or for the sole purpose of carrying out the transmission of a communication over an electronic communications network.
Preferences
The technical storage or access is necessary for the legitimate purpose of storing preferences that are not requested by the subscriber or user.
Statistics
The technical storage or access that is used exclusively for statistical purposes.The technical storage or access that is used exclusively for anonymous statistical purposes. Without a subpoena, voluntary compliance on the part of your Internet Service Provider, or additional records from a third party, information stored or retrieved for this purpose alone cannot usually be used to identify you.
Marketing
The technical storage or access is required to create user profiles to send advertising, or to track the user on a website or across several websites for similar marketing purposes.


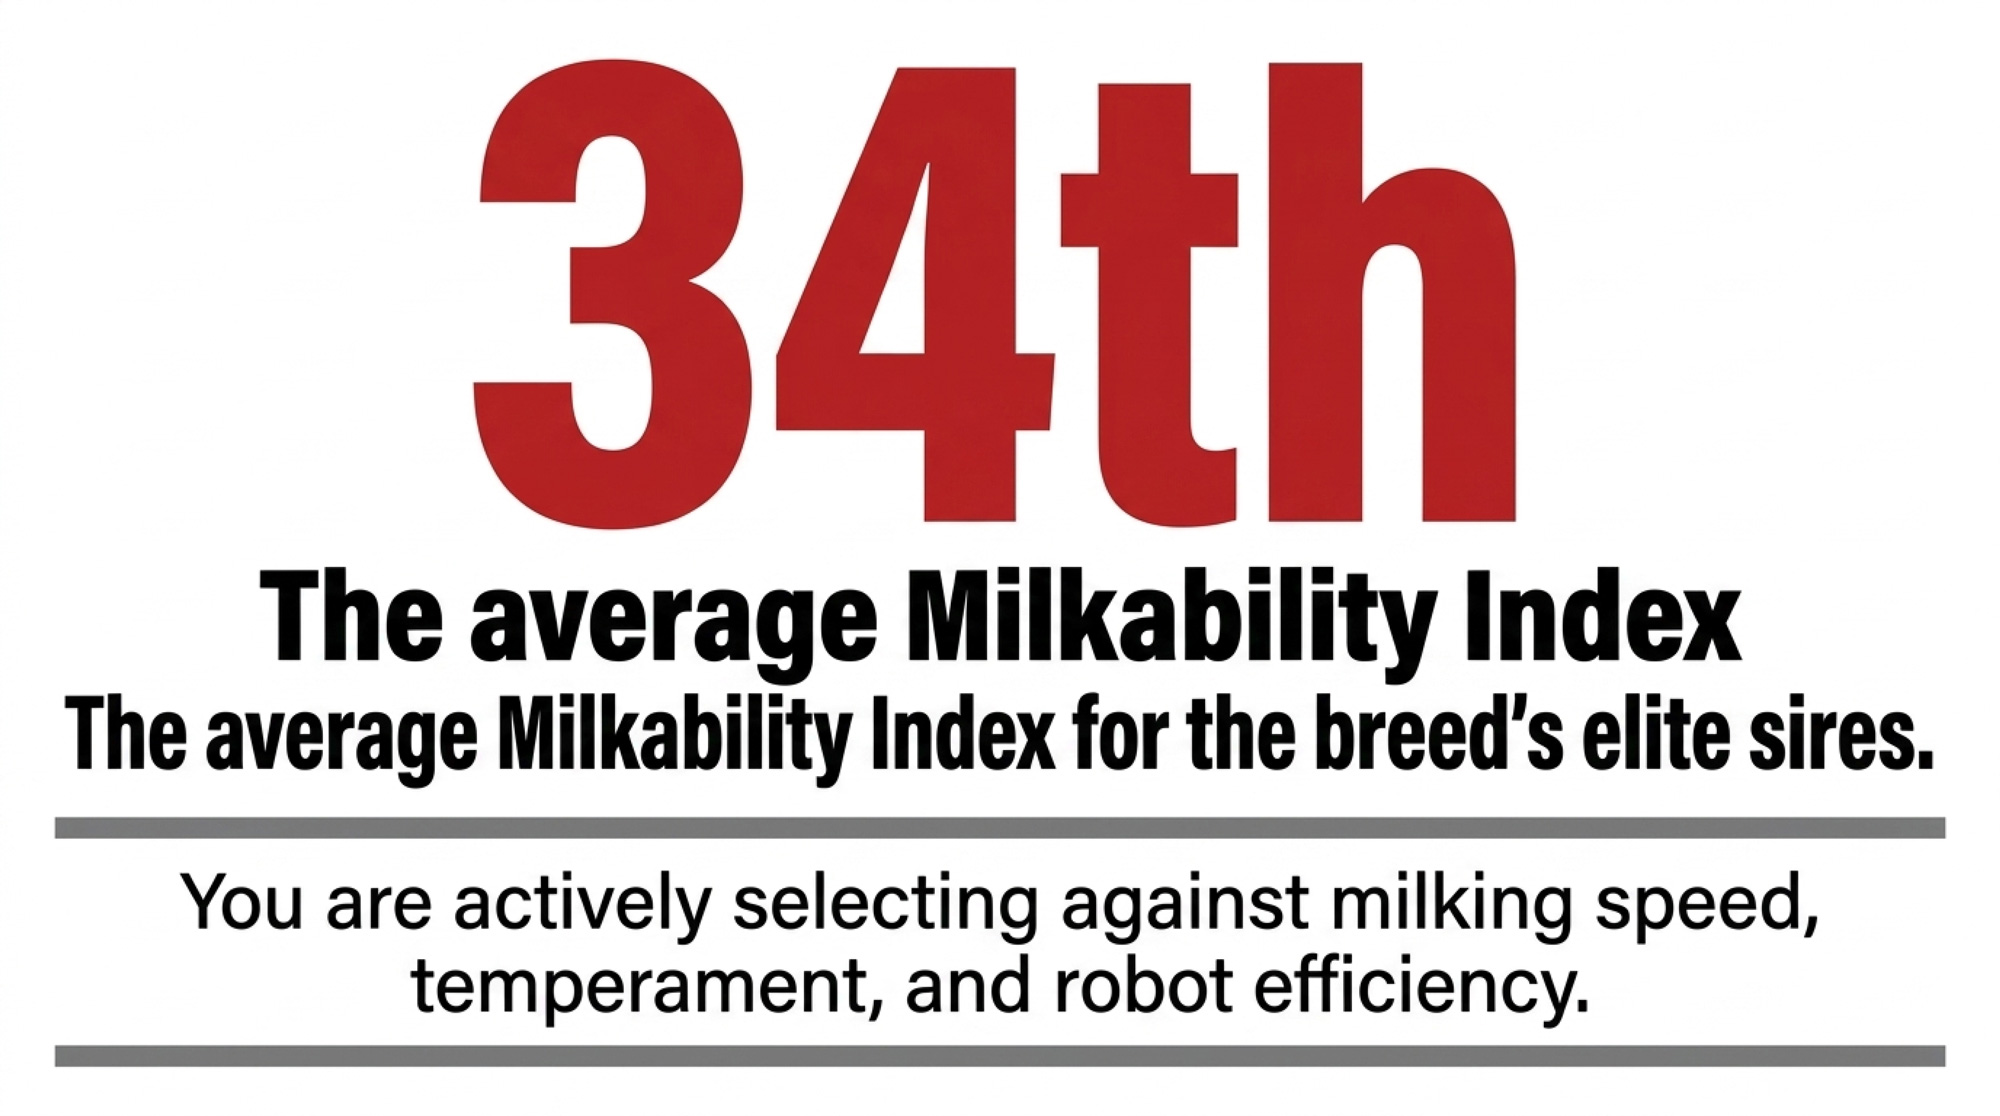
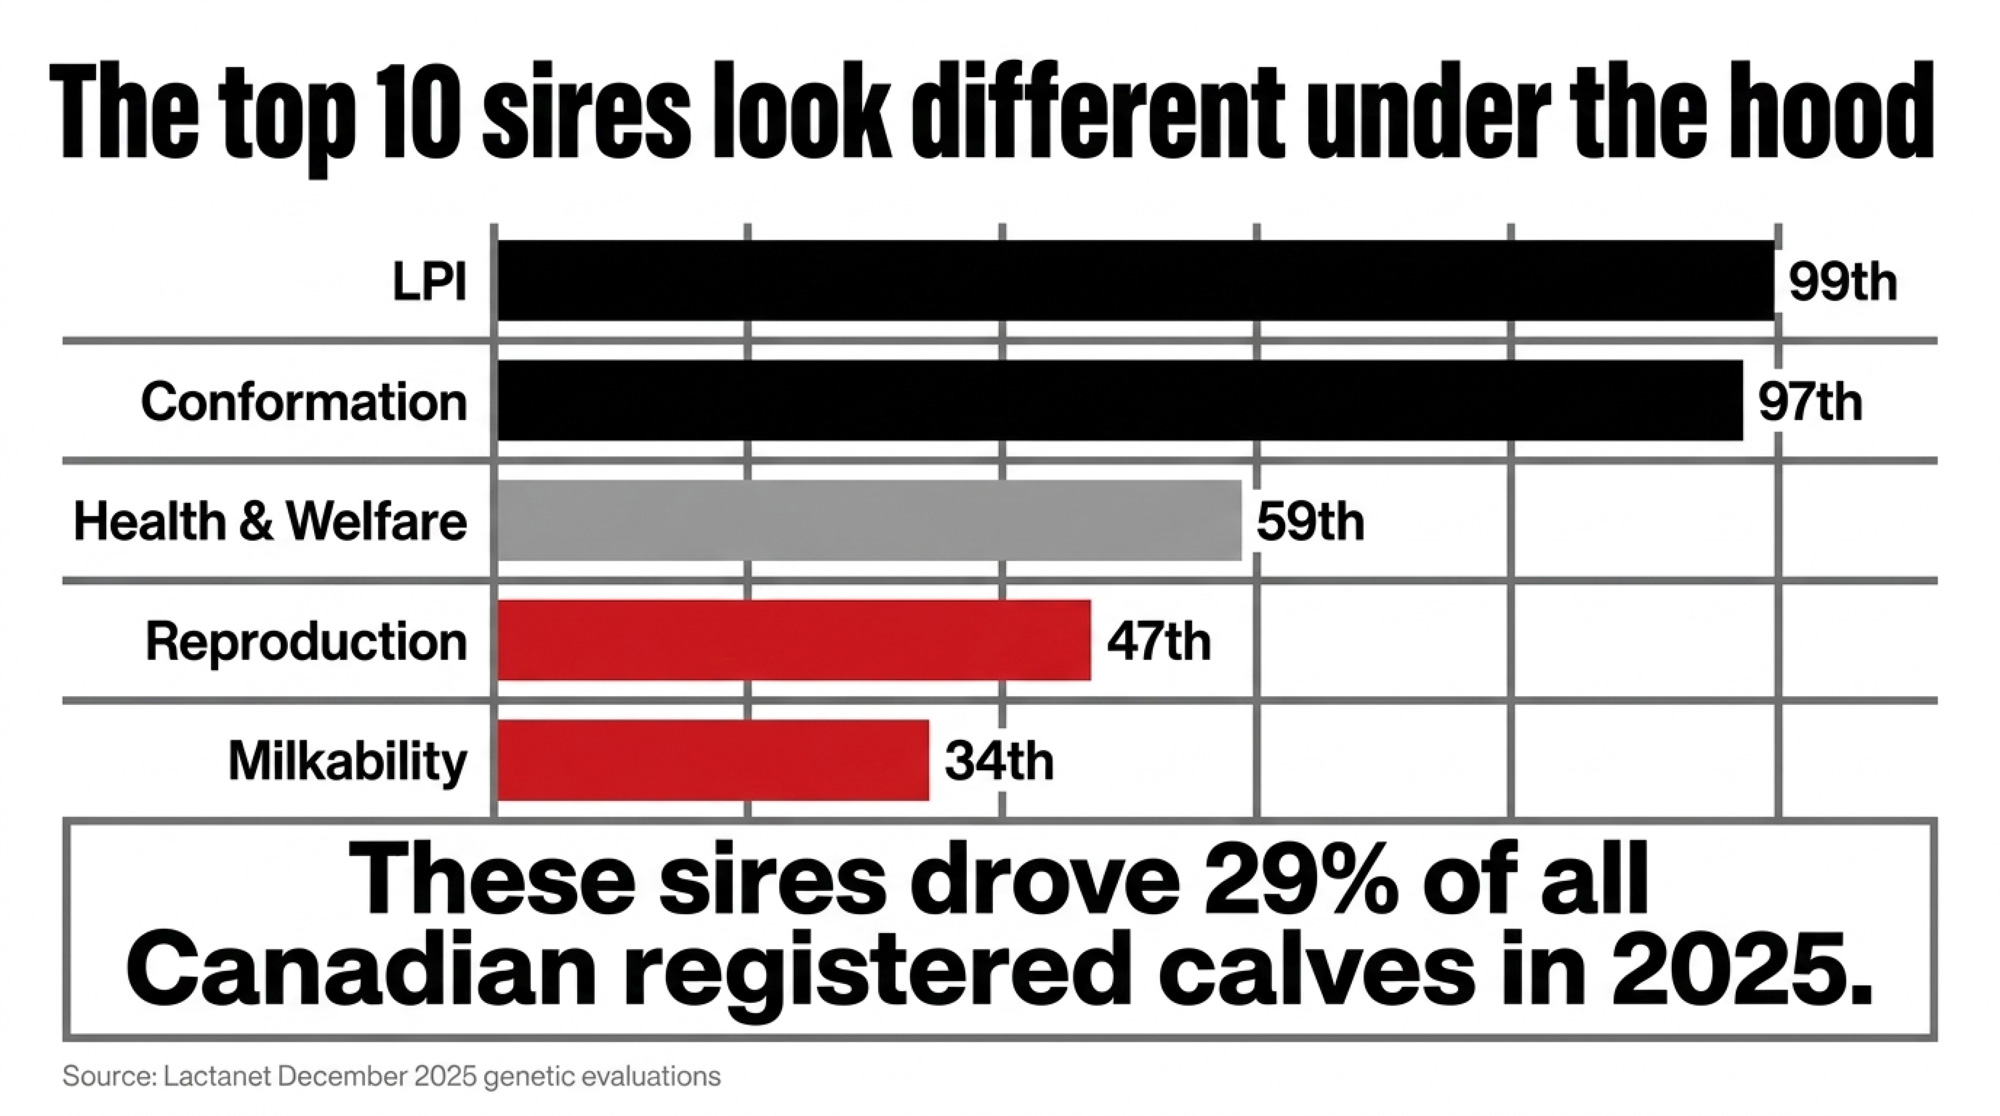
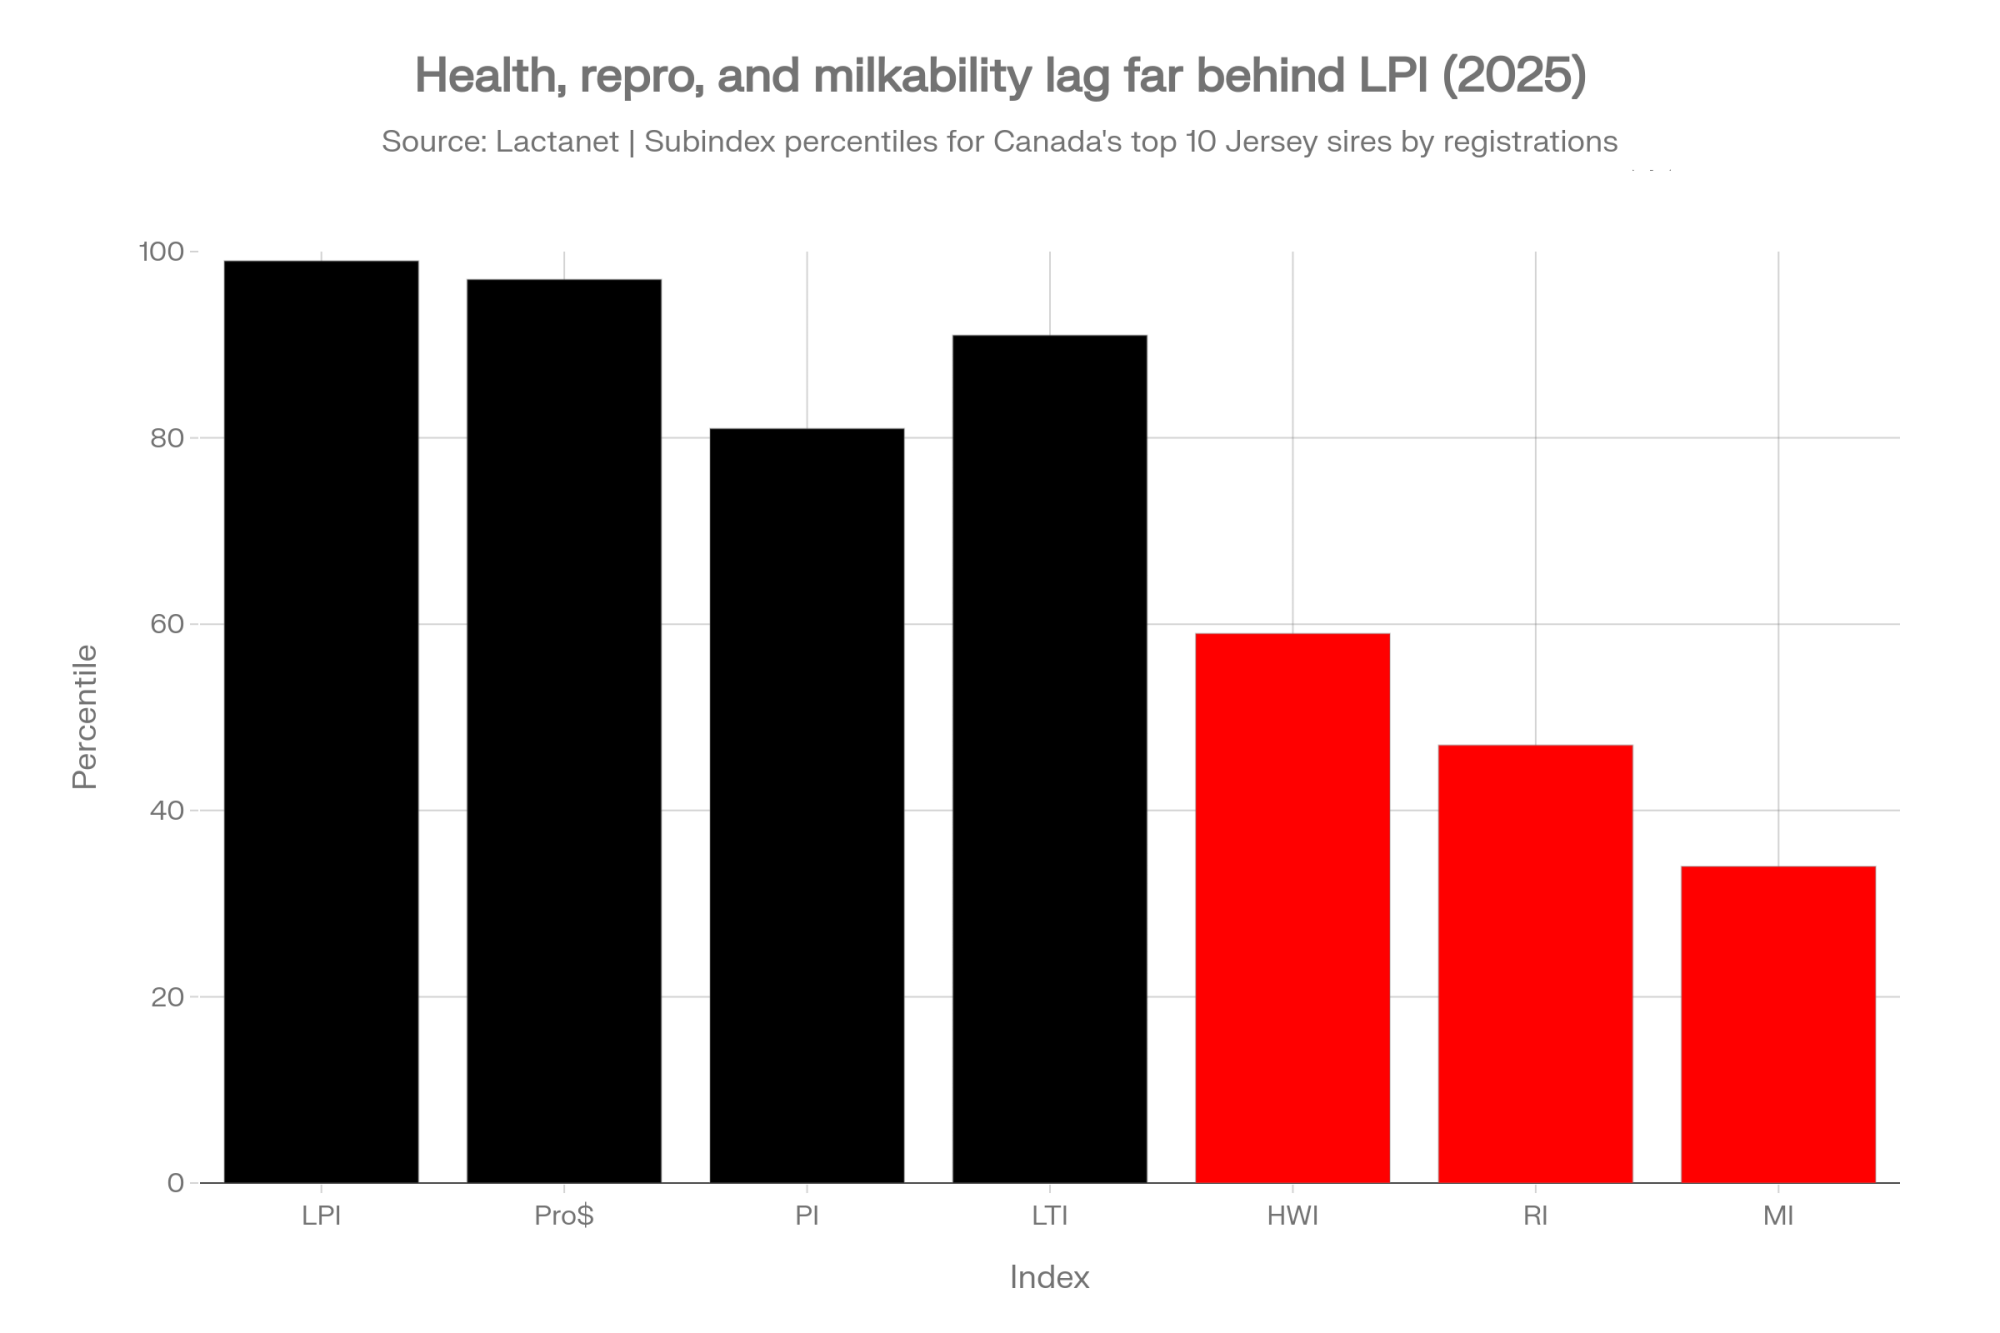
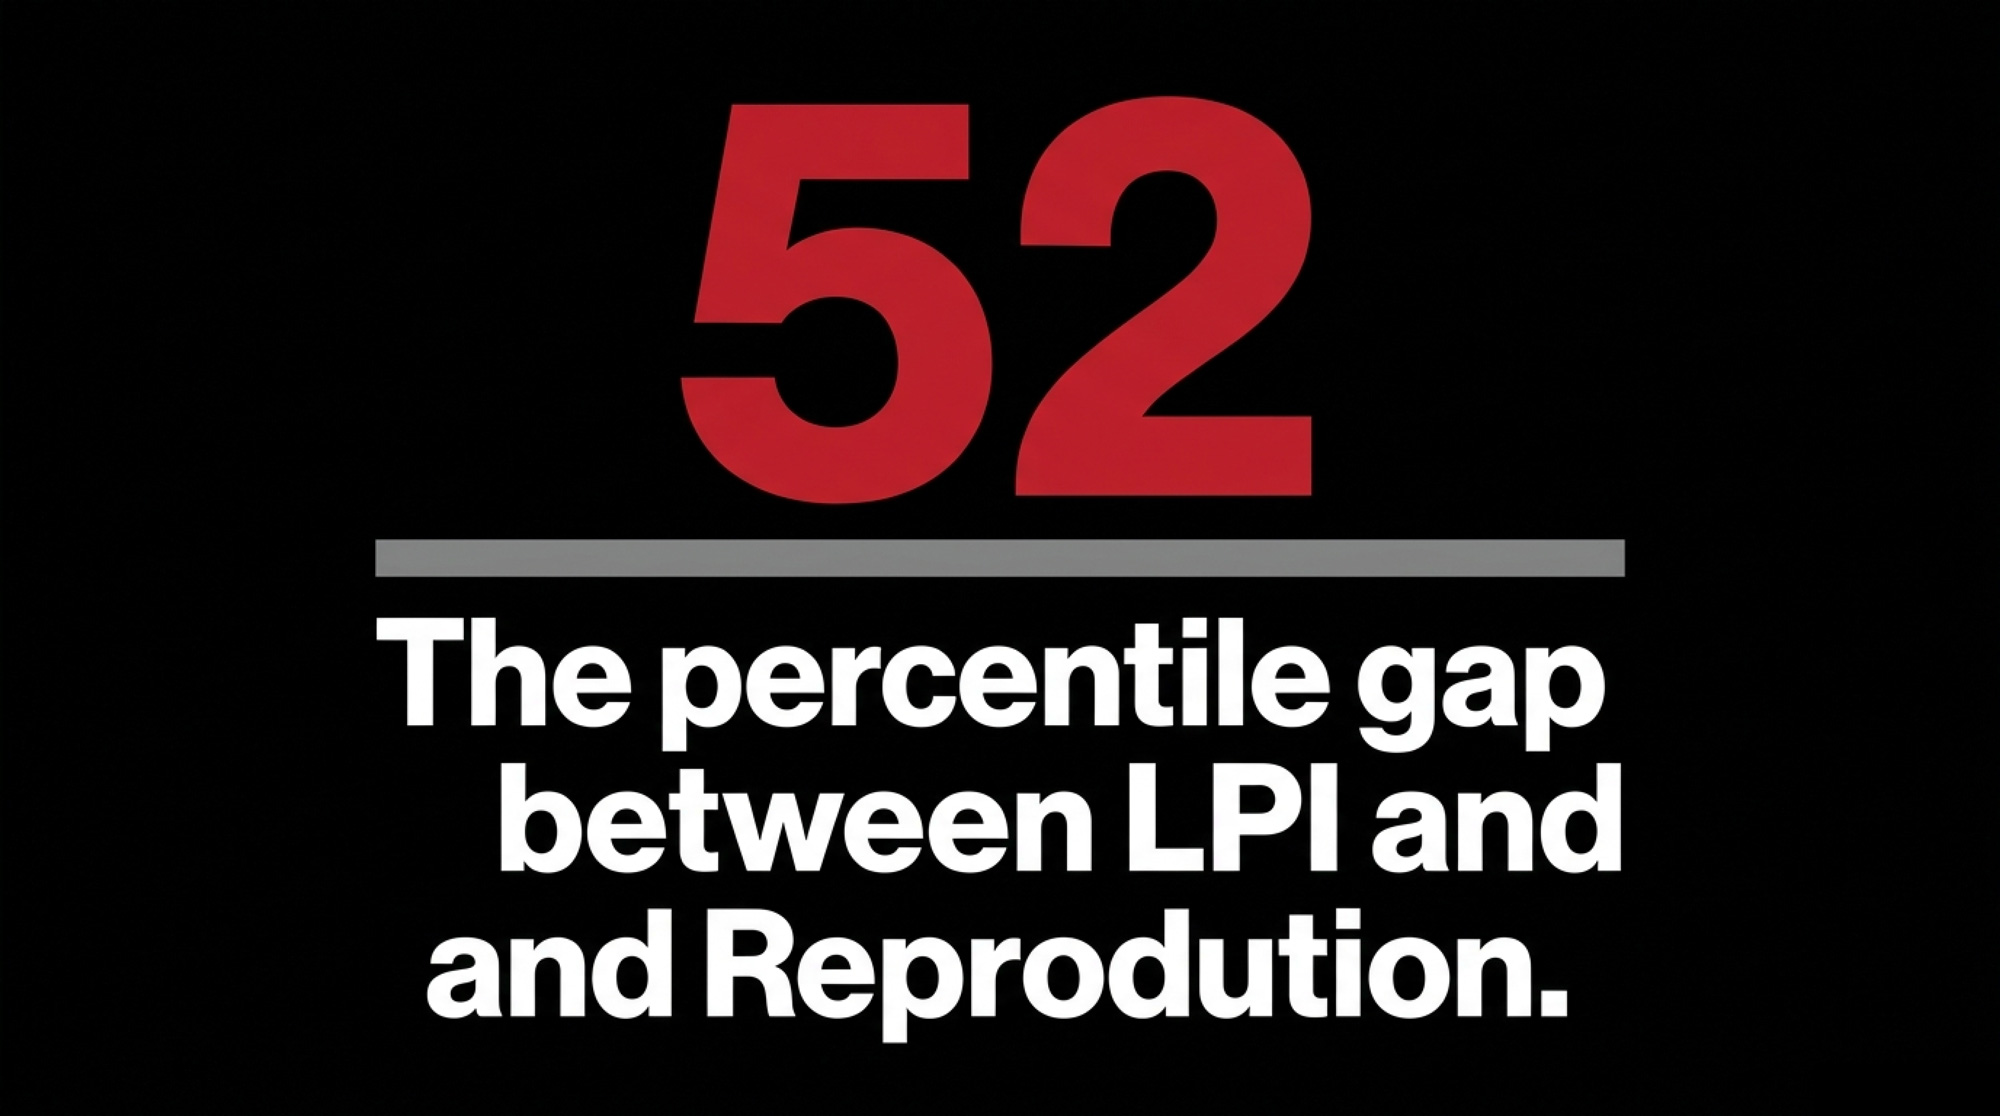
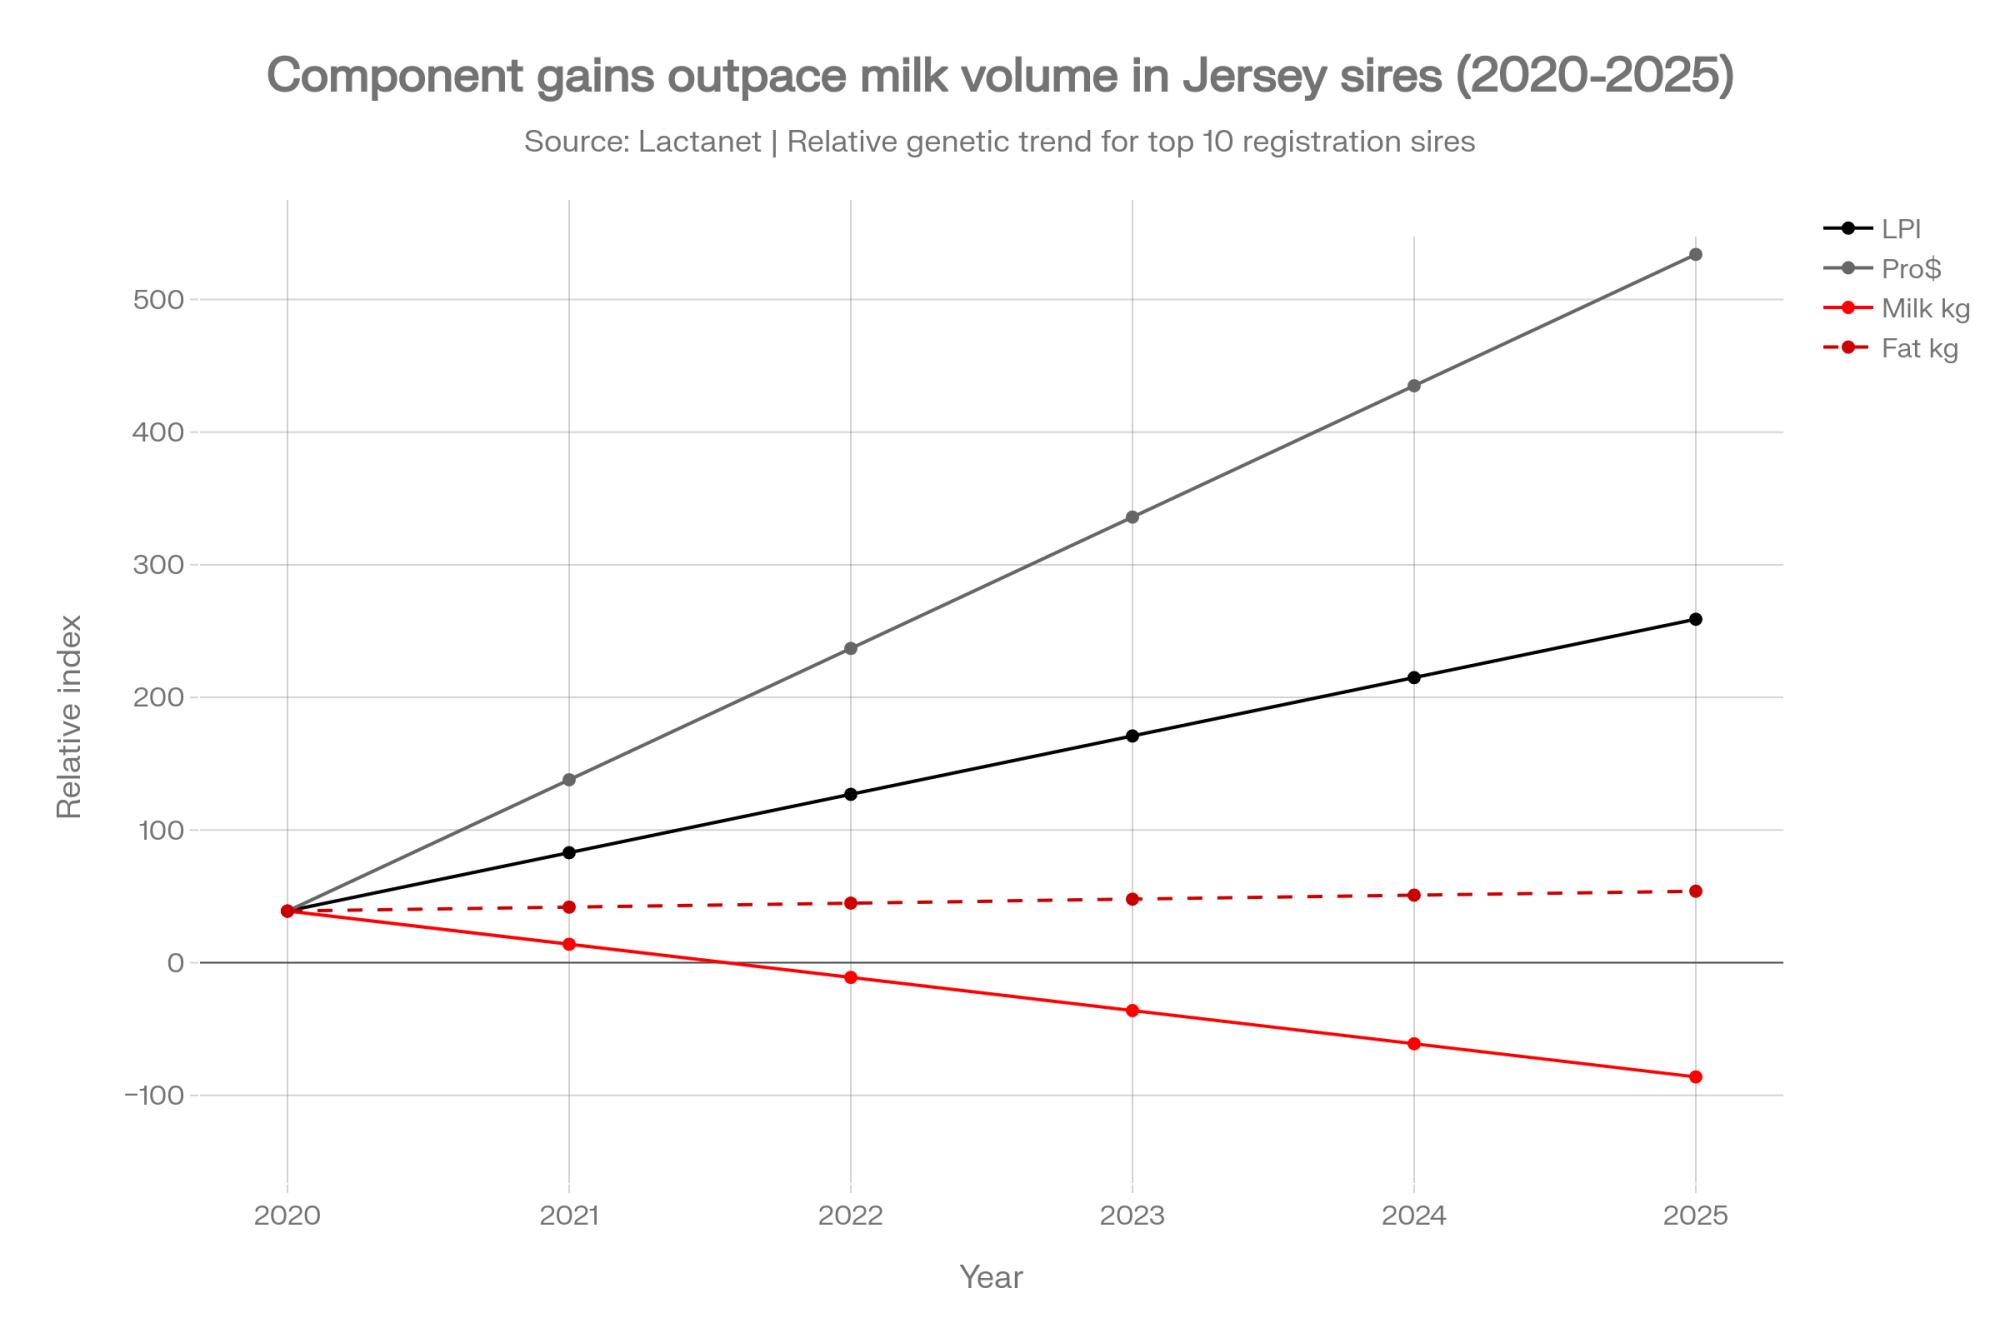
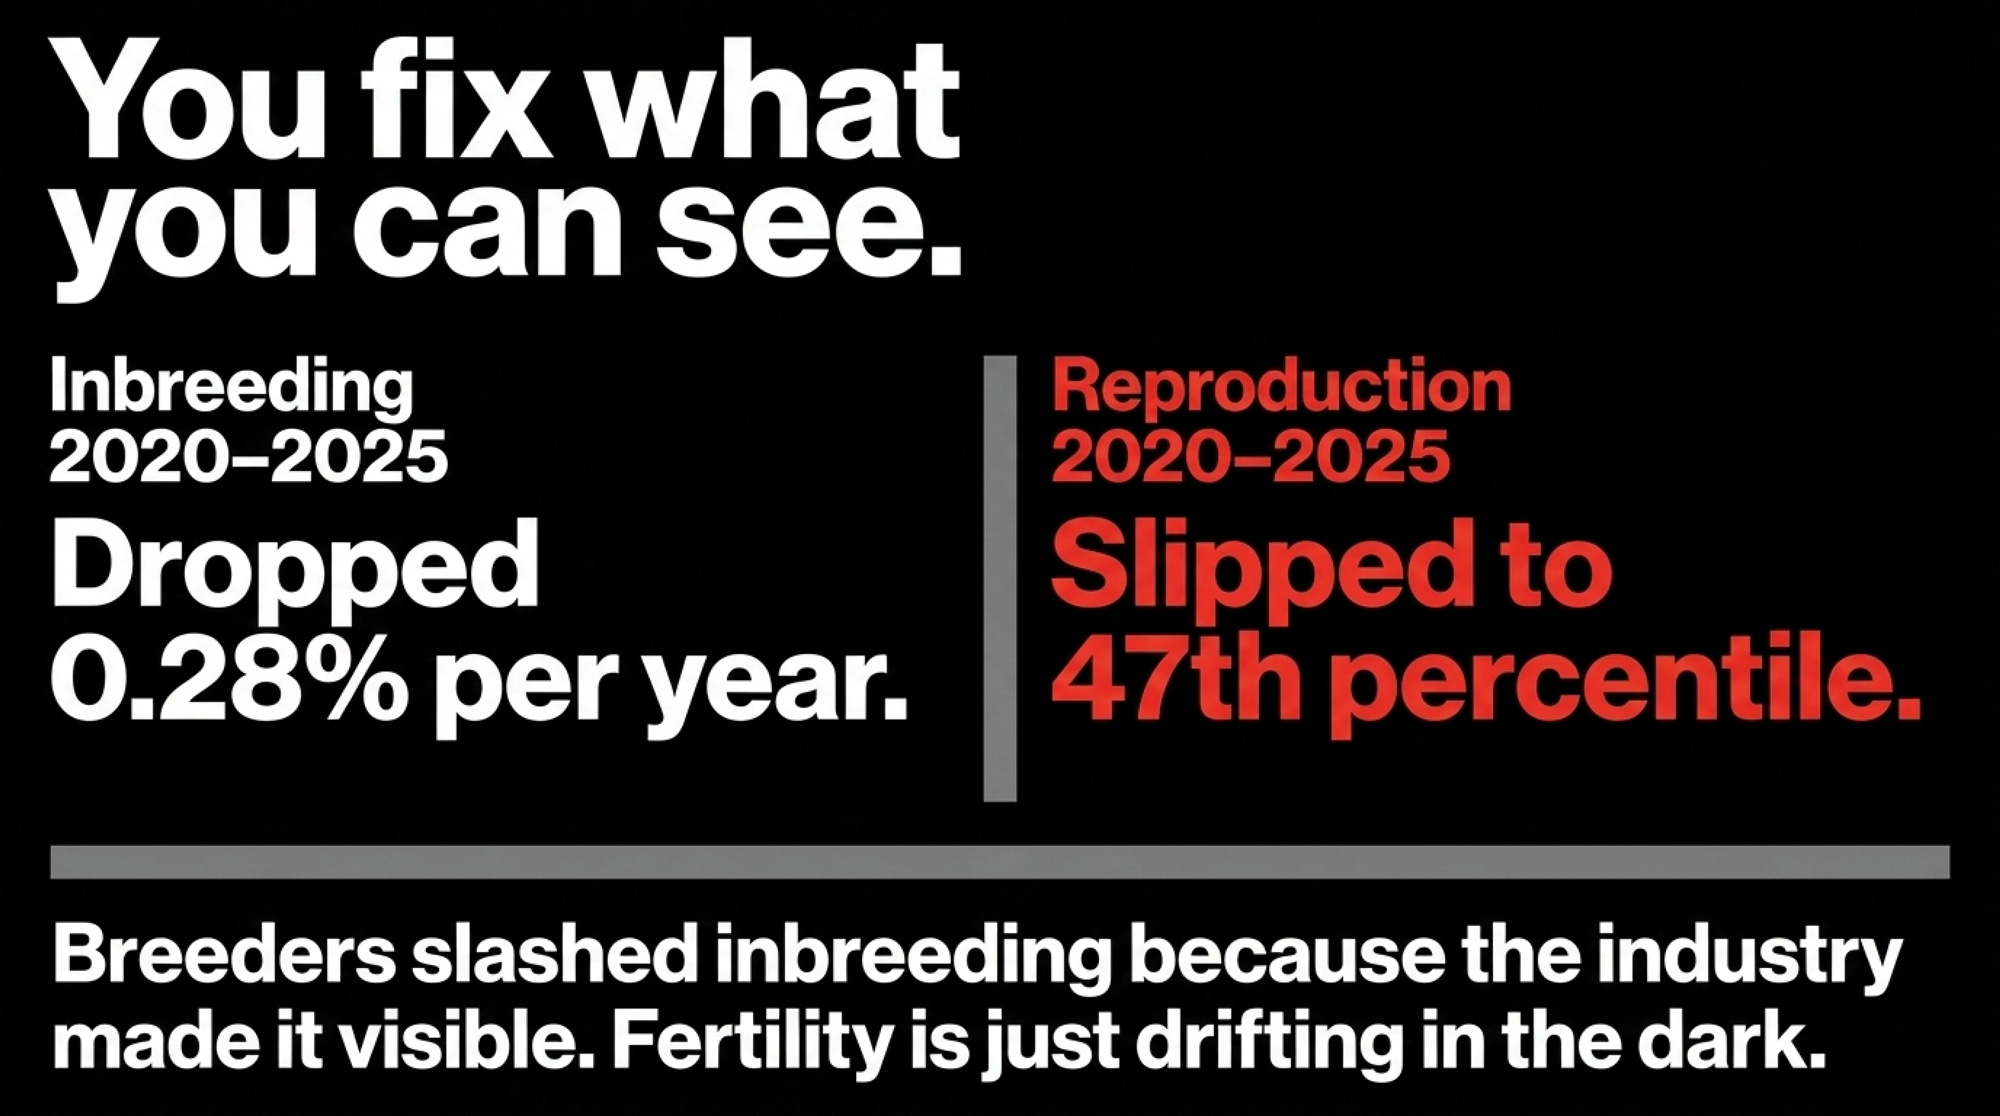
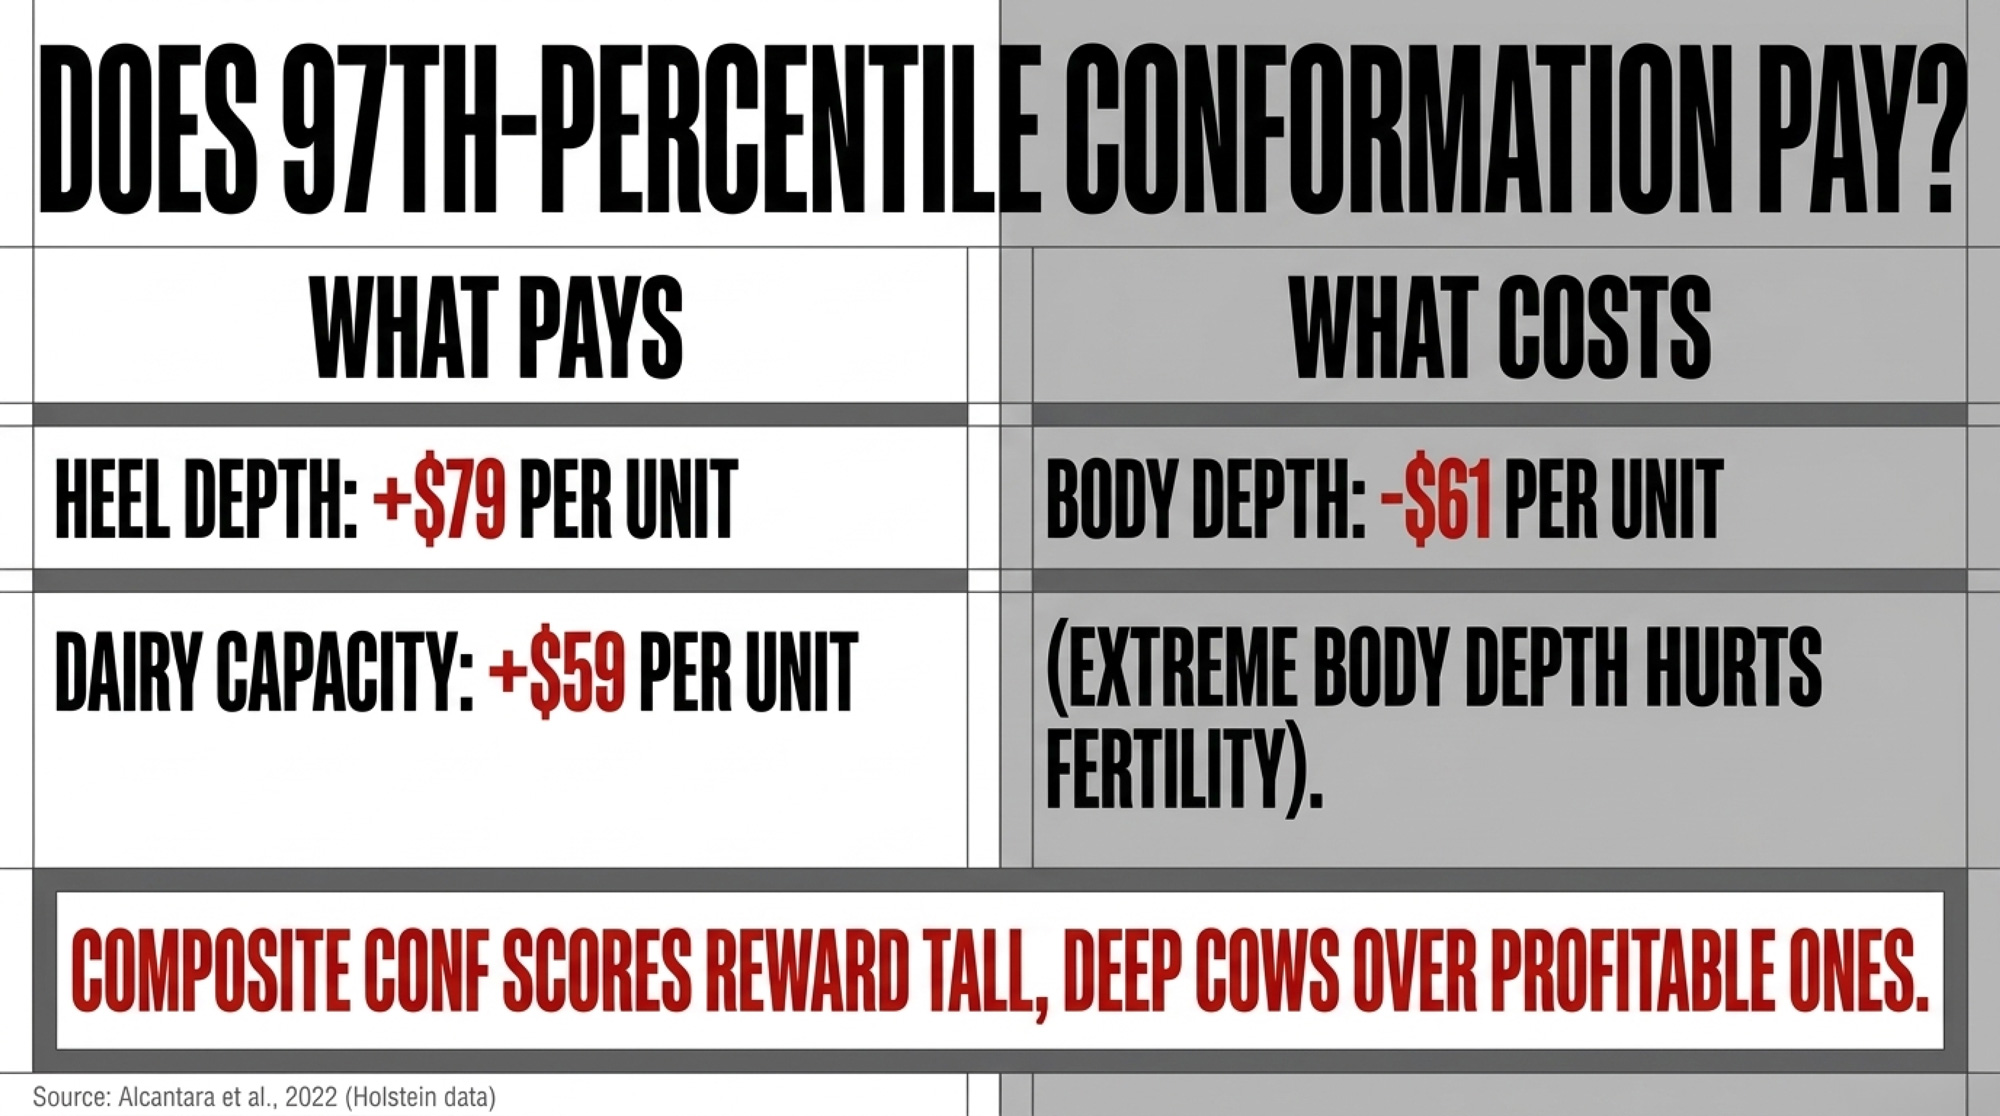
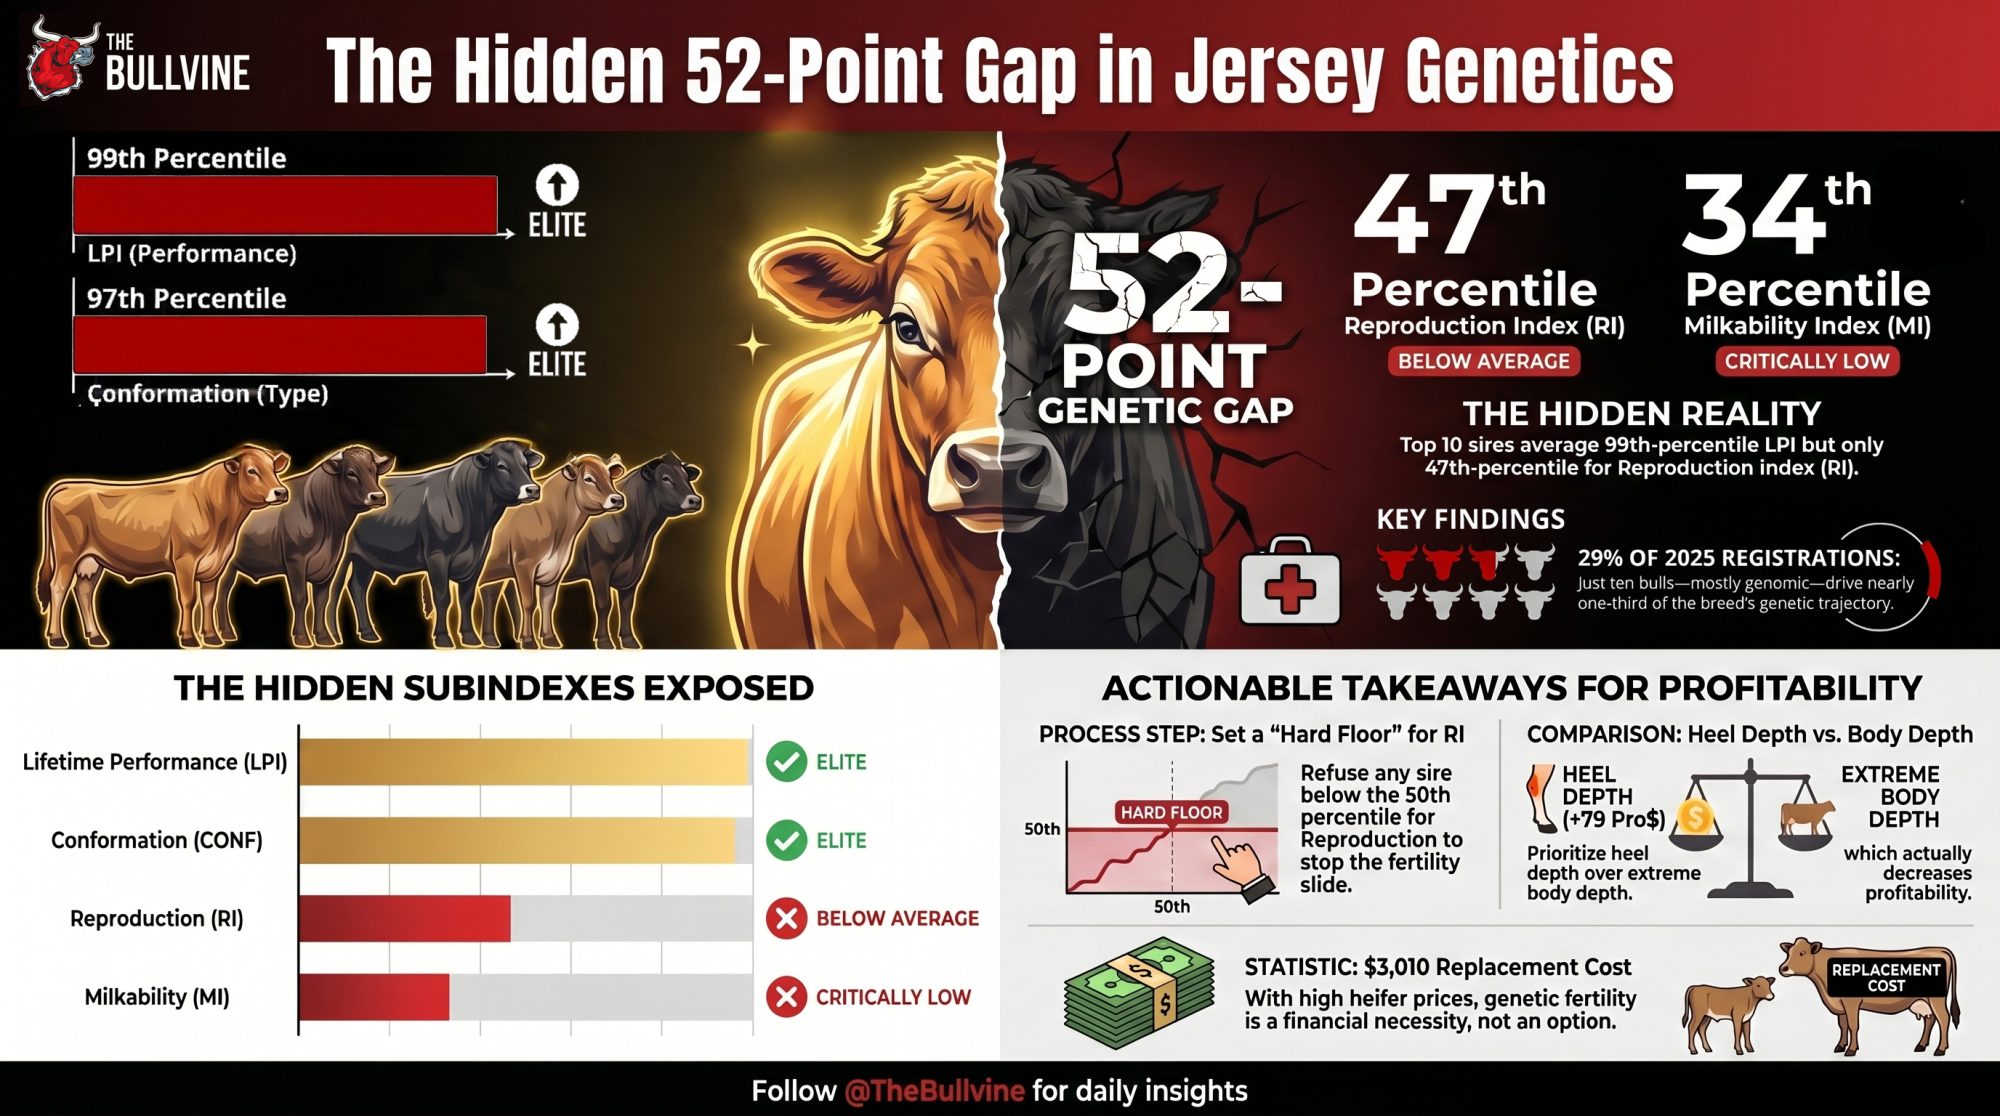
 The Sunday Read Dairy Professionals Don’t Skip.
 The Sunday Read Dairy Professionals Don’t Skip.