A lower-test herd shipped $212,000 more than its 4.25% neighbor. If you’re chasing percentages, this barn math is your wake-up call.
Executive Summary: June 2025 FMMO reforms and the 2025 NM$ revision have flipped the script so that fat and protein pounds shipped, not test percentages, drive your milk check. A side‑by‑side model of two 500‑cow Upper Midwest herds shows the lower‑test herd (4.05% fat at 82 lbs) shipping $212,000 more fat and protein value per year than a 4.25% herd at 72 lbs, using the USDA’s NM$ planning prices. NM$ now gives 31.8% weight to fat and only 3.2% to volume, which means “percent‑only” bulls with negative Milk PTAs can quietly cut lifetime component revenue even when their proofs look good on fat percentage. On the ration side, C16:0 supplement programs that add +0.10 fat test often cost three to four times more than the extra fat is worth once you do the barn math at $0.65–$1.00/cow/day. Your federal order then decides how much of that value you actually see: the same 0.3‑point fat gain is worth roughly $94,500 in a Wisconsin MCP plant but closer to $54,700 in a fluid‑heavy Florida order. The article walks through these calculations step by step and finishes with a four‑point playbook — track CFP, cull on pounds, match spending to your order, and pick sires on component pounds — so you can stress‑test your own numbers instead of trusting what the bulk tank report says.
A 500-cow Upper Midwest dairy can leave $212,000 in combined fat and protein revenue on the table by chasing a higher bulk tank test instead of shipping more component pounds. That’s not a hypothetical — it’s what the math shows when you model two herds side by side using USDA’s own NM$ planning prices.
A nutritionist working with herds in the region described the pattern: a 500-cow operation watches butterfat climb from 3.9% to 4.1% over six months. Everyone celebrates. Then somebody runs the real numbers — 78 lbs/day at 3.9% versus 74 lbs/day at 4.1% — and realizes they’re shipping nearly identical fat pounds. The test improved. The milk check didn’t.
What June 2025 Changed — And What It Cost
USDA’s April 2025 Net Merit revision pushed butterfat to 31.8% relative emphasis in NM$ — up from 28.6% in 2021 (VanRaden et al., NM$8 and NM$9). Protein carries 13.0%. Milk volume? Just 3.2%. The economic values are blunter still: fat at $5.01 per PTA pound, protein at $3.33, volume at $0.022.
Then the FMMO reforms hit on June 1, 2025. AFBF economist Daniel Munch calculated that in the first three months, producers lost more than $337 million in combined pool value — class price reductions of 85 to 93 cents per hundredweight depending on the order (AFBF Market Intel, September 2025). As Munch told Brownfield Ag News, the higher make allowances “more than wipe out” the gains from other reforms.
Upper Midwest Order 30 absorbed the worst of it. Roughly 69% of pooled milk went to Class III cheese in October 2025, with just 11.3% to Class I fluid (FMMA30 Dairy News, November 2025). That heavy cheese utilization means component value flows directly to producers — but the make allowance increase hit just as directly.
And regional structure amplifies everything. A 0.3-point butterfat improvement on a 500-cow herd captures an estimated $94,500 annually in Wisconsin’s MCP system versus approximately $54,700 in Florida’s skim-fat system. Same genetics. Same nutrition. A $40,000 gap from the order structure alone.
How $212,000 Disappears Into a Better Bulk Tank Test
Two 500-cow herds, both running 305-day lactations, were modeled using NM$ 2025 planning prices of $2.90/lb fat and $2.08/lb protein (VanRaden et al., January 2025). These are multi-year forecast prices; USDA built the index on non-spot prices. Actual FMMO butterfat ran about $2.95/lb in January 2025 and fell to approximately $1.45/lb by January 2026. The pounds principle holds at any price level; the dollar gap moves with the market.
Metric
Herd A (High Test)
Herd B (High Volume)
Difference
Milk/Cow/Day
72 lbs
82 lbs
+10 lbs
Fat Test
4.25%
4.05%
−0.20 points
Protein Test
3.05%
3.05%
Same
Annual Fat Shipped
466,650 lbs
506,453 lbs
+39,803 lbs
Annual Protein Shipped
334,890 lbs
381,403 lbs
+46,513 lbs
Fat Revenue @ $2.90/lb
$1,353,285
$1,468,712
+$115,427
Protein Revenue @ $2.08/lb
$696,571
$793,317
+$96,746
Combined F+P Revenue
$2,049,856
$2,262,029
+$212,173
Herd B — the lower-test herd — ships nearly 40,000 more pounds of fat and over 46,500 more pounds of protein. At actual January 2025 FMMO prices ($2.95 fat, $2.33 protein), the gap widens to roughly $226,000 because protein is priced higher than the NM$ assumption.
Three Places the Trap Compounds Silently
Genetics. The 2025 NM$ penalizes “percent-only” bulls with deeply negative Milk PTAs. A bull posting +0.25% fat but −500 lbs Milk loses on all three lines — less volume means fewer total fat pounds, fewer protein pounds, and less volume revenue. A bull at +0.08% fat with +1,200 lbs Milk often ships more total component pounds per lactation. That’s exactly what the $5.01/lb and $3.33/lb economic values reward.
Nutrition. Research from Prof. Kevin Harvatine’s lab at Penn State found C16:0 palmitic acid boosts fat test by +0.30 to +0.50 percentage points at ~2% of diet DM (Dairy Global, November 2023). Michigan State’s de Souza lab (J. Dairy Sci., 2024) showed mid-lactation cows at 40–50 kg/day responded best. But supplements run $0.65–$1.00/cow/day, and the protein test can slip 0.02–0.03 points. If milk yield doesn’t climb with the fat test, the P&L can go negative while the bulk tank report looks great.
Culling. Cow 1 at 90 lbs/day and 3.8% fat ships 3.42 lbs fat/day. Cow 2 at 65 lbs/day and 4.3% ships 2.80 lbs. The “low test” cow delivers 0.62 more lbs of fat daily — about $550/year at $2.90/lb. If your cull list sorts by test instead of CFP (combined fat and protein pounds shipped), you may be shipping the wrong animals.
Does Chasing +0.1% Fat Actually Pay Under Component Pricing?
Full walkthrough: a program promising +0.10 points fat test on 500 cows averaging 75 lbs/day.
Break-even: about $0.22/cow/day. That’s three to four times below what any published C16:0 program costs. If a tenth of a point on fat test is the only gain — and you’re losing milk or protein in the process — the math is underwater.
The Shift: From Test Reports to Pounds Shipped
For herds getting ahead of this, the pivot starts with one change: they stop celebrating test and start tracking CFP per cow per day. Instead of “Our herd’s at 4.1% fat,” they’re asking: “How many pounds of fat and protein did we ship per cow today?”
That reframes every proposal — a new sire lineup, a nutrition tweak, or a cull list — around one question: does it raise CFP?
The Playbook: Four Ways to Manage for Pounds
1. Make CFP your primary metric. Calculate combined fat + protein pounds per cow per day, minimum monthly. 30-day action: pull last month’s data and establish your baseline. Trade-off: watching fat test flatten while CFP climbs feels wrong. It’s not.
2. Rebuild the cull list around CFP. Rank by shipped CFP first, then overlay fertility, health, and age. 90-day action: audit last quarter’s culls against CFP. Trade-off: you still need to watch for milk fat depression — tests aren’t irrelevant, just not the sorting metric.
3. Match spending to what your order actually pays. Order 30’s 69% Class III utilization means component value flows through relatively directly. In skim-fat orders with heavy Class I, the math is different. 30-day action: call your field rep and ask how much component value hits your check. Trade-off: even within the same order, different handlers deliver different capture.
4. Run genetics and nutrition on parallel tracks. Long-term: component-pound genetics (NM$, CFP). Short-term: nutrition for quick wins. 365-day action: rebalance your sire lineup at the next proof run using pound PTAs, not percentage PTAs. Trade-off: if component prices sag — January 2026 butterfat at ~$1.45/lb is a reminder — nutrition plays may need to scale back. The genetics keep compounding regardless.
What This Means for Your Operation
Run your own Herd A vs. Herd B table. Plug in your daily lbs, fat test, protein test, cow count, and your most recent FMMO component prices. If a lower-test scenario ships more pounds, you’ll need to decide.
The break-even for a +0.1% fat program is $0.22/cow/day. Published C16:0 costs range from $0.65 to $1.00. If you’re spending three to four times the break-even, the fat gain alone doesn’t cover it.
Audit your culls. Pull three to five cows you shipped for “low components” and check their CFP against cows you kept. If CFP sorts the list differently than test did, rebuild it.
Know your order structure. Order 30’s 69% Class III means the component value flows through. If you’re in a fluid-heavy order, your capture math is different — and so is every component investment decision.
Key Takeaways
If your success metric is fat test rather than fat and protein pounds shipped, you’re managing to the wrong number. The post-June 2025 FMMO system and the 2025 NM$ ($5.01/lb fat, $3.33/lb protein) both reward pounds.
The $212,000 gap is $115,427 from fat and $96,746 from protein at NM$ planning prices. At actual January 2025 FMMO prices, it’s closer to $226,000.
The 2025 NM$ penalizes percent-only bulls. Fat emphasis jumped from 28.6% to 31.8%, but milk volume still carries a positive value. A sire whose Milk PTA drags may produce daughters that ship fewer total component pounds.
Regional structure reshapes every component decision. A 0.3-point fat gain isn’t worth the same $94,500 in Wisconsin as it is in a fluid-heavy Southeast order.
The Bottom Line
The herds that come out of this stronger won’t necessarily be the ones with the prettiest bulk tank reports. They’ll be the ones that ran the barn math and were honest about what actually pays. So — where does your herd sit: managing for the number that feels good, or the pounds that move the check?
Complete references and supporting documentation are available upon request by contacting the editorial team at editor@thebullvine.com.
Learn More
$19.14 Costs vs. $18.95 Milk: Is Your Barn Tech Paying the Difference? – Stop leaving margin on the barn floor. This analysis exposes why you’re 19¢/cwt underwater and arms you with the specific ROI calculations to ensure your current technology actually pays for itself through increased efficiency.
Every week, thousands of producers, breeders, and industry insiders open Bullvine Weekly for genetics insights, market shifts, and profit strategies they won’t find anywhere else. One email. Five minutes. Smarter decisions all week.
Three changes in the 2024 USDA school meal rules could swing your school milk and cheese premiums by dimes per cwt. Have you run your numbers yet?
Executive Summary: The 2024 USDA school meal rules just turned school milk and cheese specs into real money — and real contract risk — for U.S. herds. By capping added sugars in school-flavored milk at 10 g per 8‑oz and yogurt at 12 g per 6‑oz, and requiring a 10–15% sodium cut in school menus by 2027–28, the rule effectively decides which milk is easy to use and which is always fighting formulation. In a U.S. industry that has seen licensed herds fall from 70,375 to 26,290 since 2003 while production climbed to 226.4 billion lb, processors now have the leverage to favor herds whose protein, casein, P:F ratio, and SCC make spec‑sensitive products simple to run — and quietly step back from the rest. For co‑ops like MMPA, that alignment already shows up as millions of dollars in quality and incentive premiums, with NDQA‑caliber farms capturing a disproportionate share of more than $23 million in producer incentives and roughly $15.3 million in quality payouts. This article gives you a simple 12‑month P:F gut check, a way to measure how much of your available quality premium you’re actually capturing, three pointed questions to take to your buyer, and four realistic paths — optimize, reposition, diversify, or transition — depending on where your numbers land. It also cuts through the noise on κ‑casein, A2, and FMMO reform so you can see where genetics and policy actually move your margins over the next 3–10 years, instead of chasing buzzwords or waiting for the next rule to hit.
If you’re shipping into cheese plants or school milk contracts, USDA’s 2024 school meal rule isn’t just nutrition policy — it’s a spec and premium story that can move your milk check by a few dimes per cwt either way. For a mid‑sized herd, that’s easily a few thousand dollars a year swinging on whether your milk makes life easier or harder for a spec‑sensitive plant.
At the same time, USDA numbers show U.S. milk output climbing to about 226.4 billion lb in 2023 while the number of licensed herds collapsed from 70,375 in 2003 to 26,290 in 2023 — a 63% reduction over 20 years. Fewer herds, more milk, and more leverage for processors who can now pick and choose which farms help them win school and cheese business, and which farms they can live without.
Why the USDA School Meal Rule Suddenly Matters to Your Milk Check
Here’s what’s really going on. In April 2024, USDA’s Food and Nutrition Service finalized new nutrition standards for school meals. Those rules lock in product‑specific caps on added sugars and a single sodium cut for school breakfasts and lunches that kicks in for the 2027–28 school year.
According to the FNS comparison chart and a 2024 Congressional Research Service summary, the final rule does three big things that matter to you:
Starting in the 2025–26 school year, flavored milk in schools is capped at 10 g of added sugars per 8‑oz serving, and yogurt at 12 g per 6‑oz serving.
From July 1, 2027, schools must cut average sodium on lunch menus by 15% and on breakfast menus by 10%from current limits — essentially locking in the old “Target 2” sodium standards from the 2012 rule.
By 2027–28, added sugars across the whole weekly menu must average less than 10% of calories.
That’s national. Every district in the National School Lunch and School Breakfast Programs lives under those numbers. They don’t stay in Washington. They show up as spec lines in bid documents, in what processors have to promise, and in how your co‑op or plant looks at its supply base.
Three Spec Shifts You Can’t Ignore
Let’s strip the policy talk down to the three shifts that hit your farm.
Spec Shift
What Changes (U.S. Schools)
Where It Hits You
What to Watch in Your Herd
Sodium limits
One‑time 15% sodium cut at lunch and 10% at breakfast vs current limits, effective SY 2027–28.
Cheese plants have a smaller sodium “budget” on school menus; they need cheese that performs with less salt.
P:F ratio, protein %, κ‑casein, SCC, vat performance.
Added‑sugar caps
From SY 2025–26, flavored milk ≤10 g added sugars/8 oz; yogurt ≤12 g/6 oz.
Plants need body and flavor with less sugar cover, especially in flavored milk and yogurt.
Solids‑not‑fat, protein stability, bacteria counts, flavor consistency.
Contract specs
These limits move from “goals” to hard specs in bids and processor contracts.
Premiums and base shift toward “spec‑friendly” herds; marginal herds risk weaker terms or less secure pickup.
Your buyer’s school/cheese exposure, quality‑premium capture, and contract language.
You don’t see “10 g added sugars” printed on your milk check. You see new premium grids, new quality letters, more talk about “alignment,” and, in the worst cases, contracts that quietly get scaled back or not renewed.
Sodium: Why Cheesemakers Are Suddenly Obsessed With Your Casein
Sodium cuts mean school menu planners have less room for salty items, including cheese. Typical numbers: a 1‑oz slice of Cheddar runs around 180 mg of sodium, and part‑skim mozzarella usually lands in the 150–180 mg range depending on the formulation. If the menu sodium budget is tight, every slice of cheese eats up more of the allowance.
Now, salt isn’t just window dressing in cheese. Cheese science work — including U.S. school‑meal nutrition research in Nutrients — highlights salt’s role in moisture control, whey expulsion, pH and texture, pathogen control, and flavor and shelf life. Processors can’t simply “use less salt” and expect cheese to make weight, slice clean, and sit in a school district’s cooler for weeks without issues. Something else has to carry more of the load.
That “something” is your milk:
Casein and κ‑casein. Dairy science studies show that a higher casein-to-total-protein ratio improves curd formation and cheese yield. Multiple papers across breeds report that κ‑casein BB milk tends to coagulate faster and form firmer curd than κ‑casein AA milk, which often translates into better yield and more predictable vat performance when everything else is equal.
Somatic cell count (SCC). Elevated SCC is consistently tied to lower cheese yield and more defects; NDQA scoring and co‑op quality programs bake that reality into their metrics.
Here’s the bottom line: under tighter sodium specs, cheesemakers want milk that yields strong curd, clean drainage, and a low defect risk, even if they pull back a notch on the salt. That’s good news if your herd is already built around solid protein, casein, and NDQA‑level quality. It’s a big warning sign if you’ve been living with “good enough” SCC and protein.
A Simple P:F Ratio Gut Check
You don’t need a PhD to see if your herd is swimming with or against where cheese plants are heading. You just need your last 12 months of milk checks.
12-Month P:F Ratio
What It Usually Signals
Cheese Plant View
Your Next Move
Below ~0.77
Light on protein relative to fat; rations, transition, or fresh cow issues likely
⚠️ “We can use your milk, but you’re not making our life easier”
🚨 RED FLAG: Call nutritionist + vet this month. Focus on fresh cow health, forage quality, one ration trial targeting 0.77+
0.77–0.80
Middle-of-the-pack for Holstein cheese herds; serviceable but unremarkable
“Standard supply—we’ll keep you as long as we need volume”
⚠️ YELLOW LIGHT: Assess upside. Can you push toward 0.80+ with better transition management? Check if premium grid rewards the climb.
Above 0.80
Strong cheese-merit profile if butterfat and SCC are also solid
✅ “Exactly what we want for school cheese under tight sodium specs”
✅ GREEN LIGHT: Protect this position. Ask your buyer if you’re capturing full quality premium. Consider genetics that lock in casein advantage long-term.
Do this once a year:
Add up your total protein pounds shipped in the last 12 months.
Add up your total butterfat pounds shipped in the same period.
Divide protein by fat. That’s your 12‑month P:F ratio.
Here’s how a lot of field reps and nutritionists in cheese country use that number — purely as a rule‑of‑thumb, not a regulation:
The Breed Caveat: While the 0.77–0.81 band is the standard “North American Holstein” benchmark, remember that breed matters. Jerseys and Brown Swiss naturally carry higher components; for these herds, a ratio below 0.80 often means you are leaving significant cheese-merit dollars on the table despite having “high” test numbers. If you aren’t hitting the upper end of the scale with a high-component breed, your butterfat is likely out-pacing your protein synthesis.
These aren’t USDA lines. They’re countryside benchmarks. You still have to weigh them against your actual pay schedule, your herd’s health, and your feed and forage reality. But if you’re shipping to a cheese plant with a P:F under about 0.77, that’s not a “maybe later” project — it’s a “get your nutritionist and vet around the table this month” project.
On the flip side, if you’re above 0.80 with solid butterfat and low SCC, that’s exactly when you should be asking whether your buyer’s paying for that profile — or whether you’re subsidizing other milk in the pool.
Sugar Caps: School Milk and Yogurt Need Better Milk, Not Just Less Sugar
The sugar rules are just as blunt. Starting in SY 2025–26, flavored milk in schools is capped at 10 g of added sugars per 8‑oz serving, and yogurt at 12 g per 6‑oz serving. Then, in 2027–28, weekly calories from added sugars across the menu have to come in under 10%.
The dairy side saw this coming. Under the International Dairy Foods Association’s Healthy School Milk Commitment, 37 processors representing more than 90% of school milk volume agreed to cap added sugars in school flavored milk at that same 10 g per 8‑oz, cutting about 7 g from the average flavored school milk back in 2006–07. Processors have already cut average added sugars in school-flavored milk roughly in half, down to about 8.2 g per serving.
Public health voices aren’t done. The American Medical Association has argued flavored milk should be removed from school meals entirely and, if not, endorses tighter options. Other groups call the final rule “fair but still improvable.” That tells you the spotlight on sugar isn’t going away.
For you, the practical takeaway is simple: processors need milk they can turn into low‑added‑sugar flavored milk and yogurt that still have body, flavor, and shelf life. Less sugar means less room to hide off‑flavors or thin mouthfeel.
What they’re quietly shopping for in their supply base is:
Component consistency. Under tight sugar caps, they lean harder on solids‑not‑fat and protein to keep flavored milk and yogurt from feeling like colored water. Herds that deliver steady components month in, month out are cheaper to formulate around.
High‑end quality. With less sugar to mask issues, low SCC and low bacteria counts matter even more for flavor stability and shelf life. That’s exactly where NDQA‑level herds stand out — and get paid for it.
Where Specs Actually Bite: Contracts, Co‑ops, and FMMOs
Let’s be honest: you don’t feel “Target 2 sodium” or “10 g added sugars” directly. You feel contracts, premiums, and pooling.
WHO and USDA set the nutrition guardrails. School districts and processors turn them into bids that say “must meet these sodium and added‑sugar limits.” For plants that ship a lot of cheese, yogurt, or fluid milk into school channels, those contracts are big enough to decide how hard the plant runs — and how secure your pickup feels.
On your side, specs usually show up in three ways:
A new or revised premium sheet that pays more for protein, SCC, or quality — or quietly tightens the thresholds.
Conversations about base, hauling, or “alignment with plant needs.” When you hear “alignment” more often, that’s a clue that specs are driving talk behind the scenes.
In tighter markets, a contract that gets scaled back, or simply doesn’t reappear on your kitchen table when it’s up for renewal.
Edge Dairy Farmer Cooperative has been out front on this. Their CEO, Tim Trotter, and others at Edge have publicly pushed for stronger, more transparent processor contracts so farmers have at least some predictability about price and pickup, rather than hoping they’re still on the “keep” list when plants reshuffle supply. That fight tells you how much contract power has shifted as herd numbers dropped and plants consolidated.
Where FMMO Reform Fits
Layered over all this is the slow grind on Federal Milk Marketing Order (FMMO) reform. American Farm Bureau Federation’s Market Intel work does a good job explaining how FMMOs govern pricing and pooling across classes and regions, and how proposals on make allowances, the Class I mover, and pooling rules would directly change mailbox prices.
Specs and FMMOs aren’t the same fight, but they intersect in a pretty simple way:
Specs change who your plant wants to pick up from and which products they chase.
FMMO rules change how much of the value of those products actually shows up on your check.
If you’re in a cheese‑heavy order, lining your herd up with cheese yield and quality — and the sodium realities in school cheese — gives you a better shot at being “core” supply when plants restructure or when FMMO tweaks change the cheese vs Class I balance. If you’re in a fluid‑oriented order, being the herd that makes low‑sugar school milk and ESL products easy to execute can matter just as much when your plant decides whose milk is non‑negotiable.
The Dollars Behind Being “Spec‑Aligned”
Talking about “spec alignment” only matters if it shows up in your milk check. In co‑ops with strong quality programs, it absolutely does.
MMPA is one of the best public examples. In the 2021 NDQA results, 21 MMPA farms were among 47 National Dairy Quality Award winners — nearly half the list. That kind of dominance doesn’t happen by accident. It reflects a culture of low SCC, tight routines, and serious field support.
Farms like Crandall Dairy Farms in Battle Creek, Michigan — run by Brad, Mark, and Larry Crandall — have earned NDQA recognition year after year, including Platinum in 2022 and Gold or Silver in multiple other cycles. That’s not a one‑time fluke; it’s the kind of sustained performance that spec‑sensitive buyers fight to keep on their routes. More recently, Schultz Dairy LLC in Sandusky took home Platinum in the January 2026 NDQA awards — one of only six farms in the U.S. and Canada to earn that honor this year.
Those results sit on top of serious money. MMPA reports that in fiscal 2021, total producer incentive premiums, including quality, totaled $23.6 million. Separate coverage notes that in another year, the co‑op paid about $15.3 million specifically in quality premiums. That’s not coffee money — that’s a major re‑allocation of value inside the co‑op from “base” milk to higher‑spec milk.
When you look at numbers like that and how typical premium grids are structured, it’s realistic in strong quality programs for top‑tier SCC and bacteria performance to be worth on the order of a few dimes per cwt more than base milk, especially once you stack co‑op premiums on top of how quality plays into the federal order price. The exact spread depends heavily on your grid and your year, but the magnitude is real.
Let’s run one grounded example, just so the math isn’t abstract:
450‑cow herd.
23,000 lb shipped per cow per year.
That’s about 10,000 cwt of milk a year (23,000 × 450 ÷ 100).
If that herd shifted quality far enough to pick up an extra $0.40/cwt in quality premiums compared to where they sit today, that’s:
0.40 × 10,000 cwt = $4,000 per year in additional revenue.
That 40¢ is just a placeholder — you need to pull out your own premium sheet, look at where your SCC/bacteria performance has sat for the last 12 months, and calculate the actual difference between your performance and the next tier up. In some programs, that gap might be only 15–20¢; in others, it might be more than 50¢. The point is simple: there’s real money on the table, and spec alignment decides who gets it.
Cheese‑Heavy vs Fluid‑Heavy: Same Pressure, Different Rules
These spec fights don’t land the same way in every region.
In cheese‑heavy regions — think Wisconsin, Idaho, parts of New York, Quebec — spec pressure shows up mainly through casein, P:F ratio, and total cheese yield. Plants there are already asking which herds make their Cheddar, mozzarella, and process cheese perform inside tighter sodium windows without breaking yield or texture.
In more fluid‑oriented regions — parts of the Southeast, states like Florida — the big school milk and ESL players care a little less about cheese yield and more about consistent components, shelf life, and flavor under sugar caps. You still feel the same consolidation math, but it shows up first in which flavored milks and nutrition drinks pass spec, and which herds make those products easy to run.
Across the U.S., the structural backdrop is the same. Summary of USDA data shows that from 2003 to 2023, U.S. milk production climbed from about 170.3 billion lb to 226.4 billion lb — roughly a 33% increase — while licensed herds dropped from 70,375 to 26,290, a 63% decline. Fewer, larger herds with more technology and lower per‑unit costs. That gives processors and co‑ops a lot more freedom to say, “We’re going to lean into these 300 farms that fit our specs — and we’re going to quietly back away from those 50 that don’t.”
Genetics: When κ‑Casein and A2 Actually Belong in Your Plan
Any time specs tighten, genetics buzzwords start floating around: κ‑casein, A2, cheese merit, specialty labels. They all sound good on paper. The real question is where they belong in your actual strategy.
In κ‑casein, multiple dairy science studies across breeds report that BB milk tends to coagulate faster and form firmer curd than AA milk, and can deliver higher cheese yields and better fat recovery in many systems. European extension work and on‑farm trials back up faster clotting and, in some cases, better yields in BB cows — as long as you remember that solids, lactation stage, and management can mute or magnify that edge.
On A2, a 2016 paper in Nutrients found that some milk‑intolerant individuals had fewer gastrointestinal symptoms when drinking A2 milk compared to conventional milk. That’s a marketing and demand story, not a yield bump. It matters if your buyer is actively branding A2‑only products and paying a premium for them. If not, it’s a “nice to have” that sits behind fertility, health, and core components.
Genetics Focus
When It Matters
When It Doesn’t
The Bullvine Take
κ-Casein BB
– You’re 10+ years from retirement – Shipping to cheese-heavy plant – Bulls otherwise similar on main index
– Within 3–5 years of major transition – Buyer isn’t cheese-focused – Core fertility/health traits still need work
Use as tie-breaker when sires are equal on your main priorities. Multiple dairy science studies show BB milk tends to coagulate faster, form firmer curd, and can deliver higher cheese yields—but only if solids, SCC, and management are already dialed in.
🔴 A2 Genetics
– Buyer is actively branding and paying premiums for A2 products – You have written contract language specifying A2 pricing
– Buyer mentions A2 as “nice to have” but offers no premium – You’re chasing it for generic “marketability”
🔴 This is a demand story, not a yield story. 2016 Nutrients research found some intolerant individuals had fewer GI symptoms with A2 milk—but that’s meaningless to your bottom line unless your buyer is writing checks for it. Keep fertility, health, and core components front and center.
✅ Protein/Fat/Health Traits
– Always.No exceptions. Every herd, every year.
– Never.These are neversecondary.
If you’re debating κ-casein or A2 before you’ve maxed out fertility, daughter pregnancy rate, SCC genetics, and component consistency, you’re optimizing the wrong end of the curve. Fix the base. Then fine-tune.
Here’s where genetics really fits in a spec‑tightening world:
If you’re within 3–5 years of retirement or major succession decisions, the big returns don’t live in chasing κ‑casein or A2. They live in quality, fresh cow management, cost per cwt, and a clean transition plan.
If you’re thinking 10+ years out in a cheese‑oriented market, it’s reasonable to treat κ‑casein BB as a tie‑breaker when bulls are otherwise similar on your main index — especially if your plant leans hard into cheese.
A2 should only move up your sire priority list when your buyer is explicitly marketing A2 products and putting real money on the table. Otherwise, keep fertility, health traits, and protein/fat front and center.
What This Means for Your Operation
Here’s where this stops being a policy story and turns into decisions at your kitchen table.
1. Run a 12‑Month Spec Health Check
Once a year — after year‑end or after you file taxes — sit down with your last 12 months of milk checks and your current premium schedule and answer two blunt questions:
What’s my 12‑month P:F ratio, and does it put me below ~0.77, between 0.77–0.80, or above 0.80?
Over those 12 months, what percentage of the maximum quality premium my program offers did I actually capture?
If your P:F is below roughly 0.77 in a cheese‑oriented system, that’s a flashing yellow light. Get your nutritionist and vet around the table and talk fresh cow performance, transition, and forage quality — then commit to at least one ration trial or forage test specifically aimed at nudging P:F towards that 0.77–0.80 band.
If your quality‑premium capture sits in roughly the 60–70% or less range of what’s available, you’ve got real money sitting in SCC, bacteria, and milking routines. That’s exactly where NDQA‑level herds make their living.
2. Ask Your Buyer Three Straightforward Questions
In the next week or two, call a field rep, board member, or plant manager you trust and ask:
Roughly what share of your total volume is tied to school milk, cheese, or yogurt that has to meet these sodium and added‑sugar specs?
Do you expect your component pricing or quality standards to change over the next 2–3 years because of those specs — and if so, how?
What do your most spec‑aligned herds tend to look like on protein, butterfat performance, SCC, and overall quality?
If they tell you a third or more of their business is spec‑sensitive school and cheese channels, your spec alignment isn’t a side topic — it needs to move up your strategic list.
3. Be Honest About Which Path You’re On
Looking at your numbers and what you just heard from your buyer, which of these paths are you really on — not the one you wish you were on?
Optimize. You’re capturing most of the quality premiums — say, north of 80% as a rough benchmark — your P:F is above 0.80 in a cheese plant, debt is manageable, and your buyer wants more milk like yours. Your job is to protect that position and keep sharpening at the margins.
Reposition. The herd is fundamentally sound, but P:F, SCC, or cost per cwt are holding you back. Your focus is better forage, tighter fresh cow and transition programs, more consistent milking routines, and getting P:F into at least the 0.77–0.80 band while climbing the premium ladder.
Diversify. You’ve got the scale and risk tolerance for digesters, renewable gas, or modest on‑farm processing — after your base milk is competitive on specs. You gain margin and new revenue streams, but you give up simplicity and take on new market and execution risk.
Transition. Between debt, distance to plant, and family plans, the smart move may be a managed exit, downsizing, or a simpler setup while equity is still strong. Families who do best here start the conversation early, not after the bank starts it for them.
Path
Your 12-Month Profile
What It Means
Focus Areas
Risk/Reward
✅ Optimize
– Quality premium capture >80% – P:F ratio >0.80 (cheese) – Buyer says “we want more milk like yours”
You’re already in the “keep” pile—protect that position and sharpen at margins
Maintain SCC/bacteria performance, lock in casein genetics, ask if you’re capturing full available premium
Low risk, steady reward. Your job: don’t slip.
⚠️ Reposition
– P:F ratio 0.75–0.79 – Quality premium capture 60–75% – Fundamentals sound but held back by specs
You’re serviceable but not standout—one ration trial and tighter fresh cow work can move you up a tier
– Debt load high – Distance to plant a problem – Family/succession unclear – Specs feel out of reach
Smart move may be managed exit, downsizing, or simpler setup while equity is still strong
Start the conversation NOW—before the bank or buyer starts it for you; plan transition with dignity and control
Ignoring this path is the highest risk of all.
None of those paths is “right” for everyone. The danger is pretending you’re on one path when your numbers say you’re on another.
Key Takeaways
Specs — not just blend price — are deciding who keeps school milk and cheese contracts. The 2024 USDA school meal rule locks in sodium and added‑sugar limits that push processors toward milk with stronger protein, casein, and quality — and away from herds that make those specs harder to hit.
Your 12‑month P:F ratio is a cheap early warning light. If you’re shipping into cheese and sitting below about 0.77, that’s a “now” conversation with your nutritionist and vet about fresh cows, rations, and forage quality — not a “someday” project.
Quality and component premiums are real money, not a rounding error. Co‑ops like MMPA have paid more than $23 million in producer incentive premiums in a single year, with about $15.3 million in quality premiums in another. Spec‑aligned, NDQA‑caliber herds capture a disproportionate share of that pool.
FMMO reform and specs will collide in your mailbox price. Any changes to make allowances, Class I movers, or pooling rules will hit differently depending on whether your milk helps processors win and service spec‑sensitive school and cheese business.
The Bottom Line
You don’t control the rule. You don’t control the pool. But you do control whether your herd looks like the easiest milk to keep when processors decide who fits their 2027–2031 book of business — or the milk they can live without when specs and margins get tight. The question is simple: when you pull your last 12 months of milk checks, does your P:F ratio, your quality performance, and your premium capture put you in the “optimize” band — or in the pile that needs to catch up before the next round of contracts goes out?
Complete references and supporting documentation are available upon request by contacting the editorial team at editor@thebullvine.com.
Every week, thousands of producers, breeders, and industry insiders open Bullvine Weekly for genetics insights, market shifts, and profit strategies they won’t find anywhere else. One email. Five minutes. Smarter decisions all week.
You can’t outbreed 70/25/5 by April. The only question is whether you fix your ration and cash flow before it costs $900/cow.
EXECUTIVE SUMMARY: Western Canada’s April 1, 2026, shift to a 70/25/5 payment ratio is the clearest signal yet that protein and solids‑non‑fat now drive far more of your milk cheque than they used to. Retail and utilization data show yogurt and cheese still growing, butter stocks at five‑year highs, and CDC Class 3(d) and 4(a) prices that put real money on protein, not just butterfat. For high‑fat, lower‑protein herds—think 4.5–4.7% butterfat and 3.0–3.1% protein—modeled scenarios with 2025 prices point to a possible $80,000–$100,000 annual hit on a 100‑cow herd under the new ratio, or roughly $900 per cow and 8.5–9.0 cents per litre. The problem is you can’t breed your way out of that by April, because even with genomics, shifting herd‑level components usually takes four to six years of consistent sire selection and culling. So the real play over the next 12–24 months is tightening up nutrition to add 0.10–0.20 points of protein, re‑aiming sire choices and genomic sorting toward balanced fat and protein kilos, and reworking cash‑flow with your lender before the lower cheques arrive. The article also walks straight into the succession conversation, since a 15‑point change in component weighting—and talk of more to come in 2027—forces families to rethink risk, investment, and what it really means to pass a quota‑based dairy to the next generation. And when you zoom out to U.S. Federal Order reforms, and EU forecasts that favour cheese over butter and powders, it’s clear this isn’t a one‑off Western policy quirk but part of a global shift toward paying harder for solids and yield.
If you sit down at a winter producer meeting in Western Canada right now, you don’t get too far into the coffee before the same topic comes up: that new component ratio change landing on April 1, 2026.
You probably know the basics already. The Western Milk Pool boards—BC Milk, Alberta Milk, SaskMilk, and Dairy Farmers of Manitoba—are moving from the long‑standing 85% butterfat / 10% protein / 5% other solids weighting to a new structure of 70% butterfat, 25% protein, and 5% other solids for allocating pool dollars to producers. That’s laid out clearly in BC Milk’s October 9, 2025, Notice to Producers, so it’s not rumour; it’s policy.
Component
Old Ratio (Until March 31, 2026)
New Ratio (From April 1, 2026)
Change
Butterfat
85%
70%
-15 points
Protein
10%
25%
+15 points
Other Solids
5%
5%
No change
What’s interesting here—and what I’ve noticed is really bothering people—is the timing. For years, most Western herds have been bred and fed for strong butterfat performance because that’s what the cheque rewarded. Now the rules shift with only a few months’ lead time, while herd genetics need several years to change direction.
So you’ve got policy moving on a six‑month clock and cows moving on a four‑to‑six‑year clock. That gap is where the uneasiness lives.
Looking at this trend, the aim here is pretty simple: make sense of why the ratio changed, what the data suggests about markets and pricing, and what practical levers you still have—nutrition, genetics, and finances—during this transition period.
Why the Ratio Changed: Following the Value Chain
If you read BC Milk’s explanation, they’re quite clear about the intent. The new 70/25/5 ratio is being introduced to support increased milk volume in the Western Milk Pool to meet industrial processing commitments—whole milk powder and other manufacturing uses—and to encourage butterfat tests to stabilize rather than keep climbing.
And when you look at the numbers across Canada, that story holds up.
In its September 2025 Markets Report, Dairy Farmers of Ontario summarized national retail sales for the 52 weeks ending August 2, 2025. Yogurt was the standout, up 6.5 percent year‑over‑year; butter was up 4.9 percent, cheese 3.1 percent, ice cream 4.0 percent, cream 1.2 percent, and fluid milk barely budged at 0.2 percent.
Product Category
YoY Growth (%)
Yogurt
+6.5%
Butter
+4.9%
Ice Cream
+4.0%
Cheese
+3.1%
Cream
+1.2%
Fluid Milk
+0.2%
The data suggests demand is still solid, but the real growth is coming from products that lean heavily on protein—like yogurt and many cheese types—rather than from plain fluid milk.
At the same time, stock levels tell another part of the story. That same DFO report showed butter stocks at 41,063 tonnes in July 2025—the highest level in five years—and cheese stocks at 108,038 tonnes, also historically high for that month.
Farmtario’s November 2025 analysis added that butterfat‑equivalent production in September 2025 was up 4.48 percent compared to a year earlier, while butterfat imports over the prior 12 months were up 10.18 percent. Put simply, the system isn’t short of fat.
Now layer in component pricing. The Canadian Dairy Commission’s 2025–26 component schedules show that in Class 3(d)—cheese and related products—butterfat is priced at $11.3565 per kilogram, protein at $9.7035, and other solids at $0.8921.
Component
CDC Class 3(d) Price ($/kg)
CDC Class 4(a) SNF Price ($/kg)
Payment Weighting (Old vs New)
Butterfat
$11.36
N/A (Class 4a is SNF)
85% → 70%
Protein
$9.70
~$2.82 (protein + OS)
10% → 25%
Other Solids
$0.89
Included in $2.82 SNF
5% → 5%
In Class 4(a) solids‑non‑fat, the protein and other solids price for fall 2025 sits around $2.82 per kilogram. And in the special Class 5 ingredient/export categories, both protein and butterfat carry strong values, enabling processors to compete internationally with powders and other products.
If we glance south, the pattern lines up. As part of Federal Milk Marketing Order modernization, USDA has been working with updated standard composition factors—roughly 3.3 percent true protein, 6.0 percent other solids, and 9.3 percent nonfat solids—to better match actual milk composition.
Recent USDA class and component price bulletins, summarized in outlets like Cowsmo and Hoard’s Dairyman, have shown months when Class III protein has been close to $3 per pound while butterfat has sat noticeably lower, often in the mid‑one‑dollar range per pound. Values move month to month, but the relationship has frequently favoured protein in cheese milk.
So this development suggests that the boards are trying to align the producer pay structure with where value is truly being created in the chain. Butterfat still matters—no one’s taking that off the table—but under 85/10/5, protein’s contribution was under‑recognized relative to what markets were paying for it.
It’s worth noting one more line in the BC Milk notice. They mention that, if required, a further change may be applied in 2027 to decrease component “densities” to accommodate growth in volume. That tells you this is not viewed as a one‑time tweak, but part of a longer journey in how milk is valued in the Western Milk Pool.
How 70/25/5 Shows Up on Your Milk Cheque
You know as well as anyone that ratios don’t feel real until you run them through a herd. So let’s walk through a simple, realistic example. This is a modeled scenario using typical Western Canadian component levels and current CDC values—not someone’s actual settlement, but it shows the direction.
Herd A: High Butterfat, Lower Protein
100 cows
About 10,500 litres per cow per year (10,500 hL shipped)
Components: 4.6% butterfat, 3.1% protein, ~5.8% other solids
About 11,000 litres per cow per year (11,000 hL shipped)
Components: 4.1% butterfat, 3.5% protein, ~6.0% other solids
Under 85/10/5, Herd A has been the star. As many of us have seen in Western DHI summaries, herds with butterfat levels of 4.5–4.7% have consistently ranked near the top of payout lists for years.
Under 70/25/5, when you apply those weights with current Class 3(d) values, Herd A still benefits from strong butterfat performance, but Herd B’s extra protein and slightly higher volume dramatically close the gap. In quite a few realistic price combinations, a balanced herd like B can edge ahead on net dollars per cow.
To put some rough numbers on it, advisors modeling real farms with similar profiles using recent CDC prices have seen cases where a high‑fat, lower‑protein 100‑cow herd’s annual milk revenue under the new ratio pencils out $80,000–$100,000 lower than under 85/10/5, while a more balanced herd might see only minor changes.
Herd B (Balanced: 4.1% BF / 3.5% Protein, 11,000 L/cow)
$0 (baseline)
-$5,000
-$5,000
If you spread a $90,000 hit over 100 cows, that’s about $900 per cow per year. On a per‑hectolitre basis for Herd A (10,500 hL), that’s roughly 8.5–9.0 cents per litre in modeled scenarios. Your exact numbers will differ, but the direction is clear: the further out on the “fat‑heavy/protein‑light” end your herd sits, the more exposed your cheque is.
What’s interesting here is that many of the herds most at risk are also some of the best‑run operations on butterfat. They did exactly what the previous payment structure encouraged. That’s the sting.
The Real Tension: Policy Moves in Months, Genetics in Years
Here’s where the frustration really surfaces when you talk with producers and geneticists.
Genomic selection has absolutely changed the game. Industry reports and peer‑reviewed work show that AI programs have shortened sire generation intervals from roughly 5–7 years to around 2–3 years, enabling much faster genetic gain in traits like fat and protein. Hoard’s Dairyman, for instance, has highlighted how these “unprecedented genetic gains” are driving record component levels even in periods when total milk volume flattens.
But on a commercial dairy, you live with herd structure and replacement rates. In practical terms, it looks more like this:
You breed a heifer to a more protein‑balanced bull this year.
She calves in roughly two years.
She reaches peak performance in the second lactation, another year out.
Her daughters start meaningfully influencing the bulk tank a couple of years after that.
University extension specialists and genetic advisors generally agree that it takes around four to six years of consistent sire selection and culling for a new breeding emphasis to show up clearly in bulk tank butterfat and protein levels. That lines up with what producers in Western Canada, the Upper Midwest, and the Northeast have seen when they’ve tried to shift components on their own herds.
Now set that against the policy timeline:
October 9, 2025: BC Milk and the other Western boards issue the notice announcing the shift to 70/25/5.
April 1, 2026: the new ratio takes effect.
So policy moved on a roughly six‑month timeline, while biology—through genetics—needs four to six years to respond fully. That’s the core tension farmers are feeling.
Timeline Type
Start
End
Duration
Policy Change (85/10/5 to 70/25/5)
October 2025
April 2026
6 months
Herd Genetic Shift (meaningful bulk tank change)
Breeding decision today
Bulk tank impact
48–72 months (4–6 years)
What farmers are finding is that the herds that look “fortunate” right now are often the ones that started nudging toward higher protein and more balanced components around 2021–2023. Some were watching Ontario’s solids‑non‑fat and SNF:BF policy adjustments in the P5 pool and realizing excessive butterfat relative to SNF could be penalized.
Others were paying attention to how often U.S. Class III prices were placing a premium on protein in cheese milk compared to butterfat. Their early decisions are walking into the parlour now, while many other herds are just beginning that pivot.
So the question becomes: if genetics is a four‑to‑six‑year lever, where can you still move the needle in the next 12–24 months?
Where You Still Have Levers to Pull in 2026
The good news is that genetics aren’t the only lever you have. Producers across Western Canada—and, honestly, across regions like Wisconsin and New York as well—are leaning hard on three major fronts: nutrition, breeding strategy, and financial planning.
Looking at Nutrition: Adding Protein Without Losing Butterfat or Fresh Cows
On the nutrition side, the question that keeps coming up is, “Can we pick up some protein without hurting butterfat performance or making fresh cow management riskier?”
Recent peer‑reviewed milk quality and nutrition reviews, along with university feeding trials, show that balancing key amino acids—especially methionine and lysine—can lift milk protein yield and often nudge protein percentage up by about 0.10–0.20 points when the base ration (forage quality, effective fibre, starch) is solid. That effect is strongest in early and mid‑lactation cows when energy balance is good.
In many Western rations this season, that’s translating into:
Adding rumen‑protected methionine and lysine and aiming for a metabolizable protein profile with a lysine: methionine ratio around 2.8–3.0:1, which is consistent with extension recommendations and controlled studies.
Budgeting typical costs in the range of 15–25 cents per cow per day for these protected amino acid products, which pencils out to roughly $5,500–9,000 per year for a 100‑cow herd based on common product pricing in North American ration budgets.
Seeing protein percentage gains in the 0.10–0.15 point range in many well‑managed herds, with some trials and field reports showing improvements up toward 0.20 points when all other ration basics are well aligned.
On top of that, nutritionists are re‑examining the balance between energy and fibre in high‑fat herds.
Where cows are sorting TMR or where there are signs of subacute rumen acidosis, it’s common to see underperformance in milk protein and, sometimes, unstable butterfat. Adjustments like moderating starch levels, improving forage chop consistency, and increasing the share of high‑quality legume or grass‑legume forage can improve rumen function and help cows convert dietary protein into milk protein more efficiently.
Western diets have long relied on canola meal as a rumen-degradable protein source, and research from Canadian and U.S. universities supports its positive effect on milk protein yield when used correctly in TMRs. Some producers are now fine‑tuning canola or expeller soybean meal levels in high‑producing groups to shore up protein without driving starch or unsaturated fat too high.
What’s encouraging is that none of these changes require blowing up the ration. The goal isn’t to tank fat just to chase protein. It’s to:
Keep butterfat performance stable and respectable.
Protect cow health and fresh cow management through this transition period.
Capture that 0.10–0.20% protein improvement that’s now worth more under 70/25/5.
To make it even more concrete: if a 100‑cow herd can sustainably move protein from 3.1% to 3.25% without sacrificing butterfat or health, that extra protein can easily be worth several thousand dollars a year under the new weighting, depending on exact prices and volumes. It’s not a silver bullet, but it’s real money.
Intervention
Cost per Cow per Day
Realistic Protein Gain (percentage points)
Annual Cost (100-Cow Herd)
Est. Annual Revenue Gain Under 70/25/5 (100-Cow Herd)
Rumen-Protected Methionine & Lysine
$0.15–$0.25
+0.10 to +0.20
$5,500–$9,000
$8,000–$15,000
Improved Forage Quality & TMR Balance
Variable (forage cost)
+0.05 to +0.10
Varies by operation
$3,000–$8,000
Canola/Soy Meal Optimization
$0.05–$0.10
+0.05 to +0.10
$1,800–$3,600
$3,000–$8,000
Combined Nutrition Strategy
$0.20–$0.35
+0.15 to +0.30
$7,300–$12,800
$12,000–$25,000
Looking at Genetics: Re‑aiming Without Erasing Past Gains
On the genetics side, most producers are rightly treating this as a course correction, not a full reset.
What farmers are finding is that a few clear rules of thumb help re‑aim the program:
Put more emphasis on protein kilos alongside fat kilos. Many Western and Upper Midwest herds are now setting minimums of +35–40 kg protein and +35–45 kg fat for bulls, then checking that daughters are projected to land around 3.4–3.5% protein and 4.0–4.2% butterfat at realistic production levels—profiles that align with both Canadian and U.S. component pricing trends.
Use indexes that reflect your market. In Canada, that often means putting more weight on LPI or custom indexes that emphasize protein and functional traits, rather than relying solely on Net Merit, which is calibrated to U.S. conditions. In Wisconsin and the Northeast, similar shifts toward protein‑friendly indexes have been observed as processors reward higher protein.
Use genomic testing as a sorting tool, not a luxury. At roughly $30–40 per head, genomic tests give a much clearer picture of which heifers and young cows carry the best combination of components, fertility, and health traits. Field data from AI organizations and extension programs show that herds using genomics this way can accelerate progress by:
Breeding the top 20–30 percent to sexed dairy semen to build the next generation.
Using conventional dairy or beef‑on‑dairy in the middle tier according to replacement needs.
Using beef semen on the lowest tier and planning to cull those lines more quickly.
I recently sat down with a producer in central Alberta—190 Holsteins, a mix of free‑stall and dry lot systems, managing about 2.3 kg of quota per day—who’s been working through this with his herd advisor, a licensed independent genetics and nutrition consultant.
He said, “We didn’t do anything wrong, breeding for fat when that’s what was being paid for. Now we just need to pivot, and we know that’s going to take a few years. The goal for us is not to panic, but to make sure every heifer we keep from here on out is pointed in the right direction.”
That mindset mirrors what geneticists with major AI organizations and extension specialists have been urging in recent conferences and webinars.
What’s interesting here is that similar thinking is already well established in high‑protein U.S. cheese regions. In Wisconsin operations, for example, herds supplying specialty cheese plants have deliberately moved toward sires with stronger protein and balanced fat, and those choices now show up in their bulk tank tests and pay statements. Western Canada is essentially being nudged toward that same “balanced components” zone by the 70/25/5 shift.
Looking at Finances: Turning a Shock into a Managed Transition
The third major lever—and it’s easy to overlook when we’re focused on cows—is how you manage the money through this transition period.
What lenders and farm financial advisors are recommending, in both Canadian and U.S. dairy regions, is remarkably consistent:
Build a realistic 12–24 month cash‑flow projection that reflects your current components under the new ratio. That means taking your actual DHI butterfat and protein tests, applying the 70/25/5 allocation, and using realistic price assumptions based on CDC component tables and board guidance to sketch how your milk cheque might look from April onward.
Sit down with your lender before the first reduced cheque shows up. Past experience with policy and price shocks—including recent farm‑gate price adjustments in Canada and supply‑driven squeezes in the U.S.—shows that producers who come in early, with numbers and a plan, have more options: interest‑only periods on term loans, temporary increases to operating lines, or adjusted covenant targets.
Be selective with big capital projects. In many operations, this may not be the year to stretch for a new loader or major barn expansion unless the balance sheet is very strong. At the same time, investments that clearly support cow performance—improved ventilation, transition cow facilities, repro tools—can still make sense if you can quantify the payback in milk and components, as multiple cost‑of‑production studies have shown.
Protect the investments that actually drive revenue. Economic work on dairy cost structures consistently shows that cutting corners on nutrition consulting, hoof care, repro programs, or fresh cow management often costs more in lost production and health problems than it saves in fees.
If you put some numbers to it, that modeled $80,000–$100,000 revenue impact on a 100‑cow high‑fat herd is roughly $6,500–$8,500 per month. Knowing that ahead of time lets you and your lender decide whether to make ration changes, temporary credit adjustments, capital deferrals, or some combination of all three to cover that gap.
In Ontario, Midwest, and Northeast operations, we’ve seen this pattern over and over: farms that do the cash‑flow homework and engage their lenders early tend to navigate policy and price changes with less long‑term damage. Western herds can draw on that same playbook here.
The Succession Question That’s Hard to Ignore
There’s another layer to this story that doesn’t appear in any price table: how the change intersects with succession.
In recent years, many Western farms had fairly clear succession timelines. A son or daughter was coming back from an ag diploma program, or a long‑time employee was gradually buying in. The underlying assumption was that while class prices might swing, the basic structure of producer payments wouldn’t change dramatically over a six‑month period.
Now, after a 15‑point swing in component weighting announced in October 2025 and effective in April 2026—and with the possibility of further adjustments mentioned for 2027—some families are re‑examining what they’re asking the next generation to commit to.
Farm transition specialists and lender‑side advisors have been increasingly explicit that policy risk needs to sit alongside debt and asset values in these conversations.
What farmers are finding in succession meetings this winter is that the most constructive approach is full transparency:
Share projected revenue scenarios under 70/25/5 using real component data and realistic price bands.
Explain the steps being taken in nutrition, genetics, and finance to adapt.
Be clear about debt levels, risk tolerance, and time horizon for the current generation.
Then let the next generation respond. Some will say, “I see the challenge, but I still want in.” Others may decide to build their careers in allied sectors—such as nutrition companies, genetics firms, lenders, or equipment dealers—while maintaining a more gradual or partial involvement in the farm.
Similar patterns have been observed in California (around water and environmental regulation) and in Wisconsin (during periods of extreme Class III price volatility), where policy and market risks shaped when and how the next generation entered ownership.
What’s encouraging, based on both research and experience, is that families who have these discussions early and honestly tend to land on more durable long‑term arrangements, whether that means full succession, shared ownership, or a different path altogether.
How This Fits Into the Bigger Dairy Picture
If you zoom out beyond Western Canada, the 15‑point shift is part of a broader pattern in how milk is being valued.
In the U.S., modernization of Federal Orders and ongoing debates over pricing formulas are aimed at aligning producer pay more closely with what plants actually make and what customers buy—cheese, powders, butter, and fluid products.
Recent analyses in Hoard’s Dairyman and Dairy Herd Management have highlighted that even when national milk volume softens, component levels—especially butterfat and protein—have continued to climb thanks to genetics and focused nutrition.
Globally, market reports from sources such as Dairy Global and DairyReporter show strong, steady demand for whole milk powder, skim milk powder, whey products, and cheese, with butter prices moving alongside a broader, solids‑driven landscape. The longer‑term trend has favoured higher solids and more flexible ingredient production, and Canada’s special class pricing is structured to help processors compete in that environment.
Here at home, the Western boards’ move to 70/25/5 is one regional expression of this bigger shift. It’s an effort to ensure that the signals producers see in their milk cheques are more closely aligned with retail demand, processing economics, and international market conditions.
Pulling It Together: What Producers Can Do Next
If we were standing in a barn alley or catching up at a conference, and you asked, “So what do I actually do with all of this?” here’s how it boils down:
The 70/25/5 shift is anchored in real market signals. Retail data points to strong growth in protein‑dense products like yogurt, stock levels show no shortage of fat, and component prices—both here and in the U.S.—have been rewarding protein in several key classes.
Breeding for butterfat under 85/10/5 wasn’t a mistake. Western herds that pushed butterfat performance were responding exactly to what the pay structure incentivized. The issue isn’t what those herds did; it’s that policy has now moved faster than herd genetics can keep up.
Genetics are a slower but powerful lever. Even with genomics, you’re looking at roughly 4 to 6 years of consistent sire selection and culling to shift herd‑level butterfat and protein levels materially. The bull decisions you make over the next couple of years are really about where you want your components to be around 2030.
Nutrition can help in the near term. Thoughtful use of rumen‑protected amino acids, good forages, balanced starch and fibre, and solid fresh cow management can often add 0.10–0.20 percentage points of protein in many herds. Under 70/25/5, that’s worth more than it used to be.
Balanced cows are your safest long‑term bet. Herds targeting both solid butterfat and solid protein, rather than extremes on either side, tend to be the most resilient when pricing formulas or markets change.
Financial planning matters as much as ration planning. Honest cash‑flow projections, early lender conversations, and disciplined choices about where to invest (and where to wait) can turn a sudden policy shock into a managed transition rather than a crisis.
Succession plans deserve a fresh, honest look. This isn’t about pushing the next generation away from dairy. It’s about making sure they understand both the opportunities and this newer layer of policy risk, where pricing structures can change faster than biology.
Your 90‑Day Playbook
If you’re wondering what to do between now and April, here’s a simple action list:
Pull your last 12 months of DHI component records and model your milk cheque under 70/25/5 using current prices.
Sit down with your nutritionist to set a realistic protein target and a stepwise plan to get there without hurting butterfat or fresh cows.
Re‑screen your sire list and adjust your selection criteria to favour balanced fat and protein kilos, plus health traits.
Book a meeting with your lender to walk through your modeled cash‑flow and discuss options for the transition period.
The Bottom Line
What’s encouraging, after looking at the data and talking with producers, advisors, and researchers, is that the tools needed to navigate this change are the same ones that have always mattered: good cows, good forages, thoughtful fresh cow management, disciplined breeding, realistic numbers, and open conversations at home and with your advisory team.
As many of us have seen—whether on Western Canadian freestall herds, Wisconsin tie‑stall dairies, or Northeast dry lot systems—dairy farmers are remarkably good at adapting when they understand the rules of the game.
This component shift is a big adjustment, no doubt. But with clear information, measured changes in how you feed and breed, and proactive financial planning, there’s every reason to believe Western herds can come through this transition and still be milking strongly when the next generation is the one hosting the coffee in the kitchen.
KEY TAKEAWAYS:
Protein just got 2.5× louder on your cheque: Western Canada’s 70/25/5 ratio takes effect April 1, 2026—what you ship in protein now matters almost as much as butterfat.
Top butterfat herds face the biggest hit: Modeled scenarios show a 100-cow herd at 4.6% fat / 3.1% protein could lose $80,000–$100,000/year under the new ratio—roughly $900/cow.
You can’t outbreed this by April: Genetics need 4–6 years to shift bulk-tank components materially; policy gave you six months.
Three levers to pull now: Dial in amino-acid nutrition for 0.10–0.20 pt protein gain, re-screen sires for balanced fat + protein kilos, and sit down with your lender before the smaller cheques arrive.
Succession plans need a policy-risk conversation: A 15-point swing—with 2027 changes floated—means the next generation deserves full transparency on what they’re really buying into.
Complete references and supporting documentation are available upon request by contacting the editorial team at editor@thebullvine.com.
Every week, thousands of producers, breeders, and industry insiders open Bullvine Weekly for genetics insights, market shifts, and profit strategies they won’t find anywhere else. One email. Five minutes. Smarter decisions all week.
Stop chasing milk volume. Smart farmers banking 32¢/lb butter gains while you’re missing the component revolution that’s rewriting profitability.
EXECUTIVE SUMMARY: The biggest “I told you so” moment in modern dairy just hit: while everyone obsessed over milk volume, the real money was hiding in plain sight – and butter markets just proved it with a stunning $0.32/lb surge. CME spot butter exploded from $2.24/lb spring lows to $2.56/lb peaks while most farmers focused on the wrong metrics, missing the component revolution that’s fundamentally changed dairy economics. Your Holstein genetics now produce 4.40% butterfat compared to 3.70% two decades ago – that’s nearly 20% more profit per pound of milk, yet most operations still get paid like they’re running 1990s genetics. Americans are consuming butter at 1965 levels despite having 150 million more people, April 2025 consumption hit an all-time record of 200.1 million pounds (up 23%), and U.S. butter trades at a 60% discount to EU prices creating unprecedented export opportunities. Meanwhile, corn at $4.60/bu and favorable feed costs create a golden window for locking contracts while margins remain strong.Stop optimizing for volume and start maximizing component value – the farmers who understand this shift are literally banking the difference.
KEY TAKEAWAYS
Genetic Goldmine Unlocked: First and second lactation Holstein cows now average 5% butterfat in top herds, with national averages jumping from 4.01% to 4.33% since 2021 – farms optimizing for components over volume can capture $7,430 additional annual profit per 100 cows through strategic feed cost management
Export Arbitrage Opportunity: U.S. butter’s 60% discount to EU prices ($5,140/MT vs $8,250/MT) creates immediate export competitiveness, with 2025 exports already doubling to 42.6 million pounds through April – position now before this pricing advantage disappears
Consumer Demand Explosion: Americans consumed 746.8 million pounds of butter through April 2025 (up 8% year-over-year), with March and April setting all-time monthly records – this isn’t seasonal baking, it’s structural market transformation driven by Gen Z’s preference for natural products
Component Economics Reality Check: Despite milk production growing just 15.9% from 2010-2024, butterfat pounds surged 30.6% – operations still focused on volume metrics are missing the profit revolution happening in their own bulk tanks
Strategic Risk Management Window: CME futures pricing butter at $2.60-$2.70 for Q3 while current spot prices sit around $2.43 creates optimal hedging opportunities – implement tiered coverage at 60-70% while maintaining upside exposure to capture this unprecedented component premium
The butter market just delivered the biggest “I told you so” moment in modern dairy history. While everyone obsessed over milk volume, the real money was hiding in plain sight – and it’s about to get a whole lot bigger.
The $0.32 Wake-Up Call That Changed Everything
Here’s what happened while you weren’t looking: CME spot butter exploded from December 2021 lows of $2.24/lb to a stunning $2.56/lb peak on June 5 – that’s a 32-cent swing that should have every dairy farmer rethinking their entire operation.
But here’s the kicker – this wasn’t some random market blip. This was the inevitable result of the most significant shift in dairy economics since we started milking cows.
Why Your Holstein Herd Just Became a Goldmine
Let’s cut through the noise and talk numbers that actually matter to your bottom line. U.S. butterfat levels have quietly skyrocketed from 3.70% to 4.40% over the past two decades. That’s not a gradual improvement – that’s a genetic revolution that’s fundamentally changed the math on dairy profitability.
Think about it: your cows produce nearly 20% more butterfat per pound of milk than in 2000. Yet most farmers are still getting paid like they’re running 1990s genetics.
The Component Reality Check:
First and second lactation Holstein cows now average 5% butterfat in top herds
Federal Order data shows butterfat jumping from 4.01% in March 2021 to 4.33% by March 2025
Despite milk production growing just 15.9% from 2010-2024, butterfat pounds surged 30.6%
This isn’t just data – it’s your competitive advantage if you know how to use it.
Americans Are Eating Butter Like It’s 1965 (But There Are 150 Million More of Them)
Here’s where the demand story gets absolutely wild. Americans consumed 6.5 pounds of butter per capita in 2023 – the highest level since 1965. But here’s what most analysts miss: we had 150 million fewer people in 1965.
The spring 2025 consumption numbers are breaking every record in the book:
April 2025: 200.1 million pounds consumed (all-time April record, up 23% year-over-year)
March 2025: 209.9 million pounds (new March record, up 3%)
Year-to-date through April: 746.8 million pounds, representing an 8% jump over 2024
This isn’t seasonal baking demand – this is structural transformation. And it’s happening while plant-based alternatives are supposedly taking over the world.
The Export Opportunity Everyone’s Missing
While domestic demand explodes, U.S. butter exports more than doubled to 42.6 million pounds through April 2025. Why? Because we’re selling at a massive discount to global prices.
The Global Arbitrage Goldmine:
U.S. butter: $5,140/MT
EU butter: $8,250/MT
That’s a 60% discount that won’t last forever
European butter prices were 45% higher than U.S. levels in April 2025. This pricing differential creates unprecedented export opportunities that could vanish overnight if trade dynamics shift.
Why Feed Costs Are Your Secret Weapon Right Now
Here’s your tactical advantage: corn at $4.60/bu, soybean meal at $290/ton, and alfalfa hay at $159/ton are trending lower than 2024. Smart farmers can lock in these costs and save $7,430 annually per 100 cows.
Your Action Plan:
Audit your milk contract’s component premiums immediately
Consider culling low-fat cows to maximize per-cow profitability
Lock in feed contracts while costs remain favorable
Focus breeding decisions on butterfat genetics, not just volume
The Production Reality That’s Confusing Everyone
Here’s the paradox that’s driving markets crazy: despite reducing the national herd by 557,000 cows in 2024, calculated milk solids production increased by 1.345%.
February 2025 U.S. butter production rose 2.6% year-over-year to 203 million pounds, partly because “weaker cheese, ice cream, and sour cream production freed up some fat for butter.”
This “silent growth” in component output means effective butter supply can continue expanding even if raw milk volume stays flat. That’s why volume-focused farmers are missing the boat while component-focused operations are printing money.
The Class IV Revolution You Need to Understand
Butter now absorbs 18% of the U.S. milk supply on a milkfat basis, up from 16% in 2000. The weighted average retail price has maintained a higher range since April 2022, typically fluctuating between $3.79/lb and $4.68/lb, providing strong support for Class IV milk prices.
CME futures are pricing butter in the $2.60-$2.70 range for Q3, compared to current spot prices around $2.43. If food service cream demand improves and new cheese plants absorb more milk, prices could climb even higher.
What the Smart Money Is Doing Right Now
Current market conditions represent what analysts call a “golden window” for 2025, with futures trading at significant premiums to USDA forecasts. Here’s how forward-thinking operations are positioning themselves:
Risk Management Strategy:
60-70% coverage at current premium levels
Maintain upside exposure for potential rallies
Lock feed costs while margins remain favorable
Genetic Focus:
Prioritize butterfat content over volume in breeding decisions
Cull low-component cows that dilute profitability
Track component premiums in milk pricing
The Global Reality Check
Plant-based alternatives could capture 15-20% of the U.S. market by 2030. But here’s what the doom-and-gloom crowd isn’t telling you: the growth is happening in premium, organic, and grass-fed butter varieties that command higher prices.
Gen Z consumers are leading a charge toward “better-for-you” and natural products. They’re not abandoning butter – they’re upgrading to premium versions and paying more for them.
The Bottom Line: Component Economics Have Permanently Changed
The butter market’s explosive rally isn’t just about supply and demand – it’s validation that dairy economics have permanently shifted toward components over volume. The convergence of genetic advances producing unprecedented butterfat levels, surging consumption among younger demographics, and export opportunities created by favorable U.S. pricing has created a perfect storm of profitability.
Your competitive advantage depends on three critical decisions:
Optimize for components, not volume – Audit your breeding program and milk contracts
Lock in favorable input costs – Feed prices won’t stay this friendly forever
Implement strategic risk management – Use tiered hedging to capture the upside while protecting the downside
The data is crystal clear: butter demand isn’t just lifting markets – it’s rewriting the rules of dairy profitability. The question isn’t whether this trend will continue but whether your operation is positioned to capitalize on the most significant transformation in dairy economics in a generation.
Americans are consuming butter at levels not seen since 1965 despite having 150 million more people today. Your cows produce butterfat levels that would have been impossible two decades ago. Global pricing favors U.S. exports like never before.
The revolution is here. The only question is: are you ready to profit from it?
Learn More:
Why Boosting Butterfat and Protein Is Key to Higher Profits – Practical strategies for increasing butterfat levels through feeding adjustments and genetic selection, with specific ROI calculations showing how farms can generate an additional $19,920 annually per 100 cows.
The Export Revolution That’s Starving America’s Butter Supply – Reveals how global buyers are creating unprecedented domestic supply tightness, driving prices to $2.60/lb and creating new marketing opportunities for component-focused operations.
Every week, thousands of producers, breeders, and industry insiders open Bullvine Weekly for genetics insights, market shifts, and profit strategies they won’t find anywhere else. One email. Five minutes. Smarter decisions all week.
U.S. dairy’s butterfat boom creates a cream tsunami-butter thrives, ice cream falters. Can farmers ride the wave or drown in surplus?
EXECUTIVE SUMMARY: American dairy cows now produce record-breaking butterfat levels, flooding processors with cream. While butter production soars 5% (absorbing 25M+ lbs of fat), ice cream and cream cheese struggle with declining demand. Natural American cheese emerges as a bright spot, using 15M+ extra lbs of fat. Export markets become critical to avoid oversupply, but reliance on global demand raises volatility risks. Farmers must prioritize component-driven genetics and risk management to capitalize on this new reality.
KEY TAKEAWAYS:
Butterfat surge: 3.4% increase in Q1 2025 creates 82M lbs of extra fat-reshaping dairy economics.
Market divergence: Butter (+5%) and American cheese (+15M lbs fat) thrive; ice cream (-7.9%) and cream cheese (-6.3M lbs) falter.
Export dependency: 60% of butterfat relies on global markets-price stability hinges on overseas sales.
Farm strategy: Focus on component genetics, precision feeding, and futures/options to hedge volatility.
America’s dairy farms are pumping more butterfat than ever, creating a cream tsunami forcing processors to adapt or drown. While butter churns work overtime, traditional products like ice cream are missing the boat entirely. Smart dairy operators aren’t just watching this transformation – they’re positioning themselves to capitalize on the new component-driven reality while their neighbors wonder what hit them.
The American dairy industry is experiencing a revolution that is fundamentally altering milk production’s economics. U.S. dairy producers increased total butterfat content by a staggering 82 million pounds in Q1 2025 alone – that’s 3.4% more than last year, with barely any increase in fluid volume. This component surge isn’t just a fascinating trend – it creates winners and losers across the dairy manufacturing landscape.
THE CREAM EFFECT: WHEN ABUNDANCE CREATES OPPORTUNITY
The first ripple of this butterfat tsunami hits the cream market. When your milk truck leaves the farm at 4.3% butterfat instead of 3.7%, that extra component must go somewhere – and right now, it’s flooding the cream market like spring runoff hitting a dam.
“Cream multiples have been historically weak through early 2025,” explains Betty Berning, analyst with the Daily Dairy Report. “Until recently, we saw multiples dipping below 1.00 in some regions – a clear sign that processors are swimming in cream”.
These weak cream multiples represent a threat and an opportunity, depending on which side of the farm gate you’re standing on. For farmers, continually depressed component values could eventually filter back to the milk check. For processors with the flexibility to pivot toward butterfat-heavy products, it’s like finding $100 bills scattered across the plant floor – if you’re quick enough to pick them up.
While multiples have recently started to firm with the onset of ice cream season, the situation remains one of abundance rather than scarcity. According to Hoard’s Dairyman, cream multiples are “near the record lows of March 2020, even as domestic butter consumption is growing”. The relative weakness in U.S. butterfat markets is starkly contrasted to the rest of the world, where Oceania and European butter markets sit comfortably north of $3.50 per pound.
The fundamental question every dairy operation should be asking: Are you positioned to thrive in an era of component abundance, or are you still chasing volume like it’s 1995?
PRODUCT DIVERGENCE: FOLLOW THE FAT
The fascinating aspect of this butterfat surge is how unevenly it’s being absorbed across dairy categories. Some products are soaking up cream like thirsty calves, while others are entirely turning away from the trough.
Butter: The Relief Valve
Butter manufacturers have emerged as the primary beneficiaries and absorbers of America’s butterfat dividend. Year-to-date through March 2025, butter production reached nearly 650 million pounds – a 5% jump compared to 2024 (adjusted for leap year).
Translate that into fat utilization and you’ll see why this matters: churns processed approximately 25 million pounds more milkfat in Q1 2025 than they did in Q1 2024. March production alone hit 229 million pounds, an 8.6% surge year-over-year.
“Butter plants are essentially functioning as the relief valve for the dairy system right now,” industry consultant Jake Morrison explains. “When there’s excess cream in the system, it finds its way to the churn as predictably as water flows downhill.”
This hasn’t been entirely without risk. Reports indicate that cream prices are relatively low, and butter manufacturers carry heavier inventories than normal. This strategic inventory building makes perfect sense in the short term – like filling the hay mow in June – but creates potential price risk if domestic consumption or exports don’t keep pace with increased output.
The good news? U.S. butter exports are soaring in response to price advantages. According to recent trade data, U.S. butter exports more than doubled in February 2025, and anhydrous milkfat (AMF) sales grew tenfold, with more than 3,000 metric tons volume increases compared to last year. For the first time in more than two years, the U.S. exported more butter than it imported.
Ice Cream’s Unexpected Chill
In a surprising twist, ice cream makers have reduced their butterfat utilization despite abundant cream supplies, like refusing free feed when your TMR mixer is half empty. Regular ice cream production plummeted 7.9% year-over-year in March, with low-fat production falling 8.9%.
This counterintuitive trend – declining fat use when cream is plentiful and affordable – points to more profound shifts in consumer preferences that raw material availability alone cannot overcome.
Over 60% of consumers now actively seek “healthier” dessert options, driving growth in plant-based alternatives and premium, portion-controlled products. The traditional dairy-based ice cream category isn’t disappearing, but it’s evolving toward artisanal offerings rather than mass-market products.
When an industry refuses available, affordable inputs, it’s telling you something profound about market direction. Are we witnessing the beginning of a permanent shift away from traditional dairy ice cream, or just a temporary consumer infatuation with alternatives that will eventually fade?
Cream Cheese Contraction
The cream cheese sector shows a similar pattern of declining fat utilization, like a cow refusing grain during peak lactation. First-quarter production of cream cheese and Neufchatel was down by 6.3 million pounds compared to Q1 2024, making an additional 2.2 million pounds of butterfat available on the market.
More recent market intelligence indicates demand from cream cheese producers had “seasonally picked up” by mid-April, suggesting the Q1 decline might be temporary rather than a long-term structural trend.
American Cheese: The Comeback Kid
Among these shifting currents, Natural American cheese varieties have emerged as a bright spot in butterfat utilization, like a high-component cow in a low-component herd.
“Cheese is the largest user of U.S. milkfat, and Natural American varieties, which have a higher-fat content than Mozzarella, appear to be making a comeback,” notes Berning. This resurgence has a real impact: stronger demand increased fat intake in Natural American cheese vats by 15 million pounds in Q1 2025.
Production data confirms this trend, with American-type cheese output totaling 500 million pounds in March 2025, a 4.6% increase from March 2024. This comeback is particularly notable against a backdrop where cheese inventory levels remain tight – American-style cheese stocks were reportedly down 8% at the start of 2025.
This cheese resurgence is welcome news for dairy producers, like discovering that your corn silage tested two percentage points higher in starch than expected. Cheese plants typically operate on stable throughput volumes, providing consistent demand for farm milk throughout the year.
MARKET TIGHTROPE: BALANCING THE BUTTERFAT BOOKS
With domestic production outpacing consumption growth for fat-heavy products, exports have become critically important, just as crucial as a reliable milk hauler during spring flush. “Cheese and butter prices will need to remain low enough to keep exports moving, or U.S. dairy stocks could start to pile up,” warns Berning.
This export dependence creates both opportunity and vulnerability. International demand for butter, cheese, and whey products heavily supports the current strength of dairy prices. However, this also makes the sector more susceptible to global economic shifts, trade disruptions, or currency fluctuations, like a dairy dependent on export hay during a shipping crisis.
The U.S. currently exports roughly 16-17% of its milk production as dairy products and ingredients, but there’s a striking imbalance in the component mix. According to Corey Geiger, lead dairy economist with CoBank, “On a full-fat basis, the U.S. exported just 5.2% of its milk production last year, while it exported 21.6% of its milk production on a skim solids basis”. This indicates the U.S. traditionally skims off its butterfat for the domestic market, keeping it a relatively small player in global butterfat trade.
However, this dynamic is changing rapidly. U.S. dairy exports hit two-year highs in early 2025, with butter and milkfat exports reaching a 26-month high of 15.74 million pounds in January, doubling year-over-year shipments. A significant price advantage drives this export surge – U.S. butter is trading at a substantial discount to global competitors.
The Class III/IV Divergence Worth Watching
A curious divergence exists between milk class futures that directly impacts butterfat utilization. While Class III milk (used primarily for cheese) and Class IV milk (used for butter and powder) have historically maintained relatively predictable price relationships, current market dynamics are creating unusual patterns.
Mike North, Principal of Risk Management, speaking at the 2025 Dairy Strong Conference, highlighted how cheese and butter markets respond differently to the current component surge. With substantial new cheese processing capacity coming online in 2025, there’s increased demand for milk volume in cheese plants. However, all that extra butterfat often generates surplus cream that flows to butter manufacturers.
“We don’t have enough animals to make all the milk to supply all the plants in the U.S. This is a good problem,” North explained. “So, we will likely see some inefficient plants close and some not run at 100% capacity. But with all this cheese potentially coming online, we have a real need for exports because we will create many additional products”.
This divergence suggests that future traders may be pricing in current market tightness or that specific demand factors are not fully captured in the smoothed annual averages from the USDA. Are market participants seeing something that government forecasters are missing? Or are they setting themselves up for disappointment when production increases seasonally later this year?
THE NEW DAIRY MATH: COMPONENT ECONOMICS IN ACTION
The component revolution offers dairy producers a significant opportunity through milk payment systems that reward butterfat and protein. To illustrate the financial impact, let’s compare two hypothetical 100-cow operations:
Farm A: Traditional Volume Focus
Production: 85 lbs/cow/day
Butterfat: 3.7%
Protein: 3.0%
Total component production: 3.145 lbs/cow/day
Component value: $23.59/cwt
Daily revenue: $2,005/day
Farm B: Component Focus
Production: 80 lbs/cow/day
Butterfat: 4.3%
Protein: 3.3%
Total component production: 3.44 lbs/cow/day
Component value: $26.95/cwt
Daily revenue: $2,156/day
Despite producing 5 pounds less milk per cow, Farm B generates $151 more daily revenue– over $55,000 annually – through superior component production. This component premium is like having seven extra cows in your herd without additional labor, housing, or manure management costs.
Have you calculated what a 0.3% increase in butterfat would mean for your operation’s bottom line? For most farms, it’s a six-figure opportunity hiding in plain sight.
STRATEGIC MOVES: POSITIONING YOUR DAIRY FOR THE COMPONENT ERA
The message from the market is clear: farms focusing on butterfat and protein components will capture premium returns. This reality reshapes breeding decisions, feeding strategies, and overall farm management nationwide.
1. Genetic Selection with Purpose
Target components aggressively with your breeding program
Select sires with high PTA Fat and PTA Protein values (>100 lbs)
Balance with health traits (particularly SCS) to maximize component harvest
Prioritize productive life and fertility to optimize lifetime component production
Remember that according to industry research, butterfat and protein rank among the most heritable traits for dairy cows (0.58 for fat percentage and 0.51 for protein percentage). Every replacement heifer represents an opportunity to elevate your herd’s component production potential.
The genetic shift is happening faster than many realize. According to data presented at the 101st USDA Agricultural Outlook Forum, first and second lactation cows on progressive dairies are now completing lactations averaging 5% butterfat, while older cows (fifth lactation and beyond) range from 3.5% to 4.4%. This generational leap demonstrates how rapidly genetics can transform your herd.
2. Feed for Components, Not Just Volume
Optimize your nutrition program for maximum component yield
Implement strategic use of rumen-protected fats
Maintain optimal rumen pH (>5.8) through proper forage-to-concentrate ratios
Ensure adequate physically effective fiber (peNDF) for proper cud chewing
“The feed bunk is where genetic potential either becomes reality or gets squandered,” nutritionist Dr. Sarah Williams notes. “A properly balanced TMR can boost butterfat by 0.3-0.4 percentage points in many herds – that’s like finding an extra $75 per cow in annual revenue without adding a single animal.”
3. Harvest What You Grow
Maximize component recovery through optimal milking procedures
Implement consistent prep-lag times for complete milk letdown
Maintain proper vacuum levels and pulsation rates
Prevent over-milking that damages sphincter tissue
Cutting corners on prep time is like running your combine too fast – what you leave behind costs more than the time you save.
4. Risk Management for the Component Market
Protect your component value with strategic approaches
Evaluate Dairy Revenue Protection (DRP) policies with component endorsements
Consider Class III and Class IV futures to hedge against price volatility
Adopt partial pricing strategies rather than all-or-nothing approaches
Monitor global markets closely, as exports increasingly drive domestic prices
Smart risk management is like crop insurance for your dairy – you hope you don’t need it but can’t afford to operate without it.
THE BOTTOM LINE: CAPTURING YOUR SHARE OF THE BUTTERFAT DIVIDEND
The component revolution in U.S. milk production represents both a challenge and an opportunity. Farms that optimize for butterfat and protein will capture premium returns, but the industry must develop sustainable markets for these additional solids.
Success in this environment requires forward-thinking strategies:
Make component-driven genetics your foundation. Every breeding decision is a 5-year commitment to your herd’s production profile.
Balance your nutrition program for component yield, not just milk volume. Work with your nutritionist to target specific component levels based on your milk market.
Understand your milk market’s true component values. Different processors and cooperatives offer varying premiums and incentives.
Implement risk management tailored to component markets. Traditional volume-based hedging may not adequately protect your revenue.
Engage with your processor about product innovation. The component surge creates opportunities for new products that could benefit producers and processors.
The U.S. dairy industry’s historic component surge shows no signs of slowing. According to Federal Milk Marketing Order data, butterfat percentages climbed from 3.8% to 3.94% from March 2015 to March 2020, but that shift accelerated dramatically between March 2021 and March 2025 as butterfat moved from 4.01% to 4.33%. This is not a temporary blip – it’s the new reality of American milk production.
The thriving farms will recognize this fundamental shift and position themselves, accordingly, maximizing component production while actively developing sustainable markets for America’s butterfat dividend.
Are you still managing your dairy for volume while your neighbor’s cash in on components? Look hard at your breeding program, nutrition strategy, and milk market. The butterfat dividend is there for the taking – but only for those who adapt to this new reality.
Every week, thousands of producers, breeders, and industry insiders open Bullvine Weekly for genetics insights, market shifts, and profit strategies they won’t find anywhere else. One email. Five minutes. Smarter decisions all week.
Dairy markets plunge as milk floods markets. Can producers adapt to heifer shortage and avian flu impacts?
EXECUTIVE SUMMARY: U.S. dairy markets face intense pressure as milk production surges (+1% YOY to 17.73M lbs in February) while prices plummet: butter (-4¢), cheese blocks (-9¢), and barrels (-14¢) hit multi-month lows. Despite historic heifer shortages, herds expanded to 9.405M head, driven by lower cull rates. Component production booms—cream output up 12.7M lbs YOY, milk protein +3.1%—but processors struggle with oversupply. Regional disparities sharpen due to avian influenza (California down 3.8%) and growth in Texas/Idaho. Futures indicate painful near-term margins (Class III .95/cwt), but export opportunities and feed cost savings (10.1% YOY) offer lifelines. Producers must prioritize cost control, component optimization, and strategic culling to survive the squeeze.
Component Wars: Butterfat surges (+12.7M lbs cream) dominate, but protein growth (+3.1%) lags behind demand.
Regional Crisis: California production plummets (-3.8% YOY) from avian flu, while Texas/Idaho thrive.
Futures Forecast Pain: Class III futures at $17.95/cwt threaten margins; Q4 rebound potential hinges on exports.
Strategic Solutions: Lock in sub-$4.70 corn, target 3.5% butterfat herds, and consider culling low-performing cows.
The whey market’s 5¢ rally to 50¢/lb this week fooled nobody who’s read a milk check lately. USDA’s Dairy Market News confirms what every producer knows – demand remains “lackluster” with inventories ballooning. This dead-cat bounce comes as:
Butter crashes 4¢ to $2.3025/lb
Cheese blocks nosedive 9¢ to $1.6025
Barrels implode 14¢ to $1.55 – an 11-month low[3]
“Buyers play hardball below 50¢,” says our Chicago floor contact. “With milk flows increasing, this whey rally has expiration date written all over it.”
MILK FLOODGATES OPEN AS HERD EXPANSION DEFIES LOGIC
USDA’s March shocker: 9.405 million head in February – highest since May 2023. How?
HERD GROWTH DESPITE HEIFER ARMAGEDDON
Metric
Feb 2025
Change YOY
Total Dairy Cows
9.405M
+62k
Heifers 500lb+
3.914M
-7% (1978 low)
Cull Rate (Jan-Feb)
89k below historic avg
Producers are playing musical barns – 15k cows added in February alone. The result? 17.73M lbs February output (+1% YOY leap-adjusted) – biggest jump since 2023.
“Processors are fat-hungry,” notes USDA economist Dr. Mark Svennson. “That $2.30 butter price? Still 18% above 5-year average. The fat premium’s alive.”
COAST-TO-COAST CRISIS: BIRD FLU DECIMATES WESTERN HERDS
Avian influenza isn’t just a poultry problem anymore:
STATE-LEVEL MILK PRODUCTION
Region
YOY Change
Key Factor
California
-3.8%
62% herds infected
Texas
+4.1%
New mega-facilities
Pacific NW
-2.9%
Historic basis discounts
Upper Midwest
+1.3%
Component focus
“California’s looking at 5% production drop by June if culling continues,” warns Western United Dairies’ Janelle Hasser.
FUTURES FORECAST: PAIN BEFORE GAIN?
USDA’s revised projections paint a grim near-term picture:
2025 PRICE PROJECTIONS
Metric
March Estimate
Change vs Feb
Profit Threshold
All-Milk Price
$21.60/cwt
-$1.00
$22.00+
Class III
$17.95/cwt
-$1.15
$19.50
Class IV
$18.80/cwt
-$0.90
$20.00
Feed Cost Savings
10.1% YOY
Corn $4.85/bu
Soymeal $395/ton
“Q4 could see $19.75 Class III,” says CME analyst Luke Torrison. “But getting from here to there will bankrupt marginal operators.”
THE BULLVINE BOTTOM LINE: ADAPT OR EXIT
Cost Crunch Calculus: Lock in sub-$4.70 corn now – USDA sees 2025 feed savings offsetting 14% of milk price decline.
Component Premium Play: 3.5% BF herds now capturing $0.47/cwt premium over 3.0% herds.
Exit Strategy Window: Beef prices at $1.92/lb make culling profitable – 12% ROI on heifer-replacement deferral.
As one Wisconsin producer told us: “I’m feeding more haylage, culling 5% low-end cows, and praying Class IV finds its legs by June. If not? The auctioneer’s getting my Rolodex.”
Join over 30,000 successful dairy professionals who rely on Bullvine Daily for their competitive edge. Delivered directly to your inbox each week, our exclusive industry insights help you make smarter decisions while saving precious hours every week. Never miss critical updates on milk production trends, breakthrough technologies, and profit-boosting strategies that top producers are already implementing. Subscribe now to transform your dairy operation’s efficiency and profitability—your future success is just one click away.
Your cows are pumping out record butterfat, creating a 12.5% cheese yield windfall worth billions. But who’s pocketing the profits? (Not you.)
EXECUTIVE SUMMARY: American dairy farmers have engineered a component revolution, pushing butterfat from a 60-year plateau of 3.65% to today’s record 4.19%, dramatically increasing cheese yields from 10.14 to 11.41 pounds per hundredweight since 2010. This 12.5% yield improvement creates approximately $2.50 in additional value per hundredweight, generating billions in new revenue that’s fueling a $7 billion processor expansion boom while milk prices remain relatively flat. Though Federal Orders will finally update component standards in December 2025, farmers must act now to calculate their true component value, demand fair compensation from processors, and potentially explore direct marketing opportunities to capture more of the value they’re creating through genetic and nutritional advancements.
KEY TAKEAWAYS
Follow the money: While your components create 12.5% more cheese per vat, processors are building billion-dollar plants – calculate what YOUR components are truly worth using our simple formula
Regional advantage: Pacific Northwest producers are leading with 4.3% butterfat (vs. national 4.19%), creating a significant competitive edge in component revenue
Mark your calendar: Federal Order composition updates coming December 1, 2025 finally acknowledge higher components, but don’t wait – demand fair compensation now
Component revolution just starting: With 58% of milk check revenue coming from butterfat alone, your genetics and nutrition strategies should prioritize components over volume
Collective action required: Join industry organizations fighting for updated pricing formulas that reflect today’s higher-component reality
While dairy farmers have been pushing their herds to new genetic heights – pumping out record-breaking component levels never before seen in American dairy history – processors are quietly celebrating a 12.5% cheese yield windfall, transforming their bottom lines. For six decades, 100 pounds of milk reliably yielded about 10 pounds of cheese. Today, that same milk is producing a whopping 11.41 pounds – creating billions in new value in the dairy economy.
The question burning up milkhouses across America: Are YOU getting YOUR fair share of this component-driven gold rush?
YOUR COMPONENTS, YOUR CASH COW: THE REVOLUTION NOBODY’S TALKING ABOUT
The numbers don’t lie, and they’re frankly staggering. What started as a slow climb in 2010 has become an all-out component revolution reshaping dairy economics from farm to factory.
The most current verified data shows meteoric component growth. Butterfat and protein levels have consistently risen year after year:
2020: 3.92% butterfat and 3.18% protein
2021: 3.97% butterfat and 3.21% protein
2022: 4.06% butterfat and 3.25% protein
2023: 4.11% butterfat and 3.26% protein
2024: 4.19% butterfat and 3.28% protein (through November)
From 1966 to 2010, the butterfat content in the U.S. milk supply hovered in a very narrow range from 3.65% to 3.69%. That’s over FOUR DECADES of virtually no movement!
Then everything changed. According to USDA’s National Agricultural Statistics Service, annual averages have soared, with 2024 on track to set yet another record as the fourth consecutive year of butterfat breaking new ground.
The Production Math That Changes Everything For YOUR Bottom Line
Here’s where this gets truly interesting for YOUR operation. While traditional milk production has been falling—down in 14 of the last 17 months since July 2023—component production has continued to climb.
The 2023 to 2024 period marks the first time U.S. milk production fell in back-to-back years since the late 1960s, as confirmed by the USDA Dairy Market News. Despite this volume downturn, milk component production—as measured by butterfat and protein pounds—keeps climbing, even modestly, at 0.19% in recent months.
In cold, complex cash terms, this component-driven model is now your economic lifeline as a dairy producer. According to Federal Milk Marketing Order statistics, in 2023, a whopping 58% of milk check income came directly from butterfat, with protein commanding an additional 31%.
That’s nearly 90% of your milk check tied directly to components!
WHO’S WINNING THE CHEESE YIELD LOTTERY WHILE YOU STRUGGLE?
Let’s get straight to the question nobody wants to ask: With cheese yields climbing from 10.14 pounds per hundredweight in 2010 to today’s 11.41 pounds, who’s pocketing the extra value?
The math here is brutally simple. That 12.5% yield improvement translates to an extra 1.27 pounds of cheese from every hundred pounds of milk. At current wholesale cheese prices, we’re talking about approximately $2.50 in additional value per hundredweight that didn’t exist before.
“Consider, for example, that a one-point decrease in casein retention can translate into a loss of almost .05 pounds of cheese per every 100 pounds of milk.” – USDA ARS Dairy Processing Research.
When processors calculate yields to the hundredth of a pound, YOU can bet they’re tracking every fraction of component value. Multiply that across the billions of pounds of cheese produced annually in America, and you’re looking at billions in new value creation.
The inconvenient question: Is this windfall fairly distributed back to YOU, the farmer who made it possible through YOUR breeding programs and management practices?
FOLLOW THE MONEY: Processing Expansion Tells All
If you want to know who’s cashing in on these component gains, follow the money. According to Dairy Foods magazine, the dairy industry is currently pouring over $7 billion into new processing facilities, with a significant portion dedicated to cheese plants scheduled to come online through 2027.
Processors are building billion-dollar cheese plants while your milk price barely budges. Coincidence?
“Standardization refers to the practice of adjusting the composition of cheese milk to maximize economic return from the milk components while maintaining both cheese quality and composition specifications.” – Journal of Dairy Science.
Processors aren’t just passively benefiting from your improved components – they’re actively optimizing every drop of your milk to extract maximum economic value.
These processing investments require substantial capital risk and create essential infrastructure for farmers’ milk. However, the question remains whether the economic benefits of higher-component milk are being equitably distributed throughout the supply chain.
What’s driving this investment? Simple economics. In 2000, cheese production absorbed 37.7% of the U.S. milk supply. Fast forward two decades and that figure has climbed to 42.5%, according to the USDA Economic Research Service. Butter demand has similarly increased, growing from 16.3% of milk production in 2000 to 18.6% two decades later.
Consumers are driving this change by demanding more nutrient-dense products like cheese and butter.
COMPONENT PRICING: IS THE SYSTEM RIGGED AGAINST YOU?
With its component pricing formulas, the Federal Milk Marketing Order system was supposed to ensure farmers got paid for what mattered. But here’s the uncomfortable reality: these formulas were developed when components were far lower than today’s levels.
With multiple component pricing (MCP) as the pricing mechanism for over 90% of the nation’s milk, getting the formulas right isn’t just an academic exercise – it’s the difference between thriving and barely surviving for thousands of dairy families like YOURS.
Even USDA finally acknowledges this reality. After decades of using outdated component standards, they’re updating the milk composition factors in Federal Orders as outlined in the Federal Register:
True protein: increasing from 3.1% to 3.3%
Other solids: rising from 5.9% to 6.0%
Nonfat solids: rising from 9.0% to 9.3%
This change will take effect on December 1, 2025—a full 10 months from now—but it represents official recognition of what you’ve been delivering for years.
REGIONAL COMPONENT SHOWDOWN: WHERE DOES YOUR FARM STAND?
The component geography of American dairying reveals dramatic differences across regions and shows how far we’ve come from historical baselines:
For producers in these high-component regions, the advantage compounds with every tanker of milk that leaves the farm. However, this geographic disparity also raises serious questions about whether the federal order system fairly compensates all producers when component levels vary dramatically by region.
EXPORTS EXPLODING ON THE BACK OF YOUR COMPONENTS
While domestic processors benefit from higher cheese yields, they’re not the only ones. According to the U.S. Dairy Export Council, U.S. cheese exports have been setting new records, fueled by competitive prices made possible by higher component milk.
This export boom is directly tied to competitive U.S. cheese prices. The higher-component milk produces more cheese per vat, lowering unit costs and making American cheese more competitive globally.
But again, the question persists: Are YOU seeing YOUR fair share of this export-driven demand?
BOTTOM LINE CALCULATOR: ARE YOU GETTING PAID FOR YOUR COMPONENTS?
Use this simple formula to estimate how much additional value YOUR components are creating versus what you’re receiving in YOUR milk check:
Take YOUR butterfat test and subtract 3.65% (the historical average)
Multiply that difference by 2.5 (pounds of additional cheese per 0.1% butterfat increase)
Multiply by YOUR milk volume in hundredweights
Multiply by the current cheese price per pound
Compare this value to your component premiums
This simple calculation will show if YOU’RE capturing the full value of YOUR genetic investments.
“I’ve pushed our herd’s butterfat from 3.8% to 4.4% over the past five years through aggressive genetic selection and nutrition management. The payoff has been substantial – our income per cow is up over 15% even with relatively flat milk prices.” – Tom H., Progressive Wisconsin Dairy Producer, Green County.
THE PATH FORWARD: CAPTURING YOUR COMPONENT VALUE
For forward-thinking dairy producers, several strategies emerge from this component revolution:
1. Push YOUR Components Even Higher
The genetic ceiling for butterfat and protein hasn’t been reached. With consistent year-over-year increases in components nationwide, the upward trend continues. Every 0.1% increase in components creates significant additional value for YOUR operation.
2. Demand Answers From YOUR Processor NOW
At your next cooperative or processor meeting, ask these specific questions:
How much additional cheese is my milk-producing compared to 2010 levels?
What percentage of that additional value flows back to me as the producer?
How have component premiums adjusted to reflect today’s higher yield environment?
3. Mark December 1, 2025 On YOUR Calendar
The Federal Order composition factor updates will take effect on this date, finally acknowledging the protein revolution occurring on farms across America. But this is just the beginning of making the system genuinely fair. Keep pushing for component pricing that reflects the actual value YOU create.
4. Get Involved With Industry Organizations Fighting For YOU
Several dairy farmer organizations are actively working on component pricing reform and fair value distribution:
In 2000, cheese production absorbed 37.7% of the U.S. milk supply, climbing to 42.5% two decades later. Producers with entrepreneurial spirit might capture more of their milk’s value by processing their high-component products.
THE BOTTOM LINE: YOUR COMPONENTS, YOUR MONEY
The dairy industry is witnessing a historic shift in how milk becomes cheese, and the economic implications are massive. Despite milk production falling in 14 of the last 17 months since July 2023, the real story is what’s in that milk, not how much farmers produce.
Processors are already betting billions on this new reality, building the capacity to turn YOUR components into high-value cheese. The question isn’t whether components matter – they do.
The real question is whether you, as a producer, are getting your fair share of the revolutionary value you’re creating.
The component revolution is here. Make sure YOU’RE not left behind when it comes time to divide the spoils.
Join over 30,000 successful dairy professionals who rely on Bullvine Daily for their competitive edge. Delivered directly to your inbox each week, our exclusive industry insights help you make smarter decisions while saving precious hours every week. Never miss critical updates on milk production trends, breakthrough technologies, and profit-boosting strategies that top producers are already implementing. Subscribe now to transform your dairy operation’s efficiency and profitability—your future success is just one click away.
To provide the best experiences, we use technologies like cookies to store and/or access device information. Consenting to these technologies will allow us to process data such as browsing behavior or unique IDs on this site. Not consenting or withdrawing consent, may adversely affect certain features and functions.
Functional
Always active
The technical storage or access is strictly necessary for the legitimate purpose of enabling the use of a specific service explicitly requested by the subscriber or user, or for the sole purpose of carrying out the transmission of a communication over an electronic communications network.
Preferences
The technical storage or access is necessary for the legitimate purpose of storing preferences that are not requested by the subscriber or user.
Statistics
The technical storage or access that is used exclusively for statistical purposes.The technical storage or access that is used exclusively for anonymous statistical purposes. Without a subpoena, voluntary compliance on the part of your Internet Service Provider, or additional records from a third party, information stored or retrieved for this purpose alone cannot usually be used to identify you.
Marketing
The technical storage or access is required to create user profiles to send advertising, or to track the user on a website or across several websites for similar marketing purposes.
To provide the best experiences, we and our partners use technologies like cookies to store and/or access device information. Consenting to these technologies will allow us and our partners to process personal data such as browsing behavior or unique IDs on this site and show (non-) personalized ads. Not consenting or withdrawing consent, may adversely affect certain features and functions.
Click below to consent to the above or make granular choices. Your choices will be applied to this site only. You can change your settings at any time, including withdrawing your consent, by using the toggles on the Cookie Policy, or by clicking on the manage consent button at the bottom of the screen.
Functional
Always active
The technical storage or access is strictly necessary for the legitimate purpose of enabling the use of a specific service explicitly requested by the subscriber or user, or for the sole purpose of carrying out the transmission of a communication over an electronic communications network.
Preferences
The technical storage or access is necessary for the legitimate purpose of storing preferences that are not requested by the subscriber or user.
Statistics
The technical storage or access that is used exclusively for statistical purposes.The technical storage or access that is used exclusively for anonymous statistical purposes. Without a subpoena, voluntary compliance on the part of your Internet Service Provider, or additional records from a third party, information stored or retrieved for this purpose alone cannot usually be used to identify you.
Marketing
The technical storage or access is required to create user profiles to send advertising, or to track the user on a website or across several websites for similar marketing purposes.


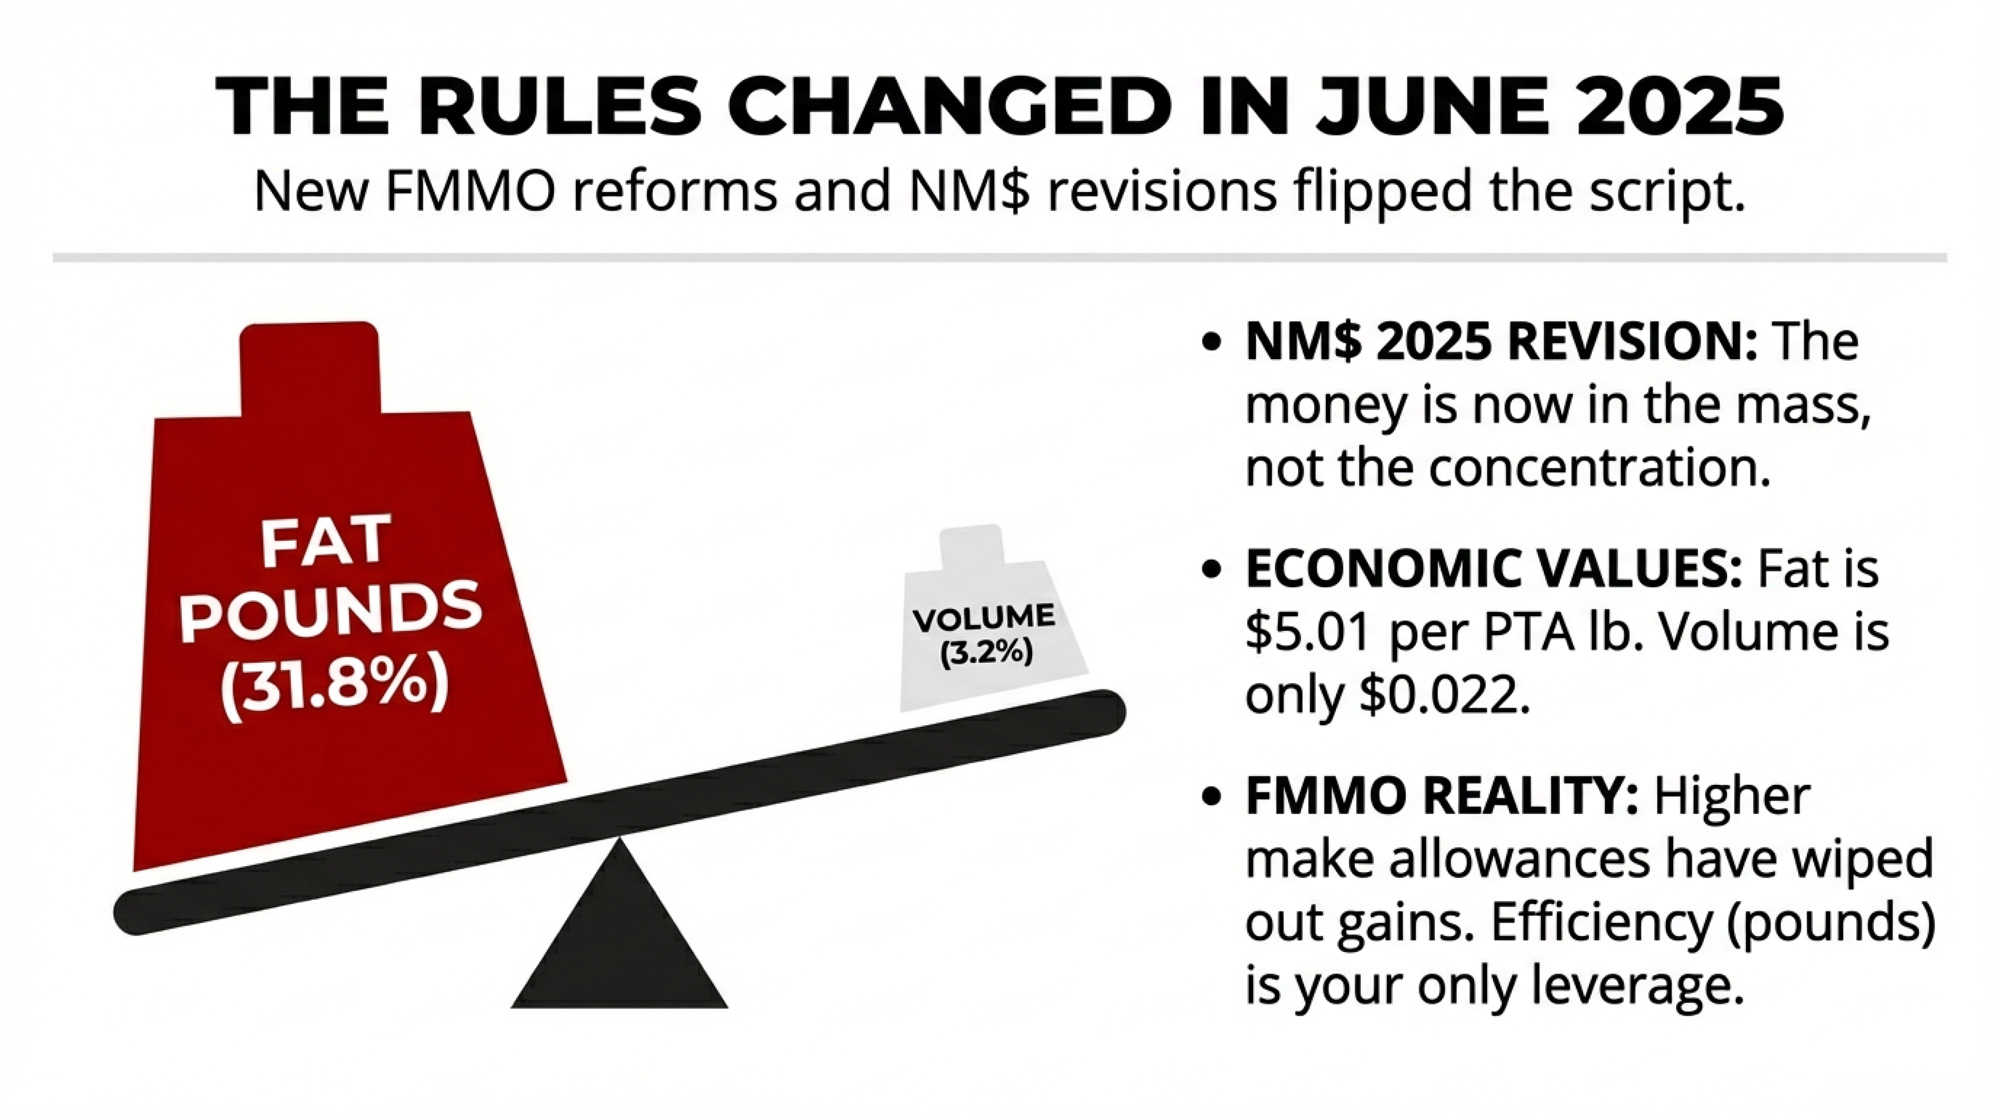
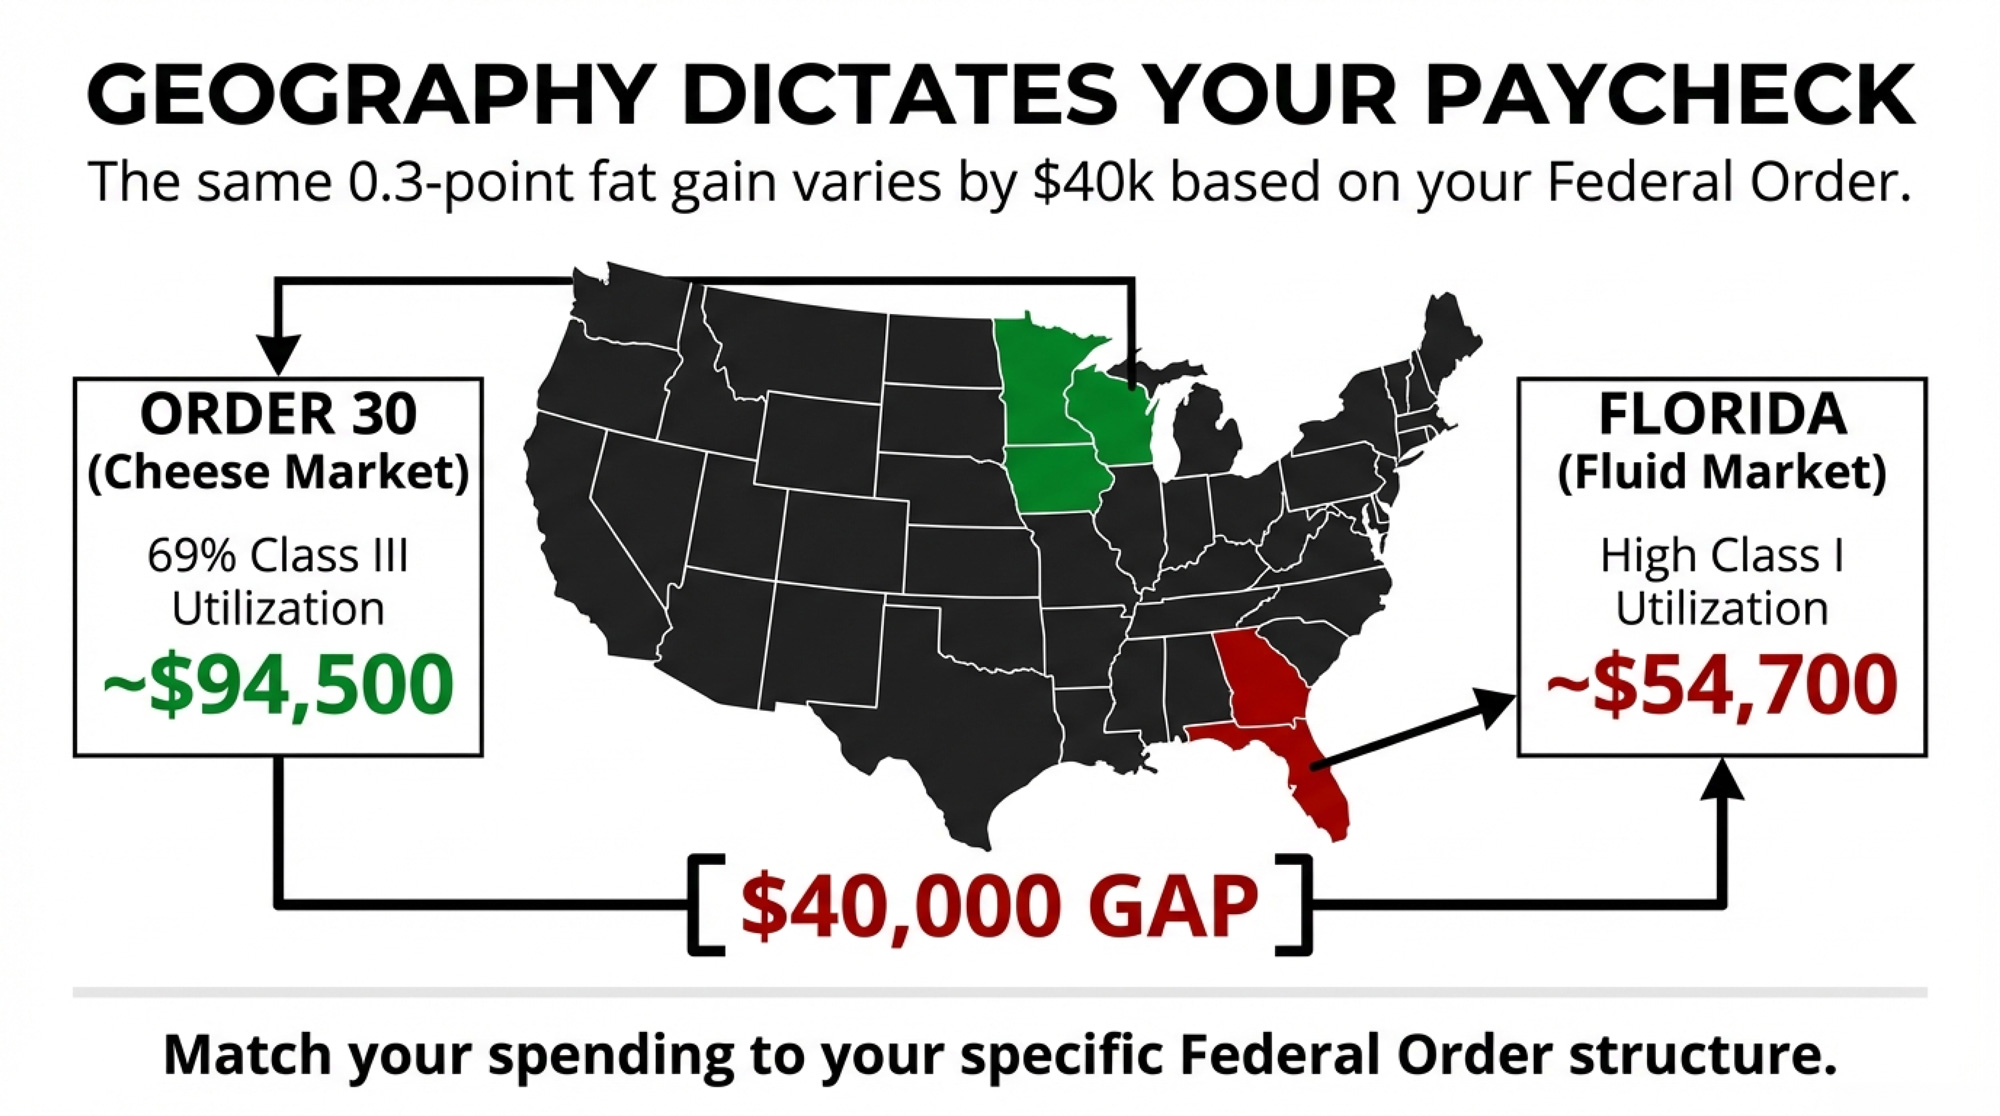
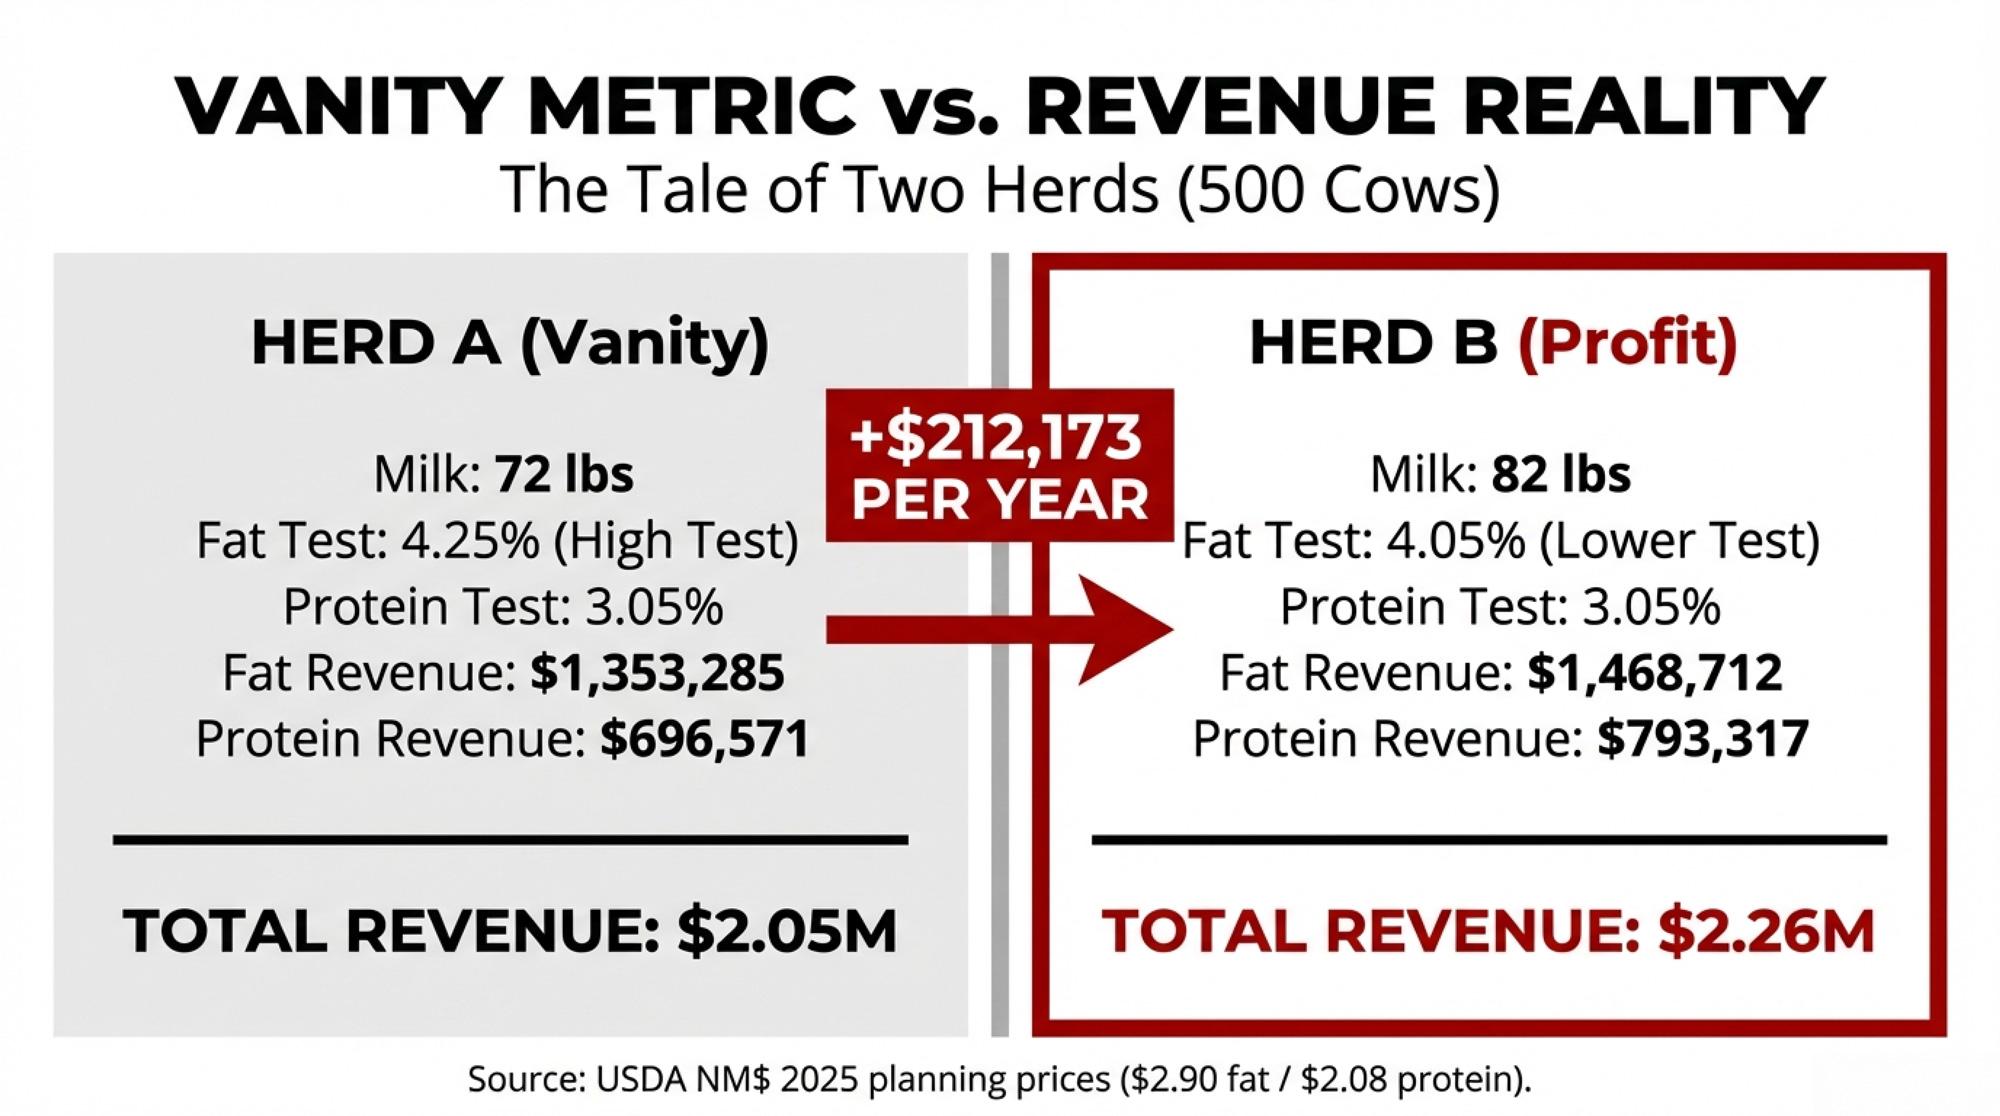
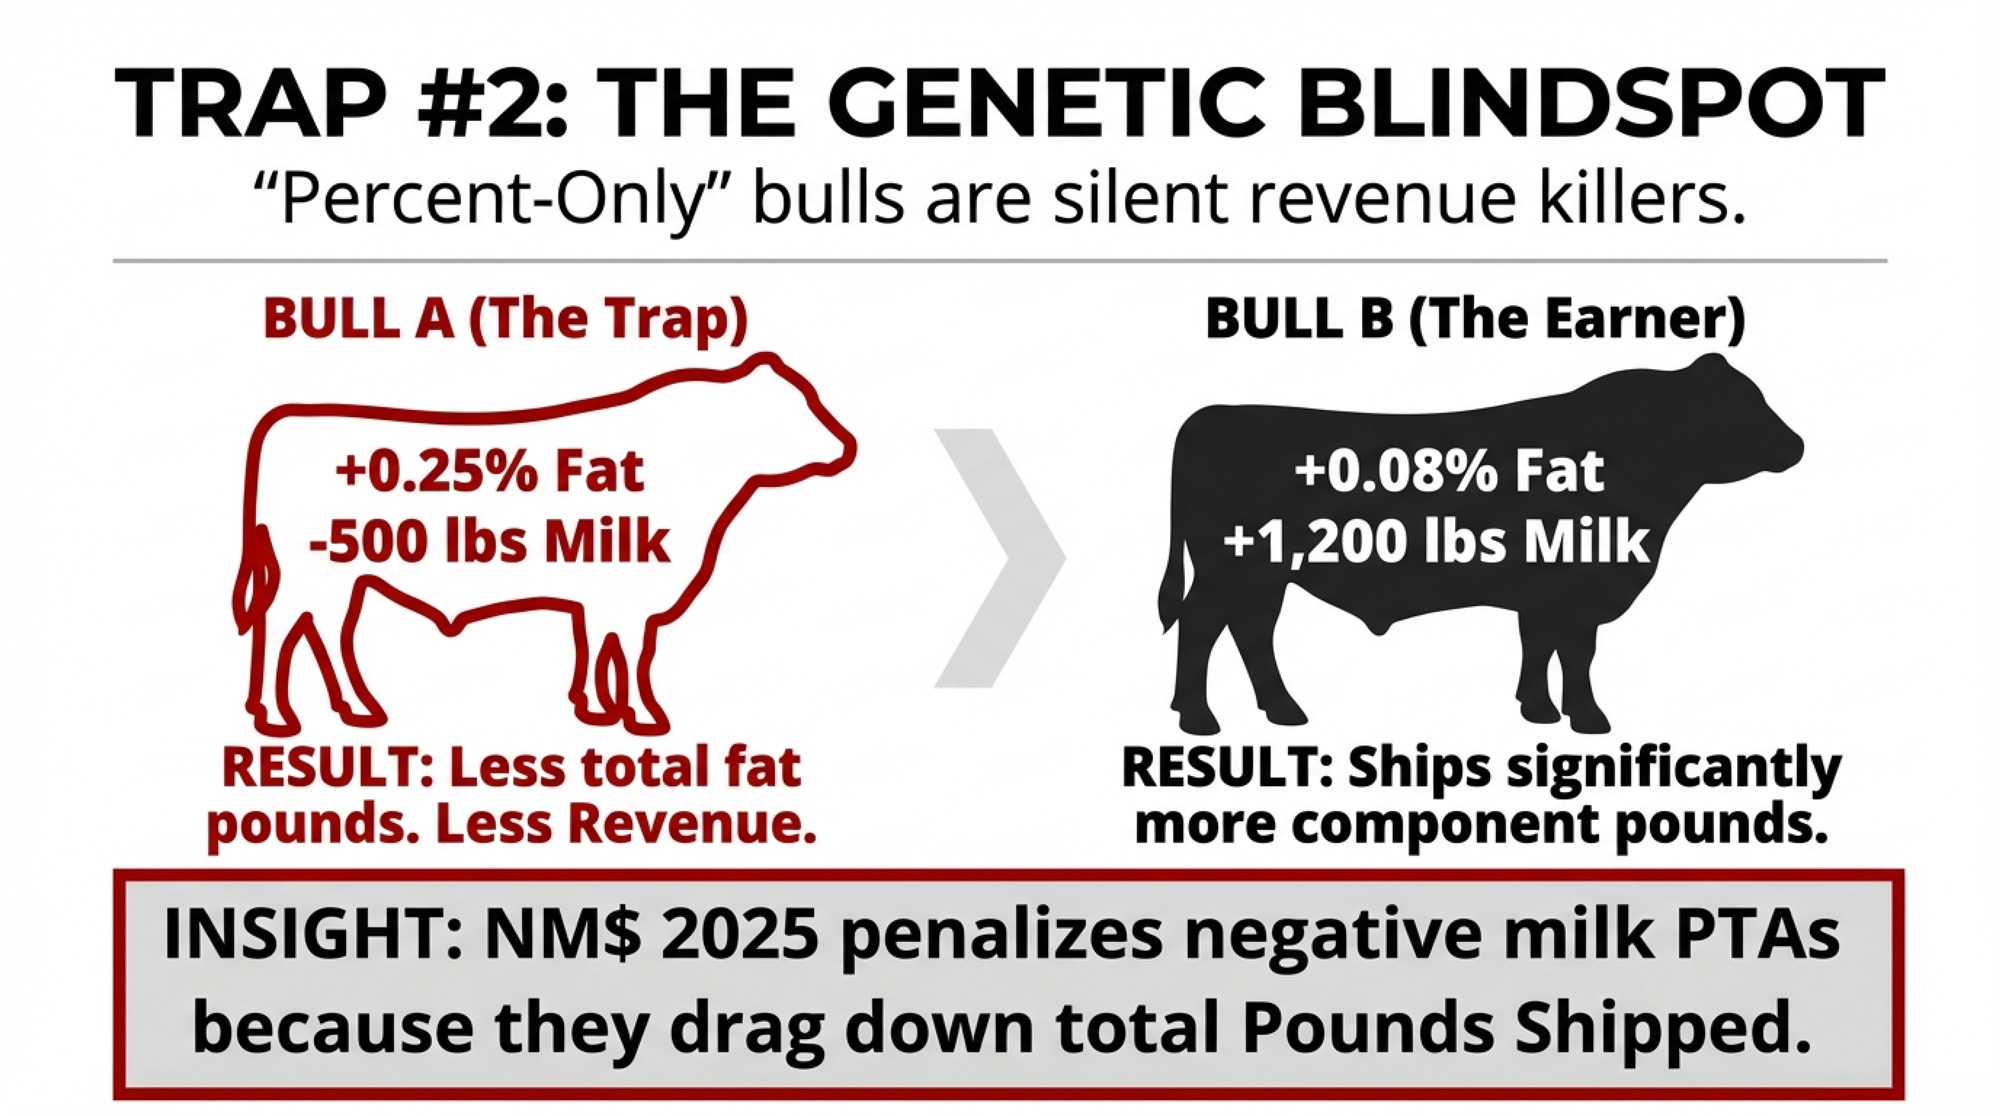
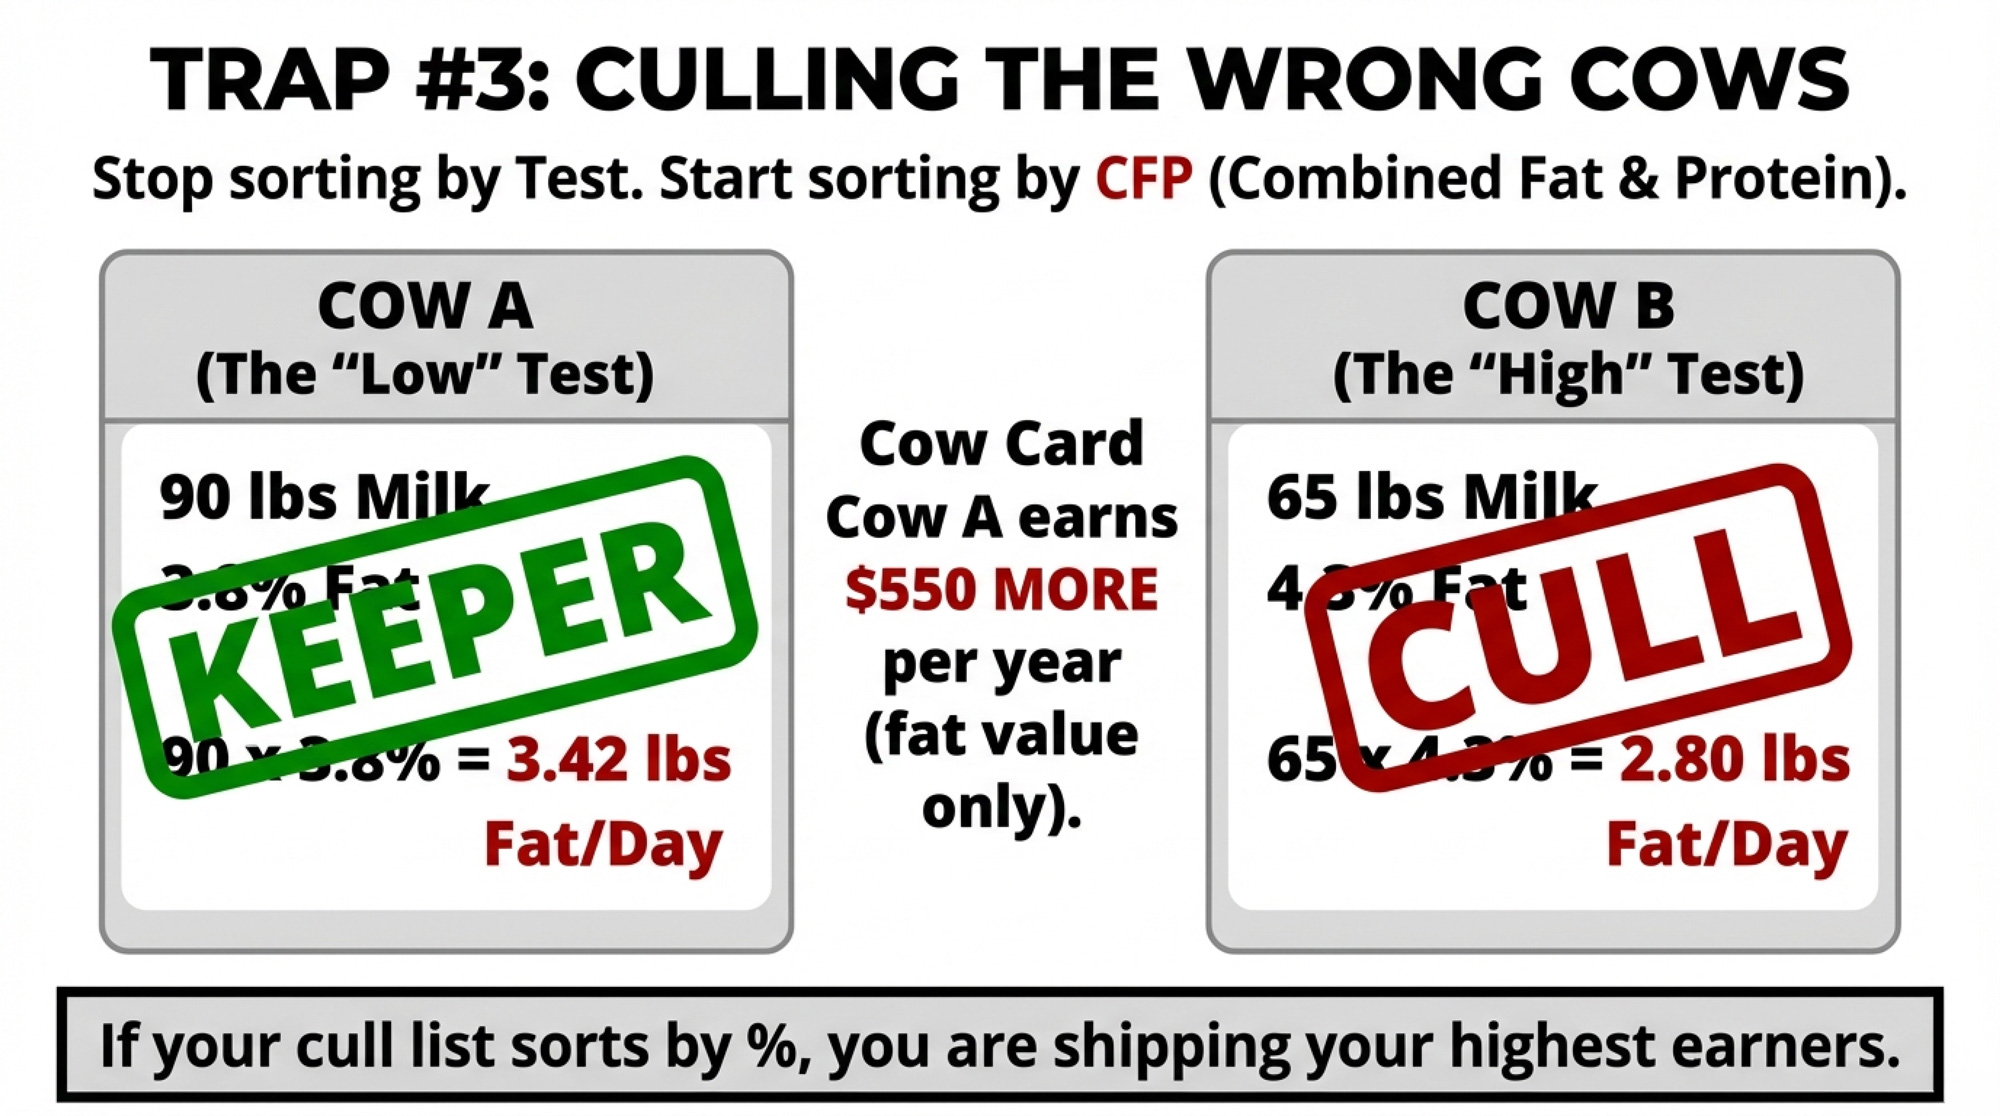
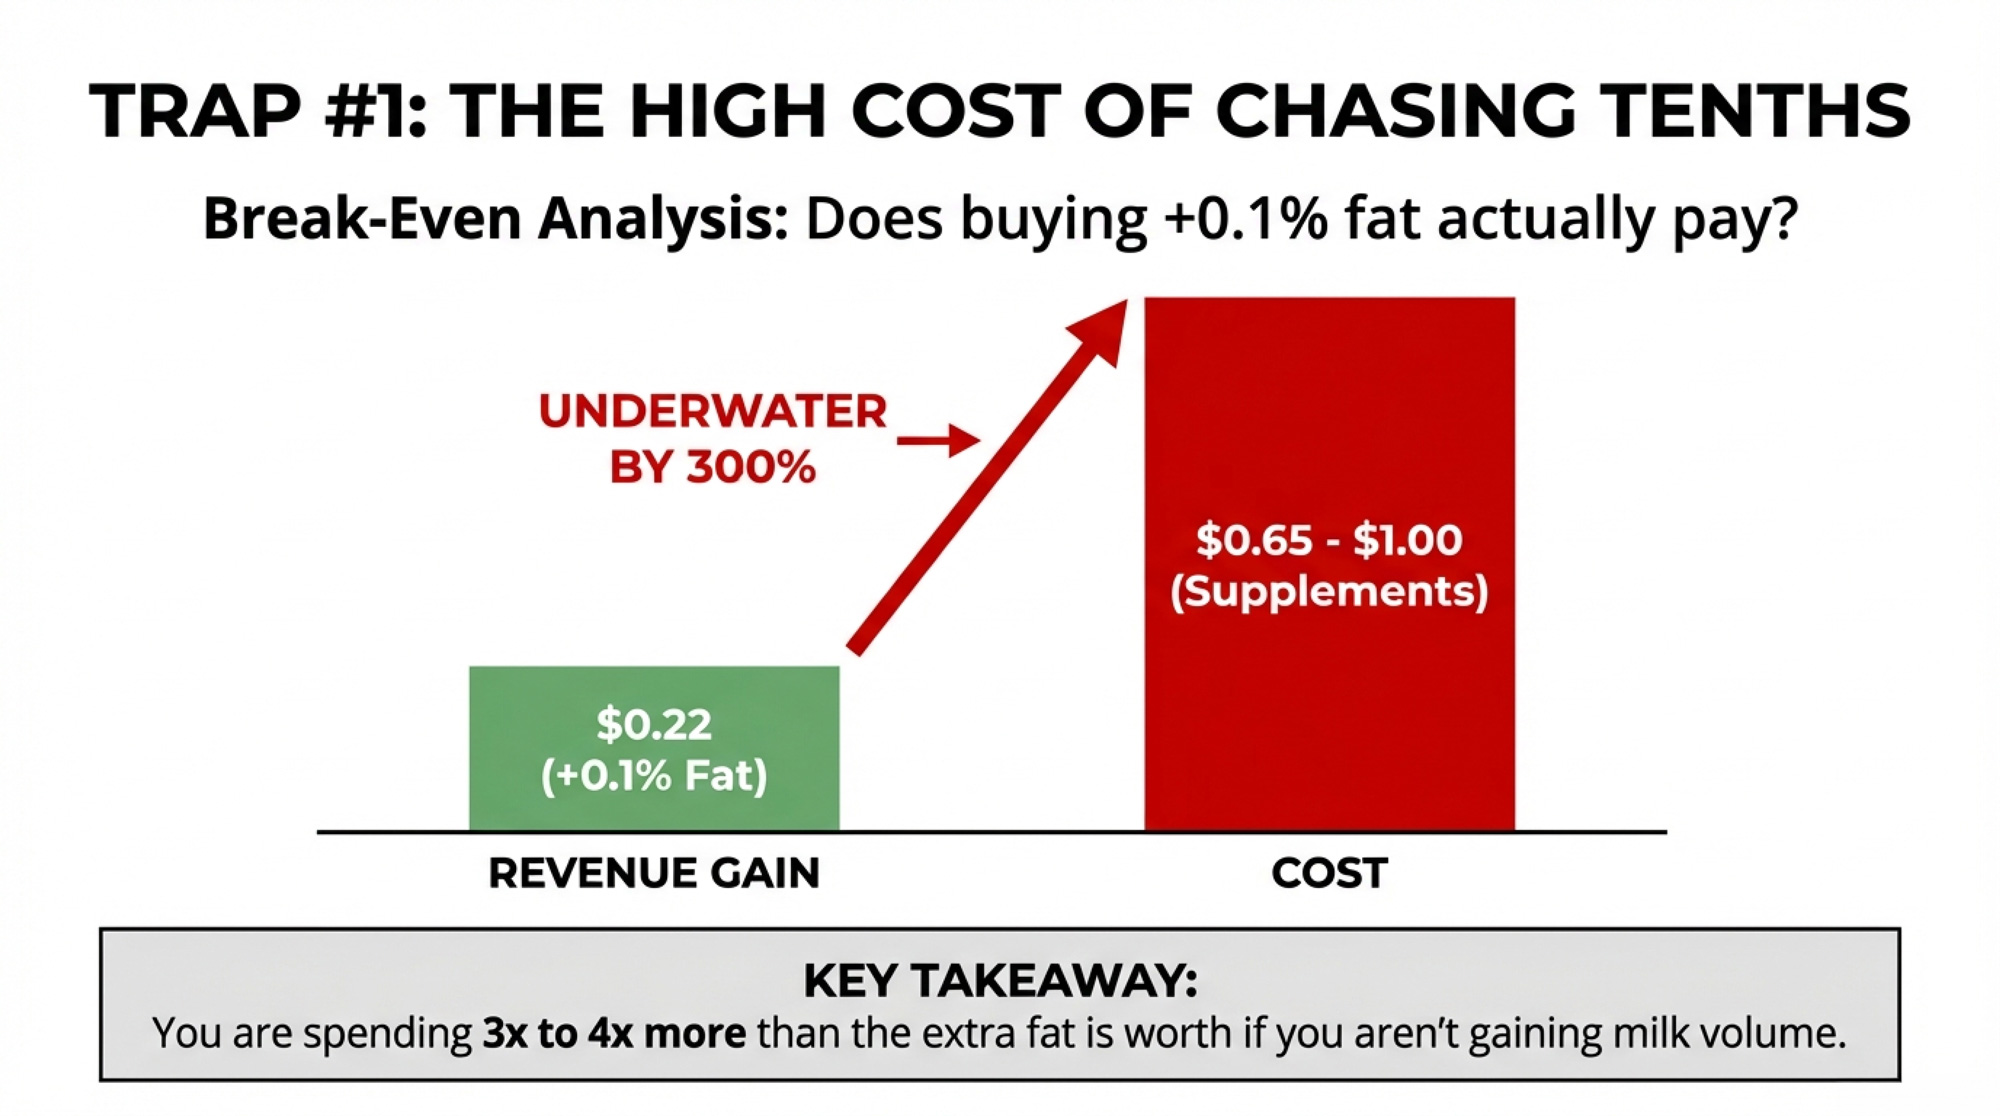

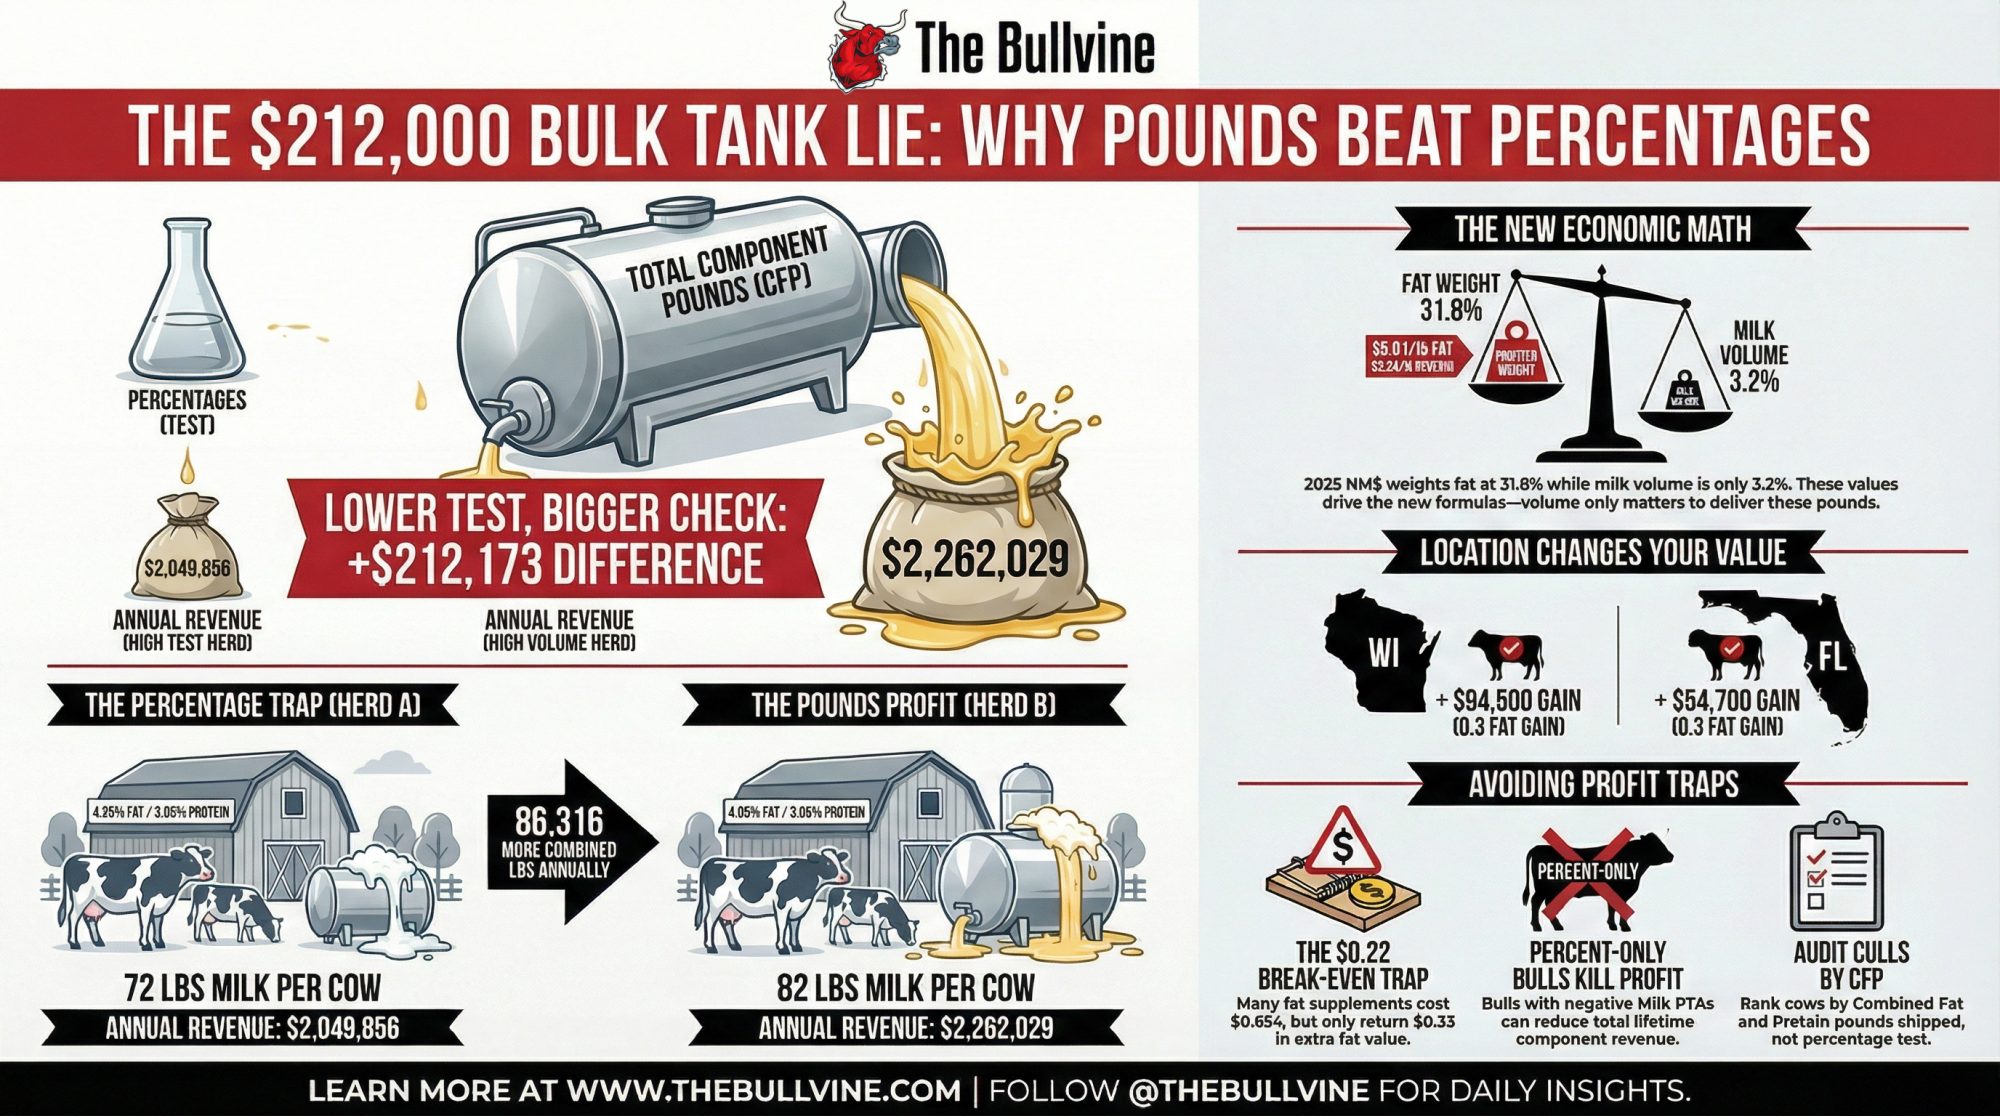
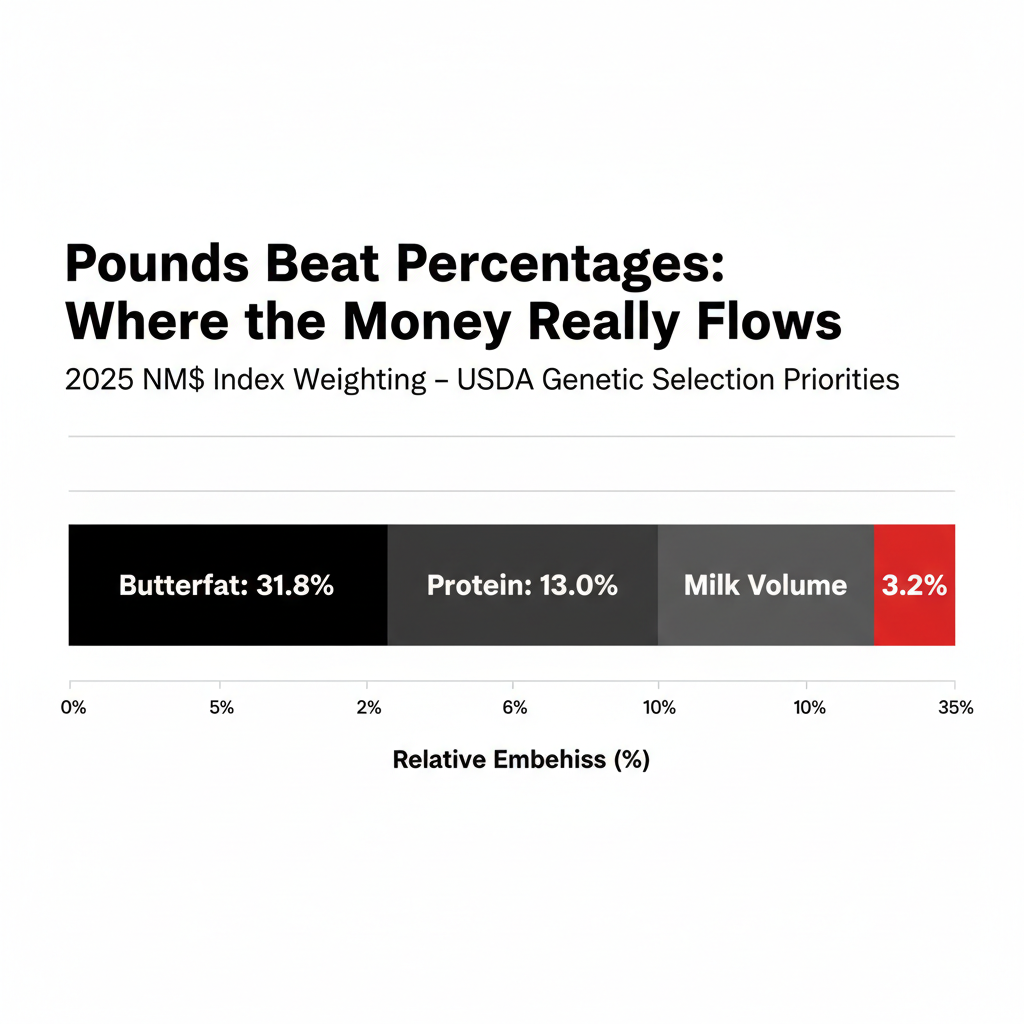
 The Sunday Read Dairy Professionals Don’t Skip.
 The Sunday Read Dairy Professionals Don’t Skip.
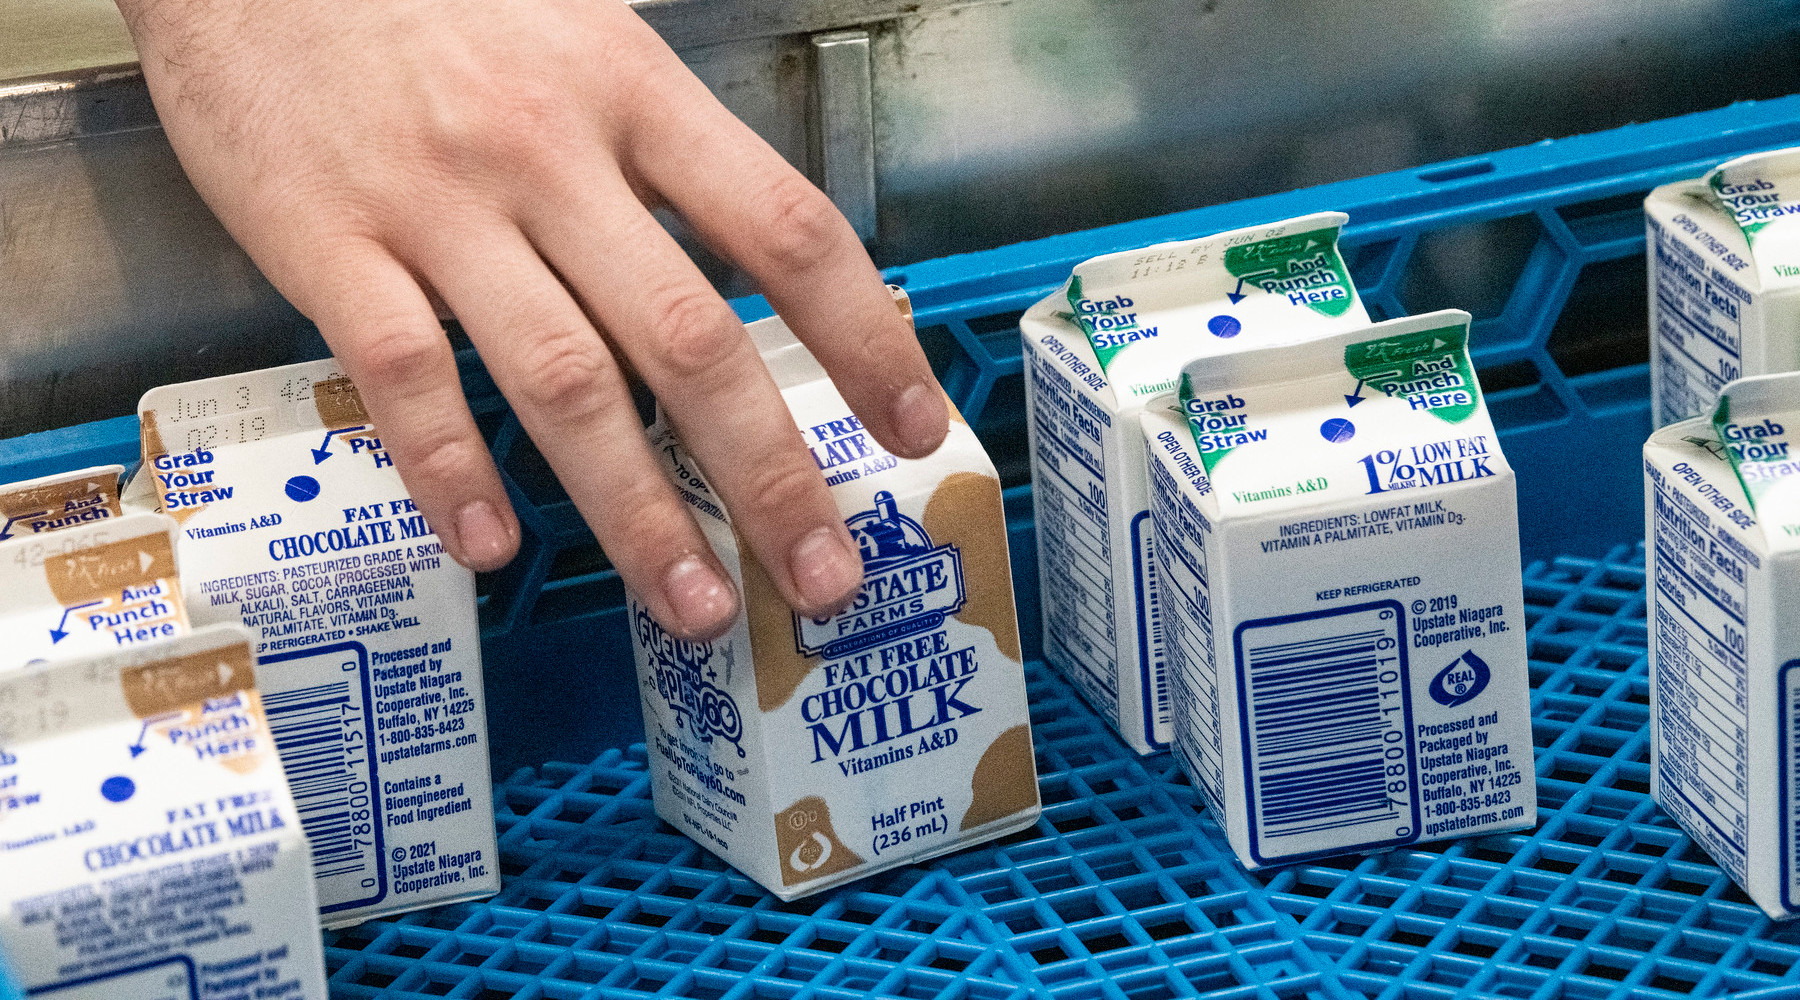
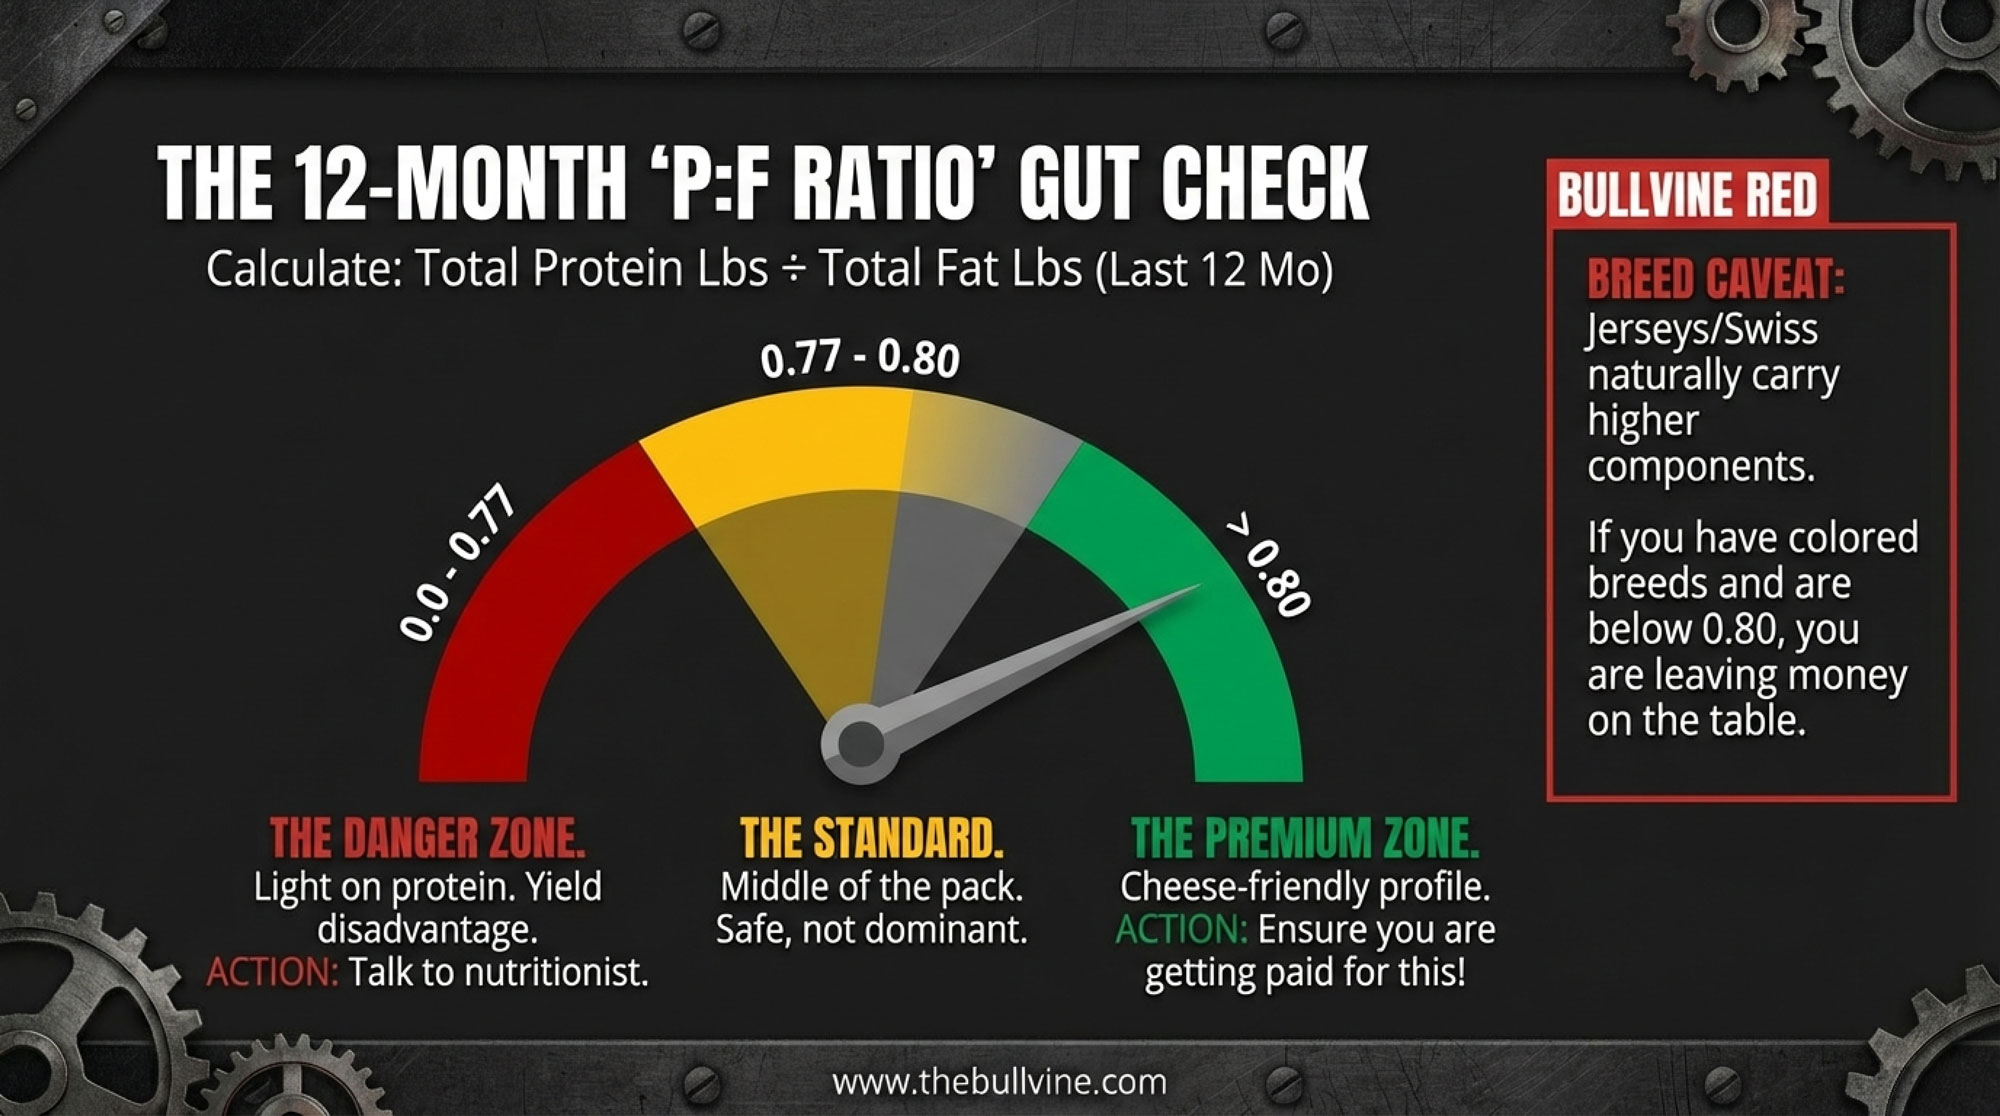
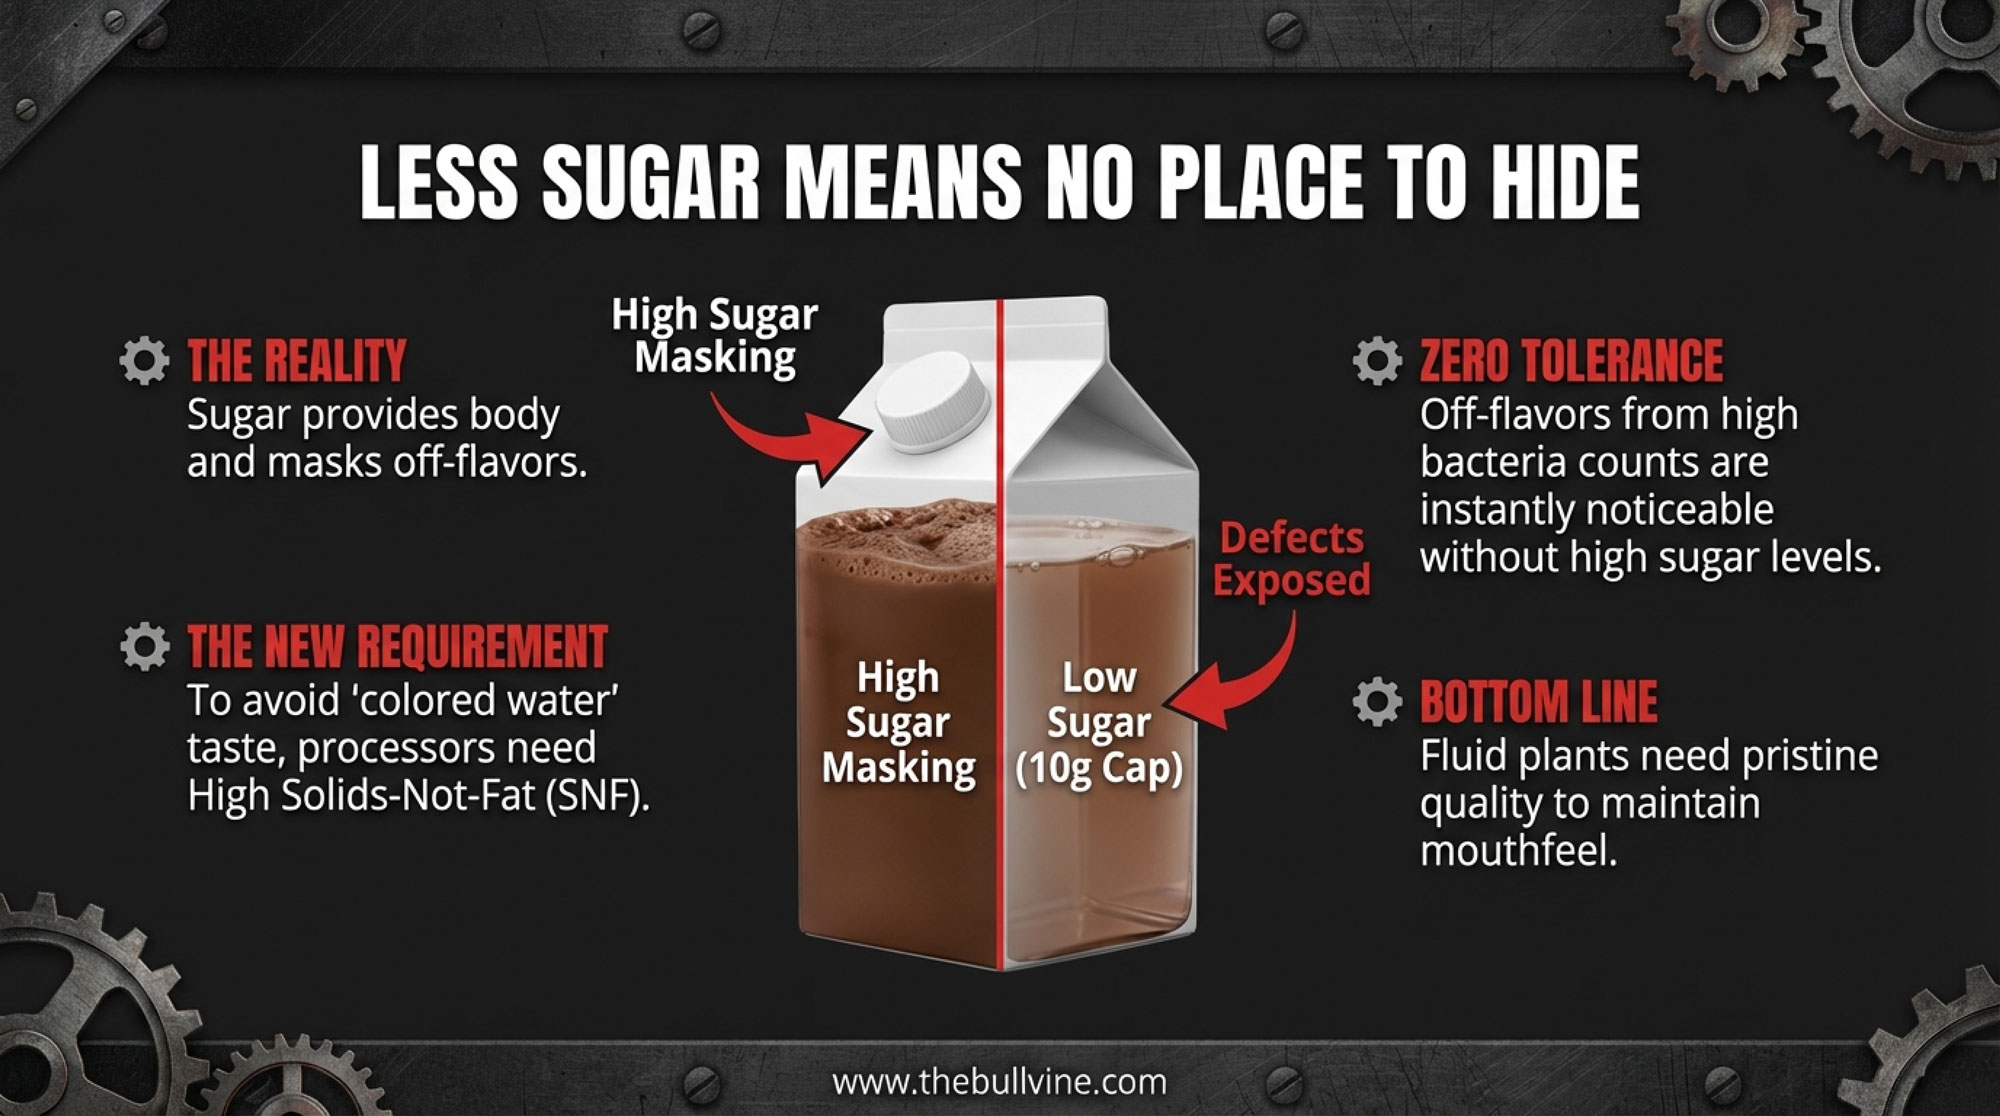
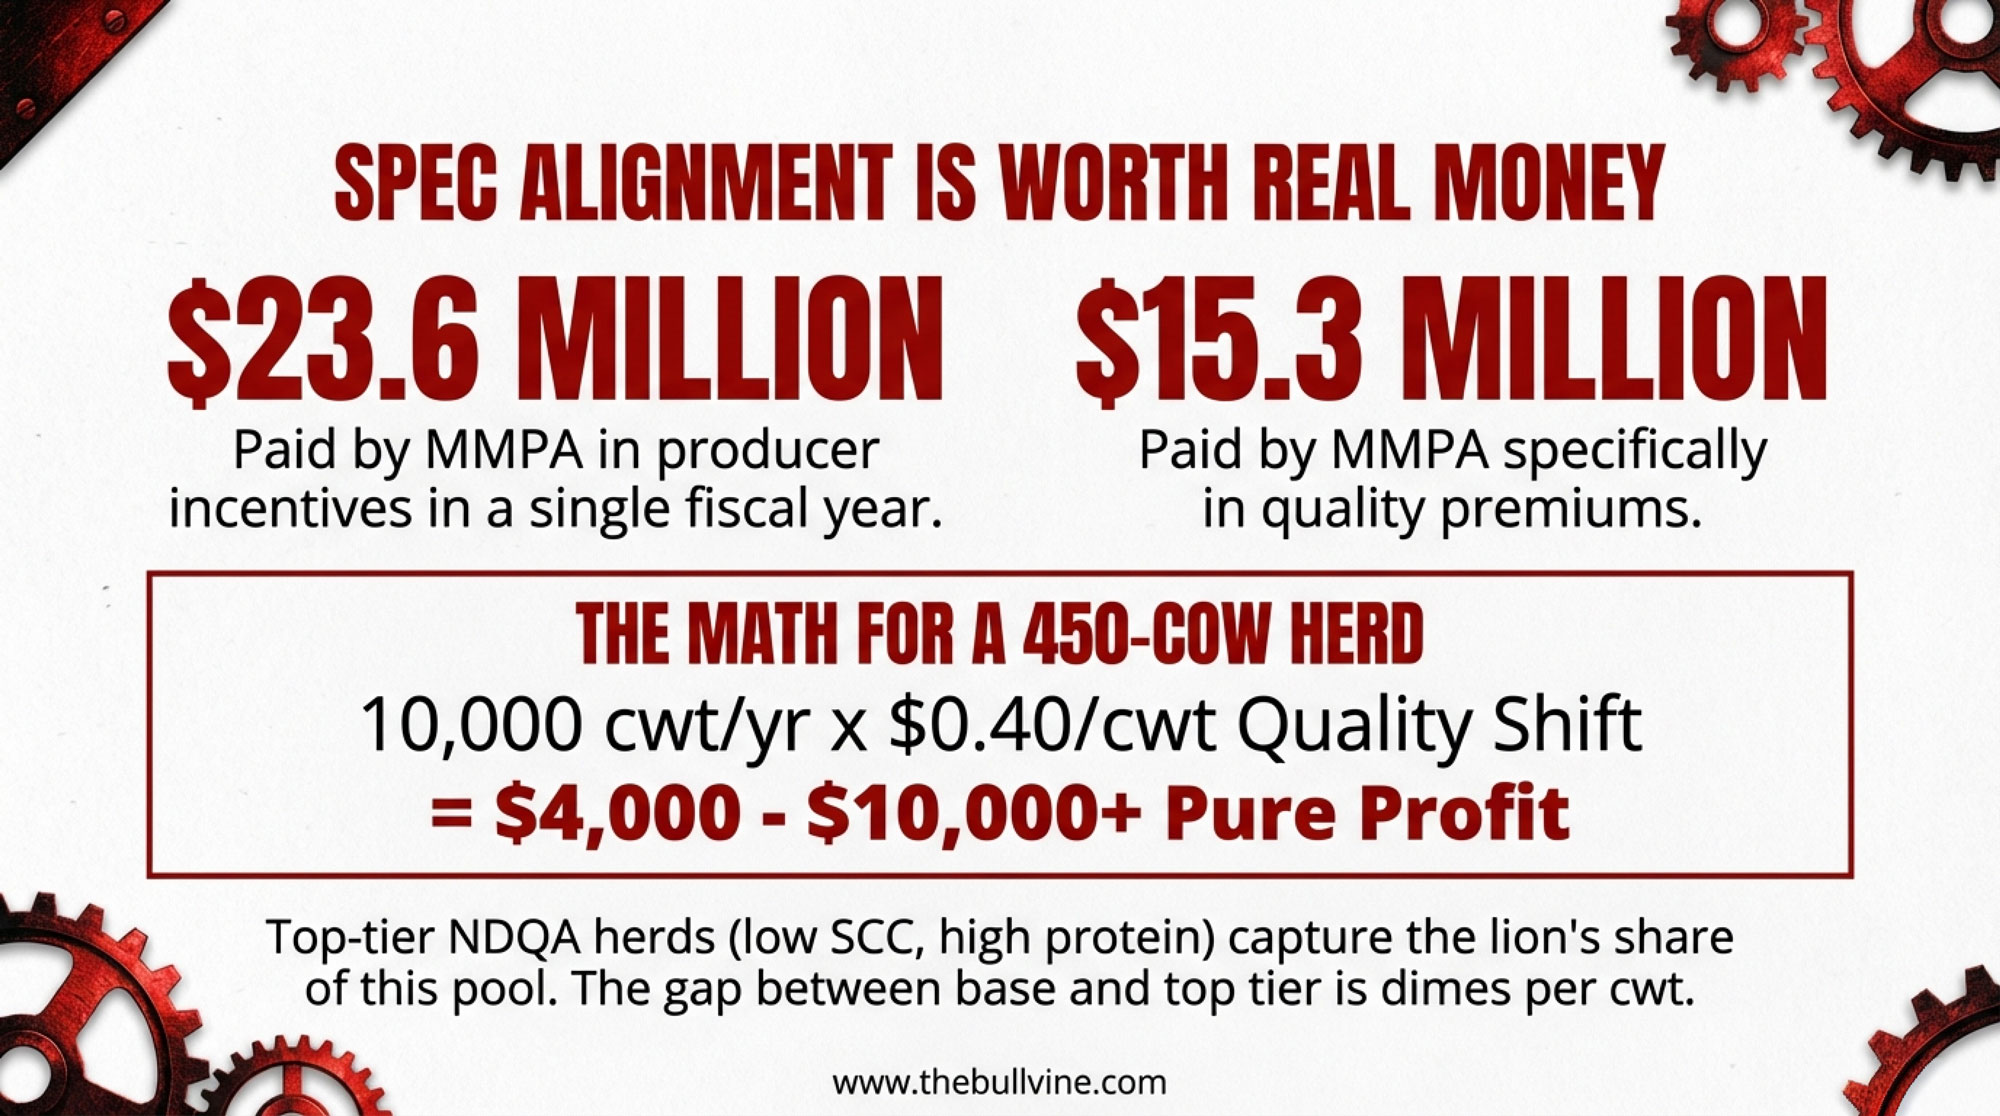
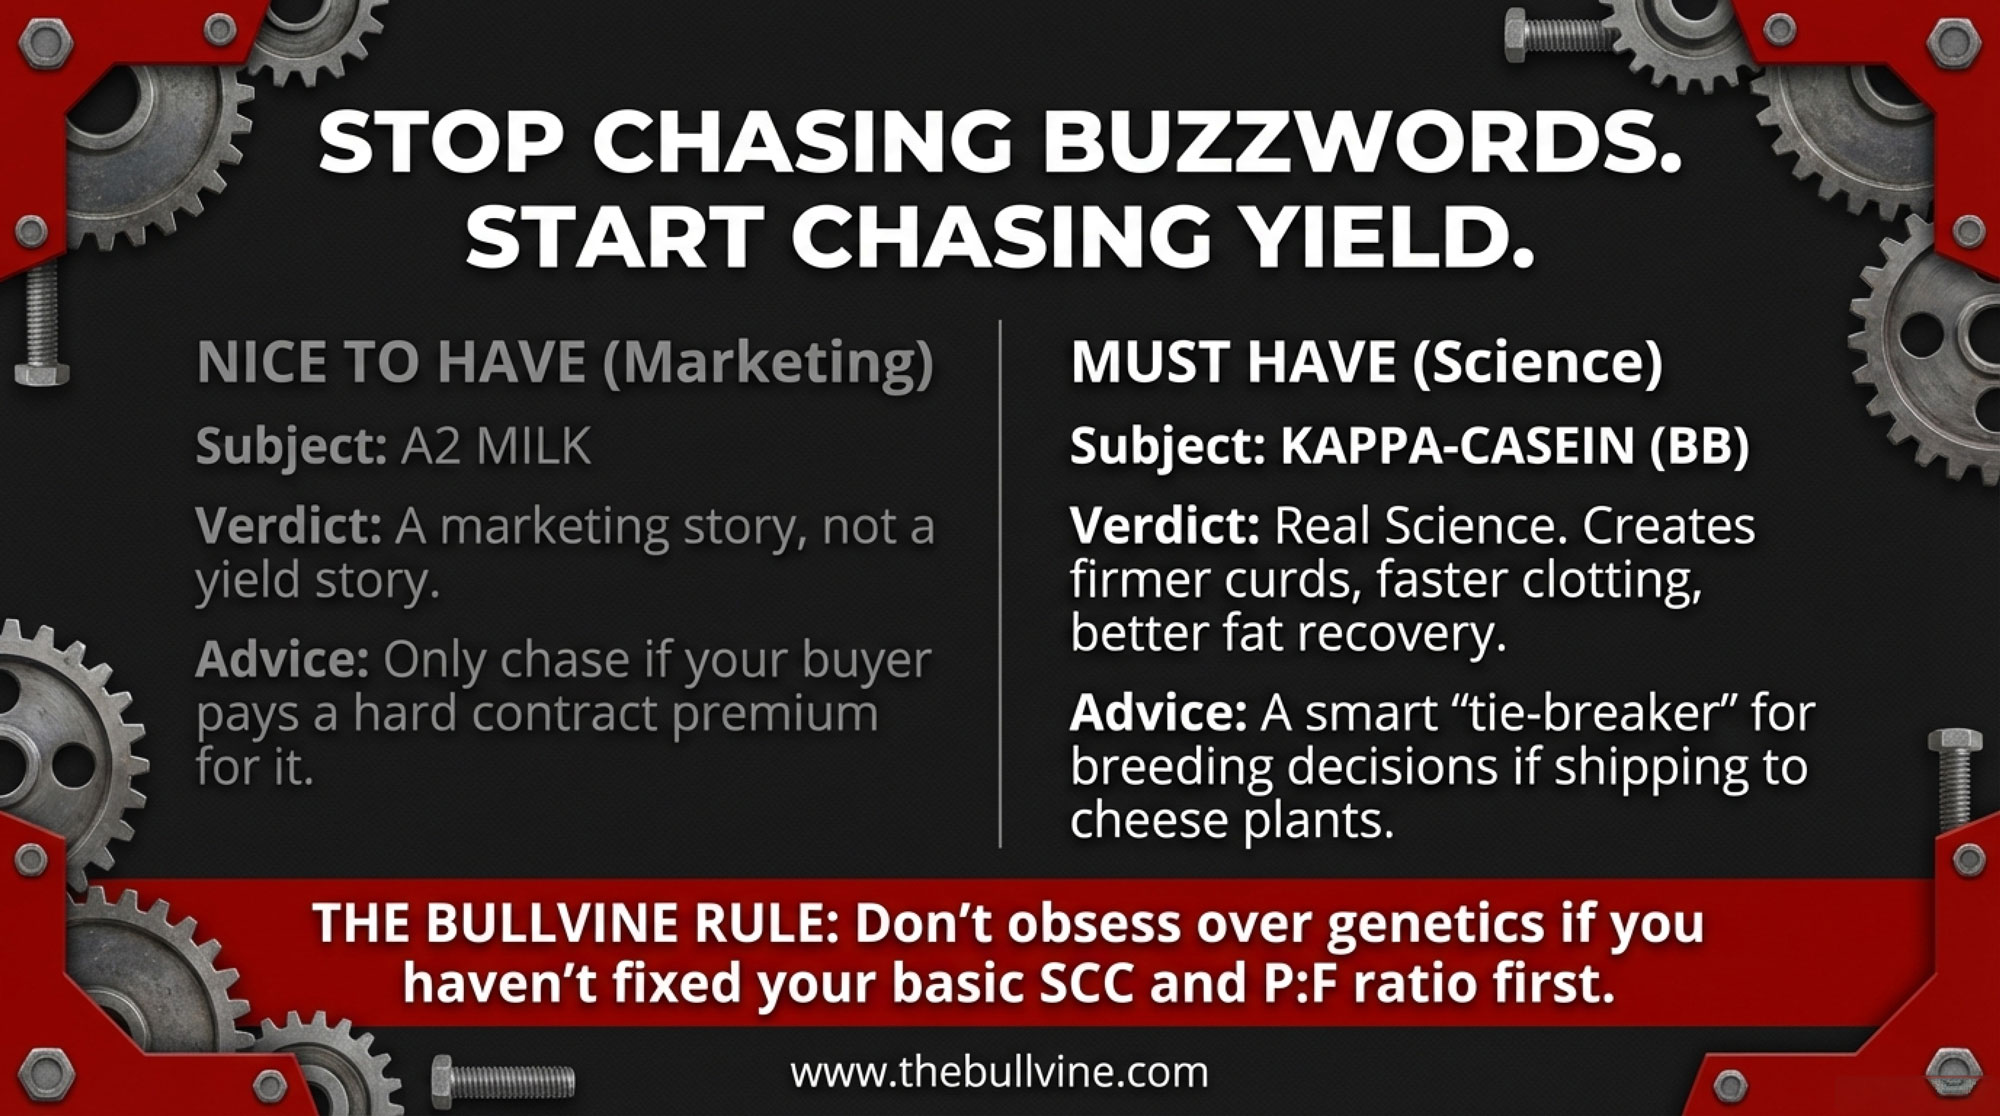


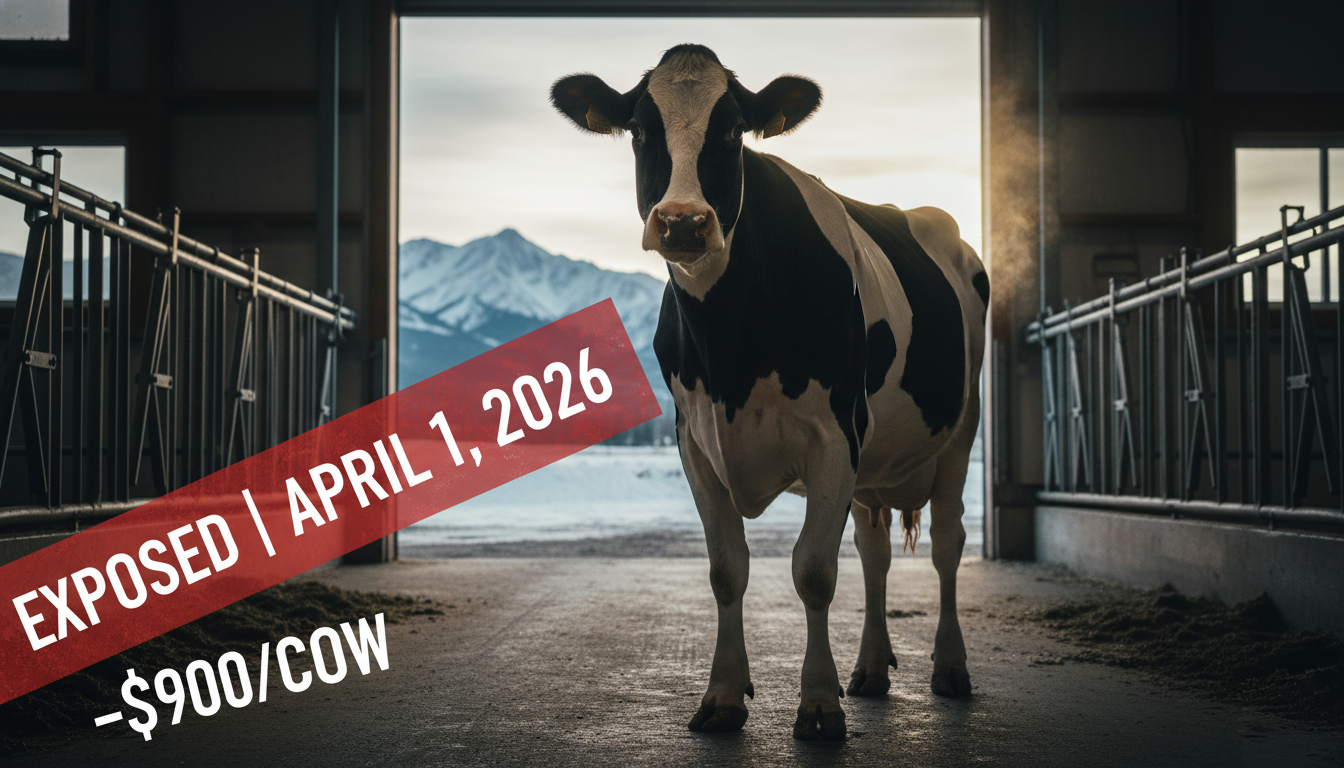
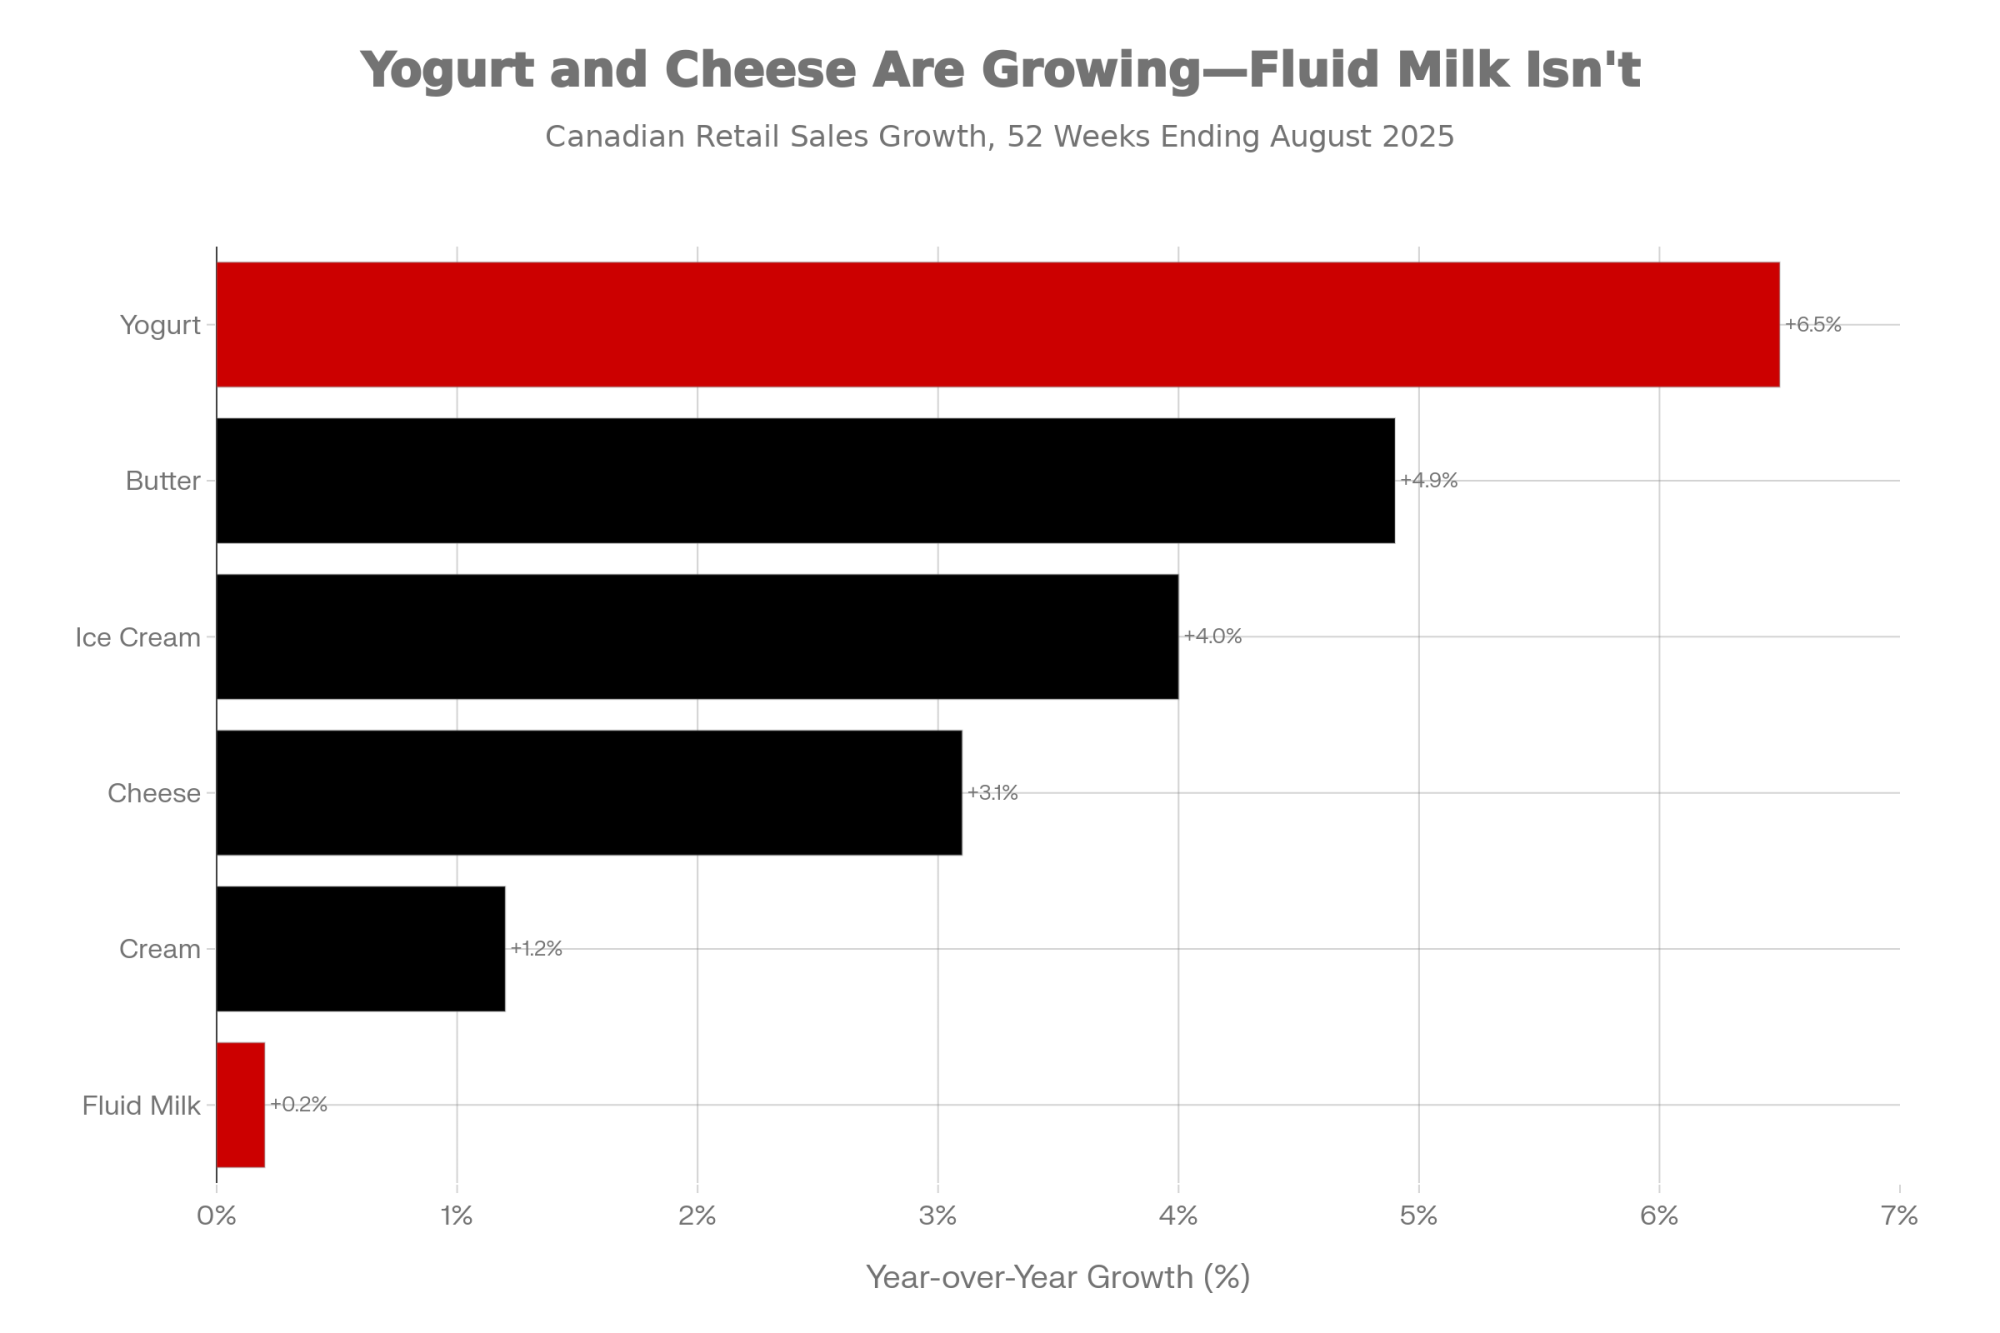
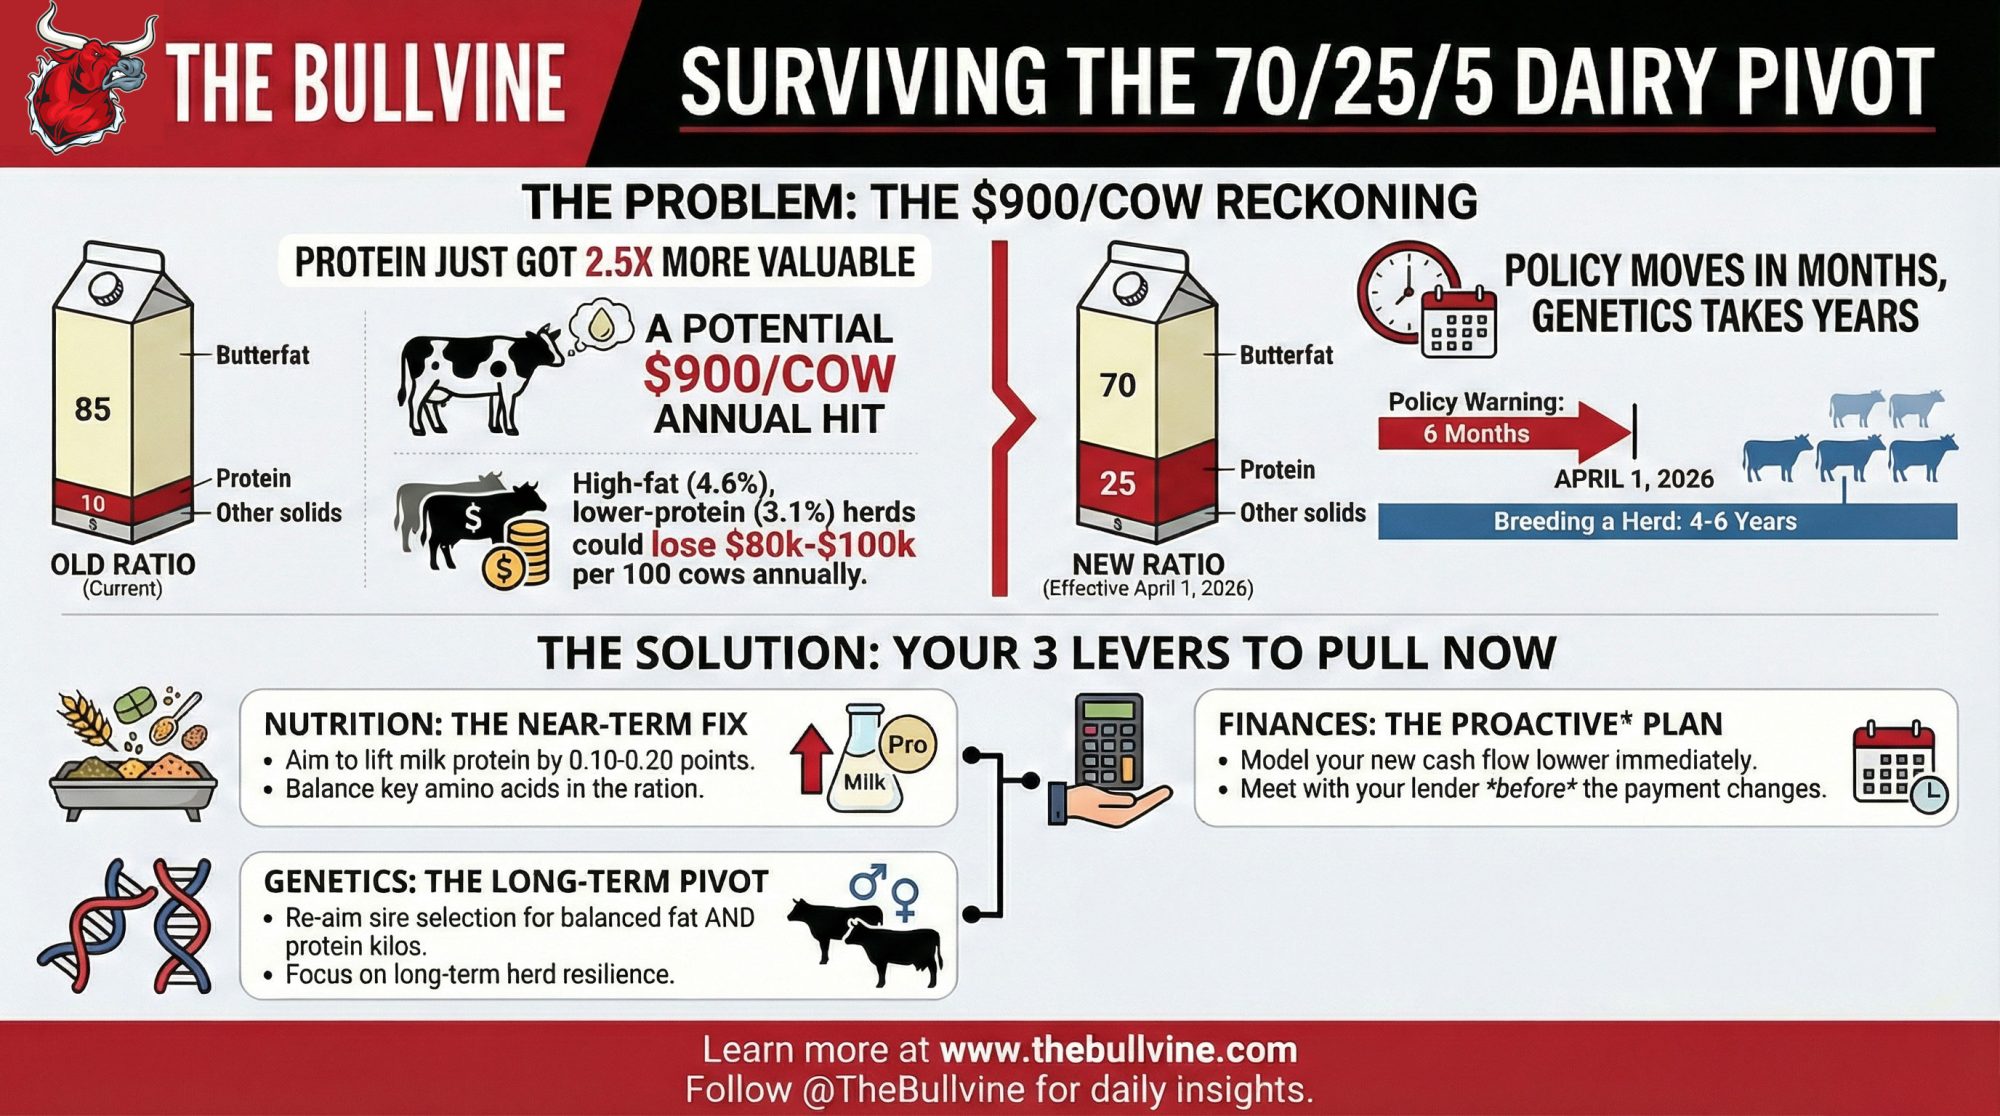


 Join the Revolution!