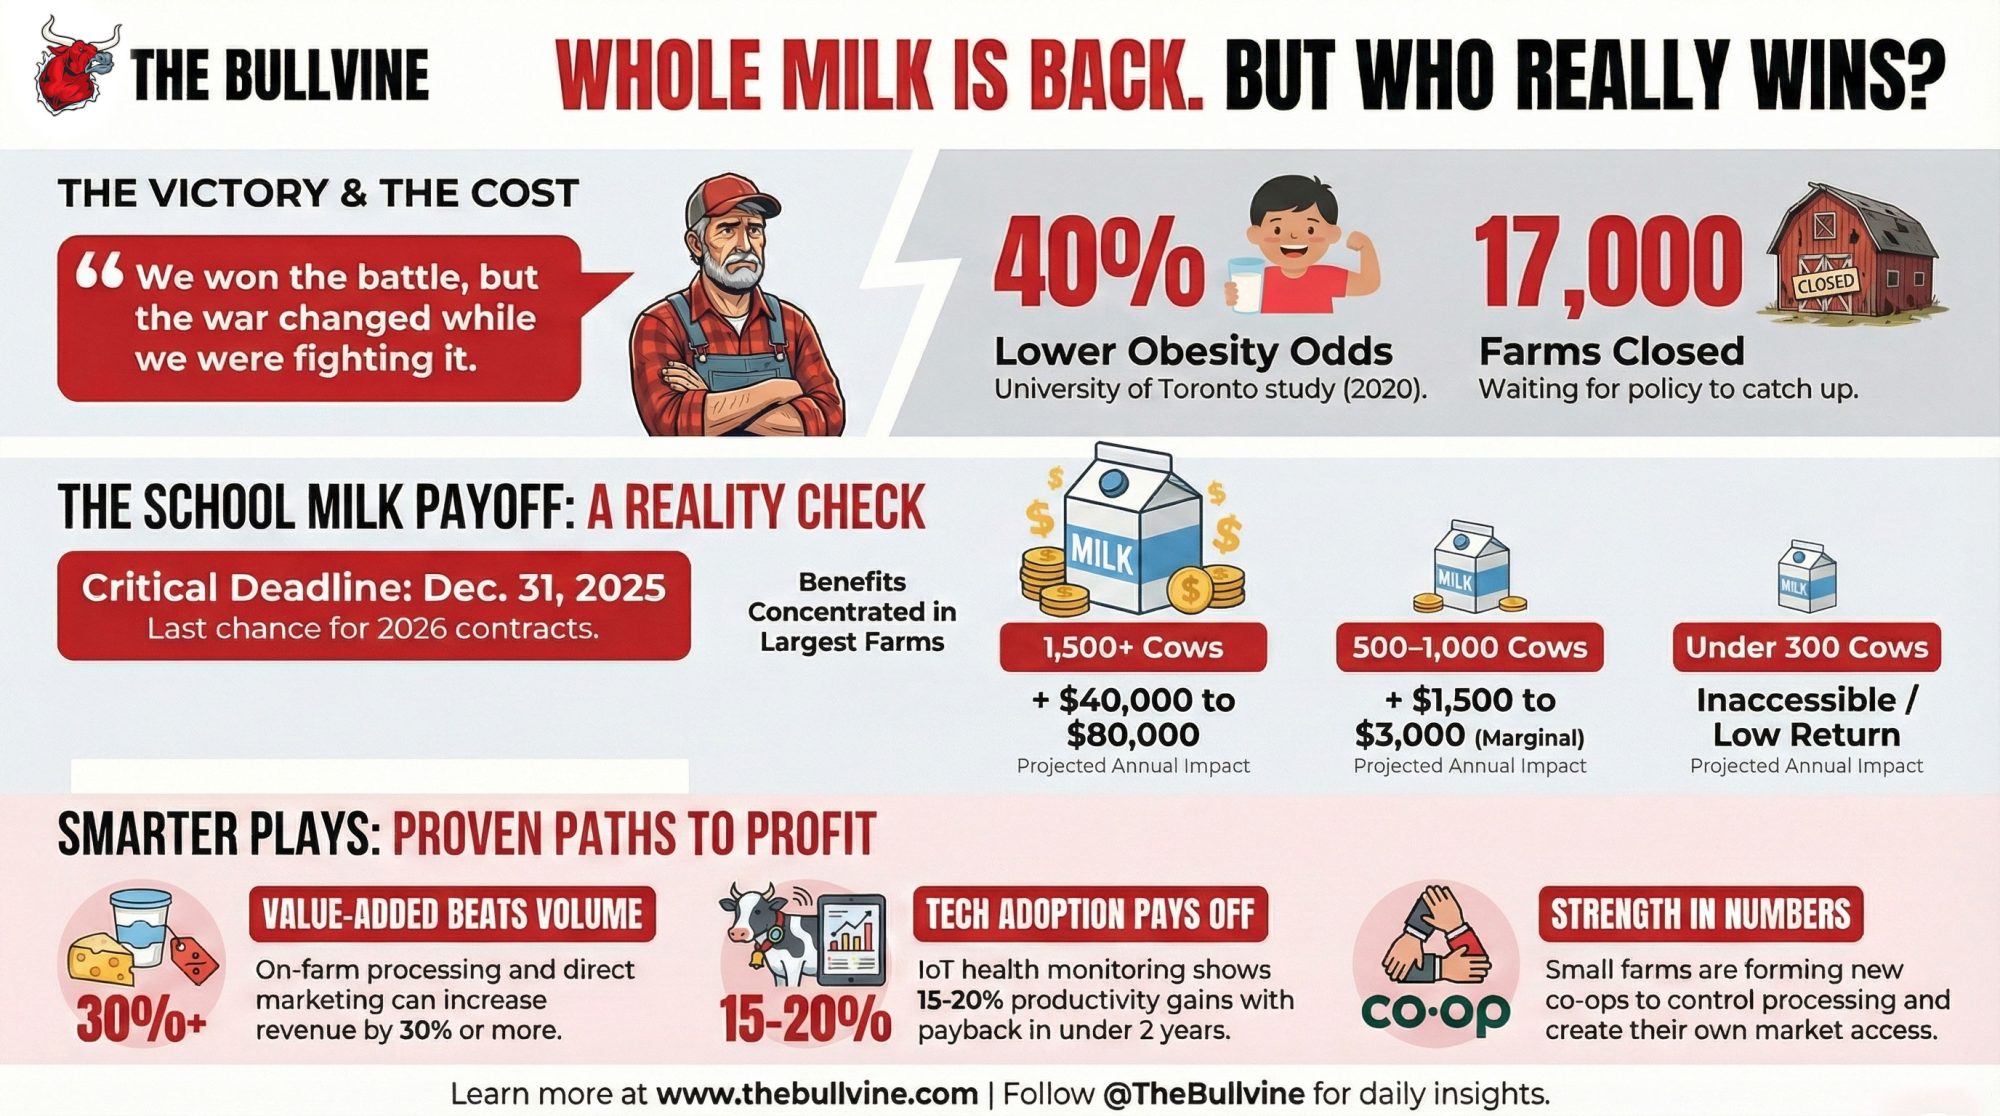
Three changes in the 2024 USDA school meal rules could swing your school milk and cheese premiums by dimes per cwt. Have you run your numbers yet?
Executive Summary: The 2024 USDA school meal rules just turned school milk and cheese specs into real money — and real contract risk — for U.S. herds. By capping added sugars in school-flavored milk at 10 g per 8‑oz and yogurt at 12 g per 6‑oz, and requiring a 10–15% sodium cut in school menus by 2027–28, the rule effectively decides which milk is easy to use and which is always fighting formulation. In a U.S. industry that has seen licensed herds fall from 70,375 to 26,290 since 2003 while production climbed to 226.4 billion lb, processors now have the leverage to favor herds whose protein, casein, P:F ratio, and SCC make spec‑sensitive products simple to run — and quietly step back from the rest. For co‑ops like MMPA, that alignment already shows up as millions of dollars in quality and incentive premiums, with NDQA‑caliber farms capturing a disproportionate share of more than $23 million in producer incentives and roughly $15.3 million in quality payouts. This article gives you a simple 12‑month P:F gut check, a way to measure how much of your available quality premium you’re actually capturing, three pointed questions to take to your buyer, and four realistic paths — optimize, reposition, diversify, or transition — depending on where your numbers land. It also cuts through the noise on κ‑casein, A2, and FMMO reform so you can see where genetics and policy actually move your margins over the next 3–10 years, instead of chasing buzzwords or waiting for the next rule to hit.
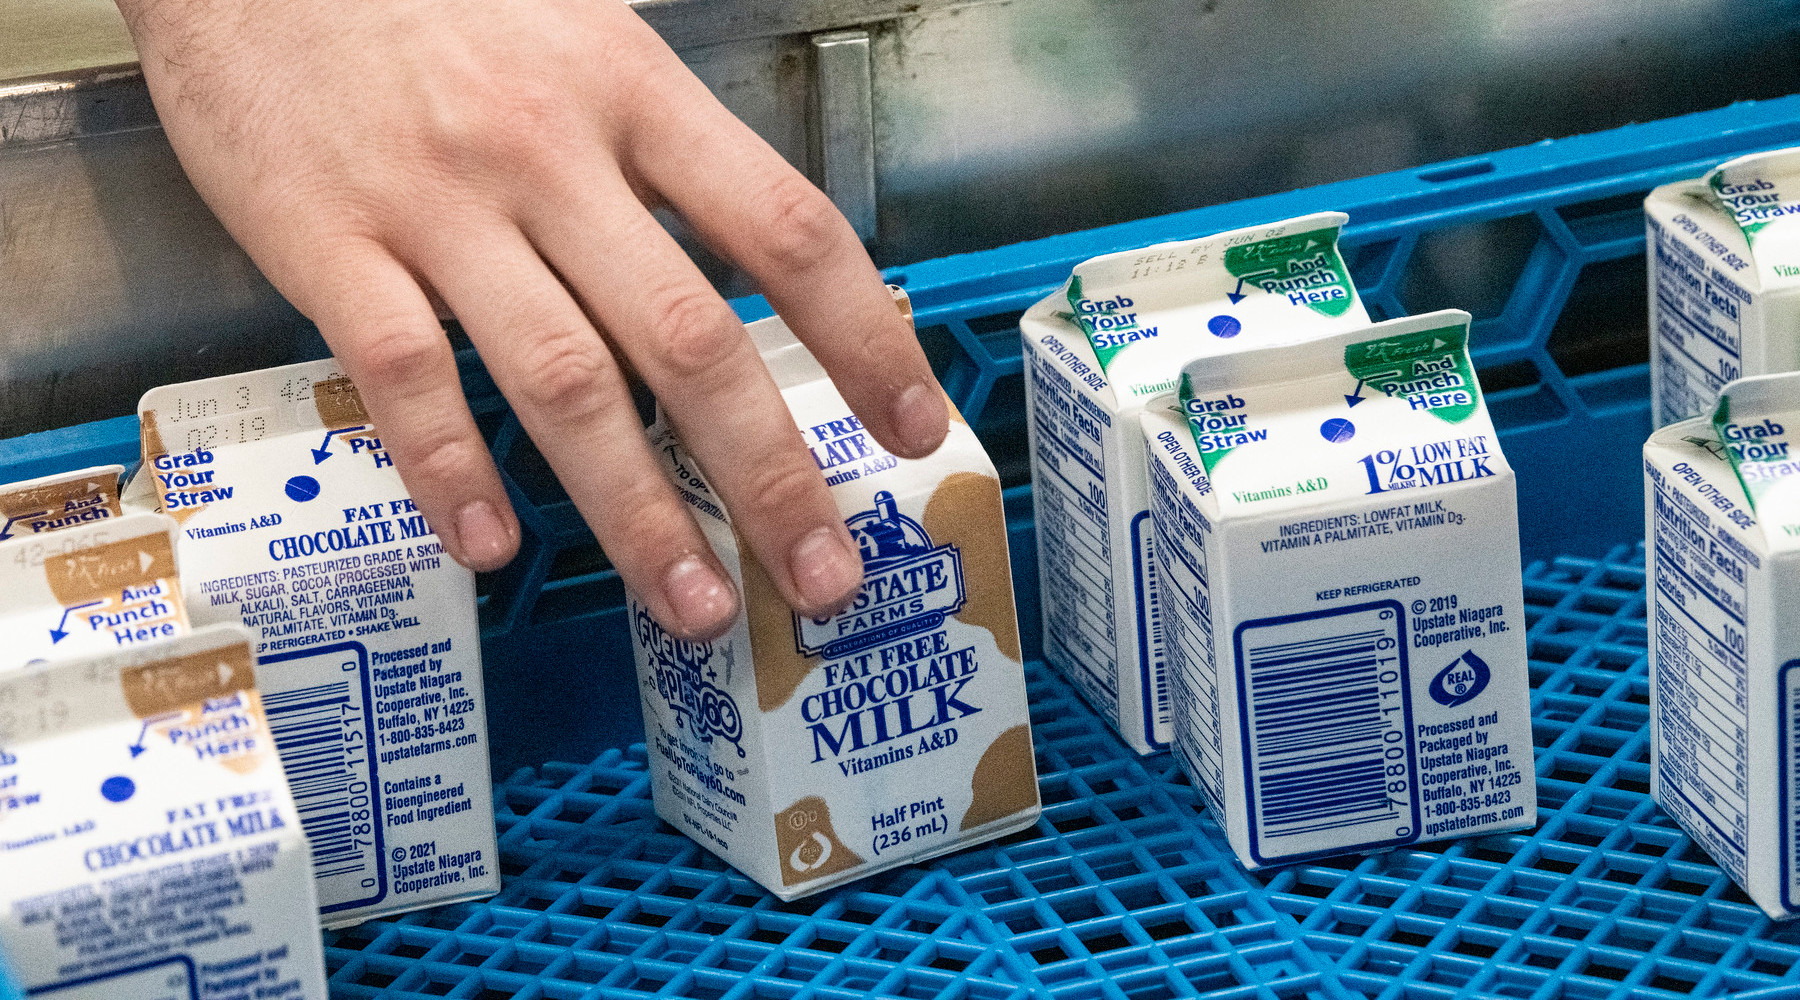
If you’re shipping into cheese plants or school milk contracts, USDA’s 2024 school meal rule isn’t just nutrition policy — it’s a spec and premium story that can move your milk check by a few dimes per cwt either way. For a mid‑sized herd, that’s easily a few thousand dollars a year swinging on whether your milk makes life easier or harder for a spec‑sensitive plant.
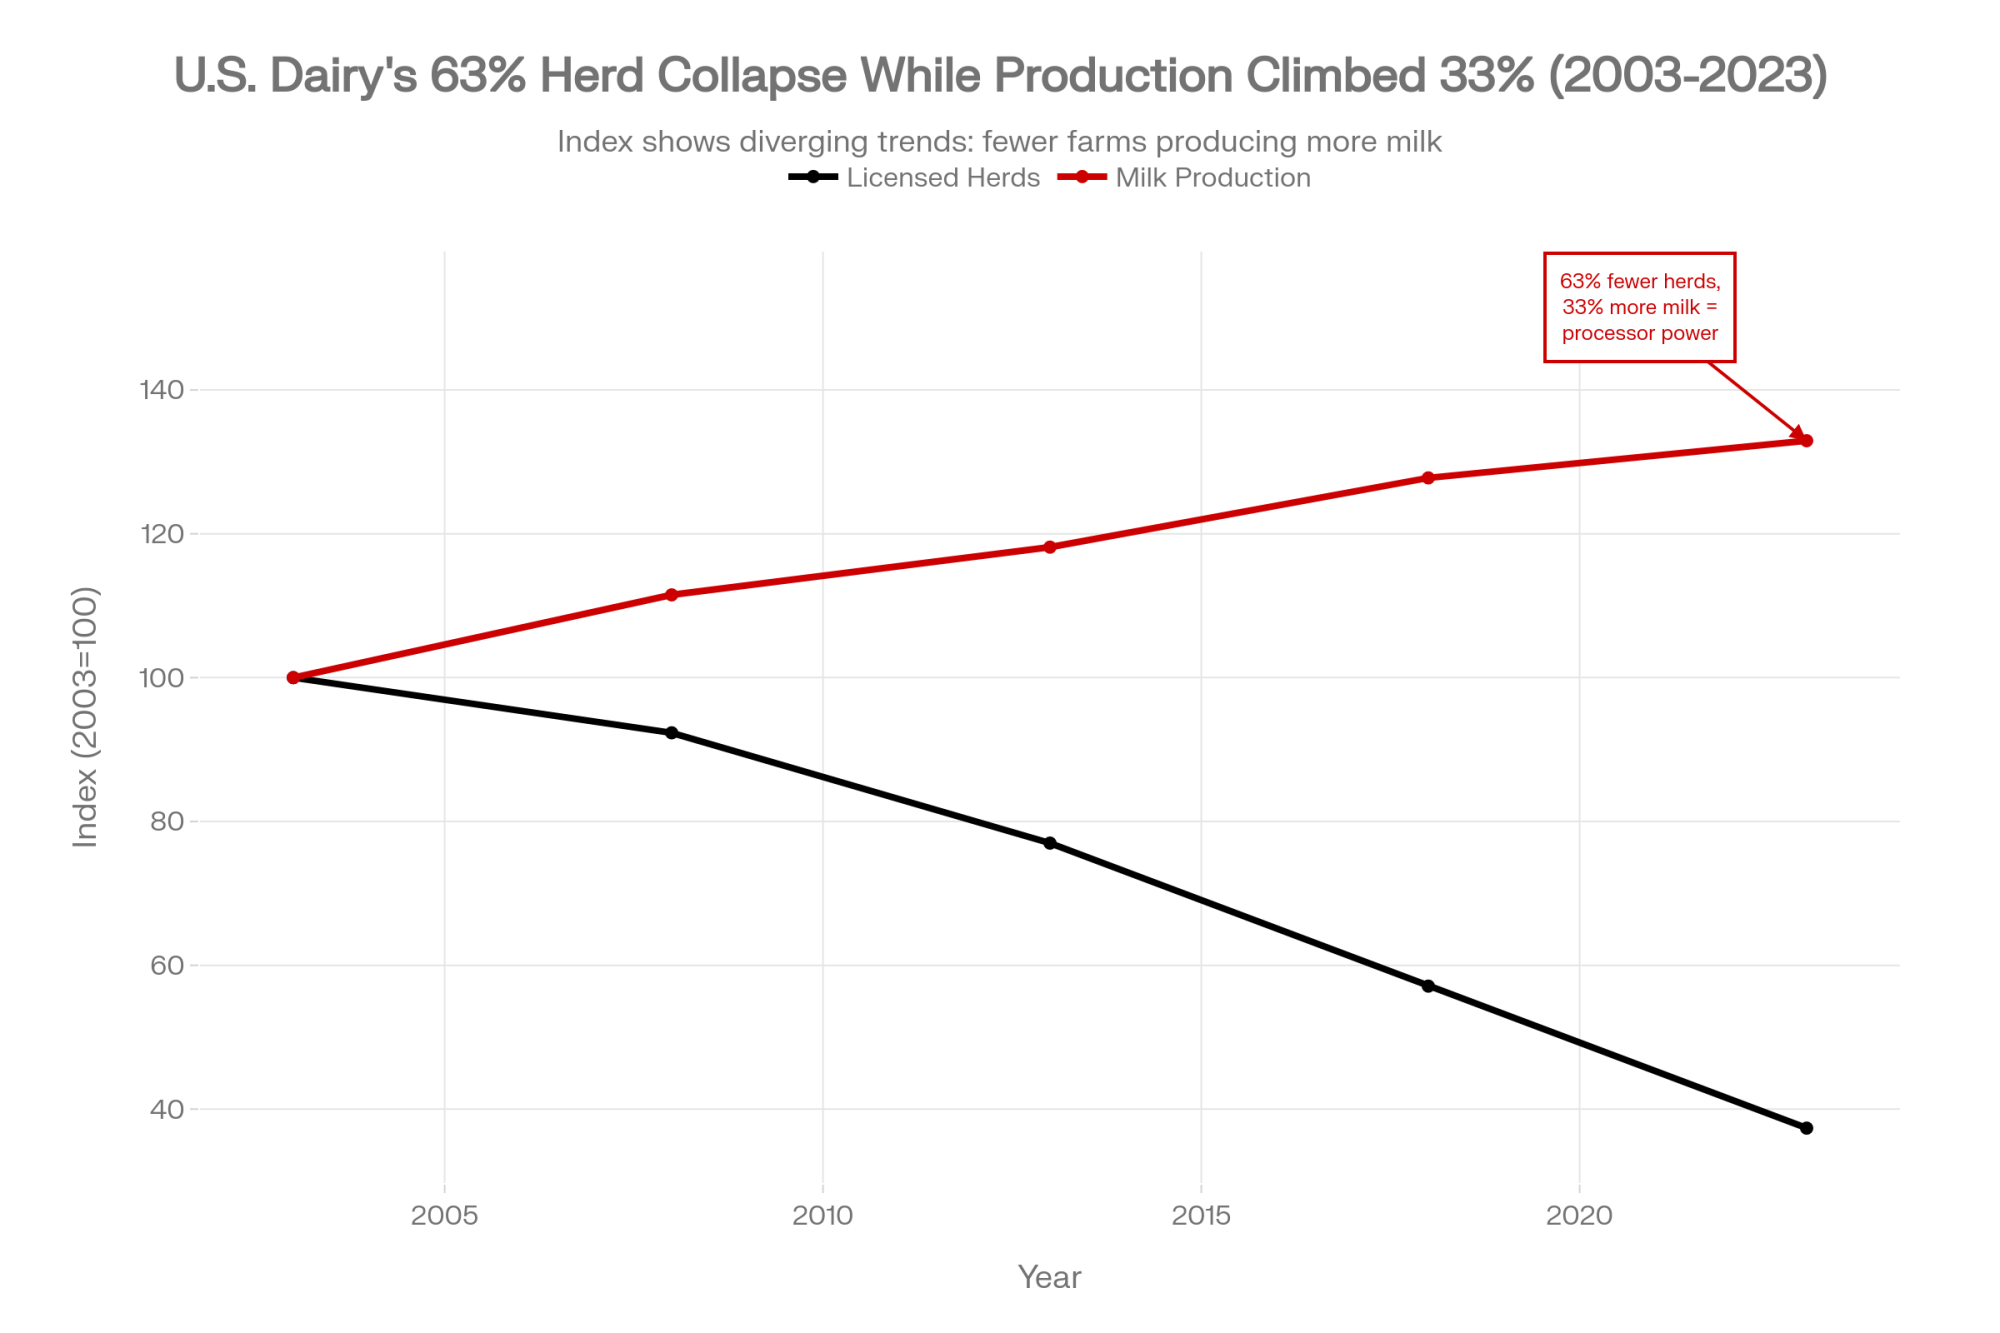
At the same time, USDA numbers show U.S. milk output climbing to about 226.4 billion lb in 2023 while the number of licensed herds collapsed from 70,375 in 2003 to 26,290 in 2023 — a 63% reduction over 20 years. Fewer herds, more milk, and more leverage for processors who can now pick and choose which farms help them win school and cheese business, and which farms they can live without.
Why the USDA School Meal Rule Suddenly Matters to Your Milk Check
Here’s what’s really going on. In April 2024, USDA’s Food and Nutrition Service finalized new nutrition standards for school meals. Those rules lock in product‑specific caps on added sugars and a single sodium cut for school breakfasts and lunches that kicks in for the 2027–28 school year.
According to the FNS comparison chart and a 2024 Congressional Research Service summary, the final rule does three big things that matter to you:
- Starting in the 2025–26 school year, flavored milk in schools is capped at 10 g of added sugars per 8‑oz serving, and yogurt at 12 g per 6‑oz serving.
- From July 1, 2027, schools must cut average sodium on lunch menus by 15% and on breakfast menus by 10%from current limits — essentially locking in the old “Target 2” sodium standards from the 2012 rule.
- By 2027–28, added sugars across the whole weekly menu must average less than 10% of calories.
That’s national. Every district in the National School Lunch and School Breakfast Programs lives under those numbers. They don’t stay in Washington. They show up as spec lines in bid documents, in what processors have to promise, and in how your co‑op or plant looks at its supply base.
Three Spec Shifts You Can’t Ignore
Let’s strip the policy talk down to the three shifts that hit your farm.
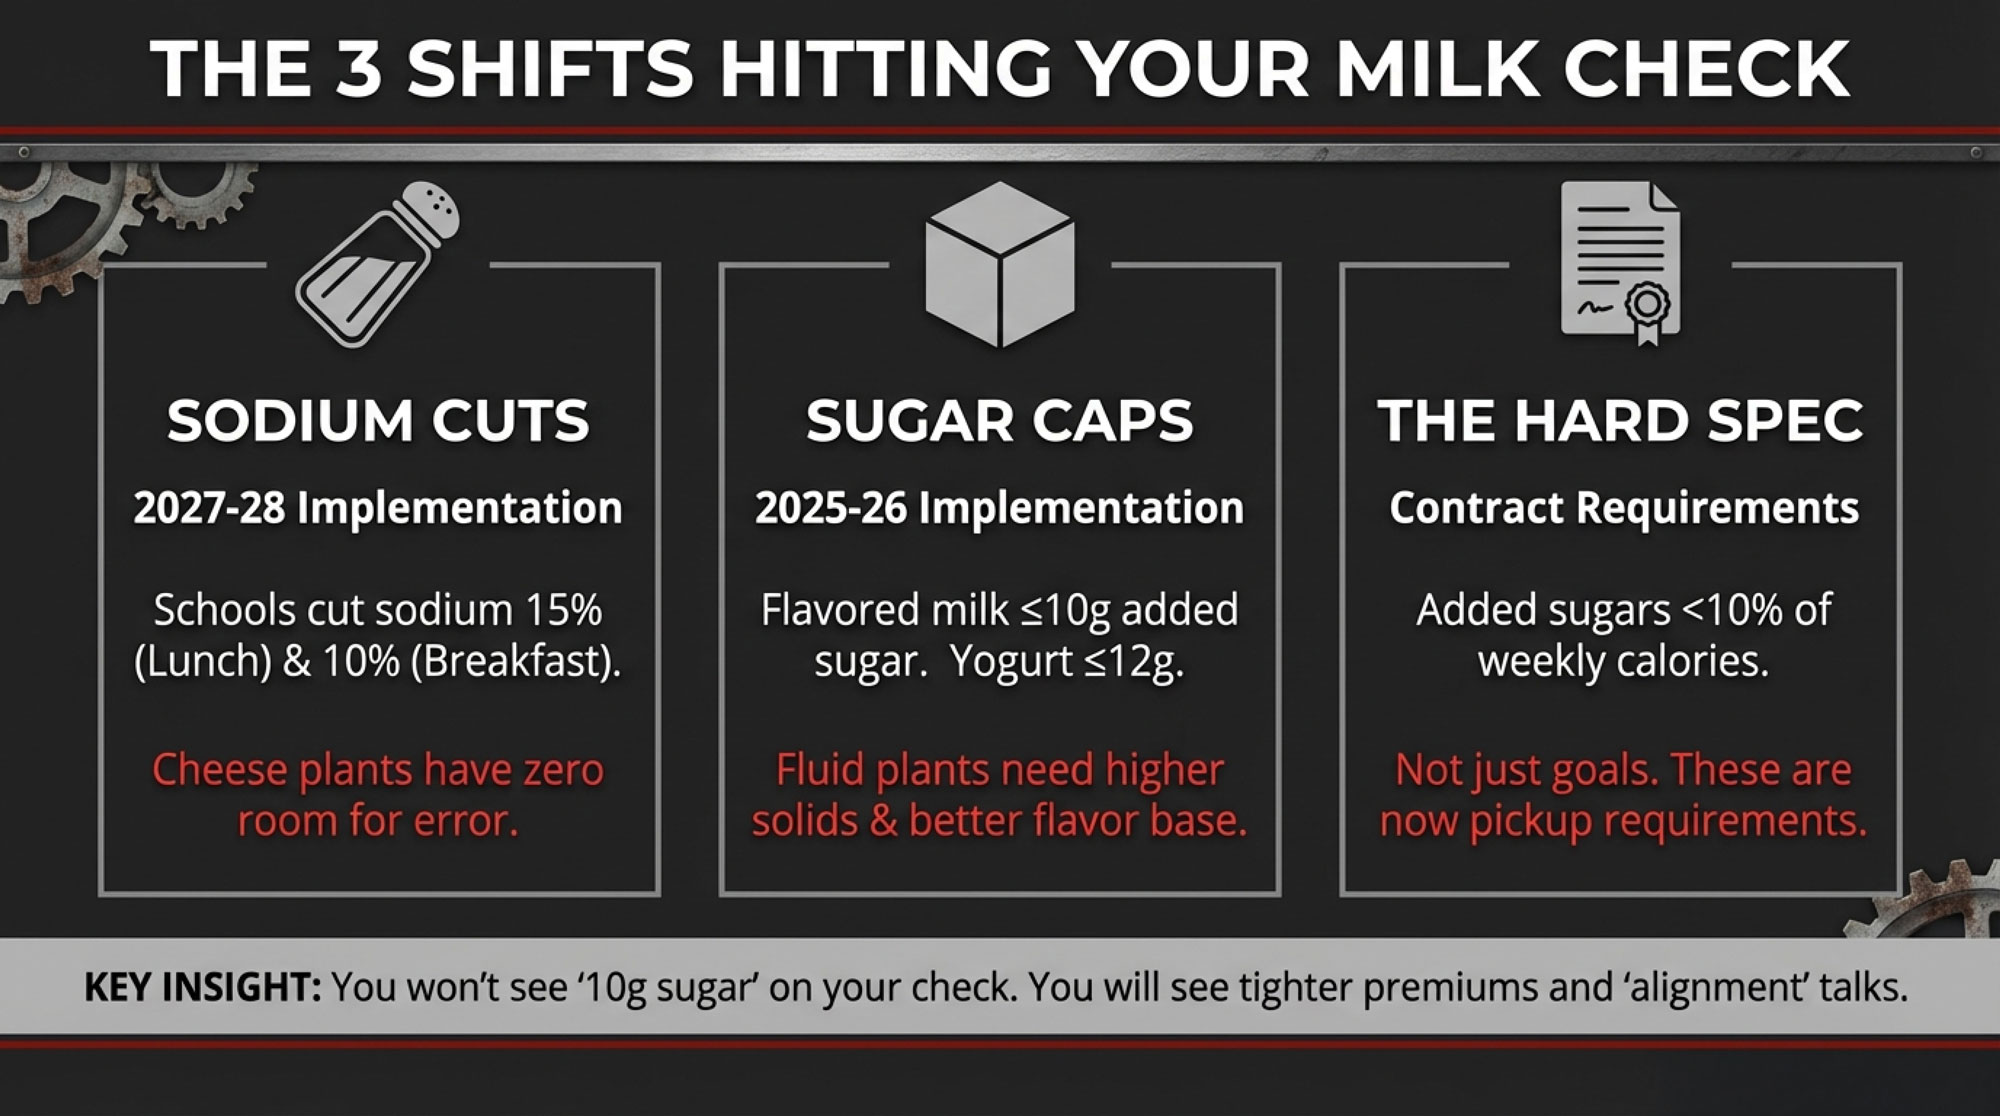
| Spec Shift | What Changes (U.S. Schools) | Where It Hits You | What to Watch in Your Herd |
| Sodium limits | One‑time 15% sodium cut at lunch and 10% at breakfast vs current limits, effective SY 2027–28. | Cheese plants have a smaller sodium “budget” on school menus; they need cheese that performs with less salt. | P:F ratio, protein %, κ‑casein, SCC, vat performance. |
| Added‑sugar caps | From SY 2025–26, flavored milk ≤10 g added sugars/8 oz; yogurt ≤12 g/6 oz. | Plants need body and flavor with less sugar cover, especially in flavored milk and yogurt. | Solids‑not‑fat, protein stability, bacteria counts, flavor consistency. |
| Contract specs | These limits move from “goals” to hard specs in bids and processor contracts. | Premiums and base shift toward “spec‑friendly” herds; marginal herds risk weaker terms or less secure pickup. | Your buyer’s school/cheese exposure, quality‑premium capture, and contract language. |
You don’t see “10 g added sugars” printed on your milk check. You see new premium grids, new quality letters, more talk about “alignment,” and, in the worst cases, contracts that quietly get scaled back or not renewed.
Sodium: Why Cheesemakers Are Suddenly Obsessed With Your Casein
Sodium cuts mean school menu planners have less room for salty items, including cheese. Typical numbers: a 1‑oz slice of Cheddar runs around 180 mg of sodium, and part‑skim mozzarella usually lands in the 150–180 mg range depending on the formulation. If the menu sodium budget is tight, every slice of cheese eats up more of the allowance.
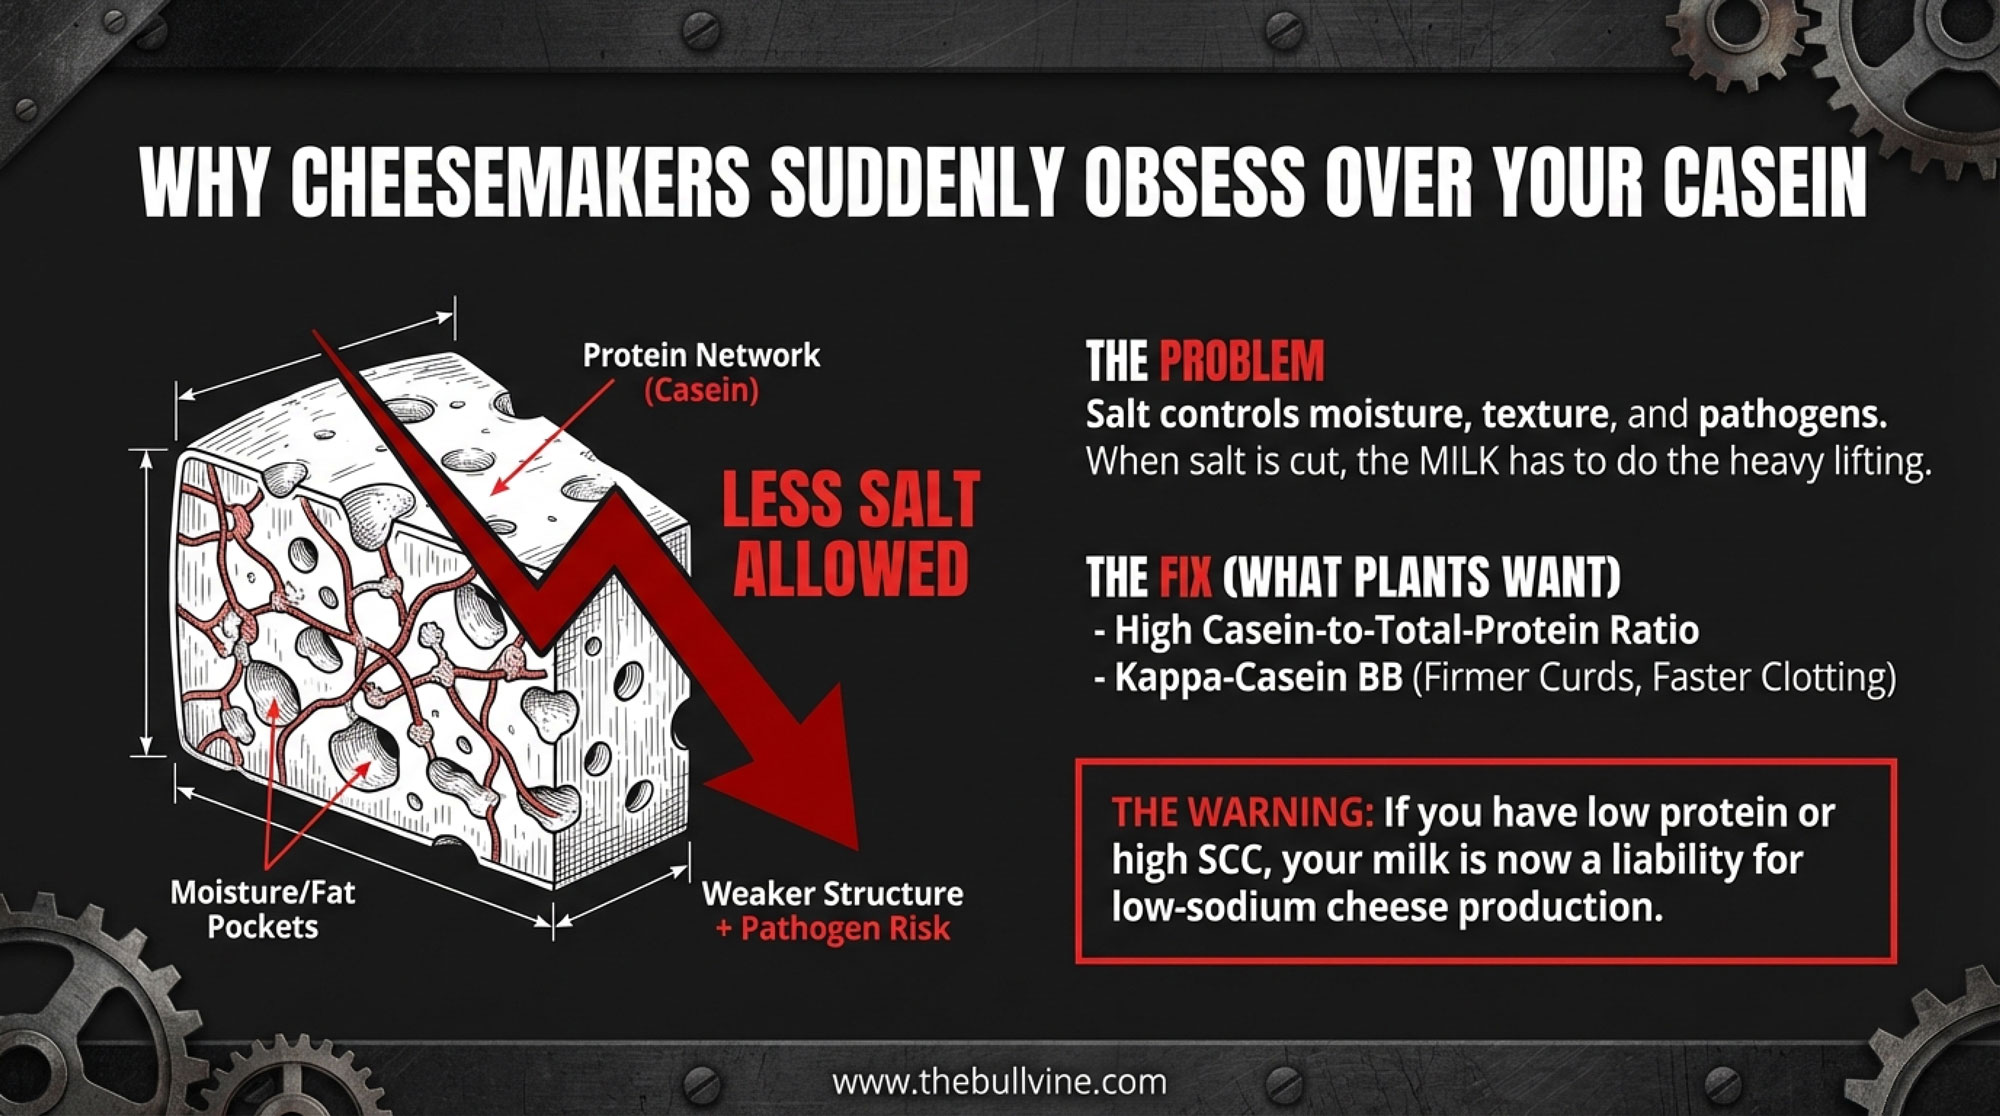
Now, salt isn’t just window dressing in cheese. Cheese science work — including U.S. school‑meal nutrition research in Nutrients — highlights salt’s role in moisture control, whey expulsion, pH and texture, pathogen control, and flavor and shelf life. Processors can’t simply “use less salt” and expect cheese to make weight, slice clean, and sit in a school district’s cooler for weeks without issues. Something else has to carry more of the load.
That “something” is your milk:
- Casein and κ‑casein. Dairy science studies show that a higher casein-to-total-protein ratio improves curd formation and cheese yield. Multiple papers across breeds report that κ‑casein BB milk tends to coagulate faster and form firmer curd than κ‑casein AA milk, which often translates into better yield and more predictable vat performance when everything else is equal.
- Somatic cell count (SCC). Elevated SCC is consistently tied to lower cheese yield and more defects; NDQA scoring and co‑op quality programs bake that reality into their metrics.
Here’s the bottom line: under tighter sodium specs, cheesemakers want milk that yields strong curd, clean drainage, and a low defect risk, even if they pull back a notch on the salt. That’s good news if your herd is already built around solid protein, casein, and NDQA‑level quality. It’s a big warning sign if you’ve been living with “good enough” SCC and protein.
A Simple P:F Ratio Gut Check
You don’t need a PhD to see if your herd is swimming with or against where cheese plants are heading. You just need your last 12 months of milk checks.
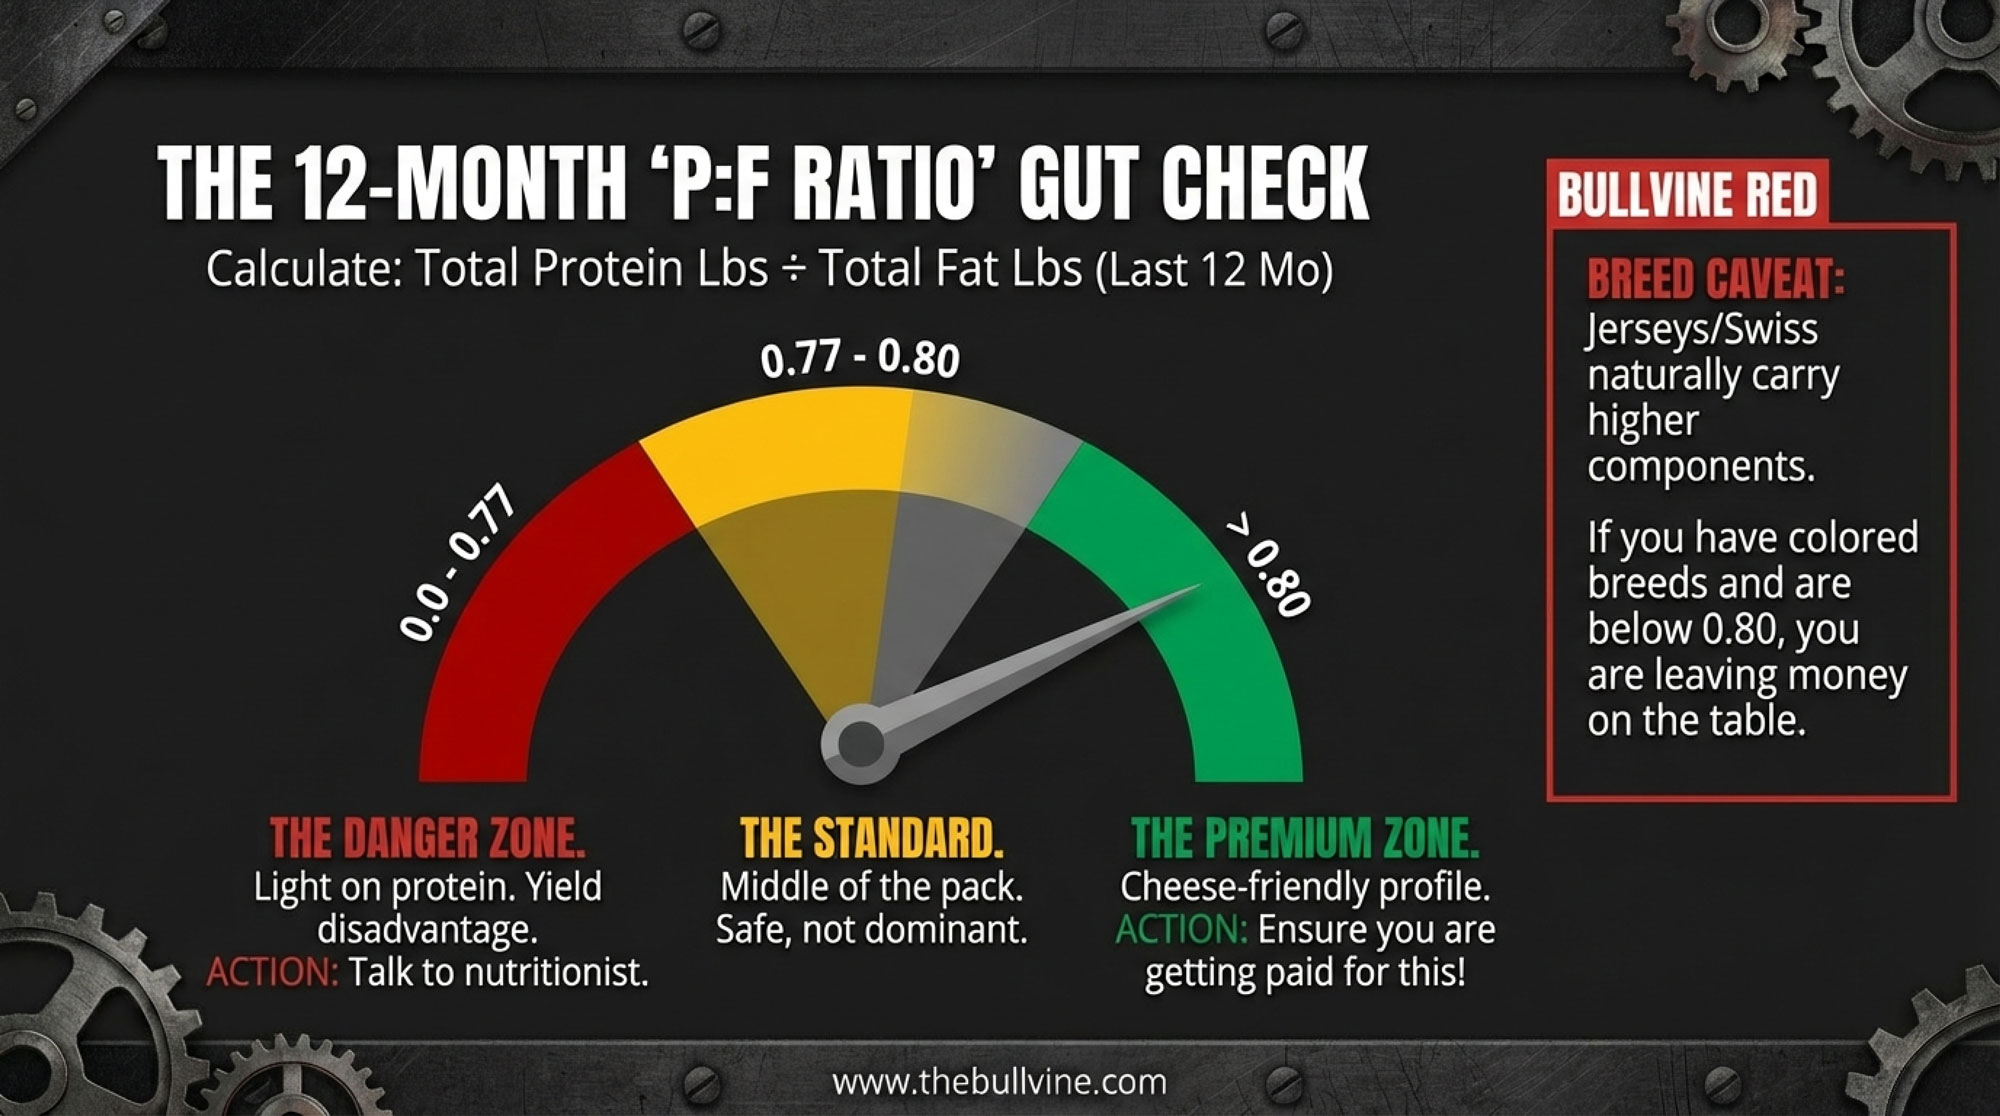
| 12-Month P:F Ratio | What It Usually Signals | Cheese Plant View | Your Next Move |
|---|---|---|---|
| Below ~0.77 | Light on protein relative to fat; rations, transition, or fresh cow issues likely | ⚠️ “We can use your milk, but you’re not making our life easier” | 🚨 RED FLAG: Call nutritionist + vet this month. Focus on fresh cow health, forage quality, one ration trial targeting 0.77+ |
| 0.77–0.80 | Middle-of-the-pack for Holstein cheese herds; serviceable but unremarkable | “Standard supply—we’ll keep you as long as we need volume” | ⚠️ YELLOW LIGHT: Assess upside. Can you push toward 0.80+ with better transition management? Check if premium grid rewards the climb. |
| Above 0.80 | Strong cheese-merit profile if butterfat and SCC are also solid | ✅ “Exactly what we want for school cheese under tight sodium specs” | ✅ GREEN LIGHT: Protect this position. Ask your buyer if you’re capturing full quality premium. Consider genetics that lock in casein advantage long-term. |
Do this once a year:
- Add up your total protein pounds shipped in the last 12 months.
- Add up your total butterfat pounds shipped in the same period.
- Divide protein by fat. That’s your 12‑month P:F ratio.
Here’s how a lot of field reps and nutritionists in cheese country use that number — purely as a rule‑of‑thumb, not a regulation:
The Breed Caveat: While the 0.77–0.81 band is the standard “North American Holstein” benchmark, remember that breed matters. Jerseys and Brown Swiss naturally carry higher components; for these herds, a ratio below 0.80 often means you are leaving significant cheese-merit dollars on the table despite having “high” test numbers. If you aren’t hitting the upper end of the scale with a high-component breed, your butterfat is likely out-pacing your protein synthesis.
These aren’t USDA lines. They’re countryside benchmarks. You still have to weigh them against your actual pay schedule, your herd’s health, and your feed and forage reality. But if you’re shipping to a cheese plant with a P:F under about 0.77, that’s not a “maybe later” project — it’s a “get your nutritionist and vet around the table this month” project.
On the flip side, if you’re above 0.80 with solid butterfat and low SCC, that’s exactly when you should be asking whether your buyer’s paying for that profile — or whether you’re subsidizing other milk in the pool.
Sugar Caps: School Milk and Yogurt Need Better Milk, Not Just Less Sugar
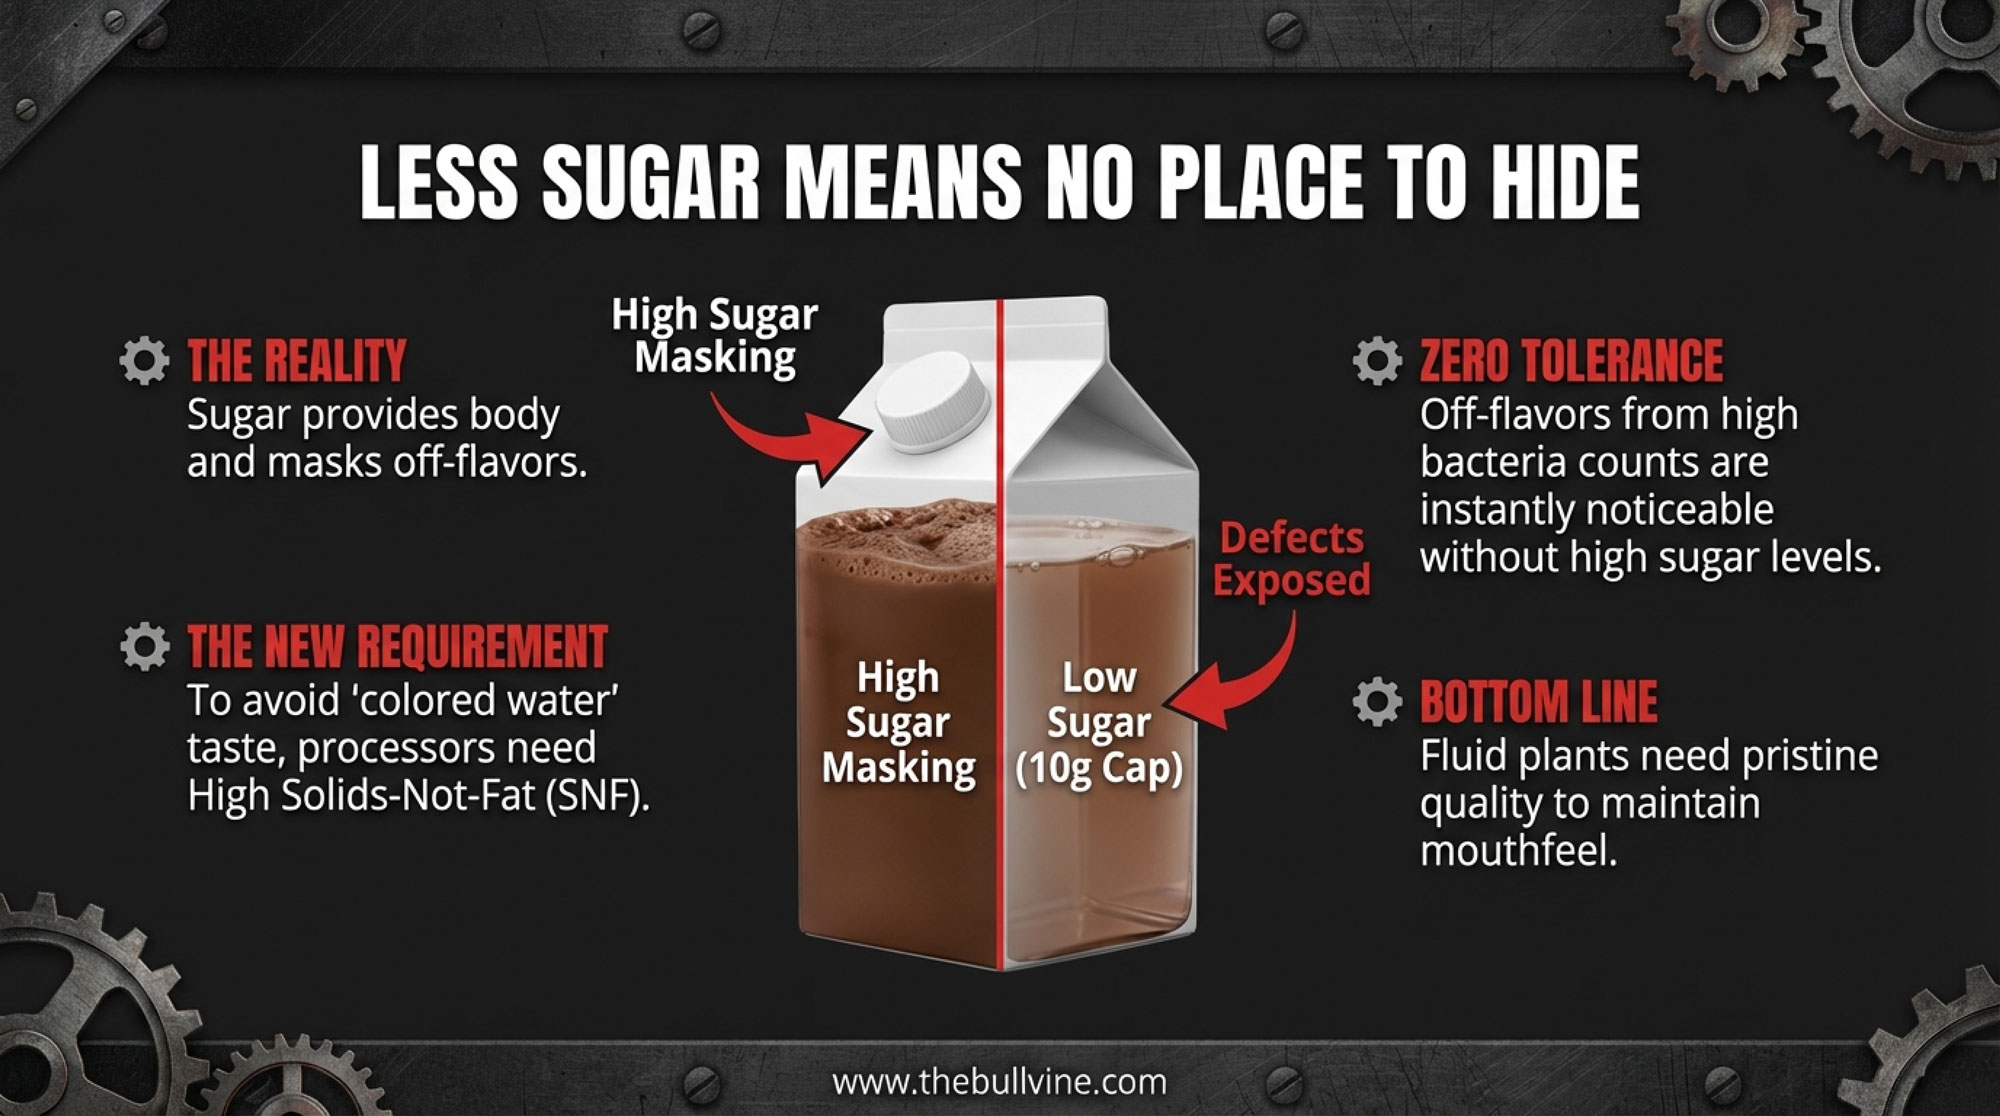
The sugar rules are just as blunt. Starting in SY 2025–26, flavored milk in schools is capped at 10 g of added sugars per 8‑oz serving, and yogurt at 12 g per 6‑oz serving. Then, in 2027–28, weekly calories from added sugars across the menu have to come in under 10%.
The dairy side saw this coming. Under the International Dairy Foods Association’s Healthy School Milk Commitment, 37 processors representing more than 90% of school milk volume agreed to cap added sugars in school flavored milk at that same 10 g per 8‑oz, cutting about 7 g from the average flavored school milk back in 2006–07. Processors have already cut average added sugars in school-flavored milk roughly in half, down to about 8.2 g per serving.
Public health voices aren’t done. The American Medical Association has argued flavored milk should be removed from school meals entirely and, if not, endorses tighter options. Other groups call the final rule “fair but still improvable.” That tells you the spotlight on sugar isn’t going away.
For you, the practical takeaway is simple: processors need milk they can turn into low‑added‑sugar flavored milk and yogurt that still have body, flavor, and shelf life. Less sugar means less room to hide off‑flavors or thin mouthfeel.
What they’re quietly shopping for in their supply base is:
- Component consistency. Under tight sugar caps, they lean harder on solids‑not‑fat and protein to keep flavored milk and yogurt from feeling like colored water. Herds that deliver steady components month in, month out are cheaper to formulate around.
- High‑end quality. With less sugar to mask issues, low SCC and low bacteria counts matter even more for flavor stability and shelf life. That’s exactly where NDQA‑level herds stand out — and get paid for it.
Where Specs Actually Bite: Contracts, Co‑ops, and FMMOs
Let’s be honest: you don’t feel “Target 2 sodium” or “10 g added sugars” directly. You feel contracts, premiums, and pooling.
WHO and USDA set the nutrition guardrails. School districts and processors turn them into bids that say “must meet these sodium and added‑sugar limits.” For plants that ship a lot of cheese, yogurt, or fluid milk into school channels, those contracts are big enough to decide how hard the plant runs — and how secure your pickup feels.
On your side, specs usually show up in three ways:
- A new or revised premium sheet that pays more for protein, SCC, or quality — or quietly tightens the thresholds.
- Conversations about base, hauling, or “alignment with plant needs.” When you hear “alignment” more often, that’s a clue that specs are driving talk behind the scenes.
- In tighter markets, a contract that gets scaled back, or simply doesn’t reappear on your kitchen table when it’s up for renewal.
Edge Dairy Farmer Cooperative has been out front on this. Their CEO, Tim Trotter, and others at Edge have publicly pushed for stronger, more transparent processor contracts so farmers have at least some predictability about price and pickup, rather than hoping they’re still on the “keep” list when plants reshuffle supply. That fight tells you how much contract power has shifted as herd numbers dropped and plants consolidated.
Where FMMO Reform Fits
Layered over all this is the slow grind on Federal Milk Marketing Order (FMMO) reform. American Farm Bureau Federation’s Market Intel work does a good job explaining how FMMOs govern pricing and pooling across classes and regions, and how proposals on make allowances, the Class I mover, and pooling rules would directly change mailbox prices.
Specs and FMMOs aren’t the same fight, but they intersect in a pretty simple way:
- Specs change who your plant wants to pick up from and which products they chase.
- FMMO rules change how much of the value of those products actually shows up on your check.
If you’re in a cheese‑heavy order, lining your herd up with cheese yield and quality — and the sodium realities in school cheese — gives you a better shot at being “core” supply when plants restructure or when FMMO tweaks change the cheese vs Class I balance. If you’re in a fluid‑oriented order, being the herd that makes low‑sugar school milk and ESL products easy to execute can matter just as much when your plant decides whose milk is non‑negotiable.
The Dollars Behind Being “Spec‑Aligned”
Talking about “spec alignment” only matters if it shows up in your milk check. In co‑ops with strong quality programs, it absolutely does.
MMPA is one of the best public examples. In the 2021 NDQA results, 21 MMPA farms were among 47 National Dairy Quality Award winners — nearly half the list. That kind of dominance doesn’t happen by accident. It reflects a culture of low SCC, tight routines, and serious field support.
Farms like Crandall Dairy Farms in Battle Creek, Michigan — run by Brad, Mark, and Larry Crandall — have earned NDQA recognition year after year, including Platinum in 2022 and Gold or Silver in multiple other cycles. That’s not a one‑time fluke; it’s the kind of sustained performance that spec‑sensitive buyers fight to keep on their routes. More recently, Schultz Dairy LLC in Sandusky took home Platinum in the January 2026 NDQA awards — one of only six farms in the U.S. and Canada to earn that honor this year.
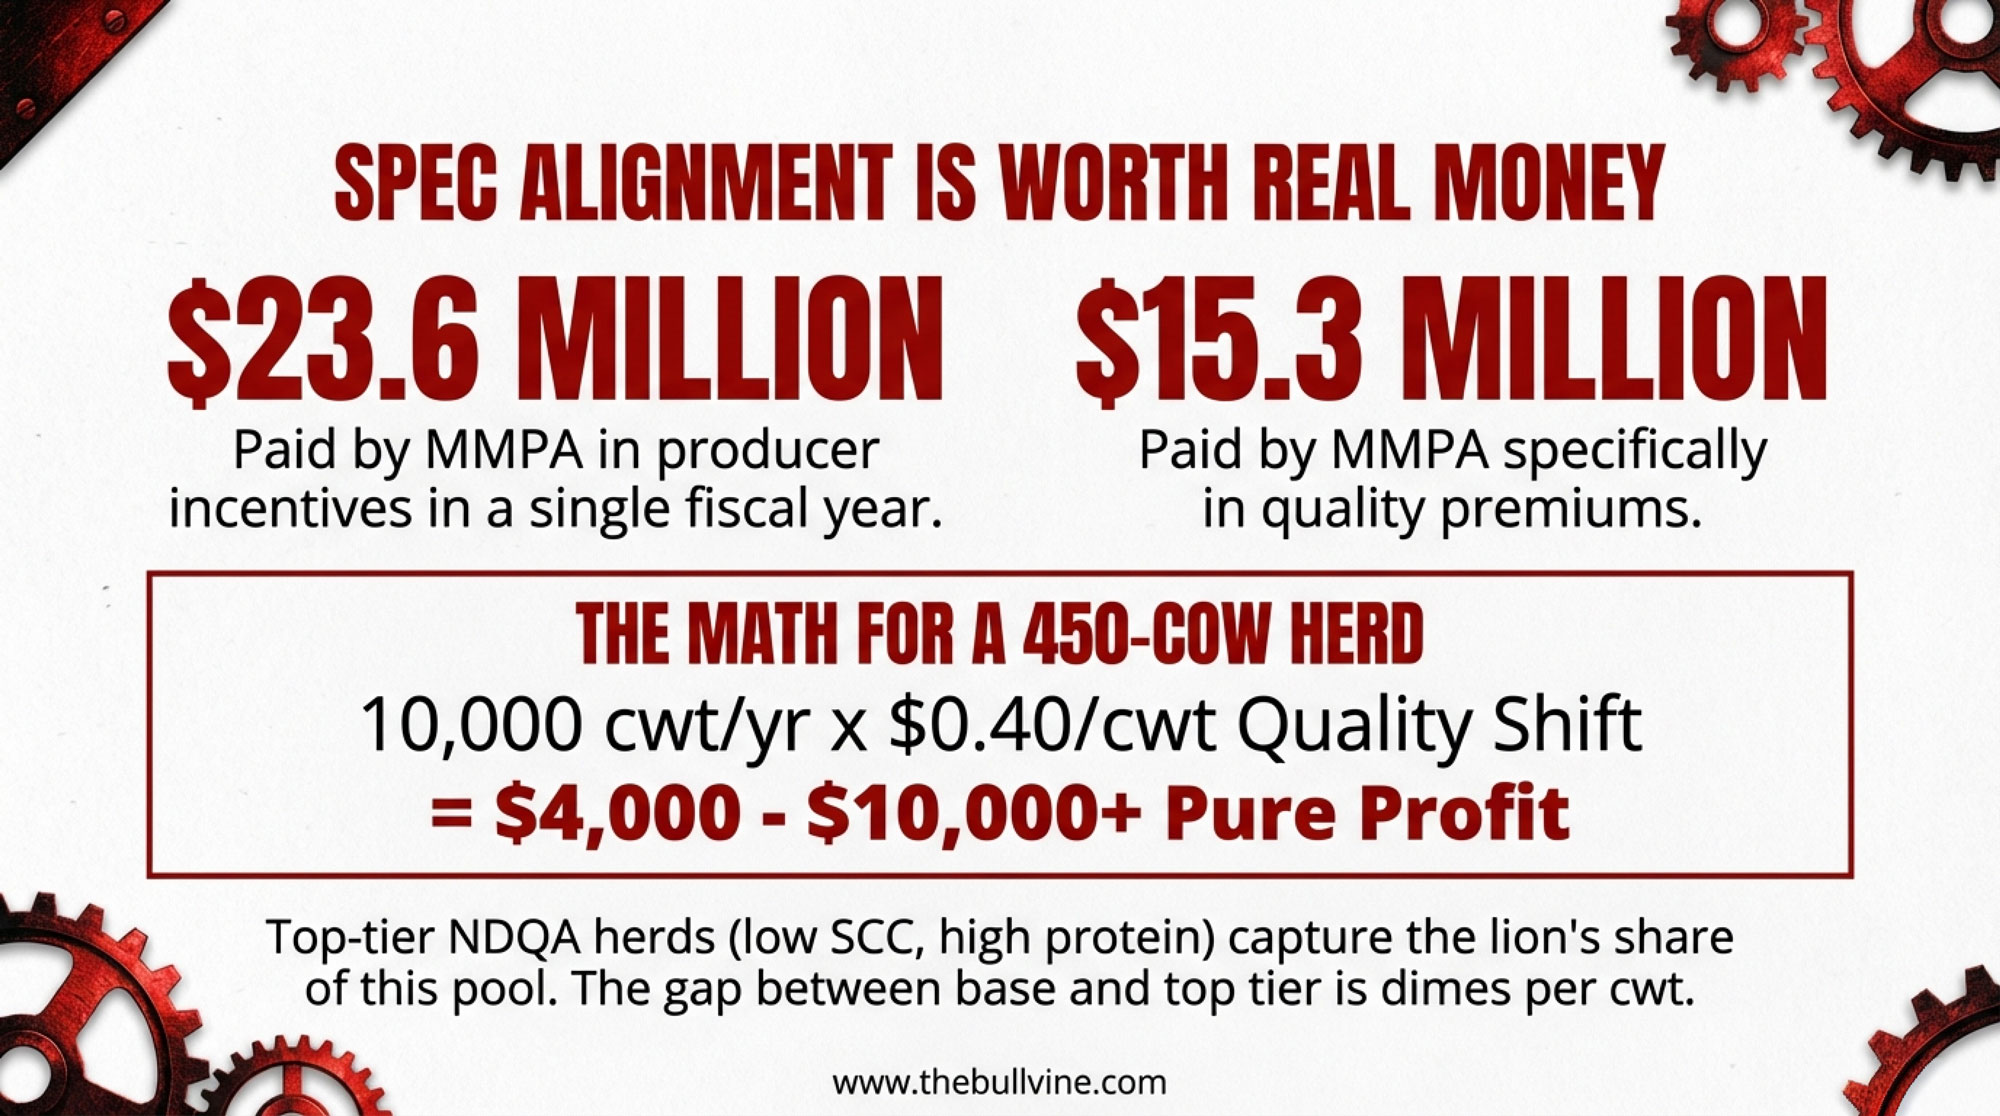
Those results sit on top of serious money. MMPA reports that in fiscal 2021, total producer incentive premiums, including quality, totaled $23.6 million. Separate coverage notes that in another year, the co‑op paid about $15.3 million specifically in quality premiums. That’s not coffee money — that’s a major re‑allocation of value inside the co‑op from “base” milk to higher‑spec milk.
When you look at numbers like that and how typical premium grids are structured, it’s realistic in strong quality programs for top‑tier SCC and bacteria performance to be worth on the order of a few dimes per cwt more than base milk, especially once you stack co‑op premiums on top of how quality plays into the federal order price. The exact spread depends heavily on your grid and your year, but the magnitude is real.
Let’s run one grounded example, just so the math isn’t abstract:
- 450‑cow herd.
- 23,000 lb shipped per cow per year.
- That’s about 10,000 cwt of milk a year (23,000 × 450 ÷ 100).
If that herd shifted quality far enough to pick up an extra $0.40/cwt in quality premiums compared to where they sit today, that’s:
- 0.40 × 10,000 cwt = $4,000 per year in additional revenue.
That 40¢ is just a placeholder — you need to pull out your own premium sheet, look at where your SCC/bacteria performance has sat for the last 12 months, and calculate the actual difference between your performance and the next tier up. In some programs, that gap might be only 15–20¢; in others, it might be more than 50¢. The point is simple: there’s real money on the table, and spec alignment decides who gets it.
Cheese‑Heavy vs Fluid‑Heavy: Same Pressure, Different Rules
These spec fights don’t land the same way in every region.
In cheese‑heavy regions — think Wisconsin, Idaho, parts of New York, Quebec — spec pressure shows up mainly through casein, P:F ratio, and total cheese yield. Plants there are already asking which herds make their Cheddar, mozzarella, and process cheese perform inside tighter sodium windows without breaking yield or texture.
In more fluid‑oriented regions — parts of the Southeast, states like Florida — the big school milk and ESL players care a little less about cheese yield and more about consistent components, shelf life, and flavor under sugar caps. You still feel the same consolidation math, but it shows up first in which flavored milks and nutrition drinks pass spec, and which herds make those products easy to run.
Across the U.S., the structural backdrop is the same. Summary of USDA data shows that from 2003 to 2023, U.S. milk production climbed from about 170.3 billion lb to 226.4 billion lb — roughly a 33% increase — while licensed herds dropped from 70,375 to 26,290, a 63% decline. Fewer, larger herds with more technology and lower per‑unit costs. That gives processors and co‑ops a lot more freedom to say, “We’re going to lean into these 300 farms that fit our specs — and we’re going to quietly back away from those 50 that don’t.”
Genetics: When κ‑Casein and A2 Actually Belong in Your Plan
Any time specs tighten, genetics buzzwords start floating around: κ‑casein, A2, cheese merit, specialty labels. They all sound good on paper. The real question is where they belong in your actual strategy.
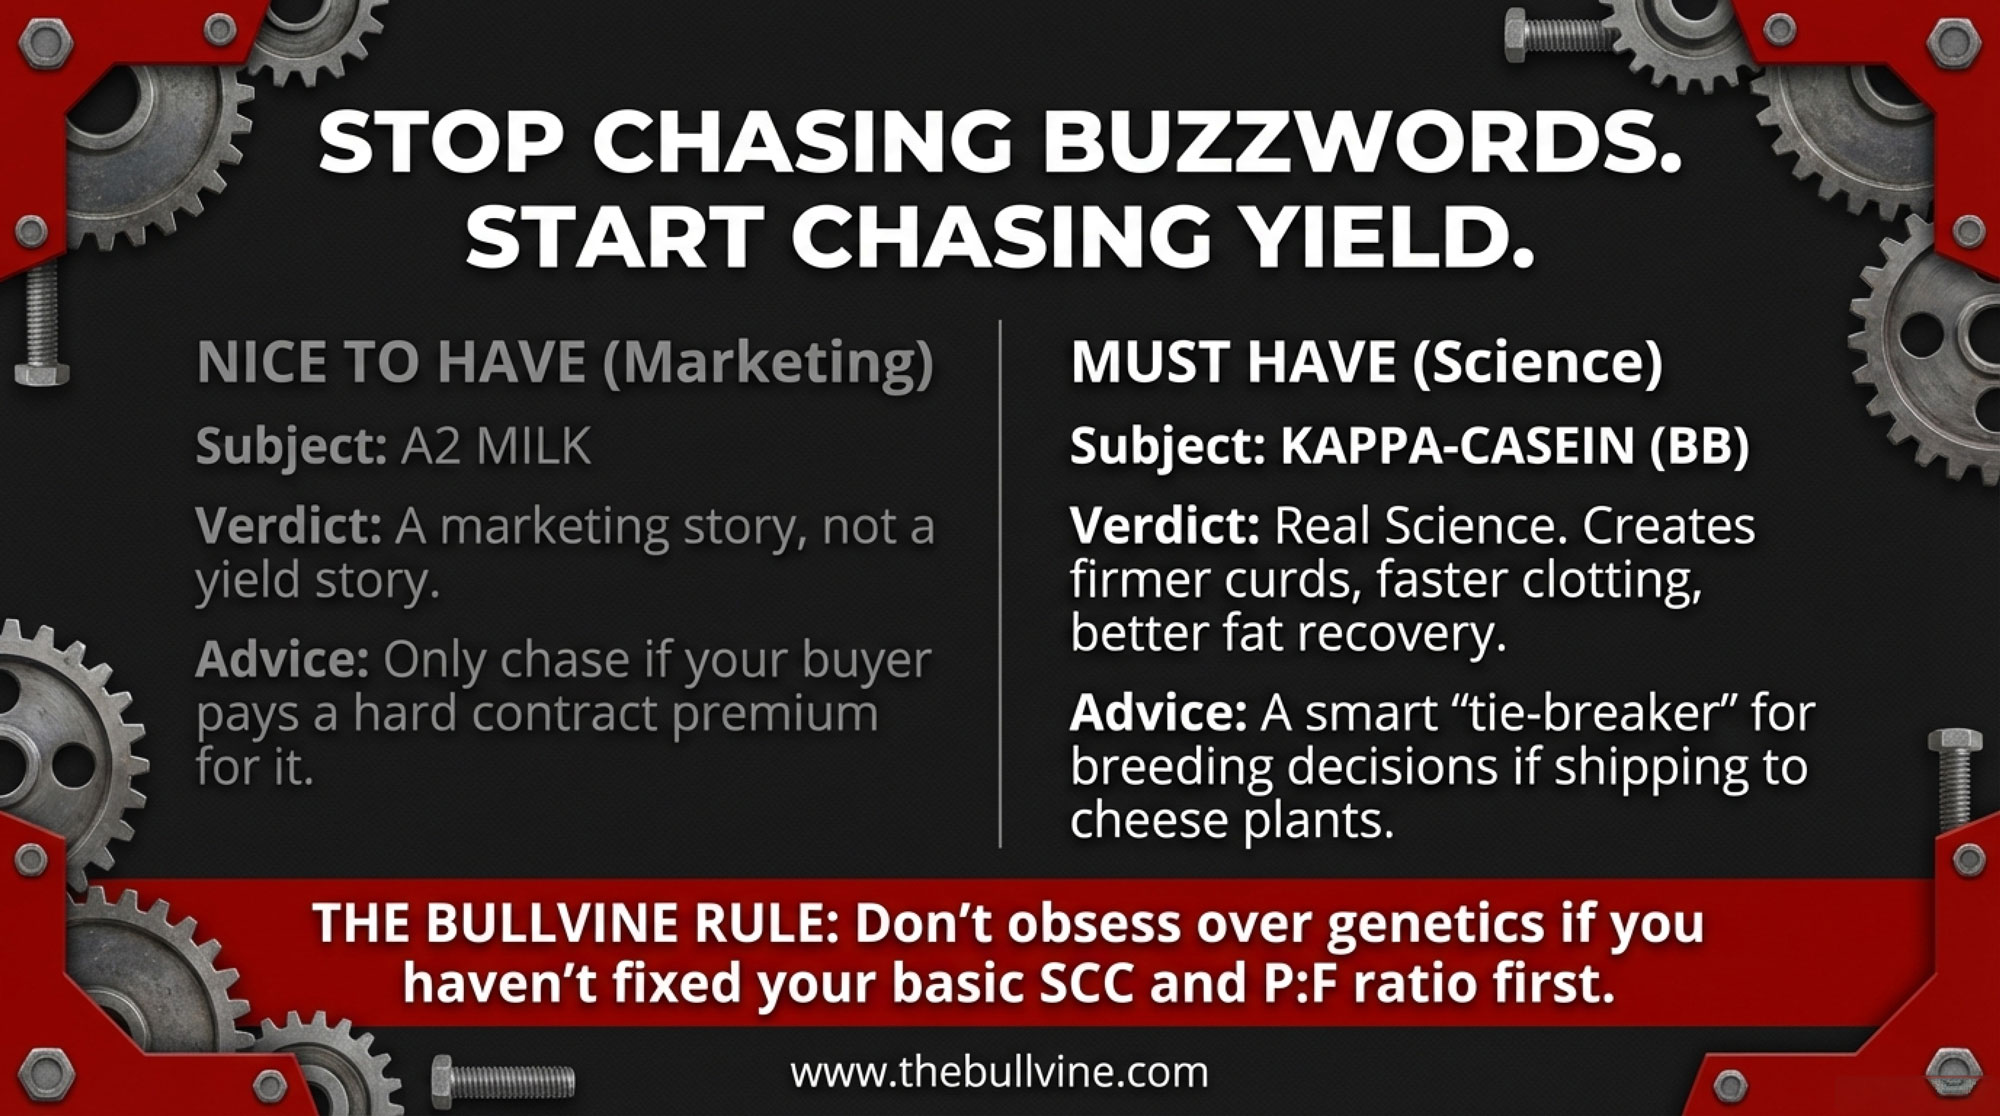
In κ‑casein, multiple dairy science studies across breeds report that BB milk tends to coagulate faster and form firmer curd than AA milk, and can deliver higher cheese yields and better fat recovery in many systems. European extension work and on‑farm trials back up faster clotting and, in some cases, better yields in BB cows — as long as you remember that solids, lactation stage, and management can mute or magnify that edge.
On A2, a 2016 paper in Nutrients found that some milk‑intolerant individuals had fewer gastrointestinal symptoms when drinking A2 milk compared to conventional milk. That’s a marketing and demand story, not a yield bump. It matters if your buyer is actively branding A2‑only products and paying a premium for them. If not, it’s a “nice to have” that sits behind fertility, health, and core components.
| Genetics Focus | When It Matters | When It Doesn’t | The Bullvine Take |
|---|---|---|---|
| κ-Casein BB | – You’re 10+ years from retirement – Shipping to cheese-heavy plant – Bulls otherwise similar on main index | – Within 3–5 years of major transition – Buyer isn’t cheese-focused – Core fertility/health traits still need work | Use as tie-breaker when sires are equal on your main priorities. Multiple dairy science studies show BB milk tends to coagulate faster, form firmer curd, and can deliver higher cheese yields—but only if solids, SCC, and management are already dialed in. |
| 🔴 A2 Genetics | – Buyer is actively branding and paying premiums for A2 products – You have written contract language specifying A2 pricing | – Buyer mentions A2 as “nice to have” but offers no premium – You’re chasing it for generic “marketability” | 🔴 This is a demand story, not a yield story. 2016 Nutrients research found some intolerant individuals had fewer GI symptoms with A2 milk—but that’s meaningless to your bottom line unless your buyer is writing checks for it. Keep fertility, health, and core components front and center. |
| ✅ Protein/Fat/Health Traits | – Always.No exceptions. Every herd, every year. | – Never.These are neversecondary. | If you’re debating κ-casein or A2 before you’ve maxed out fertility, daughter pregnancy rate, SCC genetics, and component consistency, you’re optimizing the wrong end of the curve. Fix the base. Then fine-tune. |
Here’s where genetics really fits in a spec‑tightening world:
- If you’re within 3–5 years of retirement or major succession decisions, the big returns don’t live in chasing κ‑casein or A2. They live in quality, fresh cow management, cost per cwt, and a clean transition plan.
- If you’re thinking 10+ years out in a cheese‑oriented market, it’s reasonable to treat κ‑casein BB as a tie‑breaker when bulls are otherwise similar on your main index — especially if your plant leans hard into cheese.
- A2 should only move up your sire priority list when your buyer is explicitly marketing A2 products and putting real money on the table. Otherwise, keep fertility, health traits, and protein/fat front and center.
What This Means for Your Operation
Here’s where this stops being a policy story and turns into decisions at your kitchen table.
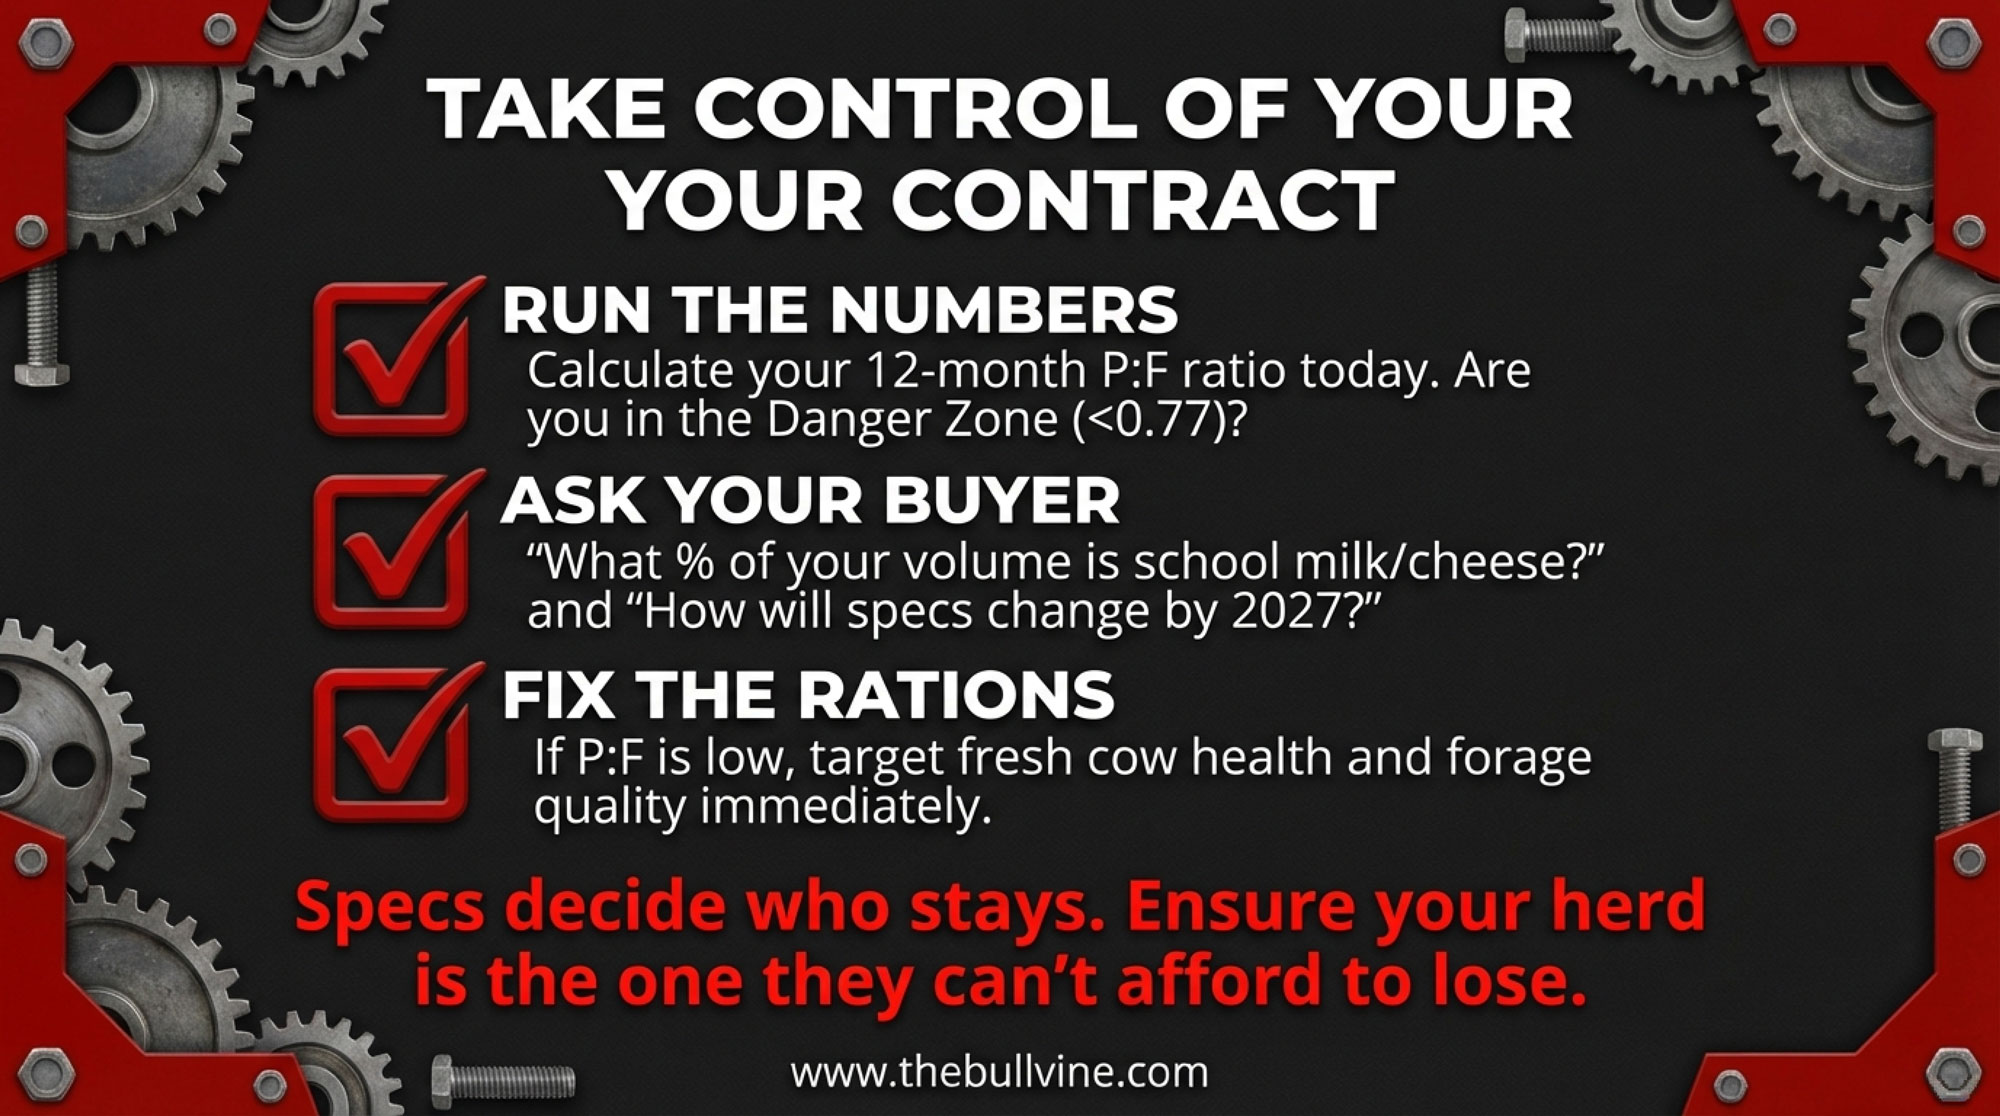
1. Run a 12‑Month Spec Health Check
Once a year — after year‑end or after you file taxes — sit down with your last 12 months of milk checks and your current premium schedule and answer two blunt questions:
- What’s my 12‑month P:F ratio, and does it put me below ~0.77, between 0.77–0.80, or above 0.80?
- Over those 12 months, what percentage of the maximum quality premium my program offers did I actually capture?
If your P:F is below roughly 0.77 in a cheese‑oriented system, that’s a flashing yellow light. Get your nutritionist and vet around the table and talk fresh cow performance, transition, and forage quality — then commit to at least one ration trial or forage test specifically aimed at nudging P:F towards that 0.77–0.80 band.
If your quality‑premium capture sits in roughly the 60–70% or less range of what’s available, you’ve got real money sitting in SCC, bacteria, and milking routines. That’s exactly where NDQA‑level herds make their living.
2. Ask Your Buyer Three Straightforward Questions
In the next week or two, call a field rep, board member, or plant manager you trust and ask:
- Roughly what share of your total volume is tied to school milk, cheese, or yogurt that has to meet these sodium and added‑sugar specs?
- Do you expect your component pricing or quality standards to change over the next 2–3 years because of those specs — and if so, how?
- What do your most spec‑aligned herds tend to look like on protein, butterfat performance, SCC, and overall quality?
If they tell you a third or more of their business is spec‑sensitive school and cheese channels, your spec alignment isn’t a side topic — it needs to move up your strategic list.
3. Be Honest About Which Path You’re On

Looking at your numbers and what you just heard from your buyer, which of these paths are you really on — not the one you wish you were on?
- Optimize. You’re capturing most of the quality premiums — say, north of 80% as a rough benchmark — your P:F is above 0.80 in a cheese plant, debt is manageable, and your buyer wants more milk like yours. Your job is to protect that position and keep sharpening at the margins.
- Reposition. The herd is fundamentally sound, but P:F, SCC, or cost per cwt are holding you back. Your focus is better forage, tighter fresh cow and transition programs, more consistent milking routines, and getting P:F into at least the 0.77–0.80 band while climbing the premium ladder.
- Diversify. You’ve got the scale and risk tolerance for digesters, renewable gas, or modest on‑farm processing — after your base milk is competitive on specs. You gain margin and new revenue streams, but you give up simplicity and take on new market and execution risk.
- Transition. Between debt, distance to plant, and family plans, the smart move may be a managed exit, downsizing, or a simpler setup while equity is still strong. Families who do best here start the conversation early, not after the bank starts it for them.
| Path | Your 12-Month Profile | What It Means | Focus Areas | Risk/Reward |
|---|---|---|---|---|
| ✅ Optimize | – Quality premium capture >80% – P:F ratio >0.80 (cheese) – Buyer says “we want more milk like yours” | You’re already in the “keep” pile—protect that position and sharpen at margins | Maintain SCC/bacteria performance, lock in casein genetics, ask if you’re capturing full available premium | Low risk, steady reward. Your job: don’t slip. |
| ⚠️ Reposition | – P:F ratio 0.75–0.79 – Quality premium capture 60–75% – Fundamentals sound but held back by specs | You’re serviceable but not standout—one ration trial and tighter fresh cow work can move you up a tier | Better forage quality, transition cow protocols, consistent milking routines, target P:F ≥0.77, climb quality ladder | Moderate risk, high reward. You can win this. |
| 🚀 Diversify | – Already “optimize” on base milk – Scale and risk tolerance for new revenue – Willing to trade simplicity for margin | You add digesters, renewable gas, or modest on-farm processing after base milk is competitive | New revenue streams, environmental story, margin stacking—but requires capital, management bandwidth, market execution | Higher risk, higher reward.Don’t diversify fromweakness. |
| 🚨 Transition | – Debt load high – Distance to plant a problem – Family/succession unclear – Specs feel out of reach | Smart move may be managed exit, downsizing, or simpler setup while equity is still strong | Start the conversation NOW—before the bank or buyer starts it for you; plan transition with dignity and control | Ignoring this path is the highest risk of all. |
None of those paths is “right” for everyone. The danger is pretending you’re on one path when your numbers say you’re on another.

Key Takeaways
- Specs — not just blend price — are deciding who keeps school milk and cheese contracts. The 2024 USDA school meal rule locks in sodium and added‑sugar limits that push processors toward milk with stronger protein, casein, and quality — and away from herds that make those specs harder to hit.
- Your 12‑month P:F ratio is a cheap early warning light. If you’re shipping into cheese and sitting below about 0.77, that’s a “now” conversation with your nutritionist and vet about fresh cows, rations, and forage quality — not a “someday” project.
- Quality and component premiums are real money, not a rounding error. Co‑ops like MMPA have paid more than $23 million in producer incentive premiums in a single year, with about $15.3 million in quality premiums in another. Spec‑aligned, NDQA‑caliber herds capture a disproportionate share of that pool.
- FMMO reform and specs will collide in your mailbox price. Any changes to make allowances, Class I movers, or pooling rules will hit differently depending on whether your milk helps processors win and service spec‑sensitive school and cheese business.
The Bottom Line
You don’t control the rule. You don’t control the pool. But you do control whether your herd looks like the easiest milk to keep when processors decide who fits their 2027–2031 book of business — or the milk they can live without when specs and margins get tight. The question is simple: when you pull your last 12 months of milk checks, does your P:F ratio, your quality performance, and your premium capture put you in the “optimize” band — or in the pile that needs to catch up before the next round of contracts goes out?
Complete references and supporting documentation are available upon request by contacting the editorial team at editor@thebullvine.com.
Learn More
- 6% Milk at Costco, 4.0% in Your Tank: Who’s Getting the $50,000 Butterfat Premium – You or Your Processor?– Arms you with the exact math and audit steps to capture up to $50,000 in butterfat premiums, ensuring your operation—not just your processor—gets paid for the record-breaking components in your bulk tank.
- The Hidden Contract Clause That Could Cost Your Dairy $55,000 in 2026 – Exposes the hidden liability shifts in 2026 milk contracts and delivers a 30-day action plan to protect up to 44% of your net profit from unlimited allergen-related costs and legal exposure.
- Your Cheese Plant’s New Bacteria Can Run 56% Faster – Why This Technology Decides Which Processors (and Farms) Survive 2030 – Breaks down how gene-edited fermentation is accelerating cheese throughput by 56% and reveals which processing supply chains will thrive—and which herds they will prioritize—as automation reshapes the 2030 dairy landscape.
 The Sunday Read Dairy Professionals Don’t Skip.
 The Sunday Read Dairy Professionals Don’t Skip.
Every week, thousands of producers, breeders, and industry insiders open Bullvine Weekly for genetics insights, market shifts, and profit strategies they won’t find anywhere else. One email. Five minutes. Smarter decisions all week.