Archive for milk quality premiums

Selective Dry Cow Therapy at 240,000 SCC: Are You Saving on Tubes or Losing $6,920?

Seven of Cornell’s 24 SDCT herds bailed on the program once their fresh‑cow mastitis numbers hit the fan. Before you join them, you’d better know which group you’re in.

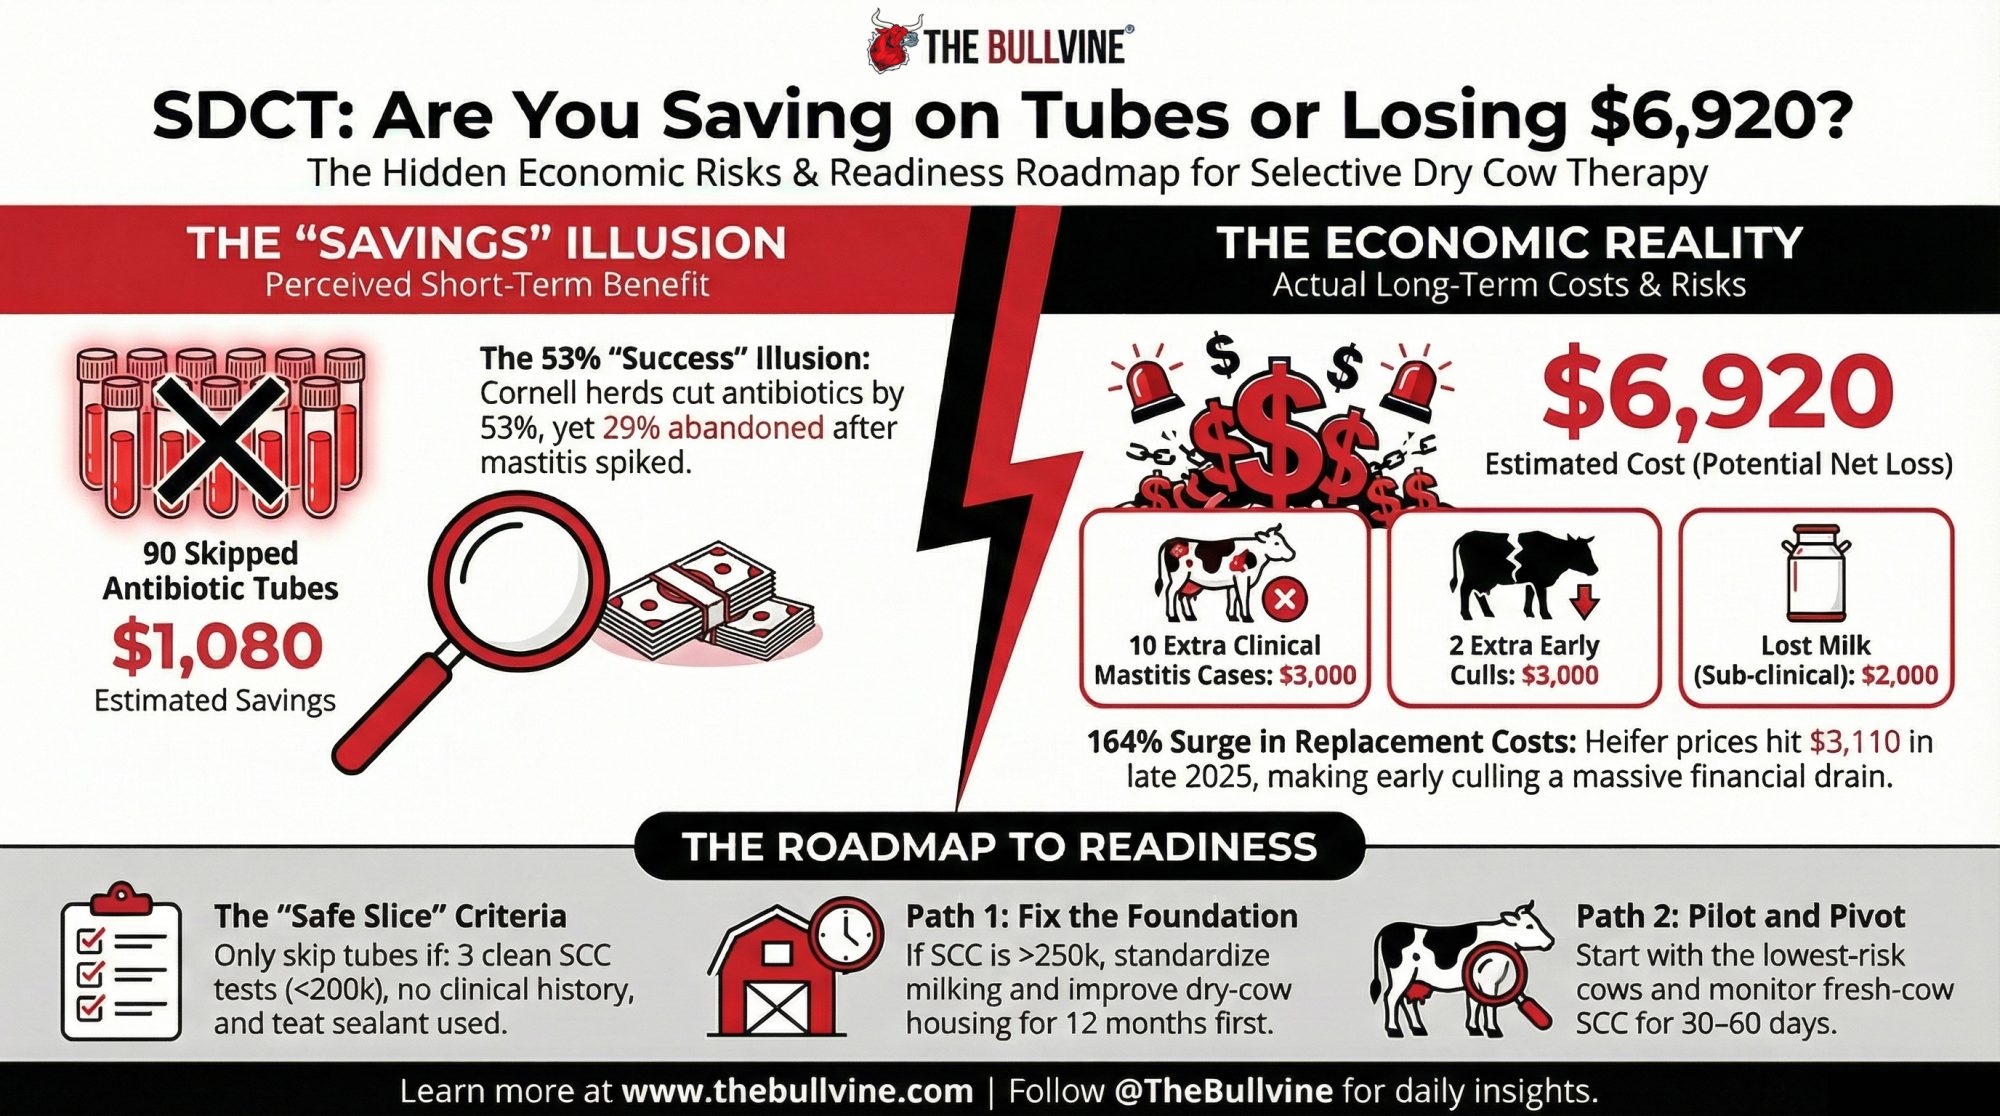
Executive Summary: Herds trying selective dry cow therapy at 240,000 SCC can easily turn “antibiotic savings” into a $6,920 loss on 300 cows once extra mastitis, culls, and lost milk are in the math. Cornell’s 24‑herd SDCT project cut dry‑cow antibiotic use 53% on average, but 7 herds still abandoned SDCT when fresh‑cow mastitis and milk quality slipped. Dutch data shows dairy can cut antimicrobial use roughly 47% without wrecking udder health, but only after years of tightening SCC, housing, and protocols. This piece lays out three realistic paths for higher‑SCC herds under processor pressure: fix infections first, pilot SDCT on the safest slice only, or use that SDCT letter as leverage for a 12–18‑month runway. You’ll see the exact SCC thresholds, AABP readiness criteria, and barn‑math assumptions so you can plug in your own DHIA and cull numbers. If your bulk tank’s been north of 200,000 and your mastitis records are patchy, you’ll likely walk away treating SDCT as a future goal, not a box to tick this dry‑off season.
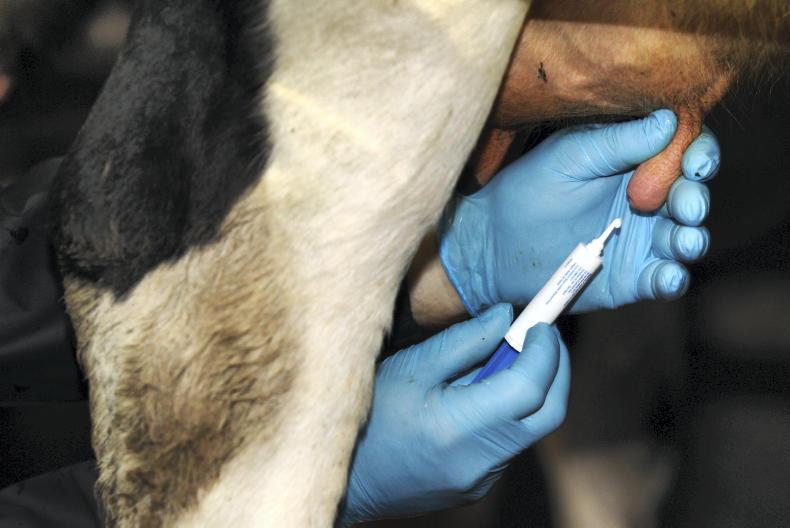
selective dry cow therapy

When The Bullvine first profiled Mystic Valley Dairy’s move to selective dry cow therapy, one detail jumped off the page: a bulk tank somatic cell count around 78,000 cells/mL and a decision to start skipping dry‑cow tubes on some cows anyway.

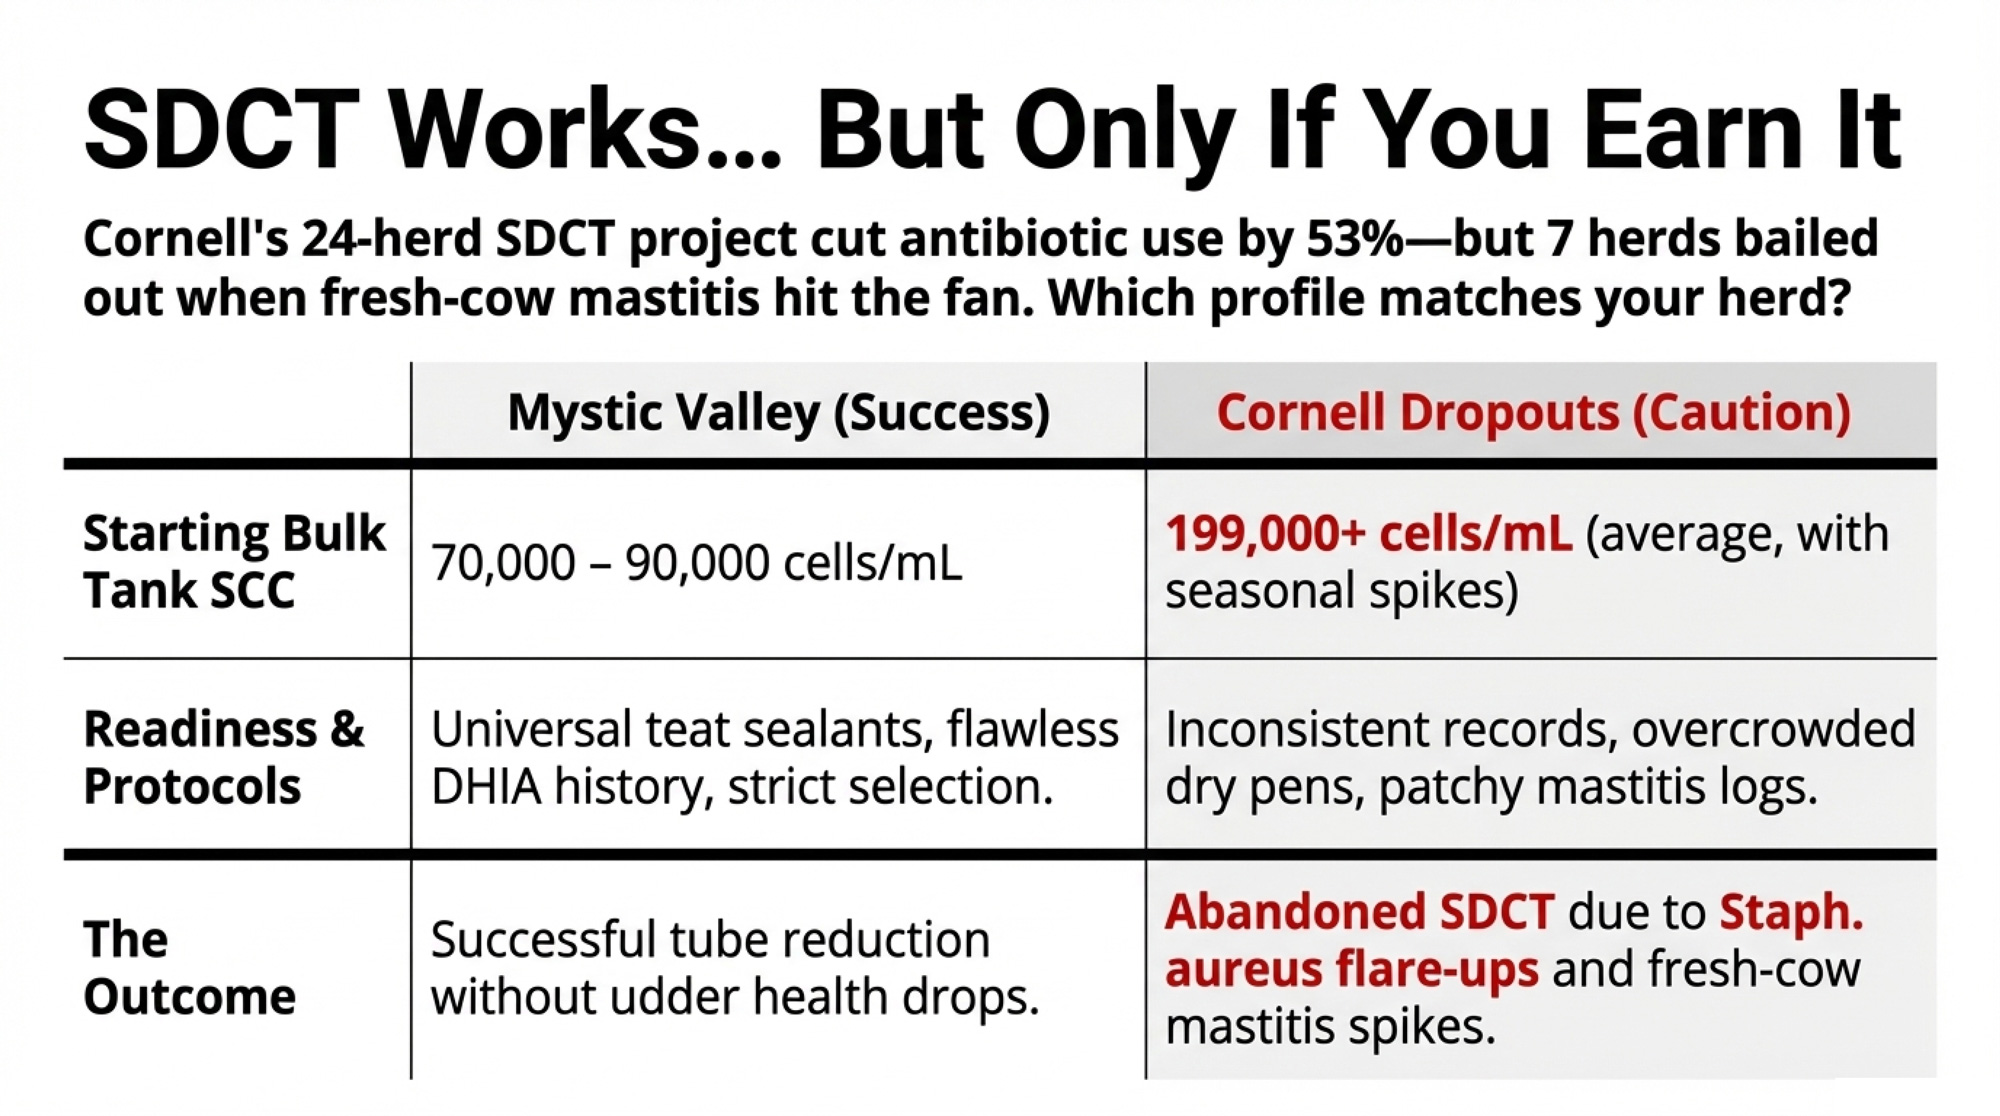
Around the same time, Cornell’s Quality Milk Production Services team was quietly tracking 24 New York herdsthrough their own SDCT transition. Those farms averaged 199,000 cells/mL SCC going in and still managed to cut dry‑cow antibiotic use by 53% on average (range: 32–78%) without wrecking udder health. Put those two stories beside a 240,000‑SCC herd with a processor letter on the kitchen table, and the contrast gets real fast.

Mystic Valley’s SDCT Story: Low SCC, High Scrutiny

Mystic Valley Dairy, Sauk City, Wisconsin, milks about 450 registered Holsteins, with a bulk tank SCC typically ranging from 70,000 to 90,000 cells/mL. In The Bullvine’s earlier coverage, owner Mitch Breunig laid out why a herd with that kind of SCC profile would even consider cutting dry‑cow tubes.
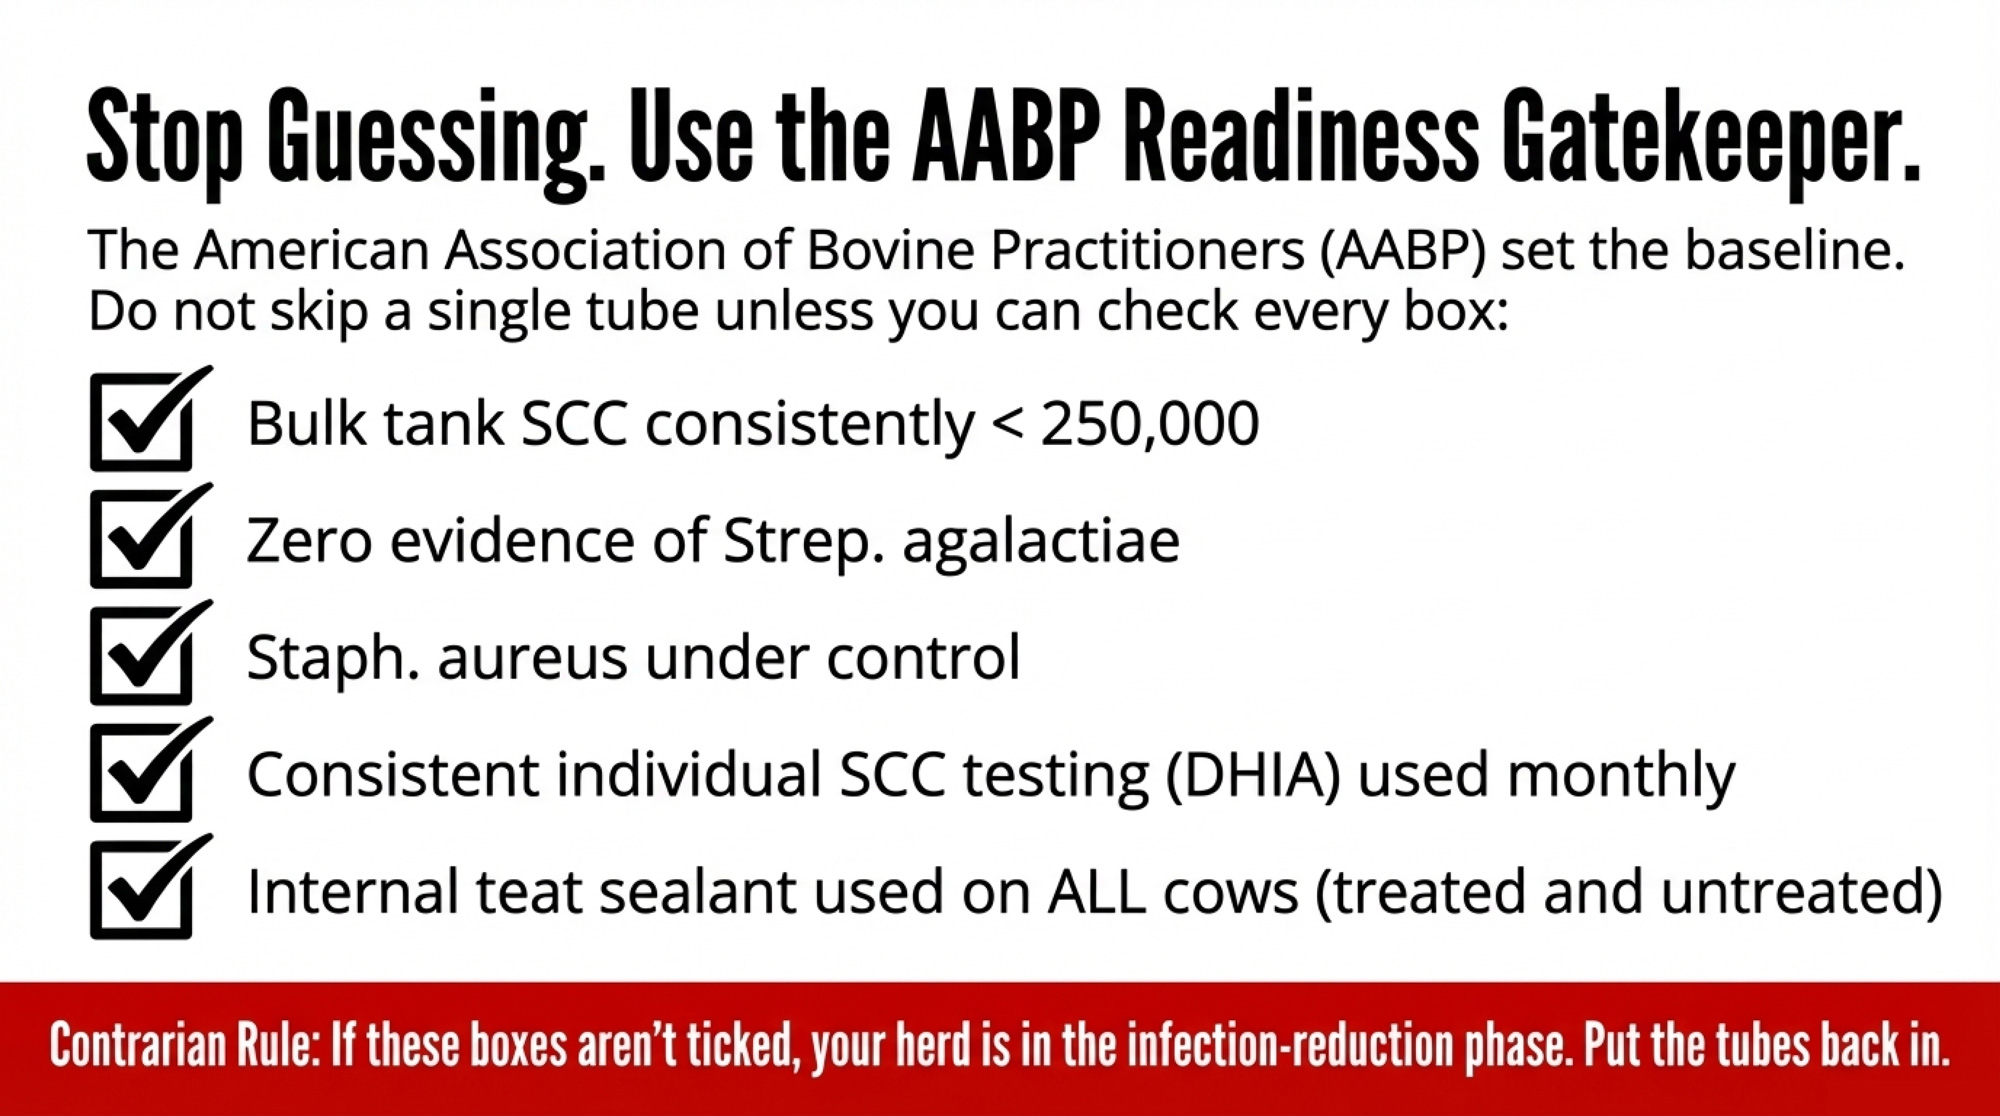
Mystic Valley already ticked every box in the 2024 AABP SDCT readiness guidelines and then some: bulk tank SCC regularly less than 250,000; no evidence of Streptococcus agalactiae; Staphylococcus aureus under control; consistent individual SCC testing; written milking and dry‑off SOPs; and internal teat sealant at dry‑off for all cows. On paper, they looked a lot like the 12 Flemish herds in Lipkens, Piepers, and De Vliegher’s 2023 trial, which had a geometric mean bulk tank SCC of 145,000 cells/mL at enrollment (range: 84,000–195,000; median 157,000) and used teat sealants on every dry cow.

Mystic Valley’s criteria were conservative from the start: cows needed three straight SCC tests under 200,000, no clinical mastitis during the lactation, no flagged problem quarters, and a good‑eyes‑on udder check at dry‑off before they were considered for sealant‑only treatment. Everyone else stayed on full dry‑cow therapy plus sealant.

Even in that low‑SCC, well‑run context, Mystic Valley still saw some early‑lactation cows whose performance raised eyebrows. Those early outcomes led the farm and its vet to tighten criteria further and pay closer attention to which cows truly belonged in the sealant‑only column.

The point isn’t that SDCT was easy for them. It’s that they were operating from a starting point — and with protocols — most 240,000‑SCC herds don’t have yet.

Cornell’s 24 SDCT Herds: 53% Fewer Tubes, Not for Everyone

If Mystic Valley shows what SDCT looks like on a very low‑SCC herd, Cornell’s New York project shows what happens when you put it into a broader mix of operations.
Readiness factorMystic Valley Dairy240,000‑SCC herd under pressure
Bulk tank SCC (cells/mL)70,000–90,000; long‑term <150,000240,000+; bounces 230,000–280,000
Individual SCC data3 consecutive tests <200,000 required for SDCT cowsPatchy DHIA; high‑SCC cows not consistently flagged
Contagious pathogensNo Strep. ag; Staph. aureus under controlStaph. aureus “suspected” or intermittently cultured
Dry‑off protocolWritten SOP; one named dry‑off lead; sealant for all cowsShared between milkers; protocol drift between shifts
Teat sealant use100% of dry cows receive internal teat sealantUsed on “problem cows” only or inconsistently
Housing & dry pensStocking density and bedding managed; low overcrowding (implied by low SCC)Overcrowded, wetter pack; limited capital for upgrades
AABP 2024 SDCT checklistTicks every box and moreFails multiple criteria; SDCT pushed by processor, not data

Potter, Forrestal, Capel, and Nydam’s 2022 AABP paper followed 24 commercial dairy farms across New York State. Herd sizes ranged from 65 to 3,774 cows, averaging 985 cows, with a starting bulk tank SCC of 199,000 cells/mL. Farms worked with veterinarians to use individual cow SCC and mastitis history to decide who received full dry‑cow therapy plus sealant and who received sealant only, and then monitored bulk tank SCC, fresh‑cow SCC, and clinical mastitis as they transitioned.

Across those 24 herds:

  • 53% average reduction in dry‑cow antimicrobial use (individual herds ranged from 32% to 78%).
  • No consistent herd‑level spikes in fresh‑cow SCC or mastitis when SDCT was implemented inside the project’s framework.
  • 17 of the 24 farms still used SDCT at the end of the study period.
  • 7 farms stopped SDCT, citing seasonal milk‑quality challenges, more dry‑period clinical mastitis, or flare‑ups of contagious pathogens such as Staph. aureus.

Cornell didn’t treat SDCT as a universal good or an obvious mistake. They treated it as a tool that fit most of those herds — but not all — even with structured support and monitoring. For a 240,000‑SCC herd being pushed toward SDCT, that nuance matters more than the headline number.

When Selective Dry Cow Therapy (SDCT) Helps — and When It Bites

The published science lines up with what Mystic Valley and Cornell saw.
A 2000–2021 systematic review and meta‑analysis found that selective dry cow therapy can deliver udder‑health outcomes similar to blanket dry cow therapy (BDCT) while reducing antibiotic use — but only in herds with low bulk tank SCC, good mastitis control, and consistent use of internal teat sealants in untreated quarters. Winder et al. (2019, Animal Health Research Reviews) concluded that SDCT increases the risk of intramammary infection at calving compared with BDCT unless internal teat sealants are used; with sealants, IMI risk is similar across strategies.

The Lipkens trial offers a clean real‑world comparison. In those 12 Flemish herds (466 cows; 244 BDCT, 222 SDCT), all cows received an internal teat sealant at dry‑off. Total antimicrobial consumption for udder health between dry‑off and 100 DIM dropped from 1.25 defined course doses (DCD) per cow in the BDCT group to 1.06 DCD per cow in the SDCT group — a 22% reduction — with no significant differences in test‑day SCC, clinical mastitis incidence, milk yield, or culling hazard. Only 33.8% of SDCT‑group cows actually skipped antibiotic tubes at dry‑off, and that share varied widely between herds (6.2–73.9%).

At the national scale, the Dutch experience shows how far antibiotic use can fall when an entire system commits to it. The Netherlands set mandatory reduction targets starting in 2009 and banned preventive antimicrobial use — including blanket dry‑cow treatment — beginning in 2012–2013. Across all Dutch livestock, the result was a 70.8% reduction in kilograms of antimicrobials sold since 2009 (Moura et al., 2022, Frontiers in Veterinary Science). Within the dairy sector specifically, Lam et al. (2020, Pathogens) reported a 47% decline in total antimicrobial usage from 2009 to 2015, after which usage stabilized at around 3 DDDA per cow per year.

Critically, Santman‑Berends et al. (2020, Journal of Dairy Science) monitored approximately 17,000 Dutch dairy herds (about 1.67 million cows) from 2013 through 2017 and found that the ban on blanket dry‑cow therapy drove a 63% drop in dry‑cow antimicrobial usage and a 15% reduction in intramammary treatment overall — with no deterioration in udder health at the herd level. An increase in new high‑SCC cases during the dry period was expected, but as their census data showed, it was not observed.

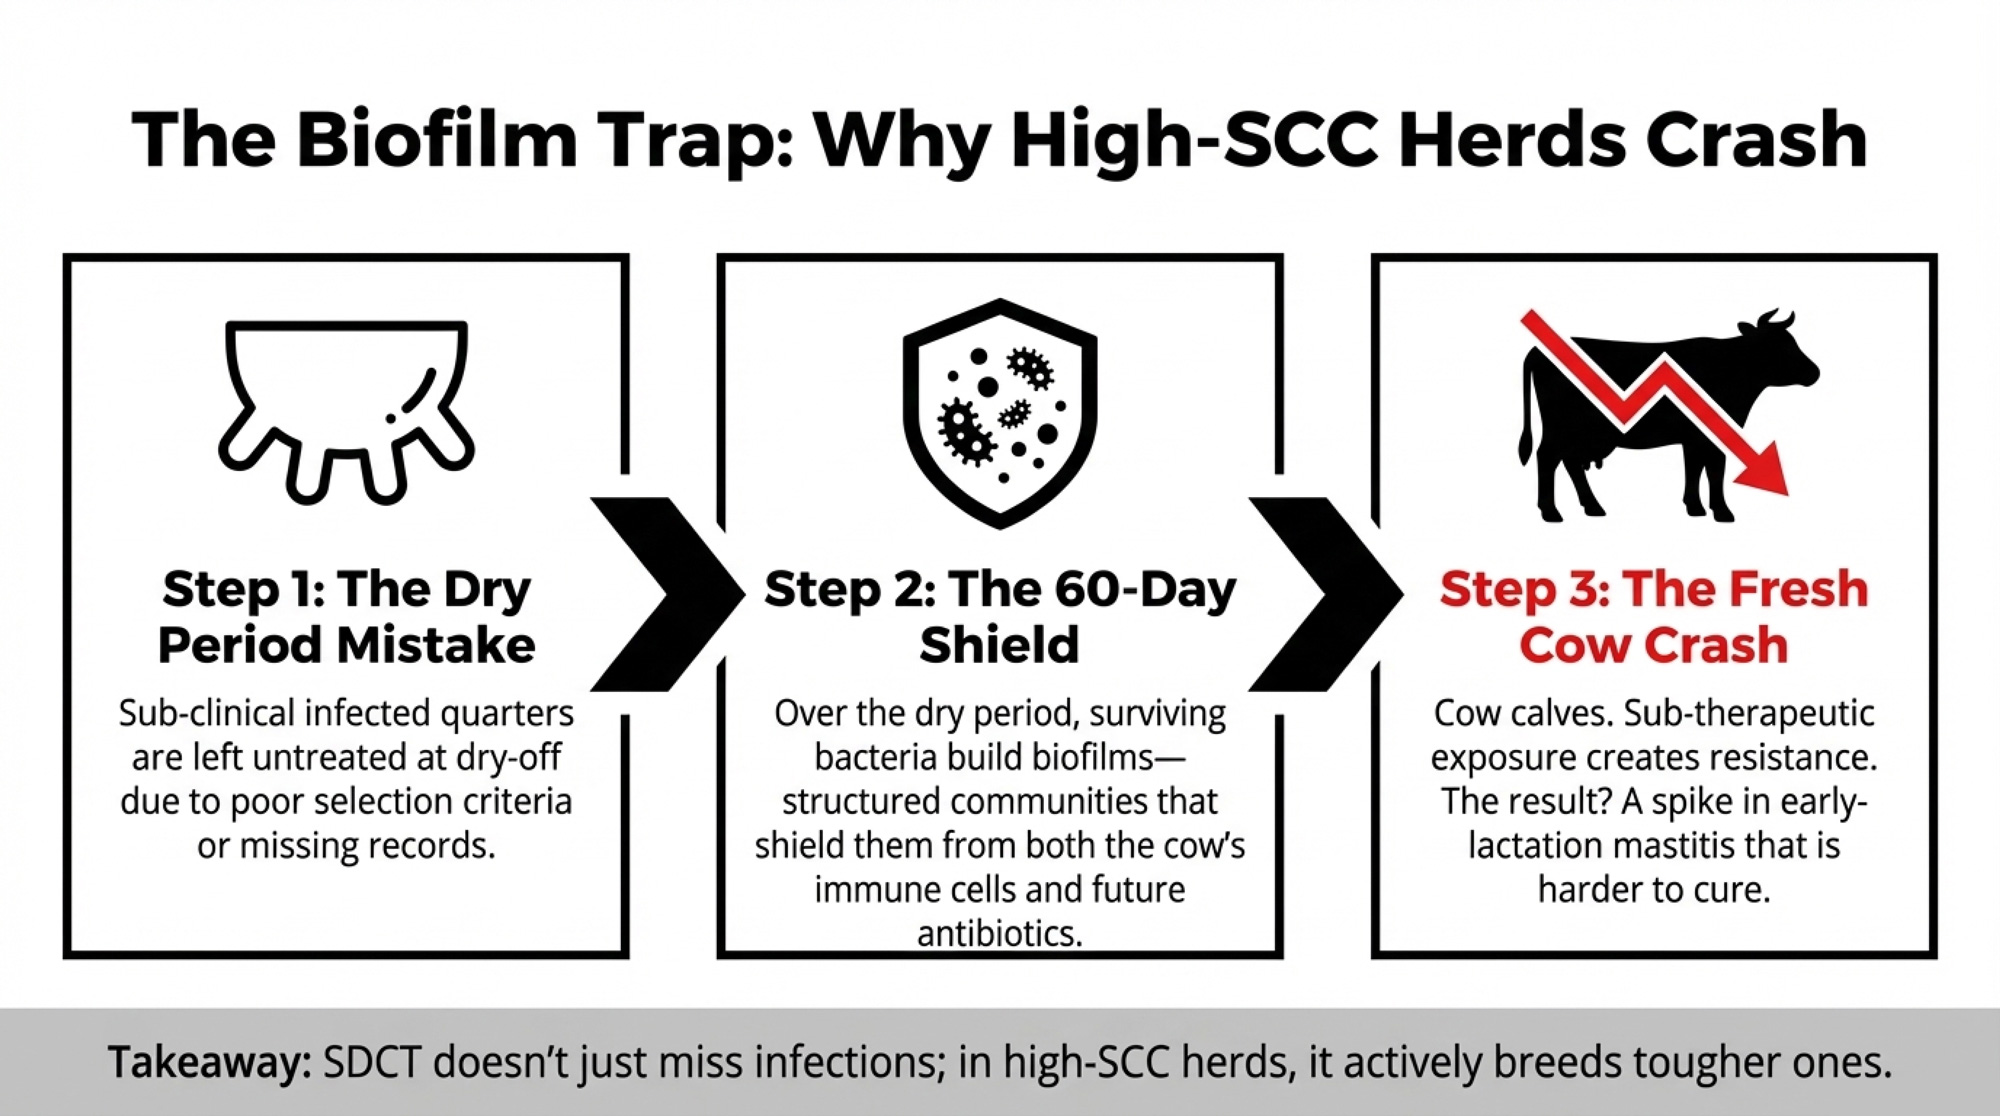
But those same studies underscore a risk that doesn’t appear in tube‑count dashboards: the biofilm and resistance trap. If infected quarters aren’t treated at dry‑off, bacteria have the entire dry period to build biofilms — structured communities that shield them from antibiotics and immune cells. Within those biofilms, resistance genes can move between bacteria more easily via plasmids and mobile DNA elements. When those cows calve and receive intermittent or incomplete lactation treatments, sub‑therapeutic exposure becomes a selection program for resistance.

For low‑SCC herds with solid protocols, that risk is manageable. For a 240,000‑SCC herd with inconsistent records or overcrowded dry pens, it’s a much easier trap to fall into.

Can a 240,000‑SCC Herd Really “Save” on SDCT?

Rollin, Dhuyvetter, and Overton (2015, Preventive Veterinary Medicine) estimated the total cost of a single clinical mastitis case in the first 30 DIM at approximately $444 per case, including lost production, treatment, discarded milk, labour, and culling risk. Other work puts direct costs closer to $120 per case, making a $120–$444 range across studies reasonable.
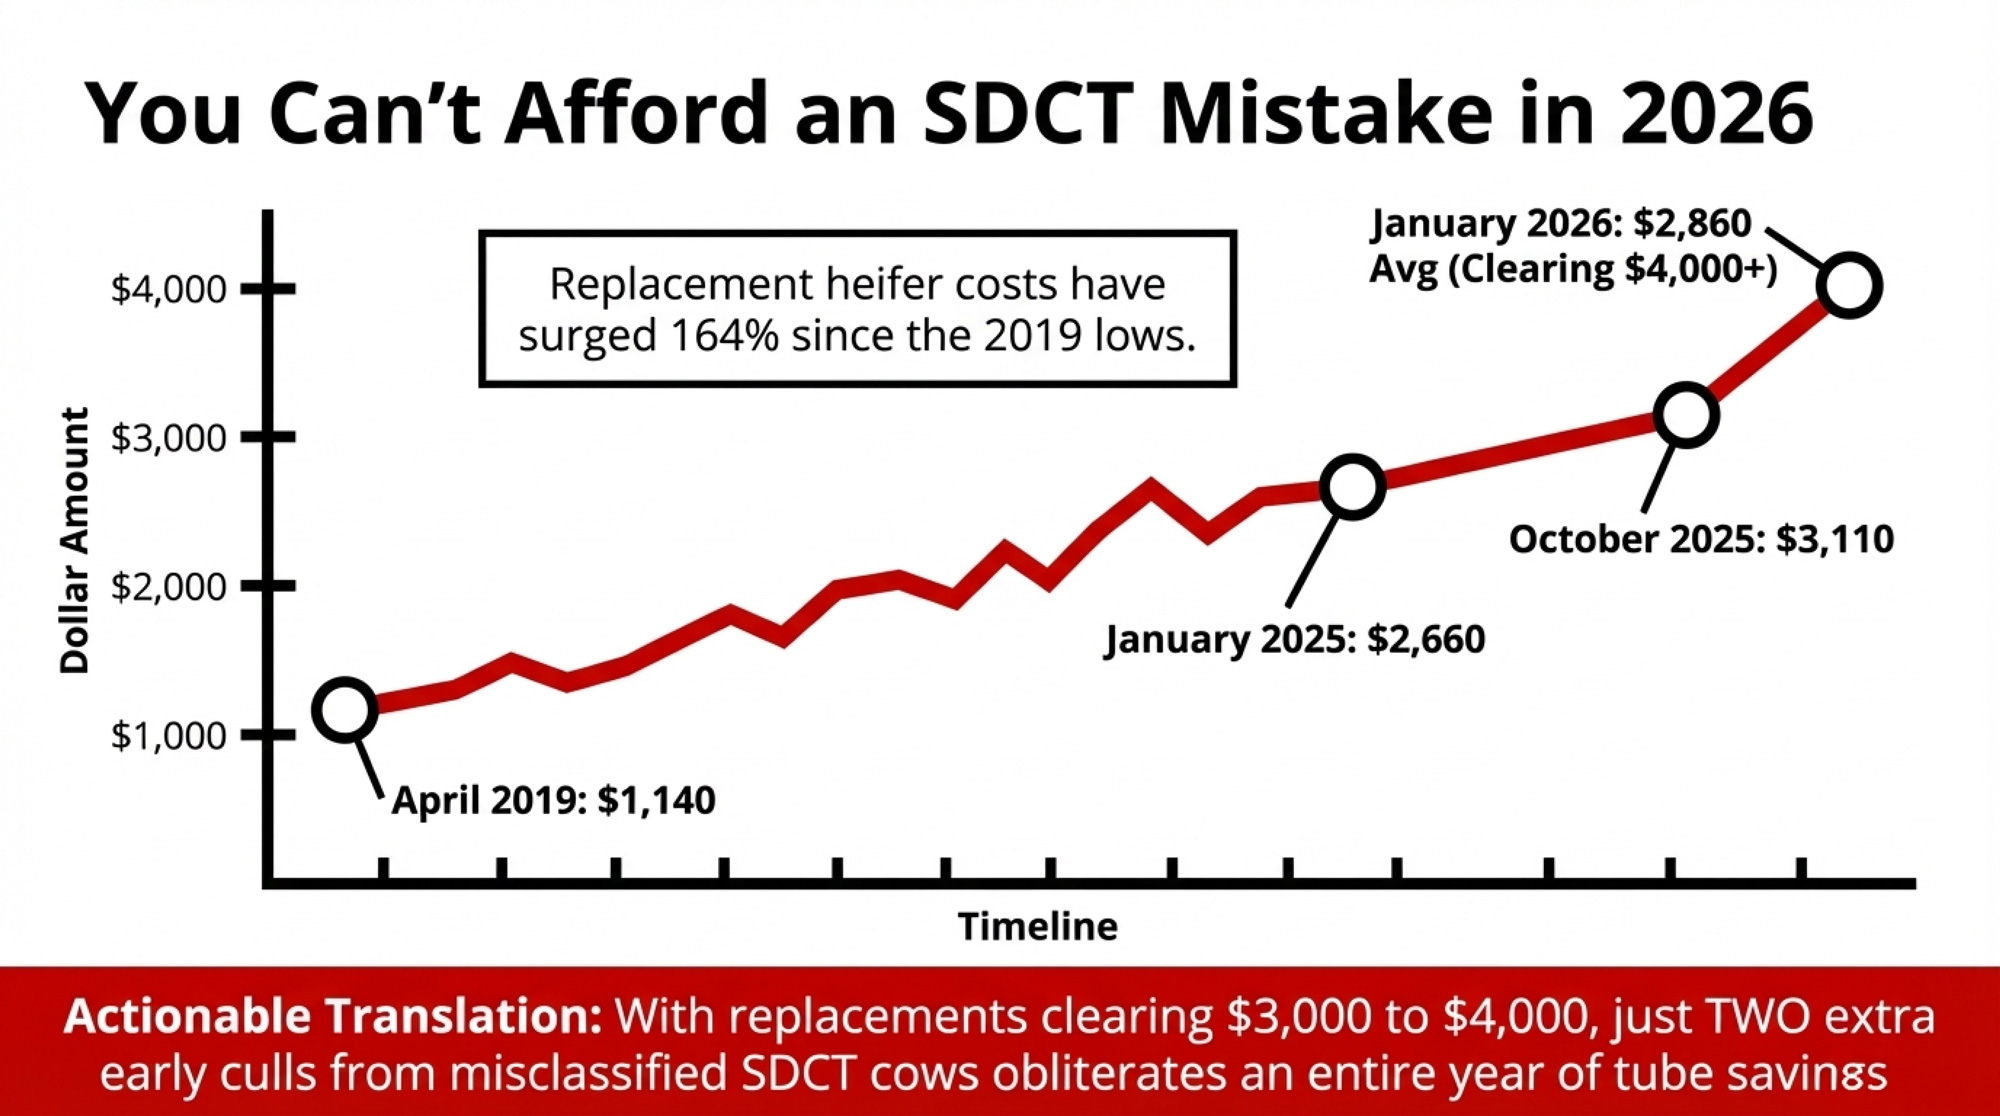
Replacement economics have shifted just as sharply. CoBank and USDA data show:

  • October 2014: dairy replacement heifers at $2,120 per head.
  • April 2019: down to $1,140.
  • January 2025: back up to $2,660.
  • July 2025: $3,010.
  • October 2025: $3,110 — about a 164% increase from the 2019 low.
  • January 2026: USDA average around $2,860, with individual Holstein springers clearing $4,000+ in some California and Midwest auctions.
Cost itemConservative valueCost vs. $1,080 tube “savings”
Clinical mastitis case (first 30 DIM)$300 per case (mid‑range of $120–$444)image.jpg4 cases = $1,200 (already exceeds tube savings)
Sub‑clinical mastitis over lactation~$200 lost milk/premiums per cowimage.jpg6 cows = $1,200 in hidden loss
Net replacement heifer (Jan 2026 avg)$2,860 − ~$1,400 cull value ≈ $1,500 per headimage.jpg+11 early cull = 1.4× tube savings; 2 culls = 2.8×
High‑end Holstein springer (auction)$4,000+ per head in some marketsimage.jpg+11 cull on premium cow = 3.7× tube savings
90 tubes skipped at dry‑off$12 per tube; total $1,080 “saved”image.jpgBest‑case upside, before any mastitis or cull penalties

Now put that together on a 300‑cow herd with a BMSCC around 240,000 that jumps into SDCT before its infection pressure, and records are ready. If your dry‑off person is also your night milker and calf feeder, SDCT will show every crack in that schedule. And if selection criteria or follow‑through miss even a modest number of quiet infections, you can see a bump in early‑lactation mastitis, a couple of cows pushed into earlier culls, and several sub‑clinical cases dragging SCC and milk across the whole lactation.

Here’s what that looks like, using conservative assumptions:
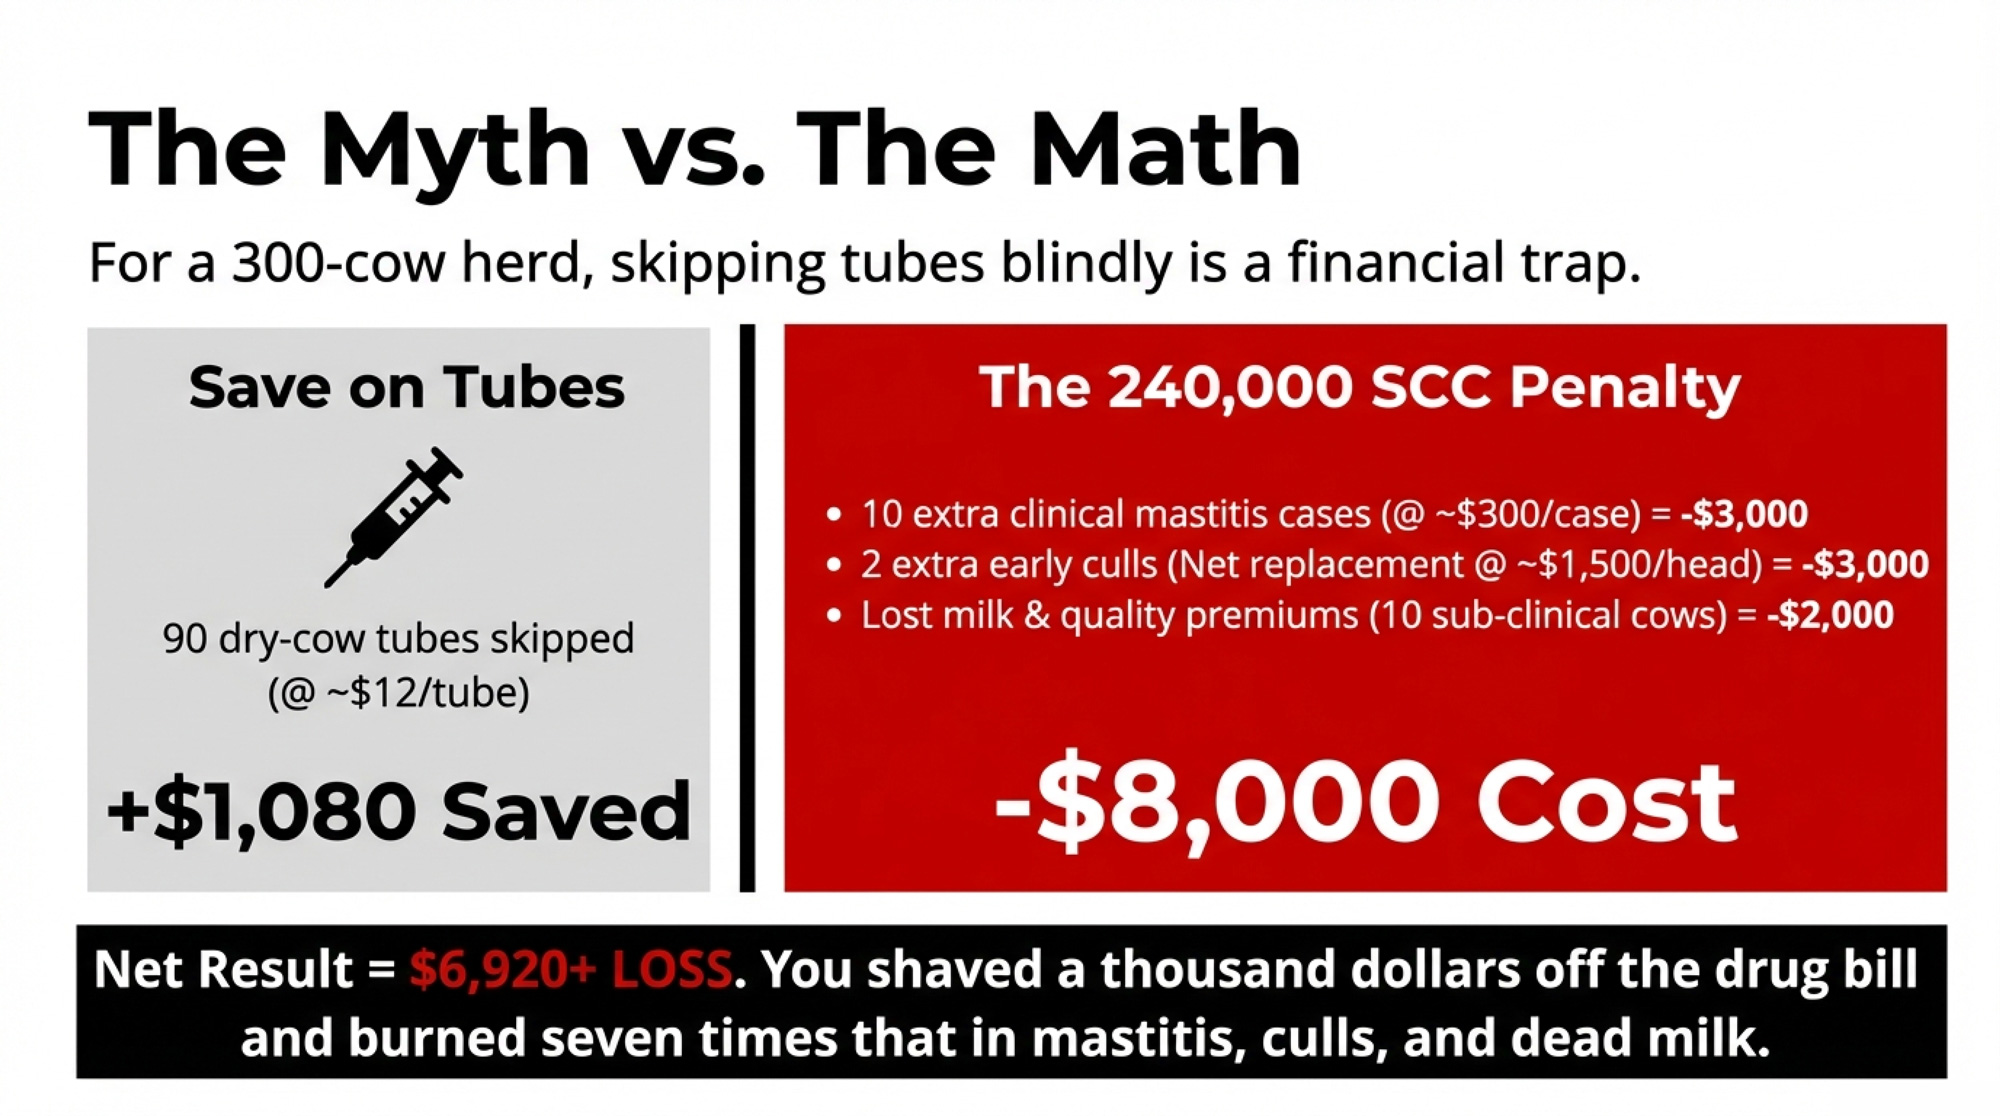
ItemSavingsCost
90 dry‑cow tubes skipped (@ ~$12/tube)$1,080
10 extra clinical mastitis cases (@ ~$300/case)$3,000
2 extra early culls (net replacement @ ~$1,500/head after cull credit)$3,000
Lost milk from 10 sub‑clinical cows (a few hundred dollars per cow across the lactation)≈$2,000
Net result ≈$6,920+ loss

Assumptions: tubes $8–$15 each (long‑acting dry‑cow products) with $12 used here; mastitis cost $120–$444/case, $300 mid‑range; net replacement cost $2,860 USDA Jan 2026 average minus roughly $1,400 cull cow value ≈ $1,500; sub‑clinical cows losing a few hundred dollars worth of milk and quality premiums per cow across a full lactation.

You’ve shaved about a thousand dollars off your dry‑cow drug bill. You’ve potentially burned seven times that in mastitis, culls, and dead milk.

Mystic Valley’s low SCC, universal sealant use, and disciplined selection meant it could adjust early and keep that risk in check. The Cornell herds that stuck with SDCT had similar structures and data feedback loops. A 240,000‑SCC herd without those pieces is betting $6,920+ a year that its infection status and records are better than they really are.

Three SDCT Paths: Matching the Science to Your Herd

The Mystic Valley and Cornell stories don’t say “don’t do SDCT.” They say “do it on the right herds, with the right prep, and be ready to stop if the data turns.”

For a 240,000‑SCC herd with a processor letter, you’ve got three realistic paths forward.
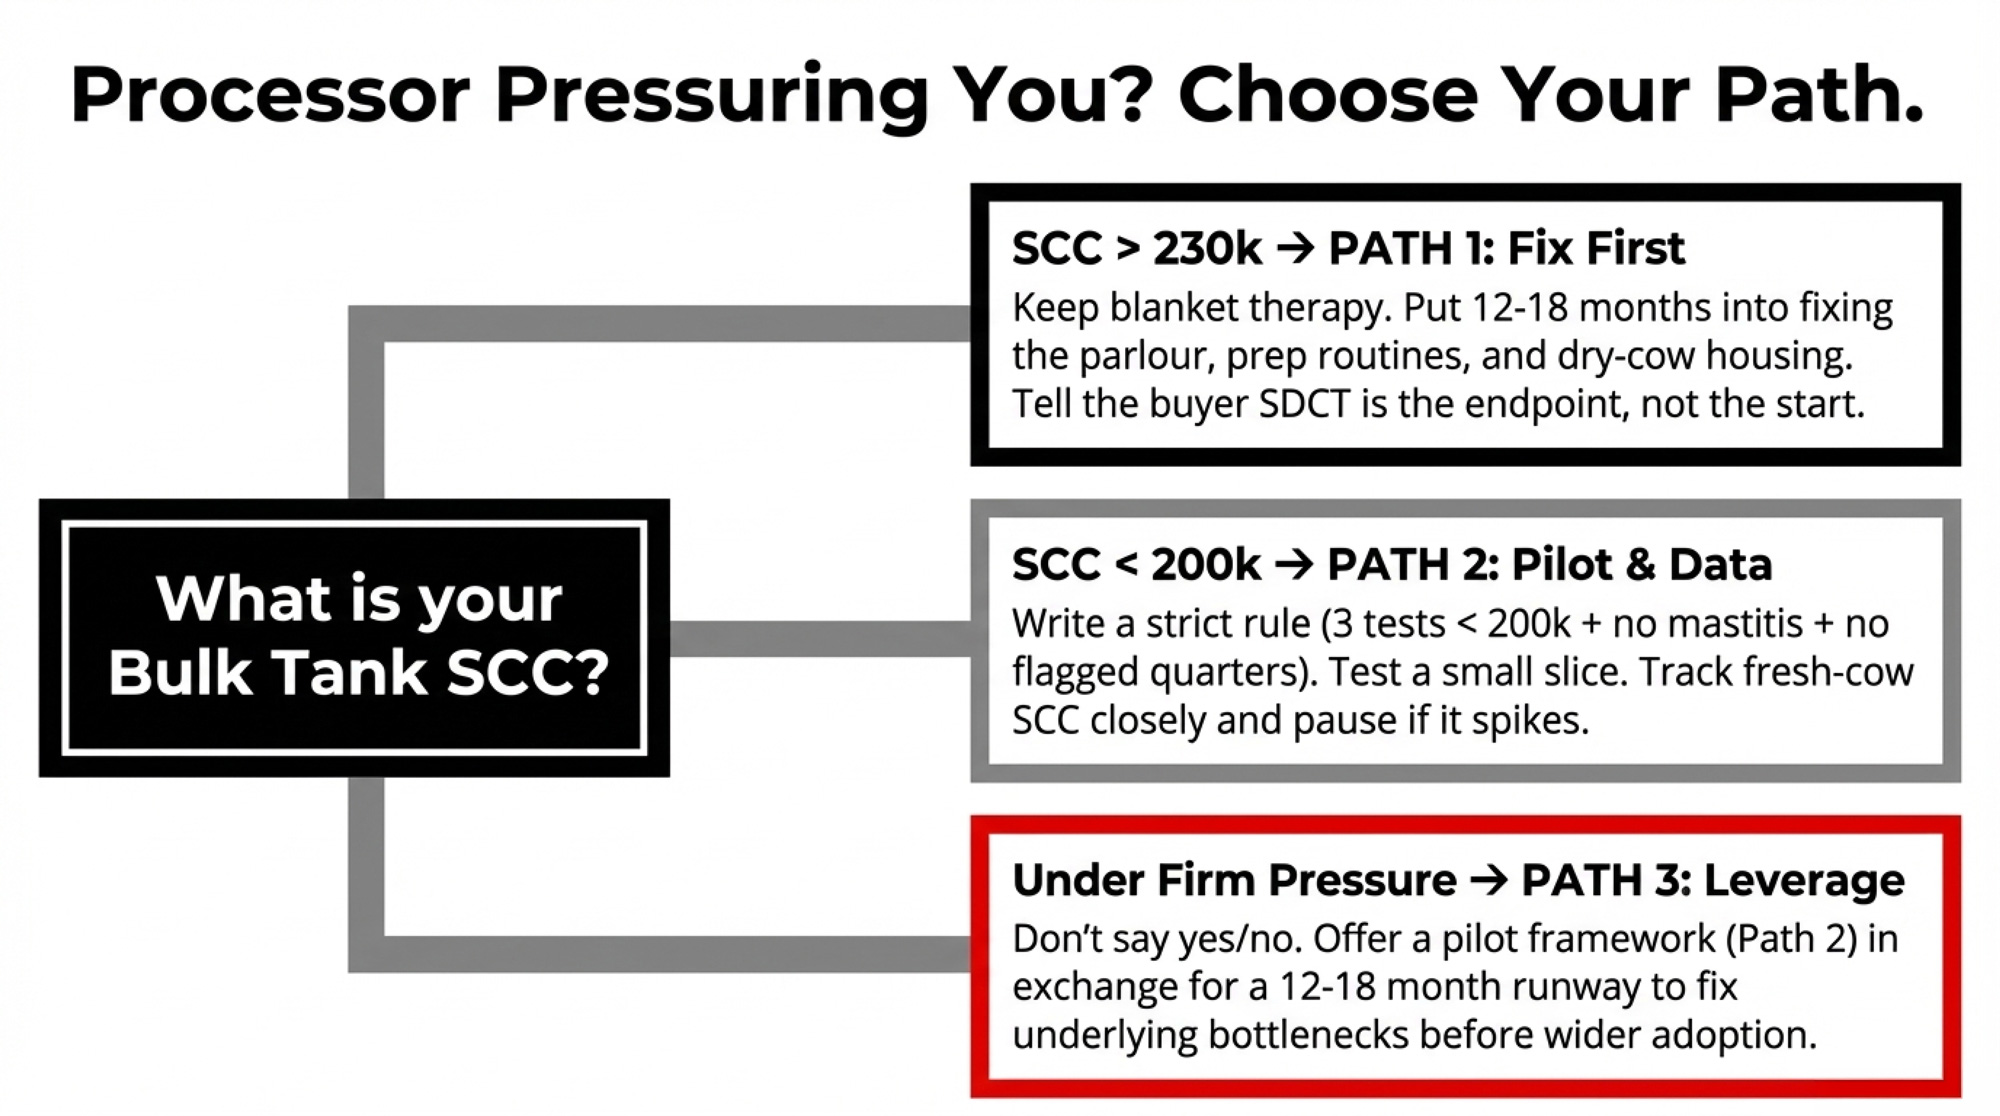
1. Infection‑First: Fix the Foundation Before You Touch Tubes

This fits herds with BMSCC regularly above 230,000–250,000, chronic high‑SCC cows you already know by number, and dry pens that are too full or too wet.

You tell your buyer SDCT is the endpoint, not the starting point. Then you put 12–18 months into:

  • Standardizing milking routines: consistent prep, lag time, and post‑dip across every shift; fix drift in technique between employees.
  • Tuning the parlour: vacuum levels, pulsation, liners, unit alignment.
  • Improving dry‑cow housing: stocking density, bedding, drainage, airflow.
  • Culling or segregating chronics instead of carrying them through another lactation.

You stay on blanket dry‑cow therapy plus internal teat sealant for all cows while you do that work. That’s exactly how the AABP 2024 SDCT guidelines recommend sequencing for herds that don’t yet meet readiness criteria. You’re trading short‑term antimicrobial‑use “wins” for long‑term udder‑health and economic stability.

2. Pilot SDCT on the Safest Slice — and Let the Data Decide

This fits herds with BMSCC trending toward 200,000 or below, reasonably clean records, and a willingness to course‑correct.

With your vet, you write a short, strict rule:

  • Last three SCC tests all under 200,000.
  • No clinical mastitis this lactation.
  • No known problem quarters or chronic flags.

Cows that pass become eligible for sealant‑only at dry‑off. Eligibility isn’t a guarantee — if anyone on the crew has doubts about a cow, she stays on full treatment.

Then you monitor:

  • Fresh‑cow SCC at first test (5–45 DIM), focusing on the percentage over 200,000.
  • Clinical mastitis in the first 60 DIM, clearly tagged by dry‑off treatment group.

The AABP guidelines include specific DairyComp setups to track this. University of Minnesota Extension’s SDCT resources walk through herd‑level readiness and monitoring in plain language. Cornell used similar metrics to sort their 24 herds into “stayed in” and “opted out.”

If your graphs look like the Lipkens and Cornell success herds — stable SCC, no disproportionate mastitis spike among sealant‑only cows — you can cautiously widen eligibility. If they start to look like the seven Cornell herds that stopped, close the gate and go back to Path 1.

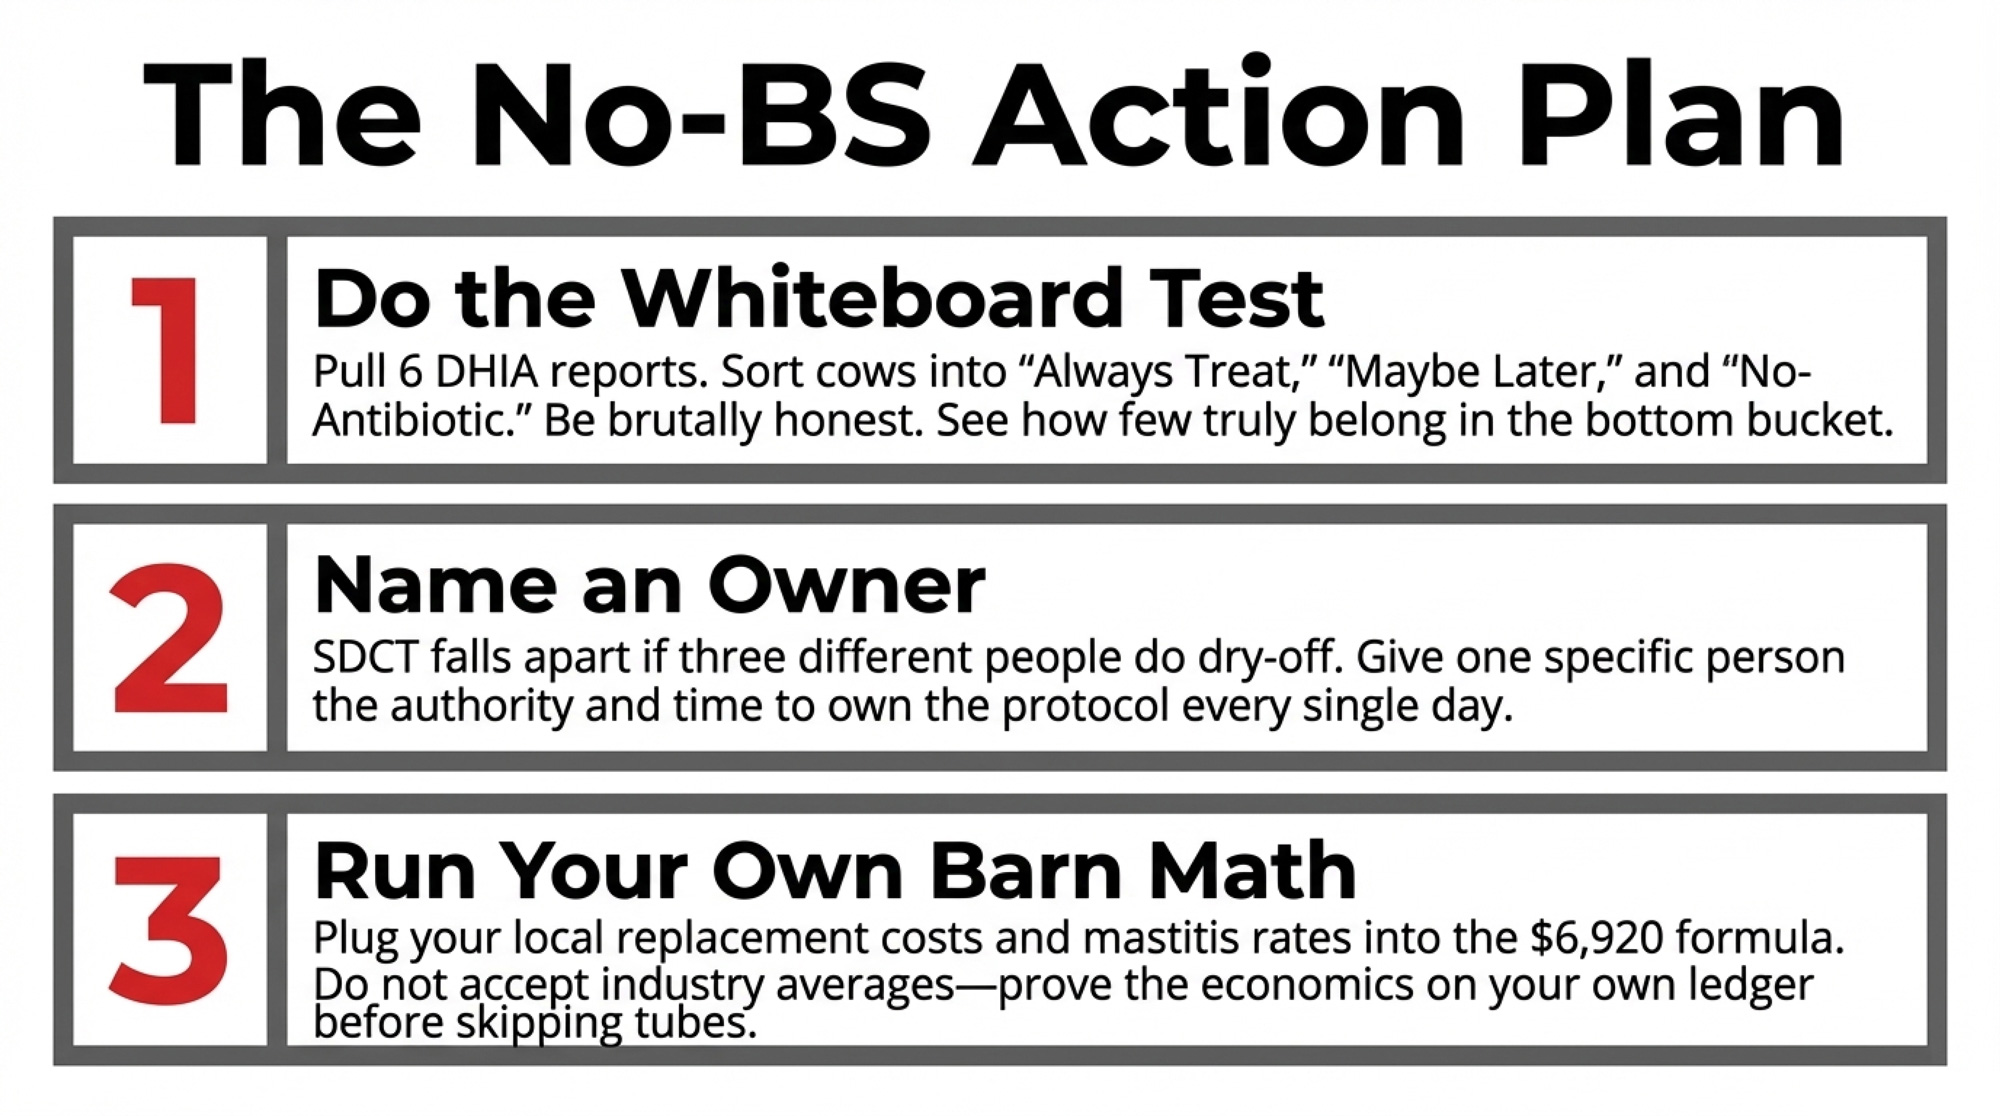
Do this within 30 days: Pull your last six DHIA reports and your current dry‑off list. On a whiteboard, make three columns:

  • “Always treat”
  • “Maybe selective later.”
  • “Pilot no‑antibiotic candidate”

Fill it in honestly. That one exercise will show you how many cows truly belong in the lowest‑risk bucket — and how far your herd sits from one that looks like Mystic Valley or the Lipkens group.

3. Turn the Processor Letter Into Leverage, Not a Deadline

This fits herds that need time and capital to fix underlying issues while facing firm SDCT language from buyers.

Go back to the processor with a framework instead of a yes/no:

  • You’ll pilot SDCT only on the safest slice (as in Path 2) this coming dry‑off season.
  • You’ll report quarterly on the bulk tank SCC trend, the percentage of fresh cows with SCC over 200,000, and the first‑60‑day mastitis incidence.
  • In return, you ask for a 12–18‑month runway to hit agreed improvements in SCC and mastitis, and to address facility bottlenecks, before any push toward wider SDCT.

The Dutch experience backs you up: that 47% dairy‑sector antimicrobial reduction happened over years, not months, and required simultaneous work on management, housing, and monitoring — not just a ban on tubes. A buyer who can show auditors your plan and your numbers is better off than one who forced SDCT onto a high‑SCC herd and then watched the metrics wobble.
What This Means for Your Operation

  • Start with your own SCC curve, not the industry average. If your bulk tank has lived under 200,000 for the last 6–12 months and you can pull a trustworthy mastitis and SCC history for each cow, you’re in the same readiness zone as the Lipkens herds and Cornell’s average SDCT adopter. If you’re swinging 230,000–280,000, you’ve still got infection work ahead of you.
  • Decide who owns dry‑off — by name. SDCT falls apart when three different people “kind of” handle it. One person needs to own that protocol and have enough time and authority to stick to it every day.
  • Use the AABP checklist as your gatekeeper, not your processor’s email. Bulk tank SCC regularly less than 250,000; no Strep. agStaph. aureus under control; individual SCC data; written SOPs; sealant for all cows. If those boxes aren’t ticked, your herd is still in the infection‑reduction phase.
  • Run your own barn math before you skip tubes. At a USDA average of $2,860 per replacement heifer — with individual animals clearing $4,000+ — even two extra early culls from mis‑classified SDCT cows can blow past a full year of tube savings. Put your own numbers into the $6,920 example; don’t just accept the model.
  • Within 90 days: Sit down with your vet and put your last six months of SCC and mastitis data beside the AABP SDCT criteria. Wherever your herd fails on that checklist, that’s where your next management or capital dollar should go.
  • Within 12 months: If you stay on BDCT while fixing management, re‑run your fresh‑cow SCC and first‑60‑day mastitis plots against last year’s. A noticeable step change does more to prove you’re SDCT‑ready than any pledge about tube counts.
Key Takeaways

  • If your herd’s SCC isn’t consistently under ~200,000 and your records can’t reliably sort truly low‑risk dry cows from the rest, SDCT is a future objective, not a current target.
  • If you pilot SDCT, every cow that skips tubes should have three consecutive SCC tests under 200,000, no mastitis this lactation, no problem quarters, and still receive a teat sealant — and you need to track her fresh‑cow outcomes separately from full‑treated cows.
  • If fresh‑cow SCC or first‑60‑day mastitis in your SDCT group climbs above your own baseline, that’s your cue to pause or narrow and invest harder in infection control rather than hoping the numbers settle.
  • If your processor is pushing a hard SDCT timeline, bring them a plan with a pilot cohort, monitoring metrics, and 12–18‑month milestones — not blanket SDCT on a 240,000‑SCC herd that isn’t structurally ready.

The Bottom Line

The herds that will be least stressed by the next round of antimicrobial stewardship rules aren’t the ones bragging about cutting the most tubes. They’re the ones whose data can prove their cows do fine without them.

When you pull up your last year of SCC curves, mastitis logs, and cull codes, do those numbers honestly look like a Mystic Valley‑style foundation for selective dry cow therapy — or are they telling you to keep the tubes while you fix what’s underneath?

Complete references and supporting documentation are available upon request by contacting the editorial team at editor@thebullvine.com.

Learn More

The Sunday Read Dairy Professionals Don’t Skip.

Every week, thousands of producers, breeders, and industry insiders open Bullvine Weekly for genetics insights, market shifts, and profit strategies they won’t find anywhere else. One email. Five minutes. Smarter decisions all week.

NewsSubscribe
First
Last
Consent

The Great Milk Divorce: The $383,000 IOFC Gap Splitting 500‑Cow Midwest Herds Into Upstairs and Downstairs Milk

On a 500-cow Midwest dairy, FMMO and UPF rules can turn the same 425 cwt/day into either solid margins or a $383,000 IOFC hole.

Executive Summary: Federal make‑allowance changes and looming UPF rules are quietly splitting processor milk into “upstairs” and “downstairs” streams, with huge IOFC consequences for 500‑cow herds. Using Illinois FBFM data, the article shows how a 500‑cow Midwest dairy shipping 425 cwt/day can see a $383,000/year swing in income over feed as feed costs rise 10–20% and processors squeeze premiums on UPF‑exposed products. Mark, a composite based on 2024 FBFM economics, sits below full‑cost breakeven at $20 milk once the June 2025 FMMO make‑allowance cuts pull about $0.85–$0.93/cwt from his milk check. Sarah, built from the same regional benchmarks, closes that gap by driving SCC under 200,000, selecting for BB kappa casein and A2/A2, and renegotiating to tie her herd to school, hospital, and clean‑label programs. The piece walks through three IOFC scenarios, a transparent $0.15/cwt “UPF hit” calculation, and the math behind SCC and protein‑variant premiums. It then lays out a 30/90/365‑day playbook so producers can diagnose whether they’re upstairs or downstairs milk today, and what it takes to move up a tier in their buyer’s supply plan.

dairy milk quality premiums

A 500‑cow Midwest operation shipping 425 cwt a day can see about a 3,000/year swing in income over feed depending on which side of the plant its milk lands on. Two forces that have hit in the last nine months are widening that gap fast.

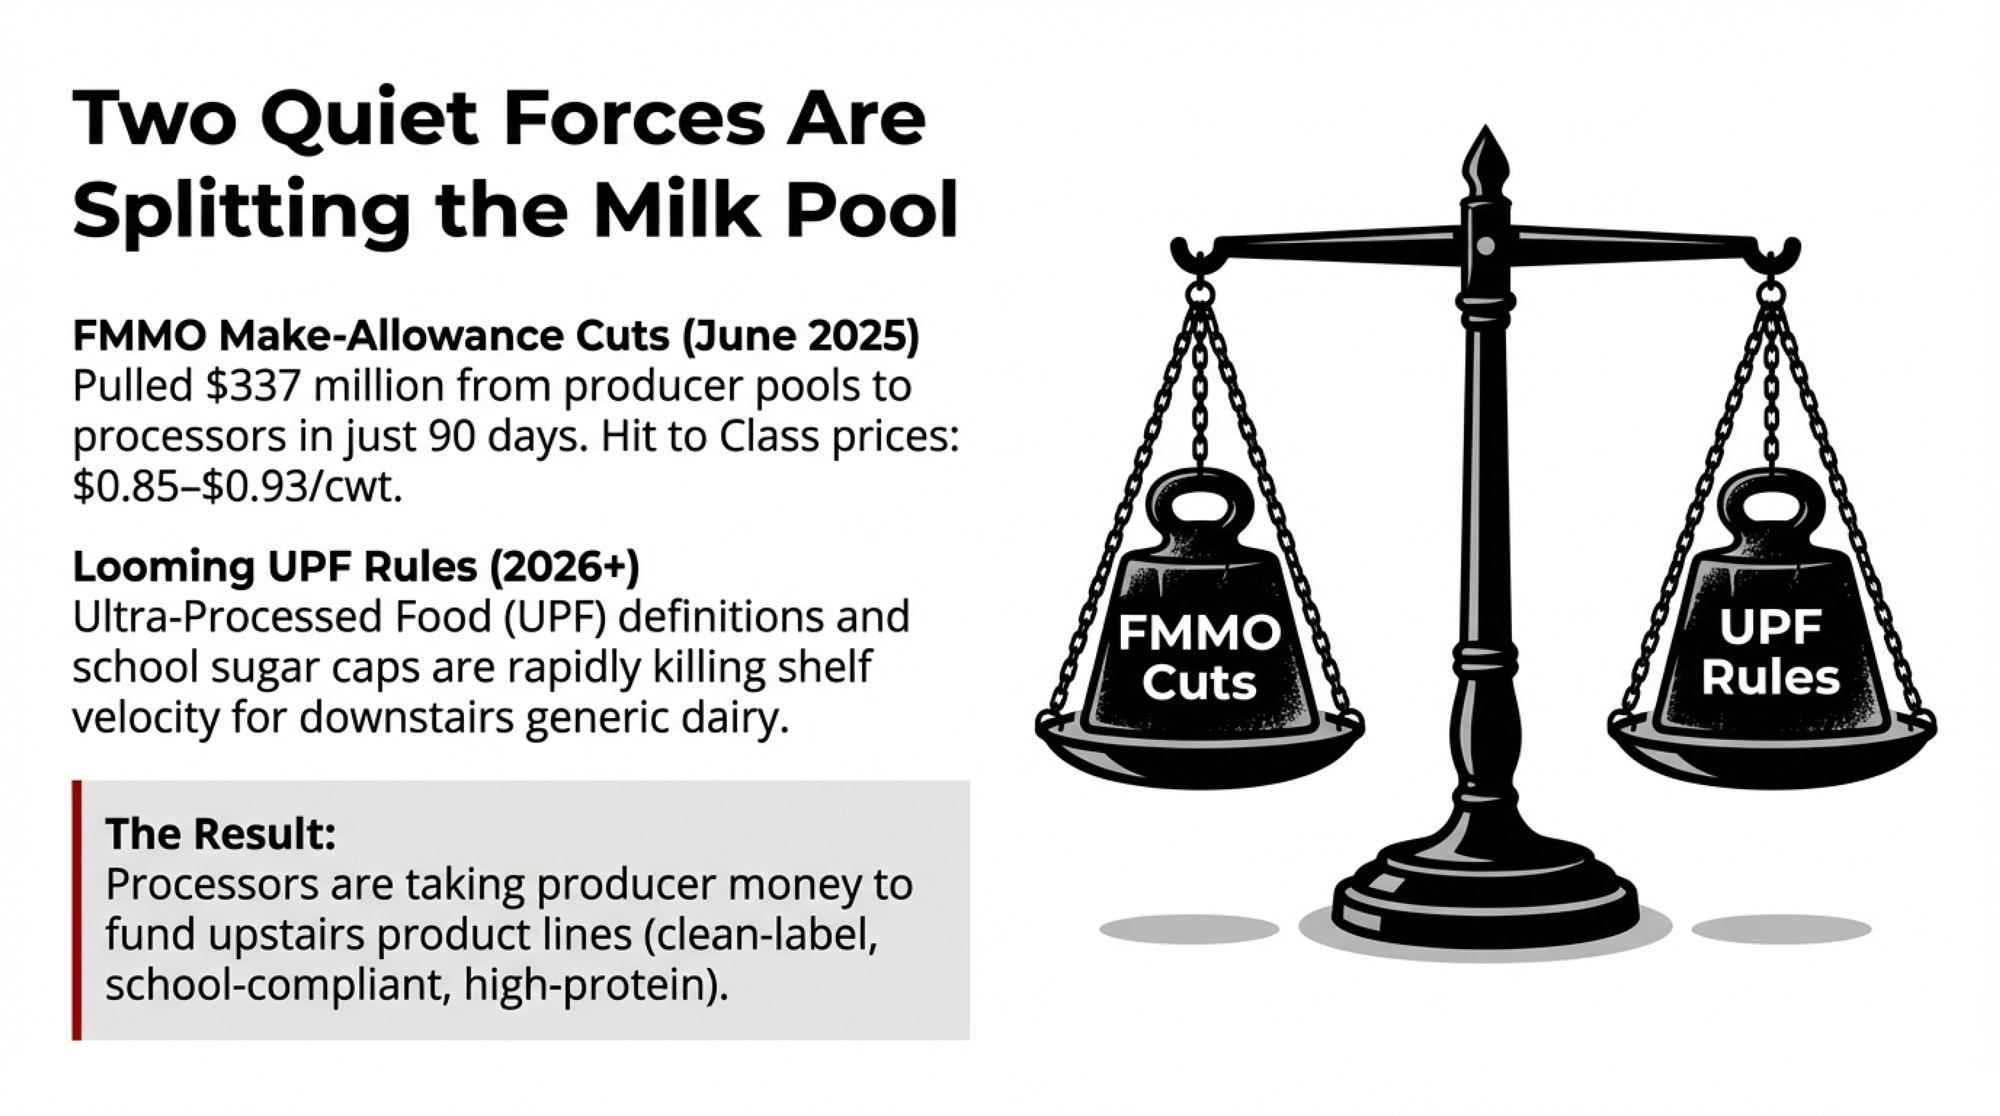
The June 2025 FMMO make‑allowance increase pulled an estimated $337 million from producer pool revenues in its first 90 days, per AFBF economist Danny Munch’s September 2025 Market Intel analysis, with Class price reductions ranging from $0.85 to $0.93/cwt. Now, a federal UPF definition — possibly arriving in 2026, based on HHS Secretary RFK Jr.’s public statements about FDA timelines — could sort every dairy plant’s product lines into “upstairs” (clean‑label, school‑compliant, high‑protein) and “downstairs” (likely to face UPF classification under proposed frameworks, with growing regulatory and market pressure on shelf velocity and margins).

Two composite operators — call them Mark and Sarah — show how that split plays out on real milk checks, benchmarked to Illinois 2024 FBFM data. They’re composites built from regional averages, not real people. But the math is real.

Mark’s Baseline: A Good Herd on the Wrong Side of the Plant

Mark runs 500 cows. Solid management. Reasonable genetics. His milk goes to a regional plant running both institutional and retail/UPF product lines.

His 2024 cost structure comes straight from the Illinois Farm Business Farm Management Association’s annual summary (farmdoc daily, December 18, 2025, Bradley Zwilling):

  • Feed cost: $11.64/cwt
  • Non‑feed costs: $11.92/cwt (a record high)
  • Total economic cost: $23.56/cwt
  • Milk production: 23,530 lbs/cow (up 549 lbs from 2023)

The actual 2024 milk price averaged $21.63/cwt — already $1.93 below total economic cost, costing Illinois producers negative $409/cow for the year. For this analysis, we model a $20.00/cwt milk price — in line with farmdoc’s 2025 projection of approximately $20.15/cwt and USDA’s outlook for further price decreases into 2026.

At $20.00 milk against $11.64 feed cost:

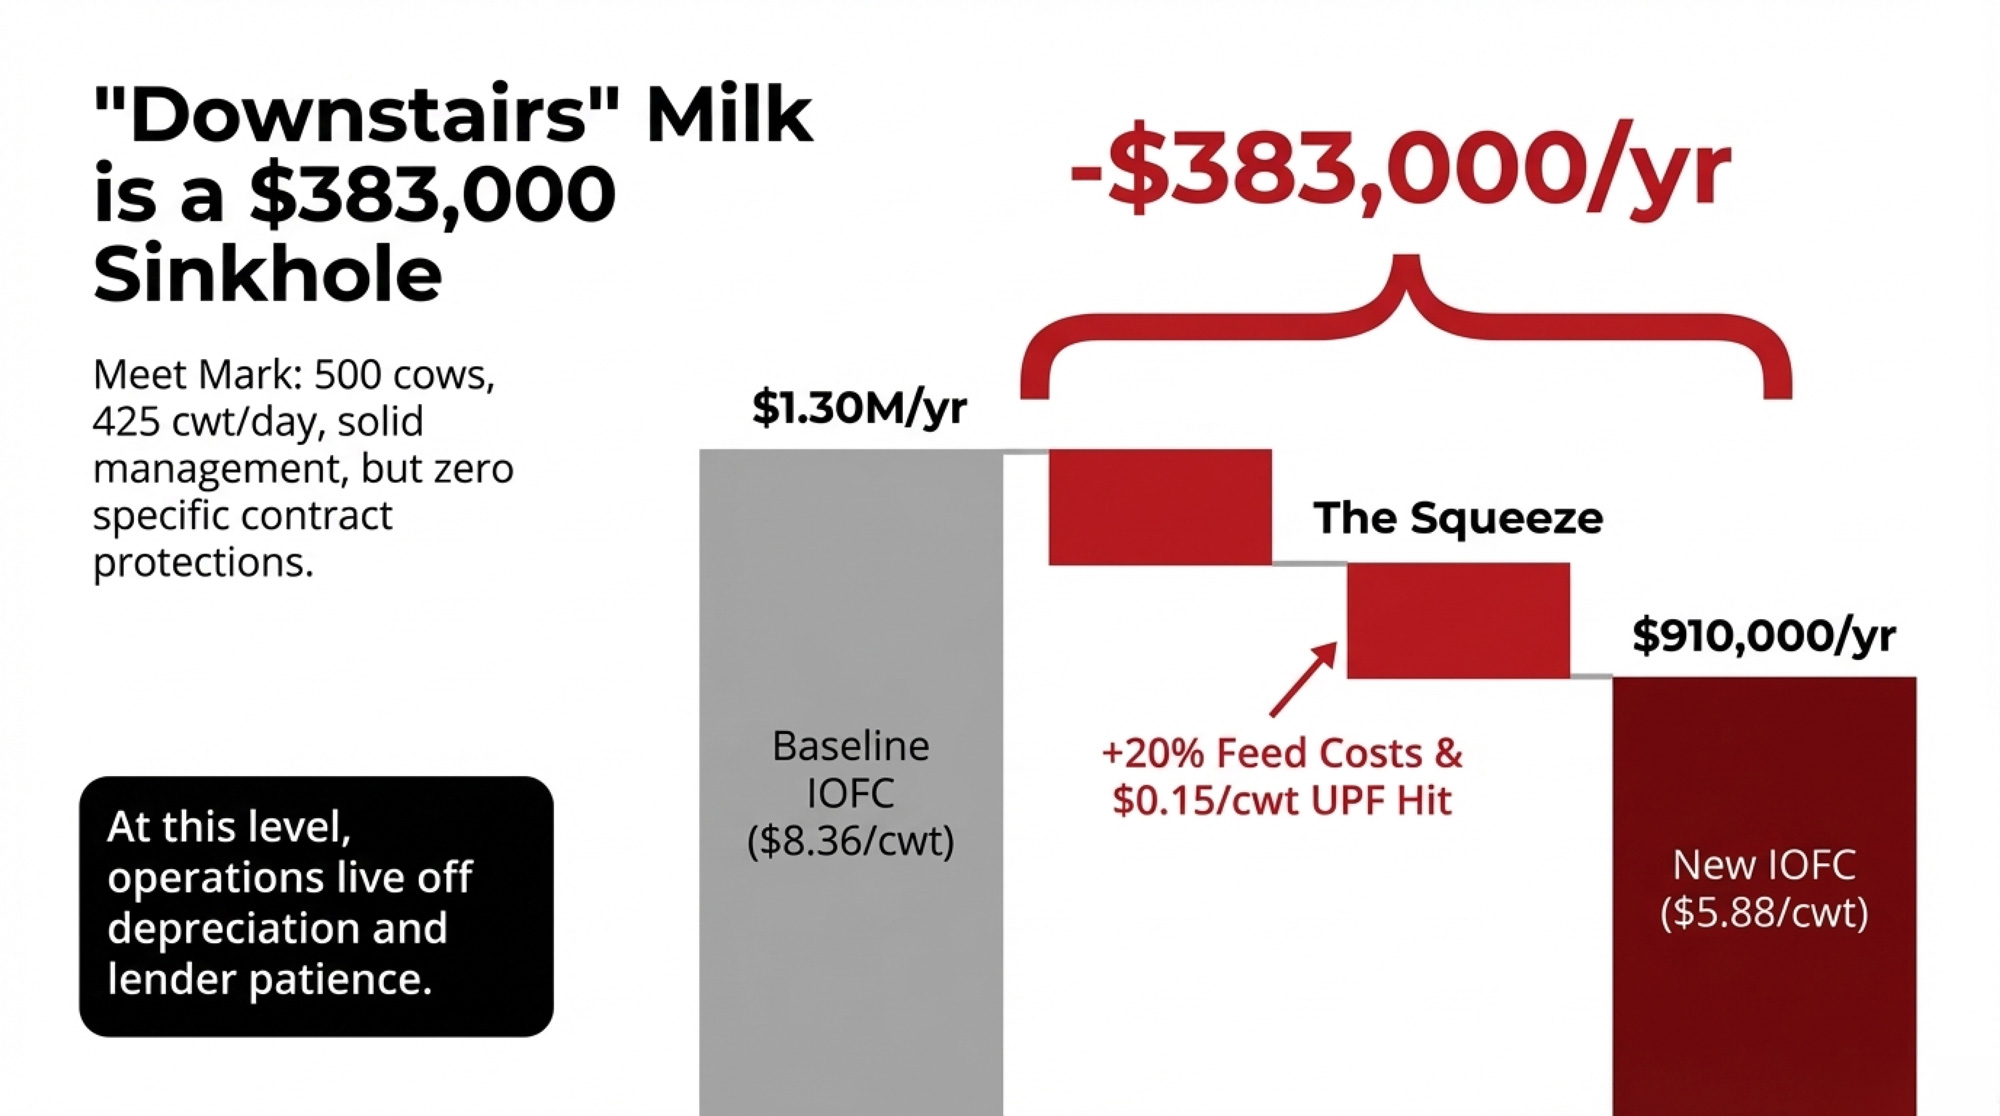
  • IOFC: about $8.36/cwt
  • Daily IOFC (425 cwt): ~$3,553/day
  • Annual IOFC: ~$1.30 million/year

He’s well below full‑cost breakeven. Then the ground moved.

The FMMO make allowance hit: On June 1, 2025, USDA raised allowances for butter, cheese, whey, and nonfat dry milk. Munch at AFBF estimated the hit to Class prices at $0.85–$0.93/cwt, shifting roughly $337 million from producer pools to processors in 90 days. That money went to the plant side of the ledger — funding reformulation, equipment upgrades, and premium‑grid tightening.

The UPF policy timeline is stacking up just as fast. In July 2025, HHS, FDA, and USDA issued a formal Request for Information on UPFs. USDA school meal standards now cap added sugar in flavored milk at 10 g/8 oz by the 2026–27 school year, and IDFA’s Healthy School Milk Commitment brought average added sugar in school milks down to 7.2 g/serving by July 2025.

That’s the federal picture. At the state level, California’s AB 1264 requires identification of harmful UPFs by July 1, 2026, with phased K–12 removal running through 2035. And north of the border, Canada’s mandatory front‑of‑pack nutrition labelling went live January 1, 2026, with enforcement beginning the same date.

Mark didn’t change his cows, his feeding program, or his contract. The economics around him changed plenty.

What Does a $383,000 Dairy IOFC Gap Look Like in 2026?

Most kitchen‑table talk still treats UPF as a nutrition story or a PR problem. Run the numbers, and it’s a feed and IOFC issue.

The following scenarios are not based on any specific processor’s current or announced pricing. They model what the economics could look like if UPF‑related policy changes affect feed costs and processor pricing grids over 3–5 years.

An IIED analysis of 2016–2021 agricultural support across 72 countries plus the EU, led by principal researcher Alejandro Guarín (published May 2025), found $14.5–$42.5 billion/year in support effectively subsidizing UPF ingredients — corn, soy, wheat, sugar — while penalizing fresh fruits and vegetables by about $16.3 billion/year. IIED’s modeling suggests repurposing those supports toward fruits, vegetables, and pulses would reduce production of previously subsidized commodities in OECD countries, though the exact percentage depends on how governments redesign the programs.

For this analysis, a 10–20% increase in feed costs over 3–5 years is the stress‑test range — not a forecast. But the directional pressure is real. USDA’s May 2025 Feed Outlook flagged that protein costs, soybean meal in particular, are expected to remain firm or increase even as corn softens — creating what the report described as a “barbell economy” of feed expenses. Purdue ag economist Michael Langemeier separately flagged DDG price shifts as a factor that could push livestock feed costs higher in 2026, with estimated DDG prices ranging from $145 to $155 per ton.

Three Scenarios for Mark’s 500‑Cow Herd

ScenarioFeed/cwtMilk Price/cwtIOFC/cwtDaily IOFCAnnual IOFC
Baseline (FBFM 2024 costs, projected price)$11.64$20.00$8.36$3,553~$1.30M
+10% feed$12.80$20.00$7.20$3,060~$1.12M
+20% feed + UPF hit$13.97$19.85$5.88$2,499~$0.91M

Note: The bottom scenario uses this article’s modeled assumptions — 30% of volume exposed to UPF‑side SKUs, $0.50/cwt plant markdown on that slice. These are illustrative. Your exposure depends on your buyer’s product mix and pricing grid.

The gap between baseline and the bottom row: about $383,000/year in IOFC. Same herd. Same people. Very different economics.

Where Does the $0.15/cwt “UPF Hit” Come From?

This isn’t on anyone’s milk statement yet. It’s a calculated risk tied to what happens when the plant’s downstairs side starts losing shelf velocity.

When Chile’s mandatory warning labels and marketing restrictions took effect, purchases of “high‑in” beverages — primarily sugary drinks — fell 23.7% over 18 months (Taillie et al., PLOS Medicine, February 2020). Canada’s black‑and‑white warning symbols for high‑sugar, high‑sodium, and high‑saturated‑fat products went live in January 2026, with immediate enforcement. FDA’s proposed front‑of‑pack labels could follow.

Plants won’t eat reformulation and marketing costs on slow‑moving UPF‑flagged SKUs forever. They’ll pass more of that pressure back through the pool — lower premiums, tighter quality grids, higher marketing deductions.

If 30% of Mark’s volume feeds UPF‑exposed SKUs and the plant shaves $0.50/cwt on that slice, the effective hit across his whole pool is 0.30 × $0.50 = $0.15/cwt. New effective price: $20.00 − $0.15 = $19.85/cwt.

IOFC in the $5.88–$6.10/cwt range, while non‑feed costs sit near $11.92/cwt, is where operations start living off depreciation, open lines of credit, and lender patience.

How Are Dairy Processors Sorting Upstairs From Downstairs Milk?

The Wisconsin Cheese Makers Association, representing more than 850 companies and cooperatives across 44 states, laid this out directly in their September 22, 2025 position statement: “In practice, a cup of fortified yogurt or a protein‑packed slice of cheese could be treated as nutritionally suspect, because it required pasteurization, culture development, or added rennet to create.” NMPF filed formal comments on October 23, 2025, warning that how UPFs are ultimately defined “could affect how [dairy] products can be marketed, and whether or not they will be included in federally funded programs such as SNAP, WIC or school meals programs.” IDFA urged the FDA not to rush a definition that lumps all processing together.

That’s the public positioning. The private math is sharper.

Upstairs products — school milk meeting sugar caps, clean‑label yogurts, high‑protein UF, A2‑certified brands, hard and specialty cheeses — are politically and contractually protected. Products more likely to face UPF classification— heavily sweetened yogurts, flavored snack cups, sugary retail-flavored milks, and private‑label processed cheese — are facing growing regulatory and market pressure.

Plants now have more manufacturing margin from the make‑allowance bump to fund that upstairs transition. They’ll pay more for milk feeding the upstairs lines — and spend less to keep the downstairs pool happy.

Where plant capacity is tight, and every tanker matters, that shift hasn’t landed yet. Generic volume still has negotiating power. But plants investing in upstairs products are getting pickier about which herds earn those seats — and building the kind of buyer relationships that survive the next downturn.

Mark’s milk goes to both places. His contract doesn’t specify which.

Sarah’s Turn: What Moving Upstairs Actually Takes

Sarah farms in the same region. Similar size. She looked at the same FMMO and UPF calendar and saw a 24‑month repositioning window, not a label headache.

She asked her processor one question: When you pitch school milk or hospital yogurt, is our herd one of the names in the deck? The honest answer — good volume, but not the herd they highlight in RFPs — told her everything.

So she made three moves.

Move 1: Crush SCC and Bacteria Counts

Pulling herd SCC from the mid‑300k band under 200,000 unlocks consistent quality premiums. The Bullvine’s own reporting on processor expansion found that farms hitting spec thresholds are seeing premiums ranging from $0.50 to over $1.50/cwt, and an 85‑cow Pennsylvania operation captured $0.75/cwt through relatively simple bypass protein and consistent feed push‑ups. Even at a conservative $0.30/cwt SCC premium on 500 cows shipping 425 cwt/day, that’s 425 × $0.30 = $127.50/day, roughly $46,500/year. That’s before the extra pounds and lower treatment costs.

Move 2: Get Specific on Protein Variants

Sarah’s genetics team didn’t just target “more solids.” They targeted which solids matter for products that survive UPF scrutiny.

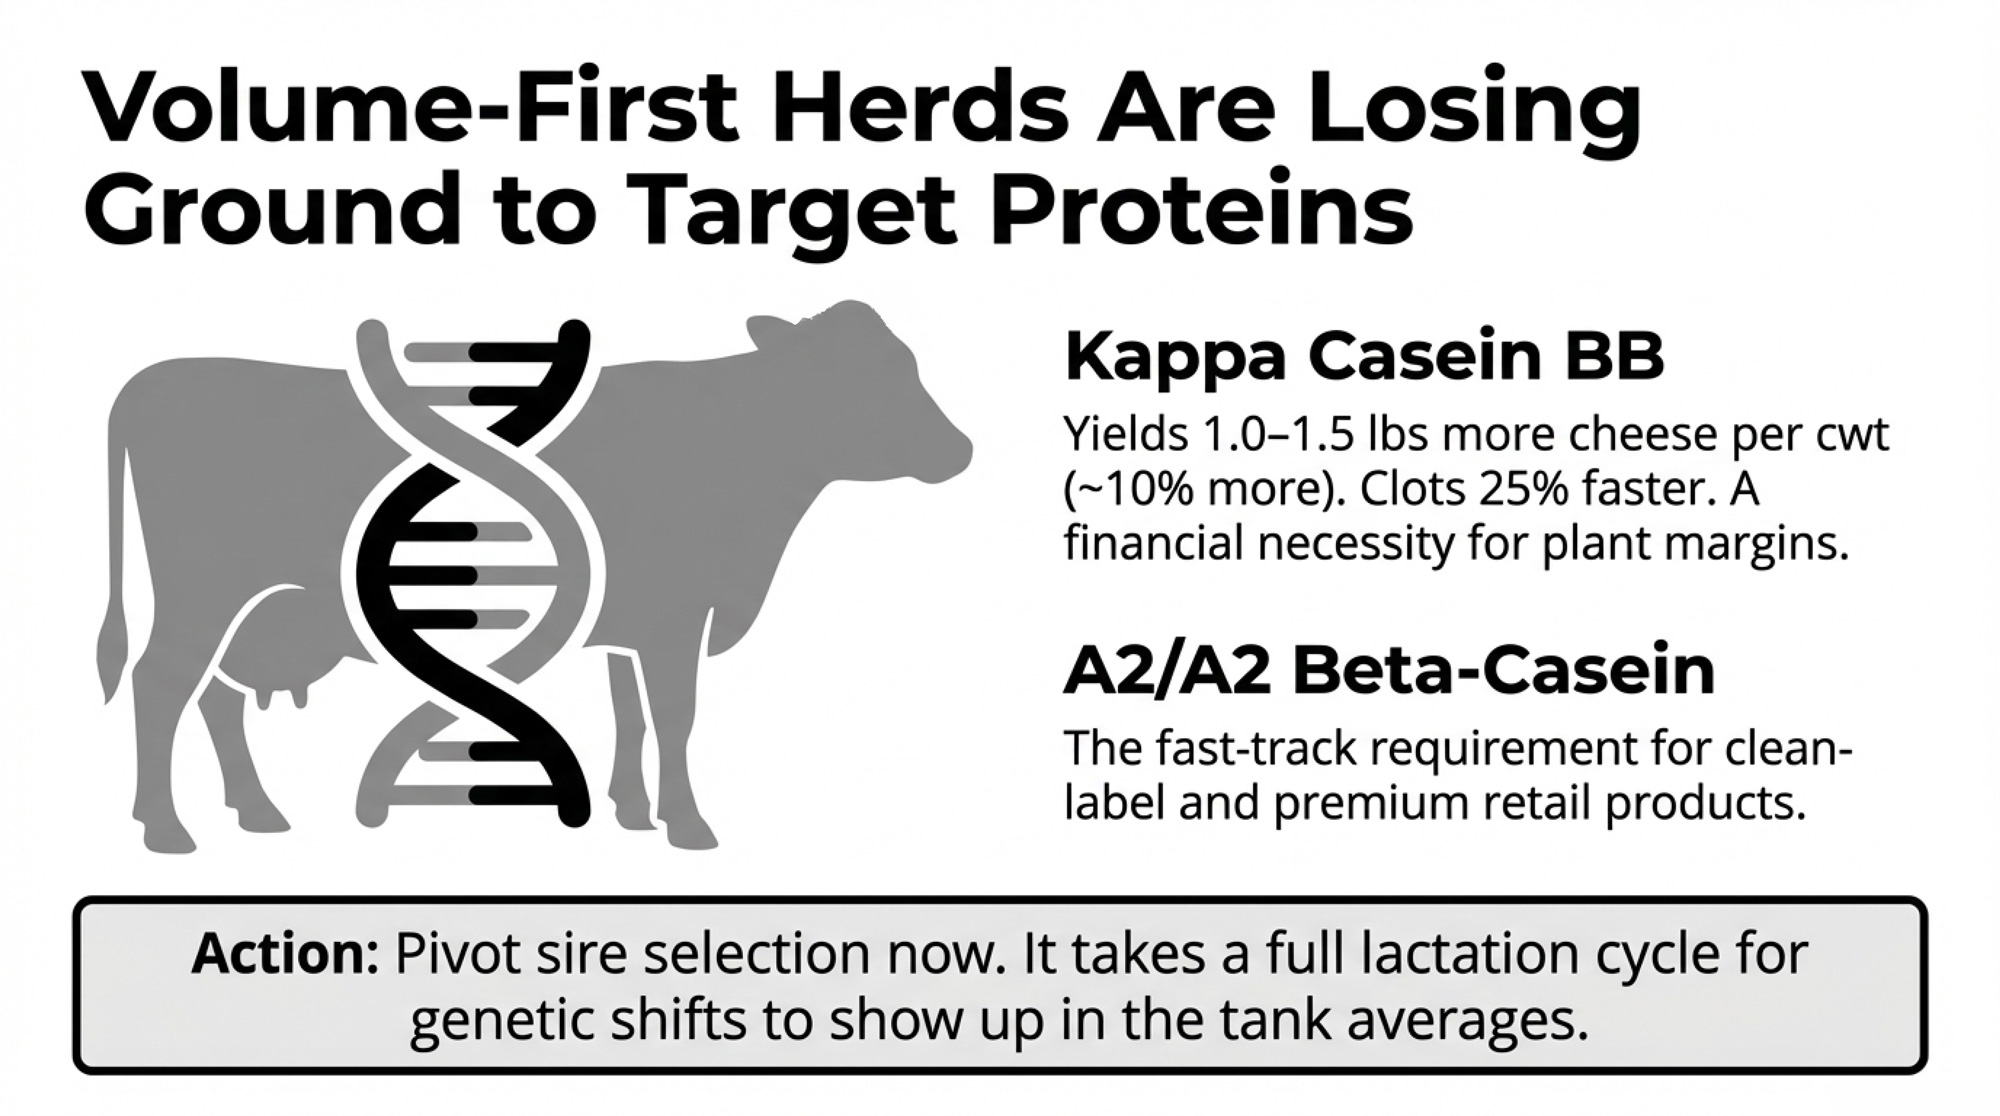
Kappa Casein BB: Cheese from BB cows clots around 25% faster, produces curd roughly twice as firm, and yields about 1.0–1.5 lbs more cheese per cwt — roughly 10% more — than AA cows. For a cheese plant, that’s not a nice‑to‑have. That’s money. Lactanet data (CDN document #586, August 2022) show BB is the dominant genotype in Jerseys (82.2%) and Brown Swiss (61.5%), but in Holsteins, it’s just 37.6% — meaning active selection toward BB and AB sires matters most where most milk is produced.

A2/A2 Beta‑Casein: Lonnie Holthaus at Milkhaus Dairy in Fennimore, Wisconsin, has selectively bred his Holsteins for A2/A2 — more than half the herd now produces only A2 protein milk, with products available through local grocery stores and direct‑to‑consumer channels. UW–Madison Extension notes the Holstein breed “is quickly moving to be an A2A2 only breed,” with a survey of five A.I. studs turning up over 800 A2A2 Holstein bulls — by far the most common beta‑casein combination now offered.

Lactanet’s published breeding guidance spells out the path: producers can increase BB frequency by “selecting for BB or AB sires,” and increase A2 frequency by “preferred use of A2A2 or A1A2 sires.” It’s not a complicated selection — it just has to be intentional.

New U.S. plant capacity backs the same direction. IDFA reported in October 2025 that processors have committed more than $11 billion in new and expanded manufacturing capacity across 19 states — over 50 individual building projects between 2025 and early 2028. A significant share of the capacity is for cheese and whey, positioned for what MarkNtel projects as a global whey protein market growing from .5 billion (2023) to .2 billion by 2030. UW–Madison Extension dairy economist Leonard Polzin noted that fat and protein components keep climbing “every single year” — and the new processing infrastructure is built to reward exactly that. Volume‑first herds are losing ground.

Sarah pivoted sire selection toward BB kappa casein and A2/A2 alongside health, solids, and longevity. Not a one‑month fix — it took a lactation cycle to start showing up in tank averages.

Move 3: Renegotiate Her Seat in the Supply Plan

Instead of asking for a better average price, she brought 12 months of cleaned‑up SCC, strong components, and documented A2/BB testing to the table. She pushed for program language tying her herd to specific products and 12‑month notice periods, so she wasn’t locked in if the plant doubled down on UPF‑heavy retail.

Two years from now, both herds could still be shipping 425 cwt/day. The difference sits on the milk check. Sarah carries a stable stack of quality and program premiums — consistent with The Bullvine’s reporting on processor expansion, which documented premiums of $0.50 to over $1.50/cwt for farms meeting spec thresholds, with top‑tier programs potentially reaching higher for herds that qualify on components, protein variants, and SCC simultaneously.

MetricMark (Downstairs)Sarah (Upstairs)Gap Impact
Herd Size500 cows500 cowsIdentical
Daily Volume425 cwt/day425 cwt/dayIdentical
SCC Average320,000185,000−42% SCC
Kappa Casein / A2 StatusNot testedBB & A2/A2 selectedActive selection
Processor Contract TypeGeneric pool volumeNamed in school/hospital RFPsProtected seat
Quality/Program Premiums$0.10/cwt$0.80/cwt+$0.70/cwt
Feed Cost/cwt$13.97$13.97Identical
Milk Price Received$19.85/cwt (base − UPF hit)$20.80/cwt (base + premiums)+$0.95/cwt
IOFC/cwt$5.88$6.83+$0.95/cwt
Annual IOFC~$912,000~$1,059,000
Annual IOFC Difference+$147,000/year

Mark is still letting his milk feed the downstairs pool.

Can You Move Off the Downstairs Staircase in 24 Months?

Federal UPF definitions, front‑of‑pack labels, and school standards all have dates attached. Here’s what to do with that calendar.

In the Next 30 Days

  • Pull the last 3–6 months of milk statements. What’s your average SCC? Where are protein and butterfat sitting? How much per cwt is the base vs. quality vs. program premiums?
  • Print your milk supply agreement. What’s the notice period? Does it mention specific programs — school milk, branded UF, clean‑label — or are you just generic pool volume?
  • Ask your field rep one blunt question: “When you pitch our plant’s school and clean‑label contracts, is our herd one you mention by name — or are we just filling tanks?”
  • Check your herd’s kappa casein and A2/A2 status. Individual tests run about $40/head through labs like UC Davis VGL; the full Milk Protein Panel (A2 + kappa casein + beta‑lactoglobulin) runs $93/head (UC Davis VGL pricing, October 2023). On 500 cows, that’s $20,000–$46,500 — significant upfront, but budget it against the $46,500/year SCC premium recovery alone. If you’re already running broader panels, Zoetis CLARIFIDE Plus costs roughly $43/head, including health and wellness traits.

Red flag: No quality or program premiums on your statement, no program language in your contract, and your buyer can’t link your herd to anything strategic? You’re deep in the downstairs story right now.

Green flag: Your buyer names your herd specifically in RFP submissions, your contract ties to at least one program, and you’ve got 12+ months of SCC under 200K on record? You’re upstairs. Protect that seat — keep specs high, contract language specific, and your testing documentation current.

In the Next 90 Days: Pick Your Branch

  1. Upgrade into the A‑pool where you are. Targets: SCC consistently <200,000, protein >3.15%, start genomic testing for kappa casein BB and A2/A2. You gain leverage with your current buyer, but you’ll spend more upfront on vet work, cow comfort, nutrition, and testing.
  2. Scout a processor switch. Map processors within a realistic hauling radius that are building school, hospital, “no UPF,” A2, or specialty cheese contracts. You gain alignment with a buyer who values upstairs milk. You take on hauling changes, relationship risk, and the chance that if the new buyer’s program changes specs mid‑contract, you’re rebuilding from scratch in a market where your old plant already filled your slot.
  3. Renegotiate your seat at the table. Push for a program language that ties your herd to products that must survive UPF rules. Aim for 12‑month notice periods. You keep the relationship you know, but it may be a harder conversation if your buyer isn’t under immediate pressure yet.

Opportunity signal: If your buyer is already talking about school sugar caps, UPF definitions, or “real food” wins with institutions, they’re feeling the heat. That’s when A‑team milk becomes more valuable inside their business than it looks on your statement.

Over the Next 365 Days

Build a 6–12 month run with SCC under 200,000 and documented component and protein‑variant testing. Lean hard into sires that bring BB kappa casein, A2/A2, solids, and longevity. After that, go back to your buyer with a simple ask: “Here’s our updated quality and component record. Which of your school, hospital, or clean‑label programs could we qualify for, and what premiums go with them?”

What This Means for Your Operation

  • If your IOFC is under about $7/cwt and quality/program premiums are thin on your statement, you’re in the zone this $383,000 gap describes. Run your own numbers — swap in your feed cost, your milk price, and your best guess at how much of your buyer’s volume feeds UPF‑exposed products.
  • If your buyer can name specific products and contracts your herd supports, you’re already upstairs. Don’t assume that the seat is permanent — keep your specs high and your contract language specific.
  • If your contract doesn’t mention notice periods or programs, assume you’re the shock absorber, not the protected volume. That doesn’t mean panic. It means read the fine print and decide if that’s where you want to sit in your buyer’s supply plan.
  • If you don’t know your herd’s kappa-casein or A2 status, you can’t negotiate for traits you haven’t tested for. At $40–$93/head, that’s cheap insurance relative to the premium it could unlock.

Signals to Watch

  • FDA UPF definition timeline: If a federal definition arrives in 2026, processor contract language could start shifting within 90 days of publication. We’ll be tracking processor responses and contract grid changes as they surface — this is the story to watch for the next 18 months.
  • California’s AB 1264 identification deadline (July 1, 2026): The first real test of which products get flagged and which don’t. What happens in California school districts will signal how other states and federal programs respond.
  • Your buyer’s institutional wins: Track whether your processor is growing school milk and hospital contracts. If those are growing, your leverage is growing too.

Key Takeaways

  • If your IOFC on a 500‑cow herd is drifting under ~$7/cwt, today’s FBFM‑style costs and a small UPF‑driven markdown can easily add up to a $383,000/year gap between you and a neighbour on the upstairs side of the plant.
  • The fastest upgrades into that upstairs pool are hard numbers, not slogans: SCC consistently under 200,000, protein north of ~3.15%, and a clear plan to move your herd’s genetics toward BB kappa casein and A2/A2 for cheese, school, and clean‑label programs.
  • Your most important 30‑day check isn’t on a spreadsheet; it’s one question for your field rep: “When you pitch school and clean‑label contracts, is our herd one you mention by name—or are we just filling tanks?”
  • If your contract doesn’t spell out program links and at least a 12‑month notice period, assume you’re in the cut‑first volume, not the protected pool—and build a 365‑day plan to either upgrade in place, switch buyers, or renegotiate your seat.

The Bottom Line

In the next 30 days, do one thing: calculate your real IOFC — not from memory, from your actual milk statements and feed records. Break down how much of your check is base price vs premiums. Then ask your buyer in plain language: Is our herd part of the milk you rely on for your safest contracts, or are we in the pool you can cut first?

What’s your real IOFC this month — and does your buyer know your milk by name, or just by tank number?

Complete references and supporting documentation are available upon request by contacting the editorial team at editor@thebullvine.com.

Learn More

The Sunday Read Dairy Professionals Don’t Skip.

Every week, thousands of producers, breeders, and industry insiders open Bullvine Weekly for genetics insights, market shifts, and profit strategies they won’t find anywhere else. One email. Five minutes. Smarter decisions all week.
NewsSubscribe
First
Last
Consent

3 Ways the USDA School Meal Rules Can Move Your School Milk and Cheese Premiums – and Decide Which Herds Keep Their Contracts

Three changes in the 2024 USDA school meal rules could swing your school milk and cheese premiums by dimes per cwt. Have you run your numbers yet?

Executive Summary: The 2024 USDA school meal rules just turned school milk and cheese specs into real money — and real contract risk — for U.S. herds. By capping added sugars in school-flavored milk at 10 g per 8‑oz and yogurt at 12 g per 6‑oz, and requiring a 10–15% sodium cut in school menus by 2027–28, the rule effectively decides which milk is easy to use and which is always fighting formulation. In a U.S. industry that has seen licensed herds fall from 70,375 to 26,290 since 2003 while production climbed to 226.4 billion lb, processors now have the leverage to favor herds whose protein, casein, P:F ratio, and SCC make spec‑sensitive products simple to run — and quietly step back from the rest. For co‑ops like MMPA, that alignment already shows up as millions of dollars in quality and incentive premiums, with NDQA‑caliber farms capturing a disproportionate share of more than $23 million in producer incentives and roughly $15.3 million in quality payouts. This article gives you a simple 12‑month P:F gut check, a way to measure how much of your available quality premium you’re actually capturing, three pointed questions to take to your buyer, and four realistic paths — optimize, reposition, diversify, or transition — depending on where your numbers land. It also cuts through the noise on κ‑casein, A2, and FMMO reform so you can see where genetics and policy actually move your margins over the next 3–10 years, instead of chasing buzzwords or waiting for the next rule to hit.

USDA school meal rule

If you’re shipping into cheese plants or school milk contracts, USDA’s 2024 school meal rule isn’t just nutrition policy — it’s a spec and premium story that can move your milk check by a few dimes per cwt either way. For a mid‑sized herd, that’s easily a few thousand dollars a year swinging on whether your milk makes life easier or harder for a spec‑sensitive plant.

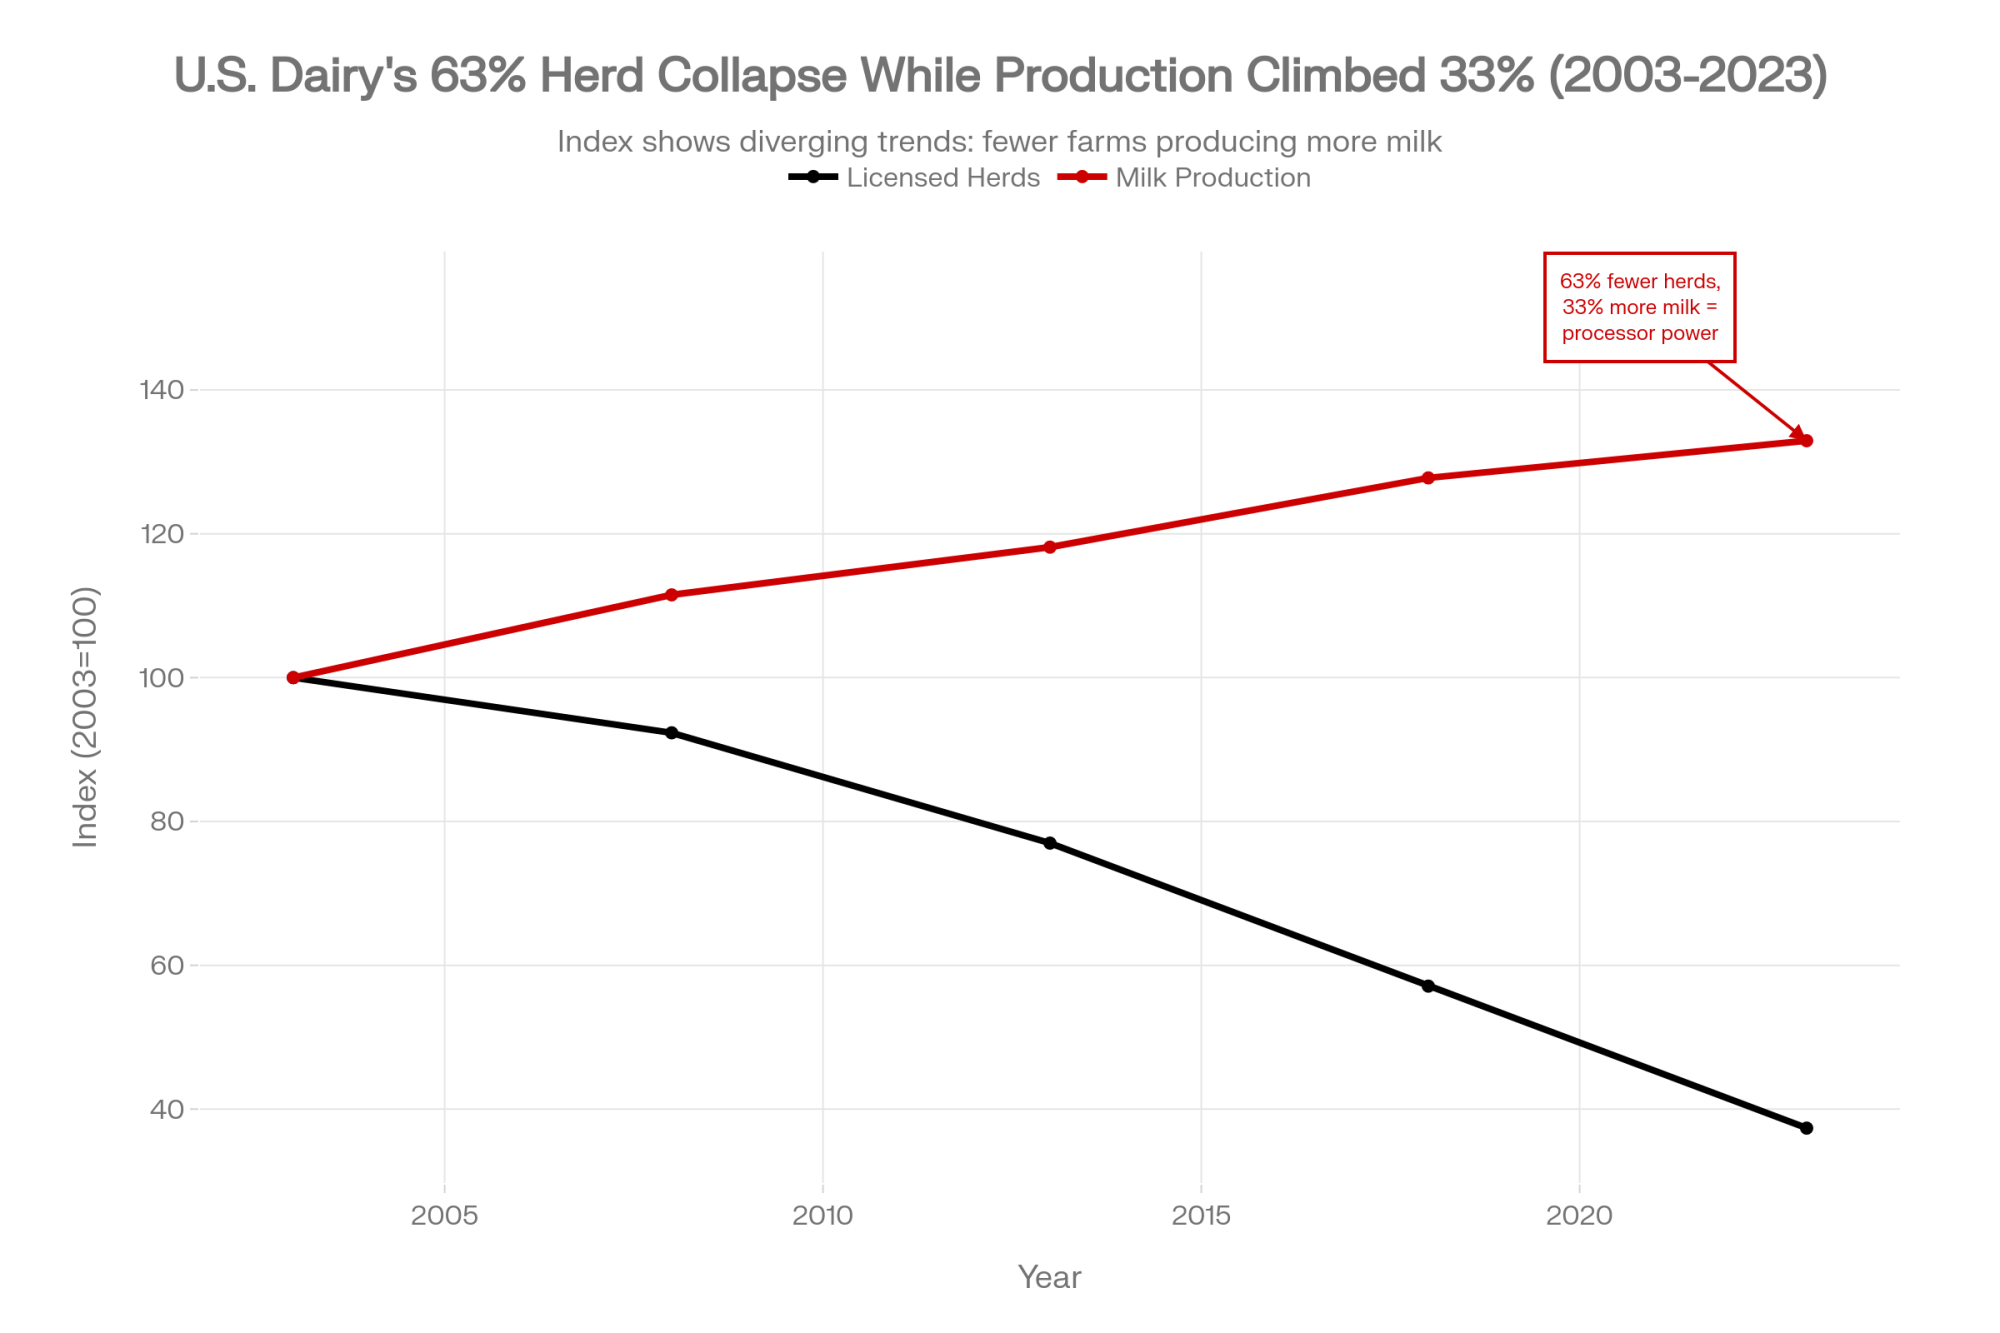
At the same time, USDA numbers show U.S. milk output climbing to about 226.4 billion lb in 2023 while the number of licensed herds collapsed from 70,375 in 2003 to 26,290 in 2023 — a 63% reduction over 20 years. Fewer herds, more milk, and more leverage for processors who can now pick and choose which farms help them win school and cheese business, and which farms they can live without. 

Why the USDA School Meal Rule Suddenly Matters to Your Milk Check

Here’s what’s really going on. In April 2024, USDA’s Food and Nutrition Service finalized new nutrition standards for school meals. Those rules lock in product‑specific caps on added sugars and a single sodium cut for school breakfasts and lunches that kicks in for the 2027–28 school year

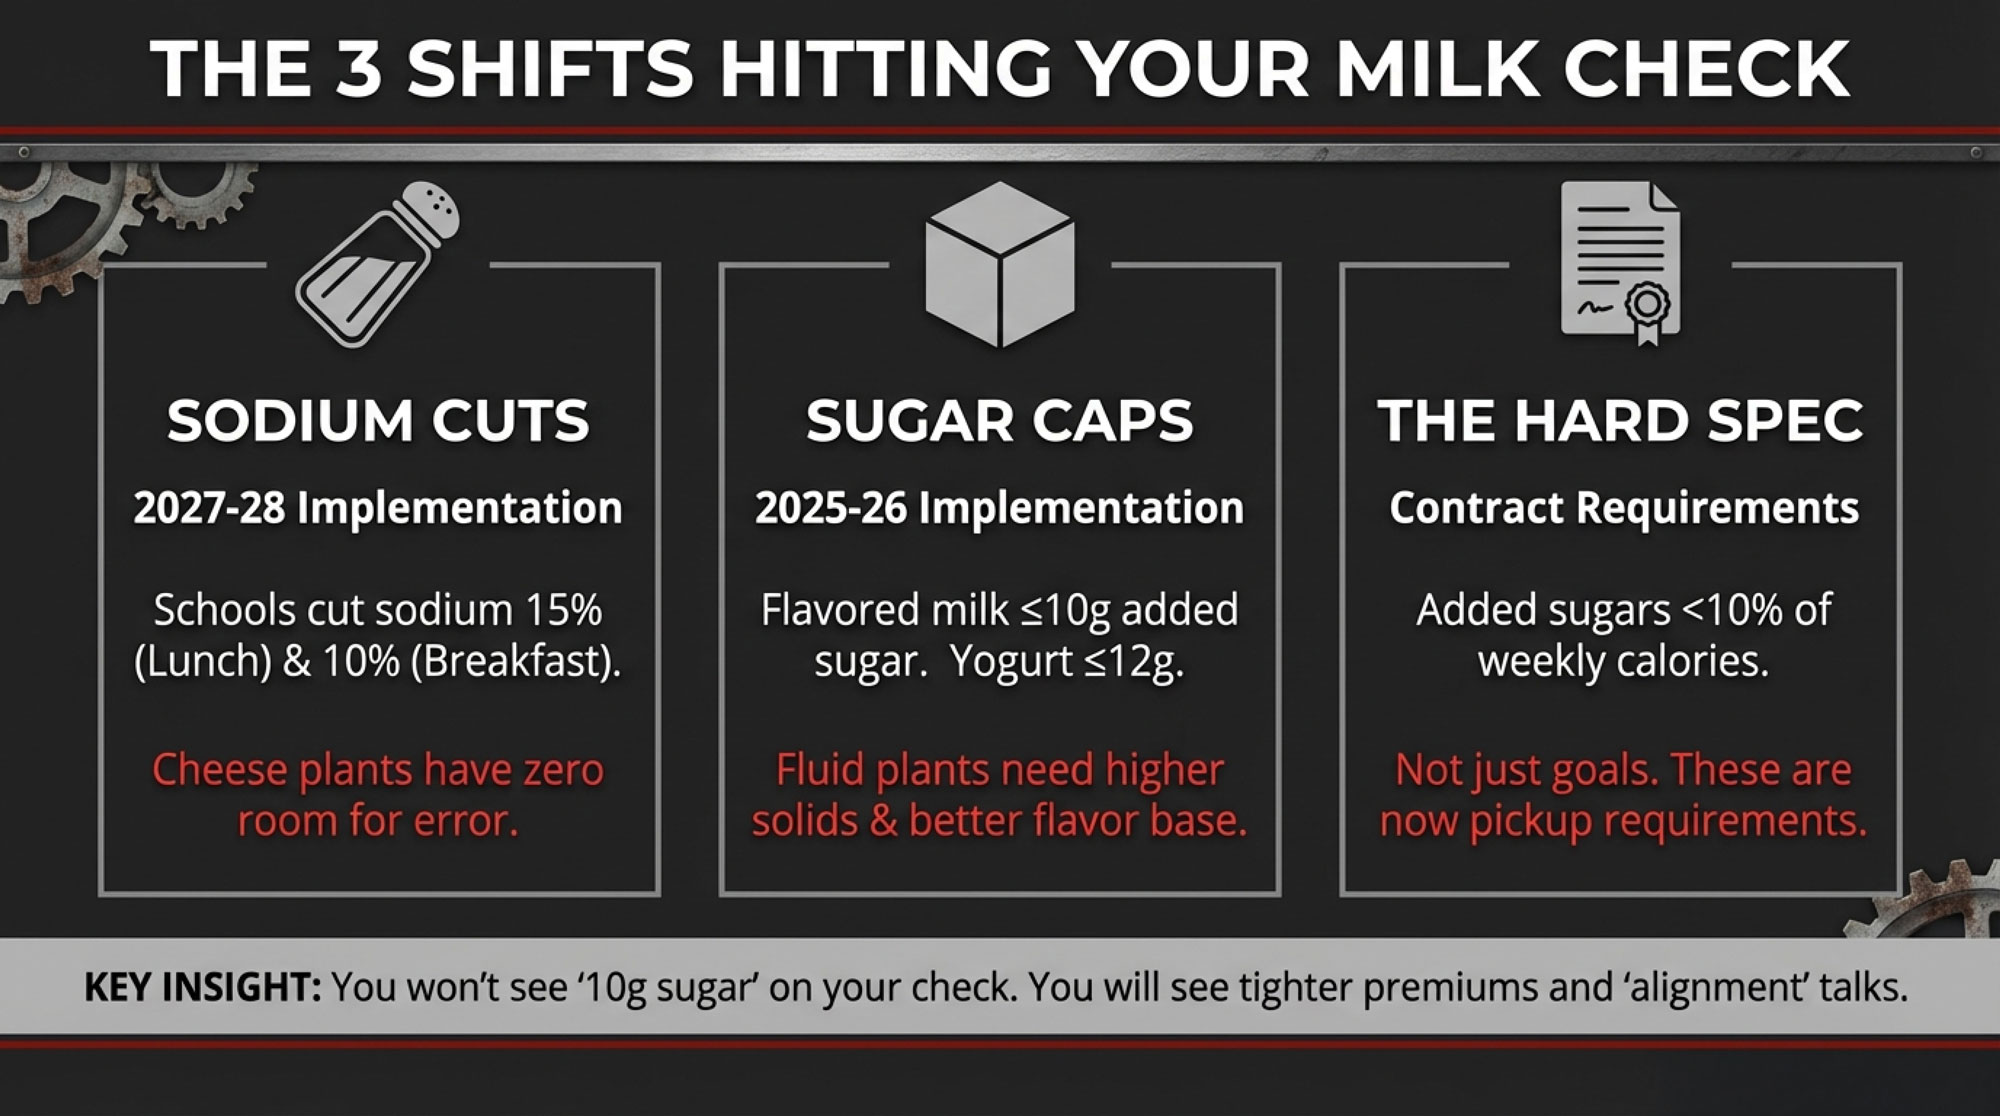
According to the FNS comparison chart and a 2024 Congressional Research Service summary, the final rule does three big things that matter to you:

  • Starting in the 2025–26 school year, flavored milk in schools is capped at 10 g of added sugars per 8‑oz serving, and yogurt at 12 g per 6‑oz serving
  • From July 1, 2027, schools must cut average sodium on lunch menus by 15% and on breakfast menus by 10%from current limits — essentially locking in the old “Target 2” sodium standards from the 2012 rule. 
  • By 2027–28, added sugars across the whole weekly menu must average less than 10% of calories. 

That’s national. Every district in the National School Lunch and School Breakfast Programs lives under those numbers. They don’t stay in Washington. They show up as spec lines in bid documents, in what processors have to promise, and in how your co‑op or plant looks at its supply base.

Three Spec Shifts You Can’t Ignore

Let’s strip the policy talk down to the three shifts that hit your farm.

Spec ShiftWhat Changes (U.S. Schools)Where It Hits YouWhat to Watch in Your Herd
Sodium limitsOne‑time 15% sodium cut at lunch and 10% at breakfast vs current limits, effective SY 2027–28. Cheese plants have a smaller sodium “budget” on school menus; they need cheese that performs with less salt.P:F ratio, protein %, κ‑casein, SCC, vat performance.
Added‑sugar capsFrom SY 2025–26, flavored milk ≤10 g added sugars/8 oz; yogurt ≤12 g/6 oz. Plants need body and flavor with less sugar cover, especially in flavored milk and yogurt.Solids‑not‑fat, protein stability, bacteria counts, flavor consistency.
Contract specsThese limits move from “goals” to hard specs in bids and processor contracts.Premiums and base shift toward “spec‑friendly” herds; marginal herds risk weaker terms or less secure pickup.Your buyer’s school/cheese exposure, quality‑premium capture, and contract language.

You don’t see “10 g added sugars” printed on your milk check. You see new premium grids, new quality letters, more talk about “alignment,” and, in the worst cases, contracts that quietly get scaled back or not renewed.

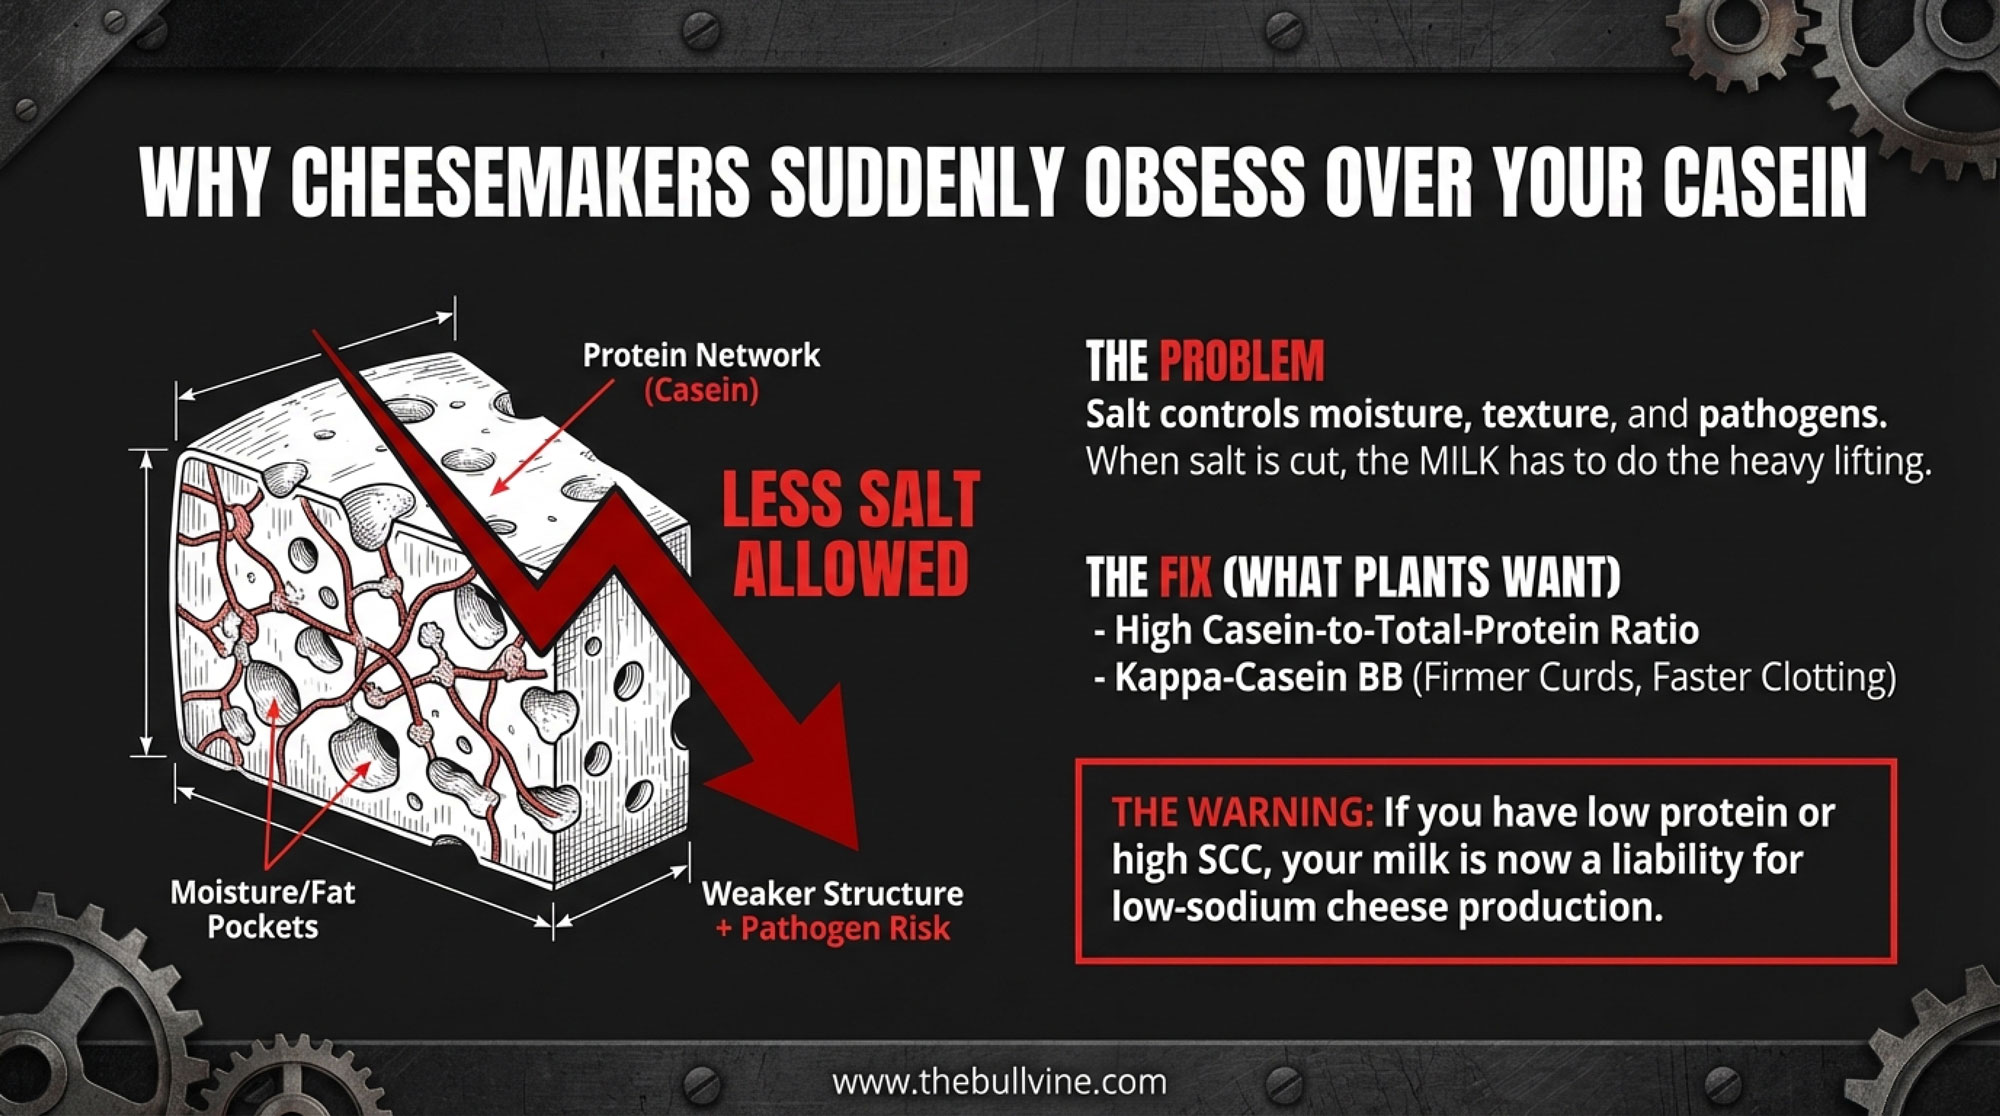
Sodium: Why Cheesemakers Are Suddenly Obsessed With Your Casein

Sodium cuts mean school menu planners have less room for salty items, including cheese. Typical numbers: a 1‑oz slice of Cheddar runs around 180 mg of sodium, and part‑skim mozzarella usually lands in the 150–180 mg range depending on the formulation. If the menu sodium budget is tight, every slice of cheese eats up more of the allowance. 

Now, salt isn’t just window dressing in cheese. Cheese science work — including U.S. school‑meal nutrition research in Nutrients — highlights salt’s role in moisture control, whey expulsion, pH and texture, pathogen control, and flavor and shelf life. Processors can’t simply “use less salt” and expect cheese to make weight, slice clean, and sit in a school district’s cooler for weeks without issues. Something else has to carry more of the load. 

That “something” is your milk:

  • Casein and κ‑casein. Dairy science studies show that a higher casein-to-total-protein ratio improves curd formation and cheese yield. Multiple papers across breeds report that κ‑casein BB milk tends to coagulate faster and form firmer curd than κ‑casein AA milk, which often translates into better yield and more predictable vat performance when everything else is equal. 
  • Somatic cell count (SCC). Elevated SCC is consistently tied to lower cheese yield and more defects; NDQA scoring and co‑op quality programs bake that reality into their metrics. 

Here’s the bottom line: under tighter sodium specs, cheesemakers want milk that yields strong curd, clean drainage, and a low defect risk, even if they pull back a notch on the salt. That’s good news if your herd is already built around solid protein, casein, and NDQA‑level quality. It’s a big warning sign if you’ve been living with “good enough” SCC and protein.

A Simple P:F Ratio Gut Check

You don’t need a PhD to see if your herd is swimming with or against where cheese plants are heading. You just need your last 12 months of milk checks.

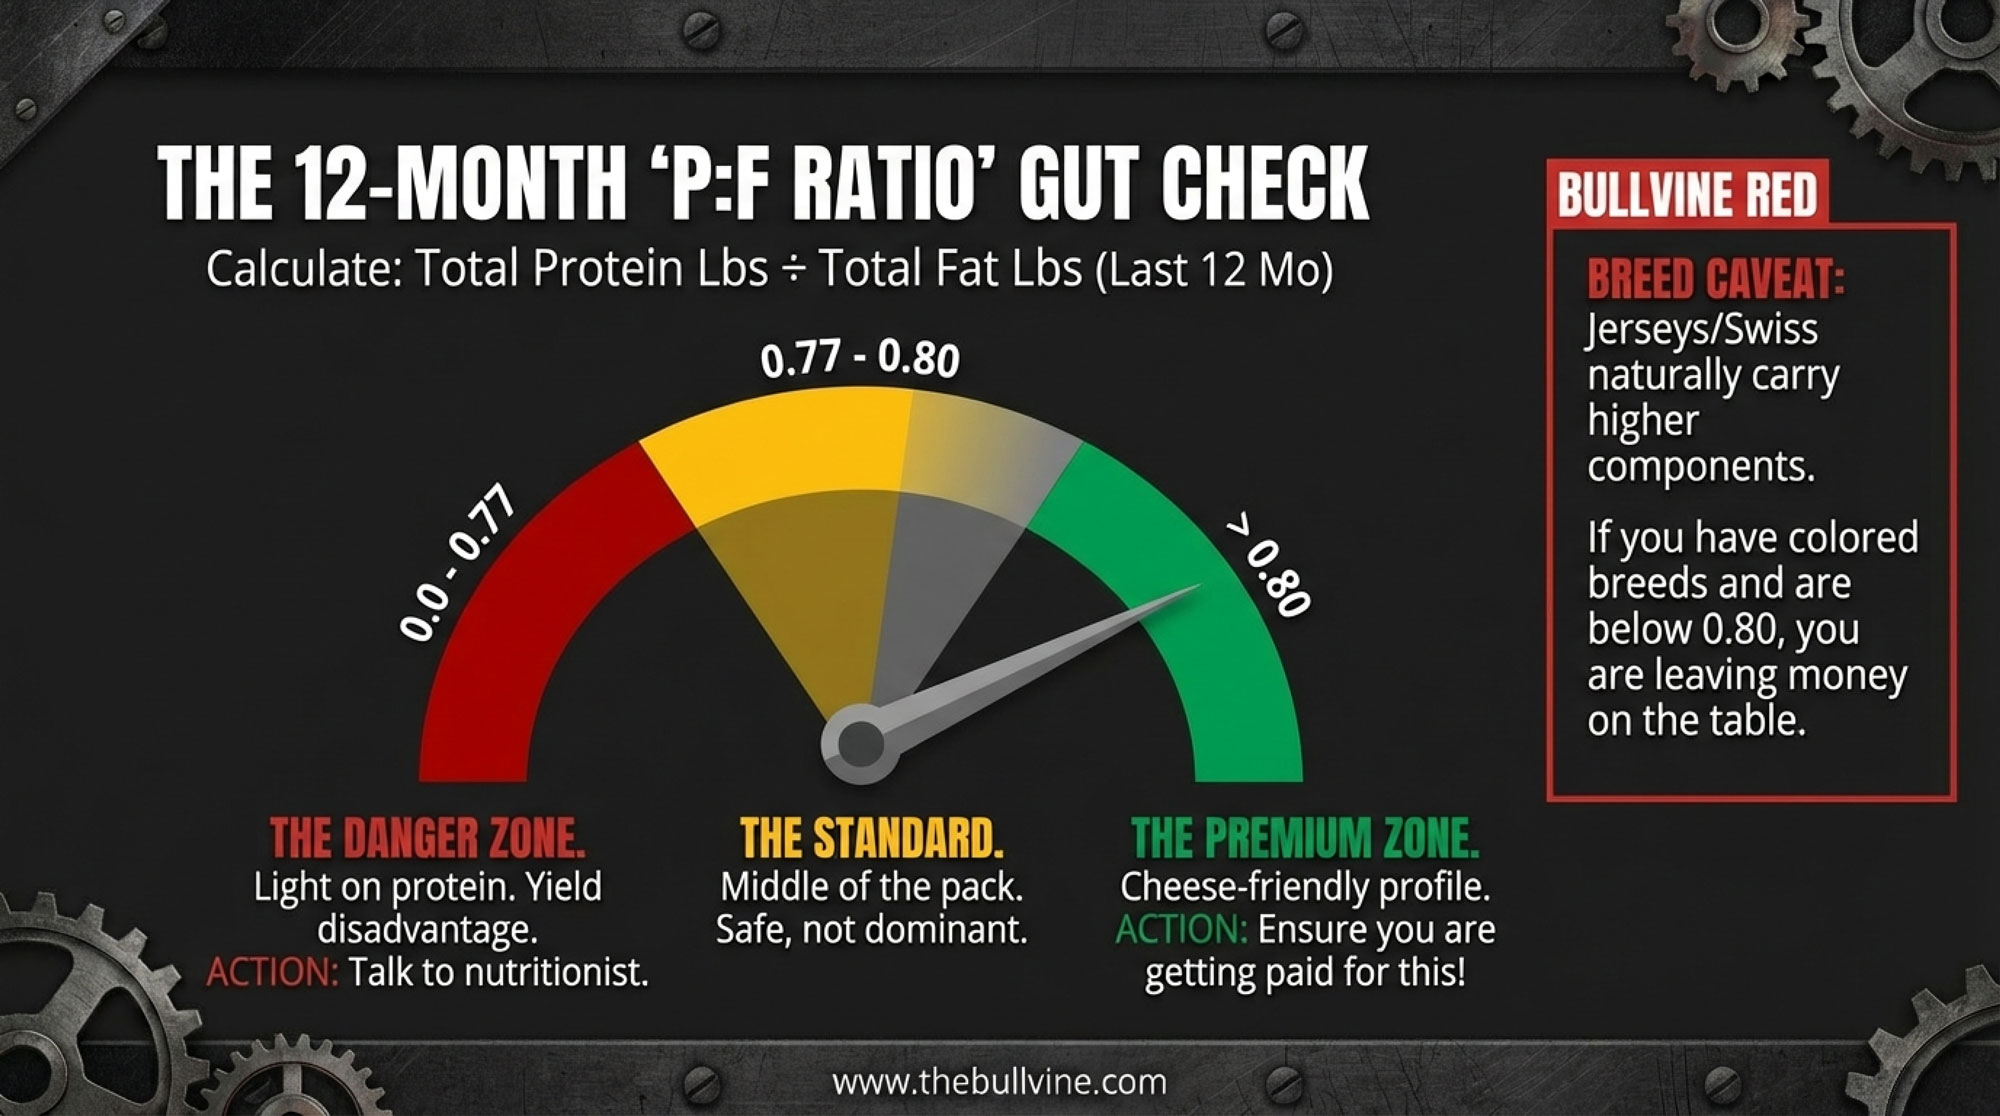
12-Month P:F RatioWhat It Usually SignalsCheese Plant ViewYour Next Move
Below ~0.77Light on protein relative to fat; rations, transition, or fresh cow issues likely⚠️ “We can use your milk, but you’re not making our life easier”🚨 RED FLAG: Call nutritionist + vet this month. Focus on fresh cow health, forage quality, one ration trial targeting 0.77+
0.77–0.80Middle-of-the-pack for Holstein cheese herds; serviceable but unremarkable“Standard supply—we’ll keep you as long as we need volume”⚠️ YELLOW LIGHT: Assess upside. Can you push toward 0.80+ with better transition management? Check if premium grid rewards the climb.
Above 0.80Strong cheese-merit profile if butterfat and SCC are also solid✅ “Exactly what we want for school cheese under tight sodium specs”✅ GREEN LIGHT: Protect this position. Ask your buyer if you’re capturing full quality premium. Consider genetics that lock in casein advantage long-term.

Do this once a year:

  1. Add up your total protein pounds shipped in the last 12 months.
  2. Add up your total butterfat pounds shipped in the same period.
  3. Divide protein by fat. That’s your 12‑month P:F ratio.

Here’s how a lot of field reps and nutritionists in cheese country use that number — purely as a rule‑of‑thumb, not a regulation:

The Breed Caveat: While the 0.77–0.81 band is the standard “North American Holstein” benchmark, remember that breed matters. Jerseys and Brown Swiss naturally carry higher components; for these herds, a ratio below 0.80 often means you are leaving significant cheese-merit dollars on the table despite having “high” test numbers. If you aren’t hitting the upper end of the scale with a high-component breed, your butterfat is likely out-pacing your protein synthesis.

These aren’t USDA lines. They’re countryside benchmarks. You still have to weigh them against your actual pay schedule, your herd’s health, and your feed and forage reality. But if you’re shipping to a cheese plant with a P:F under about 0.77, that’s not a “maybe later” project — it’s a “get your nutritionist and vet around the table this month” project.

On the flip side, if you’re above 0.80 with solid butterfat and low SCC, that’s exactly when you should be asking whether your buyer’s paying for that profile — or whether you’re subsidizing other milk in the pool.

Sugar Caps: School Milk and Yogurt Need Better Milk, Not Just Less Sugar

The sugar rules are just as blunt. Starting in SY 2025–26, flavored milk in schools is capped at 10 g of added sugars per 8‑oz serving, and yogurt at 12 g per 6‑oz serving. Then, in 2027–28, weekly calories from added sugars across the menu have to come in under 10%. 

The dairy side saw this coming. Under the International Dairy Foods Association’s Healthy School Milk Commitment, 37 processors representing more than 90% of school milk volume agreed to cap added sugars in school flavored milk at that same 10 g per 8‑oz, cutting about 7 g from the average flavored school milk back in 2006–07. Processors have already cut average added sugars in school-flavored milk roughly in half, down to about 8.2 g per serving

Public health voices aren’t done. The American Medical Association has argued flavored milk should be removed from school meals entirely and, if not, endorses tighter options. Other groups call the final rule “fair but still improvable.” That tells you the spotlight on sugar isn’t going away. 

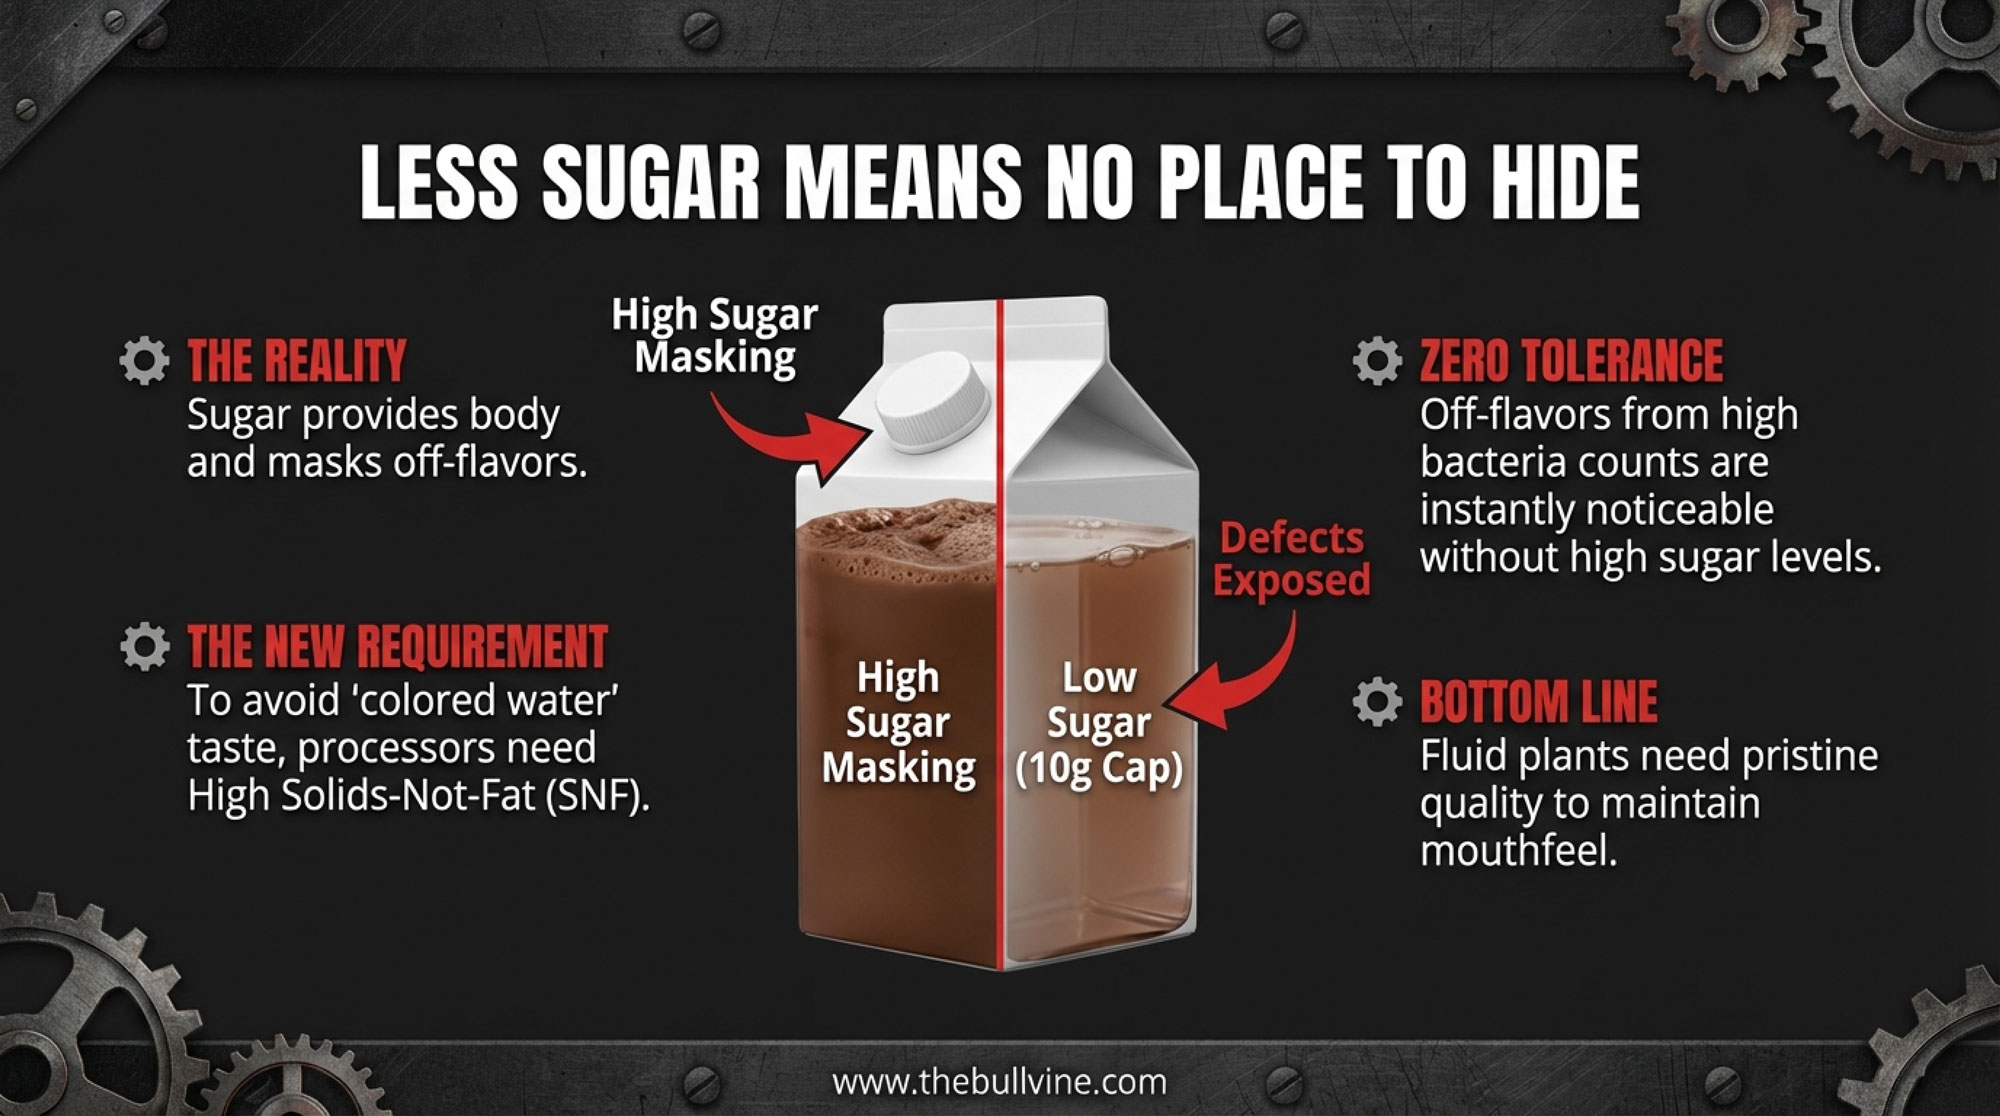
For you, the practical takeaway is simple: processors need milk they can turn into low‑added‑sugar flavored milk and yogurt that still have body, flavor, and shelf life. Less sugar means less room to hide off‑flavors or thin mouthfeel.

What they’re quietly shopping for in their supply base is:

  • Component consistency. Under tight sugar caps, they lean harder on solids‑not‑fat and protein to keep flavored milk and yogurt from feeling like colored water. Herds that deliver steady components month in, month out are cheaper to formulate around.
  • High‑end quality. With less sugar to mask issues, low SCC and low bacteria counts matter even more for flavor stability and shelf life. That’s exactly where NDQA‑level herds stand out — and get paid for it.

Where Specs Actually Bite: Contracts, Co‑ops, and FMMOs

Let’s be honest: you don’t feel “Target 2 sodium” or “10 g added sugars” directly. You feel contracts, premiums, and pooling.

WHO and USDA set the nutrition guardrails. School districts and processors turn them into bids that say “must meet these sodium and added‑sugar limits.” For plants that ship a lot of cheese, yogurt, or fluid milk into school channels, those contracts are big enough to decide how hard the plant runs — and how secure your pickup feels.

On your side, specs usually show up in three ways:

  • new or revised premium sheet that pays more for protein, SCC, or quality — or quietly tightens the thresholds.
  • Conversations about base, hauling, or “alignment with plant needs.” When you hear “alignment” more often, that’s a clue that specs are driving talk behind the scenes.
  • In tighter markets, a contract that gets scaled back, or simply doesn’t reappear on your kitchen table when it’s up for renewal.

Edge Dairy Farmer Cooperative has been out front on this. Their CEO, Tim Trotter, and others at Edge have publicly pushed for stronger, more transparent processor contracts so farmers have at least some predictability about price and pickup, rather than hoping they’re still on the “keep” list when plants reshuffle supply. That fight tells you how much contract power has shifted as herd numbers dropped and plants consolidated.

Where FMMO Reform Fits

Layered over all this is the slow grind on Federal Milk Marketing Order (FMMO) reform. American Farm Bureau Federation’s Market Intel work does a good job explaining how FMMOs govern pricing and pooling across classes and regions, and how proposals on make allowances, the Class I mover, and pooling rules would directly change mailbox prices. 

Specs and FMMOs aren’t the same fight, but they intersect in a pretty simple way:

  • Specs change who your plant wants to pick up from and which products they chase.
  • FMMO rules change how much of the value of those products actually shows up on your check.

If you’re in a cheese‑heavy order, lining your herd up with cheese yield and quality — and the sodium realities in school cheese — gives you a better shot at being “core” supply when plants restructure or when FMMO tweaks change the cheese vs Class I balance. If you’re in a fluid‑oriented order, being the herd that makes low‑sugar school milk and ESL products easy to execute can matter just as much when your plant decides whose milk is non‑negotiable.

The Dollars Behind Being “Spec‑Aligned”

Talking about “spec alignment” only matters if it shows up in your milk check. In co‑ops with strong quality programs, it absolutely does.

MMPA is one of the best public examples. In the 2021 NDQA results, 21 MMPA farms were among 47 National Dairy Quality Award winners — nearly half the list. That kind of dominance doesn’t happen by accident. It reflects a culture of low SCC, tight routines, and serious field support.

Farms like Crandall Dairy Farms in Battle Creek, Michigan — run by Brad, Mark, and Larry Crandall — have earned NDQA recognition year after year, including Platinum in 2022 and Gold or Silver in multiple other cycles. That’s not a one‑time fluke; it’s the kind of sustained performance that spec‑sensitive buyers fight to keep on their routes. More recently, Schultz Dairy LLC in Sandusky took home Platinum in the January 2026 NDQA awards — one of only six farms in the U.S. and Canada to earn that honor this year.

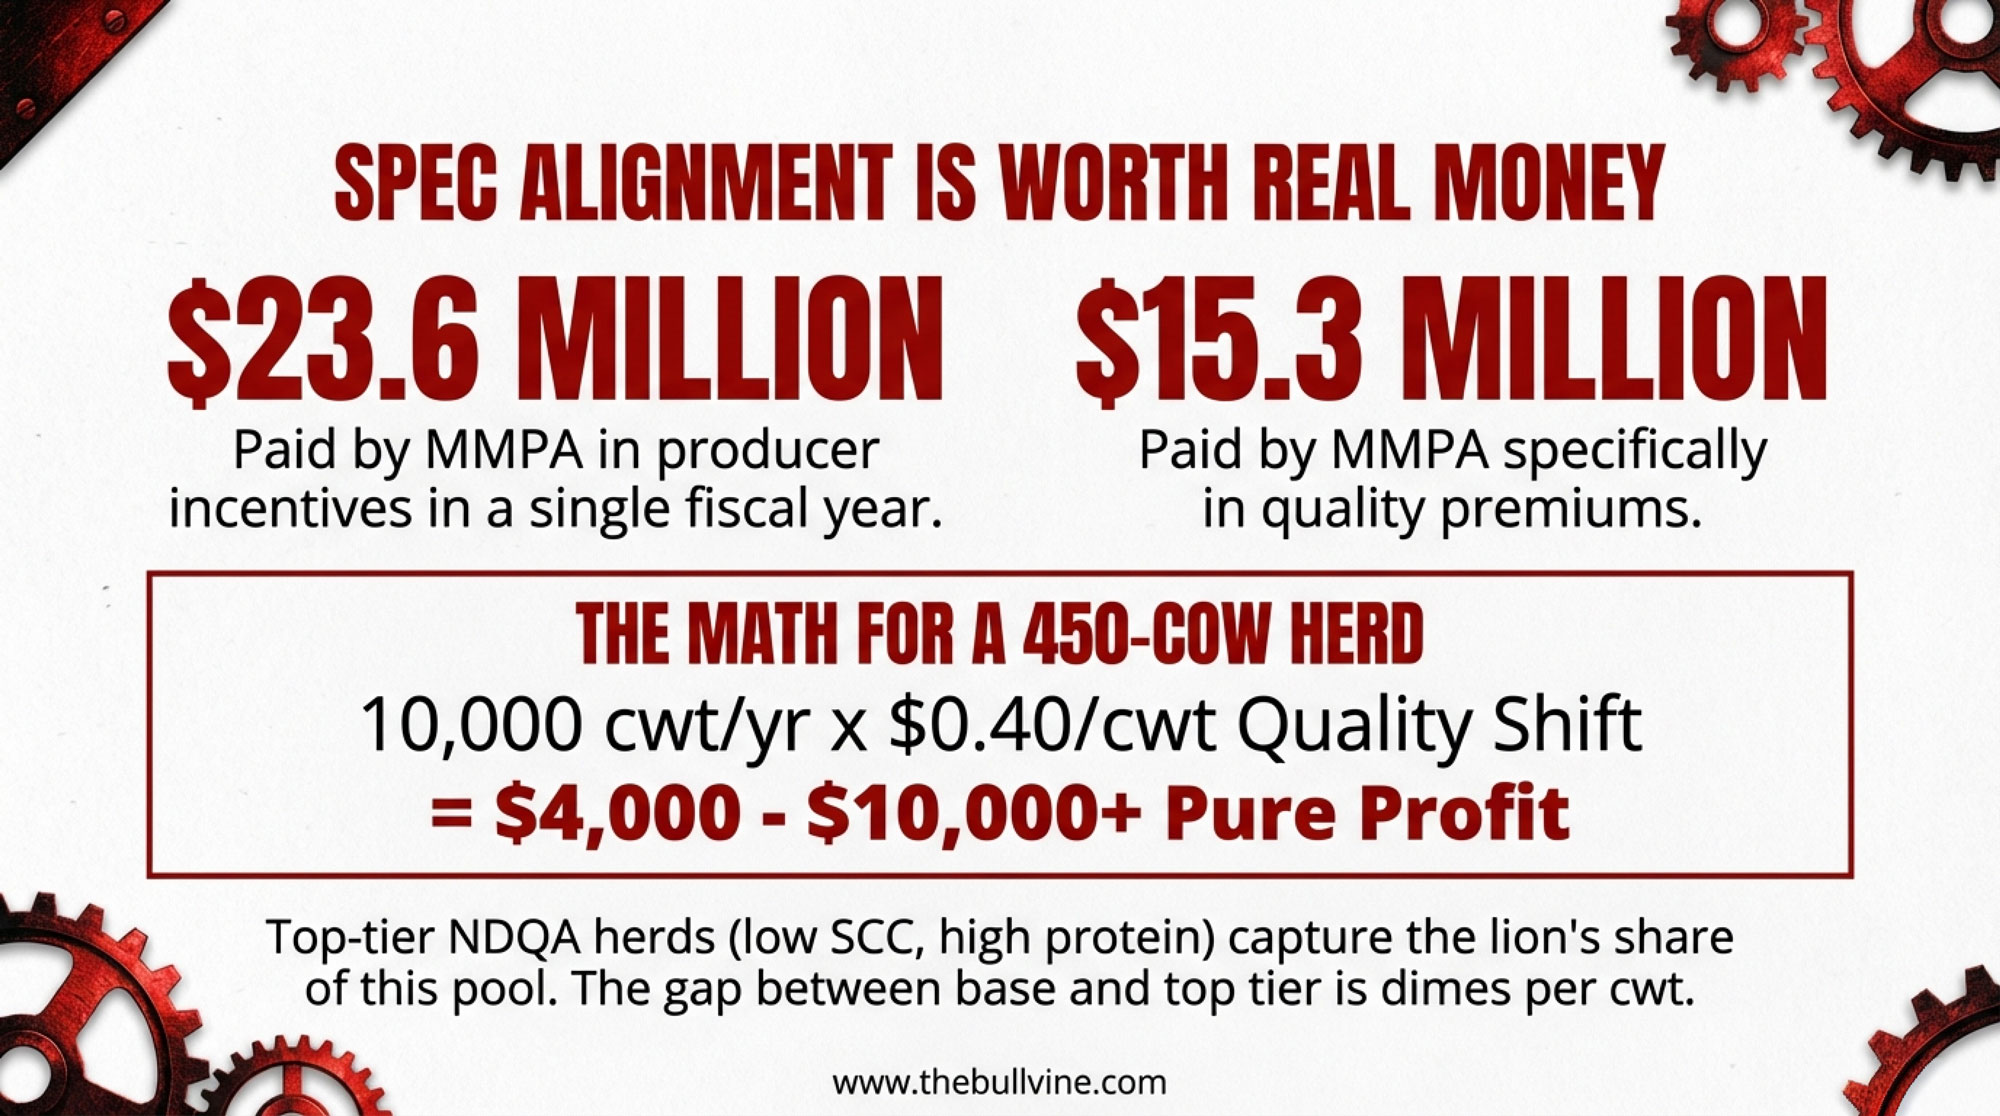
Those results sit on top of serious money. MMPA reports that in fiscal 2021, total producer incentive premiums, including quality, totaled $23.6 million. Separate coverage notes that in another year, the co‑op paid about $15.3 million specifically in quality premiums. That’s not coffee money — that’s a major re‑allocation of value inside the co‑op from “base” milk to higher‑spec milk. 

When you look at numbers like that and how typical premium grids are structured, it’s realistic in strong quality programs for top‑tier SCC and bacteria performance to be worth on the order of a few dimes per cwt more than base milk, especially once you stack co‑op premiums on top of how quality plays into the federal order price. The exact spread depends heavily on your grid and your year, but the magnitude is real.

Let’s run one grounded example, just so the math isn’t abstract:

  • 450‑cow herd.
  • 23,000 lb shipped per cow per year.
  • That’s about 10,000 cwt of milk a year (23,000 × 450 ÷ 100).

If that herd shifted quality far enough to pick up an extra $0.40/cwt in quality premiums compared to where they sit today, that’s:

  • 0.40 × 10,000 cwt = $4,000 per year in additional revenue.

That 40¢ is just a placeholder — you need to pull out your own premium sheet, look at where your SCC/bacteria performance has sat for the last 12 months, and calculate the actual difference between your performance and the next tier up. In some programs, that gap might be only 15–20¢; in others, it might be more than 50¢. The point is simple: there’s real money on the table, and spec alignment decides who gets it.

Cheese‑Heavy vs Fluid‑Heavy: Same Pressure, Different Rules

These spec fights don’t land the same way in every region.

In cheese‑heavy regions — think Wisconsin, Idaho, parts of New York, Quebec — spec pressure shows up mainly through casein, P:F ratio, and total cheese yield. Plants there are already asking which herds make their Cheddar, mozzarella, and process cheese perform inside tighter sodium windows without breaking yield or texture.

In more fluid‑oriented regions — parts of the Southeast, states like Florida — the big school milk and ESL players care a little less about cheese yield and more about consistent components, shelf life, and flavor under sugar caps. You still feel the same consolidation math, but it shows up first in which flavored milks and nutrition drinks pass spec, and which herds make those products easy to run.

Across the U.S., the structural backdrop is the same. Summary of USDA data shows that from 2003 to 2023, U.S. milk production climbed from about 170.3 billion lb to 226.4 billion lb — roughly a 33% increase — while licensed herds dropped from 70,375 to 26,290, a 63% decline. Fewer, larger herds with more technology and lower per‑unit costs. That gives processors and co‑ops a lot more freedom to say, “We’re going to lean into these 300 farms that fit our specs — and we’re going to quietly back away from those 50 that don’t.” 

Genetics: When κ‑Casein and A2 Actually Belong in Your Plan

Any time specs tighten, genetics buzzwords start floating around: κ‑casein, A2, cheese merit, specialty labels. They all sound good on paper. The real question is where they belong in your actual strategy.

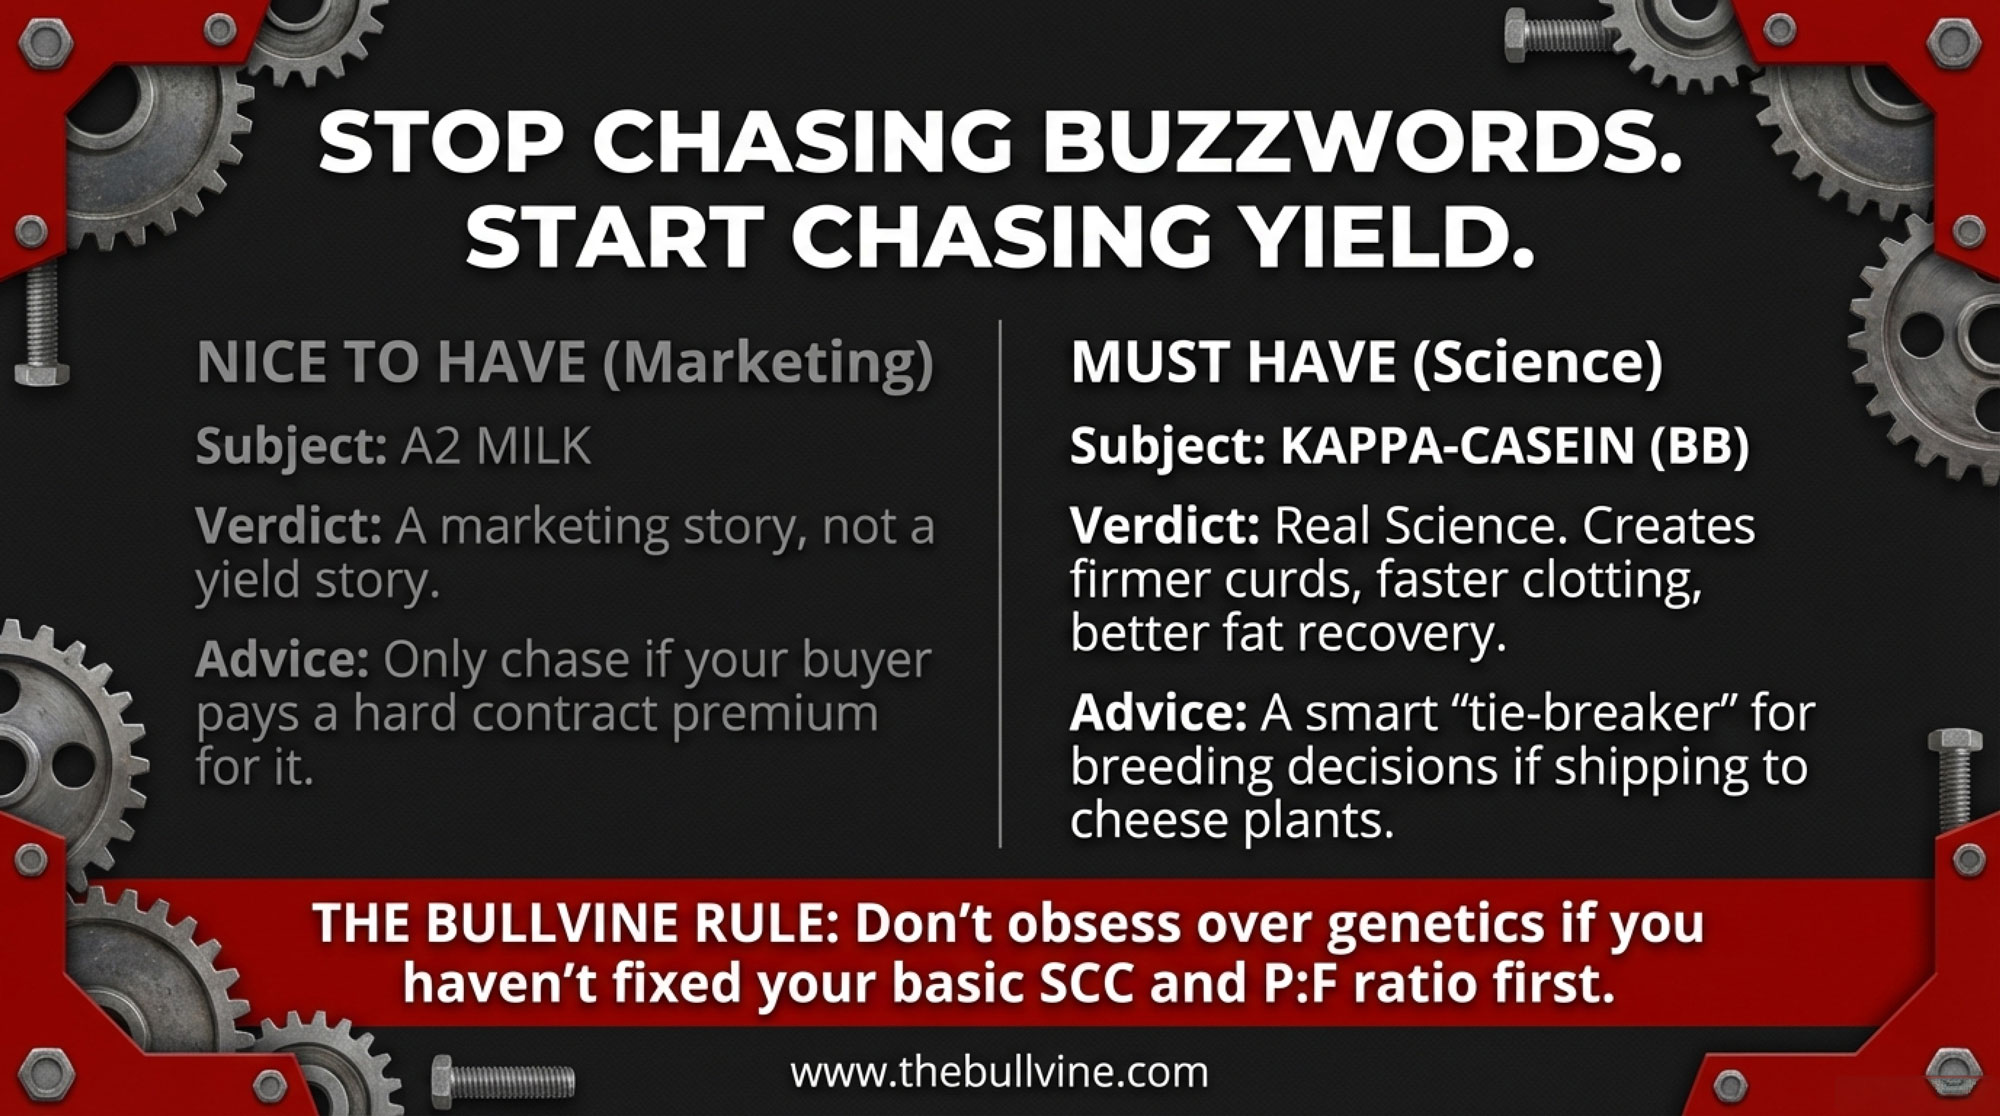
In κ‑casein, multiple dairy science studies across breeds report that BB milk tends to coagulate faster and form firmer curd than AA milk, and can deliver higher cheese yields and better fat recovery in many systems. European extension work and on‑farm trials back up faster clotting and, in some cases, better yields in BB cows — as long as you remember that solids, lactation stage, and management can mute or magnify that edge. 

On A2, a 2016 paper in Nutrients found that some milk‑intolerant individuals had fewer gastrointestinal symptoms when drinking A2 milk compared to conventional milk. That’s a marketing and demand story, not a yield bump. It matters if your buyer is actively branding A2‑only products and paying a premium for them. If not, it’s a “nice to have” that sits behind fertility, health, and core components. 

Genetics FocusWhen It MattersWhen It Doesn’tThe Bullvine Take
κ-Casein BB– You’re 10+ years from retirement
– Shipping to cheese-heavy plant
– Bulls otherwise similar on main index
– Within 3–5 years of major transition
– Buyer isn’t cheese-focused
– Core fertility/health traits still need work
Use as tie-breaker when sires are equal on your main priorities. Multiple dairy science studies show BB milk tends to coagulate faster, form firmer curd, and can deliver higher cheese yields—but only if solids, SCC, and management are already dialed in.
🔴 A2 Genetics–  Buyer is actively branding and paying premiums for A2 products
– You have written contract language specifying A2 pricing
– Buyer mentions A2 as “nice to have” but offers no premium
– You’re chasing it for generic “marketability”
🔴 This is a demand story, not a yield story. 2016 Nutrients research found some intolerant individuals had fewer GI symptoms with A2 milk—but that’s meaningless to your bottom line unless your buyer is writing checks for it. Keep fertility, health, and core components front and center.
✅ Protein/Fat/Health Traits–  Always.No exceptions. Every herd, every year.–  Never.These are neversecondary.If you’re debating κ-casein or A2 before you’ve maxed out fertility, daughter pregnancy rate, SCC genetics, and component consistency, you’re optimizing the wrong end of the curve. Fix the base. Then fine-tune.

Here’s where genetics really fits in a spec‑tightening world:

  • If you’re within 3–5 years of retirement or major succession decisions, the big returns don’t live in chasing κ‑casein or A2. They live in quality, fresh cow management, cost per cwt, and a clean transition plan.
  • If you’re thinking 10+ years out in a cheese‑oriented market, it’s reasonable to treat κ‑casein BB as a tie‑breaker when bulls are otherwise similar on your main index — especially if your plant leans hard into cheese.
  • A2 should only move up your sire priority list when your buyer is explicitly marketing A2 products and putting real money on the table. Otherwise, keep fertility, health traits, and protein/fat front and center.

What This Means for Your Operation

Here’s where this stops being a policy story and turns into decisions at your kitchen table.

1. Run a 12‑Month Spec Health Check

Once a year — after year‑end or after you file taxes — sit down with your last 12 months of milk checks and your current premium schedule and answer two blunt questions:

  • What’s my 12‑month P:F ratio, and does it put me below ~0.77, between 0.77–0.80, or above 0.80?
  • Over those 12 months, what percentage of the maximum quality premium my program offers did I actually capture?

If your P:F is below roughly 0.77 in a cheese‑oriented system, that’s a flashing yellow light. Get your nutritionist and vet around the table and talk fresh cow performance, transition, and forage quality — then commit to at least one ration trial or forage test specifically aimed at nudging P:F towards that 0.77–0.80 band.

If your quality‑premium capture sits in roughly the 60–70% or less range of what’s available, you’ve got real money sitting in SCC, bacteria, and milking routines. That’s exactly where NDQA‑level herds make their living.

2. Ask Your Buyer Three Straightforward Questions

In the next week or two, call a field rep, board member, or plant manager you trust and ask:

  1. Roughly what share of your total volume is tied to school milk, cheese, or yogurt that has to meet these sodium and added‑sugar specs?
  2. Do you expect your component pricing or quality standards to change over the next 2–3 years because of those specs — and if so, how?
  3. What do your most spec‑aligned herds tend to look like on protein, butterfat performance, SCC, and overall quality?

If they tell you a third or more of their business is spec‑sensitive school and cheese channels, your spec alignment isn’t a side topic — it needs to move up your strategic list.

3. Be Honest About Which Path You’re On

Looking at your numbers and what you just heard from your buyer, which of these paths are you really on — not the one you wish you were on?

  • Optimize. You’re capturing most of the quality premiums — say, north of 80% as a rough benchmark — your P:F is above 0.80 in a cheese plant, debt is manageable, and your buyer wants more milk like yours. Your job is to protect that position and keep sharpening at the margins.
  • Reposition. The herd is fundamentally sound, but P:F, SCC, or cost per cwt are holding you back. Your focus is better forage, tighter fresh cow and transition programs, more consistent milking routines, and getting P:F into at least the 0.77–0.80 band while climbing the premium ladder.
  • Diversify. You’ve got the scale and risk tolerance for digesters, renewable gas, or modest on‑farm processing — after your base milk is competitive on specs. You gain margin and new revenue streams, but you give up simplicity and take on new market and execution risk.
  • Transition. Between debt, distance to plant, and family plans, the smart move may be a managed exit, downsizing, or a simpler setup while equity is still strong. Families who do best here start the conversation early, not after the bank starts it for them.
PathYour 12-Month ProfileWhat It MeansFocus AreasRisk/Reward
✅ Optimize– Quality premium capture >80%
– P:F ratio >0.80 (cheese)
– Buyer says “we want more milk like yours”
You’re already in the “keep” pile—protect that position and sharpen at marginsMaintain SCC/bacteria performance, lock in casein genetics, ask if you’re capturing full available premiumLow risk, steady reward. Your job: don’t slip.
⚠️ Reposition– P:F ratio 0.75–0.79
– Quality premium capture 60–75%
– Fundamentals sound but held back by specs
You’re serviceable but not standout—one ration trial and tighter fresh cow work can move you up a tierBetter forage quality, transition cow protocols, consistent milking routines, target P:F ≥0.77, climb quality ladderModerate risk, high reward. You can win this.
🚀 Diversify– Already “optimize” on base milk
– Scale and risk tolerance for new revenue
– Willing to trade simplicity for margin
You add digesters, renewable gas, or modest on-farm processing after base milk is competitiveNew revenue streams, environmental story, margin stacking—but requires capital, management bandwidth, market executionHigher risk, higher reward.Don’t diversify fromweakness.
🚨 Transition–  Debt load high
–  Distance to plant a problem
– Family/succession unclear
–  Specs feel out of reach
Smart move may be managed exit, downsizing, or simpler setup while equity is still strongStart the conversation NOW—before the bank or buyer starts it for you; plan transition with dignity and controlIgnoring this path is the highest risk of all.

None of those paths is “right” for everyone. The danger is pretending you’re on one path when your numbers say you’re on another.

Key Takeaways

  • Specs — not just blend price — are deciding who keeps school milk and cheese contracts. The 2024 USDA school meal rule locks in sodium and added‑sugar limits that push processors toward milk with stronger protein, casein, and quality — and away from herds that make those specs harder to hit. 
  • Your 12‑month P:F ratio is a cheap early warning light. If you’re shipping into cheese and sitting below about 0.77, that’s a “now” conversation with your nutritionist and vet about fresh cows, rations, and forage quality — not a “someday” project.
  • Quality and component premiums are real money, not a rounding error. Co‑ops like MMPA have paid more than $23 million in producer incentive premiums in a single year, with about $15.3 million in quality premiums in another. Spec‑aligned, NDQA‑caliber herds capture a disproportionate share of that pool. 
  • FMMO reform and specs will collide in your mailbox price. Any changes to make allowances, Class I movers, or pooling rules will hit differently depending on whether your milk helps processors win and service spec‑sensitive school and cheese business. 

The Bottom Line

You don’t control the rule. You don’t control the pool. But you do control whether your herd looks like the easiest milk to keep when processors decide who fits their 2027–2031 book of business — or the milk they can live without when specs and margins get tight. The question is simple: when you pull your last 12 months of milk checks, does your P:F ratio, your quality performance, and your premium capture put you in the “optimize” band — or in the pile that needs to catch up before the next round of contracts goes out?

Complete references and supporting documentation are available upon request by contacting the editorial team at editor@thebullvine.com.

Learn More

The Sunday Read Dairy Professionals Don’t Skip.

Every week, thousands of producers, breeders, and industry insiders open Bullvine Weekly for genetics insights, market shifts, and profit strategies they won’t find anywhere else. One email. Five minutes. Smarter decisions all week.
NewsSubscribe
First
Last
Consent

The $50,000 Biofilm Crisis Your ATP Test Will Expose

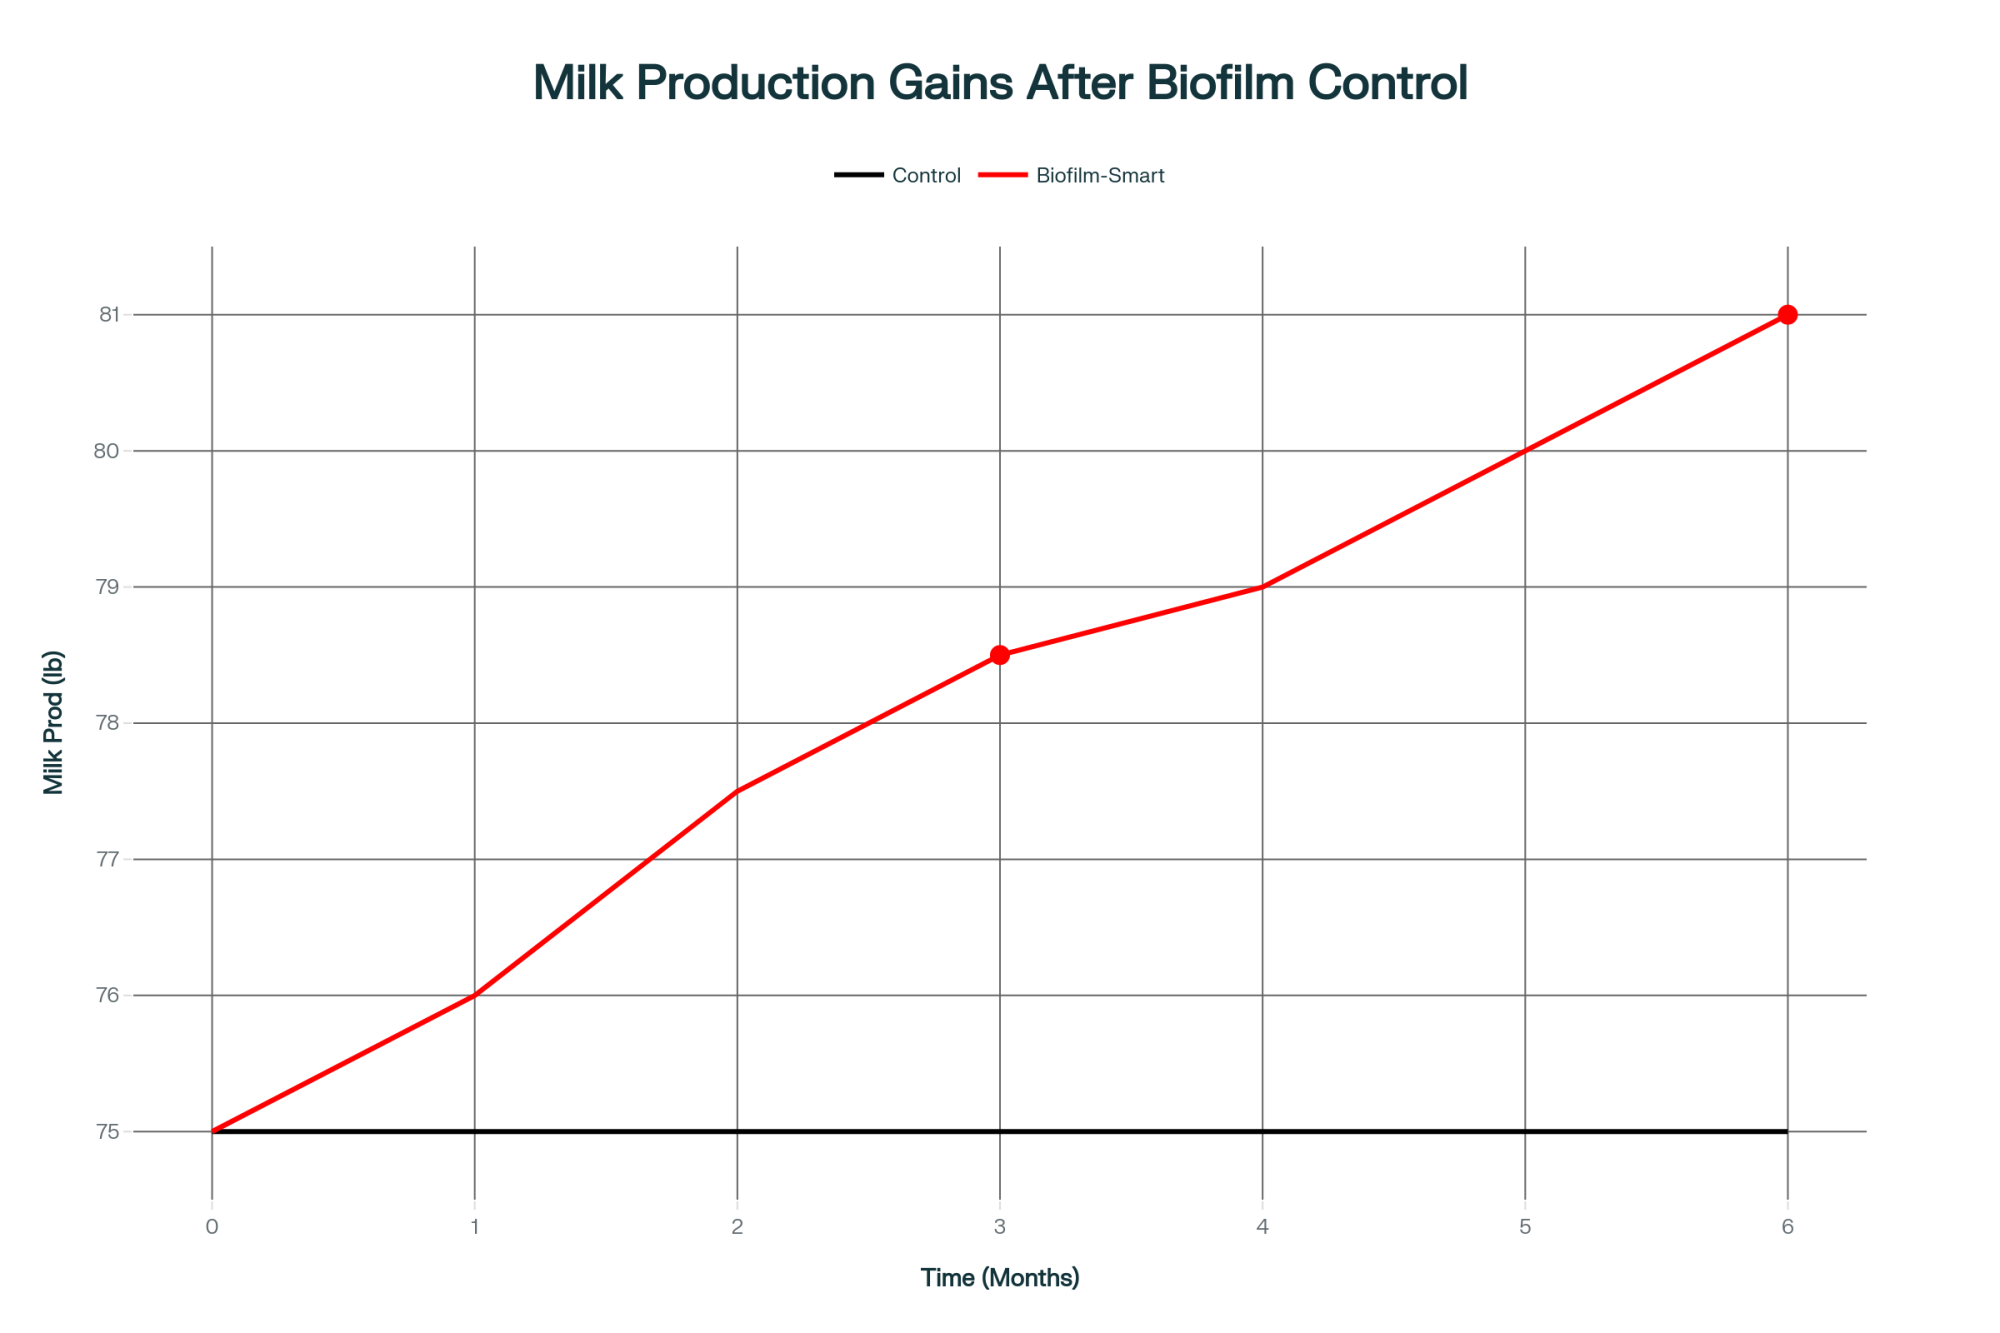
ATP tests are exposing the $50,000 problem hiding in your ‘clean’ equipment in chronic infections and production gains of up to 5 lbs per cow daily.

Dairy Biofilm Control

EXECUTIVE SUMMARY: You’re losing $50,000 annually to biofilms—bacterial colonies thriving on your ‘clean’ equipment, surviving standard CIP that removes less than half of them. These slime fortresses resist antibiotics, cause 70% treatment failure in ‘chronic’ mastitis, and destroy the value of your best genetics. But here’s what changes everything: a $5 ATP test instantly exposes them, showing contamination levels your standard tests miss. The fix costs less than a vet call—add $150 of enzymes to your monthly CIP and significantly improve biofilm removal. Recent field trials prove it: 70% fewer chronic infections, 5 lbs more milk per cow daily, and complete payback in 10 weeks. We’ve been cleaning wrong for 30 years; now we can finally clean right.

Your milking equipment looks spotless. Your CIP ran perfectly. Your bulk tank passes every quality test. Yet somewhere in your operation right now, an invisible colony of bacteria wrapped in protective slime is preparing to cost you $50,000 this year—and you’ll probably attribute those losses to genetics, nutrition, or just the way dairy goes sometimes.

This is the biofilm reality. And frankly, it’s embarrassing that we’ve ignored it for this long.

Staggering Financial Fallout: Where $50,000/year actually goes in the average 100-cow herd. Production losses are the silent profit killer.

The Hidden Enemy Producers Never Knew They Had

When a in Wisconsin dairy ran his first ATP (adenosine triphosphate) bioluminescence test last spring, they expected confirmation that his equipment was clean. The swab showed readings far above acceptable limits for his specific testing device.

“I’ve been dairying for 30 years,” they commented. “That number told me everything I thought I knew about ‘clean’ was wrong.”

Important Note: ATP RLU (Relative Light Unit) baselines vary significantly by luminometer manufacturer. Hygiena systems typically use pass <10, fail >30. 3M Clean-Trace uses different scales (often pass <150). Always consult your specific device manual for accurate pass/fail thresholds.

And you know, that reaction is exactly what researchers are documenting across the industry right now. Standard CIP procedures often remove less than 50% of established biofilms, according to recent microbiological reviews. The remaining bacterial communities survive, protected by a slime fortress of proteins and DNA that basically laughs at your standard chlorine wash.

Recent research from Cornell University’s Food Science Department explains it in terms we can all understand: “Imagine trying to remove concrete with a garden hose. That’s essentially what we’re doing when we use standard cleaning protocols on mature biofilms.”

Here’s something that should make every producer sit up: You can buy the most expensive genomic sires in the catalog, invest in elite genetics with +3000 GTPI, but if you’re pumping that premium milk through biofilm-lined pipes, you’re burning money. Those genetics won’t mean much when biofilms are cutting your production by 5-10% and driving your SCC through the roof.

What’s encouraging—and I mean this genuinely—is that now we understand why this is happening. Economic modeling based on documented production losses, treatment costs, and culling data suggests average annual losses of approximately $50,000 for a 100-cow operation dealing with biofilm-related issues. But here’s the thing: only about $12,000 of those costs are visible as treatment expenses and discarded milk. The remaining $38,000? Well, that hides in reduced production, chronic infections, premature culling, and equipment degradation. It’s the money you’re losing without even seeing where it went.

ATP Testing Guidelines

Device-Specific Thresholds (Always verify with your manufacturer):

  • Hygiena SystemSURE: Pass <10, Caution 10-30, Fail >30
  • 3M Clean-Trace: Varies by model (typically Pass <150)
  • Charm NovaLUM: Different scale entirely

Critical: RLU readings are not standardized across devices. A “350” on one system may equal “35” on another.

The 12-Hour Window That Changes Everything

Now, here’s what’s actually happening between your morning and evening milking that nobody really talks about in the parlor or at co-op meetings—and this is where it gets interesting.

Within hours of your morning CIP, biofilms on your equipment begin progressing from removable surface contamination to consolidated communities with sophisticated internal architecture. Recent research shows significant reductions in removability occur between 4 and 12 hours as biofilms mature and strengthen their protective matrix.

Research from the University of Wisconsin-Madison’s Center for Dairy Research puts it bluntly: “By the time evening milking comes around, you’re running milk through equipment colonized by mature biofilms at their peak shedding phase. Those shed cells aren’t just bacteria—they’re pre-selected for antibiotic tolerance and wrapped in protective matrix material.”

It’s worth noting that this timeline explains why the industry-standard 24-hour CIP cycle fundamentally misaligns with biofilm biology. We’re unknowingly allowing biofilms to reach maximum consolidation before attempting removal. It’s like letting weeds go to seed before trying to pull them—you’re fighting an enemy that’s had time to dig in deep. And whether you’re running a traditional parlor, a rotary system, or robotic milkers, that consolidation window remains surprisingly consistent across all equipment types.

Regional Variations: Why Your Neighbor’s Experience Might Differ

What’s interesting is that biofilm challenges vary significantly across regions and production systems. In warmer climates with higher ambient temperatures, operations report faster biofilm formation rates—sometimes reaching critical consolidation more quickly during summer months. Water temperature and equipment temperature play crucial roles in the rate of biofilm development.

Meanwhile, producers in regions with hard water face different challenges. Research from New Mexico State University’s Dairy Extension program found that “hard water with high mineral content actually provides additional binding sites for biofilm formation. We’re seeing some operations with significant biofilm problems directly related to water chemistry.”

So if you’re dealing with hard water, don’t assume you’re off the hook. You might actually have a different problem—not speed, but chemistry.

Why Your Antibiotic Treatments Keep Failing

Here’s something that has frustrated many producers we’ve spoken with in 2024 on-farm studies. Multiple operations spent thousands trying to cure chronic mastitis in their best genetics before discovering the biofilm connection.

“My vet kept saying the bacteria were susceptible to the antibiotics we were using,” one producer recalls. “The lab tests showed they should work. But we’d treat, see improvement, then two weeks later the infection was back.”

Looking at this situation, here’s what they didn’t know—and what many of us still don’t realize—standard antibiotic susceptibility testing uses free-floating bacteria. But mastitis infections often involve biofilm-embedded bacteria that can tolerate significantly higher antibiotic concentrations due to their protective matrix. It’s a fundamental disconnect.

Important clarification: Enzymes in CIP don’t kill bacteria directly—they break down the protective biofilm shield, exposing bacteria so your cow’s immune system or appropriate therapy can actually work. Think of enzymes as removing the armor, not wielding the sword.

The result? Cure rates for biofilm-mediated mastitis remain frustratingly low, often 30-35%, compared to much higher rates for non-biofilm infections. Yet both look identical on standard culture tests.

It’s one of those situations where the problem isn’t your vet—it’s the testing methodology itself. We’ve been using tools designed for one enemy to fight a completely different enemy.

The Testing Revolution: How ATP Is Changing the Game

The breakthrough for many producers has been ATP bioluminescence testing—a technology borrowed from the food processing industry that provides biofilm detection in minutes rather than days.

Here’s how it actually works on your farm:

Quick ATP Testing Protocol:

  1. Run your standard CIP cycle
  2. Wait 30 minutes for the equipment to dry
  3. Swab these critical points:
    1. Inside of milking liner (3 different units)
    1. Pipeline elbow joints (biofilm hotspots)
    1. Bulk tank outlet valve
    1. Water trough surfaces
  4. Activate the swab in the luminometer
  5. Record RLU readings
  6. Compare to YOUR device’s specific benchmarks (not generic numbers)

“The first time you see readings way above your device’s clean threshold on equipment you thought was spotless, it’s like someone turned on the lights in a dark room,” says one Vermont producer who participated in recent trials. “Suddenly, all our chronic problems made sense.”

And here’s the thing that really matters: the economics are compelling. ATP test swabs cost $3-5 each. A basic luminometer runs $200-400. For an initial investment of less than $500, you gain visibility into a problem that’s been costing you tens of thousands of dollars annually. That’s not a hard decision when you think about what you’ve been losing.

Natural Solutions That Actually Work

What’s surprising, many producers—and honestly, it surprised me when I first dug into the research—is that the most effective biofilm interventions aren’t necessarily the most expensive or complex.

Enzymatic CIP Enhancement

Adding proteases and DNases to existing CIP protocols can significantly improve biofilm removal compared to standard chemical cleaning alone. Cost? Approximately $100-200 per month for a 100-cow operation.

Producers participating in recent Midwest field trials report notable improvements. “Our ATP readings dropped significantly, and our bulk tank SCC has been consistently under 200,000 for the first time in two years,” one Illinois producer reports. That’s the kind of shift that actually matters economically.

Essential Oil Integration

Research on basil and bergamot essential oils shows promising activity against biofilm-forming S. aureus. Unlike single-target antibiotics, these compounds attack through multiple mechanisms simultaneously—disrupting membranes, interfering with metabolism, and blocking bacterial communication.

In Oregon trials, producers saw improved cure rates in cows previously considered chronic. That’s the kind of result that changes what you’d do with a problem animal.

Water System Management

Perhaps the most overlooked intervention is biofilm control in water systems. Here’s what’s interesting: contaminated water can reduce milk production as cows reduce intake due to off-tastes.

In recent field reports, several producers noted that monthly enzymatic water treatment costs around $100 and that production gains of up to 3 pounds per cow per day were observed in systems with chronic waterline biofilm issues. That’s significant milk you didn’t know you were losing.

The Farm-to-Processor Connection: A Two-Way Street

Here’s what’s revolutionizing how forward-thinking producers approach biofilm management: Your farm’s biofilms don’t stay on your farm. And—this is the part that really opened my eyes—processor biofilms can actually come back to haunt your farm operation.

Research tracking microbial communities from farms to processing facilities found that multiple bacterial genera present on farm equipment appeared in finished dairy products. Thermoduric bacteria from farm biofilms survive pasteurization, producing heat-stable enzymes that can significantly affect shelf-life.

“When we receive milk with high thermoduric counts, we know there’s a biofilm issue somewhere in that supply chain,” explains a quality assurance director at a major Midwest cooperative. “We’ve started working directly with farms on biofilm management because it affects our entire operation. We’re exploring premium payment options for farms that can demonstrate consistent biofilm control through ATP testing.”

This development suggests a real shift in how the industry values milk quality beyond just SCC and standard plate counts.

What Success Actually Looks Like: The Six-Month Transformation

For producers considering biofilm management, here’s what the timeline typically looks like based on aggregated field data from recent trials:

Month 1-2: Discovery and Baseline

  • ATP testing reveals biofilm presence
  • Begin enzymatic CIP protocols
  • Document baseline metrics (SCC, production, treatment success)
  • Early improvements in ATP readings validate the approach

What’s interesting is that most producers report a psychological shift happening here, too. “Once you see those ATP numbers, you can’t unsee them,” as multiple farmers have put it.

Month 3-4: Measurable Improvements

  • ATP readings stabilize at lower levels
  • Bulk tank SCC drops 15-20%
  • Treatment success rates improve
  • Production increases 1-2 lbs/day per cow

Month 5-6: New Normal Established

  • ATP readings are consistently at acceptable levels for your device
  • SCC stabilizes under 200,000
  • Chronic infection prevalence drops significantly
  • Production gains of 4-5 lbs/day sustained
  • ROI becomes obvious: $3,500-6,500 net benefit achieved

“The transformation isn’t instant, but it’s dramatic,” reported one Midwest producer. “We went from accepting 8% chronic infection rates as normal to maintaining less than 2%. That alone saved us thousands in reduced culling.”

When Things Don’t Go as Planned

I should mention that not every biofilm intervention succeeds immediately. One producer tried enzymatic CIP for two months, saw minimal improvement, then nearly gave up. “Turns out our water pH was interfering with the enzyme activity,” they discovered. “Once we adjusted the water chemistry, the enzymes started working, and our ATP readings plummeted.”

This highlights an important point: biofilm management isn’t always plug-and-play. Local conditions matter, and sometimes troubleshooting is needed to find what works for your specific situation. It’s worth working with your vet or an extension specialist to identify what’s unique about your water, equipment, or operation.

The Industry Awakening

Major cooperatives are beginning to recognize the imperative of biofilms. Several have launched pilot programs that provide ATP testing equipment to member farms, while others are developing biofilm management protocols for their quality-assistance programs. This isn’t fringe thinking anymore—it’s mainstream industry response.

“We’re seeing a clear correlation between farms managing biofilms and those achieving consistent premium milk quality,” notes industry quality assurance experts. “It’s becoming a competitive differentiator.”

And veterinary practices are evolving too. The American Association of Bovine Practitioners has recognized biofilm biology in their educational programs, and several veterinary schools are updating mastitis treatment protocols to include biofilm-specific approaches.

What This Means for Your Operation

Immediate Actions Every Producer Should Consider:

  • Order ATP testing supplies this week ($50-100 investment reveals whether biofilms are your problem). Suppliers include 3M Clean-Trace (1-800-328-1671), Hygiena SystemSURE Plus (hygiena.com), and Charm Sciences NovaLUM (charm.com).
  • Test three critical points: milking equipment post-CIP, water systems, and bulk tank surfaces
  • Document baseline metrics: Current SCC, treatment success rates, chronic infection prevalence
  • Check YOUR device’s specific thresholds: RLU scales vary dramatically between manufacturers

Cost-Benefit Reality Check

  • Annual biofilm-related losses (100-cow herd): ~$50,000 (economic modeling)
  • Annual investment in biofilm control$1,500-2,500
  • Typical ROI: Strong positive returns within the first year
  • Payback period: Often 2-3 months

Based on aggregated field trial data

The Competitive Advantage:

Producers managing biofilms report:

  • Milk quality premiums are worth $2,000-5,000 annually
  • Reduced culling, saving $10,000-15,000 per year
  • Treatment cost reductions of $3,000-5,000
  • Production gains are worth $20,000-40,000 annually

What’s Changing in the Industry:

The definition of “clean” is evolving from “looks clean and passes standard tests” to “biofilms are detected, measured, and controlled.” Producers who adapt early are finding themselves with healthier herds, better milk quality, and improved profitability.

“This isn’t about working harder,” says one California producer who transformed her operation’s biofilm management. “It’s about working smarter with better information. Once you can see biofilms with ATP testing, you can’t unsee them. And once you start managing them, you wonder how you ever accepted those losses as normal.”

From Stagnant to Surging: How Biofilm Management Drives Milk Yields. Red line shows the real-world spike, not just theory.

The Bottom Line

The biofilm revolution in dairy isn’t coming—it’s here. Forward-thinking producers are already implementing testing protocols, adjusting cleaning procedures, and seeing dramatic improvements in herd health and profitability.

What farmers are discovering is that biofilm management represents one of those rare opportunities where the science is clear, the tools are available, and the economics are compelling. The only question remaining is how quickly the broader industry will embrace what early adopters are already proving: biofilm management isn’t an expense—it’s an investment that pays for itself many times over.

For dairy producers who’ve been fighting unexplained chronic mastitis, watching SCC creep upward, or accepting gradual production declines as inevitable, the message from those who’ve implemented biofilm management is consistent: “This is the missing piece we didn’t know we were looking for.”

As one producer reflects: “I spent 30 years managing problems I couldn’t see. Now that I manage biofilms, I can measure them. The difference in my operation—and my stress level—is night and day. I just wish I’d known about this five years ago.”

The invisible enemy is invisible no more. And producers who see it first are reaping the rewards.

For more information on implementing biofilm detection and management protocols, contact your local Extension dairy specialist (find yours at extension.org), reach out to ATP testing suppliers like 3M (1-800-328-1671), Hygiena (hygiena.com), or Charm Sciences (charm.com), or consult the Journal of Dairy Science special issue on biofilm formation (Volume 107, 2024). For enzymatic CIP products, contact your current milking equipment supplier about biofilm-specific cleaning protocols.

KEY TAKEAWAYS:

  • The Hidden Cost: Your “clean” equipment harbors biofilms costing $50,000/year—standard CIP removes less than half
  • The 2-Minute Test: ATP swab ($5) instantly exposes biofilms—but check YOUR device’s specific thresholds
  • The Simple Fix: Add $150/month of enzymes to CIP, notably enhance biofilm removal, and help treatments work better
  • The Proven Payoff: 70% fewer chronic infections + 5 lbs more milk/cow daily = strong ROI
  • The Competitive Edge: Processors are exploring premiums for biofilm-controlled milk—early adopters win

Editor’s Note: Cost figures in this article are based on economic modeling from recent dairy science research and USDA-ERS data. Regional costs may vary. Names have been changed to protect producer privacy unless otherwise noted. We welcome producer feedback at editor@thebullvine.com.

Learn More:

The Sunday Read Dairy Professionals Don’t Skip.

Every week, thousands of producers, breeders, and industry insiders open Bullvine Weekly for genetics insights, market shifts, and profit strategies they won’t find anywhere else. One email. Five minutes. Smarter decisions all week.
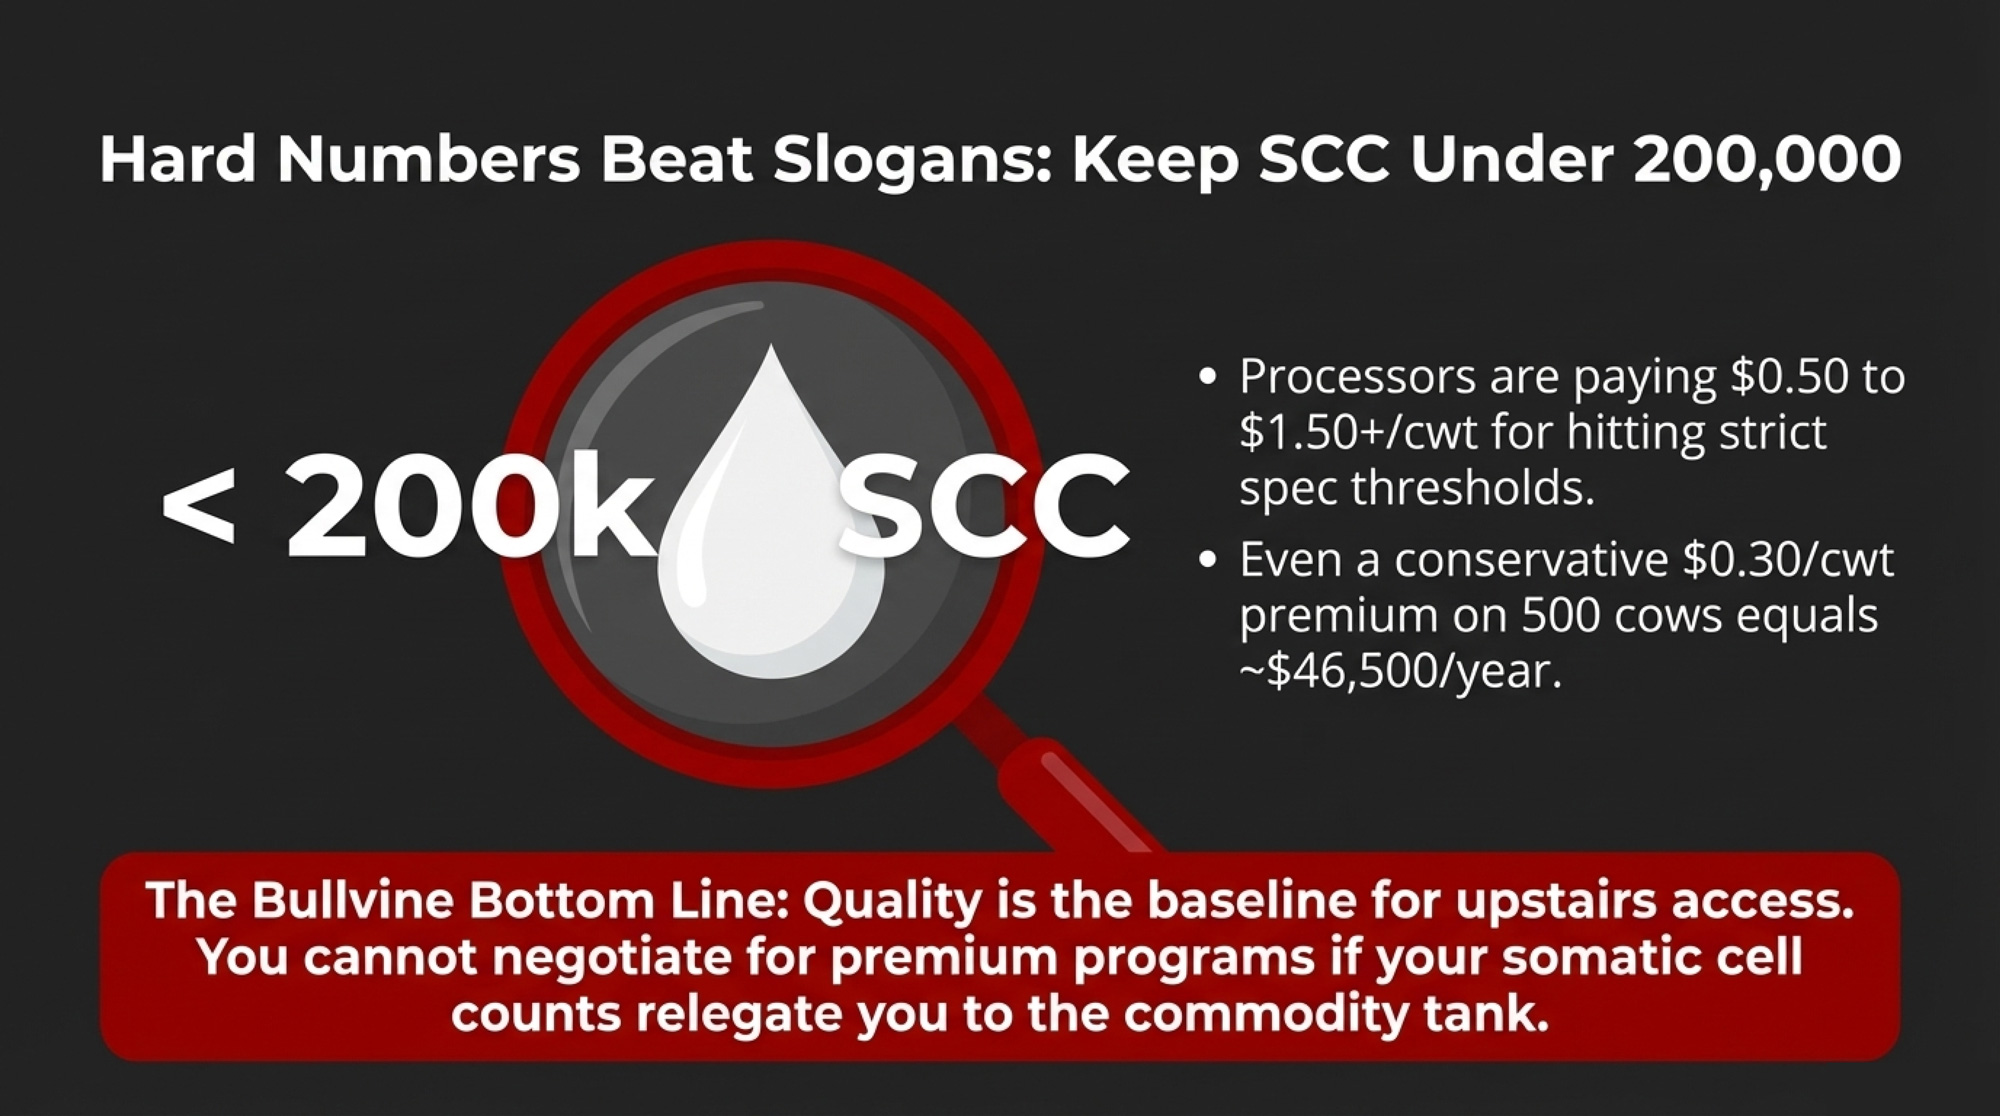
NewsSubscribe
First
Last
Consent

$2 Milk or $20 Milk: The Simple Testing Strategy Creating 1000% Premiums

Your milk check says $2/gallon. Theirs says $20. The only difference? They test monthly and post results. That’s it.

I was talking with a producer milking 75 Holsteins from Pennsylvania. Like many of us watching this fall’s milk checks, he’s seeing commodity prices bounce between $1.13 and $2.19 per gallon—depending on co-op adjustments and regional factors. His question resonated with conversations happening in barns across the country: “What’s our path forward when the traditional model keeps getting tighter?”

The answer might surprise you. It certainly caught my attention when I first learned what’s happening in Delaware.

Understanding the Current Landscape

The Premium Pricing Ladder reveals how Delaware’s testing-transparent raw milk operations command $20 per gallon—a stark 1000% premium over commodity pricing. While organic and grass-fed capture respectable premiums, Delaware’s regulatory embrace strategy demonstrates that verified safety protocols unlock unprecedented pricing power in niche dairy markets

Let me share something that’s been weighing on many of us. According to the USDA’s National Agricultural Statistics Service, approximately 2,800 dairy operations have been lost annually in recent years. That’s about eight farms closing their doors each day—from California’s Central Valley to Vermont’s Northeast Kingdom.

Meanwhile, Data Horizzon Research reports that raw milk sales grew 21 percent in 2024. Global market projections are expected to reach $1.37 billion by 2033.

Is this simultaneous growth in specialty markets while conventional operations struggle? It reveals something fundamental about where consumer preferences are headed.

“Between my wife’s teaching position and the farm, we’re managing. But the farm alone? That’s becoming a different conversation.”

A dairyman in Lancaster County shared this with me last week. His 50-cow operation grosses around $330,000 annually, yet it clears just $25,000 after expenses. I’m hearing this same story from Pennsylvania to Wisconsin.

This brings us to Delaware. The state’s 13 raw milk operations—already operating under permitted raw milk and herdshare models—didn’t just accept the state’s comprehensive testing protocols, including pioneering H5N1 screening implemented this year. They embraced them as market differentiation.

These producers now command $16 to $20 per gallon. To be clear, raw milk typically brings $10 to $12 per gallon in most markets. Delaware’s operations capture that extra $4 to $8 premium specifically because their rigorous, transparent testing protocols build exceptional consumer trust.

Testing as Competitive Advantage

Delaware’s dairy sector hemorrhaged 83% of operations since 2014, mirroring the national crisis of 2,800 annual farm losses. Yet the 13 surviving farms discovered a counterintuitive strategy: embracing stringent testing regulations to command $16-20 per gallon premiums. 

The Raw Milk Institute has been collaborating with producers on safety protocols for several years. What they’ve found shifts how we think about compliance versus marketing.

Operations treating testing results as marketing assets rather than regulatory obligations? They consistently achieve higher premiums.

Consider the research conducted by the British Columbia Fresh Milk Project from 2015 to 2019. They analyzed 265 samples through 1,060 individual pathogen tests. Zero pathogens in milk produced explicitly for direct human consumption. This contrasts sharply with peer-reviewed studies, which show pathogen detection in up to 33 percent of pre-pasteurized bulk tank samples.

That difference speaks to fundamentally different production priorities.

Enhanced testing transparency adds $4-8/gallon to standard raw milk premiums

RAWMI-certified operations maintain coliform counts averaging just 1 to 3 colony-forming units per milliliter. For context, that’s 75 times cleaner than their already stringent standards require.

Monthly comprehensive pathogen testing typically runs $300 to $500 based on laboratory price schedules. But when that investment drives premium pricing from $12 to $20 per gallon? The economics become compelling.

In Maryland, one producer showed me how she’s turning monthly laboratory reports into social media content. She posts results transparently—”Another clean month!”—and customers drive past other farms to buy from her specifically.

The economics are staggering: Delaware operations invest just $4,800 annually in comprehensive testing protocols but unlock $2.59 million in premium revenue gains. This 54,000% ROI transforms compliance from regulatory burden into competitive weapon. For a modest 50-cow operation producing 400 gallons daily, monthly testing costs of $400 generate $216,000 in additional revenue—proving Andrew’s thesis that transparency isn’t overhead, it’s profit infrastructure

Seven Patterns Among Successful Premium Operations

After extensive conversations with producers who’ve entered premium markets, certain patterns consistently emerge:

  1. Geographic positioning proves paramount
    Operations within 30 minutes of communities with median household incomes exceeding $75,000 show markedly better success rates. I’ve observed nearly identical operations experience vastly different outcomes based on 20-mile differences in location.
  2. Integration rather than random diversification
    One couple near the Delaware-Maryland border exemplifies this. Their whey feeds approximately 30 pigs, generating $12,000 annually in pork sales. The manure enriches a two-acre market garden, generating an additional $8,000. Each enterprise supports the others.
  3. Marketing sophistication matters tremendously
    An operation I know achieves modest production—perhaps 18,000 pounds per cow. Yet, their customer relationship management rivals those of successful retail businesses. They maintain detailed preferences, remember dietary restrictions, and celebrate milestones. Their net income exceeds that of their neighbors, producing 25,000 pounds per cow.
  4. Regulatory compliance becomes brand differentiation
    Rather than viewing testing as overhead, successful operations make transparency their unique selling proposition. “We exceed every standard” becomes their competitive advantage.
  5. Capital discipline distinguishes successful operations
    The Campaign for Real Milk’s economic models suggest integrated 20-cow operations can generate approximately $257,500 in gross revenue. But only after establishing market presence, not in anticipation of it.
  6. Retail-level customer engagement is essential
    Three to five social media posts weekly. Email newsletters. Customer databases. These aren’t optional anymore.
  7. Family alignment proves critical
    Operations where all members share a vision and agree on compensation structures? They show markedly better long-term viability.

The Evolving Regulatory Environment

The safety paradox: while 33% of conventional bulk tank samples show pathogen detection, operations producing specifically for direct human consumption under RAWMI protocols achieve zero pathogen detection across 1,060 tests. This isn’t luck—it’s the result of systematic testing creating production accountability. With outbreak rates declining 74% since 2005 and RAWMI-certified operations achieving coliform counts 75 times cleaner than standards require, Delaware’s testing-as-marketing strategy rests on solid scientific foundation

State-level changes are accelerating beyond what many realize. According to the Farm-to-Consumer Legal Defense Fund’s state-by-state legal status tracking, 16 states, plus Washington, D.C., now permit the retail sale of raw milk.

West Virginia’s recent passage of HB 4911 transformed the state from a complete prohibition to full retail authorization in 2025. Arkansas expanded access through farmers markets via HB1048. North Dakota’s HB1131 now permits the sale of raw milk products, including cheese and yogurt.

Researchers at institutions like UC Davis observe something interesting. States increasingly distinguish between certified and uncertified producers, moving beyond binary regulatory approaches.

A 2018 study published in Epidemiology & Infection provides important context. When researchers controlled for population growth and consumption increases, they found outbreak rates per unit of consumption declined approximately 74 percent since 2005.

Current estimates suggest 3.2 to 4.4 percent of Americans consume raw milk—roughly 10 million people. The calculated annual illness risk? Approximately 0.007 percent per consumer.

While recent outbreaks in 2024 and early 2025 received significant media attention, the longer-term trend data suggest an overall improvement in safety metrics.

Alternative Premium Strategies

Raw milk represents just one path to premium pricing. What Delaware’s success really demonstrates is broader: verified attributes consumers value command significant premiums.

  • Organic certification remains the most established alternative. The three-year transition poses significant challenges for many producers—I’ve counseled several through this process. Yet, USDA Agricultural Marketing Service data consistently show that organic milk brings $6 to $9 per gallon, versus conventional milk’s $2 to $3.
  • A2 milk gains momentum steadily. Genetic testing costs approximately $30 per cow through various laboratories. Many markets support price premiums of 50 to 100 percent. An Ohio dairyman described A2 as his “bridge to premium markets.”
  • Grass-fed certification through organizations like the American Grassfed Association appeals to similar consumer segments. A 40-cow operation in New York’s Finger Lakes recently informed me that they’re achieving $11 per gallon for organic, grass-fed milk.
  • Small-scale pasteurization offers an interesting middle path. Equipment suppliers typically quote $30,000 to $50,000 for micro-pasteurization and bottling systems.

Examining robotic milking systems, some producers are achieving efficiency gains that enhance margins, even without premium pricing. Though the capital investment is substantial, labor savings can be significant for the right operation.

The Industrial Scale Alternative

For larger operations reading this, there’s another path worth acknowledging. While middle-sized dairies face increasing pressure, operations achieving true industrial scale—typically with 2,000 or more cows—can still compete through extreme efficiency.

These mega-dairies spread fixed costs across massive volume, achieving costs per hundredweight that smaller operations simply can’t match. With advanced automation, precision feeding systems, and economies of scale in purchasing, they’re driving production costs down even as milk prices remain volatile.

One 5,000-cow operation in Idaho shared its numbers with me: producing at $14 per hundredweight, while neighbors with 500 cows need $18 just to break even. It’s not a path for everyone—capital requirements alone exceed $20 million. However, for those with access to capital and management expertise, industrial scale remains a viable option.

The key insight? You need to choose. The 200-to-1,000-cow range that defined American dairying for generations? That middle ground is disappearing.

Regional Perspectives Matter

It’s worth noting that different regions face unique dynamics. A Central Valley producer transitioning 30 cows to organic told me: “Our input costs are higher, but so is our market access. Los Angeles and San Francisco consumers understand premium pricing.”

Similarly, a Wisconsin grass-fed operation shared insights about Midwest markets. “Chicago drives our demand,” he explained. “Those consumers want transparency and will pay for it.”

Down in Texas, a producer near Austin mentioned something I hadn’t considered. “The heat makes grass-fed challenging, but our local food movement is strong. We’re finding ways to adapt.”

Timing Your Market Entry

Researchers at Cornell’s Dyson School, who study agricultural innovation cycles, offer an important perspective. We’re observing classic adoption patterns. Early entrants captured exceptional returns. Current adopters can expect solid performance. Late arrivals may struggle.

The opportunity window appears favorable through approximately 2027. Current entrants benefit from established educational resources while maintaining first-mover advantages in their immediate markets.

Your Implementation Framework

For those seriously evaluating premium strategies—whether it’s raw milk, organic, or another path—here’s a methodical approach based on successful transitions I’ve observed:

  • Market validation comes first. Conduct a survey of at least 100 potential customers within a practical driving distance. Ask specific questions: “Would you commit to purchasing two gallons weekly at $10 per gallon?” Without 50 firm commitments, reconsider.
  • Understand regulations thoroughly. Contact your state department of agriculture directly. Connect with current practitioners who understand both written rules and practical enforcement.
  • Model finances conservatively. Add 50 percent to all cost estimates. Reduce revenue projections by 30 percent. Maintain 18 months of operating reserves.
  • Invest in education before infrastructure. RAWMI offers comprehensive online training for approximately $99. Knowledge costs far less than equipment mistakes.
  • Test systems before commercial launch. Operate complete protocols for three to six months. This reveals unexpected challenges while the stakes remain manageable.

Acknowledging the Challenges

Based on conversations with multiple insurance brokers—though comprehensive industry data remains limited—liability insurance for raw milk operations typically runs $2,000 to $5,000 more annually than conventional coverage. These figures are representative but can vary significantly by state and coverage level.

Customer perception challenges are real. One Pennsylvania producer shared: “We had a customer get sick from restaurant food, but they initially blamed our milk. Took months to rebuild trust.” Reputation management becomes critical.

The time commitment is substantial. Direct marketing means you’re running two businesses—production and retail. That typically means working 60 to 80 hours a week consistently.

The Strategic Question

Through all this analysis, one question emerges as fundamental. Will you transform from a dairy farmer selling milk into a food business that happens to operate a dairy?

This distinction separates Delaware’s 13 thriving operations from the 83 percent of conventional dairies that exited since 2014, according to USDA Census of Agriculture data.

“I understand the opportunity, but I’m a dairyman, not a marketer.”

My neighbor, who manages 180 Holsteins, responded in this way when I shared this analysis. His perspective is completely valid. For some operations, staying with conventional production makes perfect sense.

The risk-reward positioning reveals why Delaware’s 13 farms chose raw milk despite extreme risk: no other strategy offers 900% premiums accessible within 3-6 months. While organic certification delivers respectable 275% premiums, the 3-year transition timeline forces operations to survive on commodity pricing while hemorrhaging capital. Raw milk’s position in the high-risk/high-reward quadrant explains both its appeal to desperate operations and why it won’t work for everyone—tiny market size (3.2%) means winners take all

Looking Forward

Market signals, conveyed through premium pricing for verified attributes, appear clear. The next 18 months represent a critical decision window.

Each operation must evaluate its unique circumstances. Location, capital, family dynamics, risk tolerance—they all matter. Some will successfully transition to premium markets. Others will pursue industrial scale through consolidation and efficiency. Still others will find creative hybrid models.

What seems certain is that the operational middle ground continues narrowing. Standing still while hoping for an improvement in commodity prices presents significant risk.

Your milk check contains information about more than this month’s cash flow. The conventional model still works for some—particularly those positioned to achieve industrial scale. Premium markets offer an opportunity for others willing to embrace direct marketing.

Both paths require commitment and strategic clarity. The challenging position is remaining in that uncertain middle ground where margins continue to compress.

Whatever you decide, make it an active choice based on careful analysis of your specific situation—not a default position. In today’s dairy economy, strategic clarity is crucial for survival.

KEY TAKEAWAYS 

  • Testing transparency creates 1000% premiums: $500/month in pathogen testing + posting results = $20/gallon vs. $2 commodity pricing
  • Validation before investment: Survey 100 potential customers, need 50 buying commitments at premium prices, or stop immediately
  • Location is destiny: Premium only works within 30 minutes of $75K+ median income areas—geography matters more than everything else
  • Multiple paths to premium: Raw milk ($16-20), organic ($6-9), A2 (+50-100%), grass-fed ($11)—pick one and commit by 2027

Complete references and supporting documentation are available upon request by contacting the editorial team at editor@thebullvine.com.

Learn More:

The Sunday Read Dairy Professionals Don’t Skip.

Every week, thousands of producers, breeders, and industry insiders open Bullvine Weekly for genetics insights, market shifts, and profit strategies they won’t find anywhere else. One email. Five minutes. Smarter decisions all week.
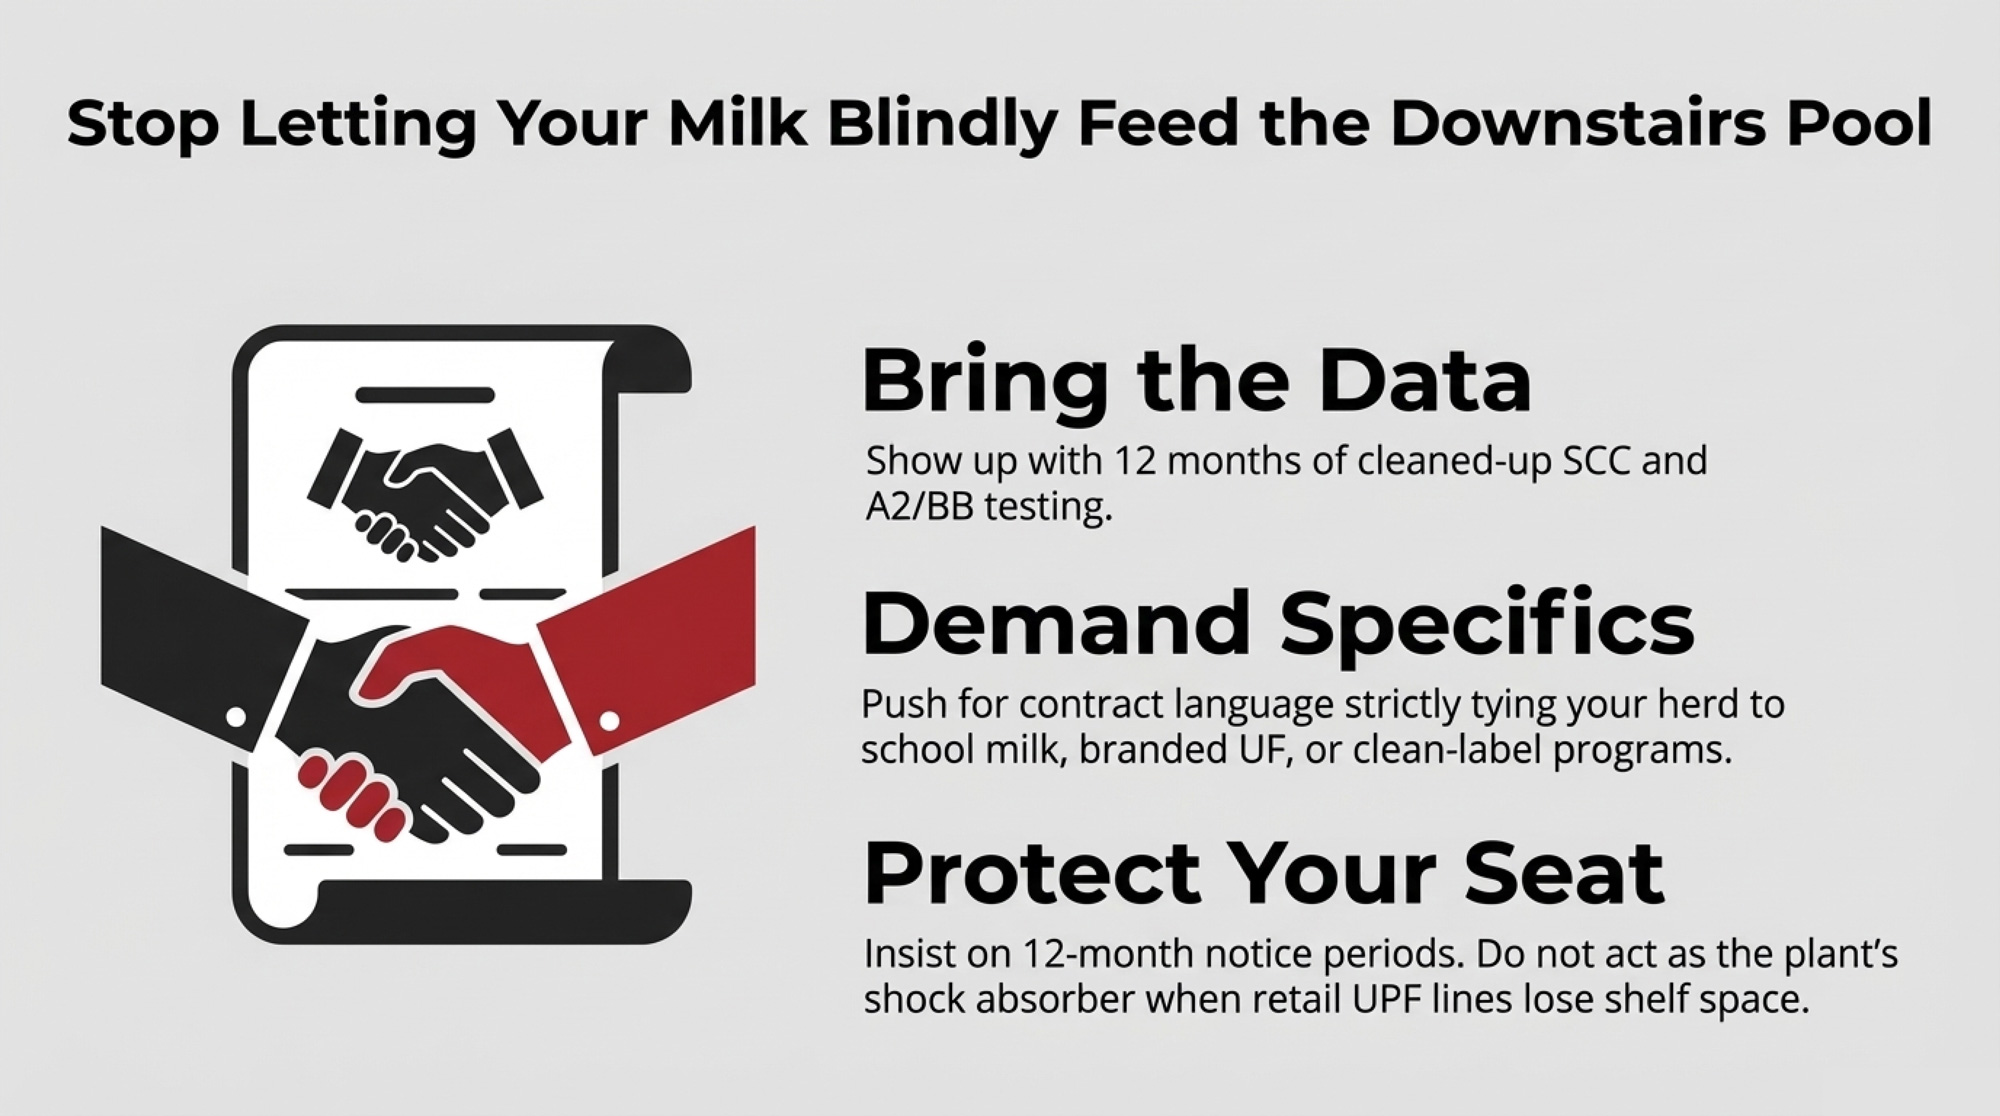
NewsSubscribe
First
Last
Consent

Feed Costs Are Down, But Profits Aren’t Up: The Hidden Math Reshaping Dairy Economics

Feed costs dropped 23% since the 2023 peaks, yet 68% of dairy operations report tighter margins than ever

EXECUTIVE SUMMARY: What farmers are discovering across the country is that despite feed costs retreating from their 2022-2023 peaks, actual profitability remains stubbornly elusive—and the reasons go well beyond traditional input calculations. USDA data from October 2025 shows feed costs averaging $9.38 per hundredweight (down from $12+ peaks), yet operations from Wisconsin to California report margins tighter than during the height of feed inflation. The culprit? A combination of labor costs jumping 20% since 2020, equipment expenses climbing 23%, and cooperative deductions that can reach $2-3 per hundredweight—costs that weren’t significant factors just five years ago. Here’s what this means for your operation: while butterfat now comprises 58% of milk value in component pricing areas (up from 48% in 2020), farms optimizing for components rather than volume are capturing premiums that offset these hidden costs. Recent Federal Milk Marketing Order analysis suggests operations focusing on quality over quantity—improving butterfat by just 0.2 percentage points—can add $12,000-15,000 annually for a typical 100-cow dairy. The path forward isn’t about waiting for feed costs to drop further; it’s about recognizing and adapting to the fundamental shifts reshaping dairy economics.

 Dairy margin improvement

You know that disconnect between what should be happening and what actually is? Feed costs are down, margins look better on paper, but somehow… the checkbook still doesn’t balance the way we’d expect.

Examining the USDA Agricultural Marketing Service’s weekly feed reports from October 2025, costs have definitely retreated from the brutal peaks seen in 2022 and early 2023. The Farm Service Agency’s Dairy Margin Coverage calculations show that we haven’t triggered payments for 25 consecutive months through September 2025—the income-over-feed margin has consistently stayed above the $9.50 threshold. Should be great news, right?

Well, yes and no. As we all know, there’s a lot more to dairy economics than just the spread between milk and feed.

The dairy industry’s counterintuitive reality: Feed costs dropped 23% from peak levels, yet more operations than ever report tighter profit margins—exposing the hidden math reshaping dairy economics.

The Evolution of Operating Costs

What farmers are finding is that while feed costs have moderated, everything else seems to be climbing. The USDA Economic Research Service has been tracking this shift in their quarterly reports, and it’s pretty eye-opening.

Labor’s become a real challenge across the country. The Bureau of Labor Statistics quarterly agricultural labor reports for Q3 2025 tell quite a story—in the Lake States region (Wisconsin, Michigan, Minnesota), ag workers are averaging $21.40 per hour, up from $17.80 just three years ago. Pacific region operations in California and Washington? They’re seeing an average hourly rate of $24.50. And that’s if you can find workers at all.

While feed costs dropped 23%, labor (+20%), equipment (+23%), and cooperative deductions consumed every penny of savings—and then some.

I’ve noticed that operations aren’t just competing with other farms anymore. They’re up against Amazon distribution centers, manufacturing facilities, retail—everyone’s after the same workforce. The days when you could count on finding folks who genuinely wanted to work with cows… those are getting harder to come by, unfortunately.

Equipment costs represent another significant shift. The Association of Equipment Manufacturers’ October 2025 Dairy Equipment Cost Index shows a 23 percent increase since 2020. Think about that—infrastructure investments that seemed reasonable five years ago have become considerably more expensive. A typical double-12 parlor renovation that ran $300,000 in 2020? You’re looking at $370,000 or more today. And these aren’t luxury items. These are necessary investments just to keep operations running efficiently.

Understanding Today’s Cooperative Economics

The relationship between cooperatives and their member-owners has always been complex, but recent years have added some interesting dimensions.

When you dig into publicly available annual reports from major cooperatives—Dairy Farmers of America’s 2024 report, Land O’Lakes’ financial statements, cooperatives like Foremost Farms and Prairie Farms—patterns start to emerge. Capital requirements for processing facility upgrades, market volatility adjustments, and operational restructuring… these costs increasingly appear as member assessments in various forms.

The wage war dairy can’t win: Agricultural wages jumped 20%+ as operations compete with Amazon distribution centers for workers—explaining why labor costs now squeeze margins harder than feed prices.

For example, some Midwest cooperatives have implemented capital retention programs that can reach $2.00 to $3.00 per hundredweight during facility expansion periods. Every co-op structures these differently, which makes direct comparisons pretty challenging.

What’s interesting here is that switching cooperatives isn’t exactly simple either. Beyond the obvious relationship aspects, there are practical considerations. Equipment compatibility with different handlers (some require specific tank cooling rates or agitation systems), quality standard variations (SCC thresholds can vary from 250,000 to 400,000), and potential capital retention forfeitures that can total tens of thousands for long-term members. The complexity can be significant.

It’s worth thinking about your own situation. Are you clear on all the deductions coming out of your milk check? Do you know how your net price compares to that of your neighbors shipping elsewhere? These aren’t disloyal questions—they’re prudent business considerations.

Component Values: Where the Real Opportunity Lies

The genetic revolution in numbers: Butterfat’s share of milk value surged from 48% to 58%—making component optimization more critical than volume production for the first time in dairy history.

Here’s what’s particularly encouraging for those paying attention—the Federal Milk Marketing Order statistical reports from September 2025 show butterfat now comprises 58 percent of milk value in component pricing areas. Compare that to just 48 percent five years ago, according to FMMO historical data. That’s a huge shift in how we need to think about production.

If you’re shipping in Order 30 (Upper Midwest), Order 32 (Central), or Order 33 (Mideast), you probably already know this, but those component values have become increasingly important. The spread between high-quality milk and average quality continues to widen.

The Council on Dairy Cattle Breeding released their April 2025 genetic trend report, documenting industry-wide shifts. Holstein breed averages for butterfat have increased from 3.83% to 3.96% over the past five years. Even modest improvements—we’re talking 0.15 to 0.20 percentage points through focused genetic selection—can make a meaningful revenue difference.

Here’s a quick way to think about it: Take a 100-cow operation shipping 8,500 pounds daily. Moving butterfat from 3.8% to 4.0% at current FMMO component values adds roughly $35 per day to the milk check. That’s $12,775 annually from the same number of cows.

Every 0.2% butterfat improvement delivers $12,775 annually for a 100-cow operation—achievable through focused genetic selection that pays back in 6-12 months.

Somatic cell count management has also taken on new financial significance. Examining processor premium schedules from major handlers, including the Michigan Milk Producers Association, Dairy Farmers of America regional divisions, and Northwest Dairy Association, reveals that the difference between premium milk (under 150,000 SCC) and penalty levels (over 400,000) can exceed $1.00 per hundredweight. Are you tracking your bulk tank SCC trends? Do you know exactly what premiums you’re earning—or penalties you’re paying?

Building Financial Resilience in Uncertain Times

MetricDMC FormulaReal Farm CostsGap Impact
Feed Costs$9.38/cwt$11.50/cwt$2.12/cwt
Labor CostsNot included$2.50/cwt$2.50/cwt
Equipment CostsNot included$1.20/cwt$1.20/cwt
Co-op DeductionsNot included$2.50/cwt$2.50/cwt
Total Coverage$9.38/cwt$17.70/cwt$8.32/cwt

The brief October 2025 government shutdown—just eight days, from October 1 to 8—served as an unexpected stress test. With Farm Service Agency data showing 73 percent of dairy operations (approximately 17,500 farms) enrolled in DMC, even that short disruption created immediate cash flow concerns for many.

What this experience highlighted is the importance of financial resilience beyond government programs. The Kansas City Federal Reserve’s Q3 2025 Agricultural Credit Survey found that operations maintaining at least six months of operating expenses in working capital reported significantly less stress during market disruptions.

Risk management tools have evolved considerably. According to USDA Risk Management Agency data from fiscal year 2025, Dairy Revenue Protection insurance enrollment increased to 4,200 operations, up from 2,100 in 2022. Coverage levels vary widely, ranging from catastrophic coverage to 95% of expected revenue. Now, it’s not right for every operation, but these tools provide options beyond traditional government programs.

I’ve been thinking about this quite a bit lately. How many months of operating expenses do you have in reserve? If DMC payments were to stop tomorrow, or your milk check were delayed by two weeks, how long could you manage? These aren’t comfortable questions, but they’re necessary ones.

The Heifer Supply Challenge Nobody Saw Coming

This one still amazes me. USDA National Agricultural Statistics Service reported 3.91 million replacement heifers in their January 31, 2025, cattle inventory—the lowest since 1998, when they counted 3.89 million. Yet, the October 2025 milk production report shows the national milking herd at 9.43 million head, up 66,000 from the previous year. How’s that math work?

Operations are keeping cows longer. Plain and simple. Research from the University of Wisconsin’s dairy management program shows average lactation numbers have increased from 2.8 to 3.3 over the past five years. Many herds are pushing cows through fourth, even fifth, lactations that would’ve been culled after two or three in previous market cycles.

When quality replacement heifers command the prices we’re seeing—USDA Agricultural Marketing Service reports from major auction markets show Holstein springers averaging $2,800-$3,500 in the Midwest, over $4,000 in water-stressed Western markets—the economics shift dramatically.

There are real trade-offs here. Penn State Extension’s 2025 dairy herd health surveys indicate extended lactations correlate with higher bulk tank SCC (averaging 285,000 for herds with 3.5+ average lactations versus 220,000 for herds under 3.0), increased lameness prevalence (28% versus 19%), and higher veterinary costs per cow ($185 versus $145 annually).

What’s your average lactation number right now? Has it changed over the past two years? If you’re like most operations, it probably has increased by 0.3 to 0.5 lactations, and that shift has implications for everything from breeding programs to facility needs.

Market Dynamics and Our Global Position

Examining price comparisons reveals an interesting story. CME Group spot butter closed at $2.33 per pound on October 8, 2025, while the European Milk Market Observatory reported EU butter at €3.52 per kilogram (roughly $3.75 per pound) for the same week. Might suggest we have a competitive advantage, right?

But dig deeper into the USDA Economic Research Service consumption data from their September 2025 Dairy Outlook. Americans consume 5.1 pounds of butter per capita annually. Europeans? 8.2 pounds according to EU agricultural statistics. That consumption gap means we’re producing beyond domestic demand, making us dependent on export markets for price discovery.

The Foreign Agricultural Service’s August 2025 Dairy Export Report is particularly revealing—40 percent of U.S. cheese exports go to Mexico (472 million pounds annually), 18 percent to South Korea, and 12 percent to Japan. For whey products, China accounts for 31 percent of the market share, despite ongoing trade tensions. This geographic concentration creates both opportunity and vulnerability.

This development suggests we need to think differently about market risk. Are you considering export market dynamics in your planning? A 10 percent shift in Mexican demand has a greater impact on U.S. cheese prices than a 5 percent change in domestic consumption.

Practical Strategies for Today’s Environment

So what’s actually working out there? Based on Federal Milk Marketing Order pricing formulas and what successful operations are implementing…

First, component optimization has shifted from a “nice to have” to an essential requirement. The September 2025 FMMO Class III price formula shows butterfat at $3.23 per pound and protein at $2.31 per pound. A 0.2 percentage point improvement in butterfat (achievable through genetic selection according to Holstein Association USA genomic data) adds approximately $0.25 per hundredweight to your milk check.

Here’s a practical starting point: Review your milk quality reports from the last three months. What’s your average butterfat? Protein? SCC? Now look at your processor’s premium schedule. Calculate the difference between your current level and the next premium level. Often, the investment required (better genetics, refined feeding protocols, enhanced milking procedures) pays back in 6-12 months.

Second, understanding your true net price matters more than ever. After all deductions—cooperative assessments, hauling charges (averaging $0.35-0.50 per hundredweight according to University of Minnesota Extension surveys), quality adjustments—what’s actually hitting your bank account? That’s the number that drives real decision-making.

Third, operational flexibility often trumps pure efficiency. Cornell’s Program on Dairy Markets and Policy Analysis, released in August 2025, indicates that the optimal herd size varies significantly depending on local labor markets, land availability, and environmental regulations. Sometimes a well-managed 650-cow dairy in Wisconsin outperforms a 1,500-cow operation in Texas when you factor in water costs, labor availability, and market access.

Looking Ahead with Clear Eyes

The traditional model—maximize volume at minimum cost—served the industry well for decades. But current market structures reward different priorities. The data from USDA reports, Federal Reserve agricultural lending surveys, and university research all point toward similar conclusions.

What patterns are you seeing in your area? Because operations that thrive increasingly share certain characteristics. They understand their true costs, including all those hidden deductions. They optimize for net returns rather than gross production. They maintain financial flexibility with adequate working capital. And they adapt quickly to market signals rather than hoping things return to “normal.”

The feed cost paradox—lower input costs not translating directly to better margins—reflects the complexity of modern dairy economics. But within that complexity lies opportunity for those willing to look beyond traditional metrics.

As many of us have learned, probably the hard way, those “good old days” when feed costs determined profitability aren’t coming back. The fundamentals have shifted permanently. But dairy farming remains a viable business for those who understand and work with the new economics rather than against them.

The key is recognizing these changes and adapting accordingly. Because at the end of the day, we’re all trying to build sustainable operations that can weather whatever comes next—whether that’s another government shutdown, export market disruption, or the next unexpected challenge.

What’s your take on all this? Are you seeing similar trends in your region? Because I believe that the more we share these observations and strategies, the better equipped we will all be to navigate this changing landscape. The industry’s evolving faster than ever, but there’s definitely a path forward for those willing to evolve with it.

KEY TAKEAWAYS:

  • Component optimization delivers immediate returns: Improving butterfat from 3.8% to 4.0% adds approximately $35 daily ($12,775 annually) for operations shipping 8,500 pounds—achievable through targeted genetics and feeding adjustments that typically pay back in 6-12 months
  • Understanding your true net price changes everything: After deductions, hauling charges ($0.35-0.50/cwt), and quality adjustments, your actual deposited price might be $2-3 below announced rates—tracking this monthly helps identify whether staying with your current handler makes financial sense
  • Labor strategy matters more than scale: With agricultural wages exceeding $21/hour in the Midwest and $24 in Western states, a well-managed 650-cow operation often outperforms 1,500-cow dairies when factoring in management intensity, component quality maintenance, and operational flexibility
  • Financial resilience beats government dependency: Operations maintaining six months of working capital weathered the October shutdown without crisis, while the 73% enrolled in DMC discovered how quickly federal safety nets can disappear—private tools like Dairy Revenue Protection now cover 4,200 farms, double the 2022 enrollment
  • Extended lactations are reshaping herd dynamics: With quality replacements hitting $4,000 in Western markets, pushing average lactations from 2.8 to 3.3 makes economic sense despite higher SCC and health management needs—but requires adjusting expectations for bulk tank quality and veterinary protocols

Complete references and supporting documentation are available upon request by contacting the editorial team at editor@thebullvine.com.

Learn More:

The Sunday Read Dairy Professionals Don’t Skip.

Every week, thousands of producers, breeders, and industry insiders open Bullvine Weekly for genetics insights, market shifts, and profit strategies they won’t find anywhere else. One email. Five minutes. Smarter decisions all week.
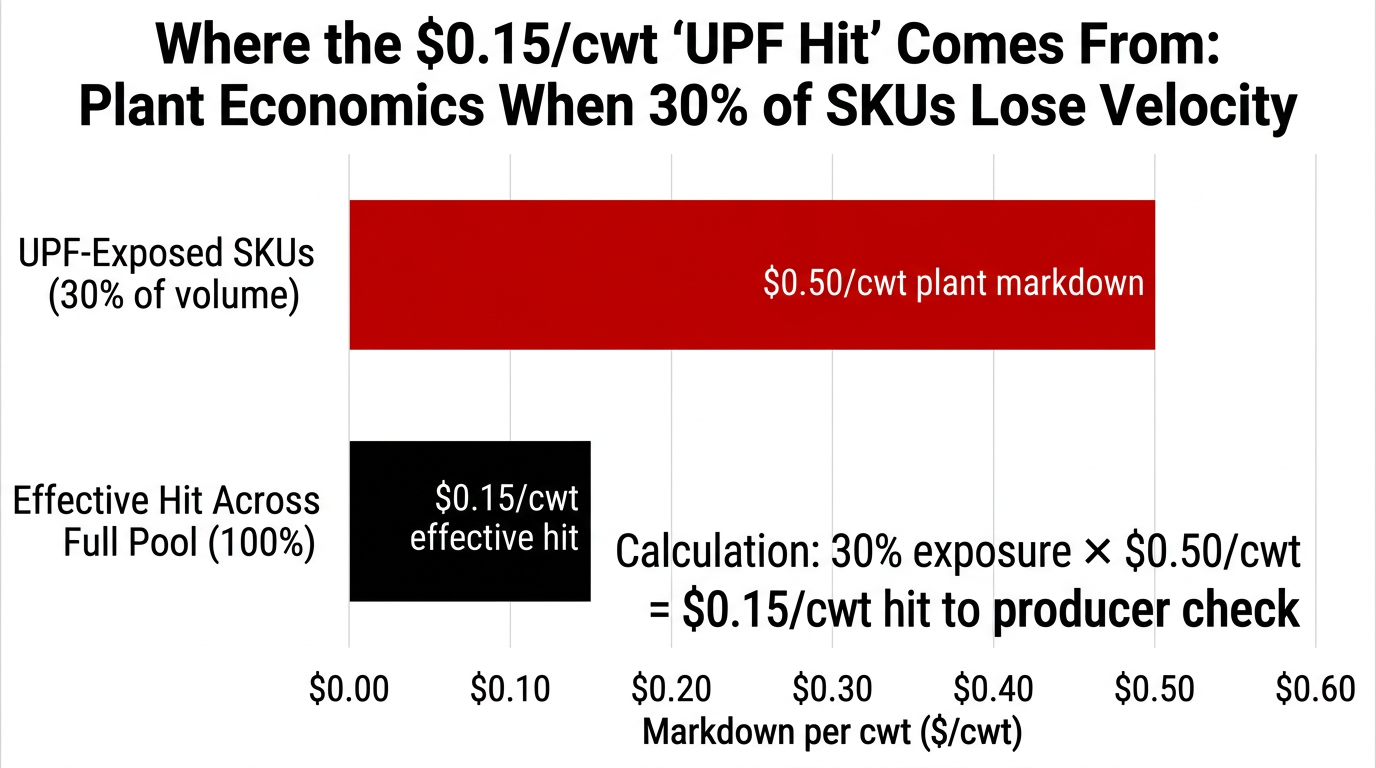
NewsSubscribe
First
Last
Consent

The Plant-Based Milk Bust: What It Means for the Smart Dairy Producer

Raw milk sales jumped 25% last year, while plant-based milk sales crashed 5%. Here’s what that means for your milk check.

EXECUTIVE SUMMARY: Here’s the deal—that whole plant-based milk revolution everyone was talking about? It’s over. Plant-based sales dropped 5% in 2024 while real dairy volume grew 3%, and smart producers are already locking in premium contracts worth 15-20 cents more per gallon. For a 200-cow operation, we’re talking $58,000+ in extra annual revenue when feed costs are crushing margins at $4.35 corn and $320 hay. Raw milk sales surged 25% because consumers want authentic nutrition, not processed substitutes with unpronounceable ingredients. Major players like Mighty Drinks and Arla are pulling out of the plant-based market entirely, signaling a massive shift back to real dairy. The window’s open right now for producers who act fast on premium contracts, hybrid products, and sustainability programs that actually pay. Don’t wait—this opportunity won’t last forever.

KEY TAKEAWAYS

  • Premium contracts are paying 15-20 cents extra per gallon — that’s $58,000+ annually for a 200-cow herd when you need it most, with current feed costs
  • Use the University of Minnesota nutrition study as your secret weapon — only 12% of plant-based milks match real milk’s protein, calcium, and vitamin D levels (Journal of the Academy of Nutrition, 2025)
  • Jump into the hybrid milk market while it’s hot — blending dairy and plant proteins in a $10.2 billion market with 7.2% growth and FDA approval for “milk” labeling
  • Turn sustainability into cash with carbon credits — rotational grazing and methane reduction programs pay $15-45 per cow annually, plus operational savings (Cornell PRO-DAIRY data)
  • Lock long-term contracts now before competitors catch on — buyers are making 2025-2027 supplier decisions while plant-based suppliers scramble to survive
milk quality premiums, dairy farm profitability, plant-based milk market, herd management, hybrid dairy products

Look, I’ve been tracking this plant-based thing for years, and 2025 is the year reality finally caught up with the marketing hype. For producers who’ve been playing defense, this is your moment to go on offense.

The plant-based milk craze? It’s hit a wall. BIG time. Back in June 2025, Mighty Drinks—the UK pea and oat milk hopeful—folded under financial strain. A few months later, Arla Foods pulled their Jörd oat milk off UK shelves. When farmer-owned co-ops start backing out of the game, it’s not just a headline—it’s a major shift.

In the United States, sales of plant-based milk declined by 5% in 2024, reaching approximately $2.8 billion, according to the Good Food Institute. Dairy? We climbed back, with fluid milk sales up 1% and volume up 3%, according to the USDA.

But here’s what really gets producers talking: raw milk sales surged 25% last year. People want the real thing.

What California’s Central Valley Is Saying

Conversations with several Central Valley producers paint the same picture. One farm running 350-500 head near Turlock has just locked in a 20-cent premium.

“Buyers? They told me this time it’s about real nutrition. None of that watered-down nonsense,” one said. That 20 cents adds up—especially when corn is pushing $4.35 a bushel, and hay prices have climbed to $320 a ton.

When Big Money Pulls Out

Mighty Drinks tossed £8 million down the drain before going bust in 2025. Meanwhile, Arla scrapped their Jörd line in January to focus on what pays the farmer bills.

That means it’s not just a market stumble—it’s a reckoning for the plant-based push.

On the Ground: Regional Realities

California farmers discuss premiums of up to 15 cents per gallon. Up north in Wisconsin, Extension specialists report a 40% surge in clean-label certification requests, as consumers push for greater transparency.

And the Northeast? USDA data shows European buyers are circling back to U.S. dairy for the nutrition they can trust.

The University of Minnesota’s Numbers

Over 200 plant-based milks tested; only 12% matched cow’s milk for calcium, vitamin D, and protein.

Protein alone? Only 16% came close. Dr. Abigail Johnson says it bluntly: “These products don’t cut it nutritionally.”

Consumer Mood

Mintel reports 67% of consumers are turned off by the processing additives in plant-based stuff.

With inflation slicing budgets, 87% have changed their buying habits.

A friend managing food programs at Ohio schools says they’ve switched back to real milk because it ticks nutrition and budget boxes.

The Hybrid Solution

Blended dairy and plant protein milks are carving out a $10.2 billion market growing at 7.2% a year. FDA clearances enable these products to be labeled as milk if they meet specific standards set by the FDA.

That’s smart innovation—without losing the milk name.

Feed and Cost Realities

Feeding cows today? Corn futures hang at around $4.35; hay in the Central Valley jumped from $245 to $320 a ton; and Northeast producers are still picking at the wet weather’s mess, pushing hay prices north of $280.

Margins? They vary. However, the USDA and the University of Illinois estimate typical dairy margins at 7-15%, depending on management and scale.

Sustainability That Pays

Dairy producers report earning carbon credits for rotational grazing and methane reduction—payments vary by operation size.

Cornell’s PRO-DAIRY program estimates these can net $15 to $45 per cow, plus savings.

So Here’s What to Do

Week 1, grab that University of Minnesota nutrition study. Print it and bring it wherever you meet buyers.

Month 1, call your co-op about hybrid milk products and premium programs.

Quarter 1, focus on locking in long-term contracts—buyers are closing deals.

Final Thoughts

The plant-based wave faltered. Meaningful milk markets are snapping back.

Got your boots on? Time to get moving.

Complete references and supporting documentation are available upon request by contacting the editorial team at editor@thebullvine.com.

Learn More:

  • Unlocking the Secrets to High Milk Components – This article provides the tactical “how-to” for capturing the premiums discussed in the main piece. It reveals practical feeding and management strategies designed to boost butterfat and protein, giving you the tools to consistently hit quality targets and maximize your milk check.
  • Navigating the Twists and Turns of the 2024 Dairy Markets – While the main article focuses on the plant-based collapse, this piece offers a broader strategic view of the entire dairy economy. Understanding these global market dynamics, from interest rates to export demand, is crucial for making smarter long-term business decisions.
  • Genetics: The Key to Unlocking Your Herd’s Full Potential – This piece looks to the future, demonstrating how to build a more profitable herd from the ground up. It focuses on using genetic selection to improve efficiency, health, and milk components, future-proofing your operation against high input costs and market volatility.

The Sunday Read Dairy Professionals Don’t Skip.

Every week, thousands of producers, breeders, and industry insiders open Bullvine Weekly for genetics insights, market shifts, and profit strategies they won’t find anywhere else. One email. Five minutes. Smarter decisions all week.
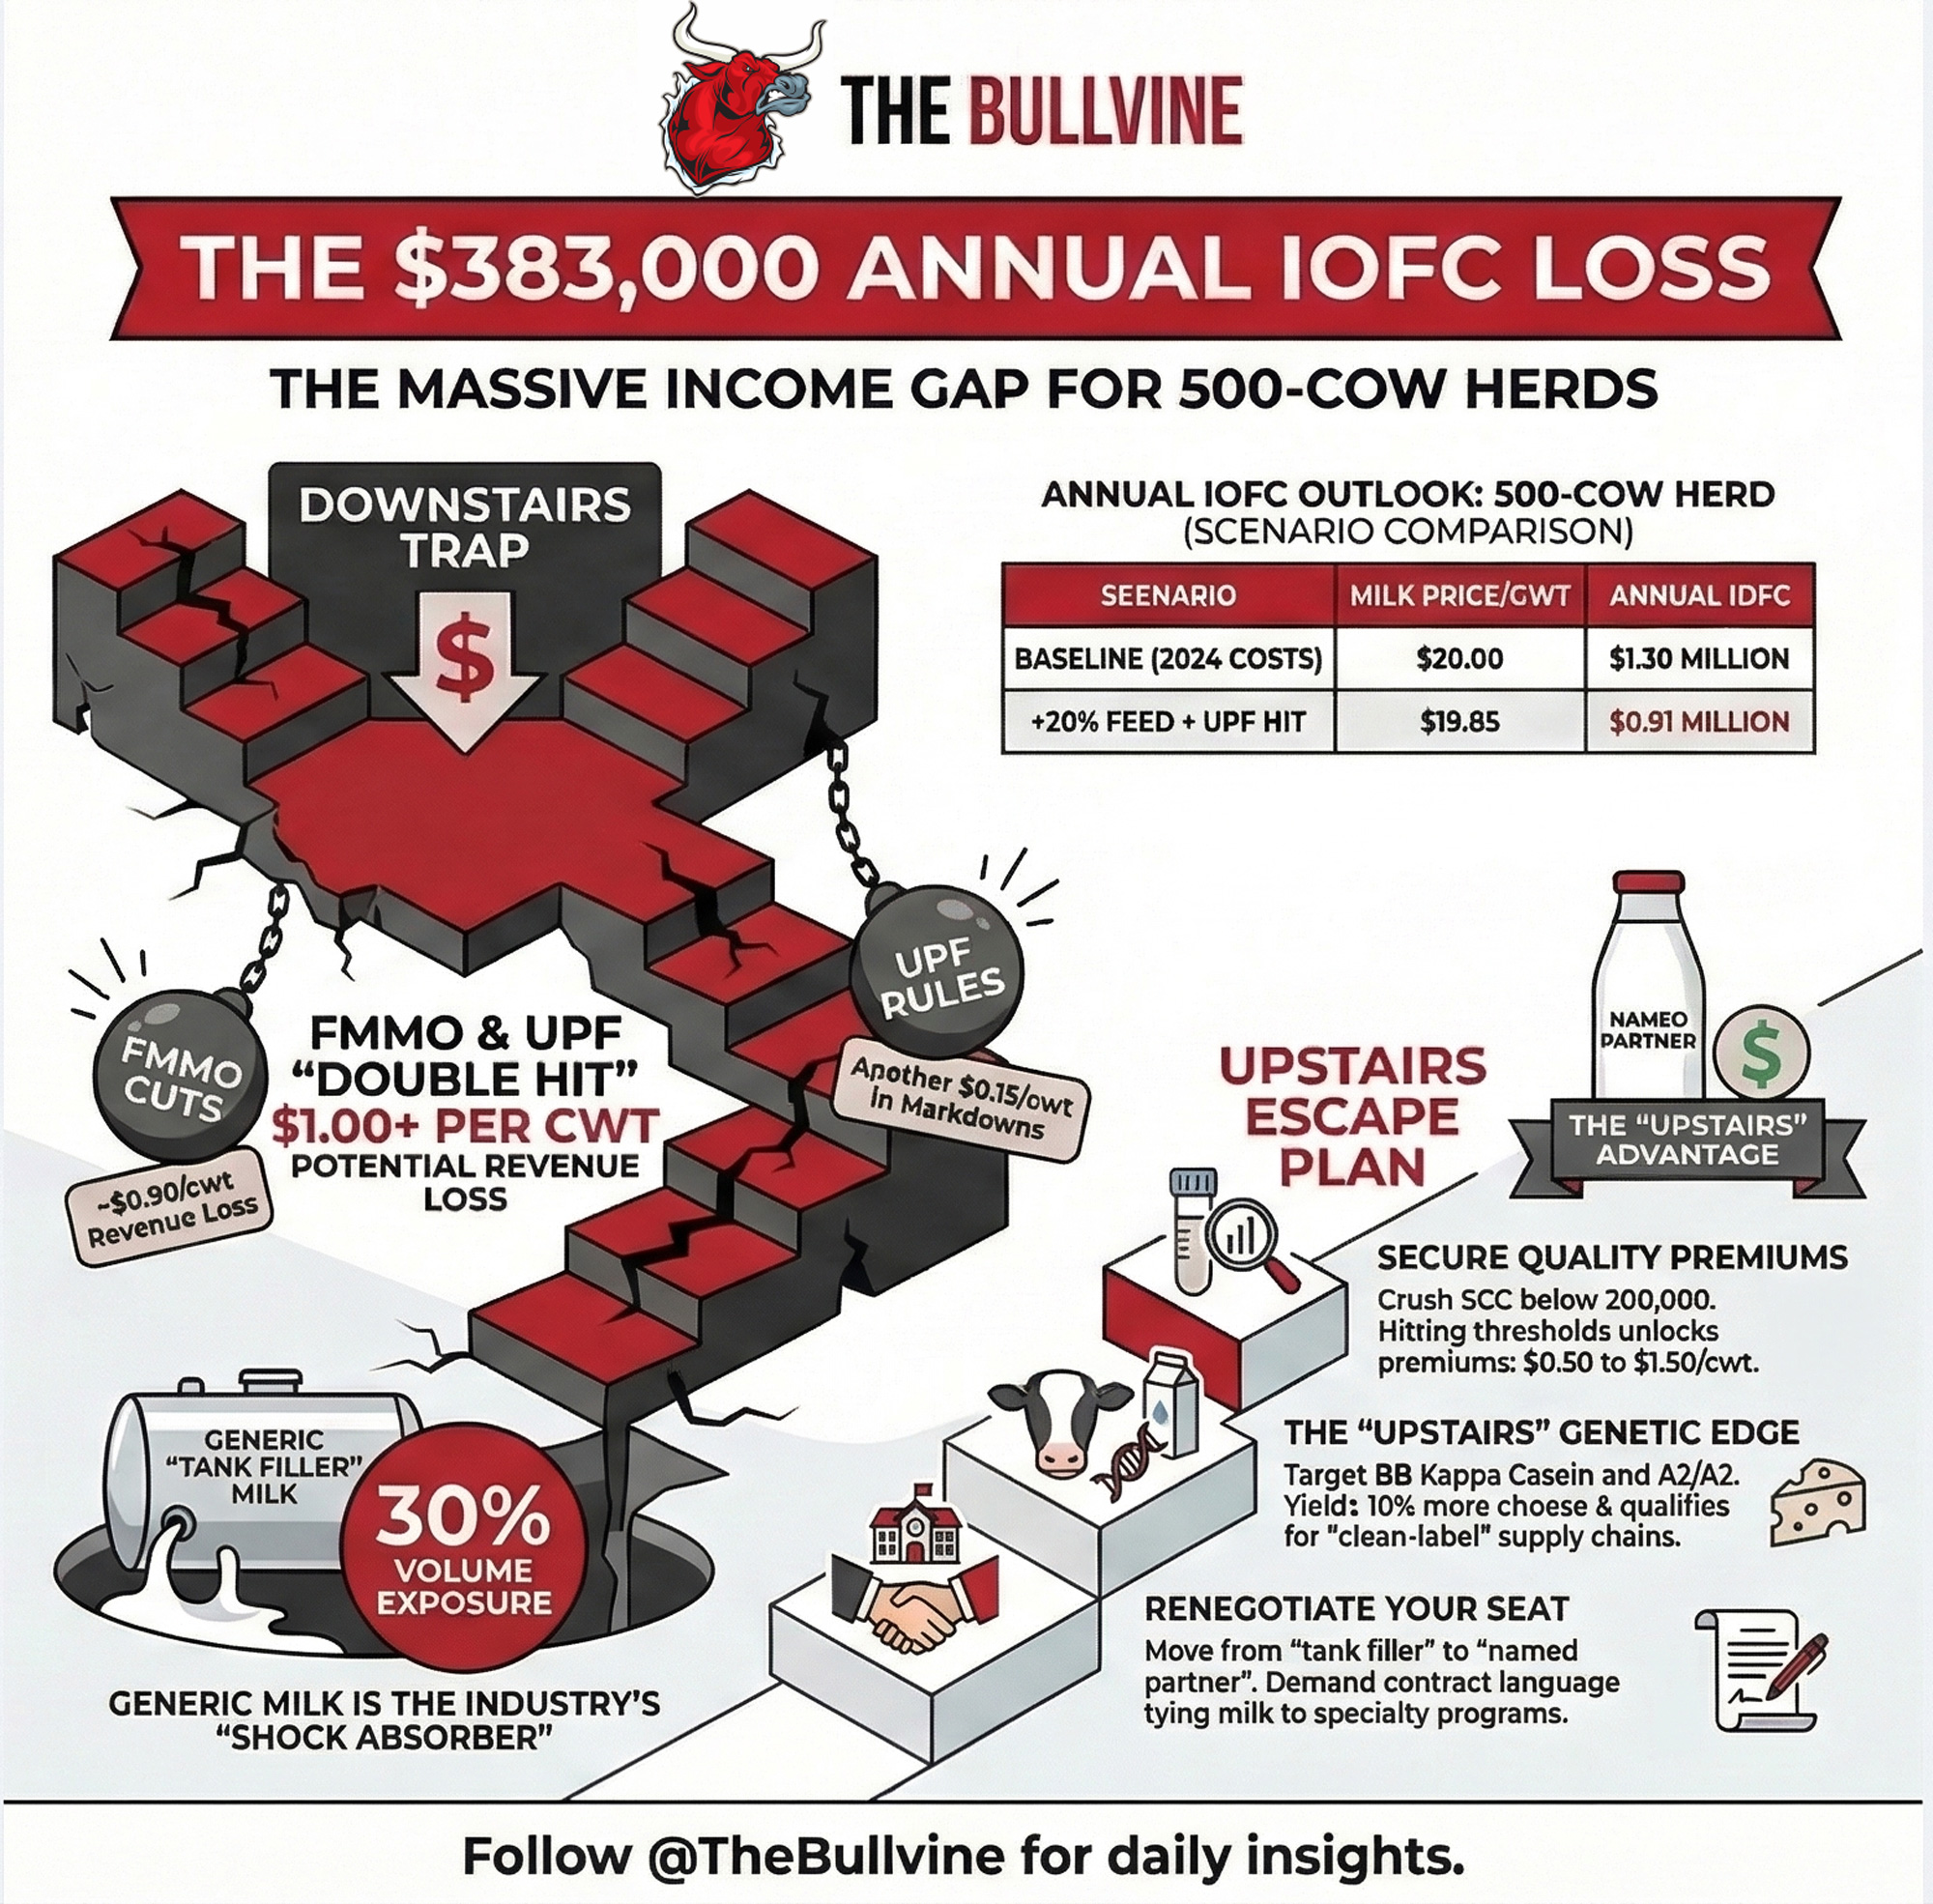
NewsSubscribe
First
Last
Consent
Send this to a friend