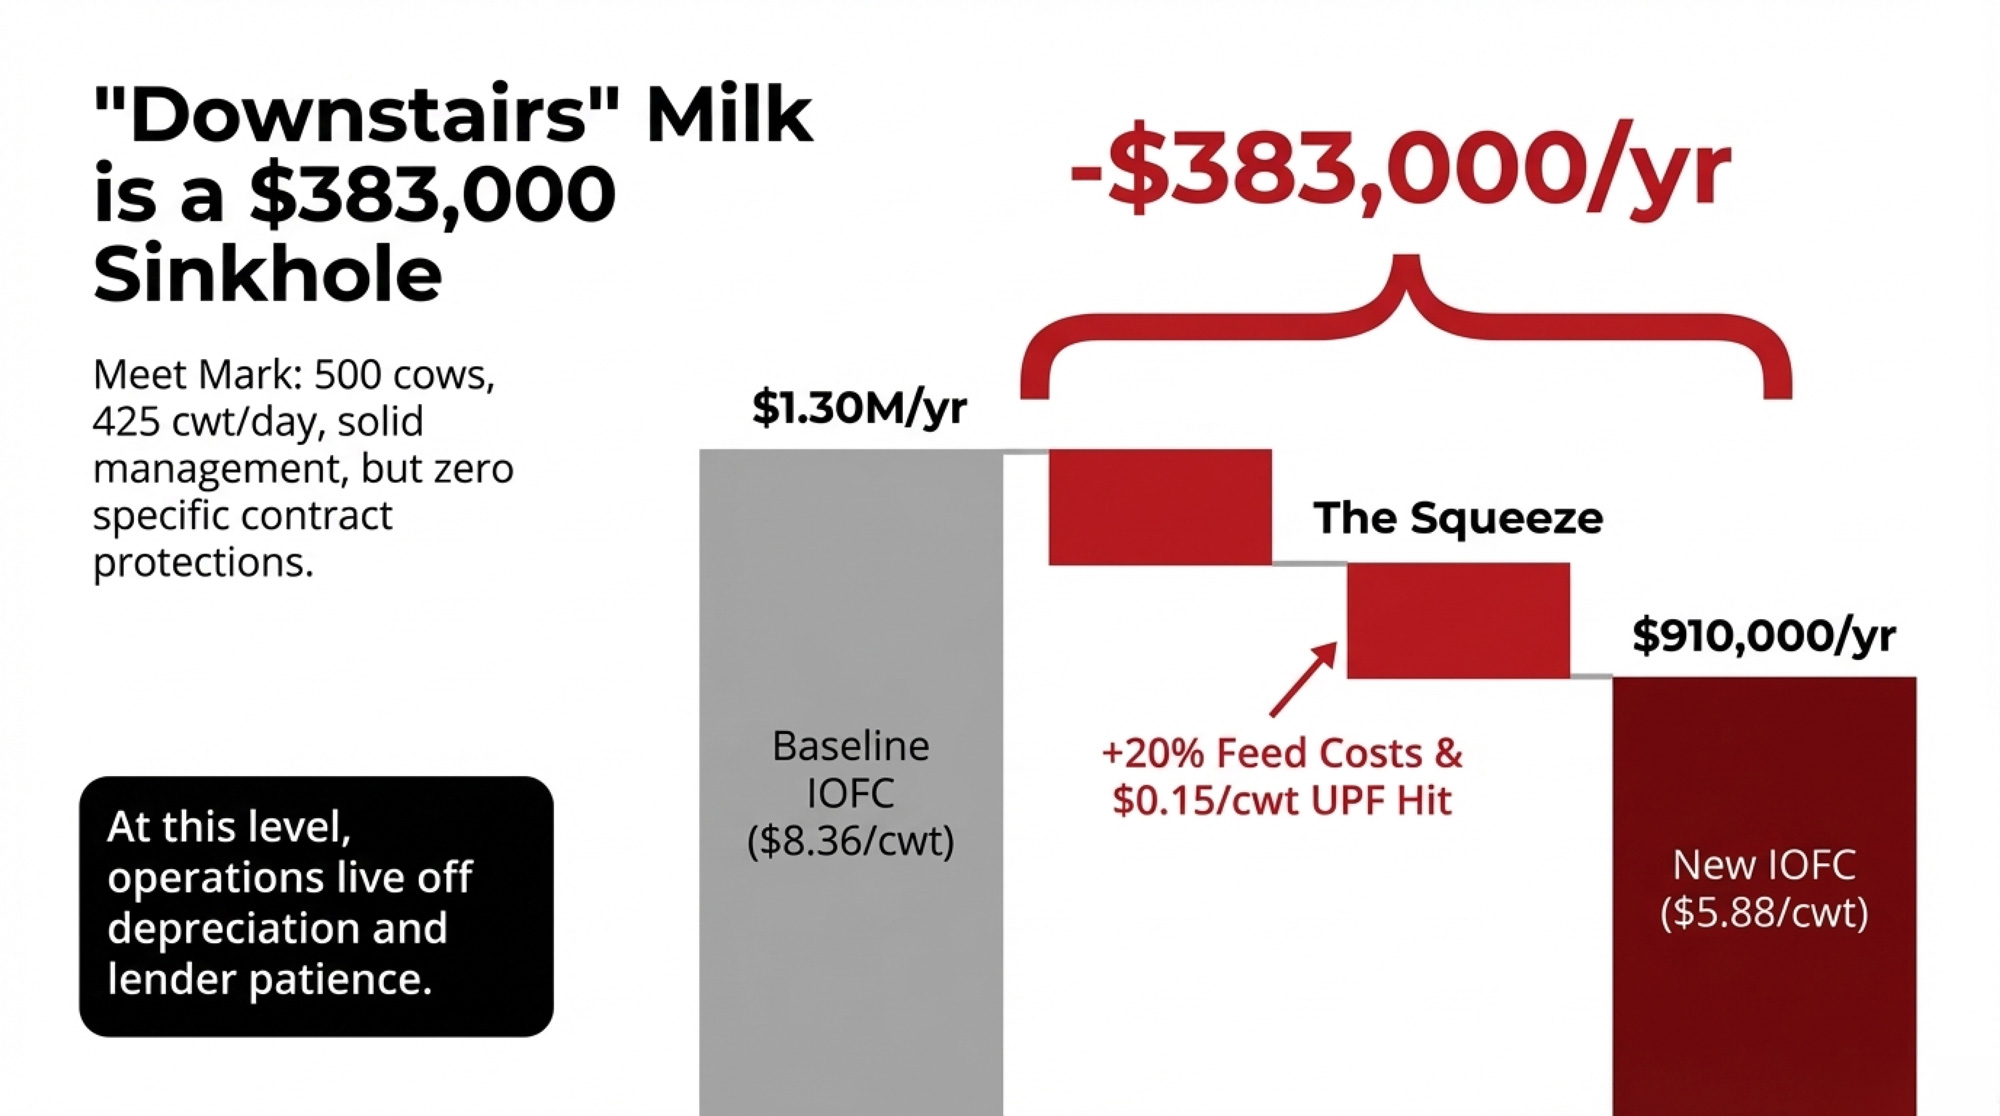
On a 500-cow Midwest dairy, FMMO and UPF rules can turn the same 425 cwt/day into either solid margins or a $383,000 IOFC hole.
Executive Summary: Federal make‑allowance changes and looming UPF rules are quietly splitting processor milk into “upstairs” and “downstairs” streams, with huge IOFC consequences for 500‑cow herds. Using Illinois FBFM data, the article shows how a 500‑cow Midwest dairy shipping 425 cwt/day can see a $383,000/year swing in income over feed as feed costs rise 10–20% and processors squeeze premiums on UPF‑exposed products. Mark, a composite based on 2024 FBFM economics, sits below full‑cost breakeven at $20 milk once the June 2025 FMMO make‑allowance cuts pull about $0.85–$0.93/cwt from his milk check. Sarah, built from the same regional benchmarks, closes that gap by driving SCC under 200,000, selecting for BB kappa casein and A2/A2, and renegotiating to tie her herd to school, hospital, and clean‑label programs. The piece walks through three IOFC scenarios, a transparent $0.15/cwt “UPF hit” calculation, and the math behind SCC and protein‑variant premiums. It then lays out a 30/90/365‑day playbook so producers can diagnose whether they’re upstairs or downstairs milk today, and what it takes to move up a tier in their buyer’s supply plan.
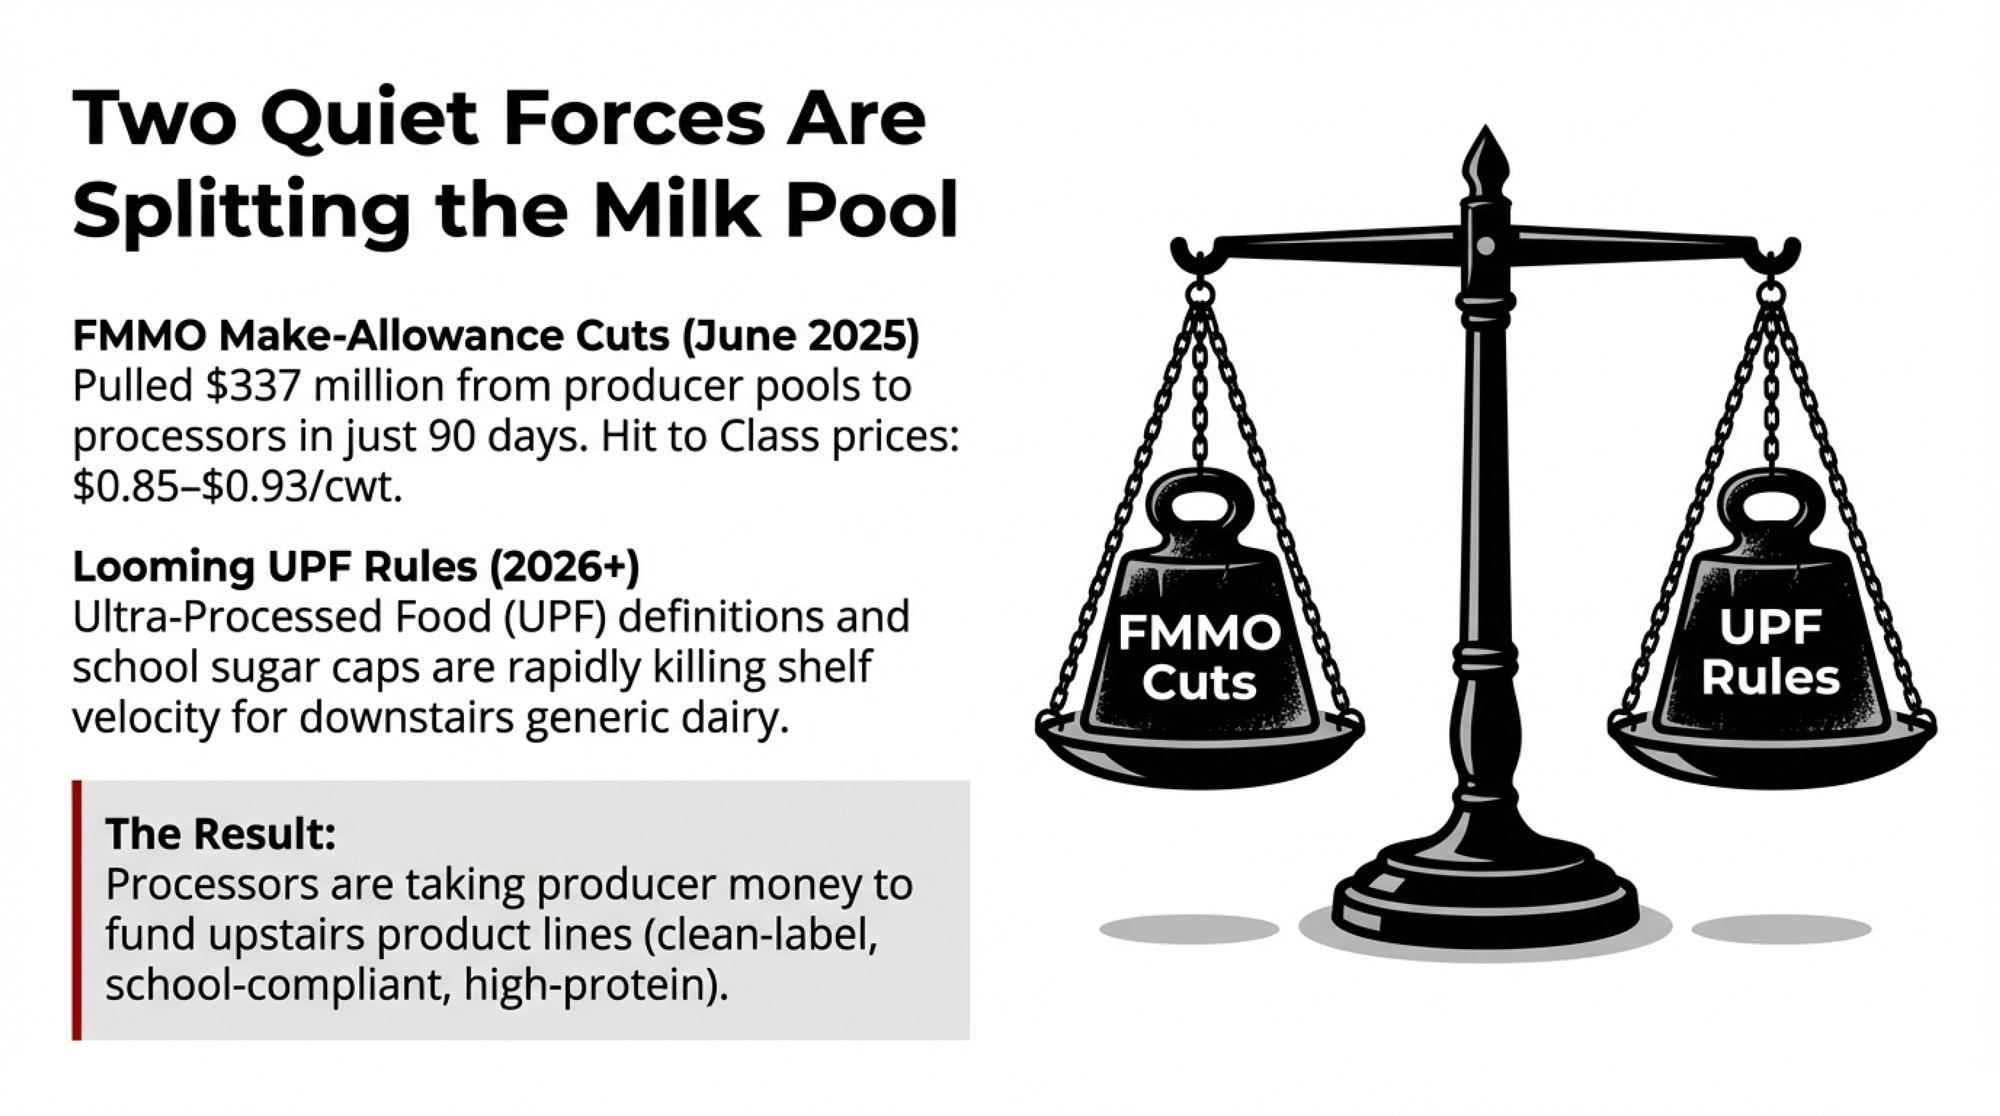
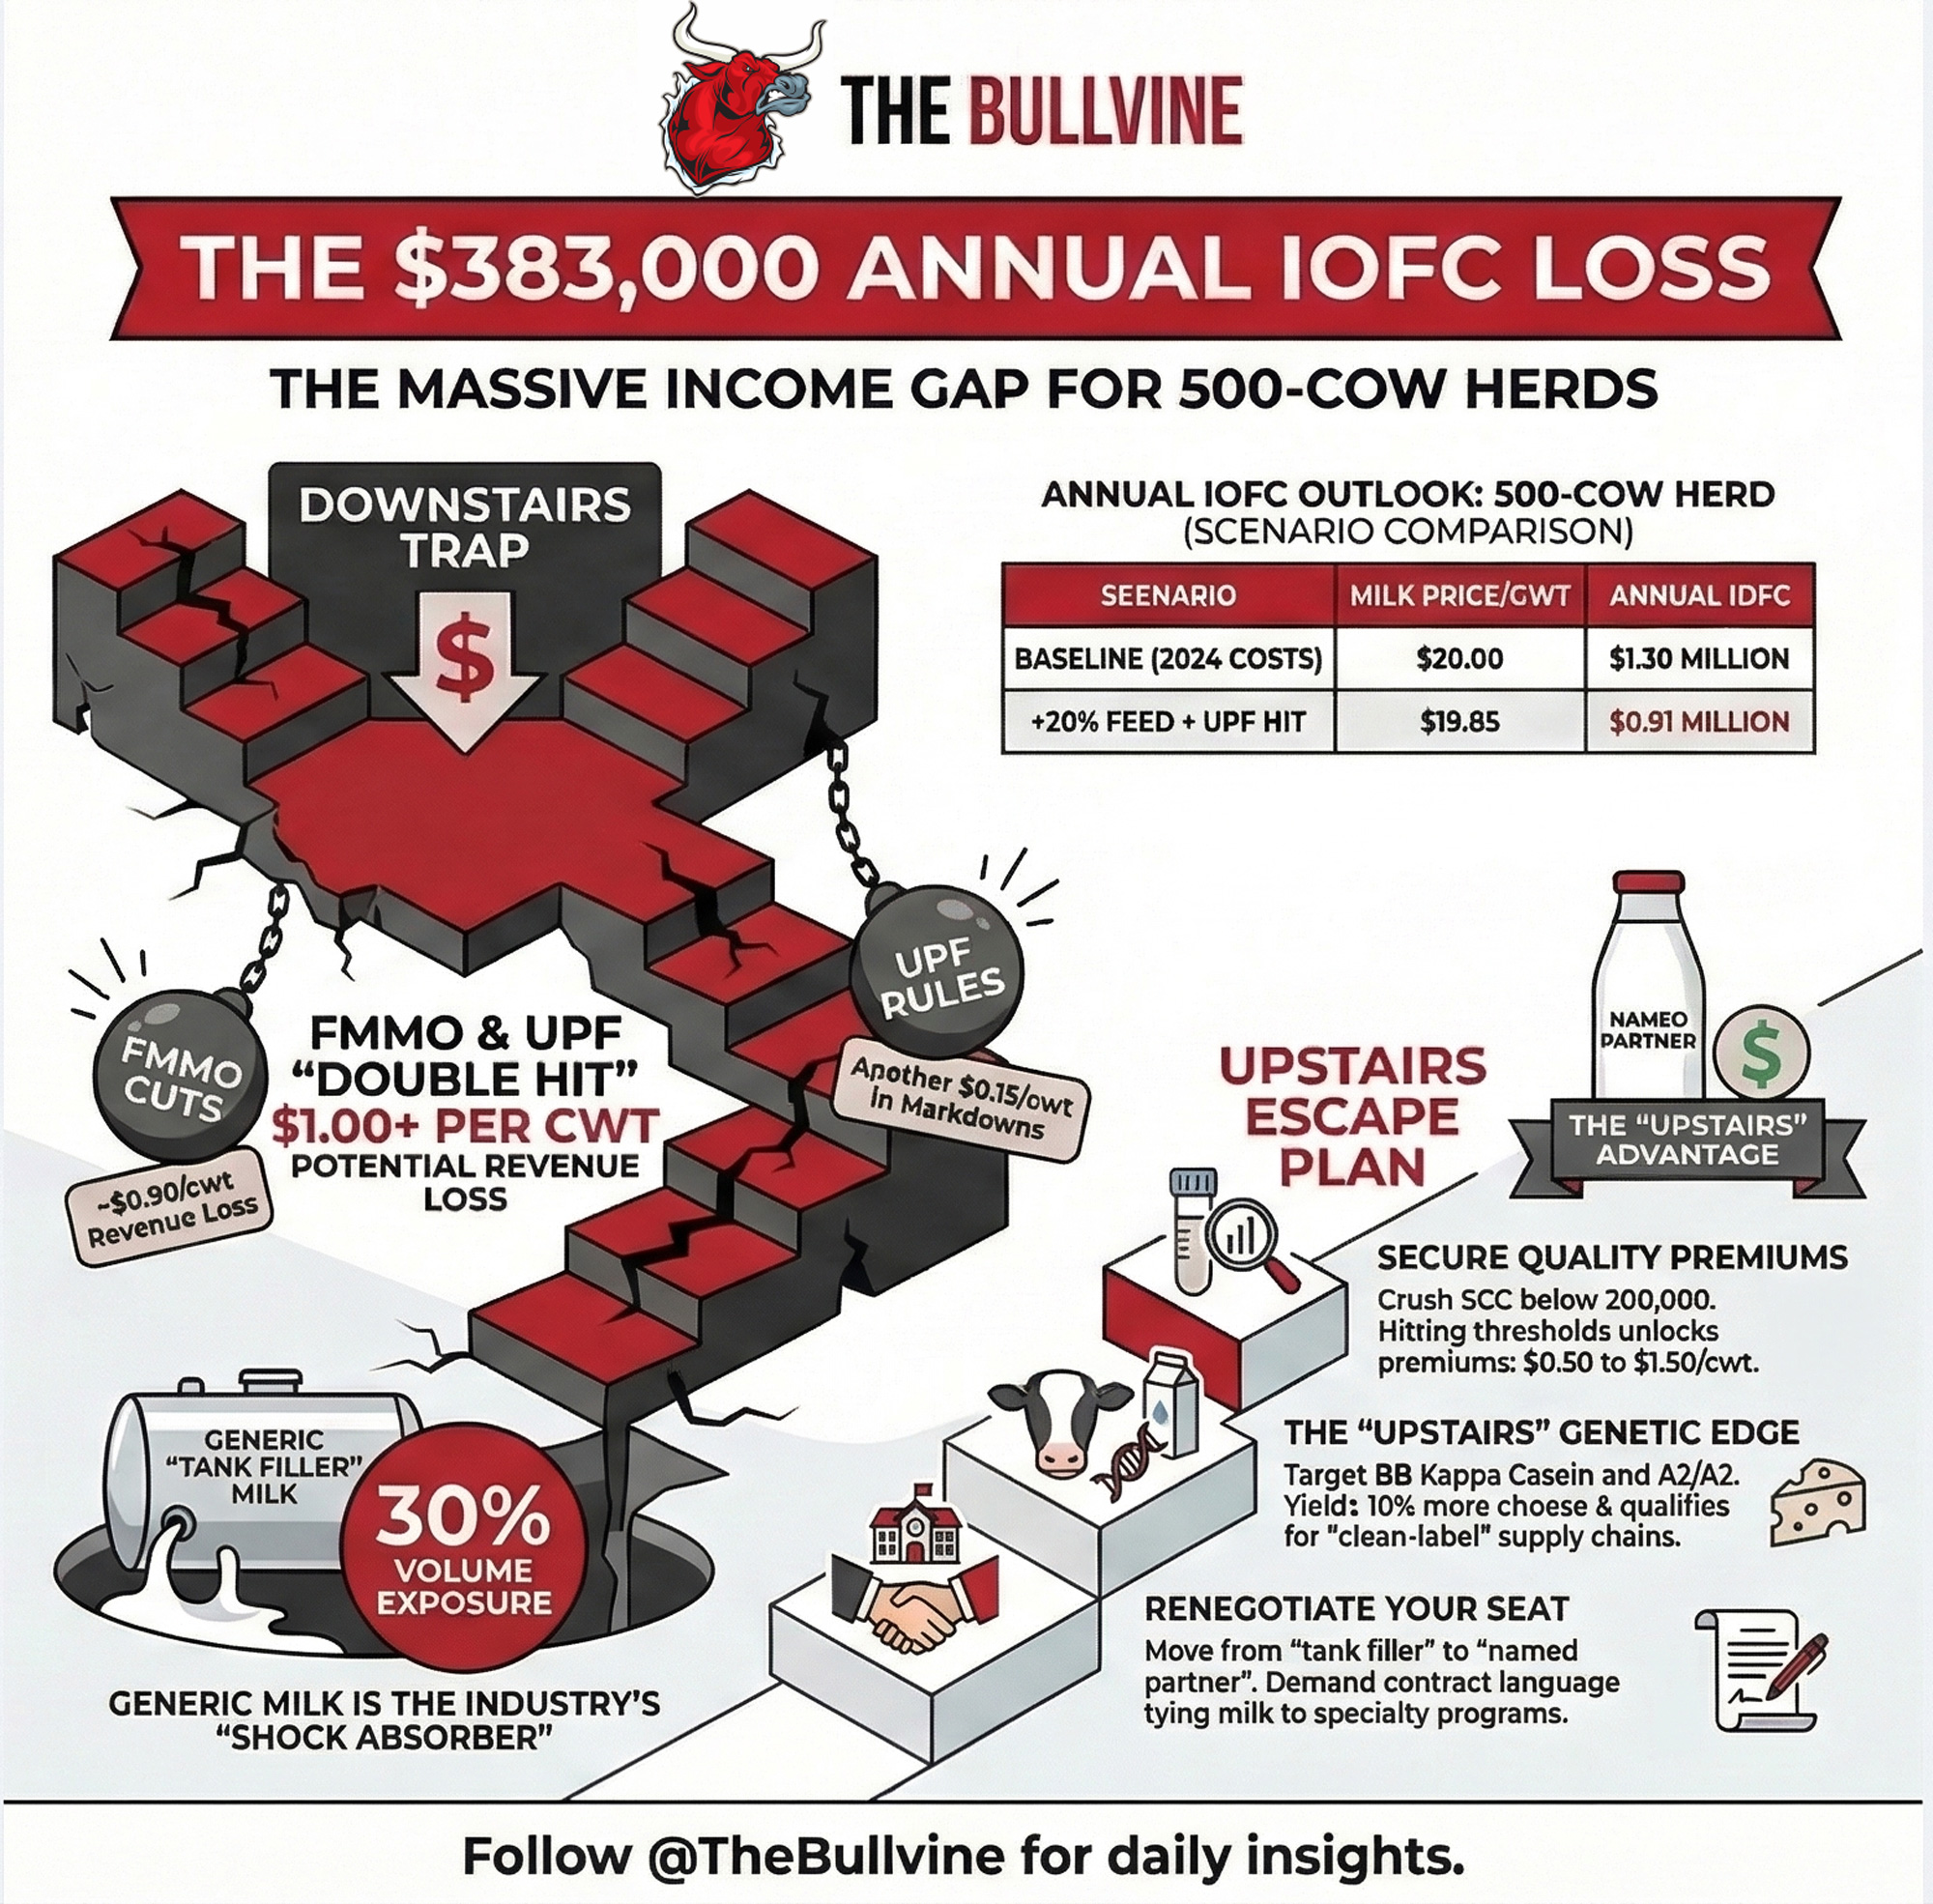
A 500‑cow Midwest operation shipping 425 cwt a day can see about a 3,000/year swing in income over feed depending on which side of the plant its milk lands on. Two forces that have hit in the last nine months are widening that gap fast.
The June 2025 FMMO make‑allowance increase pulled an estimated $337 million from producer pool revenues in its first 90 days, per AFBF economist Danny Munch’s September 2025 Market Intel analysis, with Class price reductions ranging from $0.85 to $0.93/cwt. Now, a federal UPF definition — possibly arriving in 2026, based on HHS Secretary RFK Jr.’s public statements about FDA timelines — could sort every dairy plant’s product lines into “upstairs” (clean‑label, school‑compliant, high‑protein) and “downstairs” (likely to face UPF classification under proposed frameworks, with growing regulatory and market pressure on shelf velocity and margins).
Two composite operators — call them Mark and Sarah — show how that split plays out on real milk checks, benchmarked to Illinois 2024 FBFM data. They’re composites built from regional averages, not real people. But the math is real.
Mark’s Baseline: A Good Herd on the Wrong Side of the Plant
Mark runs 500 cows. Solid management. Reasonable genetics. His milk goes to a regional plant running both institutional and retail/UPF product lines.
His 2024 cost structure comes straight from the Illinois Farm Business Farm Management Association’s annual summary (farmdoc daily, December 18, 2025, Bradley Zwilling):
- Feed cost: $11.64/cwt
- Non‑feed costs: $11.92/cwt (a record high)
- Total economic cost: $23.56/cwt
- Milk production: 23,530 lbs/cow (up 549 lbs from 2023)
The actual 2024 milk price averaged $21.63/cwt — already $1.93 below total economic cost, costing Illinois producers negative $409/cow for the year. For this analysis, we model a $20.00/cwt milk price — in line with farmdoc’s 2025 projection of approximately $20.15/cwt and USDA’s outlook for further price decreases into 2026.
At $20.00 milk against $11.64 feed cost:
- IOFC: about $8.36/cwt
- Daily IOFC (425 cwt): ~$3,553/day
- Annual IOFC: ~$1.30 million/year
He’s well below full‑cost breakeven. Then the ground moved.
The FMMO make allowance hit: On June 1, 2025, USDA raised allowances for butter, cheese, whey, and nonfat dry milk. Munch at AFBF estimated the hit to Class prices at $0.85–$0.93/cwt, shifting roughly $337 million from producer pools to processors in 90 days. That money went to the plant side of the ledger — funding reformulation, equipment upgrades, and premium‑grid tightening.
The UPF policy timeline is stacking up just as fast. In July 2025, HHS, FDA, and USDA issued a formal Request for Information on UPFs. USDA school meal standards now cap added sugar in flavored milk at 10 g/8 oz by the 2026–27 school year, and IDFA’s Healthy School Milk Commitment brought average added sugar in school milks down to 7.2 g/serving by July 2025.
That’s the federal picture. At the state level, California’s AB 1264 requires identification of harmful UPFs by July 1, 2026, with phased K–12 removal running through 2035. And north of the border, Canada’s mandatory front‑of‑pack nutrition labelling went live January 1, 2026, with enforcement beginning the same date.
Mark didn’t change his cows, his feeding program, or his contract. The economics around him changed plenty.
What Does a $383,000 Dairy IOFC Gap Look Like in 2026?
Most kitchen‑table talk still treats UPF as a nutrition story or a PR problem. Run the numbers, and it’s a feed and IOFC issue.
The following scenarios are not based on any specific processor’s current or announced pricing. They model what the economics could look like if UPF‑related policy changes affect feed costs and processor pricing grids over 3–5 years.
An IIED analysis of 2016–2021 agricultural support across 72 countries plus the EU, led by principal researcher Alejandro Guarín (published May 2025), found $14.5–$42.5 billion/year in support effectively subsidizing UPF ingredients — corn, soy, wheat, sugar — while penalizing fresh fruits and vegetables by about $16.3 billion/year. IIED’s modeling suggests repurposing those supports toward fruits, vegetables, and pulses would reduce production of previously subsidized commodities in OECD countries, though the exact percentage depends on how governments redesign the programs.
For this analysis, a 10–20% increase in feed costs over 3–5 years is the stress‑test range — not a forecast. But the directional pressure is real. USDA’s May 2025 Feed Outlook flagged that protein costs, soybean meal in particular, are expected to remain firm or increase even as corn softens — creating what the report described as a “barbell economy” of feed expenses. Purdue ag economist Michael Langemeier separately flagged DDG price shifts as a factor that could push livestock feed costs higher in 2026, with estimated DDG prices ranging from $145 to $155 per ton.
Three Scenarios for Mark’s 500‑Cow Herd
| Scenario | Feed/cwt | Milk Price/cwt | IOFC/cwt | Daily IOFC | Annual IOFC |
| Baseline (FBFM 2024 costs, projected price) | $11.64 | $20.00 | $8.36 | $3,553 | ~$1.30M |
| +10% feed | $12.80 | $20.00 | $7.20 | $3,060 | ~$1.12M |
| +20% feed + UPF hit | $13.97 | $19.85 | $5.88 | $2,499 | ~$0.91M |
Note: The bottom scenario uses this article’s modeled assumptions — 30% of volume exposed to UPF‑side SKUs, $0.50/cwt plant markdown on that slice. These are illustrative. Your exposure depends on your buyer’s product mix and pricing grid.
The gap between baseline and the bottom row: about $383,000/year in IOFC. Same herd. Same people. Very different economics.
Where Does the $0.15/cwt “UPF Hit” Come From?
This isn’t on anyone’s milk statement yet. It’s a calculated risk tied to what happens when the plant’s downstairs side starts losing shelf velocity.
When Chile’s mandatory warning labels and marketing restrictions took effect, purchases of “high‑in” beverages — primarily sugary drinks — fell 23.7% over 18 months (Taillie et al., PLOS Medicine, February 2020). Canada’s black‑and‑white warning symbols for high‑sugar, high‑sodium, and high‑saturated‑fat products went live in January 2026, with immediate enforcement. FDA’s proposed front‑of‑pack labels could follow.
Plants won’t eat reformulation and marketing costs on slow‑moving UPF‑flagged SKUs forever. They’ll pass more of that pressure back through the pool — lower premiums, tighter quality grids, higher marketing deductions.
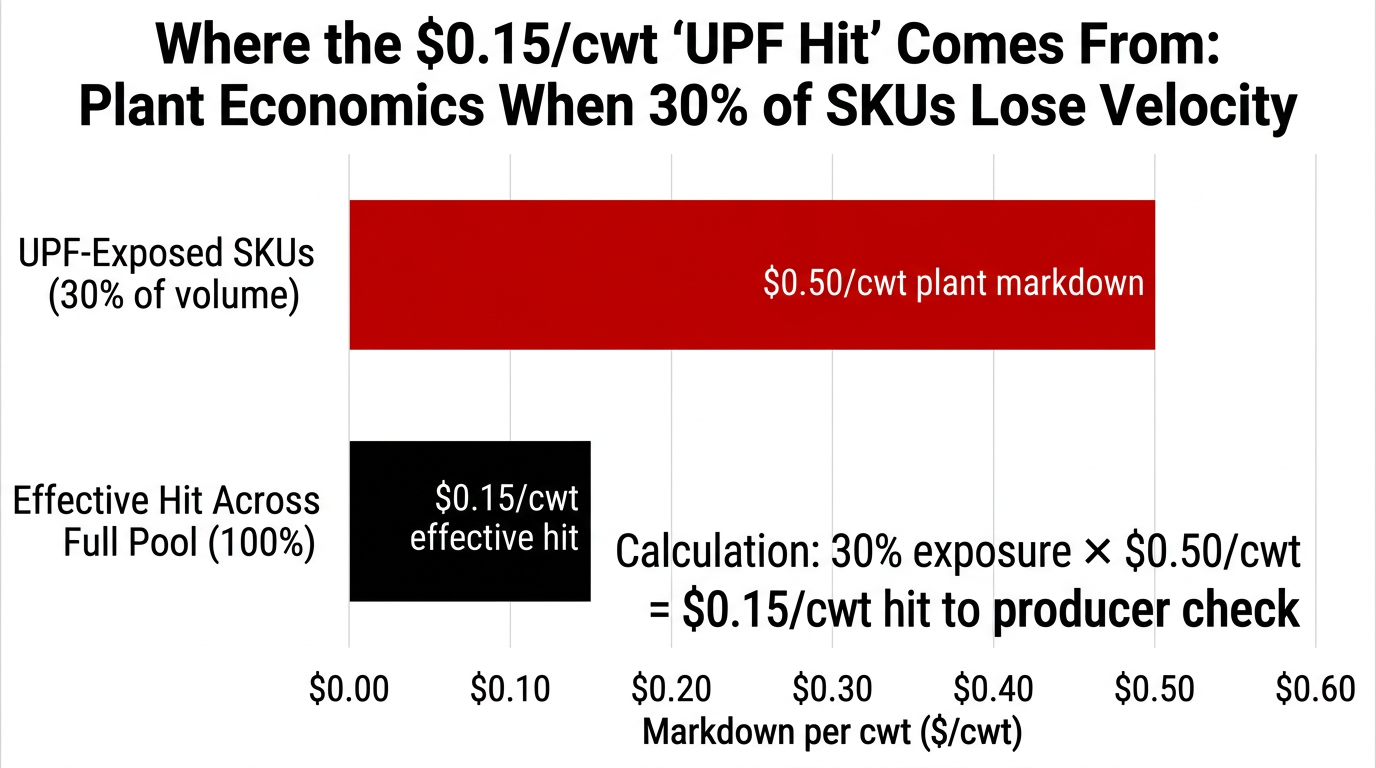
If 30% of Mark’s volume feeds UPF‑exposed SKUs and the plant shaves $0.50/cwt on that slice, the effective hit across his whole pool is 0.30 × $0.50 = $0.15/cwt. New effective price: $20.00 − $0.15 = $19.85/cwt.
IOFC in the $5.88–$6.10/cwt range, while non‑feed costs sit near $11.92/cwt, is where operations start living off depreciation, open lines of credit, and lender patience.
How Are Dairy Processors Sorting Upstairs From Downstairs Milk?
The Wisconsin Cheese Makers Association, representing more than 850 companies and cooperatives across 44 states, laid this out directly in their September 22, 2025 position statement: “In practice, a cup of fortified yogurt or a protein‑packed slice of cheese could be treated as nutritionally suspect, because it required pasteurization, culture development, or added rennet to create.” NMPF filed formal comments on October 23, 2025, warning that how UPFs are ultimately defined “could affect how [dairy] products can be marketed, and whether or not they will be included in federally funded programs such as SNAP, WIC or school meals programs.” IDFA urged the FDA not to rush a definition that lumps all processing together.
That’s the public positioning. The private math is sharper.
Upstairs products — school milk meeting sugar caps, clean‑label yogurts, high‑protein UF, A2‑certified brands, hard and specialty cheeses — are politically and contractually protected. Products more likely to face UPF classification— heavily sweetened yogurts, flavored snack cups, sugary retail-flavored milks, and private‑label processed cheese — are facing growing regulatory and market pressure.
Plants now have more manufacturing margin from the make‑allowance bump to fund that upstairs transition. They’ll pay more for milk feeding the upstairs lines — and spend less to keep the downstairs pool happy.
Where plant capacity is tight, and every tanker matters, that shift hasn’t landed yet. Generic volume still has negotiating power. But plants investing in upstairs products are getting pickier about which herds earn those seats — and building the kind of buyer relationships that survive the next downturn.
Mark’s milk goes to both places. His contract doesn’t specify which.
Sarah’s Turn: What Moving Upstairs Actually Takes
Sarah farms in the same region. Similar size. She looked at the same FMMO and UPF calendar and saw a 24‑month repositioning window, not a label headache.
She asked her processor one question: When you pitch school milk or hospital yogurt, is our herd one of the names in the deck? The honest answer — good volume, but not the herd they highlight in RFPs — told her everything.
So she made three moves.
Move 1: Crush SCC and Bacteria Counts
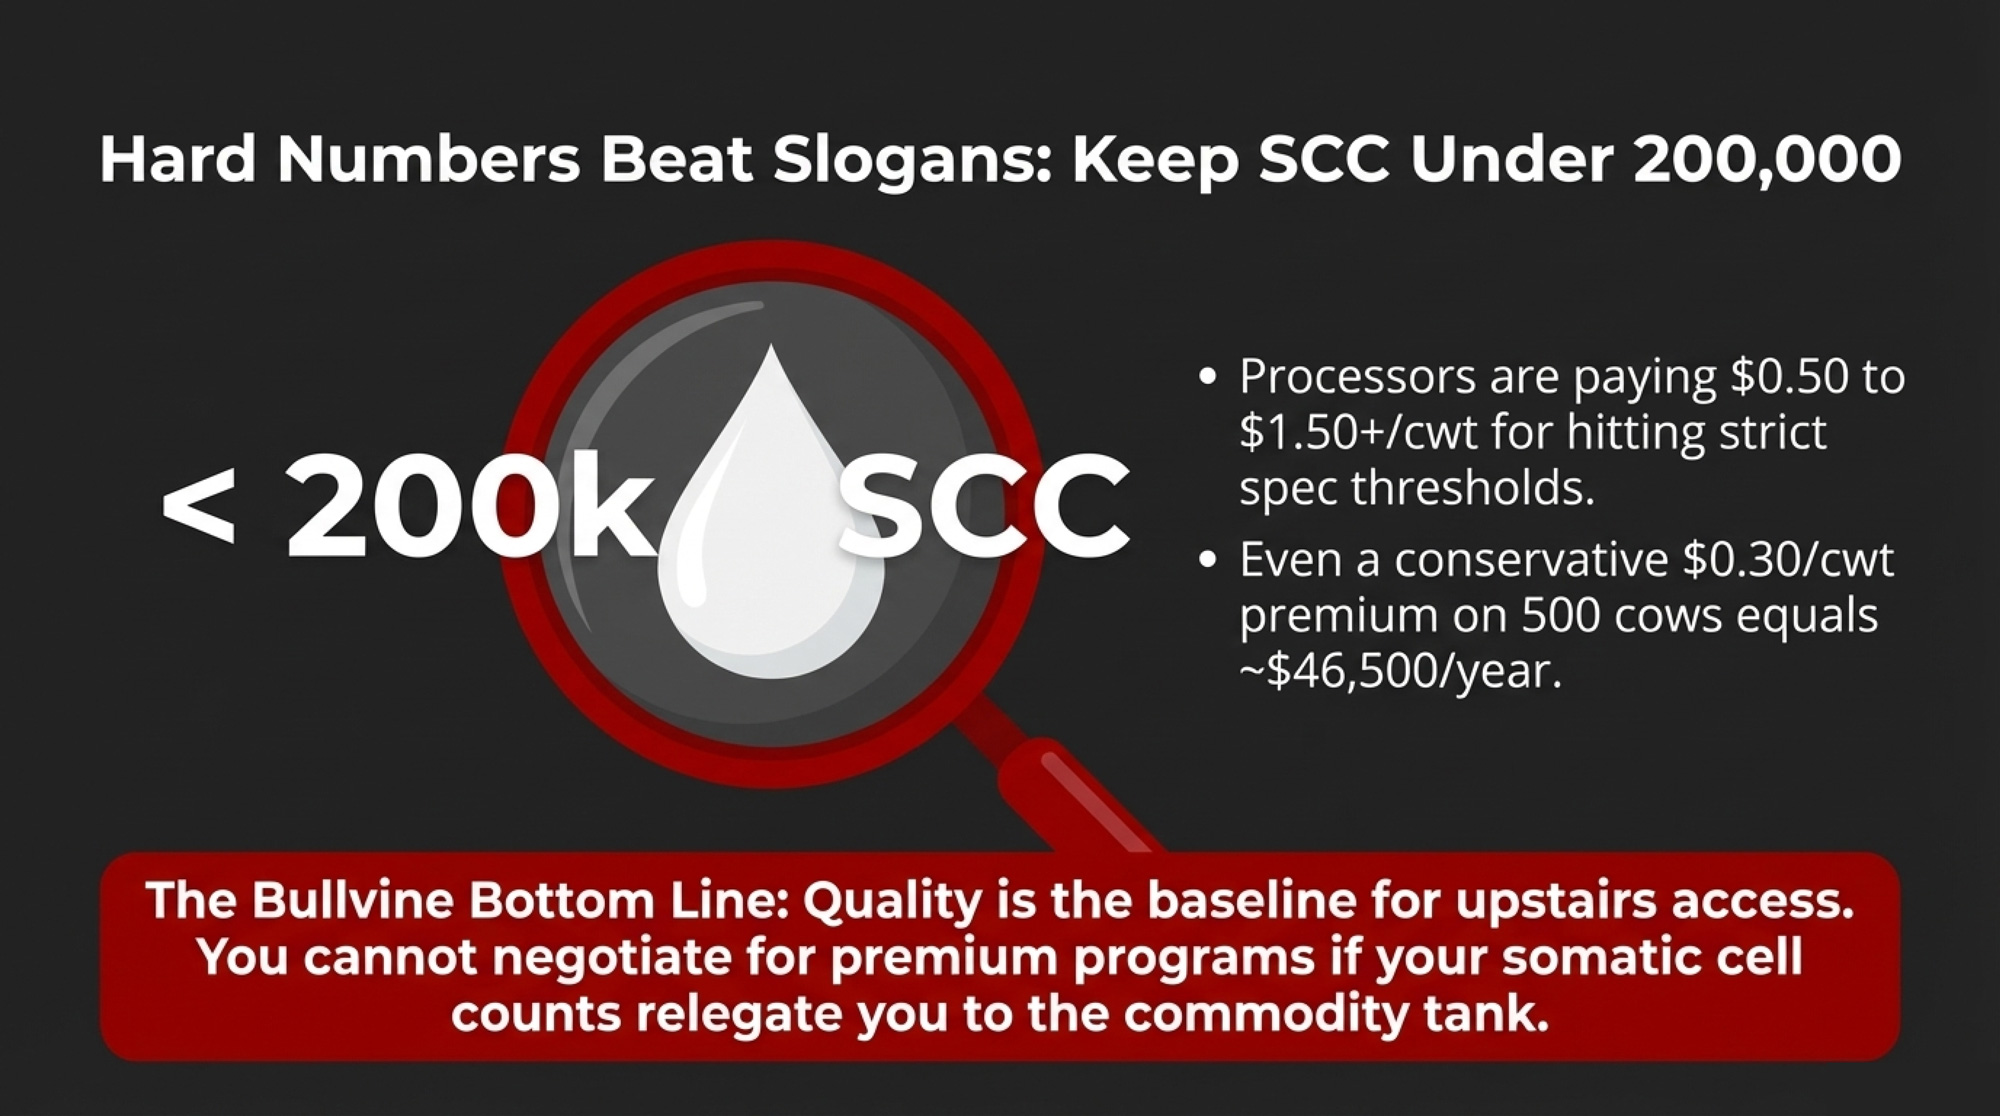
Pulling herd SCC from the mid‑300k band under 200,000 unlocks consistent quality premiums. The Bullvine’s own reporting on processor expansion found that farms hitting spec thresholds are seeing premiums ranging from $0.50 to over $1.50/cwt, and an 85‑cow Pennsylvania operation captured $0.75/cwt through relatively simple bypass protein and consistent feed push‑ups. Even at a conservative $0.30/cwt SCC premium on 500 cows shipping 425 cwt/day, that’s 425 × $0.30 = $127.50/day, roughly $46,500/year. That’s before the extra pounds and lower treatment costs.
Move 2: Get Specific on Protein Variants
Sarah’s genetics team didn’t just target “more solids.” They targeted which solids matter for products that survive UPF scrutiny.
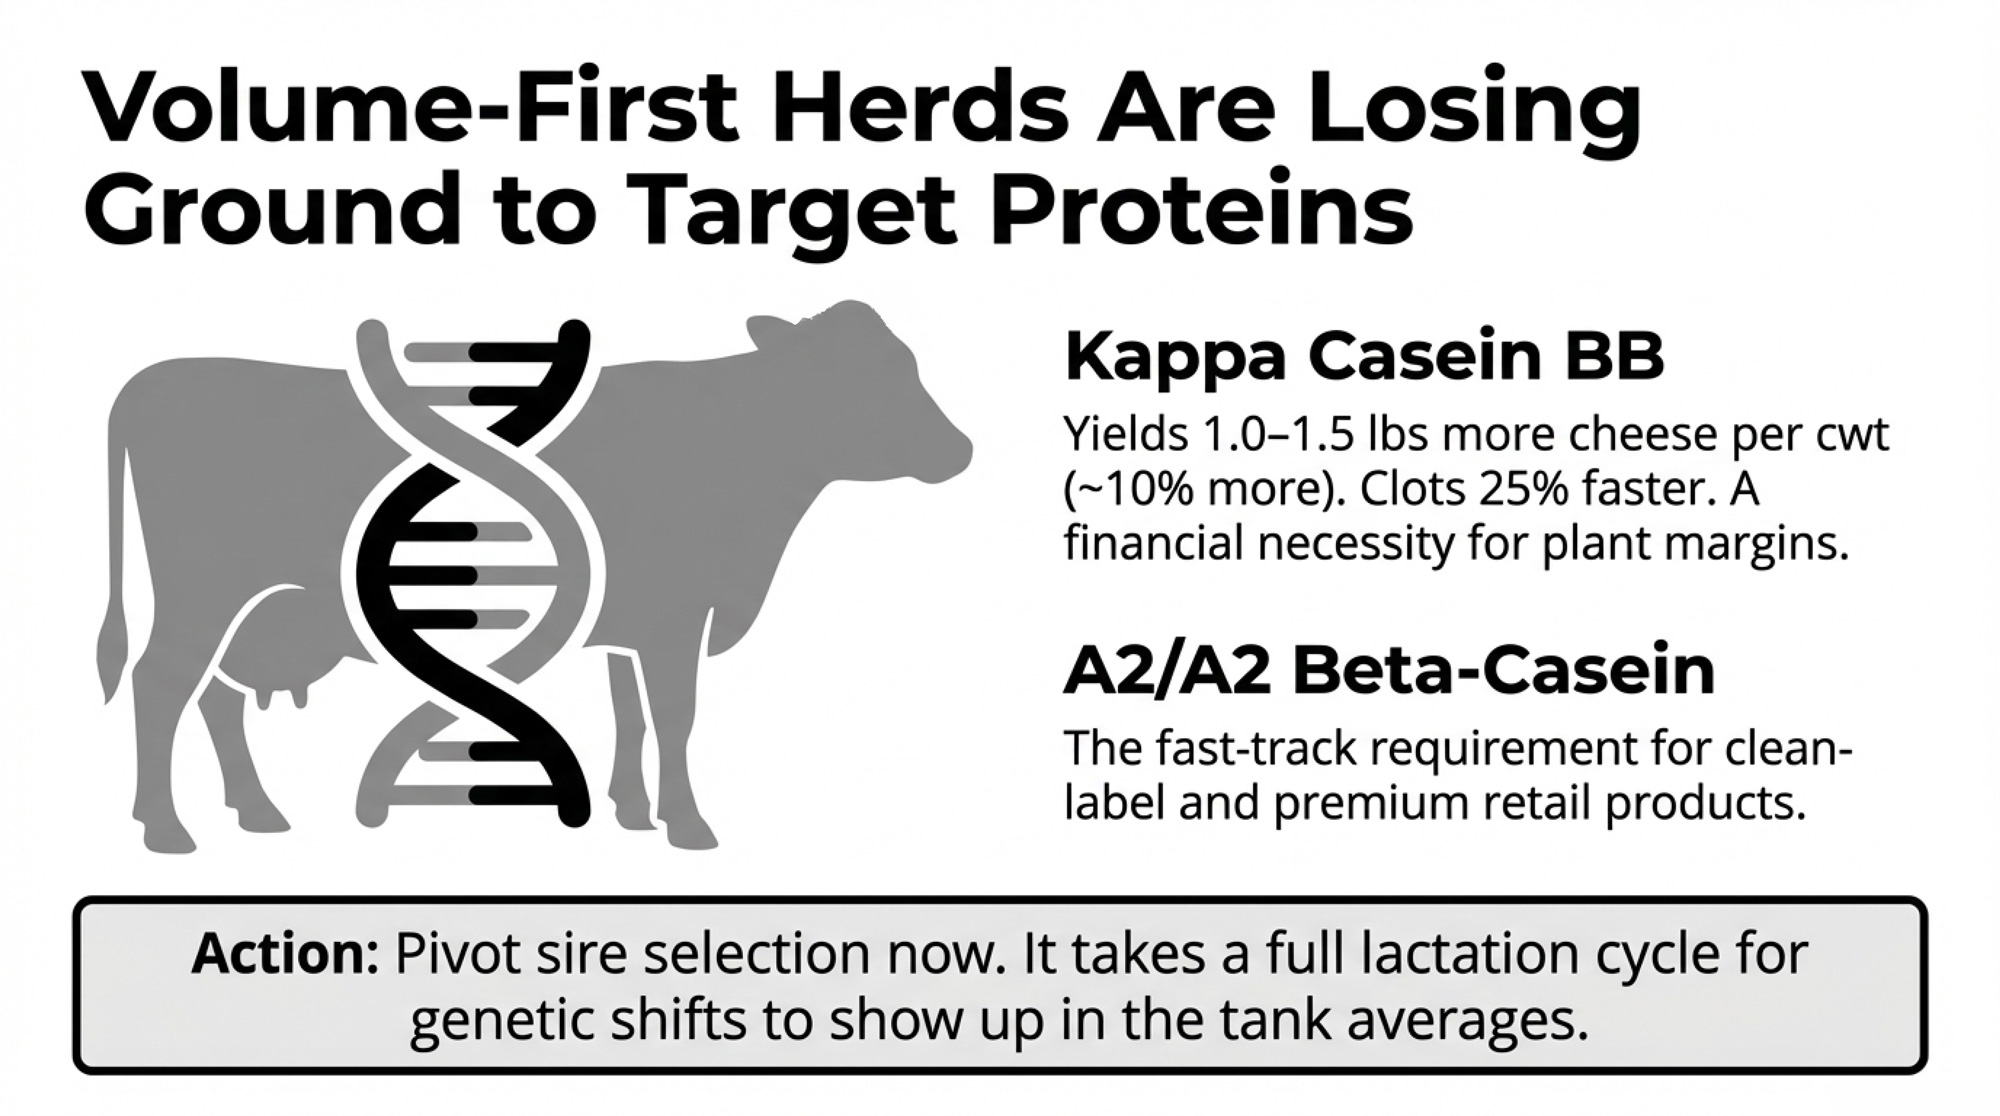
Kappa Casein BB: Cheese from BB cows clots around 25% faster, produces curd roughly twice as firm, and yields about 1.0–1.5 lbs more cheese per cwt — roughly 10% more — than AA cows. For a cheese plant, that’s not a nice‑to‑have. That’s money. Lactanet data (CDN document #586, August 2022) show BB is the dominant genotype in Jerseys (82.2%) and Brown Swiss (61.5%), but in Holsteins, it’s just 37.6% — meaning active selection toward BB and AB sires matters most where most milk is produced.
A2/A2 Beta‑Casein: Lonnie Holthaus at Milkhaus Dairy in Fennimore, Wisconsin, has selectively bred his Holsteins for A2/A2 — more than half the herd now produces only A2 protein milk, with products available through local grocery stores and direct‑to‑consumer channels. UW–Madison Extension notes the Holstein breed “is quickly moving to be an A2A2 only breed,” with a survey of five A.I. studs turning up over 800 A2A2 Holstein bulls — by far the most common beta‑casein combination now offered.
Lactanet’s published breeding guidance spells out the path: producers can increase BB frequency by “selecting for BB or AB sires,” and increase A2 frequency by “preferred use of A2A2 or A1A2 sires.” It’s not a complicated selection — it just has to be intentional.
New U.S. plant capacity backs the same direction. IDFA reported in October 2025 that processors have committed more than $11 billion in new and expanded manufacturing capacity across 19 states — over 50 individual building projects between 2025 and early 2028. A significant share of the capacity is for cheese and whey, positioned for what MarkNtel projects as a global whey protein market growing from .5 billion (2023) to .2 billion by 2030. UW–Madison Extension dairy economist Leonard Polzin noted that fat and protein components keep climbing “every single year” — and the new processing infrastructure is built to reward exactly that. Volume‑first herds are losing ground.
Sarah pivoted sire selection toward BB kappa casein and A2/A2 alongside health, solids, and longevity. Not a one‑month fix — it took a lactation cycle to start showing up in tank averages.
Move 3: Renegotiate Her Seat in the Supply Plan
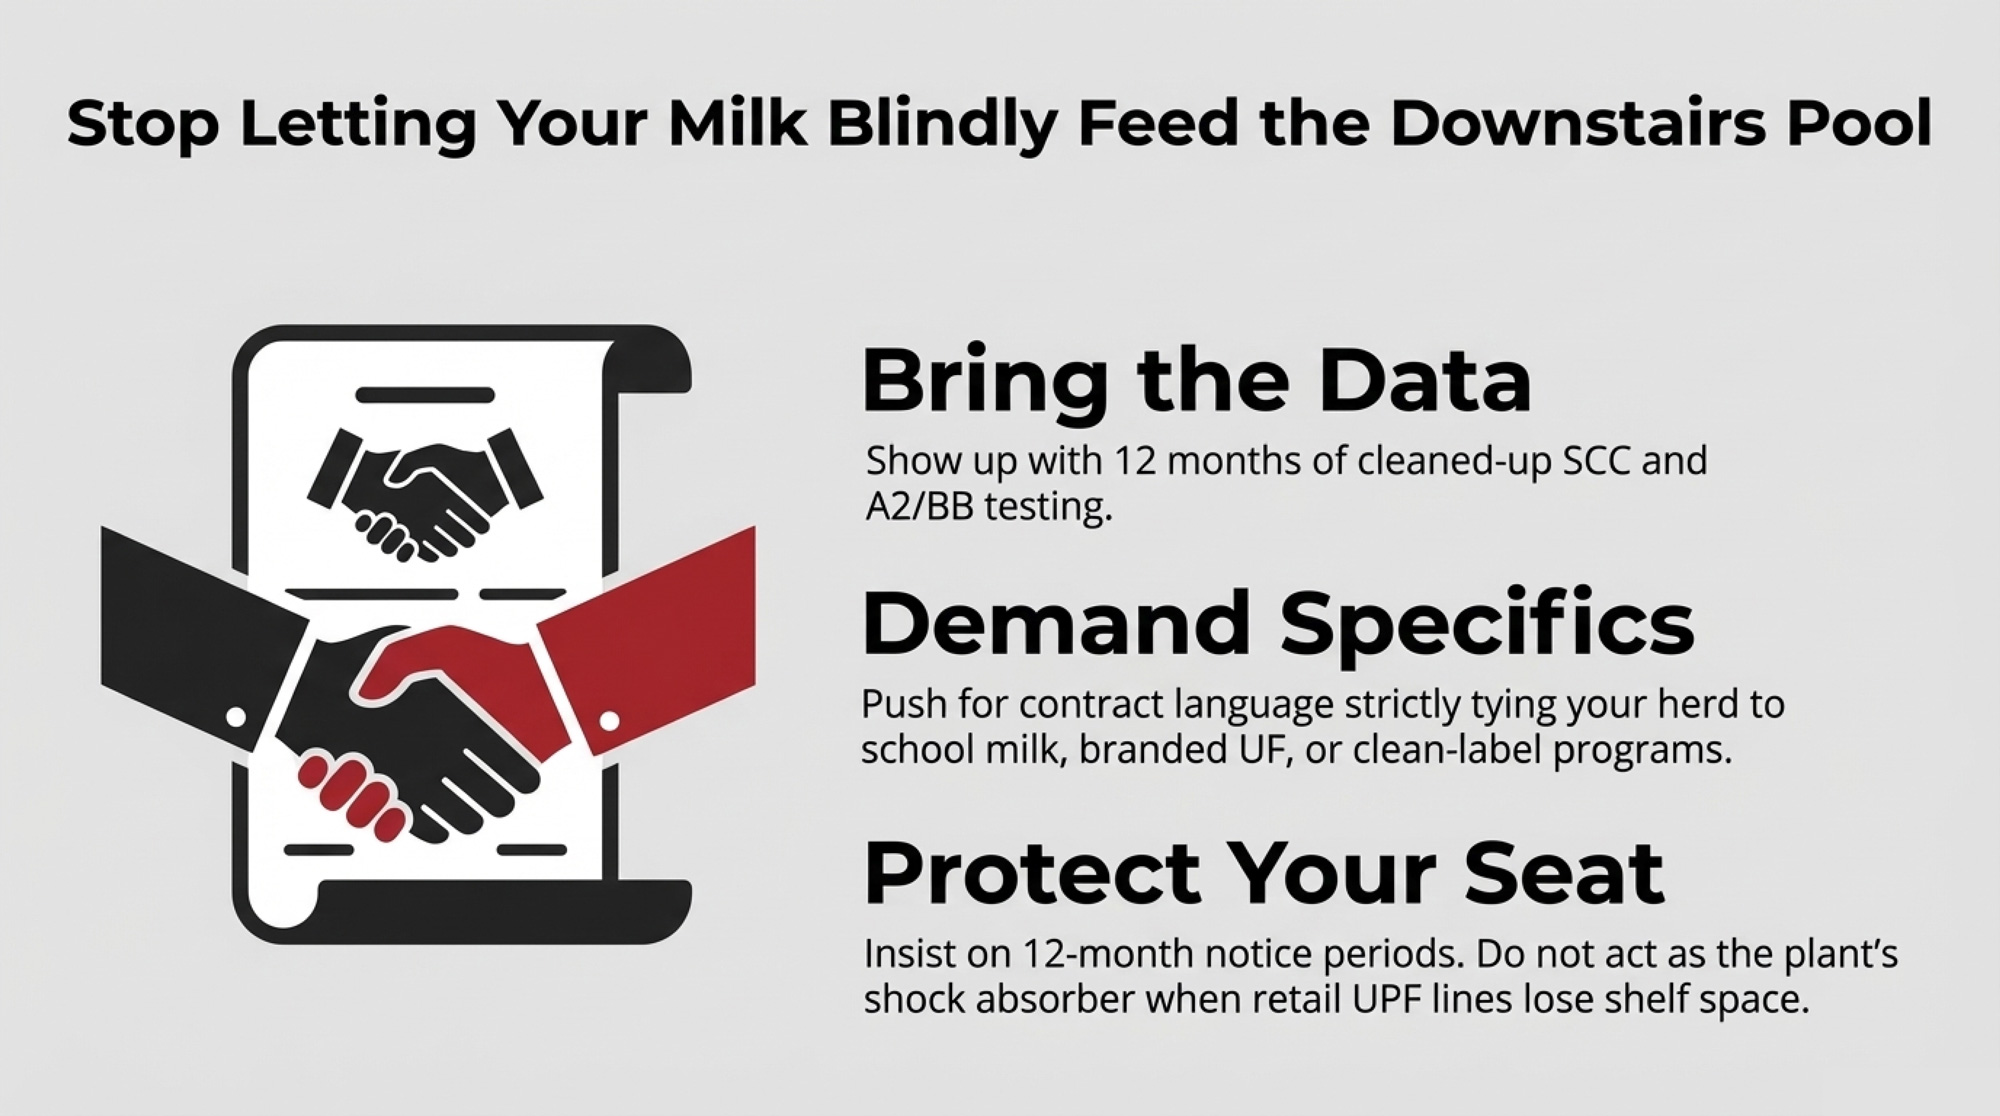
Instead of asking for a better average price, she brought 12 months of cleaned‑up SCC, strong components, and documented A2/BB testing to the table. She pushed for program language tying her herd to specific products and 12‑month notice periods, so she wasn’t locked in if the plant doubled down on UPF‑heavy retail.
Two years from now, both herds could still be shipping 425 cwt/day. The difference sits on the milk check. Sarah carries a stable stack of quality and program premiums — consistent with The Bullvine’s reporting on processor expansion, which documented premiums of $0.50 to over $1.50/cwt for farms meeting spec thresholds, with top‑tier programs potentially reaching higher for herds that qualify on components, protein variants, and SCC simultaneously.
| Metric | Mark (Downstairs) | Sarah (Upstairs) | Gap Impact |
| Herd Size | 500 cows | 500 cows | Identical |
| Daily Volume | 425 cwt/day | 425 cwt/day | Identical |
| SCC Average | 320,000 | 185,000 | −42% SCC |
| Kappa Casein / A2 Status | Not tested | BB & A2/A2 selected | Active selection |
| Processor Contract Type | Generic pool volume | Named in school/hospital RFPs | Protected seat |
| Quality/Program Premiums | $0.10/cwt | $0.80/cwt | +$0.70/cwt |
| Feed Cost/cwt | $13.97 | $13.97 | Identical |
| Milk Price Received | $19.85/cwt (base − UPF hit) | $20.80/cwt (base + premiums) | +$0.95/cwt |
| IOFC/cwt | $5.88 | $6.83 | +$0.95/cwt |
| Annual IOFC | ~$912,000 | ~$1,059,000 | — |
| Annual IOFC Difference | — | — | +$147,000/year |
Mark is still letting his milk feed the downstairs pool.
Can You Move Off the Downstairs Staircase in 24 Months?
Federal UPF definitions, front‑of‑pack labels, and school standards all have dates attached. Here’s what to do with that calendar.
In the Next 30 Days
- Pull the last 3–6 months of milk statements. What’s your average SCC? Where are protein and butterfat sitting? How much per cwt is the base vs. quality vs. program premiums?
- Print your milk supply agreement. What’s the notice period? Does it mention specific programs — school milk, branded UF, clean‑label — or are you just generic pool volume?
- Ask your field rep one blunt question: “When you pitch our plant’s school and clean‑label contracts, is our herd one you mention by name — or are we just filling tanks?”
- Check your herd’s kappa casein and A2/A2 status. Individual tests run about $40/head through labs like UC Davis VGL; the full Milk Protein Panel (A2 + kappa casein + beta‑lactoglobulin) runs $93/head (UC Davis VGL pricing, October 2023). On 500 cows, that’s $20,000–$46,500 — significant upfront, but budget it against the $46,500/year SCC premium recovery alone. If you’re already running broader panels, Zoetis CLARIFIDE Plus costs roughly $43/head, including health and wellness traits.
Red flag: No quality or program premiums on your statement, no program language in your contract, and your buyer can’t link your herd to anything strategic? You’re deep in the downstairs story right now.
Green flag: Your buyer names your herd specifically in RFP submissions, your contract ties to at least one program, and you’ve got 12+ months of SCC under 200K on record? You’re upstairs. Protect that seat — keep specs high, contract language specific, and your testing documentation current.
In the Next 90 Days: Pick Your Branch
- Upgrade into the A‑pool where you are. Targets: SCC consistently <200,000, protein >3.15%, start genomic testing for kappa casein BB and A2/A2. You gain leverage with your current buyer, but you’ll spend more upfront on vet work, cow comfort, nutrition, and testing.
- Scout a processor switch. Map processors within a realistic hauling radius that are building school, hospital, “no UPF,” A2, or specialty cheese contracts. You gain alignment with a buyer who values upstairs milk. You take on hauling changes, relationship risk, and the chance that if the new buyer’s program changes specs mid‑contract, you’re rebuilding from scratch in a market where your old plant already filled your slot.
- Renegotiate your seat at the table. Push for a program language that ties your herd to products that must survive UPF rules. Aim for 12‑month notice periods. You keep the relationship you know, but it may be a harder conversation if your buyer isn’t under immediate pressure yet.
Opportunity signal: If your buyer is already talking about school sugar caps, UPF definitions, or “real food” wins with institutions, they’re feeling the heat. That’s when A‑team milk becomes more valuable inside their business than it looks on your statement.
Over the Next 365 Days
Build a 6–12 month run with SCC under 200,000 and documented component and protein‑variant testing. Lean hard into sires that bring BB kappa casein, A2/A2, solids, and longevity. After that, go back to your buyer with a simple ask: “Here’s our updated quality and component record. Which of your school, hospital, or clean‑label programs could we qualify for, and what premiums go with them?”
What This Means for Your Operation
- If your IOFC is under about $7/cwt and quality/program premiums are thin on your statement, you’re in the zone this $383,000 gap describes. Run your own numbers — swap in your feed cost, your milk price, and your best guess at how much of your buyer’s volume feeds UPF‑exposed products.
- If your buyer can name specific products and contracts your herd supports, you’re already upstairs. Don’t assume that the seat is permanent — keep your specs high and your contract language specific.
- If your contract doesn’t mention notice periods or programs, assume you’re the shock absorber, not the protected volume. That doesn’t mean panic. It means read the fine print and decide if that’s where you want to sit in your buyer’s supply plan.
- If you don’t know your herd’s kappa-casein or A2 status, you can’t negotiate for traits you haven’t tested for. At $40–$93/head, that’s cheap insurance relative to the premium it could unlock.
Signals to Watch
- FDA UPF definition timeline: If a federal definition arrives in 2026, processor contract language could start shifting within 90 days of publication. We’ll be tracking processor responses and contract grid changes as they surface — this is the story to watch for the next 18 months.
- California’s AB 1264 identification deadline (July 1, 2026): The first real test of which products get flagged and which don’t. What happens in California school districts will signal how other states and federal programs respond.
- Your buyer’s institutional wins: Track whether your processor is growing school milk and hospital contracts. If those are growing, your leverage is growing too.
Key Takeaways
- If your IOFC on a 500‑cow herd is drifting under ~$7/cwt, today’s FBFM‑style costs and a small UPF‑driven markdown can easily add up to a $383,000/year gap between you and a neighbour on the upstairs side of the plant.
- The fastest upgrades into that upstairs pool are hard numbers, not slogans: SCC consistently under 200,000, protein north of ~3.15%, and a clear plan to move your herd’s genetics toward BB kappa casein and A2/A2 for cheese, school, and clean‑label programs.
- Your most important 30‑day check isn’t on a spreadsheet; it’s one question for your field rep: “When you pitch school and clean‑label contracts, is our herd one you mention by name—or are we just filling tanks?”
- If your contract doesn’t spell out program links and at least a 12‑month notice period, assume you’re in the cut‑first volume, not the protected pool—and build a 365‑day plan to either upgrade in place, switch buyers, or renegotiate your seat.
The Bottom Line
In the next 30 days, do one thing: calculate your real IOFC — not from memory, from your actual milk statements and feed records. Break down how much of your check is base price vs premiums. Then ask your buyer in plain language: Is our herd part of the milk you rely on for your safest contracts, or are we in the pool you can cut first?
What’s your real IOFC this month — and does your buyer know your milk by name, or just by tank number?
Complete references and supporting documentation are available upon request by contacting the editorial team at editor@thebullvine.com.
Learn More
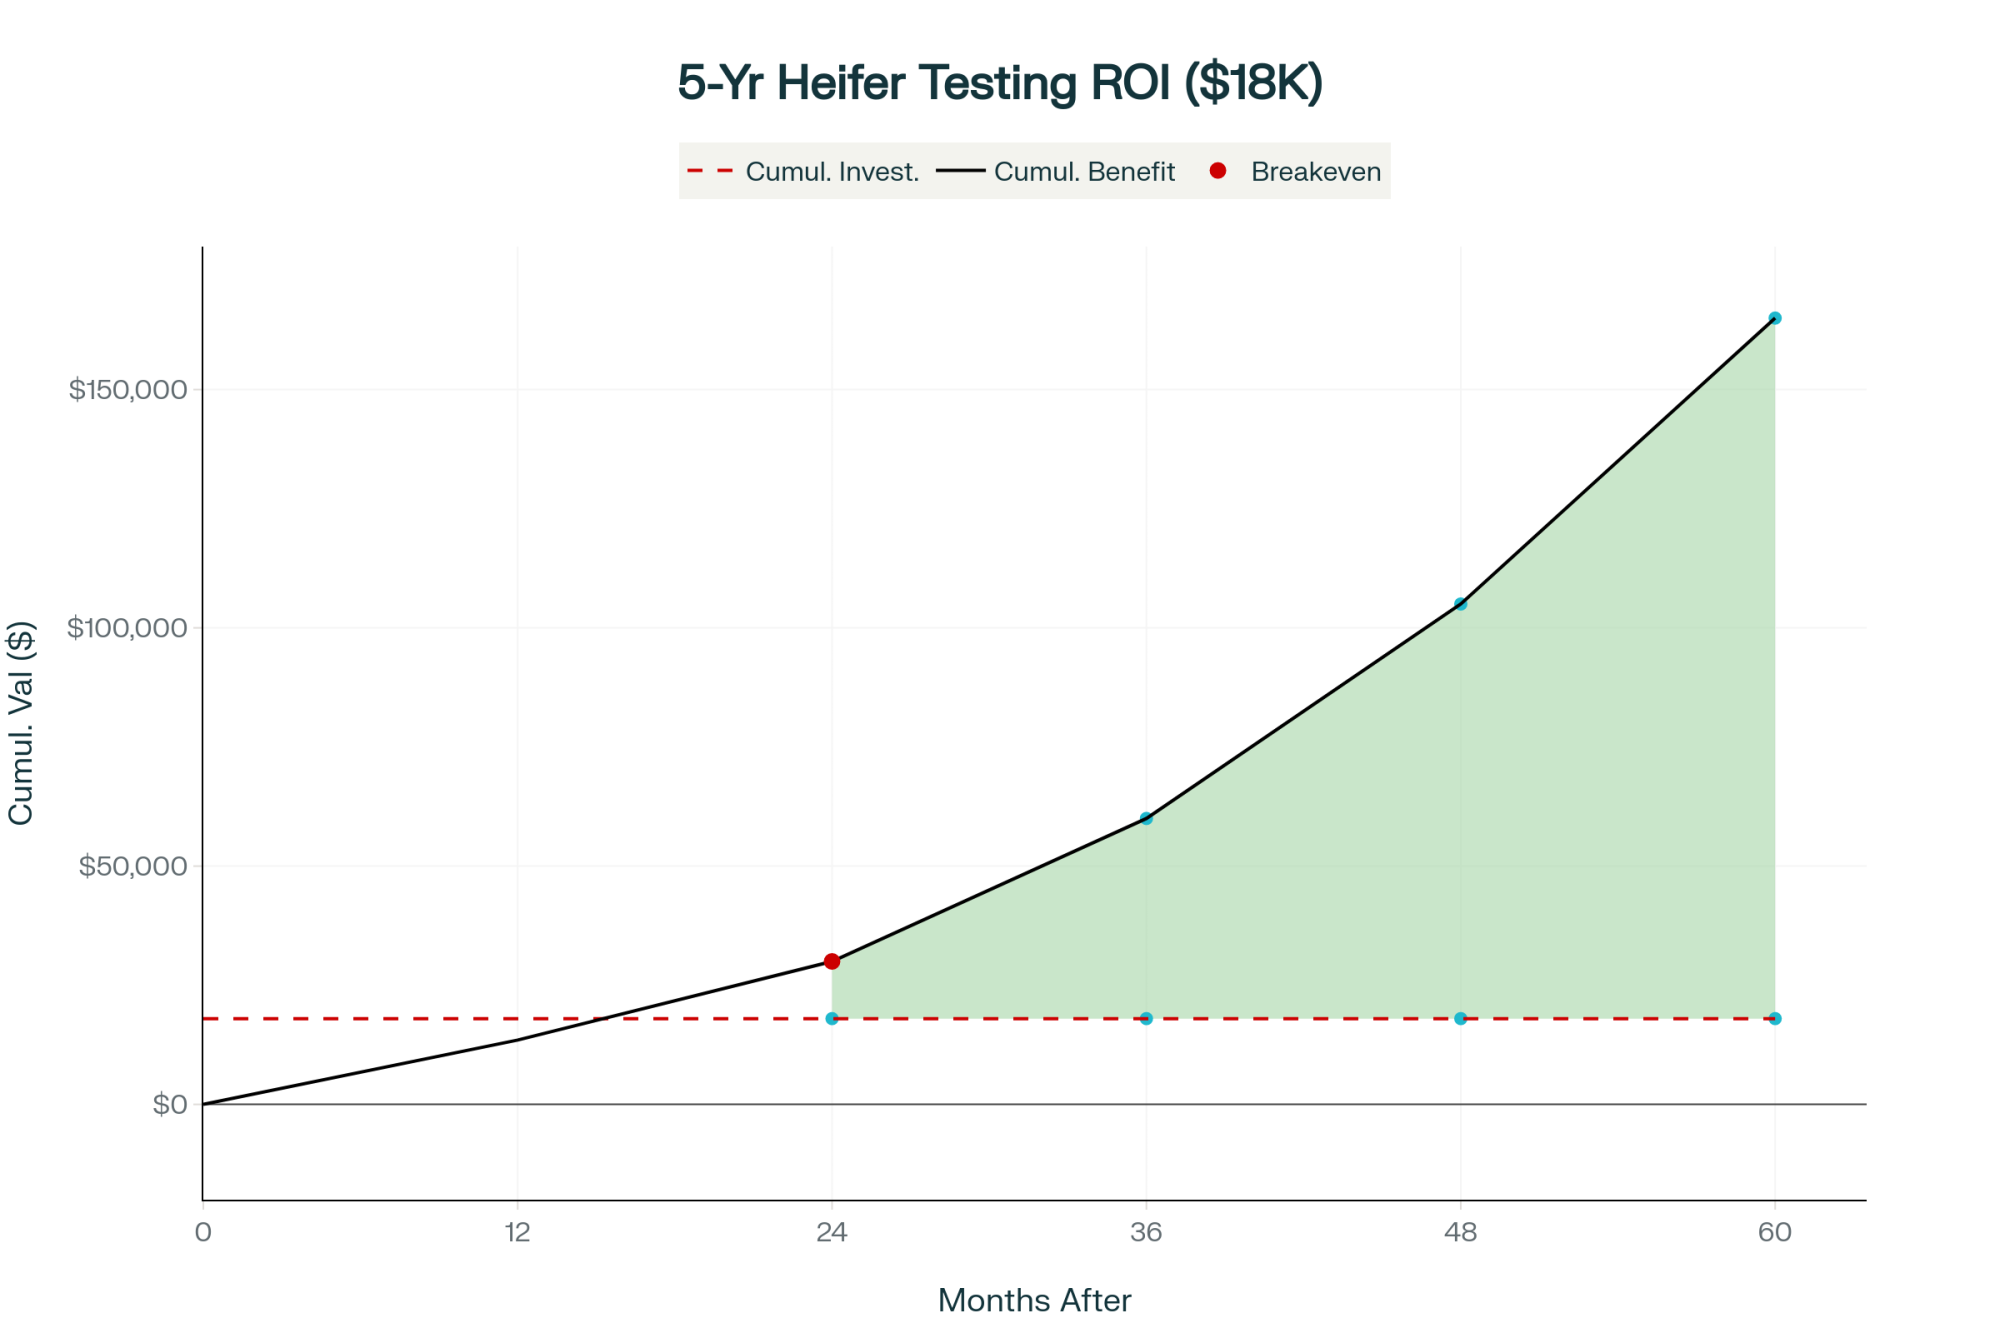
- Digital Dairy: The Tech Stack That’s Actually Worth Your Investment in 2025 – Gain a decisive ROI edge by identifying which predictive technologies actually pay back in under eight months. This breakdown reveals how 2025 tech stacks deliver a $0.30/cwt premium and slash feed costs by 10% on 500-cow dairies.
- From Shutdown to Showdown: How Dairy’s 2026 Wake-Up Call Is Redefining Survival – Armor your operation against the 2026 margin reset by exposing the “make allowance leaks” draining your milk check. This strategic analysis delivers a tiered survival plan for mid-sized herds facing the industry’s sharpening processor divide.
- The Next Frontier: What’s Really Coming for Dairy Cattle Breeding (2025-2030) – Claim an early-adopter advantage by mastering the genetic breakthroughs—from gene-edited designer milk to AI-driven breeding—set to upend the market by 2030. This vision reveals how to capture 25% price premiums through high-casein specialization.
 The Sunday Read Dairy Professionals Don’t Skip.
 The Sunday Read Dairy Professionals Don’t Skip.
Every week, thousands of producers, breeders, and industry insiders open Bullvine Weekly for genetics insights, market shifts, and profit strategies they won’t find anywhere else. One email. Five minutes. Smarter decisions all week.