Archive for heifer replacement cost

$3,110 In, $1,100 Out: The Cull Trap Holding 470,000 U.S. Dairy Cows – CPI Hits 68

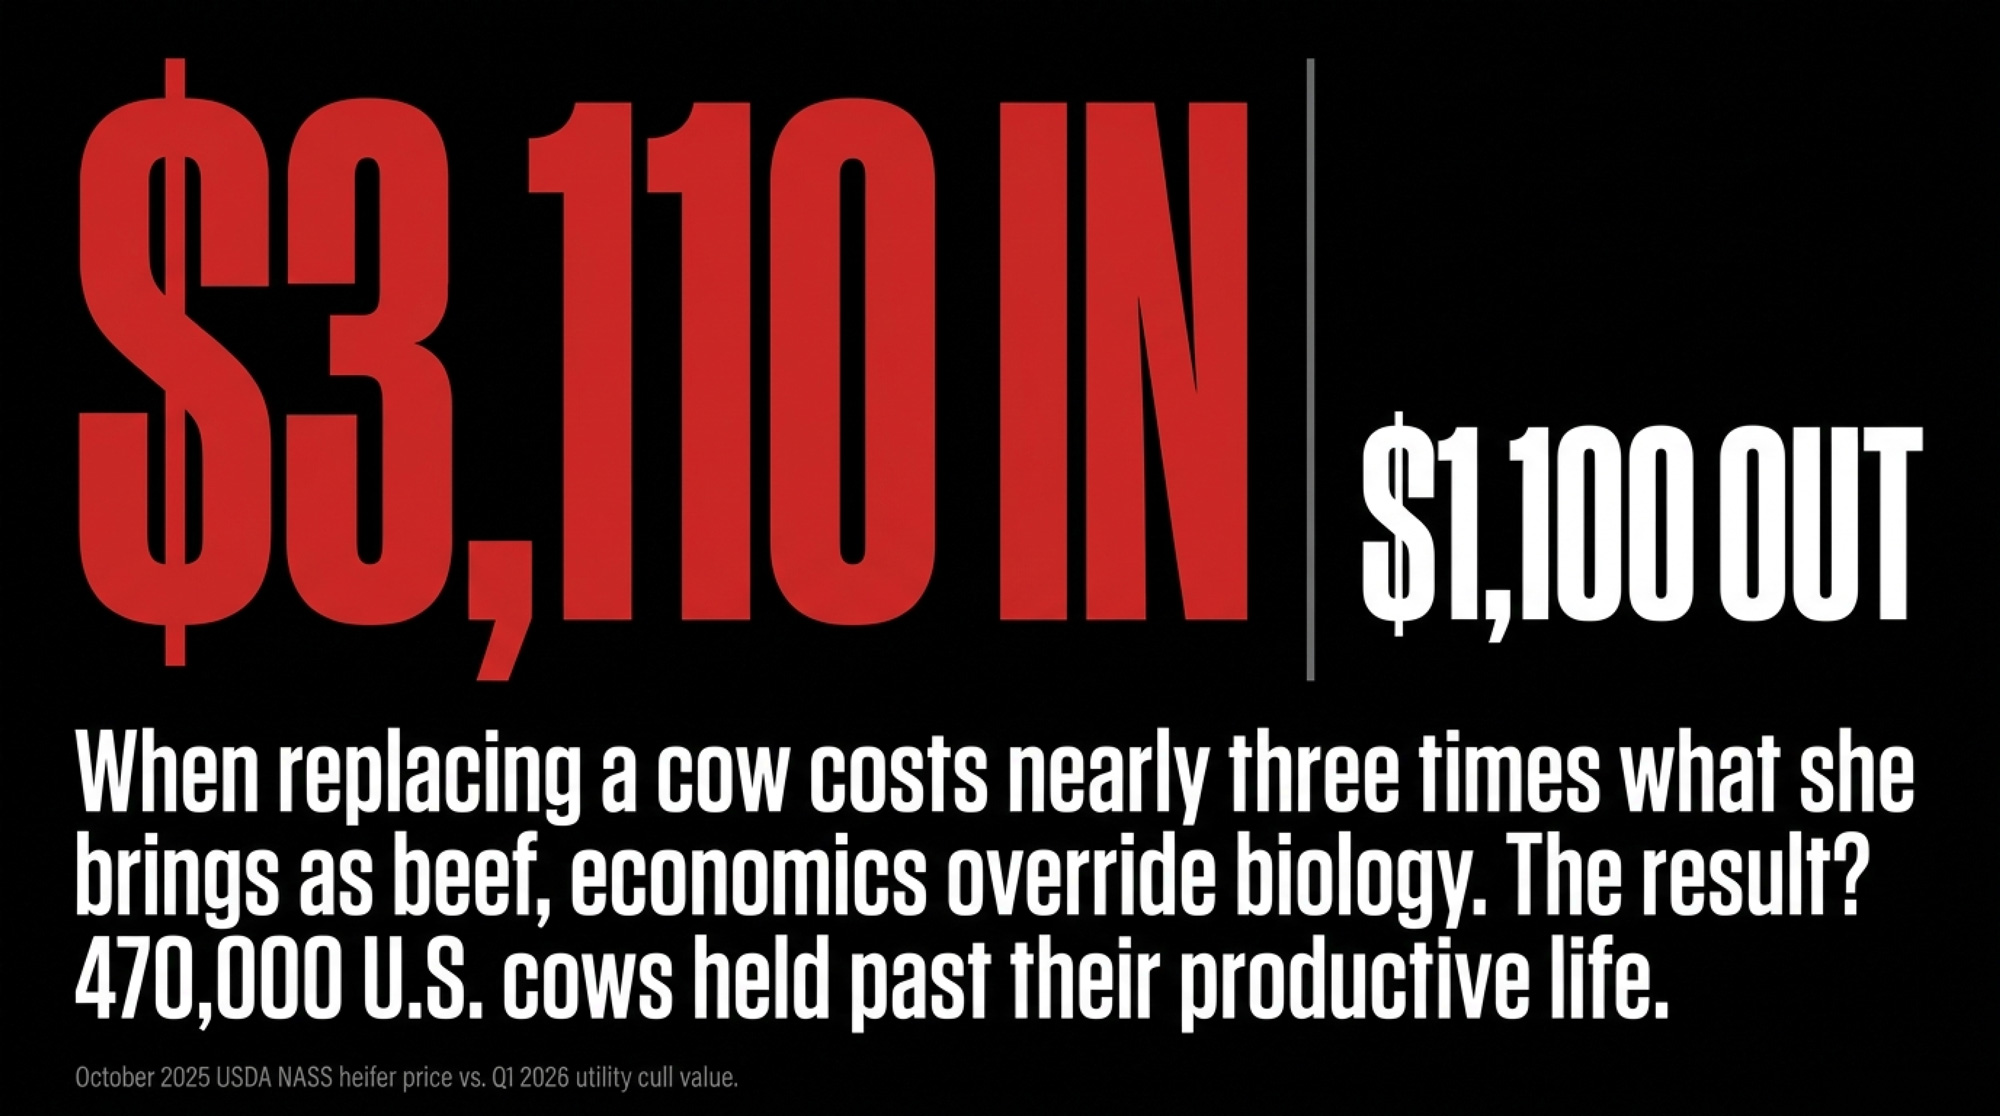
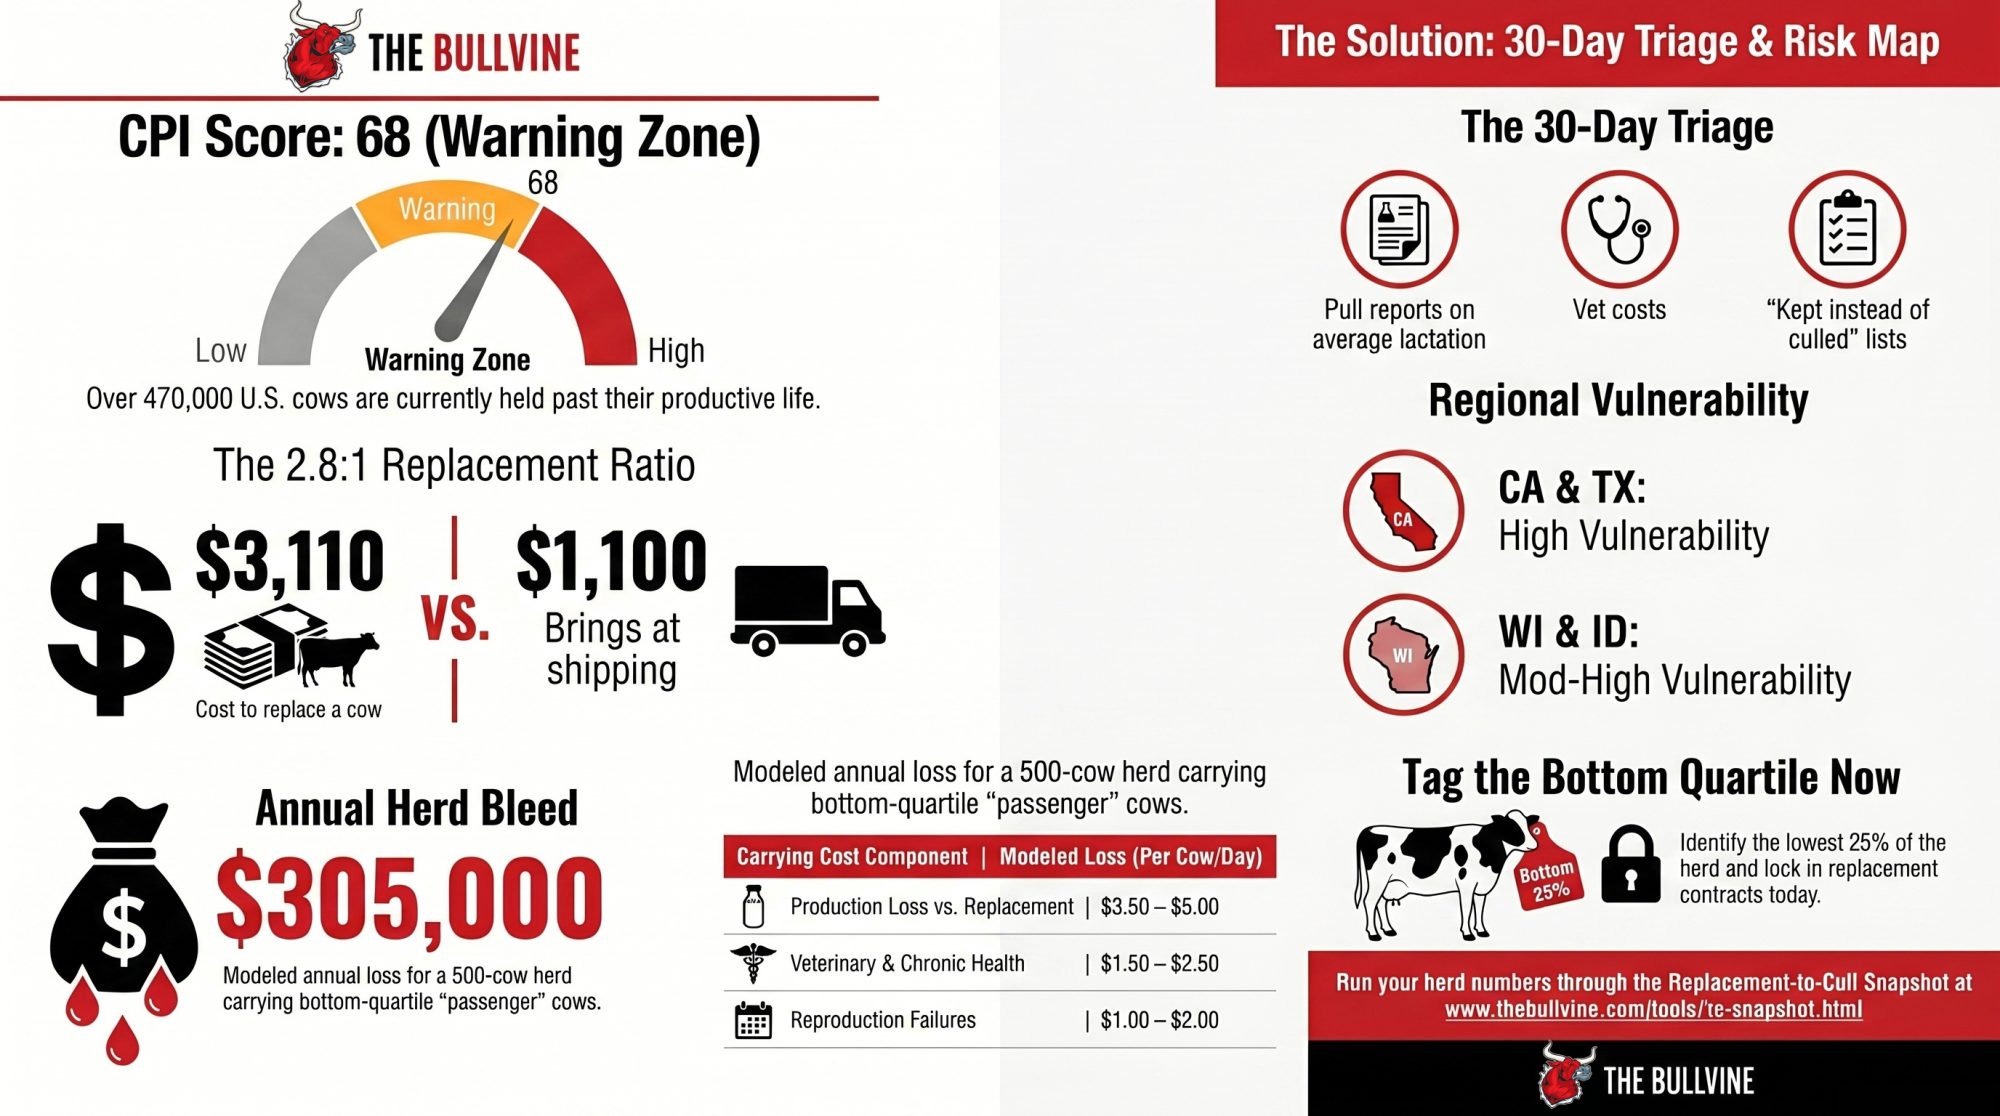
$3,110 to replace her. $1,100 to ship her. That ratio is why ~470,000 U.S. cows are still in stalls they’d have left in 2019 — and why The Bullvine’s CPI just flipped to 68. Warning Zone.

Picture a 500‑cow Wisconsin‑style herd sitting across from its lender this spring. Margin over feed dairy 2026 math says $255,000–$305,000 a year is walking out of that barn in the Bullvine model — a $205,500 milk‑over‑cost gap plus $50,000–$100,000 in bottom‑quartile carrying cost. Every culling decision runs into the same wall: the October 2025 USDA NASS Agricultural Prices release (the most recent heifer series) recorded replacement dairy heifers at a record $3,110/head.
The scene above is a composite drawn from Bullvine modeling on a representative Wisconsin 200–700 cow family operation. Milk price and cost‑of‑production inputs are national ranges applied to a Federal Order 30 (Upper Midwest) representative herd; your Order and cost structure will shift the output. Numbers throughout this piece are USDA and industry sourced; the operator is illustrative.

The cull check on the other side? Roughly $1,100/head for dairy utility cows, with better cuts clearing $1,400–$1,600in hot beef markets (USDA AMS National Weekly Cull Cow & Bull Summary, Q1 2026 range — see methodology appendix for the specific weekly reports used). That puts the replacement‑to‑cull ratio between 1.9:1 and 2.83:1.

Market CaseCow/Heifer ValueReplacement-to-Cull RatioEditorial Read
Dairy utility cull$1,100/head2.83:1Maximum pressure to defer culling
Strong beef-market cull$1,400/head2.22:1Still expensive to replace
Hot beef-market cull$1,600/head1.94:1Better exit value, but not enough relief
Replacement dairy heifer$3,110/headBaselineThe price wall driving the trap

When replacing a cow costs nearly three times what she brings as beef, the economics override the biology. That’s how you get to The Bullvine’s modeled estimate of roughly 470,000 U.S. cows held past their productive life — the first piece of the trap.

“The most expensive cow in your barn isn’t the high‑index yearling you just bought. It’s the lame third‑lactation cow you can’t afford to cull.”

The Most Expensive Cow In Your Barn Isn’t The Heifer

The most expensive cow in your barn isn’t the high‑index yearling you just bought.

It’s the lame third‑lactation cow you can’t afford to cull.

She’s giving somewhere around 60 lb/day. Vet bills stack. Repro has stalled. Every instinct says ship her — until you look at the heifer market and flinch.

That flinch, repeated across the country for 18 months, is the structural story of 2026 U.S. dairy.

The Retention Trap Your P&L Won’t Show You

On paper, the U.S. herd looks strong. USDA NASS reports February 2026 milk cow inventory at 9.62 million head, up 211,000 year‑over‑year — the largest U.S. monthly inventory since 1994 per the NASS historical milk cow series (specific comparison month cited in methodology appendix). Total 2025 milk output ran roughly 232 billion lb, up about 2.6% over 2024.

Everyone assumed that meant expansion. It doesn’t. It’s hoarding — and the slaughter data says so in plain English.

Since September 2023, U.S. producers have culled an estimated 611,600 fewer dairy cows than the five‑year rolling pace, per USDA AMS weekly Federally Inspected slaughter data (Sept 2018–Aug 2023 baseline, roughly 3.0M head/yr; full baseline table in the methodology appendix). 2025 dairy cow FI slaughter totaled around 2.53 million head the lowest U.S. annual FI total since 2011 based on AMS federally inspected series.

Co‑op briefings track the heifer shortage daily. Almost nobody is tracking what’s piled up on the other side of the barn.

The Shadow Loss Your P&L Won’t Flag

Your P&L is lying by omission. It tracks what you spent on feed, but it ignores the 10 lbs of milk you didn’t ship because a lame cow is occupying a prime stall. That’s the Shadow Loss — and it’s the most dangerous number in your barn.

The Bullvine‑modeled $50,000–$100,000/year bottom‑quartile drag on a 500‑cow herd isn’t a P&L line. It’s a shadow loss. Modeled range; actual values vary by herd, region, and breeding program. The underlying carrying‑cost methodology draws on USDA price data, typical herd records, and extension‑style budgets, triangulated against the Cornell Dairy Profit Monitor framework, Miner Institute reproductive economics, and Penn State Extension dairy decision tools.

Want your own number fast? The Bullvine Replacement‑to‑Cull Snapshot at thebullvine.com/tools/rc-snapshot.html takes your herd size, current heifer price, local cull value, and deferred‑cow count and spits out a herd‑specific pressure read with a prioritized bottom‑quartile action list. Same math as the published CPI. Your inputs.

How Deferred Culling Bleeds A 500‑Cow Wisconsin Herd

The Bullvine CPI workup models the bottom 20–25% of a typical herd carrying roughly – per cow per day in drag once production loss, vet cost, reproduction failures, and stall opportunity cost are stacked. These are Bullvine‑modeled ranges built on extension‑style budgets, not cited external point values; the full derivation sits in the carrying‑cost worksheet.

Carrying‑Cost Component (Bottom Quartile)Modeled $/Cow/DayWhy It Matters
Production loss vs a younger replacement.50–.00Aging cows commonly trail herd average at –/cwt milk, per CDCB lactation‑curve data and extension references cited in the worksheet.
Veterinary costs (lameness, mastitis, metabolic).50–.50Chronic issues compound with lactation number.
Reproduction failures (extra days open, repeats).00–.00Each extra open day past mid‑lactation costs real margin.
Stall opportunity cost.00–.50Every bottom‑quartile cow blocks a springing heifer.
Total modeled carrying cost.00–.00The barn math on the “cheap” cow you kept.

Running the Numbers: 500‑Cow Wisconsin‑Style Herd

Inputs: 500 cows | 75 lb/cow/day | –/cwt milk (national range) | –/cwt all‑in cost of production (national range) | Federal Order 30 representative; your Order and cost structure will shift the output | Modeling base: Bullvine CPI using USDA ERS Cost of Milk Production framing.

Step 1 — Daily and annual production 500 × 75 = 37,500 lb/day = 375 cwt/day 375 × 365 ≈ 136,875 cwt/year

Step 2 — Margin gap (if COP runs ~$1.50/cwt above milk price)

Note: this margin gap partially overlaps with the component‑premium gap discussed in “The $11 Billion Sorting Machine” below. Don’t stack them.

136,875 × $1.50 ≈ $205,500/year negative margin

Step 3 — Bottom‑quartile drag 100 cows × $8–$12/day × 365 ≈ $292,000–$438,000 gross

Net of replacement‑cost offset: the “drag” is the incremental loss from keeping the old cow versus a replacement in the same stall — it nets out the replacement cow’s own production contribution, her own vet/feed load, and ordinary depreciation. The Bullvine model assumes ~75% of the gross carrying cost offsets against that counterfactual, leaving ≈$50,000–$100,000/year net drag. Full derivation in the carrying‑cost worksheet.

Step 4 — Total modeled bleed

Loss LayerLow CaseHigh CaseWhat It Means
Annual production136,875 cwt136,875 cwt500 cows × 75 lb/day
Milk-over-cost gap$205,500/year$205,500/yearNegative margin at $1.50/cwt gap
Net bottom-quartile drag$50,000/year$100,000/yearDeferred cows occupying better stalls
Total modeled bleed$255,500/year$305,500/yearThe lender-facing number
Per cow equivalent$511/cow/year$611/cow/yearPain spread across the whole herd

Modeled for an illustrative 500‑cow Wisconsin operation on national milk and COP ranges. Your number will differ. Plug your own cow count, pounds, COP, and bottom‑bucket count into the Replacement‑to‑Cull Snapshot at thebullvine.com/tools/rc-snapshot.html for a herd‑specific output.

That’s the formula your lender is already running. Write it on your own whiteboard.

More from The Bullvine — Tier 3 economics: Why Your 2026 Budget Is Lying to You: USDA $18.95 Milk vs. $19.14 Costs.

Why Did The Bullvine Build A New Index For This?

The CPI exists because no one else was tracking the inverse of the heifer shortage. Every co‑op briefing reports how few heifers are coming. None publish how many cows are still in the barn that should have already left.

To The Bullvine’s knowledge, the CPI is the first published composite index scoring deferred culling and the replacement shortage together as a single trackable number. USDA doesn’t publish it. Land‑grant extensions don’t. The gap was real. The math could be done. Here’s how.

How The CPI Reads The Herd

Four components composite into a 0–100 score, updated monthly. Inputs and weights are public.
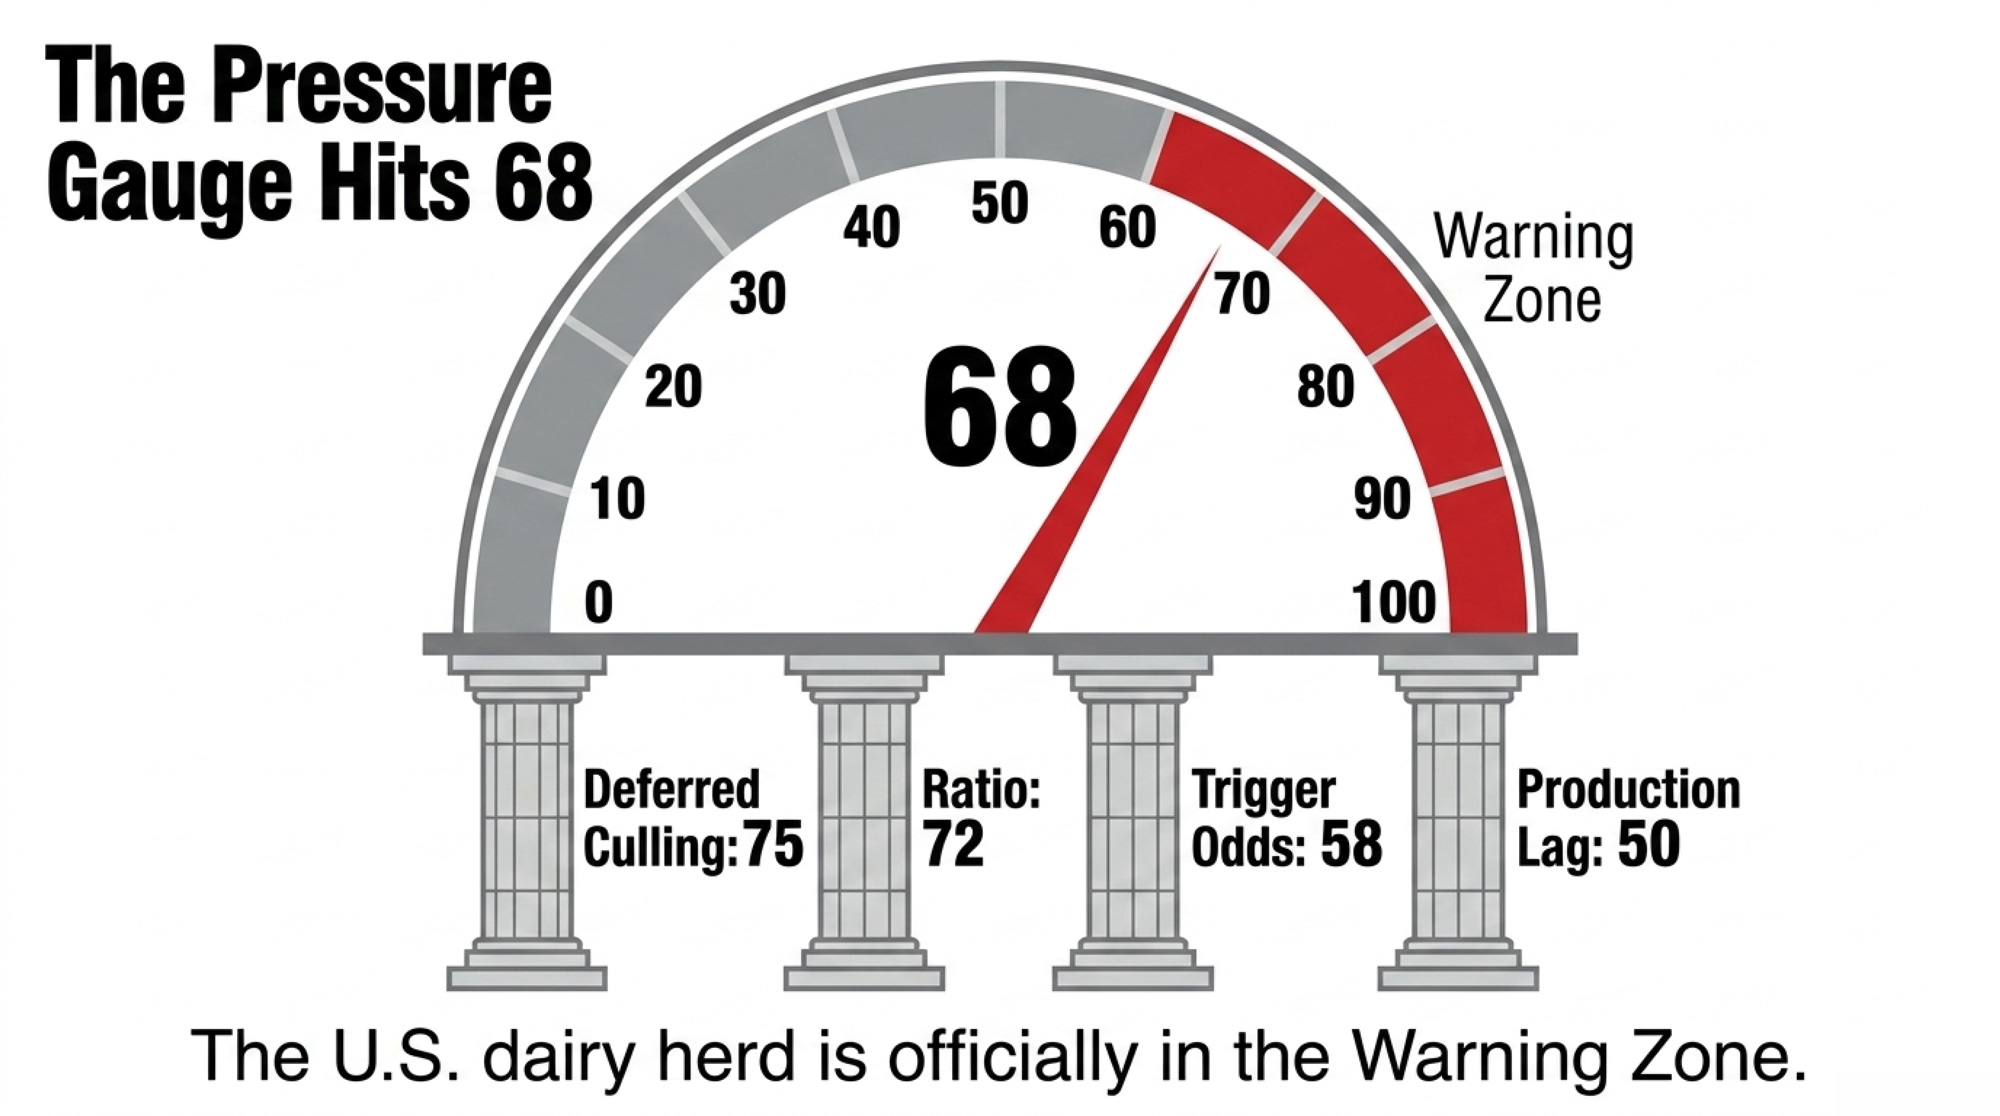
ComponentWhat It MeasuresCurrent ValueSub‑ScoreWeight
Deferred CullingCows retained past productive life~470,000 head7530%
Replacement‑to‑Cull RatioEconomic incentive to defer2.83:17225%
Production LagGenetic potential vs actual yield~144 lb implied vs 200–220 lb trend5020%
Trigger OddsProbability of a correction catalystBorderline high5825%
Composite CPIApril 202668

The Volatility Premium: Why The Reading Is 68, Not 65

The straight weighted composite lands at 65.0 (75×0.30 + 72×0.25 + 50×0.20 + 58×0.25 = 22.5 + 18 + 10 + 14.5). The published reading of 68 carries a three‑point Volatility Premium on top of the raw math.
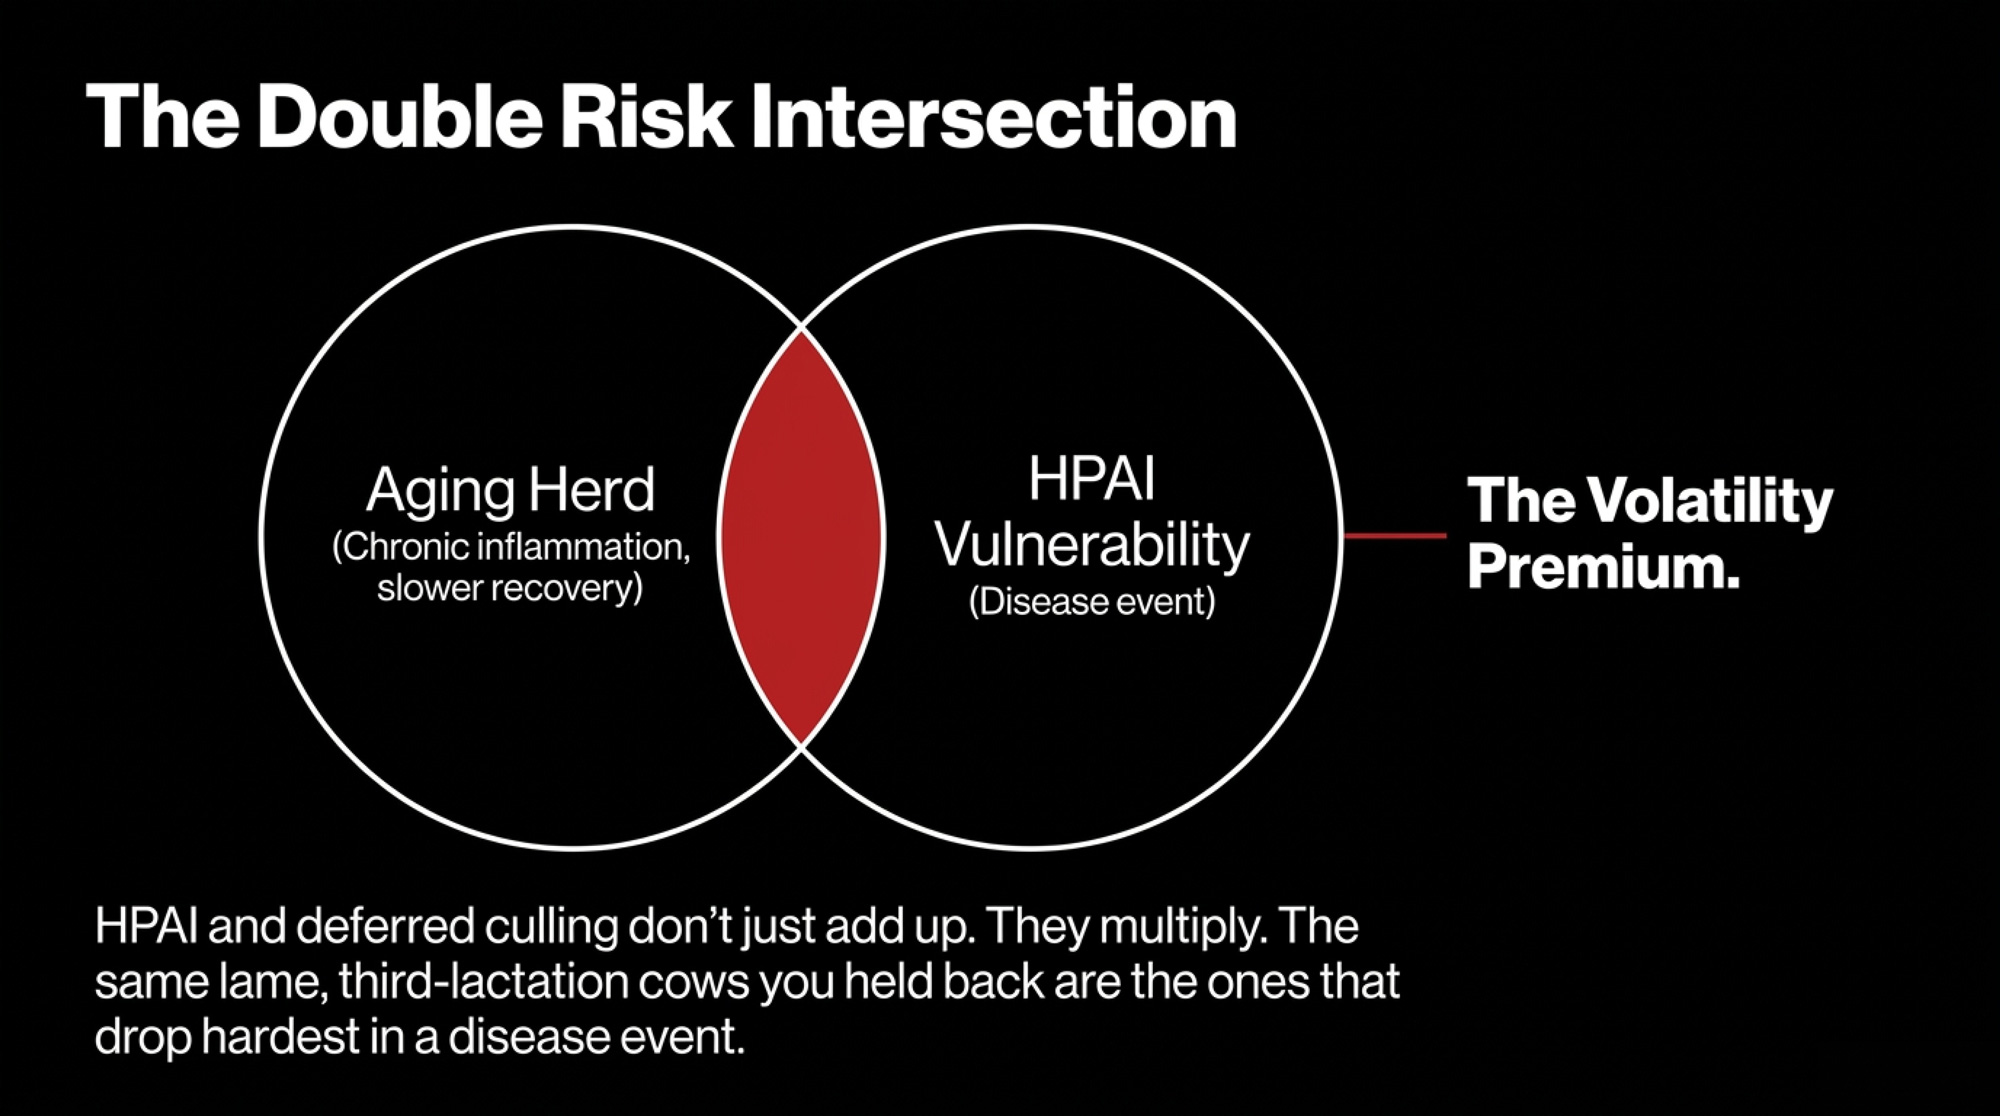
Here’s why. The four sub‑scores weight correction risks as if they add linearly. They don’t. HPAI exposure doesn’t just stack on top of deferred culling — it multiplies the weight of it, because the same aging cows are the animals most likely to drop hard in a disease event. Class III sub‑$16 for multiple prints doesn’t just add pressure — it compounds against a heifer market above $3,000, because producers facing both can’t cull or replace their way out.

The Volatility Premium quantifies that convergence risk in a single digit. Future monthly releases publish both the raw weighted composite and the premium‑adjusted reading side by side, so you can see when trigger‑convergence is doing the work and when it isn’t.

Deferred Culling — 30% weight

USDA AMS weekly FI slaughter since September 2023 runs ~611,600 head below the five‑year rolling baseline (Sept 2018–Aug 2023, roughly 3.0M head/yr; baseline table in the methodology appendix). Net of eventual exits and natural attrition, The Bullvine’s central estimate is ~470,000 head retained past productive life — plausible range 350,000–550,000 depending on assumed mortality and voluntary exit rates.

Even at 350,000, this component still scores in the 70+ band. The Warning Zone read doesn’t depend on the headline number being exact.

Replacement‑to‑Cull Ratio — 25% weight

$3,110 October 2025 USDA heifers against a $1,100 dairy utility cull gives a headline 2.83:1. On a stronger cull (~$1,600 in hot beef markets), the ratio drops toward 1.9:1. Either read, the economics tell producers to wait.

Production Per Cow — 20% weight

USDA NASS puts 2025 per‑cow production at 24,390 lb, up 218 lb over 2024 — essentially on pace with the 200–220 lb/yr genetic trend implied by CDCB data. February 2026 per‑cow production came in at 1,899 lb, just 12 lb above February 2025. If that February pace held for all 12 months, the implied annual gain would run near 144 lb — short of genetic potential.

That’s a conditional read, not a measured 12‑month result. But it’s where the Warning Zone signal lives.

Trigger Probability — 25% weight

  • Class III: $14.59 Jan 2026$14.94 Feb 2026$16.16 Mar 2026 (USDA AMS class prices).
  • April 2026 WASDE projects 2026 average Class III at $16.90/cwt.
  • Corn ending stocks ~2.127B bu, 14.6% stocks‑to‑use, season‑average $4.15/bu (April 2026 WASDE‑670).
  • IDFA capacity tracker tallies $11B+ in new or expanded U.S. dairy processing capacity through 2028, across 50+ projects in 19 states (October 2025 release).

One more sub‑$16 Class III print and this leg alone pushes CPI deeper into Warning — before the Volatility Premium even recalculates.

What The CPI Doesn’t Tell You

The CPI is a national composite. It reads industry‑wide pressure — not your barn.

  • Regional variance. California and New York face different correction probabilities at the same national score.
  • Herd‑size variance. Large‑herd financial dynamics differ from family operations.
  • Genetic merit. Strong and weak breeding programs feel the same national CPI differently.
  • Beef‑on‑dairy mix. Herds heavy on beef‑cross calf revenue face different replacement math.
  • Trade shock. Export collapse shows up only through sustained Class III pressure inside Component 4.

Regional and herd‑size CPIs are in development as Phase 2. For a herd‑specific read today, run your numbers through the Replacement‑to‑Cull Snapshot at thebullvine.com/tools/rc-snapshot.html.

What Does CPI 68 + $3,000 Heifers Mean For Your Herd?

The Bullvine built this Decision Matrix so this doesn’t stay theoretical.

CPI ScoreHeifers >$3,000Heifers $2,000–$3,000Heifers <$2,000
30–50 (Stable–Building)Normal cull pace; map 2027 replacement pipeline.Normal cull pace; opportunistic purchases.Cull freely; replace aggressively.
50–70 (Building–Warning)Identify lowest‑quartile cows; lock replacement contracts.Accelerate culling of obvious passengers.Cull hard and refresh herd age.
70–80 (High Warning)Cull lowest quartile only as fast as replacements allow.Cull aggressively; secure replacements now.Maximize herd turnover.
80+ (Correction Imminent)Cull aggressively only if replacements secured.Cull now; expect heifer prices to react.Full herd refresh, if balance sheet allows.

At CPI 68 with >$3,000 heifers, the U.S. sits in the 50–70 × >$3,000 cell. Translation: tag your bottom quartile and pre‑position replacement access now — not after the correction starts.

Companion analysis — Tier 3 economics: The $3,000 Heifer Hangover: How Beef‑on‑Dairy Emptied Your Pipeline.

Why HPAI Makes Deferred Cows A Double Risk

Older, deferred cows aren’t only an economic problem. They’re also the animals most at risk in a disease event.

Immune function declines with age. Third‑, fourth‑, and fifth‑lactation cows carry more cumulative stress, more chronic inflammation, and slower recovery than first‑ and second‑lactation cows. They’re more likely to carry subclinical mastitis, lameness, or metabolic issues that blunt immune response — a pattern consistent with published veterinary literature on age‑linked immune competence in lactating cattle in the Journal of Dairy Science and Veterinary Clinics of North America: Food Animal Practice.

In an HPAI event, those are the cows that drop hard in milk, recover slowly, and are most likely to be culled post‑outbreak. A herd that has been deferring culls for 18 months is, by definition, stacked with those animals. CPI 68 plus an HPAI event isn’t risk on top of risk. It’s the same risk hitting the same cows twice. That’s what the Volatility Premium is pricing.

The $11 Billion Sorting Machine

Processors are pouring concrete for plants the deferred herd can’t fully service. IDFA tracks $11B+ in new and expanded U.S. dairy processing capacity through 2028 — 50+ projects in 19 states, heavy on cheese, whey, and high‑protein ingredients. Those plants are built for high‑component, low‑SCC milk running 12 months a year.

What does $11 billion in new concrete actually need? Components. SCC that doesn’t kill shelf life. Supply they can count on.
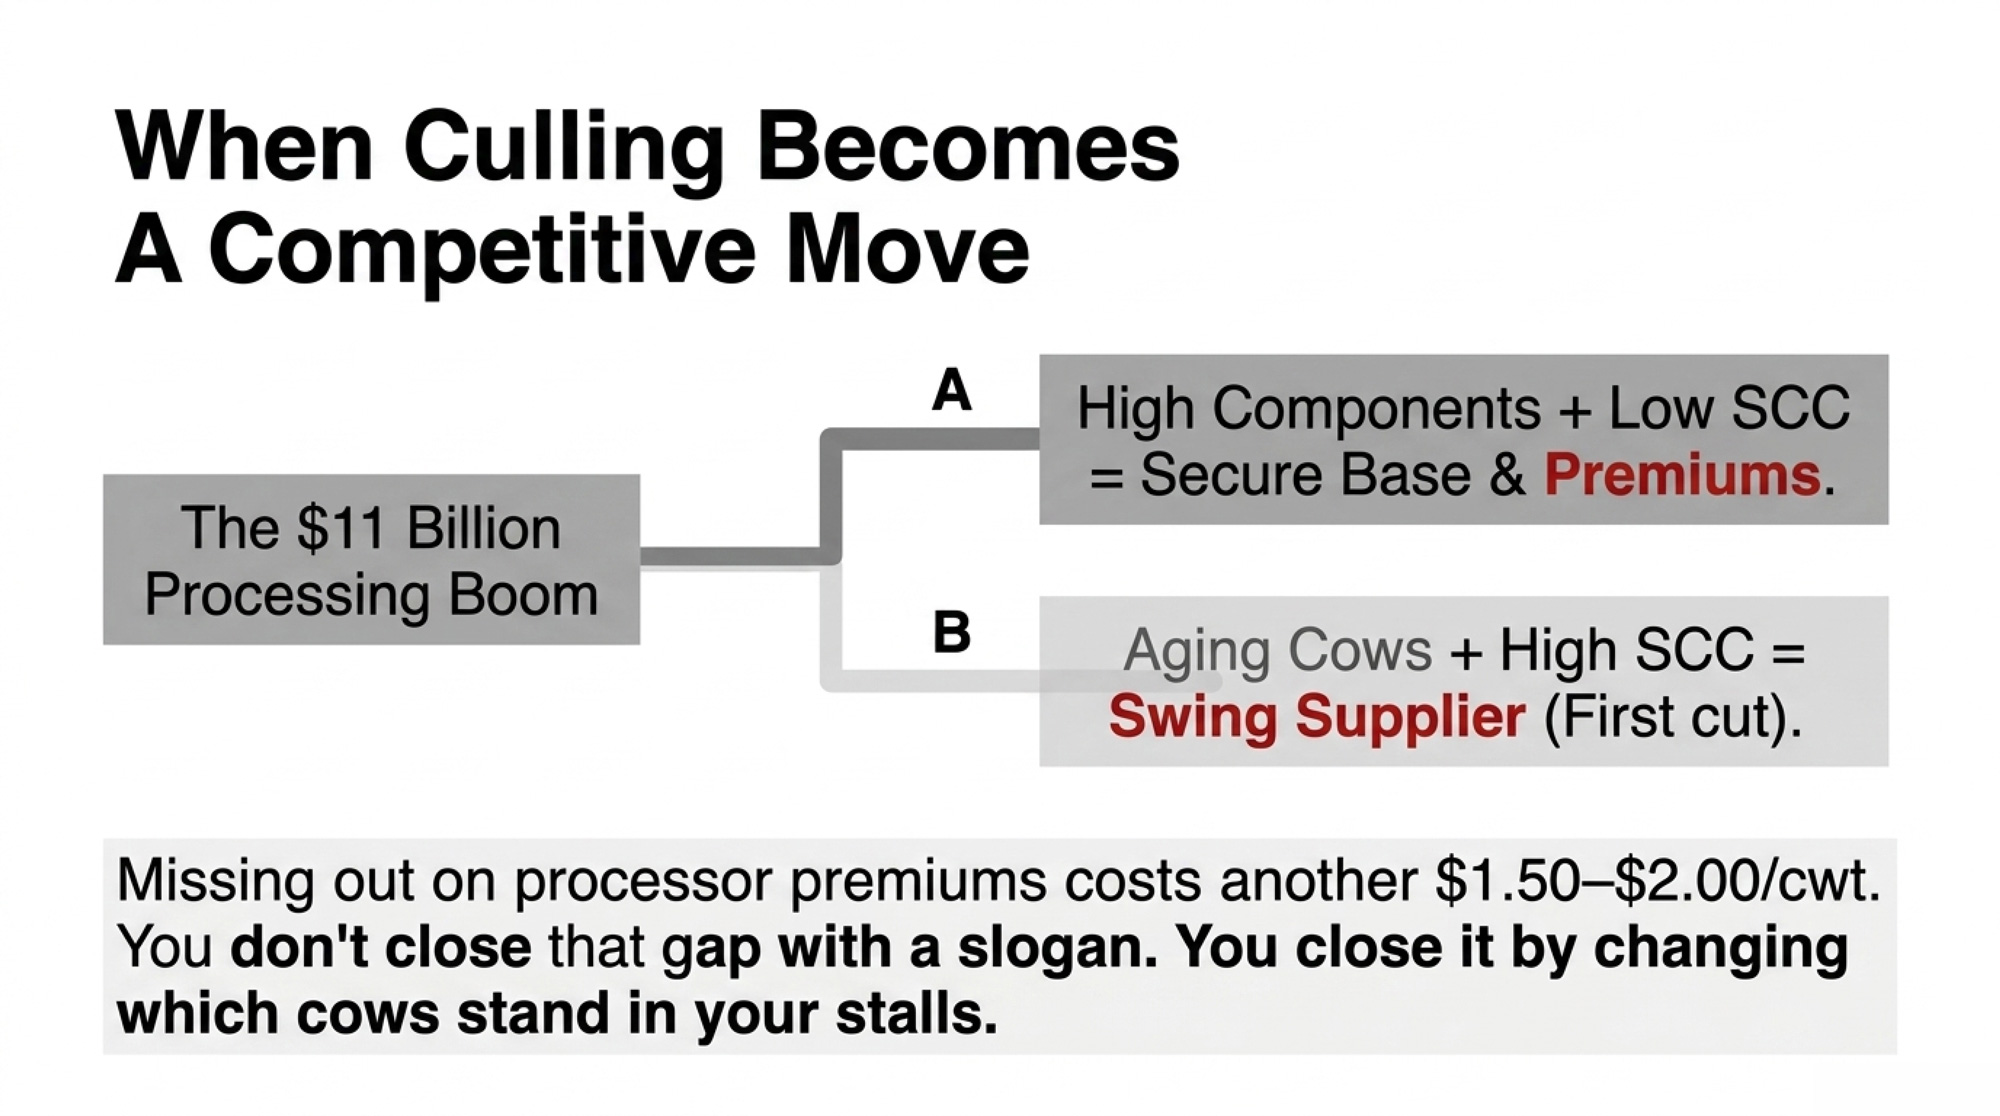
Two farm‑level outcomes:

  • High‑component, low‑SCC herds get base volume and more secure deals.
  • Average‑component, higher‑SCC herds drift into “swing supplier” territory — first cut when plants are long, last in line for premiums.

This component/quality gap partially overlaps with Step 2 in the barn‑math box above. Don’t stack them.

Missing $1.50–$2.00/cwt in component and quality premiums on 136,875 cwt is $205,000–$274,000/year in Bullvine modeling. Same order of magnitude as the deferred‑culling bleed. You don’t close that gap with a slogan. You close it by changing which cows stand in your stalls.

Continue the series — Tier 3 analysis: The $11 Billion Dairy Rush: Your 18‑Month Window to Lock in Processor Premiums.

The 438,844 Missing Heifers

The culling mess exists because of the heifer mess.

CoBank’s Dairy Heifer Inventories to Shrink Further Before Rebounding in 2027 (August 2025), read alongside USDA Cattle inventory data, implies approximately 355,000 fewer dairy replacements in 2025 than 2024, and another ~440,000 fewer in 2026 than 2025 (specific CoBank table referenced in the methodology appendix). Dairy heifers over 500 lb now sit just under 4 million head, a 20‑year low per USDA Cattle Jan 2026.

The deficit traces to the 2023–24 beef‑on‑dairy wave — sexed semen on the top, beef semen on the rest, beef‑cross calves clearing $400–$800/head above Holstein bull calves per Livestock Marketing Information Center weekly summaries and trade‑press auction reporting across 2023–24. Calf checks cashed. Replacement gap now.

CoBank’s outlook is blunt: inventories shrink through 2026 and only start rebounding in 2027. Until then, a structural heifer deficit runs underneath everything. That’s why The Bullvine runs the CPI and the Pipeline Tracker™ as a pair — one asks how many cows should have already left, the other asks how many heifers are actually coming 24 months out.

When 470,000 Cows Finally Move

Deferred culling doesn’t unwind politely. When some producers ship, more follow. The Bullvine’s scenario modeling, anchored to USDA slaughter and production data, sketches four plausible paths.

ScenarioTriggerCows ExitingTimelineMilk ImpactModeled Class III Effect
Slow ReleaseNo major trigger~150,000~12 months~ –1–2%+$0.50–$1.00/cwt
ModerateClass III <$16 for 3+ months~300,0006–9 months~ –3%+$1.50–$2.50/cwt
Full CorrectionMultiple financial triggers converge~470,000~90 days~ –5%+$2.00–$3.00/cwt
Extreme (tail risk)Financial triggers + disease event≥600,000<3 months~ –6% or more+$3.00–$5.00/cwt

These are modeled illustrative scenarios, not forecasts. The Extreme row is tail risk — a correction lining up with an HPAI event — and it’s the shape lender stress tests commonly include.

Drop Full Correction onto a 1,000‑cow, 75 lb/cow/day herd: 1,000 × 75 ÷ 100 × 365 = 273,750 cwt/year × $2.50/cwt = $684,375/year extra gross milk revenue if the rally lands in your tank.

Whether you keep that –/cwt depends on whether your cow mix and components qualify for the premium tier when the move hits. That’s the barn math on the upside.

Where Does The Pain Hit First?

Not evenly. Vulnerability scoring below reflects structural variables — herd size, replacement sourcing, cost structure — and is not an assessment of any individual operation or lender book.

StateFeb 2026 Herd (000 head)YoY ChangeVulnerabilityKey Risk
California1,712+3HIGHLargest herd; high costs; culled hard and early in the 2018–19 exit wave.
Texas718+34HIGHExpansion built on purchased replacements.
Wisconsin1,290+25MODERATE–HIGH200–700 cow backbone squeezed on costs.
Idaho724+24MODERATE–HIGHGrowth state; replacement‑dependent.
New York653+21MODERATEAging infrastructure; cash‑flow‑driven deferral.

Data source: USDA NASS Milk Production, February 2026.

California carries 1.712M cows and added just 3,000 head YoY. High replacement costs, water, and regulation load every culling decision. When margins compressed in 2018–19, California culled hard and early — a likely early indicator pattern worth watching in the national herd this cycle.

Texas grew by 34,000 cows to 718,000 — the biggest state gain, leaning most heavily on purchased replacements. A correction mid‑ramp means depreciating cows paid for at the top.

Wisconsin added 25,000 cows to 1.29M, but the backbone is still 200–700 cow herds. Those operators don’t carry the contract leverage of mega‑herds and are most likely holding marginal cows because no replacement path pencils without torching cash flow.

Idaho grew by 24,000 cows to 724,000 — replacement‑intensive throughput. Correction mid‑expansion is a double squeeze.

New York added 21,000 cows to 653,000, behind a cluster of announced regional processing projects tracked by The Bullvine against IDFA and New York State Ag & Markets filings. Specific project‑dollar totals are posted on the CPI methodology subpage. Deferred culling there is often cash‑flow‑driven.

Lender screening rule: fastest growth + highest reliance on purchased replacements = most exposed when the CPI climbs.

Breeding Your Way Out Of The Next Trap

If CPI 68 says clear your bottom 25%, the next question is who stands in those stalls next.

Paying $3,110 for a replacement only pencils if she stays out of the bottom quartile long enough to earn back. Extension cost work implies roughly a three‑lactation payback window at today’s heifer prices and milk values, while average U.S. productive life continues to run well short of that window in CDCB genetic trend reporting.

More herds are quietly shifting sire lists away from one more notch of yield and toward Productive Life, Daughter Pregnancy Rate, and health traits. In a $3,000‑heifer world, you’re better off with cows you still like in third lactation than cows you’re debating at second.

Companion genetics read — Tier 2: Sire Selection for Longevity in a High‑Heifer‑Cost Cycle.

The 30‑Day “pull three reports” step below pairs with this hidden‑gem analytics piece: Reading Your DHIA Report Like a Lender.

The 30/90/365‑Day Playbook for 200–700 Cow Deferred Herds

30‑Day Actions: Triage

Pull three reports from your herd software. Average lactation, vet cost per cow YoY, and a “kept instead of culled” list (cows you held in 2024–25 that would have shipped in 2019–20). Feed those numbers into the Replacement‑to‑Cull Snapshot the same afternoon. Requires: DHI and repro records, 20 minutes. Trigger: Average lactation >2.8 and vet cost/cow up YoY = you’re in the deferred cohort. Backfires when: You cull off software rank alone without checking repro status; some bottom‑rank cows are fresh and will climb.

Build your bottom‑quartile list. Rank by production, SCC, lameness, and days open. Tag each cow “ship within 6 months” or “re‑test at 6 months.” Requires: DHIA records and DC305/PCDart. Trigger: If your DSCR has been under 1.2 for three consecutive months on your lender’s reporting standard, treat the top third as urgent. DSCR covenant language varies — confirm with your loan officer. Backfires when: You empty stalls you can’t refill. Pair with the 90‑day replacement step below.

90‑Day Actions: Structural

Ship 25–35 cows from the bottom‑quartile list (8–12/month). Start with obvious passengers. Recheck vet cost/cow, bulk tank SCC, and daily shipped milk at Month 3. Requires: Replacement access or accepted lower cow count; freight and packer capacity. Trigger: If none of those three indicators improve, the hole is deeper than culling alone can fix. Backfires when: You ship without securing replacements and permanently shrink your base — fine if that’s the plan, a problem if it isn’t.

Lock replacement access. Heifer‑raising contracts, forward purchase agreements, or more sexed semen on your top 35–40%. Requires: 6–9 months for sexed semen to move through the pipeline; legal review on any forward contract. Trigger: Heifer prices break above $3,200 nationally, or your local replacement market tightens — pull this forward. Backfires when: Forward contracts signed at the top lock in peak prices. Build optionality where you can.

Tighten sire criteria on PL, DPR, and health. Requires: Genomic testing infrastructure and a breeding advisor aligned on PL/DPR weighting. Trigger: Average lactation trending up while production lags genetic trend = aging structurally, not just cyclically.

365‑Day Moves: Strategic

Clear 80–100 of the original bottom‑quartile cows; re‑run the diagnostic. Requires: Committed 12‑month cull and replacement schedule; lender in the loop. Trigger: Modeled annualized losses narrow by $50,000+ and cash‑flow draw slows — keep restructuring. Opportunity signal: If your components and SCC move you up a processor premium tier while Class III rallies into the Moderate or Full Correction band, you capture margin expansion your aging‑cow peers won’t. Backfires when: You keep a cow just to “earn back” the $1,000 you already spent on her vet bills. That vet check is gone. The only question left is what she produces tomorrow forward versus what a replacement produces in the same stall. Sunk cost is not a strategy.

Decide honestly at Month 12. Narrow the losses and rebuild, or plan a managed exit while cattle and heifer values still give you an equity‑preserving off‑ramp. Requires: Real data, not optimism. Accountant and lender at the table. Trigger:Equity ratio drifting below your lender’s covenant floor + two consecutive years of sub‑1.2 DSCR = managed‑exit conversation, not “one more year.” Backfires when: You wait for “one more good year” while deferred peers finally ship. That’s when heifer prices correct against you and cull prices soften.

Lender/advisor move: map CPI against your regional herd mix. Fastest‑growth, purchased‑replacement states (TX, ID) sit in a different risk band than flat regions. Portfolio exposure isn’t uniform.

The Turn: When Culling Becomes A Competitive Move

Run that same 500‑cow Wisconsin‑style herd forward 12 months in the model.

Average lactation is down. Vet cost per cow is flattening. Components trend toward the processor’s premium tier. The $205,500 margin gap hasn’t disappeared — but the $50,000–$100,000 bottom‑quartile drag has mostly retired.

A deferred‑herd peer down the road is still waiting. When the correction hits, everyone ships the same month. That’s when the lender’s “Can we afford to cull?” question flips to the only one that matters: Can we afford not to?

The CPI is a pressure gauge, not a guilt trip. Some cows are worth holding — young age structure, flat vet cost, production matching genetic expectations. If those conditions don’t describe your barn, the math isn’t ambiguous. Just uncomfortable.

What This Means For Your Operation

  • Pull those three reports in the next 30 days and set them beside your last three milk checks. If you won’t, you’re not managing this risk — you’re hoping it doesn’t land on you.
  • Run your numbers through the Replacement‑to‑Cull Snapshot today. Three minutes of inputs, a herd‑specific pressure score, a prioritized bottom‑quartile list, and a 30/90/365 plan calibrated to your barn.
  • Three or more “yes” answers on the CPI diagnostic puts your behavior inside the 470,000‑cow deferred bucket. Fix it with a 12‑month plan, not one cull load.
  • Watch Class III and your local heifer market together. Three straight sub‑$16 prints + heifer softening = shift from “prepare” to “act.”
  • Plan culls, replacements, and sire selection on one whiteboard. A CPI‑driven cull plan that isn’t tied to replacement access and sire strategy just sets up the next deferred trap.
  • Lenders and co‑ops: TX and ID expansion herds sit in a different risk tier than flat Northeast regions. Map your portfolio accordingly.
I grew up on a dairy farm where we knew every cow by name. We also knew when it was time to let one go.

That instinct hasn’t changed. But at $3,110 a replacement, the economics have overridden the instinct for hundreds of thousands of U.S. producers. The CPI is how we get the instinct back into the data.

— Andrew Hunt, Founder, The Bullvine
Run Your Herd Through The Replacement‑to‑Cull Snapshot

The Bullvine Replacement‑to‑Cull Snapshot

Your herd. Your numbers. Your pressure score.

Enter your cow count, current heifer price, local cull value, average lactation, vet cost per cow, and deferred cull count in the form below. The tool returns:

  • A herd‑specific pressure score with sub‑component breakdown.
  • A prioritized bottom‑quartile action list.
  • A 30/90/365 plan calibrated to your inputs.
  • A shareable PDF output you can bring to your lender or co‑op advisor.

The Bullvine Replacement‑to‑Cull Snapshot

Your herd. Your numbers. Your pressure score.

Having trouble viewing the tool? Open the Replacement‑to‑Cull Snapshot in a new tab.

Tool is editorial. Inputs are anonymized unless you opt in to a consulting follow‑up. The pressure score uses the same component math and weights as the published CPI and is not influenced by consulting engagements — see methodology below.

Methodology Note: How The Culling Pressure Index™ Is Built

The Culling Pressure Index™ is a monthly composite that quantifies deferred culling pressure in the U.S. dairy herd and estimates correction probability.

Update cadence. Published monthly, on the second Tuesday after the USDA NASS Milk Production release. Next update: Tuesday, May 12, 2026.

Version. CPI v1.0, April 2026.

Data inputs by component.

  • Component 1 — Deferred Culling (30%). USDA AMS weekly FI Dairy Cow Slaughter vs a five‑year rolling baseline (Sept 2018–Aug 2023, ~3.0M head/yr). Full baseline table in appendix.
  • Component 2 — Replacement‑to‑Cull Ratio (25%). USDA NASS Agricultural Prices for replacement heifers; USDA AMS National Weekly Cull Cow & Bull Summary for cull values (specific weekly reports cited in appendix).
  • Component 3 — Production Lag (20%). USDA NASS Milk Production monthly data vs CDCB published genetic trends.
  • Component 4 — Trigger Probability (25%). CME Class III futures, USDA Agricultural Prices, USDA WASDE corn stocks‑to‑use, IDFA processing capacity announcements.

Weighting rationale. 30% deferred culling (lagging indicator of accumulated risk); 25% ratio (economic driver of deferral); 20% production lag (herd‑quality drag); 25% trigger probability (correction timing).

Composite reading. The straight weighted composite for April 2026 is 65.0. The published reading of 68 includes a three‑point Volatility Premium for trigger‑convergence signals (HPAI × deferred culling, sustained sub‑$16 Class III × $3,000+ heifers). Future releases publish the raw and premium‑adjusted readings side by side.

Governance. The CPI score is editorial and is not influenced by Bullvine consulting engagements. Methodology changes are disclosed in monthly updates and historical scores are restated side‑by‑side. The embedded Replacement‑to‑Cull Snapshot at thebullvine.com/tools/rc-snapshot.html uses the same component math and weights as the published CPI.

Known limitations. State‑level data lags national data by 30–60 days. CDCB genetic trend data is smoothed annually. The natural‑attrition assumption behind the 470,000 retained‑cow estimate carries a sensitivity range of 350,000–550,000 head.

Versioning. v1.0 → v1.1 → v2.0. Material methodology changes will be flagged in monthly updates. Historical scores will be restated and presented as “as‑published” and “restated” series.

FAQ

What is the CPI? A monthly composite index, published by The Bullvine, scoring deferred culling pressure in the U.S. dairy herd and estimating correction probability.

Where does the data come from? USDA AMS FI slaughter, USDA NASS Milk Production and Agricultural Prices, CDCB genetic trends, CME dairy futures, USDA WASDE corn stocks‑to‑use. All inputs public.

What is the Volatility Premium? A qualitative adjustment on top of the raw weighted composite that prices trigger‑convergence risk — specifically HPAI exposure multiplying (not just adding to) deferred‑culling risk, and sustained sub‑$16 Class III compounding against $3,000+ heifer prices.

How is the Replacement‑to‑Cull Snapshot different from the published CPI? The published CPI scores the national herd monthly. The Snapshot at thebullvine.com/tools/rc-snapshot.html applies the same component math to your herd’s inputs and returns a herd‑specific score and action list. Both use the same methodology.

How is CPI different from the Pipeline Tracker™? Pipeline Tracker projects replacement heifer supply 24 months out. CPI measures retained‑cow pressure today. Together they form the most complete U.S. dairy supply read published.

Can I cite it? Yes. Recommended format: “The Bullvine Culling Pressure Index™, [Month Year]”

Does The Bullvine sell anything based on it? Yes — disclosed plainly. The Bullvine offers herd‑specific consulting engagements applying the CPI framework. The published CPI score and the Snapshot tool output are editorial; neither is influenced by consulting engagements.

Challenge The Model

Substantive challenges to the methodology are welcome. Write to cpi-feedback@thebullvine.com. Every substantive critique gets reviewed. Material responses are published in monthly updates.

Learn More

The Sunday Read Dairy Professionals Don’t Skip.

Every week, thousands of producers, breeders, and industry insiders open Bullvine Weekly for genetics insights, market shifts, and profit strategies they won’t find anywhere else. One email. Five minutes. Smarter decisions all week.
NewsSubscribe
First
Last
Consent

The Panhandle Springer Tax: One 500-Cow Breeding Sheet and a $116,600 Liability for 2028

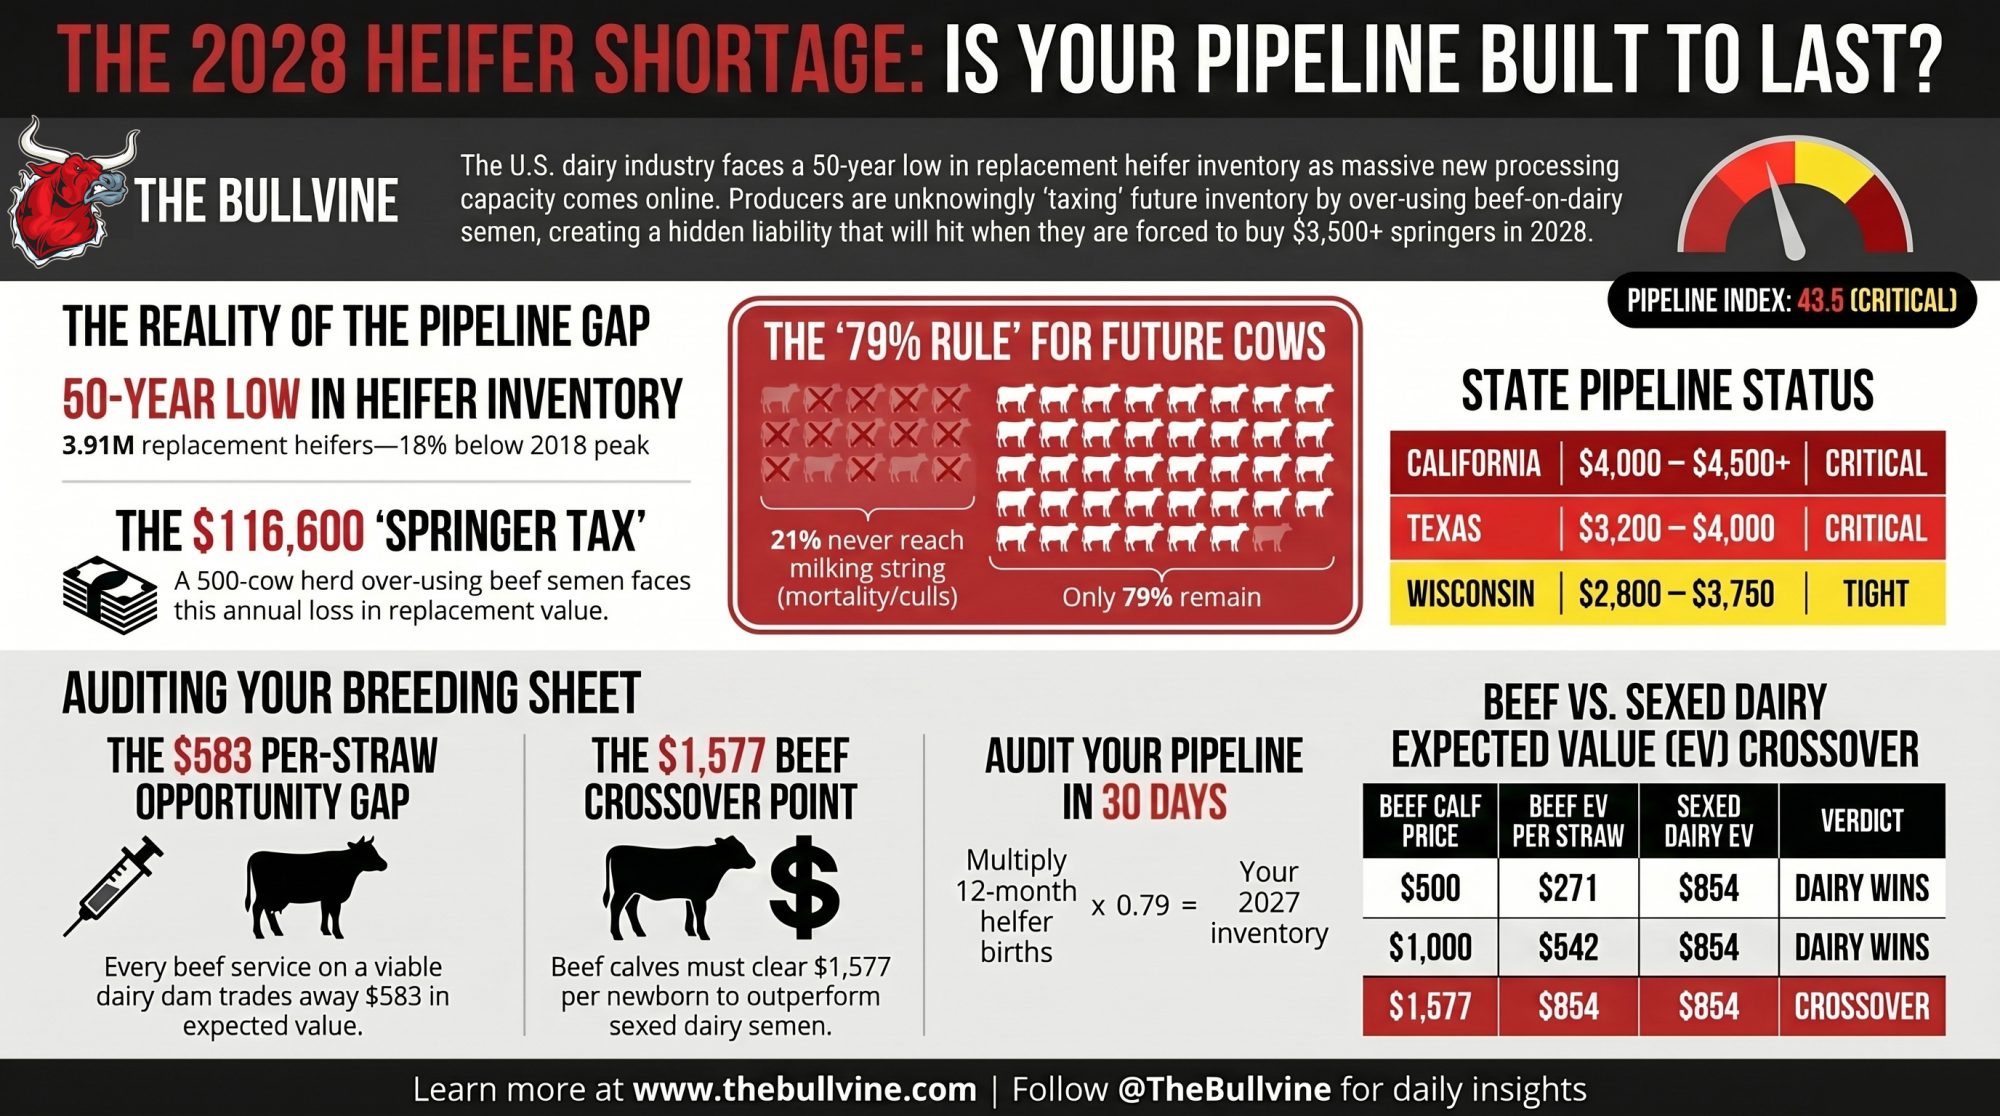
A Panhandle dairy is 200 beef services deep on viable dams and $116,600 short on 2028 replacement value. The straw’s in the gun this week. The $3,500 springer check comes later.

Executive Summary

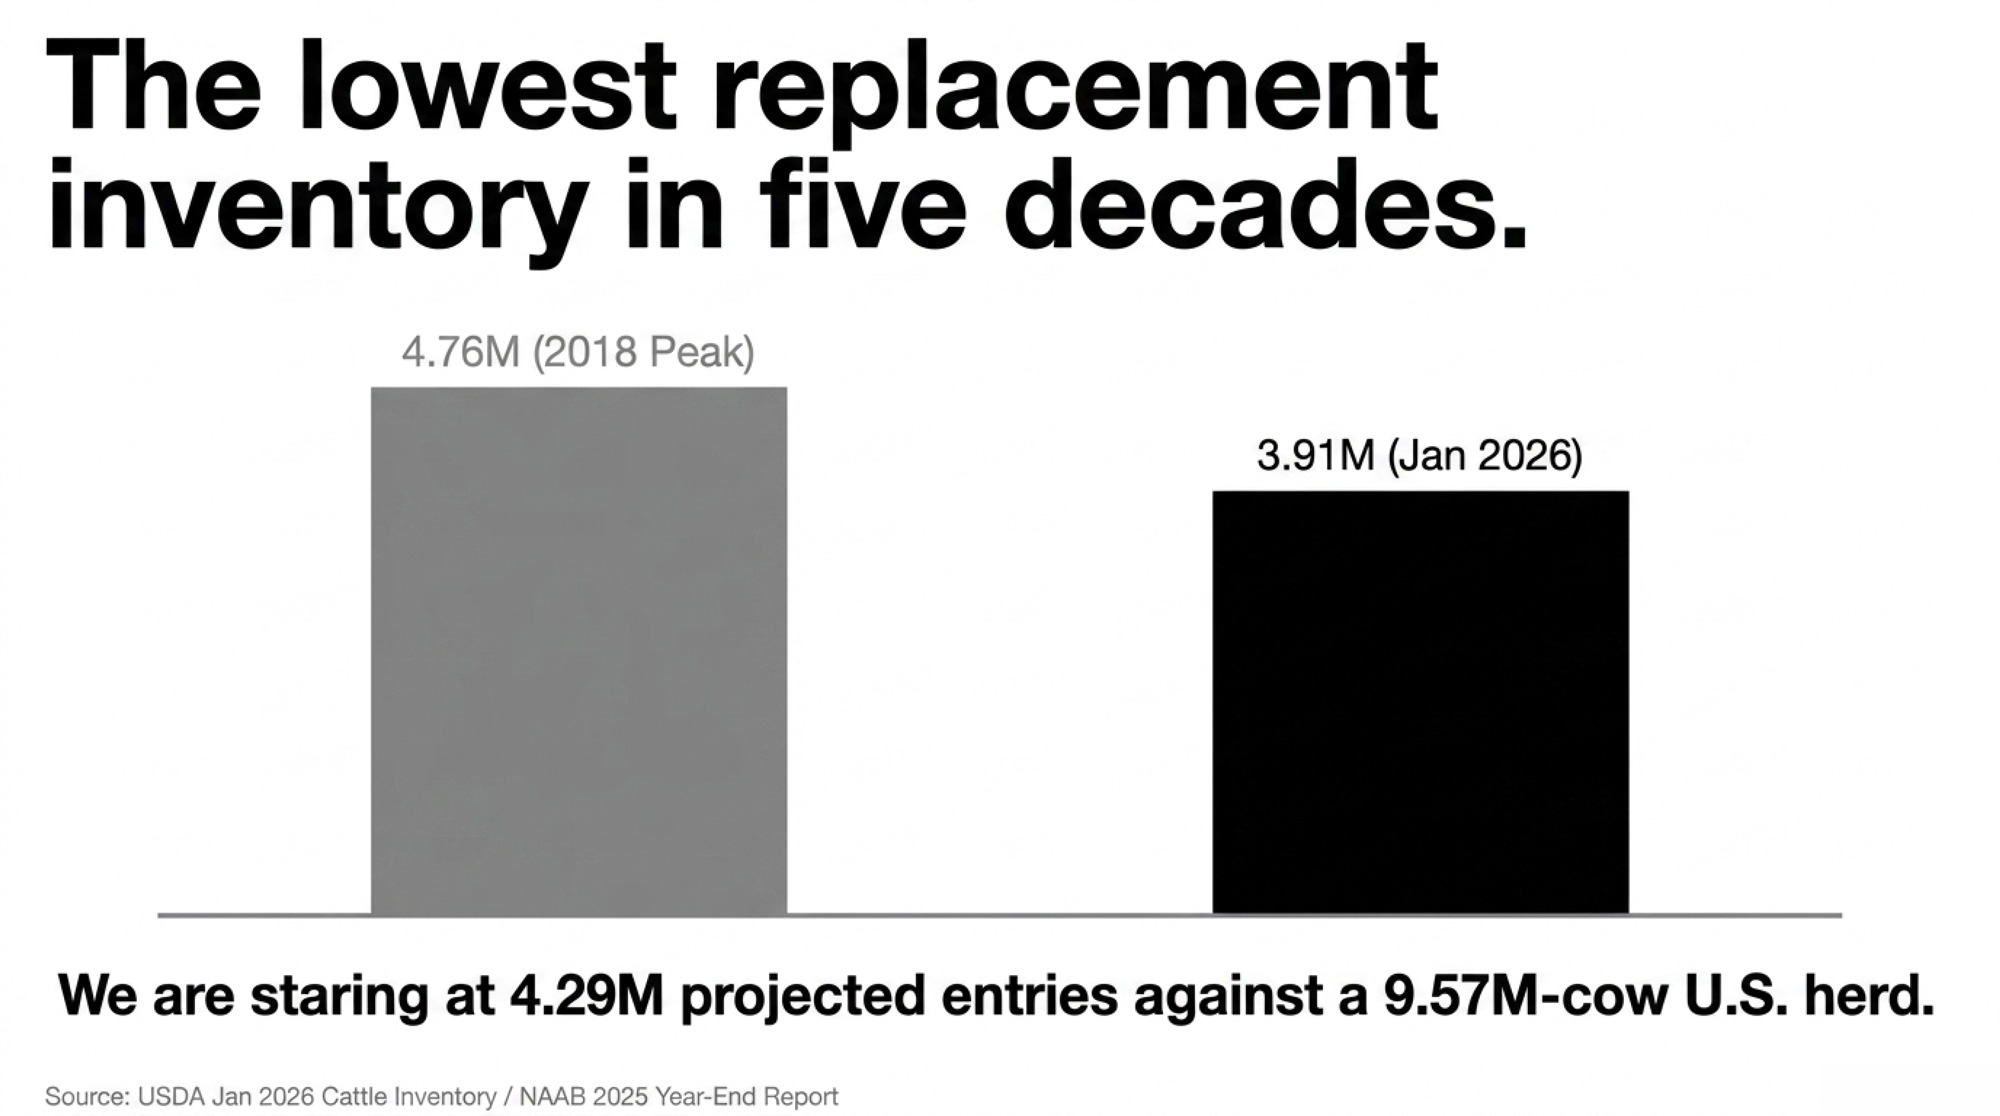
  • The gap is real: 4.29M projected milking-herd entries for 2027 against a 9.57M-cow U.S. herd, with USDA’s most recent Cattle Inventory at 3.91M replacement heifers — the lowest in nearly five decades.
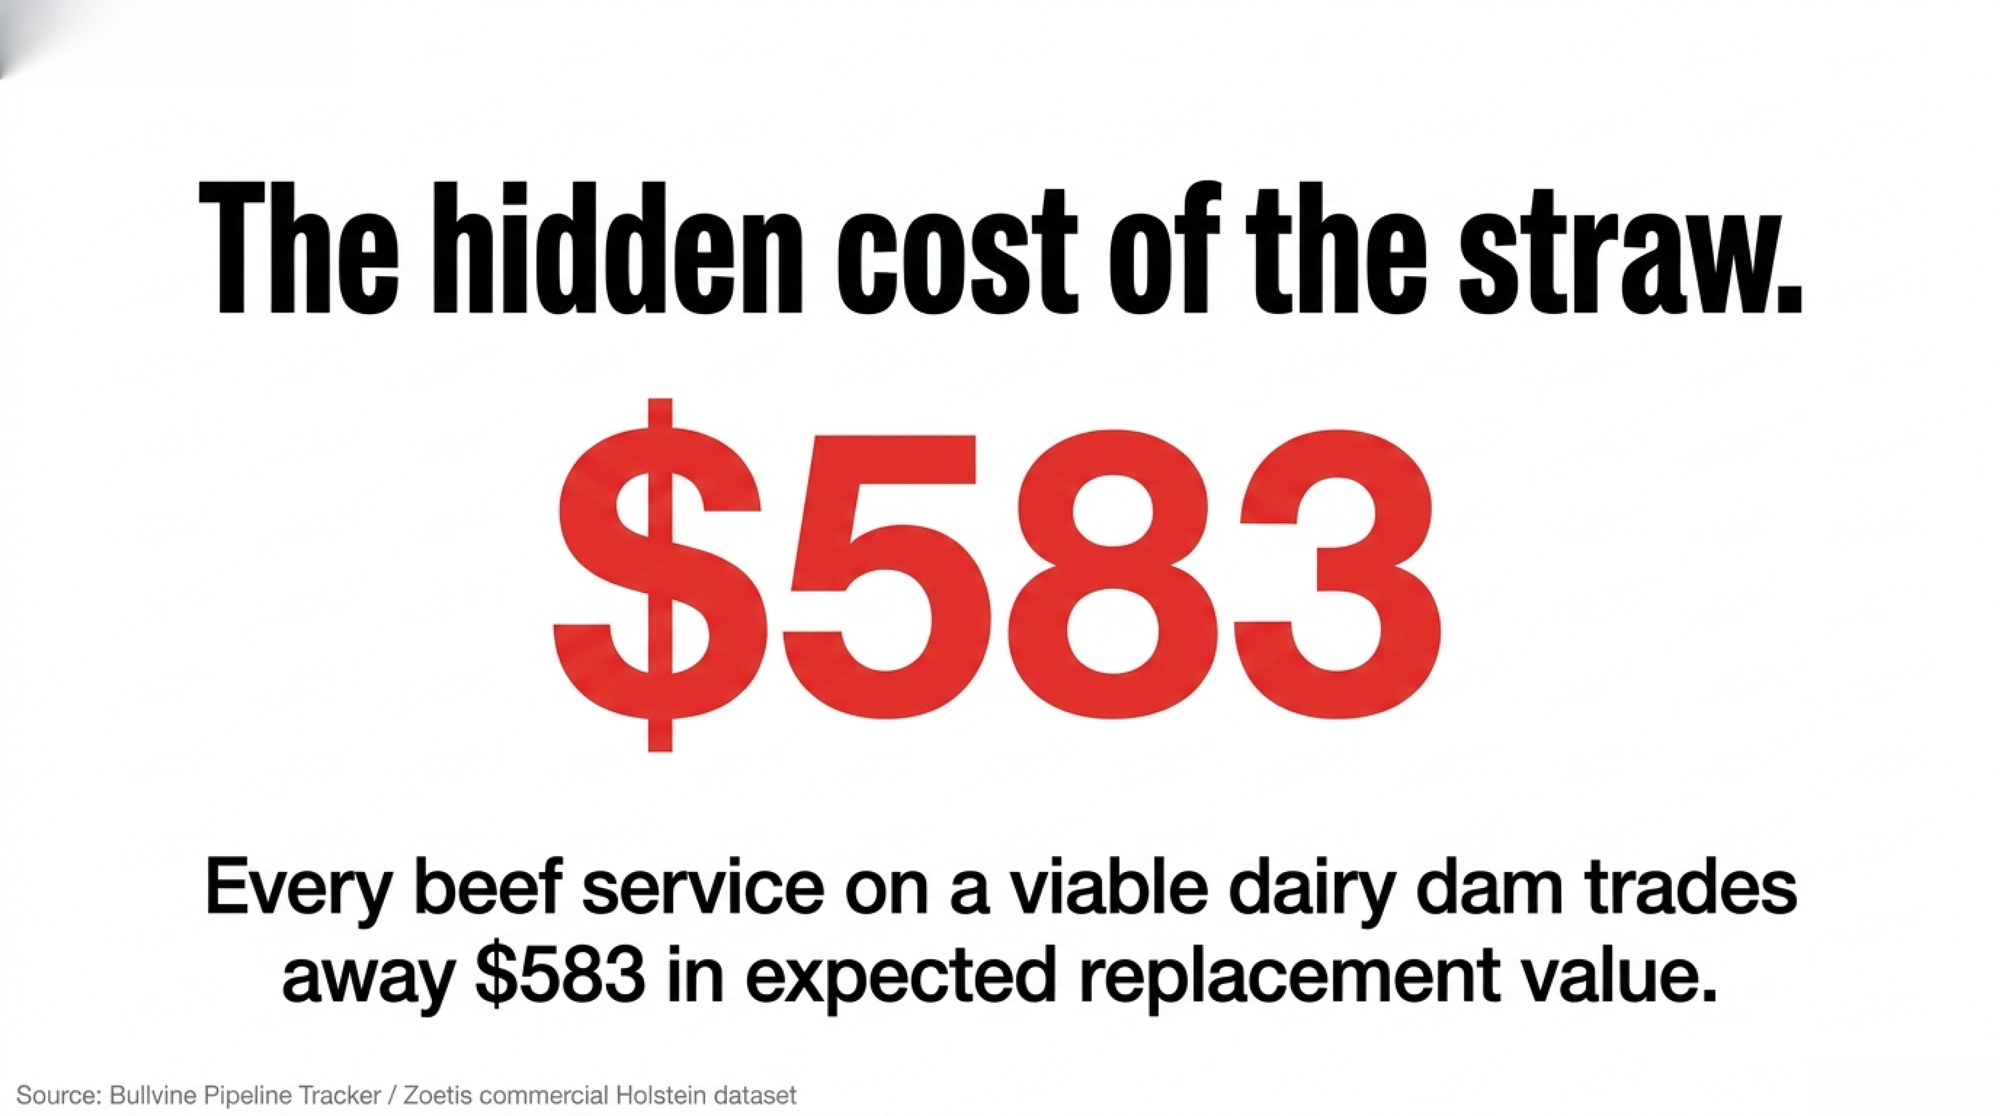
  • The per-straw math isn’t close: Every beef service on a viable dairy dam trades away ~$583 in expected replacement value. On a 500-cow Panhandle herd running 35% beef-on-dairy, that’s ~$116,600 a year walking off the breeding sheet.
  • Retention has masked the hole: Weekly slaughter ran below year-earlier levels in 86 of 88 weeks through mid-May 2025, but Class III at $14.59, $14.94, and $16.16 across Jan–Mar 2026 is changing the retention math fast — into the same shortage that $11B in new processing capacity is landing on top of.
  • The lender question: If your 12-month heifer-calf count × 0.79 doesn’t clear herd size × replacement rate, you’re already buying someone else’s springers at $3,500-plus in 2028 — the question is whether that’s on your budget or a working-capital covenant breach.
dairy heifer shortage

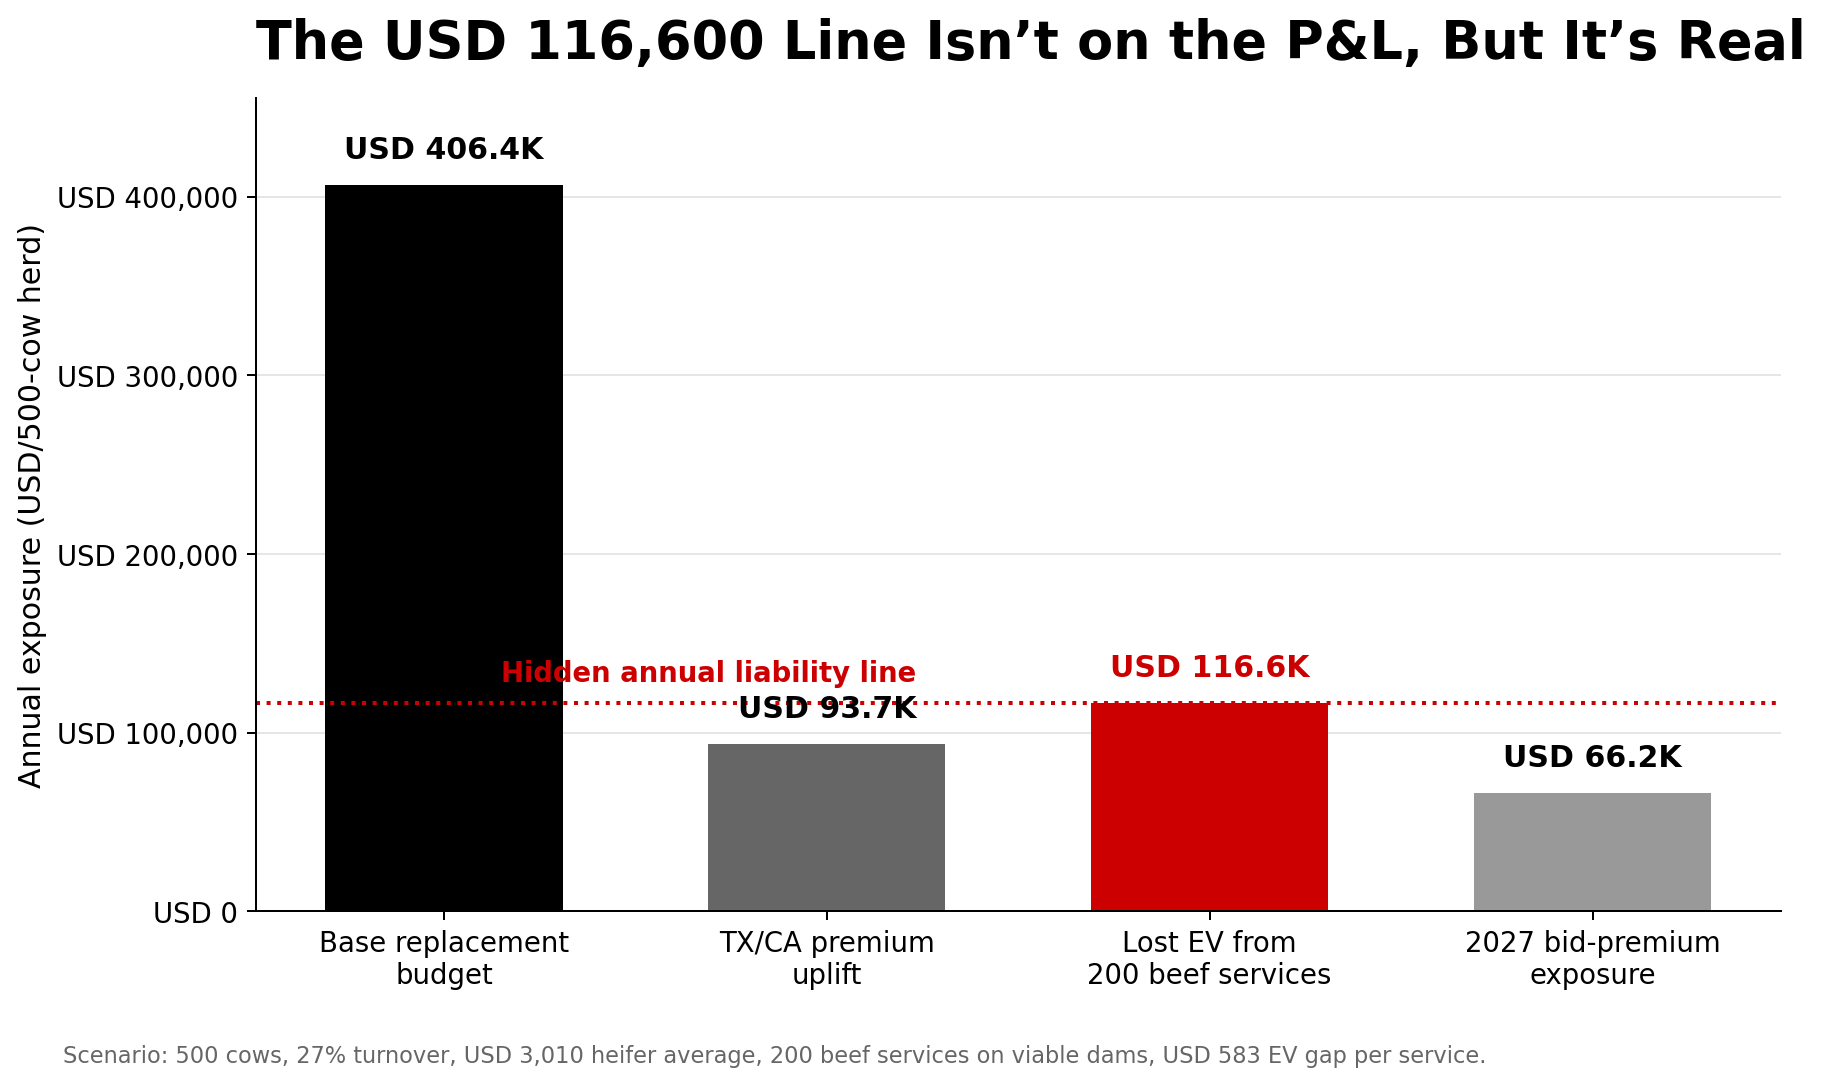
A 500-cow Panhandle dairy needs 135 replacement heifers a year at a 27% turnover rate. At the July 2025 U.S. replacement-heifer average of $3,010 per head (USDA Agricultural Prices), that’s a $406,350 annual replacement line — closer to $500,000 once California and West Texas premium bands kick in. The breeding decisions on that farm’s clipboard this week decide whether those 135 head come out of the home barn in 2028 or go under the hammer at $3,500-plus.

That Panhandle herd is a composite built from Bullvine Pipeline Tracker inputs. The pressure it’s under is not.

HOW TO READ THE PIPELINE TRACKER The Tracker converts NAAB’s semen-unit totals into projected milking-herd entries using published commercial-Holstein conversion rates (conception, pregnancy survival, heifer sex ratio, calf-to-milking-cow completion). Every Tracker number in this piece traces back to those two inputs: units sold and what they become by first lactation.

What the Pipeline Tracker Actually Shows

The Bullvine Replacement Pipeline Tracker applies commercial-Holstein conversion rates to NAAB’s 2025 Year-End Report, released March 2026. Domestic units only: 10.6 million sexed dairy, 6.0 million conventional dairy, 8.1 million beef-on-dairy. Sexed now accounts for 64% of domestic dairy units, up from roughly 58% a year earlier.

Run those volumes through the published conversion rates from Dr. Michael Overton’s Zoetis field dataset of 85 commercial Holstein herds — 42% sexed conception, 57% conventional, 95% pregnancy survival, 90% heifer sex ratio on sexed, and a 79% calf-to-milking-cow completion rate. The arithmetic lands at 4.29 million milking-herd entries projected for 2027. (Derivation applies a 50% heifer sex ratio to conventional services; sexed services carry the stated 90% ratio. The Overton dataset reflects U.S. commercial-Holstein average conditions across 85 herds, not top-third management benchmarks.)

Line that up against a 9.57-million-cow U.S. dairy herd — the largest since the early 1990s — and roughly $11 billion in new processing capacity committed across 50-plus projects in 19 states (CoBank Knowledge Exchange, August 2025). USDA’s January 2026 Cattle Inventory counted 3.91 million replacement heifers on U.S. farms, the lowest in nearly five decades and 18% below the 2018 peak.

That’s the hole. It’s not rhetoric. It’s arithmetic.

The 4.29 million number assumes current conversion rates hold. Real pipeline outcomes will move with protocol quality, pre-weaning calf mortality, and economic conditions that shift culling behavior. But the direction isn’t in dispute.

Why 79% Is the Number Producers Underestimate

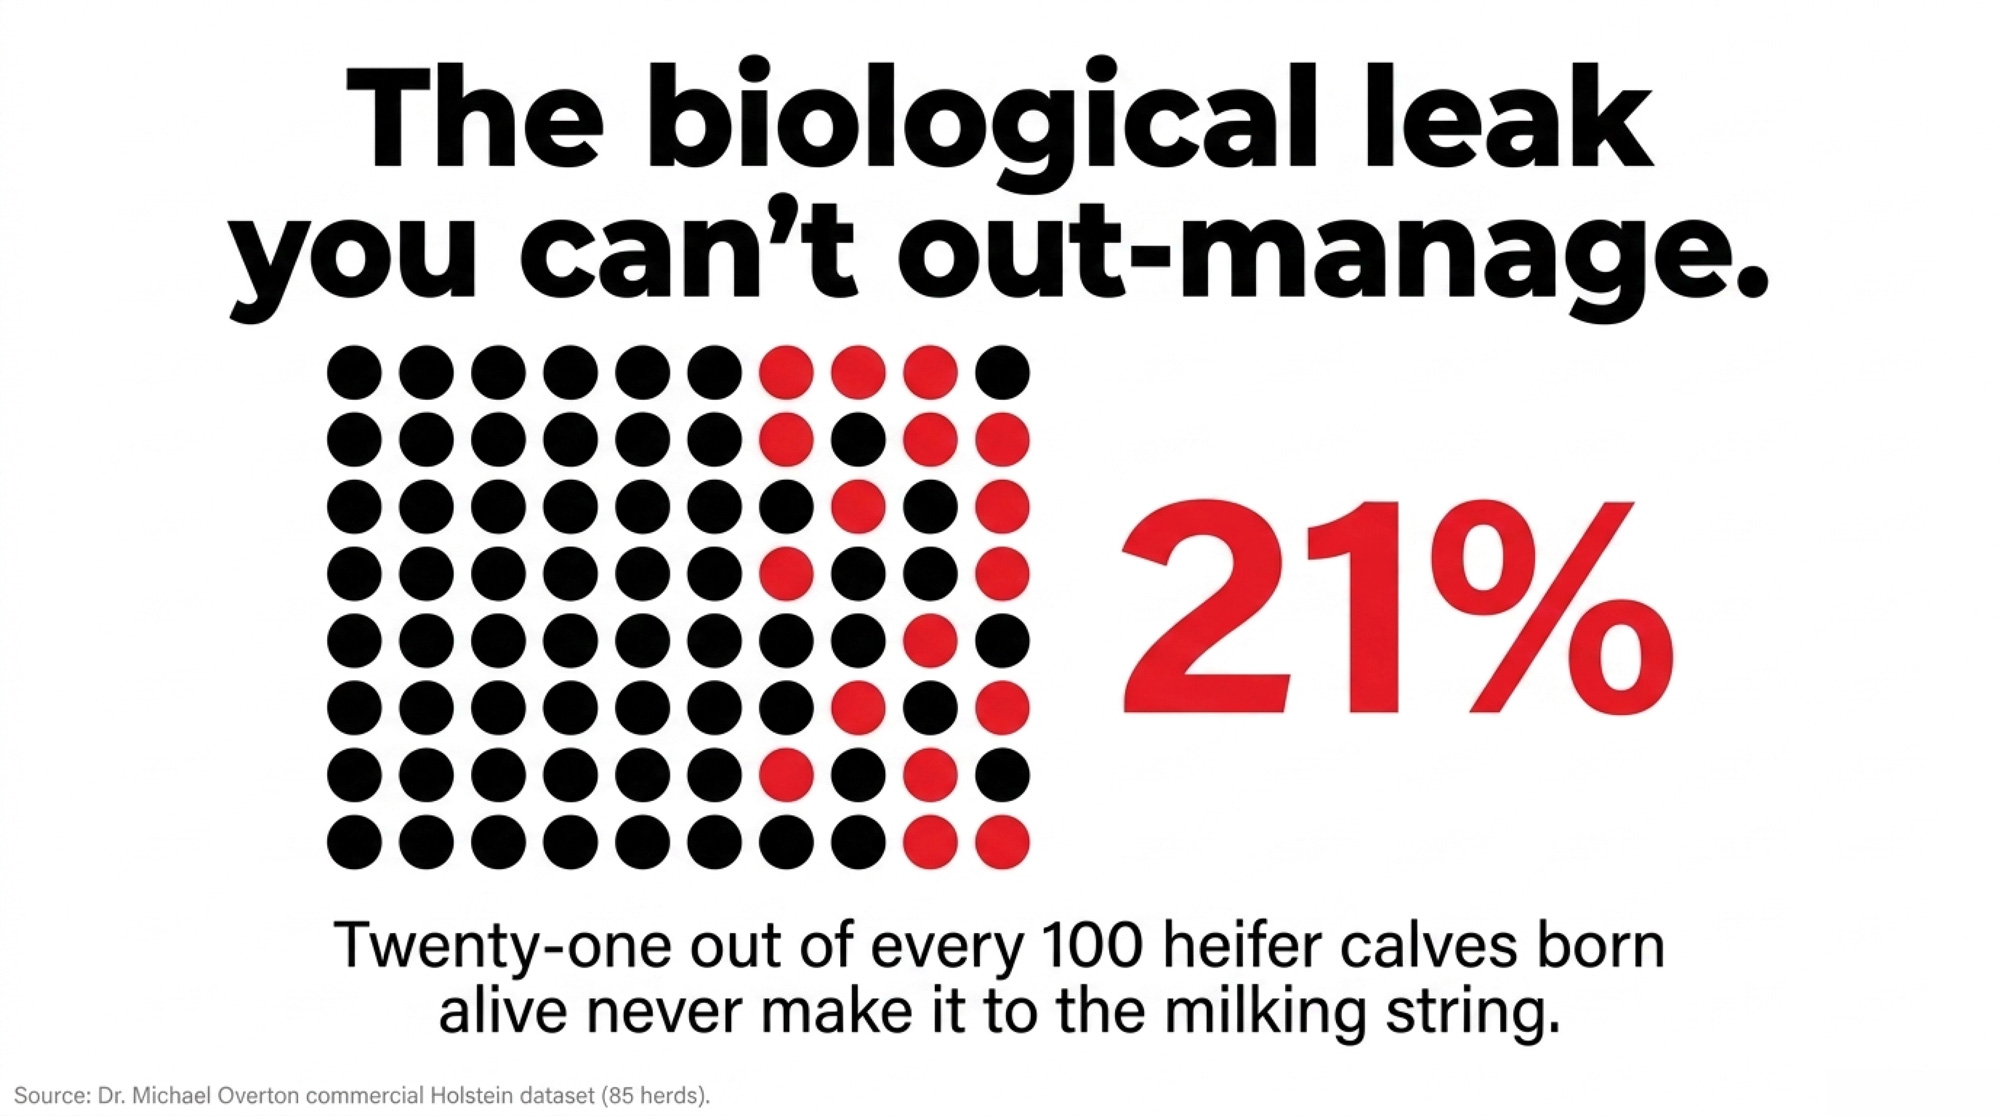
Twenty-one out of every 100 heifer calves born alive never make it to the milking string. That’s a fifth of the rearing investment walking out the door, baked into every pipeline projection that matters.

Where the 21% leaks out — audit your own barn against each of these checkpoints:

  • Pre-weaning mortality: calf scours, pneumonia, failure of passive transfer.
  • Post-weaning to breeding age: respiratory disease, lameness, chronic poor-doers.
  • Failed breeding: heifers that don’t conceive in the breeding window your SOPs allow.
  • Pregnancy loss: abortions and twins lost between confirmed preg check and calving.
  • Stillbirth and dystocia loss at calving.
  • Did-not-complete-first-lactation culls: fresh-cow disease, chronic mastitis, repeat breeder, classifier-flagged conformation issues shipped before 305 DIM.

Plug it into a 500-cow herd: pull the last 12 months of heifer-calf births, multiply by 0.79, and compare against herd size × replacement rate. If the number lands at 110 or 115 against a 135-heifer need, the future herd is already under-built. No market rally generates animals that aren’t in your pipeline.

The $583 Gap — Where Your Breeding Sheet Is Writing Checks

Here’s the expected value at the straw level, using the Tracker’s inputs.

  • Sexed dairy EV per straw: $3,010 × 0.42 × 0.95 × 0.90 × 0.79 ≈ $854.
  • Beef EV per straw at a $500 calf: $500 × 0.57 × 0.95 ≈ $271.

Three times the expected value for dairy. Every beef service on a cow that could carry a viable dairy pregnancy is roughly a 3 gap in expected replacement value — the hidden cost of rearing replacements few breeding sheets actually price in.

The scenario table shows the crossover plainly.

Beef Calf PriceBeef EV/StrawSexed Dairy EVDairy AdvantageVerdict
$200$108$854$746Dairy dominates
$500$271$854$583Dairy wins
$1,000$542$854$312Dairy still ahead
$1,500$812$854$42Near breakeven
~$1,577$854$854$0Crossover
$2,000$1,083$854-$229Beef wins

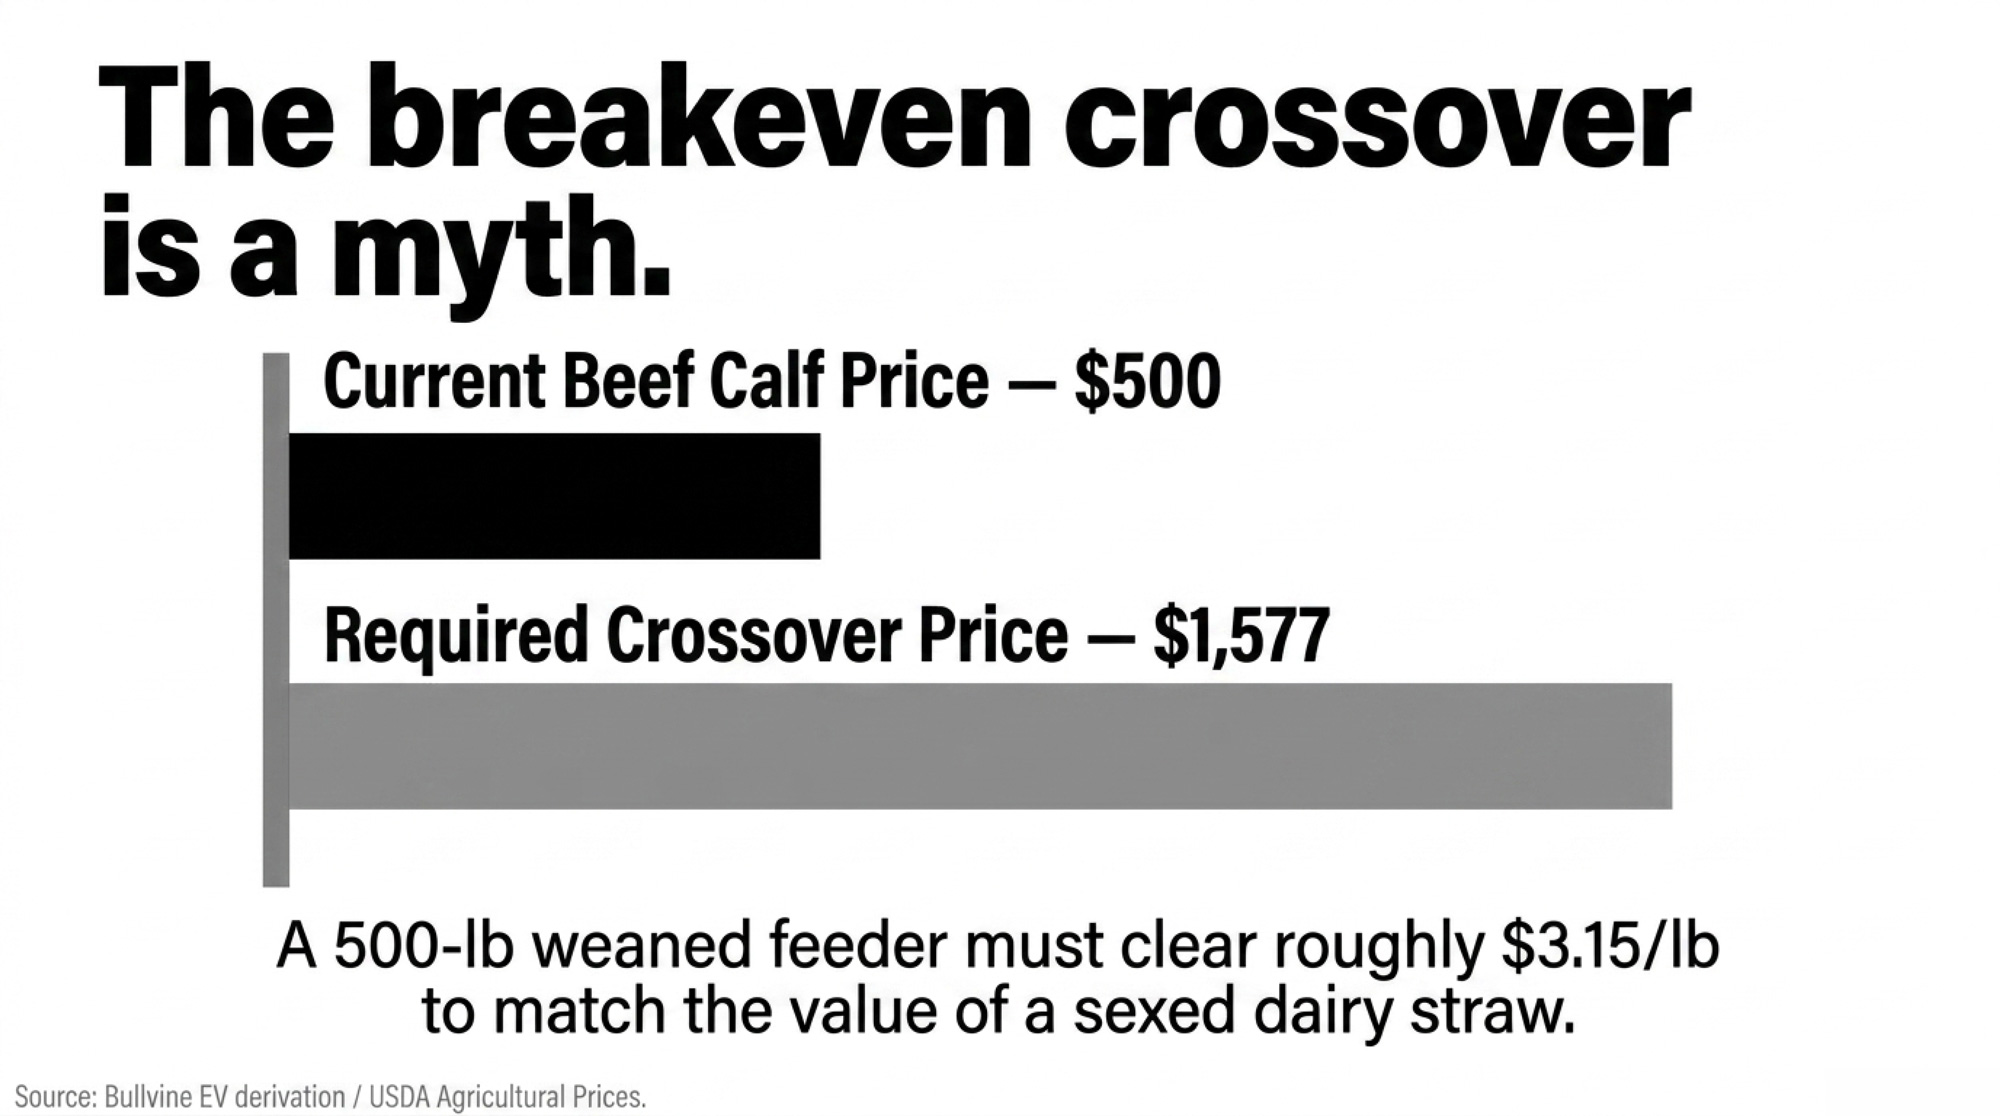
Beef calves have to clear roughly $1,577 per newborn to match sexed dairy at a $3,010 heifer. To put that in barn terms: a 500-lb weaned feeder would need to clear roughly $3.15/lb to land there — a number that assumes a high-demand year and ignores the feed and yardage cost of carrying the calf from newborn to that weight. Current beef-cross calf prices from dairy herds run $200 to $500-plus depending on genetics and region. Weaned feeders in program and video sales push higher, but at the breeding-decision level — the straw going in the gun — the math isn’t close.

Can One Panhandle Herd Really Be Leaving $117,000 on the Table?

Yes. And the arithmetic is boring.

Say that 500-cow Panhandle operation runs 35% beef-on-dairy across its total annual services — roughly 200 beef services a year on animals that could carry a dairy pregnancy, targeted at bottom-third cows. At the $583 per-service gap, the hidden math is:

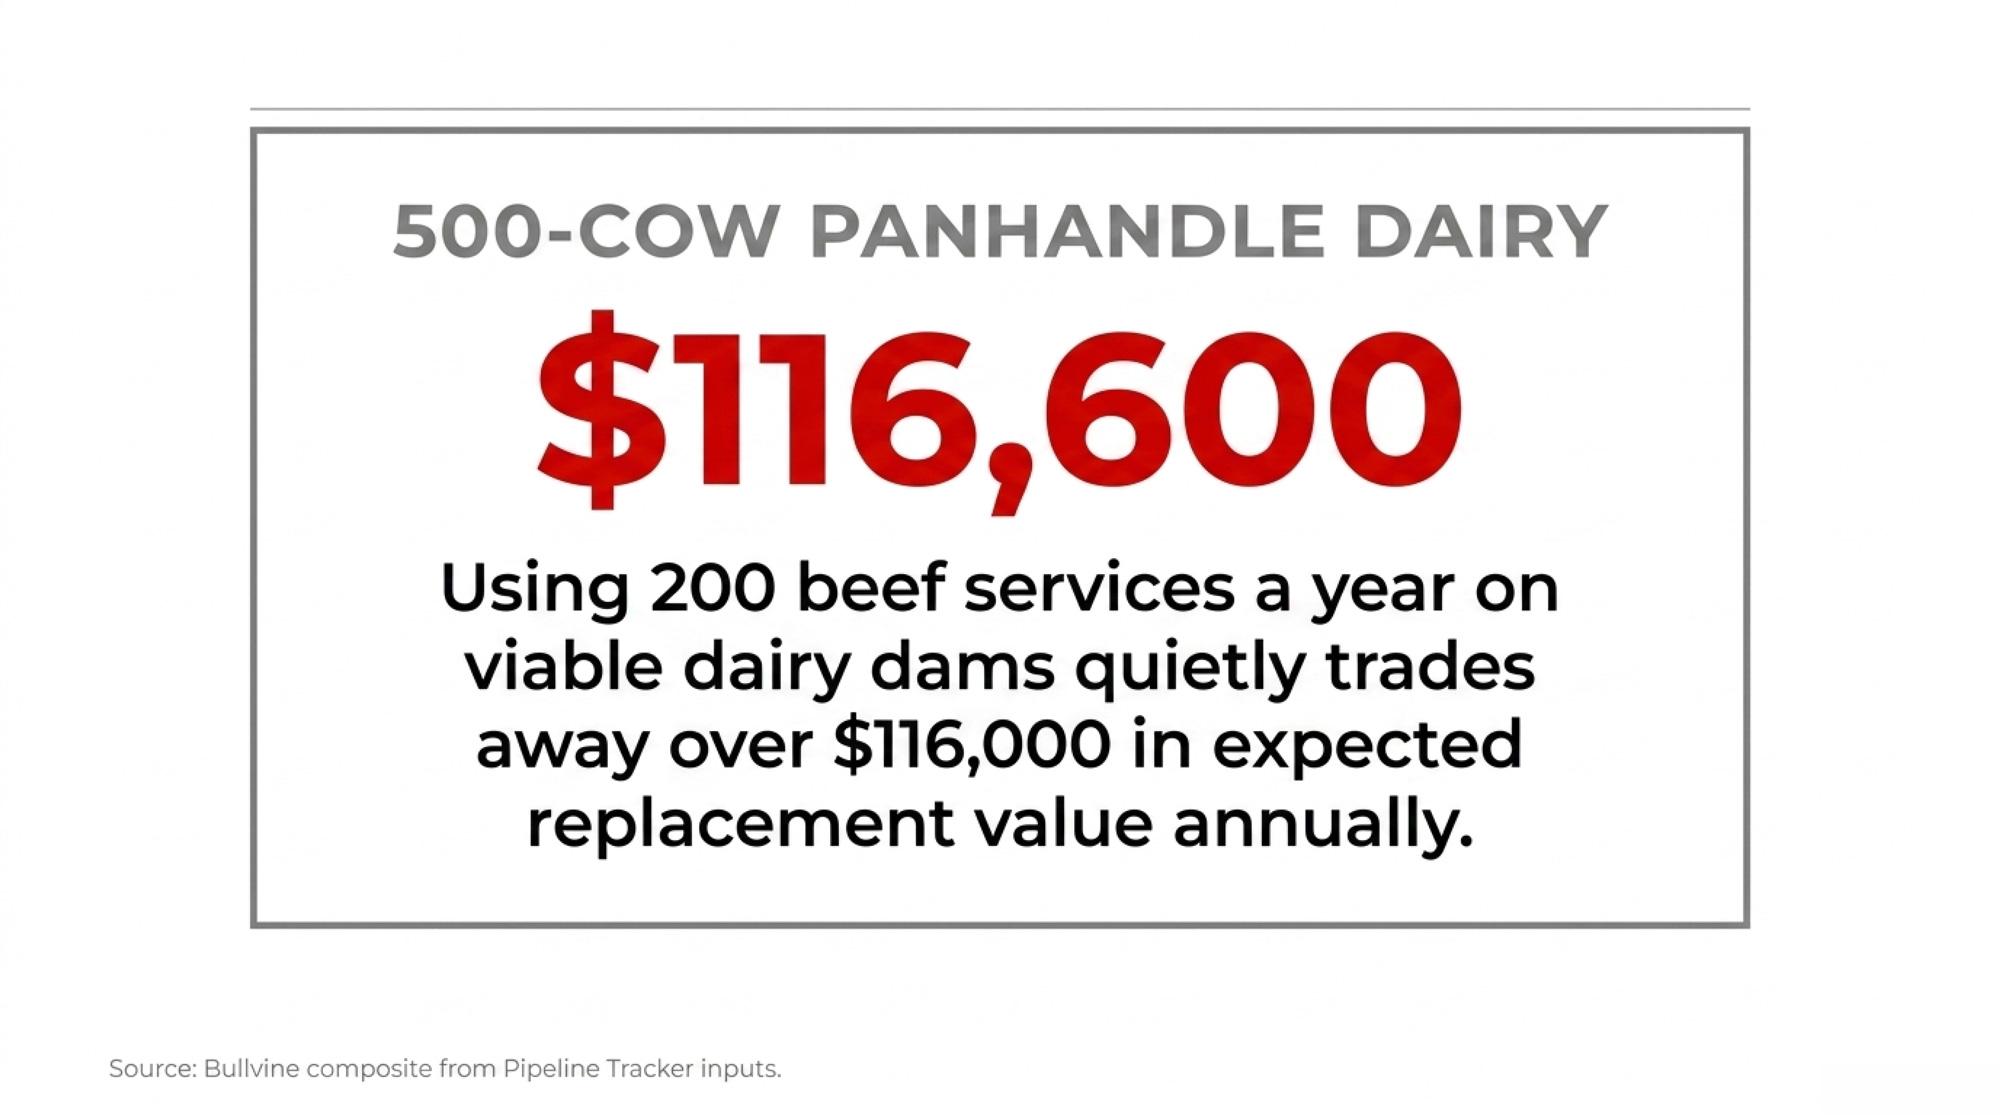
200 × $583 ≈ $116,600 in expected replacement value traded away, every year. Rounded to $117,000 in headline framing for scan value.

Cost DriverAnnual $ ExposureCategory
Base replacement budget (27% × $3,010)$406,350Base budget
TX/CA premium band uplift~$93,650Direct cost premium
Lost EV: 200 beef services × $583~$116,600Hidden risk
2027 bid-premium exposure, 135-heifer purchase at $3,500 vs. $3,010 ($490 premium)~$66,150Future risk (single-year)

That $116,600 isn’t a P&L line. It’s future cow inventory the herd is choosing not to create — and then buying back at ,010-plus when the auction ring gets to it. Your exact number moves with your calf price and your local heifer cost. The direction doesn’t. That Panhandle breeding sheet is quietly writing checks the pipeline can’t cash in 2027.

Why Behavior Hasn’t Caught Up

Three reasons. None of them irrational. All of them expensive.

Cash flow timing: a beef calf brings a check in weeks, a heifer generates milk in about 24 months. Strategy inertia: programs built when dairy-beef cross calves pulled stronger prices in 2023–2024 haven’t been rewritten for today’s 0–0 market. The biological lag itself: any heifer you want calving in 2028 has to be conceived now, and that feels like forever when feed bills hit monthly.

None of that makes the choice crazy in the moment. It just explains why the pipeline keeps bleeding. The vets running dairy-repro programs across the Panhandle and Central Valley are saying the quiet part out loud at producer meetings this spring: the breeding sheets still look like 2023, and the cash-flow math that justified them doesn’t.

The Retention Overhang Masking the Gap

Cow retention has been quietly covering the pipeline hole. Iowa State Extension’s NW Iowa Dairy Outlook (May and December 2025) documented the pattern: from September 2023 through mid-May 2025, weekly dairy cow slaughter ran behind year-earlier levels in 86 of 88 weeks. January–April 2025 slaughter came in at roughly 889,900 head — the lowest start to a year since 2008.

The Bullvine estimate extends that documented deficit through late 2025 at roughly 600,000–611,600 extra cows retained versus normal culling pace — an extrapolation from ISU’s weekly data, not a USDA statistic. Those cows carry the milk volume today.

When Class III compressed to $14.59 in January 2026, $14.94 in February, and $16.16 in March (USDA Class and Component Prices), the math on keeping marginal animals turned fast.

Month (2026)Class III Price
January$14.59/cwt
February$14.94/cwt
March$16.16/cwt

Source: USDA Class and Component Prices, Jan–Mar 2026.

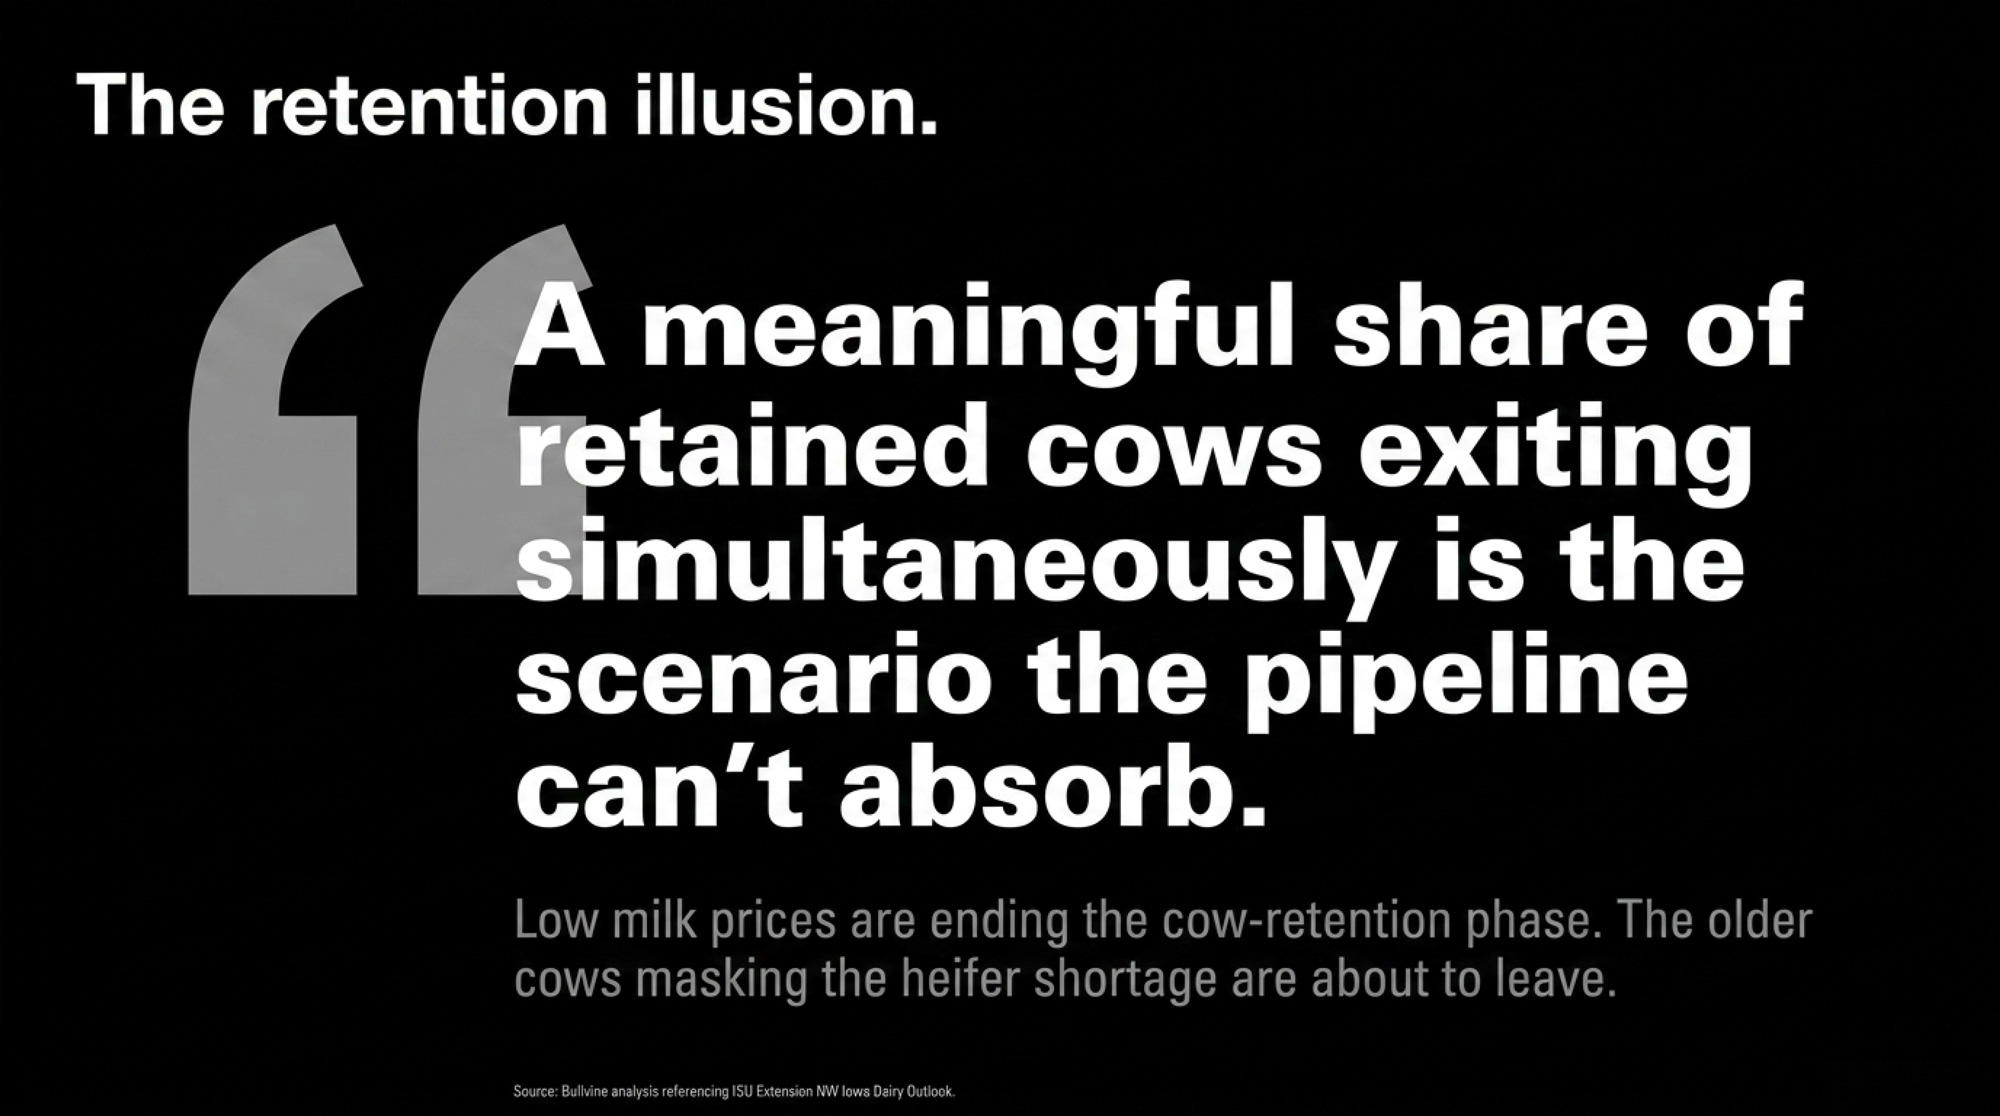
A meaningful share of those retained cows exiting simultaneously is the scenario the pipeline can’t absorb. The cows being held to supply $11 billion in new processing capacity are, by definition, the least productive animals in the herd.

Branch 1: Buying Your Way Out Is a Covenant Breach Risk

For many 500-cow herds sitting on the edge of their credit lines after Q1 2026 Class III in the $14s, buying your way through a pipeline shortfall isn’t just “expensive.” It’s a working-capital covenant question.

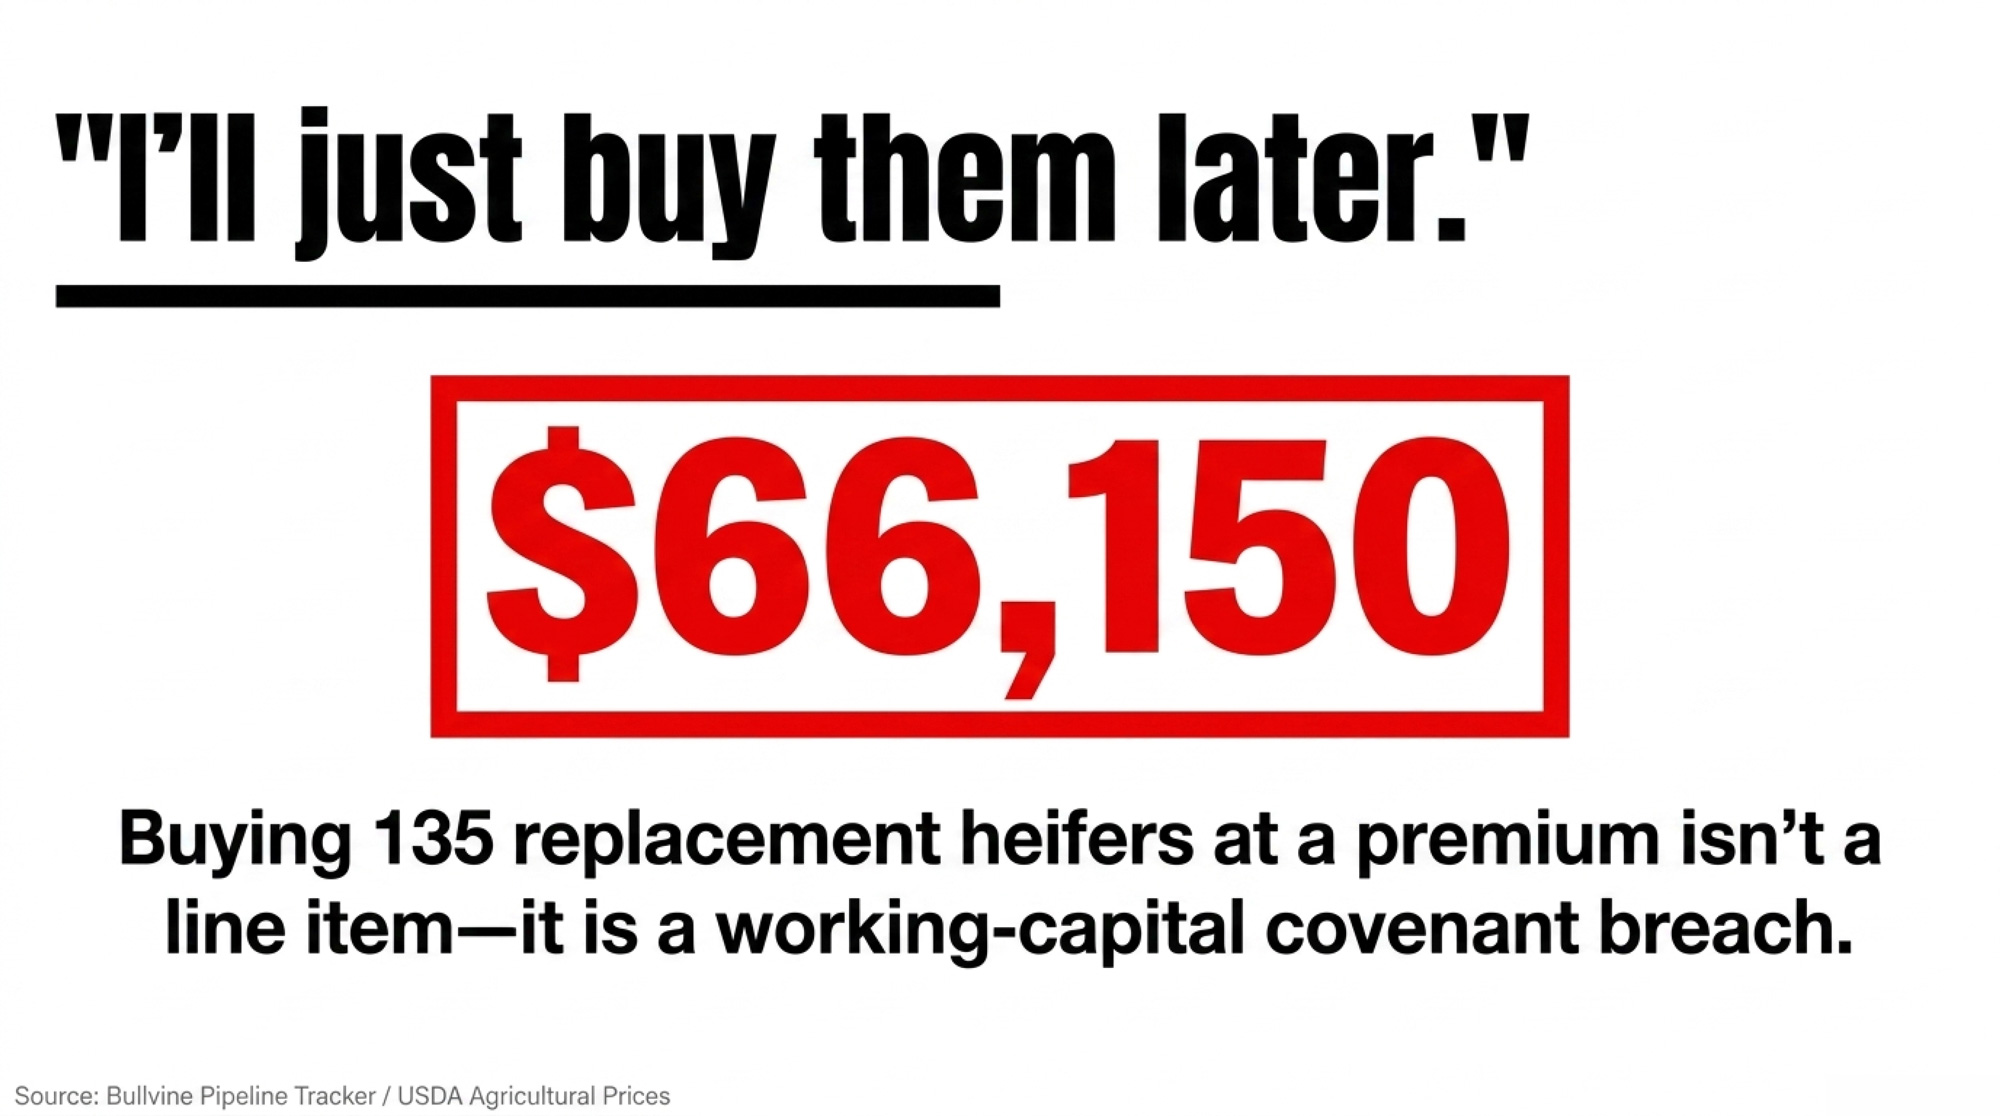
Run the arithmetic at the kitchen table. A 40–60 head single-year purchase at a $490 premium ($3,500 vs. $3,010) adds $19,600 to $29,400 of unplanned capital outlay. A full 135-heifer purchase year at the same premium is $66,150. Neither is catastrophic on its own, but neither is free working capital either — and both land on top of depressed Q1 revenue, feed carry, and whatever springer timing the auction ring actually gives you.

Before your next lender review, know two numbers cold: your current working-capital-to-revenue ratio and the specific covenant thresholds in your operating note. If a $66,000-plus unplanned heifer draw trips a covenant or forces a term-out, “I’ll buy later” stops being a strategy and starts being a restructuring conversation.

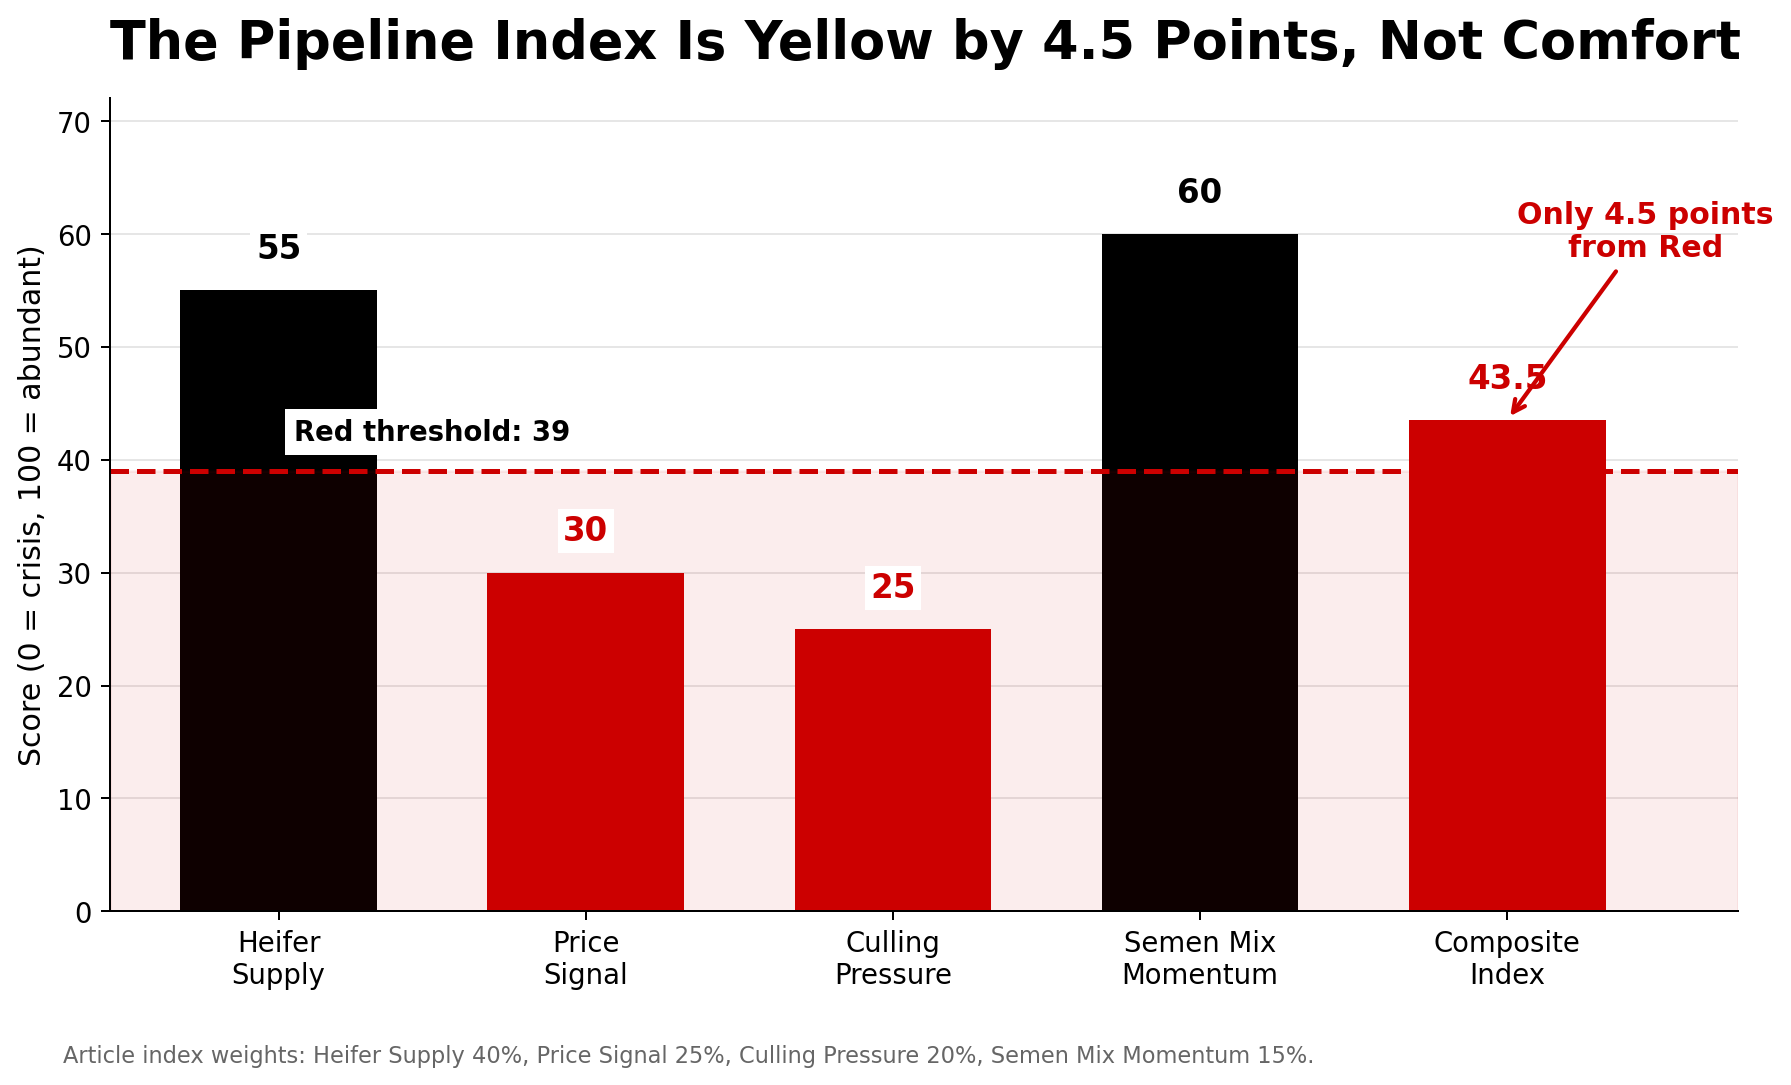
The Pipeline Index: 43.5, and 4.5 Points From Red

The Bullvine Pipeline Index runs 0 (crisis) to 100 (abundant) across four weighted components.

Component (weight)What it measuresCurrent scoreStatus
Heifer Supply (40%)Replacement ratio — ~27 per 100 cows55Marginal
Price Signal (25%)Inverse of heifer price — $3,010/head30Red-zone range
Culling Pressure (20%)Deviation from normal culling pace25Red-zone range
Semen Mix Momentum (15%)Sexed dairy share — 64% and rising60Adequate
Composite 43.5Yellow Zone

Red threshold: 39. Yellow: 40–69. The Index is riding on one component — semen mix momentum — and that’s a behavior change that takes 24 months to become a milking cow.

If slaughter normalizes and the Culling Pressure Score climbs from 25 to 15 (a −10 × 0.20 weight hit), the Index slides to 41.5. Layer in sexed-semen adoption stalling — Semen Mix Momentum dropping from 60 to the high-30s as cash-strapped herds revert to cheaper conventional — and the composite lands near 38. Red Zone. No catastrophe needed. Just normal economics catching up.

The back-trend tells the same story. Mid-2024 the Index sat at 49.4. It bottomed at 40.0 in mid-2025 — exactly on the Yellow/Red boundary — and has recovered 3.5 points since. That’s not a rebound. That’s a bounce off the floor, and the entire recovery is riding on sexed-semen adoption that won’t show up in the milking string until 2027.

Where the Shortage Bites First

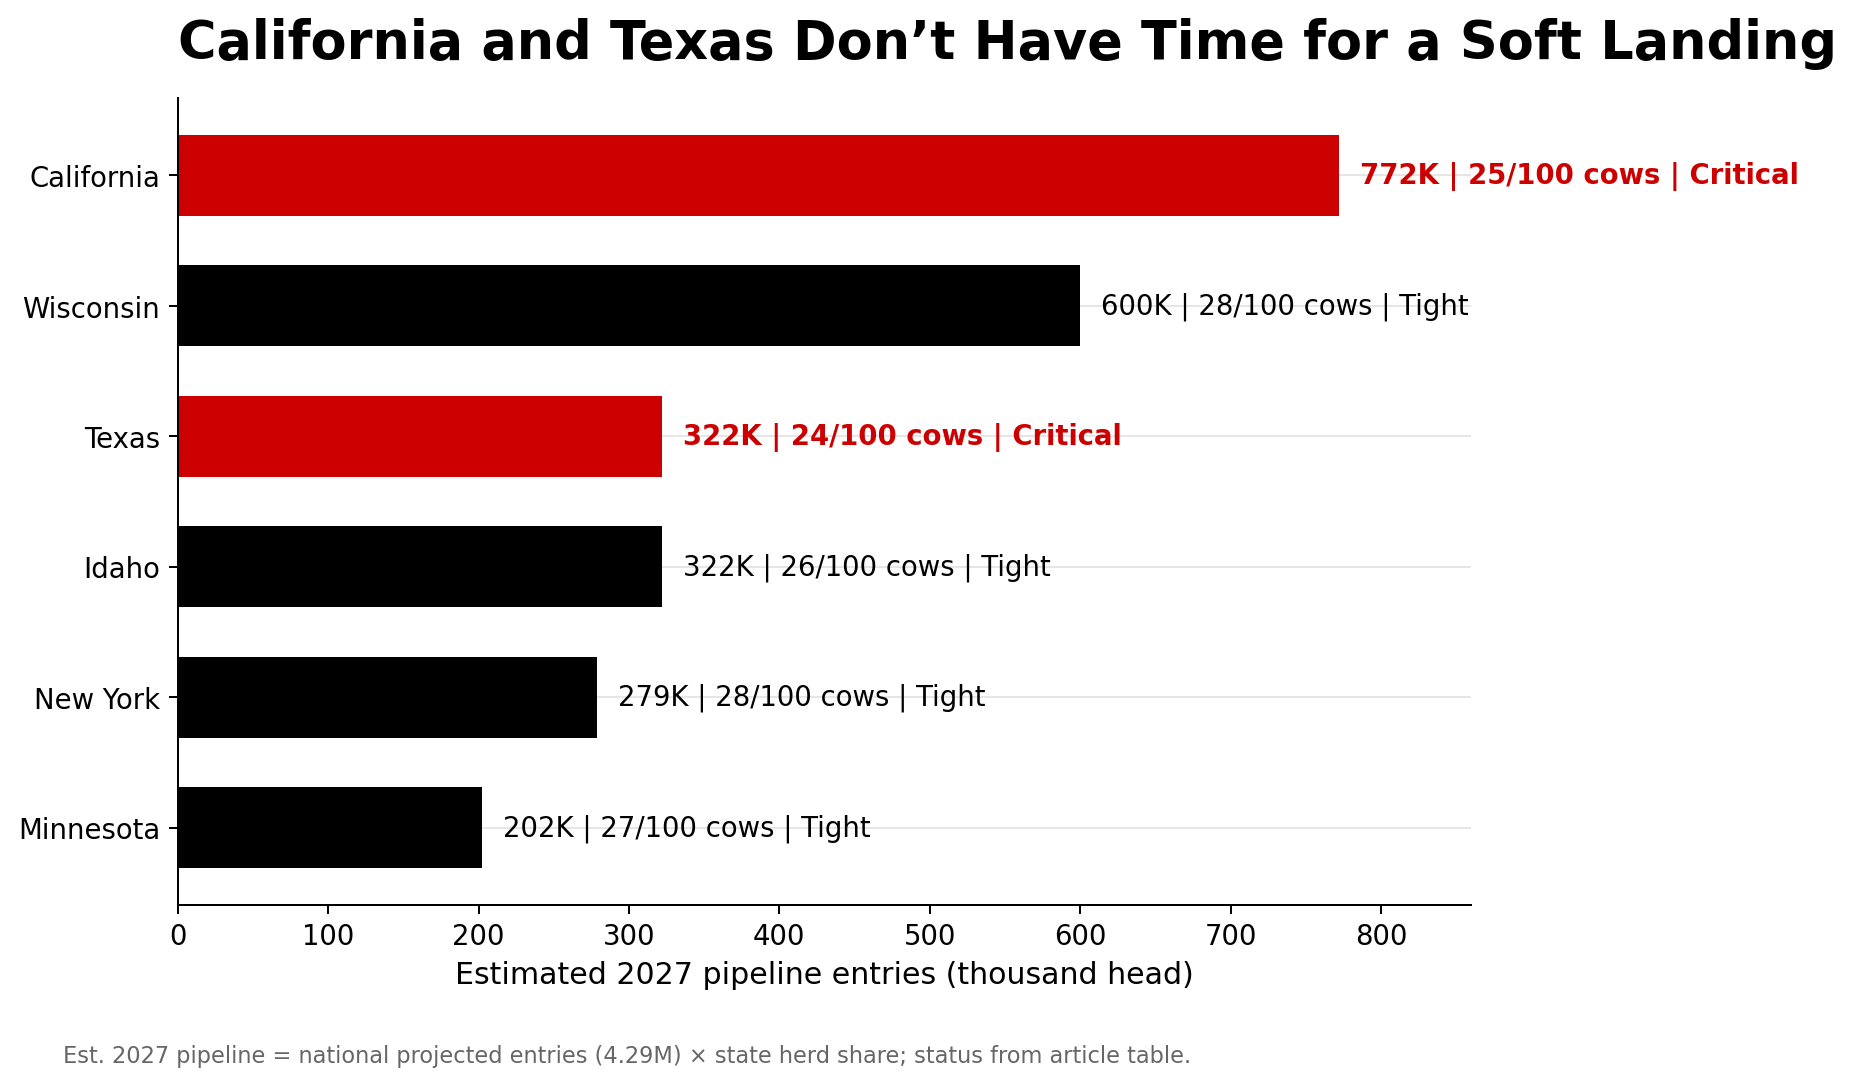
StateShare of herdEst. 2027 pipeline*Replacement ratioHeifer price rangeStatus
California~18%~772,000~25 per 100$4,000–$4,500+Critical
Wisconsin~14%~600,000~28 per 100$2,800–$3,750Tight
Texas~7.5%~322,000~24 per 100$3,200–$4,000Critical
Idaho~7.5%~322,000~26 per 100$3,100–$3,900Tight
New York~6.5%~279,000~28 per 100$3,000–$3,600Tight
Minnesota~4.7%~202,000~27 per 100$2,800–$3,850Tight

*Est. 2027 pipeline reflects each state’s projected share of national milking-herd entries (4.29M × state herd share), not in-state replacement-heifer inventory. State herd shares derived from USDA NASS Milk Cows: State (2025).

California sits at a 25-per-100 ratio, with HPAI reproductive fallout layered on top — more than 750 affected dairies and field reports of roughly 7% conception drops in the August 2024–March 2025 window. Premium Central Valley springers routinely clear $4,500. Texas added close to 40,000 cows in 2025, and the bulk of the state’s milking herd sits on a small fraction of its dairies concentrated in the Panhandle — so when one 4,000-cow dairy needs ~1,200 heifers to cover normal turnover, the regional market feels it fast. Traditional overflow from the Upper Midwest shrinks as small operations exit, and the broader replacement-price squeeze rolls downhill.

A pattern showing up across the herds feeding the Tracker: beef straws drifting onto cows that aren’t truly terminal — second-lactation animals with one bad quarter, heifers that got one rough breeding. Those are the animals that carry next year’s best daughters, and they’re getting bred to terminal sires because the protocol never got rewritten.

What This Means for Your Operation

In the next 30 days:

  • Run your pipeline math. Pull 12 months of heifer-calf births, multiply by 0.79, and compare to herd size × replacement rate. Any gap is baked into 2027–2028, regardless of what prices do.
  • Audit beef-on-dairy with your own numbers. EV_beef = your calf price × 0.57 × 0.95. EV_dairy = your local heifer cost × 0.42 × 0.95 × 0.90 × 0.79. If the dairy advantage looks anything like $583, decide how many beef services stay on viable dairy dams.
  • Pull your operating-note covenant language. Know the working-capital ratio that triggers a review, and model what a $66,000-plus unplanned heifer draw does to it.
  • Call your heifer suppliers this week. Ask how far they’re booked and whether they’ll lock numbers 12–18 months out. If “I’ll buy later” is the plan, find out whether the supply actually supports that.

In the next 90 days:

  • Tier your herd and put it into SOPs with a concrete genomic game plan. Top genetics to sexed dairy. Middle tier mixed. True terminal cows only get beef. Don’t let beef creep back onto viable dams because the straw is cheaper that day.
  • Cull on profit, not habit. Keep productive older cows if SCC and repro allow; ship chronic mastitis, repeat breeders, and low-index animals. A retained cow buys time, not margin.

Over the next 365 days:

  • Align your herd plan to your plant. If new processing steel is landing within your hauling radius, decide whether you’re growing, holding, or shrinking. Your pipeline, beef percentage, and culling strategy have to match that call.
  • Set hard floors and ceilings. Floor: the minimum beef-calf price where beef services still make cash-flow sense. Ceiling: the maximum share of breedings to beef on viable dairy dams. The ~$1,577 crossover is your north star.

Key Takeaways

  • If your 12-month heifer-calf count × 0.79 doesn’t cover herd size × replacement rate, you’re already short on future cows — and that shortfall is locked into 2027–2028, regardless of how market prices move.
  • Every beef service on a viable dairy dam trades away roughly $583 in expected replacement value at a $3,010 heifer and a $500 calf. Crossover is ~$1,577 per newborn beef calf — roughly $3.15/lb on a 500-lb feeder in a high-demand year, before feed carry. Most markets aren’t close.
  • The Pipeline Index sits at 43.5 — Yellow Zone, 4.5 points from Red. Semen mix momentum is the only component holding the score up, and it takes 24 months to turn a straw into a milking cow. One rough culling quarter pushes the national pipeline into critical territory.
  • A $66,000-plus unplanned heifer draw is a working-capital covenant question, not a line item. The $116,600 on one 500-cow Panhandle breeding sheet is the local shape of a national number. Scale it to your herd, your calf price, and your heifer cost, and the call is yours — but it’s getting made right now, whether or not it’s written down.

Before your next lender review or processor supply meeting, print the EV table and your own pipeline math side by side. One question decides the rest: does your current breeding program produce the cows your operation will need in 2028, or are you planning to compete for someone else’s heifers at $3,500-plus — and does your operating note have room for that check?

The breeding decisions locking in that answer are being made this week. Biology won’t wait for the market to make them comfortable.

Pipeline and economic data: NAAB 2025 Year-End Report (March 2026), USDA Cattle Inventory (January 2026 release), USDA Agricultural Prices (July 2025), USDA Class and Component Prices (January–March 2026), CoBank Knowledge Exchange (August 2025) as a secondary reference, and ISU Extension NW Iowa Dairy Outlook (May and December 2025). State herd shares derived from USDA NASS Milk Cows: State (2025). Biological conversion rates reference Dr. Michael Overton’s Zoetis field dataset of 85 commercial Holstein herds. The 600,000–611,600 retained-cow estimate is The Bullvine’s extrapolation from ISU’s documented weekly deficit data, not a USDA statistic. EV figures rounded from precise derivation: $853.90 sexed and $270.75 beef at a $500 calf. The ~$3.15/lb feeder-equivalent is derived from dividing the $1,577 crossover by a 500-lb weaned weight, not from a published market series; it is illustrative only. State-level HPAI and Texas herd-concentration figures reflect Bullvine reporting aggregated from USDA APHIS and state extension sources. National averages may not reflect your specific region, herd size, or management system. All figures USD.

Learn More

The Sunday Read Dairy Professionals Don’t Skip.

Every week, thousands of producers, breeders, and industry insiders open Bullvine Weekly for genetics insights, market shifts, and profit strategies they won’t find anywhere else. One email. Five minutes. Smarter decisions all week.
NewsSubscribe
First
Last
Consent

The $3,500 Calf Question: What Dairy Farmers Need to Know About April 2026’s New CDCB Calf Health Evaluations

6% calf mortality = $350K annual loss. New genomics launching April 2026. Your cost? Maybe nothing if you’re already genomic testing, up to $40K if starting fresh.

You know that sinking feeling when you walk into the calf barn and spot another one with scours? And these days—with replacement heifers running $3,000 to $4,000 according to the latest USDA market reports—every sick calf feels like watching money evaporate.

Here’s what’s got my attention: we’re still losing about 6% of our calves before weaning, at least according to the last comprehensive USDA survey from 2014. Canadian research from just a couple years back shows similar numbers, which tells me we haven’t made much progress despite all our management improvements. It’s frustrating, honestly.

So when I heard about the April 2026 launch of national genomic evaluations for calf health traits at the CDCB meeting on October 1st in Rosemont, I had to dig deeper. The Council on Dairy Cattle Breeding and USDA’s genetics lab have been working on this for years, and they’re targeting exactly what’s killing our calves—scours and respiratory disease. Those two culprits are responsible for about 75% of our pre-weaning deaths, based on research published in the Journal of Dairy Science (Urie et al., 2018).

What I’ve found is that for many of us running typical 1,000-cow operations, the economics of calf losses are worse than we probably realize. When you do the math—and I’ll walk through this with you—we’re looking at significant potential here. But there’s also a lot to consider before jumping in.

Click the link to view the presentation.

Genetic Tools for Healthier Calves
John Cole, Ph.D., CDCB Chief Research and Development Officer
Slides

What They’re Actually Measuring (And Why It Matters)

Decision Flowchart: Should Your Dairy Invest in Genomic Calf Health Testing? Follow this evidence-based decision tree to determine your optimal investment strategy based on current mortality rates. Red paths indicate caution zones where management improvements should precede genetic investments.

Let me be clear about something: these aren’t treatment protocols or management recommendations we’re talking about. These are genetic predictions—basically, which bloodlines tend to produce calves that stay healthier.

The data foundation is pretty impressive. CDCB researchers analyzed over 200,000 diarrhea records and nearly 700,000 respiratory disease records spanning the last decade. That’s a lot of sick calves, unfortunately. What’s interesting is how the breeds compare—Holstein calves made up about 80% of the dataset, with Jerseys at 17%. And here’s something worth noting: Jersey calves in this dataset showed slightly higher disease rates. We’re talking 17.8% for scours and 23.7% for respiratory disease, compared to 13.5% and 14.5% for Holsteins.

Now, the heritability numbers—2.6 for diarrhea resistance and 2.2 for respiratory disease resistance—those might seem pretty low if you’re used to seeing 30 or 40 percent for production traits. But as Dr. John Cole from CDCB pointed out at the October meeting, you can’t really compare them that way. He basically said, “Don’t worry about the lower heritability—it’s about getting started and making progress where we can.”

What really piques my interest, though, is that these calf health traits appear to be genetically independent from the other stuff we select for. The correlations with production, fertility, and longevity are hovering near zero based on the preliminary research. If that holds up—and it’s still early days—we might not face those painful trade-offs we’ve dealt with before. You know, like what happened with milk yield and fertility over the past few decades.

Let’s Talk Real Economics (The Cost Depends on You)

So here’s where it gets interesting—and more nuanced than you might think. Based on current market conditions and what we’ve seen in other countries, your actual investment could range from zero to $40,000.

The True Cost of Calf Losses: Most producers only calculate replacement value ($189K), but feed, labor, veterinary care, and reduced lifetime production from sick calves that survive push total annual losses above $350,000 for a typical 1,000-cow operation at 6% mortality.

First, the losses we’re all facing. For a typical 1,000-cow dairy, you’re probably losing around 54 calves annually at current mortality rates. That’s roughly $189,000 just in replacement value at today’s prices. Then you’ve got what you already invested in those calves before they died—feed, labor, vet care—probably another $15,000 to $20,000 based on typical rearing costs through weaning.

And that’s just the ones that die.

The survivors that got sick? They’re costing you too. Research from the University of Guelph (Winder et al., 2022, Journal of Dairy Science) shows these calves produce significantly less milk in their first lactation—we’re talking over 700 kilograms less. Plus, they tend to calve later and leave the herd earlier. Add it all up, and the total annual hit from calf health problems could easily exceed $350,000 for a 1,000-cow operation.

Your Investment Options – Quick Cost Breakdown

Your Current SituationYour Cost for Calf Health Evaluations
Already genomic testing$0 (Free on existing tests)
Never tested – heifers only$18,000 (450 animals)
Never tested – full herd$40,000 (1,000 animals)
Gradual approach$4,000-6,000 per year

Now, here’s where it gets interesting on the investment side. Your costs depend entirely on your current genomic testing status:

If you’re already genomic testing: Based on what happened in Canada, Australia, and other countries when new traits were added, you’ll likely get these calf health evaluations for free on all previously tested animals. That’s potentially thousands of animals with zero additional cost. You’d only pay for new animals going forward, and even then, the per-test cost shouldn’t increase.

If you’ve never genomic tested: That’s where the $40,000 figure comes from—testing your entire cow herd plus replacement heifers (roughly $40 per test for 1,000 animals), plus the premium for genetically superior semen (maybe $10-15 more per unit), and getting your data systems up to speed.

The smart middle ground: Start with just your replacement heifers. That’s maybe 450 animals at $40 each—$18,000instead of $40,000. You’ll still get valuable information for breeding decisions while keeping costs manageable.

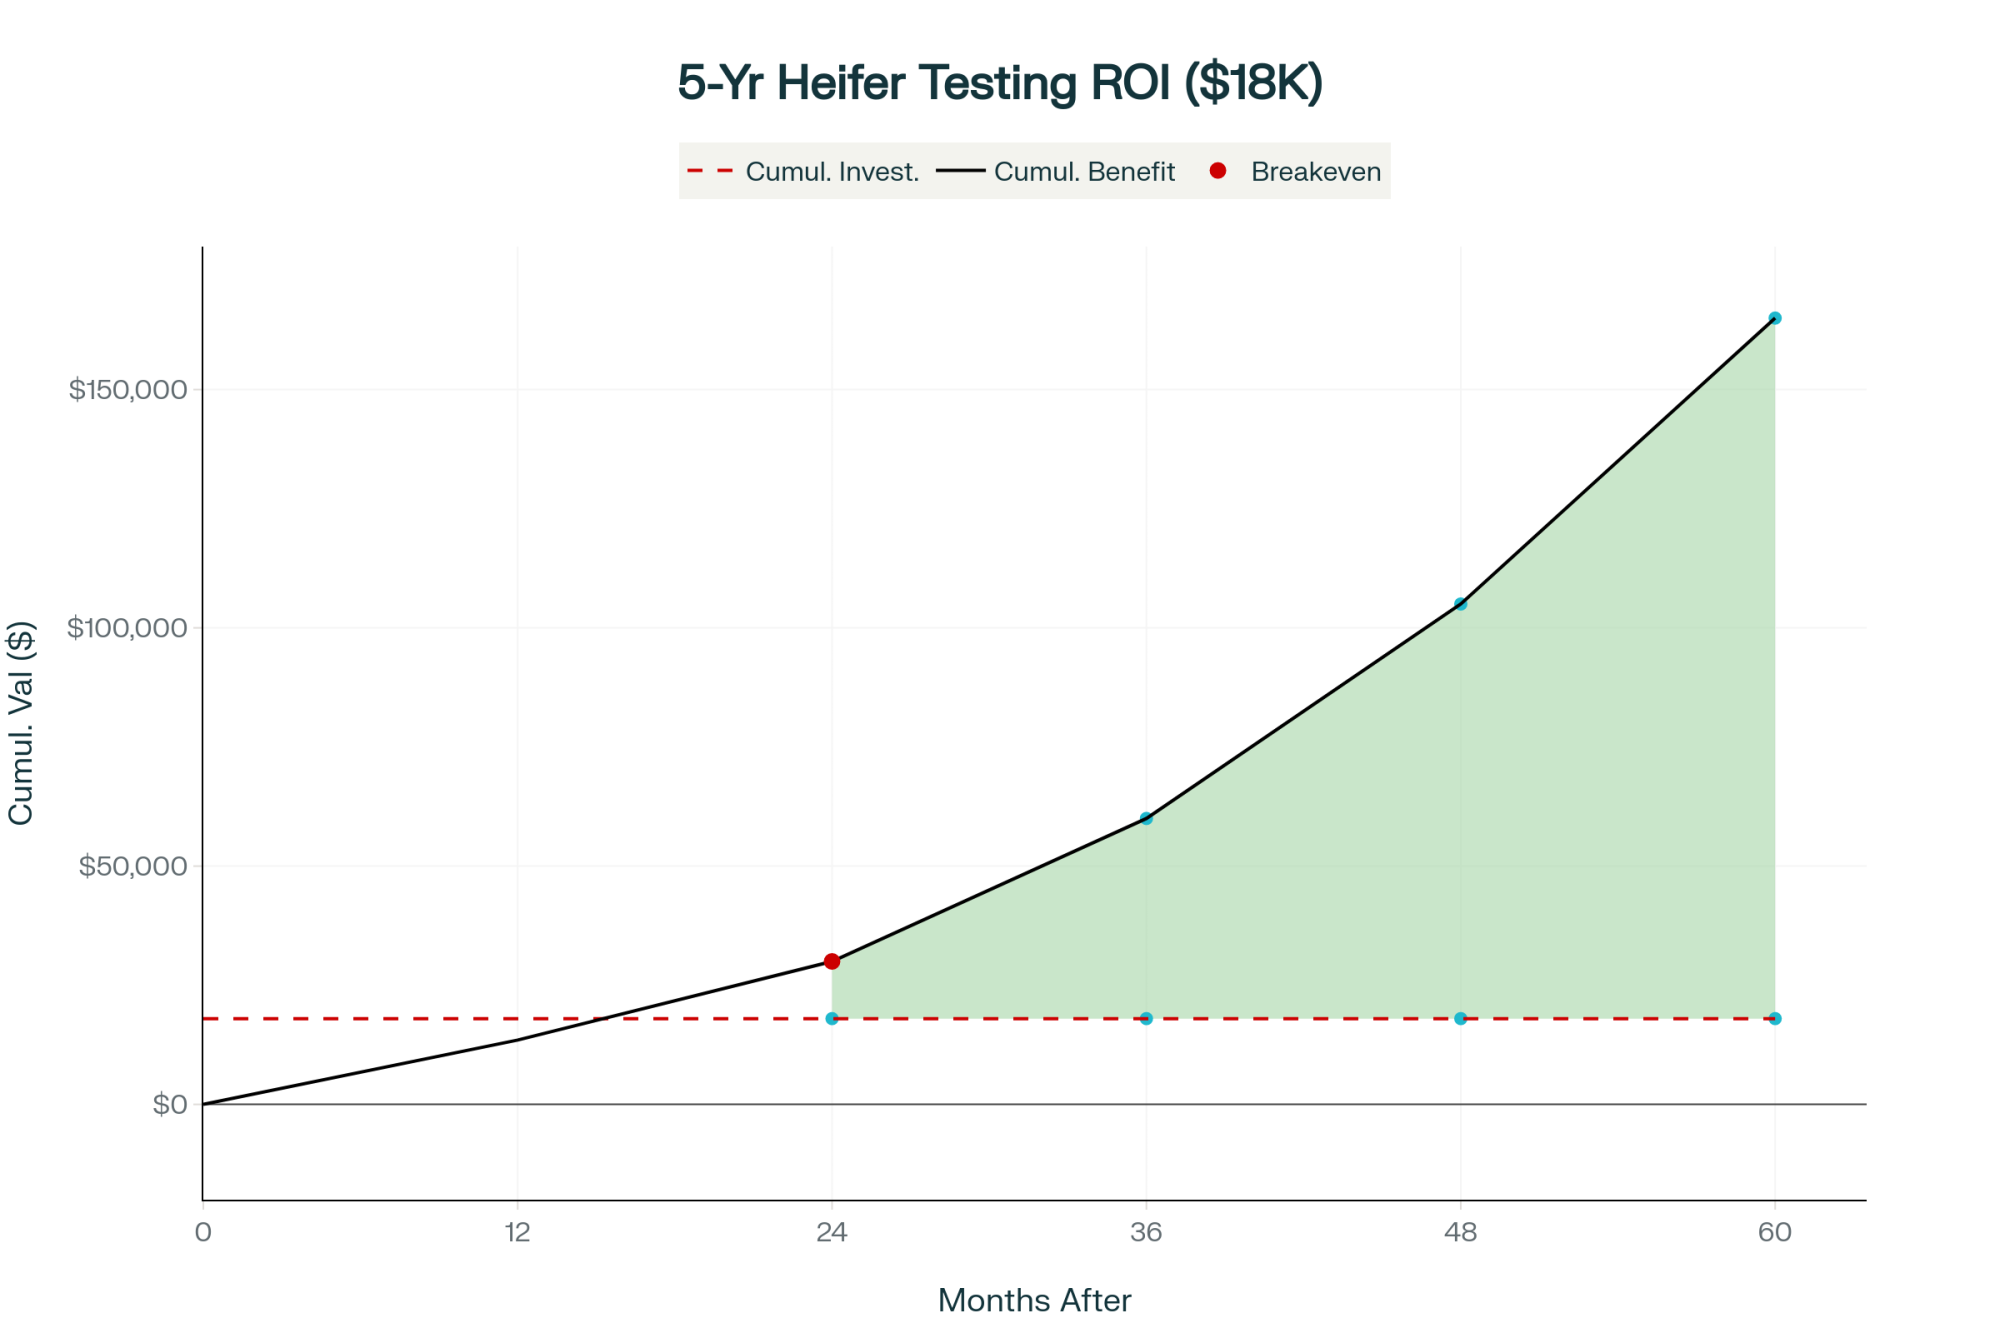
Here’s the reality check, though—and this is important—the first-year returns are modest regardless of your testing approach. Maybe $12,000 to $15,000 in reduced mortality and morbidity. You’re not breaking even until somewhere between 24 and 30 months if everything goes right. By year five, though, the modeling suggests annual benefits of around $60,000 with a pretty decent return on investment.

The Long Game Pays Off: While genomic calf health testing requires patience—hitting breakeven around 24-30 months—the compounding benefits reach $60K annually by year five as improved genetics permeate your herd. This assumes heifer-only testing strategy starting at $18K investment.

But—and this is a big but—these projections assume you’re already doing a decent job with management. If you’re at 3-4% mortality through solid protocols, genetic improvement might push you toward that elite 1-2% range. If you’re struggling at 8-10% mortality? Fix your management first. The genetics won’t overcome broken systems.

Smart Entry Strategies (You Don’t Need to Go All-In)

Here’s what many producers don’t realize: you have options beyond the all-or-nothing approach.

Option 1: The Free Ride
If you’ve been genomic testing for years, you’re sitting pretty. When April 2026 rolls around, all your historical data should automatically get calf health evaluations. No additional investment needed.

Option 2: Heifer-Only Testing
Never tested before? Start with your 450 replacement heifers. At $40 each, that’s $18,000—less than half the full-herd cost. You’ll get genetic information on your future cows and can make smarter sire selection decisions immediately.

Option 3: The Gradual Build
Test 100-150 animals per year. Spread the cost over 3-4 years while you validate whether the technology works in your herd. This approach costs $4,000-6,000 annually—much more manageable.

Option 4: Bulls Only
Just focus on selecting better sires using the published evaluations. Zero testing cost, though you won’t know which of your cows to breed to which bulls for optimal results.

The Zoetis Factor (Competition Already Exists)

Here’s something many producers don’t realize: we’re not waiting in a vacuum for CDCB’s launch. Zoetis has been selling wellness trait evaluations since 2016. Nearly a decade head start.

Their system draws from hundreds of thousands of health records and genotyped animals, based on research they’ve published in JDS (Vukasinovic et al., 2019). And from what I’m hearing from producers who use it—especially those larger operations in California and the upper Midwest—it works reasonably well. The wellness traits are already integrated into most AI stud catalogs, and the genomic prediction reliabilities are pretty solid for young animals.

Rosy Lane Holsteins 12-Month Study

Health MetricBottom 25% GeneticsTop 25% GeneticsImprovement
Scours Cases (per 100 calves)28 cases14 cases50% reduction
Pneumonia Cases (per 100 calves)44 cases30 cases32% reduction
Treatment Costs (per 100 calves)$4,200$2,100$2,100 saved
Overall Calf Mortality6.5%4.0%38% reduction

Based on Zoetis Calf Wellness Index data (similar methodology to CDCB)

So, where might CDCB have advantages? Well, they’re drawing from a broader population through the national database—we’re talking millions of genotypes from over 15,000 DHI herds. The methodology is transparent and peer-reviewed. And if you’re already on DHI, there’s no premium pricing.

Something that’s puzzling folks is the difference in heritability. Zoetis reports about 4.5 for scours, while CDCB shows 2.6. That’s not necessarily a contradiction—different statistical approaches, different populations, different ways of measuring. Both might work fine; they’re just looking through different lenses.

My guess? Both systems will coexist. Smart producers will probably compare them once CDCB launches. If the bull rankings correlate strongly, they’re telling you the same thing. If not… well, that’s when it gets interesting.

The Data Challenge Nobody Wants to Talk About

The Uncomfortable Truth: Only 12% of dairy farms contribute calf health data to genetic evaluations—and they’re mostly large, well-managed operations. This selection bias means CDCB’s predictions might not work as well for smaller dairies or different management systems. Know your risk before investing.

Here’s what really concerns me, and it’s barely mentioned: only about 12% of dairy farms systematically record calf health data, according to Canadian research (Renaud et al., 2023) that probably reflects our situation too. And those 12%? They tend to be the larger, better-managed operations that already have lower mortality.

This creates what’s called selection bias. The genetic evaluations end up being optimized for farms that look like the ones contributing data. So if you’re running a large operation with dedicated calf managers and automated systems, these predictions will probably work great. But what about smaller operations with different management styles? Or those grazing operations in Vermont compared to the freestall operations in Idaho?

What farmers are finding in states like Iowa and South Dakota is that their management systems—often smaller herds with different housing approaches—might not match what’s in the database. That’s a real concern.

What’s more, you need to actively authorize your Dairy Records Processing Center to transmit health data to CDCB using Format 6. No permission, no data contribution. And if farms like yours aren’t contributing data, the evaluations might not predict well in your environment. It’s a bit of a catch-22.

From conversations with DRPC folks, participation is growing but still lower than ideal. We need more farms sharing data before these evaluations become truly representative of the industry as a whole.

How to Know If It’s Actually Working

If you’re thinking about jumping in, you need concrete checkpoints. Here’s what I’d be watching:

Around 12-18 months after you start (late 2027), compare disease rates between calves from your top genetic sires versus your average ones. You should see the better genetics showing noticeably lower disease—maybe 20-30% lower—once you’ve got enough calves to compare. If you don’t see that difference, the evaluations aren’t predicting right in your barn.

At 24-30 months, check your financials. If you’re still deep in the red, it might be time to reconsider. Also, watch for unexpected issues—are those “healthier” calves growing slower? Birth weights creeping up? I’ve seen this with other traits where unexpected correlations pop up after a few generations.

By 36-42 months, your first heifers from high-health sires are entering the milking string. If their production is way below genetic predictions or fertility is tanking, you might be seeing those dreaded antagonistic correlations emerging.

The kicker is that all this requires obsessive record keeping. If you can’t document every health event consistently—including the healthy calves—you’ll never know if it’s working. And let’s be honest, that’s a challenge for a lot of us.

A Practical Approach to Implementation

Based on what I’ve learned from producers who’ve adopted genomics for other traits, here’s what makes sense:

Right now, through April 2026, take an honest look at your situation. Can your team consistently record health data? Is management or genetics your bigger constraint? Either way, start recording health data now—you’ll need that baseline. And call your DRPC to get the Format 6 data transmission authorized. Ask specifically about fields like “calf health event,” “treatment date,” and “disease code”—those are the critical ones.

If you’re already genomic testing: Relax. You’re likely getting these evaluations for free on all your tested animals. Focus on understanding how to use the new information effectively.

If you’ve never tested: Consider starting with just your heifers. It’s a $18,000 investment instead of $40,000, and you’ll learn whether this technology works for you before going all-in.

When April 2026 rolls around, don’t go all-in with your breeding decisions either. Start with maybe 20-30% of your breedings using top calf health sires. Keep detailed records. See if performance matches predictions. And stick with proven bulls with decent reliabilities—this isn’t the time to gamble on unproven young sires with reliabilities under 50%.

By the end of 2027, you’ll have enough data to make a decision. Seeing good improvement and approaching breakeven? Expand to more of your breedings. Mixed results? Stay conservative. No improvement or weird trade-offs? Maybe redirect that investment to management improvements.

The Bigger Industry Picture

What we’re seeing goes beyond just another trait to select for. Based on how genetic trends have evolved since genomic selection became available in 2009, this technology might widen the gap between large and small operations.

Research tracking genetic progress over the past couple of decades shows that large herds (over 500 cows) have achieved significantly faster improvement than small herds (under 100 cows) since the advent of genomics. The genetic merit gap has actually widened, not narrowed.

The same dynamics will probably play out here. Operations in Wisconsin’s Central Sands region, with their large-scale calf-raising facilities, will likely benefit more than small grazing operations in Vermont’s Northeast Kingdom. Down in Texas and New Mexico, those big dairies with automated calf feeding systems are positioned differently than the traditional tie-stall barns still common in parts of Pennsylvania and New York’s North Country.

Looking at this trend more broadly, what’s happening in the Midwest—particularly in states like Michigan and Ohio, where you’ve got a mix of farm sizes—might be most telling. The mid-sized operations (300-800 cows) are the ones really wrestling with whether this technology makes sense for them.

It’s not that the technology is biased—it’s that successful implementation requires resources that aren’t equally distributed. But here’s the silver lining: if you’re already genomic testing, you’re not at a resource disadvantage for this new trait.

Three Key Questions for Your DRPC

Before making any decisions, here’s what to ask at your next DRPC meeting:

First, what percentage of herds in your region are contributing health data? If it’s below 20%, the evaluations might not accurately reflect your management system.

Second, can they show you how CDCB and Zoetis rankings compare for bulls you’re currently using? This tells you whether the systems agree or if you’re looking at conflicting information.

Third, what’s the actual process and cost for setting up data transmission from your herd management software? Some systems need upgrades—better to know upfront. DairyComp 305 users might need different modules than PCDART folks, for instance.

And here’s the new critical question: If I’m already genomic testing, will my historical tests automatically get calf health evaluations in April 2026? Get this in writing.

The Bottom Line for Your Operation

After digging through all this, here’s my take:

If your mortality is over 5%, focus on management first. Whether genomic testing costs you nothing or $40,000, it won’t fix broken protocols.

If you’re at 3-4% mortality, you’re in the sweet spot. If you’re already genomic testing, you’ll get free evaluations to work with. If not, start with heifer testing at $18,000 to validate the technology.

If you’re already under 3%, you’re bumping against biological limits. These evaluations might be exactly what you need to get to that elite level—and if you’re already testing, it’s free value.

What concerns me is how much your success depends on other producers’ data. It’s a collective challenge that individual farms can’t solve alone. And remember—genetic selection and good management work together. They’re not either/or propositions.

At current replacement prices, we can’t afford historical mortality rates. These genomic tools offer one path forward, but only for operations positioned to use them effectively. The technology is real. Whether it revolutionizes your operation depends on matching these tools to your specific situation—and your cost of entry might be much lower than you think.

The economics are compelling if you get it right. But genomic selection can create problems as easily as it solves them if applied incorrectly. Take your time, validate carefully, and don’t let anyone convince you there’s a one-size-fits-all solution to something as complex as calf health.

What’s your take on all this? Are you planning to jump in early, or taking more of a wait-and-see approach? I’d be interested to hear what other producers are thinking as we head toward this launch. Send your thoughts to editorial@thebullvine.com—these conversations help us all make better decisions.

Key Takeaways

  • Your mortality rate dictates your path: Under 3% = invest in genomics | 3-4% = test cautiously | Over 5% = fix management first—any investment is wasted on broken basics
  • The real cost varies wildly: Free for existing genomic testers based on international precedent | $18,000 for heifer-only testing | Up to $40,000 for full-herd startup
  • Data bias could sink you: Only 12% of farms (mostly large operations) contribute health data, meaning these predictions might fail in your specific environment
  • Start smart, not big: Test heifers only ($18,000) or use free evaluations on existing tests, validate for 18 months, then decide whether to expand

Executive Summary: 

Your sick calves drain $350,000 annually, but April 2026’s genomic fix isn’t a silver bullet. CDCB’s new calf health evaluations could cost you nothing if you’re already genomic testing (based on precedent from other countries), or up to $40,000 if starting from scratch—farms above 5% mortality should invest in basics first regardless. The genetics target scours and respiratory disease with modest heritabilities of 2.6 percent and 2.2 percent, meaning gradual multi-generational progress, not instant transformation. Here’s the catch: only 12% of farms share health data, so predictions favor large operations and may not work for your specific system. With Zoetis already dominating this space since 2016, producers must choose between competing evaluations while validating what actually works in their barns. Bottom line: this technology amplifies excellent management but won’t salvage broken protocols—know which category you’re in before writing any check.

Complete references and supporting documentation are available upon request by contacting the editorial team at editor@thebullvine.com.

Learn More:

The Sunday Read Dairy Professionals Don’t Skip.

Every week, thousands of producers, breeders, and industry insiders open Bullvine Weekly for genetics insights, market shifts, and profit strategies they won’t find anywhere else. One email. Five minutes. Smarter decisions all week.
NewsSubscribe
First
Last
Consent

Your Genetics Rep Has Bad News – But Won’t Tell You Until January

Your genetics supplier might not exist in 12 months. Here’s why

You recall the conversation with your genetics representative about two-year contracts at “special pricing”? Those field service delays that keep cropping up?

There’s a bigger story here, and honestly, it caught me off guard, too.

What farmers are discovering is that the global genetics market just shifted in ways we haven’t seen before. The Eurasian Economic Commission’s October report dropped a bombshell—Russia, Belarus, Kazakhstan, Armenia, and Kyrgyzstan cut their breeding animal imports by 64% between 2022 and 2024. Russia alone boosted domestic poultry breeding production by 9.1 million head while cutting imports by 70%.

These aren’t temporary adjustments, folks. These markets are gone.

I’ve been digging into this with producers across different regions, and what I’ve found is… the ripple effects are way bigger than anyone expected.

The Numbers Tell a Wild Story

So here’s what’s interesting. Examining the National Association of Animal Breeders’ latest 2024 data, something doesn’t add up at first. Total U.S. bovine semen sales actually grew 4%, hitting nearly 69 million units. That’s a comeback after two years sliding backward.

But dig deeper—dairy exports reached 30.8 million units, up 5% from 2023, with a record value of $326 million according to NAAB’s March report. China’s still buying big, Brazil’s second, but companies are scrambling. They’re expanding into Western Europe, Central Asia, the Middle East… essentially anywhere to replace their Eastern European business.

And get this—gender-selected dairy semen jumped 18% to 9.9 million units, while beef-on-dairy hit 7.9 million units. Here’s the connection most folks are missing: The loss of volume in Eastern markets is forcing genetics companies to chase premium domestic sales, which—combined with record-high replacement costs—has created a perfect storm. We’re seeing semen price hikes and a surge in sexed semen demand because, let’s face it, producers can’t afford mistakes at these heifer prices.

The $4,000 Heifer Reality

Your replacement heifers now cost more than a new pickup truck – and the pain is just beginning

I nearly spit out my coffee when I saw the July USDA numbers. Dairy replacements averaged $3,010 per head. You probably know this already, but back in April 2019? We paid $1,140. That’s nearly triple in six years.

But those are just averages. California and Minnesota auction reports from August show quality heifers bringing over $4,000. Four grand for a heifer that hasn’t even freshened yet!

Think about what that means for your breeding program… every straw matters now. Every conception counts. No wonder sexed semen sales are exploding, even with the premium pricing.

How Companies Are Scrambling

Let me share what’s happening with genetics companies—because as many of us have seen, their moves directly affect our breeding decisions.

Select Sires and STgen announced their intent to combine back in August 2023. They signed a letter of intent to create a new company that’ll combine production and R&D while maintaining independent sales networks. The companies stated that they’re working through regulatory approvals, although the current status is not entirely clear. What’s worth noting is this isn’t your typical business combination—it’s STgen’s sexed semen technology meeting Select’s distribution network.

Alta Genetics (URUS) made a significant investment in international markets. When URUS bought Genex in 2020, that was the canary in the coal mine. Industry observers suggest their international focus could be challenging with these market shifts—and that makes sense when you think about it. I’m hearing from Midwest producers that Alta service territories are already being restructured.

STgen built their business around sexed semen technology and premium pricing. They focused on innovation over volume, which… honestly, seems to be paying off now.

ABS Global—owned by Genus plc since ’99—has been pushing what they call an “industrial genetics model.” Basically, treating dairy more like their pig and poultry operations. But you and I both know dairy doesn’t work that way. We manage individual cows, not pens. With markets shrinking, their high-volume approach faces new challenges. Several California producers mentioned they’re seeing fewer ABS reps lately.

Your Monthly Genetics Bill Is About to Get Interesting

Here’s where global disruption hits your checkbook. Industry reports suggest premium Holstein semen prices have been climbing steadily. What cost in the mid-thirties to mid-forties per dose eighteen months ago? Many producers are now seeing upper forties to low fifties. Top genomic bulls? Some markets report prices of $60 to $75 per dose.

Add sexed semen—generally running another fifteen to twenty bucks per dose, depending on your supplier. A 500-cow operation utilizing enhanced genetics could easily see breeding costs increase by thousands of dollars annually. The exact amount depends on your program, but… we’re talking serious money here.

And if that Select-STgen combination goes through? The worldwide battle will become even more deadly.

What Other Regions Figured Out (That We Didn’t)

The Journal of Dairy Science has published fascinating research on Brazilian Gyr cattle, which maintain production when Holsteins struggle with heat stress. What’s encouraging is that Australia’s DataGene introduced genomic breeding values for heat tolerance back in 2017. They saw climate change coming and took action.

Now, I’m not saying dump your Holsteins—that’d be crazy. But while we chased production records, others developed solutions for real-world challenges. There’s something to learn there.

90-Day Action Plan

Weeks 1-2: Know Your Supplier

  • Evaluate their technology position (proprietary vs. distribution)
  • Check international exposure and market focus
  • Assess financial stability indicators

Weeks 3-4: Do the Math

  • Calculate true breeding costs, including replacements
  • Factor in potential market changes
  • Build scenarios for different pricing levels

Month 2: Find Your Tribe

  • Contact neighbors about buying groups
  • Explore state dairy association programs
  • Pool for 10,000+ dose volume discounts

Month 2-3: Lock It Down (Carefully)

  • Negotiate while companies need cash flow
  • Prioritize technology and stability over price
  • Consider 18-36 month contracts

Month 3: Tech Up

  • Evaluate automated heat detection (18-24 month ROI)
  • Reduce dependence on external service
  • Build on-farm breeding capability

Regional Reality Check

This hits different depending on where you farm:

Wisconsin, California, Pennsylvania—you’ve got genetics infrastructure. Service will probably stay decent. These companies can’t afford to abandon major dairy regions.

Expansion areas, remote locations—brace yourself. Changes often show up there first. If service has always been marginal… well, time for Plan B.

Southern operations—here’s the silver lining. This disruption might accelerate heat tolerance research you’ve needed for years. I’m hearing increased interest in adapted genetics from producers dealing with heat stress, especially in Texas and Florida.

The Bottom Line

The genetics market we’ve known for decades just shifted fundamentally. That’s not pessimism—it’s reality. We’re watching the restructuring of how genetics gets developed, priced, and delivered. The Select-STgen combination, if it is approved, is likely just the beginning.

But here’s what thirty years in this industry taught me—dairy farmers adapt better than anyone when we understand what’s happening. And now you do.

Those waiting for “normal” to return? They’ll be waiting a long time. Those who recognize this shift and position accordingly? They’ll look back at this moment as when they secured a competitive advantage.

Your breeding decisions over the next few months matter more than usual. Not just which bulls you use, but which companies you bet your future on.

What you do with this information… that’s your call. But at least now you’re making it with eyes wide open.

Resources & Next Steps

Keep Learning

You’ll find NAAB market statistics and annual reports at naab-css.org, which is great for tracking trends. For those interested in heat tolerance research, the Journal of Dairy Science papers are a valuable resource.

Get Connected

Your state Extension dairy specialist offers free genetics strategy consultations—seriously, use them. They’re a great resource. Consider joining or forming a buying group through your state dairy association. Many Midwest producers report good results with this approach. Keep an eye on the Select-STgen combination for regulatory updates… it could change everything. And those ROI calculators at Penn State and Wisconsin Extension websites? They’re actually pretty helpful for running scenarios.

Share What You’re Seeing

The industry needs producers talking about these changes. Your insights could help another farm navigate this disruption. Connect with your regional dairy organizations or reach out through industry forums. We’re all in this together, after all.

KEY TAKEAWAYS: 

  • Your breeding program costs could increase by $12,000 annually starting in January.
  • Your genetics supplier might not exist in 2026—Alta’s restructuring, Select needs a merger to survive, ABS model failing
  • You have 90 days to act before January price explosions: smart producers locking contracts and forming buying groups NOW
  • The $100M question: Russia/China stopped buying genetics—guess who’s paying to fill that hole? (Hint: Check your mirror)
  • Your action plan: Evaluate supplier stability TODAY, join buying group THIS WEEK, lock contract THIS MONTH

EXECUTIVE SUMMARY: 

Your genetics rep has bad news they won’t share until January: Russia and five other nations stopped buying American genetics, creating a $100 million hole that YOU’RE filling through higher prices. With heifers at $3,010 (triple 2019) and beef and dairy calves at record prices, your breeding costs could jump $12,000 annually—and that’s before the Select-STgen merger reduces competition further. Alta’s restructuring after international losses, ABS is hemorrhaging market share, and three suppliers might not exist by 2026. Wisconsin producers pooling 10,000-dose orders are locking 15% discounts NOW, while those waiting will pay premium prices to fewer suppliers. Your 90-day action window: evaluate supplier stability, join buying groups, and lock contracts before this hidden disruption becomes your financial crisis.

Complete references and supporting documentation are available upon request by contacting the editorial team at editor@thebullvine.com.

Learn More:

  • Beef-on-Dairy: Real Talk on Turning Calves into Serious Profit – This guide reveals how to implement the strategic shift mentioned in the main article, providing a practical playbook for using sexed semen on top genetics and beef on the rest. Learn the financial sweet spot and how to net an extra $90,000 annually by transforming calf revenue.
  • Genetic Gatekeepers: The High-Stakes Gamble of Dairy’s Elite Bloodlines – Extends the market consolidation analysis by exposing the hidden $1 billion inbreeding tax caused by narrow genetics and restrictive contracts among the five major suppliers. It provides strategies for building genetic independence and reducing the $23 per cow loss from rising inbreeding.
  • The Digital Dairy: How Precision Agriculture is Redefining Farm Profitability – This article provides a strategic look at how technology mitigates market risk, detailing the ROI of precision agriculture and automated systems. It breaks down how data-driven tools, including health monitoring and feed efficiency, drive gains that buffer against the cost hikes discussed in the main piece.

The Sunday Read Dairy Professionals Don’t Skip.

Every week, thousands of producers, breeders, and industry insiders open Bullvine Weekly for genetics insights, market shifts, and profit strategies they won’t find anywhere else. One email. Five minutes. Smarter decisions all week.
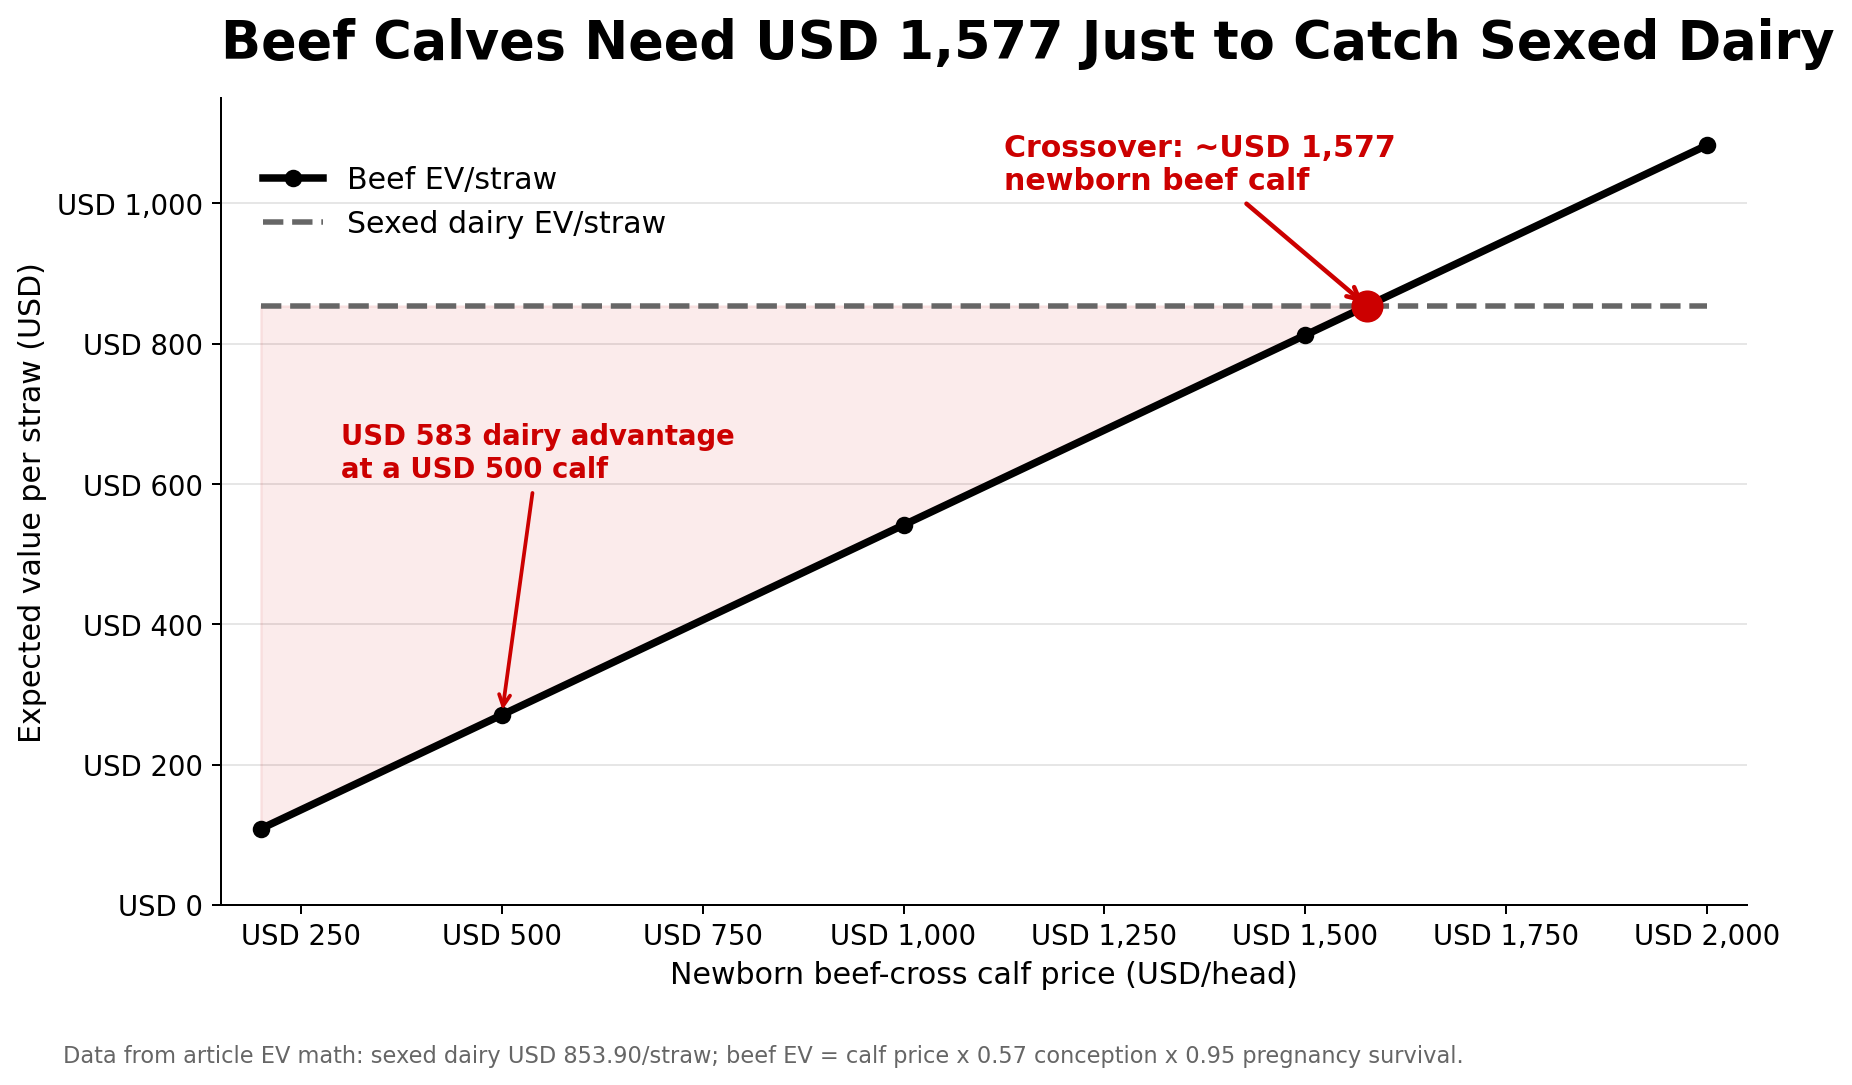
NewsSubscribe
First
Last
Consent

The $4,000 Heifer: Navigating America’s Worst Replacement Crisis in 47 Years

Ready to pay mortgage money for a springer? The heifer shortage is here, and it’s not going anywhere.

EXECUTIVE SUMMARY: The U.S. dairy replacement pipeline just hit the wall—we’re down to 3.914 million heifers, the lowest count since 1978. Meanwhile, $10 billion in new processing capacity is coming online, which will demand significantly more milk than we can currently supply. Here’s the kicker: replacement costs have more than doubled, and CoBank’s data shows we’ll lose another 800,000 heifers before any recovery starts in 2027. Farms that keep betting on cheaper replacements are playing with fire. The smart money’s on extending cow longevity by just one month to cut replacement needs by 2.8%—that’s $84 saved per cow annually at today’s prices. Add precision breeding with sexed semen (90% success rate beats the 50-50 gamble), and you’ve got a playbook that actually works. Based on USDA reports and university research, the farms implementing this three-pronged approach currently will own the market, while others struggle with yesterday’s math.

KEY TAKEAWAYS

  • Cut replacement costs 2.8% per extra month of cow longevity—focus on transition nutrition and repro management to save $84+ per cow annually while everyone else scrambles for expensive replacements
  • Deploy sexed semen strategically on your top 25% genetics—yes, it costs $15 more per straw, but that 90% female success rate beats conventional breeding’s coin flip when heifers cost $4,000+
  • Cash in on beef-cross calves from bottom-tier cows—those $1,000+ beef calves pay for your breeding program while you save dairy genetics for actual replacements
  • Budget $4,000+ per heifer through 2027—CoBank’s projections show no relief until then, so negotiate group purchases with neighbors and secure flexible credit lines now before cash flow gets tight
  • Start culling fewer cows immediately—operations reducing slaughter by 600,000+ head nationally are keeping milk flowing despite the heifer drought, and you need to join them before your competitors do
heifer replacement cost, dairy farm profitability, cow longevity, sexed semen strategy, dairy cattle prices

Walk into a cattle auction anywhere from Bakersfield to Green Bay these days and you’ll witness something that stings like a winter chill—springers hitting $4,200 or more. At a sale in Wisconsin last week, a seasoned dairyman shook his head, watching those prices climb. The young guy next to him just kept his paddle raised. “Either buy now or quit growing,” he said.

This isn’t just another bump in the road or a flash in the pan. The numbers don’t lie; this is a fundamental market reset.

The situation is stark: CoBank’s August 2025 report confirms we’re sitting with the smallest U.S. dairy replacement herd since 1978—3.914 million head as of January 2025. And with $10 billion being poured into new processing plants that demand milk through 2027, while heifer numbers continue to decline by another estimated 800,000 head, every dairy has to rethink its expansion and breeding strategy.

The numbers that change the game

Let’s break down the tough facts. USDA data shows an 18% drop in heifer inventories since 2018—from 4.77 million to just 3.914 million by early 2025. Looking even deeper, the number of heifers expected to calve this year is just 2.5 million—the lowest the USDA has seen in 24 years.

Prices? USDA’s July 2025 reports put the average replacement heifer at $3,010 nationwide—up a whopping 75% from April 2023. However, averages only tell half the story when premium springers are bringing $4,200 or more in Wisconsin or $4,500 or more in central California.

Consider a real-world example: an Eau Claire-area farm added 200 cows a few years ago, budgeting roughly $360K just for replacements. Today, that same addition would require more like $800K, and that’s without factoring in feed, labor, or facility costs.

CoBank doesn’t sugarcoat it—the forecast is for inventories to shrink even more over the next couple of years before any meaningful recovery in 2027.

How we dug this hole

Blame it on the beef market, if you will. When U.S. beef cattle numbers hit historic lows, beef-cross calves became a gold mine. Dairy farmers began breeding more bottom-tier animals to serve as beef sires, and as a result, calf prices soared while replacement heifer values lagged behind.

According to the National Association of Animal Breeders, dairy farmers snagged 7.9 million of the 9.7 million beef semen units sold in 2024—over 80% of all beef semen sales. That’s a far cry from just a few years ago, when beef semen was a small part of their breeding plan.

A good example comes from a Central Valley operation that increased its beef breeding from 20% of its herd in 2019 to nearly 65% by 2022, in an effort to chase calf revenue and stay afloat. Fast forward, and the farm grapples with a dwindling replacement herd and sky-high heifer prices.

The lesson? It wasn’t a conspiracy—it was a thousand individually smart but collectively expensive decisions. When everybody zigged into beef semen, the dairy replacement pipeline zagged.

The $10 billion squeeze: New plants demand milk that heifers aren’t here to make

Just when heifer numbers nose-dived, the industry bet big on new processing plants. Hilmar Cheese’s Dodge City facility is built to process approximately 8 million pounds of milk daily once fully operational. Chobani’s new Rome, NY, plant is targeting a massive 12 million pounds of production daily.

CoBank’s economist Corey Geiger puts it plainly: “Those plants need more milk and better components, especially butterfat and protein. To meet that demand, we need many more replacement heifers in the next few years than we have right now.”

Texas is feeling the heat especially hard. According to the Texas Dairy Association industry analysis, the state’s expanding processing capacity will require significant increases in regional milk supply, putting additional pressure on producers already dealing with tight heifer availability. However, with shrinking heifer inventories, finding those replacement animals is squeezing producers who are already juggling tight margins.

The new playbook: A three-pronged strategy for survival and growth

Prong 1: Master cow longevity

The farms weathering this storm best are pulling cow longevity into sharp focus. According to University of Wisconsin dairy management research, extending productive cow life significantly reduces annual replacement needs, with economic benefits of approximately $84 per cow per year in avoided replacement costs at current market prices.

For example, a dairy planning to add 800 cows might face an expansion cost soaring from $1.44 million in replacements five years ago to over $3.2 million today. Instead of scrapping growth plans, some farms are opting to keep more cows longer—raising the average productive life from 4.2 to 4.8 years and reducing replacement rates from 35% to 28% annually.

This strategy is catching on nationwide. Producers sent 611,600 fewer cows to slaughter than usual between late 2023 and mid-2025—a huge shift helping stabilize milk supply despite fewer heifers.

Prong 2: Leverage genetic horsepower

Many producers don’t realize we’ve been riding a genetics train that’s making the heifer shortage less painful than it could’ve been.

Since 2010, genetic improvement has accelerated, doubling the annual gains in Lifetime Net Merit from $40 to $ 80 per cow. Butterfat content climbed to 4.23% nationally in 2024—shattering decades-old ceilings. Protein jumped from 3.04% in 2004 to 3.29% in 2024.

USDA geneticist Paul VanRaden puts it simply: “A tenth-point bump in butterfat adds approximately $23 per cow per year at current component prices. Farms raising 850 cows just bumped their component premiums by close to $850 a month on the check.”

Prong 3: Execute a precision breeding strategy

Gender-sorted semen sales jumped 17.9% in 2024 to almost 10 million units, while conventional dairy semen slipped. The shift makes sense financially.

Dr. Jim Ferguson, Penn State Extension, notes: “Though sexed semen straws run $8-12 more and have slightly lower conception rates, the guaranteed outcome—90% female calves versus 50% conventional—makes them the most cost-effective heifer production strategy in today’s market.”

Here’s how a tiered breeding strategy looks in practice:

Quick Decision Matrix

Cow GroupStrategyStraw CostResult
Top 25% GeneticsGender-sorted semen$35-$4590% Heifer success
Middle 50%Conventional Dairy$20-$2550% Heifer success
Bottom 25%Premium Beef Sires$25-$30High-value beef calves

When can we expect relief?

CoBank’s modeling, considering 30 months from breeding to milking, shows that pressure will build through 2026, reaching a low point before a modest rebound begins in 2027.

Expect roughly 357,000 fewer fresh heifers in 2025 and 438,000 fewer in 2026. Recovery begins in 2027 as replacements bred in 2024 hit the milking herd, increasing numbers by about 285,000.

Regional winners and losers

Texas is building herds, while others are shrinking. The Lone Star State added 28,000 cows in early 2025 and benefits from lower land costs ($3,850/acre) than Wisconsin ($5,900/acre), along with fewer regulations to slow growth.

Wisconsin lost over 300 dairy farms in 2024, mostly smaller operations folding, but herd size overall stayed steady through consolidation.

In contrast, California’s environmental programs can add significant revenue for participating operations. LCFS credits can add $60-$75 per metric ton of CO2 reduced for qualifying dairies, and combined with renewable energy incentives, can add over $200 per cow annually to the check.

Regional Breakdown Table:

RegionLand Cost/AcreAvg Milk Price (July 2025)Regulation LevelKey Growth Driver / Challenge
Texas$3,850$19.20LowLower regulatory hurdles & land cost
Wisconsin$5,900$18.80MediumHigh land costs challenge consolidation
California$8,200$20.40HighLCFS credits & high milk price vs. strict regulation

What you can do today

Here’s a simple checklist to get you ready:

  • Calculate your replacement cost (likely well over $4,000 per heifer).
  • Segment your herd: Use sexed semen on your top cows and breed the rest to beef sires.
  • Focus on cow longevity: Nail transition cow nutrition, hoof care, and repro management.
  • Explore cooperative heifer-sharing or custom raising to spread risk.
  • Protect cash flow: Budget for longer-term heifer contracts and consider mortality insurance.

An important co-benefit

Fewer replacements mean fewer emissions. Cornell research shows cutting heifer numbers reduces methane emissions by over 12%. Meanwhile, keeping cows longer results in lower emissions per pound of milk, thanks to improved feed efficiency.

The Bottom Line

The $4,000 heifer isn’t a blip. It’s a full reset of dairy economics. If you’re waiting for prices to drop, you’re playing a dangerous game.

Get your cow longevity right, embrace precision breeding, and budget like replacements cost $4,000. The processors betting billions on increased milk production by 2027 aren’t waiting around.

Your breeding decisions today will have a significant impact on your milk situation in three years. It’s time to get serious.

Complete references and supporting documentation are available upon request by contacting the editorial team at editor@thebullvine.com.

Learn More:

The Sunday Read Dairy Professionals Don’t Skip.

Every week, thousands of producers, breeders, and industry insiders open Bullvine Weekly for genetics insights, market shifts, and profit strategies they won’t find anywhere else. One email. Five minutes. Smarter decisions all week.
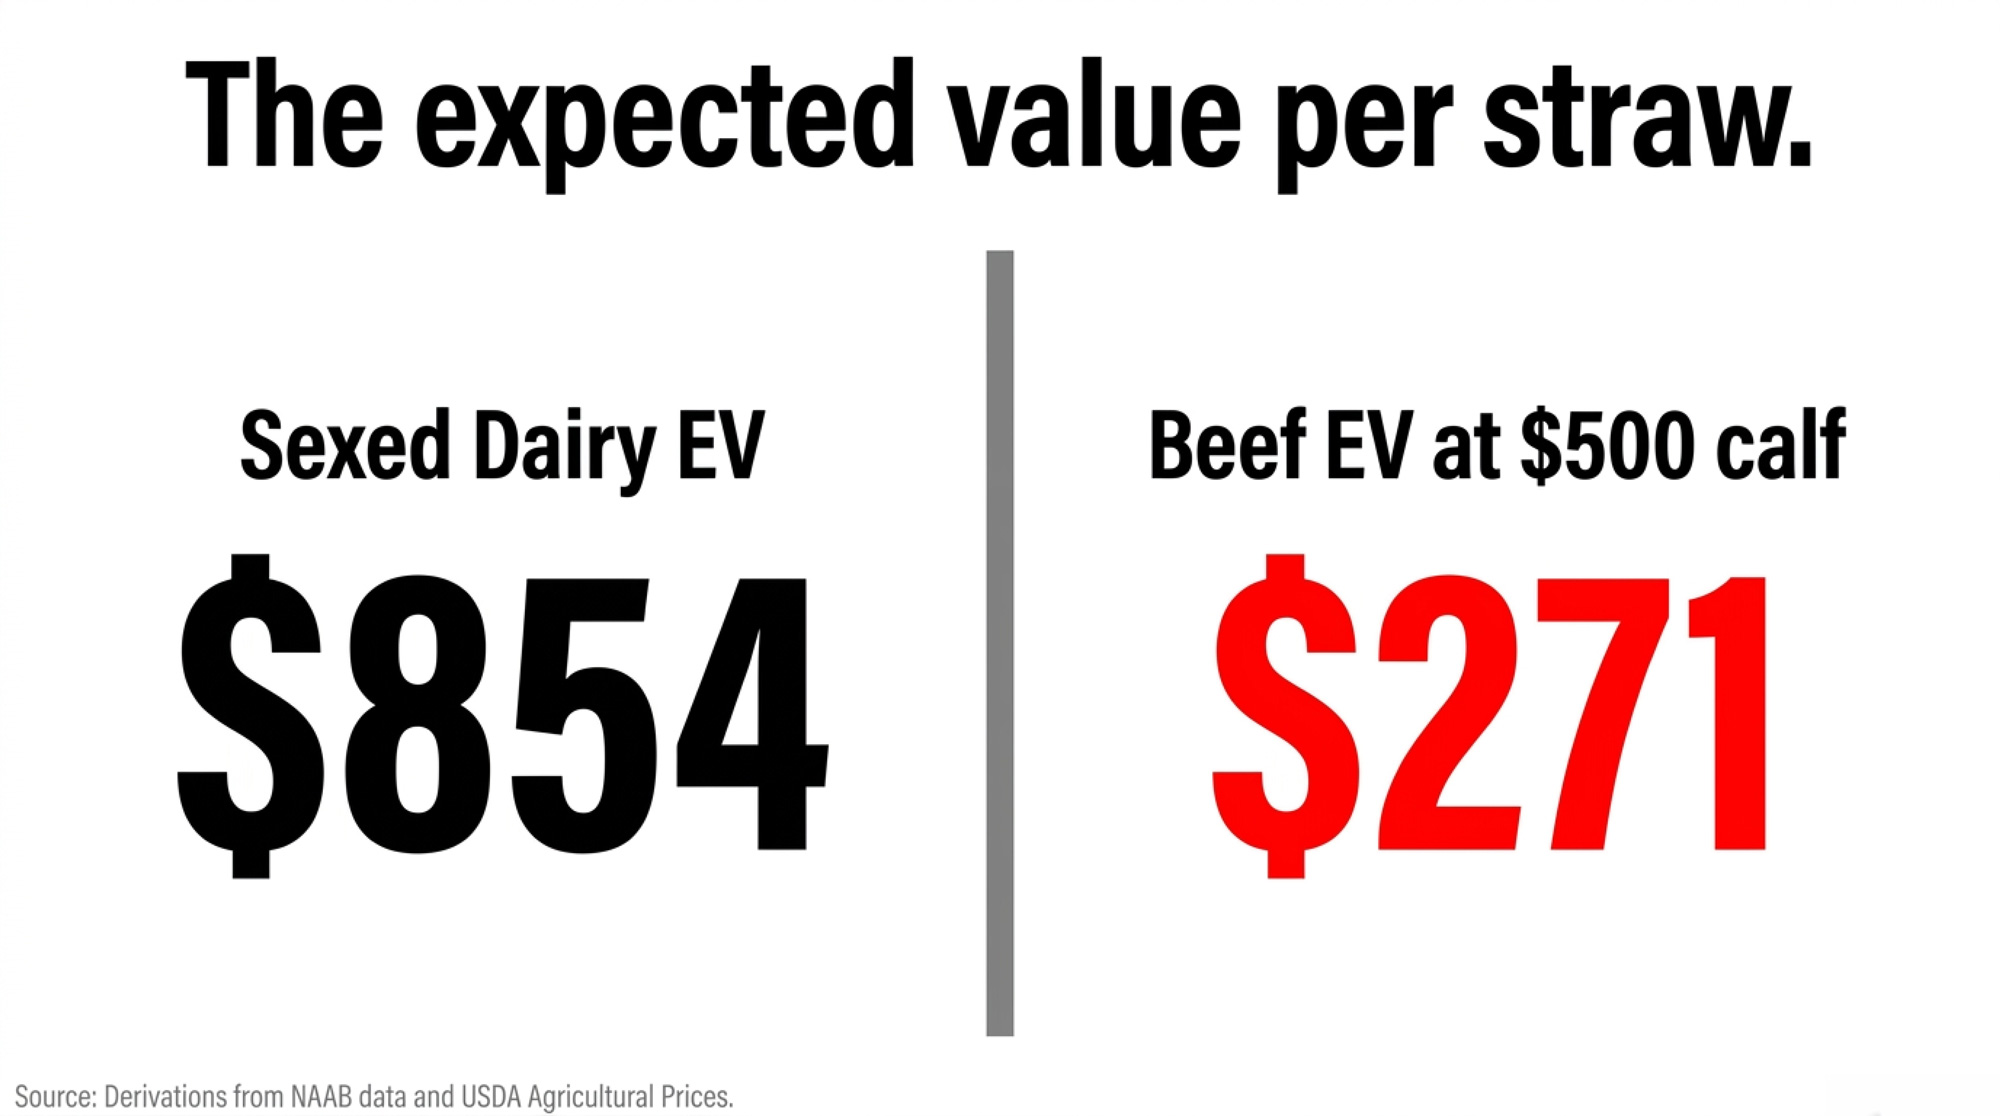
NewsSubscribe
First
Last
Consent
Send this to a friend