Archive for dairy heifer prices

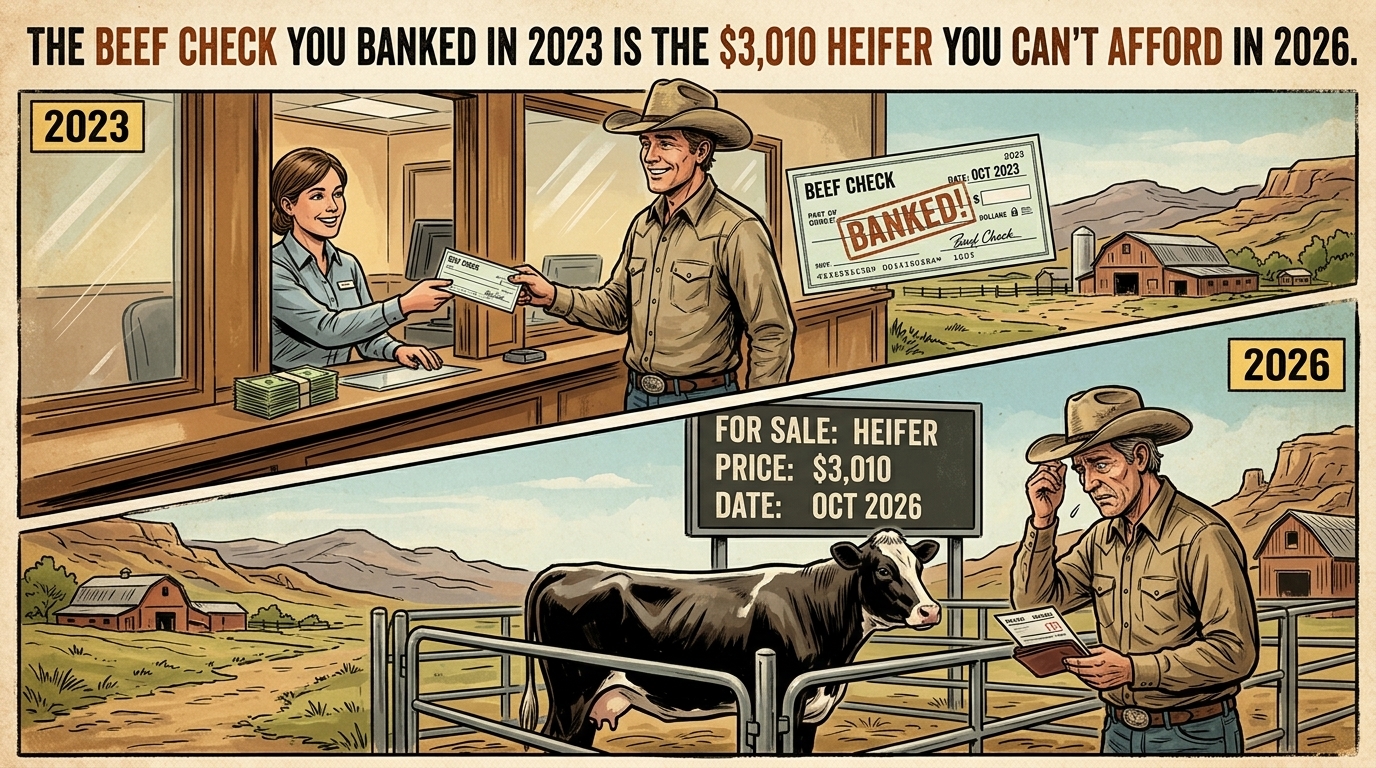
The Beef Check You Banked in 2023 Is the $3,010 Heifer You Can’t Afford in 2026

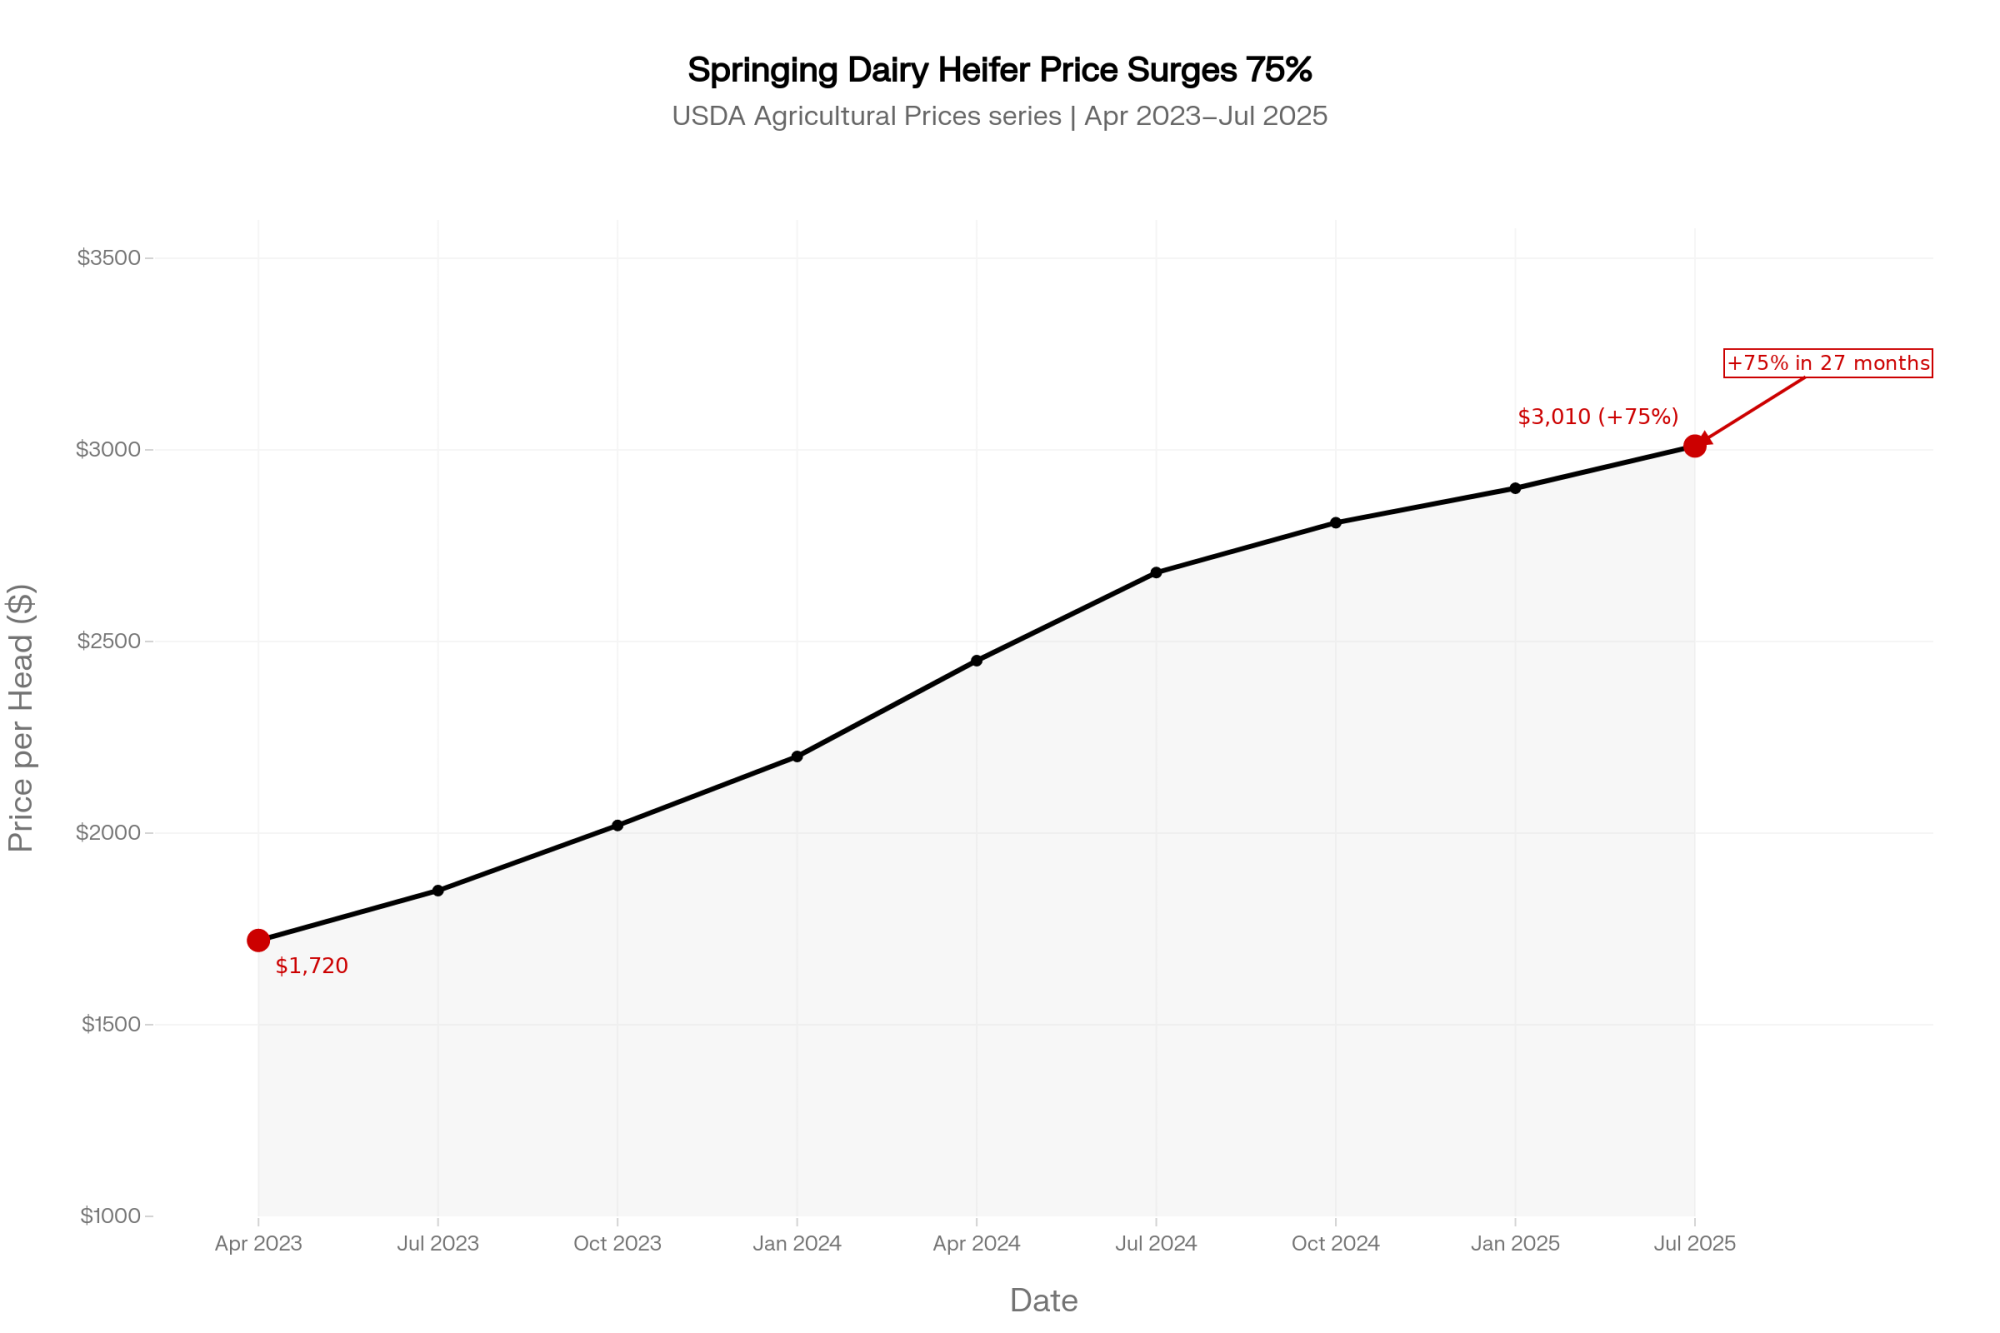
A day-old beef calf paid you a few hundred bucks in 2023. The dairy heifer it replaced now runs $3,010 — up 75% in 27 months. CoBank’s Corey Geiger says that spread decides who’s still milking in 2030.

Executive Summary: A springing dairy heifer went from $1,720 in April 2023 to $3,010 by July 2025 — a 75% jump in 27 months, per USDA’s Agricultural Prices series — and CoBank’s Corey Geiger reads that number as the signal for which mid-size herds still own their cows in 2030. The squeeze hits 250-to-600-cow operations hardest, because the replacement inventory sits at 3,914,300 head, the lowest since 1978, and there’s no cheap way to refill the pipeline. Here’s the trap: that beef-on-dairy check you banked was never free money — every beef service on a viable dam trades away roughly $585 in replacement value, and a beef calf has to clear $1,580 to match a sexed-dairy pregnancy on the same cow. Run it on a representative 500-cow Panhandle herd needing 135 replacements a year, and the price jump alone adds $174,150 to $307,800 annually — an extra $1.74 to $3.08/cwt on 100,000 cwt shipped, before you touch the interest on financing them. With Class III stuck at $14–$16/cwt through early 2026 against a mid-size breakeven near $21/cwt, that added replacement load is the difference between tight-but-surviving and your lender running the numbers before you do. The herds getting sorted out aren’t the smallest — they’re the ones running volume economics with value-farm overhead and no plan to hold DSCR above 1.0 into 2028. The full piece runs the barn math and a 30/90/365 playbook, including the $1,580 crossover that should govern every beef breeding you book this season.
dairy heifer prices

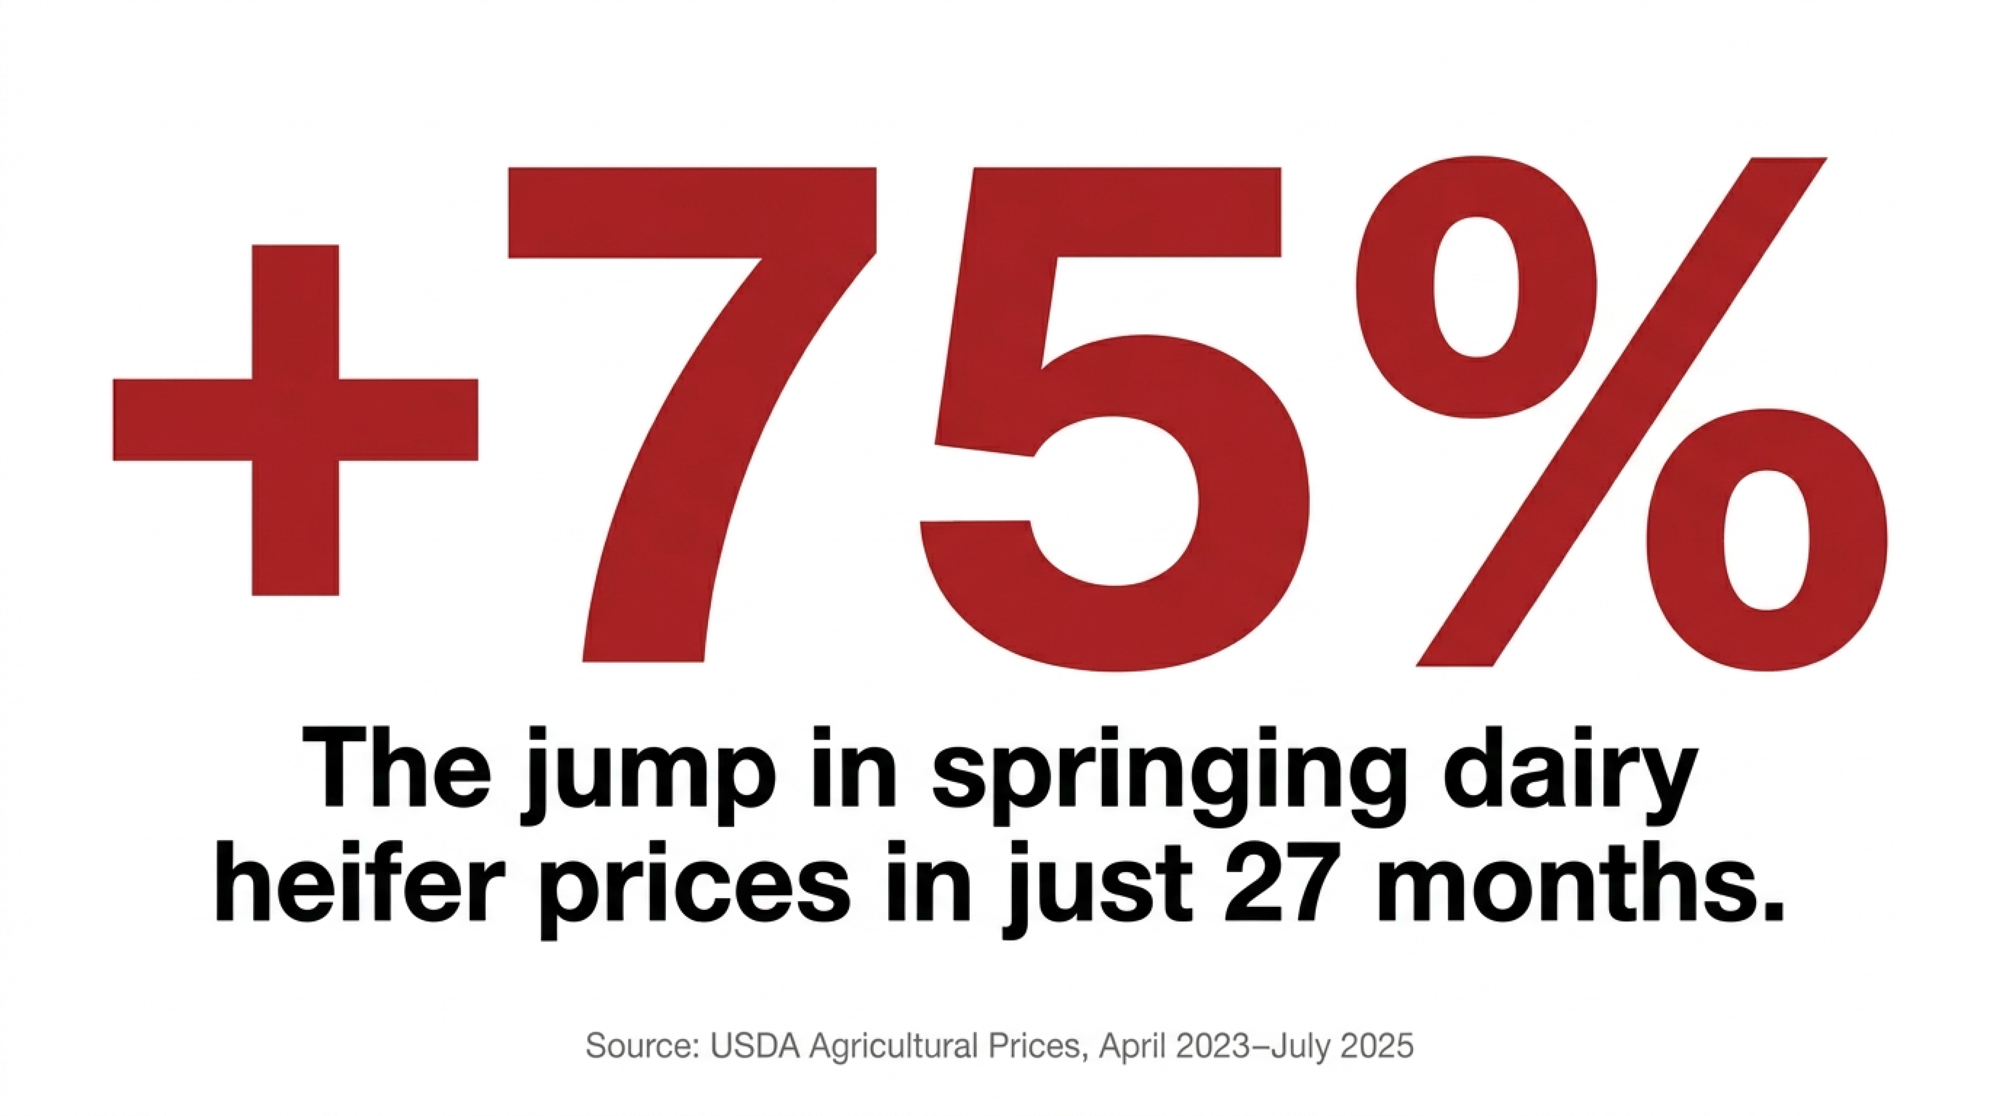
In April 2023, a springing dairy heifer ran $1,720 a head on USDA’s Agricultural Prices series. By July 2025, that same animal cost $3,010 on the same series — a 75% jump in 27 months — and premium springers were fetching $4,000 to $4,500-plus at California sale barns. CoBank dairy economist Corey Geiger’s reports keep returning to that move, because it’s the dairy heifer price in 2026 that decides which mid-size herds still own their cows in 2030 — and which ones quietly get sorted out. The beef-on-dairy math that looked smart in 2022 is sending the biology bill now, and it’s landing hardest on the 250-to-600-cow operations least able to absorb it.
This isn’t expansion. It’s a sort.

What’s Actually Behind the Record-Milk Headline

Start with the dashboard everyone’s reading off. According to the USDA NASS Milk Production report released in February 2026, U.S. milk production hit 232 billion pounds last year — a 2.6% climb over 2024. The milk-cow herd ran near 9.6 million head in early 2026, the largest in roughly three decades. Per-cow output keeps grinding higher. Every light on that row reads green.
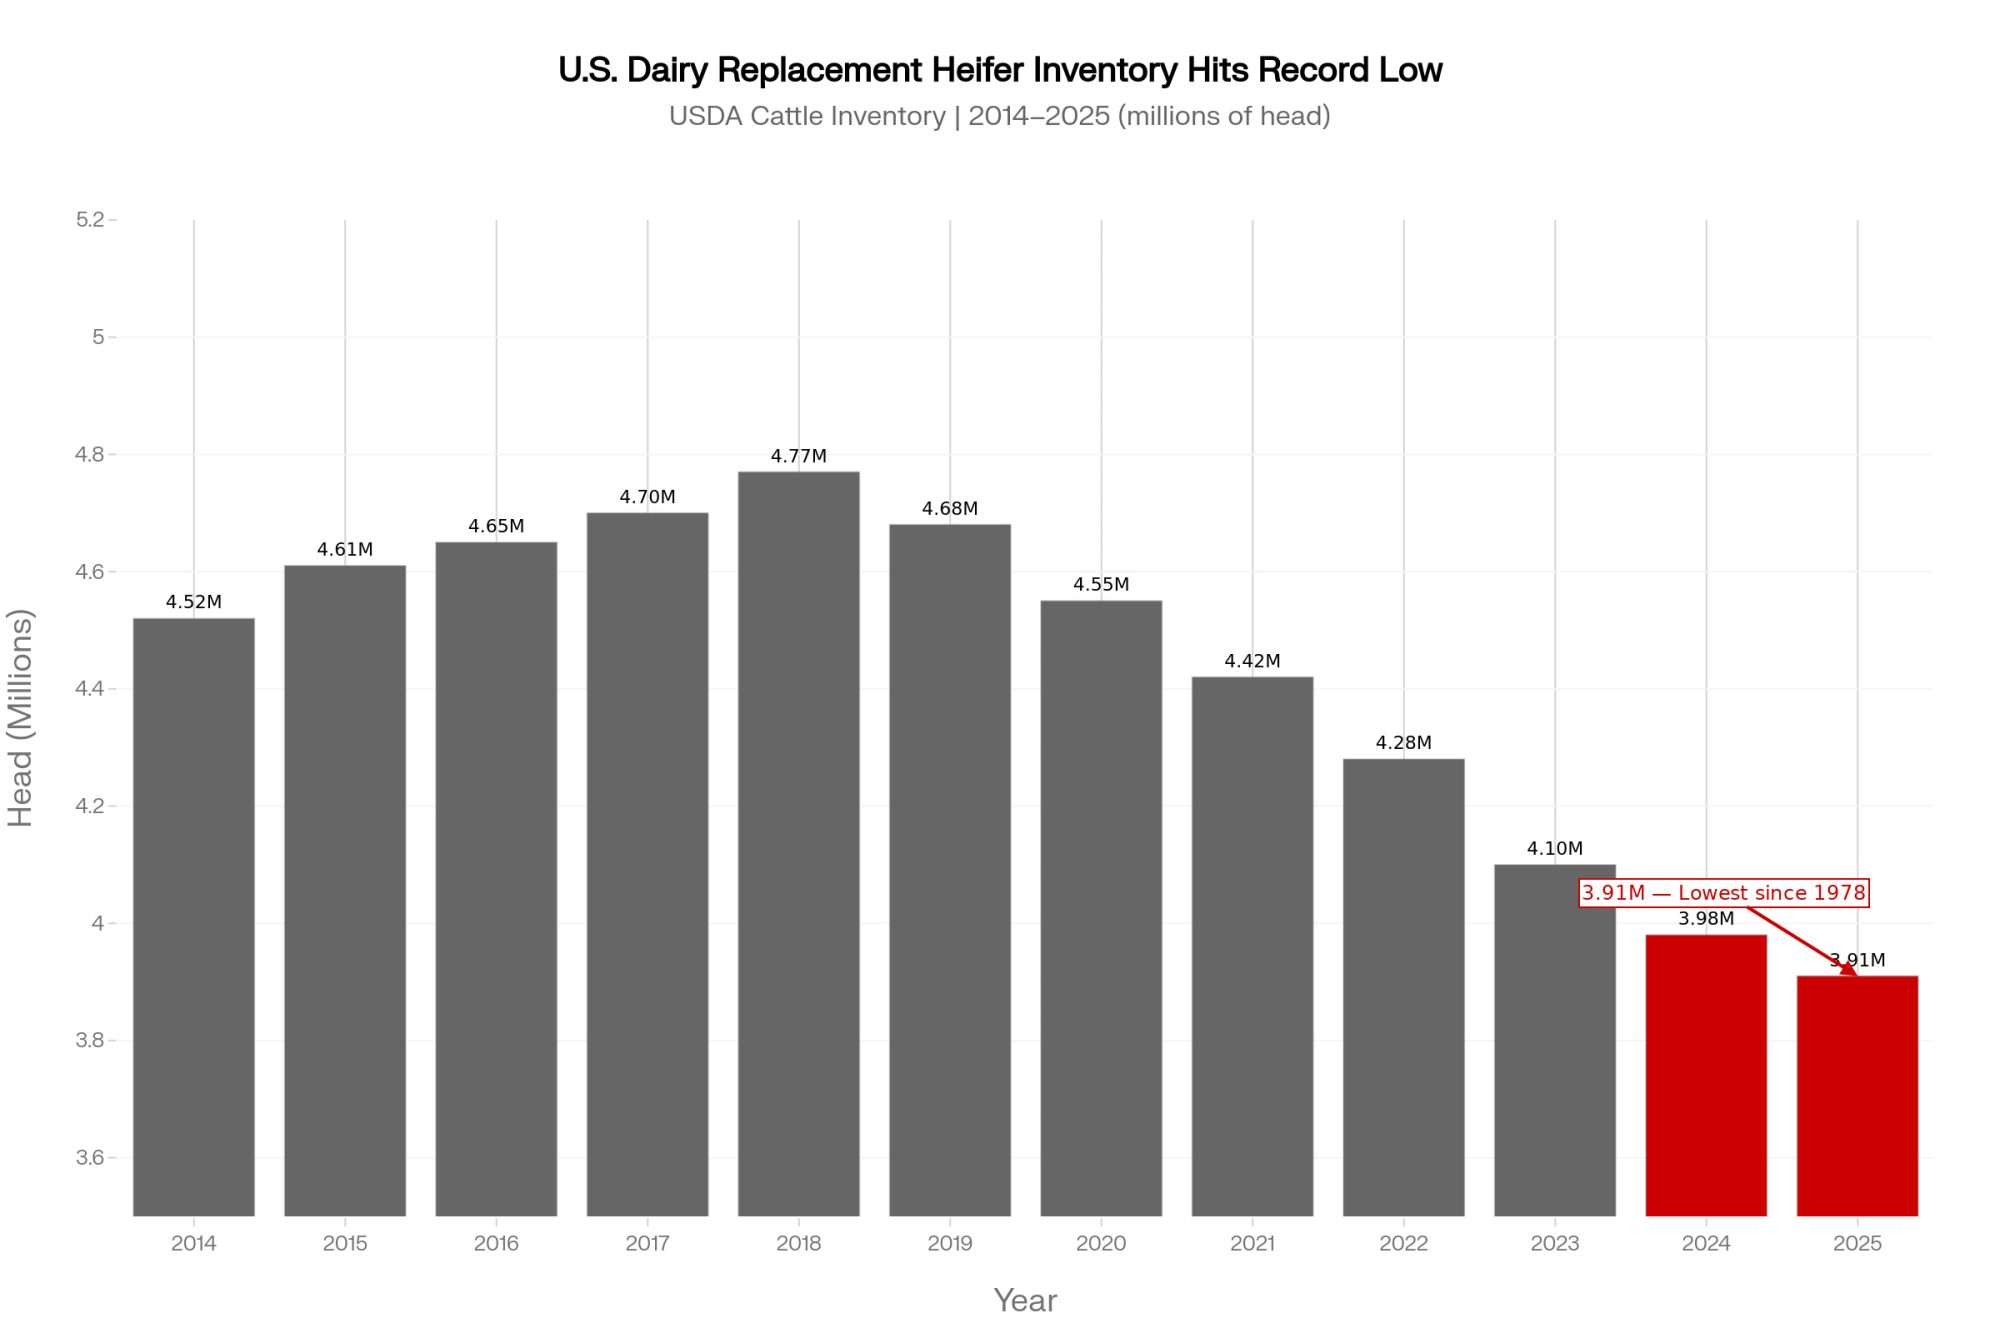
Drop down one row. USDA’s Cattle inventory report, out at the end of January 2025, counted just 3,914,300 dairy replacement heifers — the fewest since 1978, and about 18% below the 4.77 million head on hand in 2018. Dairy cow slaughter totaled near 2.53 million head through 2025, a decade low, suggesting producers held onto older cows rather than culling them, per the American Farm Bureau’s January 2026 Market Intel analysis.

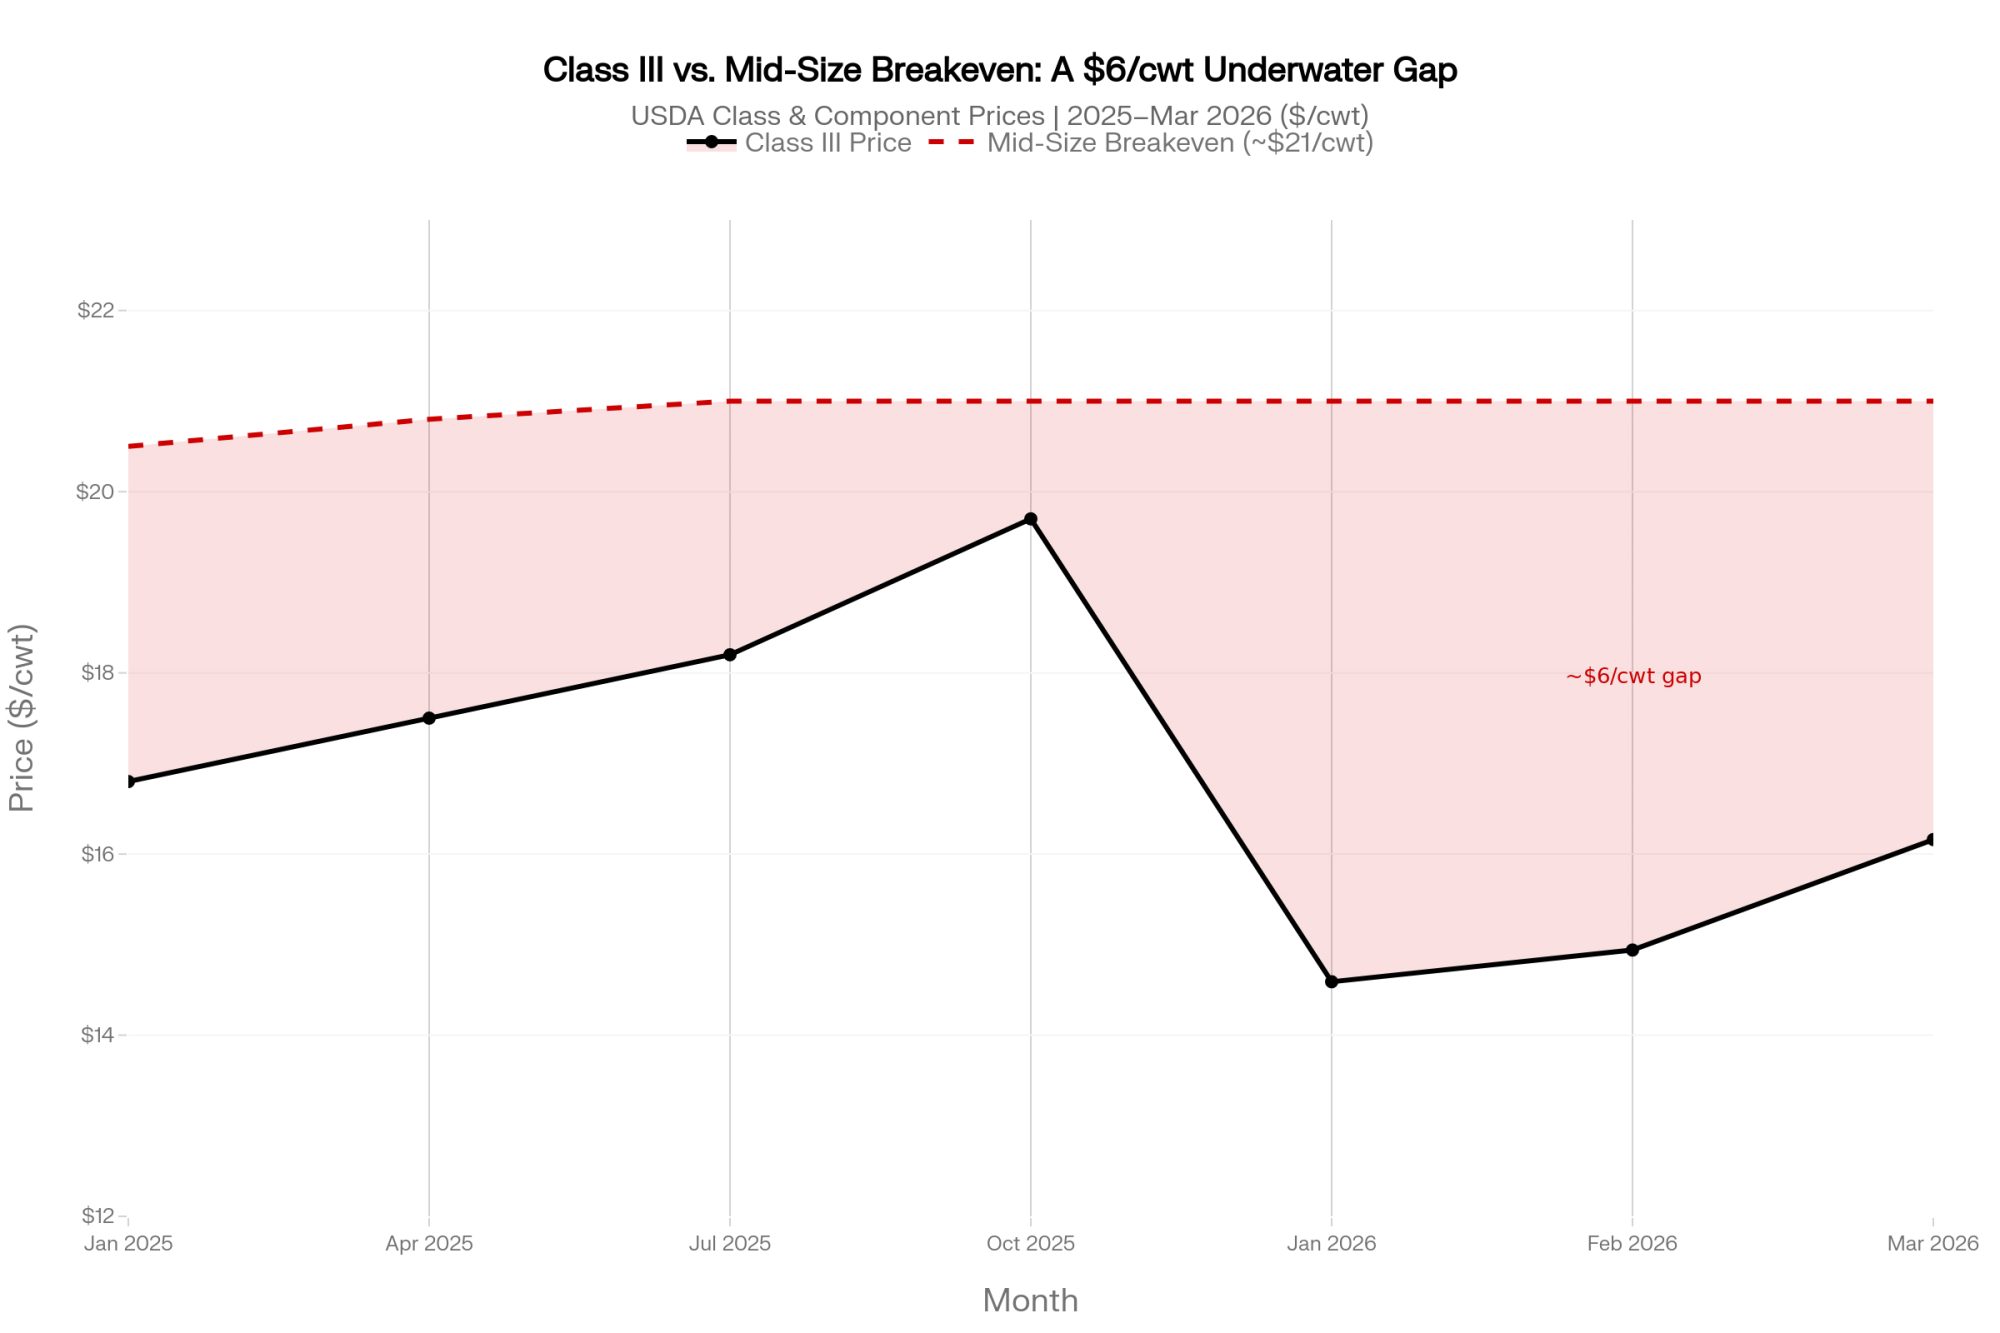
Then the milk check turned. USDA’s Class and Component prices put Class III at $14.59/cwt in January 2026, $14.94 in February, and $16.16 in March — a long way below the $19.70 all-milk average of late 2025 that Farm Bureau flagged. The green production light and the red margin light are on simultaneously. That’s the whole problem.
Geiger laid out the pipeline read in CoBank’s August 2025 report: the shortage moved replacement prices from $1,720 a head in April 2023 to $3,010 by July 2025 — that 75% climb — with the national herd at 3,914,300 head, 18% thinner than 2018.

Why does a sale-barn number matter this much to a dairy economist? Because it’s the price of staying in the cow business. At $1,700 to $2,000 a head, a 30% replacement rate stings but pencils for most family operations. At $3,000 to $4,000, the capital math changes who can afford to keep the pipeline full. That’s the lens Geiger’s using. Most of the trade conversation still isn’t.

The Assumption Was Free Money. The Math Says It Was a Cash Advance.

Rewind to when beef-on-dairy actually was the smart play. The spread was real, and it was big. By late 2024, a day-old beef-on-dairy cross calf was worth several hundred dollars more than a pure Holstein bull calf, and Farm Bureau’s Market Intel work showed the large majority of dairies capturing that premium.

University of Wisconsin dairy economist Victor Cabrera ran the break-evens early. As Progressive Dairy summarized his 2022 DairyMGT modeling in June 2023, the break-even on a beef-on-dairy calf sat near $69 a head for herds with exceptional fertility and climbed toward $300 a head for poor-fertility herds — and Northeast calf prices were clearing those break-evens with room to spare. The beef check kept growing. CoBank’s June 2026 follow-up notes beef sales now contribute roughly 12% to 15% of revenue on many dairy farms, approaching 20% per hundredweight on some.

So the industry assumption was simple: beef-on-dairy is free money on calves you didn’t want anyway.
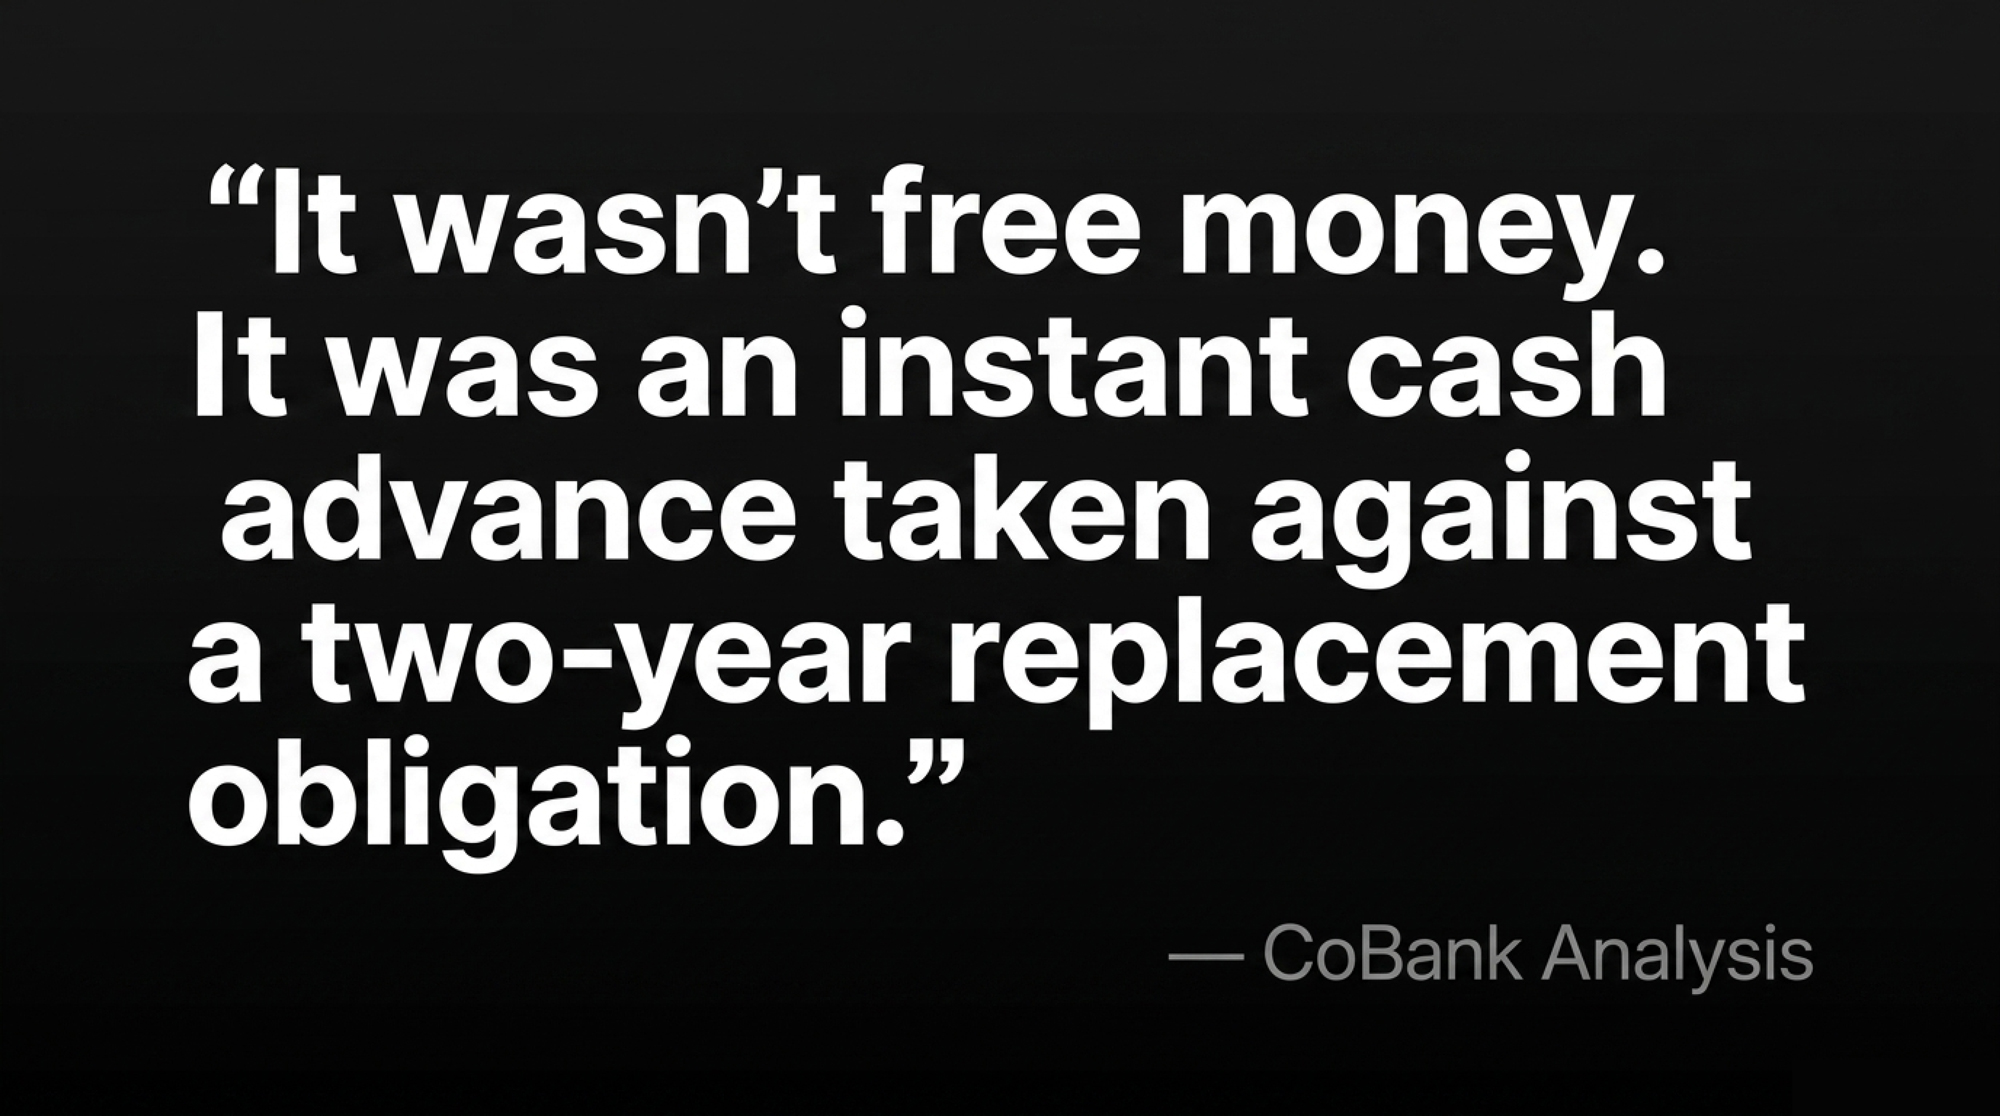
The math says otherwise, and the framing in CoBank’s analysis is the line that belongs taped to every farm lender’s monitor. In essence: a beef-on-dairy cross calf is a one-time check today, while a dairy replacement is a two-year build. Read that again. It wasn’t free money. It was an instant cash advance taken against a two-year replacement obligation — and the obligation comes due whether you budgeted for it or not.

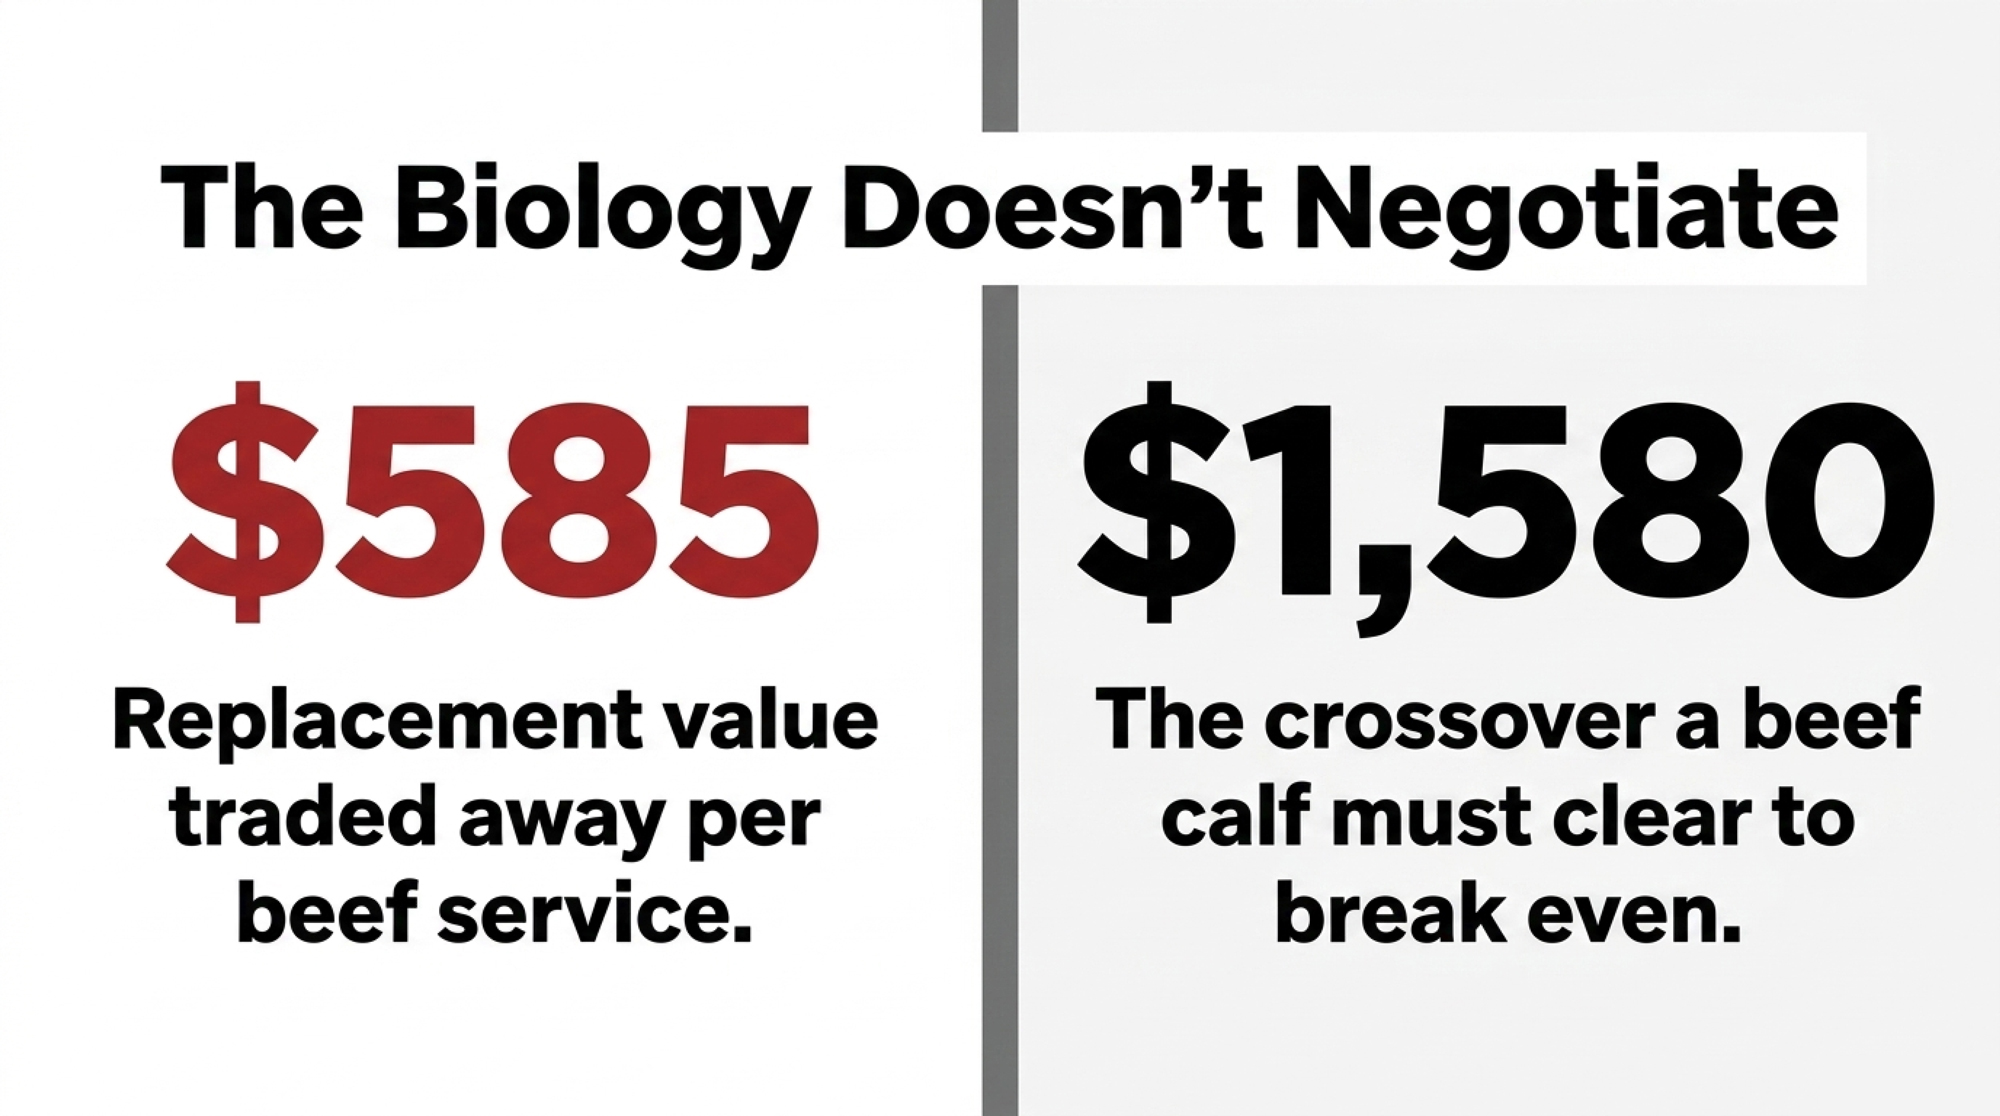
Our own Replacement Pipeline Tracker put a number on that trade. At a $3,010 replacement, every beef service on a viable dairy dam trades away roughly $585 in expected replacement value — and a beef calf has to clear $1,580 a head to match what a sexed-dairy pregnancy is worth on that same cow. Below that crossover, you’re not capturing a premium. You’re selling a future cow at a discount.
MetricBeef-on-Dairy CrossSexed Dairy Heifer Pregnancy
One-time calf revenue (avg.)~$400–$600$0 at birth
Replacement value foregone (per service)-$585$0
Crossover to match sexed-dairy valueMust clear $1,580$1,580 baseline
Time to revenue (heifer path)N/A — terminal24–26 months to first milk
Pipeline impact (2023–24 heavy beef)−796k heifers by end 2026Inventory preserved
DSCR risk by 2028HIGH if beef % > viable thresholdLower with balanced breeding
Best candidate cowsTrue terminal / low-indexTop 30–40% of herd
Worst use caseViable dairy dam, top geneticsN/A

The biology doesn’t negotiate. A replacement heifer takes about 24 to 26 months from conception to first milking. Heavy beef breeding in 2022 and 2023 showed up as missing dairy heifers in 2024 and 2025, and it rolls forward as tighter fresh-cow supply into 2026 and 2027. “This year we’re going to have 438,000 fewer dairy replacements becoming milk cows compared to last year, and this won’t rebound until 2027, when we see an improvement of 285,000,” Geiger told Iowa PBS’s Market to Market in May 2026. CoBank’s modeling puts the two-year hole at 357,490 fewer dairy heifers in 2025 and 438,844 fewer in 2026 — a combined shortfall near 796,000 head before any rebound. Enough of a rebuild ahead to stop the bleeding. Not enough to reverse the sort.

What Does the $1,720-to-$3,010 Heifer Jump Mean for a 500-Cow Herd in 2026?

This is where beef-on-dairy stops being a calf-check conversation and turns into a balance-sheet one. The heifer move isn’t just expensive. It’s selective. It separates the barns that can refill their pipeline from cash flow from the ones that have to borrow to do it — or stop doing it.

The cost bands frame the squeeze. Working from its most recent full ARMS cost series (2021 base year), USDA’s Economic Research Service puts total economic cost — cash expenses plus unpaid labor, depreciation, and opportunity cost — at $42.71/cwt for herds under 50 cows and under $20/cwt for herds with 2,000-plus cows. Herds in the 100-to-499-cow range interpolate into roughly the $19 to $21/cwt band. Set that against Class III sitting in the $14 to $16/cwt range through early 2026, and a mid-size herd carrying a true $21/cwt breakeven is deep underwater on the milk side alone.

The Canadian read is different, and worth saying plainly. Under supply management, Ontario and other provincial producers price milk through the quota system rather than through a volatile mailbox check, which softens the price-collapse risk that drives the U.S. sort. The heifer-supply squeeze and the beef-on-dairy breeding tradeoff still apply north of the border — the cash-flow timing hits differently.

That’s not hypothetical in the sense that matters. Our Replacement Pipeline Tracker ran the same trap on a representative 500-cow Panhandle dairy shipping to new Panhandle processing capacity: it needs 135 replacement heifers a year at a 27% turnover rate, and after running 35% beef through 2023–24, it’s trading away roughly $117,000 in expected replacement value annually on beef services that could’ve carried dairy pregnancies. That’s the barn where the theory stops being theory.

Editor’s disclosure: the Panhandle herd figures are modeled from the Bullvine Replacement Pipeline Tracker using representative Panhandle inputs — not a single named operation.

Now put the price move in a table you can read off in ten seconds.

Heifer Purchase PriceAnnual Cost (135 head)Capital Added vs. 2023 BaseCost per cwt (~100,000 cwt/yr)
$1,720 (USDA, April 2023)$232,200— (base year)$2.32/cwt*
$3,010 (USDA, July 2025)$406,350+$174,150+$1.74/cwt added
$4,000 (CA premium springers, 2026)$540,000+$307,800+$3.08/cwt added

*The $2.32/cwt is the total base replacement load, not an add-on. The $1.74 and $3.08 figures are what the price jump adds on top of that base — don’t stack them on the $2.32.

Running the Numbers — The 500-Cow Replacement Line
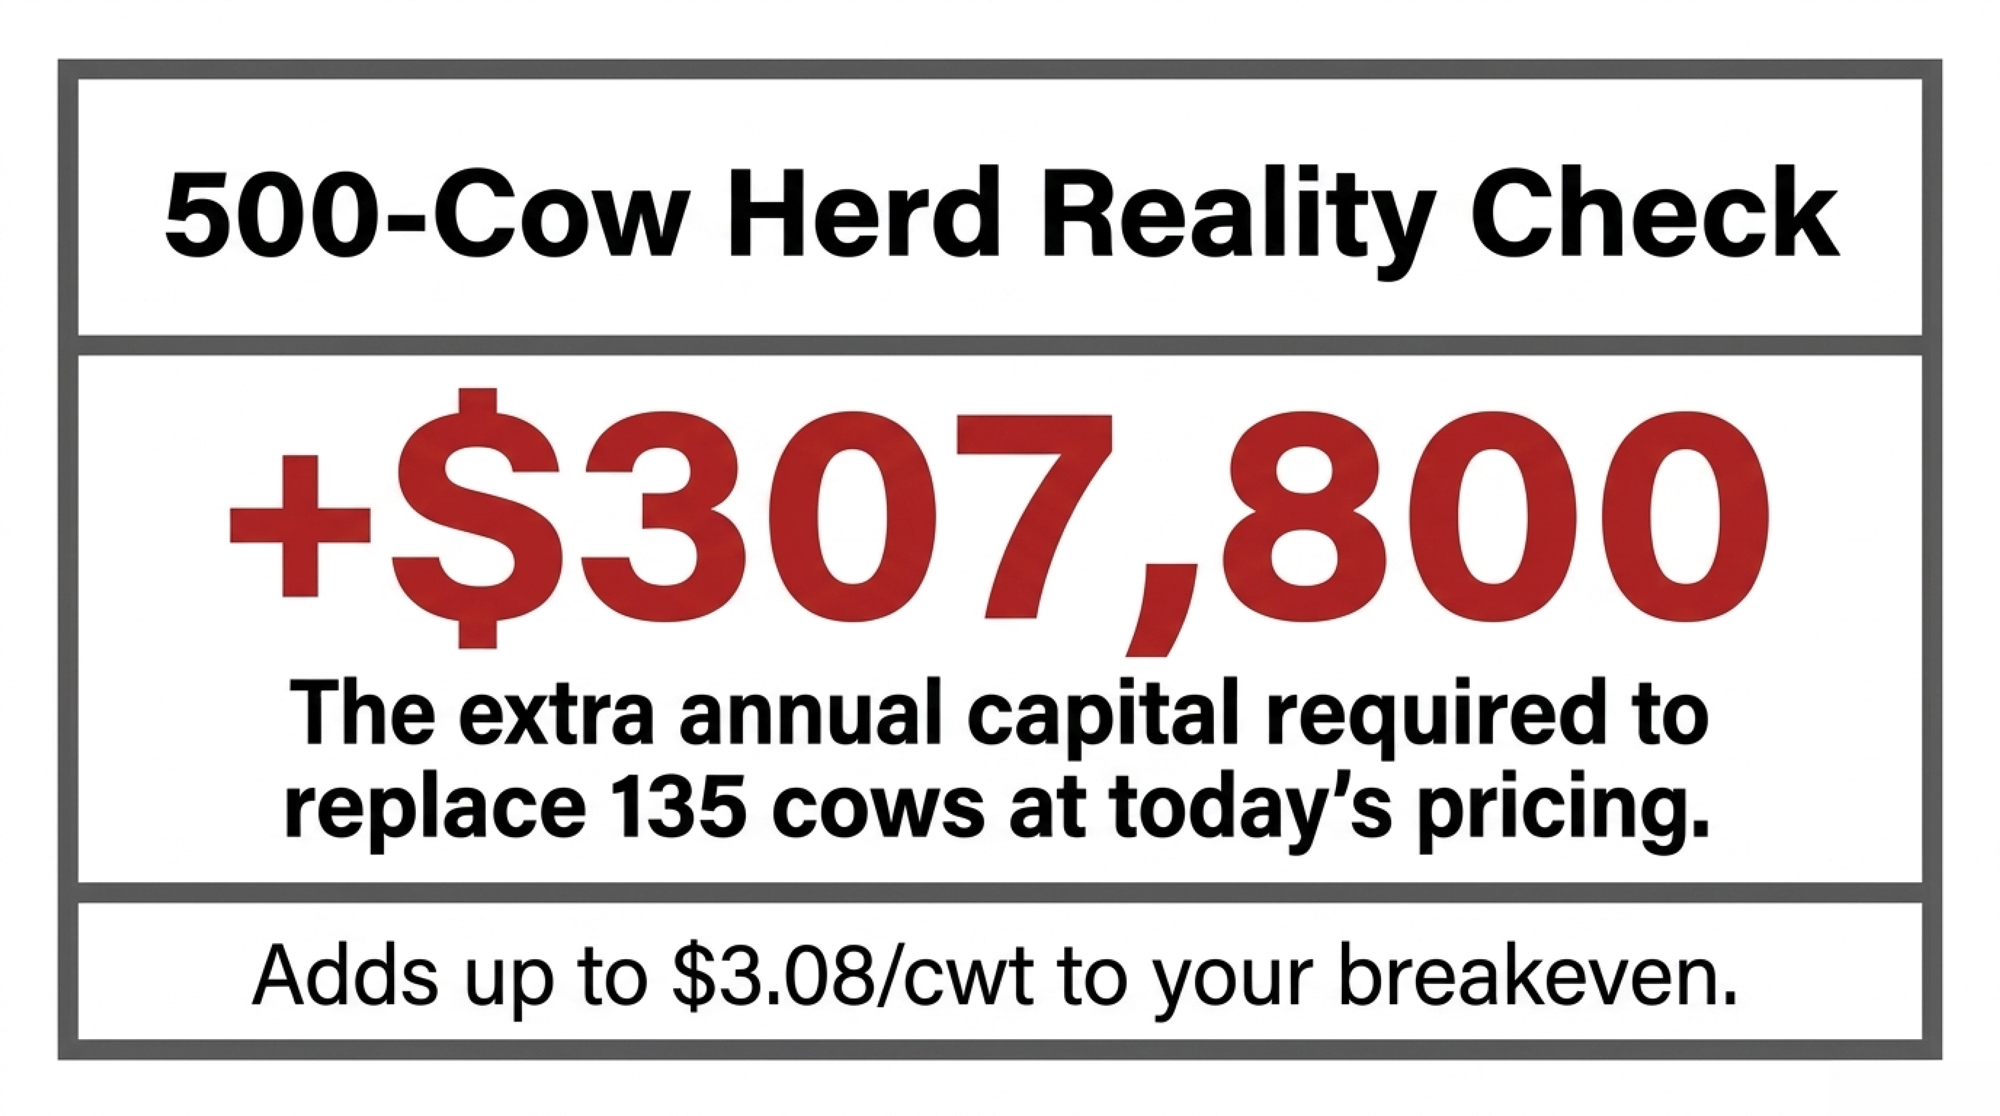
Take the Panhandle herd: 500 cows, 27% turnover, 135 replacements a year.

Same herd. Same cull rate. The price move from the 2023 base alone adds $174,150 to $307,800 a year in replacement capital — an extra $1.74 to $3.08/cwt on roughly 100,000 cwt shipped (≈ 200 cwt per cow; swap in your own rolling herd average).

Now finance them. Put 135 head at $3,010 on a note and the interest stacks on top of the purchase price — at 7% simple, that’s roughly $28,500 a year; at 9%, closer to $36,500. Run it at your own note rate and term, because a multi-year amortized loan spreads it differently than a one-year operating line.

Plug in your herd size, your cull rate, and the heifer price your local barn is printing this month.

That extra $1.74 to $3.08/cwt is the gap between tight-but-surviving and the bank running your numbers before you do. The trigger is mechanical. When replacement and interest drag push your debt service coverage ratio below 1.0 — the point where farm income no longer covers principal and interest without off-farm money or an equity draw — your options have already narrowed. Lenders generally want to see a DSCR near 1.5 and get nervous between 1.0 and 1.2.

Why the $3,000 Heifer Floor Punishes the Middle Tier

Here’s the turn. The reflex answer to a cost squeeze has always been scale — get big, spread overhead, grind out commodity milk. The $3,000-plus heifer floor breaks that reflex for the operations in the middle, and it does it through cash, not size.

For decades, a mid-size family farm could coast through a down cycle on paid-off equity. Cows die or leave, you replace them out of the herd or buy a few at a manageable price, and you ride out the low milk check on a clean balance sheet. That escape hatch is closing. When the asset you have to replace — the cow — costs $3,010 to $4,000 instead of $1,720, coasting isn’t an option. You’re forced to lay out serious cash to keep the same stalls full, and if you don’t have it sitting there, you borrow it.

Run it against the Panhandle box: 135 replacements at $3,010 is a $406,350 replacement line, versus $232,200 at the old price — and interest on the gap on top of that. A high-volume operation at sub-$20/cwt cost can absorb that. A value-model operation capturing more dollars per gallon can absorb it. The herd caught in between — running volume economics with value-farm overhead — can’t, and that’s the operation getting sorted out.

The split isn’t small-versus-large anymore. It’s disciplined-versus-not. Even some large herds bled in the last down cycle by running costs their scale couldn’t outrun. Big and undisciplined still bleeds.

As agricultural financial experts recently warned Northeast producers, the industry overall may survive, but many individual farms won’t — and producers don’t have the luxury of waiting for things to get better. They have to manage risk and make strategic calls now to stay among the survivors.

The question stopped being “how many cows?” It became “which business am I actually in — and do my numbers match it?”

What Are the 2030 Survivors Doing Now That Their Neighbors Aren’t?

The instinct in a squeeze is to do something dramatic. The data says the survivors are doing something almost boring. They measure more often than everyone else.

On the ground, that’s three disciplines. First, they pull the true cost of production every month — not the Dairy Margin Coverage proxy, which can sit well off real-world costs — counting unpaid family labor at local rates, depreciation at replacement cost, current interest, and heifers at their actual cost today. Second, they rebalanced breeding early, holding a meaningful share of matings on dairy semen and putting sexed dairy on their best cows instead of maxing the beef calf check. Third, they treat the beef check as revenue to hedge rather than a windfall.

Recent agricultural outlooks emphasize a critical shift for 2026: protect predictable cash flow rather than chasing high prices. Financial experts urge producers to maximize Dairy Margin Coverage and Dairy Revenue Protection for milk. Furthermore, as beef-on-dairy genetics become a staple revenue stream, utilizing Livestock Risk Protection to cover beef revenue is now just as essential as protecting milk margins.

You’ve seen this consolidation arc build before, and the human cost of it up close.

The 30/90/365-Day Playbook for Herds Like the Panhandle 500

This reads like a plan for a 300- to 1,500-cow operator or the advisor across the table, not a pep talk.

30-Day actions — urgent checks

  • Pull your last three milk checks and calculate your real margin over feed per cwt — same components, same hauling, every time. Requires: settlement sheets and feed invoices. Trigger: if your true breakeven sits above your rolling 12-month mailbox price, this goes to the top of the list. Watch for: omitting unpaid family labor and depreciation, which inflates the number.
  • Run your pipeline math. Pull 12 months of heifer-calf births, multiply by a realistic survival-to-first-calving rate for your herd (many well-managed herds run near 0.79; use your own if you track it), and compare to herd size × replacement rate. Trigger: if you’re short, that gap is baked into 2027–2028 regardless of where prices go. Watch for: counting beef-cross calves as replacements — they aren’t.
  • Run your DSCR using your lender’s or CPA’s method. Trigger: if it’s been under 1.2 for three straight months, this is your first call, not your last. Watch for: one-time income masking a structural cash shortfall.

90-Day actions — structural moves

  • Tier your herd and write it into your breeding SOPs: top genetics to sexed dairy, the middle tier a mix, true terminal cows only to beef. Requires: index and repro data. Backfire risk: letting beef creep back onto viable dams because the straw’s cheaper that day — that’s the $585 trade repeating itself.
  • Decide which game you’re in — volume engine or value model — and test your cost structure against it. Requires: a full ERS-style cost build and an honest read on your market access. Backfire risk: half-committing leaves you with value-farm overhead and commodity-milk revenue, the worst of both.
  • Layer revenue protection across both milk and beef. Requires: a conversation with your DRP and LRP provider before the coverage window closes. Watch for: sales-period deadlines that move; confirm the current date with your agent.

365-Day moves — strategic positioning

  • Align your herd plan to your plant. If you’re near new Panhandle processing capacity, decide whether you’re growing, holding, or shrinking, and match your pipeline, beef percentage, and culling to that call. Requires:refinancing conversations and a hard look at debt structure. Opportunity signal: if your margin over feed holds positive and your basis stays firm while neighbors exit, you may have room to add cows from someone else’s dispersal rather than buying $4,000-plus springers.
  • Set hard floors and ceilings: the minimum beef-calf price where beef services still make cash-flow sense, and the maximum share of breedings you’ll put to beef on viable dairy dams. Watch for: the $1,580 crossover — that’s your north star, not the calf buyer’s mood that week.

The Number That Forces the Question

The thing about that heifer price is it won’t let you headline your way out of the decision. Twenty-seven months took a springer from $1,720 to $3,010 on the USDA series, and that move is quietly naming who still owns dairy cows in 2030.

You gain cash today from every beef-cross calf you sell. You give up a future cow you’ll have to buy back at replacement-market prices — roughly $585 of her per service, at today’s spread. That’s the trade at the center of this whole story.

So pull your beef-on-dairy plan for this breeding season and set it next to your replacement inventory by age group. Does the calf check you’re banking this year leave you enough dairy heifers to hold your DSCR above 1.0 in 2028 — or are you taking another cash advance on cows you won’t have?

From $1,720 to $3,010 a head in 27 months — CoBank’s data says that heifer price isn’t a feed-yard story; it’s a signal about who still owns dairy cows in 2030. Which side of the sort do your replacement numbers put you on?
Key Takeaways

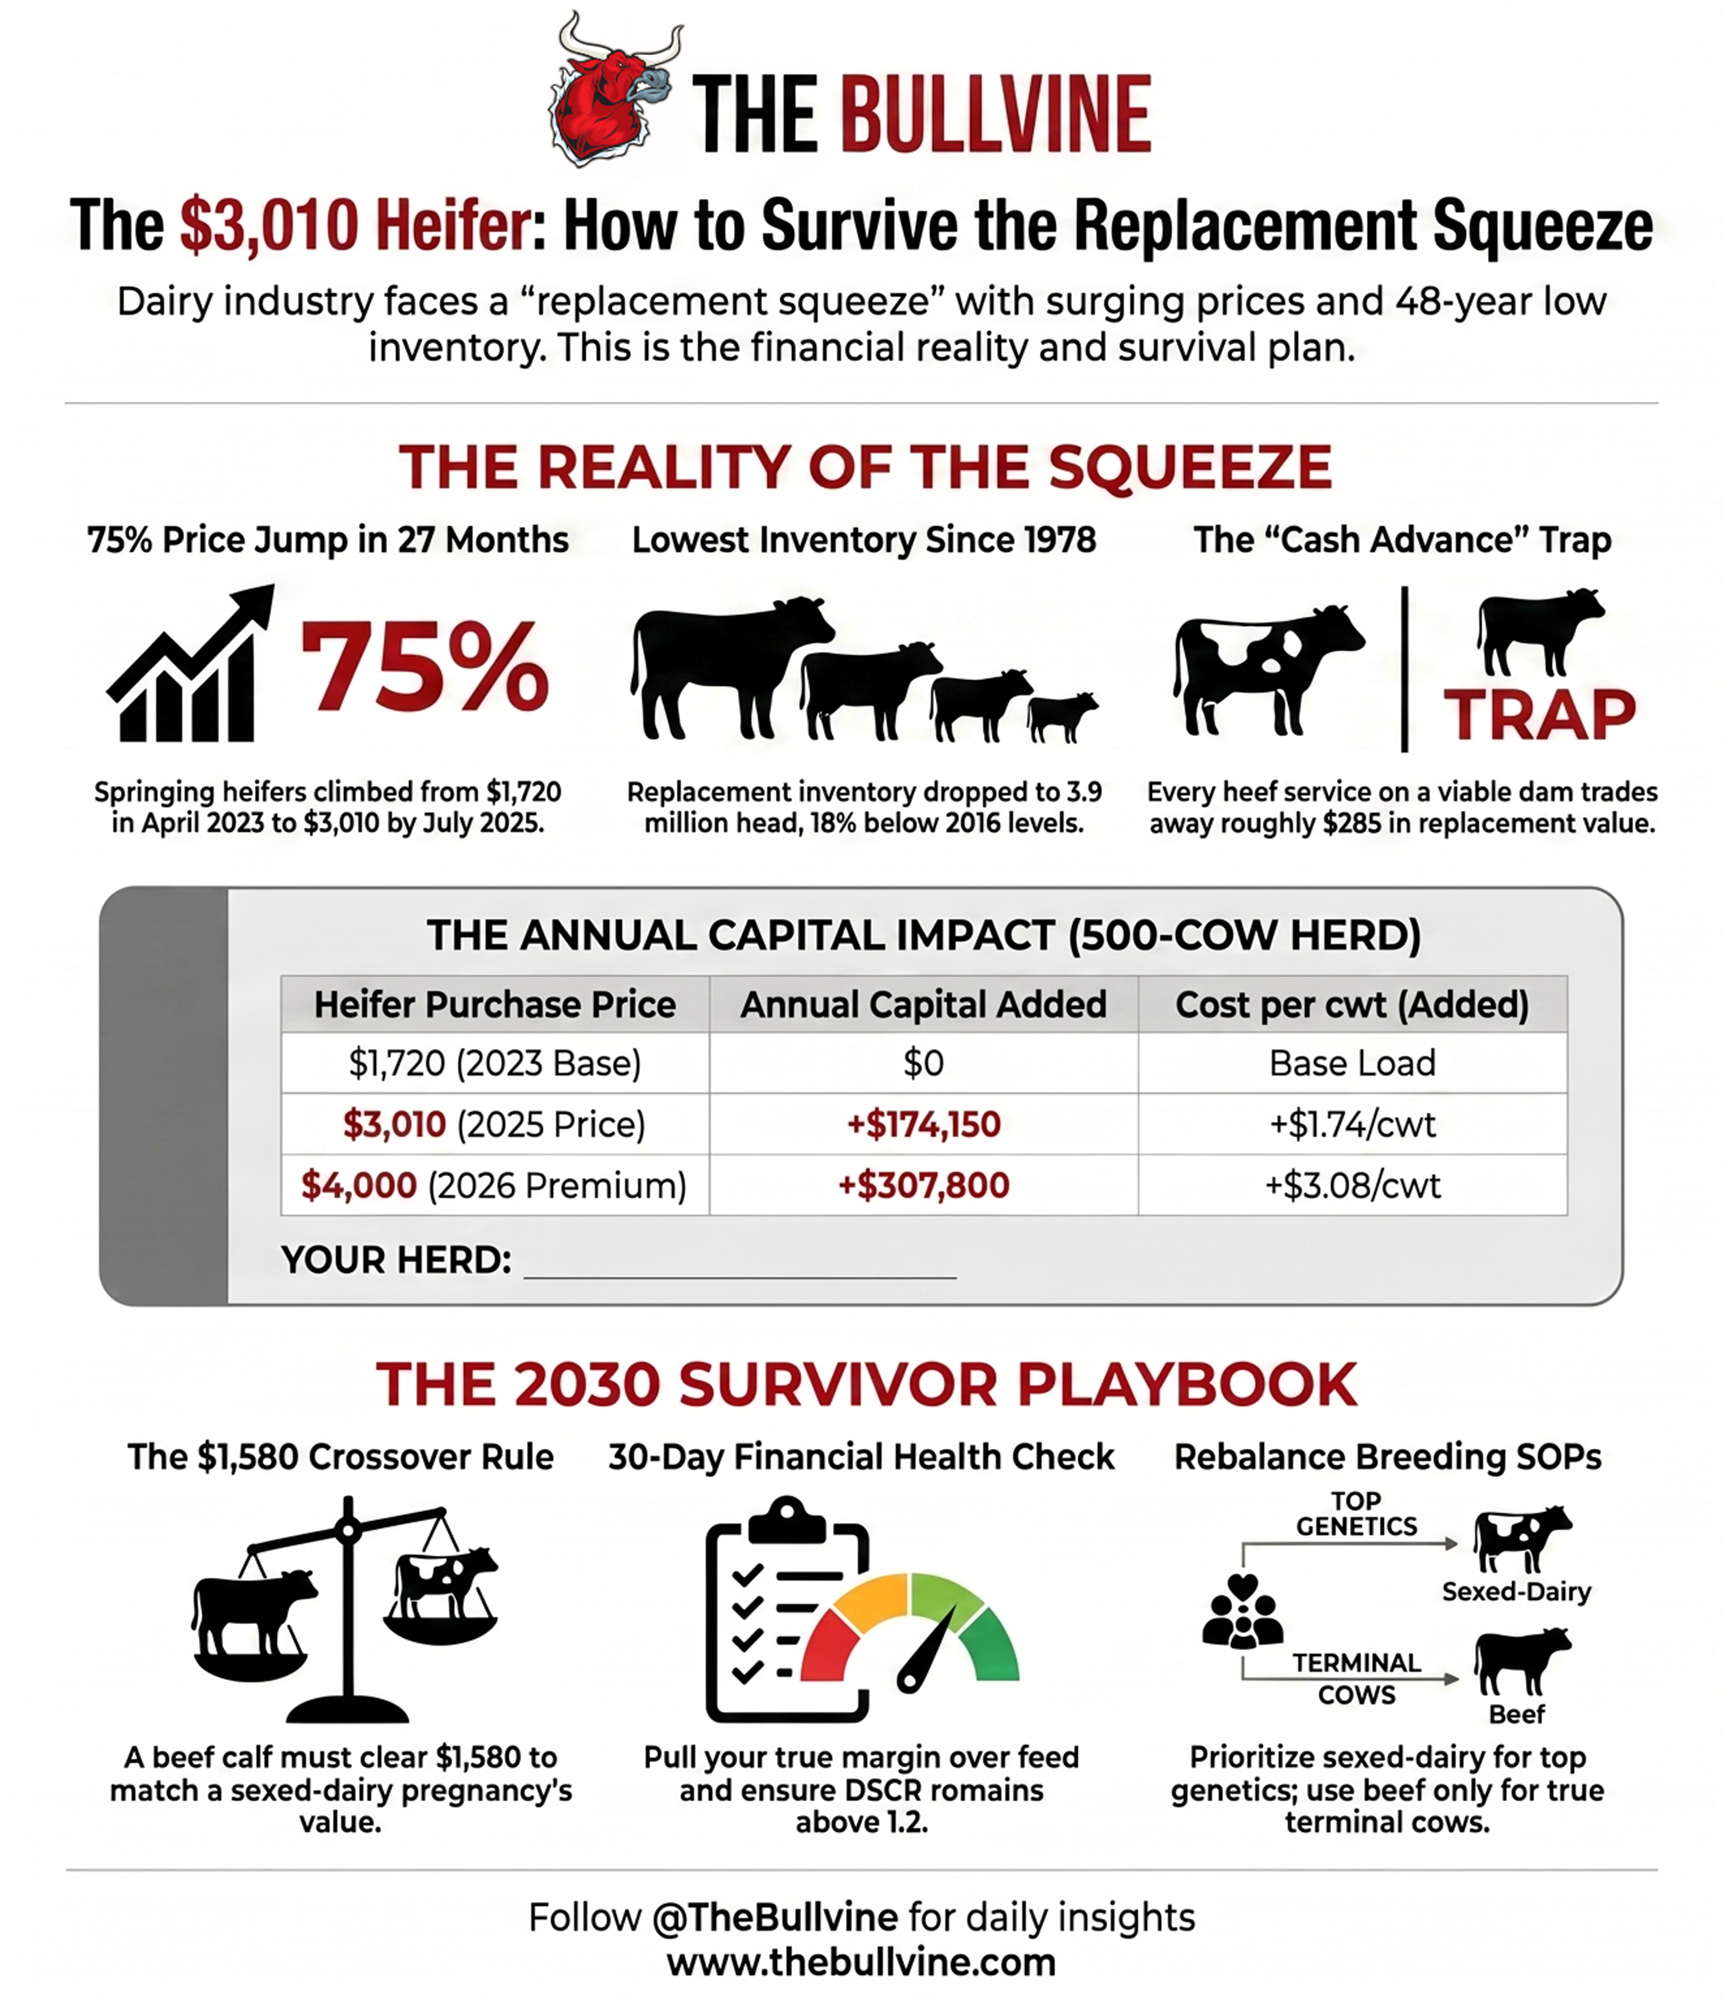
  • Every beef service on a viable dairy dam trades away about $585 in replacement value, and a beef calf has to clear $1,580 to match a sexed-dairy pregnancy on that same cow — that crossover, not the calf buyer’s mood, should govern your breeding plan.
  • At $3,010 a head, a 500-cow herd needing 135 replacements is carrying an extra $174,150 to $307,800 a year versus 2023 — roughly $1.74 to $3.08/cwt — before you touch the interest on financing them.
  • With Class III stuck at $14–$16/cwt against a mid-size breakeven near $21/cwt, the herds getting sorted out aren’t the smallest — they’re the ones running volume economics with value-farm overhead and no plan to hold DSCR above 1.0 into 2028.
  • In the next 30 days, run your real margin over feed, check your heifer pipeline against your cull rate, and pull your DSCR — if it’s been under 1.2 for three straight months, that’s your first call, not your last.
Complete references and supporting documentation are available upon request by contacting the editorial team at editor@thebullvine.com.

Learn More

The Sunday Read Dairy Professionals Don’t Skip.

Every week, thousands of producers, breeders, and industry insiders open Bullvine Weekly for genetics insights, market shifts, and profit strategies they won’t find anywhere else. One email. Five minutes. Smarter decisions all week.
NewsSubscribe
First
Last
Consent

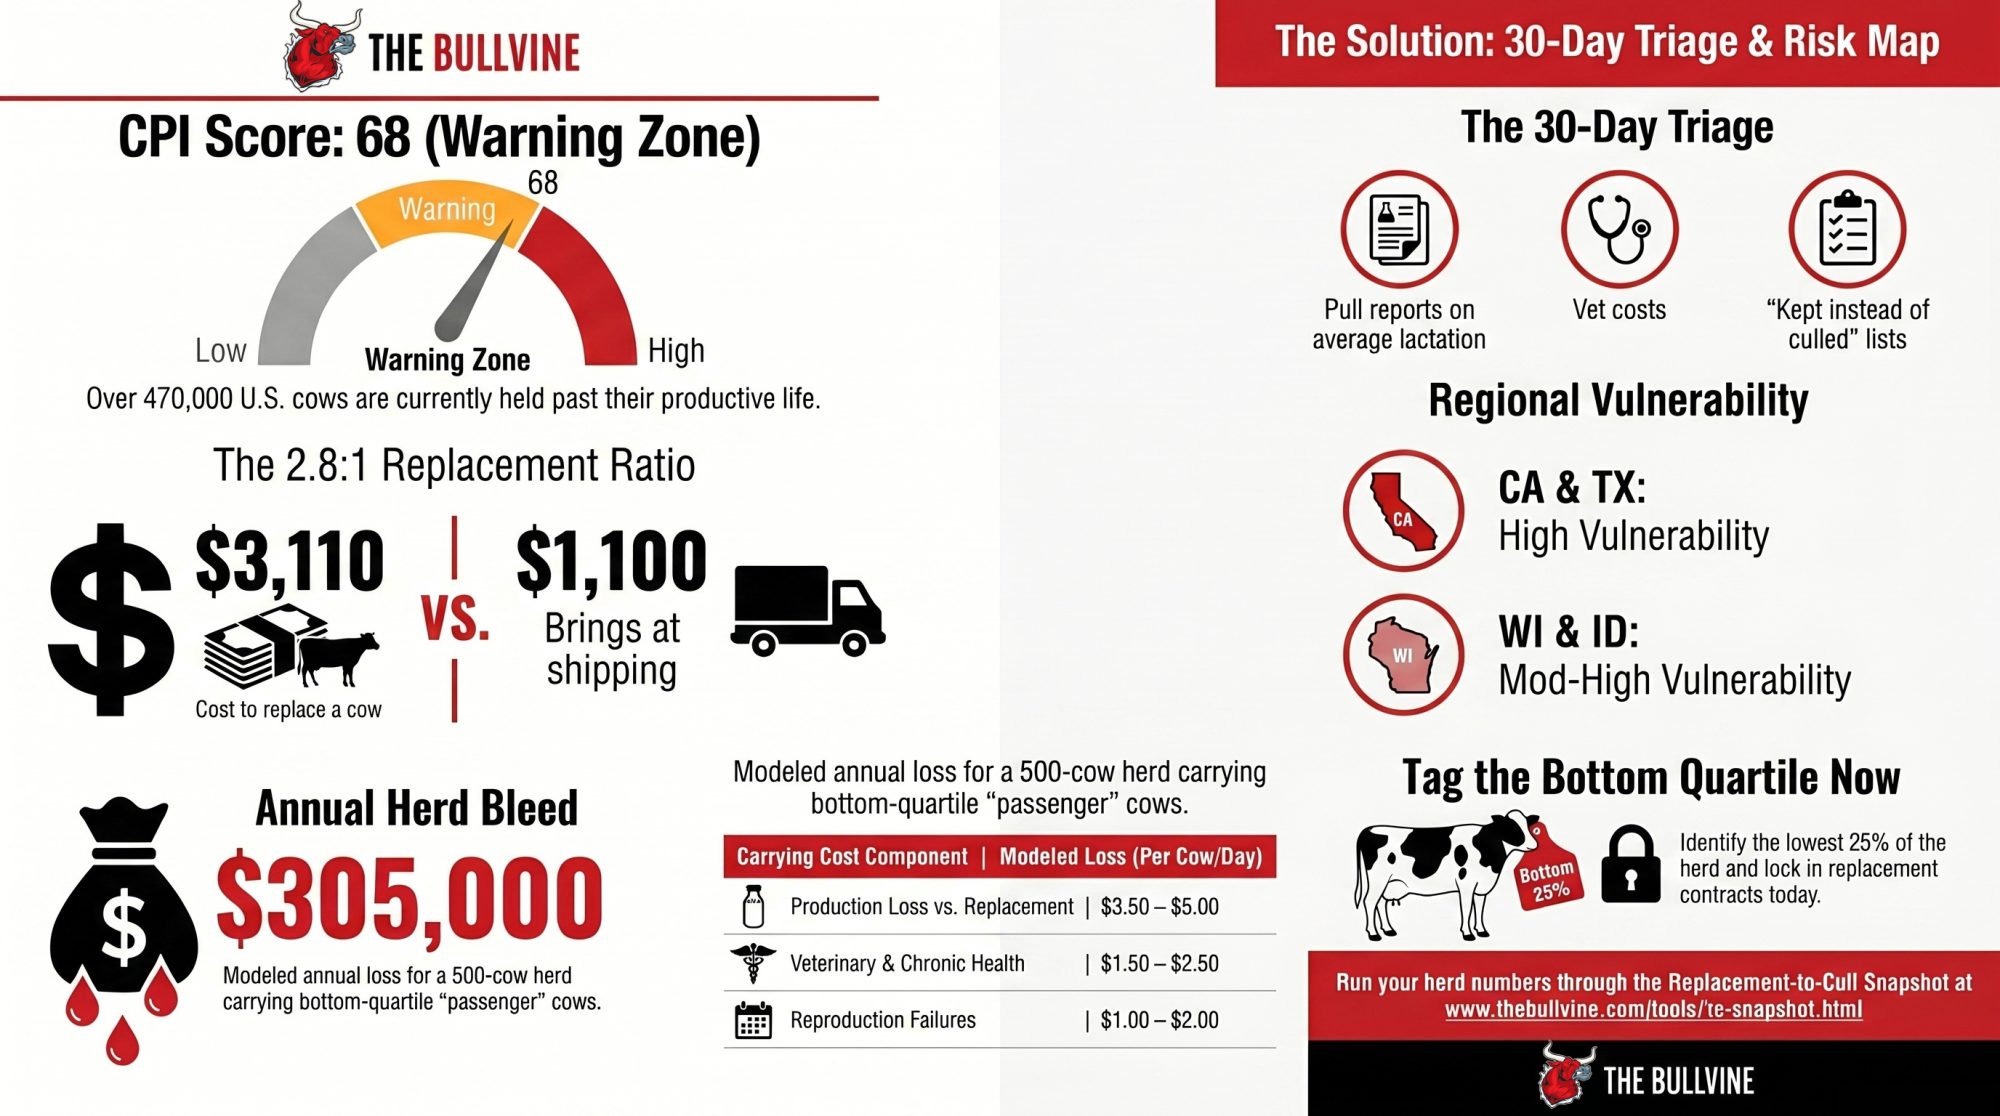
$3,110 In, $1,100 Out: The Cull Trap Holding 470,000 U.S. Dairy Cows – CPI Hits 68

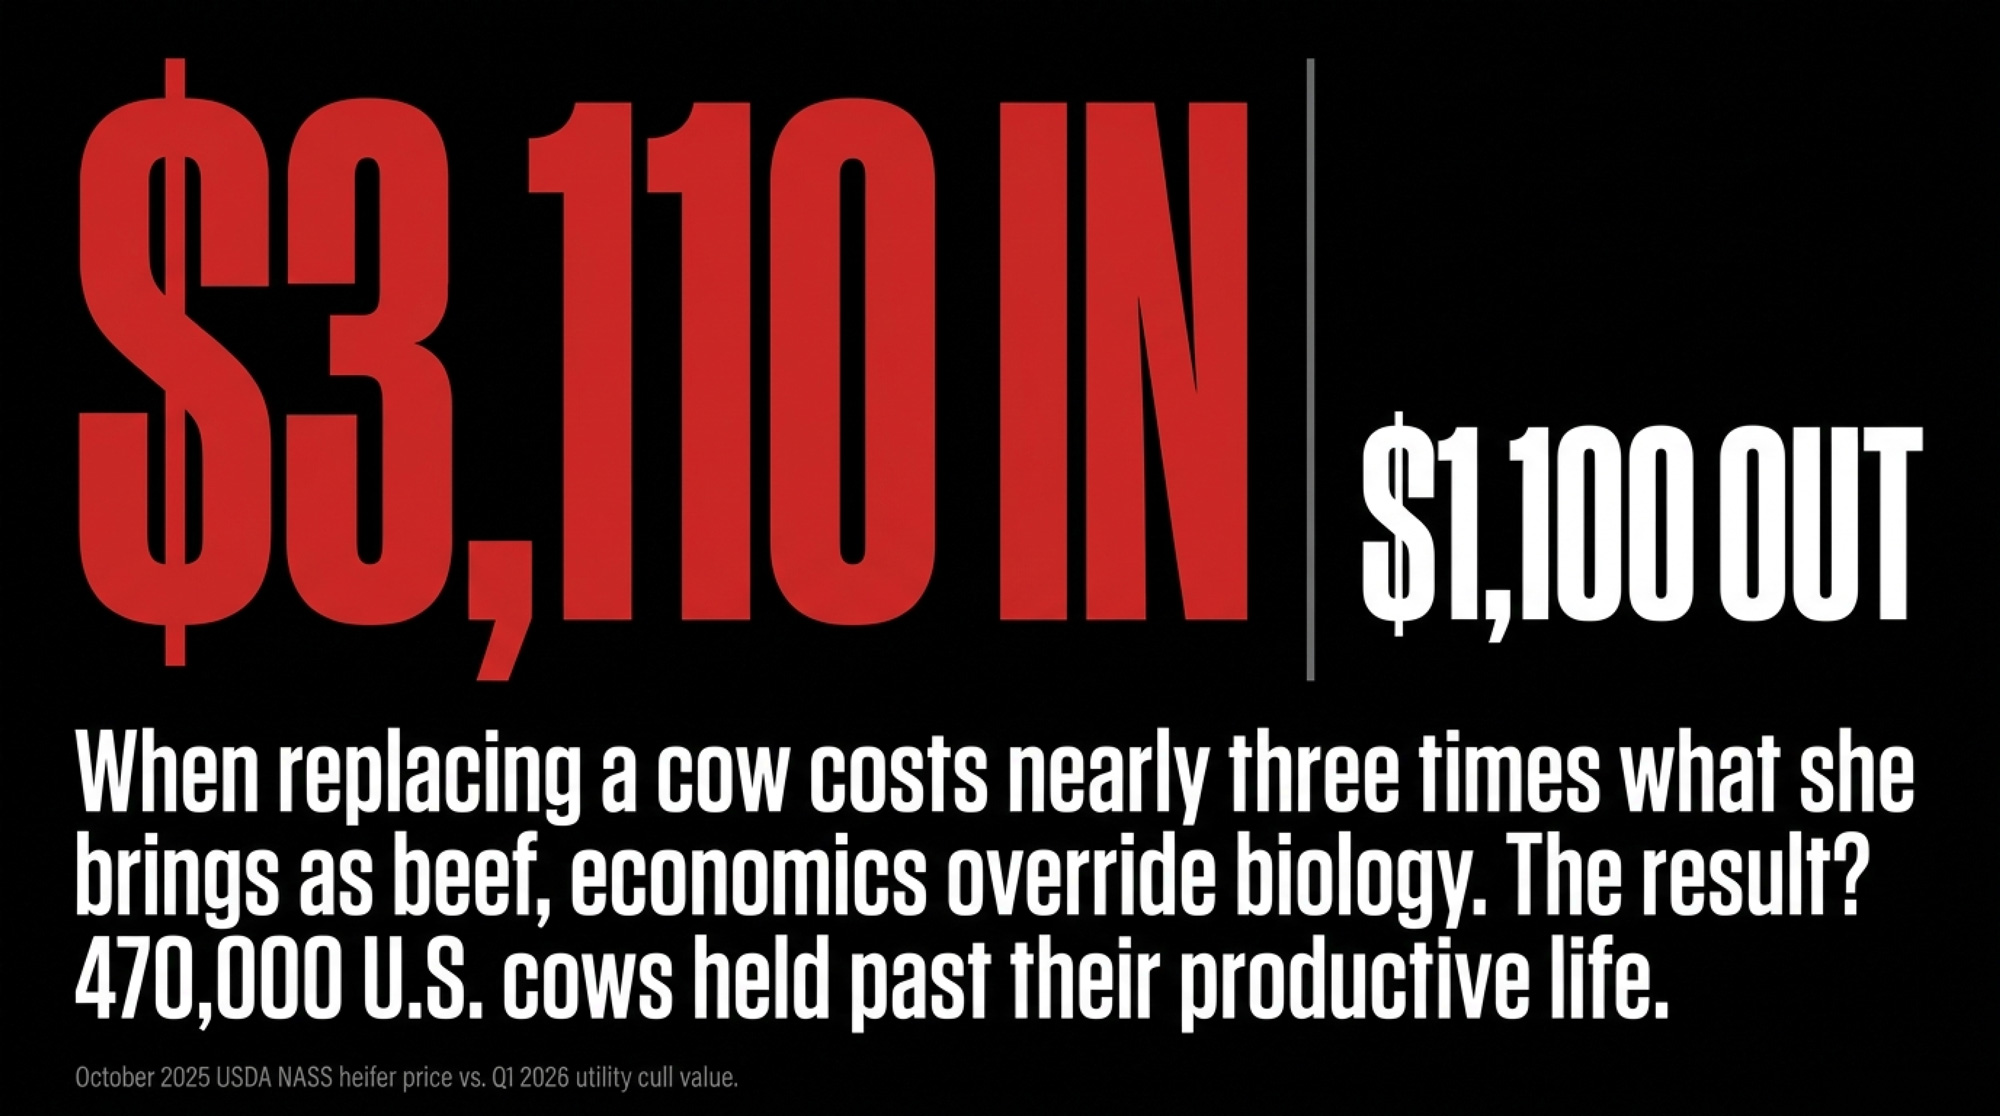
$3,110 to replace her. $1,100 to ship her. That ratio is why ~470,000 U.S. cows are still in stalls they’d have left in 2019 — and why The Bullvine’s CPI just flipped to 68. Warning Zone.

Picture a 500‑cow Wisconsin‑style herd sitting across from its lender this spring. Margin over feed dairy 2026 math says $255,000–$305,000 a year is walking out of that barn in the Bullvine model — a $205,500 milk‑over‑cost gap plus $50,000–$100,000 in bottom‑quartile carrying cost. Every culling decision runs into the same wall: the October 2025 USDA NASS Agricultural Prices release (the most recent heifer series) recorded replacement dairy heifers at a record $3,110/head.

The scene above is a composite drawn from Bullvine modeling on a representative Wisconsin 200–700 cow family operation. Milk price and cost‑of‑production inputs are national ranges applied to a Federal Order 30 (Upper Midwest) representative herd; your Order and cost structure will shift the output. Numbers throughout this piece are USDA and industry sourced; the operator is illustrative.

The cull check on the other side? Roughly $1,100/head for dairy utility cows, with better cuts clearing $1,400–$1,600in hot beef markets (USDA AMS National Weekly Cull Cow & Bull Summary, Q1 2026 range — see methodology appendix for the specific weekly reports used). That puts the replacement‑to‑cull ratio between 1.9:1 and 2.83:1.

Market CaseCow/Heifer ValueReplacement-to-Cull RatioEditorial Read
Dairy utility cull$1,100/head2.83:1Maximum pressure to defer culling
Strong beef-market cull$1,400/head2.22:1Still expensive to replace
Hot beef-market cull$1,600/head1.94:1Better exit value, but not enough relief
Replacement dairy heifer$3,110/headBaselineThe price wall driving the trap

When replacing a cow costs nearly three times what she brings as beef, the economics override the biology. That’s how you get to The Bullvine’s modeled estimate of roughly 470,000 U.S. cows held past their productive life — the first piece of the trap.

“The most expensive cow in your barn isn’t the high‑index yearling you just bought. It’s the lame third‑lactation cow you can’t afford to cull.”

The Most Expensive Cow In Your Barn Isn’t The Heifer

The most expensive cow in your barn isn’t the high‑index yearling you just bought.

It’s the lame third‑lactation cow you can’t afford to cull.

She’s giving somewhere around 60 lb/day. Vet bills stack. Repro has stalled. Every instinct says ship her — until you look at the heifer market and flinch.

That flinch, repeated across the country for 18 months, is the structural story of 2026 U.S. dairy.

The Retention Trap Your P&L Won’t Show You

On paper, the U.S. herd looks strong. USDA NASS reports February 2026 milk cow inventory at 9.62 million head, up 211,000 year‑over‑year — the largest U.S. monthly inventory since 1994 per the NASS historical milk cow series (specific comparison month cited in methodology appendix). Total 2025 milk output ran roughly 232 billion lb, up about 2.6% over 2024.

Everyone assumed that meant expansion. It doesn’t. It’s hoarding — and the slaughter data says so in plain English.

Since September 2023, U.S. producers have culled an estimated 611,600 fewer dairy cows than the five‑year rolling pace, per USDA AMS weekly Federally Inspected slaughter data (Sept 2018–Aug 2023 baseline, roughly 3.0M head/yr; full baseline table in the methodology appendix). 2025 dairy cow FI slaughter totaled around 2.53 million head the lowest U.S. annual FI total since 2011 based on AMS federally inspected series.

Co‑op briefings track the heifer shortage daily. Almost nobody is tracking what’s piled up on the other side of the barn.

The Shadow Loss Your P&L Won’t Flag

Your P&L is lying by omission. It tracks what you spent on feed, but it ignores the 10 lbs of milk you didn’t ship because a lame cow is occupying a prime stall. That’s the Shadow Loss — and it’s the most dangerous number in your barn.

The Bullvine‑modeled $50,000–$100,000/year bottom‑quartile drag on a 500‑cow herd isn’t a P&L line. It’s a shadow loss. Modeled range; actual values vary by herd, region, and breeding program. The underlying carrying‑cost methodology draws on USDA price data, typical herd records, and extension‑style budgets, triangulated against the Cornell Dairy Profit Monitor framework, Miner Institute reproductive economics, and Penn State Extension dairy decision tools.

Want your own number fast? The Bullvine Replacement‑to‑Cull Snapshot at thebullvine.com/tools/rc-snapshot.html takes your herd size, current heifer price, local cull value, and deferred‑cow count and spits out a herd‑specific pressure read with a prioritized bottom‑quartile action list. Same math as the published CPI. Your inputs.

How Deferred Culling Bleeds A 500‑Cow Wisconsin Herd

The Bullvine CPI workup models the bottom 20–25% of a typical herd carrying roughly – per cow per day in drag once production loss, vet cost, reproduction failures, and stall opportunity cost are stacked. These are Bullvine‑modeled ranges built on extension‑style budgets, not cited external point values; the full derivation sits in the carrying‑cost worksheet.

Carrying‑Cost Component (Bottom Quartile)Modeled $/Cow/DayWhy It Matters
Production loss vs a younger replacement.50–.00Aging cows commonly trail herd average at –/cwt milk, per CDCB lactation‑curve data and extension references cited in the worksheet.
Veterinary costs (lameness, mastitis, metabolic).50–.50Chronic issues compound with lactation number.
Reproduction failures (extra days open, repeats).00–.00Each extra open day past mid‑lactation costs real margin.
Stall opportunity cost.00–.50Every bottom‑quartile cow blocks a springing heifer.
Total modeled carrying cost.00–.00The barn math on the “cheap” cow you kept.

Running the Numbers: 500‑Cow Wisconsin‑Style Herd

Inputs: 500 cows | 75 lb/cow/day | –/cwt milk (national range) | –/cwt all‑in cost of production (national range) | Federal Order 30 representative; your Order and cost structure will shift the output | Modeling base: Bullvine CPI using USDA ERS Cost of Milk Production framing.

Step 1 — Daily and annual production 500 × 75 = 37,500 lb/day = 375 cwt/day 375 × 365 ≈ 136,875 cwt/year

Step 2 — Margin gap (if COP runs ~$1.50/cwt above milk price)

Note: this margin gap partially overlaps with the component‑premium gap discussed in “The $11 Billion Sorting Machine” below. Don’t stack them.

136,875 × $1.50 ≈ $205,500/year negative margin

Step 3 — Bottom‑quartile drag 100 cows × $8–$12/day × 365 ≈ $292,000–$438,000 gross

Net of replacement‑cost offset: the “drag” is the incremental loss from keeping the old cow versus a replacement in the same stall — it nets out the replacement cow’s own production contribution, her own vet/feed load, and ordinary depreciation. The Bullvine model assumes ~75% of the gross carrying cost offsets against that counterfactual, leaving ≈$50,000–$100,000/year net drag. Full derivation in the carrying‑cost worksheet.

Step 4 — Total modeled bleed

Loss LayerLow CaseHigh CaseWhat It Means
Annual production136,875 cwt136,875 cwt500 cows × 75 lb/day
Milk-over-cost gap$205,500/year$205,500/yearNegative margin at $1.50/cwt gap
Net bottom-quartile drag$50,000/year$100,000/yearDeferred cows occupying better stalls
Total modeled bleed$255,500/year$305,500/yearThe lender-facing number
Per cow equivalent$511/cow/year$611/cow/yearPain spread across the whole herd

Modeled for an illustrative 500‑cow Wisconsin operation on national milk and COP ranges. Your number will differ. Plug your own cow count, pounds, COP, and bottom‑bucket count into the Replacement‑to‑Cull Snapshot at thebullvine.com/tools/rc-snapshot.html for a herd‑specific output.

That’s the formula your lender is already running. Write it on your own whiteboard.

More from The Bullvine — Tier 3 economics: Why Your 2026 Budget Is Lying to You: USDA $18.95 Milk vs. $19.14 Costs.

Why Did The Bullvine Build A New Index For This?

The CPI exists because no one else was tracking the inverse of the heifer shortage. Every co‑op briefing reports how few heifers are coming. None publish how many cows are still in the barn that should have already left.

To The Bullvine’s knowledge, the CPI is the first published composite index scoring deferred culling and the replacement shortage together as a single trackable number. USDA doesn’t publish it. Land‑grant extensions don’t. The gap was real. The math could be done. Here’s how.

How The CPI Reads The Herd

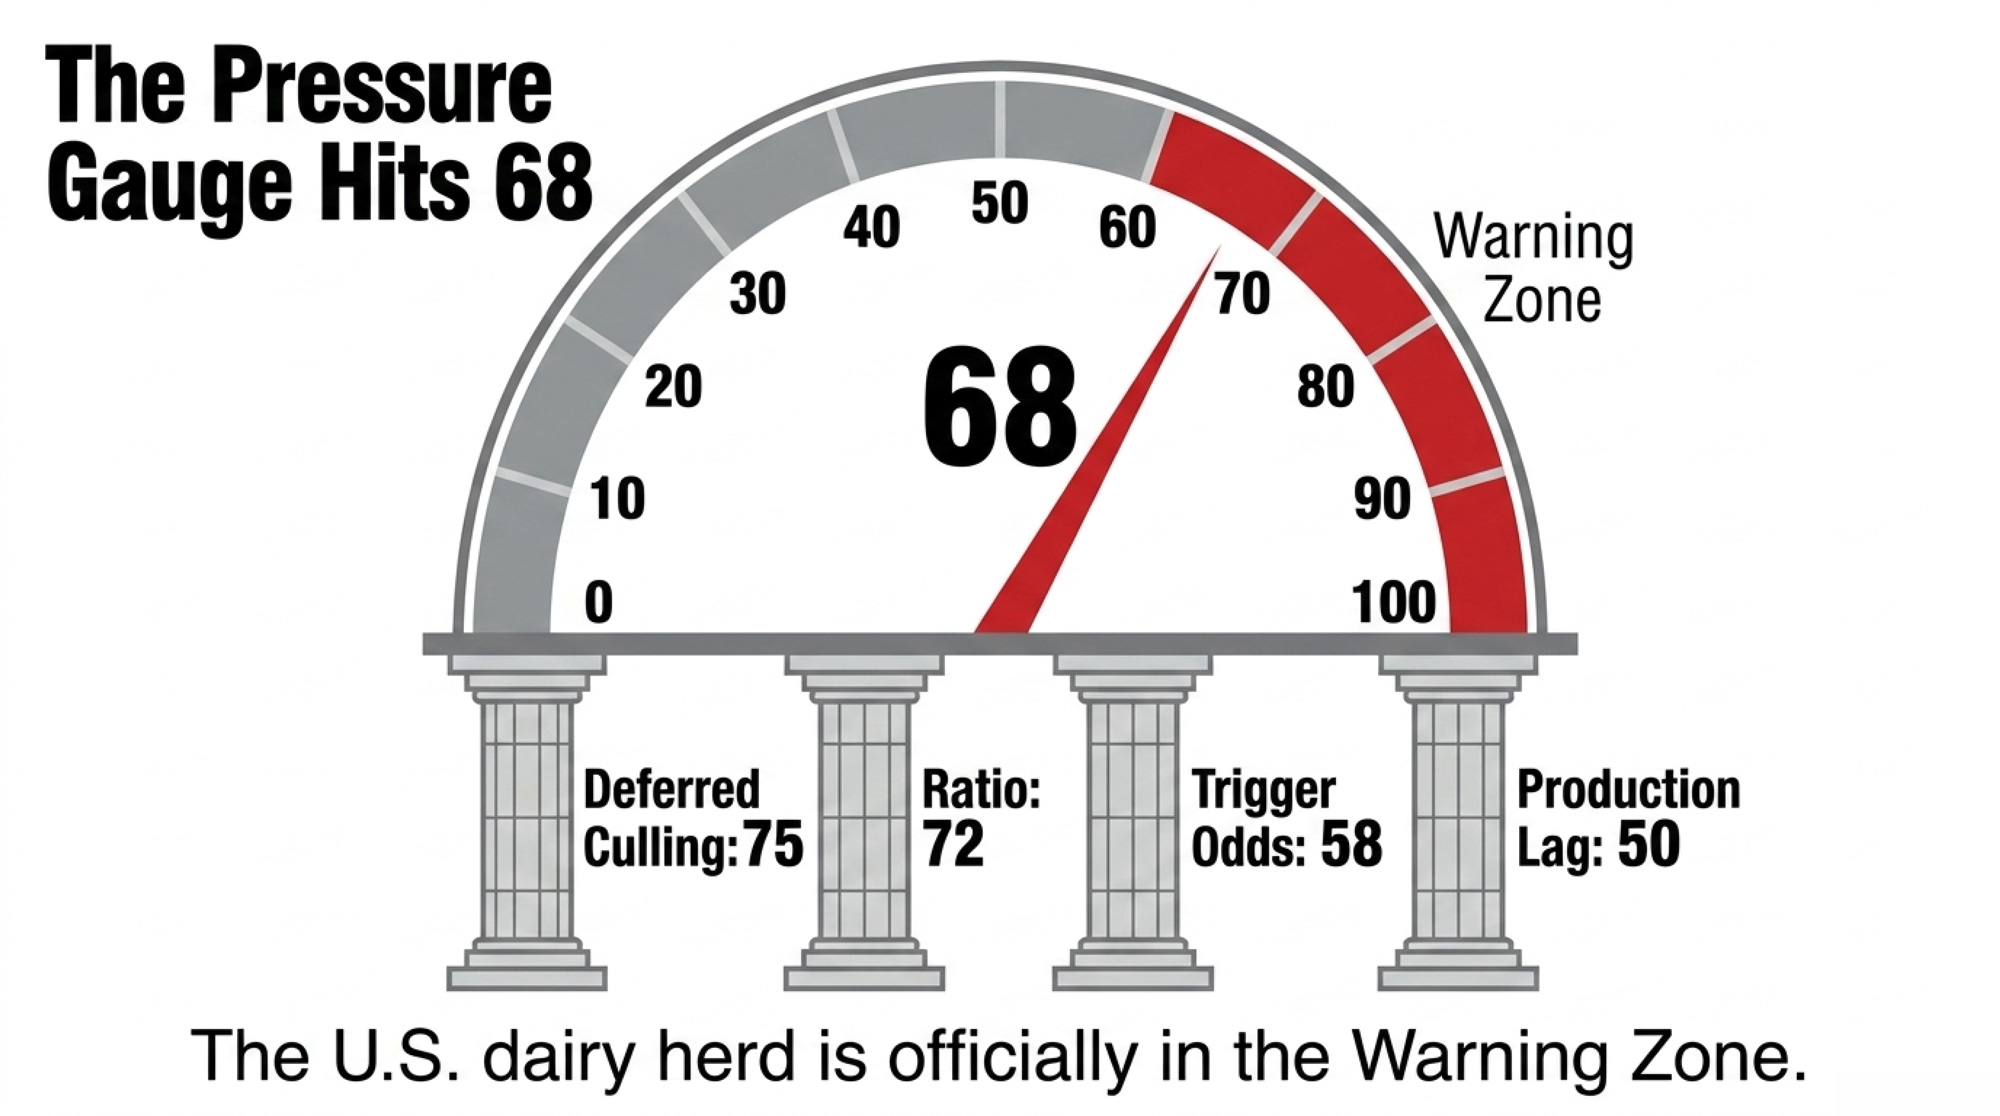
Four components composite into a 0–100 score, updated monthly. Inputs and weights are public.

ComponentWhat It MeasuresCurrent ValueSub‑ScoreWeight
Deferred CullingCows retained past productive life~470,000 head7530%
Replacement‑to‑Cull RatioEconomic incentive to defer2.83:17225%
Production LagGenetic potential vs actual yield~144 lb implied vs 200–220 lb trend5020%
Trigger OddsProbability of a correction catalystBorderline high5825%
Composite CPIApril 202668

The Volatility Premium: Why The Reading Is 68, Not 65

The straight weighted composite lands at 65.0 (75×0.30 + 72×0.25 + 50×0.20 + 58×0.25 = 22.5 + 18 + 10 + 14.5). The published reading of 68 carries a three‑point Volatility Premium on top of the raw math.

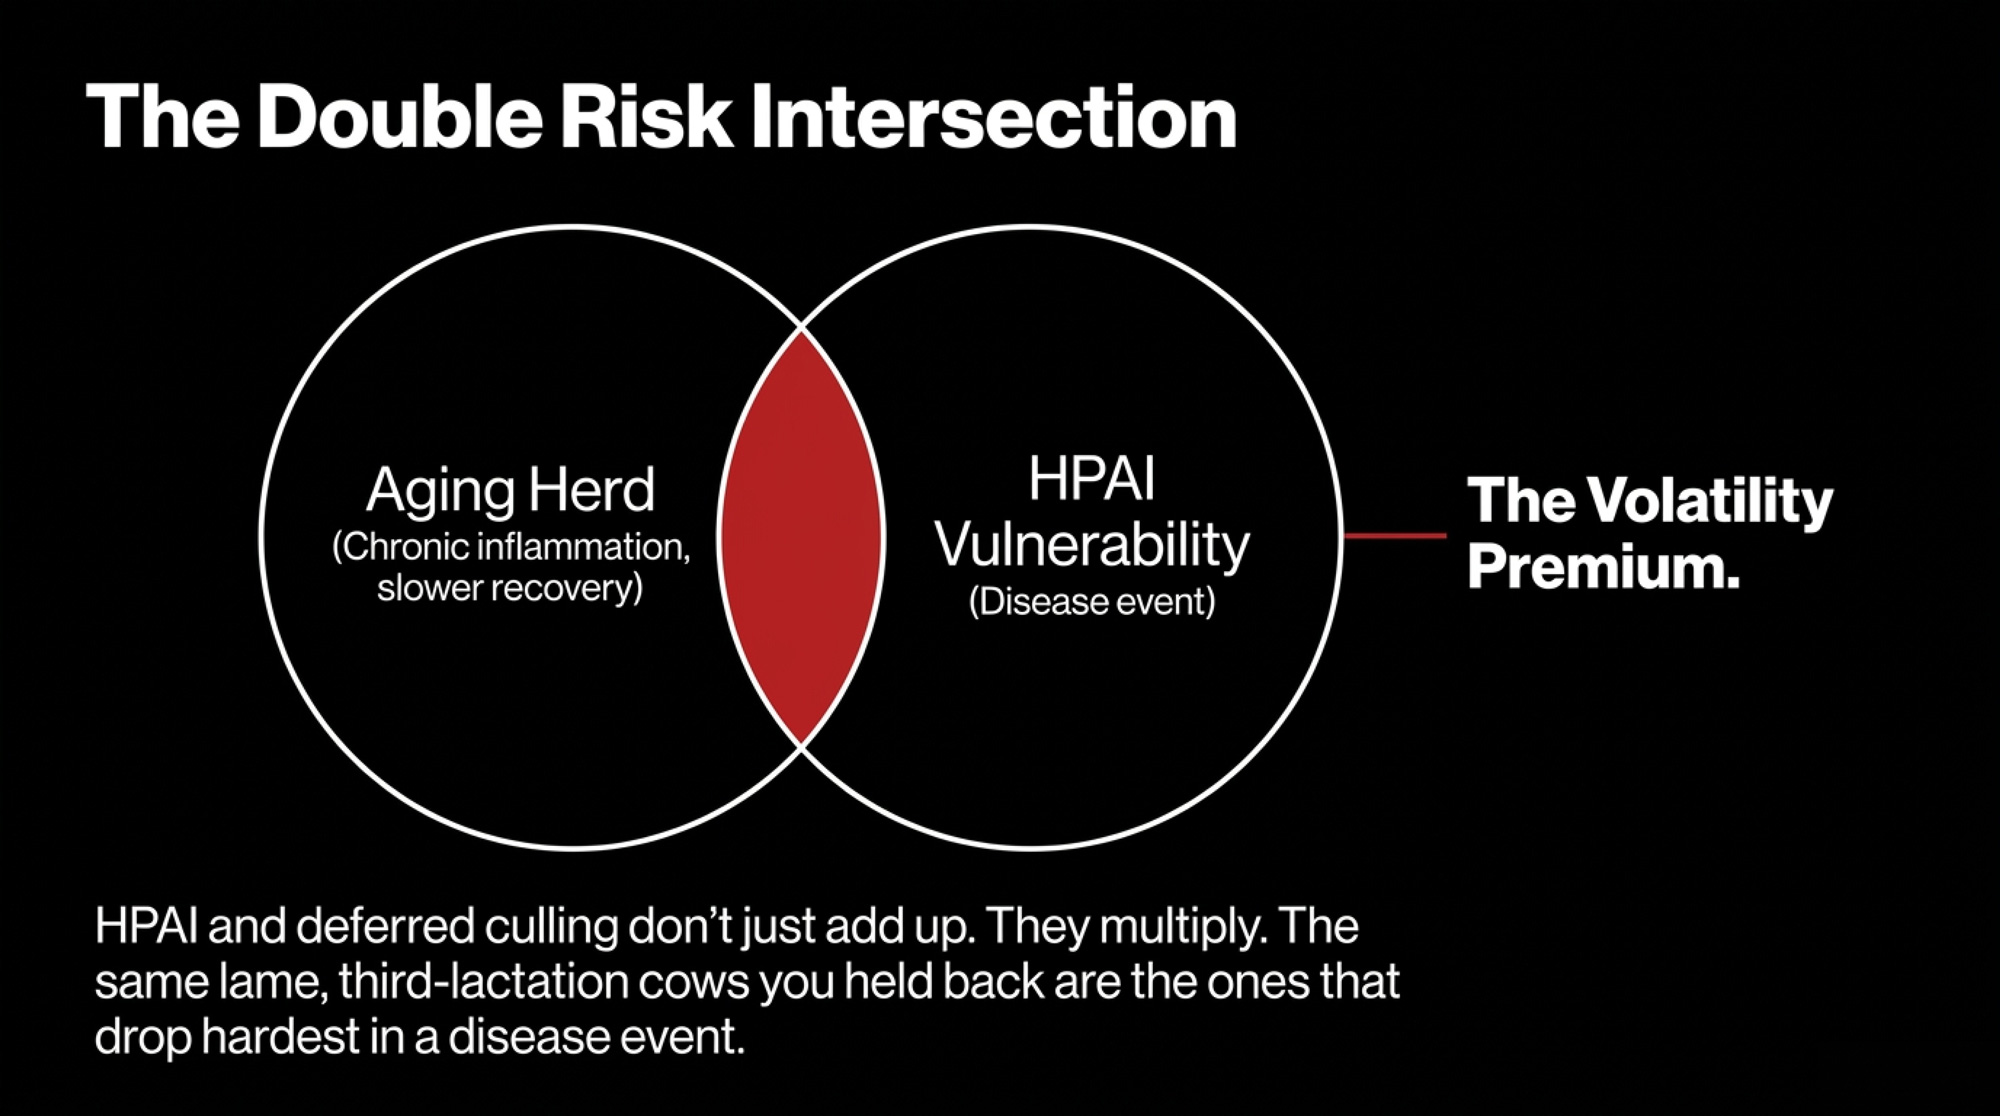
Here’s why. The four sub‑scores weight correction risks as if they add linearly. They don’t. HPAI exposure doesn’t just stack on top of deferred culling — it multiplies the weight of it, because the same aging cows are the animals most likely to drop hard in a disease event. Class III sub‑$16 for multiple prints doesn’t just add pressure — it compounds against a heifer market above $3,000, because producers facing both can’t cull or replace their way out.

The Volatility Premium quantifies that convergence risk in a single digit. Future monthly releases publish both the raw weighted composite and the premium‑adjusted reading side by side, so you can see when trigger‑convergence is doing the work and when it isn’t.

Deferred Culling — 30% weight

USDA AMS weekly FI slaughter since September 2023 runs ~611,600 head below the five‑year rolling baseline (Sept 2018–Aug 2023, roughly 3.0M head/yr; baseline table in the methodology appendix). Net of eventual exits and natural attrition, The Bullvine’s central estimate is ~470,000 head retained past productive life — plausible range 350,000–550,000 depending on assumed mortality and voluntary exit rates.

Even at 350,000, this component still scores in the 70+ band. The Warning Zone read doesn’t depend on the headline number being exact.

Replacement‑to‑Cull Ratio — 25% weight

$3,110 October 2025 USDA heifers against a $1,100 dairy utility cull gives a headline 2.83:1. On a stronger cull (~$1,600 in hot beef markets), the ratio drops toward 1.9:1. Either read, the economics tell producers to wait.

Production Per Cow — 20% weight

USDA NASS puts 2025 per‑cow production at 24,390 lb, up 218 lb over 2024 — essentially on pace with the 200–220 lb/yr genetic trend implied by CDCB data. February 2026 per‑cow production came in at 1,899 lb, just 12 lb above February 2025. If that February pace held for all 12 months, the implied annual gain would run near 144 lb — short of genetic potential.

That’s a conditional read, not a measured 12‑month result. But it’s where the Warning Zone signal lives.

Trigger Probability — 25% weight

  • Class III: $14.59 Jan 2026$14.94 Feb 2026$16.16 Mar 2026 (USDA AMS class prices).
  • April 2026 WASDE projects 2026 average Class III at $16.90/cwt.
  • Corn ending stocks ~2.127B bu, 14.6% stocks‑to‑use, season‑average $4.15/bu (April 2026 WASDE‑670).
  • IDFA capacity tracker tallies $11B+ in new or expanded U.S. dairy processing capacity through 2028, across 50+ projects in 19 states (October 2025 release).

One more sub‑$16 Class III print and this leg alone pushes CPI deeper into Warning — before the Volatility Premium even recalculates.

What The CPI Doesn’t Tell You

The CPI is a national composite. It reads industry‑wide pressure — not your barn.

  • Regional variance. California and New York face different correction probabilities at the same national score.
  • Herd‑size variance. Large‑herd financial dynamics differ from family operations.
  • Genetic merit. Strong and weak breeding programs feel the same national CPI differently.
  • Beef‑on‑dairy mix. Herds heavy on beef‑cross calf revenue face different replacement math.
  • Trade shock. Export collapse shows up only through sustained Class III pressure inside Component 4.

Regional and herd‑size CPIs are in development as Phase 2. For a herd‑specific read today, run your numbers through the Replacement‑to‑Cull Snapshot at thebullvine.com/tools/rc-snapshot.html.

What Does CPI 68 + $3,000 Heifers Mean For Your Herd?

The Bullvine built this Decision Matrix so this doesn’t stay theoretical.

CPI ScoreHeifers >$3,000Heifers $2,000–$3,000Heifers <$2,000
30–50 (Stable–Building)Normal cull pace; map 2027 replacement pipeline.Normal cull pace; opportunistic purchases.Cull freely; replace aggressively.
50–70 (Building–Warning)Identify lowest‑quartile cows; lock replacement contracts.Accelerate culling of obvious passengers.Cull hard and refresh herd age.
70–80 (High Warning)Cull lowest quartile only as fast as replacements allow.Cull aggressively; secure replacements now.Maximize herd turnover.
80+ (Correction Imminent)Cull aggressively only if replacements secured.Cull now; expect heifer prices to react.Full herd refresh, if balance sheet allows.

At CPI 68 with >$3,000 heifers, the U.S. sits in the 50–70 × >$3,000 cell. Translation: tag your bottom quartile and pre‑position replacement access now — not after the correction starts.

Companion analysis — Tier 3 economics: The $3,000 Heifer Hangover: How Beef‑on‑Dairy Emptied Your Pipeline.

Why HPAI Makes Deferred Cows A Double Risk

Older, deferred cows aren’t only an economic problem. They’re also the animals most at risk in a disease event.

Immune function declines with age. Third‑, fourth‑, and fifth‑lactation cows carry more cumulative stress, more chronic inflammation, and slower recovery than first‑ and second‑lactation cows. They’re more likely to carry subclinical mastitis, lameness, or metabolic issues that blunt immune response — a pattern consistent with published veterinary literature on age‑linked immune competence in lactating cattle in the Journal of Dairy Science and Veterinary Clinics of North America: Food Animal Practice.

In an HPAI event, those are the cows that drop hard in milk, recover slowly, and are most likely to be culled post‑outbreak. A herd that has been deferring culls for 18 months is, by definition, stacked with those animals. CPI 68 plus an HPAI event isn’t risk on top of risk. It’s the same risk hitting the same cows twice. That’s what the Volatility Premium is pricing.

The $11 Billion Sorting Machine

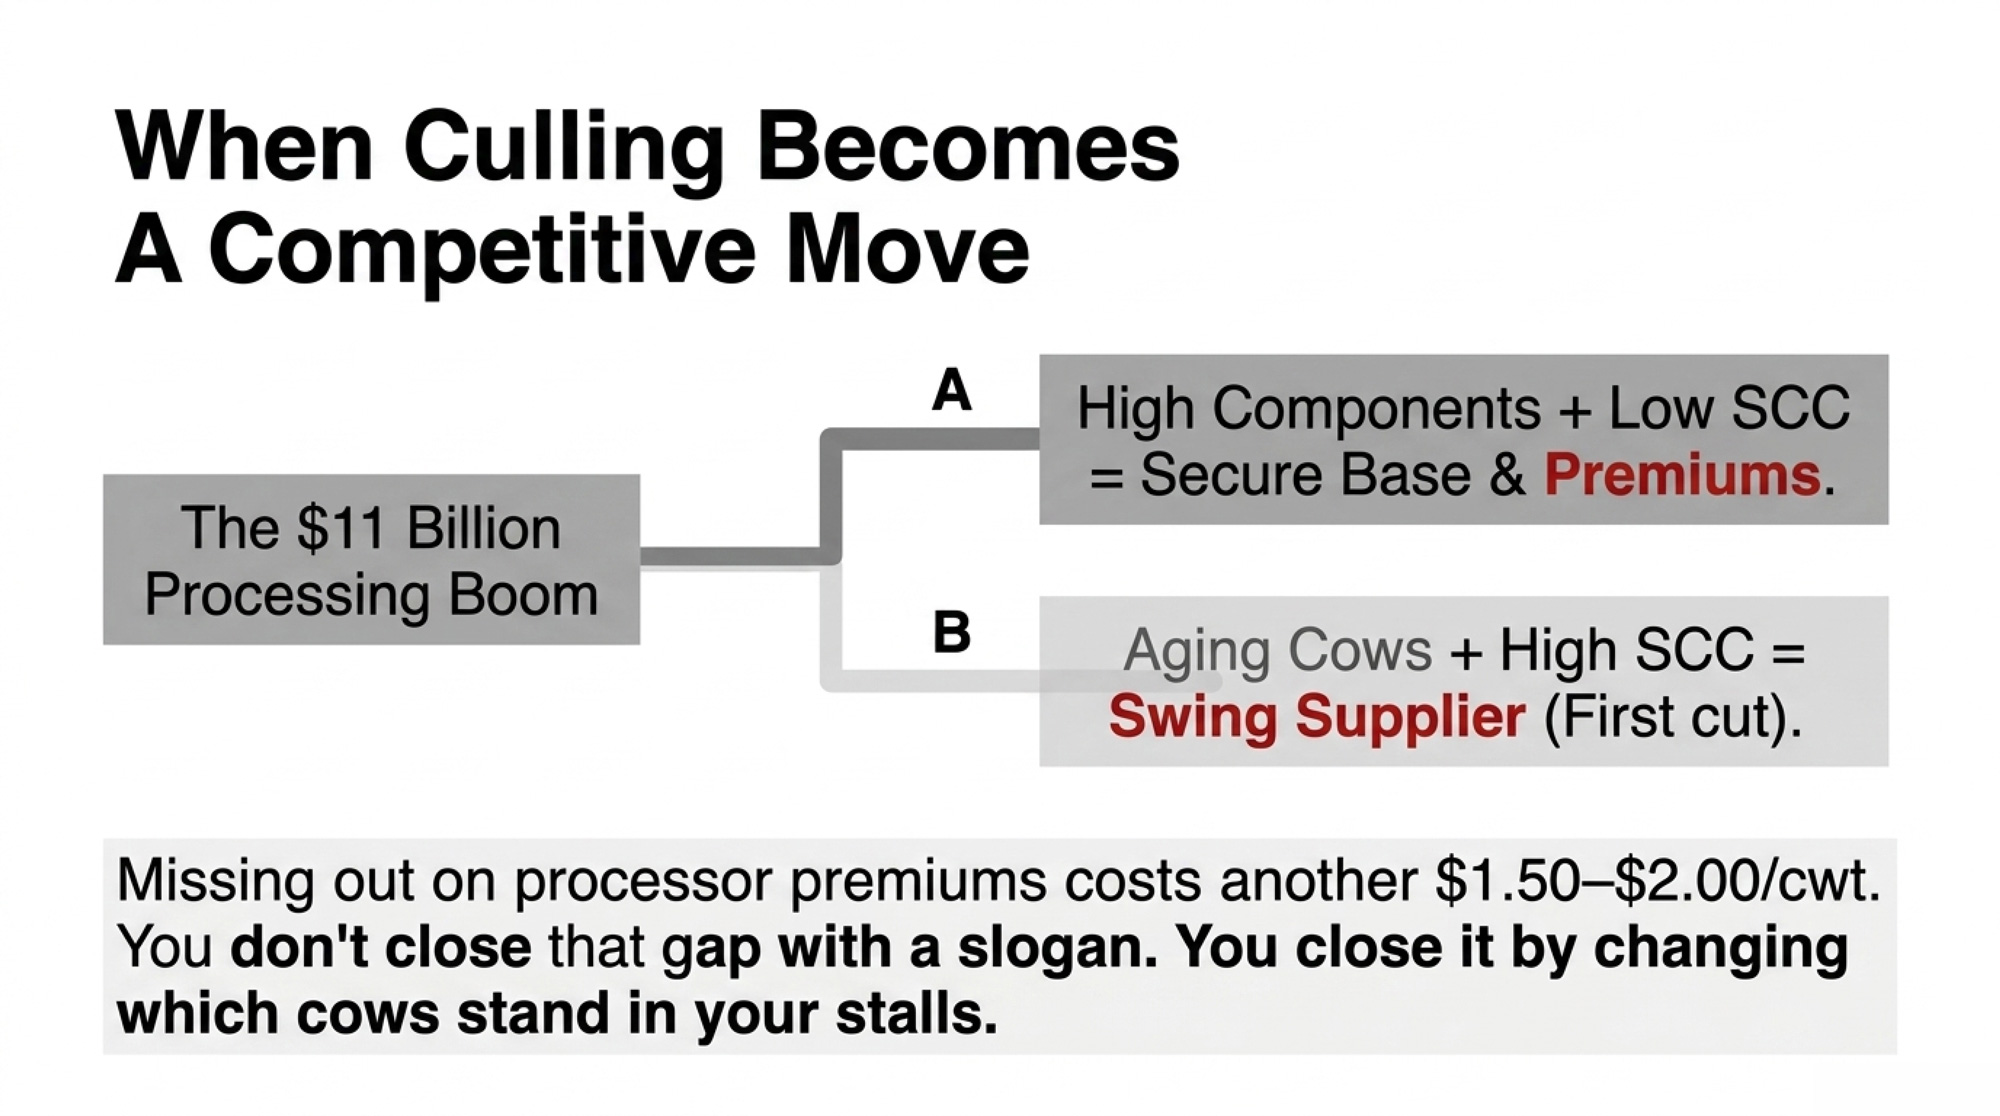
Processors are pouring concrete for plants the deferred herd can’t fully service. IDFA tracks $11B+ in new and expanded U.S. dairy processing capacity through 2028 — 50+ projects in 19 states, heavy on cheese, whey, and high‑protein ingredients. Those plants are built for high‑component, low‑SCC milk running 12 months a year.

What does $11 billion in new concrete actually need? Components. SCC that doesn’t kill shelf life. Supply they can count on.

Two farm‑level outcomes:

  • High‑component, low‑SCC herds get base volume and more secure deals.
  • Average‑component, higher‑SCC herds drift into “swing supplier” territory — first cut when plants are long, last in line for premiums.

This component/quality gap partially overlaps with Step 2 in the barn‑math box above. Don’t stack them.

Missing $1.50–$2.00/cwt in component and quality premiums on 136,875 cwt is $205,000–$274,000/year in Bullvine modeling. Same order of magnitude as the deferred‑culling bleed. You don’t close that gap with a slogan. You close it by changing which cows stand in your stalls.

Continue the series — Tier 3 analysis: The $11 Billion Dairy Rush: Your 18‑Month Window to Lock in Processor Premiums.

The 438,844 Missing Heifers

The culling mess exists because of the heifer mess.

CoBank’s Dairy Heifer Inventories to Shrink Further Before Rebounding in 2027 (August 2025), read alongside USDA Cattle inventory data, implies approximately 355,000 fewer dairy replacements in 2025 than 2024, and another ~440,000 fewer in 2026 than 2025 (specific CoBank table referenced in the methodology appendix). Dairy heifers over 500 lb now sit just under 4 million head, a 20‑year low per USDA Cattle Jan 2026.

The deficit traces to the 2023–24 beef‑on‑dairy wave — sexed semen on the top, beef semen on the rest, beef‑cross calves clearing $400–$800/head above Holstein bull calves per Livestock Marketing Information Center weekly summaries and trade‑press auction reporting across 2023–24. Calf checks cashed. Replacement gap now.

CoBank’s outlook is blunt: inventories shrink through 2026 and only start rebounding in 2027. Until then, a structural heifer deficit runs underneath everything. That’s why The Bullvine runs the CPI and the Pipeline Tracker™ as a pair — one asks how many cows should have already left, the other asks how many heifers are actually coming 24 months out.

When 470,000 Cows Finally Move

Deferred culling doesn’t unwind politely. When some producers ship, more follow. The Bullvine’s scenario modeling, anchored to USDA slaughter and production data, sketches four plausible paths.

ScenarioTriggerCows ExitingTimelineMilk ImpactModeled Class III Effect
Slow ReleaseNo major trigger~150,000~12 months~ –1–2%+$0.50–$1.00/cwt
ModerateClass III <$16 for 3+ months~300,0006–9 months~ –3%+$1.50–$2.50/cwt
Full CorrectionMultiple financial triggers converge~470,000~90 days~ –5%+$2.00–$3.00/cwt
Extreme (tail risk)Financial triggers + disease event≥600,000<3 months~ –6% or more+$3.00–$5.00/cwt

These are modeled illustrative scenarios, not forecasts. The Extreme row is tail risk — a correction lining up with an HPAI event — and it’s the shape lender stress tests commonly include.

Drop Full Correction onto a 1,000‑cow, 75 lb/cow/day herd: 1,000 × 75 ÷ 100 × 365 = 273,750 cwt/year × $2.50/cwt = $684,375/year extra gross milk revenue if the rally lands in your tank.

Whether you keep that –/cwt depends on whether your cow mix and components qualify for the premium tier when the move hits. That’s the barn math on the upside.

Where Does The Pain Hit First?

Not evenly. Vulnerability scoring below reflects structural variables — herd size, replacement sourcing, cost structure — and is not an assessment of any individual operation or lender book.

StateFeb 2026 Herd (000 head)YoY ChangeVulnerabilityKey Risk
California1,712+3HIGHLargest herd; high costs; culled hard and early in the 2018–19 exit wave.
Texas718+34HIGHExpansion built on purchased replacements.
Wisconsin1,290+25MODERATE–HIGH200–700 cow backbone squeezed on costs.
Idaho724+24MODERATE–HIGHGrowth state; replacement‑dependent.
New York653+21MODERATEAging infrastructure; cash‑flow‑driven deferral.

Data source: USDA NASS Milk Production, February 2026.

California carries 1.712M cows and added just 3,000 head YoY. High replacement costs, water, and regulation load every culling decision. When margins compressed in 2018–19, California culled hard and early — a likely early indicator pattern worth watching in the national herd this cycle.

Texas grew by 34,000 cows to 718,000 — the biggest state gain, leaning most heavily on purchased replacements. A correction mid‑ramp means depreciating cows paid for at the top.

Wisconsin added 25,000 cows to 1.29M, but the backbone is still 200–700 cow herds. Those operators don’t carry the contract leverage of mega‑herds and are most likely holding marginal cows because no replacement path pencils without torching cash flow.

Idaho grew by 24,000 cows to 724,000 — replacement‑intensive throughput. Correction mid‑expansion is a double squeeze.

New York added 21,000 cows to 653,000, behind a cluster of announced regional processing projects tracked by The Bullvine against IDFA and New York State Ag & Markets filings. Specific project‑dollar totals are posted on the CPI methodology subpage. Deferred culling there is often cash‑flow‑driven.

Lender screening rule: fastest growth + highest reliance on purchased replacements = most exposed when the CPI climbs.

Breeding Your Way Out Of The Next Trap

If CPI 68 says clear your bottom 25%, the next question is who stands in those stalls next.

Paying $3,110 for a replacement only pencils if she stays out of the bottom quartile long enough to earn back. Extension cost work implies roughly a three‑lactation payback window at today’s heifer prices and milk values, while average U.S. productive life continues to run well short of that window in CDCB genetic trend reporting.

More herds are quietly shifting sire lists away from one more notch of yield and toward Productive Life, Daughter Pregnancy Rate, and health traits. In a $3,000‑heifer world, you’re better off with cows you still like in third lactation than cows you’re debating at second.

Companion genetics read — Tier 2: Sire Selection for Longevity in a High‑Heifer‑Cost Cycle.

The 30‑Day “pull three reports” step below pairs with this hidden‑gem analytics piece: Reading Your DHIA Report Like a Lender.

The 30/90/365‑Day Playbook for 200–700 Cow Deferred Herds

30‑Day Actions: Triage

Pull three reports from your herd software. Average lactation, vet cost per cow YoY, and a “kept instead of culled” list (cows you held in 2024–25 that would have shipped in 2019–20). Feed those numbers into the Replacement‑to‑Cull Snapshot the same afternoon. Requires: DHI and repro records, 20 minutes. Trigger: Average lactation >2.8 and vet cost/cow up YoY = you’re in the deferred cohort. Backfires when: You cull off software rank alone without checking repro status; some bottom‑rank cows are fresh and will climb.

Build your bottom‑quartile list. Rank by production, SCC, lameness, and days open. Tag each cow “ship within 6 months” or “re‑test at 6 months.” Requires: DHIA records and DC305/PCDart. Trigger: If your DSCR has been under 1.2 for three consecutive months on your lender’s reporting standard, treat the top third as urgent. DSCR covenant language varies — confirm with your loan officer. Backfires when: You empty stalls you can’t refill. Pair with the 90‑day replacement step below.

90‑Day Actions: Structural

Ship 25–35 cows from the bottom‑quartile list (8–12/month). Start with obvious passengers. Recheck vet cost/cow, bulk tank SCC, and daily shipped milk at Month 3. Requires: Replacement access or accepted lower cow count; freight and packer capacity. Trigger: If none of those three indicators improve, the hole is deeper than culling alone can fix. Backfires when: You ship without securing replacements and permanently shrink your base — fine if that’s the plan, a problem if it isn’t.

Lock replacement access. Heifer‑raising contracts, forward purchase agreements, or more sexed semen on your top 35–40%. Requires: 6–9 months for sexed semen to move through the pipeline; legal review on any forward contract. Trigger: Heifer prices break above $3,200 nationally, or your local replacement market tightens — pull this forward. Backfires when: Forward contracts signed at the top lock in peak prices. Build optionality where you can.

Tighten sire criteria on PL, DPR, and health. Requires: Genomic testing infrastructure and a breeding advisor aligned on PL/DPR weighting. Trigger: Average lactation trending up while production lags genetic trend = aging structurally, not just cyclically.

365‑Day Moves: Strategic

Clear 80–100 of the original bottom‑quartile cows; re‑run the diagnostic. Requires: Committed 12‑month cull and replacement schedule; lender in the loop. Trigger: Modeled annualized losses narrow by $50,000+ and cash‑flow draw slows — keep restructuring. Opportunity signal: If your components and SCC move you up a processor premium tier while Class III rallies into the Moderate or Full Correction band, you capture margin expansion your aging‑cow peers won’t. Backfires when: You keep a cow just to “earn back” the $1,000 you already spent on her vet bills. That vet check is gone. The only question left is what she produces tomorrow forward versus what a replacement produces in the same stall. Sunk cost is not a strategy.

Decide honestly at Month 12. Narrow the losses and rebuild, or plan a managed exit while cattle and heifer values still give you an equity‑preserving off‑ramp. Requires: Real data, not optimism. Accountant and lender at the table. Trigger:Equity ratio drifting below your lender’s covenant floor + two consecutive years of sub‑1.2 DSCR = managed‑exit conversation, not “one more year.” Backfires when: You wait for “one more good year” while deferred peers finally ship. That’s when heifer prices correct against you and cull prices soften.

Lender/advisor move: map CPI against your regional herd mix. Fastest‑growth, purchased‑replacement states (TX, ID) sit in a different risk band than flat regions. Portfolio exposure isn’t uniform.

The Turn: When Culling Becomes A Competitive Move

Run that same 500‑cow Wisconsin‑style herd forward 12 months in the model.

Average lactation is down. Vet cost per cow is flattening. Components trend toward the processor’s premium tier. The $205,500 margin gap hasn’t disappeared — but the $50,000–$100,000 bottom‑quartile drag has mostly retired.

A deferred‑herd peer down the road is still waiting. When the correction hits, everyone ships the same month. That’s when the lender’s “Can we afford to cull?” question flips to the only one that matters: Can we afford not to?

The CPI is a pressure gauge, not a guilt trip. Some cows are worth holding — young age structure, flat vet cost, production matching genetic expectations. If those conditions don’t describe your barn, the math isn’t ambiguous. Just uncomfortable.

What This Means For Your Operation

  • Pull those three reports in the next 30 days and set them beside your last three milk checks. If you won’t, you’re not managing this risk — you’re hoping it doesn’t land on you.
  • Run your numbers through the Replacement‑to‑Cull Snapshot today. Three minutes of inputs, a herd‑specific pressure score, a prioritized bottom‑quartile list, and a 30/90/365 plan calibrated to your barn.
  • Three or more “yes” answers on the CPI diagnostic puts your behavior inside the 470,000‑cow deferred bucket. Fix it with a 12‑month plan, not one cull load.
  • Watch Class III and your local heifer market together. Three straight sub‑$16 prints + heifer softening = shift from “prepare” to “act.”
  • Plan culls, replacements, and sire selection on one whiteboard. A CPI‑driven cull plan that isn’t tied to replacement access and sire strategy just sets up the next deferred trap.
  • Lenders and co‑ops: TX and ID expansion herds sit in a different risk tier than flat Northeast regions. Map your portfolio accordingly.

I grew up on a dairy farm where we knew every cow by name. We also knew when it was time to let one go.

That instinct hasn’t changed. But at $3,110 a replacement, the economics have overridden the instinct for hundreds of thousands of U.S. producers. The CPI is how we get the instinct back into the data.

— Andrew Hunt, Founder, The Bullvine

Run Your Herd Through The Replacement‑to‑Cull Snapshot

The Bullvine Replacement‑to‑Cull Snapshot

Your herd. Your numbers. Your pressure score.

Enter your cow count, current heifer price, local cull value, average lactation, vet cost per cow, and deferred cull count in the form below. The tool returns:

  • A herd‑specific pressure score with sub‑component breakdown.
  • A prioritized bottom‑quartile action list.
  • A 30/90/365 plan calibrated to your inputs.
  • A shareable PDF output you can bring to your lender or co‑op advisor.

The Bullvine Replacement‑to‑Cull Snapshot

Your herd. Your numbers. Your pressure score.

Having trouble viewing the tool? Open the Replacement‑to‑Cull Snapshot in a new tab.

Tool is editorial. Inputs are anonymized unless you opt in to a consulting follow‑up. The pressure score uses the same component math and weights as the published CPI and is not influenced by consulting engagements — see methodology below.

Methodology Note: How The Culling Pressure Index™ Is Built

The Culling Pressure Index™ is a monthly composite that quantifies deferred culling pressure in the U.S. dairy herd and estimates correction probability.

Update cadence. Published monthly, on the second Tuesday after the USDA NASS Milk Production release. Next update: Tuesday, May 12, 2026.

Version. CPI v1.0, April 2026.

Data inputs by component.

  • Component 1 — Deferred Culling (30%). USDA AMS weekly FI Dairy Cow Slaughter vs a five‑year rolling baseline (Sept 2018–Aug 2023, ~3.0M head/yr). Full baseline table in appendix.
  • Component 2 — Replacement‑to‑Cull Ratio (25%). USDA NASS Agricultural Prices for replacement heifers; USDA AMS National Weekly Cull Cow & Bull Summary for cull values (specific weekly reports cited in appendix).
  • Component 3 — Production Lag (20%). USDA NASS Milk Production monthly data vs CDCB published genetic trends.
  • Component 4 — Trigger Probability (25%). CME Class III futures, USDA Agricultural Prices, USDA WASDE corn stocks‑to‑use, IDFA processing capacity announcements.

Weighting rationale. 30% deferred culling (lagging indicator of accumulated risk); 25% ratio (economic driver of deferral); 20% production lag (herd‑quality drag); 25% trigger probability (correction timing).

Composite reading. The straight weighted composite for April 2026 is 65.0. The published reading of 68 includes a three‑point Volatility Premium for trigger‑convergence signals (HPAI × deferred culling, sustained sub‑$16 Class III × $3,000+ heifers). Future releases publish the raw and premium‑adjusted readings side by side.

Governance. The CPI score is editorial and is not influenced by Bullvine consulting engagements. Methodology changes are disclosed in monthly updates and historical scores are restated side‑by‑side. The embedded Replacement‑to‑Cull Snapshot at thebullvine.com/tools/rc-snapshot.html uses the same component math and weights as the published CPI.

Known limitations. State‑level data lags national data by 30–60 days. CDCB genetic trend data is smoothed annually. The natural‑attrition assumption behind the 470,000 retained‑cow estimate carries a sensitivity range of 350,000–550,000 head.

Versioning. v1.0 → v1.1 → v2.0. Material methodology changes will be flagged in monthly updates. Historical scores will be restated and presented as “as‑published” and “restated” series.

FAQ

What is the CPI? A monthly composite index, published by The Bullvine, scoring deferred culling pressure in the U.S. dairy herd and estimating correction probability.

Where does the data come from? USDA AMS FI slaughter, USDA NASS Milk Production and Agricultural Prices, CDCB genetic trends, CME dairy futures, USDA WASDE corn stocks‑to‑use. All inputs public.

What is the Volatility Premium? A qualitative adjustment on top of the raw weighted composite that prices trigger‑convergence risk — specifically HPAI exposure multiplying (not just adding to) deferred‑culling risk, and sustained sub‑$16 Class III compounding against $3,000+ heifer prices.

How is the Replacement‑to‑Cull Snapshot different from the published CPI? The published CPI scores the national herd monthly. The Snapshot at thebullvine.com/tools/rc-snapshot.html applies the same component math to your herd’s inputs and returns a herd‑specific score and action list. Both use the same methodology.

How is CPI different from the Pipeline Tracker™? Pipeline Tracker projects replacement heifer supply 24 months out. CPI measures retained‑cow pressure today. Together they form the most complete U.S. dairy supply read published.

Can I cite it? Yes. Recommended format: “The Bullvine Culling Pressure Index™, [Month Year]”

Does The Bullvine sell anything based on it? Yes — disclosed plainly. The Bullvine offers herd‑specific consulting engagements applying the CPI framework. The published CPI score and the Snapshot tool output are editorial; neither is influenced by consulting engagements.

Challenge The Model

Substantive challenges to the methodology are welcome. Write to cpi-feedback@thebullvine.com. Every substantive critique gets reviewed. Material responses are published in monthly updates.

Learn More

The Sunday Read Dairy Professionals Don’t Skip.

Every week, thousands of producers, breeders, and industry insiders open Bullvine Weekly for genetics insights, market shifts, and profit strategies they won’t find anywhere else. One email. Five minutes. Smarter decisions all week.
NewsSubscribe
First
Last
Consent

The $4,000 Heifer Paradox: Why Record Prices Signal a Genetic Meltdown

Record $4K heifer prices hide a genetic meltdown: Holstein inbreeding jumped 167% in a decade. Are we mortgaging tomorrow for today’s profits?

dairy heifer prices, beef on dairy breeding, Holstein inbreeding, dairy replacement shortage, genetic diversity crisis

While dairy farmers celebrate $4,000 springer prices as the ultimate seller’s market, a silent crisis is brewing in the genetic backbone of American dairy. Holstein genomic inbreeding has skyrocketed from 5.7% to 15.2% in just one decade, and the beef-on-dairy revolution is accelerating this dangerous trend by concentrating all dairy breeding within an ever-shrinking nucleus of elite genetics. The very market forces creating today’s windfall profits are simultaneously engineering tomorrow’s genetic catastrophe.

Let’s cut through the industry cheerleading for a moment. If you’re selling bred heifers right now, you’re living in paradise. USDA’s National Agricultural Statistics Service reported a record national average of $2,870 per head for milk cows in April 2025—the highest figure in the history of this data series. Premium springers near freshening command over $4,000 per head at auctions nationwide.

But here’s the uncomfortable truth nobody wants to discuss while counting those commission checks: we’re witnessing the most dramatic genetic bottleneck in modern dairy history, and it’s accelerating faster than a first-calf heifer’s learning curve.

The Numbers That Should Terrify Every Progressive Dairy Operation

The data paints a story that should make every forward-thinking producer pause before their next breeding decision:

Breeding Pool Collapse:

  • Active AI Holstein bulls plummeted 61% from 2,734 to 1,079 between 2010 and 2020
  • This isn’t gradual attrition—this is the systematic elimination of genetic diversity

Genomic Inbreeding Acceleration:

  • Elite Holstein bulls: 5.7% genomic inbreeding in 2010 to 15.2% by 2020
  • Expected Future Inbreeding of Holstein base population: 7.5% (2015-born) to 9.4% (2020-born)
  • Projections suggest elite Holstein bulls could reach 18-22% genomic inbreeding by 2030

Economic Impact Per Cow:

  • Every 1% inbreeding increase costs 177-400 pounds of lifetime milk production
  • First-lactation fat and protein yields drop ~2 pounds each per 1% inbreeding increase
  • Net Merit declines $23-25 per 1% inbreeding increase

Reality Check: A Holstein cow with 15% genomic inbreeding—increasingly common in today’s elite genetics—could experience lifetime profit reductions of $1,035 to $1,890 compared to a cow with 5% inbreeding.

Ask yourself this: Are we so blinded by today’s heifer windfall that we’re willing to mortgage our genetic future?

The Economic Engine Driving Genetic Destruction

The beef-on-dairy revolution didn’t emerge from some industry boardroom—it was born from brutal economic necessity. When heifer prices crashed to $1,140 per head in April 2019, producers were hemorrhaging roughly $1,000 on every replacement they kept. Meanwhile, beef-cross calves commanded $1,000 or more than Holstein bull calves worth around $414.

The transformation has been staggering:

  • Beef semen sales to dairy farms exploded from 2.54 million units in 2017 to 7.9 million units by 2023
  • This represents 84% of total U.S. beef semen sales
  • Today, approximately 72% of U.S. dairy farms incorporate beef genetics into their breeding programs

Here’s the math that should keep you awake at night: For every 1% of dairy cows bred to beef semen, we lose approximately 95,000 dairy heifers annually. With millions of dairy cows receiving beef semen each year, we’re systematically removing potential dairy genetics from the pipeline.

The result? USDA’s January 2025 Cattle Inventory Report shows only 2.5 million dairy heifers expected to calve in 2025—the lowest number since USDA began tracking this metric in 2001.

Supply Crisis by the Numbers

MetricCurrent StatusHistorical Context
Dairy Heifers (500+ lbs)3.914 million head (Jan 2025)Lowest since 1978
Heifers Expected to Calve2.5 million head (2025)Lowest since tracking began in 2001
Year-over-Year Change-0.9% (2024 to 2025)Sixth consecutive year of decline
Average Heifer Price$2,870 (April 2025)Highest in USDA history

Sources: USDA NASS Agricultural Prices Report, USDA Cattle Inventory Report

The Beef-on-Dairy Amplification Effect: Creating Our Own Genetic Desert

Here’s where the industry’s collective decision-making becomes truly problematic. The beef-on-dairy trend isn’t just reducing heifer numbers—it’s concentrating all remaining dairy breeding within an elite subset smaller than the registered population of most heritage breeds.

When 72% of farms use beef semen on their lower-merit animals, guess what happens to dairy genetics? They get concentrated into the top-tier animals like cream rising to the surface.

This creates a vicious cycle:

  1. Lower-merit cows get bred to beef, removing their genetics from the dairy pipeline
  2. Only elite genetics remain in the dairy breeding pool
  3. Elite genetics become increasingly related due to concentrated selection pressure
  4. Genomic inbreeding accelerates within the remaining dairy population
  5. Genetic diversity plummets while runs of homozygosity soar

Industry estimates suggest that if current trends continue, the effective population size for Holsteins could fall below 50—a threshold geneticists consider the minimum for maintaining long-term adaptability.

Here’s the uncomfortable question: Are we so focused on maximizing short-term profits that we’re willing to dismantle the genetic foundation our industry was built on systematically?

Quick Assessment Tool: Evaluate Your Genetic Risk

Rate your operation’s genetic sustainability (1-5 scale):

Breeding Strategy Assessment:

  • [ ] Genomic testing usage: Do you genomically test all potential replacement females? (5=Always, 1=Never)
  • [ ] Beef semen targeting: Do you strategically apply beef semen only to lower-genetic merit cows? (5=Always strategic, 1=Random application)
  • [ ] Replacement planning: Do you breed precise numbers for your replacement needs? (5=Precisely planned, 1=No planning)

Genetic Diversity Management:

  • [ ] Inbreeding monitoring: Do you track genomic inbreeding levels in breeding decisions? (5=Always, 1=Never)
  • [ ] Sire diversity: Do you avoid overuse of popular sires? (5=Highly diverse, 1=Use same popular sires)

Score 20-25: Low genetic risk Score 15-19: Moderate risk—implement improvements Score below 15: High risk—immediate strategy revision needed

Strategic Responses: What Smart Operations Are Actually Doing

The most progressive operations aren’t waiting for industry-wide solutions—they’re implementing precision breeding programs that balance economic opportunity with genetic stewardship:

Precision Breeding Strategies

  • Using sexed dairy semen on genetically superior females to generate precise numbers of replacements
  • Applying beef semen strategically to lower-merit cows not designated for producing replacements
  • Genomic testing to identify the best candidates for each breeding strategy

Longevity Focus

  • Implementing management practices to extend productive lifespan (targeting 4-6 lactations per cow)
  • Recognizing that each additional lactation reduces replacement needs by approximately 25%
  • Investing in health protocols, nutrition, and housing to minimize involuntary culling rates

Economic Risk Management

  • Understanding that a $4,000 replacement heifer requires 18% higher milk prices to achieve breakeven compared to less expensive alternatives
  • Developing internal heifer-raising programs where current market prices exceed raising costs ($2,600-$2,900)

Action Items: Your 30-Day Genetic Sustainability Plan

Week 1: Assessment

  • [ ] Genomically test all breeding-age females in your herd
  • [ ] Calculate current replacement needs based on culling rates and expansion plans
  • [ ] Review inbreeding levels of your current AI sire lineup

Week 2: Strategy Development

  • [ ] Identify the top 30% of females for dairy breeding (based on genomic merit)
  • [ ] Map beef semen application to the bottom 40% of genetic merit
  • [ ] Calculate optimal sexed semen usage for replacement needs

Week 3: Financial Analysis

  • [ ] Compare the cost of raising vs. purchasing replacements at current market prices
  • [ ] Evaluate potential returns from extended cow longevity investments
  • [ ] Budget for genomic testing and sexed semen premiums

Week 4: Implementation

  • [ ] Adjust breeding protocols based on genetic assessments
  • [ ] Train staff on new breeding strategy protocols
  • [ ] Establish a monthly genetic progress monitoring system

The Bottom Line: Stop Mortgaging Tomorrow for Today’s Profits

The $4,000 heifer market represents a perfect storm of short-term economic thinking colliding with long-term genetic consequences. While beef-on-dairy strategies deliver immediate profits, they’re systematically dismantling the genetic foundation of American dairy.

We’re essentially conducting a massive, uncontrolled genetic experiment with the national dairy herd. The results won’t be fully visible for years, but the trajectory is clear: increasing genomic inbreeding, declining genetic diversity, and potential long-term productivity losses that could dwarf today’s replacement cost savings.

The smartest operators will find ways to profit from current market conditions while positioning themselves for genetic sustainability. That means strategic breeding decisions using both genomic testing and traditional breeding principles, investment in cow longevity, and recognition that today’s record prices reflect fundamental supply constraints that may persist longer than a typical lactation cycle.

Your Critical Decision Point

Stop and honestly assess your current breeding program right now. When did you last evaluate the genomic inbreeding levels of your breeding decisions? Can your operation sustain $4,000+ replacement costs long-term?

Here’s your challenge: For the next breeding cycle, calculate the true long-term cost of every beef-cross breeding decision. Factors include the immediate calf value, the lost genetic potential, and the increasing cost of replacement heifers.

The choice is yours, but the genetic clock is ticking. Unlike heifer prices, genetic diversity doesn’t bounce back quickly once it’s been culled from the population. Your breeding decisions today will determine whether your grandchildren operate a genetically robust dairy or struggle with the consequences of our short-sightedness.

Will you be part of the solution or part of the problem? The industry’s genetic future may depend on how you answer that question in your breeding shed next week.

Key Takeaways

  • Genetic Concentration Crisis: Holstein inbreeding has accelerated dramatically (5.7% to 15.2% in a decade) while available AI bulls dropped 61%, creating dangerous genetic bottlenecks that could cost $1,035-$1,890 per cow in lifetime profits
  • Supply-Driven Price Surge: Unlike previous peaks driven by high milk prices, current record heifer values ($2,870 average, $4,000+ premium) stem from critical scarcity—only 2.5 million dairy heifers expected to calve in 2025, the lowest since 2001
  • Beef-on-Dairy Double-Edged Sword: While generating immediate profits ($1,000+ per beef-cross calf vs. $414 for Holstein bulls), this trend systematically removes 95,000 potential dairy heifers annually for every 1% of cows bred to beef
  • Strategic Breeding Imperative: Success requires precision breeding programs using genomic testing and sexed semen on elite females for replacements while strategically applying beef semen to lower-merit cows
  • New Economic Reality: High replacement costs may persist long-term, demanding extended cow longevity (4-6 lactations), conservative culling strategies, and potential shifts toward internal heifer-raising programs where market prices exceed production costs

Executive Summary

While dairy farmers celebrate record $4,000 heifer prices driven by unprecedented scarcity, a silent genetic crisis is accelerating beneath the surface. The beef-on-dairy revolution that created today’s profitable market has simultaneously concentrated all dairy breeding within an ever-shrinking elite genetic pool, pushing Holstein inbreeding from 5.7% to 15.2% in just one decade. With active AI Holstein bulls dropping 61% and only 2.5 million dairy heifers expected to calve in 2025—the lowest since tracking began—the industry faces a genetic bottleneck that threatens long-term sustainability. Unlike the 2014 price peak driven by exceptional milk prices, today’s record valuations stem from critical supply shortages created by economic incentives favoring beef-cross calves over dairy replacements. The cumulative effect: potentially ,035-,890 in lifetime profit losses per cow due to inbreeding depression, creating a paradox where today’s windfall profits may engineer tomorrow’s genetic catastrophe. Smart operators must now balance immediate economic opportunities with strategic breeding decisions that preserve genetic diversity for future generations.

Learn more:

The Sunday Read Dairy Professionals Don’t Skip.

Every week, thousands of producers, breeders, and industry insiders open Bullvine Weekly for genetics insights, market shifts, and profit strategies they won’t find anywhere else. One email. Five minutes. Smarter decisions all week.
NewsSubscribe
First
Last
Consent

The $1,000 Calves & $4,000 Springers: How Long Will This Gravy Train Keep Rolling?

$4k heifers & $1k calves: How long can dairy’s gold rush last? Experts say 2026+ — but there’s a catch.

dairy heifer prices, beef x dairy calves, cattle market trends 2025, dairy breeding strategies, U.S. cattle inventory

Dairy farmers, it’s time to pinch yourselves. You’re not dreaming. Those newborn beef-cross calves are fetching north of $1,000 a pop, and top-quality springing heifers are commanding eye-watering prices exceeding $4,000 per head. Spring sales are shattering records left and right, leaving many of us wondering: How long can this milk check on hooves possibly last?

Buckle up, buttercup. The answer might surprise you – and it’s high time to rethink your entire breeding strategy.

The Perfect Storm: Why Cattle Prices Have Gone Nuclear

Let’s cut the bull: We’re witnessing a once-in-a-generation market realignment, not some temporary blip on the radar. The U.S. beef cow herd has crashed harder than a fresh heifer on a slick parlor floor, plummeting to its lowest level since 1961. We’re talking about a staggering 11% reduction since 2019 – equivalent to wiping out every beef cow in Texas twice over.

Meanwhile, dairy heifer inventories have shriveled faster than udders hit with oxytocin, reaching lows not seen since 1978. This isn’t just a cyclical dip – it’s a structural transformation of the entire cattle industry that’s making even the most stoic old-timers raise their eyebrows at auction barns.

The numbers tell the brutal truth: The total U.S. cattle inventory sits at a measly 86.7 million head, the lowest since 1951. We’ve endured six consecutive years of herd contraction, creating a supply vacuum that’s sucking prices skyward faster than a TMR mixer empties a silage bunker.

LocationDateCategoryPrice Range/HeadSource
Pipestone, MN1/16/2025Supreme Springing Heifers$3,700-$4,150
Lomira, WI1/31/2025Beef x Dairy Calves (60-100lbs)$680-$1,100
New Holland, PA1/27/2025Beef x Dairy Bull Calves$800-$1,160
Turlock, CA1/24/2025Approved Springing Heifers$2,400-$2,800

Source: USDA-verified auction reports

Even more telling: dairy-beef slaughter cattle are now averaging $2,485 per head, outperforming native beef cattle by $100 per head at finishing. The market has fundamentally rewired faster than a parlor after a lightning strike.

Why This Isn’t Your Grandpappy’s Cattle Cycle

Veterans of the industry might be thinking, “We’ve seen high prices before – they always come back down like butterfat in a separator.” But here’s why this time truly is different:

The Beef Herd’s Biological Bottleneck

The beef sector isn’t just choosing not to expand – it physically can’t expand quickly. Despite record-high calf prices screaming for more production louder than a hungry calf at weaning time, beef replacement heifer numbers continue dropping, down another 1% in 2025.

Why? The math is brutally simple: a 750-pound heifer selling at $274/cwt puts $2,055 in a producer’s pocket today versus waiting two years for a breeding return. With 7% interest rates and soaring labor costs, the financial incentive to sell rather than breed is more overwhelming than the urge to check milk prices first thing every morning.

Metric20252024Change
Total U.S. Cattle Inventory86.7M head87.2M head-0.6%
Beef Cows27.9M head28.0M head-0.5%
Dairy Replacement Heifers3.91M head3.95M head-0.9%
Beef Replacement Heifers4.67M head4.72M head-1.0%

Source: USDA NASS January 2025 Cattle Report

Dairy’s Genetic Revolution

Meanwhile, the dairy industry has fundamentally altered its breeding playbook. With beef-cross calves pulling $1,000+ at birth, farms are going all-in on beef genetics faster than they adopted genomic testing. The days of breeding everything to Holstein are disappearing quicker than free donuts at a DHIA meeting.

The numbers back this up: The National Association of Animal Breeders reports that 7.9 million units of beef semen were sold to dairy farmers in 2024, nearly matching the 9.9 million units of sexed dairy semen. That’s a staggering shift in breeding strategy reshaping the entire industry.

Dairy replacement heifers expected to calve in 2025 hit their lowest level since USDA began tracking this metric in 2001. The pipeline is emptier than a bulk tank on milk pickup day, and refilling it would require dairy farmers to sacrifice the immediate cash bonanza of beef-cross calves.

The Demand Side: Consumers Keep Paying Up (For Now)

You might think sky-high prices would crush consumer demand faster than a foot in a fresh cow pie. Surprisingly, that hasn’t happened – yet.

Retail beef prices hit a record $8.42 per pound in March 2025. That’s enough to make anyone flinch at the meat counter like they’ve touched an electric fence. Yet consumers keep reaching for their wallets. Why?

Quality is trumping price sensitivity. The proportion of U.S. beef grading USDA Prime has more than doubled since 2014, now representing 9.6% of production. Choice-grade beef has grown 20%, capturing over three-quarters of the market share. Americans eat less beef (down to 55.4 lbs per person annually), but they demand better beef when they indulge – much like the shift from fluid milk to higher-value dairy products.

“The strength of demand has been incredible—beef demand is at 30-year highs,” notes Lance Zimmerman, a senior beef analyst at RaboBank. “In 2014-15, the average consumer had to work 14 and a half minutes to afford a pound of beef. In 2024, they only have to work 13 minutes”.

On the dairy side, cheese consumption continues its relentless climb, with Americans now devouring 40 pounds per person annually. This cheese-fueled engine soaks up 35% of U.S. milk production, creating stable demand despite fluid milk’s ongoing decline faster than a sick cow’s body condition score.

Input Costs: The Pressure Cooker

The current economic environment for cattle producers presents many opportunities and challenges. Let’s look at what’s happening with the costs that make or break your operation:

Input Cost2025 Price2022 PeakChange
Corn (bu)$4.35$6.54-33.5%
Diesel (gal)$3.85$5.20-26.0%
Labor (hourly)$24.50$19.75+24.1%
7-Year Loan Rate7.1%4.5%+57.8%

Sources: USDA WASDE, EIA, Federal Reserve

Feed costs have moderated significantly from their 2022-2023 peaks, giving producers some breathing room. Corn prices have settled around $4.35/bushel, down from $6.54 in 2022/23. Soybean meal has dropped to the $300-$310 per ton range.

Hay stocks are up 6% from last year, pushing prices lower and making winter feeding less painful than a displaced abomasum. As of December 1, 2024, on-farm hay stocks were estimated at 81.5 million tons, up 6% from the previous year and well above the 2022 low.

But don’t get too comfortable. While feed costs have eased, other expenses are biting hard:

  • Labor now consumes 40¢ of every dollar on many dairy farms – more than twice what your grandfather budgeted
  • Interest rates hovering around 7% make expansion loans more painful than stepping on a hoof pick
  • Energy and fertilizer costs remain stubbornly high, like mastitis in a problem cow

The Crystal Ball: How Long Will This Party Last?

Now for the million-dollar question: When will this milk check bounce?

After crunching the numbers and analyzing forecasts from every ag economist worth their salt, here’s the verdict: These historically high prices will persist throughout 2025 and likely extend well into 2026.

The USDA and CattleFax projections align: expect fed cattle to average $199-$201/cwt through 2025. For a 1,400-lb steer, that’s $2,786-$2,814/head—numbers that’ll keep feedlots hungry for calves.

Why so long? Biology dictates the timeline. Even if heifer retention started today (which it isn’t), those calves wouldn’t calve until 2027. The supply pipeline simply can’t refill faster than nature allows – unlike switching from 2X to 3X milking.

The Long Game: 2027 and Beyond

Eventually, all good things must end – like the useful life of a TMR mixer. Most analysts expect a gradual price moderation in late 2026 or 2027, assuming favorable conditions finally allow herd rebuilding to gain traction.

But here’s the kicker: a return to pre-2023 price levels appears highly unlikely within the next 3-4 years. The cattle deficit is simply too deep, and the rebuilding process too slow – more like breeding a herd from scratch than making minor genetic improvements.

For dairy heifers specifically, prices may moderate even more slowly. The structural shift toward beef-on-dairy breeding has permanently altered replacement dynamics. Dairy farms can’t switch back to purebreds overnight, especially when crossbred calves continue commanding premiums that make Holstein bulls look like cull cows at auction.

Black Swan Risks That Could Derail the Boom

While the fundamentals point to sustained high prices, several wild cards could shuffle the deck faster than a nervous heifer in a headlock:

HPAI: The Looming Threat

Highly Pathogenic Avian Influenza has already jumped to 42 dairy herds nationwide. While mortality remains low, infected cows typically see a 10-15% milk production drop – similar to a moderate case of ketosis. A third distinct spillover event was confirmed in Arizona in February 2025, suggesting the virus is becoming more adept at infecting cattle.

The entire protein complex could shudder if HPAI spreads more widely or consumer confidence wavers. Vaccine development is underway but faces significant hurdles – making biosecurity more important than ever, even for operations that have been lax about footbaths.

Drought’s Comeback Tour

NOAA’s outlook paints the Southwest and Plains as tinderboxes heading into summer 2025. Another 2012-level drought could force massive sell-offs, ironically extending the supply crunch by forcing breeders to liquidate even more cows – similar to how culling during low milk prices eventually leads to higher prices.

Consumer Resistance

At some point, consumers may finally balk at $8+ per pound beef prices. While quality has kept demand resilient so far, there’s a breaking point for every budget – just as there’s a production ceiling for every cow, no matter how much bypass protein you feed her. A significant economic downturn could accelerate this demand destruction.

The Bottom Line: Are You Ready to Capitalize or Get Left Behind?

This isn’t a bubble – it’s the new reality for the foreseeable future. The biological constraints of cattle production and the structural shifts in breeding strategies have created a supply deficit that will take years to resolve – like rebuilding a herd after a catastrophic disease outbreak.

Smart dairy operators are embracing this paradigm shift, adjusting their breeding programs to capitalize on beef-cross premiums while carefully managing their replacement pipeline. They’re locking in feed costs while they remain favorable and budgeting for the long-term reality of expensive replacements.

The clock is ticking. With heifer retention still MIA and beef demand bulletproof, these prices aren’t just staying – they’re setting the stage for the next agricultural revolution. Those who adapt fastest will reap the greatest rewards.

Are you positioned to capitalize on this historic opportunity? Or are you still breeding like it’s 2015 when a day-old Holstein bull calf was worth less than the colostrum it consumed?

It’s time to challenge the sacred cows of your breeding program:

  1. Are you still breeding your bottom 30% of cows to dairy bulls “just in case”? Stop leaving money on the table.
  2. Have you explored multiple beef breeds to find the ideal cross for your herd? One size doesn’t fit all.
  3. Are you developing relationships with specific feedlots or backgrounders who recognize the value of your calves? Don’t settle for commodity prices on premium stock.

The Bullvine’s Call to Action: Look hard at your breeding program this week. Run the numbers on what an aggressive shift to beef-on-dairy could mean for your bottom line. Challenge the conventional wisdom that says you need to raise every replacement. Buying high-quality replacements might be more profitable in this market than growing your mediocre heifers.

The gravy train is running full steam ahead but won’t last forever. Will you be on board when it reaches the station, or will you be left watching from the platform, wondering what could have been?

Key Takeaways

  • Supply crunch rules: Beef herds haven’t been this small since JFK’s presidency; dairy replacements are scarce as farms prioritize beef-cross calves.
  • Demand defies gravity: Consumers pay $8.42/lb for beef despite inflation, while cheese addiction props up dairy margins.
  • No relief until 2027: Prices stay sky-high for 18–24 months—biology prevents faster herd recovery.
  • Black swans loom: HPAI in cattle, drought, or recession could crash the party overnight.
  • Adapt or bleed: Tiered breeding programs and beef genetics are now survival tools, not luxuries.

Executive Summary

Record-breaking prices for dairy heifers ($4,000+/head) and beef-cross calves ($1,000+/head) are rooted in a historic U.S. cattle shortage, with beef herds at 1961 lows and dairy replacements at 1978 levels. Tight supplies, resilient consumer demand, and a seismic shift toward beef-on-dairy breeding strategies will sustain prices through 2025–2026. Risks like HPAI outbreaks, drought, or economic downturns could disrupt the boom, but biology guarantees no quick fixes: herd rebuilding takes years. Dairy farmers must adapt breeding programs, lock in feed costs, and budget for $3,500+ replacements to survive the new normal.

Editor’s Note: This analysis synthesizes data from USDA NASS, auction reports from major markets nationwide, and forecasts from leading agricultural economic institutions. All figures current as of April 14, 2025.

Learn more:

Join the Revolution!

Join over 30,000 successful dairy professionals who rely on Bullvine Daily for their competitive edge. Delivered directly to your inbox each week, our exclusive industry insights help you make smarter decisions while saving precious hours every week. Never miss critical updates on milk production trends, breakthrough technologies, and profit-boosting strategies that top producers are already implementing. Subscribe now to transform your dairy operation’s efficiency and profitability—your future success is just one click away.

NewsSubscribe
First
Last
Consent
Send this to a friend