Archive for culling strategy

$3,110 In, $1,100 Out: The Cull Trap Holding 470,000 U.S. Dairy Cows – CPI Hits 68

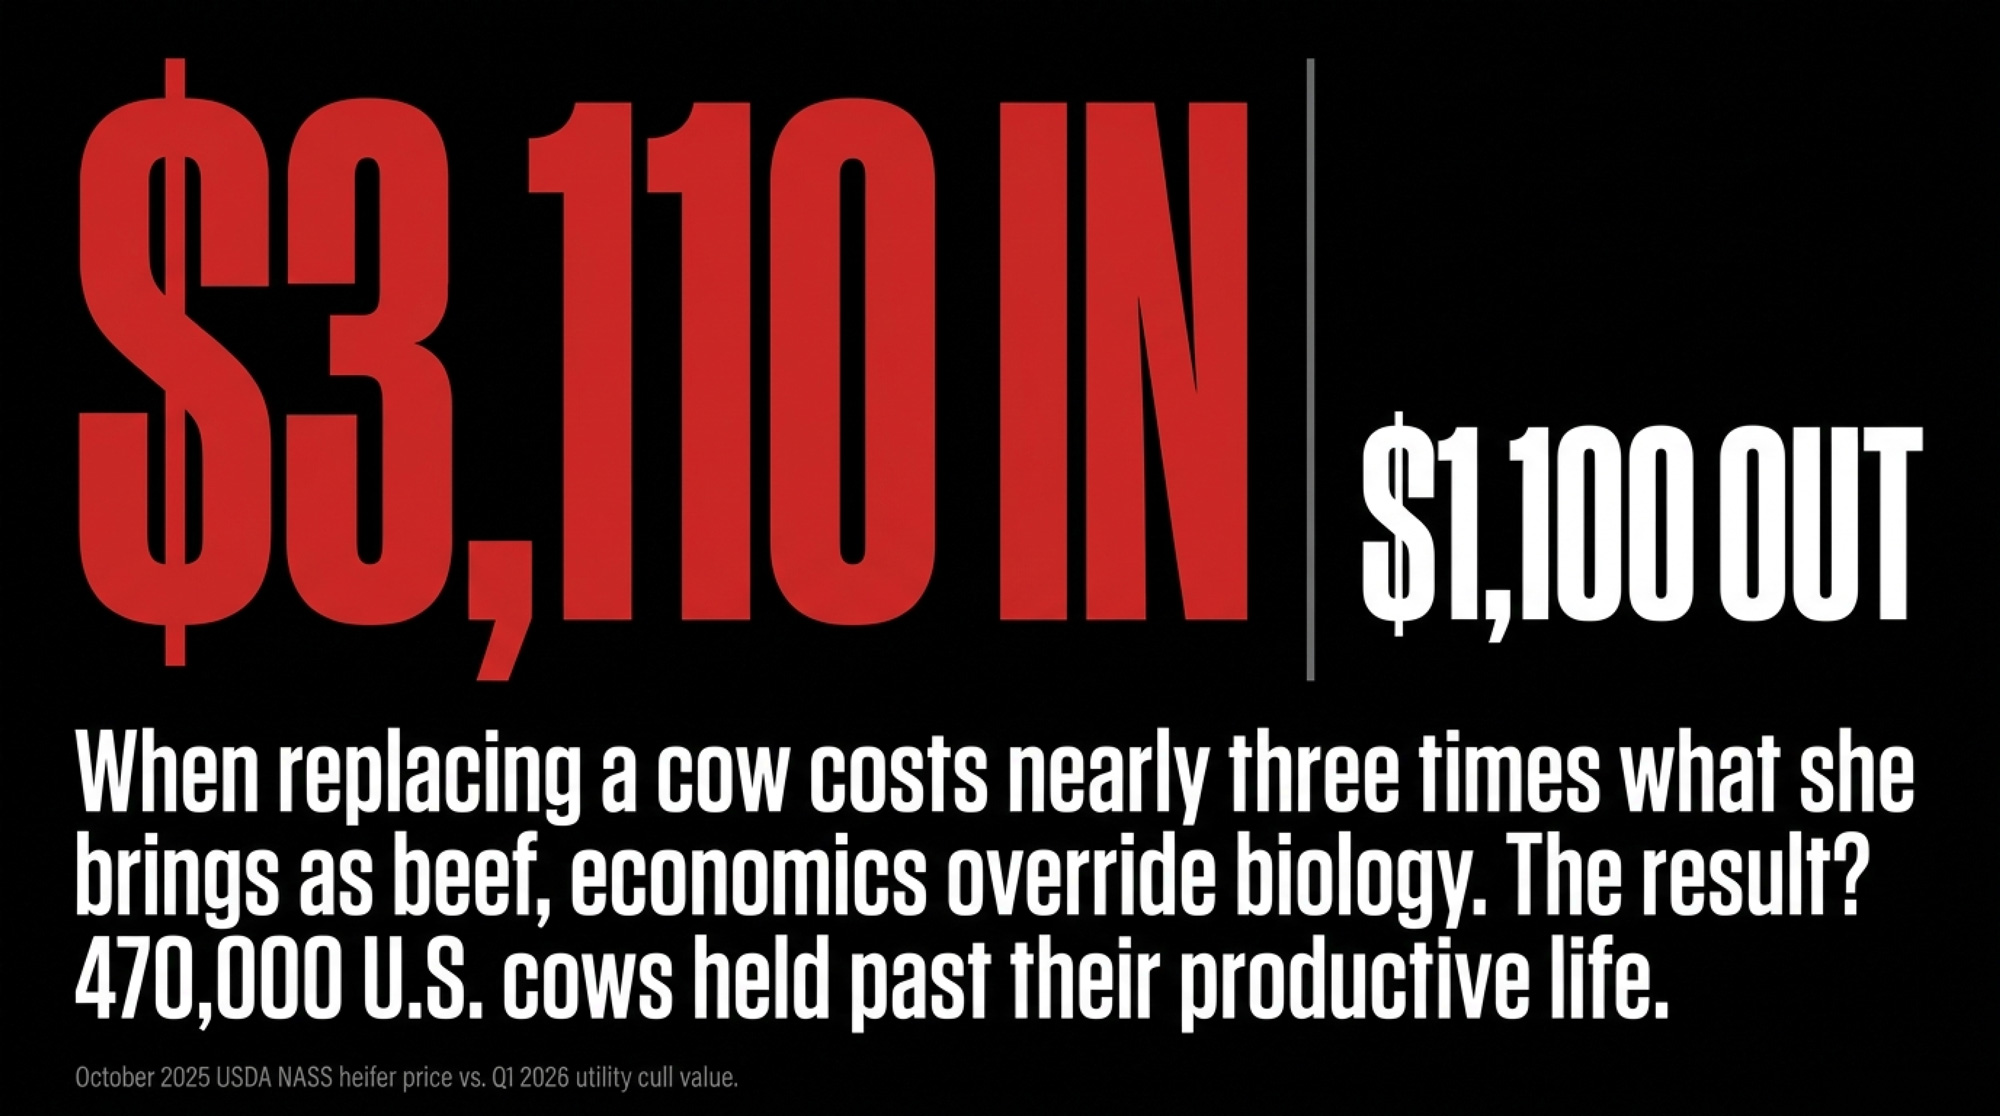
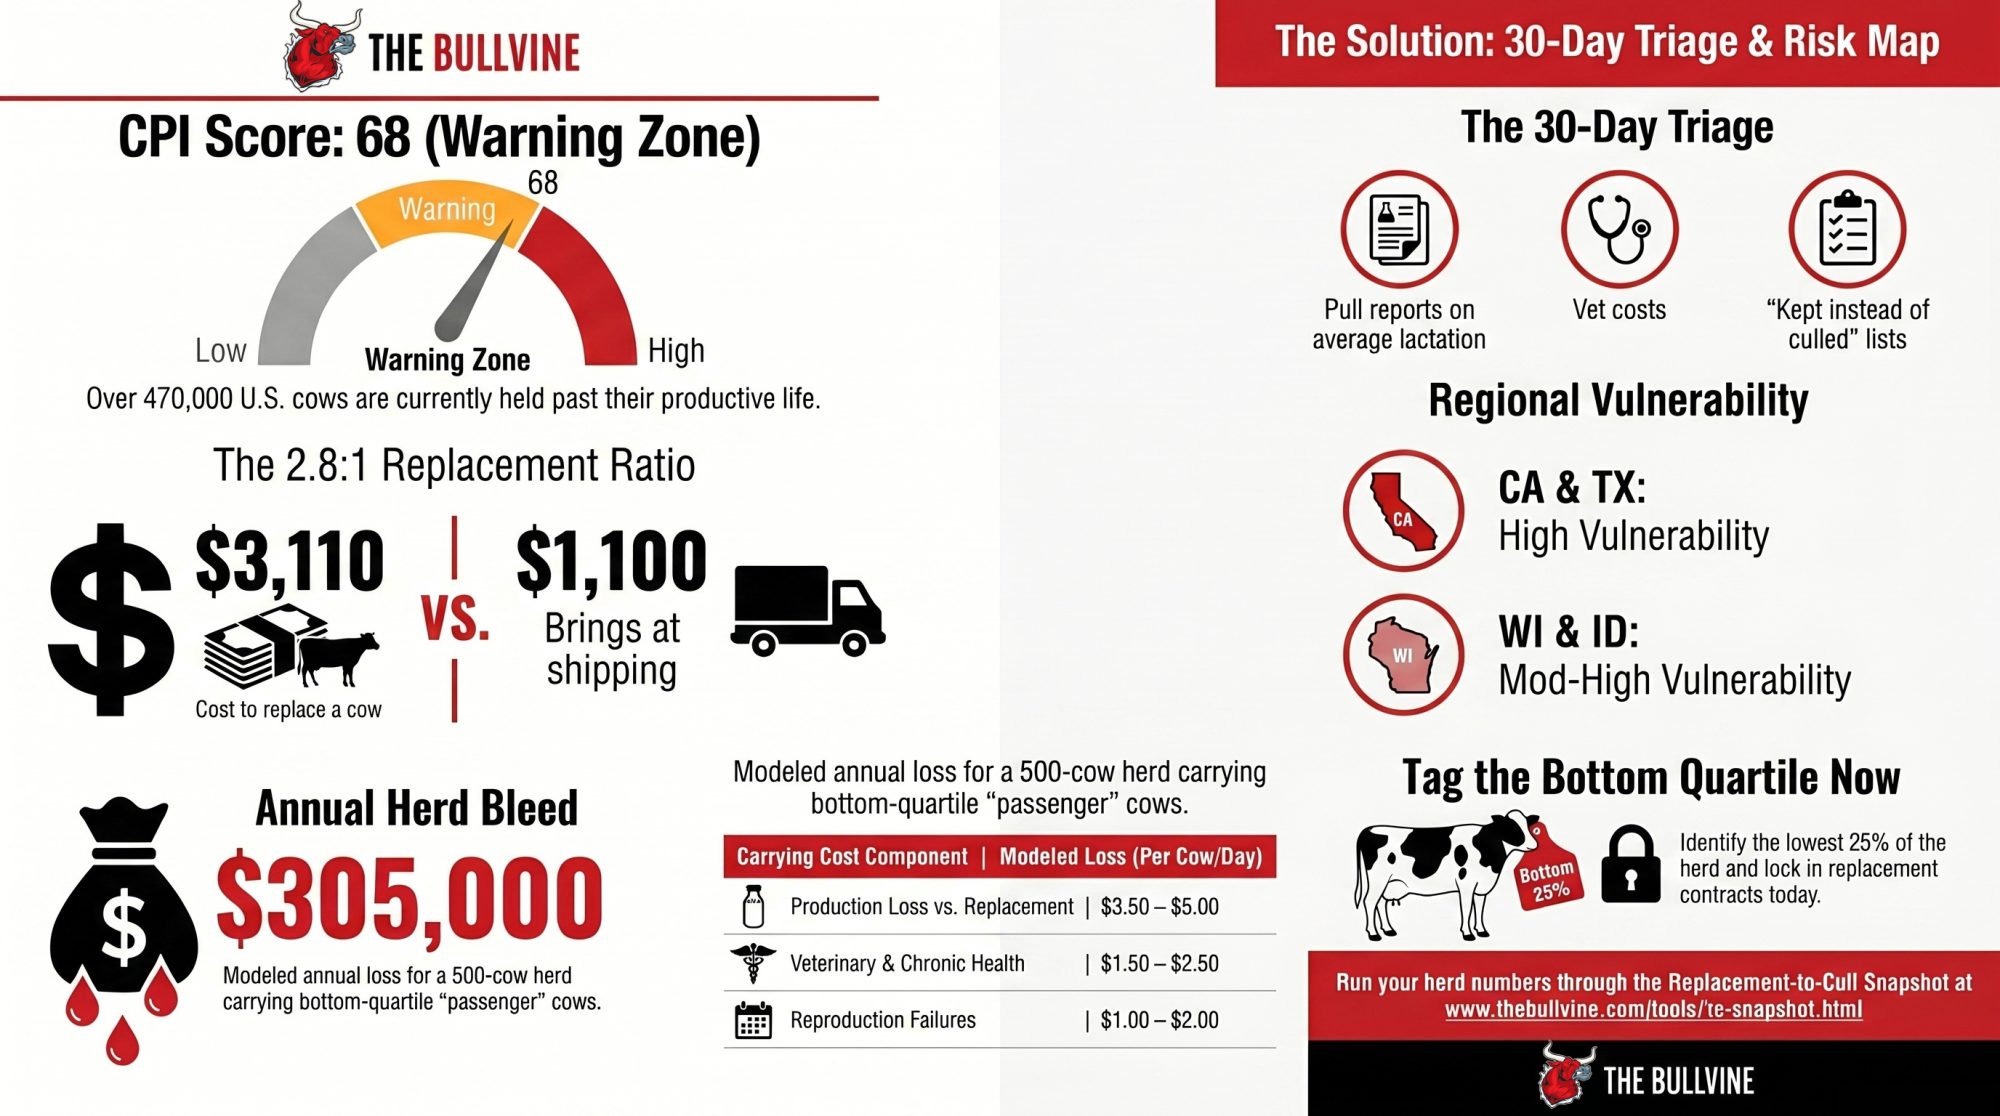
$3,110 to replace her. $1,100 to ship her. That ratio is why ~470,000 U.S. cows are still in stalls they’d have left in 2019 — and why The Bullvine’s CPI just flipped to 68. Warning Zone.

Picture a 500‑cow Wisconsin‑style herd sitting across from its lender this spring. Margin over feed dairy 2026 math says $255,000–$305,000 a year is walking out of that barn in the Bullvine model — a $205,500 milk‑over‑cost gap plus $50,000–$100,000 in bottom‑quartile carrying cost. Every culling decision runs into the same wall: the October 2025 USDA NASS Agricultural Prices release (the most recent heifer series) recorded replacement dairy heifers at a record $3,110/head.

The scene above is a composite drawn from Bullvine modeling on a representative Wisconsin 200–700 cow family operation. Milk price and cost‑of‑production inputs are national ranges applied to a Federal Order 30 (Upper Midwest) representative herd; your Order and cost structure will shift the output. Numbers throughout this piece are USDA and industry sourced; the operator is illustrative.

The cull check on the other side? Roughly $1,100/head for dairy utility cows, with better cuts clearing $1,400–$1,600in hot beef markets (USDA AMS National Weekly Cull Cow & Bull Summary, Q1 2026 range — see methodology appendix for the specific weekly reports used). That puts the replacement‑to‑cull ratio between 1.9:1 and 2.83:1.

Market CaseCow/Heifer ValueReplacement-to-Cull RatioEditorial Read
Dairy utility cull$1,100/head2.83:1Maximum pressure to defer culling
Strong beef-market cull$1,400/head2.22:1Still expensive to replace
Hot beef-market cull$1,600/head1.94:1Better exit value, but not enough relief
Replacement dairy heifer$3,110/headBaselineThe price wall driving the trap

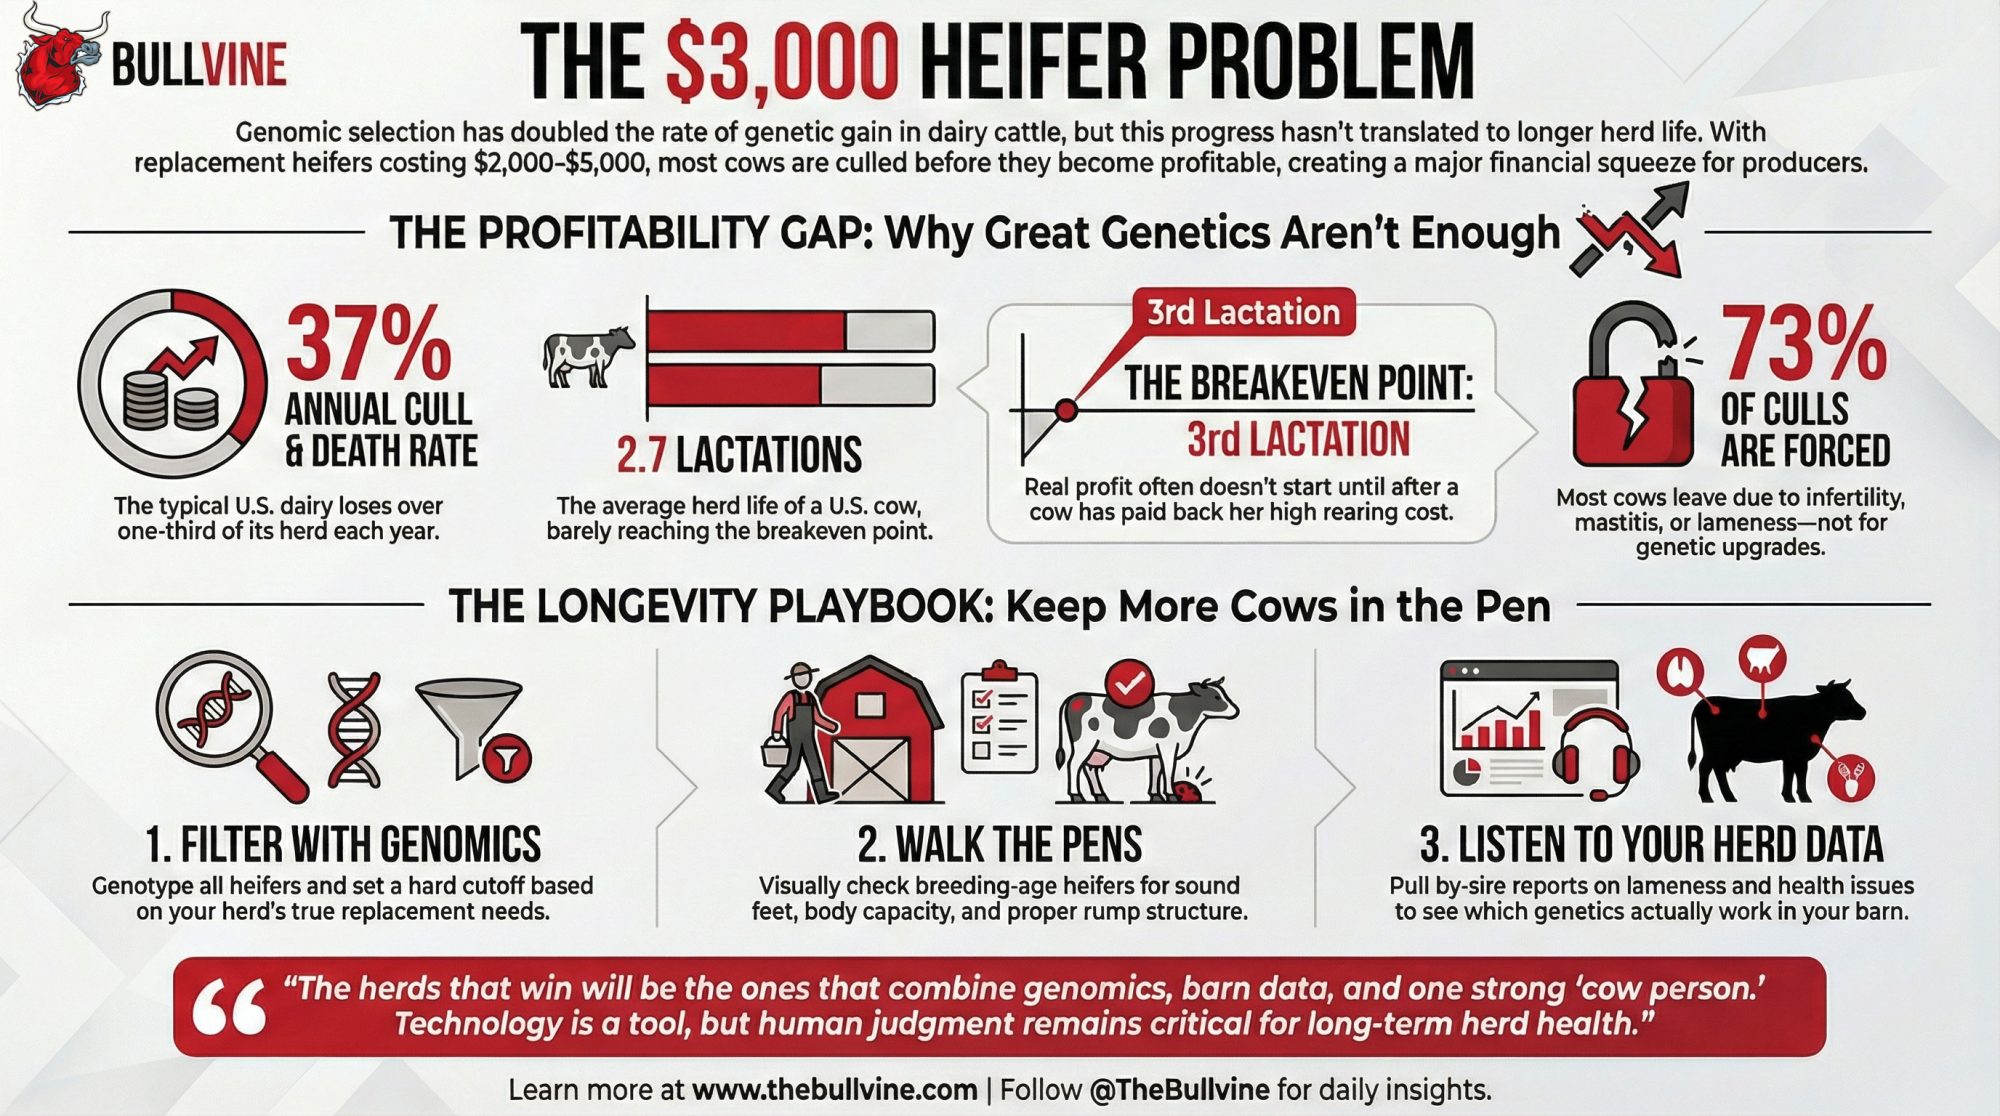
When replacing a cow costs nearly three times what she brings as beef, the economics override the biology. That’s how you get to The Bullvine’s modeled estimate of roughly 470,000 U.S. cows held past their productive life — the first piece of the trap.

“The most expensive cow in your barn isn’t the high‑index yearling you just bought. It’s the lame third‑lactation cow you can’t afford to cull.”

The Most Expensive Cow In Your Barn Isn’t The Heifer

The most expensive cow in your barn isn’t the high‑index yearling you just bought.

It’s the lame third‑lactation cow you can’t afford to cull.

She’s giving somewhere around 60 lb/day. Vet bills stack. Repro has stalled. Every instinct says ship her — until you look at the heifer market and flinch.

That flinch, repeated across the country for 18 months, is the structural story of 2026 U.S. dairy.

The Retention Trap Your P&L Won’t Show You

On paper, the U.S. herd looks strong. USDA NASS reports February 2026 milk cow inventory at 9.62 million head, up 211,000 year‑over‑year — the largest U.S. monthly inventory since 1994 per the NASS historical milk cow series (specific comparison month cited in methodology appendix). Total 2025 milk output ran roughly 232 billion lb, up about 2.6% over 2024.

Everyone assumed that meant expansion. It doesn’t. It’s hoarding — and the slaughter data says so in plain English.

Since September 2023, U.S. producers have culled an estimated 611,600 fewer dairy cows than the five‑year rolling pace, per USDA AMS weekly Federally Inspected slaughter data (Sept 2018–Aug 2023 baseline, roughly 3.0M head/yr; full baseline table in the methodology appendix). 2025 dairy cow FI slaughter totaled around 2.53 million head the lowest U.S. annual FI total since 2011 based on AMS federally inspected series.

Co‑op briefings track the heifer shortage daily. Almost nobody is tracking what’s piled up on the other side of the barn.

The Shadow Loss Your P&L Won’t Flag

Your P&L is lying by omission. It tracks what you spent on feed, but it ignores the 10 lbs of milk you didn’t ship because a lame cow is occupying a prime stall. That’s the Shadow Loss — and it’s the most dangerous number in your barn.

The Bullvine‑modeled $50,000–$100,000/year bottom‑quartile drag on a 500‑cow herd isn’t a P&L line. It’s a shadow loss. Modeled range; actual values vary by herd, region, and breeding program. The underlying carrying‑cost methodology draws on USDA price data, typical herd records, and extension‑style budgets, triangulated against the Cornell Dairy Profit Monitor framework, Miner Institute reproductive economics, and Penn State Extension dairy decision tools.

Want your own number fast? The Bullvine Replacement‑to‑Cull Snapshot at thebullvine.com/tools/rc-snapshot.html takes your herd size, current heifer price, local cull value, and deferred‑cow count and spits out a herd‑specific pressure read with a prioritized bottom‑quartile action list. Same math as the published CPI. Your inputs.

How Deferred Culling Bleeds A 500‑Cow Wisconsin Herd

The Bullvine CPI workup models the bottom 20–25% of a typical herd carrying roughly – per cow per day in drag once production loss, vet cost, reproduction failures, and stall opportunity cost are stacked. These are Bullvine‑modeled ranges built on extension‑style budgets, not cited external point values; the full derivation sits in the carrying‑cost worksheet.

Carrying‑Cost Component (Bottom Quartile)Modeled $/Cow/DayWhy It Matters
Production loss vs a younger replacement.50–.00Aging cows commonly trail herd average at –/cwt milk, per CDCB lactation‑curve data and extension references cited in the worksheet.
Veterinary costs (lameness, mastitis, metabolic).50–.50Chronic issues compound with lactation number.
Reproduction failures (extra days open, repeats).00–.00Each extra open day past mid‑lactation costs real margin.
Stall opportunity cost.00–.50Every bottom‑quartile cow blocks a springing heifer.
Total modeled carrying cost.00–.00The barn math on the “cheap” cow you kept.

Running the Numbers: 500‑Cow Wisconsin‑Style Herd

Inputs: 500 cows | 75 lb/cow/day | –/cwt milk (national range) | –/cwt all‑in cost of production (national range) | Federal Order 30 representative; your Order and cost structure will shift the output | Modeling base: Bullvine CPI using USDA ERS Cost of Milk Production framing.

Step 1 — Daily and annual production 500 × 75 = 37,500 lb/day = 375 cwt/day 375 × 365 ≈ 136,875 cwt/year

Step 2 — Margin gap (if COP runs ~$1.50/cwt above milk price)

Note: this margin gap partially overlaps with the component‑premium gap discussed in “The $11 Billion Sorting Machine” below. Don’t stack them.

136,875 × $1.50 ≈ $205,500/year negative margin

Step 3 — Bottom‑quartile drag 100 cows × $8–$12/day × 365 ≈ $292,000–$438,000 gross

Net of replacement‑cost offset: the “drag” is the incremental loss from keeping the old cow versus a replacement in the same stall — it nets out the replacement cow’s own production contribution, her own vet/feed load, and ordinary depreciation. The Bullvine model assumes ~75% of the gross carrying cost offsets against that counterfactual, leaving ≈$50,000–$100,000/year net drag. Full derivation in the carrying‑cost worksheet.

Step 4 — Total modeled bleed

Loss LayerLow CaseHigh CaseWhat It Means
Annual production136,875 cwt136,875 cwt500 cows × 75 lb/day
Milk-over-cost gap$205,500/year$205,500/yearNegative margin at $1.50/cwt gap
Net bottom-quartile drag$50,000/year$100,000/yearDeferred cows occupying better stalls
Total modeled bleed$255,500/year$305,500/yearThe lender-facing number
Per cow equivalent$511/cow/year$611/cow/yearPain spread across the whole herd

Modeled for an illustrative 500‑cow Wisconsin operation on national milk and COP ranges. Your number will differ. Plug your own cow count, pounds, COP, and bottom‑bucket count into the Replacement‑to‑Cull Snapshot at thebullvine.com/tools/rc-snapshot.html for a herd‑specific output.

That’s the formula your lender is already running. Write it on your own whiteboard.

More from The Bullvine — Tier 3 economics: Why Your 2026 Budget Is Lying to You: USDA $18.95 Milk vs. $19.14 Costs.

Why Did The Bullvine Build A New Index For This?

The CPI exists because no one else was tracking the inverse of the heifer shortage. Every co‑op briefing reports how few heifers are coming. None publish how many cows are still in the barn that should have already left.

To The Bullvine’s knowledge, the CPI is the first published composite index scoring deferred culling and the replacement shortage together as a single trackable number. USDA doesn’t publish it. Land‑grant extensions don’t. The gap was real. The math could be done. Here’s how.

How The CPI Reads The Herd

Four components composite into a 0–100 score, updated monthly. Inputs and weights are public.
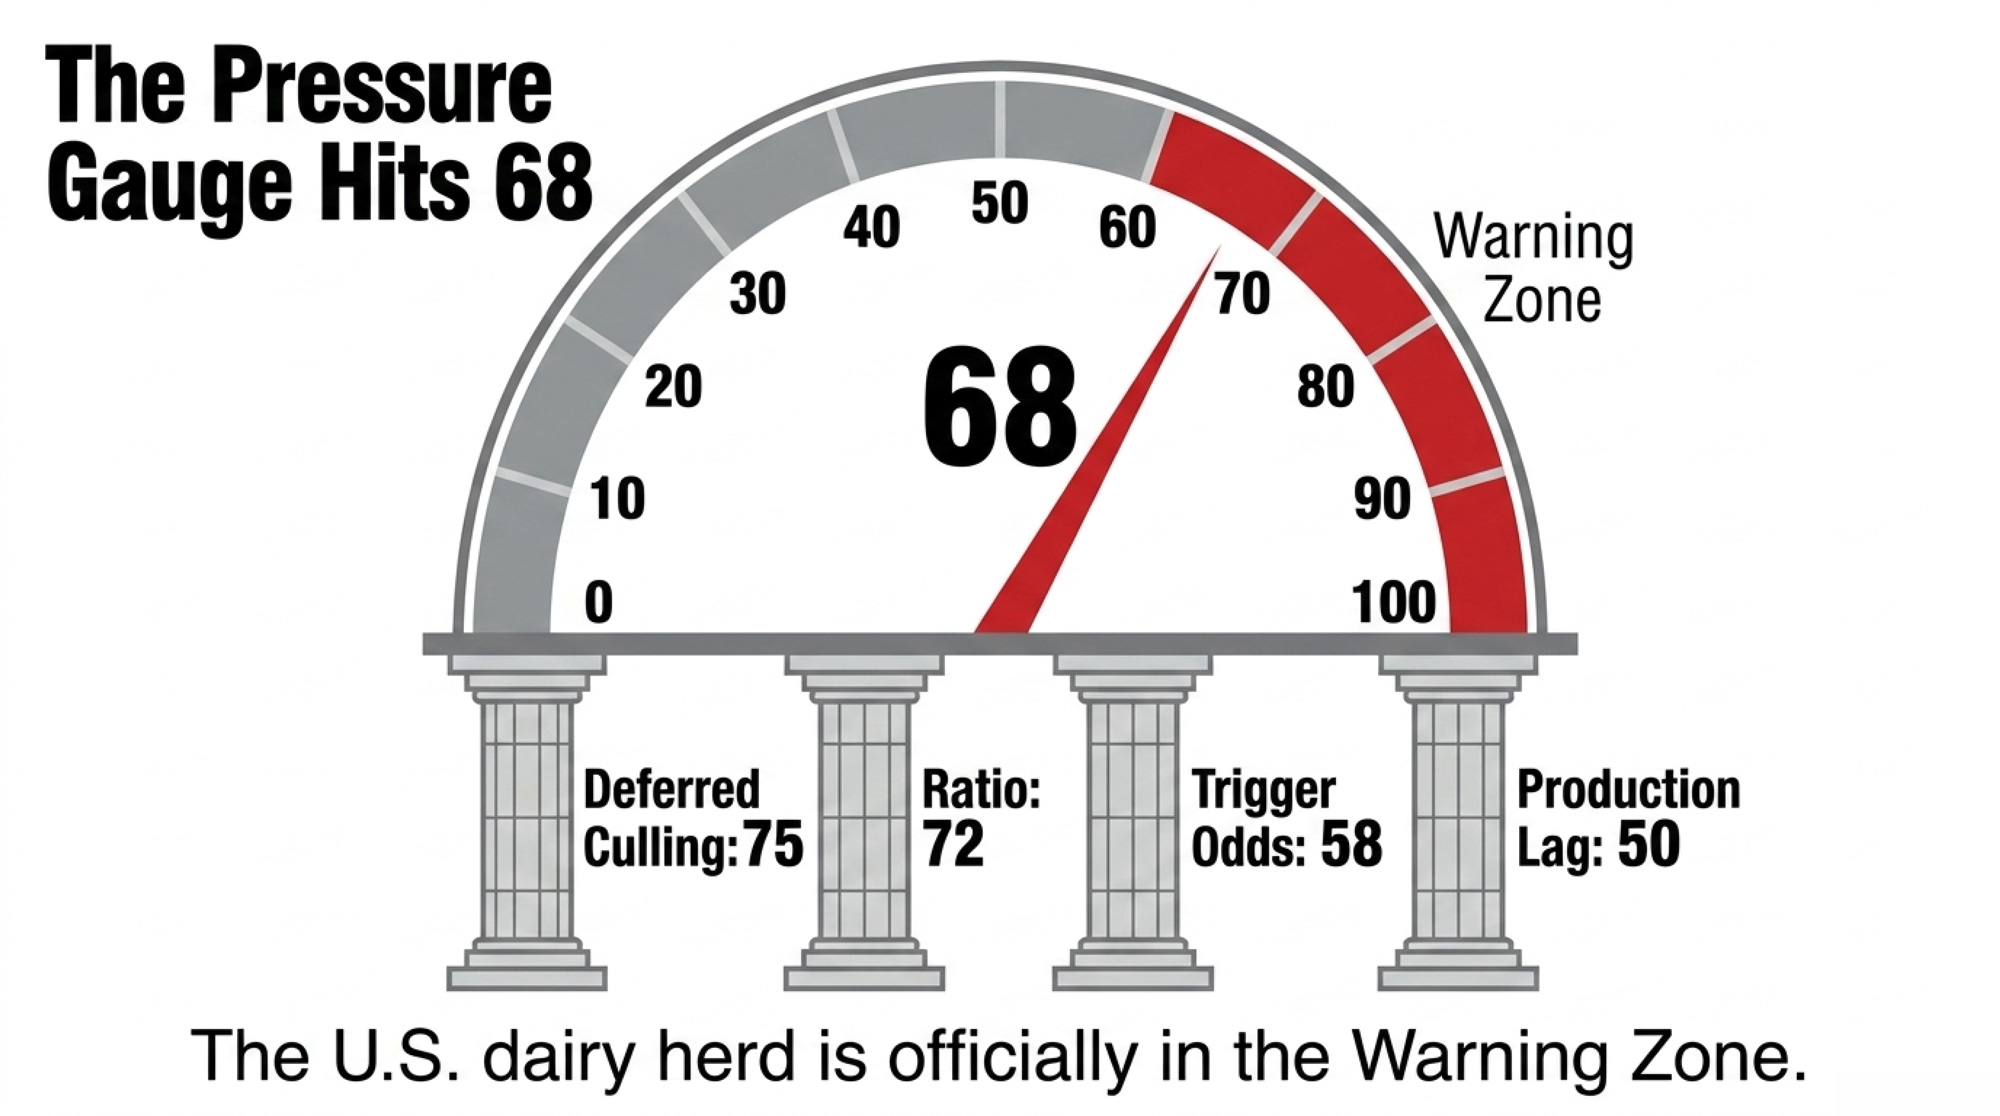
ComponentWhat It MeasuresCurrent ValueSub‑ScoreWeight
Deferred CullingCows retained past productive life~470,000 head7530%
Replacement‑to‑Cull RatioEconomic incentive to defer2.83:17225%
Production LagGenetic potential vs actual yield~144 lb implied vs 200–220 lb trend5020%
Trigger OddsProbability of a correction catalystBorderline high5825%
Composite CPIApril 202668

The Volatility Premium: Why The Reading Is 68, Not 65

The straight weighted composite lands at 65.0 (75×0.30 + 72×0.25 + 50×0.20 + 58×0.25 = 22.5 + 18 + 10 + 14.5). The published reading of 68 carries a three‑point Volatility Premium on top of the raw math.

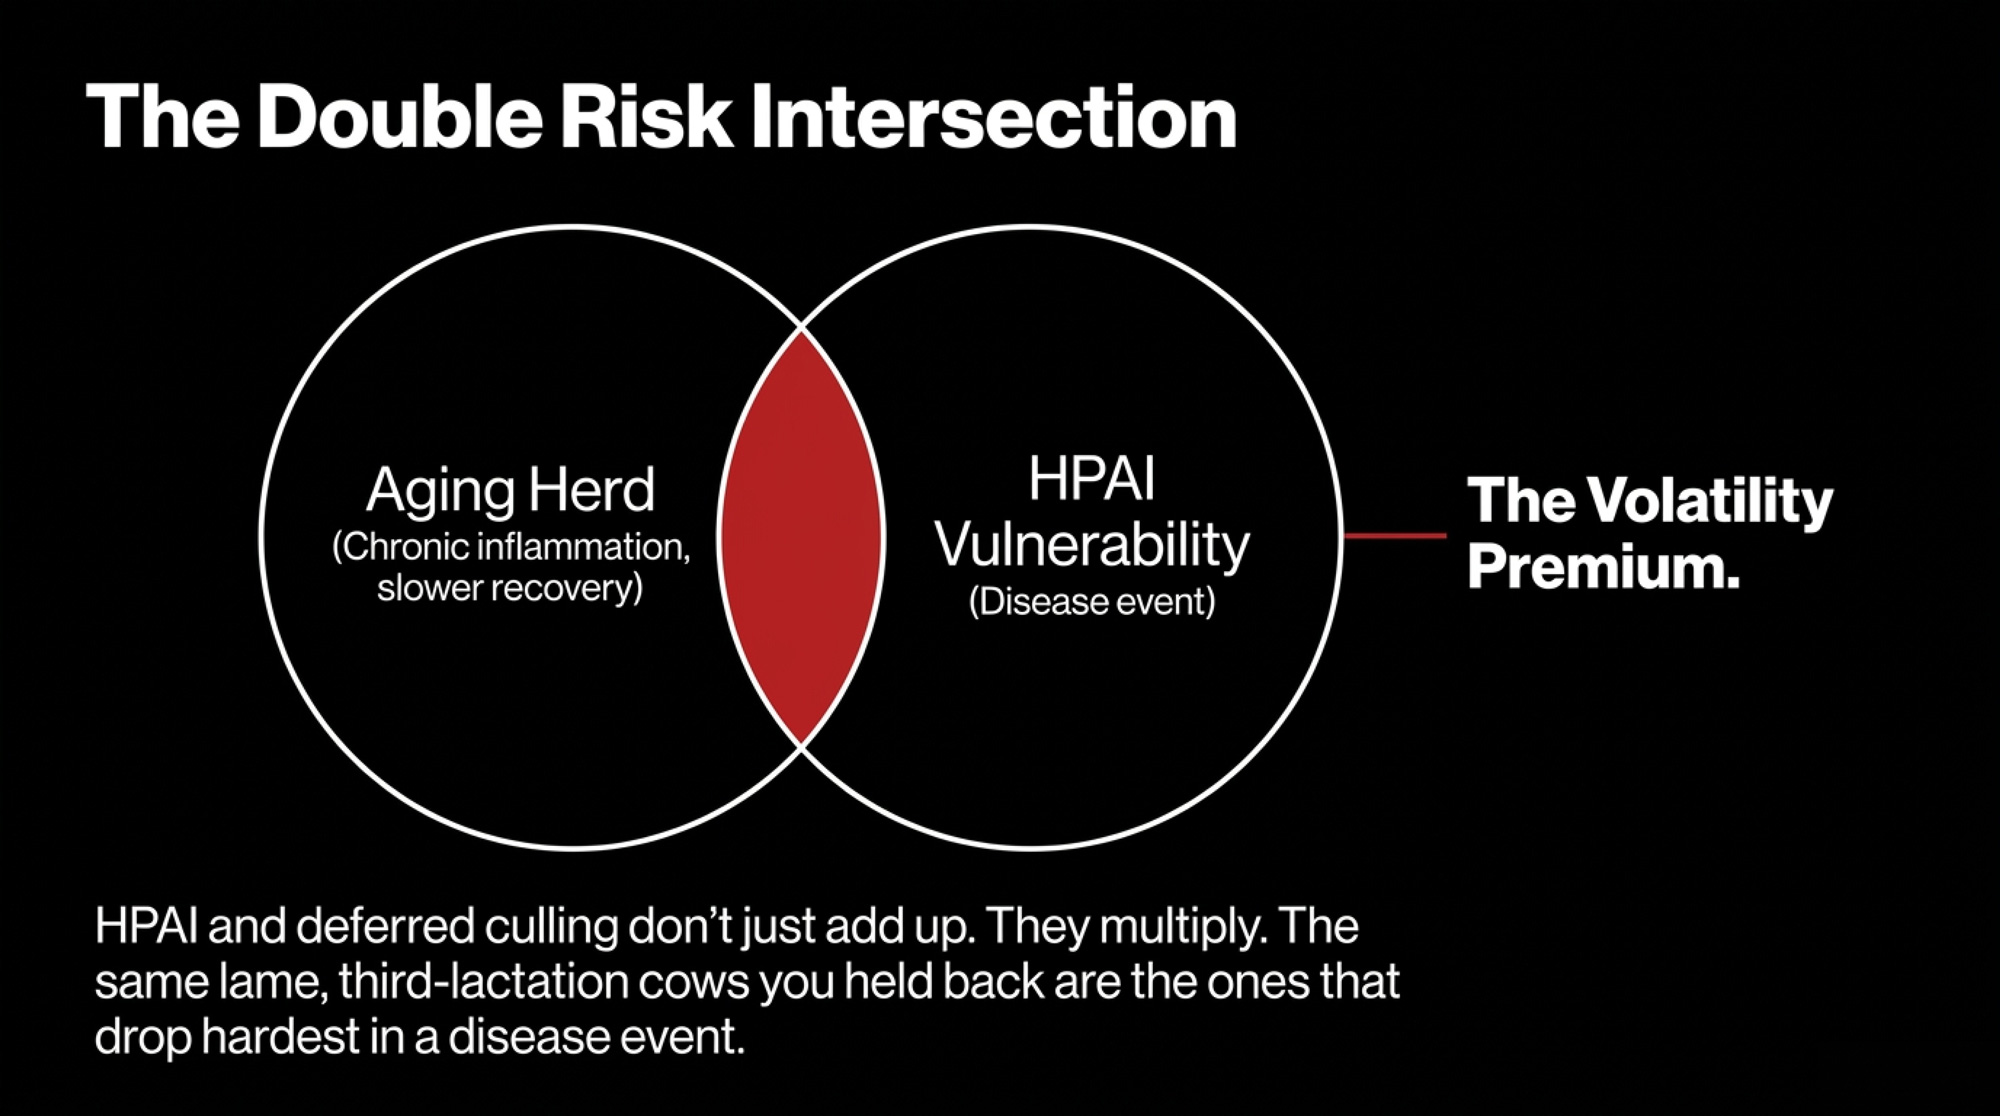
Here’s why. The four sub‑scores weight correction risks as if they add linearly. They don’t. HPAI exposure doesn’t just stack on top of deferred culling — it multiplies the weight of it, because the same aging cows are the animals most likely to drop hard in a disease event. Class III sub‑$16 for multiple prints doesn’t just add pressure — it compounds against a heifer market above $3,000, because producers facing both can’t cull or replace their way out.

The Volatility Premium quantifies that convergence risk in a single digit. Future monthly releases publish both the raw weighted composite and the premium‑adjusted reading side by side, so you can see when trigger‑convergence is doing the work and when it isn’t.

Deferred Culling — 30% weight

USDA AMS weekly FI slaughter since September 2023 runs ~611,600 head below the five‑year rolling baseline (Sept 2018–Aug 2023, roughly 3.0M head/yr; baseline table in the methodology appendix). Net of eventual exits and natural attrition, The Bullvine’s central estimate is ~470,000 head retained past productive life — plausible range 350,000–550,000 depending on assumed mortality and voluntary exit rates.

Even at 350,000, this component still scores in the 70+ band. The Warning Zone read doesn’t depend on the headline number being exact.

Replacement‑to‑Cull Ratio — 25% weight

$3,110 October 2025 USDA heifers against a $1,100 dairy utility cull gives a headline 2.83:1. On a stronger cull (~$1,600 in hot beef markets), the ratio drops toward 1.9:1. Either read, the economics tell producers to wait.

Production Per Cow — 20% weight

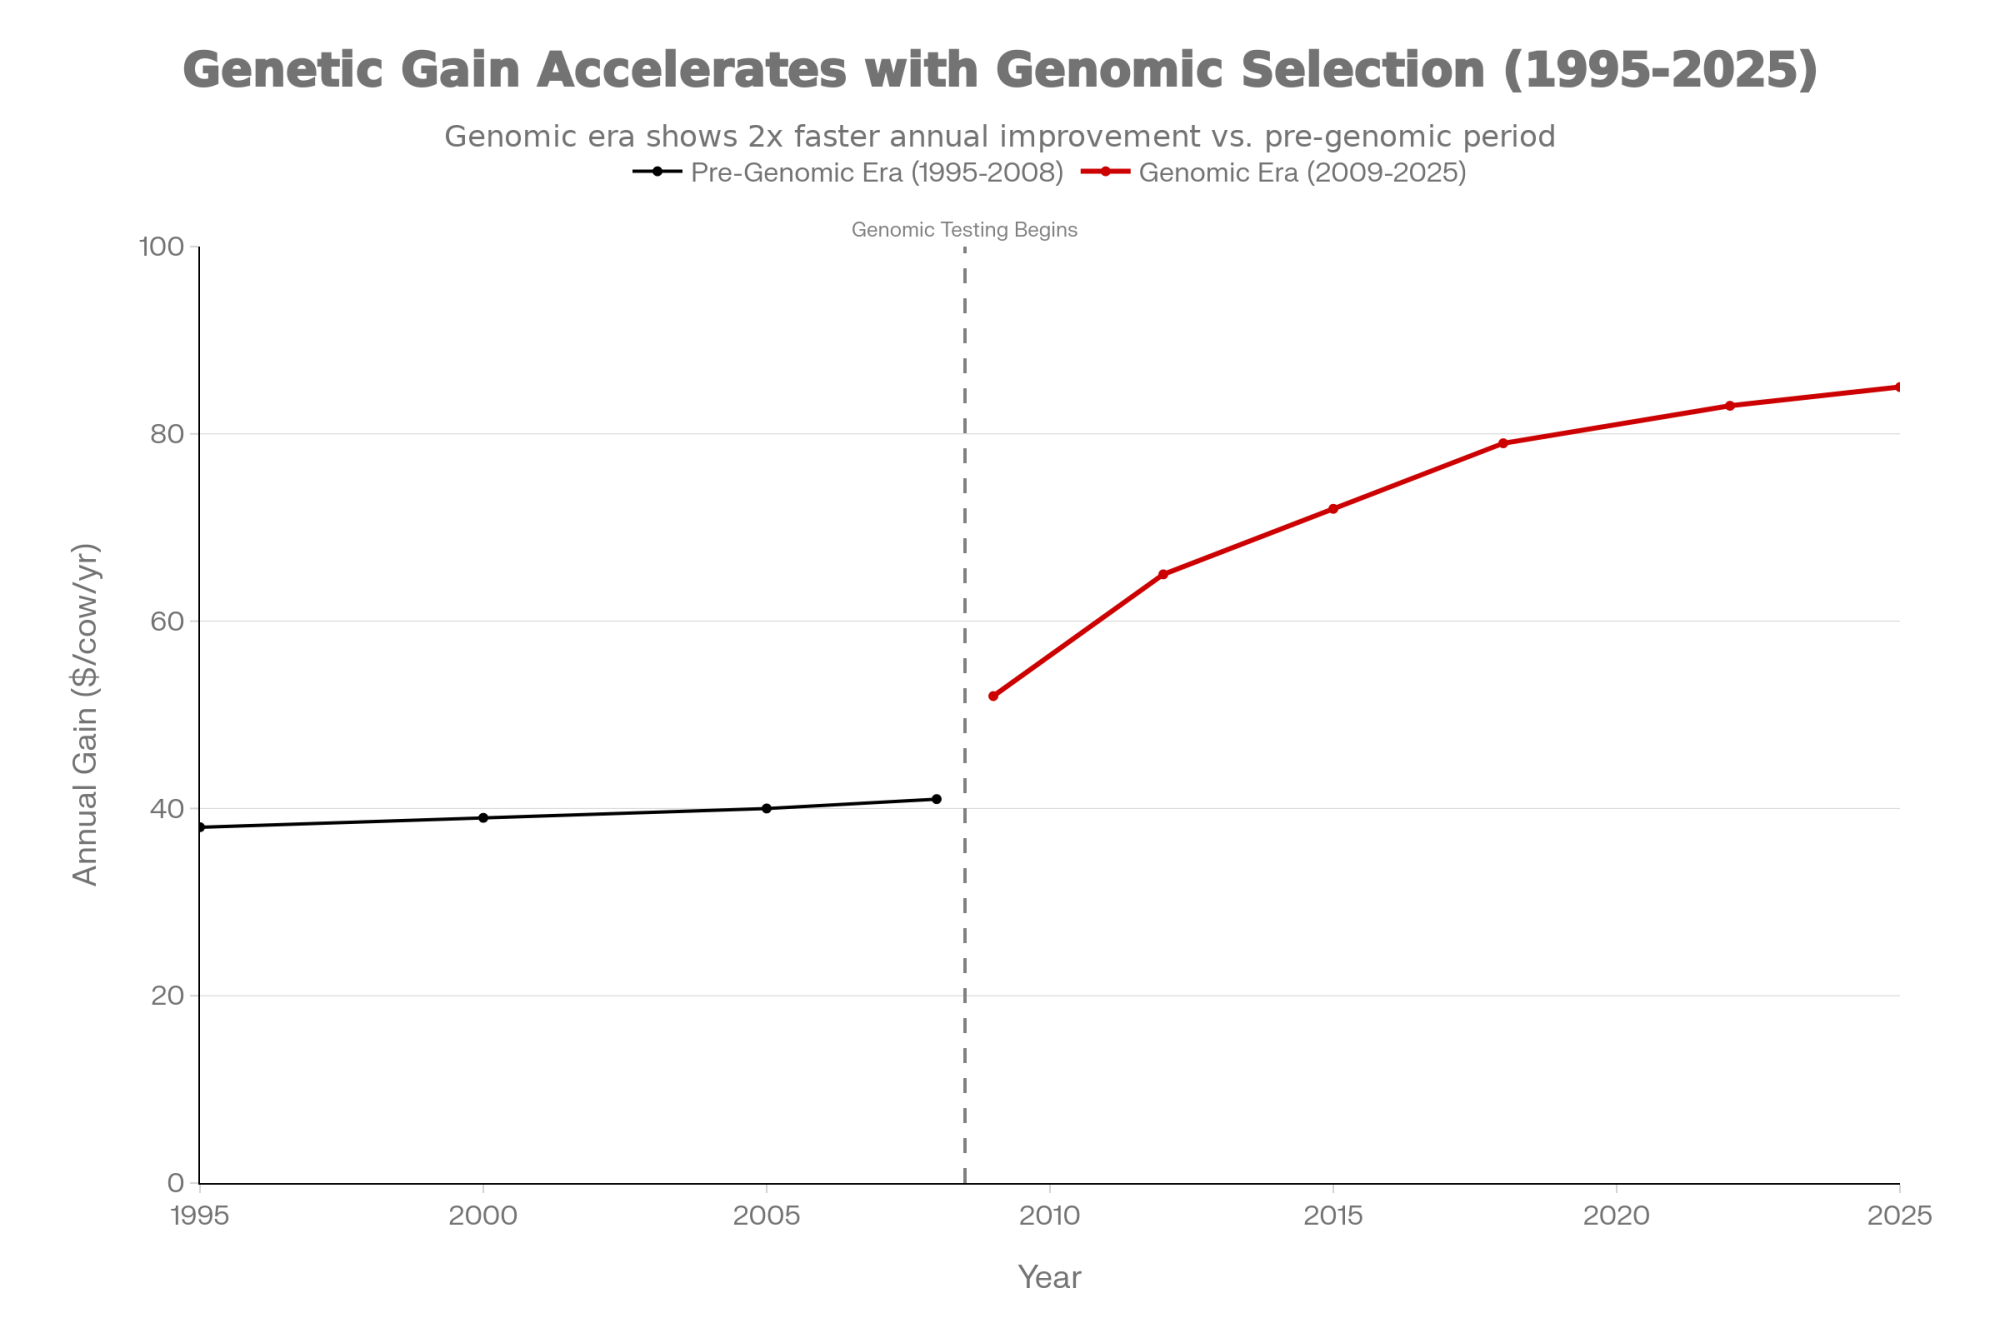
USDA NASS puts 2025 per‑cow production at 24,390 lb, up 218 lb over 2024 — essentially on pace with the 200–220 lb/yr genetic trend implied by CDCB data. February 2026 per‑cow production came in at 1,899 lb, just 12 lb above February 2025. If that February pace held for all 12 months, the implied annual gain would run near 144 lb — short of genetic potential.

That’s a conditional read, not a measured 12‑month result. But it’s where the Warning Zone signal lives.

Trigger Probability — 25% weight

  • Class III: $14.59 Jan 2026$14.94 Feb 2026$16.16 Mar 2026 (USDA AMS class prices).
  • April 2026 WASDE projects 2026 average Class III at $16.90/cwt.
  • Corn ending stocks ~2.127B bu, 14.6% stocks‑to‑use, season‑average $4.15/bu (April 2026 WASDE‑670).
  • IDFA capacity tracker tallies $11B+ in new or expanded U.S. dairy processing capacity through 2028, across 50+ projects in 19 states (October 2025 release).

One more sub‑$16 Class III print and this leg alone pushes CPI deeper into Warning — before the Volatility Premium even recalculates.

What The CPI Doesn’t Tell You

The CPI is a national composite. It reads industry‑wide pressure — not your barn.

  • Regional variance. California and New York face different correction probabilities at the same national score.
  • Herd‑size variance. Large‑herd financial dynamics differ from family operations.
  • Genetic merit. Strong and weak breeding programs feel the same national CPI differently.
  • Beef‑on‑dairy mix. Herds heavy on beef‑cross calf revenue face different replacement math.
  • Trade shock. Export collapse shows up only through sustained Class III pressure inside Component 4.

Regional and herd‑size CPIs are in development as Phase 2. For a herd‑specific read today, run your numbers through the Replacement‑to‑Cull Snapshot at thebullvine.com/tools/rc-snapshot.html.

What Does CPI 68 + $3,000 Heifers Mean For Your Herd?

The Bullvine built this Decision Matrix so this doesn’t stay theoretical.

CPI ScoreHeifers >$3,000Heifers $2,000–$3,000Heifers <$2,000
30–50 (Stable–Building)Normal cull pace; map 2027 replacement pipeline.Normal cull pace; opportunistic purchases.Cull freely; replace aggressively.
50–70 (Building–Warning)Identify lowest‑quartile cows; lock replacement contracts.Accelerate culling of obvious passengers.Cull hard and refresh herd age.
70–80 (High Warning)Cull lowest quartile only as fast as replacements allow.Cull aggressively; secure replacements now.Maximize herd turnover.
80+ (Correction Imminent)Cull aggressively only if replacements secured.Cull now; expect heifer prices to react.Full herd refresh, if balance sheet allows.

At CPI 68 with >$3,000 heifers, the U.S. sits in the 50–70 × >$3,000 cell. Translation: tag your bottom quartile and pre‑position replacement access now — not after the correction starts.

Companion analysis — Tier 3 economics: The $3,000 Heifer Hangover: How Beef‑on‑Dairy Emptied Your Pipeline.

Why HPAI Makes Deferred Cows A Double Risk

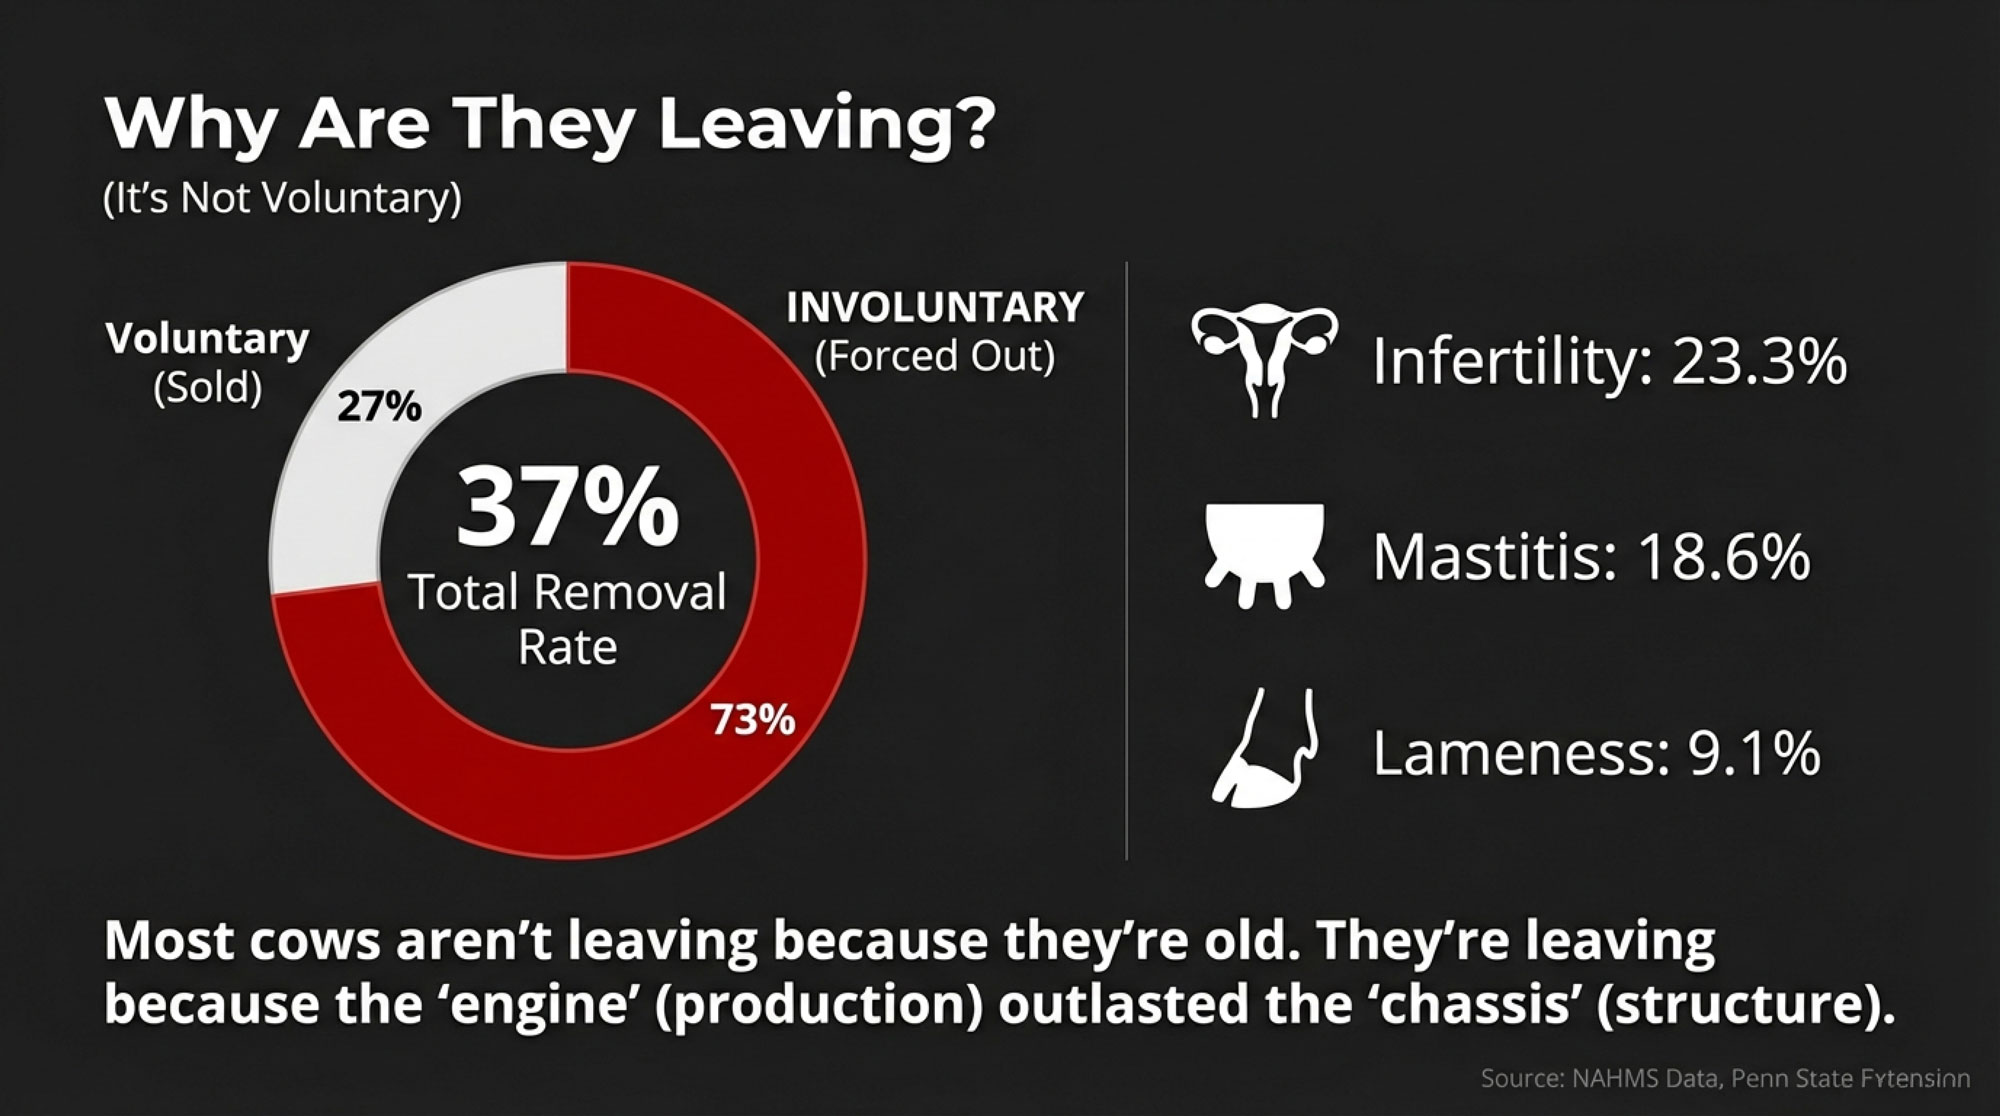
Older, deferred cows aren’t only an economic problem. They’re also the animals most at risk in a disease event.

Immune function declines with age. Third‑, fourth‑, and fifth‑lactation cows carry more cumulative stress, more chronic inflammation, and slower recovery than first‑ and second‑lactation cows. They’re more likely to carry subclinical mastitis, lameness, or metabolic issues that blunt immune response — a pattern consistent with published veterinary literature on age‑linked immune competence in lactating cattle in the Journal of Dairy Science and Veterinary Clinics of North America: Food Animal Practice.

In an HPAI event, those are the cows that drop hard in milk, recover slowly, and are most likely to be culled post‑outbreak. A herd that has been deferring culls for 18 months is, by definition, stacked with those animals. CPI 68 plus an HPAI event isn’t risk on top of risk. It’s the same risk hitting the same cows twice. That’s what the Volatility Premium is pricing.

The $11 Billion Sorting Machine

Processors are pouring concrete for plants the deferred herd can’t fully service. IDFA tracks $11B+ in new and expanded U.S. dairy processing capacity through 2028 — 50+ projects in 19 states, heavy on cheese, whey, and high‑protein ingredients. Those plants are built for high‑component, low‑SCC milk running 12 months a year.

What does $11 billion in new concrete actually need? Components. SCC that doesn’t kill shelf life. Supply they can count on.

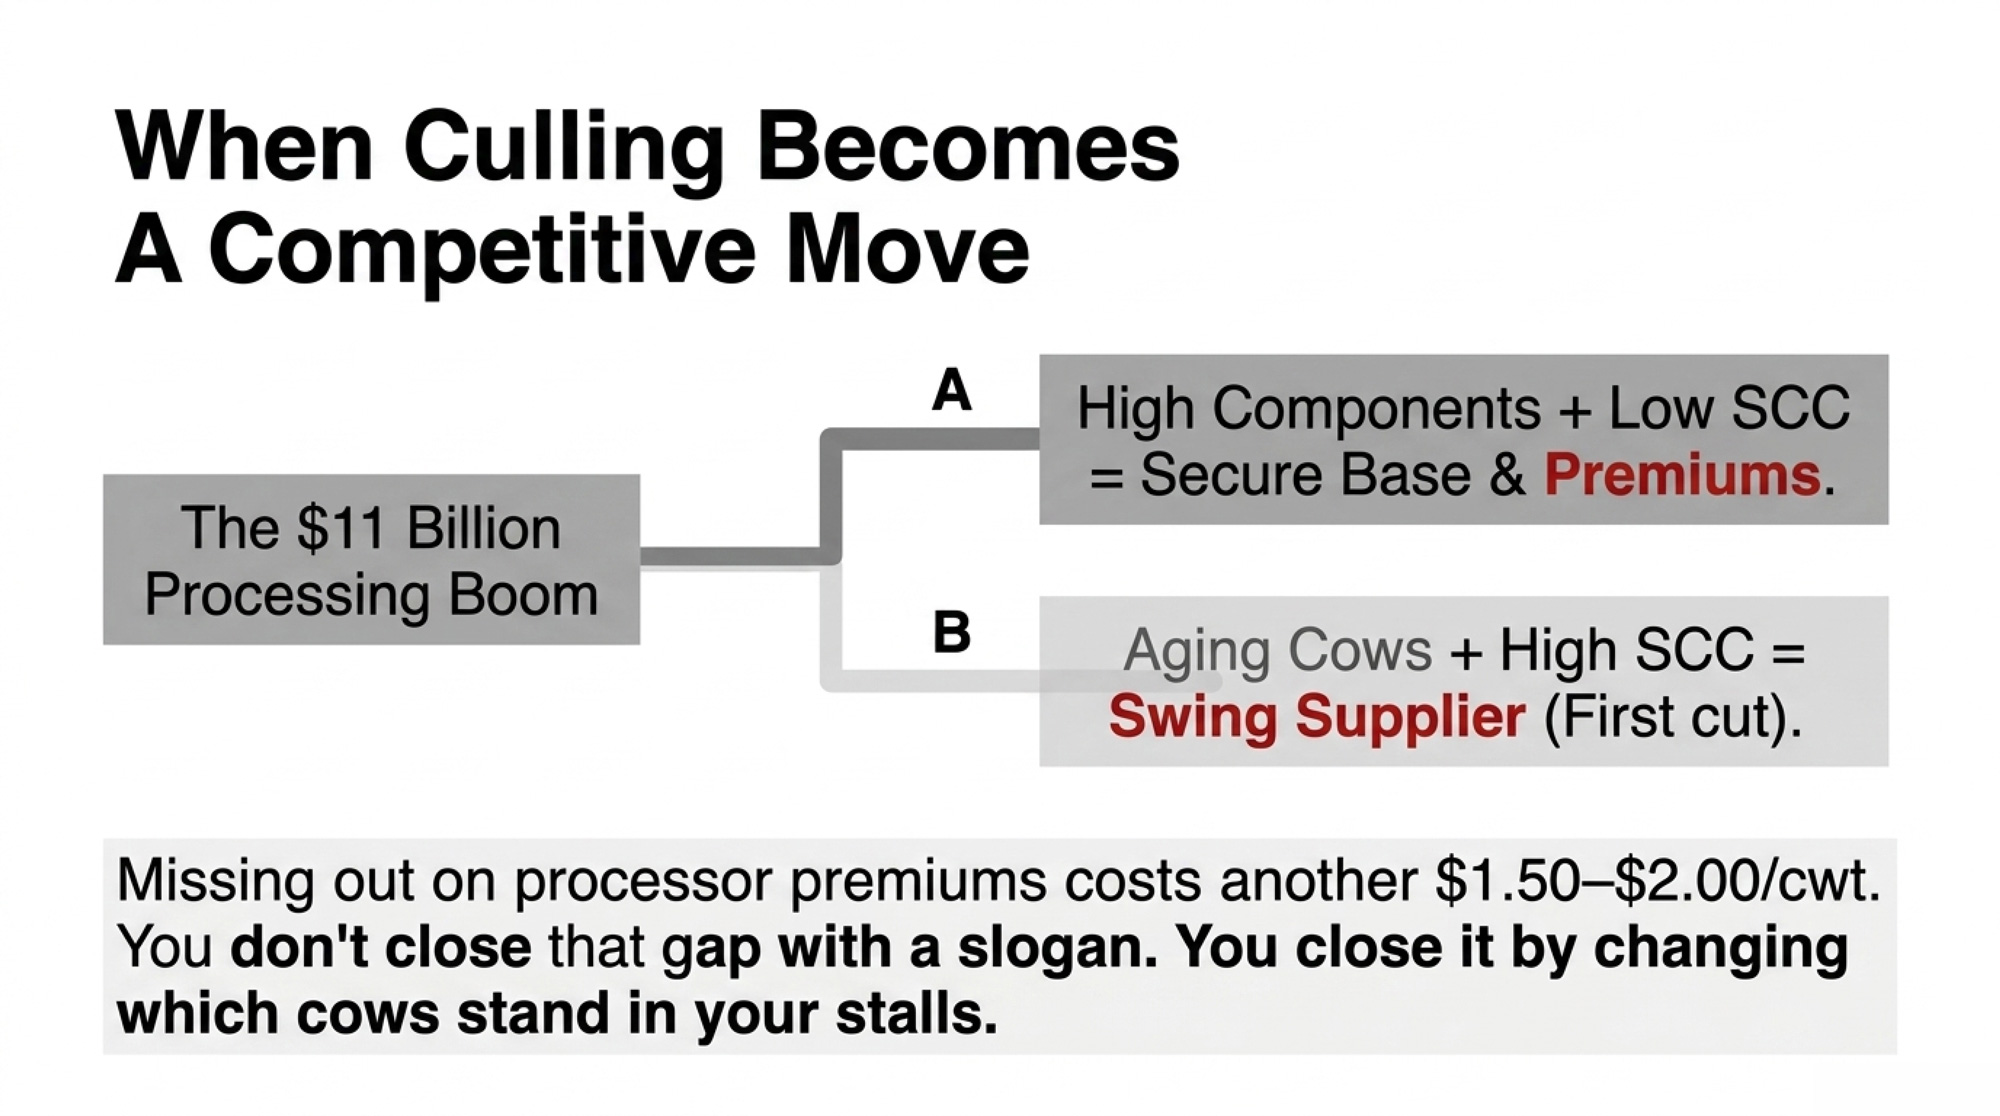
Two farm‑level outcomes:

  • High‑component, low‑SCC herds get base volume and more secure deals.
  • Average‑component, higher‑SCC herds drift into “swing supplier” territory — first cut when plants are long, last in line for premiums.

This component/quality gap partially overlaps with Step 2 in the barn‑math box above. Don’t stack them.

Missing $1.50–$2.00/cwt in component and quality premiums on 136,875 cwt is $205,000–$274,000/year in Bullvine modeling. Same order of magnitude as the deferred‑culling bleed. You don’t close that gap with a slogan. You close it by changing which cows stand in your stalls.

Continue the series — Tier 3 analysis: The $11 Billion Dairy Rush: Your 18‑Month Window to Lock in Processor Premiums.

The 438,844 Missing Heifers

The culling mess exists because of the heifer mess.

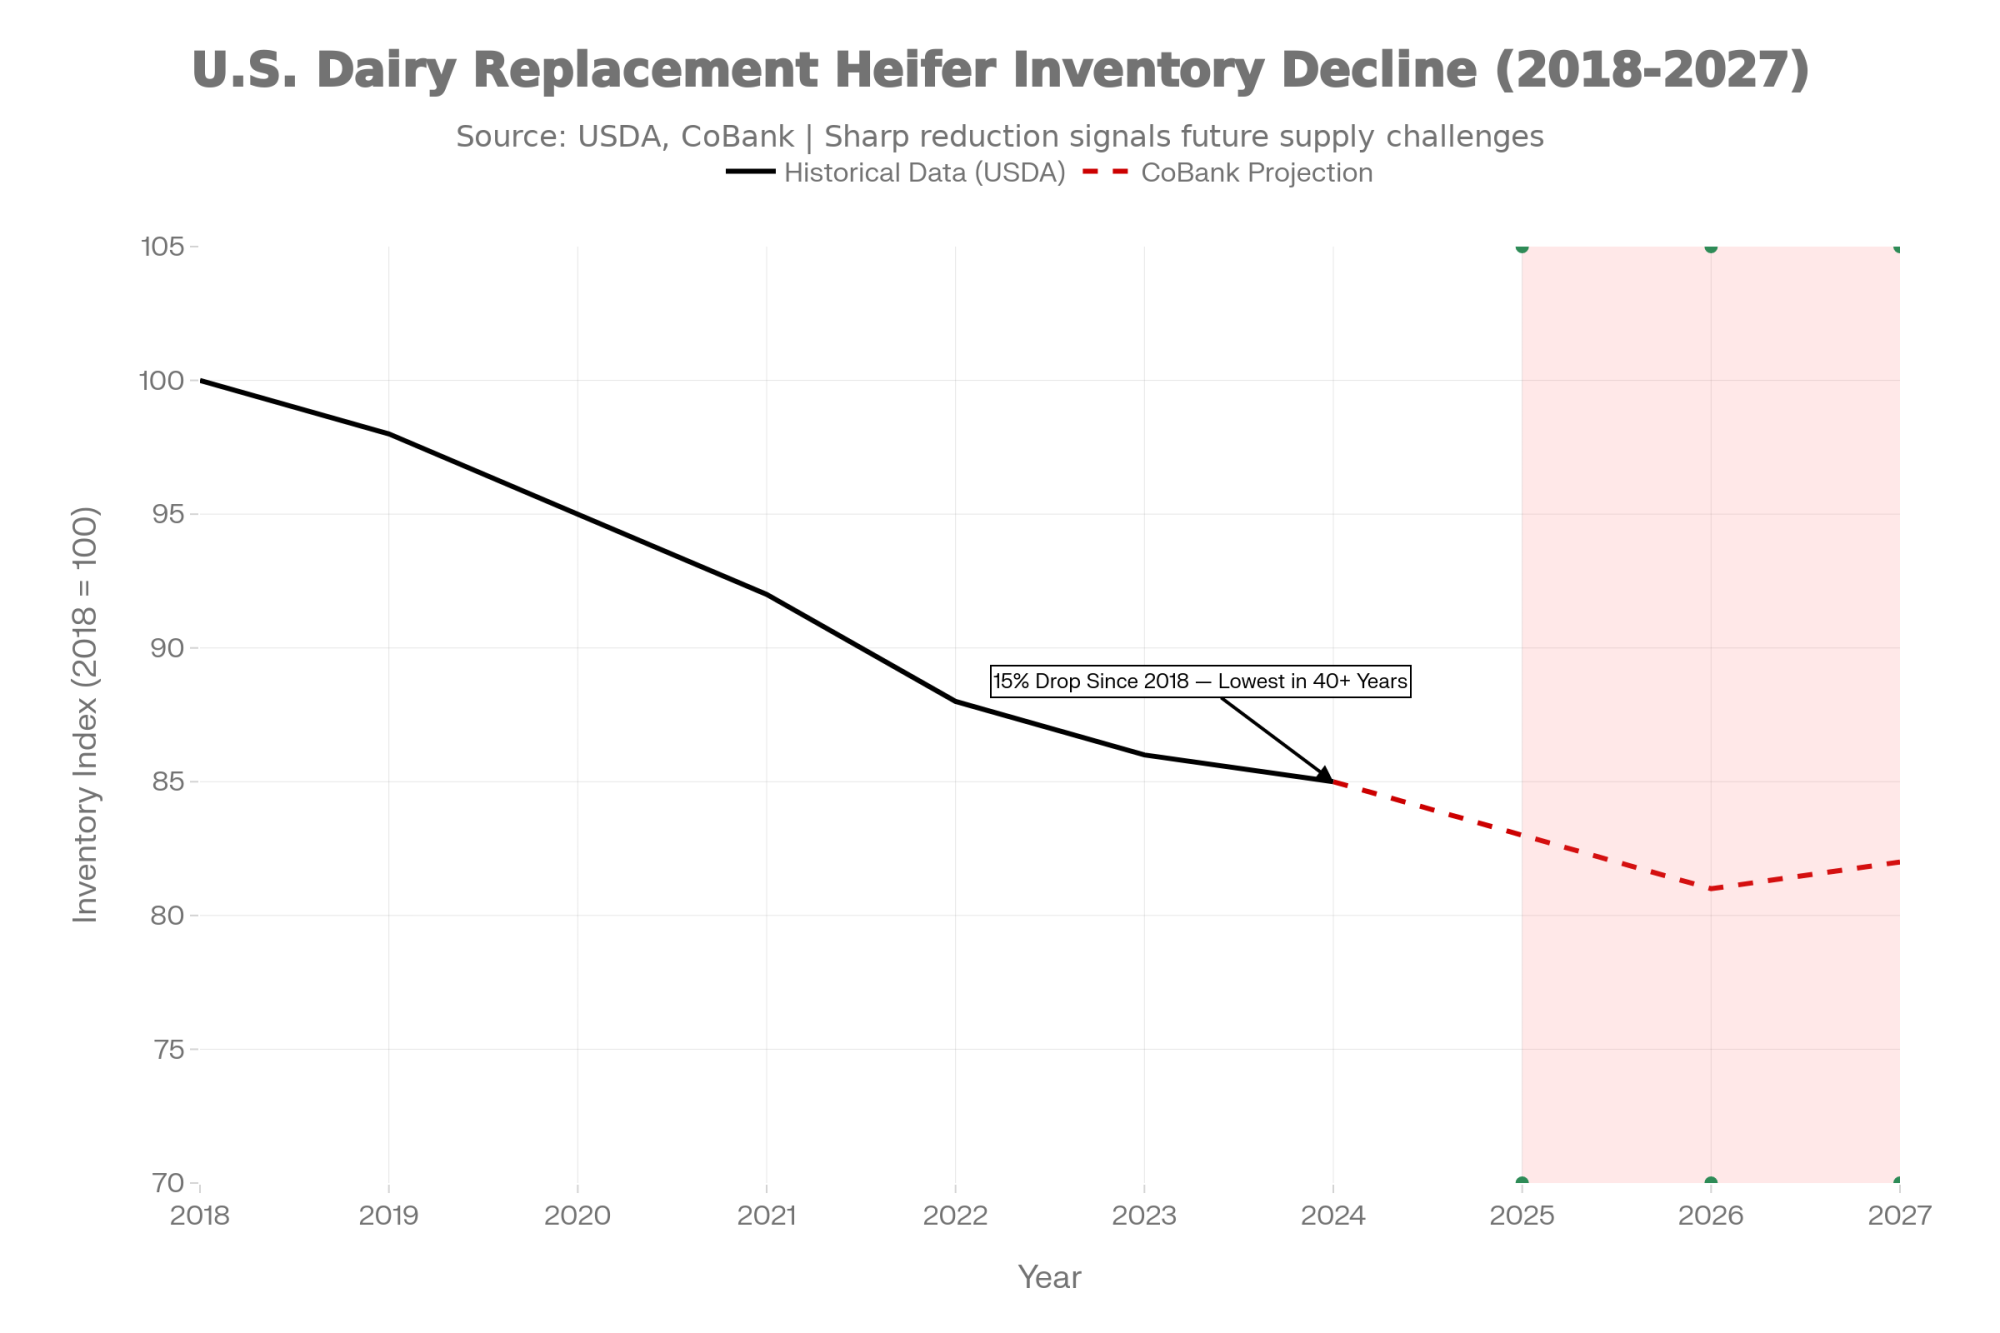
CoBank’s Dairy Heifer Inventories to Shrink Further Before Rebounding in 2027 (August 2025), read alongside USDA Cattle inventory data, implies approximately 355,000 fewer dairy replacements in 2025 than 2024, and another ~440,000 fewer in 2026 than 2025 (specific CoBank table referenced in the methodology appendix). Dairy heifers over 500 lb now sit just under 4 million head, a 20‑year low per USDA Cattle Jan 2026.

The deficit traces to the 2023–24 beef‑on‑dairy wave — sexed semen on the top, beef semen on the rest, beef‑cross calves clearing $400–$800/head above Holstein bull calves per Livestock Marketing Information Center weekly summaries and trade‑press auction reporting across 2023–24. Calf checks cashed. Replacement gap now.

CoBank’s outlook is blunt: inventories shrink through 2026 and only start rebounding in 2027. Until then, a structural heifer deficit runs underneath everything. That’s why The Bullvine runs the CPI and the Pipeline Tracker™ as a pair — one asks how many cows should have already left, the other asks how many heifers are actually coming 24 months out.

When 470,000 Cows Finally Move

Deferred culling doesn’t unwind politely. When some producers ship, more follow. The Bullvine’s scenario modeling, anchored to USDA slaughter and production data, sketches four plausible paths.

ScenarioTriggerCows ExitingTimelineMilk ImpactModeled Class III Effect
Slow ReleaseNo major trigger~150,000~12 months~ –1–2%+$0.50–$1.00/cwt
ModerateClass III <$16 for 3+ months~300,0006–9 months~ –3%+$1.50–$2.50/cwt
Full CorrectionMultiple financial triggers converge~470,000~90 days~ –5%+$2.00–$3.00/cwt
Extreme (tail risk)Financial triggers + disease event≥600,000<3 months~ –6% or more+$3.00–$5.00/cwt

These are modeled illustrative scenarios, not forecasts. The Extreme row is tail risk — a correction lining up with an HPAI event — and it’s the shape lender stress tests commonly include.

Drop Full Correction onto a 1,000‑cow, 75 lb/cow/day herd: 1,000 × 75 ÷ 100 × 365 = 273,750 cwt/year × $2.50/cwt = $684,375/year extra gross milk revenue if the rally lands in your tank.

Whether you keep that –/cwt depends on whether your cow mix and components qualify for the premium tier when the move hits. That’s the barn math on the upside.

Where Does The Pain Hit First?

Not evenly. Vulnerability scoring below reflects structural variables — herd size, replacement sourcing, cost structure — and is not an assessment of any individual operation or lender book.

StateFeb 2026 Herd (000 head)YoY ChangeVulnerabilityKey Risk
California1,712+3HIGHLargest herd; high costs; culled hard and early in the 2018–19 exit wave.
Texas718+34HIGHExpansion built on purchased replacements.
Wisconsin1,290+25MODERATE–HIGH200–700 cow backbone squeezed on costs.
Idaho724+24MODERATE–HIGHGrowth state; replacement‑dependent.
New York653+21MODERATEAging infrastructure; cash‑flow‑driven deferral.

Data source: USDA NASS Milk Production, February 2026.

California carries 1.712M cows and added just 3,000 head YoY. High replacement costs, water, and regulation load every culling decision. When margins compressed in 2018–19, California culled hard and early — a likely early indicator pattern worth watching in the national herd this cycle.

Texas grew by 34,000 cows to 718,000 — the biggest state gain, leaning most heavily on purchased replacements. A correction mid‑ramp means depreciating cows paid for at the top.

Wisconsin added 25,000 cows to 1.29M, but the backbone is still 200–700 cow herds. Those operators don’t carry the contract leverage of mega‑herds and are most likely holding marginal cows because no replacement path pencils without torching cash flow.

Idaho grew by 24,000 cows to 724,000 — replacement‑intensive throughput. Correction mid‑expansion is a double squeeze.

New York added 21,000 cows to 653,000, behind a cluster of announced regional processing projects tracked by The Bullvine against IDFA and New York State Ag & Markets filings. Specific project‑dollar totals are posted on the CPI methodology subpage. Deferred culling there is often cash‑flow‑driven.

Lender screening rule: fastest growth + highest reliance on purchased replacements = most exposed when the CPI climbs.

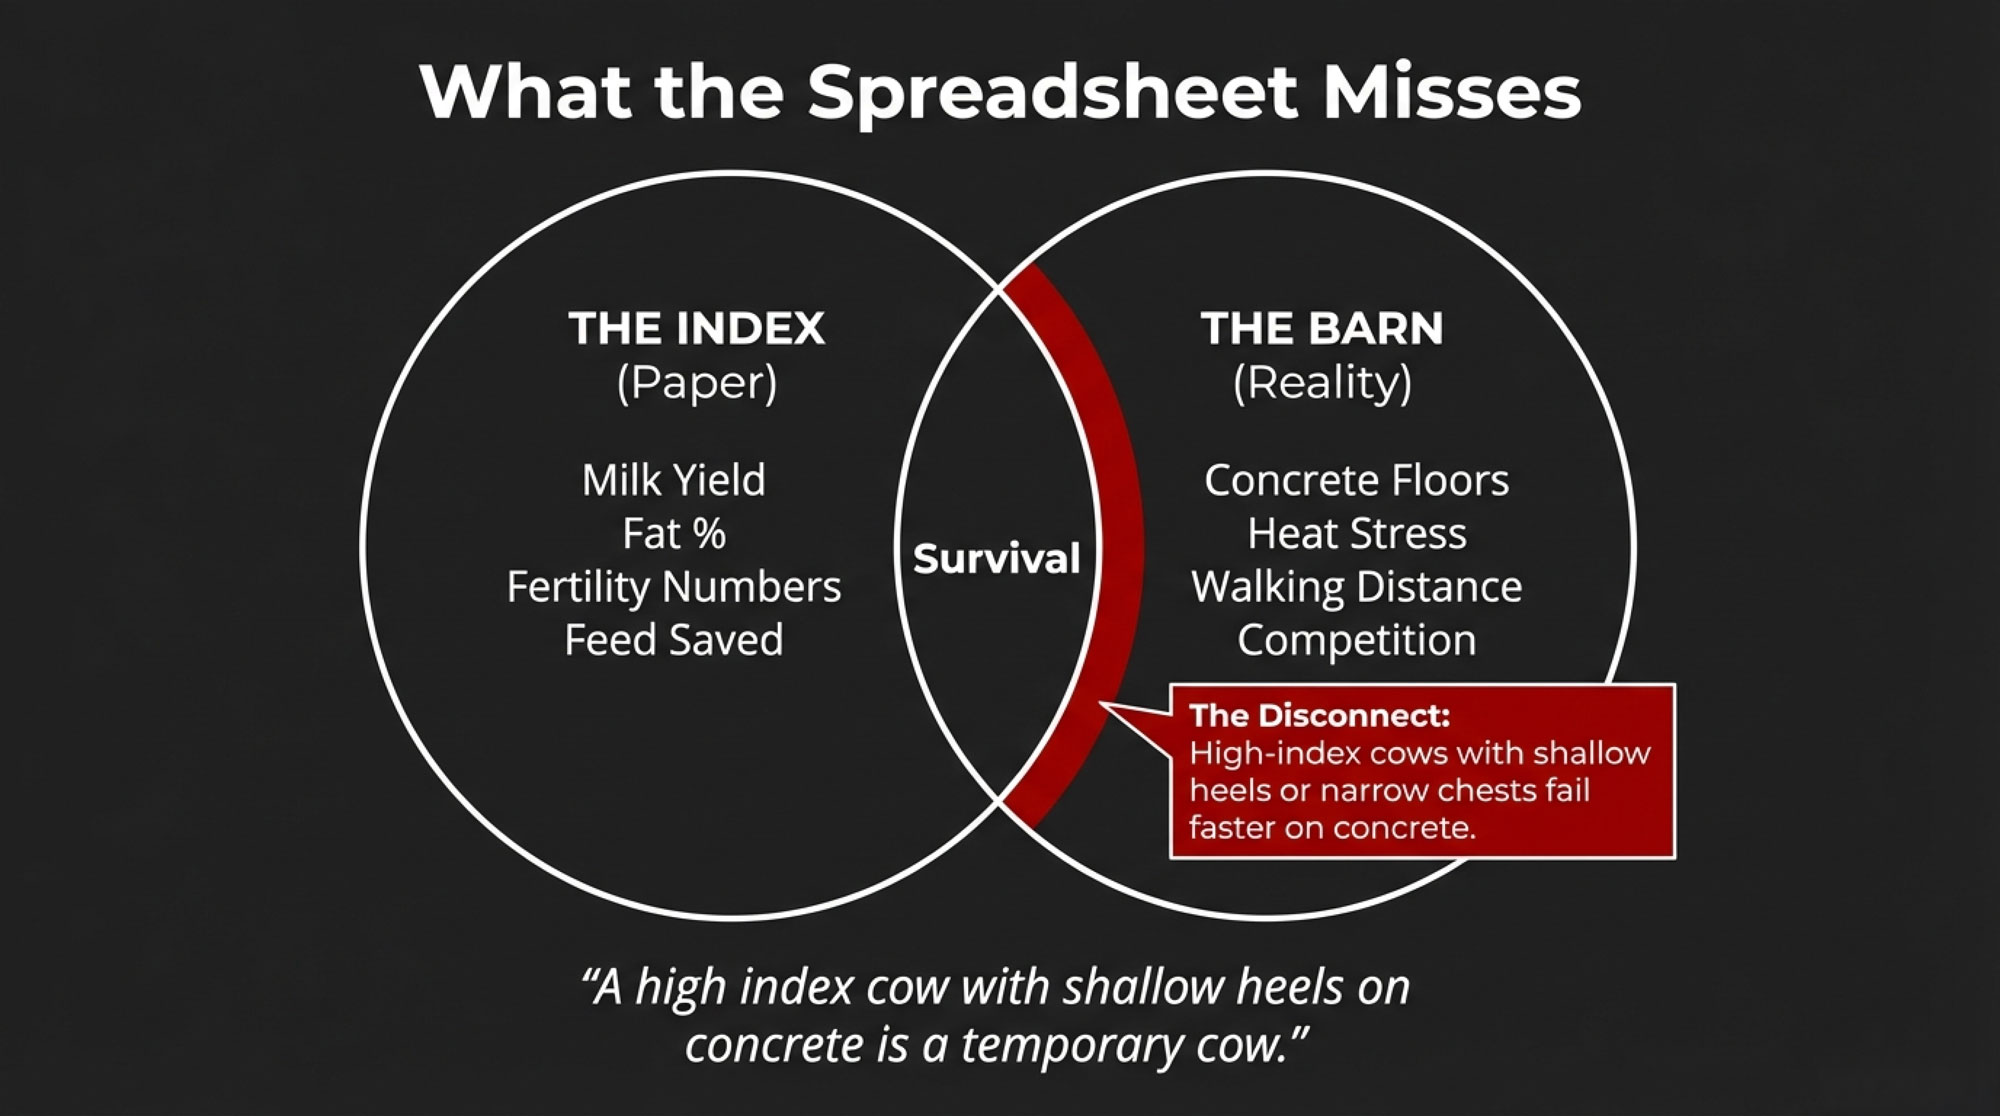
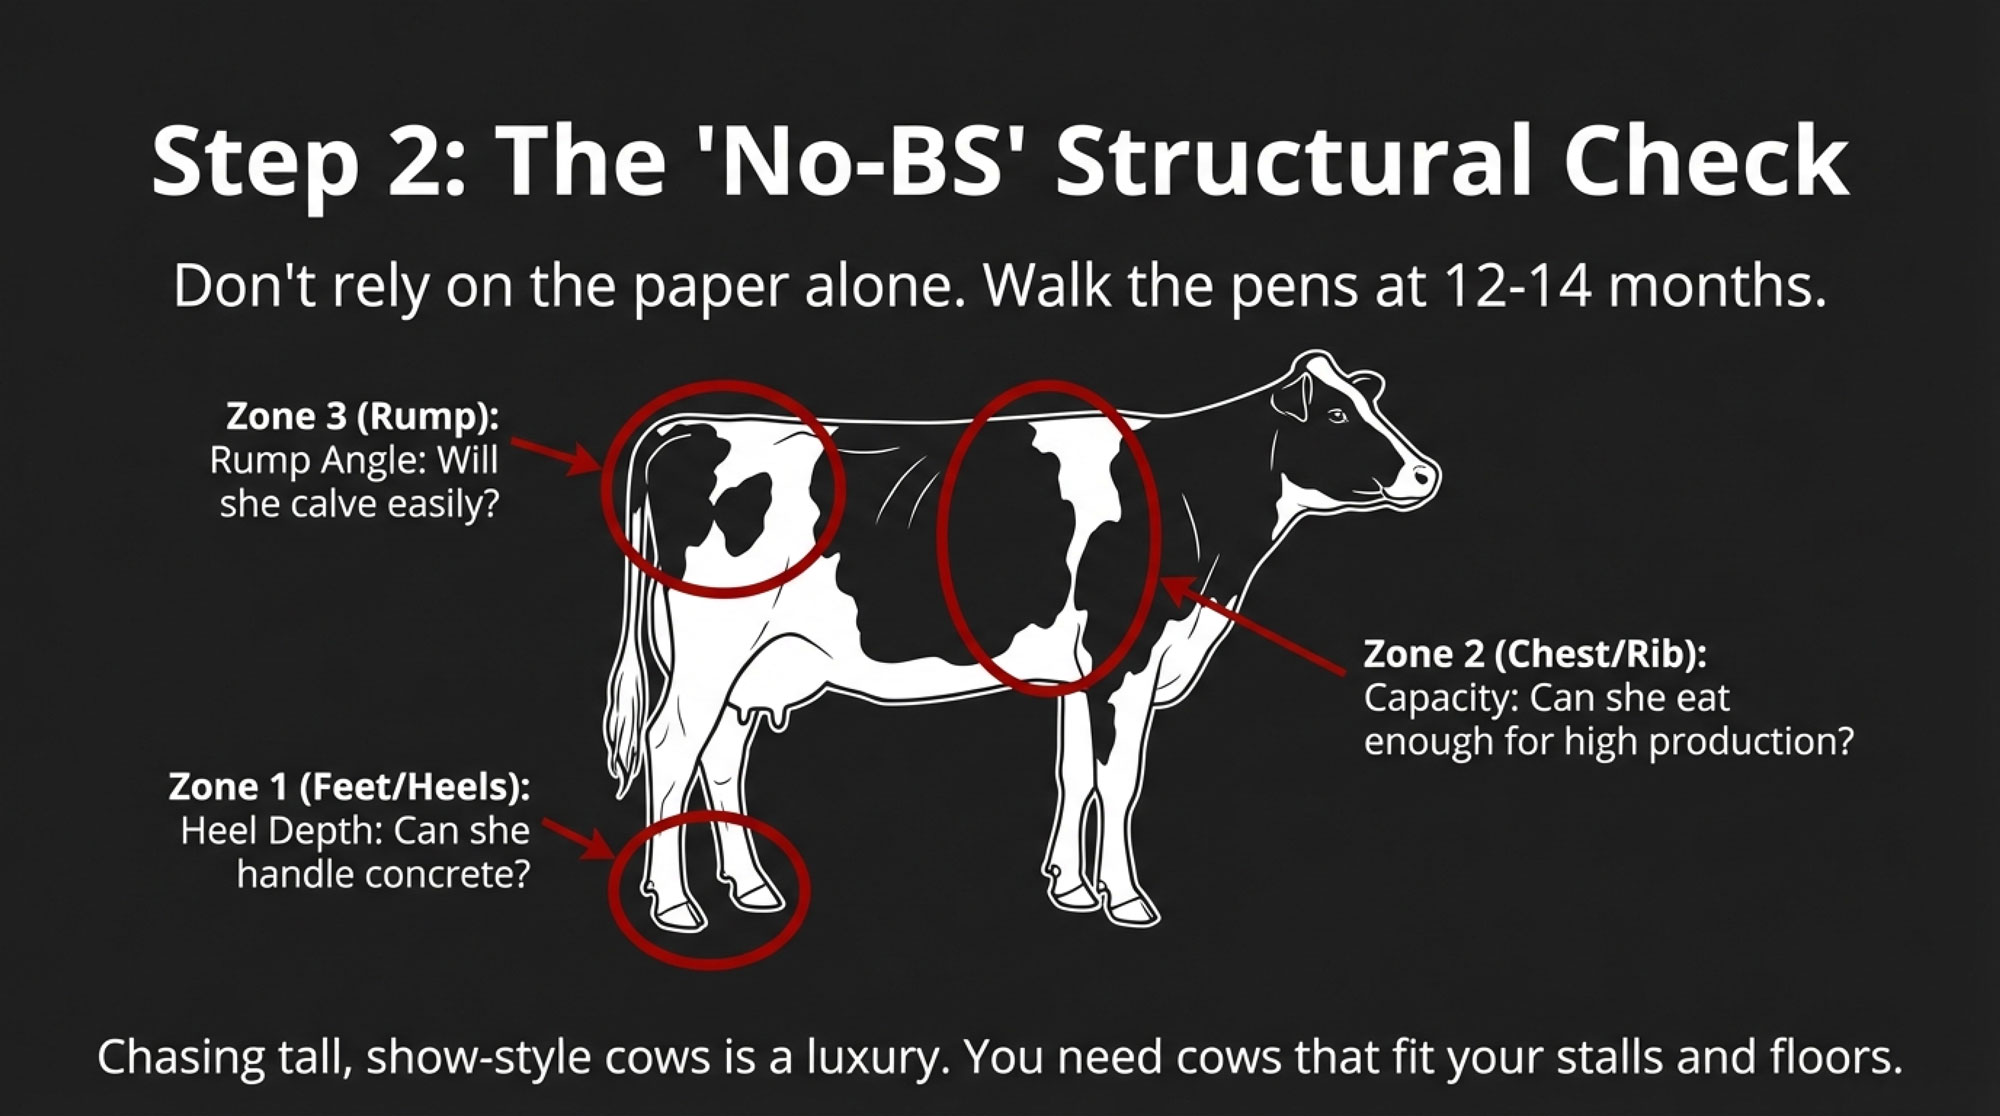
Breeding Your Way Out Of The Next Trap

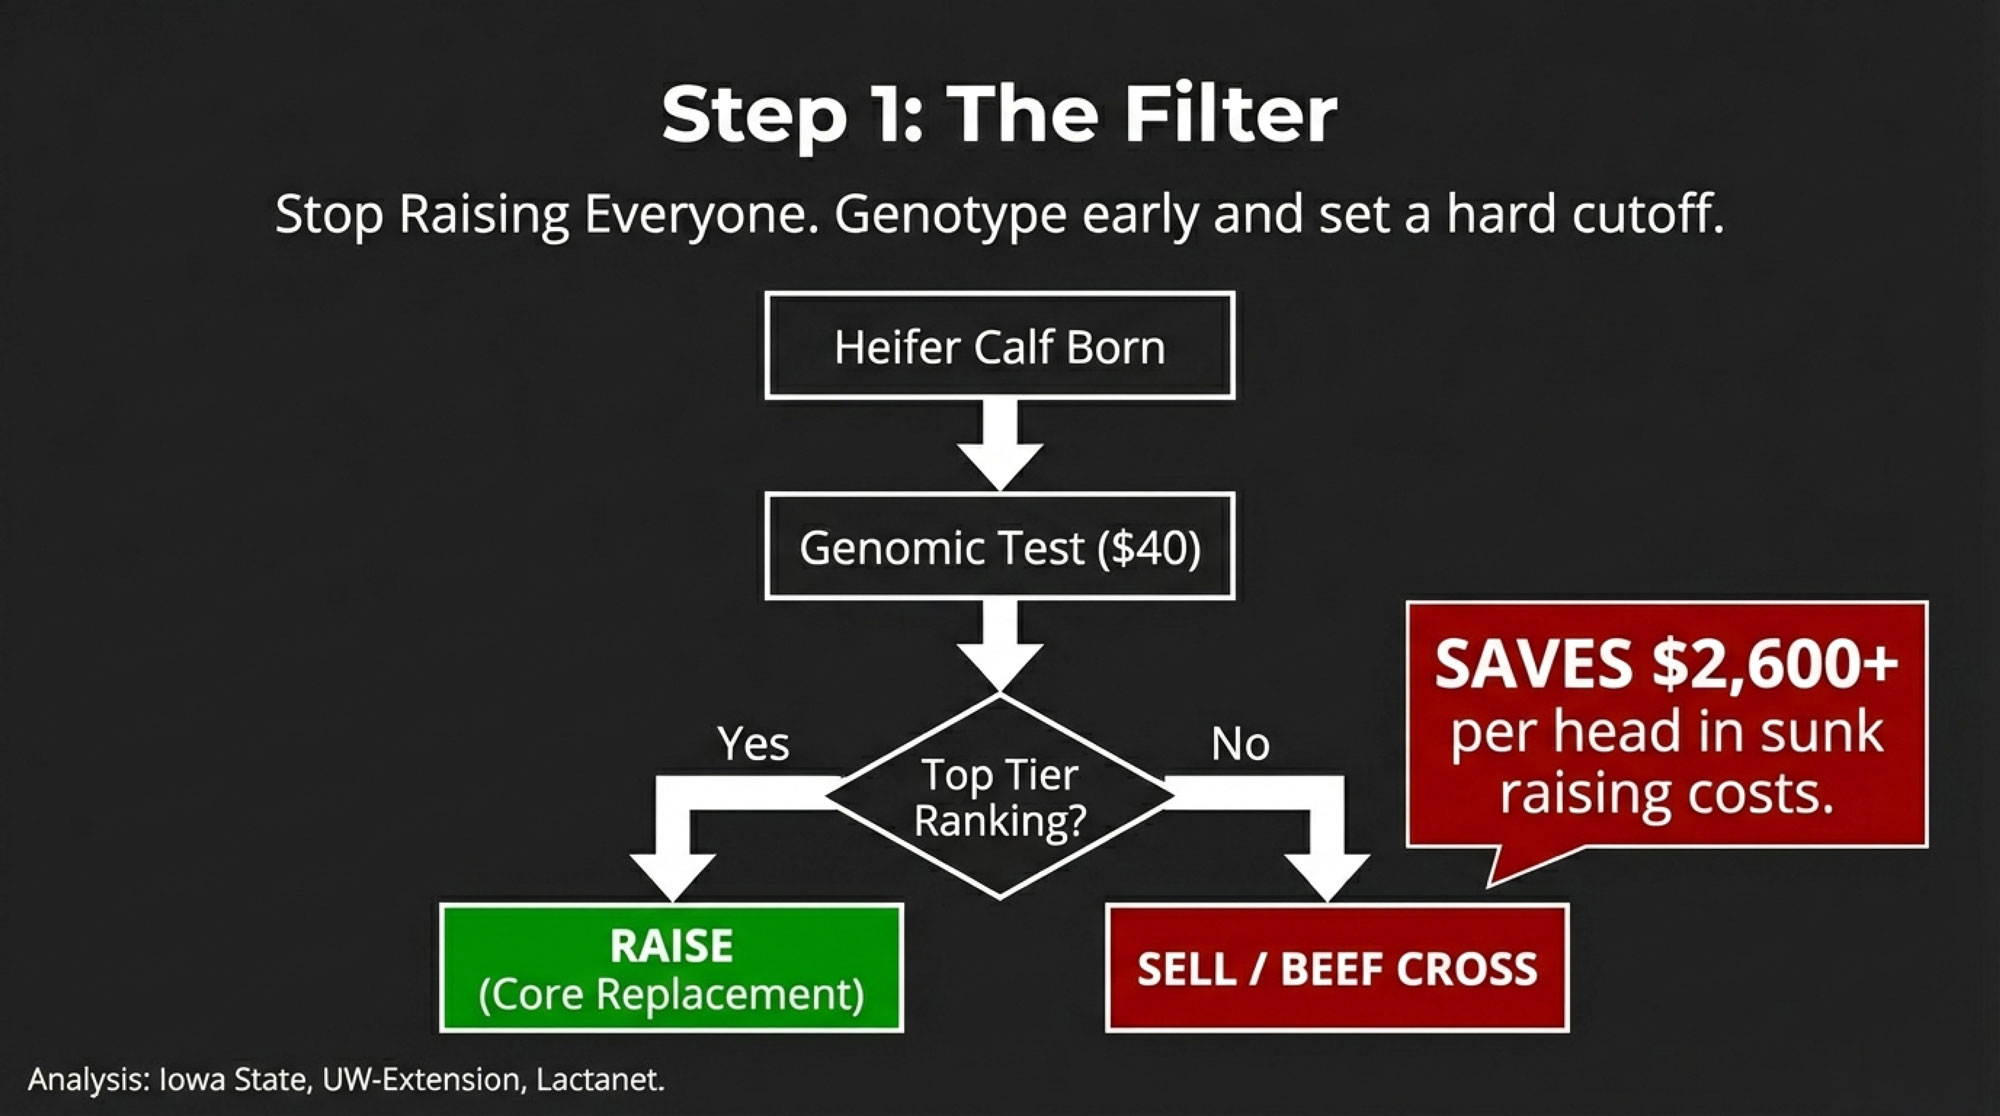
If CPI 68 says clear your bottom 25%, the next question is who stands in those stalls next.

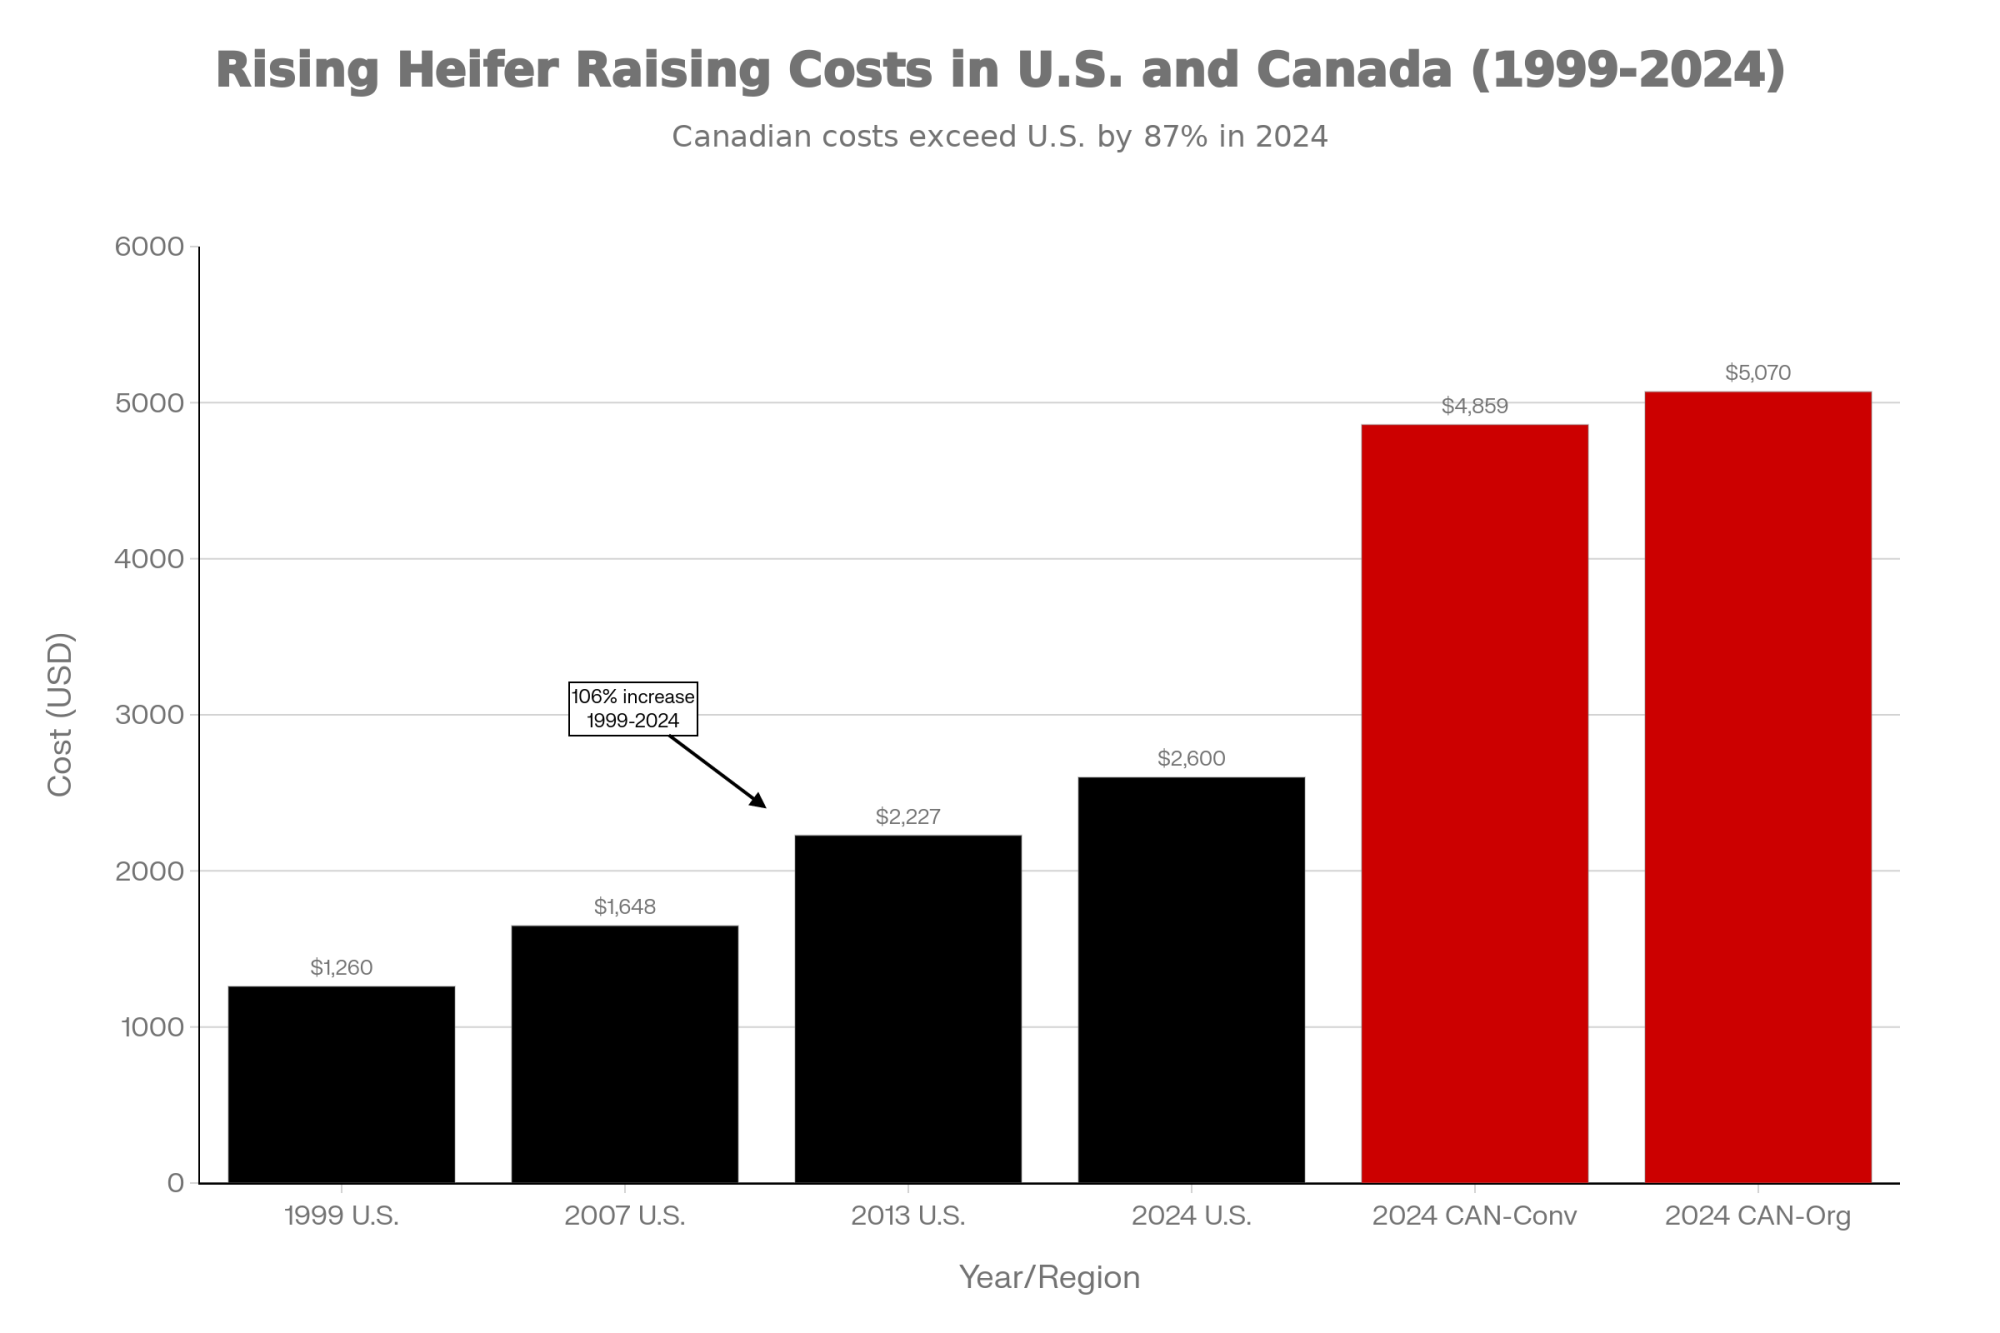
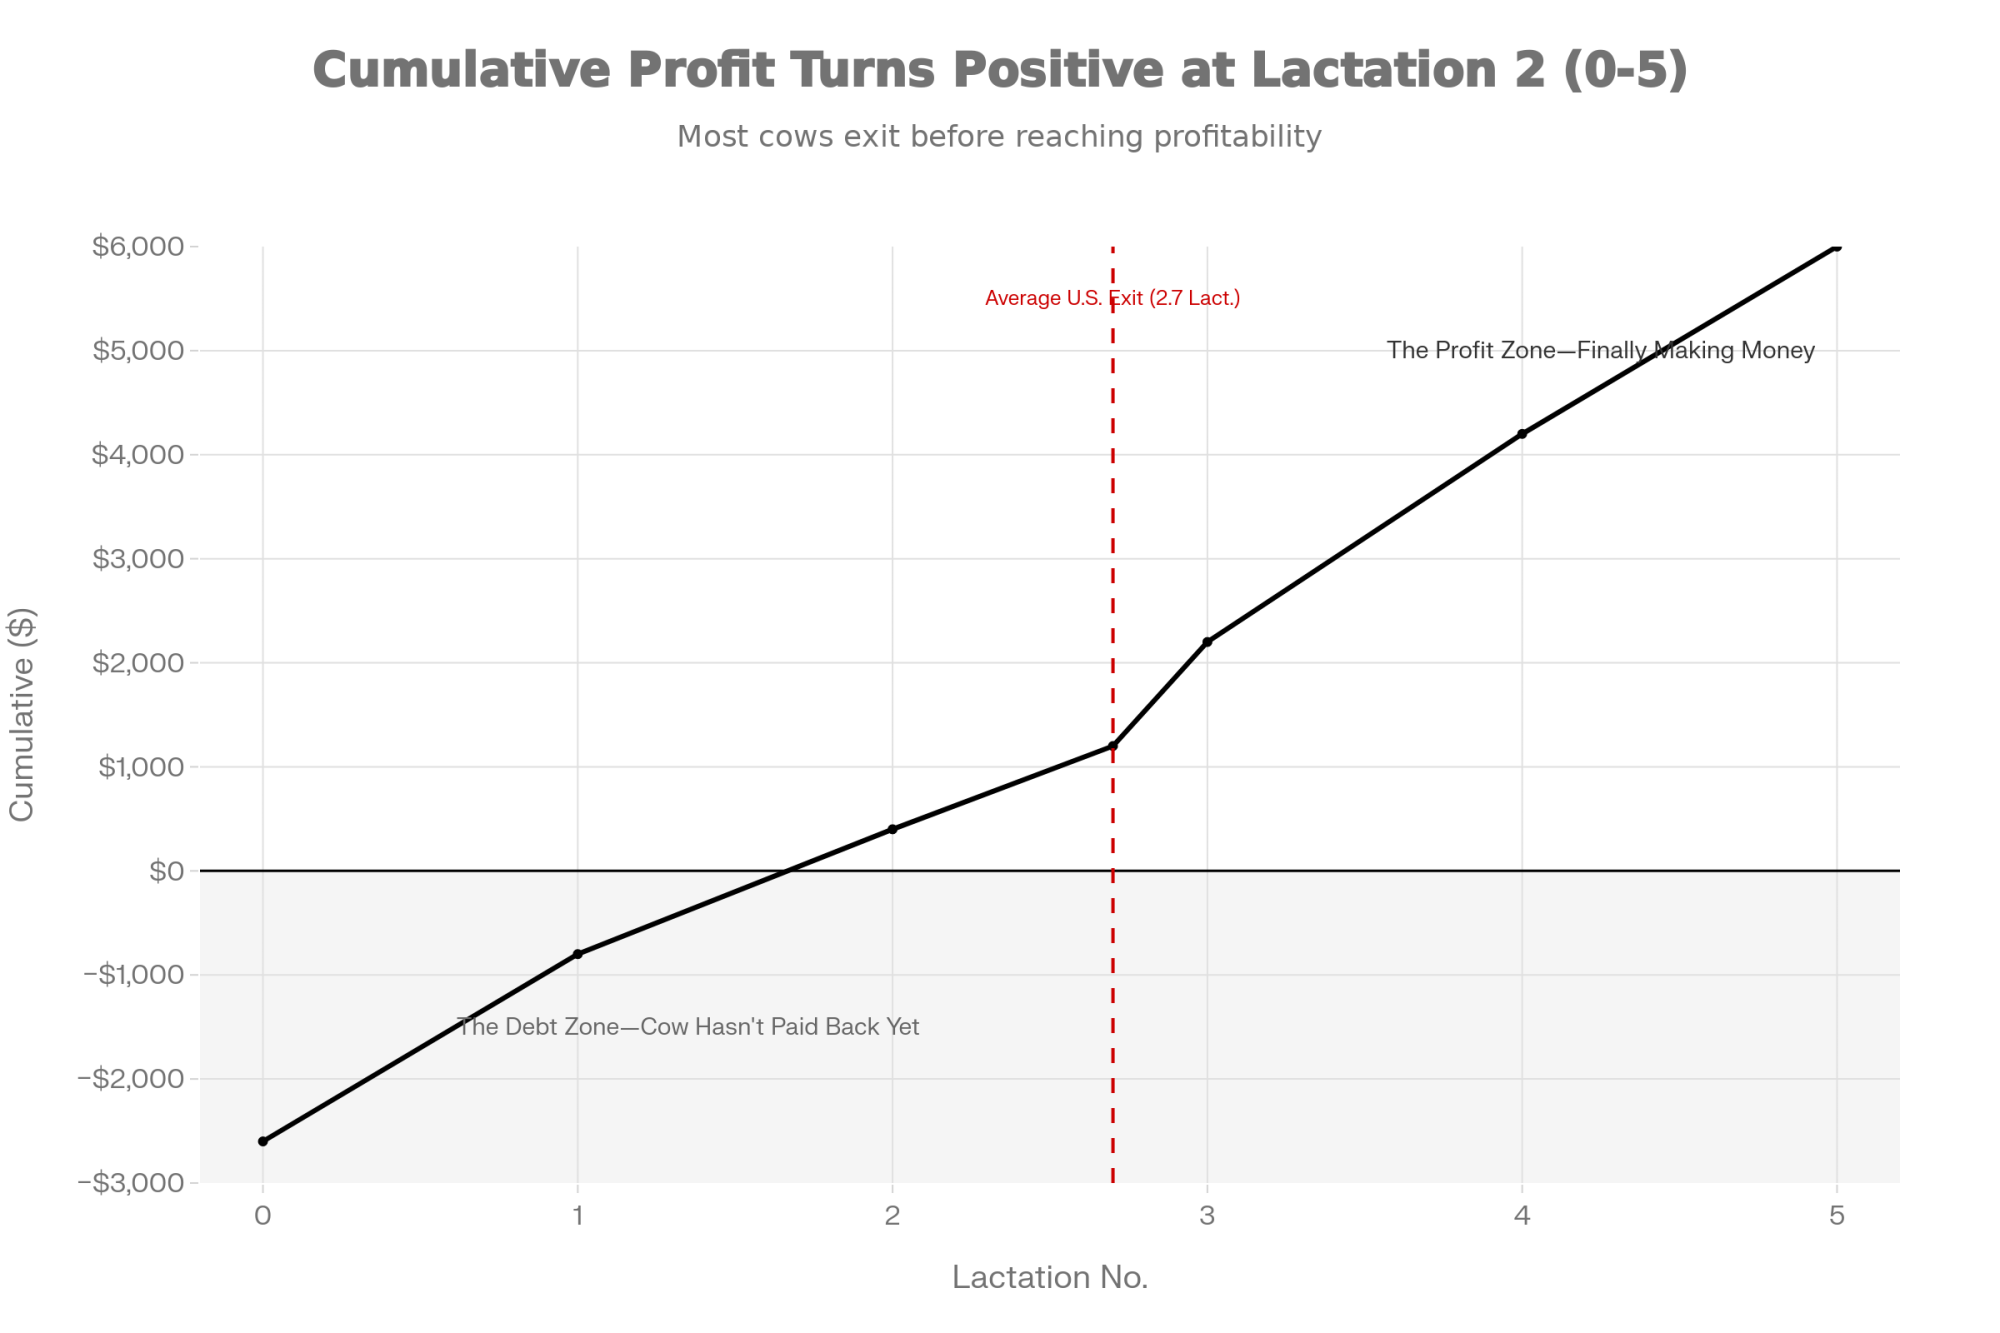
Paying $3,110 for a replacement only pencils if she stays out of the bottom quartile long enough to earn back. Extension cost work implies roughly a three‑lactation payback window at today’s heifer prices and milk values, while average U.S. productive life continues to run well short of that window in CDCB genetic trend reporting.

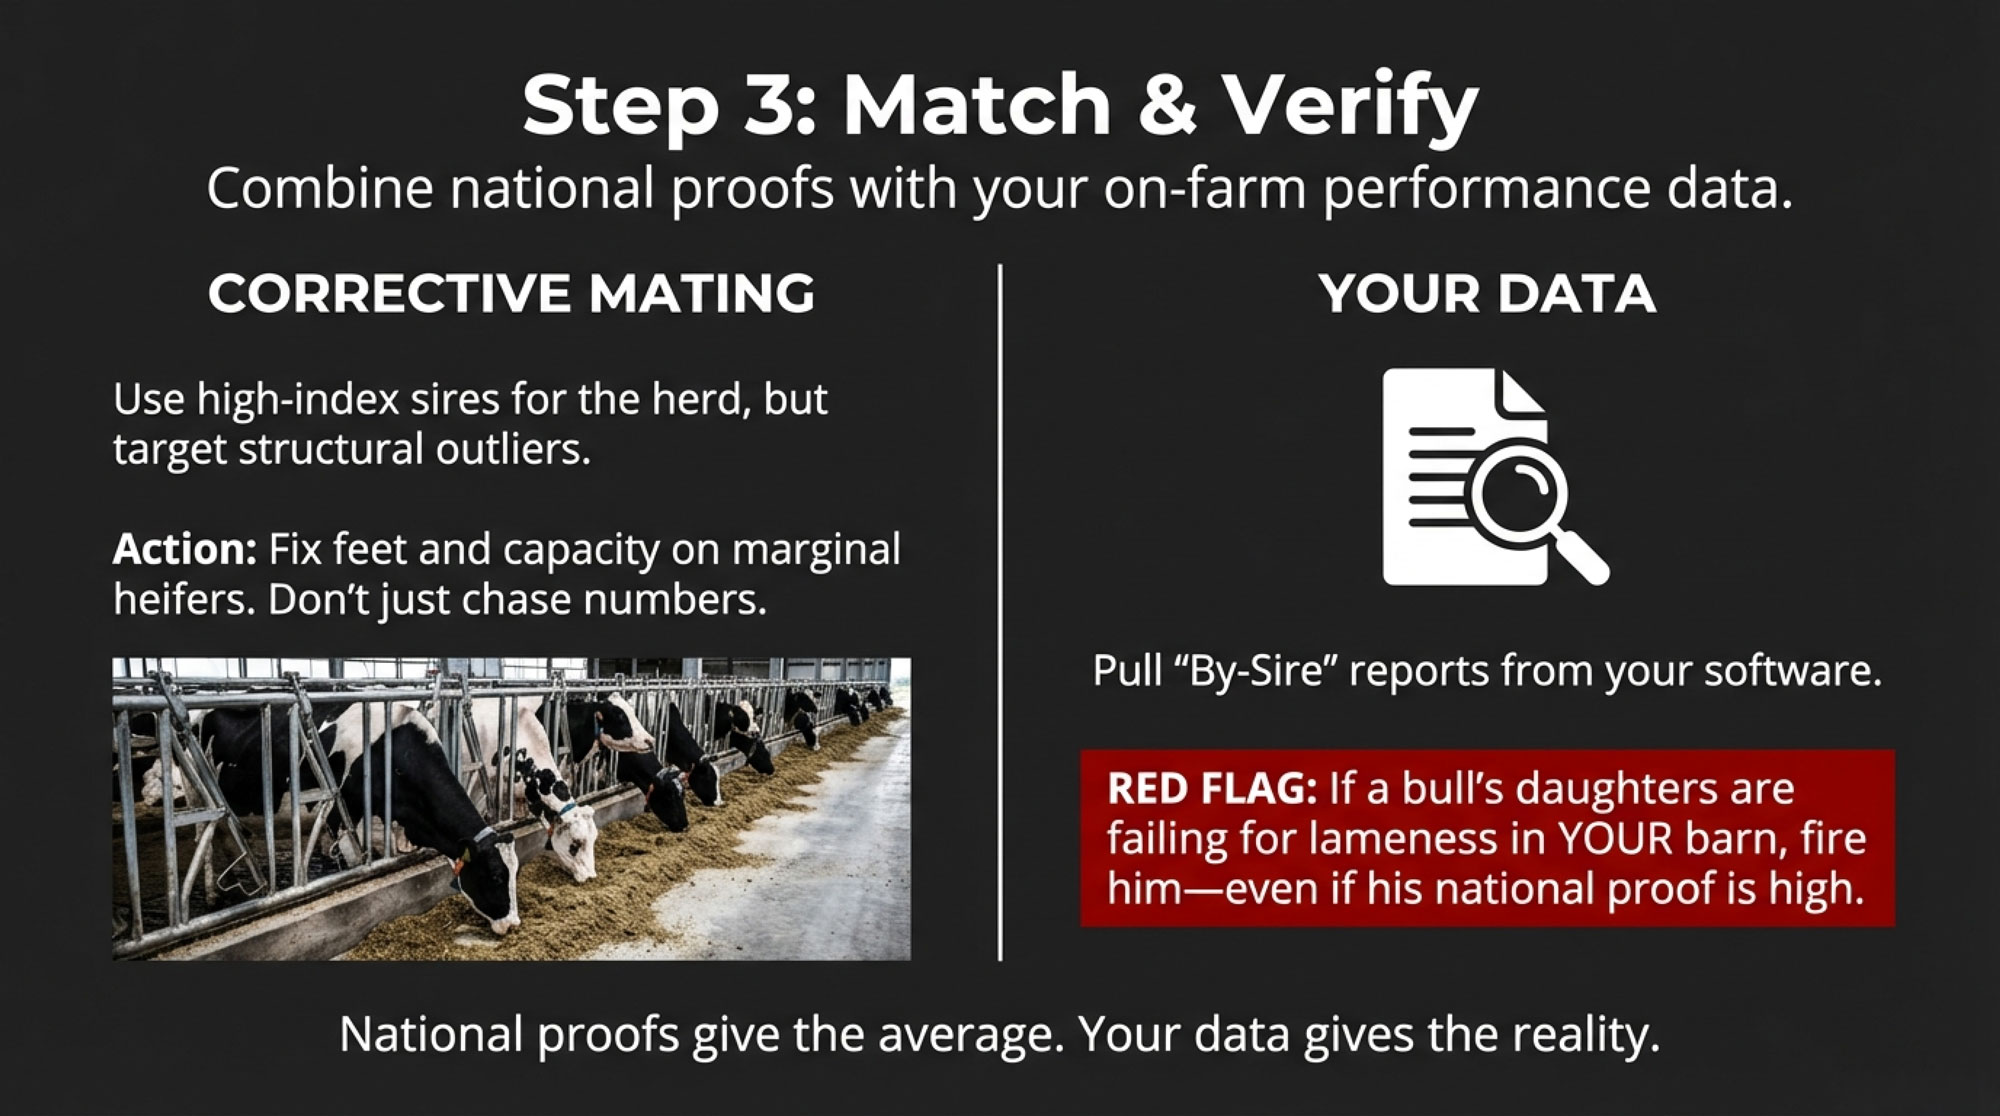
More herds are quietly shifting sire lists away from one more notch of yield and toward Productive Life, Daughter Pregnancy Rate, and health traits. In a $3,000‑heifer world, you’re better off with cows you still like in third lactation than cows you’re debating at second.

Companion genetics read — Tier 2: Sire Selection for Longevity in a High‑Heifer‑Cost Cycle.

The 30‑Day “pull three reports” step below pairs with this hidden‑gem analytics piece: Reading Your DHIA Report Like a Lender.

The 30/90/365‑Day Playbook for 200–700 Cow Deferred Herds

30‑Day Actions: Triage

Pull three reports from your herd software. Average lactation, vet cost per cow YoY, and a “kept instead of culled” list (cows you held in 2024–25 that would have shipped in 2019–20). Feed those numbers into the Replacement‑to‑Cull Snapshot the same afternoon. Requires: DHI and repro records, 20 minutes. Trigger: Average lactation >2.8 and vet cost/cow up YoY = you’re in the deferred cohort. Backfires when: You cull off software rank alone without checking repro status; some bottom‑rank cows are fresh and will climb.

Build your bottom‑quartile list. Rank by production, SCC, lameness, and days open. Tag each cow “ship within 6 months” or “re‑test at 6 months.” Requires: DHIA records and DC305/PCDart. Trigger: If your DSCR has been under 1.2 for three consecutive months on your lender’s reporting standard, treat the top third as urgent. DSCR covenant language varies — confirm with your loan officer. Backfires when: You empty stalls you can’t refill. Pair with the 90‑day replacement step below.

90‑Day Actions: Structural

Ship 25–35 cows from the bottom‑quartile list (8–12/month). Start with obvious passengers. Recheck vet cost/cow, bulk tank SCC, and daily shipped milk at Month 3. Requires: Replacement access or accepted lower cow count; freight and packer capacity. Trigger: If none of those three indicators improve, the hole is deeper than culling alone can fix. Backfires when: You ship without securing replacements and permanently shrink your base — fine if that’s the plan, a problem if it isn’t.

Lock replacement access. Heifer‑raising contracts, forward purchase agreements, or more sexed semen on your top 35–40%. Requires: 6–9 months for sexed semen to move through the pipeline; legal review on any forward contract. Trigger: Heifer prices break above $3,200 nationally, or your local replacement market tightens — pull this forward. Backfires when: Forward contracts signed at the top lock in peak prices. Build optionality where you can.

Tighten sire criteria on PL, DPR, and health. Requires: Genomic testing infrastructure and a breeding advisor aligned on PL/DPR weighting. Trigger: Average lactation trending up while production lags genetic trend = aging structurally, not just cyclically.

365‑Day Moves: Strategic

Clear 80–100 of the original bottom‑quartile cows; re‑run the diagnostic. Requires: Committed 12‑month cull and replacement schedule; lender in the loop. Trigger: Modeled annualized losses narrow by $50,000+ and cash‑flow draw slows — keep restructuring. Opportunity signal: If your components and SCC move you up a processor premium tier while Class III rallies into the Moderate or Full Correction band, you capture margin expansion your aging‑cow peers won’t. Backfires when: You keep a cow just to “earn back” the $1,000 you already spent on her vet bills. That vet check is gone. The only question left is what she produces tomorrow forward versus what a replacement produces in the same stall. Sunk cost is not a strategy.

Decide honestly at Month 12. Narrow the losses and rebuild, or plan a managed exit while cattle and heifer values still give you an equity‑preserving off‑ramp. Requires: Real data, not optimism. Accountant and lender at the table. Trigger:Equity ratio drifting below your lender’s covenant floor + two consecutive years of sub‑1.2 DSCR = managed‑exit conversation, not “one more year.” Backfires when: You wait for “one more good year” while deferred peers finally ship. That’s when heifer prices correct against you and cull prices soften.

Lender/advisor move: map CPI against your regional herd mix. Fastest‑growth, purchased‑replacement states (TX, ID) sit in a different risk band than flat regions. Portfolio exposure isn’t uniform.

The Turn: When Culling Becomes A Competitive Move

Run that same 500‑cow Wisconsin‑style herd forward 12 months in the model.

Average lactation is down. Vet cost per cow is flattening. Components trend toward the processor’s premium tier. The $205,500 margin gap hasn’t disappeared — but the $50,000–$100,000 bottom‑quartile drag has mostly retired.

A deferred‑herd peer down the road is still waiting. When the correction hits, everyone ships the same month. That’s when the lender’s “Can we afford to cull?” question flips to the only one that matters: Can we afford not to?

The CPI is a pressure gauge, not a guilt trip. Some cows are worth holding — young age structure, flat vet cost, production matching genetic expectations. If those conditions don’t describe your barn, the math isn’t ambiguous. Just uncomfortable.

What This Means For Your Operation

  • Pull those three reports in the next 30 days and set them beside your last three milk checks. If you won’t, you’re not managing this risk — you’re hoping it doesn’t land on you.
  • Run your numbers through the Replacement‑to‑Cull Snapshot today. Three minutes of inputs, a herd‑specific pressure score, a prioritized bottom‑quartile list, and a 30/90/365 plan calibrated to your barn.
  • Three or more “yes” answers on the CPI diagnostic puts your behavior inside the 470,000‑cow deferred bucket. Fix it with a 12‑month plan, not one cull load.
  • Watch Class III and your local heifer market together. Three straight sub‑$16 prints + heifer softening = shift from “prepare” to “act.”
  • Plan culls, replacements, and sire selection on one whiteboard. A CPI‑driven cull plan that isn’t tied to replacement access and sire strategy just sets up the next deferred trap.
  • Lenders and co‑ops: TX and ID expansion herds sit in a different risk tier than flat Northeast regions. Map your portfolio accordingly.

I grew up on a dairy farm where we knew every cow by name. We also knew when it was time to let one go.

That instinct hasn’t changed. But at $3,110 a replacement, the economics have overridden the instinct for hundreds of thousands of U.S. producers. The CPI is how we get the instinct back into the data.

— Andrew Hunt, Founder, The Bullvine

Run Your Herd Through The Replacement‑to‑Cull Snapshot

The Bullvine Replacement‑to‑Cull Snapshot

Your herd. Your numbers. Your pressure score.

Enter your cow count, current heifer price, local cull value, average lactation, vet cost per cow, and deferred cull count in the form below. The tool returns:

  • A herd‑specific pressure score with sub‑component breakdown.
  • A prioritized bottom‑quartile action list.
  • A 30/90/365 plan calibrated to your inputs.
  • A shareable PDF output you can bring to your lender or co‑op advisor.

The Bullvine Replacement‑to‑Cull Snapshot

Your herd. Your numbers. Your pressure score.

Having trouble viewing the tool? Open the Replacement‑to‑Cull Snapshot in a new tab.

Tool is editorial. Inputs are anonymized unless you opt in to a consulting follow‑up. The pressure score uses the same component math and weights as the published CPI and is not influenced by consulting engagements — see methodology below.

Methodology Note: How The Culling Pressure Index™ Is Built

The Culling Pressure Index™ is a monthly composite that quantifies deferred culling pressure in the U.S. dairy herd and estimates correction probability.

Update cadence. Published monthly, on the second Tuesday after the USDA NASS Milk Production release. Next update: Tuesday, May 12, 2026.

Version. CPI v1.0, April 2026.

Data inputs by component.

  • Component 1 — Deferred Culling (30%). USDA AMS weekly FI Dairy Cow Slaughter vs a five‑year rolling baseline (Sept 2018–Aug 2023, ~3.0M head/yr). Full baseline table in appendix.
  • Component 2 — Replacement‑to‑Cull Ratio (25%). USDA NASS Agricultural Prices for replacement heifers; USDA AMS National Weekly Cull Cow & Bull Summary for cull values (specific weekly reports cited in appendix).
  • Component 3 — Production Lag (20%). USDA NASS Milk Production monthly data vs CDCB published genetic trends.
  • Component 4 — Trigger Probability (25%). CME Class III futures, USDA Agricultural Prices, USDA WASDE corn stocks‑to‑use, IDFA processing capacity announcements.

Weighting rationale. 30% deferred culling (lagging indicator of accumulated risk); 25% ratio (economic driver of deferral); 20% production lag (herd‑quality drag); 25% trigger probability (correction timing).

Composite reading. The straight weighted composite for April 2026 is 65.0. The published reading of 68 includes a three‑point Volatility Premium for trigger‑convergence signals (HPAI × deferred culling, sustained sub‑$16 Class III × $3,000+ heifers). Future releases publish the raw and premium‑adjusted readings side by side.

Governance. The CPI score is editorial and is not influenced by Bullvine consulting engagements. Methodology changes are disclosed in monthly updates and historical scores are restated side‑by‑side. The embedded Replacement‑to‑Cull Snapshot at thebullvine.com/tools/rc-snapshot.html uses the same component math and weights as the published CPI.

Known limitations. State‑level data lags national data by 30–60 days. CDCB genetic trend data is smoothed annually. The natural‑attrition assumption behind the 470,000 retained‑cow estimate carries a sensitivity range of 350,000–550,000 head.

Versioning. v1.0 → v1.1 → v2.0. Material methodology changes will be flagged in monthly updates. Historical scores will be restated and presented as “as‑published” and “restated” series.

FAQ

What is the CPI? A monthly composite index, published by The Bullvine, scoring deferred culling pressure in the U.S. dairy herd and estimating correction probability.

Where does the data come from? USDA AMS FI slaughter, USDA NASS Milk Production and Agricultural Prices, CDCB genetic trends, CME dairy futures, USDA WASDE corn stocks‑to‑use. All inputs public.

What is the Volatility Premium? A qualitative adjustment on top of the raw weighted composite that prices trigger‑convergence risk — specifically HPAI exposure multiplying (not just adding to) deferred‑culling risk, and sustained sub‑$16 Class III compounding against $3,000+ heifer prices.

How is the Replacement‑to‑Cull Snapshot different from the published CPI? The published CPI scores the national herd monthly. The Snapshot at thebullvine.com/tools/rc-snapshot.html applies the same component math to your herd’s inputs and returns a herd‑specific score and action list. Both use the same methodology.

How is CPI different from the Pipeline Tracker™? Pipeline Tracker projects replacement heifer supply 24 months out. CPI measures retained‑cow pressure today. Together they form the most complete U.S. dairy supply read published.

Can I cite it? Yes. Recommended format: “The Bullvine Culling Pressure Index™, [Month Year]”

Does The Bullvine sell anything based on it? Yes — disclosed plainly. The Bullvine offers herd‑specific consulting engagements applying the CPI framework. The published CPI score and the Snapshot tool output are editorial; neither is influenced by consulting engagements.

Challenge The Model

Substantive challenges to the methodology are welcome. Write to cpi-feedback@thebullvine.com. Every substantive critique gets reviewed. Material responses are published in monthly updates.

Learn More

The Sunday Read Dairy Professionals Don’t Skip.

Every week, thousands of producers, breeders, and industry insiders open Bullvine Weekly for genetics insights, market shifts, and profit strategies they won’t find anywhere else. One email. Five minutes. Smarter decisions all week.

NewsSubscribe
First
Last
Consent

The Missing Piece in Genomic Selection: Why the Best Herds Still Walk the Pens

In 2025, you’re spending 2,000–5,000 dollars per heifer. Are those cows really staying long enough to pay you back?

Executive Summary: Right now, genomics has doubled Net Merit genetic gain in U.S. Holsteins—from about 40 to 85 dollars per cow per year—but many herds are still watching cows leave at roughly 2.7 lactations, just as they finally start to repay 2,000–5,000 dollar heifer‑raising costs. NAHMS culling data and Penn State’s longevity work show combined cull‑plus‑death rates near 37 percent and confirm that, with today’s higher rearing costs, real profit often doesn’t begin until third lactation or later. At the same time, UW–Extension, Lactanet, and CoBank document rising heifer‑raising costs, a roughly 15–18 percent drop in U.S. replacement inventories, and 2025 replacement heifer prices that commonly top 3,000 dollars, with top animals over 4,000 dollars in some regions. The article argues that if you keep raising every heifer in that environment, the real problem isn’t your proofs—it’s your replacement strategy—and the missing piece is using genomics as a hard filter on which heifers deserve a stall, backed by a simple breeding‑age structural check on feet, heels, capacity, and calving structure. It then lays out a concrete playbook: genotype and set a clear cutoff tied to your true replacement needs, walk breeding‑age heifers once with structure in mind, use corrective mating only where it removes real structural risk, and pull by‑sire reports on lameness, fresh cow problems, and early culls so you’re not blindly trusting early genomic proofs. Finally, it looks ahead to tools like 3D BCS/weight and AI lameness detection and makes the case that, in 2025’s tight heifer and margin environment, the herds that win will be the ones that combine genomics, barn data, and one strong “cow person” to keep more cows walking the pens into their fourth and fifth lactations.

You know, when you look back over the last 15–20 years, it’s pretty wild what we’ve all lived through on the genetics side of dairy. Genomic testing has changed which bulls you pick, which heifers you raise, and how fast your herd moves genetically. Geneticist George Wiggans, PhD, with USDA’s Animal Genomics and Improvement Laboratory, and his co‑authors laid this out in a 2022 Frontiers in Genetics review: once genomic evaluations came in, the average annual increase in Net Merit in U.S. Holsteins essentially doubled—from about 40 dollars per cow per year in the five years before genomics to about 85 dollars per cow per year in the genomic era—and they clearly state that this “doubled the rate of genetic gain” in U.S. dairy cattle based on CDCB trend data across millions of animals.

What’s interesting here is that it wasn’t just more milk. A landmark analysis by Ana García‑Ruiz, PhD, and colleagues in Proceedings of the National Academy of Sciences dug into the U.S. national dairy database. It showed that once genomic selection was implemented, generation intervals for sires shrank from roughly 6.8 years to under 3 years in key sire pathways. The annual genetic gains for low‑heritability traits such as somatic cell score, daughter pregnancy rate, and productive life increased by four‑ to fifteen‑fold compared to the pre‑genomic era. They based that on decades of Holstein pedigree, genomic, and performance data across the national system.

Genomic Selection Doubled Genetic Progress—From $40 to $85 Per Cow Per Year 

So the data suggest genomics hasn’t just helped you chase production; it’s sped up progress in those “hard‑to‑move” traits many of us thought would take a whole career to shift. The problem is that a lot of that progress is still walking out the cull gate before it’s actually paid you back.

Looking at This Trend: What’s Actually in Net Merit Now?

Looking at this trend a bit closer, it helps to ask a simple question: what exactly are you selecting on today?

USDA’s most recent “Net merit as a measure of lifetime profit” revision, along with the Wiggans genomic selection review, makes it clear that U.S. dairy evaluations are now calculated for over 50 traits across production, fertility, health, calving, conformation, and efficiency. Net Merit pulls a large group of these into a single lifetime profit index using economic weights based on U.S. milk prices, feed costs, and culling patterns. That index includes milk, fat, and protein yields; several fertility traits such as heifer and cow conception rates and daughter pregnancy rate; cow and heifer livability; mastitis and other health traits; calving performance and stillbirth; age at first calving; a body‑weight composite; and feed efficiency via the Feed Saved trait, which uses body‑weight and residual feed intake data.

Over the last decade, USDA and the Council on Dairy Cattle Breeding (CDCB) have deliberately shifted the emphasis in Net Merit. When new health traits and Feed Saved were added, the economic weight on disease resistance and feed efficiency went up, while the weight on large body size was reduced because research showed that heavier cows require more maintenance feed and don’t necessarily return that cost in profit. Net Merit is now driven less by raw milk yield and more by health, fertility, and feed efficiency than it was in the early 2000s.

On the reliability side, invited reviews on genomic prediction in Holsteins report that genomic reliabilities for milk, fat, and protein in young bulls often sit in the 60–80 percent range when backed by a strong reference population, while fertility and health traits have lower reliabilities but are still significantly higher than the 20–30 percent levels typical of parent‑average evaluations. Those figures come from comparisons of genomic vs traditional proofs using large U.S. and Canadian datasets.

So, on paper, genomics and Net Merit give you a more complete, profit‑focused toolbox than we’ve ever had. And the genetic gains are real. The catch is that not everything you care about shows up on that proof sheet—and 2025 economics are unforgiving if cows don’t stay long enough to pay you back.

What Farmers Are Finding: Culling, Payback, and Short Careers

What farmers are finding, when they move from the proof sheet to the cull list, is that the picture gets uncomfortable pretty fast.

USDA’s National Animal Health Monitoring System (NAHMS) 2024 data reports that the typical overall cull rate for U.S. dairies—counting death losses—is about 37 percent per year. That’s in line with the 2018 NAHMS survey in the Northeastern U.S., which documented an annual cull rate of 31.4 percent plus a 6.2 percent death rate, for a combined 37.6 percent removal rate. Penn State Extension’s “Cull Rates: How is Your Farm Doing?” uses those exact numbers as the benchmark.

When you look at why cows leave, the NAHMS data show that only 26.8 percent of removals in the Northeast were voluntary—cows sold for dairy or lower producers. The other 73.2 percent were involuntary, driven mainly by infertility (23.3 percent of removals), mastitis (18.6 percent), lameness (9.1 percent), and on‑farm deaths (6.2 percent). Penn State highlights these figures to emphasize that reproductive problems, udder health, and lameness remain the big three behind most culls.

Removal CategoryShare of Total Removals (%)What This Means
Combined Annual Removal Rate37.0%Cows + deaths leaving your herd every year (NAHMS, Northeast U.S.)
Voluntary Culls26.8%Low production, dairy sales—you decided
Involuntary Culls73.2%Forced exits—health, fertility, injury
└ Infertility23.3%Cows that won’t rebreed on your timeline
└ Mastitis18.6%Chronic udder health failures
└ Lameness9.1%Foot/leg problems that won’t resolve
└ On-Farm Deaths6.2%Metabolic disease, injury, sudden death

So most cows aren’t leaving because they’re old, paid for, and you’re trading up. They’re leaving because something went wrong—often in the transition period or early in their productive life.

Now put that right next to the cost of raising replacements. A multi‑herd study from the University of Wisconsin–Extension calculated that the total cost to raise a replacement from birth to freshening averaged 2,227 dollars in 2013, not counting the calf’s initial value. That was up from 1,648 dollars in 2007 and 1,260 dollars in 1999, with feed as the largest single expense. The UW fact sheet “Heifer raising costs continue climbing upward” breaks down those costs and shows that feed alone accounted for over half the total.

More recent U.S. work hasn’t shown those costs going down. A 2025 article, drawing on Iowa State University Extension, reported that 2024 heifer‑raising costs in the Midwest were “just over 2,600 dollars” for a 24‑month heifer in many systems once you include feed, labor, housing, bedding, and overhead.

On the Canadian side, Lactanet’s “Analysis of the cost and value of dairy rearing programs” found that average rearing costs per heifer in Quebec were approximately 4,859 dollars for conventional herds and 5,070 dollars for organic herds, with a range from roughly 3,500 to over 7,000 dollars depending on housing, feeding, and management. Their 2023 follow‑up on the cost and profitability of rearing programs reinforces that rearing is a major capital commitment under supply management.

Raising Replacements Now Costs $2,600–$5,000—Up 106% Since 1999

So generally speaking, you’re tying somewhere between 2,000 and 5,000 dollars into each heifer before she ever steps into the parlor, depending on where you are and how you raise them.

Penn State Extension took those rearing costs and asked a blunt question in their 2025 article “Have Your Cows Repaid Their Debts?” Their analysis, based on NAHMS data and economic modeling, shows that with current heifer‑raising costs, it often takes until at least the third lactation for a cow to repay her development cost. They also point out—citing NAHMS‑based summaries and regional data—that the average U.S. cow only stays in the herd for about 2.7 lactations and that many cows are culled by the end of their third lactation. Morning Ag Clips picked up similar points in a 2024 piece titled “How Long Do Your Cows Stay in the Herd?”, quoting extension specialists who warn that a large share of cows leave before they’ve yielded a strong return.

Most Cows Leave Right As They Start Making Money—The 2.7 Lactation Squeeze 

So the data suggest a tight squeeze: more expensive heifers, a payback point around three lactations, and an average cow productive life just shy of that. In a 2025 margin environment—where feed costs are still elevated, and component pricing is volatile—that’s a rough place to be.

If you run some simple numbers on a 200‑cow herd, the economic impact comes into focus. At a 37 percent cull‑plus‑death rate, you’re replacing roughly 74 cows per year. If you can move that combined rate down to 30 percent, you’re replacing about 60 cows. That’s 14 fewer heifers to raise. Using the documented U.S. cost range of 2,000–2,600 dollars per heifer, that’s 28,000–36,400 dollars per year in avoided heifer‑raising costs, before you even count the extra milk and butterfat performance from a higher proportion of mature cows. In Canadian quota herds, where Lactanet shows average rearing costs near 4,800–5,000 dollars, the same reduction in replacement needs could be worth 67,000–70,000 dollars annually.

MetricBaseline (37% Removal)Improved (30% Removal)Annual Impact
Heifers Raised per Year746014 fewer
U.S. Cost per Heifer$2,600$2,600
U.S. Total Rearing Cost$192,400$156,000Saves $36,400
Canadian Cost per Heifer$5,000$5,000
Canadian Total Rearing Cost$370,000$300,000Saves $70,000

Here’s the thing I’ve noticed: once producers see that math with their own cull rates and rearing costs plugged in, continuing to raise every heifer “just in case” starts to look less like being conservative and more like one of the most expensive habits on the farm.

The Replacement Squeeze: Fewer Heifers, Higher Prices

As if the economics of raising replacements weren’t enough, the broader replacement market has been tightening the screws, too.

CoBank analysis of USDA cattle inventory reports shows that the number of dairy heifers weighing 500 pounds or more in the U.S. has fallen to its lowest levels in decades. CoBank’s 2025 analysis estimates about a 15 percent decline in dairy replacement heifer numbers over the past six years and notes that current inventories are at their lowest since the late 1970s. Their forecast suggests that heifer numbers will shrink further before beginning to rebound around 2027.

U.S. Dairy Replacement Inventories Down 15%—Lowest Since the Late 1970s

On the price side, market reporting describes multiple 2024–2025 sales where good Holstein replacement heifers routinely brought more than 3,000 dollars, with some top groups selling for over 4,000 dollars per head in California, Minnesota, and the Pacific Northwest. Market analysts have characterized current replacement heifer prices as “vaulting into record territory,” and these numbers align with both rearing costs and the tight national inventories reported.

So the data suggest that both raising and buying heifers are expensive right now, and that the industry as a whole doesn’t have a big surplus of replacements to fall back on. In a year when many herds are still feeling the aftershocks of 2025’s margin squeeze and processor pressure on components and quality, that makes your replacement strategy a high‑stakes business decision, not just a habit.

Structure, Environment, and Why Some Cows Don’t Make It to Third Lactation

Looking at this trend from the barn floor, the piece that doesn’t fully show up in Net Merit or genomic reliabilities is structured cow health in your specific environment.

On the hoof‑health side, multiple studies published in the Journal of Dairy Science and other veterinary journals have shown that cows with shallow heel depth and low foot angle are at greater risk for claw horn lesions and lameness on concrete, especially in freestall systems with higher cow traffic. Those studies link shallow heels, weak rear feet, and poor claw conformation with increased incidence of sole ulcers, white line disease, and chronic lameness—conditions strongly tied to reduced milk production, poorer fertility, and higher culling risk.

On the metabolic side, transition‑cow reviews and field studies emphasize that low body condition score and insufficient dry matter intake around calving increase the risk of negative energy balance, ketosis, and displaced abomasum. That’s particularly true in high‑producing cows fed energy‑dense diets to maximize early‑lactation yield and butterfat performance. Research on late‑gestation heat stress has documented “programming” effects: dry cows exposed to heat during the close‑up period produce less milk and experience more health issues in the subsequent lactation; some studies have even found effects on daughters’ performance. This is especially relevant in dry-lot systems and Southern herds, where late‑gestation cows and heifers are walking longer distances in the heat.

In Wisconsin freestall herds, hoof trimmers and UW–Extension educators have commented—both in extension meetings and in trade articles—that daughters from certain sire lines with flatter feet and thinner heels show up more often in trimming lists and lameness treatments, even when those bulls look acceptable for feet‑and‑legs composites on paper. While those observations are anecdotal, they align closely with the published links between heel depth, foot angle, and the risk of claw lesions on concrete.

In Western dry lot systems in California and parts of the High Plains, producers often report that very tall, angular cows with lighter bone and less body capacity don’t handle long walks between lots and parlors in summer heat as well as medium‑sized, deeper‑bodied cows that hold condition better through the transition period. When you overlay those barn‑floor stories with the heat‑stress and transition‑cow research, the pattern makes sense: cows whose structure and metabolism aren’t well suited to that environment are more likely to end up as early culls, no matter what their genomic index says.

If you swing your attention to pasture‑based seasonal systems, you see a different set of pressures. Ireland’s Economic Breeding Index (EBI) and New Zealand’s national breeding goals have been built around cows that can walk, graze, maintain body condition, and rebreed on a tight seasonal schedule. Research from Teagasc and New Zealand spring‑calving herds shows that higher fertility, genetic merit, and better body condition scores are associated with improved reproductive performance, survival, and profitability in those grazing systems, while very large, high‑output Holsteins bred for North American TMR feeding often struggle to hold condition and pregnancy on grass.

All of that suggests that Net Merit and similar indexes capture part of the story indirectly—through traits like productive life, fertility, health, and body‑weight composite—but they can’t fully see how structure and environment interact in your particular freestall, tie‑stall, parlor, robotic setup, or grazing platform.

And this is where I’d say we run into a quiet myth: that as long as the genomic index is high, the cow will “work” anywhere. The data and the barns both say that’s not always true.

What Farmers Are Finding: How High‑Performing Herds Actually Use Genomics

What farmers are finding, especially those who’ve been in the genomic game for a while, is that the herds quietly pulling ahead tend to follow a three‑part pattern. They use genomics as a strong filter, they add a simple structural check at the right time, and they let their own herd data tell them when a bull isn’t working in their environment—even if his proof still looks good.

1. Let Genomics Decide Who Deserves a Stall

First, they use genomics to decide which heifers even get to compete for a stall.

In many progressive Midwest and Northeast operations, every heifer is genotyped between three and six months of age. CDCB reports that hundreds of thousands of female dairy cattle are genotyped every year, and case studies profile farms that use whole‑herd genotyping to drive their replacement and beef‑on‑dairy strategies.

The pattern in those herds often looks like this:

  1. Genotype the heifer group. All heifers—or at least all heifers from core cow families—get tested.
  2. Rank on a profit index. Heifers are ranked on Net Merit in the U.S. or Pro$/LPI in Canada, and key functional traits—daughter fertility, productive life, mastitis resistance, calving traits, body size—are checked against herd goals.
  3. Set a clear cutoff. An internal threshold is set based on how many replacements the herd truly needs annually, not “everything that hits the ground.”
  4. Sort replacements vs beef. Heifers clearly below that line are designated for beef‑on‑dairy matings or other marketing paths instead of being automatically raised as core replacements.

Economic analyses from Iowa State, UW–Extension, and Lactanet all support this kind of triage. If genotyping costs around 40–50 dollars per heifer and the information lets you avoid raising 10–15 low‑merit animals that would each cost 2,000–2,600 dollars in the U.S. or 4,800–5,000 dollars in Canada, you’re avoiding 20,000–75,000 dollars of future rearing costs for a testing investment of maybe 4,000–7,500 dollars. Iowa State’s heifer‑inventory work and Lactanet’s rearing‑cost modeling both illustrate this scale of impact.

A lot of herds then pair this with beef‑on‑dairy. Extension surveys and industry reports from Iowa State, Kansas State, and High Plains fieldwork confirm that using beef semen on lower‑merit dairy cows and heifers has become a common way to add value to non‑replacement pregnancies and concentrate dairy replacements among the top genomic group. ROI analyses show improved calf value and better alignment between replacement supply and milk‑herd needs when this is done with clear genomic cutoffs.

Under the Canadian quota, Lactanet’s rearing‑program analysis and their work on cost and profitability emphasize that cows must stay in the herd long enough to repay higher rearing costs and generate a return on quota. Their numbers show average rearing costs around 4,800–5,000 dollars per heifer and a wide variation in cost per litre associated with heifer inventory, age at first calving, and productive life. Many Canadian advisors use those figures to support the rule of thumb that cows generally need three or more lactations to generate strong returns under quota.

So the first big step that successful herds have taken is to let genomics decide who deserves the chance to become a cow, instead of raising every heifer and hoping it works out. If you’re still raising every heifer in 2025, this development suggests you’re tying a lot of capital up in animals that will never pay you back.

2. Walk the Pens Before First Breeding

Second, the herds that are combining genomics with longevity add a simple structural check at breeding age.

Usually, that’s around 12–14 months for Holstein heifers in freestalls or tie‑stalls, and a bit later for seasonal grazing herds that breed heifers to fit a calving block. Someone—often the breeder, herd manager, or an experienced employee—walks through the breeding‑age pens with a few key questions in mind:

  • Compared to the older cows that come through the transition period well in this herd, does this heifer have enough body depth and chest width to eat what she’ll need on the diets and in the facilities you actually have?
  • Do her feet and heels look comparable to the heifers and cows that stay sound on your floors and paths, or are they noticeably flatter and weaker?
  • Does her rump and hip structure look like it will help or hinder calving and day‑to‑day movement in your barns or on your laneways?

Lameness research has tied shallow heels and low foot angle directly to higher odds of claw lesions and lameness on concrete, and transition‑cow research has linked limited intake and low body condition around calving to higher metabolic disease risk and weaker early‑lactation performance. Those are exactly the kinds of problems that drive early culling and drag down fresh cow management.

In a 70‑cow tie‑stall in Quebec, this might mean flagging just a few heifers as “structural concerns” and thinking about different mating or marketing plans for them. In a 400‑cow freestall in Wisconsin or an 800‑cow dry lot system on the High Plains, some producers have built simple 1‑to‑3 scoring systems and trained staff to mark heifers with clear structural issues during routine handling, then revisit that list when making breeding decisions.

Chasing tall, show‑style cows in freestalls or dry lots can be a costly luxury if they don’t walk and last. The herds that are winning on both banners and bank accounts are the ones that match their type to their environment rather than copying someone else’s ideal.

3. Use Corrective Mating Where It Really Pays

Third, these herds use corrective mating selectively, focusing on the animals where it’s most likely to pay off.

For the majority of cows and heifers—the ones that clear both the genomic filter and the structural walk—they keep breeding plans straightforward. They choose high‑index sires based on Net Merit, Pro$, or LPI that are solid for daughter fertility, livability, mastitis resistance, calving ease, and feet and legs, and they avoid bulls that are extreme for body size, or that carry trait weaknesses that clearly don’t fit their barns. USDA’s Net Merit documentation and our own Bullvine articles on genetic tools both suggest that letting multi‑trait economic indexes handle most of the weighting is a sound base strategy, as long as you pay attention to a few critical traits for your system.

For the smaller group of structurally marginal heifers, they still use good bulls—just more carefully. On narrower, shallow‑bodied heifers, they’ll lean toward bulls that are known to add strength and capacity without giving up too much on profit. On heifers with flat, thin‑heeled feet in concrete or dry lot systems, they’ll favor bulls with strong feet‑and‑legs evaluations and, where available, better claw‑health and locomotion scores. On heifers with awkward rumps, they reach for sires with more functional rumps and better daughter calving ease.

Herd‑level evaluations and extension case studies suggest that trading 50–100 dollars of index on these specific matings can be worthwhile if it reduces early structural culls and improves fresh cow management, especially when you look at lifetime milk and component yield instead of just first‑lactation performance.

Raising every heifer and then breeding them all to the same top‑index bull might feel simple. In 2025, it’s also a good way to waste both semen and stall space.

StepActionFinancial Impact
1. The FilterGenotype and set a hard cutoff.Avoids $2,600+ in costs for “low-merit” calves.
2. The WalkVisual check for feet, capacity, and rump.Reduces involuntary culls in 1st/2nd lactation.
3. The MatchCorrective mating for structural outliers.Ensures the best genetics actually survive to pay back debt.

Looking at This Trend from Your Own Records

There’s one more piece that high‑performing herds have learned to lean on, and that’s their own herd data.

Geneticists working on the U.S. genomic system have been clear that even with high average reliabilities, individual genomic bulls—especially the young, high‑ranking ones—can move once daughters calve across a range of environments. That point appears in Wiggans’ work as well as in invited reviews on breeding goals and selection strategies.

What farmers are finding is that by‑sire reports from their own herd management software are one of the best early warning systems they have. The pattern usually looks like this:

  • Once or twice a year, they pull reports that show lameness events, hoof‑trimmer findings, fresh cow problems (ketosis, DA, metritis), calving difficulty, and early culls by sire.
  • They compare each sire’s daughters to herd baselines: if daughters from one bull show significantly higher rates of lameness, fresh cow treatments, calving issues, or early culls, that bull moves onto a “caution” list.
  • They dial back that sire’s usage, especially in heifers, and watch how his official proofs move in the next couple of evaluation runs.

Extension educators and consultants in the Northeast, Midwest, and West have highlighted farms that do this, and their experiences align with what geneticists recommend: use national proofs for the big picture and your own data for local calibration.

In Western dry lot and Southern herds, some producers are also starting to sort these problem lists by calving season and sire to see whether certain bulls’ daughters struggle more when they calve into heavy heat. Research on late‑gestation heat stress suggests that cows calving after hot, dry periods may be at higher risk of poor performance and health problems. A few herds are using that insight to adjust which bulls they use on cows expected to calve in the hottest windows.

So here’s a fair question: do you know, off the top of your head, which bulls sired your last 20 early culls or your worst fresh cows? If the answer is no, your herd software probably does—and it’s worth asking.

New Tools Coming: 3D Cameras, AI Gait, and Why People Still Matter

Looking out a few years, it’s pretty clear that technology is going to keep adding tools to this mix.

Several recent studies and technical articles have evaluated three‑dimensional camera systems that estimate body weight and body condition score automatically from overhead images. These systems use depth sensors and algorithms to reconstruct the cow’s shape and have shown good agreement with scale weights and experienced BCS scorers in research settings and early commercial trials.

At the same time, dairy tech companies and research groups have been developing automated lameness detection systems that use cameras, accelerometers, or pressure mats with AI‑based gait analysis. Peer‑reviewed studies and industry case reports document systems that can detect subtle gait changes before cows are obviously lame, with high sensitivity and specificity. That kind of early warning can help target hoof trimming and fresh-cow management, and reduce the severity and cost of lameness cases.

Some research teams are already experimenting with combining these high‑frequency phenotypes—weight, BCS, locomotion, rumination—with genomic information to improve predictions for traits like resilience, feed efficiency, and long‑term health that are hard to measure at scale today. A 2024 bibliometric review on genomic selection in animal breeding and recent overviews of bovine genomics highlight this as a major emerging direction.

This development suggests that, in the future, we may be able to quantify and select for “resilience” and “structural soundness” more objectively. That’s exciting, especially for larger herds that need help catching subtle changes in body condition, movement, and fresh cow behavior.

But even as these tools roll out, every one of them still needs a human in the loop. Someone has to review the alert, examine the cow, and decide whether the system’s flags match reality. Judging coaches, classifiers, and long‑time herd managers have been saying for years that as our industry has gotten better at reading proofs and genomic reports, fewer people have had deep training in reading cows—feet, legs, capacity, udders, and how cows handle the transition period in real barns. Workshops and classifier training materials echo that concern.

From what I’ve seen, the herds that are making the most of genomics and new tech are the ones that still have at least one strong “cow person” in the mix. That person can look at a genomic report, look at a heifer, look at the hoof‑trimmer’s notes, and connect those dots. In 2025, when capital is tight and processors are picky, that skill might be as valuable as any piece of hardware you can bolt into the barn.

What To Do This Year: A Short List

If you’re thinking, “Okay, what do I actually do with all this?”, here’s a short, practical list based on the data and what successful herds are doing:

  1. Genotype the heifers you’re serious about and set a real cutoff.
    Test all heifers or at least those from your best cow families. Rank on Net Merit or Pro$/LPI, check fertility, productive life, mastitis, calving traits, and size, then draw a line based on how many replacements you truly need. Heifers below the line become beef‑on‑dairy or are marketed differently, instead of automatically being raised.
  2. Walk your breeding‑age heifers once with structure in mind.
    Before first breeding, take one good look at body capacity, feet and heels, and rump structure, comparing heifers to the cows that last in your herd. Use what we know about lameness and transition‑cow risk to flag structural outliers that are more likely to become expensive early culls.
  3. Use corrective mating where it matters most.
    For structurally marginal heifers, pick high‑merit sires that also bring better feet, legs, capacity, or calving traits—even if it means giving up a bit of index on those matings. For the rest, let multi‑trait indexes do the heavy lifting and avoid extremes that don’t fit your facilities or fresh cow management reality.
  4. Pull one by‑sire problem report this year.
    Use your herd software, vet records, and hoof‑trimmer logs to see which sires’ daughters show up more often in lameness events, fresh cow treatments, calving problems, or early culls. If one bull looks worse than the herd average, dial back his usage and watch how his proof moves in coming runs. Doing nothing with this information is also a strategy—and in 2025, it’s one of the riskiest ones you can pick.
  5. Start planning how you’ll use new tech, but keep people at the center.
    If you’re considering 3D cameras or lameness‑detection systems, think about who on your team will own those alerts and how you’ll use that data alongside genomics and good old‑fashioned pen walking. The tech can sharpen your view, but it won’t replace judgment.

The Bottom Line

So, looking at this trend as a whole, the data and the barns are pointing in the same direction.

The herds that are quietly getting ahead aren’t “all genomics” or “no genomics.” They’re the ones that:

  • Use genomic tests and economic indexes to decide which heifers truly deserve a place in the replacement pipeline, instead of raising every calf and hoping it works out.
  • Bring a straightforward, honest look at structure into the picture at breeding age to make sure those heifers’ bodies fit their stalls, floors, and walking distances.
  • Use corrective mating where it actually pays—on the smaller group of structurally marginal animals—while letting Net Merit or Pro$/LPI guide most matings.
  • Listen to their own herd data on bulls and adjust usage when their cows tell a different story than early proofs suggest.
  • And keep at least one strong “cow person” in the mix to connect what the numbers say with what’s happening in the pens, especially through the transition period and fresh cow management.

You’re already paying for genomics. You’re already paying a lot to raise replacements. Either you use genomics, structure, and herd data together to keep more cows past three, four, or five lactations—or you keep pouring 2,000–5,000 dollars into replacements that walk out just as they reach breakeven.

What’s encouraging is that you don’t need to overhaul everything overnight. Testing a few more heifers, drawing a firmer line on who you raise, walking one heifer group with structure in mind, and pulling one by‑sire problem report this year can start nudging your herd in the direction the data—and the best herds—are already heading. 

Key Takeaways 

  • Genomics doubled genetic gain—but not cow longevity. Net Merit now climbs about 85 dollars per cow per year versus 40 dollars pre‑genomics, yet the average cow still exits around 2.7 lactations—often before paying back her 2,000–5,000 dollar raising cost.
  • Most culls aren’t planned—they’re forced. NAHMS data show a 37 percent combined cull‑plus‑death rate, driven by infertility, mastitis, and lameness. Penn State’s analysis confirms real profit typically doesn’t start until the third lactation or later.
  • Raising every heifer is now a high‑cost gamble. U.S. replacement inventories have dropped roughly 15 percent to multi‑decade lows, and 2025 heifer prices commonly exceed 3,000 dollars. “Just in case,” heifer programs may be your most expensive habit.
  • Top herds treat genomics as a filter, not a trophy. They genotype early, set a hard cutoff tied to true replacement needs, walk heifers at breeding age for structural fit, and use corrective mating only where it actually reduces cull risk.
  • Your own herd data can catch what the proofs miss. Pull by‑sire reports on lameness, fresh cow problems, and early culls at least once a year—bulls whose daughters don’t hold up in your barns will show up there before proofs fully adjust.

Complete references and supporting documentation are available upon request by contacting the editorial team at editor@thebullvine.com.

Learn More

The Sunday Read Dairy Professionals Don’t Skip.

Every week, thousands of producers, breeders, and industry insiders open Bullvine Weekly for genetics insights, market shifts, and profit strategies they won’t find anywhere else. One email. Five minutes. Smarter decisions all week.

NewsSubscribe
First
Last
Consent
Send this to a friend