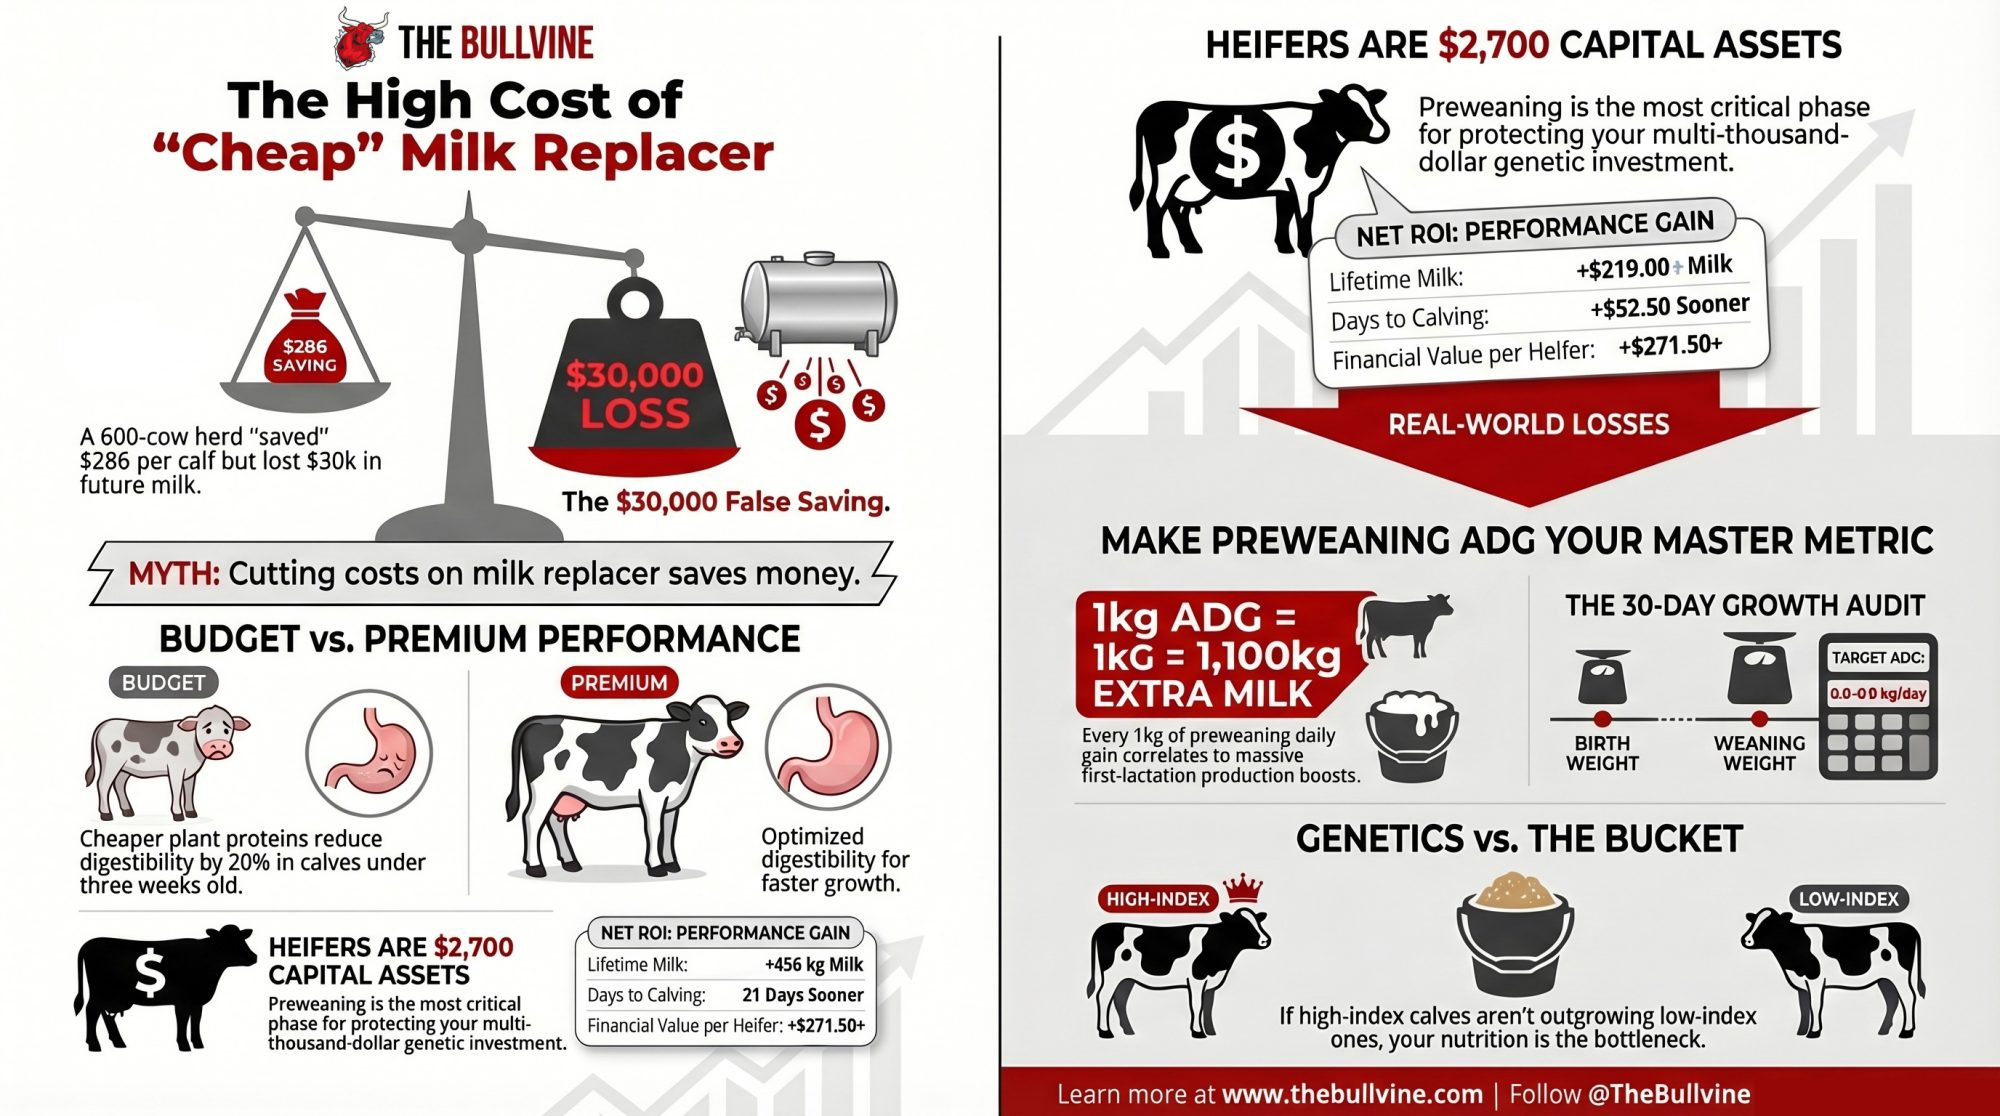
When a 600‑cow Wisconsin herd tried to save $286 per calf on milk replacer, it looked like smart cost‑cutting. Three years later, the heifer records told a different story.
In early 2023, the team at a 600‑cow Holstein herd in central Wisconsin sat down with their nutritionist and lender to “trim the fat” out of their youngstock program. Feed and labor had pushed their heifer‑raising cost toward the $2,300–$2,600 per head range Iowa State budgets were warning about for herds of their size. They moved from a premium all‑milk replacer to a cheaper 20/20 blend, cutting about $286 per heifer out of the total preweaning milk program when you include both bag price and the way they fed it — roughly $30,000 – $35,000 ‘saved’ over four heifer crops on 120 replacements a year.
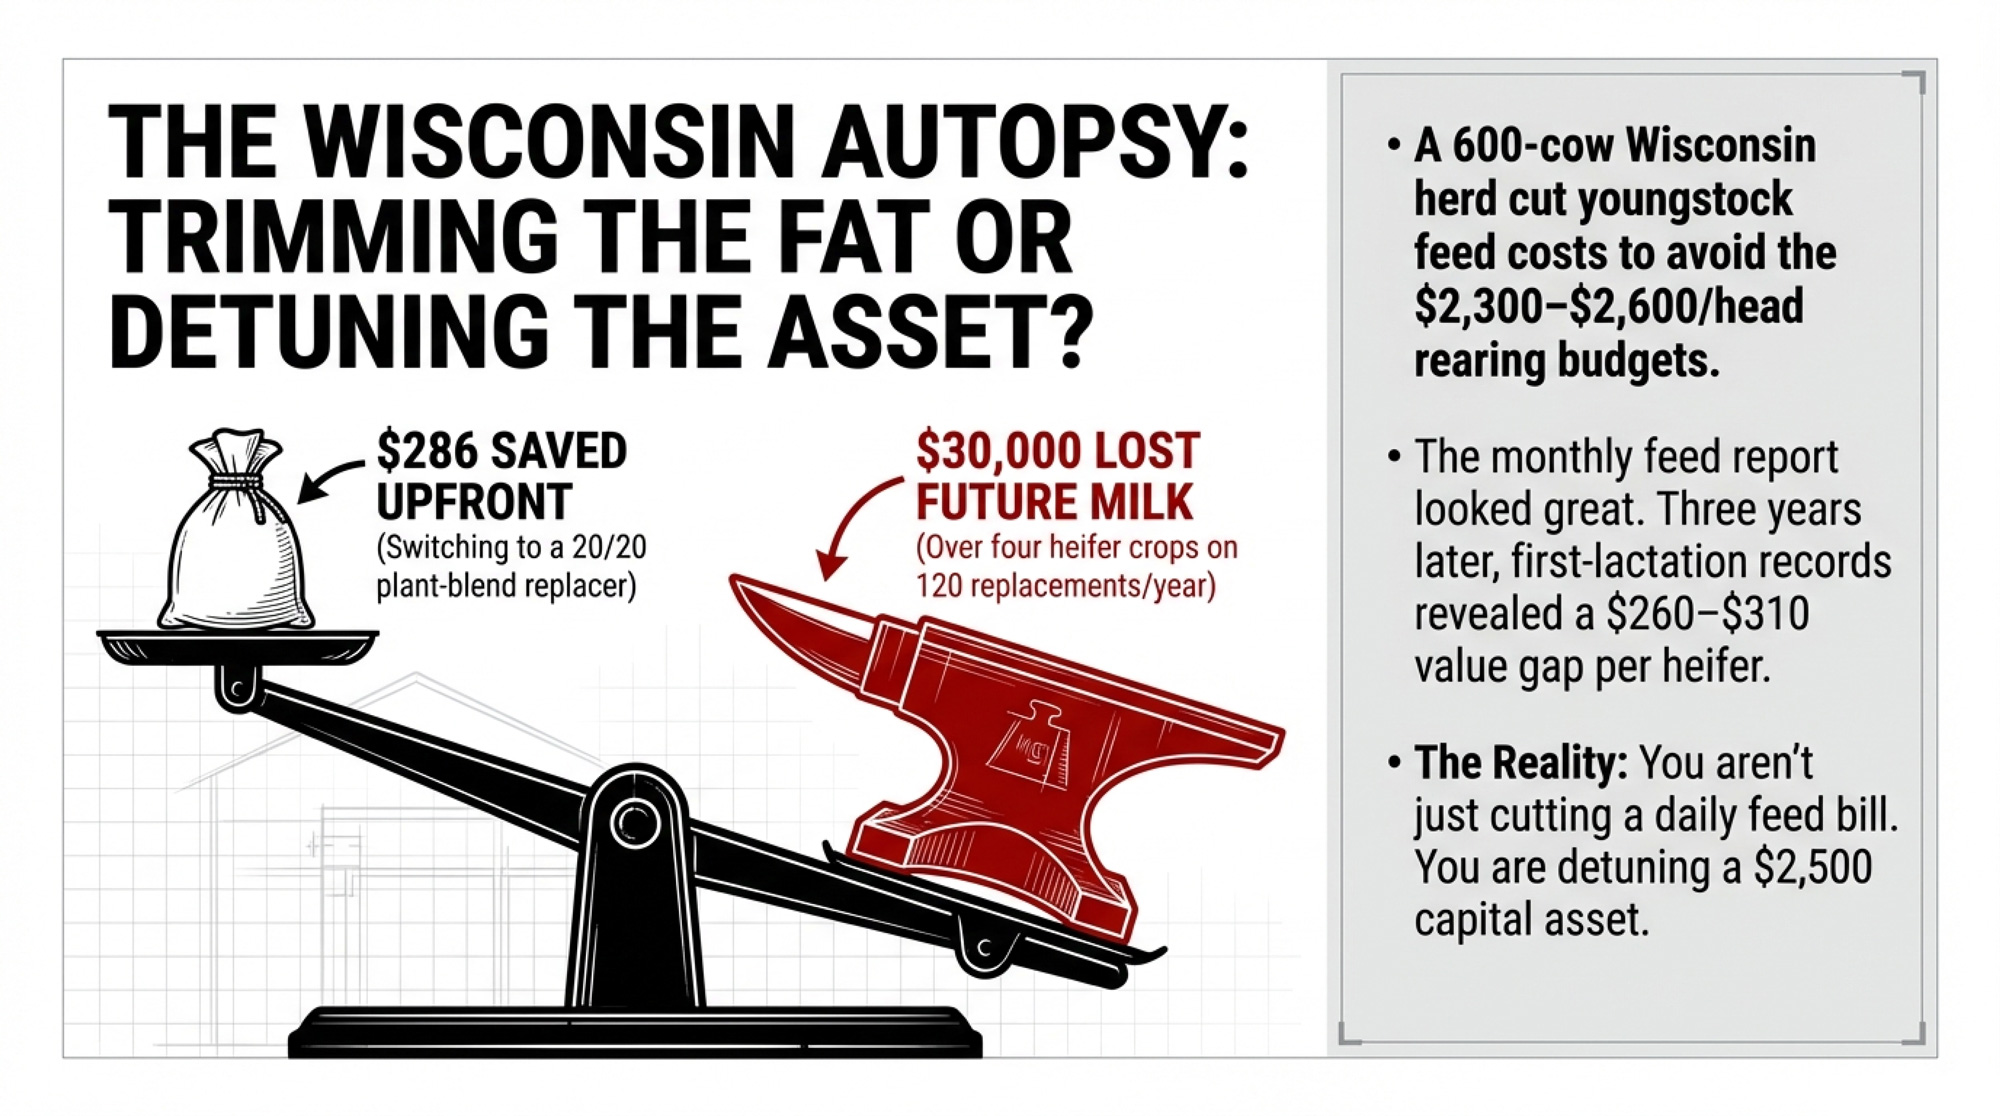
At the time, that felt like a win. When they ran first‑lactation records three years later and lined those heifers up against their previous all‑milk program, the pattern — exactly what Cornell’s calf data has been screaming for a decade — was hard to ignore. The calves raised on the cheaper program were behind on first‑lactation milk, behind on age at first calving, and more likely to leave early. When you added it up, the realistic value gap sat around $260–$310 per heifer, stacked against that $286 “saving” on replacer. You weren’t just cutting a feed bill. You were detuning a $2,500 capital asset.
| Metric | Budget 20/20 (plant protein) | Premium all‑milk program |
|---|---|---|
| Preweaning ADG (kg/day) | 0.65 | 0.85 |
| Replacer cost per heifer (USD) | Base – 286 | Base |
| Lifetime milk value per heifer (3 lactations, USD) | Base | + 218.88 |
| Days to first calving | Base | –21 days (~52.50 saved) |
| Net impact per heifer (before survival, USD) | + 286 “saved” feed | –14.62 vs budget |
What’s Really Changing in Those First 56 Days
If you’ve followed calf work over the last 10–15 years, you’ve watched the question flip. We used to ask, “How little milk can we get away with?” Now the serious conversation is, “What does early growth really do to lifetime production?”
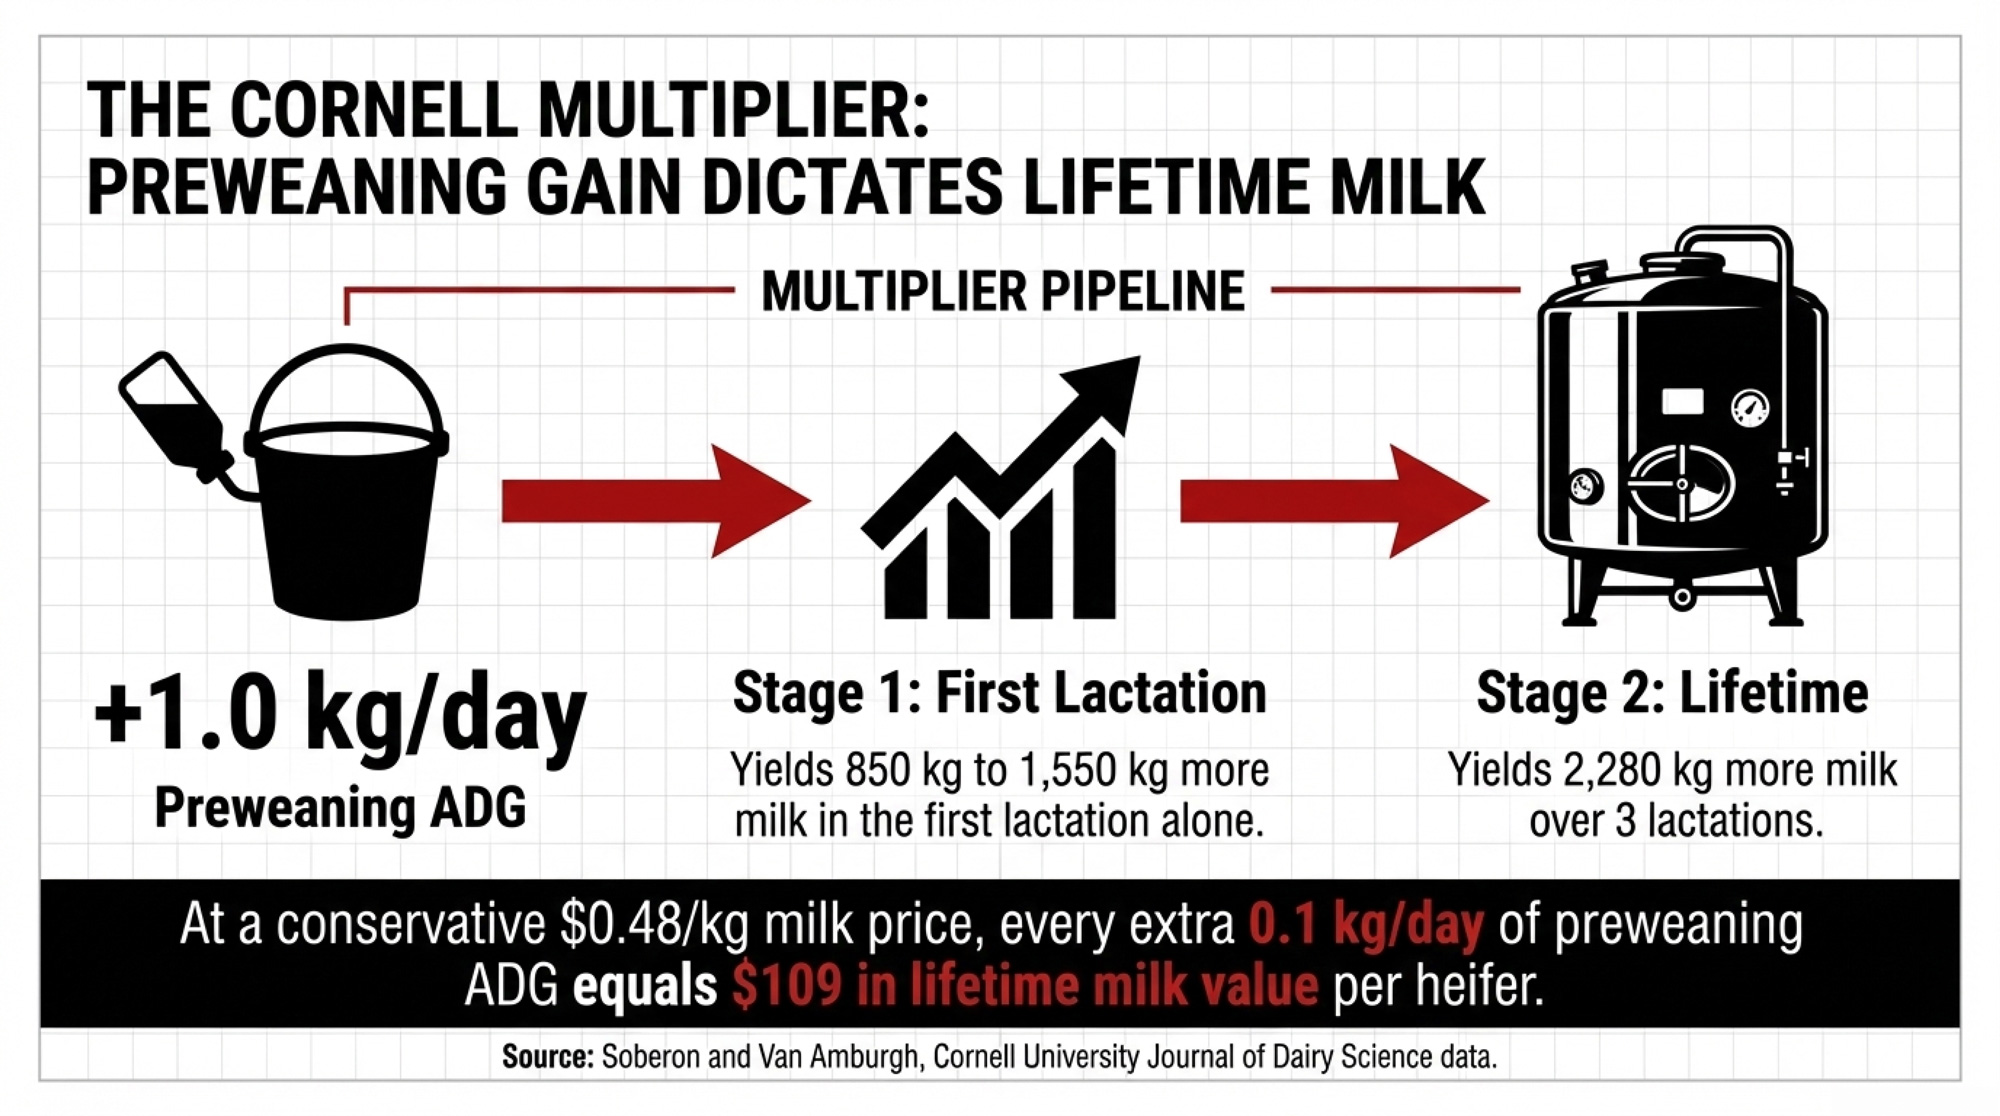
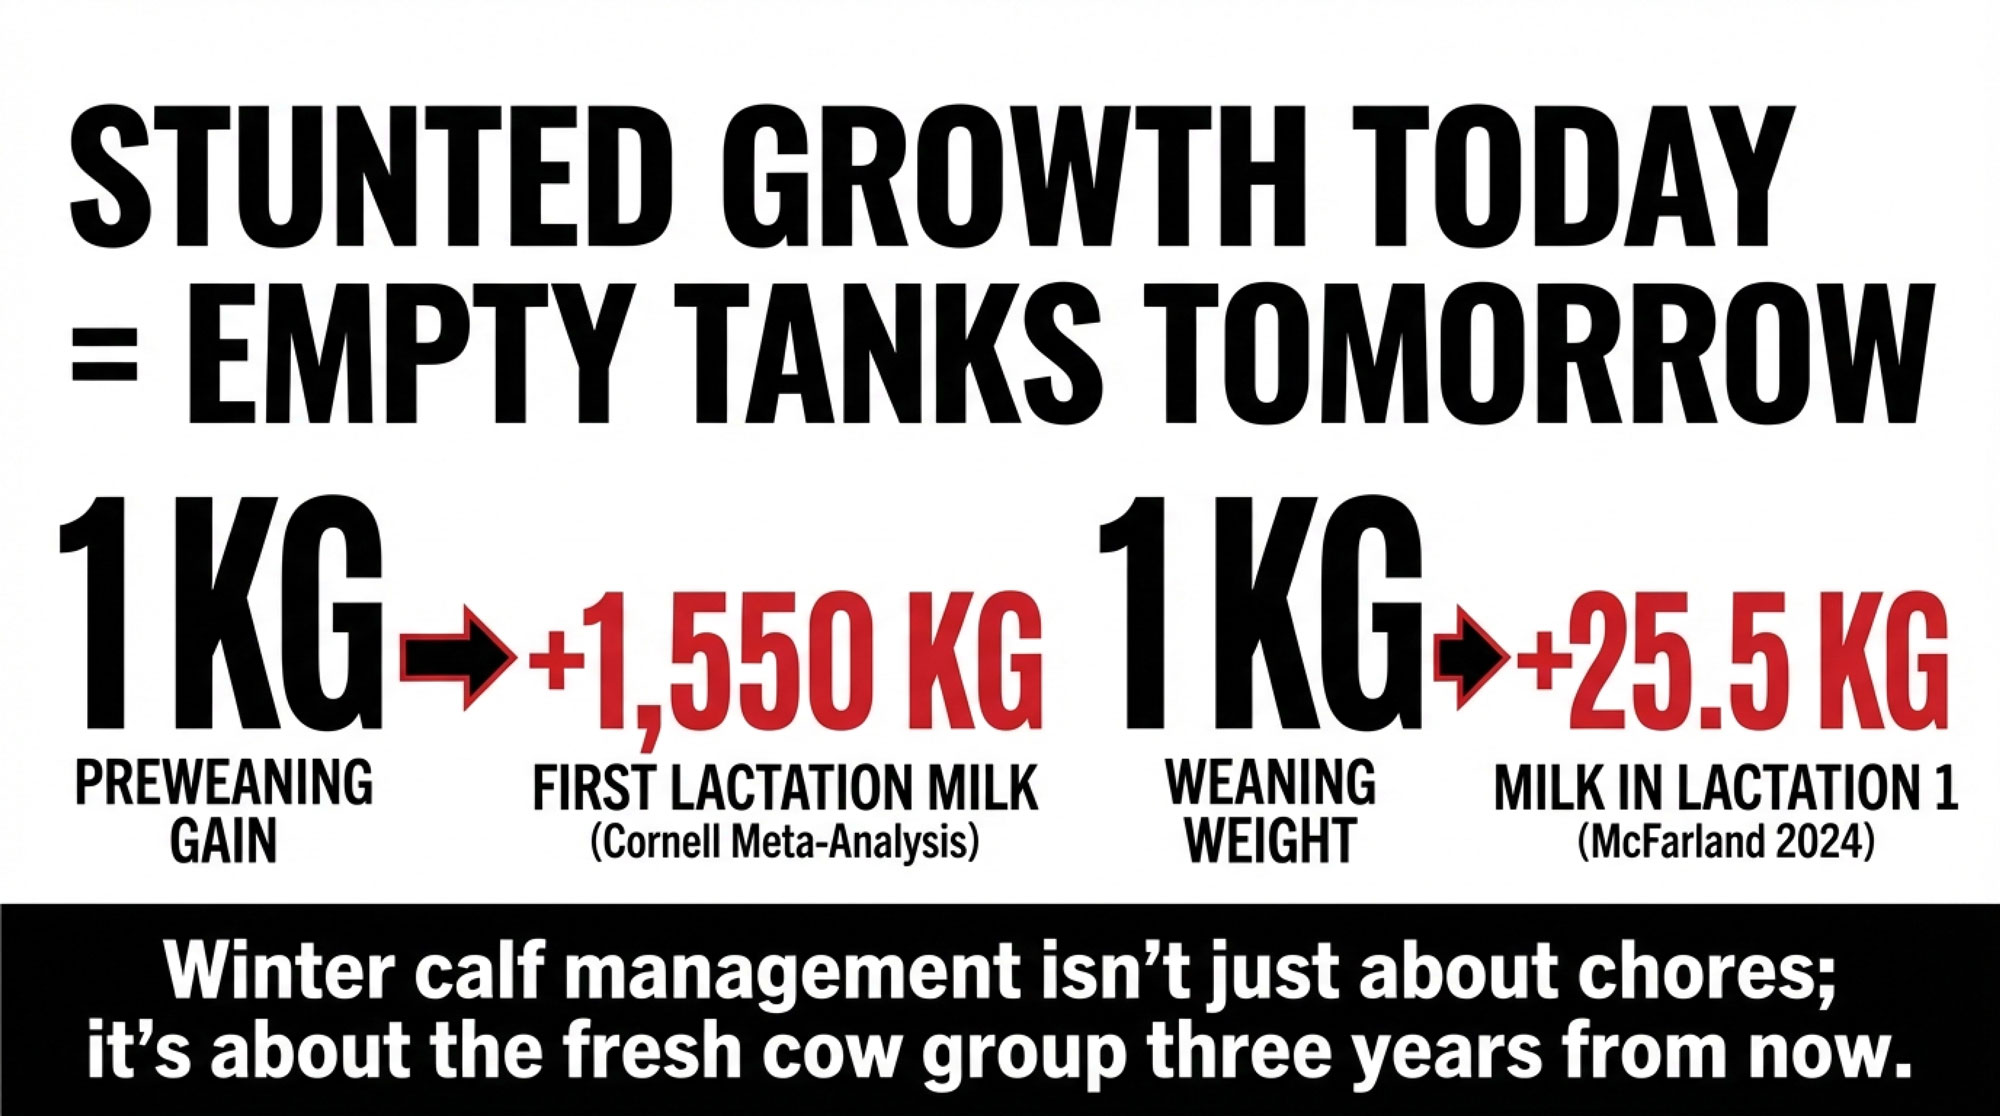
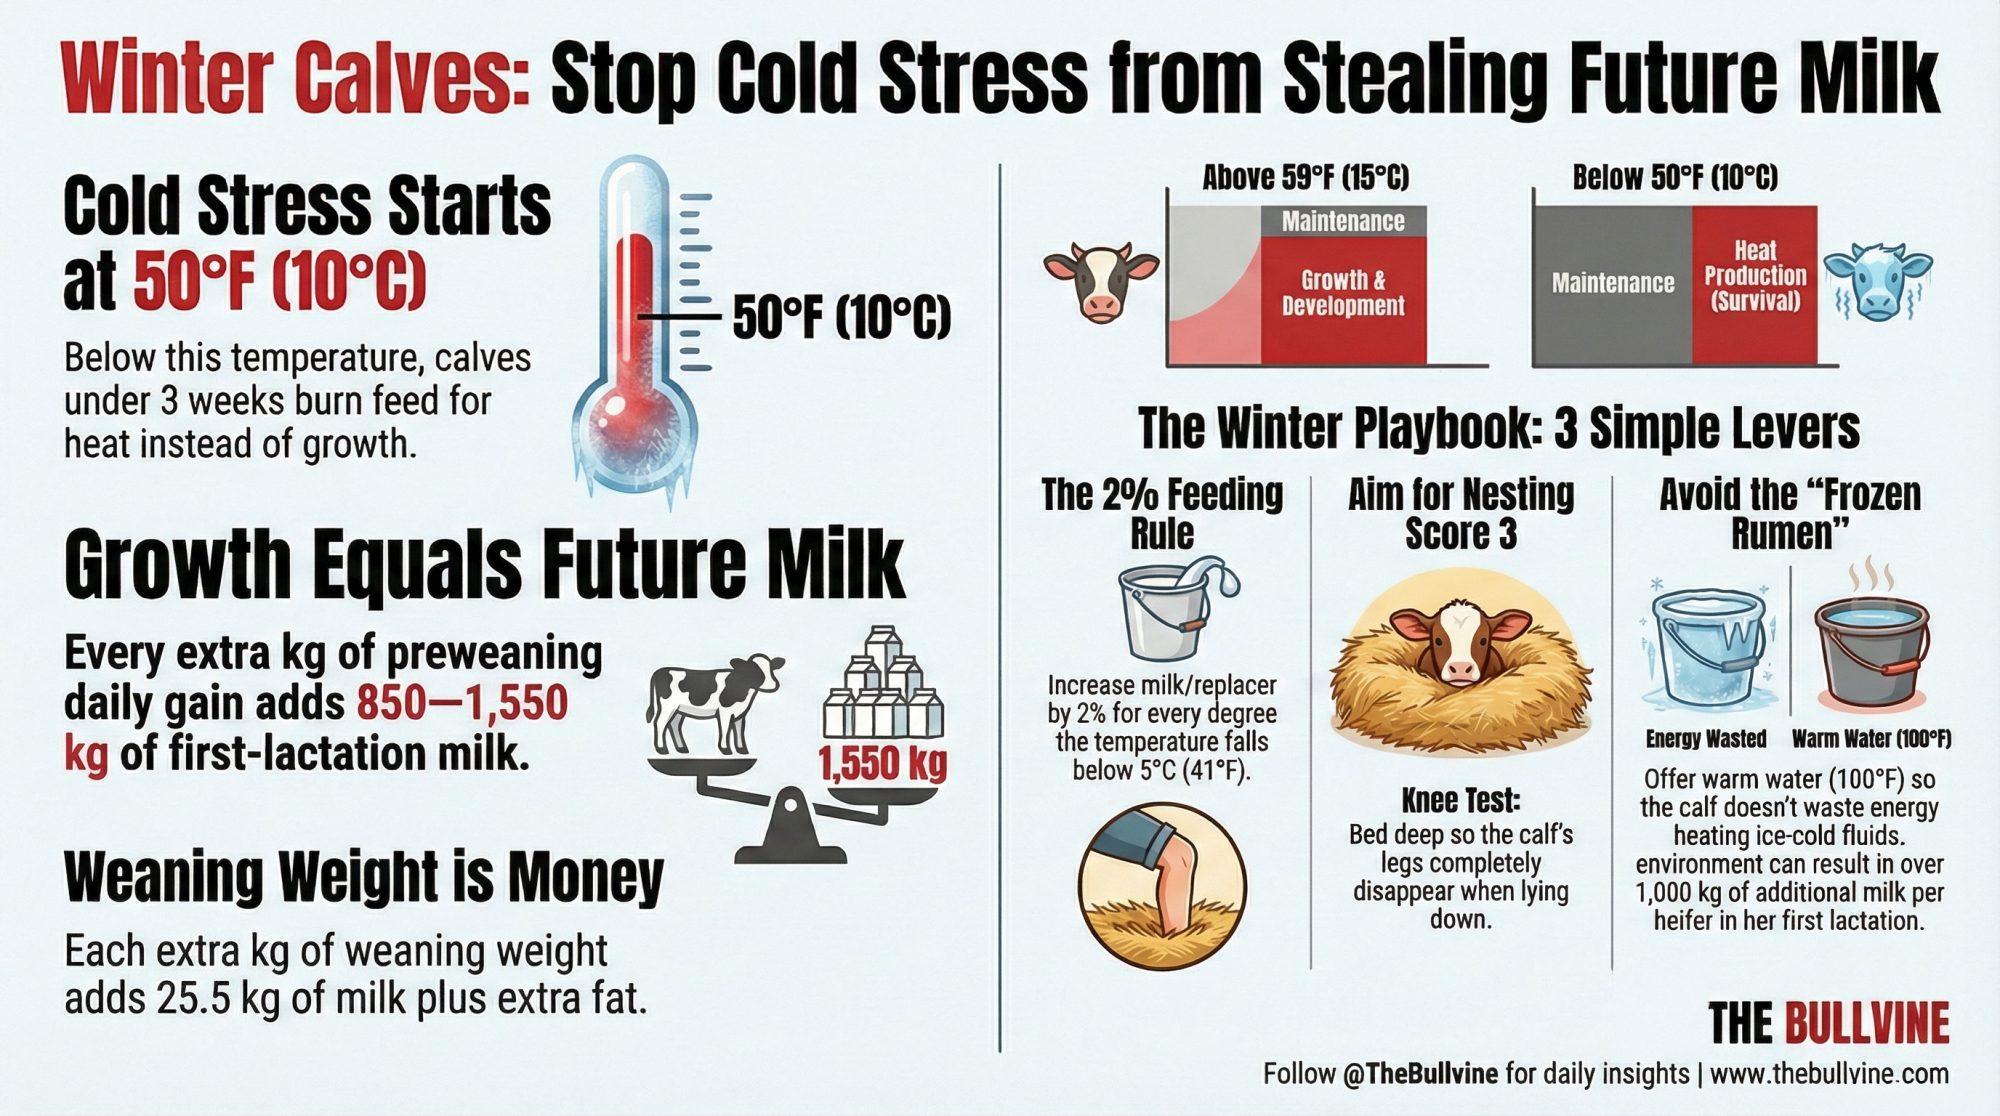
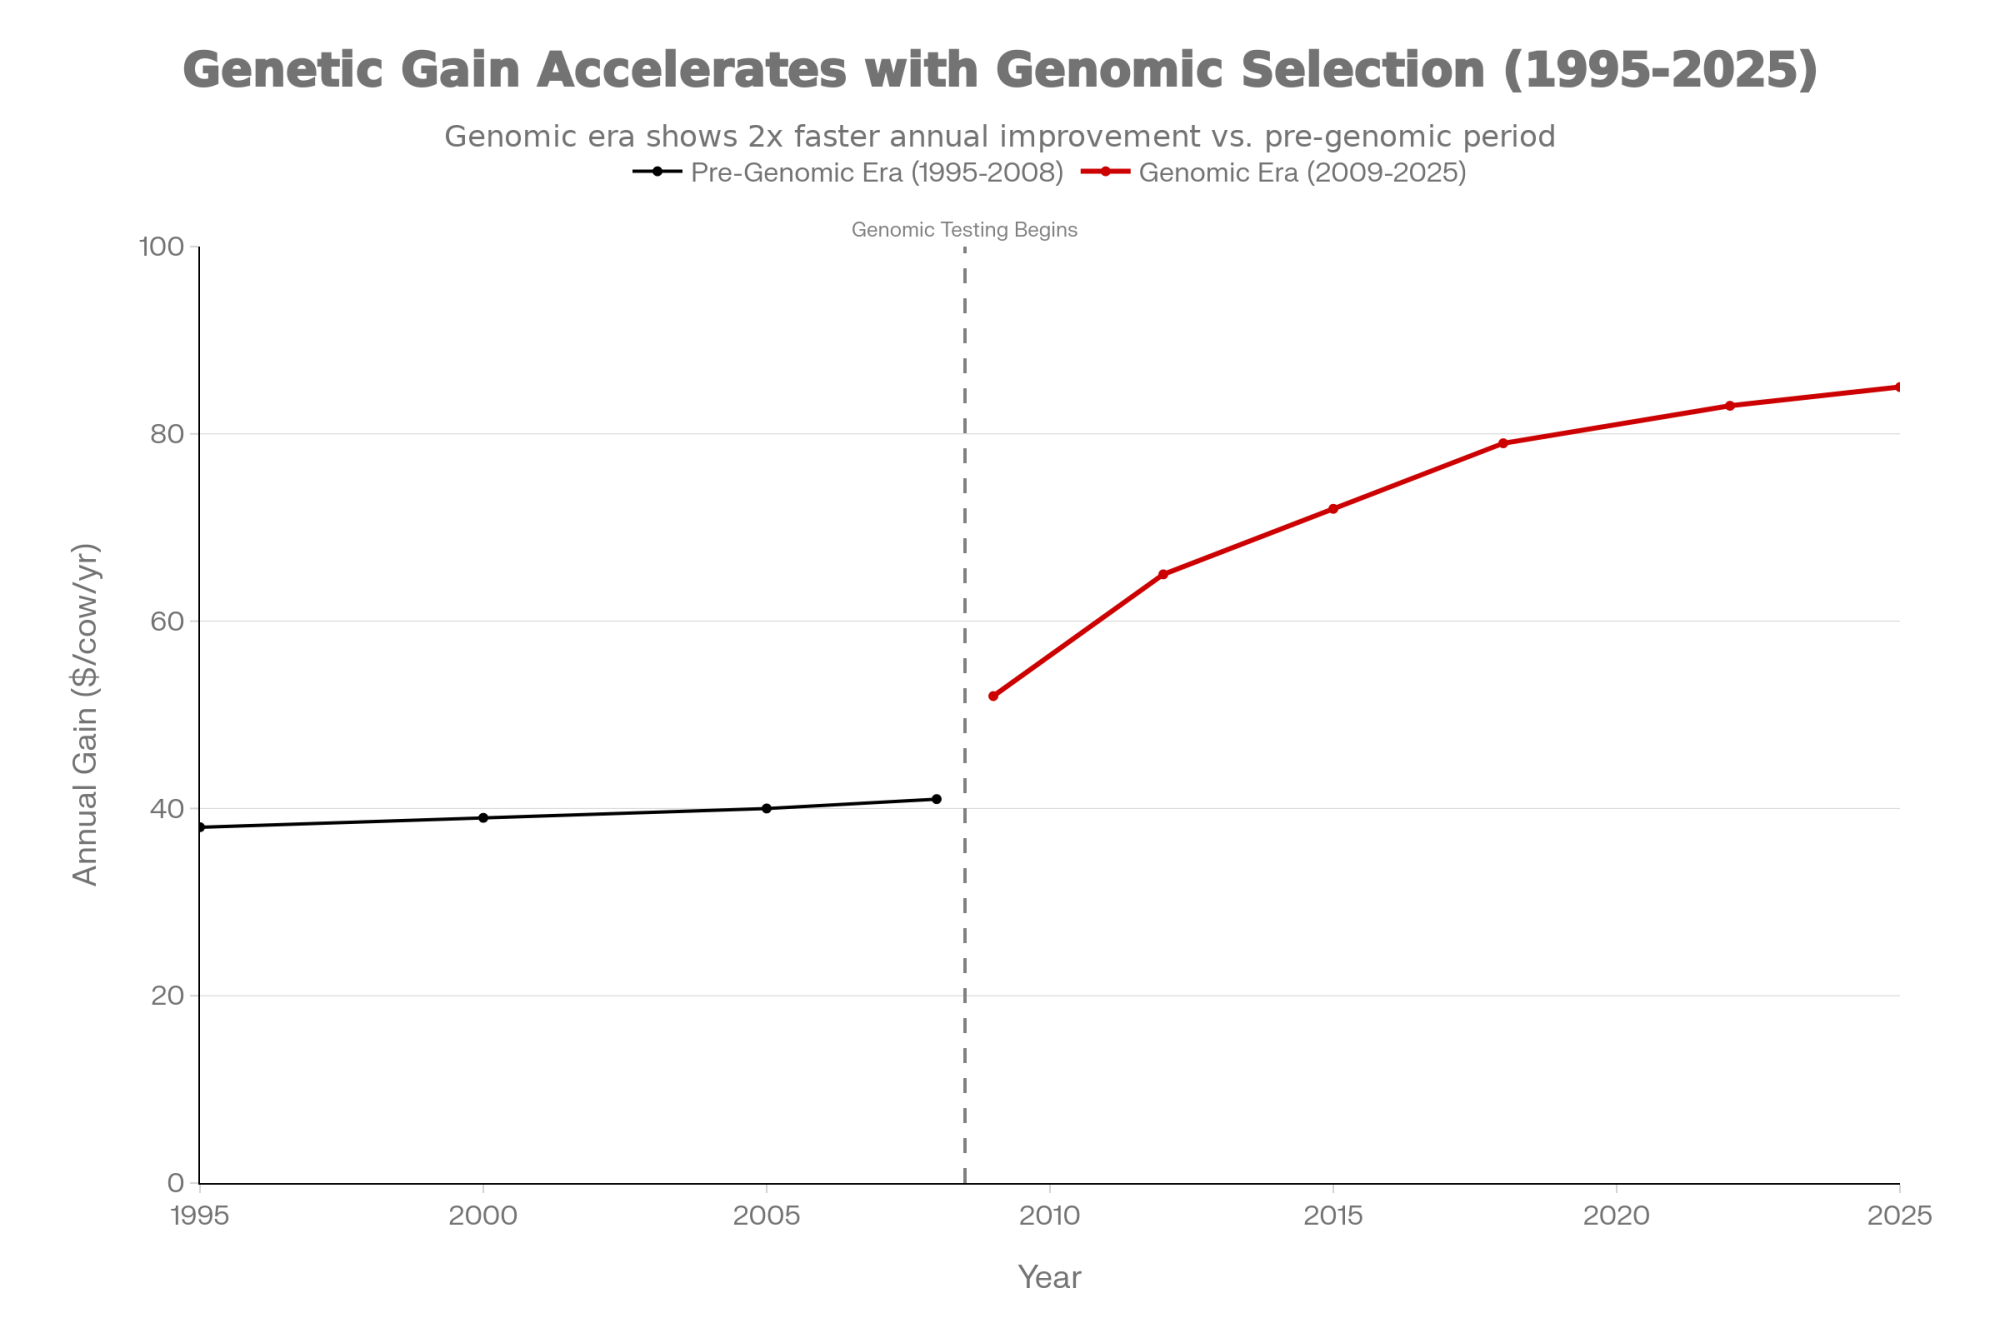
Felipe Soberon and Mike Van Amburgh at Cornell pushed that shift hard in their 2012 Journal of Dairy Science study. They tracked 1,244 heifers in the Cornell research herd and 624 heifers on a commercial dairy, tying their preweaning average daily gain (ADG) back to first‑lactation milk. For every 1.0 kg/day of preweaning ADG, they saw about 850 kg more milk in first lactation at Cornell and 1,113 kg more in the commercial herd. Later datasets pushed that first‑lactation response up to around 1,550 kg per 1 kg/day of preweaning ADG in some datasets.
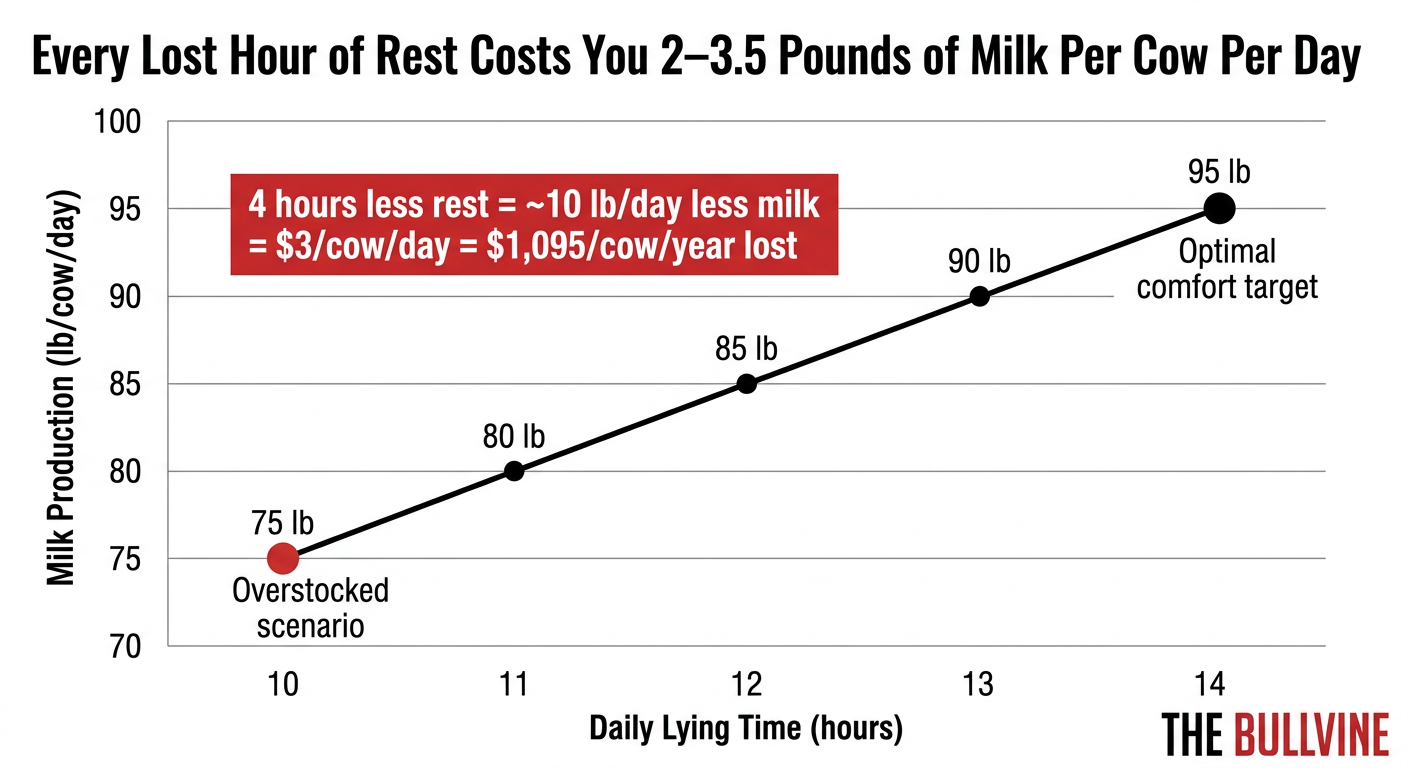
Even if you stick with the conservative end of that range, you’re looking at roughly 1,100 kg of milk tied to how a calf grew while she was on replacer. At the 2024 All Federal Order mailbox average of about $21.80/cwt — roughly $0.48/kg — that’s around $528 per heifer in first‑lactation milk value that lives or dies on those preweaning gains. Cornell’s longer‑term modeling says that in cows that make it through three lactations, each extra 1 kg/day of preweaning ADG can be worth about 2,280 kg more milk over three lactations — another $1,090 or so per heifer at that same milk price.
| ADG bump (kg/day) | Extra milk 3 lactations (kg) | Lifetime value (USD, $0.48/kg) |
|---|---|---|
| 0.00 | 0 | 0 |
| 0.10 | 228 | 109 |
| 0.15 | 342 | 164 |
| 0.20 | 456 | 219 |
| 0.25 | 570 | 274 |
| 0.30 | 684 | 329 |
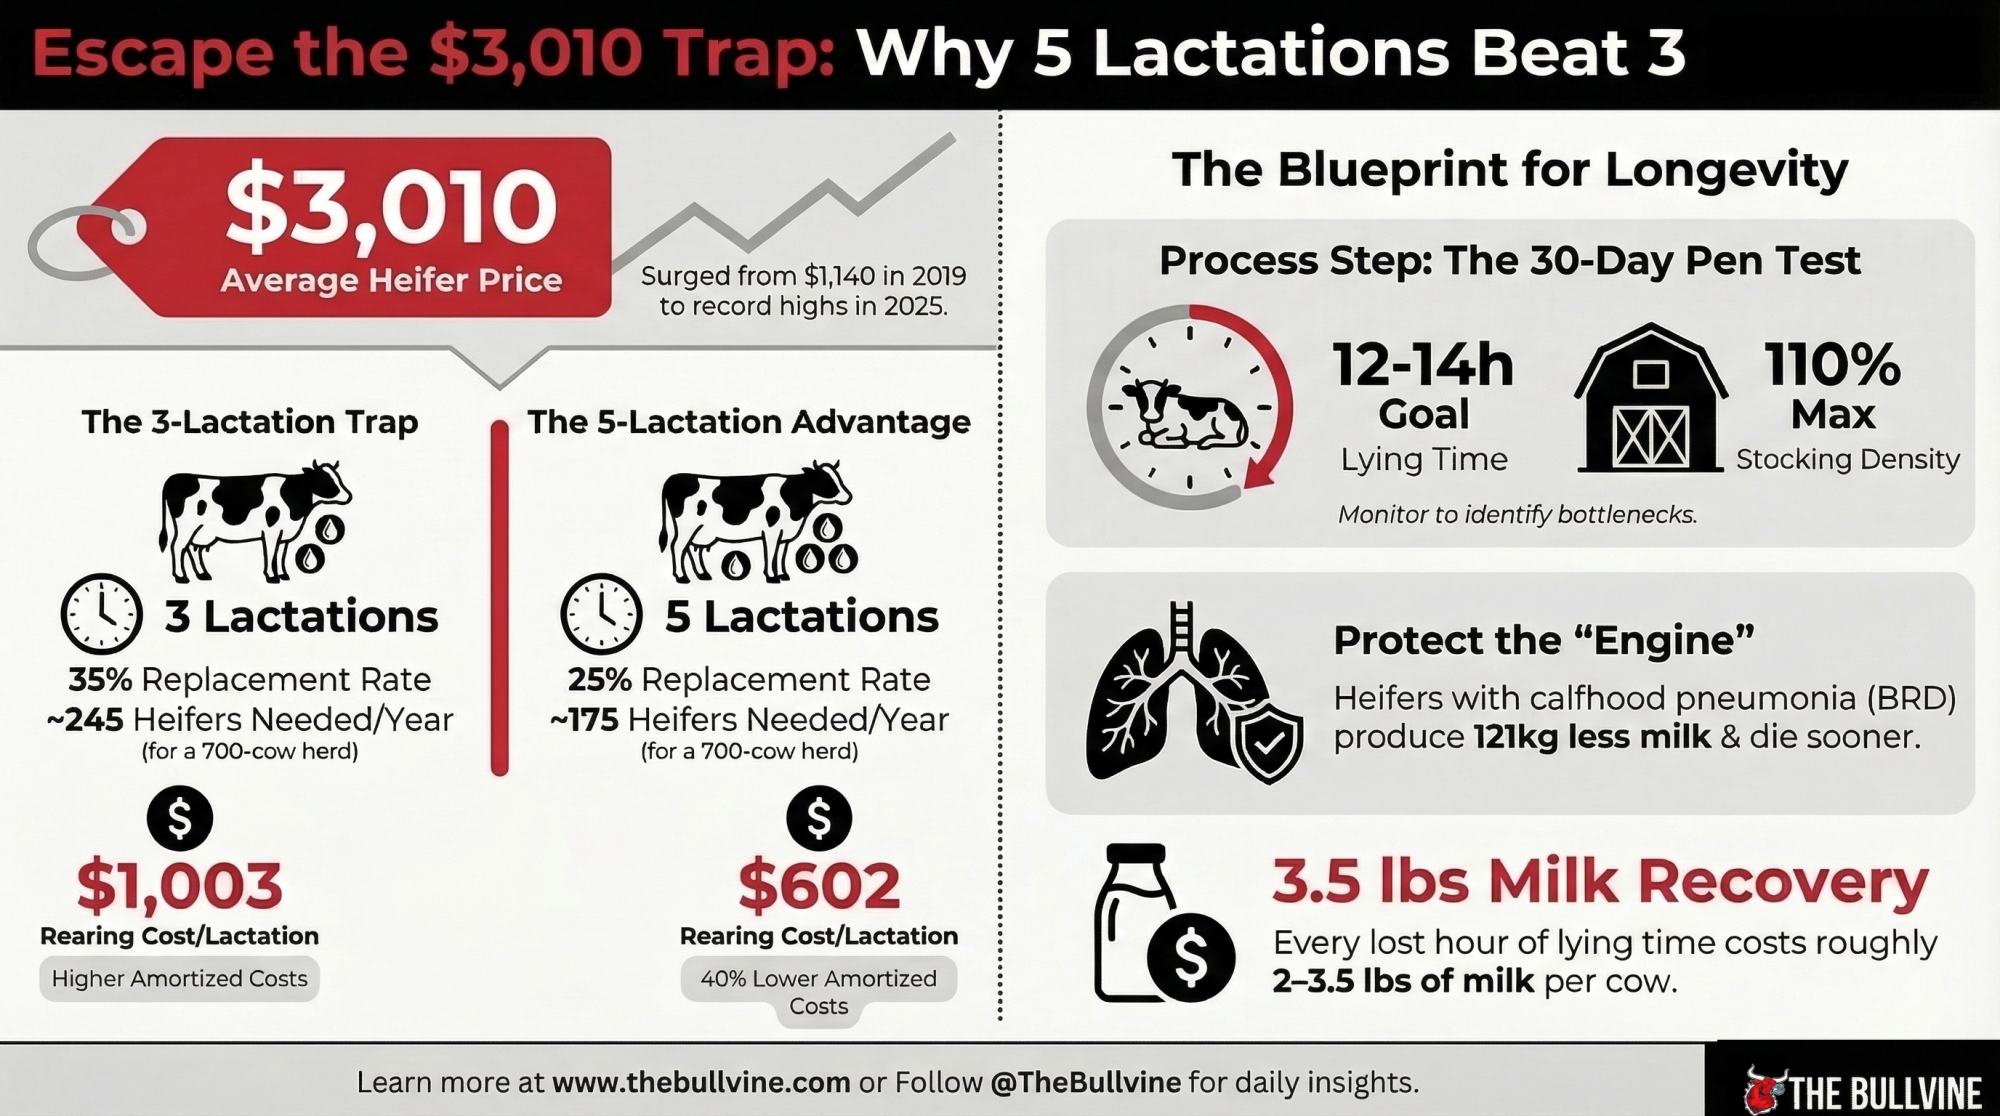
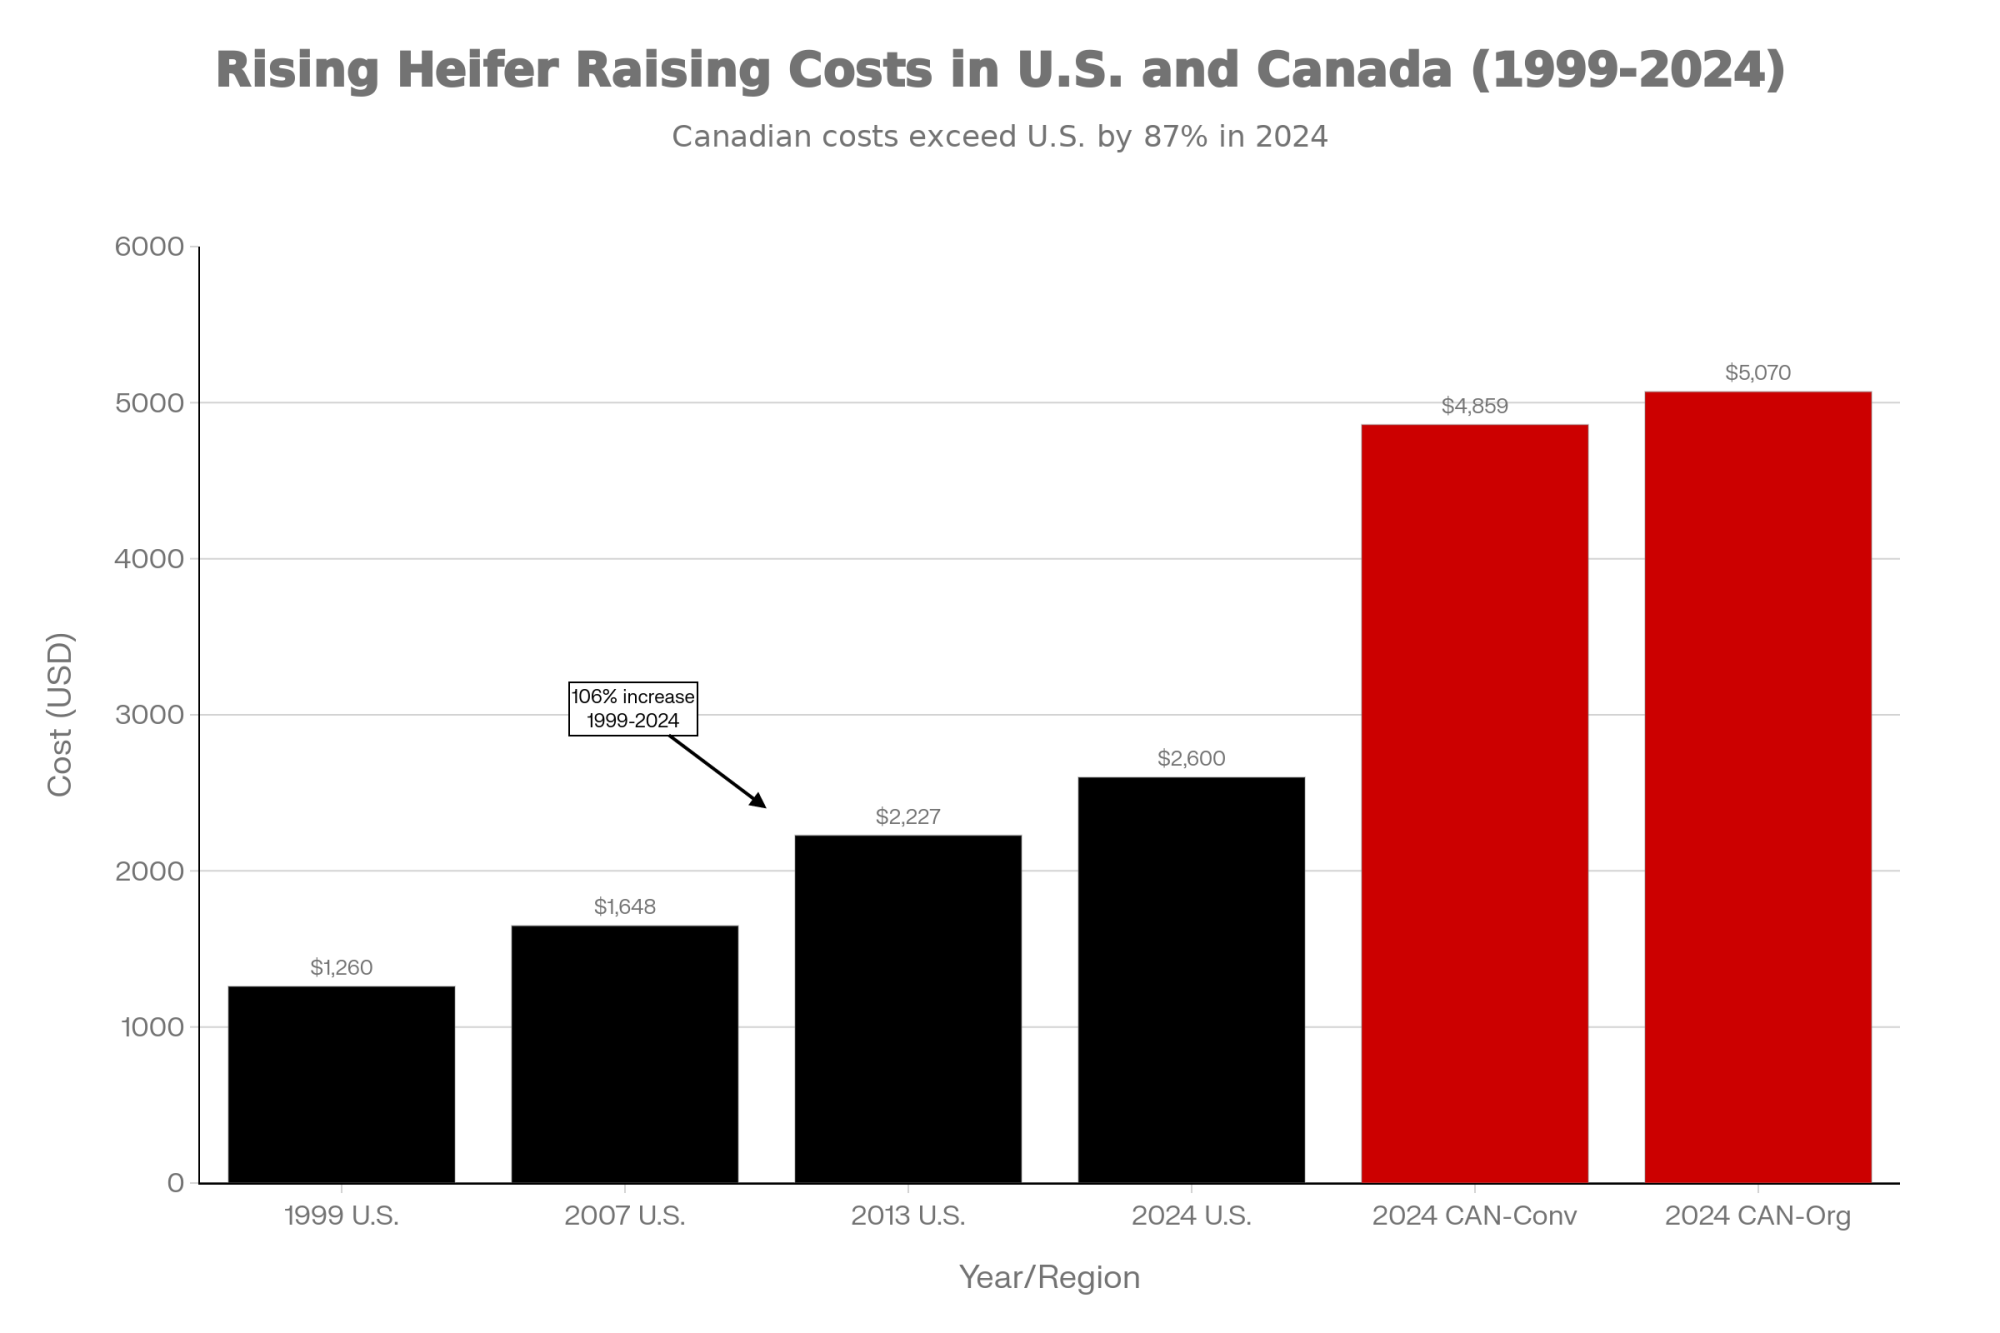
Meanwhile, the cost to get a heifer from the hutch to the parlor keeps climbing. Iowa State’s 2024 budgets put the total cost to raise a heifer to calving between about $2,258 (pasture‑based, 18,000‑lb herd) and $2,651 (confinement, 26,000‑lb herd). Back that into a per‑head, per‑day cost, and you’re looking at roughly $2.50–$3.00 once you include feed, bedding, facilities, and labor. You already treat each replacement like a $2,300–$2,700 capital asset before she ever hits the parlor.
Preweaning is the most expensive phase per day in the heifer program. It’s also the one with the cleanest, most measured link between what you feed and what that genetic investment actually does in the tank.
How This Math Shows Up in a Real Herd
Back to that 600‑cow Wisconsin herd. On paper, the change looked harmless. The monthly feed report even looked better.
On the budget replacer program, they switched into:
- 20/20 milk replacer with plant protein listed in the top half of the tag.
- Feeding rate around 0.7 kg of powder per day.
- Preweaning ADG averaged about 0.65 kg/day across Holstein heifers in hutches.
On their earlier all‑milk program:
- Higher‑cost replacer using only milk‑derived proteins.
- Feeding rate closer to 0.9 kg/day, split into two or three feedings.
- Preweaning ADG averaged about 0.85 kg/day under similar genetics and housing conditions.
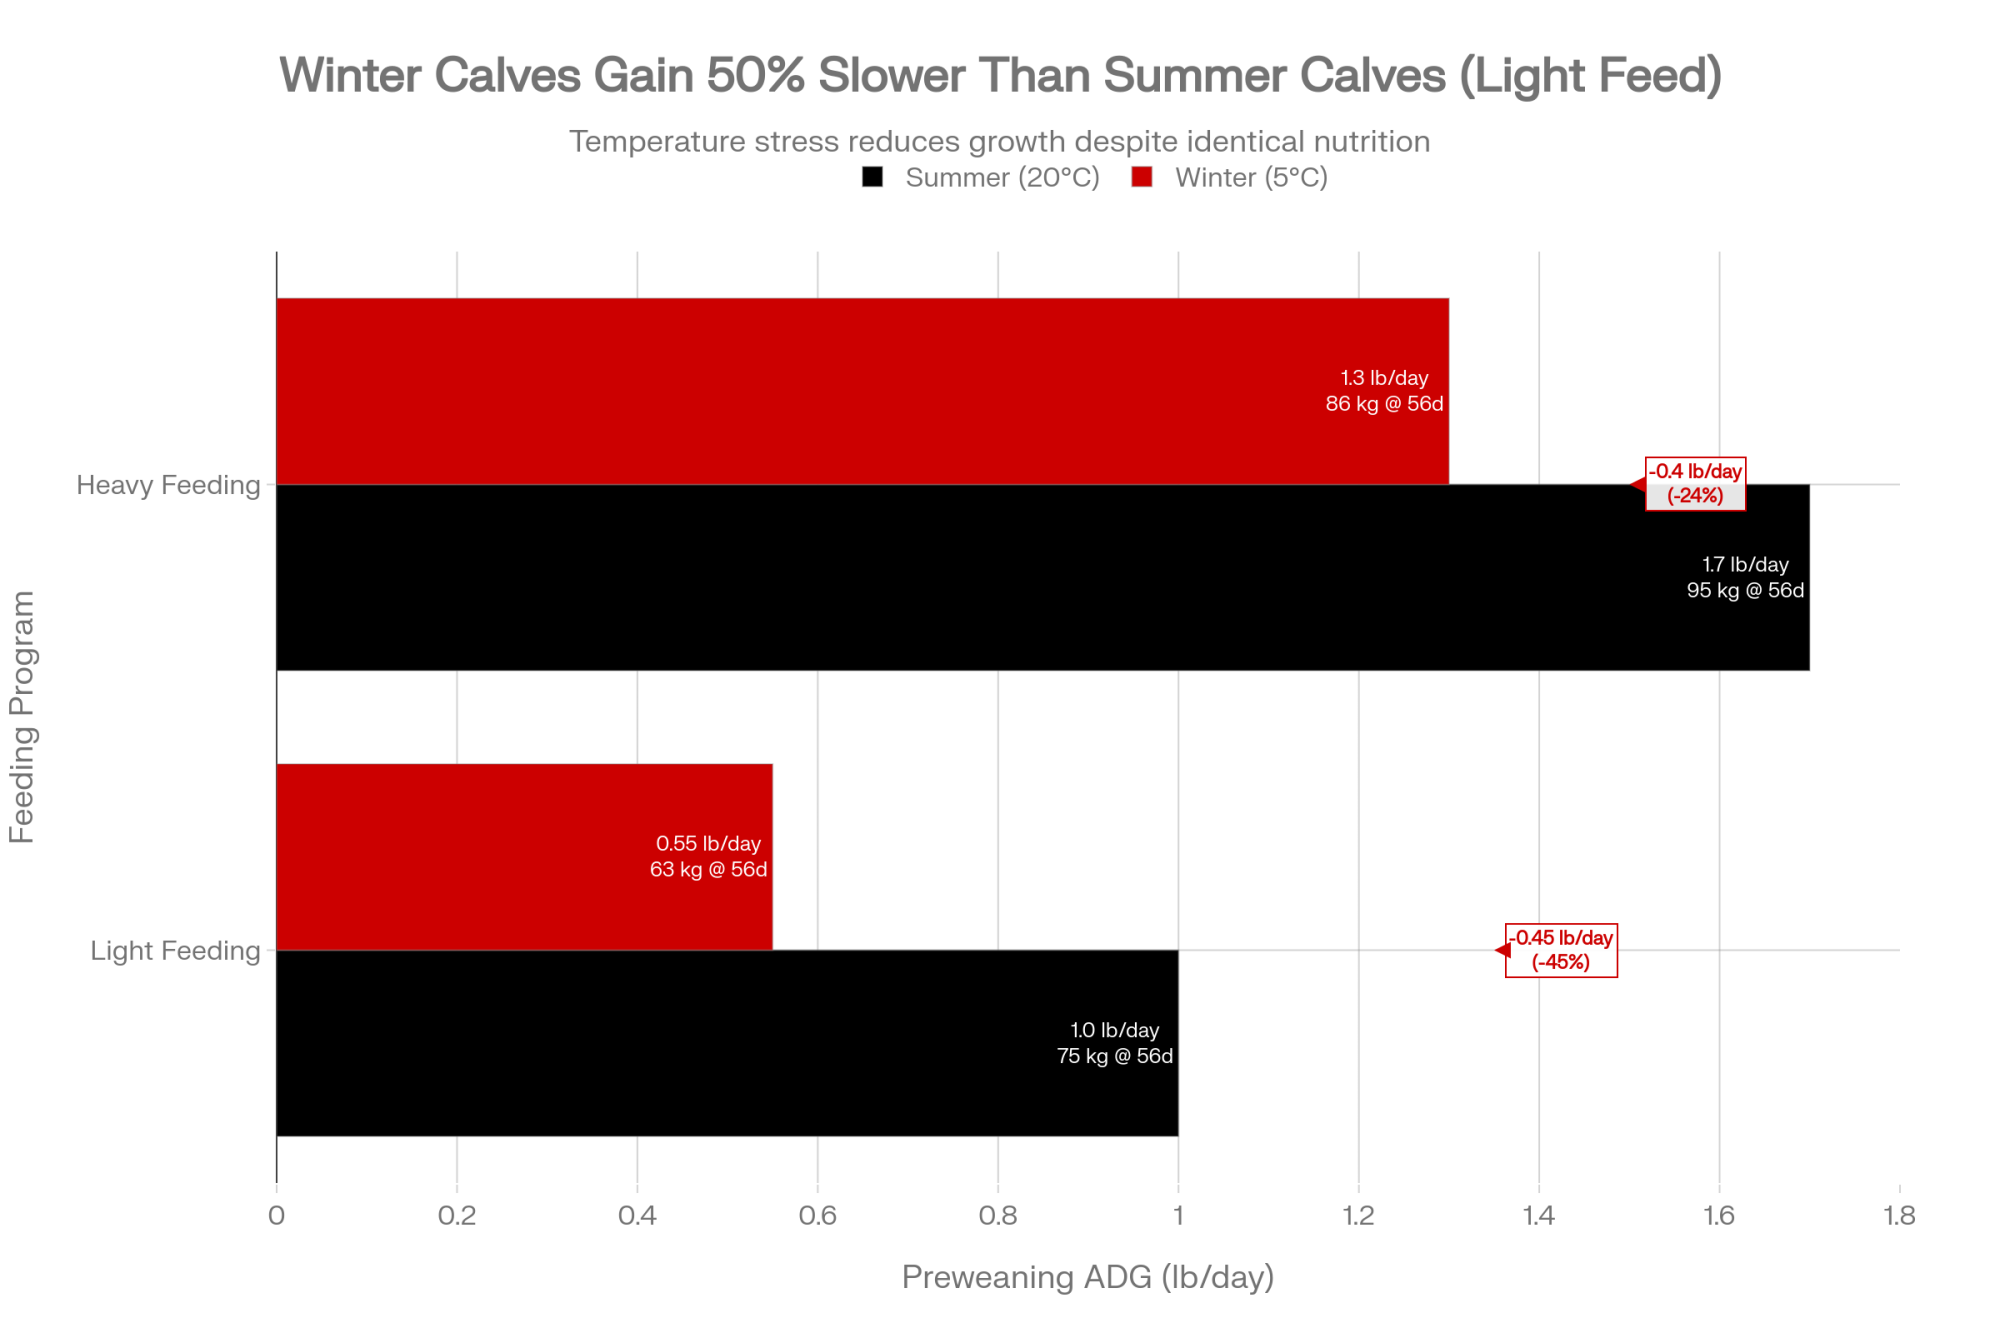
That’s a 0.20 kg/day ADG advantage for the all‑milk program across a roughly 56‑day preweaning window. Here’s the barn math — the same math they walked through when they finally put numbers to it.
0.20 kg/day × 56 days = 11.2 kg more gain to weaning. Call it about 24–25 lb of extra bodyweight when you pull the nipples. Now plug that into the Cornell relationships:
- 0.20 × 850 = 170 kg more milk in first lactation (Cornell herd).
- 0.20 × 1,113 = 223 kg more milk in first lactation (commercial herd).
Split the difference, and you’re looking at roughly 180–200 kg extra milk in first lactation from that 0.20 kg/day ADG gap. At $0.48/kg, that’s about $86–$96 more milk per heifer in her first trip through the parlor.
Over the longer run, Cornell reported that cows reaching three lactations could produce about 2,280 kg more milk per 1 kg/day increase in preweaning ADG. On that same 0.20 kg/day bump:
- 0.20 × 2,280 = 456 kg more milk over three lactations.
- 456 × $0.48 ≈ $219 lifetime milk value per heifer.
Here’s how that stacks up for this herd, using the conservative Cornell numbers and Iowa State’s cost ranges:
| Metric | Budget Program (Plant) | Premium Program (All‑Milk) | Difference (All‑Milk vs Budget) |
| Preweaning ADG | 0.65 kg/day | 0.85 kg/day | +0.20 kg/day |
| Lifetime Milk (3 lactations) | Base | +456 kg | +$218.88 |
| Approx. AFC (days to calving) | Base | −21 days | +$52.50 (at $2.50/day) |
| Direct Replacer Cost | −$286 | Base | −$286.00 |
| Net (milk + AFC, before survival) | −$14.62 per heifer |
So before you even talk about survival, the higher‑nutrition, all‑milk program is essentially breaking even on this conservative model, down roughly $15 per heifer once you net lifetime milk, earlier calving, and replacer cost. That’s not exciting on its own. The story changes when you look at which heifers actually stick around to use that extra capacity.
On this herd, the calves from the all‑milk program reached breeding weight sooner and freshened several weeks earlier on average, resulting in fewer non‑productive days and burning $2.50–$3.00/day in feed and yardage. Stack that across 120 heifers a year and add in even modest improvements in early survival, and the decision to “save” $286 per calf added up to more than $30,000 in lost potential over a few heifer crops — right in line with the research linking rough starts to higher culling and lower lifetime performance.
What Is That $286 “Saving” Really Doing to Your Herd?
If you’re trying to decide whether your “cheap” replacer is actually saving you money, you have to stack three pieces together:
| Lever | Key stat (red in design) | Take‑home message |
|---|---|---|
| Lifetime milk | ~$219 per heifer from 0.20 kg/day ADG bump | Extra early gain keeps paying for three lactations. |
| Days to first calving | ~$40–$90 saved per heifer | 15–30 fewer non‑productive days at $2.50–$3.00/day. |
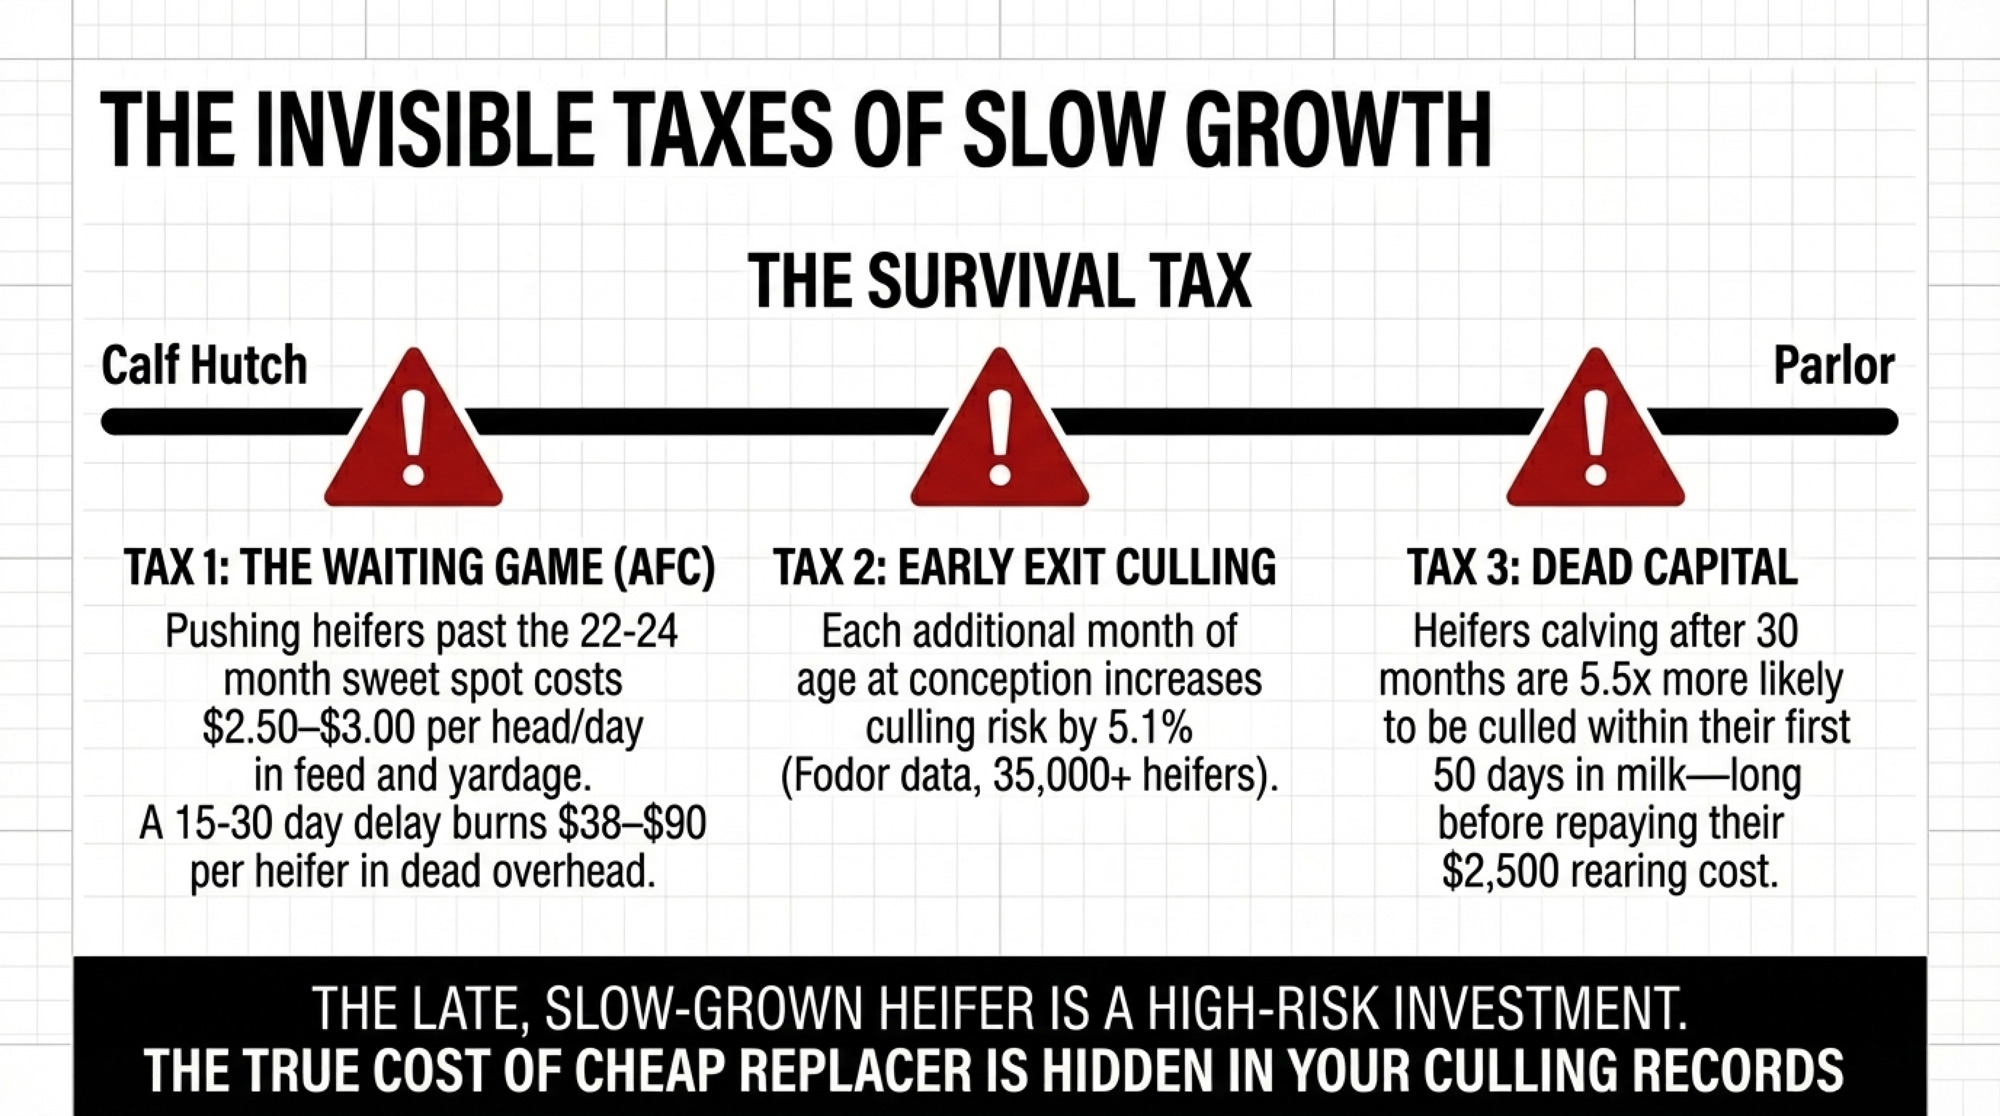
| Survival risk | +5.1% culling risk per extra month; 5.52× risk after 30 mo calving | Late, slow‑grown heifers are the riskiest “investments”. |
1. Lifetime Milk: Around $200–$220 per Heifer
A 0.20 kg/day ADG difference across preweaning realistically buys you about 456 kg more milk over three lactationsin the cows that stay in the herd. At $0.48/kg, that’s right around $219 per heifer in lifetime milk value.
Even if your herd only captures half of that response because of other bottlenecks, you’re still in the $100+ per heiferrange tied directly to preweaning gain.
2. Days to First Calving: Roughly $40–$90 per Heifer
Better‑grown calves hit breeding weight sooner and freshen earlier. They don’t spend extra months standing around eating your money while you wait for the scale to catch up.
On‑farm work in the UK, looking at 11 herds, found restricted‑milk calves running well under 0.6 kg/day, while higher‑intake calves in the same systems were closer to 0.7 kg/day or better in the first month. Those early gaps don’t just disappear; they follow heifers right up to breeding targets.
Research on age at first calving (AFC) and survival shows that the sweet spot for first‑lactation milk and lifetime performance is around 22–24 months, with performance dropping off when you push heifers much later than the mid‑20s. When you feed calves so they reach breeding size sooner instead of dragging them through extra months on low gain, you’re realistically shaving a couple of weeks to a month off the calendar for a lot of heifers.
Even a 15–30 day shift at a daily maintenance cost of $2.50–$3.00 per head — in line with recent heifer‑raising and housing cost work — is worth roughly $38–$90 per heifer in feed, bedding, and overhead you don’t have to burn.
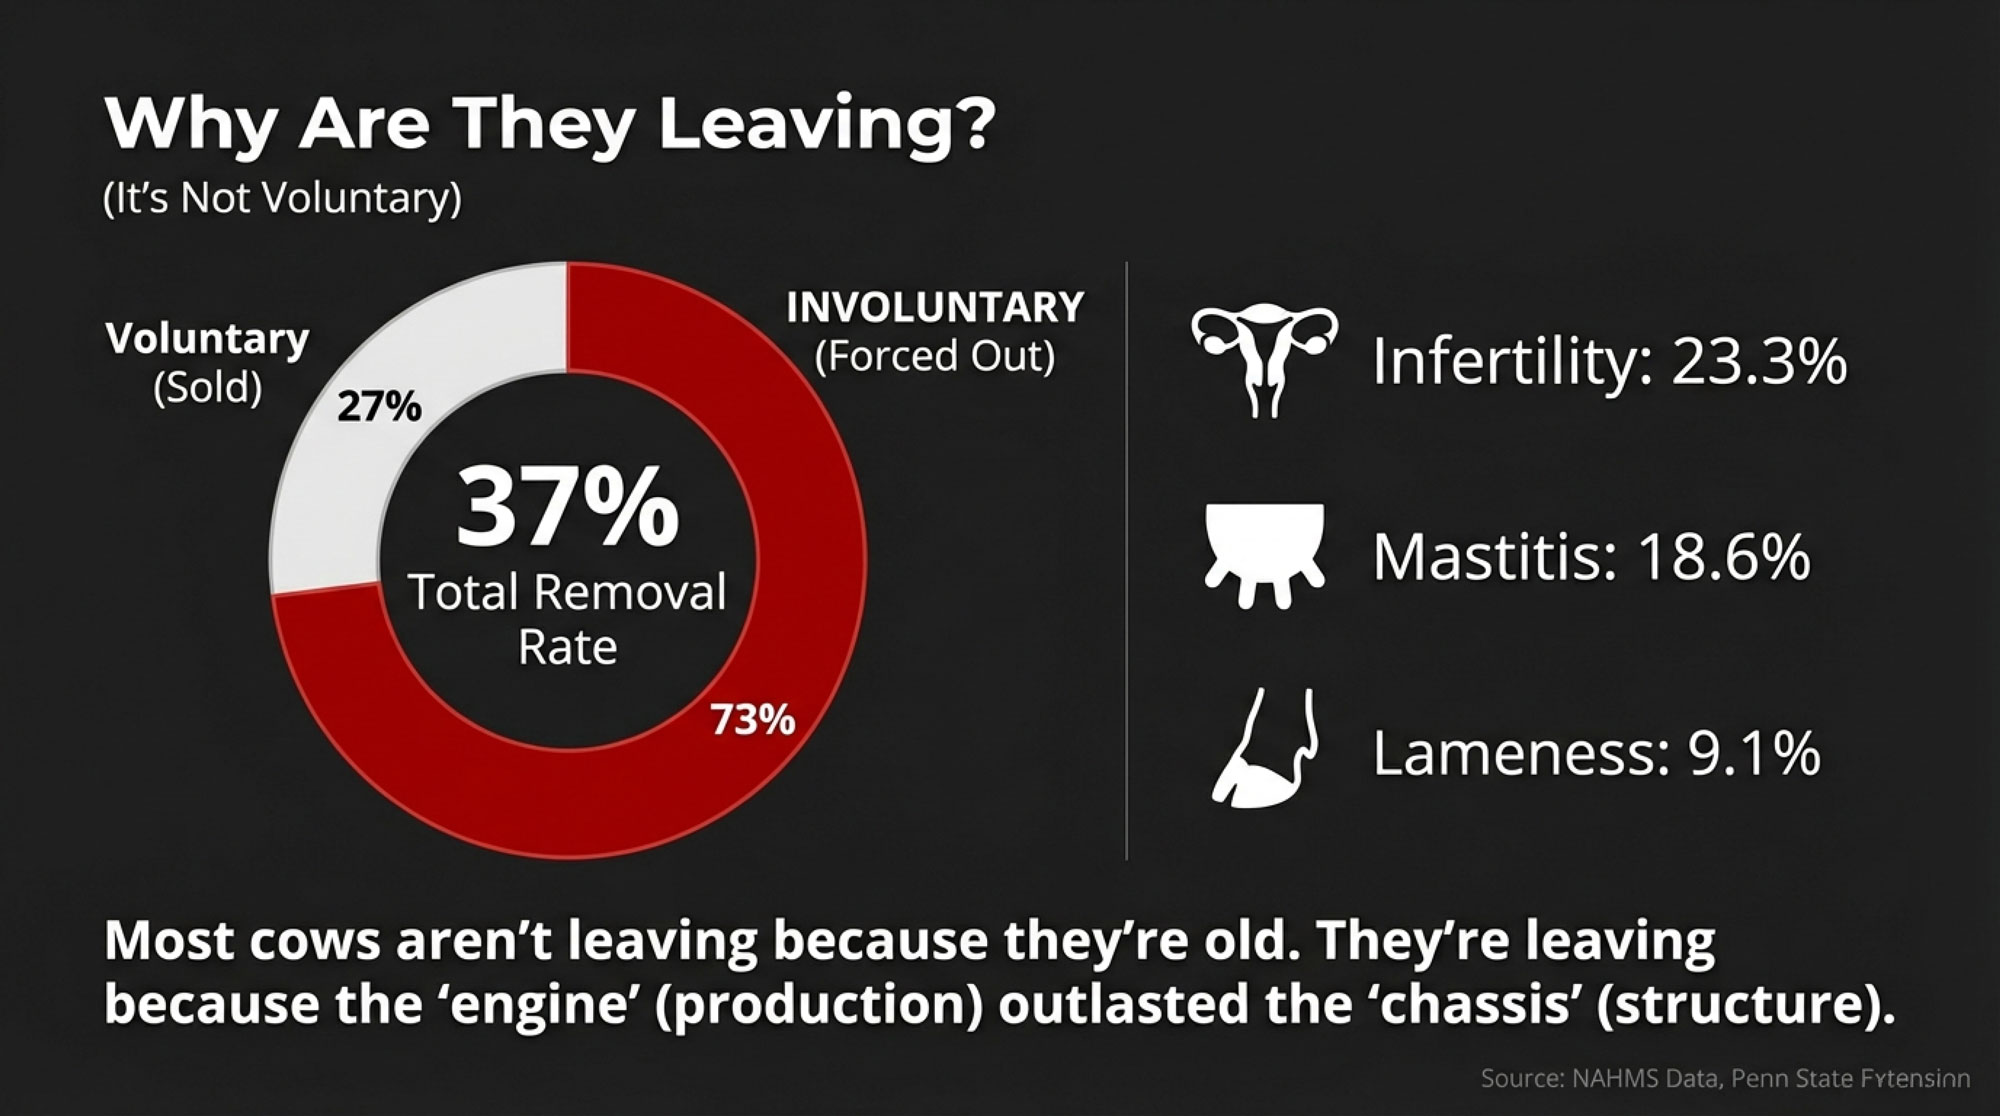
3. Survival and Longevity: Real Money, Even if the Exact Number Varies
The third piece is messier but important. Slow‑grown, disease‑hit heifers are more likely to leave early and less likely ever to pay back what you put into them.
Fodor and colleagues followed 35,128 Holstein heifers across 33 herds and found that each additional month of age at conception increased culling risk by 5.1%, and heifers calving after 30 months were 5.52 times more likely to be culled within the first 50 days in milk compared with heifers calving before 22 months. In plain language: the later and rougher you bring her in, the more likely she is to leave before she’s repaid her replacement cost.
Putting a single dollar figure on “improved survival” across all herds isn’t honest. The value depends on your replacement cost, culling patterns, and the number of cows that actually reach second and third lactation. What the Fodor data do say clearly is that the late, slow‑grown heifer is a much higher‑risk investment than the one that grew well and calved on time. For most herds, even a slight drop in early culling tied to better early growth adds real money on top of the 9 in milk and – in earlier calving.
So even if you ignore survival completely and stack the ~$219 in lifetime milk with a conservative $40–$90 from shaving non‑productive days, you’re looking at roughly $260–$310 of value per heifer against a $286 replacer gap. Add any survival benefit on top, and the “cheap” program stops looking cheap.
On a 600‑cow herd raising 120 heifers a year, that per‑head swing quickly adds up to tens of thousands of dollars in capital performance — one way or the other.
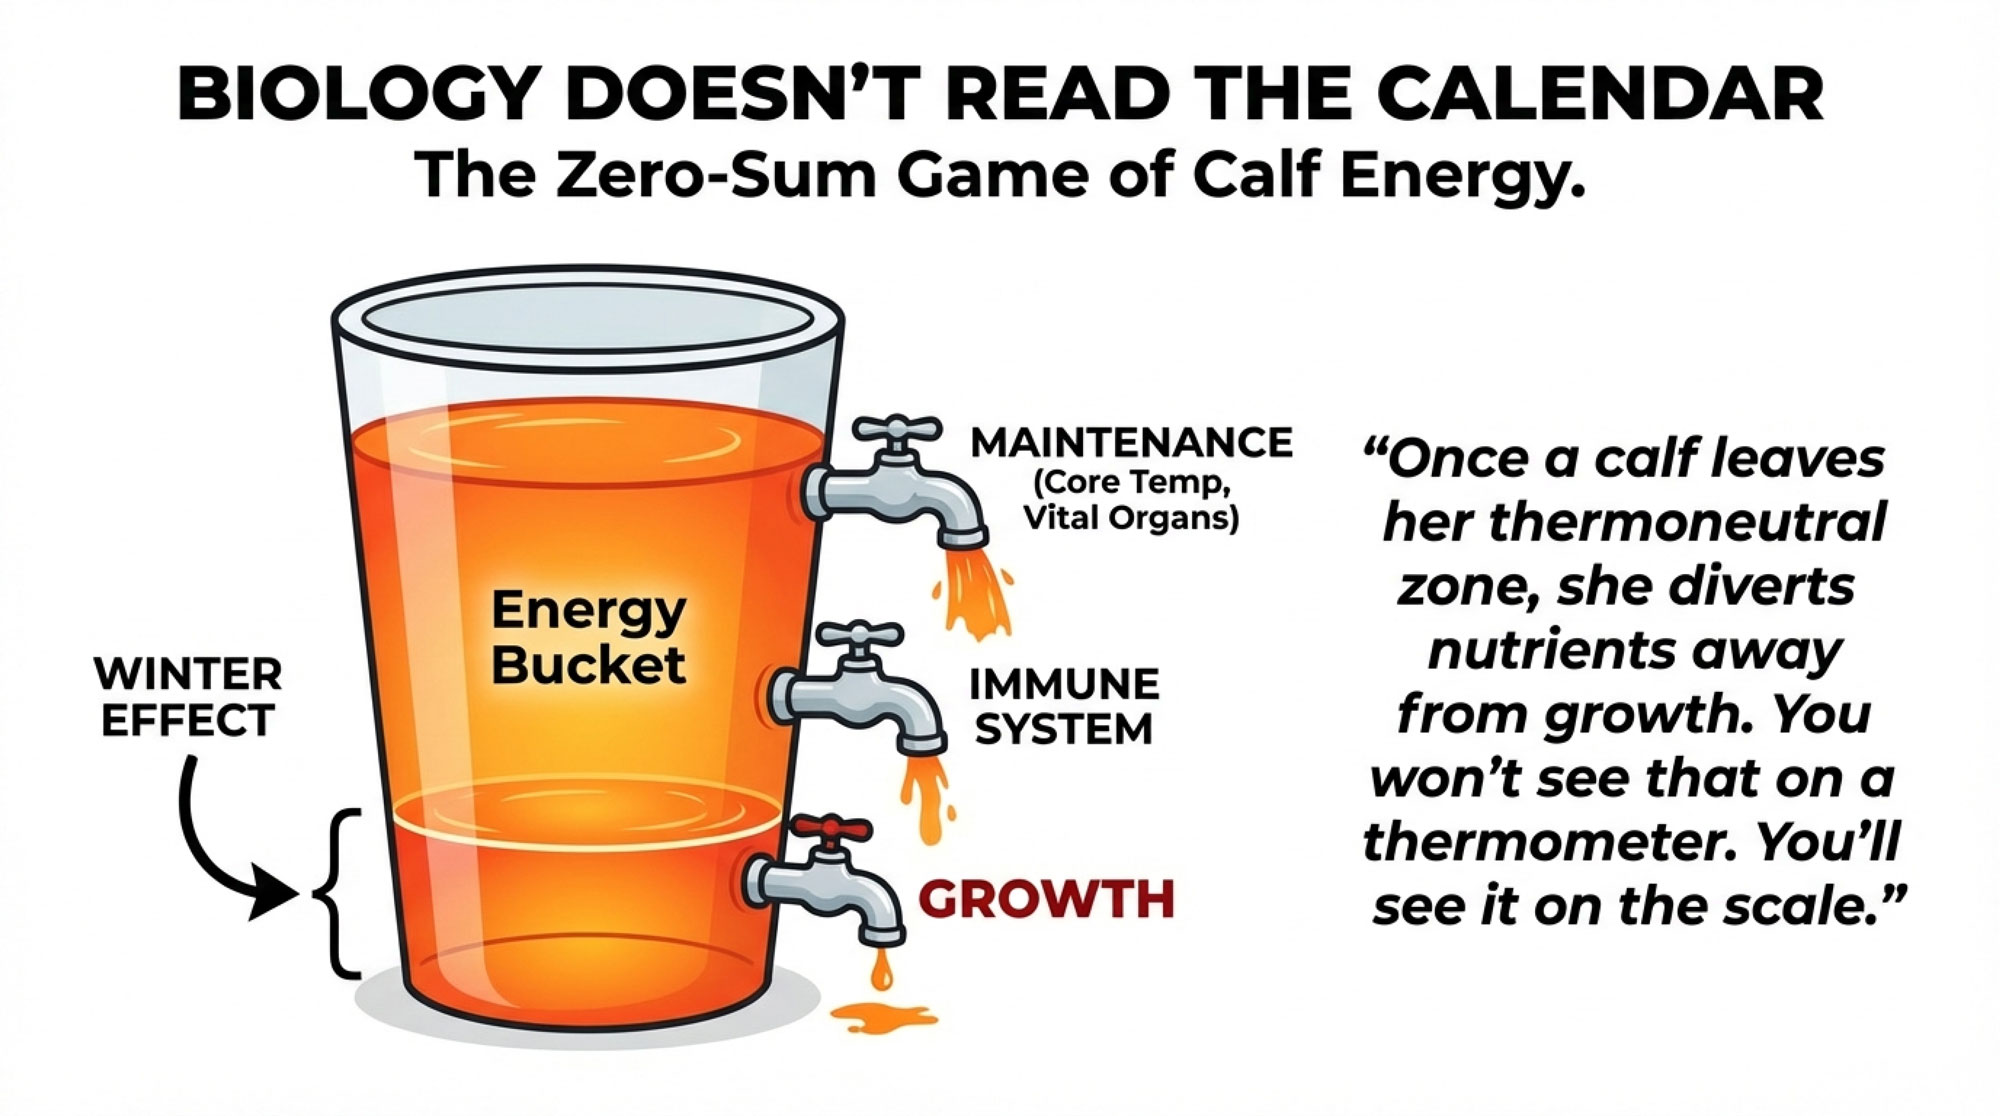
Why Protein Source in Week 1–3 Matters So Much
If those 1,100–1,550 kg of milk per 1 kg/day of preweaning ADG still feel too large, it helps to look under the hood. In those first weeks, you’re not just putting on frame. You’re building the factory, wiring the control system, and deciding how often it breaks.
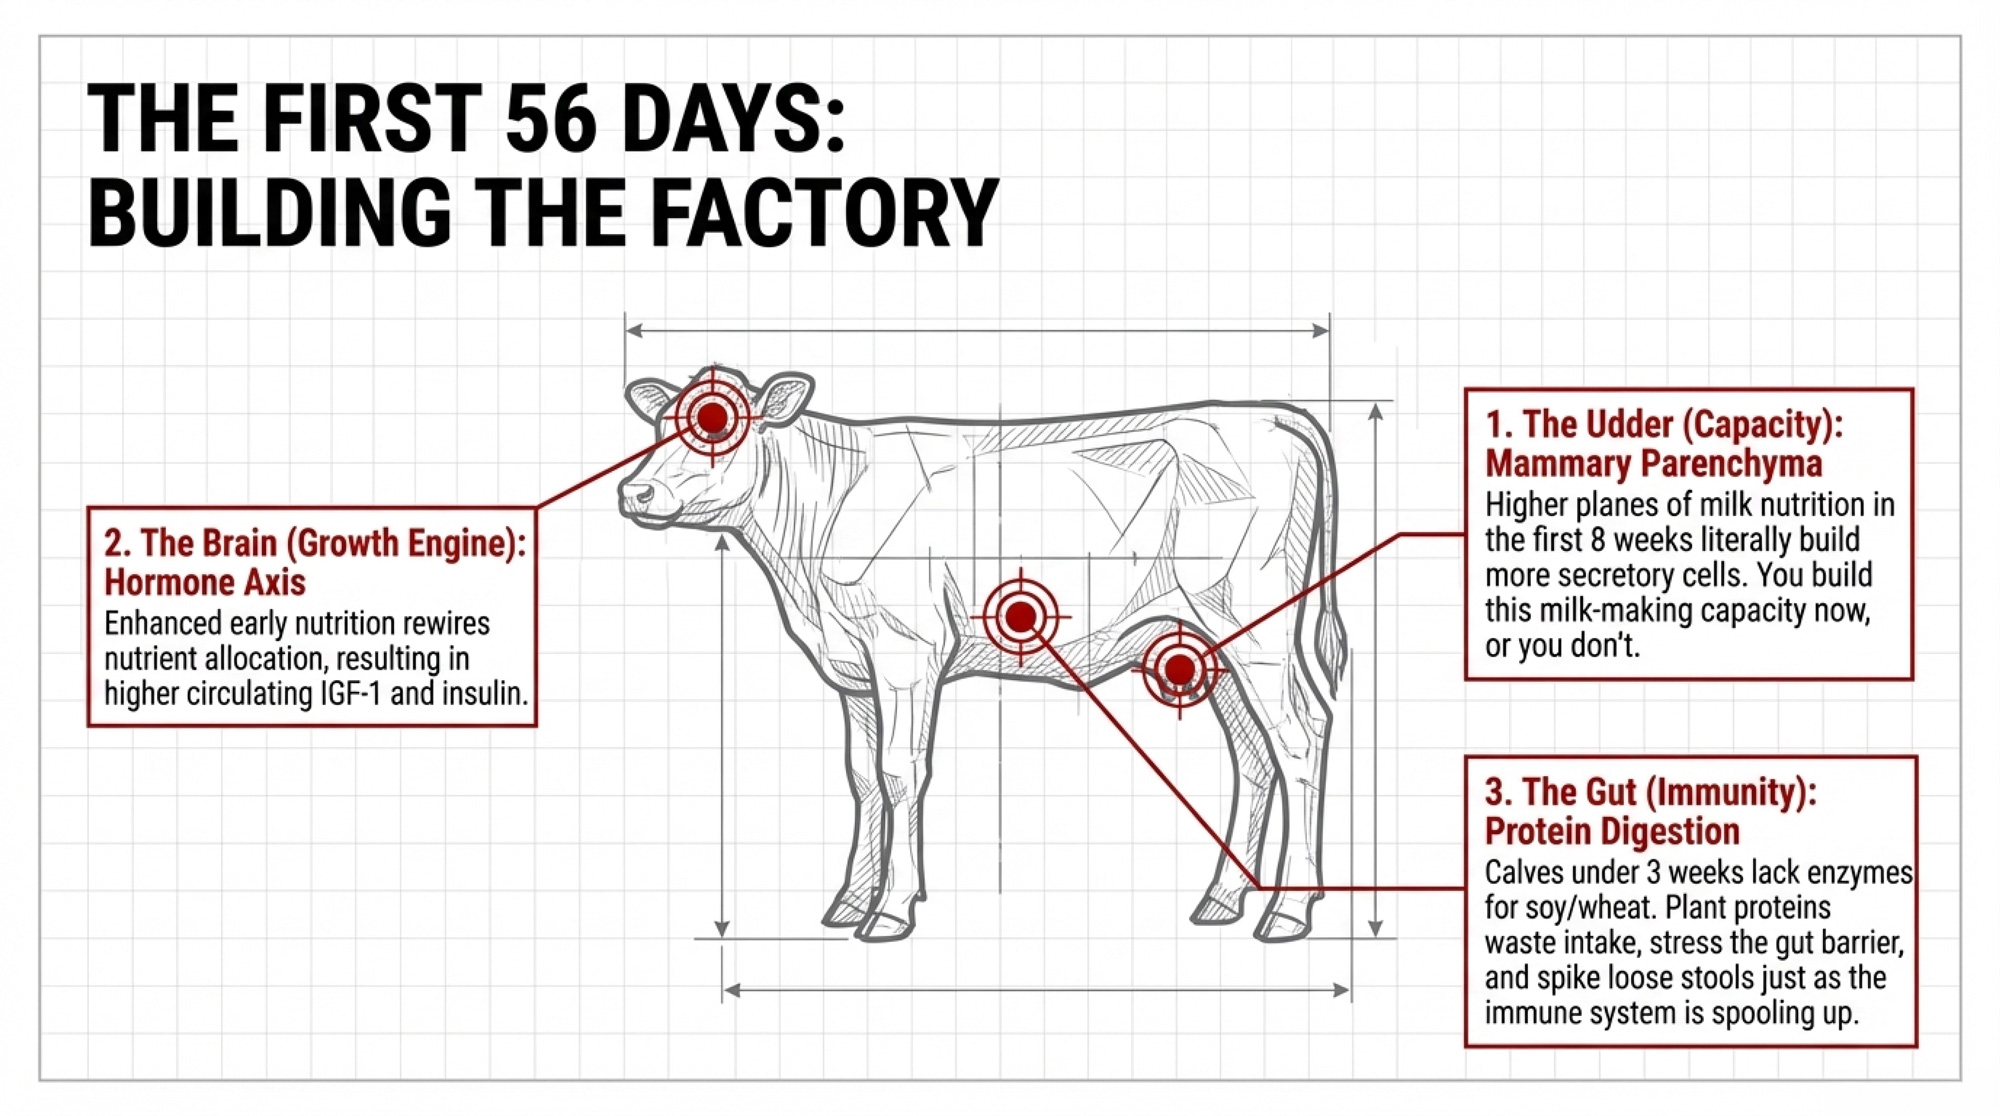
You’re building a mammary factory. Trials comparing restricted and enhanced preweaning feeding show calves on higher planes of nutrition develop substantially more mammary parenchyma — the secretory tissue — by eight weeks of age. More parenchyma now means more secretory cells later. That’s literal milk‑making capacity you either build or you don’t.
You’re resetting the growth hormone axis. Calves fed higher planes of milk nutrition show higher circulating IGF‑1 and insulin, and mammary gene expression patterns that favor development. One regression, Soberon and Van Amburgh reported — roughly milk yield = −106 + 1,551 × ADG in one model — isn’t magic; it’s what happens when better early nutrition rewires how that calf allocates nutrients and grows.
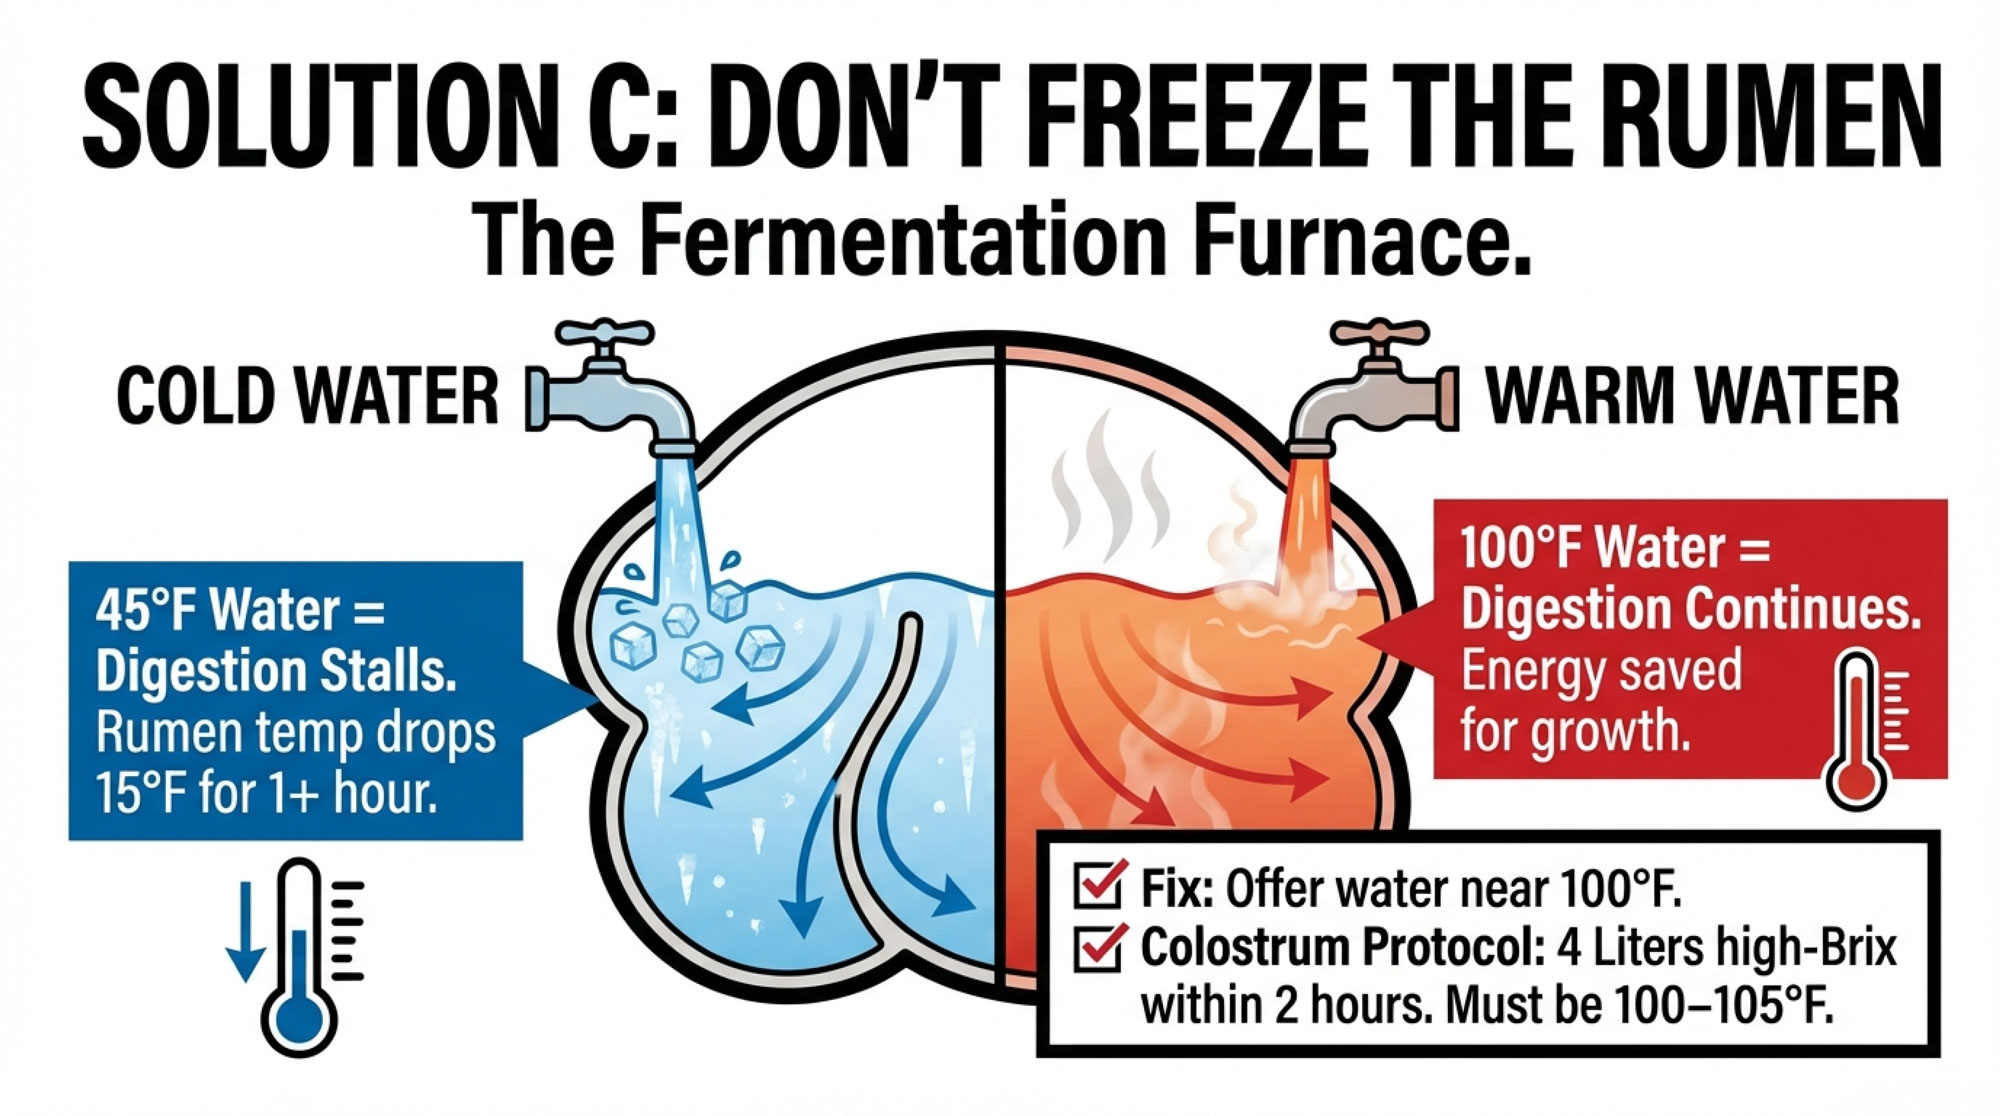
You’re wiring immunity and gut health — and protein source is a big part of it. Back in the late 1980s, researchers showed that replacing milk protein with isolated soy protein reduces the ileal digestibility of indispensable amino acids from about 82% to around 62% in neonatal calves. CalfCare.ca and similar extension programs are blunt: calves under three weeks of age should be on an all‑milk protein milk replacer, because their abomasal enzymes aren’t built to handle soy or wheat proteins efficiently yet.
When you push plant protein too early, you’re not just wasting protein. You’re buying more loose stools, depressed intake, and a gut barrier under stress right when the immune system is still spooling up. Add in research tying preweaning disease events to poorer fertility and lower first‑lactation milk later on, and it’s not surprising that preweaning ADG explained about 20–22% of the variation in first‑lactation milk yield in the Cornell models.
How Much Is Your Calf Milk Replacer Really Costing You?
Here’s the Cornell‑style math in a version you can actually drop your own numbers into.
Say your calves are averaging 0.7 kg/day preweaning ADG right now. You’re looking at a move to an all‑milk, higher‑plane program that you expect will push that to 0.8–0.9 kg/day. Trials and field data put a 0.1–0.2 kg/day improvement well within reach when you upgrade both protein quality and feeding rate and keep housing and health decent.
Take the conservative end: a 0.1 kg/day bump in ADG.
Using Soberon’s 850–1,113 kg/kg ADG range:
- 0.1 × 850 = 85 kg more milk in the first lactation.
- 0.1 × 1,113 = 111 kg more milk in the first lactation.
At $0.48/kg, that’s around $41–$53 extra milk per heifer in first lactation. Over three lactations, that same 0.1 kg/day bump scales to:
- 0.1 × 2,280 = 228 kg more milk over three lactations.
- 228 × $0.48 ≈ $109 lifetime milk value per heifer.
Now compare that to your replacer cost. If your all‑milk program runs roughly $200–$286 more per calf than a budget plant‑protein 20/20 replacer, and even that conservative 0.1 kg/day improvement is worth roughly $41–$53 in first‑lactation milk and around $109 over three lactations, you’re at $150–$162 of milk value before you even think about days to first calving or survival.
In herds where a full 0.2 kg/day improvement is realistic, the lifetime milk advantage roughly doubles. That’s how you land in the ~$219 milk value range you saw in the Wisconsin herd’s model. So if your replacer choice is “saving” $286up front, but even a cautious reading of the data says you’re giving up $219–$300 in lifetime value before you add survival, that bag isn’t cheap. It’s a capital trade‑off.
Sponsored Post
Is Your Calf Barn Measuring the Right Number?
Most calf barns can answer two questions without opening a laptop: “Did she live?” and “What did she weigh at weaning?” Helpful, but not enough.
If you want to know whether your replacer program is building the cows your genetic plan paid for, the number you need to start treating as non‑negotiable is preweaning ADG.
Here’s a 30‑day action that doesn’t require a new feeder or building:
- Weigh or tape every heifer calf at birth and at weaning. Use a platform scale if you have it, or a consistent heart‑girth tape on dry calves if you don’t.
- Calculate ADG for each calf and each birth month. (Weaning weight − birth weight) ÷ days on milk. Write it somewhere you’ll actually look — a whiteboard in the calf barn beats a forgotten tab in the herd software.
- Write the replacer product and lot number at the top of each month’s record. When a group suddenly averages 0.6 kg/day and treatments spike, you’re not guessing whether a formulation change or batch issue was involved.
- Cross‑check ADG against your genomic rankings. Are your highest‑index calves actually outgrowing the lower‑index calves preweaning? If not, the bottleneck isn’t genetics. It’s what’s in the bucket.
| Metric | Solid target (black text) | Red‑flag zone (red text in design) |
|---|---|---|
| Preweaning ADG (kg/day) | 0.8–0.9 kg/day when housing and health are decent. | <0.7 kg/day = nutrition/housing bottleneck. |
| Cost per kg of gain (preweaning) | Lower on all‑milk, higher‑plane programs because calves grow faster and stay healthier. | “Cheap” program shows higher cost per kg of gain than premium. |
| Age at first calving | 22–24 months sweet spot for milk and lifetime performance. | Regularly calving >26–27 months. |
| Heifer investment lens | View each heifer as a $2,300–$2,700 capital asset. | Decisions driven only by bag price, not lifetime ROI. |
Holstein herds using higher‑plane milk programs in trials and field reports commonly hit 0.8–0.9 kg/day preweaning when housing and health are decent. If your 30‑day snapshot says you’re living under about 0.7 kg/day, something in your replacer, feeding rate, housing, or health is capping the genetic engine you paid for.
Options and Trade-Offs for Farmers
How Much Is Your $286 “Saving” Really Costing?
When it makes sense: Any time your feed supplier or spreadsheet says, “We can save you $X per calf on milk replacer.”
What it requires:
- A realistic estimate of preweaning ADG on your current program and on the program you’re considering — even a month of tape weights is better than guessing.
- A simple ADG‑to‑milk conversion using the Cornell ranges: 850–1,113 kg per 1 kg/day ADG in first lactation, about 2,280 kg over three lactations for survivors.
- One milk‑price assumption used consistently across your math (for now, $0.48/kg based on 2024 mailbox).
Risks/limits: Your first pass won’t be perfect. But it’s better than letting the bag price decide for you.
Make Preweaning ADG a Non‑Negotiable KPI (30‑Day Action)
When it makes sense: Any herd raising replacements — whether you’re milking 80 cows or 1,800.
What it requires:
- Birth and weaning weights (or tape equivalents) for every heifer calf over the next month.
- One simple tracking sheet: calf ID, birth date, birth weight, weaning date, weaning weight, replacer, lot.
- A starting target: work toward 0.8–0.9 kg/day preweaning. Treat anything consistently under 0.7 kg/day as a red flag, not a detail.
Risks/limits: It’s one more habit to build. Once it’s in place, it becomes one of the most useful numbers in your heifer program.
Why it matters: Once ADG is on your dashboard, replacer changes, seasonality, housing tweaks, and staff shifts all show up in hard numbers. You stop arguing “calves look good” and start asking “Are they growing fast enough to justify the genetics we paid for?”
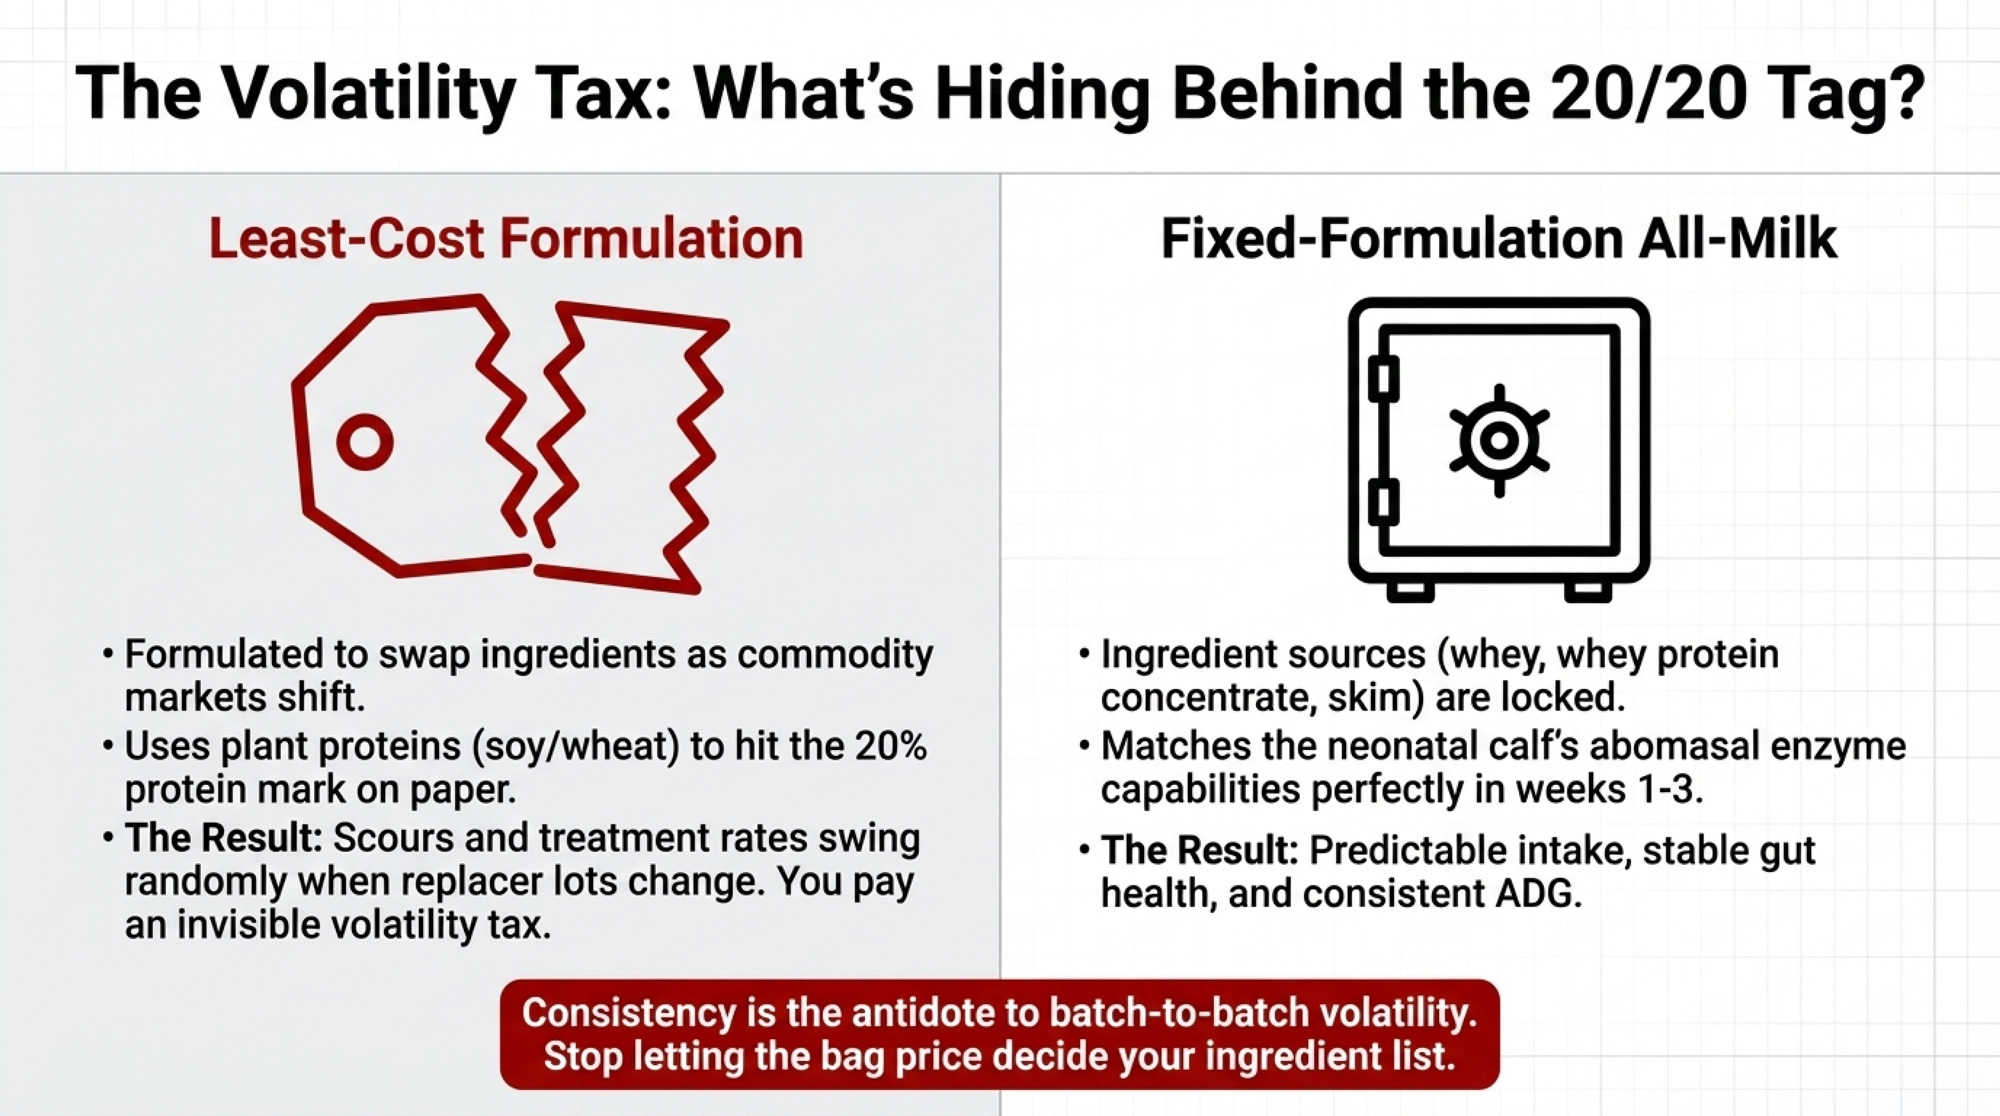
Shift From Least‑Cost to Fixed‑Formulation, All‑Milk Protein Replacer
When it makes sense: When you’ve seen calf performance bounce around with no obvious changes in housing, staff, or weather — or when you’re pretty sure your replacer is being sold on price first and formulation second.
What it requires:
- A direct question to your supplier: “Is this replacer least‑cost formulated, or are the ingredient sources fixed?”
- Confirmation that protein sources are all milk‑derived — whey, whey protein concentrate, skim — especially in the first three weeks.
- A habit of tying replacer lot numbers to calf ADG and health in your own records.
Risks/limits: Bag price will almost always go up compared with aggressive, least‑cost options. And some mills aren’t eager to talk about how often they swap ingredient sources under a least‑cost model.
Why it matters: Least‑cost formulation is built to swap ingredients as commodity markets move while keeping the 20/20 tag on paper. On some herds, those quiet shifts show up as an invisible “volatility tax” on calf performance when ingredient changes affect how calves respond. Fixed‑formulation, all‑milk replacers don’t make calves bulletproof, but they remove one of the biggest hidden variables in your heifer program.
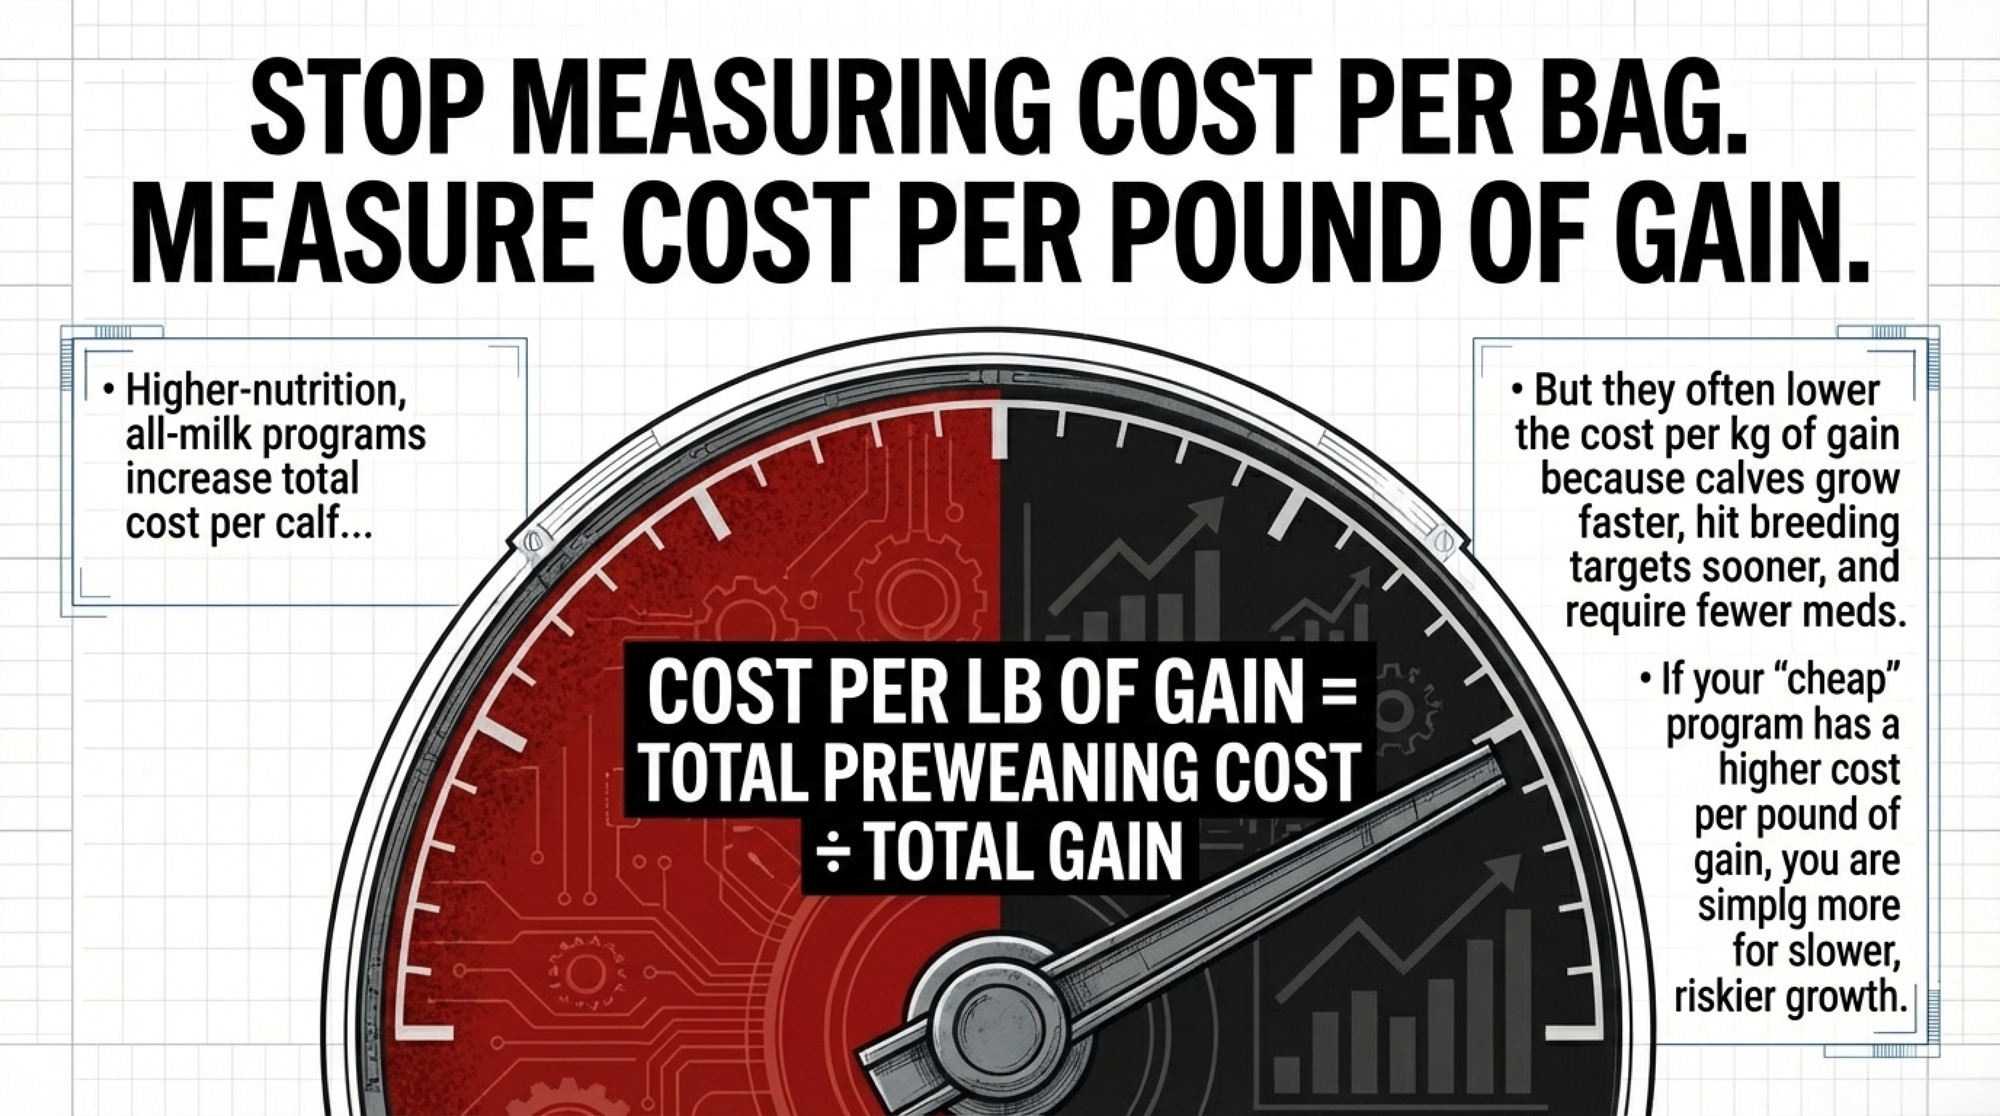
Compare Programs by Cost per Pound of Gain, Not Cost per Bag
When it makes sense: Anytime you’re comparing a “cheap” replacer against a higher‑priced option — especially if someone is trying to sell you on bag price alone.
What it requires:
For at least two recent calf groups:
- Total preweaning cost per calf: replacer, starter, meds, plus a realistic estimate for labor and bedding.
- Total gain: weaning weight − birth weight.
- The simple metric:
- Cost per lb (or kg) of gain = Total preweaning cost per calf ÷ Total gain.
Economic modeling of preweaning programs shows that while higher‑nutrition, all‑milk programs increase total preweaning cost per calf, they often lower cost per kg of gain because calves grow faster and stay healthier. In one 2019 analysis, preweaning costs ranged from about $258.56 to $582.98 per calf across different feeding strategies, but the higher‑milk programs produced more gain per dollar invested.
Risks/limits: You need enough calves in each group to avoid chasing noise. And pulling real cost numbers takes a bit of time.
Why it matters: If your cost per pound of gain is higher on the “cheap” program, that saving isn’t real. You’re paying more for slower, riskier gain.
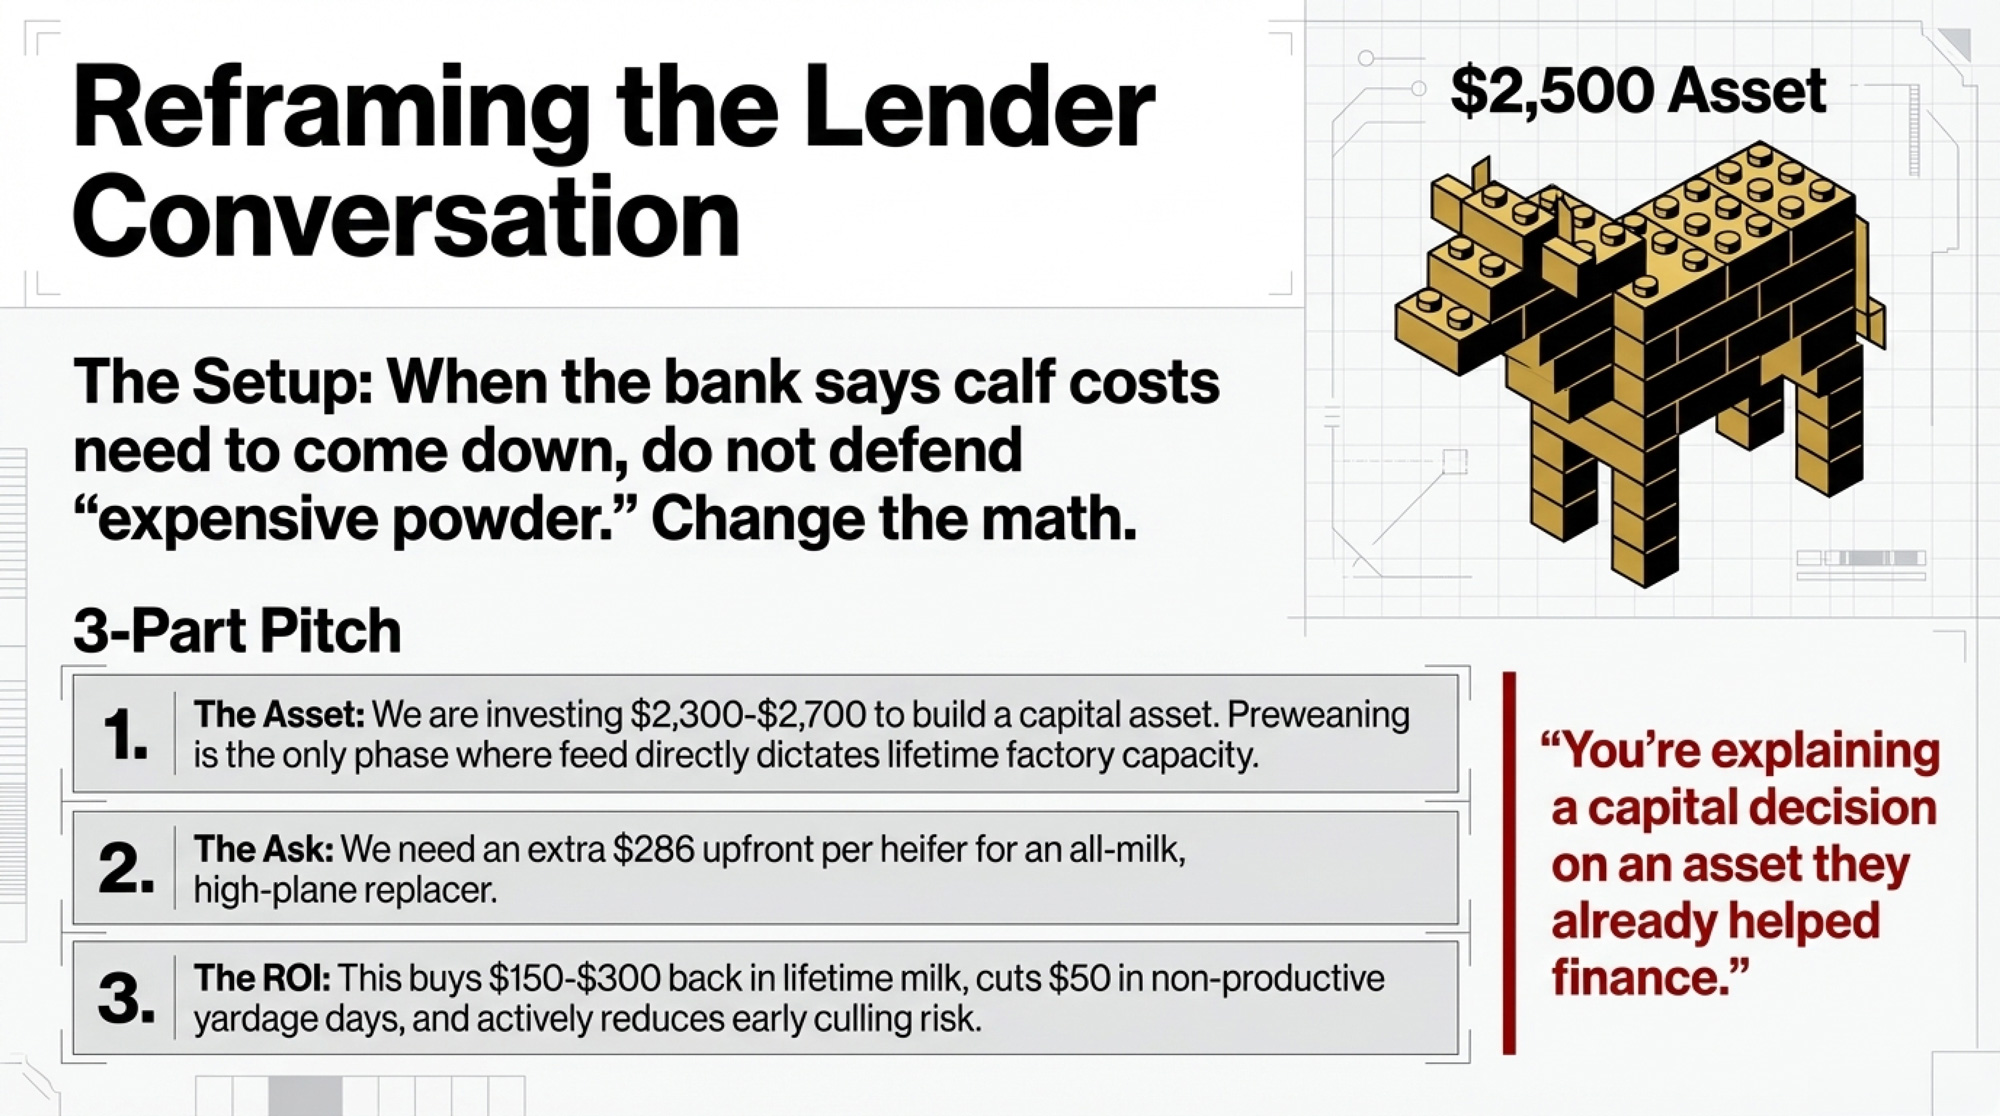
Reframe the Lender Conversation as Heifer ROI
When it makes sense: When your lender or business partner tells you calf costs need to come down this year.
What it requires:
- A one‑page summary that shows, for your herd:
- Current preweaning cost per heifer (from your cost‑per‑gain work).
- Projected extra spend per heifer on an improved replacer program (for example, around +$200–$286).
- A conservative payback story, grounded in the research: roughly $150–$300 in lifetime milk and fewer non‑productive days per heifer from even a 0.1–0.2 kg/day ADG bump, plus the survival risk differences Fodor documented for late‑calving heifers.
Risks/limits: Some lenders think in 12‑month cycles, not three‑lactation ROI. You may have to walk them through replacements as capital assets, not just an expense line.
Why it matters: When you can say, “We’re asking to invest an extra $286 in each heifer to realistically capture more than that in lifetime value and reduce early culling risk,” it changes the tone of the meeting. You’re not defending “expensive powder.” You’re explaining a capital decision on an asset your lender already helped finance.
Partner Perspective: Consistency as the Antidote to Volatility
Consistency is the antidote to the batch‑to‑batch volatility problem you’ve probably felt in your calf barn. Industry partners like Kalmbach Feeds have leaned into that with their Generations™ All Milk 20/20 and 22/20 Milk Replacers, using milk‑derived proteins in a fixed formulation and including LifeGuard® immune support, as described in Kalmbach’s product literature. The idea is simple: keep ingredient sources consistent from batch to batch so you’re not chasing unexplained intake or performance dips tied to formulation changes when you’re making a capital decision on a $2,300–$2,700 animal. Knowing what’s actually in the bag matters.
Key Takeaways
- If your preweaning ADG is consistently under about 0.7 kg/day, don’t start by chasing a cheaper bag. Start by asking why your calf barn is putting a governor on the genetics you’re paying for.
- If your highest‑index calves aren’t outgrowing your lower‑index calves preweaning, genetics aren’t the weak link — your nutrition program is. That’s a bottleneck you can actually fix.
- If your “cheap” replacer program has a higher cost per pound of gain than an all‑milk or higher‑plane program, that saving isn’t real. You’re paying more for slower, riskier gain.
- If scours and treatment rates swing when replacer lots change, treat that as a sign that the least‑cost formulation is adding volatility you never agreed to pay for.
- If you’re walking into a lender meeting under pressure to cut calf costs, go in with a three‑part story — milk, days to first calving, and survival risk — instead of a single bag price. Let the math make the case for you.
You don’t need to turn your calf barn into a research station. You do need to know whether the milk replacer in your mixer is building the cows your genetic plan is paying for — or quietly turning that investment into scrap value.
So here’s the challenge. Over the next 30 days, weigh a run of calves at birth and weaning. Calculate ADG. Tie it to replacer lots and genomic rankings. Then ask yourself, with your own numbers in front of you: is that 6 “saving” actually putting money in your pocket — or is it the most expensive cut you make all year?
Run Your Own Milk Replacer Math
Learn More
- Dairy Calf Nutrition for Healthier, Higher-Producing Cows – This implementation guide delivers a phased roadmap for optimizing gut health and enzyme development. You’ll gain concrete measurement baselines to identify exactly what’s working, cutting the guesswork and waste from your preweaning nutrition program.
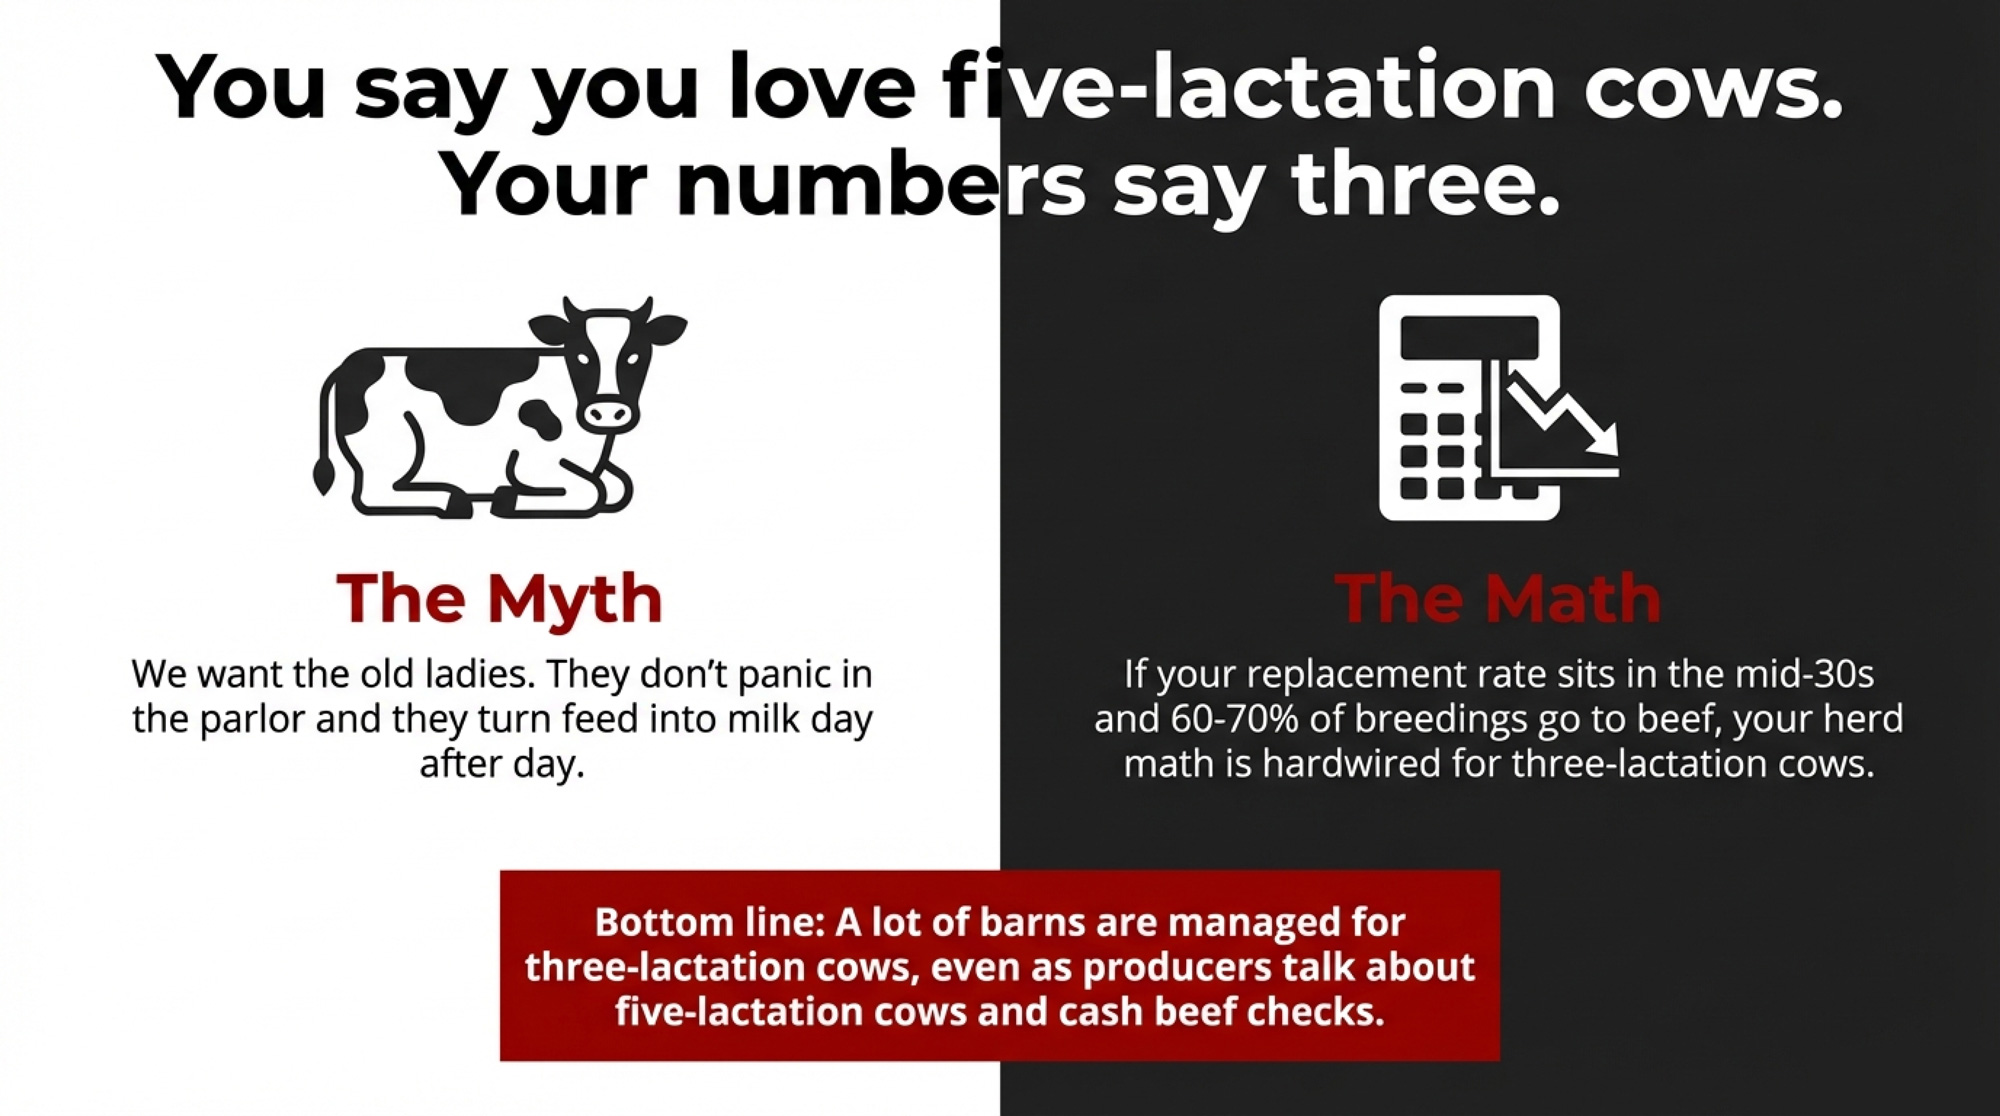
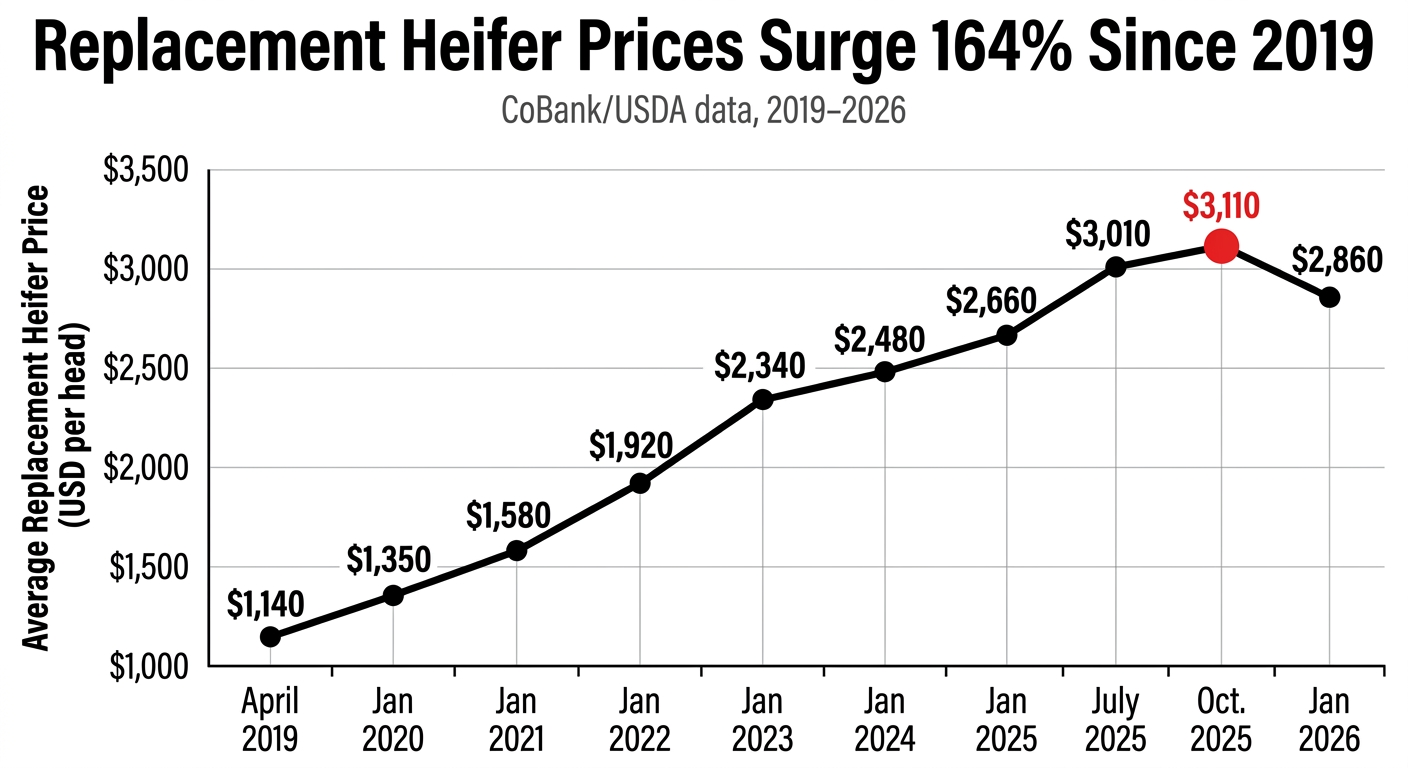
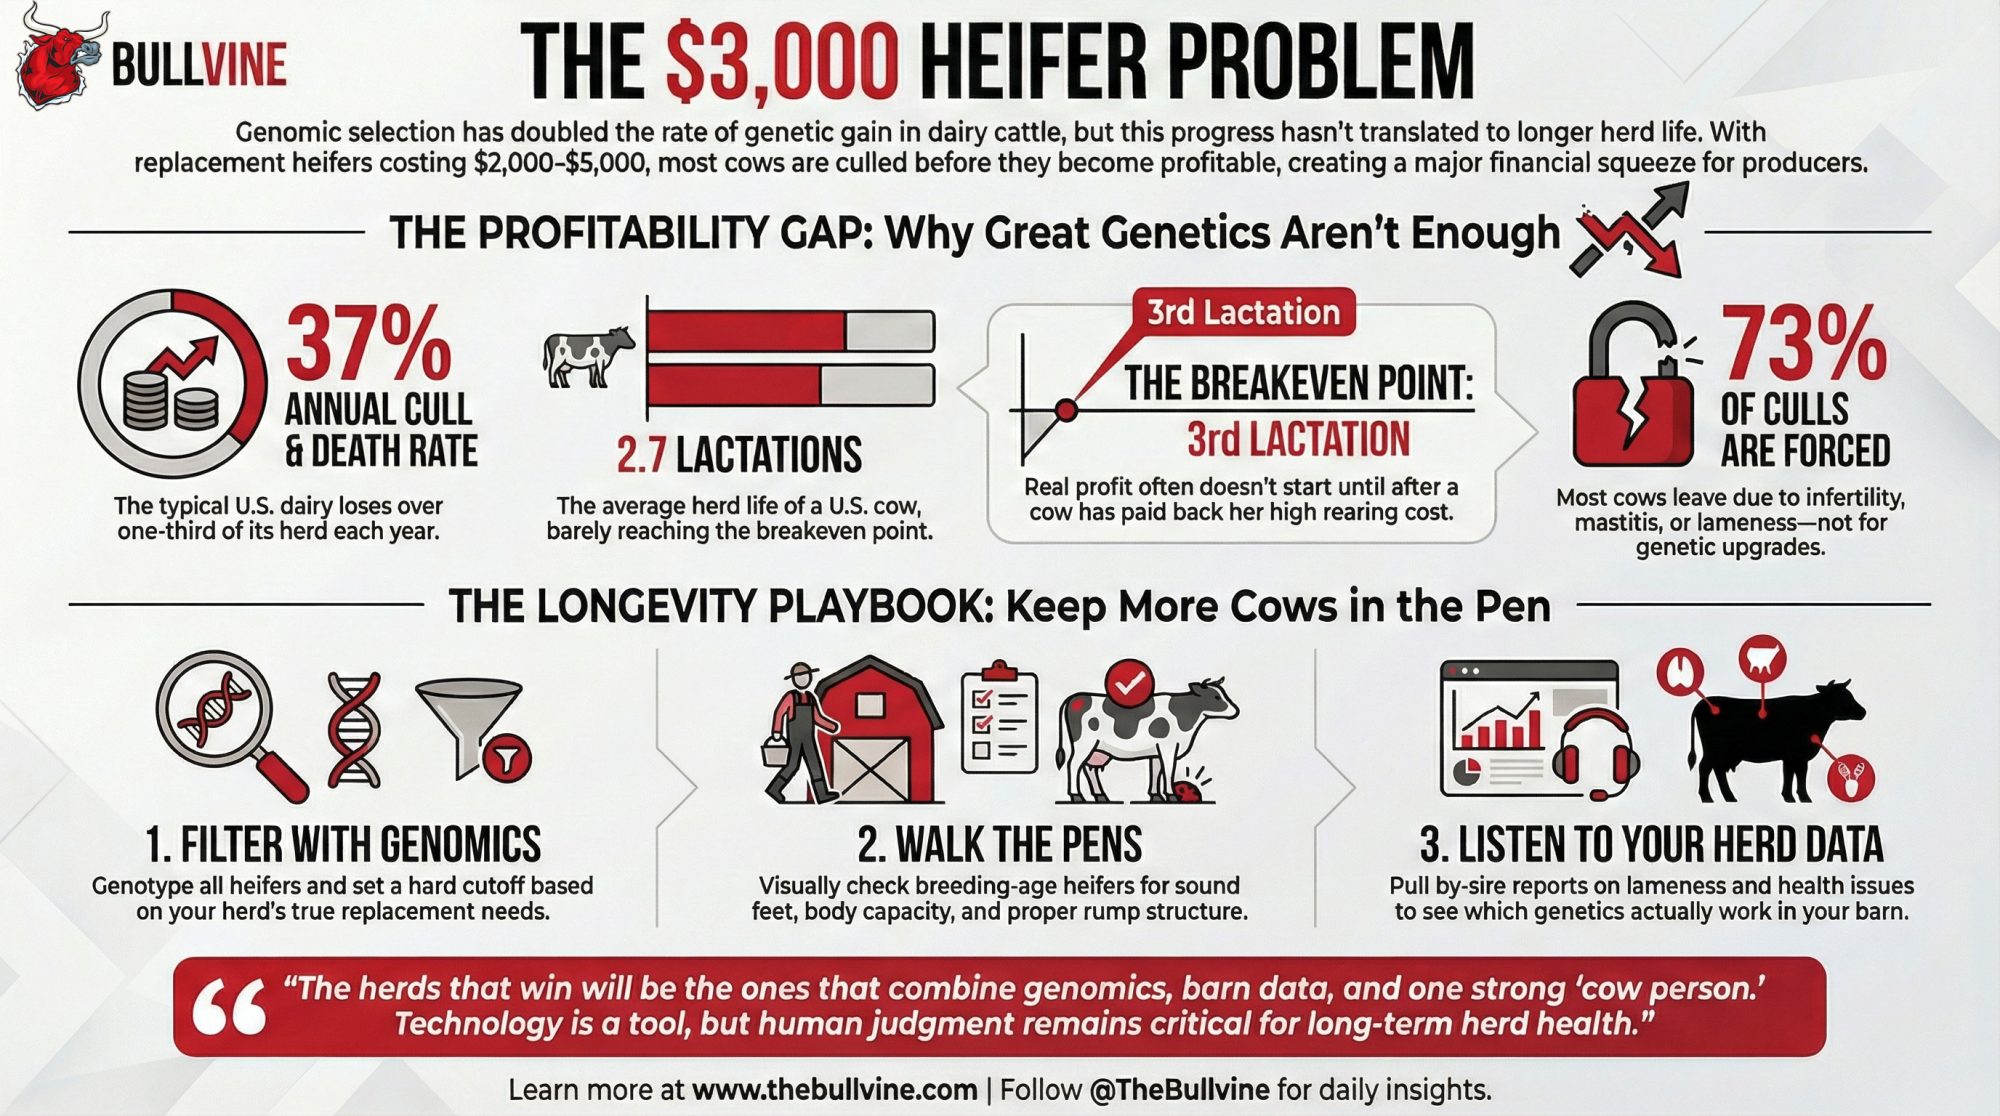
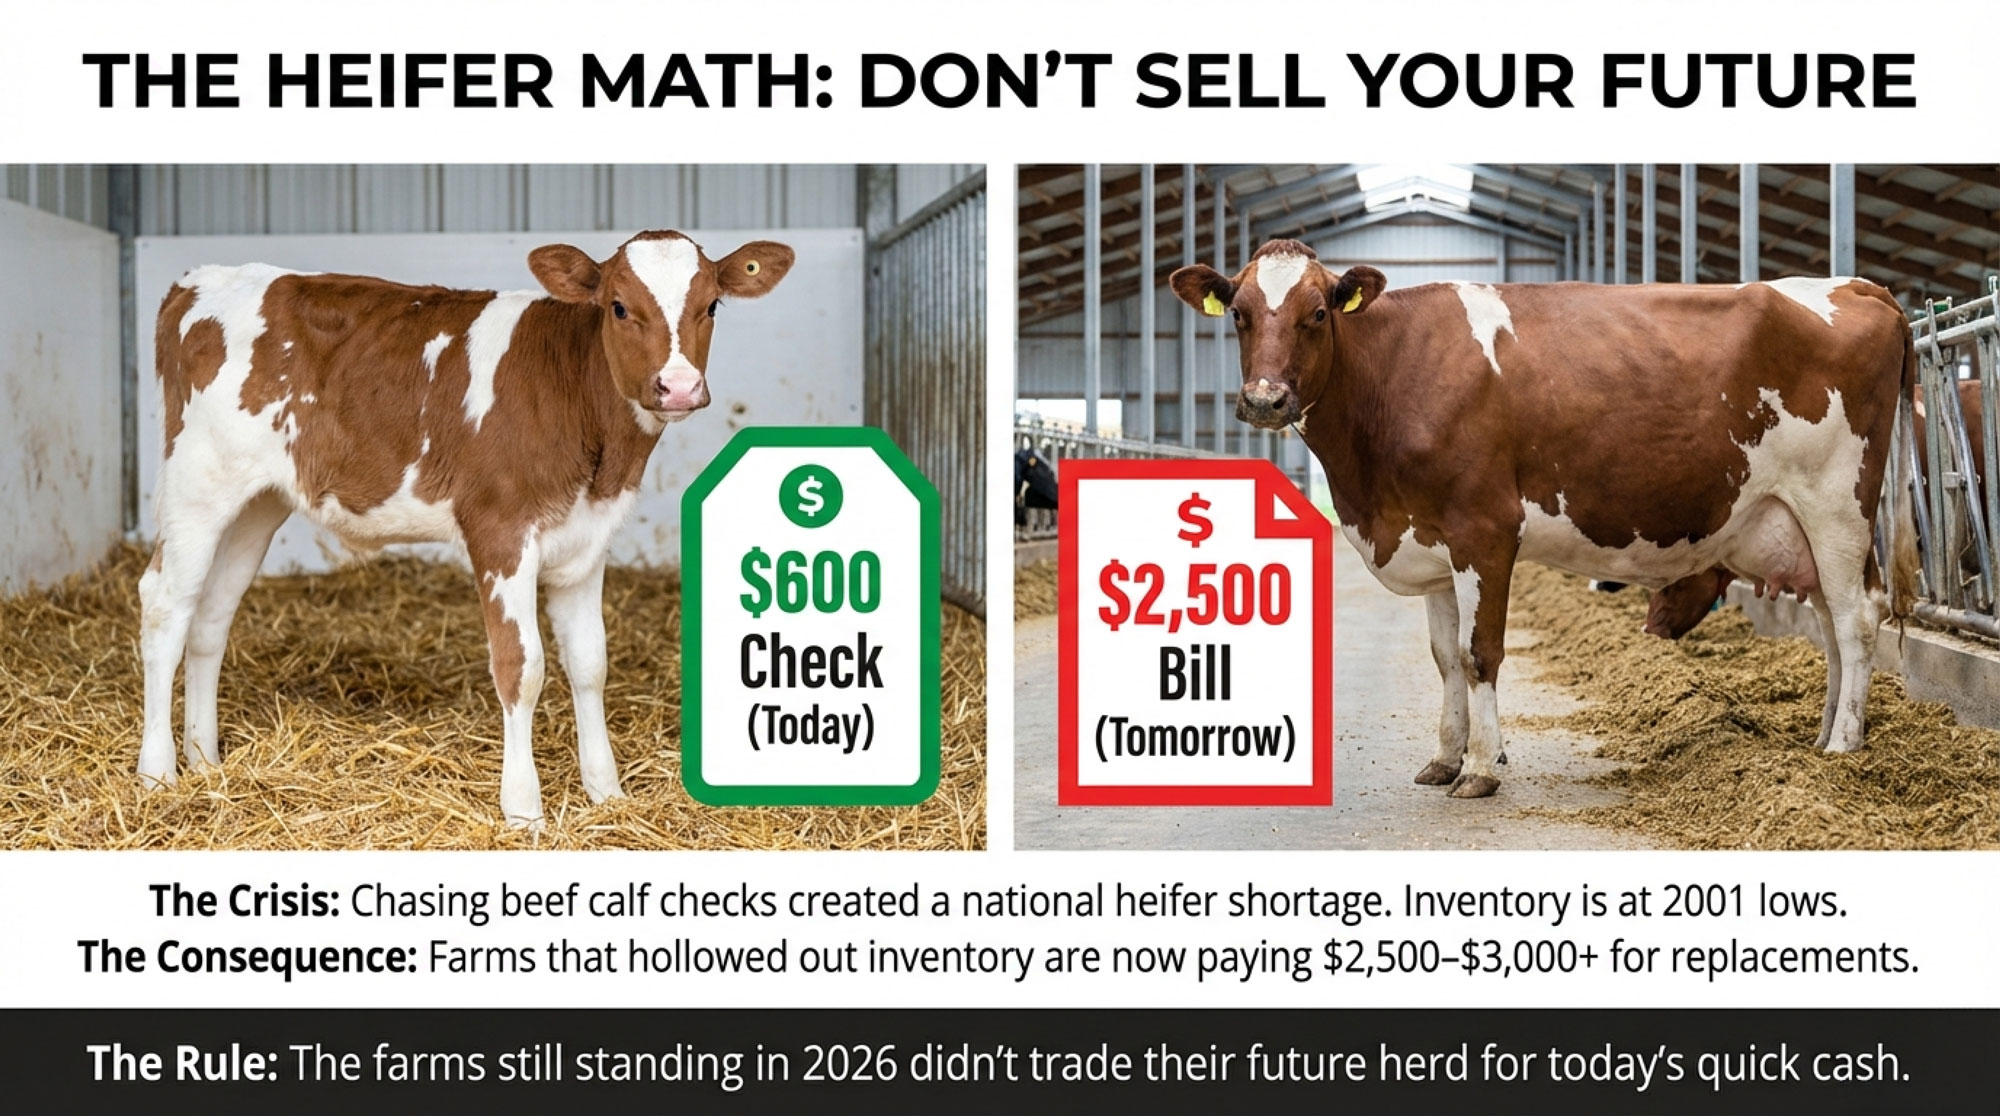
- The 3-Lactation Trap: Are $3010 Heifers Pushing You Toward Beef Checks Instead of Five-Lactation Cows? – This breakdown reveals how record-high replacement costs have upended traditional rearing economics. It arms you with a five-lactation payback model, exposing the hidden capital traps that occur when short-term calf checks cannibalize your future herd’s longevity.
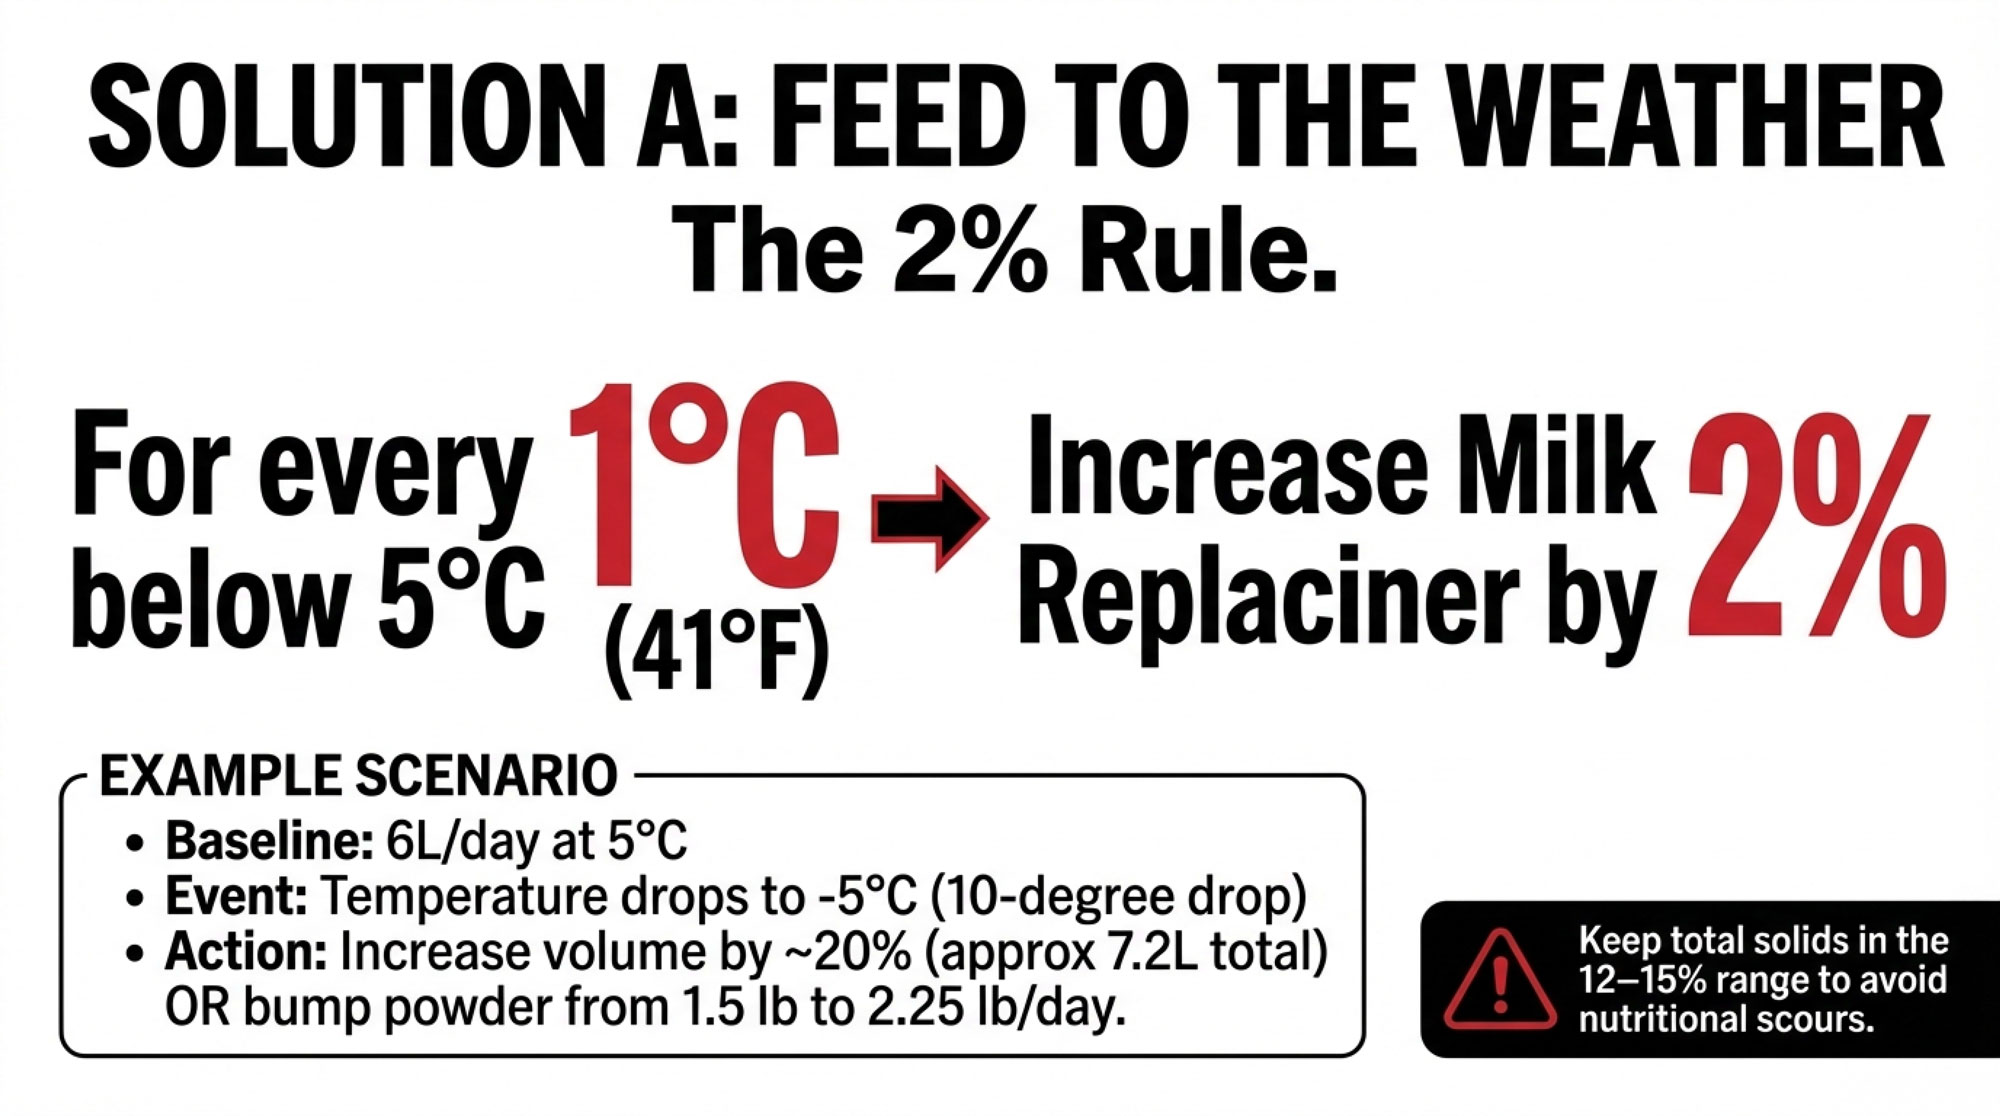
- Matching the Feed to the Calf: Birth to 120 Days – Practical Science for Dairy-Beef Calves – Exposing the latest benchmarks for dairy-beef efficiency, this guide delivers a blueprint for capturing an extra $100 per calf. You’ll discover how consistency in milk solids and temperature accelerates rumen startup to maximize your genetic investment.
 The Sunday Read Dairy Professionals Don’t Skip.
 The Sunday Read Dairy Professionals Don’t Skip.
Every week, thousands of producers, breeders, and industry insiders open Bullvine Weekly for genetics insights, market shifts, and profit strategies they won’t find anywhere else. One email. Five minutes. Smarter decisions all week.