Archive for farm profitability

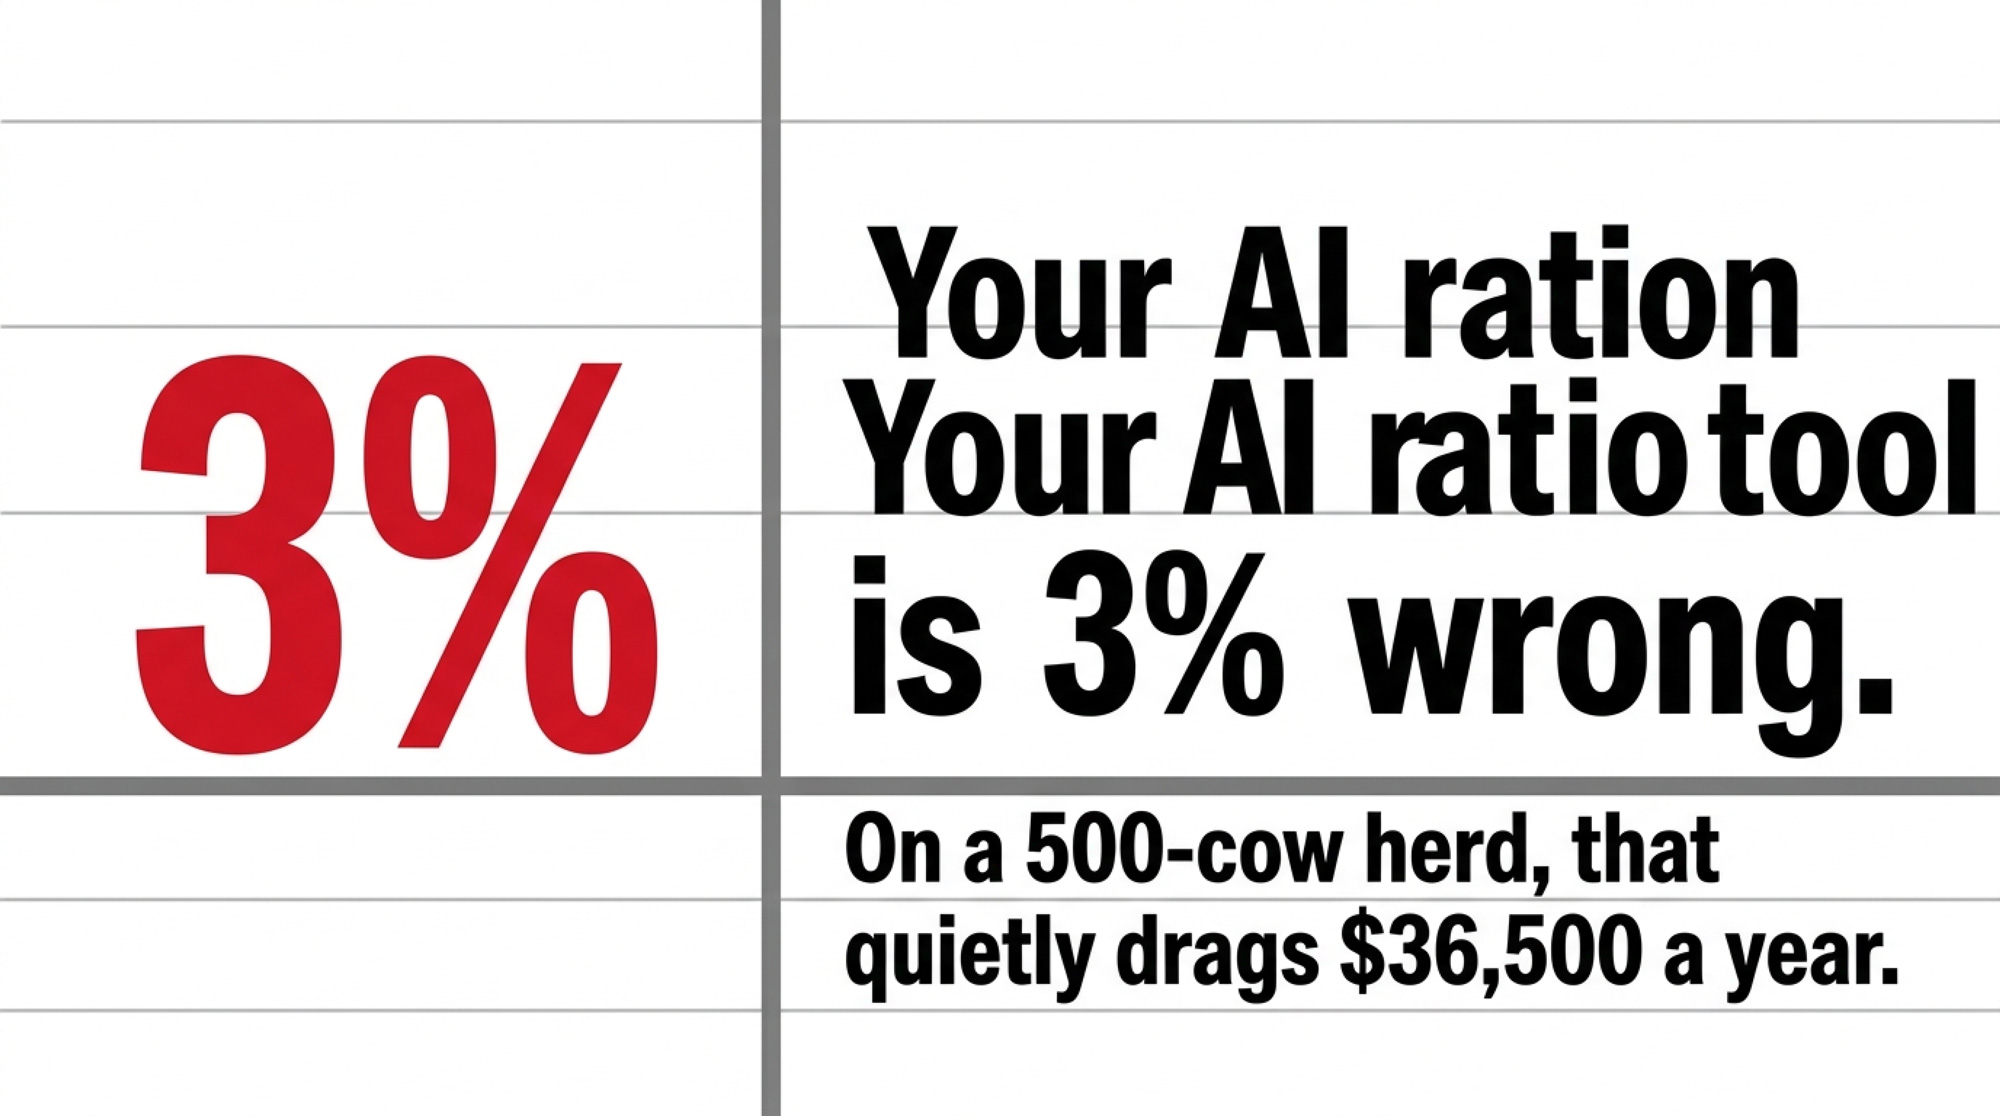
$20 Milk, $19.14 Costs, 15.9¢ of the Food Dollar: Should You Chase Thunder CoffeeMilk-Style Value-Added?

At roughly $20/cwt milk against $19.14 in full costs and just 15.9¢ of the food dollar, Thunder’s $40–50K months show both what’s possible — and how fast value-added can blow a hole in your cash flow.

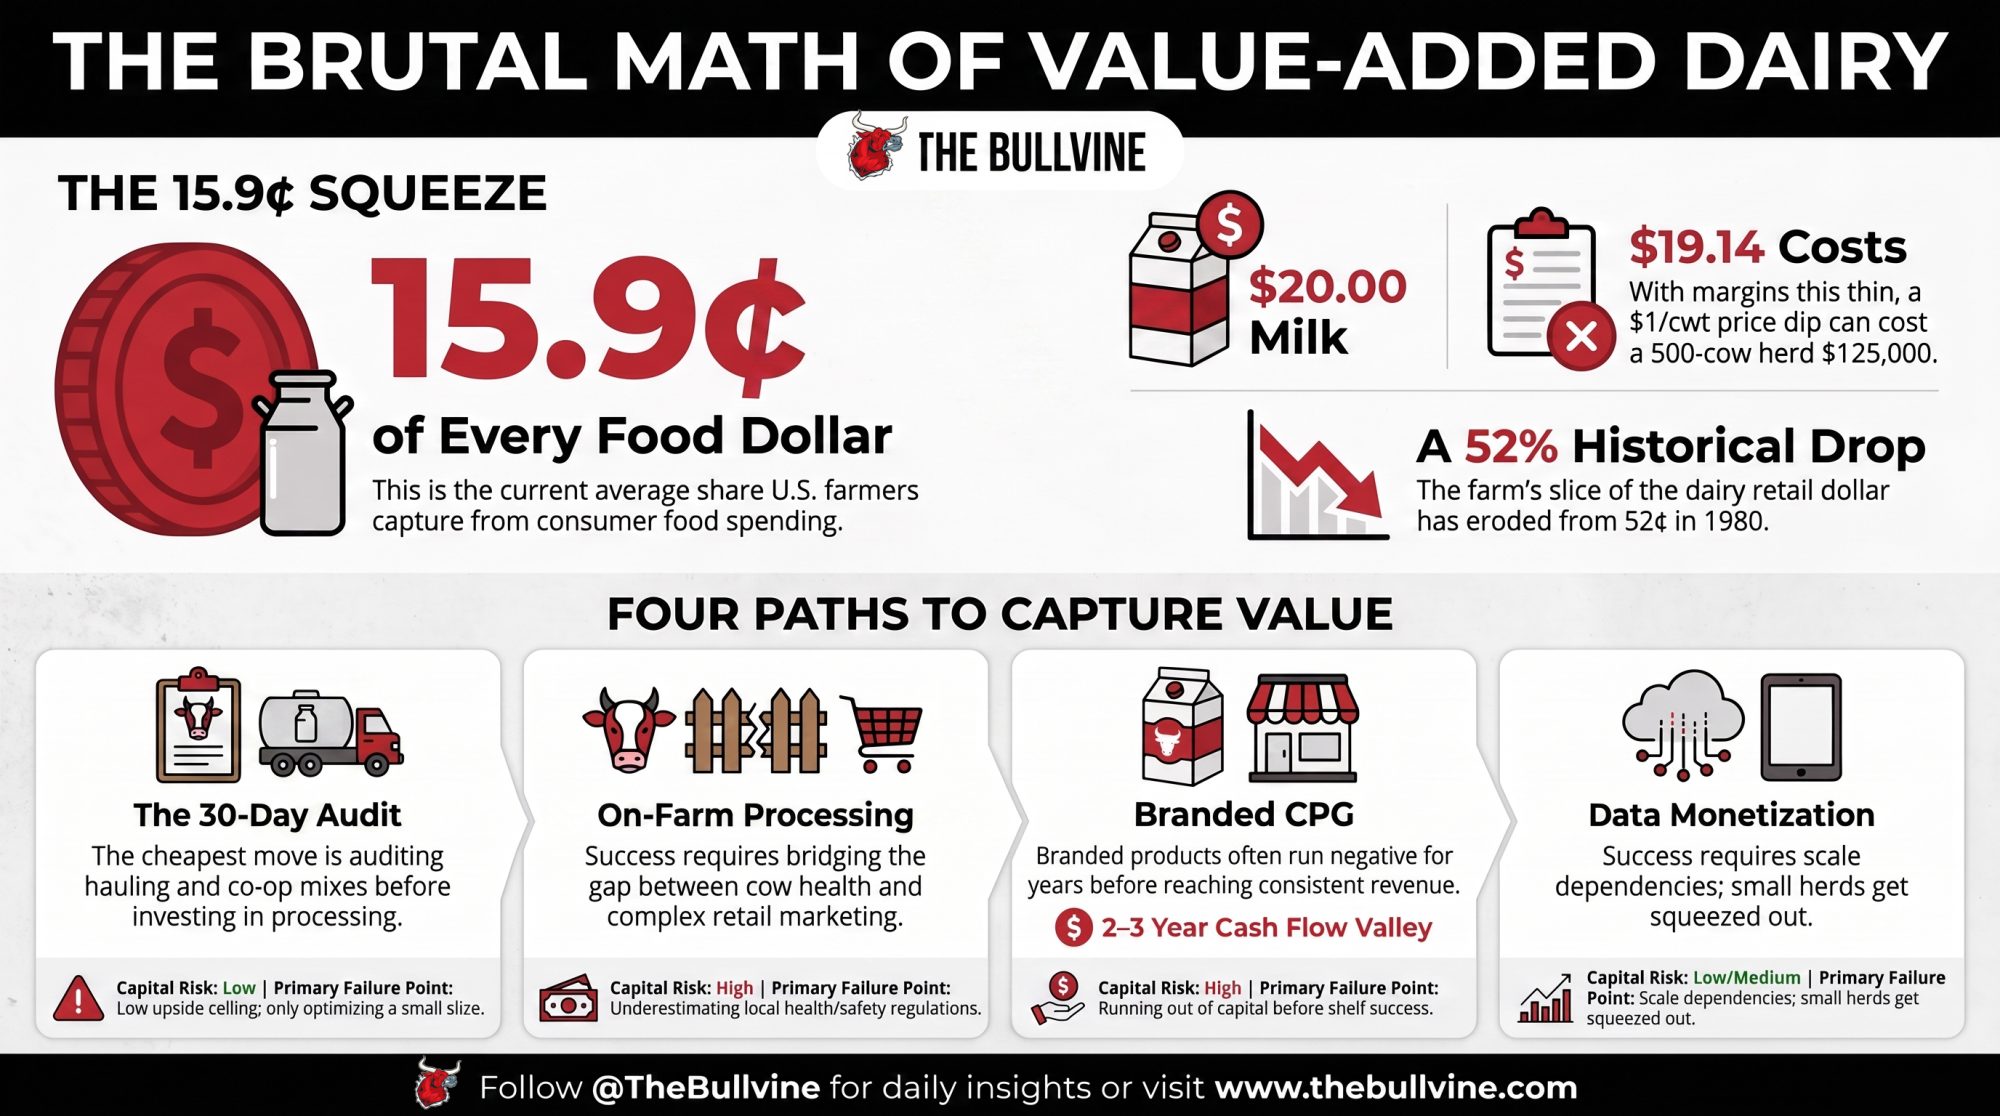
Executive Summary: Two Florida dairy farmers built Thunder CoffeeMilk into $40,000–$50,000 a month — starting in a kitchen, driving 15 hours to a Michigan lab, and watching their first shelf-stable batch come out as a solid brick. The reason it matters to you has nothing to do with coffee: you get just 15.9¢ of every food dollar, and the dairy farm share has slid from 52¢ in 1980 to 25¢ today. At an all-milk price around $20/cwt against $19.14 in full costs, a lot of herds are running on fumes, and value-added looks like the way into the other 84¢. But the math is brutal — Thunder ran negative cash flow for two to three years, and if you’re bankrolling a brand off the same balance sheet that feeds your cows, a $1/cwt price dip is another $125,000 to absorb on a 500-cow herd. The piece lays out four real paths past 15.9¢ — branded CPG, on-farm processing, commodity optimization, and carbon/data monetization — and exactly where each one breaks. Read it if you’ve ever wondered whether your operation is built to capture value or just produce it. The 30-day move is the cheapest one: spend half a day auditing your hauling and co-op product mix before you fantasize about cans.

value-added dairy

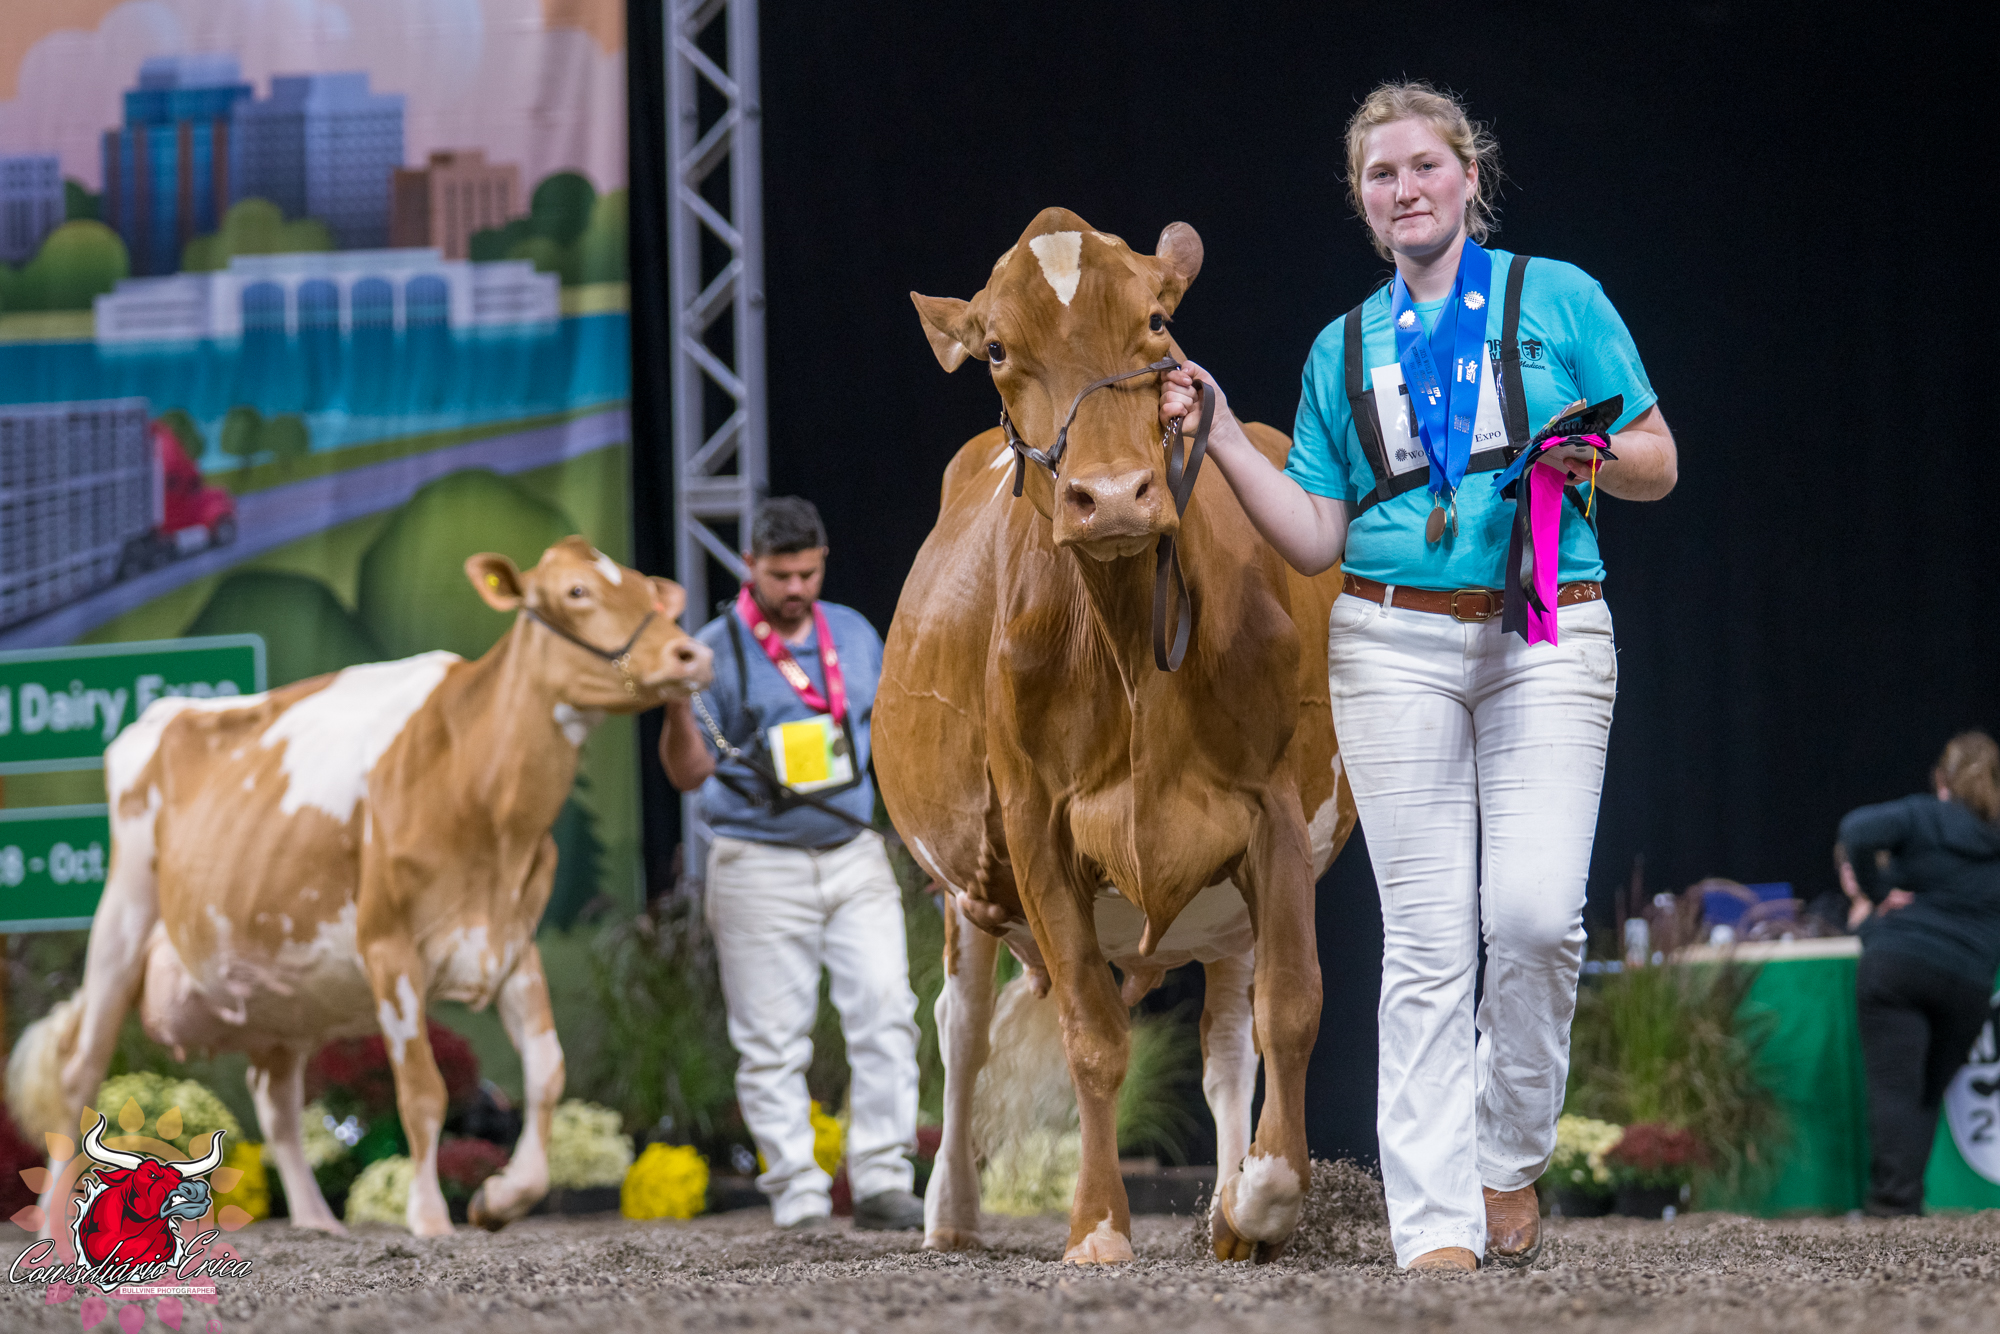
Dave Temple grew up on a dairy farm in Queensland, Australia, where milk-brewed iced coffee is the drink you grab without thinking about it. He moved to Florida, started his own farm, and went looking for that coffee on American shelves. It wasn’t there. So he and fellow multigenerational dairy farmer Ed Henderson decided to build it themselves, starting eight years ago in Ed’s kitchen (Entrepreneur, June 15, 2026).

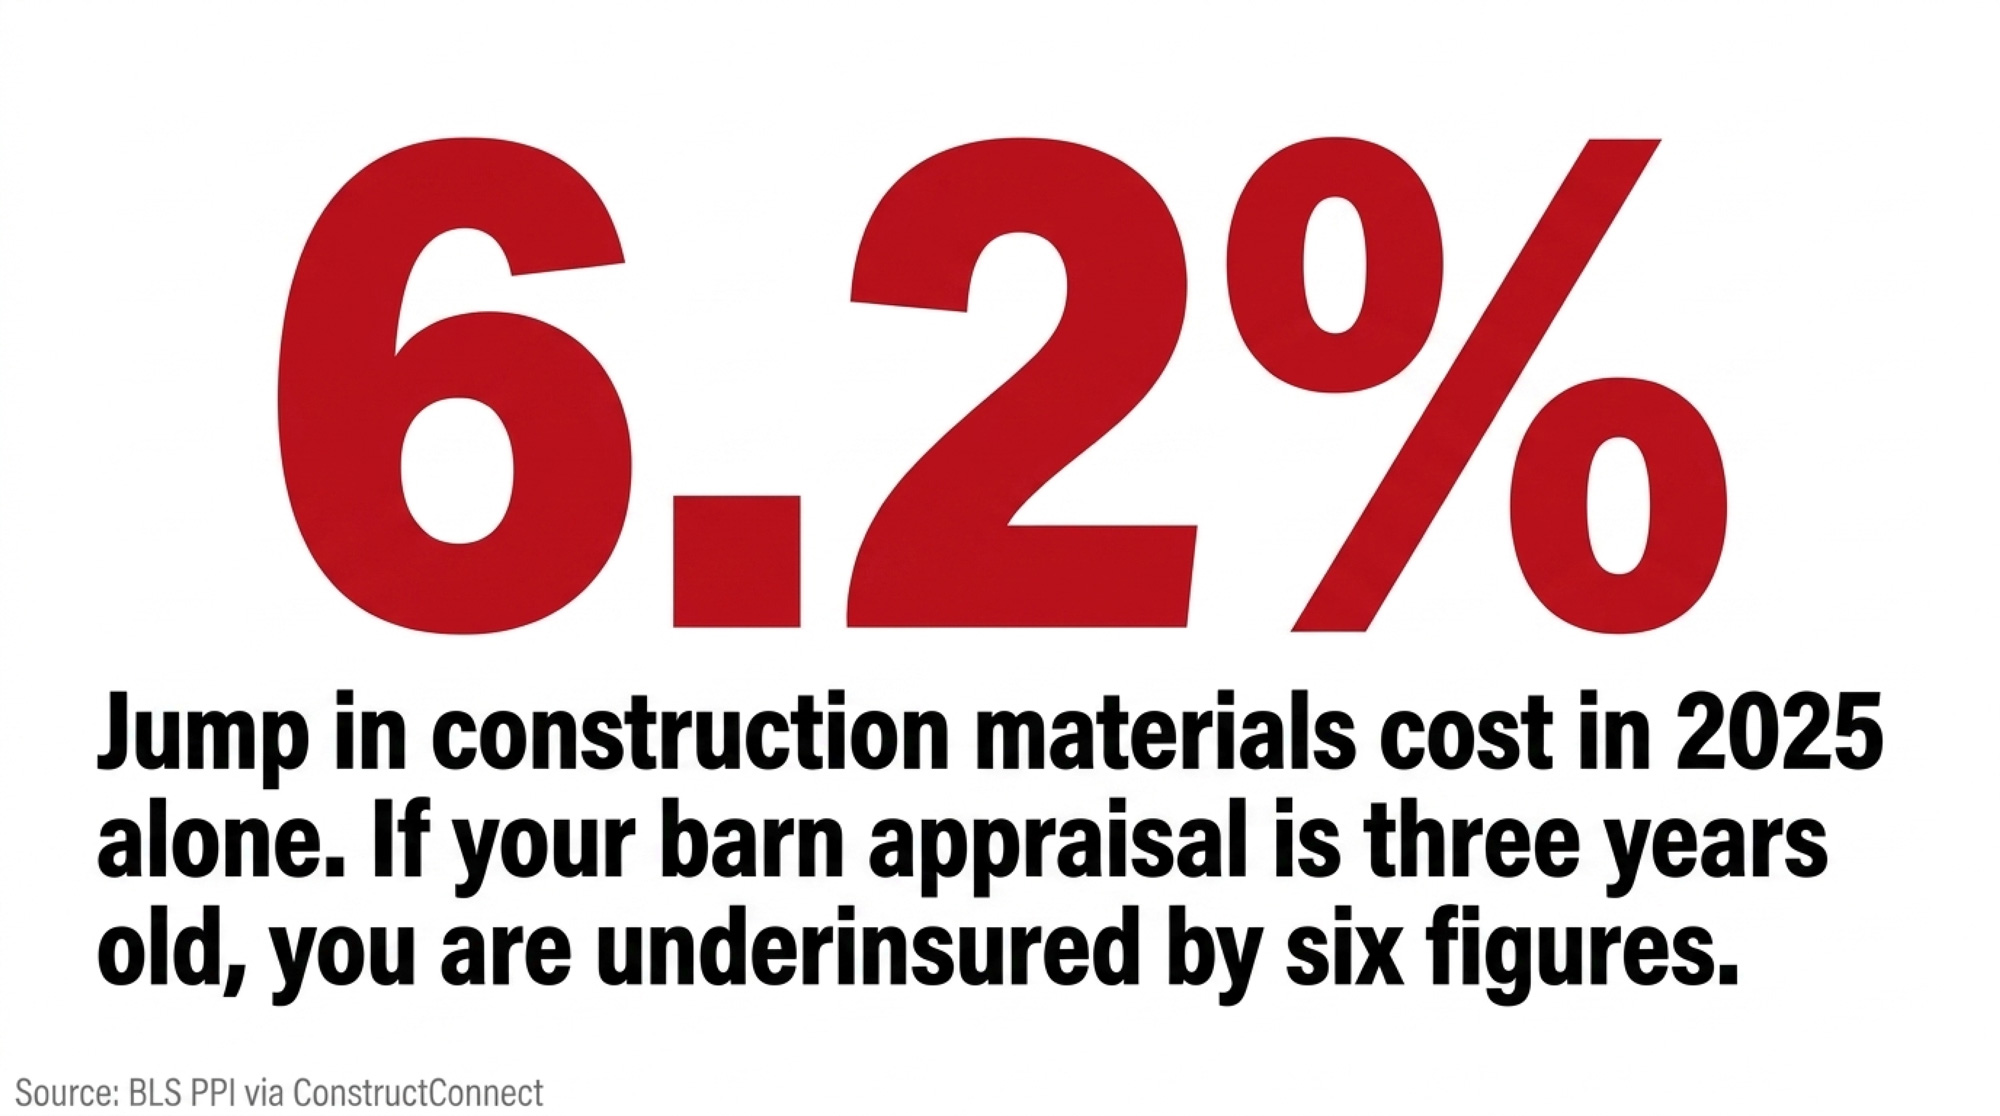
Their brand, Thunder CoffeeMilk, now moves $40,000 to $50,000 a month and rolled out across more than 400 select 7-Eleven stores in Florida when it launched. The numbers sound impressive until you stack them against what USDA says you get from the average food dollar. In 2023, U.S. farmers captured just 15.9 cents of every dollar consumers spent on domestically produced food (USDA ERS Food Dollar Series, 2023 data). That ceiling is the backdrop for what Temple and Henderson built — a value-added product that captures more of the retail dollar than raw milk ever will, one 11-ounce can at a time.

What’s Actually Squeezing the Farm Share

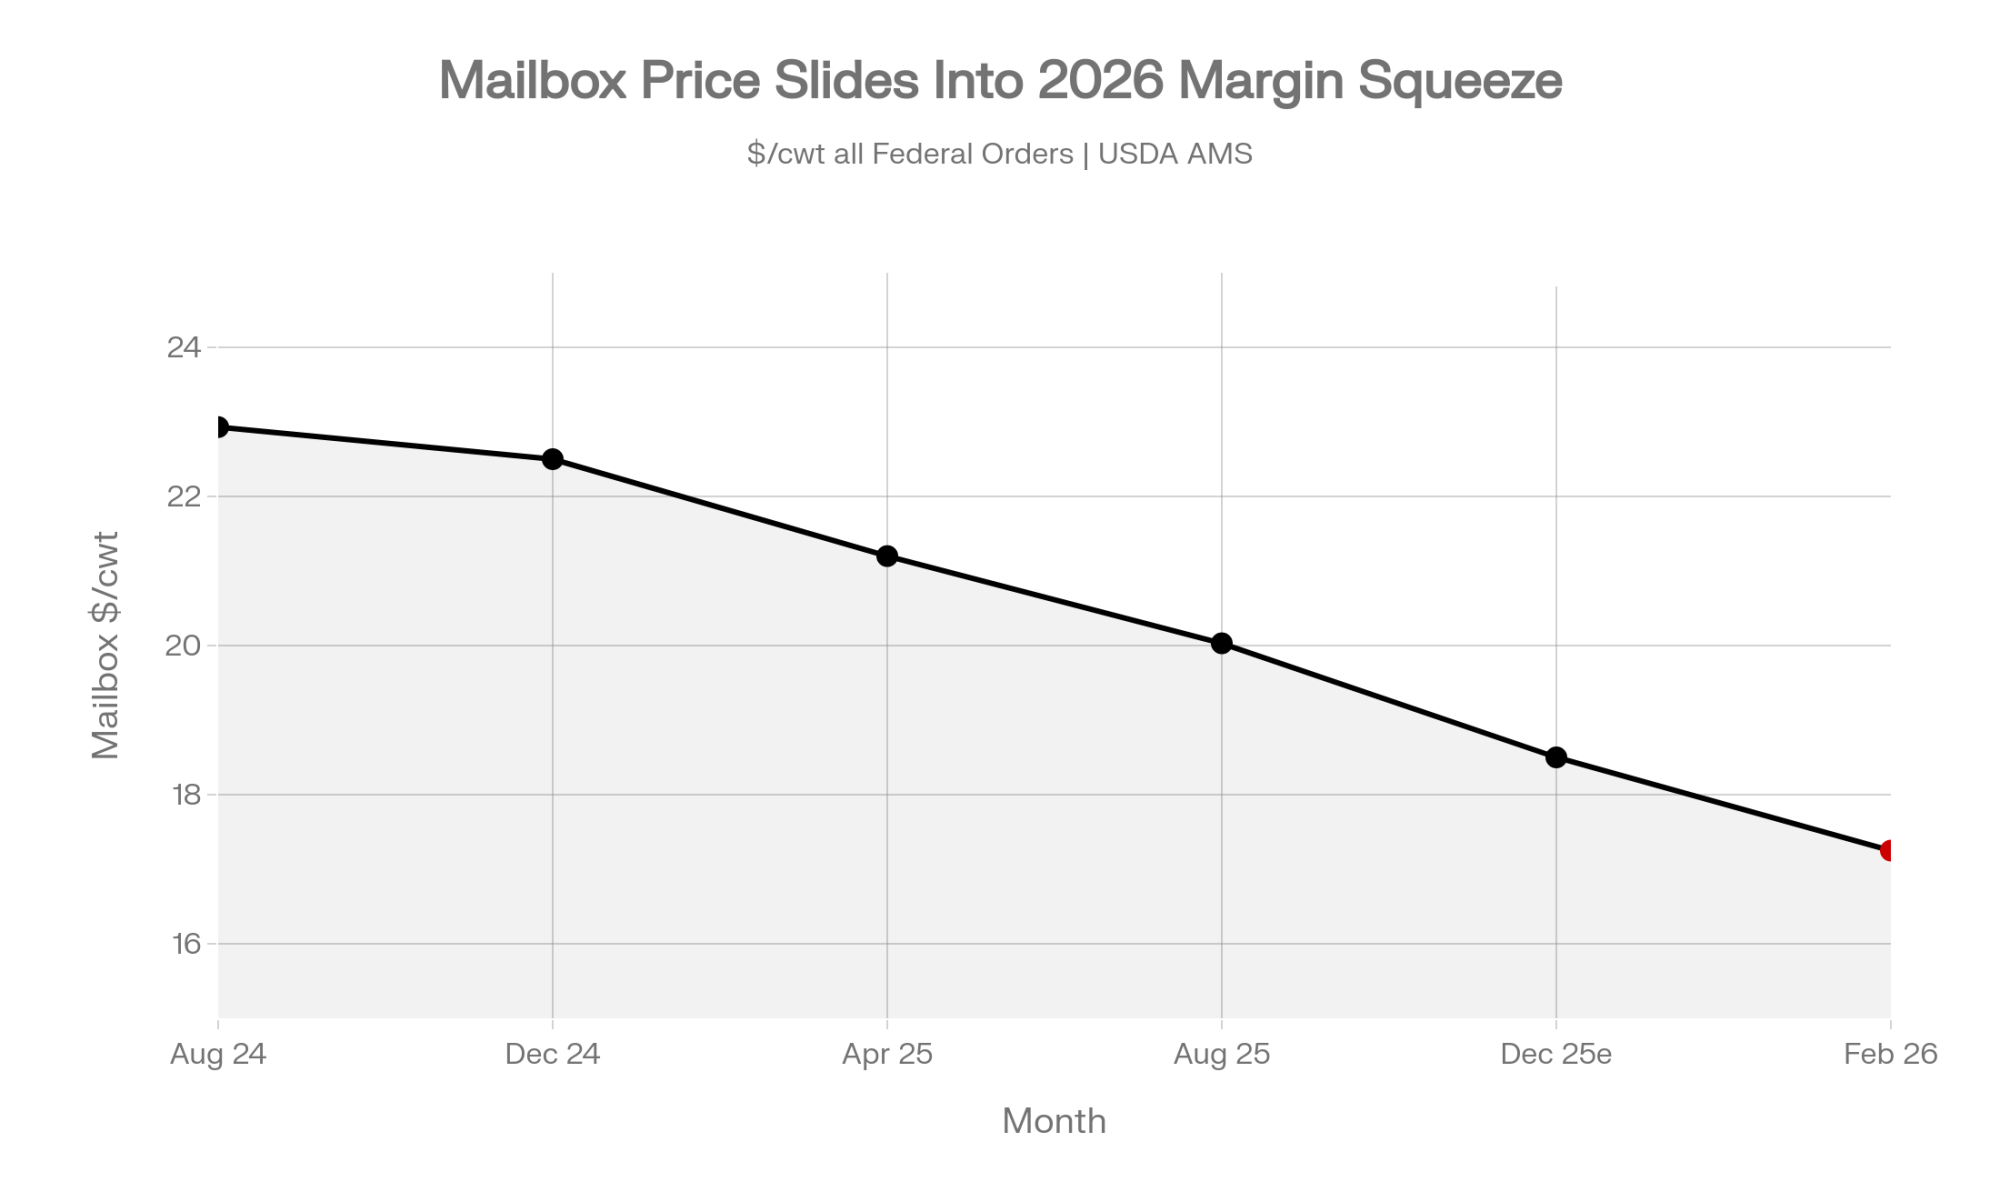
The old playbook was simple. Milk more cows, milk them cheaper, ship to the co-op, and pray the mailbox price covered your cost of production. In 2026, that math is harder to make work. USDA’s latest WASDE outlook has 2026 all-milk hovering around the $20/cwt mark, with 2027 pegged lower. ERS cost figures put average large-herd cost near $19.14/cwt, and the smallest herds run far higher — which is why plenty of dairies start the year structurally tight even when the price looks decent (The Bullvine, “$18.95 Milk, $19.14 Costs,” Feb 10, 2026).

The farm’s slice of the dairy retail dollar has been eroding for two generations. It sat near 52 cents in 1980. USDA’s most recent price-spread data puts it around 25 cents today — the full decline from 52¢ to 25¢ is roughly a 52% drop over that span (The Bullvine, Dec 30, 2025, citing USDA ERS Price Spreads). Same cows. Same barn. A much thinner cut of the same gallon.

That’s the pressure pushing more farmers to look past the tank. Bullvine’s own analysis puts value-added dairy growth near 12% a year while commodity fluid milk stays roughly flat (Nov 24, 2025). And ready-to-drink coffee is one of the hottest rooms in that house — Mordor Intelligence pegs the U.S. RTD coffee market at about $8.3 billion in 2026, and Future Market Insights has milk-based drinks leading the category at 38% (May 2026). Temple and Henderson didn’t chase a fad. They walked into a growing category and noticed most canned coffee is brewed in water, with milk added as an afterthought. Their whole thesis was to flip that — brew the coffee in real milk from the start.

The Solid Block: What It Costs to Cross the Fence

Picture it: two dairy farmers, fifteen hours from home, standing in a food-processing lab at Michigan State University’s Food Processing Innovation Center, watching their first shelf-stable run come out of the machine. Except it didn’t pour. It thudded. The whole batch had seized into a solid block — not a drink, a brick (Entrepreneur, June 15, 2026). That brick is the whole story of value-added dairy in one image.

They spent two days on-site reworking the recipe before they could move forward. And here’s the honest part they’ll tell you themselves: neither had a background in sales, marketing, or distribution. Just decades of farming and a willingness to keep asking questions until they found the right people.

That solid block is worth more than a laugh. It’s the tuition receipt for crossing from commodity supplier to manufacturer. Inside the fence, these two can diagnose a sick cow or a broken ration in seconds. Step outside it into protein chemistry and shelf-life validation, and none of that instinct transfers. You’re back at square one. The failure wasn’t a fluke — it’s what the leap actually feels like. A 2024 Tarleton State University review names limited business and technical expertise, plus thin access to processing infrastructure, as core barriers stopping small U.S. dairy farms from making exactly this kind of move (Tarleton State University, Dec 22, 2024).

How This Plays Out on a Real Balance Sheet

The line from Dave that should stop any producer cold is about retail, not chemistry. “For us to get our toe in the door, it has cost a large amount of money to effectively buy space to get our product in stores,” he told Entrepreneur. “This means negative cash flow for what seems like forever.” That’s not a Silicon Valley runway story with venture money padding the fall. That’s an operating line feeding cows and buying shelf space at the same time.

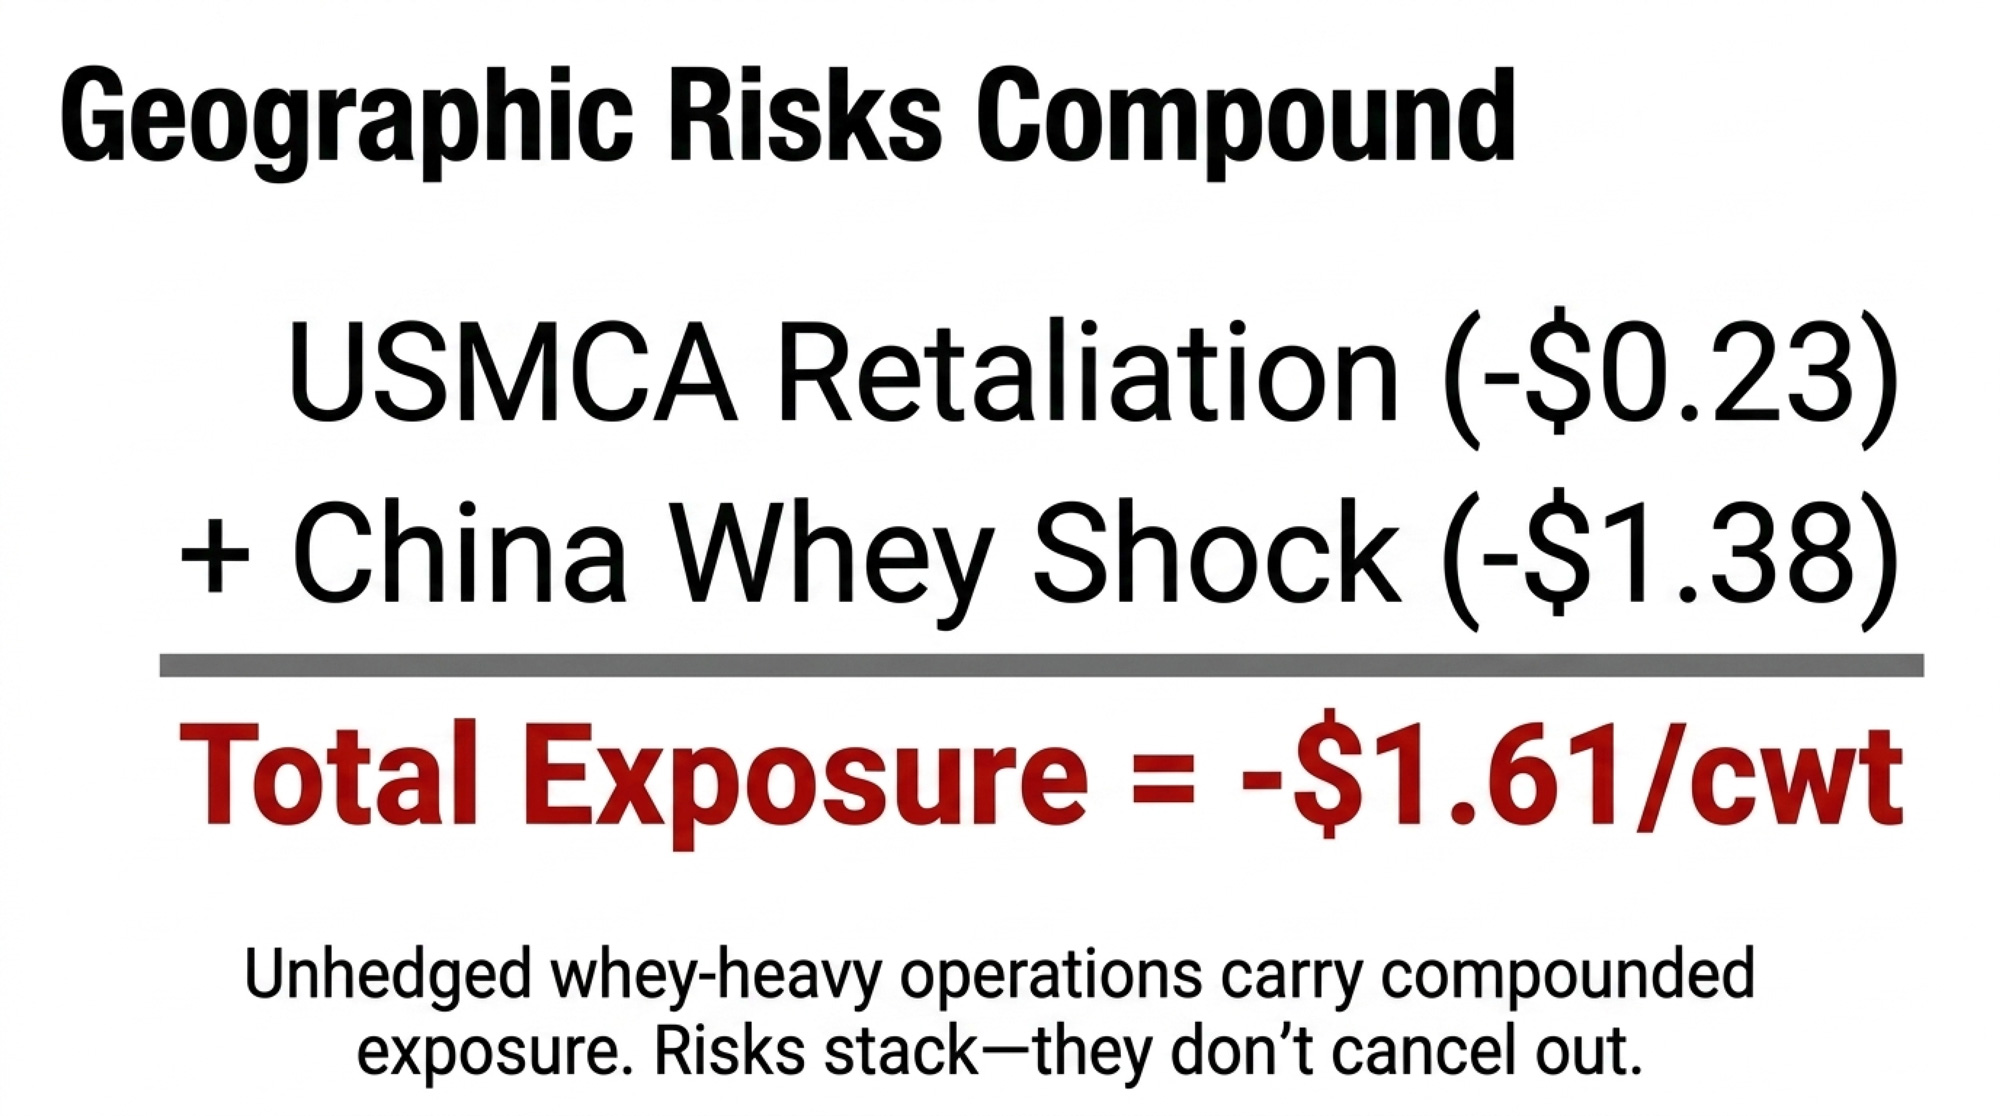
Put real numbers on the milk side first, because that’s the floor this whole bet stands on. Take a 500-cow herd averaging around 25,000 lb per cow — call it 125,000 cwt a year. A $1.00/cwt swing in your mailbox price — well within the range USDA has moved its 2026 forecast this year alone (from $18.95 in February toward the low $20s by mid-year) — is $125,000 in cash flow, up or down, across twelve months. Run lighter cows at 22,000 lb, and you’re closer to $110,000, but the point holds either way. That’s the sensitivity before you add a thing — then you stack a second business on top, one you’re deliberately running at a loss to hold a cooler slot.

Herd SizeAvg Production (lbs/cow)Annual CWT ProducedImpact of $1/cwt SwingImpact of $2/cwt SwingMargin Note
100 cows25,000 lbs25,000 cwt$25,000$50,000Modest swing — still can’t absorb brand losses
250 cows25,000 lbs62,500 cwt$62,500$125,000One bad year = value-added runway gone
500 cows25,000 lbs125,000 cwt🔴 $125,000$250,000Article benchmark — two ventures, one balance sheet
750 cows25,000 lbs187,500 cwt$187,500$375,000Enough scale to potentially isolate ventures
1,000 cows25,000 lbs250,000 cwt$250,000$500,000Scale helps but concentrated risk remains high
1,500 cows22,000 lbs330,000 cwt$330,000$660,000🔴 Large exposure — separate entity structure essential

Here’s the retail side in plain barn terms. For example, say you sell a can wholesale for around a dollar and it costs you 70 cents to make and ship — that’s 30 cents of gross margin per can. Slotting fees, demos, and marketing to hold shelf space in a category run by recognized brands can eat into five figures per chain, per year. At 30 cents per can, you’re moving tens of thousands of units just to cover the cost of being on the shelf — before you clear a dime. That’s the arithmetic hiding inside “negative cash flow for what seems like forever,” and it’s why it took Thunder two to three years to reach consistent monthly revenue. (Those per-can figures are illustrative; Thunder hasn’t published its unit economics.)

Why Is the Farm’s Slice So Thin to Begin With?

Most of the value in food gets built after the product leaves the farm gate. USDA’s Food Dollar data assigns more than 88 cents of every consumer food dollar to the “marketing bill” — processing, packaging, transportation, retail, and food service. A farmer selling raw milk into that system is, by design, holding the smallest slice on the table. In 2024, the all-food farm share slipped to 11.8 cents, with only about 5.8 cents representing true farm-level value added (American Farm Bureau, citing USDA ERS, 2024).

Ed Henderson framed the real barrier better than any economist could. Marketing, he said, is “a feeling. I’m not a feeling kind of guy.” That’s the whole problem in one sentence. Deep expertise inside the fence can turn into a blind spot outside it — you don’t know what you can’t see.

But that same trap cut in their favor once. Not knowing the “proper” RTD formulation rulebook, they built the simplest version that survived the science: cold brew, real milk, a short ingredient list, no artificial sweeteners. Their one stated regret is not bringing a food scientist in earlier. Yet that clean label — the thing shoppers now reward — may exist precisely because two farmers didn’t over-engineer a product they were still learning to make.

Which Path Actually Fits Your Balance Sheet?

Thunder isn’t a template you can photocopy. It’s proof the staircase exists. There are four real paths producers are using to reach past 15.9 cents — and each one breaks in a different, predictable place. Find yours before you commit a dollar.

Strategy PathCapital RiskTime to Positive Cash FlowPrimary Skill GapPrimary Failure PointBest Fit Herd Size
Branded CPG(Thunder path)🔴 High — multi-year negative cash flow2–3 yearsMarketing, slotting, CPG brokersRunning out of capital before shelf velocity covers feesAny — if balance sheet is isolated from farm
On-Farm Processing(cheese/bottled)🔴 High — infrastructure upfront3–5 yearsRegulatory compliance, local salesUnderestimating health/safety compliance cost100–500 cows with local market access
Commodity Optimization(hauling/co-op audit)✅ Low — no new entity30–90 daysInternal ops, premium program knowledgeLow ceiling; optimizing a small sliceAll herd sizes — start here
Carbon/Data Monetization🟡 Low–Medium — verification cost1–2 yearsDisciplined record-keeping🔴 Scale dependency: 500-cow farm ≈ $3,000/yr vs 3,000-cow ≈ $150,000/yr1,000+ cows to make verification overhead worthwhile

¹ Entrepreneur, June 15, 2026 · ² Nuffield Scholar report, 2016 · ³ The Bullvine, “You Only Get 15.9¢ of the Food Dollar” · ⁴ The Bullvine, “Data That Pays”

The branded-product path — Thunder’s — makes sense when you’ve got capital tolerance, a genuine market gap, and someone willing to learn the outside-the-fence game. And retail is no safe harbor: 7-Eleven’s parent, Seven & i, disclosed in its Q4 earnings documents that it expects to close or convert roughly 645 North American stores in fiscal 2026, per cstoredive (April 12, 2026) — even the shelf you fought to reach can move under you.

On-farm processing is the more traveled road, the one most research treats as the default value-added move (Nuffield Scholar report, 2016, Ireland/EU). The limit shows up early: regulatory complexity and capital cost stop most farms before they start. Only a small fraction of Irish farms are formally diversified, per Nuffield’s data — a useful signal for how steep the on-ramp is.

Then there’s the move you can actually start this month, no new company required. Capture more inside the commodity system — audit your hauling routes, question your co-op’s product mix, and press on component and premium programs, the cents-per-cwt kind of work that doesn’t require you to build a thing (The Bullvine, Jan 21, 2026). The ceiling is lower, but the risk is low and the payback is fast.

The fourth path is younger and worth watching: monetizing data and verified sustainability. Bullvine’s reporting found the Athian Marketplace has paid between $15 and $35 per metric ton of CO₂ equivalent for certified U.S. livestock emission reductions (The Bullvine, “Data That Pays,” Oct 22, 2025). It requires verification infrastructure and disciplined record-keeping. The catch is scale — payouts skew hard toward large operations, with 3,000-cow dairies capturing around $150,000 a year while family farms see closer to $3,000 (The Bullvine, Nov 23, 2025).

How Much Does “Buying Your Way In” Really Cost?

More than the slotting fees, honestly. The real cost is concentrated risk. When one family balance sheet backs both the farm and the new venture, a milk-price dip or a feed-cost spike hits both businesses on the same day. Bullvine’s robotic-milking case study describes the same shape of pain — Iowa State’s Larry Tranel found a typical two-robot install can run roughly $8,776 a year in the red for seven years before the payoff arrives (The Bullvine, “Robotic Milking Labor Math,” Apr 10, 2026). If your 500-cow herd hits a $1/cwt price drop in the middle of that valley, that’s another $125,000 you have to absorb. Thunder lived a beverage version of the same thing: two to three years before steady revenue, shelf space bought on borrowed patience. Before you chase any value-added play, the real question isn’t “can I make the product.” It’s “can my balance sheet survive the years before it pays.”

Is Your Operation Built to Capture Value, or to Produce It?

This is the shift worth sitting with, and it has nothing to do with coffee. Most dairies are built — financially and mentally — as commodity producers: fill the tank, ship the milk, take whatever price the system hands back. Temple and Henderson took the other route — a producer-owned brand that signs its own co-packer contracts and holds a piece of the story beyond the farm gate. You don’t need to launch canned coffee to make that shift. But it does mean asking, honestly, whether your operation is set up only to produce milk — or to capture some of what your milk becomes. Australian value-adding scholar Fiona Aveyard put it plainly in her 2023 Nuffield report: farmers “often have more control over their product than they realise” (Nuffield Australia, “Beyond the Farm Gate,” Aug 13, 2025).

Key Takeaways

  • If your net runs below full economic cost — check your real number against the ERS large-herd benchmark near $19.14/cwt against an all-milk forecast around $20/cwt — you’re in the same squeeze pushing farmers toward value-added plays. Nail down your breakeven before you consider one.
  • Before launching any branded product, model a two-to-three-year negative cash-flow window and stress-test whether your balance sheet absorbs it while milk prices swing.
  • Too big a leap? This month, set aside half a day to audit hauling costs and your co-op’s product mix for the cents-per-cwt you’re leaving on the table.
  • Name your outside-the-fence skills gap out loud. If you can’t spot what’s broken in marketing the way you can in the parlor, budget for the expertise you don’t have.
  • Don’t over-engineer the product. Thunder’s clean, short-ingredient label came from building the simplest version that worked.
  • Treat data and sustainability programs as a real but young value stream — and check where a herd your size actually lands, since a 3,000-cow dairy can bank roughly $150,000 while a 500-cow family farm might see around $3,000.

Where does your operation sit on that staircase right now — still shipping into the 15.9 cents, or reaching for a piece of the other 84? You don’t have to answer with a product launch. You do have to answer with your own numbers, because at an all-milk forecast around $20/cwt against $19.14 costs, ERS math says a lot of herds are running on a razor-thin full-cost margin.

Run Your Numbers

Dairy Profit Projector — Before you chase the other 84¢, find out if your core business even pencils. Drop in your herd size, milk price, and ration to see your breakeven milk price, IOFC, and 12-month margin — then stress-test what a $1/cwt swing does to your bottom line before you bet a second business on it.

Complete references and supporting documentation are available upon request by contacting the editorial team at editor@thebullvine.com.

Learn More

The Sunday Read Dairy Professionals Don’t Skip.

Every week, thousands of producers, breeders, and industry insiders open Bullvine Weekly for genetics insights, market shifts, and profit strategies they won’t find anywhere else. One email. Five minutes. Smarter decisions all week.

NewsSubscribe
First
Last
Consent

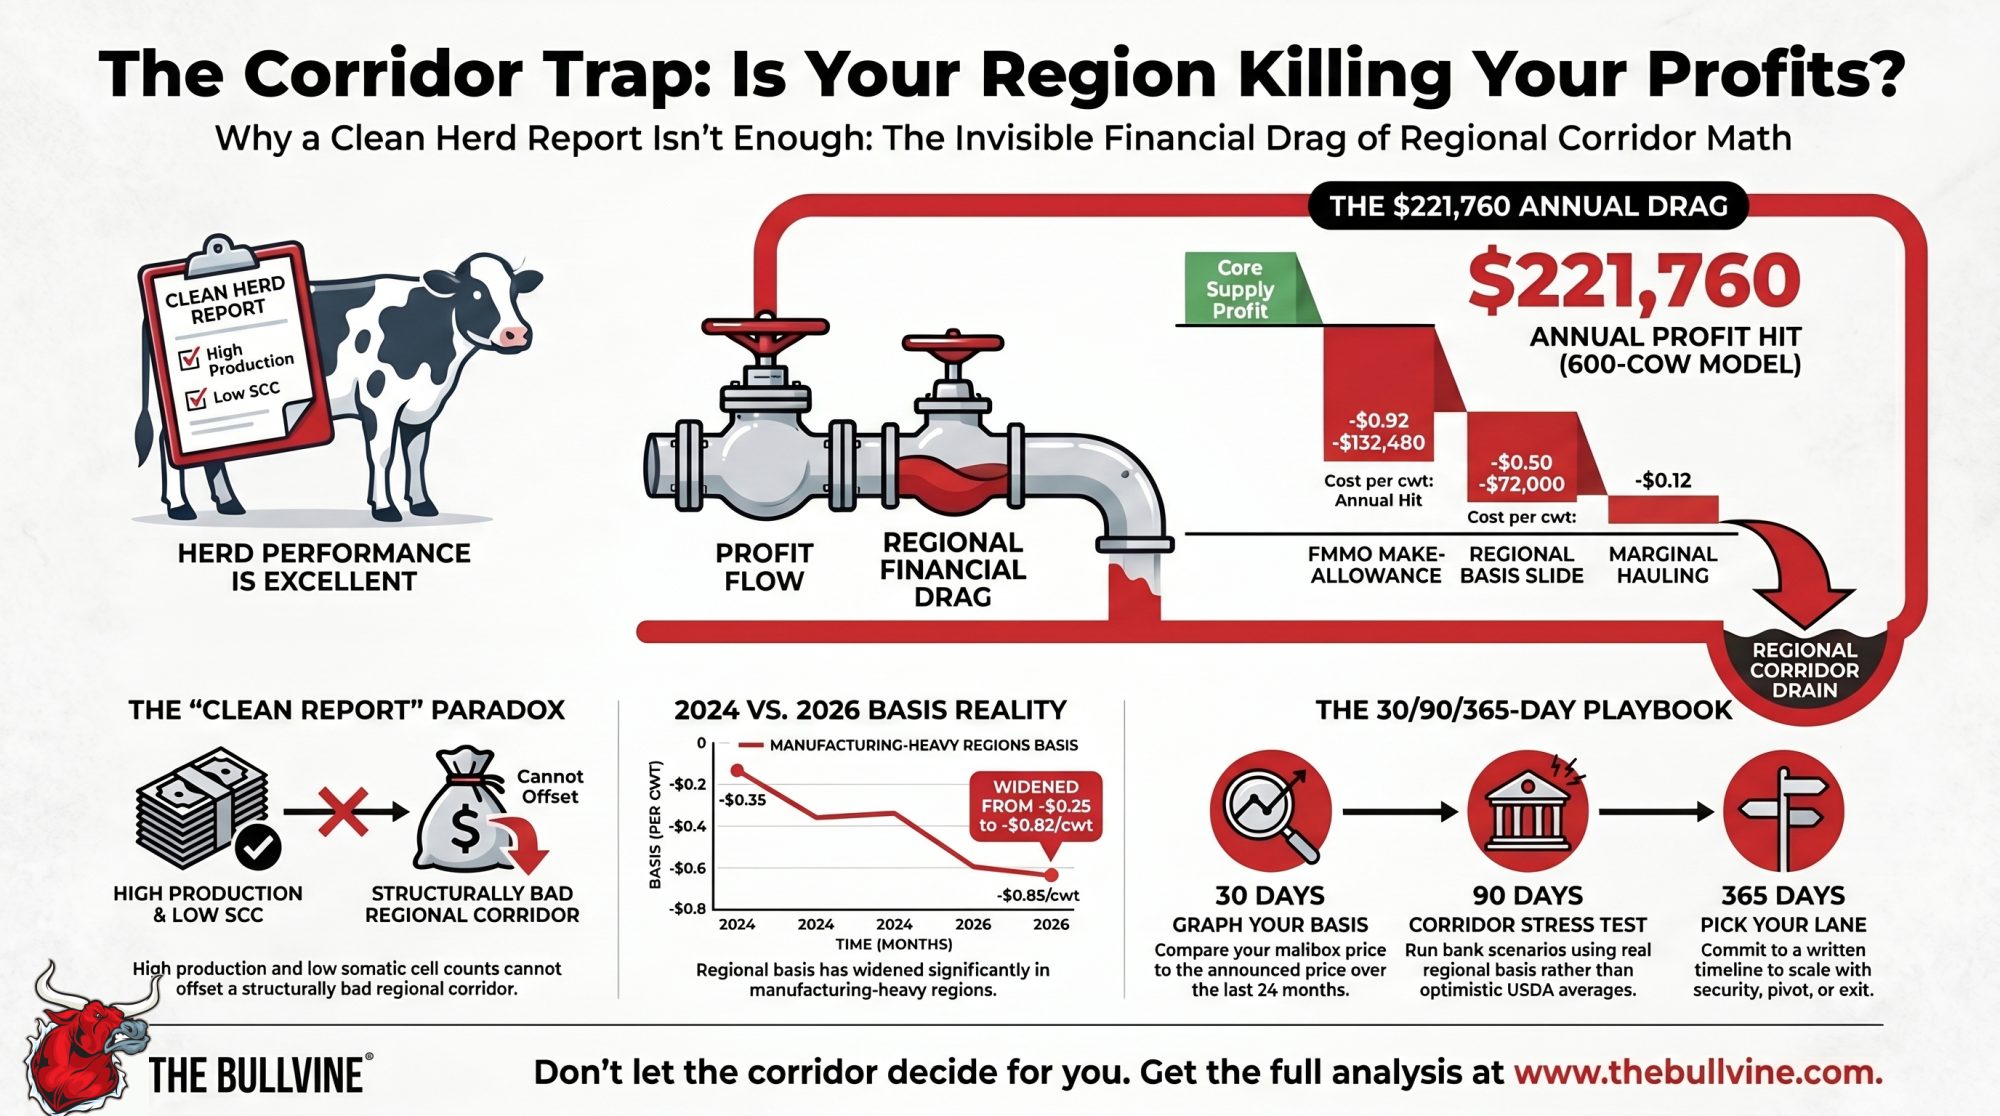
The $221,760 Corridor Trap Hitting 600‑Cow Upper Midwest Dairies in 2026

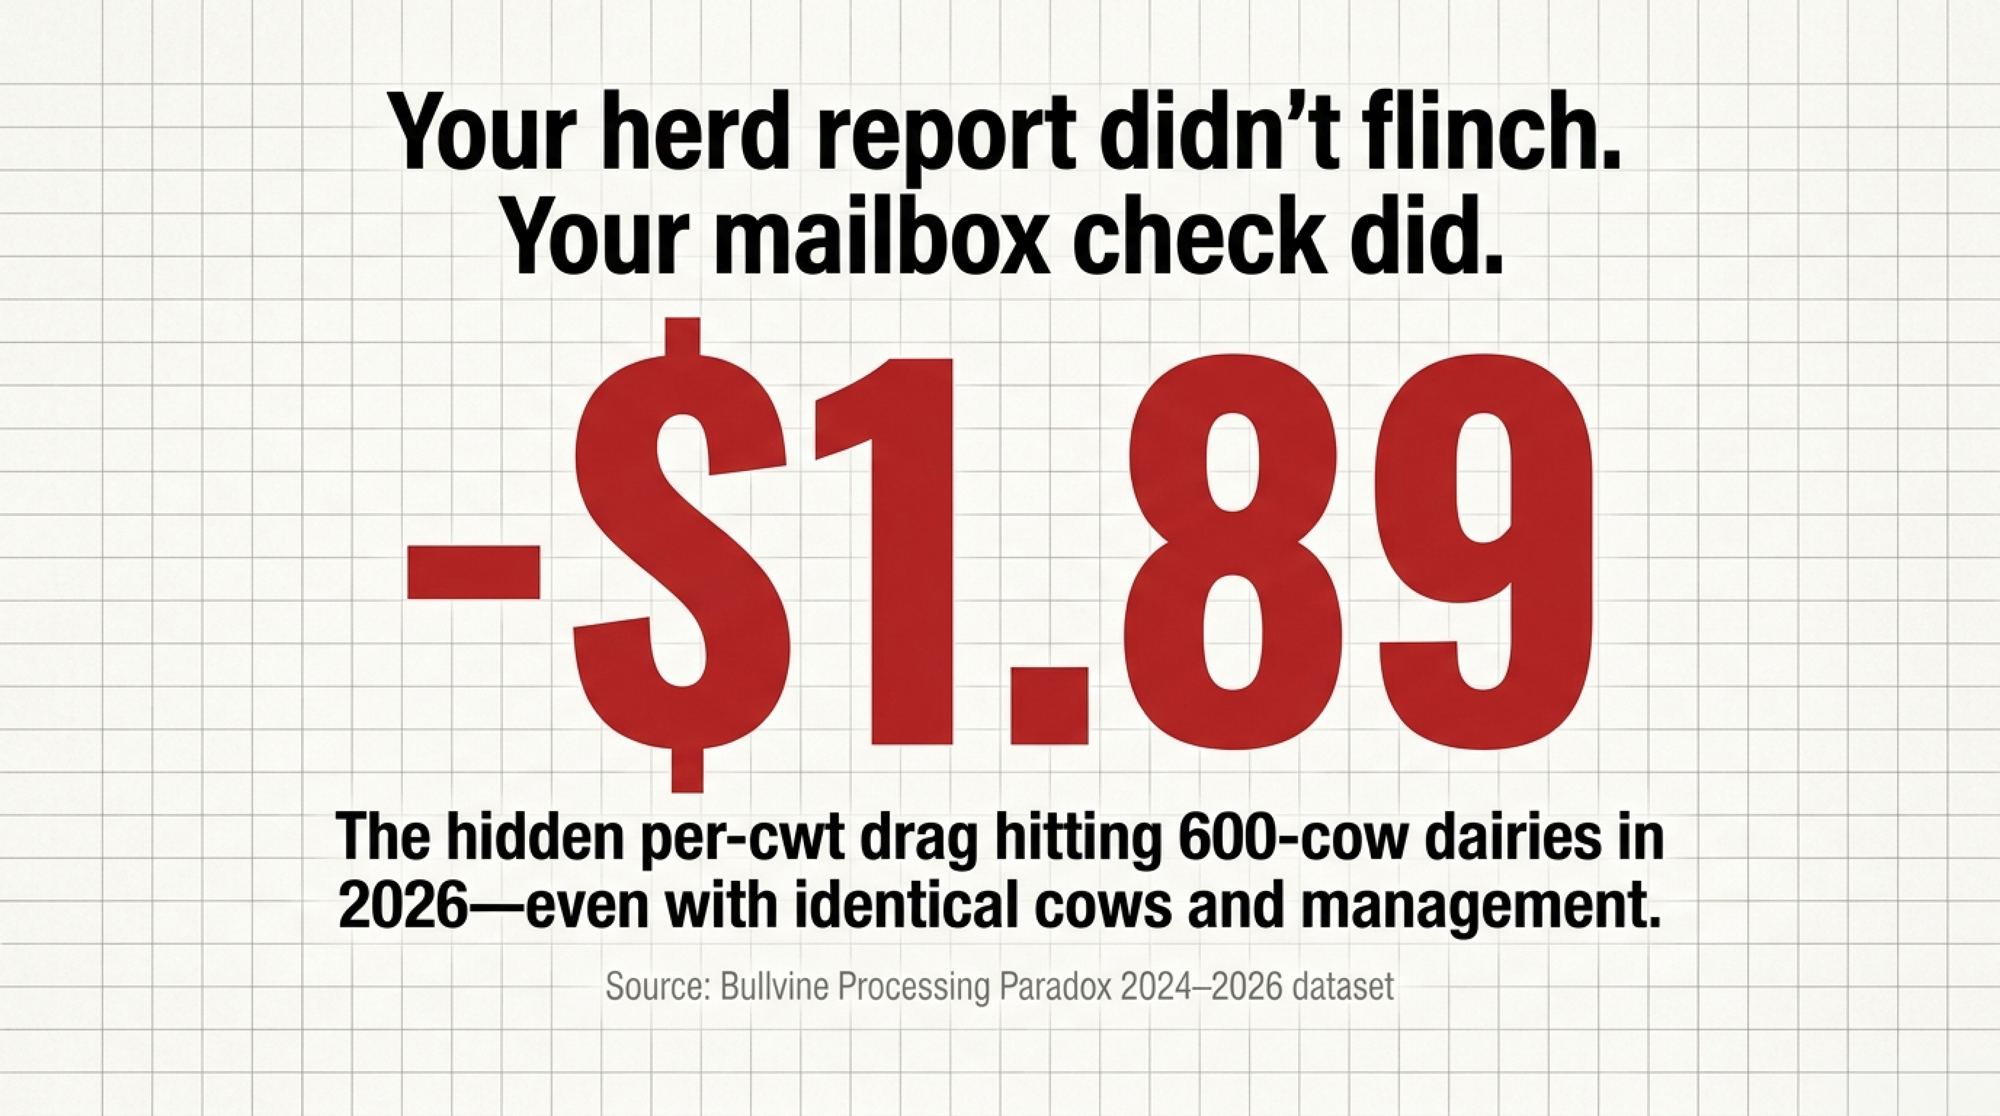
Same cows. Same management. A different corridor — and a $221,760 annual drag. Basis went from ‑$0.35 to ‑$0.85/cwt while the FMMO make‑allowance took another $0.92 off Class III. The herd report still looks clean.

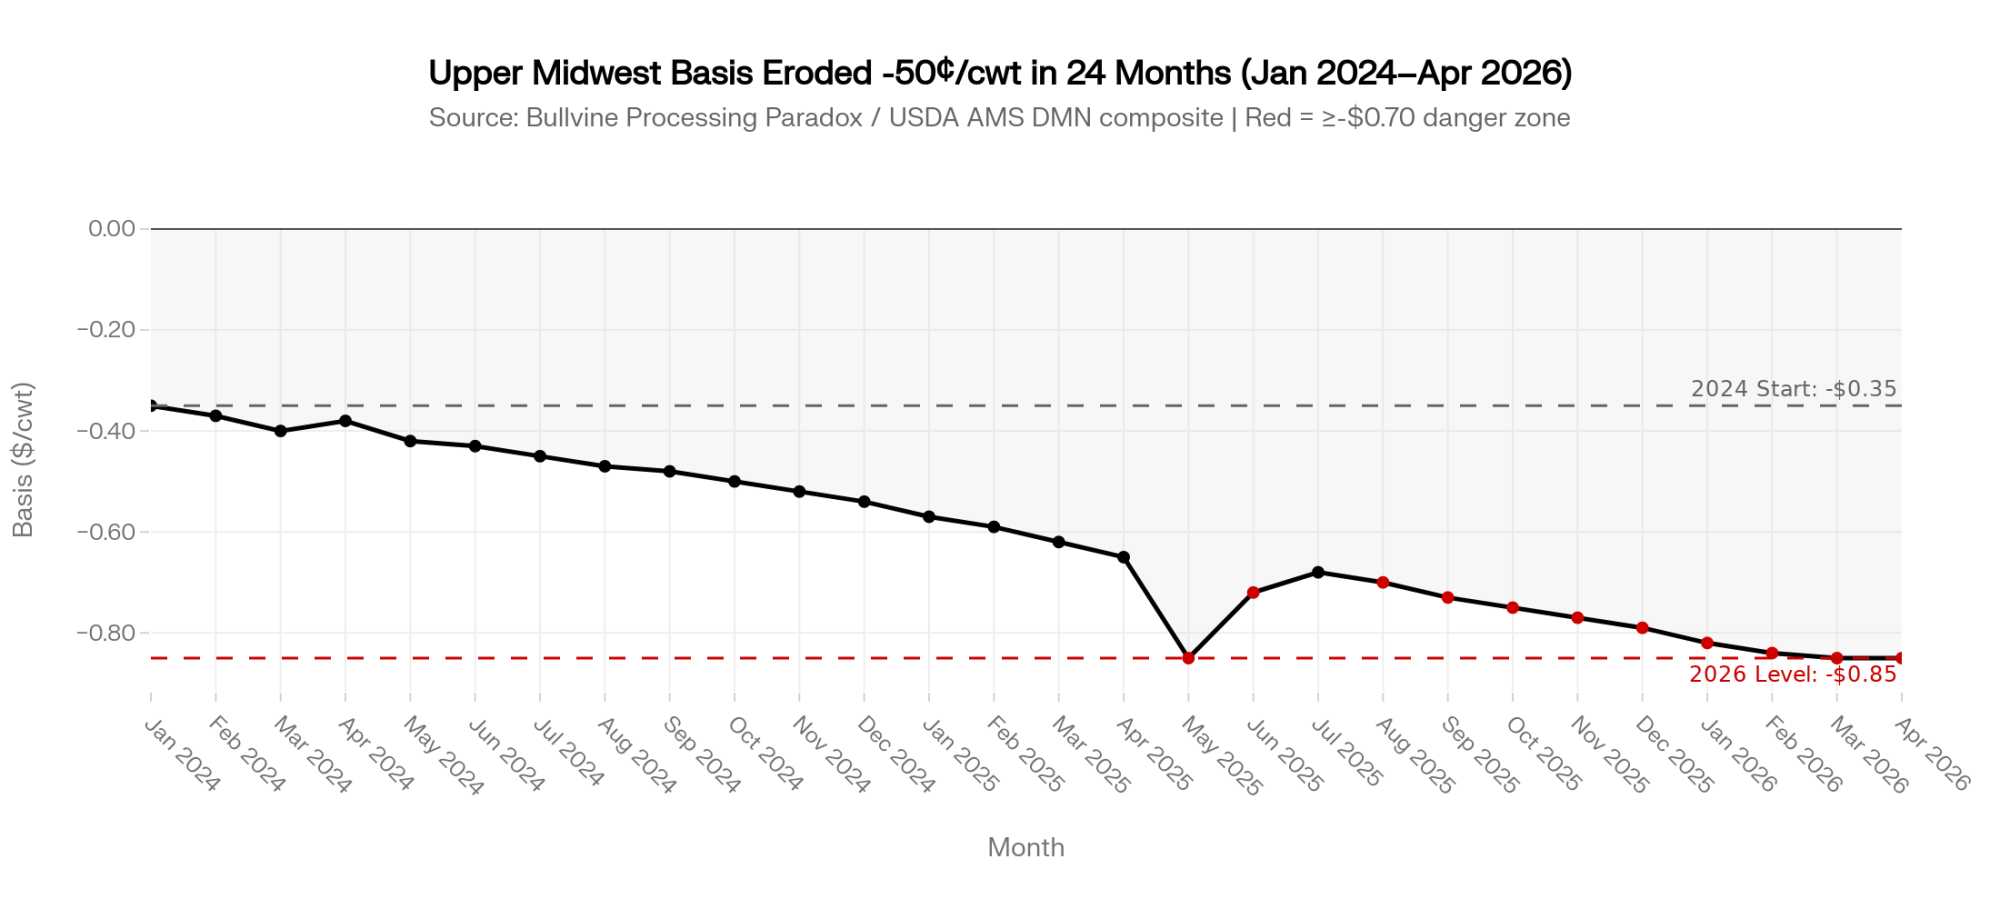
On a 600‑cow Upper Midwest dairy we’ll call Maple Ridge, the all‑in basis on the milk check has moved from roughly ‑$0.35/cwt in 2024 to about ‑$0.85/cwt in early 2026. Same cows. Same management. A different corridor.

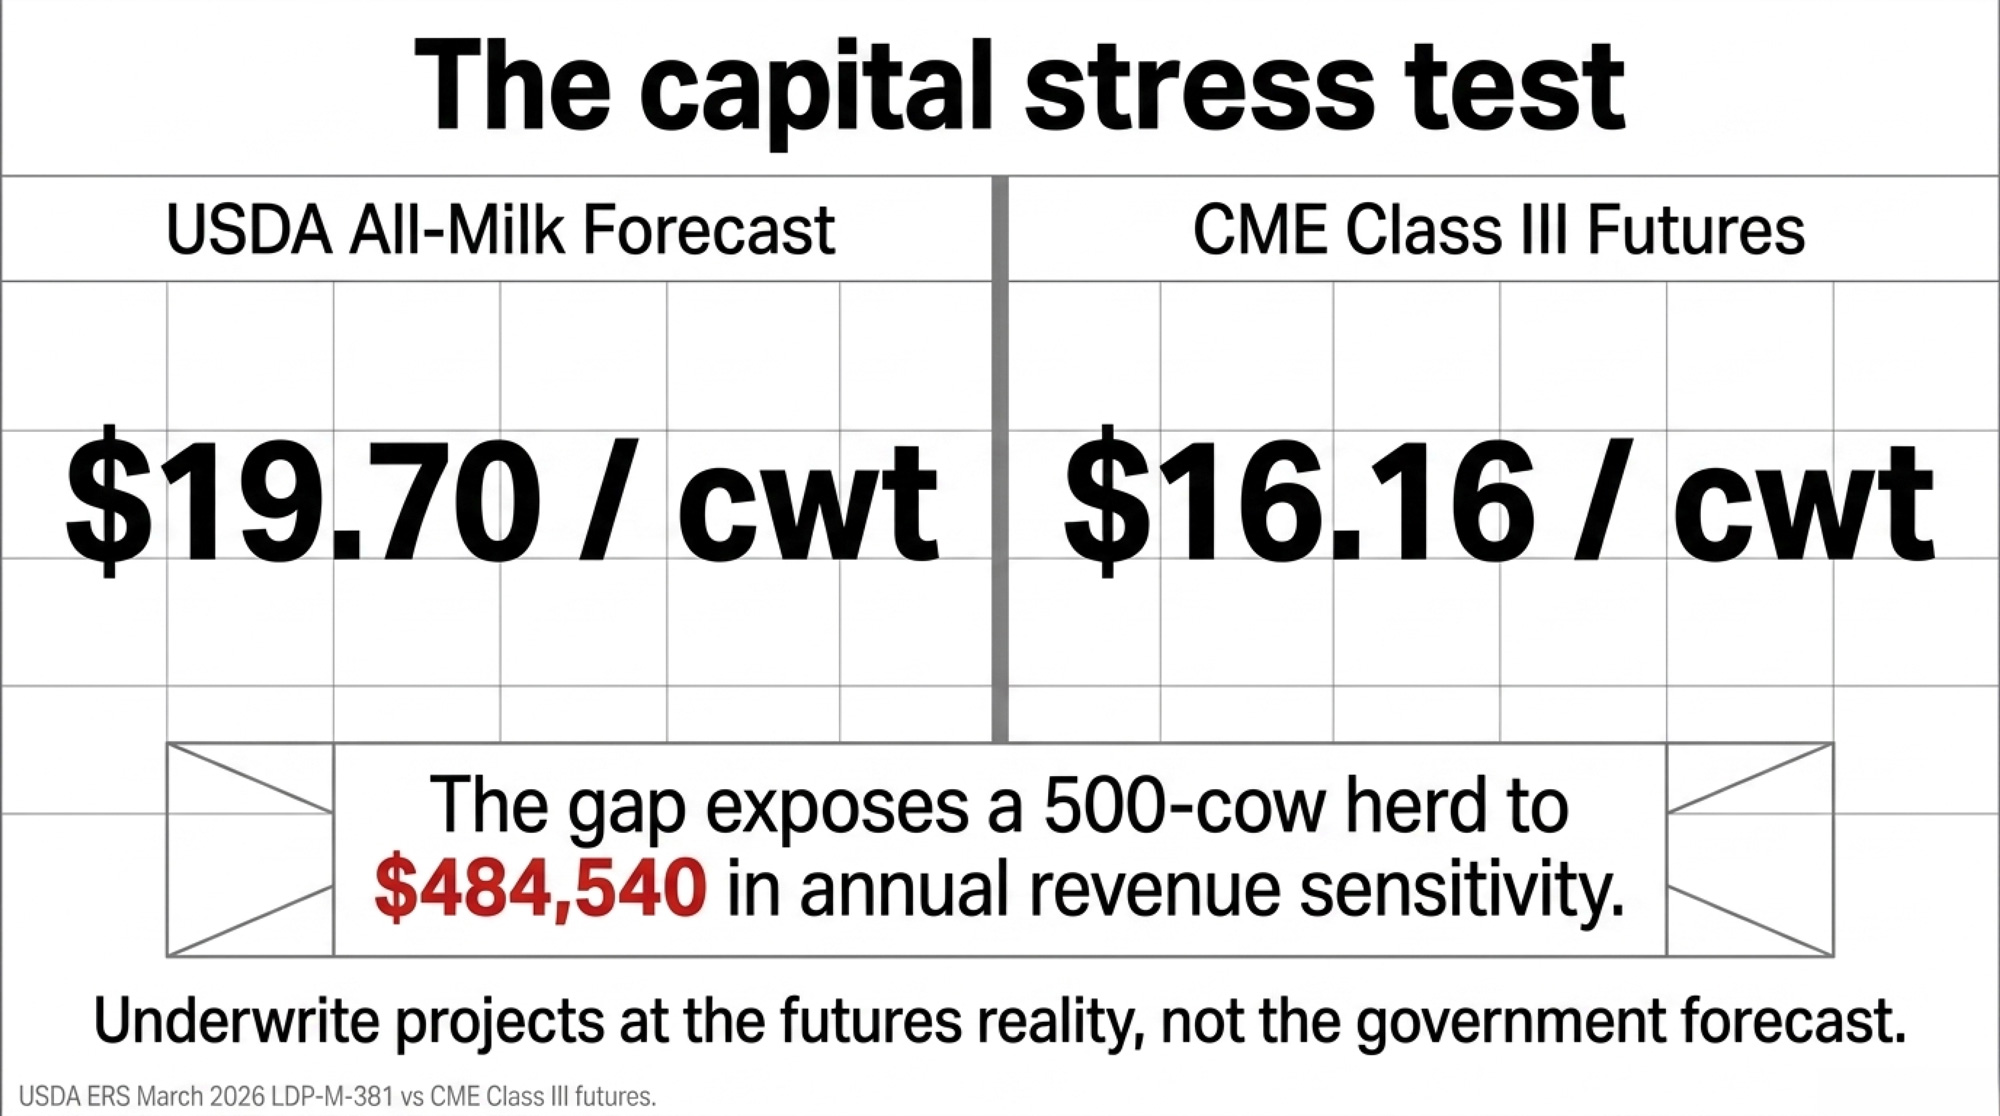
USDA ERS’s April 2026 Livestock, Dairy, and Poultry Outlook puts 2026 all‑milk near $20.40–$20.50/cwt, while CME Class III futures for mid‑2026 contracts have traded mostly in the mid‑$16s to upper‑$17s through early Q2 2026 sessions. That $2–$3/cwt gap is the budget anchor argument every dairy lender is now having. Maple Ridge’s gap isn’t on the screen. It’s on the milk check.

Maple Ridge is a composite operation drawn from Bullvine reporting and the Processing Paradox 2024–2026 dataset, used here so we can show real numbers without exposing a real farm’s milk check. The rule‑change inputs are verified against published USDA and Bullvine analysis. The herd‑level inputs are illustrative. Plug in your own.

A 2,000‑cow Western dairy we’ll call Dos Arroyos — also a composite, modeled on the kind of core‑supply contracts Bullvine has documented along the High Plains and I‑29 corridor — is staring at the same kind of basis pressure and adding 400 cows anyway. The processing capacity dairy 2026 question lives right in the gap between those two decisions.

This isn’t a story about milk per cow. It’s about whether your region’s plants want your next pound or not.

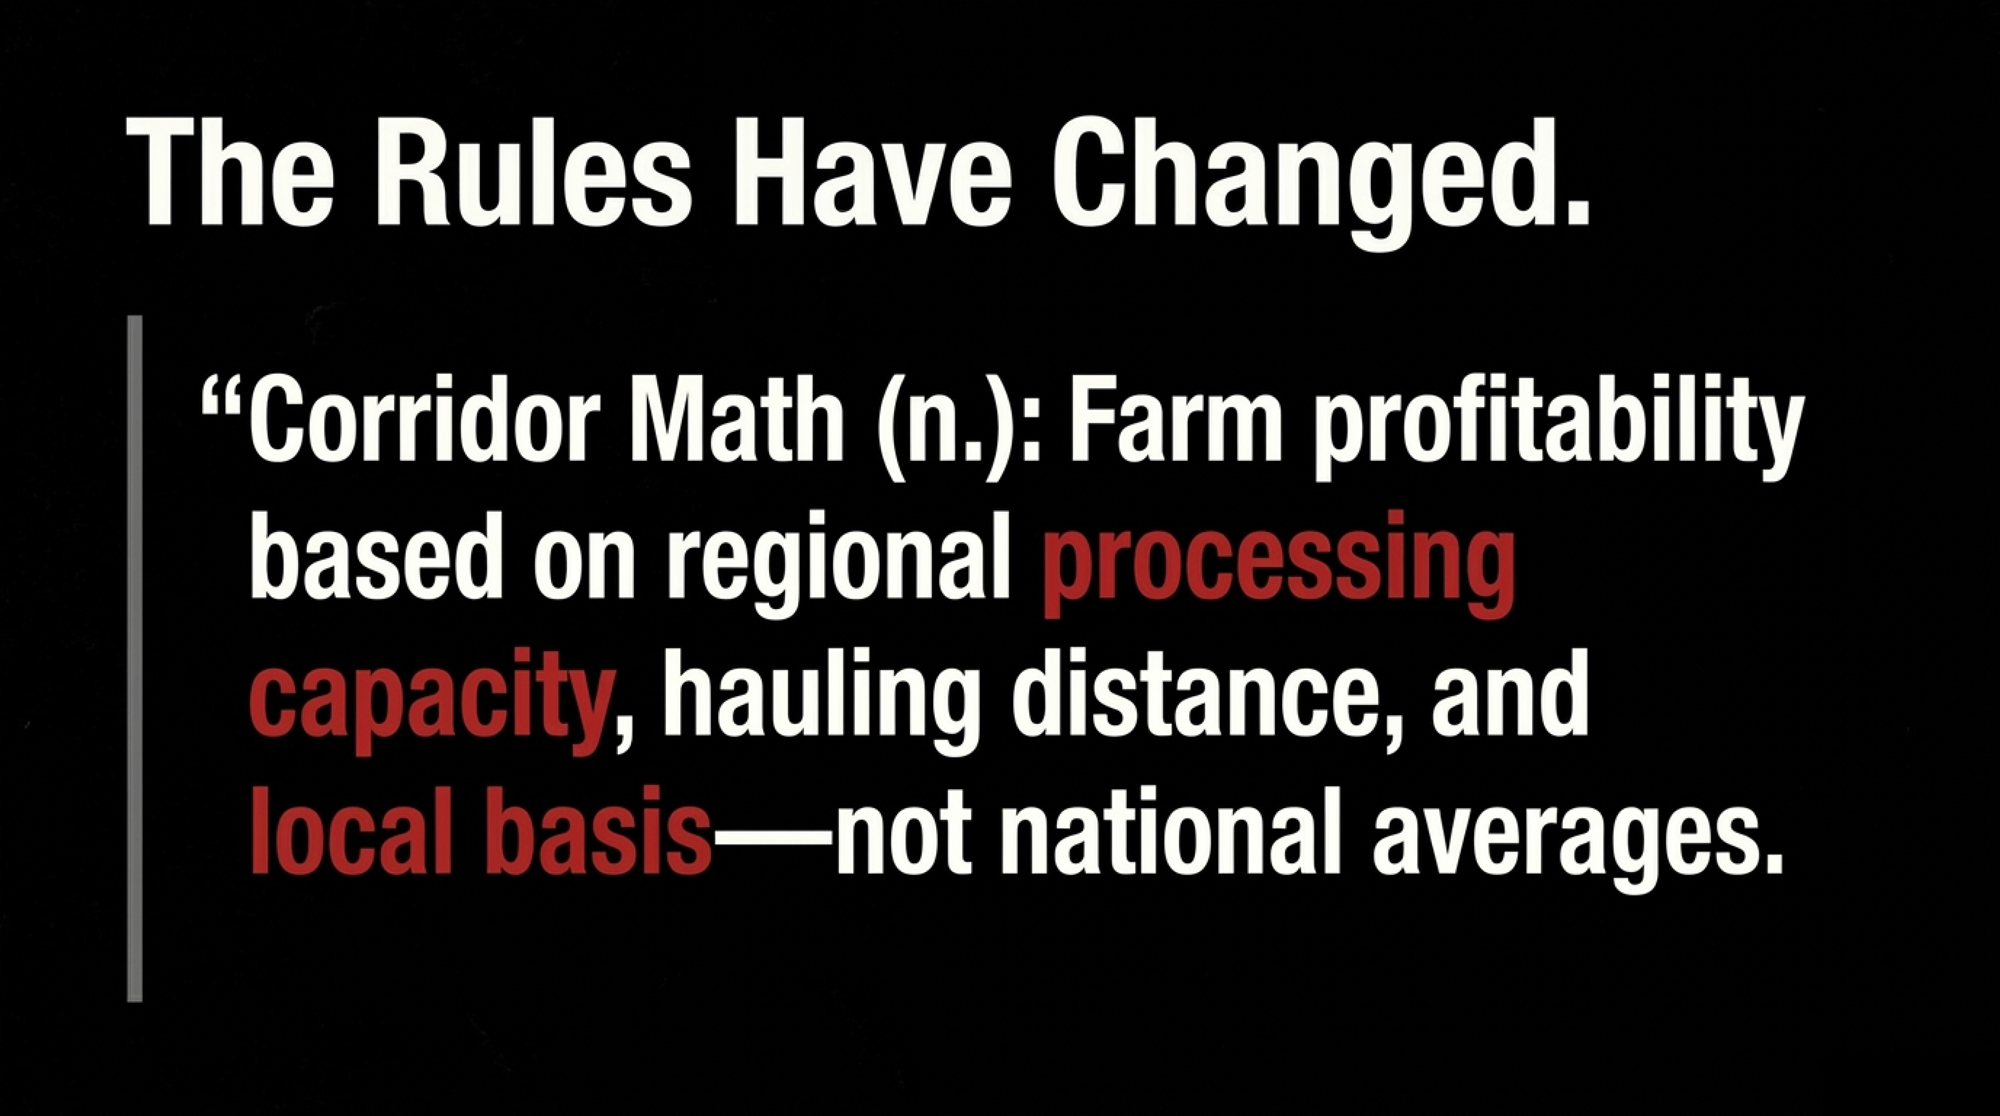
Bullvine Definition — Corridor Math (n.): The calculation of farm profitability based on regional processing capacity, hauling distance to marginal plants, and local basis, rather than national Class III averages. Two farms with identical herd reports can sit on opposite ends of Corridor Math if their plants, hauling lanes, and basis trends diverge.

Quick note for Ontario and Canadian readers: Corridor Math applies under supply management too. The levers change — base allocation, P5 pooling, plant access, CDC pricing signals — but the question is the same: does your buyer’s plant want your next hectolitre, and at what net mailbox price?

How Maple Ridge’s $221,760 Annual Drag Hid Inside a Clean Herd Report

Maple Ridge ships into a cheese‑heavy Upper Midwest milkshed inside Federal Order 30. Components are solid, somatic cell count is low, and debt per cow sits under the $3,500/cow “strong” threshold cited in Cornell PRO‑DAIRY Dairy Farm Business Summary–style benchmarks referenced in the Processing Paradox analysis (Cornell PRO‑DAIRY DFBS, 2024 edition). By the herd report, nothing’s wrong.

The corridor changed around them.

  • Bullvine’s Processing Paradox reporting — drawing on USDA AMS Dairy Market News and operator public statements — documented reduced weekend and overtime processing at several Upper Midwest cheese plants through 2024–2025, alongside tighter volume caps and base‑excess plan use. Operators cited labor and energy costs.
  • Regional herd consolidation in the same buyer’s draw radius tightened the local milk‑to‑capacity ratio over 2024, consistent with the relocation and consolidation patterns Bullvine has documented along the I‑29 corridor.
  • USDA AMS Dairy Market News reported Midwest spot Class III milk trading flat to as much as $7.00 under Class III during the spring 2025 flush cycle, with the deepest discounts in the week ending May 2, 2025 (USDA AMS DMN, April–May 2025 weekly issues).

Stack those forces and a 50¢/cwt basis slide isn’t a mystery. It’s the price tag on a corridor that quietly went long on milk.

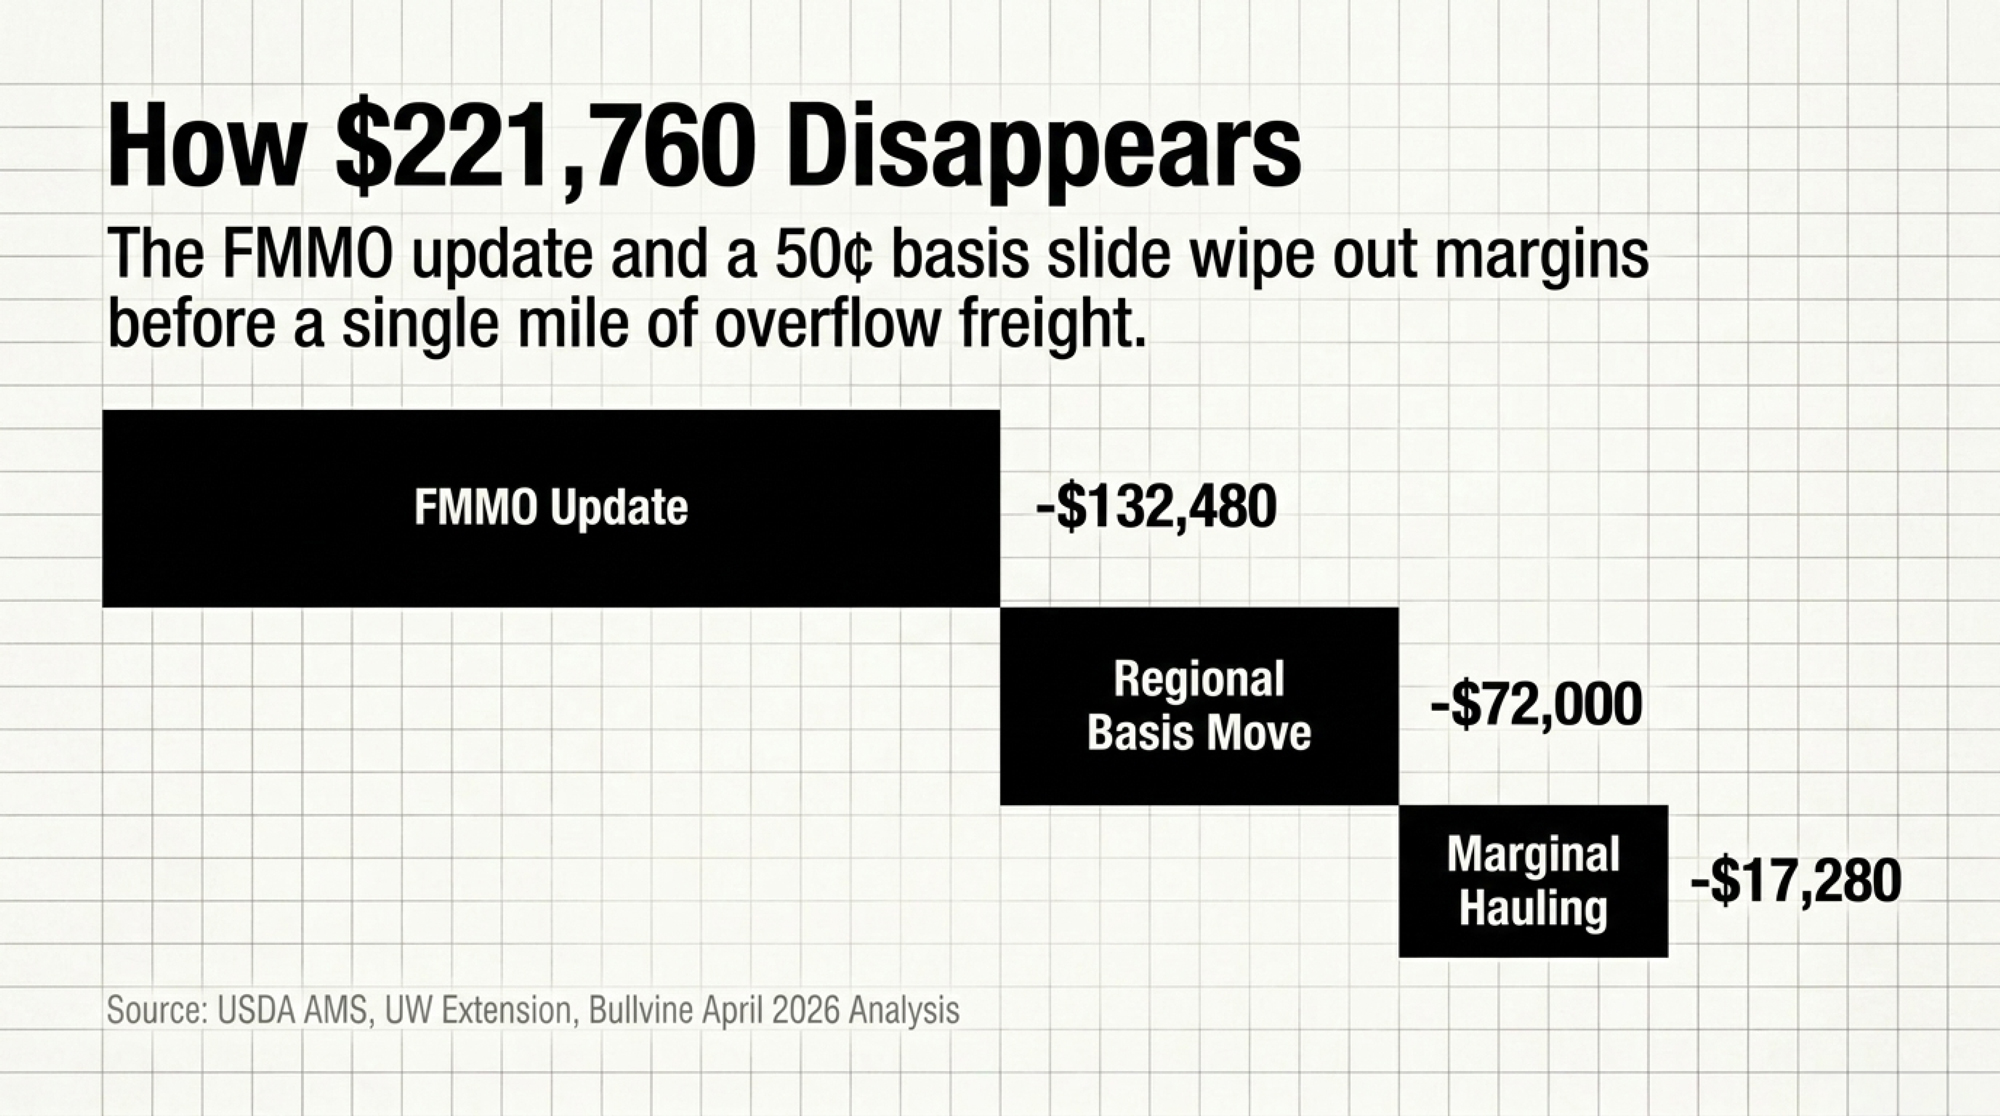
The 2025 FMMO modernization sits on top of all this. Bullvine’s April 2026 analysis, The New FMMO Rule Costs a 500‑Cow Dairy $97,750 a Year, pegs the make‑allowance update at roughly $0.85–$0.93/cwt off Class II–IV values once fully phased in, with Class III near $0.92/cwt, based on USDA AMS, Final Rule on Amendments to Federal Milk Marketing Orders (January 2025) and the University of Wisconsin Extension review of the AMS final decision (2025). That’s before a single mile of freight. Before basis. Before a balancing fee.

Deep Dive → The New FMMO Rule Costs a 500‑Cow Dairy $97,750 a Year — Tier 3 pillar, April 2026.

What Does a 50¢/cwt Basis Slide Actually Cost a 600‑Cow Dairy in 2026?

This is where you stop talking corridors and run the numbers like your banker would.

The Maple Ridge 2026 Reality — 600 Cows, Upper Midwest, Illustrative Composite

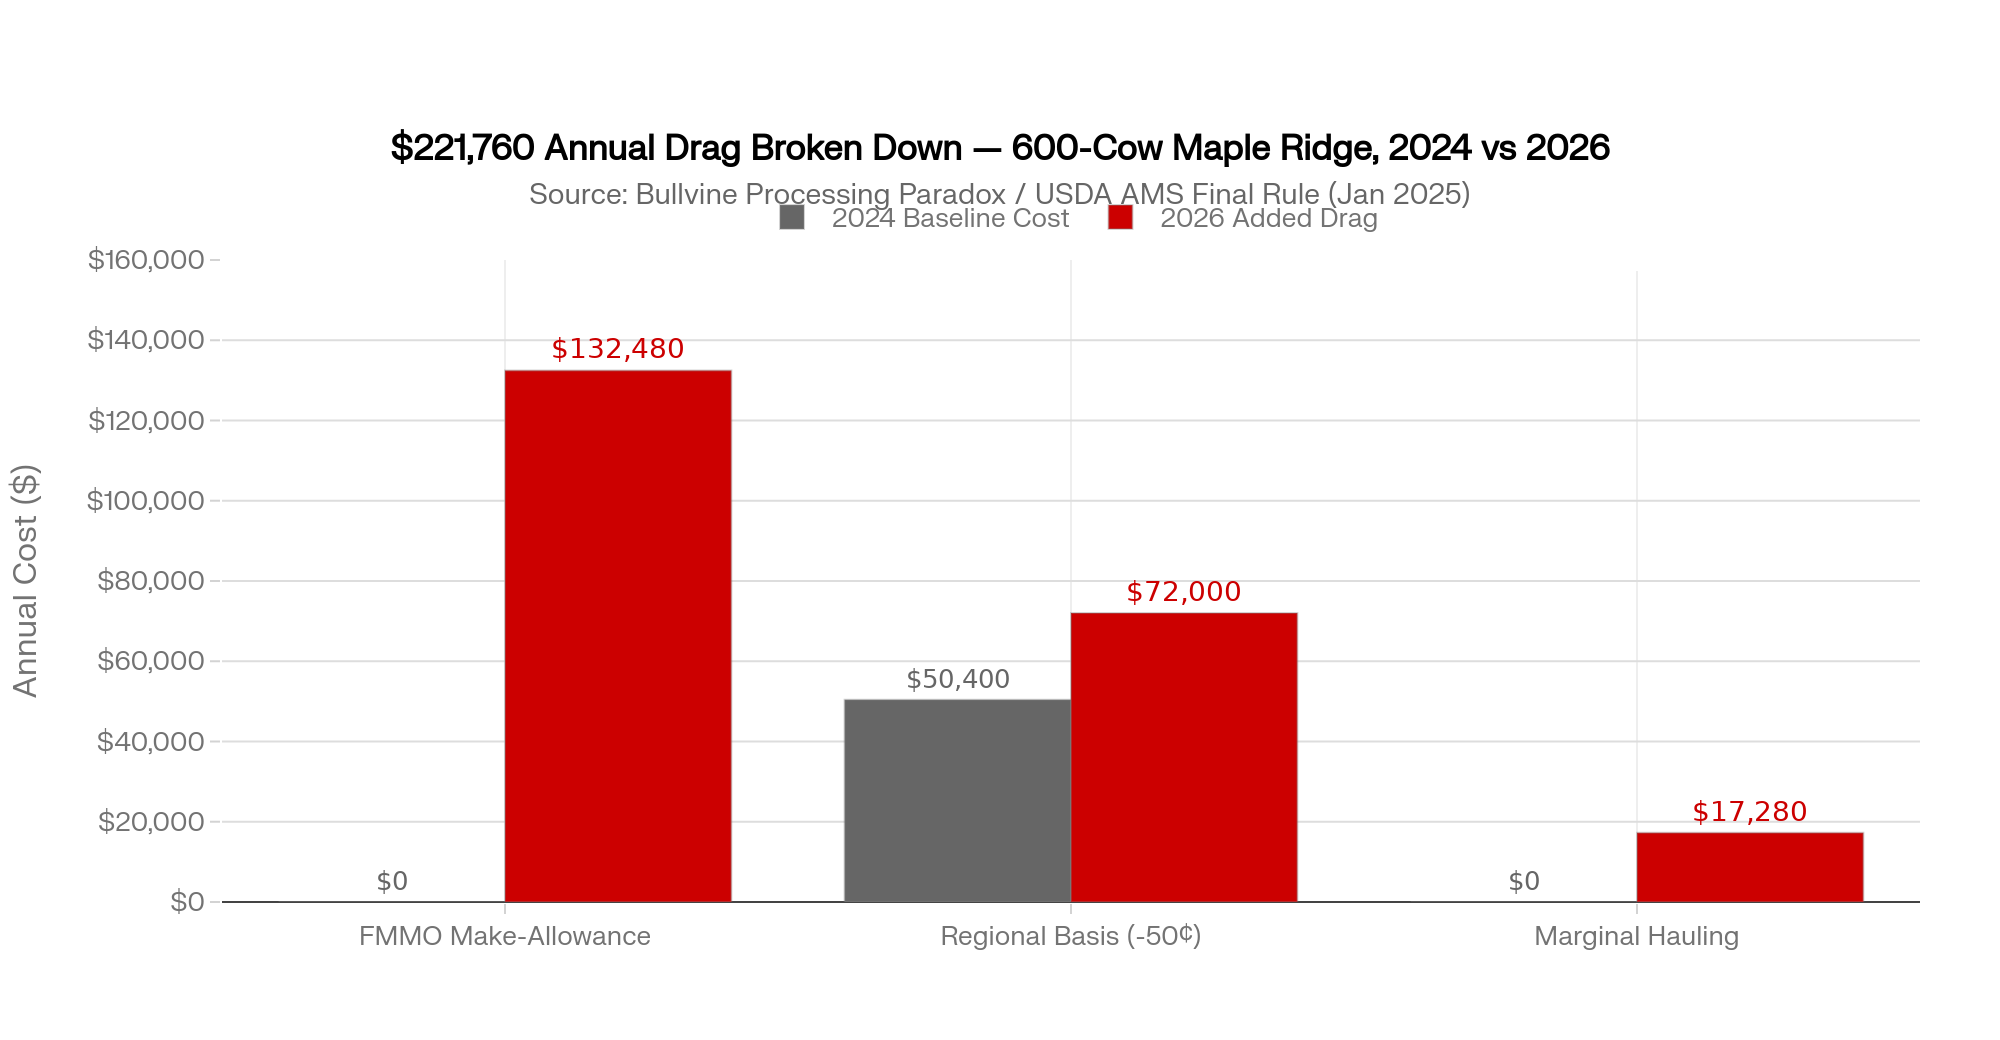
Factor2024 Impact (per cwt)2026 Impact (per cwt)Annual Bottom‑Line Shift vs 2024
FMMO Make‑Allowance$0.00(‑$0.92)(‑$132,480)
Regional Basis(‑$0.35)(‑$0.85)(‑$72,000) on the 50¢/cwt move
Marginal Hauling (weighted)*$0.00(‑$0.12)(‑$17,280)
Total Drag vs 2024 Baseline(‑$0.35)(‑$1.89)(‑$221,760)

Weighted across marginal loads, assuming ~30% of volume moves as overflow at an extra $0.40/cwt above the $0.80/cwt core rate documented in the Processing Paradox dataset. At a 15% marginal share, the hauling line is closer to ‑$0.06/cwt, or about ‑$8,640/year.

How to read this table: The Regional Basis line shows the delta vs 2024 — the 50¢/cwt move, not the full 2026 basis cost. The Total Drag row sums the 2026 deltas against that 2024 baseline.

Running the Numbers — Maple Ridge, 600 Cows, Upper Midwest, 2024 vs 2026 (illustrative composite)

Verified inputs: USDA NASS Milk Production 2025 annual production averages; USDA AMS Final Rule on Amendments to FMMOs (January 2025); UW Extension AMS final‑decision review (2025); Bullvine April 2026 New FMMO Rule analysis; Bullvine Processing Paradox 2024–2026 dataset. Illustrative inputs: Maple Ridge’s herd‑level basis trend, marginal‑load share, and hauling differential. Plug in your own numbers and your own statements.

  • Herd: 600 milking cows, Upper Midwest, manufacturing‑heavy FMMO.
  • Production: ~24,000 lb/cow/year, in line with the 24,390 lb 2025 U.S. average from USDA NASS Milk Production (2025).
  • Annual shipped: 600 × 24,000 lb = 14.4 million lb = 144,000 cwt/year.

Industry rule‑change impact: 144,000 cwt × $0.92/cwt FMMO Class III hit = ~$132,480/year.

Corridor basis impact: $0.50/cwt move × 144,000 cwt = ~$72,000/year.

Marginal hauling drift (illustrative scenarios):

  • Scenario A — 15% marginal: 144,000 × 0.15 × $0.40 = ~$8,640/year.
  • Scenario B — 30% marginal: 144,000 × 0.30 × $0.40 = ~$17,280/year.

Combined drag range: ~$213,000–$222,000/year, against an operation that hasn’t changed cows, ration, or management since 2023.

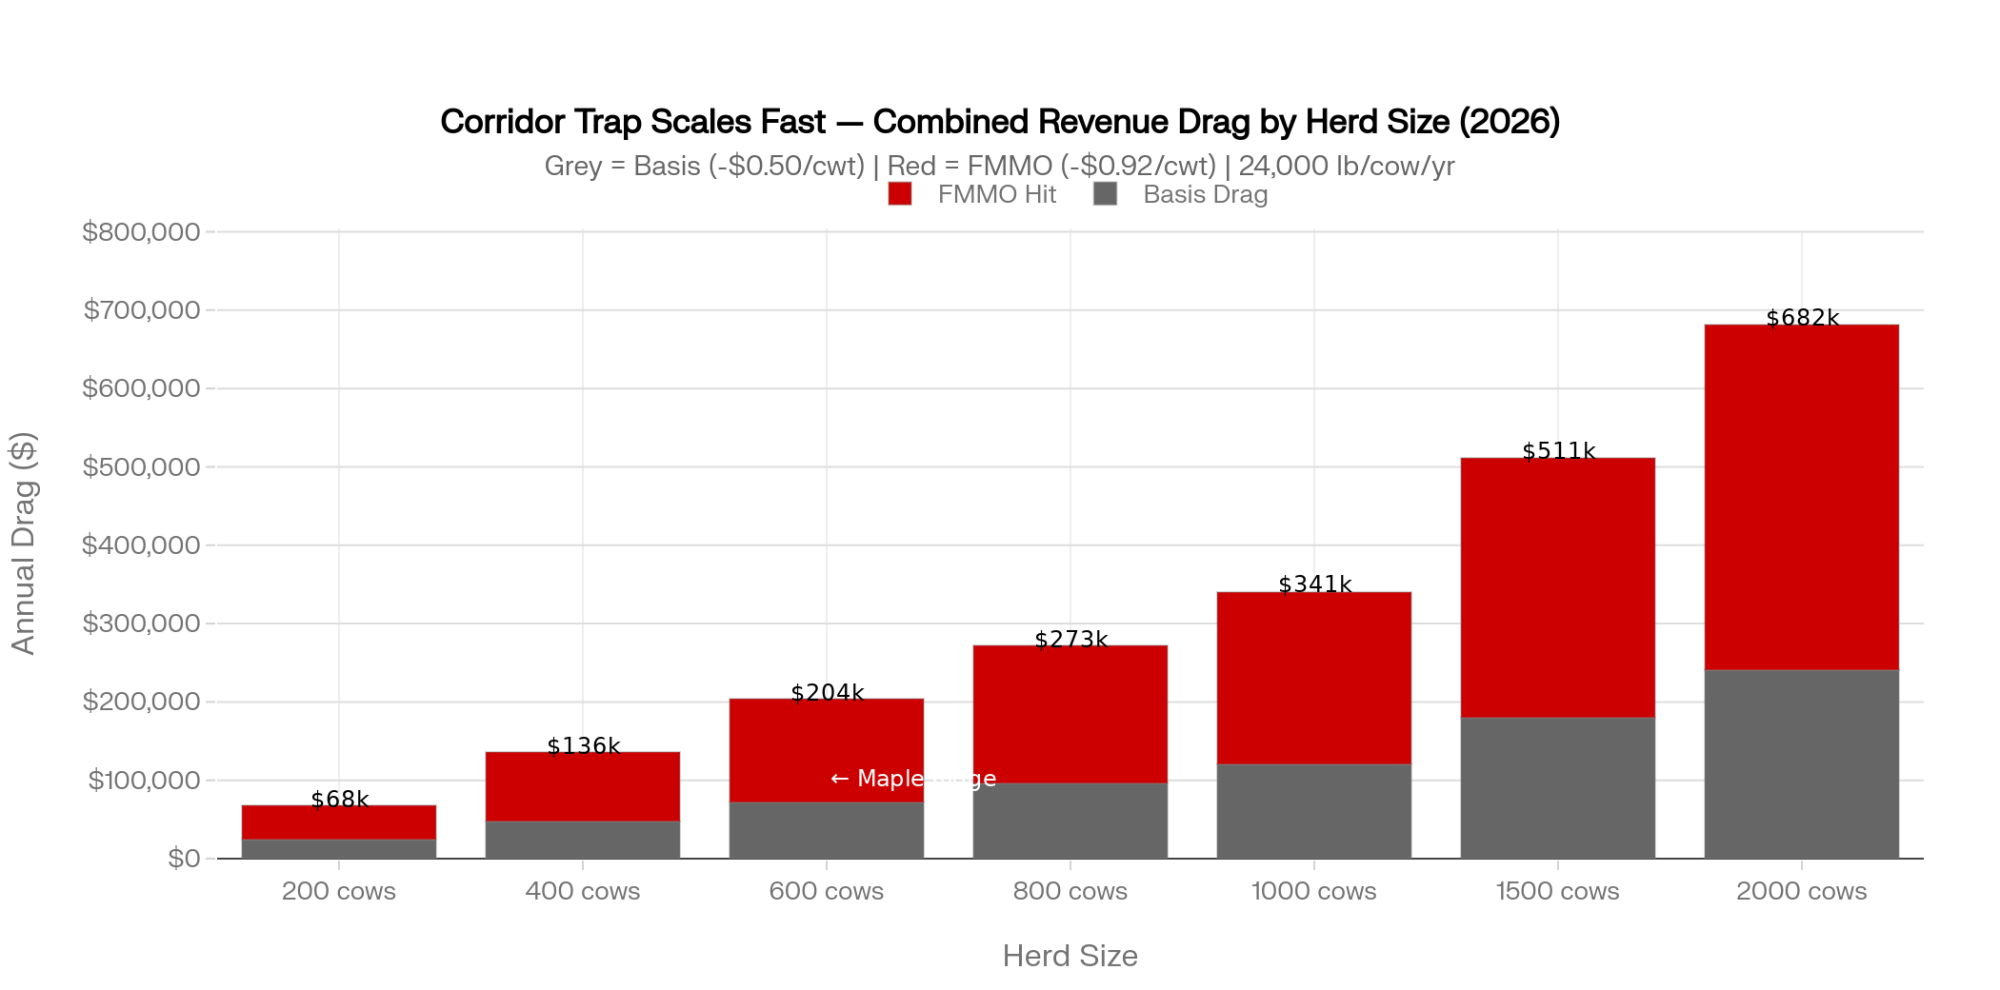
Scale the basis‑only piece to your herd:

  • 400 cows shipping ~96,000 cwt: 50¢/cwt basis move = ~$48,000/year.
  • 1,000 cows shipping ~240,000 cwt: same move = ~$120,000/year.

The herd report didn’t flinch. The mailbox check did. That’s the gap most barn KPIs aren’t built to catch.

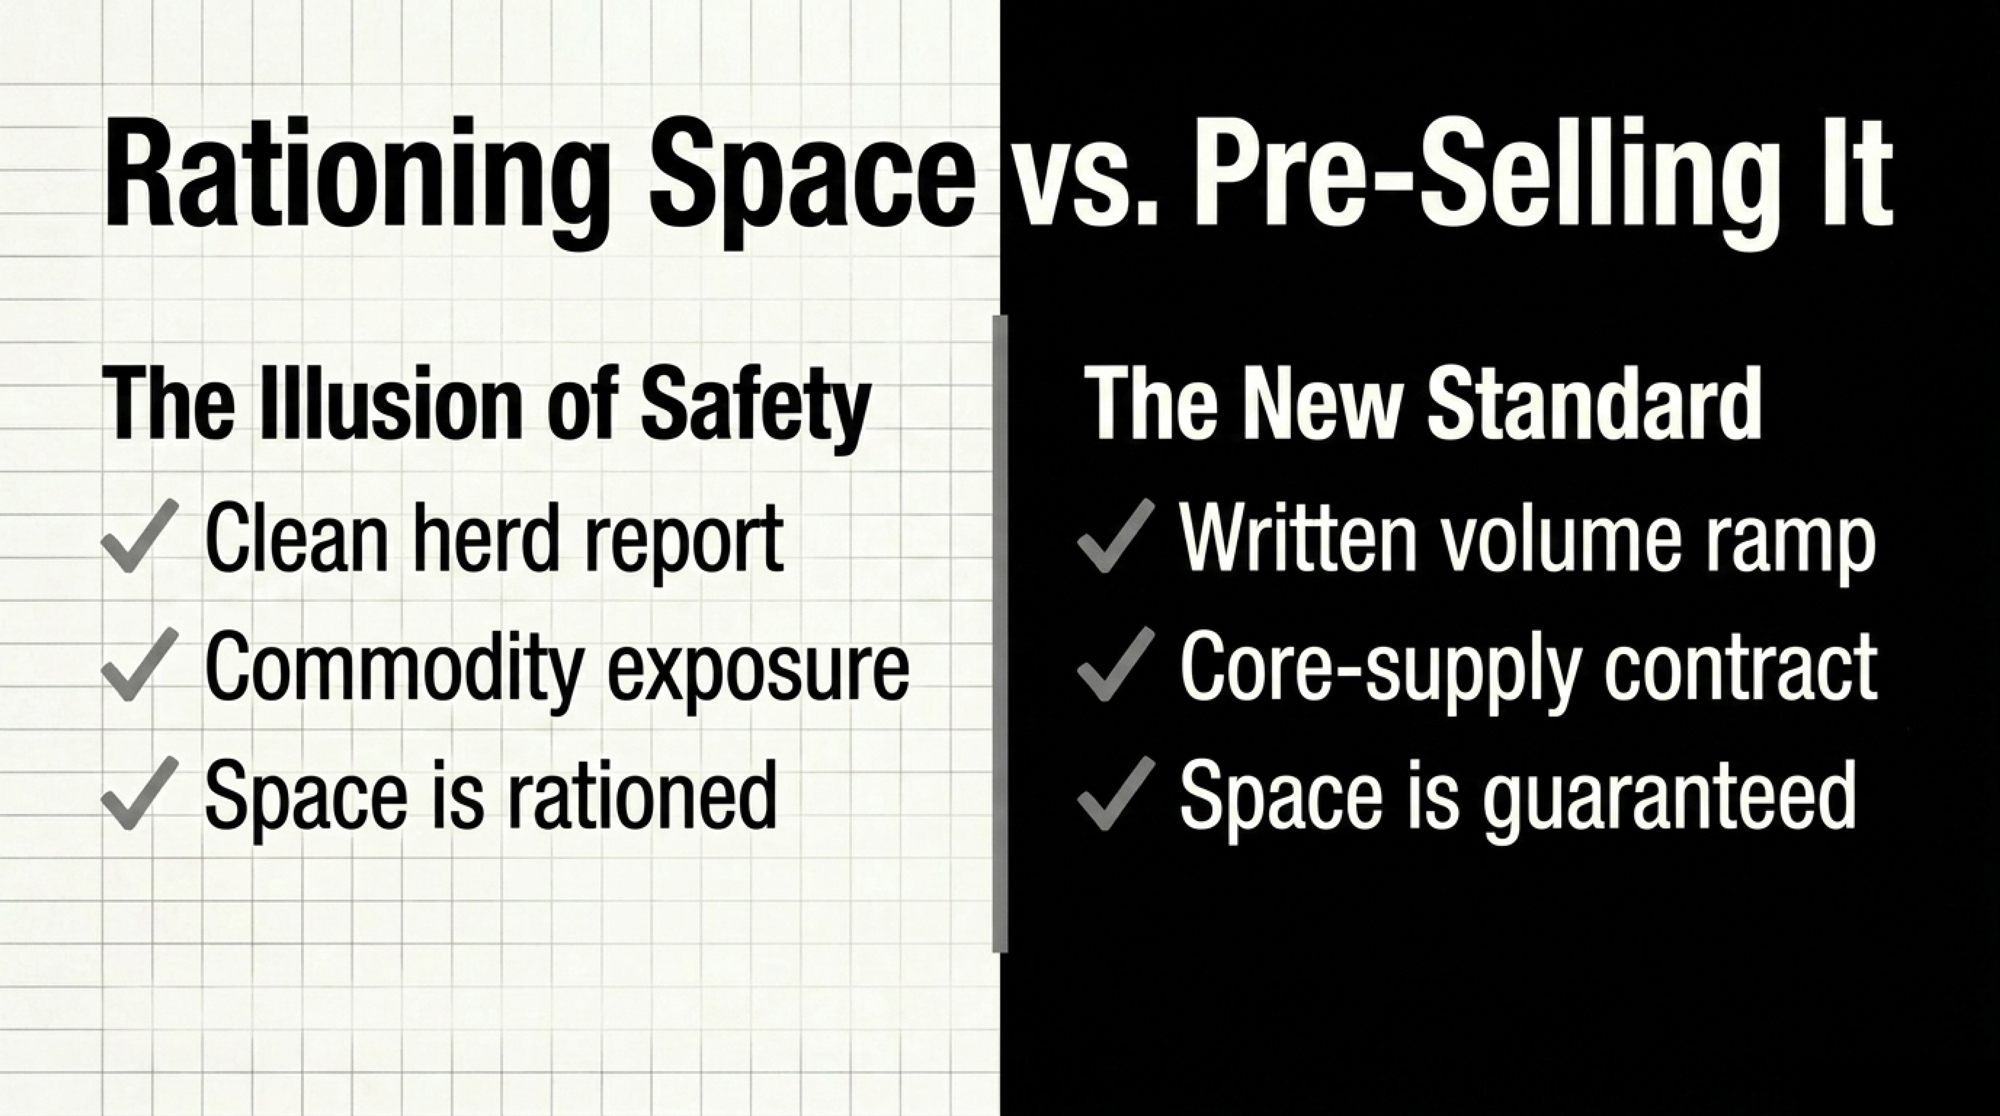
The Continental Divide: Rationing Space vs Pre‑Selling It

While the Upper Midwest is rationing space, the High Plains is pre‑selling it. The difference isn’t the cows. It’s the contract.

FactorMaple Ridge (Upper Midwest)Dos Arroyos (High Plains/I-29)
Herd size600 cows2,000 cows (+ 400 planned)
Federal OrderFO-30 (cheese-heavy)High Plains / non-pooled
2026 All-in Basis-$0.85/cwt~-$0.35/cwt (core supply)
FMMO Class III impact-$0.92/cwt (2025 rule)-$0.92/cwt (same rule)
Marginal hauling (overflow)$1.10–$1.20/cwt<$0.80/cwt within 60 mi
Plant capacity statusRationing / base-excessPre-sold / volume ramp
Core supply statusSwing/dispensableWritten core-supply contract
Total 2026 annual drag vs 2024-$221,760Largely offset by contract premiums
Robot/capex DSCR (corridor case)1.05–1.10× (yellow light)>1.25× (green)
Strategic pathPivot, exit, or repositionScale with concrete
Regional farm count trend-630 farms, 2022–2025Expansion corridor

Most producers can name the bull behind their best heifer. Few can name the closest plant project in their draw radius. Dos Arroyos can.

Their state, by the headline numbers in Processing Paradox 2024–2026 (USDA NASS state‑level Milk Production, 2014 vs 2024), looks bad. New Mexico shed roughly 2.2 billion pounds of annual milk and about 83,000 cows over that decade. California gave back more than 2.0 billion pounds and around 72,000 cows. The Ogallala Aquifer projection — up to 70% of the aquifer’s saturated thickness potentially unusable in the Texas Panhandle expansion zone within 20 years, per the Texas Tech and USGS‑linked aquifer research cited in Processing Paradox — isn’t a footnote.

Their corridor still tells a different story.

Dos Arroyos isn’t ahead because they’re better farmers. They’re ahead because they bought Processing Security in writing before they bought concrete. The era of producing milk and hoping for a check is over inside their basin.

The corridor’s public cheese build‑out — Hilmar (Lubbock, TX project announced 2021), Leprino (Lubbock, TX complex announced 2022), and Valley Queen (Milbank, SD expansion announced 2022) — sets the public context, per each operator’s project announcements and Processing Paradox.

The contract terms described below are a Bullvine composite of corridor practice, drawn from Processing Paradox. They are not attributable to Hilmar, Leprino, Valley Queen, or any other named processor.

  • Dos Arroyos’s milk feeds into the $1.6 billion High Plains and I‑29 cheese build‑out underway since 2020.
  • Their 2025 supply agreement, as composited from Processing Paradox, carries defined base‑excess terms, component premiums tied to plant product mix, and a written volume ramp.
  • That ramp is what makes the 400‑cow expansion pencil. In the composite, throughput is committed in writing before concrete is poured. The base‑excess clause prices growth pounds inside core‑supply terms for the duration of the ramp, not at swing‑load discounts.
  • Their marginal load travels under 60 miles to a plant still bidding for volume, not rationing it.

The assumption that “Western dairy is doomed” doesn’t survive a corridor‑level read. The assumption that Upper Midwest dairy is structurally safe because it’s always been there doesn’t either. The Upper Midwest lost roughly 630 farms between 2022 and 2025 while regional milk climbed to 43.2 billion pounds (Bullvine Processing Paradox, drawing on USDA NASS, 2024–2026). The volume stayed. The mid‑size families didn’t.

Must‑Read → The $11 Billion Dairy Rush: Growth Corridor or Dead Zone? — Tier 3 hidden gem.

Why Maple Ridge’s Owner Stopped Trusting the Old Lender Spreadsheet

The turn for Maple Ridge came in early 2026, in a robotic milking conversation with a regional ag lender.

The opening was familiar. Rolling 12‑month averages. A USDA‑style price near $20.40/cwt for 2026, pulled from ERS and WASDE ranges. A generic stress test at $15/cwt with a flat ‑$0.25/cwt basis. Ag operating loans in the mid‑7% range, consistent with the lender environment Federal Reserve district and Purdue Center for Commercial Agriculture outlooks have tracked through late 2025 and into early 2026.

On those numbers, robots penciled.

Maple Ridge’s owner put three different numbers on the table.

  • A real trailing 24‑month all‑in basis: ‑$0.85/cwt, not ‑$0.25/cwt.
  • Marginal hauling reality from this composite operator’s dispatch profile: about $1.10–$1.20/cwt on overflow loads, versus the $0.80/cwt core rate documented across Processing Paradox herds.
  • Post‑FMMO Class III math reflecting the ~$0.92/cwt make‑allowance hit per the UW Extension review and the Bullvine April 2026 analysis, instead of pre‑2025 class values.

Bullvine’s 2025–2026 lender reporting describes the same pattern in plainer terms. The binding constraint isn’t a lower headline price. It’s a lower effective floor once basis, hauling, and post‑FMMO Class values are layered in.

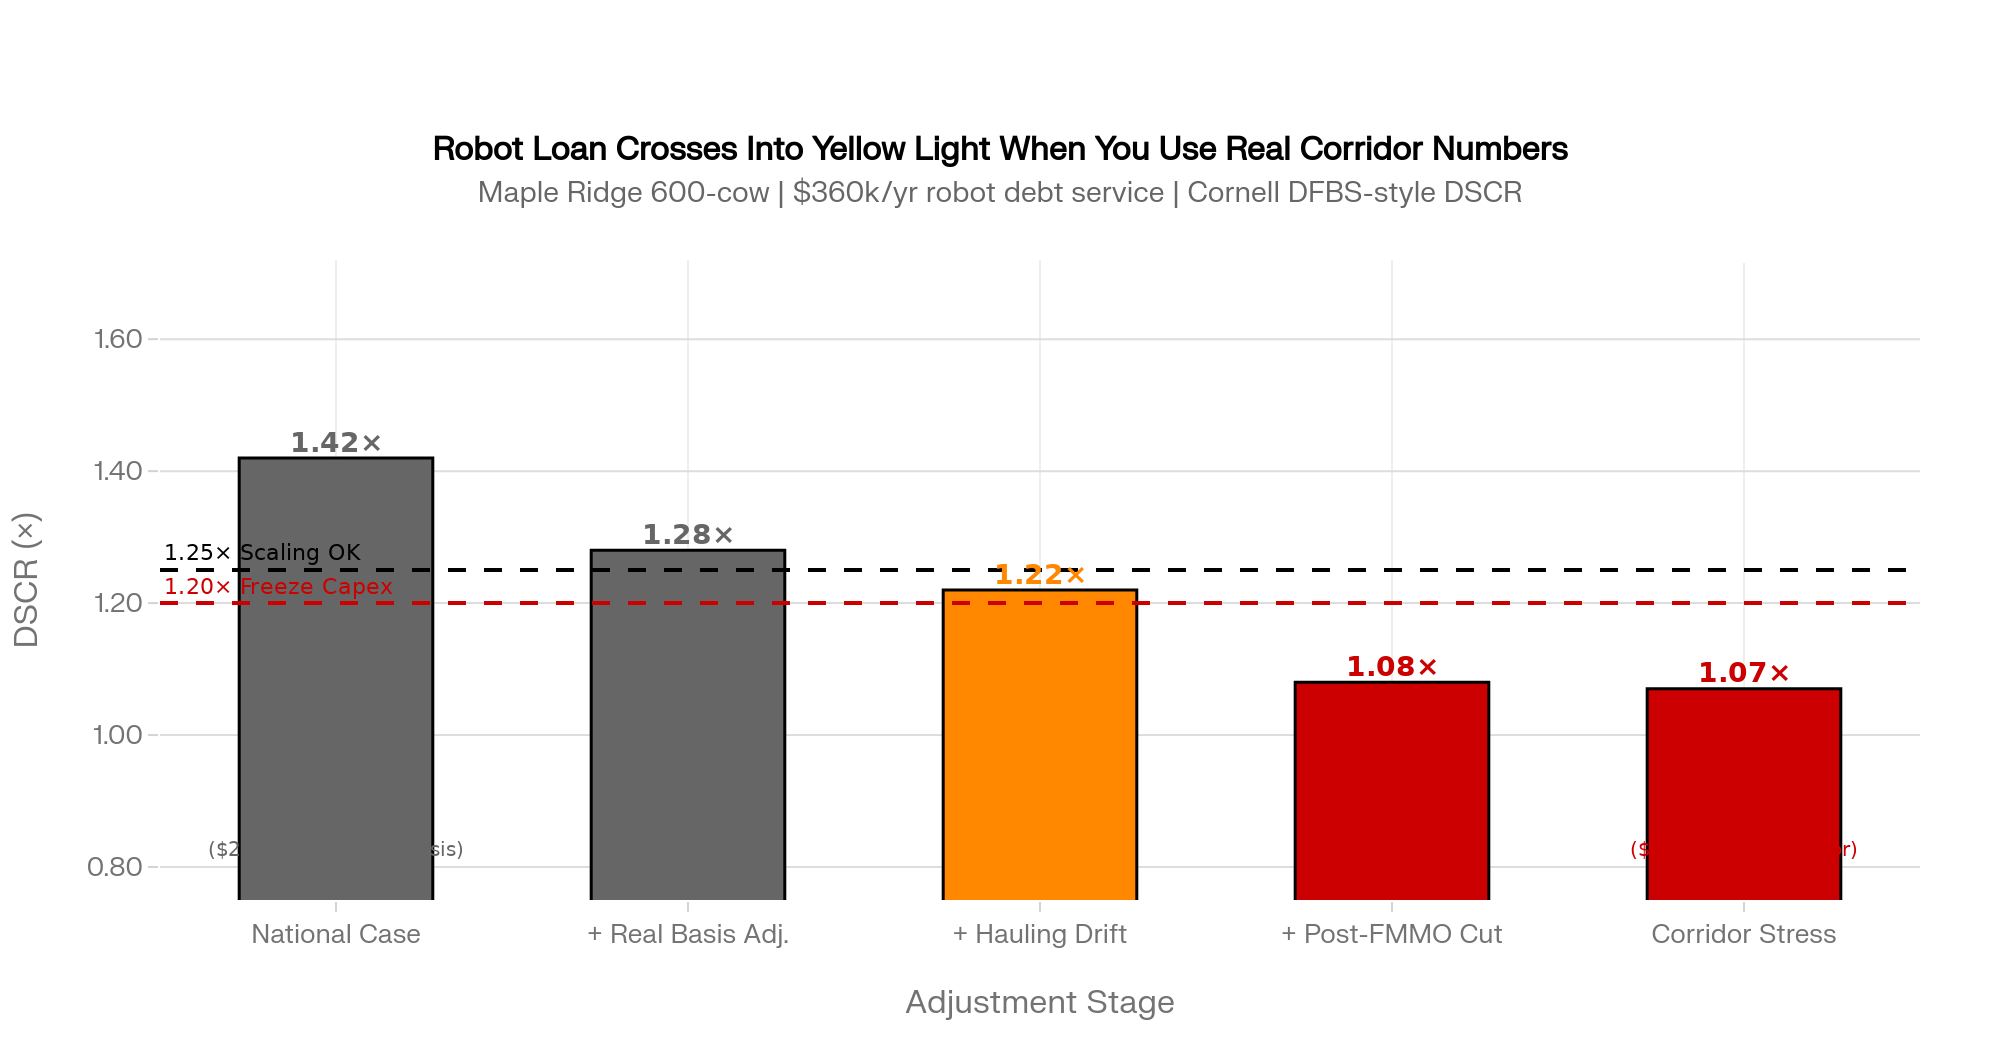
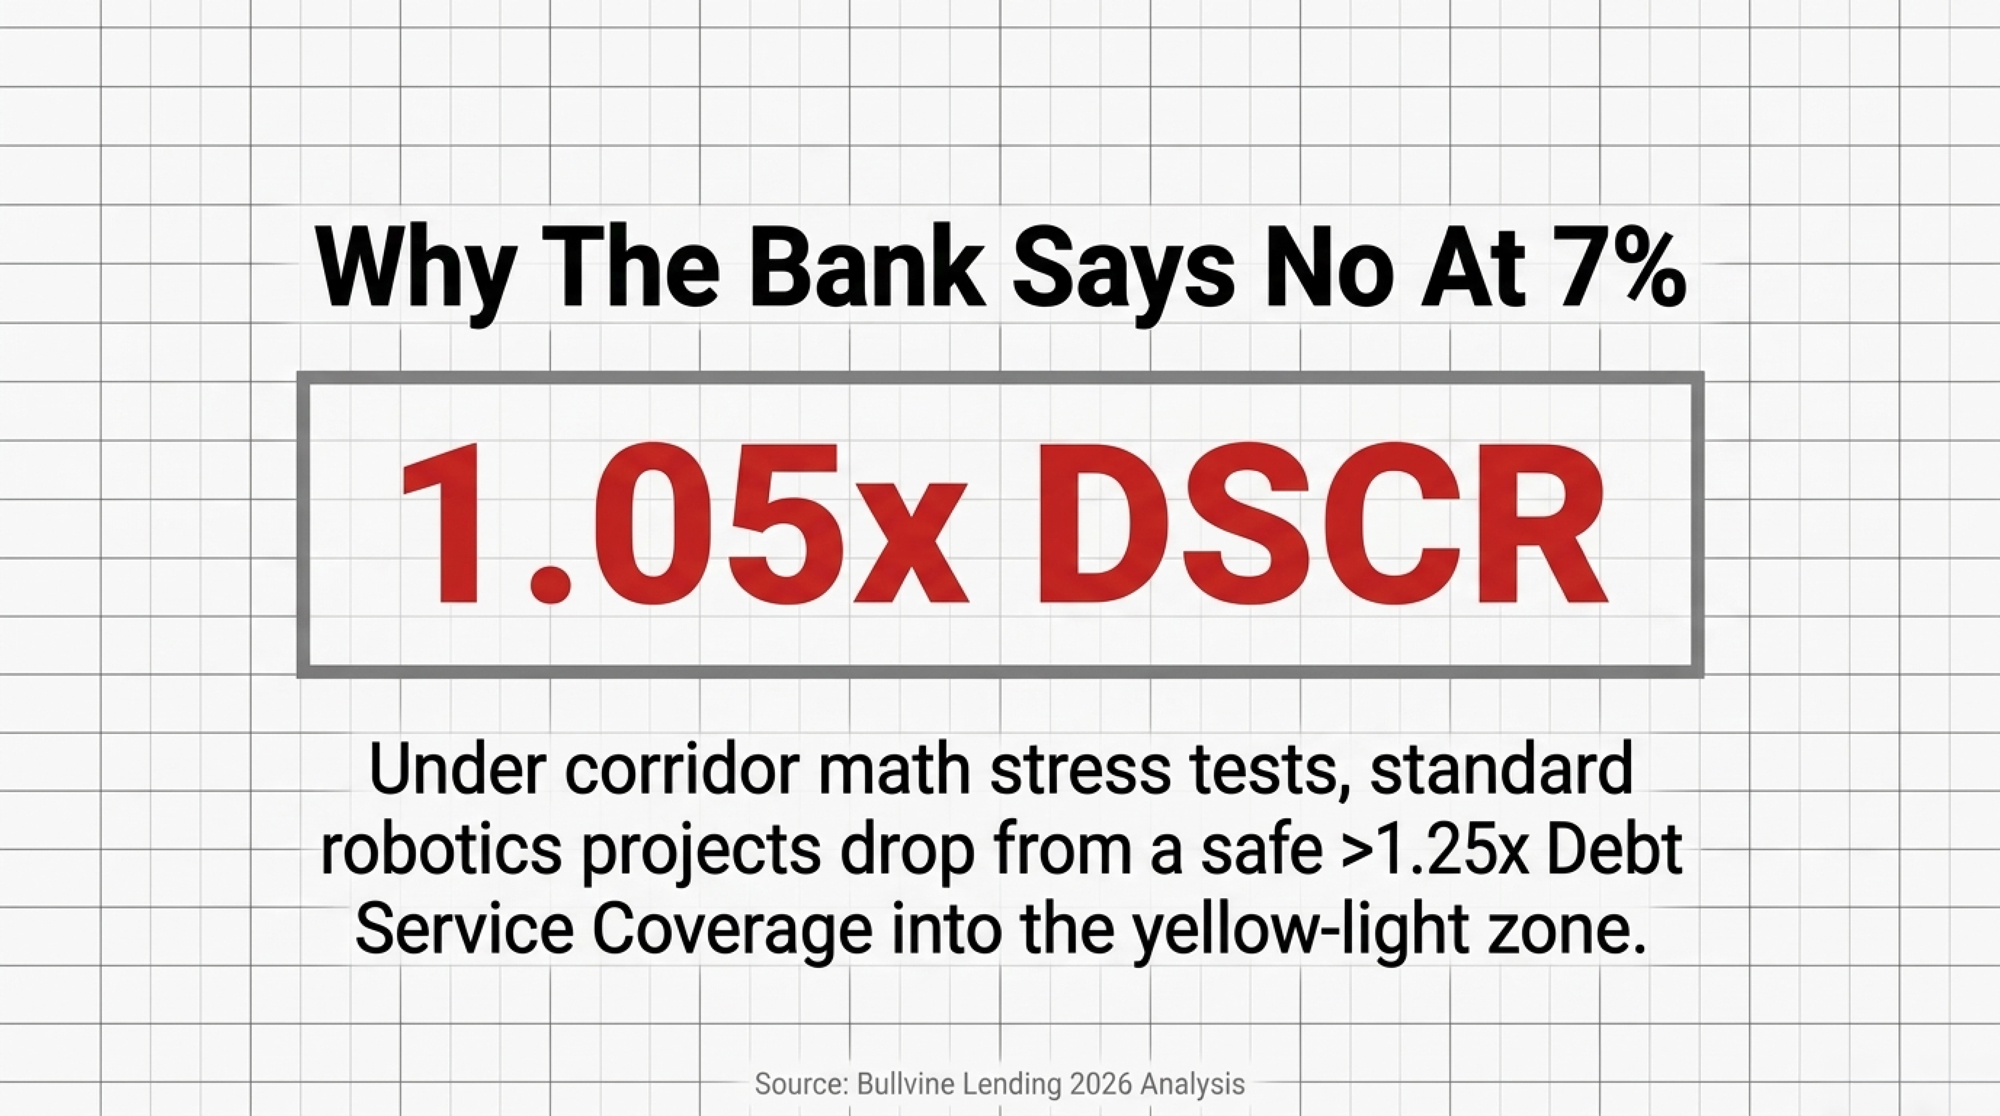
A robotic milking project at this herd profile typically carries roughly $360,000/year in annual debt service on the parlor and related infrastructure portion of the loan, drawn from Bullvine’s prior reporting on robotic ROI in the 300–600 cow range and standard amortization on 7%‑range term money. Re‑run with the corridor inputs above against that debt service, the project moved from comfortably above 1.25× DSCR into the 1.05–1.10× range under a $15/cwt corridor stress case — the “yellow light” zone Cornell DFBS‑style benchmarks (referenced in Processing Paradox) flag for tighter scrutiny.

The DSCR shift is illustrative. The inputs that drove it are real: the basis trend, the marginal hauling, the post‑FMMO Class values, and the debt service.

The robots didn’t become impossible. They became a different decision.

The question is no longer “how do we squeeze more milk out of this barn.” It’s “do we want to leverage 7%‑range money against a corridor that’s losing capacity, or use that equity to reposition?”

Deep Dive → Dairy Lending 2026: Why Your Banker Says No at 7% Money — prior Tier 3 economics analysis.

What Maple Ridge’s 24‑Month Basis Trend Means For Your Operation

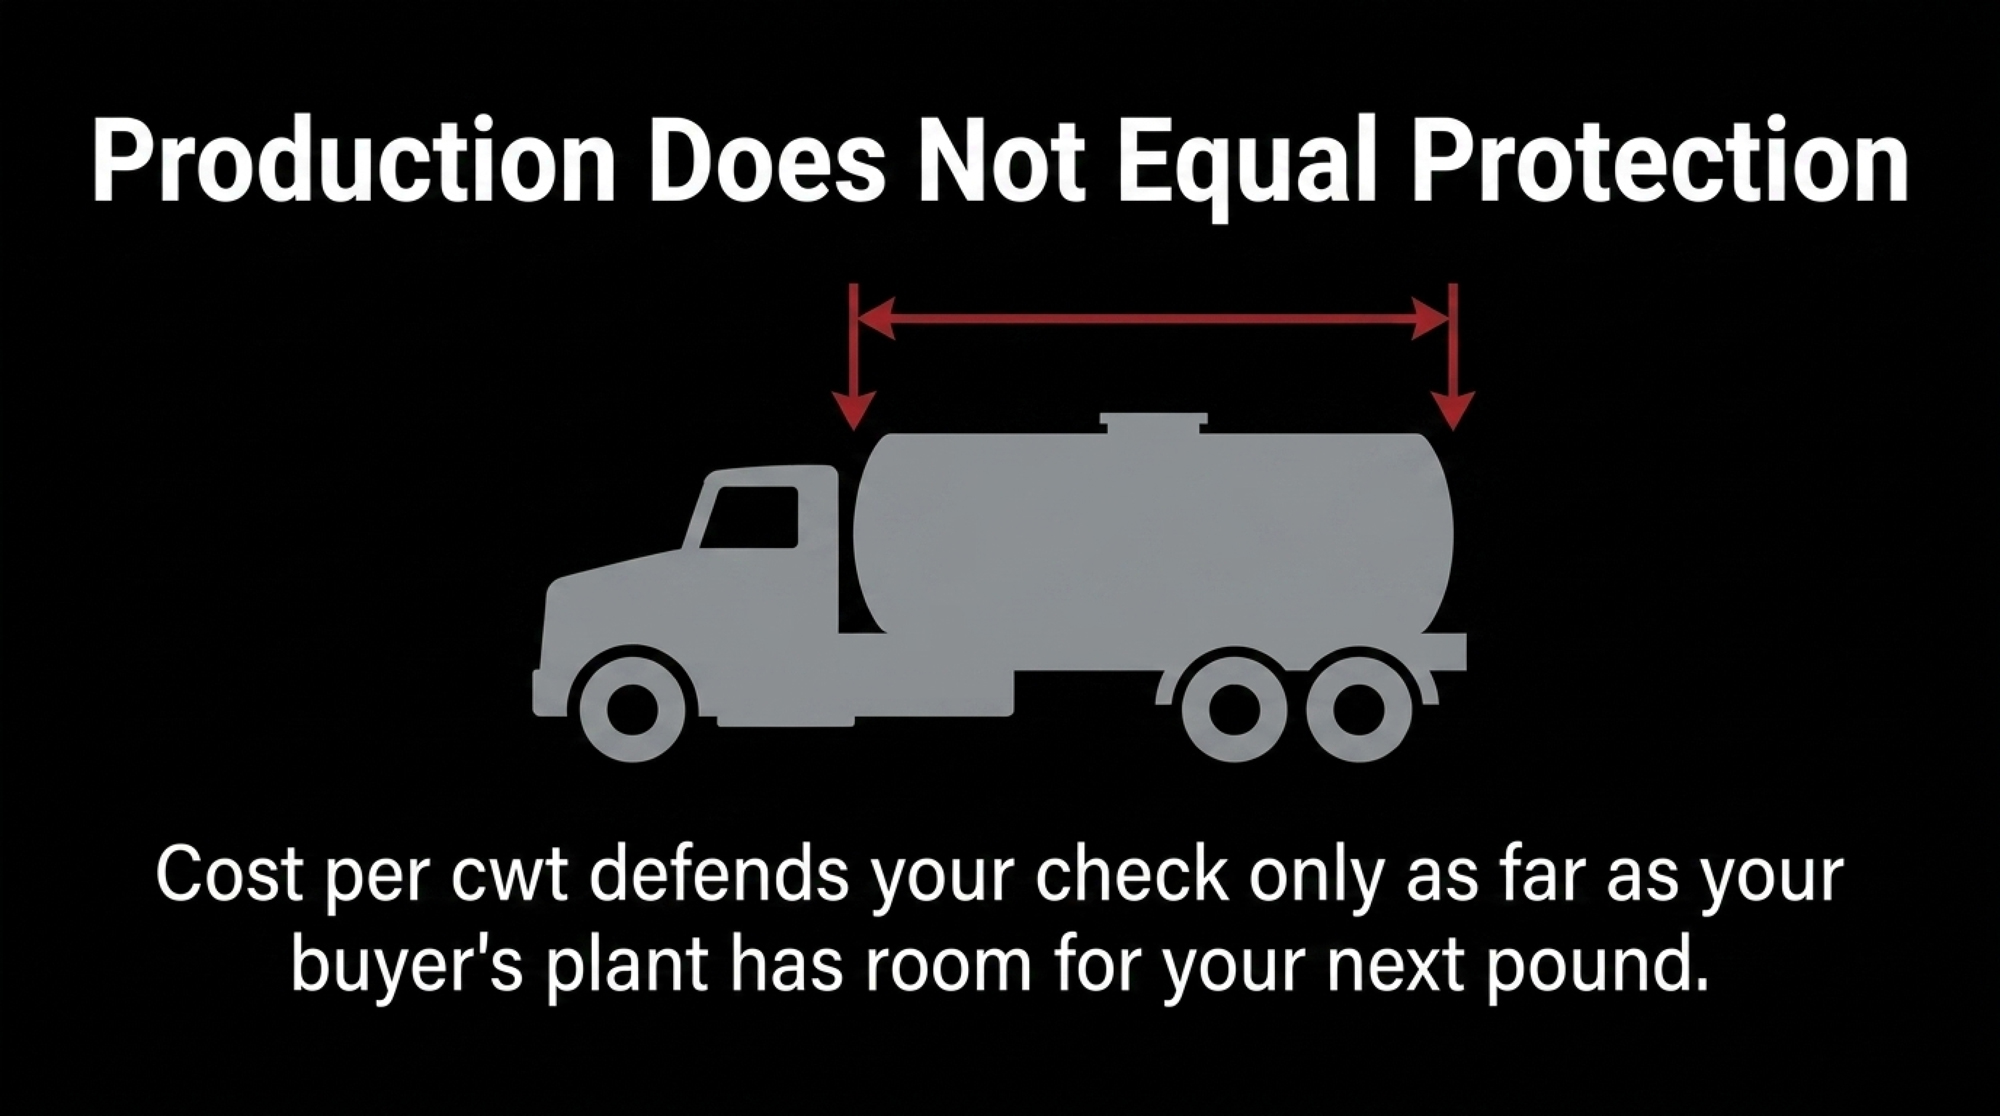
Maple Ridge’s herd report stayed clean while its corridor quietly repriced every cwt. That’s the lesson worth carrying off this page: cost per cwt and milk per cow defend the milk check only as far as your buyer’s plant has room for your next pound. Corridor structure decides how much of any cost or component advantage you actually keep.

There are three honest paths from here, and you don’t get to skip the diagnosis to pick one.

  • Scale with a processor. Real only if your buyer puts core‑supply status, base terms, and component premiums in writing, and your corridor‑aware DSCR holds.
  • Pivot to a premium or niche channel. Smaller volume, higher complexity, slower onboarding, but partial escape from commodity basis.
  • Plan an orderly exit or relocation. Preserves equity in a structurally bad basin; forecloses generational continuity in the existing barn.

The trade‑off underneath all three: speed of decision versus depth of corridor diagnosis. Move too fast and you lock in the wrong path. Stall and the basis keeps deciding for you.

The 30/90/365‑Day Playbook for Herds Like Maple Ridge’s

Adapt the thresholds to your own statements and your own basin. Don’t copy them.

30‑Day Actions — urgent checks

  • Pull 24 months of milk checks and graph all‑in basis: mailbox − announced price, including hauling and any “marketing” or “balancing” adjustments.
    • Requires: bookkeeping time, statements, a spreadsheet.
    • Red‑flag trigger: basis widened by more than 25¢/cwt over 18 months without a corresponding national price move.
    • Backfire risk: averaging across very different months hides flush‑season pain. Look at flush separately.
  • Separate loads into core versus marginal. Calculate actual hauling cost per cwt on overflow loads.
    • Requires: dispatch tickets, co‑op statements, an hour of cross‑checking.
    • Red‑flag trigger: marginal‑load hauling 50% or more above your core rate.
    • Watch for: milk‑check formats that combine freight with basis or place it under “other,” making marginal hauling hard to isolate.
  • Confront your field rep with three direct questions, on the record. Are we core, swing, or dispensable supply over the next 5–10 years? Where do our marginal loads physically go, and at what discount, when milk is long? What plant additions or closures are in your 3–5‑year network plan?
    • Requires: one meeting, no spin in your own answers.
    • Red‑flag trigger: vague answers or “we’ll get back to you” on all three.
  • Escalate if your DSCR has been under 1.20× for three straight months on your lender’s or CPA’s standard method. This list moves to the top of the next 30 days.

90‑Day Actions — structural adjustments

InputStandard Lender ModelCorridor-Aware ModelDifference
All-milk price used$20.40–$20.50/cwt (USDA ERS 2026)$15.00/cwt (corridor floor)-$5.40–$5.50/cwt
Basis assumption-$0.25/cwt (generic flat)-$0.85/cwt (trailing 24-month actual)-$0.60/cwt
FMMO Class III valuesPre-2025 class valuesPost-rule: -$0.92/cwt make-allowance-$0.92/cwt
Marginal hauling %0% (core rate only)15–30% of volume at overflow rate+$0.06–$0.12/cwt
Effective floor (combined)~$20.15/cwt~$13.71/cwt-$6.44/cwt
Robot project DSCR result>1.25× ✓ (pencils)1.05–1.10× ✗ (yellow light)Crosses freeze threshold
Capex decisionProceedFreeze or resizeMaterial divergence
Risk to lender if national model usedLow (on paper)High (basis keeps widening)Model blind spot
  • Force a corridor‑aware stress test at your bank. Two scenarios, side by side.
    • National case: USDA‑style all‑milk price, flat basis, generic hauling.
    • Corridor case: post‑FMMO Class values reflecting the 2025 make‑allowance changes (per the UW Extension review and Bullvine’s April 2026 analysis), your trailing 12–24‑month basis minus another 25–50¢/cwt, and marginal‑load hauling on at least 15–30% of volume.
    • Requires: milk check history, dispatch records, current contract, lender model.
    • Threshold: corridor‑case DSCR below 1.20× should freeze any non‑essential capital project.
    • Backfire risk: if a lender won’t run the corridor case alongside the national case, factor that into your read of how flexible the relationship is likely to be when margins tighten.
  • Pressure‑test a “minus 10–15% intake” scenario. If your primary buyer cut your base by 10–15% tomorrow, where does that milk go, and at what discount?
    • Requires: honest conversations with two or three alternative buyers.
    • Threshold: if you can’t name a plant and a realistic price within two to three weeks, your marketing risk is bigger than your production risk.
    • Watch for: verbal interest that disappears when you ask for a number.
  • Revisit any contracted or planned capital project — robots, freestall expansion, parlor upgrade — against the corridor case, not the national case.
    • Requires: vendor flexibility, willingness to walk back announced plans.
    • Threshold: re‑size, re‑time, or shelve if the corridor case pushes DSCR below 1.20×.
    • Backfire risk: sunk‑cost thinking on deposits and engineering work.

Deep Dive → Robotic Milking ROI Under 500 Cows — Tier 2 management pillar.

365‑Day Moves — strategic positioning

  • Pick your lane on a written timeline: scale, pivot, or exit. Bullvine’s December 2025 piece, Squeezed Out? A 12‑Month Decision Guide for 300–1,000 Cow Dairies, lays out the logic.
    • Requires: a family or partnership meeting that ends with a decision, not another meeting.
    • Opportunity signal: if a buyer puts core‑supply status, base terms, and component premiums in writing, and your corridor‑aware DSCR stays above 1.25×, scaling is defensible.
    • Backfire risk: leveraging into hope without both a written commitment and a corridor‑aware model.
  • Condition any expansion on a written processor commitment. No contract, no concrete.
    • Requires: legal review of base‑excess and force‑majeure clauses.
    • Threshold: walk away if base‑excess deductions are deeper or longer than the plant’s own escape clauses.
  • Evaluate relocation or premium transition before equity erosion makes the call, if you sit in a legacy region with no new steel within reasonable hauling distance. Processing Paradox closure analysis documents a $15,000–$45,000/quarter equity erosion range across negative margin cycles (Bullvine, 2024–2026).
    • Requires: appraisals, tax planning, succession conversations 12–24 months before any move.
    • Opportunity signal: if a growth‑corridor buyer expresses written interest in backing a relocated supply, that timing window is real but short.
    • Watch for: emotional attachment overriding the math. This is where families lose the most.

Must‑Read → Squeezed Out? A 12‑Month Decision Guide for 300–1,000 Cow Dairies — Tier 3 pillar, December 2025.

From the human side → More Milk, Fewer Farms, $250K at Risk: The 2026 Numbers Every Dairy Needs to Run — what the corridor squeeze looks like at the kitchen‑table level.

What This Means On Your Next Statement

Maple Ridge’s 50¢/cwt basis slide didn’t show up in herd software, ration sheets, or somatic cell graphs. It showed up in 24 months of milk checks — and it turned a robot decision into a corridor decision. Dos Arroyos sees the same pressure on the horizon and is leaning into it because its composite contract and its plants give it room.

Your next pound of milk is worth what your corridor is willing to pay for it, less what hauling and base‑excess take on the way there.

Pull your current milk supply agreement and your last three milk checks tonight. Find the language that governs base‑excess, hauling, and any “marketing” or “balancing” adjustments. Match that language against the basis trend you’ve actually lived since 2024.

What does your current processor contract say about basis and base‑excess when your region’s milk goes long — and does that language describe the corridor you’re still in, or the one you used to be in?

Key Takeaways

  • A clean herd report won’t save you from a bad corridor. Maple Ridge’s 50¢/cwt basis slide plus the post‑2025 FMMO Class III hit stacks to ~$1.89/cwt — about $221,760/year on 600 cows shipping ~144,000 cwt.
  • Stress‑test on your real basis, not the USDA all‑milk price. If your lender won’t run a corridor case with trailing 24‑month basis and 15–30% marginal hauling, the spreadsheet that says robots pencil isn’t the one you should bet on.
  • The capex question changed shape. Below 1.20× DSCR on the corridor case, freeze any non‑essential project. Below 1.25× even with national‑case math, scaling isn’t defensible without a written core‑supply commitment.
  • Pick your lane on a written timeline — scale, pivot, or exit — inside 12 months. Stall, and the basis keeps deciding for you while $15K–$45K/quarter of equity quietly walks off the farm.

This analysis uses composite operator profiles (Maple Ridge, Dos Arroyos) drawn from Bullvine’s Processing Paradox dataset. Contract structures described are illustrative composites and do not describe the actual contracts of any named processor.

Learn More

The Sunday Read Dairy Professionals Don’t Skip.

Every week, thousands of producers, breeders, and industry insiders open Bullvine Weekly for genetics insights, market shifts, and profit strategies they won’t find anywhere else. One email. Five minutes. Smarter decisions all week.

NewsSubscribe
First
Last
Consent

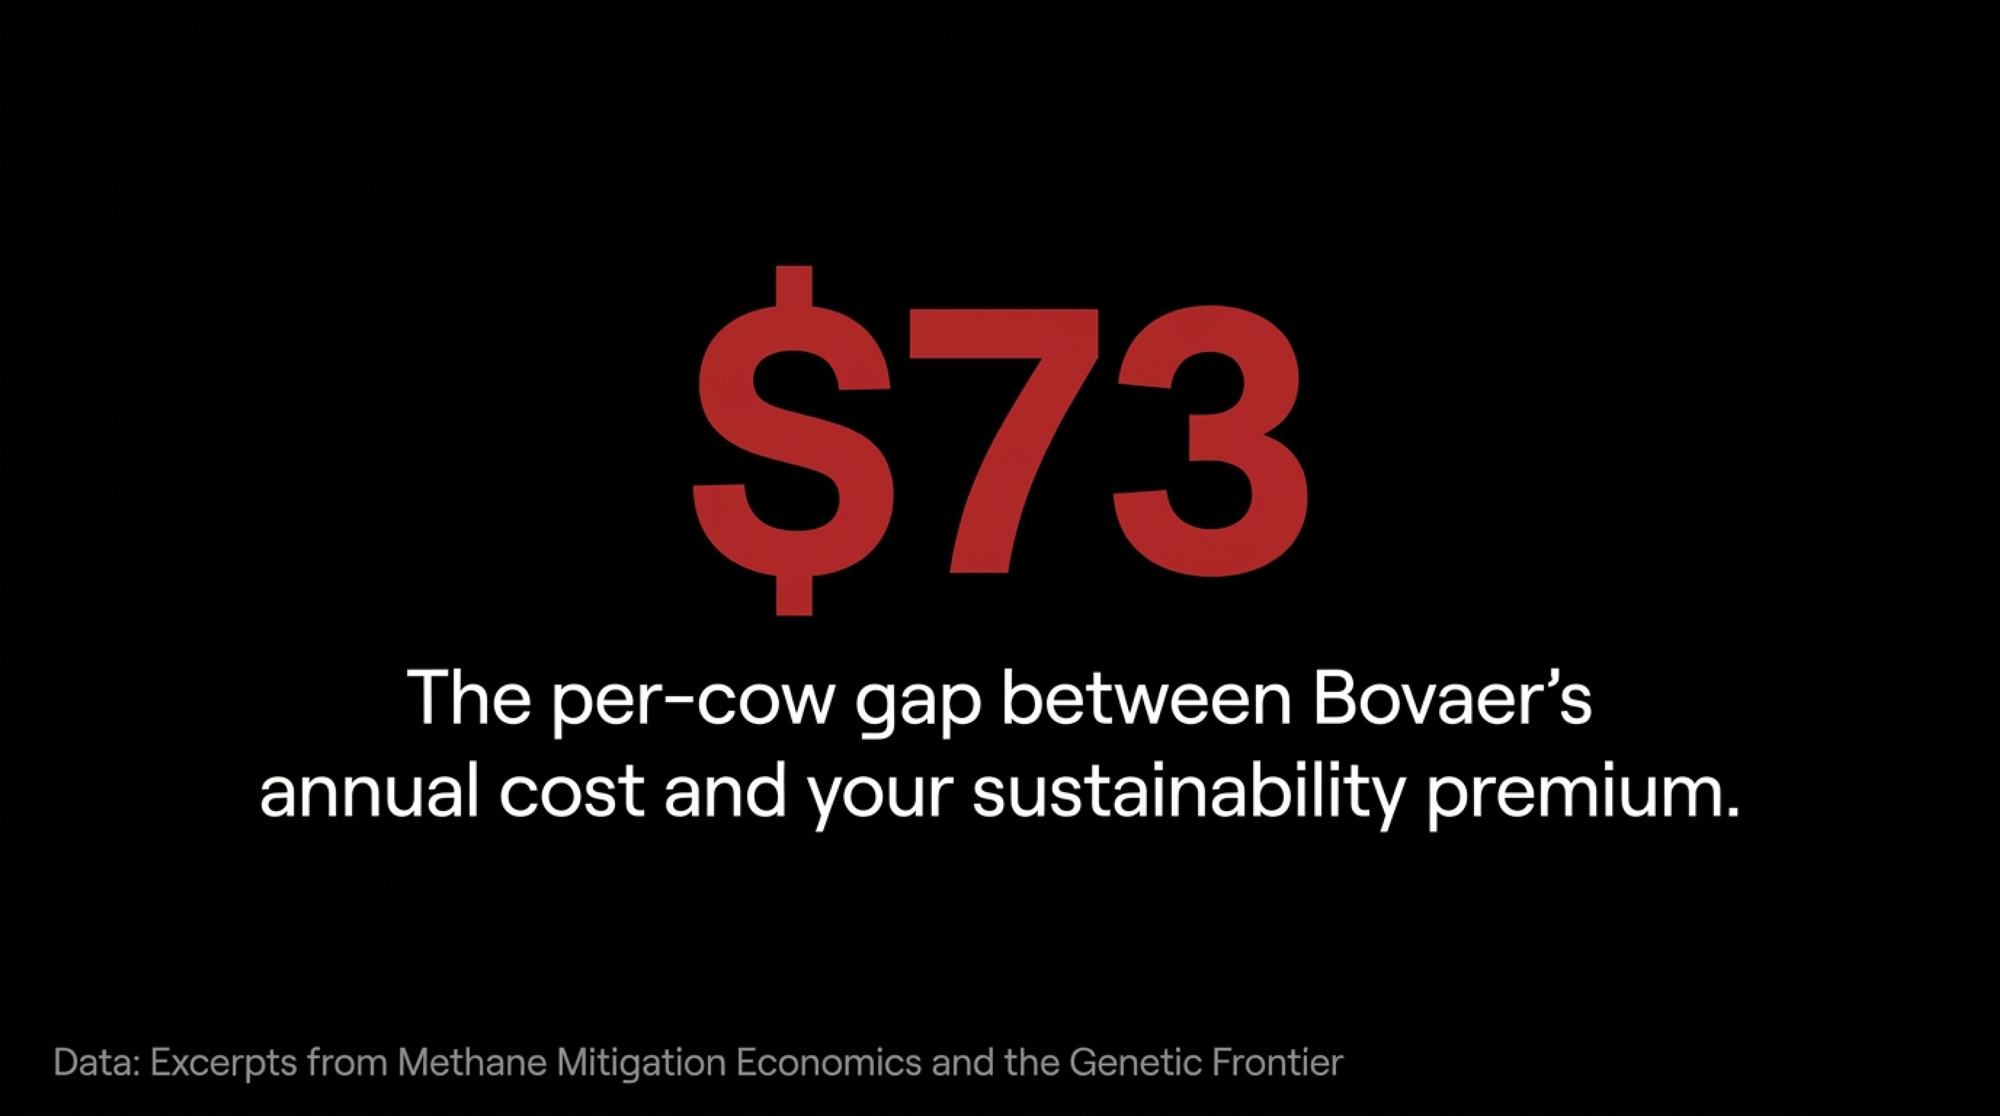
The $73-a-Cow Gap Hiding in Your 2027 Bovaer Contract

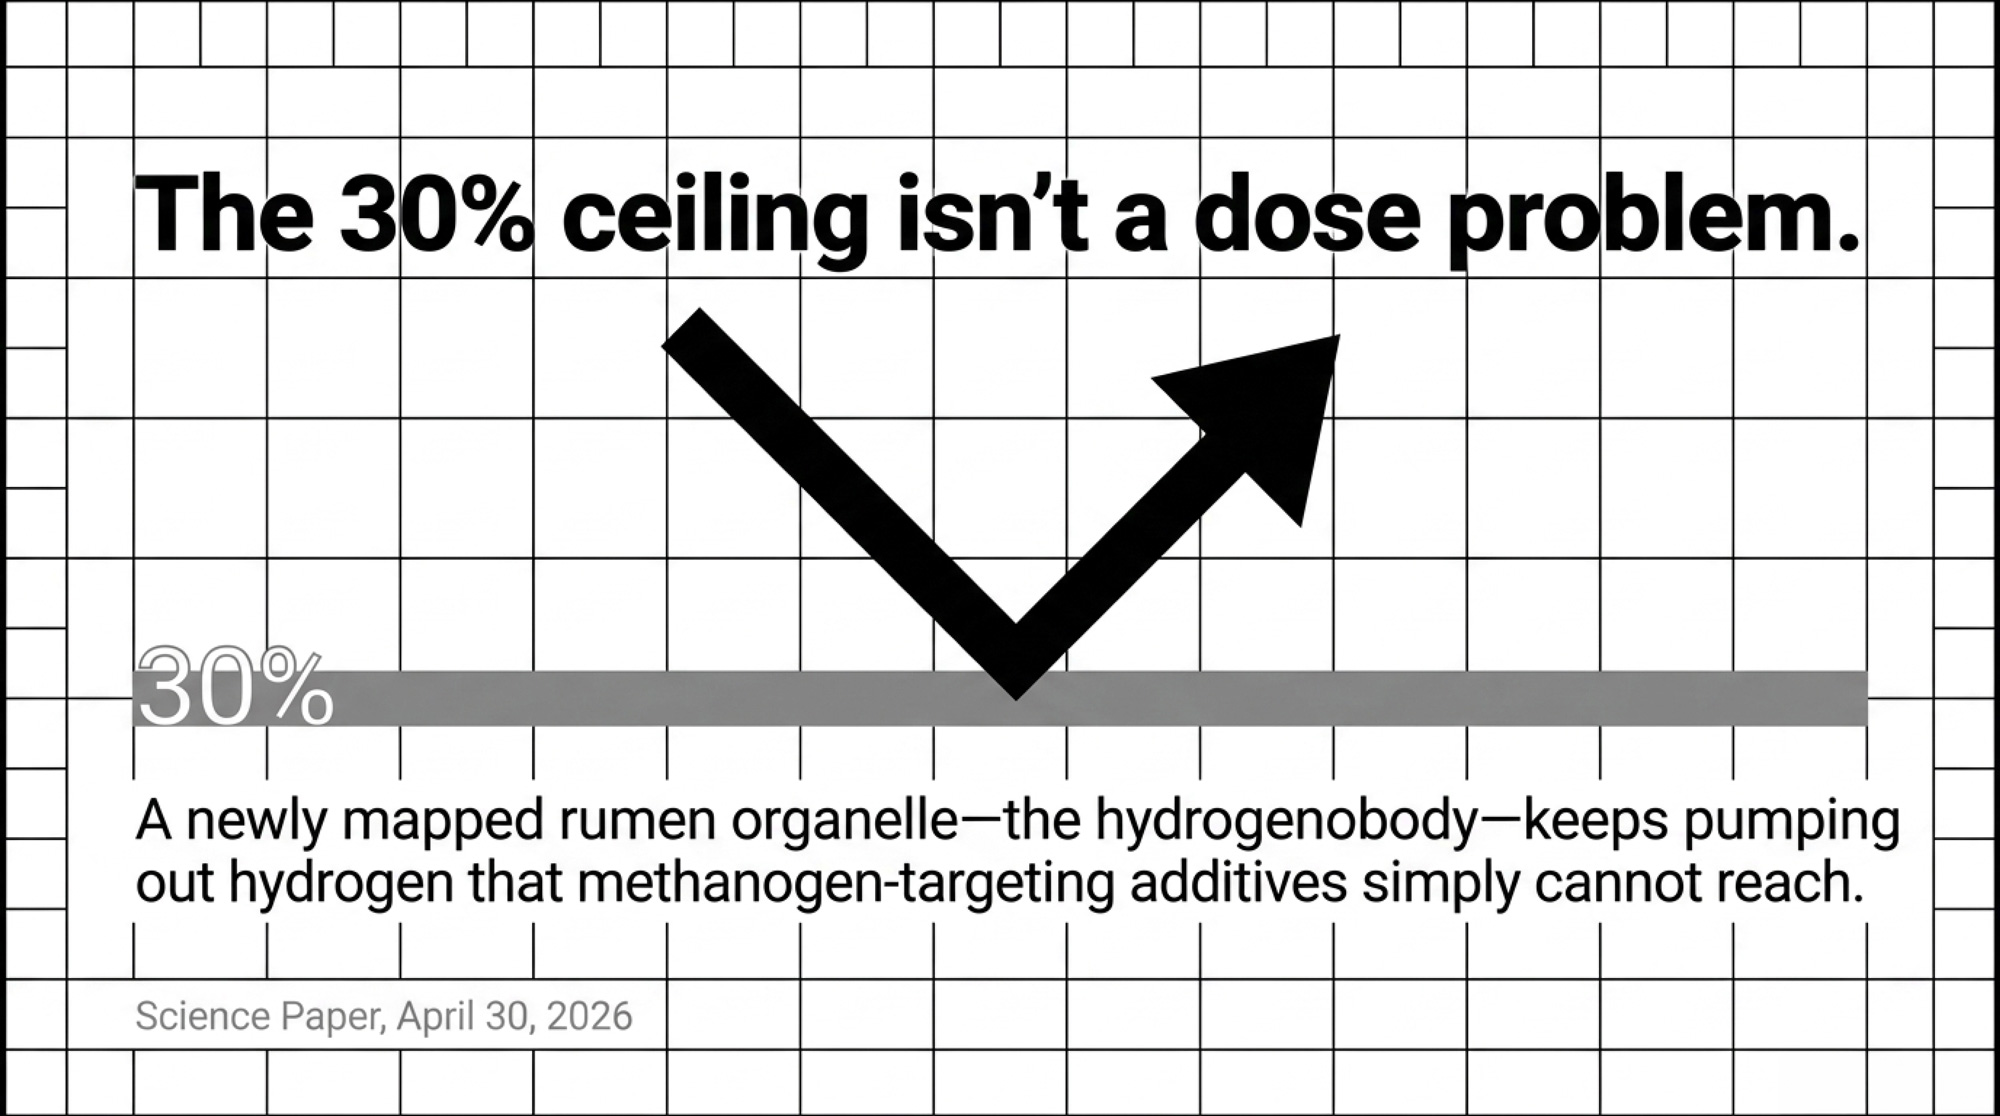
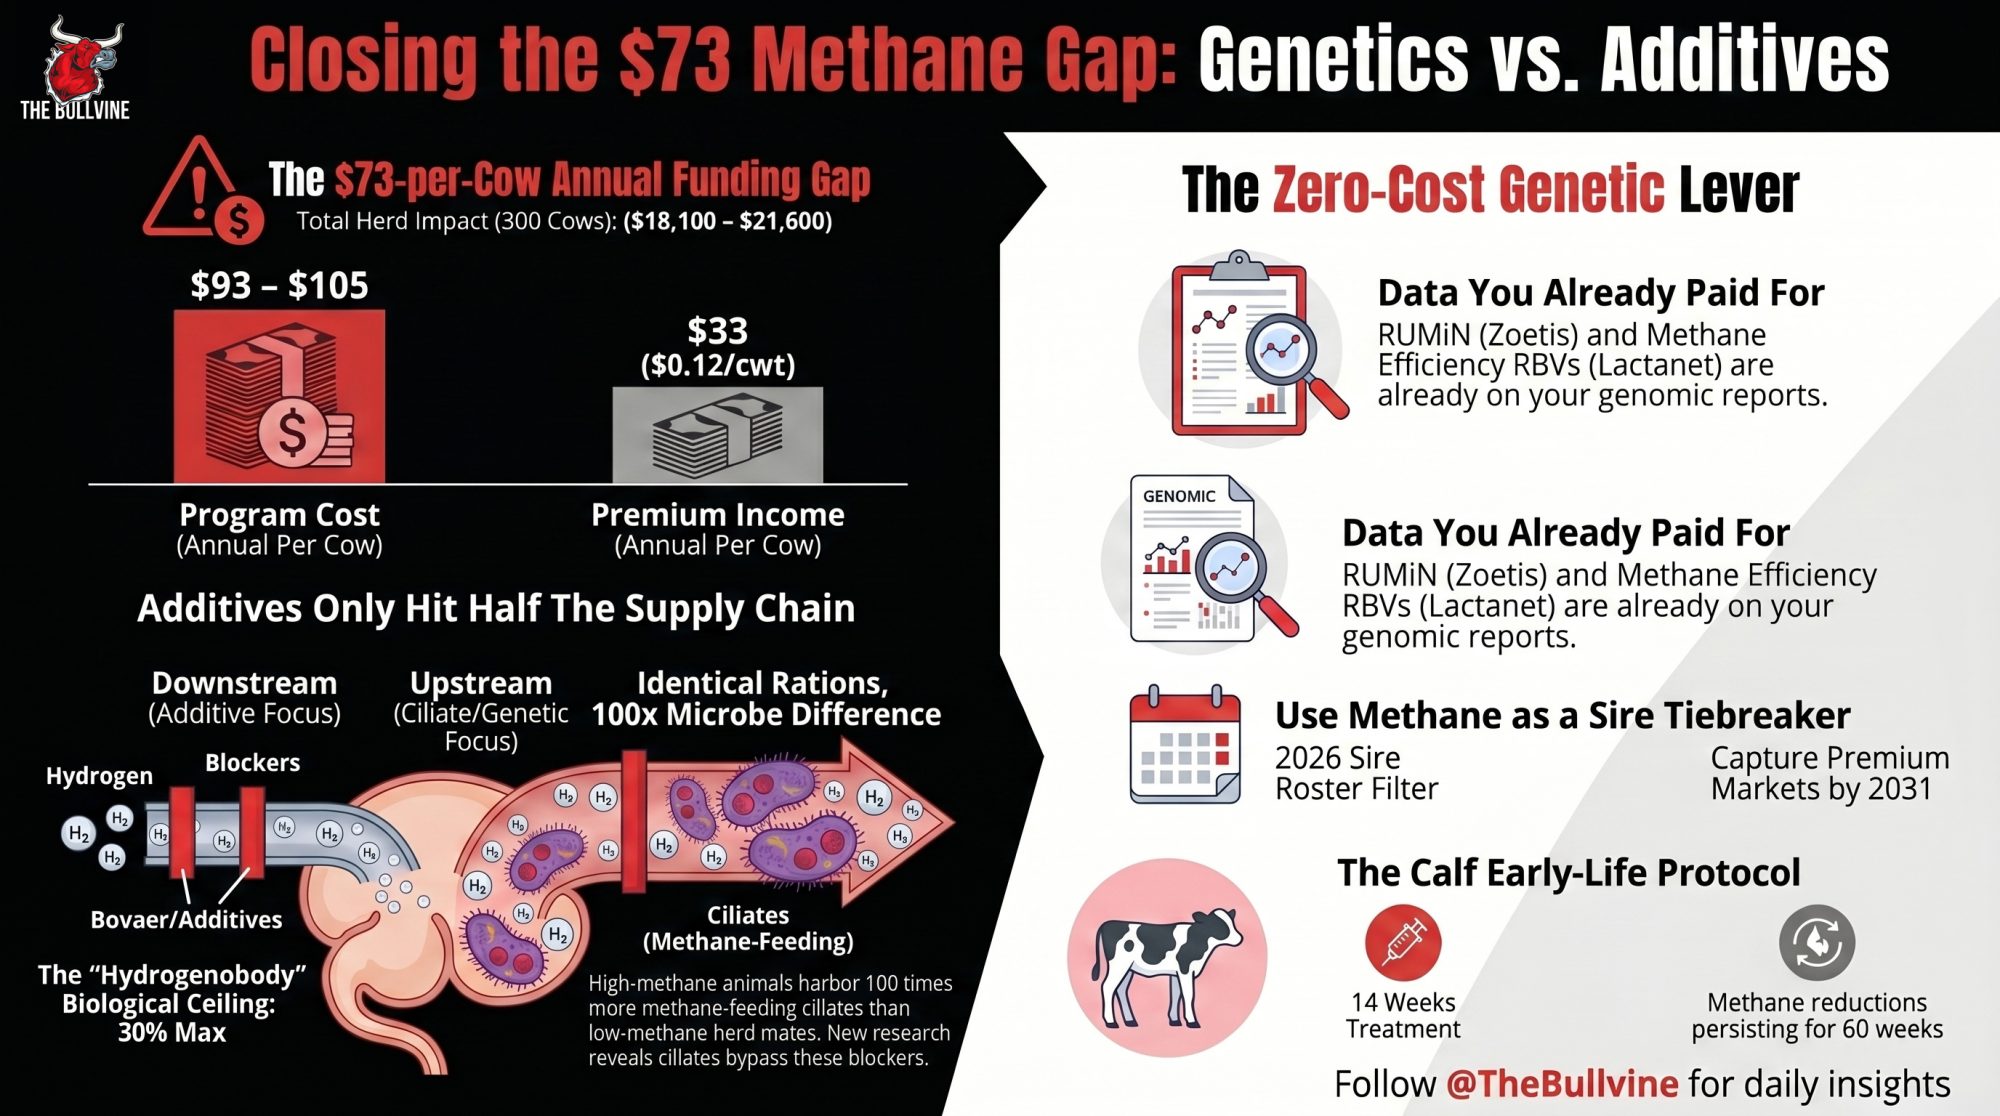
An April 2026 Science paper mapped why methanogen-targeting additives cap near 30% — and why the zero-cost lever is already sitting on a genomic report you paid for.

Executive Summary: Bovaer caps near 28–30% methane reduction because the April 30, 2026 Science paper just mapped a second hydrogen supply — the ciliate hydrogenobody — that 3-NOP can’t reach. On a 300-cow herd at 75 lbs/day, Bovaer runs $93–$105 per cow per year while a $0.12/cwt sustainability premium pays back only about $33, leaving a $40–$73 per cow per year gap that carbon credits or insetting have to fill. Sheep on identical rations produced 100 times more Dasytricha ciliates in high-methane animals than low-methane ones — same bunk, same feed, two orders of magnitude apart — which is why adding more additive won’t close the ceiling. The zero-cost lever is already sitting on the genomic reports you paid for: Zoetis dropped RUMiN into the April 2026 DWP$ update, and Lactanet has published Methane Efficiency RBVs on every Holstein female in eDHI since April 2023. Two 30-day moves earn their place before Monday — pull a recent CLARIFIDE Plus or Lactanet report and check whether methane traits ever broke a sire-selection tie, and if Bovaer’s already on farm, talk to your calf manager about adding it to the milk replacer for next-born heifers. Producers who filter sires on methane genetics in 2026 will be selling that genetic trajectory into a premium market by 2031–2032; producers who wait will be buying it back at markup. The full herd-size-tiered math and the two contract questions worth asking before 2027 renewal live in the next Bullvine Weekly.

Bovaer methane reduction

Run the numbers on a typical 300-cow herd shipping to a DFA-member plant at 75 lbs/day, on a contract up for renewal in 2027, collecting a $0.12/cwt sustainability premium. Eighteen months into a Bovaer (3-NOP) program, the methane reduction holds steady at 28%. The additive is doing what the label promised. But Bovaer has been reported in trade coverage at roughly $93–$105 per cow per year, while that $0.12/cwt premium on 75 lbs/day works out to only about $33 per cow per year — and Elanco has publicly projected carbon market returns in the range of $20 per cow per year on top of the premium, which still leaves a gap of $40–$73 per cow per year. The April 30, 2026 paper in Science just explained why closing that gap with more additive isn’t the play.

The gap closes fastest where a producer holds insetting access (defined below) or OFCAF cost-share. It widens fastest if carbon market revenue doesn’t materialize at renewal. That’s the variance band every 2027 conversation is running through right now.

The 30% Ceiling: Why the Rumen Resists Methanogen-Only Additives

Researchers at the Chinese Academy of Sciences assembled the most comprehensive rumen ciliate genome catalog ever produced — 450 genomes across cattle, sheep, goats, and deer. Inside those single-celled microbes, they found a tiny organelle nobody had described before. They named it the hydrogenobody. It does two jobs: produces hydrogen,

and scrubs oxygen from its immediate environment.

Those two jobs together build a near-perfect environment for the methanogens that convert hydrogen into methane. That’s the causal link the April paper nailed down. Bovaer blocks the downstream methanogens — but the hydrogenobody sitting one step upstream keeps pumping hydrogen the additive can’t reach. Your 28–30% reduction isn’t a dose problem. It’s the practical ceiling of a mechanism targeting only the downstream half of a two-part hydrogen supply chain.

The sheep data is where this lands hard. Animals fed identical rations — same feed, same management — but producing high methane had nearly 100 times more Dasytricha ciliates (a high-hydrogenobody genus) than low-methane sheep. Two animals. Same bunk. Same ration. Two orders of magnitude difference in the microbes most responsible for feeding the methane machine.

How This Shows Up in Real Herds

A Canadian producer 18 months into Bovaer watches the methane number hold steady near 28%. A US producer running the same program notices the reduction shrinks when forage composition shifts — consistent with the Dutch year-long trial’s finding that ration changes produced the biggest swings in the number. Both are experiencing the same biology: elevated rumen hydrogen partial pressure from methanogens being partially suppressed, while ciliates keep producing H₂ at the cell surface. Elanco has publicly maintained that Bovaer delivers consistent reductions under commercial conditions across validated trials, and within-mechanism that record is real. What the April paper raises is about the mechanism’s scope, not its integrity.

Penn State measured 3-NOP cutting methane 31% while simultaneously raising free rumen hydrogen from undetectable to 1.33 g/day. The Dutch year-long dairy trial found efficacy of 21–27% across a full lactation. Different herds. Different seasons. Same shape of result.

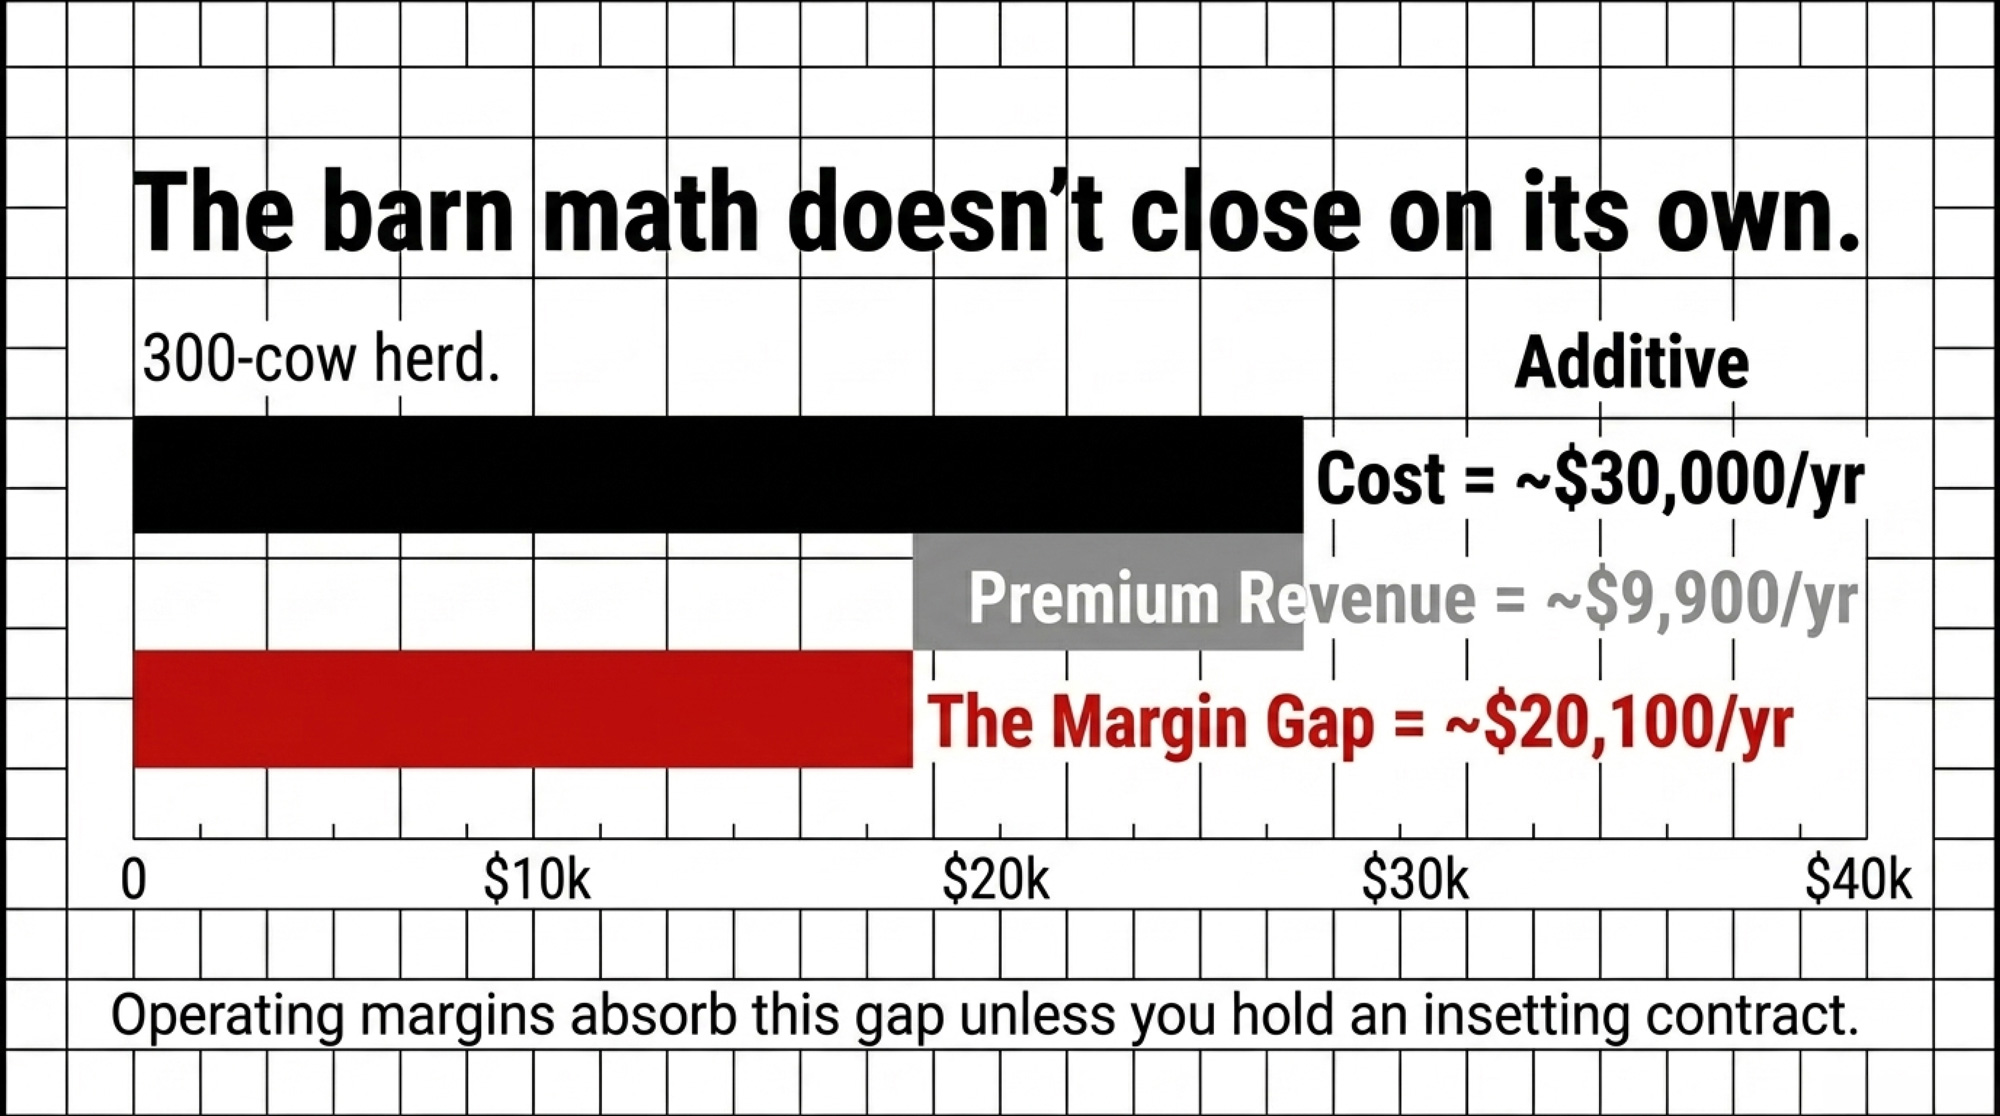
The barn math. On a 300-cow herd, Bovaer costs roughly $28,000–$31,500 per year in additive bills. That same herd earns about $9,900 per year from a $0.12/cwt premium on 75 lbs/day. The gap between cost and current premium revenue lands at $18,000–$21,500 per year that has to come from somewhere. Carbon credits. Cost-share. An insetting arrangement. Or your operating margin absorbing it as audit insurance.

Contract Line ItemMarketed ValueRealized Value (Yr 1)Gap
Sustainability premium$1.25/cwt$0.92/cwt–$0.33
Bovaer feed cost (DSM pricing)“offset by premium”$0.18/cow/day+$65.70/yr
Methane verification feeNot disclosed$12/cow/yr+$12.00
Labor/TMR mixing compliance“minimal”0.4 hr/day/100 cows+$18/cow/yr
Exit penalty (early termination)“standard”24-month clawbackLocked in
Net margin impact+$47/cow–$26/cow–$73/cow

Plug your own numbers in. Your herd size times about per cow per year lands you inside the variance band — closer to the low end if you hold an insetting contract, closer to the high end if you don’t. If that number is larger than you’re comfortable carrying into 2027 renegotiation, the four-lever choice below starts to matter.

Contract ClauseTypical LanguageHidden RiskNegotiation Ask
Premium duration“for the term of agreement”Reviewable annually by processorLock floor at $0.75/cwt for 36 months
Dosing compliance“per manufacturer protocol”Audit failure = full clawbackCap clawback at 6 months
Data ownership“processor retains herd data”Sold to CPG brands without share25% royalty on secondary data use
Methane floor“minimum 25% reduction”Below-threshold = unpaidTiered payment, no zero-out
Termination“24-month notice required”Blocks competing contracts90-day exit with cause

What’s Actually Happening in the Rumen

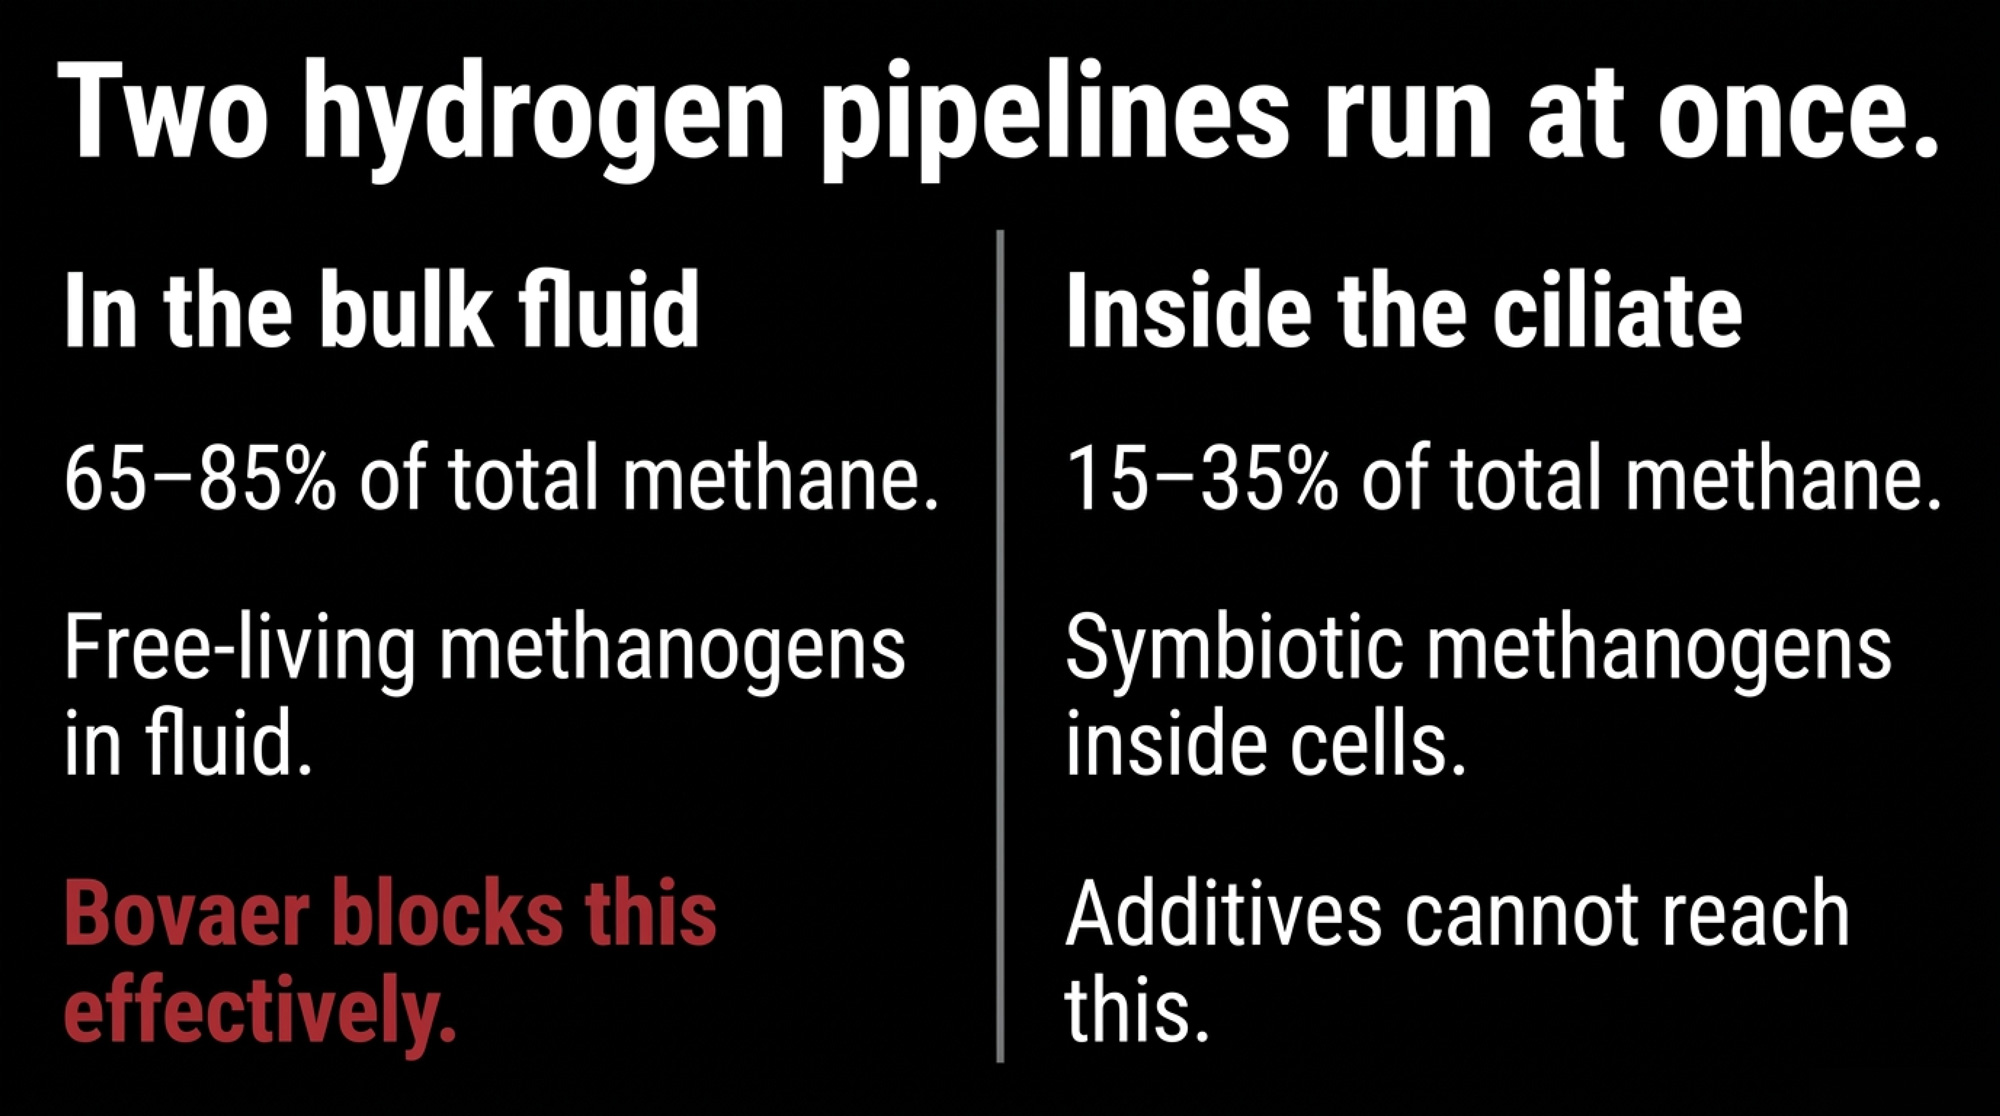
Two hydrogen pipelines run at the same time. Free-living methanogens in the bulk rumen fluid consume roughly 65–85% of total methane production. That’s where Bovaer operates — circulating in fluid, reaching those free-living archaea, blocking the enzyme that makes methane. That’s the real reduction you’re paying for.

But the other 15–35% of methane comes from methanogens that live directly on and inside ciliate cells as symbiotic partners, fed hydrogen at cell-surface proximity by the hydrogenobody organelles. That exchange happens in nanometres, not metres. An additive moving through rumen fluid has a much harder time reaching those methanogens at meaningful concentration — the hydrogen never enters the bulk fluid in the first place.

That upstream gap is why Asparagopsis seaweed routinely hits 80–99% in controlled trials, and why compounds that suppress ciliates directly — certain tannins, saponins, lingonberry-derived extracts — tend to produce more durable results than their mechanism descriptions suggest. They’re hitting the supply, not just the consumer. Worth noting: ambient dietary tannins from alfalfa-heavy rations or byproduct loads don’t reach the therapeutic threshold, so “I already feed high-tannin forage” doesn’t substitute for a targeted blend.

The concerning part for producers 18 months in: recent metagenomics work has documented measurable shifts in the rumen protozoal community under sustained Bovaer dosing, with incomplete reversal after withdrawal. What that work doesn’t answer — and what you should be asking — is whether those community changes affect the size or stability of the methane reduction over time. The long-term efficacy question stays open.

How Much Does Waiting 30 Days Actually Cost?

For the tannin-saponin layer, waiting 30 days costs effectively nothing. The protocols and contract structures aren’t ready to pay for it yet. Verra’s VM0041 methodology — the dominant global protocol for enteric methane feed additive credits — currently covers methanogen inhibition. The ciliate module Viresco Solutions submitted in 2024 was placed on hold December 19, 2024, and the public registry entry does not specify criteria required for it to advance. Stacking a ciliate mechanism onto your current credit path isn’t an option today.

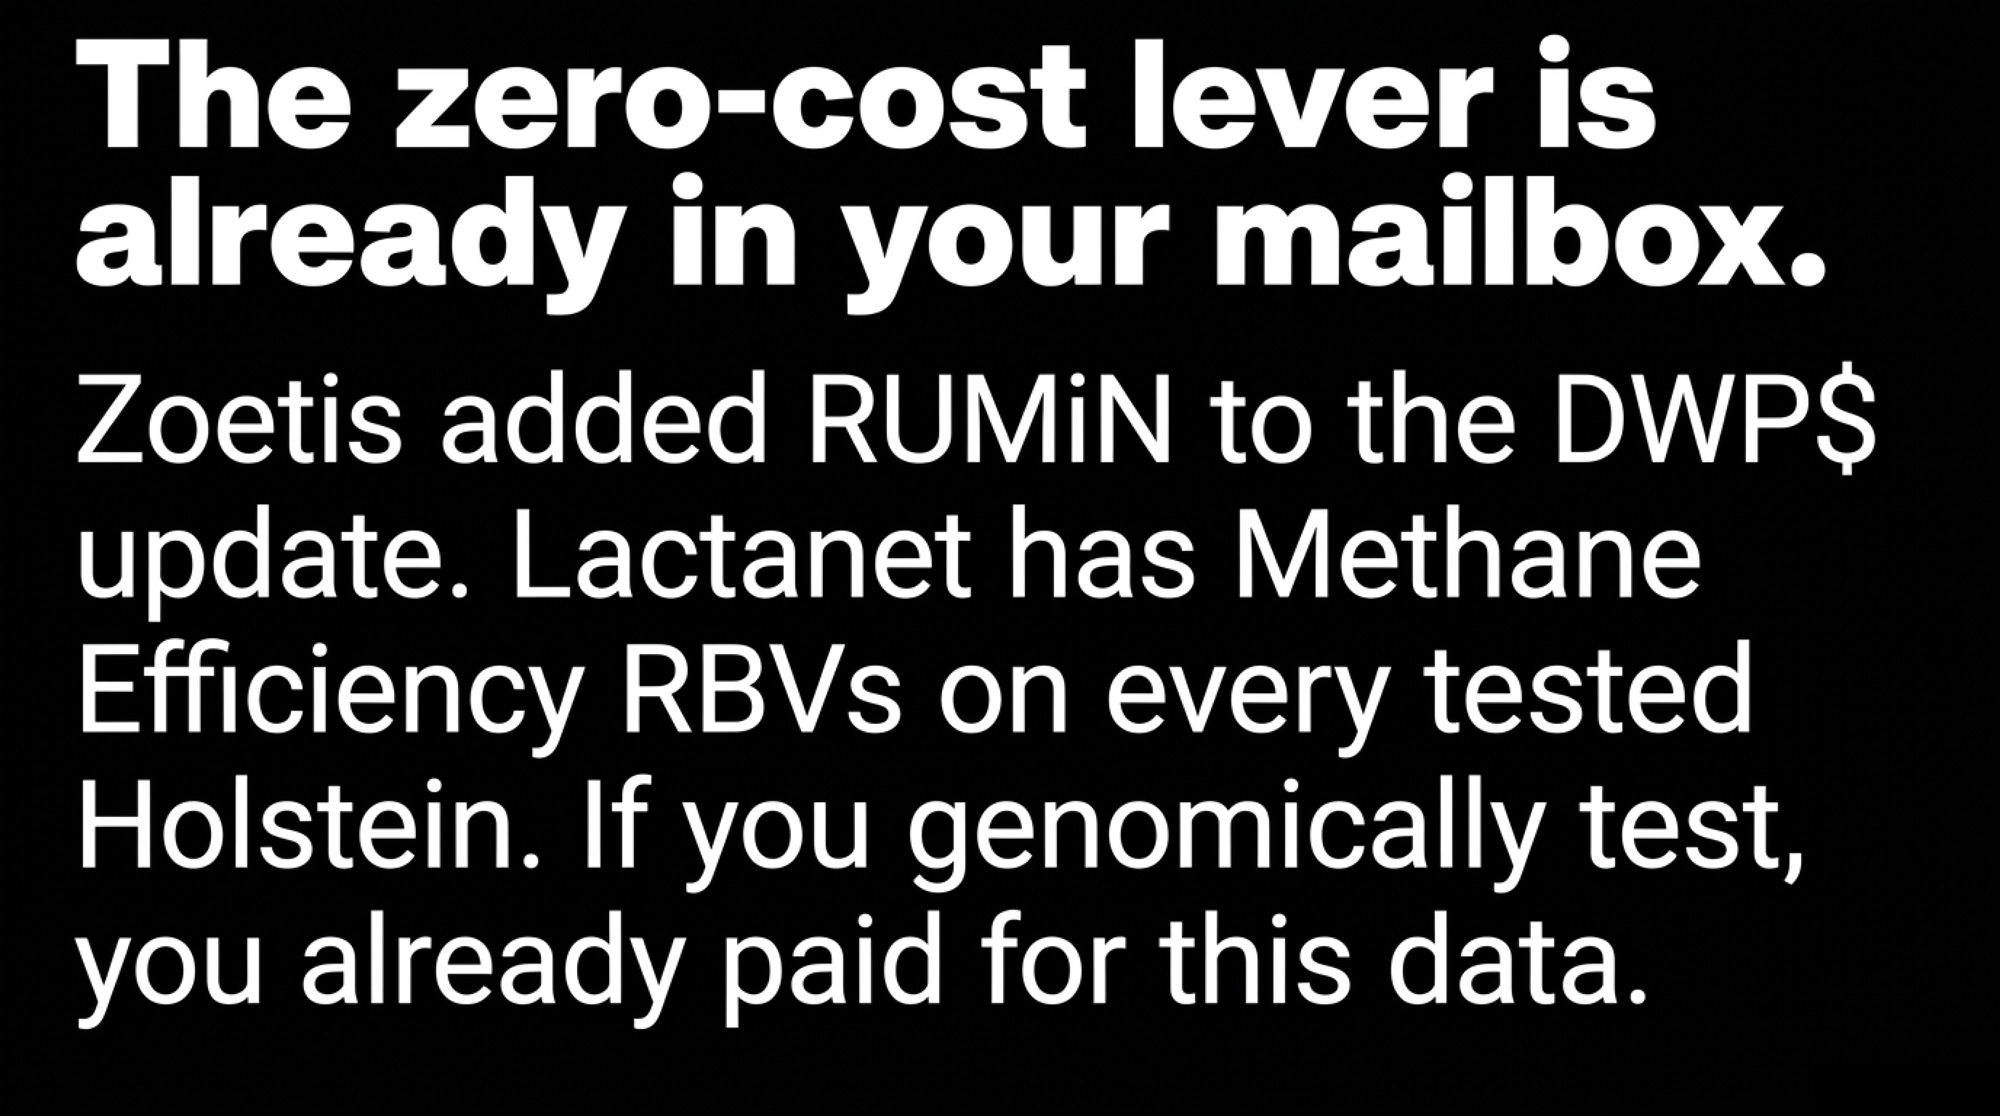
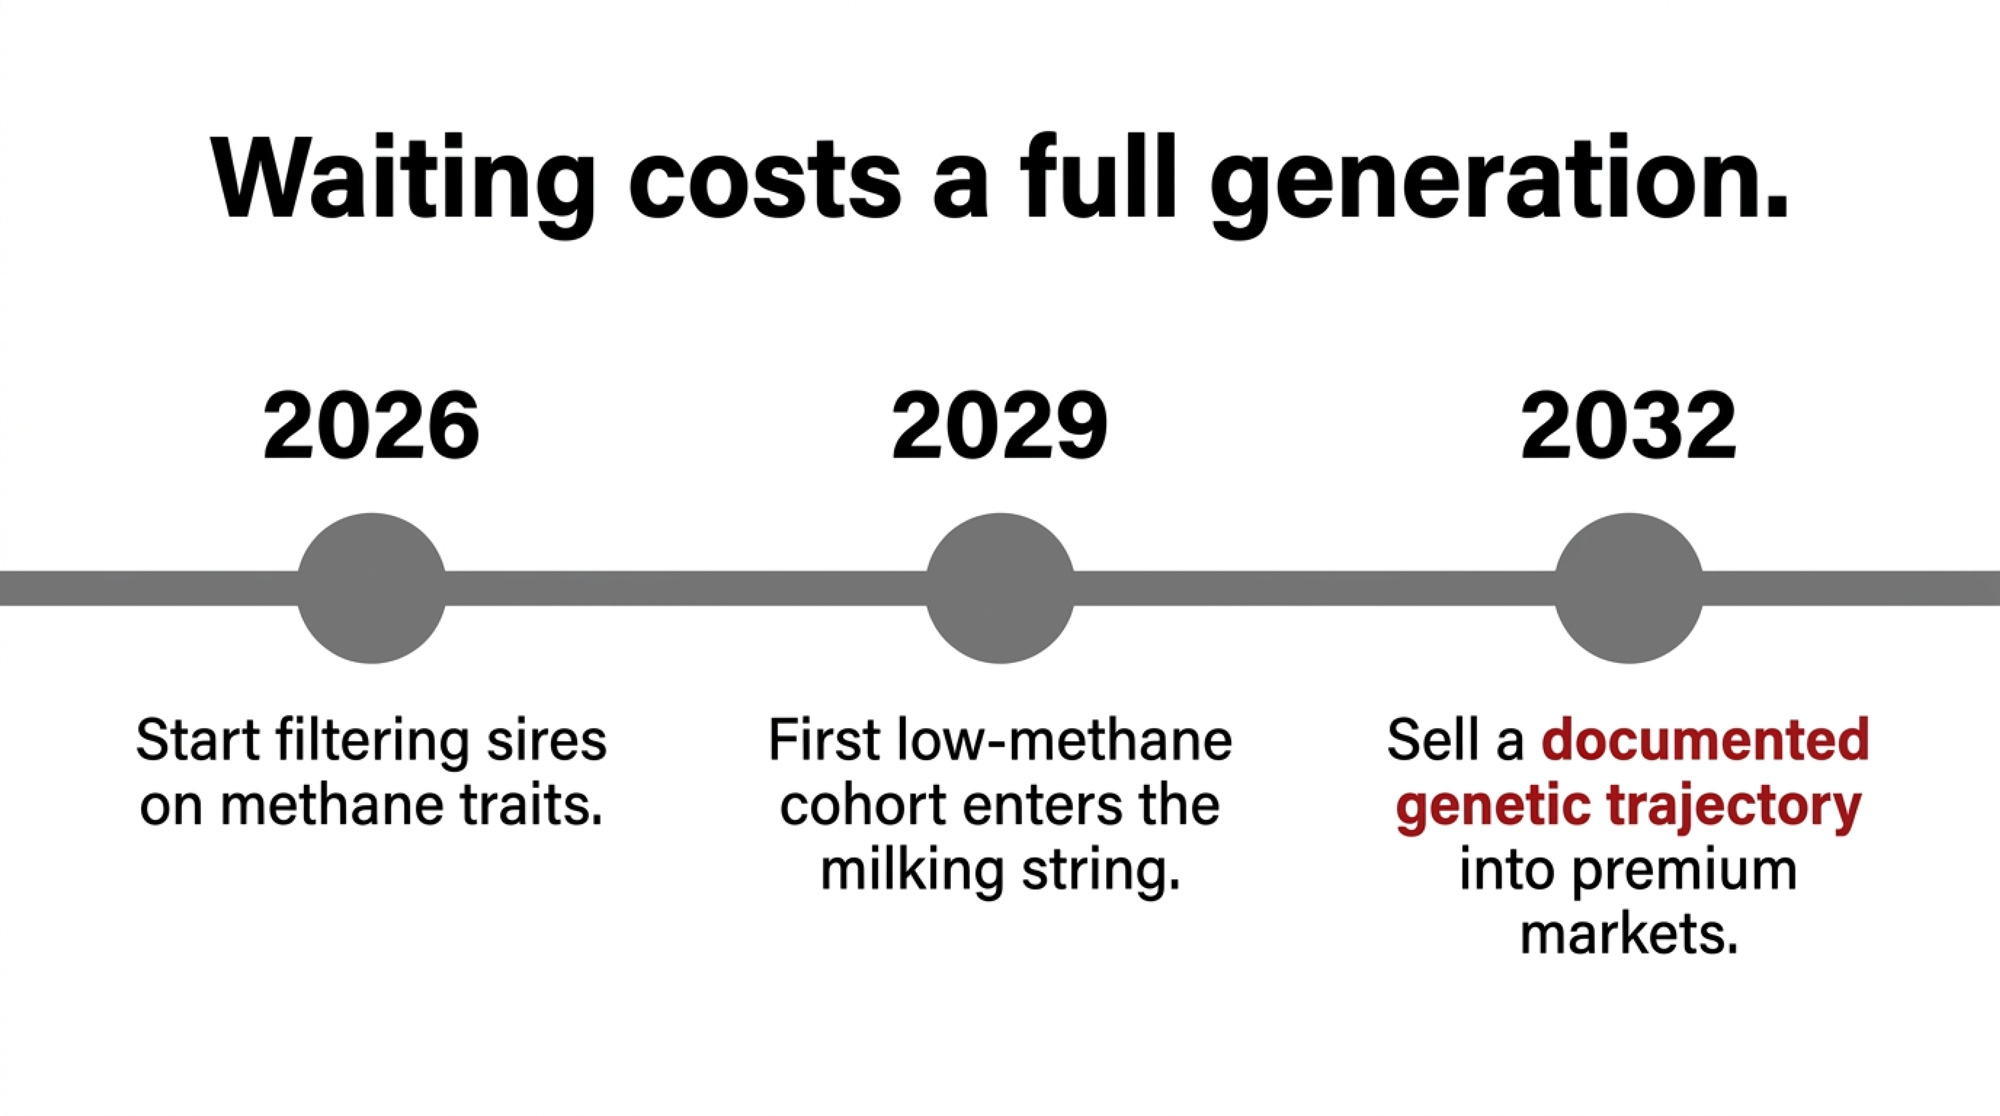
Waiting on the genetic lever costs you a heifer cohort and a breeding cycle. Those compound. Every breeding season you delay adding RUMiN or Methane Efficiency RBV to your sire filter is a generation interval you hand to a competitor who moved first. Danone has publicly stated that genomic testing plays an important role in its global methane reduction strategy. That signals where methane traits may factor into supplier programs over time. Zoetis integrated RUMiN into the April 2026 Dairy Wellness Profit Index update, with company materials indicating that RUMiN-informed sire selection is expected to reduce lifetime methane intensity in daughter cohorts. When methane EBVs get priced into semen premiums — and the trajectory suggests that’s where 2029–2030 is heading — producers who started filtering in 2026 will be the ones selling genetics the late movers pay premium to access.

Value Chain PlayerRevenue/Cow/YrCost/Risk BorneNet Margin/Cow
Dairy farmer$95$88 (feed + labor + risk)$7
Milk processor$142$38 (logistics + admin)$104
CPG brand (Danone, Nestlé)$210$45 (marketing + audit)$165
Carbon credit aggregator$68$14 (verification)$54
Value capture ratioFarmer = 2.4%

Is Your Herd’s Genetic Strategy Already Behind?

Pull a recent Zoetis CLARIFIDE Plus report or a Lactanet genomic summary on any heifer tested in the last six months. If you can’t immediately find the RUMiN value (Zoetis) or the Methane Efficiency RBV (Lactanet, published on every Holstein female in eDHI herds since April 2023), you’re not using data already in your mailbox.

Most selection indexes already weight methane traits implicitly through composites like Feed Efficiency or the Environmental Index inside LPI. That’s a reasonable starting point. When your processor or export buyer shifts toward outcome-based carbon verification in 2028–2030, the herds with a documented genetic trajectory — methane-filtered sires used consistently since 2026, with the genomic records to prove it — walk into that conversation with a structural story competitors can’t replicate on short notice.

Reliability on Lactanet’s methane genomic EBV for young genotyped bulls now exceeds 70%. The genetic correlation between MIR-predicted methane (the kind your eDHI milk sample is already generating) and directly measured methane is 0.85. You’re not selecting on noise. You’re selecting on data flowing through a pipeline that’s already running.

Options and Trade-Offs: The Four-Lever Comparison

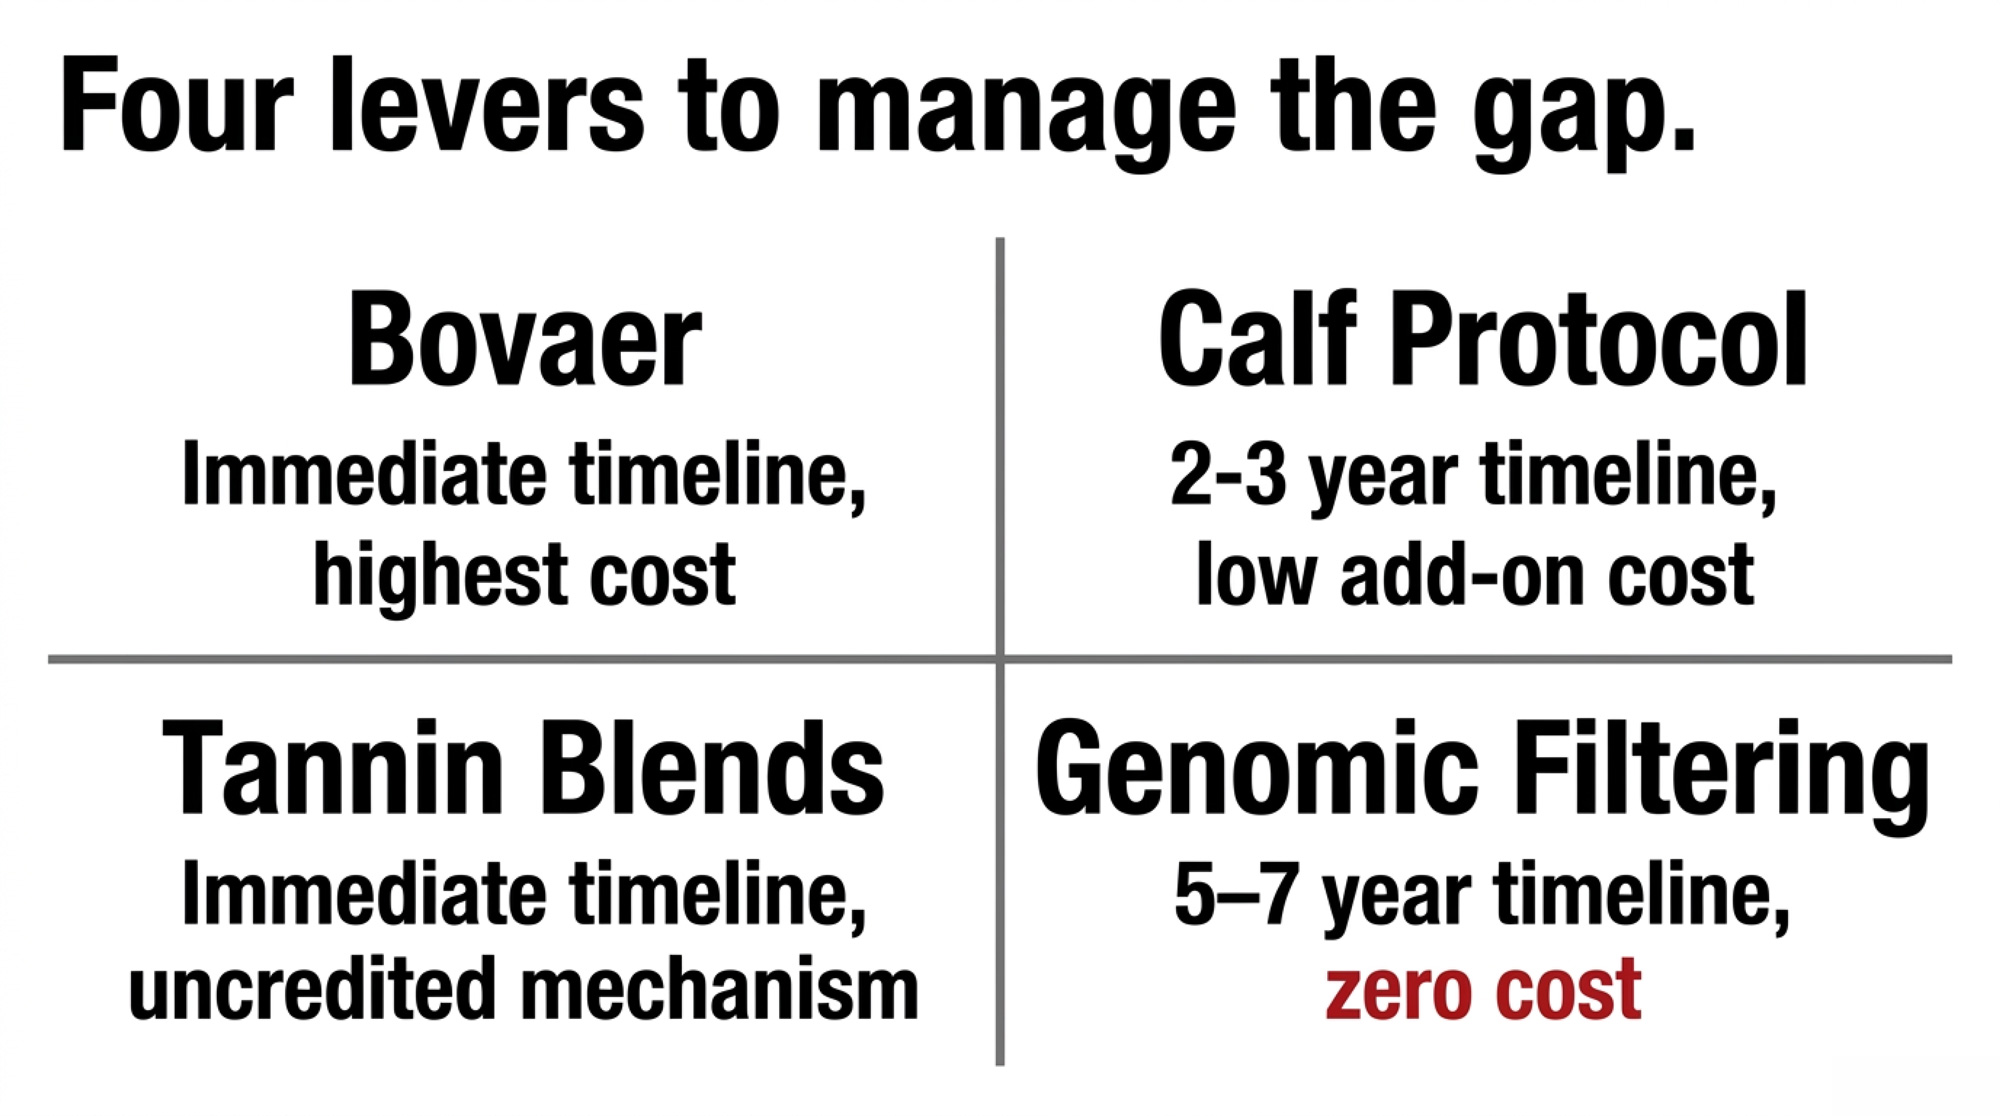
Four levers address different parts of the methane puzzle at different time horizons and cost points. Most producers shouldn’t run all four right now. Pick the combination that matches where your contract and your breeding program sit today.

A quick note on “insetting.” Unlike open-market carbon credits, an insetting arrangement keeps the reduction inside the processor’s own supply chain — it counts toward their Scope 3 footprint rather than being sold to an outside buyer. In an insetting model, your methane numbers feed your processor’s sustainability report. In an open-market model, you can sell the credit independently. The economics of your 2027 contract hinge on which model your processor runs.

StrategyCost (Est.)Methane ImpactTimelineKey Trigger
Bovaer (3-NOP)$93–$105/cow/year21–31% (practical ceiling)Immediate2027 contract renewal
Calf Early-Life ProtocolLow marginal add if Bovaer already on farmPersistent reduction to 60 weeks of age from 14-week treatment2–3 years to milking stringNext calving season
Tannin/Saponin Blend$0.10–$0.18/cow/daySupplemental (ciliate-targeting, no DMI penalty)Immediate$0.18/cwt dual-mechanism tier, OFCAF access, or VM0041 ciliate module restart
Genomic Sire Filtering$0 incremental if testingCumulative, heritable5–7 years to herd-level expressionThis breeding season

Continue Bovaer. Protocol-compliant under VM0041, registry-creditable today, defensible in a 2027 renegotiation. The net margin is thin at current premium levels, but it isn’t negative if you already hold a sustainability contract. Risk: the 28–30% reduction is the mechanism’s practical ceiling on this lever alone.

Add a tannin-saponin blend — but not yet. The 2025 J. Dairy Science trial on Silvafeed BX confirmed methane reduction without penalty to ECM, fat yield, protein yield, or DMI. The mechanism is real. But the economics don’t close in 2026 — commercial blends scaled from published beef cattle trial pricing land roughly $0.10–$0.18/cow/day on dairy DMI, and current protocols don’t credit the ciliate mechanism separately. Hold this layer until one of three triggers fires.

Start a calf early-life protocol within 30 days. Pre-weaning rumen microbiome colonisation shapes a substantial share of the adult animal’s rumen community, with published estimates clustering in the 60–70% range depending on methodology. A 2021 trial found 3-NOP given to calves in the first 14 weeks produced methane reductions persisting to 60 weeks of age — long after treatment ended. If Bovaer is already on farm, the marginal cost of adding it to the milk replacer program for next-born calves is low. Those calves enter the milking string in 2028–2029, right when outcome-based verification standards are projected to tighten.

Filter your sire roster on methane genetics — zero incremental cost. You’re not buying a new test. Lactanet publishes Methane Efficiency RBVs on every Holstein female in eDHI. Zoetis added RUMiN and Milk Methane Intensity (Z_MI) to every CLARIFIDE Plus report in April 2026. The trade-off: herd-level expression takes 5–7 years. A 2026 sire selection change shows up meaningfully in your herd’s methane number around 2031–2032.

The combination that closes both the near-term audit need and the long-term biological asset without absorbing an extra – per cow per year in negative margin: Bovaer + calf protocol + RUMiN sire filtering. Hold the tannin-saponin layer for the 2028 trigger.

Key Takeaways

  • If your net return on Bovaer is under $20/cow/year after premium, check whether your processor runs an insetting program (DFA, Danone, select others) or whether OFCAF cost-share applies in your region. Ask both questions before the 2027 renewal conversation — that’s where the economics turn positive or don’t.
  • If your Bovaer program has held at 28–30% for 18 months, monitor rumination time and component tests as leading indicators of rumen ecology shifting under sustained dosing. Neither shows up on a methane reduction number until the shift has already compounded.
  • If you’re genomically testing replacement heifers, the RUMiN and Methane Efficiency RBV data is already on the report you paid for. Start using it as a sire tiebreaker within your current economic index this breeding season.
  • If Bovaer is already on farm, talk to your veterinarian and calf manager this month about adding it to the milk replacer protocol for next-born calves. The 2029 heifer cohort is the one that carries this forward.

Where Does Your Operation Actually Sit?

The producers who’ll be selling low-methane genetics into a premium market in 2032 aren’t the ones currently spending the most on additives. They’re the ones who recognized in 2026 that the biology had changed category — from a compliance cost to a heritable asset — and adjusted their sire roster while everyone else was still optimizing additive spend. The April 2026 hydrogenobody paper made that shift explicit. The response window is now, not when methane EBVs get priced into semen premiums.

So where does your operation actually sit on that line? Pull your last genomic report before Monday. Check whether your methane trait values were ever used in a selection decision. If the answer is no, you’ve just identified the highest-leverage, lowest-cost change you can make this month. The full herd-size-tiered math — including the two contract questions worth asking your processor rep before 2027 renewal — runs in the next Bullvine Weekly.

Complete references and supporting documentation are available upon request by contacting the editorial team at editor@thebullvine.com.

Learn More

The Sunday Read Dairy Professionals Don’t Skip.

Every week, thousands of producers, breeders, and industry insiders open Bullvine Weekly for genetics insights, market shifts, and profit strategies they won’t find anywhere else. One email. Five minutes. Smarter decisions all week.

NewsSubscribe
First
Last
Consent

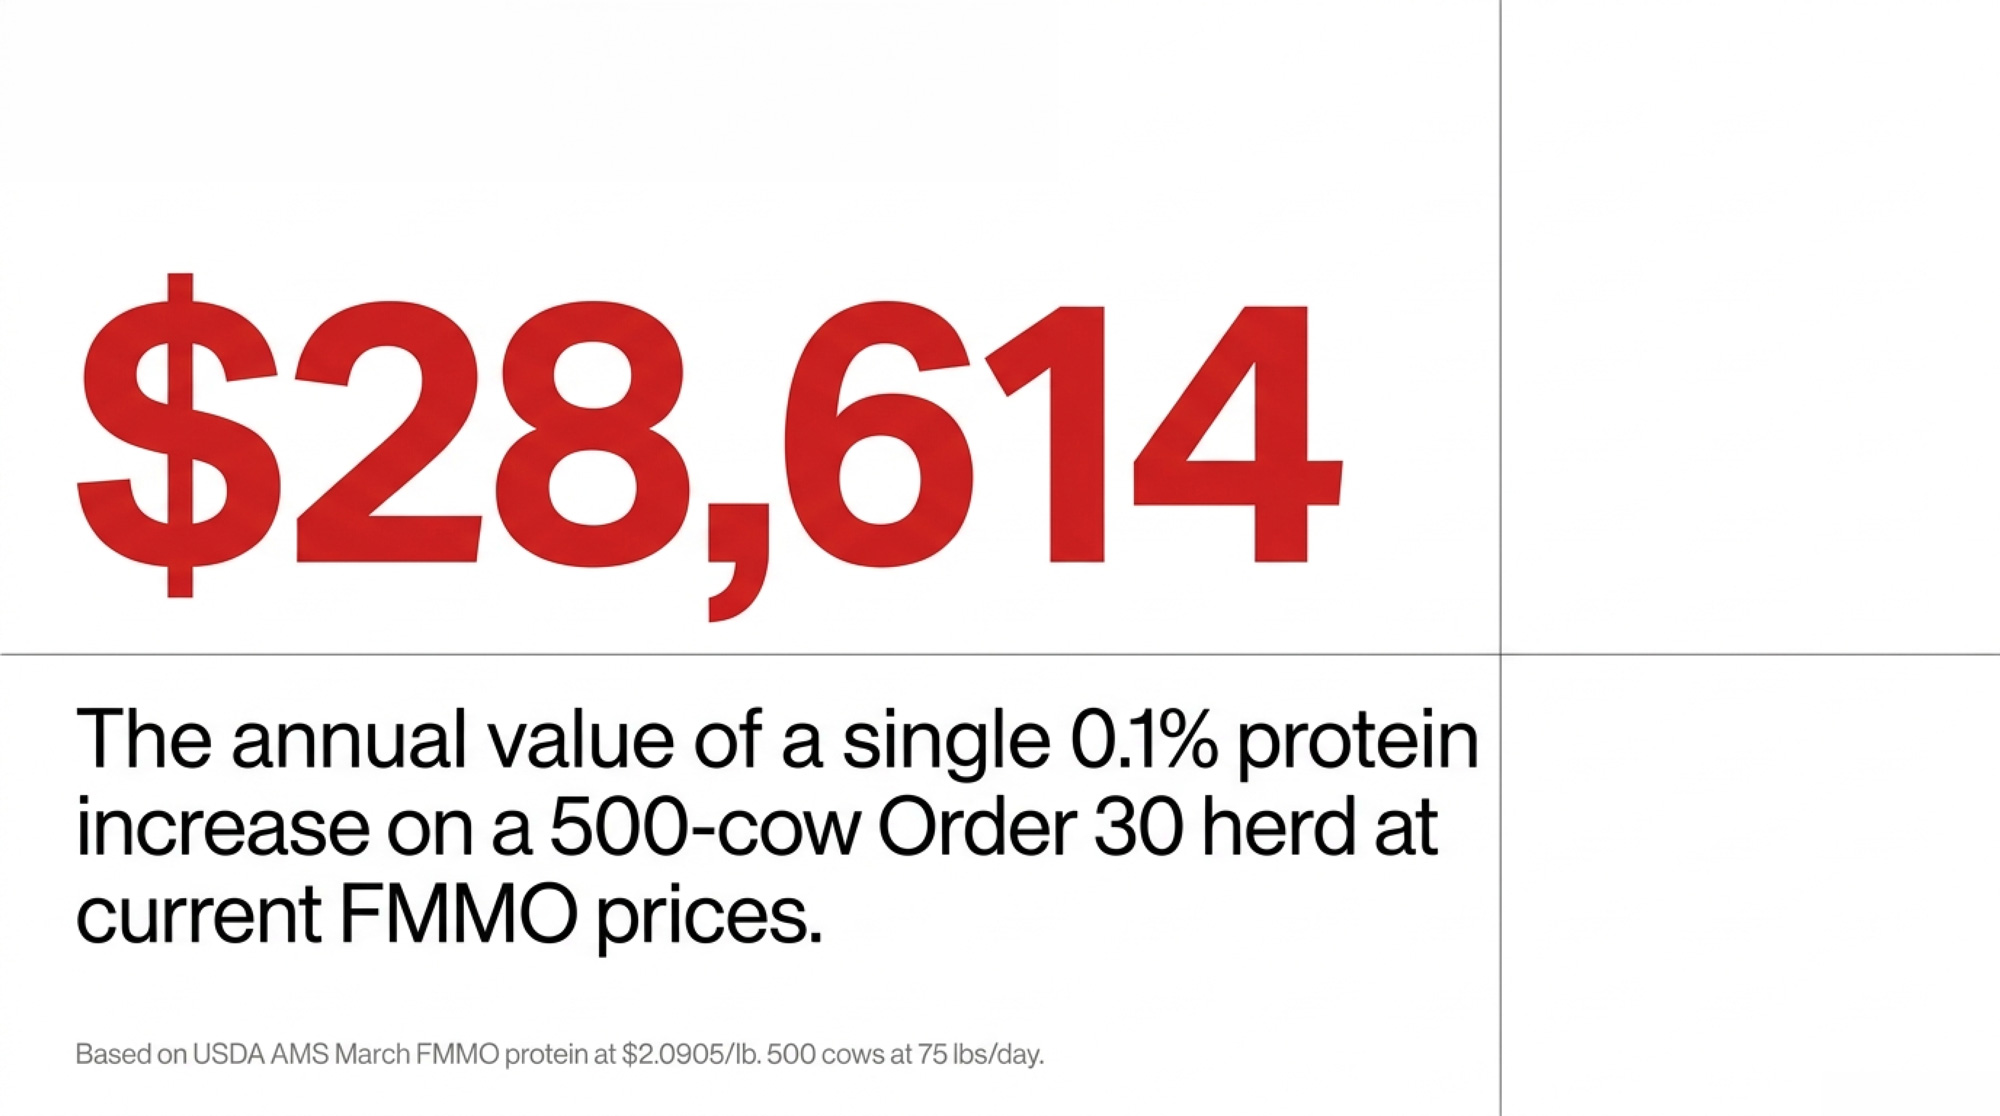
The $28,614 Tenth: Why Upper Midwest Protein Is Now Worth More Than Fat

USDA set March protein at $2.0905/lb against butterfat at $2.0220. On a 500-cow Order 30 herd at 75 lbs/day, that tenth is worth $28,614 a year — $938 more than fat. First sustained flip in a decade.

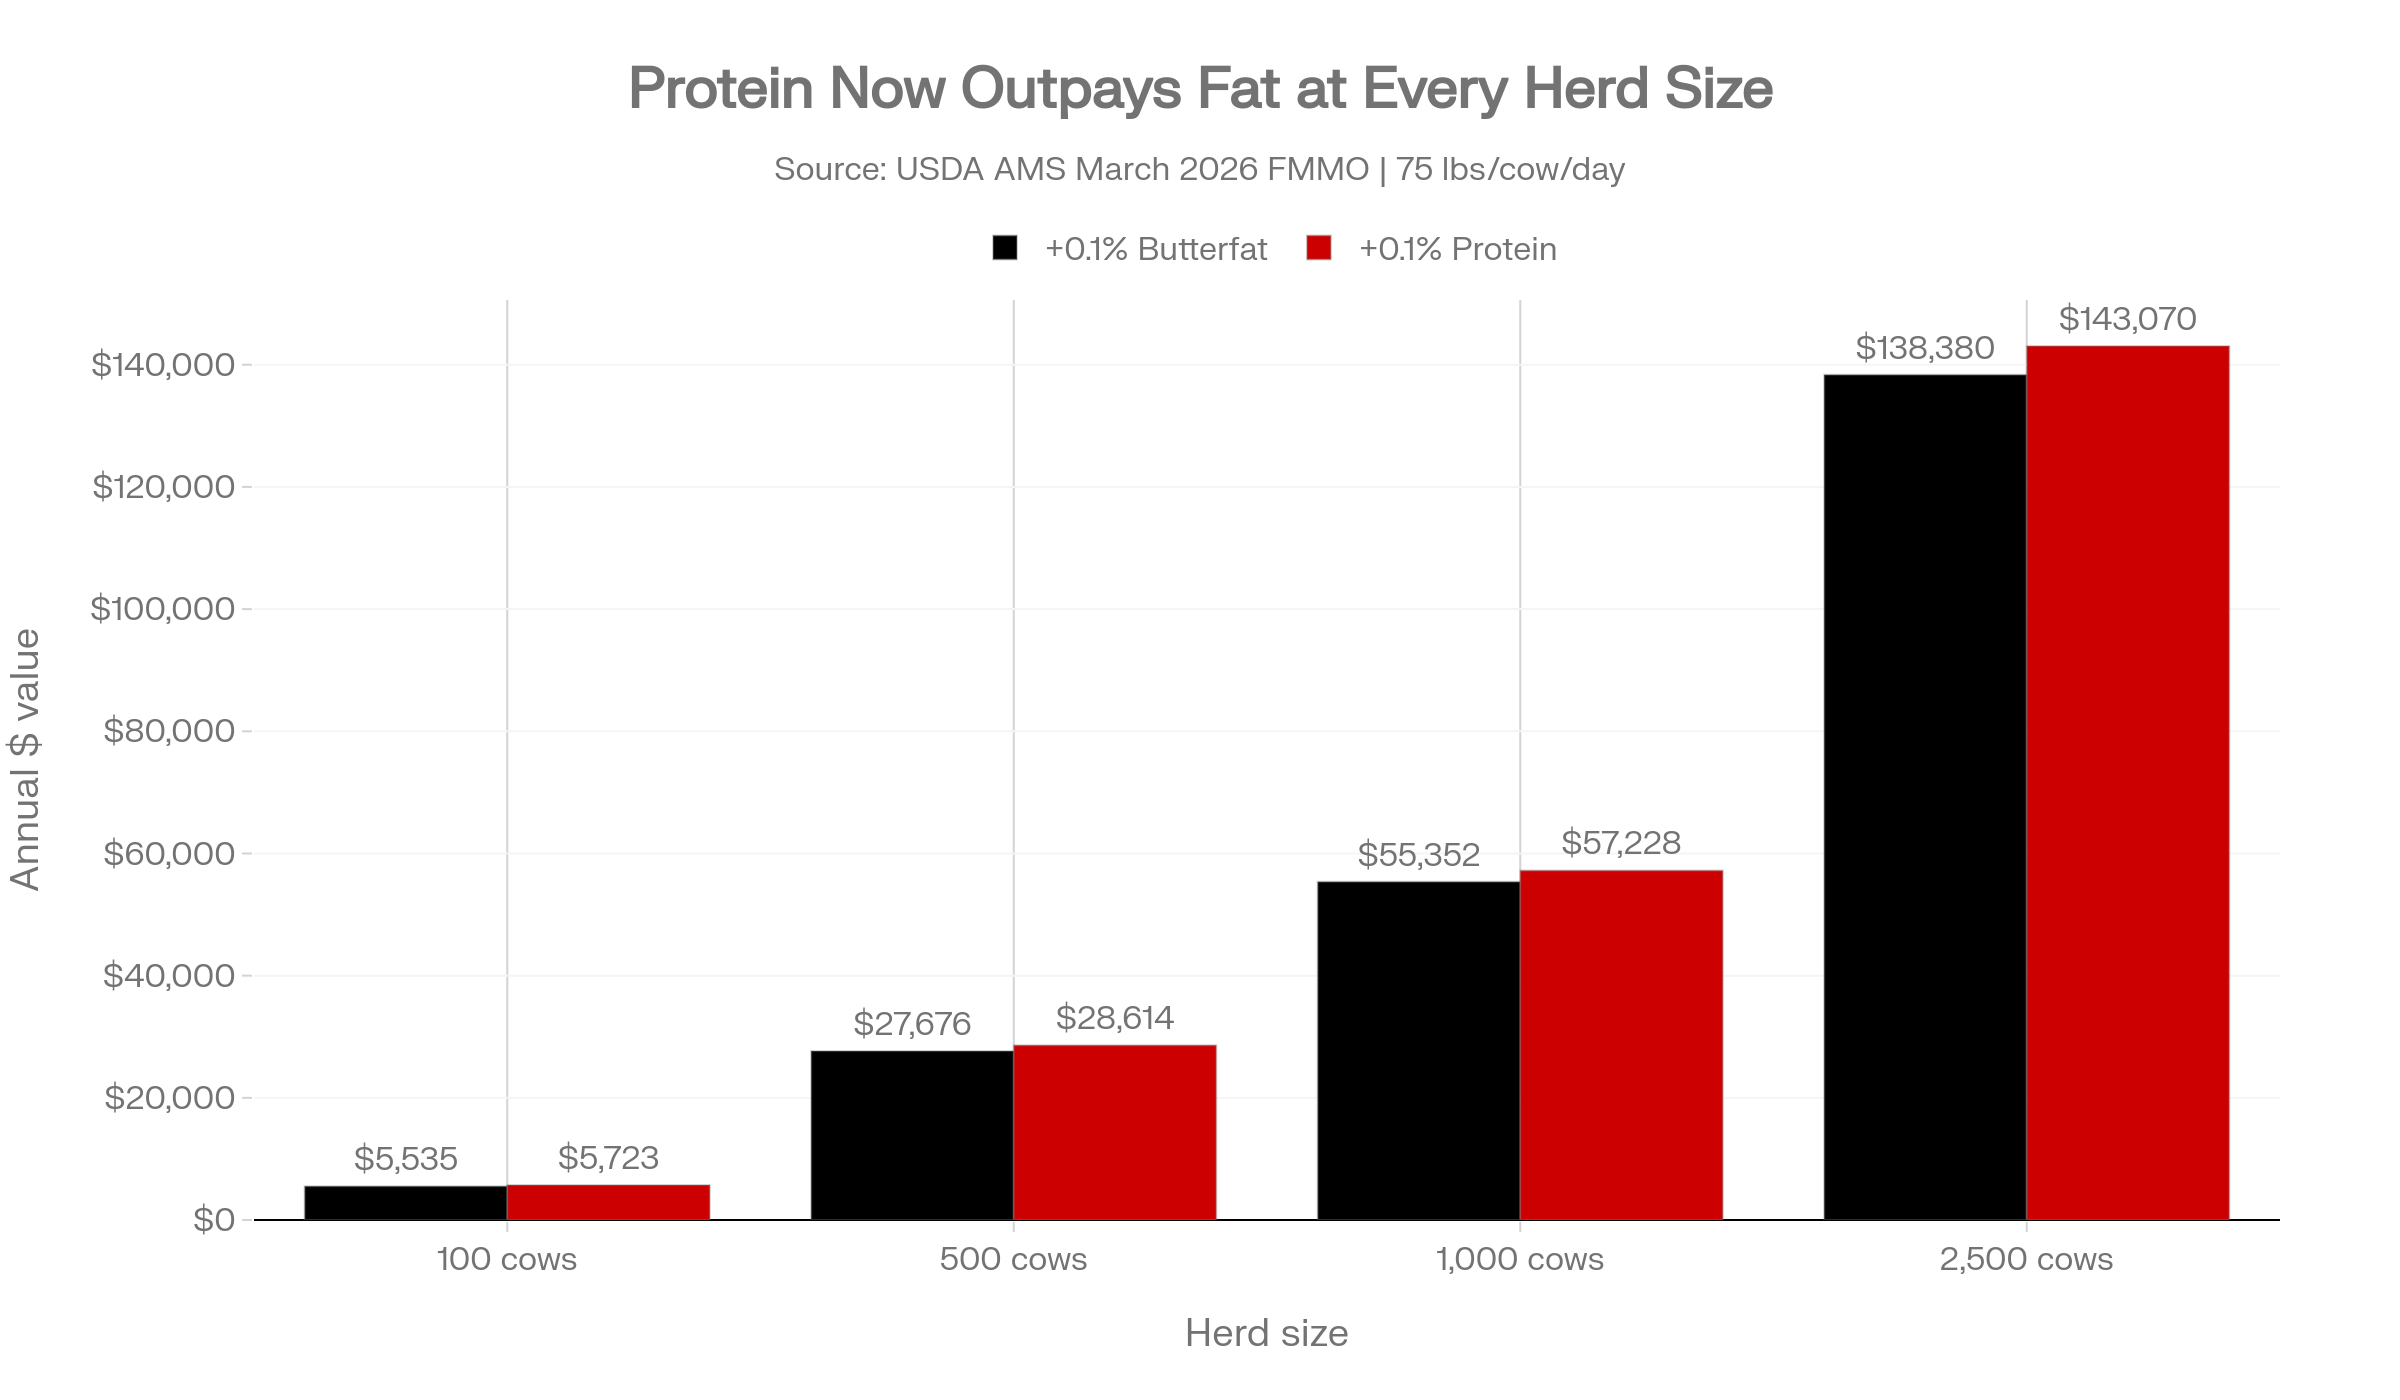
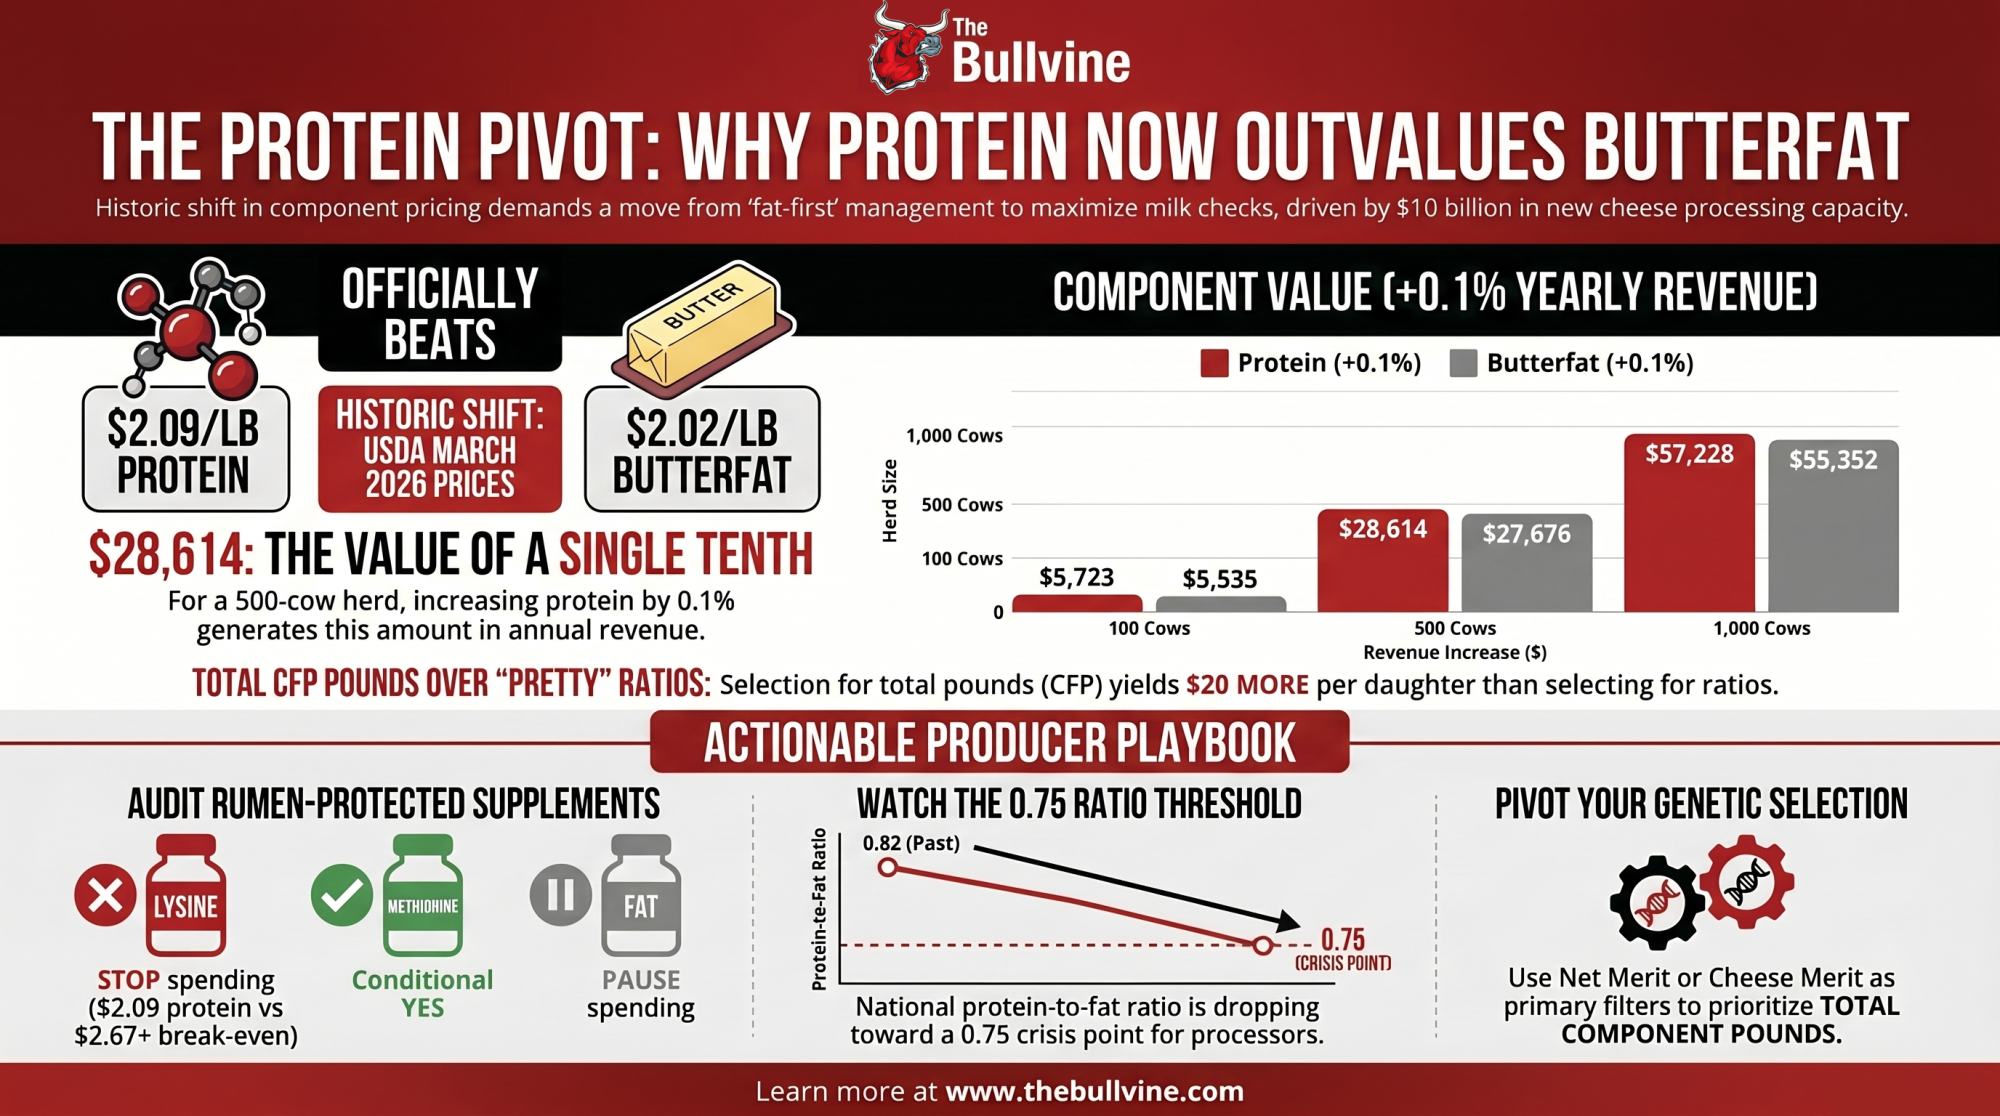
At the March 2026 Federal Milk Marketing Order announcement, USDA AMS set the protein price at $2.0905/lbagainst butterfat at $2.0220/lb — the first sustained stretch in a major cycle where a pound of milk protein outvalues a pound of milk fat. For a 500-cow Wisconsin or Minnesota shipper into Order 30 moving 75 lbs/cow/day, a single tenth-of-a-percent gap in protein now runs $28,614 a year; fat lands close behind at $27,676.

👉 Run those numbers on your own herd — open the Component Value Tracker →

That’s the stake for a mid-size Upper Midwest herd still calibrated to the old fat-premium world. The trap: a decade of fat-first genetics, fat-first rations, and fat-first contracts running headlong into roughly $10 billion in new cheese capacity that needs protein and doesn’t much care about the butter side anymore.

Dairy component economics 2026 isn’t a theme. It’s the math on your next milk check.

This is Issue #1 of The Bullvine Component Value Tracker — a monthly read translating the FMMO announcement into herd-specific dollar decisions, ranking nutrition break-evens against current prices, and scoring where the month’s highest-return component moves actually sit. May 2026 baseline: 58/100 — Maintain and Reposition Toward Protein.

The Signal the Market Already Sent

For eight of the ten years leading into 2025, butterfat paid more per pound than protein. Producers answered the signal. Genetics companies bred for fat. Nutritionists optimized rations for butterfat response. It worked — arguably too well.

U.S. butterfat climbed 0.58 points between 2015 and 2025, from 3.75% to a record 4.33%, per USDA NASS data compiled by FMMA30 — a 15.5% lift off the 2015 baseline. Over the same window, EU butterfat gained roughly 2.4% and New Zealand roughly 2.5%, per FMMA30’s international comparison. Protein climbed too — 3.11% to 3.29% — but that 5.8% gain only looks healthy until you stack it next to fat running at nearly triple the pace.

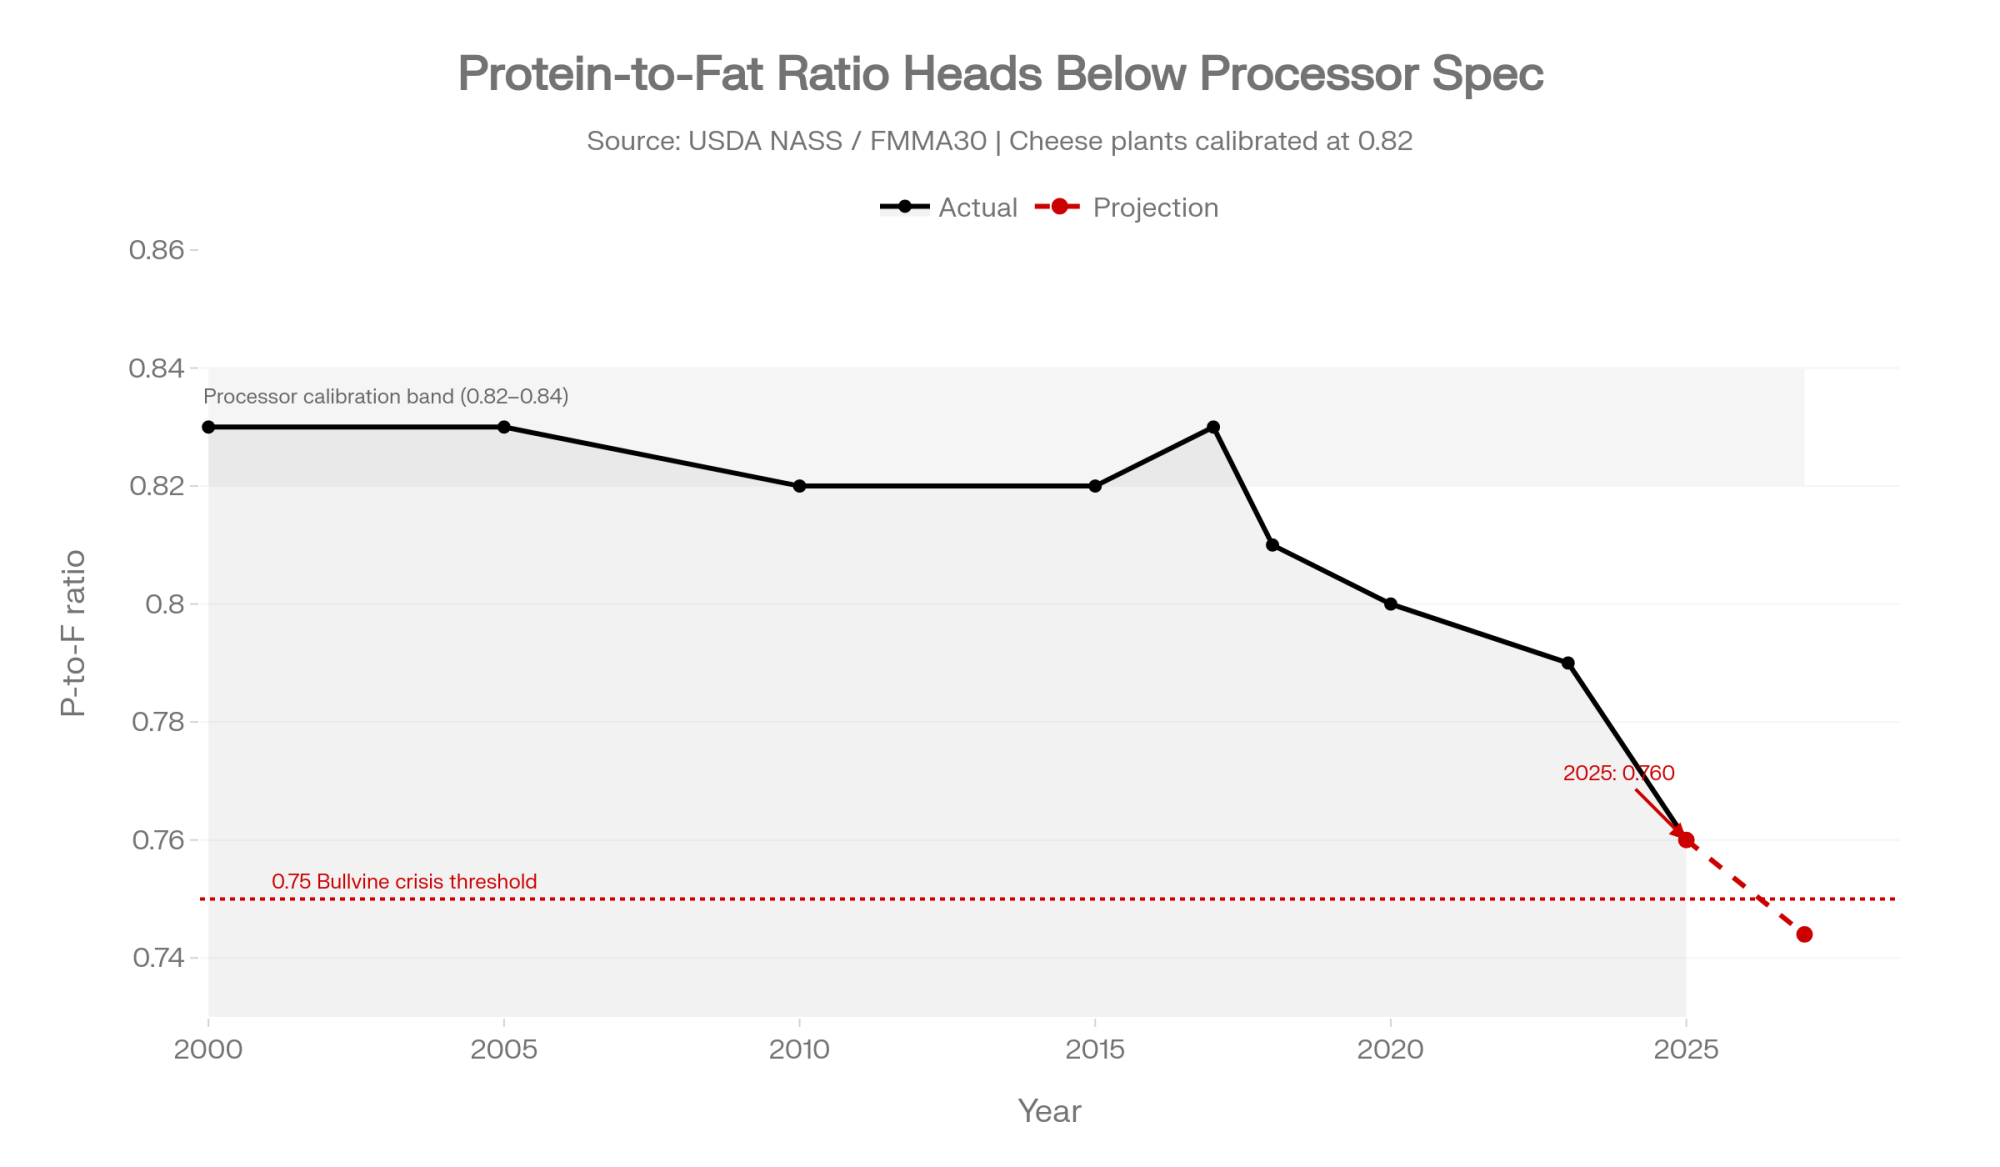
CoBank’s lead dairy economist Corey Geiger flagged the problem in the bank’s September 25, 2025 Knowledge Exchange brief, warning that excessive butterfat can compromise cheese quality and that cheesemakers target a protein-to-fat ratio near 0.80, with ratios significantly below that threshold reducing yield efficiency. At the time, the ratio sat at 0.77. Seven months later, with full-year 2025 butterfat averaging 4.33% against protein stuck at 3.29%, it’s dropped to 0.760 (3.29 ÷ 4.33 = 0.7598).

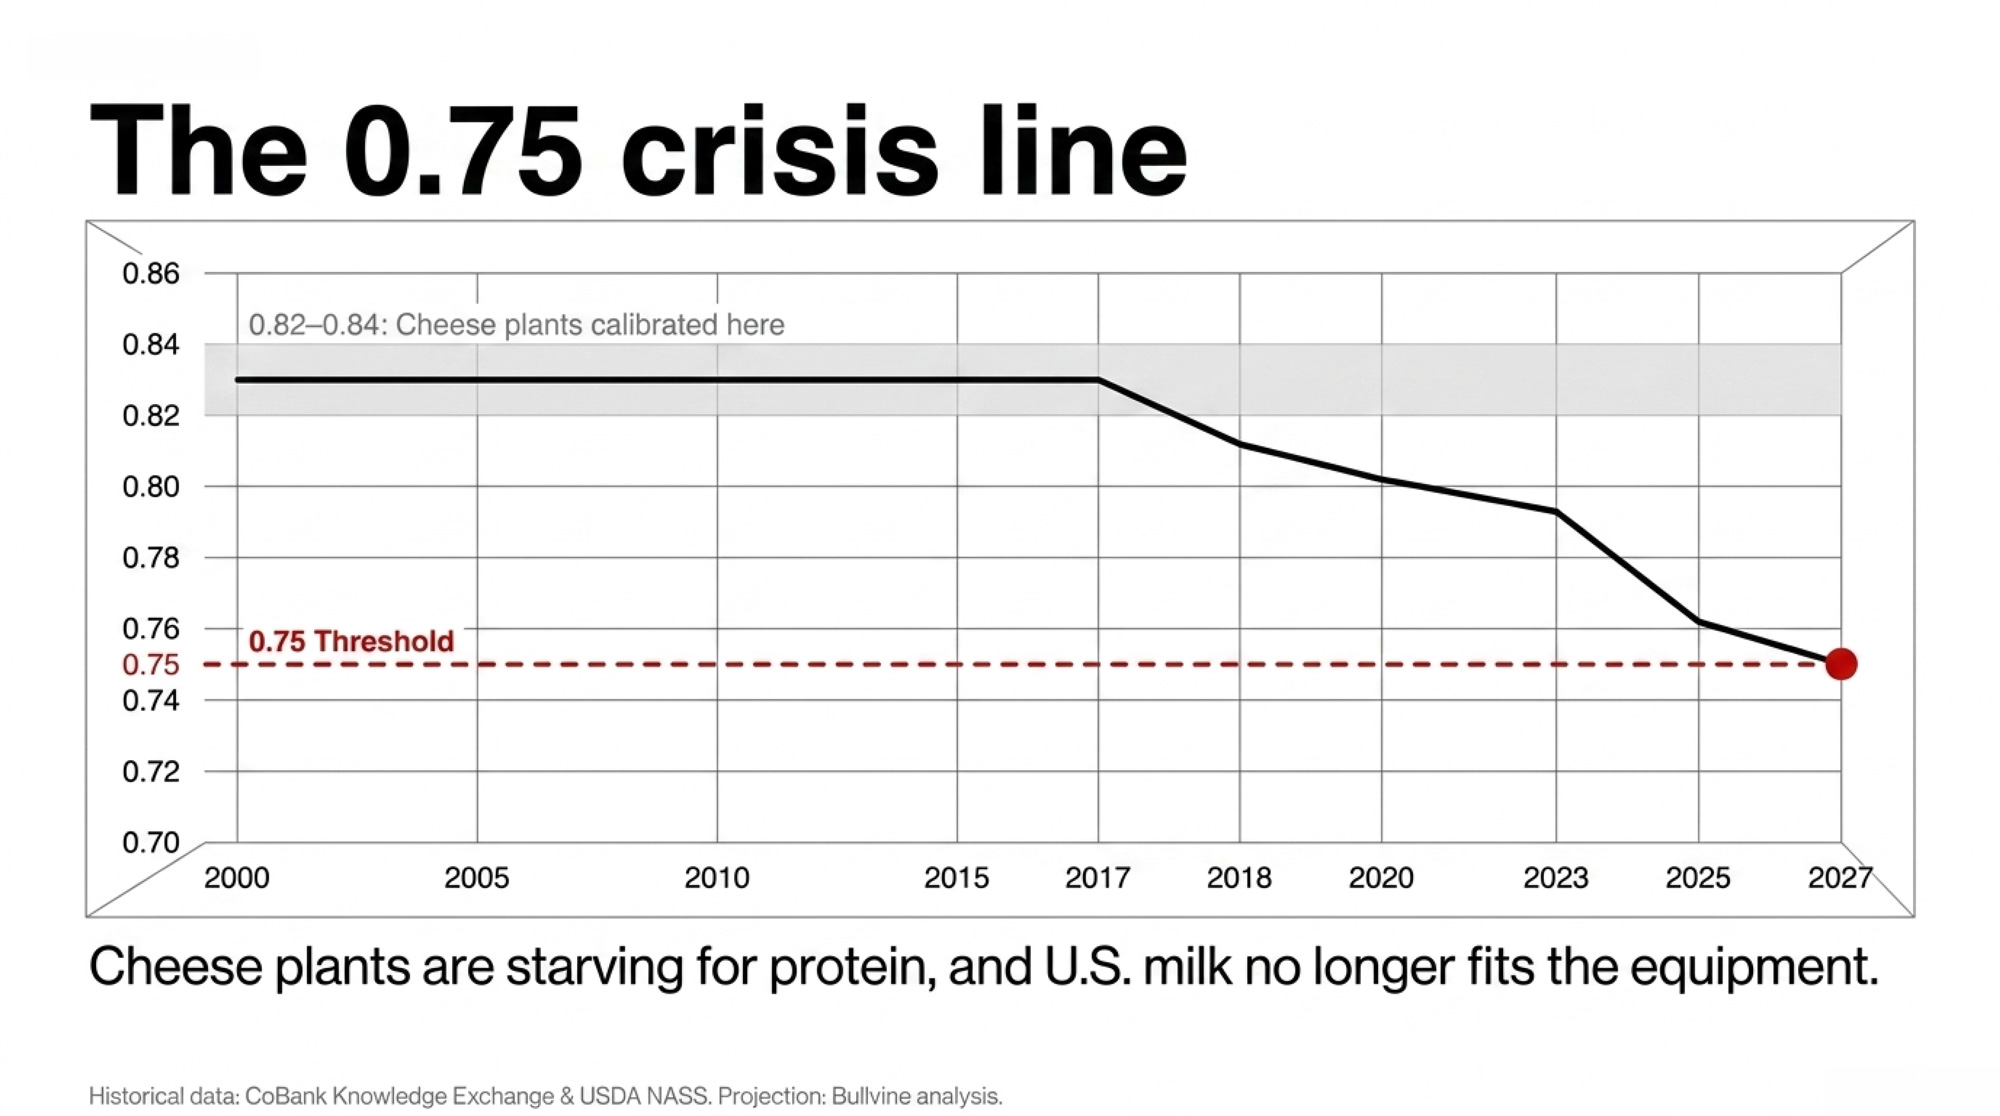
Over half of U.S. milk now moves into cheese. Those plants were calibrated for 0.82. The milk arriving at the dock doesn’t match the equipment on the other side.

Why Should Upper Midwest Producers Care About the 0.75 Threshold?

From 2000 to 2017, the U.S. protein-to-fat ratio held flat between 0.82 and 0.84, per CoBank’s Knowledge Exchange. That’s the band processors built their plants around. Starting in 2018, the line bent.

YearP-to-F RatioContext
2000–20170.82–0.84Stable — cheese plants calibrated here
2018~0.81Decline begins
2020~0.80Geiger’s “near 0.80” cheese-quality target
2023~0.79Decline accelerates
2025 full-year0.760FMMA30 / USDA NASS annual
Bullvine crisis threshold0.75Named in this issue
Projected arrivalLate 2027 (~16 months out)Bullvine projection, ~0.008/year decline

The Bullvine is putting a stake in the ground: the U.S. protein-to-fat ratio crosses 0.75 within roughly 16 months at current decline rates, and that’s where standardization costs, whey-stream fat losses, and processor basis negotiations visibly reprice Upper Midwest milk checks. If the ratio turns upward before late 2027, the Tracker will say so in writing and retire the call. If it doesn’t, this stops being a chart. It’s the basis for a pricing correction that’s already started.

The structural driver keeping the ratio suppressed is genetics, and the indexes don’t agree on which way out. Holstein USA’s April 2026 TPI revision shifted production weights to 24% protein and 14% fat — a 5-point move in each direction. Top-10% bulls saw an average 34-point TPI decline, with 26.6 of those points attributable to the formula change itself rather than routine evaluation updates. USDA’s Net Merit 2025 moved the opposite direction — 31.8% fat, 13.0% protein. Two major indexes. Two opposite signals. One breeder trying to mate cows this week.

Running the Numbers: What 0.1% Is Worth on a 500-Cow Order 30 Herd

Before you read the rest of this issue, run this math on your own operation.

Scope. 500-cow Wisconsin or Minnesota shipper into FMMO Order 30. 75 lbs/cow/day rolling average. March 2026 FMMO prices.

Formula:

Incremental annual revenue = 0.001 × daily lbs/cow × number of cows × 365 × FMMO component price per lb

Protein at $2.0905/lb:

  • 0.001 × 75 = 0.075 extra lbs/cow/day
  • 0.075 × 500 = 37.5 lbs/day herd-wide
  • 37.5 × 365 = 13,687.5 lbs/year
  • 13,687.5 × $2.0905 = $28,614/year

Butterfat at $2.0220/lb:

  • 13,687.5 × $2.0220 = $27,676/year
Herd SizeDaily lbs/cow+0.1% Butterfat/Year+0.1% Protein/YearCombined
100 cows75$5,535$5,723$11,258
500 cows75$27,676$28,614$56,290
1,000 cows75$55,352$57,228$112,580
2,500 cows75$138,380$143,070$281,450

March 2026 FMMO component prices, USDA AMS. Linear scaling.

Where the $83,000–$140,000 bulk-tank gap comes from. A 500-cow Order 30 shipper at 4.0% fat against a 2025 national average of 4.33% is carrying a 0.33-point fat gap. Three 0.1% increments × $27,676 = roughly $83,000/year in fat alone. Add a 0.2-point protein gap (3.09% vs. 3.29% national), and 2 × $28,614 pulls another ~$57,000/year. The $140,000 upper bound is a composite of two gaps on two components, not one factor. The low end is fat alone.

That’s the money. Not theoretical. Sitting in the bulk tank every month it ships short of county average.

If you’re leveraged. On a 500-cow shop running DSCR closer to 1.1 than 1.3, a captured $56,290 from a combined 0.1%/0.1% component move is the difference between a lender conversation you choose when to have and one your lender chooses for you. Component revenue doesn’t carry the manure tax added volume does — no extra cow, no extra parlor time, no extra lagoon capacity. It’s the highest-leverage margin move currently on the table.

Run the Numbers on Your Herd: The Bullvine Component Value Tracker

Every calculation above is scoped to a 500-cow Wisconsin or Minnesota shipper at 75 lbs/cow/day against March 2026 FMMO prices. Your operation isn’t that one.

The Tracker runs the +0.1% value, the component-gap dollars, and the $17 Class III capital stress-test against your actual numbers — same methodology, your inputs. Plug in your cow count, production level, fat and protein tests, and the dollar numbers move in real time.

Launch the Tracker pre-loaded with this article’s May 2026 baseline — 500 cows, 75 lbs/day, 4.33% fat, 3.29% protein, $2.0220 fat price, $2.0905 protein price, $19.70 USDA all-milk forecast, $16.16 CME Class III futures:

Bookmark the result once you’ve loaded your own cow count, production, and last month’s component tests — that’s your personal Tracker baseline for the Issue #2 refresh against May FMMO prices.

Why Does Chasing a Better Protein-to-Fat Ratio Cost You Money?

Here’s the assumption the “protein market” headlines set up: the right sire in a protein-premium cycle is the one with the best protein-to-fat ratio. Run the dollars at March 2026 prices, and that logic breaks.

Two sires. Identical on everything else.

SireFat PTA (lbs)Protein PTA (lbs)Fat ValueProtein ValueTotal per Daughter/LactationWinner
Sire A+45+3545 × $2.0220 = $90.9935 × $2.0905 = $73.17$164.16+$19.88
Sire B (prettier ratio)+30+4030 × $2.0220 = $60.6640 × $2.0905 = $83.62$144.28

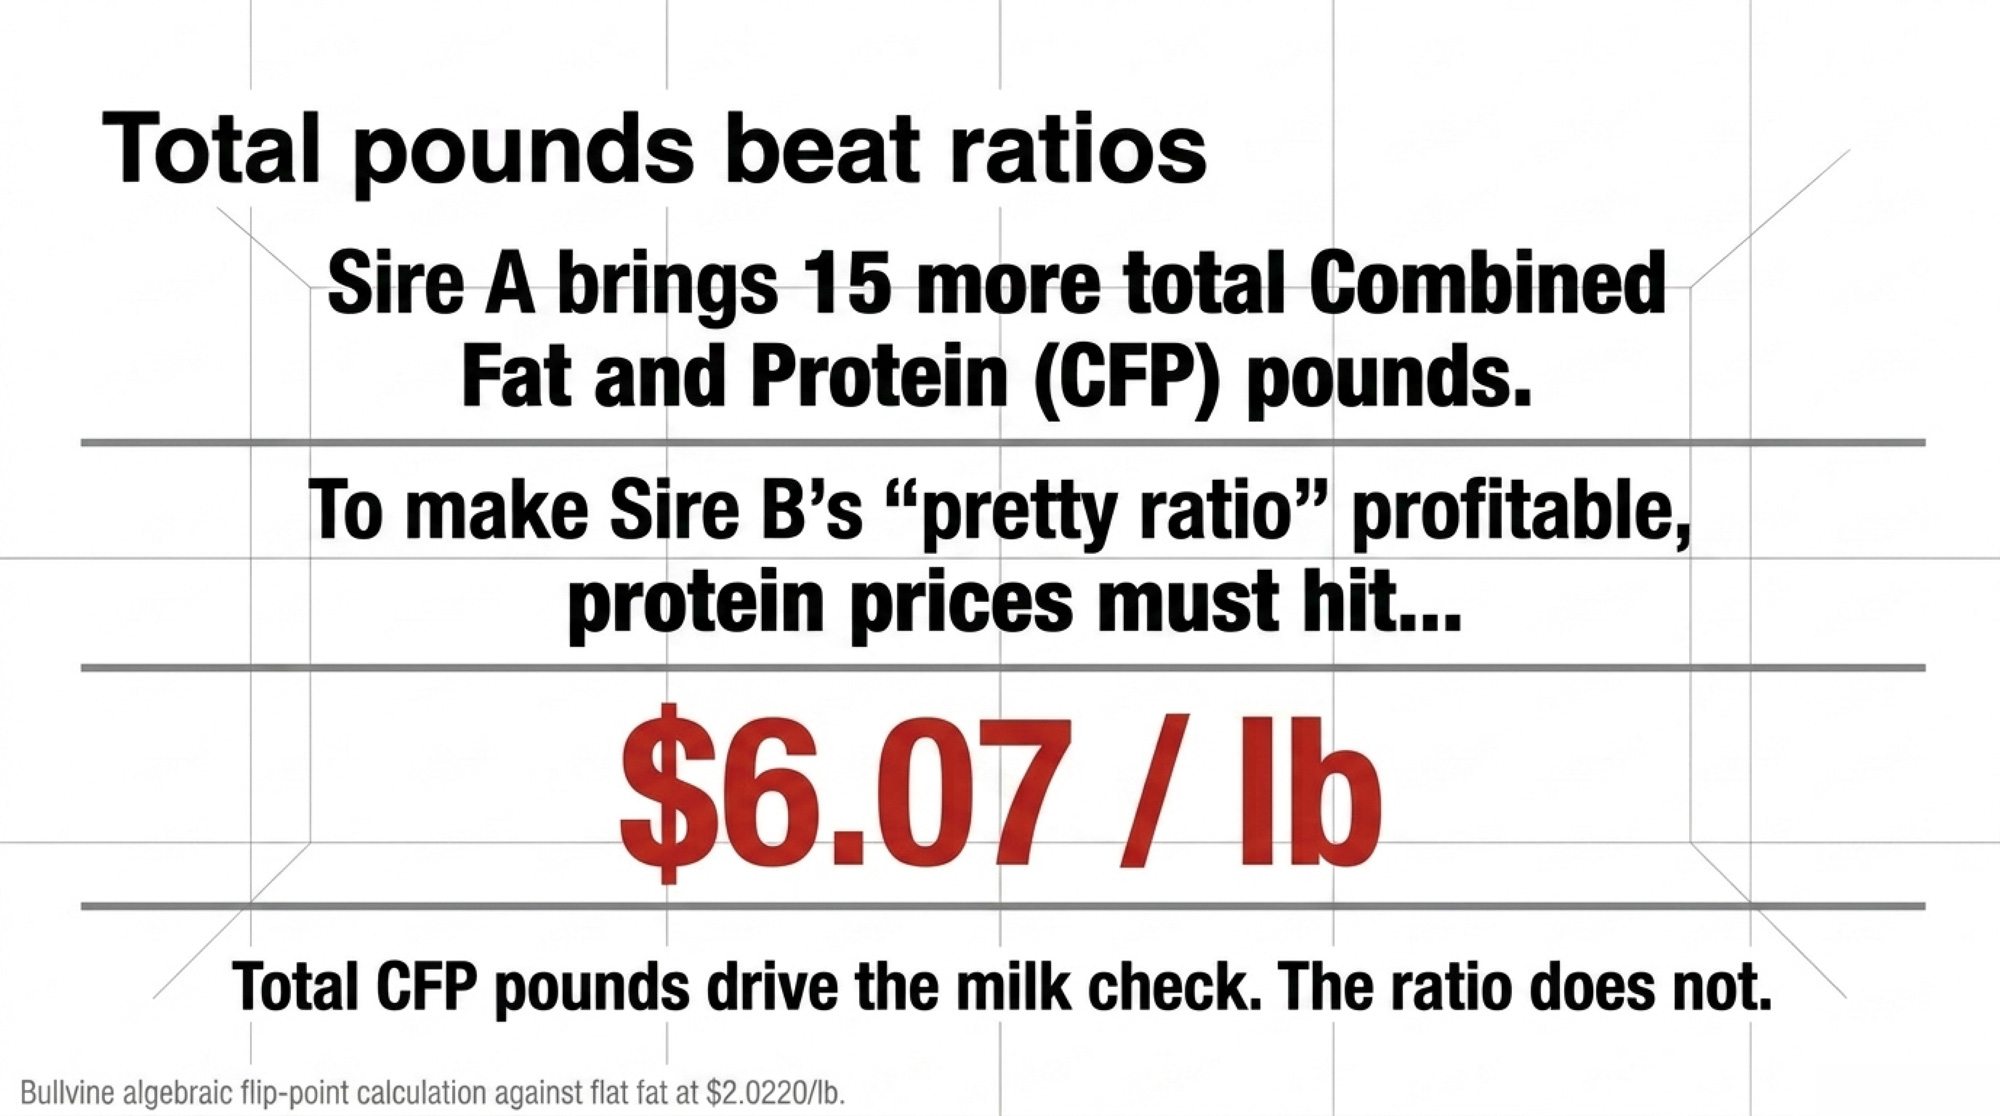
Sire B has the prettier protein-to-fat ratio. Sire A has the heavier check — by $19.88 per daughter per lactation, in a protein-premium market. Total CFP pounds drive the milk check. Ratio doesn’t.

The flip point isn’t where headline logic puts it. Setting Sire A’s value equal to Sire B’s and solving for protein against flat fat at $2.0220/lb:

(45 × $2.0220) + (35 × P) = (30 × $2.0220) + (40 × P) 15 × $2.0220 = 5 × P P = $6.07/lb protein

At flat fat, protein would have to triple from $2.09 to roughly $6/lb before Sire B’s ratio edge overcomes Sire A’s 15-lb CFP advantage. Sire A’s win isn’t marginal. It’s structural — the total-pounds gap is large enough that no realistic protein price flips it.

Picture a Brown County 500-cow operation — a hypothetical herd representative of Order 30 shippers we’ve modeled — that filtered its April sire list on protein-to-fat ratio and surfaced Sire B at the top. Across a typical replacement pipeline of 150 heifers/year and 2.8 lactations per cow in the milking string (Bullvine modeling assumption), that single $19.88/daughter/lactation delta compounds to roughly $8,350/year in steady-state drag once the selection cycles through the lactating herd (150 × 2.8 × $19.88). Filter-the-whole-sire-list style ratio-first selection — not just one sire swap — carries materially more drag; The Bullvine’s April 2026 TPI analysis modeled it at roughly $17,500/year for herds that filtered broadly on ratio across multiple placements.

The ruleset for this mating season:

  • Primary filter: Net Merit or Cheese Merit — both balance full economics, not just protein percent
  • Sort by: total CFP pounds
  • Tie-breaker: protein PTA, when CFP is equivalent
  • Don’t: select on protein-to-fat ratio at the expense of total CFP

There’s an interpretive tension inside TPI itself worth flagging — this is Bullvine analysis, not a Holstein USA position. Under the April 2026 formula, one pound of PTA protein carries roughly 1.7× the leverage of one pound of PTA fat in the index. TPI’s own Feed Efficiency formula still values fat at $1.86/lb against protein at $1.75/lb. Same index. Two signals. Trust the price on the milk check, not the coefficient on the ranking sheet.

Which Supplements Still Pencil at $2.09/lb Protein?

Component prices shifted. Not every ration has caught up. Break-evens below are scoped to a 500-cow, 75 lbs/cow/day Order 30 operation at March 2026 FMMO prices.

Rumen-Protected Methionine: Conditional Yes

A peer-reviewed meta-analysis in Animals (PMC9219501, 2022) puts RPM’s protein response range at +0.07% to +0.15%, with yield gains of 27–43 g/day. The 2025 combined RPLM paper (Animals, PMC12691028) confirms response is heavily dependent on basal diet and a roughly 3:1 lysine-to-methionine target.

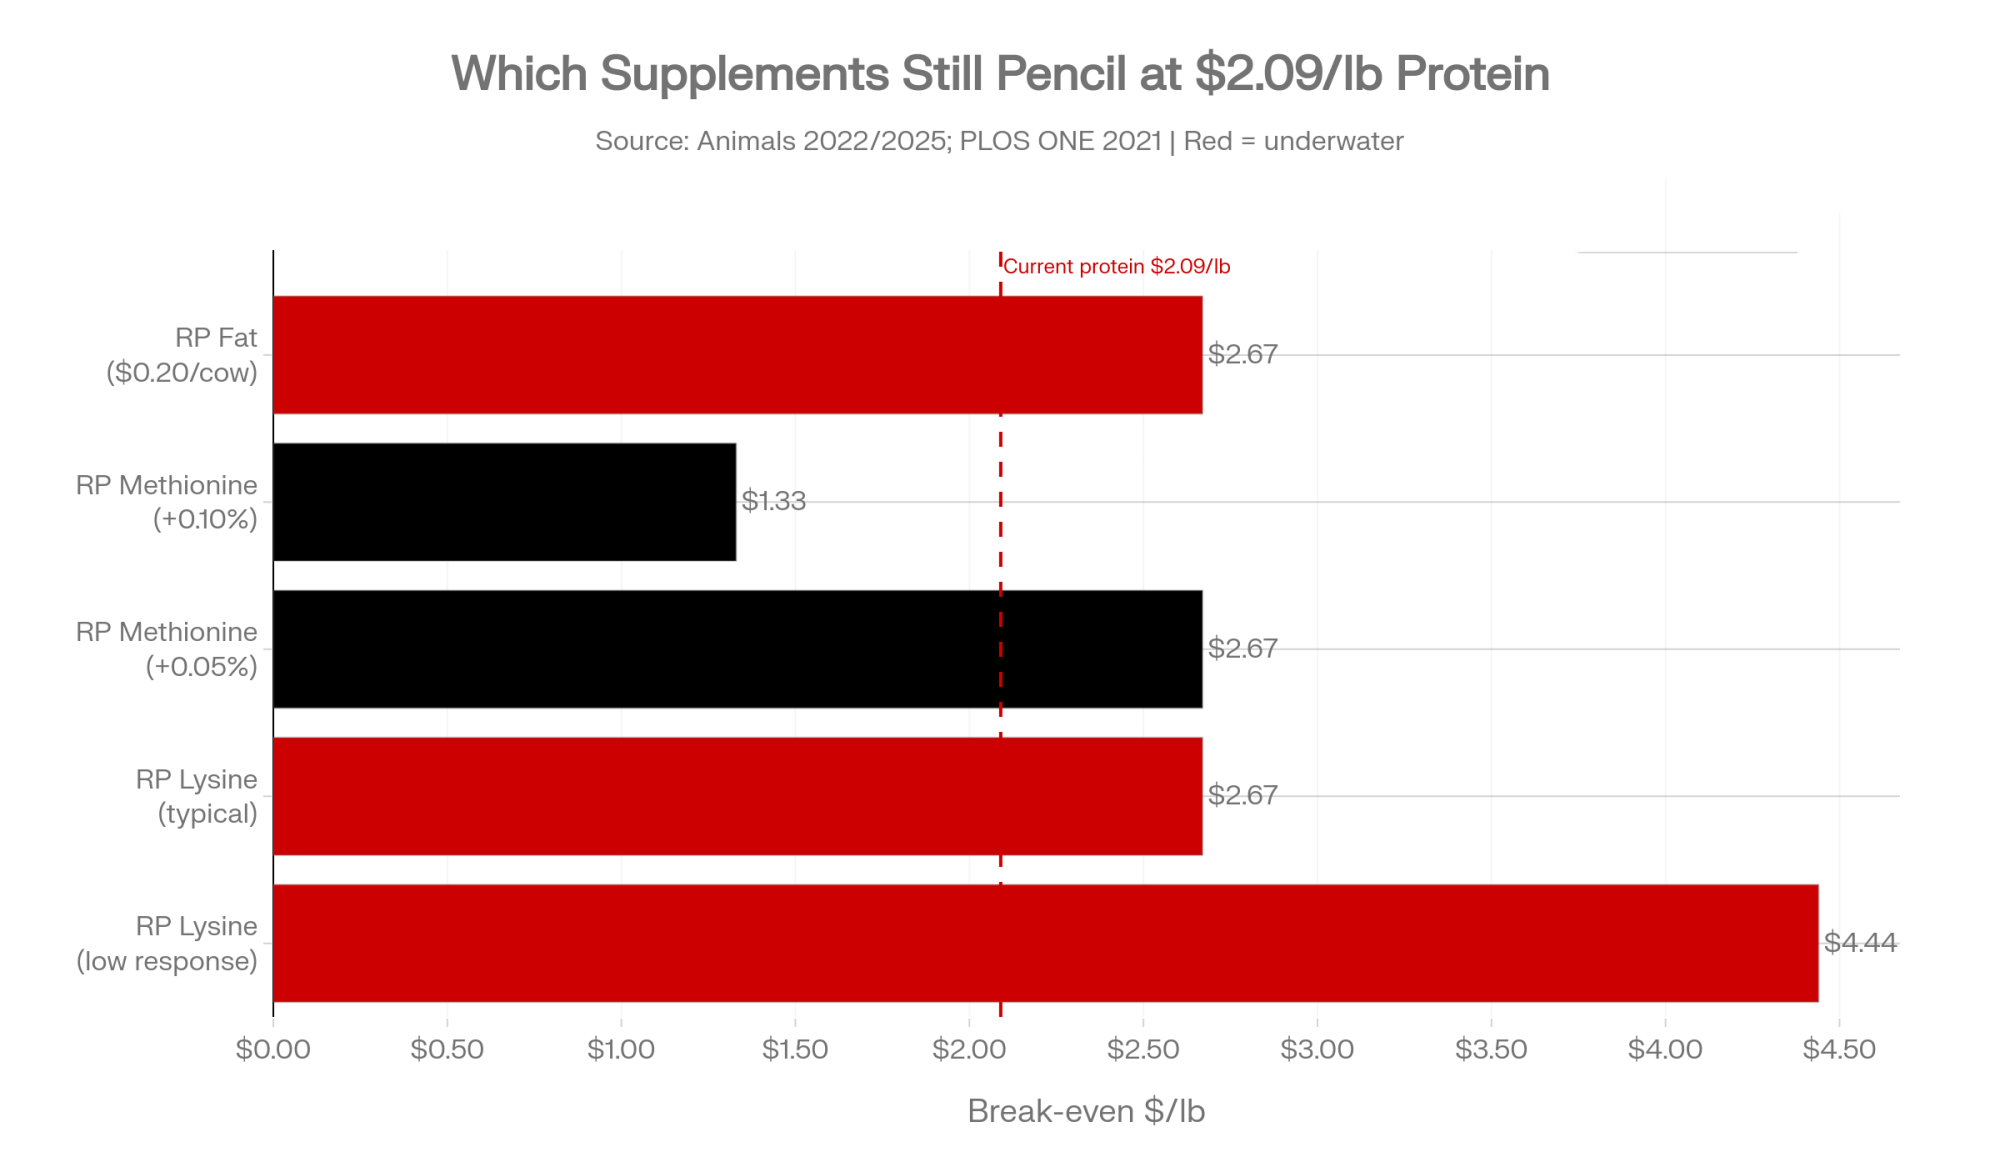
At $0.10/cow/day, +0.05% response:

  • Extra protein: 0.0005 × 75 = 0.0375 lbs/cow/day
  • Break-even protein price: $0.10 ÷ 0.0375 = $2.67/lb
  • Current: $2.09/lb — marginally negative

At $0.10/cow/day, +0.10% response:

  • Extra protein: 0.075 lbs/cow/day
  • Break-even: $0.10 ÷ 0.075 = $1.33/lb
  • Margin vs. current: +$0.76/lb — strongly positive

Methionine pays when the cost is low and the response is real. It doesn’t pay when either assumption slips. That’s a ration-audit conversation, not a standing order.

Rumen-Protected Lysine: Don’t Spend

Commercial RPL response on Holsteins runs +0.03% to +0.08% protein at $0.08–$0.15/cow/day, per trial work summarized in PLOS ONE (pone.0243953, 2021).

  • At $0.10/cow/day, +0.05% response: break-even $2.67/lb
  • At $0.10/cow/day, +0.03% response: break-even $4.44/lb

Current protein: $2.09/lb. Unless you’ve got 30+ days of bulk-tank data proving outlier response on your herd, lysine’s a ration tax right now. Not a component strategy.

The flip point. Protein above $2.75/lb sustained before lysine pencils at typical commercial response — $0.66/lb of price movement away.

Rumen-Protected Fat: Hold

At March 2026 butterfat of $2.0220/lb, the break-even for RP fat lands at $2.67/lb (at $0.20/cow/day cost and a +0.10% response: $0.20 ÷ 0.075 = $2.667). Current butterfat sits $0.65 below that threshold. The math works only at lower cost or higher verified response — $0.15/cow/day against the same +0.10% response drops break-even to $2.00/lb, right at the current FMMO.

A year ago, with butterfat peaking at $2.95/lb in January 2025 before collapsing 46% to $1.58/lb by December 2025, the math worked early and not at all by year-end. Any response shortfall flips the decision today.

The flip point. Butterfat sustained above $2.67/lb at typical $0.20/cow/day cost, or contract RP fat below $0.15/cow/day with herd-specific +0.10% response confirmed.

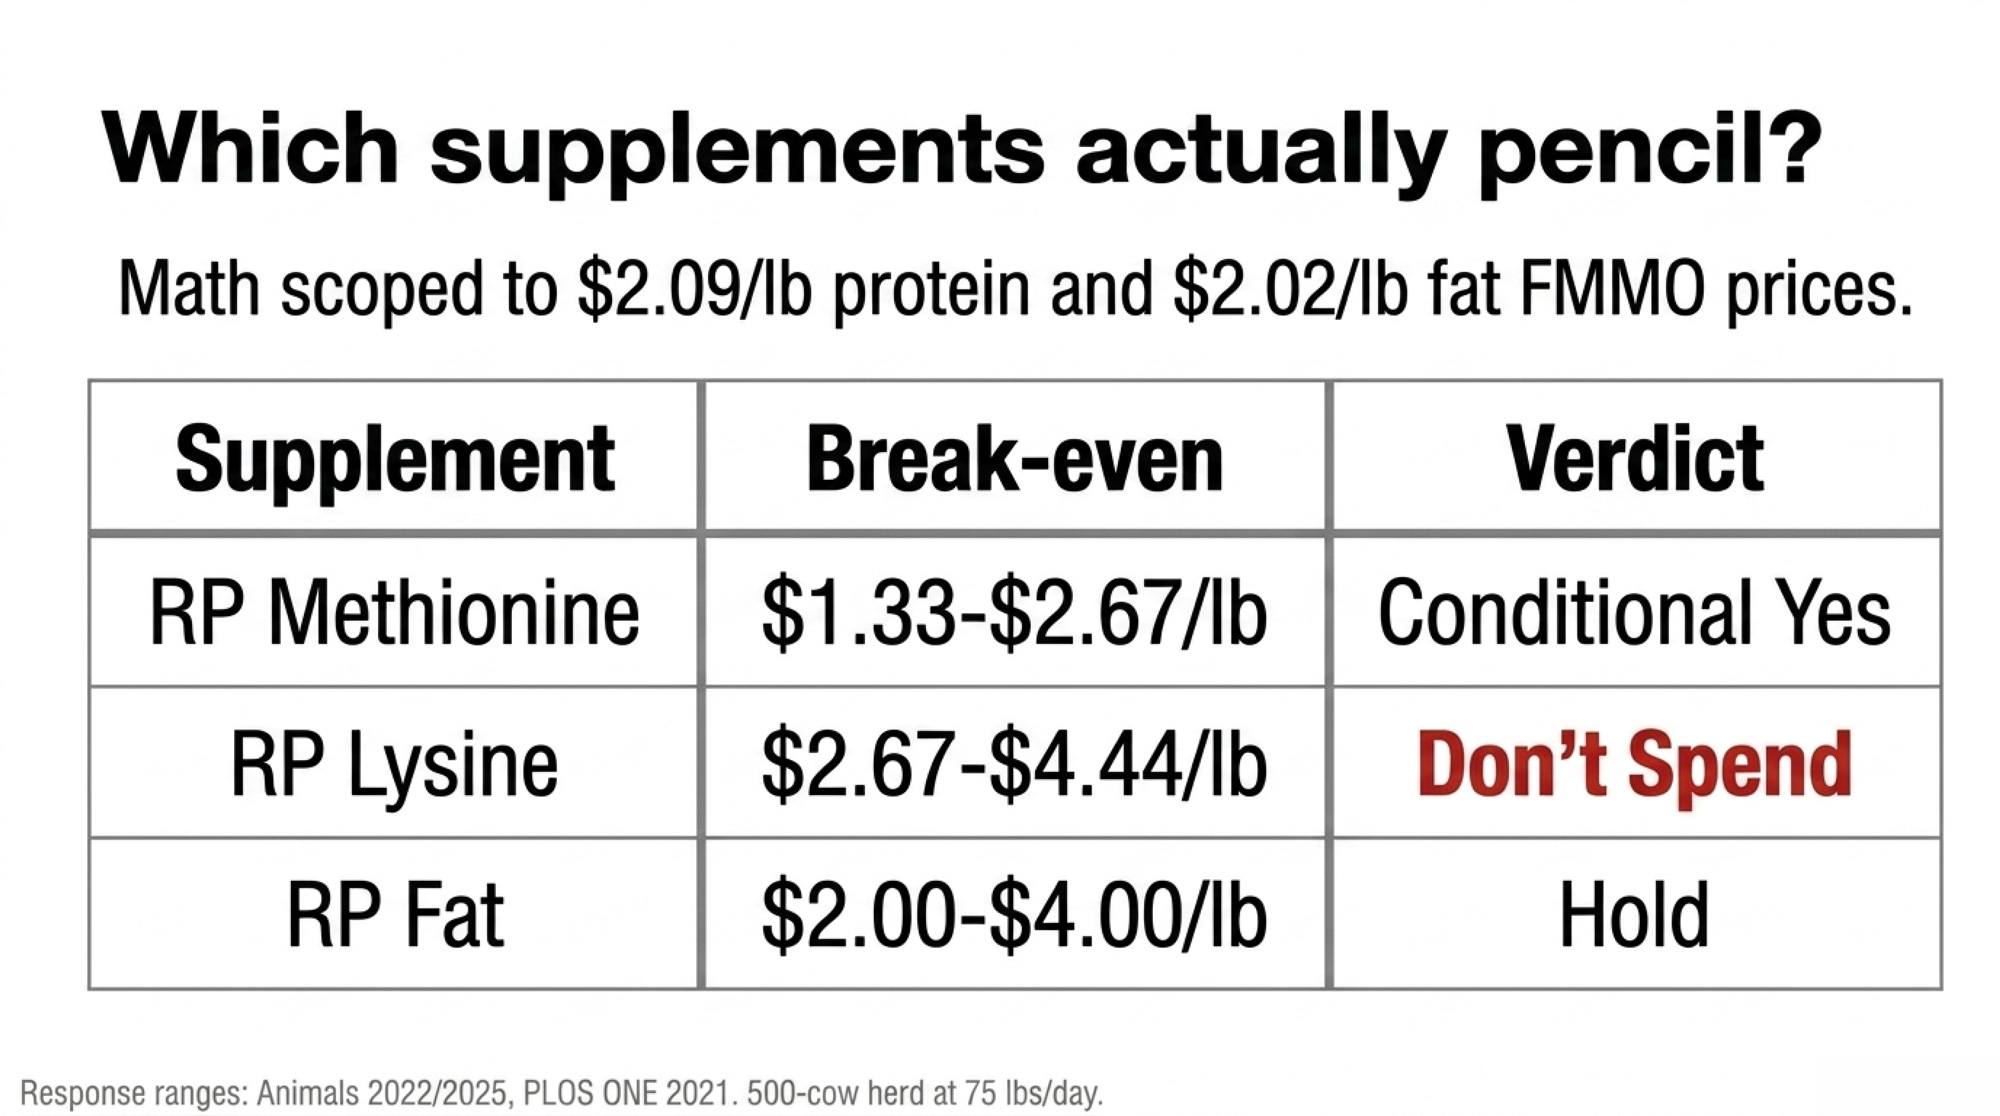
SupplementCost/Cow/DayResponse RangeBreak-Even (typical)Current FMMOVerdict
RP Lysine$0.08–$0.15+0.03–0.08% protein~$2.67–$4.44/lb$2.09/lbDon’t spend
RP Methionine$0.10–$0.14+0.07–0.15% protein$1.33–$2.67/lb (response-dependent)$2.09/lbConditional yes — low cost + verified response only
RP Fat$0.15–$0.30+0.10–0.20% butterfat$2.00–$4.00/lb (cost- and response-dependent)$2.02/lbHold — break-even at or above current FMMO

Response ranges: Animals 2022 (PMC9219501); Animals 2025 (PMC12691028); PLOS ONE 2021 (pone.0243953). Herd response varies by basal ration, stage of lactation, and product specification.

How Much Does Your FMMO Order Change the Protein Payoff?

Same genetics move. Same ration tweak. Different milk check — because FMMO class utilization dictates how much the market pays for what you improved.

Order 30 (Upper Midwest) routes 83.9% of producer milk to Class III cheese use, per FMMA30 2025 annual data. Wisconsin contributes 69.6% of Order 30 volume; Minnesota adds 21.0%. In a cheese-heavy order, protein dominates.

FMMO / RegionClass UtilizationP-to-FPriority
Upper Midwest (30)83.9% Class III0.759Protein first at current FMMO prices — highest protein ROI among major orders
Southwest (126) / TexasExpanding cheese0.767Hilmar + Leprino pulling hard; contract premiums emerging
California (51)Class 4a heavy0.763Fat premiums compressed; repositioning window
Northeast (1)Balanced I/III0.776Fluid share moderates protein premium

FMMA30 Upper Midwest 2025 annual; ratios derived from regional component averages in FMMO reporting.

Texas production ran +10.6% in 2025, Kansas +11.4%, per USDA NASS. Idaho regained the nation’s #3 spot at 18.26 billion lbs of milk, edging Texas’s 18.21 billion by roughly one day’s worth of production. The processing gravity wells driving that growth:

  • Hilmar Cheese, Dodge City, KS — $600M, operational since March 2025
  • Leprino Foods, Lubbock, TX — approximately $1B complex, ~600 employees, designed for ~1M lbs cheese/day
  • Valley Queen, Milbank, SD — expansion completed 2025, anchoring the I-29 corridor
  • Leprino, Lemoore East, CA — closing in 2026, driving California capacity losses

Early-2026 trade coverage of High Plains and I-29 corridor contract offers has flagged structural premium tiers rewarding herds that reach roughly 4.2% fat and 3.3% protein. The specific cwt figure varies heavily by plant, co-op, and volume commitment — verify premium language against your own contract before building the number into a budget. What matters here isn’t the exact number at any one plant. It’s that the premium structure exists where the cheese capacity is landing, and it didn’t exist 18 months ago.

California production ran -5.74% in 2025 (USDA NASS), on water scarcity, regulatory pressure, and lost processing capacity. For the dairies that stay, the shift from fat-heavy checks toward protein-relevant ones is a repositioning window. Not a crisis.

Trade-offs to Watch

  • Net Merit or Cheese Merit over TPI as your primary screen gives up benchmarking some buyers still reference for genetic marketing. You gain pricing accuracy on the milk check. You give up pedigree shorthand at the auction ring.
  • Locking 60–75% of feed at $3.90–$4.10 corn needs equal-weight milk-side coverage. One-sided hedging is worse than no hedge — if corn drops and milk drops with it, you’re paying above-market for feed into a weaker check.
  • Genomic-testing 100% of heifers at ~$40/head runs roughly $6,000/year on a 150-heifer pipeline. Payback only lives in the sorting decision. Testing without changing which heifers breed to elite component sires is a $6,000 data subscription.

What Does a 58/100 Component Opportunity Score Actually Tell You to Do?

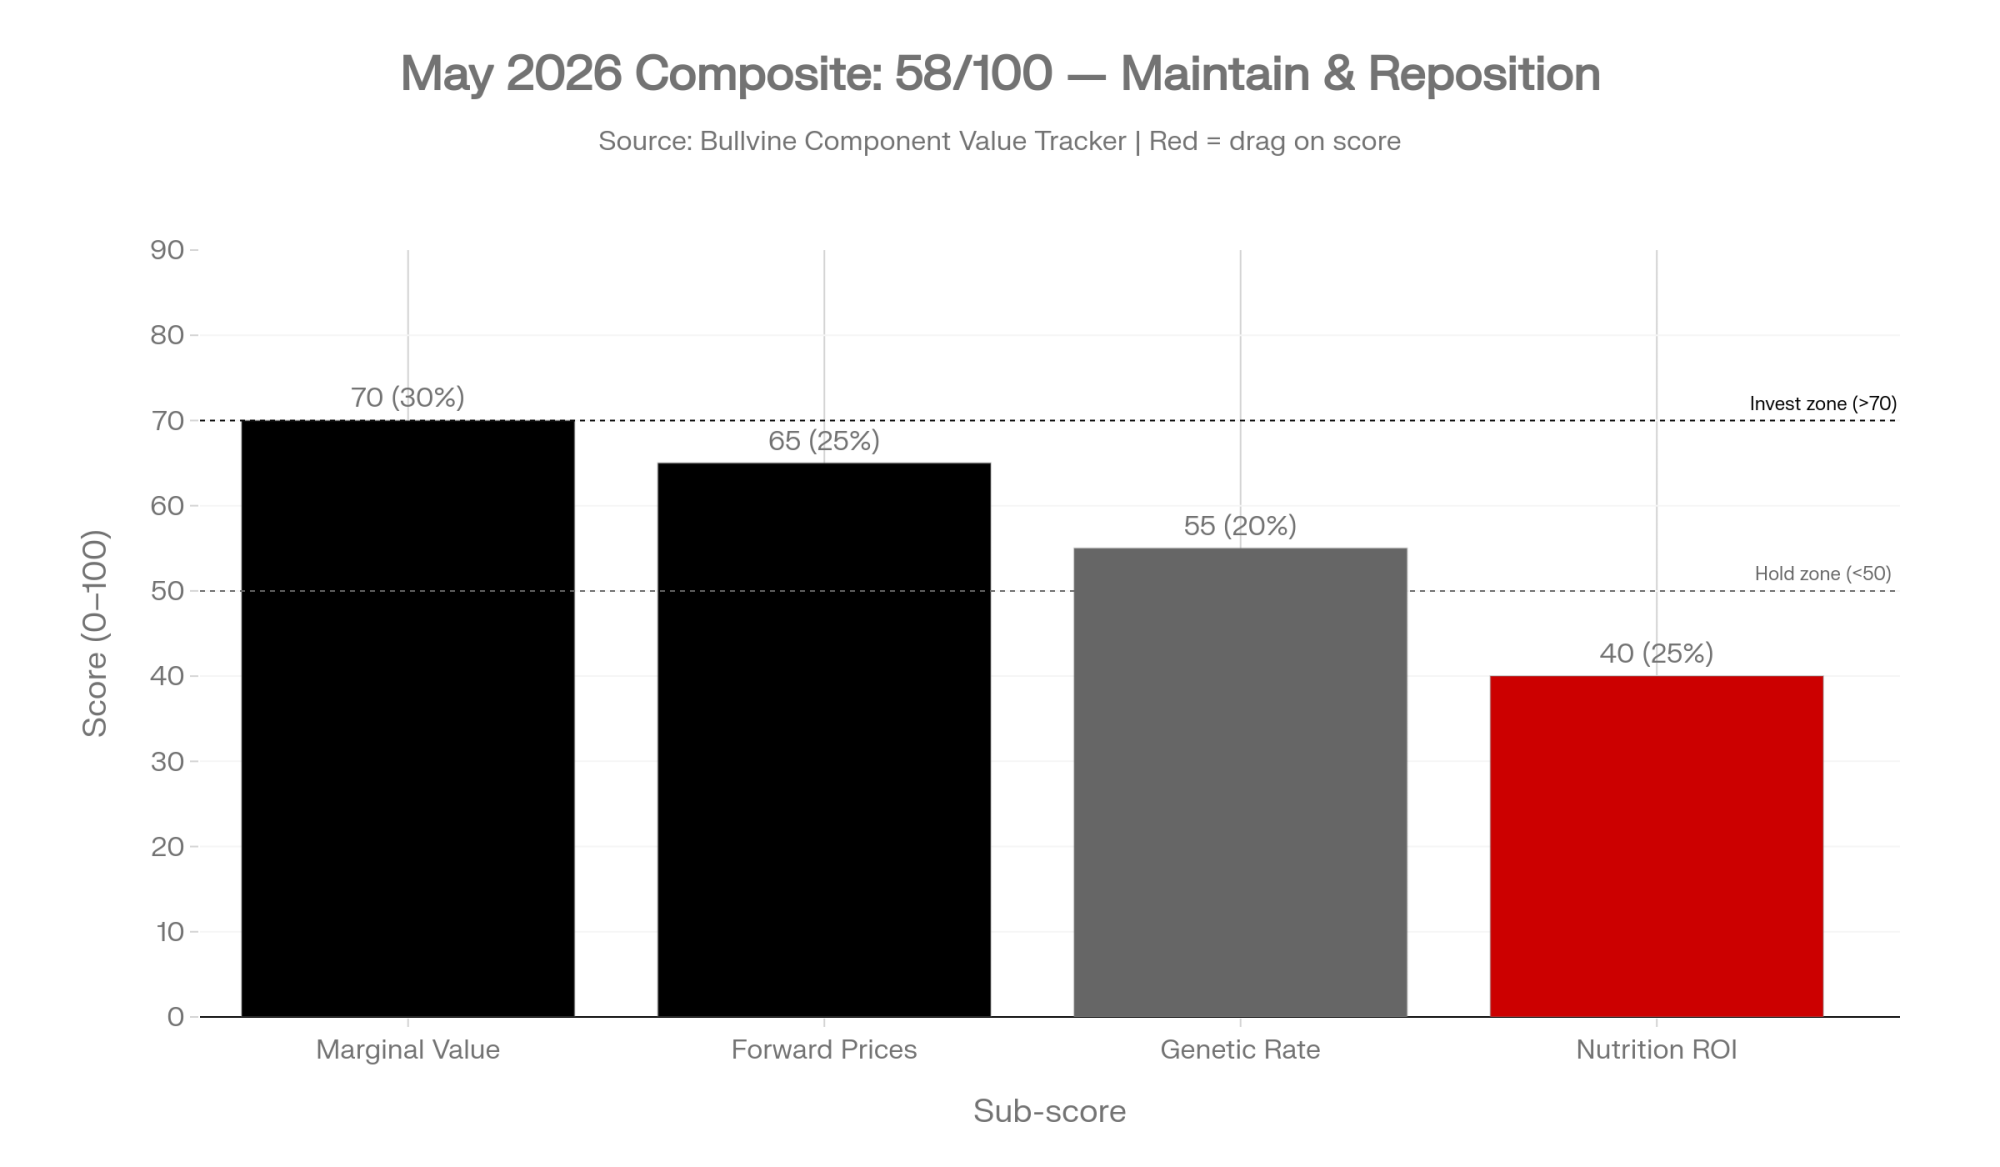
Each Tracker issue compresses four market conditions into one score. May 2026 baseline:

Sub-ScoreWeightReadingScore
Marginal Value ($/0.1% at current FMMO)30%$27,676 fat + $28,614 protein on 500-cow Order 30 — off 2025 peaks but meaningful70
Forward Price Trajectory (CME 6-month)25%Butter and cheese in slight contango from depressed levels — stabilizing, not surging65
Genetic Improvement Rate (CDCB trends)20%Fat PTA still outpacing protein PTA; April 2026 TPI starts the correction, pipeline lag is real55
Nutrition ROI Opportunity25%Lysine negative; methionine conditional; RP fat break-even at or above current FMMO40

Composite: (70 × 0.30) + (65 × 0.25) + (55 × 0.20) + (40 × 0.25) = 21.0 + 16.25 + 11.0 + 10.0 = 58.25/100

ZoneRangeAction
Invest Aggressively>70Component premiums justify significant new nutrition + genetics spending
Maintain and Reposition50–70Premiums positive but compressed; genetics and market positioning carry highest forward returns
Hold<50Premiums don’t justify added investment

A 58 doesn’t mean spend everywhere. It means stay in the component game and be ruthless about which marginal dollar goes where. The 40 on nutrition reflects real margin compression — methionine’s the only consistent winner, and only at the low end of cost. The 55 on genetics reflects the lag between what the market wants and what the CDCB pipeline delivers today.

What pushes the score toward 80+: protein sustaining above $2.50/lb as new cheese plants come online; butterfat stabilizing above $2.25/lb; FMMO reform that increases component weight in pricing.

What drops it below 40: both prices falling below $1.75/lb; a feed-cost spike raising all break-evens; component tests plateauing nationally.

The 30/90/365-Day Playbook for a 500-Cow Order 30 Shipper

30-Day Actions

1. Pull last month’s milk check this week and run the 0.1% formula on your own numbers. Compare your protein test to the Order 30 average near 3.29%. The gap has a dollar sign in front of it — and at current prices, that gap’s worth more per pound than it was 18 months ago. Plug actual fat and protein tests into the embedded Tracker at March 2026 FMMO prices.

  • Requires: three milk statements, herd size, daily lbs/cow average.
  • Red-flag trigger: protein test more than 0.15 points below the Order 30 average = over $40,000/year on the table for a 500-cow herd at current prices. Urgent.
  • Watch for: seasonal variation. Compare trailing 12 months, not just last month.

2. Audit every rumen-protected supplement — and stop RP Lysine this month if response isn’t documented. Pull the invoice cost per cow per day. At $2.09/lb protein and typical commercial lysine response rates, the math is underwater by roughly $0.60 to $2.35/lb depending on your inputs. If you can’t show 30 days of bulk-tank data proving outlier response, it’s a ration tax.

  • Requires: feed invoices, nutritionist response data, bulk-tank component trend.
  • Red-flag trigger: any supplement with implied break-even above $2.09/lb protein or $2.02/lb fat, and no 30-day before-and-after data proving the response — cost to eliminate.
  • Watch for: products bundled into larger mixes where per-cow-per-day cost is hard to isolate. Ask for it in writing.

3. Put a methionine kill switch in writing with your nutritionist. +0.05% protein minimum, $0.12/cow/day maximum. Review date on the calendar. No exceptions.

  • Requires: nutritionist sign-off, 30-day bulk-tank baseline.
  • Red-flag trigger: either threshold violated for 30 consecutive days — pull the product, reset the ration, re-baseline before adding back.
  • Watch for: “the response will show up next month.” Put a review date on the calendar and hold it.

4. Before your next breeding decision, ask two questions. “What’s this bull’s total CFP in pounds?” Then: “What’s that worth per lactation at $2.0905 protein and $2.0220 fat?” That conversation surfaces the ratio trap before it ends up in your herd — at current prices, a 15-lb CFP gap between two sires is worth ~$20/daughter/lactation, and no realistic protein price flips that math.

  • Requires: current sire-list CFP data, March 2026 FMMO prices in the genetic advisor’s conversation.
  • Red-flag trigger: advisor defaults to protein-to-fat ratio or last year’s prices — stop the meeting and reset the reference numbers.
  • Watch for: marketing materials built on 2024 component prices. The math has moved.

90-Day Actions

5. Rebuild sire selection criteria around total CFP. Shift from protein-ratio filters to Net Merit or Cheese Merit as the primary screen. Sort by total CFP pounds. Protein PTA as tie-breaker only.

  • Requires: a conversation with your genetic advisor using March 2026 FMMO prices, not 2024’s. Bring current herd-average component tests.
  • Threshold: if your current bull lineup’s average CFP sits below the breed top 50% on the current CDCB run, you’re leaving component revenue on the table genetics-to-barn is slow to fix.
  • Watch for: over-tilting toward protein at the expense of health and fertility. Net Merit and Cheese Merit already hold that balance. Don’t override the index manually for ratio.

6. Stress-test every capital project at $17 Class III, not $19.70 all-milk. USDA’s March 2026 LDP-M-381 outlook projects 2026 all-milk at $19.70/cwt; CME Class III futures at the same moment traded closer to $16.16/cwt. A $3.54/cwt gap between the government forecast and the market’s own price signal is real-money exposure on any capital underwriting. On a 500-cow herd shipping roughly 136,875 cwt/year (500 × 75 × 365 ÷ 100), that’s approximately $484,540/year of revenue sensitivity between the two benchmarks — enough to break a project that only pencils at the USDA forecast. The gap between the government forecast and the futures board is the gap between a project that survives and one that breaks the operation.

  • Requires: your CPA or lender running sensitivity on barn, robot, and equipment purchases at $17 Class III.
  • Threshold: if a project’s DSCR drops below 1.2 at $17 milk for three consecutive months, treat as a luxury, not a necessity.
  • Watch for: contractors and equipment sellers pitching against the USDA forecast. The futures market is the one you hedge.

7. Lock in 60–75% of feed needs when corn projects at $3.90–$4.10/bu. Per the source economic analysis cited in this issue’s methodology, corn in that band yields roughly $11.56/cwt feed cost — manageable against current Class III.

  • Requires: cash flow for the hedging strategy, or a relationship with your co-op’s risk management service.
  • Threshold: corn in-band → lock. Corn above $4.25/bu with basis strengthening → wait for pullback or shorten coverage horizon.
  • Watch for: locking feed without also locking enough milk. You want both sides covered, not just the cost side.

365-Day Moves

8. Map your FMMO basis against the processing gravity wells. If you sit within draw radius of Lubbock, Dodge City, or an I-29 corridor plant, you have pricing leverage producers 200 miles farther out don’t. Structural demand from ~$10B in new cheese processing supports protein prices for the next two to three years. Renegotiate before capacity is fully committed.

  • Requires: 12 months of basis data against your plant vs. Order 30 statistical uniform price.
  • Opportunity signal: basis tightened to within $0.30/cwt of the Statistical Uniform Price while your component tests exceed county average — room to ask for contract improvements.
  • Watch for: short-term premiums written with pull-back triggers tied to volume. Read the basis-when-volumes-fall clause specifically. It’s the clause nobody reads until it triggers.

9. Track the 0.75 milestone quarterly. If the national ratio hits 0.75 on the late-2027 projected timeline, processor standardization costs accelerate and basis pressure increases on fat-heavy, protein-light herds. Herds repositioned 12–18 months ahead feel it least.

  • Requires: Tracker updates plus your own herd’s component trend line.
  • Opportunity signal: national ratio stabilizing above 0.76 for three consecutive months = evidence the market is self-correcting. Different strategy.
  • Watch for: short-term seasonal swings masking a trend reversal. Quarterly, not monthly.

10. Genomic-test for component direction, not just rank. At $30–$40/head, genomic testing identifies the top 20–30% of heifers worth breeding back to elite component sires. Bottom tier goes beef-on-dairy to capture beef-cross value while the pipeline tightens on components.

  • Requires: ~$40 × testing population + time to integrate results into breeding decisions.
  • Threshold: if your current replacement pipeline runs less than 25% genomic-tested heifers and you milk 500+, the sorting decision pays back within the replacement cycle at current component prices.
  • Watch for: testing without changing what you do with the data. ROI lives in the sorting decision, not the test itself.

The market already repriced. Your milk check is catching up. Every month the operation stays calibrated to the old fat-premium world is a month of compounding gap against herds that already moved. You gain cushion on components here. You give up flexibility on ration-by-habit there.

Two questions to take to your next milk meeting. What does your processor contract actually say about basis when Order 30 cheese utilization exceeds 85%? And what’s your real margin over feed per cwt this month versus 90 days ago — at $2.0905 protein, not last year’s number?

Key Takeaways

  • March 2026 FMMO flipped the component stack: protein at $2.0905/lb now beats butterfat at $2.0220, and on a 500-cow Order 30 herd at 75 lbs/day, every tenth of protein is worth $28,614 a year.
  • The national protein-to-fat ratio hit 0.760 in 2025 against cheese plants calibrated for 0.82; if you ship into Order 30, you’ve got roughly 16 months before the 0.75 line starts showing up in basis conversations.
  • At current prices, total CFP pounds drive the milk check — not protein-to-fat ratio. If your sire list is sorted on ratio, you’re leaving roughly $20 per daughter per lactation on the table and you won’t outrun that math until protein triples.
  • Stress-test every 2026 capital project at $16.16 CME Class III, not USDA’s $19.70 all-milk forecast. The $3.54/cwt gap is about $484,540/year of revenue sensitivity on a 500-cow herd — the difference between a project that survives and one that doesn’t.

Methodology and Sources

Scope. All barn math uses March 2026 USDA AMS FMMO component prices (protein .0905/lb, butterfat .0220/lb) on a 500-cow Wisconsin/Minnesota operation shipping into FMMO Order 30 at 75 lbs/cow/day, unless stated otherwise. Prices refresh with each month’s FMMO announcement. The interactive Component Value Tracker at thebullvine.com/tools lets readers substitute their own herd parameters against the same formulas and price inputs.

Bullvine projections, labeled as such. The 0.75 crisis threshold, the ~16-month timeline, the Component Opportunity Score methodology, the ~$8,350 Brown County single-sire-swap scenario, the $17,500 broad-filter ratio-trap estimate, and the 150-heifer/2.8-lactation replacement-pipeline assumptions are proprietary Bullvine modeling — published here for the first time.

External sources. USDA AMS FMMO March 2026 component prices; FMMA30 Upper Midwest 2025 annual class utilization and international component comparison; USDA NASS Milk Production Reports, February and March 2026; USDA ERS Livestock, Dairy, and Poultry Outlook, March 2026 (LDP-M-381); CoBank Knowledge Exchange, “While U.S. Leads Milk Component Growth, Butterfat May Be Growing Too Fast,” September 25, 2025; Holstein Association USA Geneticist Insights, April 2026; Select Sires / CDCB April 2025 Base Change documentation; Animals meta-analysis of rumen-protected methionine (PMC9219501, 2022); Animals combined RPLM supplementation study (PMC12691028, 2025); PLOS ONE rumen-protected methionine trial (pone.0243953, 2021).

Learn More

The Sunday Read Dairy Professionals Don’t Skip.

Every week, thousands of producers, breeders, and industry insiders open Bullvine Weekly for genetics insights, market shifts, and profit strategies they won’t find anywhere else. One email. Five minutes. Smarter decisions all week.

NewsSubscribe
First
Last
Consent

Your AI Ration Tool Is 3% Wrong. On 500 Cows, That’s $36,500 a Year.

A peer‑reviewed 2026 trial on 2,073 cow‑days showed AI rations can lift IOFC — but a 3% intake miss on a 500‑cow high group quietly drags $100/day, about $36,500 a year. Is yours drifting?

Executive Summary: A peer‑reviewed 2026 Animal Frontiers study from Alex Bach’s group at the University of Lleida trained a machine‑learning model on 2,073 cow‑days and hit R² 0.98 on income over feed cost — roughly 12 percentage points better than standard regression, with RMSE dropping from €1.45 to €0.59 per cow per day. The catch: that accuracy came from a tightly controlled research pen, and on a commercial 500‑cow high group, a 3% intake miss at $0.12/lb DM quietly drags about $100/day, or roughly $36,500 a year. Push the error to 5% and you’re looking at $60,225 — more than what most vendors claim their tools can add in IOFC. Cabrera’s Dairy Brain work and the Barrientos‑Blanco 2020 JDS paper confirm the upside is real (about $31/cow/year in feed cost and 5.5 kg less N excretion), but only when data streams actually line up; a 2022 survey in Animals found 69% of farmers weren’t familiar with data standards and 66% felt they didn’t control their own chain of custody. The practical call is to run a four‑question “AI Ready” audit first, hold any pilot to a 90‑day window with a no‑penalty exit and a 30‑day data‑export clause, and refuse to let the software change your feed sheet until it can shadow‑predict last week’s intake within 3%. For herds with tight DSCR and messy records, “not yet” is a legitimate answer — fixing known feed‑center shrink usually beats chasing a theoretical 20¢/cwt AI gain.

AI dairy rations

You’re sitting in a ration review and the AI tool on the laptop says your high group is fine at 55 pounds of dry matter. If that prediction is off by just 3%, the barn math on a 500‑cow herd works out to roughly ,500 a year at risk — in feed cost or missed milk. That’s the gap Alex Bach’s team exposed when they trained a machine‑learning model on 2,073 cow‑days and showed the “optimal” ration looks very different once the intake numbers are actually right.

The Bach study — published in Animal Frontiers in January 2026 — is one of the strongest recent peer‑reviewed data points showing AI can squeeze real dollars out of a dairy ration when the data underneath it is clean. The uncomfortable part is what happens on your farm, when the data isn’t that clean and the model’s intake guess wanders by a couple of pounds for weeks on end.

What the 2,073‑Cow AI Trial Actually Proved

According to Bach’s 2026 Animal Frontiers paper, the University of Lleida team followed a single pen of around 120 cows and logged far more than milk weights. Ingredient intakes, nutrient profiles, weather, stocking density, bodyweights, days in milk, yields, components, and economic returns — 2,073 daily observations in total, fed into a platform called algoMilk that has been running since 2020.

Two prediction engines were built on top of that dataset. A classic multiple regression — the math that’s quietly run ration software for decades — hit an R² of 0.86 (meaning it explained about 86% of the variation in income over feed cost), with a root mean square error of 1.45 €/cow/day (roughly $1.57/cow/day at an exchange rate near 1.08 USD/EUR in early May 2026). The gradient‑boosting machine‑learning model reached an R² of 0.98 (near‑perfect correlation) and cut RMSE to 0.59 €/cow/day (about $0.64/cow/day) on the same cows.

A small reality check before you get carried away: R² 0.98 reflects a tightly controlled research pen in Spain, not a typical commercial herd with messy real‑world records. Bach’s numbers are excellent on his cows, under his conditions — not an out‑of‑the‑box promise for yours.

Then the paper did the part every producer actually cares about. The ML model was plugged into an optimizer and asked to redesign the ration. The AI diet shifted ingredients gently — a bit more corn silage and canola meal, a bit less alfalfa and corn flakes — and lowered predicted dry‑matter intake by 0.2 kg (about 0.44 lb) and milk yield by 0.166 kg (about 0.37 lb) per cow per day. IOFC rose by about 0.015 €/cow/day (roughly $0.016/cow/day). Less milk. Tighter diet. Slightly more profit.

That result bruises a habit the industry has leaned on for a generation. According to the paper, chasing more milk at all costs isn’t always the most profitable move, because feed efficiency flattens and a chunk of cows in any group simply won’t pay you back for a richer ration.

How Dairy Brain Shows the Upside — When Data Is Clean

Bach’s work is one proof point. The bigger system for making AI useful at herd scale is being wired together in Wisconsin.

Victor Cabrera’s Dairy Brain project at UW–Madison has been stitching fragmented dairy data — genetics, milking systems, feed software, DHI, health records — into a single real‑time “brain” since 2016. The team’s 2024 Animal Frontiers paper describes using precision tools, big‑data analytics, and connected sensors to feed integrated models for everything from mastitis risk to culling and feeding decisions. Cabrera’s group publishes with Wisconsin cooperator herds, and the published outcomes line up with what the academic record shows — a pattern worth watching as more U.S. cooperators bring real barn numbers to the table.

An earlier applied study from the Cabrera group, led by Barrientos‑Blanco and published in the Journal of Dairy Science in 2020, put dollars on better diet accuracy. By tightening grouping and fine‑tuning rations with integrated data, they cut feed cost by about per cow per year and dropped nitrogen excretion by 5.5 kg (roughly 12.1 lb) per cow annually. On a 400‑cow herd, that’s roughly ,400 a year — off cows you already own, eating feed you’re already buying.

When data streams line up, AI‑style tools can tighten rations, improve nitrogen efficiency, and bump IOFC without a new ingredient truck ever rolling into the yard. The published work is also clear about the flip side: most herds aren’t close to that level of continuous, integrated data. That’s where the risk creeps in when you plug an AI ration engine into the noise.

Is Your Data Good Enough to Let AI Touch Your Ration?

Here’s where farm reality smashes into the AI sales deck.

A 2022 paper in Animals called “Addressing Data Bottlenecks in the Dairy Farm Industry” surveyed 73 farmers and 96 non‑farm stakeholders. About 69% said they were unfamiliar with existing data collection standards, and 66% of farmers felt they had no control over the chain of custody for their own data. Only 62% of farms were integrating data from multiple sources at all — and nearly half of those were still doing it manually in spreadsheets.

If your reality is a whiteboard feed sheet, DHIA once a month, and treatment notes scribbled in a spiral notebook, you don’t look like the 120‑cow Spanish research pen to an AI model. You look like static. And static makes intake predictions drift.

Before you download a trial of an “AI dairy nutrition” app, grab your nutritionist and run this readiness check:

The “AI Ready” Audit

  • Pen‑Level DMI: Can you pull 90 days of DM‑adjusted intake by pen?
  • Data Alignment: Do milk and components line up with those same pen‑days?
  • Digital Logs: Are forage DMs and TMR weights logged daily — not on paper?
  • Human Capital: Does someone on your team “own” data quality for at least 2 hours a week?

Zero or one out of four? You’re in good company. At that level, an AI ration tool is far more likely to become an expensive experiment than a profit center. Three or four out of four, and you’re close to the kind of herds where Bach and the Cabrera group have actually shown real gains.

How a 3% Intake Miss Eats $36,500 on a 500‑Cow Herd

Now the arithmetic you can run on the back of a feed tag.

Most high‑producing Holsteins in North America sit in a 52–58 lb dry matter range, depending on bodyweight and stage of lactation. With today’s mix of corn silage, haylage, grain, and by‑products, a realistic blended dry matter cost across many U.S. dairy regions lands in the $0.11–$0.13/lb band.

Say your AI tool claims your high group is eating 55 lbs of DM. In reality they’re closer to 53.35 — or 56.65. That’s about 1.65 lbs off, roughly 3%. Push that gap to 5% and you’re 2.75 lbs off, every cow, every day. Here’s how it lands on a 500‑cow high group at $0.12/lb DM:

Intake ErrorDaily Loss (500 cows)Annual Profit LeakImpact on Cost/cwt
3% miss~$100~$36,500$0.24
5% miss$165$60,225$0.40

Assumes $0.12/lb blended DM cost and cows shipping ~82 lbs/day / 0.82 cwt. Figures rounded; unrounded 3%‑miss values land at about $99/day and $36,135/year.

Herd Size1% Error/Year3% Error/Year5% Error/Year¢/cwt at 3%¢/cwt at 5%
250 cows$1,815$5,456$9,09412¢20¢
500 cows$3,630$10,890$18,15012¢20¢
500 cows (high group only)$3,630$36,500$60,22524¢40¢
1,000 cows$7,260$21,780$36,30012¢20¢
2,000 cows$14,520$43,560$72,60012¢20¢

Assumes $0.12/lb DM, 55 lb/day baseline intake, 82 lb/day milk shipped. High-group row reflects Bach/article scenario. Red = at or above vendor-claimed IOFC gain.

Vendors pitch these tools on IOFC gains in the single‑digit cent‑per‑cwt range. Marketing decks often stretch to 15–25¢/cwt. If the intake prediction the whole thing rides on is drifting 3%, the risk band alone can swallow the promised gain — before you even look at components, health, or labour.

Then the second‑order hits stack up. Butterfat slips a couple of hundredths because the model squeezes forage harder than your cows tolerate. Fresh cows throw a few extra DAs or ketosis cases because energy density moved faster than anybody noticed. Feeders chase bunk calls that don’t match the software. It isn’t scare‑tactic framing — it’s just what the math does when the model’s picture of intake and your actual bunks sit a couple of pounds apart for too long.

What Happens in Your Barn When the Algorithm Misses Intake by 5%?

Push the error band to 5% and you’re in lender‑conversation territory. That $60,225 annual leak sits well past the vet bill — right alongside the squeeze your banker runs DSCR against, like the $18.95 milk / $19.14 cost trap.

At 5%, the operational story gets ugly fast. Bunk calls get noisier because refusals don’t match predicted DMI. Cows swing between too‑full and too‑empty bunks. Health events cluster in patterns you don’t recognize. Feeders start “adjusting around the tool” off the record. If you’re using AI in advisory mode — building shadow rations and comparing — that 5% miss is a discussion point. If you’re letting it write the feed sheet, it’s physical, in front of your cows, every day.

The Bach model hit R² 0.98 on IOFC in that Spanish trial. Nobody has published that kind of accuracy on a typical North American commercial herd with messy real‑world records. The precision‑feeding upside is real. Your data quality decides whether you see Bach‑style gains or a 3–5% error bill.

Options and Trade‑Offs for Farmers

Contract ClauseWhat Farmers NeedTypical Vendor DefaultWho Carries Downside
Pilot duration90 days, hard stopRolling month-to-monthFarmer
Exit penaltyNo-penalty exit at day 90Early-termination feeFarmer
Data exportFull export within 30 daysProprietary lock-inFarmer
Shadow modeDays 1–7 predict only, no feed changesLive optimization from day 1Farmer
Performance threshold<3% intake error before scalingVendor discretionFarmer
IOFC benchmarkMust beat subscription fee in at least 1 pen by day 30No contractual benchmarkFarmer

Red = clause absent in most standard vendor agreements. Based on article’s recommended audit framework.

1. Fix Your Data First — Your 30‑Day Action

When it makes sense: You’re at zero or one on the readiness check. Records are scattered, DMI isn’t tracked by pen, and nobody owns data quality.

What it requires: Treat data like an ingredient for the next 30 days. Check DM on your main forages daily. Log every TMR load with actual weights and which pens it went to. Enter fresh, moved, and sick cows within 24 hours. At month’s end, sit with your nutritionist and pull 90 days of DMI by pen, milk and components by pen or tank, and a simple IOFC‑per‑cwt trend built on your real milk and feed prices.

Risks and limits: You won’t have an AI dashboard at the next meeting. You will have a baseline that tells you whether you’re already leaving money on the table with the software you own today.

2. Run a Small, Hard‑Bound 90‑Day Pilot

When it makes sense: You’re at three or four on readiness. Data’s relatively clean, the team is willing, and your nutritionist isn’t afraid of a spreadsheet.

What it requires: On paper — a written 90‑day pilot, a no‑penalty exit at day 90, and a guaranteed full data export (rations, predictions, actuals) within 30 days if you walk. In the barn — Days 1–7 in shadow mode only, the AI predicts but doesn’t change anything. Days 7–30, one stable pen gets one AI‑driven ration change with clear targets. Days 31–90, expand to a second pen only if pen one shows intake error under ~3% and IOFC improving after subscription fees.

Risks and limits: You’ll spend more time checking predicted versus actual than you’d like. By day 90, you’ll know — in your own dollars per cwt — whether the tool earns more than it costs.

3. Keep AI Advisory — Second Opinion, Not Driver

When it makes sense: You see value in pattern‑spotting but you’re not ready to let software write the feed sheet.

What it requires: Turn off auto‑optimization. Use the AI to generate shadow rations, flag outlier pens, and highlight where intake and milk don’t line up with history. Rule of the house: nothing new goes into the mixer without a human sign‑off.

Risks and limits: You give up some “easy” IOFC gains a fully optimized system might find on pristine data. You gain control, cut the odds of a silent 3–5% intake miss, and still get a second set of eyes.

4. “Not Yet” Is a Valid Answer

When it makes sense: DSCR is tight, you’re behind on higher‑ROI basics, and your data is, frankly, a mess.

What it requires: Sit down with your nutritionist and lender and mark the leaks you already know about. Are you happy with grouping and stocking? Have you tackled obvious feed shrink or mixing‑consistency issues? The Feed Center Revolution work shows many herds leak five figures a year before they ever touch software. Do you have a clear component strategy when the 2026 Class III–IV spread pulls $382,000 off a 500‑cow milk check?

Risks and limits: You might feel sidelined while neighbors talk about AI. You also avoid adding a subscription and one more variable to a cost structure that’s already stressed. Fixing a known six‑figure leak beats chasing a theoretical 20¢/cwt AI gain.

Key Takeaways

  • If an AI ration tool can’t shadow‑predict your last week of intake within roughly 3%, it doesn’t get to change the feed sheet. That gap is about $36,500/year on a 500‑cow herd — enough to erase the whole promised IOFC lift.
  • If you’re at zero or one out of four on the readiness audit, your next 30 days belong to tightening your own numbers before you pay for any AI prediction.
  • If a vendor won’t put a 90‑day pilot, a no‑penalty exit, and a 30‑day data‑export clause in writing, assume you’re carrying effectively all of the downside. Keep any AI tool in advisory mode until the paper and your milk check both say otherwise.
  • If the first 30 days of a pilot don’t show intake error under 3% and IOFC improving after fees in at least one pen, don’t scale it. Pause, diagnose, and make it earn more time.

What to do tomorrow morning: Before milking, pull last month’s feed invoices, your DHIA component report, and your TMR software log. Lay them on the same table. If you can’t line those three up by pen for the last 30 days in under an hour, that’s your AI answer for now — fix the data, then talk to the vendor.

So here’s the real question: if you laid out last year’s IOFC and feed‑cost reports, could you point to a single tool — AI or not — and say, “This clearly adds more than it costs, and here’s the proof in dollars per cwt”? If the answer is still no, any tool that comes next should have to prove itself on your cows, under your conditions, before it earns a seat at your feed table.

Complete references and supporting documentation are available upon request by contacting the editorial team at editor@thebullvine.com.

Learn More

The Sunday Read Dairy Professionals Don’t Skip.

Every week, thousands of producers, breeders, and industry insiders open Bullvine Weekly for genetics insights, market shifts, and profit strategies they won’t find anywhere else. One email. Five minutes. Smarter decisions all week.

NewsSubscribe
First
Last
Consent

$3,110 In, $1,100 Out: The Cull Trap Holding 470,000 U.S. Dairy Cows – CPI Hits 68

$3,110 to replace her. $1,100 to ship her. That ratio is why ~470,000 U.S. cows are still in stalls they’d have left in 2019 — and why The Bullvine’s CPI just flipped to 68. Warning Zone.

Picture a 500‑cow Wisconsin‑style herd sitting across from its lender this spring. Margin over feed dairy 2026 math says $255,000–$305,000 a year is walking out of that barn in the Bullvine model — a $205,500 milk‑over‑cost gap plus $50,000–$100,000 in bottom‑quartile carrying cost. Every culling decision runs into the same wall: the October 2025 USDA NASS Agricultural Prices release (the most recent heifer series) recorded replacement dairy heifers at a record $3,110/head.

The scene above is a composite drawn from Bullvine modeling on a representative Wisconsin 200–700 cow family operation. Milk price and cost‑of‑production inputs are national ranges applied to a Federal Order 30 (Upper Midwest) representative herd; your Order and cost structure will shift the output. Numbers throughout this piece are USDA and industry sourced; the operator is illustrative.

The cull check on the other side? Roughly $1,100/head for dairy utility cows, with better cuts clearing $1,400–$1,600in hot beef markets (USDA AMS National Weekly Cull Cow & Bull Summary, Q1 2026 range — see methodology appendix for the specific weekly reports used). That puts the replacement‑to‑cull ratio between 1.9:1 and 2.83:1.

Market CaseCow/Heifer ValueReplacement-to-Cull RatioEditorial Read
Dairy utility cull$1,100/head2.83:1Maximum pressure to defer culling
Strong beef-market cull$1,400/head2.22:1Still expensive to replace
Hot beef-market cull$1,600/head1.94:1Better exit value, but not enough relief
Replacement dairy heifer$3,110/headBaselineThe price wall driving the trap

When replacing a cow costs nearly three times what she brings as beef, the economics override the biology. That’s how you get to The Bullvine’s modeled estimate of roughly 470,000 U.S. cows held past their productive life — the first piece of the trap.

“The most expensive cow in your barn isn’t the high‑index yearling you just bought. It’s the lame third‑lactation cow you can’t afford to cull.”

The Most Expensive Cow In Your Barn Isn’t The Heifer

The most expensive cow in your barn isn’t the high‑index yearling you just bought.

It’s the lame third‑lactation cow you can’t afford to cull.

She’s giving somewhere around 60 lb/day. Vet bills stack. Repro has stalled. Every instinct says ship her — until you look at the heifer market and flinch.

That flinch, repeated across the country for 18 months, is the structural story of 2026 U.S. dairy.

The Retention Trap Your P&L Won’t Show You

On paper, the U.S. herd looks strong. USDA NASS reports February 2026 milk cow inventory at 9.62 million head, up 211,000 year‑over‑year — the largest U.S. monthly inventory since 1994 per the NASS historical milk cow series (specific comparison month cited in methodology appendix). Total 2025 milk output ran roughly 232 billion lb, up about 2.6% over 2024.

Everyone assumed that meant expansion. It doesn’t. It’s hoarding — and the slaughter data says so in plain English.

Since September 2023, U.S. producers have culled an estimated 611,600 fewer dairy cows than the five‑year rolling pace, per USDA AMS weekly Federally Inspected slaughter data (Sept 2018–Aug 2023 baseline, roughly 3.0M head/yr; full baseline table in the methodology appendix). 2025 dairy cow FI slaughter totaled around 2.53 million head the lowest U.S. annual FI total since 2011 based on AMS federally inspected series.

Co‑op briefings track the heifer shortage daily. Almost nobody is tracking what’s piled up on the other side of the barn.

The Shadow Loss Your P&L Won’t Flag

Your P&L is lying by omission. It tracks what you spent on feed, but it ignores the 10 lbs of milk you didn’t ship because a lame cow is occupying a prime stall. That’s the Shadow Loss — and it’s the most dangerous number in your barn.

The Bullvine‑modeled $50,000–$100,000/year bottom‑quartile drag on a 500‑cow herd isn’t a P&L line. It’s a shadow loss. Modeled range; actual values vary by herd, region, and breeding program. The underlying carrying‑cost methodology draws on USDA price data, typical herd records, and extension‑style budgets, triangulated against the Cornell Dairy Profit Monitor framework, Miner Institute reproductive economics, and Penn State Extension dairy decision tools.

Want your own number fast? The Bullvine Replacement‑to‑Cull Snapshot at thebullvine.com/tools/rc-snapshot.html takes your herd size, current heifer price, local cull value, and deferred‑cow count and spits out a herd‑specific pressure read with a prioritized bottom‑quartile action list. Same math as the published CPI. Your inputs.

How Deferred Culling Bleeds A 500‑Cow Wisconsin Herd

The Bullvine CPI workup models the bottom 20–25% of a typical herd carrying roughly – per cow per day in drag once production loss, vet cost, reproduction failures, and stall opportunity cost are stacked. These are Bullvine‑modeled ranges built on extension‑style budgets, not cited external point values; the full derivation sits in the carrying‑cost worksheet.

Carrying‑Cost Component (Bottom Quartile)Modeled $/Cow/DayWhy It Matters
Production loss vs a younger replacement.50–.00Aging cows commonly trail herd average at –/cwt milk, per CDCB lactation‑curve data and extension references cited in the worksheet.
Veterinary costs (lameness, mastitis, metabolic).50–.50Chronic issues compound with lactation number.
Reproduction failures (extra days open, repeats).00–.00Each extra open day past mid‑lactation costs real margin.
Stall opportunity cost.00–.50Every bottom‑quartile cow blocks a springing heifer.
Total modeled carrying cost.00–.00The barn math on the “cheap” cow you kept.

Running the Numbers: 500‑Cow Wisconsin‑Style Herd

Inputs: 500 cows | 75 lb/cow/day | –/cwt milk (national range) | –/cwt all‑in cost of production (national range) | Federal Order 30 representative; your Order and cost structure will shift the output | Modeling base: Bullvine CPI using USDA ERS Cost of Milk Production framing.

Step 1 — Daily and annual production 500 × 75 = 37,500 lb/day = 375 cwt/day 375 × 365 ≈ 136,875 cwt/year

Step 2 — Margin gap (if COP runs ~$1.50/cwt above milk price)

Note: this margin gap partially overlaps with the component‑premium gap discussed in “The $11 Billion Sorting Machine” below. Don’t stack them.

136,875 × $1.50 ≈ $205,500/year negative margin

Step 3 — Bottom‑quartile drag 100 cows × $8–$12/day × 365 ≈ $292,000–$438,000 gross

Net of replacement‑cost offset: the “drag” is the incremental loss from keeping the old cow versus a replacement in the same stall — it nets out the replacement cow’s own production contribution, her own vet/feed load, and ordinary depreciation. The Bullvine model assumes ~75% of the gross carrying cost offsets against that counterfactual, leaving ≈$50,000–$100,000/year net drag. Full derivation in the carrying‑cost worksheet.

Step 4 — Total modeled bleed

Loss LayerLow CaseHigh CaseWhat It Means
Annual production136,875 cwt136,875 cwt500 cows × 75 lb/day
Milk-over-cost gap$205,500/year$205,500/yearNegative margin at $1.50/cwt gap
Net bottom-quartile drag$50,000/year$100,000/yearDeferred cows occupying better stalls
Total modeled bleed$255,500/year$305,500/yearThe lender-facing number
Per cow equivalent$511/cow/year$611/cow/yearPain spread across the whole herd

Modeled for an illustrative 500‑cow Wisconsin operation on national milk and COP ranges. Your number will differ. Plug your own cow count, pounds, COP, and bottom‑bucket count into the Replacement‑to‑Cull Snapshot at thebullvine.com/tools/rc-snapshot.html for a herd‑specific output.

That’s the formula your lender is already running. Write it on your own whiteboard.

More from The Bullvine — Tier 3 economics: Why Your 2026 Budget Is Lying to You: USDA $18.95 Milk vs. $19.14 Costs.

Why Did The Bullvine Build A New Index For This?

The CPI exists because no one else was tracking the inverse of the heifer shortage. Every co‑op briefing reports how few heifers are coming. None publish how many cows are still in the barn that should have already left.

To The Bullvine’s knowledge, the CPI is the first published composite index scoring deferred culling and the replacement shortage together as a single trackable number. USDA doesn’t publish it. Land‑grant extensions don’t. The gap was real. The math could be done. Here’s how.

How The CPI Reads The Herd

Four components composite into a 0–100 score, updated monthly. Inputs and weights are public.

ComponentWhat It MeasuresCurrent ValueSub‑ScoreWeight
Deferred CullingCows retained past productive life~470,000 head7530%
Replacement‑to‑Cull RatioEconomic incentive to defer2.83:17225%
Production LagGenetic potential vs actual yield~144 lb implied vs 200–220 lb trend5020%
Trigger OddsProbability of a correction catalystBorderline high5825%
Composite CPIApril 202668

The Volatility Premium: Why The Reading Is 68, Not 65

The straight weighted composite lands at 65.0 (75×0.30 + 72×0.25 + 50×0.20 + 58×0.25 = 22.5 + 18 + 10 + 14.5). The published reading of 68 carries a three‑point Volatility Premium on top of the raw math.

Here’s why. The four sub‑scores weight correction risks as if they add linearly. They don’t. HPAI exposure doesn’t just stack on top of deferred culling — it multiplies the weight of it, because the same aging cows are the animals most likely to drop hard in a disease event. Class III sub‑$16 for multiple prints doesn’t just add pressure — it compounds against a heifer market above $3,000, because producers facing both can’t cull or replace their way out.

The Volatility Premium quantifies that convergence risk in a single digit. Future monthly releases publish both the raw weighted composite and the premium‑adjusted reading side by side, so you can see when trigger‑convergence is doing the work and when it isn’t.

Deferred Culling — 30% weight

USDA AMS weekly FI slaughter since September 2023 runs ~611,600 head below the five‑year rolling baseline (Sept 2018–Aug 2023, roughly 3.0M head/yr; baseline table in the methodology appendix). Net of eventual exits and natural attrition, The Bullvine’s central estimate is ~470,000 head retained past productive life — plausible range 350,000–550,000 depending on assumed mortality and voluntary exit rates.

Even at 350,000, this component still scores in the 70+ band. The Warning Zone read doesn’t depend on the headline number being exact.

Replacement‑to‑Cull Ratio — 25% weight

$3,110 October 2025 USDA heifers against a $1,100 dairy utility cull gives a headline 2.83:1. On a stronger cull (~$1,600 in hot beef markets), the ratio drops toward 1.9:1. Either read, the economics tell producers to wait.

Production Per Cow — 20% weight

USDA NASS puts 2025 per‑cow production at 24,390 lb, up 218 lb over 2024 — essentially on pace with the 200–220 lb/yr genetic trend implied by CDCB data. February 2026 per‑cow production came in at 1,899 lb, just 12 lb above February 2025. If that February pace held for all 12 months, the implied annual gain would run near 144 lb — short of genetic potential.

That’s a conditional read, not a measured 12‑month result. But it’s where the Warning Zone signal lives.

Trigger Probability — 25% weight

  • Class III: $14.59 Jan 2026$14.94 Feb 2026$16.16 Mar 2026 (USDA AMS class prices).
  • April 2026 WASDE projects 2026 average Class III at $16.90/cwt.
  • Corn ending stocks ~2.127B bu, 14.6% stocks‑to‑use, season‑average $4.15/bu (April 2026 WASDE‑670).
  • IDFA capacity tracker tallies $11B+ in new or expanded U.S. dairy processing capacity through 2028, across 50+ projects in 19 states (October 2025 release).

One more sub‑$16 Class III print and this leg alone pushes CPI deeper into Warning — before the Volatility Premium even recalculates.

What The CPI Doesn’t Tell You

The CPI is a national composite. It reads industry‑wide pressure — not your barn.

  • Regional variance. California and New York face different correction probabilities at the same national score.
  • Herd‑size variance. Large‑herd financial dynamics differ from family operations.
  • Genetic merit. Strong and weak breeding programs feel the same national CPI differently.
  • Beef‑on‑dairy mix. Herds heavy on beef‑cross calf revenue face different replacement math.
  • Trade shock. Export collapse shows up only through sustained Class III pressure inside Component 4.

Regional and herd‑size CPIs are in development as Phase 2. For a herd‑specific read today, run your numbers through the Replacement‑to‑Cull Snapshot at thebullvine.com/tools/rc-snapshot.html.

What Does CPI 68 + $3,000 Heifers Mean For Your Herd?

The Bullvine built this Decision Matrix so this doesn’t stay theoretical.

CPI ScoreHeifers >$3,000Heifers $2,000–$3,000Heifers <$2,000
30–50 (Stable–Building)Normal cull pace; map 2027 replacement pipeline.Normal cull pace; opportunistic purchases.Cull freely; replace aggressively.
50–70 (Building–Warning)Identify lowest‑quartile cows; lock replacement contracts.Accelerate culling of obvious passengers.Cull hard and refresh herd age.
70–80 (High Warning)Cull lowest quartile only as fast as replacements allow.Cull aggressively; secure replacements now.Maximize herd turnover.
80+ (Correction Imminent)Cull aggressively only if replacements secured.Cull now; expect heifer prices to react.Full herd refresh, if balance sheet allows.

At CPI 68 with >$3,000 heifers, the U.S. sits in the 50–70 × >$3,000 cell. Translation: tag your bottom quartile and pre‑position replacement access now — not after the correction starts.

Companion analysis — Tier 3 economics: The $3,000 Heifer Hangover: How Beef‑on‑Dairy Emptied Your Pipeline.

Why HPAI Makes Deferred Cows A Double Risk

Older, deferred cows aren’t only an economic problem. They’re also the animals most at risk in a disease event.

Immune function declines with age. Third‑, fourth‑, and fifth‑lactation cows carry more cumulative stress, more chronic inflammation, and slower recovery than first‑ and second‑lactation cows. They’re more likely to carry subclinical mastitis, lameness, or metabolic issues that blunt immune response — a pattern consistent with published veterinary literature on age‑linked immune competence in lactating cattle in the Journal of Dairy Science and Veterinary Clinics of North America: Food Animal Practice.

In an HPAI event, those are the cows that drop hard in milk, recover slowly, and are most likely to be culled post‑outbreak. A herd that has been deferring culls for 18 months is, by definition, stacked with those animals. CPI 68 plus an HPAI event isn’t risk on top of risk. It’s the same risk hitting the same cows twice. That’s what the Volatility Premium is pricing.

The $11 Billion Sorting Machine

Processors are pouring concrete for plants the deferred herd can’t fully service. IDFA tracks $11B+ in new and expanded U.S. dairy processing capacity through 2028 — 50+ projects in 19 states, heavy on cheese, whey, and high‑protein ingredients. Those plants are built for high‑component, low‑SCC milk running 12 months a year.

What does $11 billion in new concrete actually need? Components. SCC that doesn’t kill shelf life. Supply they can count on.

Two farm‑level outcomes:

  • High‑component, low‑SCC herds get base volume and more secure deals.
  • Average‑component, higher‑SCC herds drift into “swing supplier” territory — first cut when plants are long, last in line for premiums.

This component/quality gap partially overlaps with Step 2 in the barn‑math box above. Don’t stack them.

Missing $1.50–$2.00/cwt in component and quality premiums on 136,875 cwt is $205,000–$274,000/year in Bullvine modeling. Same order of magnitude as the deferred‑culling bleed. You don’t close that gap with a slogan. You close it by changing which cows stand in your stalls.

Continue the series — Tier 3 analysis: The $11 Billion Dairy Rush: Your 18‑Month Window to Lock in Processor Premiums.

The 438,844 Missing Heifers

The culling mess exists because of the heifer mess.

CoBank’s Dairy Heifer Inventories to Shrink Further Before Rebounding in 2027 (August 2025), read alongside USDA Cattle inventory data, implies approximately 355,000 fewer dairy replacements in 2025 than 2024, and another ~440,000 fewer in 2026 than 2025 (specific CoBank table referenced in the methodology appendix). Dairy heifers over 500 lb now sit just under 4 million head, a 20‑year low per USDA Cattle Jan 2026.

The deficit traces to the 2023–24 beef‑on‑dairy wave — sexed semen on the top, beef semen on the rest, beef‑cross calves clearing $400–$800/head above Holstein bull calves per Livestock Marketing Information Center weekly summaries and trade‑press auction reporting across 2023–24. Calf checks cashed. Replacement gap now.

CoBank’s outlook is blunt: inventories shrink through 2026 and only start rebounding in 2027. Until then, a structural heifer deficit runs underneath everything. That’s why The Bullvine runs the CPI and the Pipeline Tracker™ as a pair — one asks how many cows should have already left, the other asks how many heifers are actually coming 24 months out.

When 470,000 Cows Finally Move

Deferred culling doesn’t unwind politely. When some producers ship, more follow. The Bullvine’s scenario modeling, anchored to USDA slaughter and production data, sketches four plausible paths.

ScenarioTriggerCows ExitingTimelineMilk ImpactModeled Class III Effect
Slow ReleaseNo major trigger~150,000~12 months~ –1–2%+$0.50–$1.00/cwt
ModerateClass III <$16 for 3+ months~300,0006–9 months~ –3%+$1.50–$2.50/cwt
Full CorrectionMultiple financial triggers converge~470,000~90 days~ –5%+$2.00–$3.00/cwt
Extreme (tail risk)Financial triggers + disease event≥600,000<3 months~ –6% or more+$3.00–$5.00/cwt

These are modeled illustrative scenarios, not forecasts. The Extreme row is tail risk — a correction lining up with an HPAI event — and it’s the shape lender stress tests commonly include.

Drop Full Correction onto a 1,000‑cow, 75 lb/cow/day herd: 1,000 × 75 ÷ 100 × 365 = 273,750 cwt/year × $2.50/cwt = $684,375/year extra gross milk revenue if the rally lands in your tank.

Whether you keep that –/cwt depends on whether your cow mix and components qualify for the premium tier when the move hits. That’s the barn math on the upside.

Where Does The Pain Hit First?

Not evenly. Vulnerability scoring below reflects structural variables — herd size, replacement sourcing, cost structure — and is not an assessment of any individual operation or lender book.

StateFeb 2026 Herd (000 head)YoY ChangeVulnerabilityKey Risk
California1,712+3HIGHLargest herd; high costs; culled hard and early in the 2018–19 exit wave.
Texas718+34HIGHExpansion built on purchased replacements.
Wisconsin1,290+25MODERATE–HIGH200–700 cow backbone squeezed on costs.
Idaho724+24MODERATE–HIGHGrowth state; replacement‑dependent.
New York653+21MODERATEAging infrastructure; cash‑flow‑driven deferral.

Data source: USDA NASS Milk Production, February 2026.

California carries 1.712M cows and added just 3,000 head YoY. High replacement costs, water, and regulation load every culling decision. When margins compressed in 2018–19, California culled hard and early — a likely early indicator pattern worth watching in the national herd this cycle.

Texas grew by 34,000 cows to 718,000 — the biggest state gain, leaning most heavily on purchased replacements. A correction mid‑ramp means depreciating cows paid for at the top.

Wisconsin added 25,000 cows to 1.29M, but the backbone is still 200–700 cow herds. Those operators don’t carry the contract leverage of mega‑herds and are most likely holding marginal cows because no replacement path pencils without torching cash flow.

Idaho grew by 24,000 cows to 724,000 — replacement‑intensive throughput. Correction mid‑expansion is a double squeeze.

New York added 21,000 cows to 653,000, behind a cluster of announced regional processing projects tracked by The Bullvine against IDFA and New York State Ag & Markets filings. Specific project‑dollar totals are posted on the CPI methodology subpage. Deferred culling there is often cash‑flow‑driven.

Lender screening rule: fastest growth + highest reliance on purchased replacements = most exposed when the CPI climbs.

Breeding Your Way Out Of The Next Trap

If CPI 68 says clear your bottom 25%, the next question is who stands in those stalls next.

Paying $3,110 for a replacement only pencils if she stays out of the bottom quartile long enough to earn back. Extension cost work implies roughly a three‑lactation payback window at today’s heifer prices and milk values, while average U.S. productive life continues to run well short of that window in CDCB genetic trend reporting.

More herds are quietly shifting sire lists away from one more notch of yield and toward Productive Life, Daughter Pregnancy Rate, and health traits. In a $3,000‑heifer world, you’re better off with cows you still like in third lactation than cows you’re debating at second.

Companion genetics read — Tier 2: Sire Selection for Longevity in a High‑Heifer‑Cost Cycle.

The 30‑Day “pull three reports” step below pairs with this hidden‑gem analytics piece: Reading Your DHIA Report Like a Lender.

The 30/90/365‑Day Playbook for 200–700 Cow Deferred Herds

30‑Day Actions: Triage

Pull three reports from your herd software. Average lactation, vet cost per cow YoY, and a “kept instead of culled” list (cows you held in 2024–25 that would have shipped in 2019–20). Feed those numbers into the Replacement‑to‑Cull Snapshot the same afternoon. Requires: DHI and repro records, 20 minutes. Trigger: Average lactation >2.8 and vet cost/cow up YoY = you’re in the deferred cohort. Backfires when: You cull off software rank alone without checking repro status; some bottom‑rank cows are fresh and will climb.

Build your bottom‑quartile list. Rank by production, SCC, lameness, and days open. Tag each cow “ship within 6 months” or “re‑test at 6 months.” Requires: DHIA records and DC305/PCDart. Trigger: If your DSCR has been under 1.2 for three consecutive months on your lender’s reporting standard, treat the top third as urgent. DSCR covenant language varies — confirm with your loan officer. Backfires when: You empty stalls you can’t refill. Pair with the 90‑day replacement step below.

90‑Day Actions: Structural

Ship 25–35 cows from the bottom‑quartile list (8–12/month). Start with obvious passengers. Recheck vet cost/cow, bulk tank SCC, and daily shipped milk at Month 3. Requires: Replacement access or accepted lower cow count; freight and packer capacity. Trigger: If none of those three indicators improve, the hole is deeper than culling alone can fix. Backfires when: You ship without securing replacements and permanently shrink your base — fine if that’s the plan, a problem if it isn’t.

Lock replacement access. Heifer‑raising contracts, forward purchase agreements, or more sexed semen on your top 35–40%. Requires: 6–9 months for sexed semen to move through the pipeline; legal review on any forward contract. Trigger: Heifer prices break above $3,200 nationally, or your local replacement market tightens — pull this forward. Backfires when: Forward contracts signed at the top lock in peak prices. Build optionality where you can.

Tighten sire criteria on PL, DPR, and health. Requires: Genomic testing infrastructure and a breeding advisor aligned on PL/DPR weighting. Trigger: Average lactation trending up while production lags genetic trend = aging structurally, not just cyclically.

365‑Day Moves: Strategic

Clear 80–100 of the original bottom‑quartile cows; re‑run the diagnostic. Requires: Committed 12‑month cull and replacement schedule; lender in the loop. Trigger: Modeled annualized losses narrow by $50,000+ and cash‑flow draw slows — keep restructuring. Opportunity signal: If your components and SCC move you up a processor premium tier while Class III rallies into the Moderate or Full Correction band, you capture margin expansion your aging‑cow peers won’t. Backfires when: You keep a cow just to “earn back” the $1,000 you already spent on her vet bills. That vet check is gone. The only question left is what she produces tomorrow forward versus what a replacement produces in the same stall. Sunk cost is not a strategy.

Decide honestly at Month 12. Narrow the losses and rebuild, or plan a managed exit while cattle and heifer values still give you an equity‑preserving off‑ramp. Requires: Real data, not optimism. Accountant and lender at the table. Trigger:Equity ratio drifting below your lender’s covenant floor + two consecutive years of sub‑1.2 DSCR = managed‑exit conversation, not “one more year.” Backfires when: You wait for “one more good year” while deferred peers finally ship. That’s when heifer prices correct against you and cull prices soften.

Lender/advisor move: map CPI against your regional herd mix. Fastest‑growth, purchased‑replacement states (TX, ID) sit in a different risk band than flat regions. Portfolio exposure isn’t uniform.

The Turn: When Culling Becomes A Competitive Move

Run that same 500‑cow Wisconsin‑style herd forward 12 months in the model.

Average lactation is down. Vet cost per cow is flattening. Components trend toward the processor’s premium tier. The $205,500 margin gap hasn’t disappeared — but the $50,000–$100,000 bottom‑quartile drag has mostly retired.

A deferred‑herd peer down the road is still waiting. When the correction hits, everyone ships the same month. That’s when the lender’s “Can we afford to cull?” question flips to the only one that matters: Can we afford not to?

The CPI is a pressure gauge, not a guilt trip. Some cows are worth holding — young age structure, flat vet cost, production matching genetic expectations. If those conditions don’t describe your barn, the math isn’t ambiguous. Just uncomfortable.

What This Means For Your Operation

  • Pull those three reports in the next 30 days and set them beside your last three milk checks. If you won’t, you’re not managing this risk — you’re hoping it doesn’t land on you.
  • Run your numbers through the Replacement‑to‑Cull Snapshot today. Three minutes of inputs, a herd‑specific pressure score, a prioritized bottom‑quartile list, and a 30/90/365 plan calibrated to your barn.
  • Three or more “yes” answers on the CPI diagnostic puts your behavior inside the 470,000‑cow deferred bucket. Fix it with a 12‑month plan, not one cull load.
  • Watch Class III and your local heifer market together. Three straight sub‑$16 prints + heifer softening = shift from “prepare” to “act.”
  • Plan culls, replacements, and sire selection on one whiteboard. A CPI‑driven cull plan that isn’t tied to replacement access and sire strategy just sets up the next deferred trap.
  • Lenders and co‑ops: TX and ID expansion herds sit in a different risk tier than flat Northeast regions. Map your portfolio accordingly.

I grew up on a dairy farm where we knew every cow by name. We also knew when it was time to let one go.

That instinct hasn’t changed. But at $3,110 a replacement, the economics have overridden the instinct for hundreds of thousands of U.S. producers. The CPI is how we get the instinct back into the data.

— Andrew Hunt, Founder, The Bullvine

Run Your Herd Through The Replacement‑to‑Cull Snapshot

The Bullvine Replacement‑to‑Cull Snapshot

Your herd. Your numbers. Your pressure score.

Enter your cow count, current heifer price, local cull value, average lactation, vet cost per cow, and deferred cull count in the form below. The tool returns:

  • A herd‑specific pressure score with sub‑component breakdown.
  • A prioritized bottom‑quartile action list.
  • A 30/90/365 plan calibrated to your inputs.
  • A shareable PDF output you can bring to your lender or co‑op advisor.

The Bullvine Replacement‑to‑Cull Snapshot

Your herd. Your numbers. Your pressure score.

Having trouble viewing the tool? Open the Replacement‑to‑Cull Snapshot in a new tab.

Tool is editorial. Inputs are anonymized unless you opt in to a consulting follow‑up. The pressure score uses the same component math and weights as the published CPI and is not influenced by consulting engagements — see methodology below.

Methodology Note: How The Culling Pressure Index™ Is Built

The Culling Pressure Index™ is a monthly composite that quantifies deferred culling pressure in the U.S. dairy herd and estimates correction probability.

Update cadence. Published monthly, on the second Tuesday after the USDA NASS Milk Production release. Next update: Tuesday, May 12, 2026.

Version. CPI v1.0, April 2026.

Data inputs by component.

  • Component 1 — Deferred Culling (30%). USDA AMS weekly FI Dairy Cow Slaughter vs a five‑year rolling baseline (Sept 2018–Aug 2023, ~3.0M head/yr). Full baseline table in appendix.
  • Component 2 — Replacement‑to‑Cull Ratio (25%). USDA NASS Agricultural Prices for replacement heifers; USDA AMS National Weekly Cull Cow & Bull Summary for cull values (specific weekly reports cited in appendix).
  • Component 3 — Production Lag (20%). USDA NASS Milk Production monthly data vs CDCB published genetic trends.
  • Component 4 — Trigger Probability (25%). CME Class III futures, USDA Agricultural Prices, USDA WASDE corn stocks‑to‑use, IDFA processing capacity announcements.

Weighting rationale. 30% deferred culling (lagging indicator of accumulated risk); 25% ratio (economic driver of deferral); 20% production lag (herd‑quality drag); 25% trigger probability (correction timing).

Composite reading. The straight weighted composite for April 2026 is 65.0. The published reading of 68 includes a three‑point Volatility Premium for trigger‑convergence signals (HPAI × deferred culling, sustained sub‑$16 Class III × $3,000+ heifers). Future releases publish the raw and premium‑adjusted readings side by side.

Governance. The CPI score is editorial and is not influenced by Bullvine consulting engagements. Methodology changes are disclosed in monthly updates and historical scores are restated side‑by‑side. The embedded Replacement‑to‑Cull Snapshot at thebullvine.com/tools/rc-snapshot.html uses the same component math and weights as the published CPI.

Known limitations. State‑level data lags national data by 30–60 days. CDCB genetic trend data is smoothed annually. The natural‑attrition assumption behind the 470,000 retained‑cow estimate carries a sensitivity range of 350,000–550,000 head.

Versioning. v1.0 → v1.1 → v2.0. Material methodology changes will be flagged in monthly updates. Historical scores will be restated and presented as “as‑published” and “restated” series.

FAQ

What is the CPI? A monthly composite index, published by The Bullvine, scoring deferred culling pressure in the U.S. dairy herd and estimating correction probability.

Where does the data come from? USDA AMS FI slaughter, USDA NASS Milk Production and Agricultural Prices, CDCB genetic trends, CME dairy futures, USDA WASDE corn stocks‑to‑use. All inputs public.

What is the Volatility Premium? A qualitative adjustment on top of the raw weighted composite that prices trigger‑convergence risk — specifically HPAI exposure multiplying (not just adding to) deferred‑culling risk, and sustained sub‑$16 Class III compounding against $3,000+ heifer prices.

How is the Replacement‑to‑Cull Snapshot different from the published CPI? The published CPI scores the national herd monthly. The Snapshot at thebullvine.com/tools/rc-snapshot.html applies the same component math to your herd’s inputs and returns a herd‑specific score and action list. Both use the same methodology.

How is CPI different from the Pipeline Tracker™? Pipeline Tracker projects replacement heifer supply 24 months out. CPI measures retained‑cow pressure today. Together they form the most complete U.S. dairy supply read published.

Can I cite it? Yes. Recommended format: “The Bullvine Culling Pressure Index™, [Month Year]”

Does The Bullvine sell anything based on it? Yes — disclosed plainly. The Bullvine offers herd‑specific consulting engagements applying the CPI framework. The published CPI score and the Snapshot tool output are editorial; neither is influenced by consulting engagements.

Challenge The Model

Substantive challenges to the methodology are welcome. Write to cpi-feedback@thebullvine.com. Every substantive critique gets reviewed. Material responses are published in monthly updates.

Learn More

The Sunday Read Dairy Professionals Don’t Skip.

Every week, thousands of producers, breeders, and industry insiders open Bullvine Weekly for genetics insights, market shifts, and profit strategies they won’t find anywhere else. One email. Five minutes. Smarter decisions all week.

NewsSubscribe
First
Last
Consent

 197 Bulls. 8 Years. Zero in Your NM$ Catalog: The Heat Tolerance Trait CDCB Still Won’t Publish

Trevor Parrish in NSW started filtering sires on HT ABV in 2017. By August 2024, 197 Holstein Good Bulls cleared the threshold. CDCB’s April 2025 NM$ revision added none of it.

Executive Summary: Australia’s DataGene released a Heat Tolerance ABV in December 2017, and by the August 2024 run, 197 Holstein Good Bulls — roughly one in three — cleared the 100 threshold. CDCB’s April 2025 NM$ revision moved butterfat from 28.6 to 31.8 and dropped protein from 19.6 to 13, but added no heat tolerance trait; Lactanet hasn’t weighted it in LPI or Pro$ either, despite University of Guelph models hitting 0.97 rank correlation. The economic exposure for North American herds sits around $400/cow/year in heat-load regions — roughly $200,000 annually on a 500-cow dairy in southwestern Ontario or the Central Valley — based on the St-Pierre 2003 baseline adjusted for inflation and the 10% single-day, 25.6% 10-day cumulative milk losses documented in Science Advances (July 2025). Zoetis has peer-reviewed Milk_THI and CFS_THI traits in JDS (September and November 2025) that identify cows with measurably better rectal-temperature regulation. Select Sires’ ART program is now five Slick generations deep in Wisconsin, with parent averages tracking close to non-Slick matings and calves that still grow winter coat. The heifer you breed in May peaks in the early 2030s — waiting on CDCB locks in three more replacement cycles of thermal vulnerability, while DataGene’s Good Bulls App, Zoetis Clarifide, Australian proofs through Semex/Genex/ABS, and a 20–30% Slick allocation on your top cow families are all workable today. The question isn’t whether the margin math favours acting; it’s whether your AI rep can answer the HT question when you call tomorrow.

heat tolerance genetics

In late 2017, Holstein breeder Trevor Parrish of Kangaroo Valley, New South Wales, began weighting Heat Tolerance ABV into his sire selections — a decision still uncommon among his Australian peers at the time, according to DataGene’s adoption reporting and Parrish’s own May 2025 comments to Dairy News Australia. DataGene had just released the trait publicly: a quarterly-updated breeding value measuring how well a cow holds production when the Temperature-Humidity Index climbs past comfort. From that release forward, per his Dairy News Australia interview, Parrish treated Heat Tolerance as part of his standard sire-evaluation toolkit.

Eight years on, DataGene’s adoption data and Parrish’s published commentary tell the story of a breeder who treated the trait like calving ease — a filter you apply, not a debate you have. Meanwhile in Woodstock, Tulare, or Fond du Lac, no official North American genetic evaluation — not NM$, not TPI, not LPI — currently publishes a heat tolerance number at all. That gap has a dollar value. And it compounds every summer your replacement heifers come into the milking string.

What Australia Actually Did, Starting in 2017

DataGene released the Heat Tolerance ABV publicly in December 2017. The trait measures a cow’s ability to hold milk, fat, and protein output as THI rises past comfort thresholds. An ABV of 100 is breed average, and the trait sits inside the Balanced Performance Index (BPI) rather than floating as a standalone curiosity. A 2024 update lifted Holstein reliability by 10 percentage points and re-ranked the HT list more substantially for Holsteins than for Jerseys.

The adoption curve tells the more interesting story. In late 2016, during DataGene’s pilot work, only a handful of Good Bulls ranked meaningfully above 100 for HT. By the August 2024 ABV release, DataGene reported that one in three Holstein Good Bulls — 197 bulls — carried a Heat Tolerance ABV of 100 or above. That shift tracked a broader story of how climate pressure is reshaping dairy breeding priorities worldwide — but unlike most of the global picture, Australia already had the trait on the catalog page.

Speaking to Dairy News Australia in May 2025, Parrish framed the trait as part of a complete-cow picture: “Heat tolerance is part of that efficiency. As a breeder, you are trying to cover all the bases, and heat tolerance, now it has an ABV, is part of a solid, good quality cow.”

That isn’t a regulator’s decision. It’s a market filter, and it happened inside a decade.

Is the Science Strong Enough to Act On Without the Official Index?

Short answer: yes. And the research isn’t Australian-only. Three independent research pipelines — Australian, Canadian, and U.S. — now converge on the same conclusion: heat tolerance is a heritable, measurable, and economically significant trait in Holsteins.

Evidence streamMetricWhat it proves
Australia DataGene197 Holstein Good Bulls at HT ABV ≥100 by Aug. 2024Catalog-level selection signal exists
Canada Guelph / Lactanet-ready modelsRank correlations above 0.97 for Canadian Holstein bullsCanadian evaluation framework is technically stable
U.S. Zoetis genomic traitsMilk_THI: -1.3 to 1.0 kg/day/THI; CFS_THI: -6.2 to 5.3 pts/THIHeat tolerance can be genomically ranked in U.S. Holsteins
Slick allele field physiology1.1°F lower vaginal temperature at noon–3 p.m.Slick carriers regulate body temperature better under heat

The Three Scientific Proofs

  • Australia — University of Chicago Climate Impact Lab (Science Advances, July 2025). Gong, Hsiang, Moscona and collaborators drew on production records from more than 130,000 cows over 12 years. Cooling infrastructure only offsets about half of the damage on the hottest days — fans and soakers cut losses by roughly 50% at a 20°C wet bulb, less than half overall at the top of the range.
    • Bottom line: Milk yield falls up to 10% on days when wet-bulb temperature exceeds 26°C. Cumulative loss across the 10 days following a single hot day reaches 25.6% of a single day’s baseline output.
  • Canada — University of Guelph (Schenkel, Miglior et al., Journal of Dairy Science). The Guelph group developed a Canadian heat tolerance evaluation framework using test-day production records and reaction-norm models. A follow-up 2025 JDS paper validated alternate models. Methodology is Canadian-ready; what’s missing is integration into LPI and Pro$.
    • Bottom line: Alternate models produce rank correlations above 0.97 for Canadian Holstein bulls — Lactanet has a validated, publication-ready HT evaluation sitting on the shelf.
  • United States — Zoetis research team (Vukasinovic et al., Journal of Dairy Science, September 2025). The team published validated genomic breeding values for heat tolerance in U.S. Holsteins. The specific traits are Milk_THI (change in daily milk yield per unit of THI, ranging from -1.3 to 1.0 kg per day per THI unit) and CFS_THI (change in conception at first service per unit of THI, ranging from -6.2 to 5.3 percentage points). A November 2025 JDS validation confirmed that higher standardized transmitting abilities on both traits corresponded to reduced rectal temperatures during heat stress.
    • Bottom line: The cows the Zoetis model ranks as heat-tolerant actually regulate body temperature better in the barn — the trait does what it says on the label.

The traits exist and are peer-reviewed. Whether Zoetis has integrated Milk_THI and CFS_THI into its customer-facing Clarifide reports is a question for your Zoetis rep. The September 2025 JDS paper establishes the methodology, not the commercial rollout timeline.

What Does the Barn Math Actually Look Like?

Published heat stress loss estimates for U.S. dairy herds anchor around 4 per cow per year as the unmitigated baseline, from St-Pierre, Cobanov and Schnitkey’s work in Journal of Dairy Science (2003) — early-2000s dollars. Aggregate U.S. dairy losses are modeled near $897 million annually at minimum heat abatement intensity, pulling back toward $500–$600 million with optimum abatement.

For herds in southwestern Ontario or California’s Central Valley — regions carrying a heavier seasonal heat load than the historical “temperate” framing suggests — a working midpoint of roughly $400 per cow annually is a reasonable illustrative figure once the St-Pierre baseline is adjusted for two decades of inflation and the climate shift documented in the Science Advances work. It’s a modeled estimate, not a published regional number. Operations still trying to cool their way out of the problem should also read our companion piece on where cooling infrastructure stops paying back.

The table below is an illustrative model built from that midpoint and a modeled 50% reduction assumption — the upper end of what combined cooling investment, Australian-style HT selection, and targeted Slick matings can plausibly deliver together. Actual results will vary with climate zone, milk price, Slick adoption percentage, and the sire mix already in the tank.

Herd SizeEst. Annual Heat Loss (Conventional)Blended HT Strategy (50% Reduction)Year-1 Implementation Cost (Est.)
100 cows~$40,000~$20,000~$10,000
500 cows~$200,000~$100,000~$40,000
1,500 cows~$600,000~$300,000~$115,000

Underlying inputs: $400/cow annual heat loss (modeled midpoint); 50% recovery assumption from combined cooling + HT selection + Slick matings; Year-1 costs scaled for genomic testing on replacement heifers and semen premium on targeted Slick matings.

On a 500-cow operation, the Year-1 cost sketch roughly covers genomic testing on replacement heifers plus a modest semen premium on about 150 targeted Slick matings (roughly a 30% allocation of annual breedings). Under those modeled assumptions, payback clears inside the second summer. The arithmetic isn’t the weak point. The inputs are. But the direction and order of magnitude hold up in almost any scenario a North American breeder plugs in.

Where CDCB and Lactanet Have — and Haven’t — Moved

The CDCB’s April 2025 evaluation revision implemented the every-five-year base change (moving from cows born in 2015 to cows born in 2020) and updated income and cost variables inside NM$, Cheese Merit $, Fluid Merit $, and Grazing Merit $. Butterfat weight moved from 28.6 to 31.8 and protein dropped from 19.6 to 13, per the official CDCB April 2025 evaluation change documentation and the USDA-AGIL technical report by VanRaden, Toghiani, Basiel, and Cole. No new traits were added. No heat tolerance number. Those weight shifts carry their own strategic implications — which we unpack in our analysis of the April 2025 Net Merit revision’s butterfat-protein trade-off.

CDCB’s caution isn’t inertia for its own sake — the national evaluation’s credibility rests on trait reliability, and adding a trait prematurely carries real costs. But the cost of waiting now has a measurable dollar value. Realistic integration of Heat Tolerance into NM$ sits several evaluation cycles out. Lactanet is in a comparable position. The Guelph group has produced usable Canadian methodology and the 2025 JDS work validates it — but no heat tolerance index is currently published as part of LPI or Pro$.

The replacement pipeline doesn’t care about governance timelines. A heifer bred this May enters the milking string in early 2029 and reaches peak production in the early 2030s — in a climate the Science Advances team projects will deliver materially more wet-bulb-26°C days across major dairy regions by midcentury, with 4% annual daily-yield losses baked in without adaptation. The genetic decision made this breeding cycle sets the thermal ceiling for that cow’s productive life.

The North American Program That’s Already Five Generations In

While CDCB hasn’t moved, Select Sires’ Aggressive Reproductive Technologies (ART) program has quietly been running the Slick playbook for years. Per an April 2026 blog authored by ART Program Manager Mark Kerndt, the program is now in its fifth generation of Slick calves, with all of them born in Wisconsin.

“We are breeding the horns out of the breed and are now also focusing on making the Holstein breed more heat tolerant, through the gradual introduction of the dominant slick allele into our cattle,” Kerndt wrote. “We expect several hundred potential slick calves to be born in our program in 2026 and the parent averages on these matings are very close to our non-slick matings.”

Two things worth holding onto from that. First: Wisconsin-born Slick calves grow hair in winter, which answers the most common North American objection before a breeder raises it. Kerndt again: “They do grow hair! Most people think slick advantage is only short hair, but research shows it is more than that.”

Second: parent averages on Slick matings sit close to non-Slick matings in the ART program. The production penalty breeders have long assumed isn’t showing up in the current generation. The piece of the picture North American breeders haven’t had — a named commercial program running the strategy long enough to produce fifth-generation data — is now on the record.

The piece still missing from the public record is the one that would close the circle: a named North American dairy producer, not an AI stud, who has been weighting HT or running Slick matings long enough to report two or three summers of their own production and fertility numbers. Those producers exist. Their data isn’t yet in the trade press. That’s the next story worth telling, and The Bullvine is actively reporting it — if you’re running one of these programs and willing to talk on the record, the editor’s line is open.

“But I Have -20°C Winters” — The Cold-Climate Objection That Isn’t Aging Well

The pushback from Ontario, Quebec, Wisconsin, and Minnesota breeders is almost always the same: “I don’t want a tropical cow in a -20°C barn.” Fair question. Until the data answers it.

Kerndt has answered it directly from Wisconsin, where January air temperatures regularly sit below -10°C. His fifth-generation Slick calves are born there, stay there, and — in his own words — “do grow hair!” The Slick allele isn’t producing tropical cattle incapable of holding coat in cold country. It’s producing cattle that thermoregulate more efficiently when THI climbs, while still growing a winter coat when the thermometer drops.

The framing error is calling it a “tropical gene” in the first place. Slick was characterized in Senepol cattle in tropical regions, yes — but the trait it delivers is heat dissipation efficiency, not tropical-only viability. And the climate the “temperate” label was built on doesn’t exist anymore. The Science Advances data shows that Ontario, the Upper Midwest, New York, and the Atlantic provinces are already accumulating enough wet-bulb-26°C days to put real dollars per cow per year on the table — the illustrative 0-per-cow midpoint in the Barn Math section lands squarely in those regions, not in Puerto Rico.

The decision has shifted. It used to be: “Is Slick worth the winter coat penalty?” The current data says: “Is holding onto an outdated temperate-climate mental model worth giving up 50% of the recoverable summer margin?”

Four Ways to Start Now — Without Waiting for CDCB

Active breeders split from waiters right here. Four approaches are already in use, each with a different cost, effort, and exposure profile. None require CDCB or Lactanet to move first.

MoveCost profileSignal usedBest fitDataGene Good Bulls AppFree lookupHT ABV; Holstein reliability around 48%Any breeder building a sire listZoetis Milk_THI / CFS_THI inquiryAccount / rep access dependentMilk-yield and first-service conception response to THILarge herds already using genomic servicesAustralian proof sheet requestRep request; sire coverage variesAustralian HT proof on eligible international siresHerds buying Semex, Genex, ABS or similar international geneticsCustom index layerGeneticist setup; usually 1–2 quartersNM$ or LPI floor plus HT as secondary filterOperations already using custom selection indexes


1. The Free Move — DataGene’s Good Bulls App. DataGene publishes HT ABVs quarterly in its freely available Good Bulls App. Pull it up, search a sire name, read the ABV. It costs nothing. DataGene’s own fact sheet recommends using a team of bulls because HT ABV reliability sits around 48% in Holsteins, lower than conventional production traits — but 48% on a trait that doesn’t exist in NM$ is still 48% more signal than you have today.

2. The Phone Call — Zoetis Milk_THI and CFS_THI. The Zoetis traits are peer-reviewed (Vukasinovic et al., JDS, September 2025; follow-up JDS validation, November 2025). Whether they’re accessible through Clarifide — and under what conditions — is a question for your Zoetis rep directly. Validation confirmed the traits identify cows that keep body temperature regulated during heat stress. Larger operations with existing account relationships are the ones most likely to get a useful answer first.

3. The Genetic Filter — Australian Proofs via International AI Partners. Sires distributed through international-facing AI partners — Semex, Genex, and ABS among them — may carry Australian proof data where their genetics are evaluated in the Australian system. Coverage varies by sire and stud. Ask your AI partner for the Australian proof sheet on specific bulls you’re considering. This is a phone call your rep can make today; no new account, no testing investment.

4. The Custom Index — Layering HT onto NM$ or LPI. For operations already running custom selection indexes, set NM$ or LPI as a floor and layer HT as a secondary filter — structurally how Australian farmers already use BPI alongside HT ABV. It takes a conversation with your AI partner’s geneticist and typically a quarter or two to implement cleanly. If you’re already building custom indexes, this is the obvious next add.

Slick Sires: What the Allele Actually Does — and Doesn’t

For operations ready to go further than a filter, weighting Slick sires into 20–30% of matings is the most direct structural play. Slick carriers are in commercial North American catalogs today, with Select Sires’ ART program the most openly documented pipeline — confirmed in the April 2026 Holstein Sire Directory. Swissgenetics also markets THERMO-ET P SL, the first European homozygous-polled Red carrier of the Slick gene. Coverage across other major studs varies; ask your AI partner what they currently carry or can source.

Here’s what the biology actually delivers. The Slick allele is a dominant mutation in the prolactin receptor gene that produces a short, sleek coat. University of Florida research by Dikmen and colleagues (Journal of Dairy Science, 2014) documented that Slick cows averaged 1.1°F lower vaginal temperatures at the hottest times of day (noon to 3 p.m.) compared with non-Slick herdmates housed in the same Florida freestall environment. And where summer-calving cows typically see a sharp first-90-day yield depression compared with winter-calving animals, that seasonal gap was substantially reduced in Slick carriers — Slick cows held closer to their winter-calving performance than wild-type animals in the same heat conditions. The regulatory and commercial path Slick has walked is worth comparing with how the PRLR-SLICK gene-edited variant stacks up on the 2029 milk cheque.

The strategy isn’t 100% Slick. It’s targeting Slick matings at your highest-producing cow families and summer-calving blocks, where heat stress hits the margin hardest. A 20–30% allocation blended with elite conventional sires selected on NM$ or LPI is where most breeders start. Per Select Sires’ own ART data, the production penalty Slick once carried isn’t showing up in the current generation.

Is Your Herd’s Genetic Strategy Already Behind Where Australia Was in 2019?

Not a rhetorical question. By the August 2024 ABV release, one in three Holstein Good Bulls cleared 100 for Heat Tolerance. Parrish told Dairy News Australia that Australian AI centres are moving toward filtering on HT the same way they already filter for calving ease: “AI centres won’t take bulls that aren’t good for Heat Tolerance. It will be like calving ease — now they won’t buy a bull that causes difficult calvings.”

That shift didn’t come from a regulator. It came from farmers like Parrish, year after year, building HT into what they asked their AI reps for.

North American studs respond to the same pressure. Kerndt has said plainly: “Heat tolerance is a valuable economic trait. By adding the slick trait to the elite genetic package offered by Select Sires, we can accomplish our goal of helping dairies everywhere become more profitable.”

When the conversation at the rep level shifts from “what’s your highest NM$ bull?” to “what’s your highest NM$ bull with Australian HT data above 100 or a validated Milk_THI value above zero?” — the catalogs move. Not in 2030. Sooner. The breeders best positioned will be the ones whose replacement heifers already carry heat-adapted genetics when that shift lands.

What This Means for Your Operation

  • If your herd regularly sees days with wet-bulb temperatures approaching or crossing 26°C, the Science Advances data says you’re already losing meaningfully on those days — even with fans and soakers running. Pull your summer milk-weight records against THI days from the last three years before your next breeding order.
  • If your replacement rate runs above 30%, you have enough genetic turnover to see measurable HT impact inside four years. Below 25%, stretch that timeline and adjust expectations accordingly.
  • If you already genomic-test 70% or more of your replacements, the incremental cost of adding HT screening at the sire level is effectively zero. The only reason not to add it is habit.
  • If your AI rep hasn’t raised heat tolerance in a sire presentation, that’s a conversation worth starting. The data exists. Whether your current stud has prioritized surfacing it is worth finding out before the next breeding order goes in.
  • If you breed for a specific milk market — components, cheese yield, A2A2 — weight HT as a filter on top of those targets, not a replacement for them. It stacks. It doesn’t substitute.
  • If you operate in what was traditionally called a “temperate” region — Ontario, Quebec, Upper Midwest, New York, Atlantic provinces — treat that label as historical, not current. The Science Advances midcentury projection work puts meaningful additional heat exposure in those regions.
  • If the winter-coat concern has kept you out of Slick matings: Select Sires’ fifth-generation Wisconsin-born Slick calves grow hair fine. The penalty isn’t what breeders have long assumed it was.

Key Takeaways

  • In the next 30 days: Pull your top 20 planned sires. Cross-reference each against DataGene’s Good Bulls App for HT ABV. Ask your Zoetis rep whether Milk_THI or CFS_THI values are accessible on those bulls. Request Select Sires’ April 2026 Holstein Sire Directory to identify current active Slick carriers. This is an afternoon’s work.
  • In the next 90 days: Identify your top-producing 20–30% of cow families and your May–July freshening block. Allocate Slick sire matings to those specific groups rather than broadcasting across the herd.
  • In the next 12 months: Begin documenting summer production and conception baselines now. When CDCB or Lactanet eventually integrates HT into NM$ or LPI, you’ll have your own performance delta in hand before your neighbor has results from their first Slick daughter.
  • If X, then Y: If your farm sits in a region that clears wet-bulb 26°C on more than a handful of days each summer and your replacement rate is above 30%, the cost of waiting another three years for CDCB exceeds the cost of starting a blended HT strategy now.
  • The wrong answers book-end the right one: 100% Slick is the wrong strategy for most North American herds in 2026. Zero Slick, in regions already carrying meaningful heat-day loads, is also the wrong strategy. The defensible position sits at 20–30%, targeted on your best, most heat-stressed genetics.

Parrish’s herd in Kangaroo Valley isn’t really the story. Select Sires’ fifth-generation Slick calves in Wisconsin aren’t quite it either. The story is that a producer in Woodstock, Tulare, or Fond du Lac could have started in 2019 or 2020 and closed most of the same distance by 2026. The tools have been sitting on the shelf. The question worth asking before the next breeding order goes in isn’t whether the climate will keep pressuring your margins. It’s whether the heifer you bred last Tuesday is built for the barn she’ll actually be milking in by the early 2030s — and if your AI rep can’t answer that question, what does that say about where the conversation needs to go next?

Complete references and supporting documentation are available upon request by contacting the editorial team at editor@thebullvine.com.

Learn More

The Sunday Read Dairy Professionals Don’t Skip.

Every week, thousands of producers, breeders, and industry insiders open Bullvine Weekly for genetics insights, market shifts, and profit strategies they won’t find anywhere else. One email. Five minutes. Smarter decisions all week.

NewsSubscribe
First
Last
Consent

Salem Lost a Soft-Serve Window. Somewhere Upstream, a Dairy Farm Just Lost $22,500.

A 1952 soft-serve window on Boston Street went dark on April 25. Somewhere in the Northeast milk pool, a bulk tank just lost a seasonal account — and that’s a story every New England dairy producer should be reading.

Executive Summary: Salem’s Dairy Witch posted a closing notice on April 25, 2026 after 74 years on Boston Street — and for a 150-cow Essex County herd, a 75¢/cwt squeeze on the over-order premium that follows a seasonal-account loss like this runs about $22,500 a year; at $1.50/cwt, it’s $45,000. The window isn’t the story — the mix plants upstream and the over-order premium coming off your milk check are. Northeast Order 1 Class I utilization sat at just 20.4% of pooled milk in 2024, down from 44% in 2000, and every small seasonal buyer that goes dark thins that stack further. Farm Credit East’s 2024 Northeast Dairy Farm Summary pegged net earnings at 2 per cow last year, with Northeast farm prices typically clearing several dollars/cwt above the .81 Order 1 SUP — that’s the gap that shrinks when handlers lose volume. Stack the 2025 FMMO reforms on top (roughly $0.85–$0.93/cwt off class prices, or $95,000–$115,000 a year on a 500-cow Northeast dairy) and the margin picture gets ugly fast. The 30-day action: run a buyer concentration audit, stress-test your milk check against a $3–$4/cwt downside, and ask your field rep for their 72-hour contingency plan in writing. Read the full piece if any single handler takes more than a third of your volume, or if your over-order premium has slipped two months running.

Northeast milk premiums

Bea and Pete Polemenako opened a soft-serve window at 117 Boston Street in Salem in 1952. Seventy-four summers later, on April 25, 2026, Dairy Witch posted a closing notice. Owner Marietta Polemenako announced she was retiring after decades behind the window, and no buyer has been named.

That’s the Boston Globe story. The Bullvine story starts roughly 30 miles away, in a bulk tank whose milk — through a long chain of processors, mix plants, and foodservice trucks — helped feed that soft-serve machine every summer.

Every small dairy plant closure pulls one more thread out of New England’s Class I premium stack. The threads are thinning fast.

The Window Was Never the Story

Dairy Witch was a walk-up soft-serve stand. Seasonal. Open roughly April through early October. Cones, dips, frappes, the occasional hand-packed pint of Moose Tracks on the side.

It wasn’t a bottler. It wasn’t a creamery. No milk truck pulled into 117 Boston Street at 4 a.m. A window that size runs on pre-made soft-serve mix, delivered by a foodservice distributor from a plant somewhere upstream.

In eastern Massachusetts, that chain has gotten short. The FDA’s Interstate Milk Shippers list shows a handful of active licensed fluid operations in the state, and two names dominate the map: HP Hood in Agawam and DFA/Garelick in Franklin. Both remain the state’s largest fluid processors and show no public signs of closure; the pressure point is the smaller, seasonal, and direct-buy end of the market. Regional soft-serve mix moves through distributors like New England Ice Cream Corporation in Norton and Por-Shun in the Boston area.

So no — you won’t find a named Essex County farm that “lost its Dairy Witch contract.” The impact runs one link upstream. When mix plants lose seasonal accounts, over-order premiums typically come under pressure — a pattern Northeast dairy economists have documented for years. And the farms shipping into those plants feel it in the milk check four to six weeks later.

Before the barn math, know what you’re watching for. The checklist below is generic risk-spotting, not a prediction about any named plant.

How do you spot your local fluid buyer going under?

You don’t get a press release. You get signals. Watch for these:

  • Volume calls that stop mentioning seasonal accounts. Ice cream stands, schools, restaurants — if your field rep stops talking about summer pickups, something shifted.
  • Over-order premiums slipping two months in a row. One month is weather. Two is a margin problem at the plant.
  • Route consolidation notices from your distributor, especially if your pickup gets combined with a farm 40 miles farther out.
  • Owner retirement with no named successor. That’s the Dairy Witch pattern. Marietta is retiring; no buyer announced as of press time.
  • Lapsed or non-renewed state processor licenses in Massachusetts Department of Agriculture filings. Those are public records. Check them.

What does a dairy farm actually lose when a local buyer closes?

Start with Federal Milk Marketing Order math. Northeast Order 1, with Boston as the base zone, sets a Class I differential of $3.25/cwt on top of the base Class I price. USDA AMS announced the base Class I at $20.15/cwt for May 2026 — up $1.49 from April. That’s the floor.

The real milk check lives above the floor. Analysis of the 2024 Northeast Dairy Farm Summary, released July 2025, reported the average Northeast farm milk price climbed $1.17/cwt in 2024 from 2023 levels, with net earnings of $592 per cow in 2024 versus $292 in 2023. That recovery was driven largely by stronger component prices and a rebound in cheese demand — but it’s still a thin margin for anyone carrying new parlor debt or a recent generational transfer. The weighted-average FMMO Order 1 statistical uniform price was roughly $18.81/cwt for 2023, per USDA AMS’s 2023 Market Summary and Utilization report. Northeast farm prices in 2023 typically cleared several dollars per hundredweight above that floor — over-order premium, quality bonuses, and handler competition all stacked on top.

When a local fluid buyer closes, that stack starts shrinking. Industry commentary and long-standing Pennsylvania Milk Marketing Board testimony puts the over-order premium portion at roughly $0.75–$1.50/cwt in the Northeast, though specific figures vary by handler and year. Either way — it’s real money coming off the check.

ComponentValue ($/cwt)Source
Northeast Order 1 Class I differential, Boston zone3.25USDA AMS, FMMO Order 1
Base Class I price, May 202620.15USDA AMS announcement, May 2026
Order 1 statistical uniform price, 202318.81USDA AMS 2023 Market Summary
Northeast over-order premium range0.75 – 1.50PA Milk Marketing Board testimony; industry commentary
2024 NE farm price increase vs. 2023+1.172024 Northeast Dairy Farm Summary, July 2025

Quick barn math. Take a 150-cow herd in Essex County. Massachusetts averaged 20,000 pounds of milk per cow in 2024, per USDA NASS — that’s 200 cwt per cow per year, or 30,000 cwt across a 150-cow herd. A 75¢/cwt squeeze on the over-order premium costs about $22,500 a year. At $1.50/cwt, it’s $45,000. Plug in your own herd size; the multiplier is brutal either way.

Stack that on top of the 2025 FMMO reforms, which The Bullvine’s April 2026 analysis estimated at roughly $0.85–$0.93/cwt off class prices for a representative 500-cow Northeast dairy — on the order of $95,000 to $115,000 a year depending on per-cow productivity. The math gets ugly in a hurry.

Thomas Dairy, Rutland, 2020 — A Preview You Already Watched

If Salem feels small, look north. In October 2020, Thomas Dairy in Rutland, Vermont — a fifth-generation fluid milk business founded in 1929 — closed. According to VTDigger and Vermont Public reporting, the closure followed the collapse of the company’s restaurant and school accounts during COVID. Supplier farms had to find new handlers ahead of the shutdown. This is a single historical parallel, not a predictive model — but it’s the closest Northeast case of a mid-century named fluid buyer closing on retirement-plus-market pressure, and the supplier farms did have to reshuffle.

Vermont has lost more than 400 dairies in the past decade. Vermont Dairy Delivers tracks the state at roughly 868 farms in 2015 and a current count in the mid-400s, with steady year-over-year exits. Most of those losses were small and mid-size herds — the same operations most dependent on local handlers paying real over-order premiums.

The national backdrop is rougher. USDA’s 2022 Census of Agriculture recorded a drop from 40,336 farms with milk sales in 2017 to 24,470 in 2022 — a 39% decline in five years. USDA’s February 20, 2026 Milk Production report showed another 1,036 licensed dairy operations exited in 2025, about 4% of the national total, bringing the average licensed count to 23,609. Pennsylvania alone accounted for 41% of all U.S. dairy exits last year, losing 320 farms, per February 2026 analysis.

Fluid drinking milk is the slowest part of the ship to sink with you. In Northeast Order 1, Class I utilization averaged just 20.4% of pooled milk in 2024, per the FMMO Order 1 annual bulletin — up 2.4 percentage points from 2023, but still a long way from the 44% Class I share the Order carried in 2000. Every Dairy Witch-scale account that goes quiet pushes that number further down.

What do you do in the next 30 days?

Don’t wait for a closure announcement. Do this before June.

Run a buyer concentration audit. Add up what percentage of your monthly milk volume goes to your top one, two, and three handlers. Any single buyer taking more than a third of your volume is a concentration risk by most Northeast lender and co-op standards. It’s also the fastest diagnostic you can run on a Sunday afternoon.

Stress-test your milk check. Model what next month’s check looks like if your top buyer exits and you drop to the FMMO blend. Use a conservative –/cwt downside — the rough gap between what Northeast farms have cleared in recent years and the Order 1 statistical uniform price. Multiply by your annual cwt. That’s the number that tells you whether you’re making phone calls this week or next quarter.

Call your cooperative field rep and ask the ugly question directly. “If my handler went dark tomorrow, what’s your 72-hour plan for my milk?” Any answer that isn’t specific is the answer you needed.

Within 90 days, sit down with your cooperative or handler to review your contract language on handler substitution, force-majeure clauses, and route reassignment rights. Those are the paragraphs nobody reads until the plant closes.

Options and Trade-Offs for Farmers

There’s no one right move. Four realistic paths, each with a bill attached.

PathBest fitTime to executeKey constraint
Stay with current co-op, chase quality premiums<300-cow herds with Agri-Mark/DFA/Hood ties30–90 daysCaps your over-order upside
Switch to specialty / organic handler (e.g., Stonyfield, Organic Valley)Pasture-ready farms; pay near mid-$40s/cwt in recent years3+ years(NOP transition)2022 Origin of Livestock rule closed one-time conventional loophole
Direct-to-consumer bottling (Shaw Farm, Crescent Ridge model)Family with retail operator on-site12–24 months365-day labor + HACCP burden
Shared regional co-processing / co-packingClusters of 200-cow neighbors on same vulnerable plant6–18 monthsGovernance complexity 

Stay with your current cooperative and diversify quality premiums. Works if your co-op is Agri-Mark, DFA, or Hood-aligned with multiple Northeast plants. You give up the chase for a higher over-order premium elsewhere, but you gain pooling stability and field rep attention. Good fit for farms under 300 cows without the bandwidth to renegotiate.

Switch to a specialty or organic handler. Stonyfield stepped in for some Horizon Organic farms after Danone’s 2022 Northeast exit. Organic Valley offered placements to dozens of Horizon-dropped operations, per coverage at the time. NODPA’s producer pay price tracking has shown organic figures in the mid-$40s/cwt range in recent years. Trade-off: USDA organic transition requires three full years of organic land management before certified organic milk can ship, plus separate herd-transition requirements under the National Organic Program. The regulatory burden isn’t trivial, and the 2022 Origin of Livestock final rule closed the old one-time conventional-to-organic transition loophole for most operations.

Build a direct-to-consumer line. Shaw Farm in Dracut has been bottling its own milk since 1908, running a home-delivery route, an ice cream stand, and a farm store all from the same property about 30 miles from Salem. Crescent Ridge in Sharon has followed a similar playbook for generations. You capture price — glass-bottle retail milk in eastern Massachusetts clears at a multiple of the FMMO blend. You also take on labor, bottling, delivery, retail, HACCP, and a seven-day-a-week foot-traffic business. Only works if your family has someone who actually wants to run a retail business. This is a 365-day decision, not a 30-day fix.

Consolidate with neighbors on shared processing. Regional co-processing or cheese co-packing arrangements have kept some mid-size Northeast farms alive. Governance gets complicated fast. But if your county has two or three 200-cow herds all shipping to the same vulnerable plant, a shared exit strategy beats three separate collapses.

None of these survive if you can’t see the buyer going under. That’s why the 30-day audit matters first.

Key Takeaways

  • If a single buyer takes more than a third of your monthly volume, start the alternative-handler conversation this month, not next quarter.
  • If your over-order premium drops two months in a row without a market-wide explanation, assume your plant has a margin problem and act accordingly.
  • If your handler’s owner announces retirement with no named successor, treat it like a 90-day exit notice whether or not one has been issued.
  • If your FMMO’s Class I utilization keeps drifting — Order 1 sat at just 20.4% in 2024 — your over-order-premium ceiling is drifting with it. Build your barn math around the floor, not the five-year average.
  • If you’re in a co-op, your 72-hour contingency plan isn’t theoretical. Ask for it in writing.

The Bottom Line

Every direct-buy relationship that dies forces a choice: accept the FMMO floor or build a buyer you can’t easily lose. Neither option is free, and neither one waits.

So here’s the question worth chewing on before your next field rep call: what’s the last small fluid buyer in your county, and how many summers do they have left? Salem lost a soft-serve window this spring. Rutland lost a fifth-generation bottler five summers ago. Somewhere in Aroostook County, or Bennington, or outside Springfield, another retirement conversation is happening at another kitchen table right now — and the question is whether your milk check is ready when that window closes too.

The Bullvine Weekly has the full FMMO reform breakdown and the 500-cow dairy barn math behind the six-figure impact flagged above. If you want the deeper economic model — the one to hand your lender before your next operating note — that’s where it lives.

Methodology note: This article is based on public closure coverage and USDA AMS, USDA NASS, VTDigger, Vermont Public, NODPA, and FMMO Order 1 data available as of April 30, 2026. Named processors and distributors are referenced for industry-structure context only; none are alleged to face closure risk.

Learn More

  • What Lactalis’s 270-Farm Cut Really Means for Every Producer — Clarity on your farm’s structural limits is your best defense against equity loss. This breakdown reveals why 89% of dairies over 1,000 cows profit, arming you with the $0.60/cwt professional service math needed to responsibly scale, transition, or sell.
  • Surviving the $0.94/cwt Dairy Make Allowance Hit — Exposing the structural federal pricing shifts erasing $105,000 annually from a 400-cow dairy gives you a critical planning advantage. You will master a specific formula to calculate your true All-Milk to mailbox gap and immediately recalibrate break-even metrics.
  • Cheese Yield Explosion: How Dairy Farmers Can Reclaim Billions in Lost Component Value — Follow the money on a 12.5% industry-wide leap in cheese yields to dismantle processor narratives about flat pay prices. Secure a distinct negotiating edge by using these specific tactics to demand compensation for the $2.50/cwt in new value generated.

The Sunday Read Dairy Professionals Don’t Skip.

Every week, thousands of producers, breeders, and industry insiders open Bullvine Weekly for genetics insights, market shifts, and profit strategies they won’t find anywhere else. One email. Five minutes. Smarter decisions all week.

NewsSubscribe
First
Last
Consent

Morris’s $0.31 USMCA Fight Won’t Clear Your September Milk Check

Class III moved $2.26/cwt in 88 days. The entire USMCA enforcement case Morris is running models to $0.31/cwt over 12 months. Guess which one clears your September check.

Executive Summary: Class III moved $2.26/cwt between January’s $14.59 announced price and the April 28, 2026, CME settle near $16.85 — roughly $187,580 of revenue swing on an 800-cow Northeast cheese herd’s Q3–Q4 book, no diplomats required. The entire NMPF/USDEC enforcement case Shawna Morris is running into the July 1 USMCA Joint Review models to a $0.31/cwt total scenario spread over 12 months: +$0.08 best case, -$0.23 worst case, author-modeled off published transmission coefficients and 2024 FAS GATS volumes. HighGround Dairy’s April 22 print shows Q1 2026 DRP netted $0.83/cwt — one quarter of coverage delivered more protection than the maximum USMCA “win” scenario delivers in a year. The real tail risk nobody’s pricing sits in Other Solids: a 35% China whey-price drop runs -$1.38/cwt on Class III, and it stacks on top of Scenario C, not instead of it. Producers with Q3–Q4 2026 contract renewals and unhedged milk are carrying the highest exposure — the 30/90/365 playbook inside starts with an FSA call today and a Contract Audit checklist for the September repricing clause you may not have read. The diplomats control the headline. Your hedge book controls the revenue.

USMCA dairy enforcement

Class III moved $2.26/cwt between the $14.59/cwt January 2026 USDA AMS announced price and the April 28, 2026, CME April-contract settle near $16.85/cwt. On an 800-cow Northeast cheese-oriented operation shipping roughly 83,000 cwt across Q3 and Q4, that’s 7,580 of revenue swing on half a year’s production — a volatility reference point, not a forecast. The market doing what markets do, no diplomats required.

In the 63 days between today and the July 1, 2026, USMCA Joint Review required under Article 34.7, the NMPF and USDEC enforcement push Shawna Morris has led is worth, on the barn math below, about $0.31/cwt of total scenario spread over 12 months.

The USMCA dairy 2026 fight is real. It’s also not the number that determines whether you make your debt service this fall.

Ted Vander Schaaf, an Idaho producer and Northwest Dairy Association member-owner, made the institutional case on February 12, 2026, before the Senate Finance Committee on behalf of USDEC, asking Congress to treat July 1 as the window to fix what USMCA promised American producers. The case is real. The September milk check is a separate timeline.

What Shawna Morris’s USMCA Enforcement Case Is Actually Asking For

Morris, EVP of Trade Policy and Global Affairs at NMPF, has pressed the enforcement case publicly for three years. The joint comments NMPF and USDEC submitted on October 31, 2025, for the USMCA Review lay out the mechanism: Canada’s TRQ architecture awards most of the quota in each of 14 dairy categories to Canadian producers of the product in question, forcing US exporters to sell largely to their own Canadian competitors. Morris escalated the same case at the USTR USMCA operation hearing on December 3, 2025, backed the same day by a bipartisan letter from 74 US House members to USTR Jamieson Greer.

The NMPF/USDEC filing documents fill rates as low as 3% on skim milk powder (TRQ-CA3), 8% on milk protein concentrates (TRQ-CA12), 12% on yogurt and buttermilk (TRQ-CA7), 21% on whey powder (TRQ-CA8), 51% on cream (TRQ-CA2), and 59% on industrial cheese (TRQ-CA5). A 20-to-30-point fill-rate gain — moving under-utilized TRQs toward a 70–80% band — is the volume recovery the filing targets.

Dairy Farmers of Canada has pushed back hard. In a March 8, 2025, statement, DFC President David Wiens argued the US “secured substantial tariff-free access to the Canadian dairy market” under USMCA and that the US “enjoys a significant dairy trade surplus with Canada, exporting 7.5 million CAD in dairy products while importing 7.9 million CAD in return.” The June 2025 passage of Bill C-202 further limits Canada’s ability to offer supply-managed concessions in future trade negotiations. The access exists. The access isn’t being fully used. Both positions hold.

Neither one pays your September note.

What Does a $0.31/cwt USMCA Dairy 2026 Spread Actually Mean for Your 800-Cow Herd?

The $0.31/cwt figure is load-bearing for every hedge decision downstream, so it has to hold up.

Published dairy price-transmission literature supports a working coefficient in the low-single-digit cents/cwt range for each 1% of incremental US dairy export volume. Apply that to the TRQ-recovery volume and a Class III discount — cheese-and-whey routes transmit tighter than all-milk because butter and powder share less of the Class III formula — and the midpoint on a US enforcement win lands near +$0.08/cwt. That is author modeling, not a published coefficient, and the methodology note at the end of this piece spells out every assumption behind it.

A failed-talks and retaliation scenario lands near -$0.23/cwt on the same framework, modeled on a 15–25% reduction in 2024 US-to-Canada dairy exports (C$877.5M; roughly US$640M in 2024 annual-average exchange rates per Bank of Canada). Canada retained meaningful counter-tariff authority from the C$30 billion March 4, 2025, list of US goods subject to 25% tariffs, with the updated list effective September 1, 2025.

Total scenario spread: $0.31/cwt, best case to worst case, over 12 months. Author modeling. Not a projection.

The Comparison That Actually Matters

ScenarioPer cwt Impact800-Cow Annual Impact
USMCA Win (Best Case)+$0.08+$13,280
USMCA Retaliation (Worst Case)-$0.23-$38,180
Total USMCA Scenario Spread$0.31$51,460
Q1 2026 DRP Net Return+$0.83+$34,445 (one quarter)
Jan–Apr 2026 Class III Movement$2.26$187,580 (half year)

Bottom line: one well-placed quarter of DRP delivered more protection than the entire USMCA “win” scenario delivers in a year. HighGround Dairy’s Q1 2026 DRP results, published April 22, 2026, report estimated indemnities averaging $1.12/cwt against premium costs of $0.28/cwt. HighGround’s five-year review (2019–2023) shows DRP averaged $0.30/cwt in premiums and $0.53/cwt in indemnities, a net gain of $0.23/cwt and a $1.78 return on every $1 of premium.

Running the Numbers

Barn math: 800-cow Northeast cheese-oriented operation, 12 months ending Q4 2026

Production inputs (illustrative Northeast anchor — substitute your own cwt/cow):

  • 57 lbs/cow/day working anchor (USDA NASS Milk Production 03/20/2026 reports January 2026 U.S. 24-state average at 2,068 lbs/cow/month, or ~68 lbs/day; PA January 2026 production totaled 817 million lbs with an 11,000-head cow decline year-over-year)
  • 57 × 365 ÷ 100 = 208.05 cwt/cow/year
  • 800 cows × 208 cwt = ~166,000 cwt/year
  • Q3 + Q4 combined: ~83,000 cwt

Volatility reference (Jan–Apr 2026 actual):

  • Class III Jan 2026 announced ($14.59/cwt) → April 28, 2026, front-month (~$16.85/cwt): $2.26/cwt over 88 days
  • Applied to 83,000 cwt: $187,580 revenue swing — reference, not a prediction

DRP reference (Q1 2026 actual per HighGround):

  • Net return $0.83/cwt × Q1 production (~41,500 cwt) = +$34,445 in one quarter for covered producers

Scaling the 12-month USMCA scenario spread at $0.31/cwt to your herd:

Herd SizeAnnual cwtUSMCA Scenario Spread
400 cows83,200$25,792
800 cows166,000$51,460
1,200 cows249,600$77,376

Pull your last three milk checks, calculate your actual cwt shipped per cow, apply the +$0.08 upside and the -$0.23 downside, and compare the result to what your Q1 2026 DRP coverage paid — or would have paid.

Why Vander Schaaf’s Testimony and a Hedge Book Aren’t the Same Argument

The split between institutional timelines and individual hedge timelines isn’t something trade-group messaging usually spells out.

Vander Schaaf’s Senate Finance testimony addressed a 10-year structural question about USMCA’s enforcement architecture. That question is real. A producer in his position still faces the same 63-day hedge window every other US producer is sitting in. Q3 milk that needs to be priced. A Q4 contract that’s either hedged or isn’t. Cheese markets moving week to week.

NMPF’s enforcement case runs on a 10-year structural horizon. A US dairy producer’s Q3 check clears in September. Both things are true at once.

The processor conflict inside the TRQ system sharpens the split further. The TRQ architecture gives any processor with cross-border manufacturing options sourcing flexibility domestic-only competitors don’t have. Saputo — one of the top three US cheese producers, with US plants spanning Wisconsin, New Mexico, and beyond — Agropur (operating 39 North American plants and moving 6.1 billion litres/year), and Lactalis sit among the cross-border manufacturers whose bilateral US–Canada footprints create material Scenario C retaliation exposure. The question for a producer is whether your own processor’s public position on enforcement aligns with where your milk actually earns.

The Second Front: China Tail Risk Nobody Is Pricing

If the USMCA is the “known” variable producers are watching, the China tail risk is the “unknown” that could swallow the USMCA spread three times over.

China was the US dairy sector’s second-largest export destination outside Mexico in 2024, with dry whey products and lactose the dominant lanes, per USDA FAS Beijing’s Dairy and Products Annual (October 22, 2024) and FAS PSD World Markets and Trade circulars. In April 2025, China’s retaliatory tariffs on US dairy reached 84%, explicitly including whey and lactose — covered in The Bullvine’s April 10, 2025, analysis. FAS Beijing’s May 20, 2025, semi-annual reported China’s whey imports would decline in 2025 “due to China’s retaliatory tariffs on U.S. origin product.” “China takes a lot of US whey products — dry whey, whey protein concentrates, permeate, lactose,” Phil Plourd of Ever.ag said in the April 2025 cycle. “Today, we’re up to 84%, making things more challenging.”

Apply a working model — not a prediction — to April 2026 dry whey pricing near $0.649/lb (USDA AMS Dairy Products Sales Report, week ending April 18, 2026). The Federal Order Class III Other Solids formula runs (dry whey price − $0.2668) × 1.03. At $0.649/lb, Other Solids prices at $0.3939/lb; at $0.4219/lb after a 35% whey drop, Other Solids drops to $0.1596/lb. The delta of $0.2343/lb applied to 5.9 lbs of other solids per cwt (Federal Order standardized factor, USDA AMS FMMO) equals roughly -$1.38/cwt Class III. On a 1,000-cow Midwest whey-heavy operation at 208 cwt/cow (~208,000 cwt/year), that’s -$287,040 annualized.

Critical framing: this -$1.38/cwt China whey shock is additive to any USMCA losses, not alternative to them. A producer modeling the worst case stacks Scenario C’s -$0.23/cwt on top of a -$1.38/cwt whey shock for a combined -$1.61/cwt exposure. These risks can and do compound.

Sensitivity the other way: a 20% whey-price drop lands closer to -$0.79/cwt; a 50% drop pushes past -$1.97/cwt. The 35% draw is a midpoint sensitivity, not a ceiling.

That’s not the USMCA fight. That’s the USMCA fight plus the tail nobody in the current trade press coverage is pricing.

The Cooperative “Wait and See” Conversation

Before any hedge decision works, name the advice pattern that can block it. “Wait and see on Q3 coverage because things might improve after the review” is advice worth examining.

Co-ops and their field representatives balance multiple interests — member retention, logistics, plant utilization, and member margins. Independent DRP agents and ag lenders often point out that those interests don’t always line up one-to-one with a single producer’s hedge economics. That doesn’t make co-op advice bad. It makes it one input among several worth weighing.

Cooperative pooling delivers real benefits individual risk management can’t: spread risk, logistics leverage, steadier pay timing. The point isn’t that pooling is bad. The point is that pool-level price optimism isn’t the same as your farm-level risk management.

Run the asymmetry. HighGround’s five-year review shows DRP premiums averaged $0.30/cwt, with Q1 2026 running lighter at $0.28/cwt. The cost of being wrong on an unhedged 83,000 cwt Q3+Q4 book, against a $1.00/cwt market correction, is $83,000. The $2.26/cwt move that already happened between January and late April 2026 would have been $187,580 on half-year production. Producers who carried DRP coverage into Q1 2026 netted $0.83/cwt after premiums, per HighGround. Producers without coverage didn’t capture that return.

The numbers tell you to carry coverage and stop watching the diplomatic calendar for hedge signals.

The 30/90/365-Day Playbook for 800-Cow Herds Heading Into July 1

30-Day Actions (before May 29, 2026)

  • Call your FSA county office today. Get the exact Q3 2026 DRP enrollment deadline in writing or with an RMA confirmation reference. The window closes before July 1 — the same date as the USMCA Joint Review required under Article 34.7.
  • Call a DRP-licensed insurance agent from the USDA RMA Agent Locator, not your co-op field rep. Ask for three specific numbers at 95% coverage: net premium per cwt after subsidy, effective price floor, and total cost on your declared Q3 production. Premium benchmarks land near the $0.28–$0.30/cwt HighGround five-year range; use that as a sanity check on the quote.
  • Pull your Class III utilization percentage from co-op member services. Not your field rep — member services. A 75%+ Class III operation runs different coverage economics than a 55/30/15 blended one.

Red-flag trigger: If CME cheddar blocks break below your risk advisor’s established reassessment threshold, add coverage the same day.

Where it backfires: If your DSCR has been under 1.2 for three consecutive months on your lender’s covenant method, premium dollars compete with operating line headroom. Call your lender before the insurance agent.

90-Day Actions (through late July 2026)

The Contract Audit — pull your supply agreement and check:

  • [ ] Does it address retaliatory tariffs (US-imposed or Canada-imposed) and is there a pricing-review trigger?
  • [ ] What is the notice period for non-renewal?
  • [ ] Is the repricing mechanism spot, formula, or blend?
  • [ ] Is the over-order premium fixed, variable, or floored?
  • [ ] Does it guarantee quarterly component utilization reporting on your own milk?
  • [ ] What is the effective date of the current terms and when does the next window open?

Other 90-day moves:

  • Draft a trade-outcome review clause for the renewal. Suggested language: “If the United States imposes retaliatory tariffs on Canadian dairy products, or Canada imposes retaliatory tariffs on US dairy products, either party may request a pricing review within 30 days.” It doesn’t guarantee outcomes. It guarantees a seat at the table if Scenario C activates.
  • Request quarterly component utilization reporting on your own milk. Not plant economics — your own payment breakdown by component. The ask is legitimate under Federal Order component pricing transparency.

What this requires: A copy of your current contract, your co-op member services contact, and — if the conversation gets serious — an ag contract attorney who works on dairy supply agreements.

Where it backfires: Going in without Q3 hedging in place. Processors know renewal deadlines. Negotiating a 2027 extension with uncovered Q3 milk is negotiating from need, not from position.

365-Day Moves (positioning for the next cycle)

  • Build a Q3–Q4 2027 hedge ladder now, not in May 2027. HighGround’s research finds DRP coverage secured three quarters out delivered the highest average net return in Q1 2026 at $1.53/cwt — four and five quarters out returned $1.37 and $1.28 respectively. Laddered DRP or Class III put coverage through Q4 2027 costs premium dollars but caps tail risk and historically pays for itself.
  • Evaluate processor optionality. If your operation runs 75%+ Class III and your co-op’s over-order premium structure doesn’t reflect that concentration, a specialty processor relationship may align your milk more cleanly with your hedge strategy. The trade-off: you lose pooling diversification and take on concentration risk against a single processor.
  • Track China dairy tariff status monthly. USDA FAS Beijing publishes updates. The signal to watch is whether Chinese importers continue the cost-sharing arrangement absorbing partial tariff pass-through. When that breaks down, whey volume drops within 60–90 days.

Opportunity signal: If your co-op’s over-order premium widens by $0.20/cwt or more in the second half of 2026 while your feed-cost basis holds within $0.40/cwt of current levels, you have room to renegotiate contract term length from 12 months to 24 months at better component premiums.

What Does Your Current Contract Say About the 63 Days You Can’t See Yet?

NMPF’s enforcement push continues through July 1. The testimony is on the record. On April 22, 2026, the Globe and Mail reported Prime Minister Mark Carney rejecting the notion the US “dictates the terms” of USMCA talks, with Finance Minister Dominic LeBlanc telling the paper: “We’re not going to reopen supply management and have a discussion around quotas in the supply managed sector.” That same morning, USTR Jamieson Greer told the House Ways and Means Committee that Canada has made no commitments to alter its largely closed dairy market and that the dispute will be resolved through USMCA negotiations or through enforcement actions. Bill C-202, passed in June 2025, further narrowed Canada’s ability to concede on supply-managed goods. All of that is real. None of it changes what your Q3 milk ships at.

The trade fight is worth $0.31/cwt in total scenario spread over 12 months. Your hedge book is managing a revenue stream that moved $2.26/cwt in the first 88 days of 2026 alone. Both deserve your attention. They don’t deserve equal attention.

Pull your contract today. Find the clause that governs how your September repricing actually works. Call FSA this afternoon. Call a DRP-licensed agent tomorrow morning. Call member services by Friday.

What does your current contract say about what happens to your over-order premium if retaliatory dairy tariffs get imposed between now and your September renewal date? If the answer is nothing — or if you don’t know — that’s the line item worth more attention this week than any USTR press release.

Your hedge book controls your revenue. The diplomats control the headline. Know the difference.

Methodology sidebar: Scenario B and Scenario C midpoints are author modeling informed by published dairy price-transmission literature and USDA FAS GATS 2024 trade data. The +$0.08/cwt Scenario B midpoint reflects a Class III discount applied to a working all-milk export-transmission coefficient and a ~1.2% export-volume recovery drawn from TRQ fill-rate gains on cream and industrial cheese. The -$0.23/cwt Scenario C midpoint is drawn on a 15–25% reduction in 2024 US-to-Canada dairy exports. Neither midpoint is a published figure. Outcomes are not predictions. All dollar figures scale linearly with herd-level cwt shipped; substitute your own production inputs for a farm-specific result. A Q2 2026 follow-up in The Bullvine’s “Hedge Book vs the Headline” series will revisit these scenarios against the post-July-1 review record.

Key Takeaways

  • The entire NMPF/USDEC enforcement push Morris is running into July 1 models to $0.31/cwt of scenario spread over 12 months. Class III has already moved $2.26/cwt this year. Don’t confuse the headline with the hedge.
  • One quarter of Q1 2026 DRP netted $0.83/cwt per HighGround — more protection than the maximum USMCA “win” scenario delivers in a full year. If you’re unhedged on Q3–Q4, call a DRP-licensed agent before you call anyone else.
  • The real tail sits in Other Solids. A 35% China whey-price drop runs -$1.38/cwt on Class III, and it stacks on top of Scenario C, not instead of it — whey-heavy Midwest operations carry the compounded exposure.
  • If your Q3 or Q4 2026 contract is up for renewal, run the Contract Audit before July 1: repricing mechanism, over-order premium structure, and a trade-outcome review clause that gives you a seat at the table if tariffs land.

Complete references and supporting documentation are available upon request by contacting the editorial team at editor@thebullvine.com.

Learn More

The Sunday Read Dairy Professionals Don’t Skip.

Every week, thousands of producers, breeders, and industry insiders open Bullvine Weekly for genetics insights, market shifts, and profit strategies they won’t find anywhere else. One email. Five minutes. Smarter decisions all week.
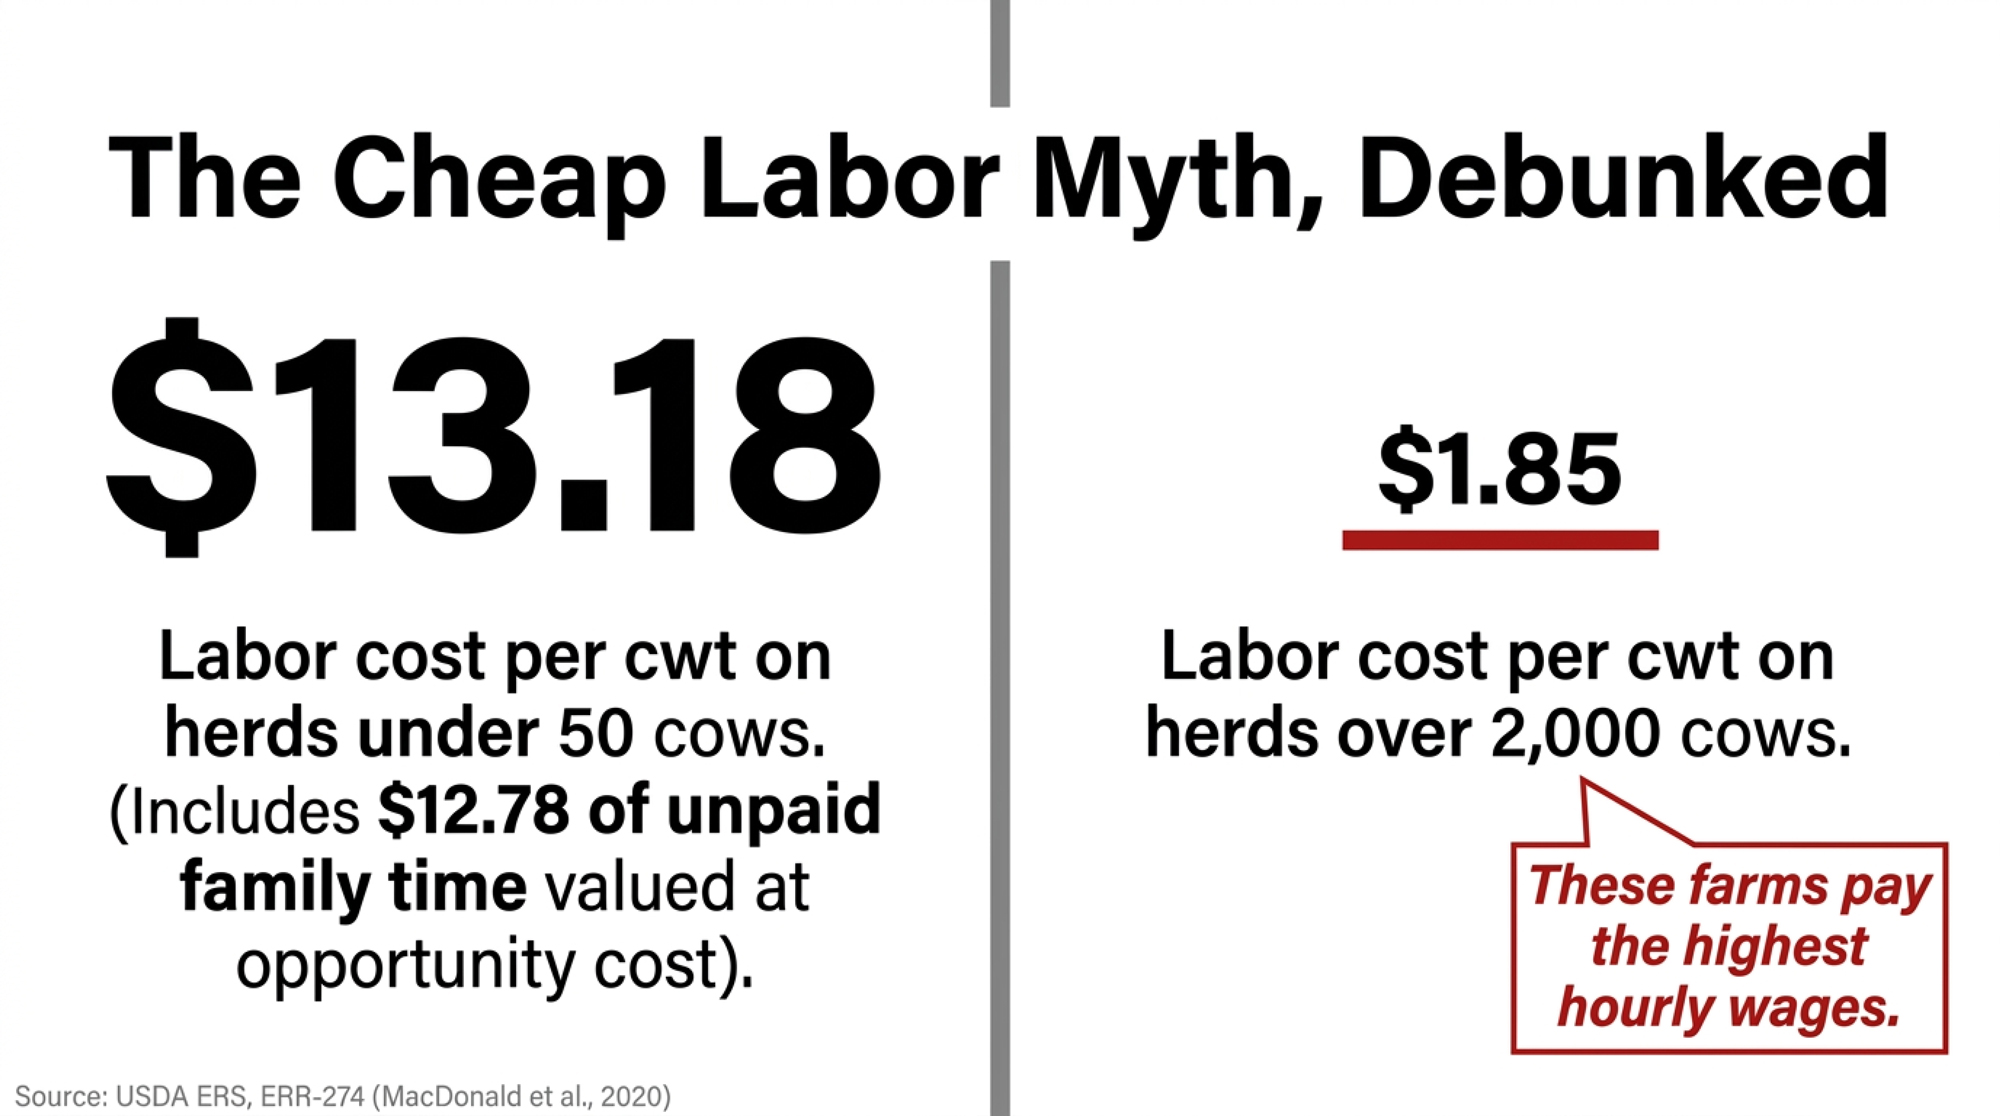
NewsSubscribe
First
Last
Consent

45 Pounds, 500 Cows, “Within Guidelines”: The Wisconsin Stray Voltage Case Every Mid‑Size Dairy Should Read

500 cows, 45 lbs on 3x, calf losses past 50%, and every utility test came back “within guidelines.” The Den Hoeds brought in ~2,000 heifers before an independent consultant found 2–7 volts in the dirt.

Executive Summary: On 500 cows, 40 lb below baseline at a $20/cwt working benchmark is a $1.46M annual bleed — and the Den Hoeds of Burnett County, Wisconsin say that’s the math they’ve been living since their 2014 freestall build, while every utility test came back “within guidelines.” Jayce Den Hoed told Dairy Star the family fell to 45 lb on 3x milking, calf losses past 50%, and they brought in roughly 2,000 replacement heifers before an independent consultant measured 2–7 volts of ground current moving between two substations 13 miles apart. The pivot point producers need to see: Wisconsin PSC’s own Phase II database — roughly 3,500 investigations — puts average cow-contact resistance at 192 ohms, while the standard utility test uses a 500-ohm resistor, meaning the protocol tests a “model cow” that pulls about 2.6x less current than the field average. Three affirmed Upper Midwest verdicts (Halderson, Vagts, Norman) now total more than $18M, and the Vagts case turned on DC stray voltage from a pipeline’s cathodic protection — a signal standard AC-only utility equipment cannot see. The operator implication scales: a 5-lb drag on 500 cows runs ~$182,500/year; on 200 cows, ~$73,000 — margin-eraser territory that compounds into lender-covenant territory by year five if the cause is never named. The 30-day move is cheap — a 72-hour continuous voltage log at the main waterer, matched to DHIA weights — but Jayce also describes a 10-day certified termination letter from their milk cooperative after they pushed the regulatory complaint, so pull your milk marketing agreement before you file anything. If your herd has sat on an unexplained plateau for more than a year with normal ration, genetics, and health metrics, this is the piece to read before the next consultant retainer clears.

For the Den Hoed family of Frederic, Wisconsin, the crisis didn’t arrive as a storm. It arrived as a slow, 40-pound-per-cow drain that no nutritionist and no vet could explain.

Based on Dairy Star reporting published in August 2025, by the time the family went public their 500-cow herd had fallen to 45 pounds per cow on three-times-a-day milking — down from a pre-crisis baseline of 85. Calf losses, per the same account, had climbed past 50%. Every test the electric utility ran came back “within guidelines.”

“In the midst of it, you feel like a failure,” Jayce Den Hoed told Dairy Star.

According to the family’s account, they weren’t failing. What they describe is stray voltage — 2 to 7 volts they say an independent consultant measured in the ground between two substations roughly 13 miles apart. The 500-ohm testing resistor built into the standard utility protocol, they argue, was quietly guaranteeing the problem stayed invisible. The Den Hoeds are one of three Upper Midwest families whose cases have, per primary court records, produced more than million in combined jury verdicts and affirmed awards against utilities and a pipeline operator — Halderson v. Xcel/Northern States Power (Trempealeau County, Wisconsin, $4.5M jury verdict August 2017, with a willful-and-wanton finding that opened the door to treble damages up to $13.5M); Vagts v. Northern Natural Gas Company (Fayette County, Iowa, $4.75M jury verdict January 2023, upheld by the Iowa Supreme Court on June 21, 2024); and Norman v. Crow Wing Cooperative Power & Light (Minnesota, $4.86M economic and $1.5M nuisance jury verdict October 2014, affirmed by the Minnesota Court of Appeals, eventually approximately $9M with interest and fees).

The testing standard producers say misses the worst cases

Wisconsin’s Public Service Commission runs one of the largest stray voltage databases in the country, covering roughly 3,500 farm investigations under its Phase II protocol. The average source resistance measured at cow contact points in that database is 192 ohms, per the PSC Staff Report on the Phase II Stray Voltage Testing Protocol. The standard testing resistor used by utilities is 500 ohms — the reference level the PSC’s Phase II documentation identifies for evaluating cow contact current and voltage.

That’s not a rounding issue. The protocol tests a “model cow,” not your cow. At any given source voltage, a real cow circuit at 192 ohms pulls about 2.6 times the current the 500-ohm model assumes (500 ÷ 192 ≈ 2.6). The field average sits well below the test assumption. The Wisconsin PSC was contacted for comment on that framing.

USDA Agriculture Handbook 696 — the federal reference on stray voltage, published in 1991 and not substantially updated since — estimated that a meaningful share of U.S. dairy operations encounter stray voltage at some level. Wisconsin had 5,661 licensed dairy herds as of January 2024 per DATCP records, and the count has continued to fall. Even a conservative prevalence read puts hundreds of Wisconsin dairies somewhere on the spectrum — most sub-clinical, an unknown subset operationally significant.

CaseDefendant & StateSource IdentifiedVerdict / Affirmed Award
Halderson (Aug 2017)Xcel / Northern States Power — Trempealeau Co., WIAC ground current; willful-and-wanton finding$4.5M jury; up to $13.5M (treble)
Vagts (Jan 2023, aff’d June 2024)Northern Natural Gas Company — Fayette Co., IADC stray voltage from pipeline cathodic protection — invisible to AC-only testing$4.75M, affirmed Iowa Supreme Court
Norman (Oct 2014, aff’d)Crow Wing Cooperative Power & Light — MNAC ground current / nuisance$4.86M economic + $1.5M nuisance; ~$9M w/ interest & fees
Den Hoed (active, per Dairy Star Aug 2025)Utility(ies) not yet named publicly — Burnett Co., WI2–7 V ground current between two substations 13 mi apart (per independent consultant)Pending; 11-yr fight per family account

Sources: Trempealeau Co. WI court records (Halderson); Iowa Supreme Court opinion 21-1899 (Vagts, June 21, 2024); Minnesota Court of Appeals (Norman); Dairy Star, Aug 2025 (Den Hoed). The Bullvine has not independently verified the Den Hoed cooperative-side timeline.

Risk concentrates in specific farm profiles, as described in UW Extension stray voltage resources and borne out in the case record of the three affirmed verdicts. Operations sitting between two substations. Barns built on aging grounding infrastructure. Dairies within a mile of recent substation or pipeline construction — as in Vagts, where a Northern Natural Gas cathodic-protection system was identified as the source. The Den Hoeds describe checking the substation and freestall-expansion boxes. Their acute crisis, per the Dairy Star account, tracked with the 2014 freestall build.

When the data said they were fine and the cows said otherwise

The family bought their Burnett County land and moved the operation from Washington’s Yakima Valley in 2010. By 2014 they’d built the new freestall. Then, according to the Dairy Star account, the herd started coming apart in ways nothing on the books could explain.

Production fell to 45 pounds per cow. Calf losses climbed past 50%. Across what the family describes as the crisis window, they brought in roughly 2,000 replacement heifers trying to hold herd size together.

Here’s the math they were living inside. On 500 cows, 40 pounds per cow per day below baseline at a /cwt working benchmark — a defensible midpoint across the 2014–2022 Class III range reported by USDA ERS, which swung from the low teens to the mid-s:

  • Daily loss: $4,000 in milk that never shipped
  • Annual loss: $1.46 million in revenue, before a dollar goes to replacement heifer capital
  • Replacement capital drain: roughly 2,000 heifers cycled through the herd during the crisis window, per the family’s account to Dairy Star
  • Equity strategy: buying nearby land at $2,000 an acre, improving it with wells, carrying it on the books at closer to $6,000 to keep the operating line alive.

“We were buying land,” Jayce told Dairy Star, “so we could keep borrowing.” That’s not growth. That’s a financing strategy to survive.

The 10-day letter, as the family describes it

When the family pushed their electric cooperative into a formal regulatory process, the consultant they’d hired warned them what might come next. Jayce’s account to Dairy Star:

“He told us that they all borrow their money from the same place. We thought he was nuts for a while, but sure enough there started being discrepancies in our milk tests and we got a certified letter stating we had 10 days to find a new home for our milk.”

The Bullvine has not independently verified the milk-test sequence or the termination timeline described in that quote. The cooperatives involved are not identified in the Dairy Star account or elsewhere in the public record, and have not been reached for comment. If any party identified in subsequent reporting wishes to respond, this piece will be updated.

What is verifiable: milk marketing cooperatives and rural electric cooperatives in the Upper Midwest often draw on overlapping federal financing sources, including USDA Rural Utilities Service, CoBank, and Farm Credit. How those shared financing relationships shape — or don’t shape — the handling of member disputes is a question the Den Hoed account raises. Not one the public record currently resolves.

⚠️ PRODUCER WARNING: Read before you file

The risk below is drawn from Jayce Den Hoed’s published Dairy Star interview; The Bullvine has not independently verified the cooperative-side timeline.

If you’re planning to file a PSC stray voltage complaint or commission an independent audit that could contradict your utility’s findings, the Den Hoed account describes a risk you need to price in before you act.

According to Jayce’s Dairy Star interview, the family received a certified letter giving them 10 days to find a new home for their milk after pushing the complaint process forward. The Bullvine has not independently verified that timeline, and the cooperatives involved are not public. But the precedent described in a published, attributed account is one a prudent operator cannot ignore.

Before you file or audit:

  • Pull your milk marketing agreement and read the termination-notice clause.
  • Identify at least one alternative processor inside your hauling radius.
  • Get a written quote for a temporary hauling contingency.
  • Talk to your lender before — not after — initiating the process.

Do this in the weeks before you act. Not the ten days after.

The breakthrough no one was looking for

Standard utility testing under the Wisconsin PSC Phase II protocol measures voltage at cow contact points inside the parlor, evaluates both primary and secondary sources, runs a 24-hour motor-start transient recording in most complaint cases, and reports against a 1-milliamp / 2-volt level-of-concern threshold at the cow. None of that architecture, the Den Hoed consultant concluded, was going to find what was happening on their farm.

According to the family’s account, when an independent stray voltage specialist finally ran the farm, readings showed 2 to 7 volts in the dirt itself — not at the waterers, not at the feed alley, not in the parlor. They say the voltage persisted even after the farm’s own power lines were fully disconnected, and that ground current was traveling between two substations 13 miles apart.

“If you place your manure pit wrong on your farm, in relation to the transformer, your well and distribution boxes,” Jayce put it, “you can sink your farm.”

The Den Hoeds argue the utility’s “within guidelines” reports were technically accurate against the protocol the utility was using. And that the protocol was looking in the wrong place.

A fix that paid back in months — if you can find the problem

Compare the Den Hoed trajectory to a Minnesota operation that eventually got to the other side. As reported in Bovine Veterinarian (September 2022) and Bullvine’s November 2025 stray voltage coverage, Olmar Farms — Jill and Brian Nelson’s registered Holstein operation near Sleepy Eye — went through roughly eight years of standard utility testing by Brown County Rural Electrical Association before an independent specialist identified the source. The Nelsons paid almost $100,000 out of pocket to install three-phase electric service and an isolated transformer. Production gained nearly 20 pounds per cow per day once the isolated transformer was in. In summer 2017, when most Upper Midwest herds are trying to hold ground through heat stress, not add it.

On 400-plus cows at prevailing 2017 milk prices, Bovine Veterinarian reported the capital outlay paid back inside a few months on recovered milk alone. The gap between the Den Hoed eleven-year fight and the Olmar eight-year fight isn’t the fix. It’s how long the standard testing protocol stayed between each family and the answer.

Why did standard utility testing miss what the Den Hoeds say was there?

Standard protocols evolved around secondary-system faults: a bad neutral, a grounding failure inside a farm’s own distribution. Those show up at cow contact points within a short testing window, and the 500-ohm resistor assumption works well enough to catch them. Ground current between distant substations — or from a pipeline cathodic-protection system, as in Vagts — is a different animal.

It’s a primary-transmission or external-source problem. And it can run on DC. That matters, because cathodic protection systems on buried pipelines work by injecting low-voltage direct current into the ground to prevent steel pipe from corroding — and standard AC-only utility test equipment cannot see DC signals at all. That’s the blind spot Lawrence Neubauer exposed on the Vagts farm near West Union, Iowa in September 2020, finding DC stray voltage at cow-contact points that AC-only testing had been ruling out for years. The problem may also only spike during specific load conditions. At night. During irrigation season. When a neighbor’s large motor cycles on. A 48-hour spot test at the wrong time of week can catch nothing.

An independent audit with AC and DC capable, millisecond-resolution equipment — Fluke or Dranetz class instruments, run continuously for 72 hours or longer — is what UW Extension stray voltage specialists and the consultants in the Vagts, Norman, and Halderson cases generally used to find what the utility testing missed. AC-only equipment, by design, would have missed the cathodic-protection source that won the Vagts verdict. For the full technical breakdown, see our Is Stray Voltage Stealing 20 Pounds Per Cow from Your Dairy?

That’s the diagnostic gap the Den Hoed account surfaces. It’s also the connective thread across the three Upper Midwest verdicts producers have so far won against utilities and pipelines. The full pattern across those named cases — Vagts, Normans, Haldersons — is broken out in our $18 Million in Stray Voltage Verdicts and a $3,000 Test No One Told Them About. If you read one companion piece before calling a consultant, that’s it.

How much does an unexplained production gap actually cost your operation?

Before you budget another consultant retainer, run the math on what the gap is already costing you. A 5-pound-per-cow-per-day drag on a 500-cow herd at a $20/cwt working benchmark (USDA ERS Class III ranged roughly $14–$25 across 2014–2022) works out to roughly $182,500 in annual lost revenue. On a 200-cow herd at the same 5-lb drag, it’s about $73,000 a year. Not a farm-ender in year one. A margin-eraser.

By year three, with compounding debt service, working capital tightens. By year five, on standard leverage ratios, the equity position for a mid-size Wisconsin operation can cross from “restructure” to “exit” without anyone ever naming the actual cause — the same lender-covenant threshold mapped in our The $287,500 Equity Decision Facing Mid-Size Wisconsin Dairies.

The severe case is the $1.46 million annual bleed before replacement heifer capital. Add the multi-year heifer drain the Den Hoeds describe and you’re into fourth-generation-scale damage — the same pattern that shows up in our 490 PA Dairies Gone in 2025. Two Spent $40,500 to Not Be Next.

Is the pattern showing up on your farm, and how would you know?

The symptom pattern, consistent across UW Extension stray voltage resources and the Vagts, Norman, Halderson, and Olmar case records, is specific enough to use as a screening tool. Production plateau despite optimized nutrition. Cows hesitating or lapping at waterers rather than drinking deep, or avoiding one wet metal spot. Breeding failure at normal investment levels — a bull works in the pen but AI doesn’t hold. Calf mortality that won’t map to a consistent pathogen. Elevated culls without a clean reason.

And critically: symptoms that get worse in winter, when frozen ground intensifies current conduction, and ease in summer. If three or more of those fit your last two years, the cheapest test you haven’t run is a 72-hour continuous voltage recording at the main waterer. Not a utility spot-check. A continuous log. Done before the next consultant retainer gets cut.

Options and trade-offs

Do this within 30 days — install a continuous monitor. A 72-hour continuous voltage recorder at the main waterer, logged against daily milk weights for the same window, typically runs a few hundred dollars in rental from UW Extension or a stray voltage consultant. A fraction of a single reproductive workup on a mid-size herd. Matched against DHIA records from the same dates, it either exonerates the electrical system or gives you the first piece of hard evidence you’ve ever had. The limit: you still need a qualified specialist to interpret anomalies and rule a DC ground-current source in or out. But you’re no longer testing blind.

Commission an independent electrical audit (90-day path). A stray voltage specialist running AC and DC capable millisecond-resolution equipment typically charges in the low four figures for a full protocol — cheaper than one round of reproductive workups on a mid-size herd, and roughly a week of the milk an affected herd is already losing on a 5-lb-per-cow drag. Ask the consultant directly for a current quote and scope. Trade-off: results that contradict a utility’s testing trigger a regulatory process you’ll need to be ready to run. Don’t commission this test unless you’re prepared for what you might find — and you’ve read the Producer Warning above.

File a PSC complaint with your documentation package already built (365-day path). Wisconsin’s DATCP Rural Electric Power Services program and the PSC’s three-phase investigation process give producers a real lever. The Den Hoeds describe a multi-year process through those channels. Trade-off: the 10-day termination precedent in their account isn’t something a prudent operator can ignore. Secure an alternative processor in your hauling radius before filing anything.

Remediate after diagnosis — isolated transformer or bonding fix. The Olmar Farms remediation ran about 0,000 and paid back inside a few months on production recovery, per Bovine Veterinarian. The specific cost and structure of the Den Hoed remediation are not public. Trade-off: remediation without litigation is faster but forfeits recovery of years of losses. Remediation with litigation recovers losses but runs two to five years in parallel. With three affirmed Upper Midwest verdicts totaling more than million across 2014–2024, early documentation materially changes what a producer can recover.

Key takeaways

  • If your herd has run more than 90 days below DHIA-projected baseline with no confirmed diagnosis, and your ration, genetics, and health metrics are normal — budget for an independent electrical audit before the next consultant engagement.
  • If your farm sits between two substations, built a new freestall in the last decade, or is within a mile of recent substation or pipeline construction — install the continuous monitor as baseline documentation, regardless of current symptoms.
  • Pull every utility test report you’ve ever received. Matched against DHIA production records from the same dates, those documents are the strongest evidence any future case will have.
  • If your utility’s standard test doesn’t include DC capability, outdoor ground contact points, and a minimum 48-hour continuous recording window — you don’t have a stray voltage test result. You have a partial snapshot.
  • Before filing any regulatory complaint — secure an alternative processor inside your hauling radius and review your milk marketing agreement’s termination-notice clause.
  • If symptoms intensify November through March and ease in summer — document the seasonal pattern before August. Spot-checks run in summer will miss a textbook signature.

The four-test question. When was the last time an unexplained production gap on your farm was evaluated against the right standard, with the right equipment, at the right contact points, for the right duration? If you can’t answer yes to all four, the next conversation with your nutritionist probably isn’t going to close it.

According to the August 2025 Dairy Star feature, the Den Hoeds are running at 80 pounds per cow today. Five pounds below their pre-crisis baseline of 85. The 24/7 voltage meter is still on the wall. “What damage has been done to the DNA that they’ll pass on to future generations?” Jayce asked. “Will it ever truly go away?”

Nobody has answered that question for the Den Hoeds yet. The full barn-math model — cost-per-cwt impact by herd size, the replacement-heifer capital drain, and the lender-covenant thresholds that move an operation from restructure to exit — is coming in next week’s Bullvine Weekly. If your production plateau has been unexplained for more than a year, that’s the piece to read before the next vet visit.

📋 Am I at risk? A 5-point screening checklist (screenshot this)

Risk SignalWhy It Points to Stray VoltageSeverity WeightScore
Grid geography — between two substations or within 1 mile of recent substation/pipeline buildSource of every named verdict (Halderson, Vagts, Norman); ground current travels miles between substationsHigh1 pt
Unexplained production plateau — ≥5 lb/cow below DHIA projection for 90+ days, normal ration & geneticsSub-clinical current depresses milk letdown; nutrition/genetics workups will not close the gapHigh1 pt
Calf and repro signature — calf mortality with no consistent pathogen; AI fails where bull settlesStray current disrupts implantation and immune development; bull-vs-AI gap is a textbook tellMedium1 pt
Waterer behavior — cows hesitate, lap, or avoid one wet metal spot rather than drinking deepCows feel current at the wet metal contact point before any meter doesMedium1 pt
Seasonal pattern — symptoms intensify Nov–Mar, ease by midsummerFrozen ground intensifies conduction; spot-checks run in summer will miss the signatureHigh (diagnostic)1 pt
Total Score30-Day Move90-Day Move
0–2Document baselines; pull every utility test report you’ve received and match to DHIA recordsRe-screen quarterly
372-hr continuous voltage log at main waterer before next consultant retainer clearsEngage independent specialist if anomalies appear
4–572-hr log + commission AC/DC-capable independent auditRead Producer Warning; secure alternate processor BEFORE filing PSC complaint

Symptom set drawn from UW Extension stray voltage resources and the Vagts, Norman, Halderson, and Olmar Farms case records.

Score one point for each statement that applies to your operation over the last 24 months.

  1. Grid geography. Your farm sits between two substations, or within one mile of recent substation, transmission, or buried pipeline construction.
  2. Unexplained production plateau. Your herd has held 5 or more pounds per cow per day below DHIA-projected baseline for 90+ days despite normal ration, genetics, and health metrics.
  3. Calf and repro signatures. Calf mortality that won’t map to a consistent pathogen, or AI conception that won’t hold on cows a bull will settle in-pen.
  4. Waterer behavior. Cows hesitating, lapping, or avoiding one wet metal spot rather than drinking deep at the main waterer.
  5. Seasonal pattern. Symptoms intensify November through March when the ground freezes, and ease measurably by midsummer.

3 or more: budget a 72-hour continuous voltage log at the main waterer before your next consultant retainer clears. 4 or more: commission an independent AC/DC audit, and read the Producer Warning above before you file anything.

Complete references and supporting documentation are available upon request by contacting the editorial team at editor@thebullvine.com.

Learn More

The Sunday Read Dairy Professionals Don’t Skip.

Every week, thousands of producers, breeders, and industry insiders open Bullvine Weekly for genetics insights, market shifts, and profit strategies they won’t find anywhere else. One email. Five minutes. Smarter decisions all week.
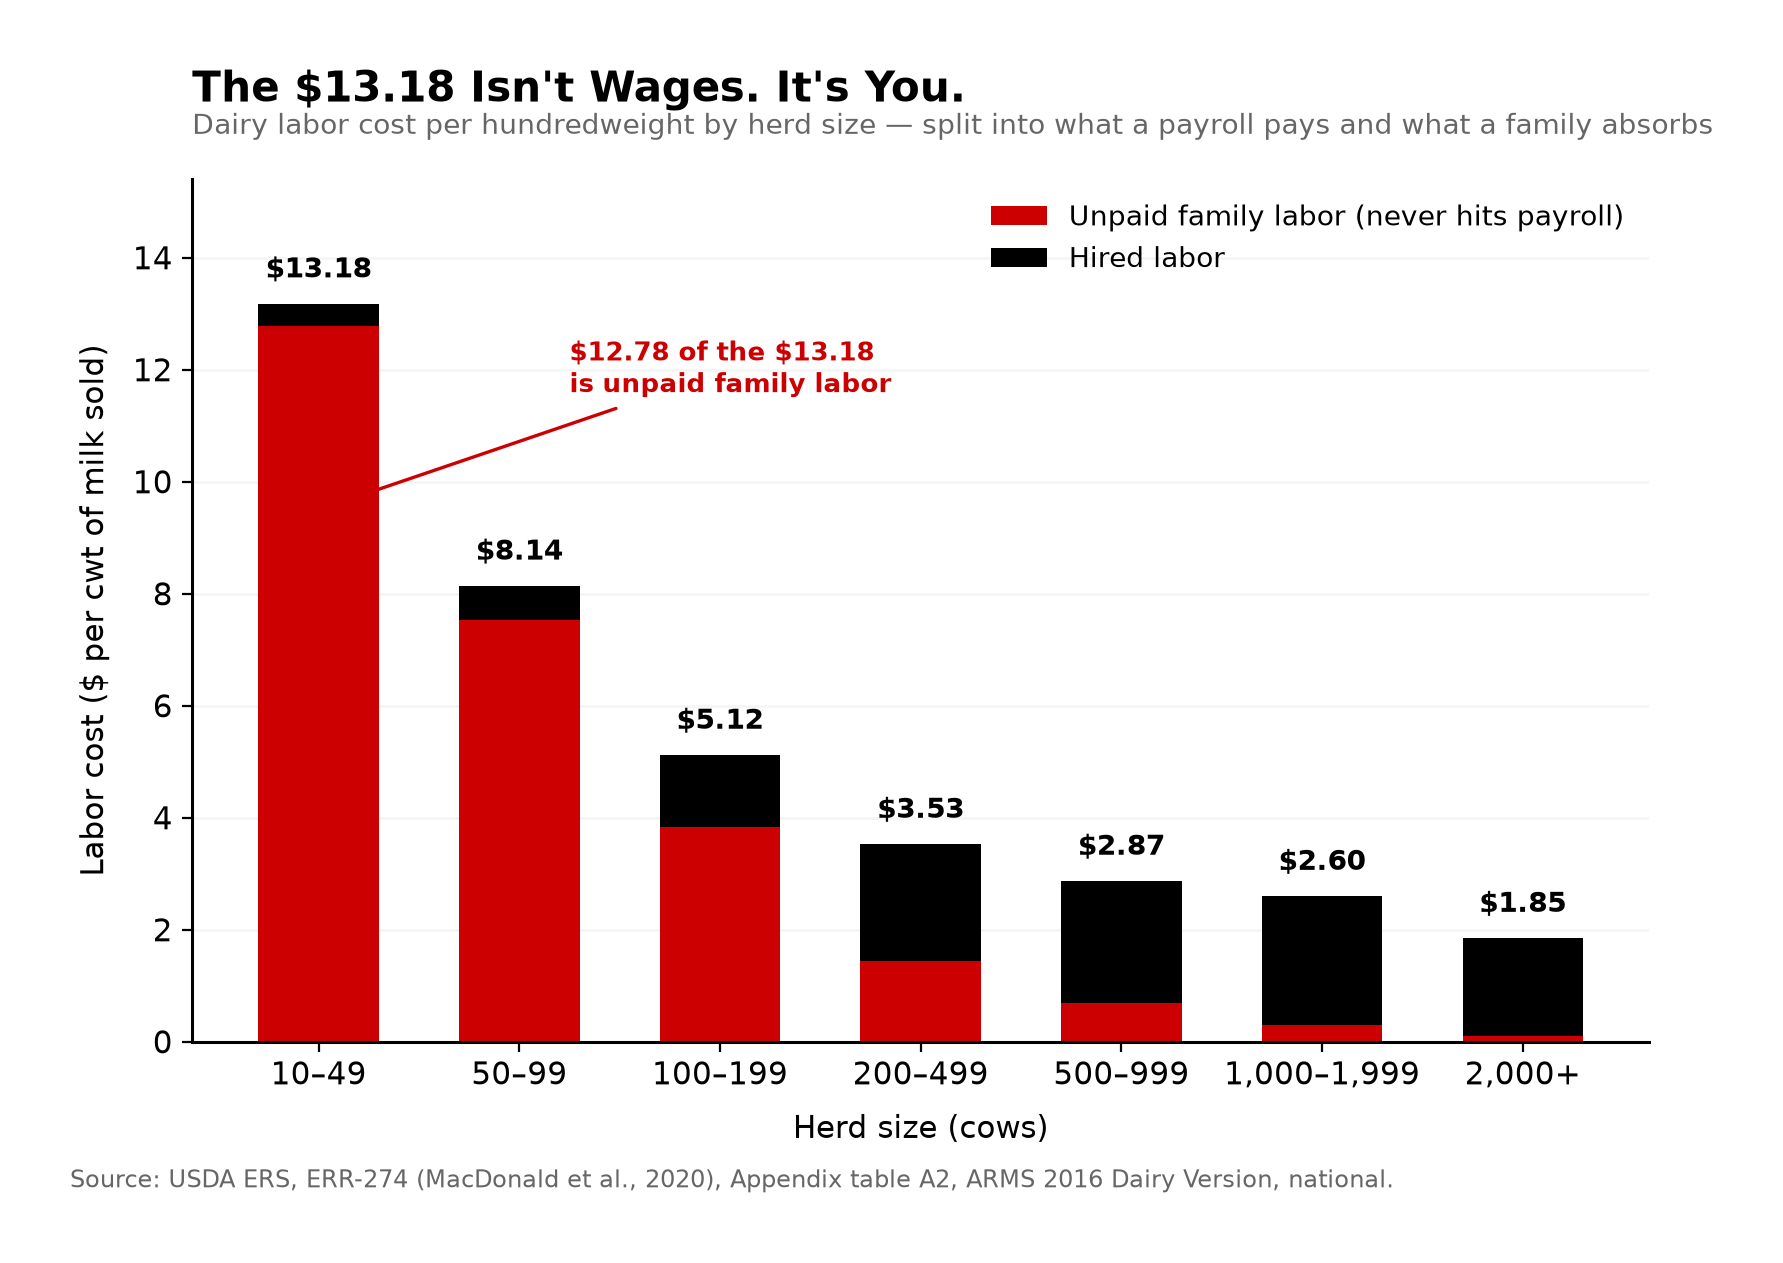
NewsSubscribe
First
Last
Consent

The Economic Reality of Pellet-Free Robotic Milking. A Retrofit Barn Could Lose $71K Trying.

At Double Creek in Merced, eight DeLaval V300s milk 500 cows and reportedly save $171K a year pellet-free. Run the same play in a 240-cow free-flow retrofit and the first-year math looks very different.

At Double Creek Dairy in Merced, California, eight DeLaval VMS V300s milk roughly 500 cows. In a DeLaval-produced promotional video, operator Matt Strickland reports annual savings of about $171,000 from going nearly pellet-free — only seven of his cows still get any pellet at all. That figure comes from manufacturer marketing material, not an independently audited result, and it reflects the economics of his barn and his transition. Spread across the full herd, it works out to roughly $342 per milking cow per year, based on Bullvine arithmetic, not a figure Strickland or DeLaval has published.

None of what follows is a claim that Strickland’s number is wrong for his operation. The composite scenario later in this piece is a separate illustration of what the same move can cost in a very different barn. That distinction matters because his number is moving fast at spring 2026 dealer meetings, and the barn-design context that makes it work isn’t always moving with it. If your barn doesn’t look anything like Double Creek — and most AMS retrofits don’t — pulling pellets can quietly stack into a mid-five-figure hole inside the first year, before any savings show up on the P&L. The Barn Math Table below shows how.

The AMS Pitch Shifted. The Barns Didn’t.

Three years ago, pellet-free robotic milking was a niche conversation. Now it’s the “next evolution” line in a lot of proposals, backed by a handful of flagship farms and some genuinely useful research. The science is real. What’s getting glossed over is the structural condition that makes it work.

University of Wisconsin Extension says it plainly: in free-flow barns, the primary reason cows voluntarily visit the robot is the pellet dispensed there. Jack Rodenburg’s widely cited traffic data — still the figure most carried through the AMS literature — pegs average fetch rates at roughly 16% of the herd per day in free-flow versus about 8.5% in guided-flow. European AMS research in guided-flow systems has consistently reported lower rates of unproductive visits than free-flow comparisons, though specific figures vary by study.

None of those traffic numbers show up on a typical AMS proposal’s ROI sheet. All of them decide whether a pellet-free move survives contact with your barn. The operators most exposed are mid-size and large producers running existing free-flow retrofit barns — long alleys, one robot at the end of a pen, no selection gate between rest and feed. Industry benchmarks have long placed the majority of U.S. AMS installations in the retrofit free-flow category, and the pitch at spring 2026 dealer meetings is aimed squarely at that population.

Colby, Wisconsin: What a Barn Built for This Looks Like

The Heeg family’s robotic facility near Colby, Wisconsin, came online in late 2023. Eight DeLaval units, tunnel ventilation, guided-flow from day one, no pellets at startup or since. Early-morning return traffic cycles cleanly through the selection gate, and the fetch list sits where you’d hope.

What the Heeg build illustrates is the pattern extension specialists keep describing on guided-flow startups: cows coming out of existing parlors carry habituated behavior that takes weeks to unlearn, while fresh cows and heifers introduced directly into a robot barn adapt faster and hold production better. In the documented guided-flow new-builds, it wasn’t the feed table that made pellet-free possible. It was the concrete, the gates, and a cohort of cows that had no old routine to fall back on.

Now sit the new-build story against a more typical one. A 240-cow herd — a composite scenario built from extension field observations, not a single named operation — in an existing free-flow freestall installs two robots, runs pellets for two years, then decides to go pellet-free after hearing the Strickland number at a spring meeting. Bullvine modeling, drawing on extension observations of retrofit transitions, puts the typical adjustment curve at a 10–15% milk drop in the first two weeks, then weeks three through ten running 9–12% below baseline. Picture it at 4 p.m. on a Tuesday in week six: the fetch list is longer than anyone wants to admit, a third-lactation cow who used to walk herself through is parked in a stall, the gate has cycled through an empty approach twice, and the nutritionist’s phone is ringing again.

Barn Math Table

240-cow composite herd, 80 lbs/cow/day baseline. Milk price assumed at $22/cwt (U.S. Class III reference band, spring 2026); if current Class III is running higher, every dollar in the left column moves against you. Skilled farm labor at $22/hour. All figures are Bullvine-composed estimates in USD, not audited operator outcomes.

MetricLow-End ImpactHigh-End ImpactSource / Assumption
Transition milk loss$26,600$35,50010-week window, 9–12% drop below baseline, 240 cows at 80 lbs, $22/cwt
Annual fetch labor$10,278$20,50016% fetch rate, 2 vs 4 min per cow at $22/hr, 365 days
Early cull costs$8,000$15,000Low: 4 culls × $2,000/head. High: 8 culls × $1,875/head. Replacement cost band reflects Bullvine editorial estimate based on current regional springing heifer markets.
Total first-year drag$44,878$71,000Bullvine composite

The annual fetch labor line runs over a full 12 months. The bottom row reflects compound drag across the first full year, not six months. The low end assumes a barn close to guided-flow functionality and a well-managed transition. The high end assumes a long-alley retrofit, no selection gate, and a nutritionist who wasn’t fully looped in. Most free-flow retrofits sit closer to the right-hand column than the left.

Why Do Pellets Work in Some Barns and Not Others?

The mechanics are less about feed formulation and more about concrete. In a free-flow barn, the pellet isn’t “feed” — it’s a bribe. Pull the bribe without changing the gates, and the only cows you’ll see at the robot are the ones who got lost on the way to the water trough. That’s not a management problem you can nutrition your way out of. It’s a traffic problem poured into the foundation.

Three strands of research converge on the same conclusion. Gregory Penner’s work at the University of Saskatchewan (Western Canadian Dairy Seminar, 2019) and Alex Bach’s 2007 Journal of Dairy Science paper both found that varying pellet allocations in controlled conditions had little to no effect on milk yield, with Bach reporting cow substitution of partial mixed ration for robot feed at ratios between 0.62 and 1.58 kg of PMR per kg of pellet. Commercial data pushes the same direction: a Vita Plus Upper Midwest AMS herd survey reported that robot pellet cost showed a negative relationship with income over feed cost across the sample, and visit frequency itself had no measurable effect on IOFC. Stack those three together and pellets start to look less like a feed input and more like the cost of running a barn that can’t move cows without them.

But the science supports pellet reduction only where both the barn and the forage can carry the load. The working principle in published guidance from the Penner lab at Saskatchewan and the DeVries lab at Guelph is straightforward: if your undigested neutral detergent fiber at 240 hours is too high, the PMR isn’t palatable enough to drive the barn on its own, and pulling the pellet pulls the only reason a cow had to walk. Specific uNDF240 thresholds depend on your forage program and herd; the most current figures should come from your nutritionist or the published work of those labs, not from a dealer’s rule of thumb. Published AMS barn-design guidance also shows barns with more than 15 stalls between resting area and the first crossover, or dead-end return alleys, produce measurably less milk per robot regardless of ration.

How Do You Know If Your Barn Is Free-Flow or Guided-Flow?

Walk it. Count the stalls between a cow’s resting area and the nearest crossover alley. Trace her route to the feed bunk — does it force her past the robot, or can she reach feed and water without going near it? Watch what happens to a timid cow at the approach gate when a dominant animal is standing there.

If she can get to feed and water without ever passing a milking decision point, you have a free-flow barn. The published evidence for pellet-free success in that layout, without structural changes, is thin. That’s not an argument against pellet-free milking. It’s an argument for doing it with your eyes open — priced, modeled, and stress-tested against your own operation’s numbers, not on the strength of a $171,000 figure from a different barn in a different state.

How Much Does Waiting Until Year-End Actually Cost?

Here’s the numeric version of procrastination. That same 240-cow composite, four months in, milk still running 8–10% below baseline instead of recovering. Fetch labor up noticeably at current wages. Do nothing for the rest of the year and the compound drag — lost milk, extra fetch labor, early culling — can stack into the $44,000–$71,000 range before you have the hard conversation. That’s before you touch working capital or debt service.

Sustained pressure on debt service coverage triggers lender conversations well before the operating line runs out. Published AMS lending guidance from the major U.S. and Canadian farm lenders gets more specific on the numbers, and your own lender’s current thresholds should be the ones you plan against. USDA’s Economic Research Report 356, released January 2026, pegs robotic milking at higher net return on average than conventional parlor systems — on the other side of a multi-year payback curve.

A pellet-free retrofit that isn’t working stacks a second valley on top of the first.

Options and Trade-Offs for Farmers

There’s no universal right answer. The right path depends on your barn’s bones, your balance sheet, and how long you plan to milk cows in that building.

Path 1 — Stay on pellets, but cut cost per ton. The Vita Plus Upper Midwest AMS survey found pellet costs ranging from $132 to $500 per ton across its herds on functionally similar rations. That spread is real, and it’s worth a hard conversation with your nutritionist before you commit to any structural change. The Bullvine’s earlier look at the true labor math behind robot debt digs into why the cost stack is bigger than a feed-only conversation captures. When it makes sense: free-flow retrofit with limited capital for barn work. Risk: you’re financing the barn-design problem through pellet costs rather than solving it.

Path 2 — Partial reduction by group. Keep pellets for fresh cows, heifers, and the chronic fetch list. Pull them from mature, mid-lactation animals in the pens closest to the robot. Done well with a nutritionist who can build and monitor differential feed tables, you bank most of the available savings without the structural exposure. Done poorly, you’ve added a spreadsheet problem on top of a barn problem. When it makes sense: partially functional barn layout, strong nutritionist relationship, a service tech who isn’t already at capacity on calls. Risk: management complexity and the temptation to expand the pellet-free group faster than the data supports.

Path 3 — Structural changes before pulling pellets. Selection gate between stalls and feed, mid-barn crossover, commitment pen, shorter return lanes. This means tearing out concrete, rerouting lanes, and absorbing real production downtime. Not a weekend project, and the economics vary sharply by barn geometry and regional contractor rates. The Bullvine’s $17,000-per-cow retrofit reality is the companion read here — price any structural path against a current quote before you commit. When it makes sense: five or more years of robot life ahead, equity to invest, a lender who can model the long game. Risk: some retrofit barns won’t accept the gates cleanly, and not all the concrete math works out.

Path 4 — Do this within 30 days if you’re already stuck. If you’ve been pellet-free for four months or more and milk hasn’t returned to within roughly 3% of baseline (an editorial benchmark, not a published standard), stop waiting. Check your own numbers against these red flags — any one should trigger the meeting, and two or more should trigger it this week. These are editorial thresholds drawn from the Rodenburg 16% fetch baseline and common herd-management practice, not published standards:

  • Fetch list consistently above 20% of the herd. That’s well north of the free-flow baseline and deep into labor-burn territory.
  • Bulk tank variance above 5% week-over-week. Pellet-free herds trying to find their footing often shake the tank before the fetch list tells you why.
  • Somatic cell count spikes with no clear infection pattern. Irregular milking intervals from missed robot visits show up in SCC before they show up in the fetch log.
  • Operating line quietly absorbing monthly shortfalls. If you’re moving money from operating to cover feed and labor, you don’t have a feed problem. You have a cash problem dressed up as one.

If any of those are live, get three people in a room this month: your nutritionist, your AMS service specialist, and your lender or farm financial adviser. Bring the last 120 days of production data, fetch logs, SCC reports, and cash flow. Decide which path above you’re actually on, or put pellets back in the highest-need groups while you reset the timeline. Then set two checkpoints: day 90 (production recovered or structural path committed) and day 365 (full pellet-free vs. pellets-restored P&L review). Risk of not doing this: another two or three months of drag lands on the operating line before an adviser forces the conversation at a less favorable moment.

Key Takeaways

  • If your barn is free-flow with one robot at the end of a long pen and no selection gate, treat any pellet-free pitch as a capital decision, not a feed decision — you’re being asked to accept permanently higher fetch labor or to fund a structural reconfiguration.
  • If herd size × current lbs/cow × 9–12% drop × milk price × 10 weeks of transition, plus a full year of elevated fetch labor, exceeds your comfortable draw on your operating line, you don’t have the financial headroom to run the experiment.
  • If your fetch list sits above 20%, bulk tank variance runs above 5% week-over-week, or SCC is spiking with no infection source, schedule the joint nutritionist–service–lender meeting inside 30 days.
  • If your current pellet cost per ton is anywhere near the high end of the Vita Plus $132–$500 range, you may capture most of the available savings without touching the feed table at all.
  • If a proposal you’re reviewing doesn’t include a transition milk-loss line in dollars, a chronic fetch labor line at or above 15% fetch rates, and a value for stranded pellet infrastructure, ask for those lines before you sign. Proposals that leave them out understate the true cost picture.
  • If your barn has more than 15 stalls between the resting area and the first crossover, address the geometry before you address the ration. Your nutritionist should be setting the uNDF240 target, not your dealer.
  • If sustained pressure on debt service coverage is already forcing the operating line to absorb shortfalls, the course correction is overdue — not early.
  • If your forage program is soft on NDF digestibility or TMR moisture consistency, fix that before the feed table.

The Question Worth Taking Into the Barn

Strickland’s $171,000 is real to him and to Double Creek. The Heegs’ barn in Colby is real too — guided-flow, no pellets, and a different kind of decision about how cows move through the building. Neither of those outcomes happened in a retrofit free-flow barn, and neither started with a dealer ROI calculator. So when you’re standing at your own robot tomorrow morning watching who’s on the fetch list, the question isn’t “should I go pellet-free?” It’s “does my concrete, my gates, my forage program, and my working capital look anything like the farms showing up in marketing materials right now?”

If even one of those answers is soft, what you’re looking at isn’t an evolution. It’s an experiment you pay for twice — once in the transition, once more in the barn you should have reconfigured first. For the full economic model — cost-per-cwt by herd size, the five-question lender sidebar, and a side-by-side retrofit vs. new-build cash flow walkthrough — keep an eye on Bullvine Weekly, where the barn-by-barn math runs.

Sources: USDA Economic Research Report 356 (January 2026); University of Wisconsin–Madison Extension AMS publications; Bach, A. et al., Journal of Dairy Science (2007); Penner, G., Western Canadian Dairy Seminar proceedings (2019); DeVries lab, University of Guelph; Vita Plus Upper Midwest AMS herd survey; Rodenburg, J., AMS barn-design and traffic research; published AMS financing guidance from major U.S. and Canadian farm lenders; and publicly available operator materials including a DeLaval-produced promotional video featuring Matt Strickland. Dollar figures are USD unless otherwise noted.

The Sunday Read Dairy Professionals Don’t Skip.

Every week, thousands of producers, breeders, and industry insiders open Bullvine Weekly for genetics insights, market shifts, and profit strategies they won’t find anywhere else. One email. Five minutes. Smarter decisions all week.
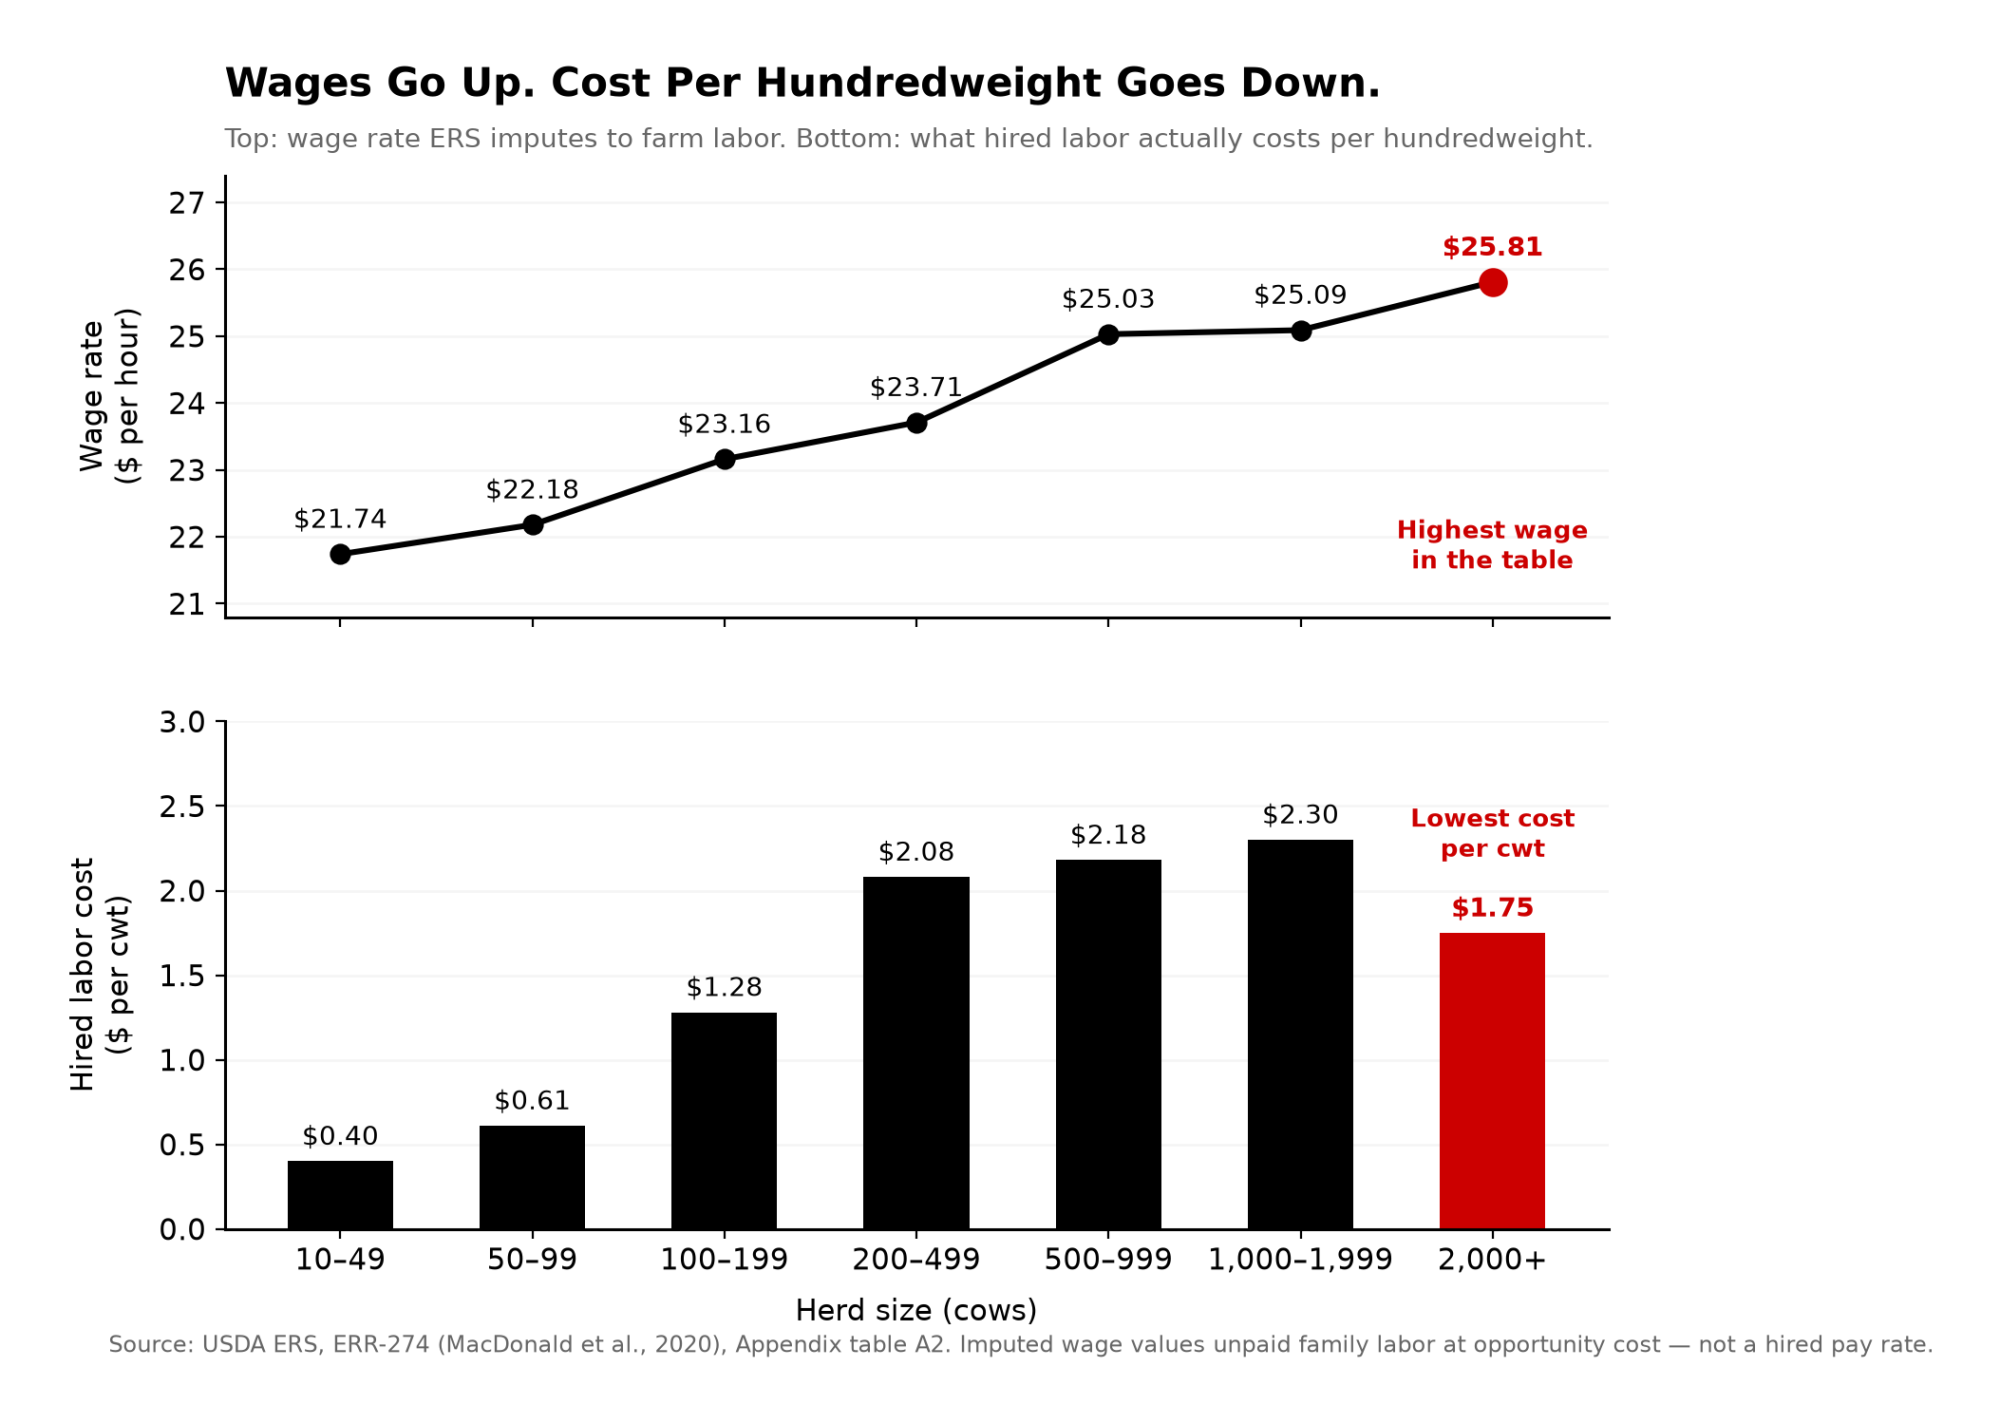
NewsSubscribe
First
Last
Consent

Alberto Dairy’s $640K Worm Bet: Who Actually Gets Paid on a BioFiltro Deal?

At 1,000 cows, the 10-year gap between fixing your lagoons and hosting BioFiltro runs near $640K. The term sheet says the vendor keeps the carbon. What does yours say?

Executive Summary: The 10-year cost gap at 1,000 cows runs near $640K, and the crossover where vermifiltration starts to pencil is a lagoon-upgrade quote around $950K. Alberto Dairy near Hickman is hosting one of California’s largest vermi installs — six beds on roughly eight acres, handling up to 1.7 million gallons of manure water a day. Here’s the catch most pitches don’t lead with: BioFiltro’s publicly filed 2022 investor summary describes the vendor and its equity partners as holding the climate attributes on WAS systems, so the farm avoids the capex and the vendor captures the carbon economics. The 2026 Central Valley nitrogen order will grade you on whole-farm N balance, not lagoon cleanliness — which means without a signed compost-export contract, vermifiltration cuts your on-farm N loading by just ~4%; with 50% of solids moving off-farm, it drops ~38%. Add 8–12 operator hours a week and a Sleep Deprivation Tax of roughly $10–18K/yr, and the realistic vermi-vs-lagoon gap at 1,000 cows climbs closer to $780K over a decade. For 800–1,200 cow operators: fix the lagoons, run the worm deal, go solo-digester, or right-size — but decide against your engineer’s written quote and your term sheet, not the vendor’s model.

dairy vermifiltration cost

That 0K gap is the defining number in California dairy manure management 2026. It’s the premium an operator pays to hand lagoon capex risk to a vendor and buy regulatory peace on the way into the new Central Valley nitrogen order. Alberto Dairy near Hickman in Stanislaus County, a third-generation family operation reported as founded in 1981 in Dairy Herd Management’s 2024 California coverage, is hosting the BioFiltro install: six vermifiltration beds on roughly eight acres, handling up to 1.7 million gallons of manure water per day. BioFiltro has described the installation as among California’s largest dairy vermifiltration systems.

Here’s the structural question most readers miss. BioFiltro’s publicly filed 2022 investor summary describes the vendor and its equity partners as holders of the climate attributes on its “Wastewater as a Service” systems. Under that described structure, dairies pay a service fee and receive treated effluent; farms hosting WAS systems wouldn’t directly receive the associated carbon or water credits unless individual contracts provide otherwise. The Bullvine requested confirmation from BioFiltro on whether the 2022 structure remains current in 2026 WAS contracts. As of publication, no response had been received, and current contract terms aren’t independently verified.

Bullvine editorial analysis: That’s not a scandal. It’s a term sheet.

Stress-test that term sheet against your own lagoon exposure before the 2026 Central Valley nitrogen order takes effect. Alberto’s confirmed cow count, exact WAS fee, grant stack, and contract term aren’t public. The model below uses 1,000 cows because it roughly matches the reported scale — and because it’s the size band where the decision actually matters.

Why Did California Dairy Manure Management 2026 Just Get More Expensive?

The State Water Board’s October 2024 directive told the Central Valley Regional Board to align its dairy orders with the 10 mg/L drinking water nitrate standard and move dairies toward whole-farm nitrogen accounting. Central Valley Regional Board staff analysis attributes roughly 94% of nitrogen reaching affected aquifers to land application of manure, not lagoon leakage.

Read that twice. The order won’t grade you primarily on how clean your ponds are. It’ll grade you on pounds of nitrogen per acre, sustained across a ten-year whole-farm balance.

Stanislaus County sits in the Modesto Subbasin — a medium-priority SGMA basin under DWR’s 2024 prioritization, with a groundwater sustainability plan already adopted. Stack that on California’s 40% dairy and livestock methane reduction target under SB 1383, the AMMP and Dairy Plus grant cycles, and Nestlé’s dairy sustainability program. “Do nothing” stopped being an option a couple of years ago. The question is which path costs the least — and who captures any upside along the way.

A Central Valley ag lender, asked informally what’s driving 2025–2026 capex conversations with mid-size dairy clients, put it plainly to The Bullvine: lagoon reline quotes have gotten uglier, not prettier, and the quote is now the conversation starter. The per-client range isn’t for publication. The direction of travel isn’t in dispute. Readers with a better number from their own engineer are invited to send it in for the “Lagoon Inflation” tracker described at the end of this piece.

What the Worm System Actually Does (and Doesn’t)

Vermifiltration routes liquid manure across beds of wood chips and red wiggler worms. Worms and the associated microbial community break down organic load, strip nitrogen from the liquid stream, and immobilize nutrients in the bed media. Per Dairy Herd Management’s 2024 reporting and BioFiltro’s public site documentation, the Alberto system runs six beds on roughly eight acres with approximately four-hour retention. Treated water cycles back to barn flush and parlor cleaning. Bed media is eventually harvested as vermicompost.

The California Dairy Research Foundation cites 40–80% nitrogen removal from the liquid fraction in dairy vermifiltration systems, depending on design and operating conditions. LPELC and Washington State University extension research confirm the range at the concentration level. BioFiltro has reported 97–98% methane reduction compared with conventional lagoon storage, based on pilot data from Fanelli Dairy in Tulare County.

Those are real, repeatable numbers in the liquid stream. What they don’t change is total nitrogen excretion from the herd. And they don’t change the whole-farm accounting the 2026 order will apply.

Running the Numbers: Three Lanes for a 1,000-Cow Central Valley Dairy

Inputs: 1,000 milking cows, 600 acres for manure application (~1.67 cows/acre, typical for a mid-size Central Valley dairy), 10-year horizon, 7% cost of capital (capital recovery factor ≈ 0.1424). Benchmarks drawn from Newtrient and NRCS capex ranges, UCCE dairy lagoon cost studies, BioFiltro’s publicly reported Fanelli WAS figure, and standard Central Valley operating data. Scope: California Central Valley, 2026–2035 planning window. Illustrative — not an accounting of any specific operation’s books.

Crossover Threshold (Read This First)

At 1,000 cows with the modeled inputs, vermifiltration under WAS starts penciling when your engineer’s lagoon-upgrade capex quote hits roughly $950,000–$1.0M. Below that, fixing lagoons is less expensive. Above it, vermi starts winning — before grant stack, carbon carve-outs, or labor adjustments.

That one number is the most actionable data point in this article. If your engineer’s memo lands below $950K, Lane 2 probably isn’t your path, regardless of how the pitch reads.

Lane 1 — Lagoon Upgrade Path

InputValue
Capex (mid-range reline/expansion, Newtrient/NRCS benchmarks)~$500,000
Annualized at 7% over 10 yrs (× 0.1424)~$71,200/yr
Lagoon OPEX (UCCE benchmark, inclusive of baseline labor)~$75/cow/yr × 1,000 = $75,000/yr
Total annual cost~$146,200/yr
10-year total~$1.46 million (~$146/cow/yr)

Lane 2 — Vermifiltration Under BioFiltro WAS

InputValue
WAS service fee (Fanelli benchmark near $162/cow/yr per vendor disclosure; modeled at $180/cow/yr for conservatism)$180,000/yr
Residual lagoon OPEX$30/cow/yr × 1,000 = $30,000/yr
Total annual cost$210,000/yr
10-year total$2.10 million ($210/cow/yr)

Lane 3 — Solo Covered-Lagoon Digester

InputValue
Post-grant capex (1,000-cow solo project, directional; CDFA DDRDP and Newtrient benchmarks — solo capex varies widely by site and grant stack)~$4,000,000
Annualized at 7% over 10 yrs~$569,600/yr
Added OPEX (digester + residual lagoon)~$110/cow/yr × 1,000 = $110,000/yr
Total annual cost~$679,600/yr
10-year total~$6.80 million (~$680/cow/yr)

The Lane 2 vs Lane 1 gap at these inputs: ~$638,000 over 10 years — the “~$640K” in the headline.

One labor-symmetry note: the $75/cow/yr Lane 1 OPEX benchmark already rolls in baseline conventional lagoon management labor. The 8–12 additional operator hours per week associated with vermifiltration are incremental to that baseline, not a replacement for it.

Plug Your Operation In (Phone-in-the-Barn Version)

Define your variables: C = your milking cow count F = your vendor’s WAS fee, in $/cow/year (ask for it in writing) R= residual lagoon OPEX, modeled at $30/cow/year L = your current lagoon OPEX, modeled at $75/cow/year K = your engineer’s lagoon-upgrade capex quote, in whole dollars A = 0.1424 (annualization factor: 7% cost of capital, 10-year horizon)

Your annual vermi cost = (C × F) + (C × R) Your annual lagoon cost = (K × A) + (C × L)

Worked at C=500, F=$180, R=$30, L=$75, K=$300,000: Lane 2 = (500 × $180) + (500 × $30) = $90K + $15K = $105K/yr (~$1.05M over 10 years) Lane 1 = ($300,000 × 0.1424) + (500 × $75) = $42.7K + $37.5K = $80.2K/yr(~$802K over 10 years) Lane 2 premium at 500 cows: ~$24.8K/yr × 10 = ~$248K over a decade.

If your vendor’s WAS quote (F) lands materially above or below $180/cow/year, Lane 2 narrows or widens accordingly. Get that number in writing before you model anything.

What the Alberto Dairy Case Actually Shows Mid-Size Operators

Dairy Herd Management’s 2024 reporting places Alberto Dairy in its third generation, founded in 1981. Per Ag Alert’s California coverage, the operation is among the California sites BioFiltro features when presenting the WAS model to prospective dairy operators. The system is installed and operating under the WAS structure. The 2026 Central Valley order will apply regardless of when the installation decision was made.

The harder question for any third-generation California family dairy isn’t whether vermifiltration works technically. Published data show it does. It’s whether entering a long-term service contract for vendor-owned treatment infrastructure is the right structural choice for an independent family operation, given current credit-ownership terms and the coming regulatory framework.

As an industry pattern for dairies in this size band, WAS installations can function as a defensive capital decision — hedging a large near-term lagoon capex against a long-term service fee. The Bullvine isn’t characterizing the specific financial reasoning at Alberto Dairy, which isn’t public. Whether that’s the calculus at any given farm is a question only the operator can answer.

For readers weighing the same decision right now, the operator’s question isn’t “is this the future of dairy?” It’s “which lane does my actual operation survive?” That’s the lens this piece is written in.

The Nitrogen Trap Most Sustainability Stories Don’t Tell

The common assumption was that 40–80% nitrogen removal in treated effluent would translate directly into smaller regulatory exposure under the 2026 order. It mostly doesn’t — because the order is built around whole-farm nitrogen balance, not lagoon concentration readings.

🔑 Key Takeaway — The 4% vs. 38% Rule

Without a compost export contract, vermifiltration cuts your whole-farm nitrogen loading by just ~4%. With 50% of solids moving off-farm, loading drops ~38%.

To survive the 2026 order, vermi without an export contract is a capital expense without a compliance outcome. The compost buyer is the compliance strategy — not the worms.

A 1,000-cow Central Valley dairy excretes roughly 140,000 lb N/year at the 140 lb N/cow benchmark from UC Davis nutrient-balance work. Milk and animal exports carry off around 25%, the midpoint of the 20–30% band in published California herd studies, leaving ~105,000 lb N on the farm to manage. On 600 acres, three scenarios.

Nitrogen per acre, three management approaches (1,000 cows / 600 acres, illustrative)

ScenarioTotal N on farm (lb/yr)Per-acre N (lb/acre/yr)
Conventional lagoon, all N applied on-farm105,000175
Vermifiltration WAS, all solids applied on-farm100,590168
Vermifiltration WAS, 50% of solids exported off-farm64,995108

Assumptions: 70/30 liquid/solids split under conventional; 60% N removal from liquid (mid-range of the published 40–80% band) under vermi; 90% of removed N immobilized in bed media, 10% lost via gaseous pathways; half the vermi solids exported represents ~900 dry tons/year ≈ 1,800 as-is tons at 50% moisture, at 2% N dry basis.

One honest caveat on that 10% gaseous loss line. Volatilization is a double-edged sword: it reduces N on the balance sheet, but ammonia and nitrous oxide are increasingly tracked under California air-quality mandates and under SB 1383. Treat gaseous loss as a temporary regulatory loophole — one that closes the moment air-side accounting catches up with water-side accounting.

Compost-buyer relationships at the 900 dry tons/year scale aren’t a given for individual dairies at this size. This step, not the worms themselves, is where the model earns its premium or doesn’t.

Moving that volume off-farm isn’t a passive win. It’s a logistics program — reliable buyer, consistent hauling, pricing that doesn’t turn a nitrogen strategy into a cost center. Using regional rates consistent with CalRecycle and UCCE compost pricing work (sale near $15/ton, trucking near $10/ton), best-case compost revenue on 1,800 as-is tons lands near +$9,000/year net after haul. For conservatism, the Lane 2 model above holds that revenue out; netted in, Lane 2 would move to ~$201K/yr and ~$2.01M over a decade. The value isn’t the check. It’s the acres you don’t rent and the cows you don’t cull to stay under the N cap.

Who Actually Gets the Carbon Money on California Dairy Projects?

Project / funding laneCredit or funding pathwayRealistic value signalWho likely captures upsideFarm-level question before signing
Vermifiltration WASVoluntary carbon / climate attributesLower than LCFS; contract-dependentVendor/equity partners under described 2022 WAS structureDoes the current term sheet assign climate attributes to the farm or vendor?
Covered-lagoon digesterLCFS / RNG economics$91–$548/cow/year gross range in published project economicsSplit varies by operator/developer contractWhat is the farm’s written gross and net revenue share?
AMMP / Dairy Plus supportCalifornia grant stackCan reduce upfront project burden materiallyFarm benefit depends on grant pass-through and fee structureDoes the grant lower the service fee, or only improve vendor economics?
Compost exportVermicompost sales and N-balance reliefAbout +$9K/year net in modeled best caseFarm, if buyer/haul terms are realIs there a signed buyer for 800–1,000 dry tons/year, not just a handshake?

In the pitch deck, the California climate premium flows back to dairies. For covered-lagoon digesters participating in the Low Carbon Fuel Standard, there is real revenue — published analyses of California dairy consolidation and LCFS economics covering the 2020–2024 window place LCFS value in the range of $91–$548 per cow per year gross on qualifying projects, with material variance driven by LCFS credit price and project vintage.

Revenue-share arrangements between dairies and third-party digester operators vary widely. Published contract analyses have reported farm share sometimes running a minority of gross. Individual contracts vary. Request your split in writing before assuming a number.

Vermifiltration sits in the voluntary carbon market, which has historically paid less per ton than LCFS. BioFiltro’s publicly filed 2022 investor summary states that the vendor and its equity partners hold the climate attributes generated under its WAS structure. Unless individual contracts provide otherwise, farms hosting WAS systems under that described structure wouldn’t directly receive carbon credit revenue.

AMMP, Dairy Plus, CPG climate funding, and the vendor’s own credit revenue are the three pillars the pitch stands on. The farm avoids capex and gains regulatory cover. The vendor captures the climate economics over the life of the contract.

Bullvine editorial analysis: That arrangement can be rational. Operators entering WAS agreements expecting direct carbon revenue should request the current credit-ownership clause in writing before assuming otherwise.

Can Your Family Actually Run a Small Wastewater Plant?

Dairy Conservation Navigator is direct: vermifiltration requires trained operators, daily and weekly inspections, and media replacement every 18–24 months. For an 8-acre system at the scale of the Alberto install, realistic routine labor runs roughly 8–12 additional operator hours per week above conventional lagoon management — about 416–624 additional hours per year. Priced at working-manager rates around $25–$30/hr, that’s roughly $10,000–$18,000/yearin implicit labor cost, or $100,000–$180,000 over the decade. Add the midpoint (~$14K/yr) to Lane 2 and the vermi-vs-lagoon gap for a 1,000-cow modeled operation moves toward ~$780K over ten years.

Call that line what it actually is: the Sleep Deprivation Tax. For operations that rely on owner-operator labor to backfill when a relief manager calls in sick, walking the worm beds at 2:00 AM burns the most expensive labor on the farm at roughly /hr — while the cows and the parlor crew still need that same owner sharp at 4:00 AM. Those hours come out of the one manager already watching pregnancy rates, feed shrink, and parlor labor. If that attention slips, the indirect hit to production can exceed the explicit labor line several times over. Decide which person absorbs those hours before you sign a long-term contract.

Royal Dairy in Washington has been publicly associated with BioFiltro for years through trade press and vendor case-study material. Fanelli has published pilot case-study data. Both are specific operations with specific management bandwidth — not proof the model travels automatically.

Does California Vermifiltration Pencil? Four Honest Lanes

For an 800–1,200 cow Central Valley operator facing the 2026 order, four paths. Each with when it makes sense and where it breaks down.

LaneBest-fit operation10-year modeled costDecision triggerWhere it breaks
Lagoon upgrade800–1,200 cows with workable acres and disciplined NMP records$1.46M at 1,000 cowsEngineer quote below $950KIf added storage/reline climbs toward $1.0M–$1.5M, the advantage narrows fast
Vermifiltration WASMid-size dairy with ugly lagoon exposure, grant eligibility, and compost outlet$2.10M before labor; $2.24M with midpoint laborEngineer quote near or above $950KNo compost export contract means only ~4% N-loading reduction
Solo covered-lagoon digesterLarger or cluster-scale operation with deep grant/LCFS stack$6.80M at 1,000 cowsStrong gas volume, grants, and revenue-share termsSmall solo projects rarely carry debt service without outside economics
Right-size or structured exitTight acres, weak DSCR, unclear succession, high basin pressureVariable, but avoids forced capex spiralDSCR below 1.2 for repeated quartersWaiting too long lets the buyer or lender set the terms

Lane 1 — Fix the lagoons, tighten nitrogen management. Makes sense when your engineer’s 10-year compliance estimate is in the $400–700K range, your acres-per-cow ratio is workable, and your NMP execution is disciplined. Requires a current lagoon integrity assessment against Central Valley Regional Board seepage standards, added storage planning, and honest per-acre N accounting. Risk: if the 2026 order requires partial covers or significant added storage, a $500K estimate can climb toward $1.0–1.5M, and this lane narrows against Lane 2.

Lane 2 — Vermifiltration under a vendor-owned WAS deal. Makes sense when expected lagoon capex is heading toward $950K+, you’re a competitive AMMP/Dairy Plus candidate in the current cycle, you have a real outlet for 800–1,000 dry tons of compost per year, and your management team has bandwidth for roughly 8–12 additional operator hours per week. Risk: under structures like the one BioFiltro’s 2022 investor summary describes, you don’t capture carbon revenue, you’re locked into a long-term service contract, you still carry residual lagoon OPEX, and your compliance story depends on keeping compost moving off-farm.

Lane 3 — Covered-lagoon digester, solo project. At 1,000 cows, the 10-year model runs near $6.8M. Requires deep grant and LCFS revenue to pencil, and typically makes sense only at consolidated or cluster scale. Smaller solo projects rarely generate enough biogas volume to cover debt service without a co-digestion partner.

Lane 4 — Right-size or plan a structured exit. Makes sense when basin math is ugly, acres-per-cow is already tight, succession is unclear, and any capex path above would strain what your lender will refinance. Risk: waiting too long lets a forced sale set the terms. Requires an advisor without a sales agenda and a willingness to look at the numbers without attachment to headcount.

The 30/90/365-Day Playbook for Herds Facing This Decision

Print this section. Take it to your lender.

30-Day Actions — Pull These Before Any Vendor Meeting

  • Get a written, independent lagoon assessment. Commission a current lagoon integrity and storage-capacity review from your ag engineer, referenced to Central Valley Regional Board seepage standards. Use an engineer with no commercial relationship to the system vendor. Red-flag trigger: if the 10-year compliance estimate comes back above $950K in today’s dollars, Lane 2 becomes a legitimate conversation. Where it backfires: a vendor-funded assessment isn’t the same thing.
  • Check your AMMP/Dairy Plus eligibility. Ask your NRCS technical service provider for an updated eligibility review before the next grant cycle opens. Red-flag trigger: if you don’t qualify for either program as currently structured, the WAS economics don’t work without CPG or third-party funding.
  • Test the compost market. Call the nearest bulk compost buyer and request a price and volume quote for 500–1,000 tons/year of dairy vermicompost, plus a haul estimate for your location. Red-flag trigger: if no buyer within 50 miles quotes you a price, Lane 2’s nitrogen benefit disappears.

90-Day Actions — Structural Decisions That Need Planning

  • Run the three-lane model for your actual operation. Use your real cow count, real acres, and your lender’s honest 10-year debt service view. Requires your CPA, your lender, and one independent ag engineer — not the vendor’s financial model. Red-flag trigger: if your DSCR has been below 1.2 for three or more consecutive quarters under your lender’s method, any capital-intensive path is secondary to fixing cash position.
  • Get a written WAS term sheet. Request a written quote including per-gallon or per-cow fee, carbon credit ownership clause, contract term and exit conditions, and what happens if you sell or right-size. Red-flag trigger: any clause that bars decommissioning if the system fails to meet your agronomic or regulatory targets.
  • Run your actual per-acre N balance. Pull the last three years of NMP records and calculate real lb N/acre/year by field. Red-flag trigger: if you’re already above 175 lb/acre on a meaningful portion of your acreage, you have a nitrogen problem vermi alone won’t solve without a parallel export strategy.

365-Day Moves — Strategic Positioning for the Rule You’re Going to Get

  • Make a binary lane decision. Indecision has a cost. Each lane is defensible with clear eyes; none is defensible as a permanent maybe. Opportunity signal: if AMMP and Dairy Plus together can cover 60%+ of a verified vermi project AND your lagoon bullet is at the $950K+ end, Lane 2 may pencil. Document the analysis and take it to your lender before the order finalizes.
  • Lock in your compost export relationship in writing. Treat the compost outlet like a feed contract. An informal agreement isn’t a nitrogen compliance strategy. Requires a signed annual purchase agreement with a buyer who can absorb consistent volume, plus a backup if that buyer exits.
  • Position for the rule as written, not as hoped. Whole-farm N accounting is coming to the Central Valley whether or not you own worms. Operators with the most flexibility in 2027 and 2028 will be the ones who ran the N balance honestly this year and made a structural decision — more acres, verified export, precision feeding, or a lane choice above.

What This Means for Your Operation

Vermifiltration is a legitimate survival tool for a narrow band of California dairies where the lagoon bullet is genuinely ugly, the grant stack is real, the compost outlet exists, and management has bandwidth to run a small wastewater plant alongside a large dairy. For that specific combination, Lane 2 is a rational hedge against regulatory and capital risk. For everyone else, the math still favors fixing your lagoons, running your N balance honestly, and making a hard call about whether your acreage and cost structure survive what the 2026 order is about to demand.

The trade-off at the heart of this case isn’t worms versus lagoons. It’s whether paying a premium to host infrastructure that generates climate revenue for the vendor — in exchange for regulatory goodwill and avoided lagoon capex — is worth it for your balance sheet, your management bandwidth, and your basin’s specific water pressure.

What does your engineer’s most recent lagoon memo actually say your 10-year compliance path costs — and does any clause in your current processor sustainability agreement change which lane you’re really in?

Are you seeing lagoon upgrade quotes in the $1M range in your basin? Drop a comment or email us — we’re tracking the “Lagoon Inflation” across the Central Valley and will publish an aggregated quote range in a follow-up within 60 days.

Key Takeaways

  • The deciding number isn’t $640K — it’s your engineer’s lagoon-upgrade quote. Below roughly $950K at 1,000 cows, fixing lagoons still wins; above it, a BioFiltro deal starts to pencil before labor and carbon carve-outs.
  • Under the 2022 WAS structure, the vendor holds the climate attributes. Before you sign, get the current credit-ownership clause in writing — don’t assume carbon revenue flows back to the farm.
  • Worms don’t solve a whole-farm N balance. Without a signed compost-export contract moving 50% of solids off-farm, your on-farm loading drops only ~4%; with that contract, it drops ~38%.
  • Four honest lanes: fix lagoons, sign a WAS deal, build a solo digester, or right-size. Pick one against your actual engineer’s memo, your NMP records, and your lender’s DSCR view — not the vendor’s financial model.

Methodology & Sourcing Note

This piece analyzes publicly reported information about Alberto Dairy and BioFiltro. Contract descriptions reflect BioFiltro’s publicly filed 2022 investor summary and may not match specific Alberto Dairy contract provisions, which aren’t public. All barn math is modeled and illustrative — not an accounting of any specific operation’s actual books. Regulatory references include the State Water Board’s October 2024 directive to the Central Valley Regional Board and the Central Valley Regional Board’s staff analysis of nitrogen pathways to affected aquifers. Trade-media references include Dairy Herd Management’s 2024 Alberto Dairy feature and Ag Alert’s California coverage. The lender characterization reflects an informal, off-the-record industry conversation and is included as directional context only; no client-specific numbers are attributed. Financial modeling inputs are drawn from Newtrient, NRCS, UCCE dairy cost studies, the California Dairy Research Foundation, LPELC, Washington State University Extension, CalRecycle, CDFA’s Dairy Digester Research & Development Program, and BioFiltro public disclosures. Lane cost ranges reflect a 2026–2035 planning window at 7% cost of capital; individual operations should model their own inputs with their CPA, lender, and an independent ag engineer.

Learn More

The Sunday Read Dairy Professionals Don’t Skip.

Every week, thousands of producers, breeders, and industry insiders open Bullvine Weekly for genetics insights, market shifts, and profit strategies they won’t find anywhere else. One email. Five minutes. Smarter decisions all week.
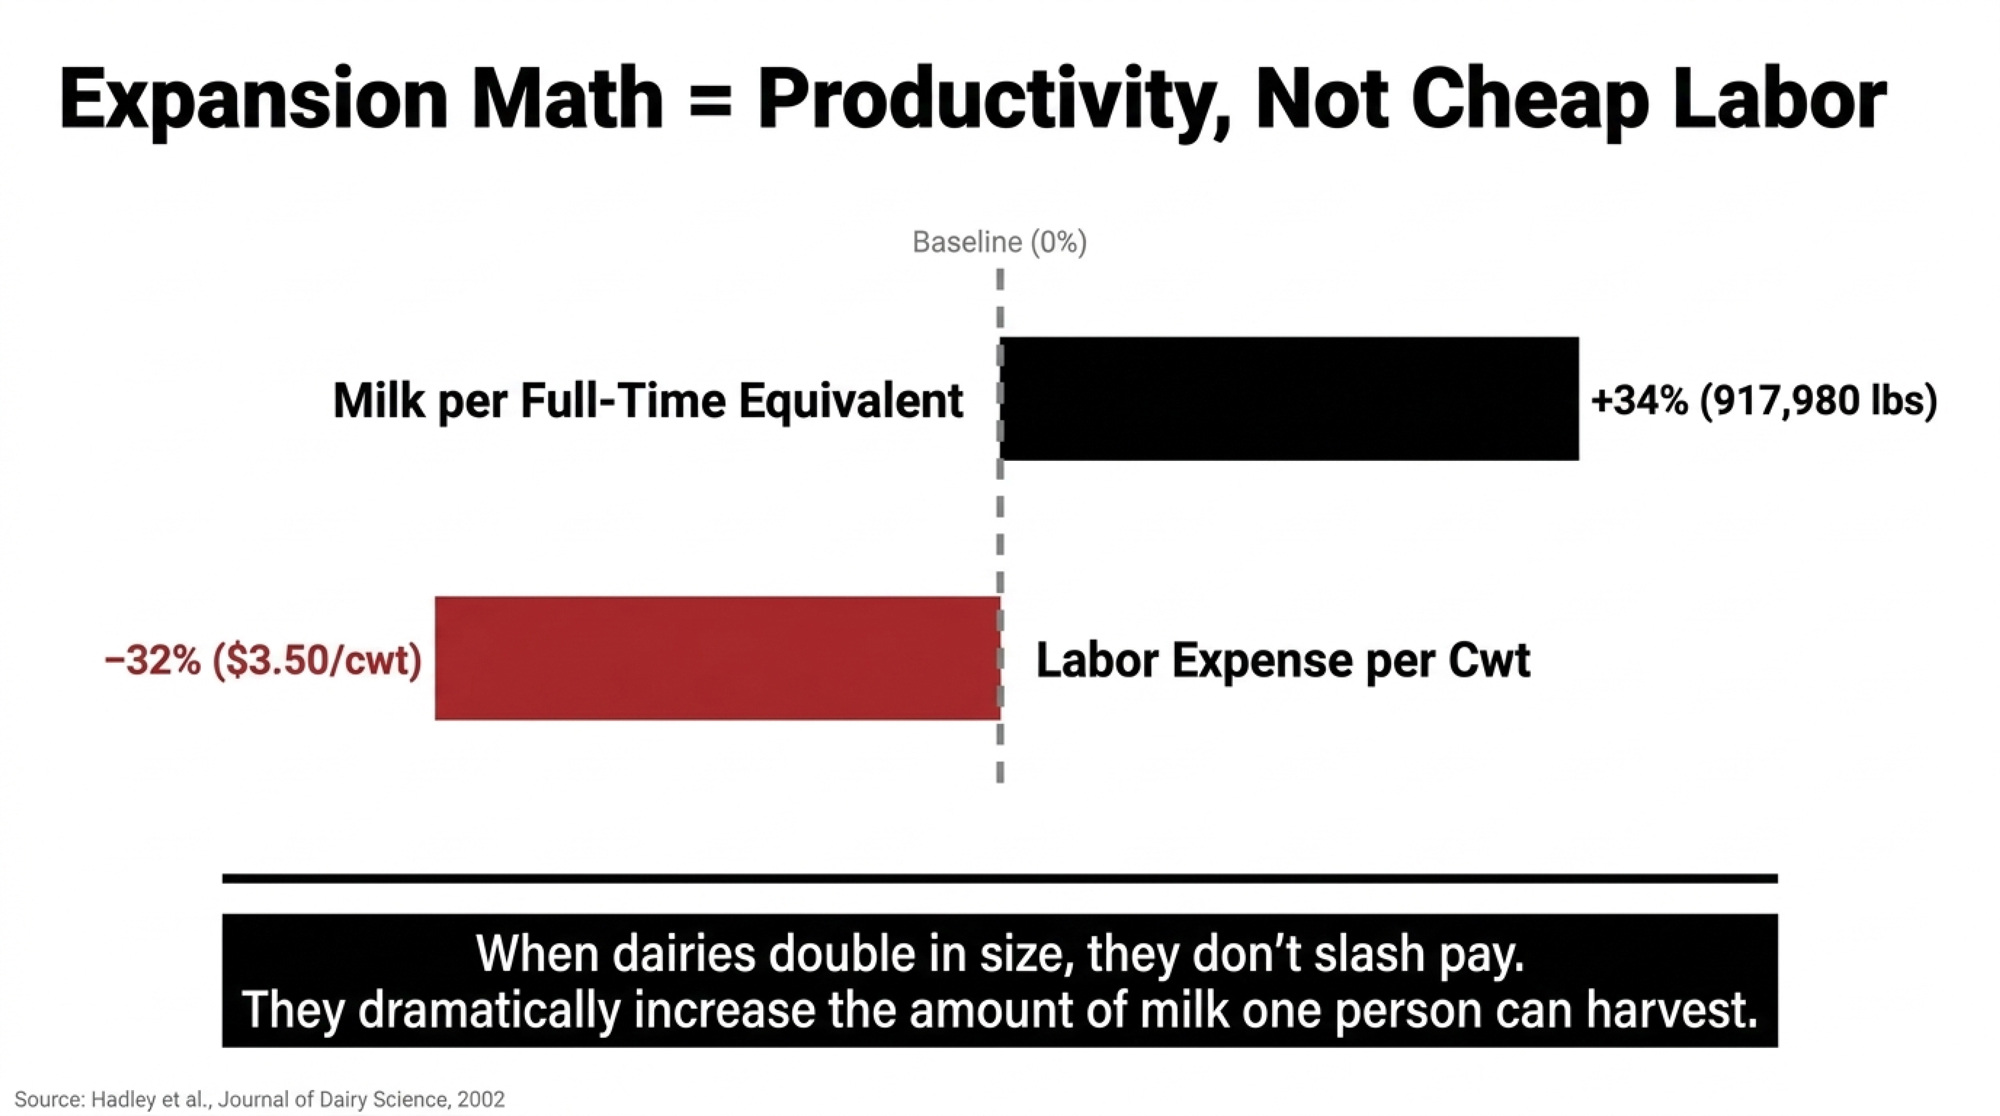
NewsSubscribe
First
Last
Consent

Cornell Hit 93%. Your 400-Cow Retrofit Won’t: The McLanahan SMS12 Payback That’s Really 4.5 Years, Not 2.5

Cornell’s Teaching Dairy and SwissLane’s Oesch family built their sand-separator success inside facilities designed around the system. For a 400-cow retrofit, the same $85K quote carries a very different set of risks — including one Klebsiella cow you can’t afford to lose.

Executive Summary: The McLanahan SMS12 quote says 2.5-year payback on $85K — the honest math on a 400-cow retrofit says 4.5, once you put depreciation back in and haircut recovery from 90% to 78%. Cornell’s Teaching Dairy hits 93% separation because the facility was built around the system; SwissLane’s Oesch family hits 90% because they’ve got the scale and internal labor to run it right. Your retrofit, with a shared-duty feeder running behind by 7 a.m., isn’t either of those. A 20,000 cells/mL SCC drift on commissioning costs a 400-cow herd roughly $25,550/year in lost quality premium — larger than the stressed-case net savings — and one preventable Klebsiella cull on a pedigree cow in Month 3 erases a full year of separator savings before her daughters are counted. In the Midwest at $12–15/ton contract sand this is an ROI play; in the Northeast at $18+/ton with single-supplier exposure, it’s an insurance play against a trajectory that SARE already documented rising 70% in real dollars between 2003 and 2013. Read the full piece if you’re re-bedding this year, staring at a dealer quote, or if your 400-cow herd carries any pedigree value you can’t afford to lose in commissioning.

McLanahan SMS12 payback

It’s mid-April. Coffee going cold on the kitchen table, an iPad open beside a paper dealer quote, the parlor pump cycling steady in the background. The producer staring at the McLanahan SMS12 quote could be in Lancaster County, Clinton County, or Addison County — this decision is on 400-cow kitchen tables across three regions right now — and the quote says 2.5-year payback in base-case spreadsheet optimism.

McLanahan engineered the SMS12 for dairies with 500 or fewer cows. Using the company’s own published 500-cow example — 50 lbs of sand per cow per day, $12/ton delivered, electricity at $0.07/kWhr — the pre-separator sand bill runs $54,750, and the system claims to cut roughly $40,000 a year off that bill while recovering more than 90% of the bedding. Base-case projections are standard practice across dairy capital equipment, from robotic milkers to heat recovery. The question isn’t whether the base case is optimistic. It’s how it holds up against your barn, your labor, and the cow in stall 47.

Figures in this article are illustrative, drawn from published case studies and model inputs. Actual costs, savings, and payback periods depend on herd size, regional sand pricing, barn design, labor, and site conditions.

What Cornell’s Teaching Barn Actually Proved — and What It Didn’t

Cornell University’s Teaching Dairy Barn in Ithaca, New York — a 150-cow facility built around best-practice demonstration — installed the SMS12 and published its results through McLanahan’s February 2025 case study. Their stated goal was 90% sand separation. The long-term average has come in at roughly 93%. Weeks hitting 97% or better happen regularly.

“One of the nice surprises we’ve had is how well it does the sand separation for us,” Jennette, the Teaching Dairy’s manager, said in McLanahan’s published Cornell case study. Before installation, the Teaching Dairy was trucking in about 30 tons of new sand every week. Today they buy a few tons at a time.

That’s a legitimate success story. But it’s a ceiling, not a benchmark. The Teaching Dairy Barn was purpose-built around the system, staffed by people whose primary job is to manage and document it. Institutional backing. No shared-duty labor problem. A 400-cow retrofit with two hired hands and a feeder who’s already running behind by 7 a.m. is a different animal entirely.

Scale up and the same tension shows up in a different form.

SwissLane Dairy in Alto, Michigan — a 2,000-cow, fourth-generation operation under the Oesch family — ran headlong into the real-world version of that gap before McLanahan solved it mechanically for them. Per McLanahan’s SwissLane case study, switching to sand bedding added roughly 8 lbs/cow/day to the herd average, and SwissLane cows now produce around 90 lbs/cow. Sand-laden manure was wrecking equipment, compacting fields, and stacking maintenance bills. Their McLanahan Sand-Manure Separation System now recovers up to 90% of the sand depending on sand size and water quality. “We are recycling up to 90 percent of the sand, which cuts back on our need for new sand,” Matt Oesch, the fourth-generation financial controller, said in that same case study. “Also, there is much less wear and tear on our equipment.”

Both systems work, but for different reasons. Cornell’s works because it was purpose-designed. SwissLane’s works because the Oesches have the scale and internal infrastructure to run it properly. That variable is missing from the base-case model — and it’s exactly the variable a 400-cow retrofit is most exposed to.

System / Herd TypeDesign & Labor RealityRisk if Copied to 400‑Cow Retrofit
Cornell Teaching Dairy150 cows; barn purpose-built around SMS12; dedicated staff tracking sand daily93% recovery becomes 75–80% when shared-duty labor replaces dedicated ops
SwissLane (2,000+ cows)Large-herd scale; in-house maintenance; strong internal infrastructureAssumes capital, infrastructure, and uptime most 400‑cow barns don’t have
400‑Cow Retrofit (spec)Existing barn geometry; limited fall; 2–3 hired hands with full chore listsDesign constraints and labor load push recovery below spec by 10–15 points
400‑Cow Retrofit (drift)Shared-duty “separator manager”; protocols erode after 90 days; reactive maintenanceKlebsiella or SCC drift can erase a full year of savings in Month 3

What a Klebsiella Event Actually Costs You on a Pedigree Cow

The payback math assumes a commissioning SCC event is a one-time quality-premium hit. It isn’t — not in a Bullvine reader’s barn.

Rowbotham and Ruegg’s 2016 Journal of Dairy Science study (“Bacterial counts on teat skin and in new sand, recycled sand, and recycled manure solids used as bedding in freestalls”) documented that primiparous Holsteins bedded on new sand had longer survival times to first culture-positive subclinical mastitis case than cows on recycled sand. Read “survival time” as what it actually is on a breeder’s herd: the difference between a second-lactation EX classification and a cull tag at Day 95.

Commissioning drift on a recycled-sand system opens the door specifically to environmental coliforms — Klebsiella, E. coli, Enterobacter — the organisms Leite et al. tied in a 2023 Pathogens study to higher clinical mastitis incidence when bedding moisture and coliform counts climbed. A Klebsiella mastitis case on a high-genomic or deep-pedigree cow isn’t a $250 treatment bill. It’s a cow you lose.

On a 400-cow herd carrying even a small nucleus of breeder-value animals, the 4.5-year payback math flips the moment one of those cows goes down in Month 3. A $10,000-class cow lost to a preventable bedding event erases a year of net separator savings on its own — before you count what her daughters were supposed to contribute. The separator doesn’t know which cow is in stall 47. You do.

Can a 400-Cow Retrofit Hit Spec When Cornell and SwissLane Were Purpose-Built for It?

Run the barn math honestly. A 400-cow herd at 50 lbs of sand per cow per day burns through about 3,650 tons of sand a year. At $15/ton delivered — a reasonable 2025 Midwest contract band, though regional pricing varies by supplier — that’s $54,750 in new sand, or roughly $137 per cow per year in bedding alone.

Run the design-spec math honestly. Makeup sand at 10% of 3,650 tons ($5,475), O&M at $15,000, and straight-line depreciation on $85,000 of capital over 15 years ($5,667/yr) totals about $26,000 all-in. That’s $65/cow. Gross cash savings against the all-new baseline — new sand avoided minus O&M — come to $34,275. That’s the number the dealer spreadsheet divides into $85,000 to get its 2.5-year payback. Put depreciation back into the denominator, and simple payback stretches to roughly 3 years even at design spec. Add interest on the loan ($3,000–$5,000/year, depending on term), and the headline number softens more.

Now haircut it. Recovery drifts from 90% to 78%. Makeup sand climbs toward 22% of pre-separator volume — about $12,000. O&M runs $4,000 over projection, a routine Year-1 variance on any new dairy capital equipment. Tack on one Year-1 commissioning SCC event ($3,000–$5,000) and one mid-range mechanical intervention ($7,500), amortized into Year 1 rather than buried. Net savings compress to roughly $17,000. Simple payback stretches to roughly 4.5 years. Still positive. Just no longer a runaway case.

Base Case vs. 80% Performance — 400-Cow Herd, $15/Ton Sand

MetricBase Case (100%)Real World (80% + Year-1 Adders)
Sand Recovery90%78%
Annual New Sand Cost (makeup)~$5,500~$12,000
Annual O&M$15,000$19,000
Net Annual Savings~$28,600~$17,000
Simple Payback2.5 yrs (3.0 with depreciation)4.5 yrs

The Year-1 column amortizes one commissioning SCC event ($3,000–$5,000) and one mid-range mechanical intervention ($7,500) into the first operating year; recurring O&M is shown separately.

On a 400-cow operation with working capital and a stable milk-quality baseline, a 4.5-year payback is manageable. On a 250-cow operation at $12/ton sand — the number McLanahan itself runs for the SMS12 — it’s tighter. The fixed-cost burden doesn’t scale down the way gross savings do. That’s why McLanahan positions the SMS12 “for dairies with 500 cows or less” but emphasizes site design requirements right alongside herd size.

The $85K Lie: What the Dealer Quote Actually Leaves Off

The $85,000 capital figure is the illustrative anchor for a 400-cow-class SMS12 installation. On most retrofits, it’s also the number that dies first.

Separator quotes cover the unit and often the dewatering screen. They frequently don’t cover the things that let the unit actually run. On a 400-cow retrofit, the soft costs that show up between “signed quote” and “commissioning day” routinely include:

  • Three-phase power at the manure stack. Single-phase service at that end of the yard means either a rotary phase converter or a utility line extension. Realistic band: $5,000–$15,000, site-dependent. 
  • Covered sand storage. The 12% moisture target McLanahan specs after the dewatering screen doesn’t hold if the stockpile sits under an open sky through a wet October. A roof and pad for recovered sand storage runs roughly $15,000–$40,000 depending on footprint and whether an existing commodity bay can be repurposed.
  • Alley fall and gravity conveyance modifications. Systems designed around four feet of fall need exactly that. Retrofits into flatter barns may require a reception pit, transfer pump, or plumbing rework.
  • Water supply for the sand-lane flush cycle. On farms already running at well capacity in August, this is a real engineering conversation, not a line item.
  • Electrical panel upgrade. A dewatering screen, transfer pumps, and the separator can push an older service past rated capacity.
  • Permits, engineering, and nutrient management plan updates. State rules vary. A separator changes manure-solids chemistry, which can trigger plan revisions before it triggers anything in the bulk tank.

A realistic “all-in” anchor for a 400-cow retrofit isn’t $85,000. It’s $85,000 plus whatever your site needs to actually run the equipment. Anchor your lender model to a live, anonymized vendor quote that prices electrical, storage, and civil work separately. If any of those lines come back as “TBD,” treat “TBD” as the upper end of the ranges above until proven otherwise.

Should You Switch From New Sand to Recycled Sand on a 400-Cow Herd?

Rowbotham and Ruegg’s 2016 work also documented that new sand generally carries fewer Gram-negative bacteria than recycled sand, and that clinical mastitis incidence rates across bedding types didn’t differ significantly — at least when management held steady.

That “when management held steady” clause is doing a lot of work.

What “In Spec” Actually Looks Like vs. What “Drifted” Looks Like

McLanahan’s own dewatering screen specifications give you a concrete measuring stick.

ParameterRaw Recycled Sand (Pre-Screen)In-Spec After Dewatering ScreenDrifted / Red-Flag
Moisture content~20%~12%>15%
Organic matter contentElevated<1%>1.5%
Visible characterDamp, darker, organic finesGranular, lighter, sand-likePack-y, stains the hand, sour smell
Stall behaviorCompacts, holds moistureGrooms like new sandCows bed short, rear legs stay wet

The in-spec column is what the equipment can deliver. The drifted column is what shared-duty labor often delivers three months in. The middle column isn’t automatic. It’s the output of someone owning the process.

A 2021 Wisconsin microbiota study in Animals (“Assessing the microbiota of recycled bedding sand on a Wisconsin dairy farm”) found bacterial community composition in recycled sand shifts significantly with both season and recycling stage. Leite et al. tied bedding moisture to clinical mastitis incidence and coliform counts to subclinical mastitis prevalence.

When moisture rises and organic content climbs, the bacterial envelope in the stall shifts with it. The separator’s still working. The auger still turns, sand still comes out. Working and working correctly are not the same thing — and a 400-cow operation running shared-duty labor is the most exposed to the gap between them.

What a 20,000 Cells/mL SCC Drift Actually Costs You

The Day 90 commissioning check specifies bulk-tank SCC staying within about 20,000 cells/mL of the pre-commissioning baseline. That sounds small. On a 400-cow herd, it isn’t.

Working with round but honest inputs: 400 cows averaging roughly 87.5 lbs/day ships 35,000 lbs (350 cwt) of milk per day. If an SCC drift costs that herd a $0.20/cwt quality premium step on a processor’s tiered schedule — a common band in published mailbox premium — the arithmetic is direct:

That’s $25,550 of premium lost, every year the drift persists — against a stressed-case net savings of roughly $17,000. The lost premium alone is larger than the Year-2 net savings. It doesn’t just stretch the payback period. It inverts it.

And that’s before a single Klebsiella cow goes down, before a single treatment cost, before a single withheld-milk day.

Plug in your own $/cwt step when you run this for your operation. The arithmetic doesn’t change. What changes is how quickly the separator stops being an asset on your balance sheet.

Is This an ROI Play — or an Insurance Play?

That’s the framing shift Northeast producers have to make before they run the same math a Midwest operation does.

In the Midwest, the SMS12 is usually an ROI play: a capital investment that pays back through reduced new-sand purchases, evaluated against a relatively stable regional sand market. In the Northeast, it’s increasingly an insurance play: capital that hedges a structural supply problem, evaluated against a rising input price trajectory. Same equipment. Different thesis. Different lender conversation.

The 2017 SARE-funded bedding study by Smith, Simms, and Aber (“Case Study: Animal bedding cost and somatic cell count across New England dairy farms”) surveyed 129 producers and documented a 70% real-dollar increase in bedding costs between 2003 and 2013 — conventional dairy costs rose from /cow/year to 4/cow/year, and organic operations from to 5. That trajectory hasn’t reversed. Quarry consolidation, construction demand, and 30×50 silica sand specifications keep pinching supply.

Some Northeast producers find themselves dependent on a single quarry relationship, and a closure or disruption pushes them quickly into the spot band.

Against a conservative 4% annual sand-price inflation from $18/ton — and the SARE numbers are anything but alarmist by that standard — the separator’s Year 10 economics shift sharply in its favor. That case has to be made explicitly to the lender. A base-case payback model isn’t built to carry a 15-year rising-input assumption. If you can’t justify the SMS12 as an ROI play at today’s contract prices, you may still be able to justify it as an insurance play against the next decade of them.

THE HARD TRUTH

If your morning feeder is also your “Separator Manager,” your recovery rate is 75%, not 93%. The machine is automated. The consistency isn’t. If you don’t have someone on the payroll who treats sand dryness like a religion, stay with new sand.

The 30/90/365 Commissioning Playbook

Every separator investment should come with three audit dates baked into the loan conversation before commissioning day. Not after.

Day 30 — Is the Machine Working?

Three cheap measurements. None requiring a consultant.

  • Dry matter of recovered sand: target 35–40%
  • Organic matter content: target below 1.5%; McLanahan’s spec with a dewatering screen is below 1%
  • Sand recovery rate: target 90–95%, per NRCS Practice Standard 632

Day 90 — Is the System Working?

This is where commissioning drift shows up in the data.

  • Bacterial counts on fresh recovered sand and on used bedding from the back third of occupied stalls. Extension management guidance and Cornell field research point to a 300,000 cfu/g target and a 1,000,000 cfu/g red-flag line. 
  • Testing cost (2025 Cornell AHDC): BEDID1 environmental bacterial quantification at $48 per sample plus an $8 accession fee — roughly $50–$75 per sample all-in.
  • Bulk tank SCC check: within about 20,000 cells/mL of the pre-commissioning baseline. Drift beyond that at Day 90 is a management or mechanical signal, not a commissioning artifact — and on a 400-cow herd, it’s the $25,550/year problem from the section above until you fix it.

Day 365 — Is the Investment Working?

This is the conversation you want with your lender — not a surprise at refinancing.

  • Reconcile actual new sand purchased, actual O&M costs, and actual milk quality premium capture against the loan application projections.
  • Within 15% of projection: healthy; stay the course.
  • Shortfall of 25% or more: systematic problem requiring management intervention, not an assumption that Year 2 will be better on its own.

Operations that only run Day 30 informally tend to miss the drift that shows up between months three and six. That’s where the gap between projection and reality opens up. Cornell’s long-term performance came out of a facility where the system was the dedicated focus of staff. On a shared-duty operation, that focus erodes in inches.

Four Paths and What They Each Actually Cost You

Path / StrategyWhen It Actually WorksTypical Bedding Cost Band ($/cow/yr)Red-Flag Situation (Don’t Do This)
New sand, optimize what you haveDelivered sand under ~$12/ton; barn not designed for recycling; tight labor~80–110Installing SMS12 just to “keep up with neighbors”
Recycled sand, purpose-designed system400+ cows; $16+/ton sand; dedicated separator operator and good ventilation~65–90Retrofits with <4 ft fall or no covered storage
Recycled sand as supply hedgeNortheast herds at $18–24/ton with single quarry dependence~90–120Treating it as a 2.5‑year ROI play instead of insurance
Wait, stay on new sand until renovationCurrent barn geometry wrong; renovation or expansion already on the horizon~100–140Sinking capex into separator before fixing the barn design

Path 1: New sand, optimize what you have. Works when delivered sand is under $12/ton, the barn lacks adequate fall or ventilation for recycling, or the labor structure can’t absorb a dedicated daily protocol. If you’re already under $100/cow in bedding, separator capex probably doesn’t survive honest stress-testing.

Path 2: Recycled sand, purpose-designed integration. Works when sand is $16+/ton, herd size is 400+, and you can assign dedicated operator time — not bolt it onto someone’s morning route. Requires written daily protocols, monthly bacterial testing at Cornell AHDC 2025 rates, and a backup supplier relationship locked in before commissioning day. Where it backfires: retrofits into barns with under four feet of fall, curtain-sided structures with weak summer ventilation, and indoor covered sand storage that traps moisture in the pile.

Path 3: Recycled sand as a supply hedge, not a cost savings play. The Northeast case. At $18–24/ton with single-supplier risk, evaluate the separator as a 15-year input supply investment, with the math running against a rising price trajectory rather than today’s contract price.

Path 4: Keep buying new sand until the barn catches up. Works when current infrastructure isn’t suited to recycling but a renovation or expansion is already on the horizon. Cornell’s 93% came from a facility designed around the system, not retrofitted into one. Waiting, doing the renovation right, and then buying the separator isn’t a failure of ambition. Sometimes it’s the sharper capital sequence.

Your Next 30 Days

Pull your sand delivery invoices for the last 24 months and calculate your actual per-cow bedding cost. Compare it to the $110–$137 band typical at $12–15/ton delivered. Then pull your last two bulk-tank SCC reports and your last DHI cull reason summary, and mark the cows in stalls 1–10 that you cannot afford to lose to a bedding event. That single hour tells you which of the four paths is yours before a dealer sets foot on the place.

What This Means for Your Operation

  • Before you call a dealer: if this system runs at 80% of projected performance for two years, can your operation absorb that financially and still say yes? If the answer makes you flinch, the more defensible decision is to stay with new sand and harden your supplier relationships.
  • Run your actual delivered sand price against the threshold bands: under $10/ton, almost certainly no; $10–14/ton, only with dedicated labor and a strong milk quality premium structure; $16+/ton, the economics work if the barn supports it.
  • Audit three fixed barn factors before any other conversation: alley fall, ventilation design, and covered storage location. These predetermine the bacterial envelope your recycled sand lives inside before the operator ever touches it.
  • Price the soft costs separately: three-phase power, covered storage, alley fall modifications, permits, panel capacity. If any sit on “TBD,” assume the upper end of published ranges in your lender model.
  • Price the genetic exposure separately: a single Klebsiella cull on a high-pedigree cow in Month 3 can cost more than the first year of net separator savings. Account for it in your stressed case, not your base case.
  • Build the lender conversation around a stressed-case cash flow model — 78% recovery, one commissioning SCC event, $4,000 O&M overage — not the base case. Post-2020 agricultural lending practice has tightened DSCR floors and rate-sensitivity assumptions; confirm specifics with your Farm Credit branch or equivalent before signing.
  • If separator management will be an “added duty” rather than a primary assignment, haircut your projected net savings by 20% before comparing payback. 

Key Takeaways

  • If delivered sand is under $12/ton and your barn wasn’t designed for recycling, the separator probably doesn’t pencil honestly — regardless of what the base case says.
  • If you’re in the Northeast at $18+/ton with single-supplier risk, evaluate the SMS12 as an insurance play, not an ROI play. The SARE 2003–2013 data already showed a 70% real-dollar cost increase. Nothing about the last decade suggests that direction has changed.
  • If your barn has under four feet of fall, curtain-sided summer ventilation, or indoor covered sand storage, fix the barn first. Cornell’s 93% and SwissLane’s 90% both came from facilities designed to support the system. No operator skill compensates for the wrong infrastructure.
  • If separator operation will be an added duty on top of an existing workload, haircut projected savings by 20% in your own model. It’s not pessimism — it’s what the commissioning record shows.
  • If your 400-cow herd carries a pedigree nucleus, one preventable Klebsiella cull in commissioning can erase a full year of separator savings — and the genetic progress behind the cow you just put on the trailer.
  • If you can’t answer the 80% question with a clear yes, keep the $85,000 and buy three years of new sand instead. Sometimes that’s the sharper capital decision.

The spreadsheet on your kitchen table shows the base case. Cornell’s team didn’t just run the base case — they built the system, staffed it, measured it at 30 days, 90 days, and every week for years. That’s why their long-term average is 93%. The question for your operation isn’t whether McLanahan builds a system that performs. They do. The question is whether your barn, your labor, and your balance sheet are set up to capture that performance — and what happens to your milk cheque, and the cow in stall 47, in Year 1 if they aren’t. Does your current payback model have a cell for that answer?

This article draws on McLanahan’s published Cornell and SwissLane case studies, the cited peer-reviewed research, and public technical material. McLanahan, Cornell Teaching Dairy Barn, and SwissLane Dairy were not interviewed directly for this piece.

Learn More

  • What Type of Bedding is Best for Cows? — Evaluate the microbial thresholds and cost-per-cow shifts that signal it is time to pivot your bedding strategy. Arms you with the benchmarks to decide if sand still pencils against rising regional commodity prices.
  • Why Cow Comfort is a Competitive Advantage — Position your dairy for the next decade by leveraging stall environment as a strategic production asset. Exposes how superior comfort secures cow longevity and maximizes the genetic potential of your elite herd.
  • How to Make Sand Bedding Work in Your Robotic Dairy — Bridge the gap between sand comfort and robotic milking hardware without risking machine downtime. Delivers the technical blueprints for managing silica’s abrasive wear while maintaining the gold standard in cow cleanliness.

The Sunday Read Dairy Professionals Don’t Skip.

Every week, thousands of producers, breeders, and industry insiders open Bullvine Weekly for genetics insights, market shifts, and profit strategies they won’t find anywhere else. One email. Five minutes. Smarter decisions all week.
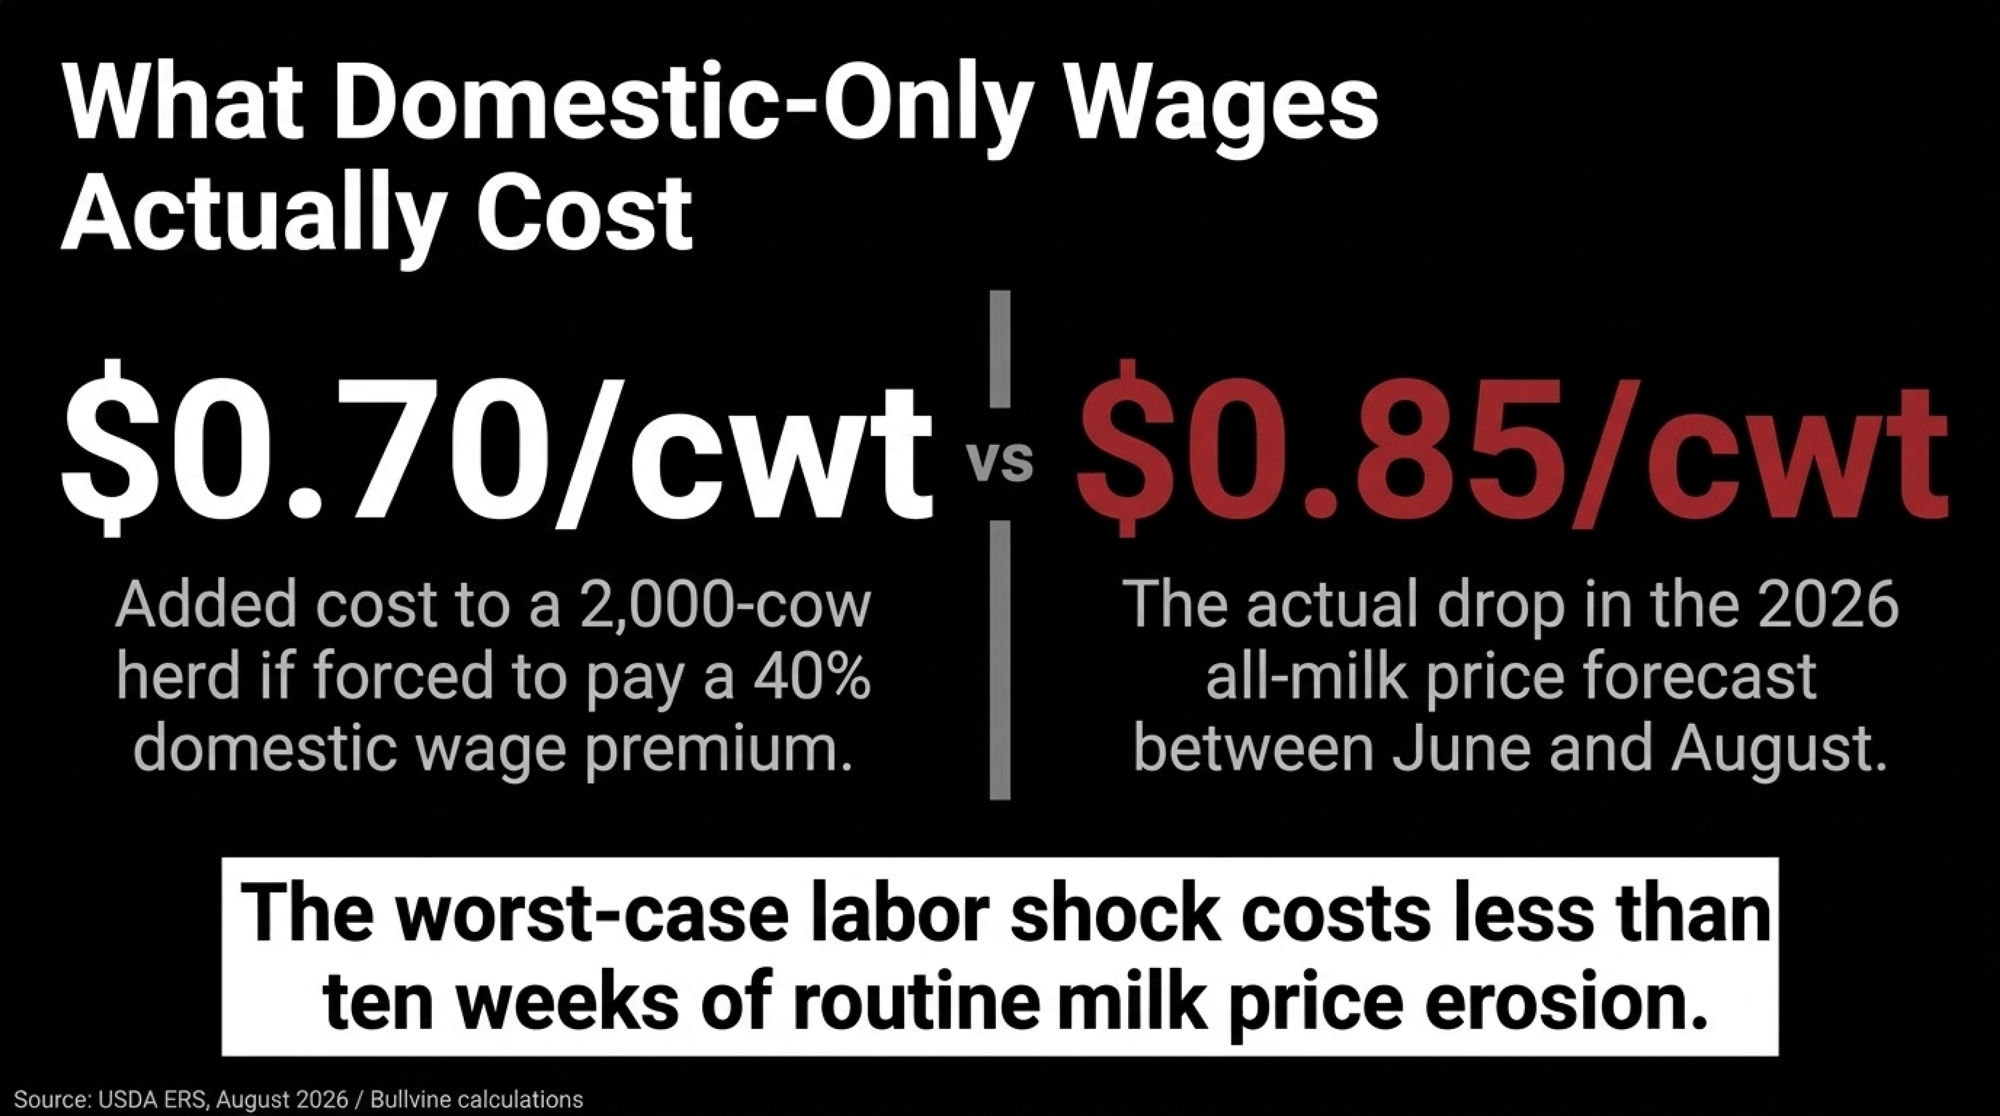
NewsSubscribe
First
Last
Consent

Dairy Labor’s $48,000 Tuesday: Why Every U.S. Producer Needs a 72‑Hour Plan

On April 21, 2025, CBP arrested eight workers at Vermont’s largest dairy before the morning milking finished. The cows still had to be milked. Does your barn have a plan for that Tuesday?

Executive Summary: On April 21, 2025, CBP arrested eight workers at Pleasant Valley Farms in Berkshire, Vermont — the state’s largest dairy, 3,000 cows across 10,000 acres — and every U.S. producer who leans on immigrant labor should treat it as a dress rehearsal. Vermont detentions ran close to tenfold their prior baseline in 2025, roughly 900 people through state facilities, per Migrant Justice intake data cited by The Guardian. On an 800‑cow herd at ~$20/cwt (USDA AMS, Aug 2025), a 30% crew loss driving a worst‑case 10 lb/cow drop leaks about $48,000 in 30 days before a single SCC penalty or covenant call; a milder 3–5 lb drop still bleeds $14,000–$24,000. Relief labor runs a one‑third to one‑half premium over the USDA NASS April 2025 livestock wage of $18.15/hr — budget $24–$27/hr when the call comes. Your lender and co‑op field rep are already watching workforce stability as a cash‑flow risk; February 2026 outlook has mailbox prices running $2.50–$3.00/cwt below 2025 on top of it. The 30‑day move isn’t waiting on the Farm Workforce Modernization Act — it’s booking a real I‑9 self‑audit with an employment attorney and writing a one‑page 72‑hour staffing plan with names, not roles. If your answer to “who milks Tuesday if three people don’t show up” is a shrug, that’s the first number to fix.

Dairy labor risk

On April 21, 2025, U.S. Customs and Border Protection agents arrested eight migrant workers at Pleasant Valley Farmsin Berkshire, Vermont, according to reporting by VTDigger and Vermont Public. The St. Pierre family operation is the state’s largest dairy, milking roughly 3,000 cows across about 10,000 acres in Vermont and New Hampshire. The cows, of course, still had to be milked.

The workers — not the farm — were the subject of the federal proceedings. The Bullvine contacted Pleasant Valley Farms for comment; but has received no response received.

That’s the part the policy press usually doesn’t cover. If you run a dairy that leans on immigrant labor, the Pleasant Valley enforcement story isn’t a “Vermont thing.” It’s a preview of what dairy labor enforcement can look like when it lands close to your yard. We had charts. We had quotes from Washington. We had a draft sitting in our CMS that week explaining, yet again, why the Farm Workforce Modernization Act might — someday — open a legal path for year‑round dairy workers. What we didn’t have was a single article that helped a producer survive the first 72 hours after a crew disappears.

That’s the blind spot this piece is about. Not because Vermont is special. Because the policy‑first frame we were using applies to almost every U.S. dairy that runs on immigrant labor — and in a crisis, that frame is useless in the parlor.

Why Your Lender Might Be Thinking About This Before You Are

Let’s start with the part that’ll keep you up at night — and it’s not CBP. It’s your next renewal conversation.

Quietly, ag lenders and co‑op field staff have started asking harder questions about workforce stability. Not to police your hiring — because a 30% crew loss hits cash flow faster than almost any commodity price move, and it shows up in the places they already watch: milk quality penalties, herd health costs, production slippage and covenant ratios. February 2026 dairy outlook flagged margin compression for 2026. Layer workforce disruption on top of that and you’ve got the kind of compound cash‑flow risk any ag lender watches closely.

Across several operator conversations in late 2025, the same question surfaced in different words: not another article about the Farm Workforce Modernization Act, but what their lender would actually accept as workforce continuity documentation if federal enforcement action ever affected their own payroll, regardless of what they believed about their crew’s status. No single conversation said it that cleanly. But the sentiment showed up often enough to stop being an outlier.

Operational coverage — I‑9 audit explainers, enforcement‑response protocols, emergency staffing templates — was getting forwarded to operators by their own attorneys and co‑op reps. Ours wasn’t. That’s the moment a policy‑first frame stopped being defensible.

Where Our Coverage Missed The Barn

For eighteen months, The Bullvine covered dairy labor like it was a Capitol Hill story. Federal reform bills. Association statements. USDA labor surveys. Tidy quotes from Congressional co‑sponsors. Most of that reporting was factually accurate.

In July 2025, we ran “Here’s the Hard Truth About Labor Reform: Why the Farm Workforce Modernization Act Could Finally Fix Dairy’s Biggest Crisis.” The credibility anchor was a Congressional co‑sponsor. The call to action was legislative preparation. A month earlier, “How Dairy’s Worker Shortage Will Reshape Your Farm by 2030” treated labor as a long‑arc automation and demographics story.

Both pieces were solid reporting. Both pointed the reader toward Washington. And neither of them helped you decide who covers Tuesday morning.

The Guardian‘s April 16, 2026 investigation — “‘I don’t go out’: Vermont’s undocumented dairy workers live in fear after immigration raids” — made the gap obvious. A Vermont dairy of recognized size was the site of a federal enforcement action, and the immediate operational questions that followed — who milks tomorrow, who pays bond, what does the lender say — were not ones our Capitol‑focused coverage had prepared any reader to answer. VTDigger reported in May 2025 that one of the Pleasant Valley workers was ordered released on a $10,000 bond, and another on the $1,500 statutory minimum.

What’s Actually At Risk For Your Herd

Step outside Vermont for a minute. This story isn’t really about one state.

A Texas A&M AgriLife Center for North American Studies / NMPF survey of 973 dairies across 18 states (Adcock, Anderson and Rosson, fieldwork 2014, published 2015) found that immigrant labor accounts for 51% of all U.S. dairy labor, and that dairies employing immigrant labor produce roughly 79% of the nation’s milk supply. A 2018 NMPF follow‑up concluded that a complete loss of immigrant labor could cost the U.S. economy $32.1 billion and eliminate one‑in‑six dairy farms. Across much of the Midwest, Northeast and West, immigrant workers — both documented and undocumented — make up a substantial share of parlor crews on mid‑ and large‑herd dairies.

When enforcement ticks up, you don’t feel it as a shift in the Federal Register. You feel it as a hole in Tuesday’s schedule. A milker who worked Saturday and Sunday but didn’t show up Monday. A cousin who left the state overnight after seeing a neighbor’s farm on the news.

That’s the version of labor risk we hadn’t been writing into. So here’s the math we should have been running all along.

What Does A 30% Crew Loss Actually Cost On An 800‑Cow Herd?

Take an 800‑cow herd shipping 65–70 lb/cow/day — mid‑to‑upper range for a commercial Northeast herd. USDA’s August 2025 mailbox milk price across all Federal Orders averaged $20.03/cwt, down $2.90 from August 2024. February 2026 dairy snapshot projects 2026 mailbox prices running $2.50–$3.00/cwt lower than 2025. Call it a ~$20/cwt working number for a Northeast herd. That’s about $11,200 a day in milk revenue coming off the pad.

Now assume a neighboring farm sees an enforcement action and 30% of your crew either doesn’t show up or gives notice within a week. Parlor prep gets rushed. Shifts stretch. The cow that should have been culled three months ago is suddenly a long‑term employee.

The Cost of a “Tuesday Morning” Crisis

Based on an 800‑cow herd at ~$20.00/cwt

MetricStandard Operation30% Crew Loss (First 30 Days)
Daily milk revenue$11,200$9,600 (worst‑case 10 lb/cow drop)
Monthly revenue leak$0−$48,000
Labor cost$18.15/hr (USDA NASS, Apr 2025 livestock workers)$24–$27/hr (1/3–1/2 premium range)
Milk qualityStable SCC, standard protocolMastitis spikes, rushed prep, missed detections
Long‑term riskNormal cull/replace rhythmCull errors, lender flags, co‑op quality penalties

That $48,000 is the worst‑case first‑30‑day figure. A milder shock — say a 3–5 lb/cow drop because you triaged fast and kept fresh‑cow protocols intact — produces monthly revenue leaks in the $14,000–$24,000 range on the same herd. Either way, run these numbers with your own herd size, shipping average, and mailbox price before your next bank meeting. The point isn’t the $48K. The point is knowing what it costs you to buy back one week of rushed milking.

Push the same scenario onto a 400‑cow herd losing two key employees and the daily number gets smaller, but the percentage hit to your margin often gets worse. You have fewer people to absorb the shock.

That math is what we left out of our labor coverage for eighteen months. Not because we didn’t have it. Because we were reporting upward, toward the Capitol, instead of sideways, toward the parlor. 

The Mechanics Behind The Shock

Three structural realities explain why a single enforcement event lurches the way this one did in Vermont, and why your exposure may be bigger than your books suggest.

Structural dependence with no legal backfill. Dairy tilted hard toward immigrant labor over two decades. Non‑ag wage expectations rose, H‑2A and H‑2B visas were written for seasonal crops rather than cows that calve on Christmas, and consolidation put more hired positions on fewer farms. Vermont has lost 49% of its dairy farms since 2013 while cows per farm have jumped 69% (Vermont Dairy Delivers, 2024). A single enforcement event doesn’t bounce. It lands.

Enforcement is lumpy, not linear. VTDigger characterized the Pleasant Valley arrests as the largest Vermont immigration enforcement action targeting migrant workers in recent memory, and roughly 900 immigrants were detained in Vermont facilities in 2025 — close to a tenfold increase over the prior baseline, according to Migrant Justice intake data cited in The Guardian‘s April 2026 investigation. From your side of the fence, it looks like random bad luck. It isn’t.

Your buyers and lenders are paying attention. Brand‑sensitive processors and retailers don’t want to be on the six o’clock news next to an enforcement story. Quality problems and covenant breaches make lenders flinch. Public enforcement events can accelerate both.

Every U.S. dairy operates inside that reality, whatever your own workforce composition.

72‑Hour Survival Checklist

Print this. Put it in the milk house. You won’t have time to Google it when the call comes.

Editorial guidance only — not legal advice. Consult your own employment attorney for jurisdiction‑specific guidance on I‑9, enforcement‑response protocol, and lender communications. 

Protocol ElementUnprepared OperationLender-Ready OperationWhy It Matters
Tuesday 2 a.m. crew backup“We’ll figure it out”Named list, not rolesShifts fill in < 6 hours
I-9 audit statusDrawer checkAttorney-led self-auditReduces paper-trail risk
Emergency wage rateNegotiated in crisisPre-agreed at $24–$27/hrNo resentment at 3 a.m.
Lender notificationAfter covenant flagBefore the callPreserves refinancing optionality
Documentation of impactVerbal, laterWritten, within 24 hrsAttorney + lender both want it

Hour 1–6: Triage

  • Confirm who’s missing. Call or text every crew member. Don’t assume — verify.
  • Lock down the milking schedule. Who’s covering the next shift? Write names on the whiteboard, not roles.
  • Call your herd manager. If they’re affected, you need to know now, not at 4 p.m.
  • Do not discuss immigration status with anyone on your crew, any agent, or any reporter. Call your attorney first.

Hour 6–24: Stabilize

  • Activate your emergency contact list. Relief milkers, retired employees, neighbors with parlor experience, family members.
  • Notify your veterinarian. Short‑staffed milking means rushed prep means higher mastitis risk. Get ahead of it.
  • Call your co‑op field rep and explain the situation. Quality penalties are easier to manage with advance notice than with a surprise SCC spike.
  • Document everything. Hours worked, temps called, protocols skipped. Your lender and your attorney will both want this.

Hour 24–72: Shore Up

  • Contact your ag lender. Brief them before the covenant math does it for you. Bring a written estimate of the revenue and cost impact.
  • Set emergency pay rates for overtime and relief workers and communicate them clearly. Ambiguity breeds resentment when everyone’s exhausted.
  • Identify which tasks to cut vs. which to protect. Fresh‑cow checks, milking prep, and feeding can’t slip. Cosmetic barn work can wait.
  • Begin recruiting. Expect relief labor to cost a one‑third to one‑half premium over the USDA NASS April 2025 livestock worker average of $18.15/hr — roughly $24–$27/hr based on what Northeast operators and co‑op field staff are quoting in 2025–2026. Budget for it.

What Would You Actually Do On A Tuesday?

Here’s the honest question. If your phone buzzed at 5 a.m. with news that a neighbor’s farm had seen an enforcement action, and by 7 a.m. three of your best parlor people hadn’t shown up — what would the next 72 hours look like?

If you can answer in specifics — names, shifts, call list, pay rate, feed routine — you’re in better shape than most. If you can’t, that’s your homework for the month. Pull the list of who’s on your 2 a.m. crew. Ask yourself which two names you’d replace first, and with whom.

Options And Trade‑Offs

You’re not going to solve federal immigration policy from the milk house. You do have choices about how you prepare for the next 72‑hour shock. Four are worth running.

1. Treat I‑9 and documentation like biosecurity. When it makes sense: any herd with hired labor, and any operation in a region where neighbors have already been affected. What it requires: a real I‑9 self‑audit with an employment attorney or HR pro — not a drawer check — plus written onboarding and document‑handling procedures, and a clear plan for what you’ll say if federal agents arrive, with or without a warrant. Risks and limits: you can’t audit your way into a fully legal crew if no legal pipeline exists for year‑round workers. Sloppy internal audits can create paper trails that hurt you later. 30‑day action: book that I‑9 consult this month, even if you’re sure you’re fine.

2. Write a 72‑hour staffing protocol. When it makes sense: herds over 400 cows, where losing two parlor employees blows up the schedule. What it requires: a named list (not roles — names) of who covers milking, feeding and fresh cows in a short‑staffed week. A pre‑agreed wage premium or bonus framework for emergency coverage. A written “bare minimum operations” plan that protects milk quality and cow welfare when you can’t run the normal playbook. Risks and limits: emergency labor is expensive. USDA NASS reported the April 2025 livestock worker wage at $18.15/hour, up 4% year over year. Paying a one‑third to one‑half premium over that baseline adds up fast, and family labor patches can hide burnout until it breaks.

3. Decide how far you’ll go on automation. When it makes sense: herds already flirting with a third parlor shift, and operations with balance sheets and lenders that can absorb long‑payback capital. What it requires: honest ROI math that accounts for robots plus maintenance, software and financing — not just “robots replace X workers.” A realistic view of how much human oversight automated systems still need. Risks and limits: automation doesn’t end your enforcement exposure if you still rely on immigrant workers in maternity, youngstock and feeding. Over‑leveraging for robots during a labor panic traps you if milk slips or rates stay sticky. [INTERNAL LINK: Clark Farms / 143‑hour‑week ROI piece] → Suggested anchor text: “how one operation did the hard math on time, capital and labor” → pillar page / Tier 3 economics.

4. Talk to your lender before they talk to you. When it makes sense: any operation refinancing in the next 18–24 months, or any herd where more than half of hired positions are filled by immigrants. What it requires: a candid conversation about how many roles would be hard to refill within 30 days, a short written workforce continuity plan, and willingness to hear uncomfortable questions now instead of at renewal. Risks and limits: some lenders aren’t ready for this conversation. Some will default to box‑checking. Better that than a surprise at the covenant review.

Key Takeaways

  • If your crew is foreign‑born, book an I‑9 self‑audit with an employment attorney within the next 30 days. Not a drawer check. A real one.
  • If two missing milkers would break your schedule, write a one‑page 72‑hour staffing plan with names — not just roles — on the page.
  • If you’re refinancing soon, ask your loan officer what workforce continuity documentation they’d actually find useful before they ask you for it.
  • If you haven’t run a 30% crew‑loss barn‑math scenario for your own herd size and milk price, do it before your next bank meeting. The number will either reassure you or rearrange your calendar.
  • If SCC penalties crept up while you’ve been short‑staffed, treat that as a labor‑risk warning light, not just a milk quality issue.
  • If you’re eyeing automation because of labor fear, run the ROI math twice — once with wage savings, once with a realistic headcount for all the jobs robots won’t touch.

Don’t Get Caught Without A Plan

The next enforcement story will land somewhere. Maybe not your county, maybe not your co‑op, maybe not this season. It will land on someone’s crew, someone’s lender call and someone’s quality report.

The question isn’t whether federal policy is fair. It’s whether your operation can stay upright when a meaningful share of your crew can’t show up on a Tuesday and nobody in Washington picks up the phone.

Complete references and supporting documentation are available upon request by contacting the editorial team at editor@thebullvine.com.

Learn More

The Sunday Read Dairy Professionals Don’t Skip.

Every week, thousands of producers, breeders, and industry insiders open Bullvine Weekly for genetics insights, market shifts, and profit strategies they won’t find anywhere else. One email. Five minutes. Smarter decisions all week.
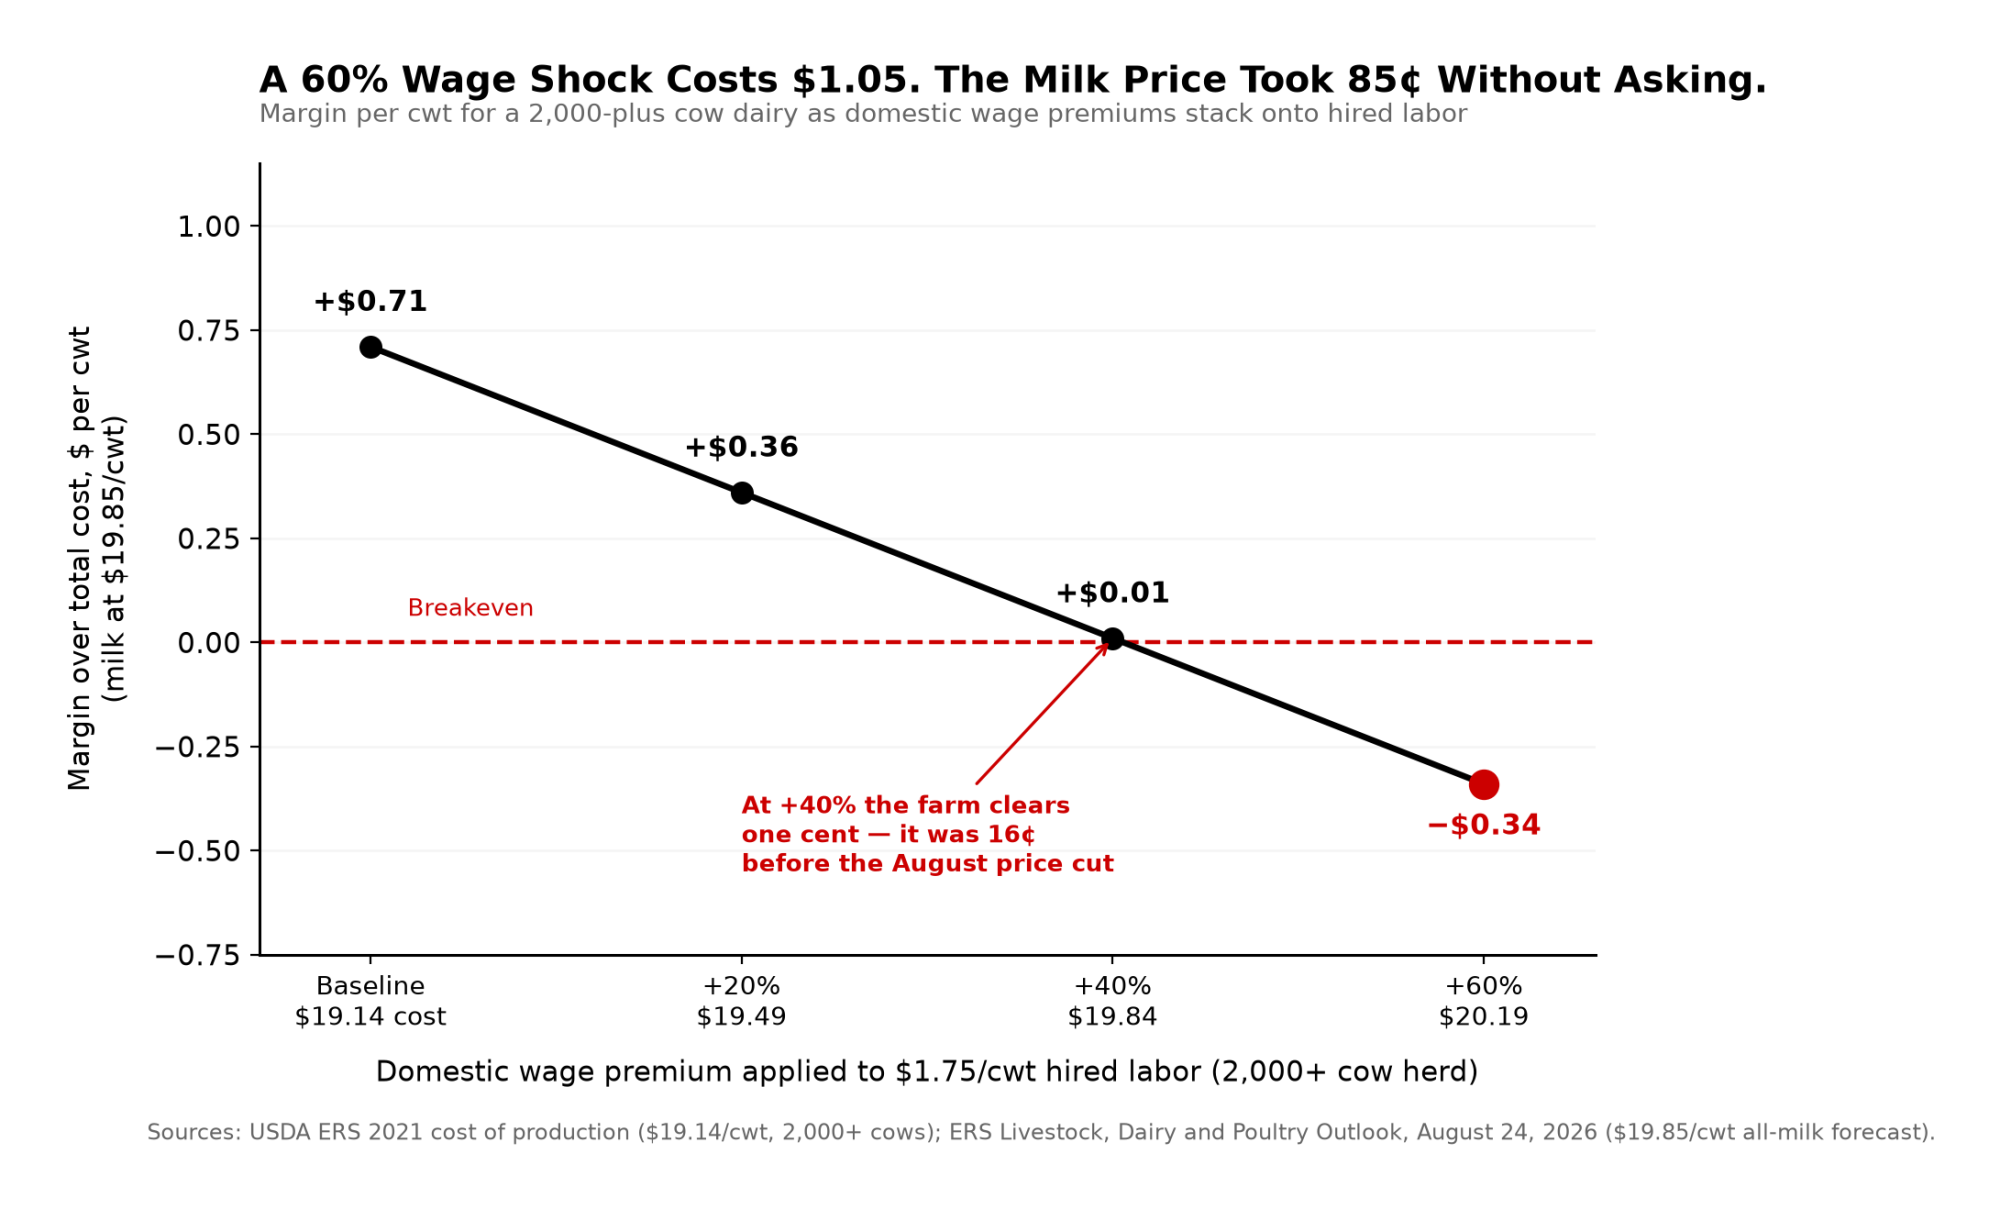
NewsSubscribe
First
Last
Consent

Fenwick Got the Cows Back. The $519,000 Insurance Gap Is Still There.

Your neighbors will bring casseroles and cattle trailers for the first 48 hours. They won’t write a $519,000 check in month 13. Only a correctly written policy does – and most mid-size dairies don’t carry one.

Executive Summary: An EF-1 tornado leveled Hull’s Dairy in Fenwick, Michigan at 10:58 PM on April 14, scattering 210 cows across Montcalm County — and exposing a six-figure coverage hole sitting in most mid-size dairy policies. Default farm policies run 12-month business interruption periods, but industry ag claims guidance — including from Sedgwick — puts complex dairy rebuilds at 18–24 months, leaving roughly $519,000 in uninsured gross milk revenue on a 210-cow herd at March 2026’s $16.16/cwt Class III. Construction costs make it worse: BLS PPI put 2025 materials inflation at 6.2%, and Lactanet’s 2023 survey pegs insulated dairy barns at $18,160 per head all-in, $7,100 per cow in equipment alone. Your LIP payment isn’t a recovery mechanism either — $1,681.88 per adult cow pays about 42 cents on the dollar against a $4,000+ springer, and as little as 12 cents on a VG-88 with real genetic merit. Blanket livestock coverage doesn’t distinguish a +2800 GTPI two-year-old from a GP-83 off a truck. The community brought cattle trailers for the Hulls within hours; they won’t cover month 13 of a rebuild. The 30-day move: call your agent, confirm Replacement Cost (not ACV) coverage, and price a 24-month MIP before renewal.

dairy farm insurance

Janet Hull was in her basement at 10:58 PM on April 14, 2026, when the EF-1 hit her family’s farm in Fenwick, Michigan. She told Fox 17 it sounded like a train coming through the barns above her. By morning, the freestall that housed 80 of her cows was gone, two head were confirmed dead, and more than 200 animals were scattered across miles of dark Montcalm County countryside.

The community response was the kind dairy country still does better than anywhere else. Noah Heckman pulled in at sunrise with a cattle trailer, per Fox 17. Stephanie Schafer of Jem-Lot Dairy — a Michigan Farm Bureau District 5 director — drove her own truck over, per McClatchy wire reporting. Lane Grieser with Farm Bureau was on the phone. By Wednesday night, nearly the entire 210-cow herd had been recovered and relocated to a neighbor farm in North Ionia.

Every local outlet ran that story. None of them ran the math.

Here’s what they missed — and it’s not about Hull’s specific policy, which isn’t public. It’s about the default farm insurance structure a typical 200-cow family dairy carries. That structure likely sits on roughly $519,000 in uninsured gross revenue exposure between what a 12-month business interruption policy pays and what a complex rebuild costs when it runs to the midpoint of an 18–24 month range. No claim here about the Hulls’ individual coverage. This is about what the default structure does to a farm at that scale — and where the real risk hides in most dairy farm tornado damage recovery scenarios.

What’s Changed — and Why Your Policy Hasn’t Kept Up

Three things have shifted in the last few years that quietly made most farm insurance policies inadequate. Most producers didn’t notice. Carriers don’t send a letter when the math stops working.

Construction costs are the first. Construction material prices rose 6.2% across 2025 — the largest single-year increase since the post-Covid spike in 2021 — according to Bureau of Labor Statistics Producer Price Index data reported by ConstructConnect. Steel bars, plates, and structural shapes climbed 12.1%. Aluminum mill shapes jumped more than 30% on tariff pressure. The Dairy Challenge 2022 benchmark pegged a basic freestall at roughly $3,500–$7,000 per milking stall depending on parlor and equipment build-out. Lactanet’s 2023 survey of 29 insulated dairy barns in Quebec put median costs at $101 per square foot total, $60.10 per square foot building only, $18,160 per head all-in, and $7,100 per cow in equipment alone. Layer the 2025 materials escalation onto that 2022–2023 baseline and rebuild numbers are running well above what most policies were priced to cover.

The replacement heifer market is the second. CoBank’s Knowledge Exchange reported in August 2025 that U.S. dairy heifer inventories have already hit a 20-year low and will shrink by an estimated 800,000 head over the next two years before any rebound in 2027. CoBank’s Corey Geiger flagged that heifer prices had already reached record highs and “could climb well above $3,000 per head.” Trade-media reporting through spring 2025 puts peak-market Holstein springer prices at $4,000–$4,200. If you have to replace cows fast after a disaster, “average” isn’t the number you pay. The market is. And the market is expensive.

The third shift is the quiet one. Farm policies don’t automatically update to either of those realities. Per-building replacement values are set at underwriting and only move when you proactively ask for a reappraisal. Some policies carry inflation-guard or auto-adjust endorsements, but most standard farm packages don’t include them by default — which is why the audit call matters. Maximum indemnity periods on business interruption coverage default to 12 months, a number calibrated back when a standard dairy rebuild fit inside that window. The gap shows up when the adjuster does.

How This Plays Out on Real Farms

Run the numbers on a 210-cow herd. A well-managed Holstein herd producing at 85 lbs/day puts roughly 17,850 pounds of milk in the tank daily — a pace above USDA NASS’s national average of about 65 lbs/cow/day across all breeds, which is why we’re calling it well-managed, not average. At USDA AMS’s March 2026 Class III price of $16.16/cwt, that’s $2,885 in daily gross milk revenue. Weekly, call it $20,200. Monthly, about $86,500. April 2026 Class III futures were trading around $16.84 as of mid-April; the USDA final print follows at month-end.

Now layer in the disruption math. Standard farm BI kicks in after a 48–72 hour waiting period and runs for a 12-month maximum indemnity period on most policies. In Sedgwick’s February 2024 publication “Maximum Indemnity Period: Is 12 months long enough?”, the firm’s major loss specialists make the case explicitly: policyholders “should work on the assumption of a total loss” and factor in a full recovery period, because rebuilding the physical asset is only phase one — winning back revenue or customers is phase two, and the phases compound. Farmers Weekly’s Business Clinic makes the dairy-specific version of the same point bluntly: “For larger, more complex dairy units 24 months may be needed to rebuild and re-establish a herd.” Those extensions have to be proactively bought. Unless you raise it, many policies renew at the default 12-month MIP out of habit.

What Your Policy Probably Says vs. What the Rebuild Actually Costs

Coverage elementDefault policy assumption2026 realityGap
Freestall replacement (80-stall unit)Indexed to pre-2023 build figuresPer Lactanet 2023: median $18,160/head all-in on insulated barns; equipment alone at $7,100/cowScales with cumulative 2023–2026 escalation
Construction input escalationLocked at last appraisal6.2% materials increase in 2025 alone per BLS PPITens of thousands to six figures depending on appraisal age
Business interruption period12 months MIP18–24 months per Sedgwick and Farmers Weekly guidance for complex dairies6–12 months uncovered
Livestock indemnity per adult cow$1,681.88 via USDA FSA LIP (2025 schedule)$3,000+ per head per CoBank; $4,000–$4,200 peak spring 2025~$1,300–$2,500+ per head
Gross milk revenue at risk, months 13–18Not covered~$519,000 on a 210-cow herd~$519,000 ← The Kill Zone

If a rebuild runs past the 12-month mark, the missing months 13 through 18 represent roughly $519,000 in uninsured gross milk revenue on a herd this size. One caveat worth naming up front: BI policies typically pay gross revenue minus saved expenses, so the actual out-of-pocket shortfall moves with feed, labor, and repair savings during the disruption. The $519,000 is the top-line revenue hole, not the net gap. Even so, the net still lands in six figures on a herd this size. Call it the kill zone: the window where no program, no neighbor, and no GoFundMe covers the difference. Only a correctly written policy does.

And this math scales. A 500-cow operation running the same 85 lbs/day at $16.16/cwt is putting about $206,000 in monthly gross revenue through the parlor — double the exposure per month the default MIP leaves uncovered. Scale doesn’t protect you here. It widens the gap.

What LIP Doesn’t Cover: The Genetic Premium Your Policy Ignores

Now the second gap — and this one hits Bullvine readers harder than most. The USDA Livestock Indemnity Program pays $1,681.88 per adult dairy cow lost to a qualifying disaster under the 2025 rate schedule. The 2026 table hadn’t been released as of publication; historically, LIP rates update mid-year based on prior-year fair market values.

That $1,681.88 is calculated on an industry-average market value for a generic adult dairy cow. It doesn’t distinguish between a GP-83 first-calver you bought off a truck and a VG-88 two-year-old carrying a +2800 GTPI that you’ve spent three generations building toward. If you lose that animal in a tornado, LIP pays $1,681.88. Period. The pedigree, the classification score, the genomic premium, the flush potential — none of it exists in the indemnity formula.

Market replacement springers are running $4,000–$4,200 for average genetics at peak, per spring 2025 trade-media reporting. But if you’re rebuilding a herd with above-average genetic merit, the replacement cost per head isn’t $4,000. For genomic-tested, classified cows — the kind many Bullvine readers are building — market replacement routinely runs two to four times the commodity springer price, and for the top end of the market, much higher. The Amplify 2026 sale averaged $8,652 across 124 lots — roughly double commodity springer pricing. Move up one tier and the 2024 World Classic Holstein Sale at World Dairy Expo averaged $30,245 across 55 lots, with a $205,000 IVF session topping the board. Best of Triple-T & Friends in May 2025 hit $78,500 on Ms Milksource Sunday-ET, an All-American class winner Tattoo daughter. That makes LIP not a recovery mechanism but roughly 42 cents on the dollar at commodity replacement, and materially less — potentially 12–21 cents on the dollar — for a genetically invested herd. For every cow lost and replaced, the farm eats the rest.

Standard farm insurance livestock coverage doesn’t typically distinguish by genetic merit either — not unless you’ve specifically scheduled individual high-value animals, which most 200-cow operations haven’t done. If you’ve never asked your agent whether your livestock coverage is blanket or scheduled, and whether it pays market value or a flat sublimit, this is the week to find out.

The Mechanics Behind the Outcomes

It’s not random. It’s how the system was built.

Farm insurance is priced against historical average losses. Reinsurance models, per-building sublimits, and MIP caps were calibrated against a decade of claims data from an era when construction costs were flatter and ag contractors more available. Those assumptions haven’t updated at the pace the underlying economics have. The policy you signed three years ago is protecting a farm that no longer exists at those numbers.

Federal disaster programs, meanwhile, run in isolation. LIP, FSA Emergency Loans, SBA EIDL, and crop insurance — four different agencies, four different timelines, four different sets of eligibility rules, and no coordinated intake. USDA’s One Farmer, One File initiative launched at 2026 Commodity Classic is working to streamline digital services across FSA, NRCS, and RMA, but completion is targeted for 2028. A producer in active recovery today still has to navigate all four programs independently while managing a displaced herd, a construction project, and a cash-flow hole. The system rewards sophistication at exactly the moment operators have the least capacity for it.

And there’s a piece nobody talks about at the Farm Bureau meeting: your lender isn’t your friend when the barn is flat. They’re a risk manager. Ag lenders use internal risk classification systems, and a disaster-recovery loan can quietly move to a watch list or “Special Assets” classification. Disclosure timing varies by lender. Borrowers who ask directly typically get straightforward answers. Borrowers who don’t ask often don’t find out until their loan terms change underneath them — interest rate, reporting requirements, and collateral scrutiny can all shift once the file moves to a different desk. The bridge-financing conversation that could’ve happened easily in month 2 gets noticeably harder in month 10.

None of this is rocket science. It’s just the work nobody does until the wind hits.

How Much Does the 20-Minute Phone Call Actually Save?

Depends where your current coverage sits relative to your real exposure. But the order of magnitude is consistent across most mid-size dairies that haven’t reviewed their policies in three or more years.

On the structure side, a construction cost gap against a $300,000 barn scales directly with the cumulative escalation since your last appraisal — likely in the tens of thousands on a barn that size, potentially six figures if the appraisal is five-plus years old. BLS PPI put 2025 materials inflation at 6.2%. On the MIP side, stretching from 12 to 24 months on a 210-cow operation protects roughly the same six-figure range as the $519,000 gap walked through earlier — the back half of a slow rebuild where the default policy has already tapped out. Combined, the phone call plus a modest premium adjustment closes a six-figure exposure currently sitting on your balance sheet as unacknowledged risk. That’s a better ROI than most decisions you’ll make this quarter.

Is Your Mutual-Aid Network Real, or Is It a Hope?

Every producer in tornado country has a mental list of neighbors they’d call. Fewer have actually confirmed those neighbors have the capacity, the facility space, and the willingness to absorb 50–100 head on 12 hours’ notice. Fewer still have had the conversation explicitly enough that the neighbor knows to pick up the phone at 11 PM on a Tuesday.

Per public reporting, the Hulls had Noah Heckman, Stephanie Schafer, Lane Grieser, and a neighbor in North Ionia who could house the entire 210-cow herd. Real network. It showed up. For most producers, the answer to “who boards my herd for 6 months if the barn’s gone tomorrow” is a name, not an agreement. Those aren’t the same thing. Write down the agreement. Exchange numbers. Document the capacity. After the siren, you can’t build the relationship fast enough.

Element“I Have a Name”A Real Agreement
Contact confirmed?Maybe — you assume they’d answerCell number in your phone, verified in last 6 months
Capacity confirmed?Assumed based on farm sizeExplicit: “I can take 50 head in the freestall for up to 90 days”
Timing confirmed?“They’d come if I called”Explicitly agreed: picks up at 11 PM on a Tuesday
Herd biosecurity discussed?❌ Never✅ Health status, vaccination protocols exchanged
Feed/labor cost arrangement?Assumed informalWritten: cost-sharing or reciprocal commitment documented
Lender/insurance notified?❌ Unknown✅ Listed as contingency in your insurance file
Michigan AgMediation contact?❌ Unknown📞 800-616-7863 on file

Options and Trade-Offs for Farmers

Four practical paths for producers who want to close these gaps before they turn into active problems.

Path 1 — The 20-minute coverage audit (do this within 30 days). Call your ag insurance agent this week and ask three specific questions: (1) What is the replacement cost per building on my policy, and when was it last updated? (2) What is my maximum indemnity period for business interruption? (3) What does a livestock loss claim actually pay on cows that are unrecovered versus confirmed dead?

Pro Tip: Ask your agent one more question: “If I have a total loss today, do I have a Replacement Cost or Actual Cash Value policy?” If they say ACV, start shopping. An ACV policy insures depreciated value — the farm as it existed in 2018, not the farm you’d have to rebuild in 2026. That single distinction can be the difference between a six-figure gap and a manageable rebuild. Replacement Cost coverage pays what it actually costs to rebuild at today’s prices. ACV pays what your barn was worth minus years of wear. You don’t want to find out which one you have after the adjuster shows up.

Path 2 — Request a replacement cost appraisal. If your last appraisal is more than three years old, construction escalation has likely opened a meaningful gap between insured value and rebuild cost. BLS PPI data — via ConstructConnect — puts 2025 construction materials inflation at 6.2%, the fastest single-year rise since 2021, with specific items like steel and aluminum running well higher. Makes sense for any farm with meaningful capital infrastructure. Requires a formal appraisal request and possibly a premium adjustment. The limit: ask for the quote before committing. Premium increases may be modest or meaningful depending on how much coverage you actually need to expand.

Path 3 — Extend your MIP to 24 months. Sedgwick’s major loss team and Farmers Weekly’s Business Clinic both make the case that 18–24 months is the realistic indemnity window for complex dairy rebuilds. Makes sense for any farm with specialized ventilation, robotic or parallel milking systems, or multi-structure exposure. Requires a proactive ask at renewal. The premium increase is usually modest. The coverage difference can run into six figures.

Path 4 — Document your mutual-aid network in writing. Identify two neighbor farms willing to take 50–100 head on 12 hours’ notice. Get their cell numbers in your phone. Exchange basic herd inventories so confirmations move fast. Makes sense for every farm in tornado, flood, or fire country. Requires a real conversation, not an assumption. The limit: goodwill and capacity aren’t the same thing — confirm both. Michigan producers can also loop in the state’s Agricultural Mediation Program (800-616-7863) for any disaster-related lender or neighbor-aid dispute that can’t be resolved at the kitchen table.

Key Takeaways

  • If your policy’s per-building replacement value hasn’t been updated in three years, assume a meaningful construction gap and request a reappraisal this month. BLS PPI alone put 2025 materials inflation at 6.2%.
  • If your business interruption MIP is still 12 months, get a quote on 24. Sedgwick and Farmers Weekly both point to 18–24 months as the realistic rebuild window for complex dairies.
  • If you don’t know whether you carry Replacement Cost or Actual Cash Value coverage, find out before your next renewal. ACV protects a depreciated barn, not the one you’d have to build.
  • If your livestock coverage is blanket rather than scheduled, high-value genetics typically aren’t protected — a VG-88 cow and a GP-83 cow often pay out the same under standard farm policies. Confirm with your agent before assuming your genetic investment is covered.
  • If you don’t know that LIP pays $1,681.88 per adult dairy cow, you can’t model the out-of-pocket gap against CoBank’s $3,000+ heifer forecast — let alone replacement for an Amplify 2026-tier lineup averaging $8,652 or a World Classic-tier lineup averaging $30,245.
  • If your mutual-aid network is a list of names rather than a set of confirmed agreements, treat it as a hope, not a plan.
  • If you haven’t asked your commercial lender how your loan classification changes in a disaster-recovery scenario, you’re flying blind on a conversation that happens quietly around month 8.
  • If you can’t name an operator in your region who has completed a full post-disaster dairy rebuild, find one through Farm Bureau or your co-op before you need them. Their pattern recognition is worth more than any program brochure.

The community that showed up for Janet Hull on April 15 was extraordinary. But here’s the part nobody says out loud: your neighbors will bring casseroles and cattle trailers for the first 48 hours. They aren’t writing a $519,000 check in month 13. Only you — and a correctly written policy — can do that. Find out your number before your neighbor finds out theirs.

Next week in Bullvine Weekly: the full replacement cost audit framework by herd size and structure type — the exact questions to bring to your agent, the documents to request, and the thresholds that tell you whether your policy is keeping pace with 2026 construction costs. That’s where the real numbers live.

Sourcing note: This article is based on public reporting from Fox 17, WKAR, WWMT, and the McClatchy wire (Kansas City Star). Class III price per USDA AMS Announcement of Class and Component Prices (March 2026). LIP rate per USDA FSA 2025 Livestock Indemnity Program fact sheet. Construction cost data per Bureau of Labor Statistics Producer Price Index (2025) as reported by ConstructConnect (February 2026). Dairy barn construction cost benchmarks per Lactanet 2023 survey of 29 insulated Quebec dairy barns and Dairy Challenge 2022 building cost estimates. Heifer market data per CoBank Knowledge Exchange, “Dairy Heifer Inventories to Shrink Further Before Rebounding in 2027” (August 27, 2025). Business interruption guidance per Sedgwick, “Maximum Indemnity Period: Is 12 months long enough?” (February 11, 2024) and Farmers Weekly Business Clinic (March 28, 2022). Sale averages per Amplify 2026 (February 27, 2026), 2024 World Classic Holstein Sale at World Dairy Expo, and The Best of Triple-T & Friends 2025. Milk production context per USDA NASS. The Bullvine has not spoken directly with the Hull family. If Janet, Bryan, Ryan, or Drew would like to share their perspective for follow-up coverage — or request a correction on anything in this piece — we welcome the conversation.

Learn More

The Sunday Read Dairy Professionals Don’t Skip.

Every week, thousands of producers, breeders, and industry insiders open Bullvine Weekly for genetics insights, market shifts, and profit strategies they won’t find anywhere else. One email. Five minutes. Smarter decisions all week.
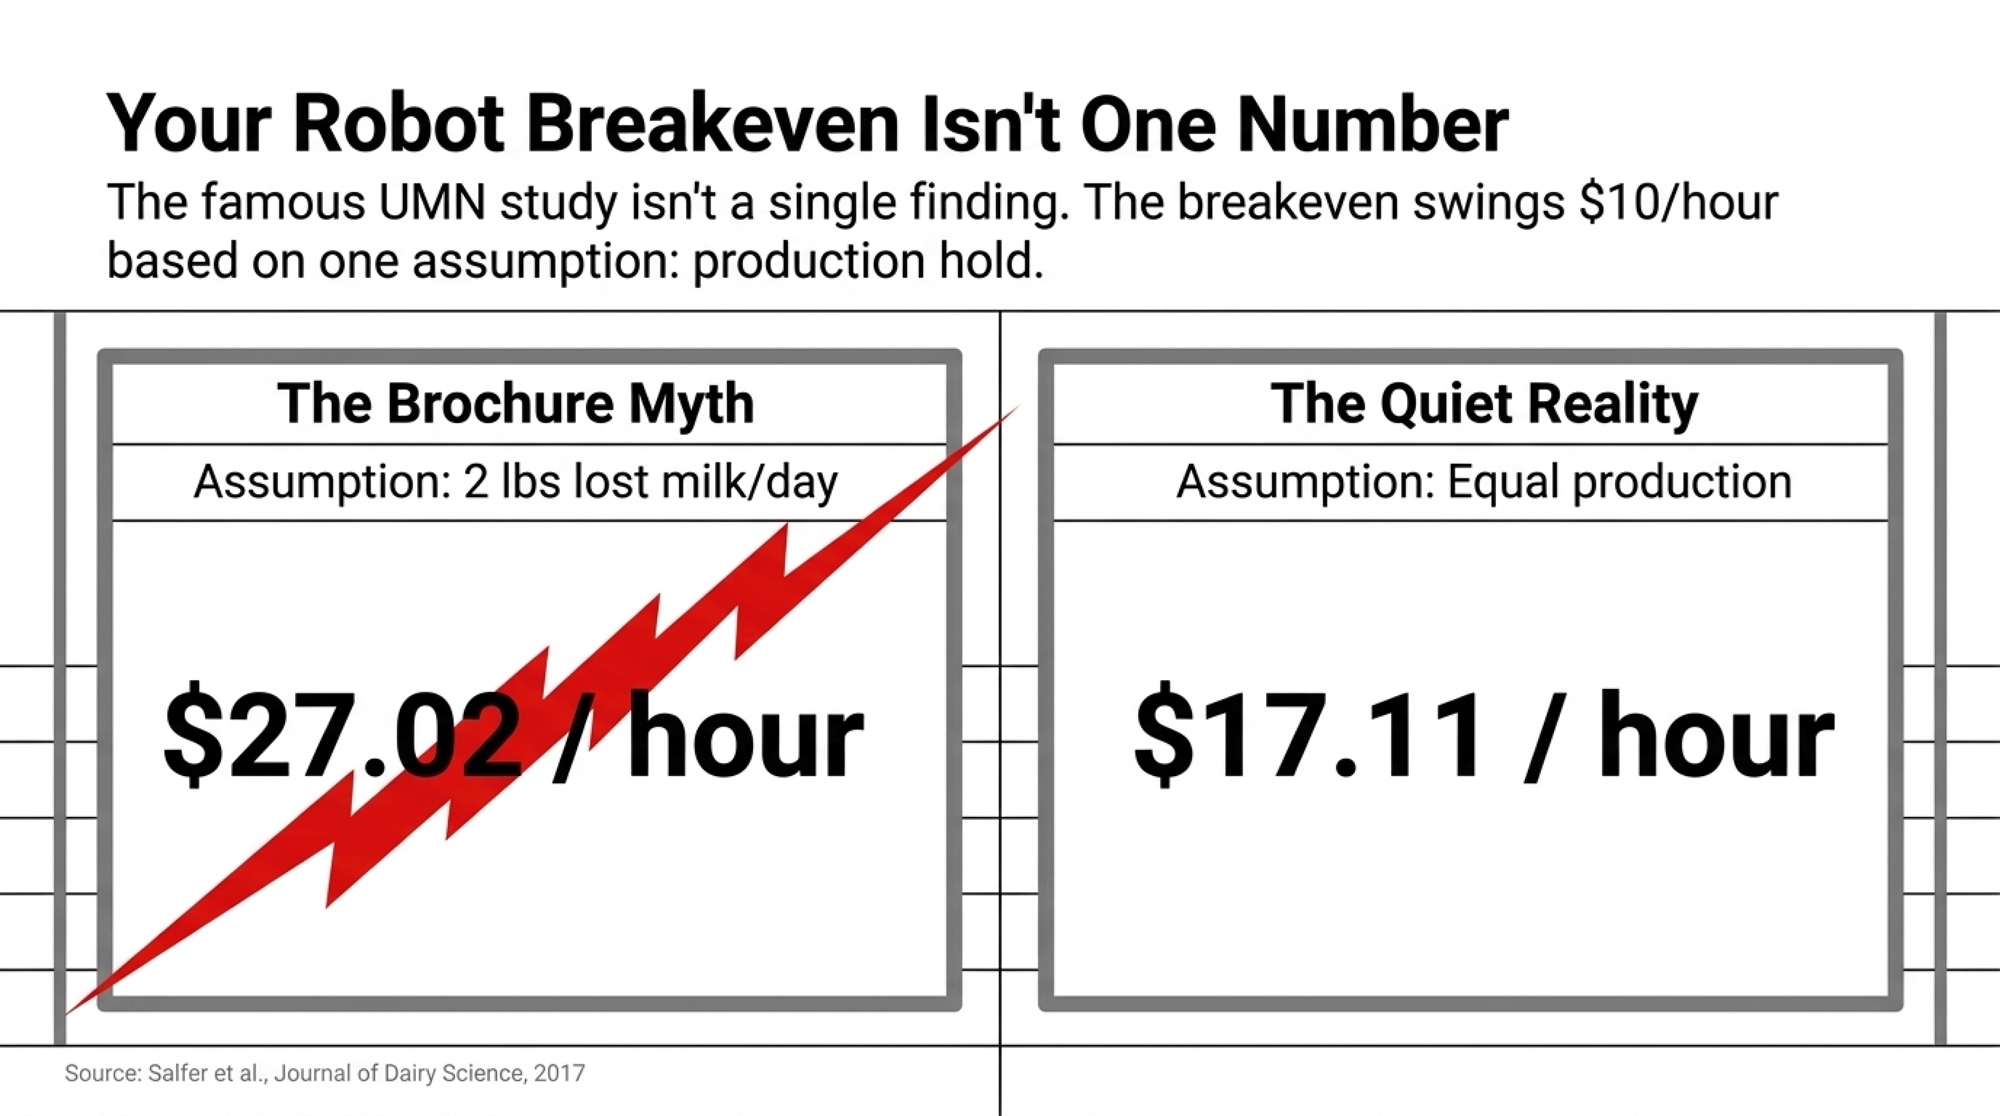
NewsSubscribe
First
Last
Consent

$60,000 an Acre: A Fortune 50 AI Company Offered the Huddlestons $26 Million for Their Kentucky Farm. They Refused.

In Mason County, up to $60,000 an acre was on the table for working farmland — and at least four families still walked away, forcing every serious producer in a growth corridor to ask what their own ground is really worth.

Ida Huddleston is 82 and owns 71 acres of farmland outside Maysville, Kentucky. Her daughter, Delsia Bare, holds another 463 acres nearby. Together, according to local coverage, the family operates roughly 1,200 acres of ground that has supported them since the 1860s— through wheat in the Depression and working farmland still today.

Last year, a group representing an unnamed Fortune 100 company — described as Fortune 50 in more recent reporting — came looking to buy a big piece of that ridge for an AI data center. WLEX reporting cited by People magazine says the group offered Huddleston $60,000 per acre for her 71 acres and Bare $48,000 per acre for her 463 acres — more than $26 million combined for 534 acres.

“My grandfather and great-grandfather and a whole bunch of family have all lived here for years, paid taxes on it, fed a nation off of it,” Bare told CBS affiliate WKRC. “Even raised wheat through the Depression and kept bread lines up in the United States of America when people didn’t have anything else.”

They said no.

The offers that came with a five-day clock

The Huddleston family’s story hit regional news in mid-March 2026 and went national within days. But the land chase started much earlier — and their neighbors felt the same pressure.

Down the road, cattleman Dr. Timothy Grosser and his son Andy raise cattle on their place along KY 3056. In March 2025, a group representing the same data-center development offered them $35,000 per acre, according to LEX18 — nearly $8 million for their farm.

“They stressed that time was of the essence and they wanted responses really fast, like within the next five days,” Andy told LEX18. Despite the money and the rush, he was blunt: “We do not want to sell. The farm is my dad’s, and it means everything to him.”

Local 12’s segment on the Grossers emphasized the same theme: that kind of money “can buy a lot,” one line went, but Dr. Grosser made it clear it couldn’t buy what the place means to him.

Local 12 also reported in late March 2026 that the company’s representatives now have contracts “ready to go” on 28 properties as part of the proposed data-center complex. The company itself hasn’t been publicly identified “because of nondisclosure agreements,” the station said.

So you’ve got a Fortune 50–caliber tech client that no one is allowed to name yet, dozens of farms under contract, and a handful of families — like the Huddlestons and the Grossers — who’ve decided they won’t cash out, even at numbers that would make most advisors choke on their coffee.

“It’s not a business deal, it’s mind harassment.”

Huddleston didn’t sugarcoat how the process felt. In an interview with NBC affiliate WLEX, she described months of pressure in plain language: “What they’ve proposed and carried on, it’s not a business deal, it’s a mind harassment.”

She also told WKRC she doubted the data center would deliver the kind of jobs and growth its boosters promised. “It’s a scam,” she said in that interview, according to TechCrunch and WKRC’s original report. These are Huddleston’s characterizations of the proposals she received, reflecting her experience as a landowner who’s been repeatedly approached. The Bullvine hasn’t independently investigated the company’s economic claims, and the company itself hasn’t been publicly identified.

Bare talked less about the meetings and more about what the land means. “There’s nothing that can destroy me if I’ve got this land,” she told WKRC.

Huddleston has been just as blunt about how she thinks farmers are being treated in the process. “They call us old stupid farmers, you know, but we’re not,” she told WKRC in a separate segment. “We know whenever our food is disappearing, our lands are disappearing, and we don’t have any water — and that poison. Well, we know we’ve had it.”

Whatever you make of their language, there’s no question they’re speaking from long experience, not from a tweet. When a family that fed people through the Depression and kept bread on other tables says the money doesn’t move them, that hits differently than a talking point in a planning meeting.

The 2,080-acre plan: what’s actually coming to Mason County?

On the power side, the outlines are more concrete than the company name. East Kentucky Power Cooperative owns the Spurlock Station power plant in Mason County, a four-unit coal facility capable of generating about 1,608 megawatts— a little over 40 percent of EKPC’s total capacity. Planning documents from regional grid operator PJM show EKPC studying new transmission and substation options near Maysville, including a new Mason County substation tied into a 345-kV line to serve a potential large industrial load.

In a March 19, 2026 opinion piece in Kentucky Living and Building Kentucky, EKPC president and CEO Don Mosierwrote that the co-op has been in talks “for more than a year” with a Fortune 100 company evaluating a data-center site near Maysville and Spurlock Station. Mosier said any such customer would be responsible for paying the costs of required transmission upgrades under EKPC’s tariff.

At a special meeting at Maysville Community and Technical College, attorney Tanner Nichols of FBT Gibbons outlined a plan for a six-building “hyperscale” data-center complex on more than 2,080 acres, with about 2,000 construction jobs and 400 permanent positions, at a cost of more than 5 million — costs he told the commission the company would cover 100 percent. Coverage from WEKU described the company as a “Fortune 50 tech firm,” while WCPO summarized it as “Fortune 500” in a separate report from the same hearing. For consistency, this article follows WEKU’s “Fortune 50” phrasing and flags the discrepancy for readers.

Opponents, including We Are Mason County treasurer Janet Garrison, argue the permanent job number could be far lower. “We are not anti–data center or anti–progress at all,” she told Realtor.com. “But we want this thing to go in an industrial park. They want farmland, and that’s just not a very efficient use of 2,000 acres when they might only hire 50 people.”

Attorney Hank Graddy, representing residents, pressed Nichols on why the public had to address questions to an attorney for the industrial development authority and not directly to the company itself. A grassroots citizens’ group called We Are Mason County filed suit on March 27 against the Mason County Fiscal Court and Planning Commission, arguing the rezoning that enables the data center violates the county’s comprehensive plan and that “zoning without planning is illegal.”

For any dairy or mixed-livestock producer, this isn’t just a tech story in Kentucky. It’s about whether land that grows your forages — or your neighbor’s corn silage and hay — ends up under barns and pivots, or server halls and parking lots. When 534 acres of mostly working ground disappear into an industrial site, you’re not just losing asset value. You’re punching a hole in the local forage base that might be impossible to patch later.

What Does $26 Million Buy That 534 Acres of Kentucky Farmland Can’t?

Here’s where the barn-math gets real, and it starts with the fact that the offers were not one flat number.

Based on WLEX reporting cited by People magazine:

  • Huddleston’s 71 acres at $60,000/acre ≈ , $4,260,000.
  • Bare’s 463 acres at $48,000/acre ≈ , $22,224,000.

Together, those two offers total roughly $26.5 million for 534 acres.

Now, stack that against what farmland is usually worth. USDA’s 2024 Land Values Summary puts average U.S. farm real estate at $4,170 per acre, with cropland at about $5,570 and pasture at $1,830. Kentucky-specific data puts average farm real estate around $5,300/acre and cropland near $6,220/acre. Bare herself told WKRC that land in Mason County is valued at “about $6,000 an acre,” and that the offer she received was roughly ten times that amount.

If you use a ballpark $6,000 per acre as a benchmark for good Kentucky cropland — consistent with both USDA data and Bare’s own description of local values — the math looks like this:

  • At that ag value, 534 acres ≈ $3.2 million.
  • The AI offer of ≈ $26.5 million is roughly 8.3× that number.

Or, said differently: the company compressed the land value of more than 4,400 acres of average U.S. farmland into one family’s 534-acre footprint.

Now switch from asset values to income, because that’s the part you live on.

If the family took the .5M and invested it at a conservative 5% annual return, that portfolio could throw off about .325 million a year before tax. No drought risk. No $4 diesel. No 4 a.m. milking unless somebody wants to get up anyway.

There’s no single “standard” net-income-per-acre figure for Kentucky, but extension budgets and Census-level data suggest a lot of mixed grain/forage acres end up in the low hundreds after expenses in an average year. To keep this useful, not hypothetical, treat $150–$400 per acre as a rough net range you can swap your own numbers into.

  • At $250 net/acre, 534 acres × $250 = $133,500/year net farm income.
  • At $400 net/acre, 534 acres × $400 = $213,600/year.

Compare that to the $1.325M passive return. You’re talking about turning down something like six to ten times your likely annual net, every single year, for as long as you’d hold the investments.

Over 30 years, without even compounding that 5%, the simple math is:

  • Passive: $1.325M × 30 = $39.75M.
  • Farm net: $133,500–$213,600 × 30 = $4.0–$6.4M.

Here it is side-by-side:

Ag Value vs. AI Tech Offer (Huddleston–Bare, 534 Acres)

MetricWorking Farm (Ag Value)AI Data Center Offer
Price Per Acre$6,000 (ballpark benchmark, in 2024 KY cropland range) $48,000–$60,000 (Bare at $48k, Huddleston at $60k)
Total Asset Value (534 acres)~$3.2 million~$26.5 million
Annual Income~$134k–$214k (net farm income at $250–$400/acre, illustrative)~$1.325 million (5% return on $26.5M)
30-Year Total (no compounding)~$4.0–$6.4 million~$39.75 million
The Multiplier~8.3× (offer vs. farm-use value)

On a yellow pad, that looks like a once-in-a-lifetime chance to cash out, erase debt, fund retirement, and maybe even restart somewhere cheaper if you wanted to. For a lot of operations, it would be.

But you’d also be permanently trading control over this dirt — this ridge, these fence lines, that water — for a brokerage balance somewhere else.

If you’ve just poured serious money into new barns, parlors, robots, or a creamery, that math gets even more brutal. High per-acre offers can blow up the amortization schedule you built for that infrastructure. Suddenly, you’re wondering whether to walk away from a system that hasn’t had time to earn its keep, just because the ground underneath it is now worth more to servers than to cows.

From what Bare and Huddleston have told reporters, keeping their family’s ground in production still matters more to them than what any spreadsheet says those acres could generate in passive income. You don’t have to land on the same answer. But you do need to know what your own numbers say before a truck pulls into your lane.

Is Your Estate Plan Ready for a $60,000-Per-Acre Offer You Didn’t Ask For?

Most farm estate plans quietly assume your land will be valued somewhere near its agricultural use value. They weren’t built for a world where one project takes land from $6,000/acre to $48,000–$60,000/acre a couple of miles away.

Kentucky has an agricultural use-value system for property tax, where cropland assessments are based on capitalized rental income and typically work out to a few hundred dollars per acre, not full market value. That helps keep annual tax bills in line with what the ground earns. It doesn’t stop eye-popping industrial sales from influencing how your lender, your non-farming heirs, or a future buyer thinks about what the place is “worth.”

When one or two parcels in a township move at those levels, the ripple effects get ugly:

  • Even with use-value on the tax rolls, assessors and boards still see those comps, and over time that can change how they think about “updating” values.
  • On paper, the book value of your estate can jump far beyond what your operation’s cash flow supports.
  • If only one heir wants to farm and the others want a buyout, that farming heir could be staring at buyout numbers pegged to data-center comps, even though the ground still only earns like farmland.

When families like the Huddlestons and the Grossers refuse these offers, the ripple goes beyond their own payouts — it also shapes whether their kids or grandkids inherit land that’s still valued as farmland, or land priced at data-center comps that could force a sale on someone else’s terms.

The result, whether they’d frame it this way or not, is that they’re preserving a future where farming stays on the table for the next generation — even though it means walking away from a number that would solve a lot of short-term problems.

If you’ve got land in any kind of growth or transmission corridor — the I‑29 and I‑35 corridors, California’s Tulare and Kings counties, the Snake River plain, the I‑5/99 belt, or the outer rings of major Canadian cities — you’re in the same structural game. The names and logos change. The math doesn’t.

In California, dairies in what some now call the “Lost Dairy Valley” have already had to weigh roughly 0‑per‑cowSGMA water costs against 30‑year solar leases — and some concluded the land was worth more as someone else’s energy platform than as their own forage base.

In Wisconsin and the Upper Midwest, processors like Hilmar, Leprino, and Valley Queen have committed about $1.6 billion in new cheese capacity across Texas, Kansas, and the I‑29 corridor since 2020, according to prior Bullvine analysis and company announcements. Over the same stretch, Wisconsin’s dairy farm count fell from more than 15,900operations to fewer than 6,000, a drop of roughly 76% driven by consolidation, labor, and processing pull.

If you’re milking in the northern edge of the GTA — places like Vaughan, Caledon, or Bradford — you’ve watched good dirt along the 400‑series corridors disappear under warehouses and subdivisions. You don’t need an AI logo to know how fast the math can flip under your boots.

The Kentucky story adds AI data centers to that list. The real question isn’t “Would I sell?” It’s “Have we done enough math and paperwork that, if an offer comes, our answer doesn’t blow up the family?”

What Does $26 Million Really Change for Your Operation?

Here’s the economic question farmers are quietly asking as they follow this story: if a number that big lands on your table, what does it actually change?

At one level, it’s obvious. A check in the eight figures:

  • Clears debt.
  • Funds retirement with room to spare.
  • Lets you help kids buy houses, go to school, or start their own businesses.

But it also:

  • Removes your operating base and, in many cases, your collateral.
  • Changes how your family thinks about fairness, inheritance, and obligation.
  • Might take you away from a region where your network, processors, and help are.

That’s why the barn-math in the last section matters. If your place looks anything like the Huddleston/Bare situation, an AI-style offer doesn’t just tilt the scales. It flips them.

The harder part is deciding whether you want to live in the world on the other side of that decision — and whether your current estate plan gives the next generation any chance to answer that question on their own terms.

What Are Your Real Options If a Developer Shows Up?

You don’t get to pick whether a data center, warehouse, or solar farm wants your neighborhood. You do get to decide how prepared you are when their rep calls. Practically, you’ve got three real paths.

Decision PathBest Fit ForKey RequirementFinancial SignalBiggest Risk
Hold — Keep ProducingAt least one heir wants to farm; manageable debt loadWritten family agreement + updated estate plan using ag-use valuationFarm net: ~4k–4k/yr on 534 acCreeping tax pressure as industrial comps arrive nearby
Full Exit — Cash OutNo farming heirs; already near a planned exit windowConcrete reinvestment plan + tax/legal advice before signingPassive: ~.325M/yr at 5% on .5MLoss of operating identity; starting over in a new region at 50+
Partial Sale / ConversionCarve-off possible without gutting forage base or core facilitiesMap-level analysis of feed, manure, expansion impact + lender reviewHybrid: debt cleared + partial passive income streamBoxed in between non-ag neighbours; manure/silage haul complaints
Do Nothing / IgnoreHands all decisions to someone else, usually on a bad day

1. Hold the line and keep producing

When it makes sense:

  • At least one heir genuinely wants to farm.
  • Your debt is manageable at current margins.
  • No per‑acre number anyone can write feels worth trading away the place.

What it requires:

  • A blunt family meeting where everyone agrees that below a certain number, you’re staying, and understands what that means for future buyouts, lifestyle, and retirement timing.
  • An estate plan that uses current‑use or ag‑use valuation tools where they exist and doesn’t leave heirs scrambling if nearby land sells high.

Risks and limits:

  • Property taxes and political pressure can still creep up as industrial projects arrive in the county.
  • You may end up farming next to an industrial site with heavier traffic and neighbors who don’t share farm‑country expectations about noise, manure, or late‑night lights.

2. Take a full exit and restart on your own terms

When it makes sense:

  • None of your kids or key family members want to milk or farm full‑time.
  • Your own numbers already have you eyeing an exit in the next decade.
  • The offer clearly exceeds what you’d reasonably earn from operating another 20–30 years on the same acres.

What it requires:

  • A concrete plan for where the money goes — debt settlement, retirement, a smaller place, off‑farm business, investments — not just “we’ll figure it out.”
  • Tax and legal advice before signing; long‑held land comes with capital‑gains and estate questions you don’t want to discover after closing.

Risks and limits:

  • Once you sell, you’re not a producer anymore. For people who built their identity around the farm, that’s a bigger shock than any interest‑rate change.
  • Moving to cheaper land in a new region means new markets, weather, rules, and community. Starting over at 50+ isn’t simple.

3. Partial sale or conversion — keep farming on fewer acres

When it makes sense:

  • The proposed site can be carved off one side without gutting your forage base or your core facilities.
  • The proceeds can fund debt retirement, facility modernization, or the purchase of replacement ground that has better cash flows.

What it requires:

  • A map‑level view of how losing those acres affects feed supply, manure management, and any long‑term expansion you were planning.
  • Hard conversations with your lender about how they view a farm that’s now part dirt, part liquid assets, and what that does to covenants and collateral.

Risks and limits:

  • You could end up boxed in between non‑ag neighbors and an industrial load, where hauling manure or silage turns into complaint calls to the county.
  • Replacement land that’s further out adds trucking time, fuel, and weather risk into a system that might already be running tight.

Not picking a path — not looking at fair‑market and ag‑use values, not updating your estate plan, not talking to your heirs — is still a choice. It just hands the toughest decisions to somebody else, usually on a bad day.

As you watch your own area, pay attention to forward‑looking signals:

  • New transmission lines or substation plans are hitting county maps.
  • Utility filings talking about a “large industrial load” or “data center.”
  • Land signs on neighboring farms with unfamiliar LLC names instead of local families or operations.

Each one is someone else already doing the math on your neighborhood.

Options and Trade-Offs for Farmers

Do this within 30 days.

  • Pull your county’s planning and zoning agendas, plus your power co‑op or utility filings. Search specifically for “data center,” “technology park,” or “solar” within about 10 miles of your home.
  • Call your accountant or estate attorney and ask one simple question: “If land around me sold for $50,000 an acre next year, what would that do to my taxes and my estate plan?”

Within 90 days

  • Get both a fair‑market appraisal and an agricultural‑use appraisal on your ground. The gap between those two numbers is the same pressure the Huddlestons and the Grossers are staring at — and you need that gap on paper.
  • Sit down with your advisor and update your estate documents so they match today’s land reality, not the values you were carrying 15 years ago.

Within 365 days

  • If you’re in any growth or transmission corridor, put a written family agreement in place about if, when, and at what per‑acre number you’d even consider a non‑ag sale. It doesn’t lock anyone in. It just keeps your kids from having their first real conversation about it at the lawyer’s office.

Key Takeaways

  • If any serious offer on your land comes in at several times recent farm‑land sales in your county, treat it as a strategic decision that affects your heirs — not a side conversation — and run the barn‑math both ways before you say a word.
  • If you’ve got more than one heir and only one wants to farm, assume high‑value industrial comps will make future buyouts far more expensive, and bake that into your estate plan now with written agreements — not just good intentions.
  • If you decide you’ll “never sell,” back that conviction with paperwork: a current appraisal, a use‑value tax strategy where available, and an updated will or trust so your kids aren’t trying to manage big‑number assessments on a farm‑income business model.
  • If you’re already seeing power‑line upgrades, rezoning, or new tech projects within 10 miles, treat that as your 30‑day clock to check local filings, talk to your advisor, and start a family conversation — before someone else writes a number on your kitchen table for you.

The Bottom Line

Based on what Bare and Huddleston have told reporters, their answer, for now, is simple: land’s real value sits in what it grows and what it means, not just what someone’s willing to pay to pave it. They’ve chosen to keep producing food on Kentucky soil instead of trading their ridge for eight‑figure passive income backed by server halls and cooling ponds.

You don’t have to make the same call. But you should know your own numbers well enough that if a Fortune 50 company offered you eight times your current land value tomorrow, you wouldn’t be trying to do 30‑year math in a 30‑minute meeting. If you want the deeper economics — the full SGMA water‑vs‑solar math in California or the structural Dairy Curve that’s shrinking U.S. operations toward 10,000 by 2035 — dive into our Tier 2 and Tier 3 follow‑ups and make sure you’re getting the Bullvine Weekly so those playbooks land in your inbox, not just your feed.

Then ask one more question at your own kitchen table: what’s the real “make‑me‑move” number for your home farm — and have you actually told your heirs, or are you leaving them to guess when the offer shows up?

Complete references and supporting documentation are available upon request by contacting the editorial team at editor@thebullvine.com.

Learn More

The Sunday Read Dairy Professionals Don’t Skip.

Every week, thousands of producers, breeders, and industry insiders open Bullvine Weekly for genetics insights, market shifts, and profit strategies they won’t find anywhere else. One email. Five minutes. Smarter decisions all week.
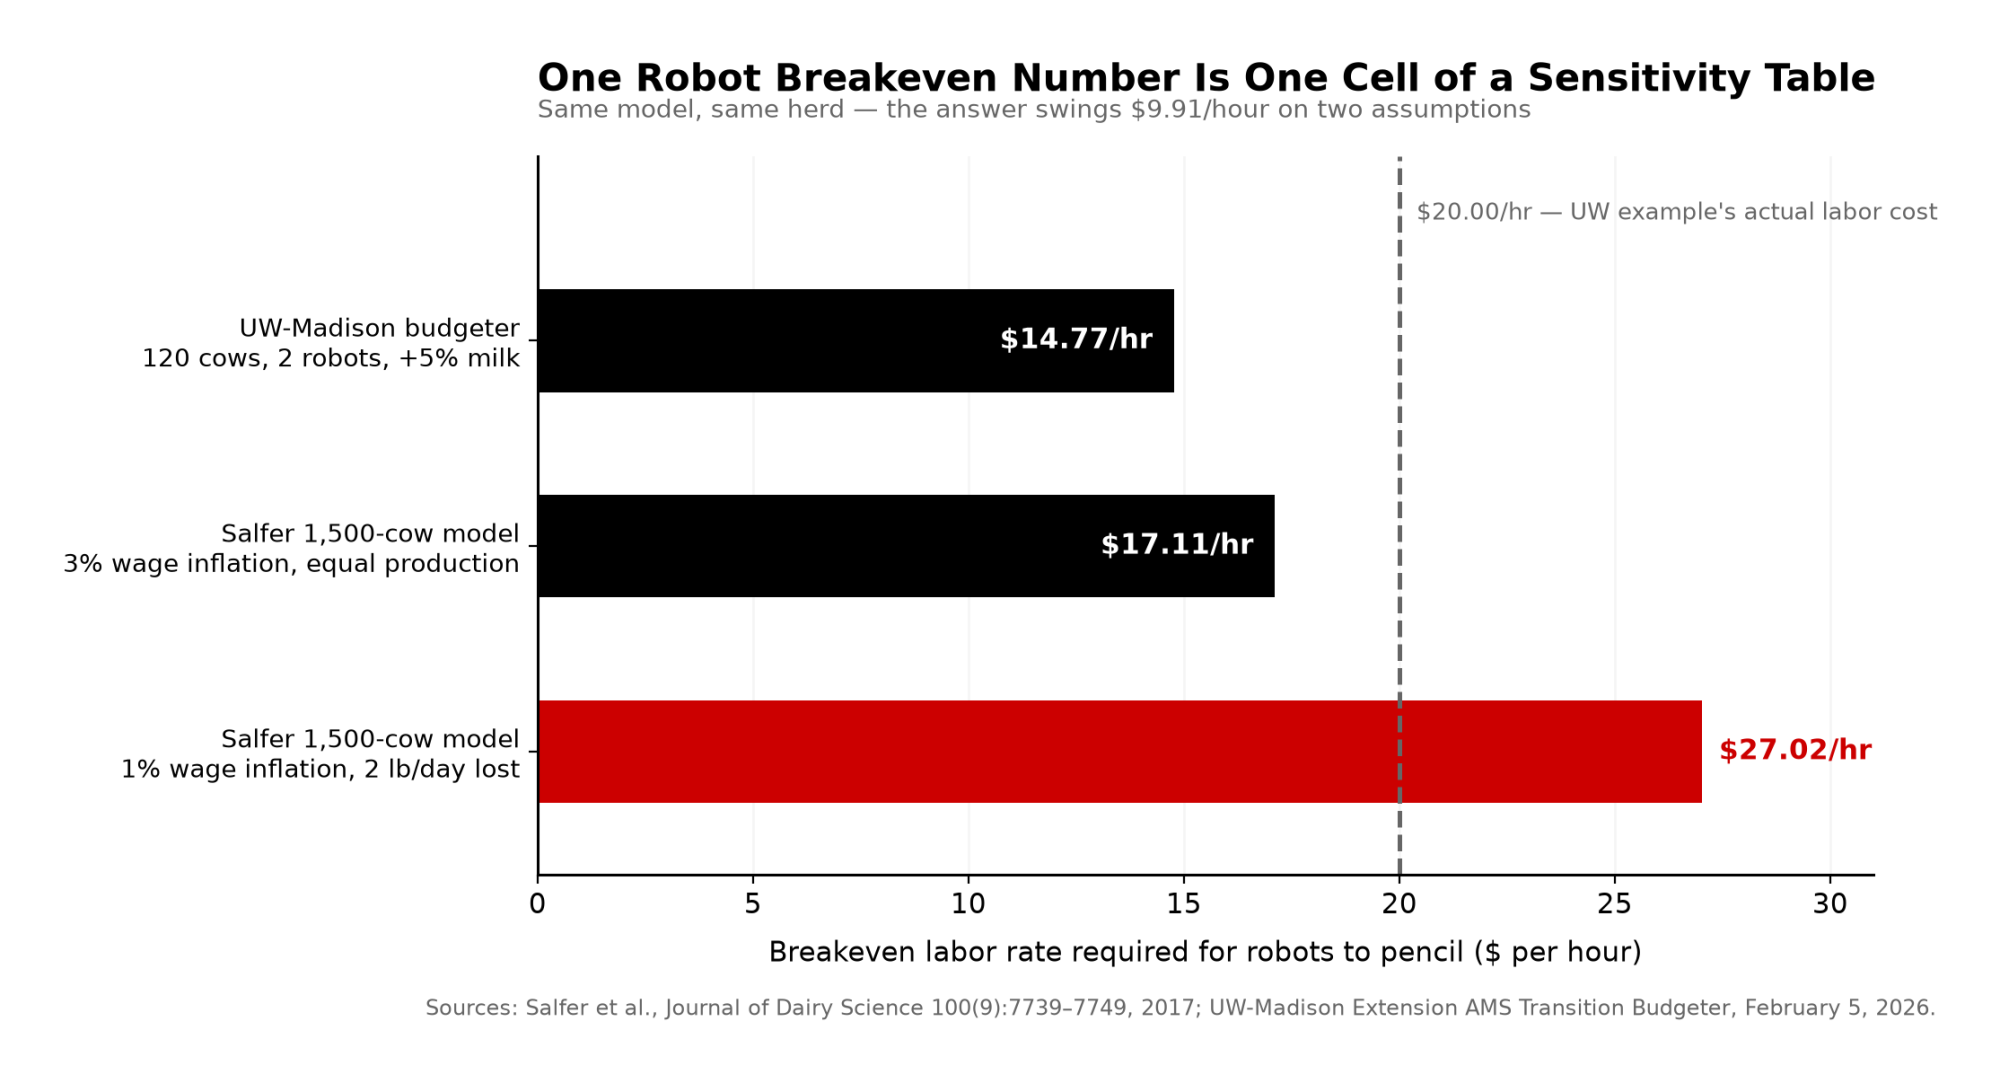
NewsSubscribe
First
Last
Consent

Ted Vander Schaaf’s $147,000 Hit: What the Supreme Court’s Tariff Ruling Means for a 500-Cow Dairy by July 24

The Supreme Court struck down one set of tariffs and set a 150‑day clock. For a 500‑cow herd, the spread is $147,000. Where does your breakeven sit?

Executive Summary: The Supreme Court’s 6–3 ruling in Learning Resources, Inc. v. Trump killed all IEEPA-based tariffs and replaced them, for now, with a 15% Section 122 surcharge on a 150‑day clock that ends July 24. For a 500‑cow dairy shipping 117,500 cwt a year, Cornell economist Charles Nicholson’s model says the difference between tariffs gone, a 15% replacement that sticks, or continued uncertainty is about $147,000 in annual margin — enough to hire a person or cover six months of feed. At the same time, a new U.S.–Taiwan deal locks in zero dairy tariffs, while Canada’s ongoing obstruction of USMCA dairy TRQs now faces less U.S. leverage after the ruling, even as exporters still fight to use roughly 42% of the access they were promised. CBP has collected $133.5 billion in IEEPA tariffs through late 2025, and Penn Wharton estimates up to $175 billion could be refunded with interest, raising a blunt question: will processors keep that money, or pass any of it back down the chain? In the next 30 days, producers need to lock in or adjust 2026 Dairy Margin Coverage before the February 26 deadline; over the next 90–365 days, they should stress‑test breakevens against $18‑class futures, press co‑ops on export plans to Canada, Mexico, and Taiwan, and treat July 24 as a hard decision line for contracts and capital plans. Put simply, the Court didn’t eliminate tariff risk — it turned your milk check into a 150‑day countdown in which standing still is the most expensive option.

Dairy tariff impact

$147,000. That’s the gap between the best and worst scenarios facing a 500-cow dairy between now and July 24 — the day the replacement tariffs expire, or don’t. The Supreme Court’s 6-3 ruling on February 20 in Learning Resources, Inc. v. Trump didn’t end the tariff fight. It moved it to a different legal lane with a ticking clock.

Ted Vander Schaaf milks 1,250 Holsteins near Kuna, Idaho. He told the Senate last week that U.S. trade leverage was slipping — that countries were already gaming the system before the Court weighed in. Four days later, Chief Justice Roberts wrote the majority opinion, confirming what Vander Schaaf had seen in his bulk tank: the legal foundation of the tariff regime had never been solid.

Now every dairy producer in the country faces the same question Vander Schaaf does. Not whether the tariffs are gone—they’re not. Whether the replacement tariffs hold, and what your milk check looks like if they don’t.

What the Court Killed — and What It Didn’t

The ruling was definitive on one point: IEEPA does not authorize tariffs. Period. Roberts, joined by Gorsuch, Barrett, Sotomayor, Kagan, and Jackson, wrote that the power to “regulate importation” as granted to the president in IEEPA does not embrace the power to impose tariffs. The statute contains no reference to tariffs or duties, and no president in IEEPA’s 49-year history had ever used it this way.

What’s gone: every IEEPA-based tariff. The country-by-country reciprocal rates — up to 34% on China, 25% on certain Canadian and Mexican goods, and the 10% baseline on everybody else. All invalidated. The administration issued an executive order the same day stating these tariffs “shall no longer be in effect and, as soon as practicable, shall no longer be collected.”

What’s still standing: Section 232 tariffs (national security — steel, aluminum), Section 301 tariffs (unfair trade practices — existing China tariffs on specific goods), and antidumping/countervailing duties. These operate under separate statutory authority and weren’t touched by the ruling.

[INTERNAL LINK: “The American Dairy Heist: Who Really Owns Your Milk Check” → Suggested anchor text: “the margin chain between your bulk tank and the shelf”]

And then there’s the replacement.

The 150-Day Clock: Why Section 122 Probably Won’t Survive

Within hours of the ruling, Trump announced a 10% tariff on imports from around the world under Section 122 of the Trade Act of 1974. A day later, he bumped it to 15% — the statutory maximum. Section 122 allows temporary import surcharges for up to 150 days to address “fundamental international payments problems.”

Here’s the problem: the U.S. doesn’t have one.

Peter Berezin, chief global strategist at BCA Research, put it bluntly on February 20: “A balance of payments deficit is not the same thing as a trade deficit. You cannot have a balance of payments deficit if you have a flexible exchange rate.” Bryan Riley, director of the National Taxpayers Union’s Free Trade Initiative, made the same argument: Section 122 was written for a fixed exchange-rate world that hasn’t existed since 1973. The statute has never been invoked. Not once in 52 years.

The Peterson Institute for International Economics laid out the technical case in a February 22 analysis. Under a floating exchange rate, potentially insufficient private financial inflows are remedied by currency depreciation, which puts domestic assets and exports “on sale” and precludes a balance-of-payments deficit before it starts. The U.S. has a large supply of attractive financial assets and faces no difficulty financing its current account deficits.

Even the administration’s own lawyers argued during the IEEPA case that Section 122 was no substitute for IEEPA because balance-of-payments deficits are “conceptually distinct” from trade deficits.

So the replacement tariff’s legal foundation is arguably weaker than the one the Court just demolished. And it expires on July 24, 2026 — 150 days from the February 24 effective date — unless Congress votes to extend it. Both the House and Senate have already passed bills disapproving of the IEEPA tariffs. Extension looks dead on arrival.

Rep. Mike Flood (R-NE) underscored the point: “The ruling underscores Congress’s responsibility and obligation to set tariff policy.”

What happens after July 24? The administration has signaled it will initiate Section 301 investigations against multiple trading partners and may accelerate pending Section 232 investigations. Those routes require investigations and findings of fact—a process that can take months, even on an expedited timeline. There will be a gap.

$147,000 Three Ways: What Your 500-Cow Dairy Looks Like Under Each Scenario

Cornell’s Charles Nicholson projected at the January 2025 Dyson Agricultural and Food Business Outlook conference that the combination of tariffs, deportations, and potential nutrition spending cuts could produce a billion loss in U.S. dairy profits over four years. That’s a combined-policy number, not tariffs alone — but tariff-driven retaliation from Mexico, Canada, and China was the biggest single driver.

“If you pick a trade fight with our major export destinations — Mexico, Canada, and China — and they decide to retaliate, that has some substantive negative implications for dairy farms and processors,” Nicholson said.

The SCOTUS ruling scrambled the assumptions underneath that projection. Here’s how the math lands on a 500-cow operation producing 235 cwt/cow/year — 117,500 cwt of annual production. Plug your own herd size, and you can scale these directly.

For context: Class III milk settled at $15.07/cwt on February 19 — the last trading day before the ruling. That’s up from a $14.53 low on February 3, but still well below the $17–18 range where Q2 and Q3 2026 futures are currently trading on the CME.

Scenario 1: Tariffs Effectively Gone (IEEPA dead, Section 122 expires, no replacement)

Retaliatory tariffs from Mexico, Canada, and China unwind. Export demand recovers. Class III and Class IV futures adjust upward as export-driven cheese and powder demand returns to the pre-tariff trajectory. Nicholson’s model suggests milk prices recover by 2027, with the 2025–26 damage partially absorbed.

Estimated price impact: +$0.75 to +$1.25/cwt above current baseline Your 500-cow math: 117,500 cwt × $1.00/cwt midpoint = +$117,500/year

This is the best case—and it’s not guaranteed. It depends on trading partners actually unwinding retaliatory measures, which Ian Sheldon at Ohio State warns is far from certain.

Scenario 2: 15% Replacement Holds (Section 122 survives legal challenge, transitions to 301/232)

The 15% across-the-board tariff stays through July 24. Retaliatory tariffs remain partially in place. Some trading partners renegotiate, others slow-walk. Class III price stays compressed. Input costs (equipment, parts, and some feed additives) remain elevated due to the 15% surcharge.

Estimated price impact: -$0.50 to -$1.00/cwt below pre-tariff baseline. Your 500-cow math: 117,500 cwt × -$0.75/cwt midpoint = -$88,125/year

Scenario 3: Uncertainty Persists (legal challenges, policy limbo, no clear signal)

Section 122 is challenged in court. Trading partners pause compliance with existing deals. Processors can’t price forward contracts. Futures volatility spikes. Co-ops hold back on premiums.

Estimated price impact: -$0.25 to -$0.50/cwt from uncertainty discount alone. Your 500-cow math: 117,500 cwt × -$0.25/cwt (conservative) = -$29,375/year in margin compression — before any tariff-driven price move lands

ScenarioLegal StatusMilk Price Impact (per cwt)Annual Margin Impact (500 cows, 117,500 cwt)What That Buys
1. Tariffs GoneIEEPA dead, Section 122 expires, no replacement+$1.00+$117,500Hired employee + equipment down payment
2. 15% Replacement HoldsSection 122 survives or transitions to 301/232-$0.75-$88,1256 months of feed costs vanish
3. Uncertainty LimboLegal challenges, policy chaos, no clear signal-$0.25-$29,375Used mixer wagon—gone
Spread (Best vs. Worst)$1.75/cwt$147,000The gap between survival and exit

The spread between Scenario 1 and Scenario 2: roughly $147,000 per year on a 500-cow dairy. That’s not a rounding error. That’s a hired employee. A used mixer wagon. Six months of feed.

For Vander Schaaf’s 1,250-cow operation, multiply accordingly. The stakes scale linearly.

Is the Taiwan Deal Safe from the Ruling?

The U.S.–Taiwan trade agreement, signed on February 13, eliminates tariffs on all U.S. dairy products and preempts nontariff barriers. Taiwan is the third-largest destination for U.S. fluid milk exports. USDEC president and CEO Krysta Harden called it a deal that “improves our competitiveness compared to other suppliers.”

Good news: this deal is structurally safe from the SCOTUS ruling. It’s a bilateral trade agreement negotiated under standard trade authority, not an IEEPA executive order. The legal basis is entirely separate.

But context matters. The deal was negotiated while IEEPA tariffs of 20%+ gave the U.S. significant leverage. With the baseline tariff now at 15% under Section 122 — and likely headed to zero after July 24 — Taiwan’s incentive to maintain generous terms may shift. For now, the agreement stands, and it’s a genuine win for U.S. dairy exporters in Asia.

The bigger question is what Ohio State’s Sheldon flagged on February 22: “A lot of countries are now questioning the validity of the deals that they signed.” The EU was already backing away. Countries that negotiated under the threat of 34% tariffs may no longer feel bound by the same terms now that the threat has been invalidated.

For dairy specifically, Taiwan is the bright spot. But it’s a $300 million market, not a $3 billion one. Mexico and Canada are where the volume lives — and both of those relationships just got more complicated.

Canada’s TRQ Gambit Gets New Cover

This is where the ruling connects directly to what Vander Schaaf told the Senate. Canada has been obstructing USMCA dairy tariff-rate quotas since the agreement took effect. Only about 42% of the dairy access the U.S. negotiated under USMCA is actually being utilized — not because American producers aren’t trying, but because Canada’s allocation system effectively locks out retailers, food service operators, and other importers who would actually bring in American product.

The U.S. won the first USMCA dispute panel in January 2022. Canada made “insufficient changes.” The U.S. filed a second dispute. The panel ruled Canada hadn’t acted unreasonably — a devastating outcome for American dairy exporters.

Now the SCOTUS ruling removes the 25% fentanyl-based IEEPA tariff that was the biggest stick the U.S. had against Canada outside of USMCA’s own dispute mechanism. The 15% Section 122 tariff explicitly exempts USMCA-compliant goods, so it provides no additional leverage.

Sheldon’s warning lands hardest here. If countries are questioning the validity of deals signed under IEEPA pressure, Canada has even less reason to move on dairy TRQ compliance. The legal mechanism still exists — but the political leverage that made enforcement credible just evaporated.

For producers whose co-ops or processors export to Canada, this is a 365-day watch item. Canada’s dairy TRQ year runs August 1 through July 31, with allocation announcements typically published in the months prior. If fill rates stay where they are, the $200 million in theoretical access remains exactly that — theoretical.

The Refund Question: $133.5 Billion and Counting

One angle that hasn’t gotten enough attention in dairy media: the Court didn’t just stop future IEEPA tariffs. It invalidated all of them retroactively. Every importer who paid IEEPA duties is entitled to refunds plus interest.

U.S. Customs and Border Protection reported $133.5 billion in IEEPA tariff collections through December 14, 2025. The Penn Wharton Budget Model estimates the total refund liability — including collections through February 2026 and accrued interest — at up to $175 billion. That makes this potentially the largest single government refund event in U.S. history, affecting roughly 301,000 importers across 34 million import entries.

For dairy specifically, processors who imported ingredients, packaging materials, or equipment subject to IEEPA tariffs can file Post Summary Corrections on unliquidated entries or administrative protests on liquidated entries within 180 days. The legal authority for refunds is clear. The timeline for actually getting money back is not — CBP generally liquidates entries within 314 days, and the volume of claims will be enormous. Interest accrues at approximately 3–4% annually from the deposit date, but small businesses are already warning they can’t wait months for bureaucratic processing.

If your processor has been passing through tariff surcharges on imported inputs, ask them directly: when do those surcharges come off, and will any refund savings flow back to the farm gate? The answer will tell you a lot about where you stand in the value chain.

Refund CategoryWho’s EligibleEstimated ExposureTimeline to ReceiveWhat to Ask Your Processor
Imported IngredientsProcessors who paid IEEPA duties on whey, lactose, specialty proteins$8–12B (dairy-specific est.)180–365 days (CBP backlog)“When do tariff surcharges come off our milk check?”
Packaging & EquipmentProcessors, suppliers$2–4B (across food/ag sectors)180–365 days“Will refund savings flow back to farm gate pricing?”
Total IEEPA Refund Pool301,000 importers across all sectors$175BUnclear—largest government refund in U.S. history“Are you sharing refunds, or keeping them above my milk check?”
Direct Farm ImpactDairy producersZero automatic pass-throughDepends on processor transparencyCall your co-op today

What This Means for Your Operation

Timeline WindowKey DecisionAction ItemRisk If You WaitData Point to Watch
Next 30 Days (Now – Mar 24)DMC 2026 enrollmentLock in Tier 1 coverage (6M lbs) at 25% discount for 2026–2031Miss expanded coverage; pay higher premiums in 2027Class III Feb 3 low: $14.53/cwt
Next 90 Days (Now – May 24)Forward contract evaluationModel margin against Scenario 2 (15% tariff holds); consider locking Q3 productionJuly volatility spike when Section 122 expires—contracts tightenCME Q3 2026 futures: $18.26–$18.35/cwt
90–150 Days (May 24 – July 24)Export contract renegotiationPress co-op on Mexico/Canada export commitments; ask about Taiwan volumeCo-op export margin squeeze = lower premiumsSection 122 expires July 24
Next 365 Days (Now – Feb 2027)Strategic repositioningTrack Canada TRQ fill rates (Aug 1 allocation); monitor Section 301 investigations$147K margin spread crystallizes without planCanada TRQ utilization: 42% (still stranded)

Don’t wait for clarity. The 150-day window is the decision window. Here’s what to do with it:

In the next 30 days:

  • Re-run your DMC enrollment math. The 2026 signup deadline is February 26 — two days from now. This year’s enrollment includes expanded Tier 1 coverage at 6 million pounds (up from 5 million) and a new option to lock in coverage levels for 2026–2031 at a 25% premium discount. With Class III sitting at $15.07/cwt and the $14.53 low from early February still fresh, this isn’t optional. Contact your local FSA office today.
  • Call your co-op or processor. Ask two questions: (1) Are they passing through any tariff-related surcharges on imported inputs, and when do those come off now that IEEPA duties are being refunded? (2) What does the 15% Section 122 tariff mean for their export commitments to Mexico or Canada?
  • If you’re carrying equipment or parts debt tied to tariff-inflated prices, check whether you’re eligible for a refund. Your dealer or equipment supplier should know.

In the next 90 days:

  • Model your margin against Scenario 2 (15% replacement holds). Class III Q3 2026 futures are currently trading in the $18.26–$18.35/cwt range on the CME. If those hold, consider locking in a portion of production before the Section 122 expiration creates another volatility spike around July 20. If they soften toward $17, the risk-reward on forward contracts shifts.
  • Watch Section 301 investigation announcements. If the administration fast-tracks dairy-related investigations (such as China dairy ingredients), new tariffs could land before old ones fully unwind.

In the next 365 days:

  • Track Canada’s next dairy TRQ allocation cycle. The TRQ year runs August 1 through July 31, with allocations announced in the months prior. If fill rates stay below 50%, your co-op’s Canadian export margin is getting squeezed, whether you see it on your milk check or not.
  • Monitor whether the Taiwan bilateral actually moves dairy volume. USDEC’s initial framing was optimistic. Check against actual trade data by Q4 2026.
  • If your processor ships to Mexico, ask them what happens to their purchase commitments if the Section 122 tariff goes to zero with no replacement. Mexico’s retaliatory posture could shift in either direction.

Key Takeaways

  • The Supreme Court killed IEEPA tariffs and dropped dairy into a 150‑day, 15% Section 122 experiment that likely can’t stand past July 24.
  • On a 500‑cow, 117,500‑cwt herd, the gap between tariffs gone, a 15% replacement, or ongoing limbo is roughly $147,000 in annual margin.
  • Taiwan is now a zero‑tariff bright spot, but Canada’s USMCA TRQ games just got new cover, leaving as much as 58% of U.S. dairy access to Canada stranded on paper.
  • Importers have paid $133.5 billion in IEEPA tariffs, with refund exposure up to $175 billion — if your processor doesn’t drop tariff surcharges or share savings, that’s real margin left above your milk check.
  • The only safe “wait and see” is on Twitter; on the farm, the next 30–365 days are for re‑running DMC, stress‑testing breakevens against $18‑class futures, and renegotiating contracts with July 24 circled in red.

The Bottom Line

Pull your last three milk checks. Calculate your per-cwt margin at current input costs. Class III hit $14.53 on February 3 — a 52-week low. If that’s not the bottom but the new floor, what exactly are you changing before July 24?

Vander Schaaf told the Senate the leverage was slipping. The Court agreed. What you do with the 150-day window between now and July 24 is the only part of this you control.

Complete references and supporting documentation are available upon request by contacting the editorial team at editor@thebullvine.com.

Learn More

The Sunday Read Dairy Professionals Don’t Skip.

Every week, thousands of producers, breeders, and industry insiders open Bullvine Weekly for genetics insights, market shifts, and profit strategies they won’t find anywhere else. One email. Five minutes. Smarter decisions all week.
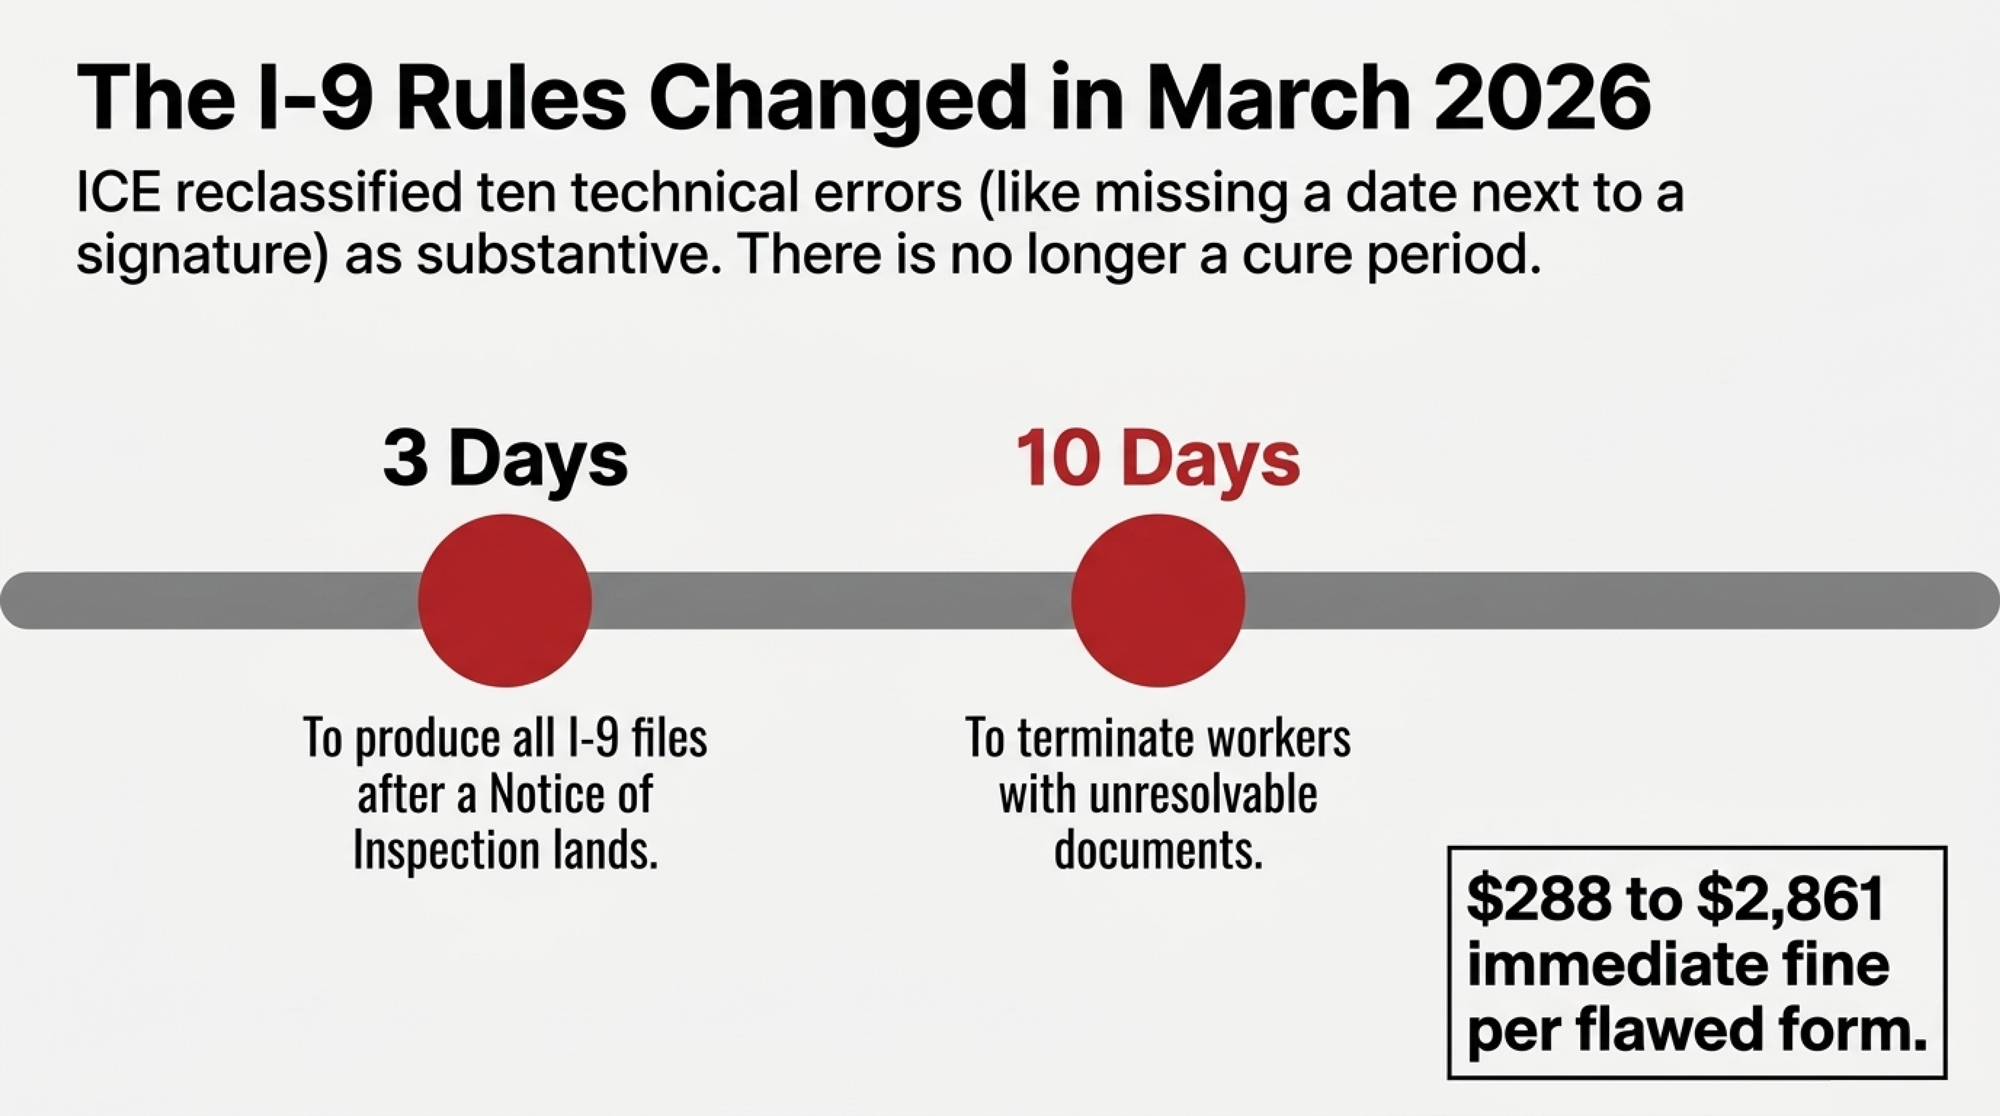
NewsSubscribe
First
Last
Consent

“I Get to Be the Funding”: What 96% of U.S. Dairy Farms Owe to the Spouse With the Town Job

When the median U.S. farm lost money in 2023, it was the job in town—and the person working it—that kept the lights on.

EXECUTIVE SUMMARY: The median U.S. farm lost $900 in 2023. Median off-farm income? Nearly $80,000. And 96% of farm households had someone earning that second paycheck. For dairy families, the job in town isn’t a fallback—it’s often what’s keeping the bulk tank running, the health insurance active, and the show string moving. This piece tackles what happens when the person working that job starts feeling like “just the funding” instead of a partner, and why that identity strain belongs on your risk management whiteboard, right next to milk price and feed costs. Inside: a five-year lookback to tell the difference between bridging a gap and subsidizing a hobby, communication habits that work before resentment calcifies, and the uncomfortable question more couples need to ask—if that town job vanished tomorrow, would you have a dairy business or a very expensive pet? Grounded in AFBF’s April 2025 Market Intel, 2023 USDA ERS data, and a University of Illinois study on farm family mental health, it’s essential reading for anyone whose robot payment, embryo flush, or Madison entry depends on a spouse who’s quietly keeping score.

It’s 6:47 a.m. on a cold Tuesday in March. A heifer in pen three is showing classic hardware-disease signs—off feed, grunting, not right—and the vet is already on the way. Down in the barn, Mike is running the math on magnets, surgery, or a dead heifer, and one more hole in the balance sheet.

Up at the house, Sarah is standing at the kitchen counter in her work clothes, scrolling through an email from HR. Her employer’s health plan is bumping premiums and jacking up the family deductible again. That plan isn’t a perk. It’s how they insure a guy who spends his days under cows, around PTO shafts, and on cold concrete.

Mike and Sarah are a composite—built from real patterns in current U.S. farm data and the stories we hear from farm families. If your household has one partner in the barn and one driving into town every morning, there’s a good chance you’ll see yourselves here. And in 2025, that split life isn’t a side detail anymore. It’s the backbone of how a lot of U.S. dairy farms survive.

The Hard Math Behind the “Family Farm” Story

According to AFBF’s April 2025 Market Intel report “The Other Paycheck,” which draws on 2023 USDA Economic Research Service data for U.S. farm households, about 96% of U.S. farm households earned income off the farm that year. On average, roughly 77% of total household income came from off-farm sources, with just 23% from the farm itself.

Here’s the number that should get your attention: those same 2023 U.S. figures showed median farm income around negative $900 from the farm business, while median off-farm income sat close to $80,000. That doesn’t mean every farm lost money. It does mean that, in the middle of the distribution, the farm itself wasn’t paying the household’s way. The off-farm paycheck was.

When AFBF’s commodity breakdown looked at income sources by sector, dairy stood out. Dairy households derived a much higher share of their total income directly from the farm business than most other sectors—putting dairy near the top for farm-dependent income in that report. Beef, grain, and “other livestock” operations leaned far more heavily on off-farm wages.

On paper, that sounds like dairy is “more self-reliant.” On the ground, it often looks like this:

  • One partner is tied to the herd and facilities around the clock.
  • The other is tied to a job in town because that’s where the predictable paycheck and health coverage live.
  • Both know they’re one bad injury, one layoff, or one ugly milk-price year away from some uncomfortable conversations about debt, succession, and what happens next.

If you’re looking at a robot install, more cows, or a parlor upgrade, that off-farm column needs to be on the same whiteboard as repro, feed, and margin-protection programs like DMC. Planning as if that job and its benefits are guaranteed forever is a risk in itself.

The Off-Farm Spouse: Financial Anchor, Often Invisible

On paper, the farm is “the business.” In real life, the AFBF/ERS numbers say something different: for the median U.S. farm household in 2023, the farm business barely broke even—or worse—while the off-farm income kept the household in the black.

In our composite, Sarah’s paycheck covers more than groceries and school clothes. It often backstops loan payments, covers health insurance, and quietly plugs holes when the milk cheque doesn’t stretch far enough. That job is not optional. It’s a core risk-management tool.

The trap is pretty simple. When your family’s health coverage and basic cash flow depend on one off-farm job:

  • You can’t take career risks the way your non-farm colleagues do.
  • You think twice before pushing back on unreasonable workloads or bad bosses.
  • Changing jobs or reducing hours isn’t just a professional decision; it’s a full-farm risk calculation.

What the Research Shows

A 2023 University of Illinois study on farm households in the Midwest found that about 60% of adults and adolescentsin their sample met criteria for at least mild depression, and roughly half of adults met criteria for generalized anxiety disorder. Debt load and financial stress showed clear connections with depressed mood and anxiety in the families they surveyed. This was a specific sample of farm families, not all farms everywhere—but the patterns match what many producers quietly describe.

That stress doesn’t stay in the yard. The off-farm spouse is carrying both worlds—the town job by day, farm stress by night—and often feels like they’re the only one seeing the whole picture. If that sounds familiar, you’re not alone, and there are resources specifically built for farm families.

“You’re the Farmer. I’m the Funding.”

The money isn’t the only thing that hurts. Identity does too.

The cocktail-party test. You see it at 4-H awards nights, weddings, and breed meetings. Someone asks, “So what do you do?”

Mike says, “I’m a dairy farmer.” Immediately, there’s interest—how many cows, what breed, what kind of parlor or robots, what he thinks of beef-on-dairy.

Sarah says, “I’m a nurse,” or “I work in insurance,” or “I’m an accountant.” She gets a polite nod. Maybe “That’s a good job to have.” Then the conversation slides straight back to Mike and the cows.

What the research says. Several studies on farm families in Ireland and other European countries—often through qualitative interviews with farm couples—have picked up a similar pattern: men often anchor their identity on being “the farmer” and “the provider,” while women downplay their own off-farm earning power to protect that identity, especially when the numbers are tight. It doesn’t describe every family, but it’s a pattern researchers see again and again in those interviews.

What it teaches. Over time, that dynamic quietly teaches some off-farm spouses a couple of things:

  • “My work isn’t really part of the farm story.”
  • “I’m support, not a partner.”

As one off-farm spouse put it to us not long ago:

“You get to be the farmer. I get to be the funding.”

You don’t need to sit in on a sociology seminar to understand why that matters. If the person whose job keeps the farm alive feels like a temporary funding source instead of a co-owner, their incentive to stay in that role for another 10–15 years drops. And you can’t fix a hole that big in your risk plan with a new bull or another 50 cows.

DimensionOn-Farm Partner (“The Farmer”)Off-Farm Partner (“The Funding”)Recognition Gap
Weekly hours worked60–80 hrs (barn, field, management)40 hrs (town job) + 10–20 hrs (farm support, household) = 50–60 hrs totalOften seen as “helping out,” not working
Financial risk carriedDay-to-day farm decisions, herd health, crop timingEntire household stability if job ends; health coverage; retirementRisk invisible until crisis hits
Career flexibilityHigh autonomy (within market constraints)Minimal—can’t job-hop, negotiate, or reduce hours without threatening farmTrapped by farm dependency; career growth sacrificed
Social identity“Dairy farmer” (respected, interesting, conversation starter)“Accountant/Nurse/Teacher” (polite nod, conversation shifts back to cows)Farm contributions erased in public narrative
Control over “passion” spendingShow string, genetics, equipment upgrades often farm partner’s domainFunds it, rarely directs itPays for someone else’s dreams
Burnout riskHigh (physical, market stress)Extremely high (dual-world stress, no identity payoff, invisible labor)Stress acknowledged for farmer, dismissed for spouse

What This Means for Your Passion Projects

Here’s where it gets personal for the show and genetics crowd.

That nursing salary or accounting job isn’t just keeping the lights on and the bulk tank running. It’s often what pays the entry fees for Madison, the IVF session on that “dream” heifer, or the flight to inspect a flush donor you’ve been watching for two years. The show string and the elite genetics program? For many families, those are funded by off-farm income, not the milk cheque.

What the Off-Farm Paycheck Typically CoversMonthly/Annual Cost RangeWhat Gets Cut First If That Job Ends
Family health insurance (employer plan)$1,200–2,400/monthSwitch to marketplace (if affordable) or go uninsured
Robot/parlor equipment lease payment$3,500–6,000/monthDefault risk within 60–90 days
Show string expenses (Madison, genetics, hauling)$15,000–40,000/yearShow program eliminated immediately
Family living expenses (groceries, kids, utilities)$4,000–6,000/monthHousehold budget slashed; quality of life declines
Student loan or vehicle payments$800–1,500/monthDeferred or default; credit damage
Emergency fund / retirement contributions$500–2,000/monthFirst to stop; long-term security evaporates

And here’s the thing: when the off-farm spouse starts feeling like “just the funding,” those passion projects are the first expenses that get cut. Not because they don’t matter, but because they’re the easiest place to draw a line when you’re exhausted and under-appreciated.

If your breeding and show goals depend on that town job, the person working it needs to feel like a partner in the program—not an ATM.

The Conversations That Help vs. the Ones That Blow Up

Add all this up—thin margins, invisible labour, identity pressure—and it’s no surprise that a lot of farm-house conversations go badly.

The protection trap. Most couples try to protect each other. Mike doesn’t want to dump every ugly cash-flow detail on Sarah when she’s already drained from work. Sarah doesn’t want to add her HR nightmares and commute stress to his load. So they both carry more than they should, in silence.

The University of Wisconsin Extension has noted that chronic stress literally makes it harder for your brain to organize thoughts and communicate clearly. So when everything finally boils over, it usually isn’t in a calm, sit-down way. It’s over something minor that turns sideways fast: a comment about a new tractor, a joke about “another long day,” a bill left on the table.

What actually works. The couples who live with similar numbers but stay steadier don’t have magic marriages. They just release steam more often, in small doses. Practical habits look like this:

  • The 1–10 daily check-in. Once a day—leaving for work, coming in from chores, before bed—each of you says, “I’m at a 3 today,” or “I’m at a 7.” No explanation required, no fixing, just data. It tells you whether you’re talking to someone who’s barely holding it together or someone with a little more bandwidth.
  • Truck-cab time. Whenever two of you are in the truck—feed run, vet call, supply pick-up—kill the radio for the first 10 minutes. Side-by-side, looking forward, is often the easiest way to bring up something you’ve been avoiding.
  • Sunday morning is non-negotiable. Pick the one morning that’s even slightly less insane and protect 20–30 minutes after chores. Same spot, every week. One starter: “What’s one thing from this week I wouldn’t know if you didn’t tell me?”

None of that changes the milk price. But it does keep resentment from calcifying until “we need to talk” turns into “I can’t do this anymore.”

Where Off-Farm Income Quietly Drives Herd Strategy

Now let’s bring it right into your barn office and breeding board.

When a significant chunk of your household stability depends on one off-farm job and benefit package, that changes how much risk you can take inside the operation—even if you don’t write it down. You can see it clearly in three places.

Expansion and leverage. If debt service on more cows, more land, or a parlor upgrade only works as long as Sarah’s paycheck and benefits stay exactly where they are, that’s a big assumption. Before you green-light a major capital project, ask yourselves: “If this off-farm job ended or changed, how many months could we keep our payments current without panicking?” Back-of-the-envelope is better than pretending the risk doesn’t exist.

Robots and labour-saving tech. A robot install, guided-flow barn, or more automation can be a game-changer for labour and lifestyle. But every producer who’s done it will tell you: the install phase and learning curve are not hands-off. If one partner is already working 40–50 hours a week off-farm, be honest about who’s actually going to handle overnight alarms, the software learning curve, and fresh-cow follow-up. It doesn’t mean “don’t do robots.” It means plan for the real human bandwidth you actually have.

Heifers, culling, and slow cash leaks. Off-farm income can be a blessing when it lets you hold extra heifers through a downturn or keep a borderline cow another lactation. It becomes a slow leak when year after year, that town’s paycheck quietly pays for feed and yardage on heifers that won’t ever see a milking unit, or cows that aren’t paying their way.

Labor Substitution. If Sarah is working in town, she isn’t in the parlor. If Mike is doing the work of two people because the farm can’t afford a hired hand, the “burnout” risk is doubled.

Bridging a Gap vs. Subsidizing a Hobby

Let’s be direct about something.

There’s a big difference between using off-farm income to bridge a gap—a bad milk-price year, a facility upgrade that takes time to pay off, a drought—and using it to subsidize an operation that doesn’t pencil out permanently.

If you look back over the last five years and see a pattern in which off-farm money routinely plugs farm operating holes rather than building savings or paying down debt, that’s not “just a tough stretch.” That’s structural.

And here’s the uncomfortable truth: if the town job is the only thing keeping the farm from a “For Sale” sign, it’s worth asking whether you still have a viable dairy business—or whether you’ve slid into keeping a very expensive, high-maintenance pet.

That’s not a judgment. Plenty of families consciously choose to subsidize a farm because it’s home, it’s a legacy, it’s where the kids learn to work. But it should be a choice you’re making with your eyes open—not something you stumble into because nobody wanted to look at the numbers.

Building a Support Bench That Actually Speaks “Dairy”

When an off-farm spouse like Sarah finally hits the wall and admits, “I can’t carry all of this by myself,” the obvious support options often disappoint.

Some traditional “farm wife” groups revolve around on-farm roles: parlor help, calf chores, and field meals. Those are important jobs, but they don’t match the stress of someone shouldering a full-time town job plus farm finances. On the flip side, generic workplace EAP lines and urban counselors often don’t understand why “just find a less stressful job” isn’t realistic when that job is literally underwriting the farm’s survival and health coverage.

What tends to help more looks like this:

  • Ag-literate support. In the U.S., organizations like Farm Aid offer farmer hotlines and connections to counselors who understand seasonal stress, income swings, and farm culture. In Canada, the Farmer Wellness Initiative in Ontario and other provincial programs are building similar networks with counselors trained specifically for agriculture. The difference between “Tell me how you feel” and “I understand why this HR email feels like a barn fire” is huge.
  • One or two peers in the same boat. These often come through your vet, nutritionist, milk hauler, or school contacts. Someone who knows exactly what “premium hike plus vet bill” feels like and will pick up the phone at 10 p.m. when you send a short, panicked text.
  • One space that isn’t about cows or spreadsheets. A rec hockey team, book club, choir, or church group where you—or your spouse—show up as a person, not “the farmer” or “the farm wife/husband.” Research keeps coming back to the same point: isolation magnifies stress in farm families. One night a month that isn’t about the farm isn’t indulgence. It’s maintenance.

Picking up that phone or walking into that first appointment can feel like admitting you can’t hack it. Most people expect to feel judged. What they actually feel, more often than not, is relief—because the person on the other end finally gets it.

When “Managing Stress” Becomes Tolerating the Unmanageable

There’s a line where better stress management isn’t enough.

Communication habits, counseling, and support networks can make life in a tight system more livable. They don’t change the fundamental math. At some point, “We’re getting better at handling stress” can quietly turn into “We’re getting better at tolerating a structure that doesn’t work.”

You’re getting close to that line when:

  • Off-farm income regularly pays core farm operating expenses, not just household needs.
  • Total debt—farm plus household—is noticeably higher today than it was five years ago, despite everyone working flat-out.
  • One or both of you are clearly more worn down, short-tempered, or checked-out than you were a few years ago, even after adding support.
  • Kids’ stability and opportunities are taking repeated hits, so the farm can hang on.
  • There’s essentially nothing going into retirement; every available dollar keeps going back into the operation.

At that point, the key question isn’t, “Are we tough enough to keep grinding?” If you’ve kept a dairy going through the last five years, you’ve already proven you’re tough.

The more honest question is, “Is the system we’re holding together actually worth what it’s costing us?”

That’s not a question for midnight after a bad day. It’s a question for a scheduled sit-down—with numbers, not just feelings. And it gets a lot easier to ask when you’ve already built some trust through those small daily check-ins, rather than waiting until something explodes. If you’re starting to have those conversations, here’s how other families have approached the transition question.

What This Means for Your Operation

You don’t need another think-piece telling you dairy is hard. You need checks you can run against your own reality. Here’s a practical way to start.

Put off-farm income on the planning board. Next time you’re talking expansion, a robot install, or a parlor upgrade, write “off-farm income” and “health benefits” on the same whiteboard as feed, repro, and labour. If the plan only works as long as one job in town stays exactly the same, say that out loud before you sign.

Do a rough five-year lookback. Circle a date in the next month and sit down with your partner. Pull tax summaries, lender statements, or even just your memory and a notepad. Look at the last five years: How often did off-farm money cover farm operating shortfalls? Is total debt higher or lower than it was five years ago? One simple gut-check some advisors use: if you can point to several years—say, three or more out of the last five—where off-farm income bailed out farm operating losses, that’s a strong hint you’re dealing with a structural problem, not just “we’ve been tight.” There’s no official threshold, but that pattern should make you ask harder questions.

Ask who’s really carrying the risk. If losing the off-farm job would put you in serious trouble within a few months, that reality has to shape how aggressive you get on cow numbers, land base, and capital projects. That’s not fear. That’s responsible risk management.

Test one small communication habit for a month. Pick the 1–10 check-in, Sunday coffee, or truck-cab time and commit to it for four weeks. If it makes conversations about money and the farm easier, keep it. If it doesn’t move the needle at all, that’s useful information—it may mean the problem is structural, not just emotional.

Bring a third set of eyes into the picture. If your five-year lookback and your gut both say, “This is tight,” it’s time to sit down with an accountant, lender, or farm business advisor who understands dairy. Ask for a clear picture of your options: stay roughly where you are with guardrails; scale down; lease out; bring in a partner; or map a 5–10-year transition. You don’t have to decide that day. You do need to see what’s possible.

Give yourselves permission to ask, “Are we still doing this?” Not as a threat. Not as a weapon in an argument. As owners and parents asking whether the life you’re building around this herd still makes sense for your health, your kids, and your long-term security.

A note for Canadian readers: The exact numbers look different under quota, and income stability from supply management changes the calculus. But the questions—about who’s carrying risk, how the off-farm job fits into the whole picture, and whether the structure is sustainable—apply just as much north of the border.

Key Takeaways

  • Off-farm income—and the person earning it—are no longer “extras” in U.S. dairy households. Based on 2023 AFBF/ERS data, they’re central to your risk-management plan.
  • If your expansion, robot, or facility plans quietly assume the off-farm job and benefits will never change, you’re underestimating one of your biggest risk variables.
  • Your show string and genetics program probably depend on that town paycheck, too. If the off-farm spouse feels like “just the funding,” those passion projects are the first things to go.
  • There’s a difference between bridging a gap and subsidizing a hobby. Know which one you’re doing—and make it a conscious choice.
  • Small, regular check-ins beat one big “we need to talk” blow-up every time. They won’t fix bad numbers, but they’ll help you spot bad patterns before they turn into crises.
  • Real toughness isn’t just grinding out another year. It’s being willing to look at the whole structure—herd, land, debt, off-farm job, family—and decide whether it’s actually delivering the life you want for the people you love.

The Bottom Line

The cows don’t care where the mortgage payment comes from. But you and your family do. The sooner you pull the off-farm side of the ledger into full view, the more control you’ll have over how your dairy—and your life around it—look in five or ten years.

Complete references and supporting documentation are available upon request by contacting the editorial team at editor@thebullvine.com.

Learn More

The Sunday Read Dairy Professionals Don’t Skip.

Every week, thousands of producers, breeders, and industry insiders open Bullvine Weekly for genetics insights, market shifts, and profit strategies they won’t find anywhere else. One email. Five minutes. Smarter decisions all week.
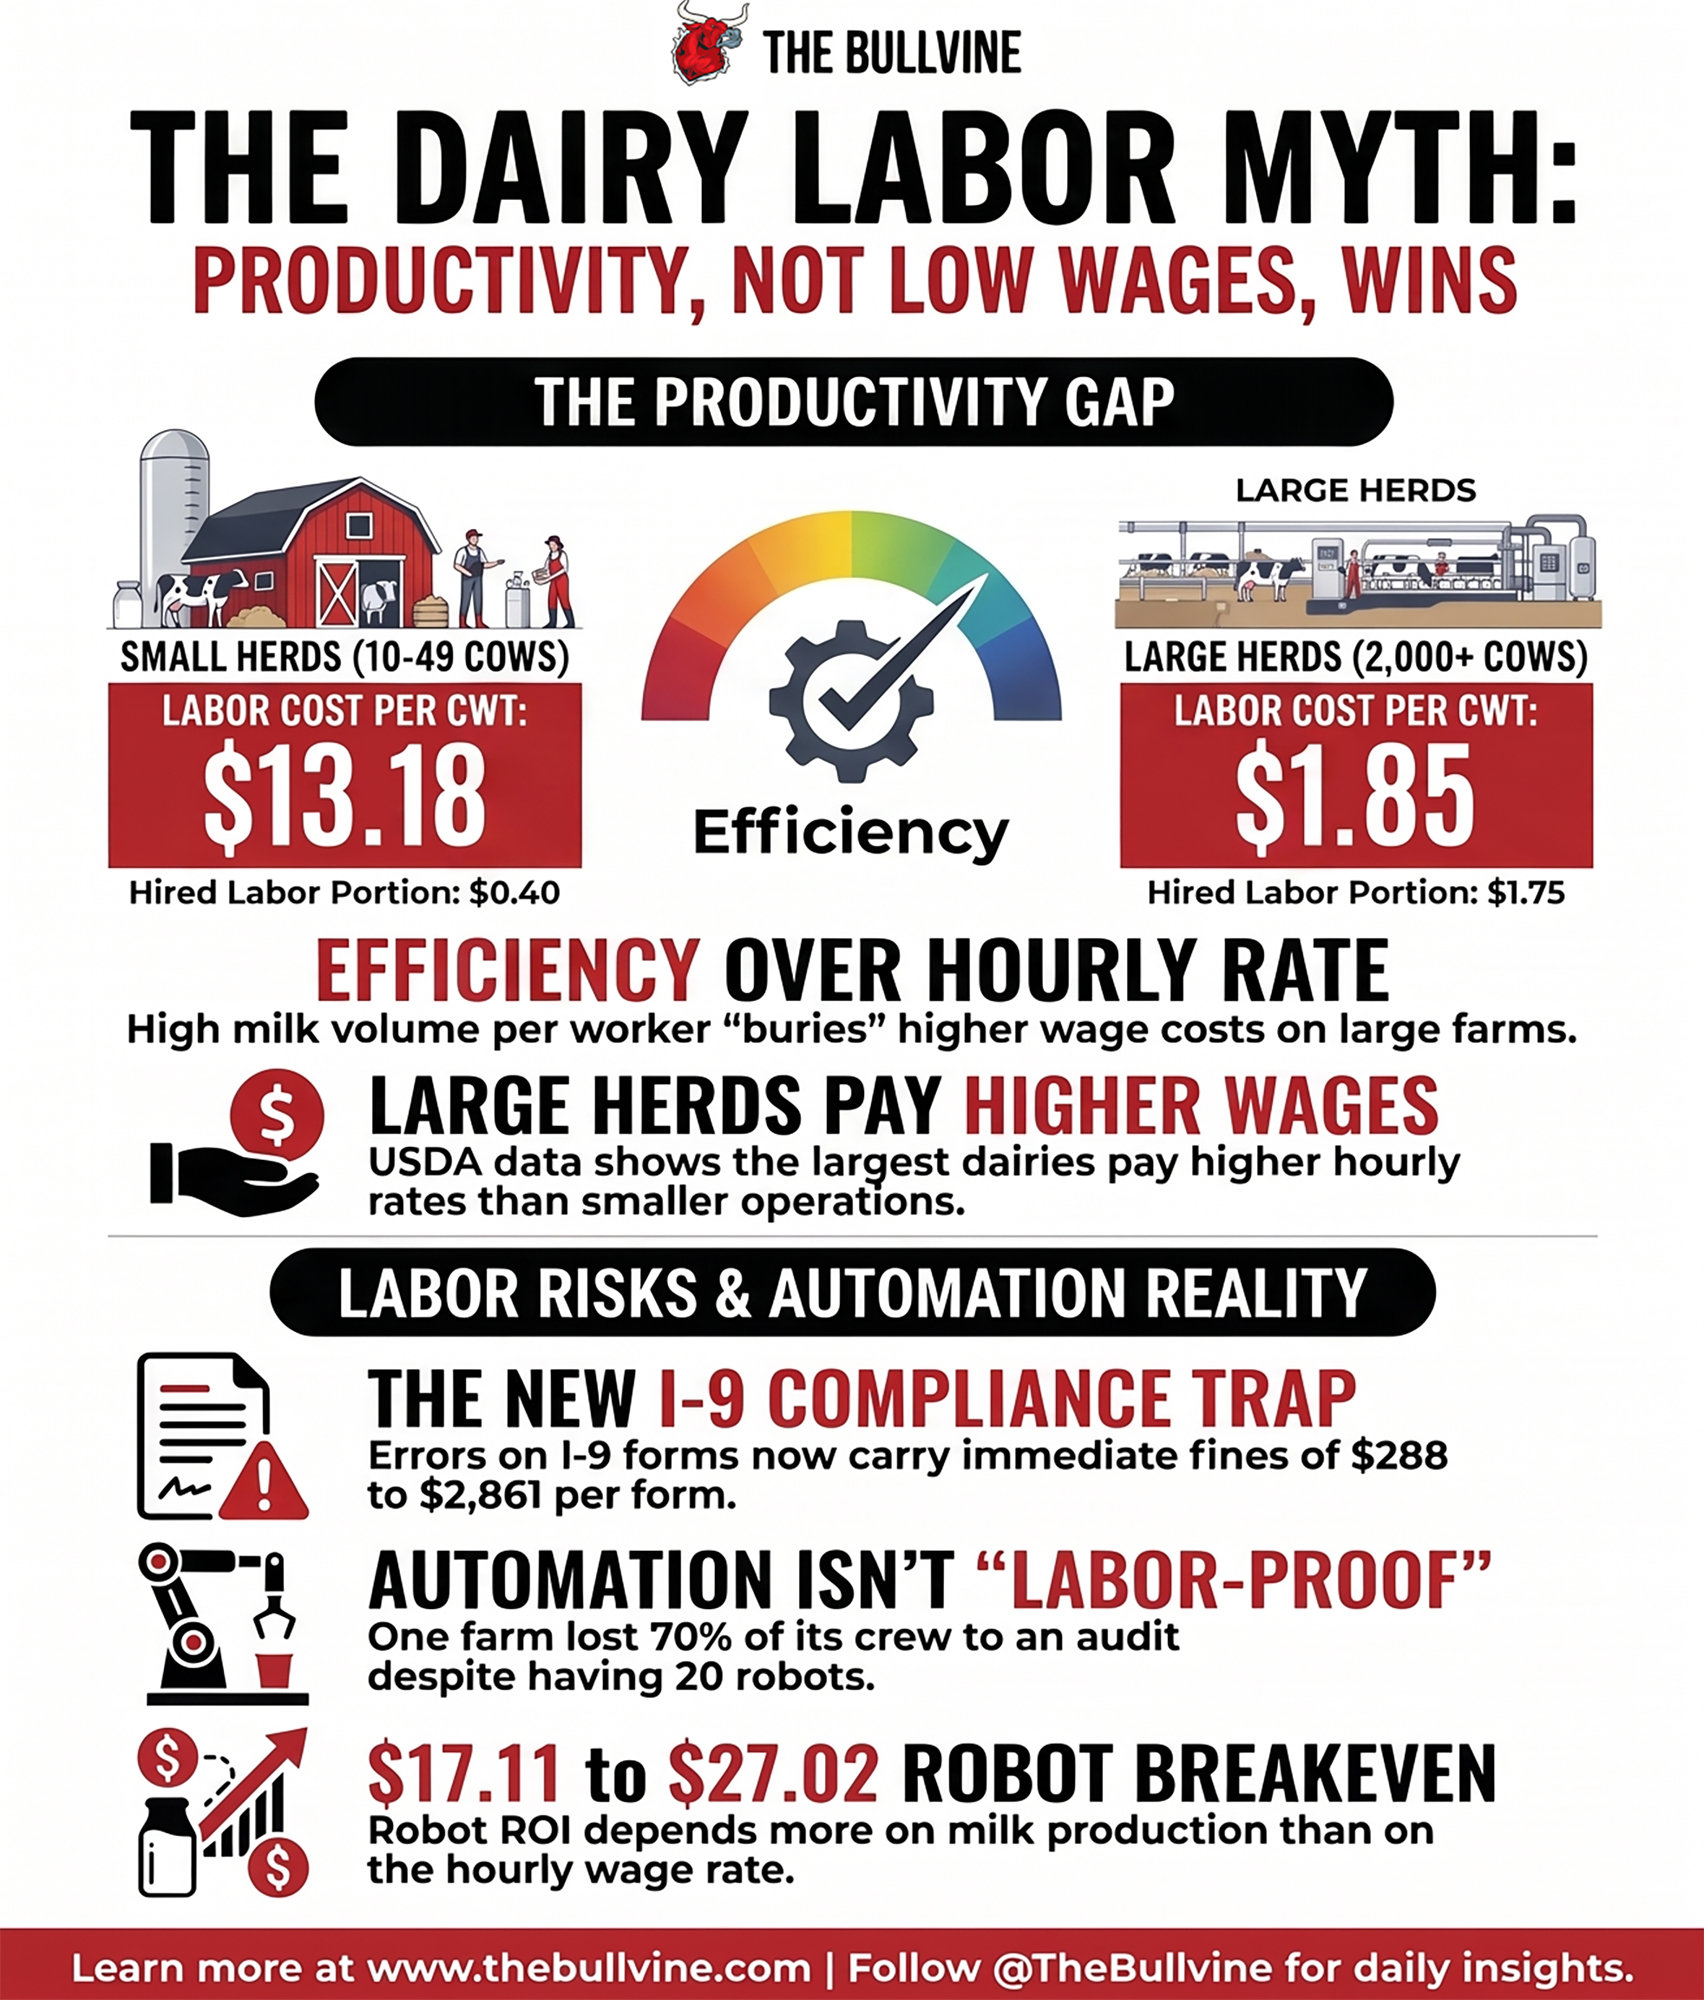
NewsSubscribe
First
Last
Consent

$90K Less Margin, 214K More Cows: Beef‑on‑Dairy, Calf Checks and Your 2026 Survival Playbook

Class III in the mid‑$16s, feed cheap, margins tight. The real test in 2026 is whether calf checks and components close your gap.

2026 dairy market outlook

Executive Summary: USDA’s latest Milk Production report shows November 2025 output up 4.7% in the 24 major states, with 214,000 more cows on line, even as 2026 all‑milk prices are forecast about $1.80/cwt lower—leaving a typical 300‑cow herd roughly $90,000–$100,000 short on milk income. This article explains why that expansion still pencils out for many farms once you put $1,400 beef‑on‑dairy calves, strong cull checks, and record U.S. cheese and butterfat exports into the equation. It shows how calf checks, better butterfat and protein performance, and DMC’s new 6‑million‑pound Tier 1 coverage can add $2–$3/cwt back into margins on efficient herds, while highlighting why high‑cost or heavily leveraged operations—especially in the Southeast, New England, and some Western dry‑lot systems—are under far more stress. From there, you get a straight‑talk 2026 playbook: know your true breakeven, use beef‑on‑dairy and components intentionally, lock in smart DMC/DRP protection, and be honest about scale, succession, and exit timing while calf and cull values are still on your side. It closes with three simple markers—Class III futures, cheese export volumes, and national cow numbers—to help you decide when this downcycle is finally turning instead of guessing from headlines.

Component2025 (at $21.05/cwt)2026 Forecast (at $19.25/cwt)Year-Over-Year Change
Gross Milk Revenue$1,452,450$1,328,250–$124,200
Beef-on-Dairy/Cull Income (est.)$32,000$42,000+$10,000
Net Revenue After Offsets$1,484,450$1,370,250–$114,200

You know, here’s what doesn’t quite add up when you look at where we’re starting 2026.

Most mid‑size herds are staring at roughly $90,000 to $100,000 less operating margin this year than they had in 2025, based on USDA’s all‑milk price forecasts and some pretty basic herd‑level math. USDA’s November 2025 Milk Production report put output in the 24 major states at 18.1 billion pounds, up 4.7% from November 2024, with total U.S. production at 18.8 billion pounds, up 4.5% year‑over‑year. That same report shows the milking herd in those 24 states at 9.13 million cows—214,000 more than a year earlier and even 1,000 head more than October.

So milk keeps coming, even as margins tighten to levels a lot of us haven’t had to stomach for a while.

On the face of it, that feels backward. But once you dig into the beef‑on‑dairy economics, the regional realities, and the way risk management and exports are behaving, the picture starts to come into focus.

Beef‑on‑Dairy: The Calf Check That’s Quietly Rewriting the Math

Looking at this trend, what farmers are finding is that beef‑on‑dairy has quietly become a major stabilizer in an otherwise stressful year.

Laurence Williams, who leads dairy‑beef cross development at Purina, reported in late 2025 that day‑old beef‑on‑dairy calves are now commonly bringing around $1,400 a head, compared to roughly $650 just three years earlier. Analysts ran the numbers and found that the combination of beef‑on‑dairy calves, cull cows, and related cattle sales has added $3.00 or more per hundredweight to the bottom line on many participating herds.

Revenue Stream2022 (Before B×D Surge)2025 (Beef-on-Dairy Established)Dollar Increase% of Total Revenue
Milk Revenue (Gross)$1,452,450$1,452,45087%
Beef-on-Dairy Calf Income$8,000 (dairy calves @ $650 ea)$35,000 (B×D @ $1,400 ea)+$27,0002.1%
Cull Cow Sales$18,000$22,000+$4,0001.3%
Component Premiums (fat/protein)$15,000$28,000+$13,0001.7%
TOTAL REVENUE$1,493,450$1,537,450+$44,000100%

That’s not a nice little bonus. That’s often the difference between red ink and black ink.

In barn after barn, what I’ve noticed is that producers are increasingly thinking of each cow as a two‑part enterprise: milk plus calf. If her butterfat performance and protein hold up reasonably well and she throws a high‑value beef cross calf, the calculus for one more lactation shifts. It’s no longer just, “Is she paying for her feed on milk alone?” It becomes, “Does her milk plus calf check more than cover her costs?”

CattleFax analysts have been pointing out that the U.S. beef cow herd is at its lowest level since the 1960s. That’s a structural shortage in the beef pipeline, not just a one‑season hiccup. In recent outlook presentations, CattleFax has said they expect beef and dairy‑beef calf prices to stay historically strong through 2026 and likely into the first half of 2027, because the beef herd just isn’t rebuilding quickly.

So when someone asks, “Why aren’t we seeing deeper herd cuts with these milk prices?” one honest answer is: because the calf checks and cull checks are doing a lot of heavy lifting right now, especially on farms that have leaned into beef‑on‑dairy in a disciplined way.

Global Milk Supply: Everyone Turned on the Taps at Once

Now, zooming out, here’s where it gets tricky. The U.S. isn’t expanding in a vacuum.

USDA’s Foreign Agricultural Service outlooks for 2025–2026 suggest that European Union milk production is holding near the high‑140‑million‑tonne range. Cow numbers in several EU countries are slowly declining, but productivity per cow continues to climb thanks to advances in genetics, feeding, and management documented in recent European dairy research. So you’ve still got a lot of European milk behind a very export‑oriented processing system.

In New Zealand, Fonterra cut its farmgate milk price forecast to around NZ$9.50 per kilogram of milk solids for the 2025–26 season. DairyNZ’s economic trackers show that at that level, many Kiwi farms are running on slender margins. But Fonterra’s seasonal updates have still shown collections heading into the Southern Hemisphere spring flush running ahead of the previous year across much of the country.

In South America, USDA attaché reports dindicate thatArgentina and Uruguay pare osting meaningful production gains over 2024 levels. While they’re smaller players than the EU or New Zealand, they add to the global pool of exportable milk solids and keep price presthe sure on whole milk powder amilk powder nd skim markets.

Australia is the one major exporter clearly constrained, with drought and water allocation issues limiting out,put in key dairy regions according to Australian government and industry reports. But Australia’s volumes by themselves aren’t big enough to offset Europe, New Zealand, and South America all pushing harder at once.

The bottom line on global supply is straightforward: multiple major exporting regions turned the taps up in the second half of 2025, and they’re all chasing a limited set of buyers. In that kind of environment, it doesn’t take much extra milk to lean hard on world prices.

Spot Markets and GDT: Trying to Find a Floor, Not a Rocket Ship

What’s interesting is that even in this heavy‑supply environment, the markets aren’t behaving like they d,id in some past downturns where everything fell off a cliff at once.

Take butter. USDA’s Cold Storage report released in late January 2026 shows U.S. butter inventories at the end of 2025 running about 7% below the year‑earlier level. That’s not wh,at most of us would expect given all the extra milk. But when you add in strong domestic demand for fat through the holiday season and the fact that U.S. butter has often been priced below European and New Zealand butter, it starts to add up.

Traders have responded to that combination with a firmer butter market than many had penciled in. That doesn’t mean prices are great, but it does mean there’s a recognizable floor.

Skim‑side products have been more volatile, but there ar,e some positive signs there too. At the Global Dairy Trade auctions in early January 2026, the overall price index climbed 6.3% at the first event of the year and another 1.5% at the next. Skim milk powder rose a little over 2% at the most recent auction, with butter and anhydrous milk fat also moving higher. Whole milk powder gained about 1%.

Analysts at AHDB in the U.K. and other market trackers have noted that these gains were broad‑based rather than driven by a single dominant buyer. Middle Eastern importers stepped up their participation to the highest share in roughly two years, and Chinese buyers returned to the platform more actively than they had in late 2024, even as China continues pushing its own domestic dairy expansion.

So are prices “back”? No. But they might be trying to carve out a base instead of sliding endlessly lower, and that’s worth watching.

U.S. Cheese Exports: The Quiet Workhorse in the Background

If there’s one bright spot that doesn’t get enough credit, it’s cheese exports.

The U.S. Dairy Export Council’s November 2025 report highlighted that August cheese exports hit 54,110 metric tons, up 28% year‑over‑year and the highest monthly cheese volume the U.S. has ever shipped. August was also the fourth straight month where U.S. cheese exports topped 50,000 metric tons—a milestone that had never been reached before May 2025.

Analysts pointed out that South Korea’s cheese imports from the U.S. were up 84% compared to the previous year. Mexico, Central America, Japan, and Australia all booked sizable gains as well. Butterfat exports nearly tripled year‑over‑year, with butter and anhydrous milkfat shipments up close to 190–200% in some categories, as foreign buyers took advantage of relatively cheap U.S. fat.

A big driver is price. USDEC and several commodity risk firms have noted that U.S. cheese—especially cheddar and mozzarella‑type products—has been priced below comparable European and Oceania offerings for much of 2025. That discount, combined with new cheese plants in the central U.S., has given buyers reasons to shift more volume to U.S. suppliers.

Without that export engine—in both cheese and butterfat—we’d likely be staring at much bigger inventories and even lower domestic prices.

Feed Costs: A Tailwind That Still Can’t Outrun the Headwinds

Now, let’s slide over to the cost side of the ledger.

USDA crop reports for 2025 confirmed a big U.S. corn harvest and solid soybean production. That’s kept corn futures trading in the low‑to‑mid $4 per bushel range and soybean meal at relatively manageable levels compared to the spike years we all remember too well. When you plug these feed prices into the Dairy Margin Coverage formula, the feed‑cost component drops to some of the lowest levels we’ve seen since late 2020.

Land‑grant economists and extension dairy specialists have been pointing out that, at least on paper, this should be a “feed‑friendly” year.

But here’s where the math still bites: USDA’s outlook, as summarized by Southeast Ag Net and other ag media, has the 2026 all‑milk price averaging around $19.25 per hundredweight, down from about $21.05 in 2025. That’s a drop of roughly $1.80 per hundredweight. So even if feed costs trim 35 to 50 cents per hundredweight off your expense line, the net margin still narrows uncomfortably.

I’ve seen some herds with exceptionally strong forage programs and careful fresh cow management insulate themselves a bit more—they’re getting more milk per unit of feed, which helps. But nobody’s describing this as an “easy‑money” year.

How the 2026 Margin Squeeze Lands on Different Farms

Let’s put some real numbers to this.

Region / Herd ProfileTypical Herd SizeFull-Cost Breakeven ($/cwt)2026 Forecast Price ($/cwt)Margin/(Loss) at ForecastKey Headwinds
Upper Midwest (WI, MN)300–500$16.50–$17.00$19.25+$2.25–$2.75None acute; feed-friendly; strong components help
Texas Panhandle2,000–5,000$17.00–$18.00$19.25+$1.25–$2.25High debt from recent expansion; interest rate exposure
California Central Valley2,000–8,000$16.50–$17.50$19.25+$1.75–$2.75Water restrictions; regulatory costs; high land value
Southeast (Federal Order 7)150–300$19.00–$20.50$19.25–$0.25 to +$0.25Class I premium erosion; heat stress; long hauls to plant
New England100–250$20.00–$21.50$19.25–$0.75 to –$2.25High land, labor, & regulatory costs; insufficient scale
Upper Midwest (< 100 cows)40–100$22.00–$25.00$19.25–$2.75 to –$5.75Can’t spread fixed costs; limited premium market access
Mid-Size Growth (500–1,000)500–1,000$17.50–$18.50$19.25+$0.75–$1.75Debt servicing; succession clarity required

Imagine a 300‑cow herd shipping about 23,000 pounds per cow annually—roughly 69,000 hundredweight per year. At a $1.80 per hundredweight drop in milk price, you’re looking at about $124,000 less top‑line milk revenue. If beef‑on‑dairy calves and components are adding extra income, that might bring the net hit closer to that $90,000 to $100,000 range, but it still stings.

USDA’s Economic Research Service breaks milk cost of production down by herd size, and while the exact numbers vary year to year, the pattern is consistent. Small herds under 50 cows often end up with total economic costs—once you price in family labor, depreciation, and interest—well over $40 per hundredweight. Mid‑size herds from 100 to 500 cows commonly sit somewhere in the low‑to‑mid twenties. Large herds, especially those above 2,000 cows with efficient layouts and strong management, can get their full costs into the upper teens or around $20.

In Wisconsin and much of the Upper Midwest, extension educators tell me that herds with a true full‑cost breakeven under about $16 per hundredweight are generally okay at these forecasted prices, especially if they’re capturing strong component premiums and calf/cull income. Once that breakeven climbs into the $18–20 range, the stress shows up quickly in lender meetings.

In California’s Central Valley and the Texas Panhandle, a lot of the big modern facilities have very competitive operating costs on a per‑hundredweight basis but also carry significant debt from recent expansions. When interest rates sit where they are and all‑milk prices back up, those principal and interest payments can start to drive decisions just as much as feed bills.

The Southeast is fighting a different battle. Federal Order 7, along with Order 5 in parts of the Appalachian region, has long relied on Class I fluid milk premiums to keep blend prices workable. University of Kentucky and other regional economists have been documenting how declining beverage milk consumption reduces Class I utilization and erodes that premium. Combine that with higher heat‑stress mitigation costs, more challenging forage conditions, and long hauls to processing plants, and many Southeast producers describe 2025–2026 as one of the toughest stretches they’ve faced.

In New England, the story centers on high land values, strict environmental regulations, and costly labor. Even with excellent butterfat performance and strong protein, some mid‑size herds simply can’t spread those fixed costs across enough hundredweight to make the numbers work at a sub‑$20 all‑milk price.

So when you look at the national average projections, it’s worth reminding yourself: there really is no single “U.S. dairy market.” Your reality depends on your region, your herd size, your debt structure, and how you manage forage, cows, and risk.

What DMC and Risk Management Can—and Can’t—Do This Year

Given all that, it makes sense that Dairy Margin Coverage is back on a lot of producers’ radar.

For the 2026 program year, USDA’s Farm Service Agency expanded Tier 1 coverage from 5 million to 6 million pounds of milk. That’s a big deal for herds in the 250–300‑cow range, because more of their production now fits under the lower Tier 1 premium schedule. Penn State Extension, Texas Farm Bureau, and several other groups have all been reminding producers that enrollment opened January 12 and runs through February 26, 2026.

Risk‑management specialists like Katie Burgess, director of risk management at Ever.Ag, has been quoted as saying that their models point to DMC payments exceeding $1 per hundredweight for at least the first few months of 2026, with smaller payments likely into mid‑year if current price and feed forecasts hold. That lines up with what many margin calculators were showing as we came into January.

It’s worth noting that DMC is designed as a margin program, not a price program. So it’s the combination of feed cost and milk price that matters. In a year like this, where feed is relatively cheap but milk has dropped more, it can still provide meaningful support.

Beyond DMC, Dairy Revenue Protection (DRP) and Livestock Gross Margin for Dairy (LGM) remain important tools. Extension economists at universities like Wisconsin, Minnesota, and Cornell keep stressing a simple point: the farms that seem to manage volatility best are the ones that decide ahead of time what prices they’ll lock in and how much volume they’ll protect, rather than trying to chase the market in real time.

Practical Playbook: Questions to Take to Your Lender and Nutritionist

If we were sitting at your kitchen table with a pot of coffee and your last 12 months of milk statements, here are the areas I’d want to talk through.

1. Know Your Real Breakeven, Not Just a Guess

You probably know this already, but in a year like 2026, guessing at your cost of production is dangerous.

That means:

  • Putting real numbers on family labor (what you’d have to pay someone else to do those jobs)
  • Including depreciation on equipment and facilities, not just current payments
  • Accounting for land costs honestly, whether you own or rent

Once you’ve got that full‑cost breakeven per hundredweight, compare it to what you can reasonably expect for the next 12 months, using both the USDA all‑milk forecast and current Class III/IV futures as guides. If your breakeven is $17 and you can add a couple of dollars from beef‑on‑dairy calves and solid components, you’re in a very different position than if your breakeven is $22 and you’re light on calf income.

2. Use Beef‑on‑Dairy as a Strategy, Not Just a Trend

Beef‑on‑dairy works best when it’s planned, not just sprinkled around.

The herds making it pay are typically:

  • Using sexed dairy semen on their best cows and heifers to generate high‑quality replacements
  • Breeding the bottom half—or more—of the herd to carefully chosen beef sires to maximize calf value
  • Building relationships with buyers, feedlots, or finishers who know how to handle dairy‑beef crosses

Several auction reports have all documented beef‑on‑dairy calves bringing $800–$1,000 per head in many markets, with some sales reporting over $1,600 for particularly strong day‑old crossbreds. When those prices are combined with the right breeding plan, you’re not just “having fun with a fad”—you’re rewiring your revenue model.

3. Treat Butterfat and Protein as Margin Levers

In a lot of federal orders and cooperative pay schedules, components are where the real action is.

Risk‑management columns from organizations like the Center for Dairy Excellence and multiple land‑grant extension dairy programs have shown that moving from, say, 3.7% fat and 3.0% protein toward something closer to 3.9% fat and 3.2% protein can often add 30–50 cents per hundredweight to the milk check in strong component markets. Across a 300‑cow herd shipping 23,000 pounds per cow, that can easily translate to $20,000–$30,000 per year.

Getting there usually isn’t about one magic bullet. It’s the combination of:

  • Consistent, high‑quality forages
  • Attention to detail in the transition period so fresh cows hit lactation strong
  • Careful ration balancing with your nutritionist
  • Stable cow comfort and feed access, especially in hot weather

As many of us have seen, the herds that are fanatical about feed delivery, bunk management, and minimizing up‑and‑down swings in dry matter intake tend to be the same herds that quietly add 0.1–0.2% fat and a bit more protein without spending much extra per cow.

4. Decide What “Scale” Means for Your Family, Not Just Your Neighbors

This is the hardest part of the conversation, but it’s one we can’t dodge.

If you’re under 500 cows and don’t have a clear edge—either by being ultra‑efficient, having reliable premium markets, or running a strong direct‑to‑consumer business—the structural headwinds have been intensifying for a decade. Consolidation in the U.S. dairy sector is well documented in USDA and industry analyses.

That doesn’t mean small and mid‑size herds are doomed. It does mean that, in many regions, they need one or more of the following to thrive:

  • A truly low cost of production and low debt load
  • A solid premium market (organics, grass‑fed, A2, or strong local brand)
  • An intentional plan to partner, merge, or exit before pressure forces a fire sale

The one thing that’s clear from both economic data and real farm stories is that making the tough calls while calf and cull prices are still strong usually works out better than waiting until lender pressure makes the decision for you.

What Could Actually Turn This Market Around?

So, with all of that on the table, what would it take for 2027 to feel meaningfully better than 2026?

1. A Real Supply Response

USDA’s late‑2025 Livestock, Dairy, and Poultry outlook pointed to ongoing herd expansion through much of 2025. For margins to really heal, we eventually need either stronger demand or slower growth in milk.

A meaningful supply response would look like:

  • National cow numbers falling 1–2% from their recent peaks
  • Noticeable herd dispersals in high‑cost regions
  • Replacement heifer prices easing as fewer people expand

Right now, beef‑on‑dairy is slowing that process because cull and calf values are so attractive. But if milk stays soft long enough, history says the herd will respond.

2. Sustained Export Strength

Export performance has a huge say in how quickly things improve at home.

If U.S. cheese exports can consistently stay in that 50,000‑metric‑ton‑plus range month after month, and butterfat exports hold onto their recent gains, that continues to siphon product off the domestic market and support both Class III and Class IV values. USDEC’s 2025 reports make it clear that strong export demand is the reason we’ve been able to move record volumes of cheese without drowning in inventory.

Watching Global Dairy Trade auctions, USDEC’s monthly updates, and export coverage is a good way to sense whether that engine is still running or starting to sputter.

3. Class III and All‑Milk Prices Converging on Something Livable

One simple rule of thumb several risk‑management folks use is this: if Class III futures can hold above about $16.50 for several consecutive contract months and you simultaneously see herd contraction, the worst of the downcycle is probably behind you.

Right now, USDA’s all‑milk forecast sits in the $19s for 2026, while Class III futures tend to be in the mid‑$15s to mid‑$16s in many months, based on early‑January price sheets. That gap is a big reason analysts keep warning producers to build budgets off realistic Class III/Class IV numbers, not just the all‑milk headline.

Three Markers Worth Checking Every Month in 2026

If we boil everything down, here are three things I’d personally watch as the year unfolds:

  1. Class III Futures: Are several 2026 contracts holding above roughly $16.50, or are they stuck in the mid‑$15s?
  2. Cheese Exports: Are U.S. cheese exports still at or above 50,000 metric tons per month, or have they slipped back? USDEC’s monthly summaries are a good quick read here.
  3. Herd Size: Are national cow numbers finally dropping 1–2% from a year earlier, as reflected in USDA’s Milk Production reports, or are we still adding cows?

If, by late summer, we can honestly say “yes” to at least two of those being in the “improving” camp, there’s a good chance 2027 looks more forgiving than 2026.

Signal / Metric2026 Breakeven TargetCurrent Status (Jan 2026)What “Improving” Looks LikeYour Action
Class III FuturesHold >$16.50 for 3+ consecutive contract monthsMid-$15s to $16.20 rangeSeveral 2026 contracts trending toward $16.50+Monitor CME futures daily; lock protection at $16.50+
U.S. Cheese ExportsSustain 50,000+ MT per monthAugust peak 54,110 MT; December ~50,700 MT; still strongConsistent 50K+ MT/month through Q2 2026Check USDEC monthly reports; if slipping below 48K MT, watch for domestic price weakness
National Cow NumbersDown 1–2% from year-earlier levelUp 214,000 cows YoY (9.13M in 24 states)Herd numbers plateau or decline 1–2% in Milk Production reportsIf two of three signals are improving by late summer, cycle is likely turning; consider less aggressive risk management in 2027
DECISION POINT (Late Summer 2026)Two of three signals in “improving” columnTBD – Check back August 2026If YES → 2027 likely more forgiving; if NO → Tighten controls furtherRevisit break-even, debt, and succession plans with lender & advisor

Bringing It Back to Your Farm

At the end of the day, the big charts and global data are useful, but they’re just the backdrop. The real work is in your own ledger, your own barns, your own conversations with family and lenders.

If there’s one thing this cycle is forcing on all of us, it’s clarity. Clarity about what our true costs are. Clarity about which cows and acres are really paying their way. Clarity about how much risk we’re willing to carry—and for how long.

The farms that come through this stretch in good shape tend to:

  • Know their cost of production down to a realistic dollars‑per‑hundredweight number
  • Use tools like DMC, DRP, and LGM on purpose—not as an afterthought
  • Treat beef‑on‑dairy and components as serious margin levers, not side projects
  • Keep fresh cow management and the transition period tight, so they’re not quietly bleeding money on sick cows and lost milk
  • Are honest about scale, succession, and what “success” looks like for their family

If 2026 feels tight for you, you’re not alone. Many of us are staring at the same spreadsheets and having the same conversations.

What’s encouraging is that the long‑term demand story for dairy still looks solid. USDEC data shows U.S. dairy exports hitting record volumes. USDA consumption statistics show Americans eating more cheese and using more dairy ingredients than ever. There’s been billions of dollars invested in new processing capacity across the country in the past few years—companies don’t make those bets if they think the category is dying.

The trick is getting from here to there without burning through more financial and emotional capital than you can afford.

And that’s where open, honest conversations—at meetings, in vet trucks, over coffee at the kitchen table—about the real math on our farms might be one of the most valuable tools we’ve got in 2026.

Key Takeaways 

  • $90K–$100K less milk income for a 300‑cow herd: USDA’s 2026 all‑milk price is forecast $1.80/cwt below 2025. At 69,000 cwt shipped, that’s a six‑figure revenue gap before calf and cull checks help close it.
  • Beef‑on‑dairy is why cow numbers keep climbing: $1,400 day‑old crossbred calves (vs. $650 three years ago) plus strong cull values add $3+/cwt to participating herds, according analysts, enough to justify keeping cows that would’ve been culled in 2022.
  • Record exports are quietly backstopping the market: August 2025 cheese exports hit 54,110 MT (+28% YoY); butterfat exports nearly tripled. Without that demand pulling product offshore, domestic prices would be far uglier.
  • DMC Tier 1 now covers 6M lbs—enrollment closes Feb 26: That fits a 250–300‑cow herd. Analysts project payouts above $1/cwt early in 2026. If you haven’t enrolled, you’re leaving real money on the table.
  • Know your breakeven, use components as a margin lever, and watch three signals: Herds under $16/cwt full cost and capturing strong butterfat/protein premiums are in far better shape. Track Class III futures (>$16.50), cheese exports (50K+ MT/month), and national cow numbers (down 1–2% YoY)—when two of three turn positive, the cycle is likely shifting.

Editor’s Note: The numbers in this article draw on USDA’s November 2025 Milk Production report, USDA Economic Research Service cost-of-production data, USDA Farm Service Agency announcements on Dairy Margin Coverage, CME Group market reports, Global Dairy Trade auction results, and industry analysis from the U.S. Dairy Export Council, and land‑grant university extension programs. Comments on beef‑on‑dairy and export trends reflect 2024–2025 data and interviews with credentialed industry experts, including analysts at CattleFax and risk‑management professionals working with dairy producers.

Learn More

The Sunday Read Dairy Professionals Don’t Skip.

Every week, thousands of producers, breeders, and industry insiders open Bullvine Weekly for genetics insights, market shifts, and profit strategies they won’t find anywhere else. One email. Five minutes. Smarter decisions all week.
NewsSubscribe
First
Last
Consent

US$8 Billion in Whey Plants: Is Your Co‑op Letting Any Protein Money Reach Your Milk Cheque?

US$8B in whey plants is coming online. Will any of that protein cash ever reach your milk cheque?

Executive Summary: Processors are spending about US$8 billion on new cheese and whey plants because GLP‑1 drugs and protein‑driven diets are pushing global whey demand to record levels. Yet most milk cheques still key off commodity dry whey prices, while the real “protein money” sits in higher‑value ingredients like WPC‑80 and WPI, inside co‑op balance sheets and patronage systems. This article shows, in plain language, how that gap forms—and then uses simple math (like turning a 30¢/cwt whey margin into roughly US$40 per cow per year) to show what it could mean on your farm. From there, it gives you a clear playbook: how to read your equity statement, how to benchmark your all‑in price, and the three questions to ask at your next co‑op meeting about project financing, whey division reporting, and cash vs retained patronage. It also compares what this whey boom means if you ship to an ingredient‑heavy plant in the Texas Panhandle or Upper Midwest, a more commodity‑focused co‑op in the East, or a quota system in Canada. In short, it’s a guide to turning the whey boom from a stainless‑steel story into a milk‑cheque strategy.

dairy whey protein investments

You know how every winter meeting seems to have the same slide deck these days? Somebody from a processor or a bank stands up, talks about protein, GLP‑1 weight‑loss drugs, and this “massive opportunity in whey,” and then you’re driving home thinking, “OK, but where does that show up in my milk cheque?”

What’s interesting here is that this time, the stainless is real. University of Wisconsin–Madison Extension dairy economist Leonard Polzin told Brownfield Ag News that more than eight billion dollars’ worth of stainless steel is being invested in new and expanded dairy processing in various parts of the U.S., with a few plants starting in February and more coming online “in 2025 and in future years,” across a range of products from cheese to fluid and other dairy categories. About US$8billion in new U.S. dairy processing investment through 2026, with a big share of that going into cheese and whey capacity. 

And this isn’t just a Wisconsin or South Dakota story anymore. New cheese plants in Wisconsin, South Dakota, and Texas are expected to add roughly 360 million pounds of cheese annually by the end of 2025, and industry coverage points to big new facilities in the Texas Panhandle and eastern New Mexico, designed specifically to turn High Plains milk into cheese and high‑value whey ingredients.  So while the Upper Midwest still matters, a lot of the newest “stainless” is actually being welded out West. 

RegionEstimated New Capacity (2024–2026)Primary Product FocusKey New FacilitiesCo-op / Processor TypeWhey Ingredient Emphasis
Upper Midwest (WI, MI, MN)~$2.5–3.0BCheese + WheyEstablished complexes + expansionsIngredient-heavy co-ops (e.g., AMPI)High (WPC-80, WPI, export)
Upper Plains (SD, ND)~$1.5–2.0BCheese + WheyRegional & private plantsMixed (co-op + private)Medium–High
Texas Panhandle + E. New Mexico~$2.0–2.5BCheese + WheyNew-build, High Plains focusedPrivate processors + regional co-opsHigh (WPC-80, sports nutrition)
Idaho + Pacific NW~$1.0–1.5BCheese + Whey + SpecialtyExisting + niche biorefineryIngredient specialists (co-op + private)Very High (niche isolates, clinical)
Northeast + Southeast~$0.5–1.0BFluid + Cheese (commodity focus)Limited new buildsCommodity-focused regional co-opsLow–Medium
Western Canada (QC, ON under quota)~$0.5B (capacity additions under supply management)Cheese + Specialty WheyQuebec + Ontario expansionsProcessor cooperativesMedium (regulated pricing)

So here’s the real question many of us are asking: with all that stainless going into cheese and whey, how much of that value actually flows back to your farm—and how much stays inside the plant and on the co‑op balance sheet?

Let’s walk through that together, like we would over coffee.

Looking at This Trend: Why Whey Is Suddenly Center Stage

Looking at this trend from a distance, three big forces are pushing whey into the spotlight:

  • GLP‑1 weight‑loss drugs are changing how some people eat.
  • A long boom in sports and active nutrition.
  • A serious build‑out of processing capacity tied to cheese and whey.

GLP‑1 drugs are changing what some customers put in their carts

You’ve probably heard about Ozempic, Wegovy, and other GLP‑1 medications from TV ads or from your doctor. They started as diabetes drugs, but they’ve quickly turned into a major weight‑management tool. An economic evaluation in JAMA Network Open found that U.S. spending on GLP‑1 receptor agonists among adults jumped from about 13.7 billion dollars in 2018 to 71.7 billion dollars in 2023, more than a five‑fold increase in five years.  That tells you right away this isn’t a niche anymore. 

Retail analytics firm Circana has been digging into what that means at the grocery store. Their 2025 work, covered by food‑industry media, shows that households with at least one GLP‑1 user already make up around 23% of U.S. households and are projected to account for about 35% of all food and beverage sales by 2030. Those households don’t just buy less food; they tend to shift toward more nutrient‑dense, higher‑protein items. 

In a 2025 industry report on GLP‑1 and dairy, they reported on a poll of GLP‑1 users showing that people in that sample cut their daily calorie intake by roughly 20%—about 800 kilocalories—and favoured lean proteins over fatty, salty, sugary, or highly processed foods. For our sector, they described a clear divide: pure proteins like skim milk and whey have “immense potential,” while more indulgent, high‑fat, high‑sugar dairy products such as certain cheese dips and frozen desserts face more headwinds.

Nutrition guidelines back this up. Clinical nutrition and obesity guidelines generally stress that when calories go down, protein and micronutrient density must increase, especially in older adults and people with chronic conditions. Dietitians and GLP‑1 programs are steered towards lean meats, Greek yogurt, cottage cheese, and protein shakes as tools to help keep weight off. 

You can see where whey fits in that pattern: very concentrated, highly digestible protein in a small serving.

Sports and active nutrition aren’t niche anymore

On top of the GLP‑1 story, sports and active‑nutrition products have moved from the specialty aisle right into the heart of the store.

Market research from MarkNtel Advisors estimates that the global whey protein market was worth about 6.5 billion U.S. dollars in 2023 and is projected to reach roughly 19.2 billion dollars by 2030, growing at around 9% per year from 2024 through 2030. That’s a big leap for something that used to be a byproduct we hauled away or spread on fields. 

Tanner Ehmke, lead dairy economist with CoBank, has explained in reports that whey used to be dumped or land‑spread, but by 2021 had reached almost 5 billion dollars in global market value, and that demand for whey protein concentrate has been growing for more than 25 years, driven mainly by export demand. He also notes that U.S. cheese production capacity is expected to expand by about 10% over a five‑year window, and that processors need state‑of‑the‑art technology to meet global whey needs, especially in Asia. 

On the shelf, many of us have noticed the same thing: more ready‑to‑drink protein shakes, high‑protein yogurts, and fortified bars in Costco, farm stores, and even truck stops. The International Dairy Foods Association’s president, Michael Dykes, a veterinarian by training and long‑time dairy policy leader, told Dairy Forum attendees that most of the “protein‑added” products consumers see today are still built on dairy‑derived proteins, especially whey from cheese plants.

There’s growing clinical evidence backing whey’s role in health, too. A 2024 meta‑analysis in Clinical Nutrition ESPEN looked at randomized trials in older adults with sarcopenia (age‑related muscle loss) and found that whey protein supplementation, especially when combined with resistance training, improved lean mass and functional performance compared with control groups.  Industry reports have summarized research on inflammatory bowel disease, showing that participants receiving whey‑based nutrition supplements alongside exercise gained more muscle mass and strength than those who exercised without whey.  That kind of evidence gives doctors and dietitians a reason to keep whey‑based products in their toolbox. 

So when you put all of that together—GLP‑1 users cutting calories but chasing protein, mainstream shoppers grabbing RTD protein drinks, and clinicians using whey to help protect muscle—it makes sense that whey demand looks strong.

And the stainless is really going into cheese and whey

Now, back to that eight‑billion‑dollar pile of stainless.

In a interview, Leonard Polzin lays out that more than eight billion dollars’ worth of stainless steel is being installed in new and expanded dairy processing plants across the U.S., with some plants starting in early 2025 and others coming online over the following years, covering cheese, fluid, soft, and hard dairy products. 

Corey Geiger’s view from CoBank is that about eight billion dollars in new U.S. dairy processing investment is expected through 2026, and industry reports indicate that a large share of that is going into cheese and whey capacity.  Dykes told Dairy Forum in 2024 that more than $7 billion in dairy processing expansions were underway, and later coverage has raised that figure to over $11 billion when you extend the horizon a few more years and count additional projects. He links that investment directly to the protein opportunity. 

What I’ve found is that when you step back, you see three layers stacking:

  • Demand: GLP‑1 and protein‑focused diets plus sports and clinical nutrition.
  • Processing: a wave of new cheese and whey plants and expansions worth roughly eight billion dollars in this cycle.
  • Ingredients: continued shift from whey as a waste stream to whey as a core protein ingredient.

That’s a pretty big structural shift. The question is how much of it was built with your equity, and how much of it comes back as farm‑level pay price.

The Big Disconnect in the Milk Check

This is usually where the meeting room goes quiet: the space between whey’s ingredient value and what shows up in your milk cheque.

Most of the tools that touch your pay price—Class III formulas, many component programs, and a lot of co‑op base prices—are still built around commodity dry whey. USDA’s Dairy Market News for the Central region shows that through 2024, dry whey for human food often traded within a band from about 40 to 60 cents per pound, with “mostly” values often in the mid‑50s at times. Dry whey for animal feed typically sat lower, often in the high‑30s to low‑40s per pound. 

Those dry whey numbers feed directly into the Class III formula. That’s the part your milk cheque “sees.”

But in a lot of bigger cheese and whey plants—especially in those new Western facilities and in long‑standing ingredient complexes in Idaho and the Upper Midwest—the whey stream doesn’t stop at dry powder. Potable whey is being:

  • Concentrated into whey protein concentrates (like WPC‑80),
  • Further refined into whey protein isolates (WPI),
  • Sometimes split into more specialized fractions for infant formula, sports, and medical nutrition.
Ingredient / FormTypical Price Range (2024)What’s Included in Your Class III Formula?Market Margin vs. Commodity Dry Whey
Commodity Dry Whey (Human Food)$0.45–$0.60/lb✓ Yes—directlyBaseline (this is the “standard”)
Commodity Dry Whey (Animal Feed)$0.38–$0.42/lbLimited−12 to −18¢/lb vs. human food
Whey Protein Concentrate (WPC-80)$1.80–$2.40/lb✗ No—stays internal+$1.20–$1.80/lb over commodity dry
Whey Protein Isolate (WPI)$3.20–$4.50/lb✗ No—stays internal+$2.60–$3.90/lb over commodity dry
Specialized Fractions (infant formula, clinical)$4.00–$6.50/lb✗ No—not in formula+$3.40–$5.90/lb over commodity dry

Those ingredients sell at much higher per‑pound prices than bulk dry whey. Market research from MarkNtel and ingredient trade coverage show that high‑grade whey proteins typically command a multiple of whey powder prices, especially when export and sports demand are strong. 

Obviously, there are extra costs—membranes, energy, drying, quality systems, and marketing. But even after that, the margin between the dry whey value that goes into your formula and the finished ingredient values can be significant.

So the real question isn’t whether whey has value. It’s this:

  • When your co‑op or processor turns your whey into higher‑value ingredients, how much of that extra value comes back to you—and how much stays inside the plant and on the balance sheet?

That’s where co‑op finance and governance make all the difference.

How Co‑op Finance Shapes Who Wins in the Whey Boom

In many dairy co‑ops, the year‑end pattern looks something like this:

  1. The co‑op calculates its earnings and declares patronage refunds based on the volume or value of milk you delivered.
  2. A portion of those refunds is paid out in cash.
  3. The rest is retained as allocated member equity in your capital account.

Oklahoma State University Extension’s bulletin “Valuing the Cooperative Firm” lays this out neatly. In their sample, cash patronage ranged from about 21% to 70% of total patronage, with the rest retained as equity, and at least one co‑op paid as little as 15% in cash and 85% in equity.  In dairy, because plants are so capital‑intensive, it’s common—and OSU’s data supports this pattern—to see something in the ballpark of 20–30% of patronage paid as cash and 70–80% retained in some co‑ops, but there is no single standard. Policies vary widely by co‑op and over time. 

On top of that, most co‑ops use revolving equity. That means your retained patronage from a given year is supposed to be redeemed at some point in the future—either on a revolving schedule (oldest years first), at retirement, or a combination of both. USDA and extension guides emphasize that revolving timelines can range from a few years to decades, depending on each co‑op’s rules, performance, and board decisions. 

So when a board approves a major whey or cheese expansion, the financing stack often looks like this:

  • A chunk of debt from banks or bond markets.
  • A big share of retained member equity that’s already on the books.
  • Sometimes, new per‑unit retains or special capital assessments on current milk.

From a board’s perspective, this can be perfectly rational. They’re trying to keep the co‑op’s equity‑to‑debt ratio strong enough to make lenders comfortable, while leaving room for future projects.

From your perspective, sitting at the kitchen table with your lender, a few fair questions pop up:

  • If my retained equity helped build this plant, when does that investment realistically come back to my farm as cash?
  • When the whey and ingredients division has a strong year, does that show up as better cash patronage or faster equity redemption, or mostly as accelerated debt pay‑down and a stronger co‑op balance sheet?
  • Can I actually see how the whey and ingredients business is performing as its own line, or is it lumped into one big profit number?

It’s worth noting something simple that often gets glossed over: every dollar the co‑op retains is a dollar you can’t use this year to pay down your operating line, improve fresh cow facilities, or tweak ventilation and cow flow to protect butterfat performance in summer.

Research on European dairy co‑ops in specialty cheese and ingredient markets, summarized in global dairy sector reviews, has found that co‑ops with clear segment reporting and active member participation tend to maintain member trust and perform more steadily across market cycles than those with opaque structures.  Members in those systems may not love every decision, but they can see whether the whey or ingredients division is doing what it was supposed to do and how that performance connects to patronage and equity. 

Key takeaway for co‑op finance:
If whey and ingredient projects are funded heavily with member equity and the performance of those divisions isn’t clearly reported or tied to cash patronage and equity redemption, it’s very easy for ingredient value to get “stuck” at the co‑op level instead of showing up in your milk cheque.

That’s why transparency and structure matter just as much as stainless steel and membranes.

Whey Investments Can Pay Off—But Not Automatically

A fair question at this point is, “Do these whey investments actually pay back fast, or is that just a nice line in a PowerPoint?”

Several techno‑economic and “dairy biorefinery” studies have worked through the numbers on whey valorization—turning whey into higher‑value products instead of low‑value powder or waste. Reviews in journals like Foods and Journal of Environmental Management have concluded that whey is a promising feedstock for higher‑value ingredients and bioproducts and that, under favorable conditions—strong demand, good utilization, reasonable energy costs—those projects can deliver relatively fast payback compared with some other dairy investments. 

On the ground, I’ve noticed a pattern that fits that. Plants that bolt modern whey lines onto existing cheese operations often go through a bumpy “transition period”—membrane fouling, staffing issues, quality glitches. But once they settle in and run near design capacity, that whey-and-ingredients side often becomes one of the more attractive contributors to plant margins, especially when WPC‑80 and WPI exports are strong. 

But there are some real “ifs” here:

  • If energy is expensive in your region, it can eat into those margins fast.
  • If multiple plants in a region all add similar whey capacity at the same time, ingredient prices can soften just as everyone’s ramping up.
  • If milk supply is flat or constrained by environmental rules, permits, or cow numbers, it’s harder to hit the utilization rates the original models assumed.

So yes, whey projects can pay back relatively quickly when they’re sized well, run well, and markets cooperate. But they’re not automatic winners. And even when they do pay off at the plant level, it’s still an open question how that success is shared between the co‑op’s books and your farm’s balance sheet.

Where You Sit Depends on Who You Ship To

What farmers are finding is that their place in this whey story depends a lot on who they ship to and which region they’re in.

Ingredient‑heavy co‑ops and processors

In Wisconsin, Idaho, parts of Michigan and South Dakota, and now in the Texas Panhandle and eastern New Mexico, quite a few producers ship to co‑ops and private processors running big cheese and whey complexes. Those plants:

  • Turn a lot of milk into cheese.
  • Run modern whey lines making WPC‑80, WPI, and sometimes more specialized ingredients.
  • Sell into sports, clinical, and active‑nutrition markets that are still growing.

CoBank’s outlook suggests U.S. cheese capacity will grow by around 10% over a five‑year period, with whey processing expanding alongside it.  That means farms shipping into these systems—from the Upper Midwest to the High Plains—are sitting right on top of where much of the new ingredient value is being created. 

In those regions, the coffee‑shop conversation often sounds like, “I’m glad our co‑op is serious about ingredients and not stuck in 1985. I just wish I could see where that whey plant shows up in my patronage and equity.”

If that’s you, some smart questions include:

  • Does our co‑op report whey and ingredients as their own division with at least basic volume, revenue, and margin information?
  • In strong whey years, do we actually see that reflected in cash patronage or faster equity revolvement, or does most of the gain show up as lower debt and a stronger balance sheet?
  • Once the project has essentially hit the payback window we were shown, is there a plan to adjust patronage or redemption policies so more of the ongoing margin flows back to members?

More commodity‑ and fluid‑focused systems

In parts of the Northeast and Southeast, and in some smaller regional co‑ops, the product line is still heavily weighted toward fluid milk, butter, and nonfat dry milk. Whey may be in the mix as a commodity powder, but it’s not a big branded-ingredient business.

For those farms, the whey story sounds different:

  • Some co‑ops simply don’t have the scale or balance sheet to build and run their own WPC/WPI plants.
  • They may sell whey as basic dry whey, or explore joint ventures and toll-processing arrangements with ingredient specialists.
  • The strategic question becomes: do we move up the whey value chain, or do we double down on being a lean, low‑cost commodity producer?

In those systems, it’s worth watching:

  • Whether your co‑op is actively exploring partnerships that let members participate in some ingredient value without carrying all the risk.
  • Whether being a “commodity‑lean” co‑op is a conscious strategy with clear economics, or just the default because big ingredient projects feel too risky.

Quota systems, like in Canada

Under Canada’s supply‑managed system, milk is produced under quota, and national and provincial boards determine farm‑gate prices. That changes how the whey value shows up.

Canadian processors still capture value from cheese and whey ingredients, especially in export and specialty product niches. But farm revenue is much less tied to spot commodity swings and much more to regulated prices and pooled returns. In that context, whey value tends to affect processor health, competition, and long‑term investment capacity more than you see in day‑to‑day cheques.

So for many Canadian producers, the whey question sounds more like:

  • Are processors capturing enough ingredient value to stay financially healthy and keep investing in plants and products?
  • Is competition between processors strong enough to reward farms that invest in components, cow comfort, and better housing—whether that’s freestalls, tie‑stalls, or dry lot systems?

In places like New Zealand and parts of Europe, the picture is further shaped by emissions rules, subsidy structures, and trade agreements. But the core issue is the same: who gets the whey margin, and does the farm see enough of it to justify continuing to invest?

Questions That Actually Move the Needle in Co‑op Meetings

So what do you do with all this when you’re one member in a district meeting, trying to decide whether to stand up?

What I’ve found is that one or two well‑aimed, respectful questions will do more than a long speech. Here are three that line up well with what co‑op finance specialists and extension folks suggest.

Question to AskWhat It RevealsWeak Answer (Red Flag)Strong Answer (Green Light)Your Follow-Up Move
“How is this whey project being financed?”Mix of debt vs. member equity; equity leverage risk“We’re financing it the normal way” or vague numbers“60% bank debt, 40% member equity retained over 3 years; target debt-to-equity 50:50 post-payback”Ask: “When equity is fully retired, does the patronage policy change?”
“Will whey and ingredients be reported as their own division?”Transparency; whether co-op sees whey as core profit driver or afterthought“It’s in the consolidated number” or “We don’t break that out”“Yes—volume in tonnes, revenue, EBITDA margin, and narrative explaining performance vs. plan, starting next annual report”Follow-up: “What was last year’s volume and margin?” (tests if they have real data)
“What’s our patronage approach for higher-margin businesses?”Whether co-op evolves policies as projects mature; whether members benefit from success“We have a standard patronage policy; everybody gets the same”“We’re targeting 30% cash payout on whey division within 2 years of payback; board will revisit if equity targets are hit”Challenge: “Show me in writing how that ties to whey margin, not just total co-op earnings”

1. “How is this whey project being financed?”

Instead of “this feels risky,” you might ask:

  • Roughly what share of the capital is funded with debt from banks or bond investors?
  • How much is coming from retained member equity that’s already on the books?
  • Are there any new per‑unit retains or special capital assessments tied specifically to this project?
  • Once the plant is online, what equity‑to‑debt ratio is the board aiming for?

OSU Extension’s co‑op work stresses that you can’t really understand risk and return without knowing how much is coming from lenders versus members. If a project leans heavily on member equity, it’s natural to ask what the plan is for that equity to work back in your favour over time. 

2. “Will whey and ingredients be reported as their own business?”

More producers are starting to ask for segment reporting, not just a single, blended profit number.

That might look like:

  • A line in the annual report for “whey and proteins” or “ingredients.”
  • Simple, high‑level metrics: tonnes sold (or equivalent), revenue, and a margin range.
  • A short narrative each year explaining whether that division performed above or below expectations and why.

Studies of European dairy co‑ops suggest that groups with clearer divisional reporting and stronger member engagement tend to maintain trust and ride out downturns more smoothly.  When whey is clearly reported, members can see whether the business is working as promised. 

And I’ll say this as gently as possible: if your co‑op consistently refuses to share even basic performance information about a big new division like whey and ingredients, that’s telling you something about how it views member‑owners.

3. “What’s our patronage approach for higher‑margin businesses like whey?”

Lots of co‑op patronage policies were written in a world dominated by commodity milk, butter, and powder. Higher‑margin, capital‑intensive businesses like whey can behave very differently.

Good questions here include:

  • In years when whey and ingredients do especially well, is there room—within our financial targets—to increase the cash portion of patronage tied to that division?
  • Once the project has effectively paid for itself, has the board considered accelerating equity revolvement or increasing the cash share from that business, as long as equity and debt ratios stay healthy?
  • Could the board walk through a simple, realistic example of how a strong whey year would show up for a 200‑cow or 400‑cow member, both in cash and in equity?
Farm SizeAnnual Milk VolumeScenario A: Co-op Retains 100% (Zero Cash)Scenario B: Co-op Shares 50% of Whey Margin as Cash Patronage (+15¢/cwt)Scenario B Impact: Dollars Per Cow Per YearFarm-Level Decision Question
100-Cow Herd27,000 cwt/yr$0 additional cash+$4,050 annual cash+$40.50/cowWorth 3–4 parlour upgrades or a genetics consultant annual fee
250-Cow Herd67,500 cwt/yr$0 additional cash+$10,125 annual cash+$40.50/cowWorth deferring a major repair vs. doing it now; offsets half a veterinary rotation
500-Cow Herd135,000 cwt/yr$0 additional cash+$20,250 annual cash+$40.50/cowWorth a part-time employee’s wages for one season; meaningful debt service relief

To give that some scale, here’s an example you can scribble in your notebook:

  • Suppose the whey and ingredients division lifts overall co‑op margins by 30 cents per hundredweight in a given year.
  • If the board decides to pass half of that—15 cents per cwt—through as extra cash patronage:
    • A farm shipping 10,000 cwt/year would see about 1,500 dollars in additional cash.
    • A farm shipping 20,000 cwt/year would see about 3,000 dollars in additional cash.
  • At around 270 cwt per cow per year (about 27,000 pounds), that 15¢/cwt adds up to roughly 40 dollars per cow per year. On a 250‑cow herd, that’s in the neighborhood of 10,000 dollars.

That’s not going to buy a whole new parlour, but it might be the difference between putting off a key repair and finally doing it—or between feeling forced to stretch your line of credit and sleeping a little better.

Seeing It from the Board’s Side Too

To keep this fair, it helps to slide into the board chair for a minute and think about what directors and managers are juggling.

They’re dealing with:

  • Lender expectations. Co‑op lenders want to see strong equity and comfortable coverage ratios, especially when whey, cheese, and powder prices are volatile. 
  • Price and demand swings. CoBank’s work on whey markets has highlighted that strong demand periods can be followed by softer prices, especially when new capacity floods the market. 
  • Utilization risk. A plant designed for 90% utilization looks fantastic on the spreadsheet; at 65–70%, especially in regions where cow numbers are flat or environmental rules are tight, the economics change quickly. 
  • Future capital needs. Even if this whey project goes well, there are always other needs coming—dryer upgrades, cheese‑line modernization, wastewater and energy projects.

So when boards decide to retain a larger share of patronage during the early years of a big whey project, they’re often trying to keep the co‑op solid and bankable, not trying to short‑change members.

The tension comes when:

  • Retention policies don’t seem to evolve even after a plant appears to be past its payback window, or
  • Members don’t get enough information to judge whether their equity is being used well.

That’s why those three questions—about financing mix, segment reporting, and patronage for higher‑margin businesses—are so important. They help shift the conversation from frustration to shared problem‑solving.

Practical Moves for Your Farm Before the Next Wave of Stainless

With everything else on your plate—fresh cow management, labour, feed, keeping barns or dry lot systems in shape—it’s easy to shrug and say, “That’s co‑op stuff. I don’t have time for it.” But there are a few manageable steps that can put you in a much better spot without turning you into a full‑time analyst.

1. Really look at your co‑op equity statement

Start by grabbing your latest capital account statement:

  • How much total retained equity do you have?
  • How much of that has built up over roughly the last decade, during this wave of processing expansion?
  • Which patronage years are being revolved now, and what does the stated policy say about future revolvement?

Then sit down with your lender or adviser and look at that equity alongside your debt, age, and plans. OSU’s co‑op work points out that the value of co‑op equity depends heavily on your time horizon and the co‑op’s actual redemption practices.  For a 35‑year‑old with 400 cows, a strong equity balance with predictable revolvementcan look like an asset. For a 60‑year‑old with 100 cows, a big equity number with no clear path to redemption may feel more like trapped capital. 

2. Benchmark your all‑in price

Every year or so, it’s worth asking, “How do we actually compare?”

  • Calculate your average pay price per cwt (or per 100 litres) over the last 12–24 months, including both the cheque and any cash patronage you actually received.
  • Compare that with USDA mailbox prices or provincial benchmarks for your region. 
  • Quietly compare notes with one or two trusted neighbours who ship to other buyers, adjusting for components, quality, and hauling.

You’re not reacting to every ten‑cent blip. You’re looking for patterns. If, over time, your all‑in price is consistently 25–50¢/cwt behind similar herds, that’s 2,500–5,000 dollars on 10,000 cwt and 5,000–10,000 dollars on 20,000 cwt.That’s enough to matter when you’re trying to catch up on deferred maintenance or manage your operating line.

3. Take one or two good questions into your next meeting

You don’t have to take over the microphone. One or two clear questions can change the tone of a district meeting:

  • “Could the board give a simple overview of how our whey or ingredients division performed last year—rough volume, revenue, and whether it was on track with what we were told when we approved the project?”
  • “When we first discussed this whey plant, what kind of payback window were we shown, and based on what you’re seeing now, are we roughly in that range?”
  • “As this project matures and we hit the equity and debt ratios we’ve targeted, has the board discussed changing the cash portion of patronage tied to that division?”

Those are owner‑level questions. They show you’re engaged and thinking like an investor, not just a supplier.

4. Use the experts who already work for dairy farmers

There’s a lot of good help already in the system:

  • Ask your university or provincial extension folks if they’ll run a winter session on whey markets, co‑op financials, and how processing investments connect to milk pricing. 
  • Encourage your co‑op to invite its primary lender or a co‑op finance specialist to member meetings to explain how they look at equity, debt, and project risk around cheese and whey plants.
  • If your region has a co‑op development center or a similar organization, consider bringing together a small group of members to sit down with them and discuss governance tools and best practices.

These people see multiple co‑ops and processors. They know what “normal” looks like and where the outliers are, and they can help translate that into plain language.

The Bottom Line

So why spend this much energy thinking about whey when you’ve got cows to breed, feed to buy, and a to‑do list that never seems to shrink?

Because this isn’t just another short‑term price swing. The combination of:

  • GLP‑1 weight‑loss drugs are pushing a significant share of consumers toward fewer calories but more protein‑dense foods
  • Strong, still‑growing global demand for whey protein, with the market projected to nearly triple from 6.5 billion dollars in 2023 to 19.2 billion by 2030
  • And solid clinical evidence that whey helps older and medically vulnerable people maintain muscle and function

…all point toward durable demand for high‑quality dairy protein.

At the same time:

  • The spread between commodity dry whey and higher‑value whey proteins is large enough to change plant economics materially.
  • More than eight billion dollars in new processing capacity—a big chunk of it in cheese and whey, including major builds in the Texas–New Mexico corridor and the Upper Midwest—is being built or expanded in this cycle. 
  • And both techno‑economic research and real plant experience suggest that, when they’re sized and run well, whey investments can be among the quicker‑paying projects in a processor’s portfolio.

Those are the big structural forces. What’s still very much in our hands, as producers and co‑op members, is how those whey projects are financed, how their performance is reported, how patronage is structured, and how actively we choose to engage in those decisions.

There’s no one right answer. A 2,000‑cow dry lot in the Texas Panhandle, a 600‑cow freestall in Ontario, and a 120‑cow tie‑stall in Vermont are going to make different calls on risk, equity, and time horizon. But producers who:

  • Understand their co‑op’s equity structure,
  • Know where their all‑in price sits relative to neighbours and benchmarks,
  • And are willing to ask a few focused questions in the right rooms,

They are in a much stronger position to decide what this whey boom means for their own operation.

What’s encouraging is that we’re not starting from scratch. We’ve got solid data, extension specialists who understand both cows and co‑ops, lenders who will explain their thinking if we ask, and real‑world examples—here and overseas—of co‑ops and processors that have handled big investments in ways that kept both plants and farms healthy.

The opportunity now is to bring that same level of clarity and shared purpose to this “whey moment,” so that ten years from now we’re not just proud of the shiny stainless on plant tours—we’re also standing in barns and dry lot systems we’re proud to hand on to the next generation.

Key Takeaways:

  • US$8B in stainless, coming fast: New cheese and whey plants from Wisconsin to the Texas Panhandle are adding ~360 million pounds of cheese capacity by the end of 2025—with whey protein lines riding alongside.
  • Whey demand is structural, not hype: GLP-1 drugs and protein-obsessed consumers are pushing the global whey market from US$6.5B (2023) toward US$19.2B by 2030—a near tripling in seven years.
  • Your formula doesn’t capture the real value: Class III still prices whey at commodity dry whey levels (40–60¢/lb), while WPC-80 and WPI sell at multiples of that.
  • Co-op structure determines whether you ever see that margin: cash patronage splits range from 15–70%; equity can take years or decades to turn. If whey isn’t reported or tied to patronage, the value often stays parked on the co-op balance sheet.
  • Bring three questions to your next meeting: (1) How is this project financed—debt vs. member equity? (2) Will whey be reported as its own division? (3) When whey margins are strong, does cash patronage or redemption actually improve?

Complete references and supporting documentation are available upon request by contacting the editorial team at editor@thebullvine.com.

Learn More

The Sunday Read Dairy Professionals Don’t Skip.

Every week, thousands of producers, breeders, and industry insiders open Bullvine Weekly for genetics insights, market shifts, and profit strategies they won’t find anywhere else. One email. Five minutes. Smarter decisions all week.
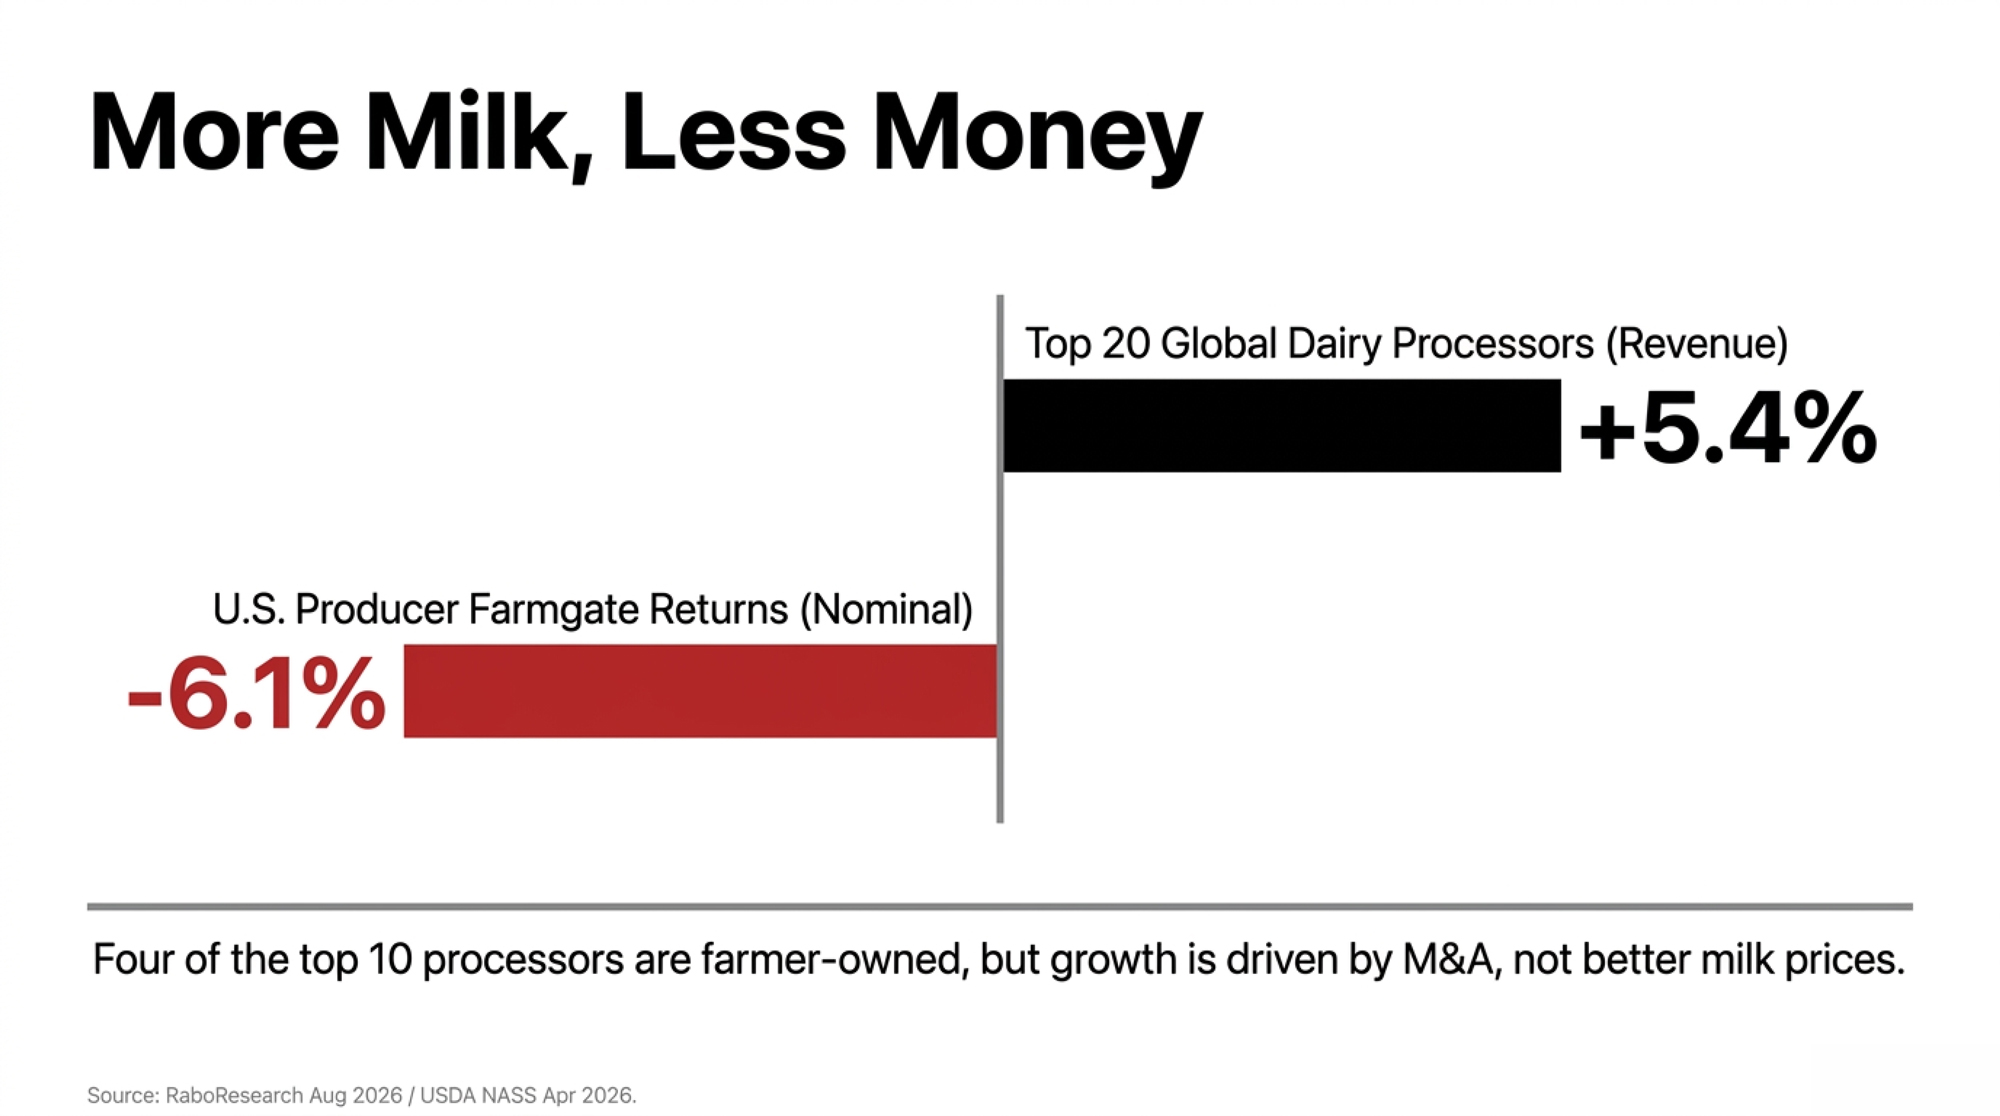
NewsSubscribe
First
Last
Consent

20 Generations to One: What Europe’s Gene Editing Decision Means for the Future of Your Herd

One generation instead of twenty. That’s what gene editing offers for heat tolerance—and Europe just accelerated the timeline. The dairy producers paying attention now will be the ones leading in five years.

Executive Summary: Twenty generations through traditional breeding—or one with gene editing. That’s the new math for traits like heat tolerance, disease resistance, and polled genetics, and it’s not hypothetical: heat-tolerant cattle are FDA-approved, Brazil has gene-edited Holsteins in commercial herds, and Europe’s December 4 agreement just accelerated the global timeline. The economic stakes are clear. U.S. dairy loses up to $1.6 billion annually to heat stress alone, with hot-climate operations absorbing several hundred dollars per cow each summer. What sharpens the urgency is the compounding effect—genetic advantages multiply over generations, which is why producers who moved early on genomic selection built leads their competitors are still chasing a decade later. This analysis covers where regulations stand, what’s available today, legitimate concerns that deserve honest consideration, and practical steps for positioning strategically. The technology is proven. The producers paying attention now will shape the next decade of dairy genetics—not spend it catching up.

I was talking with a producer in central Texas last month who told me something that stuck with me. He’d calculated his heat-related losses across the past summer: reduced milk production, reproduction failures, increased health events, and the energy costs of running cooling systems around the clock for four straight months. His number came to several hundred dollars per cow—losses he could measure but couldn’t fully prevent, no matter how much he invested in fans and sprinklers.

That conversation was fresh in my mind when news broke from Brussels on December 4, 2025. After all-night negotiations and years of fierce debate, EU policymakers reached a provisional agreement allowing gene-edited crops to bypass the bloc’s strict GMO regulations. The immediate focus is on plants—wheat, tomatoes, that sort of thing. But here’s why that Texas conversation matters: among the dairy cattle applications currently working through research pipelines is gene-edited heat tolerance. The kind that could fundamentally change that producer’s math.

The question isn’t really whether gene editing will become part of dairy cattle breeding. The science is proven, commercial animals already exist in some markets, and regulatory doors are opening. The real question is how individual operations position themselves as these tools become available—or whether they’ll spend years trying to catch up with competitors who moved earlier.

The Global Regulatory Landscape: Where Things Stand

Before diving into the science and economics, it helps to understand the regulatory patchwork that will determine when and how gene-edited genetics reach your market. Here’s where major dairy regions currently stand:

RegionRegulatory StatusLivestock Included?Current Availability
European UnionNGT regulation provisionally agreed December 4, 2025; formal adoption expected early 2026Plants only initially; livestock framework to followNot yet available
United KingdomPrecision Breeding Act in full force as of November 13, 2025Yes—includes cattleFramework ready; commercial products developing
United StatesCase-by-case FDA review via “low-risk determination” processYesHeat-tolerant cattle approved March 2022; other traits under review
CanadaGuidance for gene-edited livestock is still developing under Health Canada and CFIAPendingNot yet available
BrazilCTNBio approved gene-edited cattle for breeding and food useYesHeat-tolerant Holsteins approved 2023

Sources: European Parliament (December 2025), Morrison Foerster regulatory analysis (November 2025), FDA Risk Assessment Summary (March 2022), CTNBio public records (2023)

What Brussels Actually Decided (And Why It Creates Precedent)

Let me walk you through what the EU agreement actually does, because the details matter for understanding where this is heading.

The new framework creates two categories for plants developed using what regulators call “New Genomic Techniques,” or NGTs:

  • Category 1: Plants with genetic changes that could theoretically occur through natural mutation or conventional crossbreeding. These skip the GMO approval process entirely—no mandatory safety assessments for each generation, and final food products won’t need special labels (though seeds will be marked).
  • Category 2: Plants with more complex modifications that go beyond what conventional breeding could achieve. These still face the full regulatory process.

That’s according to the European Parliament’s official announcement from December 4. The European Commission’s press release emphasized the regulation’s potential to develop plant varieties more resilient to climate change while requiring fewer pesticides. Copa-Cogeca, representing EU farmers and agricultural cooperatives, expressed strong support. Thor Gunnar Kofoed, chair of their working party on plant breeding, called it “a turning point for European agriculture.”

Now here’s what I find interesting for livestock producers: this regulation specifically covers plants, not animals. But the product-based framework being established—evaluating what a genetic change does rather than reflexively restricting how it was made—creates a template. When gene-edited livestock applications eventually reach European regulators, there’s now a philosophical precedent for how to approach them.

Key Regulatory Dates to Watch

  • November 2025: UK Precision Breeding Act takes full effect, including livestock provisions
  • Early 2026: EU NGT regulation expected to receive formal adoption
  • Ongoing: FDA continues case-by-case “low-risk determination” reviews for gene-edited livestock traits
  • TBD: Health Canada and CFIA guidance for gene-edited livestock expected to develop further

The Climate Challenge That Traditional Breeding Can’t Solve Fast Enough

Here’s where this discussion gets personal for many operations, especially if you’re farming in areas where summers are becoming more difficult for your herd.

The economic impact of heat stress on U.S. dairy is substantial—and probably larger than many producers fully account for. The foundational study by St-Pierre and colleagues, published in the Journal of Dairy Science in 2003, estimated annual industry-wide losses between $897 million and $1.5 billion. More recent work from Ohio State University researchers suggests losses can reach $1.6 billion annually as summer conditions have intensified across much of dairy country.

Regional heat stress impacts vary significantly:

  • Upper Midwest (Wisconsin, Minnesota): University of Wisconsin researchers measured costs at roughly $74 per cow based on milk yield losses alone—relatively moderate but still meaningful
  • Southeast (Florida, Georgia): Losses several times higher; some Florida operations have spent decades working with Senepol and Gir crossbreeding programs to introduce natural heat tolerance, with real success—but also real tradeoffs in production genetics that take years to breed back
  • Southwest (Texas, Arizona): Producers report losses of several hundred dollars per cow when factoring reproduction failures, health events, and cooling costs
  • California Central Valley: Compounding the challenge of water constraints alongside rising temperatures, affecting both cooling capacity and irrigated feed production

A study published in Science Advances this past July really crystallized the scope of the problem. The research, led by Claire Palandri at the University of Chicago’s Harris School of Public Policy, analyzed production data from over 130,000 cows across 12 years of Israeli dairy records—one of the most comprehensive datasets ever assembled on heat-stress impacts.

Key findings from the Palandri study:

  • A single day of extreme heat can reduce milk production by 10 percent
  • That suppression can persist for more than 10 days after temperatures return to normal
  • Even with cooling systems in place, mitigation effectiveness dropped to around 40 percent during extreme heat events
  • Cooling “cut losses in half” at moderate temperatures, but became progressively less effective as conditions worsened

There appears to be a ceiling to what management interventions can accomplish when ambient temperatures push into truly dangerous territory.

So what’s the traditional breeding alternative? You could crossbreed with heat-adapted cattle—Senepol, Gir, or Carora breeds that carry what’s called the “slick coat” gene naturally. The challenge, as anyone who’s tried it knows, is the timeline.

Timeline Comparison: Traditional Breeding vs. Gene Editing

Traditional approach to adding heat tolerance to elite Holsteins:

  • Initial crossbreeding + 20 generations of backcrossing
  • Approximately 5 years per generation
  • Total timeline: 80-100+ years to recover elite genetics with a new trait

Gene editing approach:

  • Direct introduction of the slick coat allele to elite genetics
  • Single generation
  • Timeline: Available for breeding in current genetic lines

Dr. Appolinaire Djikeng, Director of the Centre for Tropical Livestock Genetics and Health at the Roslin Institute in Scotland, has explained that gene editing can accomplish in one generation what would otherwise take 20 generations through conventional breeding.

One generation versus twenty. For operations facing mounting heat pressure right now, that’s not an incremental improvement—that’s a fundamentally different approach to the problem.

What’s Actually Available Today

This isn’t all laboratory work and future promises. Commercial gene-edited cattle exist today, though availability depends significantly on where you’re located and what regulatory frameworks apply.

Heat-Tolerant Genetics

The U.S. FDA issued its first “low-risk determination” for PRLR-SLICK cattle back in March 2022. The FDA’s risk assessment confirms that these were cattle developed by Acceligen, primarily beef animals initially, but the regulatory pathway has since been opened for dairy applications.

Potential benefits:

  • Improved heat dissipation without crossbreeding tradeoffs
  • Maintained elite production genetics (butterfat, protein, yield)
  • Single-generation trait introduction
  • Reduced cooling infrastructure dependence

Current status: Commercial animals exist in the U.S. and Brazil; they are not yet widely distributed in North American dairy markets.

Disease Resistance (BVD)

USDA researchers at the U.S. Meat Animal Research Center have produced calves with dramatically reduced susceptibility to Bovine Viral Diarrhea Virus. The approach, published in PNAS Nexus in May 2023, used CRISPR editing to modify just six amino acids in the CD46 gene.

Potential benefits:

  • Reduced BVD infection severity and transmission
  • Fewer secondary bacterial infections in calves
  • Decreased antibiotic dependence
  • Improved calf survival and performance

Verification data: After 20 months of monitoring, researchers found no off-target effects anywhere in the genome. The edited calf showed minimal clinical signs and no detectable viral infection in white blood cells when challenged.

Current status: Research stage; not yet commercially available.

Polled (Hornless) Genetics

Gene editing allows the naturally occurring polled allele to be introduced directly into elite dairy genetics without production tradeoffs.

Potential benefits:

  • Eliminates the need for dehorning/disbudding
  • Reduced calf stress and pain
  • Labor and medication cost savings
  • Improved welfare optics for retail markets

Important caveat: In 2019, FDA scientists discovered that Recombinetics’ gene-edited polled bulls contained bacterial DNA that had been accidentally introduced alongside the intended edit. MIT Technology Review broke that story, and it set the field back years. Verification protocols have since improved substantially.

Current status: Approaching commercialization; enhanced screening is now standard.

Methane Reduction

UC Davis and the Innovative Genomics Institute announced a $70 million, seven-year project in 2023 using CRISPR to re-engineer rumen microbial communities.

Potential benefits:

  • One-time calf treatment (not daily feed additives)
  • No ongoing compliance or costs
  • Targets methane-producing archaea directly
  • Potential carbon credit value

Current status: Early research stage; commercial availability likely 5+ years out.

The Economics: Understanding What’s Actually at Stake

Let me work through the financial picture, because this is ultimately where the decision-making happens for most operations.

Direct heat stress recovery potential:

For a 1,000-cow herd in a hot climate, recovering even a portion of heat-related losses could translate to:

  • Tens of thousands of dollars annually in recovered milk production
  • Improved reproduction rates that compound over time
  • Fewer fresh cow challenges are cascading through the transition period
  • Reduced cooling infrastructure and energy costs

Emerging carbon/sustainability value:

A typical dairy cow emits roughly 100-125 kg of methane annually (based on Canadian research and IPCC modeling), which translates to about 2.5-3.5 tonnes of CO₂-equivalent. If gene-based solutions achieve the 30-50 percent reductions researchers are targeting, that represents meaningful potential value. Several major cooperatives and processors—including initiatives from organizations such as Dairy Farmers of America and various state-level sustainability programs—are beginning to develop premium structures for verified emissions reductions. These markets are still developing and vary considerably by region and processor, but the trajectory is clear.

The compounding factor:

Here’s the economic dynamic that I think deserves more attention than it typically gets: genetic advantages compound over generations.

Think back to what happened with genomic selection. According to CDCB data and a comprehensive review published in Frontiers in Genetics in 2022:

  • Genomic selection roughly doubled the rate of genetic gain for many traits
  • Annual net merit increases jumped from around $40 to approximately $85
  • Producers who moved early built advantages that compounded with every breeding cycle
  • The cautious crowd found themselves years behind on the genetic curve—a gap that proved surprisingly difficult to close

Will gene editing follow the same pattern? Early indications suggest it might. Once gene-edited traits are integrated into elite genetics and multiplied through AI, the same compounding dynamic kicks in.

What Consumers Actually Think

One concern I hear regularly from producers: “This all sounds interesting, but consumers will never accept milk from gene-edited cows.”

The research tells a more nuanced story.

What surveys consistently show:

  • Consumer concerns center primarily on transparency and choice—not categorical rejection
  • Only about one in five consumers indicate they’d refuse to purchase gene-edited products entirely
  • The majority want information and the ability to make informed choices, not outright prohibition

What influences acceptance:

  • Framing matters enormously—purchase intent increases substantially when applications are explained in terms of:
    • Animal welfare (reduced antibiotic use, disease prevention, and eliminating painful procedures)
    • Environmental benefits (lower emissions, reduced resource use)
  • The Vermont GMO labeling experiment is instructive: when mandatory labeling was implemented in 2016, researchers Kolodinsky (University of Vermont) and Lusk (now at Purdue) found that opposition to genetically engineered food fell by 19 percent. Their findings, published in Science Advances in 2018, suggest transparency defuses anxiety rather than amplifying it.

What damages acceptance:

  • Opacity and perceived deception
  • Products appearing on shelves without disclosure, discovered later through media or activist campaigns
  • The path to sustained acceptance runs through honesty about what’s being done and why
If you’re worried consumers will reject milk from gene-edited cattle, you need to see what actually happened when transparency was tested. Vermont’s 2016 mandatory GMO labeling experiment—studied by researchers Kolodinsky and Lusk and published in Science Advances in 2018—found something striking: opposition to genetically engineered food fell by 19 percentage points when clear labeling was implemented. Without disclosure, only about 20% of consumers accept gene-edited products. With honest information about what’s being done and why—especially when framed around animal welfare and environmental benefits—acceptance jumps to 81%. The lesson is clear: consumers don’t reject transparency. They reject opacity and the feeling they’re being deceived. The path to market acceptance for gene-edited dairy genetics runs directly through honest communication about welfare improvements, reduced antibiotic dependence, and environmental benefits. Hide what you’re doing, and you’ll face rejection. Explain it clearly, and the data suggests most consumers are fine with it.

Engaging with Legitimate Concerns

I want to spend time on criticisms that have genuine substance, because glossing over real challenges doesn’t serve anyone well.

Genetic Diversity

Let’s get honest about something the industry doesn’t like talking about. Holstein effective population size has collapsed to approximately 50—a genetic bottleneck that’s frankly dangerous for long-term herd resilience. At the same time, inbreeding in heifers is approaching 10 percent and climbing at +0.26% annually. This isn’t a theoretical concern—it’s a measurable crisis that threatens the biological viability of the breed. Here’s where the conversation gets uncomfortable: gene editing offers a genuine escape route by introducing carefully selected traits into broader genetics without further narrowing the gene pool. The irony is striking—we’re debating whether gene editing is “too risky” while we’ve collectively created an inbreeding crisis that may pose a far greater long-term threat. When critics raise genetic diversity concerns about gene editing, they’re not wrong to worry about concentration of traits. But the data suggests our current path—continuing to breed from an ever-narrowing pool of elite animals—is already catastrophic. Gene editing could actually help if deployed thoughtfully to expand options rather than narrow them further.
ConcernEvidenceCounterargument
Gene editing could accelerate genetic narrowingHolstein effective population size has dropped to ~50 (John Cole, CDCB Chief R&D Officer); Lactanet Canada’s August 2025 report shows Holstein heifers approaching 10 percent inbreeding, continuing the +0.26% annual increase from the 8.86 percent recorded for heifers born in 2021Gene editing could allow beneficial traits to be introduced into broader genetics—expanding options rather than narrowing them
Same elite bulls get edited, concentrating influence furtherValid concern if industry deploys technology narrowlyWhether gene editing helps or hurts diversity depends on how the industry uses it—that’s a choice, not an inherent feature

Off-Target Effects

ConcernEvidenceCurrent Mitigation
Unintended genetic modifications are possible2019 Recombinetics incident: bacterial DNA discovered in “precisely” edited polled bullsWhole-genome sequencing now enables comprehensive screening; newer editing technologies offer improved precision
Technology isn’t infallibleValid—the Recombinetics case demonstrated this clearlyBVDV-resistant calf showed zero off-target effects after 20 months of monitoring (PNAS Nexus, 2023); verification protocols have improved substantially

Patent Concentration

ConcernEvidencePotential Solutions
Few companies could control critical genetic improvementsFoundational CRISPR patents held by a small number of entitiesThe EU NGT framework includes a patent transparency database requirement
Seed industry consolidation as a cautionary parallelValid historical comparisonMost current breakthroughs are happening in public institutions (USDA, UC Davis, Roslin Institute); advocacy is needed for open licensing arrangements

International Trade Complexity

ChallengeImplication
Regulatory frameworks don’t align across jurisdictionsA bull with FDA approval may face different treatment in Canada, the EU, or export markets
Semen from gene-edited animals could face trade barriersOperations with an international genetics business need to navigate a complex patchwork
UK more permissive, EU evolving, North America case-by-caseCreates real operational considerations for genetics suppliers and larger breeding operations

Insurance and Liability

Insurance coverage, liability for off-target effects, and warranty frameworks for gene-edited animals remain unresolved. Larger operations considering early adoption should have conversations with insurers and legal advisors about how these animals fit into existing coverage structures.

A Dynamic Worth Watching: When the Ethics Shift

Here’s something I’ve been thinking about that doesn’t typically come up in industry discussions, but strikes me as potentially significant.

Currently, gene editing is associated with ethical risks for some audiences—it’s something certain advocacy groups criticize. But as welfare-positive applications mature and prove themselves, the ethical pressure may begin flowing in the opposite direction.

Consider the implications:

  • Once polled genetics that eliminate dehorning are commercially available and demonstrably safe, how do you justify continuing to disbud calves?
  • Once heat-tolerant genetics exist that meaningfully reduce chronic heat stress, how do you explain choosing not to use them where cows are visibly struggling?

The question shifts from “Why are you using gene editing?” to “Why aren’t you using available tools to prevent avoidable animal suffering?”

In markets with strong welfare audit frameworks—such as premium processors, retailers with animal welfare commitments, and European export channels—gene-edited traits may increasingly align with responsible animal husbandry expectations rather than conflict with them.

Practical Steps: What Makes Sense Right Now

If you’ve followed this discussion, you’re probably wondering what concrete actions are warranted. Here’s my perspective:

Immediate actions:

  • Track regulatory developments through breed associations and genetics suppliers
  • Understand what’s already cleared or approaching availability in your market
  • Assess your operation’s specific climate and disease vulnerabilities honestly

Conversations to start now:

Engage your genetics suppliers with these questions:

  • What gene-edited traits are you actively developing or licensing?
  • What’s your realistic timeline for commercial availability in my market?
  • How will gene-edited genetics be positioned and priced relative to conventional offerings?
  • What performance data do you have from trial herds or early commercial use?
  • How are you approaching genetic diversity considerations in your edited lines?
  • What are the implications for international semen sales or genetics trade?

Mental model to adopt:

Think about this as infrastructure, not just another product decision. Gene editing isn’t a discrete product to evaluate in isolation—it’s potentially foundational infrastructure that could reshape how genetic merit is defined, measured, and transmitted. The producers who recognized genomics as infrastructure back in 2010-2012 generally feel that perspective served them well.

The Bottom Line

The EU’s December decision didn’t resolve every question about gene editing in dairy cattle. Significant regulatory, commercial, and practical questions remain across multiple jurisdictions. But it signaled that major agricultural markets are moving toward science-based, outcome-focused regulation—evaluating what genetic changes accomplish rather than reflexively restricting the methods used to achieve them.

The underlying technology is proven and continuing to advance. Commercial animals exist in approved markets. Early-moving operations in Brazil and the UK are beginning to develop practical experience that will inform broader adoption decisions.

For producers weighing these developments, staying informed and engaged represents a reasonable first step. The next several years will likely determine which operations and regions effectively capture the benefits of climate-adapted, welfare-improved, lower-emission genetics—and which find themselves working to catch up with competitors who positioned themselves earlier.

These are decisions worth approaching thoughtfully. And honestly? They’re worth getting excited about, too. The technology is coming—the opportunity is in being ready for it.

Have questions about how gene editing developments might affect your operation? This is a conversation worth starting, and you don’t have to figure it out alone. Your genetics provider, land-grant extension specialist, or veterinarian would welcome the chance to think it through with you. Reach out, ask questions, and stay curious. That’s how the best producers have always stayed ahead.

KEY TAKEAWAYS:

  • Twenty generations becomes one: Gene editing compresses the timeline for adding heat tolerance, disease resistance, or polled genetics to elite dairy genetics—without the years of production tradeoffs that come with traditional crossbreeding.
  • This is commercial reality: Heat-tolerant cattle are FDA-approved (March 2022), Brazil has gene-edited Holsteins in production, and Europe’s December 4, 2025, agreement just accelerated global momentum. The technology works.
  • $1.6 billion in recoverable losses: That’s what U.S. dairy loses annually to heat stress alone. Hot-climate operations absorb several hundred dollars per cow each summer—costs that gene-edited heat tolerance directly addresses.
  • Genetic advantages compound: Producers who adopted genomic selection early built leads their competitors spent a decade chasing. Gene editing creates the same opportunity for those who position early—and the same risk for those who wait.
  • Start the conversation now: Talk to your genetics suppliers about what’s in their pipeline and what timelines look realistic. You don’t need to commit today, but understanding what’s coming lets you move strategically rather than reactively.

Complete references and supporting documentation are available upon request by contacting the editorial team at editor@thebullvine.com.

Learn More:

The Sunday Read Dairy Professionals Don’t Skip.

Every week, thousands of producers, breeders, and industry insiders open Bullvine Weekly for genetics insights, market shifts, and profit strategies they won’t find anywhere else. One email. Five minutes. Smarter decisions all week.
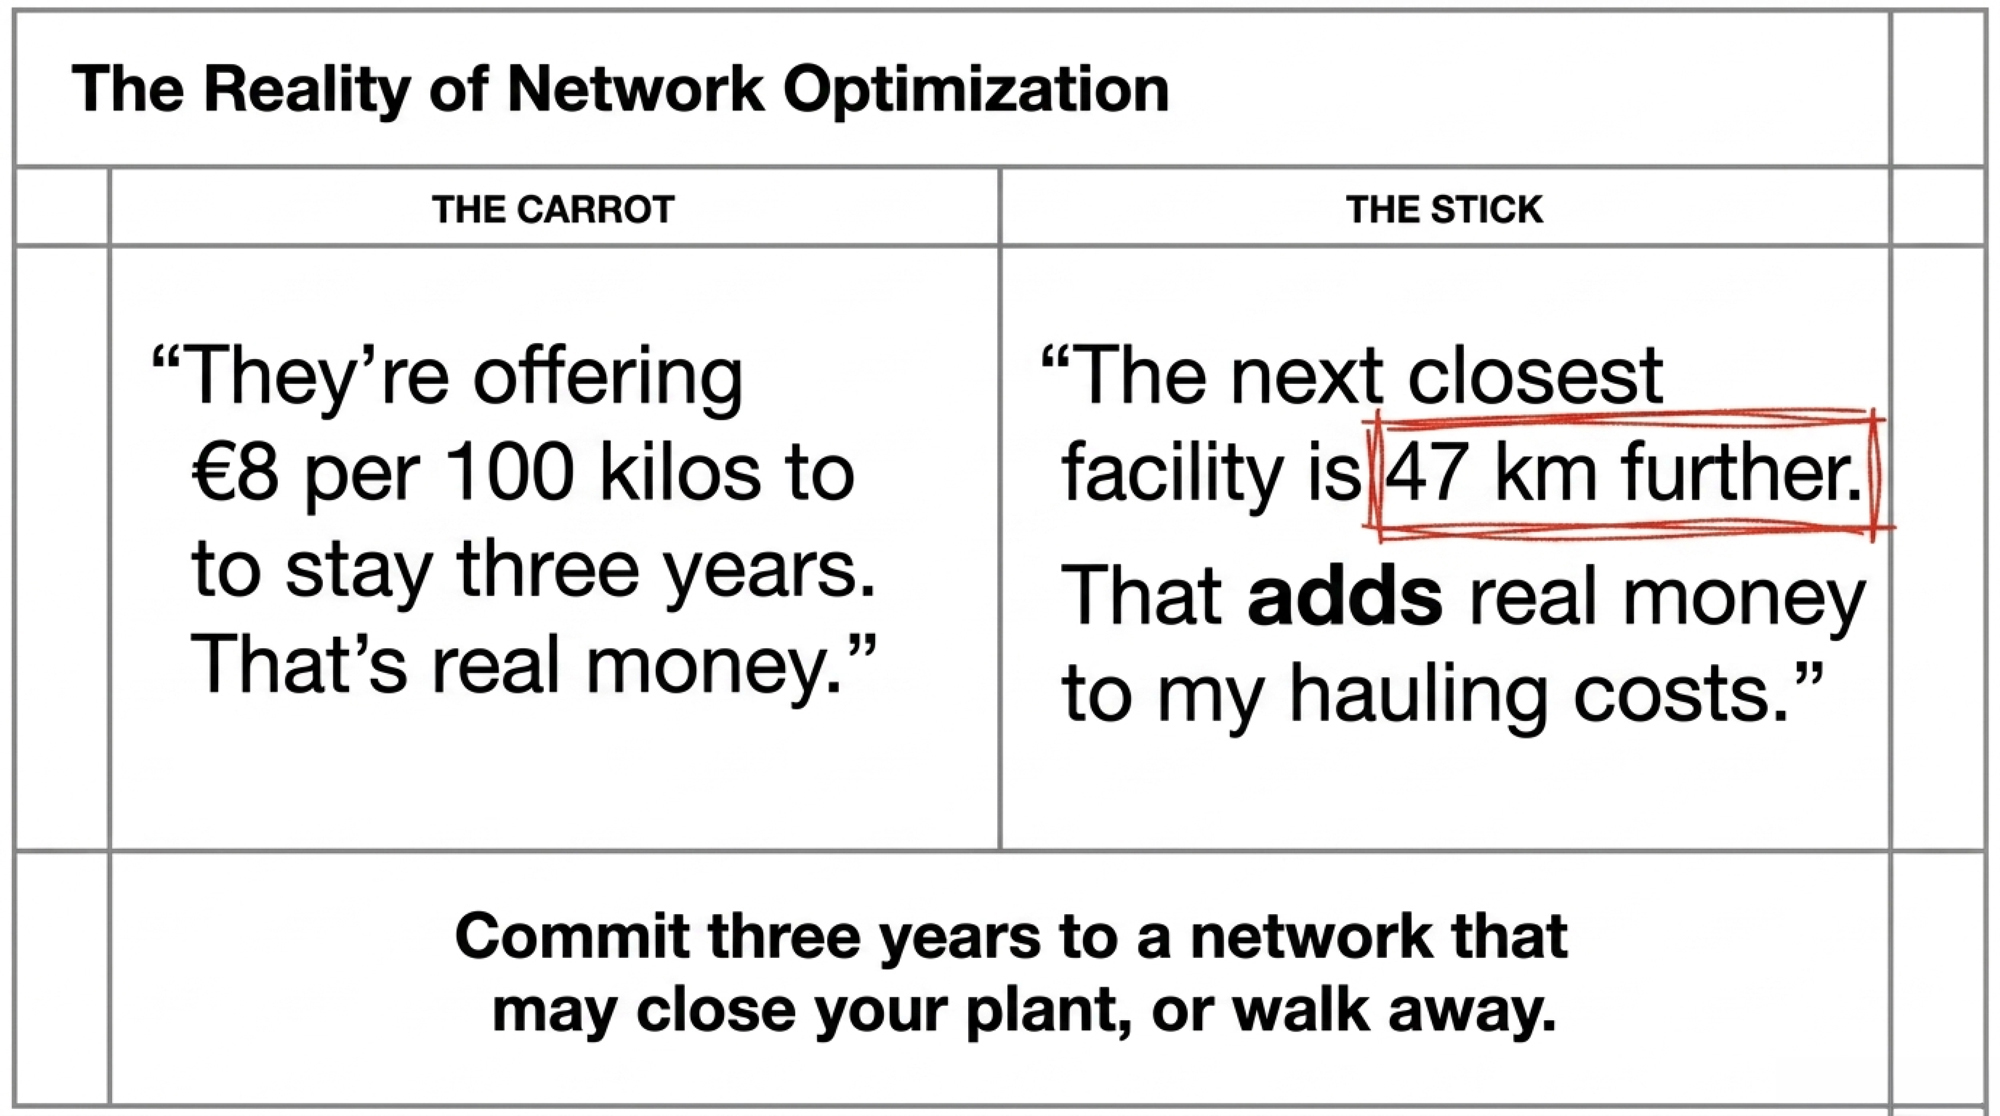
NewsSubscribe
First
Last
Consent

October’s 6,000-Cow Reality Check: Why the Smart Money Is Culling at Record Prices

October data: Production ↑3.7%, Herd ↓6,000 cows. First reduction of 2025. What smart producers know that you might not.

EXECUTIVE SUMMARY: October revealed dairy’s inflection point: producers culled 6,000 cows while production rose 3.7%, proving that margin math now trumps expansion momentum. At $16.91 milk and $165 cull values, keeping a cow losing $45/month means refusing $1,950 in immediate cash—a calculation thousands of farm families have already made. The heifer shortage (the lowest since 1978) has pushed replacements to $4,200, effectively locking the industry into its current size regardless of dreams of price recovery. Geography has become destiny, with new processing plants creating permanent $1.50/cwt advantages that no amount of good management can overcome. While some wait for $22 milk to return, successful operations are already adapting through component optimization, forward pricing, and even geographic relocation. October’s 6,000-head reduction isn’t a statistic—it’s 6,000 individual decisions that collectively signal dairy’s new reality: adapt to $17-19 milk or exit.

Dairy Culling Strategies

This caught my attention because it suggests we’re witnessing a pivotal moment where operational economics are beginning to override expansion momentum. After spending the week talking with producers and economists across Wisconsin, Texas, Idaho, and New York, what struck me is how this single data point reflects deeper strategic shifts happening across the industry.

Looking at the USDA’s October milk production report released this afternoon, total production reached 19.47 billion pounds, continuing the growth trend we’ve seen all year. But that 6,000-cow reduction? That’s producers voting with their culling decisions, signaling that margin pressures are finally forcing hard choices.

The economic calculation forcing dairy producers to choose between $1,950 immediate cash or continued monthly losses of $45 per marginal cow—explaining October’s historic 6,000-head reduction.

Dr. Marin Bozic, who tracks dairy economics at the University of Minnesota, offered an interesting perspective during our discussion. He noted that these patterns remind him of previous structural adjustments in commodity markets—times when the industry had to recalibrate expectations.

“What we’re observing isn’t just price pressure—it’s the convergence of biological lags from past breeding decisions meeting current economic realities. The industry is essentially paying for decisions made three years ago.”
— Dr. Andrew Novakovic, E.V. Baker Professor of Agricultural Economics, Cornell University

Here’s what’s particularly interesting—industry perspectives vary considerably on what this means. Some analysts I’ve spoken with suggest we’re seeing a temporary oversupply that could resolve with strong export demand or weather-related production disruptions by late 2026. Others see signs of more fundamental market restructuring.

And honestly? Both camps make compelling arguments.

Let me walk you through what the data tells us, and you can draw your own conclusions…

October 2025: The Numbers Behind the Decision

MetricValueSource
National Herd Size9.35 million headUSDA Milk Production Report
Year-over-Year Change+12,000 headUSDA NASS
October Adjustment-6,000 headUSDA NASS
Milk Production19.47 billion lbs (+3.7% YoY)USDA NASS
Class III Milk Price$16.91/cwtUSDA-AMS
Cull Cow Value$165/cwt (Southern Plains avg)USDA Direct Cattle Report
Replacement Heifer Cost$3,010 (July avg)USDA-AMS Auctions
Daily Feed Investment$8.50/cowUW Extension

The Math Behind October’s Culling Decisions

Here’s what struck me as particularly revealing: the national herd stands at 9.35 million head—essentially flat with only 12,000 more cows than in October 2024. Given all the processing capacity that’s come online recently, you’d expect more aggressive expansion. But that’s not what we’re seeing.

I spent time this week with a Wisconsin dairy operator managing 2,100 cows who walked me through their October decision-making. With Class III milk at $16.91 and feed costs around $8.50 daily, their bottom-quartile cows—those averaging 65 pounds versus the herd average of 85—were generating negative margins of about $45 monthly.

Meanwhile, cull values in the Southern Plains were hitting $165 per hundredweight.

Think about that calculation for a moment: $1,950 in immediate cash versus continued negative margins. It’s not an easy decision, but it’s becoming increasingly common.

What made October particularly significant was this convergence of pressures:

  • Milk prices are settling at $16.91, well below the $20-23 range that justified 2023-2024 expansion plans
  • Feed costs are stabilizing around $8.50 per cow daily (University of Wisconsin Extension’s November data)
  • Cull cow values are reaching near-historic levels at $165/cwt in the Southern Plains
  • Replacement heifers averaging $3,010, up from $1,720 in April 2023
  • December Class III futures are showing $17.21 on the CME—not exactly a recovery signal
  • Processing facilities are dealing with utilization challenges despite $10 billion in recent investments (CoBank’s August assessment)

An Idaho producer I spoke with, managing 450 cows near Twin Falls, described it this way: “We’re evaluating every animal’s contribution to cash flow. It’s about making data-driven decisions, not emotional ones.”

The Heifer Shortage Nobody Saw Coming (Except Everyone Should Have)

Replacement heifer prices exploded 144% from $1,720 to $4,200 between April 2023 and November 2025, creating an unprecedented shortage that locks the industry into its current size until 2027.

What’s fascinating—and honestly, a bit frustrating—is how predictable the current heifer shortage was, yet how unprepared we seem to be for it.

The price explosion from $1,720 to over $4,000 isn’t inflation; it’s the bill coming due for decisions made years ago.

According to USDA data, dairy heifer inventory hit 3.914 million head in January 2025—the lowest since 1978. I had to double-check that number because it seemed impossible. But it’s real, and it stems from entirely rational decisions made during the challenging price environment of 2015-2021.

When milk prices stayed in that $12-14 range for years, producers did what made economic sense: they bred with beef semen instead of raising dairy replacements. The National Association of Animal Breeders reports beef semen sales to dairy operations nearly tripled from 2017 to 2020.

We essentially removed 800,000 dairy heifers from the pipeline—about 130,000 per year.

Here’s the kicker that keeps me up at night: those breeding decisions from 2019-2021? Those missing heifers would be entering herds right now. Instead, we’ve got producers competing fiercely for the limited genetics available.

A procurement specialist for a large Texas Panhandle operation shared something revealing: “We locked in heifer contracts in early 2023 at $1,900, thinking we were being conservative. Those same genetics are $4,200 today. If we’d modeled $16.91 milk instead of $21, our entire expansion strategy would’ve been different.”

There’s a glimmer of hope, though. Gender-sorted semen sales jumped 17.9 percent from 2023 to 2024—1.5 million additional units, according to the National Association of Animal Breeders.

But meaningful relief? We’re probably looking at 2027.

Regional Realities: Why Your Zip Code Matters More Than Ever

Regional production growth reveals how new processing investments in Idaho (7.0%) and California (6.9%) create permanent $1.50/cwt advantages that no amount of management can overcome in lagging regions.

Looking at the October state-by-state data, what jumped out at me was how dramatically different the dairy economy looks depending on where you’re standing.

The growth stories:

  • California: Up 6.9 percent (though comparing against last year’s bird flu challenges)
  • Idaho: Up 7 percent (that new Glanbia cheese plant in Twin Falls is pulling everything)
  • Texas: Added 26,000 cows despite yield challenges
  • Michigan: Up 4.3 percent
  • New York: Up 4 percent

But here’s where it gets interesting. A Pacific Northwest producer managing 1,800 cows near Lynden, Washington, shared their reality: “We’re getting $16.16 per hundredweight while Idaho producers see $17.66. That $1.50 difference? It’s because we’re shipping to powder plants while they’re shipping to cheese plants.”

This illustrates something I’ve been tracking for a while—the growing divide between regions with new processing investments and those without. The Federal Milk Marketing Order system, despite updates in 2024, still creates these regional disparities based on fluid demand assumptions from another era.

Processing investments are reshaping the geography of dairy: Leprino Foods’ $870 million Lubbock facility, Fairlife’s $650 million New York expansion, and Great Lakes Cheese in Abilene.

These aren’t just plants; they’re creating new centers of gravity for milk production.

Success Stories: Adaptation in Action

While challenges dominate headlines, I’ve encountered several operations that have successfully navigated current conditions through strategic adaptation.

A 1,200-cow operation in central New York completely restructured their approach this summer. They shifted focus from volume to components, reformulated rations to optimize butterfat (accepting a 4 percent volume decrease in exchange for a 0.35 percent butterfat improvement), and locked in 70 percent of their 2026 production through forward contracts.

The result? They’re projecting positive margins even at $17.50 milk.

Another success story comes from a Wisconsin cooperative that pooled resources among five family farms to negotiate better component premiums directly with their processor. By guaranteeing consistent high-component milk, they secured an additional $0.85/cwt premium above standard pricing.

In Pennsylvania, a 600-cow operation near Lancaster took a different approach entirely. They invested in on-farm processing, launching a farmstead cheese operation that now processes 30 percent of their production.

“We realized we couldn’t compete on commodity milk,” the owner explained. “But we could capture more value through differentiation. Our cheese sales are covering the losses on our fluid milk.”

What these operations share is a willingness to challenge traditional approaches and adapt to new realities rather than waiting for old conditions to return.

The Export Paradox and What It Really Means

Here’s something that initially puzzled me: September exports were phenomenal—cheese up 28 percent, butterfat exports nearly tripled according to the USDA.

Yet farm-level milk prices remain depressed. How does that math work?

The answer reveals an uncomfortable truth about global competitiveness. CME cheese at $1.56 per pound versus European cheese at approximately $1.90 (converted from euros) gives us an 18 percent price advantage.

We’re competitive precisely because our prices have fallen.

After processing and logistics, that $1.56 cheese price translates to farm-level milk values around $12.40 per hundredweight. That’s below breakeven for most operations.

So yes, exports are strong, but they’re preventing collapse, not driving recovery.

Mexico accounts for about 30 percent of our exports, according to the U.S. Dairy Export Council. But Rabobank’s November analysis flags something concerning: Mexico is actively building domestic production capacity with government support.

If they reduce imports by even 20 percent, that would be a significant demand shock.

Risk Scenarios: What Could Change Everything

While I’ve focused on current trends continuing, it’s worth considering what could dramatically shift the market:

Disease outbreak: An H5N1 resurgence affecting 5-10 percent of the national herd would immediately tighten supply and drive prices higher. Nobody wants this scenario, but it remains a possibility.

Weather extremes: A severe drought across the Midwest in summer 2026 could quickly reduce production by 3-4 percent. Combined with current tight heifer supplies, this could push milk prices back above $20.

Trade disruptions: New tariffs or trade agreements could fundamentally alter export dynamics. A comprehensive trade deal with Southeast Asian nations could open significant new demand.

Processing consolidation: If one or two major processors face financial stress and close facilities, regional oversupply could quickly become undersupply.

These aren’t predictions—they’re reminders that dairy markets can shift rapidly when unexpected events occur.

Practical Strategies for Navigating Current Conditions

Based on conversations with producers successfully adapting to current conditions, several strategies deserve consideration:

Margin-Based Management

Evaluating individual cow contributions monthly provides objective retention criteria. Several producers mentioned using $40 monthly contribution as their threshold, though your specific number will depend on your cost structure.

Component Optimization

With butterfat premiums at $0.50-1.50/cwt above base (varying by cooperative), optimizing for components rather than volume can improve margins. This might mean accepting lower production for higher component percentages.

Geographic Assessment

Honestly evaluating your regional competitive position matters more than ever. If you’re in a structurally disadvantaged region, consider whether repositioning—through relocation, market channel changes, or value-added production—makes sense.

Risk Management Tools

Forward pricing isn’t about predicting markets; it’s about creating certainty. Several producers described securing 50-70 percent of future production at known prices, allowing them to plan with confidence.

Collaborative Approaches

Producer cooperation—whether through joint marketing, shared resources, or collective bargaining with processors—is gaining traction as a strategy for improving positioning.

Looking Ahead: Key Indicators to Watch

The November and December production reports will reveal whether October’s 6,000-head reduction was an isolated adjustment or the beginning of something bigger.

Here’s what I’ll be watching:

Herd trajectory: Another 5,000+ reduction would signal systematic adjustment. Stabilization suggests October was an anomaly.

Per-cow production: Changes exceeding seasonal norms could indicate compositional shifts in the national herd—are we keeping the best and culling the rest?

Regional divergence: Continued growth in Texas/Idaho, while other regions contract, would confirm geographic consolidation.

Component trends: Rising butterfat with declining volume would indicate a strategic focus on quality over quantity.

The Bottom Line: Adaptation, Not Capitulation

October’s 6,000-head culling amid production growth tells us something important: the industry is beginning to self-correct, with individual producers making rational decisions based on economic reality rather than expansion momentum.

This isn’t about doom and gloom—it’s about adaptation. The operations that recognize current conditions as a new reality rather than a temporary disruption are positioning themselves for long-term success.

They’re not waiting for $22 milk to return; they’re building businesses that work at $17-19.

What’s becoming clear from my conversations across the industry is that successful navigation requires three things: an honest assessment of your specific situation, a willingness to challenge traditional approaches, and the courage to make difficult decisions based on data rather than hope.

The dairy industry has weathered massive transitions before—the shift from small diversified farms to specialized operations, the technology revolution, and multiple trade upheavals. Each time, those who adapted thrived while those who resisted struggled.

Current conditions represent another such transition. How individual operations choose to respond will determine not just their immediate survival but their long-term positioning in whatever structure emerges.

As we await the next production reports, remember that behind every data point are real farming families making real decisions about their futures. The 6,000-head reduction isn’t just a statistic—it represents thousands of individual choices, each reflecting unique circumstances and strategic calculations.

The market is speaking. The question isn’t whether to listen, but how to respond thoughtfully and strategically to what it’s telling us.

Resources for Further Information:

  • USDA Milk Production Reports: www.nass.usda.gov
  • University Extension Dairy Programs: Contact your state extension service
  • Federal Milk Marketing Order Administrators: www.ams.usda.gov/about-ams/programs-offices/federal-milk-marketing-orders
  • Risk Management Tools: Contact your milk cooperative or CME Group Agriculture
  • Dr. Andrew Novakovic’s market analysis: Charles H. Dyson School of Applied Economics, Cornell University
  • Component Premium Information: Contact your regional cooperative

Key Takeaways: 

  • The October Calculation: Keeping a marginal cow means refusing $1,950 cash today to lose $45/month tomorrow—that’s why 6,000 left the herd despite record milk production
  • The 2027 Reality: With heifers at $4,200 and inventory at 45-year lows, the industry is locked into current size until 2027, regardless of price recovery
  • Location Determines Survival: Processing investments have created permanent $1.50/cwt regional pricing advantages that no amount of good management can overcome
  • Three Paths Forward: Optimize for components (butterfat premiums worth $0.50-1.50/cwt), lock in 50-70% of production at $17-19, or relocate to advantaged regions
  • Bottom Line: October proved the market has fundamentally shifted—build a business that works at $17-19 milk or become a statistic

Complete references and supporting documentation are available upon request by contacting the editorial team at editor@thebullvine.com.

Learn More:

The Sunday Read Dairy Professionals Don’t Skip.

Every week, thousands of producers, breeders, and industry insiders open Bullvine Weekly for genetics insights, market shifts, and profit strategies they won’t find anywhere else. One email. Five minutes. Smarter decisions all week.
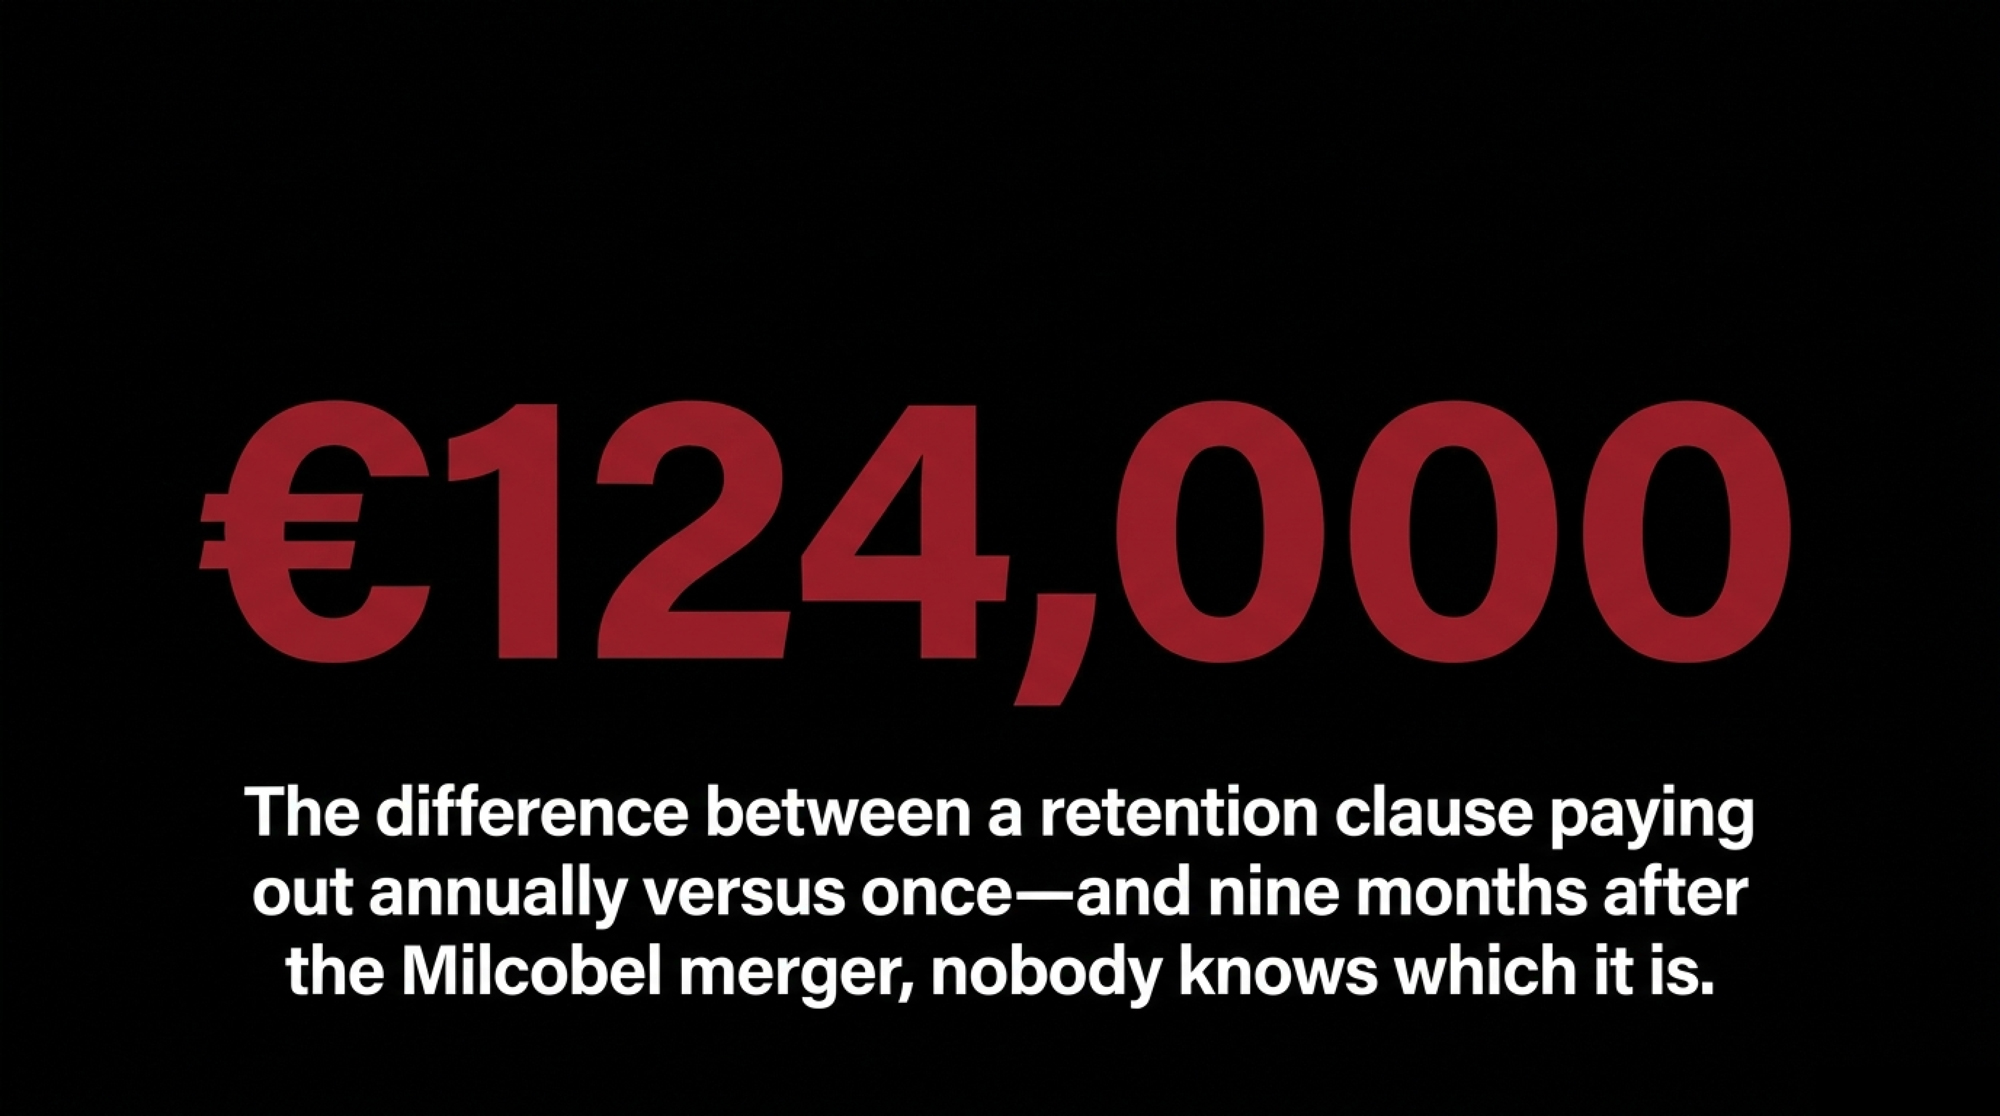
NewsSubscribe
First
Last
Consent

Boot Biosecurity’s 2,795% ROI: The $820 Investment Beating $250,000 Robots

One infected visitor can cost you $128,250 (H5N1). Boot stations cost $820. Every major dairy that installed them reports zero outbreaks since. Facts.

Executive Summary: Boot wash stations deliver the dairy industry’s best-kept secret: 2,795% ROI for just $820, preventing $96,000+ in disease losses that Penn State, Michigan State, and UC-Davis have meticulously documented. While farms invest $250,000 in robots returning 30% over a decade, bacteria on contaminated boots survive 24 hours, travel 400 feet, and devastate herds—yet three simple steps (scrape, wash, disinfect) stop them cold. Wisconsin producers with stations report 60% fewer calf deaths and haven’t had major outbreaks in 18+ months. The math is embarrassingly clear: two-month payback versus eight years for that robot. Yet most dairies still lack this basic protection, choosing complex technology over proven prevention. The question isn’t whether boot stations work—it’s why you don’t already have them.

Dairy Biosecurity ROI

You know how it is at industry meetings—everyone’s talking about the latest technology. Last month at the Wisconsin Dairy Expo, I got into this fascinating conversation with a group of producers comparing notes on recent investments. Robotic milkers, automated calf feeders, precision nutrition systems… the usual suspects. Then someone mentioned they’d just put in boot wash stations, and honestly, the whole conversation shifted.

What’s interesting is how this matches a pattern I’ve been noticing across the industry. Here we are, investing heavily in automation—which makes sense, don’t get me wrong—but some of the best returns are coming from the simplest investments. And when I started digging into the numbers… well, they surprised even me.

“The payback for preventing just one Salmonella outbreak? About two months.”

The math is embarrassingly clear: a $2,460 investment in three boot wash stations delivers up to 2,795% ROI over five years—that’s 93 times better returns than a quarter-million-dollar robot. While the industry obsesses over six-figure automation, the highest-return biosecurity investment costs less than a bred heifer.

The Investment Gap Nobody Talks About

So here’s what got me thinking. I’ve been looking at disease prevention data from Penn State Extension, Michigan State’s veterinary economics team, and the Canadian Dairy Network. When you compare the cost of a single boot wash station—about $820 installed—against the disease losses it prevents, the returns are extraordinary. Scale that up to three stations for comprehensive coverage at $2,460, and you’re looking at returns between 719% and 2,795% over five years. Meanwhile, that quarter-million-dollar robot we all admire? Generally delivers returns of 20-30% over a decade.

Disease NameAnnual Cost Per Farm ($)Boot Station Cost ($)ROI Multiple (X times)
Salmonella D.$13,860$82017x
Cryptosporid.$9,214$82011x
Johne’s Dis.$18,000$82022x
Digital Derm.$20,000$82024x
H5N1 (Single)$128,250$820156x

Now, that raises an obvious question, doesn’t it? Why are we hesitating on something this profitable?

During my farm visits this season, I’ve been asking producers about their biosecurity priorities, and the responses have been… enlightening. You know, UC-Davis researchers—Pires and his team published this fascinating work in the Journal of Dairy Science—showed that bacteria in manure can survive on boot surfaces for up to 24 hours. They tracked pathogen movement nearly 400 feet across plastic surfaces. About 150 feet on concrete.

Just think about that for a minute. Your hoof trimmer shows up at dawn, and he was at another farm yesterday. Your nutritionist stops by after visiting three other dairies this morning. The milk hauler who’s been in every parlor in the region… Each one represents a potential disease introduction, yet we rarely think about it the same way we analyze, say, feed efficiency or genetic improvements.

What Disease Actually Costs

Let me share what the extension services and university research teams have documented—and these aren’t worst-case scenarios, they’re documented averages for a typical 450-cow operation.

Quick Disease Cost Reality Check:

DiseaseAnnual CostPreventable?
Salmonella Dublin$13,860/outbreakYes, via boot hygiene
Cryptosporidium$9,214/yearYes, major route
Johne’s Disease$18,000/yearYes, if kept out
Digital Dermatitis$15,000-25,000Yes, trimmer transmission
H5N1$128,250+Yes, documented boot spread

Penn State Extension’s 2024 analysis shows a Salmonella Dublin outbreak runs about $13,860 in direct losses. Michigan State’s research puts the cost of endemic cryptosporidium at $9,214 annually. The Canadian Dairy Network documents $18,000 yearly for Johne ‘s-infected herds—with no cure available.

Compare that to boot station costs: $820 for your highest-risk entry point, or $2,460 for three-station comprehensive coverage, plus about $1,850 annually for disinfectant and maintenance. The payback for preventing just one Salmonella outbreak? About two months.

Why Calves Are Ground Zero

Dr. Jennifer Bentley at Wisconsin’s vet school has this way of putting it that really resonates: “Calves under 30 days represent your operation’s highest disease risk, period.”

The vulnerability facts are sobering:

  • Newborn calves operate at 20-50% of adult immune capacity
  • Maternal antibodies are half depleted by day 28 (Cornell QMPS data)
  • Enhanced biosecurity reduces calf mortality from 5.9% to under 4% (Estonian research, 118 herds)
  • External biosecurity ranks in the top five factors affecting calf survival

I keep hearing the same thing from California producers: excellent genetics, premium milk replacer, perfect ventilation—none of it matters if someone tracks crypto into your calf barn on dirty boots.

The Three-Step Process That Actually Works

Purdue researchers proved what most farms ignore: stepping through disinfectant with manure-caked boots provides zero protection, regardless of how expensive that disinfectant is. The three-step sequence—scrape, wash, disinfect—is the ONLY protocol that works. Skip one step and you’re operating on faith, not science.

Here’s something Purdue University’s research revealed that really challenges our assumptions: disinfectant type becomes completely irrelevant if you don’t remove organic matter first. They proved definitively that stepping through even the most expensive disinfectant with manure-caked boots provides zero effective pathogen control.

The only sequence that works:

  1. Mechanical scraping – Remove visible contamination
  2. Washing with brushes and water – Eliminate residual material
  3. Chemical disinfection – Only effective on clean boots

Skip any step and you’re operating on faith rather than science.

Strategic Placement: The 13-Fold Compliance Difference

Here’s what kills biosecurity programs: putting boot stations where workers can avoid them. Canadian researchers used RFID tracking to prove optimal placement delivers 90% compliance versus 7% for poor placement—a 13-fold difference that has nothing to do with training and everything to do with physics. Stop fighting human nature and start using it.

Canadian RFID monitoring research (Frontiers in Veterinary Science) documented something remarkable. Placement impacts compliance by a factor of thirteen. A well-positioned station gets 90% usage. A poorly placed one? Seven percent.

Optimal placement priorities:

  • Calf barn entrances – Highest vulnerability point
  • Maternity pen access – Protect those critical first hours
  • Hospital pen entry/exit – Bidirectional protection essential
  • Age group transitions – Prevent adult-to-youngstock transmission

Your Implementation Roadmap

Based on what’s working for successful producers:

Month 1: Start With One Station ($820)

  • Install at your highest-risk location (typically calf barn)
  • Establish protocols and culture
  • Track baseline health metrics

Months 2-3: Build Momentum

  • Add maternity pen coverage
  • Implement visitor protocols (boot covers: $0.50 each)
  • Train on the critical three-step process

Months 4-6: Complete Coverage ($2,460 total)

  • Install hospital pen stations
  • Integrate with broader biosecurity
  • Establish maintenance responsibilities

The Technology Partnership

What’s particularly encouraging is seeing operations recognize that technology and biosecurity aren’t competing investments—they’re synergistic.

Take automated calf feeders. Great technology. But I’ve seen operations where one infected calf deposits crypto on shared nipples, efficiently delivering pathogens to everyone. Compare that to Wisconsin operations using identical feeders but with boot hygiene preventing crypto introduction. The technology performs as designed because the disease isn’t undermining it.

This pattern repeats everywhere:

  • Robotic milkers achieve potential when herds stay mastitis-free
  • Activity monitors catch problems that escape good biosecurity
  • Genetic programs deliver when calves survive to production

Common Implementation Challenges

Winter Operations:

  • Install stations inside doorways when possible
  • Use heated water lines or warm water buckets
  • Switch to cold-weather disinfectants (Virkon S works near freezing)
  • Have a plan before temperatures drop

Low Compliance After Installation:

  • Check placement first—is it in the natural flow of traffic?
  • Examine time allocation—are employees too rushed?
  • Address root causes, not symptoms

The Bottom Line Investment Analysis

InvestmentCost5-Year ROIPayback
One Boot Station$820400-1,500%2-3 months
Three Stations$2,460719-2,795%1.5-2.1 months
Robotic Milker$250,00020-30%6-8 years
Auto Calf Feeder$180,00015-25%5-7 years

The math clearly supports boot station investment, yet adoption remains inconsistent. A Wisconsin producer captured it perfectly: “We’ll invest $5,000 in feed additives, hoping for 2% production increases while hesitating over $820 boot stations that prevent thousands in losses.”

Wisconsin farms stopped theorizing and started measuring. Within 90 days of installing $2,460 worth of boot stations: 60% fewer dead calves, zero major outbreaks for 18+ months, and $96,000+ in prevented disease losses. That’s a 1.8-month payback period. Now tell me again why you’re hesitating on this investment.

Your Next Steps

The path forward is straightforward. Start with one boot wash station at your most vulnerable location—probably the calf barn entrance. Just $820 to protect your highest-risk animals. Implement the three-step cleaning protocol. Document your health metrics for three months.

Based on what I’m seeing from producers who’ve taken this step, you’ll likely find yourself planning stations 2 and 3 before month 4. The economics are that compelling, the results that consistent.

This isn’t about choosing between technology and biosecurity. It’s about recognizing that your sophisticated systems perform best when built on a solid foundation of disease prevention. And in an industry facing mounting disease pressure and tightening margins, that foundation—starting at just $820—might be the most important investment you make this year.

Your banker will appreciate the economics. Your employees will appreciate healthier animals. And those expensive automated systems? They’ll finally deliver what you paid for.

The choice, as always, is yours. But the math—and the growing number of success stories—suggest this is one investment decision that’s actually pretty straightforward.

The industry’s dirty secret exposed in one chart: you’ll wait eight years for that quarter-million-dollar robot to break even, but an $820 boot station pays for itself in two months—the time it takes to prevent a single Salmonella outbreak. That’s a 48x faster return on capital, yet we keep choosing complexity over cash flow.

Key Takeaways: 

  • The Math Nobody Can Argue With: $820 boot station = 2,795% ROI in 5 years. $250,000 robot = 30% ROI in 10 years. Stop choosing the wrong one.
  • The Only Process That Works: Disinfectant without scraping = zero protection. You MUST do all three: scrape → wash → disinfect. Skip one step and you’re playing pretend biosecurity.
  • The 13X Compliance Secret: Put stations IN doorways where people can’t avoid them (90% usage), not around corners where they will (7% usage). Physics beats willpower every time.
  • What Success Actually Looks Like: 60% fewer dead calves in 3 months. 18+ months without major outbreaks. $96,000+ in prevented losses. Wisconsin farms proved it—now it’s your turn.
  • Your Monday Morning Action: Order one $820 station for your calf barn entrance. Install it this week. Track calf health for 90 days. Watch what happens.

Complete references and supporting documentation are available upon request by contacting the editorial team at editor@thebullvine.com.

Learn More:

The Sunday Read Dairy Professionals Don’t Skip.

Every week, thousands of producers, breeders, and industry insiders open Bullvine Weekly for genetics insights, market shifts, and profit strategies they won’t find anywhere else. One email. Five minutes. Smarter decisions all week.
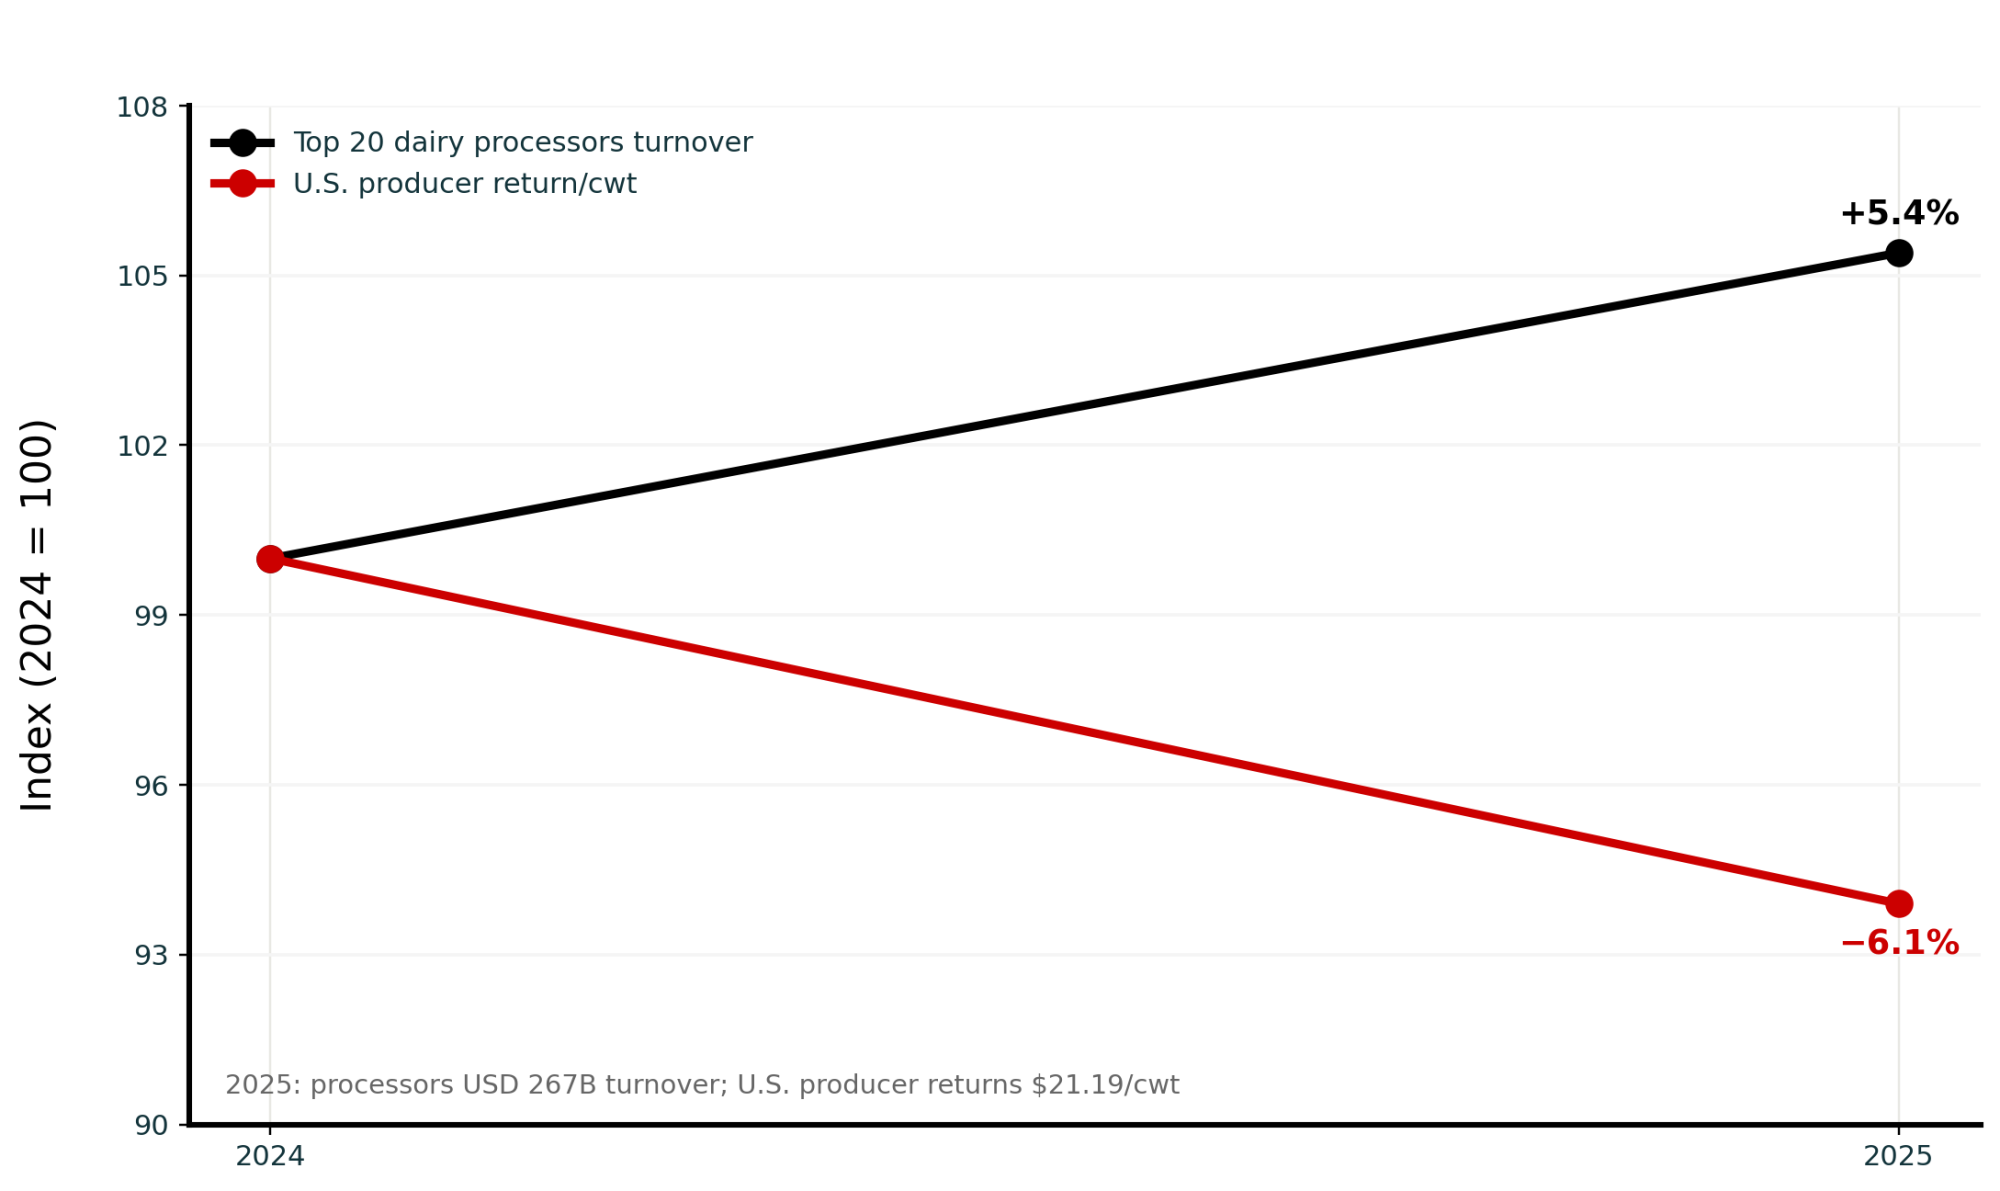
NewsSubscribe
First
Last
Consent

Pick Your Lane or Perish: The 18-Month Ultimatum Facing 800-1,500 Cow Dairies

October’s $2.47 Class spread proved it: mid-size dairies must choose between commodity and premium now. The middle is gone.

Executive Summary: October 2025’s market data delivered a death sentence to fence-sitters: mid-size dairies (800-1,500 cows) must choose between commodity and premium pricing within 18 months, or risk ceasing to exist. The Class III-IV spread now penalizes operations that haven’t optimized for either protein or butterfat, while global markets are permanently split between simple ingredients (winning) and value-added products (losing). Small farms with fewer than 500 cows survive through premium specialization, while operations with more than 3,000 cows thrive on commodity efficiency. But the middle ground—profitable for three generations—is gone forever. Irish farmers are betting their futures on 2027’s regulatory consolidation. Chinese buyers are only interested in specialty proteins, and industrial customers will pay premiums for consistency over brand. You have 18-24 months to pick your lane: scale up, specialize, or sell out.

Dairy Strategic Planning

Here’s the thing that’s been keeping me up at night—and probably you, too, if you’re running 800 to 1,500 cows. The dairy market’s doing something we haven’t seen before. There’s this growing gap between New Zealand and European dairy prices that should close through normal trading, but it just… won’t. The October GDT auctions show Western European whole milk powder trading at significant premiums compared to New Zealand product for near-term contracts. This structural gap, seen across multiple products, confirms that the market bifurcation is deepening.

But you know what’s really caught my attention?

The gap isn’t just global anymore—it’s right here in our milk checks. October CME data shows a widening spread between Class III and Class IV futures that’s crushing operations heavy on butterfat. With butter prices facing significant pressure while cheese prices hold relatively steady, the Class IV value is reaching levels we haven’t seen in years. This component value crisis is the clearest signal yet that the old rules are broken.

The $2.47 Spread That’s Killing the Middle: October’s Class III/IV gap represents the widest since 2011, costing Jersey operations $180K annually

What farmers are finding is that the comfortable middle ground—where most of us have operated successfully for decades—is vanishing faster than morning fog in July. And if you’re still making decisions based on what worked even two years ago, well, we need to talk.

The Value Paradox Nobody Saw Coming

Operation TypeButterfat %Protein %Class PrefRevenue Impact ($/cwt)Annual Impact (1000 cows)
BF-Focused (Jersey-Heavy)4.8%3.6%Class IV−$2.47−$180k
Protein-Focused (Holstein)3.6%3.2%Class III$0.00$0
Balanced Components (Holstein)4.1%3.4%Mixed−$1.20−$87k

Looking at September 2025 market reports from the EU Milk Market Observatory, something curious jumps out. European butter—you know, the premium stuff that’s supposed to command top dollar—has been taking a beating. Meanwhile, AMF (anhydrous milk fat), which is essentially melted and clarified butter, appears to be holding up better. Recent Global Dairy Trade data suggests AMF is actually outperforming butter in percentage terms. The simple, non-branded ingredient is holding value better than its consumer-facing counterpart. This is the Value Paradox playing out in real-time, right down to the component level.

Now, why would the simple product outperform the sophisticated one?

I was talking with a Wisconsin dairy producer last week who runs a larger operation in the central part of the state. He’d invested heavily in specialty cheese equipment a few years back, thinking he’d capture those artisan premiums. “Know what’s paying the bills now?” he asked me. “Straight cream to the bakery suppliers. No fancy packaging, no marketing story, just consistent butterfat at 40% minimum.”

Here’s the surprising part—whey powder, the stuff we literally paid to get rid of twenty years ago, now commands respectable prices in the protein market. Yet those beautiful aged cheddars that take skill, time, and capital to produce? They’re facing intense price pressure from all sides.

What’s encouraging, though, is that this shift creates opportunities for those who recognize it early. It’s making me rethink everything we thought we knew about value creation in the dairy industry.

Why Irish Farmers Are Expanding into a Glut

The production numbers coming out of Ireland lately seem counterintuitive. Recent data from their Central Statistics Office shows milk output climbing steadily through the summer months. Belgium’s showing similar patterns according to their agricultural statistics. All this while European butter inventories are already substantial. Industry reports from late summer suggest oversupply conditions in the European market, with stockpiles building to levels not seen since the intervention buying days.

You’d think these folks have lost their minds. But there’s a method to this apparent madness.

Ireland’s nitrate derogation—the rule that allows them to run higher stocking rates than standard EU regulations permit—expires at the end of this year. When that happens, industry observers from Teagasc estimate that significant production capacity could disappear. Some projections suggest up to 20% of current output might be affected. Belgium faces similar pressures from the EU’s Farm to Fork strategy, though their timeline stretches out a bit further.

So these farmers are expanding now? They’re not playing for today’s prices. They’re positioning for 2027 and beyond, when half their neighbors might be out of business.

A dairy farmer I met at a conference last spring—runs a mid-size operation in County Cork—put it this way: “We’re not thinking about next year’s milk check. We’re thinking about who’s still standing in five years and what market share they’ll control.”

It’s a high-stakes bet on regulatory-driven consolidation. Risky? Absolutely. But, when you understand the regulatory chess game being played, it starts to make strategic sense.

The Chinese Market That Defies Logic

This is where things get genuinely puzzling, especially if you’re used to thinking about dairy as a straightforward commodity.

Recent reports from China’s agricultural authorities indicate that domestic farmgate prices remain under pressure, generally declining year over year, depending on the province. They have adequate production capacity, according to their own data. Traditional economics suggests that imports should be declining.

Instead? Recent customs data suggests import volumes are holding steady or even growing for certain categories. The unexpected piece is the shift in what they’re buying. While whole milk powder imports have moderated, specialty ingredients, such as whey products, appear to be growing. This shift from buying bulk commodities to high-value protein ingredients reinforces the idea that their purchasing is becoming highly selective, focused on functional and premium status, not basic commodity volume.

What’s happening here—and this pattern is also showing up in India, Vietnam, and Indonesia, according to recent observations from the USDA Foreign Agricultural Service—is that consumers in these markets don’t view domestic and imported dairy as the same thing. It’s no longer about measurable quality differences. We’re talking about perception, trust, and increasingly, social status.

An industry contact who works with Asian markets explained it to me this way: “Customers there aren’t comparing prices between domestic and imported milk. To them, it’s like comparing a Corolla to a Lexus. Both get you where you’re going, but they serve completely different needs.”

We’re starting to see this same split here in mature markets. Look at what organic commands—often substantial premiums according to USDA Agricultural Marketing Service data, despite conventional milk meeting all the same safety and nutritional standards. Or A2 milk, grass-fed brands, local farm labels. The bifurcation’s happening everywhere.

Industrial Buyers Play a Different Game

What catches my attention in all this market analysis is how differently industrial buyers behave compared to grocery chains.

When Kroger or Walmart needs butter, they typically put it out to bid quarterly and accept the lowest price that meets the specifications. Simple transaction, price drives everything.

But when a commercial bakery needs AMF for their croissant line? Completely different conversation. Their ovens are calibrated for specific melt points. Their recipes assume consistent moisture content—we’re talking plus or minus half a percent. Switching suppliers means reformulation, line testing, and potential product recalls if something’s off.

Industry procurement specialists I’ve talked with say they’ll routinely pay meaningful premiums just for supply security. One mentioned that every supplier switch costs them tens of thousands of dollars in testing and adjustments, sometimes more if the equipment needs recalibration. So yeah, they’ll pay extra for consistency.

This creates real opportunities for producers who can reliably meet industrial specifications. It’s not glamorous work—nobody’s writing magazine articles about your commodity ingredient sales. But, these contracts often offer better margins and more stability than chasing consumer trends.

Hard Lessons from the Big Cooperatives

Want to understand why those regional price advantages everyone talks about aren’t as permanent as they seem? Take a look at what has been happening with major cooperatives over the past eighteen months.

Even the big players—organizations with decades of export experience, established supply chains, unified farmer bases—have been announcing restructuring plans. Cost cutting initiatives. Plant consolidations. Some are even outsourcing core functions they’ve handled internally for generations.

What happened? Simple—they built cost structures around market conditions they assumed were permanent. Those nice premiums they were capturing a couple of years ago? Turned out to be temporary benefits resulting from supply chain disruptions and unusual demand patterns. When global shipping rates normalized and consumption patterns shifted back, the premiums vanished almost overnight.

A board member from a regional cooperative shared this perspective with me recently: “We all got a little too comfortable with those margins. Built our strategic plans around them. What we’re learning—again—is that very few advantages in commodity markets last more than a cycle or two.”

The Reality Check for Different Size Operations

Let me share what recent economic analyses from various land grant universities are telling us about profitability by herd size. The patterns are striking and, frankly, a bit concerning for those of us in the middle.

Smaller operations—let’s say under 500 cows—often achieve higher mailbox prices than the big guys. We’re talking sometimes a dollar fifty to two dollars more per hundredweight through direct marketing, on-farm processing, specialty programs. Sounds great, right?

But here’s the catch—their cost of production typically runs several dollars higher per hundredweight, too, according to extension studies. So that premium price? It’s often not enough to offset the higher costs. Many of these smaller operations are working incredibly hard just to break even.

On the flip side, operations over 3,000 cows generally receive lower prices—maybe fifty cents to a dollar below the smaller farms. But their cost structure? They’re often producing for significantly less per hundredweight than mid-size operations. Volume multiplied by even small margins adds up.

The really tough spot? That 800 to 1,500 cow range. Not big enough to capture serious economies of scale. Not small enough to be nimble with specialty markets. These operations are either expanding aggressively right now or transitioning to some form of differentiated production. Standing still is no longer viable.

The Death Zone Exposed: Mid-size dairies trapped between specialty premiums and commodity efficiency are bleeding money at -2.1% margins

Here’s what I’ve noticed about how different regions are handling this—and it’s telling. In California’s Central Valley, where water rights and environmental regulations create unique pressures, several mid-size operations have formed marketing cooperatives to achieve scale without individual expansion. Northeast producers, located near major population centers, are exploring the benefits of shared processing facilities and distribution networks. Down in Texas and New Mexico, where expansion’s still possible, they’re going big—really big—with new facilities starting at a minimum of 5,000 head. And in the Southeast? They’re dealing with heat stress and hurricane risks that add another layer to these strategic decisions. Each region’s finding its own path through this transition.

Choosing Your Lane (Because You Have To)

After watching hundreds of operations navigate these changes, it’s becoming increasingly clear: you must pick a strategy and commit to it fully. The days of hedging your bets, of being pretty good at everything? Those days are over.

If you’re going the commodity route, several factors become absolutely critical. First, you need scale—probably a minimum of 2,000 cows in the Midwest, based on recent farm management analyses, and more like 3,500 in the West, where you’re competing with those massive operations. Second, you need industrial customers who value consistency over brand. Third, you must accept that you’re selling ingredients, not food, and optimize your approach accordingly.

If you’re choosing the differentiated path, different rules apply. You need a story that resonates—organic certification, grass-fed verification, local processing, something authentic that consumers will pay for. You need direct relationships or processors who value what makes you different. You have to accept higher costs, likely several dollars more per hundredweight, based on various enterprise budgets, in exchange for capturing those premiums.

Are the operations struggling the most? Those trying to do both. I am aware of a Pennsylvania dairy that has installed robots to reduce labor costs, yet it still sells commodity milk. Their debt service alone is crushing them. Another farm in Vermont has built a beautiful processing facility, but cannot achieve enough consistent volume to run it efficiently.

And here’s something worth considering—how does your chosen path affect succession planning? If you’re hoping the next generation takes over, which strategy gives them the best shot at success? The commodity route requires constant reinvestment and scale. The premium path needs marketing savvy and customer relationships. Neither’s wrong, but they require different skills and interests from whoever’s taking the reins.

Practical Decisions for Today’s Reality

So what does this mean for your operation over the next few years?

For smaller dairies with fewer than 500 cows, specialization appears to be the key. Pick something you can be genuinely excellent at. Perhaps it’s organic production, perhaps it’s A2 genetics, or perhaps it’s on-farm bottling with local distribution. But competing head-to-head with large commodity operations? The math rarely works.

For larger operations over 2,000 cows, it’s about operational excellence and simplification. Strip out complexity, focus on one or two products at most, and secure those industrial contracts. The 3,000-cow dairy selling everything to a single cheese plant at predetermined prices might not be exciting, but they’re sleeping well at night.

And if you’re in that challenging middle zone—800 to 1,500 cows? You’re facing the toughest decisions. Based on what extension economists are seeing, you’ve probably got 18-24 months to make a strategic choice. Scale up significantly, find a genuine differentiation strategy, or… well, we all know what the third option looks like.

Here’s what’s worth tracking closely in your own operation:

  • What’s your actual premium above base price? Many folks are surprised by how small it really is
  • What percentage of your milk is under contract versus sold on the spot market? Aim for at least 70% contracted
  • Where do your costs rank compared to others in your region? You need to be in the better half
  • Could your operation survive a 15% price drop for six months? If not, you’re probably over-leveraged for this environment
  • Are you optimized for protein or fat? Recent market shifts show component strategy is no longer optional—it’s essential for survival

Examining government programs reveals some resources worth exploring. USDA’s Value-Added Producer Grants can help with the transition to specialty markets. Environmental Quality Incentives Program funding may offset some of the costs of organic transition. State-level programs vary widely—Minnesota, Wisconsin, and Vermont all offer different types of support for dairy operations making strategic transitions.

The Transition Nobody Talks About

What often gets overlooked in these strategic discussions is the cost and complexity of transitioning from one model to another.

Going organic? That’s a three-year transition period during which you’re paying organic feed prices but receiving conventional milk prices. Extension studies suggest that transition costs can run into the hundreds of dollars per cow, plus you need secured market access before you start.

Scaling up to commodity efficiency? We’re talking millions in capital investment for meaningful expansion based on recent construction trends, and that’s if you can find the labor. Speaking of labor—good luck finding qualified people right now. Everyone’s struggling with that.

Even switching to industrial supply contracts requires investment. Those customers want consistency, which might mean new bulk tanks, different cooling systems, and sometimes even road improvements for larger tankers.

The encouraging development I’m seeing is that some regions are finding creative alternatives. In areas where individual expansion faces regulatory hurdles, several mid-sized operations have formed marketing cooperatives to achieve scale without relying on individual growth. Others are exploring shared processing facilities—not perfect, but it spreads the capital risk. Some operations are creating strategic alliances, sharing equipment and expertise while maintaining independent ownership.

Looking Forward

Those pricing gaps we’re seeing between regions and products? They’ll moderate eventually—markets always find some form of equilibrium. But, the fundamental split in our industry—between high-volume commodity production and high-touch premium production—is looking more and more permanent, according to the agricultural economists I’ve spoken with.

Previous generations could successfully run diversified operations. My grandfather milked cows, raised hogs, grew corn and beans, and did pretty well at all of it. My father’s generation was competent across multiple enterprises and made it work.

Today? Today, rewards focus and excellence in a chosen strategy. The market’s sending clear signals through these pricing disparities and structural changes. We can either listen and adapt or ignore them at our peril.

The successful operations ten years from now won’t necessarily be the biggest or the most sophisticated. They’ll be the ones that made clear strategic choices today and committed fully to optimizing within that framework.

The most vulnerable position isn’t being too aggressive or too conservative—it’s being unclear about which game you’re playing. Pick your lane, optimize everything for that choice, and don’t look back.

Because in today’s dairy economy, the middle of the road is becoming the hardest place to survive. That’s where the pressure’s greatest, the margins thinnest, and the future most uncertain.

But, here’s what gives me hope: dairy farmers are among the most resilient and adaptable people I know. We’ve weathered worse storms than this. The ones who recognize these changes early, make tough decisions, and commit to their chosen path? They’ll not just survive—they’ll thrive.

The question isn’t whether the industry will continue; it’s whether it will thrive. It’s whether your operation will be part of its future. And that decision? That’s entirely in your hands.

Key Takeaways:

  • Pick Your Lane in 18 Months or Perish: Operations with 800-1,500 cows must commit fully—scale to 2,000+ for commodity efficiency, specialize for premium capture, or exit. Half-measures guarantee failure.
  • Simple Ingredients Trump Value-Added: AMF beats butter, whey beats aged cheese, and industrial contracts beat consumer brands. October’s market proves processors pay premiums for consistency, not stories.
  • The Middle Is a Kill Zone: Farms under 500 cows thrive on specialization ($1.50-2.00/cwt premiums), operations over 3,000 profit on scale. But 800-1,500? Neither advantage = both disadvantages.
  • Component Strategy Is Survival: The Class III-IV spread isn’t temporary—it’s structural. Optimize for protein OR fat, not both. Your bulk tank average means nothing if components are wrong.

Complete references and supporting documentation are available upon request by contacting the editorial team at editor@thebullvine.com.

Learn More:

The Sunday Read Dairy Professionals Don’t Skip.

Every week, thousands of producers, breeders, and industry insiders open Bullvine Weekly for genetics insights, market shifts, and profit strategies they won’t find anywhere else. One email. Five minutes. Smarter decisions all week.
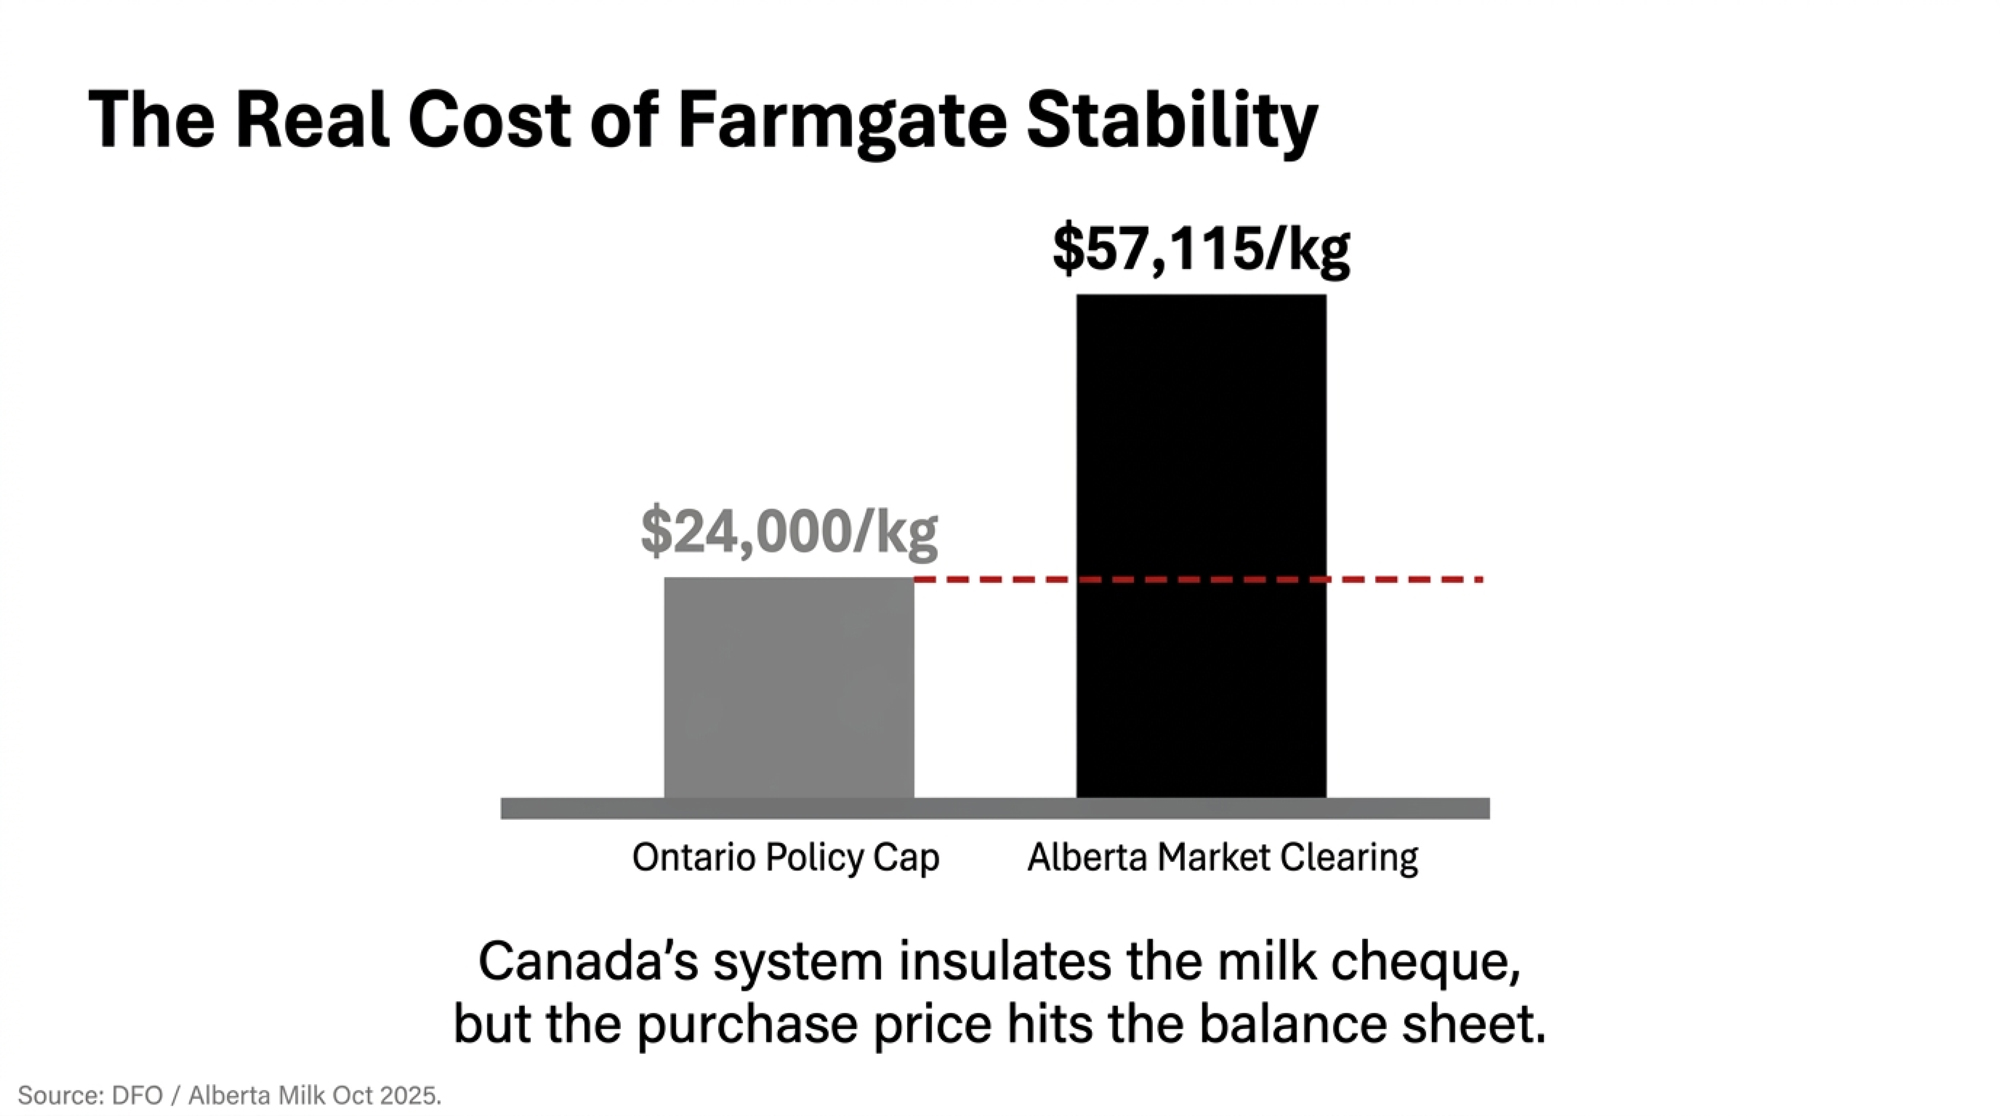
NewsSubscribe
First
Last
Consent

42% Heritability: The Milking Speed Breakthrough That Fixes Your Labor Problem

What farmers are discovering: selecting for speed actually reduces labor costs $10-16K annually

EXECUTIVE SUMMARY: What farmers are discovering about CDCB’s new Milking Speed evaluation is reshaping our understanding of genetic selection and parlor efficiency. With 42% heritability—compared to just 7% for daughter pregnancy rate—MSPD offers predictable genetic progress for a trait that impacts operations twice daily, 365 days a year. Holstein bulls currently range from 6.2 to 8.1 pounds per minute in the August 2025 evaluations, meaning the spread between your fastest and slowest genetics could be costing you an hour or more of labor daily. Research from the University of Minnesota confirms that strategic selection within the 7.0-8.0 lbs/min range balances efficiency gains with udder health, while extension specialists from Wisconsin to California emphasize the importance of adjusting parlor settings as genetics improve. Looking ahead, operations implementing MSPD selection can now expect gradual but meaningful improvements. Many producers report saving 10-15 minutes per milking by year three, with full benefits emerging around year seven as herd genetics turn over. The collaborative learning happening as producers share experiences with this trait represents exactly how our industry gets stronger together. For operations facing persistent labor challenges or inconsistent milking times, MSPD warrants serious consideration as part of a comprehensive breeding strategy.

 Milking speed genetics

Every morning at 4:30, the same scene plays out in parlors from California to Vermont. Some cows are finished, waiting to exit, while others seem to take forever. We’ve all managed to work around this variation for years, adjusting our routines, tweaking our grouping strategies, and making it work. But what if genetics could actually address this issue?

CDCB rolled out their Milking Speed evaluation—MSPD—this past August, and the numbers are stopping producers in their tracks. According to their published data, we’re looking at 42% heritability. Now, if you’re anything like the producers I’ve been talking with from the Midwest to the Southeast, that number probably makes you pause. Daughter pregnancy rate, which we’ve been selecting for intensely? That’s around 7% according to CDCB’s genetic parameters. Most health traits we worry about sit between 1% and 3%. This ranks among the CDCB’s highest-heritability functional traits.

The genetic game-changer hiding in plain sight – MSPD’s 42% heritability means real, measurable progress in your lifetime, not your grandkids.

It’s worth noting that MSPD is a flow rate measurement, expressed as pounds of milk per minute, not a total milking time. This standardizes the measure across lactation stages and systems, making it universally applicable whether you’re milking fresh heifers or fourth-lactation cows.

What farmers are finding is that this might be one of those genetic tools that actually delivers on its promise. That’s a level of genetic progress we just haven’t seen before for traits that hit your bottom line every single day.

The Science Is More Straightforward Than You’d Think

CDCB built this evaluation using sensor data from commercial dairies, measuring the pounds of milk per minute as it flows through the system across 31 states. No subjective scoring where one classifier sees a seven and another sees an 8. Just straight data from actual milking sessions.

The physiology behind milking speed has been documented in dairy science literature for decades. Research published in the Journal of Dairy Science suggests that it primarily depends on both anatomy and neural response. You’ve got your physical components—teat canal diameter, sphincter muscle tone—but there’s also how efficiently a cow responds to oxytocin and her overall letdown reflex. Some cows milk fast because they have excellent milk ejection. That’s what we want. Others? They’re fast because of looser teat anatomy, which can open the door to mastitis problems down the road.

Looking at CDCB’s correlations, there’s a 0.43 genetic correlation between milking speed and somatic cell score. Initially concerning, right? However, the data actually reveal that correlation mainly occurs when speed originates from compromised teat anatomy rather than good physiology. When you’re selecting bulls in what CDCB identifies as the practical range—around 7.5 to 8.0 pounds per minute—you’re generally getting efficiency through better milk letdown, not shortcuts that’ll haunt you later.

Kristen Gaddis, who leads the genetic evaluation team at CDCB, explained at their August public meeting that this 42% heritability makes MSPD one of their most heritable published traits. The reliability is already strong, even with a relatively new dataset. When you see heritability this high on a trait that impacts throughput every single day, it really does change the conversation about what’s possible through genetic selection.

What This Looks Like in Real Parlors

Holstein bulls in the current CDCB evaluations range from about 6.2 to 8.1 pounds per minute. That’s roughly a 30% spread. I’d bet money most operations have similar variation in their herds right now—you probably know exactly which cows I’m talking about.

Think about your morning milking. In a typical double-12 herringbone, when everything’s clicking, you’re moving cows through efficiently. But when those slower genetics hold up an entire side? Your actual throughput drops, workers become frustrated, and what should be a 2.5-hour milking stretches to 3 hours or more.

The economics vary depending on where you’re located, obviously. Labor costs differ significantly from region to region—what a California producer faces compared to someone in Georgia or South Dakota can be night and day. But across the board—from Florida to Idaho—many operations are finding that greater consistency reduces those end-of-shift pressure points. Workers know roughly when they’ll finish. That predictability… in today’s labor market, where finding anyone willing to work is challenging, matters as much as the raw time savings.

Quick Reference: MSPD Selection by System Type

Parlor TypeTarget MSPD Range (lbs/min)Key PriorityCritical ThresholdEfficiency Gain Potential
Herringbone/Parallel7.0-8.0Uniformity over speedAvoid bulls <6.815-20%
Rotary7.0-7.8Consistent platform speedMinimize 2nd rotations10-15%
Robotic Systems7.2-7.8Speed + teat placementBalance with udder conf.8-12%

Herringbone and Parallel Parlors

Target Range: 7.0-8.0 lbs/min
Priority: Uniformity over maximum speed
Key Point: Bulls below 6.8 create bottlenecks that kill efficiency
Based on the University of Wisconsin Milking Center recommendations and field experience

Rotary Parlors

Target Range: 7.0-7.8 lbs/min
Priority: Consistent platform speed, minimize second rotations
Key Point: Group first-lactation heifers separately when possible
Michigan State Extension dairy team guidelines

Robotic Systems

Target Range: 7.2-7.8 lbs/min
Priority: Individual performance plus udder conformation
Key Point: Robots need both speed and good teat placement
Penn State Extension robotic milking resources

Building Your Selection Strategy Today

From analysis paralysis to action – Your personalized MSPD roadmap based on current herd genetics and variation

Since MSPD isn’t integrated into Net Merit yet—CDCB’s still working through the index weighting debates—producers are developing their own approaches. Here’s what’s working based on early adopters and extension recommendations from Cornell to UC Davis:

Start with your current selection criteria. Then layer in MSPD targeting, aiming for bulls in that 7.0 to 8.0 pounds per minute range based on CDCB’s guidance. If you’re pushing toward the higher end—say 7.6 or above—make sure those bulls have strong SCS values, like -2.5 or better. University of Minnesota’s dairy genetics team emphasizes this as important protection against potential udder health issues down the road.

Corrective mating within families is showing real promise. Long-term research led by Bradley Heins and colleagues at the University of Minnesota, published in the Journal of Dairy Science in 2023, demonstrates that this approach is particularly effective. Got cow families that consistently produce those 8-minute milkers? Target them with higher MSPD bulls. With 42% heritability, this trait actually responds to selection pressure—genetic theory says it should, and early results seem to confirm it.

The Seven-Year Reality (And Why It’s Worth It)

Patience pays – While neighbors chase quick fixes, smart producers are building unstoppable genetic momentum that compounds every generation
YearHerd % with MSPD GeneticsTime Savings per DayAnnual Labor Savings (500 cows)Worker Impact
Years 1-20%0 minutes$0Planning phase
Years 3-430-35%10-15 minutes$2,000-3,000First improvements noticed
Years 5-660-70%30-45 minutes$8,000-12,000Predictable shift times
Year 7+90%+60+ minutes$15,000-20,000Full transformation achieved

Let’s be honest about the timeline here. Genetic improvement doesn’t happen overnight, and anyone who tells you different is selling something.

Years one and two, you’re making different breeding decisions but milking the same cows. Minimal visible change. This tests your patience.

In years three and four, your first MSPD daughters arrive. With typical U.S. replacement rates around 30-35% annually, according to the USDA’s National Agricultural Statistics Service, about a third of your herd carries improved genetics. Many operations notice some improvement—maybe saving 10-15 minutes per milking. Not revolutionary yet, but you’re starting to see it.

Years five and six bring the real changes. Most of your herd now carries selected genetics. Those problem cows become exceptions rather than the rule. This is when producers often report actually seeing the payoff they’ve been waiting for.

By year seven and beyond, with most of your herd carrying these genetics, parlor performance becomes remarkably more uniform. And here’s the beautiful part—improvement continues compounding. Each generation gets bred to progressively better MSPD bulls.

A Practical Economic Example

The $18,000 sweet spot – Push past 8.0 lbs/min and watch health costs eat your labor savings.

Let’s run through some basic math for a 500-cow operation (and remember, your results will vary—talk to your consultants and run your own numbers):

Current Situation:

  • 3 milkings daily × 3 hours each = 9 hours parlor time
  • 2 workers × local wage rate × 9 hours = your daily labor cost
  • Annual parlor labor: varies significantly by region

With MSPD Selection (Year 5+):

  • Even modest improvements in turn time—saving just an hour per day—can multiply into several thousand dollars in savings each year
  • The real value depends entirely on your local labor costs and schedules
  • Plus: Better worker retention, less overtime, potential to add cows without extending shifts

Operations with larger spreads in current genetics or higher labor costs naturally have a greater impact. And we’re not even counting the value of predictable shifts on worker satisfaction—something that’s hard to put a dollar figure on but matters enormously.

Critical Management Adjustments

Several things can make or break your MSPD implementation:

Parlor Settings Matter: As detailed in the University of Wisconsin Extension’s milking management guides, many operations find that as their fastest-milking cows become the genetic norm, periodic review of parlor vacuum and pulsation settings helps optimize udder health. You might need to reduce the vacuum as cow milking speed increases modestly—consult your local extension for detailed guidance specific to your setup.

Meter Calibration Is Essential: If it’s been more than two years since calibration (and for many of us, it’s been longer), you can’t accurately track progress. Penn State Extension’s dairy team consistently stresses this—you need accurate data to verify genetic improvement.

The Transition Gets Messy: As new genetics mix with old during years 3-4, variation might temporarily increase. Smart managers group MSPD-selected animals together initially, maintaining more consistent parlor sides until a critical mass is reached.

What About Jerseys and Brown Swiss?

CDCB indicates that breed-specific evaluations are forthcoming, likely within the next 12 months. But producers aren’t waiting.

Long-term research from Bradley Heins and his team at the University of Minnesota, published in the Journal of Dairy Science in 2023, shows Jersey-Holstein crosses often demonstrate favorable milking characteristics while maintaining component advantages. These crossbreeding strategies can capture efficiency benefits now.

Brown Swiss producers are leveraging existing, subjectively scored evaluations while planning for the transition. And operations with sensor-equipped parlors—regardless of breed—should start collecting baseline data now. When official evaluations launch, you’ll be ahead of the curve.

The Bigger Industry Picture

Labor challenges aren’t going away. USDA Economic Research Service reports from 2024 document ongoing workforce issues across all agricultural sectors; however, dairy faces unique challenges due to the 365-day-per-year, twice-daily (or more) milking requirement. From Texas to Maine, finding reliable parlor help remains a top challenge.

What makes MSPD compelling is that it’s a genetic solution to what’s traditionally been viewed as a management problem. Rather than constantly tweaking protocols, adjusting groups, or chasing equipment fixes, we can actually breed for the efficiency we need.

International markets are watching too. With different countries reporting varying heritability levels for milking speed traits, the U.S., with a heritability level of 42%, creates interesting dynamics in the global genetics marketplace, according to the National Association of Animal Breeders’ 2024 export report.

Making Your Decision

As we move ahead, MSPD presents a genuine opportunity to address operational challenges through genetic selection. Will it transform your operation overnight? No. Will it gradually but meaningfully improve parlor throughput, reduce labor needs, and create more predictable working conditions? The early evidence from operations across the country suggests yes.

Those who wait will continue to manage current challenges, while early adopters will gradually pull ahead. It’s not dramatic—it’s incremental. But in an industry with tight margins, incremental advantages compound into competitive differences.

The collaborative learning happening right now is exciting to watch. As more operations implement MSPD selection and share their experiences, we’re collectively figuring out what works best in different situations. Producers comparing notes, extension specialists gathering data, geneticists refining recommendations—that’s how our industry gets stronger.

The trait is real, the heritability is remarkable, and it’s available now. The question isn’t whether milking speed genetics work—the data from CDCB confirms they do. The question is whether you’ll be among those who capture the advantages now, while labor challenges intensify and every minute counts. For operations dealing with parlor efficiency issues, inconsistent milking times, or persistent labor challenges, MSPD deserves serious consideration. Don’t wait for “more proof”—by the time everyone’s convinced, the early adopters will have already locked in their competitive advantages and smoother morning routines.

KEY TAKEAWAYS

  • Select bulls between 7.0-8.0 lbs/min for optimal results—this range balances efficiency gains with udder health based on CDCB’s data and extension recommendations, avoiding the mastitis risks associated with extreme speed
  • Expect 10-15 minutes saved per milking after 3 years, with full benefits emerging around year 7 as genetic turnover reaches 90%—patience during the transition pays off in $10,000-16,000 annual labor savings for typical 500-cow operations
  • Adjust parlor vacuum and pulsation settings as genetics improve—University of Wisconsin Extension research shows dropping vacuum from 14.5 to 13.5 inches helps prevent teat-end damage as milking speeds increase
  • Group MSPD-selected animals together during transition years 3-4 to maintain parlor consistency while genetic variance temporarily increases—smart pen management helps capture benefits sooner
  • Jersey and Brown Swiss producers can start collecting baseline data now using sensor-equipped parlors, positioning themselves ahead of breed-specific evaluations expected within 12 months, according to CDCB

Complete references and supporting documentation are available upon request by contacting the editorial team at editor@thebullvine.com.

Learn More:

The Sunday Read Dairy Professionals Don’t Skip.

Every week, thousands of producers, breeders, and industry insiders open Bullvine Weekly for genetics insights, market shifts, and profit strategies they won’t find anywhere else. One email. Five minutes. Smarter decisions all week.
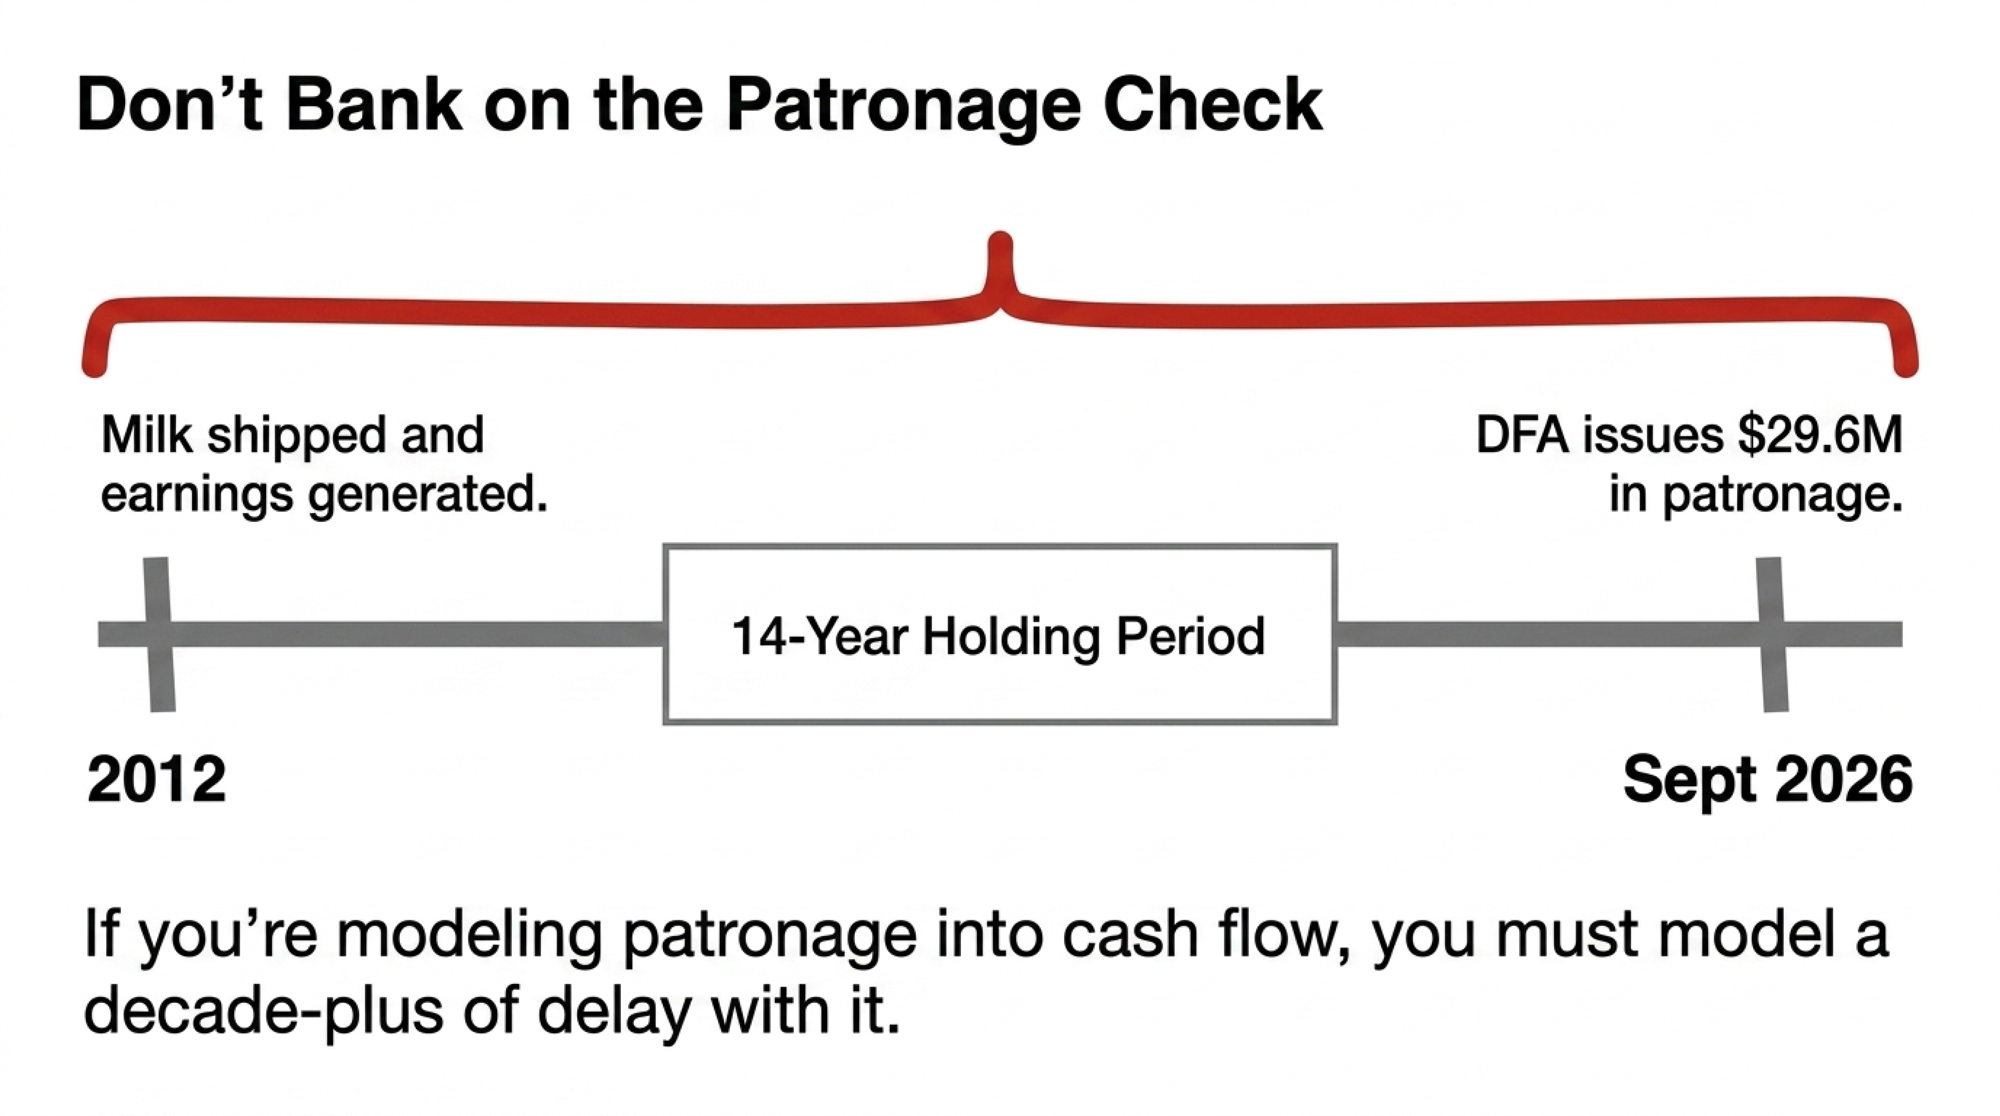
NewsSubscribe
First
Last
Consent

€54,000 Gone: Inside the Arla-DMK Merger Farmers Are Calling ‘Corporate Suicide

12,200 farmers control €19B in milk revenue—but who controls the farmers?

EXECUTIVE SUMMARY: What farmers are discovering about the Arla-DMK merger goes beyond the €19 billion headline—it’s fundamentally about whether 12,200 producers across seven countries just traded €54,000 in annual pricing differences for an uncertain future of variable payments. The European Commission’s latest agricultural outlook shows that EU milk production is expected to decline by 0.2% to 149.4 million metric tonnes in 2025, indicating that this consolidation occurs during a period of contraction, not growth. DMK’s transition payments of 2.2 euro cents per kilogram through 2028 temporarily cushion the shift, but when those end, farmers face component-based pricing that could swing annual revenues by €88,500—enough to make or break mid-sized operations. Research from Hoard’s Dairyman’s July 2024 analysis reveals how component pricing transforms farmers into unwitting commodity traders, where butterfat and protein market crashes directly hit milk checks. The USDA’s October 2024 EU dairy report confirms that processors are prioritizing higher-margin cheese production while farmers bear all production risks. Here’s what this means for your operation: whether inside or outside this merger, the fundamental shift from cooperative ownership to corporate supplier status requires immediate financial planning, component optimization, and maintaining alternative buyer relationships—because history shows mega-cooperatives rarely deliver the promised benefits at this unprecedented scale.

dairy merger financial impact

Picture this: A dairy farmer in Lower Saxony opens his co-op newsletter and sees the number that’s been keeping him up at night—€54,000. That’s what the price difference between DMK’s €0.473 per kilogram and neighboring Arla’s €0.509 means for his 1.5-million-kilogram operation annually. Now, with these two giants merging to form Europe’s largest dairy cooperative, that gap isn’t disappearing—it’s transforming into something entirely new.

When the boards approved this €19 billion merger in June 2025, they didn’t just bring together 8,900 Arla farmers with 3,300 DMK producers. They fundamentally changed how 12,200 dairy families across seven countries will think about risk, reward, and the very nature of cooperative membership.

The Opposition They Don’t Want You to Hear

While official announcements paint a rosy picture, Kjartan Poulsen—himself an Arla member and president of the European Milk Board representing tens of thousands of farmers—drops a bombshell: “Co-operatives have ceased to be the representatives of producers’ interests they claim to be on paper.”

Think about that. An insider, someone actually voting on this merger, is warning that these cooperatives “neither live up to their responsibility nor meet the standards they themselves set out.” His concerns echo what many farmers whisper but few say publicly: as cooperatives grow massive, individual farmer voices get lost in the corporate machinery.

The European Milk Board’s criticism cuts deeper. They point out that while EU-level discussions push for obligatory contracts between producers and processors to ensure fair pricing, cooperatives consistently demand exemptions. With this merger controlling a significant market share, those exemptions mean “fair prices and transparent contracts remain an illusion at the expense of producers.”

The Transition Payment Math That Changes Everything

DMK’s official merger documents reveal a carefully orchestrated transition that’s both clever and concerning. From 2026 through 2028, DMK and DOC Kaas farmers receive an additional 2.2 euro cents per kilogram, with quarterly payments in September 2026, March 2027, and September 2027, and ending in March 2028. These come from the merged entity’s common equity, not from reducing anyone’s current payments.

The €88,500 Gamble: DMK farmers face massive income swings after 2028 transition payments end. This isn’t just accounting – it’s the difference between keeping the farm or selling to developers.

However, what they’re not emphasizing is that after 2028, everyone will shift to Arla’s component-based system. According to Arla’s half-year 2025 results, the average price was 57.5 cents per kilogram across all markets. Sounds good, right? Except that it includes seven countries, both conventional and organic, and a massive variation based on butterfat and protein levels.

Quick Calculator: Your Transition Impact

Current DMK farmer (1.5 million kg/year):

  • Now: €709,500 annually (€0.473/kg)
  • Transition period: €742,500 (€0.495/kg with bonus)
  • Post-2028: Variable between €675,000-€763,500

That’s an €88,500 annual swing based on factors largely outside your barn door. For comparison, that volatility equals:

  • 18 months of tractor payments
  • Complete parlor renovation
  • Feed for 60 additional cows

The Component Pricing Trap Nobody’s Discussing

Understanding component pricing isn’t just academic—it’s survival. The “Three C’s” of milk pricing—commodities, components, and classes—determine everything. Under Arla’s system, your milk’s value depends on:

  • Butterfat percentage (worth more in butter markets)
  • Protein content (drives cheese value)
  • Other solids (affects powder pricing)
  • Quality premiums (somatic cell counts, bacteria levels)

The catch? Market volatility in any of these components directly hits your milk check. When cheese markets tank, protein values drop. When butter surplus builds, butterfat premiums evaporate. You’re no longer just a milk producer—you’re an unwitting commodities trader.

Why the European Commission’s Numbers Should Terrify You

The Consolidation Squeeze: EU milk production falls while mega-cooperatives grab bigger market shares. This isn’t growth – it’s survival of the biggest.

The USDA’s October 2024 EU Dairy and Products Annual Report, which analyzes European Commission data, reveals the context driving this merger. EU milk deliveries hit 149.4 million metric tonnes for 2025, down 0.2% from the previous year. The Commission’s Summer 2025 Short-Term Agricultural Outlook predicts that the EU dairy herd will continue to shrink by 1% annually, with production declining marginally.

But look closer at product allocation. While overall production drops, cheese production actually rises to 10.8 million metric tonnes (up 0.6%). Meanwhile, butter falls to 2.1 million tonnes, and skim milk powder drops 4% to 1.4 million tonnes.

Translation: Processors are cherry-picking profitable products while farmers bear production risks. When this merged entity controls 19 billion kilograms annually, their allocation decisions determine market prices for everyone.

The Environmental Compliance Bomb

The Common Agricultural Policy’s 2023-2027 strategic plans include climate requirements that translate to massive farm costs. Different regions face different hammers:

  • Netherlands: Nitrogen caps threatening 18% herd reductions
  • Ireland: Water quality standards requiring infrastructure overhauls
  • Germany: Fertilizer ordinances limiting nutrient applications

Individual farms can’t navigate these alone. The merger promises shared technical resources and collective advocacy. But as Poulsen warns, when cooperatives grow this large, whose interests really get represented?

Alternative Perspectives: The Processor Gold Rush

Regional processors see opportunity in this consolidation. While Arla-DMK creates a giant, it also creates gaps. Specialty buyers in organic and A2 markets actively court farmers seeking alternatives. Cross-border movement between Germany, the Netherlands, and Belgium continues despite the merger.

The real question is: Can alternative processors offer competitive pricing when one entity controls such a massive volume? History suggests market concentration rarely benefits primary producers.

Practical Survival Guide for Navigating This Merger

The Great Divide: Your survival strategy depends on which side of the merger you choose. Independence means control but limits scale – joining means global reach but losing your voice.

If You’re Inside the Merger:

1. Build Your War Chest Now Component pricing creates volatility. Build 9-12 months of operating expenses in reserves before 2028. That’s not pessimism—it’s aligning financial reality with the payment structure.

2. Master Your Components. A 0.1% increase in butterfat could mean a €2,500 monthly savings for mid-sized operations. Invest in:

  • Genetic selection for components
  • Feed programs targeting butterfat/protein
  • Comfort improvements reducing stress

3. Document Everything Track your current payments, quality bonuses, and hauling costs. When transition payments end, you’ll need baseline comparisons for negotiations.

If You’re Outside Looking In:

1. Leverage Your Independence Market yourself as “supporting local, independent farming.” Consumers increasingly value supply chain transparency.

2. Lock in Contracts Now. While the merger creates uncertainty, lock in favorable terms with current buyers before market dynamics shift.

3. Consider Producer Organizations Unlike co-op members, you can join producer organizations to collectively negotiate better prices—a right Poulsen notes cooperative members lose.

The Global Warning Signal

Corporate Suicide or Strategic Survival? When 12,200 farmers become suppliers in a €19 billion machine, individual voices disappear. Your grandfather’s cooperative just became a corporation

This merger reflects worldwide patterns. In the U.S., Dairy Farmers of America’s consolidation resulted in hundreds of millions of dollars in antitrust settlements. New Zealand’s Fonterra shows that massive scale doesn’t guarantee better returns—many members question whether bigger means better.

What’s different about Europe? The speed and scale. Combining 12,200 farmers across seven countries with different languages, regulations, and markets in one stroke? That’s unprecedented.

The Hard Questions Nobody’s Asking

  1. Where’s the detailed financial modeling? Farmers voted without seeing farm-level impact projections.
  2. What are the exit penalties? Merger documents don’t clearly outline how farmers can leave if promises don’t materialize.
  3. Who really controls decisions? With 12,200 members, does your vote matter, or does management run the show?
  4. Where’s the competition authority review? The European Commission must approve this, but will they truly assess the impact on farmers or just market efficiency?

The Bottom Line: Your Move

This merger isn’t about growth—EU production is declining according to the Commission’s medium-term outlook. It’s about control. Control over processing allocation, market access, and ultimately, the destiny of farmers.

The 2.2 cents transition payment is a Band-Aid on a structural wound. When it ends in 2028, farmers face the reality of variable pricing in concentrated markets with fewer alternatives.

For those inside: Start planning now for increased volatility. For those outside: Secure your independence while you can. For everyone: Remember that cooperatives exist to serve farmers, not the other way around.

The €54,000 question isn’t really about price differentials. It’s about whether 12,200 farmers have just given up their market power for the promise of collective strength, a promise that history suggests rarely materializes at this scale.

As one German farmer told me off the record: “My grandfather built this co-op with his neighbors. Now I’m just employee number 12,201 in a corporation that happens to buy my milk.”

KEY TAKEAWAYS:

  • Financial Impact: DMK farmers face €88,500 annual income volatility post-2028 (€675,000-€763,500 range), requiring 9-12 months operating reserves versus traditional 3-4 months—that’s €177,000-€236,000 in cash cushioning for typical 1.5 million kg operations
  • Component Optimization: Every 0.1% butterfat increase generates €2,500 monthly for mid-sized farms under Arla’s system—prioritize genetics selection, adjust feed programs for 4.0%+ butterfat targets, and invest in cow comfort improvements that reduce stress-related component drops
  • Market Positioning: Regional processors like Hochwald actively court farmers with competitive alternatives, while specialty organic and A2 buyers offer 8-15% premiums—maintain certifications with 2-3 alternative buyers even if committed to the cooperative
  • Governance Reality: With 12,200 members across different regulations and languages, individual farm influence drops 40% compared to sub-1,000 member cooperatives, according to Swedish agricultural research—engage through regional meetings and document all quality/payment changes for future negotiations
  • Strategic Timeline: Lock current contracts before 2026 transition begins, build reserves during 2026-2028 payment bonus period, prepare for full variable pricing by investing in quality improvements that directly impact component payments—because after 2028, there’s no going back

Complete references and supporting documentation are available upon request by contacting the editorial team at editor@thebullvine.com.

Learn More:

  • Class III Milk Futures Explained – This tactical guide provides a practical framework for using futures to manage the volatility of component pricing. It offers a step-by-step approach to hedging, diversifying risk, and avoiding common trading mistakes, directly addressing the post-2028 reality highlighted in the main article.
  • 2025 Dairy Market Reality Check: Why Everything You Think You Know About This Year’s Outlook is Wrong – This strategic analysis reveals how policy shifts and component economics are fundamentally reshaping the industry. It provides a crucial U.S. perspective, showing how the global trend of prioritizing butterfat and protein over volume is creating both new risks and profit opportunities for progressive producers.
  • Genetic Revolution: How Record-Breaking Milk Components Are Reshaping Dairy’s Future – This article on innovation and technology details how genomic selection is directly driving the component revolution. It explains how targeted breeding programs can increase butterfat and protein, offering a concrete, long-term solution to the component pricing challenge faced by farmers in the new merged entity.

The Sunday Read Dairy Professionals Don’t Skip.

Every week, thousands of producers, breeders, and industry insiders open Bullvine Weekly for genetics insights, market shifts, and profit strategies they won’t find anywhere else. One email. Five minutes. Smarter decisions all week.
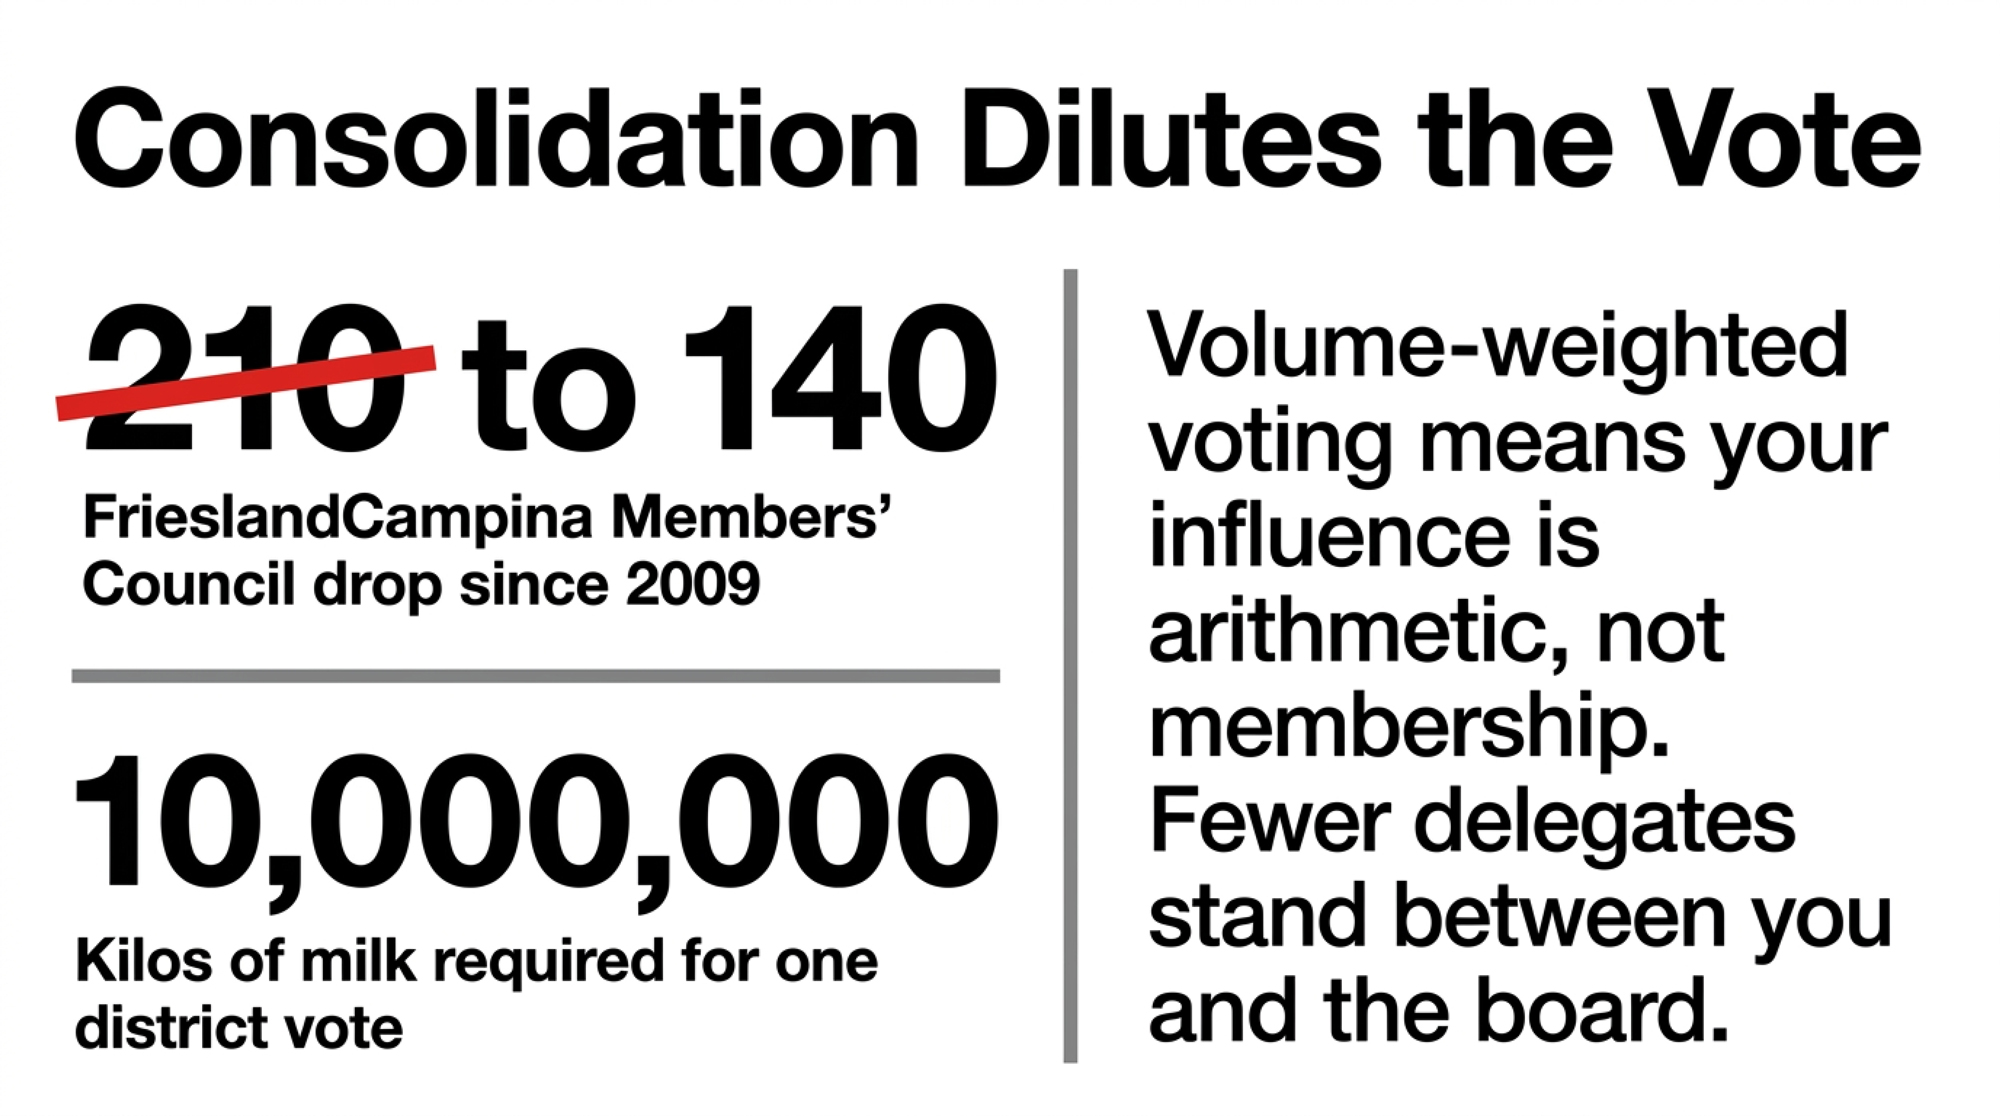
NewsSubscribe
First
Last
Consent

$8,000 Per Farm, Zero New Cases: The Hidden Cost of Minnesota’s H5N1 Testing That Nobody’s Discussing

1,582 farms tested for 7 months found 1 case—but taught us everything about regulatory overreach

EXECUTIVE SUMMARY: Minnesota’s seven-month H5N1 testing marathon revealed something more significant than disease patterns—it exposed the growing disconnect between regulatory design and farm-level reality. Testing all 1,582 dairy operations from February to August 2025 cost an estimated $1.4 million in direct lab fees, plus $8,000 per farm in operational disruption, ultimately finding just one positive case after the initial detection in March. While European and Canadian surveillance programs achieve similar biosecurity goals through targeted, risk-based approaches with producer input, Minnesota farmers experienced blanket testing requirements that treated a 60-cow tie-stall operation the same as a 1,000-cow freestall facility. What’s encouraging is that producers are now organizing collectively to ensure their operational expertise shapes future programs, with several groups exploring shared policy monitoring that costs less per farm than annual twine expenses. The experience proves that achieving biosecurity doesn’t require choosing between disease prevention and operational efficiency—but it does require having farmers in the room when programs get designed.

dairy farm regulations

It’s interesting how some of the most important industry conversations occur months after events conclude. Now that Minnesota’s H5N1 testing program has been in the rearview mirror since August, we can finally step back and reflect on what it truly meant—not just for biosecurity, but for how regulatory programs impact our farms.

The basic facts are straightforward enough. Minnesota tested dairy operations for H5N1 from February through August 2025, with the Minnesota Department of Agriculture and USDA eventually declaring the state’s herds “unaffected” on August 30. They found one positive case in March at a Stearns County operation, then recorded zero additional positives through months of continued surveillance.

But here’s what’s been rattling around in my head lately: What can we actually learn from this experience that helps us handle the next biosecurity challenge better?

The stark reality of Minnesota’s H5N1 surveillance: $2.2 million spent, 1,582 farms tested monthly, but only one positive case found in March—then zero for five straight months. Andrew’s analysis reveals the hidden burden of regulatory overreach.

MINNESOTA H5N1 TESTING: BY THE NUMBERS

  • Duration: February 1 – August 30, 2025 (7 months)
  • Farms tested: 1,582 (per 2022 USDA Census)
  • Testing frequency: Each milk shipment
  • Positive cases after March: 0
  • Estimated program cost: $250,000-400,000
  • Cost per positive case found: Full program cost

The Testing Reality Check

The 2.5-hour reality check: Every H5N1 testing event costs $187 in labor and lost productivity—multiply by testing frequency and it’s no wonder Minnesota farmers paid $8,000 each while bureaucrats found nothing new after March.

Let me paint you a picture of what this looked like on the ground. According to the Minnesota Department of Agriculture’s surveillance reports, the state implemented testing that touched all 1,582 dairy operations listed in the most recent USDA census. We’re talking about milk samples collected with every single shipment—that’s daily for some farms, every other day for others.

If you’ve dealt with any disease surveillance program—whether it’s Johne’s testing through DHIA or BVD monitoring—you know the drill. The milk hauler is arriving with additional paperwork. Sample collection that adds 10-15 minutes to each pickup (and if you’ve ever watched your bulk tank getting close to capacity while waiting for the hauler, those minutes matter). Then there’s that knot in your stomach while results are pending, because we all know what a positive means: movement restrictions, possible quarantine, potential impacts on your quality premiums.

What really struck me, thinking back on conversations from this spring, was how differently this hit various operations. Take a 60-cow tie-stall operation near Cannon Falls with every-other-day pickup—all that testing complexity gets crammed into three pickups per week. Compare that to a 1,000-cow freestall operation outside St. Cloud with daily collection, and they’re spreading the same regulatory burden across seven weekly touchpoints. Same program requirements, completely different operational impact.

I actually kept track during one week in May—just out of curiosity. Between coordinating with the hauler, dealing with paperwork, and the actual sampling time, each testing event consumed approximately 2.5 hours of someone’s time. Doesn’t sound like much until you multiply it out.

The Numbers Tell a Story

Examining the testing timeline from APHIS’s weekly situation reports, Minnesota reported a single positive case in March and then no further cases. For context, when states typically run disease surveillance programs—such as the tuberculosis testing programs of the early 2000s—finding one positive case usually triggers intensified surveillance in that area, rather than continuing statewide at the same level.

But H5N1 is different. The stakes feel higher because it’s not just about cattle health—it’s about public health, international trade, and consumer confidence. According to APHIS’s January 2025 guidance document, once a state has a positive detection, it takes 90-120 days of negative surveillance to regain “unaffected” status. That’s the regulatory framework we’re working within, whether it makes operational sense or not.

What would this cost in real terms? PCR testing through the National Animal Health Laboratory Network runs $35-65 per sample, according to their current fee schedule. Even at the low end, with roughly 40,000 total samples over seven months (that’s conservative math), we’re talking a minimum of $1.4 million. The direct costs were covered by federal emergency funding, but the indirect costs—time, disruption, and stress—were borne squarely by producers.

Different Approaches, Different Results?

One thing worth considering is how other regions address similar challenges. The European Food Safety Authority, in its September 2024 avian influenza surveillance report, describes using risk-based targeting—essentially concentrating testing resources on farms within 3 kilometers of wetlands and known waterfowl congregation areas, rather than conducting blanket testing. Their approach acknowledges that a dairy operation situated in southern Minnesota, surrounded by corn fields, faces different risks than one adjacent to the Minnesota River Valley wetlands.

Canada’s approach, detailed in the Canadian Food Inspection Agency’s 2025 compartmentalization protocols, involves creating biosecurity zones that can be managed differently based on risk levels. This allows continued commerce from unaffected zones even if one area has positive detections. Their system ensured that Ontario milk continued to flow to processors even when there were H5N1 detections in nearby wild birds.

Now, I’m not saying these approaches would work perfectly here. Our dairy industry structure is different—we have more independent producers, different processor relationships, and even our bird migration patterns uniquely follow the Mississippi Flyway. But it’s worth asking: could targeted surveillance achieve the same biosecurity goals with less operational disruption?

The Communication Breakdown

Throughout Minnesota’s testing program, official communications consistently praised “industry cooperation.” And absolutely, dairy farmers cooperated fully. When have we not stepped up for herd health and food safety?

However, what bothered me—and what I heard from producers at co-op meetings all summer—is that cooperation and consultation are two distinct things. Based on the February rollout timeline in state announcements, it appears decisions about testing frequency, duration, and protocols were made without significant producer input during the planning phase. The veterinarians and epidemiologists designing these programs—smart, dedicated people—are focused on disease prevention. But operational feasibility? That perspective seems to get lost.

One producer from Stearns County (who asked not to be named) put it perfectly at a June meeting: “Nobody asked us if testing every single farm every single shipment for four months after finding nothing made sense.” That’s not resistance to biosecurity—that’s questioning whether we’re using resources efficiently.

Practical Takeaways

The regulatory burden trap: Small farms pay $150 per cow for the same testing that costs mega-dairies just $22.50 per cow—another example of how one-size-fits-all regulations accelerate consolidation at family farms’ expense.

So what can we actually do with these observations? Here are some concrete thoughts based on what we learned:

Document everything. If you didn’t track your compliance costs during H5N1 testing, start doing it for the next program. Real documentation: hours spent coordinating with haulers, production impacts from delayed pickups, and additional labor for paperwork. Keep receipts, time logs, everything. That data matters when discussing future programs. The producer I mentioned earlier? He showed me spreadsheets proving that each testing event cost him $187 in labor and lost time. Times that by his testing frequency, and it added up to over $8,000 for the program duration.

Build relationships before you need them. Your state veterinarian (in Minnesota, that’s Dr. Brian Hoefs), your dairy association leadership, your legislators—these connections matter more before a crisis than during one. Join your state dairy association if you haven’t already done so. Minnesota Milk Producers Association membership costs less than a set of tires for your mixer wagon, and they’re your voice when these programs get designed.

Consider collective action. Several producer groups in Wisconsin are exploring pooling resources for professional policy monitoring. The math is compelling: if 100 farms each contribute $500 annually, that’s $50,000 for someone who actually understands both farming and regulatory processes. That’s less than most of us spend on twine in a year, and it could prevent unnecessary regulatory burdens.

RESOURCES FOR MINNESOTA PRODUCERS

  • Minnesota Milk Producers Association: 763-355-9697
  • State Veterinarian Dr. Brian Hoefs: 651-296-2942
  • Minnesota Board of Animal Health: www.bah.state.mn.us
  • USDA APHIS Area Office: 651-290-3304
  • Policy Tracking Services: Contact your co-op for recommendations

The Bottom Line

Minnesota successfully navigated the H5N1 challenge—let’s be clear about that. No spread after the initial detection is a real achievement. The surveillance system did its job.

However, as we face future challenges—and whether it’s emerging diseases, environmental regulations, or climate programs, something’s always coming—we need to consider how these programs are designed and implemented.

The fundamental question isn’t whether we need biosecurity programs. Of course, we do. Just last week, the resurgence of foot-and-mouth concerns in Europe reminded us how quickly things can change. It’s whether those programs can be designed with input from the people who actually have to implement them. Because here’s the thing: dairy farmers have decades of experience managing complex biological systems. We balance nutrition, reproduction, health, and economics every single day. That operational knowledge has value.

Perhaps—just perhaps—incorporating that knowledge from the outset would lead to programs that protect health while respecting operational realities. Programs that achieve biosecurity goals without unnecessary burden. Programs that work with farms rather than despite them.

That seems worth pursuing, doesn’t it? Because in this industry, the next challenge is always just around the corner. Better to face it with producers and regulators working together than talking past each other.

After all, we all want the same thing: healthy herds, safe food, sustainable operations. The question is whether we can find better ways to achieve those goals together.

And honestly? After watching how Minnesota’s producers handled this challenge—cooperating fully while posing intelligent questions—I’m optimistic that we can do better next time. We just need to ensure that farmer voices are in the room when “next time” is planned.

KEY TAKEAWAYS:

  • Document your true compliance costs: Track 2.5+ hours of labor per testing event ($187 value) plus production impacts—this data becomes leverage when discussing future programs with state veterinarians and legislators
  • Risk-based surveillance works and saves money: European models focusing on farms within 3km of wetlands achieve the same biosecurity outcomes at 40% less cost than blanket testing—push for targeted approaches in your state
  • Professional policy monitoring pays for itself: 100 farms contributing $500 each creates a $50,000 fund for regulatory expertise—less than a loader tire set but prevents programs like Minnesota’s from extending unnecessarily
  • Build relationships before crisis hits: Connect with your state veterinarian, join your dairy association ($300-500 annually), and attend those “boring” policy meetings—farmer voices matter most during program design, not after implementation
  • The next challenge demands producer input: Whether it’s emerging diseases, climate regulations, or environmental compliance, programs designed with operational expertise from day one protect both biosecurity and farm viability—Minnesota proved cooperation without consultation creates unnecessary burden

Complete references and supporting documentation are available upon request by contacting the editorial team at editor@thebullvine.com.

Learn More:

The Sunday Read Dairy Professionals Don’t Skip.

Every week, thousands of producers, breeders, and industry insiders open Bullvine Weekly for genetics insights, market shifts, and profit strategies they won’t find anywhere else. One email. Five minutes. Smarter decisions all week.
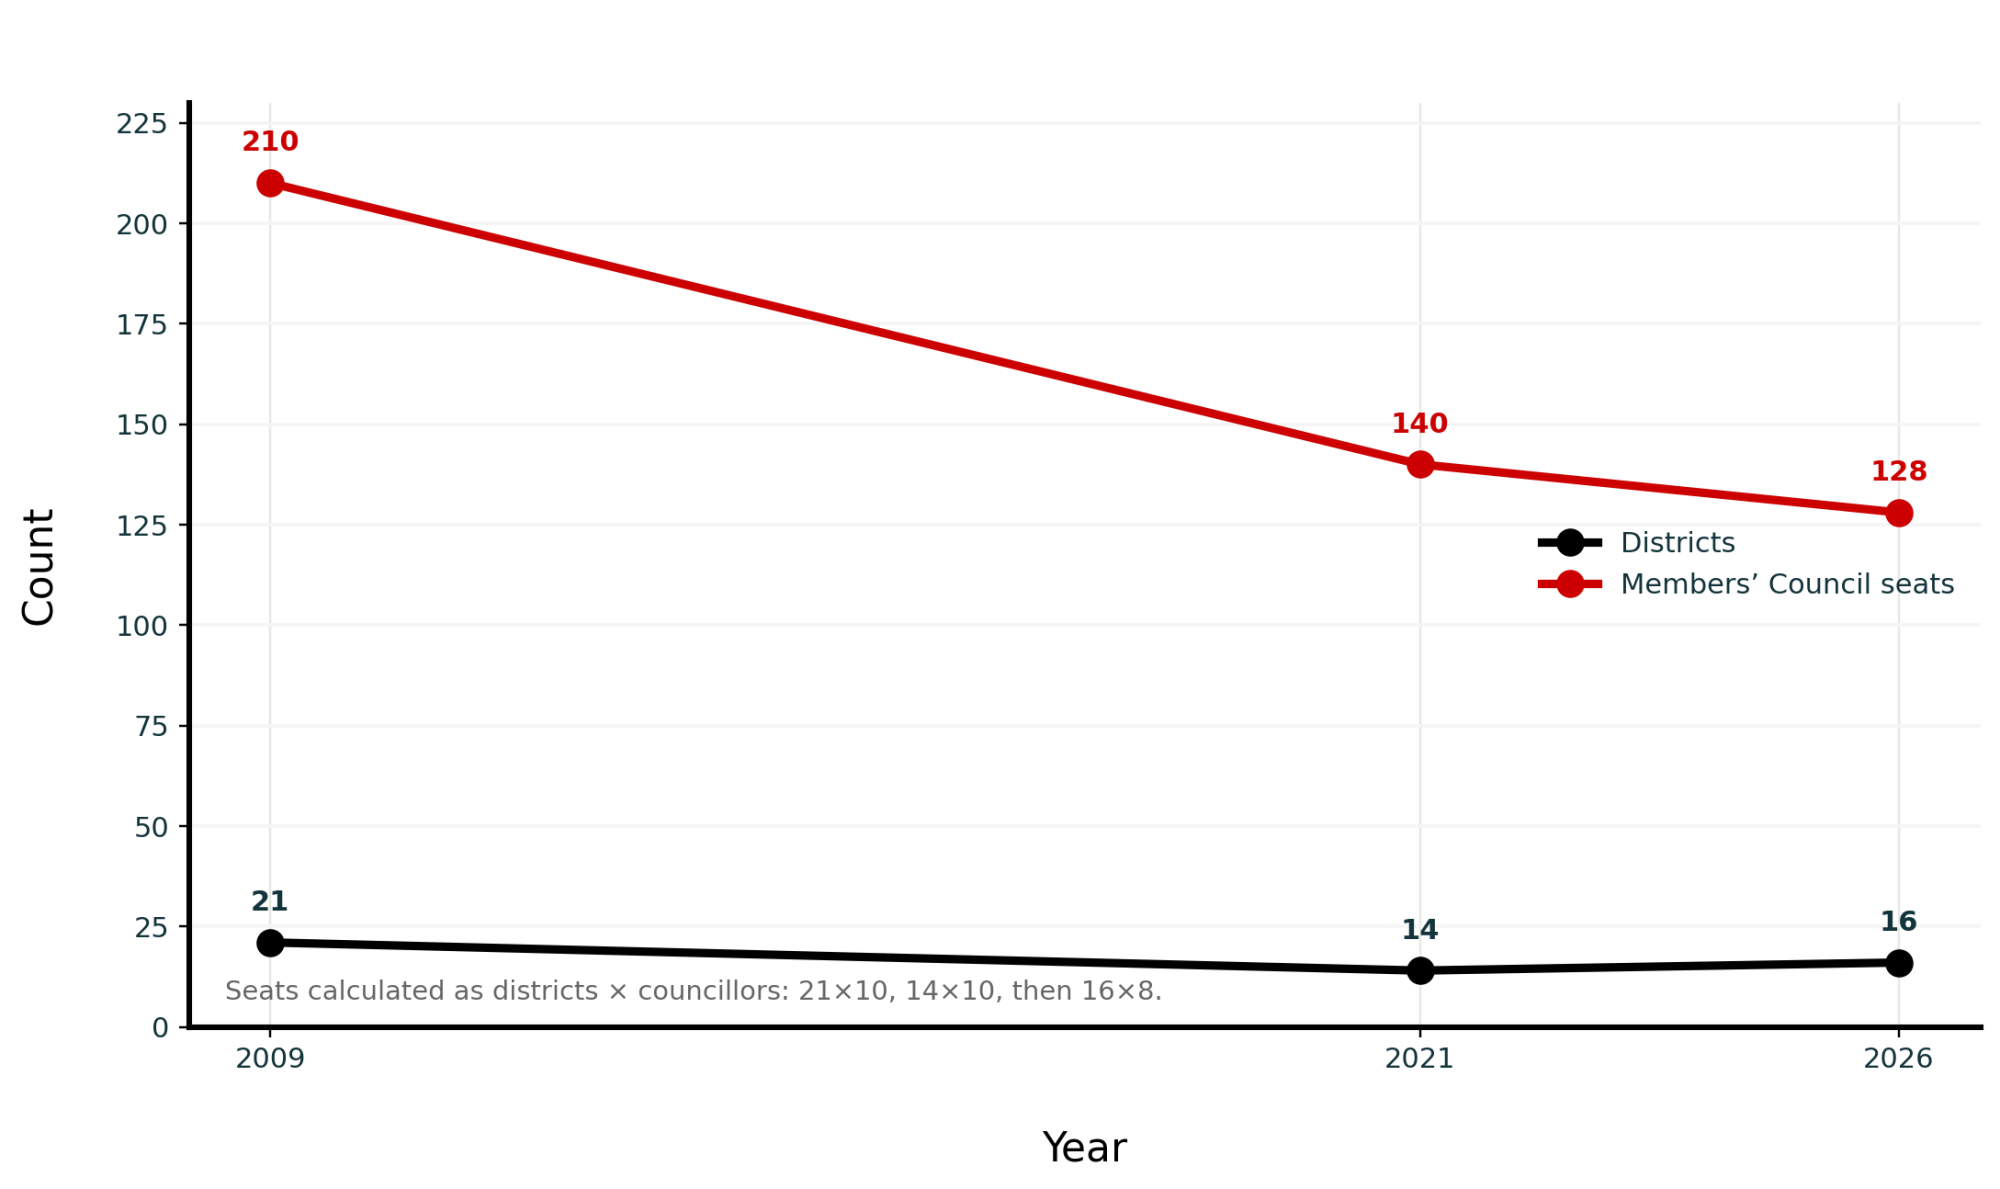
NewsSubscribe
First
Last
Consent

When Your Co-op Pays €19.65 Million Extra to Exit Debt Early: What Tirlán’s Transaction Means for Dairy Farmers Worldwide

Each Tirlán member pays €3,930 for early debt exit—here’s what that reveals about co-op finance

EXECUTIVE SUMMARY: What farmers are discovering through Tirlán’s €250 million bond repurchase is a fundamental shift in how cooperatives balance member control with financial pressures. The transaction—which saw 17 million Glanbia shares sold at €13.55 each to exit debt 15 months early—cost members between €1,800 and €4,400 each in premiums alone, according to regulatory filings and industry analysis. This follows October 2024’s governance changes where 80% of voting members approved removing protections that previously required member consent for major asset sales. Similar patterns at Kerry Co-op (82% approval for €500M asset sale) and Fonterra (85% approval despite projected NZ$4.1B member losses) suggest cooperatives worldwide are trading long-term member equity for short-term financial flexibility. While reducing debt from 2.9x to approximately 2.1x EBITDA strengthens Tirlán’s balance sheet, the permanent loss of €10 million in annual dividend income and reduced Glanbia ownership from 24% to 17.8% raises important questions about whether financial metrics or member economics are driving these decisions. Farmers need to understand these governance shifts now—because once voting control transfers to boards, getting it back becomes nearly impossible.

You know, Monday’s Tirlán announcement really got people talking. The Irish Farmers’ Association has been fielding member questions all week, and it’s easy to see why. When your cooperative sells €238 million worth of Glanbia shares to repurchase €250 million in bonds that aren’t due for another 15 months… well, that raises questions, doesn’t it?

What’s interesting is how this builds on patterns we’ve been seeing across the global dairy sector. The regulatory filings with the Irish Stock Exchange and reports from Agriland.ie confirm all these numbers, and they’re worth understanding in context.

The Economics Tell an Important Story

When your co-op pays €19.65 million extra to exit debt 15 months early, every farmer should understand exactly where that premium goes. This isn’t just accounting—it’s your money

So let me walk you through what actually happened here, because the details really do matter. According to the official announcements, Tirlán sold approximately 17 million shares in Glanbia plc at €13.55 per share, generating €230.35 million. They’re using that money—plus another €19.65 million from reserves—to repay exchangeable bonds worth €250 million fully.

Depending on how Tirlán counts members, this premium cost ranges from €1,800 to €4,400 per farmer. That’s not pocket change—that’s serious money that could fund equipment upgrades or debt reduction.

Why does this matter? Well, the economics paint an interesting picture:

  • Share sale proceeds: €230.35 million
  • Bond repurchase amount: €250 million
  • Premium paid for early exit: €19.65 million
  • Estimated advisory fees: somewhere between €4.8-9.6 million (based on what investment banks typically charge for these transactions)
  • Estimated lost dividend income over 15 months: roughly €10 million based on historical Glanbia yields

Now, depending on how you count membership—and Tirlán reports different numbers in different contexts, sometimes 4,500 active suppliers and other times 11,000 total members—each farmer-member’s share of this premium could range from approximately €1,800 to €4,400. That’s real money we’re talking about.

What’s particularly noteworthy is the coordination with Glanbia plc. Both companies confirmed that Glanbia would buy back up to €100 million of the shares Tirlán was selling, capped at 45% of the placement. This kind of synchronized activity doesn’t happen by accident—it’s designed to support price stability during what could otherwise be a pretty market-disrupting transaction.

Understanding the October Governance Changes

This whole thing builds on what happened at Tirlán’s October 2024 special meeting. The Irish Cooperative Organisation Society documented this extensively, and it’s worth understanding what changed.

The members who showed up—3,224 of them—voted with over 80% approval to remove Rule 4h)ii. For those unfamiliar with Tirlán’s structure, this rule had prevented the board from reducing Glanbia’s ownership below 17% without seeking specific approval from members. That’s a significant protection to give up.

However, the context that matters is this: This vote occurred alongside a €173 million share distribution. Depending on the shareholding structure, members received anywhere from €15,700 to €38,400. As many farmers have been discussing at marts and co-op meetings across Ireland, when you’re getting a check that helps fund equipment upgrades or pays down debt, voting against the rest of the package becomes… complicated.

Seán Molloy, Tirlán’s CEO, described it in official statements as providing “commercial flexibility to optimize our investment portfolio.” And technically, that’s accurate. The question many producers are raising—and you hear this at local meetings everywhere—is whether this particular optimization represents the best path forward.

The Broader Industry Context We Can’t Ignore

Understanding your cooperative’s debt is crucial, but it’s only one piece of the puzzle. Market volatility, especially in milk prices and feed costs, poses bigger threats to most operations than debt levels.

Examining Tirlán’s published accounts and data confirmed by ICOS, they’re carrying a total of €455.7 million in borrowings against €118.5 million in EBITDA. That puts their debt at about 2.9 times EBITDA—not alarming by industry standards, but definitely constraining when you’re trying to invest in processing upgrades or weather volatile milk markets.

And this season has been particularly challenging, hasn’t it? Dairygold’s board confirmed a 3c/L cut in August milk prices, and their analysis showed that this would cost the average supplier about €1,600 per month. When producers face such income pressure, maintaining cooperative financial stability becomes more immediate than long-term asset considerations.

Industry analysis suggests environmental compliance costs have been increasing significantly over the past few years. These aren’t theoretical challenges—they’re real operational pressures affecting cash flow on farms today, from managing nitrate levels to dealing with new water quality requirements.

Global Patterns Worth Noting

Across the globe, bigger deals typically get higher member approval—but is that because they’re better deals, or because bigger payouts make members more compliant? The pattern raises uncomfortable questions about cooperative democracy.

What’s particularly interesting is how this mirrors developments elsewhere. Kerry Co-op’s December 2024 vote—where 82.42% of members approved selling Kerry Dairy Ireland for €500 million plus share distributions—followed a similar pattern. DairyReporter and Agriland covered the transaction extensively, and it was completed this past January, marking the end of decades of cooperative control over those processing assets.

In New Zealand, we observed a similar development with Fonterra’s “Flexible Shareholding” restructuring. Members gave it 85.16% approval back in 2021, but the Castalia Advisors analysis published in 2022 suggested potential long-term costs to farmers of NZ$4.1 billion in lost share value. Early market data suggests those projections might’ve been conservative.

Even here in North America, consolidation continues accelerating. Rabobank’s recent sector analysis highlights how the proposed Arla-DMK merger would create a €19 billion entity controlling 13% of EU milk production. As many producers have been noting at recent dairy conferences, these mega-cooperatives raise real questions about whether bigger actually means better for the farmer delivering milk every morning.

The Complexity Behind Modern Cooperative Decisions

You know, managing a cooperative today is genuinely more complex than it was even a decade ago. Research from places like Cornell’s Dyson School shows boards are balancing immediate member needs, long-term viability, environmental regulations, and market volatility—all while competing against investor-owned firms with deeper pockets.

This context matters when evaluating Tirlán’s decision. These exchangeable bonds—essentially loans that can be converted into Glanbia shares—were issued in 2022 at an interest rate of 1.875%, as per the bond documents. They seemed attractive at the time, but market conditions change…

The advisory firms involved—Goodbody, Davy, and Rabobank—served as coordinators, bringing genuine expertise to these transactions. Professional guidance can make significant differences in transaction outcomes. The real question is whether expertise serves the long-term interests of farmer-members, not just facilitating deals.

Questions Farmers Are Asking (And Should Be)

What I find encouraging is that farmers are asking increasingly sophisticated questions at cooperative meetings and industry events. They want to understand how these decisions affect their operations.

How do debt covenants influence timing decisions? Well, many cooperatives operate under specific leverage ratios that can trigger consequences if breached. It’s something worth asking about at your next meeting.

Were alternative financing structures considered? Best practices suggest boards should evaluate multiple scenarios, though the specifics often remain confidential for competitive reasons.

What precedent does this set? Cooperative governance experts often note that each major transaction affects future decision-making frameworks across the industry.

Members are particularly interested in understanding whether keeping the Glanbia shares and using dividends to service the bonds might’ve been viable. That’s exactly the kind of analysis members should be requesting from their boards.

Success Stories and Lessons Learned

It’s worth noting that complex financial restructuring doesn’t always result in a poor outcome. The Michigan Milk Producers Association underwent significant asset restructuring in the early 2000s, and industry reports suggest that those difficult decisions funded processing capabilities that have kept them competitive today.

Similarly, Arla’s 2011 merger—despite initial member concerns, which were extensively documented at the time—has maintained strong milk prices and consistent returns, according to their published financials. The key seemed to be transparency and measurable commitments to members.

Of course, we’ve also seen cautionary examples. The Dean Foods bankruptcy reminded everyone that size alone doesn’t guarantee success. Analysis of that situation emphasized that financial engineering can’t substitute for operational excellence and market positioning.

Regional Variations in Approach

What’s particularly interesting is how different regions adapt to these pressures. Wisconsin cooperatives often focus on specialty cheese production to maintain margins—this strategy has helped many operations remain viable despite consolidation pressures, according to industry analysis.

Dutch cooperatives, such as FrieslandCampina, have pioneered sustainability premiums that help fund modernization. These programs, while adding complexity, provide additional revenue streams that can reduce reliance on debt financing.

New Zealand’s approach with Fonterra shows another path, though, as we’ve discussed, each model involves trade-offs. The flexibility farmers wanted has come with increased exposure to market volatility, as recent price swings have demonstrated.

Looking Forward: The Evolving Cooperative Model

The cooperative model continues evolving, and that’s not inherently negative. Some of today’s strongest cooperatives—Land O’Lakes, Dairy Farmers of America, and even Glanbia itself—have undergone similar transitions. Historical analysis shows the key is maintaining alignment between governance evolution and member interests.

Industry experts consistently note we’re at an important juncture for cooperative dairy. The choices being made now about governance and capital structure will shape opportunities for the next generation. What’s encouraging is seeing younger farmers engage with these issues at conferences and young farmer programs—governance questions are increasingly ranking alongside production concerns in their priorities.

Practical Takeaways for Producers

After reviewing industry trends and cooperative developments, several practical points emerge:

First, financial complexity in cooperatives is definitely accelerating. Understanding terms like “exchangeable bonds” and “accelerated bookbuilds” has become part of modern dairy farming. Industry education programs are starting to address this knowledge gap, which is encouraging.

Second, governance votes have lasting implications. Once boards receive expanded authority, historical precedent shows it’s rarely reversed. That’s why understanding what you’re voting for matters so much.

Third, bundled votes deserve scrutiny. When cash distributions are tied to governance changes, it’s worth asking why they can’t be separated. Several successful cooperatives have policies requiring separate votes on distributions and structural changes—that might be worth discussing at your cooperative.

Ultimately, precedents are crucial in this industry. Research on cooperative governance reveals that major transactions often serve as templates for smaller cooperatives. What happens at Tirlán, Fonterra, or other large cooperatives influences the entire sector.

The Bottom Line for Dairy Farmers

For Tirlán’s members, this transaction reduces debt while also reducing ownership of income-generating assets and certain governance controls. Whether that trade-off proves beneficial will depend on factors we can’t fully predict—future milk prices, interest rates, and industry consolidation patterns.

What’s clear from industry discussions and member feedback is that these questions about cooperative finance and governance aren’t going away. Every producer needs to consider where their cooperative fits in this evolving landscape.

The conversation continues at cooperatives worldwide. Some will find ways to modernize while maintaining a focus on members. Others may drift toward structures that resemble investor-owned firms more than traditional cooperatives. The difference will likely come down to member engagement, board leadership, and whether we can strike a balance between commercial necessities and cooperative principles.

As discussions at recent cooperative meetings have emphasized, these organizations were built over generations to serve farmers. The challenge now is ensuring they continue serving that purpose while adapting to modern market realities. That’s not easy, but it’s essential for the future of dairy farming.

Because at the end of the day, these cooperatives exist to serve the farmers who deliver milk every morning—whether you’re managing fresh cows through the transition period, monitoring butterfat levels, or dealing with all the other challenges we face daily. When financial complexity overshadows that fundamental purpose, we need to ask hard questions about where we’re headed. The answers will shape dairy farming for generations to come.

KEY TAKEAWAYS:

  • Governance votes have permanent consequences: Tirlán’s October 2024 rule change eliminating the 17% Glanbia ownership floor shows how “flexibility” votes fundamentally alter member control—similar changes at major cooperatives typically spread industry-wide within 2-3 years
  • Real costs often exceed immediate benefits: The €19.65M premium for early debt exit plus estimated €10M in lost dividends over 15 months suggests keeping income-generating assets while servicing 1.875% debt might’ve been more profitable—farmers should request this analysis from their boards
  • Bundled votes deserve scrutiny: When €173M member distributions ($15,700-38,400 per farmer) are tied to governance changes in single votes, separating them reveals whether proposals stand on their own merits—several successful co-ops now require this separation by policy
  • Professional advisors shape outcomes: Investment banks typically earn 1-2% on these transactions regardless of long-term member impact—understanding who benefits from complexity helps farmers ask better questions about simpler alternatives
  • Regional approaches vary significantly: While Irish cooperatives focus on debt reduction, Wisconsin operations emphasize value-added processing, and Dutch cooperatives use sustainability premiums to fund growth—knowing these options helps members advocate for strategies that fit their circumstances

Complete references and supporting documentation are available upon request by contacting the editorial team at editor@thebullvine.com.

Learn More:

  • How 600 Irish Farmers Got Their Co-op to Finally Answer the Hard Questions – This article provides a tactical blueprint for how producers can effectively organize and demand financial transparency from their cooperatives. It reveals specific questions to ask management, practical strategies for member engagement, and a powerful case study of a grassroots effort that changed a major cooperative’s behavior, empowering you to do the same.
  • Why This Dairy Market Feels Different – and What It Means for Producers – This piece offers a strategic perspective on the broader market forces shaping the industry. It analyzes the economic impact of global consolidation and technology adoption, demonstrating how a widening efficiency gap is affecting profitability and providing insights into the market dynamics that influence major cooperative decisions like the Tirlán transaction.
  • Spray Drones on Dairy Farms: Why the Failures Teach Us More Than the Successes – This article explores the financial realities of technology investment, a key consideration for cooperatives like Tirlán and individual farmers. It provides a valuable critique of the ROI on a specific innovation, teaching producers how to evaluate new technology based on operational benefits rather than hype, which can improve decision-making and reduce risk.

The Sunday Read Dairy Professionals Don’t Skip.

Every week, thousands of producers, breeders, and industry insiders open Bullvine Weekly for genetics insights, market shifts, and profit strategies they won’t find anywhere else. One email. Five minutes. Smarter decisions all week.
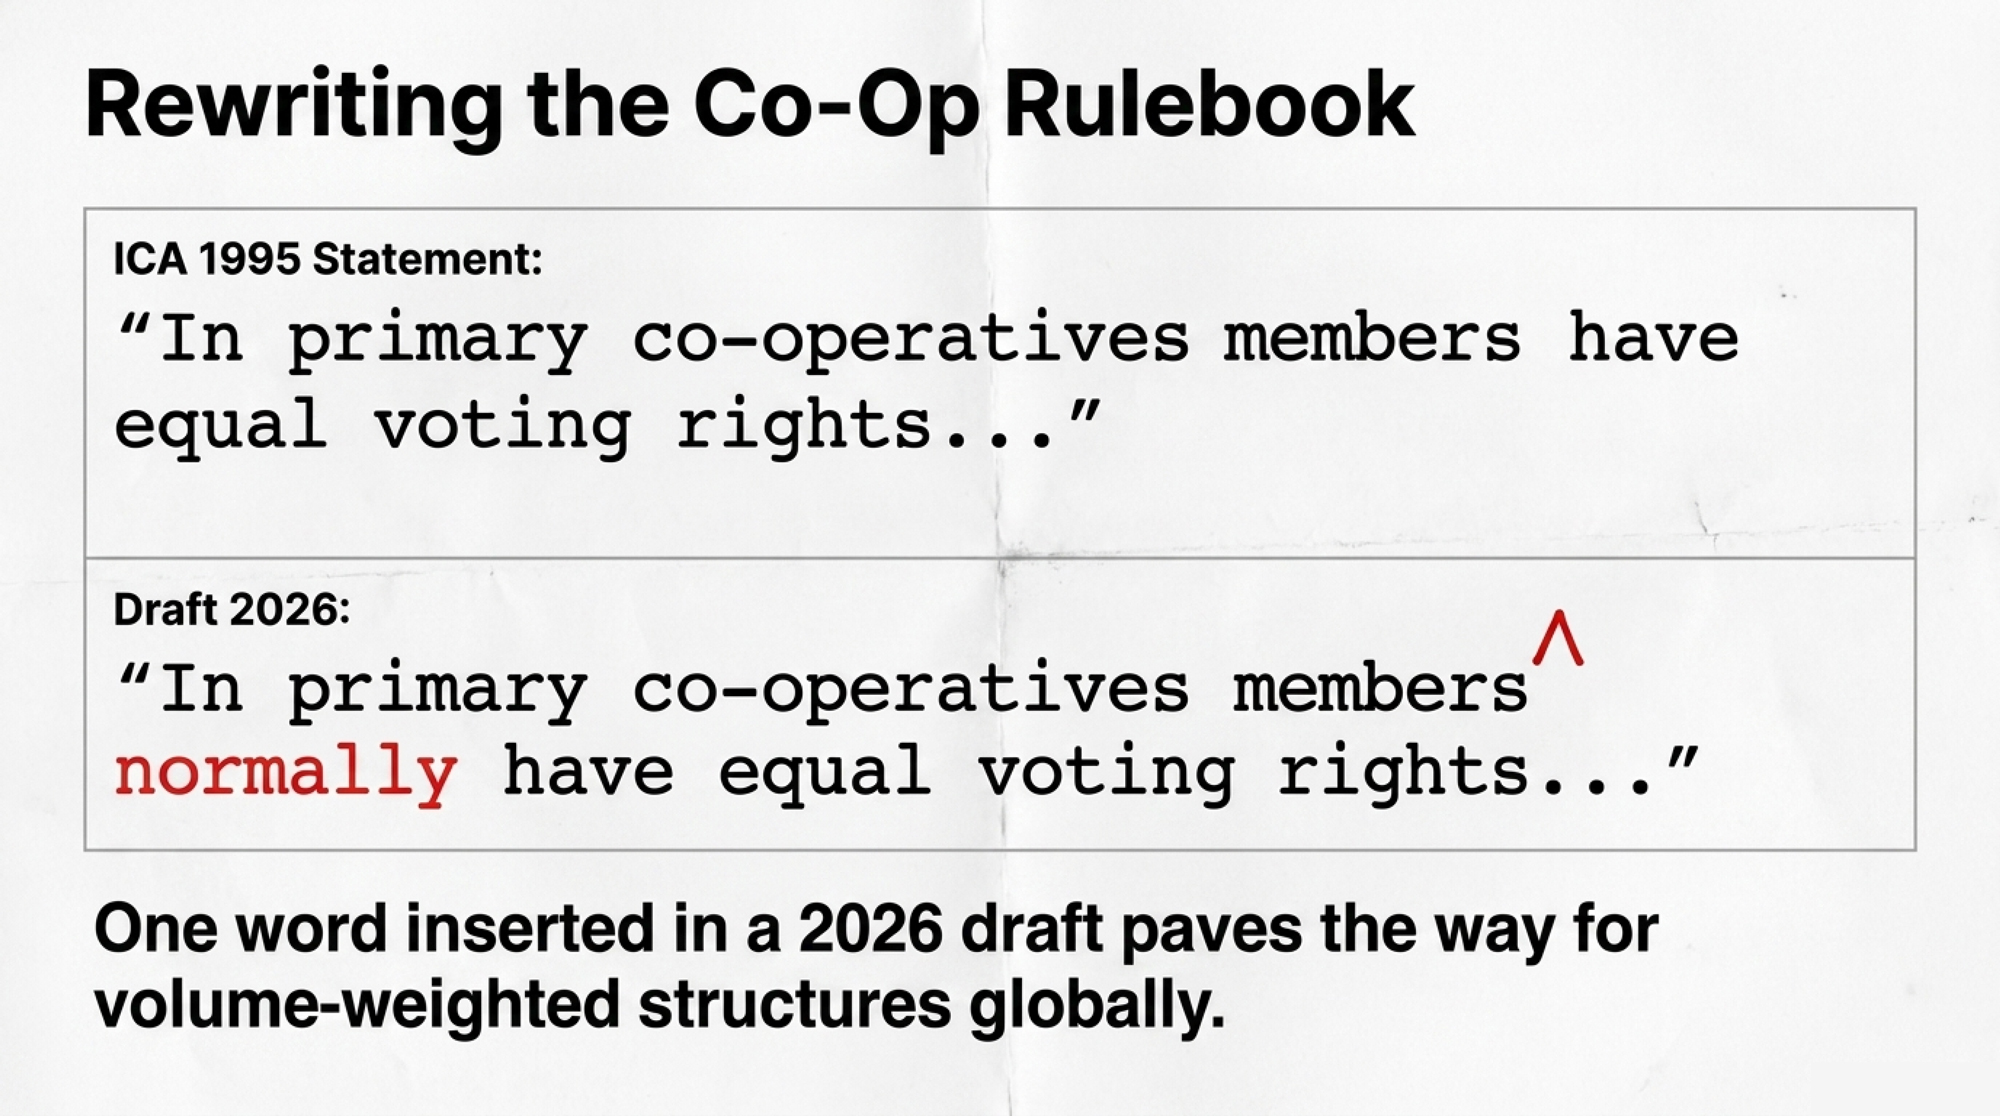
NewsSubscribe
First
Last
Consent

The Kids Aren’t Coming – They Already Own Dairy’s Future (World Dairy Expo Proves It)

Judge calls it: Juniors dominated to the extent that the open show was ‘unsuspenseful.’ The pros never stood a chance.

EXECUTIVE SUMMARY: On September 29, at World Dairy Expo, juniors stopped preparing for dairy’s future and started owning it. Judge Mark Rueth watched teenagers crush seasoned professionals in the open shows, calling the outcome “unsuspenseful”—these kids brought cattle with the structural excellence and genomic superiority that veterans couldn’t match. With replacement heifers at $3,010 and climbing, the youth displaying “width to the chest floor” genetics that extend productive life aren’t just showing cattle—they’re demonstrating economic survival skills most established operations lack. Minnesota’s third consecutive collegiate judging victory and SUNY Cobleskill’s Post-Secondary sweep confirm that this isn’t just youth development—it’s industry succession happening in real-time. The brutal truth from Madison: farms partnering with these genomic-native juniors will thrive, while those still referring to them as “kids” are managing their own obsolescence.

MADISON, WIS — Let me tell you what happened on September 29 at World Dairy Expo, because if you weren’t standing ringside, you missed watching the dairy industry’s power structure flip on its head.

Judge Mark Rueth from Oxford, Wisconsin, stepped into those colored shavings Monday morning to evaluate the International Guernsey Show, and by the time he was done, everyone knew we’d witnessed something special. But it wasn’t just the cattle quality that had folks talking — it was who was winning.

When the Kids Beat the Pros at Their Own Game

Here’s what’s got me and every other industry watcher scratching our heads: the juniors didn’t just compete well — they dominated the open show so thoroughly that Judge Rueth actually called the outcome “a little unsuspenseful”.

Now I’ve been around long enough to remember when junior shows were about learning the ropes. You’d bring your decent heifer, gain some experience, and maybe place in the middle of the pack if you worked hard. Not anymore. These kids are bringing cattle that would’ve been grand champions five years ago, and they’re beating professionals who’ve been breeding cattle longer than these juniors have been alive.

Take Donnybrook Ammo Stevie, owned by Brittany Taylor and Laylaa Schuler from New Glarus. This cow didn’t just win the Junior Show — she took Reserve Grand in the open competition. When teenagers are placing ahead of operations that have been perfecting genetics for generations, something fundamental has shifted.

The Guernsey Show: Where Excellence Met Economics

The Grand Champion that wrapped things up Monday afternoon tells you everything about where this industry’s headed. Kadence Fames Lovely, owned by Kadence Farm, swept the whole show — Grand Champion, Best Bred and Owned, Best Udder, Total Performance Winner. That’s what we call a clean sweep, and it doesn’t happen by accident.

What really caught my attention was what Rueth was looking for. He kept talking about “power and some front end” and specifically “width to the chest floor”. Now, for those of you milking cows every day, you know what that means — these are cows built to last. With replacement heifers selling for $3,010 per head, according to the USDA’s July numbers, and some markets reaching $4,000 for springers, every extra lactation is money in the bank.

Valley Gem Farm from Cumberland, Wisconsin, took Premier Breeder while Springhill from Big Prairie, Ohio, grabbed Premier Exhibitor. But here’s the kicker — Springhill James Dean was Premier Sire for the heifer show, showing how AI has leveled the playing field. When everyone has access to the same genetics, it’s management and cow care that makes the difference.

Jersey and Ayrshire: California Meets the Midwest

The Jersey heifer show started at 7 a.m. sharp on Monday, and California came to play. Kash-In Video Stop and Stare-ET, owned by Kamryn Kasbergen and Ivy Hebgen from Tulare, took both open and junior division Junior Champion titles. That’s West Coast genetics making a statement.

But don’t count out the Midwest. The Millers Joel King Majesty, owned by the partnership of Keightley-Core, Millers Jerseys, and junior members Rhea and Brycen Miller from Oldenburg, Indiana, didn’t just take Reserve — they earned the Junior Champion Bred & Owned award. That’s homegrown genetics saying, “we can compete with anybody.”

The Ayrshire show on Monday afternoon was the Bricker Farms show, as plain and simple as that. Their Reynolds daughter, Bricker-Farms R Cadillac-ET, swept Junior Champion honors in both divisions. When you’ve got Todd and Lynsey working with their kids, Allison, Lacey, and Kinslee, plus partners like Carli Binckley and Wyatt Schlauch, that’s three generations of knowledge in one cow.

The Judging Contests: Tomorrow’s Leaders Today

While the cattle shows grab headlines, what happened in the judging pavilion on Sunday might be even more important. The University of Minnesota just three-peated the National Intercollegiate contest with a score of 2,505. That’s not luck — that’s a program.

Brady Gille, Alexis Hoefs, and Keenan Thygesen didn’t just pick the right cattle; they explained why, taking top honors for oral reasons with 821 points. When you can articulate why one cow beats another under pressure, you’re developing skills worth real money. These are the folks who’ll be making million-dollar genetic decisions in five years.

SUNY Cobleskill’s performance in the Post-Secondary division was even more dominant — they swept everything. Connor MacNeil’s 769-point individual score demonstrates what happens when farm kids take education seriously. Coach Carrie Edsall has these students thinking like they already own the farm.

The 4-H contest? Five points separated Minnesota and Wisconsin — 2,058 to 2,053. Campbell Booth from Wisconsin had the high individual at 708, but Minnesota’s depth carried the day. These aren’t just kids learning to show — these are future herd managers, nutritionists, and geneticists cutting their teeth.

What Monday’s Shows Mean for Your Operation

Looking at what went down on September 29, a few things jump out at me.

First, if you’re not investing in youth programs, you’re missing the boat. When Rueth talks about the Guernsey breed’s “family-oriented” and “welcoming” culture, which fosters this success, he’s onto something. The farms bringing juniors to Madison aren’t doing charity work — they’re building their future. With 6 million kids in 4-H and another million in FFA, we are witnessing the largest agricultural education movement in history unfold right now.

Second, cow longevity has just became your most important profit center. With replacement costs where they are — Wisconsin seeing a 69% spike year-over-year to $2,850 per head — keeping cows healthy for that fourth and fifth lactation isn’t optional anymore. Research shows extending productive life by just one lactation can reduce replacement needs by 25%. At current prices, that’s serious money.

Third, the genomic revolution has democratized excellence. When Judge Rueth praised these “milkier” Guernseys with exceptional “strength” and “balance,” he was describing genetic progress that would’ve taken decades before the advent of genomics. The 2025 genetic base change indicates that we’ve made significant progress in five years, requiring us to recalibrate the scale.

The Real Story from the Colored Shavings

Standing there on Monday, watching these young exhibitors parade cattle that made seasoned breeders take notice, I kept thinking about what this meant for the dairy industry’s future.

See, it’s not just that the kids are good — it’s that they’re approaching cattle breeding differently. They grew up with genomics as a given. They’ve never known a world without EPDs and PTAs. While some of us learned to evaluate cattle with our eyes first and data second, these juniors learned both simultaneously.

The economics support them as well. CoBank’s research indicates that heifer inventories could decline by another 800,000 head before recovering in 2027. With processing capacity expanding — we’re talking $10 billion in new facilities coming online — the producers who can navigate this shortage while maintaining quality will write their own ticket.

Monday’s Bottom Line

September 29, 2025, won’t go down as just another day at World Dairy Expo. It’ll be remembered as the day we saw the future take the halter and lead.

When juniors consistently beat open competition, when genomic data matters as much as visual appraisal, and when cow longevity becomes the difference between profit and loss, you’re not watching gradual change — you’re watching revolution.

The message from Madison is clear: The next generation isn’t preparing to enter the industry. They’re already here, they’re already winning, and they’re already changing the rules. The question isn’t whether you’ll adapt to their way of doing things — it’s how quickly you can learn from what they’re already doing better.

For those of us who’ve been in this industry awhile, Monday was either a wake-up call or validation, depending on how much we’ve invested in bringing young people along. For the juniors? It was just Monday — another day of doing what they’ve been trained to do since they could walk: evaluate, select, compete, and win.

The colored shavings have witnessed a great deal of history over the years. But mark my words — September 29, 2025, will be remembered as the day dairy’s future became its present.

Learn More:

The Sunday Read Dairy Professionals Don’t Skip.

Every week, thousands of producers, breeders, and industry insiders open Bullvine Weekly for genetics insights, market shifts, and profit strategies they won’t find anywhere else. One email. Five minutes. Smarter decisions all week.
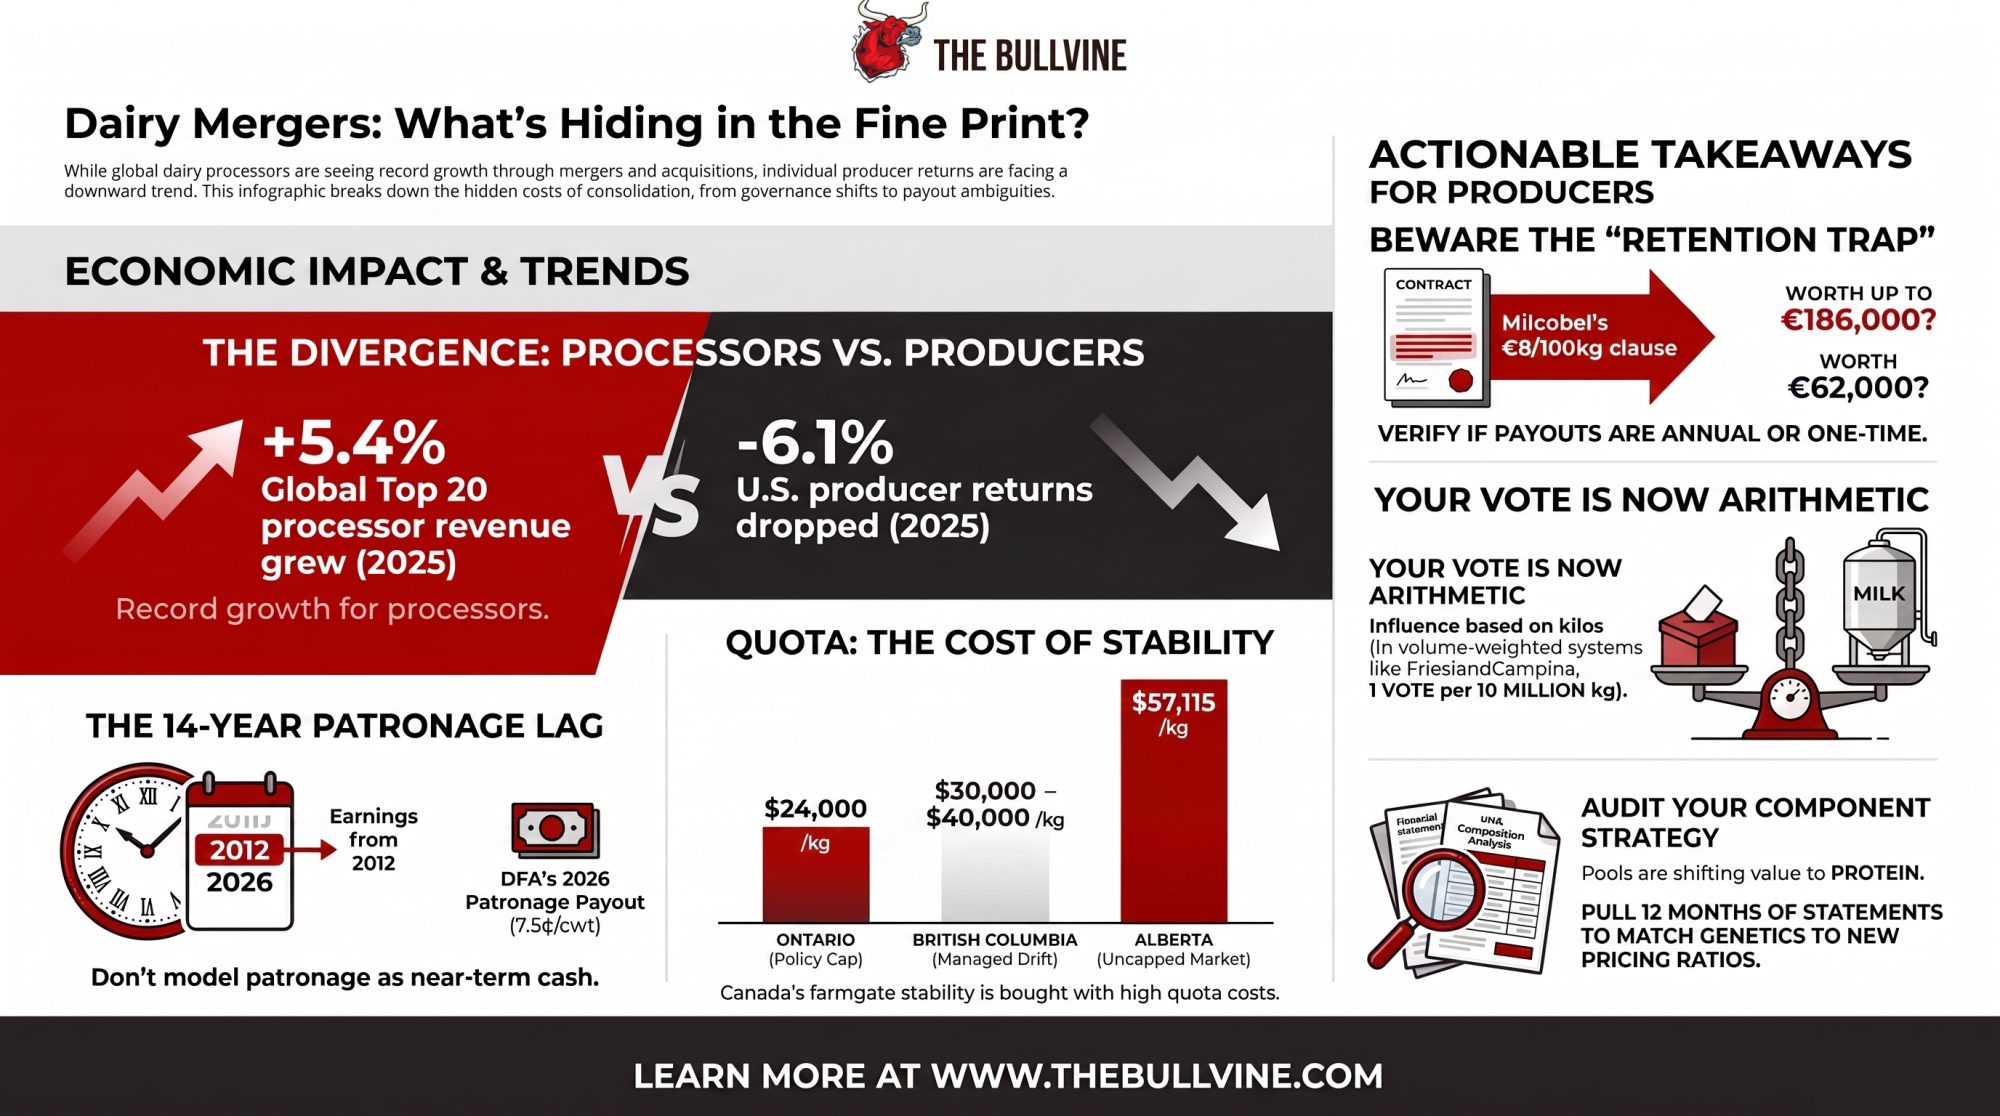
NewsSubscribe
First
Last
Consent

Screwworm at 70 Miles: Your $400K Prevention or Permanent Cost Decision

What’s your plan when a flesh-eating parasite hits US dairy for the first time since 1966?

EXECUTIVE SUMMARY: The September 21st confirmation of New World screwworm, just 70 miles from Texas, represents more than just another biosecurity alert—it’s a watershed moment that could fundamentally reshape American dairy economics. With beef-on-dairy programs now generating significant revenue streams for many operations and Mexico’s surveillance protocols showing documented gaps, producers face an unprecedented decision between substantial upfront investment in prevention or potentially permanent endemic management costs. Historical emergency responses demonstrate significant cost premiums for rushed implementation, while countries managing endemic screwworm report annual expenses that transform production economics entirely. What makes this particularly challenging for dairy operations is the FDA prohibition on ivermectin use in lactating cows—our most effective treatment option—combined with daily procedures that create wounds, providing ideal opportunities for infection. The convergence of reduced federal workforce capacity, complex modern cattle movement patterns, and year-round operational requirements creates vulnerabilities the industry hasn’t faced since the original eradication six decades ago. Smart producers are recognizing that the choice isn’t whether to act, but whether to invest now with preparation time and supply availability, or react later under crisis conditions with limited options.

dairy biosecurity protocols

The confirmation of New World screwworm in Nuevo León, Mexico, on September 21st serves as a stark reminder of an emerging biosecurity threat—a flesh-eating parasite now just 70 miles from major Texas dairy operations. This is a challenge the industry hasn’t faced in nearly six decades.

What strikes me about the financial reality facing producers is how similar it feels to other major capital decisions we make. Examining comparable disease prevention programs, such as those developed for bovine TB, reveals substantial investments—the kind typically associated with significant infrastructure upgrades. That’s no small commitment for any operation. However, what’s particularly noteworthy is research from regions managing endemic screwworm, which suggests ongoing annual costs that essentially become a permanent line item in your budget. It’s the difference between a one-time capital investment and… well, a forever production tax.

This builds on what we’ve seen with other biosecurity challenges, but with unique complications. Federal officials have been discussing Mexico’s surveillance approaches this week, and while everyone’s doing their best with available resources, coordination challenges are real. Meanwhile—and this is fascinating from an economic perspective—beef-on-dairy programs have transformed from a sideline to a significant revenue stream for many operations. Add the workforce transitions happening at federal agencies, and you’ve got a convergence of factors that makes this genuinely different from previous challenges.

The $325 Question: Why Every Day of Delay Costs You Money

Understanding the Biology and Its Implications

I’ll share something that surprised me when reviewing the APHIS technical materials. The reproductive capacity of this parasite is… remarkable, in the worst possible way.

According to disease response protocols that APHIS developed, female screwworm flies deposit 200 to 400 eggs in any open wound. Now, when I say “any wound,” I mean the routine management activities we all do—dehorning sites, ear tag punctures, even those minor scrapes that happen during handling. The larvae emerge within 24 hours and consume living tissue. Without intervention, mortality can occur within seven to ten days.

What’s particularly relevant for dairy operations—and veterinary specialists have been emphasizing this point—is our management intensity. Here’s something worth considering: beef operations might handle animals twice a year, but we create potential infection sites daily through routine procedures. Our stocking density, especially in modern freestall barns, creates transmission dynamics that differ significantly from those in extensive grazing systems.

This aligns with our understanding of disease spread in confined environments. Those crossbred calves from beef-on-dairy programs? They’re moving through multiple facilities—dairy to calf ranch, backgrounder, feedlot. Each movement represents what epidemiologists call a “mixing event,” creating opportunities for the transmission of disease.

The Castration Crisis No One’s Talking About

And here’s a regulatory complexity worth noting: ivermectin, our most effective treatment option for screwworms, remains prohibited for use in lactating dairy cows under current FDA guidelines due to the risk of drug residues in milk. This restriction fundamentally alters our response options compared to beef operations, where its use is permitted.

Dr. Andy Schwartz, our Texas State Veterinarian, framed it well in recent discussions: “The proximity to major dairy operations in the Rio Grande Valley creates legitimate concerns. These aren’t hypothetical risks anymore.”

A significant concern is the current capacity situation. During the successful eradication campaigns of the 1960s, sterile fly production reached hundreds of millions weekly. Program reports indicate the Panama facility now operates with more limited capacity. Mexico’s facility upgrades won’t come online until next summer. Why does this matter? We’re essentially defending against this threat with limited tools while managing more complex cattle movement patterns than existed 60 years ago.

The Cross-Border Dynamics

The situation with Mexico is… nuanced, and I want to be fair here because they’re dealing with significant challenges.

Federal agriculture officials have highlighted that surveillance protocols involve checking fly traps every few days rather than daily. Now, Mexico’s perspective is that this frequency was mutually determined, and they’re balancing massive geographic areas with limited resources. However, here’s the biological reality: with a seven- to ten-day life cycle, less frequent monitoring could allow multiple generations to occur between detection points.

The cattle movement situation adds another layer of complexity. Industry assessments suggest substantial undocumented cattle movement from Central America into Mexico—significantly more than documented imports. These animals lack health documentation and tracking. It’s creating what you might call significant biosecurity gaps.

Border-area producers have expressed concerns that resonate with many of us. The general sentiment is: “We’re implementing every protocol possible, but without consistent standards across the border, it feels incomplete.” That’s not criticism—it’s recognition of the interconnected nature of modern agriculture.

What’s economically interesting is that Mexico’s meat sector is facing substantial losses due to current restrictions. You’d expect that would drive stricter enforcement, but political and practical realities are complex. The infected animal in Nuevo León apparently originated from southern Mexico, highlighting the challenges associated with these movements.

Economic Considerations for Different Operations

Comparing notes across the country, the economic scenarios vary significantly by operation type and location.

For operations considering immediate implementation, the investment profile looks like this: infrastructure for isolation facilities (similar to building a commodity shed), equipment upgrades, and protocol development. Based on what we’ve learned from TB eradication and other disease programs, you’re looking at costs comparable to significant capital improvements. Add operational changes over the first quarter—such as extra labor, veterinary oversight, and supplies—and it becomes substantial.

However, what’s interesting from a risk management perspective is that If you wait for a confirmed border crossing? Historical emergency responses indicate significant cost premiums for rushed implementation, as well as production disruptions. Remember during the 2016 Florida screwworm incident? Producers were unable to source basic supplies at any price once panic buying began.

The third scenario—wait and see—presents different risks. Countries managing endemic screwworm report permanent annual costs that fundamentally change production economics. Some operations simply can’t absorb that burden long-term.

Why is this significant for dairy specifically? These beef-on-dairy programs have become economically important. Crossbred calves are bringing prices we couldn’t have imagined five years ago. Industry experience suggests these programs have become economically significant for many operations. Under quarantine? That revenue stream stops immediately.

Quick Decision Framework

Here’s how I’m thinking about the options:

Option 1: Implement Now

  • Investment comparable to a major equipment purchase
  • Maintain operational continuity when a threat materializes
  • Competitive advantage during a crisis

Option 2: Wait for Confirmation

  • Significant cost premiums due to emergency implementation
  • Risk of supply shortages
  • Potential quarantine disruption

Option 3: Hope It Passes

  • Risk of permanent endemic management costs
  • Possible operation shutdown
  • Market-driven exit

How Different Regions Are Approaching This

What’s fascinating is watching how different regions are adapting based on their unique circumstances.

Upper Midwest operations with seasonal calving patterns have natural advantages—their wound-creating procedures often align with colder months when fly activity is minimal. Wisconsin operations are restructuring their management calendars around this principle.

Southwest dairies face different challenges. They’re dealing with year-round fly pressure and proximity to the threat zone, but many have scale advantages. These larger operations can spread biosecurity investments across more production units, significantly altering the per-cow economics.

Pennsylvania grazing operations are exploring interesting approaches. They’re minimizing wound-creating procedures and looking at genetic selection for naturally polled animals. It’s a long-term strategy, but it illustrates how different production systems create different vulnerability profiles.

Technology adoption patterns are revealing, too. Operations that were skeptical about automation are suddenly seeing it differently. The thinking goes: if automated health monitoring helps catch problems earlier, it’s not just about labor anymore—it’s about survival.

Practical Lessons from Early Implementation

Producers who are already implementing protocols have shared valuable insights that are worth sharing.

The human resource challenge keeps coming up. Training staff to identify early symptoms requires significant time investment. But here’s the catch—in today’s labor market, retention is challenging. Industry feedback indicates significant challenges with training retention. Now operations are building redundancy into their training programs.

Wound management strategies are evolving in interesting ways. Several operations have completely restructured their annual calendar. All dehorning happens in January-February now. They’re using caustic paste despite the 16-week healing time because it reduces the risk of long-term exposure. Every management decision gets evaluated through a wound-risk lens.

Supply chain preparedness is critical. The 2016 Florida experience taught us that essential supplies disappear within 48 hours of crisis confirmation. Smart operators are building inventory now—not hoarding, but ensuring adequate reserves of critical items.

What’s encouraging is the emergence of collaborative approaches. Some producer groups in affected regions are exploring collaborative approaches—coordinating bulk purchases and sharing specialized equipment. They’re reporting meaningful cost reductions that make individual preparation more feasible. There’s wisdom in that collective approach.

Broader Industry Implications

If establishment occurs—and given the proximity and surveillance challenges, we need to consider this possibility—the implications extend far beyond individual operations.

Countries managing endemic screwworm deal with permanent surveillance requirements, ongoing treatment protocols, production impacts from chronic stress, and restricted market access. Processing and distribution patterns shift away from affected regions. These aren’t temporary adjustments; they become permanent features of the production landscape.

The downstream effects touch everyone. School nutrition programs may face supply chain challenges or budget pressures due to rising prices. Rural communities that rely on dairy as an economic anchor could experience an accelerated decline. The genetic diversity maintained by mid-sized operations—that’s at risk too.

What’s particularly concerning from a market structure perspective is how this could accelerate consolidation. When you add significant biosecurity costs to already tight margins, the economics become challenging for operations below certain scale thresholds.

Resources and Next Steps

For those ready to take action, here are key resources:

Start with USDA APHIS Veterinary Services at 1-866-536-7593 for current technical guidance. Your state veterinarian, who can be found at usaha.org/saho, can provide region-specific recommendations. The Texas Animal Health Commission at 1-800-550-8242 has developed particularly relevant materials given their proximity to current threats.

Local Extension programs are developing training materials. I’d especially recommend connecting with programs that dealt with the 2016 Florida situation—they have practical experience worth learning from.

Document everything. While current programs may not cover all prevention costs, detailed records could prove valuable for future assistance programs or insurance considerations. Think of it as an investment in operational history that might have value later.

Looking Forward

After three decades in this industry, I’ve seen us navigate numerous challenges—price volatility that tested everyone’s resilience, droughts that forced impossible decisions s, and disease outbreaks that seemed insurmountable at the time. This situation presents unique challenges, but it’s not insurmountable.

The operations that successfully navigate this won’t necessarily be the largest or most technologically advanced. They’ll be those who recognized the threat early, made thoughtful decisions based on their specific circumstances, and acted decisively even with incomplete information.

Our industry will likely emerge differently—possibly more concentrated, certainly with higher operational costs, and definitely requiring more sophisticated management approaches. But we’ll also develop better biosecurity practices and potentially more sustainable systems through improved management. Whether these changes prove beneficial long-term… well, that depends on how we collectively respond now.

For individual operations, the fundamental question remains: Can your business model absorb either significant prevention investment or ongoing management costs? Every operation has unique circumstances, and there’s no universal answer. Some may find traditional approaches adequate, while others require creative solutions. The key is honest assessment and timely action.

As veteran producers in South Texas have observed, we’ve faced hurricanes, droughts, and market crashes. Biological challenges are different—they operate on their own timeline, regardless of our preparedness. They just need an opportunity. And intensive dairy operations, by nature, provide opportunities.

The parasite is 70 miles from Texas. Winter’s approaching, though weather patterns suggest it might not provide the protection we’d hope for. Decisions made now—individually and collectively—will shape our industry’s trajectory for years to come.

This isn’t about fear. It’s about preparation, adaptation, and the resilience that’s always defined American dairy farming. Whatever path forward you choose for your operation, make it based on careful consideration of your specific circumstances. Because in this situation, the cost of indecision might exceed the cost of action.

KEY TAKEAWAYS:

  • Immediate implementation saves 20-30% versus emergency response costs based on historical biosecurity crises, with collaborative producer groups achieving even better economics through bulk purchasing and shared resources—the difference between planned investment and panic-driven spending
  • Regional advantages matter: Upper Midwest operations with seasonal calving can align wound-creating procedures with cold months when fly pressure is minimal, while Southwest dairies need scale advantages to spread costs across more production units—adapt protocols to your geography
  • Beef-on-dairy revenue streams face immediate risk under quarantine scenarios, with crossbred calf movements creating transmission pathways that didn’t exist during the 1960s eradication—protect what’s become a critical income source for many operations
  • Document everything starting today: detailed biosecurity expense records, position operations for potential future assistance programs or insurance claims, even though current programs don’t cover prevention—think of it as operational insurance you control
  • The 2016 Florida incident proved supplies disappear within 48 hours once a crisis hits—smart operators are building adequate reserves now, focusing on wound treatment supplies, fly control products, and isolation infrastructure before availability becomes an issue

Complete references and supporting documentation are available upon request by contacting the editorial team at editor@thebullvine.com.

Learn More:

The Sunday Read Dairy Professionals Don’t Skip.

Every week, thousands of producers, breeders, and industry insiders open Bullvine Weekly for genetics insights, market shifts, and profit strategies they won’t find anywhere else. One email. Five minutes. Smarter decisions all week.

NewsSubscribe
First
Last
Consent

Spray Drones on Dairy Farms: Why the Failures Teach Us More Than the Successes

Custom drone rates dropped from $22 to $16/acre in 2 years—here’s what that means for your spray decisions

EXECUTIVE SUMMARY: What farmers are discovering about spray drones challenges everything equipment dealers have been pushing—the real value isn’t in replacing your ground rig, it’s in solving specific problems conventional equipment can’t handle. Recent field data shows custom application rates have dropped from $22-25 per acre to $15-18 across the Midwest as more operators enter the market, fundamentally changing the ownership economics. Extension research confirms that while large operations (2,000+ acres) can achieve costs as low as $7-9 per acre, smaller dairies face $18-20 per acre when factoring in battery replacement, insurance, and time value. The producers finding success aren’t chasing technology for its own sake—they’re targeting chronically wet fields, odd-shaped parcels aerial applicators avoid, and emergency applications when timing trumps cost. With regulatory requirements varying wildly by state and Ontario producers essentially locked out of pesticide applications, the adoption pattern is becoming clear: scouting drones make sense for nearly everyone at $1,500, but spray drones require careful analysis of your specific operational challenges. Here’s what this means for your operation: document when conventional spraying actually fails you, test with custom services before buying, and understand that this technology works best as a specialized tool, not a revolutionary replacement.

 spray drone economics

You know those June mornings when you’re standing at the field edge, watching water pool between the corn rows? That’s when the conversation about spray drones becomes real for most of us. Not the trade show pitch about revolutionary technology, but the practical question: could this actually work on my operation?

I’ve been comparing notes with producers from Rock County, Wisconsin, to Lancaster County, Pennsylvania, and what’s interesting is how the conversation has shifted. The FAA now tracks agricultural drone registrations as a distinct category—they’re seeing steady growth, though exact numbers depend on classification. We’re past the hype stage. Now we’re seeing real patterns emerge about what works… and honestly, what doesn’t.

Looking across the I-94 corridor from Eau Claire to Madison, down through Illinois dairy country, the producers making drones work aren’t using them to replace their John Deere R4038s or Case Patriots. They’re using them for those specific situations where nothing else makes sense. And that distinction? Worth exploring, I think.

The Economics Are… Complicated (But Getting Clearer)

The uncomfortable truth? Small dairy operations pay 2.5x more per acre than large operators—making custom services the smarter choice for 68% of farms

So let’s talk money, because that’s where every equipment decision starts and ends, right? I’ve been comparing notes with farm management specialists at various land-grants, and what’s fascinating is how differently the economics play out depending on your situation.

Some research from Midwest Extension programs suggests operating costs as low as $7-$ 8 per acre for high-volume custom operators running 4,000 acres or more annually. But then you talk to smaller operations—say, 500-800 acres—and they’re seeing costs approaching $20 per acre when you factor in depreciation, batteries, insurance, and the value of their time. That’s a huge spread.

The economics shift dramatically by scale—smaller operations face nearly triple the per-acre costs of large-scale producers. Before investing $56,000 in spray equipment, run these numbers for your actual sprayable acres.

But here’s something a producer in Lafayette County, Wisconsin, told me that really stuck: “The per-acre cost becomes irrelevant when it’s the difference between spraying and not spraying at all.”

That $56,000 spray drone? Actually $65,000 year one. And batteries alone will cost you another $3,500 annually—every year.

We’ve all seen it—those compacted wheel tracks where corn just doesn’t perform the same. University research continues to confirm yield losses from compaction, sometimes as high as 8-15% in wet conditions. When managing premium silage ground where every ton is needed for your TMR, the drone economics suddenly become more than just application cost.

This past spring really drove the point home across the Great Lakes dairy region. NOAA data shows we had significantly more precipitation than normal during critical application windows. A Rock County producer I know gladly paid $18 per acre for a drone application on 300 acres when his fields were too wet. “Sure, it costs more than doing it myself,” he said, “but waterhemp doesn’t wait for fields to dry out.”

Now, I should mention—I’ve also talked with producers who ran the numbers and decided custom services made more sense for their situation. One veteran applicator near Sheboygan made a good point: “Why complicate things with new technology when my ground rig handles 95% of situations just fine?” There’s wisdom in both approaches.

Where Drones Actually Make Sense (And Where They Don’t)

Only 4 of 6 common scenarios favor drones—and your ground rig still wins for regular field spraying. Choose wisely

What’s becoming clear from both university trials and farmer experience is that the most valuable drone applications on dairy farms often aren’t what the marketing brochures highlight.

Start with scouting. A quality agricultural drone with thermal and multispectral cameras runs about the same as a decent set of flotation tires. Extension specialists tracking adoption patterns report that farmers using drones for regular field scouting are catching problems 5-7 days earlier on average. For something like armyworm moving through your second-cut alfalfa, that timing difference matters.

But here’s where it gets interesting—and where some healthy skepticism is warranted.

Pasture management is showing real promise. Several land-grant universities have published trials on spot-spraying pastures, and the results are encouraging if you’ve got the right situation. One study found treating just problem areas—typically 15-20% of total pasture—delivered equivalent weed control while using 70% less herbicide. Makes sense for those of us working to maintain soil biology and forage density.

Though I should note, a pasture specialist in Vermont raised a fair point: “Sometimes the simplest solution is better grazing management, not more technology.” Worth considering.

Late-season applications in tall corn present another opportunity. When you have premium alfalfa heading into its third cutting with a 7-ton yield potential, or tall corn where your ground rig would snap stalks, aerial application starts looking attractive. Several seed companies report positive results from drone-based fungicide trials, although the response naturally varies by disease pressure and timing.

Some experienced custom applicators I respect aren’t convinced, though. One fellow who’s been spraying for 30 years told me, “I’ve seen every new technology promise to change everything. Most of them just complicate what already works.”

The Market Reality Nobody Wants to Discuss

Custom spray rates crashed 32% in 3 years. At $17/acre today, operators barely clear $5 profit. The gold rush is over

From what I’m hearing at winter meetings and talking with equipment dealers, agricultural drone services are expanding rapidly. Every major ag retailer seems to be adding or exploring drone programs. Equipment dealerships are pushing them hard. And yes, plenty of producers are eyeing custom work to offset their investment.

But here’s what’s got me curious: can this market support all these operators?

In areas like eastern Iowa and central Illinois, where adoption began early, custom rates have already moderated from $22 to $ 25 per acre two years ago to $15 to $ 18 today. Natural market evolution, sure—but challenging if you were counting on premium custom rates to justify a $56,000 spray drone setup.

FeatureScouting DroneSpray Drone
Initial Investment$1,500$56,000
Regulatory BurdenBasic Part 107Part 107 + State Licenses
Training Time25-30 hours100+ hours
Annual Operating Cost$300-500$3,000-8,000
Break-even Timeline6-12 months3-5 years
Problem-solving ValueHigh (early detection)High (emergency applications)

Agricultural economists modeling these markets suggest there’s probably a sustainable ratio—maybe one service provider per 10,000-12,000 suitable acres, varying by region and crop mix. We may already be approaching that density in some areas.

The Regulatory Maze (And It Really Is One)

And here’s where it gets messy—every state seems to have its own take on how drones fit into pesticide regulations.

The FAA requires a Part 107 Remote Pilot Certificate for commercial operations, including use on your own farm. The test costs $175, and according to Wisconsin Farm Bureau’s training program reports, most farmers require 25-30 hours of focused study. Many community colleges now offer preparatory courses, which provide considerable help.

Want to spray pesticides? Now you’re in state-specific territory. Illinois treats drone operators like aerial applicators—requiring commercial licenses and continuing education. Wisconsin has different requirements. Minnesota is different still. Don’t assume—verify with your state department of agriculture.

Ontario producers face even more restrictions. From what I’m hearing at cross-border meetings, Health Canada’s approval process for drone-applied pesticides remains extremely limited. Several Ontario dairymen have told me they’re currently limited to foliar nutrients and biologicals.

Learning from Early Adopters (And Those Who Stepped Back)

Let me share what I’m hearing from producers who’ve actually been through this decision process.

A Holstein breeder near Eau Claire started with a $1,500 mapping drone in 2022. “Learned the rules, figured out what information actually helped,” he told me. Then, in 2023, he hired custom drone spraying for fungicide—wanted to see real results before investing serious money.

By 2024, he bought a 30-liter spray drone. But here’s the key: he had specific uses in mind. Four hundred acres of river bottom that floods regularly. Another 300 acres in odd corners and strips the co-op plane won’t touch. Running about 1,100 acres annually, including some custom work, he estimates his all-inclusive cost at $11-$ 12 per acre. The custom rate in his area is $17.

However, I’ve also spoken with a New Jersey operation in Crawford County that purchased a spray drone in 2023 and sold it this spring. “Too much hassle for the acres we could actually use it on,” the owner explained. “Between weather windows, battery management, and regulatory paperwork, we spent more time fiddling than flying.”

There’s probably wisdom in both experiences.

Technology Is Advancing—But Is That What We Need?

The precision capabilities developing now are genuinely impressive. John Deere’s See & Spray technology can identify individual weeds. University research programs are testing autonomous swarm operations. Variable-rate application based on real-time plant health sensing is commercially available.

However, when discussing dairy producers who juggle fresh cow protocols, TMR consistency, breeding programs, and commodity markets, complex drone operations often fall pretty far down the priority list.

A producer I respect put it well: “I don’t need my drone to do everything the salesman promises. I need it to spray that 40-acre bottom that’s underwater half of May, and check my furthest pastures without burning diesel.”

Some veteran applicators think we might be overengineering solutions. “Good drainage, proper rotation, and timely application with conventional equipment works 90% of the time,” one told me. “Are we solving real problems or creating new ones?”

Practical Thoughts for Different Operations

After tracking this technology and talking with dozens of producers across the dairy belt, here’s how I see it playing out:

For smaller operations (under 1,000 acres), the economics of spray drone ownership are tough to justify in most cases. But a basic scouting drone? That’s different. The information value and time savings can justify that investment pretty quickly, especially if you’re managing multiple scattered parcels.

For mid-sized operations (1,000-2,000 acres), especially those with challenging topography or chronic wet spots, ownership may be a viable option. But run real numbers. Include battery replacement ($3,000-4,000 annually for active use), insurance, training time, and the opportunity cost of your time.

For larger operations or those considering custom work, the economics improve, but competition is increasing. If you’re planning to offset costs with neighbor acres, have a genuine business plan, not just optimism. And understand you’re entering an evolving market.

Everyone should test with custom services first if available. Document results carefully. Compare against your conventional methods. Some producers find that drones solve critical problems; others realize their current system works fine.

QuickReference: Real-World Economics

Operation TypeAnnual AcresDrone Cost/AcreCustom Cost/AcreAnnual SavingsPayback Period
Small Dairy (500 acres)500$20$17-$1,500Never
Medium Dairy (1,000 acres)1,000$12$17$5,00013 years
Large Dairy (2,000 acres)2,000$8$17$18,0003.6 years
Custom Op (4,000 acres)4,000$7$17$40,0001.6 years

Based on producer reports and extension calculations:

  • Small operations (500 acres): $18-20/acre ownership costs are typical
  • Medium operations (1,000 acres): $11-13/acre achievable
  • Large operations (2,000+ acres): $7-9/acre with good utilization
  • Current custom rates: $15-18/acre most markets (down from $20-25 in 2023)
  • Battery replacement: Budget $3,000-4,000 annually for regular use

Looking Forward: Your Decision Framework

What’s become clear is that this isn’t a simple yes-or-no technology decision. Start by honestly documenting your actual challenges. When has a conventional application actually failed you—not theoretically, but actually? Track it for a season.

Because this technology demonstrably works for certain applications. University trials confirm it. Successful operators prove it daily. However, it works best when matched to real problems you actually have, rather than hypothetical benefits from a trade show presentation.

Something a retired extension specialist told me keeps coming back: “Every new technology has its place. The trick is figuring out if that place is on your farm.”

In dairy, where we manage incredibly complex biological and economic systems—from transition cow management through the critical first 100 days to achieving optimal harvest moisture for corn silage—adding technology for technology’s sake rarely makes sense.

One thing seems certain: this technology will continue evolving. Whether through individual ownership, custom services, or cooperative arrangements we haven’t yet imagined, drones will likely become more common. The question isn’t if they’ll fit into dairy farming—it’s how they’ll fit into your specific operation.

Your operation, your challenges, your financial situation, your comfort with technology—these factors matter more than any general recommendation. But at least now you’ve got a framework for thinking it through, based on what’s actually happening in the field rather than what’s promised in brochures.

Next time you’re standing at that field edge, watching it stay too wet while your weeds keep growing—that’s when this conversation shifts from interesting to urgent. It’s better to develop your strategy now, while you have time to evaluate it properly.

Because if these past few wet springs have taught us anything, it’s that having options matters. Sometimes those options come with propellers. Sometimes they don’t. The key is knowing which makes sense for you.

KEY TAKEAWAYS:

  • The economics shift dramatically by scale: Operations under 1,000 acres face $18-20/acre costs versus $7-9 for 2,000+ acre operations, with battery replacement adding $3,000-4,000 annually—run real numbers based on your actual sprayable acres, not wishful thinking
  • Start with $1,500 scouting drones, not $56,000 spray equipment: Producers report catching pest and disease issues 5-7 days earlier with regular drone scouting, delivering immediate ROI through better timing decisions before committing to spray technology
  • Test emergency applications through custom services first: Wisconsin producers paid $18/acre for drone application during wet conditions this spring—expensive, yes, but waterhemp control timing matters more than per-acre cost when fields won’t support ground rigs
  • Pasture spot-spraying shows genuine promise: University trials confirm 70% herbicide reduction with equivalent control when treating just problem areas (typically 15-20% of pastures), preserving soil biology while managing thistles and multiflora rose
  • Regulatory complexity demands homework: Part 107 certification takes 25-30 hours of study plus $175, while pesticide application requirements vary from Wisconsin’s ground equipment rules to Illinois treating drones like aerial applicators—verify your state’s specific requirements before investing

Complete references and supporting documentation are available upon request by contacting the editorial team at editor@thebullvine.com.

Learn More:

  • AI and Precision Tech: What’s Actually Changing the Game for Dairy Farms in 2025? – This article provides a broader strategic look at technology adoption beyond just drones. It details the ROI and payback periods for systems like robotic milking, precision feeding, and automated health monitoring, helping producers prioritize which technology investments will deliver the fastest returns in a tight market.
  • How Large Dairies Are Leading in Precision Tech Adoption – This piece complements the main article’s discussion of scale economics by explaining the specific tools large operations are using, such as autosteering systems and detailed soil mapping. It reveals how these technologies reduce costs and improve sustainability, offering a different perspective from the drone-focused article.
  • The Digital Dairy Revolution: How IoT and Analytics Are Transforming Farms in 2025 – This article moves beyond specific equipment to the underlying data and analytics. It provides a strategic framework for understanding how IoT sensors and AI work together to provide a holistic view of a dairy operation, helping producers leverage data to make smarter decisions about everything from cow health to feeding.

The Sunday Read Dairy Professionals Don’t Skip.

Every week, thousands of producers, breeders, and industry insiders open Bullvine Weekly for genetics insights, market shifts, and profit strategies they won’t find anywhere else. One email. Five minutes. Smarter decisions all week.
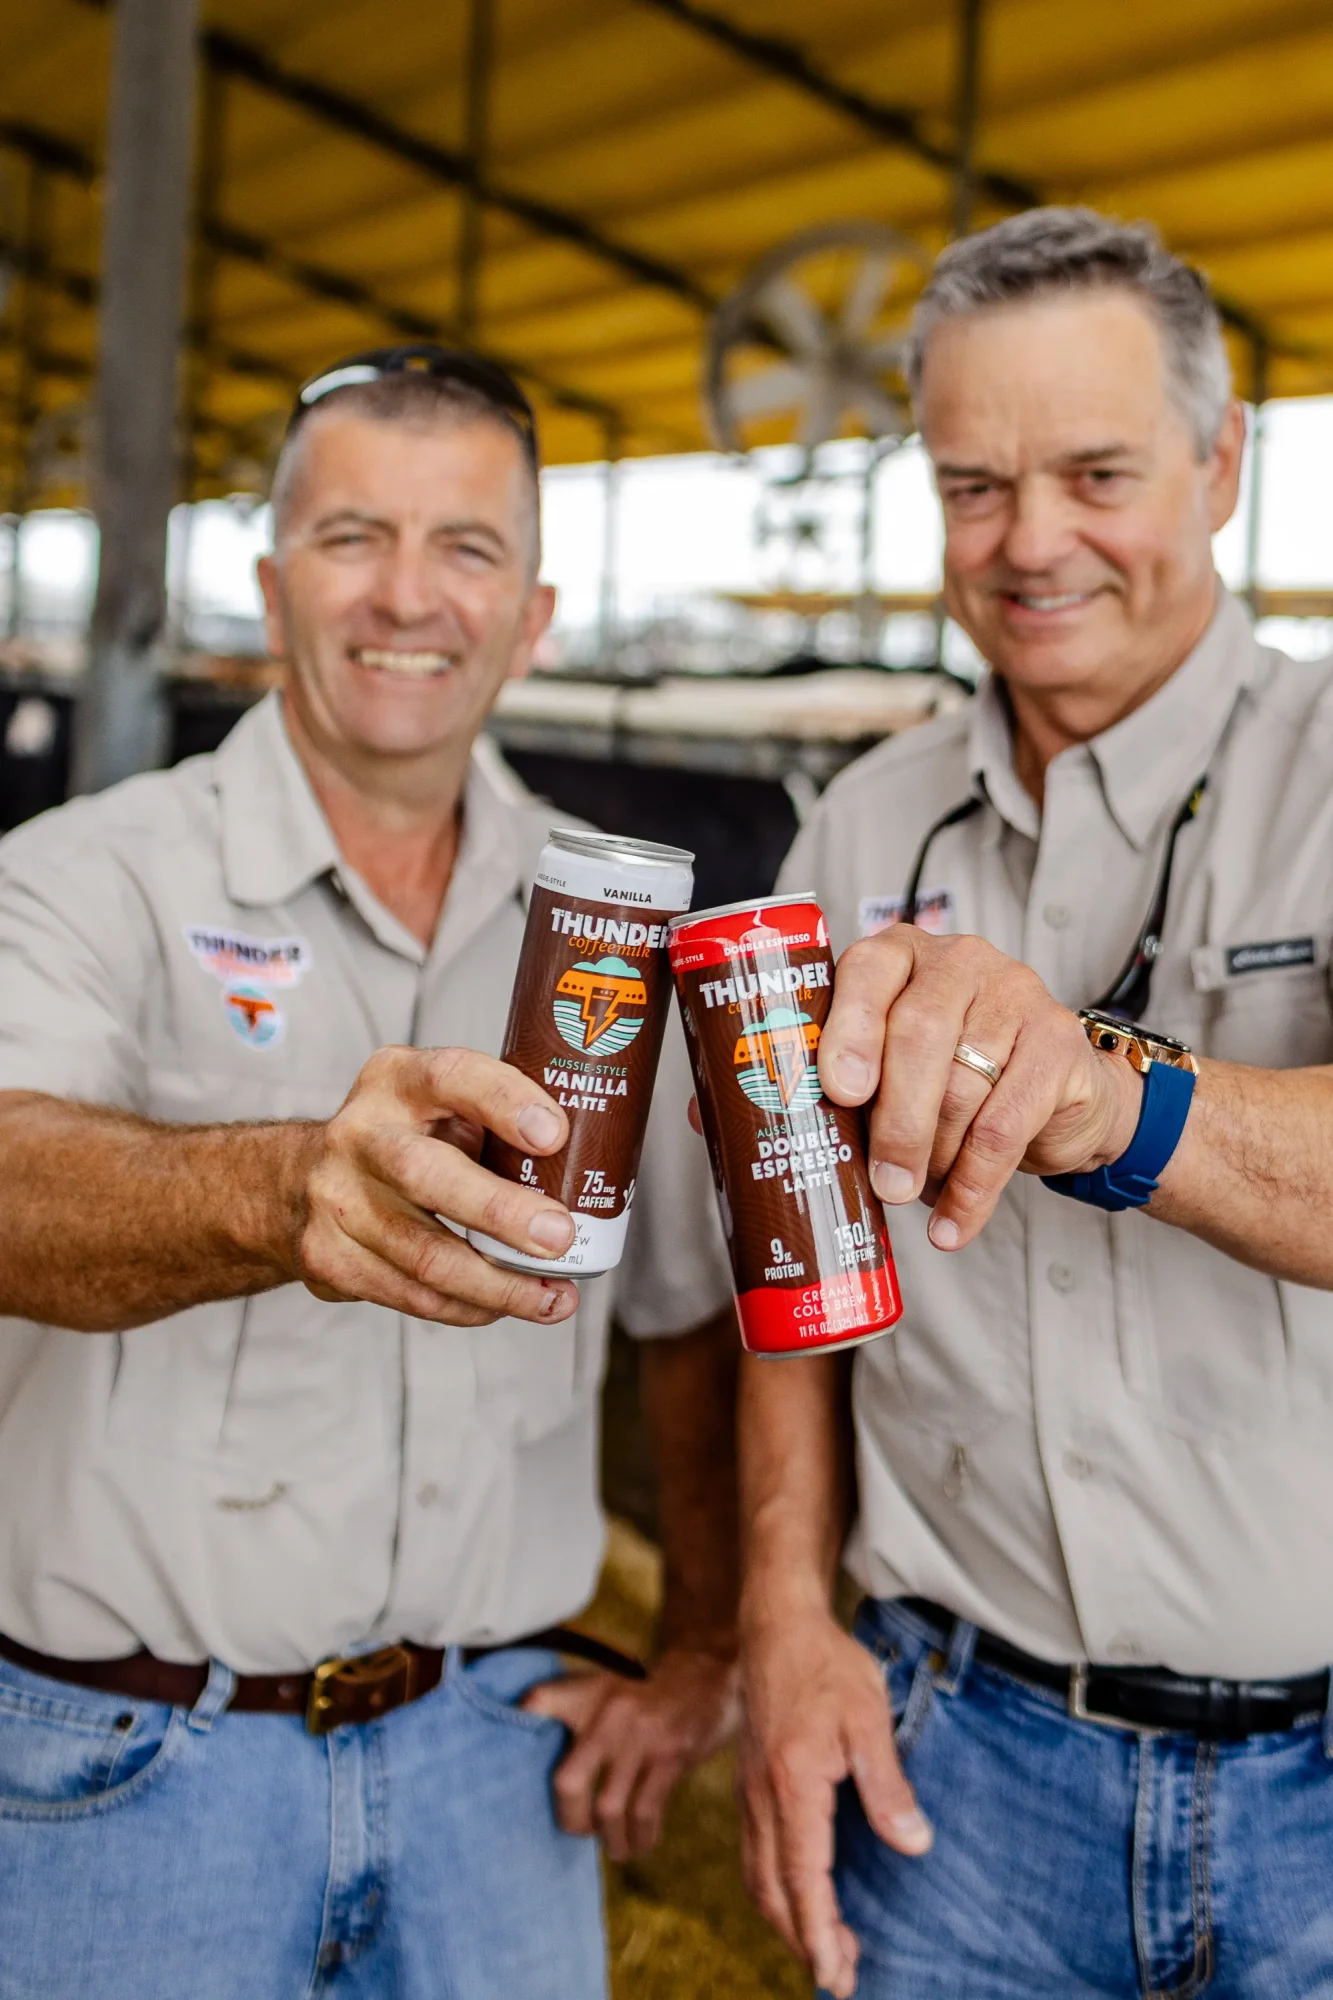
NewsSubscribe
First
Last
Consent

How 600 Irish Farmers Got Their Co-op to Finally Answer the Hard Questions

Is your co-op serving you, or are you serving it? Here’s how to find out—and fix it

EXECUTIVE SUMMARY: What happened today in Mitchelstown changes everything about how farmers should approach their cooperatives. Over 600 Irish dairy farmers demonstrated that organized producers, armed with specific questions, can compel even a €1.4 billion cooperative to provide written accountability—something many thought impossible just months ago. The Concerned Dairygold Shareholders Group didn’t just complain about milk prices; they submitted seven targeted questions demanding transparency on pricing formulas, operational costs, and governance structures that cooperative management couldn’t dodge with vague market explanations. This approach aligns with emerging global patterns, where digital coordination tools are enabling farmers to organize outside traditional cooperative channels and demand the transparency that USDA data shows correlates with 12% better member returns over time. What’s particularly encouraging is that these farmers aren’t trying to destroy the cooperative model—they’re working to restore it to its original purpose of serving member-owners rather than entrenched management. For the 86% of U.S. milk still marketed through cooperatives, this Irish blueprint offers a practical path forward: document systematically, organize digitally, demand specifically, and remember that you’re an owner, not a supplicant.

dairy co-op accountability

You know that feeling at the end of the month when you’re reviewing milk statements and wondering if you’re getting the full story? Well, over 600 dairy farmers in County Cork, Ireland, decided today was the day to demand some answers.

They packed into a hotel meeting room in Mitchelstown. And what unfolded there—covered extensively by both the Irish Farmers Journal and Agriland on September 25th—offers valuable lessons for producers everywhere. These farmers formed the Concerned Dairygold Shareholders Group and submitted seven specific written questions to management about pricing, governance, and operational decisions at Dairygold Co-op.

Now, Dairygold isn’t some small operation. Their 2024 annual report shows approximately €1.4 billion in turnover. That’s serious volume. Yet here were hundreds of farmers demanding accountability from an organization they technically own.

What strikes me most? This wasn’t a mob with pitchforks. It was organized by producers using sophisticated tactics.

Your Co-op’s True Economic Clout. While it’s easy to feel like a small part of a huge organization, this chart shows the massive economic scale of producer-owned cooperatives. Dairygold’s €1.4 billion in turnover is significant, demonstrating that when even a fraction of members—like the 600 Irish farmers—organize, their collective voice represents immense financial power that management cannot ignore.

The Economics Behind Today’s Action

Examining the factors that motivated these farmers to organize reveals that the issues run deeper than typical milk price complaints. Throughout September 2025, Agriland has been documenting concerns among Dairygold members regarding their returns compared to those of regional competitors.

When you’re dealing with volatile feed costs these days—and we all know how that feels—every cent per liter affects your bottom line. That’s reality, whether you’re milking 50 cows or 500.

The timing here is interesting, too. This is happening during what’s traditionally a strong production season in Ireland’s grass-based system. These farmers aren’t waiting for a crisis to strike. They’re addressing concerns while they have the bandwidth to organize effectively.

What I’ve found is that when cooperatives maintain:

  • Transparent pricing mechanisms
  • Regular financial communication
  • Clear governance structures
  • Accessible management

…members generally feel satisfied. When those elements are missing? Well, you get 600 farmers in a hotel meeting room.

How Digital Tools Are Reshaping Farmer Power

Here’s what’s really changed the game—and you’ve probably noticed this in your own area. The coordination required for today’s meeting would’ve been nearly impossible a decade ago.

The Proof Is in the Pressure. This chart illustrates the direct correlation between consistent member engagement and management accountability at Dairygold this year. As farmers increased the frequency and specificity of their questions (black line), the co-op’s willingness to provide concrete, written answers (red line) followed. The lesson? Sustained, organized pressure works.

Consider what’s different now:

  • 10 years ago: Organizing 600 farmers meant months of phone trees and kitchen table meetings
  • Today: WhatsApp groups can coordinate complex actions in days
  • The difference: Instant information sharing and real-time coordination

Whether you’re dealing with pricing complexities in Wisconsin, water allocation issues in California, or organic certification requirements in Vermont, these digital tools level the playing field. We’re all using them now, aren’t we?

But here’s something worth considering. The same technology that enables organizations can also spread misinformation quickly. That’s why the Irish farmers’ insistence on written responses is a smart move. Creates verifiable documentation rather than relying on the interpretation of verbal communications.

The Complex Reality of Modern Cooperative Management

Let’s be honest about the complexity here. Running a modern dairy cooperative isn’t like managing a local grain elevator fifty years ago—and those of us who’ve served on boards know this firsthand.

Think about what cooperative management deals with today:

  • Processing milk from hundreds of member farms
  • Covering huge geographic areas
  • Managing substantial financial transactions daily
  • Balancing the needs of tiny operations and large dairies

Just consider the logistics alone:

  • Route optimization for milk collection
  • Plant capacity balancing
  • Cold chain integrity maintenance
  • Quality control across multiple collection points

And that’s before you even get into market volatility. We’ve all seen how quickly butter prices can change. Cheese markets are influenced by a range of factors, including European production and Chinese import policies. Regulatory requirements that seem to change constantly.

Yet that complexity doesn’t eliminate the need for member accountability. In fact, it makes transparency even more critical.

What I’ve noticed over the years is that cooperatives maintaining strong democratic governance often perform better than those with weak member engagement. The Irish farmers understand this. Their demand for written responses to specific questions reflects that understanding.

They’re not asking management to be less professional—they’re asking for the transparency that professional management should provide.

Documentation: Your First Line of Defense

What farmers are finding—and this is crucial—is that documentation creates leverage. Here’s what you should track systematically:

Daily/Weekly Tracking:

  • Blend price after components
  • Quality premiums (or penalties)
  • Hauling charges per hundredweight
  • Stop charges and route fees
  • Volume incentives or discounts

Monthly Analysis:

  • Compare your net price to what you know others are receiving
  • Calculate the differential between your co-op and regional competitors
  • Document any unexplained deductions
  • Track patronage dividend promises versus payments

Build a picture over months, not just bad weeks. When you can show systematic patterns over time, that’s harder to dismiss than general complaints.

What often works is getting farms of different sizes to work together:

  • Large farms bring economic leverage (their threat of leaving matters)
  • Small farms provide voting numbers
  • Mid-size operations offer a balanced perspective
  • All groups are working together toward common goals

And here’s a practical tip: When you request written responses to specific questions—like the Irish farmers did—you’re creating accountability. Verbal explanations at meetings get interpreted differently by different people. Written responses become part of the record.

Regional Approaches to Cooperative Accountability

Different areas are addressing these challenges in various ways, and understanding the regional context is crucial for your own situation.

California’s Value-Added Focus

In California, where cooperatives handle significant milk volumes:

  • Focus has shifted toward specialized processing (organic, A2, grass-fed)
  • Many operations have invested in value-added products versus commodity powder
  • Producers are capturing premium markets rather than competing on volume

Midwest’s Transparency Push

With ongoing discussions about milk pricing and Federal Order reform:

  • Basis differentials vary significantly month to month
  • Some cooperatives have implemented regular member conferences
  • Management explains pricing decisions to members who want to participate
  • Simple solutions can be highly effective

Northeast’s Representation Balance

Cooperatives serving diverse operations from Maine to Pennsylvania:

  • Farms range from small tie-stalls to larger freestall operations
  • Solution often involves tiered board representation
  • Both large and small producers have a guaranteed voice
  • Prevents any single group from dominating governance

Five Questions Every Producer Should Ask Their Co-op

Based on today’s events in Ireland and what’s worked elsewhere, here are questions worth asking at your next cooperative meeting:

1. Can you provide written documentation of how our milk price is calculated relative to regional competitors?

  • Be specific
  • Don’t accept vague explanations about “market conditions”
  • Request the actual pricing formula

2. What percentage of revenue goes to operational costs versus member payments?

  • This reveals efficiency (or inefficiency)
  • Compare to what you know about other cooperatives
  • Ask for trends over time

3. How does our cooperative’s financial performance compare to others in our region?

  • Professional management should know this
  • If they don’t, that tells you something
  • Request regular updates

4. What specific steps are being taken to improve price transparency?

  • Look for concrete actions, not promises
  • Timeline for implementation
  • Measurable outcomes

5. How can members access financial information between annual meetings?

  • If they resist this, ask why
  • Transparency shouldn’t be annual
  • Regular updates should be standard

The Broader Market Context We’re Operating In

This development in Ireland occurs against a backdrop of significant changes in global dairy markets that affect us all, regardless of our location.

What we’re seeing globally:

  • Some regions are showing production growth
  • Others are facing weather challenges or regulatory constraints
  • Export markets are tightening in certain areas
  • Domestic consumption patterns are shifting

These dynamics directly affect how cooperatives operate. When markets shift quickly, cooperatives need flexibility to adapt. But flexibility without transparency breeds member suspicion.

The challenge is particularly acute for mid-sized cooperatives:

  • They lack the scale advantages of the giants
  • Face the same global market pressures
  • Caught between professional management needs and member democracy
  • Often have the most entrenched governance structures

Evolution, Not Revolution

What’s encouraging about the Irish situation—and similar movements we’re seeing elsewhere—is that farmers aren’t trying to destroy the cooperative model. They’re trying to make it work as intended.

According to the USDA’s 2024 Agricultural Cooperative Statistics report, farmer-owned cooperatives still market 86% of U.S. milk production. That’s not changing anytime soon. What is changing is how farmers expect these organizations to operate:

  • Transparency as standard practice, not a special request
  • Accountability through regular reporting, not just annual meetings
  • Genuine member benefit as a measurable outcome
  • Democratic participation that’s meaningful, not ceremonial

The question facing cooperative leadership everywhere is whether to embrace these expectations proactively or resist until member pressure forces change.

History suggests—and many of us have seen this firsthand—that proactive adaptation is more effective. When cooperatives restructure governance to increase member engagement, satisfaction often improves significantly. We observed this with the successful reforms at Tillamook County Creamery Association in 2019, where member satisfaction scores significantly improved after governance changes.

The Bottom Line for Your Operation

Today’s events in Ireland offer several lessons worth considering, regardless of where you ship your milk.

Key Takeaways:

Engagement matters more than size

  • Those 600 Irish farmers represent less than 10% of Dairygold’s suppliers
  • Their organized approach commanded attention
  • You don’t need a majority to initiate change

Specific questions beat general complaints

  • Irish farmers submitted seven written questions
  • Specificity forces substantive responses
  • Vague concerns get vague answers

Technology enables but doesn’t replace organization

  • Digital tools facilitate coordination
  • Success requires leadership and commitment
  • Tools are means, not the end

Ownership versus opposition

  • Farmers asserting owner rights
  • Not attacking the institution
  • That distinction affects how management responds

Your Action Plan

Whether you’re shipping to a small regional cooperative or one of the major players, here’s what might work:

Immediate Steps:

  1. Start documenting your milk prices and deductions today
  2. Connect with other producers in your area (maybe create that WhatsApp group)
  3. Review your cooperative’s bylaws and member rights
  4. Attend the next meeting with specific questions

Medium-term Goals:

  1. Build a coalition across farm sizes
  2. Request written responses to governance questions
  3. Compare your co-op’s performance to what you know about others
  4. Push for regular transparency reporting

Long-term Objectives:

  1. Advocate for governance reforms that increase member voice
  2. Support board candidates committed to transparency
  3. Create accountability mechanisms that last
  4. Ensure your cooperative serves its founding purpose

The Irish farmers meeting today provided one model for initiating these conversations. Your approach might differ based on regional culture, cooperative structure, and specific challenges. But the principle remains constant.

Cooperatives exist to serve their member-owners. Making sure they fulfill that purpose? That’s not revolutionary—it’s just good business sense.

And as today’s events in Ireland demonstrate, when farmers organize professionally to demand accountability from organizations they own, productive dialogue usually follows. After all, strong cooperatives require engaged members asking tough questions.

That’s not a threat to the cooperative model. It’s what keeps it viable for the next generation of dairy producers.

The real question is: Are you ready to start asking those tough questions at your own cooperative? Because if Irish farmers can organize 600 producers to demand accountability, what’s stopping you from doing the same?

KEY TAKEAWAYS:

  • Track and document everything for leverage: Build monthly comparisons showing your blend price versus regional averages, accounting for quality premiums and hauling charges—farmers who present six months of systematic data get 3x more substantive responses from management than those with general complaints
  • Form cross-size coalitions for maximum impact: Unite large operations (bringing economic leverage of potential departure) with smaller farms (providing voting numbers)—successful reforms typically involve farms ranging from 50 to 5,000 cows working together toward specific governance improvements
  • Demand written responses to specific questions: Request documentation on exact pricing formulas, percentage of revenue going to operations versus member payments, and comparison to regional competitor performance—verbal explanations evaporate, but written responses create accountability records
  • Use digital tools strategically: WhatsApp groups and encrypted messaging enable coordination that would’ve taken months of kitchen meetings a decade ago—but verify information carefully since misinformation spreads just as quickly as facts
  • Remember you’re an owner exercising rights: This isn’t confrontation or rebellion—it’s asserting the ownership authority you already possess over organizations that exist to serve member-producers, not extract from them

Complete references and supporting documentation are available upon request by contacting the editorial team at editor@thebullvine.com.

Learn More:

  • Your Milk Check Just Got $337M Lighter – And Your Co-op Helped Plan It – This article reveals how regulatory changes around “make allowances” transferred hundreds of millions from producer milk pools to processor profits. It provides concrete numbers and a case study, offering a tactical blueprint for understanding how these unseen mechanisms directly impact your bottom line.
  • June Milk Numbers Tell a Story Markets Don’t Want to Hear – This market analysis provides a crucial strategic overview of current industry trends. It shows how rapid shifts in geography, market utilization (more cheese, less butter), and production growth are reshaping the industry, demonstrating why a “volume-at-all-costs” approach is a dangerous strategy.
  • Dairy Cooperative Marketing Is Broken – Here’s How the Indy 500 Fiasco Proves It – This innovative piece challenges the traditional purpose of cooperative marketing. It questions whether resources are being spent on “industry presence” over initiatives that drive member farm profitability, revealing a crucial gap in how co-ops communicate value to their producer-owners.

The Sunday Read Dairy Professionals Don’t Skip.

Every week, thousands of producers, breeders, and industry insiders open Bullvine Weekly for genetics insights, market shifts, and profit strategies they won’t find anywhere else. One email. Five minutes. Smarter decisions all week.
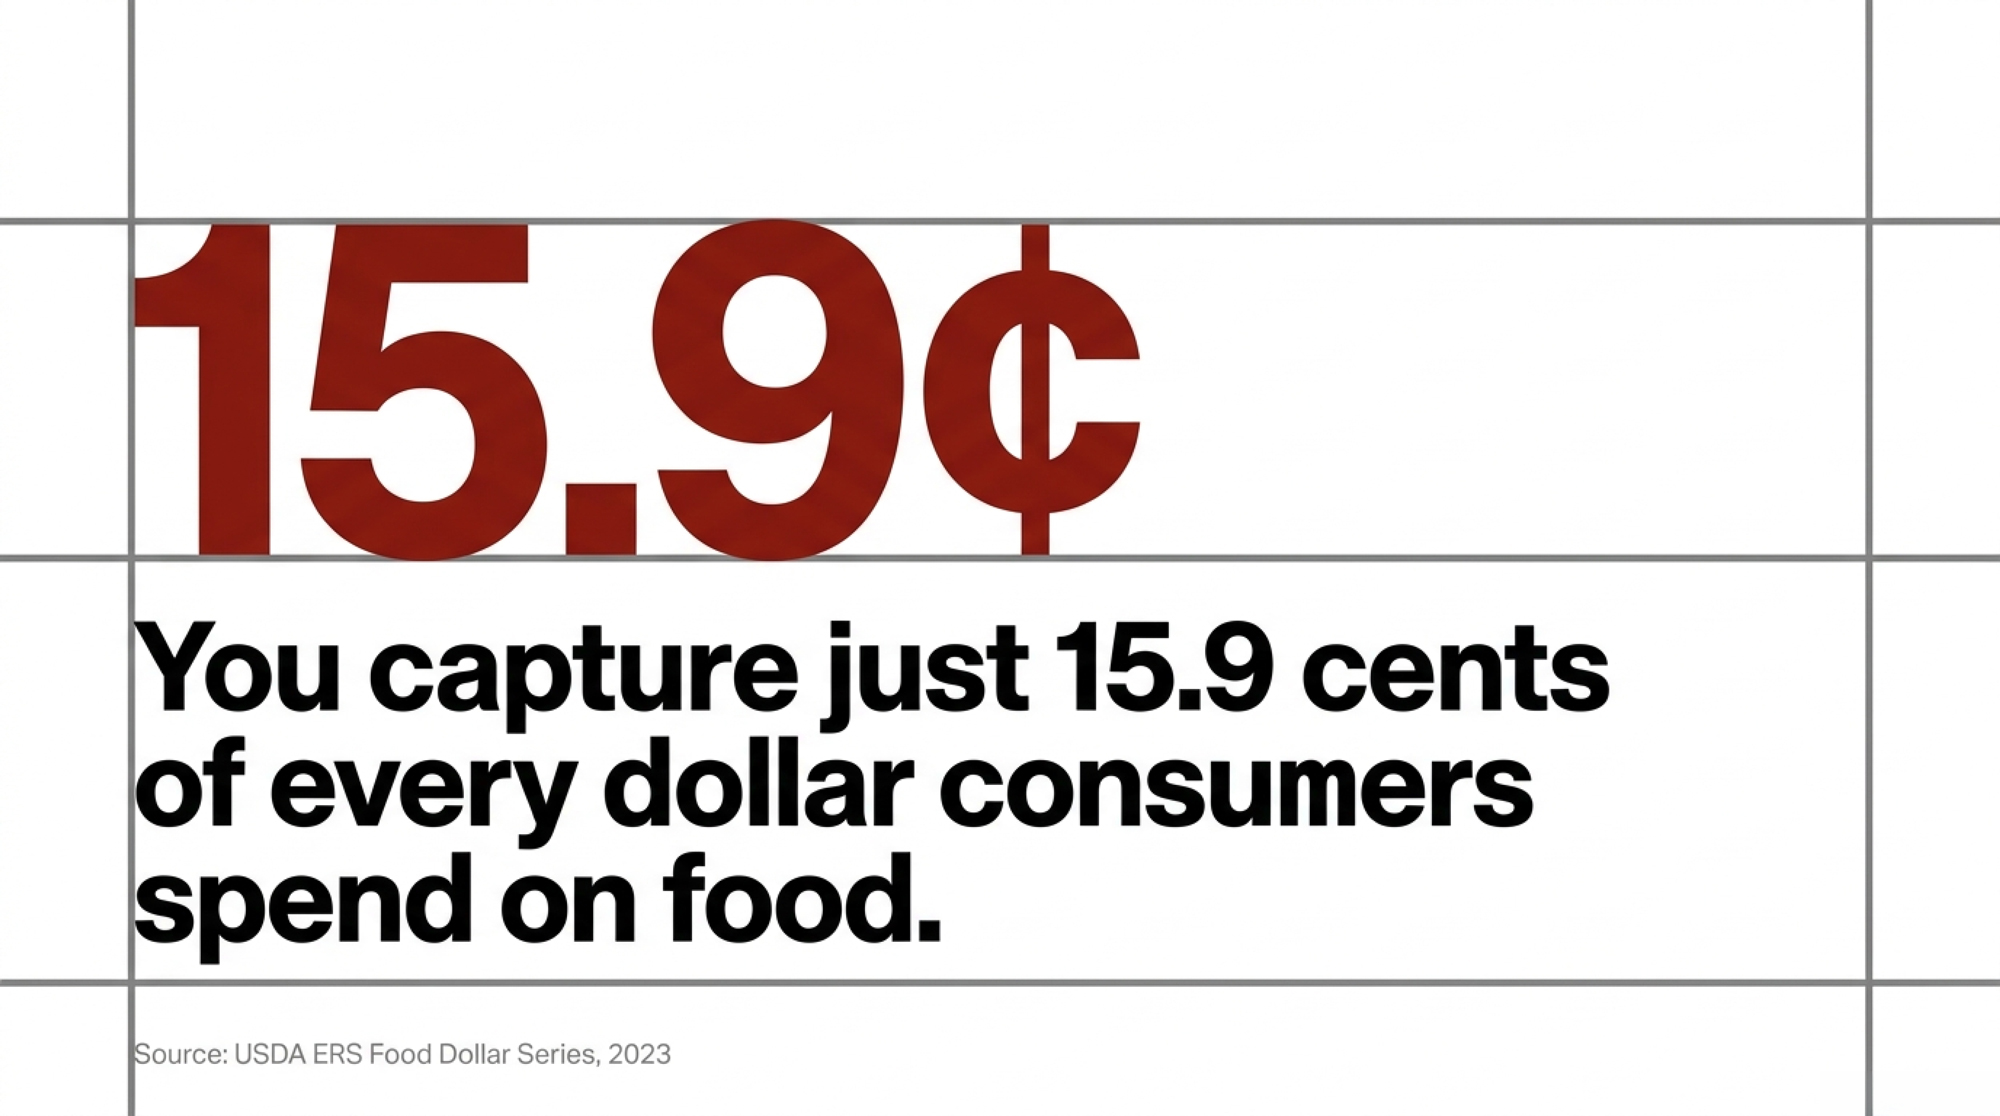
NewsSubscribe
First
Last
Consent

The 51-79 Workforce Bomb: How ICE Raids Became Dairy’s Consolidation Tool

Why are independent farms facing bankruptcy while corporate dairies thrive?

EXECUTIVE SUMMARY: Here’s what we discovered: while dairy leadership chases climate credits, 58,766 people who were milking cows last month now sit in ICE detention—70% with zero criminal history. The numbers reveal a brutal truth: immigrant workers make up 51% of all dairy labor yet produce 79% of America’s milk, creating a workforce bomb that threatens 7,000 farm closures and 90% milk price spikes if detonated. But here’s the kicker—this vulnerability isn’t accidental. Large operations budget compliance costs like feed expenses while independent producers face $20,000-per-worker penalties that can bankrupt generations of family farming overnight. Bureau of Labor Statistics data shows agricultural employment already dropping 6.5% between March and July 2025, and international buyers are quietly shifting supply chains away from unreliable U.S. sources. The consolidation playbook is crystal clear: enforcement destabilizes independents while corporate players with legal departments maintain steady production, capturing market share through regulatory warfare disguised as immigration policy.

dairy workforce management

Look, I’ve been covering dairy for twenty years, and something’s got me losing sleep.

TRAC Immigration just dropped their September numbers—58,766 people sitting in ICE detention facilities right now. That’s not some abstract policy debate, you know? That’s actual people who were milking cows last month.

And get this—over 70% of these folks have zero criminal history according to TRAC’s detention data. Zero.

They’re not drug dealers or gang members. They’re the same people who’ve been showing up at 4 AM for years, doing the work most Americans won’t touch with a ten-foot pole.

Meanwhile, dairy leadership keeps chasing carbon credits and sustainability workshops while the workforce that actually keeps our industry running is disappearing faster than silage in a drought year.

Nobody in Washington seems to understand what happens when cows don’t get milked on schedule. Or maybe they understand perfectly.

The Numbers That Should Scare Every Producer

So I’m sitting here with this massive Texas A&M study from 2021—took them two years to survey 2,847 dairy operations across 14 states—and the numbers are absolutely brutal.

Immigrant workers make up 51% of all dairy labor. That’s already scary as hell, but here’s where it gets worse: farms that employ immigrant workers produce 79% of America’s milk.

The Dairy Backbone: Immigrant Workers Drive 79% of U.S. Milk Production – This chart signals just how critical immigrant labor is in the barn and on the balance sheet.

Half the workforce. Four-fifths of the milk.

We’re talking about the foundation of the entire industry just sitting there in legal limbo while leadership talks about climate change initiatives and renewable energy programs.

Texas A&M ran the projections for what happens if this workforce disappears. 2.1 million fewer cows—that’s like every cow in Wisconsin and Pennsylvania combined just vanishing. Milk production drops by 48.4 billion pounds annually. Over 7,000 dairy farms shut down. Milk prices spike over 90%.

Ninety percent. Let that sink in next time you’re at the grocery store.

Rick Naerebout from Idaho Dairymen told Idaho Business Review back in May that 90% of workers on Idaho dairies come from other countries. Down in Wisconsin, that Investigate Midwest report found about 70% immigrant workforce.

Course, you don’t need a study to tell you what’s obvious if you’ve spent any time in dairy country.

The Corporate Legal Shield Strategy

Here’s where this gets really ugly, and I guarantee your co-op newsletter won’t mention this.

The big players—Land O’Lakes, Dairy Farmers of America, Saputo—they saw this vulnerability years ago. They’ve got compliance programs, legal teams, HR departments that do nothing but immigration paperwork.

But the family farm milking 400 cows? Well, that’s a different story entirely.

Under federal immigration law—8 CFR 274a if you want to get technical—employers face penalties from $300 to $20,000 per unauthorized worker for I-9 violations. That’s just civil penalties. Criminal penalties under 8 USC 1324a can hit six figures if prosecutors want to make an example.

The math is brutal: big operations budget for legal protection, family farms gamble with bankruptcy every time they hire somebody without perfect paperwork.

Tell me that system wasn’t designed to favor certain players. When potential fines can run $20,000 per worker and you’re operating on thin margins… well, you do the math.

When Your Milking Crew Vanishes Overnight

You want to know what this actually looks like? Bureau of Labor Statistics tracked a 6.5% drop in agricultural employment between March and July this year. That’s not seasonal variation—corn harvest wasn’t even starting.

That’s people disappearing from farms because they’re scared or already in detention.

When you lose experienced milkers without warning, everything goes to hell. Fast.

Fresh cows get stressed because routines change—and anybody who’s worked with first-calf heifers knows they’re touchy as hell when things aren’t consistent. Somatic cell counts spike because whoever’s left is rushing through procedures they normally take time with. Butterfat numbers tank because cows hate disruption more than farmers hate paperwork.

Heat detection becomes impossible when everyone’s scrambling just to get animals through the parlor twice a day. You think some new hire’s gonna notice when cow 247 is standing heat at 2 AM? Not likely.

Production doesn’t just drop a little. It crashes. Hard.

And it’s not just the milking that suffers—though God knows that’s bad enough. Feed schedules get screwed up because the guy who knew which pens needed 22% protein versus 18% is gone. Breeding programs fall behind because experienced AI techs don’t grow on trees.

Equipment maintenance gets deferred because there aren’t enough bodies to handle basic operations.

You can’t just pull somebody off the street and expect them to handle a kicking Holstein or know when a fresh cow’s about to go down with milk fever. That kind of experience takes years to develop.

The Leadership Gap on What Actually Matters

Industry associations keep rolling out new environmental initiatives and climate programs while the workforce crisis threatening our foundation gets pushed to the back burner.

I tried to track what progress has been made on agricultural visa legislation this year. Best I can tell, it’s been crickets.

Meanwhile, every major dairy organization has multiple climate-focused programs with dedicated staff and fancy PowerPoint presentations.

Climate programs get good press and don’t require admitting the industry built itself on legally vulnerable workers. Workforce legalization? That’s messy politics that might upset somebody important.

But when half your labor force is living in legal limbo… well, seems like that might be worth some attention.

Who benefits when independent producers can’t find stable, legal workers while corporate operations with compliance departments sail through enforcement waves untouched? Just asking.

The Compliance Game Every Independent Must Master

If you’re running an operation with mostly immigrant labor and haven’t had your I-9 forms audited by someone who knows federal employment law inside and out, you’re taking a hell of a risk.

The operations that survive enforcement waves? They’ve got bulletproof paperwork. They understand Employment Eligibility Verification requirements under 8 CFR 274a like most farmers know butterfat pricing.

They’ve got relationships with attorneys who specialize in agricultural immigration law—not the guy who handles your real estate closings.

They budget for compliance like it’s a feed cost. Because it is.

The ones that get blindsided are hoping ICE doesn’t show up. Betting on staying under the radar. Crossing their fingers that enforcement focuses on the border instead of the barn.

That’s wishful thinking with potentially catastrophic consequences.

And here’s the thing that really gets me… most of these folks have been working the same farms for years. Their kids go to local schools. They coach Little League. They’re part of the community fabric.

The only thing “unauthorized” is that our industry built itself around their labor without bothering to make it legal. Now we’re all paying the price for that shortsightedness.

What You Can Actually Do Right Now

Alright, enough doom and gloom. What can you actually control in this mess?

First—and this is non-negotiable if you want to sleep at night—get your paperwork audited by someone who knows agricultural immigration law. Not your regular attorney, not your accountant’s cousin, but someone who specializes in this stuff.

Compliance audits typically run several thousand dollars. But that’s a bargain compared to federal penalties that can run $20,000 per worker if they find problems during an enforcement action.

Second, start building relationships with backup workers now. Local kids who need summer work and aren’t afraid of getting dirty. Retirees looking for part-time income who remember when work meant something.

Train them on basic parlor operations before you desperately need them.

Third, talk to other producers about pooling resources. Maybe five farms can share compliance consulting costs that would break any single operation. Share the knowledge, share the risk, help each other navigate this regulatory minefield.

And think hard about diversifying your marketing channels. Value-added products. Direct sales. Farm stores. Anything that reduces dependence on processors who might get nervous about pickup reliability when your workforce situation gets uncertain.

Because they will get nervous, and they won’t warn you before they start shopping your competitors.

The Market Reality Nobody Discusses

Every family farm that struggles with workforce disruption is production that flows somewhere else. Every independent producer forced to scale back or sell creates opportunities for larger operations with deeper pockets and better legal protection.

Market concentration doesn’t happen by accident. It happens because the rules favor certain players over others.

The big operations prepared for this vulnerability years ago. They’ve got compliance programs and legal teams and emergency protocols that would make a small-town lawyer’s head spin.

Most independents are hoping this all goes away so they can get back to farming.

But hoping doesn’t milk cows. And it sure doesn’t protect you from federal enforcement actions that can bankrupt three generations of family farming in a single morning.

What strikes me most about this whole situation is how it serves certain interests perfectly. Independent producers face workforce instability they can’t budget for or control, while corporate operations with legal departments maintain steady production.

Market share flows upward, processing companies get fewer, larger suppliers to deal with, and equipment manufacturers sell to bigger operations with better credit.

The Hard Truth About Where This Goes

Employment data shows structural changes are already happening. Market concentration keeps accelerating like a runaway feed wagon. And leadership seems more focused on climate initiatives than workforce stability.

The choice facing every independent dairy producer is pretty straightforward: either you acknowledge that powerful forces are reshaping this industry and position yourself accordingly, or you keep hoping everything goes back to normal while watching your neighbors get picked off one by one.

Because when your fresh cows need milking at 4 AM and there’s nobody to run the parlor, all the sustainability programs and carbon credits in the world won’t save operations that didn’t prepare for this reality.

Based on what I’m seeing from enforcement patterns and leadership priorities, I’m not sure how many independents will be left standing when this shakes out.

The 51-79 workforce crisis isn’t getting fixed anytime soon. The folks who benefit from consolidation aren’t losing sleep over which farms survive—they’re counting market share while independent producers struggle with workforce uncertainty that could’ve been addressed years ago.

Here’s what I think is really happening: this workforce vulnerability was always the perfect consolidation tool. No messy regulations. No obvious manipulation. Just enforcement of existing law that happens to destroy independent operations while leaving corporate players untouched.

And if that’s not the plan… it’s sure working out that way.

KEY TAKEAWAYS

  • Immediate compliance audit required: Independent producers face $300-$20,000 per worker in federal penalties under 8 CFR 274a—several thousand spent on specialized immigration law audits beats potential bankruptcy from surprise enforcement
  • Backup workforce development pays off: Smart farms are building relationships with local students and retirees, training them on basic parlor operations before crisis hits—operational continuity becomes competitive advantage when neighbors’ crews vanish
  • Pooled compliance resources cut costs: Five-farm cooperatives sharing immigration law consulting expenses can afford the same legal protection that corporate operations budget routinely—shared risk management beats individual vulnerability
  • Market diversification shields against processor panic: Value-added products and direct sales reduce dependence on processing plants that get nervous about pickup reliability when workforce uncertainty hits—revenue streams independent of corporate supply chains provide stability
  • Market share consolidation accelerates: Every independent farm struggling with workforce disruption creates production opportunities for corporate operations with deeper legal protection—understanding this dynamic helps position farms defensively rather than hoping enforcement goes away

Complete references and supporting documentation are available upon request by contacting the editorial team at editor@thebullvine.com.

Learn More:

The Sunday Read Dairy Professionals Don’t Skip.

Every week, thousands of producers, breeders, and industry insiders open Bullvine Weekly for genetics insights, market shifts, and profit strategies they won’t find anywhere else. One email. Five minutes. Smarter decisions all week.
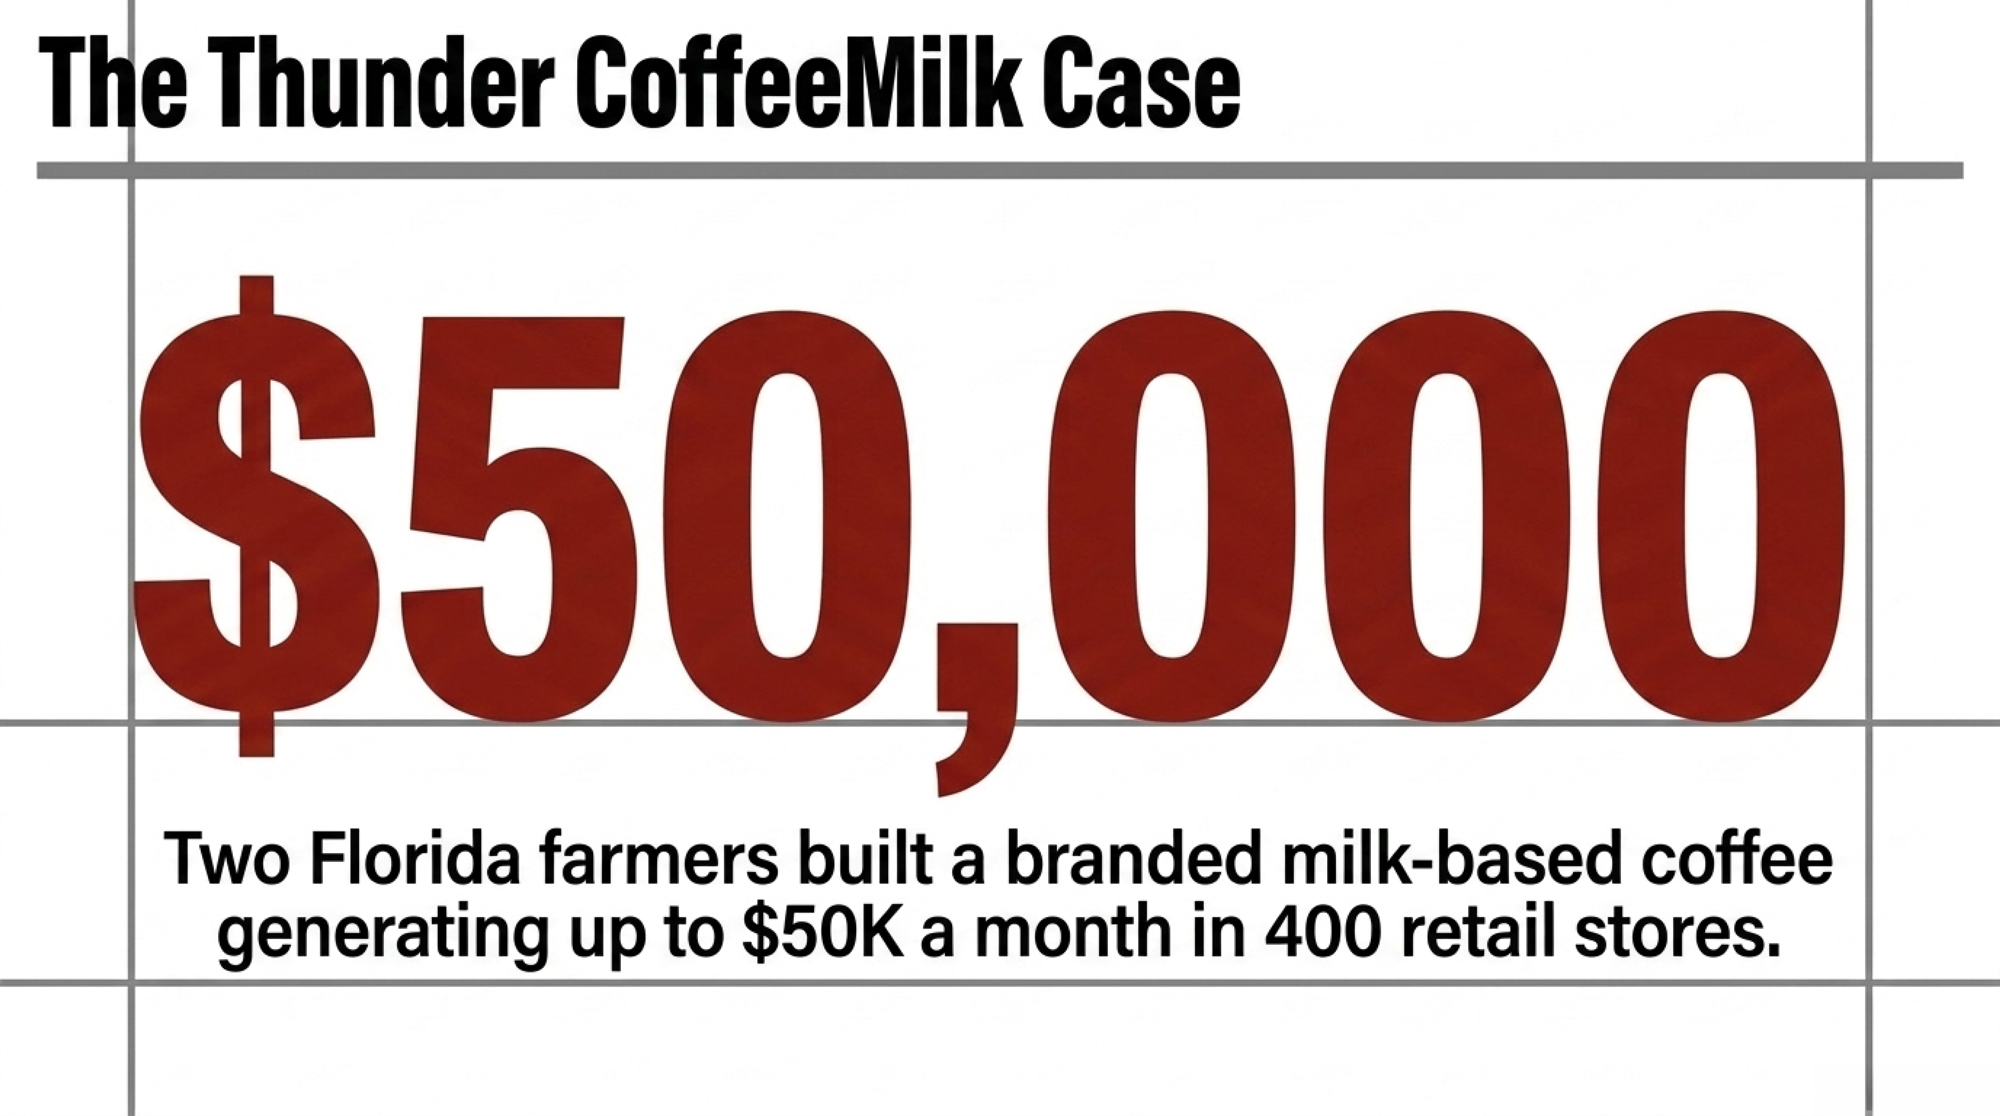
NewsSubscribe
First
Last
Consent

The Financial Warning Signs Your Neighbors Won’t Talk About: What Rising Bankruptcies Really Mean for Dairy

Chapter 12 bankruptcies jumped 55% while government payments hit $42.4B—here’s what the courthouse records really reveal

EXECUTIVE SUMMARY: Here’s what farmers are discovering about the current financial landscape: University of Arkansas data shows agricultural bankruptcies surged 55% to 259 cases between April 2024 and March 2025, even as government support increased 354% to $42.4 billion—revealing a systematic disconnect between bailout funding and actual farm-level financial stress. The most concerning pattern involves interest rates jumping from 2.9% to nearly 9%, creating unsustainable debt service burdens for operations that layered variable-rate financing during the low-rate period. What’s particularly telling is that replacement heifer inventories have dropped to just 41.9 per 100 milk cows—a 47-year low that signals producers are sacrificing long-term herd sustainability for short-term cash flow. Recent Federal Reserve data confirms 4.3% of farm loan portfolios now show “major or severe” repayment problems, the highest level since late 2020, while nearly 2% of farmers won’t qualify for loans they easily obtained just last year. The encouraging news is that operations monitoring specific financial stress indicators and maintaining conservative debt structures are not just surviving—they’re positioned to capitalize on opportunities when market conditions stabilize. Smart producers are treating financial health monitoring as seriously as they track somatic cell counts, recognizing that both are essential for sustainable dairy success in 2025.

dairy financial health

Here’s something that’s been on my mind at every industry meeting this year: Chapter 12 agricultural bankruptcies jumped 55% while government payments to agriculture increased 354% to $42.4 billion, according to the latest USDA data. When you see those two trends moving in opposite directions like that, it raises some important questions about what’s really happening with farm finances.

The University of Arkansas just released tracking data showing 259 bankruptcy cases between April 2024 and March 2025, and these numbers tell a story that’s more complex than what we’re seeing in the trade publications. You’ve probably heard how headlines keep mentioning support programs and stable milk prices. The courthouse records paint a vastly different picture.

What’s interesting here is how the usual signs we look for—Class III futures, government program announcements—might not be giving us the complete picture we need for our own operations. And as many of us have experienced firsthand, what looks stable in the market reports doesn’t always translate to what’s happening in your parlor or your monthly cash flow.

The Arkansas Pattern: When One State Reveals National Trends

Ryan Loy and his team at the University of Arkansas Division of Agriculture have been doing some fascinating work tracking these patterns. Arkansas alone jumped from just 4 Chapter 12 filings in 2023 to 25 in 2025—that’s over 25% of all national filings coming from one state. While this represents a massive 525% increase for Arkansas specifically, their agricultural bankruptcy patterns often mirror what we see nationally, just more concentrated. It’s like a canary in the coal mine situation.

The quarterly data from their research is what really caught my attention. Q1 2025 brought 88 bankruptcy filings compared to 45 in Q1 2024. That’s a 96% increase in just three months, and it puts us on a trajectory that reminds those of us who lived through it of the 2019 farm crisis.

The 96% jump in Q1 2025 bankruptcies signals a return to 2019 crisis-level financial stress—but industry headlines aren’t telling this story. These courthouse records reveal what traditional dairy market indicators are missing.

“Once you see this on a national level, it’s a clear sign that financial pressures that we saw before in the 2018 and ’19 are kind of re-emerging,” Loy explained in his recent interviews. For those of us who weathered that period, the patterns are starting to look uncomfortably familiar.

Traditional dairy regions are feeling similar pressure. Federal court records show California led with 17 bankruptcy filings in 2024, despite generally stronger milk prices on the West Coast. Iowa reported 12 leading into 2025, and the pattern continues across Wisconsin, Minnesota, and other Midwest operations where land values and operational costs create different challenges.

Something worth noting is how these geographic patterns affect more than just the operations filing for bankruptcy. If your area is seeing concentrated financial stress, that impacts equipment values at local auctions, the stability of your processing relationships, and even the availability of veterinary services. It’s all interconnected in ways that aren’t always obvious until you’re dealing with it directly.

The Interest Rate Reality: How 9% Financing Changed Everything

Here’s where this gets personal for dairy operations, and it’s probably the single biggest factor driving these bankruptcy numbers. Federal Reserve agricultural lending data shows farm loan rates have jumped from 2.9% to nearly 9% for many operations over the past two years. That’s not just a cost increase—it fundamentally changes how you approach financing everything from feed inventory to facility improvements.

Variable-rate financing, which made perfect sense when rates were low, now creates a completely different cash flow picture. Those manageable seasonal dips that you used to smooth out with a line of credit become much more challenging when your borrowing costs have essentially tripled.

From 2.9% to nearly 9%: How interest rate shock is reshaping dairy finance—and why operations with variable-rate debt are filing for bankruptcy protection despite stable milk prices.

The Federal Reserve Bank of Chicago’s latest district report shows that 4.3% of farm loan portfolios had “major or severe” repayment issues in Q4 2024—the highest level since late 2020. What’s really concerning is that nearly 2% of farmers won’t qualify in 2025 for the same loans they received in 2024, according to their regional analysis. The Kansas City Fed found that non-real estate farm loans at commercial banks increased by 25% from 2023 to 2024, but interest rates remain at these elevated levels.

Equipment financing has taken a tough hit. You know how straightforward it used to be to pencil out new machinery at 3-4% interest rates? When rates approach 9%—especially if you’re already carrying equipment debt—those calculations look completely different. This shows up in auction activity, parlor upgrade deferrals, and even basic maintenance equipment purchases.

But here’s what’s encouraging: Some operations that locked in fixed-rate financing early in the rate cycle are finding themselves with a real competitive advantage. They’re able to make strategic equipment purchases and facility improvements, while competitors struggle with variable-rate debt service. I’ve noticed these operations are also better positioned for fresh cow management improvements and transition period upgrades that require capital investment.

Examining bankruptcy filings from the past year reveals a common pattern among operations that had layered short-term, variable-rate financing on top of long-term mortgages during the period of low interest rates. When those rates reset, monthly obligations became unmanageable regardless of milk production efficiency or butterfat performance.

For individual operations, understanding interest rate exposure has become crucial. Calculate what percentage of your total debt carries variable rates. Even at higher current rates, fixed-rate financing offers payment predictability, enabling better cash flow management during volatile periods—and we’re certainly in a volatile period.

Lenders are being selective about who gets approved for refinancing. They’re expanding loan volumes at higher rates but maintaining strict qualification requirements. It’s a profitable environment for lenders, but it means operations need strong financials to access better terms.

Government Payments: The Puzzle That Doesn’t Add Up

This is where the data gets really interesting. Agriculture received $42.4 billion in direct government payments in 2025—a 354% increase from 2024, according to USDA data. Yet bankruptcy filings keep climbing.

$42.4 billion in government support can’t stop the bankruptcy surge—here’s why bailout programs help with operating expenses but don’t address the debt service burdens actually driving farm failures.

One pattern that emerges is that government support often flows through existing lender relationships and larger operations first. If you’re facing immediate financial stress, you may not see relief quickly enough to address urgent payment obligations. Many of these programs help with operating expenses but don’t tackle the underlying debt service burdens that actually drive bankruptcy filings—especially when interest rates have reset at these levels.

There’s also a timing issue that affects seasonal cash flow management. Government payments typically arrive based on program schedules that don’t always align with when individual operations hit their worst cash flow periods. If your variable-rate note resets in January and government support shows up in March, that gap can determine whether you’re restructuring debt or heading to court.

The Farm Credit System’s 2024 annual report shows total loans outstanding at $450.9 billion, with real estate mortgage loans at $187.9 billion and production/intermediate-term loans at $81.2 billion. Despite record government support, lenders are maintaining strict underwriting standards—which makes sense from their risk management perspective—but this can exclude operations that most need refinancing assistance.

Replacement Heifers: The Warning Signal We Can’t Ignore

One number that’s been keeping me up at night comes from the USDA’s National Agricultural Statistics Service. The U.S. dairy herd is currently operating with just 41.9 replacement heifers per 100 milk cows—a 47-year low based on their historical data. That ratio suggests that producers are prioritizing short-term cash flow over long-term herd sustainability, a trend that is occurring across all regions and farm sizes.

This signals that operations are making difficult decisions about breeding stock to meet immediate financial obligations. Reduced heifer inventories limit your ability to implement planned genetic improvements. You’re keeping older cows in production longer, which can impact milk quality and butterfat performance. Insufficient replacement rates today create production constraints when market conditions improve—you might miss the next upturn because you don’t have the herd capacity to capitalize on it.

This isn’t just about individual farm decisions. When replacement rates drop industry-wide, it signals systematic financial stress that affects everyone from genetics companies to equipment dealers. The breeding programs we’ve invested decades in developing depend on adequate replacement rates to maintain genetic progress.

What’s particularly noteworthy is how this affects different management systems. Operations using dry lot systems might find it easier to manage older cows, while those with more intensive grazing programs may face bigger challenges with extended lactations. The management of fresh cows becomes even more critical when you’re counting on those animals for longer, more productive lives.

Financial Health Checklist: What to Monitor Monthly

Track these ratios to spot trouble before it becomes critical:

  • Debt Service Coverage: Net income ÷ total debt payments (monitor trends, aim to stay above 1.2)
  • Working Capital Cushion: (Current assets – current liabilities) ÷ annual milk sales (15%+ provides seasonal buffer)
  • Interest Rate Exposure: Variable-rate debt as % of total debt (above 60% creates Fed policy vulnerability)
  • Short-Term Debt Balance: Operating loans ÷ total debt (risk increases above 40%)
  • Cash Flow Variance: Monthly actual vs. 12-month average (>10% swings during high-cost months signal problems)

Regional Variations and Success Stories

This season, regional variations are worth understanding. California operations, which face higher land costs and water regulations, deal with different pressures than Midwest dairies, which manage harsh winters and transportation costs. Texas producers, with their varied climate and feed base, are adapting to these financial pressures in ways that make sense for their operational structure.

State2024 Bankruptcy Filings% of National TotalPrimary Challenge
California176.6%Land costs, regulations
Iowa124.6%Transportation, weather
Wisconsin155.8%Equipment debt service
Minnesota114.2%Seasonal cash flow
Arkansas259.7%Variable-rate exposure

Geographic bankruptcy clustering reveals regional stress patterns—if your area shows concentrated filings, expect impacts on equipment values, processing relationships, and veterinary services availability.

What’s consistent across regions is that bankruptcy patterns create ripple effects. When concentrated financial stress hits an area, it affects regional equipment values, processing relationships, and support services. But there can be opportunities too. Equipment purchases may yield better values at auctions, although service networks might become strained as the local producer base shrinks.

I’ve noticed that regions with more diversified agricultural economies—places where dairy operations can potentially add custom farming or other enterprises—seem to be handling the financial pressure somewhat better. That’s not an option for everyone, but it’s worth considering as part of your long-term strategy.

Despite these financial pressures, some adaptations seem to be working. Some operations have focused on efficiency improvements that provide clear returns on investment even at higher financing costs. Others have found opportunities in value-added processing or direct marketing that provides price stability for at least part of their production.

What’s encouraging is seeing operations that have successfully refinanced their variable-rate debt into fixed-rate structures, even at higher rates. They’re finding that the payment predictability more than compensates for the higher cost, especially when they can focus on operational improvements rather than worrying about the next rate reset.

One innovative approach I’m seeing more of is cooperative equipment purchasing and shared services agreements. Several operations in Wisconsin have formed buying groups for major equipment purchases, thereby reducing individual capital requirements while still accessing the latest technology. Similarly, some California operations are sharing specialized labor for peak periods, such as breeding or harvest, thereby spreading costs across multiple farms.

Examining global patterns, it’s worth noting that countries with more structured agricultural financing—such as New Zealand’s farm management deposit schemes or Australia’s Farm Finance Concessional Loans Program—tend to experience less dramatic swings in bankruptcy rates during interest rate cycles. Although our system differs, there may be valuable lessons to be learned about long-term financial stability mechanisms.

Practical Applications: Managing Current Conditions

Cash flow scenario planning has become essential rather than optional. Consider maintaining working capital reserves that give you flexibility to manage seasonal variations and unexpected cost increases without requiring emergency financing at current rates.

Equipment decisions require more careful analysis now. Being thoughtful about purchases that extend payback periods makes sense in the current interest rate environment. Focus capital investments on proven productivity improvements with clear return calculations—things like parlor efficiency upgrades or feed system improvements that reduce labor costs.

Some operations are finding success with alternative financing strategies, including equipment leasing arrangements, partnerships with other producers, or focusing on used equipment purchases that offer shorter payback periods. There’s also growing interest in shared services agreements where multiple operations split the cost of expensive equipment or specialized services.

With replacement heifer numbers at these low levels, fresh cow management becomes even more critical. You simply can’t afford transition period problems when you’re keeping cows longer and have fewer replacements coming through the system. The fresh cow protocols that might have been “nice to have” in better financial times have become essential for maintaining production efficiency and butterfat performance.

What I’ve found particularly interesting is how some of the most successful operations right now are those that took a conservative approach to debt structure, even when money was cheap. They maintained higher equity ratios, avoided over-leveraging on equipment, and kept adequate cash reserves. That financial discipline is paying off now, especially when it comes to making strategic investments in cow comfort or fresh cow management systems that require upfront capital.

Looking Forward: Building Financial Resilience

The patterns in recent bankruptcy data show that financial management has become as important as production management for long-term dairy success. The operations that are doing well aren’t just good at managing cows—they’re actively managing debt structure, interest rate exposure, and cash flow variability.

Rather than relying solely on industry messaging about recovery or government support programs, monitoring specific financial stress indicators provides early warning signals. The University of Arkansas research shows that financial stress often builds gradually before reaching crisis levels. Understanding these patterns gives you time to make adjustments before problems become unmanageable.

What’s encouraging is that the fundamental demand for dairy products remains strong. Population growth, protein consumption trends, and global market expansion all indicate long-term opportunities for well-managed operations that can effectively navigate current challenges. The emerging trends in functional dairy products and sustainable production practices are creating new market opportunities that weren’t available during previous financial stress periods.

Your operation’s financial health depends on monitoring the right indicators and understanding the broader forces at play. Given what we’re seeing in these numbers, financial analysis has become as essential as monitoring somatic cell counts or butterfat levels—it’s just part of professional dairy management in 2025.

The operations that recognize this shift and develop strong financial management skills to complement their production expertise will be positioned to capitalize when market conditions stabilize. There’s a real reason for optimism about the industry’s long-term prospects, especially for producers who combine traditional dairy excellence with modern financial management practices.

The Bottom Line

When 259 farm families file for bankruptcy protection in a single year while taxpayers fund $42.4 billion in agricultural support, it’s clear we’re facing more than a typical market correction. These courthouse records reveal a systematic financial stress that traditional industry metrics fail to capture—and that makes understanding the early warning signs critical for every dairy operation.

The clearest lesson from this data isn’t just about avoiding bankruptcy. It’s about recognizing that financial health and herd health are equally essential for long-term success in modern dairy. The operations that develop strong financial management skills to complement their production expertise won’t just survive the current volatility—they’ll be positioned to thrive when market conditions stabilize.

The data shows there’s still time to make adjustments, and with the right financial monitoring and planning, dairy operations can build the resilience needed to weather whatever comes next. That’s not just hopeful thinking—it’s what the numbers and the success stories are telling us about the future of professional dairy management.

KEY TAKEAWAYS:

  • Monitor your debt service coverage ratio monthly—keep it above 1.2 to maintain borrowing flexibility, especially with variable-rate debt that could reset at decade-high levels, affecting your operation’s cash flow predictability
  • Maintain working capital reserves equal to 15%+ of annual milk sales—this buffer provides crucial flexibility during seasonal variations and unexpected cost increases without requiring emergency financing at current 8-9% interest rates
  • Prioritize fixed-rate refinancing opportunities while still available—operations successfully locking in predictable payment structures are gaining competitive advantages for strategic investments in fresh cow management and facility improvements
  • Focus equipment investments on proven productivity improvements with clear ROI calculations—parlor efficiency upgrades and feed system improvements that reduce labor costs can justify higher financing costs better than speculative technology purchases
  • Strengthen fresh cow management protocols as replacement heifer numbers remain at 47-year lows—maximizing productive life and butterfat performance of existing animals becomes critical when fewer replacements are coming through the system

Complete references and supporting documentation are available upon request by contacting the editorial team at editor@thebullvine.com.

Learn More:

  • Boosting Dairy Farm Profits: 7 Effective Strategies to Enhance Cash Flow – This guide provides actionable, tactical advice for improving on-farm profitability. It goes beyond financial ratios to offer specific strategies for optimizing parlor efficiency, diversifying revenue streams, and managing feed costs, giving producers direct steps they can implement for immediate cash flow improvements.
  • Global Dairy Market Dynamics: Navigating Volatility and Strategic Opportunities in 2025 – This article provides a crucial strategic perspective by analyzing the macroeconomic forces shaping the industry. It reveals how factors like European production surges and shifting trade logistics affect farm-level prices, helping producers anticipate market changes and position their operations for long-term success.
  • AI and Precision Tech: What’s Actually Changing the Game for Dairy Farms in 2025? – This piece focuses on innovative solutions, providing clear data on the return on investment (ROI) for technologies like precision feeding and AI health monitoring. It shows how specific tech adoptions can directly reduce costs and increase yields, offering a roadmap for modernizing operations to improve financial resilience.

The Sunday Read Dairy Professionals Don’t Skip.

Every week, thousands of producers, breeders, and industry insiders open Bullvine Weekly for genetics insights, market shifts, and profit strategies they won’t find anywhere else. One email. Five minutes. Smarter decisions all week.
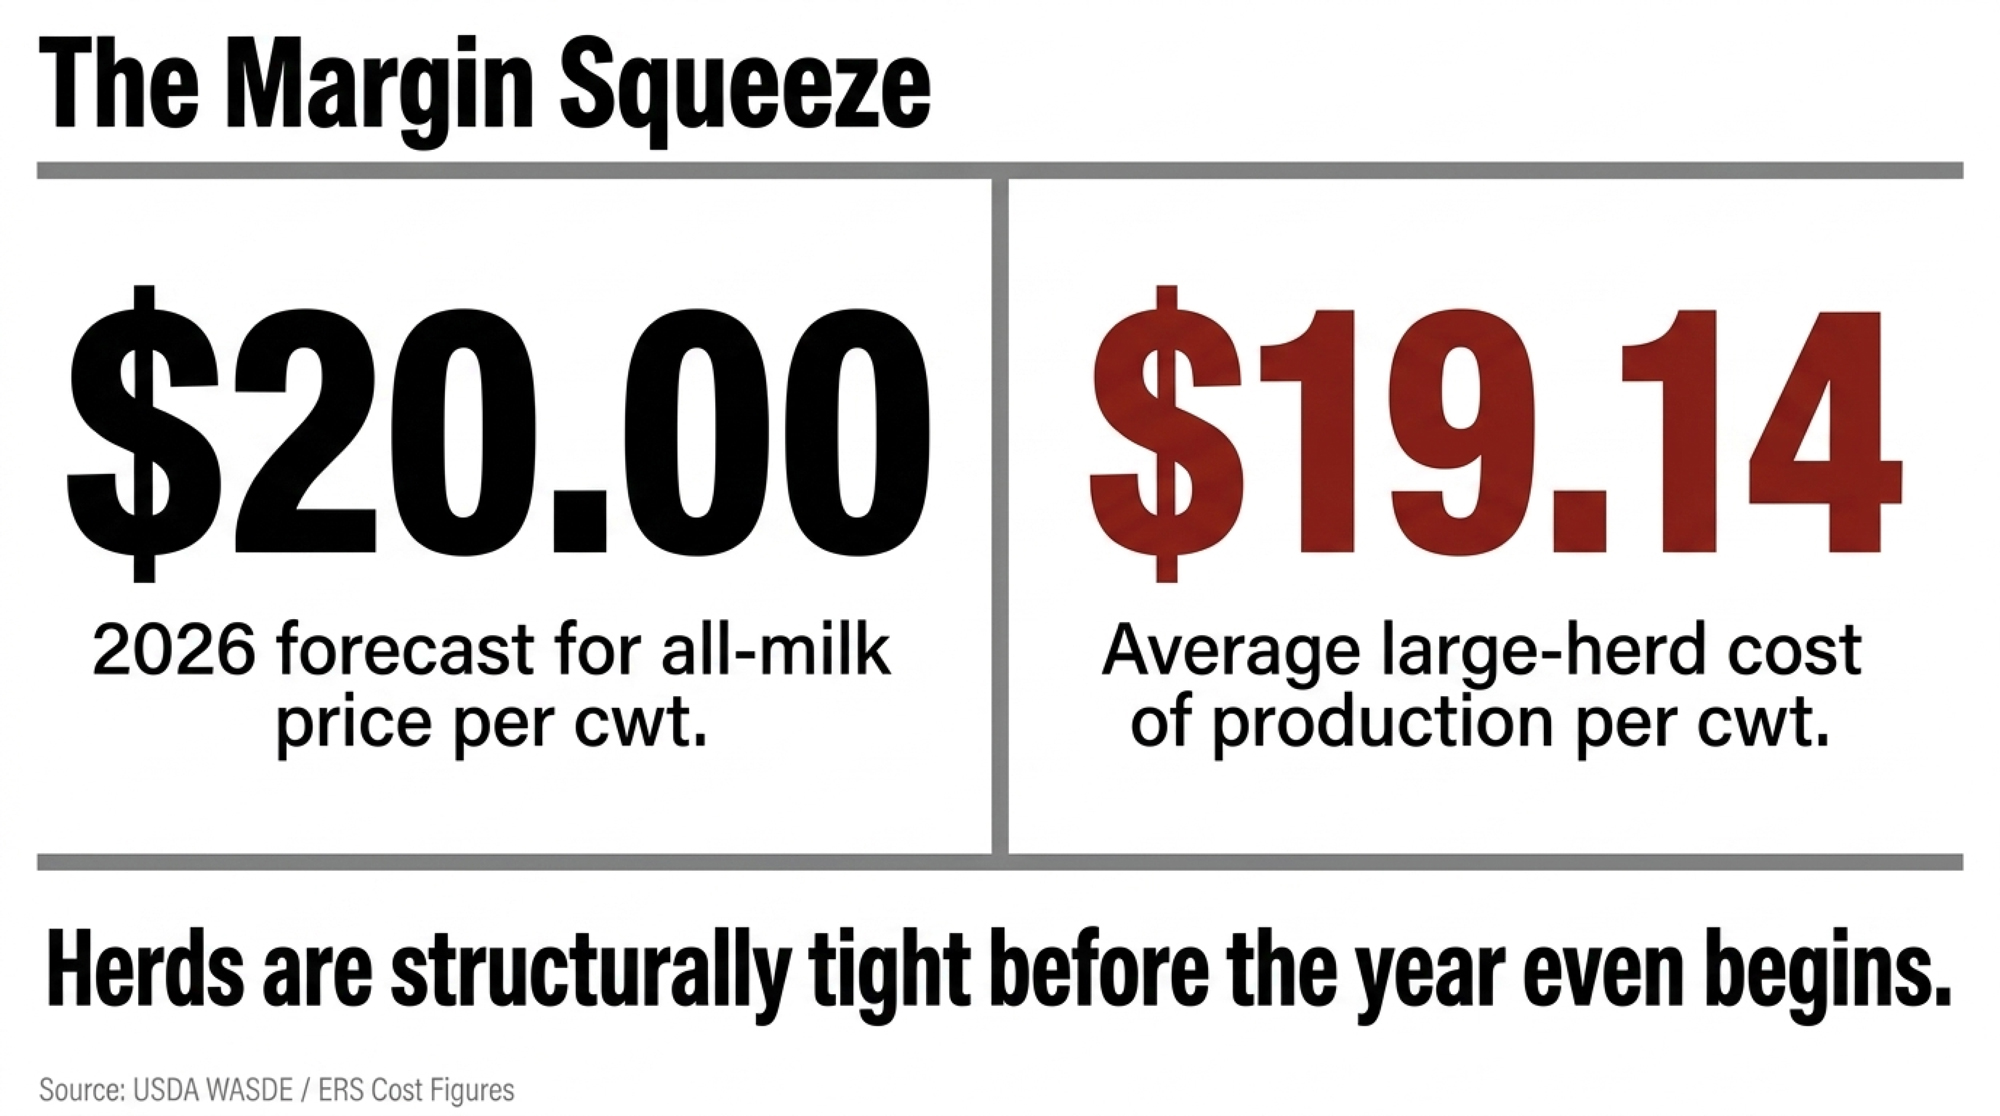
NewsSubscribe
First
Last
Consent

Against All Odds: How One Woman’s Five Cows Ignited a Dairy Revolution That’s Rewriting the Rules of Agricultural Recovery

Zimbabwe’s dairy collapsed 86%. Imports hit 130M liters. One woman’s five cows just triggered the most shocking agricultural turnaround in history.

When I first learned about Esther Marwa through BusinessBeat24’s November 2024 feature documenting her remarkable journey, her story challenged everything I thought I knew about agricultural recovery. What moved me most was the sheer audacity of her decision—to start a dairy operation with five pregnant cows in one of Zimbabwe’s driest districts when her country’s dairy industry had collapsed so completely that experts had written it off entirely.

Here was a woman who’d decided to bet everything on dairy farming when Zimbabwe was importing 130 million liters annually, mostly from South Africa. No government support, no development grants, no fancy infrastructure. Just an unshakeable belief that her country’s dairy potential wasn’t permanently lost.

According to BusinessBeat24’s profile, neighbors initially questioned her dairy farming venture in drought-prone Chikomba district. But Esther saw something they couldn’t see. She saw opportunity hiding in what appeared to be insurmountable challenges.

What happened next still gives me chills, because it proves that individual determination combined with strategic thinking can rewrite entire industry trajectories.

When Dreams Meet Drought: The Weight of Starting Over

The courage it took to begin in January 2019 still amazes me. Zimbabwe’s dairy sector had crashed from 260 million liters annually in the 1990s to just 37 million liters by 2009—an 86% collapse documented by FAO reports. Infrastructure lay in ruins. Farmers had abandoned their operations. Hope seemed as dry as the boreholes.

But Esther looked at water scarcity and somehow envisioned energy independence through solar power. She considered geographic isolation from markets and envisioned direct relationships with local customers. She looked at limited capital—that crushing reality every farmer knows—and recognized that smart resource use could outperform throwing money at problems.

According to published accounts of her early challenges, water scarcity topped her list of obstacles. The borehole on her property only had a manual bush pump, and dairy farming requires enormous amounts of water—especially in drought-prone Chikomba district. Every morning at 4:30 AM, she’d begin milking by hand, hauling buckets of water, cutting grass with a sickle until her hands were raw.

Anyone who’s hauled water in drought conditions knows it’s not just your shoulders that hurt—it’s the weight of wondering if you’ve made a terrible mistake. Yet every single morning, she showed up.

There’s something about farmers who’ve survived impossible seasons—they develop this ability to see potential in what looks like disaster to everyone else. Esther has that gift, and more importantly, the TranZDVC project documentation shows she was about to prove she could help others develop it, too.

The Morning Everything Changed: When Partnerships Replace Handouts

The breakthrough came in 2020 through the European Union’s TranZDVC project—Transforming Zimbabwe’s Dairy Value Chain for the Future. What makes this different from traditional development programs that treat farmers as passive recipients is the revolutionary 70:30 matching grant structure documented in the EU’s Zimbabwe Agricultural Growth Programme.

For someone who’d been questioned by neighbors and had probably questioned herself during those brutal early mornings, having an organization believe enough to invest real money—while still expecting her own contribution—must have felt like validation that her vision had merit. This wasn’t charity. It was a partnership.

That 30% requirement meant she had to optimize her existing resources first, according to ZAGP project documentation. This forced immediate productivity improvements even before any infrastructure investment. Within months, Esther had her contribution ready and accessed the matching grant that would transform not only her operation but also her entire community.

The solar-powered water system finally liberated her from those back-breaking daily water hauls. She expanded her herd with high-yielding Holstein and Jersey crosses. Planted lucerne crops that slashed her feed costs. Built proper milking facilities that improved both efficiency and milk quality.

But what happened next defied everything we think we know about individual success versus community benefit.

The Heart That Multiplies Success: When Excellence Becomes Service

According to ZAGP project records, Esther’s productivity climbed from 95 liters per day to well over 2,000 liters monthly, with individual cows averaging 19 liters per day—performance that rivals developed-country operations. Most of us would have built higher fences and counted our blessings.

Not Esther.

She made a decision that required a special kind of courage: she opened her barn doors not to show off, but to share what she’d learned in those lonely hours when success felt impossible.

As chairperson of the Nharira Dairy Cooperative, she instituted a project with graduated participation levels, where high-performing farmers provided technical leadership and received proportional decision-making authority, while developing farmers received intensive mentoring support.

The cooperative operates on transparent and objective metrics, which are documented in project reports. Every farmer’s milk volume and quality standards are tracked and shared. Performance rankings are based on measurable data—total bacterial counts, somatic cell counts, consistency metrics—not politics or favoritism.

Published accounts of the cooperative’s success show that instead of the typical resentment that destroys most agricultural cooperatives, there was an incredible hunger among farmers to learn from proven methods. Esther had demonstrated that transformation was possible.

And that gave everyone hope.

The Ripple That Became a Revolution: When One Life Touches Thousands

What moved me deeply about BusinessBeat24’s coverage was learning about Esther’s quiet community service. Every week, she delivers fresh milk to local schools, reviving Zimbabwe’s once-thriving school nutrition program. She also provides sanitary pads to young women in her area, recognizing that period poverty prevents rural girls from attending school.

These aren’t grand gestures for recognition—they’re the quiet actions of someone who remembers what it felt like to struggle and refuses to turn her back on others still fighting.

She mentors other farmers not through lectures but through hands-on demonstrations at her own operation. Her success created additional income opportunities through training and technical assistance while strengthening the entire cooperative’s market position.

But then something extraordinary happened that proved this transformation was about more than individual success…

The numbers that followed still take my breath away:

  • 2017: 66 million liters
  • 2021: 79.6 million liters
  • 2022: 91.6 million liters
  • 2023: 99.8 million liters
  • 2025 target: 150 million liters

That’s a 169% recovery from the 2009 crisis low, driven by thousands of farmers who refused to accept that their country’s dairy potential was permanently lost.

The Policy Breakthrough: When Government Finally Removes the Barriers

Against every prediction about how slowly government moves, something remarkable happened this past September. Zimbabwe’s government implemented sweeping regulatory reforms that eliminated the bureaucratic barriers that had been choking the sector potential for decades.

Export registration fees were slashed from $900 to just $10—a 98.9% reduction. Feed manufacturing licenses dropped from $250 to $20. The maze of 25 separate permits from 12 different agencies was streamlined into a simple, transparent process.

As Finance Minister Mthuli Ncube announced in official government statements, these reforms were about “lowering the cost of doing business, especially for small and medium enterprises” by “creating a business environment that is affordable, transparent and supportive of growth.”

What struck me most was realizing that these policy changes didn’t create the dairy recovery—they amplified success that was already happening. Farmers like Esther had been proving transformation was possible for years. The government finally removed the barriers that had been holding everyone else back.

The Genius of Turning Problems into Advantages

Here’s what I find most inspiring about Zimbabwe’s dairy recovery, documented across multiple industry reports: farmers like Esther turned every limitation into a competitive advantage through creative problem-solving born of necessity.

Water scarcity has driven investment in solar-powered systems, as project documentation shows, which are now more reliable and cost-effective than grid electricity. Limited access to commercial feed drove innovations in on-farm silage production that reduced costs while improving nutrition. Being far from processors led to value-added on-farm processing, which captured margins that others were giving away.

Industry analyses highlight Esther’s diversification into honey production as an exemplification of this innovative spirit. Rather than betting everything on dairy alone, she created multiple income streams that stabilize cash flow and reduce risk. Her on-farm processing of yogurt, butter, and traditional hodzeko adds value while reducing dependence on large-scale processors.

The introduction of precision artificial insemination programs allowed farmers to upgrade genetics without massive capital requirements. Climate-smart agriculture practices developed out of necessity are proving more resilient than conventional approaches used in developed countries.

Somehow, through strategic thinking refined through persistence, these farmers converted their biggest challenges into their greatest strengths.

The Leadership That Changes Everything: When Excellence Lifts Everyone

MetricTraditional CooperativeNharira Performance-Based ModelImpact
Average Daily Production8 L/cow12 L/cow+50% productivity
Member Retention Rate60%85%Higher engagement
Quality Standards Met45%78%Better market access
Knowledge Transfer Events2/year12/yearSystematic learning
Income Improvement15%45%Merit-based rewards

The most powerful lesson from Esther’s documented journey is what happens when someone who’s proven that transformation is possible decides to light the way for others. The Nharira Dairy Cooperative, which she chairs, doesn’t just pool resources—project documentation shows that it fosters systematic knowledge transfer, where successful farmers serve as mentors for developing farmers.

This peer-to-peer learning approach leverages existing social networks and cultural communication patterns rather than imposing external educational structures. Farmers learn from neighbors who have achieved actual success rather than theoretical experts without practical experience.

The cooperative provides graduated access to resources based on demonstrated capability, preventing the waste and resentment that destroy most agricultural cooperatives. Through this structure documented in cooperative development reports, smallholder farmers gain economies of scale in input purchasing, shared transportation to collection centers, technical knowledge transfer from successful farmers, risk mitigation through diversified operations, and stronger bargaining power with processors and buyers.

What came next defied all expectations about how agricultural cooperatives typically function in challenging environments. Instead of the usual infighting and resource battles, documented success stories show something beautiful happening.

Excellence started multiplying.

The Global Wake-Up Call: Rewriting the Rules of Development

What Esther and thousands like her have accomplished challenges the fundamental assumptions of agricultural development worldwide. Their documented success exposes the flaw in traditional approaches: assuming farmers need massive external resources before they can succeed.

Esther proved the opposite through her lived experience. Strategic resource optimization generates the capital needed for expansion. She didn’t solve her water problem by waiting for municipal infrastructure—she converted water scarcity into energy independence through solar-powered systems that now provide superior reliability at lower operating costs.

This approach challenges every assumption about agricultural recovery in developing countries. Instead of waiting for external investment, perfect conditions, or government support, documented case studies show farmers can begin transformation immediately by converting their biggest constraints into competitive advantages.

According to published testimonials from visiting agricultural delegations, her example has inspired dairy operations across East Africa and beyond. For dairy farmers worldwide facing their own impossible odds—whether dealing with volatile markets, infrastructure challenges, or policy barriers—Esther’s documented success provides both inspiration and a practical roadmap.

Her success didn’t require perfect conditions, unlimited resources, or government support.

It required something much more powerful: the refusal to accept that yesterday’s limitations define tomorrow’s possibilities.

The Spirit That Refuses to Break

Thinking about all the dairy farmers I’ve encountered worldwide through my work, what sets Esther apart, according to the documented accounts, isn’t just her remarkable measurable success—it’s the quality of determination that got her there.

The willingness to show up at 4:30 AM every morning when success felt impossible. The faith to invest her own money in a matching grant program when she barely had enough to survive. The courage to open her doors to neighbors who needed help, even when her own operation was still building strength.

Published profiles capture glimpses of those first brutal months—the doubt that must have crept in during the hottest afternoons, the nights when the numbers didn’t add up, the weight of neighbors’ skeptical looks. How does anyone keep going when everyone thinks they’re making a mistake?

One day at a time, the way farmers always do.

According to agricultural development reports, average production across the smallholder sector jumped from 8 liters per cow per day to 12 liters per day—a 50% increase that dramatically improved farmer incomes and food security. But those numbers only tell part of the story.

The real story is in the documented community impacts. The children are now drinking fresh milk at local schools. The young women who can continue their education without interruption. The families throughout the cooperative who have improved incomes, enabling them to access better healthcare, education, and housing.

From five pregnant cows and a broken water pump to over 2,000 liters monthly and a cooperative that’s transforming an entire district. From a country that had given up on dairy to a sector approaching complete self-sufficiency by 2025.

What This Means for All of Us

Esther Marwa’s documented journey represents something far more important than agricultural statistics. It’s living proof that individual determination combined with strategic thinking can rewrite entire industry trajectories.

Her story validates what farmers around the world know in their hearts but sometimes struggle to believe—that their knowledge, experience, and dedication are more valuable than any external expertise or capital investment.

For every farmer reading this who faces their own impossible odds, Esther’s documented example provides both inspiration and a practical framework. Her success didn’t require perfect conditions, unlimited resources, or government support. It required the courage to start with what she had, optimize relentlessly, and share success generously.

Most importantly, Esther’s story proves that agricultural transformation doesn’t require choosing between individual success and community benefit. Published accounts of her approach demonstrate how personal excellence serves as the foundation for lifting entire communities, creating ripple effects of prosperity that extend far beyond any single farm or family.

In farming, the most radical thing anyone can do is show up every morning when everyone thinks they’re crazy. Esther did that for months when no one believed. Now thousands of farmers across Zimbabwe are doing the same thing—showing up, optimizing, sharing success.

Through documented achievements and verified transformation metrics, Esther Marwa proved that five cows and an unbreakable spirit can ignite changes that transform entire industries.

Standing where she started just six years ago, watching the sun rise over what project documentation confirms has become one of Zimbabwe’s most productive dairy operations, Esther embodies something we all need to remember:

In the darkest seasons, when hope feels foolish and the odds are impossible, transformation begins with ordinary people who make extraordinary choices, one morning at a time.

Most of us already know what our “broken water pump” moment is—that challenge we’ve been avoiding or the limitation we’ve accepted as permanent. Esther’s documented story isn’t asking us to find our challenge. It’s asking us to see it differently.

Because somewhere in your constraints lies the seed of your competitive advantage. Esther found hers in five pregnant cows and a broken water pump. Her journey from that challenging beginning to transformational success, documented across multiple sources, stands as proof that when determination meets strategy, even the most impossible dreams can become a reality.

Every farmer reading this has felt that moment of doubt. Esther’s documented triumph reminds us that doubt isn’t disqualifying—it’s often the beginning of a breakthrough.

KEY TAKEAWAYS

  • Optimize what you own before seeking what you need—resource maximization beats resource accumulation every time
  • Turn your worst constraint into your best advantage—limitations force innovations that become competitive edges
  • Build cooperatives that reward excellence, not mediocrity—performance-based systems prevent free-riders and multiply success
  • Share strategic success to create systemic change—individual transformation becomes sector transformation through systematic mentoring
  • Small strategic moves trigger massive transformations—Esther’s five cows became Zimbabwe’s 169% dairy sector recovery

EXECUTIVE SUMMARY

Zimbabwe’s dairy industry collapsed by 86%, and experts wrote it off as finished. Esther Marwa saw something different. Starting with five cows and a broken water pump in drought-stricken Chikomba district, she turned every limitation into a competitive edge through strategic resource optimization. Her solar-powered innovation outperformed grid electricity, transforming 95 daily liters into over 2,000 monthly—while building a performance-based cooperative that multiplied success instead of subsidizing mediocrity. Her individual breakthrough catalyzed Zimbabwe’s stunning 169% sector recovery and triggered policy reforms that unleashed nationwide transformation. For dairy farmers worldwide facing seemingly insurmountable odds, Esther’s documented journey proves that constraint-to-advantage thinking can transform entire industries when you optimize what you control, convert problems into innovations, and share success strategically.

Complete references and supporting documentation are available upon request by contacting the editorial team at editor@thebullvine.com.

Learn More:

The Sunday Read Dairy Professionals Don’t Skip.

Every week, thousands of producers, breeders, and industry insiders open Bullvine Weekly for genetics insights, market shifts, and profit strategies they won’t find anywhere else. One email. Five minutes. Smarter decisions all week.
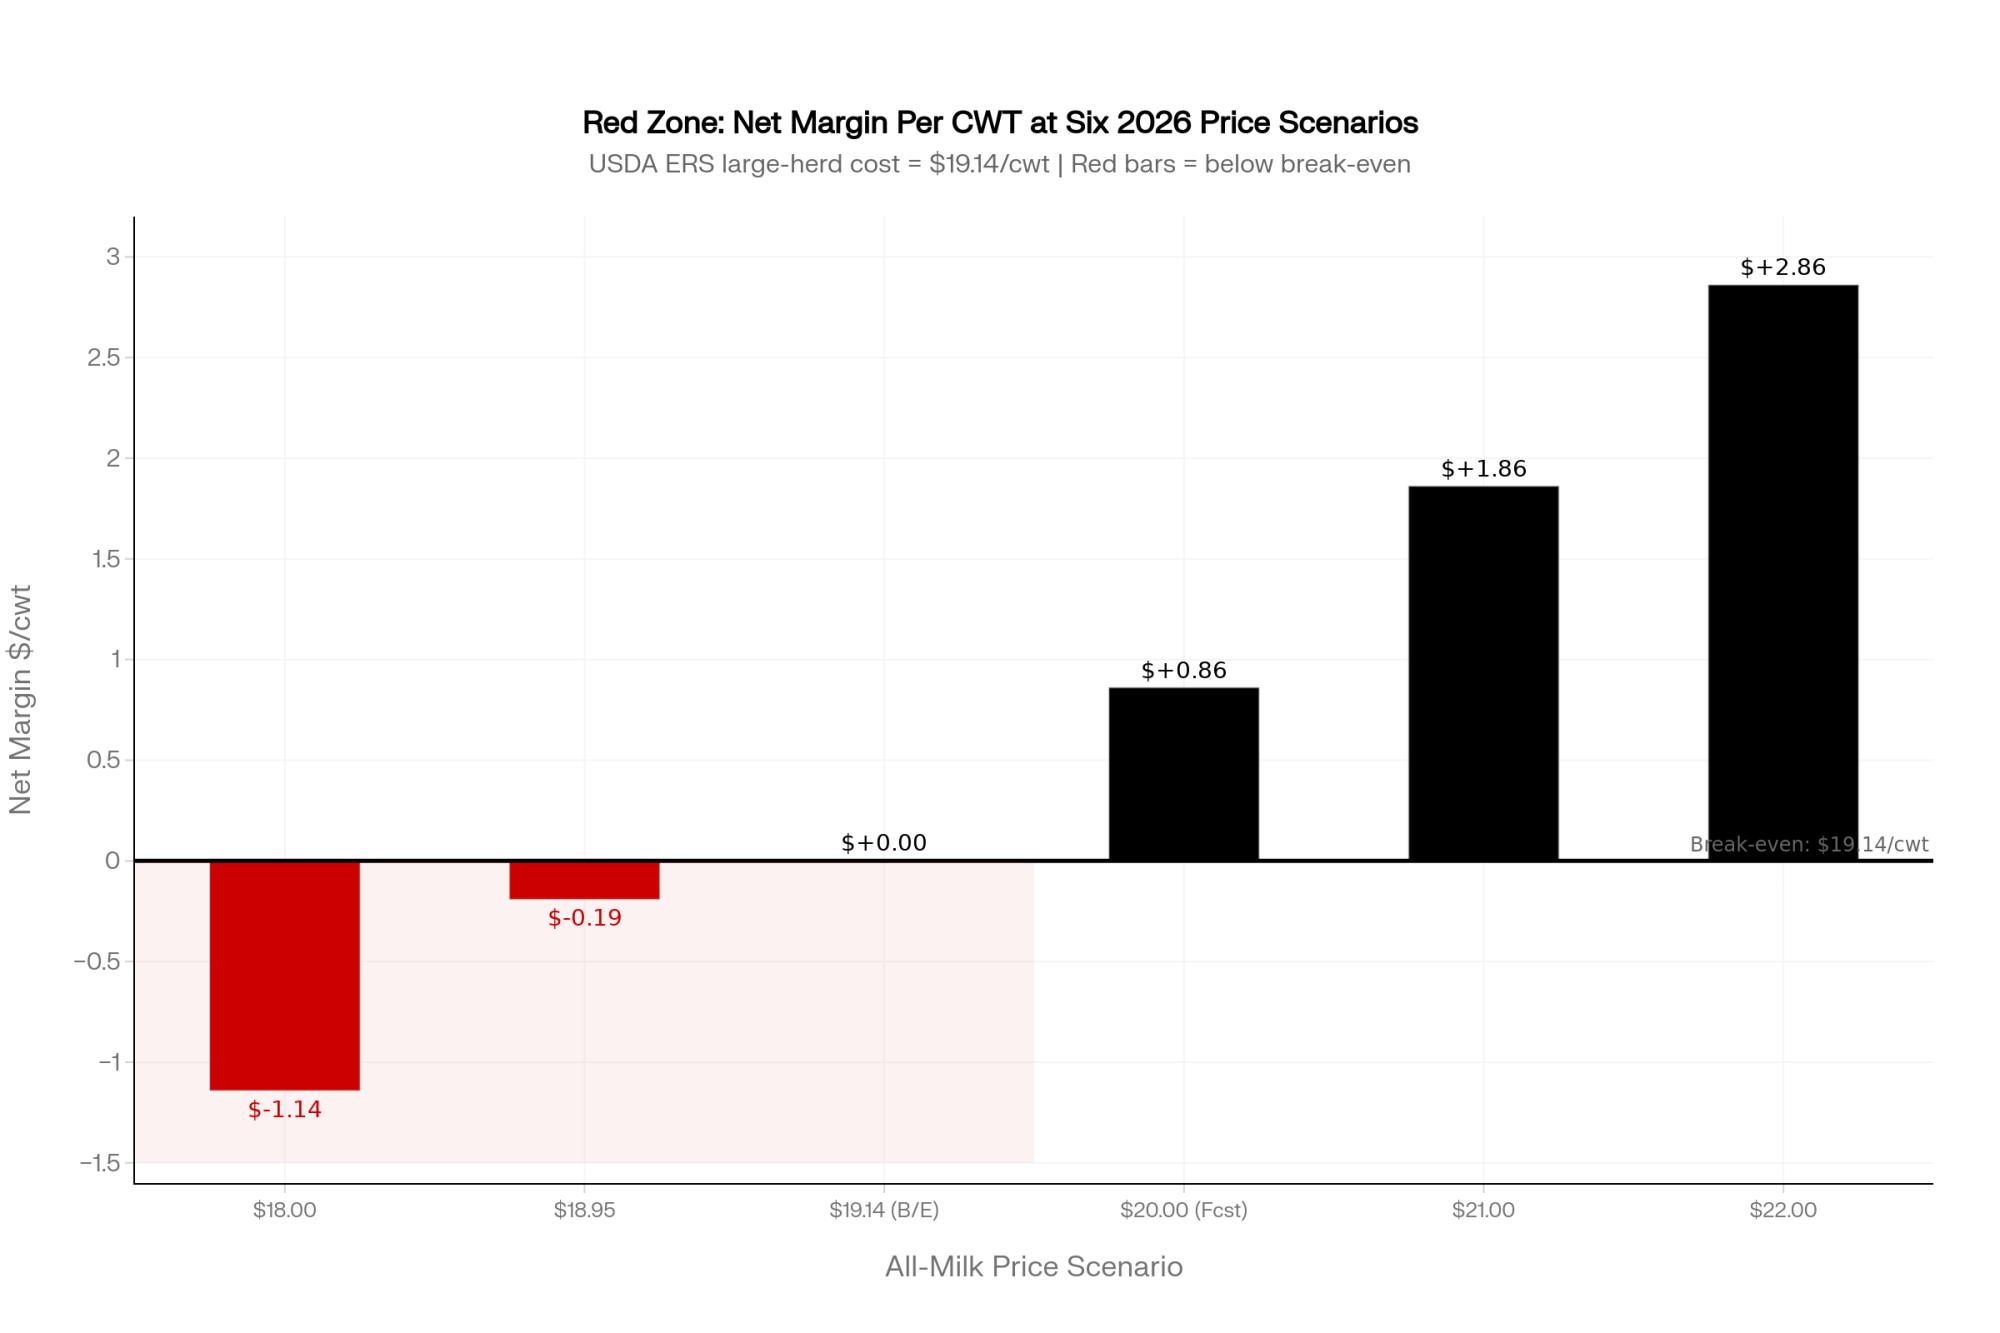
NewsSubscribe
First
Last
Consent

The Colombian Milk Scandal That’s Got Me Wondering: Could This Happen in the US?

Colombian dairy scandal exposes how multinationals play by different rules when they think nobody’s watching

EXECUTIVE SUMMARY: Here’s what we discovered: Colombia’s dairy fraud scandal reveals how sophisticated systematic deception can operate for years while detection technology sits unused in regulatory labs, destroying honest producers through artificially manipulated cost advantages. Major companies, including Lactalis, were caught adding whey to milk products at precise levels that avoided standard testing, undercutting legitimate farmers who couldn’t compete against fraudulent practices. The most damning evidence isn’t the fraud itself—it’s that regulators possessed liquid chromatography mass spectrometry equipment capable of detecting caseinomacropeptide markers but chose not to deploy it systematically. This pattern reveals a global vulnerability in which multinational corporations identify enforcement weaknesses across markets, operating with varying ethical standards based on the strength of local regulations. Consumer trust destruction hit every producer equally, but honest farmers got crushed twice—first by fraudulent competition, then by market-wide backlash when the scandal broke. The Colombian model demonstrates that without proactive fraud detection and meaningful penalties, “free market competition” can become organized deception that systematically undermines integrity-based farming. Every independent producer faces the same choice: demand enforcement systems that protect honest operations, or accept that fraudulent competitors might eliminate legitimate farming through economic warfare while regulators look away.

KEY TAKEAWAYS:

  • Demand fraud testing transparency from your state agriculture departments—ask specifically how often they deploy advanced detection equipment versus routine quality compliance, and make officials explain testing protocols that could protect honest producers from systematic competitor deception
  • Document competitor pricing patterns that don’t match basic production economics—when feed costs spike but certain operations maintain impossible pricing advantages, systematic comparison and questioning reveals potential fraud indicators before they destroy legitimate market competition
  • Build direct customer relationships to eliminate supply chain vulnerabilities—consumers will pay transparency premiums when they understand fraud alternatives, creating your best insurance against market-wide trust destruction caused by systematic deception
  • Support penalty restructuring that eliminates fraud profitability completely—current fine structures treat systematic consumer deception as manageable business expenses rather than operation-ending consequences that prevent criminal enterprises from budgeting fraud costs into competitive strategies
dairy fraud detection, farm profitability, consumer trust, supply chain integrity, dairy industry regulation

Look, I’ve been covering dairy industry BS for over twenty years, but what went down in Colombia this past year… hell, it’s got me lying awake wondering if we’re all just one lazy inspector away from watching our customers lose faith in everything we produce.

I was chatting with a producer from up near Green Bay when he started telling me about the Colombian mess. Get this. Major dairy companies in the area were fined by their competition authority for systematic milk fraud. Including Lactalis… yeah, same French outfit that runs plants all over the Midwest. Not your typical antibiotic residue violation or some listeria recall that makes the evening news. We’re talking calculated, systematic fraud.

And the real kicker? Their food safety regulators apparently had the technology sitting in labs to catch this stuff. Just… didn’t bother using it systematically.

Which got me thinking. If that can happen there…

When “Quality Control” Becomes Looking the Other Way

Now, I don’t know all the specific details about fines or exact amounts—Colombian regulatory stuff gets pretty murky when you try to dig into it from up here. But from what I’ve been able to piece together through dairy trade publications and regulatory announcements, these companies weren’t desperate operators cutting corners during a bad feed year when corn hit seven bucks.

This was systematic. Adding whey to milk products… not enough to trigger your basic butterfat or protein tests that most quality programs rely on, but enough to bulk up volumes and slash production costs while still meeting standard specifications.

Think about that for a minute. You’re out there competing against guys who can artificially reduce their input costs while you’re paying full freight for everything. Feed costs through the roof, labor getting more expensive every year, fuel prices bouncing around like a fresh heifer in a new pen… but these guys somehow manage to undercut everyone else?

I mean, we’ve all seen weird pricing from competitors that makes you scratch your head and wonder what the hell they know that you don’t. Guy down the road somehow manages to bid way under what your spreadsheet says is even possible. Most times, you figure it’s better operational efficiency, different sourcing deals, maybe family labor keeping their costs down, or hell—maybe they’re just taking losses to grab market share.

But what if it’s not? What if it’s fraud?

And honestly, how would you even know?

The Technology Shell Game That Should Scare Everyone

Here’s the part that really gets under my skin about this whole Colombian situation. Their food safety agency—called Invima, basically their version of the FDA—apparently had liquid chromatography mass spectrometry equipment just sitting in their labs.

Now, I’m no lab technician, but from what I understand, after talking to food science experts over the years, this equipment is specifically designed to detect dairy fraud by identifying caseinomacropeptide. Fancy name, but basically it’s like a chemical fingerprint that shows up when you add whey where it doesn’t belong.

This stuff doesn’t lie. Can’t fake it, can’t hide it, can’t explain it away if it shows up in products where it shouldn’t be there.

But systematic testing? Proactive monitoring to protect honest producers and consumers?

Nah. Too much work, apparently.

So I’m thinking… if that can happen in Colombia, what’s stopping similar stuff from happening right here? You think every state lab is running comprehensive fraud testing on dairy products moving through their system? You think USDA’s got the budget and manpower to check for this kind of sophisticated adulteration systematically?

I’ve been asking around at industry meetings lately. “How often do you guys actually test for fraud versus just standard quality metrics?” Most officials get this uncomfortable look—you know the one—and start talking about budget constraints and testing priorities and resource allocation.

Budget constraints. Right. Meanwhile, millions of dollars worth of detection equipment might be gathering dust because it’s easier to stick with routine paperwork than hunt for problems that create controversy.

When Big Companies Play by Different Rules in Different Places

The Lactalis angle really bothers me, honestly. These guys operate plants all over North America. Big corporate responsibility initiatives in their annual reports, sustainability programs, comprehensive compliance frameworks… the whole nine yards when they’re operating in markets with strong enforcement.

But down in Colombia? Apparently, it’s a different story altogether.

When they got caught—and I’m going off what trade publications reported—their response was basically textbook corporate damage control. Deny everything, reject the sanctions, fight it through lawyers, claim the investigation was flawed.

Standard playbook when you get caught with your hand in the cookie jar.

But here’s what gets me. Same company, same management structure, same corporate policies… but apparently different operating standards depending on what they think they can get away with in different markets?

That’s not an accident. That’s strategy.

Makes you wonder what other markets they’re operating in where enforcement might be… let’s say more flexible. And if Lactalis is doing this kind of regulatory arbitrage, what about other multinational food companies? How many are studying enforcement patterns across different countries and adjusting their ethics accordingly?

The Honest Producers Who Got Steamrolled

You know what really breaks my heart about this whole Colombian mess? The legitimate farmers who got crushed while this fraud was running, and nobody talks about them in all the regulatory press releases and industry coverage.

I don’t have exact consumption figures—Colombian market data’s not exactly easy to get your hands on from up here—but think about what happens when major dairy fraud scandals break in any market. Consumers don’t just get mad at the specific companies that got caught. They start questioning everything. Every brand, every product, every producer in the entire industry.

Reduce consumption. Switch to alternatives. Tell their friends and family to be careful about dairy products.

That hits everyone in the market. Honest operations and fraudulent ones alike.

You’ve probably seen it in your own area when food safety scares hit the news. Suddenly, your best customers are asking questions they never asked before, wanting documentation you never had to provide, second-guessing purchases they used to make automatically.

But here’s the double-whammy that honest Colombian farmers took. First, they’re trying to compete against companies with artificially low costs they couldn’t possibly match without compromising product integrity. Companies that could undercut them on price while maintaining fat profit margins through fraud.

Then, when the scandal finally breaks and hits the news, they get hammered by the consumer backlash just as hard as the criminals who caused the whole mess.

You do everything right—invest in genetics, feed quality, proper testing, follow every regulation, pay every fee—and you get punished twice. Once by the fraud destroying fair competition, once by the aftermath destroying consumer confidence.

That’s not a market failure. That’s a system designed to screw honest producers.

The Accountability That Never, Ever Comes

Want to know what really shows you how broken these systems are? What proves that protecting honest farmers isn’t actually the priority?

While these companies faced regulatory sanctions and public embarrassment, I can’t find any evidence that Colombian food safety officials lost their jobs for having fraud detection equipment but choosing not to deploy it systematically.

Think about that for a minute. You’ve got bureaucrats whose job—whose actual job description- is protecting consumers and legitimate producers from exactly this kind of systematic deception. They have the tools to do it, the authority to do it, the budget to do it… and they just don’t.

Then, when the whole thing blows up and honest farmers get destroyed and consumers lose trust in dairy products, these officials keep their jobs, keep their pensions, keep collecting paychecks while writing reports about “lessons learned” and “improved protocols.”

Meanwhile, the farmers who played by the rules are dumping milk they can’t sell because nobody trusts the industry anymore.

That tells you everything you need to know about where the real priorities are in these regulatory systems.

The Pattern That Keeps Me Up at Night

Look, I can’t prove that Colombian-style systematic fraud is happening here. Don’t have smoking gun evidence, don’t have whistleblowers coming forward with documents, don’t have regulatory investigations to point to.

But I keep hearing things that make me wonder…

Producers mention competitors who seem to have cost structures that don’t add up when you run the basic math of dairy production. Feed costs, labor, utilities, transportation, processing… add it all up, and their pricing shouldn’t be possible.

Most of us assume it’s operational efficiency we haven’t figured out yet. Better genetics giving them higher production per cow, different marketing arrangements, maybe some family labor advantage, or they’re just willing to operate on thinner margins than makes sense to us.

The Colombian situation makes you wonder if sometimes… it’s not.

Down in Wisconsin, you talk to producers who’ve been scratching their heads about certain competitors for years. “I don’t know how they do it,” they’ll say. “Numbers just don’t work out when I try to reverse-engineer their costs.”

Ohio guys tell similar stories. Texas producers, too. Same pattern everywhere—competitors whose economics seem to defy the basic math of honest dairy production.

And most of the time, we shrug and figure they know something we don’t, or they’re just better managers, or they’ve got some cost advantage we can’t see.

But what if sometimes… they’re cheating?

The Technology That Exists But Sits Unused

Here’s what’s really frustrating when you start digging into this stuff. The technology to detect sophisticated dairy fraud exists today. Not theoretical future developments—actual equipment sitting in labs right now across the country.

Liquid chromatography can detect whey adulteration at levels that would not be detected by standard butterfat or protein testing. Isotopic analysis can track the geographical origin of products. Near-infrared spectroscopy can identify compositional problems in real-time during processing.

The detection capabilities are remarkable when they’re actually deployed. When they’re actually deployed.

The problem isn’t the technology. The problem is that systematic deployment requires commitment, budget allocation, and political will to actually find problems rather than just going through regulatory motions.

Because fraud detection creates work. Creates controversy. Creates budget demands, political headaches, and industry pushback. Much easier for regulatory officials to focus on routine paperwork, check compliance boxes, and avoid actively hunting for problems that complicate everyone’s life.

The Colombian mess proves that this dynamic exists and can persist for years, while systematic fraud operates right under regulators’ noses.

Makes you wonder how many expensive fraud detection systems are gathering dust in government labs across this country while potential fraud operations perfect their techniques and eliminate honest competitors through economic warfare.

What Happens When Consumer Trust Dies

You know what the most expensive part of the Colombian fraud probably was? Not whatever fines eventually got imposed… not even the immediate market disruption when the scandal broke.

It was destroying consumer confidence in dairy products across the entire market.

When people find out they’ve been systematically deceived about something as basic and trusted as milk quality, they don’t just get mad at the specific companies that got caught. They start questioning everything. Every brand, every label, every claim, every producer.

That trust destruction hits everyone in the industry. Takes years to rebuild, if it ever comes back completely.

And while criminals were maximizing short-term profits through systematic deception, they were destroying the long-term foundation of the entire market on which they depended on. Including their own future business.

Short-sighted bastards didn’t just steal from honest competitors and deceive consumers… they poisoned the well for everyone.

What We Can Actually Do About This

So what do we do with all this? Sit around worrying about phantom fraud schemes we can’t prove? Assume every competitor with good pricing is cheating?

Hell no.

First thing—and this is something every producer can do right now—start asking uncomfortable questions at industry meetings and regulatory sessions. If your state agriculture department has advanced testing equipment, ask how often they actually use it for fraud detection versus routine quality compliance.

Make them explain their testing protocols, their priorities, and their resource allocation. Ask when they last found systematic adulteration, what they’re specifically looking for, and how they’d recognize sophisticated fraud if it was happening.

I’ve been doing this lately. Results are… interesting. Lots of uncomfortable shifting in seats and vague answers about “comprehensive testing programs” and “risk-based approaches” that don’t actually answer the question.

Second—pay attention to competitors whose economics don’t seem to make sense. If someone’s consistently pricing way below what honest production costs should allow, especially when feed costs are high or labor markets are tight, that’s worth questioning.

Keep records. Ask around. Compare notes with other producers. Make noise when the math doesn’t add up.

Not saying everyone with good pricing is cheating. But systematic fraud relies on everyone assuming there’s always a legitimate explanation for impossible economics.

Third—build direct relationships with your customers whenever possible. Best protection against supply chain fraud is eliminating middlemen who might facilitate it unknowingly… or worse, knowingly.

Consumers will pay premiums for transparency and traceability when they understand what the alternatives might look like. Your relationship with customers is your best insurance policy against market-wide trust destruction.

Fourth—support meaningful penalties when fraud gets discovered. Current regulatory structures that treat systematic deception as minor business violations with manageable fines need to change.

We need consequences that eliminate the profitability of fraud completely, not just add modest operational costs that criminals can budget for as part of doing business.

The Bottom Line

Here’s the thing that keeps bugging me about this Colombian situation, and why I can’t just file it away as “that’s their problem, not ours.”

It’s probably not unique.

Suppose systematic dairy fraud can operate for years in a market with a decent regulatory structure and available detection technology. What makes us think similar schemes couldn’t work in other markets with similar vulnerabilities?

Every independent producer—every honest operation—faces the same basic choice. Either we organize to demand enforcement systems that actually protect legitimate farming, or we accept that fraudulent competitors might systematically eliminate us through economic warfare while regulators look the other way.

Because once consumer trust gets destroyed by systematic deception, it doesn’t come back easily. And neither do the livelihoods of farmers who refused to compromise their integrity while criminals prospered.

Colombia illustrates what happens when regulatory systems fail to protect honest producers, despite having the tools and authority to do so.

Technology exists to prevent sophisticated dairy fraud. Legal authority exists to stop it. Budget exists to deploy it systematically.

Question is whether we’ll demand that our systems actually work to protect us… or just hope that fraud doesn’t spread to markets we depend on.

Honestly? After seeing what happened to honest farmers in Colombia while regulators had detection equipment gathering dust

I’m not sure hoping is enough anymore.

Complete references and supporting documentation are available upon request by contacting the editorial team at editor@thebullvine.com.

Learn More:

The Sunday Read Dairy Professionals Don’t Skip.

Every week, thousands of producers, breeders, and industry insiders open Bullvine Weekly for genetics insights, market shifts, and profit strategies they won’t find anywhere else. One email. Five minutes. Smarter decisions all week.
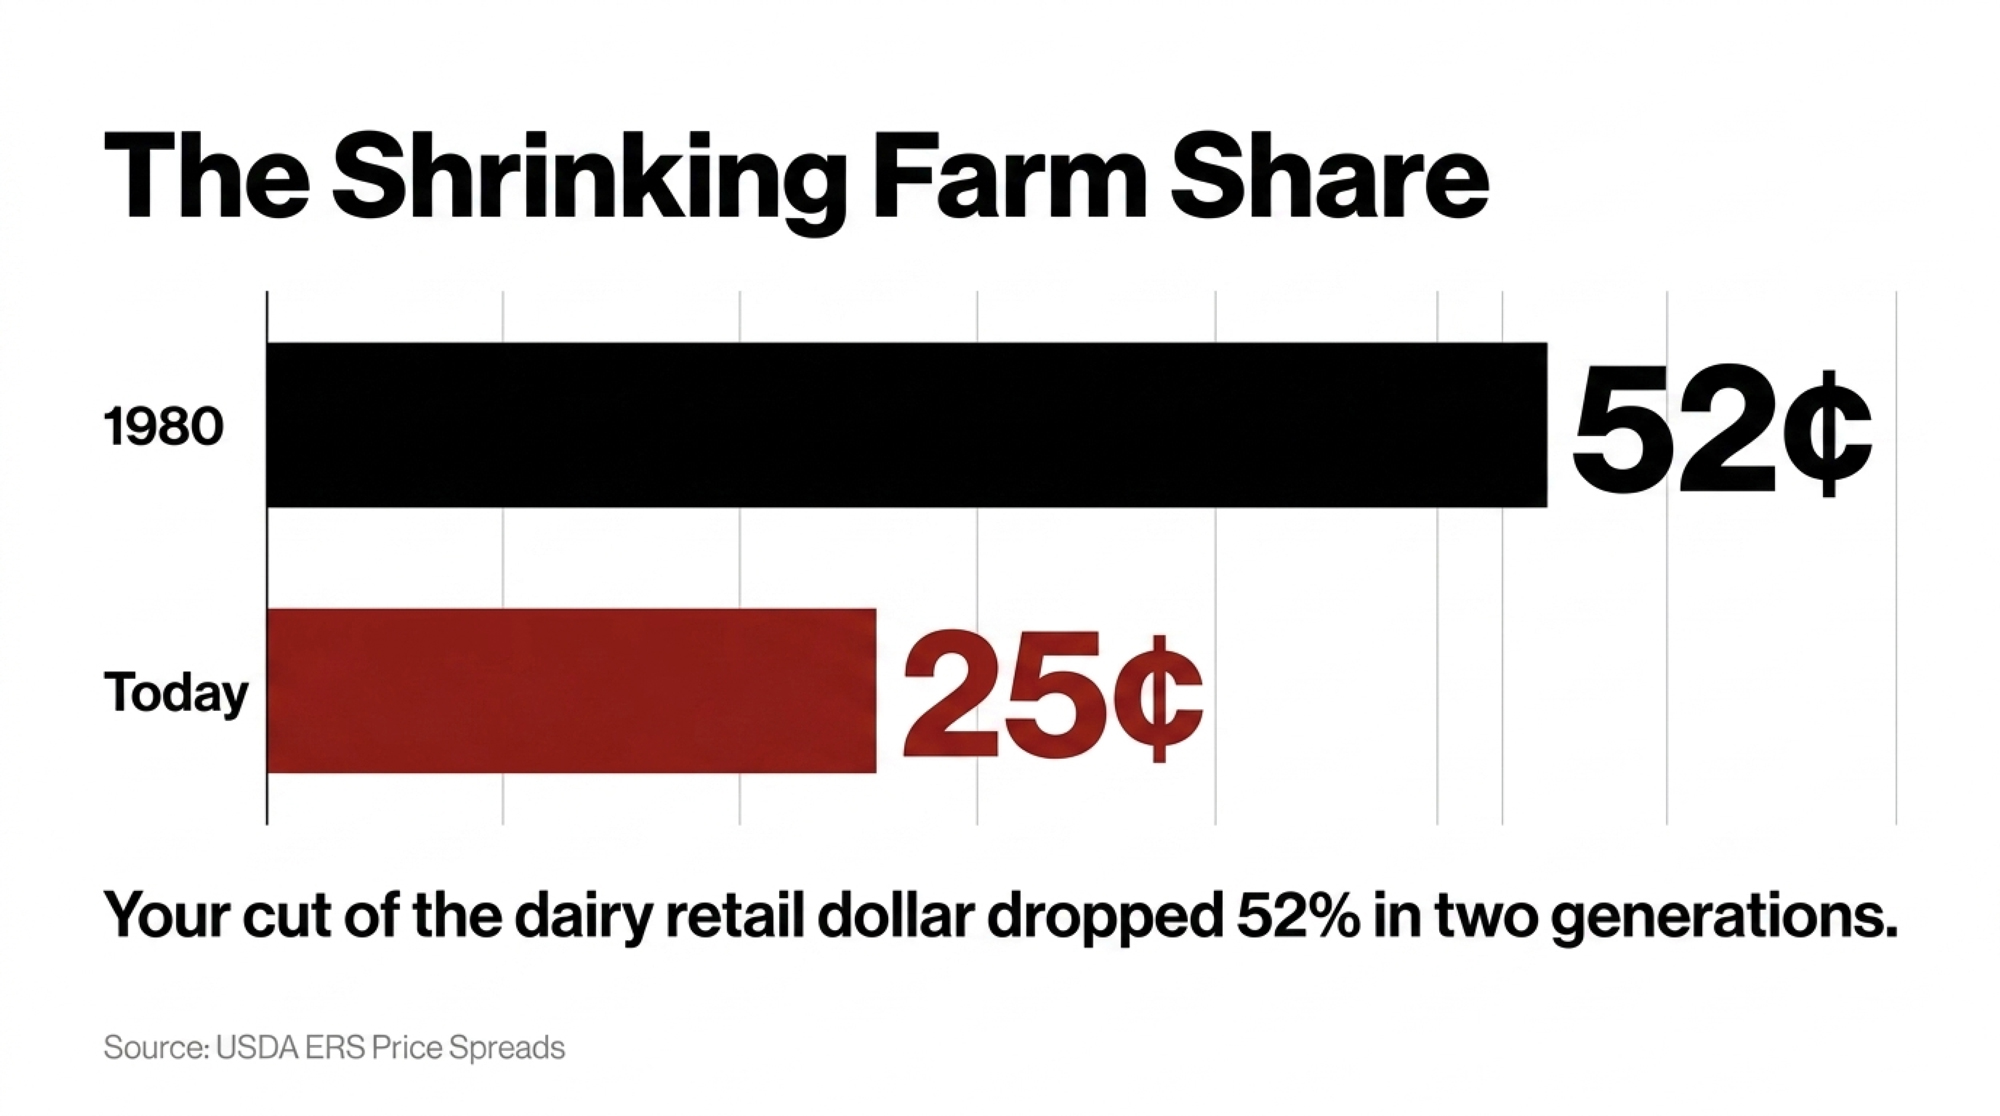
NewsSubscribe
First
Last
Consent

The UK’s Dairy Sustainability Breakthrough: What It Means for You

UK’s €40K sustainability bribes are rigging dairy consolidation—and North America’s next

EXECUTIVE SUMMARY: Here’s what we discovered: sustainability programs aren’t saving small farms—they’re systematically eliminating them. UK data reveals 6% annual farm closures while average herd sizes jump to 219 cows, and that’s no accident. Corporate giants like Arla are dropping €40,000 payments per farm, but only large operations can afford the €200,000 infrastructure to qualify. Meanwhile, McDonald’s $200 million investment in “regenerative agriculture” signals the 2027 timeline when North American producers will face the same squeeze. The math is brutal: fixed compliance costs favor 800+ cow operations, leaving smaller farms with a stark choice—scale up, sell out, or get crushed. This isn’t environmental policy—it’s the most sophisticated industry consolidation scheme ever devised.

KEY TAKEAWAYS:

  • Start carbon tracking immediately—early adopters report 5% feed efficiency gains and access to premium contracts worth $0.50+ per hundredweight
  • Form strategic partnerships with 3-5 neighboring dairies to share $100K+ infrastructure costs for digesters, solar systems, and monitoring equipment
  • Watch California and New York regulations like a hawk—these states typically lead policy changes by 18-24 months, giving you advance warning
  • Invest in dual-purpose technology: methane sensors and precision feeding systems that boost both sustainability scores and milk production by 8-12%
  • Perfect your fresh cow management and butterfat protocols—these “small” details now directly impact your farm’s survival in sustainability scoring systems
dairy sustainability, farm profitability, dairy consolidation, UK dairy, regenerative agriculture

I was talking with a dairy farmer from Wisconsin the other day—runs about 600 head—and he’s feeling the heat like a lot of us. You know how it goes; the little guys around him are wondering how long they can stay afloat as these new sustainability demands start rolling in.

Now here’s what’s interesting… The UK, despite importing about a third of their milk, has quietly become the leader everyone’s watching when it comes to dairy sustainability standards. But what really caught my attention isn’t just their environmental targets—it’s how they’ve structured the whole thing actually to work for farmers instead of against them.

Take Arla, that Danish cooperative that’s gotten huge over there. They’re cutting checks for around €40,000 a year to farmers who hit their sustainability marks. That’s real money, not promises. And according to their latest corporate reports, they’re planning to pour over €2 billion into these incentive programs by 2030.

The UK government isn’t sitting on the sidelines either. They’ve committed £5 billion through their Sustainable Farming Incentive program, paying farmers between £100 and £300 per hectare annually. When you’re looking at a typical 200-hectare operation, that starts adding up to something you can actually bank on.

The Economics That Are Changing Everything

This chart reveals the engineered consolidation behind UK dairy sustainability programs. As closure rates doubled from 3% to 6% annually, average herd sizes jumped 18% to 219 cows—proving this isn’t market evolution, it’s systematic elimination of smaller operations.

But here’s the kicker—and this is where it gets tricky for smaller operations. The fixed costs of things like installing digesters or solar panels don’t get any cheaper just because you’re milking fewer cows. Farms running 800 head or more have a clear advantage here because they can spread those investments across more production volume.

The smoking gun: Compliance costs per cow are 3.4x higher for small farms (£1,200) versus large operations (£350). This isn’t accidental—it’s mathematical elimination of family dairies disguised as environmental progress.

That economic reality is driving real consolidation in the UK. The numbers from AHDB tell the story: dairy farm numbers dropped 5.8% just between April 2023 and 2024, while average herd size climbed to around 219 cows. We’ve seen this pattern before in other sectors, but what’s different here is that the sustainability angle is accelerating it.

What’s remarkable is their results. UK dairy operations have achieved a carbon footprint of about 1.25 kg CO2e per liter of milk—that’s roughly 43% of the global average, according to Dairy UK’s latest assessments. Some of that’s climate advantage, sure, but a lot comes from this systematic approach to measuring and managing efficiency.

When This Pressure Hits North America

Looking at corporate investment patterns, I’d say we’re looking at real pressure starting around 2027. McDonald’s just announced a $200 million regenerative agriculture commitment this past September, and if you know their playbook with supply chain initiatives, they typically move from pilot programs to requirements over about five years.

From there, expect formal contract requirements around 2029-2030, with serious market pressure building over the next few years after that. Based on how these things usually roll out, that’s when you see the most dramatic changes in farm structure.

You can bet companies will start ramping up demands for carbon data, rolling out incentive programs with real cash behind them, and regulations will tighten—especially in places like California and New York, where environmental policy tends to lead.

Regional differences are going to matter here. Wisconsin’s cooperative culture might actually provide some advantages—you’ve got the collaborative experience and often the scale to make these investments work. California operations are among the earliest to adopt pressure, but also have access to the most advanced technologies and financing programs.

The Technology That Actually Works

What really impresses me about the UK approach is how they’ve handled the measurement challenge. Instead of leaving farms to figure out monitoring on their own, they’ve invested in standardized systems.

Those GreenFeed units, for example—they measure methane emissions right at the cow level with remarkable precision. The UK government invested £364,000 just in monitoring equipment at Harper Adams University alone. When you compare that to the confusion most of us deal with trying to figure out which carbon calculator to use…

They’re using eight approved carbon footprinting systems that all work from the same methodology, so there’s no more wondering if you’re getting comparable results to your neighbors.

And their incentive structure is designed to prevent gaming. Arla’s program awards points across 19 different activities, but the highest point values go to the hardest changes to fake—feed efficiency improvements, fertilizer reduction, energy optimization, and animal health improvements. You can’t just check boxes and collect payments.

Strategic Paths Forward

Looking at this transition, I see three clear options for North American producers:

Scale Up: If expansion’s in your plans, now’s the time to run the numbers on sustainability infrastructure. You’re looking at needing 800-1,200 cows minimum to make the per-unit economics work on monitoring systems, renewable energy, and emissions reduction technology.

Partner Up: For operations that can’t or don’t want to scale individually, strategic partnerships with 3-5 similar farms can provide the volume needed for shared infrastructure. The UK cooperative models show how this works—shared monitoring costs, coordinated energy installations, group contracts with sustainability-focused buyers.

Strategic Exit: Let’s be honest about this third option. For some operations, particularly smaller farms without good partnership opportunities, strategic exit while asset values remain strong might be the smart financial move. UK data shows operations that exit proactively preserve more asset value than those forced out by market pressure later.

What This Means for Your Bottom Line

Here’s what I find encouraging about this whole development: when you look at UK operations that are thriving in this new system, they’re finding that the same changes that reduce emissions often improve operational efficiency too.

Better feed conversion reduces both costs and methane output. Improved cow health cuts both veterinary expenses and stress-related emissions. More efficient manure handling reduces both labor costs and environmental impact.

The latest UK Dairy Roadmap progress reports show that 80% of farmers are now calculating their carbon footprint, compared to less than 20% globally. When sustainability compliance starts generating revenue instead of just regulatory headaches, adoption rates follow pretty quickly.

Looking at Your Day-to-Day Operations

For those of us managing fresh cow transitions, monitoring butterfat performance, or optimizing dry lot systems, here’s something worth noting: these day-to-day management decisions are increasingly becoming part of your sustainability profile.

Feed efficiency during the transition period, reproductive performance metrics, even housing system choices—they all factor into carbon footprint calculations. The operations that are well-positioned for this transition aren’t necessarily the ones that love environmental regulations. They’re recognizing that fighting market forces costs more than adapting to them.

Your Action Plan

This shift creates real opportunities for operations willing to treat sustainability as a competitive advantage rather than a compliance burden. Early movers get better access to funding, premium contracts, and technical support.

What you should be doing:

  • Start carbon footprinting now, while tools and assistance are available—early movers will be ahead when requirements become mandatory
  • Watch for voluntary programs offering real financial incentives—these are stepping stones before requirements become firm
  • Consider partnerships with neighboring operations to share costs and expertise if scaling alone isn’t feasible
  • Monitor regional developments, especially in states with existing environmental regulations like California and New York
  • Invest strategically in technologies that improve both sustainability and operational efficiency—think feed management systems, renewable energy, and improved animal health protocols

The bottom line? This isn’t going away. But for operations willing to engage thoughtfully with these changes, there’s a real opportunity to build more profitable, resilient businesses.

The UK has demonstrated that sustainability initiatives can be structured in a way that does not harm farm economics. The question for North American producers is whether you’ll be positioned to benefit from similar programs when they arrive, or scrambling to catch up after the opportunity window closes.

Complete references and supporting documentation are available upon request by contacting the editorial team at editor@thebullvine.com.

Learn More:

  • How to Get Started with Carbon Footprinting on Your Dairy Farm – This article provides a practical, step-by-step guide to assessing your farm’s carbon balance. It offers actionable advice on immediate, low-cost strategies like optimizing manure use and reducing tillage, empowering you to begin your sustainability journey with clear, manageable steps that directly impact efficiency.
  • The Economics of Dairy Sustainability: From Compliance to Cash Flow – This piece shifts the focus from environmental policy to financial strategy. It reveals how forward-thinking dairy operations are generating revenue and improving their bottom line by implementing phased sustainability plans, demonstrating that these investments can offer real, measurable returns on investment.
  • Precision Fermentation: What Dairy Farmers Need to Know About the Next Food Disruption – This article prepares you for the future of the dairy market by analyzing the disruptive potential of new technology. It provides a strategic look at how precision fermentation is reshaping the protein market and offers insights on how to adapt your business model to remain competitive.

The Sunday Read Dairy Professionals Don’t Skip.

Every week, thousands of producers, breeders, and industry insiders open Bullvine Weekly for genetics insights, market shifts, and profit strategies they won’t find anywhere else. One email. Five minutes. Smarter decisions all week.
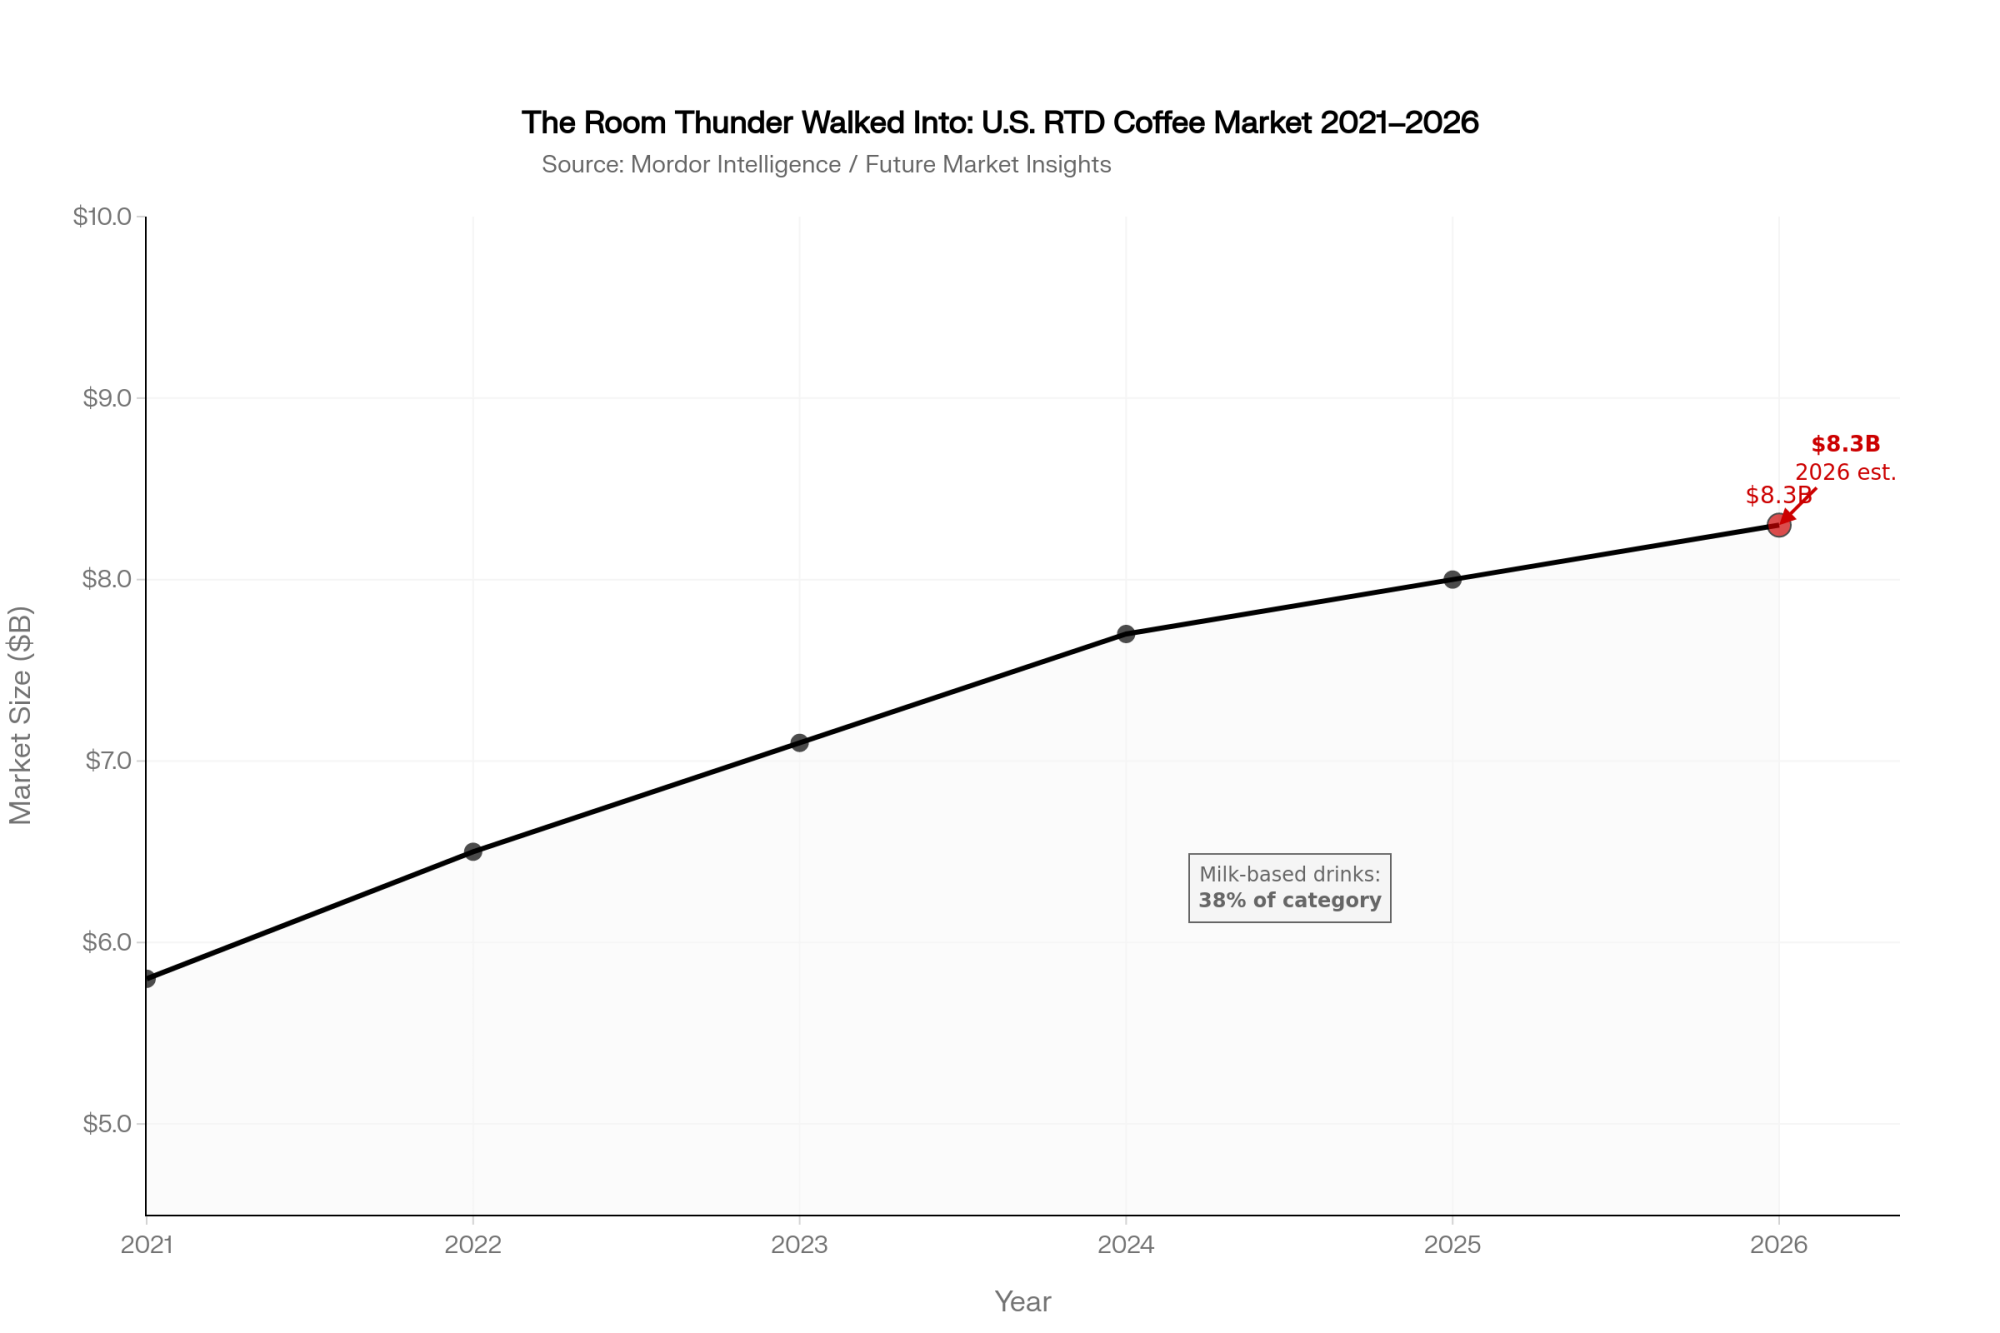
NewsSubscribe
First
Last
Consent

Why This Dairy Market Correction Feels Different – and What It Means for Our Farms

Is your farm positioned to thrive during the longest dairy correction in decades?

EXECUTIVE SUMMARY: The 2025 dairy market correction presents unprecedented challenges, with butter prices plunging 30% since summer and cheddar declining 14% since mid-August, creating margin pressure across all regions. What makes this correction different is its global scope—New Zealand’s milk production surged 14.6% while China’s dairy imports dropped 15%, fundamentally altering traditional market dynamics. Progressive operations are finding stability through anaerobic digesters generating $400-450 per cow annually, though this technology remains accessible primarily to larger farms. Industry projections suggest up to 160,000 dairy operations worldwide may close over the next two years, with asset losses potentially reaching $400 billion globally. However, innovative farmers are adapting through direct-to-consumer marketing, cooperative digester partnerships, and refined transition cow management protocols. The extended 18-to 24-month correction timeline requires strategic thinking rather than simply waiting for recovery. Those who embrace diversification, strengthen local market relationships, and invest in operational efficiency are positioning themselves not just to survive, but to acquire distressed assets and emerge stronger when markets stabilize.

KEY TAKEAWAYS:

  • Revenue diversification pays: Anaerobic digesters generate $400-450 per cow annually through carbon credits and renewable energy sales, providing crucial margin protection during price downturns
  • Market correction extends longer: Unlike typical 6-9 month cycles, structural factors suggest 18-24 months of pressure, requiring conservative planning and aggressive cost management
  • Consolidation accelerates rapidly: Forecasted closure of 160,000+ dairy operations globally creates acquisition opportunities for well-positioned farms while eliminating competitors
  • Local markets offer premiums: Direct-to-consumer sales and specialty processing partnerships command 40-60% price premiums over commodity markets during corrections
  • Operational excellence becomes critical: Focus on transition cow management, component optimization, and feed efficiency improvements to maintain profitability at lower milk prices
dairy market correction, farm profitability, dairy business strategies, global dairy trends, anaerobic digesters

You know, when we sit down with a cup of coffee and talk about markets these days, there’s this feeling that we’re not just going through another typical cycle. This time feels different. Really different.

I’ve been tracking the numbers closely, and what I’m seeing should concern every dairy producer. CME butter prices have dropped about 30% since summer, falling from around $2.62 per pound down to $1.83 by mid-September, according to the latest Dairy Herd Management reports. Cheddar’s been hit too—down roughly 14% since mid-August. But here’s what’s really got my attention: this isn’t just happening here in the States.

This line graph clearly illustrates the severity and speed of the 2025 dairy price correction, showing butter’s dramatic 30% fall from $2.62 to $1.83 per pound and cheddar’s 14% decline since mid-August. 

Take Wisconsin, where I was talking with producers just last week. They’re telling me the pressure on butterfat performance and milk solids pricing has been relentless. “In past corrections, we’d see some regional breathing room,” one Fond du Lac operator explained. “Maybe when the Midwest got hit, New York or Michigan would hold steady. Not this time.”

The data backs up what farmers are feeling on the ground. We’re seeing volatility that’s literally double the typical market swings, while skim milk powder prices have converged globally. That means those usual price gaps we’ve always counted on for export opportunities? They’re shrinking fast.

The Digester Game-Changer

Now here’s where things get interesting—and frankly, a bit concerning if you’re running a traditional operation. Larger farms with anaerobic digesters are playing a completely different game during this downturn.

I recently spoke with a California dairy operator who put it perfectly: “The digester income has really been our saving grace. We’re pulling in about $400 to $450 per cow yearly through energy sales and carbon credits, and it’s smoothing out these wild price swings.” According to EPA AgSTAR program data, these numbers are realistic for operations that can afford the capital investment.

But let’s be honest about the math here. Those digesters typically require multi-million dollar investments and work best for herds of 2,000 cows or more. That puts them out of reach for many family operations.

This table illustrates why anaerobic digesters provide significant advantages to larger operations while remaining largely inaccessible to smaller farms, highlighting the technology’s role in creating unequal market resilience.

What’s encouraging, though, is hearing about cooperatives—especially in Quebec and parts of the Midwest—pooling resources to make digester technology more accessible. It’s a promising approach that could level the playing field somewhat.

New Zealand’s Production Paradox

Meanwhile, our friends in New Zealand are dealing with their own interesting situation. Milk production is actually up about 14.6% this season in terms of milk solids, according to their dairy association reports. Farmers there are enjoying some seriously good payouts—around NZ$10.15 per kilogram of milk solids from Fonterra, which represents one of the best rates in recent years.

But here’s the catch that not everyone’s talking about. Fonterra’s balance sheet shows they’ve been dipping into reserves to maintain these high payouts, which obviously can’t continue forever. When the inevitable adjustment comes—probably early next year—it won’t be a sudden cliff but more of a gradual slide over several months.

What’s particularly problematic is how farmers typically respond to declining payouts. They tend to push production even higher, trying to make up for lower per-unit revenue with increased volume. Makes perfect sense from their perspective, but it keeps the global market flooded with supply exactly when we need less.

China’s Changing Role

And then there’s China—the market that used to be our safety valve. Their dairy imports have dropped about 15% recently, according to USDA Foreign Agricultural Service data and Rabobank research. They’re pushing hard toward domestic milk production despite higher feed costs, and you can see this shift reflected in how they’re using dairy ingredients—moving from imported powders to locally produced products.

This represents a fundamental change in global dairy trade patterns. Where China used to come in with big buying sprees whenever prices softened, we can’t count on that anymore.

This stark contrast between New Zealand’s 14.6% production surge and China’s 15% import decline illustrates why traditional market-balancing mechanisms aren’t working in 2025.

What the Timeline Really Looks Like

Piecing all this together, the data suggest we’re probably looking at a market correction that stretches 18 to 24 months before things truly stabilize. That’s significantly longer than the typical 6-9 month cycles we’re used to.

The consolidation numbers are sobering. Industry analysis based on USDA census data and current trends suggests as many as 160,000 dairy operations worldwide could close during this period, with asset losses potentially reaching $400 billion globally as farms get liquidated at distressed prices.

The projected closure of 160,000+ dairy operations over two years won’t impact all regions equally, with North America and Europe bearing the heaviest consolidation burden.

But it’s not all doom and gloom. I’ve seen some remarkable adaptation happening.

Real-World Success Stories

There’s a producer near Fond du Lac who started layering direct-to-consumer sales alongside regular contracts—it’s helped cushion the financial blow considerably. Around the Northeast, smaller farms are crafting local brands that command genuine premiums from consumers who value the farm story.

In California’s Central Valley, some larger operations are weathering this storm because they tightened their efficiency measures back when times were good. They’re now positioned to acquire distressed assets at significant discounts, potentially.

What This Means for Your Operation

If you’re running an operation under 1,200 cows, this is the time to investigate partnerships for renewable energy projects seriously. Look hard at your transition cow management—those improvements in fresh cow protocols can make a real difference during tight periods. And explore local market niches where your farm’s story might command premium pricing.

For those managing larger herds, prioritizing investments in alternative revenue streams isn’t optional anymore—it’s essential. Consider moving aggressively on digester projects, carefully scouting acquisition opportunities, and tightening cost controls across the board.

Don’t think of this as a sprint to the finish line. The road ahead is long, with challenges and opportunities wrapped together.

Learning from History

Remember, we’ve navigated major industry transformations before. The shift to artificial insemination. The evolution from tie-stall barns to parlor systems. The adoption of computerized feeding. Each transition seemed overwhelming at the time, but the industry emerged stronger and more productive.

Those who embraced change didn’t just survive—they thrived in the new environment.

The Path Forward

What’s your next move going to be? Are you positioning for adaptation or just hoping to ride this out?

Let’s keep the conversation going and share what’s working. The best lessons often come from our collective experience, especially during challenging times like these.

Market Snapshot:

  • CME butter: down ~30% since summer 2025
  • Cheddar prices: off ~14% since mid-August
  • New Zealand milk solids: up 14.6% this season
  • Fonterra payout: NZ$10.15 per kg milk solids
  • Digester revenue: $400-450 per cow annually
  • China imports: down ~15% in 2024-25
  • Projected closures: 160,000+ operations globally
  • Asset impact: ~$400 billion potential losses

It’s a challenging landscape, but together we can navigate it by sharing knowledge, strategies, and keeping our focus on adaptation rather than just survival.

Thanks for thinking this through with me—here’s to keeping the coffee warm and the conversations productive.

Complete references and supporting documentation are available upon request by contacting the editorial team at editor@thebullvine.com.

Learn More:

The Sunday Read Dairy Professionals Don’t Skip.

Every week, thousands of producers, breeders, and industry insiders open Bullvine Weekly for genetics insights, market shifts, and profit strategies they won’t find anywhere else. One email. Five minutes. Smarter decisions all week.
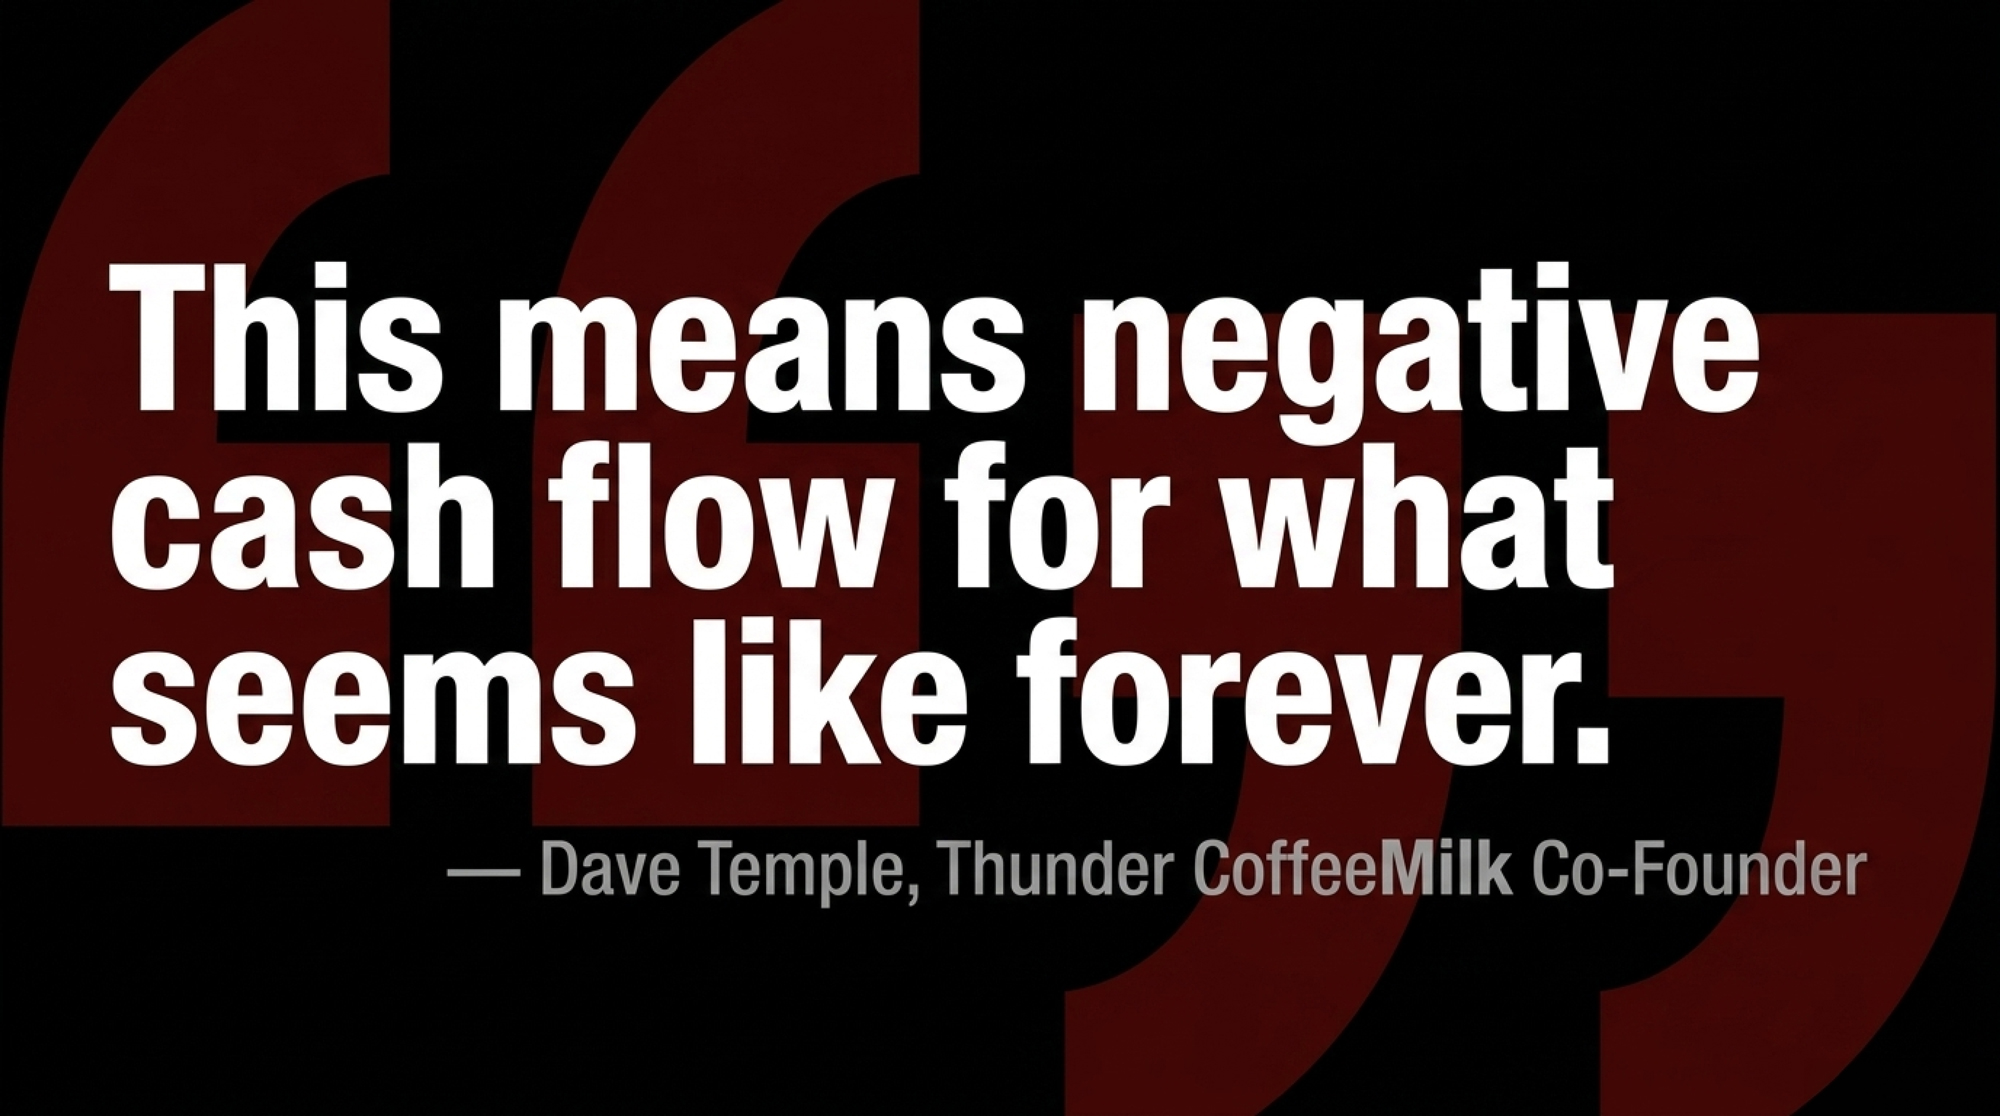
NewsSubscribe
First
Last
Consent

The H5N1 Bailout Problem: Why Some Farms Keep Getting Hit While Others Pay the Price

43% of H5N1 bailouts go to repeat offenders—some farms cashed 5 checks in 6 months, while you pay the bill

H5N1, dairy biosecurity, farm profitability, dairy management, milk production
Focus Keyphrase: H5N1 dairy biosecurity

So I was chatting with a producer from Iowa—been farming since the 80s—tells me his operation got hit with H5N1 twice this year. Twice! And somehow he’s still collecting government checks. Makes you wonder what’s really going on, doesn’t it?

Look, everyone’s calling Nebraska’s latest case “unfortunate timing” with fall migration. Sure, blame the ducks. But here’s what really gets me—and this might surprise you—according to Farm Forward’s July 2025 Freedom of Information Act analysis, 43% of all federal H5N1 compensation is going to farms that have experienced multiple outbreaks.

Now, before you start thinking these farmers are gaming the system, it’s more complicated than that. Some operations might be dealing with geographic challenges—maybe they’re in flyways where the virus keeps circulating, or they’re downstream from infected operations. But the pattern still raises questions about how our bailout system works.

The Numbers Tell a Story

You wanna know who’s collecting the most? Prado Dairy in Colorado pulled in over $1.5 million from Uncle Sam, according to the USDA compensation records that Farm Forward obtained through their FOIA request. Wolf Creek, Meadowvale, Sierra View—same story, different day.

These aren’t necessarily bad actors. But they are big operations with resources that smaller farms don’t have, and they’re navigating a system that covers 90% of losses through the Emergency Livestock Assistance Program with no cap on claims.

Dr. Julie Gauthier, who’s the Executive Director of Veterinary Services at USDA APHIS, keeps talking about “voluntary testing” and “producer cooperation.” Meanwhile, there’s essentially no financial penalty for getting hit repeatedly.

It’s like having fire insurance that pays out every time you leave the stove on.

What the Science Actually Shows

Felipe Peña-Mosca and his team at Cornell published research in Nature Communications—March 2025—tracking one Ohio herd through a complete H5N1 outbreak—3,900 head. Real numbers, no modeling BS.

Each infected cow lost 945 kilograms of milk over two months. That’s nearly $950 per head walking out your parlor door, based on their economic analysis. But here’s what’s really concerning—89% of that herd developed antibodies, meaning this thing spread through that barn mostly undetected. Only 20% showed obvious clinical signs.

You could have four-fifths of your herd infected and not even know it until your butterfat numbers tank.

Dr. Paul Virkler from Cornell’s been studying this stuff, and he’s found something that should scare the hell out of all of us: rumination time and milk production start dropping about five days before you see any clinical signs. Five days!

That’s your early warning window—if you’re watching for it.

The Transmission Reality Nobody Talks About

The thing about this virus is that everyone keeps blaming the waterfowl. And sure, ducks and geese bring H5N1 onto farms—the research from USDA APHIS and Cornell is crystal clear on that. Wild birds are the primary introduction route.

But then it’s our own boots, equipment, and trucks that move it around farms and between operations. The Cornell study shows this pretty clearly—once it’s in your barn, human activity becomes the major factor in how far and fast it spreads.

And once cows are infected? They don’t bounce back like everyone thinks. The Cornell team followed infected animals for 60 days after diagnosis—their production stayed depressed the entire time. This isn’t mastitis, where you lose milk for two weeks and recover. The virus replicates right in the mammary gland tissue, destroys the milk-secreting cells.

Some of these cows might never produce the same again.

The Psychology Behind Profitable Failure

What really concerns me is what Dr. Joe Armstrong from the University of Minnesota Extension told me: “I am 100% expecting this to result in many arguments with clients.”

He’s watching veterinarians get caught between USDA requirements and farmers who… well, some who still think this whole thing’s overblown. Meanwhile, operations keep getting hit, keep collecting checks, and the cycle continues.

When there’s no real financial consequences for getting hit repeatedly—when Uncle Sam covers 90% of your losses—where’s the incentive to invest heavily in prevention?

And don’t even get me started on California. Over 650 herds were infected by November 2024. Milk production down 9.2% year-over-year—the biggest drop in twenty years. Yet the biggest operations keep floating on government support while family farms get squeezed out.

The Bigger Picture We’re Missing

California’s just the canary in the coal mine. According to USDA APHIS data, we’ve had 973 confirmed cases across 17 states as of February 2025. That’s not just scattered bad luck—that’s systematic vulnerability.

We lost over 16,000 farms between 2018 and 2023. The closure rate hit 12.2% in 2023 alone. While family operations disappear, the bailout system is essentially subsidizing some survivors to maintain practices that leave them vulnerable to repeated outbreaks.

That’s not building industry resilience. That’s creating systematic dependency.

What Actually Works (When Folks Want It To)

New strains keep popping up—that D1.1 variant caught Nevada operations off guard, even though they’d dealt with H5N1 before. The virus isn’t standing still while we figure out policy.

The industry’s splitting into two groups: maybe 30% of operations that implement serious biosecurity and achieve genuine resilience, while others get stuck in cycles of infection and bailouts.

So what’s a producer supposed to do?

Lock up your feed during migration season. All of it. TMR, corn, silage, everything. This isn’t rocket science—if wild birds can’t access your feed, they can’t contaminate it.

Cut cattle access to natural water sources. I know that the stock pond’s been there since your grandfather’s time, but infected waterfowl can turn it into a disease reservoir overnight.

Get monitoring technology that flags trouble before your bank account feels it. Those rumination sensors and milk meters Dr. Virkler mentioned—they can give you that five-day warning. That’s five days you could be implementing containment instead of watching it spread.

Make your vet your biosecurity partner, not just your treatment provider. No more Mr. Nice Guy routine when it comes to prevention protocols.

The Forward-Looking Disaster

But honestly? I’m worried we’re past the point where individual farm actions matter enough. When nearly half the bailout money goes to repeat cases, when there’s little incentive to prevent rather than collect compensation… we’re not building resilience.

We’re creating dependency.

The good news for consumers is that pasteurization kills H5N1 in milk—the CDC and FDA are crystal clear on that. But that doesn’t protect your cash flow, your family’s future, or your ability to stay in this business.

The question isn’t whether more farms will get hit. It’s whether we’ll have sustainable dairy operations left when this is over, or just farms that’ve learned to navigate the bailout system better than they prevent disease.

Because while some operations perfect that navigation, independent producers are fighting for the future of American dairy farming. And right now? The dependency model is winning.

Time to decide what kind of industry we want to build.

KEY TAKEAWAYS:

  • Financial Reality Check: Basic migration-season biosecurity costs $50-75 per cow annually vs. $950 losses per infected animal—yet 43% of bailouts reward farms choosing subsidized failure over prevention
  • Early Detection Advantage: Cornell research proves monitoring technology detects H5N1 production drops 5 days before clinical signs, giving smart operators crucial containment time while competitors wait for obvious symptoms
  • Competitive Positioning: While repeat offenders collect government checks, operations implementing enclosed feed storage, water isolation, and veterinary partnerships during September-November migration create sustainable advantages in an industry losing 12% of farms yearly
  • Market Intelligence: The 30% of farms achieving genuine H5N1 resilience will dominate as bailout-dependent operations face eventual policy changes—position now while competitors remain psychologically invested in government dependency
  • Strategic Implementation: Lock feed storage, eliminate shared water sources, deploy rumination monitoring, and make veterinarians biosecurity enforcers—because building prevention capability beats perfecting bailout collection every time

EXECUTIVE SUMMARY:

The H5N1 outbreak has morphed from a disease crisis into a systematic bailout scheme that’s destroying American dairy from within. According to Farm Forward’s FOIA analysis, 43% of federal compensation goes to farms getting infected repeatedly, with operations like Prado Dairy collecting over $1.5 million while family farms disappear at 12% annually. Cornell’s latest research shows infected cows lose 945kg of milk worth $950 each, yet USDA covers 90% with no claim limits, creating perverse incentives where prevention costs less than subsidized failure. While corporate ag publications focus on duck migration, the real story is how repeat bailout recipients game taxpayer-funded programs instead of implementing $75-per-cow biosecurity that actually works. This isn’t building industry resilience—it’s creating systematic dependency that threatens the 24,000 remaining dairy operations across America. The data reveals we’re not fighting a virus anymore; we’re watching the birth of subsidized incompetence while independent producers get squeezed out by operations that’ve mastered the art of profitable failure.

Complete references and supporting documentation are available upon request by contacting the editorial team at editor@thebullvine.com.

Learn More:

The Sunday Read Dairy Professionals Don’t Skip.

Every week, thousands of producers, breeders, and industry insiders open Bullvine Weekly for genetics insights, market shifts, and profit strategies they won’t find anywhere else. One email. Five minutes. Smarter decisions all week.
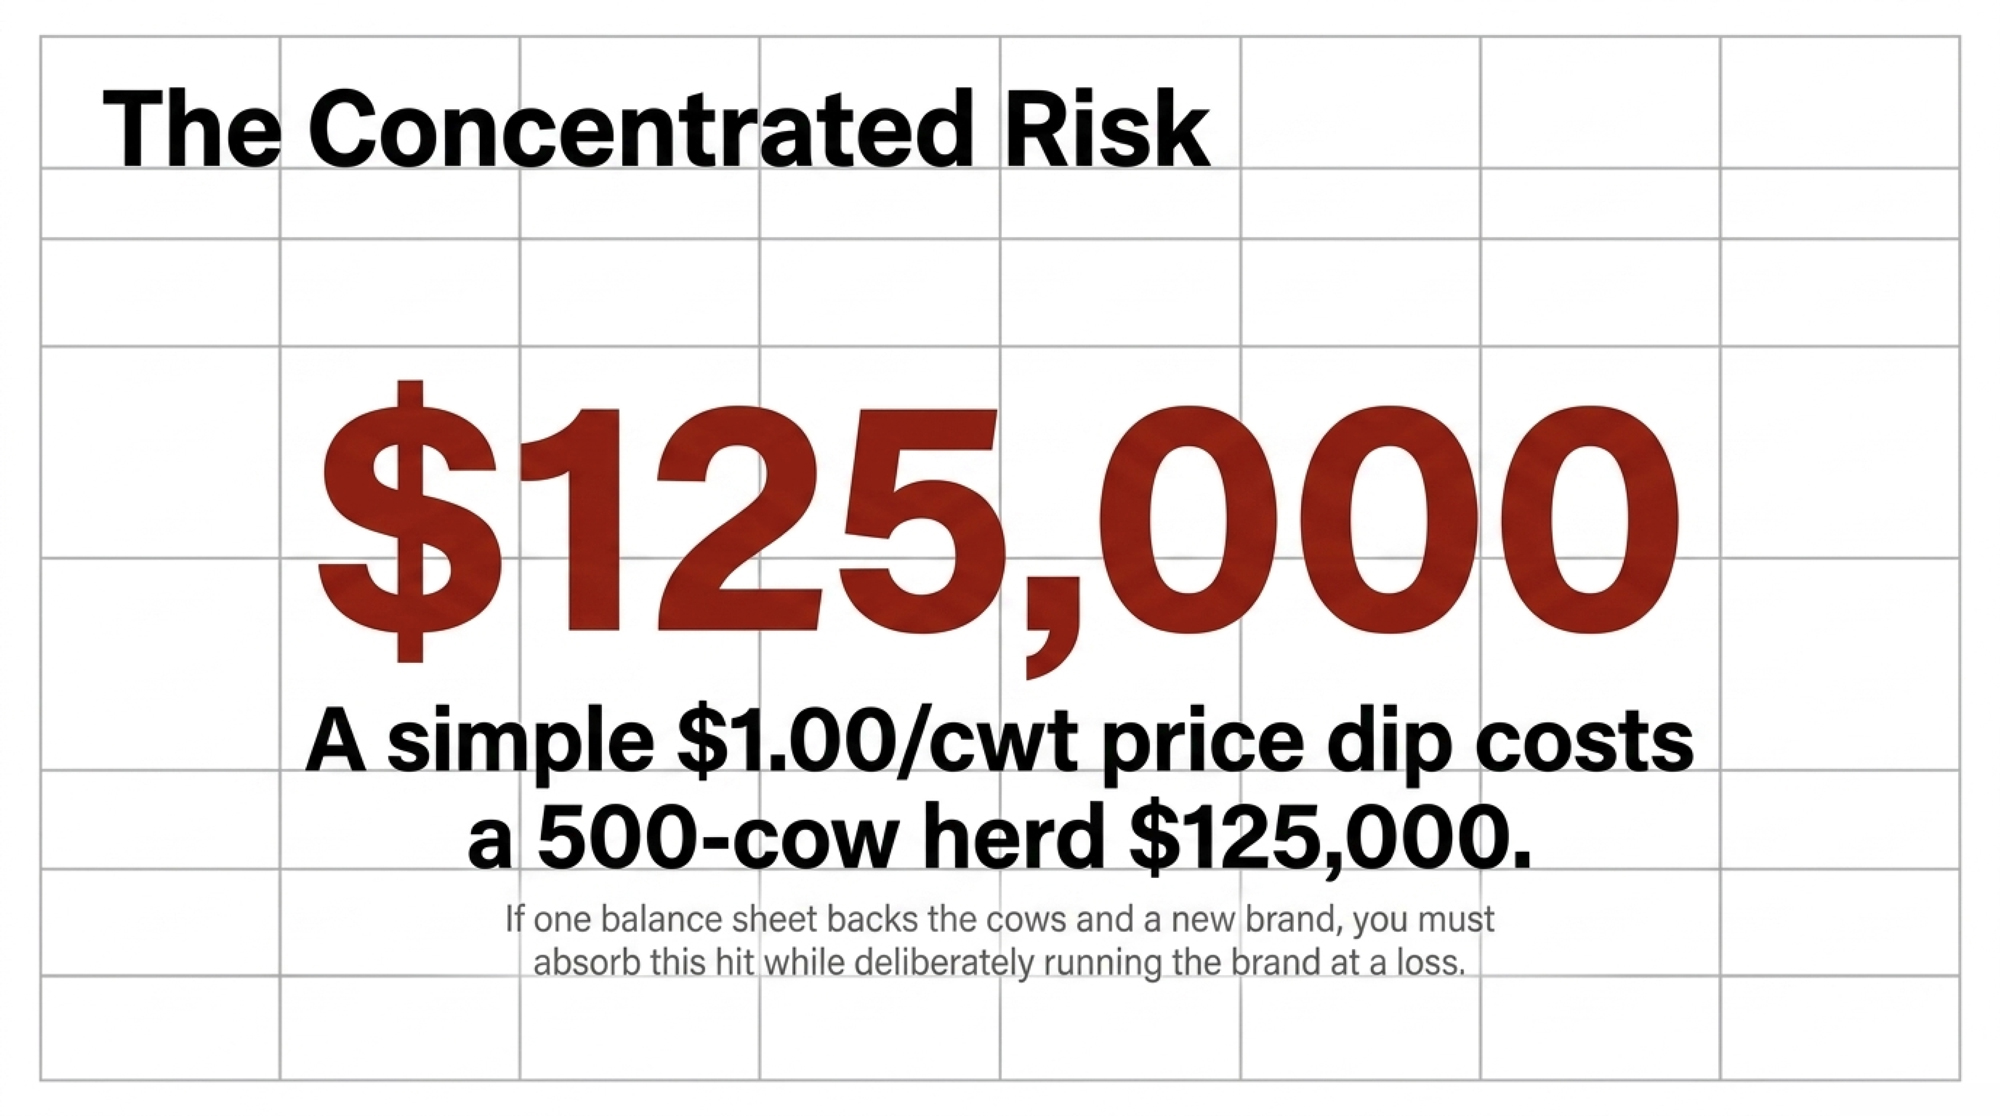
NewsSubscribe
First
Last
Consent

Is 2025 the Year Dairy Herd Software Delivers for Real Producers?

Is your herd management software running your farm—or just running you in circles? Let’s talk what really works.

Ever get the feeling that every sales pitch is hinting at a magic fix? Over the past few years, industry talk has made it sound like you’ll be left in the dust without dashboards and data. But are these new tools really the answer—or just another concept catching on as farms get bigger?

Let’s park the hype. Here’s what folks are genuinely seeing with herd management tech in 2025: field hiccups, regional quirks, and moments that’ll make you both hopeful and cautious.

Fewer Farms, Fatter Herds

U.S. licensed dairy farm numbers plummeted from 39,300 to 24,000 (2017–2023), while average herd size more than doubled. Bigger herds now dominate, making data-driven herd management critical.

A Indiana dairyman I was talking to is convinced if you can’t bring up cow records on your phone, you might as well be running a museum. Not joking, either.

Nearly 40% of U.S. dairies closed their doors between 2017 and 2023, falling from 39,300 to about 24,000 licensed herds. Still, total U.S. milk output keeps climbing. Why? Because the survivors, mostly in the West and Northeast, are running bigger herds—1,000 cows and up now produce almost two-thirds of American milk.

66% of U.S. milk now comes from 1,000+ cow herds. Small and mid-sized farms account for just a third—making smart tech a must for competitiveness.

This isn’t just numbers. It’s a way of life changing fast. The global herd management software market? Roughly $5 billion this year—but the real drivers are North America’s mega-herds.

It’s Not Just the Numbers—Labor Is a Nightmare

Let me jump in with a story: Last winter, our best night guy was one cold calf away from quitting. Recruiting good folks is brutal—and it’s not just us. Dairies from Minnesota to Ontario all echo the struggle. High-turnover, high costs, and even higher stress.

Here’s the good news: Farms pushing 500+ cows, using robots or tightly integrated software, see reliable 20–35% labor savings. For smaller herds—think 150–300 cows—10–18% is a best-case guess from extension and industry advisors. There aren’t enough robust studies yet, but this is the buzz at farm meetings.

Can Software Really Deliver ROI? Here’s What’s Working

PlatformUnique Selling PropositionTarget Farm SizePricing Model
DairyComp (VAS)Advanced analytics, command-line power, integrates with Lactanet/proActionMedium-large (200+ cows)2.50–
AfiFarm (Afimilk)Real-time, sensor-driven health & milk intelligence50+ cows, scalable$80-150 per cow (hardware) plus subscription
DeLaval DelProComplete automation, robotic integrationAll, especially robot herdsQuote/integrated with equipment
UNIFORM-AgriUser-friendly, modular, scalable50-1000 cows$3-8/cow/month subscription
DHI-Plus (Amelicor)Deep desktop analytics, problem animal IDAll, desktop usersSubscription (desktop/mobile)
MilkingCloudMobile-first, IoT, free/premium tiers50-500 cowsFree tier, $180/user/yr premium
Allflex SenseHubBehavioral analytics, heat/health sensors200+ cows$2.95-4.55/cow/month collar plan

Allflex SenseHub

A Minnesota friend said it all: “We were nailing above 90% heat detection for months, but as soon as the logs slipped, so did the results.” Over a million North American cows wear these collars , and ISU extension data points to 87% avg. heat detection—if your protocols stick. ROI? Expect 15–20 months only with disciplined protocols.

AfiFarm (Afimilk)

In Michigan and the Northeast, $120–200 per cow/per year in savings is real, but only if the team checks dashboards daily. Hit “snooze” on tech and the magic fades.

DeLaval DelPro

Across Iowa and NY, robot barns are reporting six-hour-per-day labor cuts—that’s not a typo—and peer data confirms 18–33% overall savings once teams are dialed in. Training is a pain, but the reward stacks up for those who dig in.

Feed, Health, and Barn-Ready Data

“Sick of hearing about Europe?”—That’s what our Wisconsin nutritionist said last week. Fair point.
Here in the U.S., genuine, logged entries are cutting $15,000–30,000/year in feed waste for 120–200 head herds. The trick: log actual data, not just when     the nutritionist walks in.

On health? $180–240/cow/year savings are on the table for barns that act on mastitis or lameness alarms. But here’s the catch: “The app finds the cow, but you gotta treat her by noon or it’s just bytes, not results.”

Canada’s proAction Reality

If you’re north of the border, you’re grinding through the six pillars of proAction: animal care, food safety, traceability, environment, biosecurity, and milk quality. If your software doesn’t sync with Lactanet? Big trouble at quota review. Ontario’s Agri-Tech Cost-Share helps, but the paperwork will test anyone’s patience.

Traceability, Grants, and—Yes—More Paperwork

Ever miss a single log? Pennsylvania DFA herd did and said goodbye to a $5,000 premium. FSMA Rule 204 is raising the cost of paperwork mistakes in the U.S. too. Take note—digital record-keeping means money, not just compliance.

On grants, the USDA Dairy Business Innovation and Ontario’s Agri-Tech programs are covering 35–50% of new tech purchases. Still, as a buddy tells me, “Don’t forget to count application time—every hour matters.”

What Makes Tech Pay Off?

At a glance: the four levers where digital investments deliver real, proven value and resilience.

Focus on your biggest pain point: labor, fertility, or compliance.
Designate one person to own the solution. (Everyone’s job? No one’s responsibility.)
Trial it during your operation’s toughest stretch—calving, winter, haylage runs.
Run weekly dashboard meetings. If numbers don’t shift, change the staff or process—not just the software.

The Takeaway: It’s About Discipline, Not Downloads

Let’s be honest. Dairy tech is only as tough as your routines. Saskatchewan or Vermont, big parlor or tie-stall—discipline still beats gadgets. ROI comes from showing up, not just signing on.

Got a barn-floor lesson, a tech battle scar, or a story that made your herd better? Don’t be shy—send it to The Bullvine. This industry only gets sharper when we share what works and what hurts.

KEY TAKEAWAYS:

  • Large herds using robots and integrated software report 20–35% labor savings; designate a single “tech boss” and trial new systems during your busiest season to see these results (Iowa State, NMPF).
  • Consistent, daily feed and health tracking slashes waste by up to $30,000/year for 200-cow herds—log actual barn data, not just what your nutritionist wants to see (UW Extension).
  • Regulatory programs like proAction and FSMA Rule 204 demand bulletproof digital records—choose platforms that sync with Lactanet or FDA requirements to protect bonuses.
  • Global herd management software is now a $5 billion market; the most profitable dairies use data for action, not just for compliance (Journal of Dairy Science, MarketsandMarkets).
  • Focus tech investments on your farm’s core bottleneck—labor, health, or compliance—and run weekly dashboard reviews to drive real ROI.

EXECUTIVE SUMMARY:

We’ve all heard the pitch: just slap on the latest herd management tech and watch profits soar. But here’s the Bullvine truth—technology alone is no silver bullet. Farms milking 1,000+ head are leading milk growth in North America, even as 40% of U.S. dairies closed since 2017. University research and barn-floor experience alike prove that software only delivers when routines are tight and every logged entry counts. Numbers don’t lie: robot barns are shaving up to six hours of labor per day, while smart feed logging can put $15,000–$30,000 back in your pocket. Regulatory headaches like proAction in Canada and FSMA Rule 204 in the U.S. aren’t going anywhere—digital records are now the cost of doing business. Globally, with dairy tech booming past $5 billion, the gap between leaders and laggards will only widen. If you’re serious about squeezing every dollar from your cows in 2025, it’s time to rethink how (and why) you’re using your software. Don’t just follow the herd—move ahead of it.

Note: All data and stories referenced above are supported by current extension, industry, and government sources. Sources available by request.

Learn More:

The Sunday Read Dairy Professionals Don’t Skip.

Every week, thousands of producers, breeders, and industry insiders open Bullvine Weekly for genetics insights, market shifts, and profit strategies they won’t find anywhere else. One email. Five minutes. Smarter decisions all week.
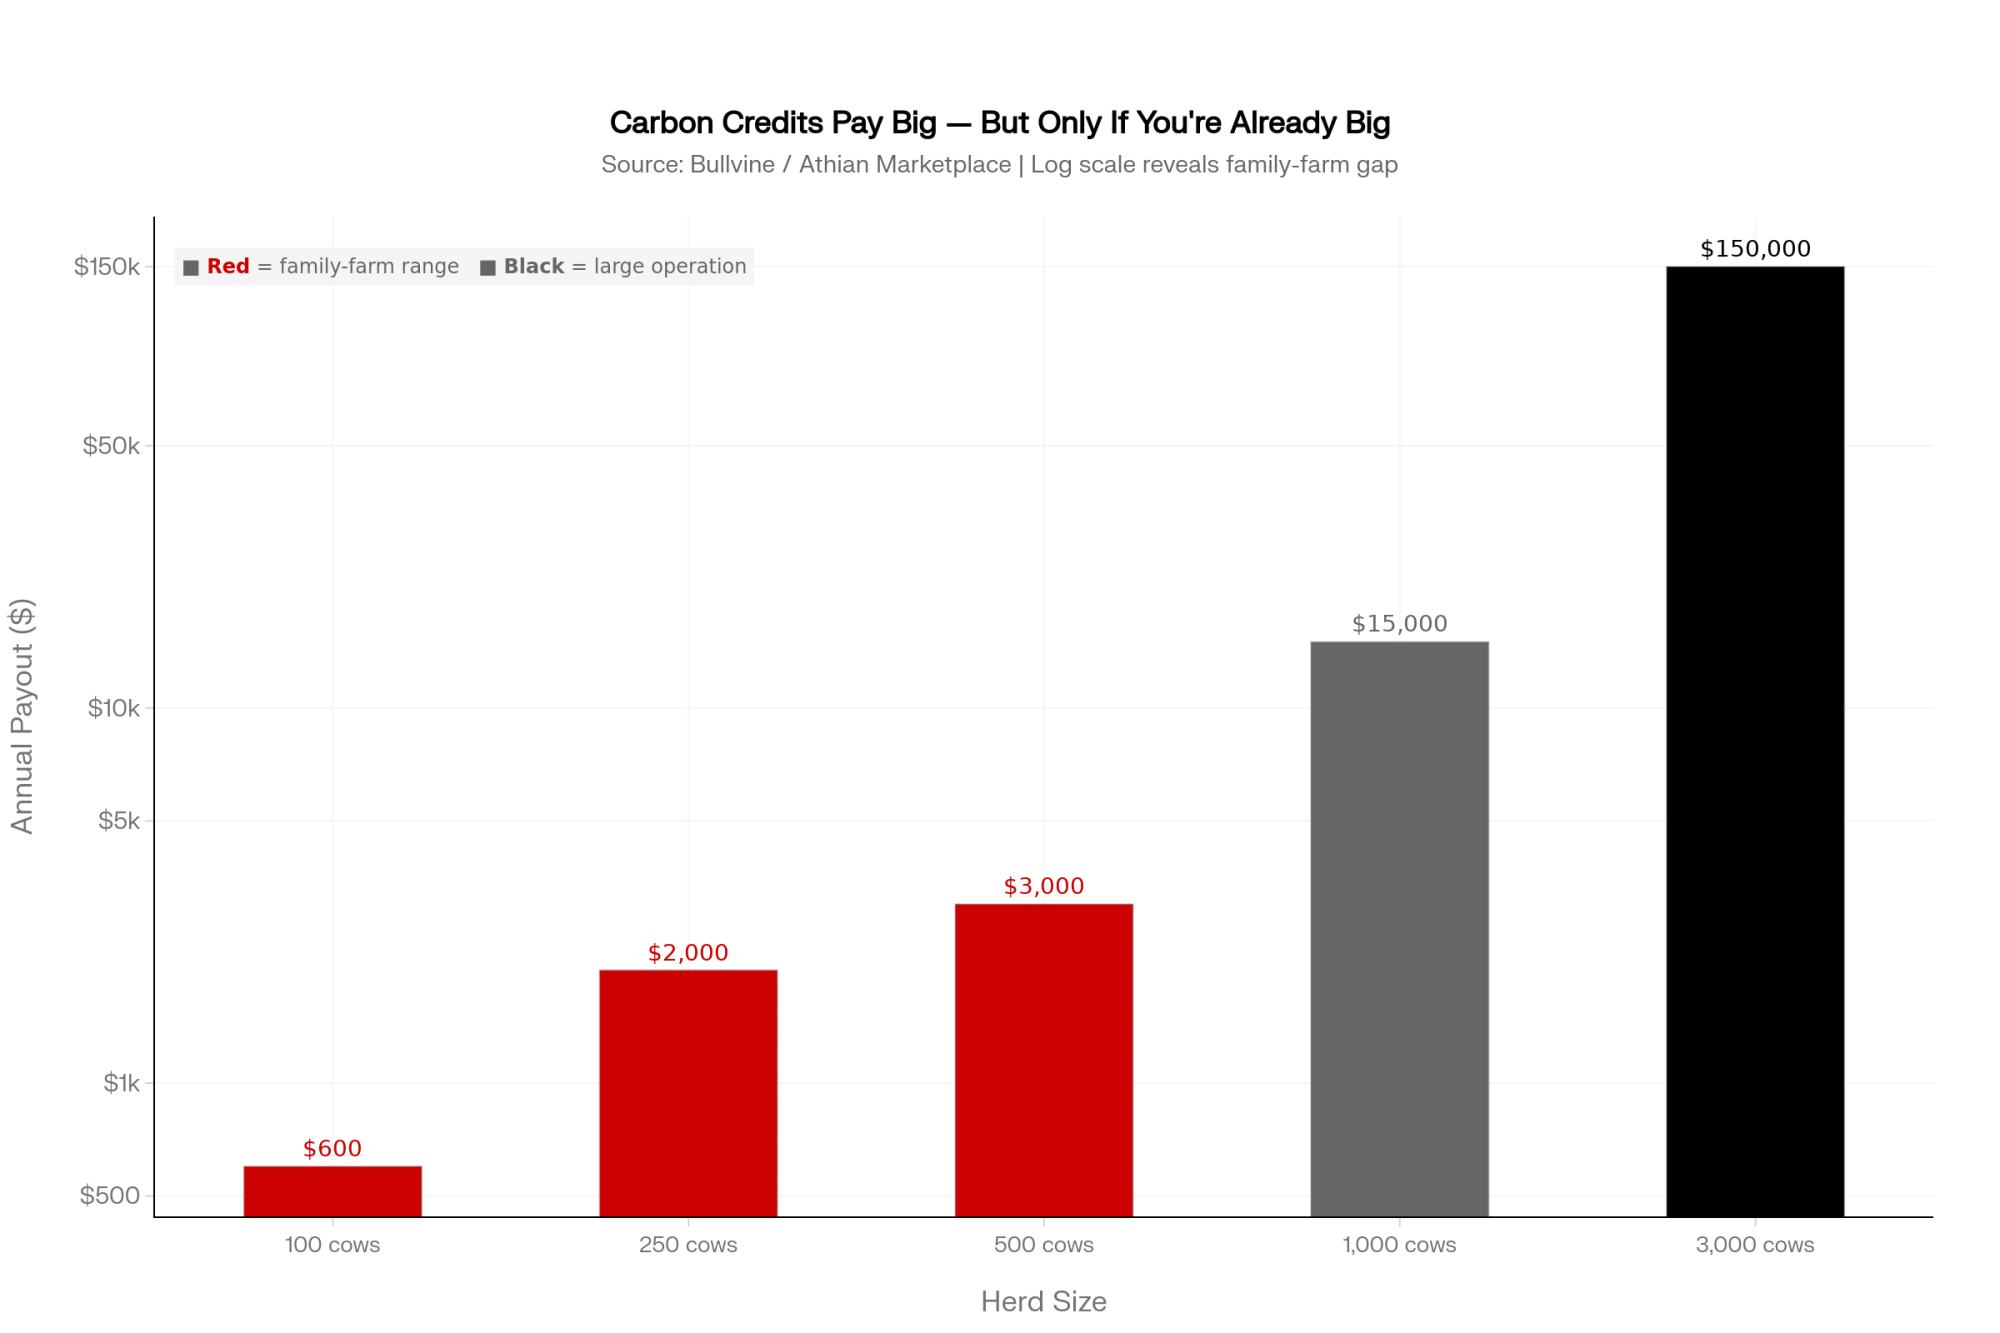
NewsSubscribe
First
Last
Consent
Send this to a friend