


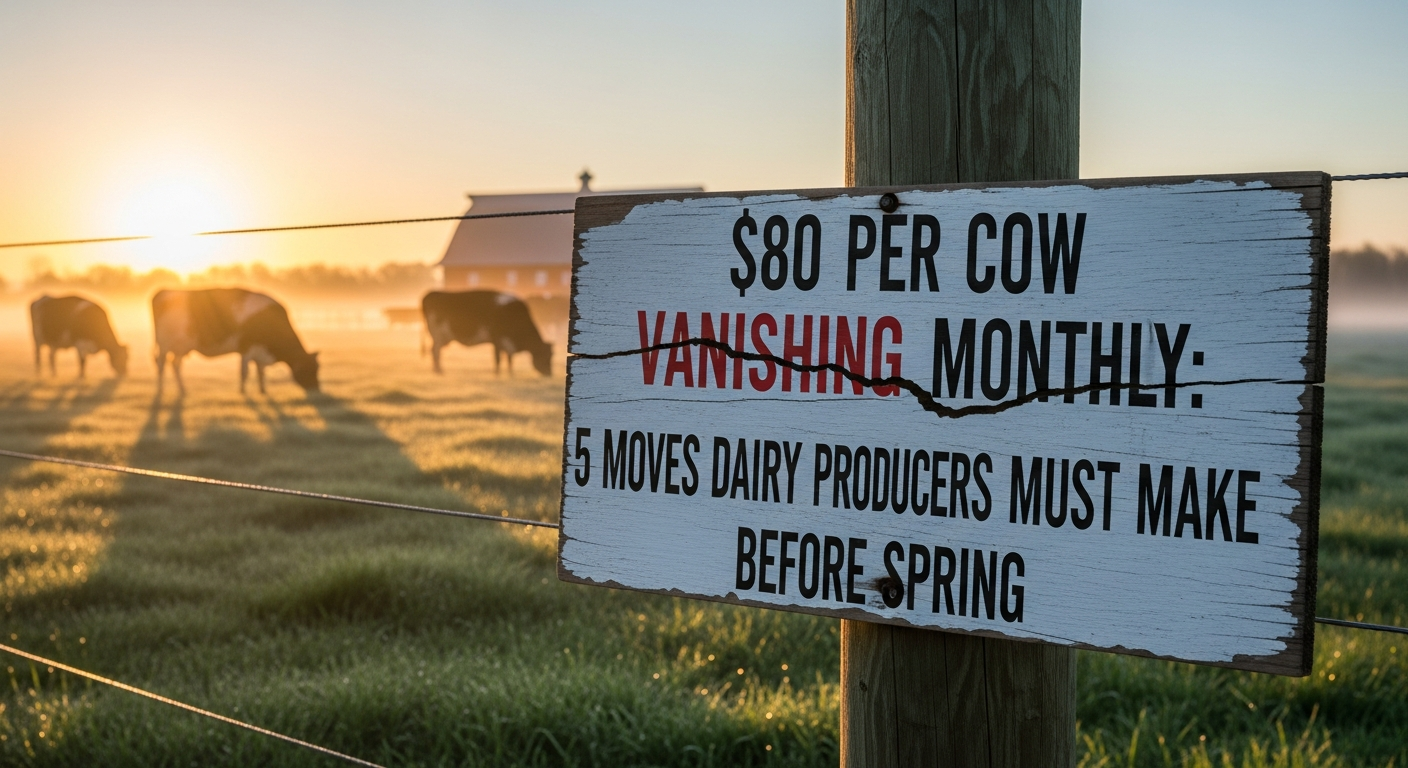
Your lender’s pro forma works at today’s margins. Your gut remembers 2023. One of them is right — and a $323,600 annual payment doesn’t care which.
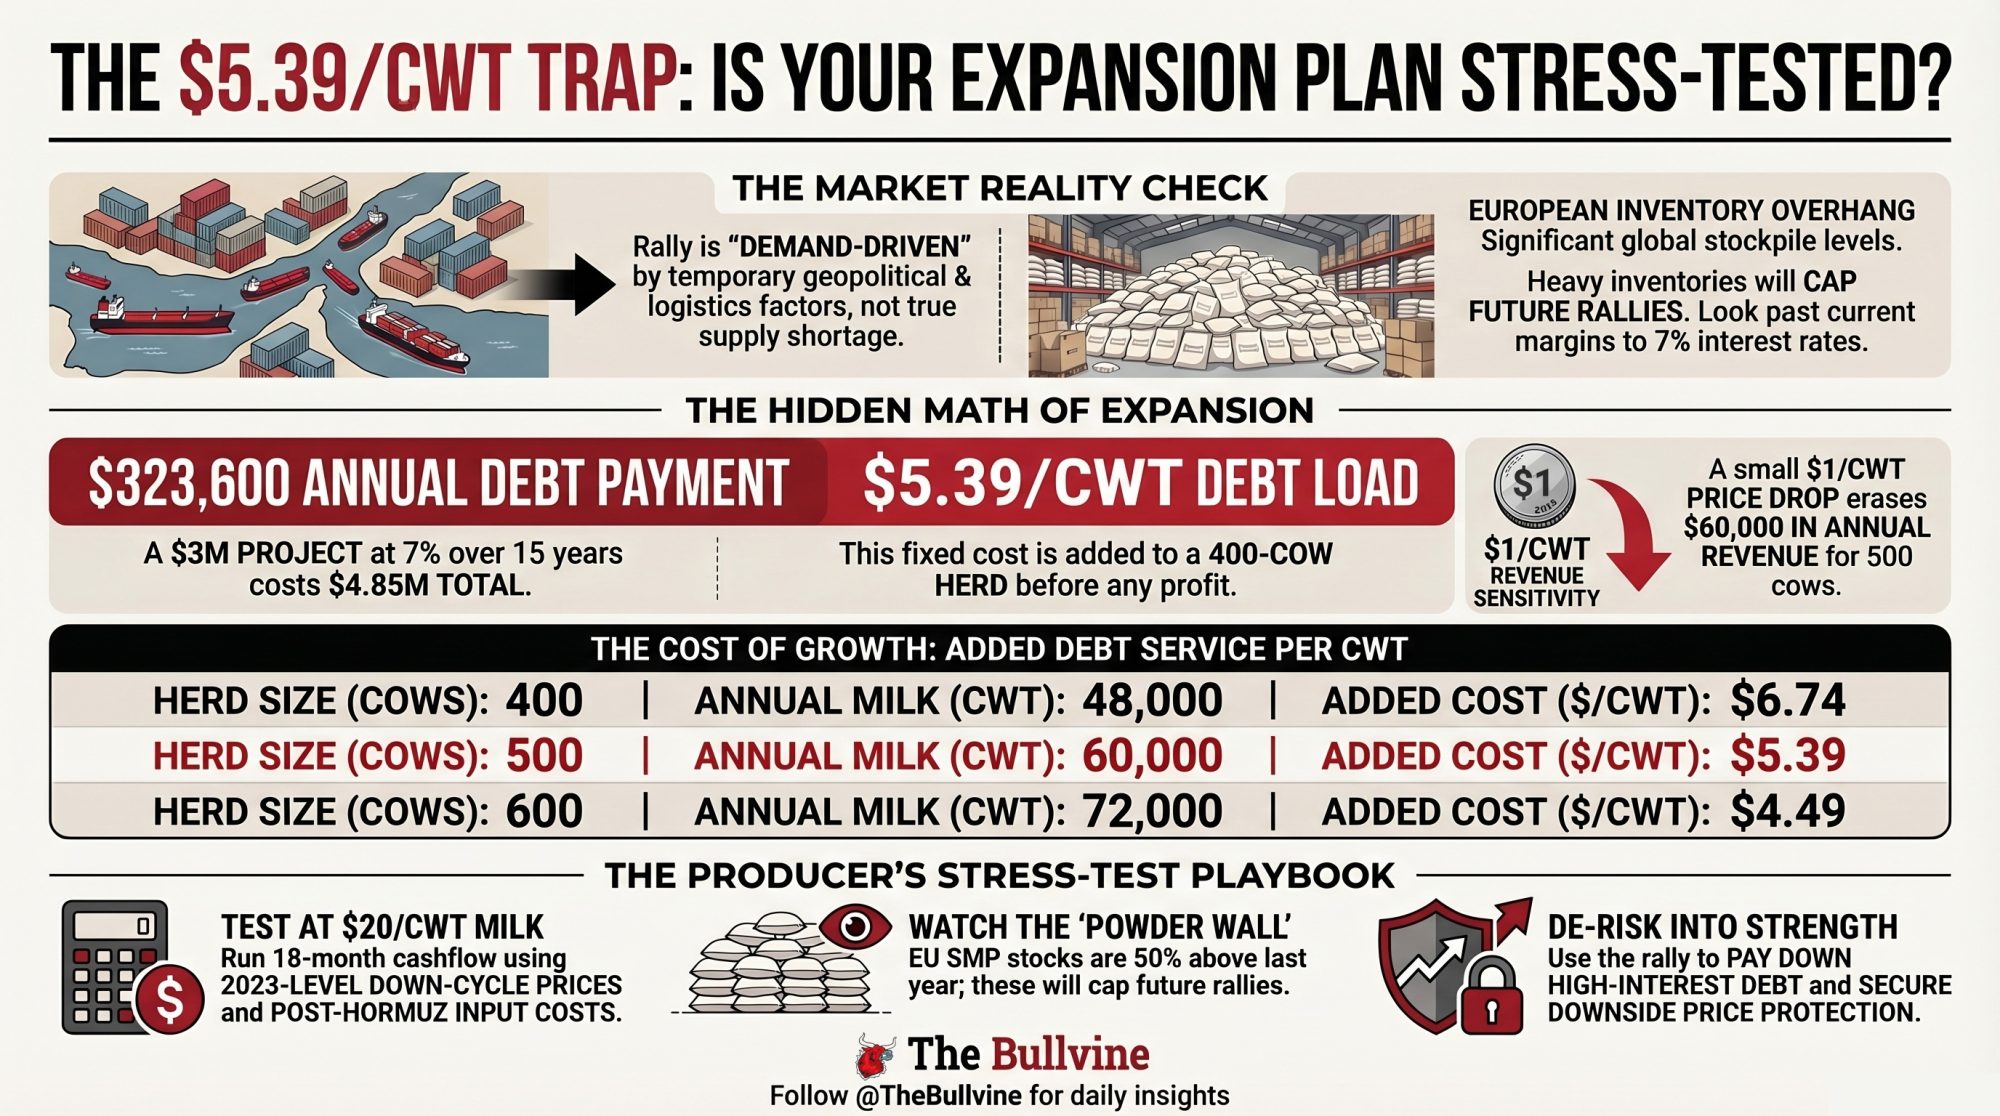
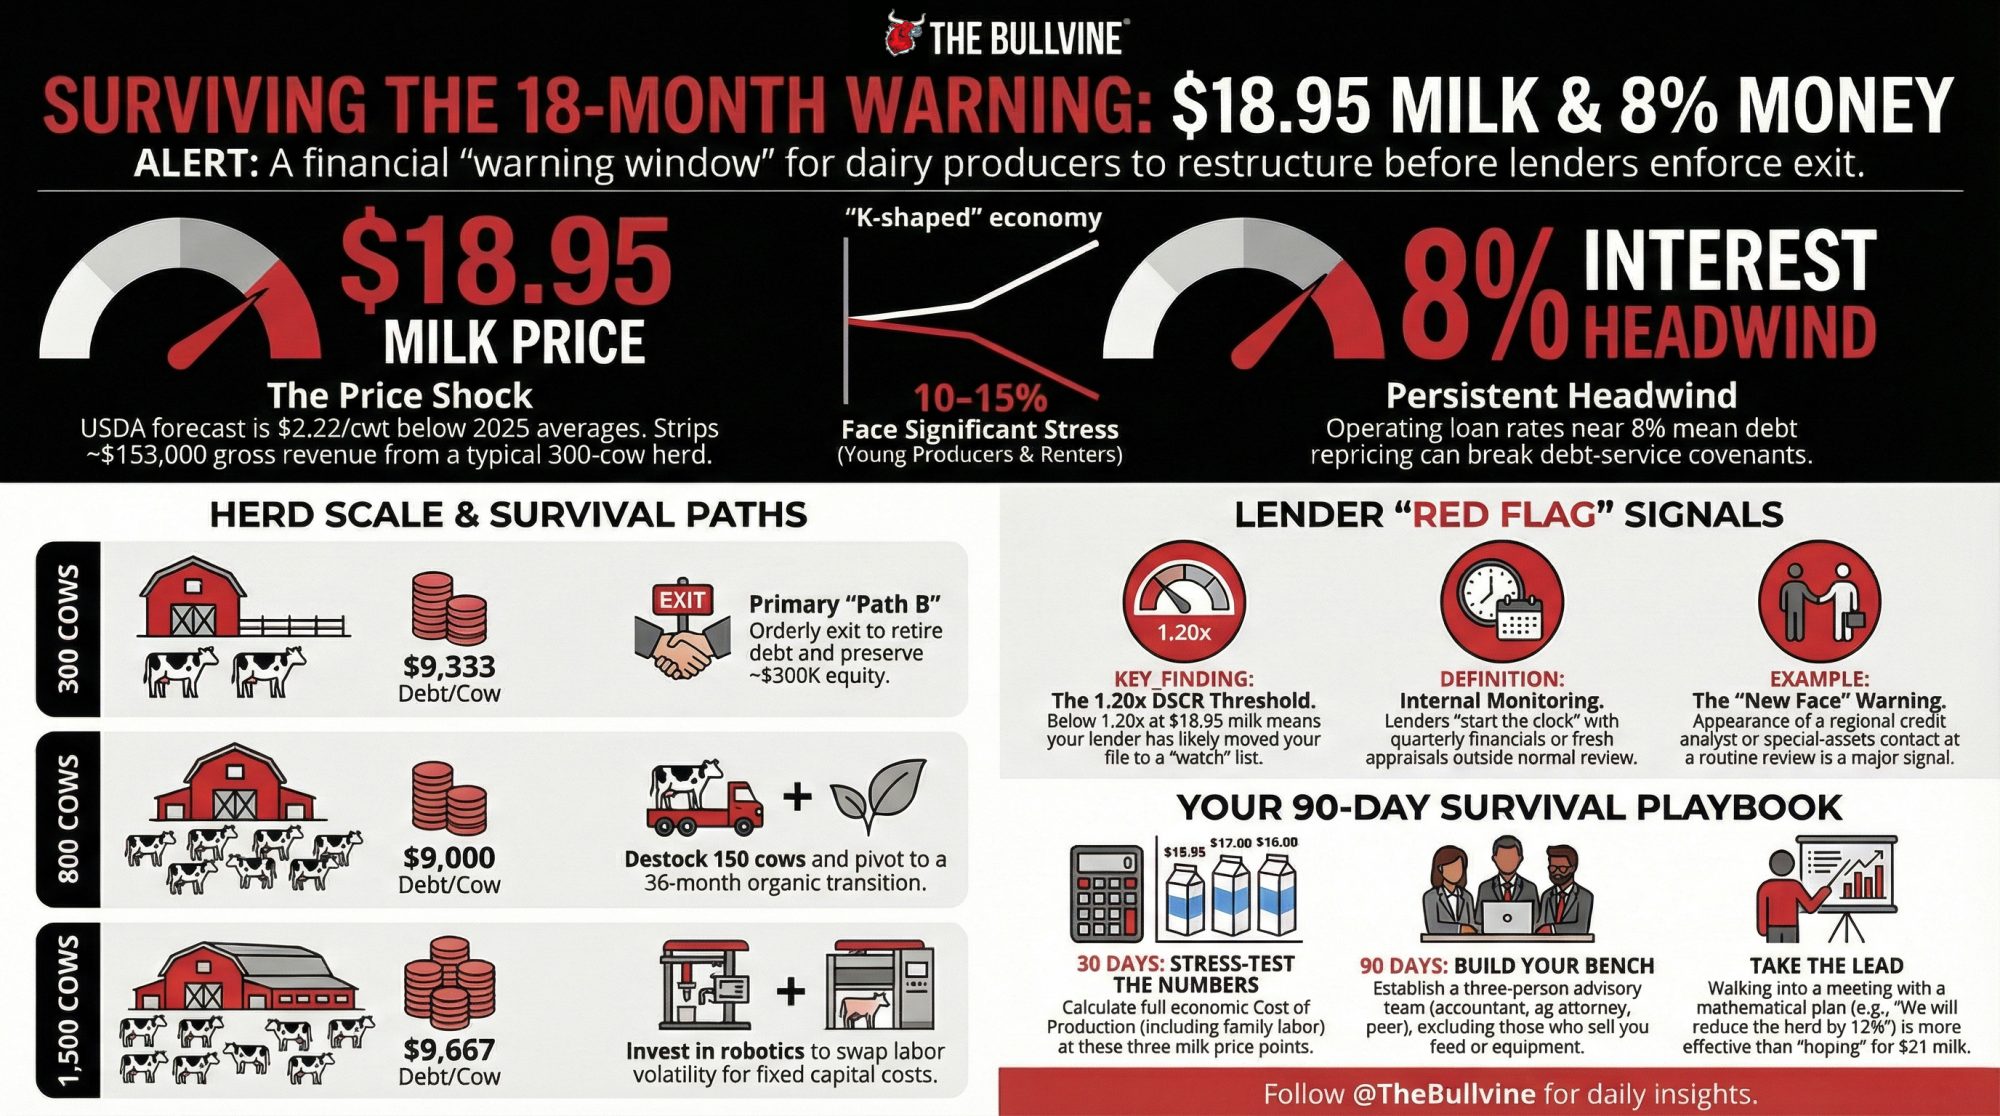
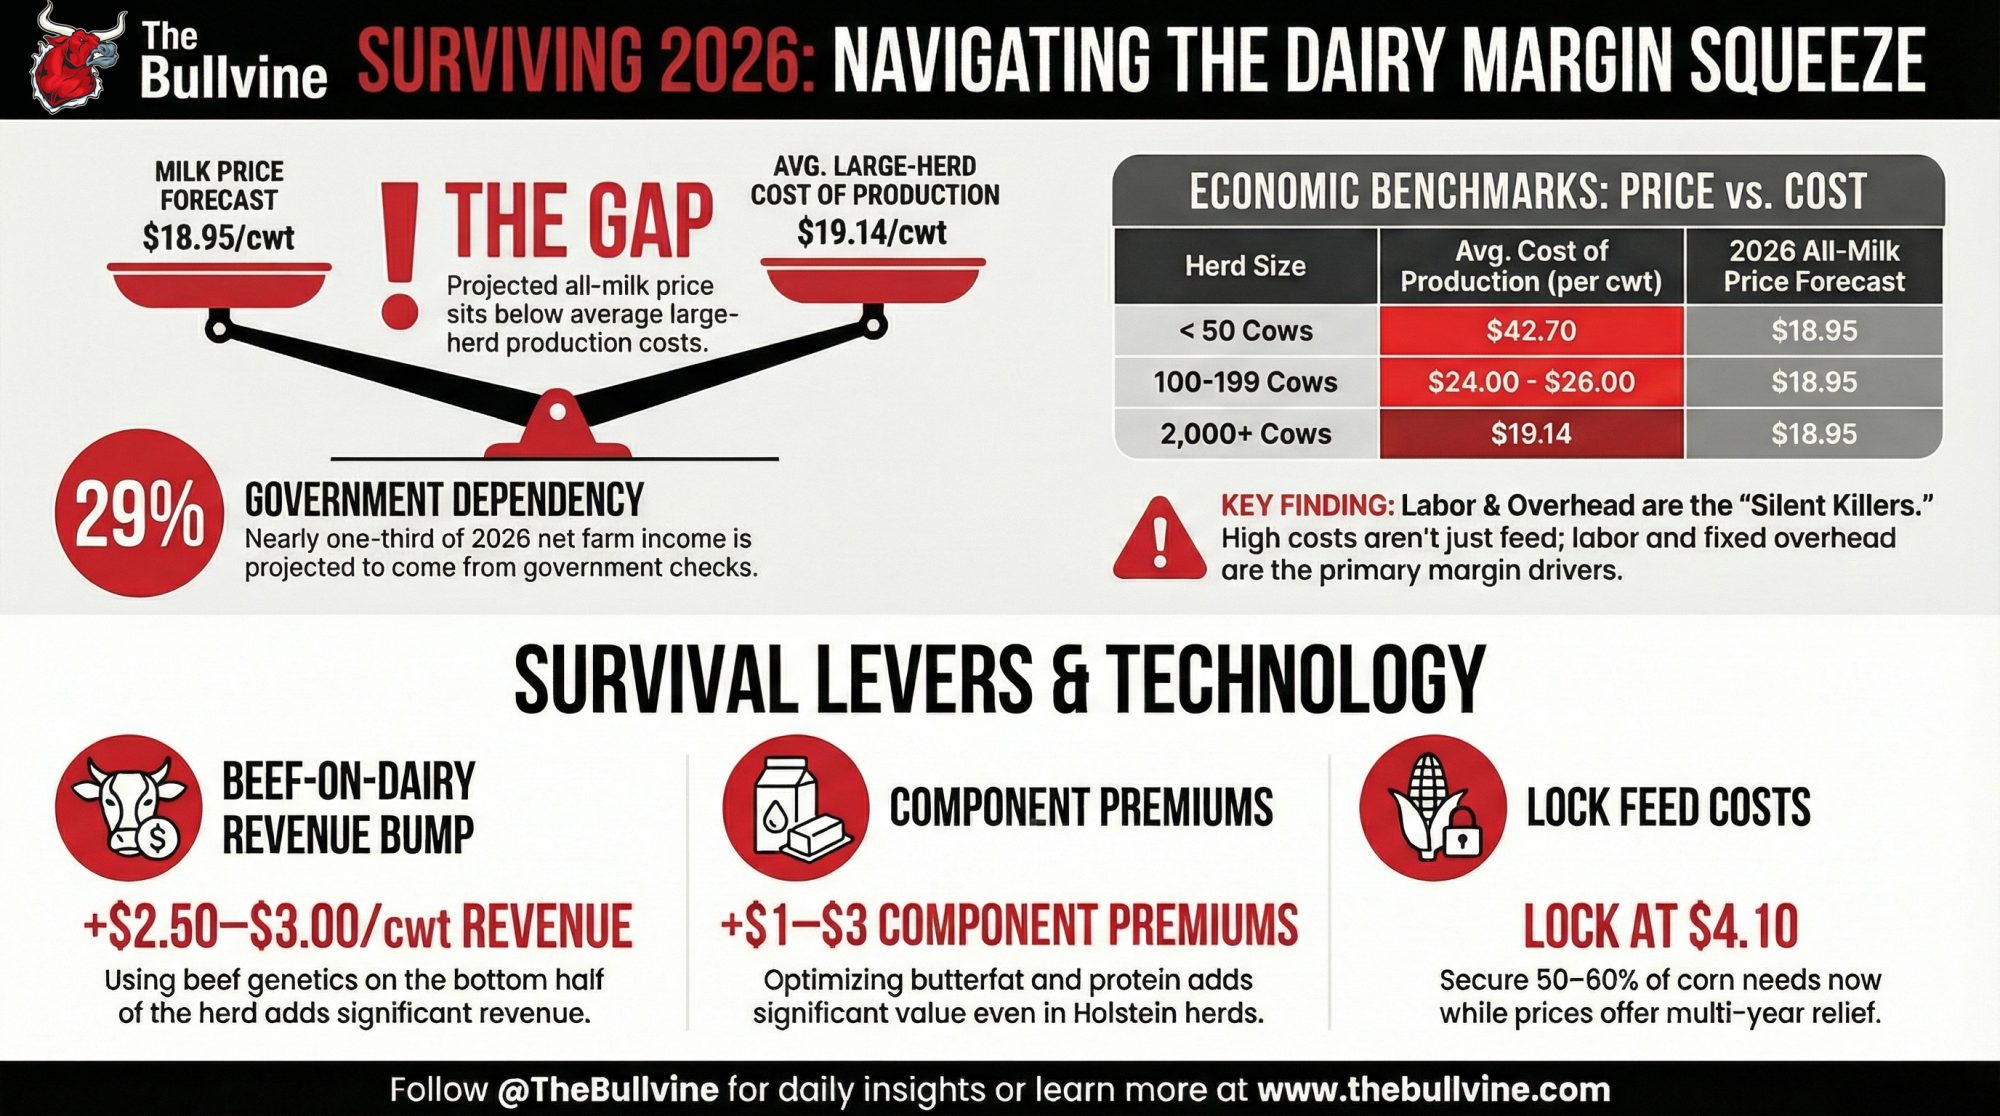
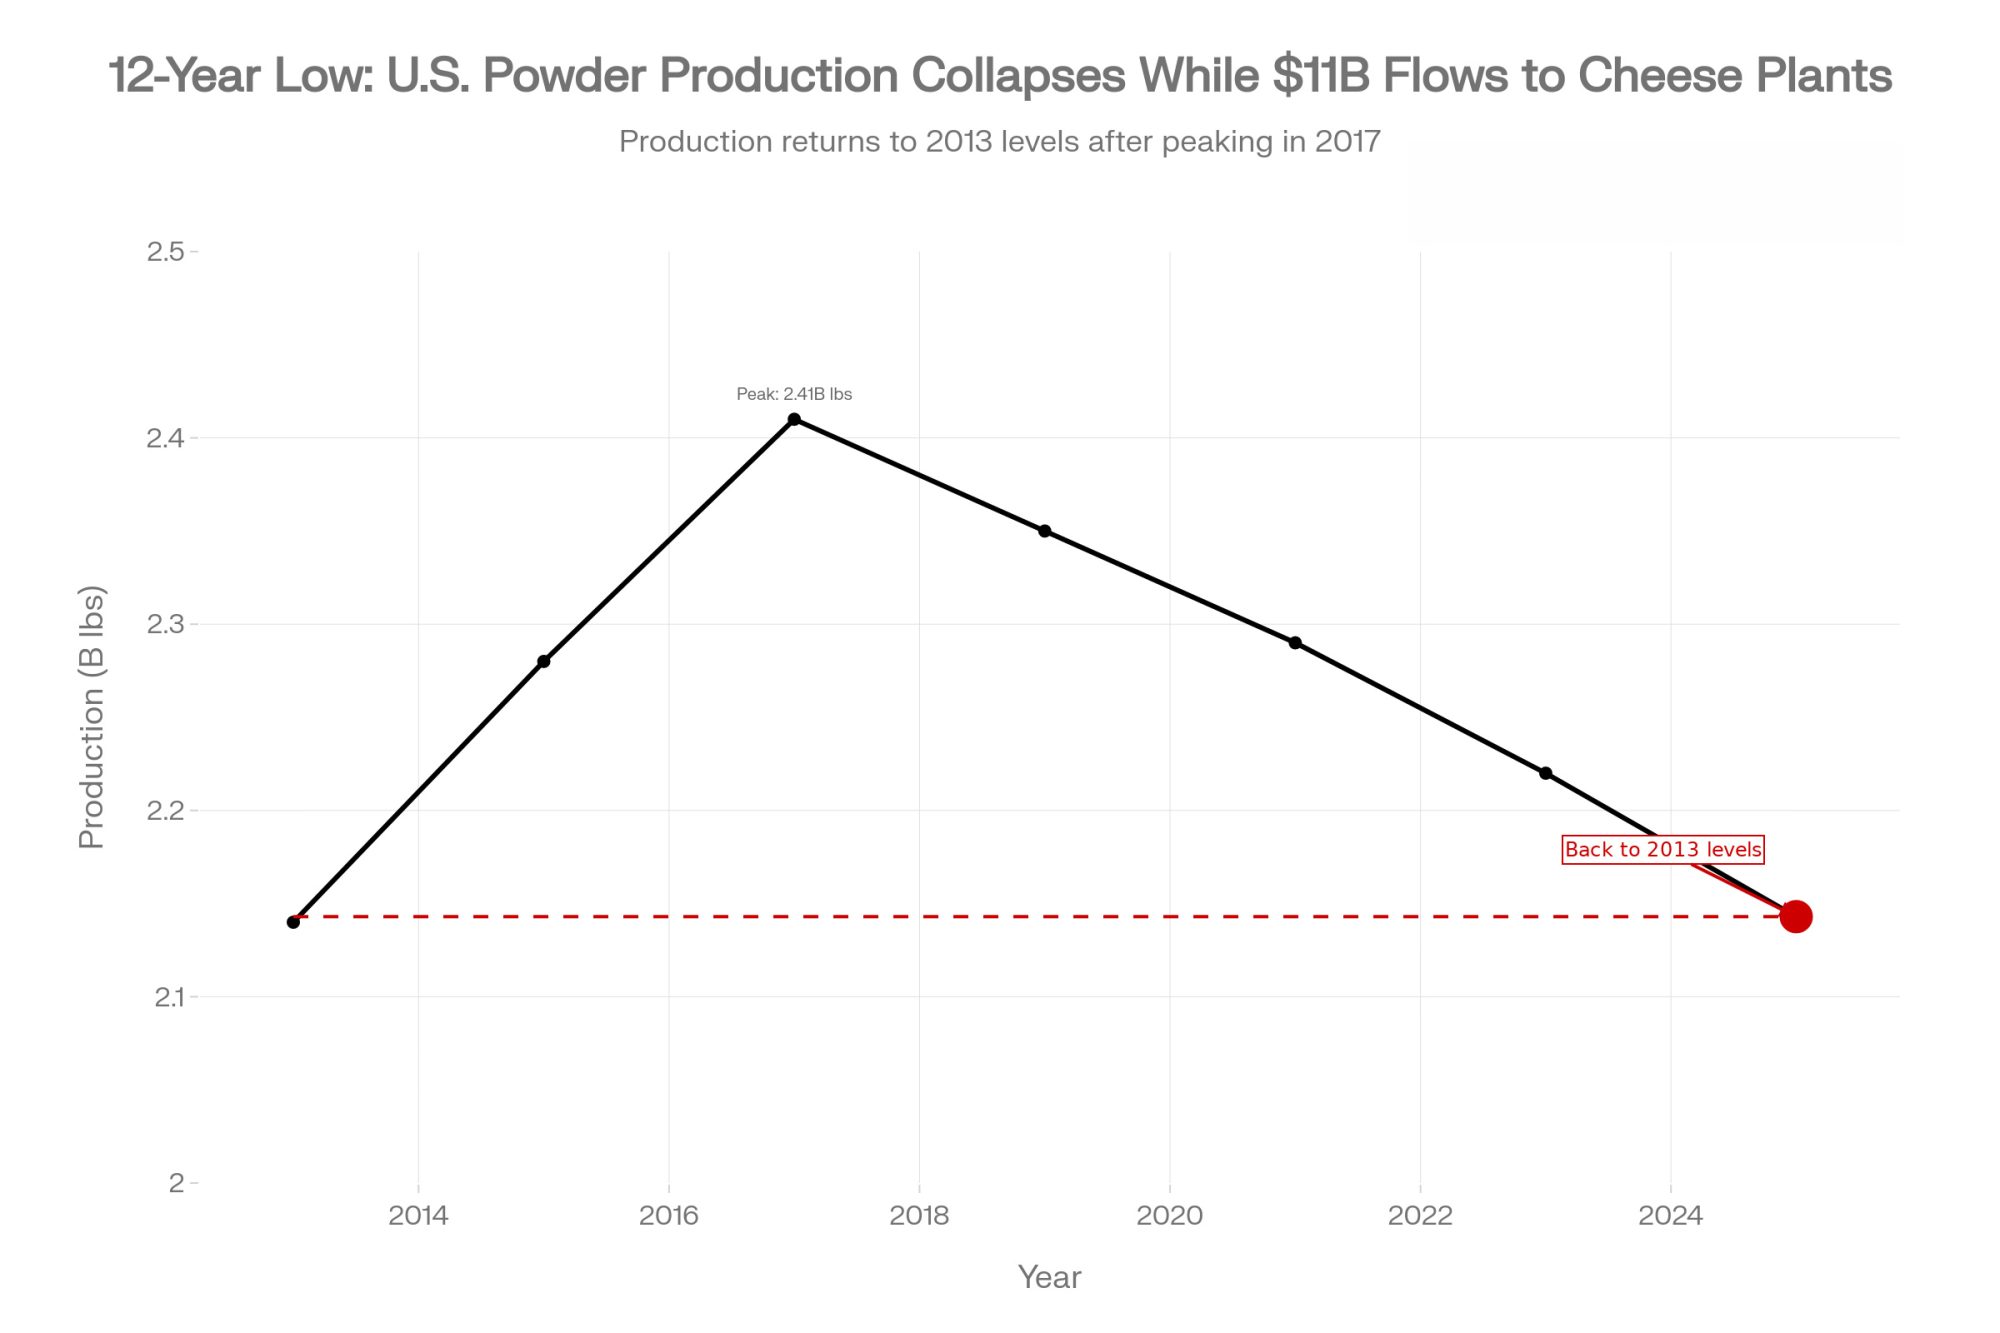
Executive Summary: A million dairy expansion at 7% over 15 years costs you .85 million — adding .39/cwt in fixed debt service on a 500‑cow herd before you pay yourself. The Q1 2026 rally, making those numbers look comfortable, rests on two temporary forces: a global restocking wave that pulled demand forward, and a Hormuz closure that stranded six percent of traded dairy behind a war zone. The supply picture behind the rally hasn’t changed — U.S. herds added 49,000 cows in January–February 2026 alone, EU SMP stocks are running 50% above last year, and butter inventories have doubled. Feed costs feel manageable now because you’re still burning through inputs bought before the conflict repriced fertilizer and energy; late 2026 into 2027 is when the real cost of rationing hits. If your expansion math doesn’t survive 18 months at /cwt milk with post‑Hormuz input costs and full debt service loaded, the project’s timing doesn’t match the risk. The 30/90/365‑day playbook here starts with one check: run your true breakeven with family labor, realistic depreciation, and 7% money — then stress‑test it at a price you know you might see.
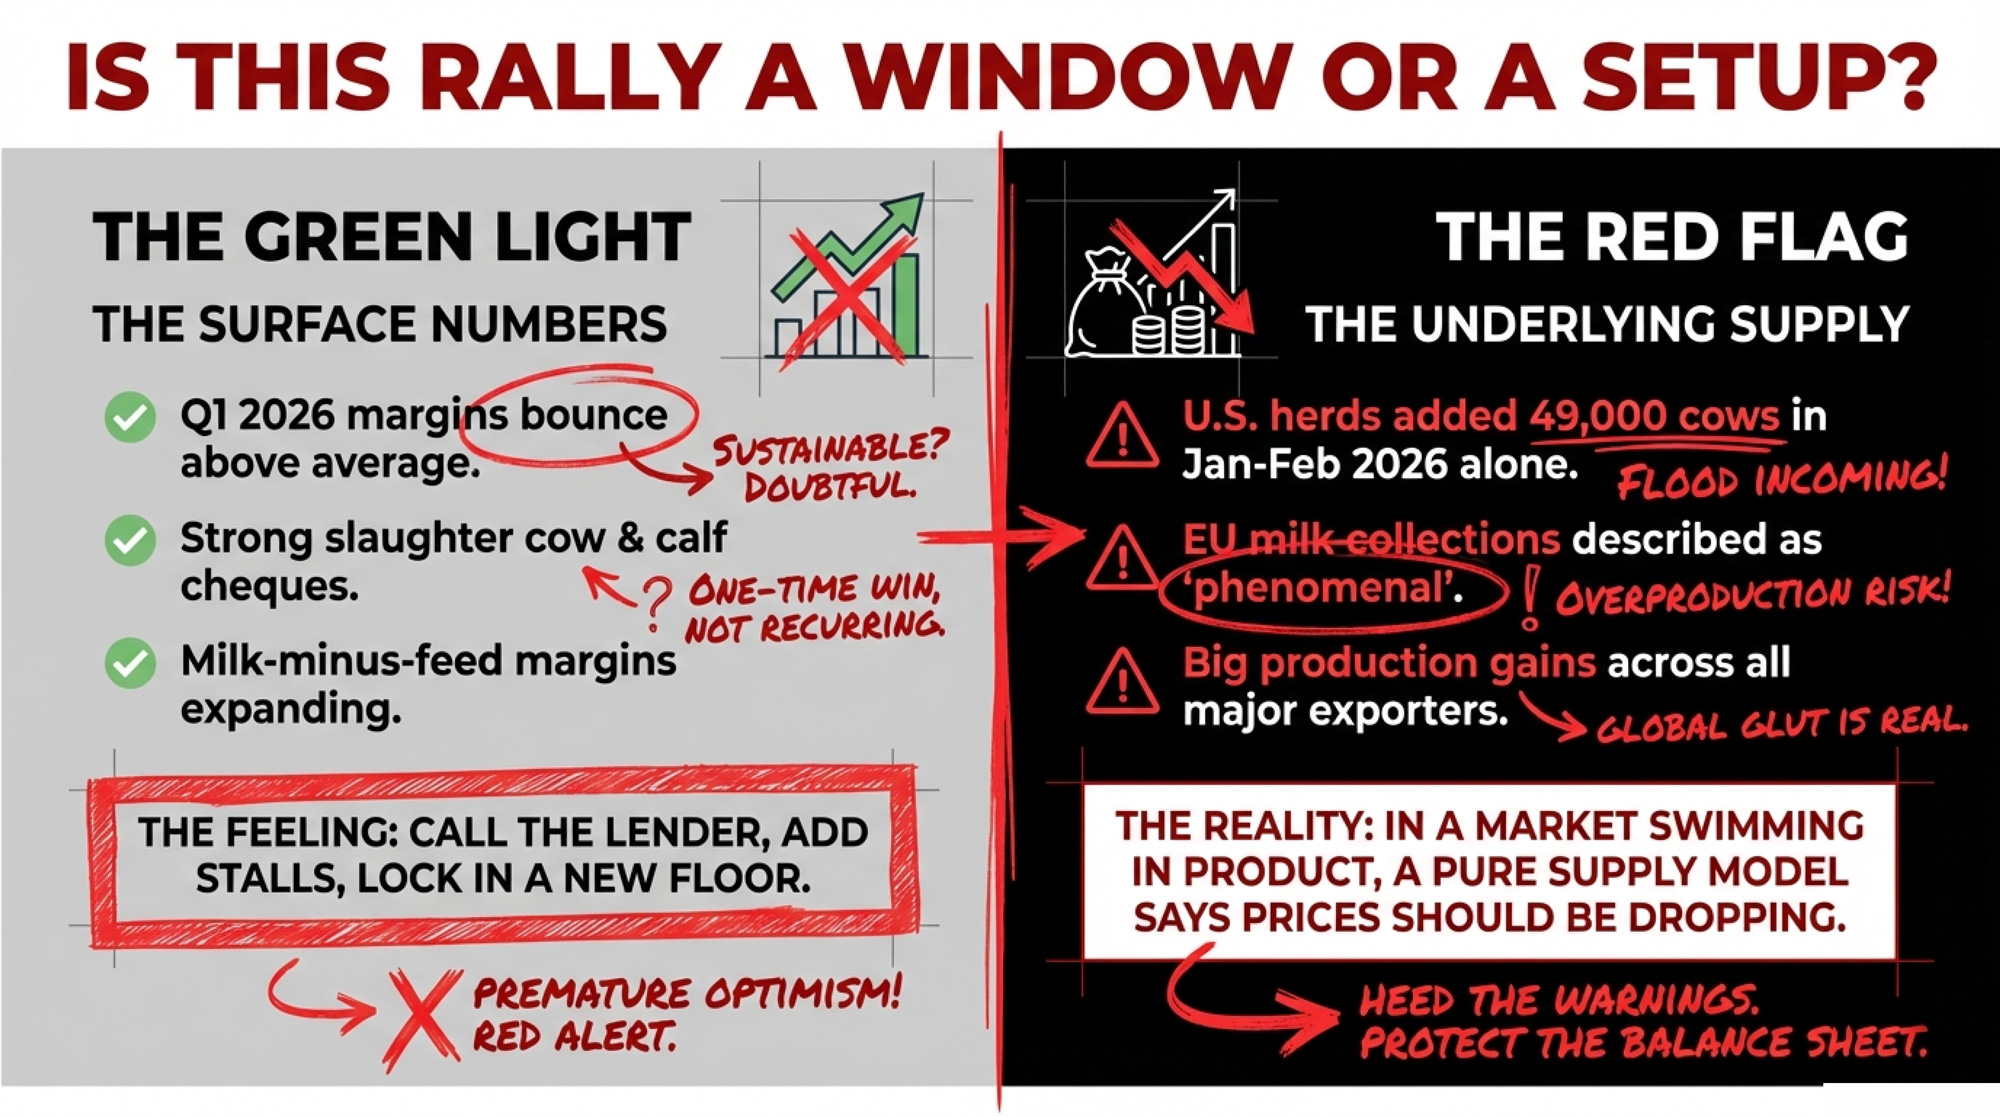
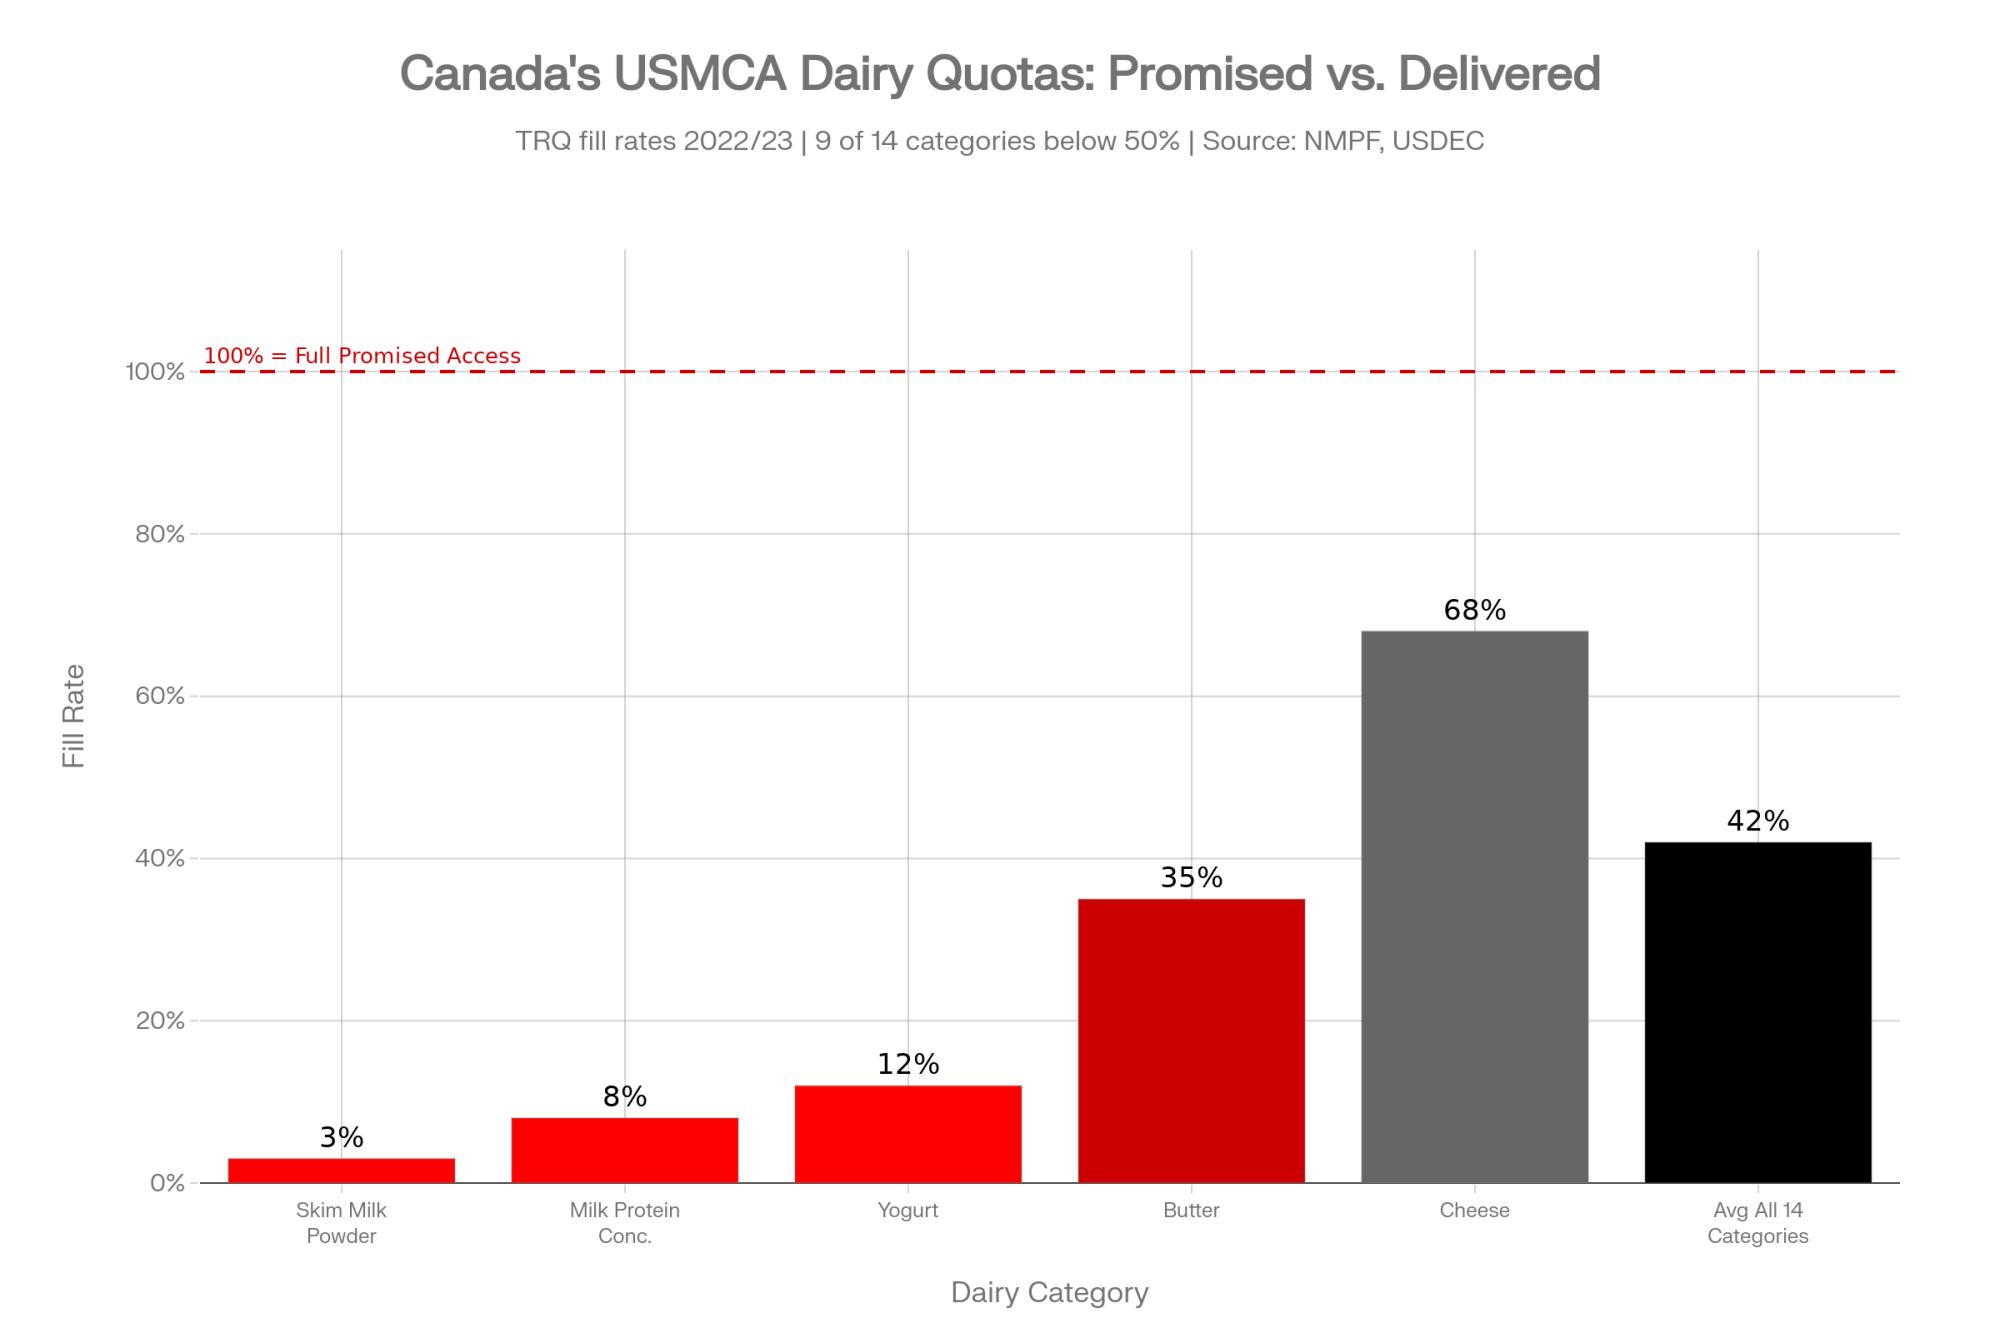
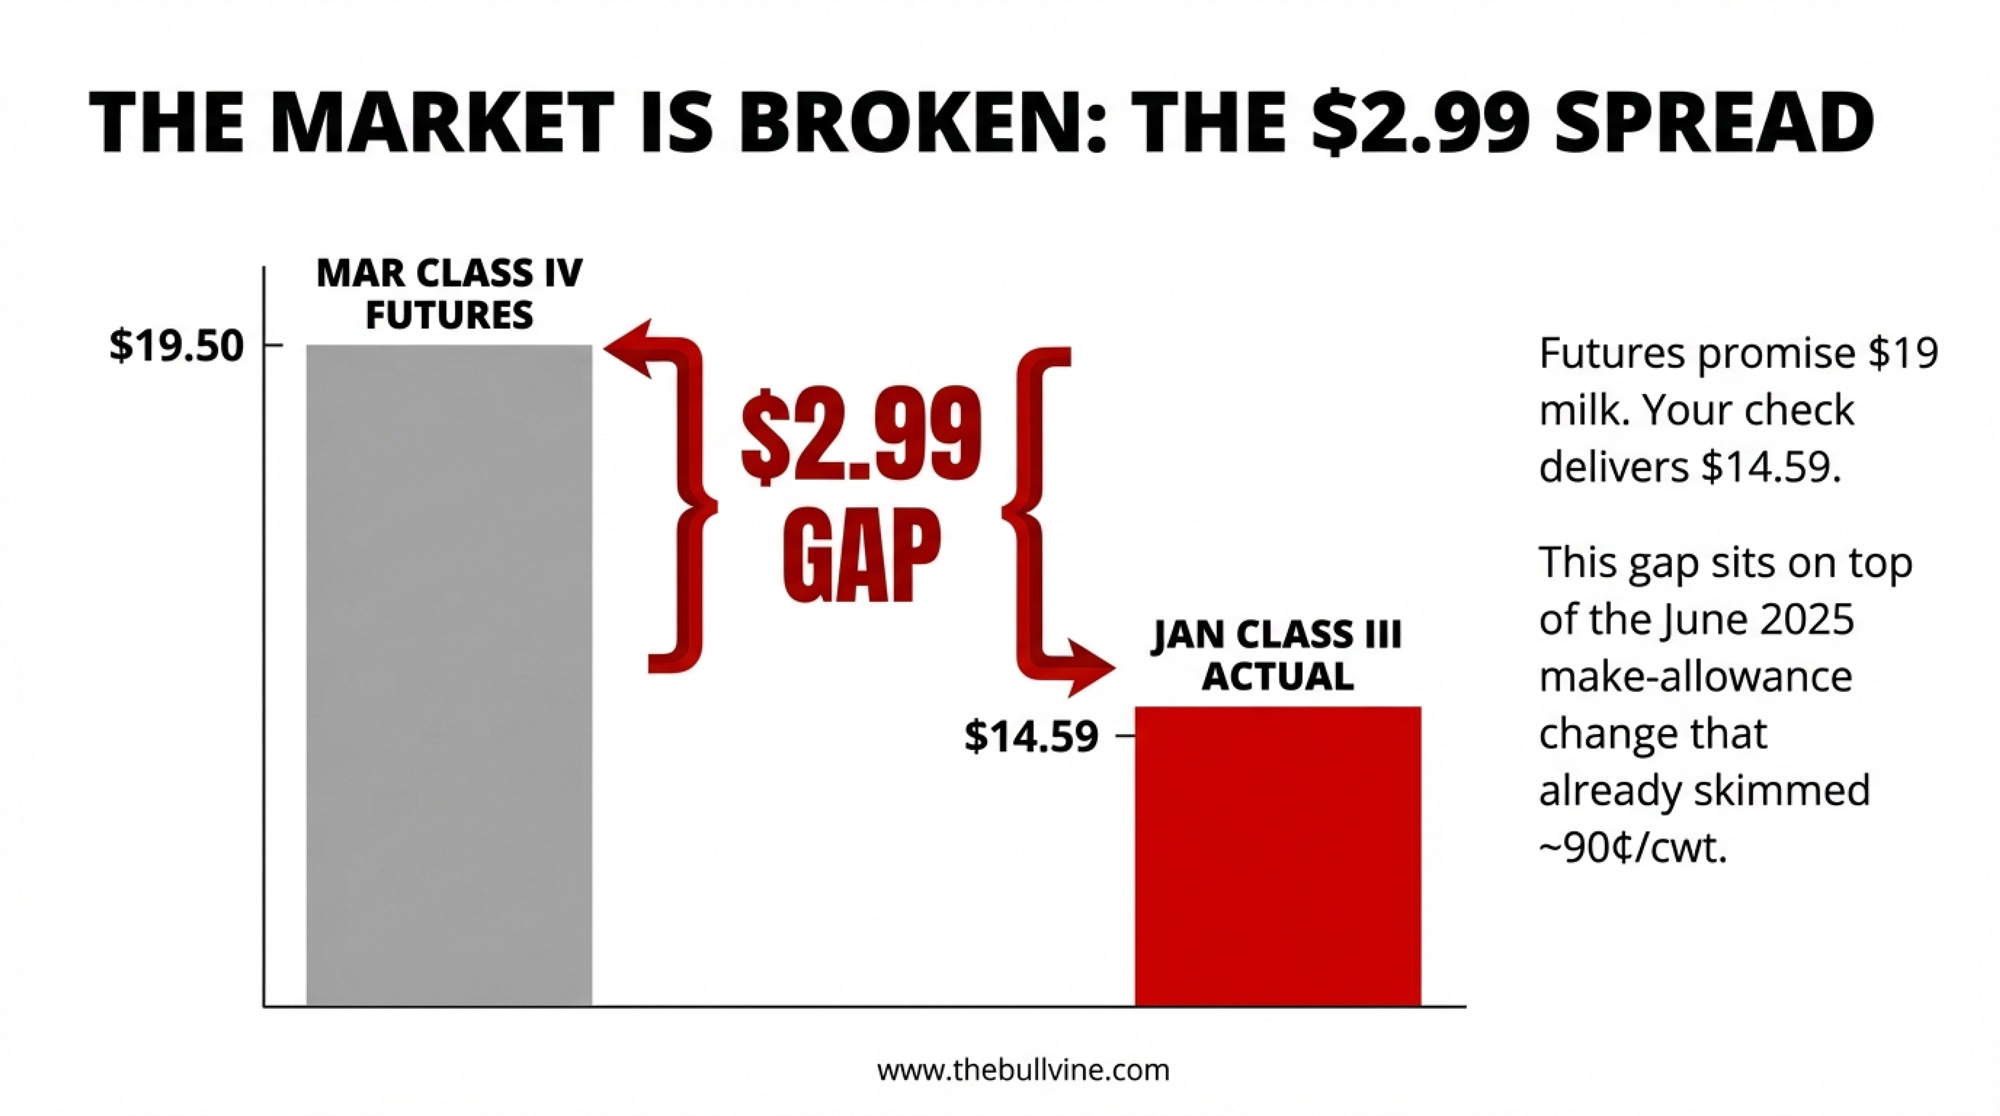
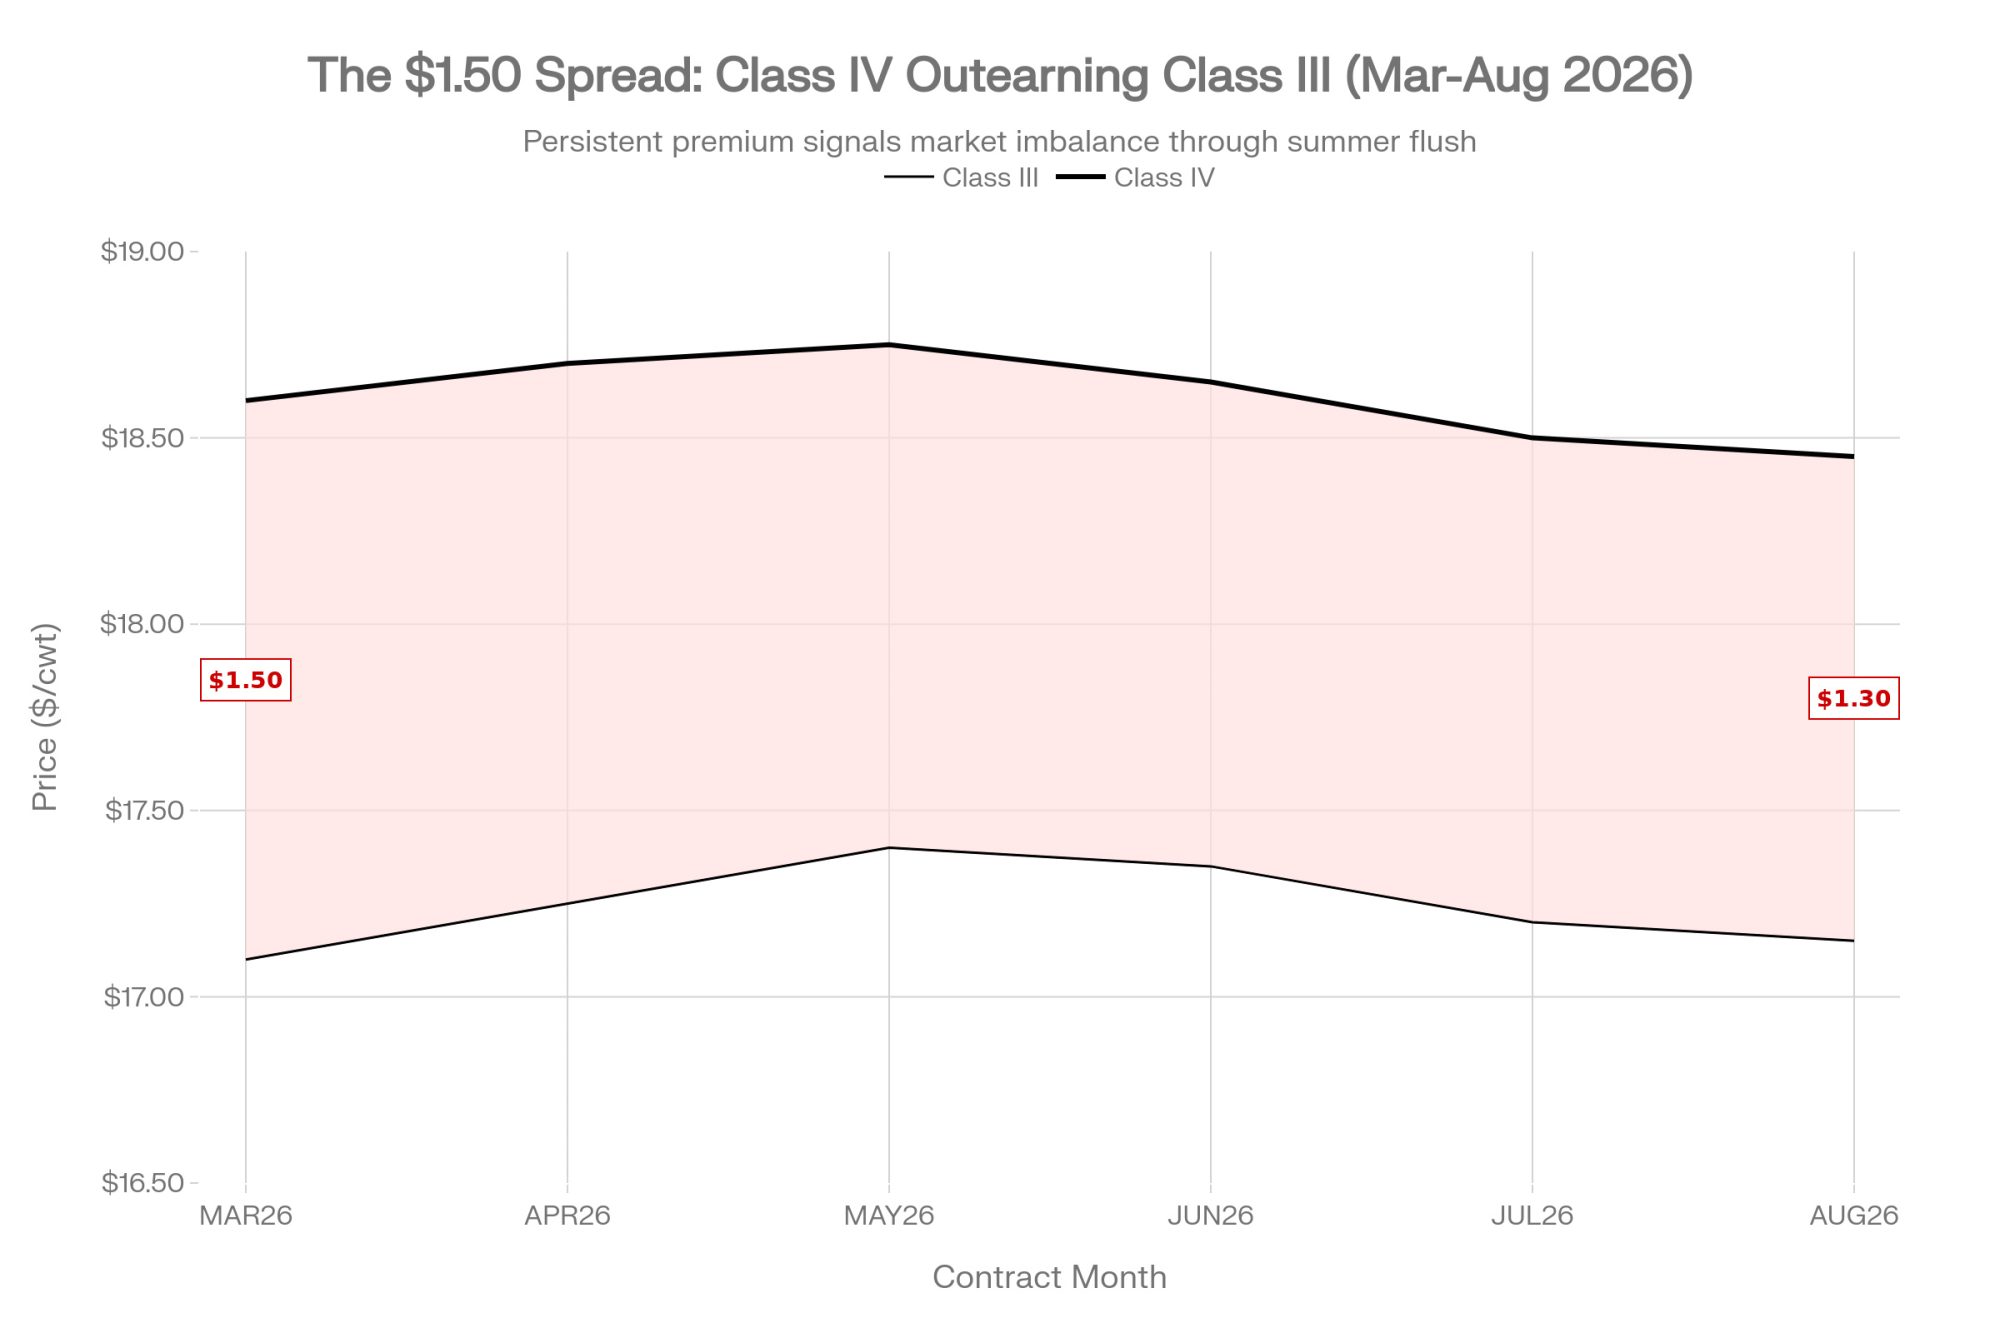
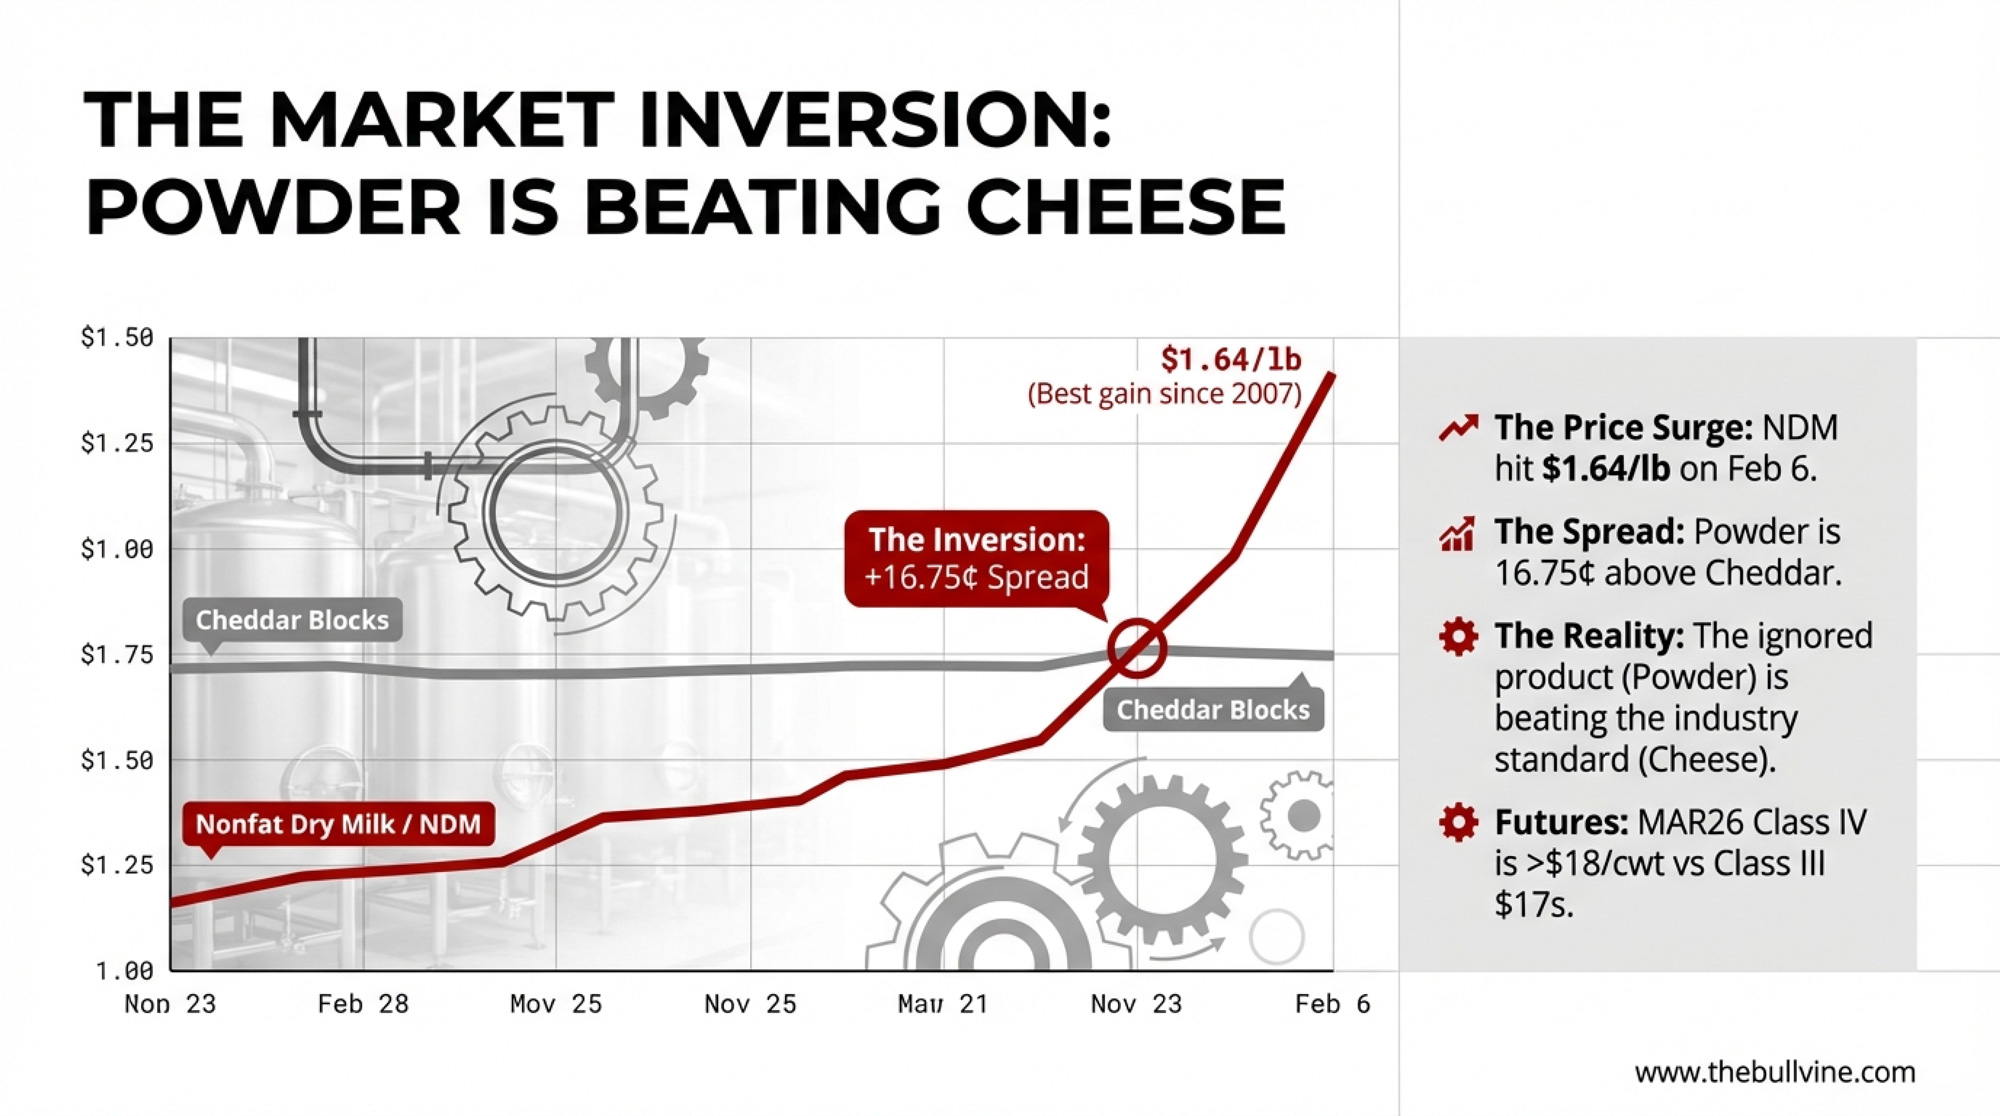
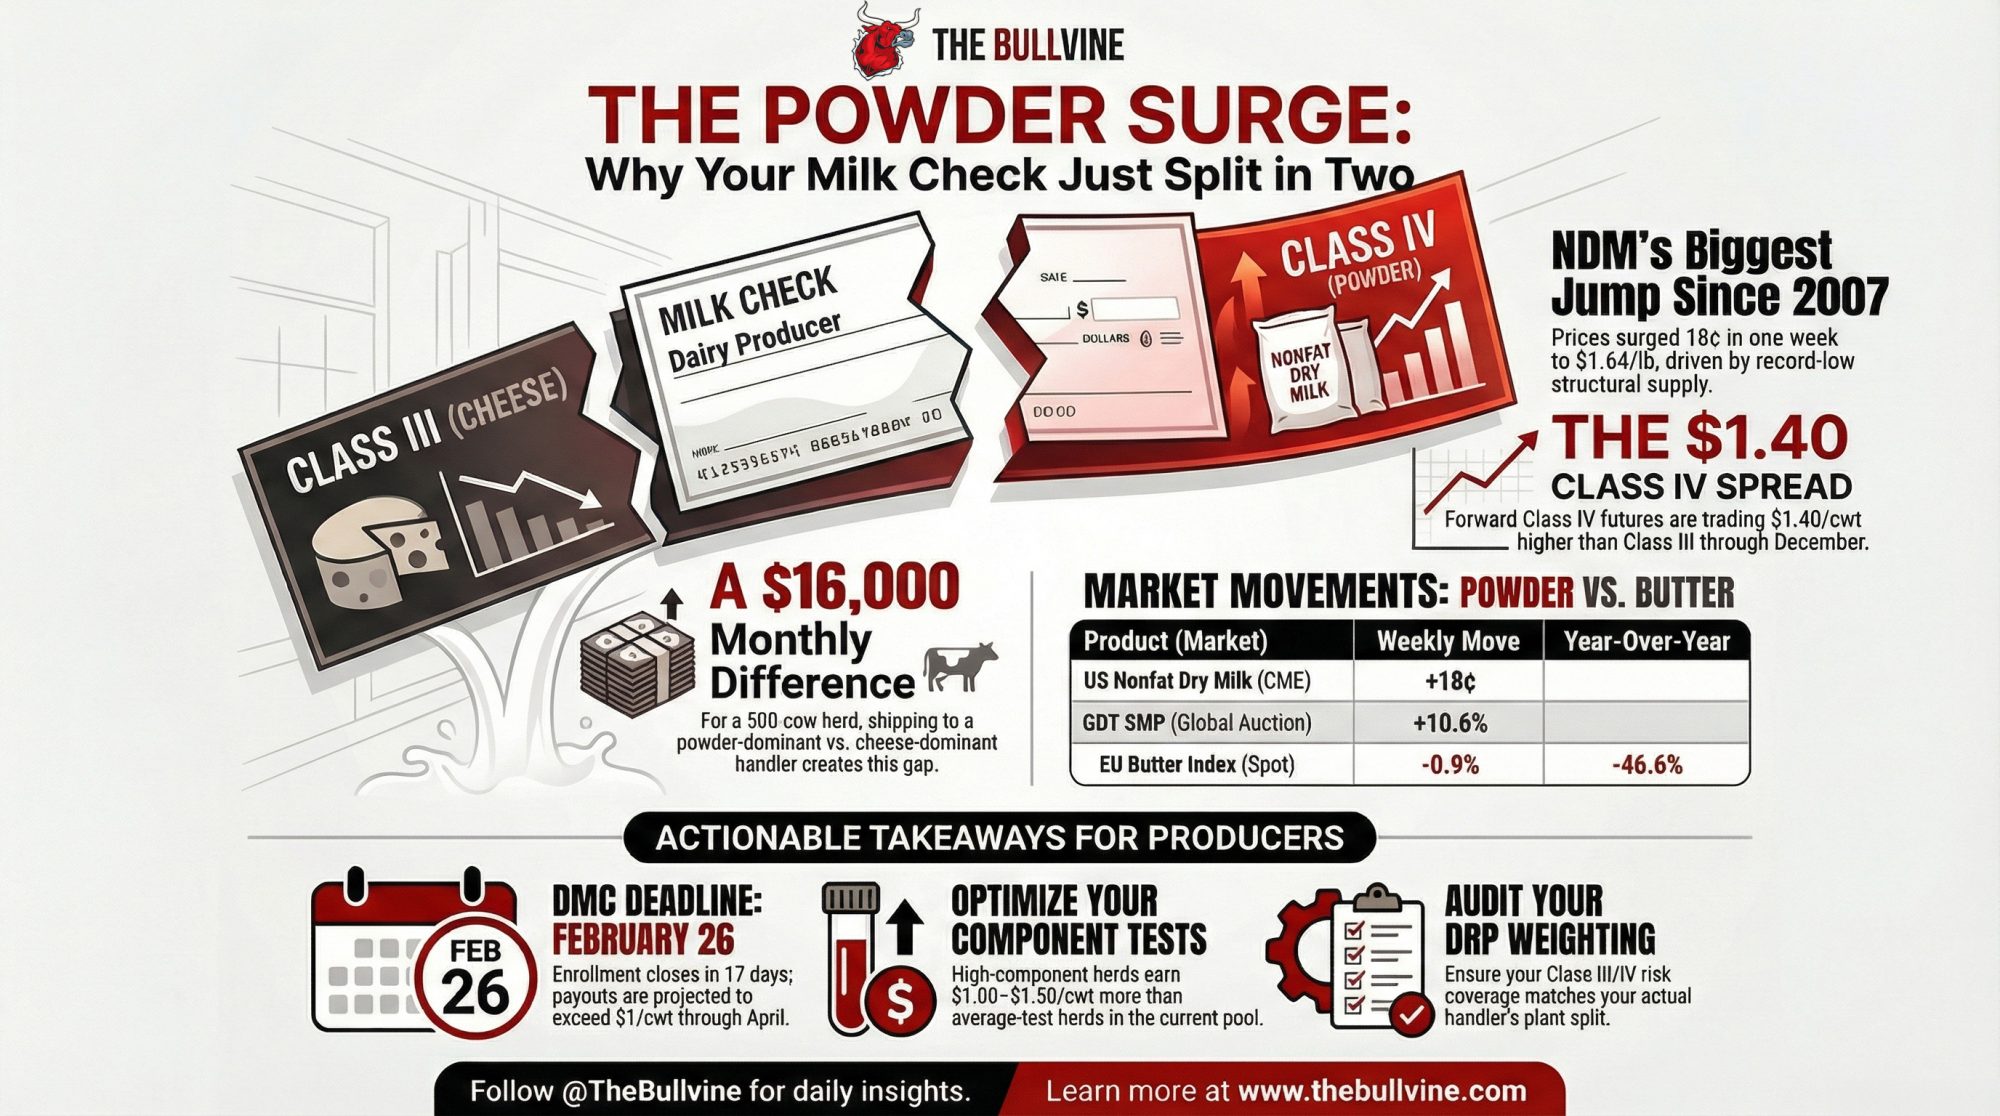
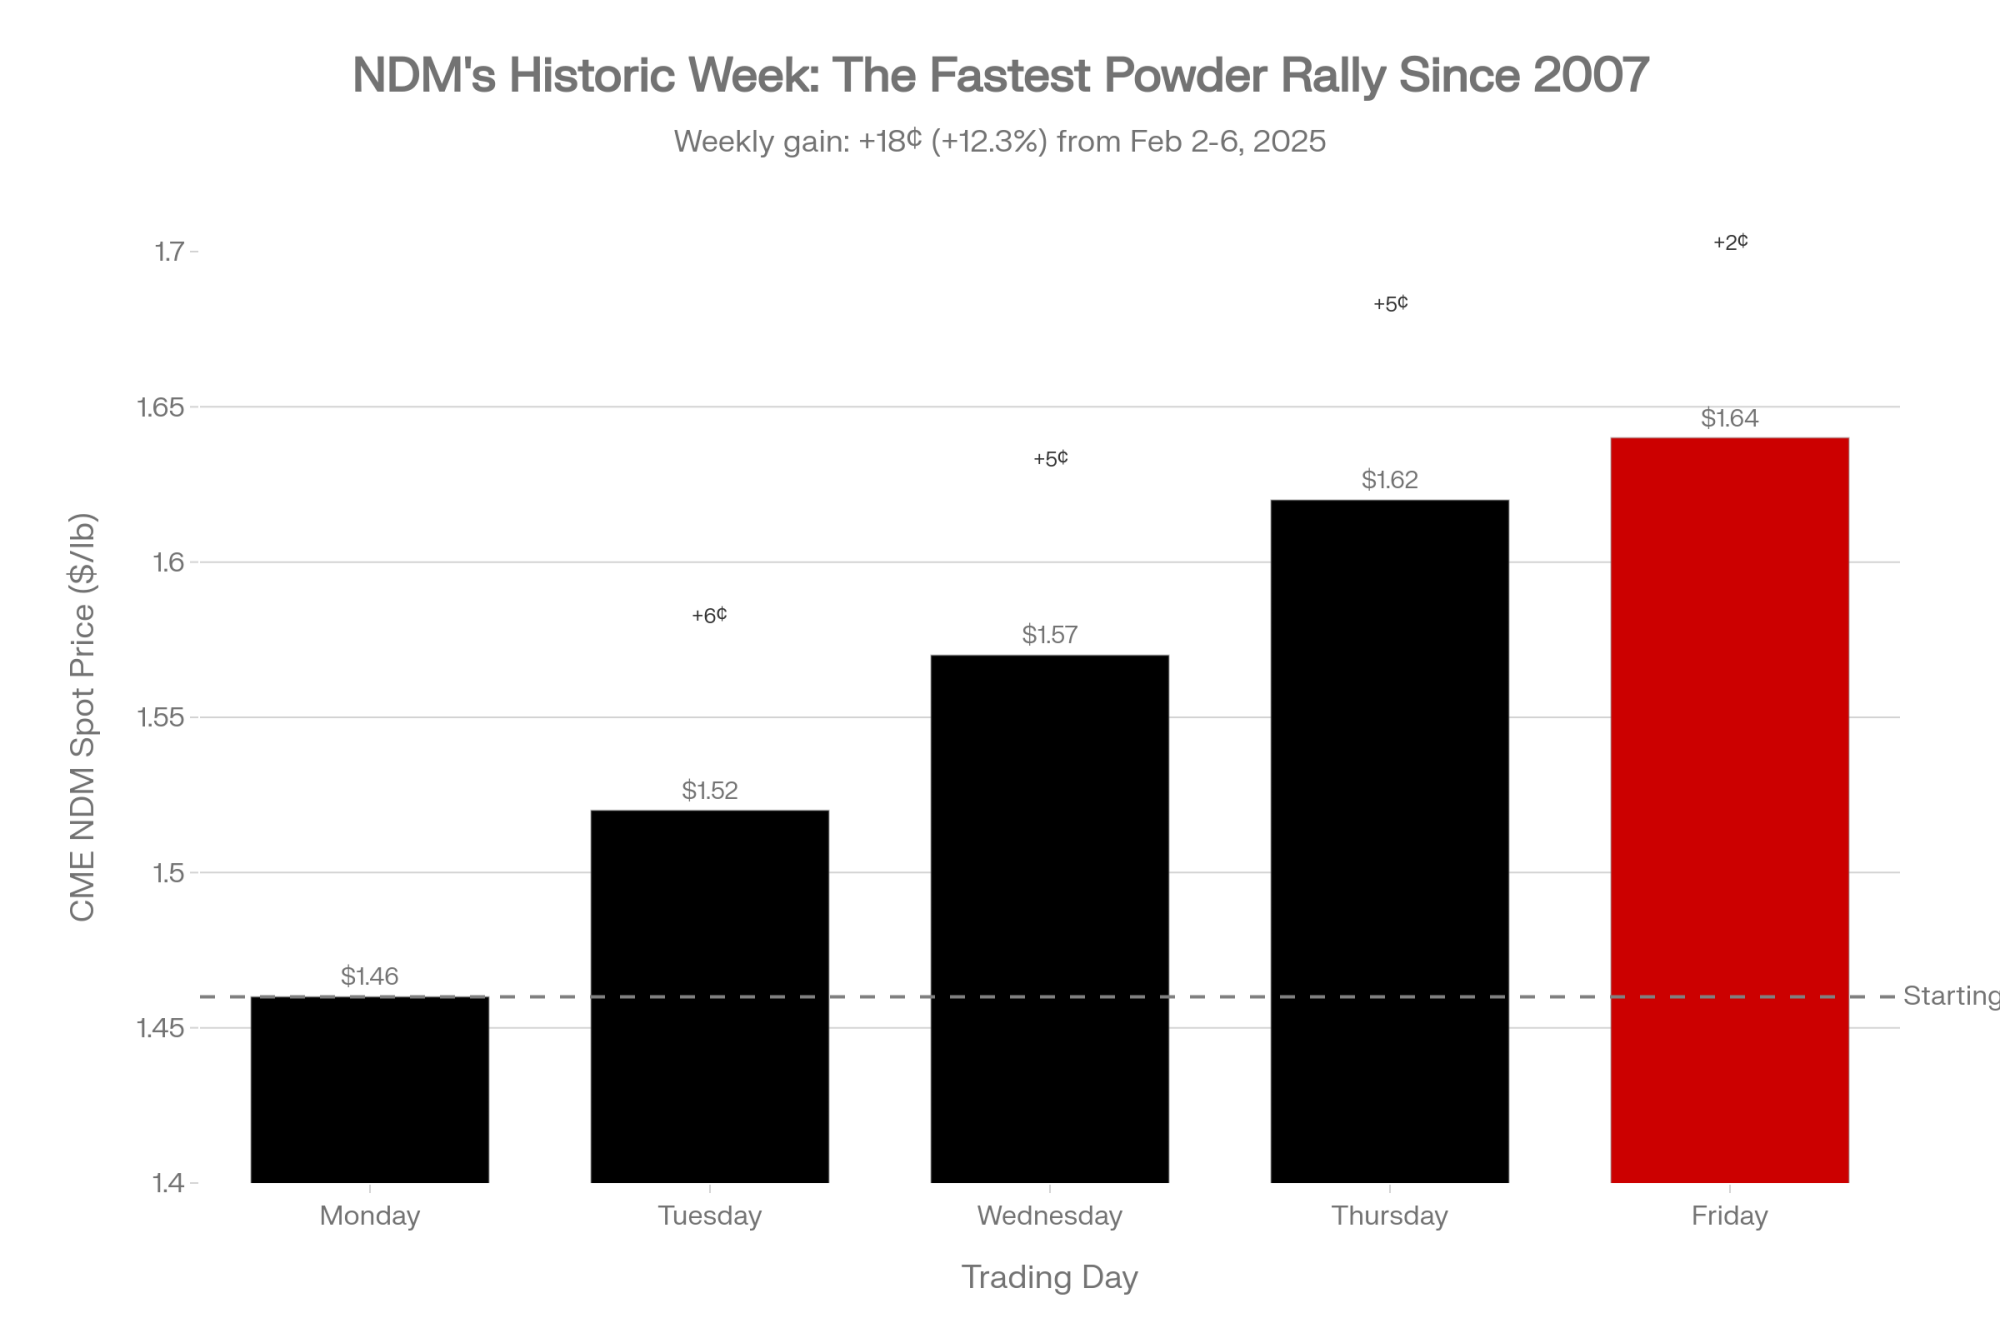
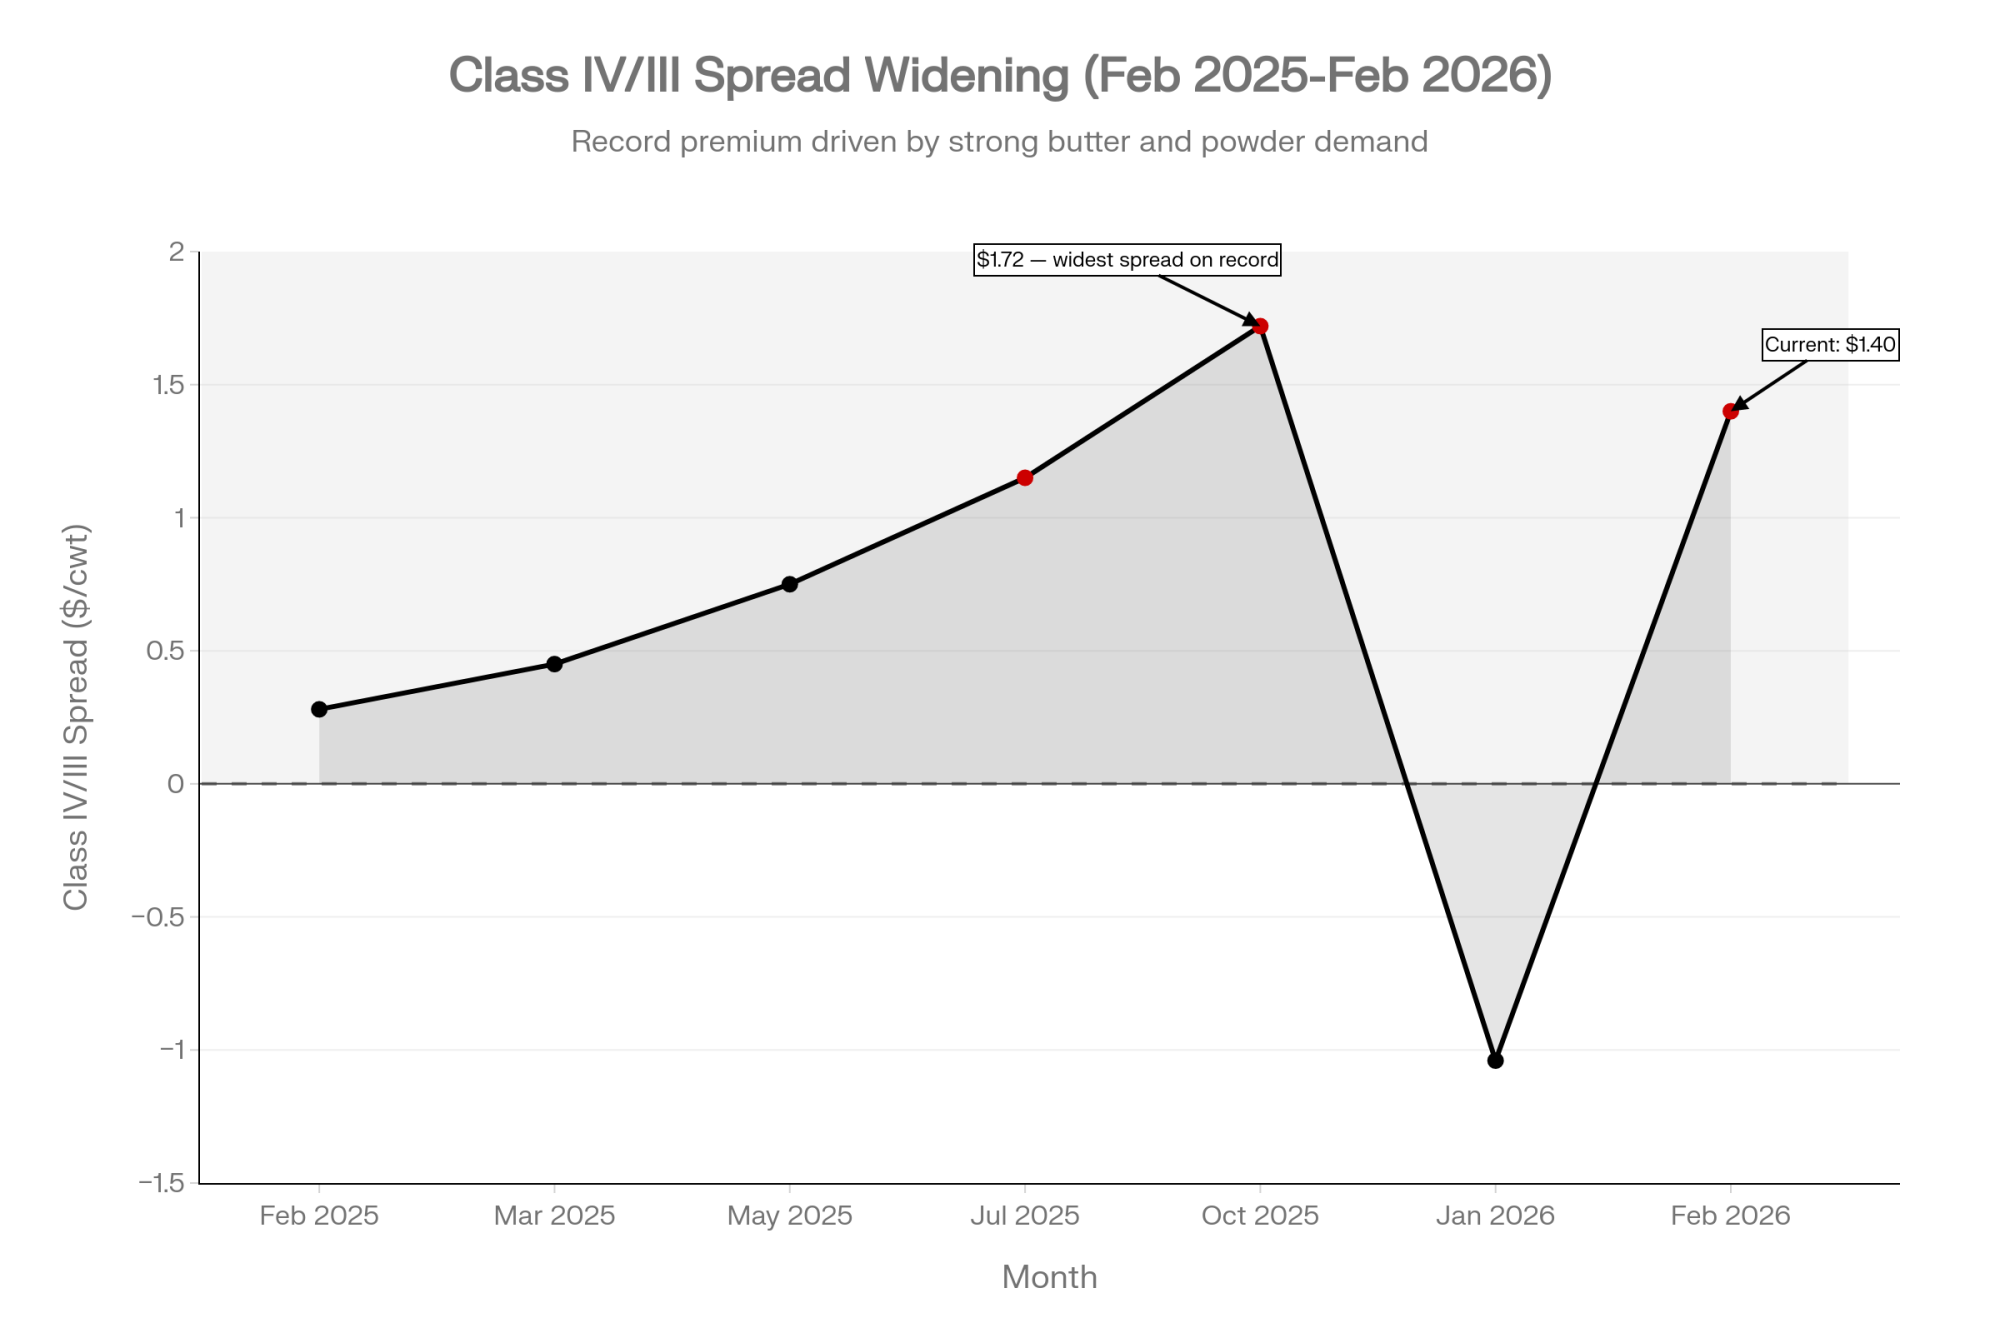
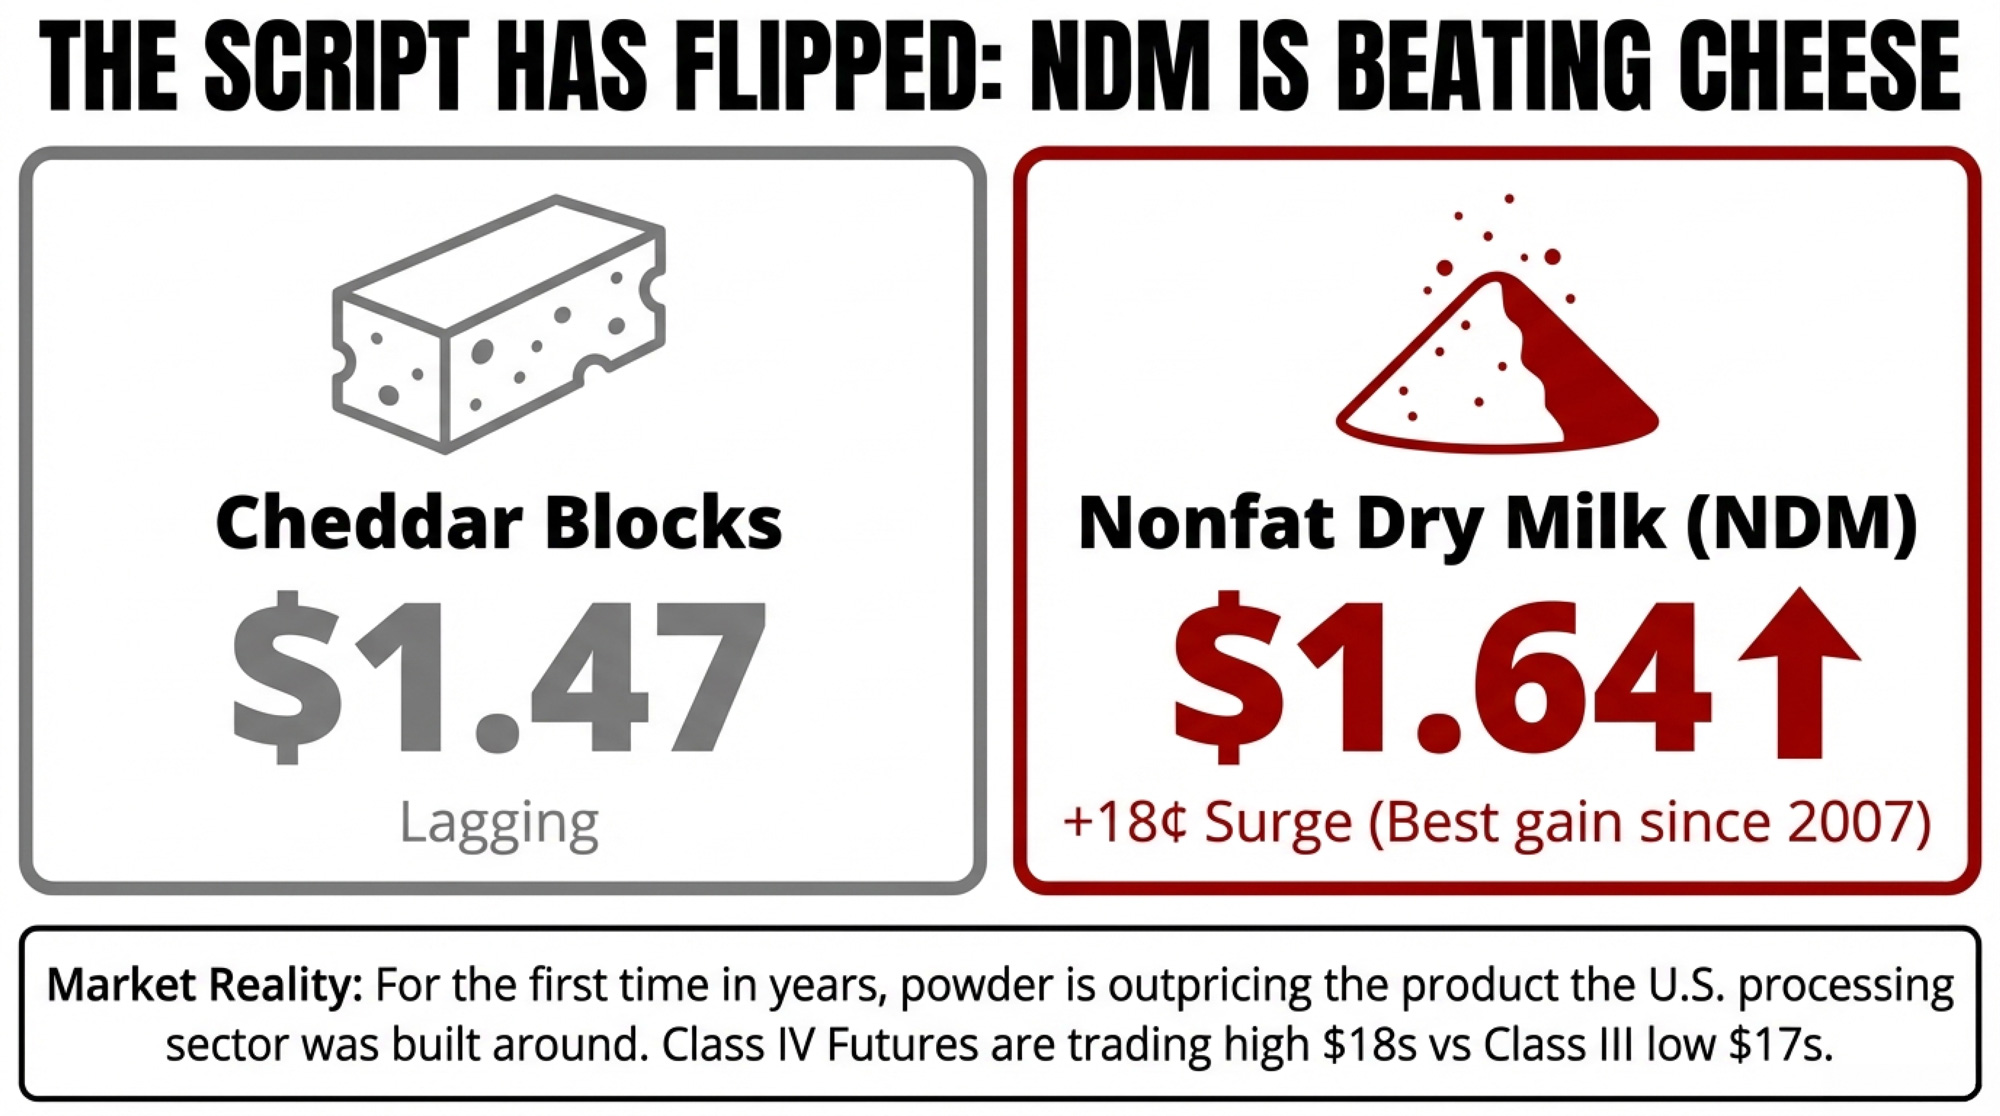
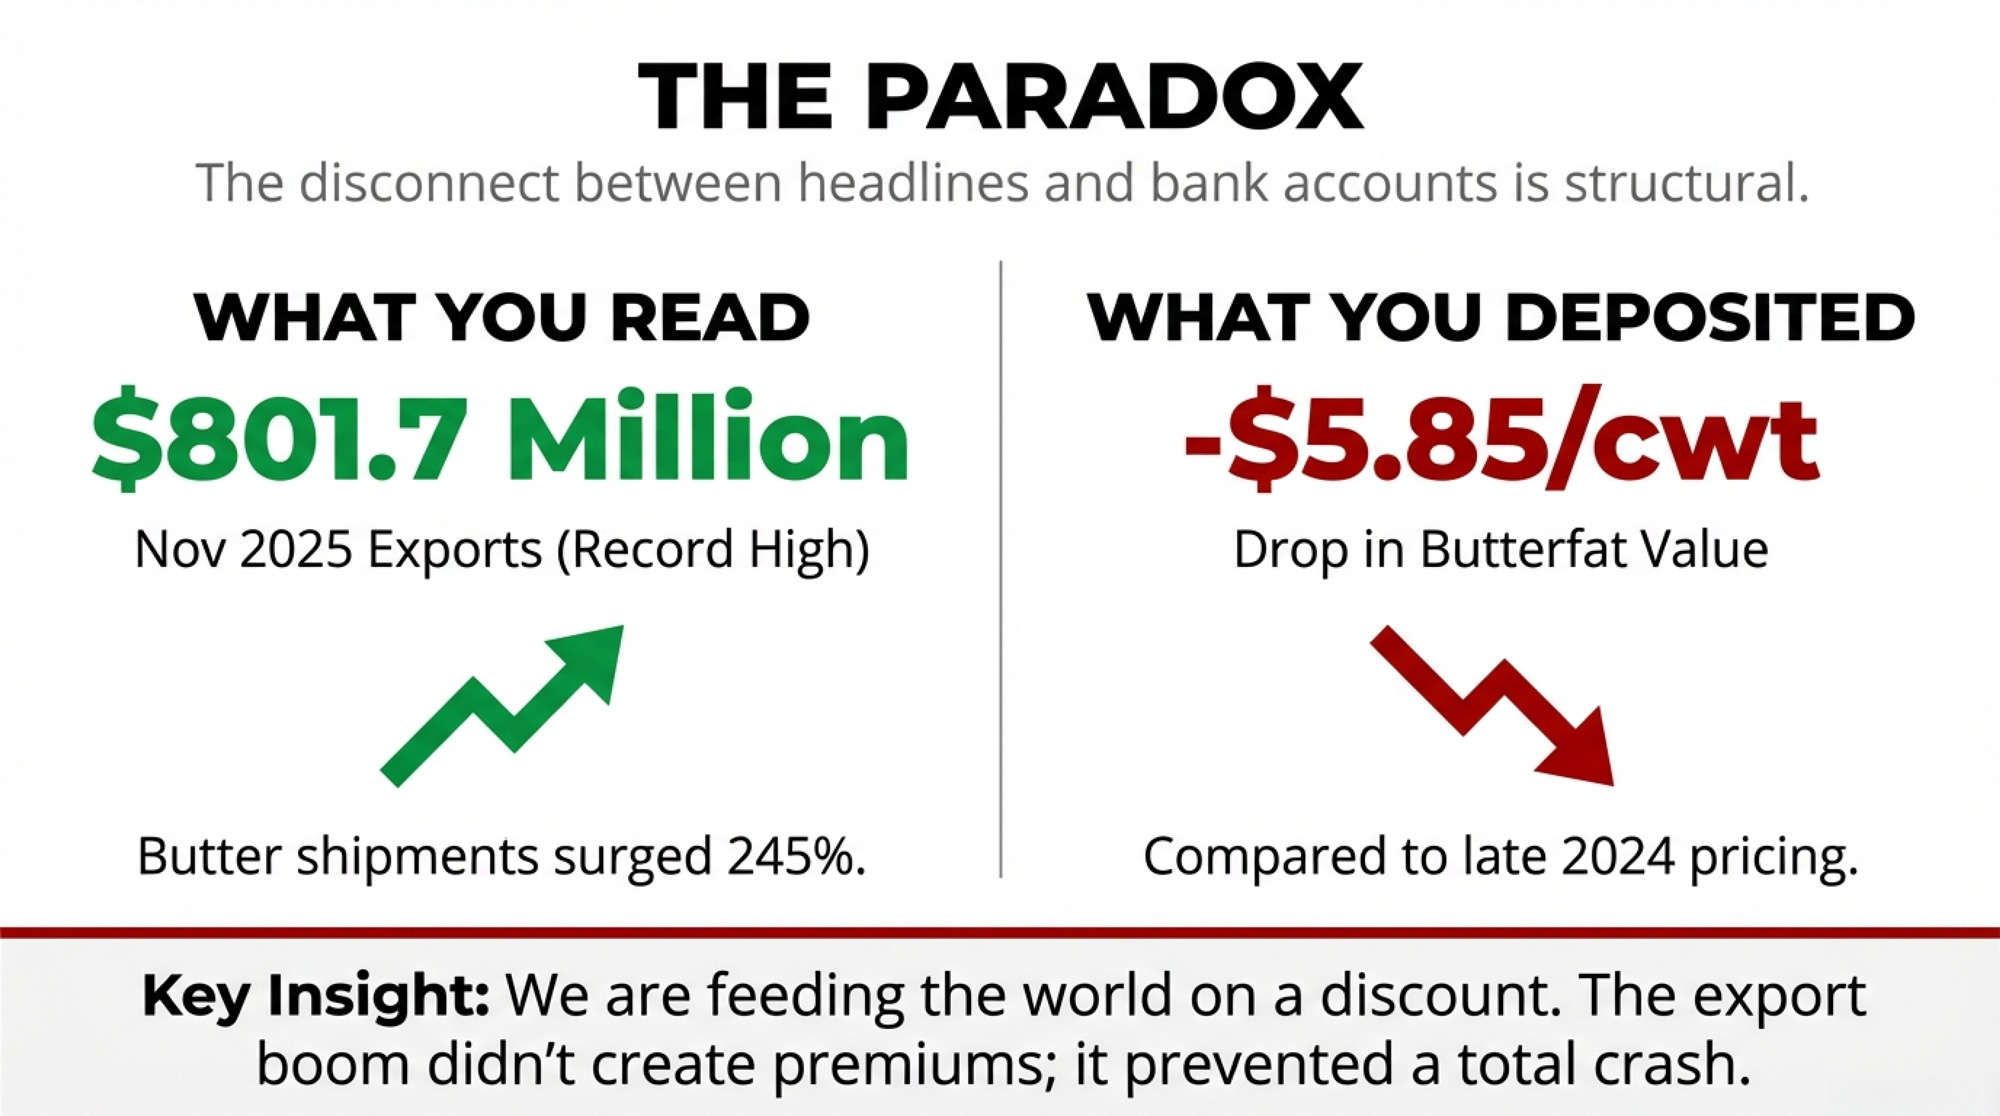
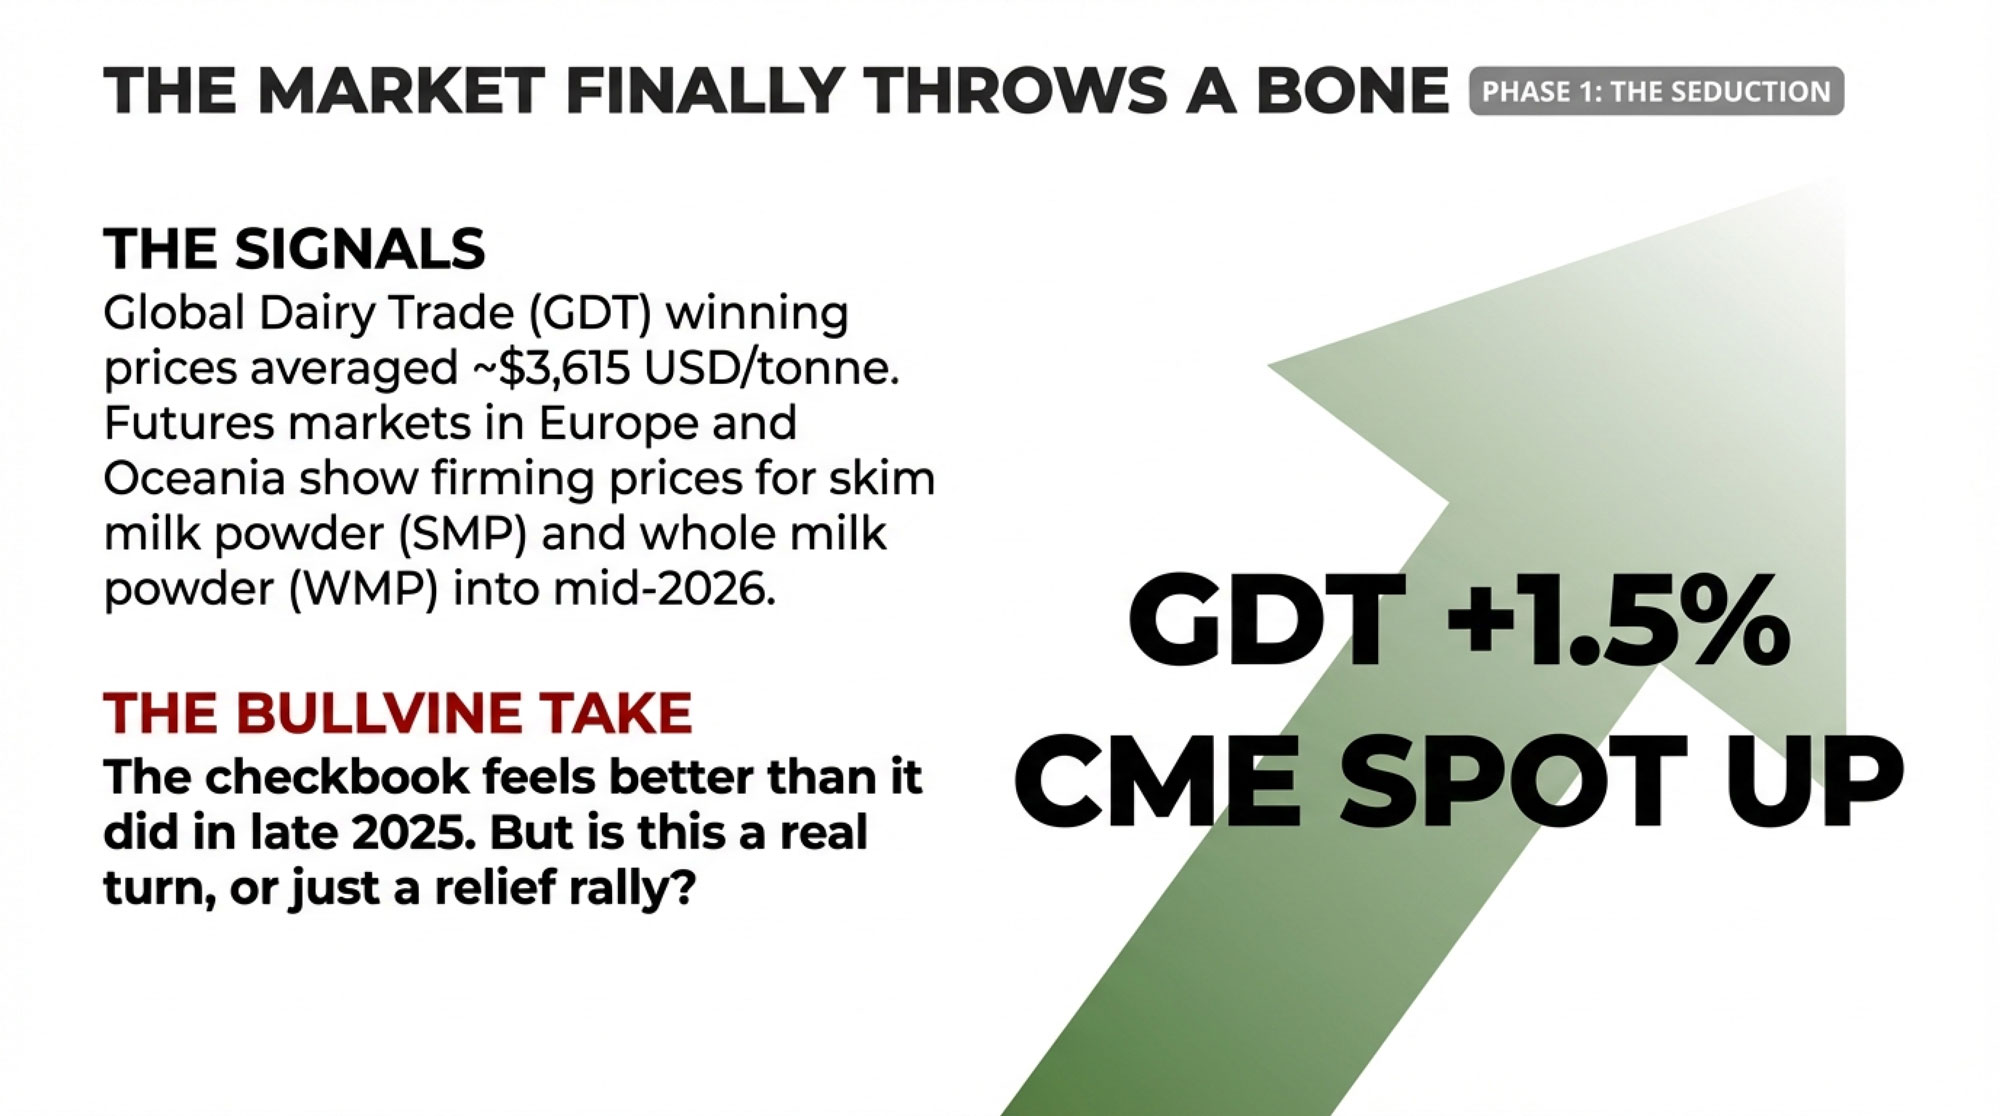
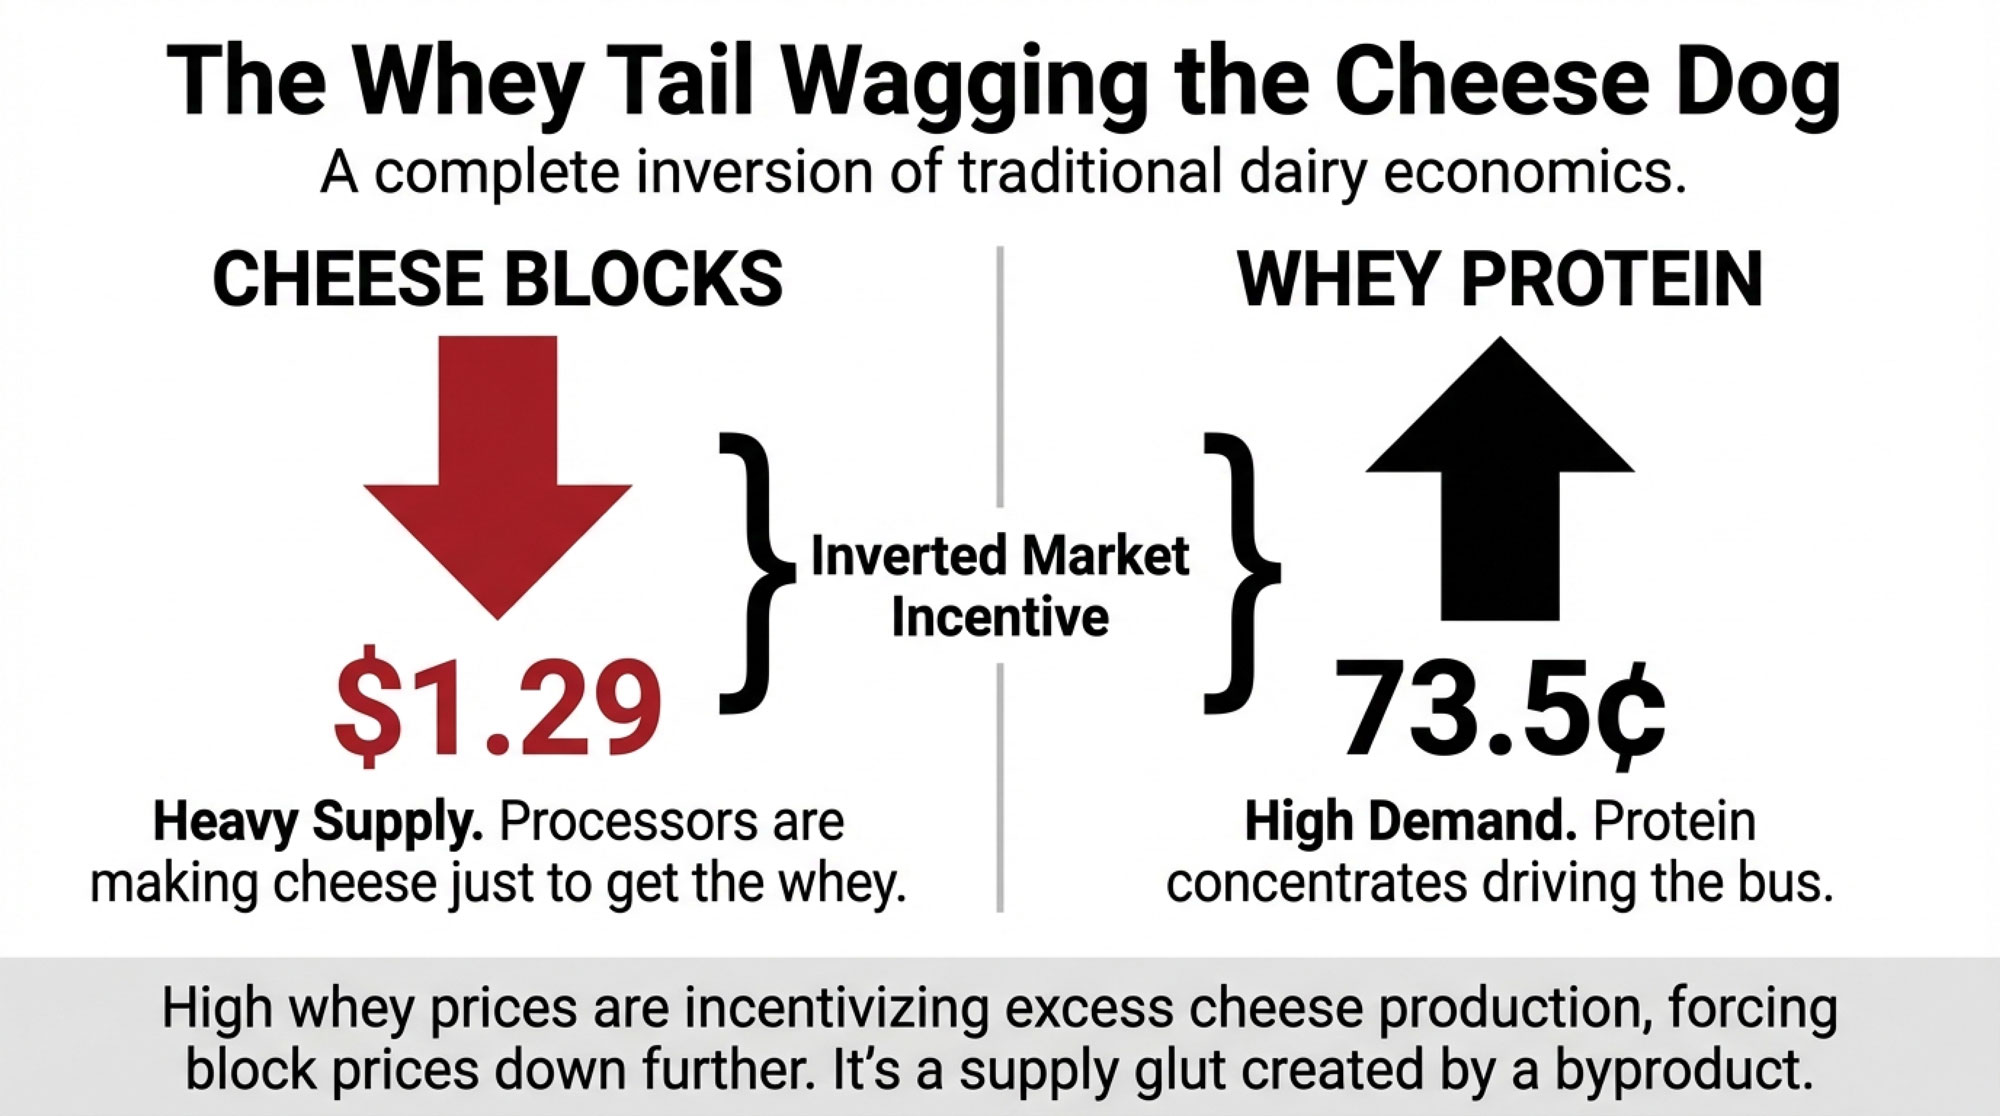
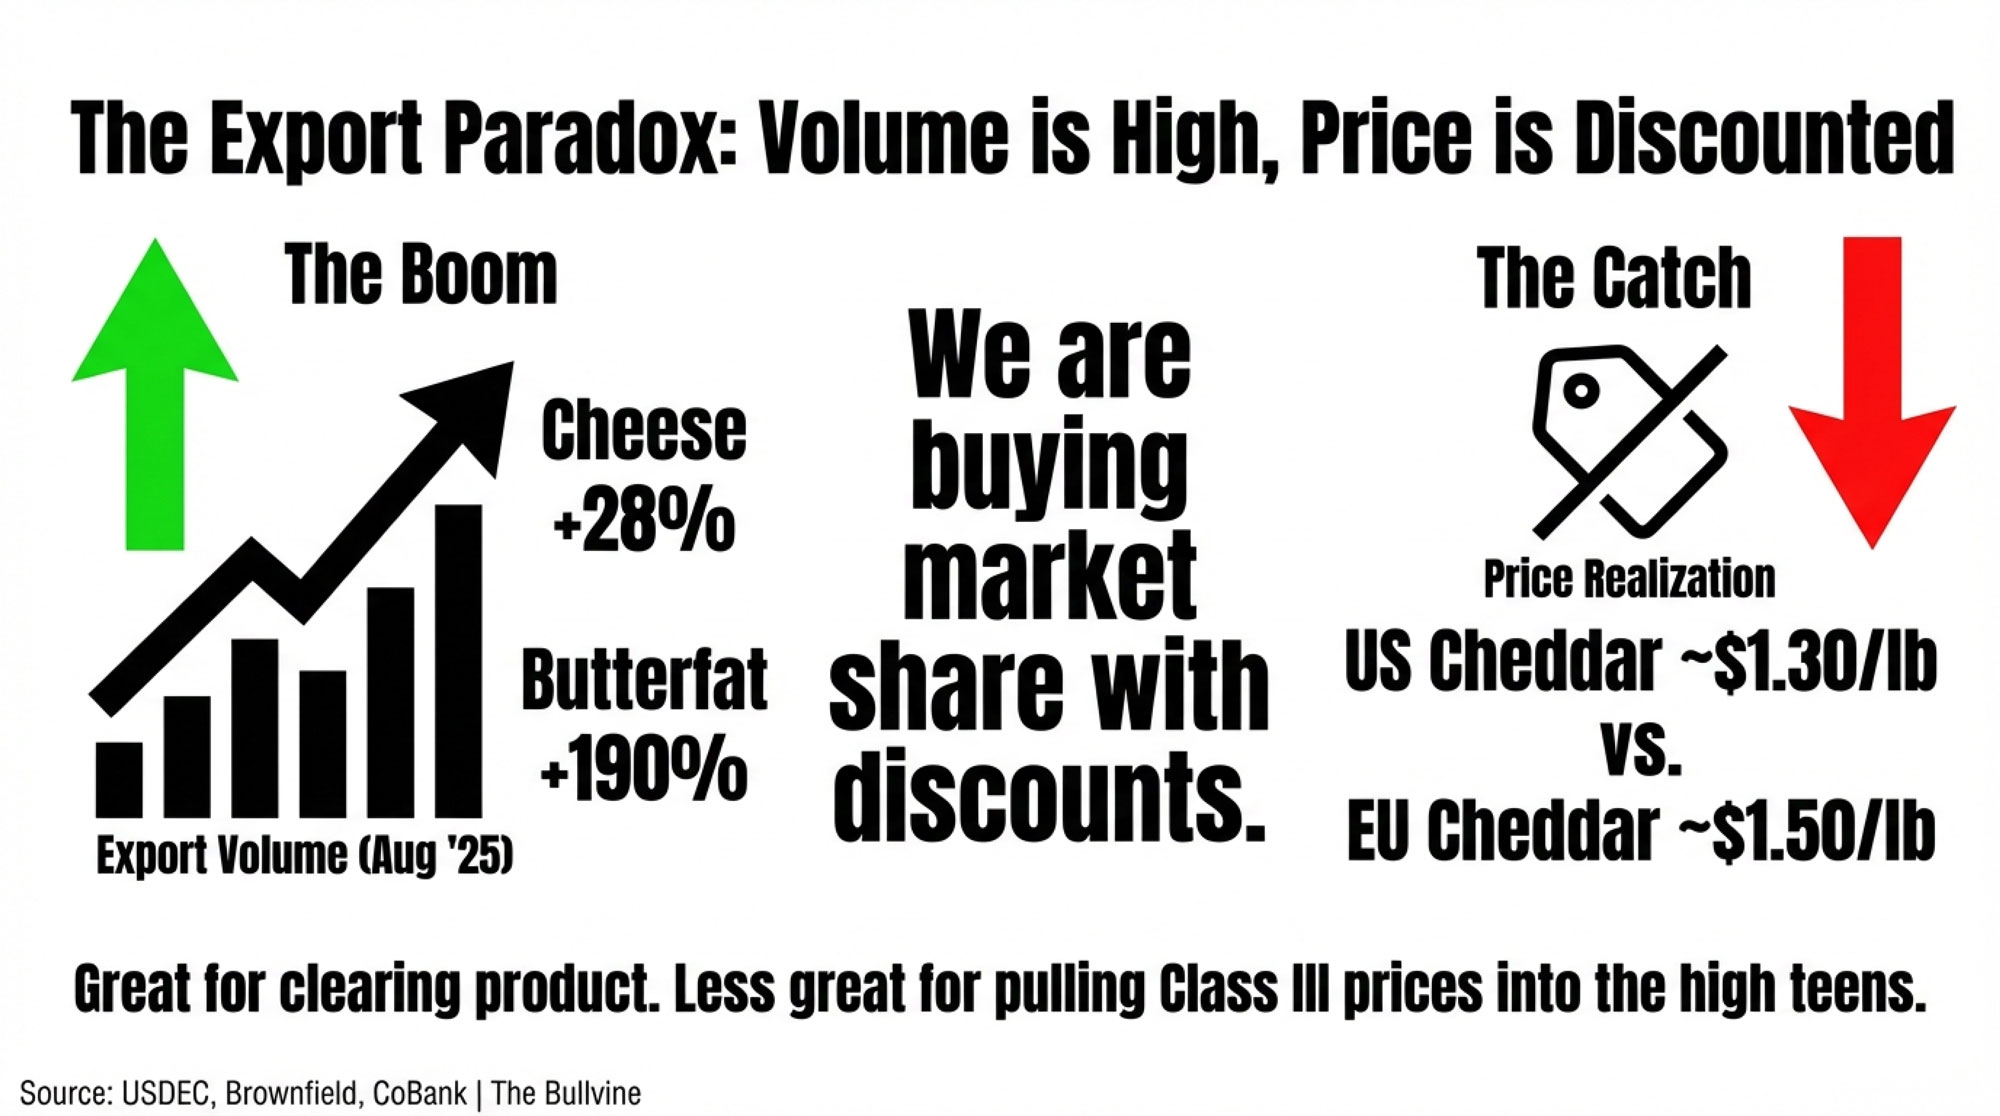
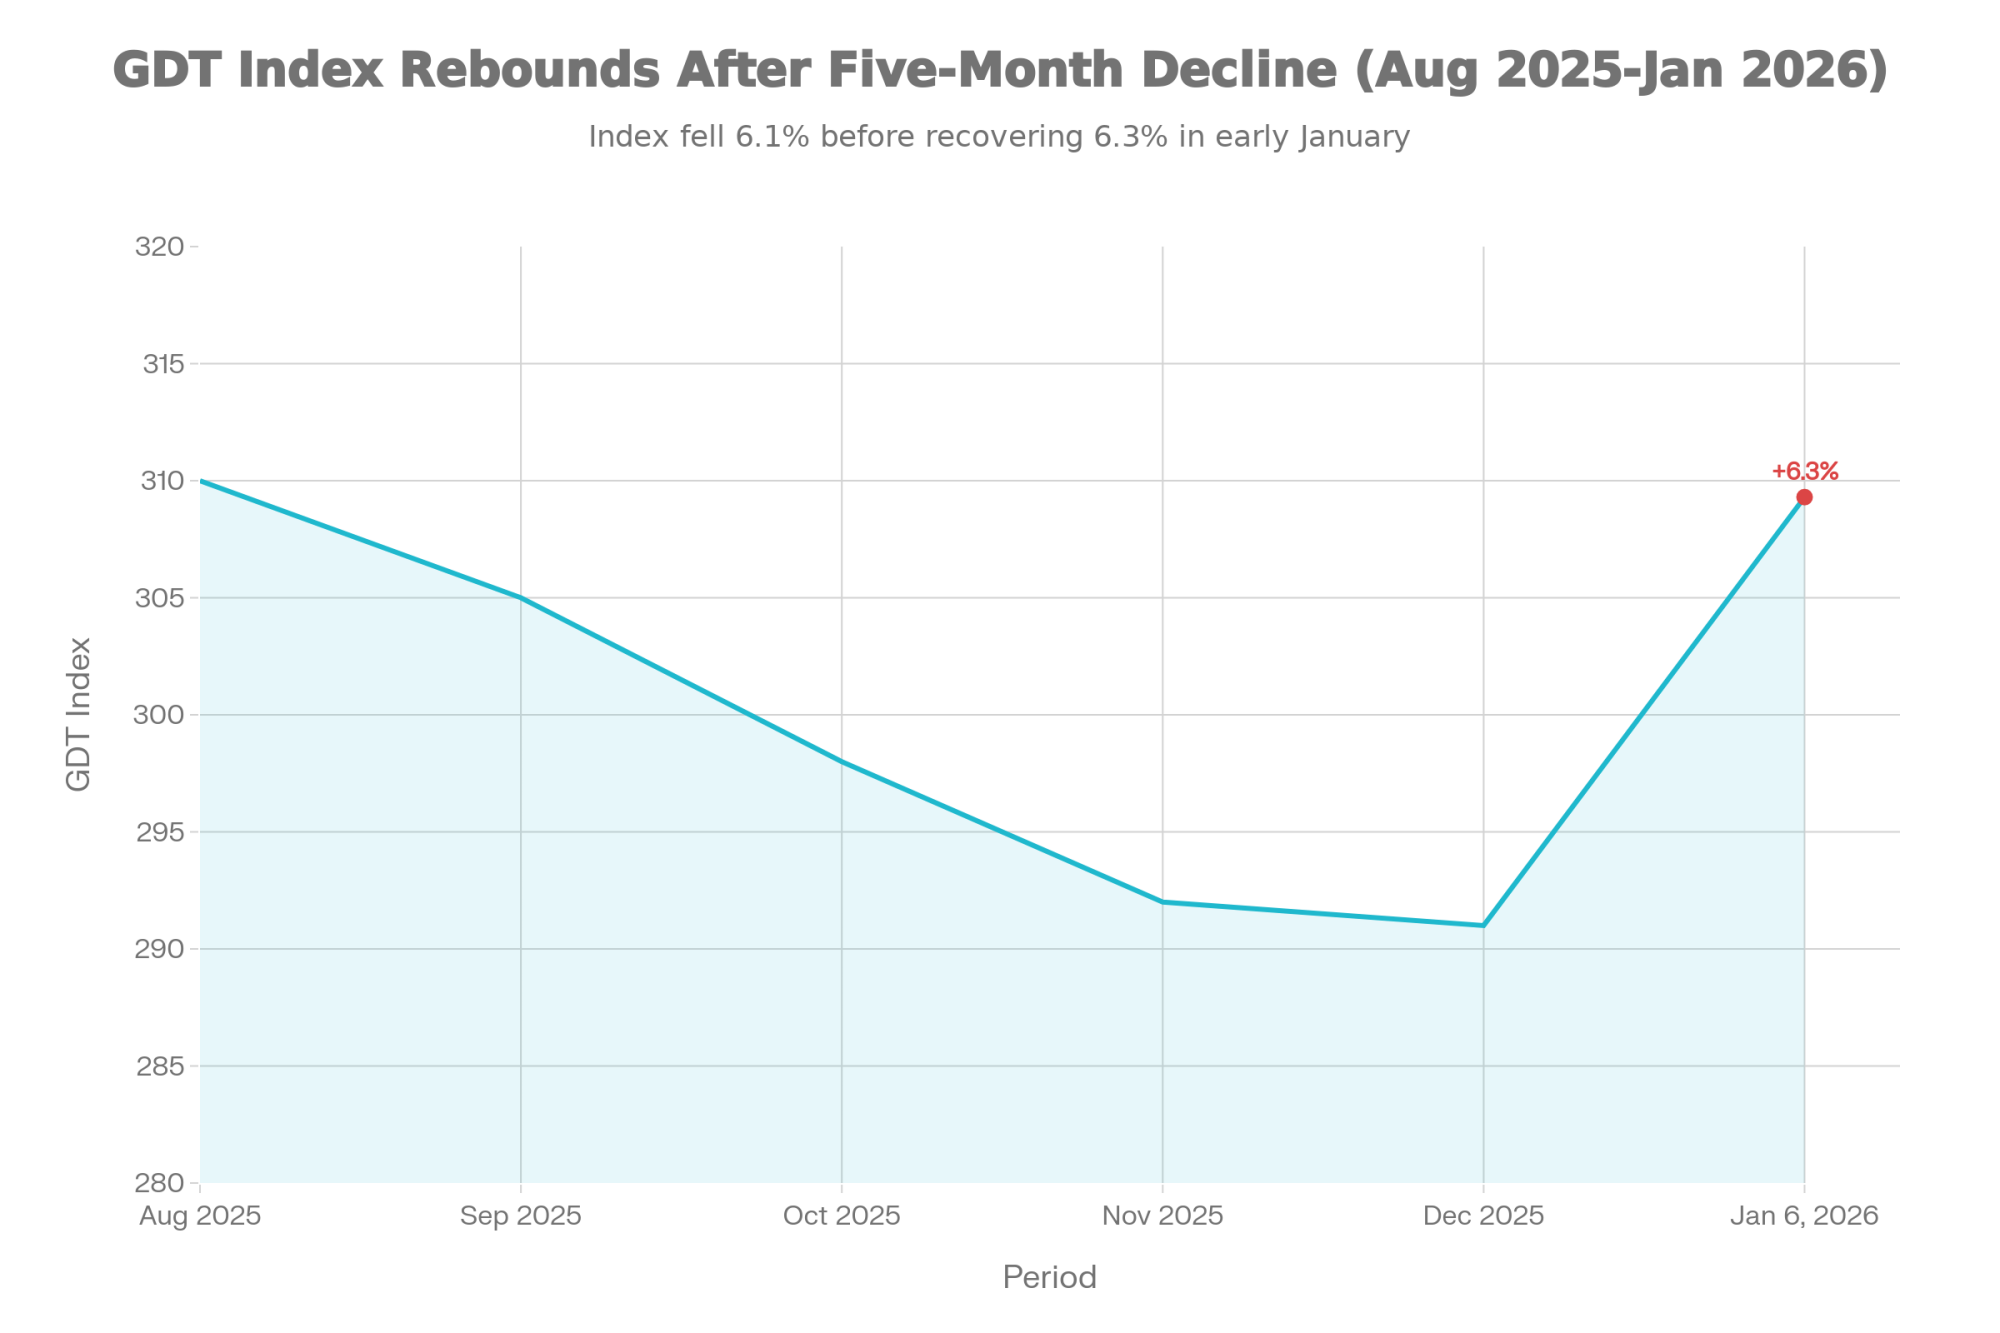
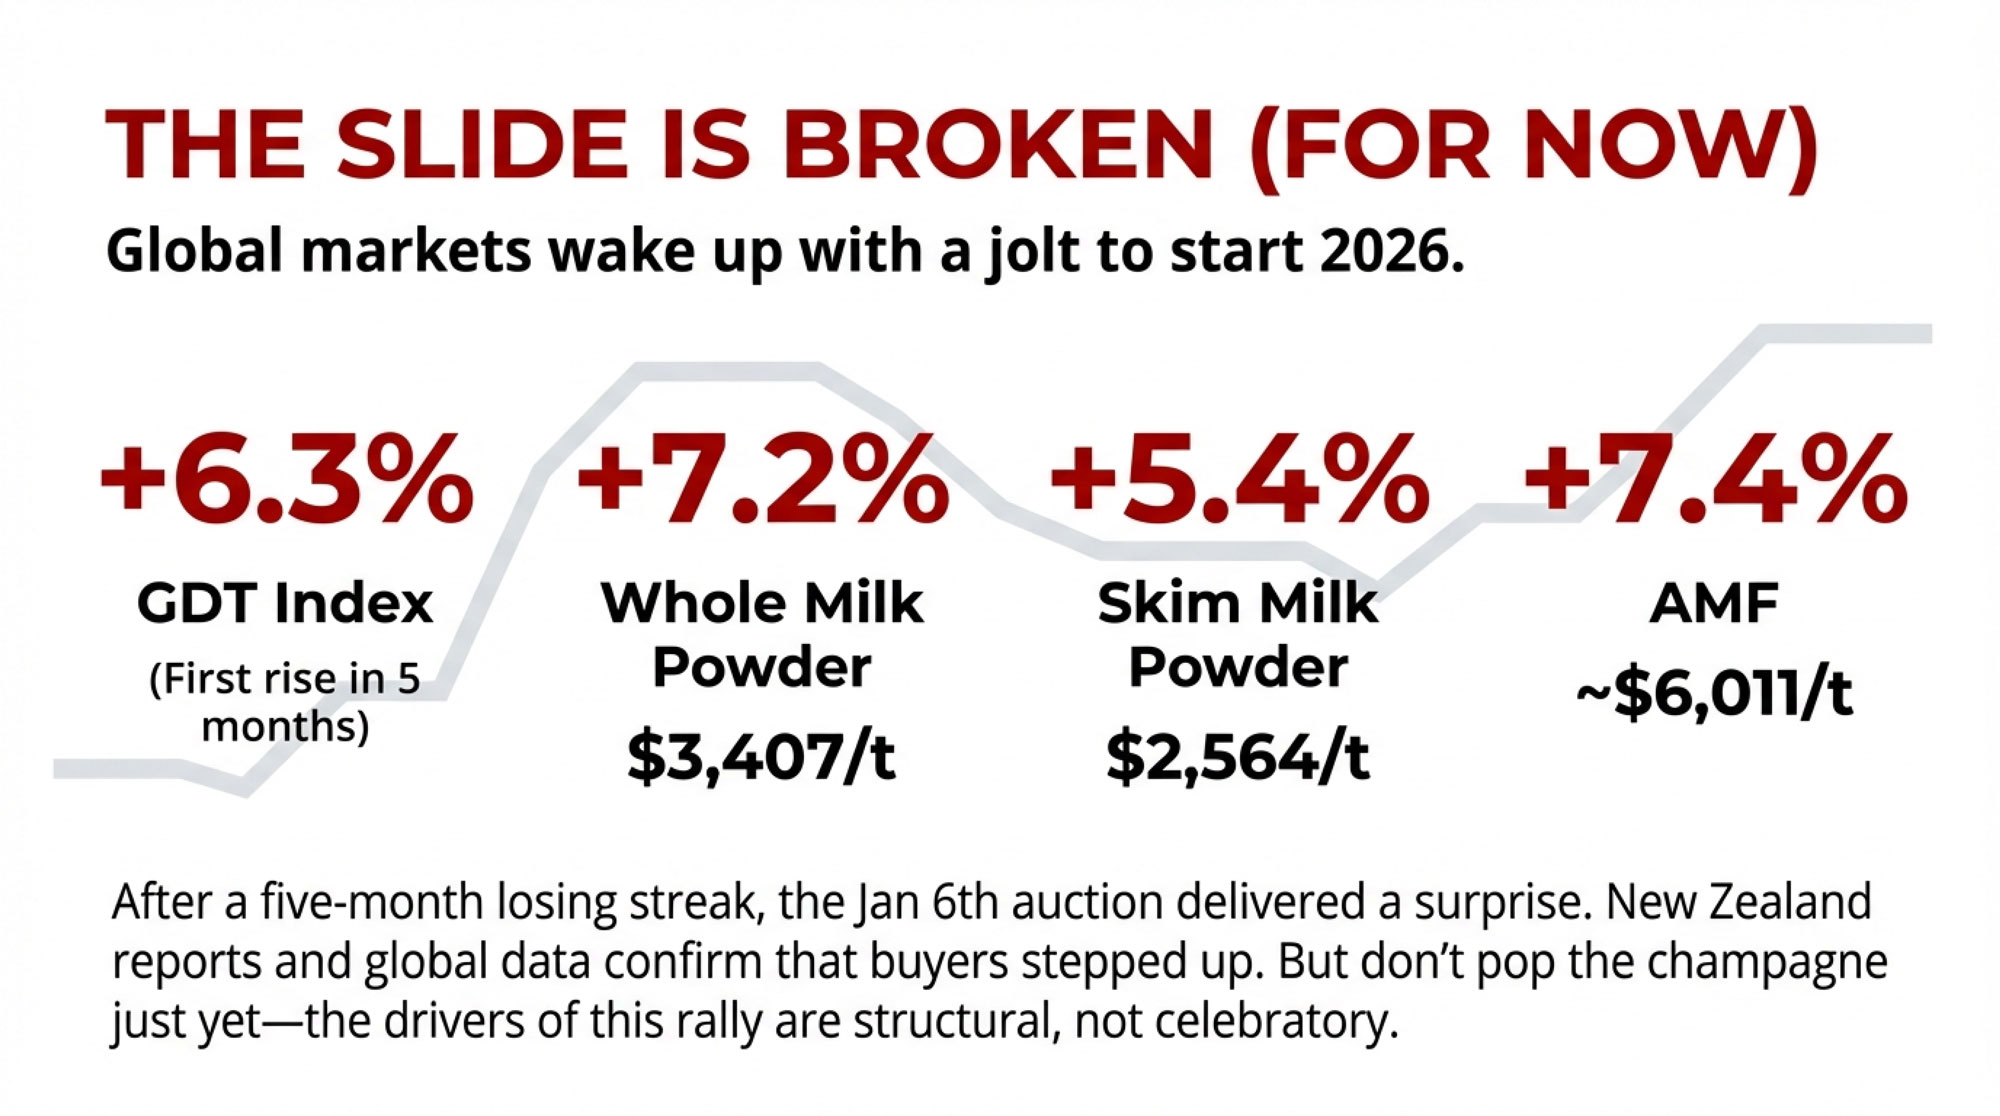
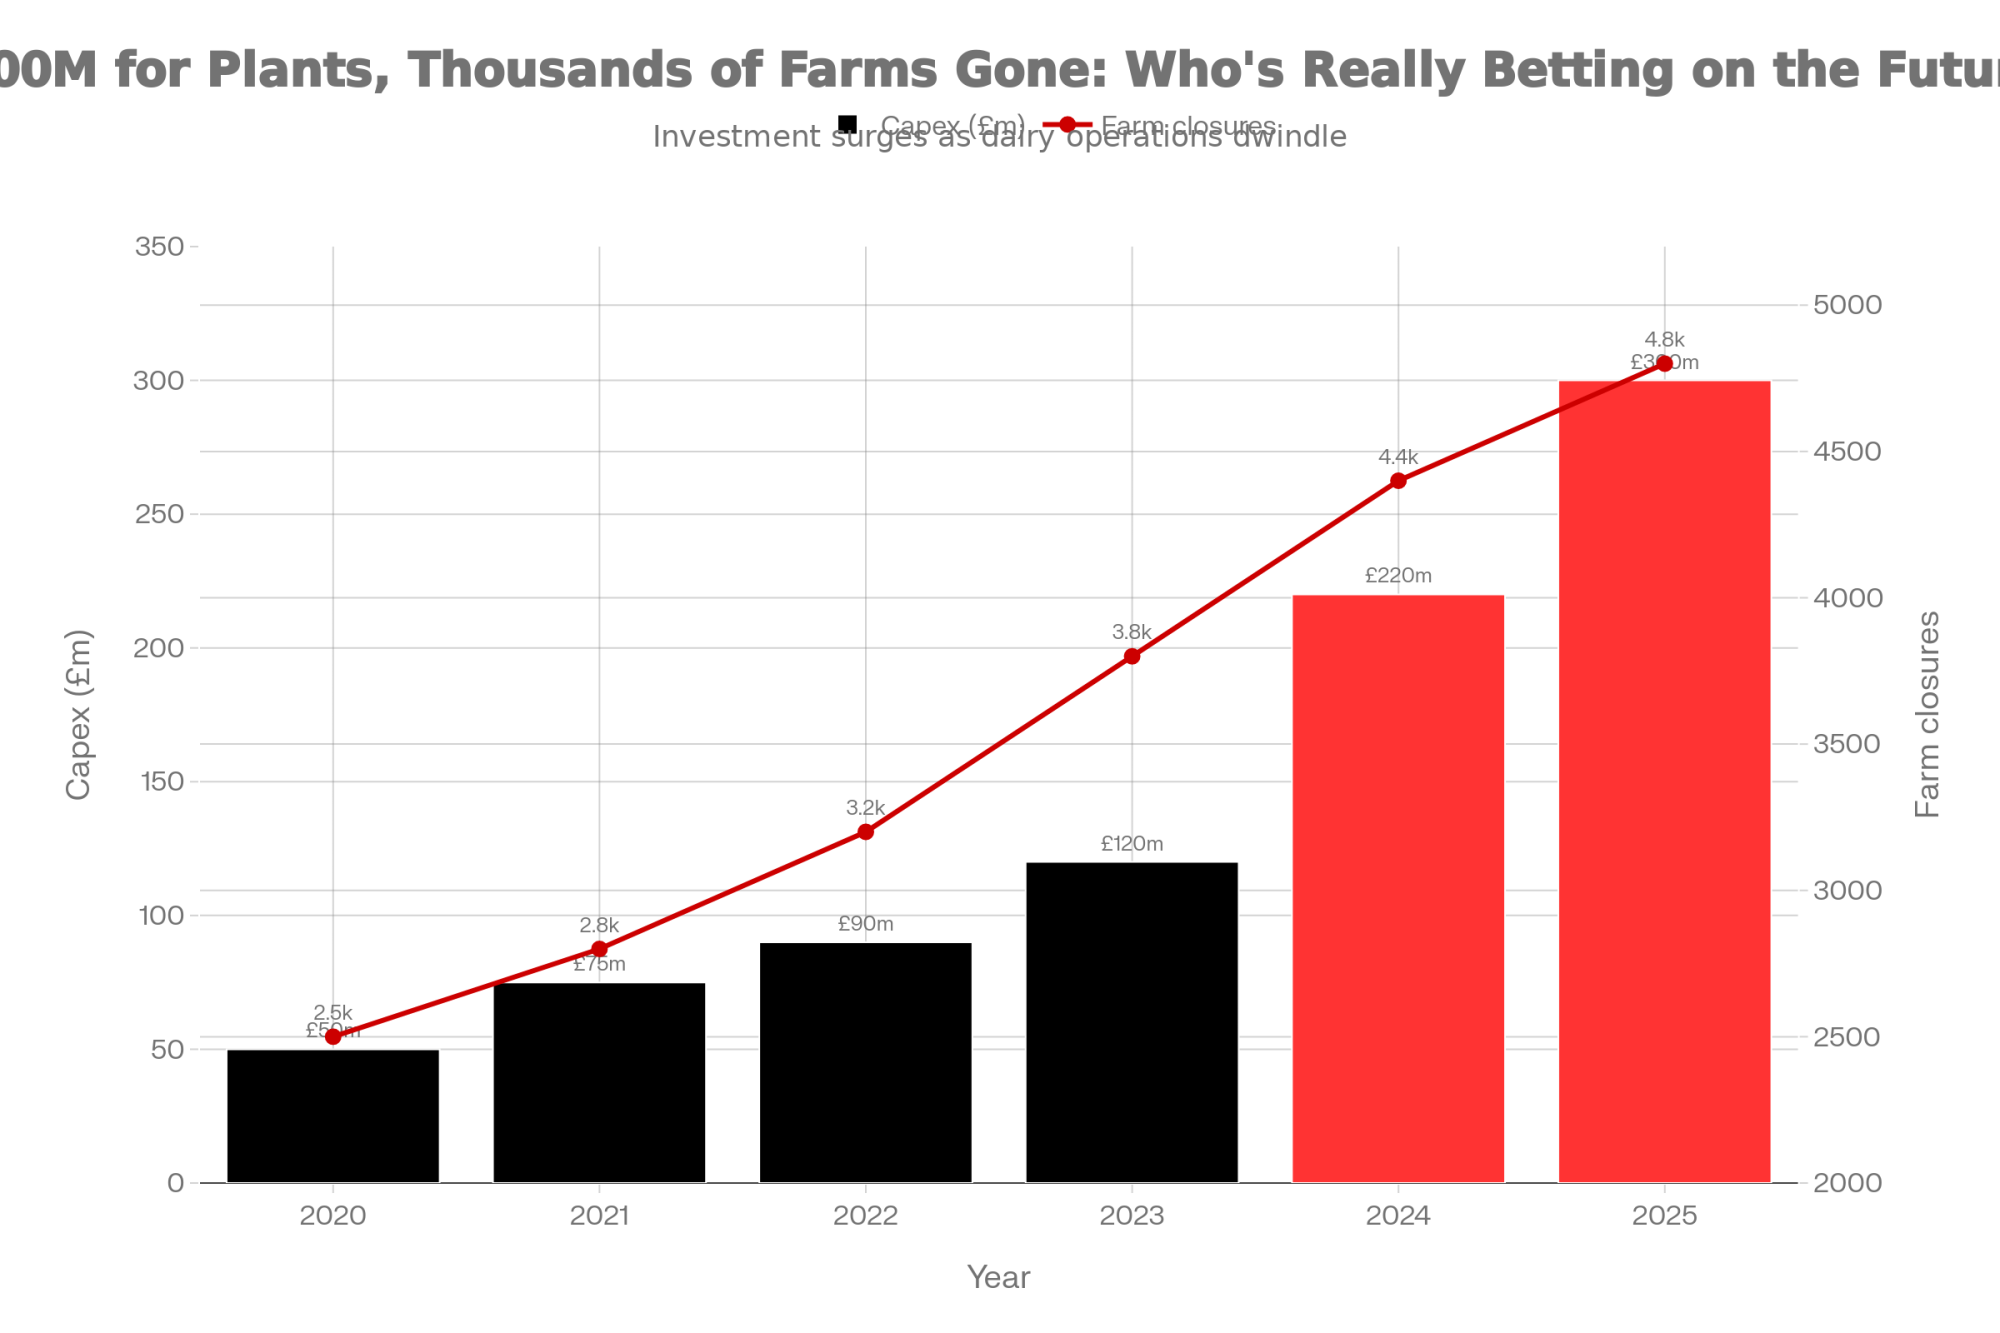
Six percent of global dairy trade sitting behind a chokepoint should’ve pushed prices down, not up. Instead, early 2026 has skim milk powder, cheese, and butter all stronger than most models projected — and a lot of 300‑ to 800‑cow U.S. dairies staring at expansion plans that suddenly “pencil.” You’re looking at a rally and wondering if it’s a window or a setup. On a $3 million project at 7% over 15 years, that choice carries an annual payment of roughly $323,600 and nearly $1.85 million in total interest.
Nate Donnay, a Minneapolis‑based dairy market insight director who’s been modeling international and U.S. dairy markets since 2005, told clients in late 2025 to expect a heavy market: big production gains across every major exporter, growing stocks, and prices under pressure. Instead, the first quarter turned into a demand‑driven rally stacked on top of already strong milk flow. For a 500‑cow family operation, that rally now looks like a green light — call the lender, add stalls or robots, lock in what feels like a new floor.
The Rally That Shouldn’t Have Happened
From a pure supply standpoint, this rally shouldn’t be here.
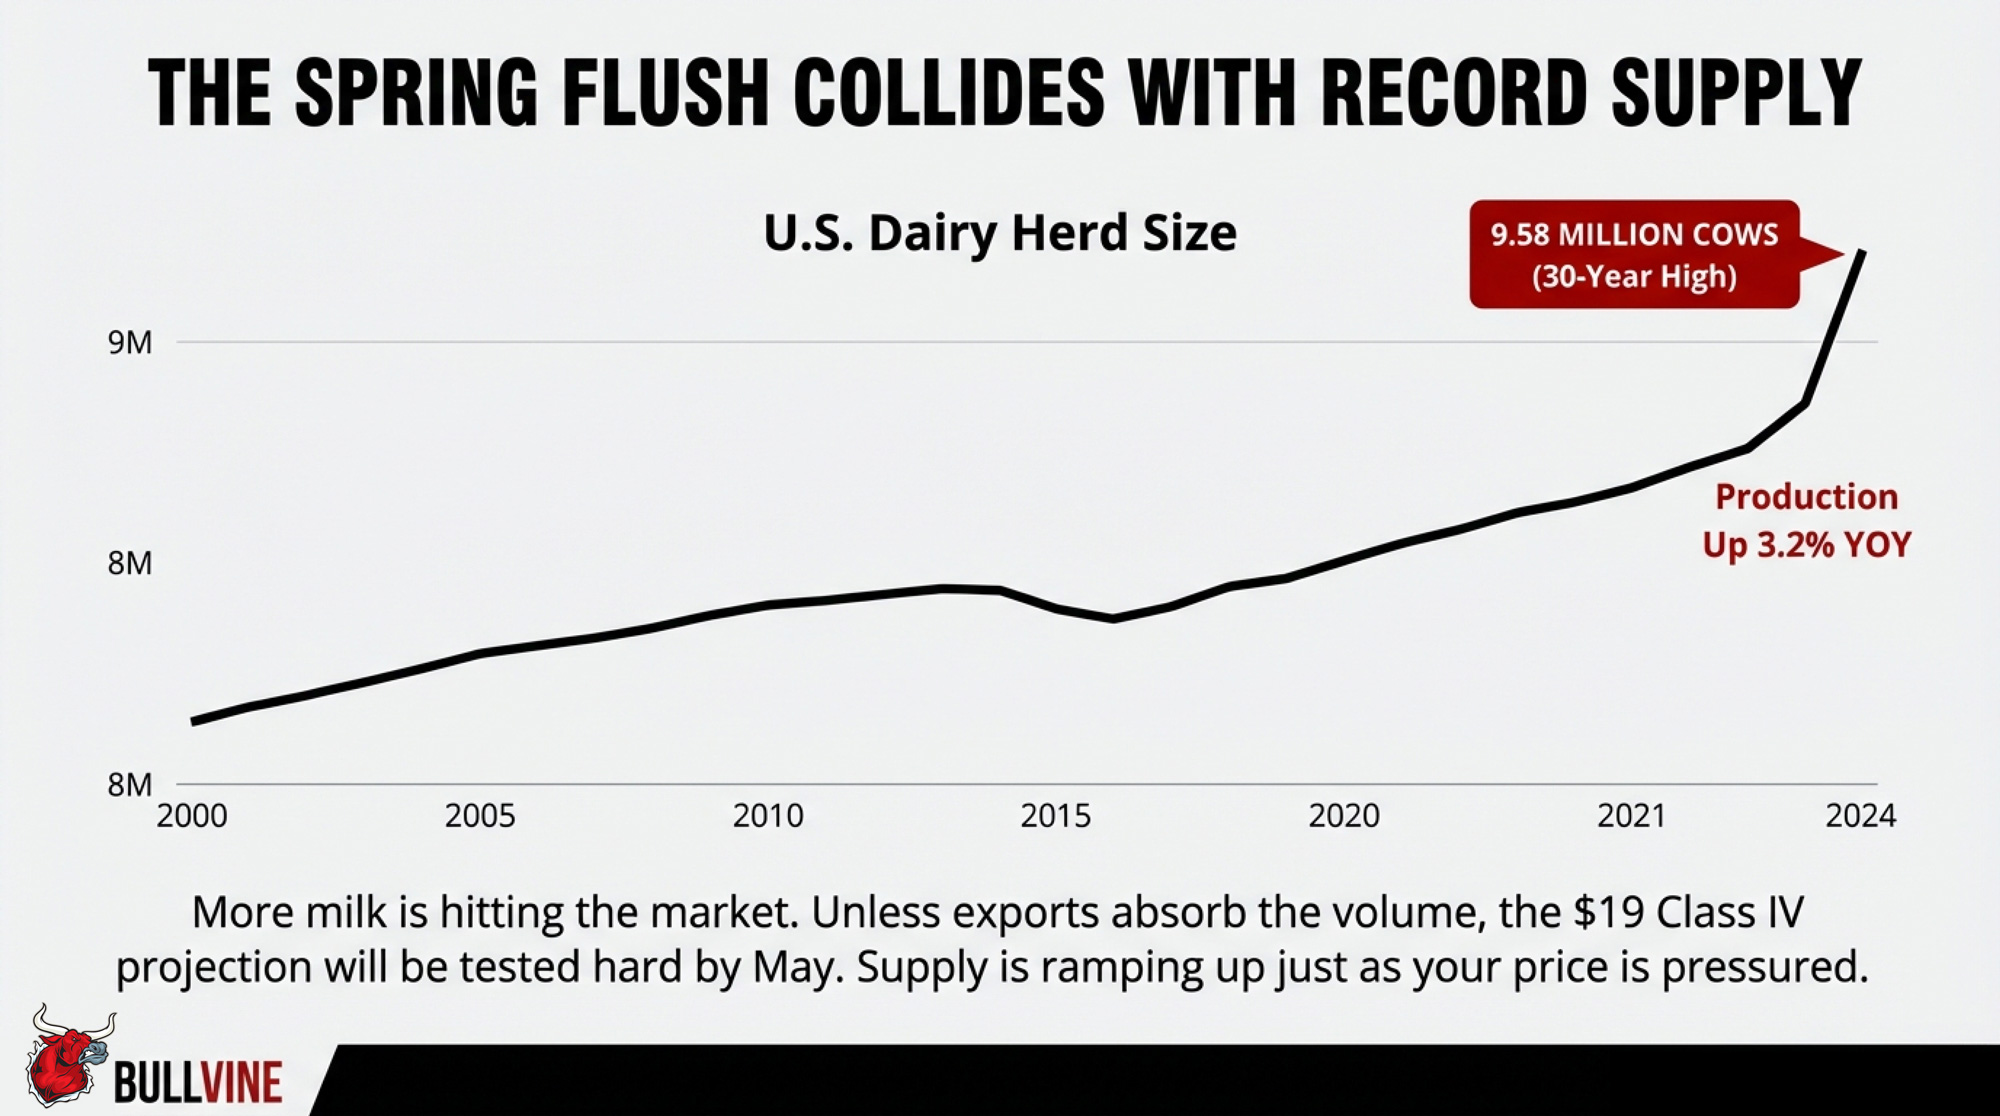
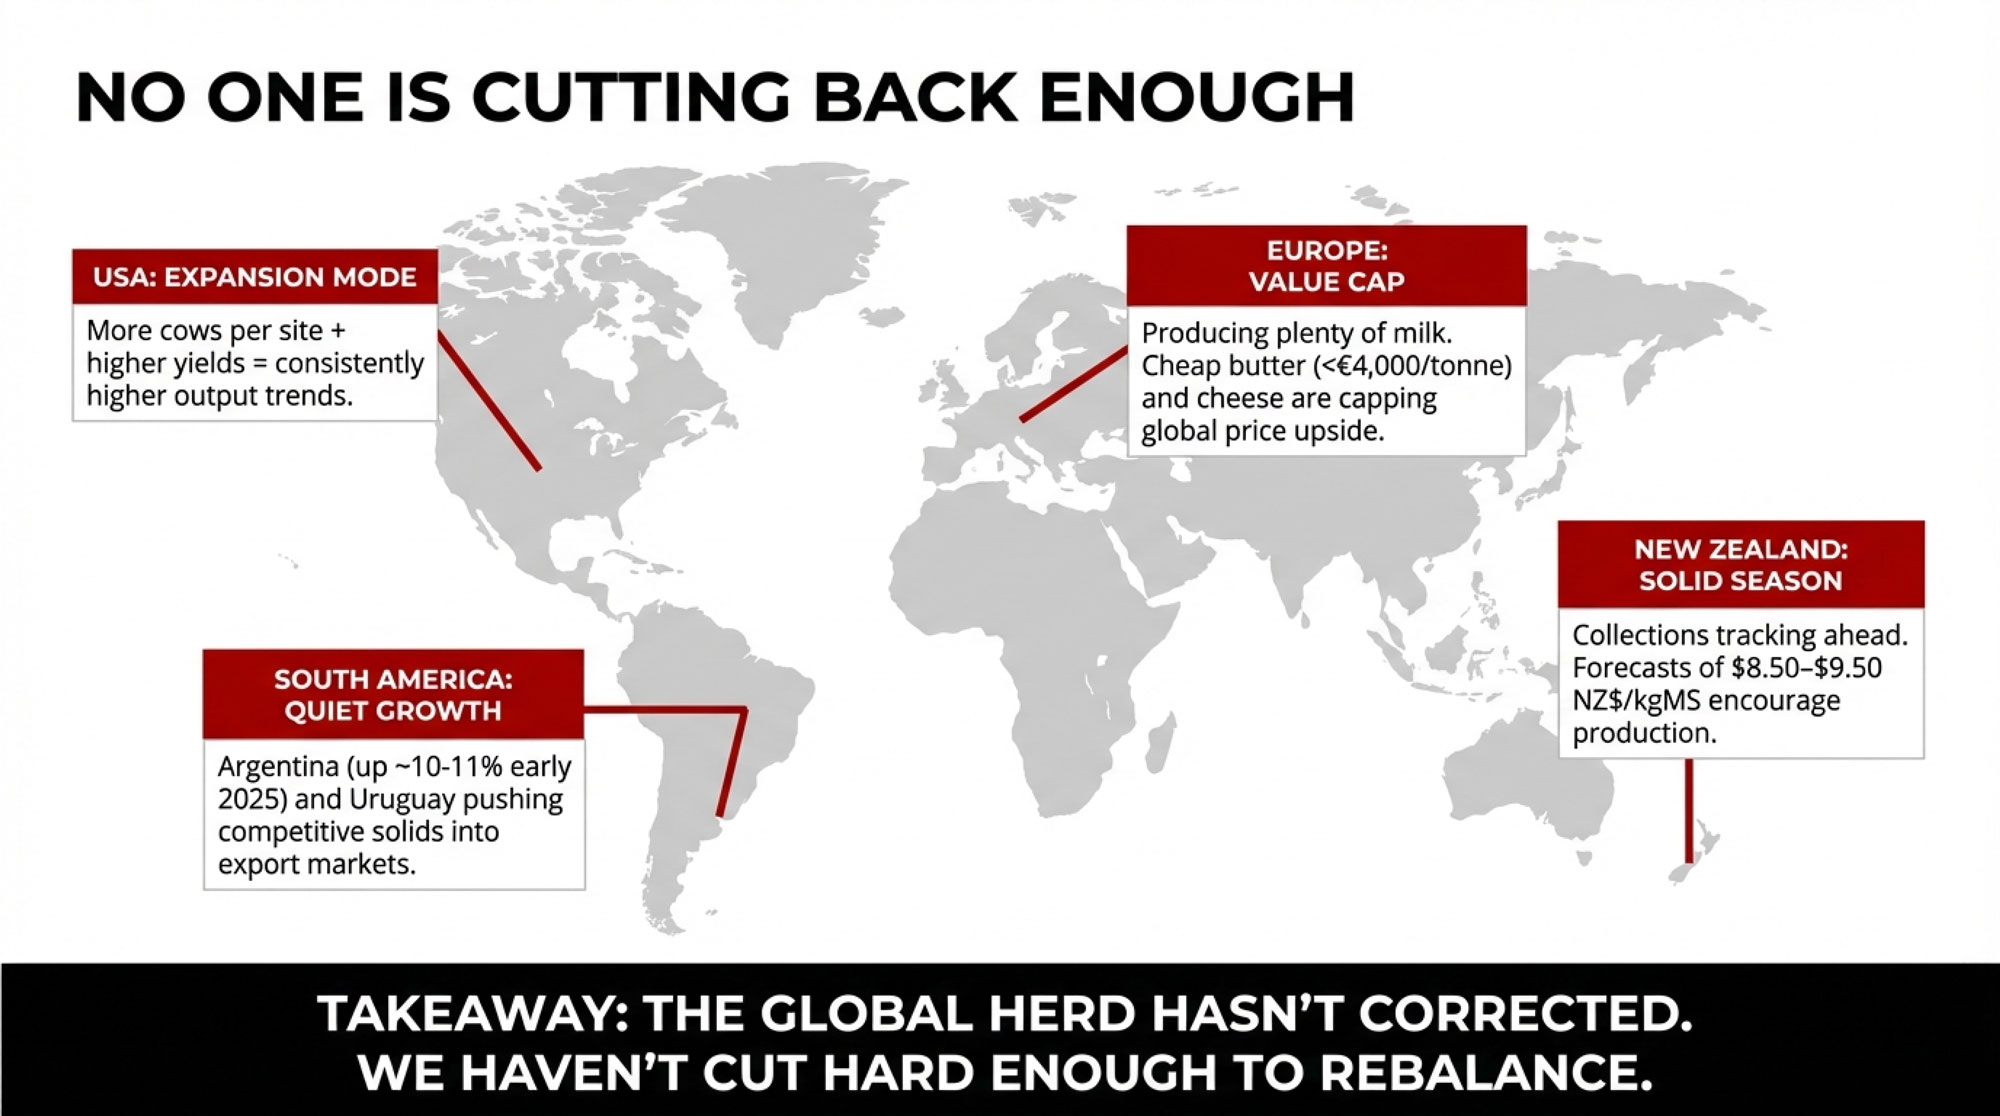
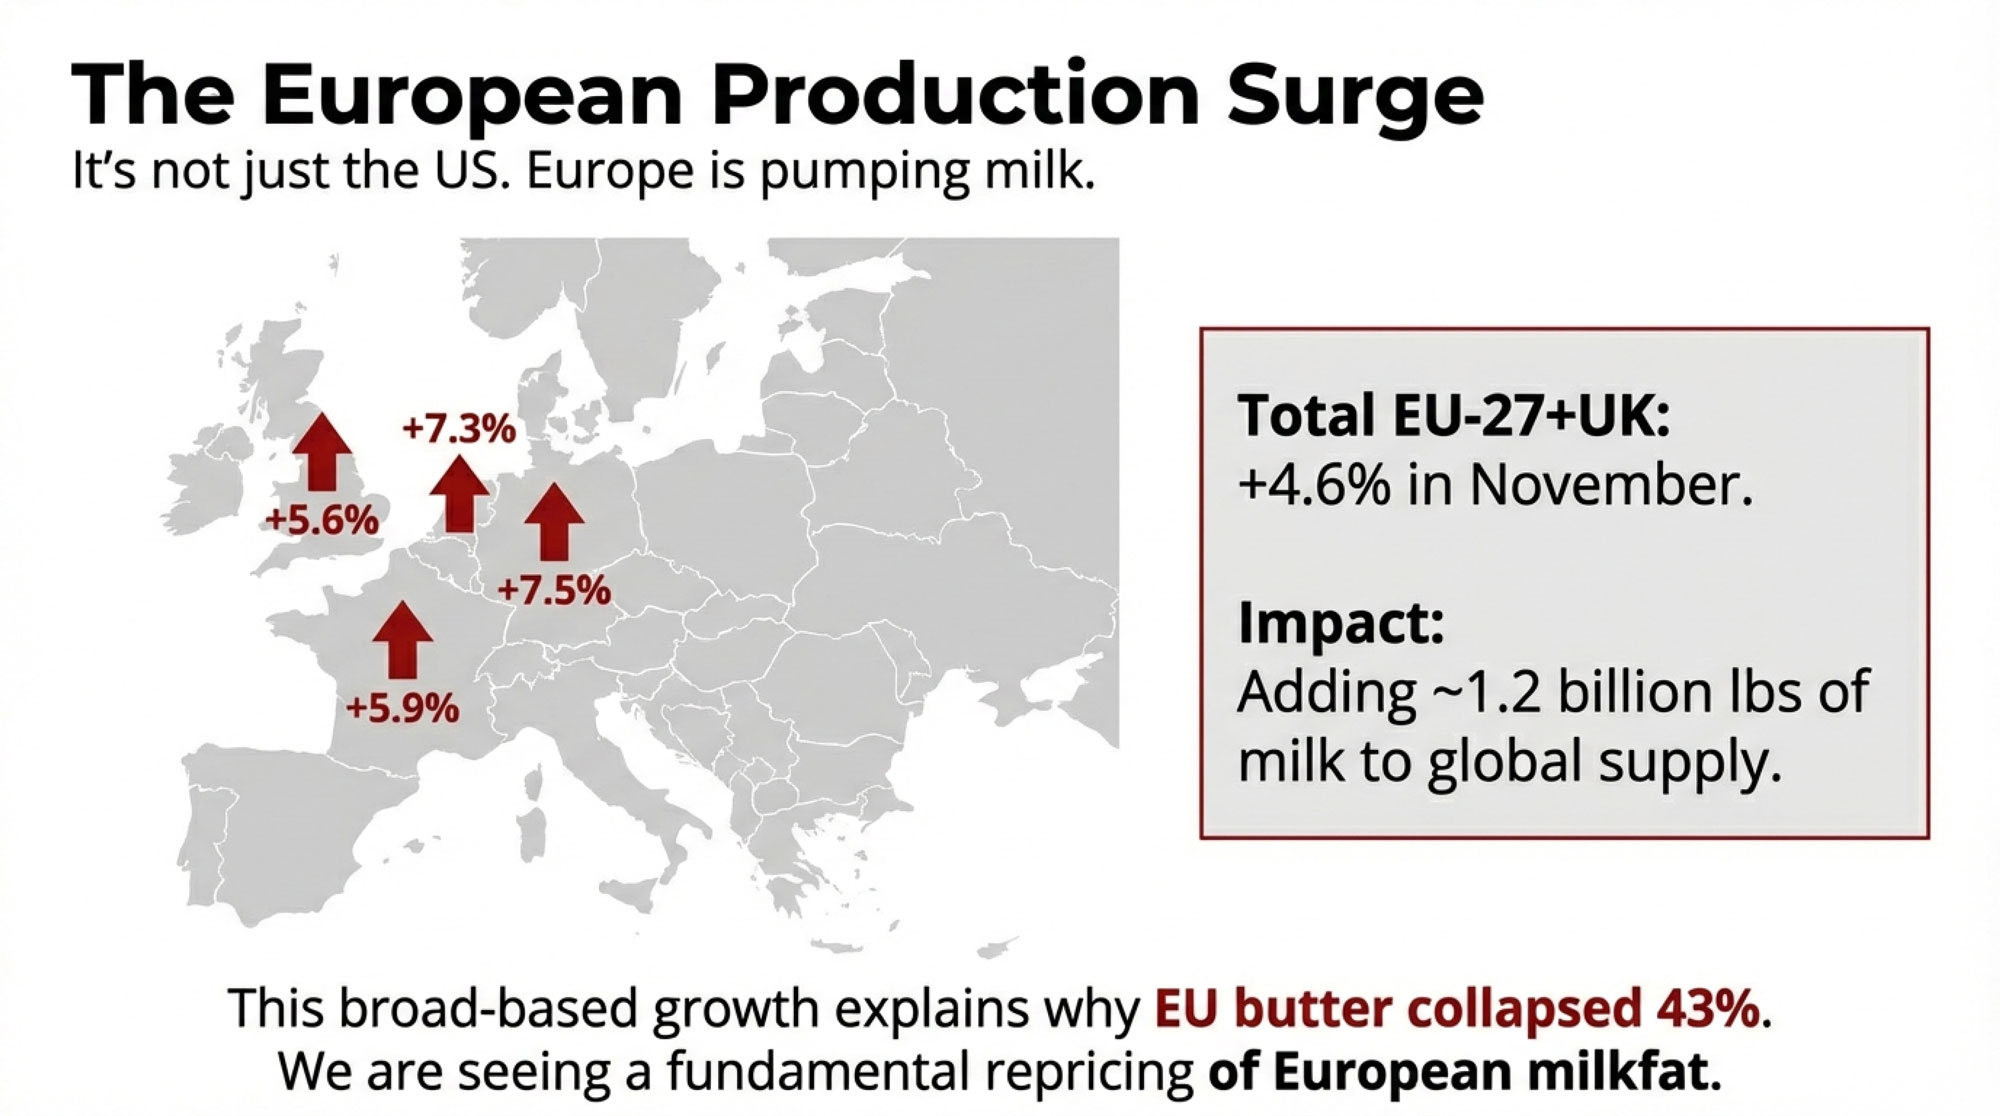
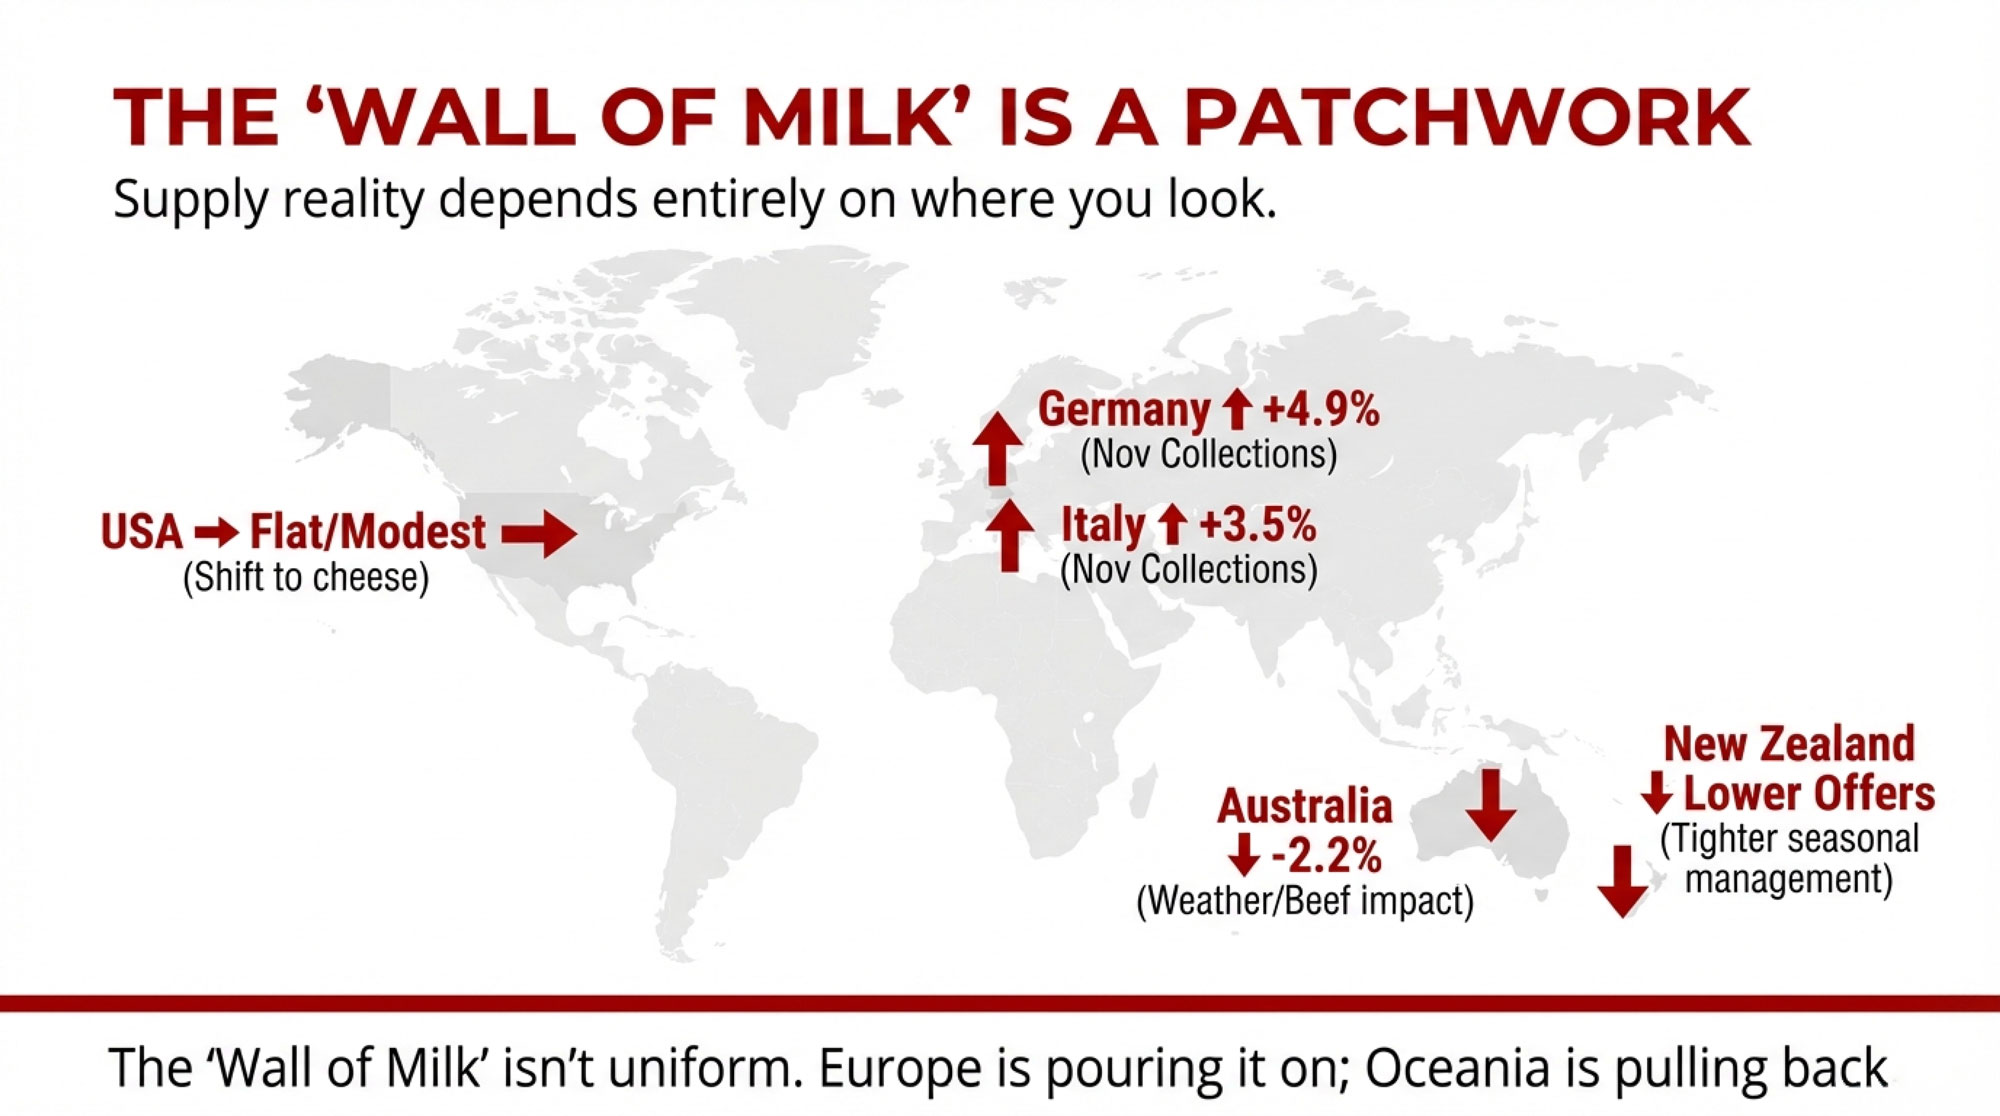
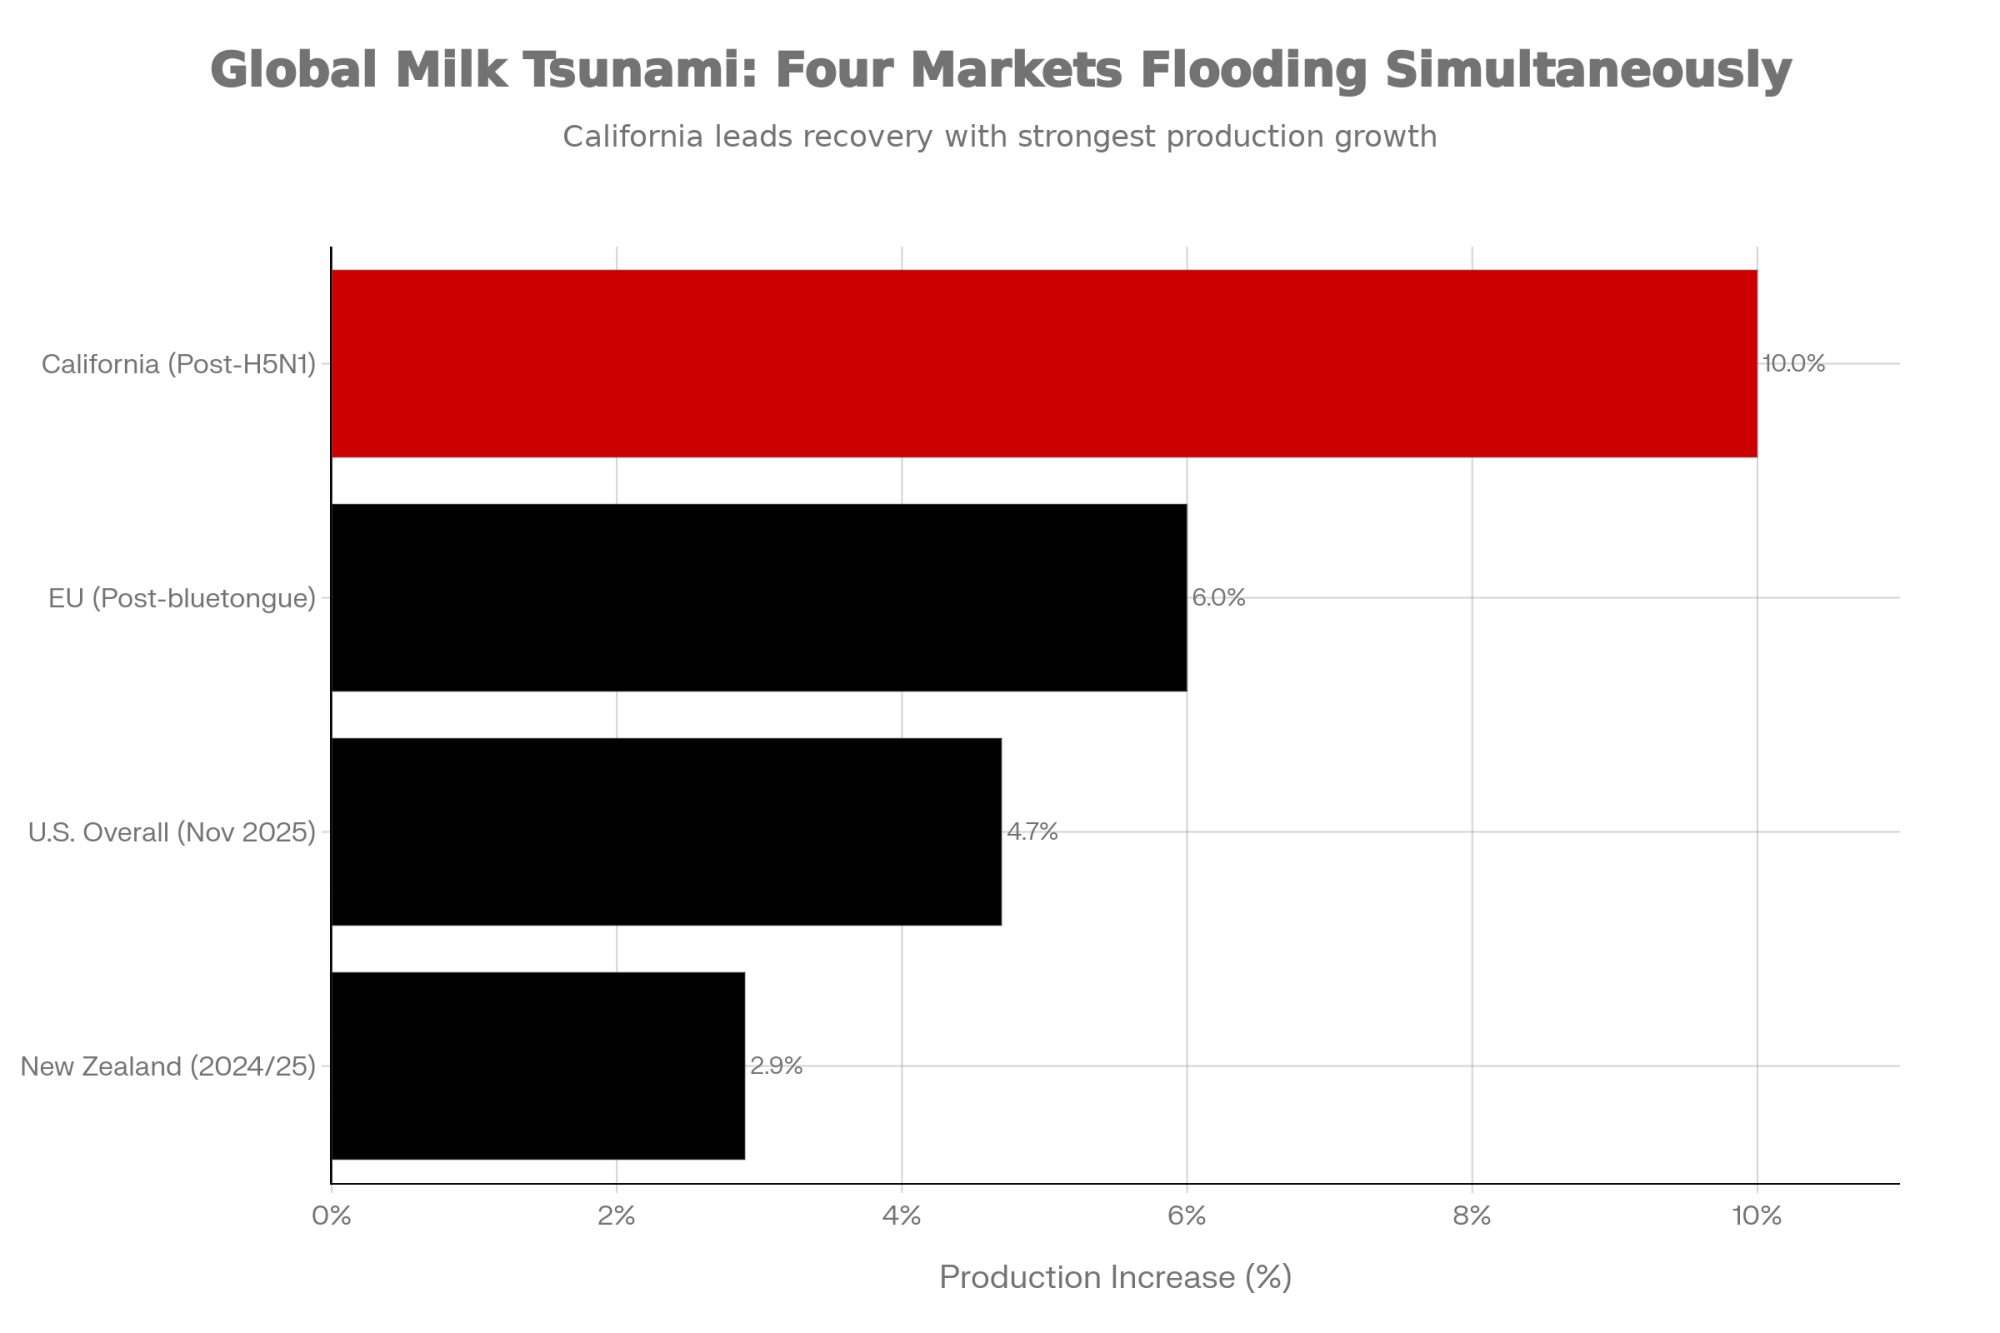
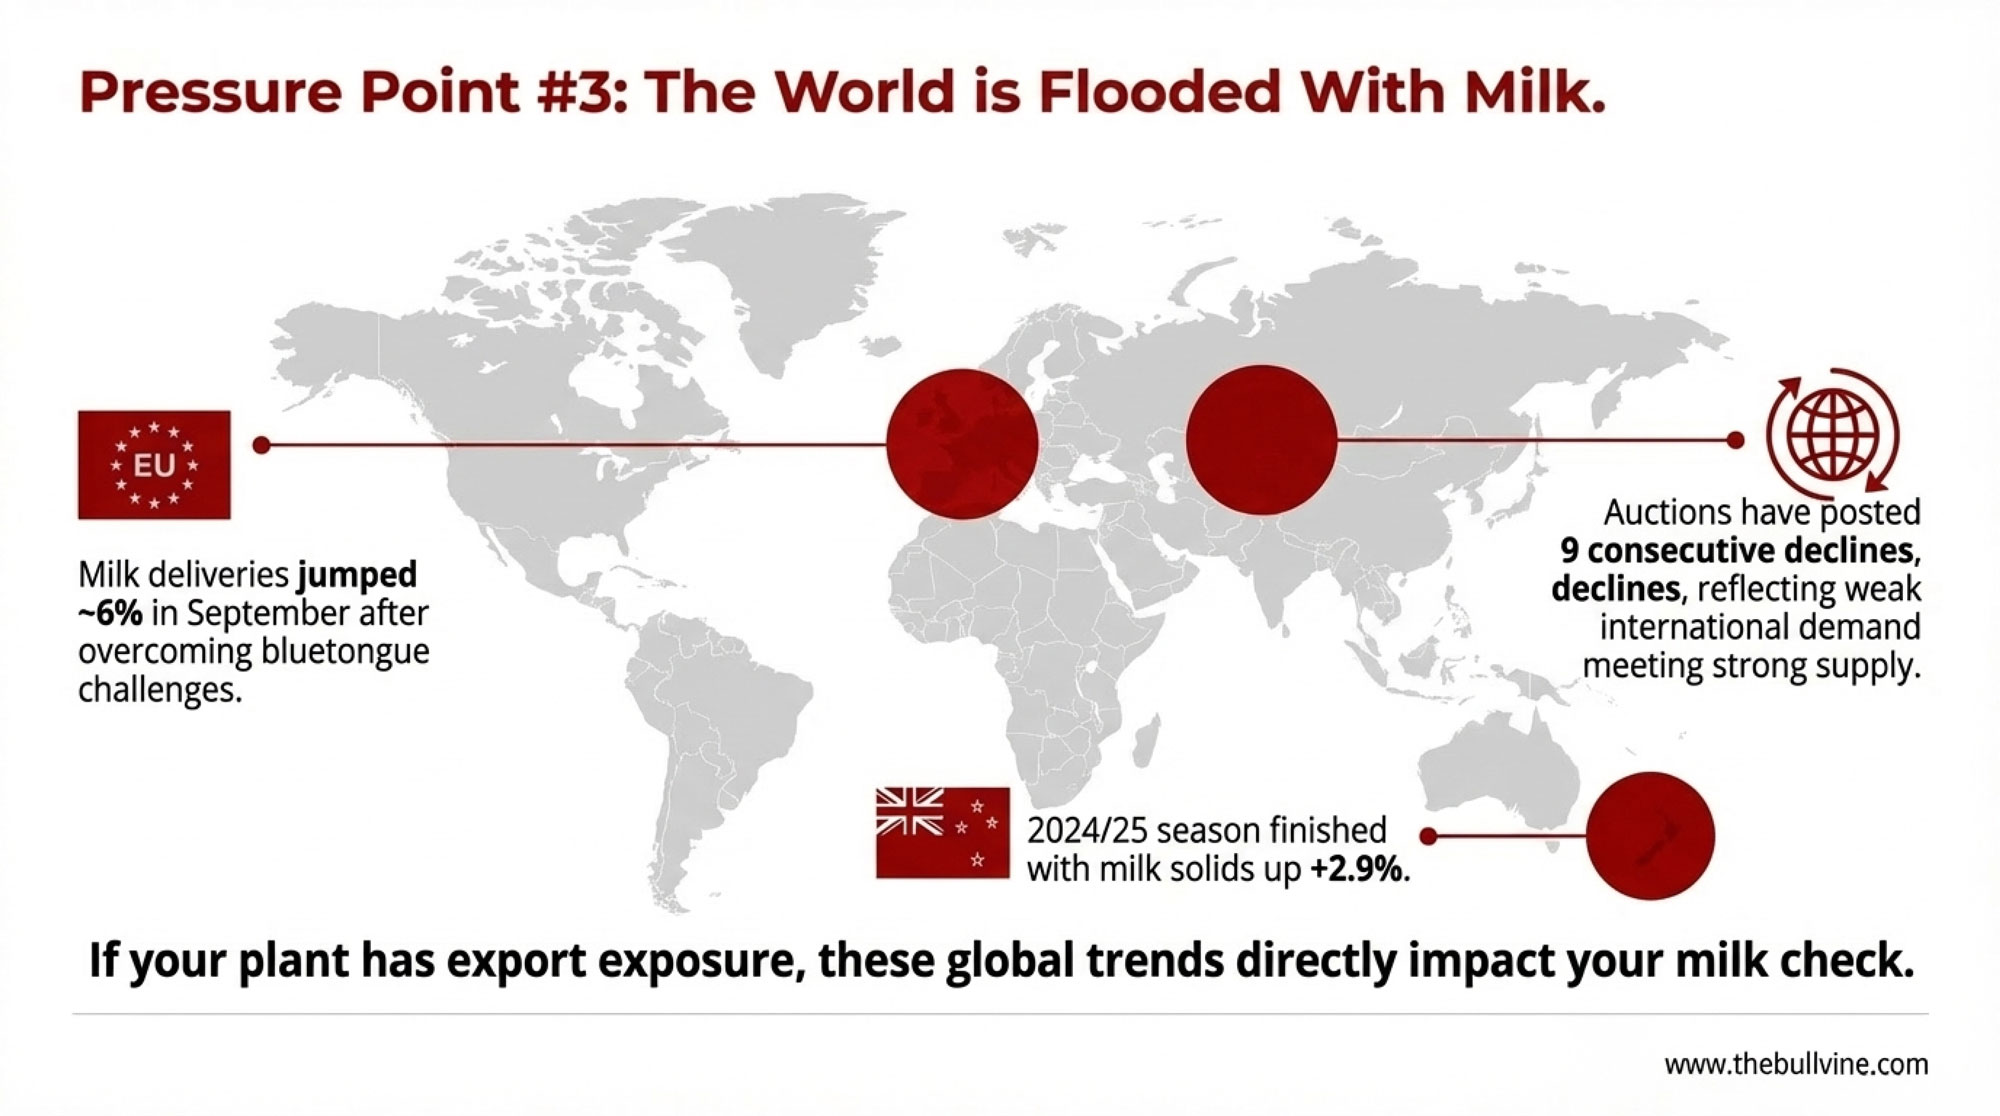
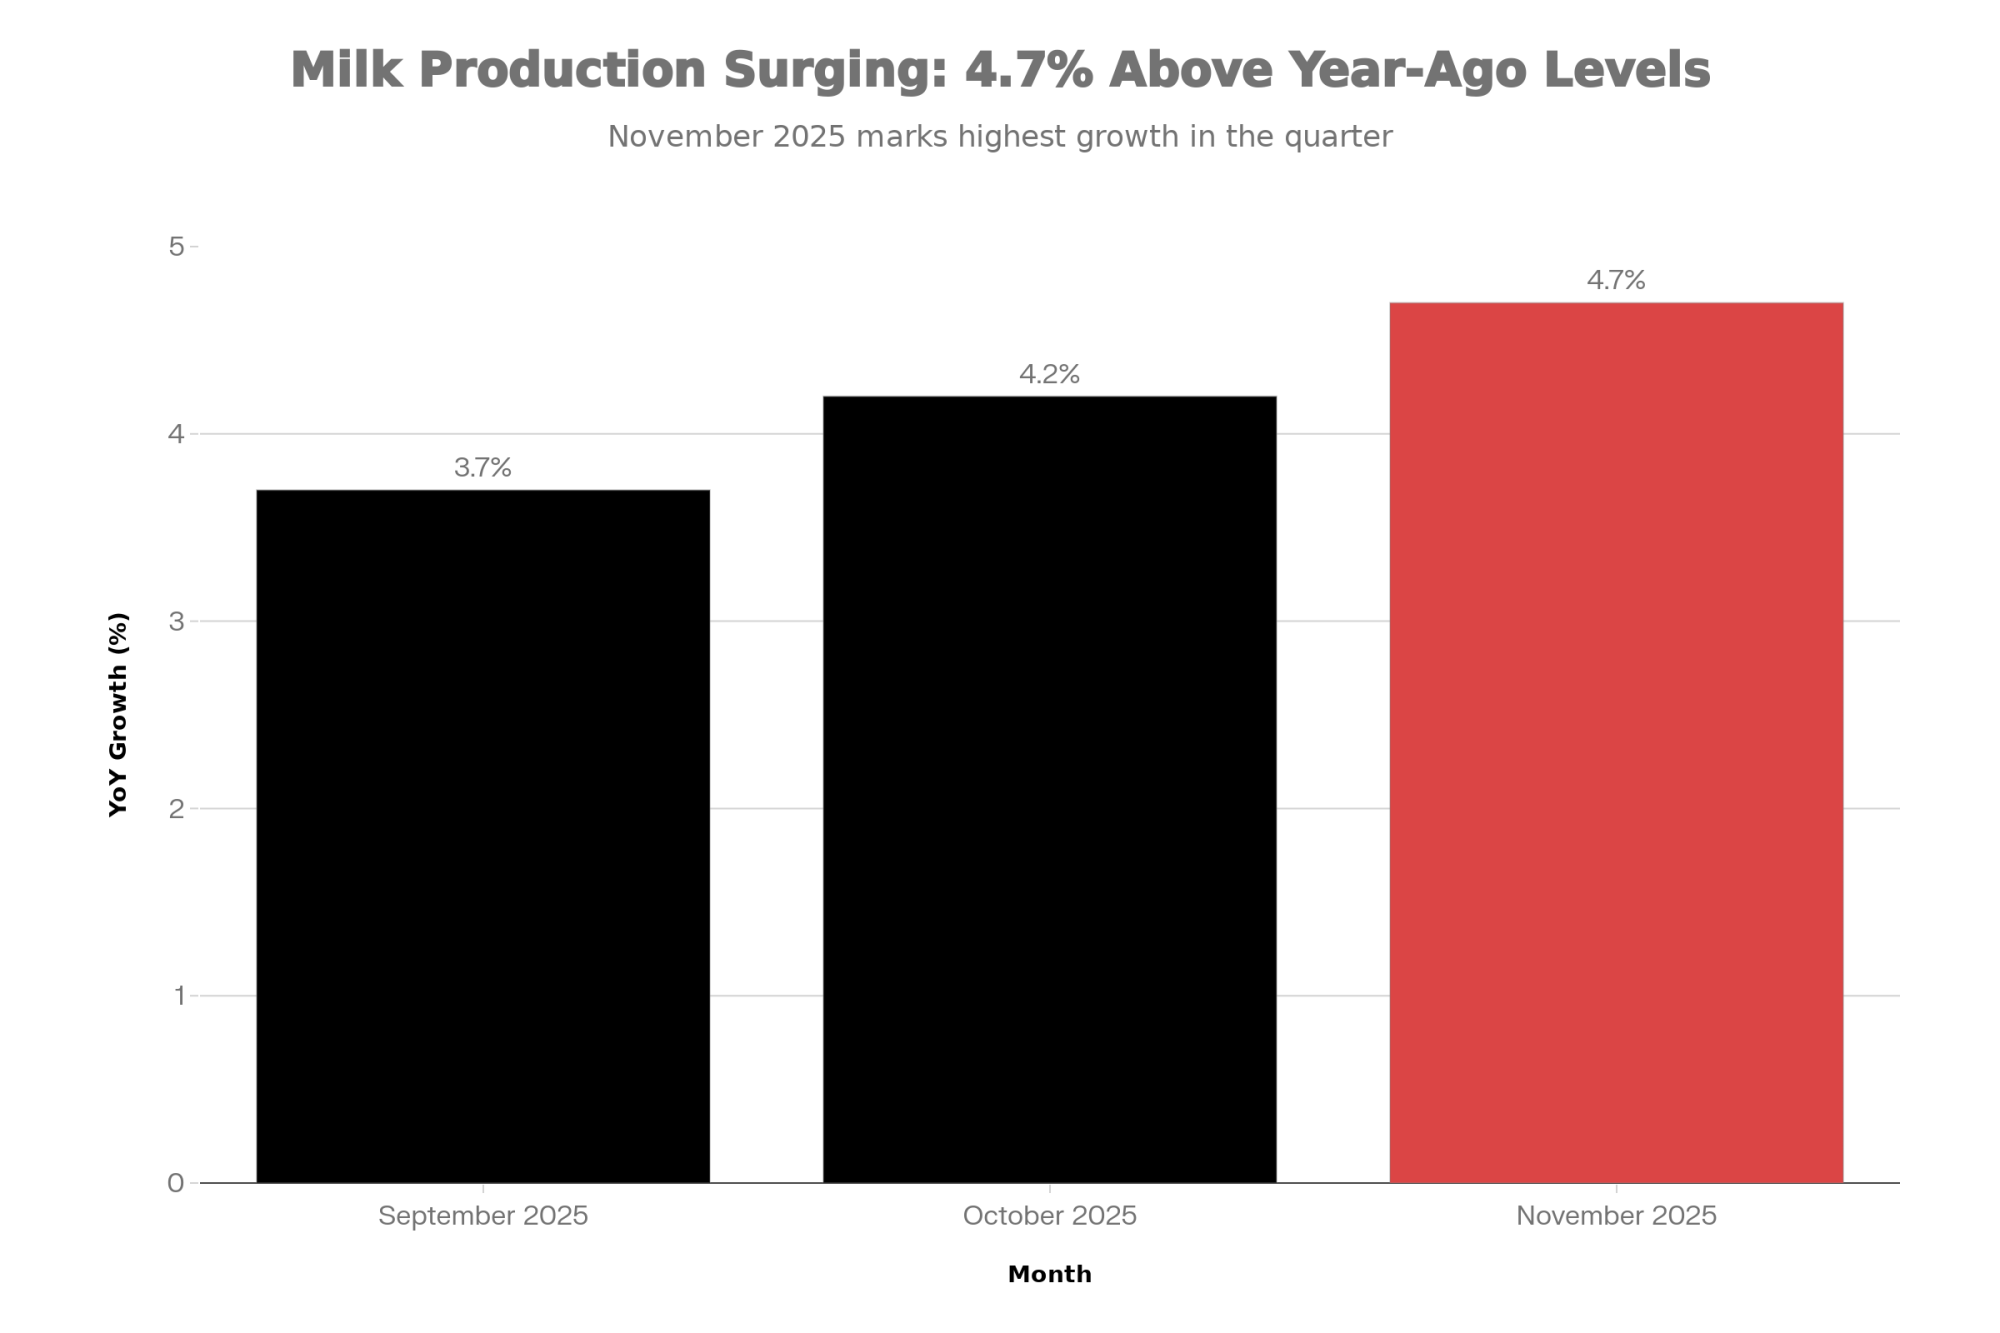
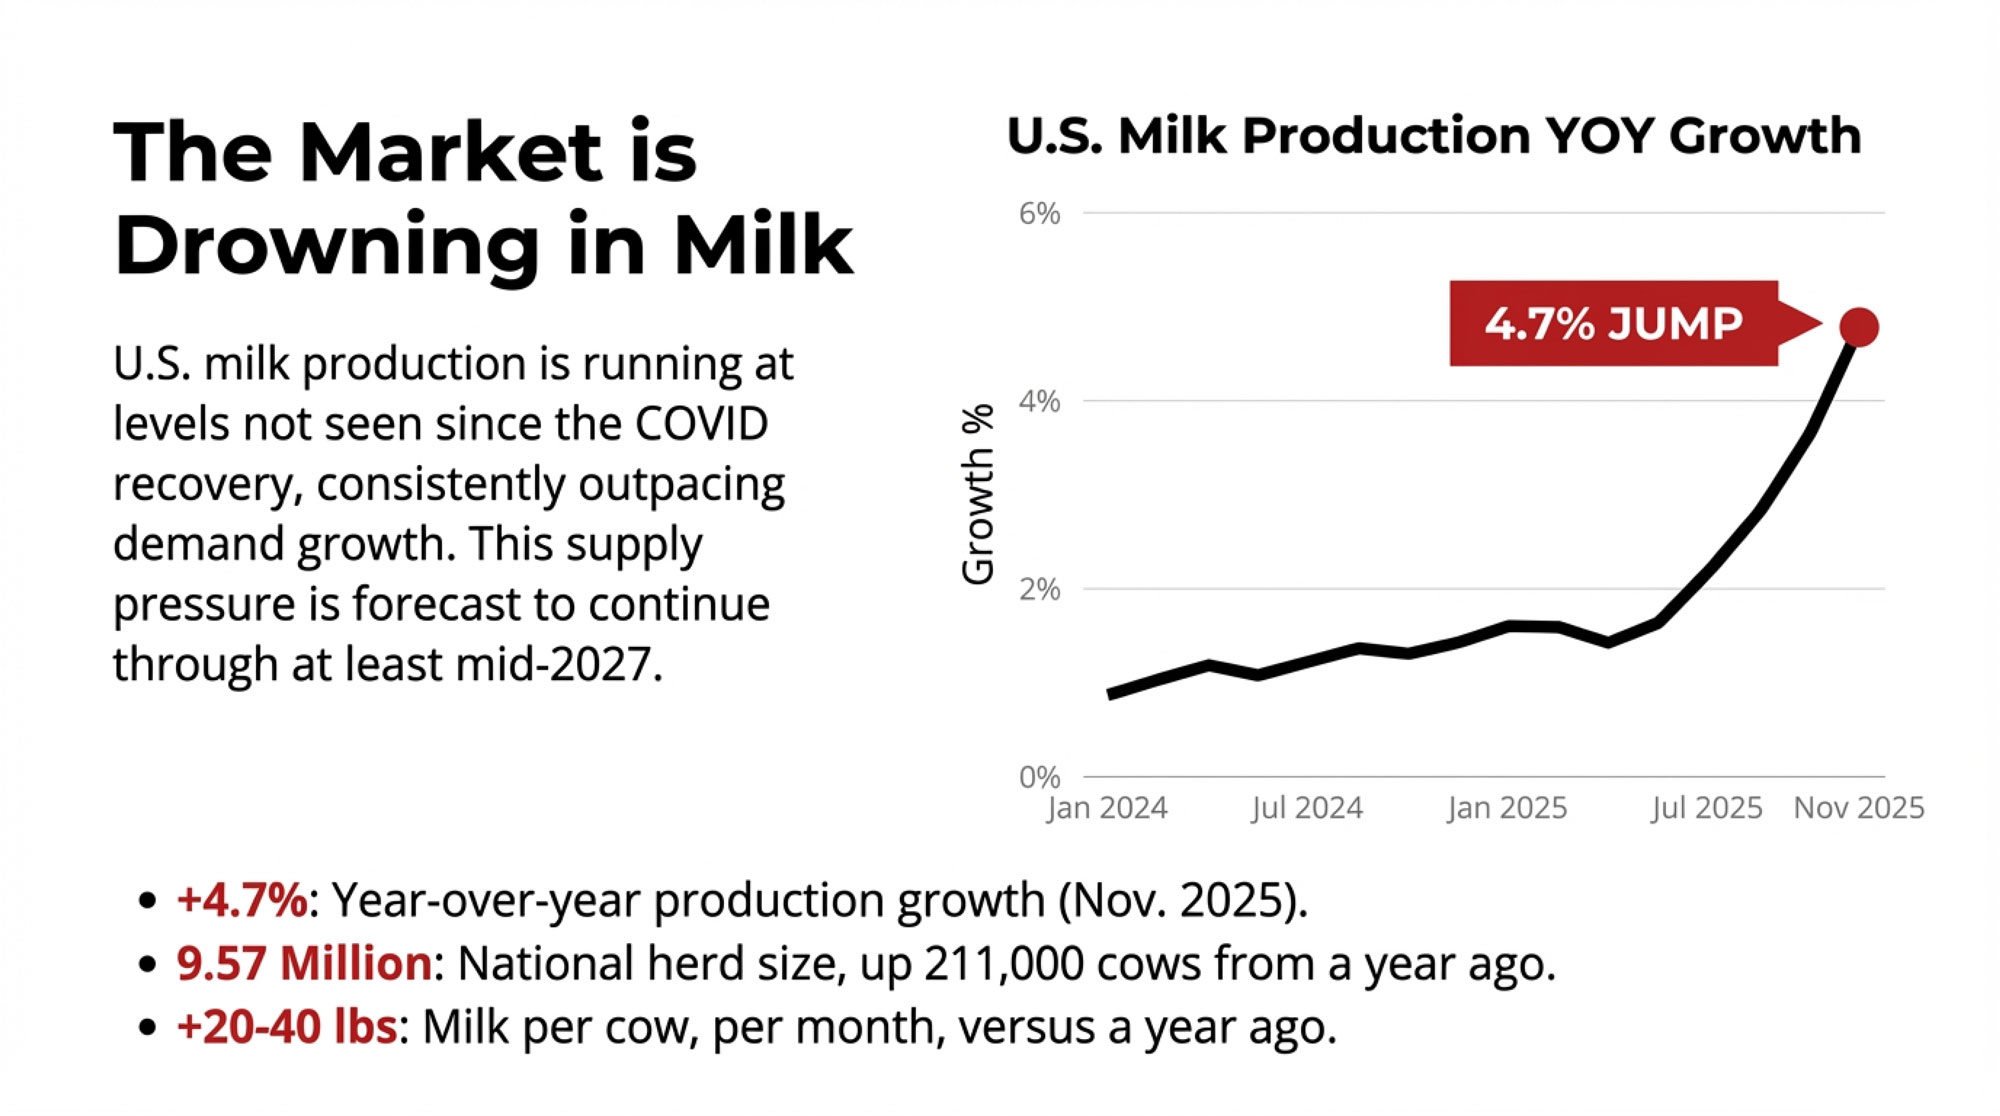
By late 2025, milk production across the big exporting regions — the U.S., EU, New Zealand, Australia, and Argentina — was running hot. On a component‑adjusted basis, U.S. supply alone was growing at more than three percent year‑over‑year into early 2026. New Zealand was on track for roughly four percent milk‑solids growth for the 2025/26 season after Fonterra revised its midpoint milk price forecast upward to NZ.70, up from NZ.50, with decent weather backing it up. EU collections in the second half of 2025 and early 2026 were described as “phenomenal.”
In Donnay’s models, every scenario pointed in the same direction: more milk, more product, lower prices. That’s not what happened.
The restocking wave outside China
The first twist came from buyers, not cows.
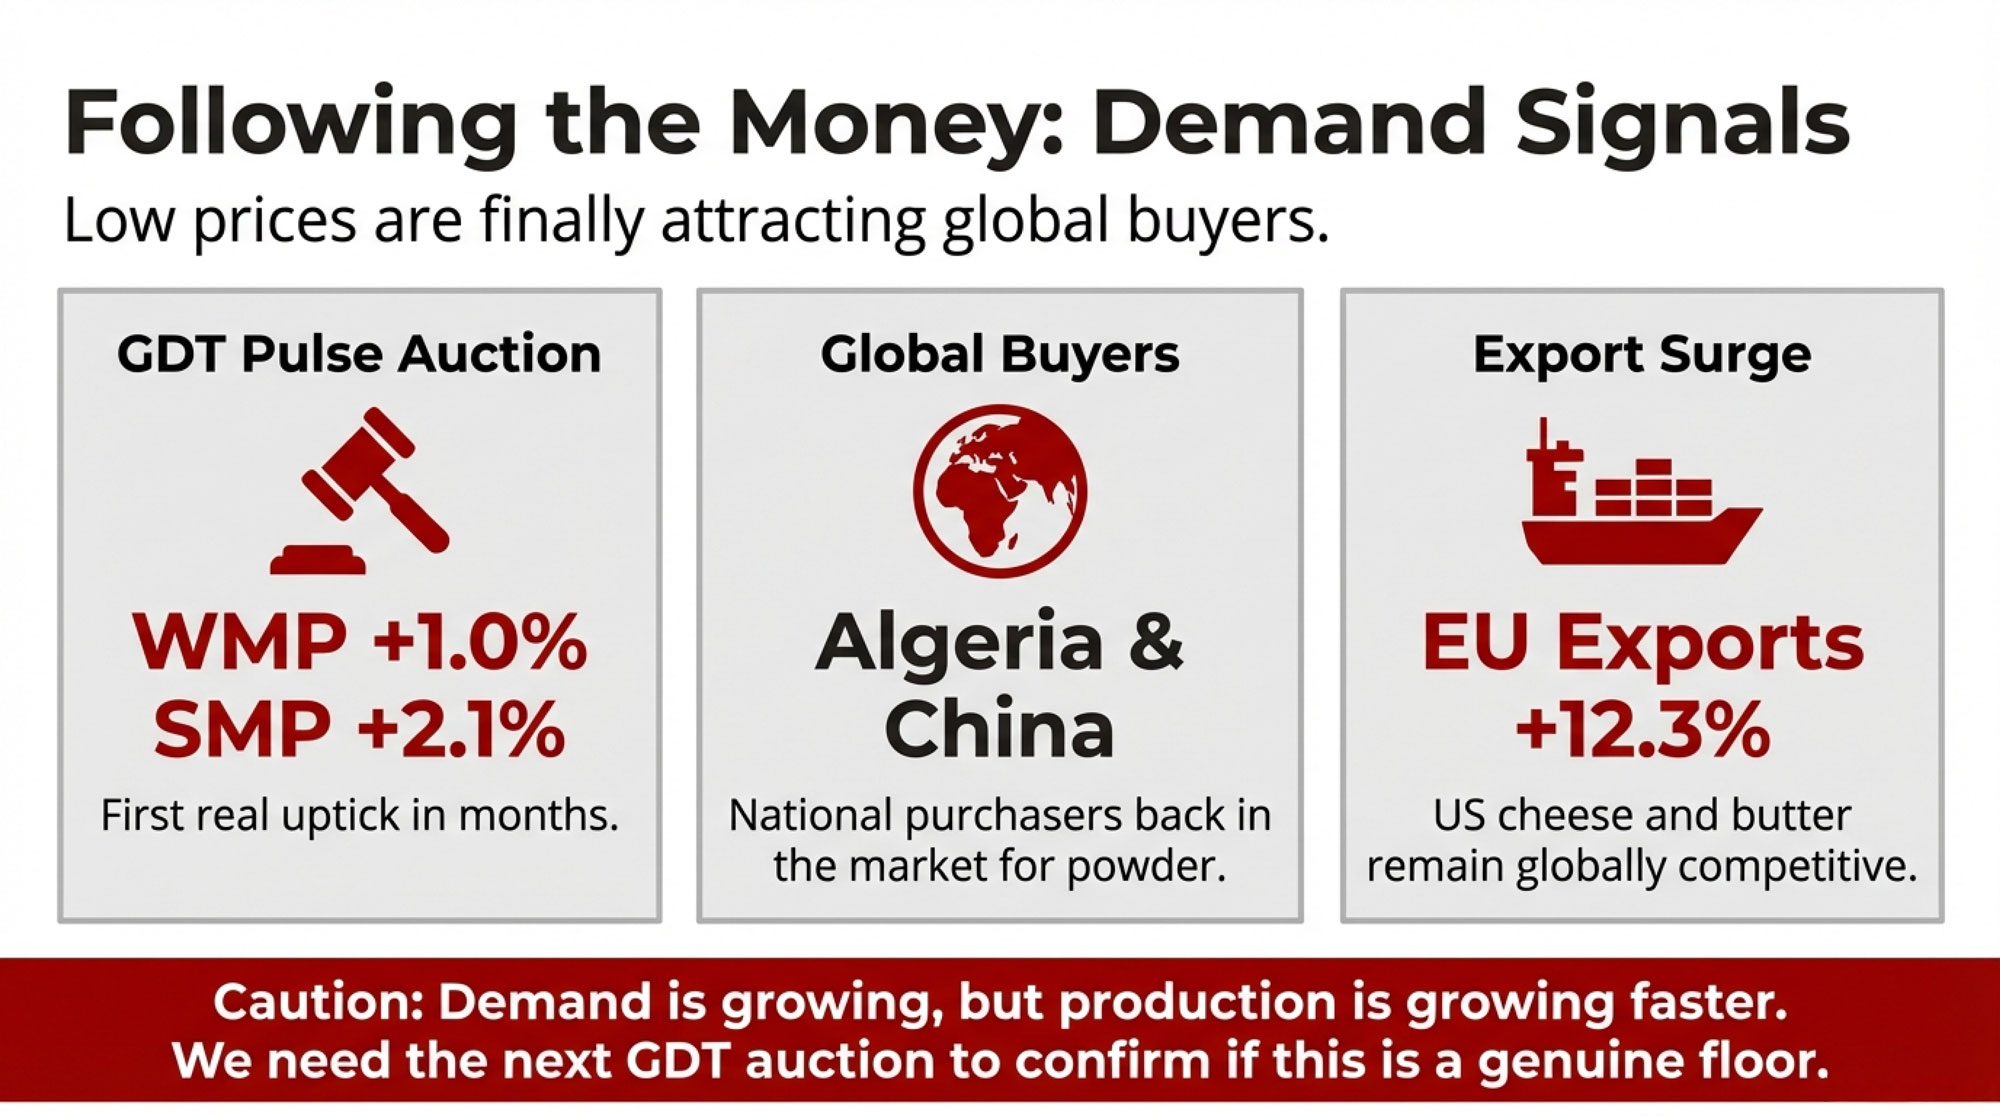
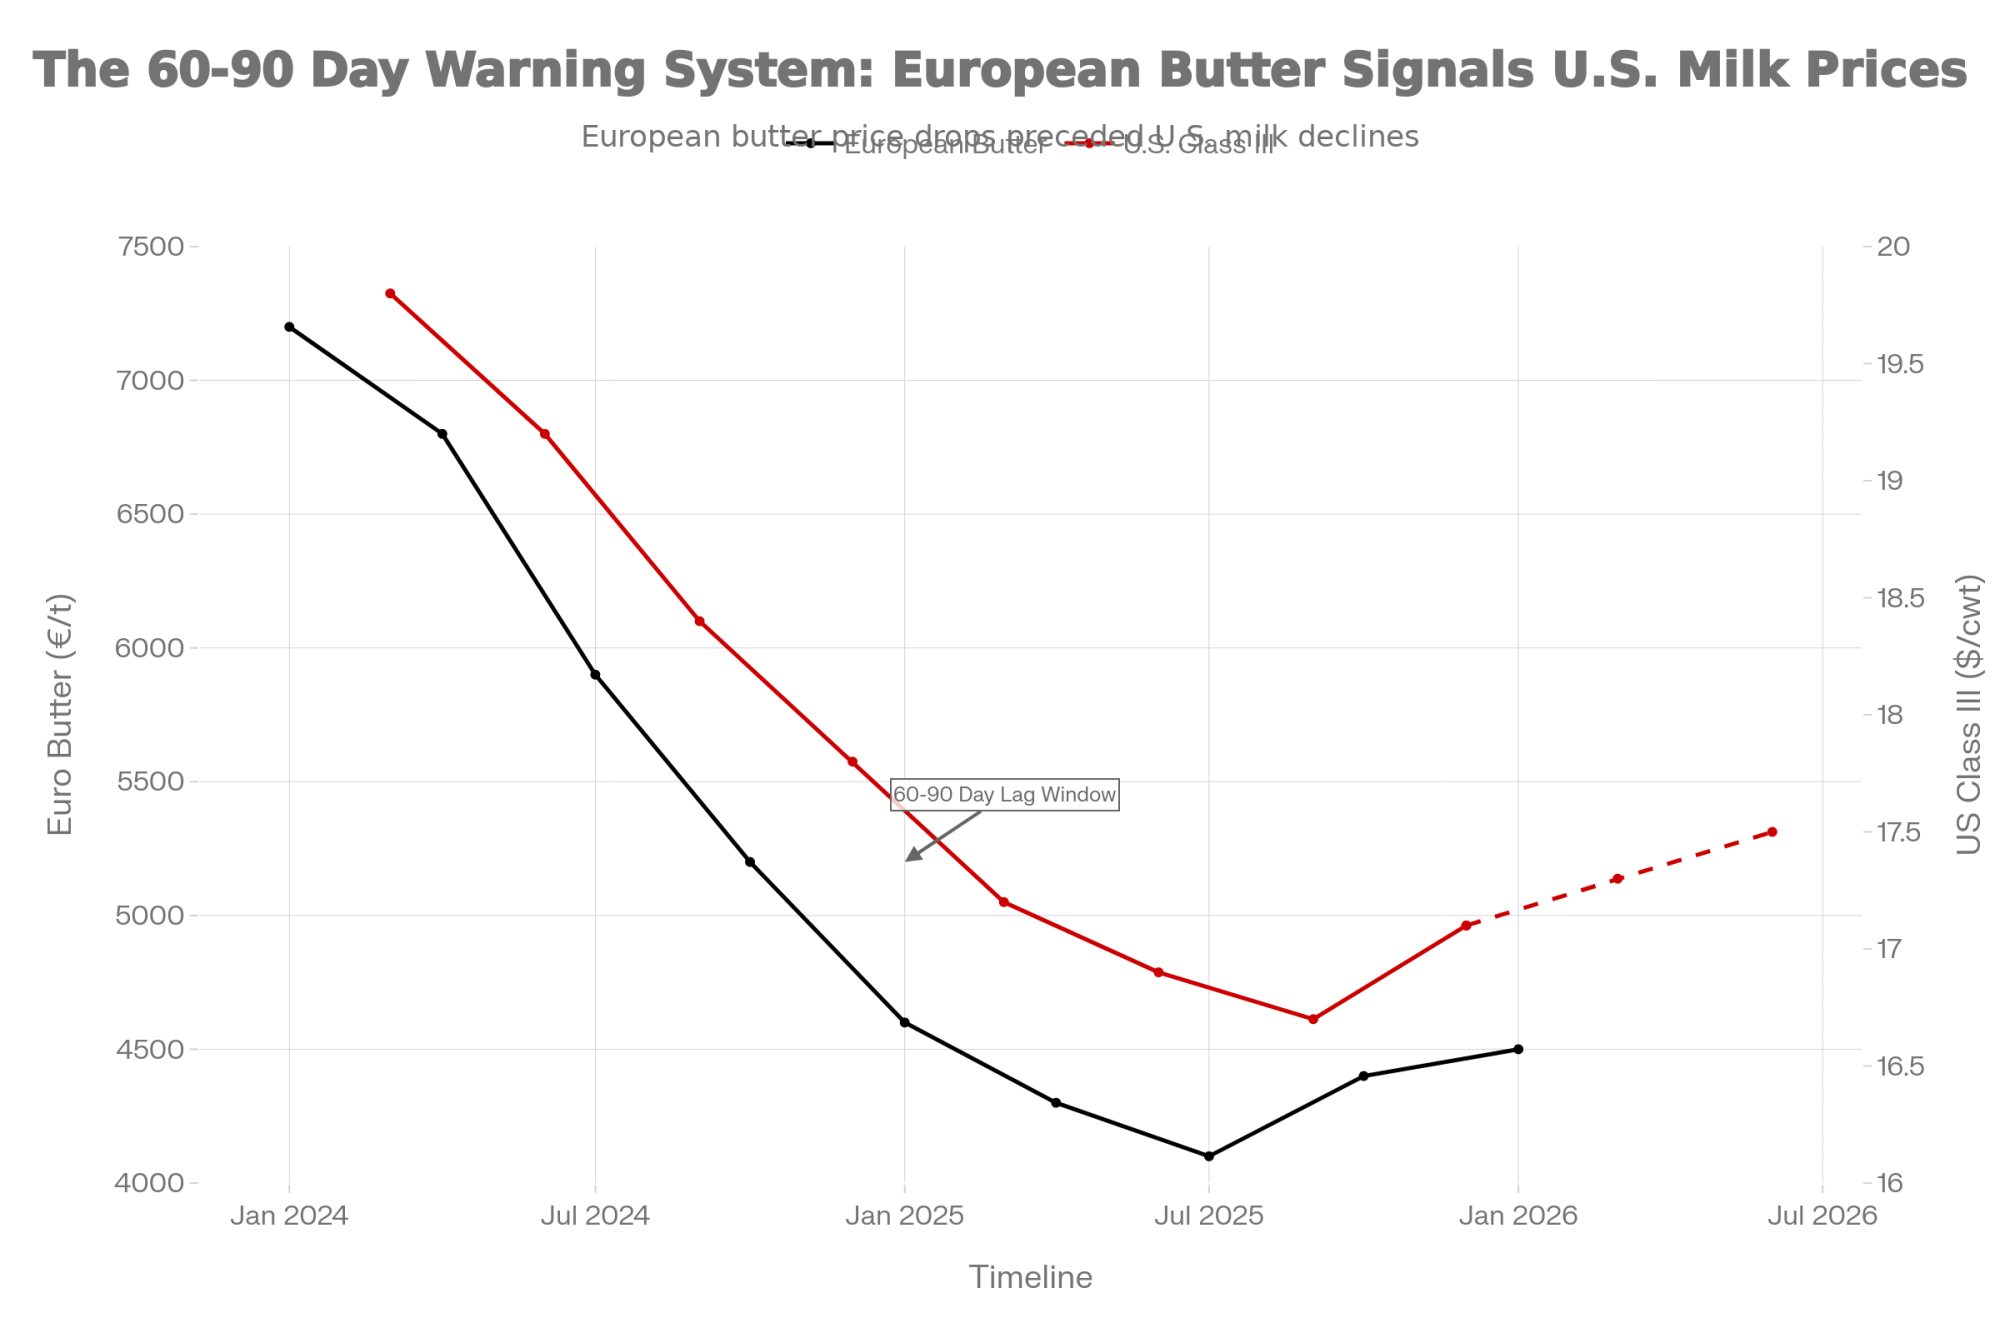
One of Donnay’s key charts tracks milk‑equivalent imports by all countries other than China. As prices fell hard across exporters in mid‑2025, those non‑China imports started climbing in August–September. Buyers in Southeast Asia, the Middle East, and parts of Africa had been running inventories tight, waiting for the bottom to fall out. When prices finally felt “cheap enough,” they moved. Hard.
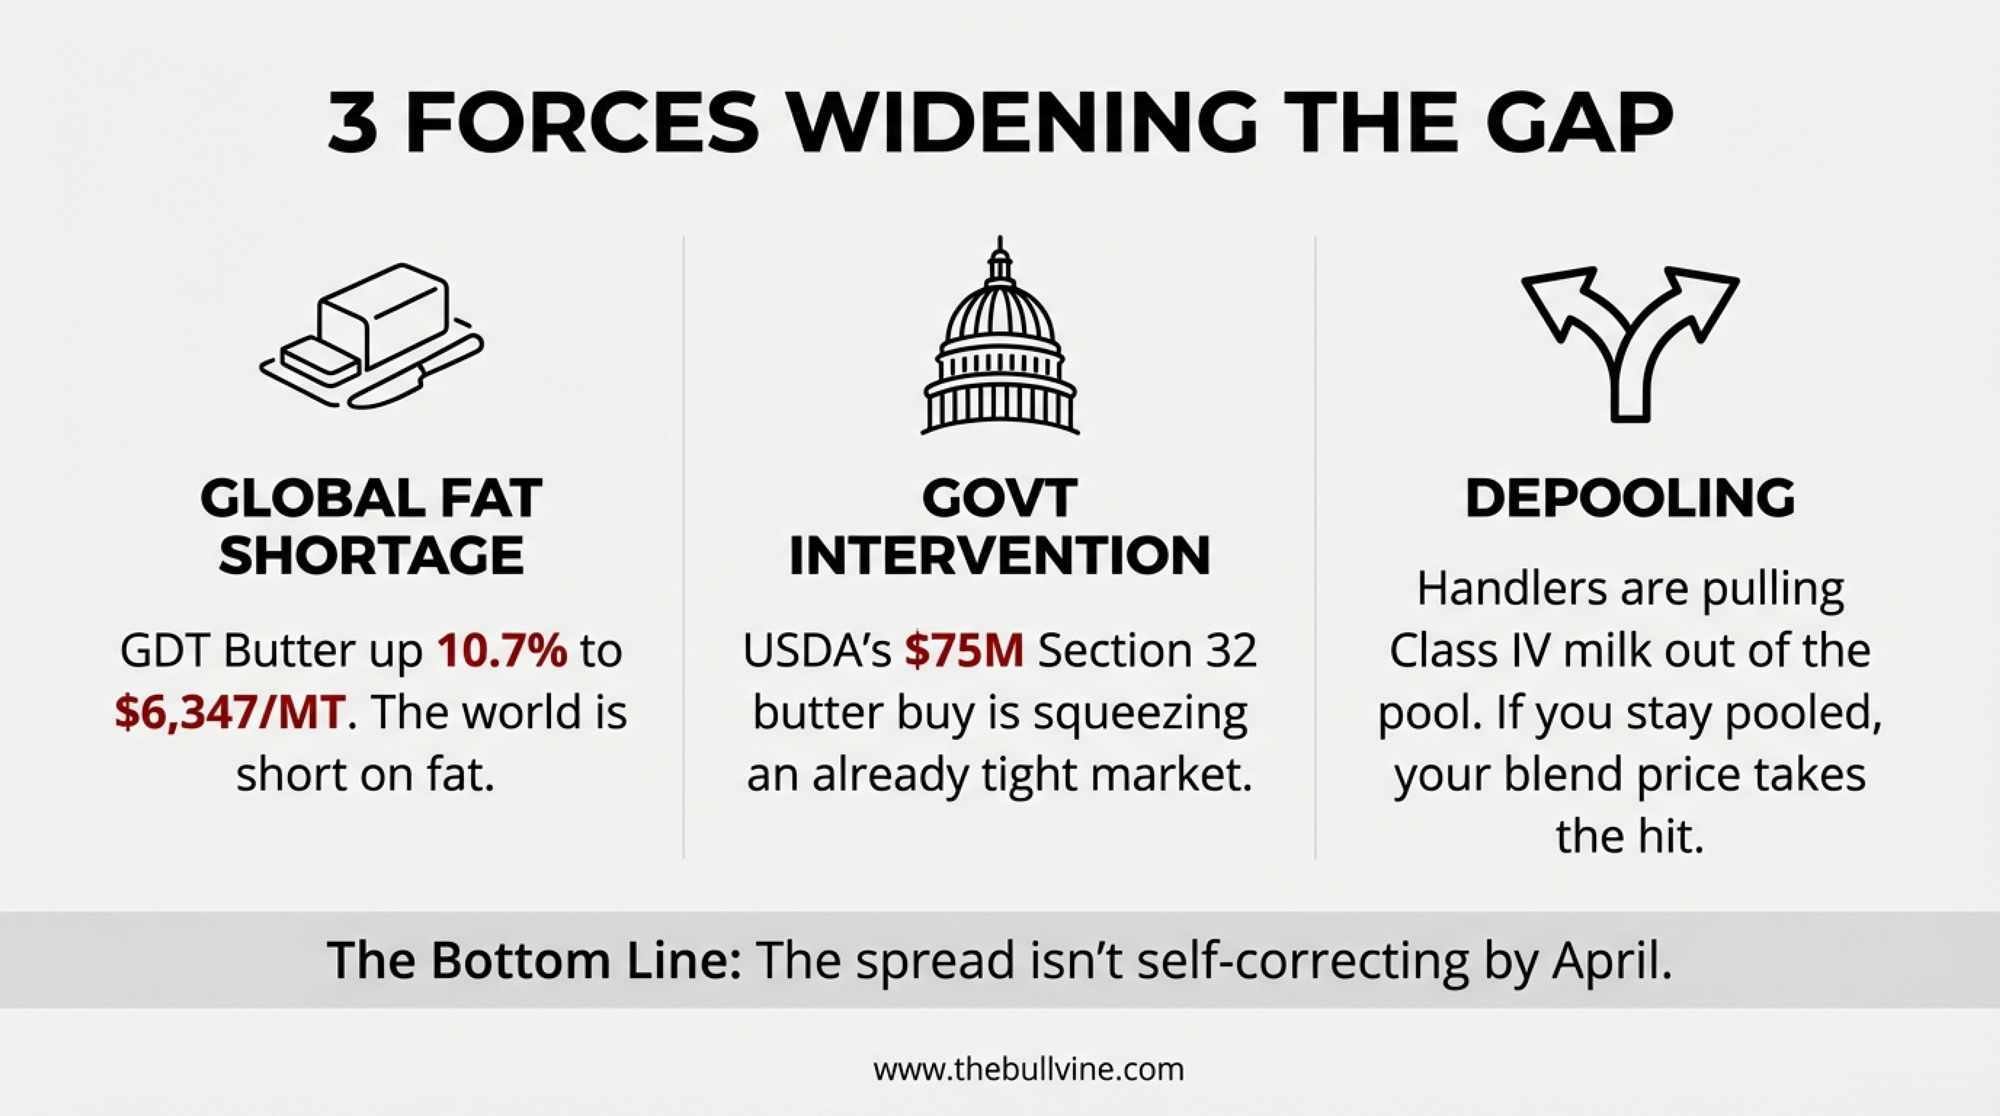
That restocking didn’t magically remove product. It pulled demand forward into a market that was already well supplied. Then a geopolitical choke point poured fuel on the fire.
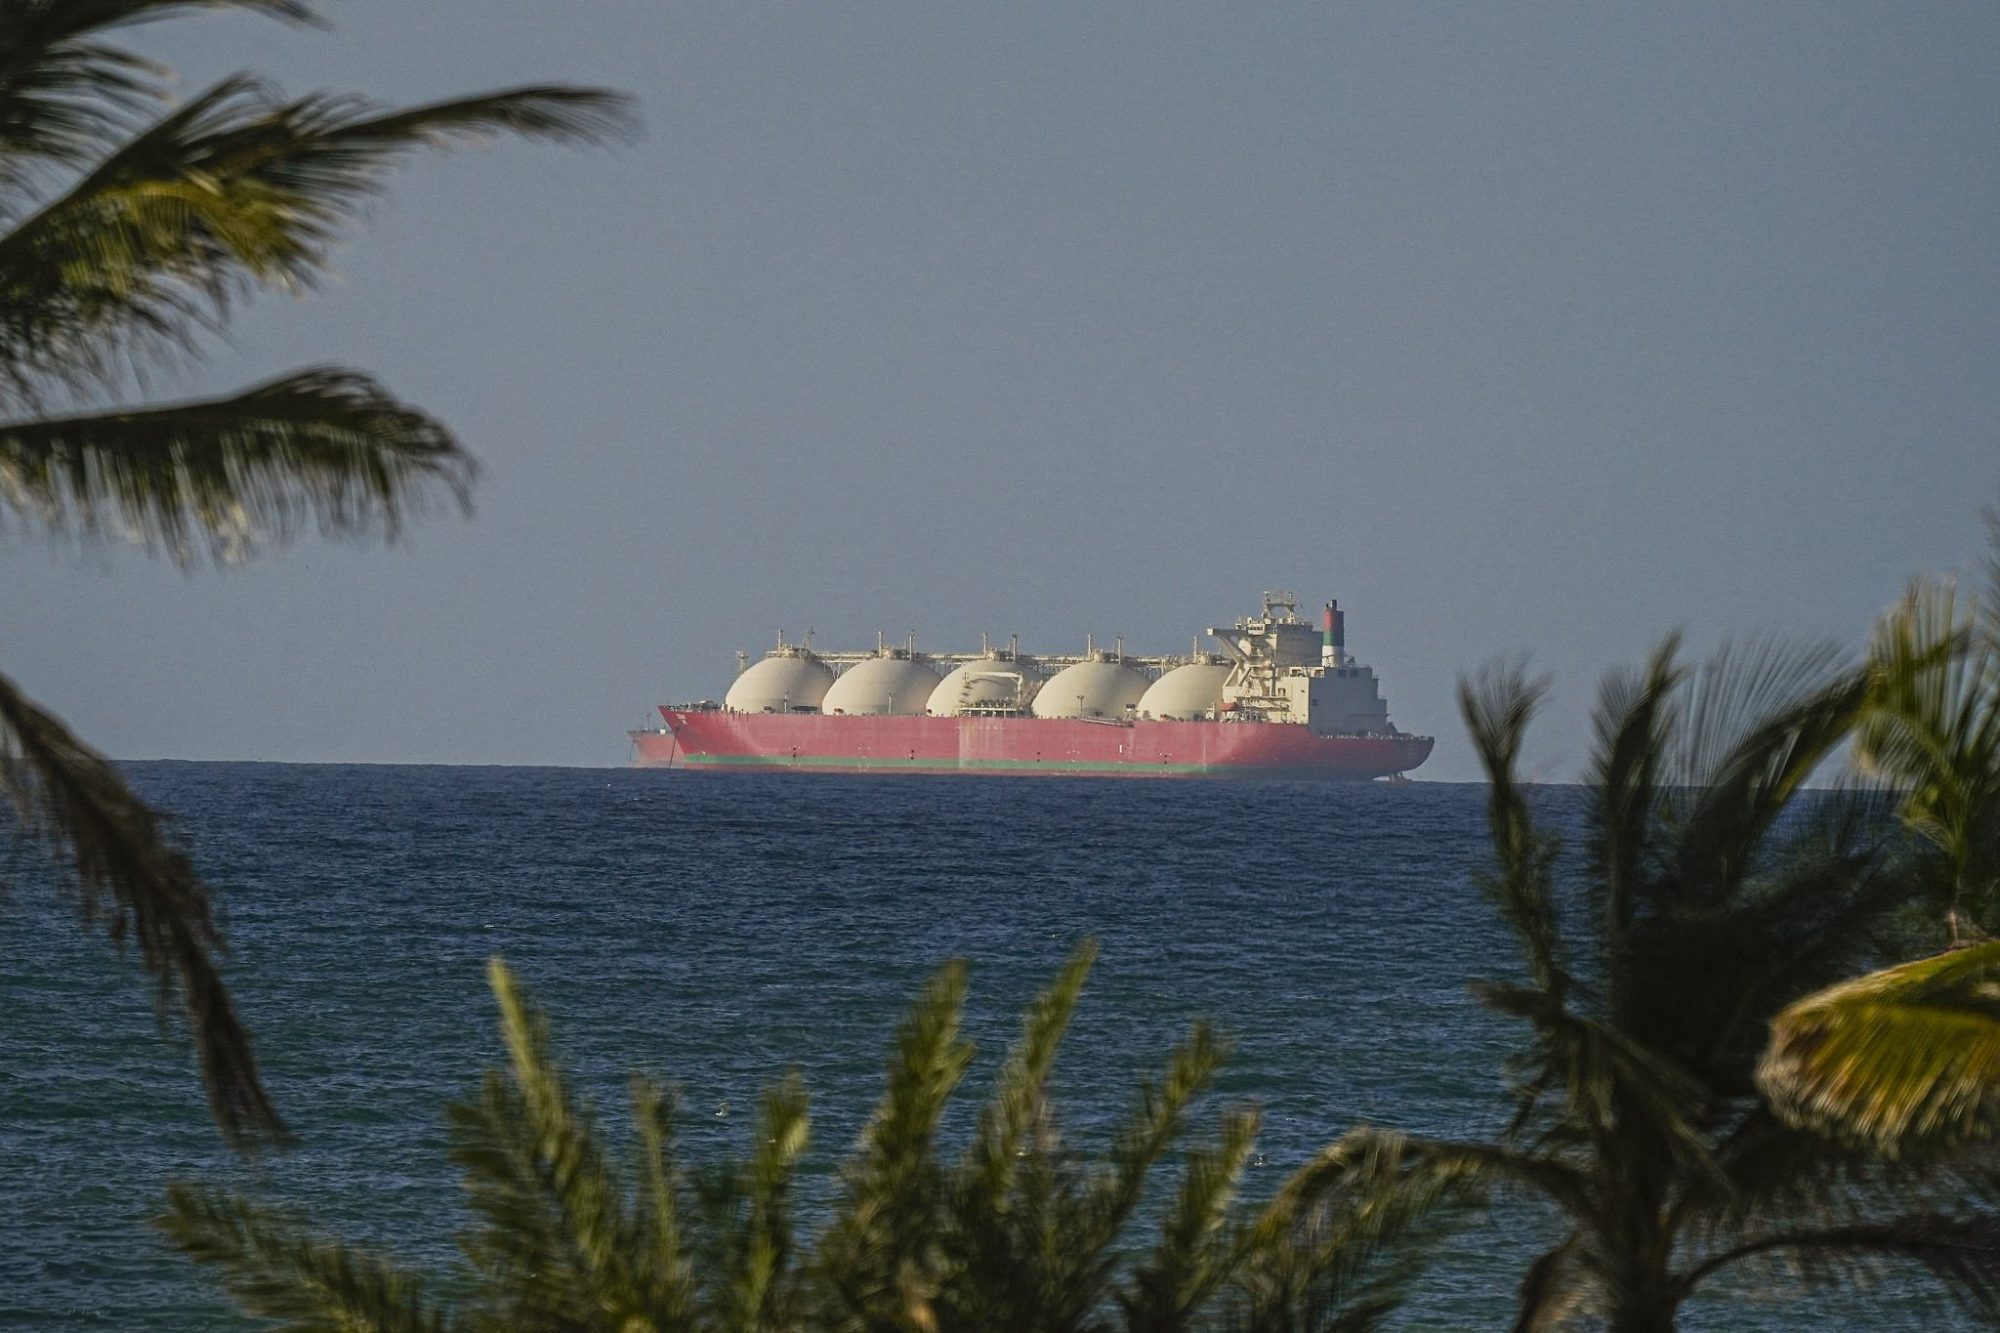
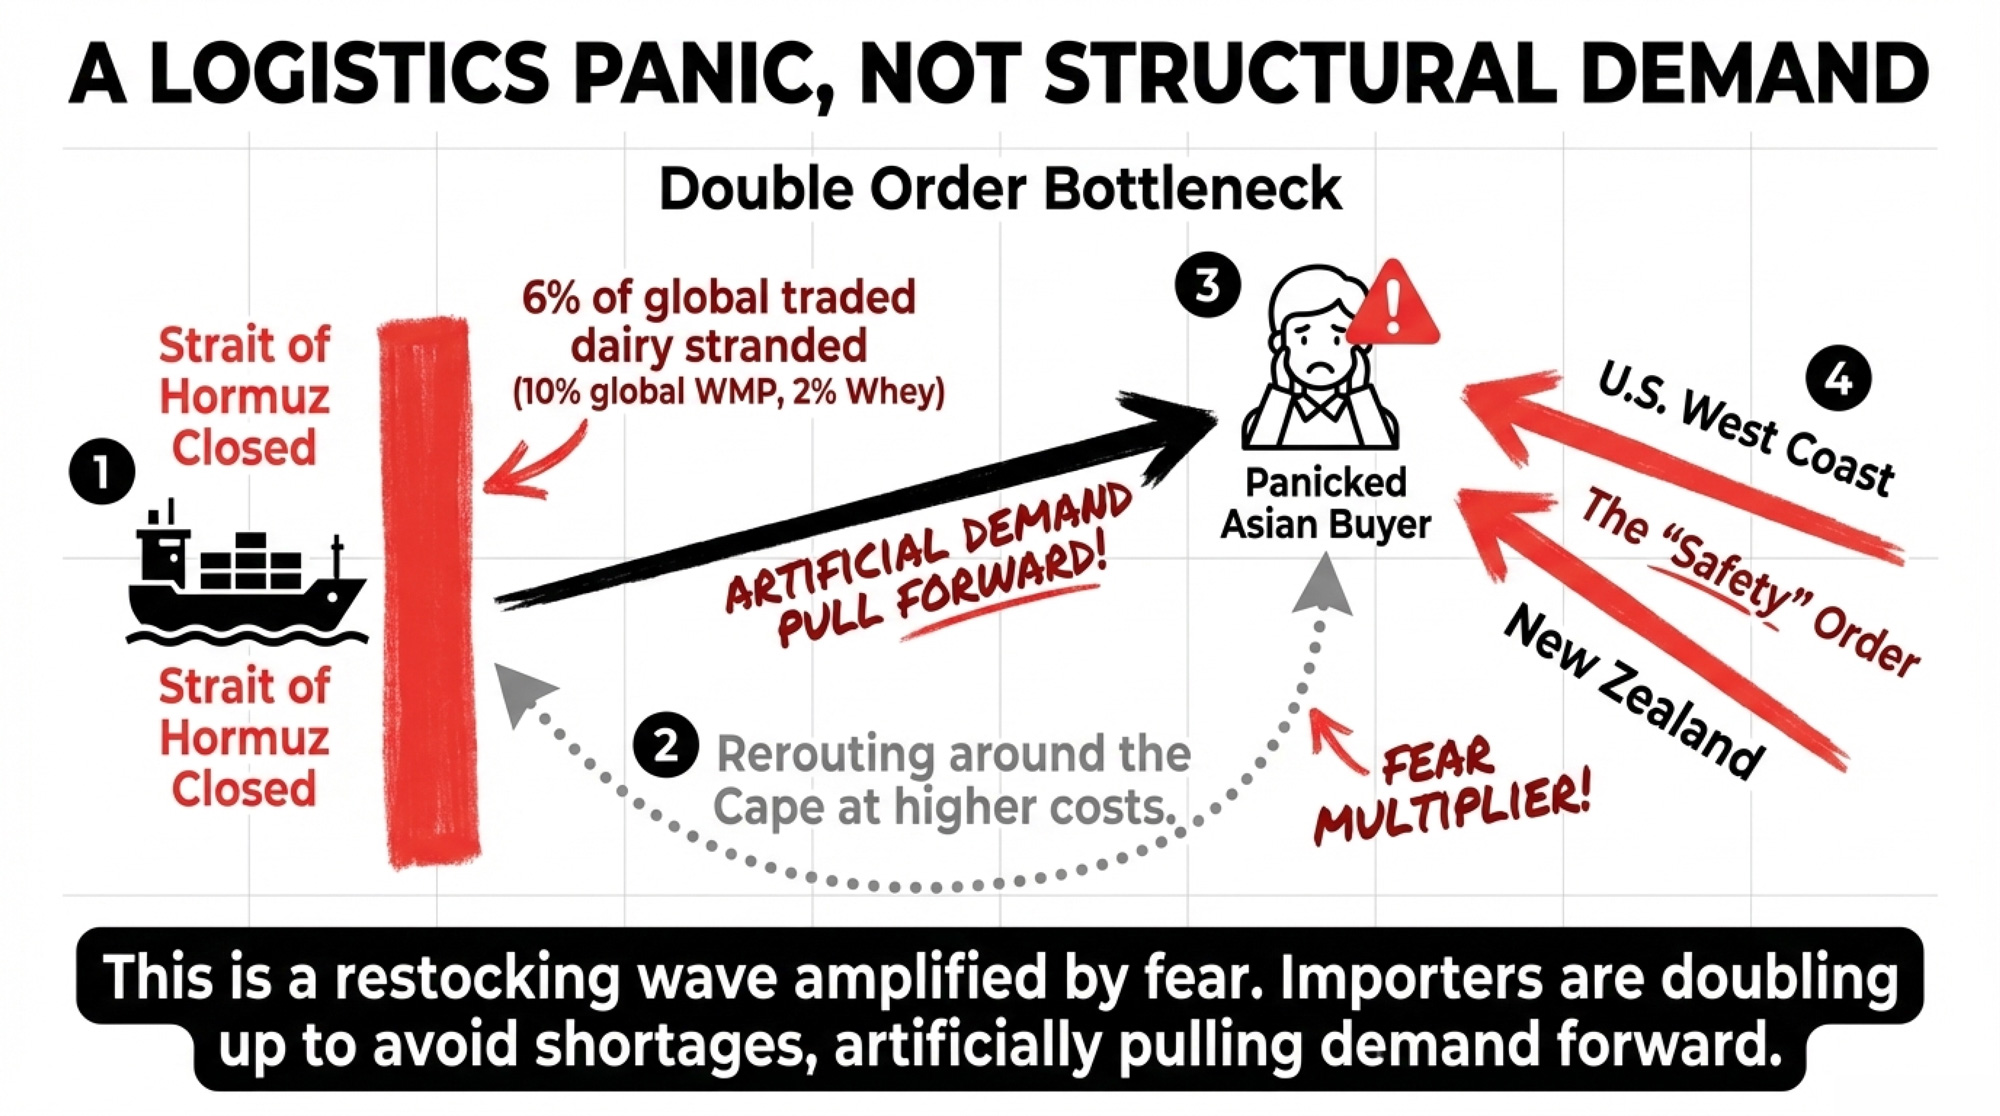
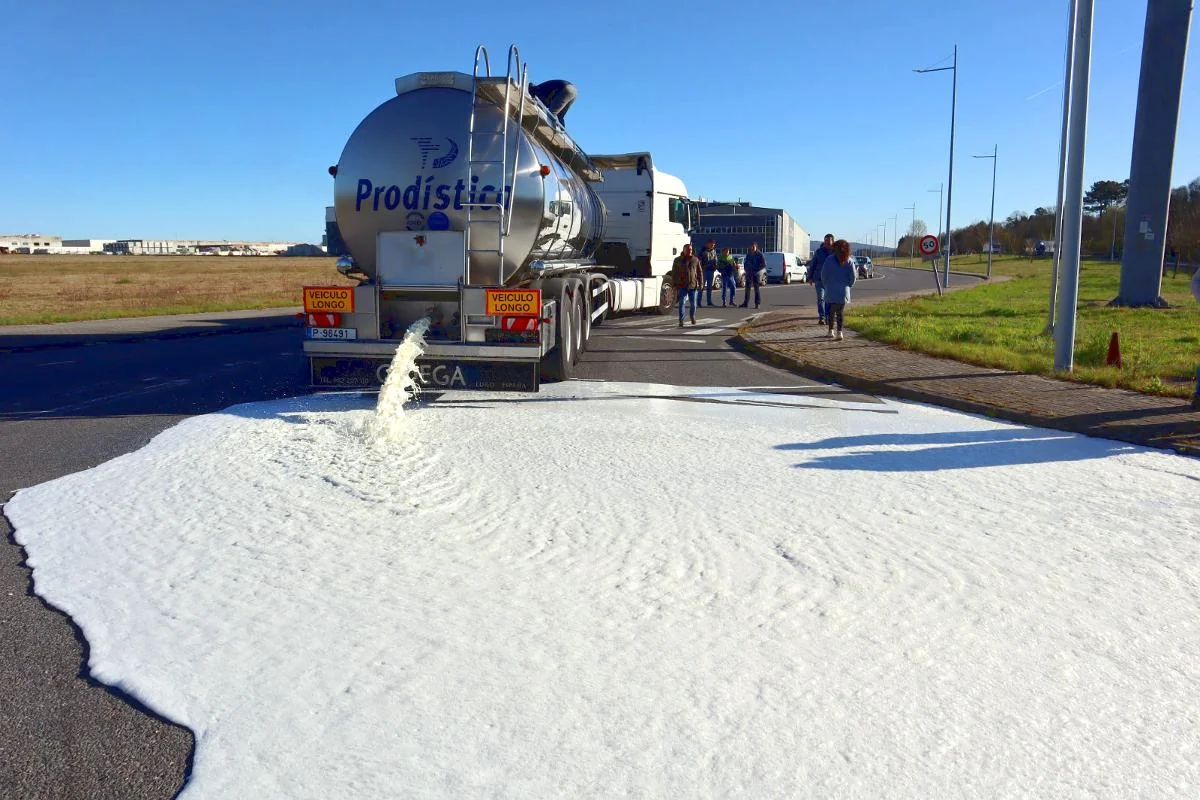
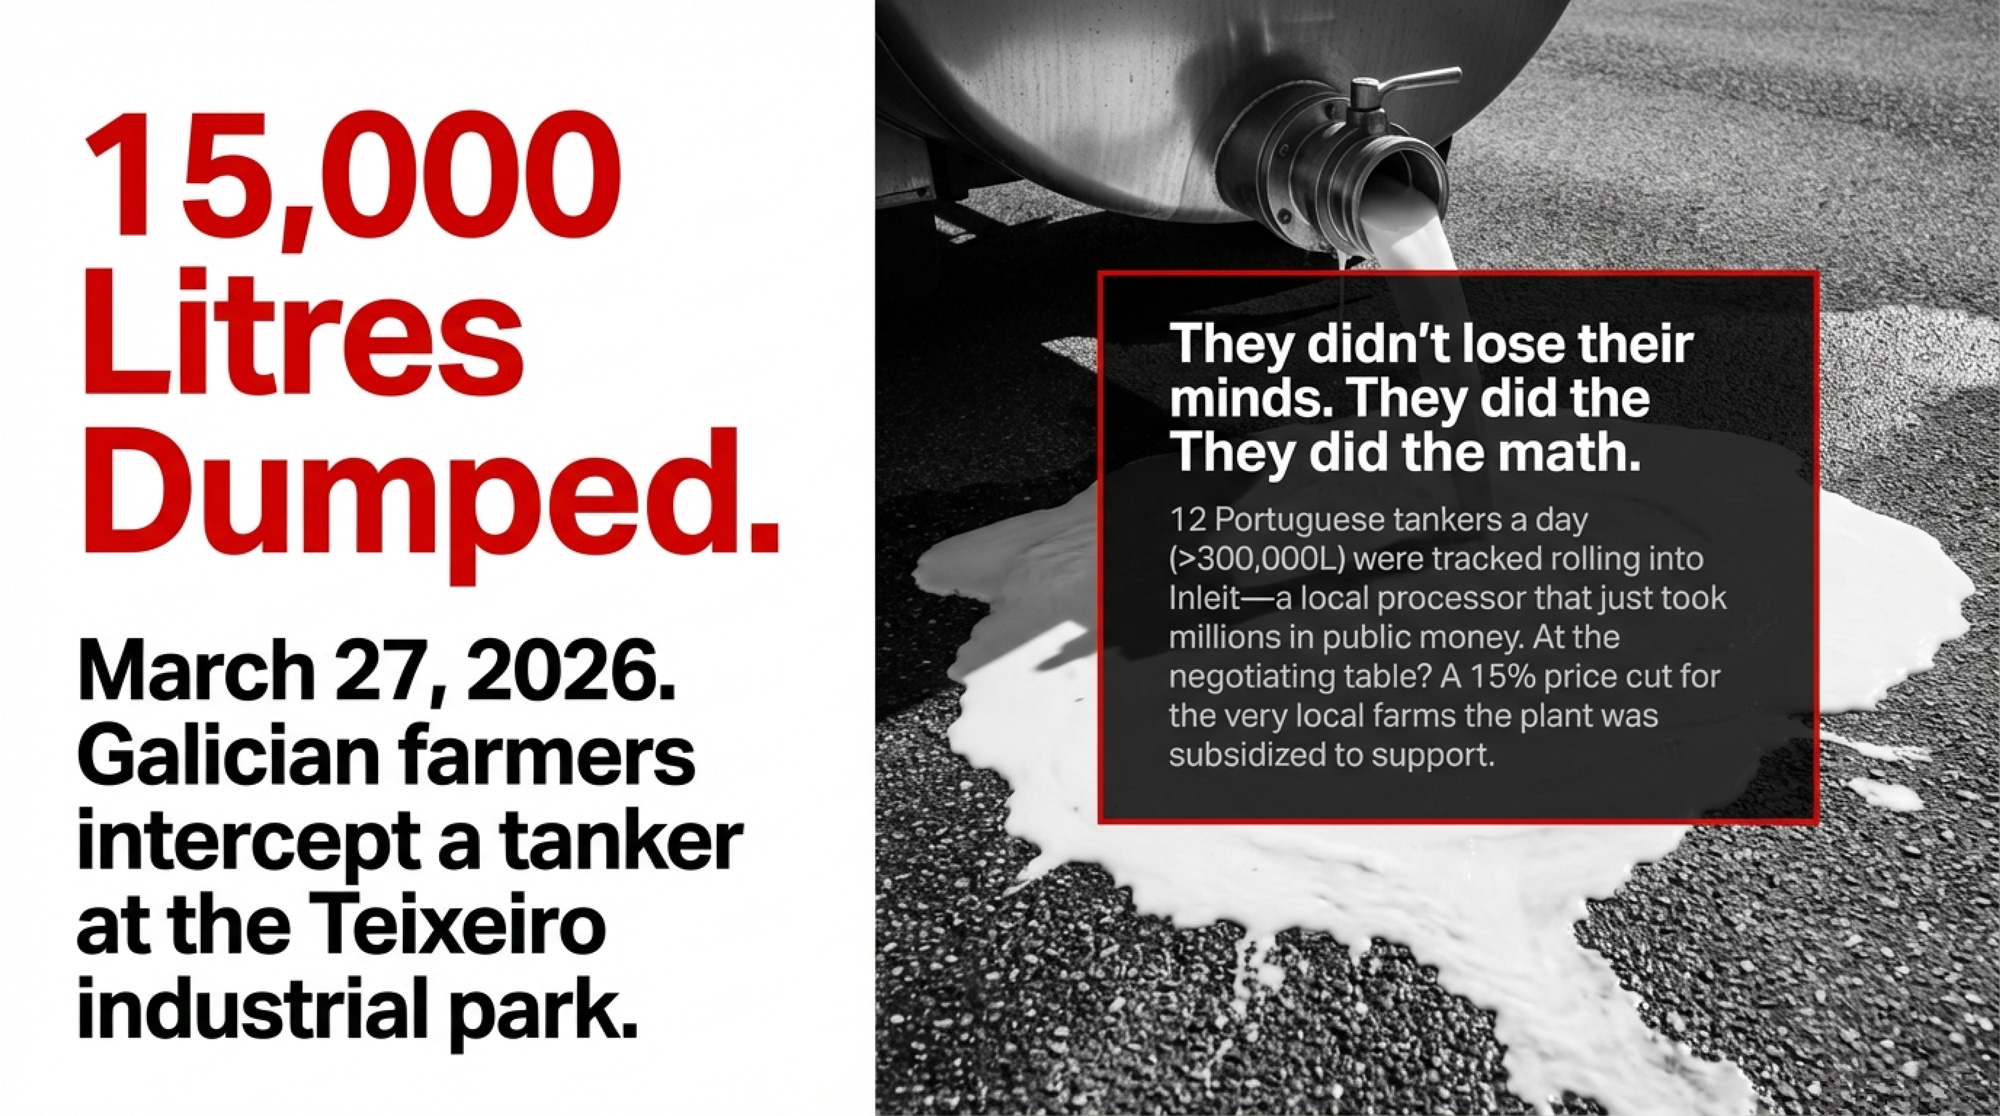
Six percent of trade is stuck behind Hormuz.
When conflict in Iran effectively closed the Strait of Hormuz in late February, roughly six percent of the world’s traded dairy — on a milk‑equivalent basis, in Donnay’s modeling — suddenly sat behind a chokepoint.
The exposure wasn’t equal:
- Around 10% of the global trade in whole-milk powder moved through Hormuz.
- Roughly two percent of global whey trade relied on the same route.
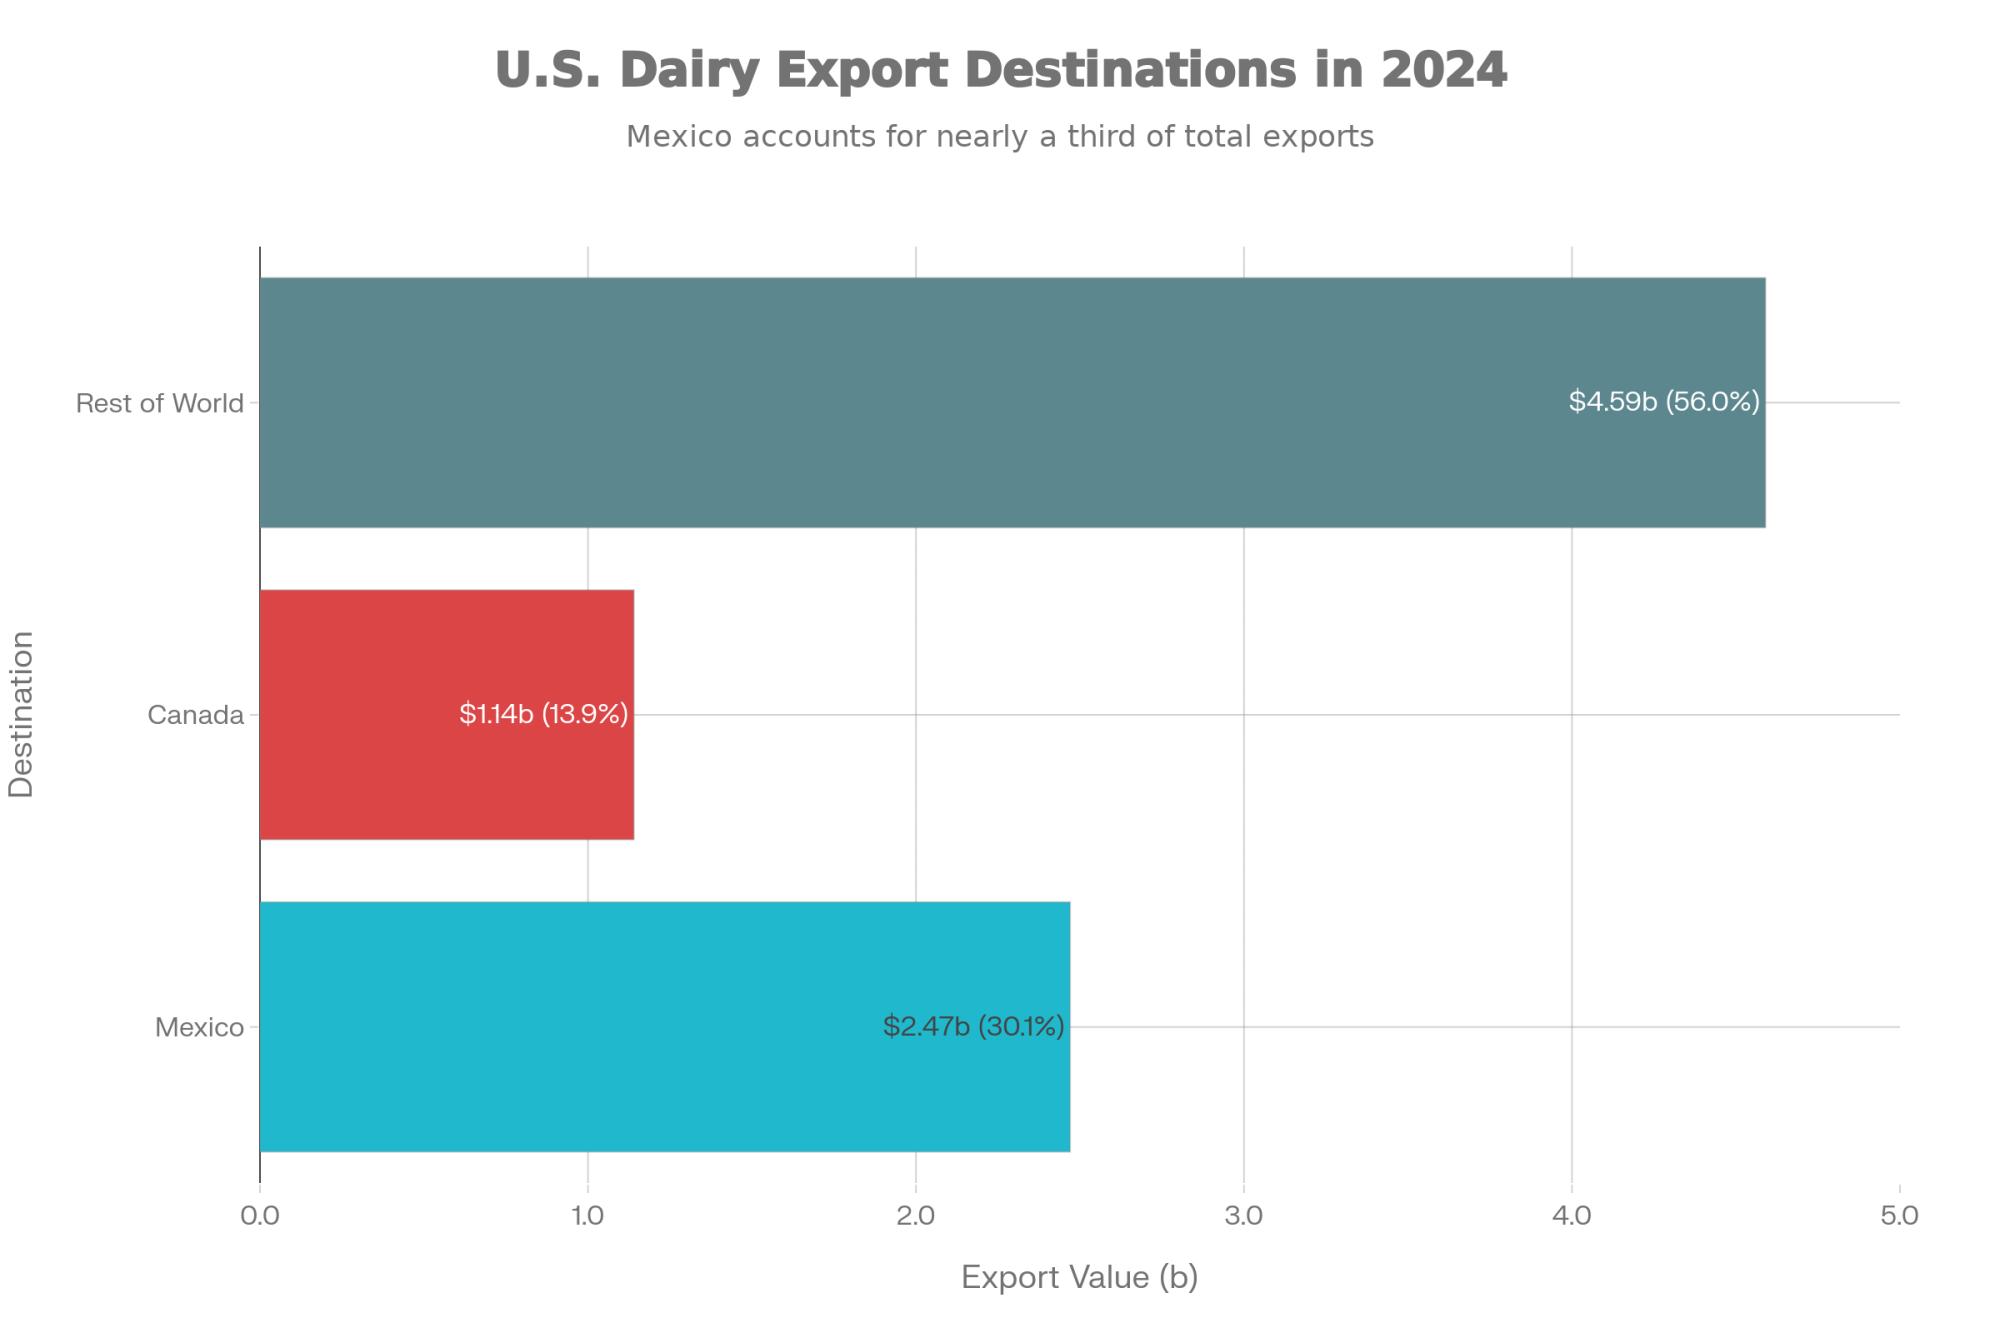
- Europe was the dominant dairy supplier to the Gulf, followed by New Zealand; U.S. volumes into that corridor were smaller.
The product didn’t vanish, but it didn’t flow smoothly. Exporters rerouted vessels outside the Gulf and trucked loads inland at higher cost. Faced with longer transit times and shipping uncertainty, importers did what risk‑averse buyers always do when they’re afraid of being short: they doubled up.
An Asian buyer with a European powder vessel now going the long way around the Cape might place an additional order from the U.S. West Coast or New Zealand “just to be safe.” Multiply that across enough buyers, on top of the restocking wave already running, and demand suddenly pulled harder than anyone’s supply model expected.
That’s how you get a rally in a market still swimming in product.
| Signal | Direction | Detail | Duration Estimate |
|---|---|---|---|
| Non-China restocking wave | 🟢 Bullish | SE Asia, Middle East buyers pulling demand forward into a well-supplied market | Short-term; demand already pulled forward |
| Hormuz closure (6% of trade) | 🟢 Bullish near-term | ~10% of global WMP, ~2% of whey stranded; importers double-ordering | Temporary; risk-premium only |
| EU SMP stocks +50% YOY | 🔴 Bearish | Modelled January 2026 SMP production up ~20% YOY; stocks well above last year | Ongoing; caps rallies through mid-2026+ |
| EU butter inventories ~2× 2025 | 🔴 Bearish | Butter prices already backing off highs in early 2026 | Ongoing |
| U.S. herd +49k head (Jan–Feb 2026) | 🔴 Bearish | +63% vs. same period in 2025; component-adjusted growth still ~3% YOY | Multi-year structural supply build |
| NZ milk solids growth ~4% | 🔴 Bearish | Fonterra midpoint raised to NZ$9.70; good weather backing it | Season-long (2025/26) |
| Hormuz demand destruction (medium-term) | 🔴 Bearish | Gulf importing nations face higher costs, shipping disruption reduces orders | Develops over 6–12 months |
| China domestic SMP/MPC exports | 🔴 Bearish | Chinese processors now exporting SMP and MPC70 to SE Asia — competing with NZ and EU | Structural shift, not a blip |
Europe’s Calving Echo and the Powder Wall Behind This Rally
So why should a delayed calving wave in Germany or France matter to your 500‑cow barn? Because it helped build the powder wall sitting behind every price you’re looking at today.
John Lancaster, who leads EMEA dairy and food consulting from Dublin, sees two main EU drivers: how the milk got here, and how much of it is now sitting in bags and boxes.
Delayed calving, prolonged lactation
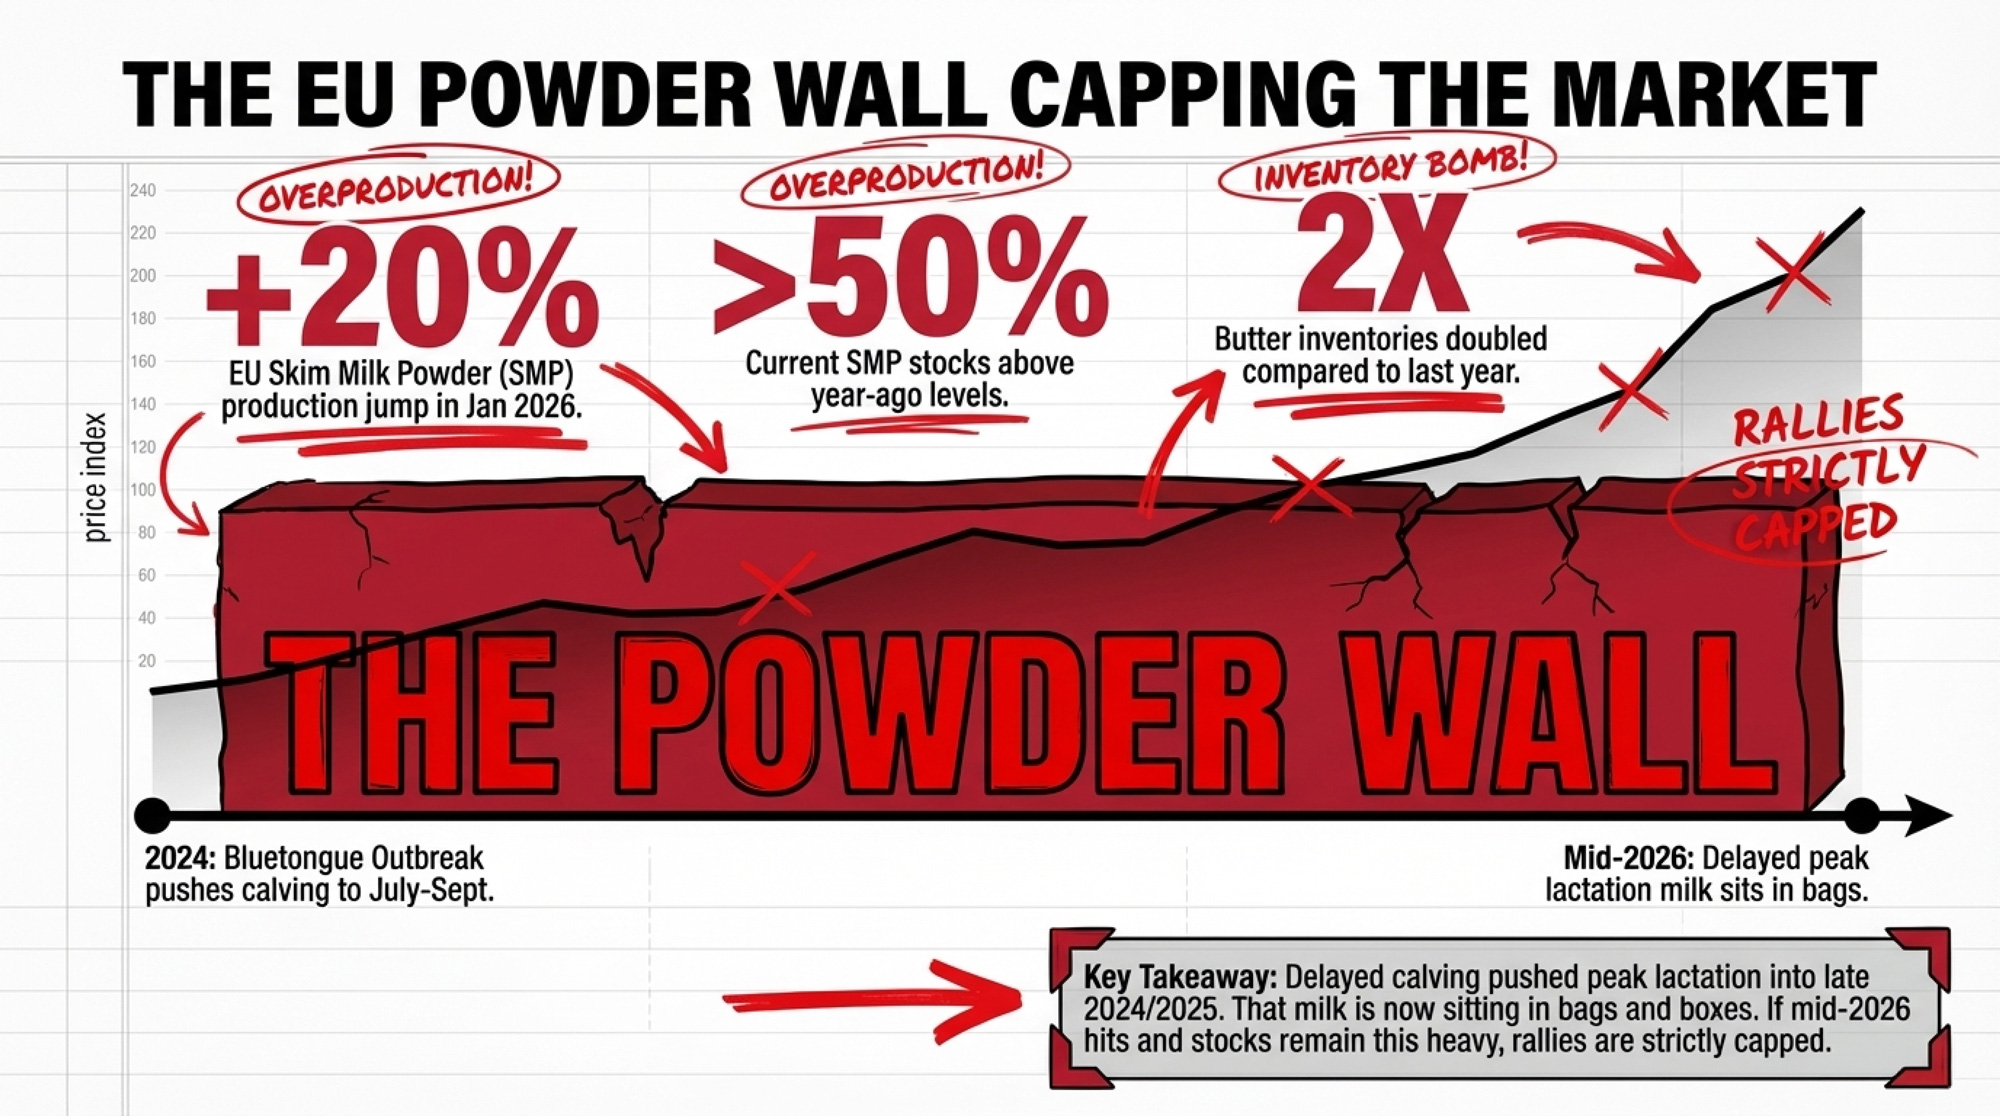
Lancaster traces the current EU milk profile back to 2024, when Bluetongue hammered fertility in France, Germany, Belgium, and the Netherlands. Cows that should’ve calved in April through June didn’t freshen until July through September. That shoved a wave of peak‑lactation production into late 2024 and well into 2025.
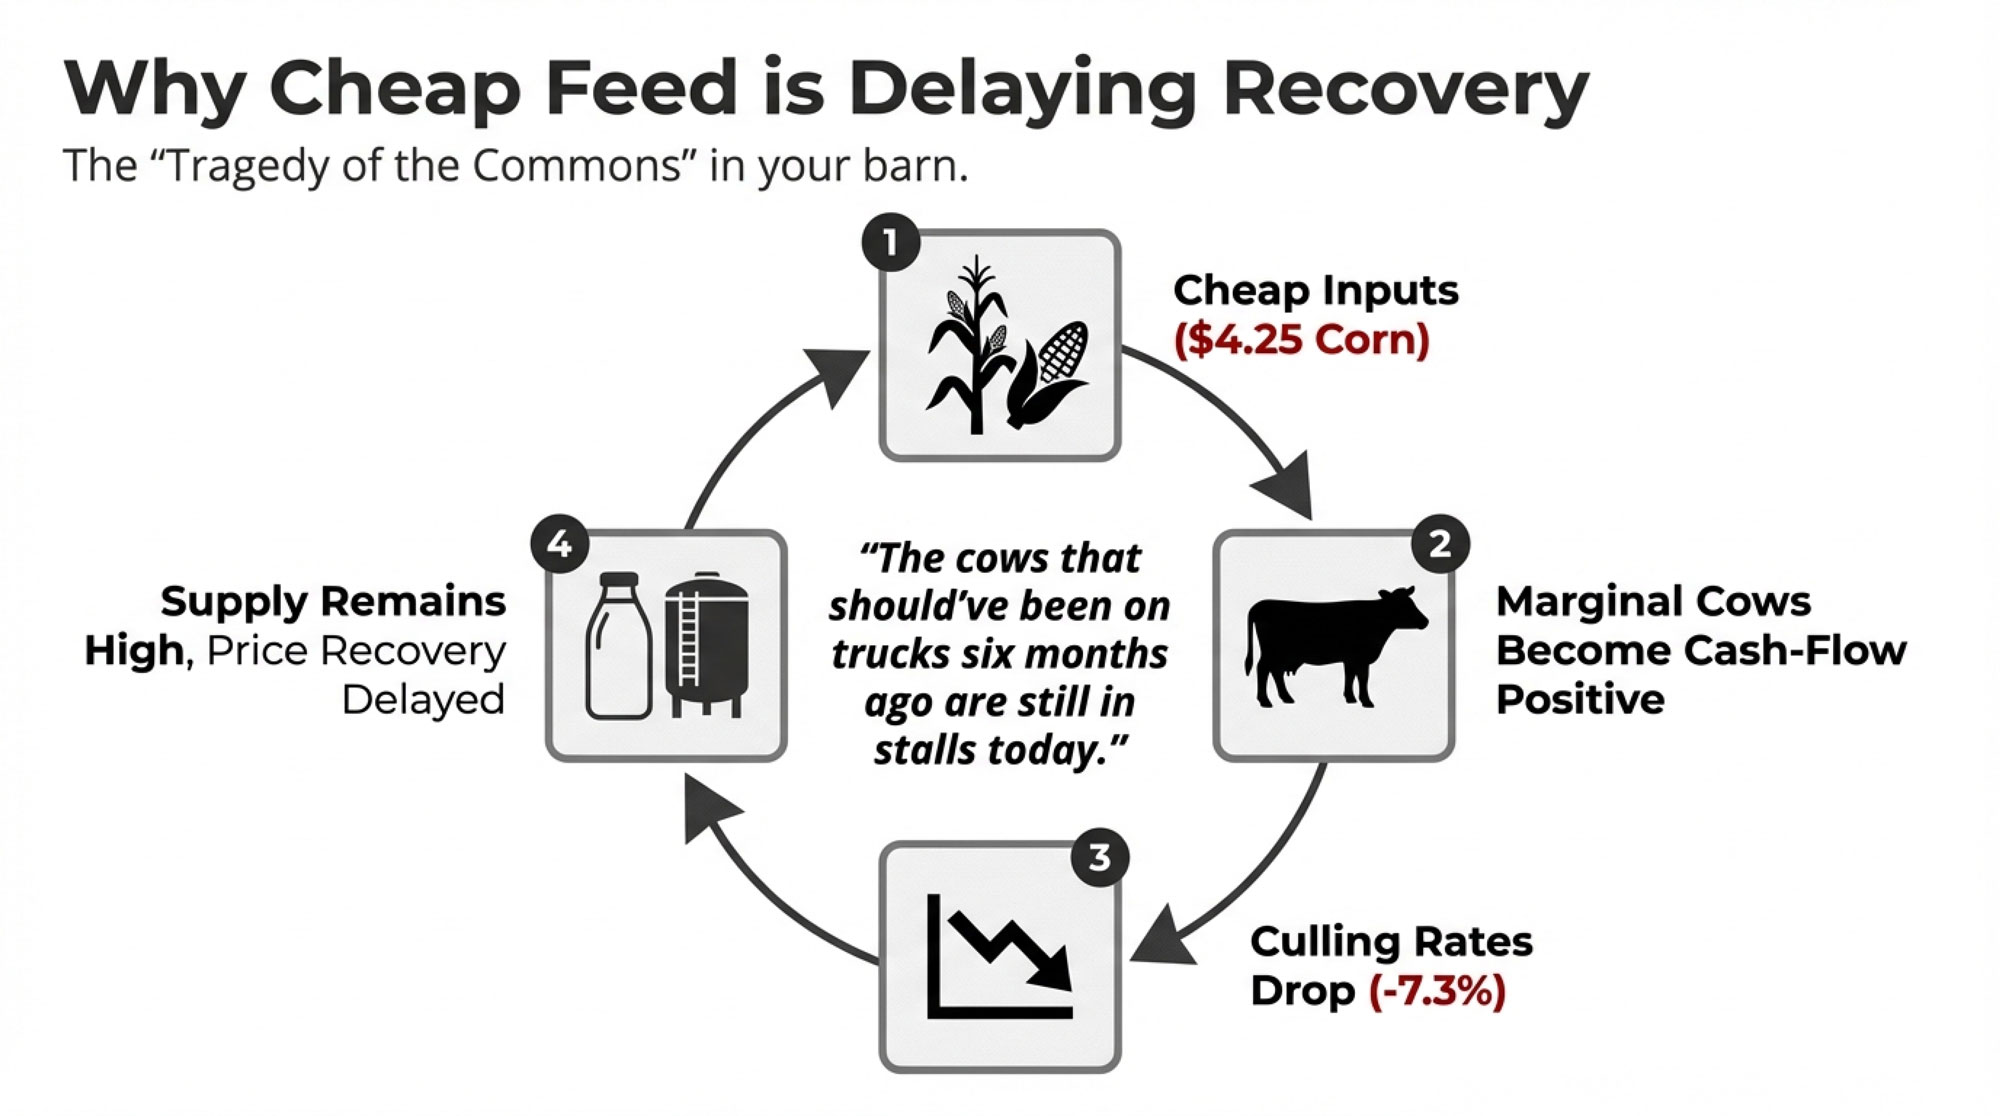
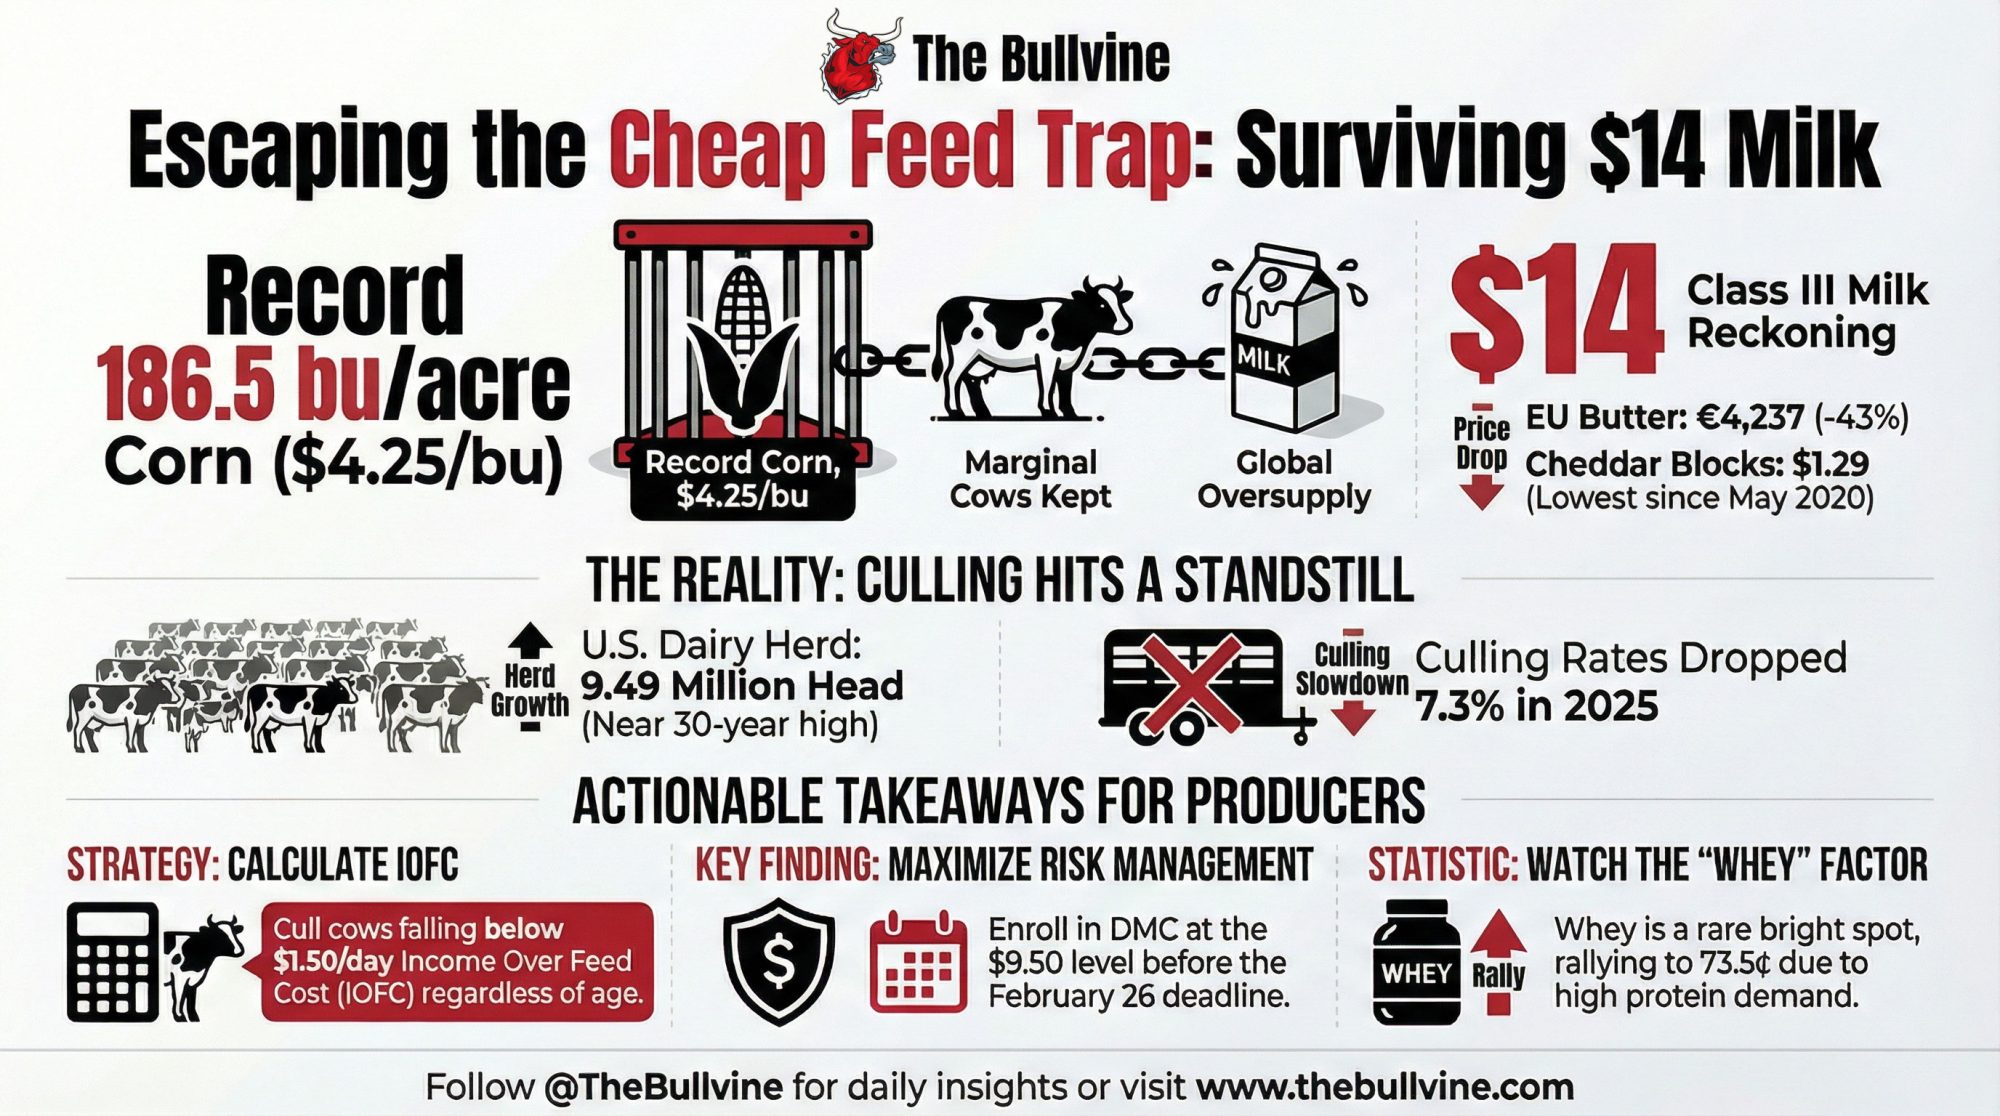
At the same time, with margins decent and feed grains toward the low end of their five‑year range, plenty of EU producers chose to keep marginal cows milking rather than drying them off.
The result in early 2026: a big cohort of late‑calving cows still in relatively strong lactation stages, older cows kept in milk longer than they would be in a tighter year, and a smaller overall herd producing more milk per cow. Growth built on timing and persistence — not a permanent structural jump.
In Lancaster’s modeling, EU production growth slows sharply as 2026 progresses, especially from Q3 onward. Once 2026 starts to be compared against inflated Q3/Q4 2025 numbers rather than weaker 2024 figures, the growth bars shrink quickly. Donnay agrees with the math but admits he’s “nervous” that the slowdown hasn’t yet shown up in weekly collection numbers from Germany, France, and the UK, which remain very strong.
The SMP and butter overhang nobody’s worked off yet
Based on Donnay and Lancaster’s modeling:
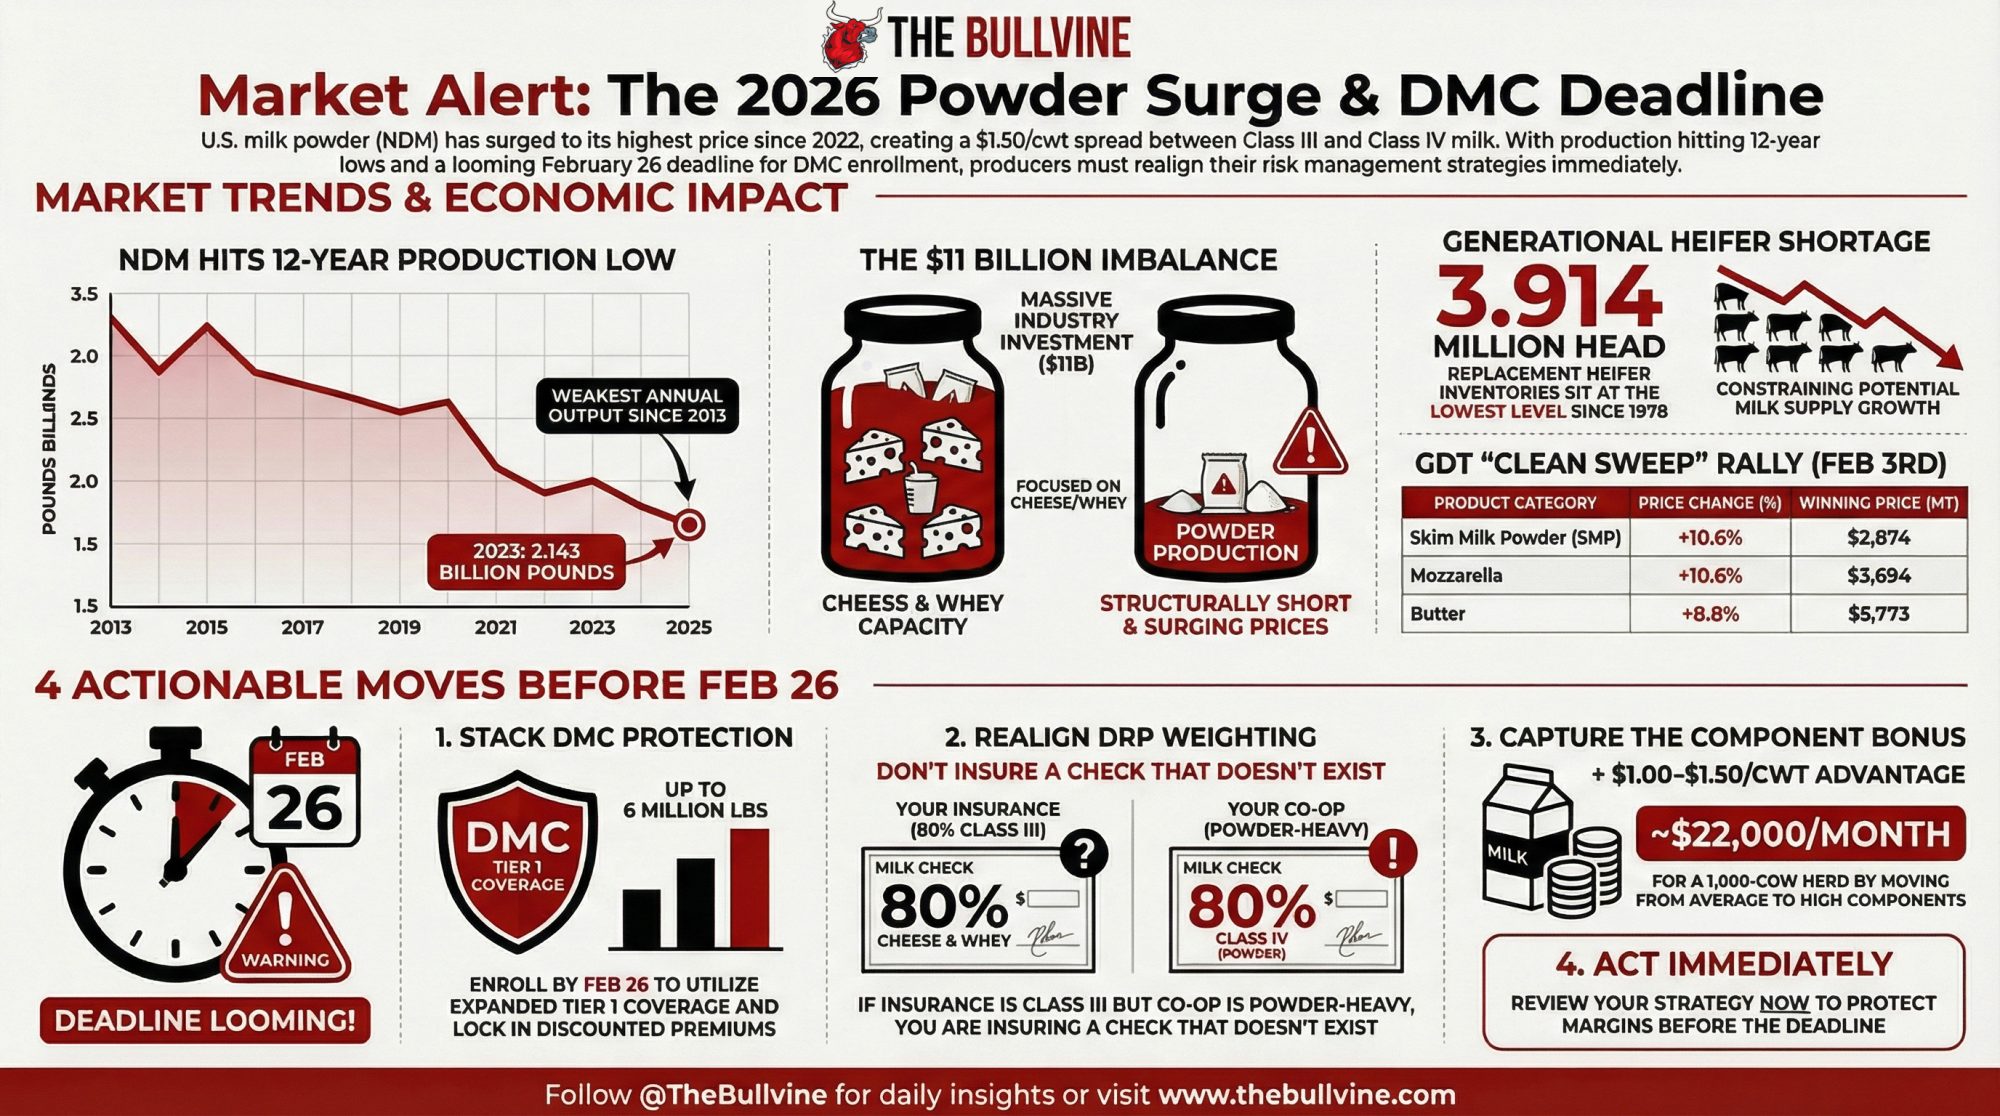
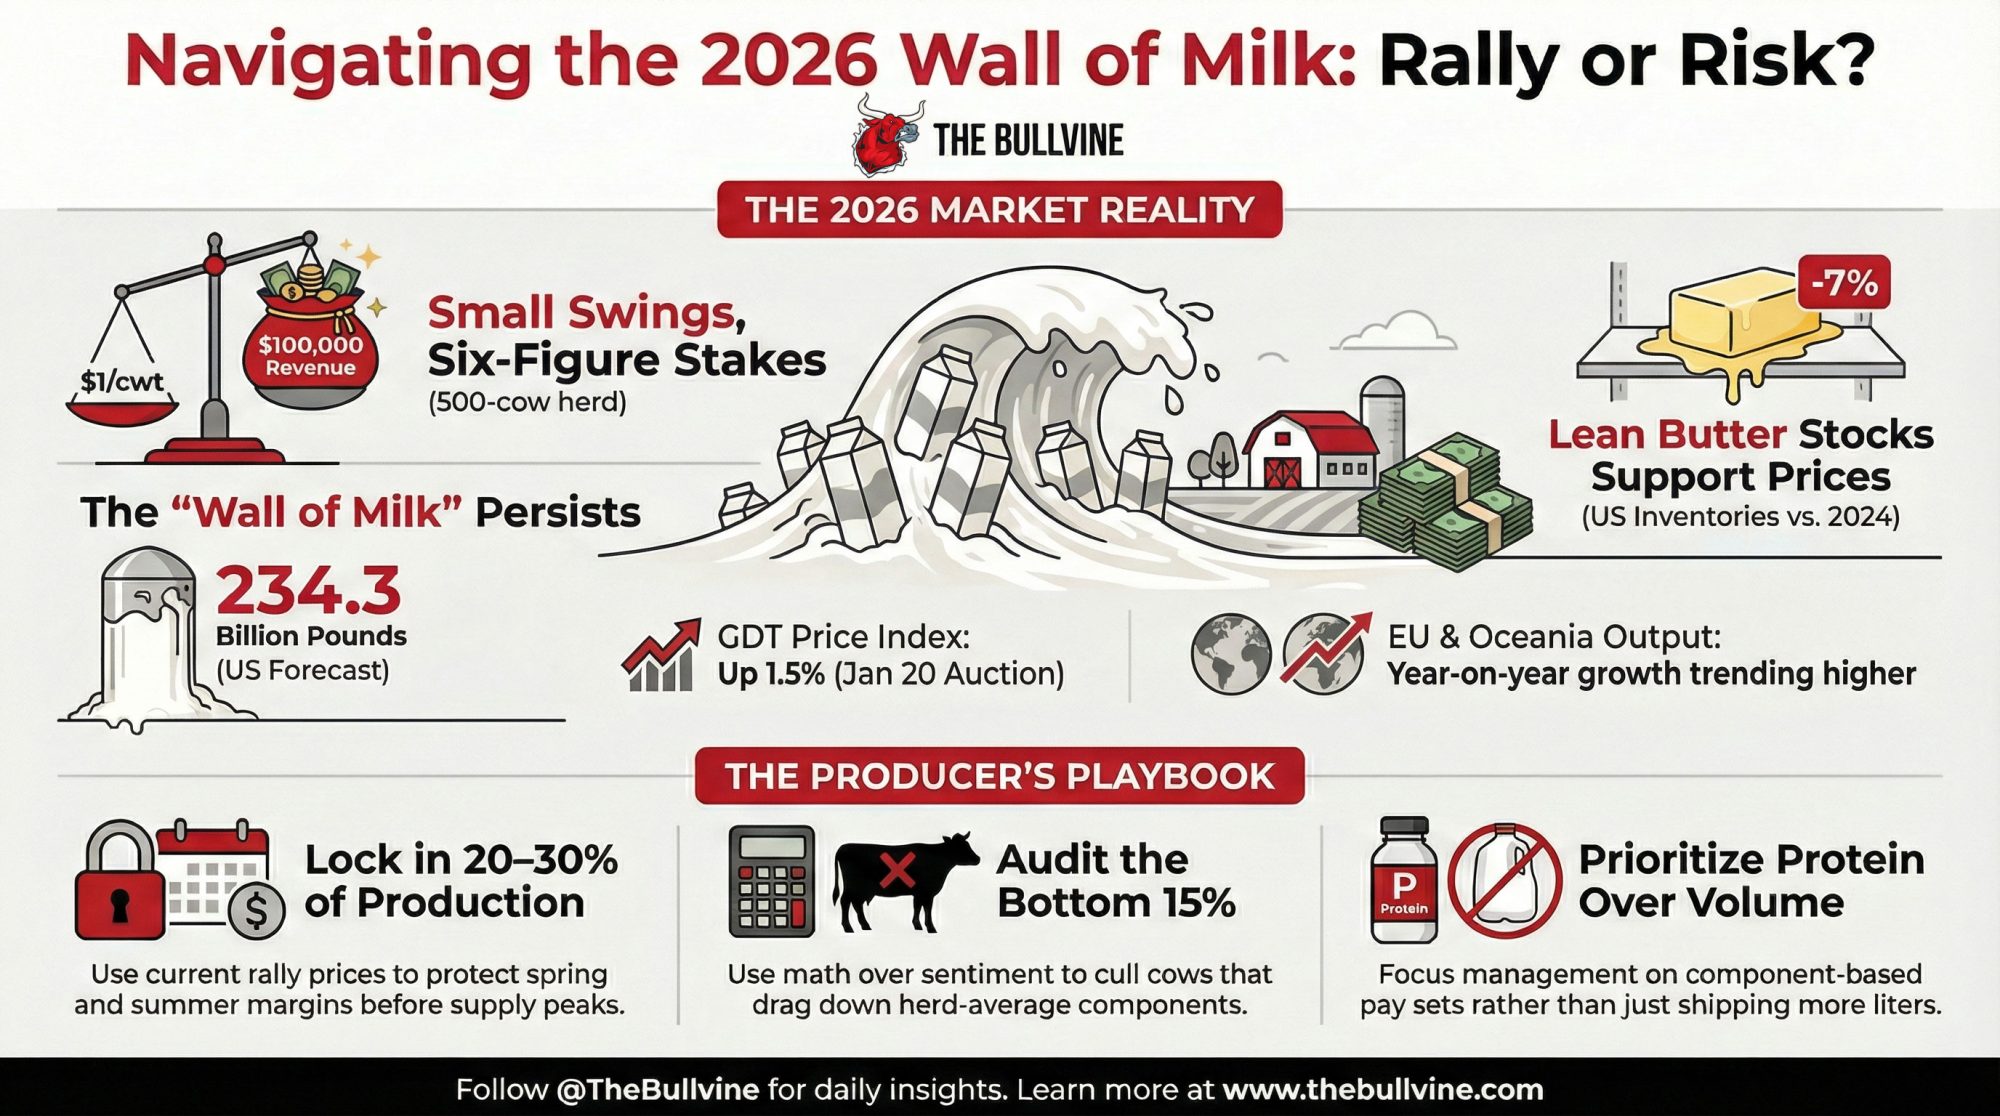
- EU SMP production was up about 20 percent year‑over‑year in January 2026, with estimated SMP stocks more than 50 percent above year‑ago levels.
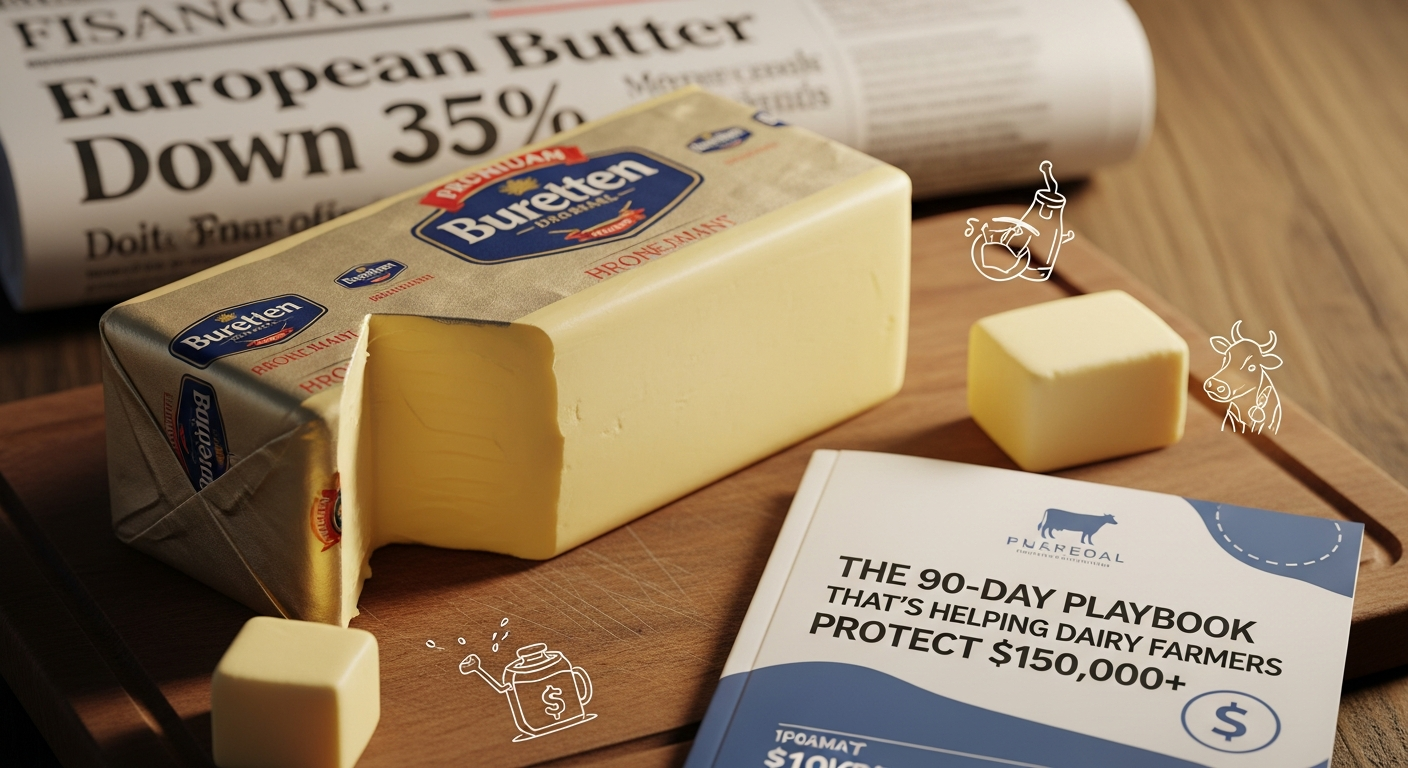
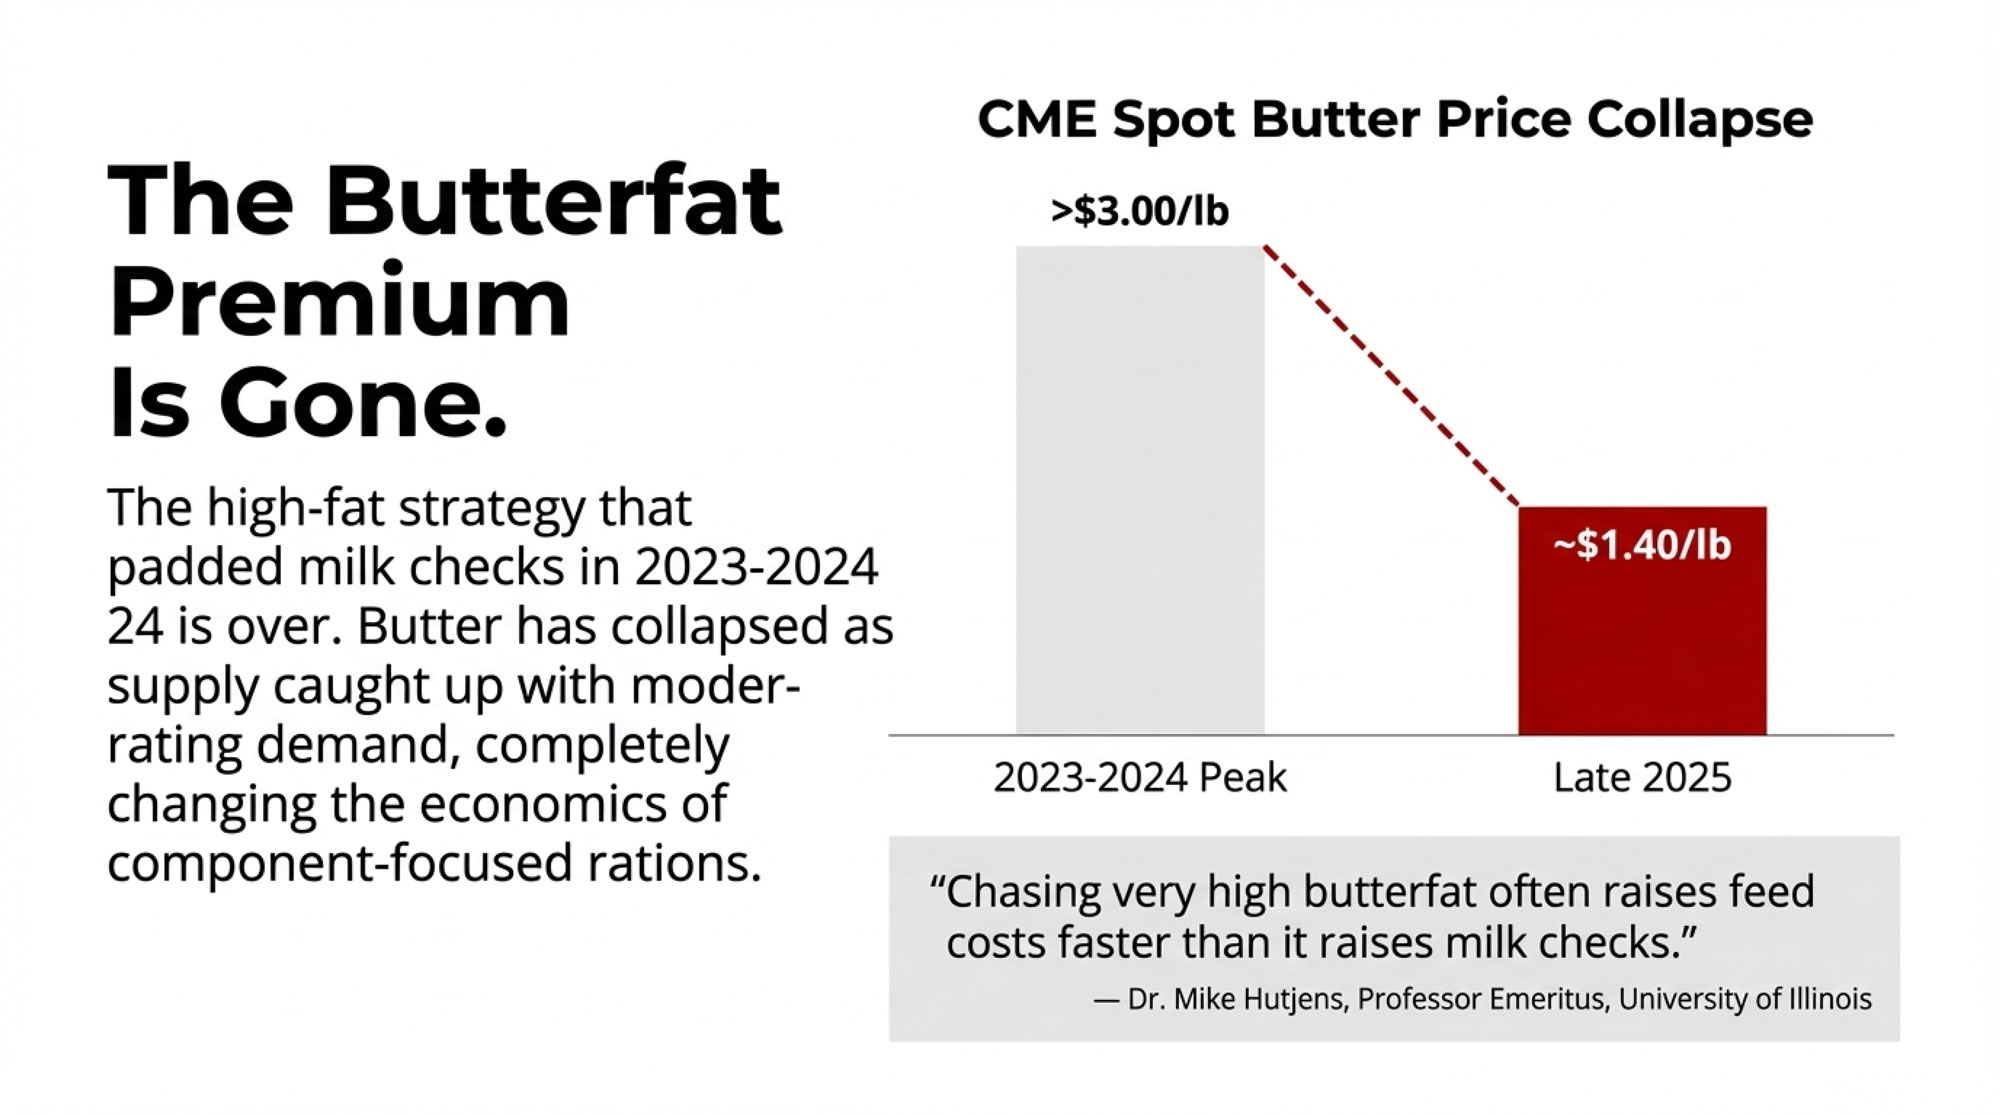
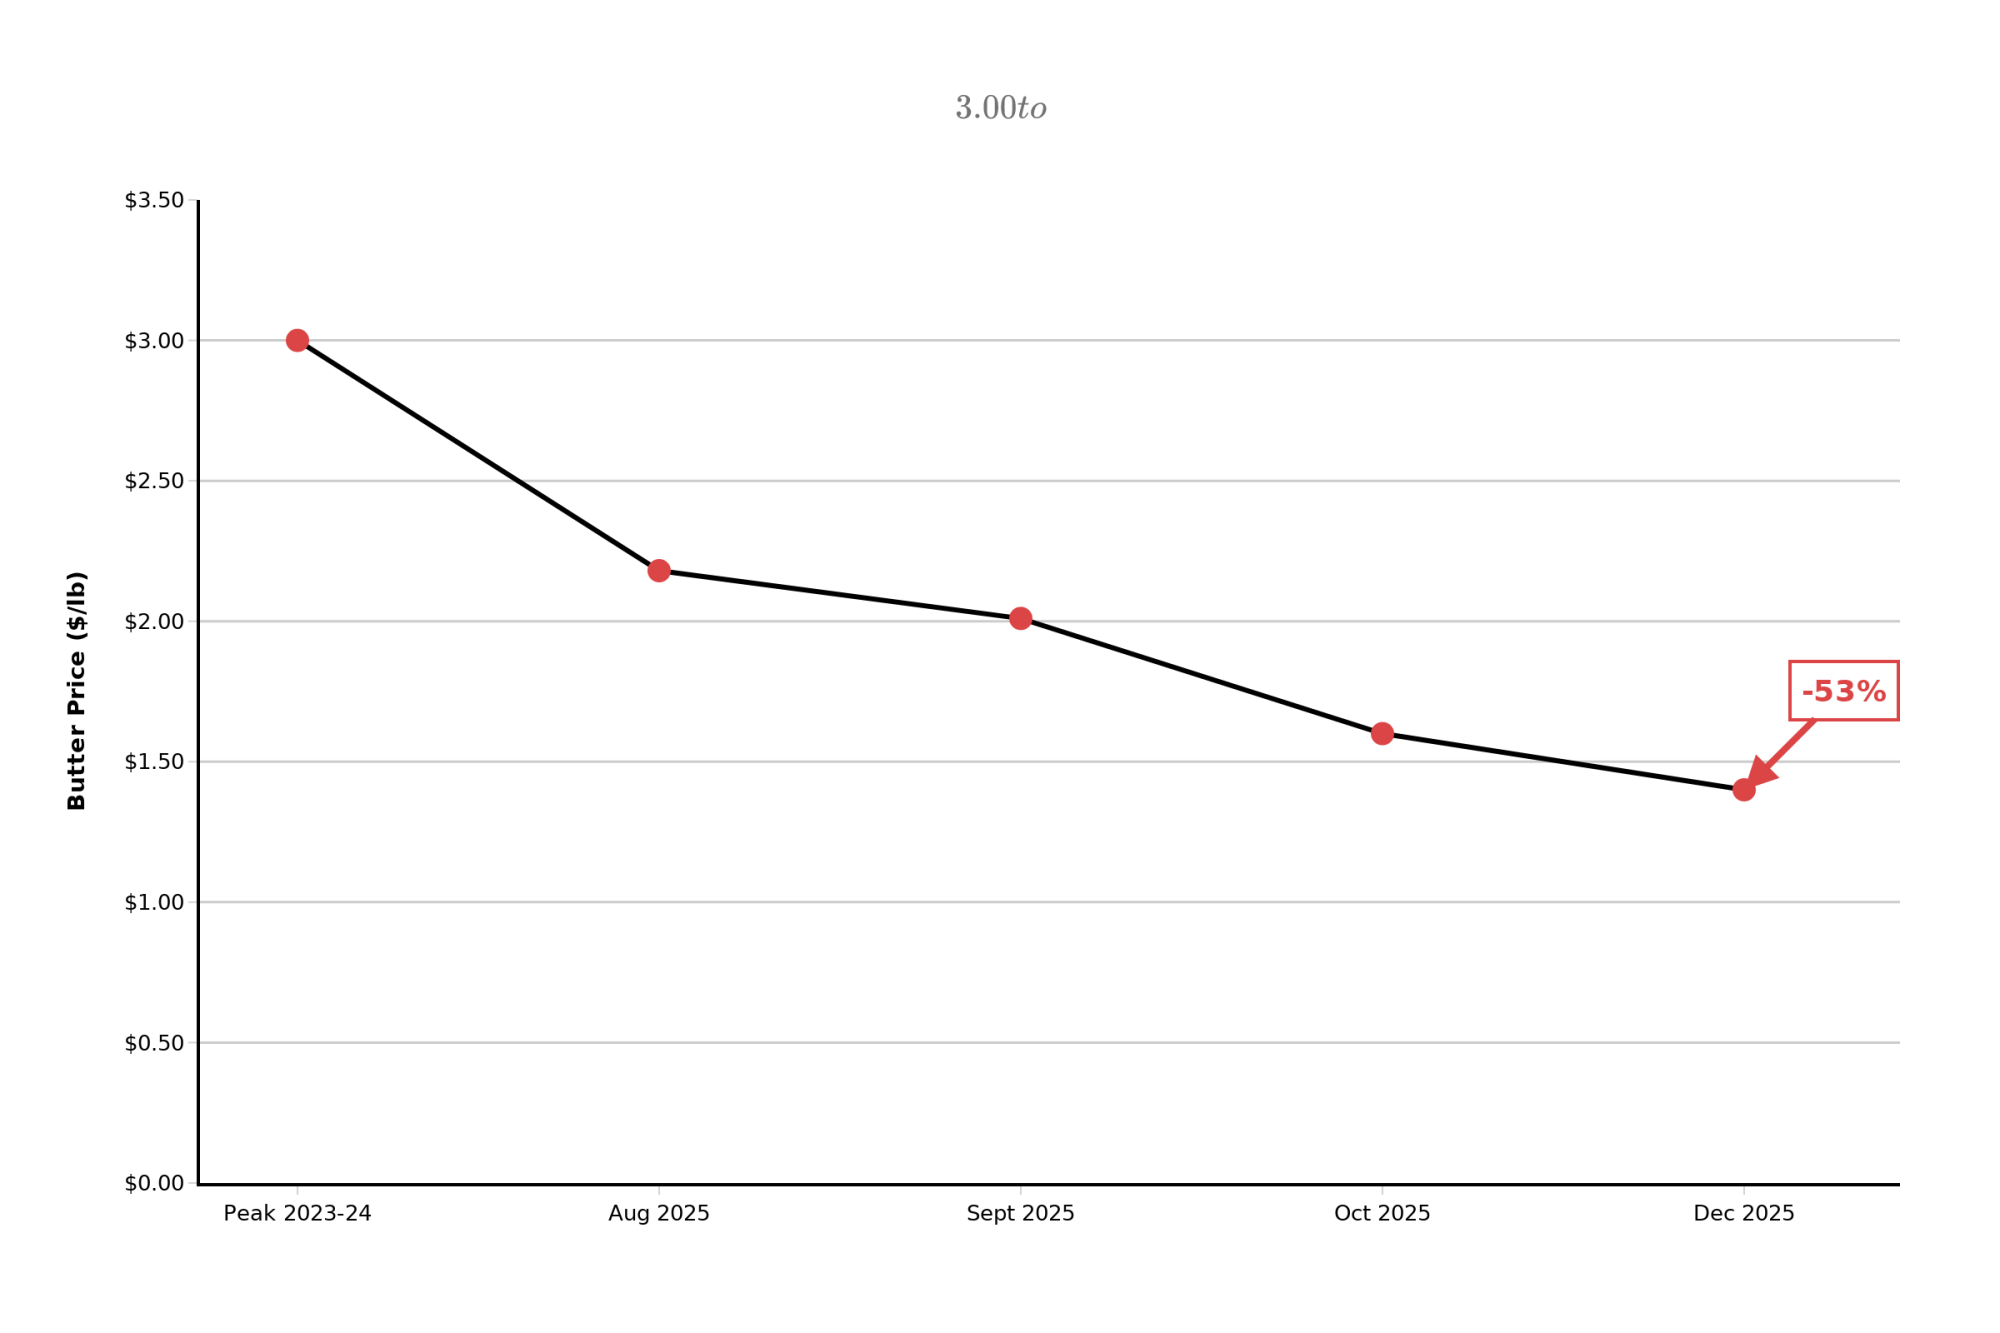
- Butter inventories were estimated at more than double last year’s — one reason EU butter prices have already backed away from their highs.
Those are modeled estimates, not official Eurostat figures, but they line up with reports from processors and traders and with AHDB analysis showing a build‑up in available SMP and butter supplies into late 2025.
Lancaster’s test is simple. If SMP stocks peak by late Q2 and start a steady decline — and butter stocks narrow their gap versus 2025 as milk growth slows — the overhang is easing. But if we reach mid‑2026 with SMP still very heavy and butter inventories near twice 2025 levels, that overhang is intact. And it’s going to cap rallies.
Right now, the 2026 rally is underway, with that powder-and-butter wall still sitting behind it.
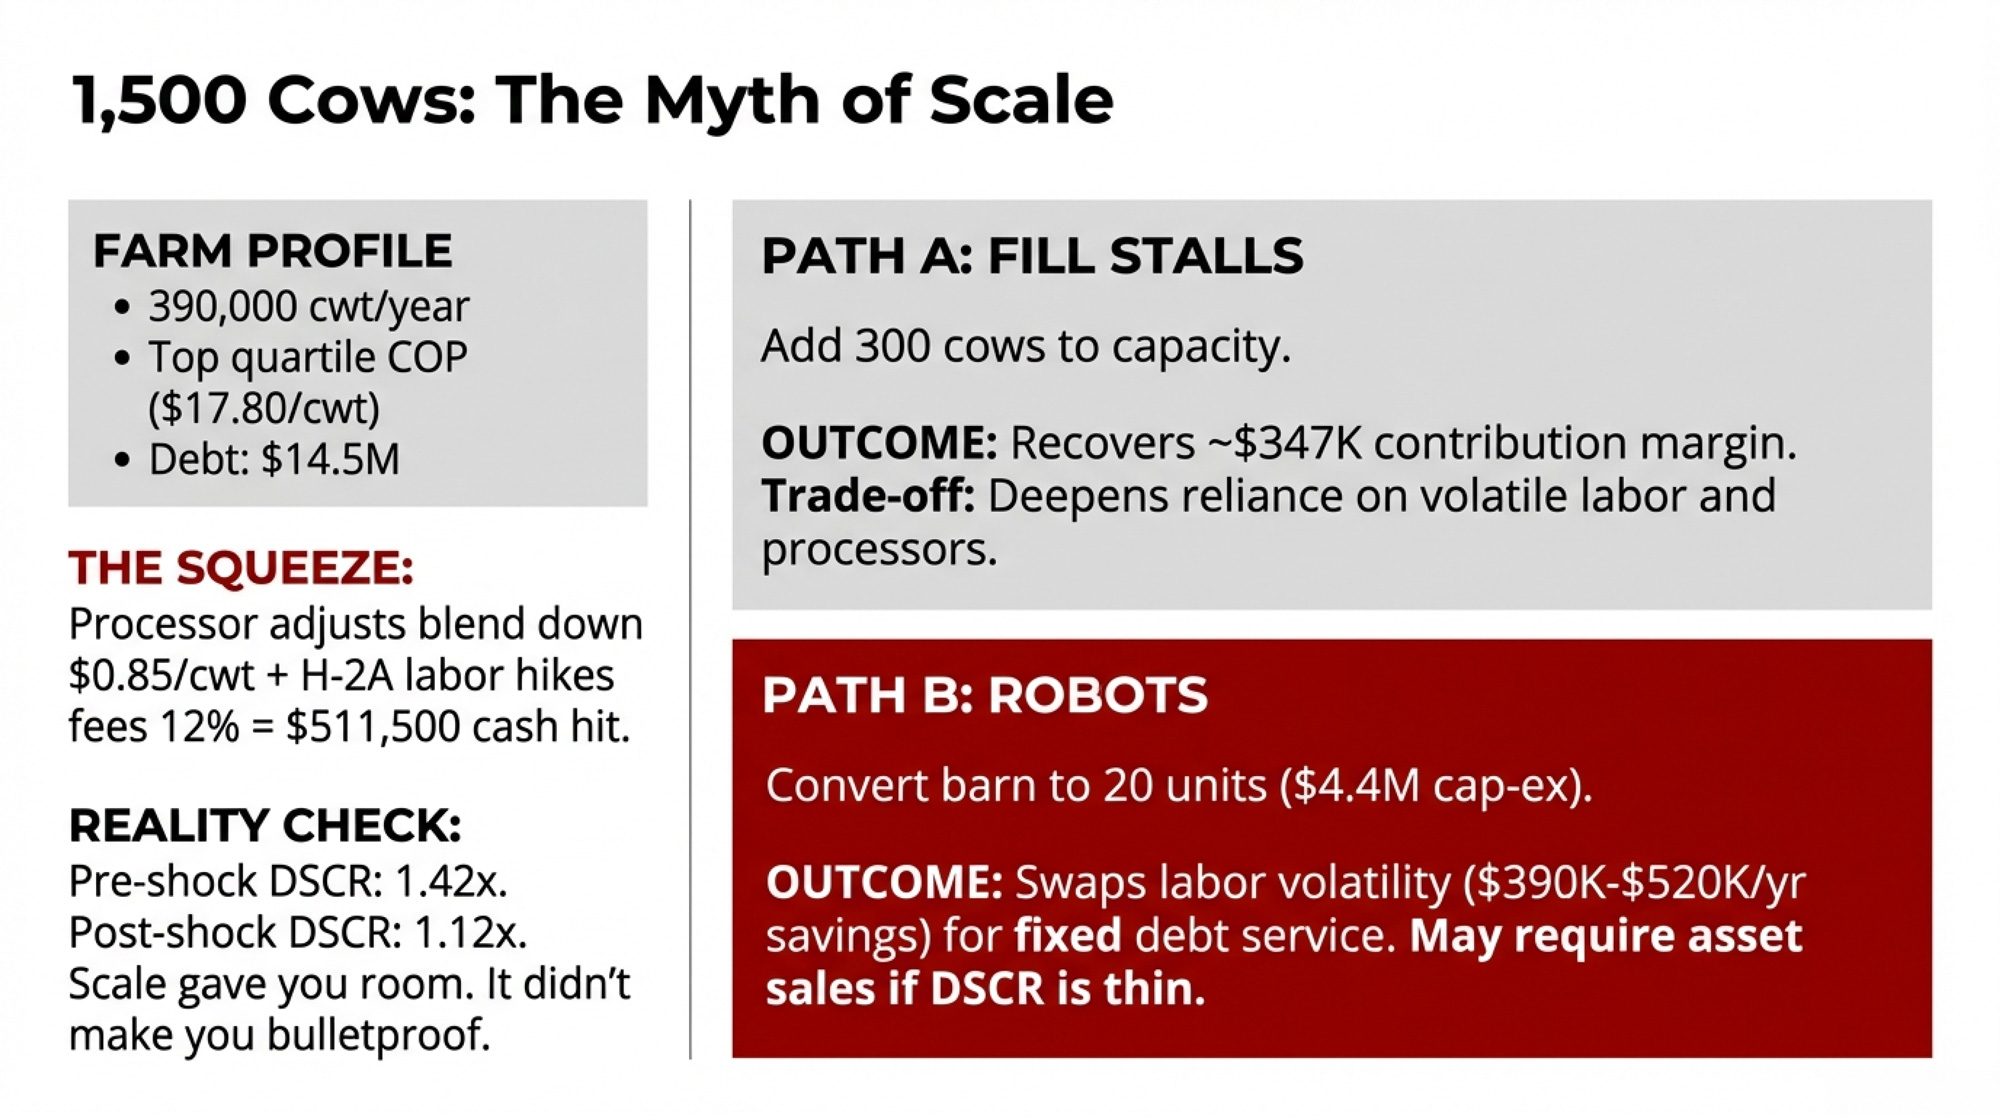
What Does This Rally Really Mean for a 500‑Cow U.S. Dairy’s Cashflow?
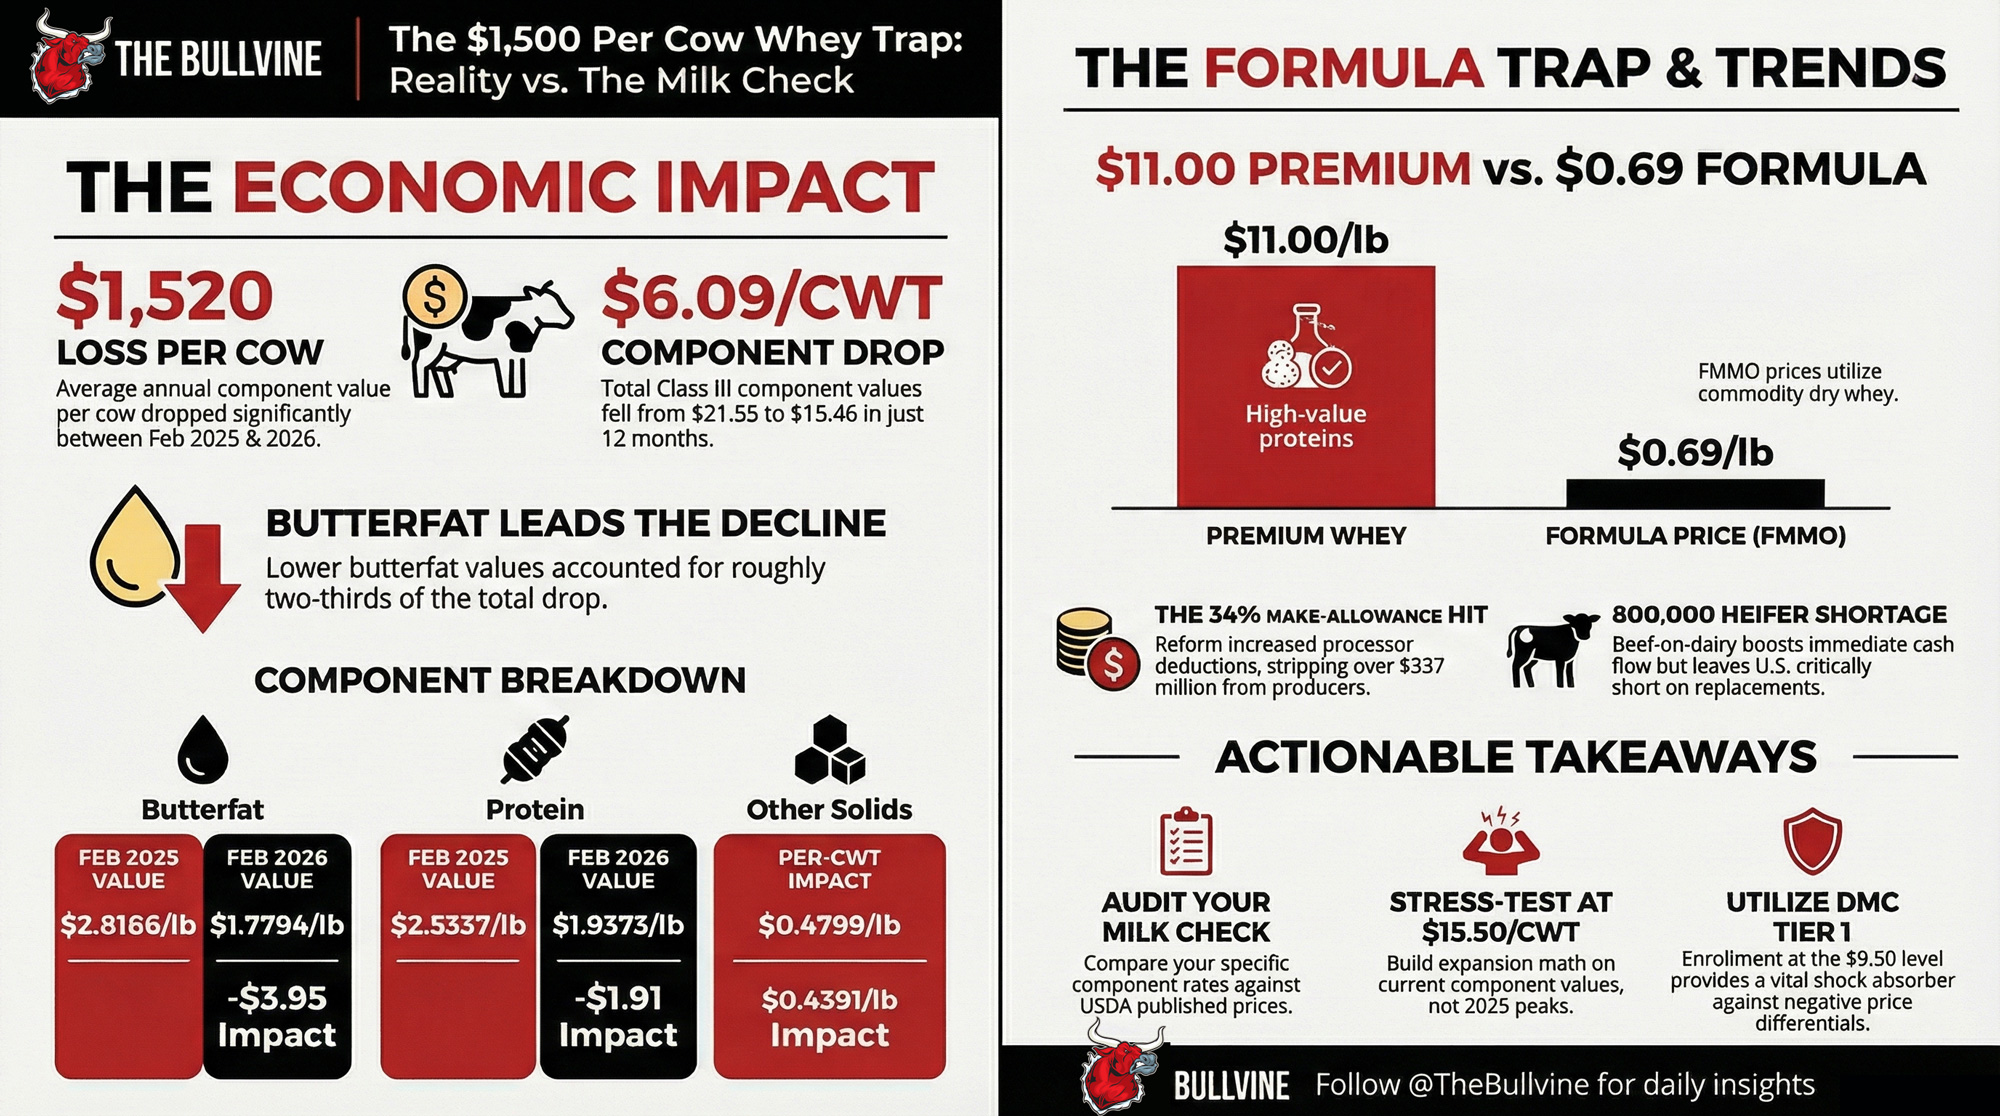
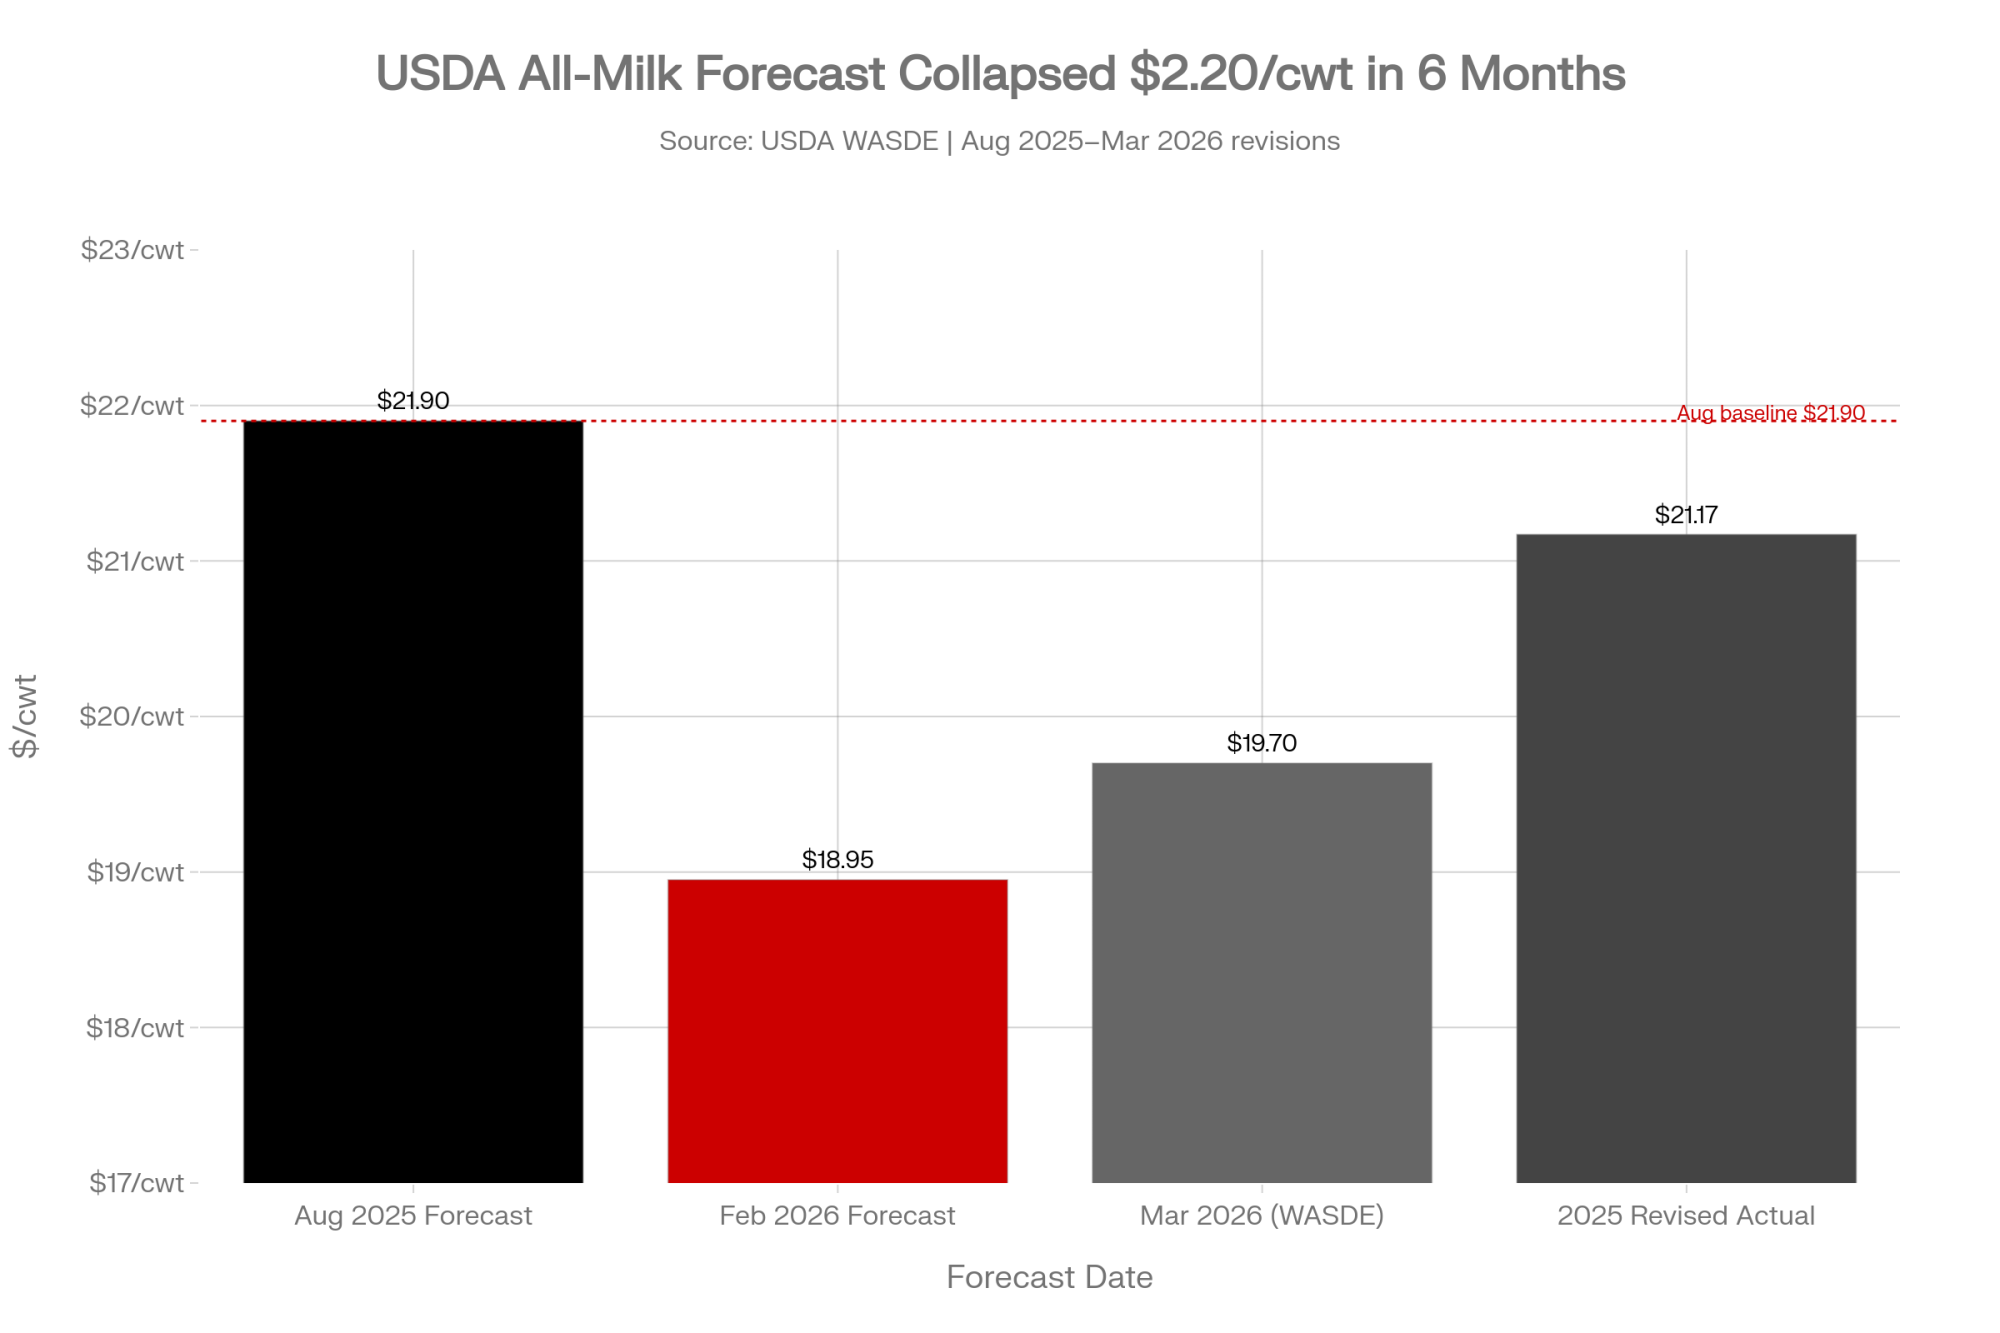
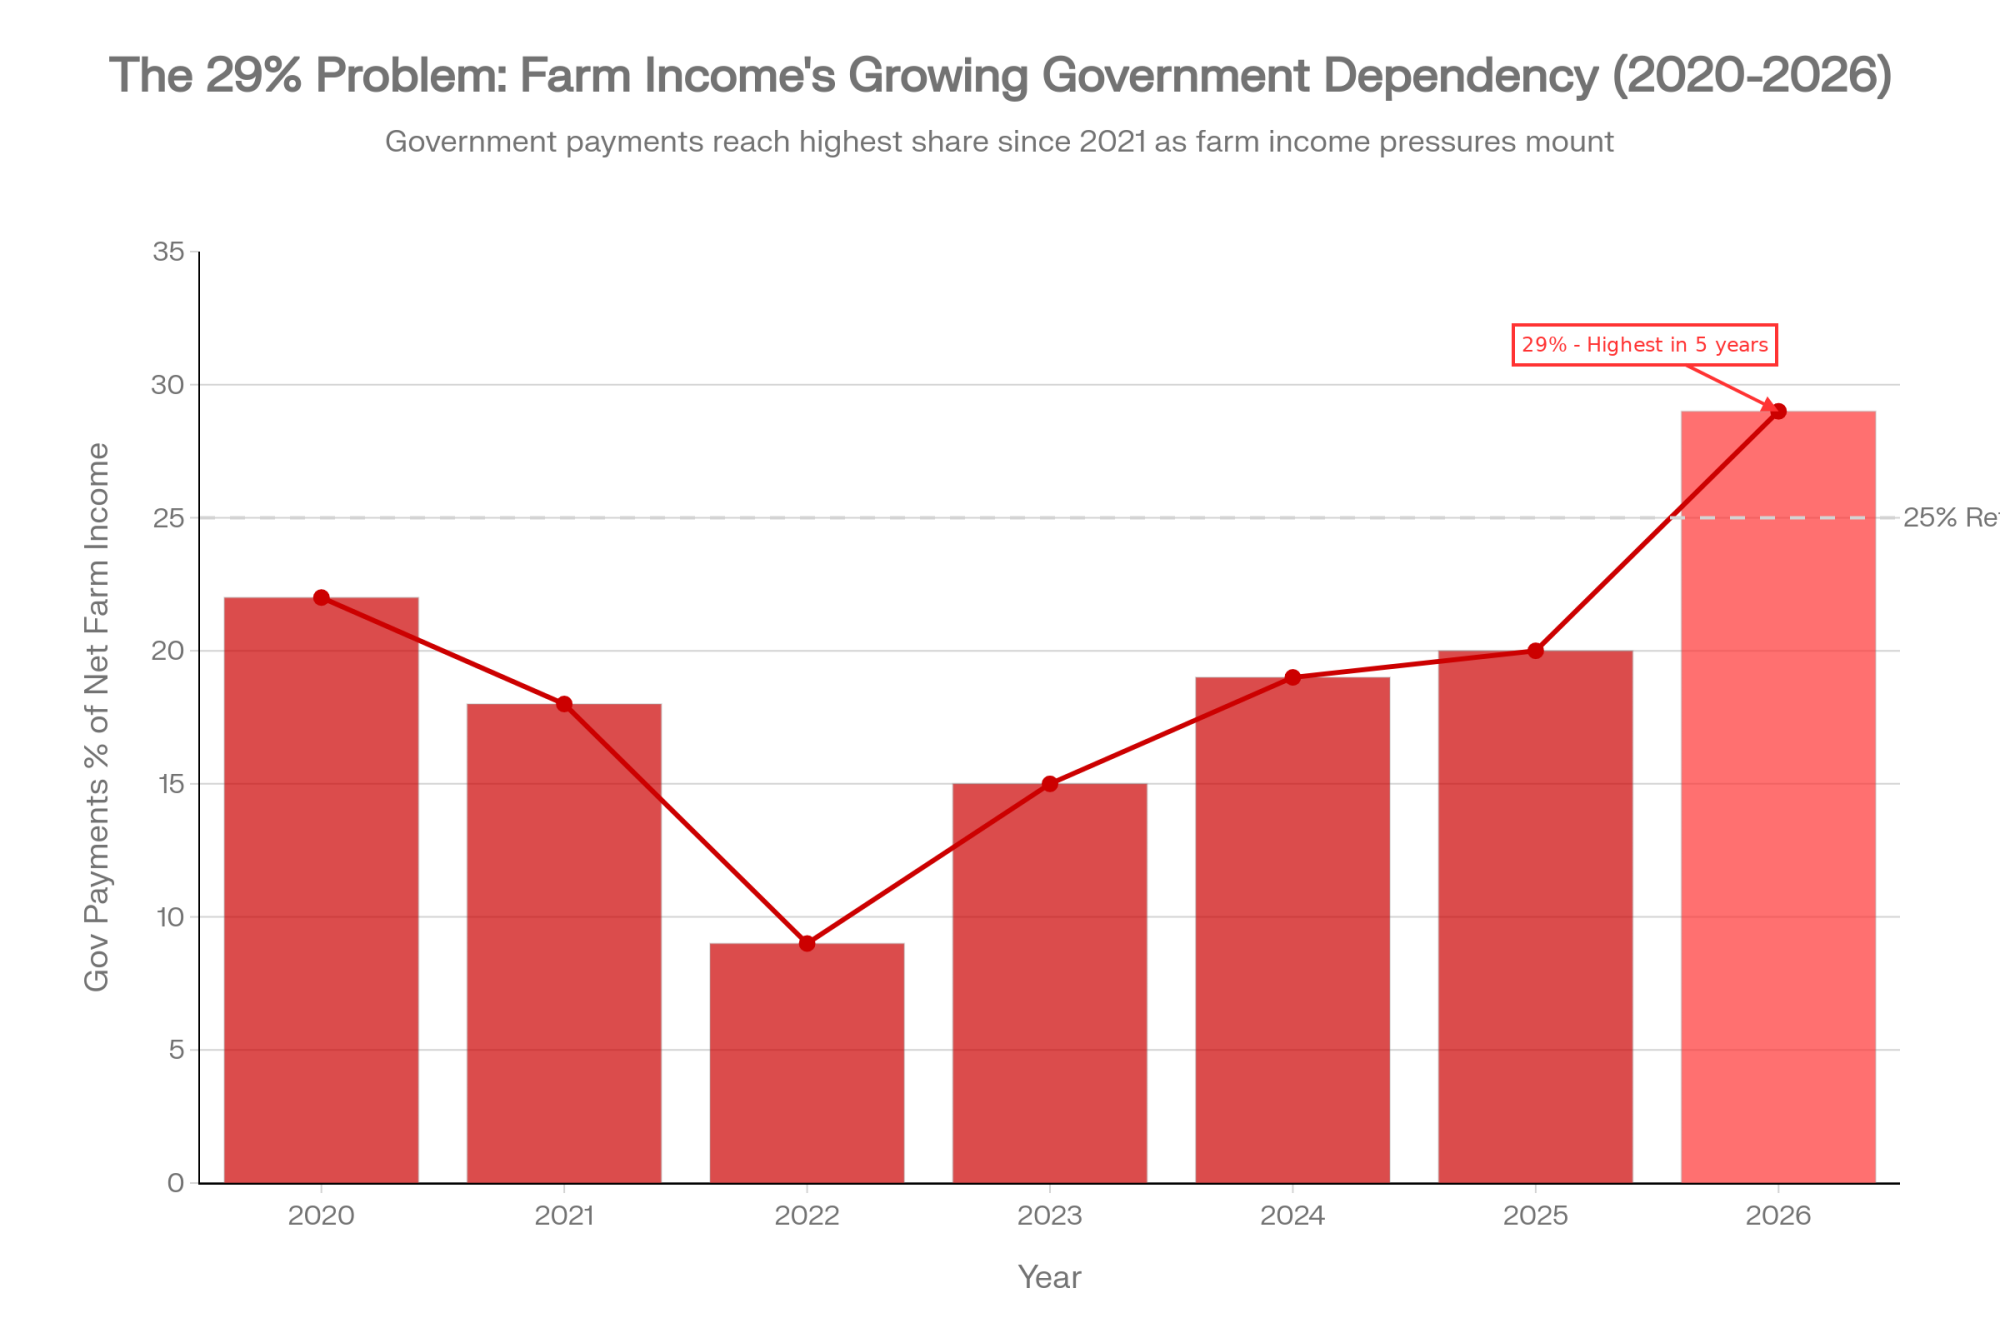
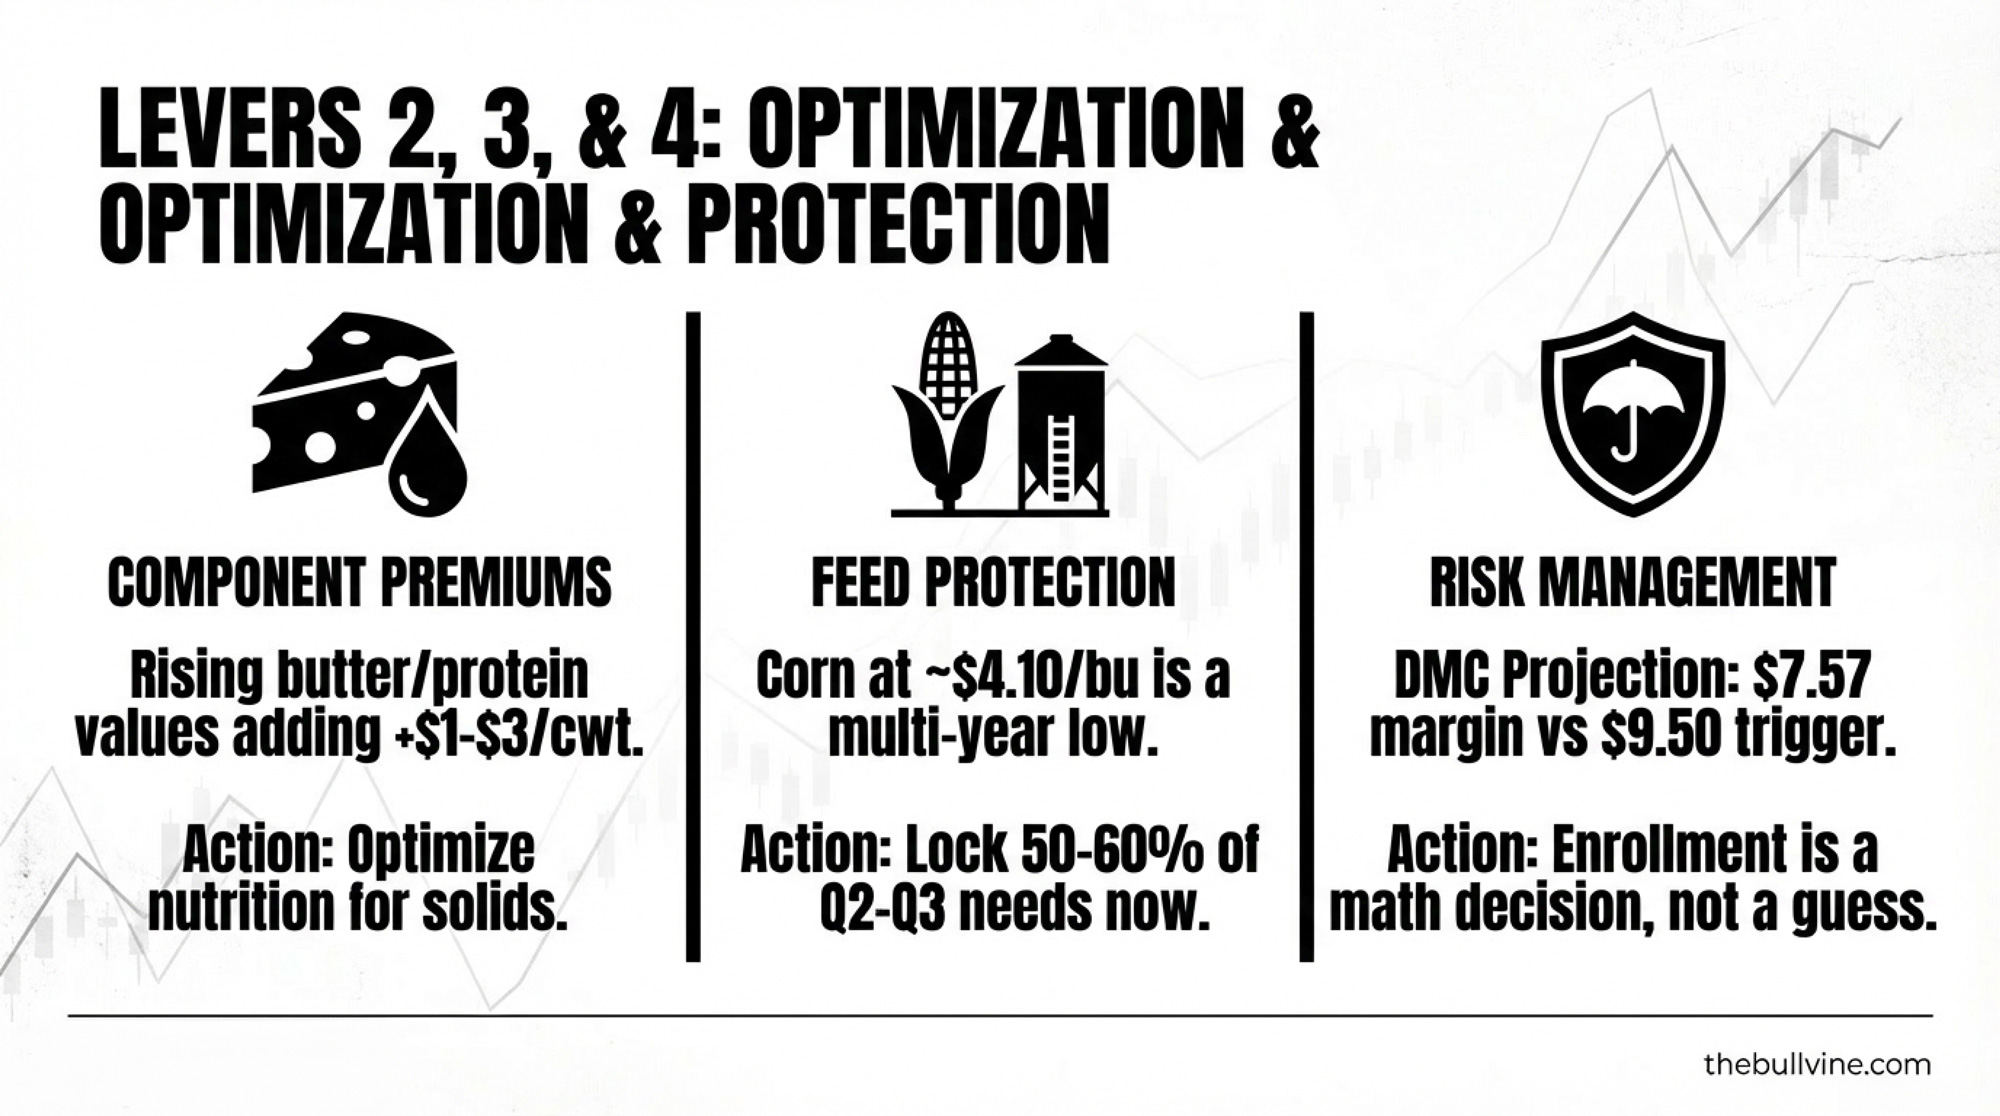
Donnay shows a U.S. gross‑margin chart that explains why so many producers are talking expansion again. After dipping below the long‑term average in January 2026, milk‑minus‑feed margins bounced back above average in February and March. Add in strong slaughter cow and calf cheques, and the total margin line jumps “well above average.”
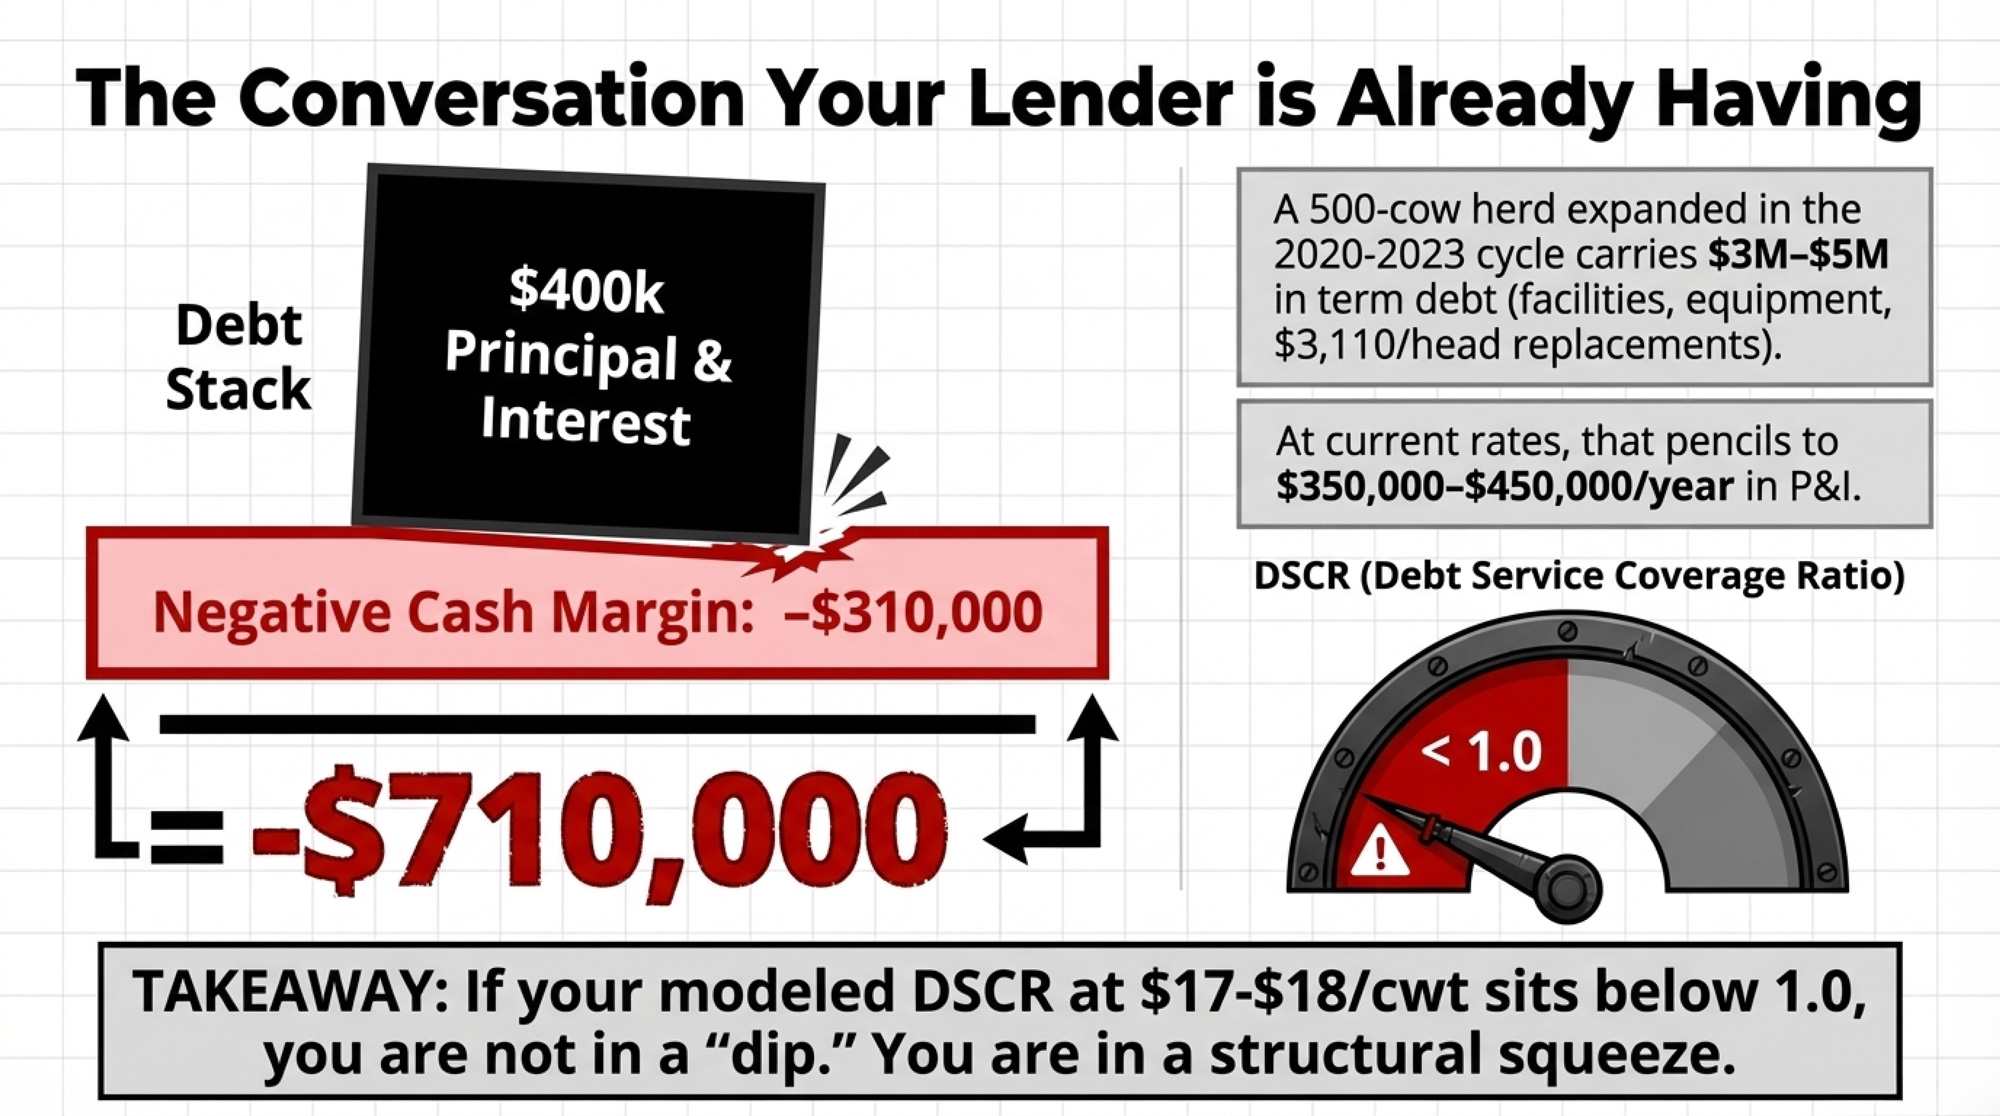
For a 500‑cow herd, that feels like breathing room. For your lender, it looks like the year you finally pull the trigger.
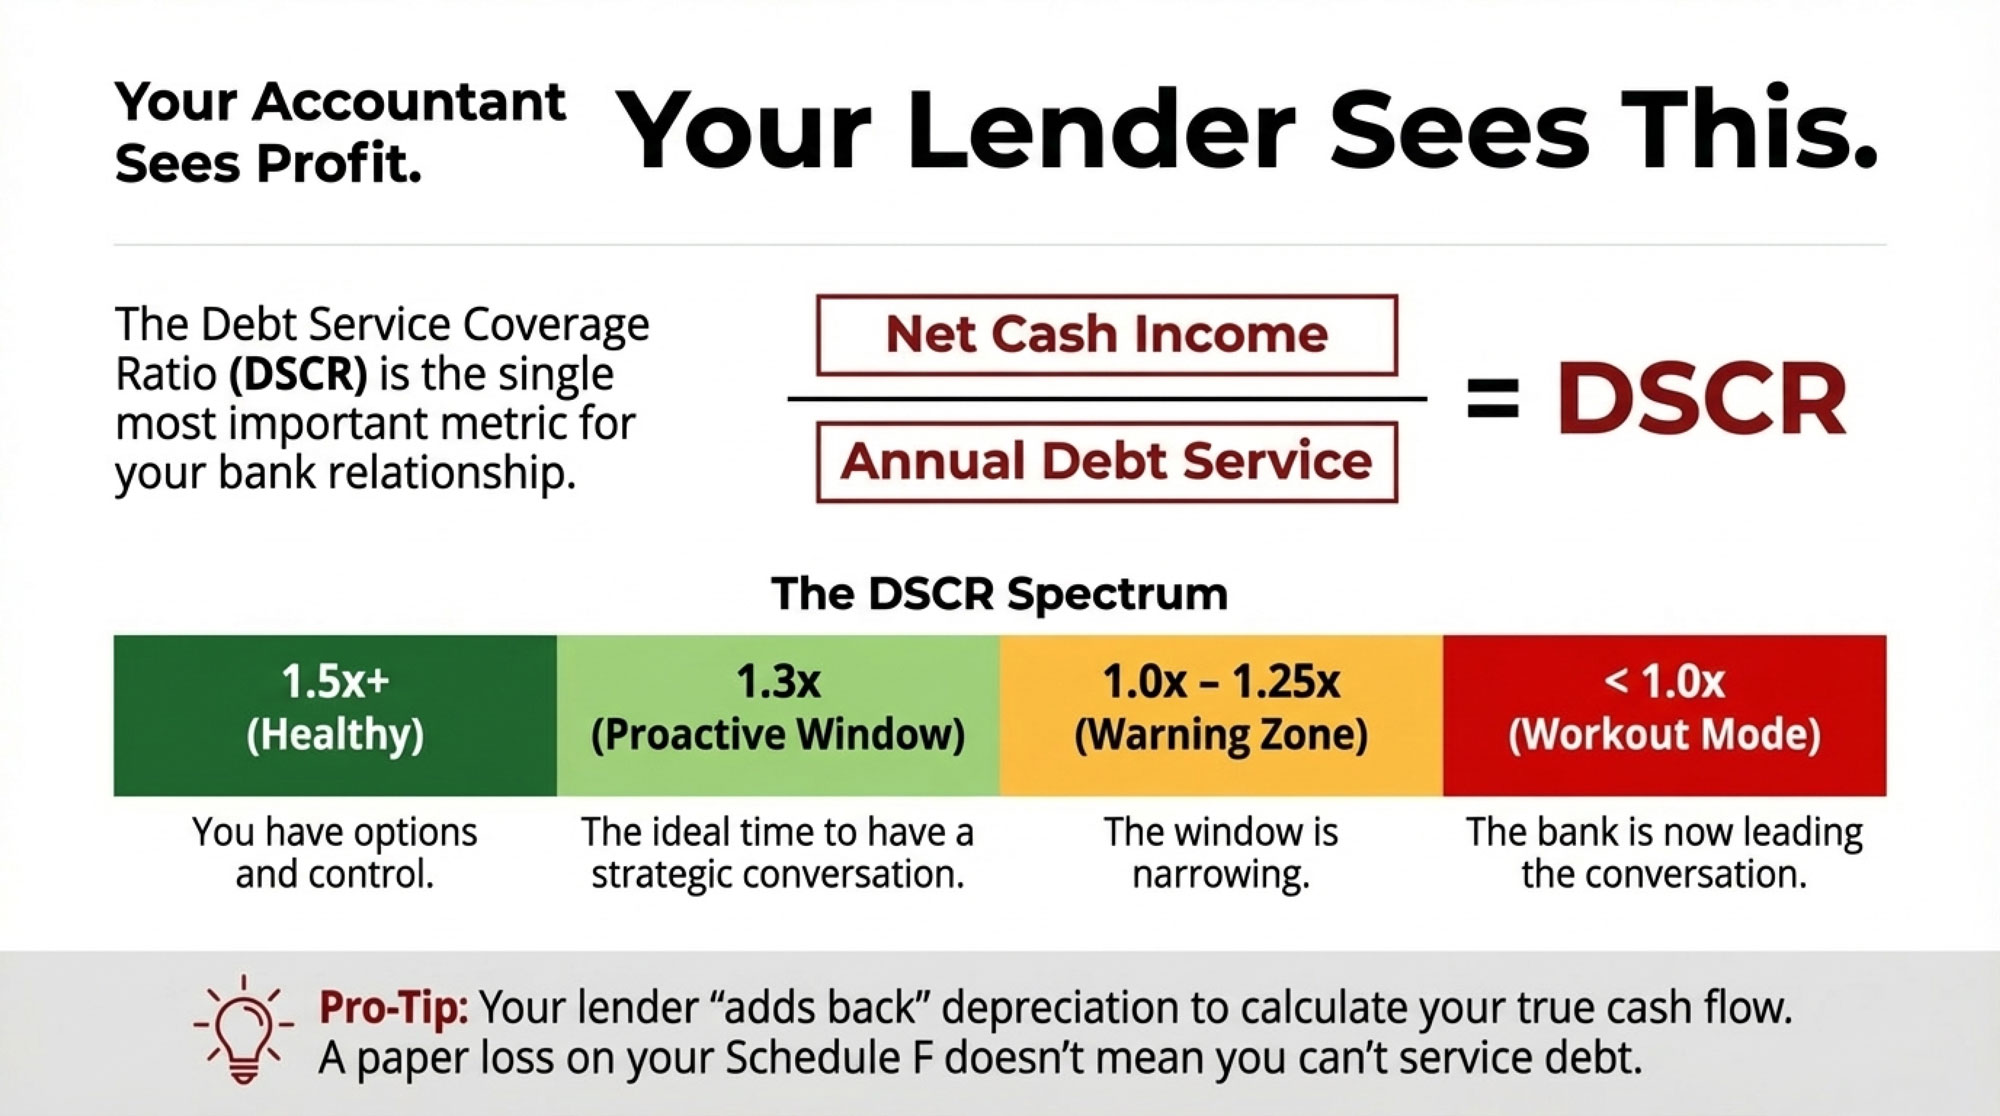
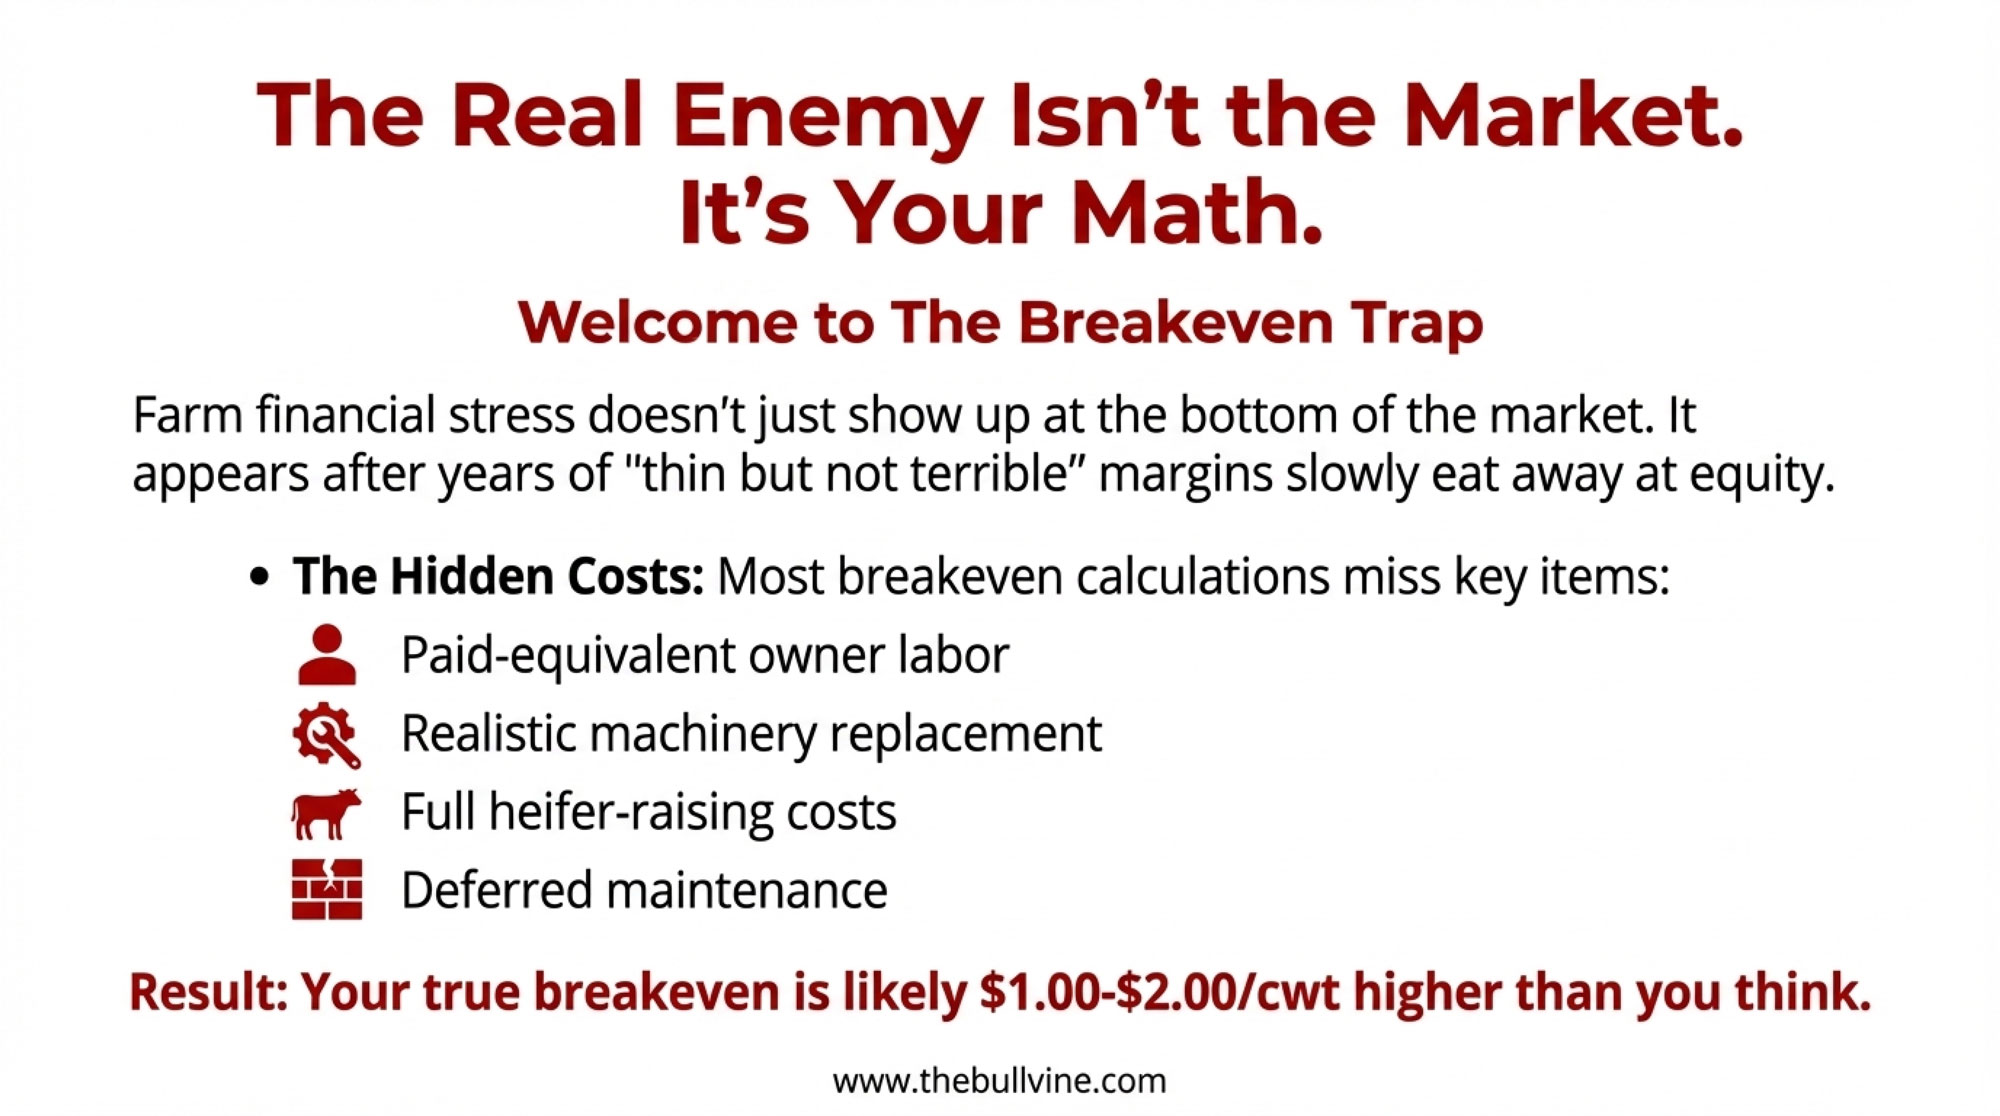
The problem: that gross‑margin line is not your full cash flow. It usually doesn’t load principal and interest on newlong‑term loans, a fair wage for unpaid family labor, depreciation at replacement cost, or fertilizer and fuel that haven’t repriced because you’re still on pre‑conflict contracts.
The barn‑math reality: $3 million at 7% over 15 years
Here’s where compound interest on a farm loan really matters — and why this isn’t just “principal plus a little interest.”
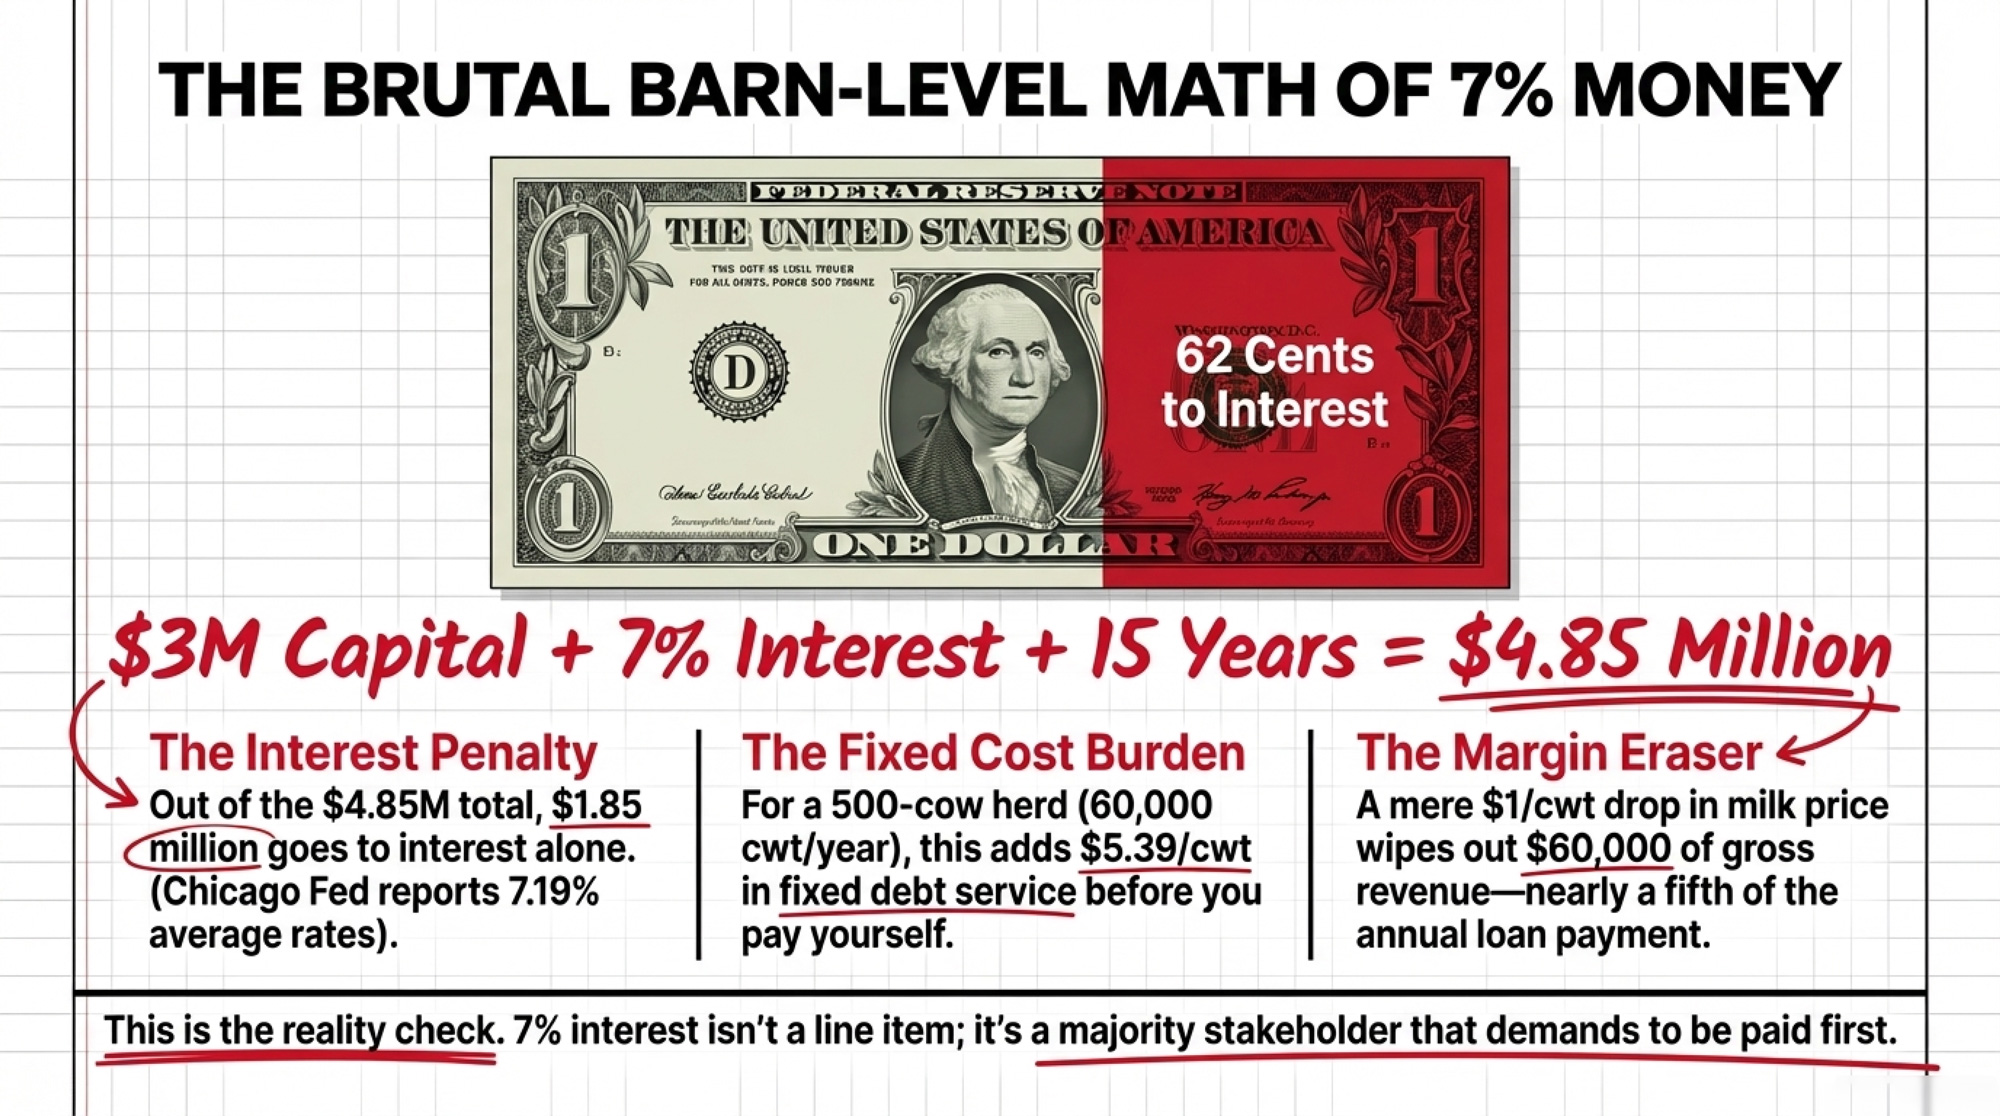
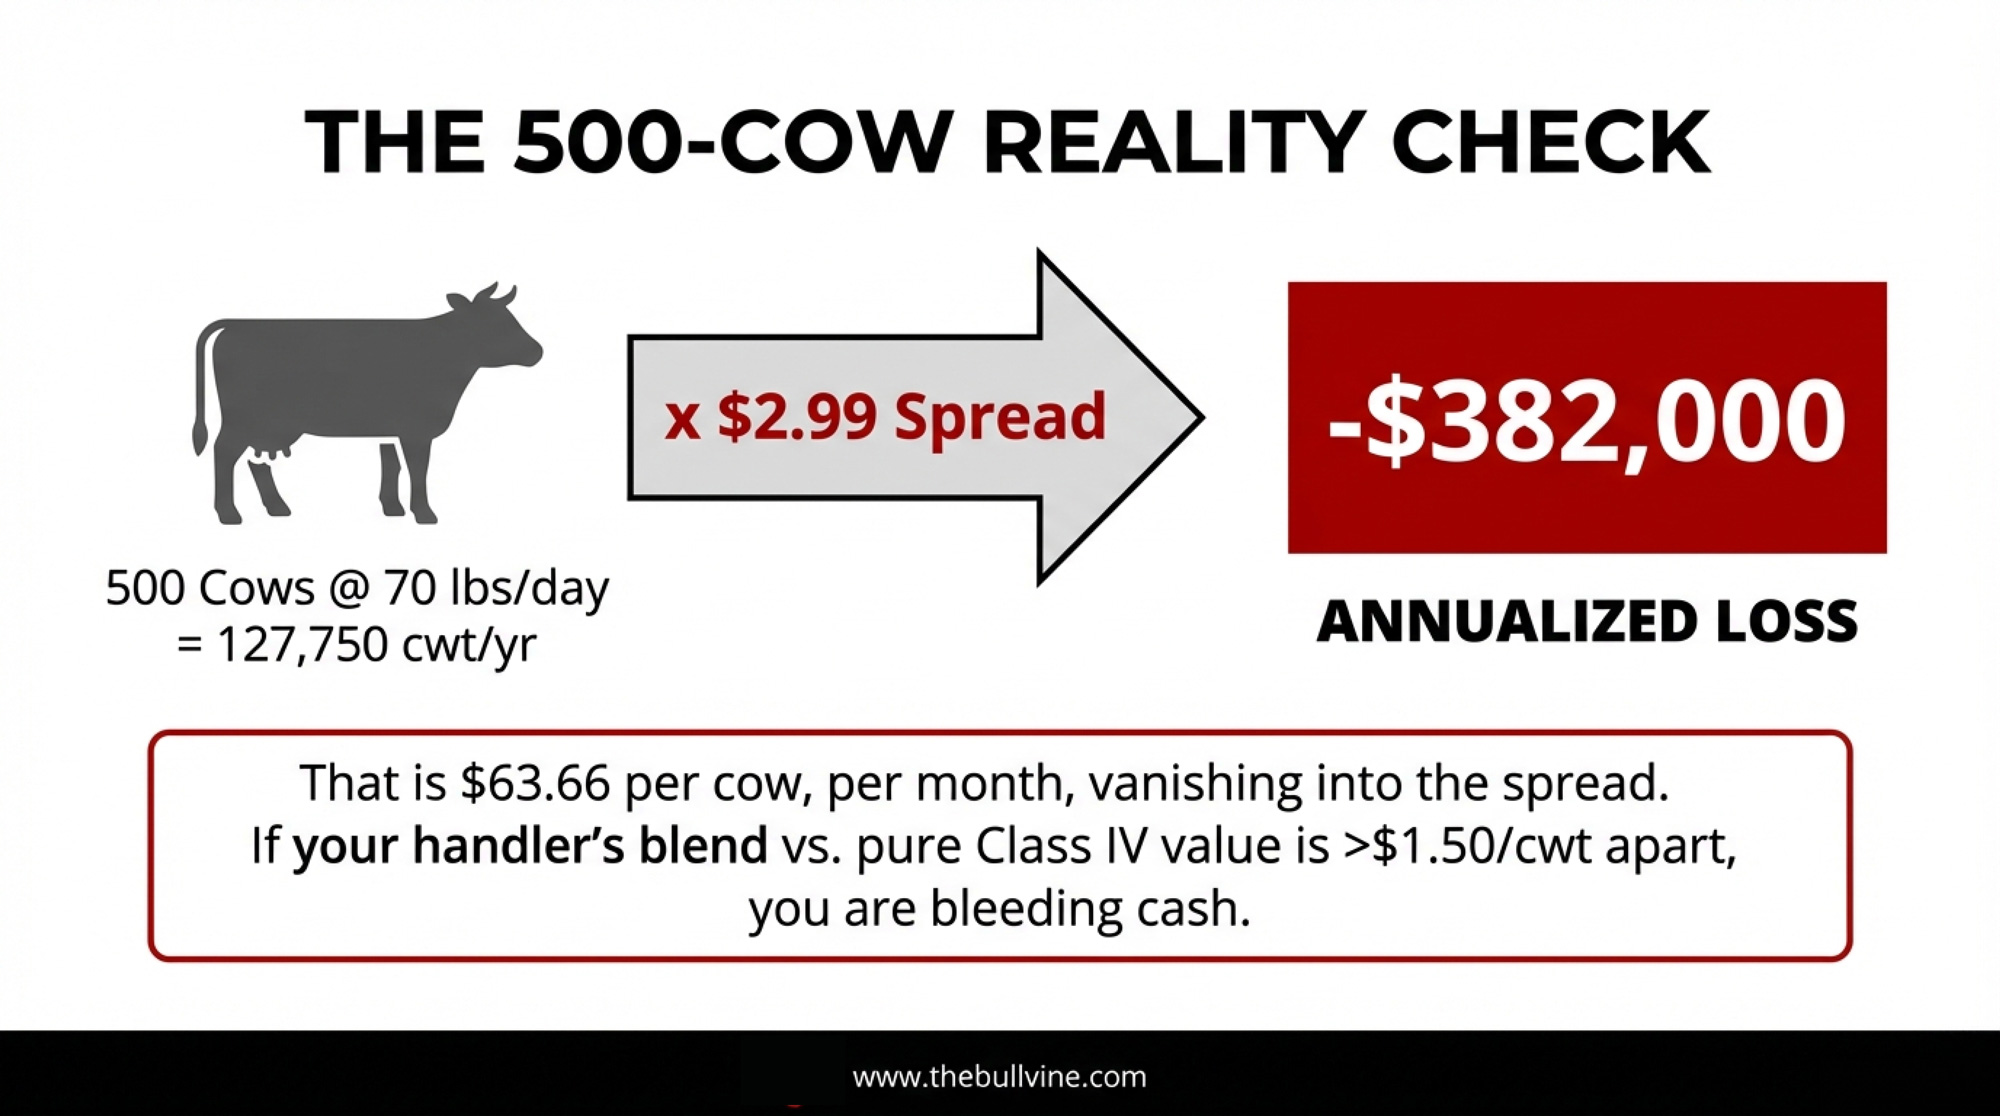
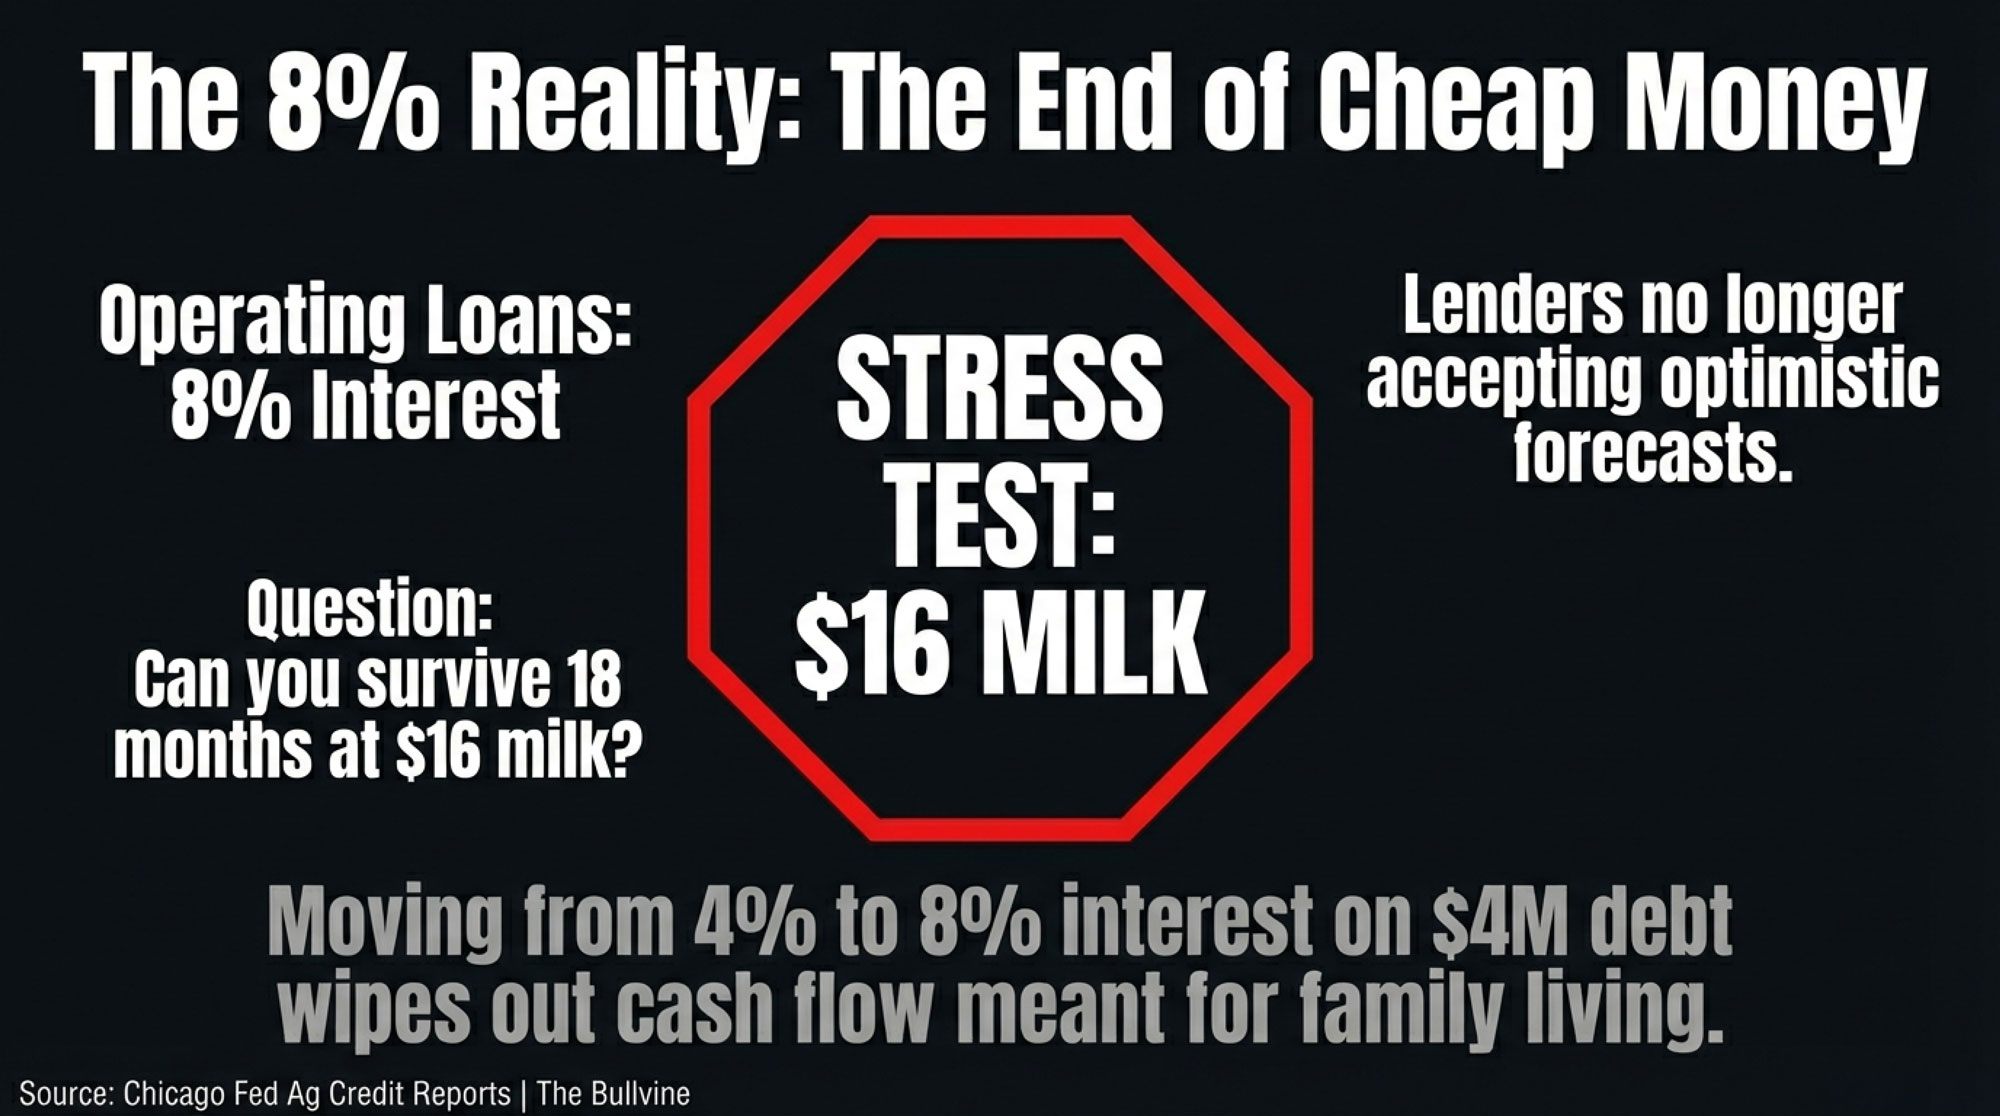
At 7%, each monthly payment on a $3 million, 15‑year loan runs approximately $26,965. That’s roughly $323,600 per year in combined principal and interest. Over the full 15 years, you pay back approximately $4.85 million — meaning roughly $1.85 million goes to interest alone. That’s about 62 cents in interest for every dollar you borrowed.
The 7% rate isn’t hypothetical. The Chicago Fed’s AgLetter reported farm real‑estate loan rates in the Seventh District around the 7.19% range at the start of 2025, with rates hovering in the high‑6 to low‑7 percent band through much of the year. So 7% sits right in the middle of what lenders were actually charging through 2025.
Now translate that annual payment into the number that actually matters — cost per hundredweight shipped:
| Herd Size (Cows) | Annual Milk (cwt) | Added Cost ($/cwt) | $1/cwt Revenue Hit |
| 400 | 48,000 | $6.74 | $48,000 |
| 500 | 60,000 | $5.39 | $60,000 |
| 600 | 72,000 | $4.49 | $72,000 |
Note: Based on 120 cwt/cow/year and a $3M project at 7% over 15 years (~$323,600/year).
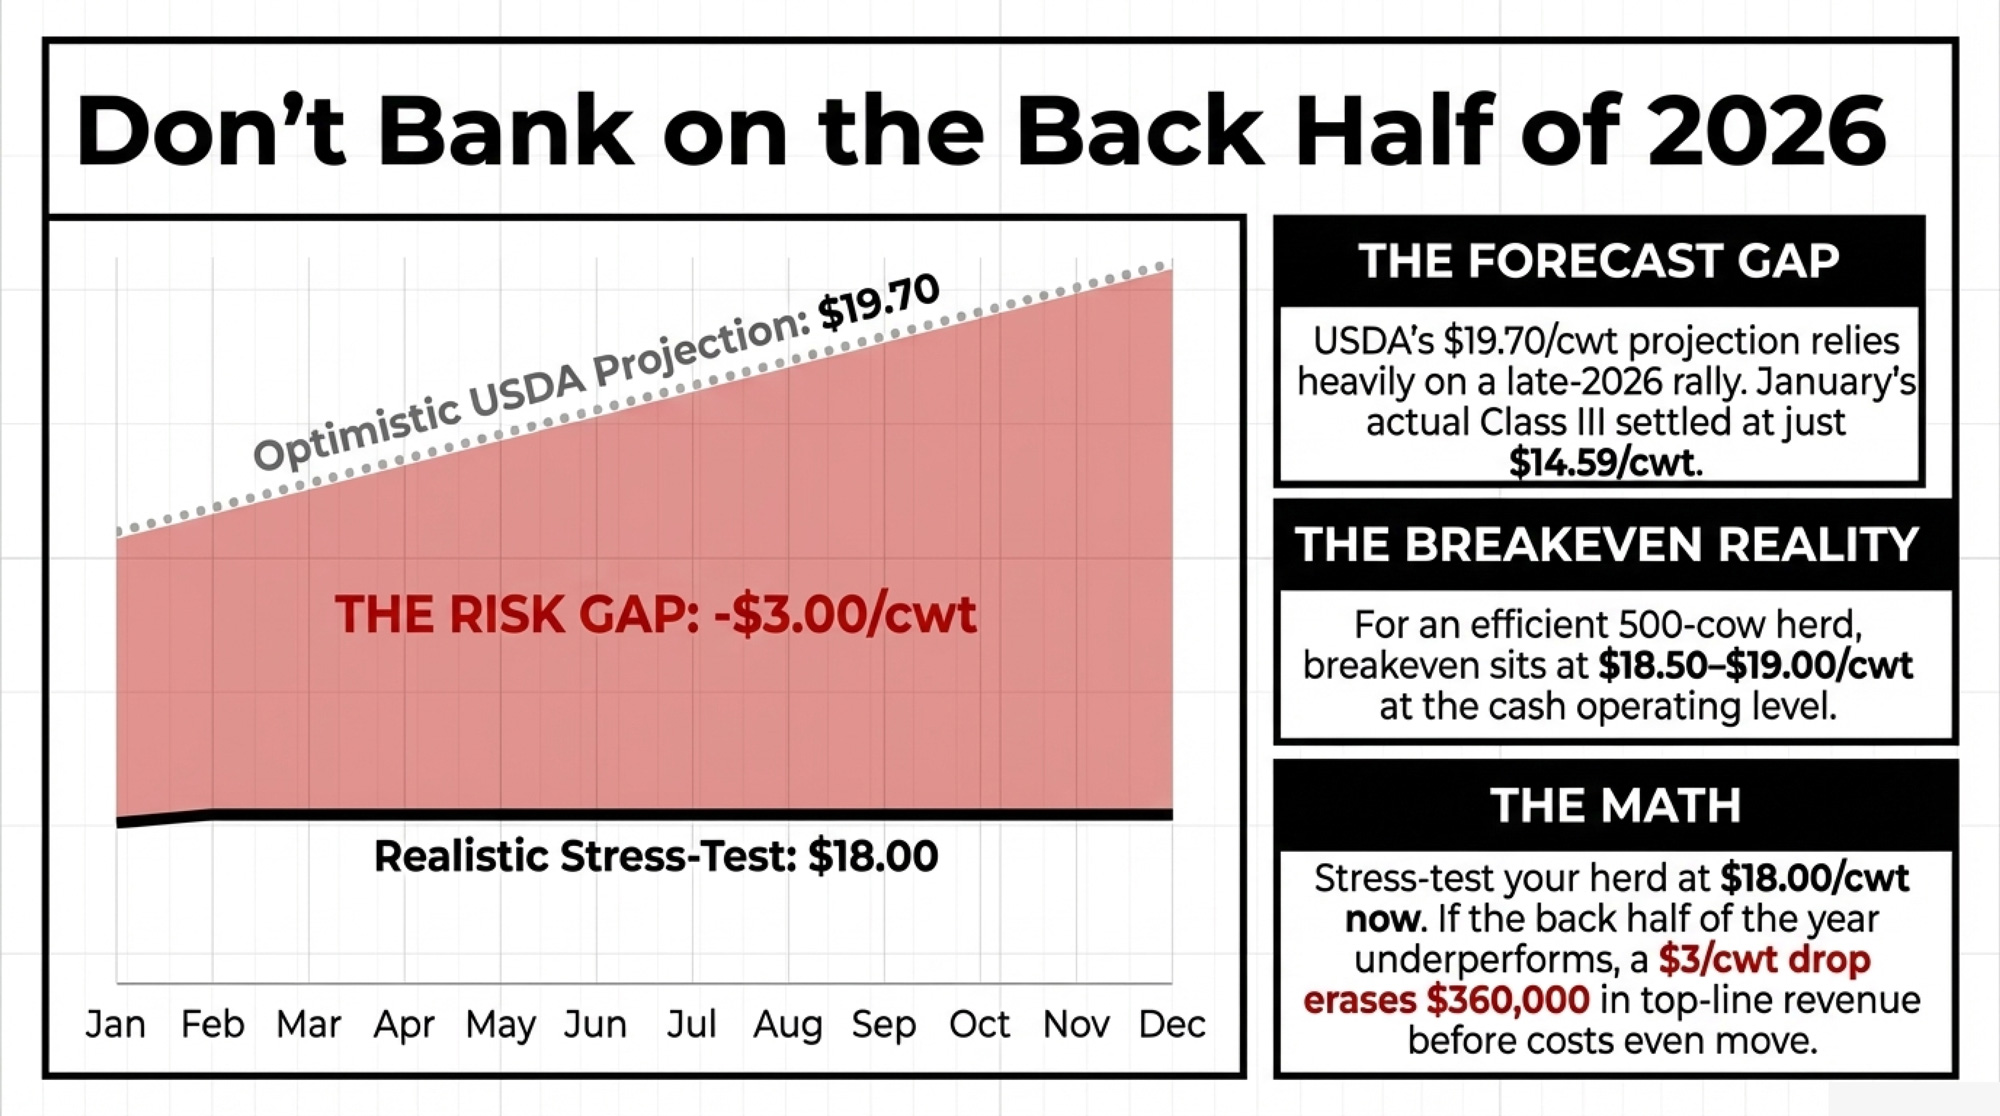
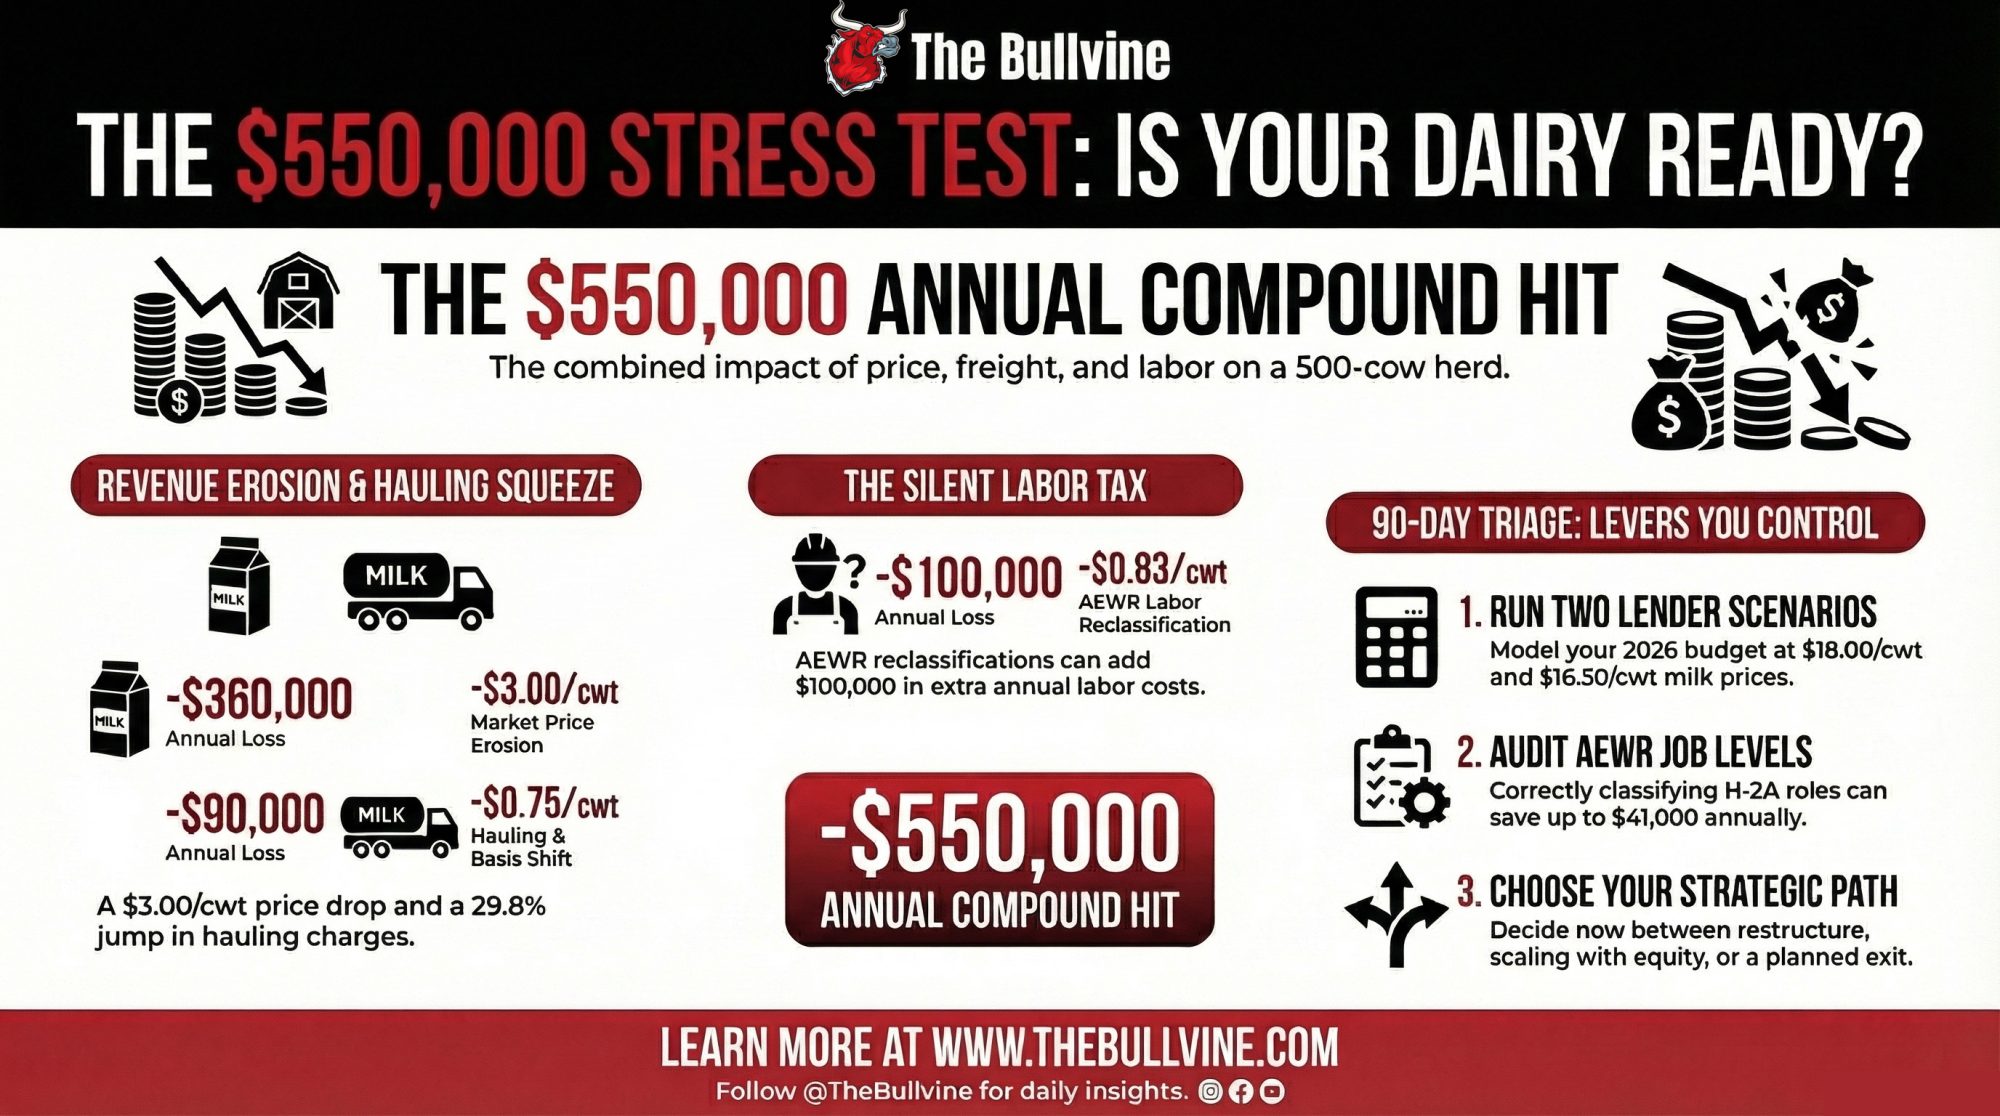
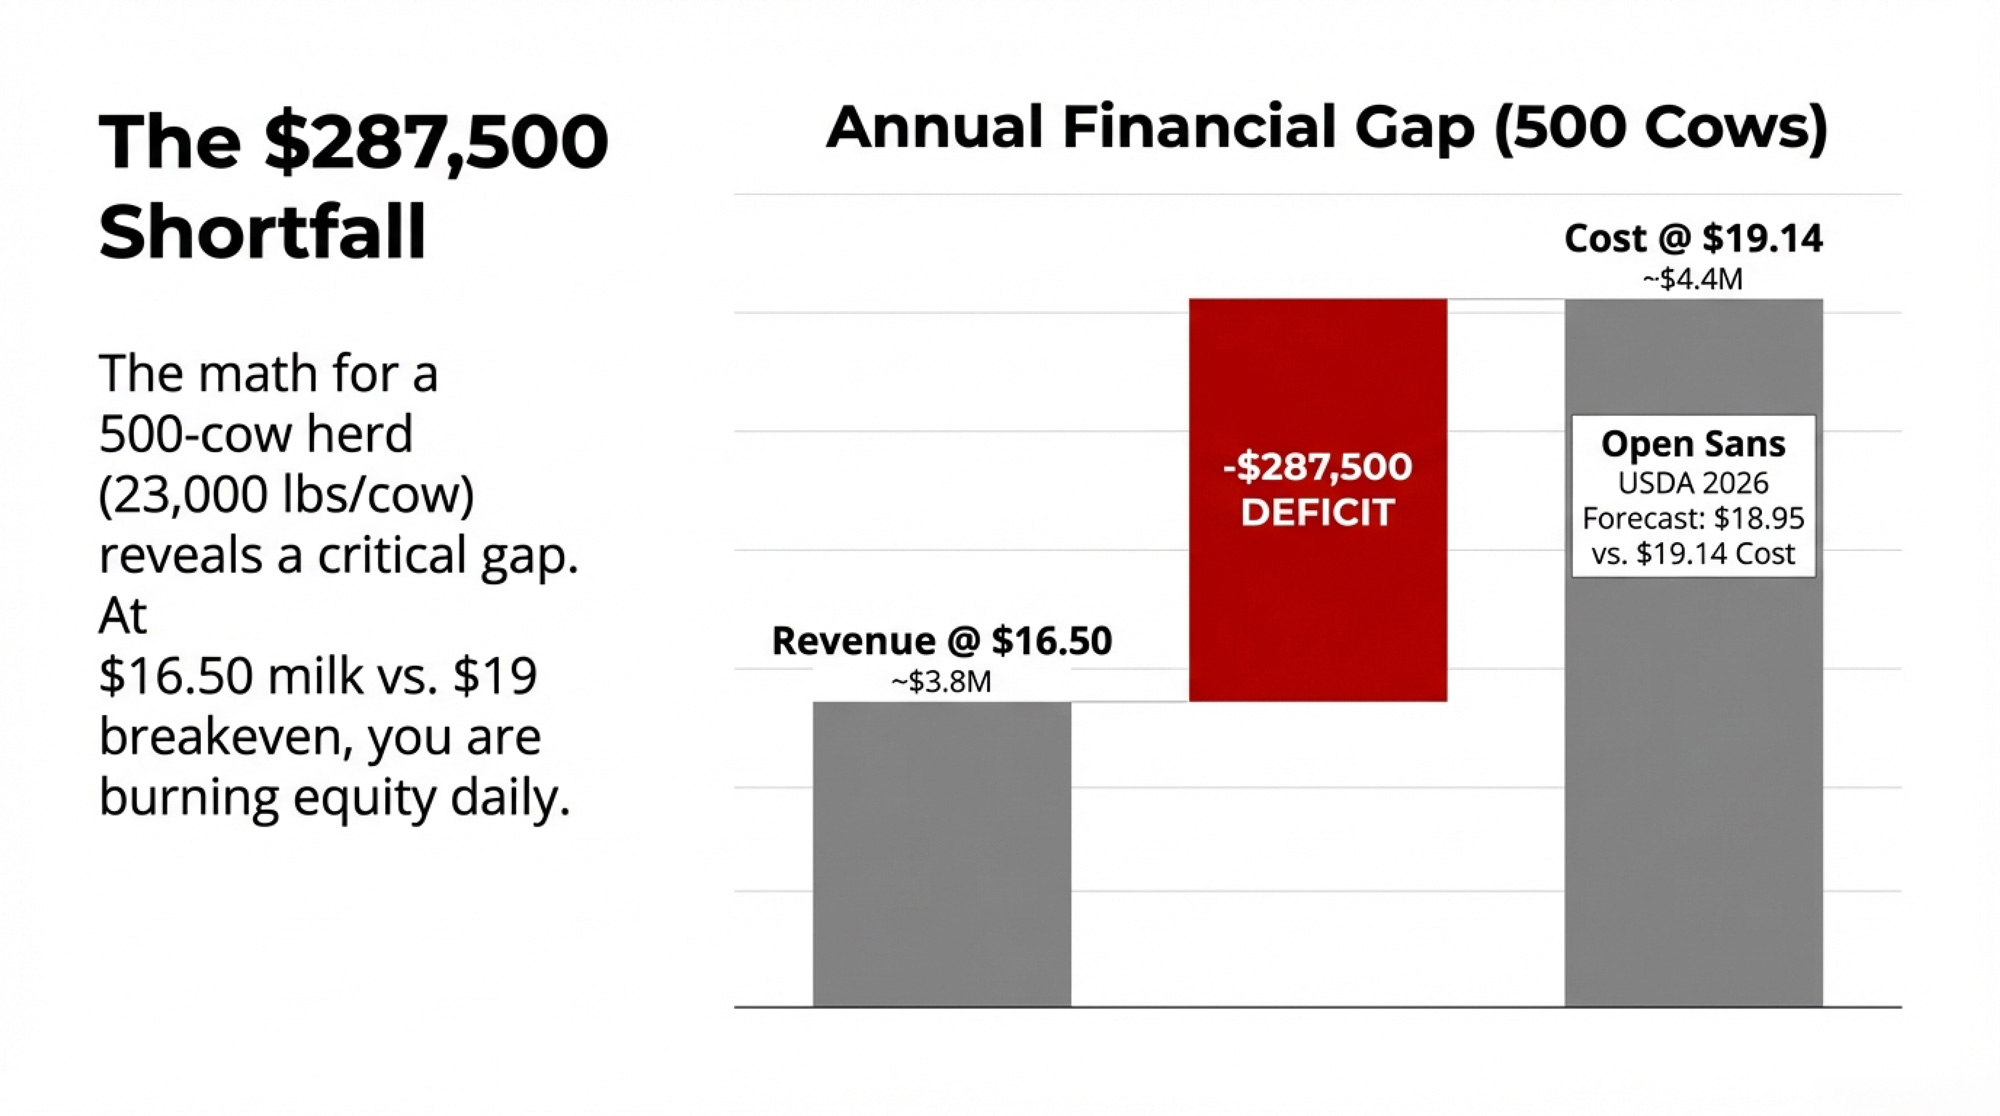
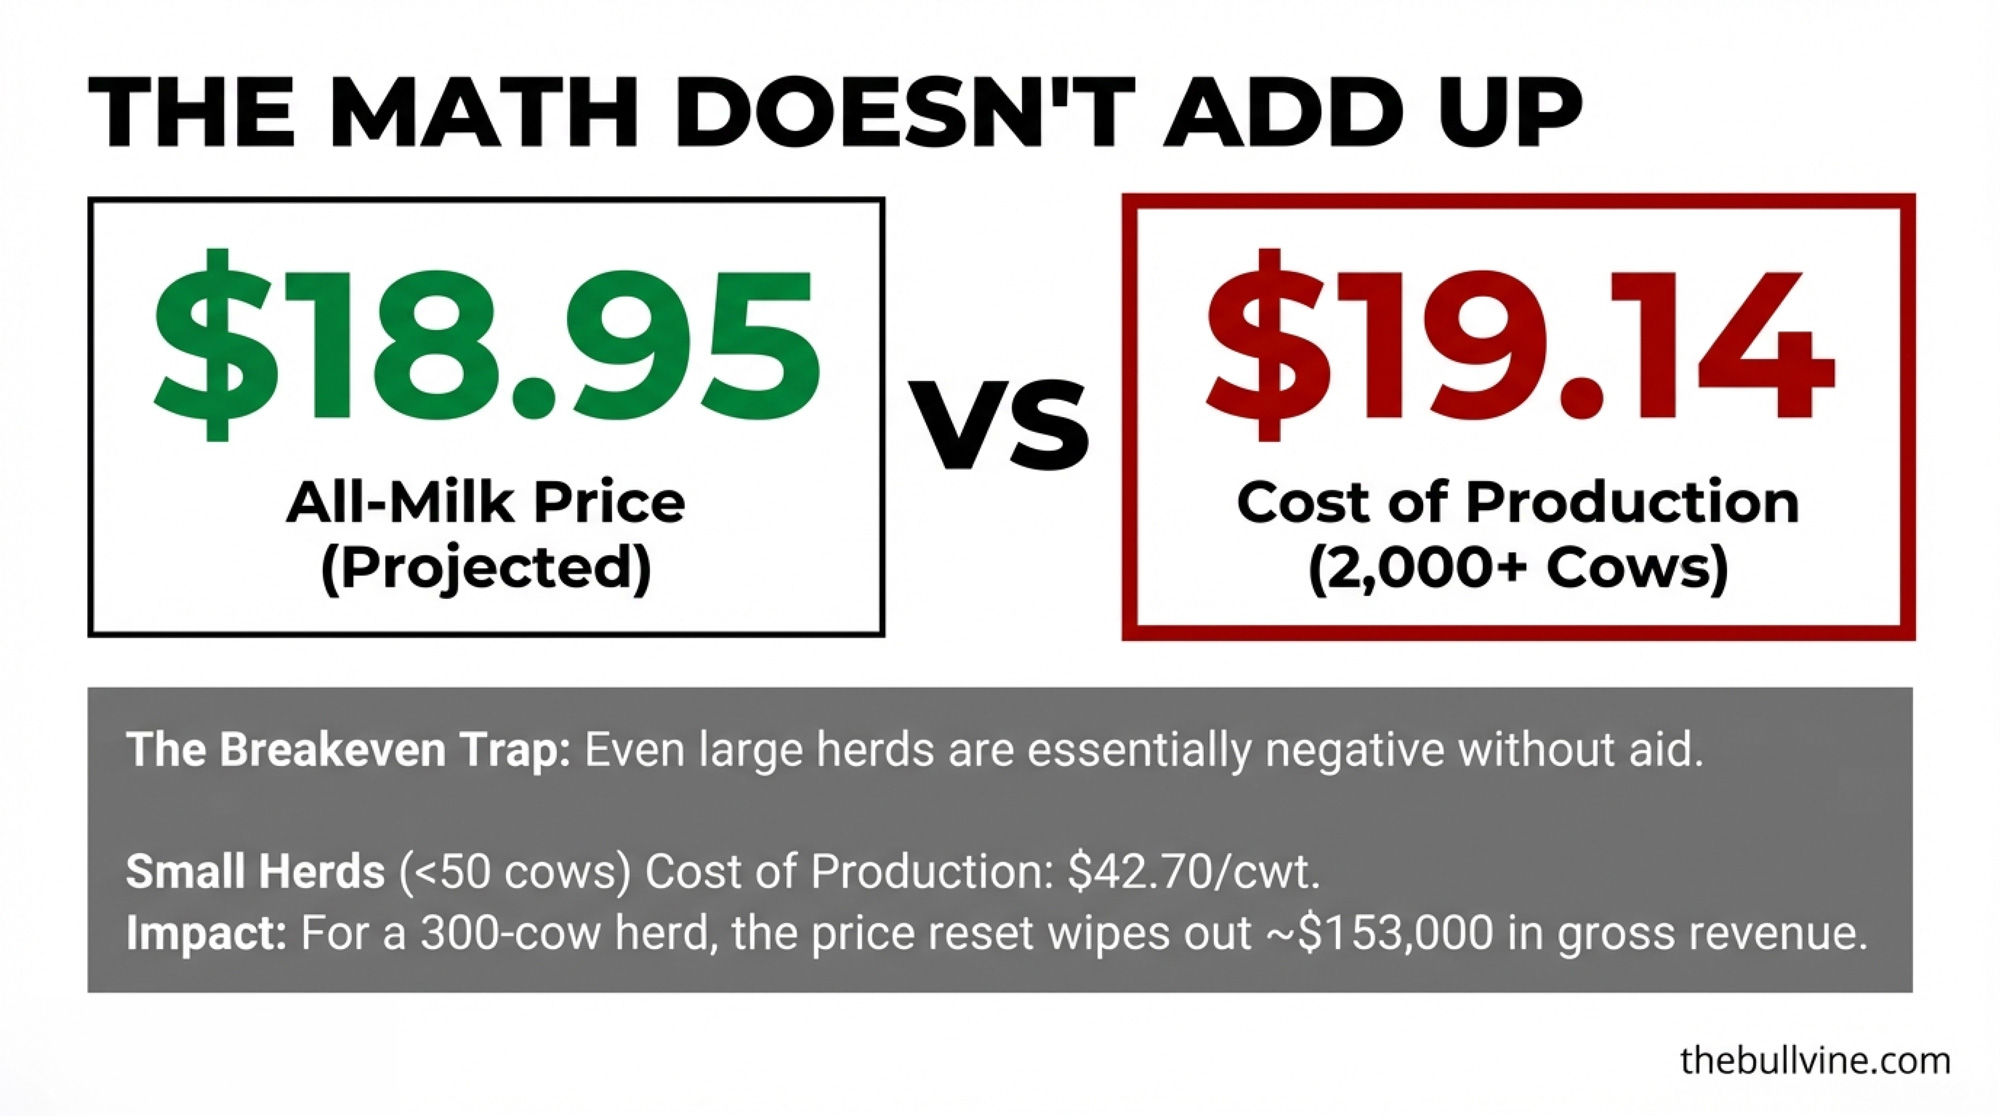
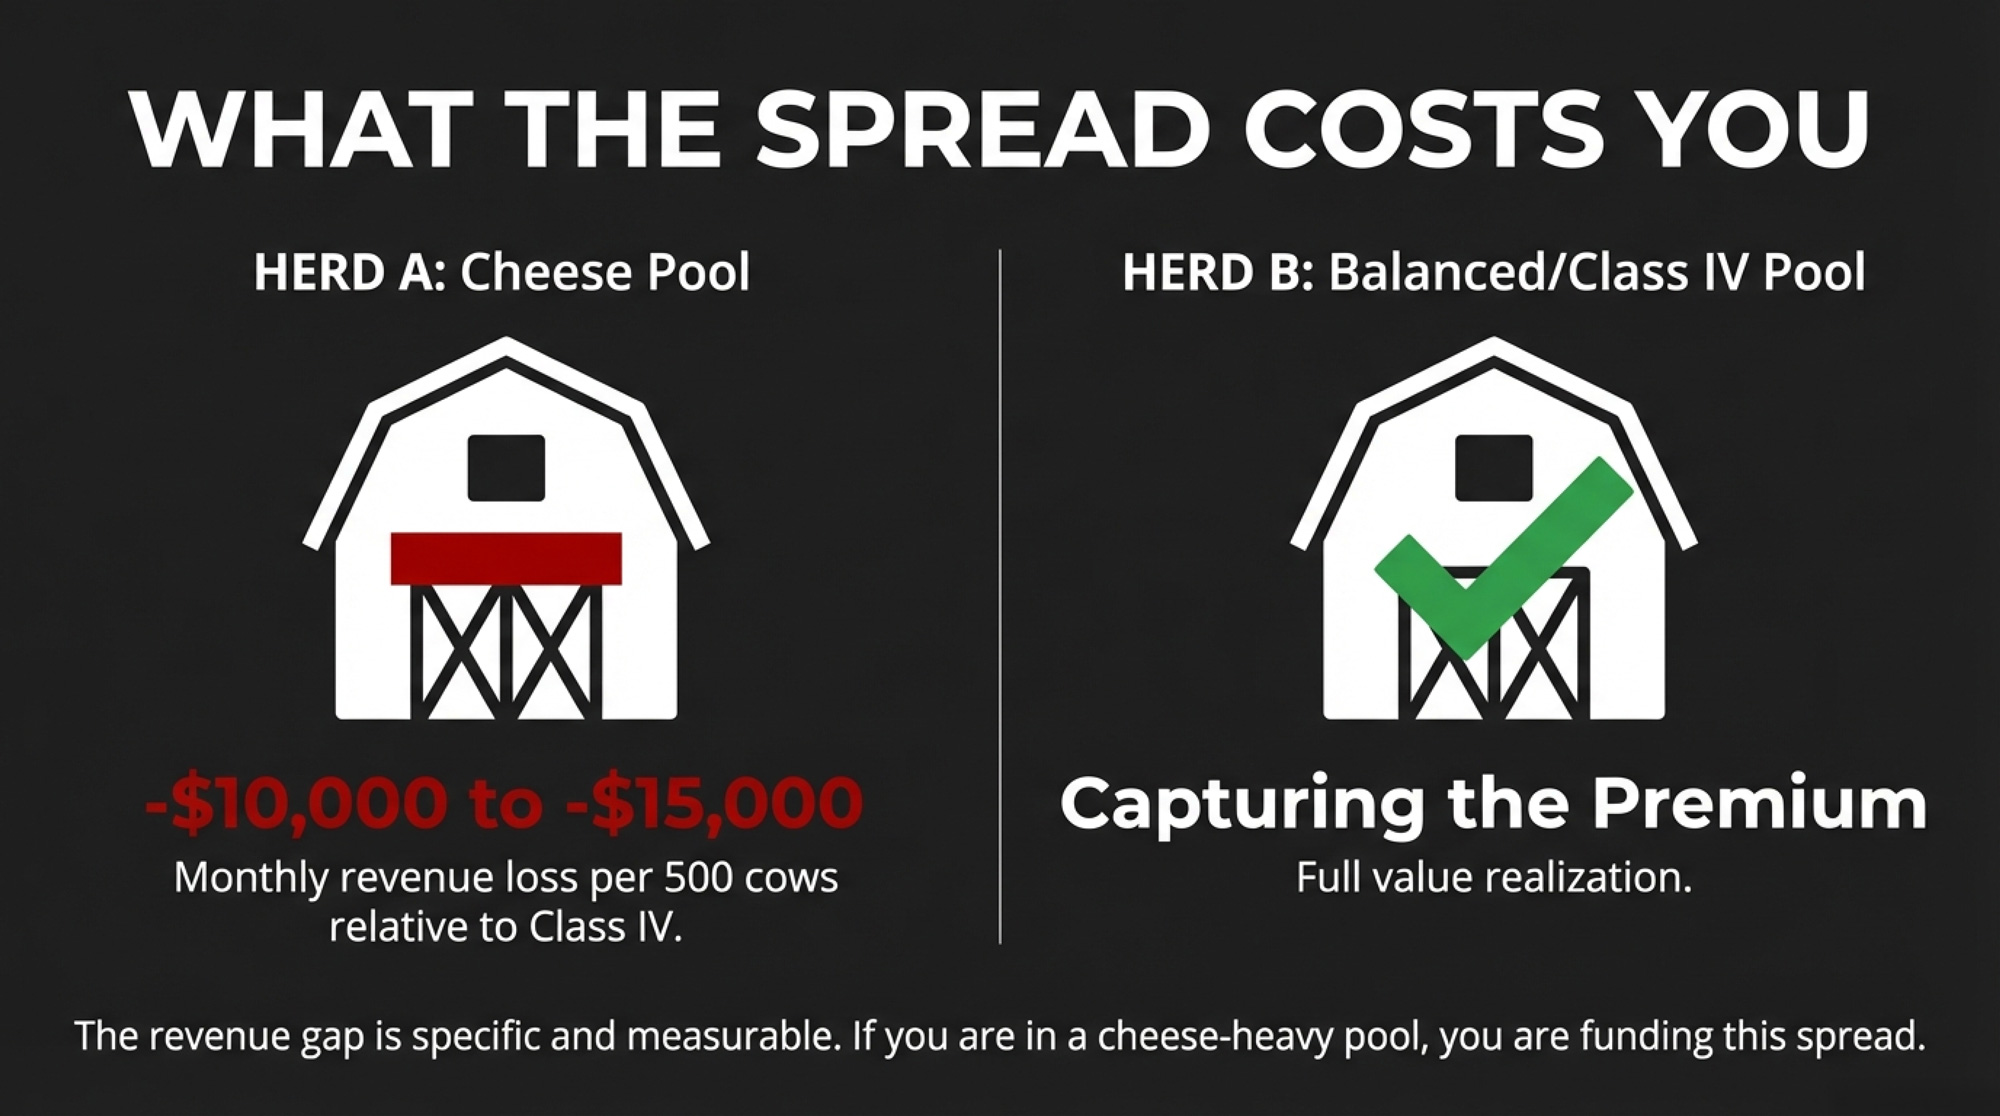
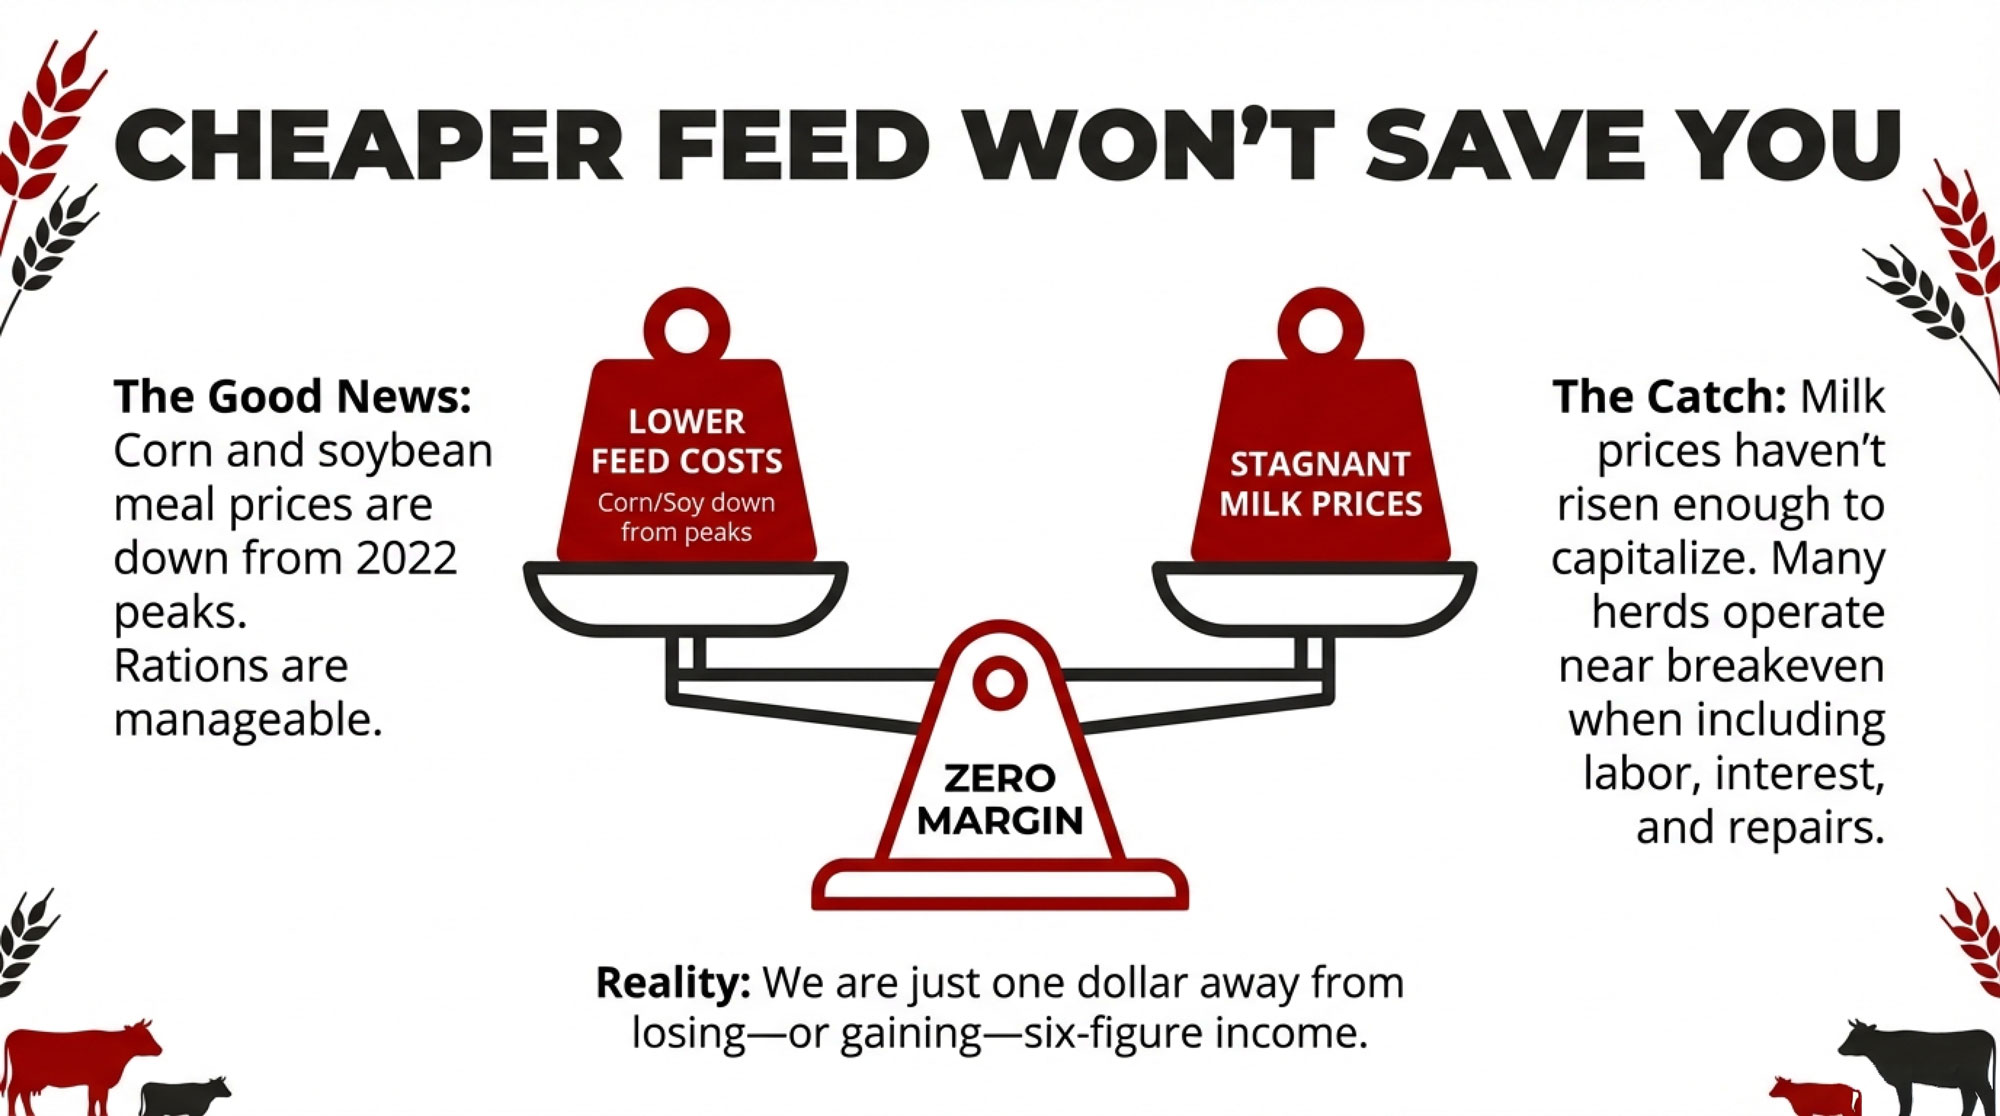
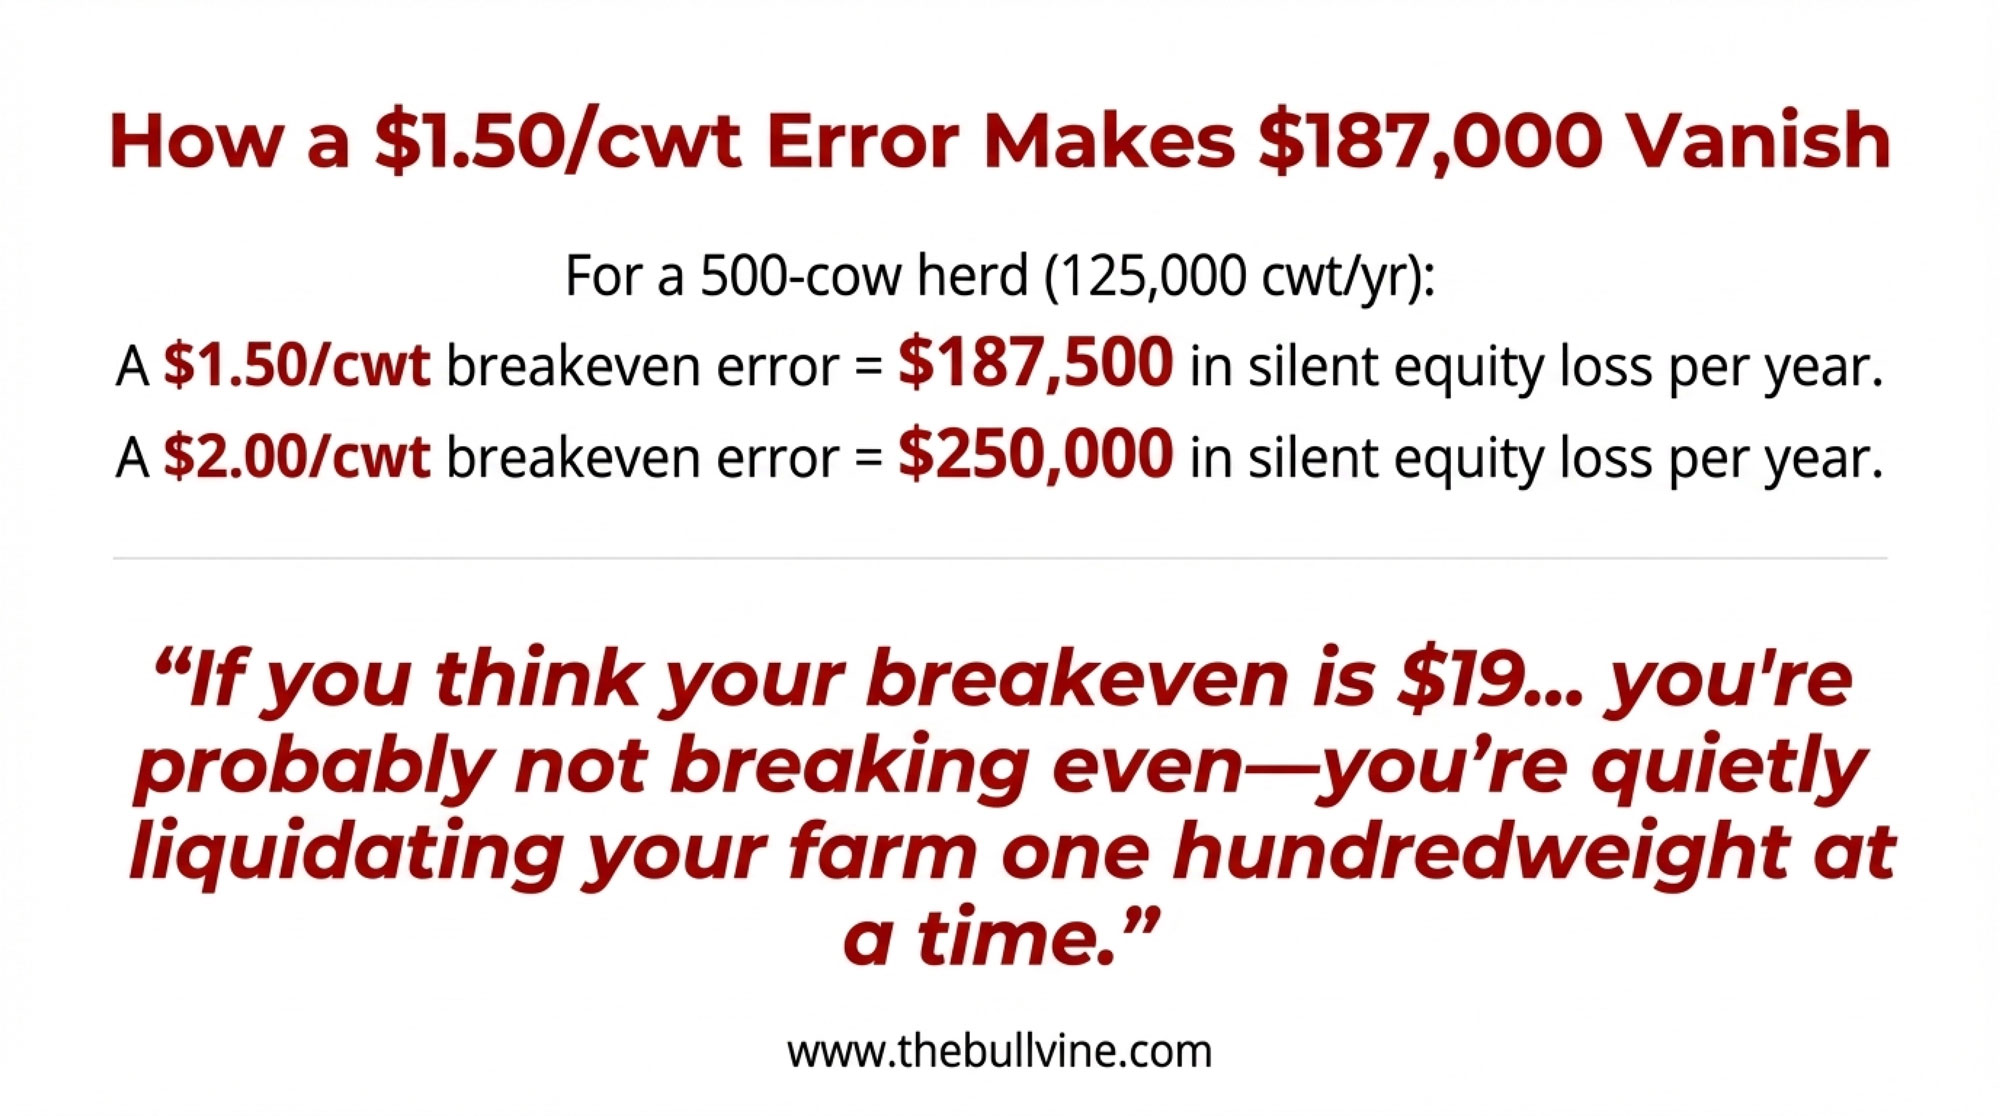
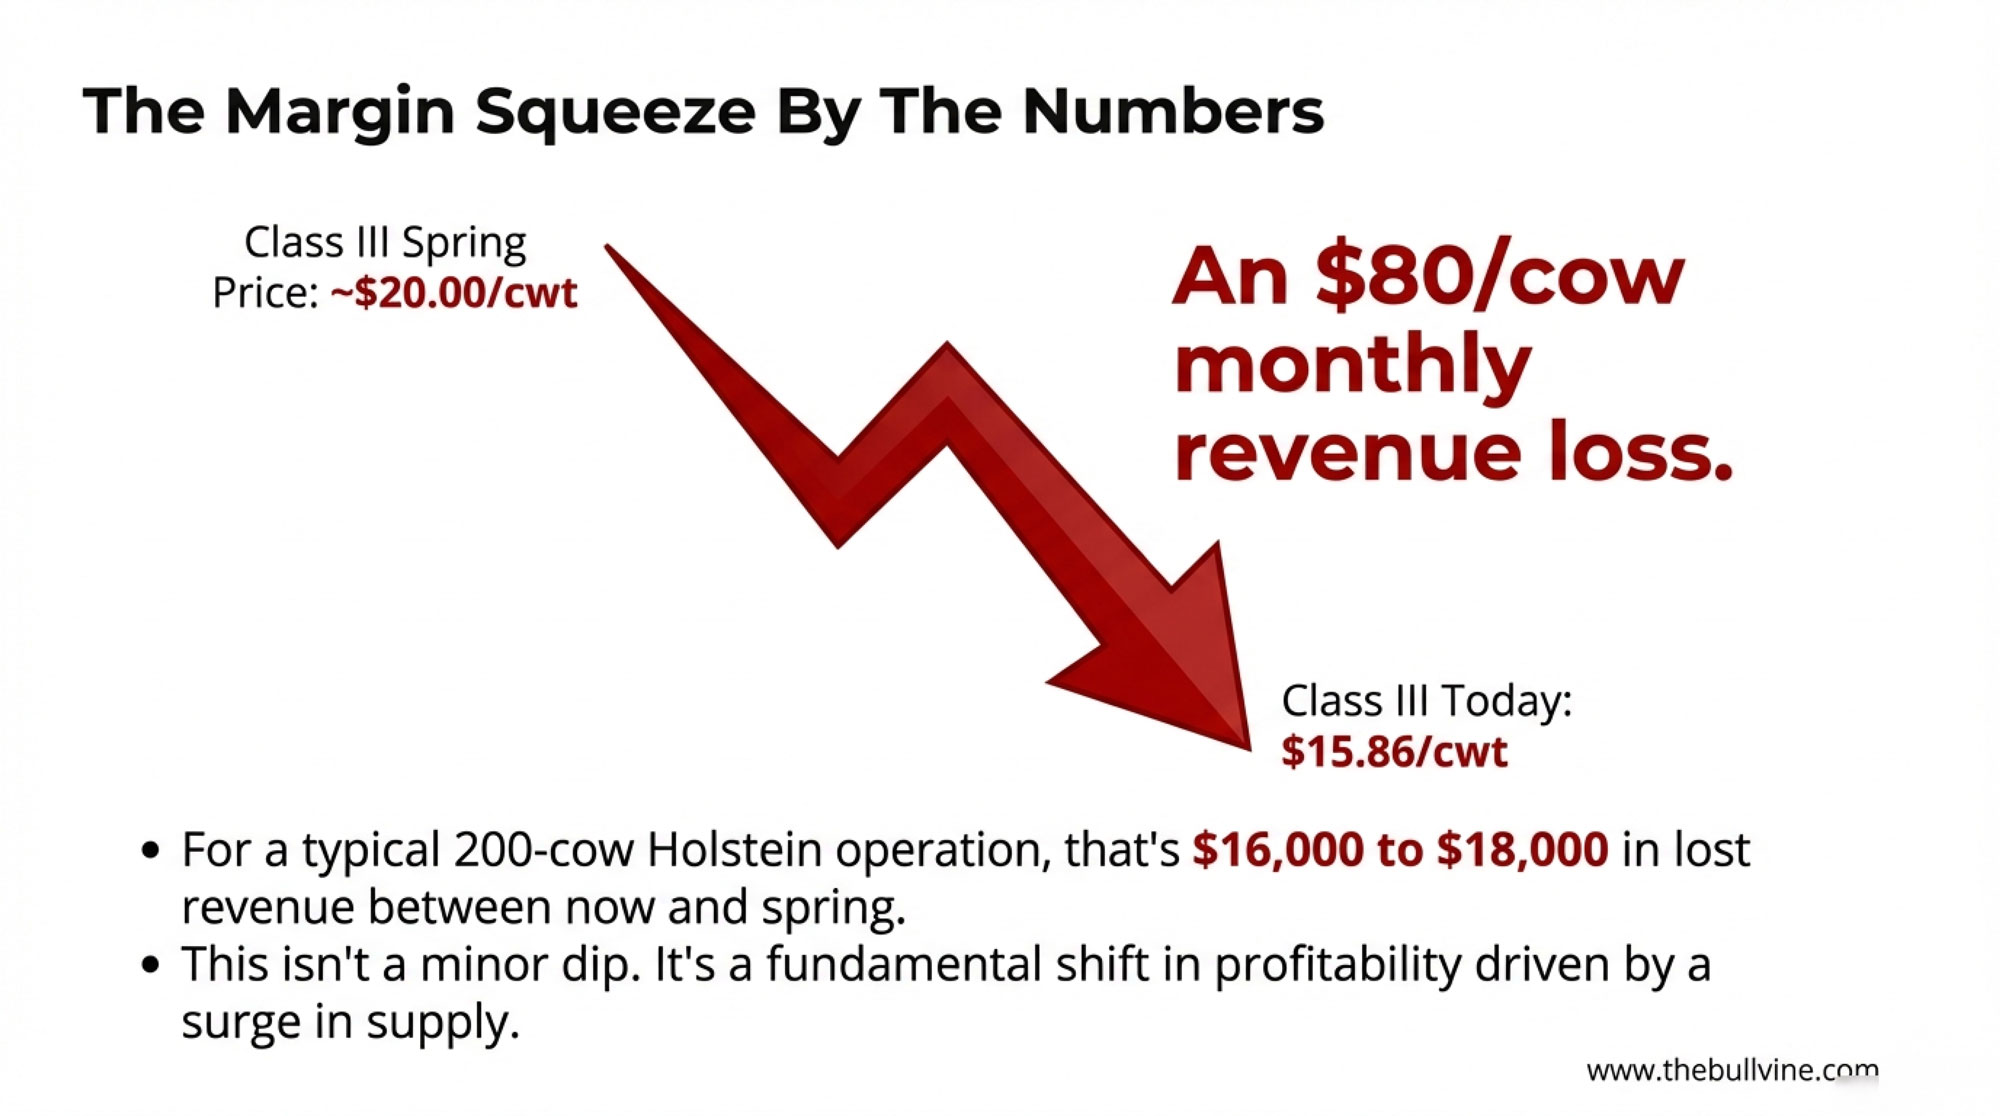
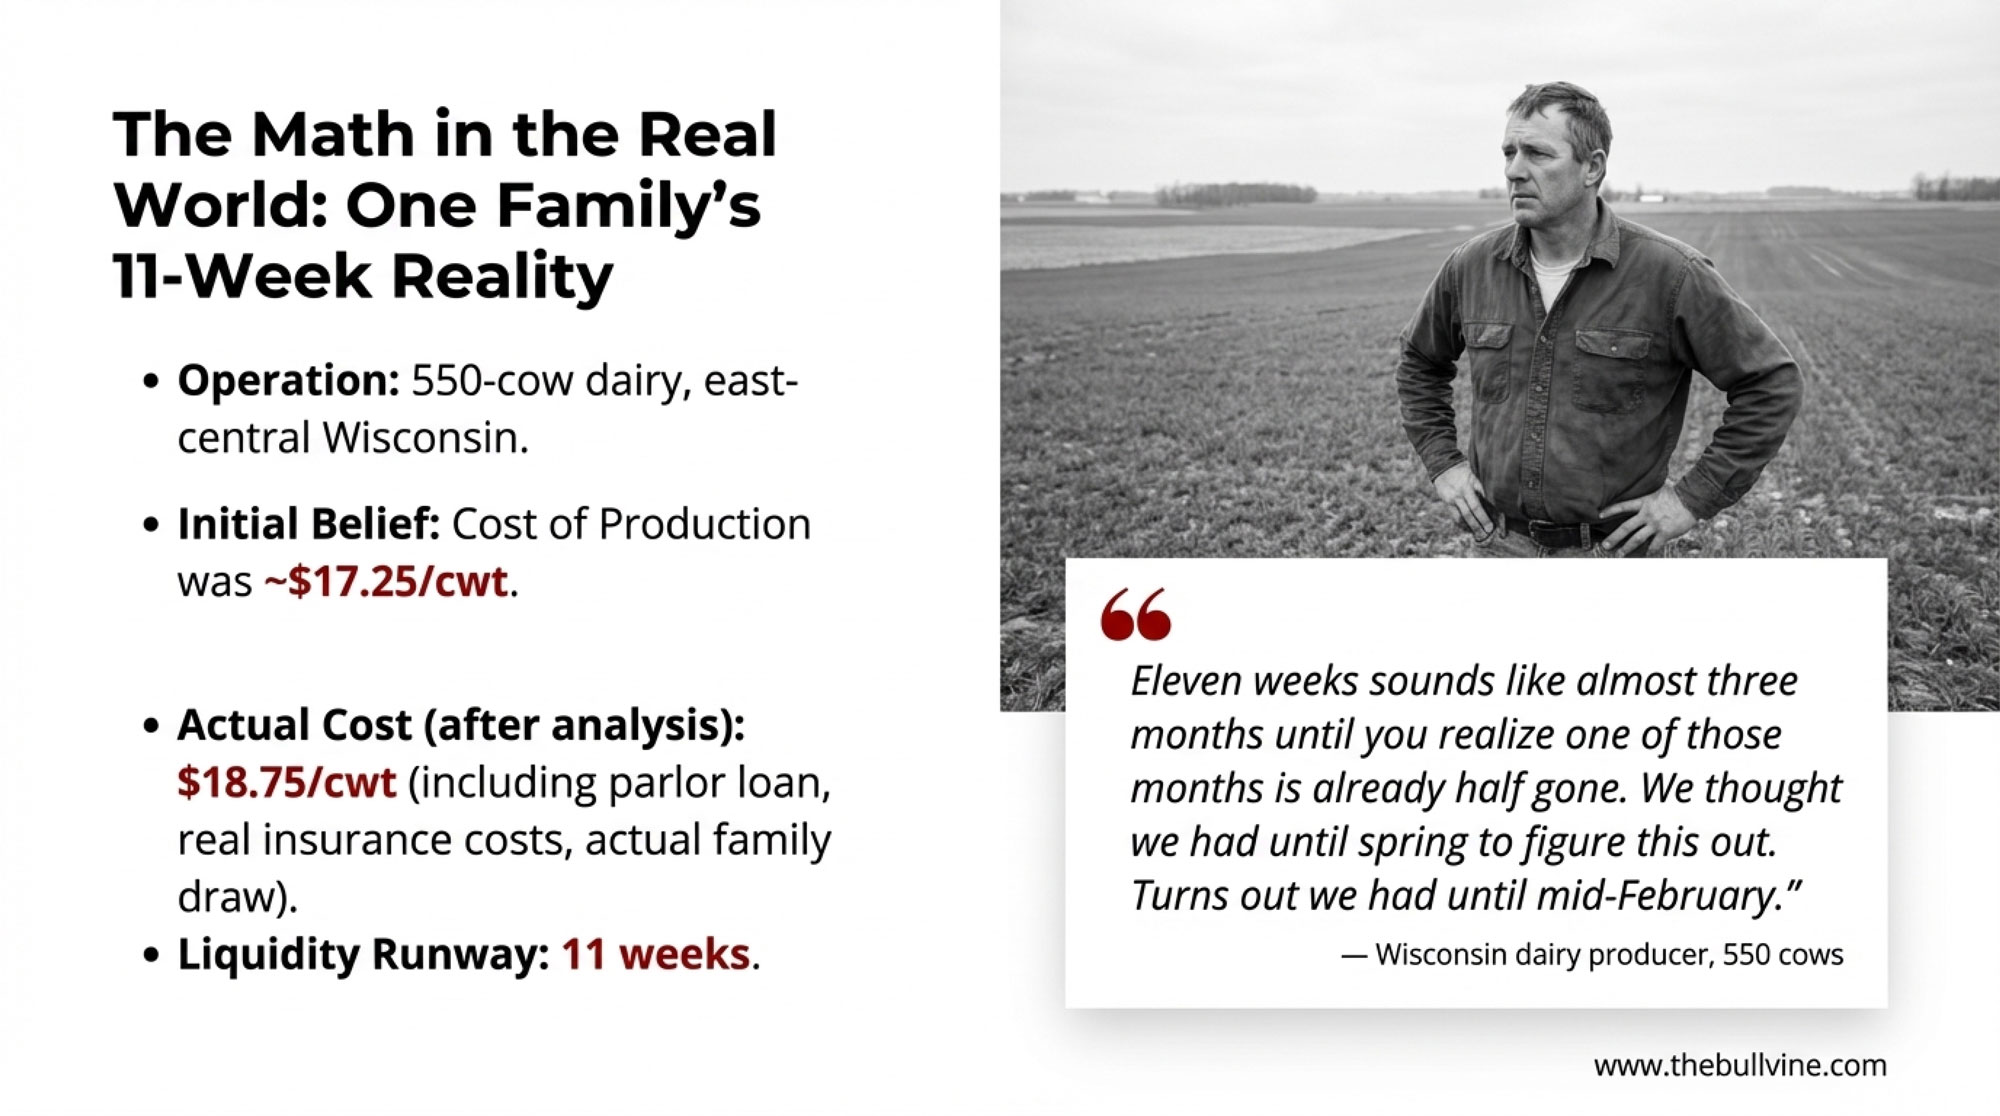
That “$1/cwt Revenue Hit” column is the one that should keep you up at night. Drop milk by just a dollar, and a 500‑cow herd loses $60,000 in gross revenue — nearly a fifth of that annual loan payment.
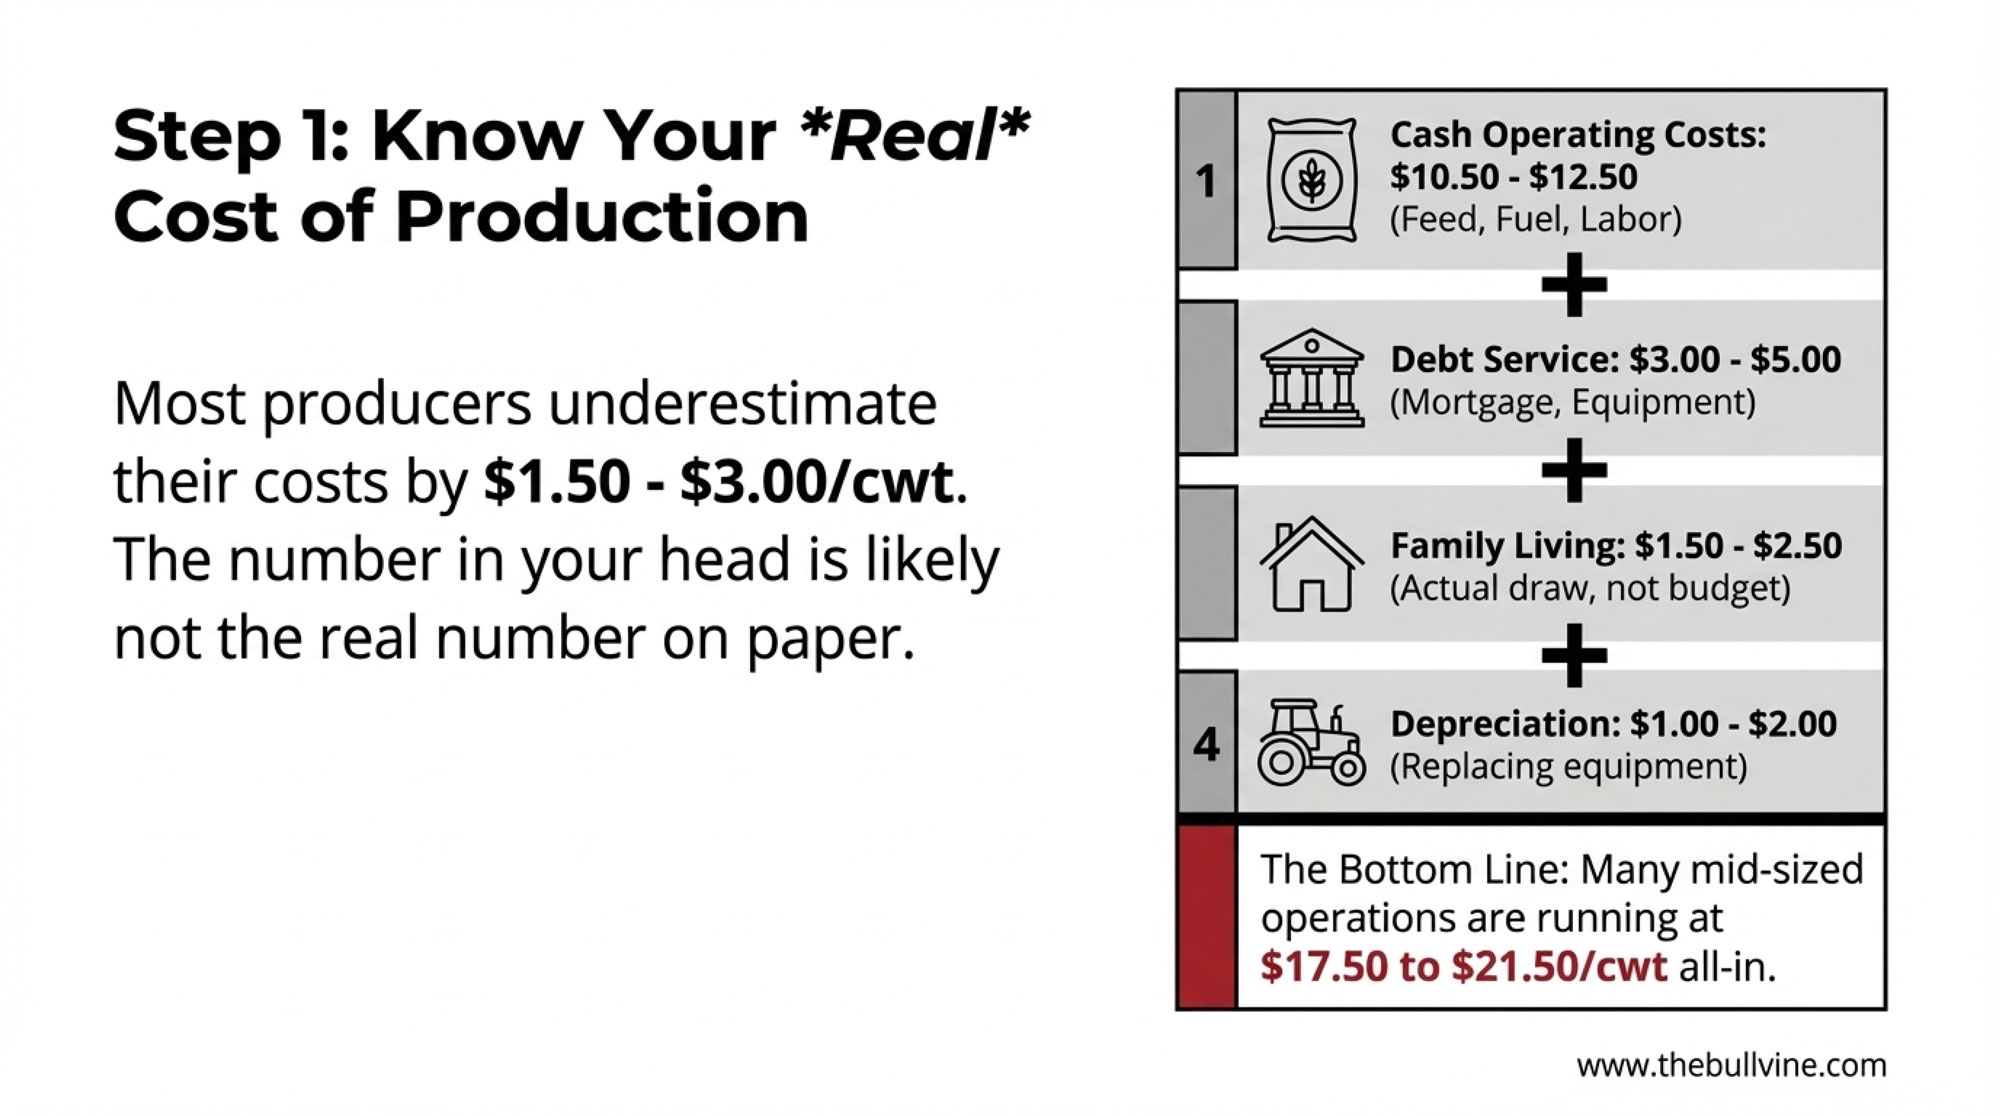
Many farm financial advisors and extension economists note that once they fully load family labor, realistic depreciation, and current interest costs, breakevens often land several dollars per cwt higher than what producers carry in their heads. That’s the gap you don’t want to discover two years after concrete is poured.
When Do Fertilizer and Fuel Really Hit Your Ration?
Margins feel better today than they did in 2023. Some of that is the milk price. Some of it is just timing.
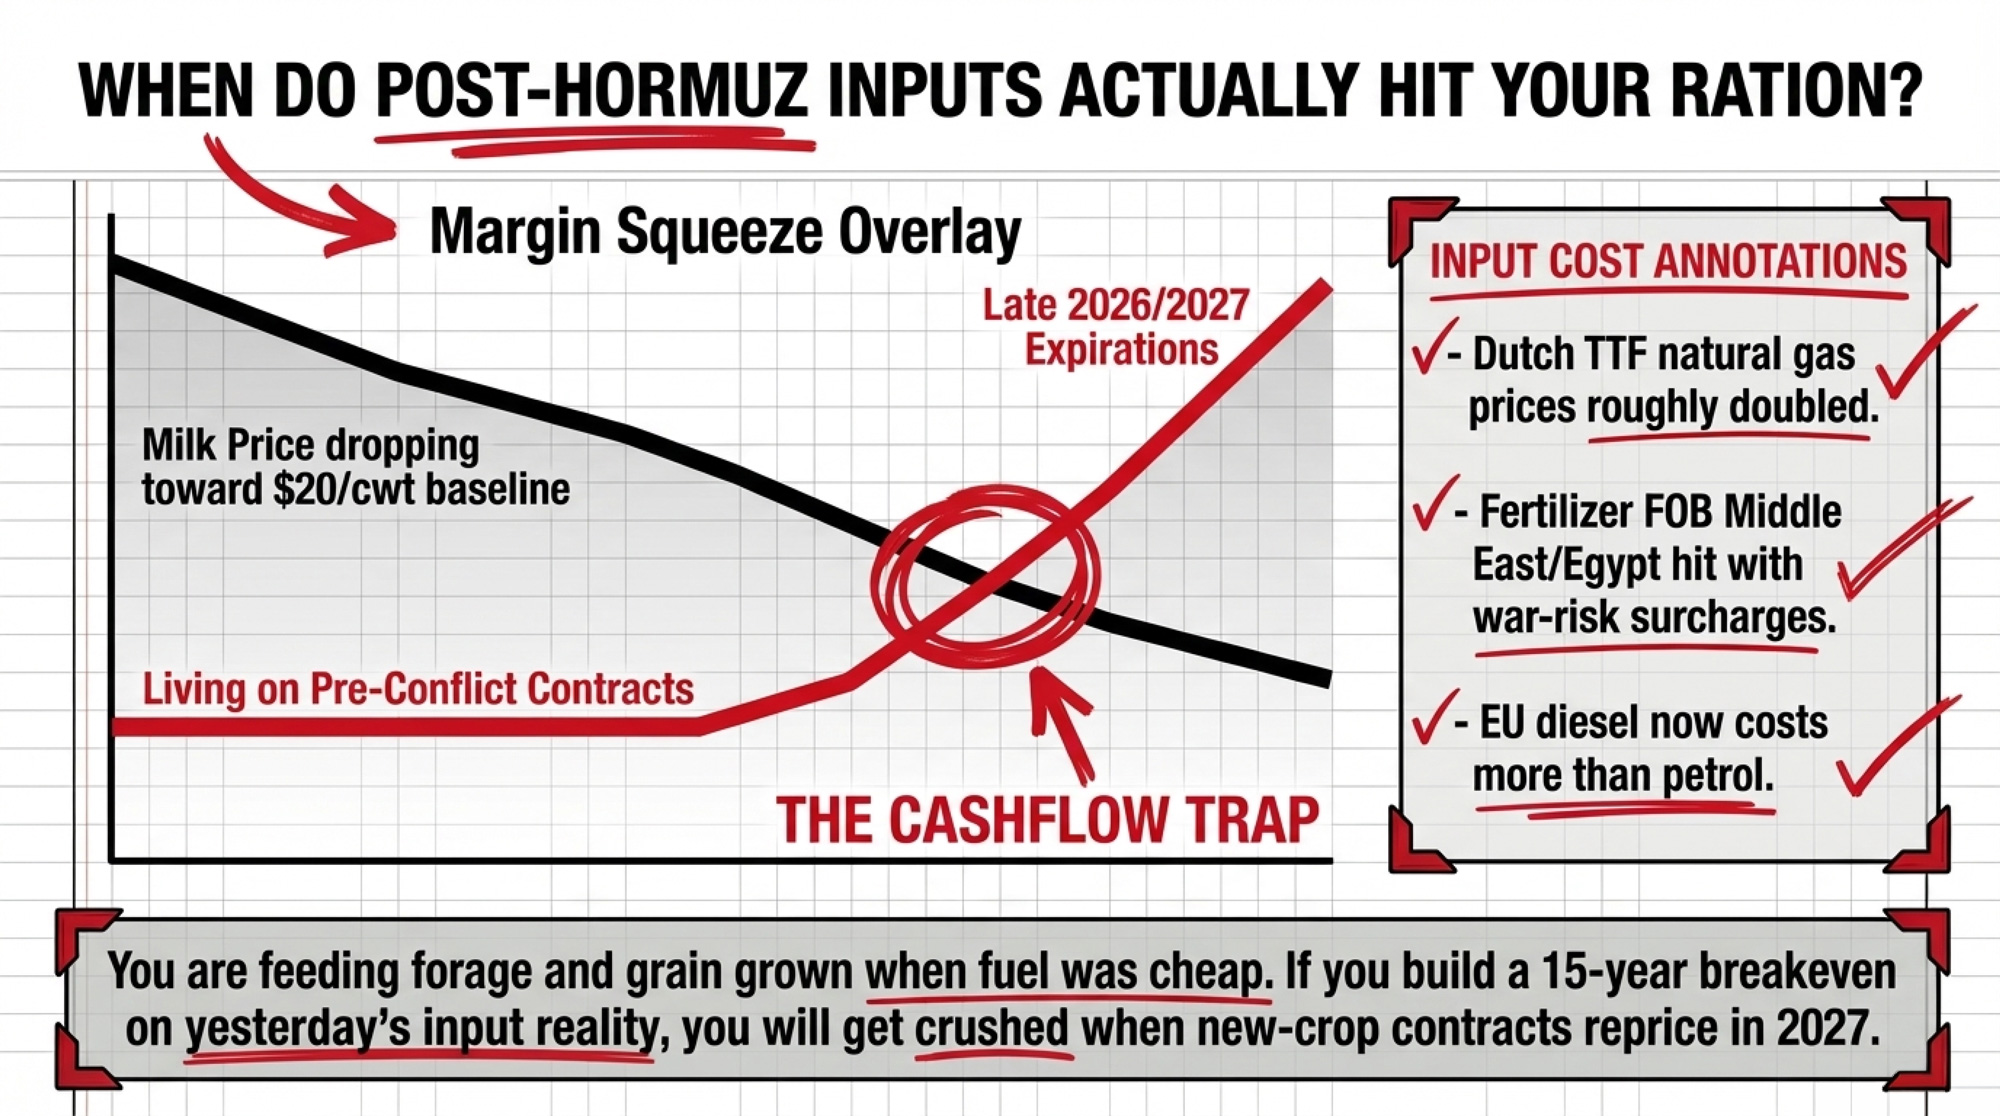
On the feed side, global grain markets look calmer than in 2022 — prices for corn, wheat, and soymeal are closer to the low end of their five‑year range, helped by expectations for decent yields. That’s one big reason rations feel manageable. But fertilizer and energy are on a different trajectory:
- Benchmark fertilizer prices FOB Middle East/Egypt have “risen substantially,” with delivered costs pushed higher by freight and war‑risk surcharges.
- Gasoline prices have risen enough that, in many European countries, diesel now costs more than petrol after taxes are added — the reverse of normal.
- Dutch TTF natural gas prices roughly doubled after the conflict flared, and the spread between European and U.S. gas widened sharply.
That doesn’t hit your TMR overnight. Through mid‑2026, you’re still feeding off forage and grain grown or bought when fertilizer and fuel were cheaper. Late 2026 into 2027 is when new‑crop contracts fully reflect the higher input environment — and that’s when the true variable‑cost increase lands in your ration.
If you price an expansion project off 2025/early‑2026 input costs and assume they hold, you’re building your 15‑year breakeven on yesterday’s input reality.
What If the 2026 Rally Sticks Around?
This all sounds cautious. So what’s the scenario where the rally holds, and you’d wish you’d built?
In Donnay and Lancaster’s modeling, there is a path where 2026 doesn’t roll over quickly. You’d need some combination of:
- Europe is slowing harder than the models assume. If weather, disease, or policy push EU collections into outright decline sooner than Lancaster’s base case, that tightens export supply faster.
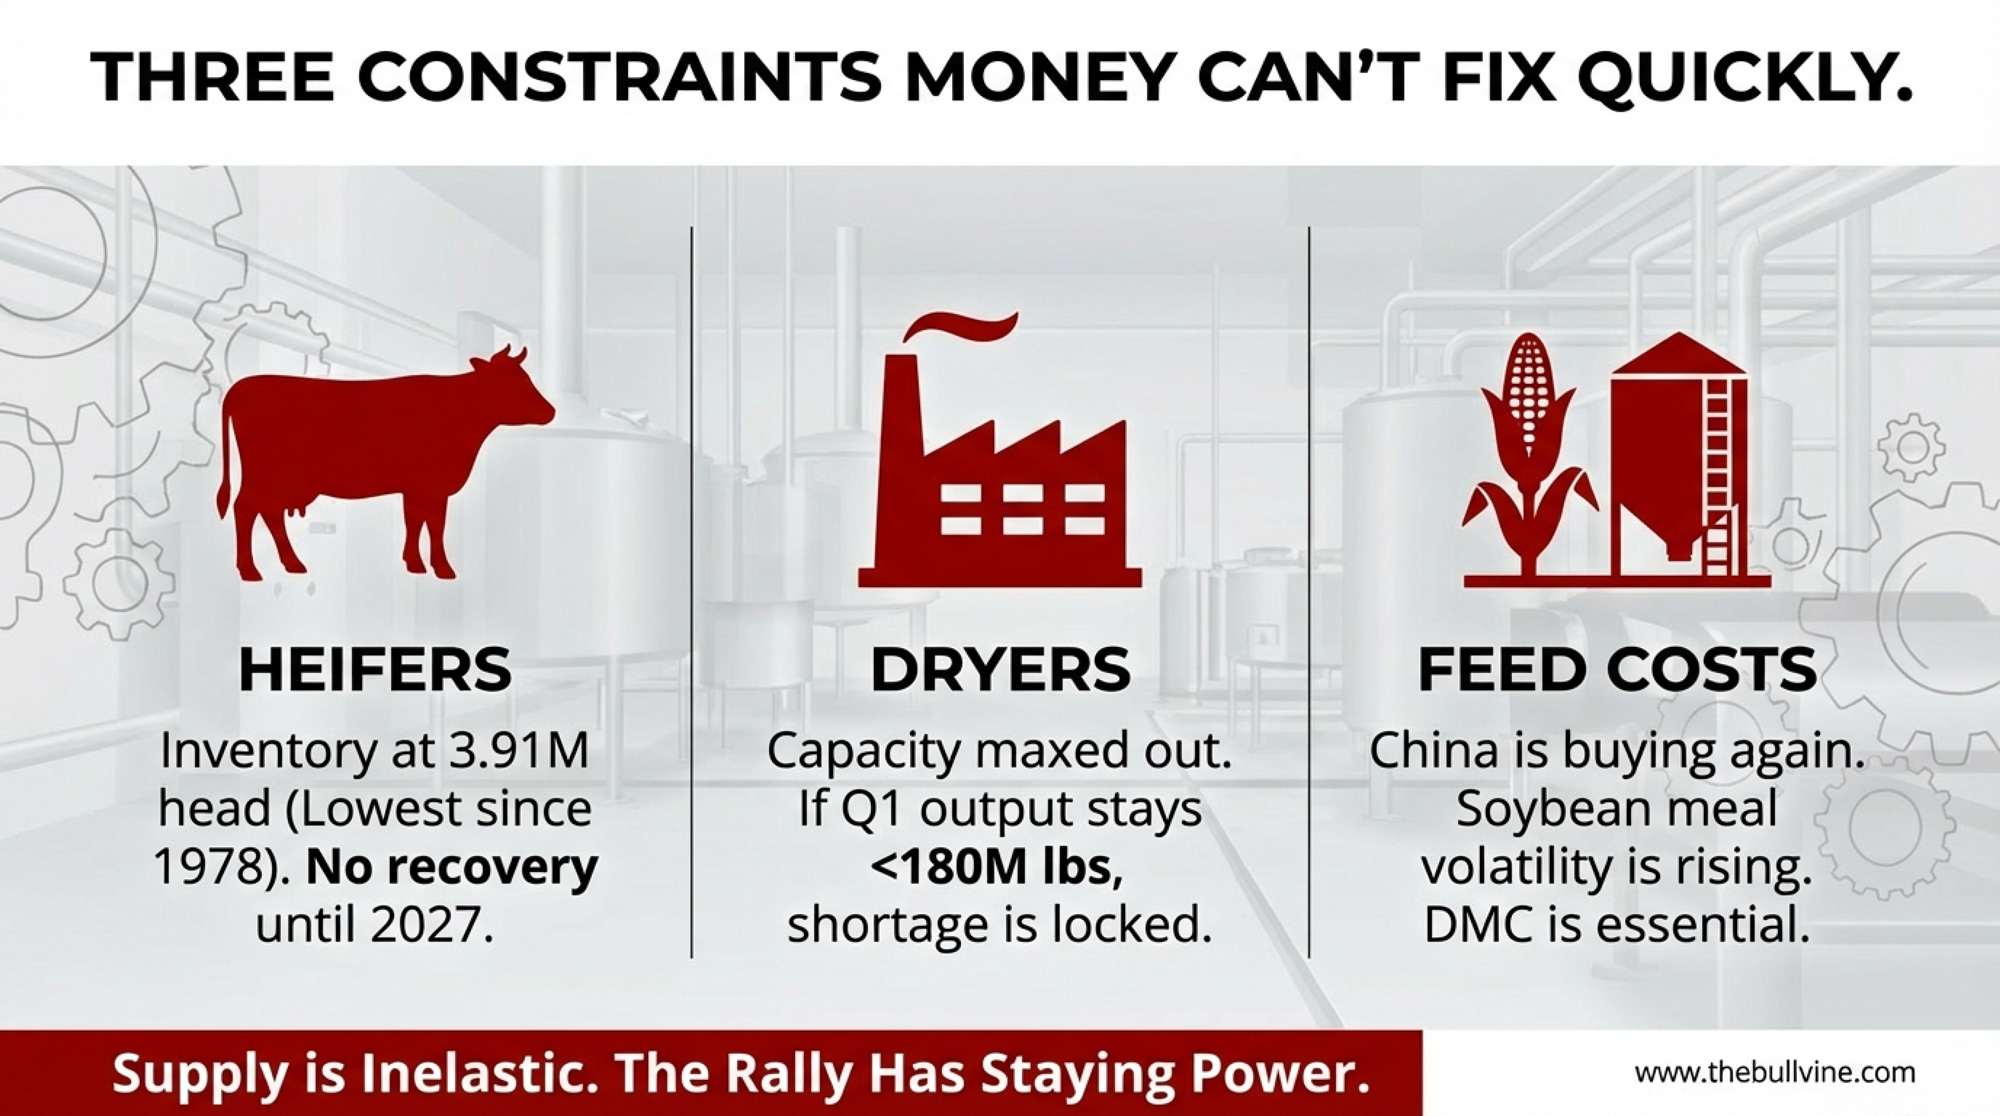
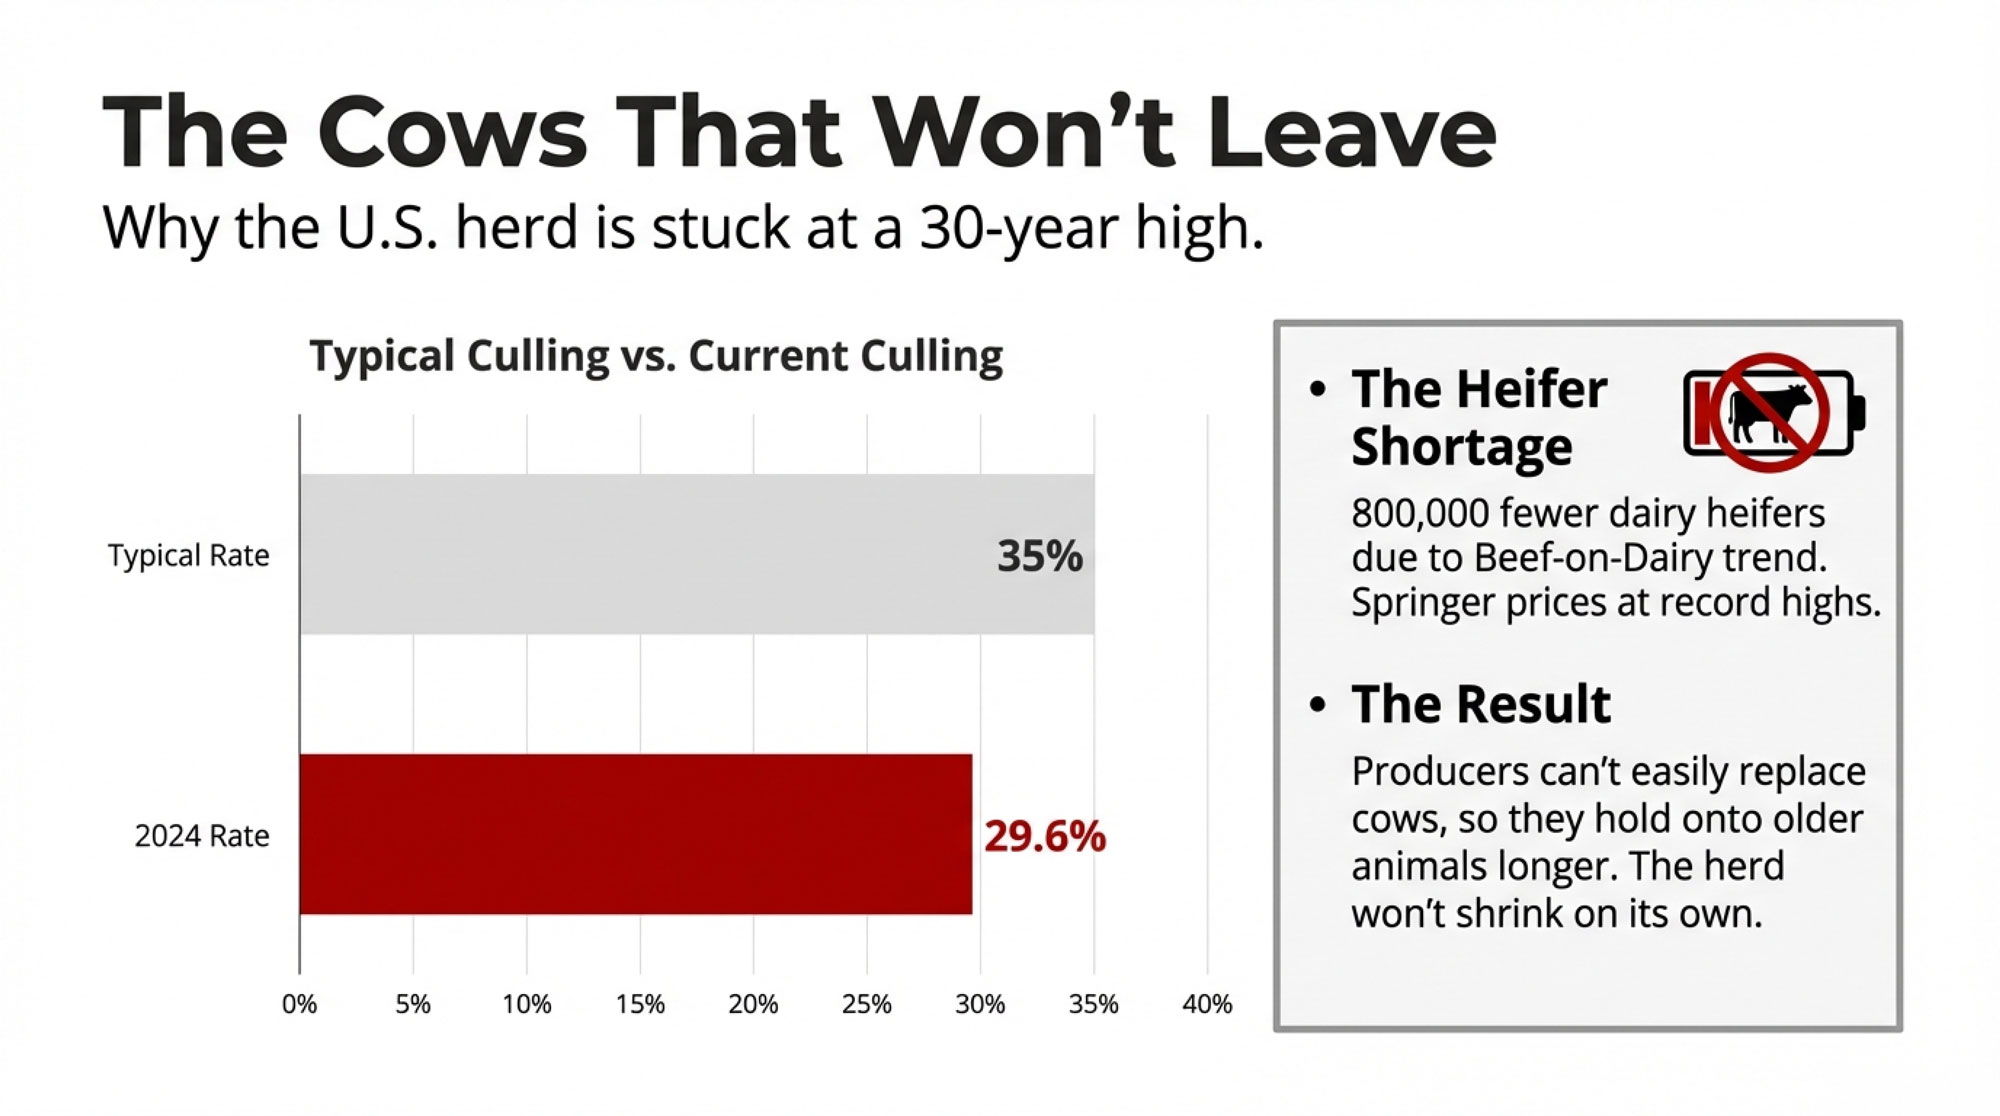
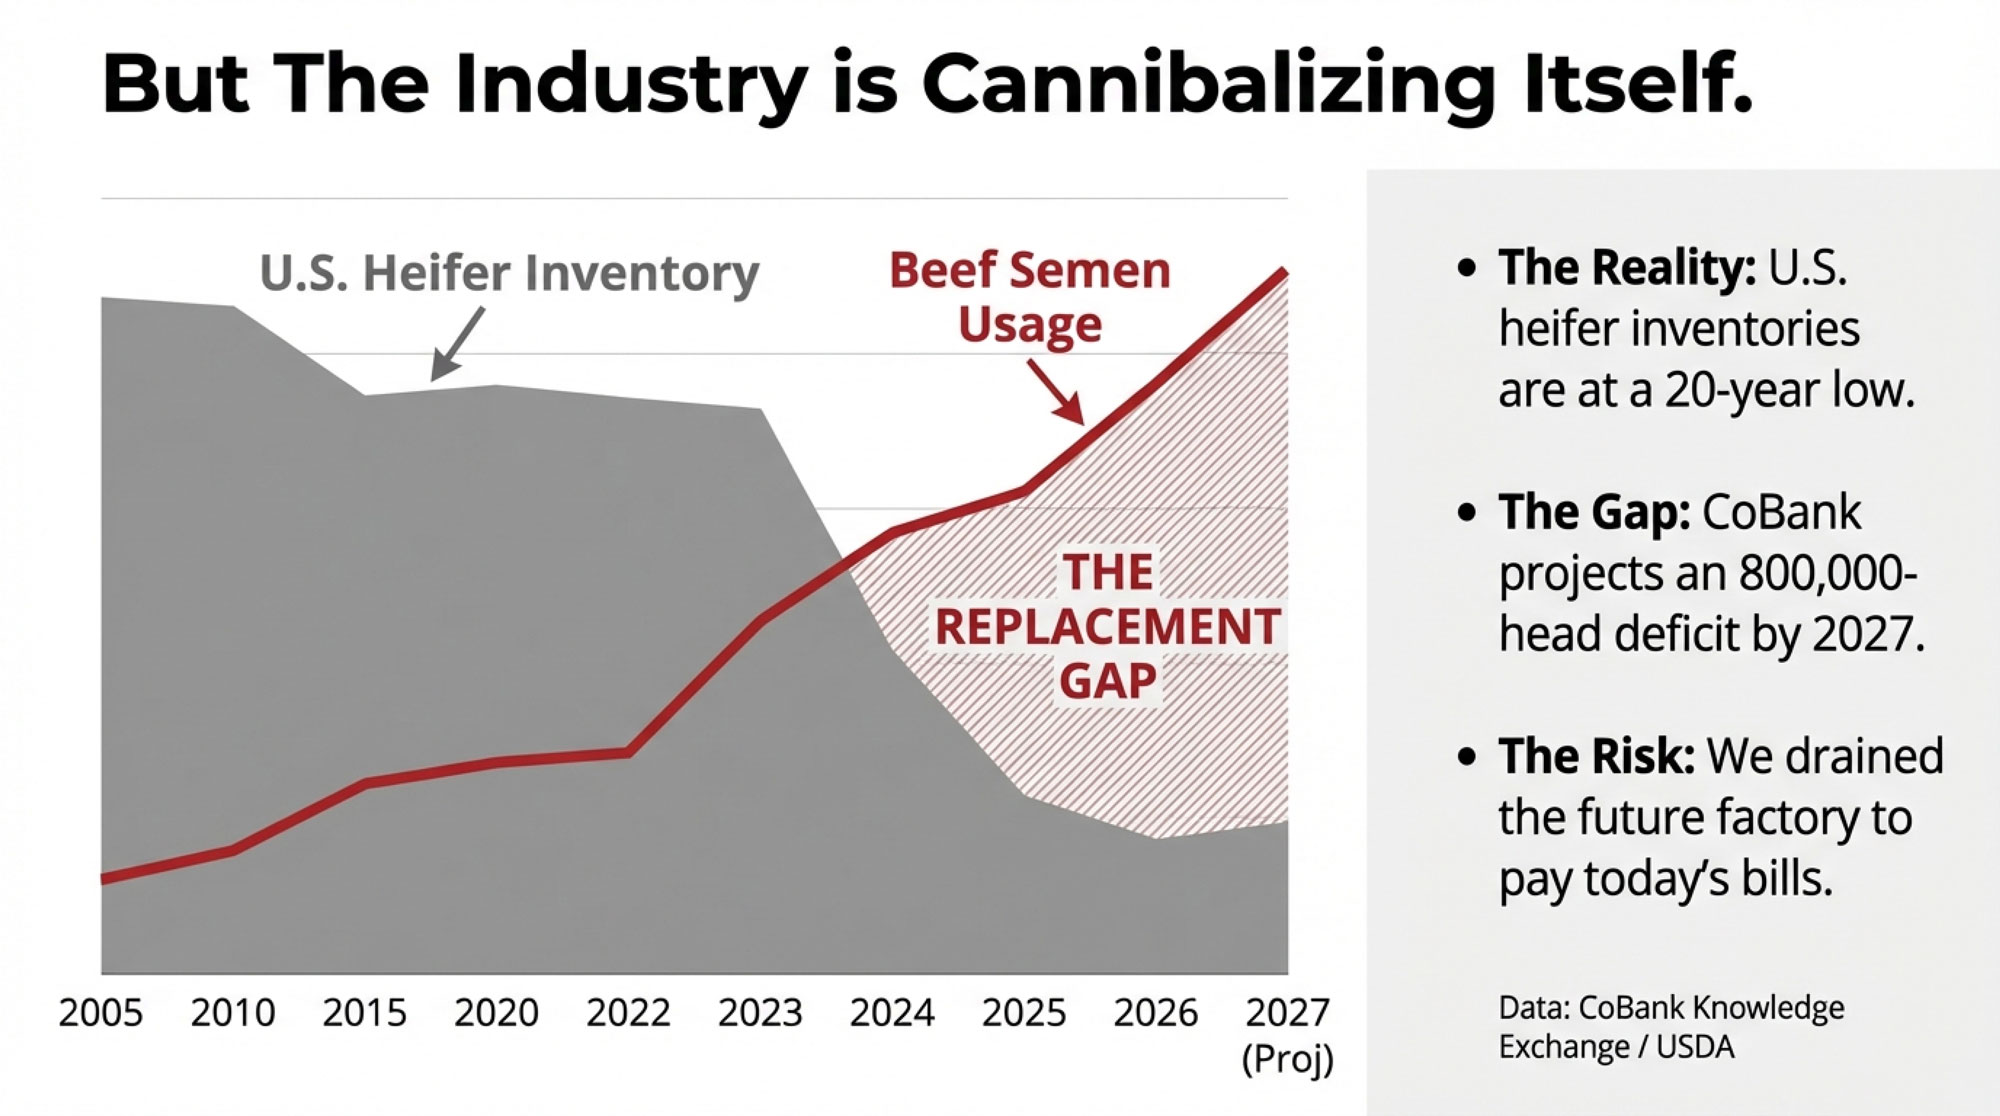
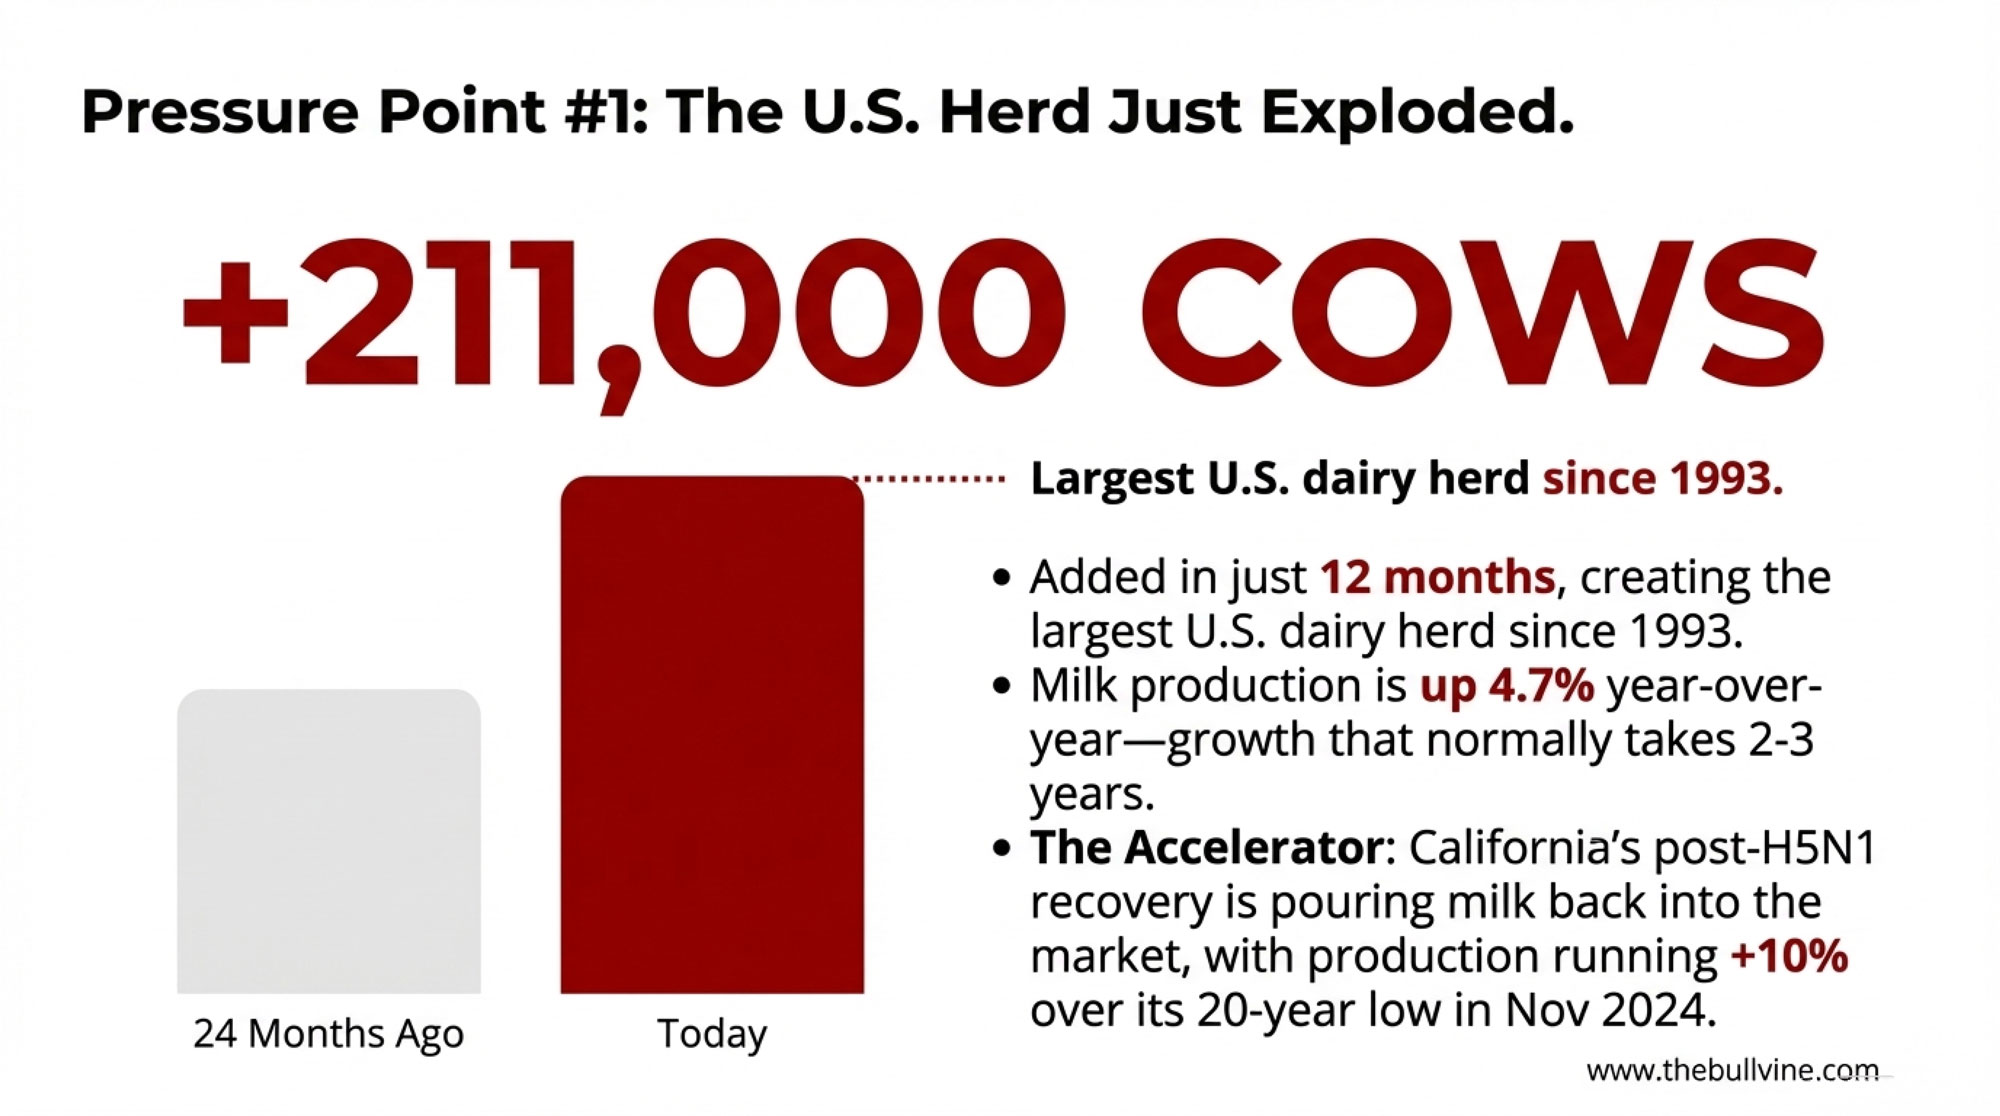
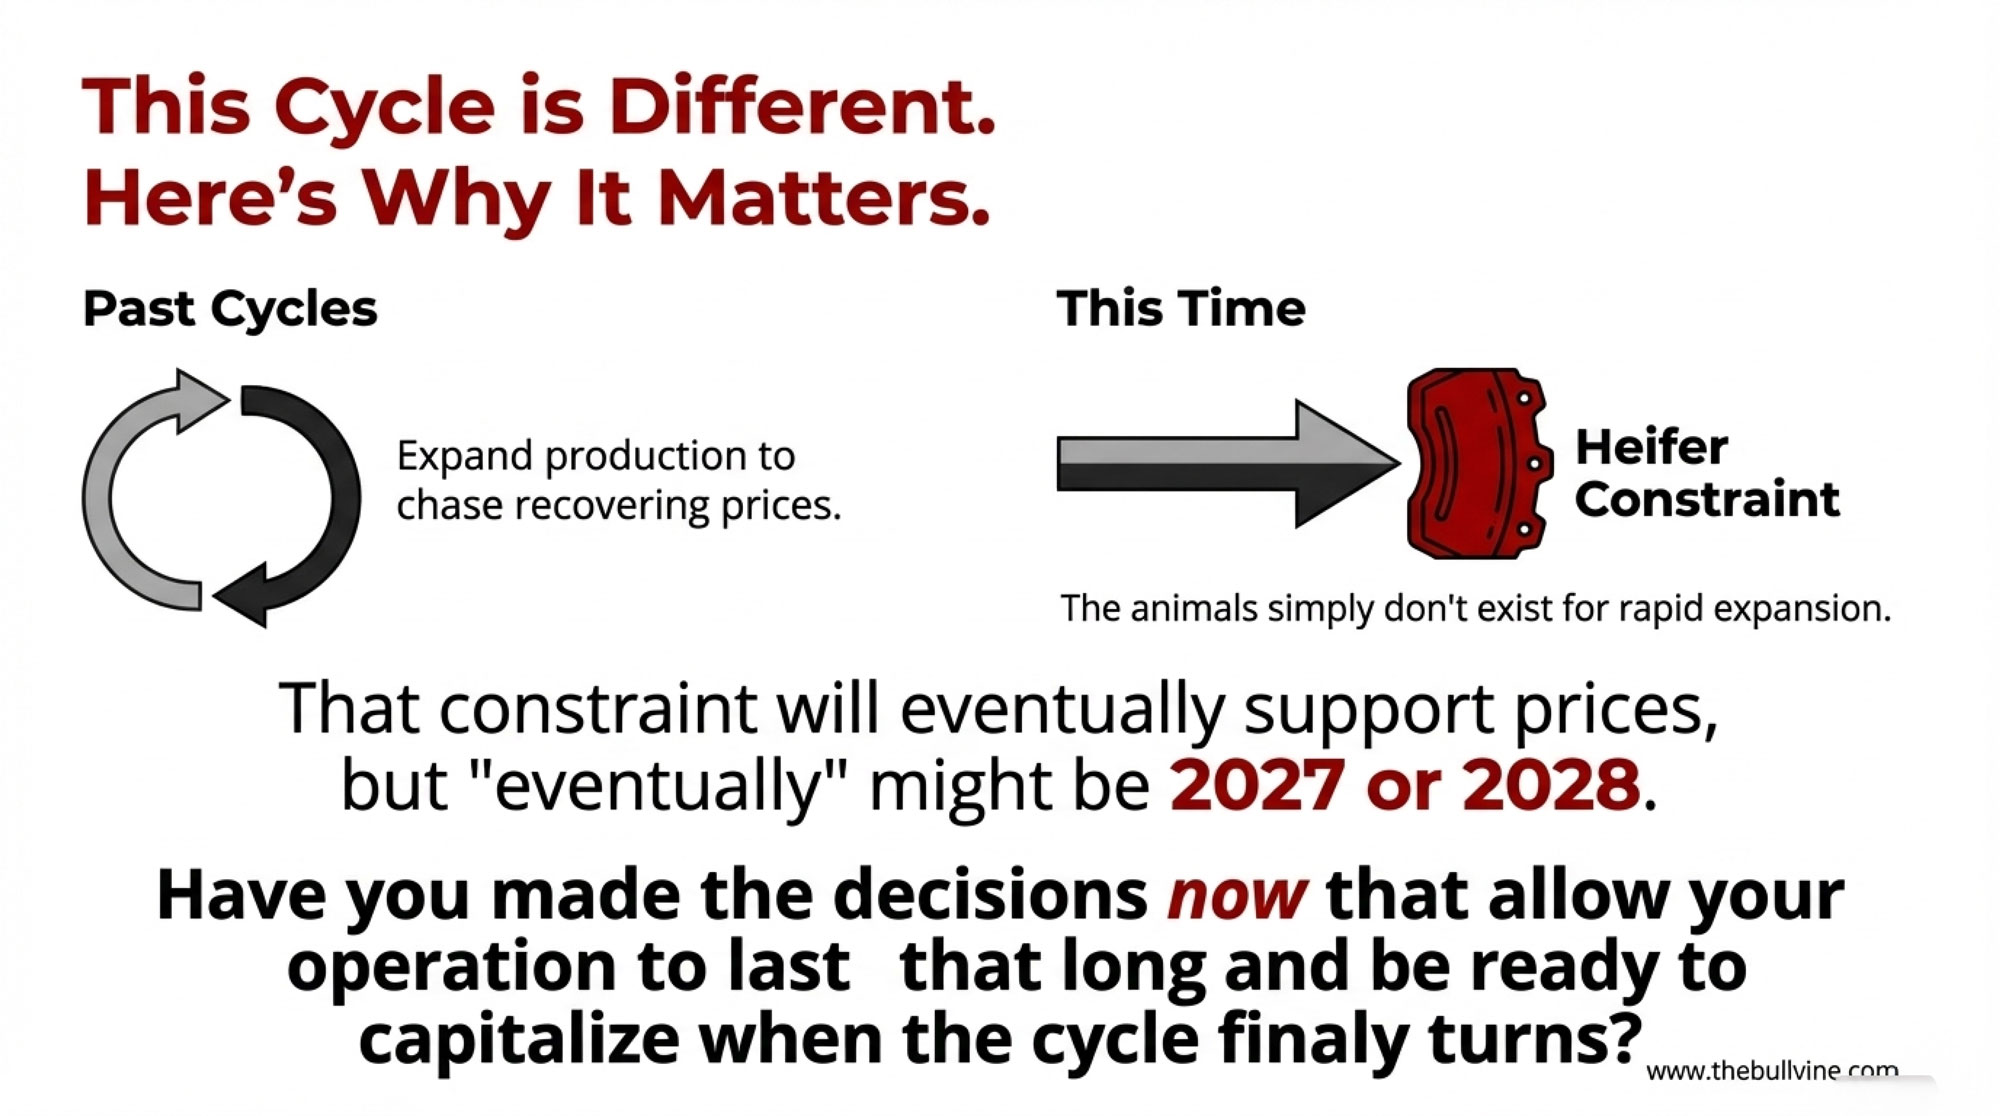
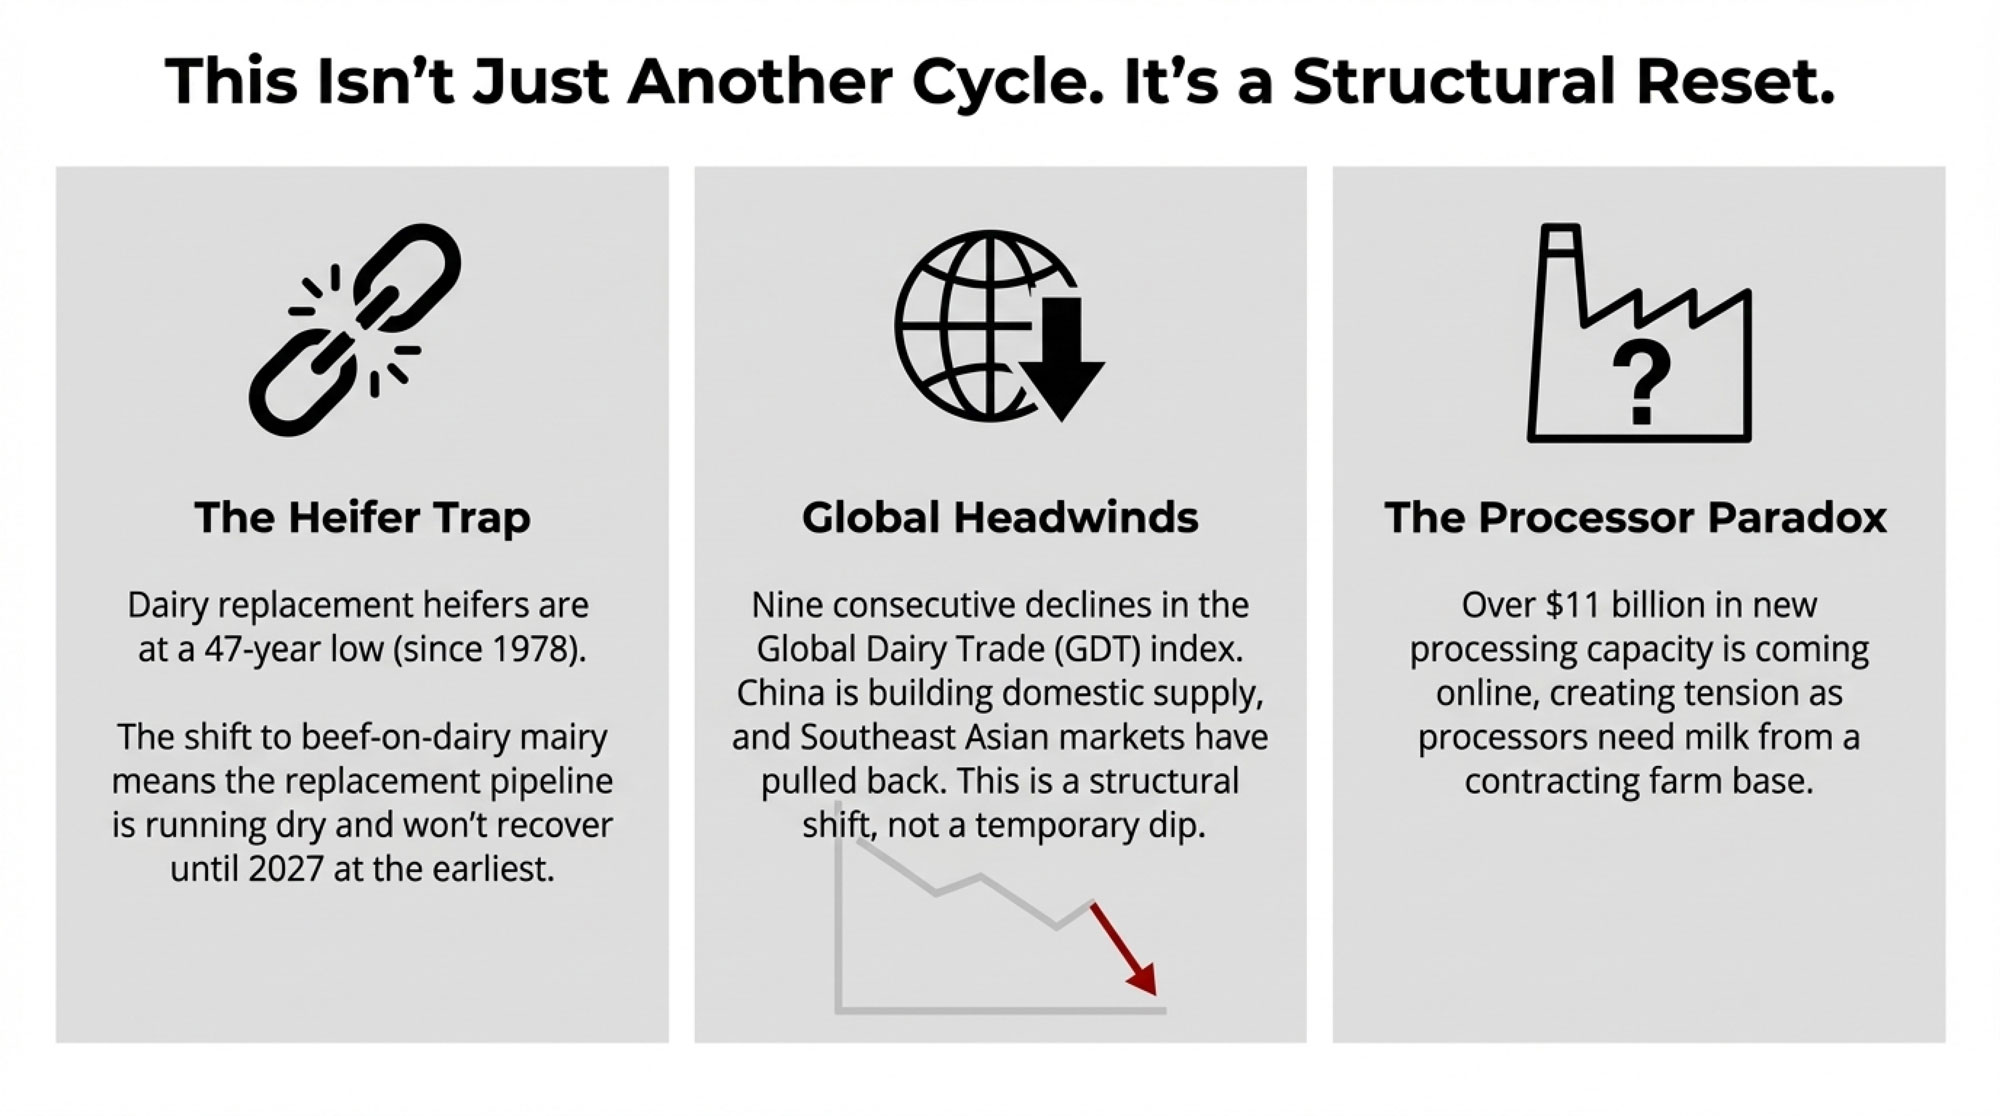
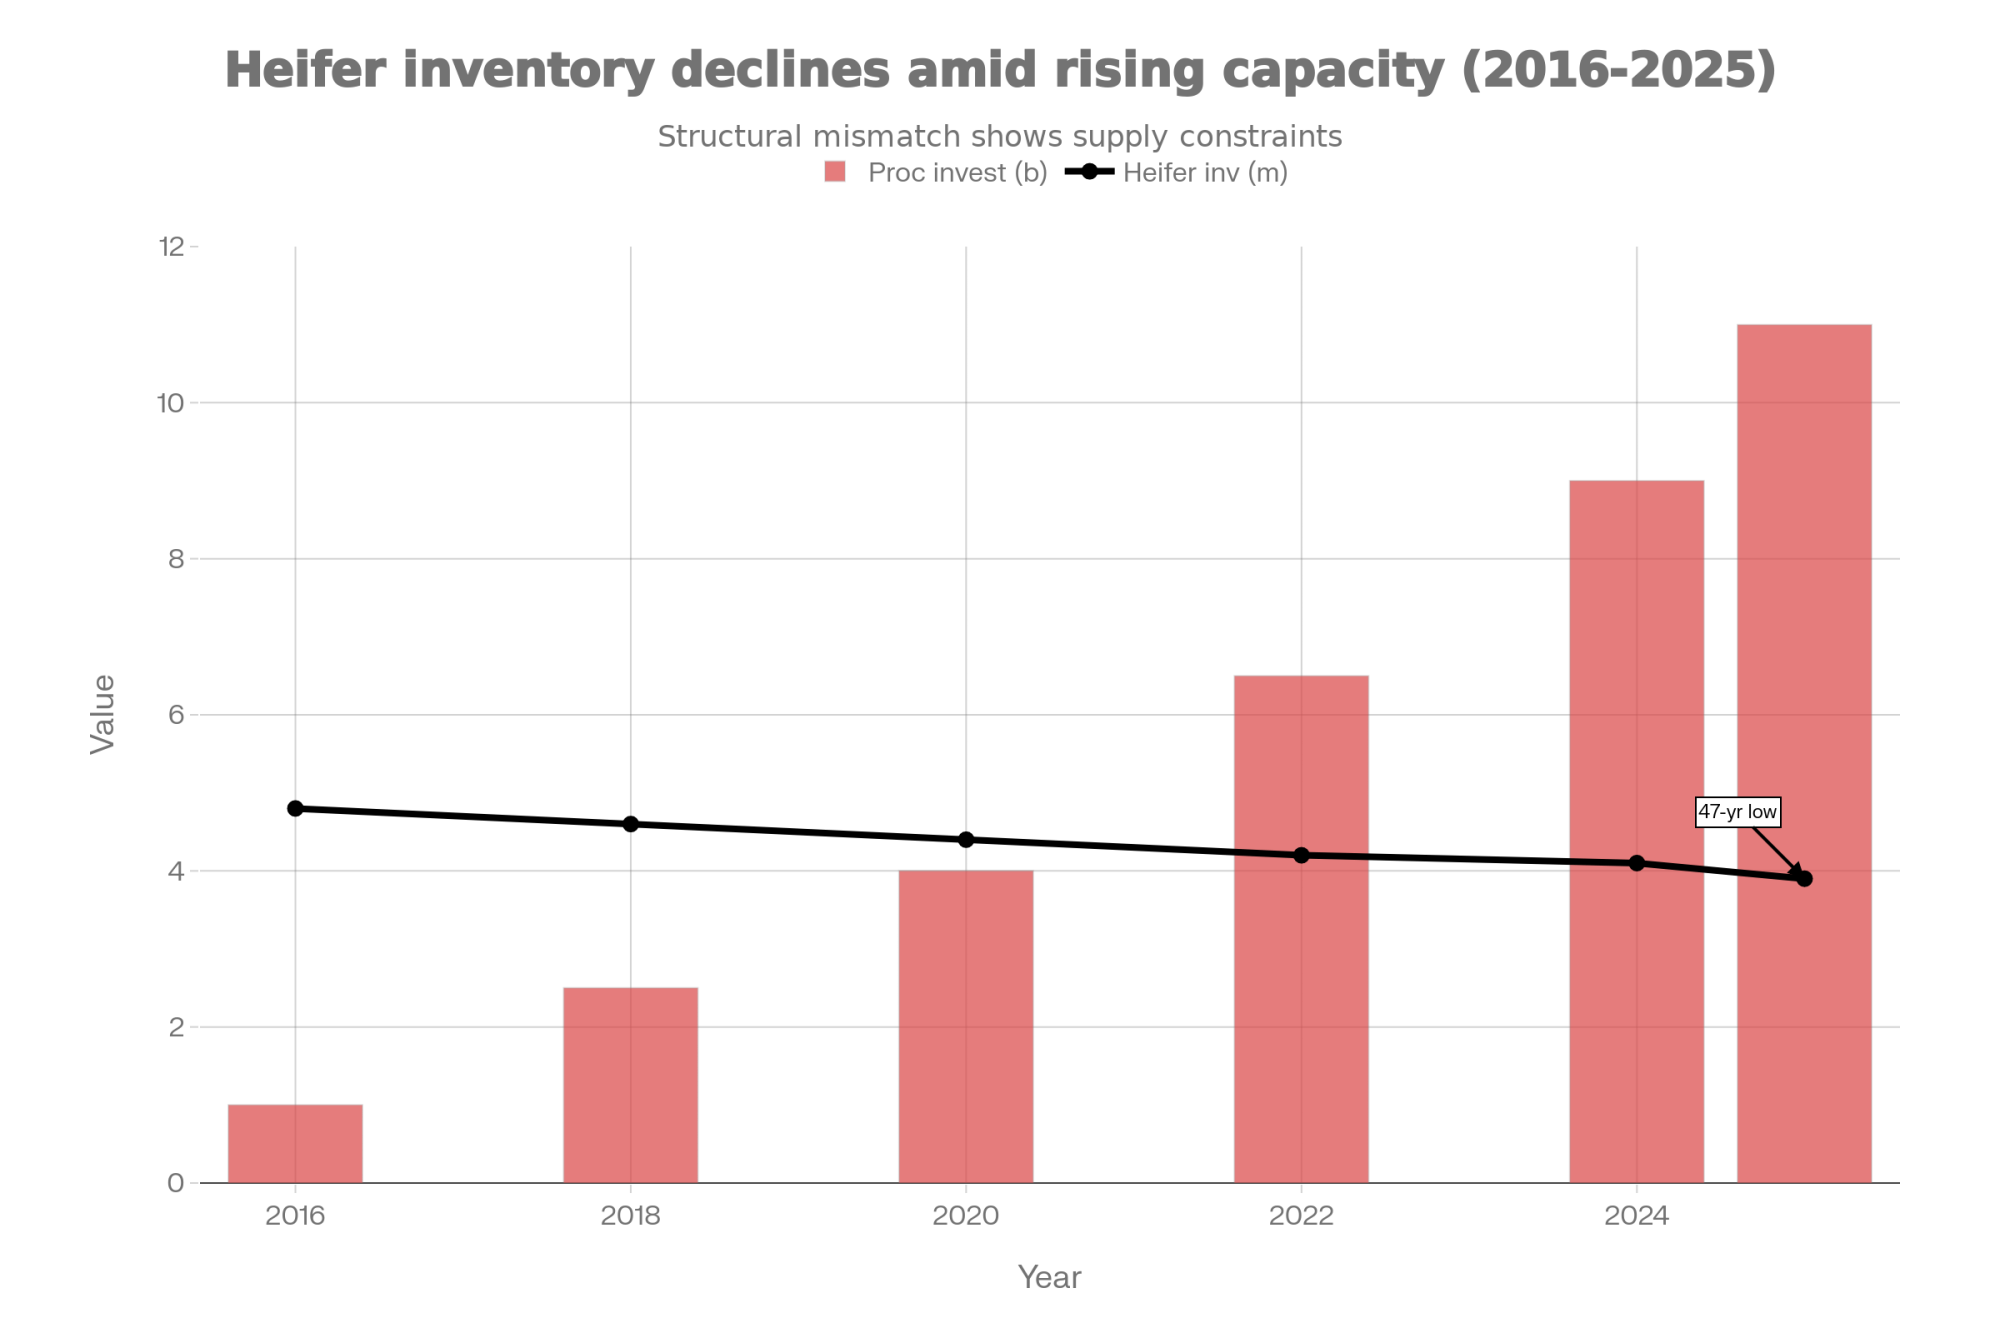
- U.S. herd growth is breaking sooner. Since mid‑2024, U.S. dairy farmers have added 293,000 cows, including 49,000 head in January–February 2026 versus 30,000 in the same period a year earlier. Donnay expects this expansion to slow, with component‑adjusted growth easing toward roughly two percent by late 2026. If it plateaus faster, that’s supportive.
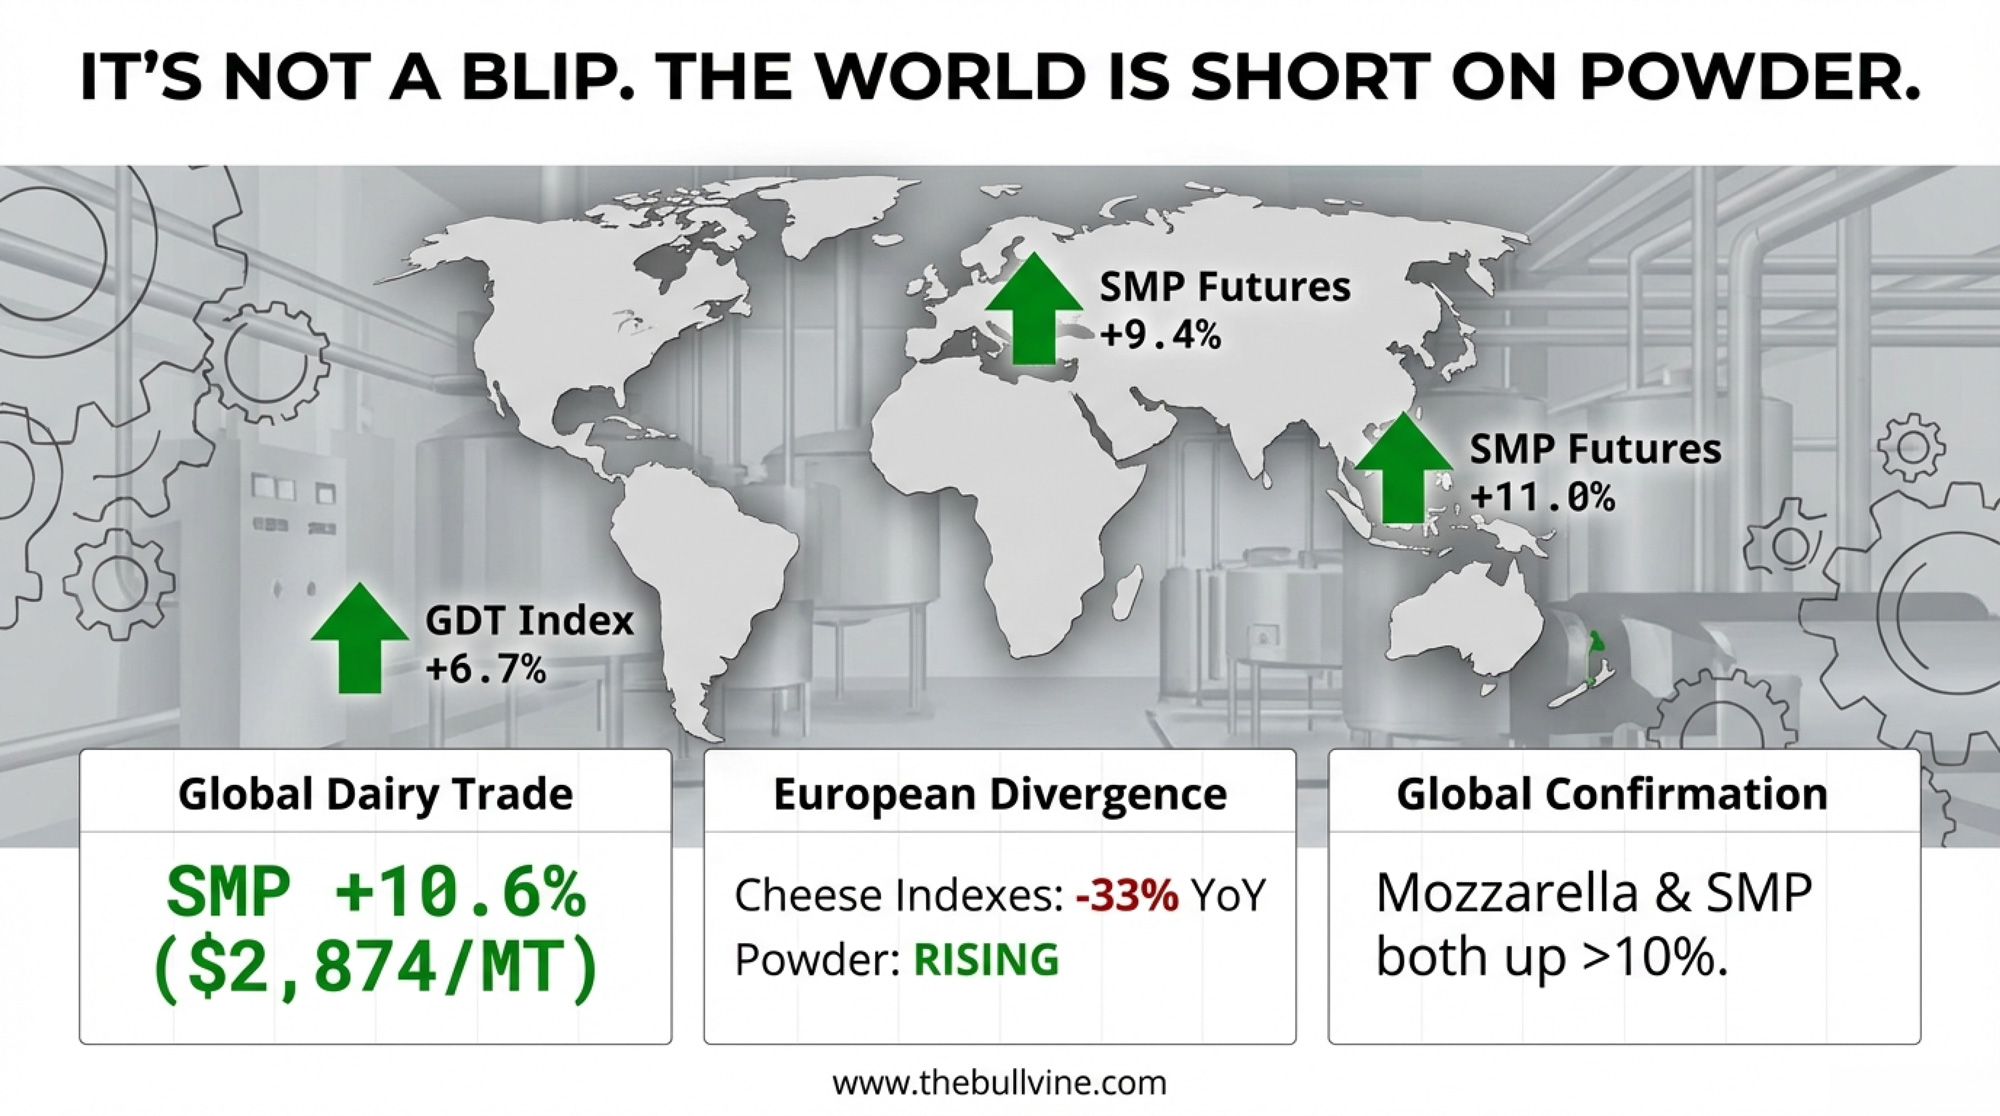
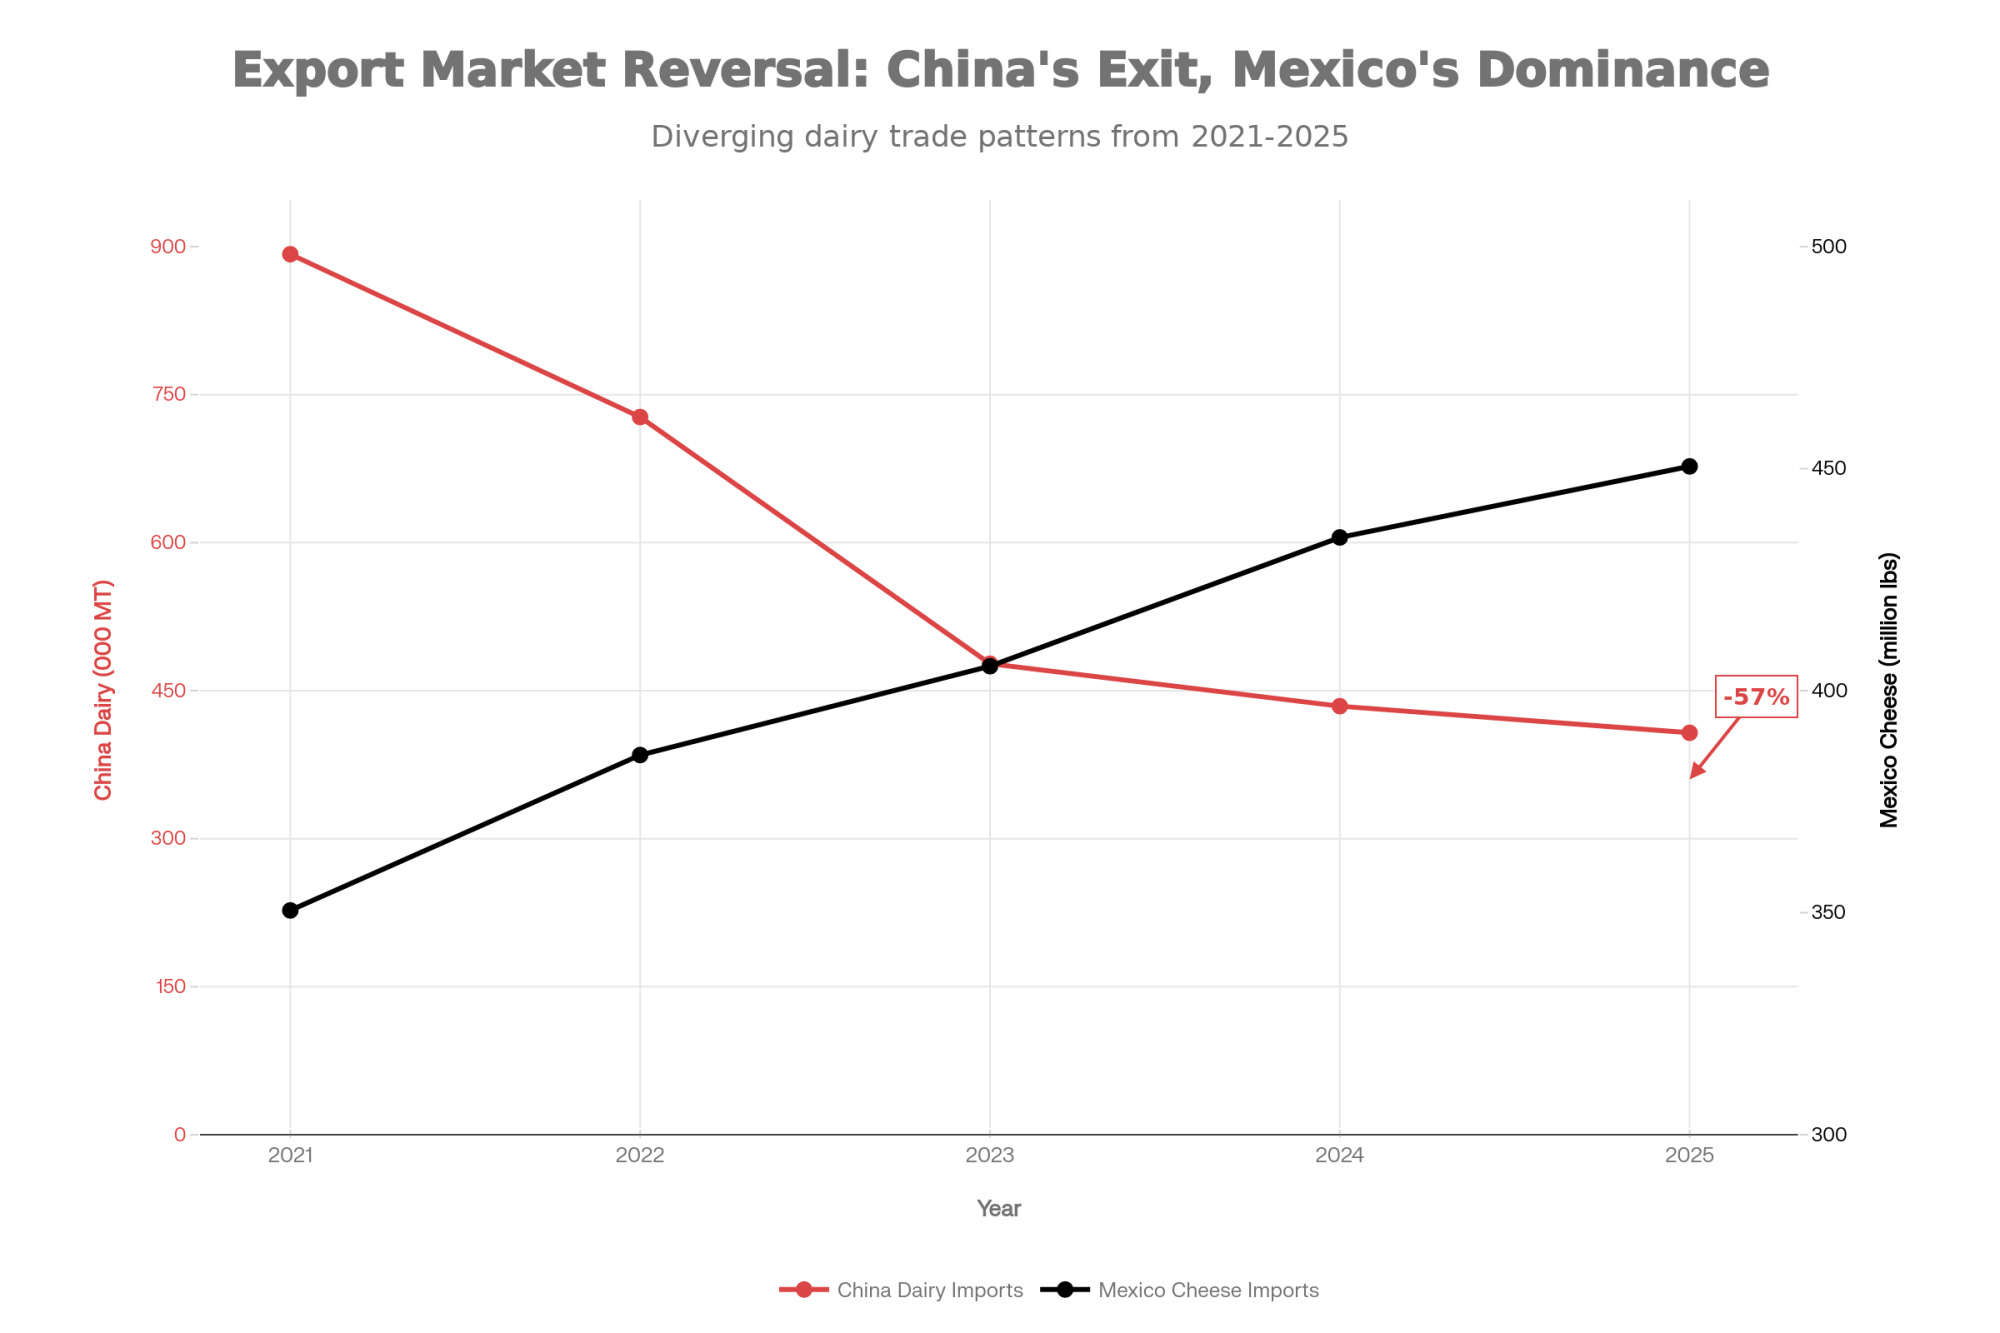
- China is tilting back toward imports. Over the last 12 months, Chinese processors exported about 12,000 tonnes of SMP and began shipping MPC70 into Southeast Asia, as Yifan Li notes. If domestic demand or policy nudges them to rely more on imports again, that removes a growing competitor at the margin.
- Hormuz is keeping a fear premium without crushing Gulf demand or blowing input costs through the roof. Donnay’s view: the conflict could be “mildly supportive” short term, then turns bearish for demand in the medium term, and potentially bullish longer term if fertilizer and energy costs eventually tighten supply.
Is that combination impossible? No. Is it guaranteed? Not even close.
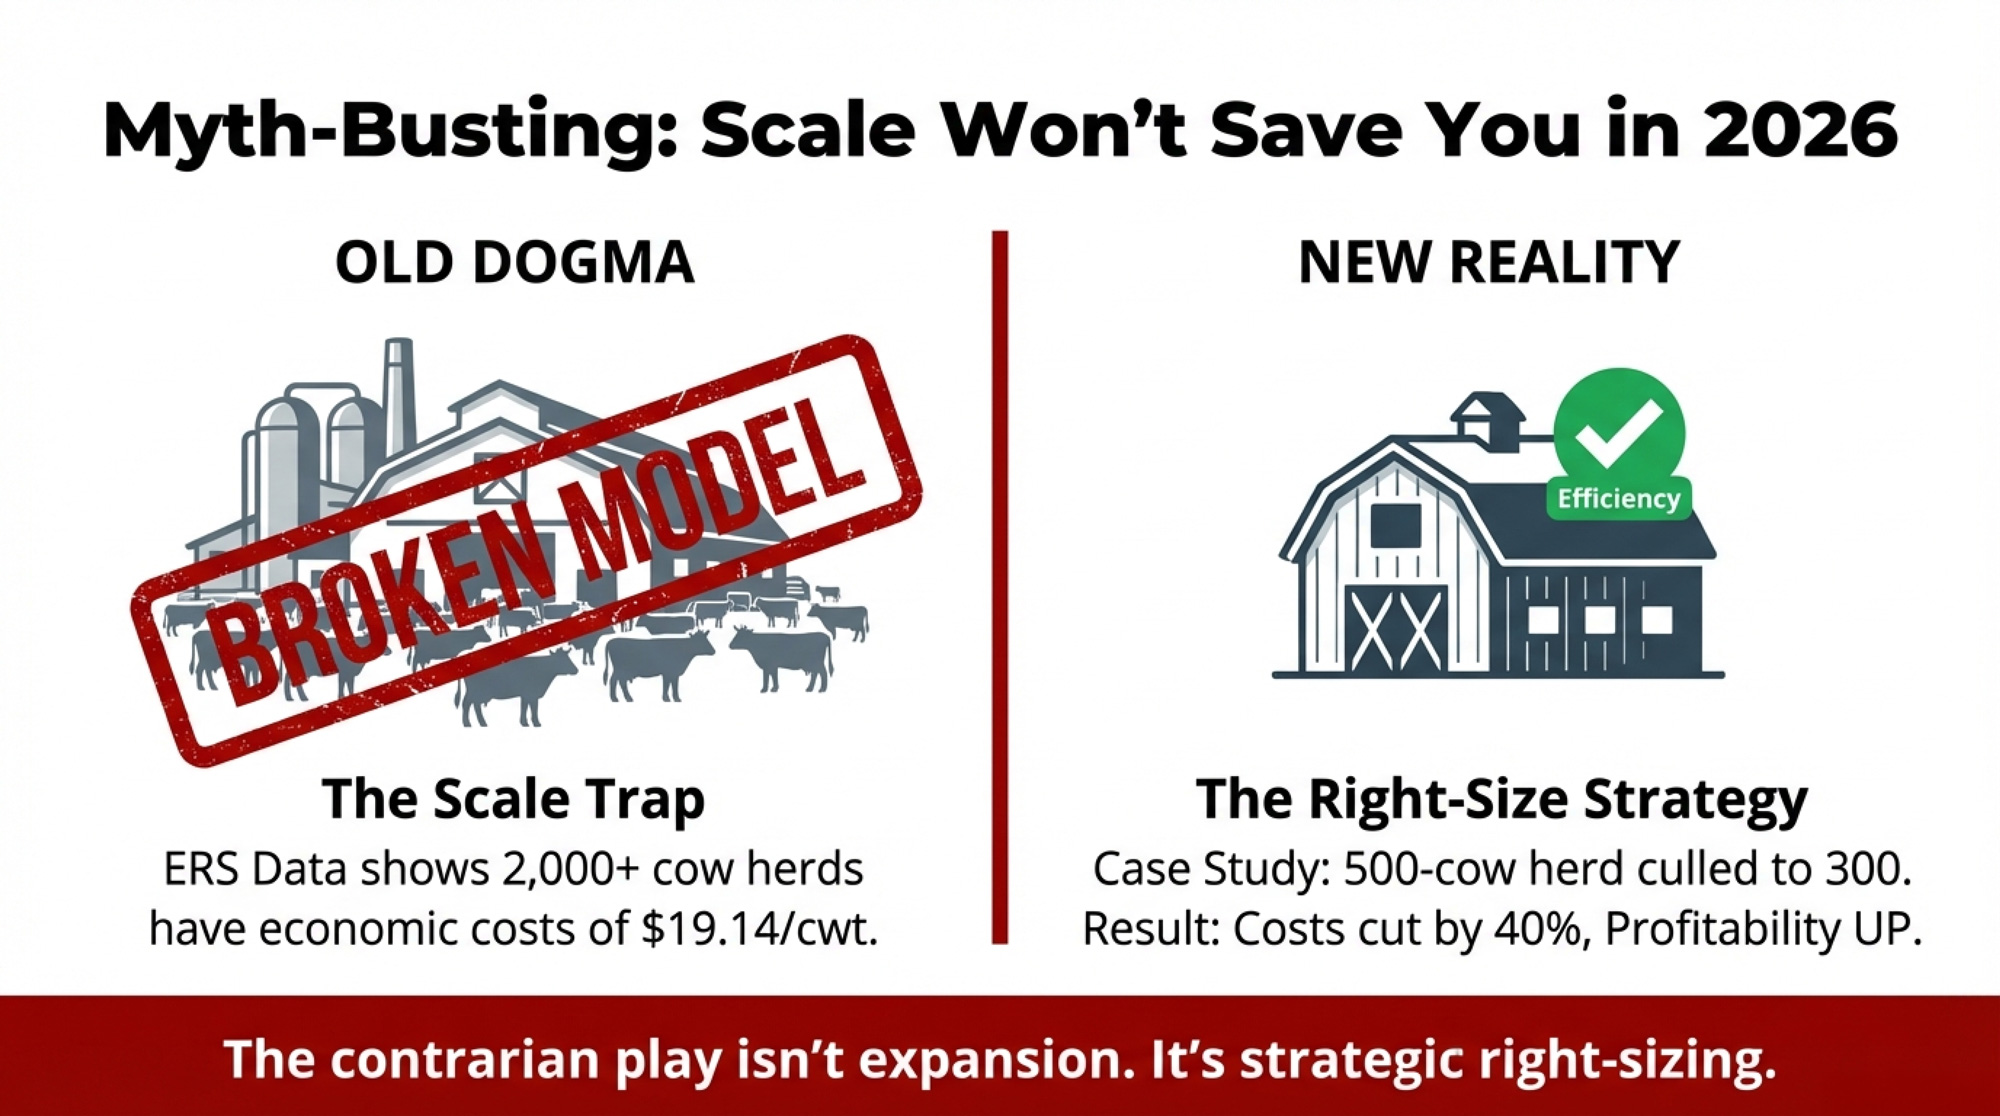
Donnay and Lancaster’s base case still points to strong production across major exporters, heavy EU SMP and butter stocks relative to 2025, a U.S. herd that keeps expanding even if the pace eases, and China with one foot in the export game. That’s why the contrarian play isn’t “never expand.” It’s “don’t build as if this rally is a floor.”
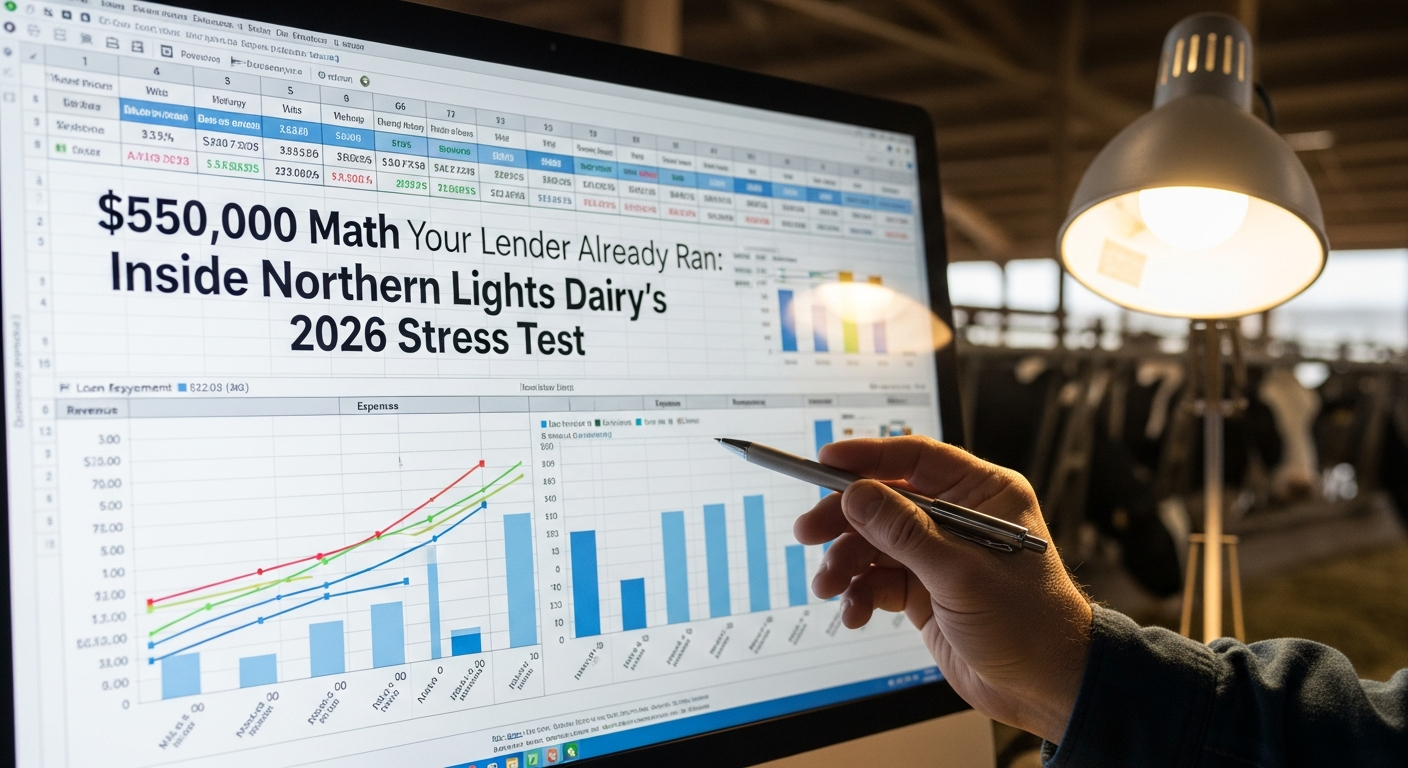
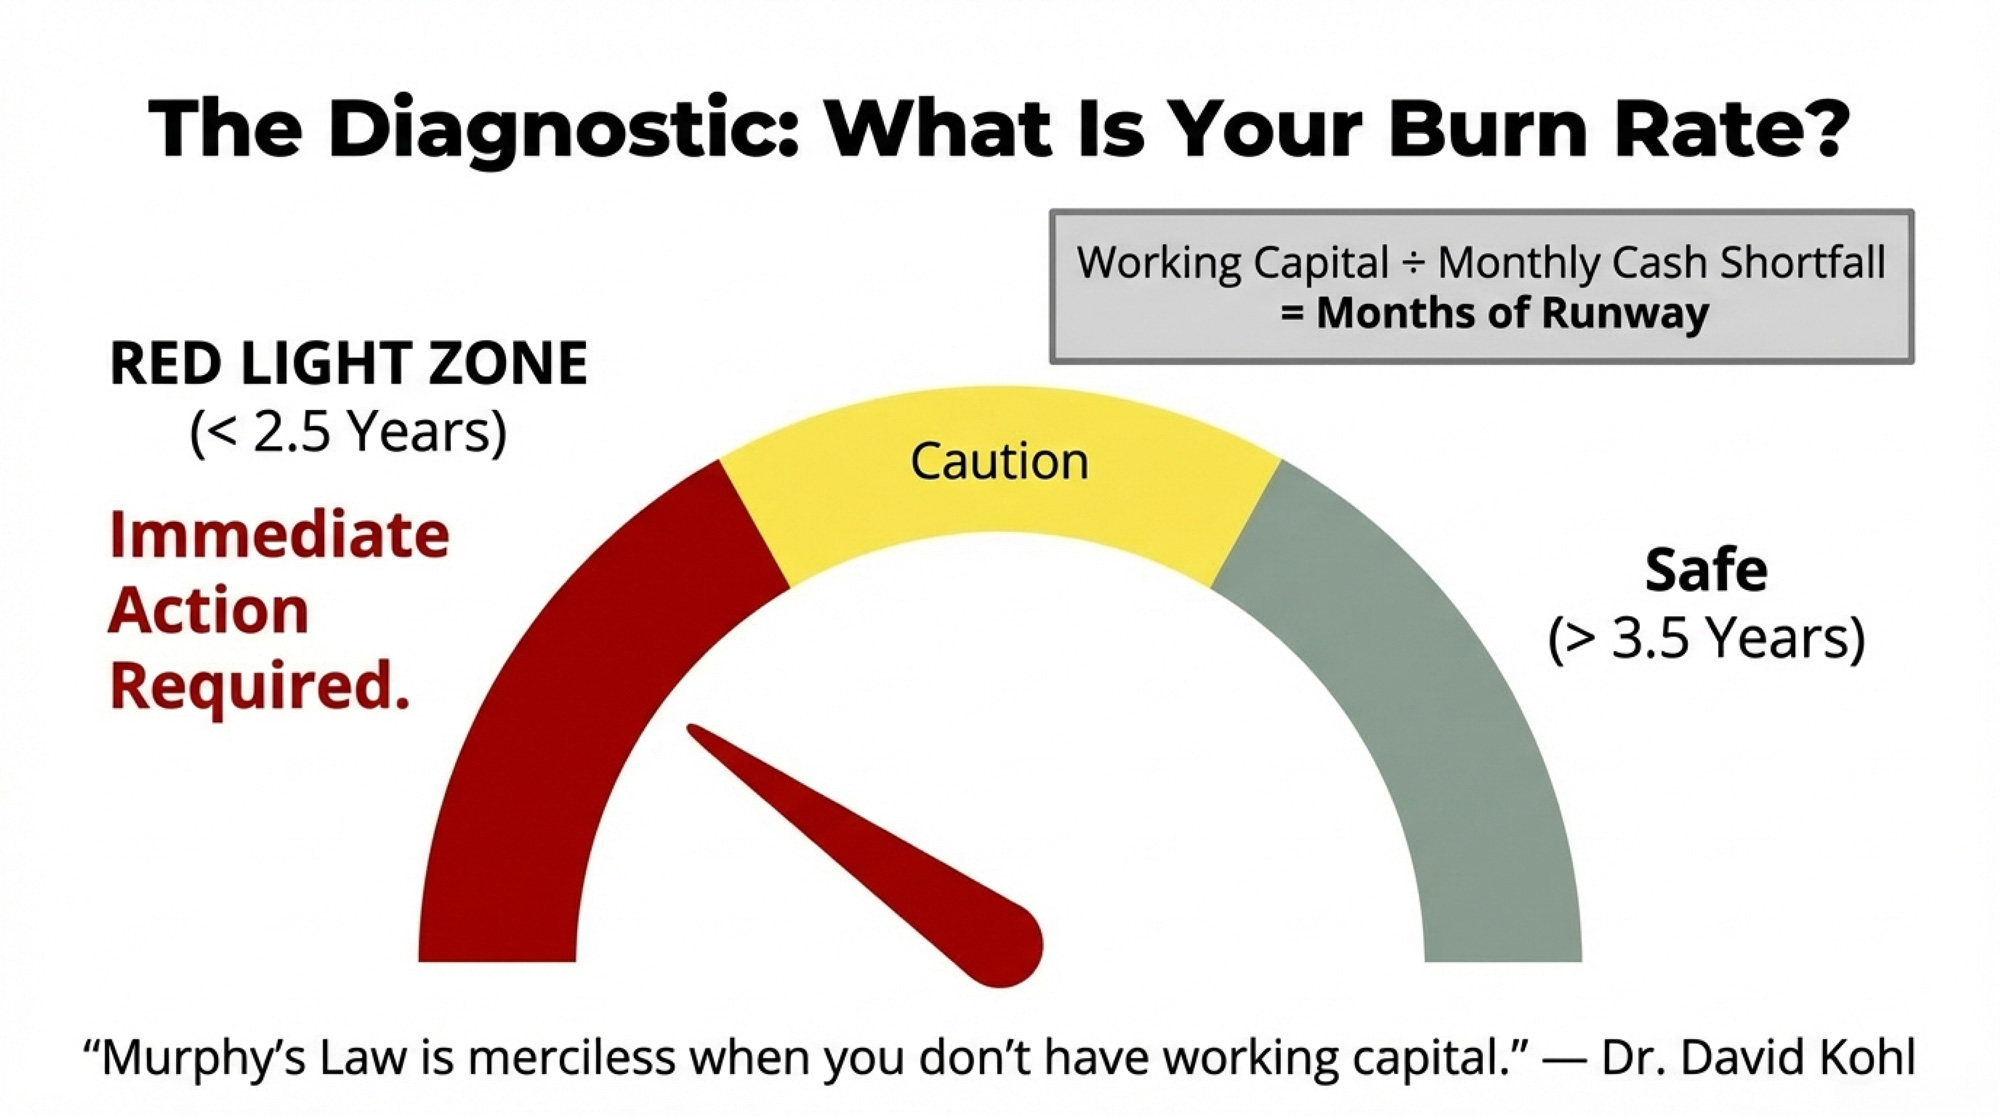
The Turn: One Stress Test Before You Sign Anything
Here’s where this shifts from “what the market’s doing” to “what you do about it.”
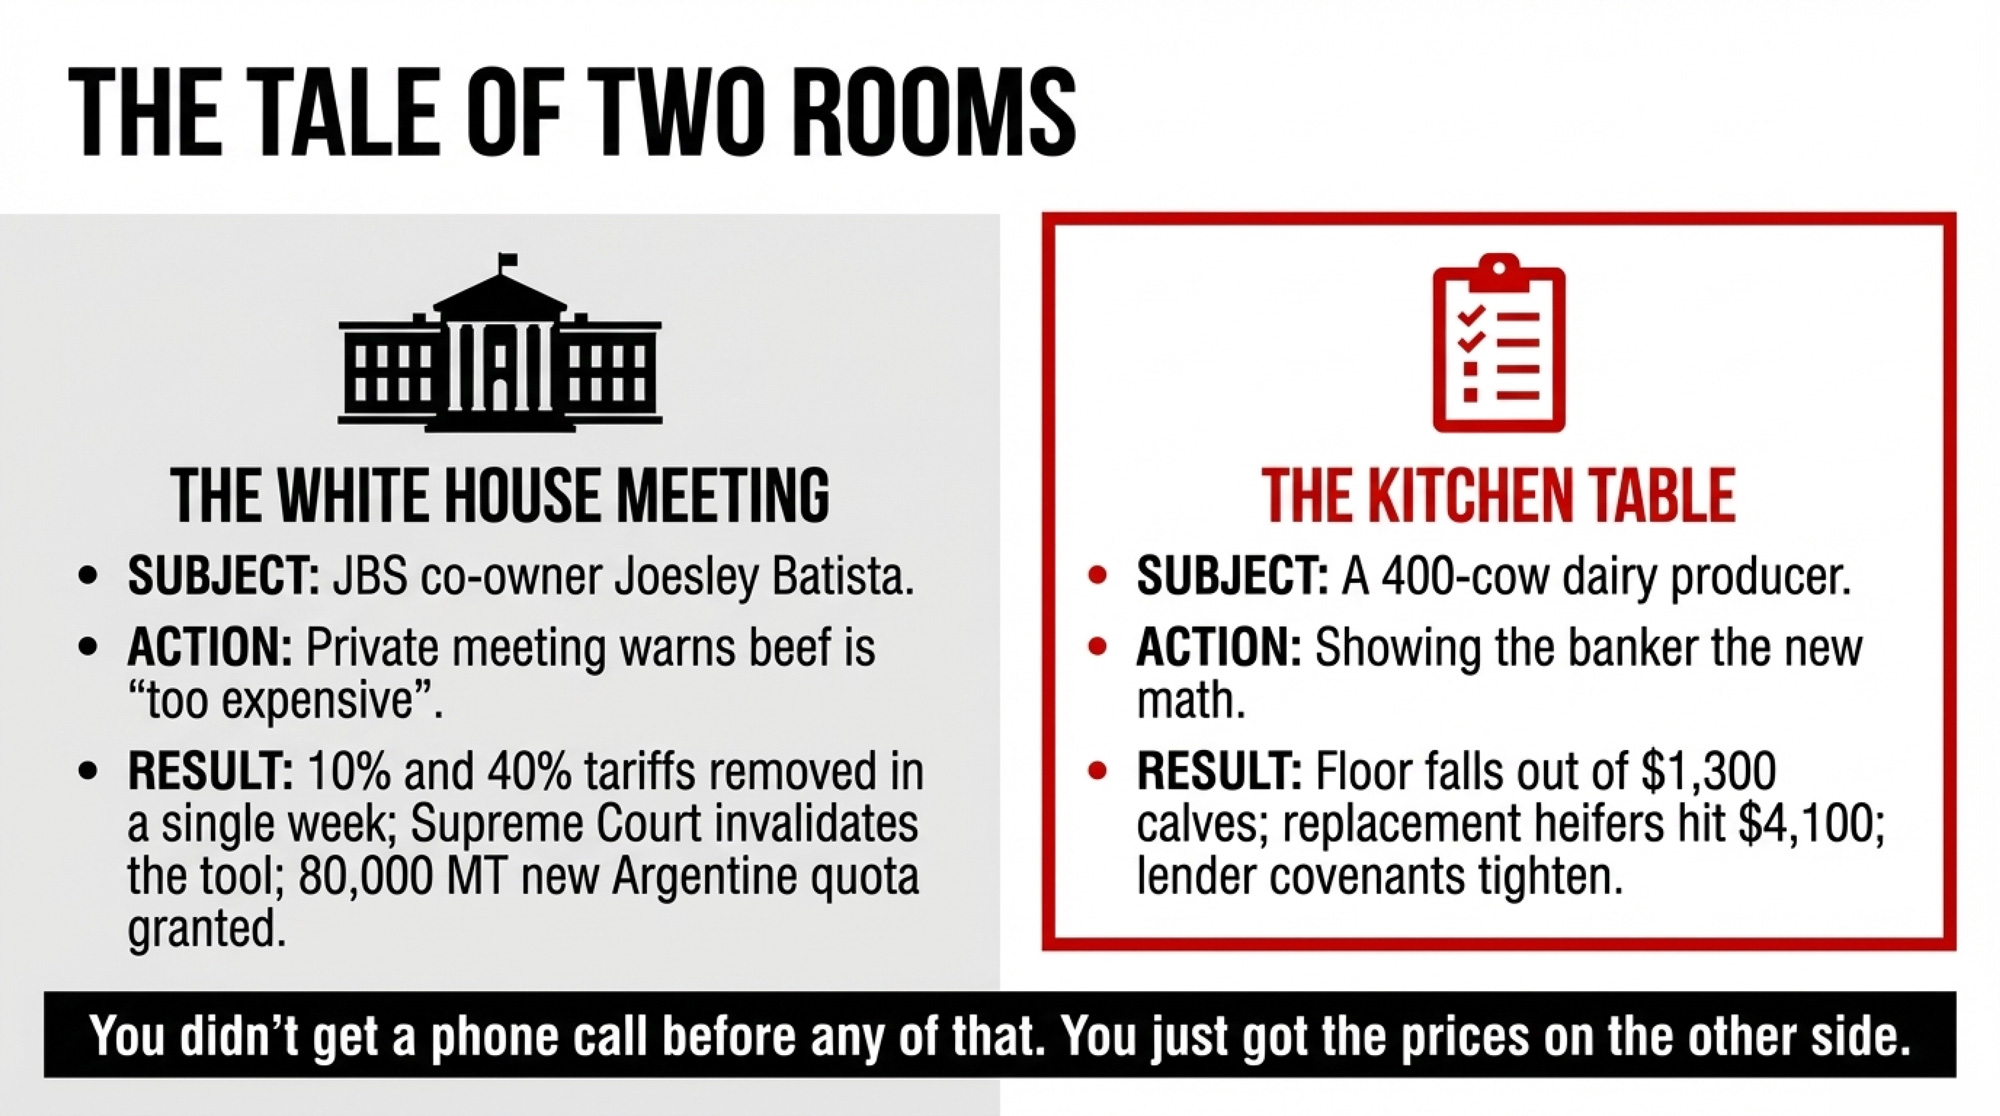
Picture the kitchen table. On one side, your lender has a pro forma that works at current margins. On the other hand, someone in the family remembers 2023 and isn’t sure those margins will be there when your kid takes over payments. The numbers on the screen say “go.” The knot in your stomach isn’t so sure.
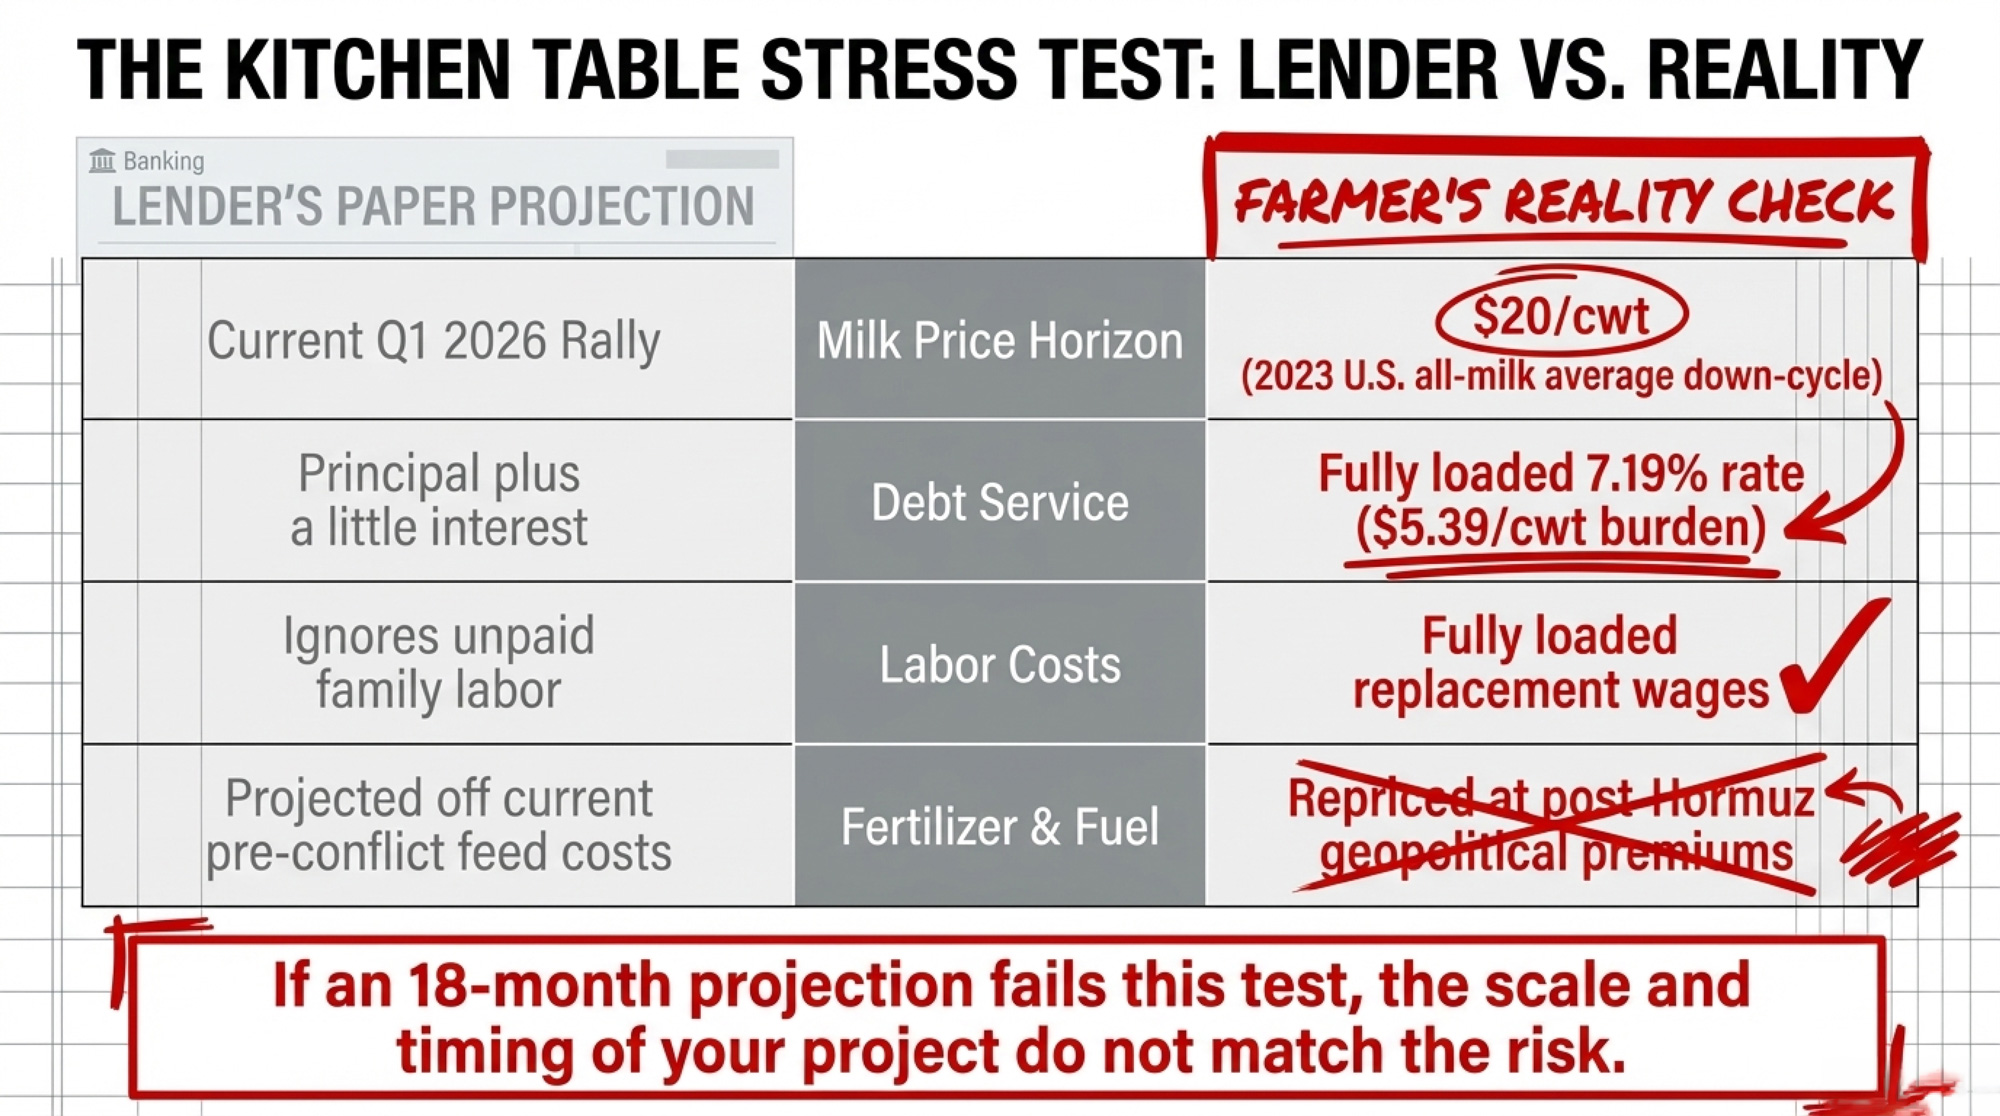
The market picture Donnay lays out — strong supply, heavy stocks, a rally built on logistics panic — points to one stress test every expansion plan should pass before pen hits paper:
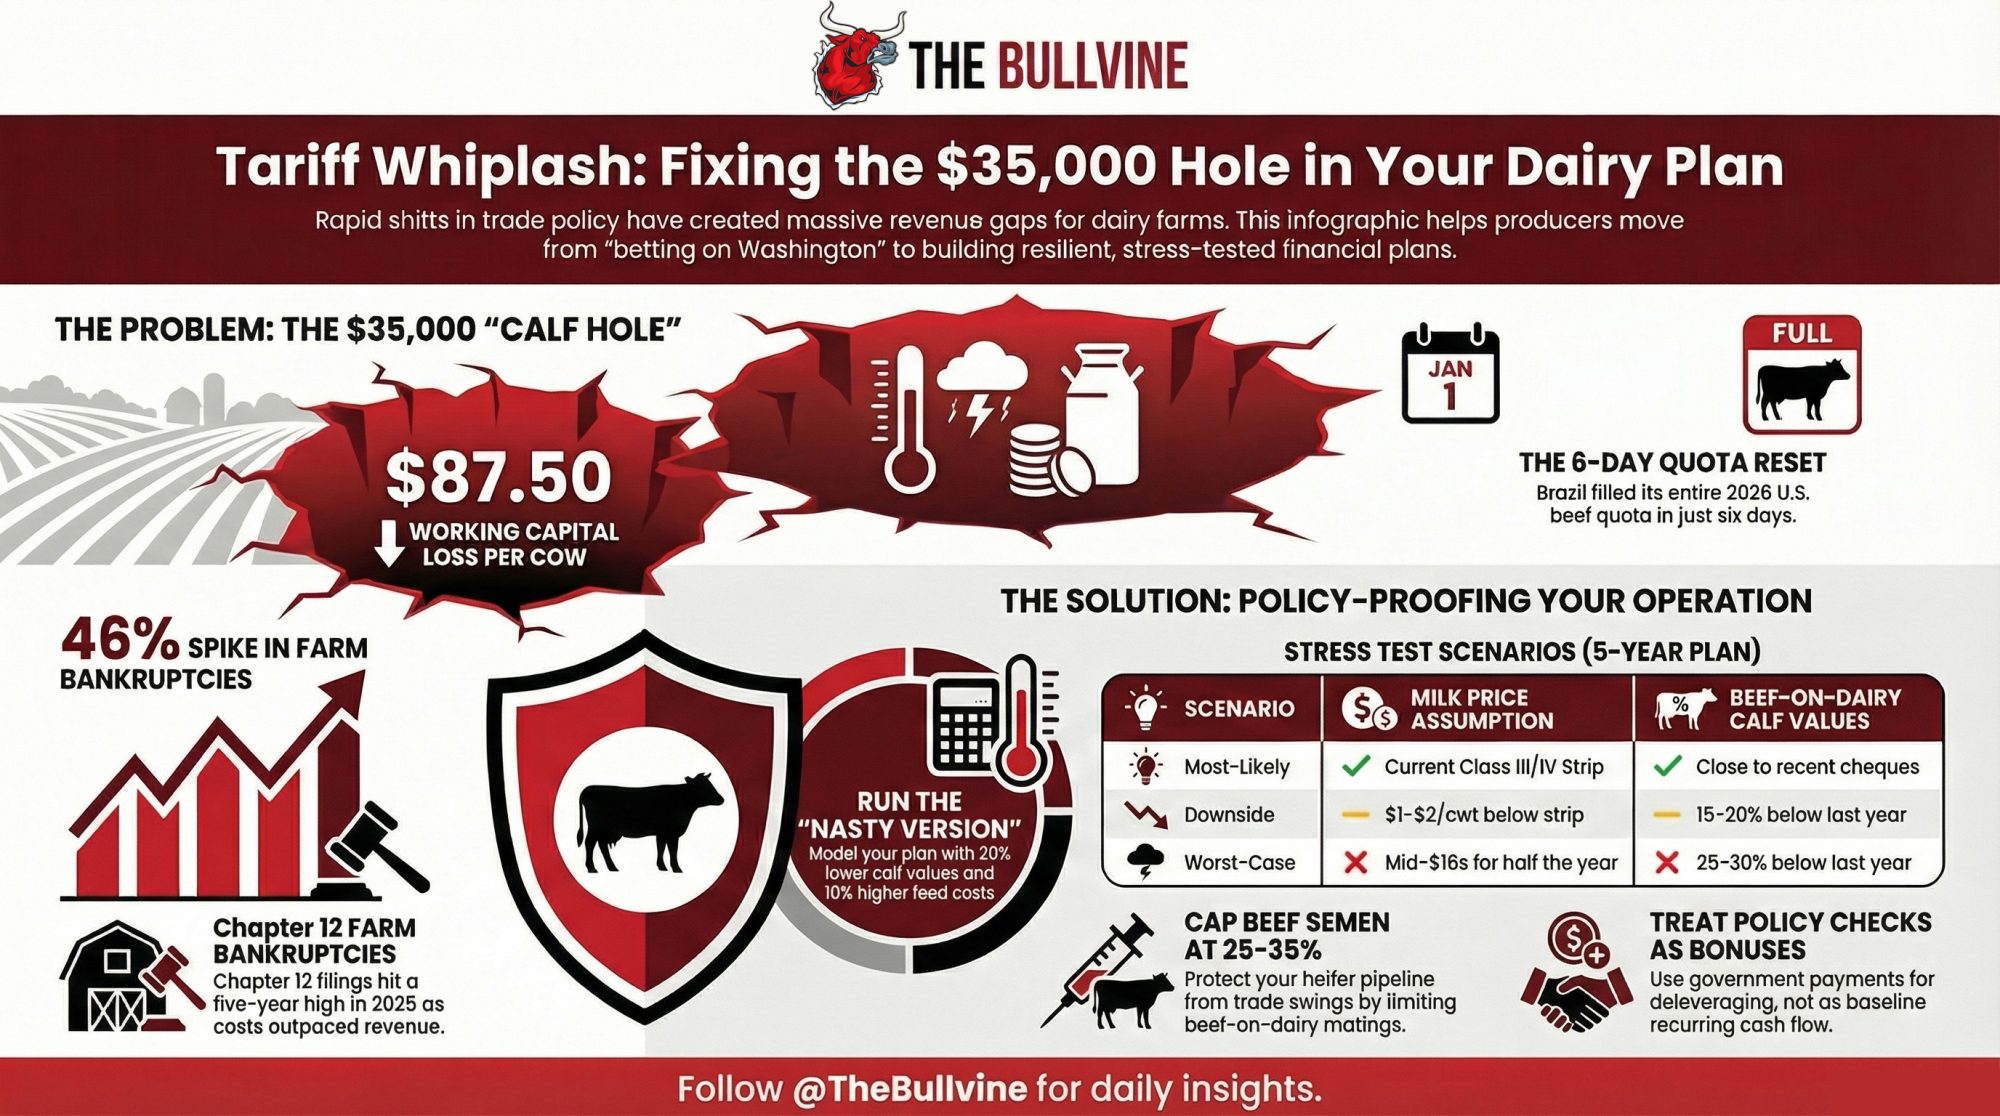
Run an 18‑month cashflow at a realistic down‑cycle milk price and softer beef cheques, using your full post‑expansion cost structure.
Not the price you hope for. The price you know you might see.
A conservative version of that test:
- Use a price around the 2023 national U.S. all‑milk average — roughly $20/cwt — as your down‑cycle starting point, then adjust for your own market and component program.
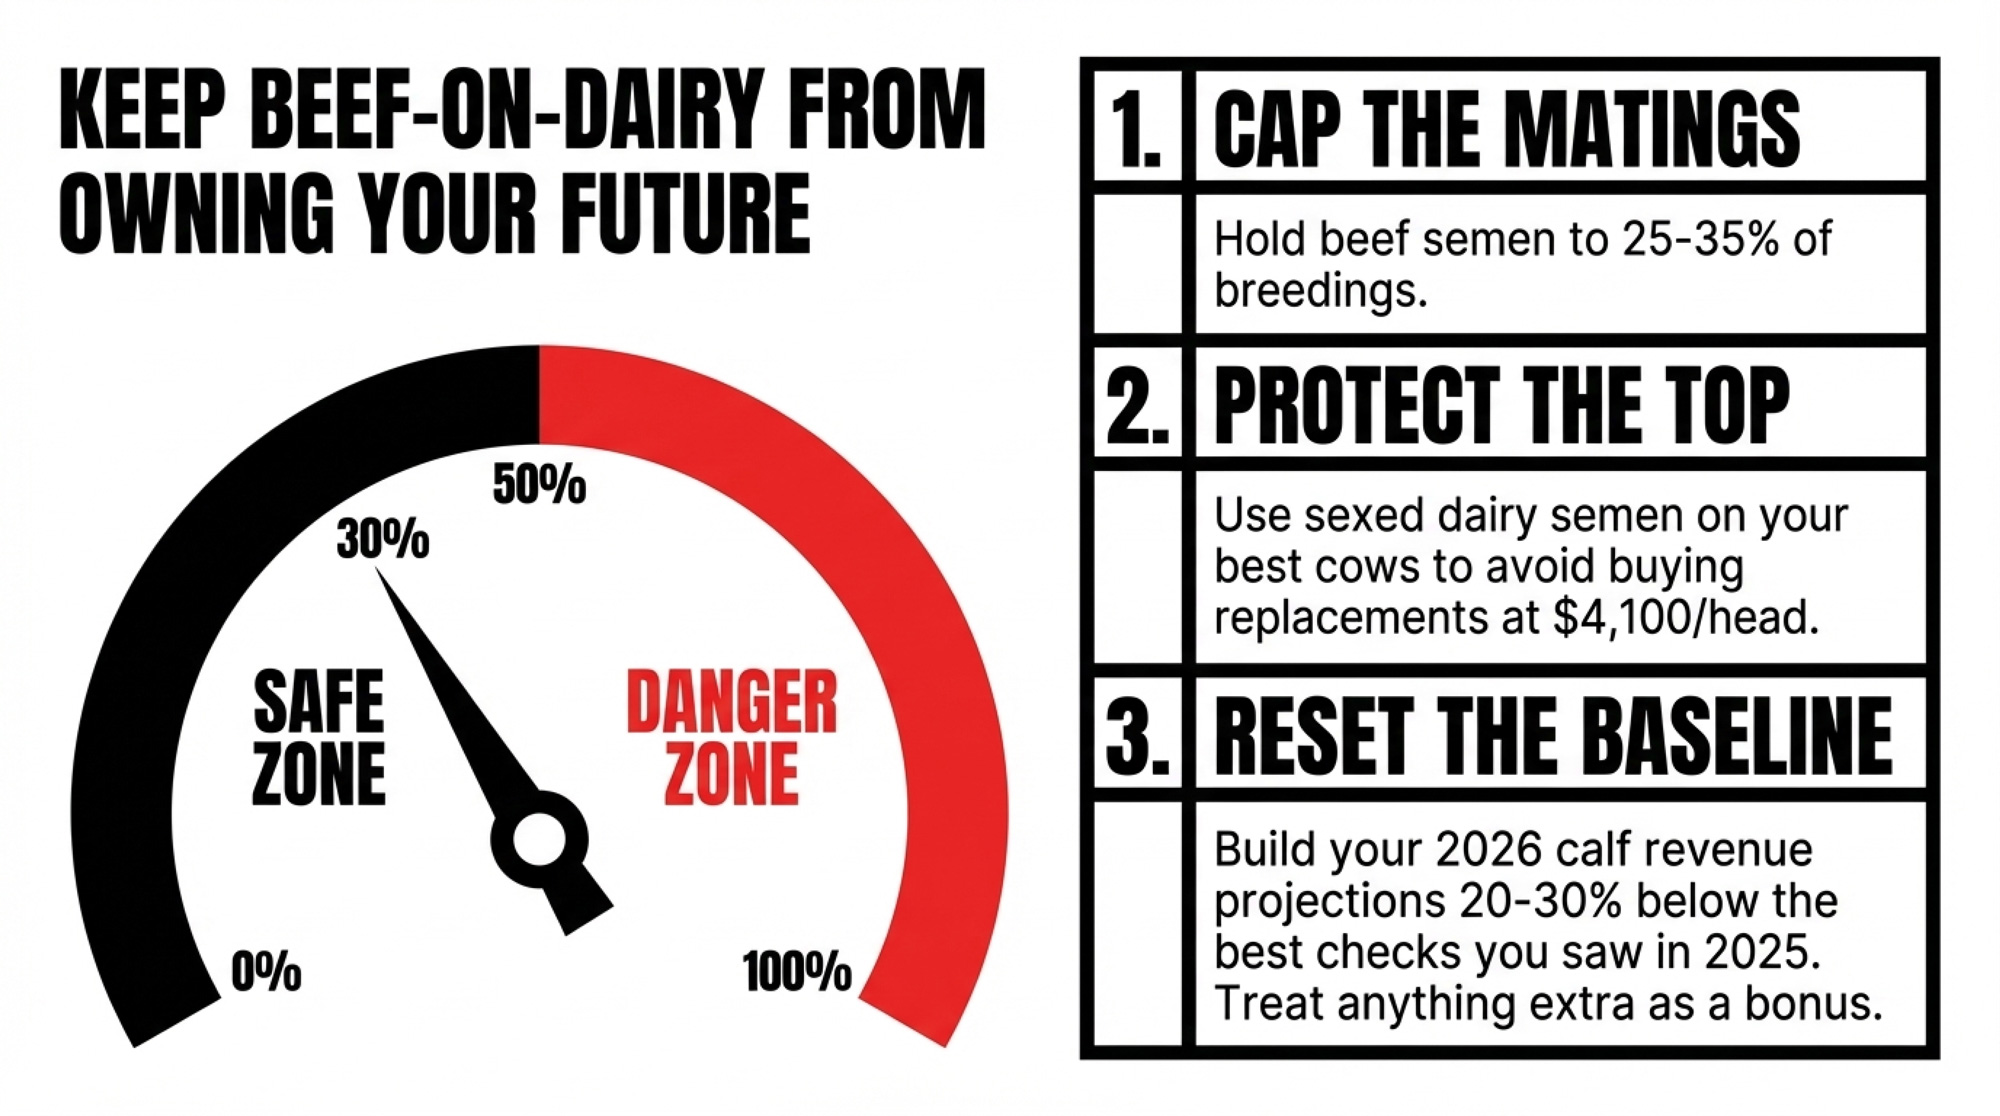
- Cut your beef and calf revenue assumptions back from today’s highs.
- Load in full principal + interest on all existing and new loans.
- Pay yourself and your family at replacement wages.
- Price fertilizer, fuel, and purchased feed at post‑Hormuz levels once current contracts expire.
If that 18‑month projection shows operating debt climbing with no credible path back down, that’s not just “tight.” It means the scale or timing of the project doesn’t match the risk you’re actually comfortable carrying.
| Scenario | Milk Price ($/cwt) | Feed+Var ($/cwt) | Debt Svc ($/cwt) | Net Cash/Cow/yr | 500-Cow Annual Net |
|---|---|---|---|---|---|
| Current Rally (Q1 2026) | $23 | $14.50 | $5.39 | $373 | $186,600 |
| Base / Mid-Cycle | $21 | $14.50 | $5.39 | $133 | $66,500 |
| 2023 Down-Cycle Avg | $20 | $14.50 | $5.39 | $13 | $6,600 |
| Post-Hormuz Input Costs | $20 | $16.00 | $5.39 | -$$173** | -$86,400 |
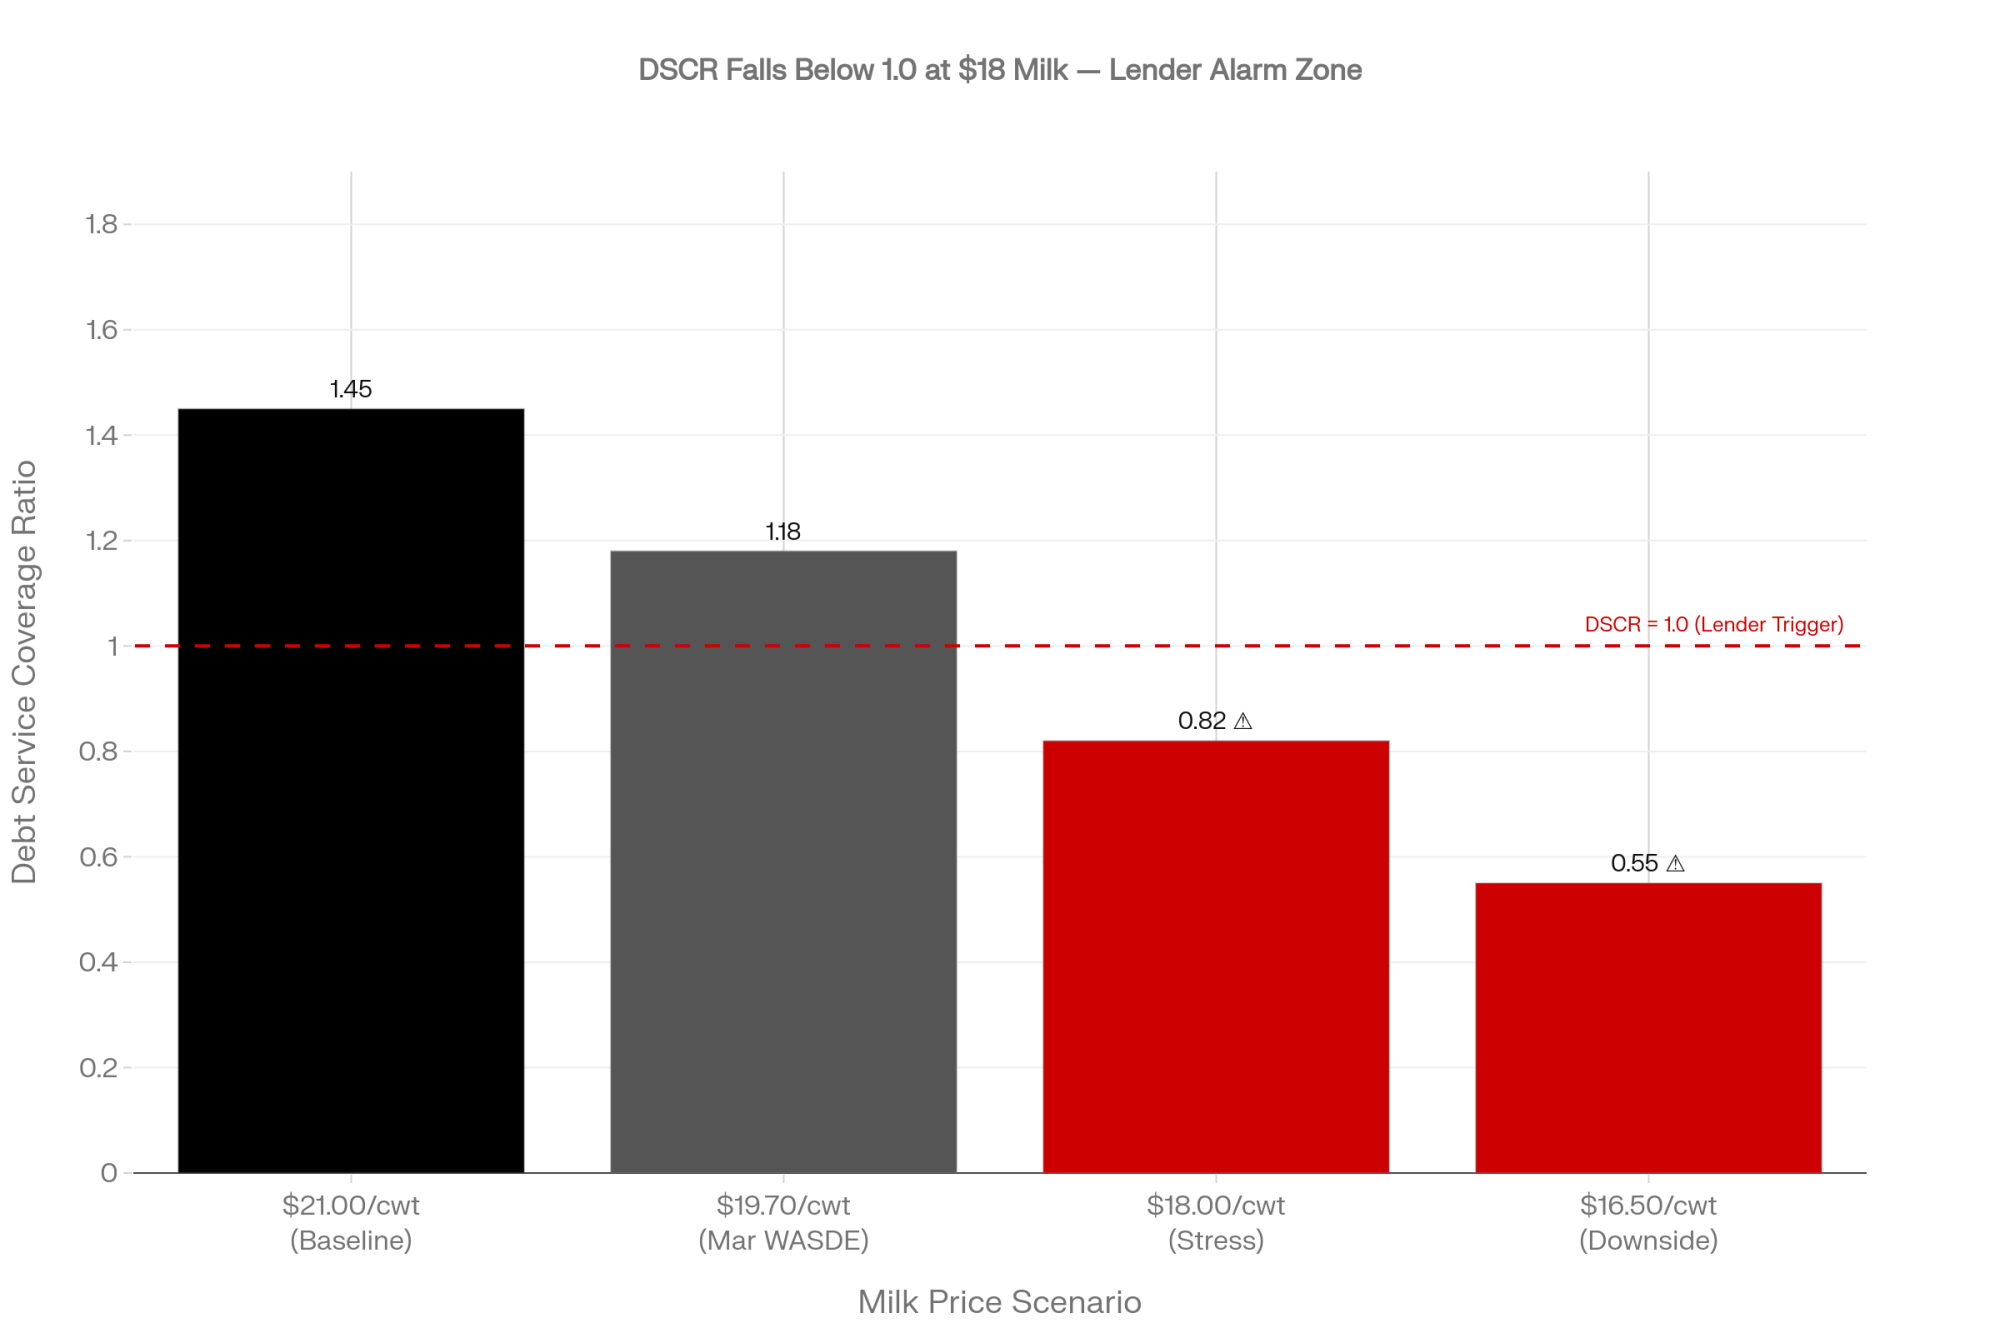
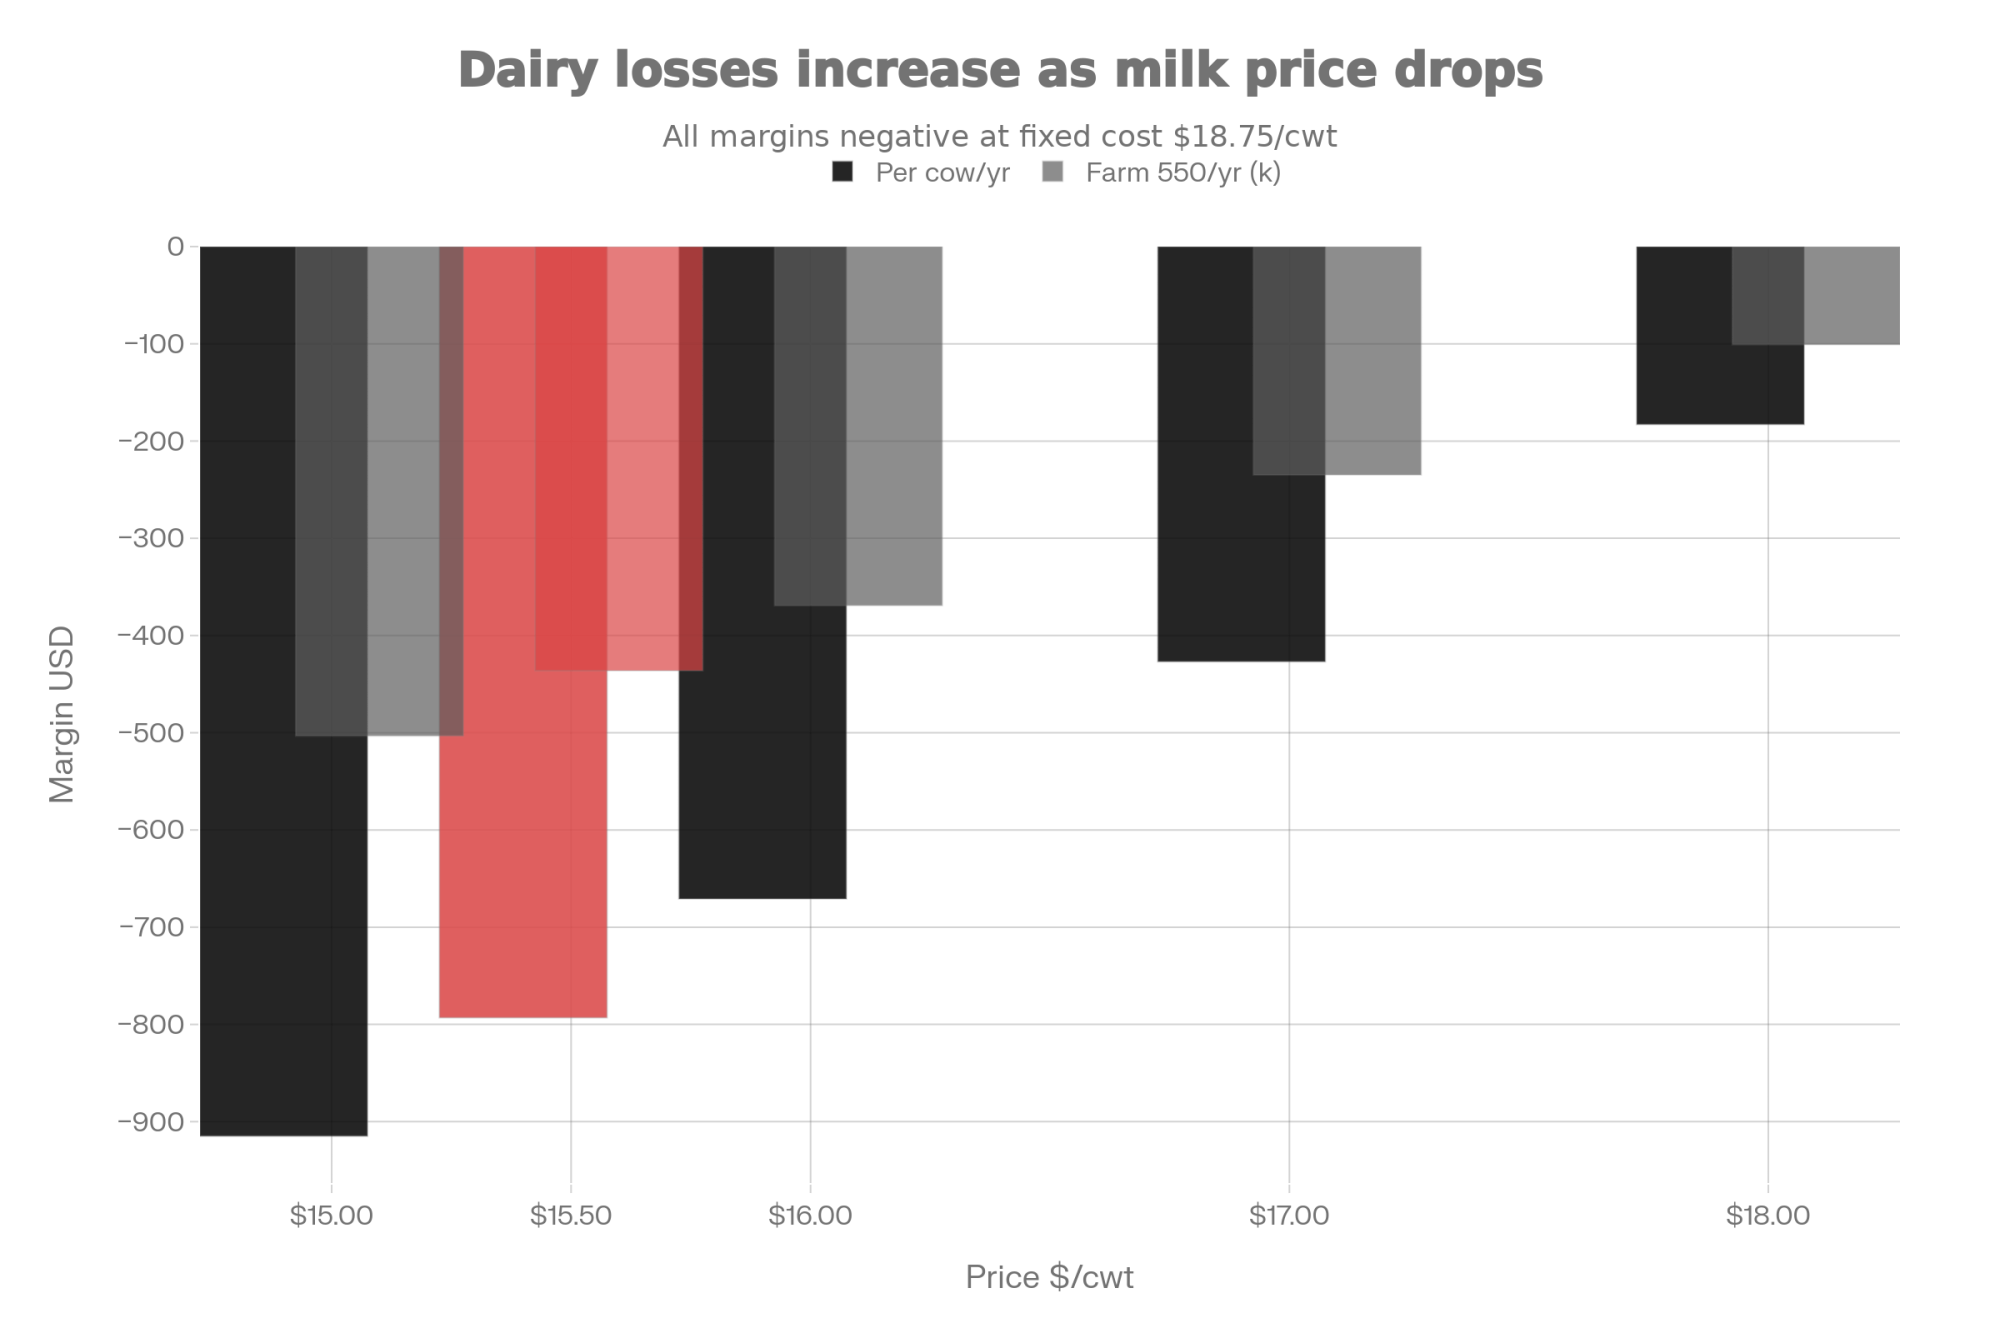
| Severe Stress (teens) | $18 | $16.00 | $5.39 | -$413 | -$206,400 |
How Should a 500‑Cow Dairy Use the 2026 Rally Without Getting Trapped?
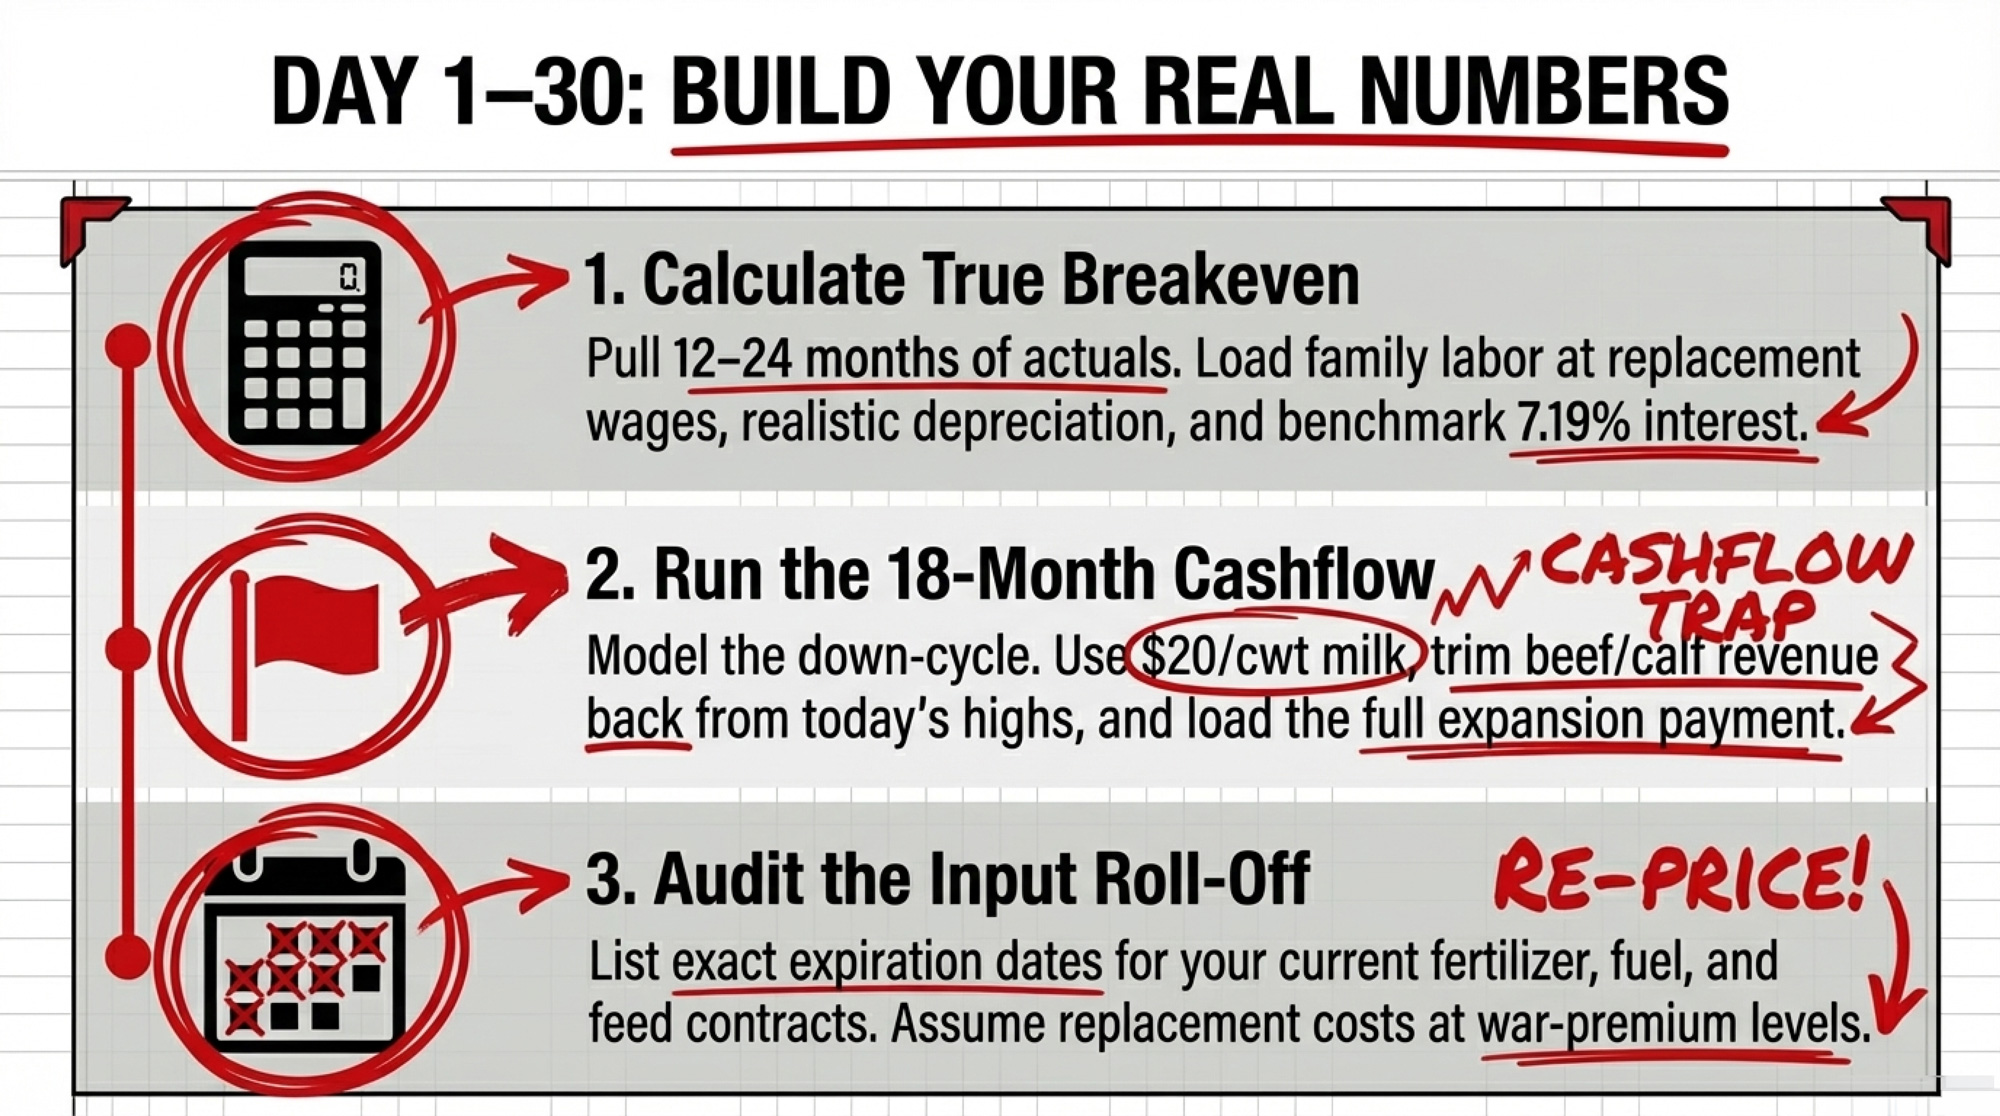
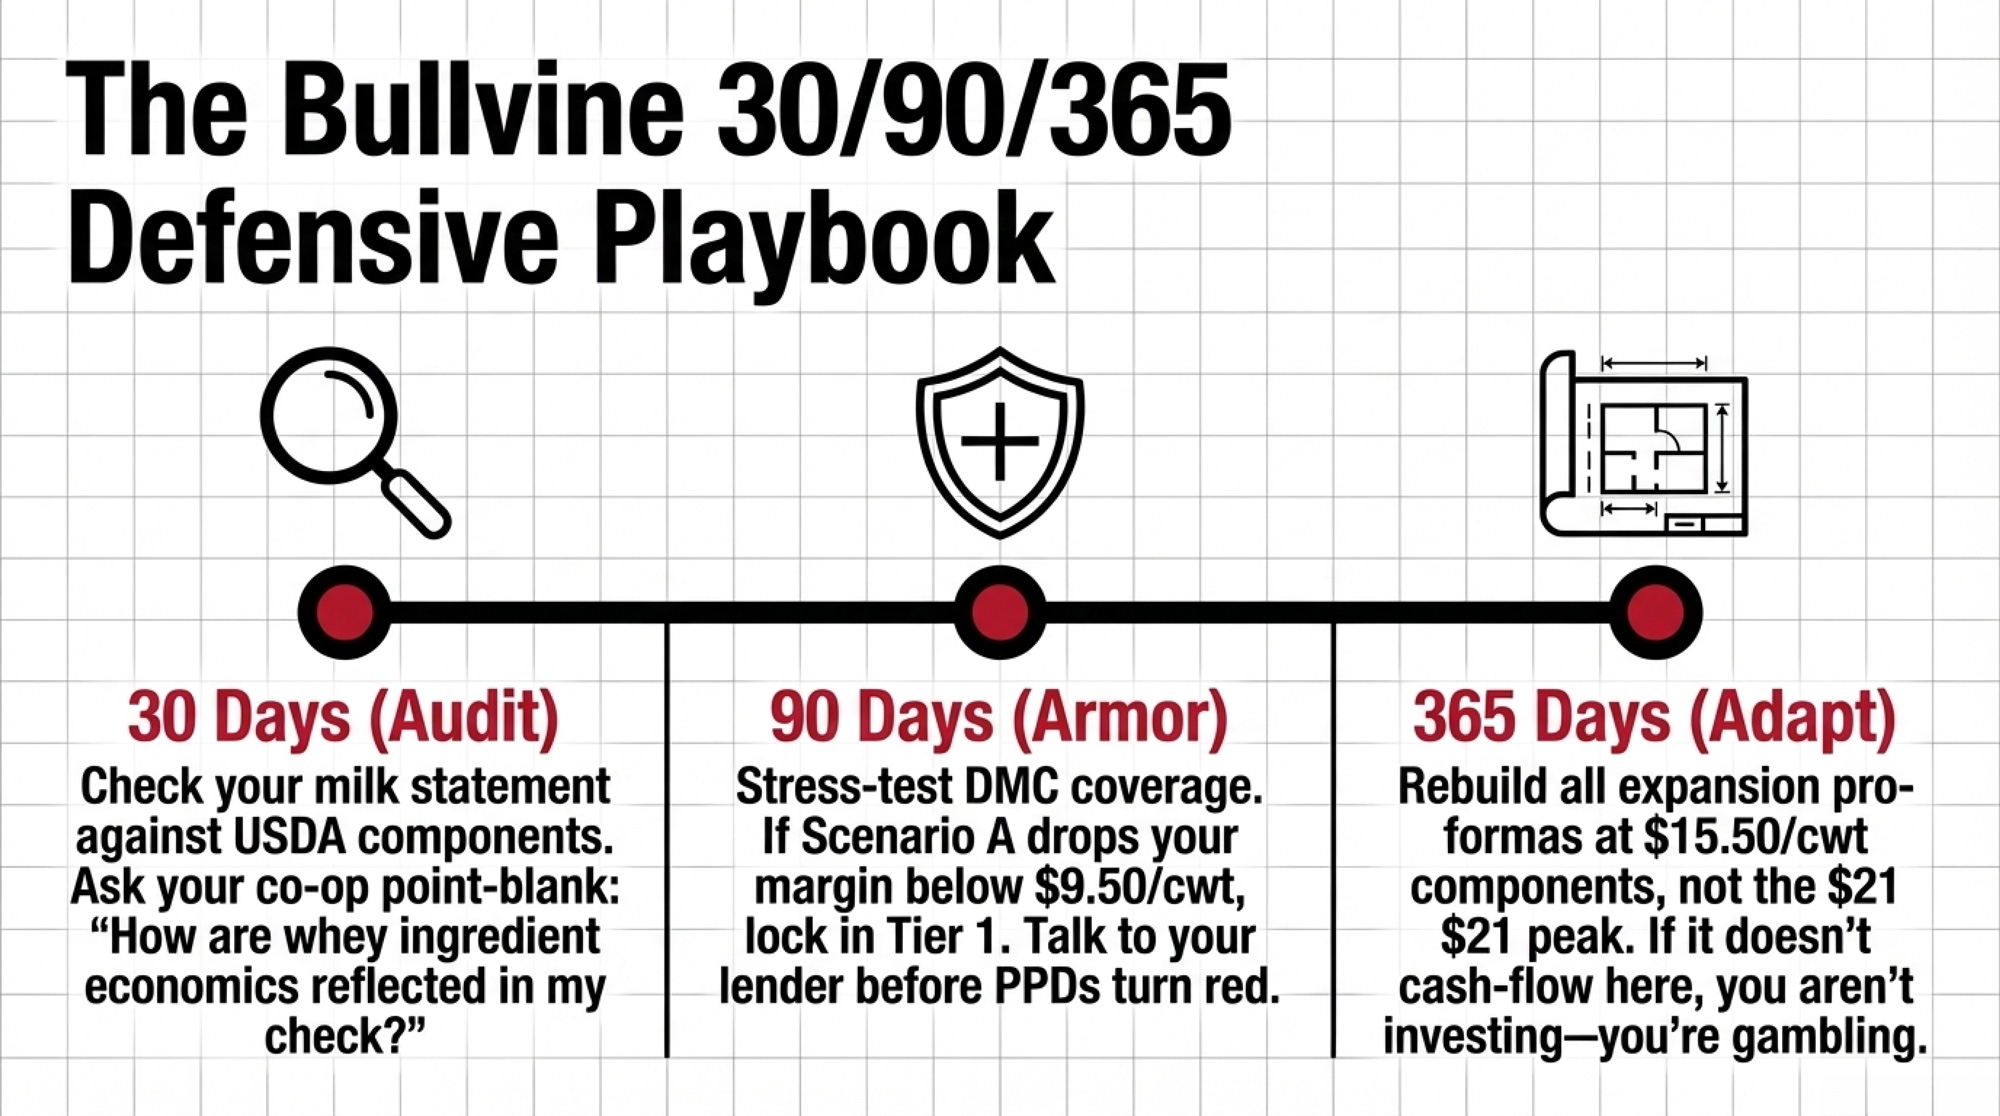
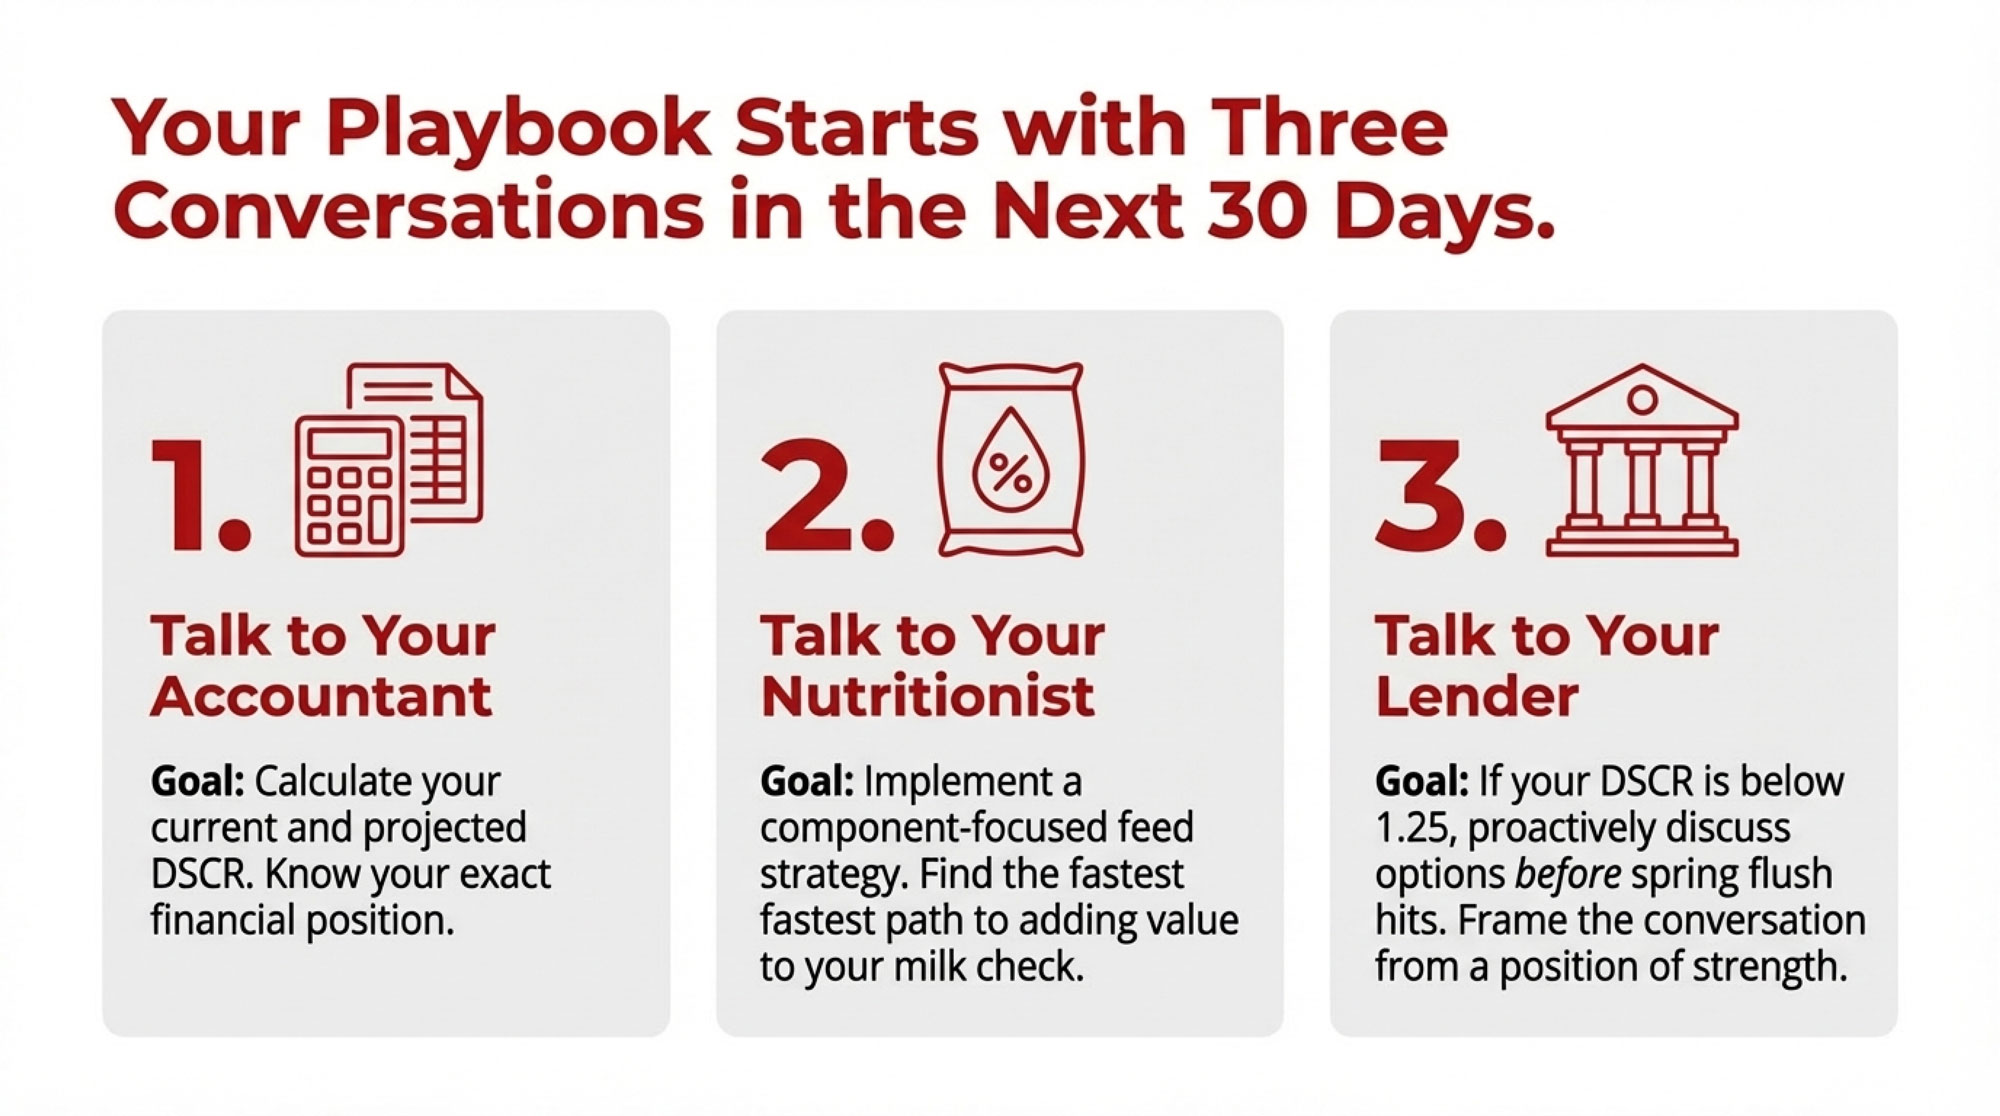
In the Next 30 Days: Build Your Real Numbers
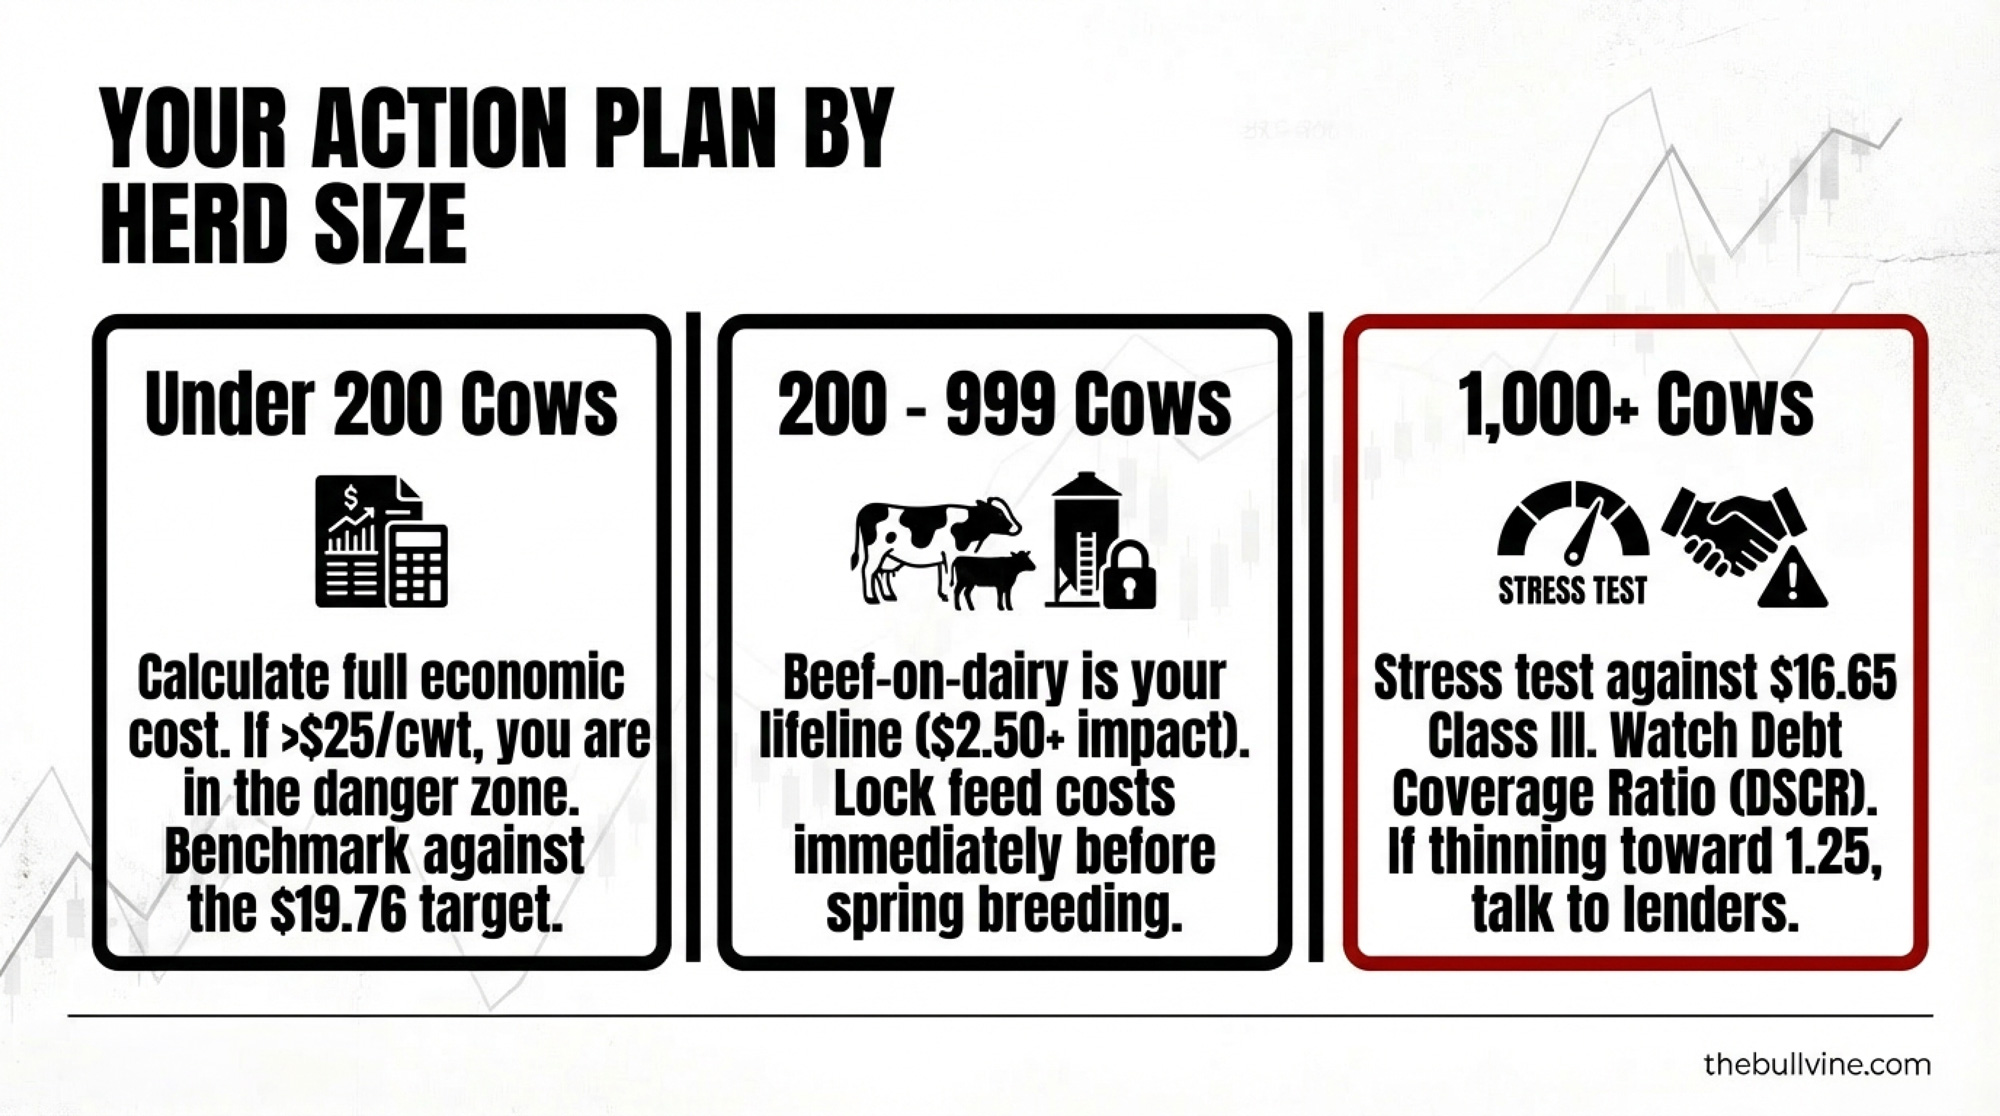
- CALCULATE your true breakeven. Pull 12–24 months of actual data — milk checks, feed bills, fert, fuel, repairs, debt statements. Build a breakeven that includes family labor at replacement wages, realistic depreciation, and current interest rates. Farm real‑estate rates in the Chicago Fed district sat in the high‑6 to low‑7 percent range through 2025, with farm real‑estate loans around 7.19% at the start of 2025 — use that as your benchmark.
- RUN the 18‑month cashflow at a down‑cycle price. Use a conservative milk price for your region (around 2023 levels or below), trim beef revenue, and include full payments on any expansion you’re considering. If operating debt climbs for most of that window, revisit project scale or timing.
- AUDIT when “cheap” inputs roll off. List expiration dates for your fertilizer, fuel, and feed contracts. Where you’re still living on pre‑conflict pricing, assume the replacement cost is higher and model it.
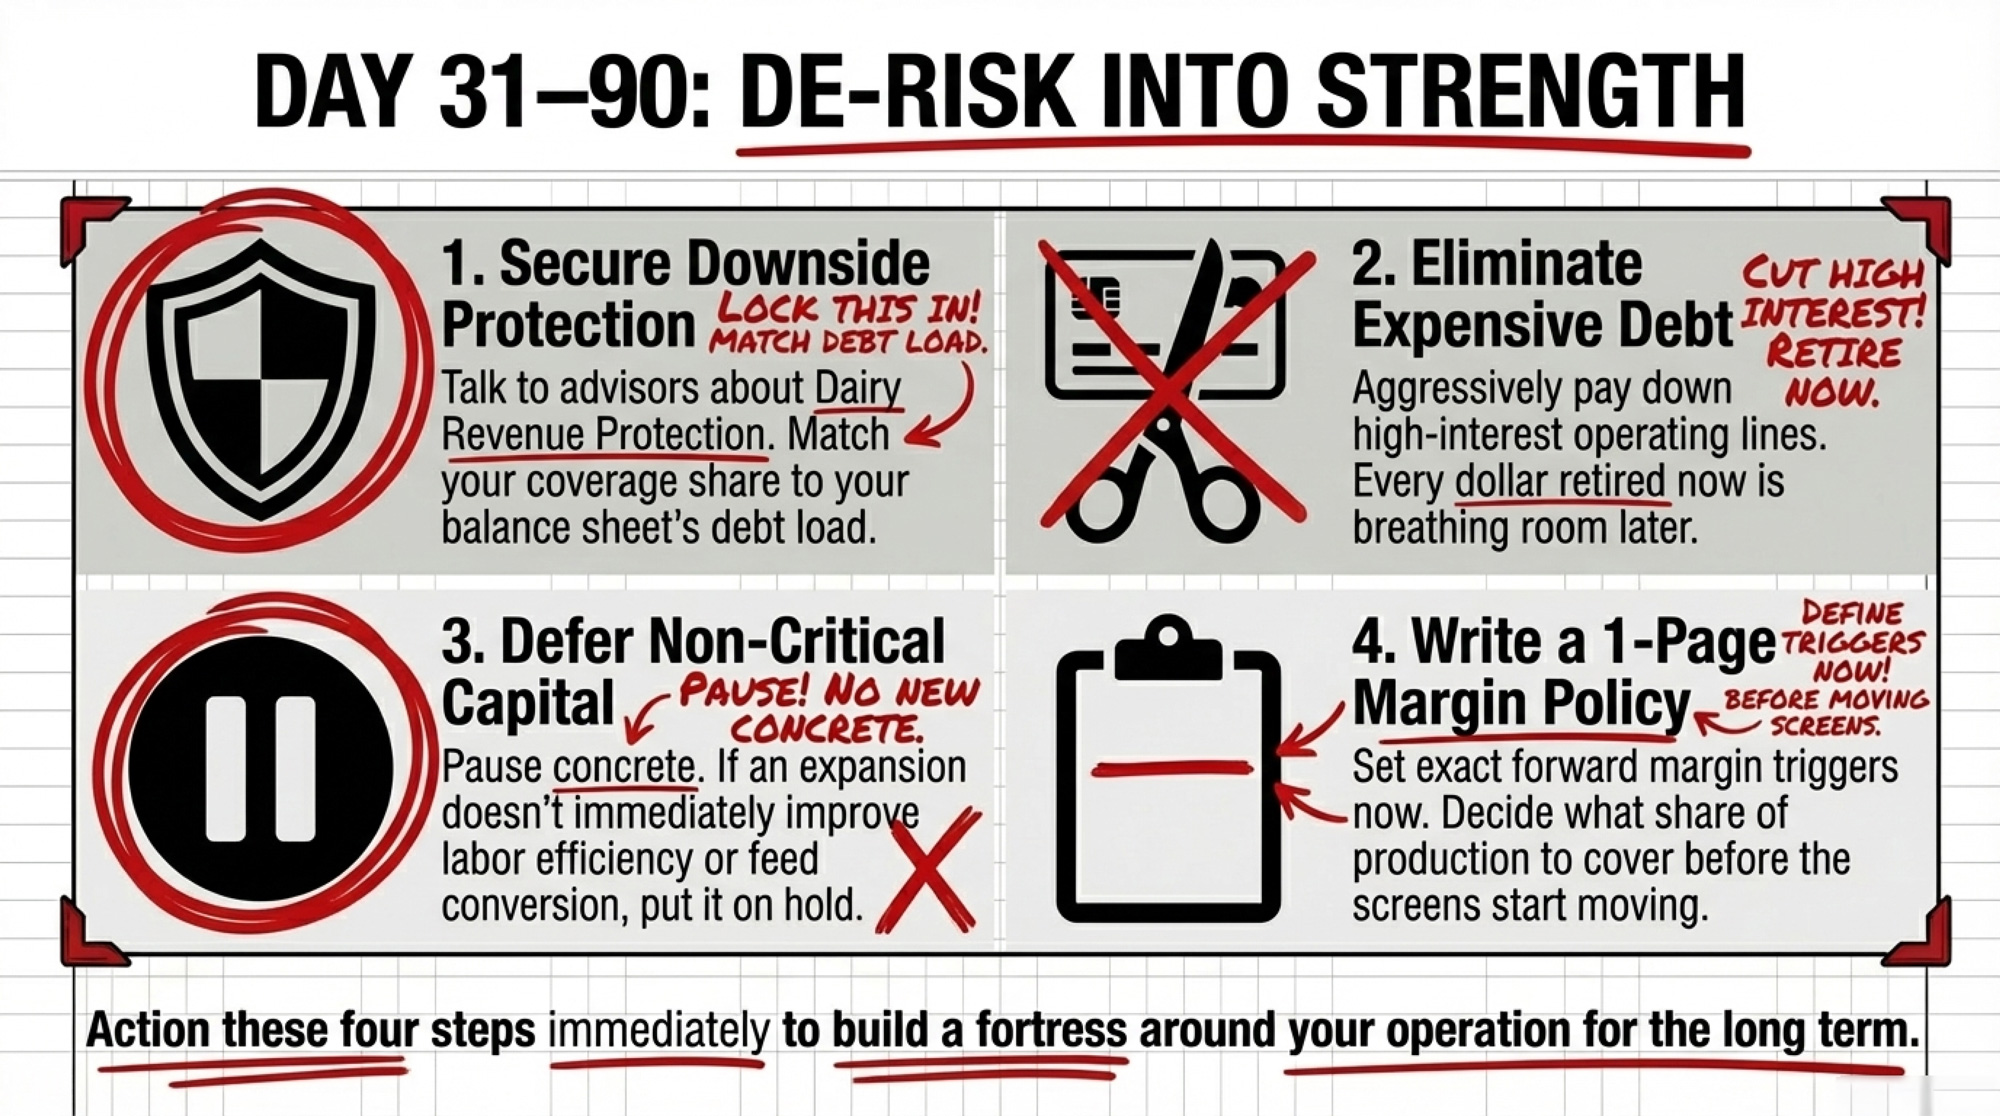
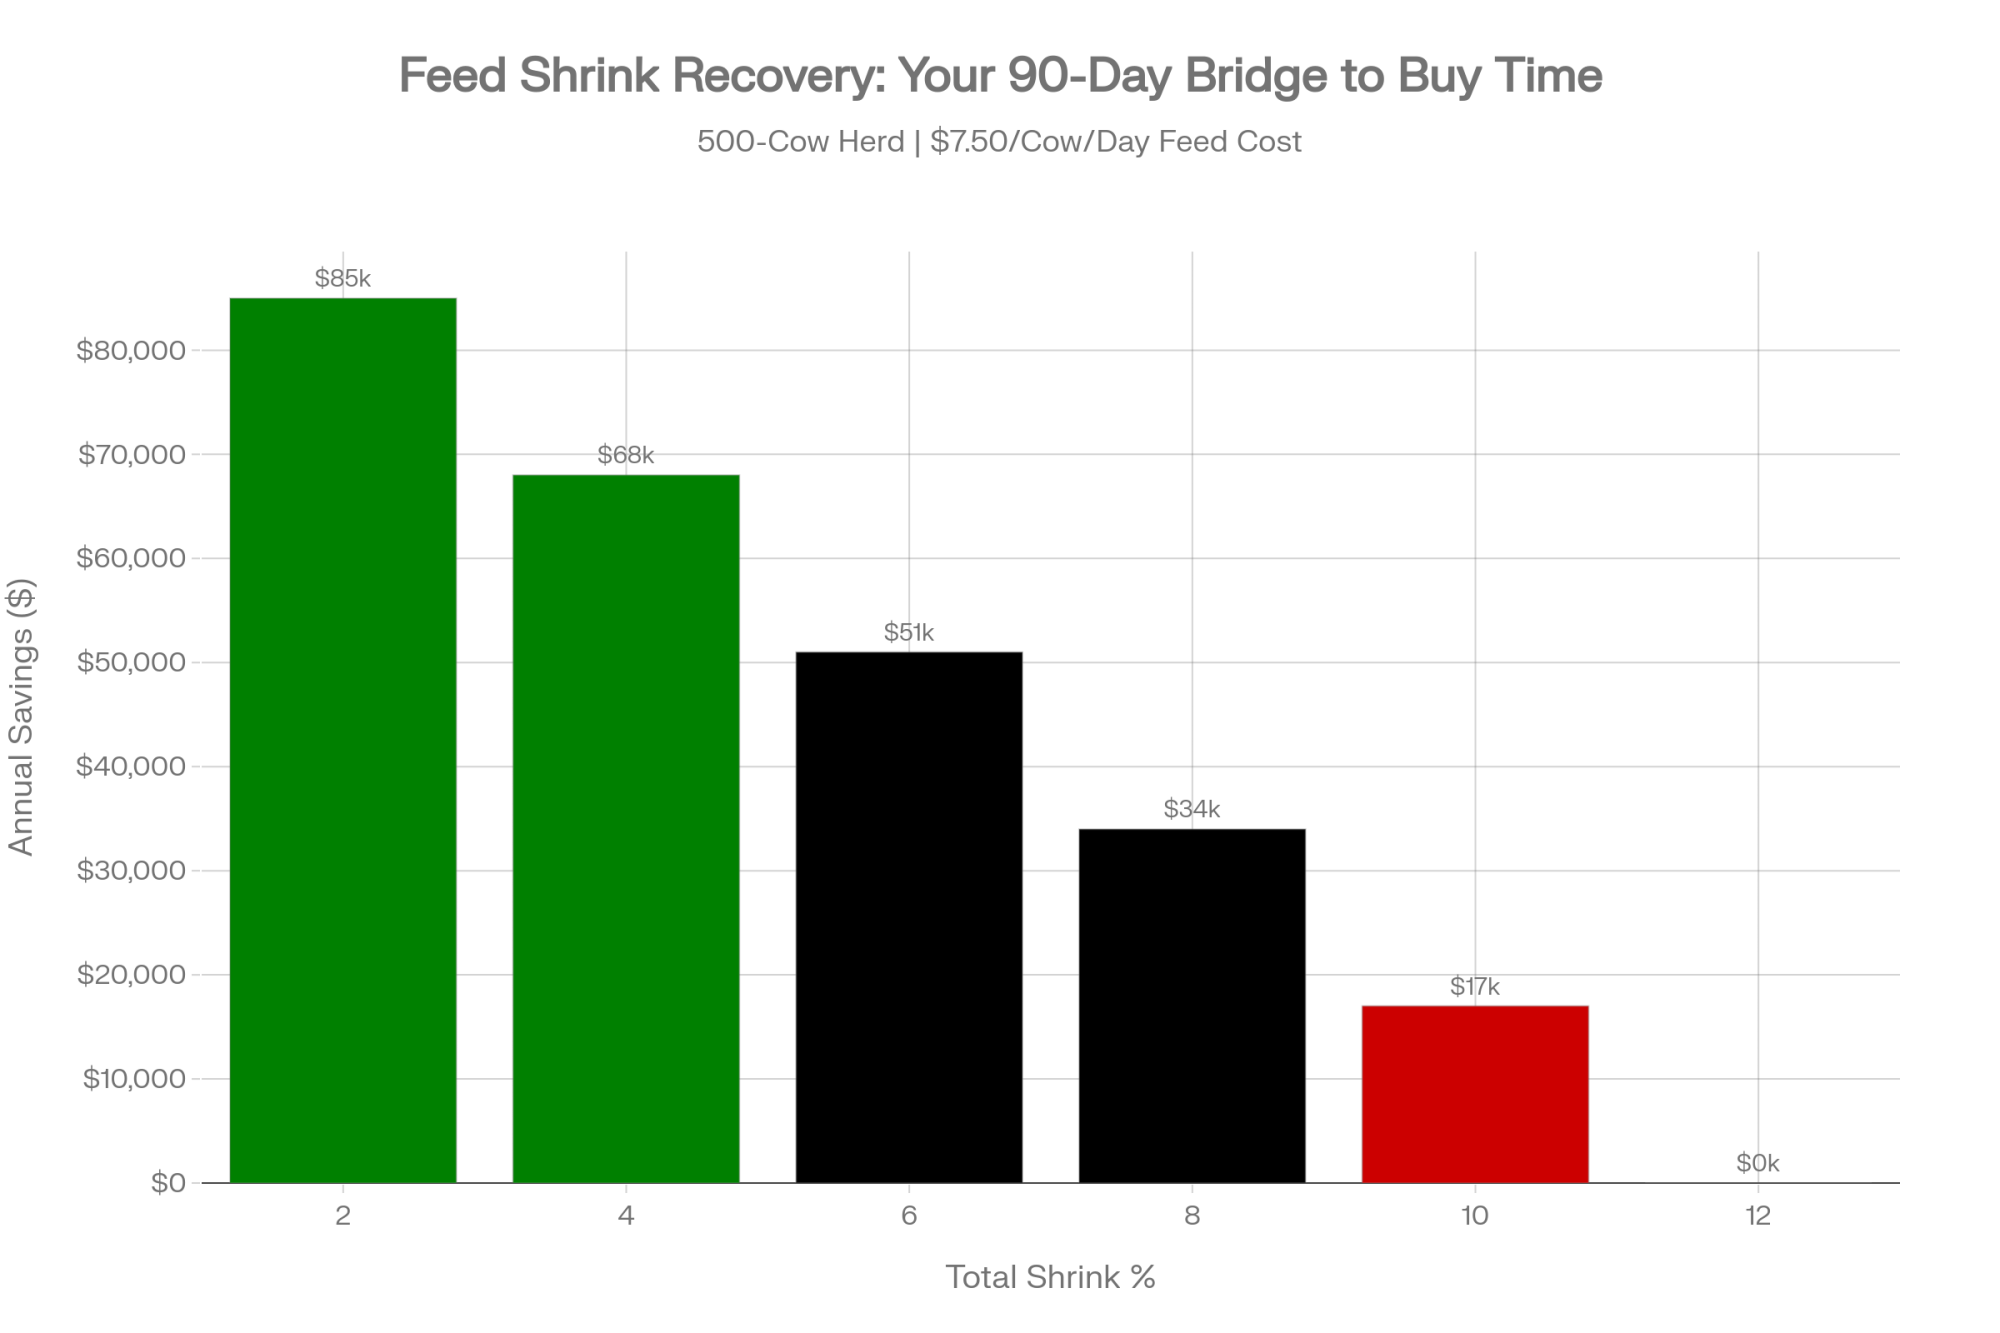
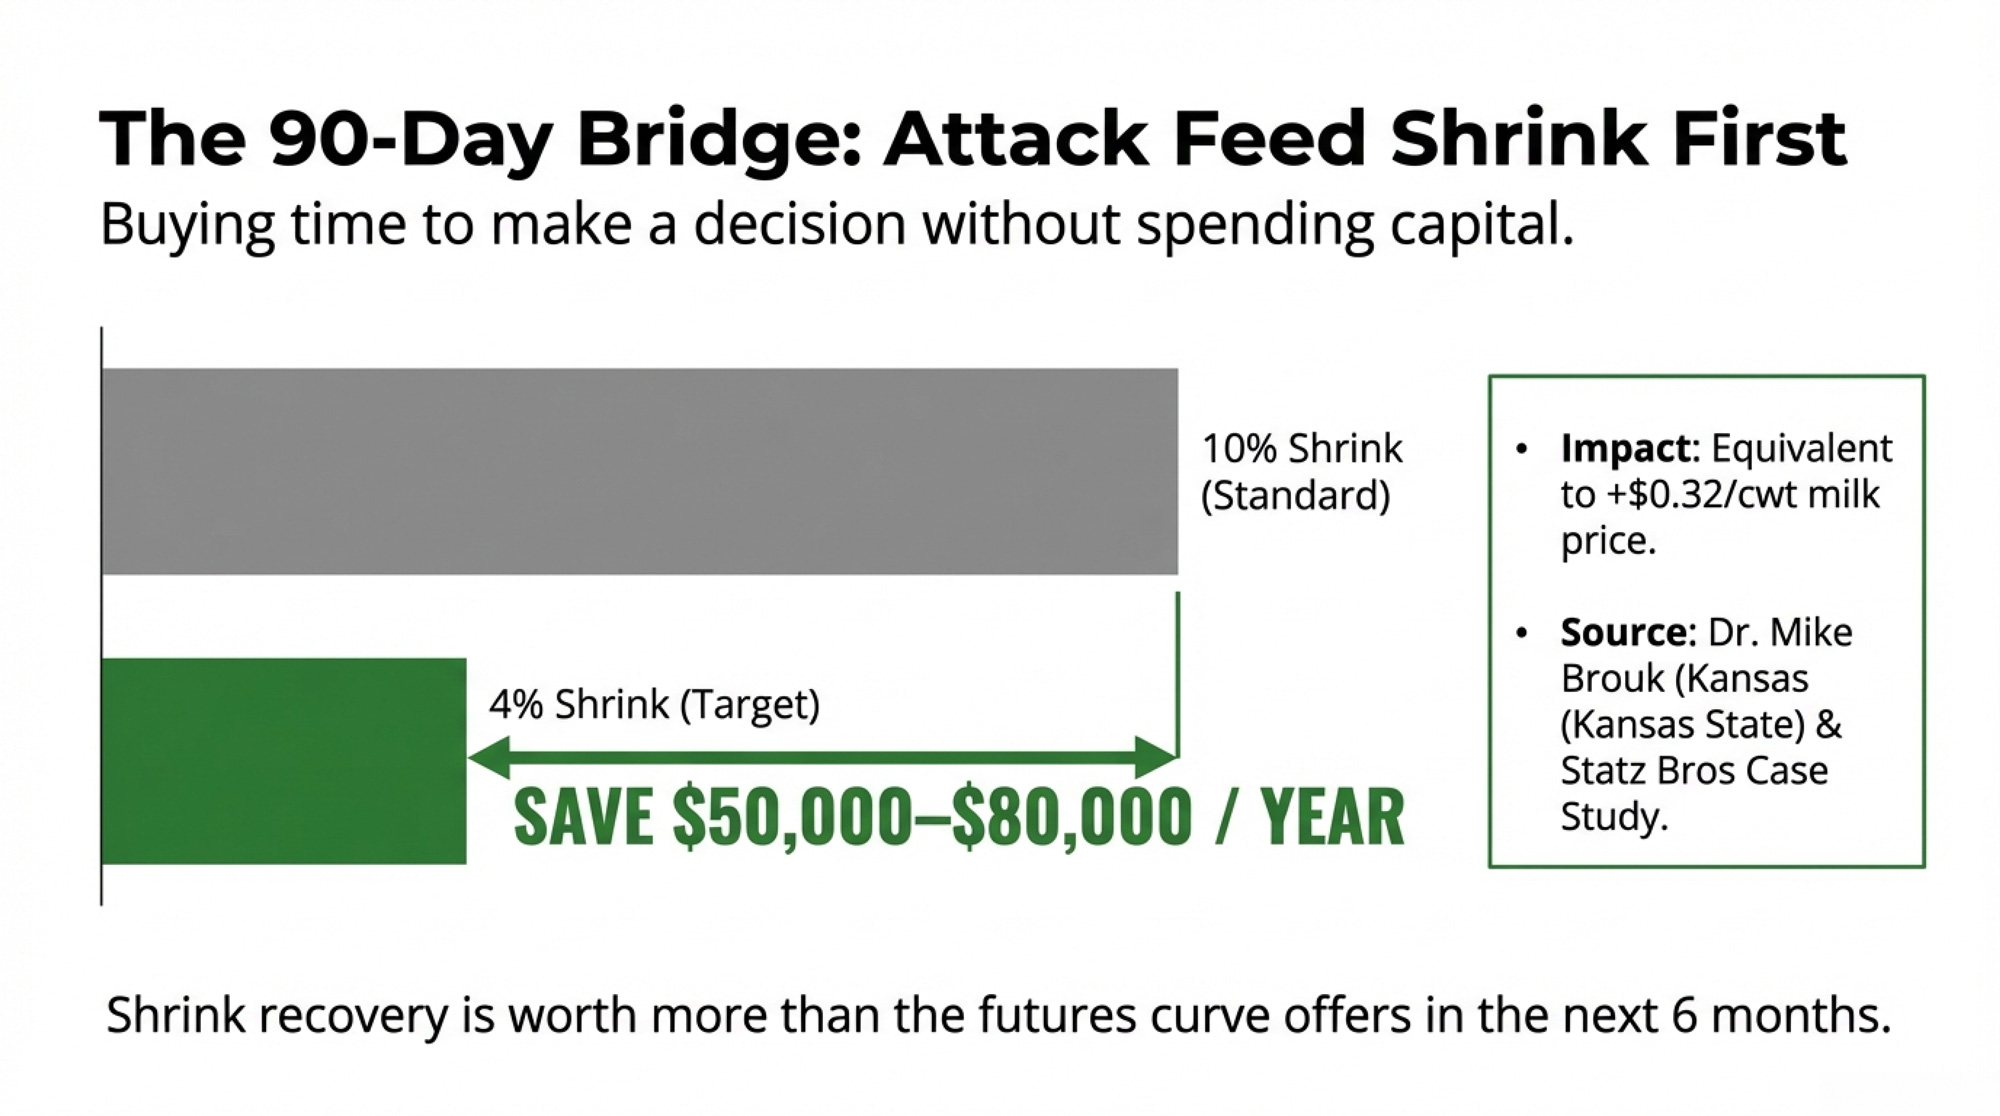
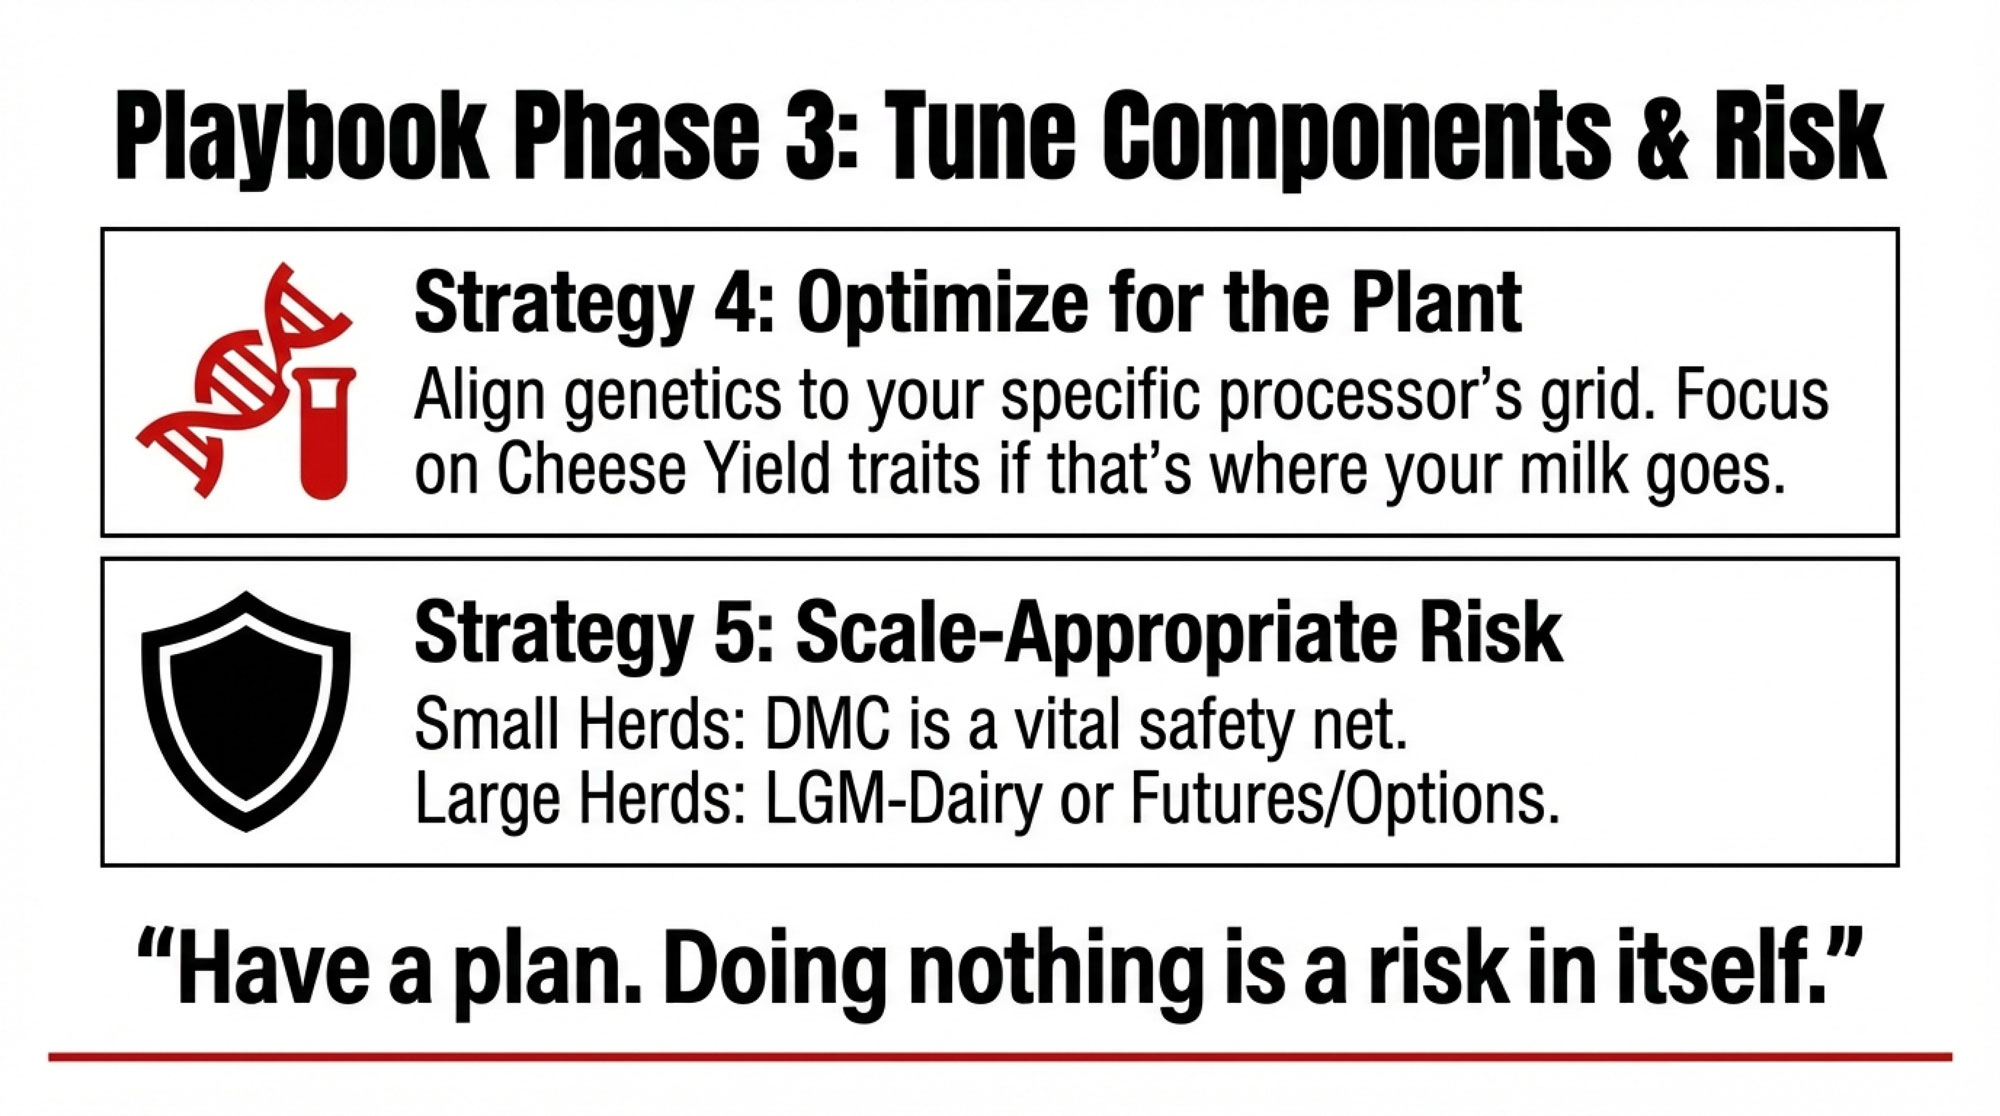
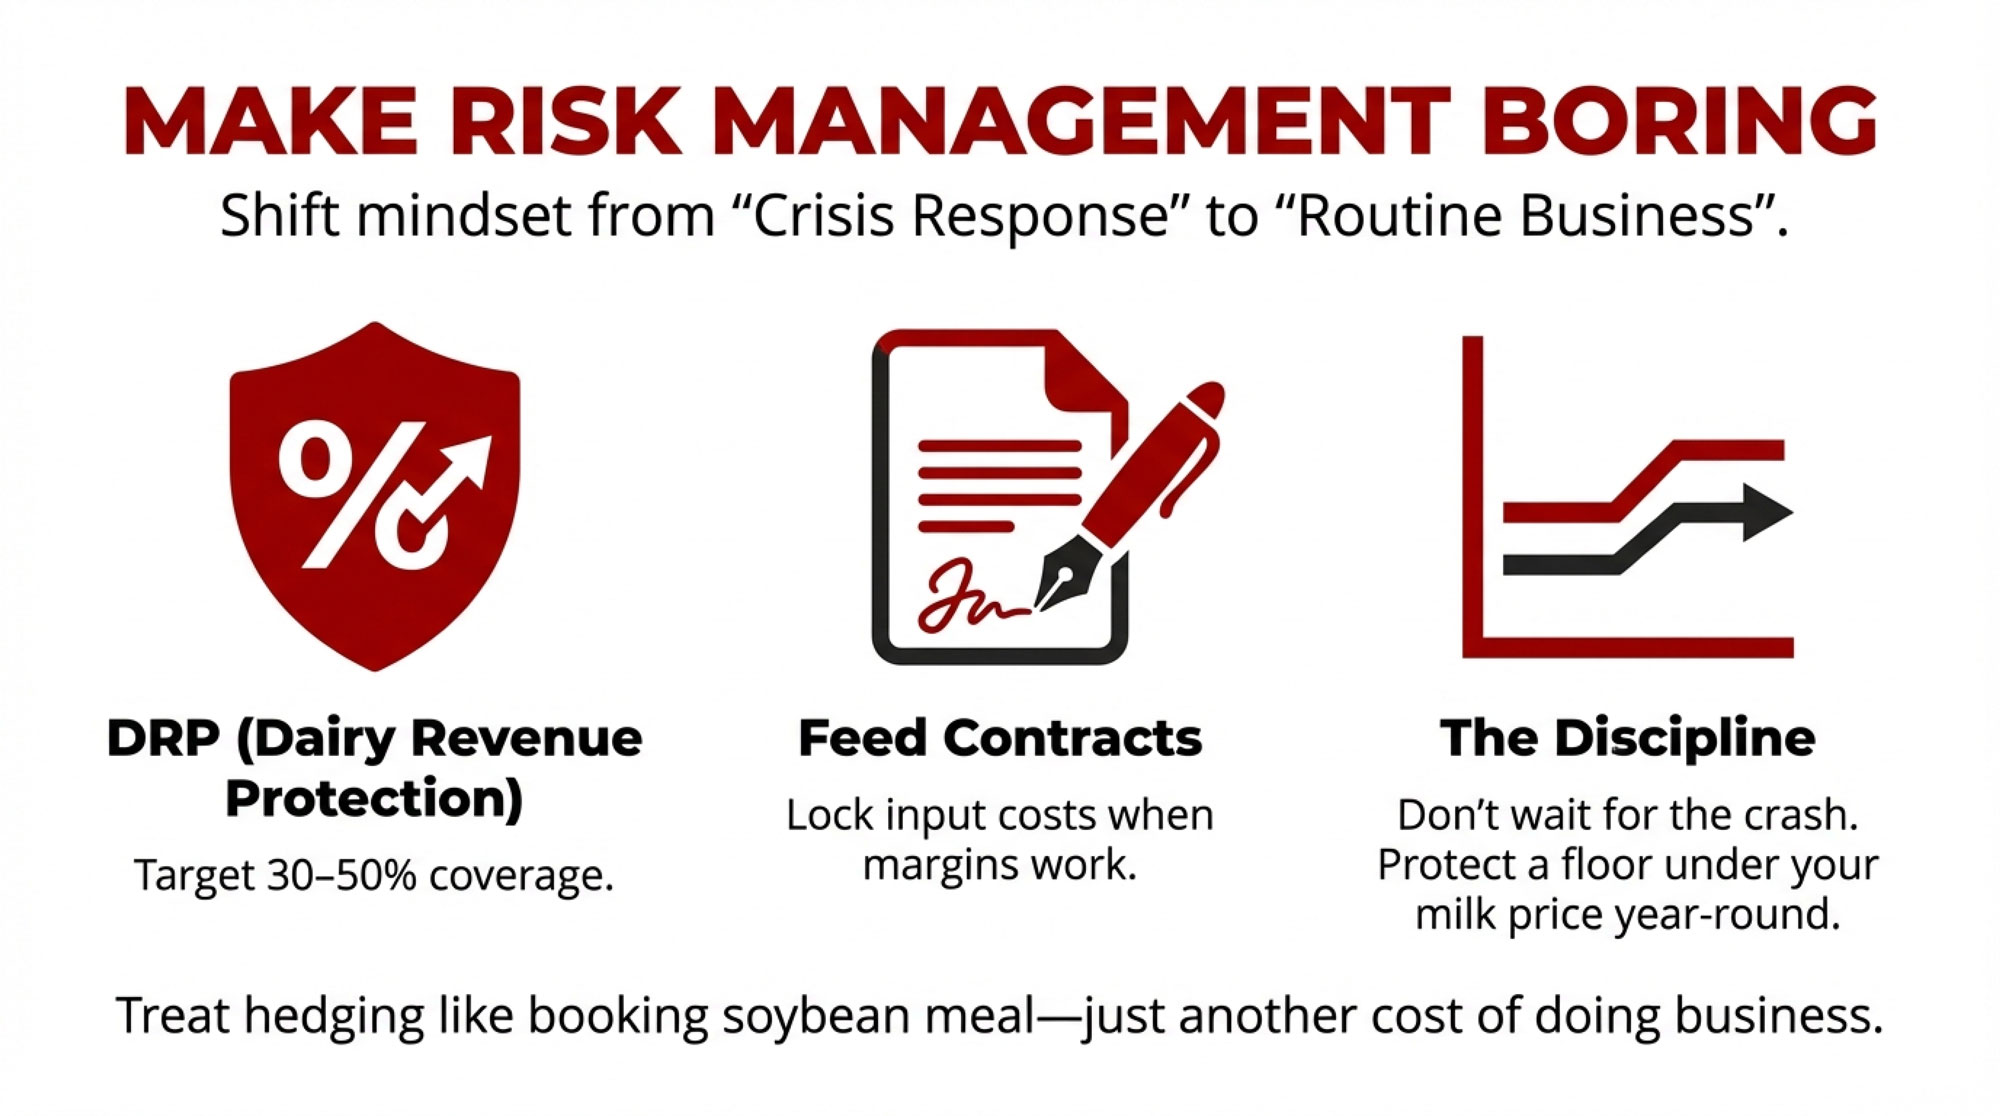
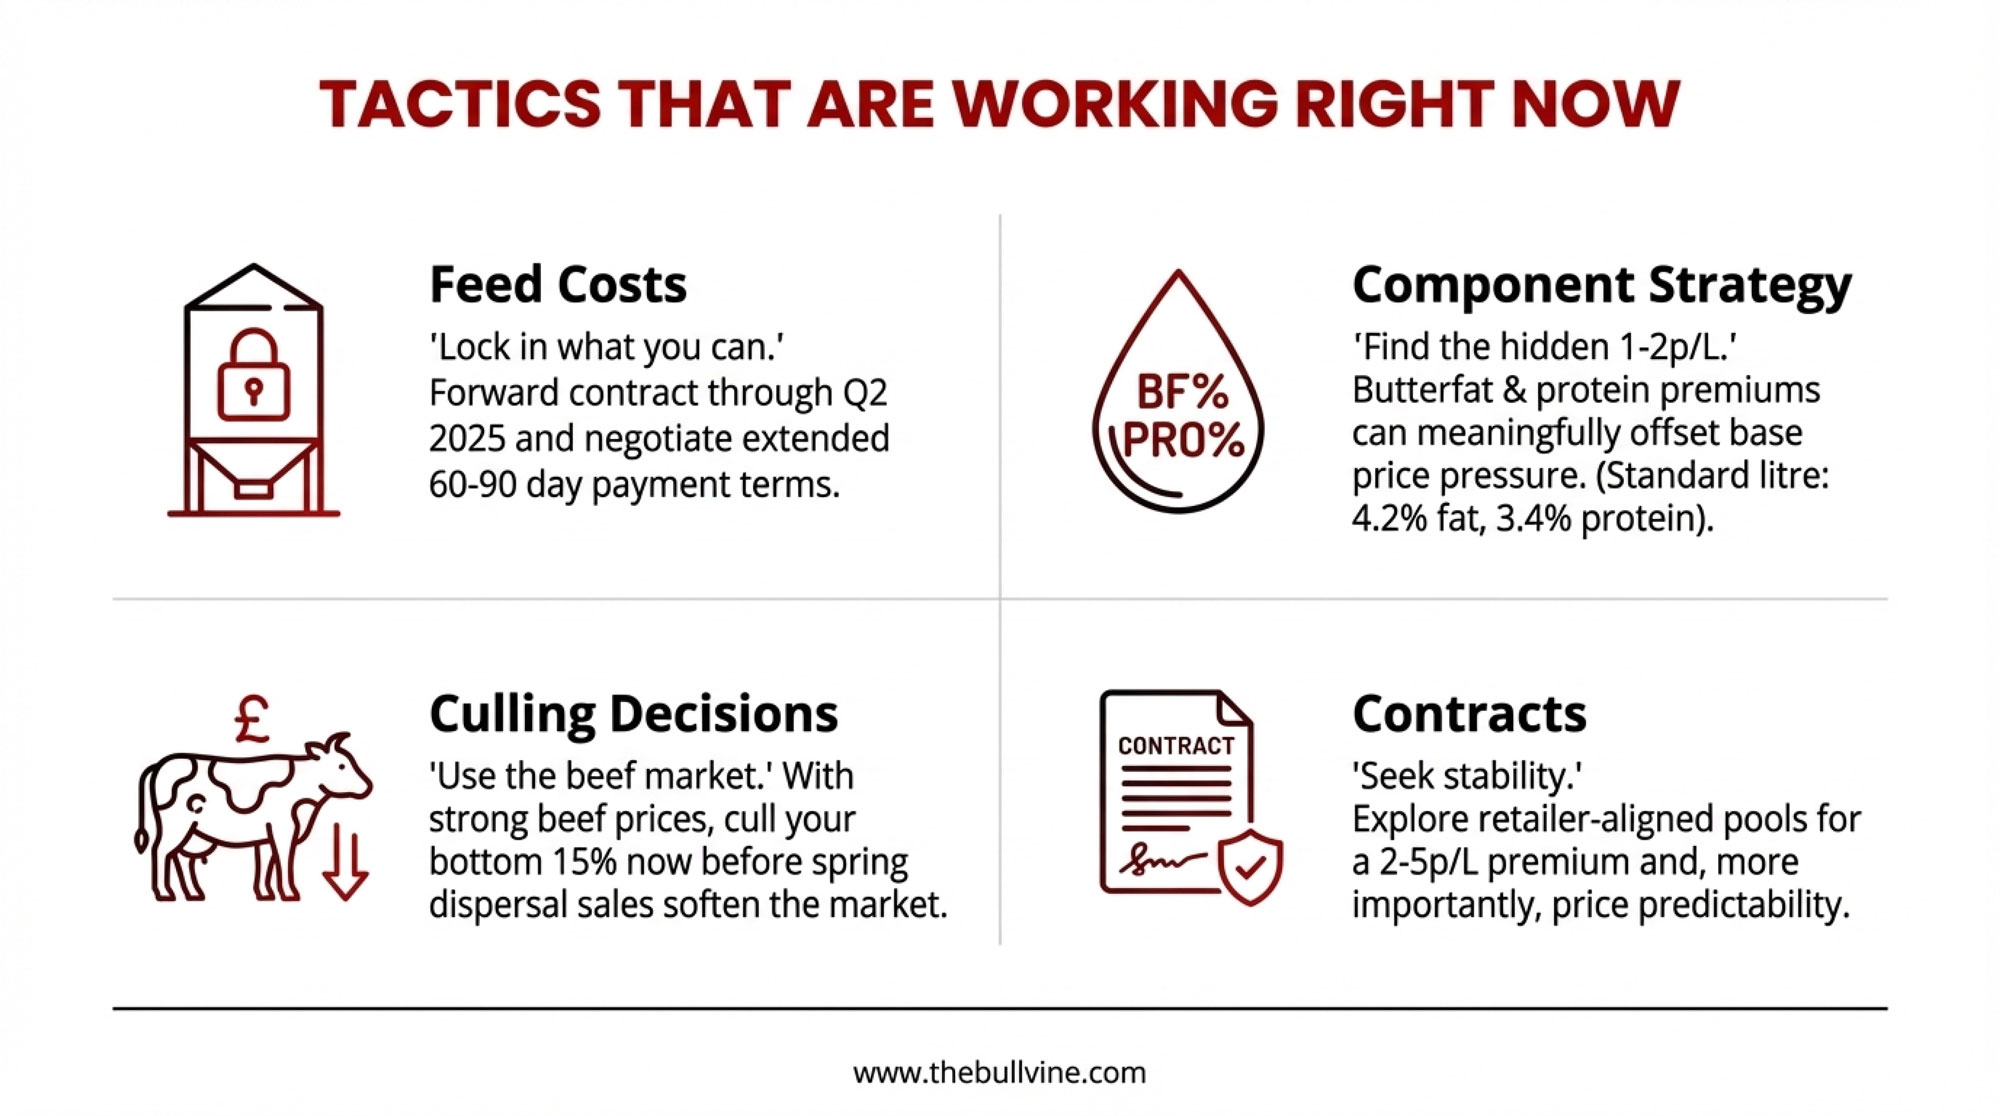
In the Next 90 Days: Lock In Strength
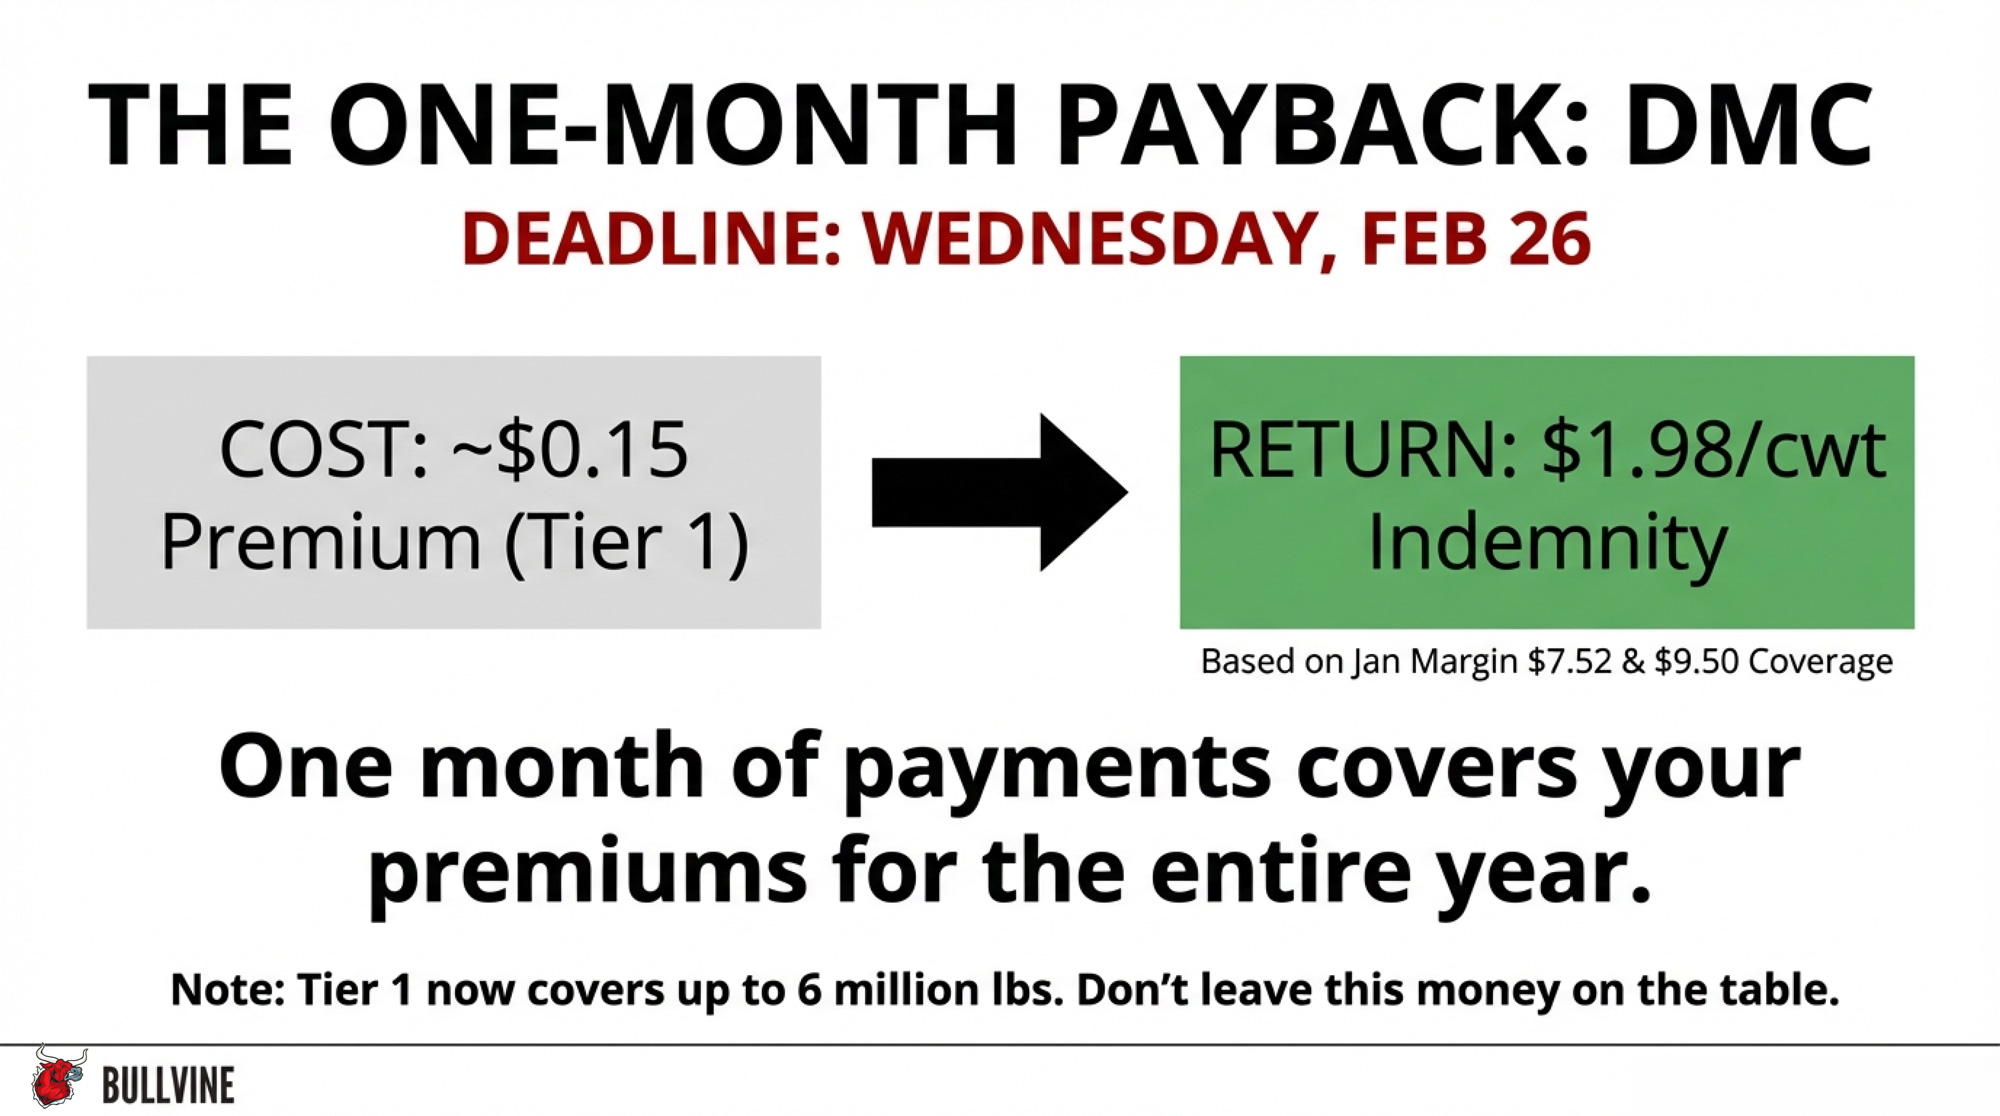
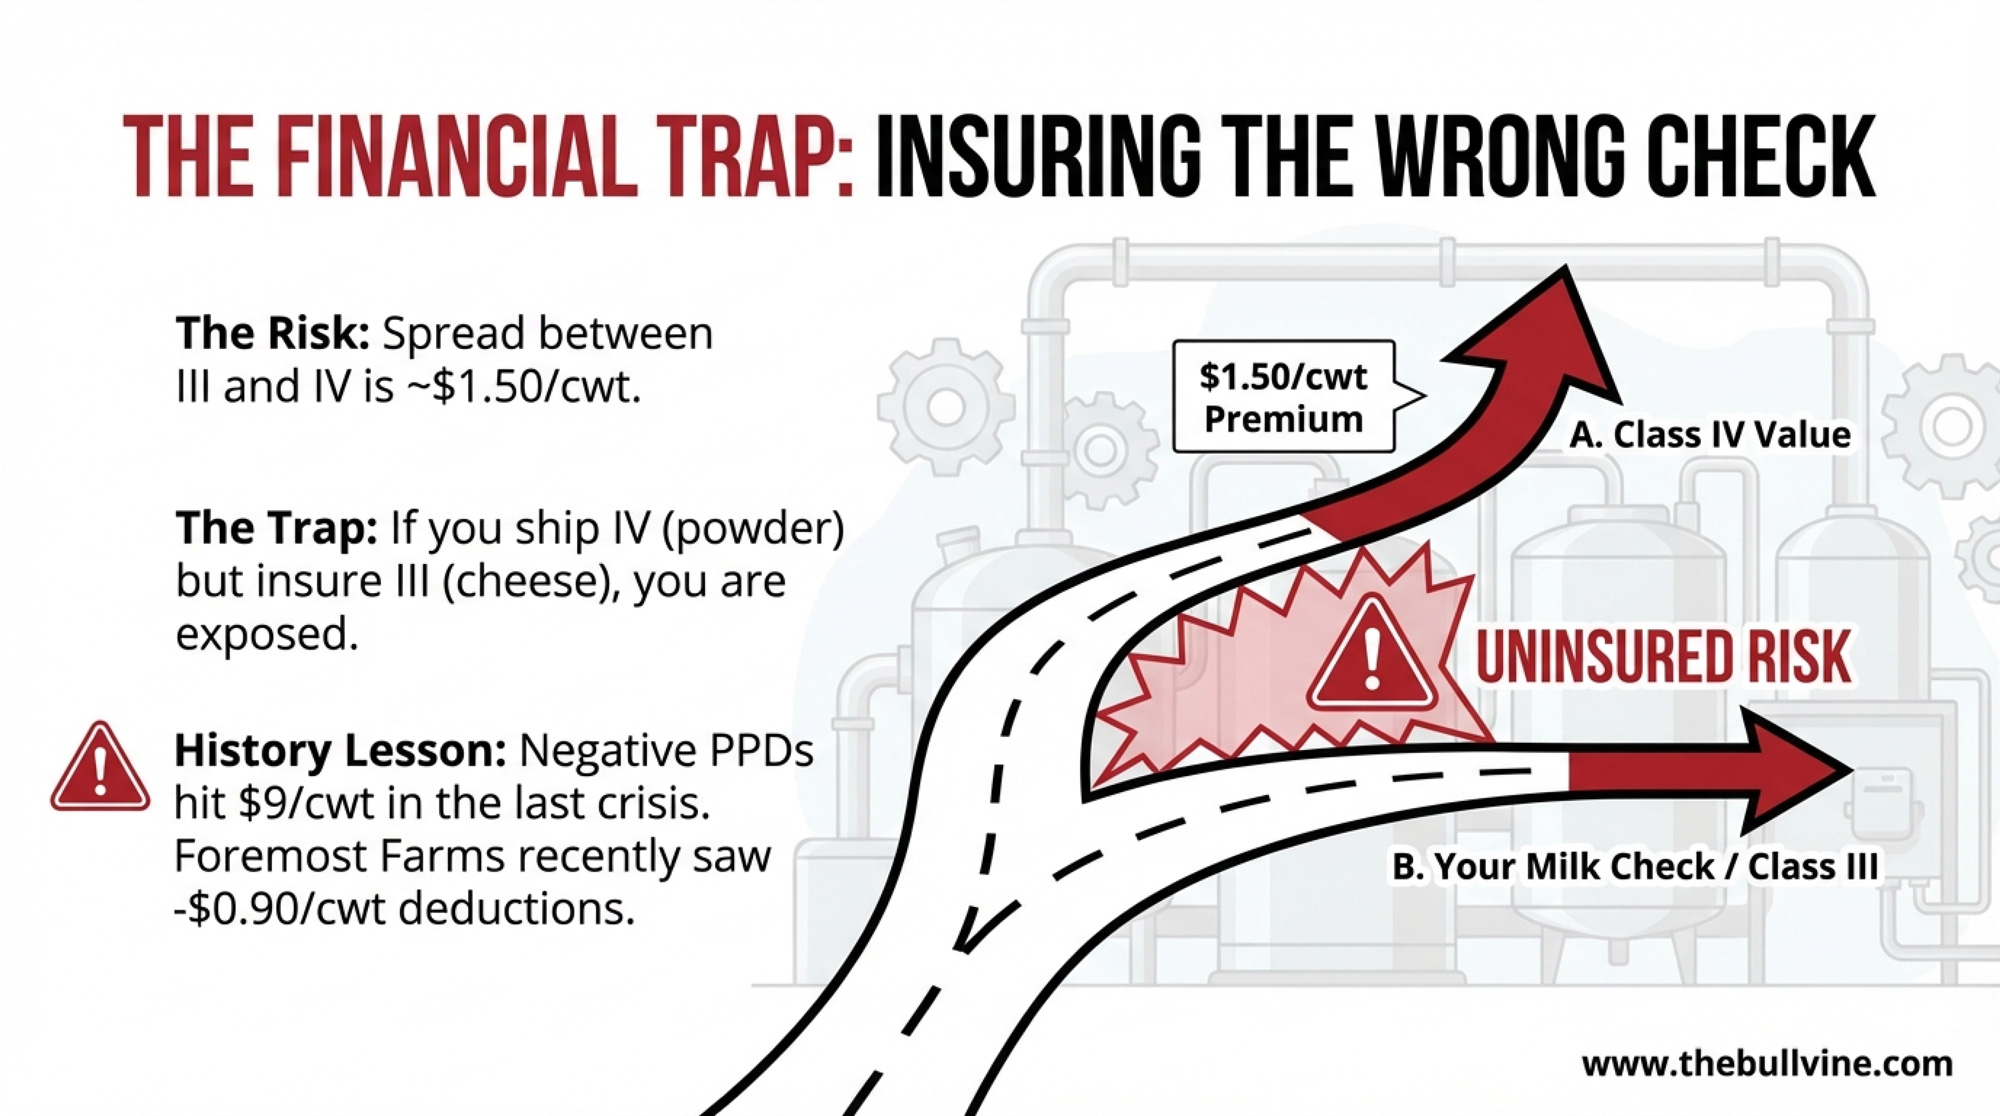
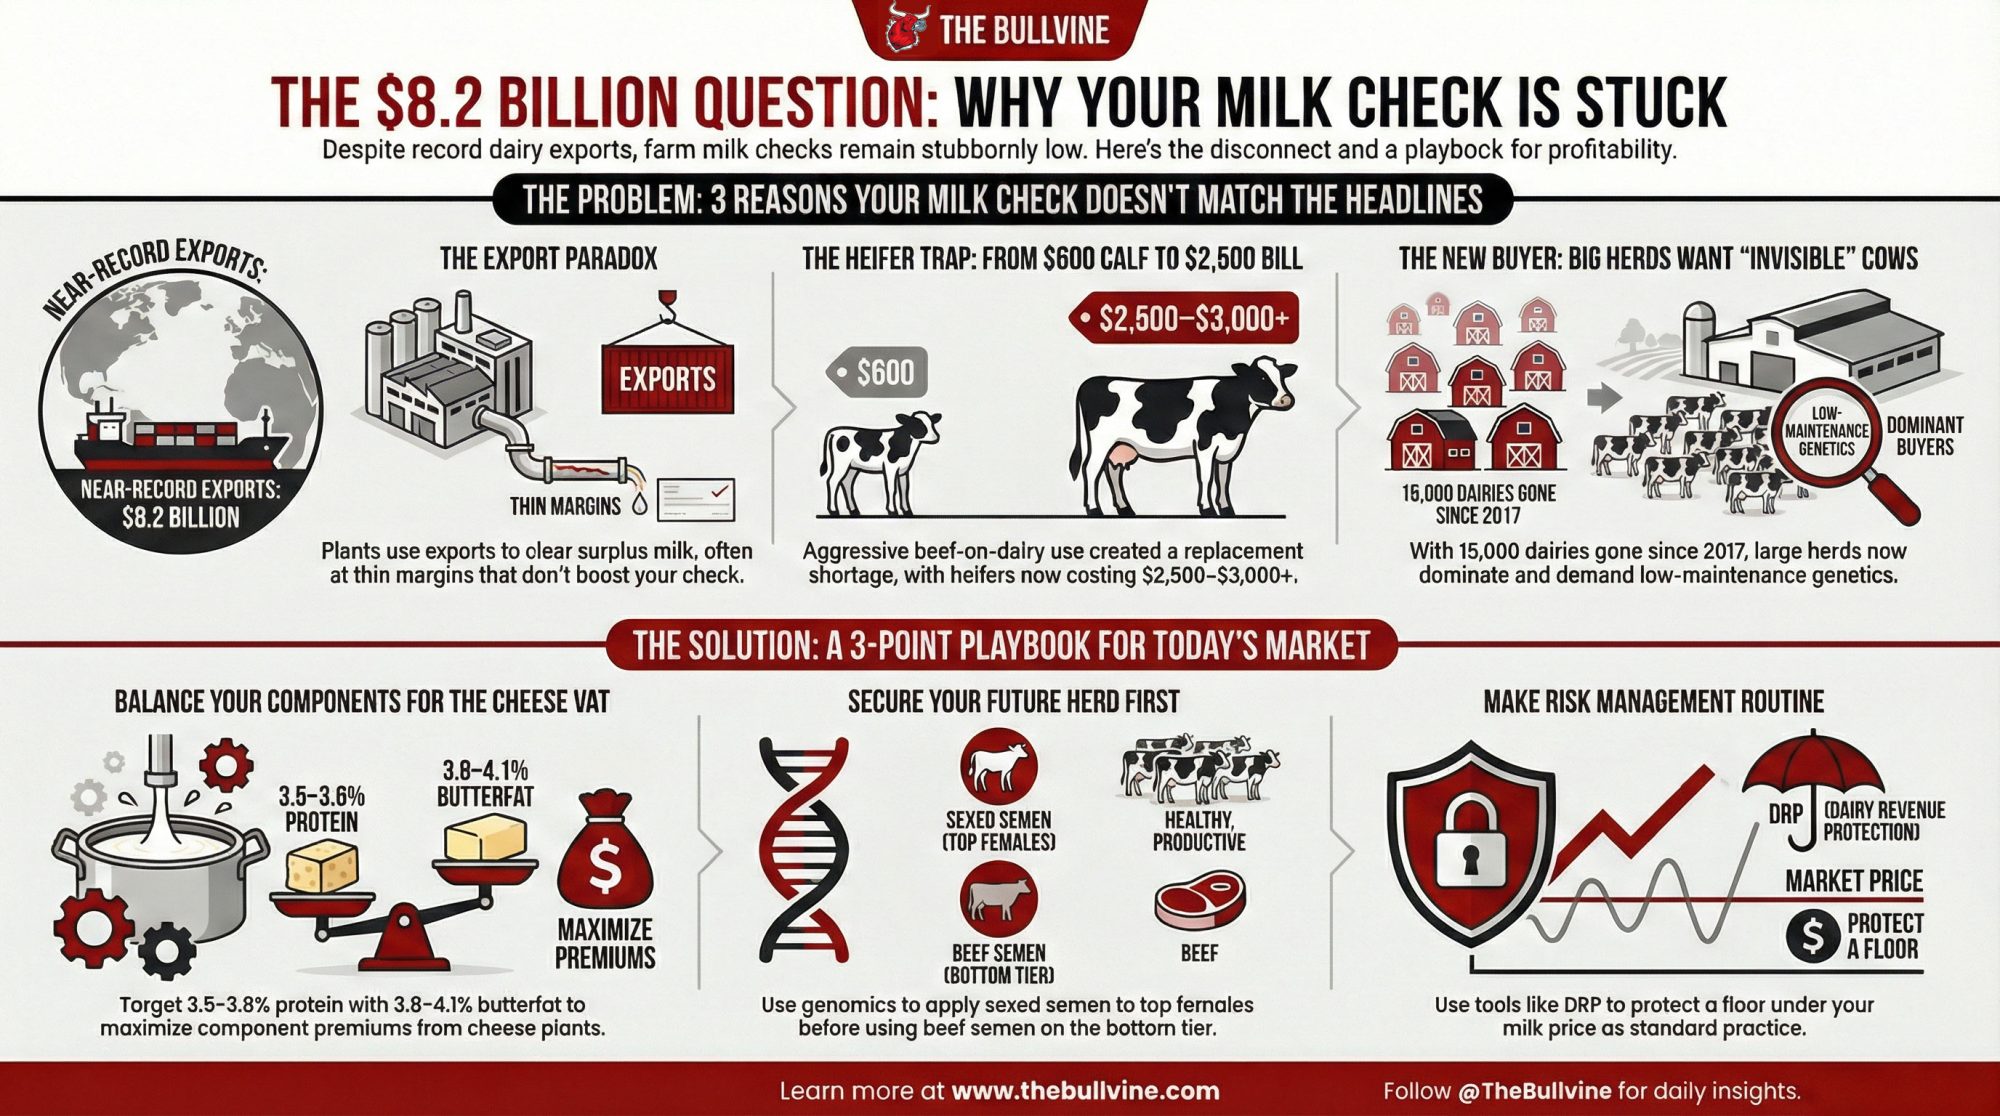
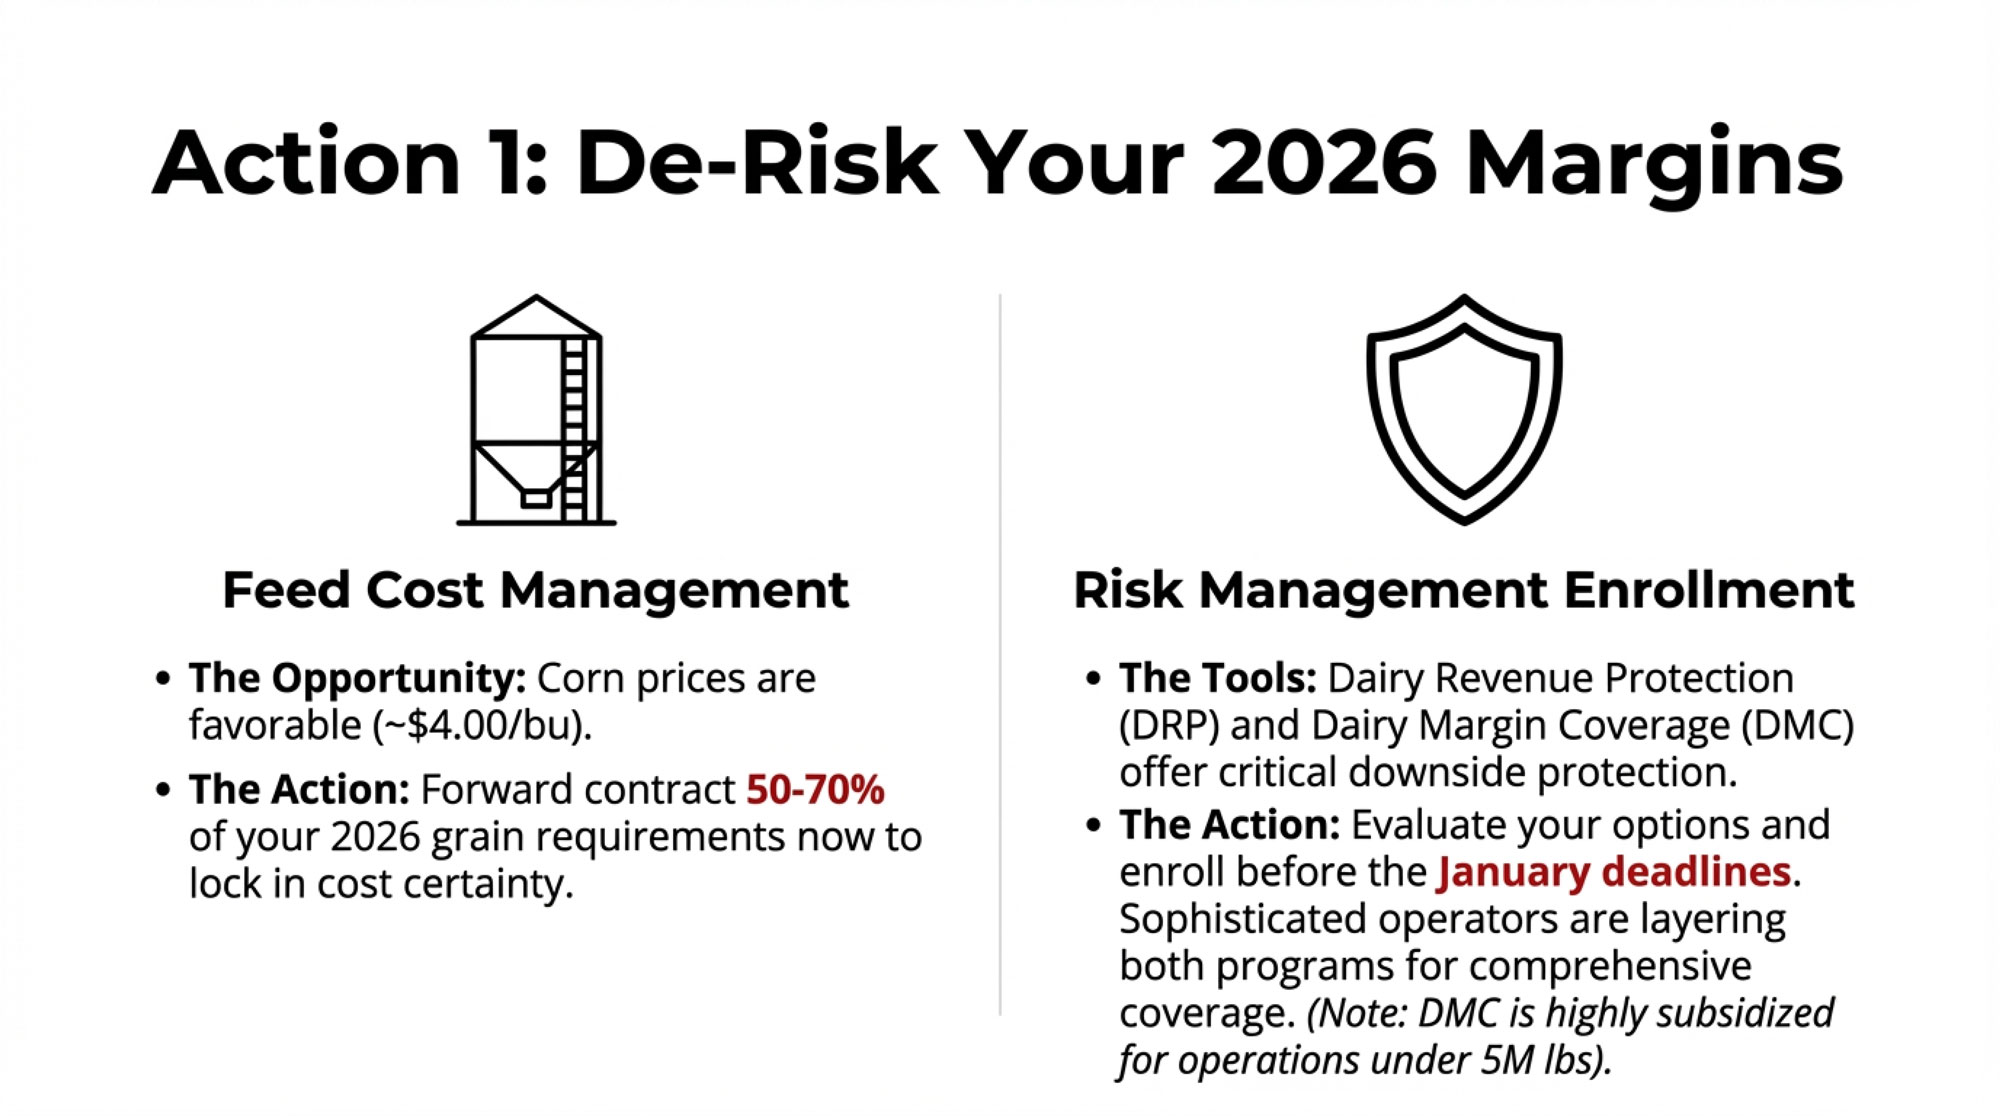
- SECURE downside protection. Talk with your risk‑management advisor about Dairy Revenue Protection or similar tools in your region. The right share to cover depends on your debt load and risk tolerance, so work it through with someone who knows your balance sheet.
- ELIMINATE expensive debt. Prioritize paying down high‑interest operating lines and short‑term notes. Every dollar of principal you retire now is room you get back if you spend time in the teens again.
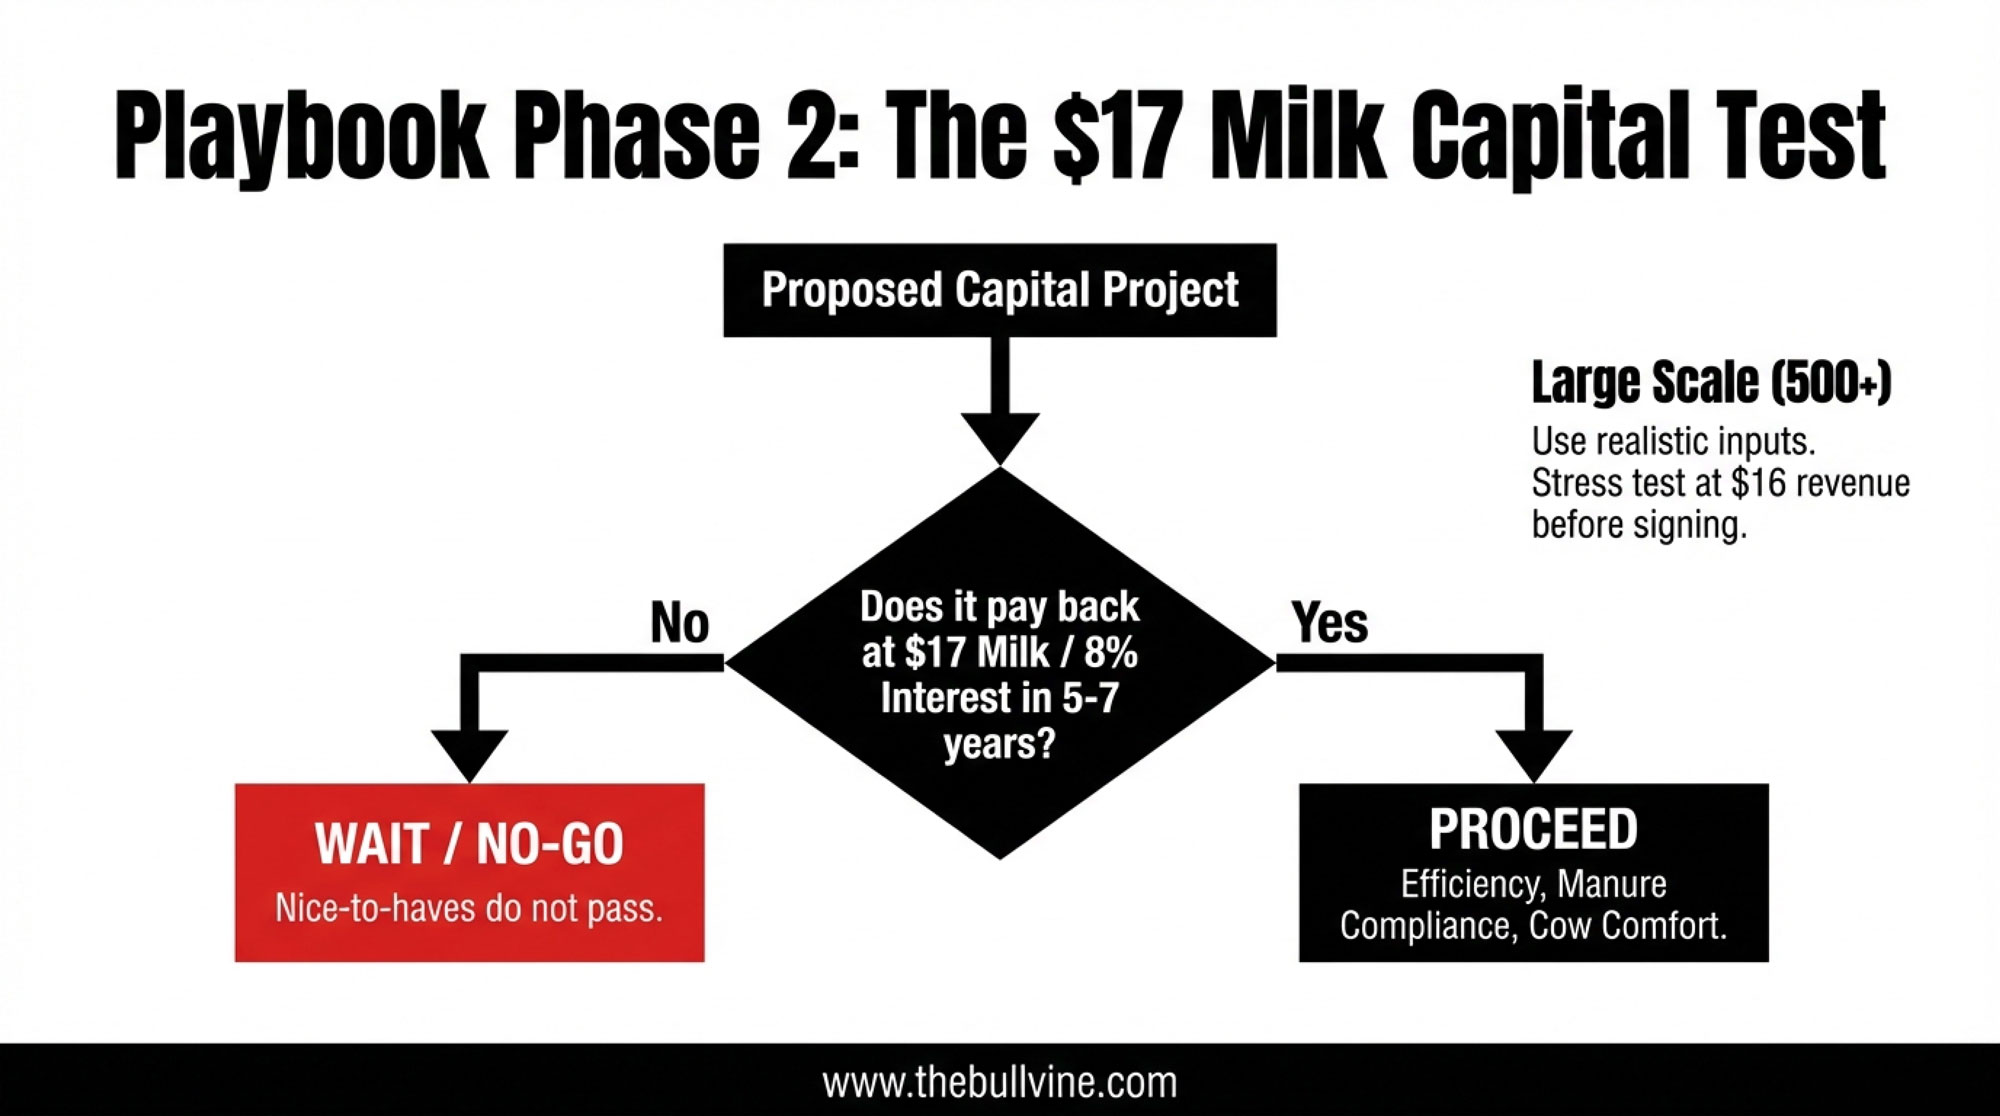
- DEFER non‑critical capital spending. Anything that doesn’t clearly improve labor efficiency or feed conversion goes on hold until you’ve seen how this rally resolves.
- WRITE a one‑page margin policy. Decide now what forward margin level triggers you to layer in price protection, and what share of production you’ll cover at each trigger. Don’t negotiate with yourself when screens are moving.
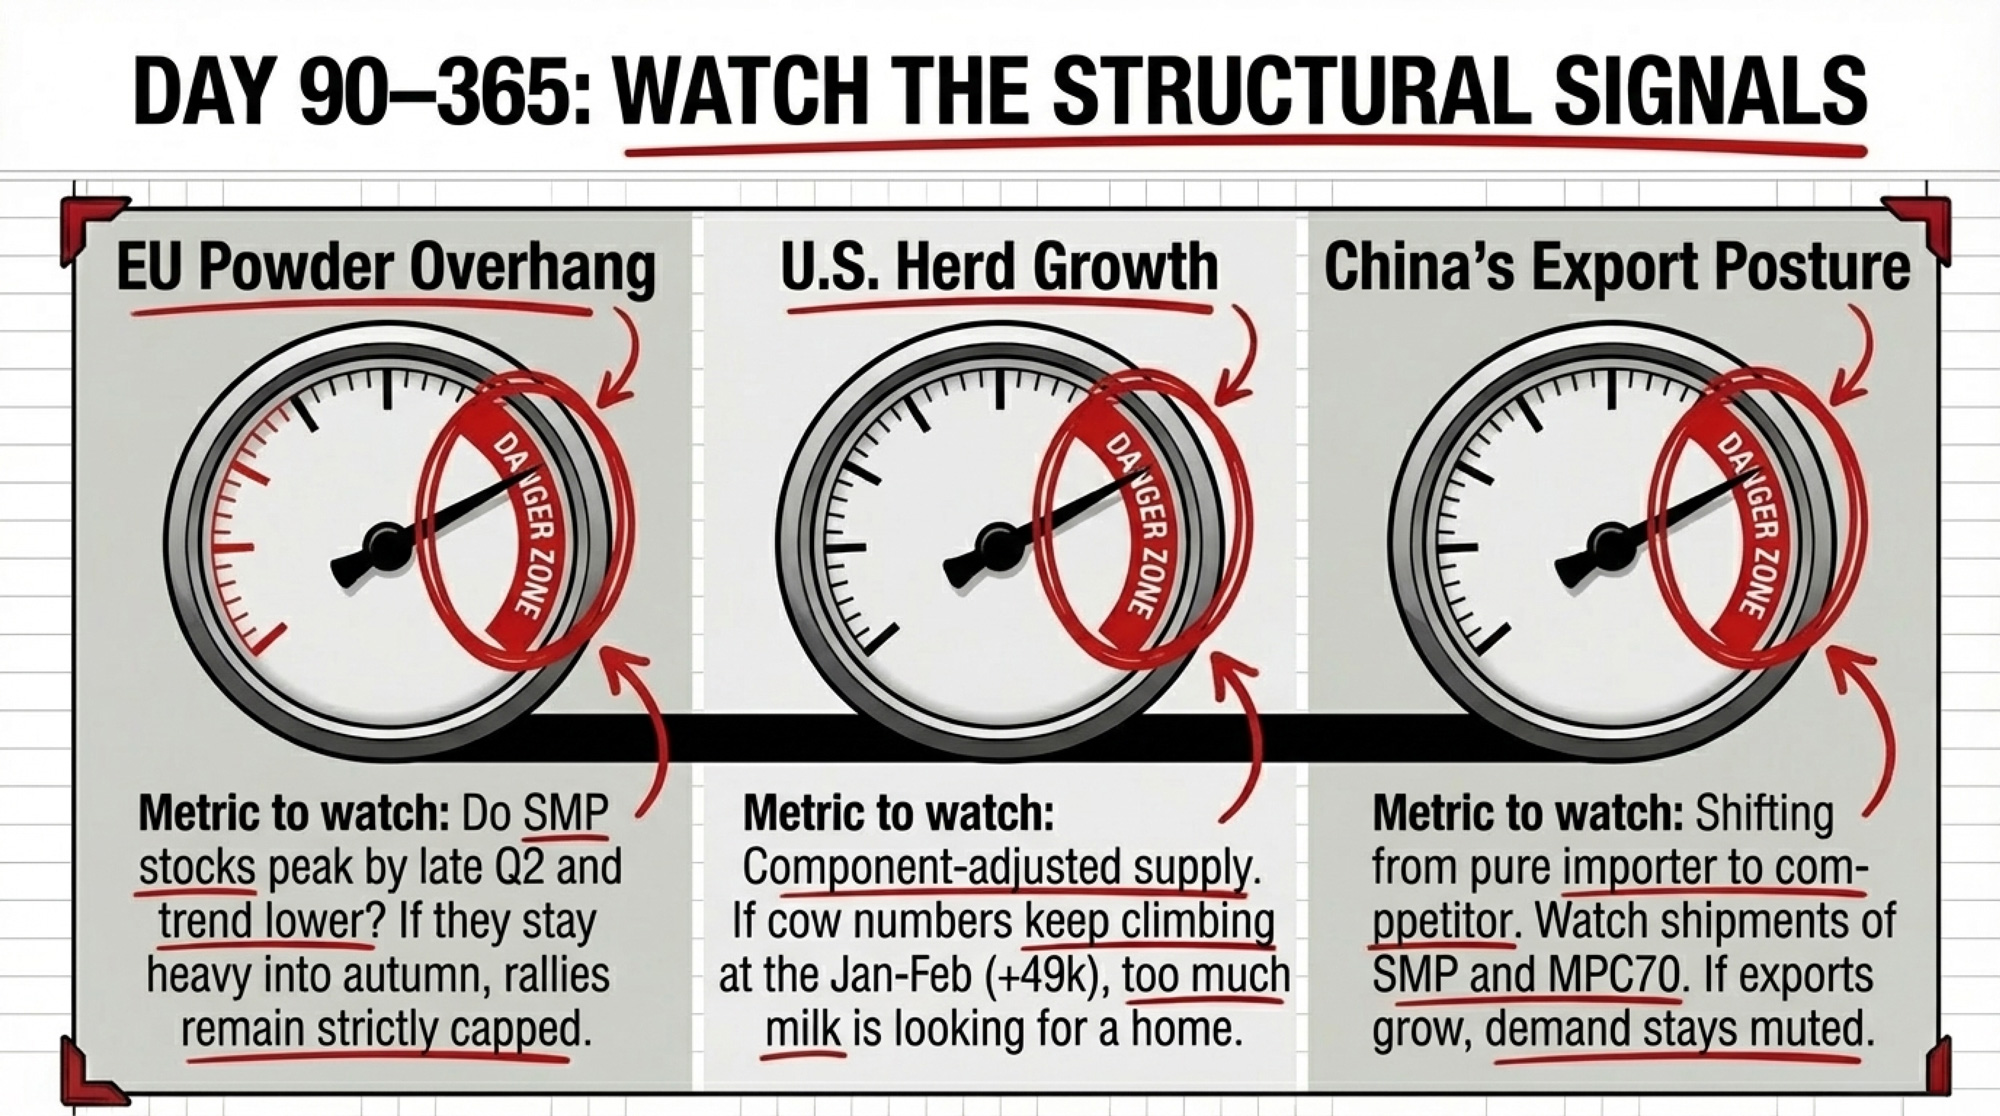
Over the Next 365 Days: Watch the Structural Signals
- TRACK EU stocks and production. If SMP stocks peak by late Q2 and trend lower as milk growth slows and butter inventories narrow relative to 2025, the overhang is easing. If stocks stay heavy into autumn, assume there’s still a cap on rallies.
- MONITOR U.S. herd growth. Donnay’s base case has the U.S. component‑adjusted supply still growing by around 2% by late 2026, even as expansion slows. If cow numbers keep climbing at the Jan–Feb pace, that’s more milk looking for a home.
- WATCH China’s role. Li points out that Chinese processors are already shipping SMP and MPC70 to Southeast Asia, and that China’s dairy sector has shifted from pure import dependence to a mixed import‑plus‑export model. If those exports keep growing and imports stay muted, China is a competitor. If exports flatten and imports recover, it’s back as a source of demand.
What This Means for Your Operation
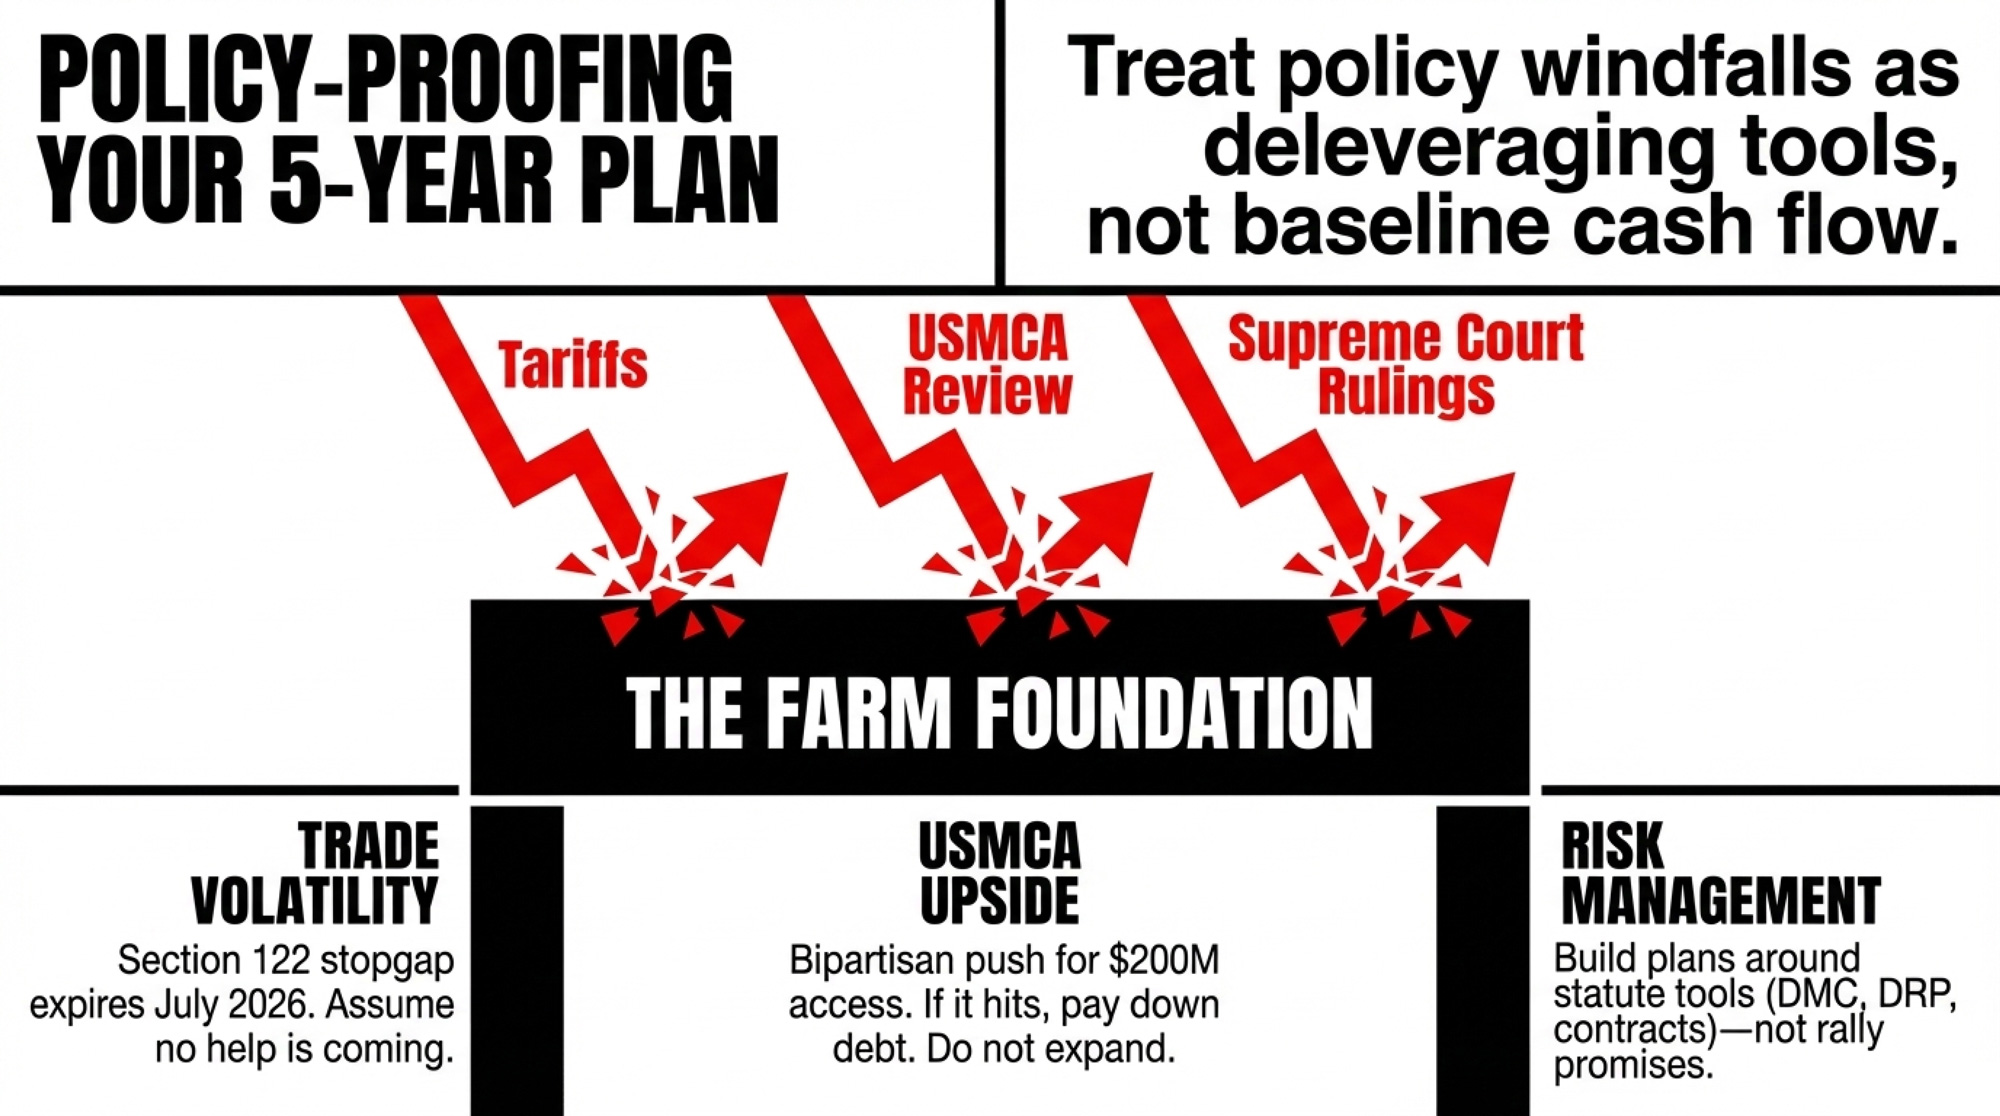
- Don’t treat a fear‑driven rally as a permanent rise. Q1 2026 rests on restocking and logistics panic with a heavy EU powder and butter overhang behind it. That’s not a safe foundation for 15‑year debt.
- Your “mental breakeven” is probably lower than your actual breakeven. Once you include family labor, realistic depreciation, and post‑Hormuz input costs, the margin cushion you see today may be several dollars per cwt thinner than you think.
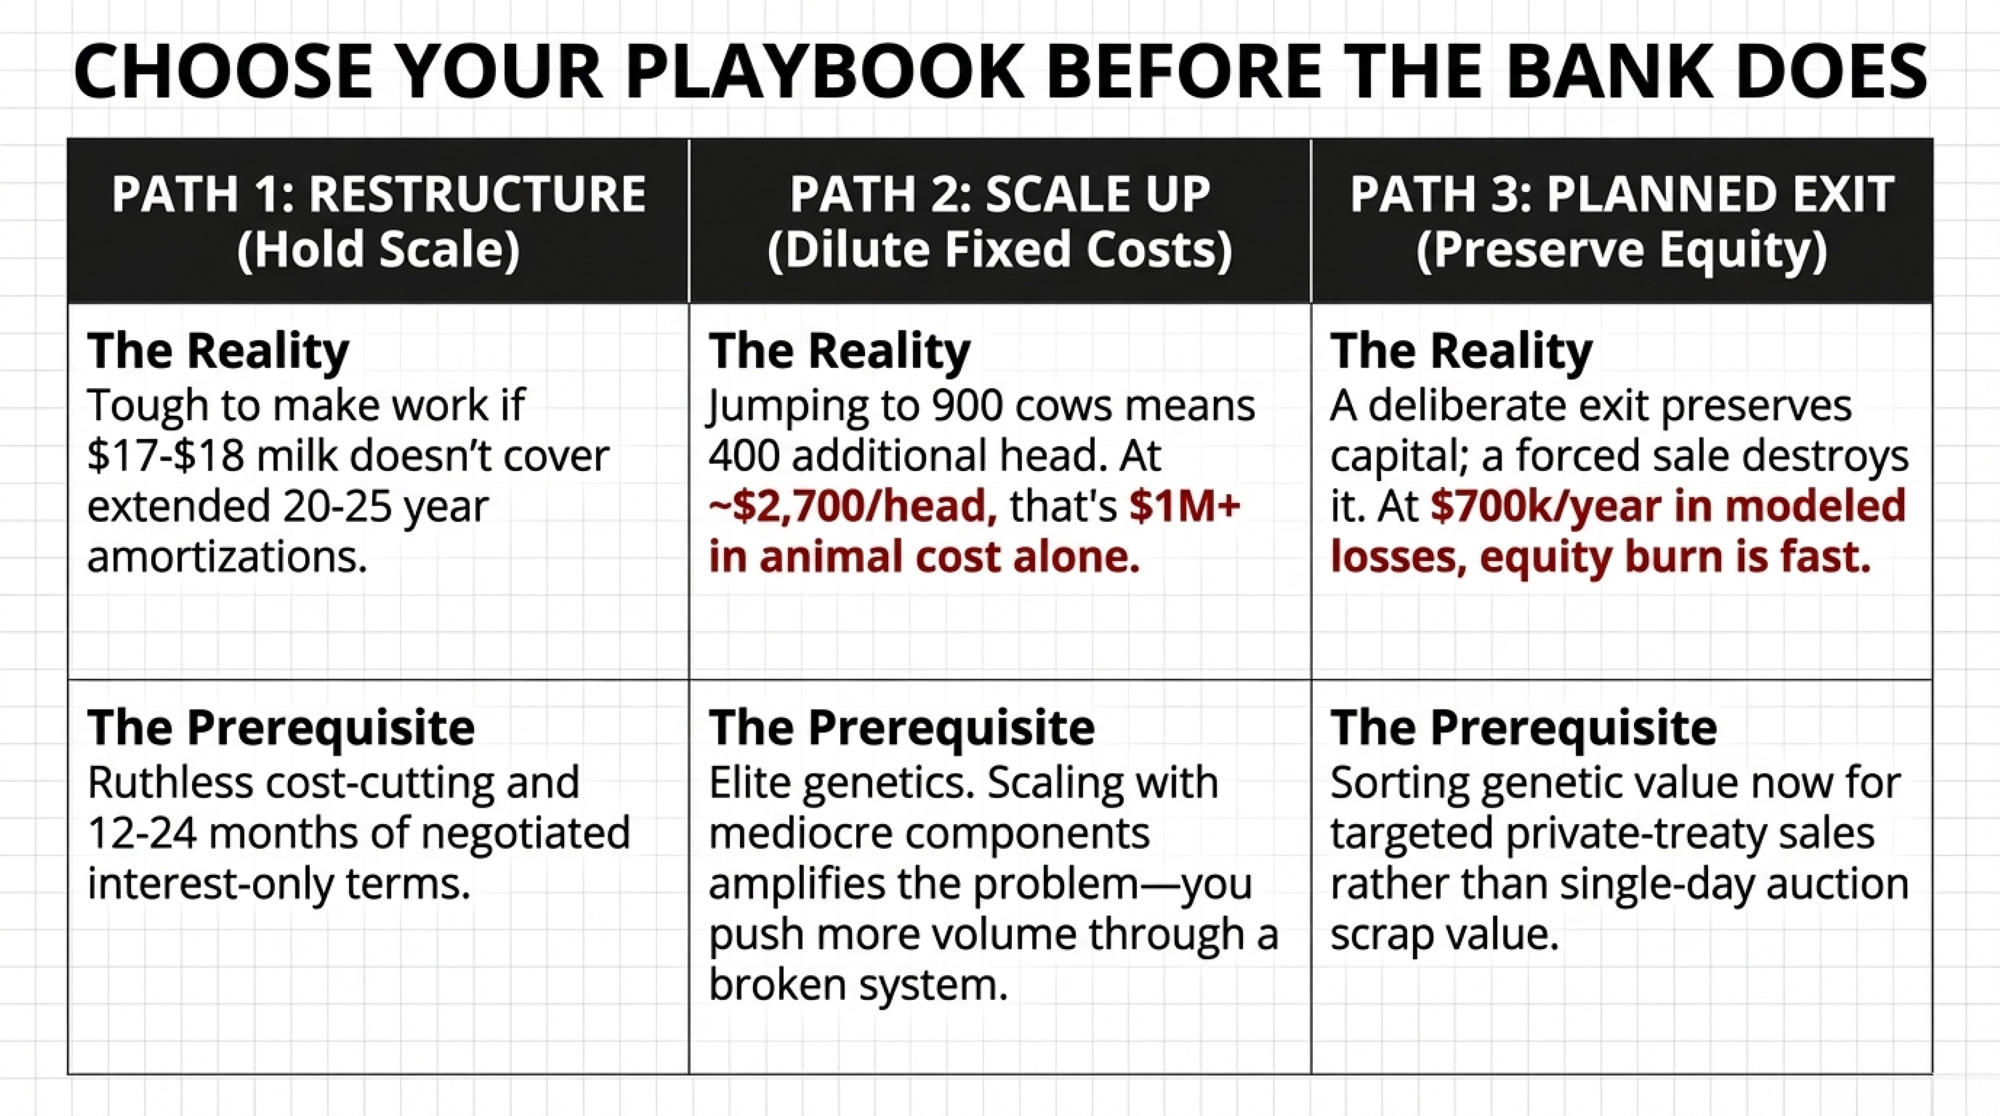
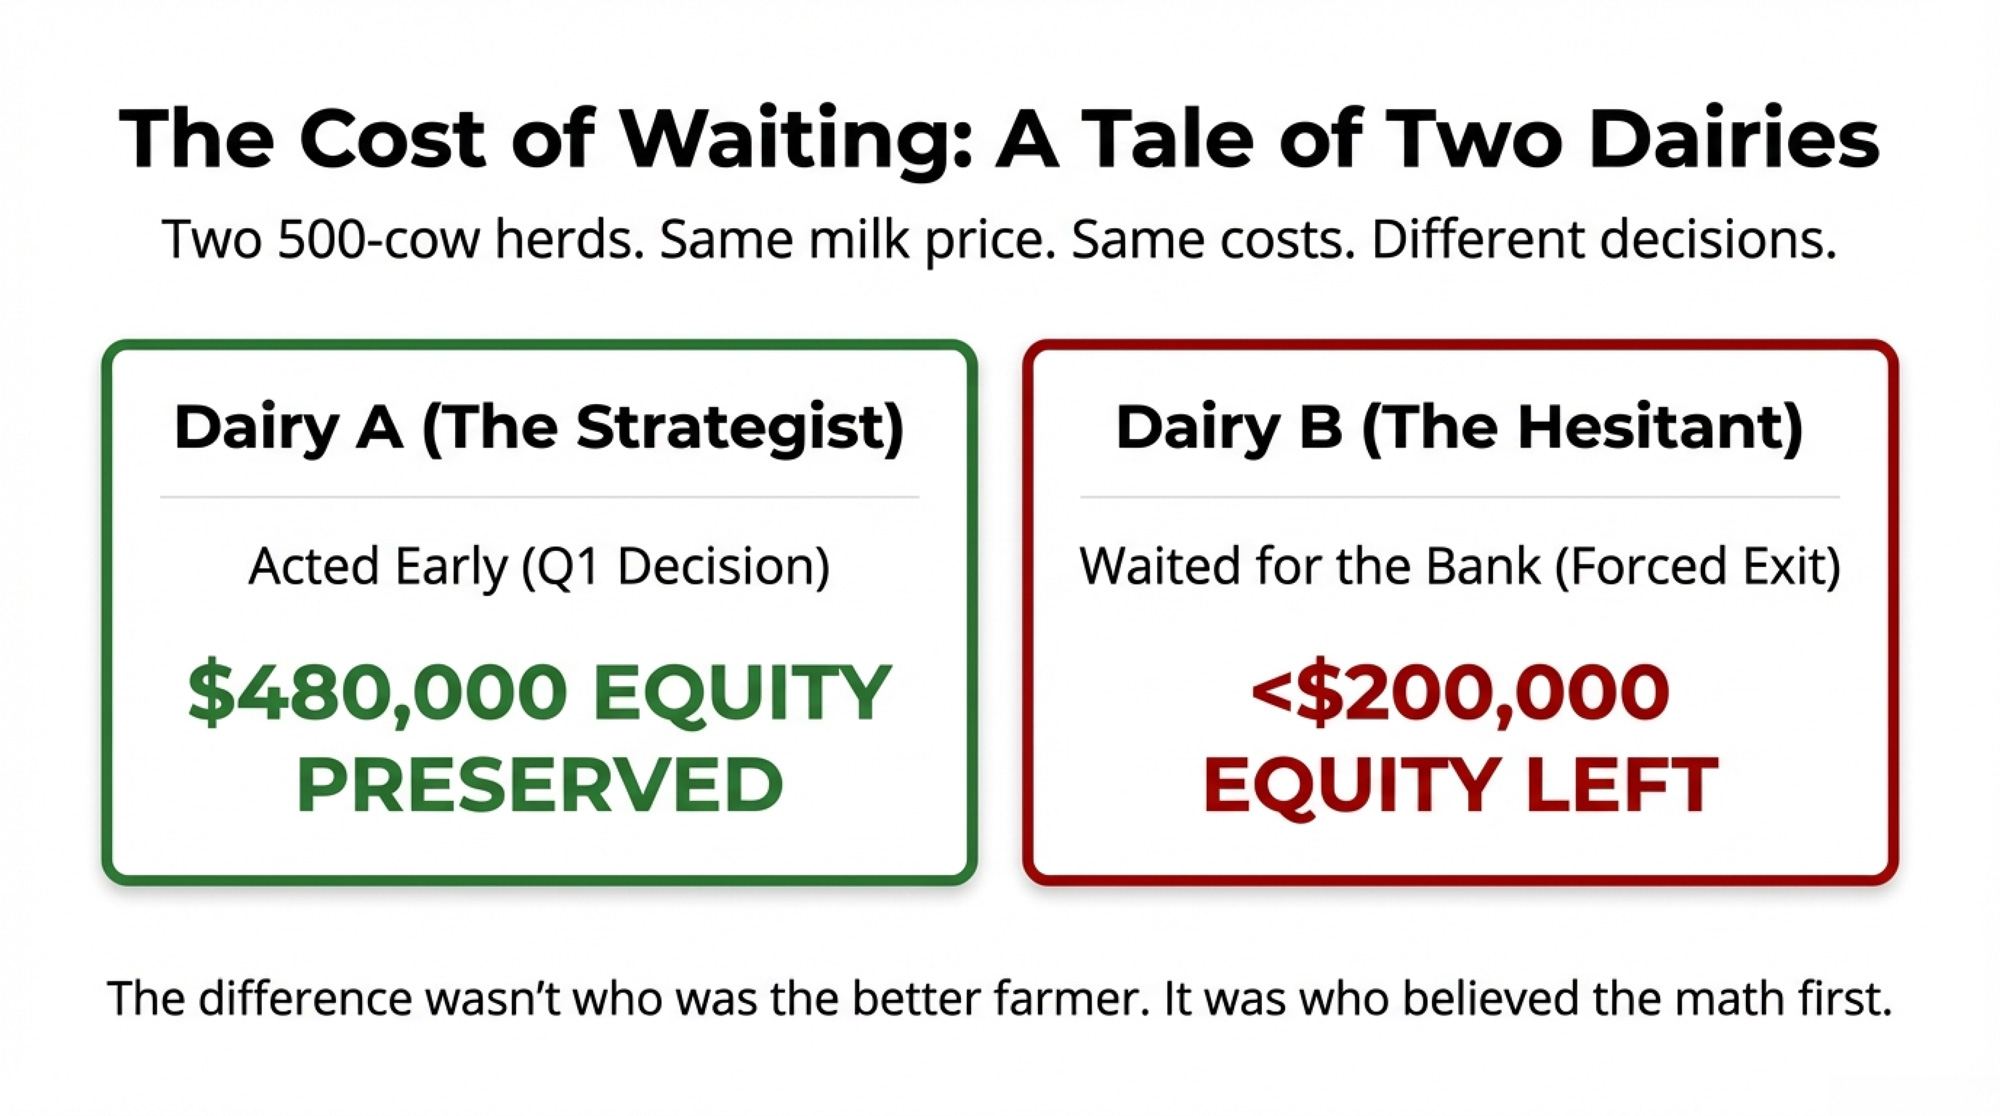
- Expansion isn’t wrong. Bad timing is. If your 18‑month stress test only works at top‑third milk prices and current beef cheques, the project scale or timing doesn’t match the risk you’re taking on.
- The safest contrarian move is to de‑risk into strength. Use this rally to knock down high‑cost debt, lock in partial downside protection for late‑2026/early‑2027, and build flexibility rather than stretch fixed costs.
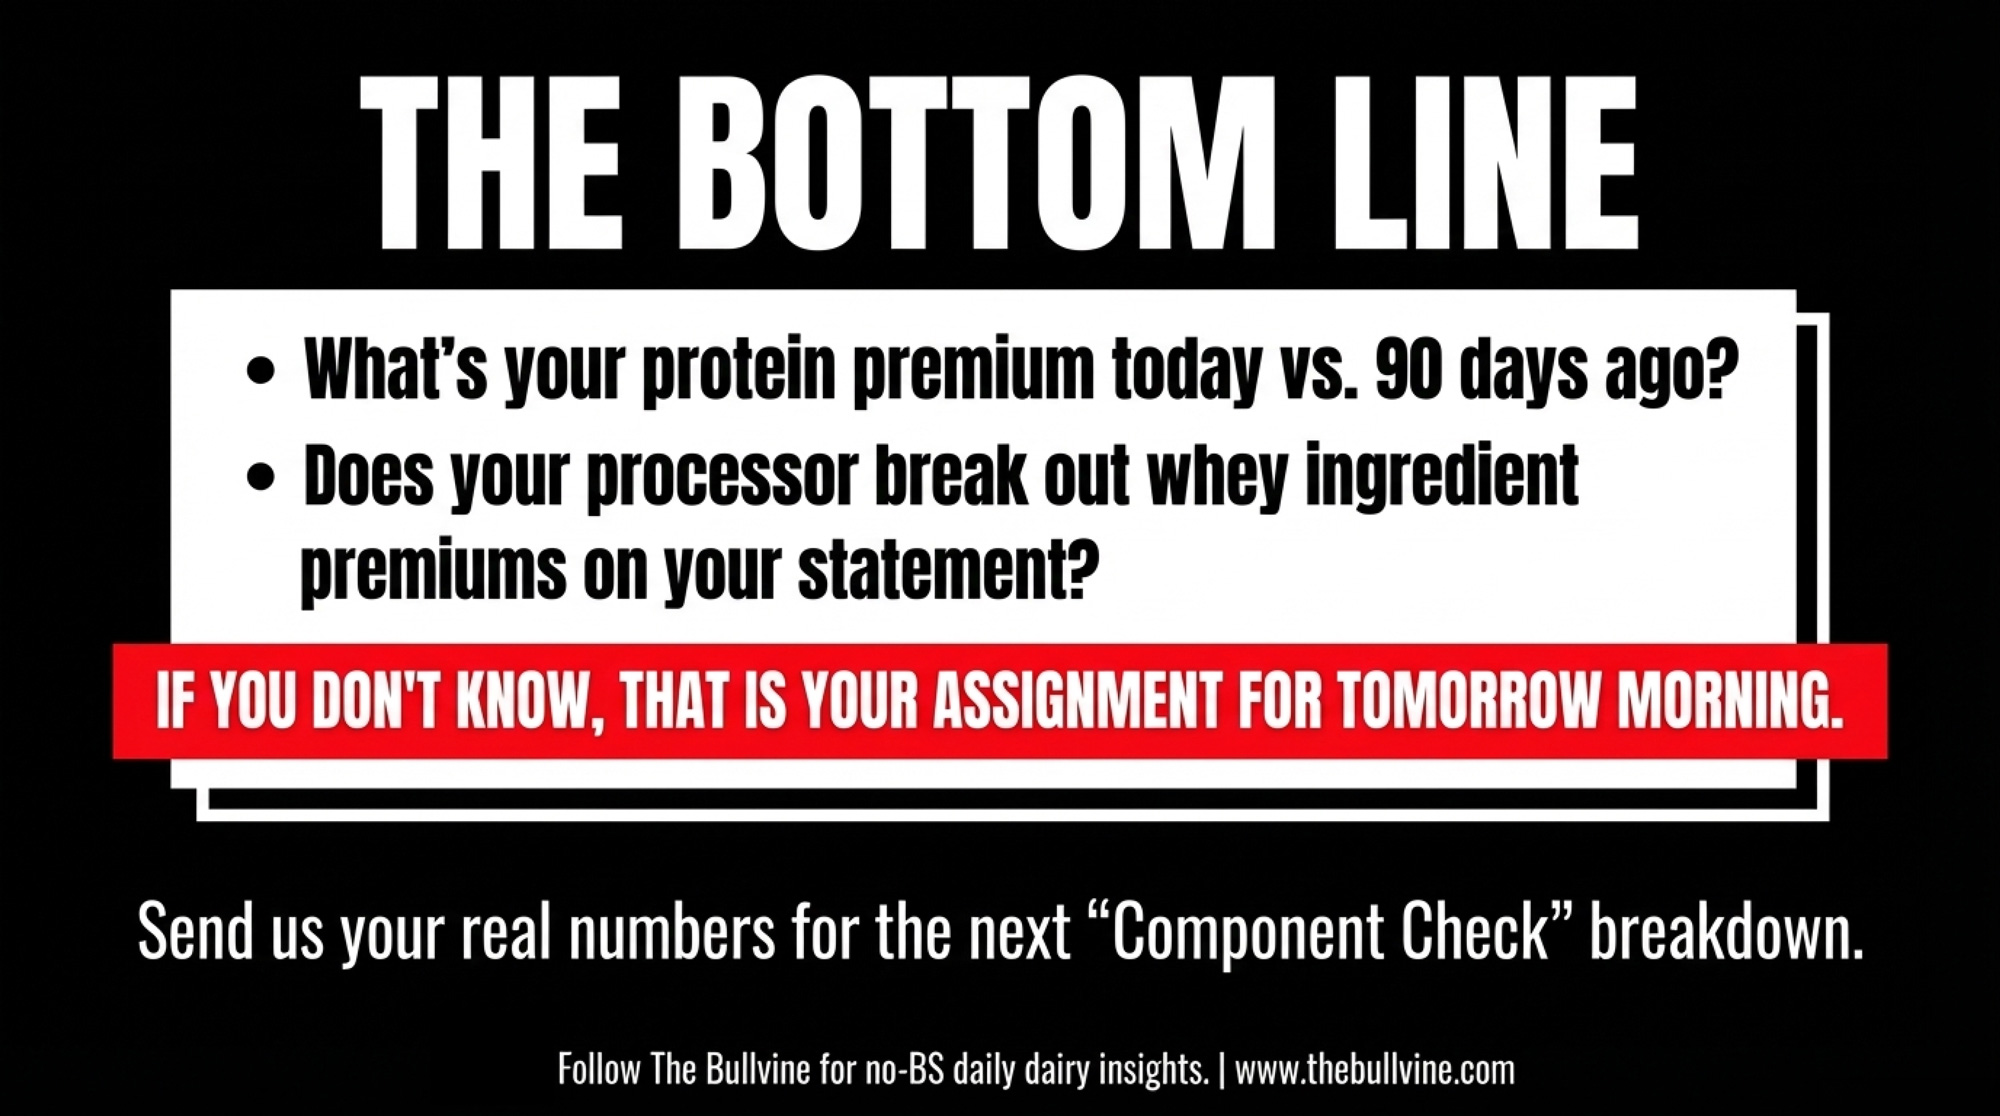
- In the next 30 days, pull one number that forces an honest conversation. Take your current feed cost per cwt and compare it to 90 days ago. Then lay your expansion loan’s $/cwt debt service on top of that. If you wouldn’t sleep with $2–$3/cwt less margin, that tells you whether this project belongs in 2026 or 2027.
Key Takeaways
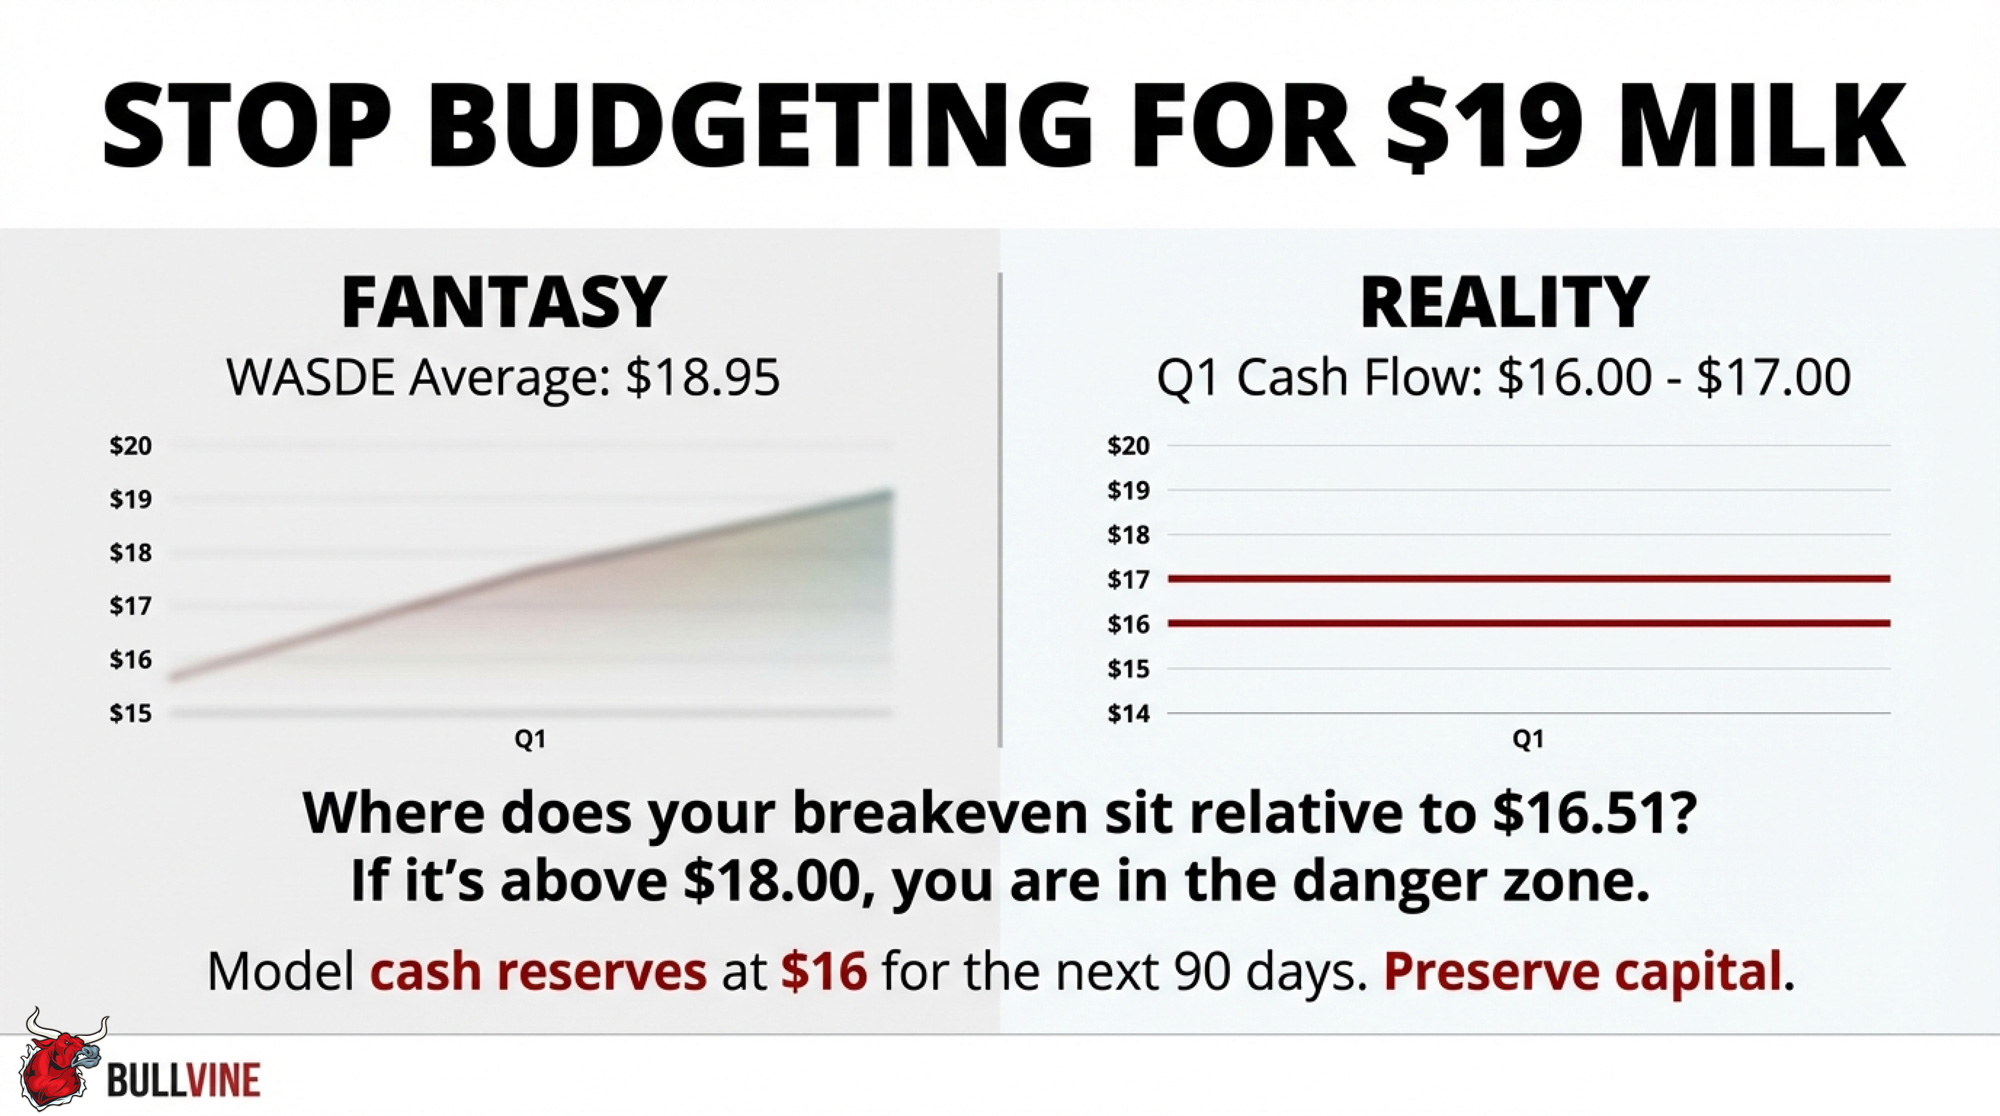
- If your expansion doesn’t pencil at $20 milk, it doesn’t pencil. Use the 2023 all‑milk average as your down‑cycle starting point and build your 18‑month stress test from there, with full principal and interest, family labor, and post‑Hormuz input costs loaded.
- A $3M project at 7% is a $4.85M commitment. For a 500‑cow herd shipping 60,000 cwt a year, that adds about $5.39/cwt in fixed cost before you pay yourself, and the first $1/cwt drop in milk erases $60,000 of that cushion.
- Use the 2026 rally to buy flexibility, not just concrete. If you come out of this year with less high‑interest debt, some downside protection layered in, and a clear margin policy, you’ve gained options whether milk trades at $18 or $24.
- Watch the overhang and the herd, not just the headline price. EU SMP and butter stocks, U.S. cow numbers, and China’s export posture will tell you more about how long this rally can last than any single futures quote.
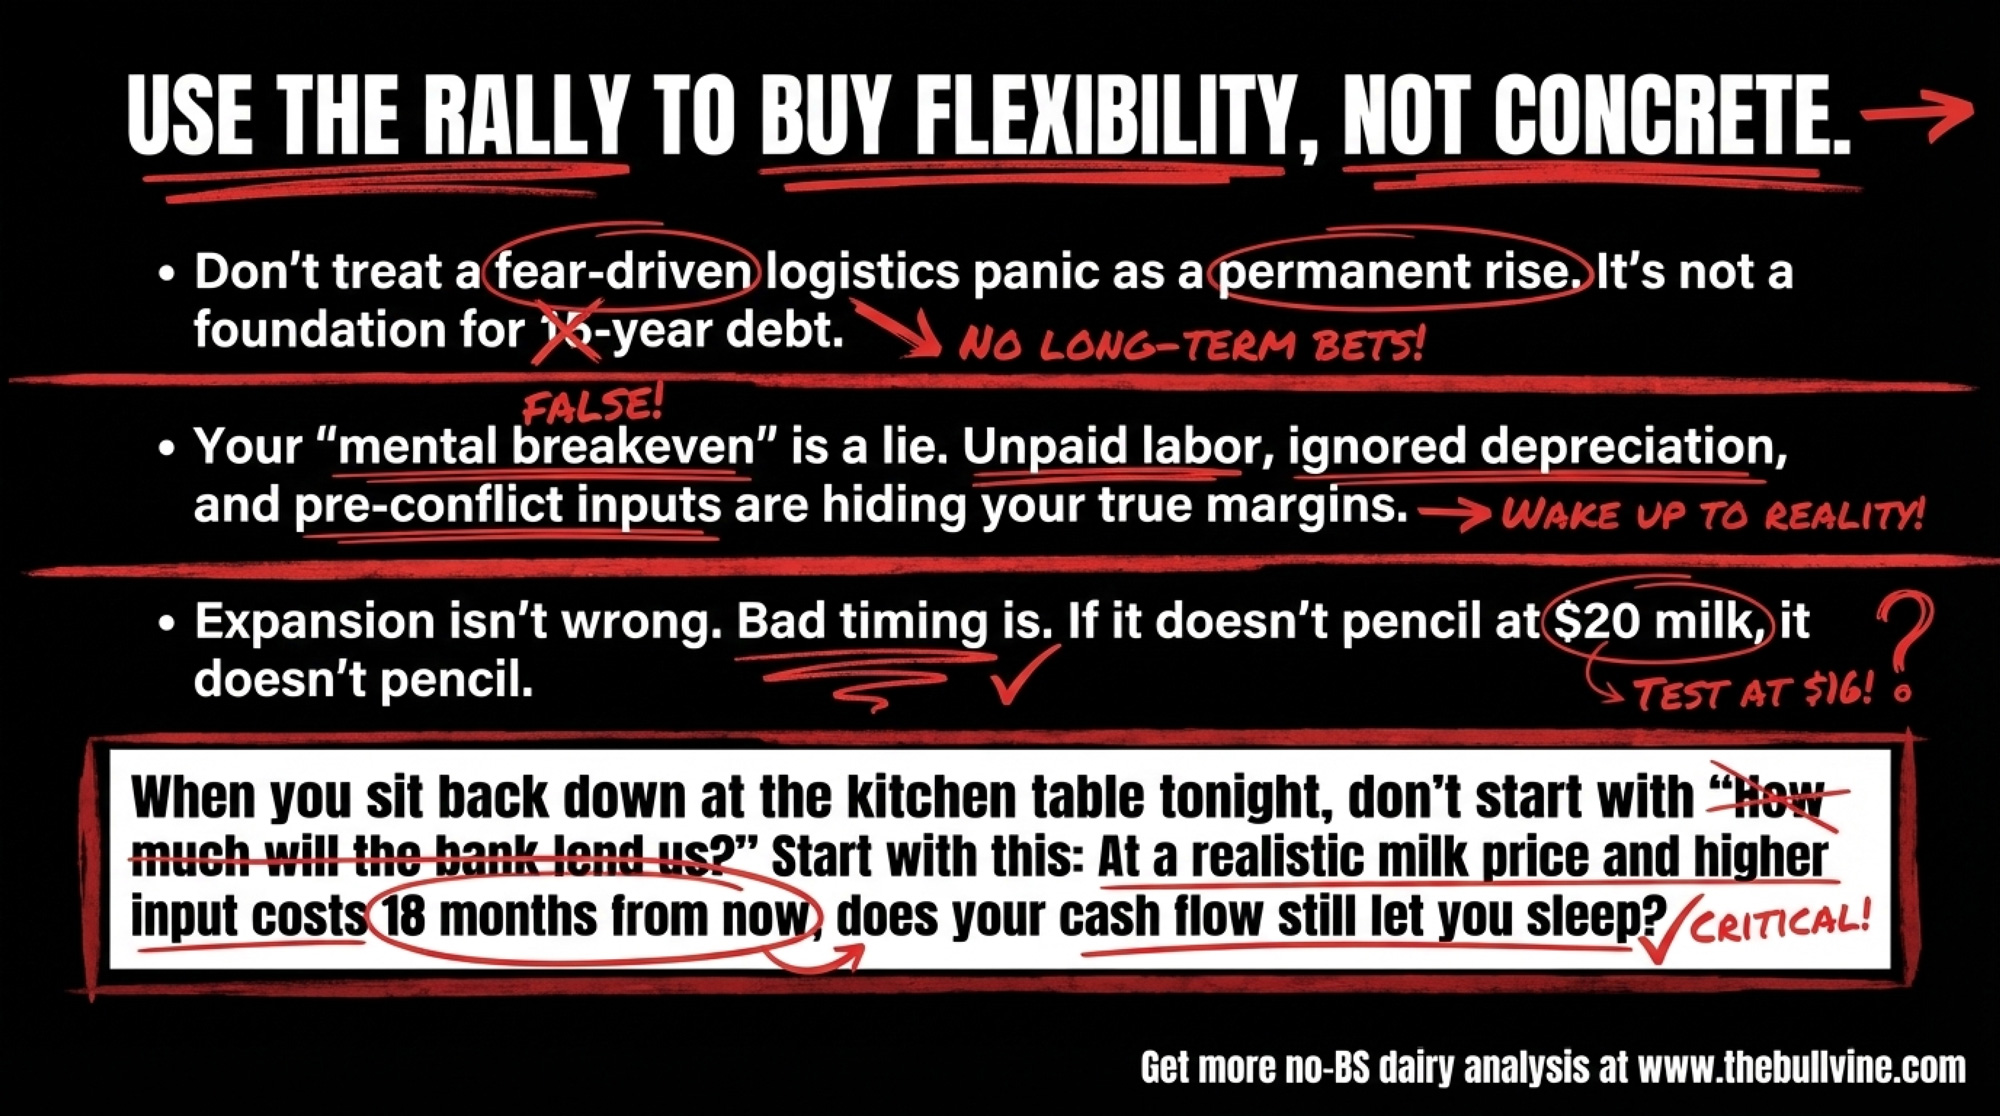
When you sit back down at the kitchen table tonight, don’t start with “How much will the bank lend us?” Start with this: at a realistic milk price and higher input costs 18 months from now, does your operation’s cash flow still let you sleep?
Complete references and supporting documentation are available upon request by contacting the editorial team at editor@thebullvine.com.
Learn More
- The 3.5-Hour Bottleneck: Why Smart Farms Track Parlor Time, Not Cow Count – Breaks down the ‘3.5-hour rule’ that determines whether your next 100 cows generate profit or bleed cash. This operational audit arms you with the specific benchmarks needed to stress-test your existing infrastructure before expanding.
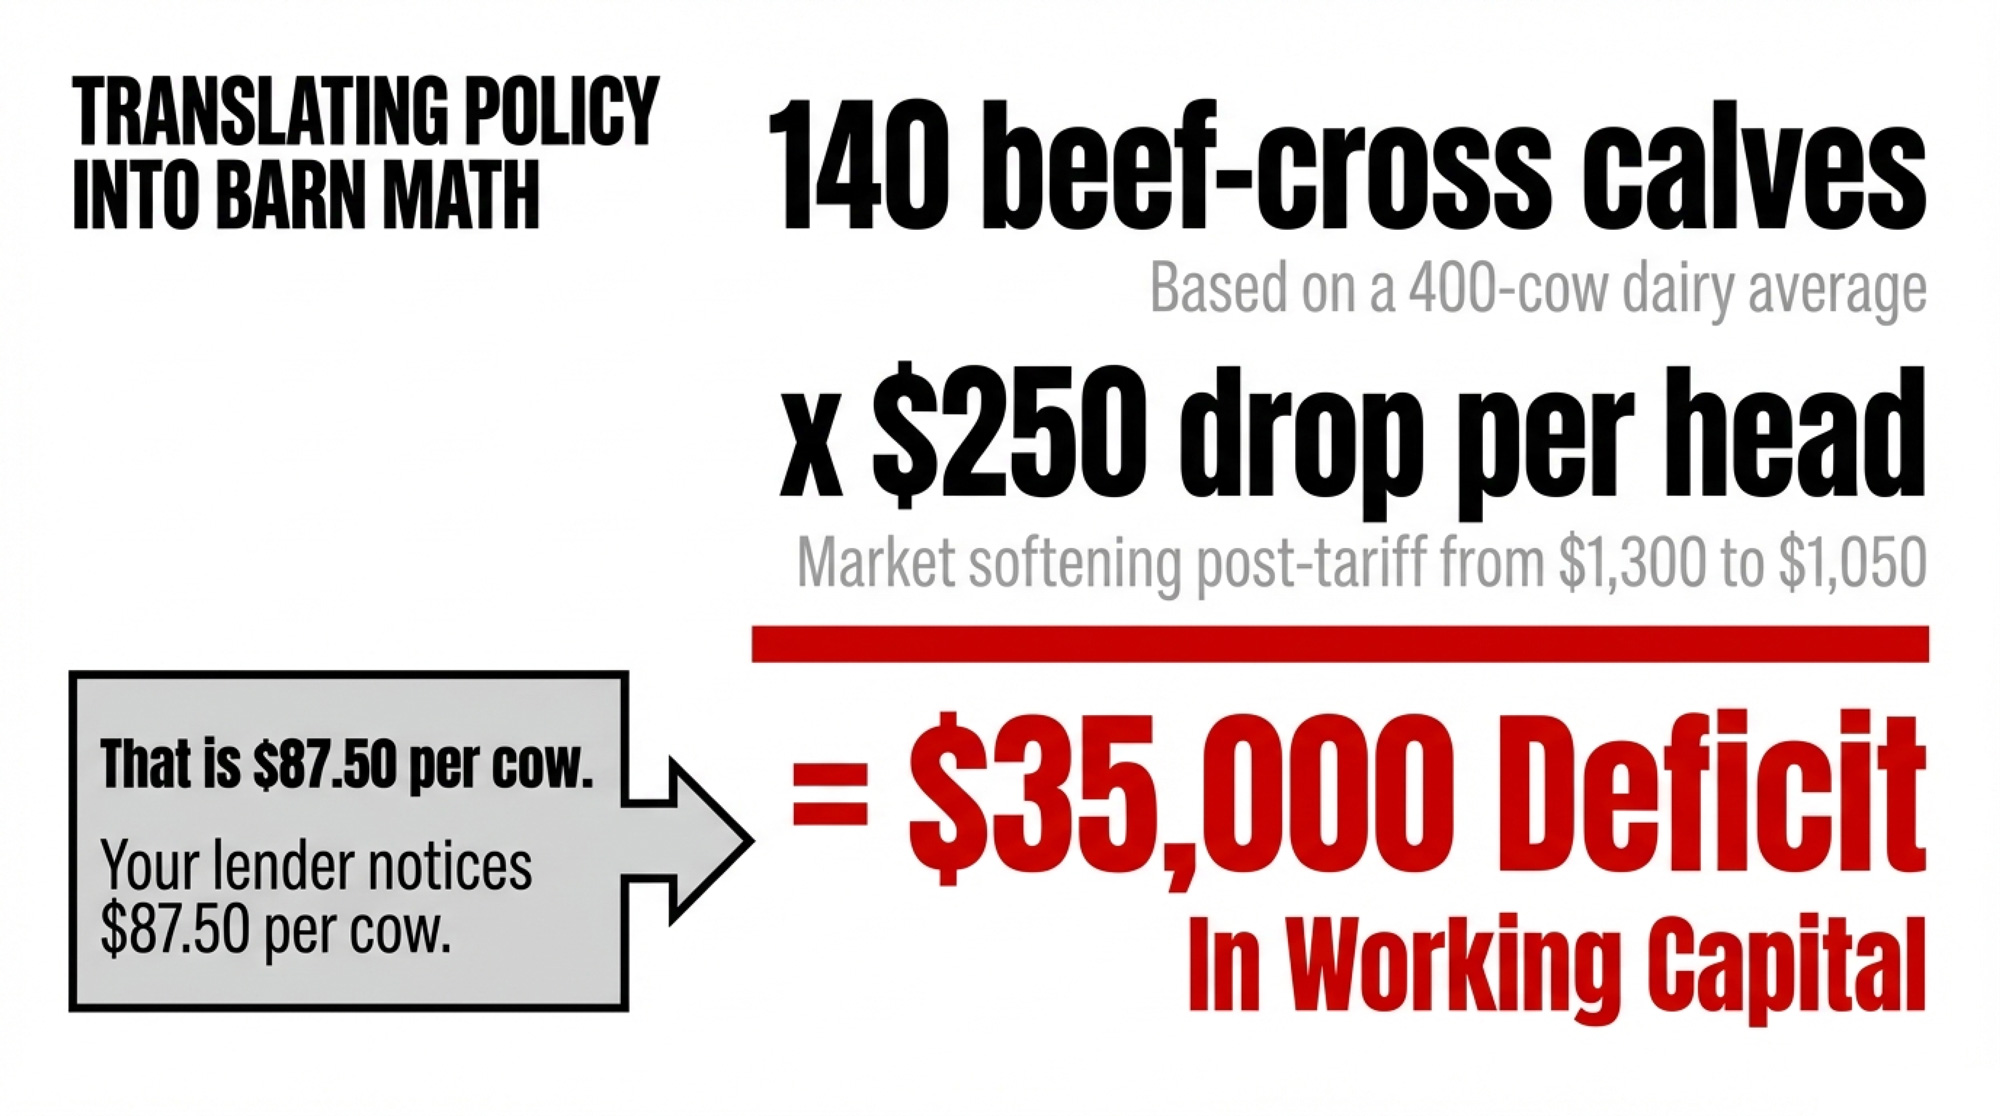
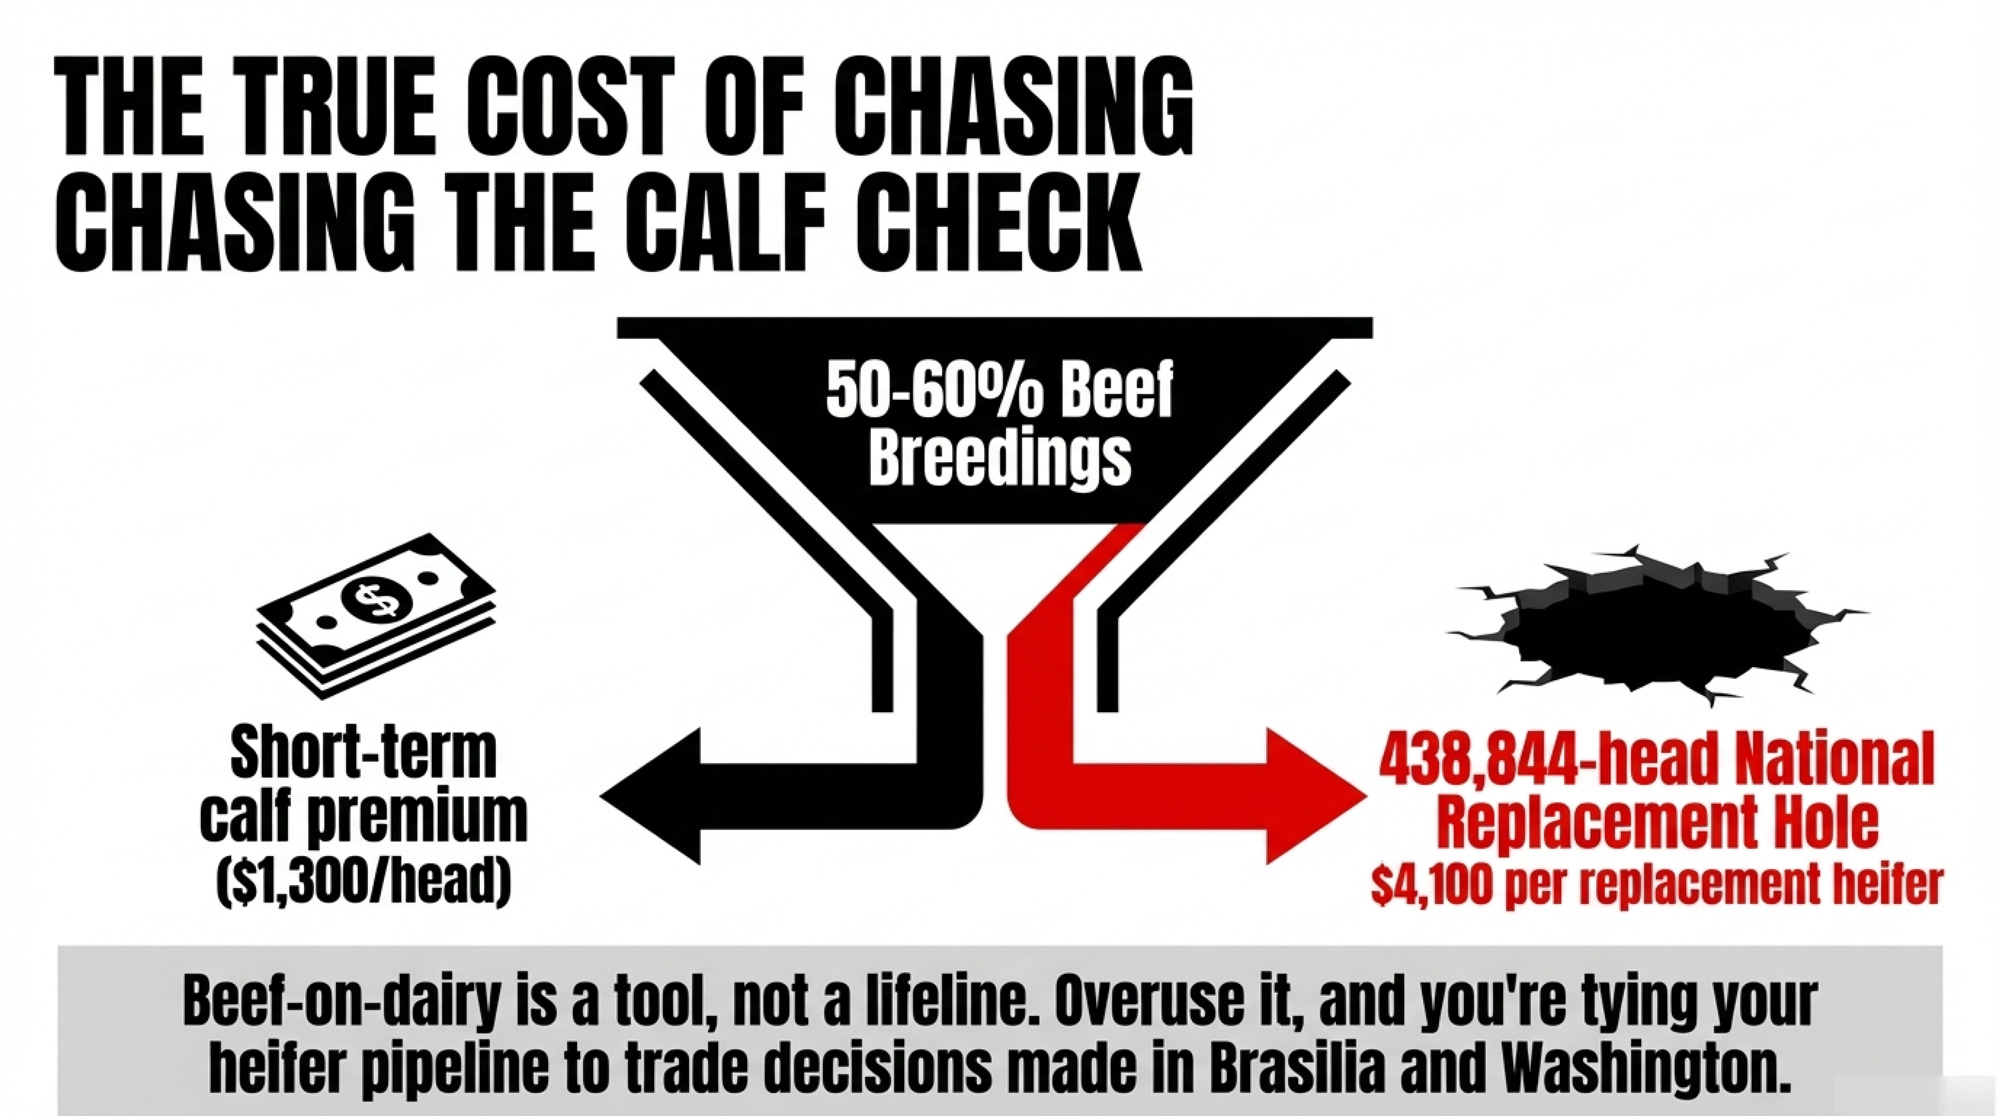
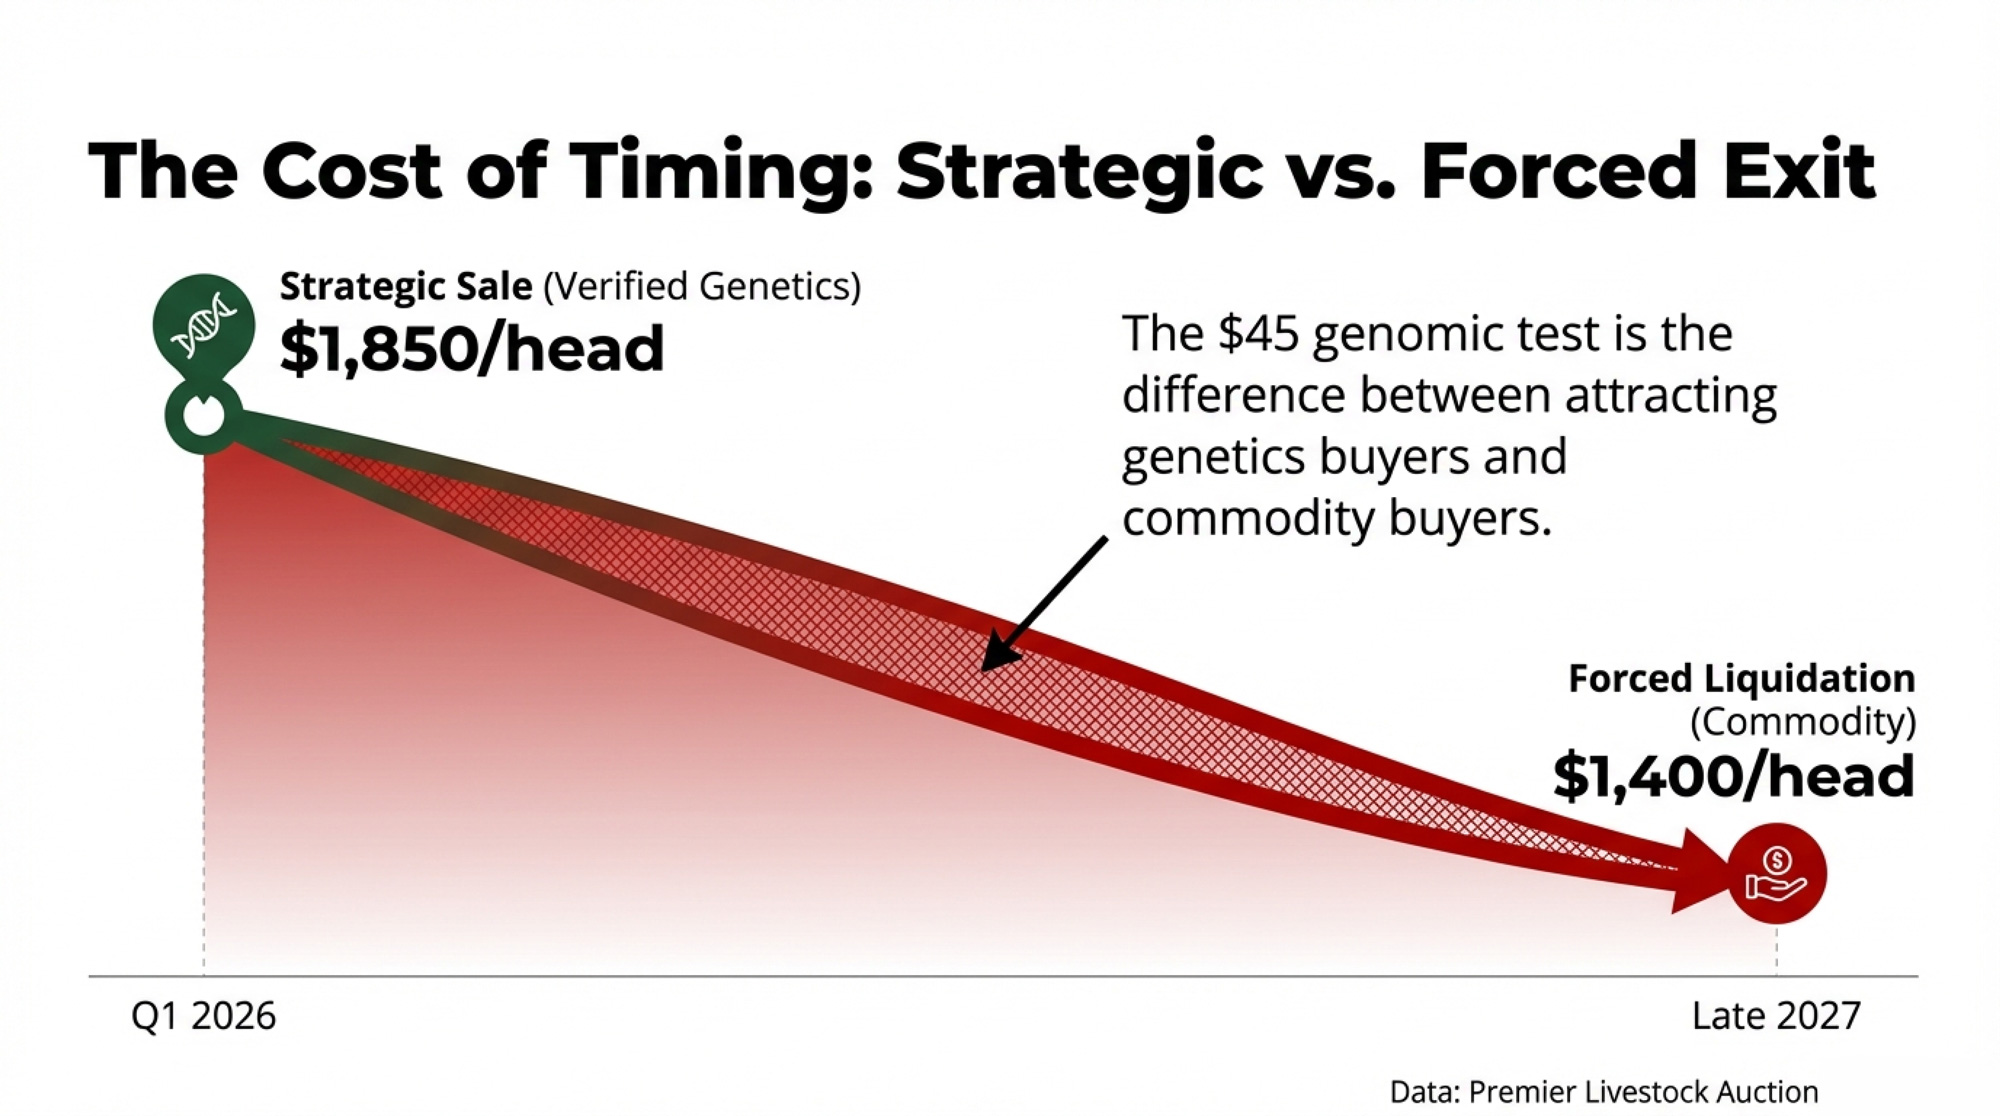
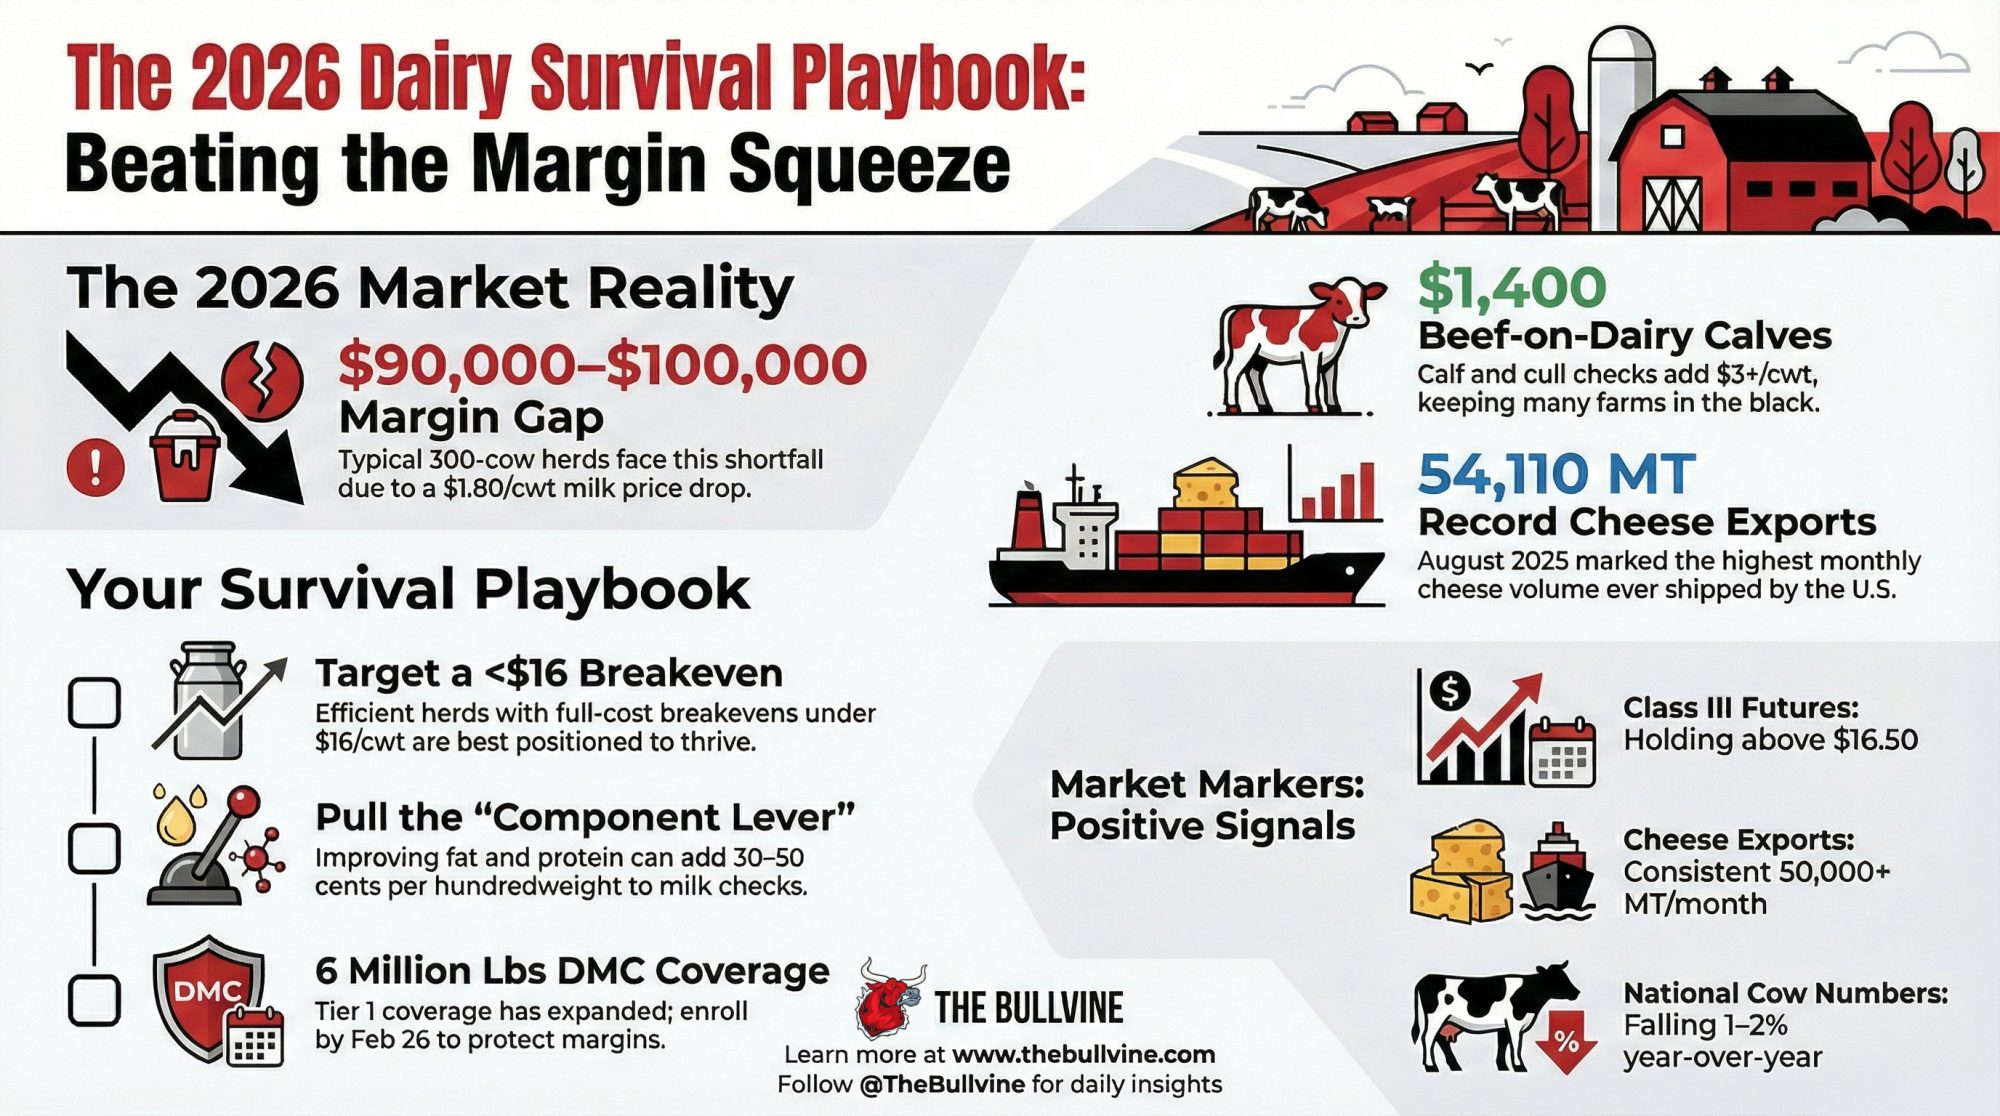
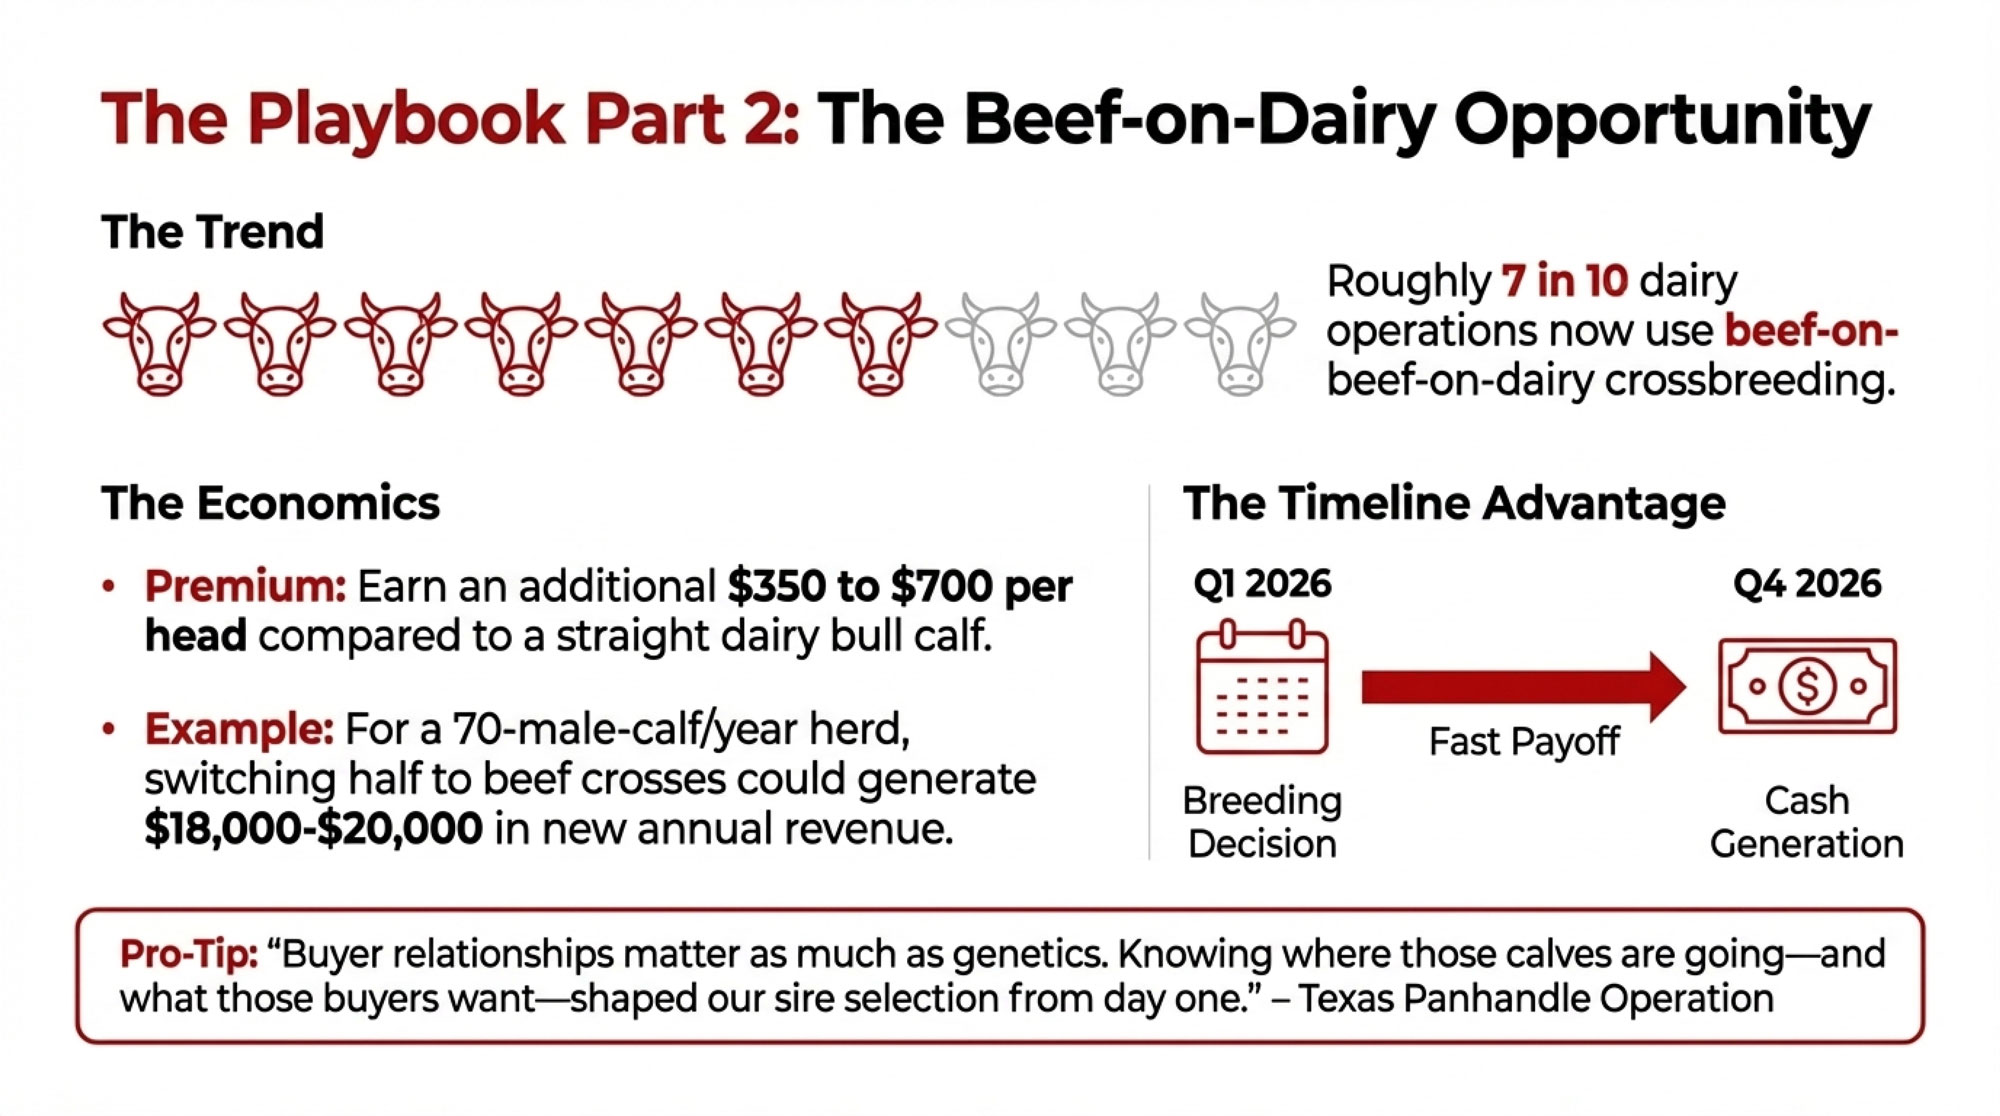
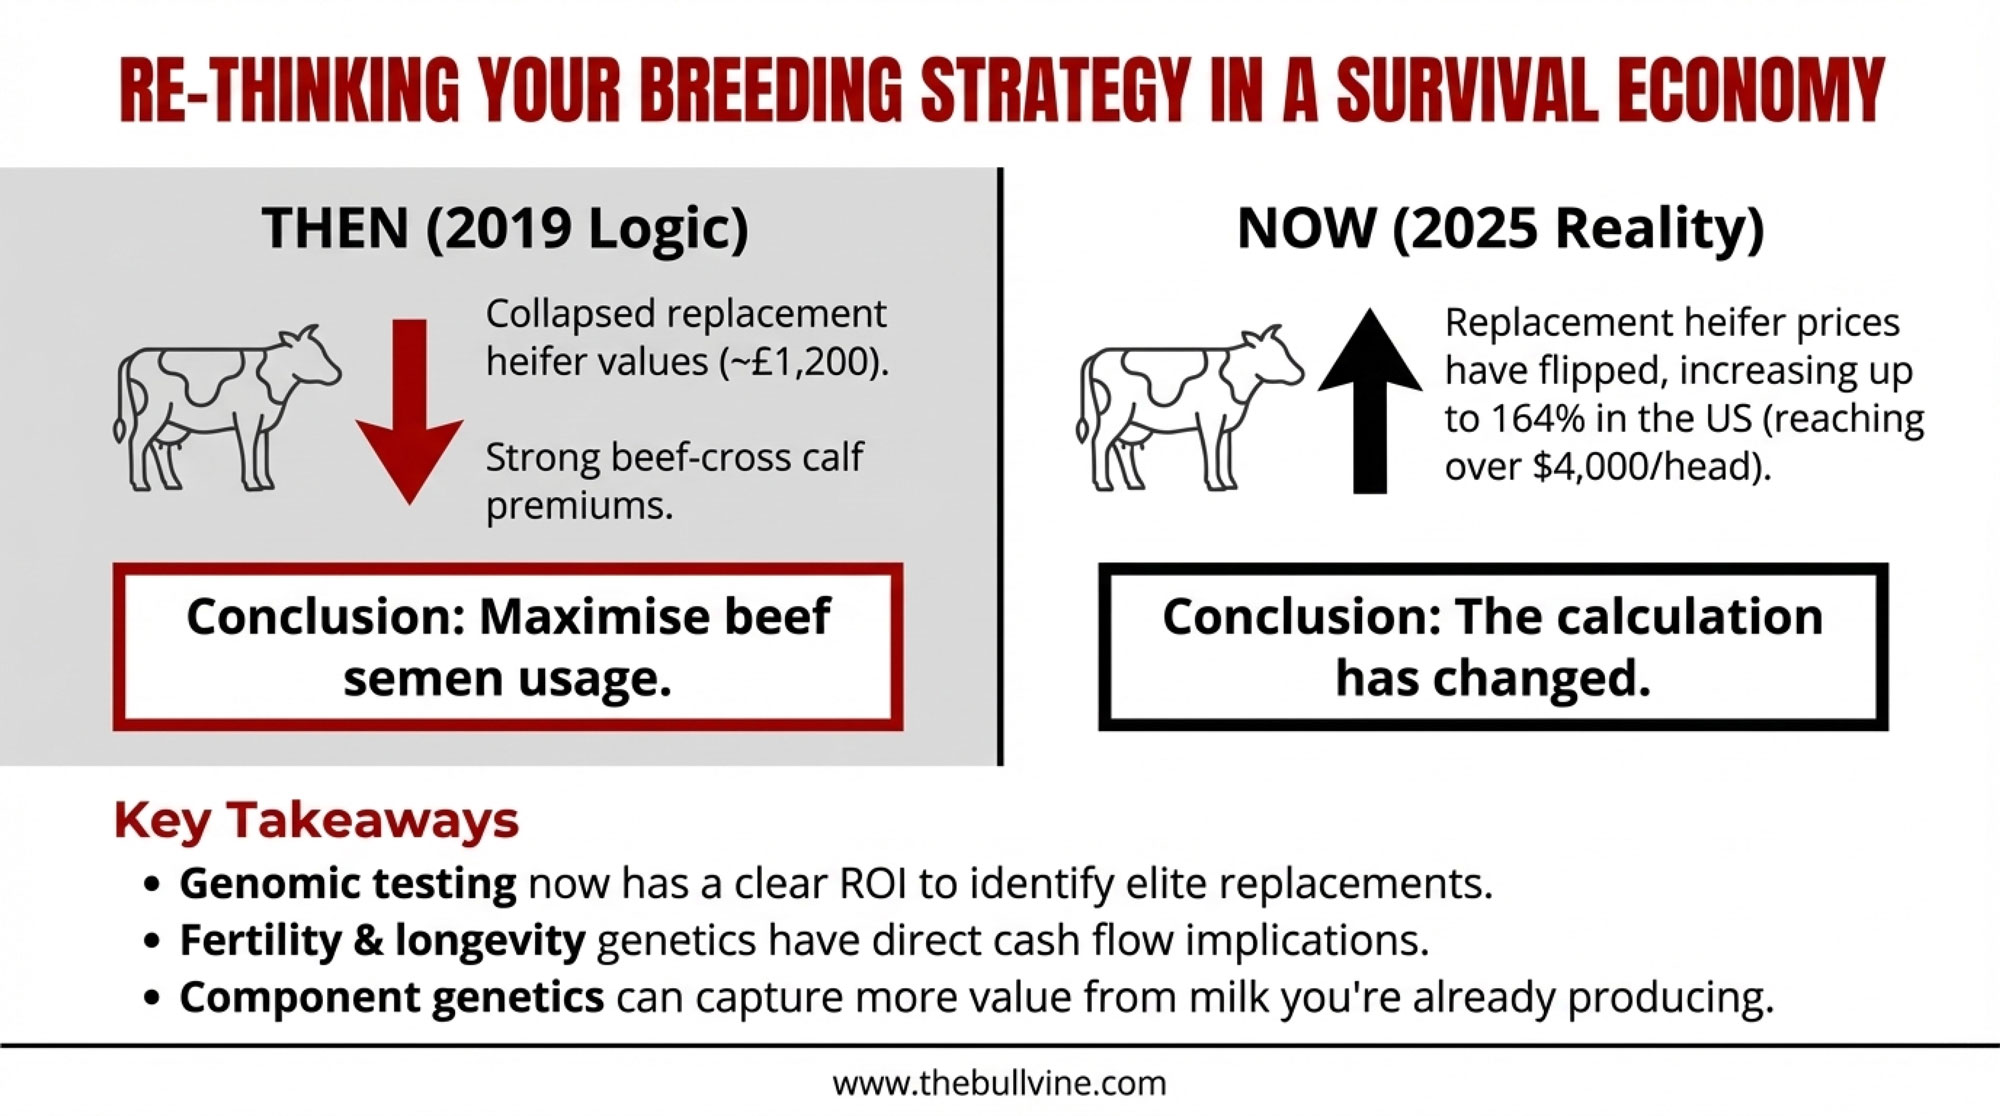
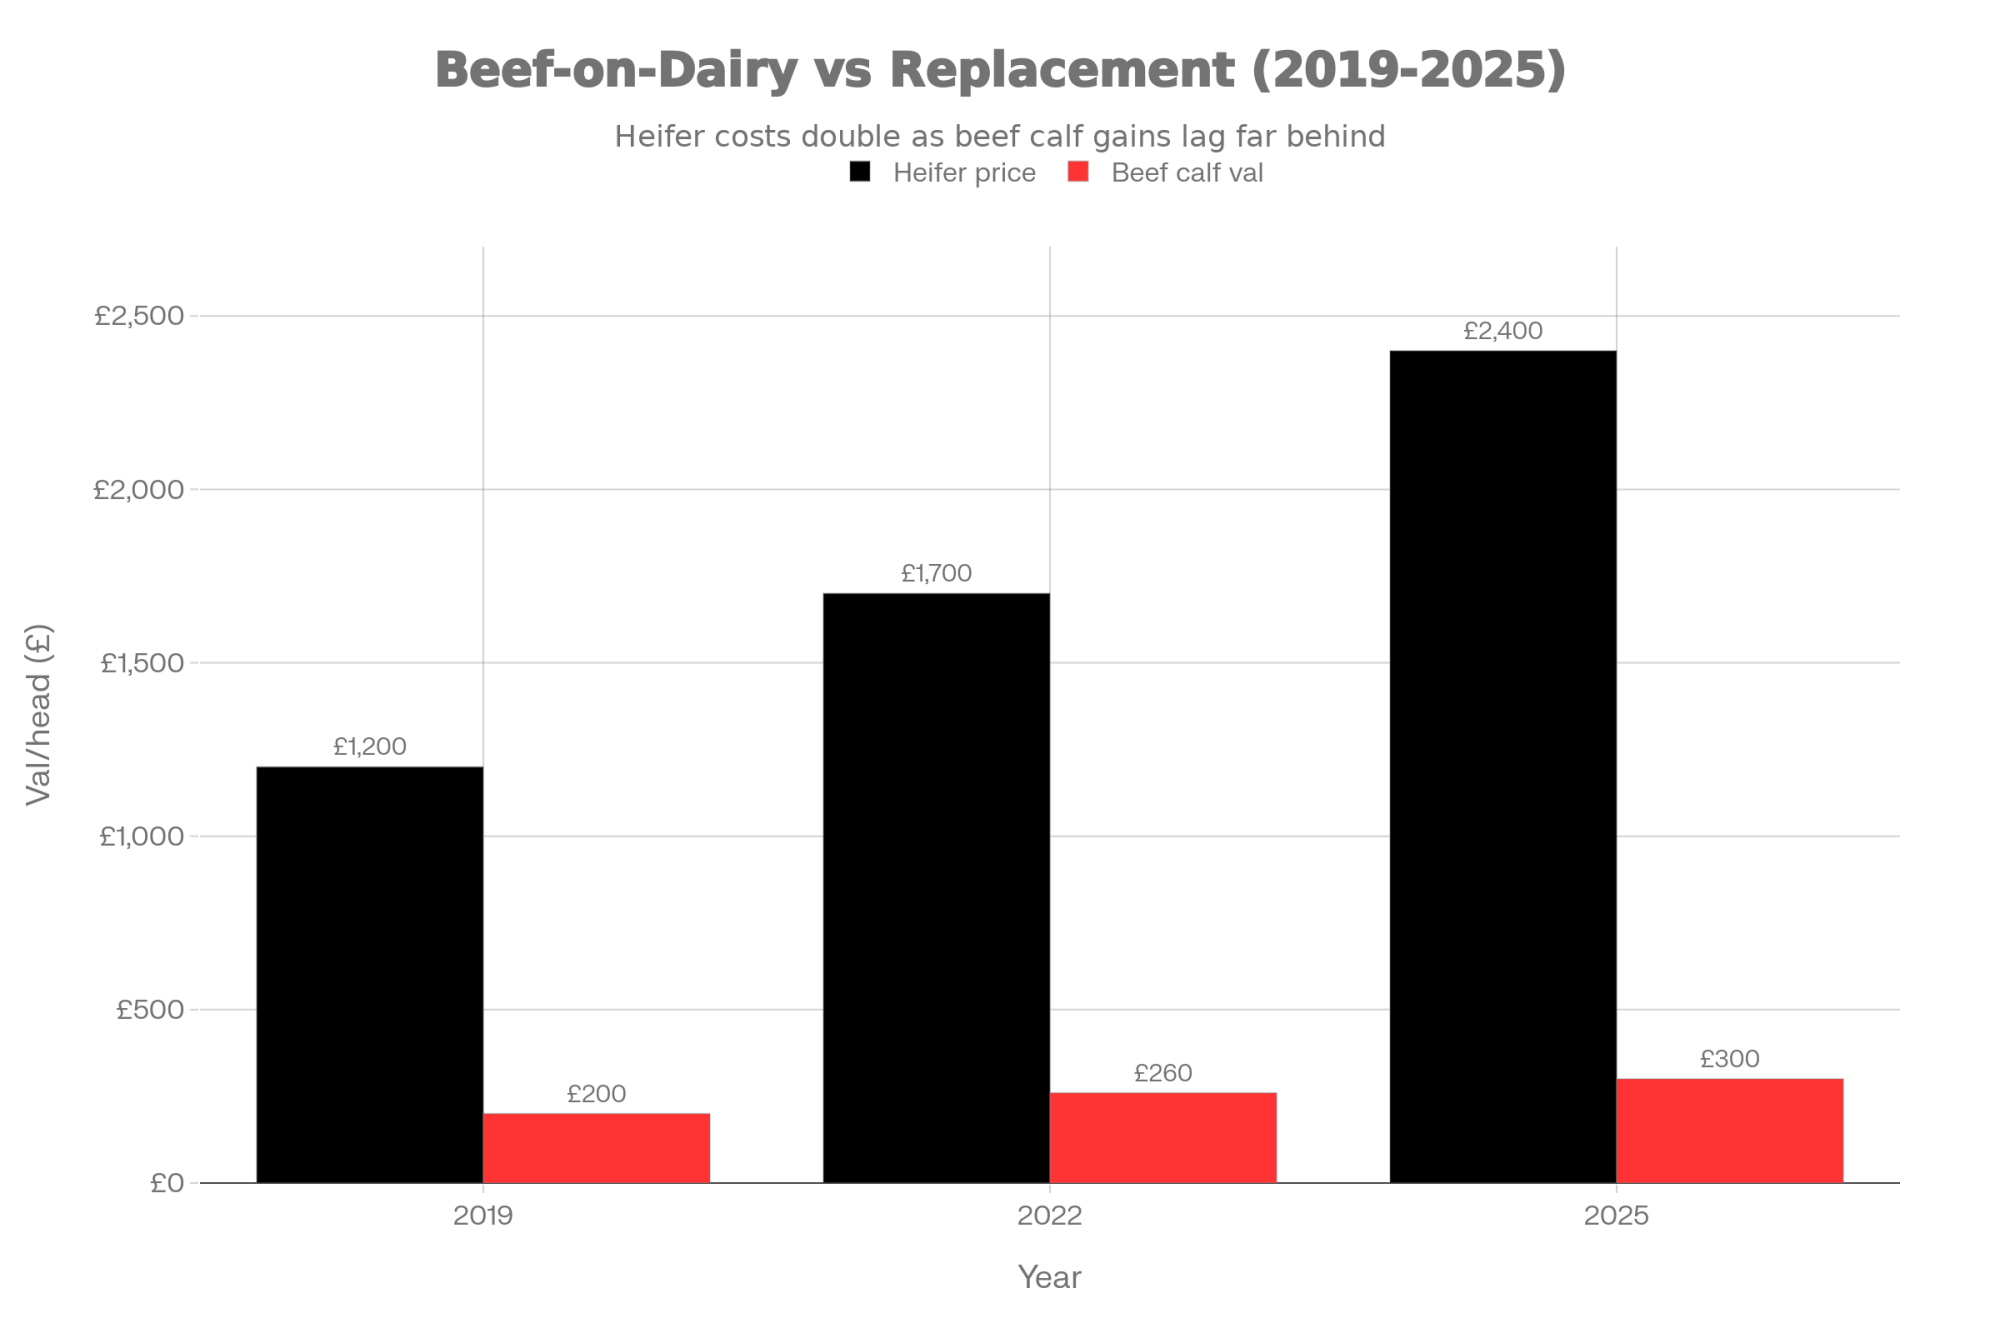
- $90K Less Margin, 214K More Cows: Beef‑on‑Dairy, Calf Checks and Your 2026 Survival Playbook – Delivers a hard-hitting 2026 economic forecast, revealing how a $90,000 revenue gap is restructuring the mid-sized sector. It exposes the critical beef-on-dairy signals you need to position your operation for long-term survival through 2026.
- Ditching Robot Pellets: How Smart Farms Save $36000 and Improve Milk Components – Reveals a maverick strategy for robotic milking that saves $36,000 annually by defying 25 years of industry logic. This field-tested approach breaks down the management shifts required to boost butterfat while slashing your automation costs.
 The Sunday Read Dairy Professionals Don’t Skip.
 The Sunday Read Dairy Professionals Don’t Skip.
Every week, thousands of producers, breeders, and industry insiders open Bullvine Weekly for genetics insights, market shifts, and profit strategies they won’t find anywhere else. One email. Five minutes. Smarter decisions all week.


 Join the Revolution!