Archive for farm exit strategy

The 90-Day Reckoning: What Your Milk Check Is Really Saying About 2026

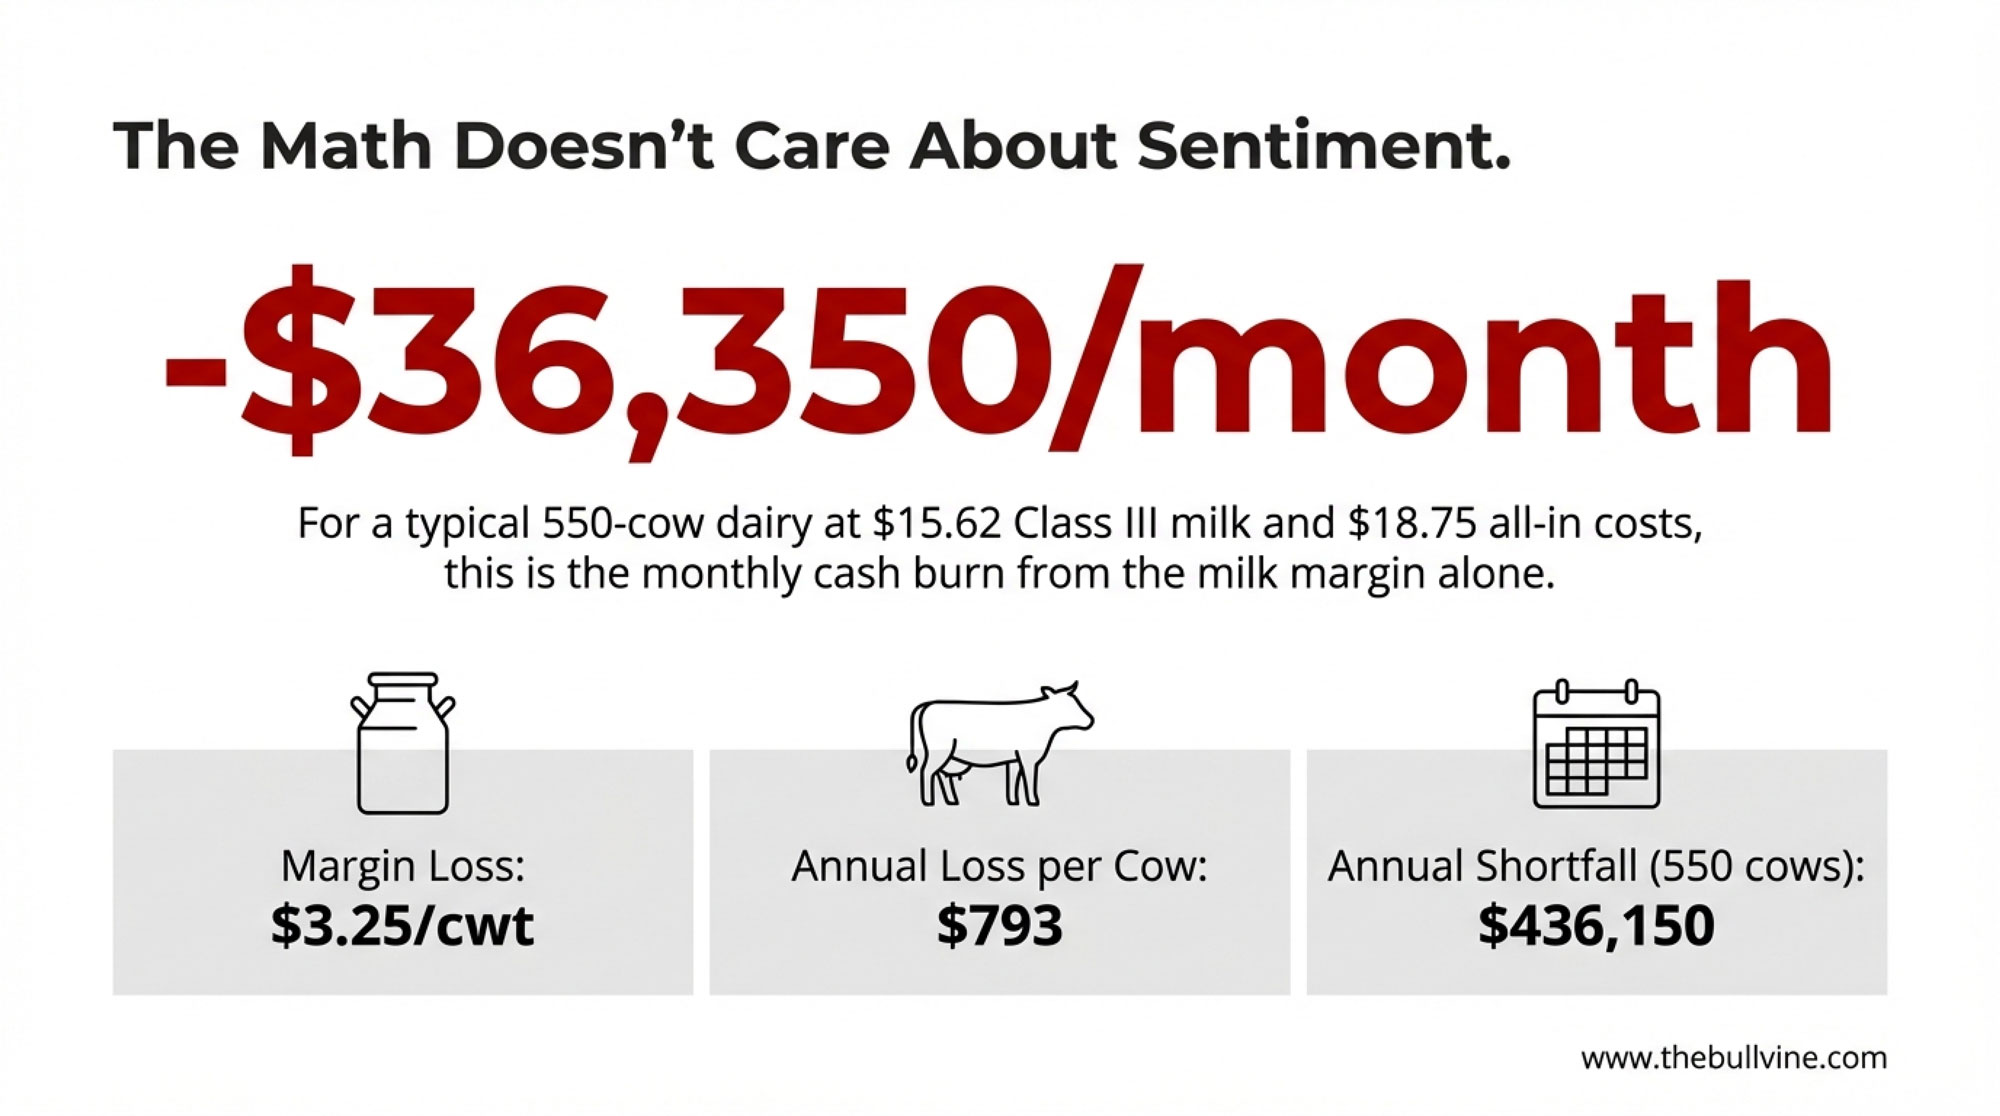
The math doesn’t care about sentiment. At $15.62 milk and $18.75 costs, a 550-cow dairy burns $36,350/month. What’s your number?

EXECUTIVE SUMMARY: At $15.62 Class III milk and $18.75 all-in costs, a 550-cow dairy burns $36,350 every month—and the math doesn’t care about sentiment. Heifer inventories have hit a 47-year low. Nine consecutive GDT auctions have declined. Over $11 billion in new processing capacity is coming online while farms contract. This isn’t a cycle; it’s a structural reset. For producers with costs in the $17-19 range and limited liquidity, the window to preserve family equity through a controlled transition is roughly 90 days. The frameworks are here—true cost of production, liquidity runway, decision pathways—because knowing your real numbers is the difference between making decisions and having them made for you.

You know how it goes this time of year. You’re wrapping up evening chores, maybe checking futures on your phone while the parlor finishes up, and the numbers just don’t add up the way you need them to.

Class III contracts for early 2026 have been trading in the mid-teens on the CME—January 2026 recently settled around $15.62—and for a lot of operations, that’s a couple of dollars or more below what’s needed to cover everything. Not just feed and labor. Everything. The mortgage, the equipment note, and family living expenses.

Here’s what makes this moment unusual, though. Feed costs have actually come down. Corn’s running around $4.40-4.45 a bushel on the Chicago Board of Trade as of mid-December. Soybean meal’s around $300-320 a ton—well below where it was a couple of years back. Butter inventories look manageable. Domestic cheese demand is holding steady.

So why does the math still feel so difficult?

After spending the past few weeks going through the data—conversations with economists, reports from CoBank and the extension services, watching the Global Dairy Trade auctions—I’ve come to believe that what we’re looking at in early 2026 isn’t just another down cycle. Global supply growth, shifting export dynamics, and significant new processing capacity all arriving at once… these conditions seem likely to reshape dairy’s structure over the next several years.

This isn’t about waiting for prices to recover. It’s about understanding where your operation actually stands—and thinking through your options while they’re still open.

The Numbers Nobody Wants to See

The Global Dairy Trade auctions have been tough to watch lately. The December 16th event marked the ninth consecutive decline, with the index dropping 4.4% according to GDT Event 394 results. The auction before that fell 4.3%. Whole milk powder values have softened enough to create real headwinds for exporters trying to move product internationally.

On the domestic side, butter’s been trading in the mid-$2 range per pound, down from earlier this fall. Block cheese has settled into the mid-$1.60s after pushing toward $1.90 in October, based on CME spot market data. Not terrible, but not where most of us need it to be either.

What’s worth noting—and this is something that’s frustrated a lot of folks—is what’s happening with Dairy Margin Coverage. The program triggered a solid payment in January 2024 when margins dipped below $9.50, according to USDA Farm Service Agency records. Since then? With feed costs lower than they were, the formula shows margins that look healthy on paper, even when your cash flow is telling a very different story.

Danny Munch, an economist at the American Farm Bureau Federation, has spoken to this dynamic. When corn and soybean meal prices drop, the DMC calculation can paint a rosier picture than what many farms are actually experiencing. The safety net’s still there, but the way the formula works means it doesn’t always deploy when you’d expect it to.

💰 THE MATH THAT MATTERS

What margin pressure actually looks like per cow:

At $18.75 all-in cost and $15.50 Class III milk:

  • $3.25/cwt margin loss
  • Average U.S. cow produces ~24,375 lbs/year (that’s from USDA’s December 2025 Economic Research Service forecast)
  • That works out to 244 cwt × $3.25 = $793/cow/year loss

For a 550-cow dairy:

  • $436,150 annual margin shortfall
  • $36,350/month cash burn from milk margin alone

And that’s before you add debt service, family living, and depreciation. You can see why liquidity evaporates faster than most folks expect.

The Heifer Trap

Those of us who’ve been through 2009, 2015-16, and 2018 know what price cycles look like. We’ve navigated them before. But a few things are converging now that really do set this period apart.

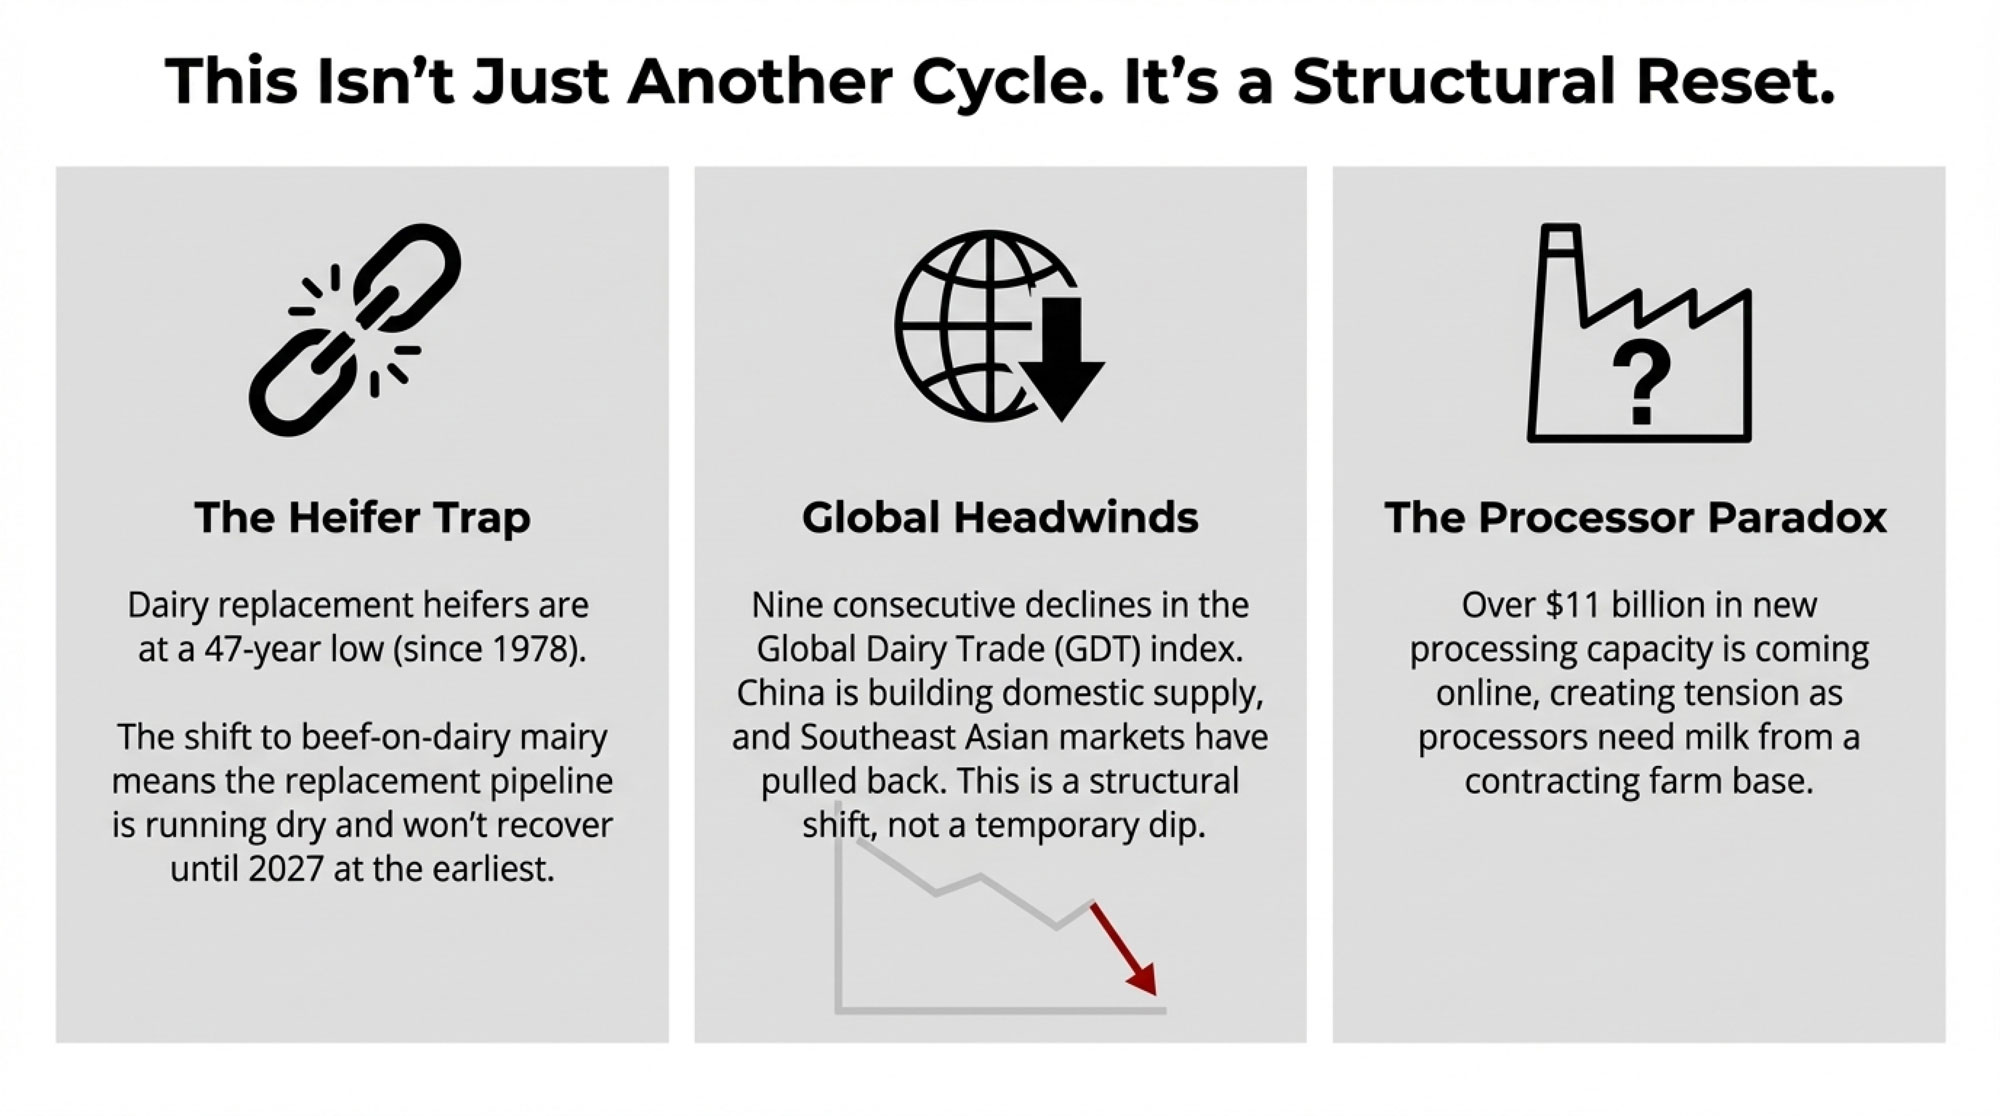
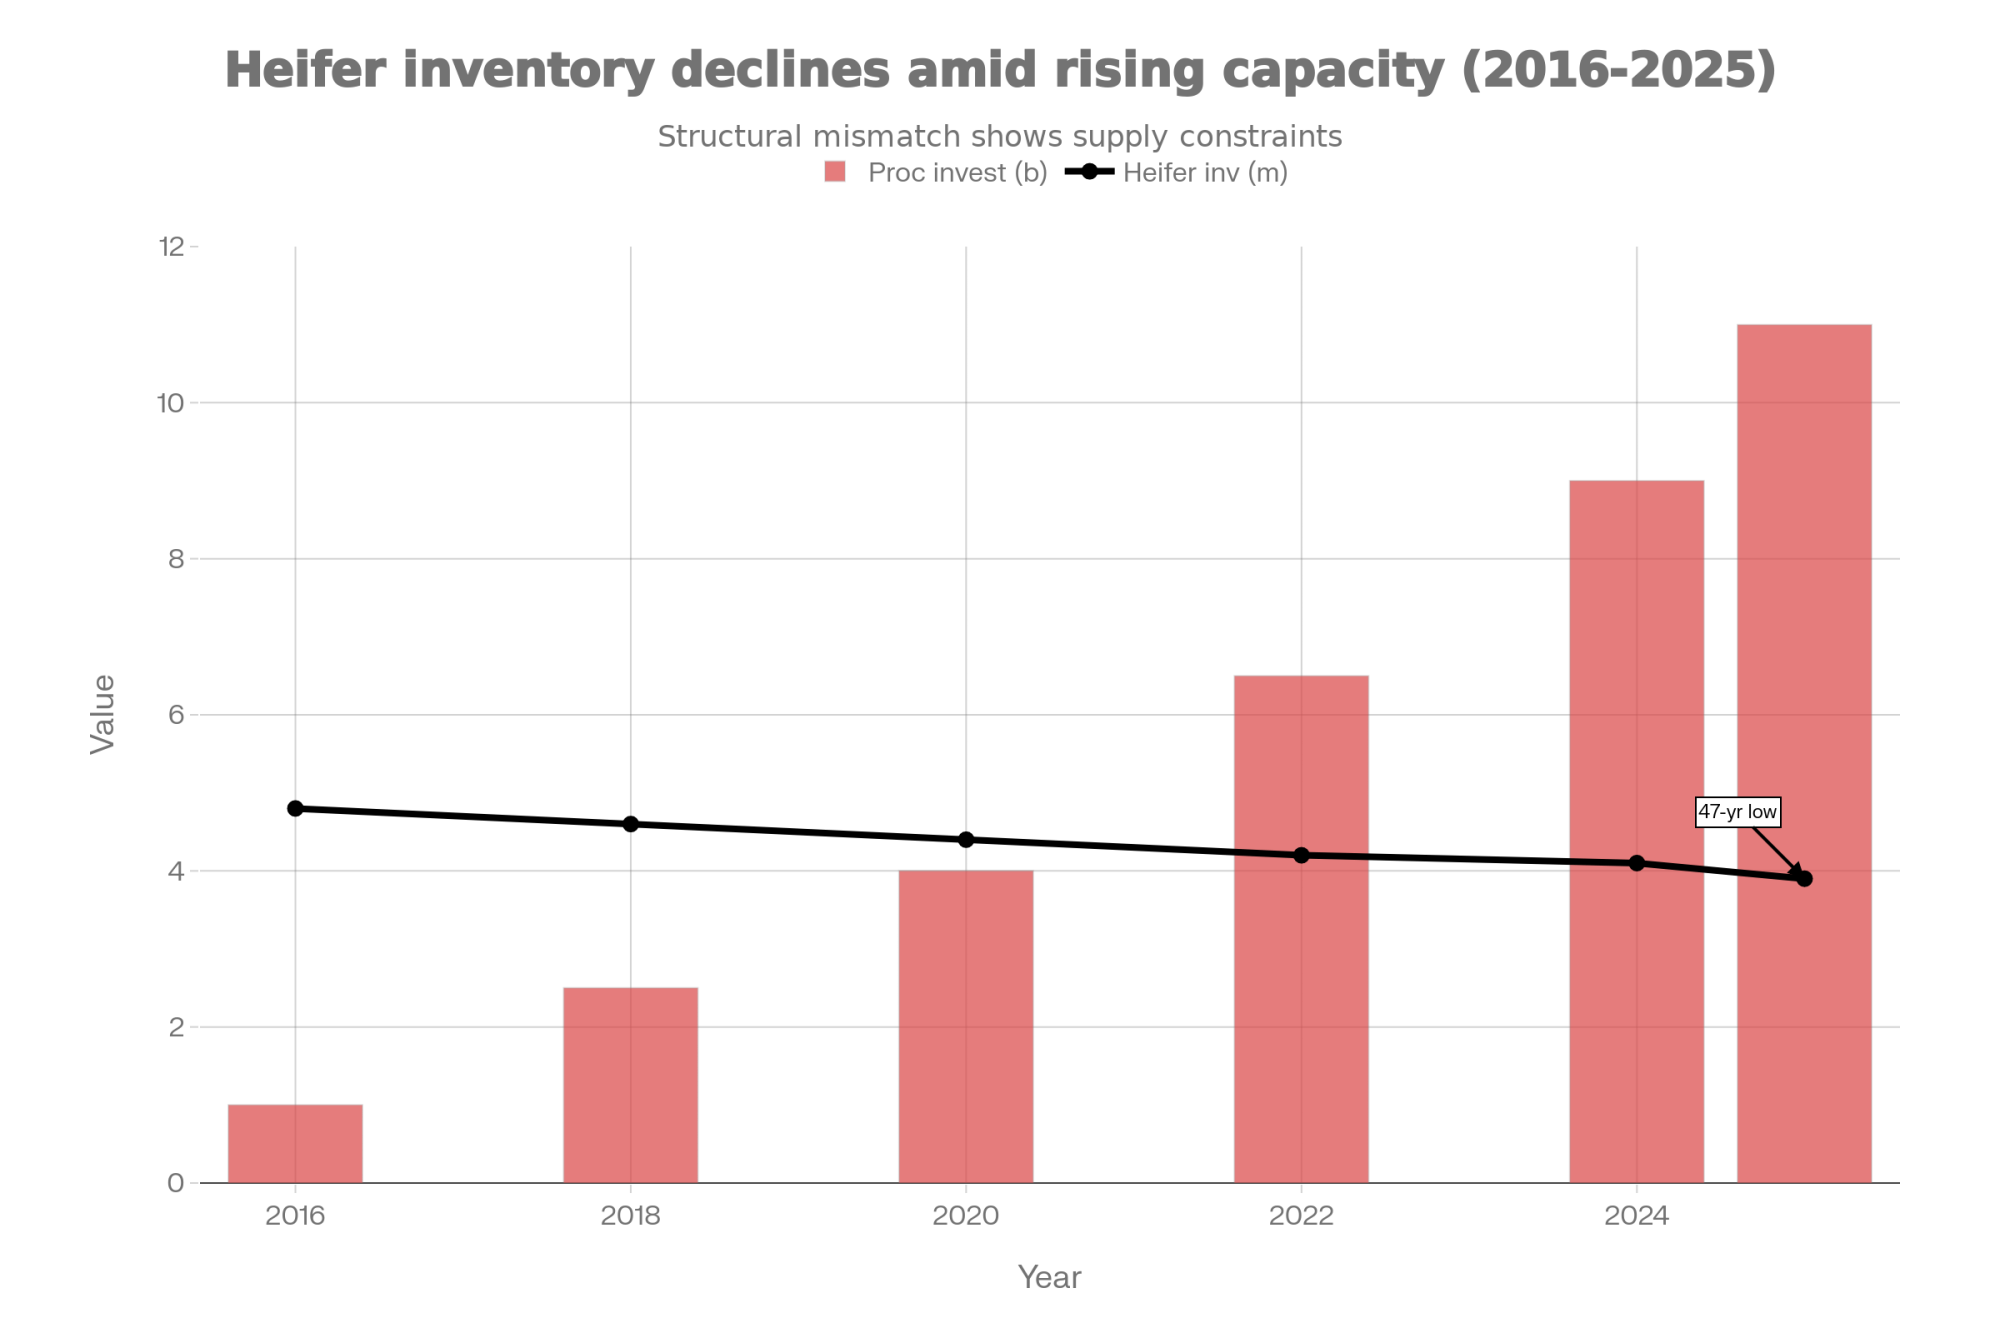
The replacement pipeline is running dry. USDA’s cattle inventory data from January 2025 showed dairy replacement heifers over 500 pounds at around 3.9 million head—the lowest since 1978, according to the National Agricultural Statistics Service. That’s a 47-year low. Let that sink in for a moment.

How did we get here? Well, you probably know, because you may have made some of the same decisions I’ve seen across the industry. When beef-on-dairy started penciling out so well, a lot of operations shifted their breeding programs. NAAB data shows beef semen use on dairy operations climbed substantially over the past decade. It made economic sense at the time—those crossbred calves brought good money, and they still do. But it means fewer heifers in the replacement pipeline, and that’s not something that corrects quickly.

CoBank’s August 2025 Knowledge Exchange report projected that heifer inventories will likely tighten further before any meaningful recovery, probably not until 2027 at the earliest. Biology takes time. You can’t speed up gestation.

Export markets have shifted underneath us. China has been building domestic production capacity for years now. USDA Foreign Agricultural Service and OECD-FAO analyses show they’re meeting most of their dairy needs internally these days internally, with imports focused more on specific ingredients than on bulk commodities. That’s a structural change, not a temporary dip.

Several Southeast Asian markets—Indonesia, Vietnam, the Philippines—have also pulled back from where they were a few years ago, according to USDA’s Dairy: World Markets and Trade reports. There’s still an opportunity there, but competition has intensified considerably.

Processing is expanding while farms contract. According to IDFA data released in October 2025, more than $11 billion in new and expanded dairy processing projects are underway across 19 states, with over 50 facilities scheduled to come online between 2025 and early 2028. That represents significant demand for raw milk—but also creates some interesting pressure on the supply side.

This creates a tension that’s worth watching closely. Processors built capacity expecting continued production growth. The heifer shortage complicates that considerably. And margin pressure is affecting decisions across the board. Everyone in the supply chain is working through the same challenges simultaneously.

Editor’s note: We’re working on a follow-up piece—”What Your Milk Buyer Wants You to Know About 2026″—examining how processors are managing supplier relationships during this consolidation period. If you’re a processor willing to share perspective, reach out to us at info@thebullvine.com.

Know Your Real Numbers

I’ve been talking with financial consultants and extension specialists about what metrics matter most right now. Every operation is different—different debt structures, different facilities, different family circumstances—but a few numbers keep coming up in those conversations.

Your Actual Cost of Production

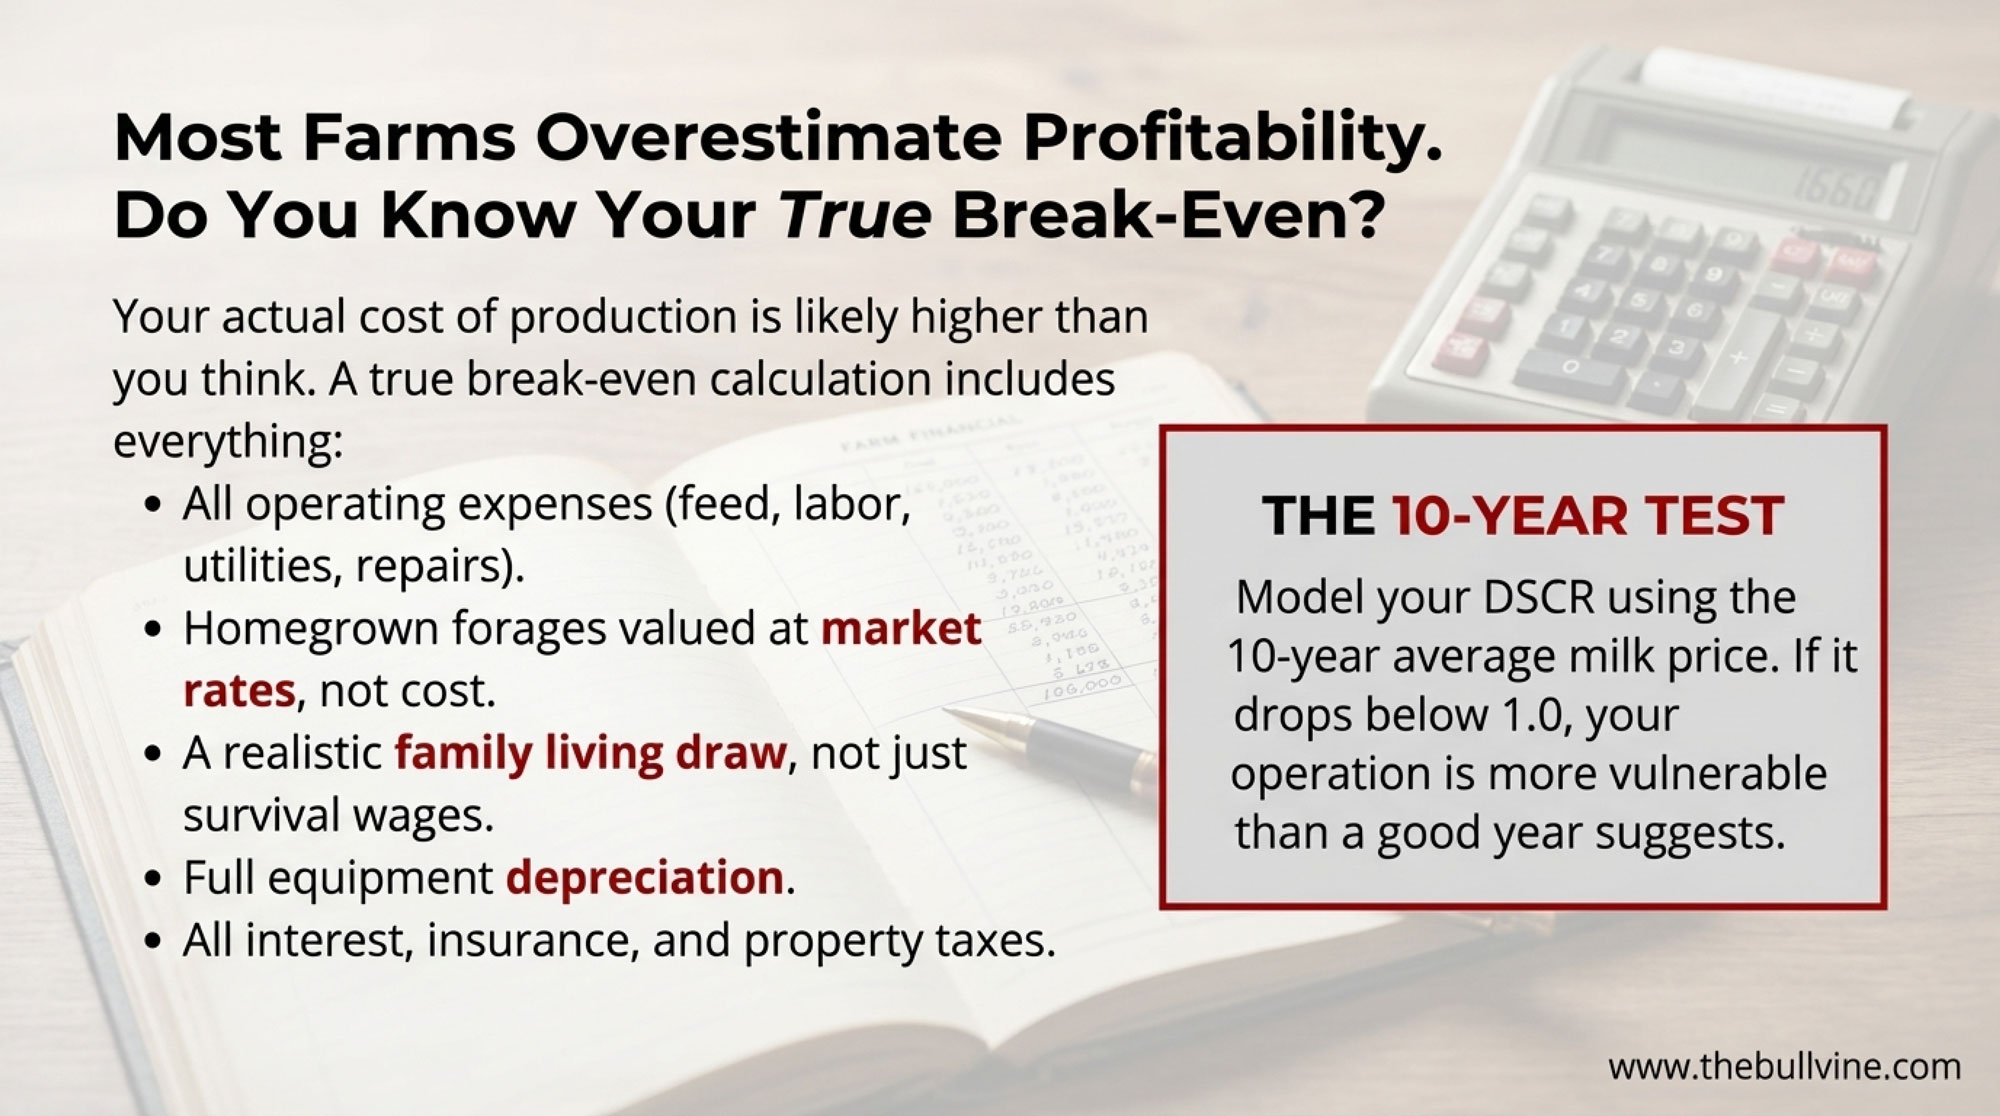
This is probably the most important number you can know. It’s also the one most commonly underestimated.

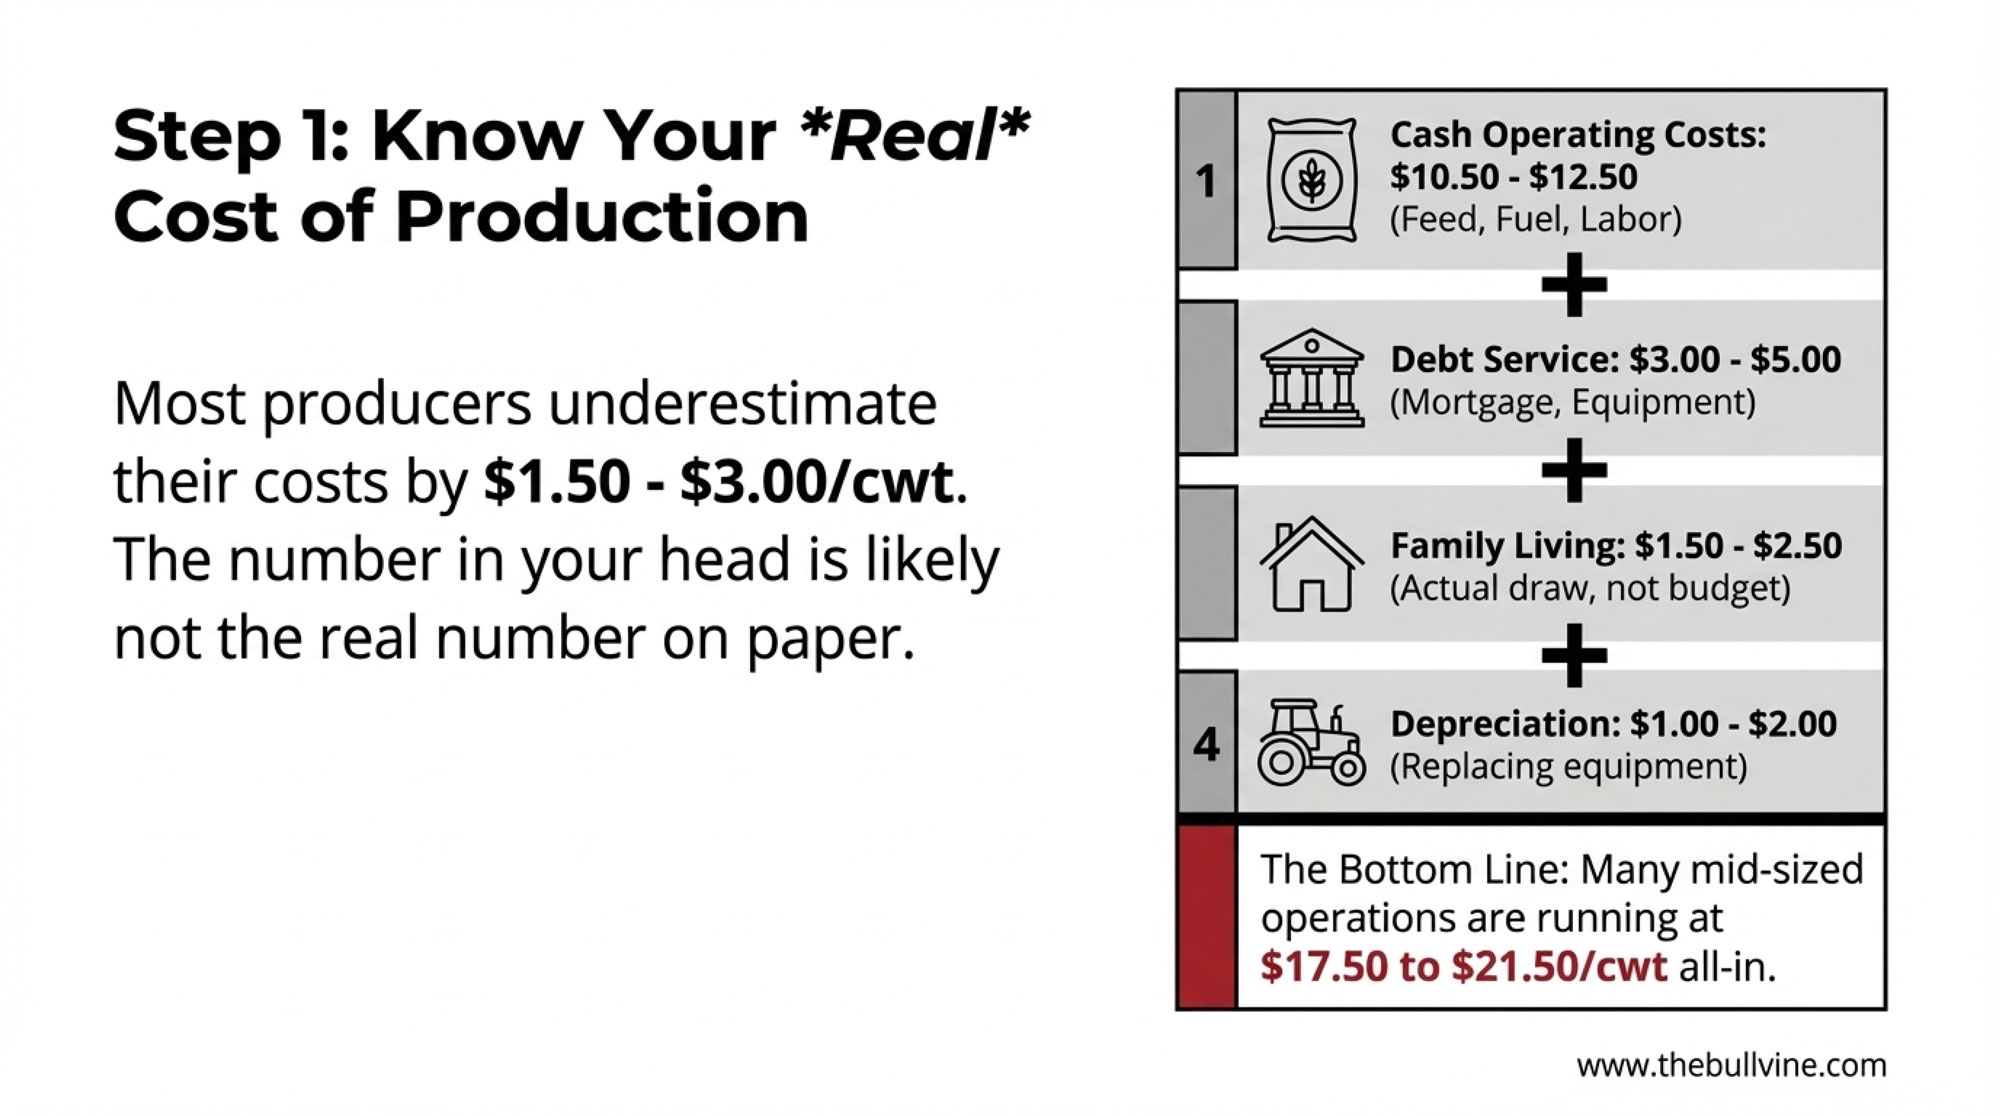
A farm financial analyst who works with Midwest dairies shared something that stuck with me: most producers he sits down with think they know their cost of production, but once they work through everything carefully, they often find they’re $1.50 to $3.00 higher than they thought. That’s a significant gap when margins are already tight.

A complete picture typically includes:

  • Cash operating costs—feed, fuel, labor, utilities, supplies. For most operations, that’s somewhere in the $10.50-12.50 per hundredweight range, according to Penn State Extension dairy breakeven analyses.
  • Debt service—equipment payments, real estate, operating lines. That can add another $3-5 per hundredweight depending on your situation.
  • Family living—what you actually draw, not what you budgeted. Another $1.50-2.50. And be honest here.
  • Depreciation—what it really costs to maintain and replace equipment and facilities over time. Perhaps $1-2 more.

When you add everything up, many mid-sized operations are running $17.50 to $21.50 per hundredweight all-in. The Penn State Extension dairy breakeven tools, the Wisconsin Center for Dairy Profitability benchmarking data (which compares over 500 farms annually), and the University of Minnesota extension work all show similar ranges.

Regional pricing differences matter here, too. Your mailbox price depends heavily on where you’re located and your Federal Order. California’s quota system creates dynamics different from those in FMMO regions. Upper Midwest producers in Order 30 generally benefit from proximity to processing—Wisconsin’s weighted average hauling charge runs around 47 cents per hundredweight, according to Federal Order 30 market administrator data from May 2025.
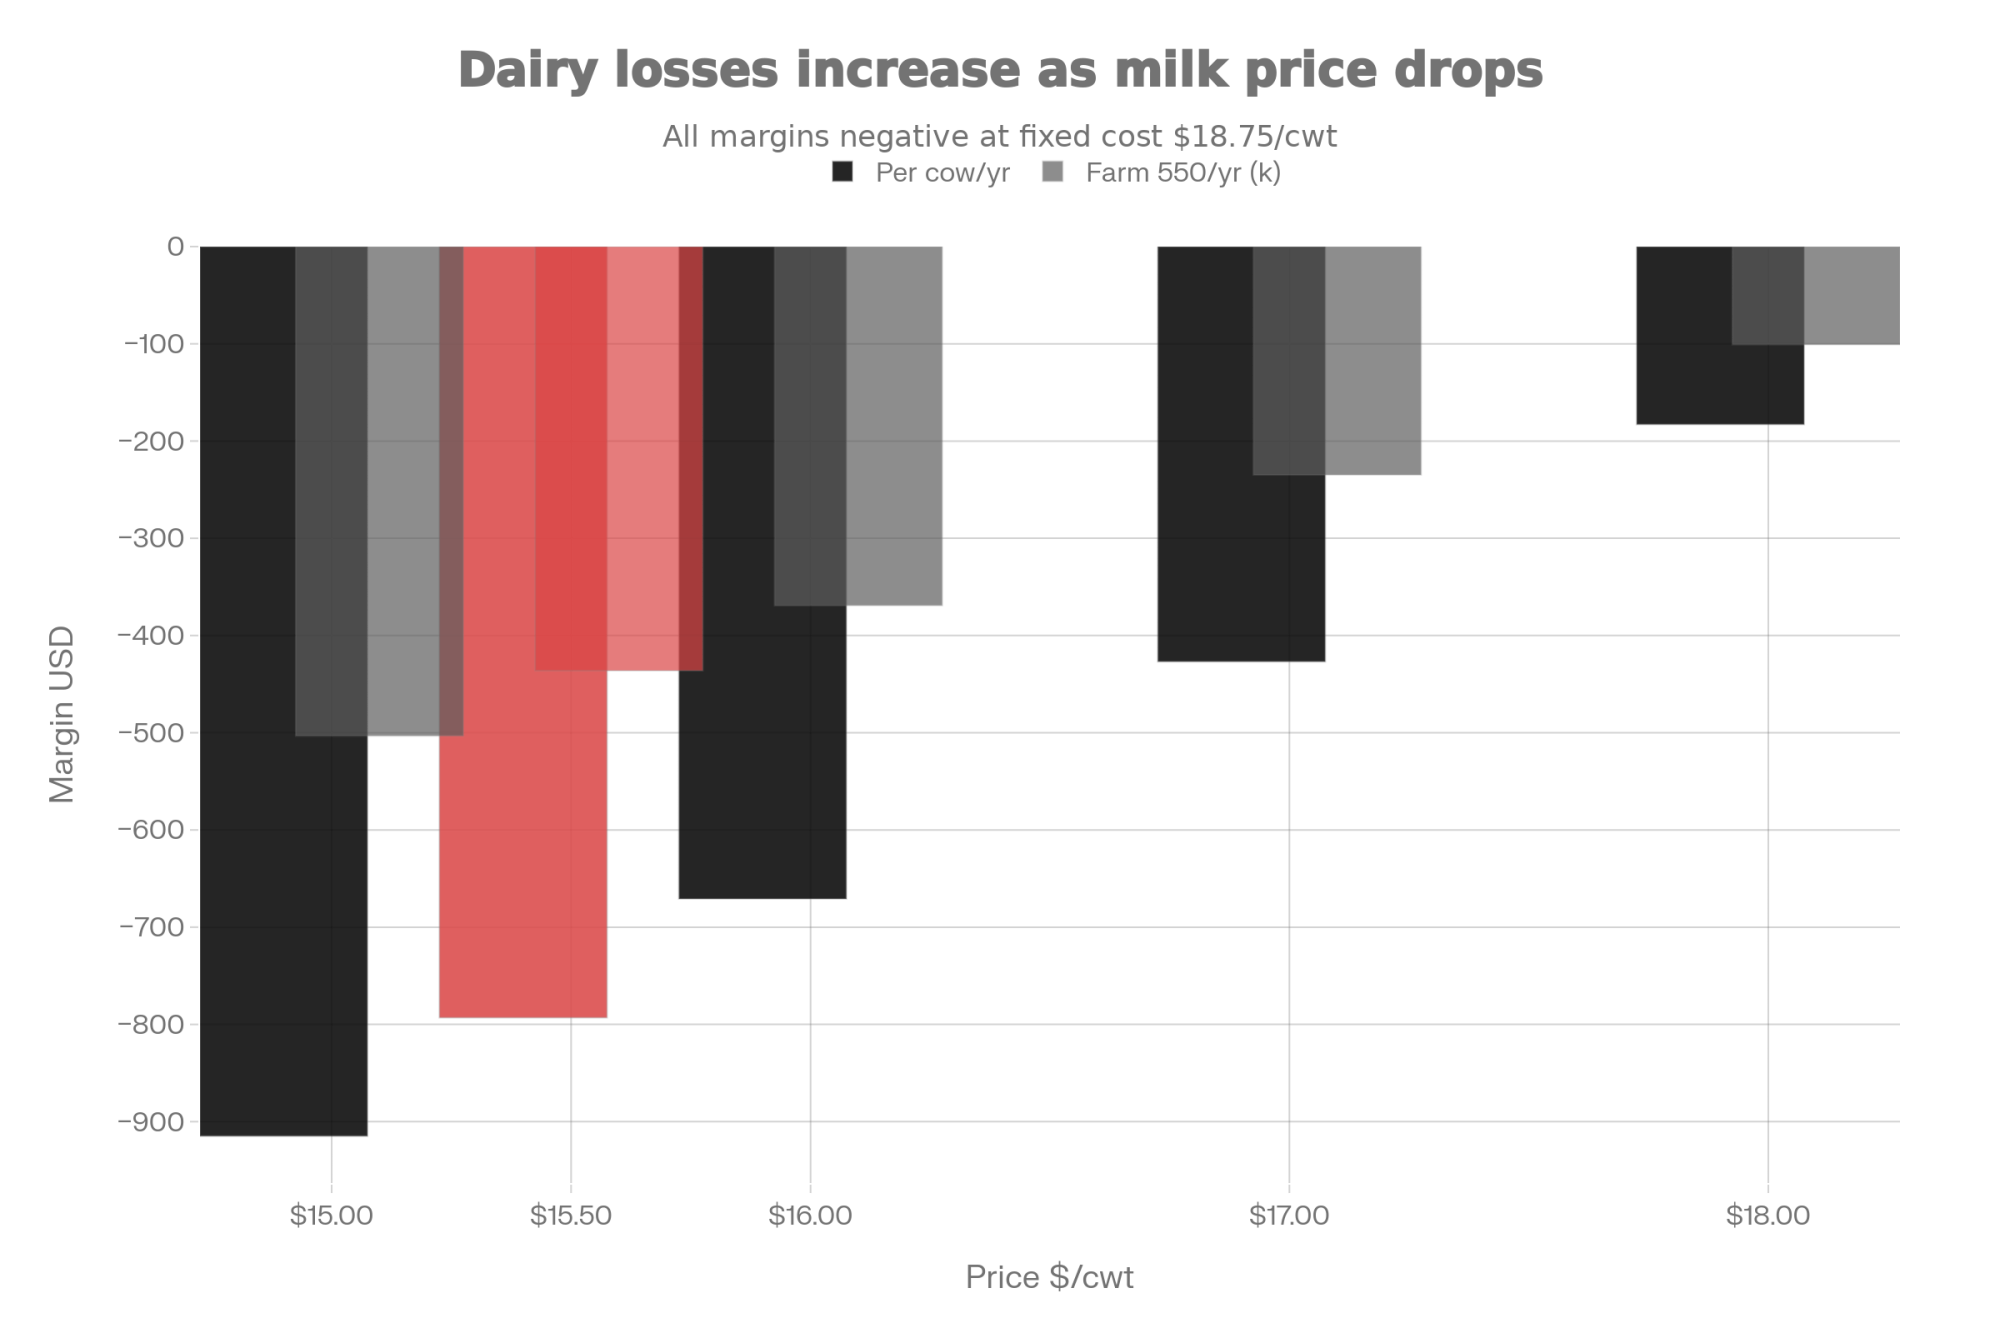
Cost Scenario (all‑in)Margin per cwt (USD)Margin per cow per year (USD)550‑cow farm margin per year (USD)Monthly cash flow (USD)
$17.00/cwt-1.00-244-134,200-11,183
$18.50/cwt-2.50-610-335,500-27,958
$20.00/cwt-4.00-976-536,800-44,733

But if you’re in the Northeast under Order 1 or the Southeast under Order 7, you’re facing different math entirely. The June 2025 FMMO reforms increased Class I differentials specifically to reflect the higher cost of servicing fluid markets in those regions—the Southeast saw the largest increase nationally at $1.74 per hundredweight on average, according to USDA analysis. Recently passed intraorder transportation credits are helping offset some of those long-haul costs for Southeast producers, according to Progressive Dairy’s 2025 State of Dairy report. Still, when you’re calculating your margins, make sure you’re using your actual milk check, not a national average.

If your true cost is north of $18 and milk’s in the mid-teens, the gap becomes challenging to manage for very long. You know this already. The question is what to do about it.

The Runway Calculation

This next calculation can be uncomfortable, but it’s genuinely important.

📊 YOUR LIQUIDITY RUNWAY

The Formula: (Available Cash + Remaining Operating Credit) ÷ Monthly Loss at Current Prices = Months of Runway

What It Means:

  • 6+ months: Time to evaluate options strategically
  • 3-6 months: Decisions needed in next 30-60 days
  • Under 3 months: Urgent situation requiring immediate action

Example: $87,000 cash + $140,000 credit line = $227,000 total liquidity At $21,000 monthly loss = 10.8 weeks of runway

Farm finance advisors tell me that many mid-sized operations—the ones in that $18-19 breakeven range—have roughly 3-4 months of liquidity right now. Factor in what’s already been drawn during Q4, and some folks are looking at eight to twelve weeks before things get genuinely difficult.

Can Growth Change the Equation?

Some producers are thinking: if I could get bigger, spread fixed costs over more milk, maybe I could bring my per-hundredweight costs down enough to make this work.

Sometimes that does pencil out. Often it doesn’t.

Here’s one way to think about it: take the investment required—new parlor, additional cows, facility improvements—and divide it by the capital you can realistically access. If that ratio gets much above 2.0, the new debt service often consumes the efficiency gains. I’ve seen operations attempt to grow their way out of margin pressure and find themselves worse off because interest payments exceeded the cost savings they achieved.

What About Premium Markets?

Organic, grass-based, A2—there are genuine opportunities in specialty markets. Premiums in the $22-28 range exist for the right product in the right market.

But transitions require time and capital. Organic certification is a three-year process under the USDA National Organic Program rules. That’s three years of meeting the requirements without receiving the premium. If your liquidity runway is 12 months, that timeline just doesn’t work, regardless of the long-term potential.

One Family’s Experience

Let me share what this analysis looks like in practice. I spoke with a 550-cow dairy in east-central Wisconsin a few weeks ago. The family asked me not to use their names, but they were willing to walk through their numbers openly.

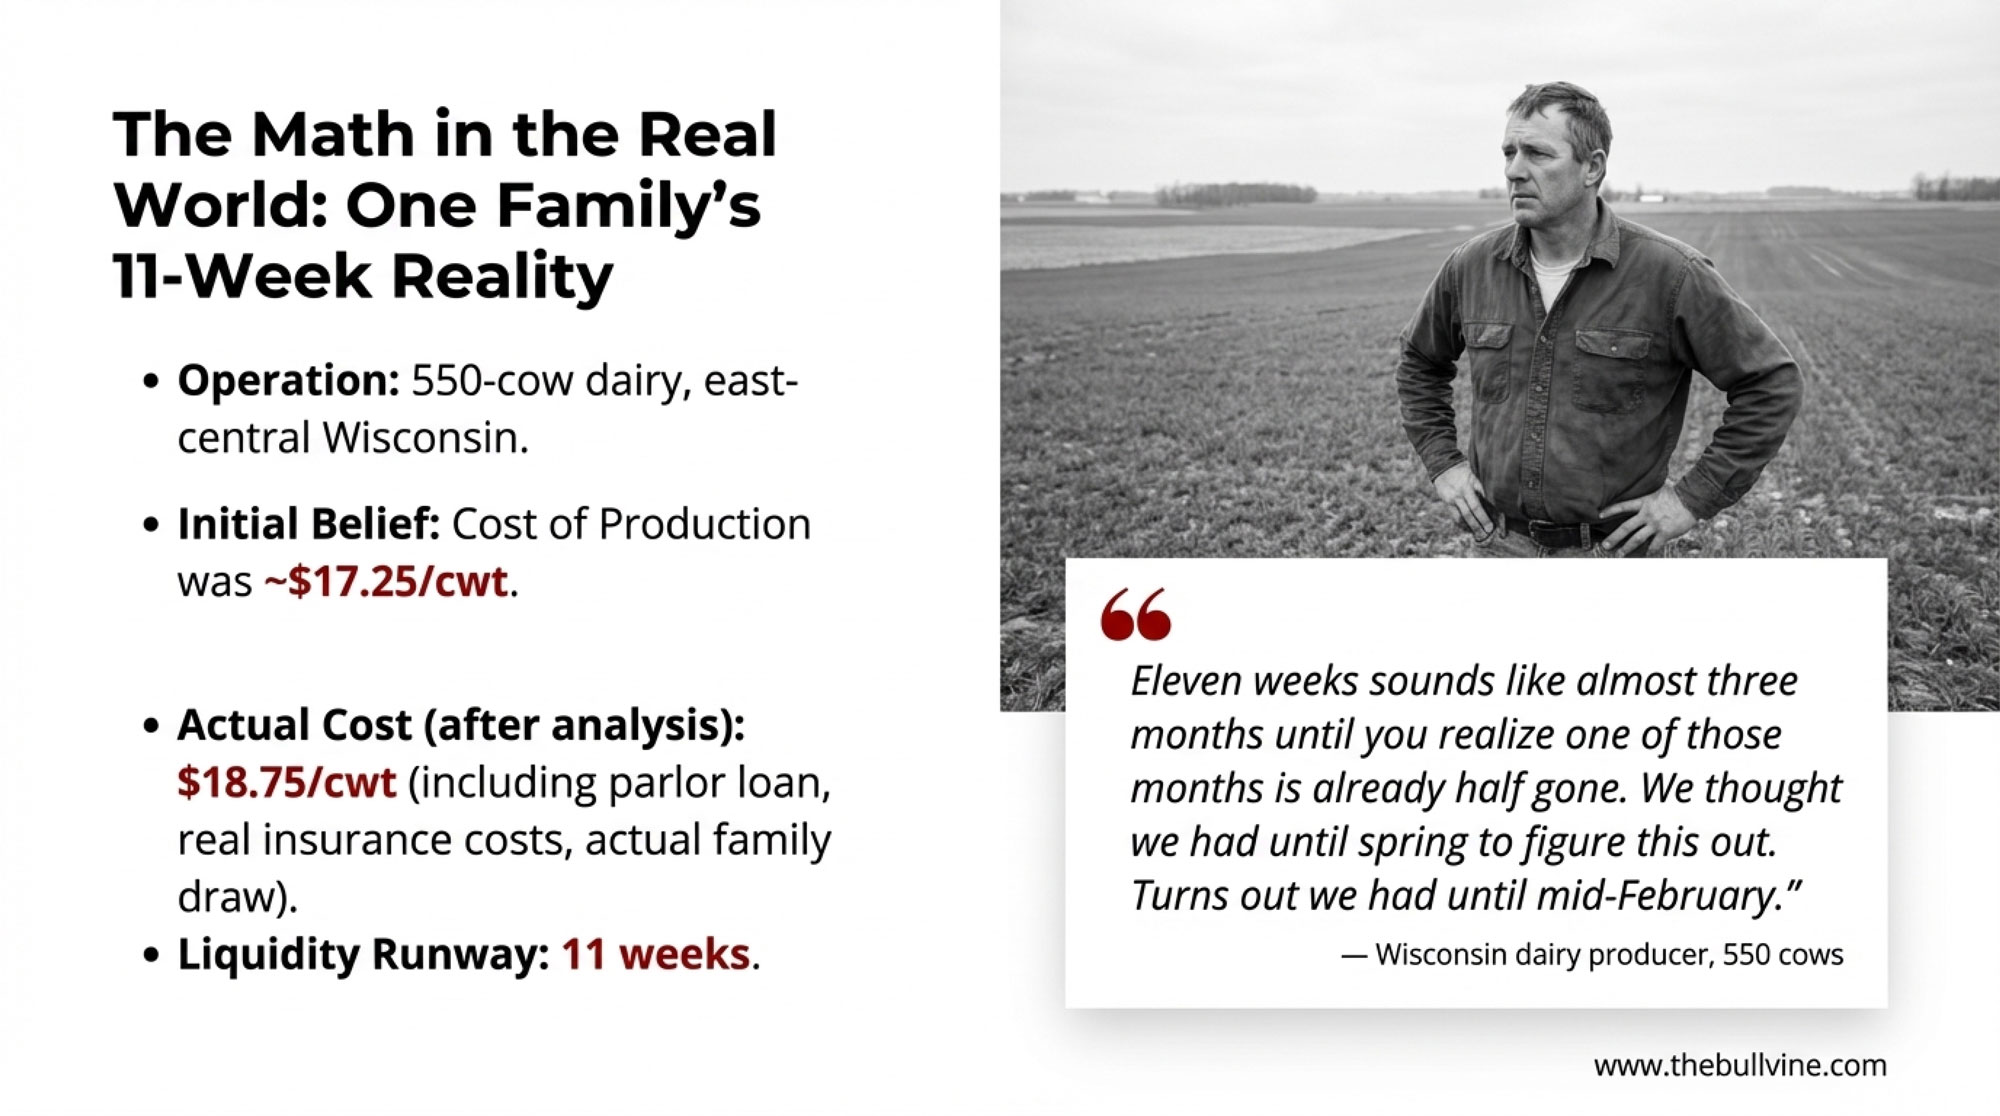
When they sat down in early December to really nail down their cost of production, they initially thought they were at about $17.25. That’s the figure they’d been carrying in their heads. But once they included the equipment loan from their 2021 parlor renovation, actual family health insurance costs, and what they’d really been drawing for living expenses—not the budget, but actual spending—they landed at $18.75.

Their available cash was $87,000. Operating line had about $140,000 remaining. Total liquidity: $227,000.

At current milk prices, their monthly cash burn worked out to roughly $21,000. That gave them about 11 weeks.

“Eleven weeks sounds like almost three months until you realize one of those months is already half gone. We thought we had until spring to figure this out. Turns out we had until mid-February.”

— Wisconsin dairy producer, 550 cows

They’re now working with their lender on an orderly timeline. Not the outcome anyone hoped for. But better to understand the situation in December than to discover it in April when options have narrowed considerably.

Three Paths Forward

Based on where your numbers fall, you’re likely looking at one of three general situations. And I want to be clear about something—these aren’t judgments about management ability. Cost structures reflect decisions made over decades, regional differences, facility age, land costs, and interest rates at the time of financing. This is simply about matching current circumstances to realistic options.

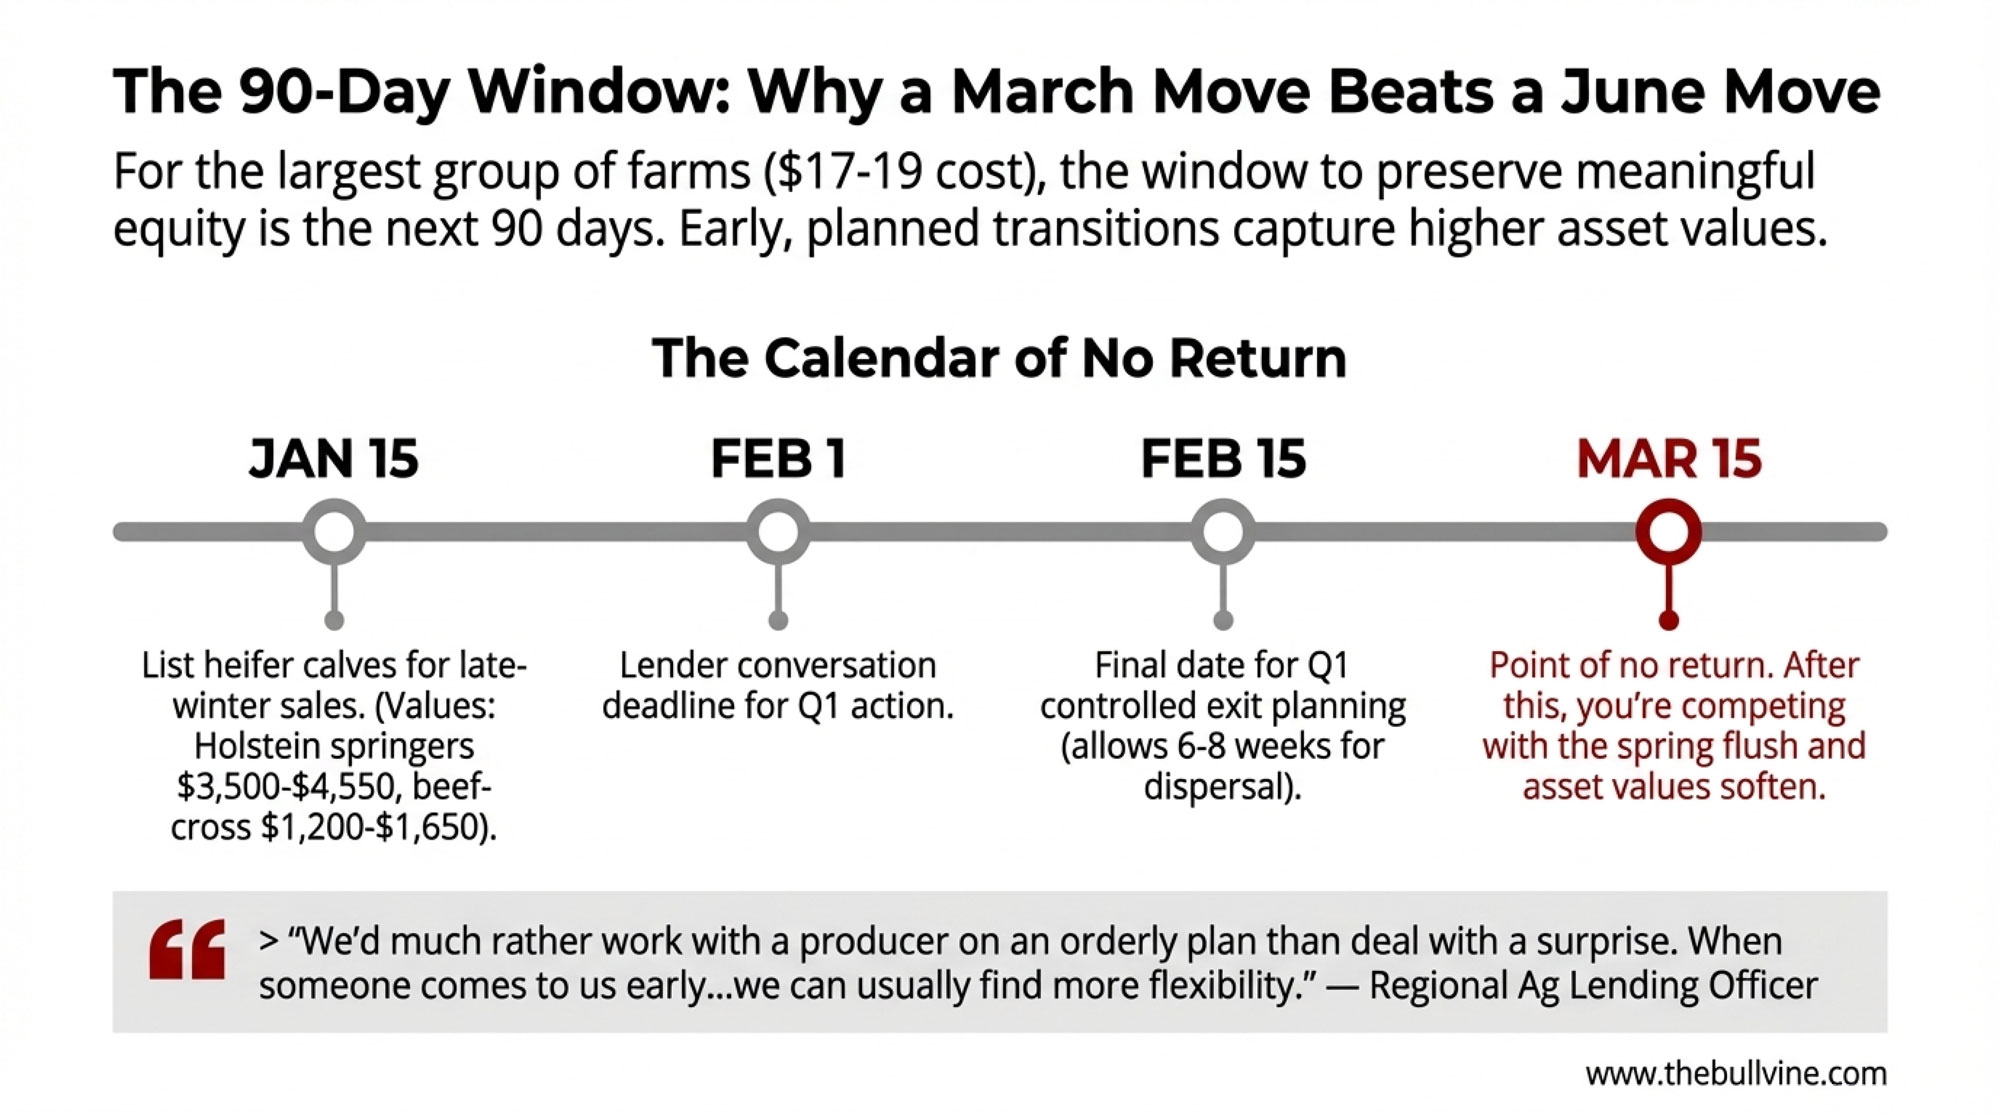
📅 CALENDAR OF NO RETURN: Key Decision Windows

If you’re considering a controlled transition, timing affects value significantly:

DateDecision PointWhy It Matters
Jan 15, 2026Final date to list heifer calves for late-winter salesHeifer calf values typically are strongest before the spring flush; Dairy Herd Management reported Holstein springers hitting $3,500-$4,550 and beef-cross calves commanding $1,200-$1,650 at fall 2025 auctions
Feb 1, 2026Lender conversation deadline for Q1 actionBanks close Q1 books in March; flexibility drops significantly after February conversations
Feb 15, 2026Last reasonable date for Q1 controlled exit planningAllows 6-8 weeks for orderly herd dispersal before the spring flush depresses values
March 15, 2026Point of no return for spring timingAfter this date, you’re competing with spring flush volumes; asset values typically soften as supply increases

These windows assume a controlled transition. Crisis liquidations follow different, more compressed timelines.

SituationKey IndicatorsPrimary Focus
Well-PositionedCosts under $17/cwt, 6+ months liquidity, solid debt coverageStrategic positioning for the consolidation period
Middle GroundCosts $17-19/cwt, 3-6 months liquidity, tight but manageable debtEvaluate controlled transition within 90 days
Immediate PressureCosts above $19/cwt, under 3 months liquidity, debt coverage below 1.0Proactive restructuring or professional consultation

The Strong Position Play

All-in costs under $17, 6+ months of liquidity, solid debt coverage, and a good lender relationship.

This describes a minority of operations currently—more common among larger Western dairies with scale efficiencies and some newer Midwest facilities with recent upgrades. If this is your situation, you have the runway to work through the consolidation period ahead.

What tends to make sense here: lock in feed costs while they’re favorable. Ensure your Dairy Revenue Protection coverage is in place for 2026. Have substantive conversations with your milk buyer about 2026-27 arrangements. If heifer availability improves through processor partnerships—and CoBank reports some buyers are offering co-financing to maintain key supplier relationships—you may be positioned to grow at reasonable terms.

The key discipline is avoiding overextension. The operations that emerged strongest from 2015-16 were often those that stayed conservative even when they had the capacity to expand. There’s wisdom in that.

The 90-Day Window

Costs in that $17-19 range, three to six months of liquidity, and debt coverage that’s manageable but tight.

Many farms fall into this category—probably the largest group, honestly. For this group, the window for a controlled transition that preserves meaningful equity is roughly 90 days.

Financial advisors who work with dairy operations consistently report that farms executing planned transitions early in a downturn preserve significantly more equity than those who wait until circumstances force their hand. The Wisconsin Center for Dairy Profitability has tracked these patterns through multiple price cycles.

Timing matters because asset values—particularly herd values—typically soften when many farms are selling simultaneously. Operations moving in March or April will likely realize stronger prices than those waiting until May or June if exit activity accelerates as some expect. Dairy Herd Management’s fall 2025 auction reports showed Holstein springers commanding $3,500-$4,550 per head and beef-cross calves bringing $1,200-$1,650—but these premiums depend on moving before the market gets crowded.

What does a controlled transition look like? Liquidate heifer calves first while prices remain firm. Market cull cows and productive animals over six to eight weeks rather than all at once. Apply proceeds strategically to debt, prioritizing real estate obligations. Communicate openly with your lender throughout.

I spoke with a regional agricultural lending officer in the Upper Midwest who’s worked with dairy borrowers for over 20 years. His perspective: “We’d much rather work with a producer on an orderly plan than deal with a surprise. When someone comes to us early and says, ‘Here’s what I’m seeing in my numbers, here’s what I’m thinking,’ we can usually find more flexibility than if they wait until they’ve missed payments and we’re both in a corner.”

An operation with $6 million in assets and $4.5 million in debt can potentially preserve $1 million or more in family equity through well-timed management. That’s meaningful capital for whatever comes next—whether that’s a different agricultural venture, off-farm investment, or retirement.

When Restructuring Is the Reality

Costs above $19, less than three months of liquidity, and debt coverage below 1.0.

A growing number of farms find themselves here. For this group, the question isn’t whether restructuring happens—it’s whether you’re making the call or someone else is.

Chapter 12 bankruptcy was designed specifically for family farm operations under the Bankruptcy Abuse Prevention and Consumer Protection Act. It provides court protection for three to five years. Lenders can’t foreclose during that period, and debt typically gets reduced by 30-50%.

An agricultural bankruptcy attorney in Iowa who handles dairy cases offered this perspective: file proactively rather than waiting for your lender to accelerate the note. Farmers who seek advice before they’re in full crisis tend to have better outcomes than those who wait until foreclosure is imminent.

The honest reality with Chapter 12: it works when restructured debt levels actually allow the operation to generate positive cash flow going forward. For situations where even halving the debt wouldn’t create sustainable margins at current milk prices, restructuring may delay the outcome rather than change it. That’s a hard truth, but it’s worth considering carefully.

Hard-Won Wisdom

I reached out to several producers who navigated the 2015-16 downturn to ask what they learned from it. Their perspectives are worth hearing.

A 400-cow producer in upstate New York—he asked to remain anonymous—emphasized the lender relationship: “Your banker isn’t working against you. They don’t want to foreclose—that’s a loss for them too. But they need to know what’s happening. The worst thing you can do is go quiet and let them be surprised.”

A manager at a 2,200-cow operation in California’s San Joaquin Valley offered additional perspective. Scale doesn’t eliminate these challenges, he noted—it changes the arithmetic. “We have more runway because of volume, but we also have more at stake. The weight of these decisions feels the same.”

Several people I spoke with mentioned the difficulty of separating emotional attachment from financial analysis. These are multi-generational operations. Family history, land that’s been worked for decades, identity tied to being a dairy farmer—that’s all profoundly real. But financial calculations don’t account for sentiment. And the operations that survive to transition to the next generation potentially require decisions grounded in numbers.

Where to Find Help

If you’re working through these calculations and want assistance, the land-grant universities offer genuinely valuable tools:

Penn State Extension provides a dairy breakeven cost worksheet that walks through the analysis in detail, available at extension.psu.edu.

The Wisconsin Center for Dairy Profitability has benchmarking tools that compare your numbers against more than 500 farms, accessible through the UW-Madison Division of Extension.

University of Minnesota Extension offers financial planning worksheets through their farm management program.

Your local extension dairy specialist can often sit down with you and work through the numbers—that’s exactly what they’re there to help with. Don’t hesitate to reach out.

For DMC specifically, the USDA Farm Service Agency maintains a decision tool on their website at fsa.usda.gov.

Five Questions to Answer This Week

If you take nothing else from this piece, sit down sometime in the next few days and work through these:

  1. What’s your true all-in cost of production? Not the number you’ve been carrying in your head. The real figure, including debt service, family living, and depreciation.
  2. What’s your actual liquidity runway at current prices? Cash on hand plus remaining credit, divided by monthly losses. Be honest about what you find.
  3. What would need to change for your operation to cash flow at $16 milk? Is that achievable, or would it require changes that aren’t realistic?
  4. When did you last have a substantive conversation with your lender about your financial position? If it’s been more than 90 days, that conversation is overdue.
  5. What does your best realistic outcome look like two years from now? Not the hopeful scenario—the one you’d actually bet money on.

The Road Ahead

If your position is strong, use this time wisely—secure favorable feed costs, strengthen processor relationships, and maintain discipline on growth decisions.

If you’re in that middle ground, recognize that the window for preserving equity through a managed transition is perhaps 90 days. Earlier timing—March or April—will likely yield better outcomes than waiting until mid-summer.

If you’re facing immediate pressure, consult with professionals now, before you’re in crisis. Outcomes improve significantly when decisions are proactive rather than reactive.

The Bottom Line

The dairy industry that emerges from 2026-27 will look different from what we see today. More consolidated. Different economics of scale. That’s a difficult reality to acknowledge—these are real families, real communities, real legacies at stake.

But the market data is clear. The frameworks for decision-making are available. What remains is the hard part: making choices based on numbers rather than hope, and making them while options remain.

The producers I’ve come to respect most aren’t those who never faced difficult decisions. They’re the ones who faced them honestly, made the best choice available with the information they had, and found a way forward.

Whatever path makes sense for your operation, the most challenging choice may be making no choice at all.

KEY TAKEAWAYS 

  • Run your numbers this week: At $15.62 Class III and $18.75 all-in costs, a 550-cow dairy loses $793/cow/year—that’s $36,350 in monthly cash burn.
  • Recognize this for what it is: Heifer inventories at a 47-year low, nine consecutive GDT declines, $11B in new processing capacity arriving. This isn’t a down cycle. It’s a structural reset.
  • Calculate your true cost of production: Include debt service, actual family draw, and depreciation. Most producers discover they’re $1.50-$3.00/cwt higher than the number they’ve been carrying.
  • Know your liquidity runway: (Cash + remaining credit) ÷ monthly loss at current prices = months until decisions get made for you.
  • Act while options remain: For operations in the $17-19 cost range with limited liquidity, the window to preserve family equity through a controlled transition is roughly 90 days. March moves beat June moves.

Complete references and supporting documentation are available upon request by contacting the editorial team at editor@thebullvine.com.

Learn More

The Sunday Read Dairy Professionals Don’t Skip.

Every week, thousands of producers, breeders, and industry insiders open Bullvine Weekly for genetics insights, market shifts, and profit strategies they won’t find anywhere else. One email. Five minutes. Smarter decisions all week.

NewsSubscribe
First
Last
Consent

Trump’s $12 Billion Missed Dairy: Your 30-Day Window Before Lenders Come Calling

Trump’s $12B went to grain farmers. Dairy’s much-needed big relief check isn’t coming. Your lender’s review is. You’ve got 30 days to get ahead.

Executive Summary: Trump just handed farmers $12 billion. Dairy didn’t make the cut. The Farmer Bridge Assistance Program announced on December 8 sends $11 billion to row crops—corn, soybeans, wheat—while dairy gets shuffled into a vague $1 billion reserve with no timeline and no check in the mail. After two years of Class III prices swinging $9 per hundredweight, that’s not the relief dairy families needed. With lender portfolio reviews hitting in February, producers have 30 days to get clear on their real numbers: true break-even, actual debt-service coverage, and competitive position. Three paths forward exist—expand, restructure, or exit strategically—and the farms still milking in 2030 won’t be the ones waiting for Washington to save them.

dairy farm financial strategy

December 8 came and went. Row crop farmers got a $12 billion lifeline. Dairy farmers got a press release mentioning a billion-dollar reserve “for other commodities”—no details, no timeline, no checks. Most producers will receive some bridge payments—often $70,000 to $90,000 for a 300-cow operation. But after this week’s announcement, we now know that this fall’s check is likely the last one you’ll see for a long time. That changes the math. You didn’t just get a bonus; you got a severance package. The question is: What are you doing with it?

Some folks deposited the check, caught up on the feed bill, and went back to managing their transition cows and monitoring bulk tank components. Others paused. They asked a harder question: What am I actually going to do differently with this breathing room?

Use of FundsShort-Term Relief (0-3 months)Long-Term Impact (12+ months)Best For (DSCR)Result
Pay down feed bill/operating debtHigh – immediate pressure reducedLow – resets cycle but doesn’t change trajectoryAbove 1.25 (temporary squeeze)Buys time, doesn’t change math
Catch up equipment paymentsHigh – stops late fees, preserves creditLow – unless part of turnaround planAbove 1.5 (isolated issue)Fine if part of bigger strategy
Invest in diagnostic analysis ($2-5K)Low – feels like spending during crisisVery High – clarity drives right decisionsALL levels (knowledge is power)BEST investment – $5K buys $450K saved
Bank it (emergency fund)Medium – no immediate benefitMedium – cushion for next volatility1.0-1.5 (need flexibility)Smart for uncertainty, boring but wise
Down payment on expansionLow – commits to larger expenseHigh or Catastrophic (depends on execution)Above 1.75 onlyOnly if you already had financing lined up
Premium market certification (organic transition)Low – costs continue during transitionHigh if markets materialize, costs recovered1.25+ with 3-year horizonRequires sustained commitment, not desperate pivot
Labor improvements (housing, wages)Medium – retention benefits take timeHigh – turnover reduction = $155K savings1.25+ with retention crisisRetention pays dividends, but takes 12-18 months

A fourth-generation Wisconsin dairyman put it simply: “That check bought me time. But time for what? That’s the part I hadn’t really thought through.”

Mark Stephenson at the University of Wisconsin–Madison, who has served as Director of Dairy Policy Analysis and Director of the Center for Dairy Profitability, has been tracking these financial dynamics for years. What the data consistently shows is sobering but won’t surprise most of us. For operations running tight margins, that kind of payment might cover a few months of cash-flow pressure—but it doesn’t fundamentally change the long-term trajectory.

The difference between how farmers use that breathing room may well determine which operations are still shipping milk in 2030.

The Financial Reality We’re Living With

You probably know this already, but it bears repeating: U.S. dairy has been facing structural profitability challenges since at least 2015. This isn’t just bad luck or one tough year strung after another.

USDA Economic Research Service cost-and-return data and farm business summaries from land-grant universities tell a consistent story. Many commercial dairies have operated with thin margins over the past decade—often leaving only a small cushion after covering operating expenses and debt service. Ag lenders generally consider a debt-service coverage ratio above 1.25 “adequate” and above 1.75 “strong,” according to Farm Credit lending materials. Many operations haven’t seen those stronger numbers consistently in years.

Why does this matter so much right now? Volatility.

USDA Agricultural Marketing Service Class III price data clearly tells the story. In 2023, prices ranged from a low of $13.77 in July to $19.43 later in the year. Then, in 2024, it swung even wider—from $15.17 to $23.34 in September. That’s the kind of $4-plus per hundredweight annual swing that’s become almost routine.

Class III milk prices swung $9.57 between July 2023’s crisis low ($13.77/cwt) and September 2024’s peak ($23.34/cwt)—representing $31,200 in annual revenue volatility for a typical 300-cow operation. This isn’t bad luck; it’s the new normal forcing strategic decisions you can’t avoid.

For a 300-cow herd shipping around 65,000 pounds monthly, a $4 swing represents roughly $30,000 in annual revenue. That’s the difference between upgrading your cooling system and wondering how you’ll make the equipment payment.

A $4/cwt price swing—routine in today’s market—costs a 300-cow operation $31,200 annually. That’s not margin erosion; that’s the difference between upgrading equipment and wondering how you’ll make the payment. Small operations can’t absorb this volatility without fundamental changes. Find your herd size. Feel the impact.

You can’t plan around that kind of volatility. You can only build systems—financial and operational—that survive it.

What Lenders Actually See

When your lender reviews your file, they’re looking at a handful of key ratios. Here’s what those numbers mean from their perspective, based on Farm Credit and Compeer Financial lending benchmarks:

Current Ratio (current assets ÷ current liabilities)

  • Above 2.0: Breathing room. You can handle surprises.
  • 1.2 to 1.5: Functional but vulnerable. One bulk tank rejection, one compressor failure, one key employee quitting—and you’re scrambling.
  • Below 1.0: Crisis. You can’t cover short-term bills without new borrowing.

Debt-to-Asset Ratio

  • Under 50-60%: Comfortable. You have options.
  • 60-70%: Refinancing gets harder. Lenders watch you closer.
  • Above 70%: Difficult territory. Conversations change.

Debt-Service Coverage Ratio (net income available ÷ total debt payments)

  • Above 1.25: Adequate coverage with cushion for bad months.
  • 1.0 to 1.15: Making payments, but zero margin for error.
  • Below 1.0: Farm income can’t cover debt. Something has to change.

When margins run this tight, a price drop or feed cost spike doesn’t just reduce profits. It triggers cascading stress that takes years to recover from. I’ve seen operations that looked solid on paper in January find themselves in workout discussions by August because one thing went sideways and there was no cushion.

Government support programs address immediate pressure. They don’t change the underlying cost structures or market dynamics that created the margin compression.

Getting Honest About Your Numbers

This is where things get practical—and where most farm families haven’t done the math as precisely as they probably should.

The Center for Dairy Excellence in Pennsylvania coordinates a Dairy Decisions Consultant program connecting dairies with experienced advisors. What their work consistently reveals is that many operators overestimate profitability because they don’t accurately capture all costs.

Cost CategoryTypical $/cwtOften Underestimated?Why It Matters
Feed (homegrown at market value)$9.50✓ YES (many use cost-of-production not market value)Homegrown hay worth $180/ton? That’s your cost, not $0
Labor (including family)$4.20✓✓ YES (family labor valued at zero or minimum wage)Your time has value – $45K/year minimum or you’re paying to work
Repairs & Maintenance$1.80✓ YES (deferred maintenance not counted)Deferred = future crisis. Include realistic annual average
Utilities (electric, water, fuel)$1.40No (usually accurate)Usually captured accurately in most analyses
Insurance & Property Taxes$1.20✓ YES (property tax increases forgotten)Increasing property values = rising taxes many forget to model
Interest on Debt$2.10No (debt service is visible)Interest is painful but at least it’s visible in statements
Equipment Depreciation$1.60✓✓ YES (many skip or undervalue)Equipment wears out. $500K parlor ÷ 15 years = $33K/year real cost
Family Living Draw (realistic)$2.50✓✓✓ MOST MISSED (survival wages vs actual need)Can your family ACTUALLY live on what you draw? Be honest.
Other Operating Expenses$1.70✓ YES (small categories add up)Vet, breeding, supplies, fuel – individually small, collectively $1.70/cwt
TOTAL True Break-Even$26.00Penn State studies: Most farmers underestimate by $3-5/cwt

Three numbers matter most:

  • Your true break-even milk price. This isn’t just operating expenses divided by production. It’s everything: feed, including homegrown forages valued at market rates; labor; utilities; repairs; interest; insurance; property taxes; a realistic family living draw—not survival wages, but what you’d actually need—and equipment depreciation. Penn State Extension cash-flow tools consistently show that once you include family living, full depreciation, and opportunity costs, many dairies discover their true cost of production runs noticeably higher than their mental estimates.
  • Your actual DSCR. Net farm income available for debt service is divided by total annual payments. This tells you whether profitability is genuine or depends on favorable price cycles. Here’s a useful exercise: model your DSCR using the 10-year average milk price instead of current levels. If it drops below 1.0, you’re more vulnerable than the good months suggest.
  • Your competitive position. How does your cost of production compare to similar operations? USDA’s Agricultural Resource Management Survey and state dairy business summaries group herds by cost percentile. There’s a clear top tier of low-cost producers, a large middle group, and a smaller segment of high-cost operations struggling at commodity prices regardless of market conditions.

What’s revealing—and this comes from conversations with consultants across the Upper Midwest—is how often farmers discover they’re in a different position than they assumed. Operations that undergo formal financial analysis often find that their actual situation differs materially from their intuitive sense of how things are going.

Three Paths Forward

Once you have accurate numbers, strategic options come into focus. Research from Iowa State’s Beginning Farmer Center and Wisconsin’s Center for Dairy Profitability points to three main directions. None is universally right. All require honest assessment.

The Expansion Path

For operations with strong debt-service coverage and genuine competitive advantages—exceptional genetics, reliable labor, favorable land costs, proximity to processing—expansion into the 1,000-plus cow range may offer scale economics needed to remain competitive.

But here’s the reality check. Recent lender case studies and construction bids suggest that taking a 300-cow dairy into that range can require several million dollars in new facilities, equipment, and working capital. At current commercial interest rates—often running 7-8% for expansion financing through private lenders according to Federal Reserve district surveys—payback periods approaching a decade aren’t unusual unless margins run consistently strong.

A Minnesota lender framed the key question this way: Can your operation achieve profitability at the 10th percentile milk price for your region? If expansion only pencils out when prices are above average, the risk profile may be too aggressive.

That said, for the right operation with strong management depth, disciplined financial oversight, and realistic timelines, expansion remains viable. The farms succeeding at scale typically share those characteristics—it’s not just about cow numbers.

The Restructure Path

For DSCR values between 1.0 and 1.25, there’s a middle path. Stay near the current scale while fundamentally improving profitability through efficiency gains or market repositioning.

What’s working for farms pursuing this approach?

  • Premium market access. Organic certification can add meaningful dollars per hundredweight according to USDA Agricultural Marketing Service organic price reports, though the three-year transition demands careful cash-flow planning. A2 programs and grass-fed premiums offer smaller but real improvements for operations with appropriate genetics and infrastructure.
  • Cost structure improvement. Feed efficiency typically offers the largest opportunity—improving pounds of milk per pound of dry matter intake flows to the bottom line across every cow, every day. Labor efficiency through better scheduling and reduced turnover comes next. Genetic selection emphasizing productive life and component yield rather than type traits rounds out the practical options. For herds averaging 4.0% butterfat versus 3.5%, component premiums can add $0.50 to $1.00 per hundredweight to your mailbox price—that’s real money across a full year of production.
  • Cooperative positioning. Farmer-owned cooperatives often provide better price transparency than commodity channels, though this varies by region. Edge Dairy Farmer Cooperative in the Upper Midwest has been active on contract transparency. For some operations, the right co-op relationship provides stability worth as much as a premium.

This path typically requires 3-5 years of focused execution. It works best when the next generation has a genuine interest and developing capability.

The Exit Path

Let’s be clear: Exiting isn’t quitting. It’s preserving equity.

Burning $450,000 of family wealth just to say you hung on for three more years isn’t pride—it’s poor management. And I’ve watched too many families learn that lesson the hard way.

For operations with DSCR persistently below 1.0 or structural losses that relief payments mask rather than resolve, a strategic exit often preserves more family wealth than continued operations.

Same farm. Same family. Same equity—until timing changed everything. Strategic exit at month 8-10 preserved $480K. Waiting for forced liquidation at month 18 left $100K. That $380,000 difference? It’s not theory. It’s a real Wisconsin dairy, documented by Cornell researchers. It’s the literal cost of hoping things will turn around when the math says they won’t. Courage isn’t staying—sometimes it’s knowing when to preserve what three generations built.

Farm transition research from Cornell’s Dyson School frames the arithmetic starkly: A farm losing $150,000 annually that delays exit by three years destroys $450,000 in equity—plus the psychological toll on everyone involved. An orderly exit preserves substantially more equity than forced liquidation, in which lenders set the timeline and distressed sales become unavoidable.

That’s not a small difference. That’s the difference between retiring with dignity and starting over with nothing.

Farm transition specialists across Wisconsin and Minnesota consistently report that families preserve substantial wealth—often $100,000 or more—by making decisions earlier and executing deliberately rather than waiting until a crisis removes options.

A retired dairyman in central Wisconsin shared something that stuck with me: “The hardest part was admitting it to myself. Once I did that, the actual process wasn’t that bad. And my kids thanked me for not making them watch it fall apart.”

Exit isn’t failure. For many families, it’s the decision that preserves generational wealth and allows the next generation to build lives that match their actual interests. Sometimes the bravest thing you can do is know when to stop.

FactorExpansion PathRestructure PathStrategic Exit
Minimum DSCRAbove 1.751.0-1.25Below 1.0
Capital Required$3-5M+$50-150KConsultant fees only
Timeline5-7 years to payback3-5 years8-10 months
Risk LevelVery HighModerateLow (preserves equity)
Success Rate<5% access financing30-40% achieve goals100% preserve wealth
Next Generation?Strongly committedInterested, developingFree to choose their path
Best Case Outcome1,000+ cows, economies of scaleProfitable niche, sustainablePreserve $400K-$680K equity
Worst Case OutcomeCrushing debt at 7-8% interestMargin improvement insufficientWait too long, lose $450K
Andrew’s Reality CheckOnly works for top-tier operations. Most can’t get financing.Requires discipline and premium market access. Not a miracle cure.Not failure—it’s strategy. Preserves generational wealth.

Different Stakeholders See This Differently

Farmers, processors, cooperatives, and lenders view consolidation through different lenses. Understanding those perspectives helps explain why solutions remain elusive.

From the processor perspective, consolidation creates efficiencies. The International Dairy Foods Association has noted that larger, more consistent milk supplies reduce collection costs and enable capital investment in specialized processing. The trend toward fewer, larger farms isn’t something most processors resist—their infrastructure investments often assume it continues.

Cooperatives occupy more complicated ground. Organizations like Dairy Farmers of America represent both large farms that benefit from consolidation and mid-sized operations that struggle against it. That tension surfaces in policy debates, pricing decisions, and governance questions.

Lenders are segmenting portfolios more deliberately. Operations with strong metrics receive competitive rates and expansion financing. Those in the middle face cautious credit and frequent reviews. Those showing deterioration get workout discussions—sometimes before the farm family has acknowledged the trajectory.

The Kitchen Table Conversation

Whatever path makes financial sense, research on farm transitions reveals something important: Most failed successions trace back to communication and expectations more than financial impossibility.

Farm transition educators at Manitoba Agriculture and Penn State Extension report this pattern consistently. Families carry different assumptions about what should happen—and unspoken expectations compound into problems that could have been addressed years earlier.

What seems to work:

  • Before the family meeting, each person answers hard questions individually. Senior generation: Can I genuinely step back and let the next generation make different choices? What income do I actually need in retirement? Is this operation viable for the next generation without ongoing relief?
    For the next generation: Do I actually want to farm, or am I carrying an obligation? Can I earn a reasonable living from this operation as structured?
  • During the meeting, a neutral third party presents actual financial data—an accountant, extension educator, or consultant without an emotional stake —presenting facts rather than perceptions.
  • After the meeting, document whatever’s decided. Not from distrust. Because written agreements prevent the “I thought you meant…” conversations that later fracture relationships.

The Labor Reality

For operations choosing to stay and optimize, labor management has become as critical as milk price management.

Texas A&M research confirms what many of us have seen firsthand: immigrant labor accounts for about 51% of all dairy workers nationally. And turnover remains a persistent challenge—the FARM Workforce Development program found average turnover approaching 40% across participating dairies. For a 300-cow operation needing three or four milkers, that means potentially replacing more than one person every year.

At 38.8% annual turnover, a typical 20-worker dairy operation loses nearly $155,200 every year to workforce churn. That’s not just an HR problem—it’s production poison. Studies show high turnover triggers 1.8% decrease in milk production, 1.7% increase in calf losses, and 1.6% spike in cow mortality. You’re literally losing cows and calves because you can’t keep people.

Michigan State University Extension research shows the total cost of losing and replacing a dairy employee can reach 100-150% of annual wages—accounting for recruiting, training, productivity loss, and learning-curve mistakes. For a full-time milker earning $38,000-$45,000, that’s potentially $40,000 or more every departure.

What are farms with strong retention doing?

  • Housing makes a real difference. University of Wisconsin and Cornell Extension case studies describe dairies that added on-farm housing, resulting in dramatic declines in turnover—some reporting waiting lists for positions.
  • Total compensation matters more than hourly rate. Consistent year-round hours often retain people better than higher wages with unpredictable schedules. Health insurance moves the needle on retention.
  • Career pathways change the equation. Paying for certifications, creating advancement from milker to lead to herd manager—these transform dairy work from a temporary job to a career worth building.

Robotic milking can make sense, but the investment is larger than sometimes expected. Industry benchmarks from Hoard’s Dairyman put individual robots at $150,000 to $275,000 before construction. Three or four units with barn modifications can climb well past a million dollars. The math works when operations are financially solid, and labor genuinely constrains options. It often doesn’t work when you’re already stressed—adding fixed costs to situations that need flexibility.

Regional Realities: Why Your Location Changes Everything

RegionTypical “”Mid-Size””Key AdvantageMajor ChallengeWhat Success Looks Like
Upper Midwest (WI, MN)300-500 cowsCheese market infrastructure, cooperative network, land costs moderateWinter feed costs, labor housing in rural areas, consolidation pressureDSCR 1.5+, feed efficiency >1.5, co-op loyalty for price stability
California / Southwest2,000+ cowsScale economies, year-round production, processing proximityWater costs ($50K+/year), regulatory compliance, manure management expenses2,500+ cows minimum, robotic milking, water rights secured
Northeast (NY, VT, PA)120-250 cowsFluid milk premiums, local market access, population densityLand cost 3-4X Midwest, fragmented processing, limited expansion roomOrganic or premium markets, direct-to-consumer options, 150+ cows profitable
Southeast (GA, FL, TN)200-400 cowsGrazing-based lower feed costs, heat-tolerant genetics availableHeat stress (May-Sept), forage quality in humidity, limited processingGrazing-based <$15/cwt cost, heat abatement investment, niche marketing

Everything discussed applies most directly to Upper Midwest operations—the Wisconsins and Minnesotas, where cheese-focused production dominates. The framework translates elsewhere, but the specifics shift considerably.

  • California and the Southwest operate at entirely different scales—a “mid-sized” Central Valley dairy might milk 2,000 cows. Water costs that barely register in Wisconsin can run $50,000-plus annually in California. Compliance with manure management adds layers of expense. I talked with a Tulare County producer last year who said his regulatory costs alone would bankrupt most Midwest operations his size.
  • The Northeast offers stronger local market access and premium opportunities—fluid milk still dominates, and proximity to population centers creates options. But land costs can run three to four times those in the Upper Midwest, and fragmented processing means fewer outlets. A Vermont organic producer told me his premium market access is the only reason he’s still viable at 120 cows.
  • The Southeast operates with grazing-based systems, creating fundamentally different cost structures. Heat-stress management and forage systems look nothing like those in Upper Midwest production. Fluid milk focus means different price exposure than cheese-market operations.

The framework—understand your numbers, choose a path, have family conversations, address labor strategically—applies everywhere. But the thresholds and viable options vary considerably. Your local extension dairy specialist can help translate.

What to Do in the Next 30 Days

For the producer who just received government support: Before allocating it all to operations, invest a small portion in understanding your actual position.

A diagnostic assessment from a qualified dairy consultant typically runs $2,000 to $5,000, depending on scope and region. What you receive: actual DSCR compared to benchmarks, true break-even determination, competitive position assessment, and honest conversation about realistic options.

Why January matters: Most lenders conduct annual portfolio reviews in late winter. Getting your analysis done now—before those reviews, before spring planting decisions lock in cash flow, and with time to implement changes before peak production season—gives you maximum flexibility. If your lender identifies concerns in their February review and you haven’t done your homework, you’re reactive. If you’ve already got a plan and the data to support it, you’re in a much stronger position. Wait until March, and you’ve lost two months of runway.

Where to start: County Extension offices often provide free initial consultations. In Wisconsin and the Upper Midwest, the Center for Dairy Profitability at UW-Madison offers farmer-focused analysis at cdp.wisc.edu. The Center for Dairy Excellence coordinates approved consultants across Pennsylvania and neighboring states at centerfordairyexcellence.org. Farm Credit associations offer analysis as part of lending relationships.

Questions worth asking: Where do I actually stand financially? How do I compare to similar operations in my region? What’s my true break-even? Based on these numbers, what options make sense?

Schedule it now. The farmer who gets clarity in January makes better decisions in March—and has time to act on them before the year gets away.

WeekAction ItemWho to ContactWhat You’ll LearnCost
Week 1 (Jan 6-12)Gather financial documentsYour accountant/bookkeeperActual liabilities, assets, cash flow$0
Week 1 (Jan 6-12)Calculate actual DSCRExtension office (free tools)Where you REALLY stand (not where you hope)$0-200
Week 2 (Jan 13-19)Contact dairy consultantCenter for Dairy Profitability / local consultantWhat diagnostic analysis costs ($2-5K)$0-500
Week 2 (Jan 13-19)Run break-even analysisConsultant + your actual production dataTrue cost per cwt including ALL costs$2,000-5,000
Week 3 (Jan 20-26)Schedule family meetingSpouse, next generation, key familyWhether expectations align across generations$0
Week 3 (Jan 20-26)Model 3-path scenariosConsultant or extension advisorWhich path makes financial sense for YOUR numbersIncluded
Week 4 (Jan 27-Feb 2)Meet with lender (proactive)Your ag lender (Farm Credit, etc)Their view of your operation BEFORE formal review$0
Week 4 (Jan 27-Feb 2)Decide & document planAttorney if exit, consultant if expand/restructureCommitment to action or need to pivot$500-2,000

Government support provides breathing room. What dairy families do with that breathing room—pursue honest assessment and deliberate decisions, or extend the status quo—will shape which operations remain viable.

The farms navigating this successfully share one trait: they got clear on their actual position early enough to still have options.

That’s not pessimism. That’s strategy.

Key Takeaways

  • Relief payments buy time—not a future. Use this cash to understand your true position, not just pay down the feed bill.
  • Below 1.25 DSCR? You have no cushion. Model your numbers at 10-year average milk prices. If it drops below 1.0, you’re exposed.
  • Three paths exist: expansion, restructuring, or strategic exit. All are valid. None work can be done without an honest financial assessment first.
  • Waiting costs more than deciding. Cornell research shows that delaying exit by three years destroys $450,000 in family equity. Exiting isn’t failure—it’s strategy.
  • January clarity beats March panic. Lenders review portfolios in late winter. A $2K-$5K diagnostic now gives you leverage before those conversations start.

Learn More:

Complete references and supporting documentation are available upon request by contacting the editorial team at editor@thebullvine.com.

Learn More:

The Sunday Read Dairy Professionals Don’t Skip.

Every week, thousands of producers, breeders, and industry insiders open Bullvine Weekly for genetics insights, market shifts, and profit strategies they won’t find anywhere else. One email. Five minutes. Smarter decisions all week.

NewsSubscribe
First
Last
Consent

The $228,000 Exit Strategy Reshaping Dairy: Inside the 55% Surge in Strategic Bankruptcies

Dairy farmers found a way to keep $228K that would go to the IRS. It’s legal, it’s smart, and bankruptcies are up 55%. Here’s how.

EXECUTIVE SUMMARY: Dairy farmers have discovered that filing bankruptcy can net them $228,000 more than selling their farms outright—and 259 operations did precisely that in the past year, driving a 55% surge in Chapter 12 filings. The catalyst is Section 1232, a 2017 tax provision that treats capital gains as dischargeable debt, turning a $285,600 IRS bill into just $57,120 for a typical Wisconsin farm sale. These aren’t failures but strategic exits by producers facing 8% interest rates and margins squeezed to breakeven who see no point grinding through more unprofitable years. While this tax-advantaged bankruptcy helps retiring farmers preserve decades of equity building, it’s fundamentally reshaping the industry. Young farmers without inherited land face nearly insurmountable entry barriers, and production is rapidly consolidating in states like Texas, where operations compete on efficiency rather than land appreciation. The result: bankruptcy has become a financial planning tool as strategic as any breeding decision or ration formulation.

Strategic Farm Bankruptcy

You know, when the University of Arkansas Extension released their recent data showing 259 dairy farms filed for Chapter 12 bankruptcy between April 2024 and March 2025—that’s a 55% jump from the previous year—most of us in the industry took notice. But here’s what’s really interesting: the more I dig into these numbers, the more I’m seeing something unexpected happening out there.

Many of these filings don’t look like the desperate collapses we’ve seen before. Not at all. What we’re actually witnessing is strategic financial planning, and it all ties back to a 2017 tax law change that most of us didn’t pay much attention to when it passed.

Now, let me be clear about something important: these aren’t wealthy farmers gaming the system. Most of these operations are facing real financial pressure—margins have been squeezed to breakeven or worse for many producers. When you combine operating loan rates jumping from 3% to nearly 8% (Federal Reserve Bank of Chicago data), input costs that never came back down after their spike, and milk prices that the USDA reports are back at 2018-2019 levels, a lot of operations are genuinely struggling. The difference is that Section 1232 gives them a strategic exit option that preserves more value than grinding it out for another few unprofitable years would.

“I’ve milked cows for 35 years. I’m not failing—I’m choosing the smartest path forward for my family with the rules as they exist. If that means using bankruptcy court to maximize our retirement after decades of 4 a.m. milkings, I’m at peace with that decision.” — Wisconsin dairy farmer preparing for strategic Chapter 12 filing.

Follow the data-driven rise in strategic dairy bankruptcies that reframes exit planning as financial optimization FY2023-FY2025. This visual doesn’t just inform—it electrifies: bankruptcy isn’t defeat, it’s savvy planning!

What’s Actually Happening with These Numbers

So let me share what I’ve been learning about the current situation. You probably know this already, but today’s economic are fundamentally different from previous downturns. Back in 2019, when USDA’s Economic Research Service documented 599 Chapter 12 filings nationally, we all understood what was happening—milk prices had absolutely tanked, and those trade wars were killing our export markets. It was straightforward and brutal.

Today? Well, it’s more nuanced. Ryan Loy from the University of Arkansas’s Division of Agriculture puts it well—commodity prices have basically returned to those 2018-2019 levels, yet our input costs…they never came back down. Fertilizer, feed, diesel—they’re all still elevated, and we’re all feeling that squeeze.

But here’s what’s really changed the game for a lot of operations: interest rates. The Federal Reserve Bank of Chicago’s agricultural finance data shows operating loan rates essentially doubled between 2021 and 2023. We went from around 3% to nearly 8% by mid-2025.

And if you’re like many producers who expanded with variable-rate financing when money was cheap…well, you know exactly what that means for your monthly payments.

The regional patterns we’re seeing are worth noting too:

  • First quarter 2025 brought us 88 Chapter 12 filings nationally—that’s nearly double Q1 2024’s 45 filings
  • Arkansas went from 4 filings in 2023 to 25 in 2025—that’s quite a shift
  • Michigan moved from zero in 2023 to 12 in 2024
  • Wisconsin, as many of you know, lost another 400 operations in 2024, bringing them down to 5,348 licensed herds

Understanding Section 1232 and Why It Matters

Now, here’s where things get particularly interesting—and if you haven’t heard about this yet, you’ll want to pay attention even if bankruptcy’s the last thing on your mind.

Remember the Supreme Court’s Hall v. United States case back in 2012? Lynwood and Brenda Hall sold their farm for $960,000 during bankruptcy, triggered about $29,000 in capital gains taxes, and the court basically said, “you’ve got to pay that in full before we’ll approve your reorganization plan.” It made Chapter 12 pretty much useless for anyone with appreciated land.

Well, Senator Chuck Grassley from Iowa—he’s been a friend to agriculture for years—pushed through the Family Farmer Bankruptcy Clarification Act in October 2017. This added Section 1232 to the bankruptcy code, and honestly, it’s a game-changer.

Dr. Kristine Tidgren, who runs Iowa State’s Center for Agricultural Law and Taxation, explained this really well in her 2020 analysis. Unlike Chapter 11 bankruptcies, where you’d have to pay capital gains in full, Chapter 12 now treats those tax obligations as general unsecured debt. That means they can potentially be discharged—either partially or sometimes entirely—through your reorganization plan.

Let’s Walk Through the Math Together

So here’s a real-world scenario using Wisconsin farmland values from the USDA’s August 2025 data. Say you’re a producer who purchased 200 acres in 2005 for $2,000 an acre—pretty typical for that time. According to the Wisconsin Realtors Association, that same ground’s worth about $8,000 an acre today.

Traditional Sale (Outside Bankruptcy):

ItemAmount
Sale proceeds$1,600,000
Capital gain$1,200,000
Federal capital gains tax (20%)$240,000
Net investment income tax (3.8%)$45,600
Total tax to IRS$285,600
Net proceeds after tax$1,314,400

Strategic Chapter 12 Filing with Section 1232:

ItemAmount
Sale proceeds$1,600,000
Tax becomes unsecured debt$285,600
Payment to unsecured creditors (20%)$57,120
Tax savings$228,480
Net proceeds$1,542,880

See how Section 1232 flips the tax equation for dairy producers: from IRS bill to retirement nest egg—making Chapter 12 a strategic tool. This isn’t just about bankruptcy—this is smarter farm succession!


Scenario
Sale ProceedsTotal Tax PaidNet ProceedsStrategic Tax Savings
Traditional Sale$1,600,000$285,600$1,314,400$0
Chapter 12 w/ Section 1232$1,600,000$57,120$1,542,880$228,480

Now, that’s real money. And when you’re looking at those numbers…it makes you think differently about what bankruptcy means, doesn’t it?

The Wisconsin Story: It’s Not What Most People Think

Mike Vincent, the ag economist at UW-Madison’s Extension, shared something with me that really stuck: “The biggest issue we’re facing is that the farmers are retiring.”

And you know what? The data backs him up completely.

In 2020, UW-Madison and USDA NASS conducted the Dairy Farm Transition Survey. What they found was eye-opening—17% of Wisconsin dairy farms said they wouldn’t be milking within five years.

For smaller operations — those with under 100 cows — the number jumped to 22%. And here’s the kicker: only 40% of Wisconsin dairy farmers had identified someone to take over the operation.

So when Mike says he’s not surprised by these closure numbers, he’s got a point. Many of these aren’t panic exits at all. They’re planned transitions that just happen to coincide with bankruptcy provisions that make Chapter 12 filing financially smart.

I was talking with a producer up in Shawano County recently—been milking for 35 years, profitable most years, but his kids aren’t interested in taking over. His land’s worth four times what he paid for it. He asked me straight up: “Why would I leave $200,000 on the table for the IRS when I could use that for my retirement?”

And honestly? I couldn’t give him a good reason not to consider it.

Who Benefits and Who Doesn’t—The Regional Differences

What’s fascinating is how differently this plays out across regions. According to USDA NASS’s August 2025 land value data, if you’re farming in Iowa, where land’s averaging $10,200 an acre, or Illinois at $9,850, or certain parts of Wisconsin ranging from $6,800 to $18,500…well, you’ve got options that other producers don’t.

The National Agricultural Law Center’s been tracking filing patterns, and they’re seeing it’s mostly farmers over 60 planning retirement, operations needing to downsize—maybe from 300 cows to 150 or 200—and family farms where the next generation just isn’t interested in continuing.

But here’s the thing: if you’re running a modern operation in Texas or New Mexico, where most producers lease their ground—Texas A&M AgriLife Extension reports the average operation there leases about 70% of their cropland—this doesn’t help you at all. Same story if you bought land recently, or if you’re in a state like New Mexico where USDA data shows land’s only worth about $725 an acre.

A Texas producer I know who’s managing 2,100 cows near Amarillo put it pretty bluntly: “We compete on production efficiency, not land equity. This Section 1232 stuff means nothing to us.” And she’s absolutely right—it’s a completely different business model.

Now, in the Northeast, it’s another story entirely. Vermont and New York operations often sit on land that’s appreciated significantly due to development pressure, but they also face some of the highest production costs in the country.

A producer from St. Albans, Vermont, told me recently that while his land’s worth more than ever, the combination of labor costs and environmental regulations means he’s still weighing whether strategic bankruptcy makes sense compared to a traditional sale.

A Young Farmer’s Perspective

I recently connected with Jake Martinez, a 29-year-old who started a 180-cow operation in central Minnesota in 2022. His take on all this was eye-opening.

“I’m watching neighbors who’ve been farming for 40 years walk away with tax-free gains while I’m trying to scrape together enough for a down payment on 80 acres,” Jake told me. “Don’t get me wrong—they earned it. But for someone like me trying to build something from scratch? The entry barriers just keep getting higher.”

Jake’s financing his expansion through custom heifer raising and a small on-farm cheese operation. “I can’t compete on land acquisition,” he explained. “So I’ve got to find other ways to build equity. Direct marketing, value-added production—that’s where young farmers like me have to look for opportunities.”

His perspective highlights something important: while Section 1232 helps retiring farmers maximize their exit value, it’s creating an even wider gap for the next generation trying to get started.

How Word Is Spreading Through the Industry

What’s really accelerated this trend is the education happening through agricultural networks. The National Agricultural Law Center at the University of Arkansas reported in its FY2024 annual report that it hosted 16 webinars attended by over 2,400 people. Sessions on agricultural bankruptcy and debt management are drawing standing-room-only crowds at farm conferences these days.

Joe Peiffer, who runs Ag & Business Legal Strategies in Iowa—he grew up on a Delaware County dairy farm himself—has been particularly vocal about this. He makes a good point: “The producers who are decisive and adapt to changing conditions have the best opportunity to remain viable.”

There’s also Russell Morgan, an agricultural consultant in Arkansas, who’s been working with Chapter 12 trustee Renee Williams to educate Mid-South farmers. I heard their April 2025 webinar drew a huge crowd—dairy and row crop producers all trying to understand their options.

What the Lenders Are Thinking

Now, you might wonder what lenders think about all this. Bob Mikell from AgSouth Farm Credit shared some interesting thoughts at the recent Mid-South Agricultural and Environmental Law Conference.

He basically said they’d rather see a farmer successfully reorganize through Chapter 12 than lose everything in foreclosure. If Section 1232 helps someone right-size their operation and keep farming, he sees that as better for everyone involved.

That’s not universal, of course. Some commercial banks aren’t thrilled about strategic Chapter 12 filings by solvent borrowers. But the Farm Credit System—they hold about 47% of total farm real estate debt according to USDA’s Economic Research Service—seems to be taking a pretty pragmatic approach to the whole thing.

Looking North: How Canada Does Things Differently

It’s worth comparing our situation to what’s happening in Canada, because it really highlights the trade-offs we’re dealing with. Statistics Canada shows Canadian dairy farms maintain debt-to-asset ratios around 0.191—that’s about half what we typically see in comparable U.S. operations. Bankruptcies? They’re basically non-existent up there.

While we’re dealing with volatility and needing various support programs, their supply management system provides built-in stability. But—and this is a big but—that stability comes at a cost. Canadian Dairy Commission data from November 2024 shows quota costs running CAD $24,000 to $58,000 per cow’s worth of production capacity. A typical 100-cow operation needs $3-5 million just in quota before they buy their first animal. And consumers? They’re paying CAD $1.07 per liter for milk.

Meanwhile, we’ve got the freedom to expand and chase export markets. U.S. Dairy Export Council data shows we hit $8.22 billion in exports in 2024. But with that freedom comes the volatility that’s driving these bankruptcy patterns we’re seeing.


Country/Region
Entry BarrierProducer Age (avg)Bankruptcy IncidenceMilk Price (USD/L)Export RatioKey Challenge
Canada (Quota)$30,000/cow quota55+Rare$0.80-1.10<10%High startup cost
USA (Free Market)$400,000+ down60+Up 55% (2024)$0.40-0.6015%+Volatility, consolidation
Texas/Idaho (Efficiency)Leased land, $250K+ equity50-58Low, not equity-driven$0.40-0.5520%+Scale, tech adoption

The Personal Side of These Decisions

I think it’s important to acknowledge something here: not everyone’s comfortable with strategic bankruptcy, even when the math makes perfect sense.

A producer from Fond du Lac County recently told me that his grandfather would “roll over in his grave” if he filed for bankruptcy, regardless of the circumstances. “In his day, you paid your debts, period.” That sentiment’s real, and it matters in our communities.

At the same time, Jamie Dreher from Downey Brand LLP made a good point at the Western Water, Ag, and Environmental Law Conference this past June. Congress designed Section 1232 specifically to help farmers transition without getting crushed by tax obligations. Using a tool that was created for your exact situation? There’s no shame in that.

It’s a deeply personal decision. There’s no right answer that works for everyone’s values and circumstances.

Where This Is All Heading

Looking ahead, several trends are becoming pretty clear. Dr. Ani Katchova at Ohio State’s Department of Agricultural, Environmental, and Development Economics thinks that by 2030, strategic bankruptcy planning might become just another standard option we discuss in farm transition planning, right alongside traditional succession strategies.

We’re likely to see continued geographic consolidation. States with high land values will keep seeing farms exit through tax-advantaged bankruptcy, with that land flowing to the remaining large operations.

Meanwhile, production’s going to keep concentrating in states like Texas and Idaho, where operations focus on efficiency rather than land equity. USDA data shows Texas already surpassed Idaho as the number three milk-producing state in 2025—they’ve grown 190% since 2001.

For young farmers trying to get started? It’s getting tougher. Iowa State’s Beginning Farmer Center reports that the traditional path—building wealth through dairy excellence over 20-30 years—is becoming nearly impossible in high-land-value regions.

Practical Thoughts for Producers

If you’re weighing your options, here’s what I’d suggest thinking about.

First, really understand your complete financial picture. Not just your cash flow, but your land equity position too. The Federal Reserve has some good agricultural finance calculators that can help you see how interest rate changes affect your debt service.

And honestly consider whether downsizing might actually strengthen your operation’s viability.

Get professional advice early—and I mean early, not when you’re in crisis mode. Find agricultural financial advisors who understand Chapter 12 provisions. IRS Publication 225 has farmer-specific guidance that’s worth reading regardless of what you decide.

Consider all your restructuring options:

  • Traditional refinancing might work
  • Maybe partial asset sales make sense
  • Strategic Chapter 12 filing could be right if your situation aligns
  • Or planned succession—even if it’s not to the family—might be the answer

And recognize that the landscape has fundamentally shifted. Higher interest rates have changed the game. Strategic downsizing isn’t failure—it’s adaptation. If you’ve been farming for decades and you’re ready to retire, that’s an achievement, not a defeat.

For younger farmers and those looking to expand, the playbook’s different. In regions where land values are not appreciating, excellence in milk production remains your primary path. Think about lease-based expansion models that don’t tie up all your capital in land. Look at emerging dairy regions where entry costs are still manageable.

You’ve got to plan for different wealth-building strategies now. Land appreciation might not provide what it did for previous generations. Consider diversifying income streams beyond traditional dairy production. Value-added processing, direct marketing—these might be where your opportunities are.

The Bottom Line

What we’re discovering about Chapter 12 bankruptcy reflects broader changes in American agriculture that we’re all navigating together. That provision Congress passed in 2017 to help struggling farmers? It’s evolved into something more complex—a financial planning tool that rewards strategic thinking about asset management as much as farming excellence.

Is that good or bad? Honestly, it depends on your perspective. For farmers who’ve built substantial equity over decades, Section 1232 provides a path to capture that value as they transition out. For communities, it can mean orderly succession instead of crisis liquidation.

But it also highlights some uncomfortable truths about modern dairy economics. When tax-advantaged bankruptcy can be more profitable than continuing to milk…when land ownership matters more than production efficiency…well, we’ve got to ask ourselves some fundamental questions about where the industry’s headed.

The 55% surge in Chapter 12 bankruptcies isn’t simply a crisis or a loophole. It’s farmers adapting to new economic realities with the tools available. Understanding these tools—how they work, what they mean, when they make sense—that’s going to be essential for anyone navigating dairy’s evolving landscape.

As that Wisconsin producer preparing for a strategic Chapter 12 filing told me: “I’ve milked cows for 35 years. I’m not failing—I’m choosing the smartest path forward for my family with the rules as they exist. If that means using bankruptcy court to maximize our retirement after decades of 4 a.m. milkings, I’m at peace with that decision.”

That sentiment—practical, unsentimental, focused on optimal outcomes—pretty much captures how American dairy farmers are approaching this transformation. The old stigmas about bankruptcy? They’re fading. What’s replacing them is a new pragmatism where strategic financial planning matters as much as picking the right bull for your breeding program or getting your ration formulation dialed in.

For better or worse, that’s the new reality we’re dealing with. And understanding it? That might just be the difference between thriving and merely surviving in the years ahead.

KEY TAKEAWAYS:

  • The $228,000 Opportunity: Section 1232 transforms Chapter 12 bankruptcy into a tax-saving tool—farmers selling 200 acres can keep $1.54M versus $1.31M in traditional sales by discharging capital gains taxes as unsecured debt
  • Strategic, Not Crisis: The 55% bankruptcy surge represents planned exits by farmers facing 8% interest rates and compressed margins, not business failures—these are profitable operations choosing smart transitions
  • Winners and Losers: Benefits farmers 60+ with appreciated land in high-value states (Iowa: $10,200/acre); offers nothing for lease-based operations or young farmers trying to enter
  • Timing Is Everything: This strategy requires filing bankruptcy BEFORE selling land—farmers should consult specialized ag attorneys early, not wait for a crisis
  • Industry Transformation: This trend accelerates dairy’s shift from land-wealth to operational efficiency, with production consolidating in states like Texas, where success depends on milk per cow, not land appreciation

Editor’s Note: This article draws on interviews with dairy producers across Wisconsin, Arkansas, Iowa, Texas, Minnesota, and the Northeast conducted between September and October 2025. Some producers requested anonymity to discuss sensitive financial matters candidly.

Complete references and supporting documentation are available upon request by contacting the editorial team at editor@thebullvine.com.

Learn More:

  • The Ultimate Guide to Dairy Farm Succession Planning – While the main article explores bankruptcy as a final exit strategy, this guide provides a proactive roadmap for a successful farm transition. It details strategies for communication, financial structuring, and legal planning to preserve the family legacy and business continuity.
  • Decoding Dairy’s Crystal Ball: Top 5 Economic Trends Producers Must Watch – This strategic analysis dives deep into the market forces—like interest rates and input costs—driving the financial pressures mentioned in the main article. It provides critical context for anticipating market shifts and positioning your operation for long-term resilience.
  • Beyond the Bulk Tank: How Value-Added Dairy Is Creating Bulletproof Businesses – For producers seeking alternatives to the land-equity model, this article reveals how to build a more resilient business through direct marketing and on-farm processing. It offers a tangible path for young farmers to build equity and insulate their profits from commodity volatility.

The Sunday Read Dairy Professionals Don’t Skip.

Every week, thousands of producers, breeders, and industry insiders open Bullvine Weekly for genetics insights, market shifts, and profit strategies they won’t find anywhere else. One email. Five minutes. Smarter decisions all week.

NewsSubscribe
First
Last
Consent
Send this to a friend