Archive for milk production costs

The 40‑Hour Cliff: How a $48,000 Overtime Bill Is Forcing Dairy Farms to Choose Between People, Robots, and Fewer Cows

New overtime thresholds in Washington, California, Oregon, and New York are handing mid‑size dairies a cost nobody budgeted for — and every option for absorbing it carries a price the regulators never modeled.

Executive Summary: New overtime laws in WA, CA, OR, and NY are adding roughly 12% to dairy payroll, which works out to about $48,000 a year, or 36–37¢/cwt, for a 480‑cow herd with a $400,000 labor bill. That pushes you into a three‑way choice: pay overtime to keep your best milkers, take on $1.4–$2.4 million in robot debt, or cut cow numbers and labor together, and each option carries risks regulators never modeled. OSU and UMN data show that if your all‑in labor cost is over $4.00/cwt, the problem is structural, but if you can hold it under $3.50/cwt, paying overtime to hang onto an A‑team can pencil better than a rushed robot install. At the same time, Zoetis/Compeer and MSU work make it clear that chopping hours and constantly retraining new milkers is a fast way to wreck SCC and give up $0.64/cwt in net income plus premium dollars you can’t afford in a tight year. The article walks through barn‑floor math on all four paths — overtime, robots, downsizing, and shift redesign — so you can plug in your own herd size, labor bill, and milk price to see which version of your operation actually survives a milk drop and one key milker walking away.

dairy farm overtime laws

On January 25, 2024, about 300 farmworkers packed the steps of the Washington state Capitol in Olympia. They weren’t chanting for overtime pay. They were protesting what the new law was doing to their paychecks.

Washington’s agricultural overtime threshold had just finished phasing down to 40 hours per week after a two‑year rollout sparked by the Martinez‑Cuevas court decision. Workers who once counted on 60‑ or 70‑hour weeks during peak season were now getting scheduled for closer to 36–40 hours, because farms were hiring more people and spreading hours around to avoid time‑and‑a‑half. “It’s not giving enough money to send to his family in Mexico,” one H‑2A dairy worker told Northwest Public Broadcasting reporter Johanna Bejarano about his new schedule.

Down in Chehalis, Washington, Sun‑Ton Farms has been milking cows for three generations. In local interviews, the Schilter family has made it clear that new labor rules are right up there with milk prices and feed costs as the challenges that decide whether their legacy continues. For operations like theirs, the dairy farm overtime laws 2026 don’t read like a policy debate. They read like a $48,000 problem they didn’t ask for. For many family herds, these dairy farm overtime laws 2026 are less about politics and more about whether the barn math still works.

The Deadlines You’re Actually On
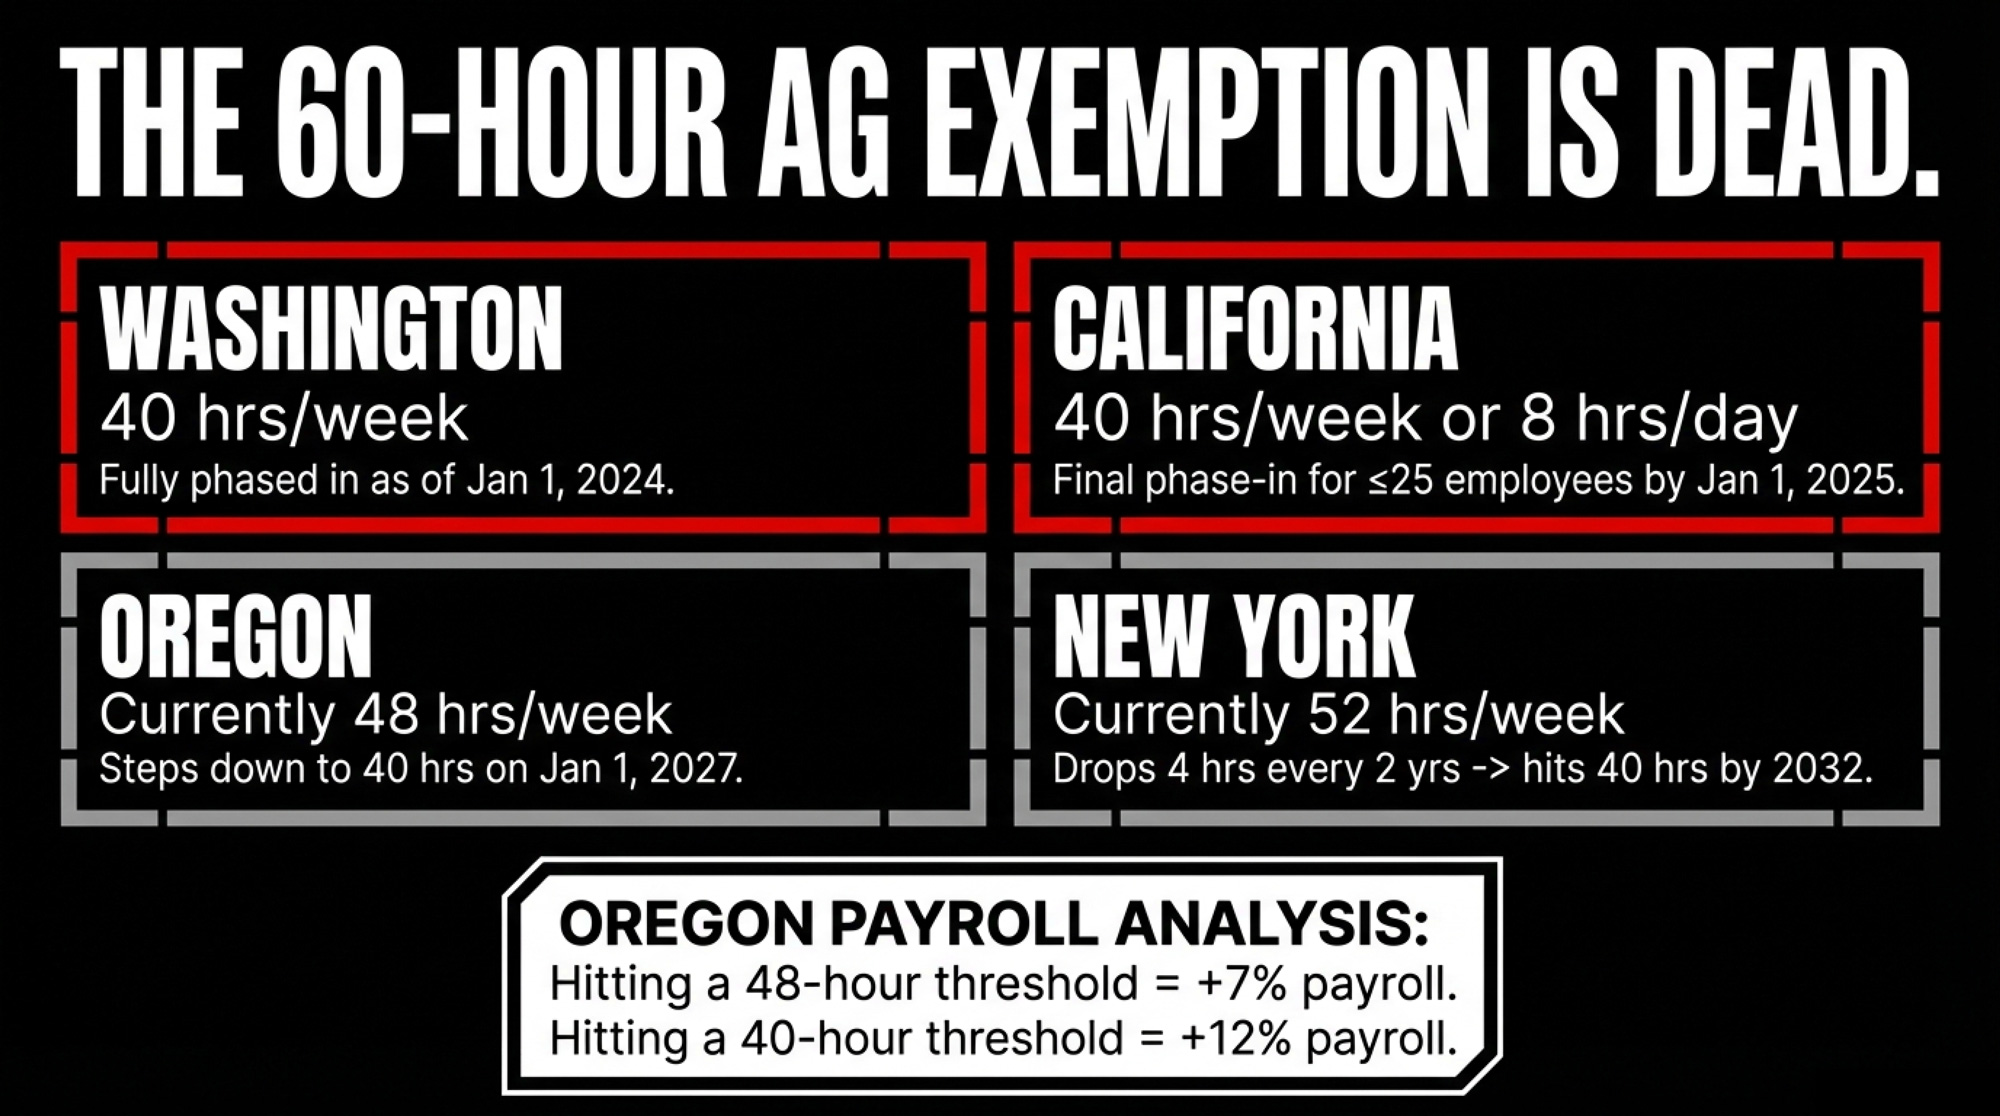
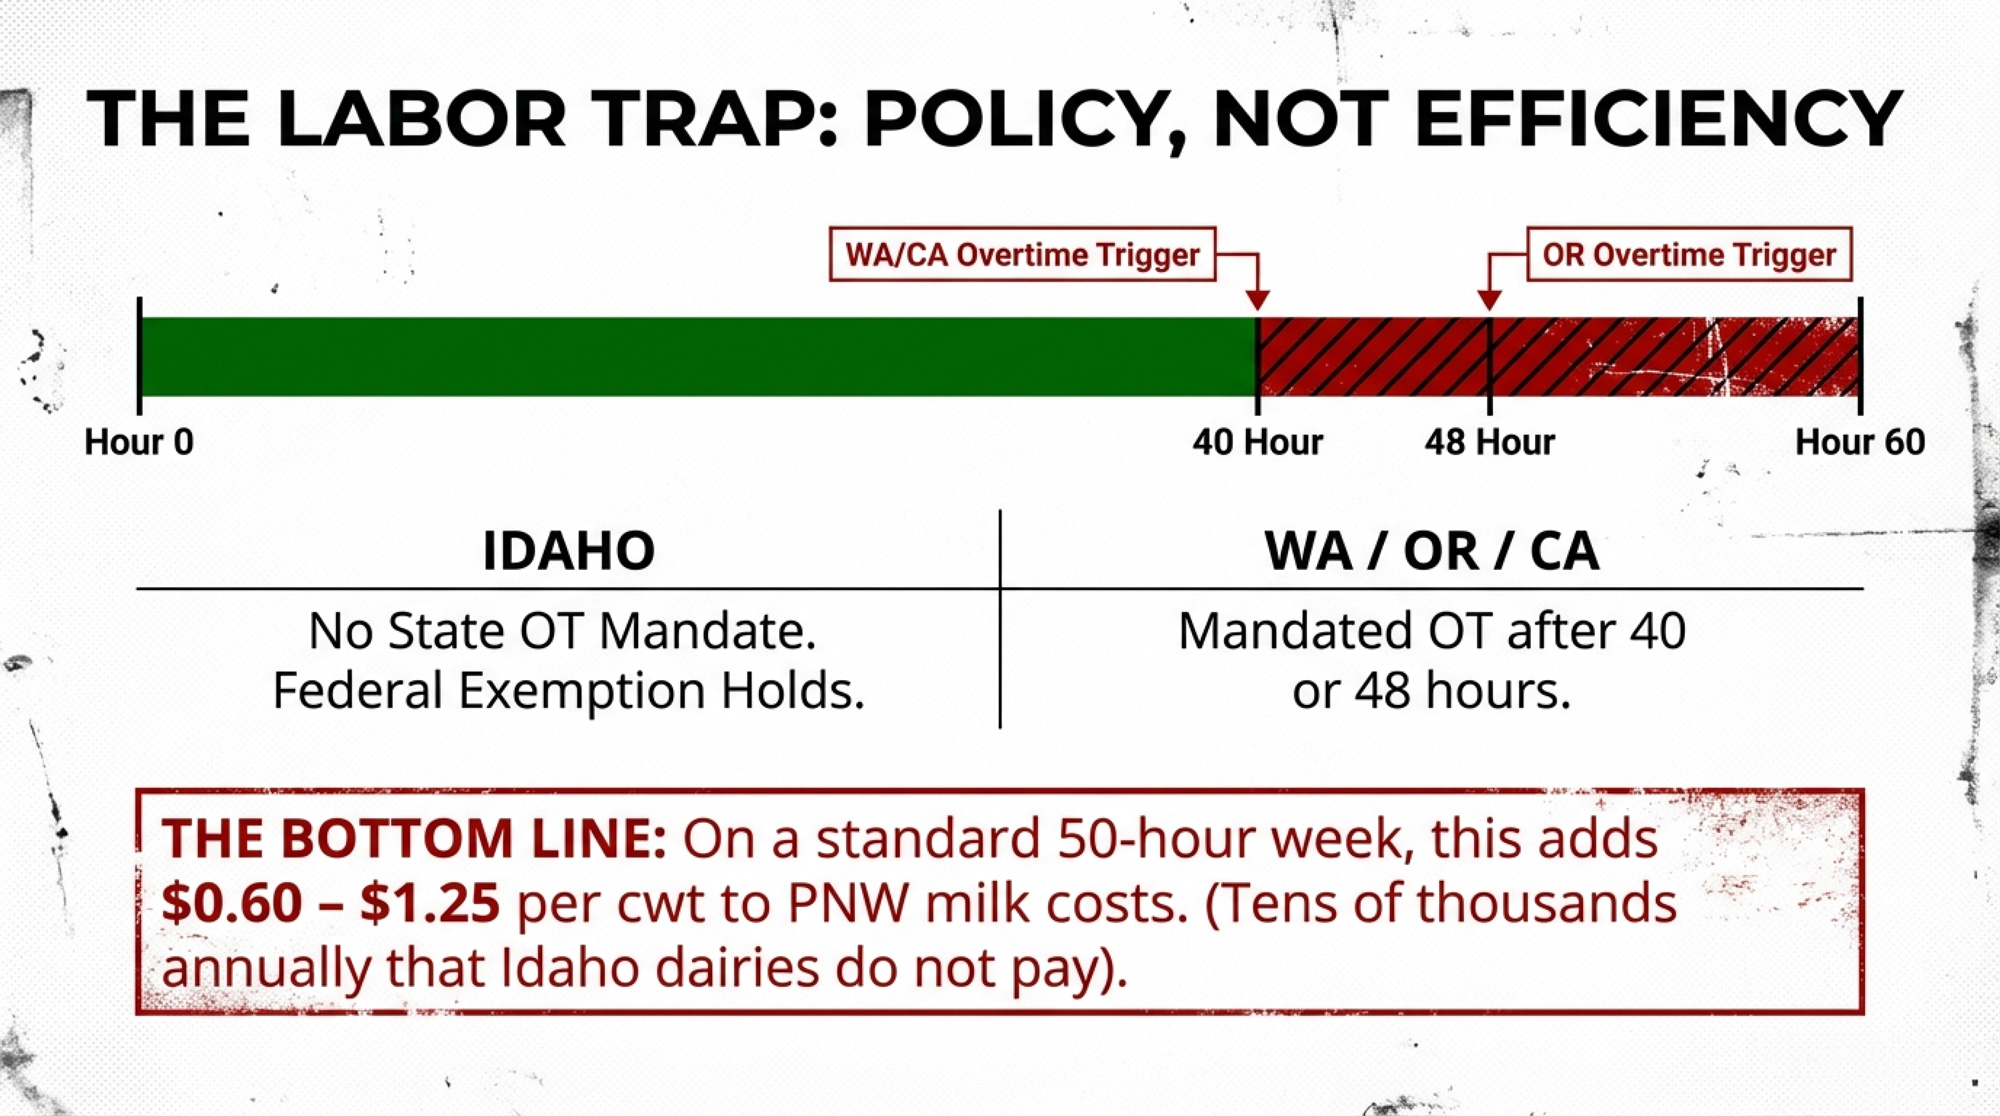
The ag overtime exemption that let dairy crews work 55–70 hours at straight time for decades is disappearing, state by state. The practical scoreboard looks like this:

StateOT Threshold NowEffectiveWhere It’s Headed
Washington40 hrs/weekJan 1, 2024 Fully phased in
California40 hrs/week or 8 hrs/dayJan 1, 2025 final phase‑in for ≤25 employees Larger employers already there
Oregon48 hrs/weekJan 1, 2025 (HB 4002) Steps down to 40 hrs on Jan 1, 2027
New York52 hrs/weekJan 1, 2026 Drops 4 hrs every 2 yrs → 40 hrs by 2032

Washington is your preview. Analysis of real payroll records and interviews with both workers and employers show that farms aren’t simply paying overtime. They’re restructuring around it — adding more bodies, capping hours below 40, and compressing schedules.

California’s numbers tell a similar story. USDA Farm Labor Survey data, analyzed by Cornell’s Agricultural Workforce Development group, shows California’s directly hired farmworkers averaged 2.7 more hours per week than all U.S. farmworkers in 2016; by 2023, they averaged about one hour less. The overtime law didn’t automatically boost total paychecks. Hours shrank. Weekly earnings often went the wrong way.

For dairy, which already ran some of the longest workweeks on the farm, those trends hit harder than in most crops.

The Barn Math Behind the $48,000 Shock

Oregon State economists Tim Delbridge and Jeff Reimer pulled anonymized payroll records from five Oregon farms — three dairies, three nurseries, and two cherry orchards — and modeled what happens at different overtime thresholds. Dairy was the most exposed because its employees were already working the longest weeks.
Their estimates:

  • At a 48‑hour threshold, dairy payroll jumped around 7%
  • At 40 hours, the increase was about 12%.

Now put that into your barn.

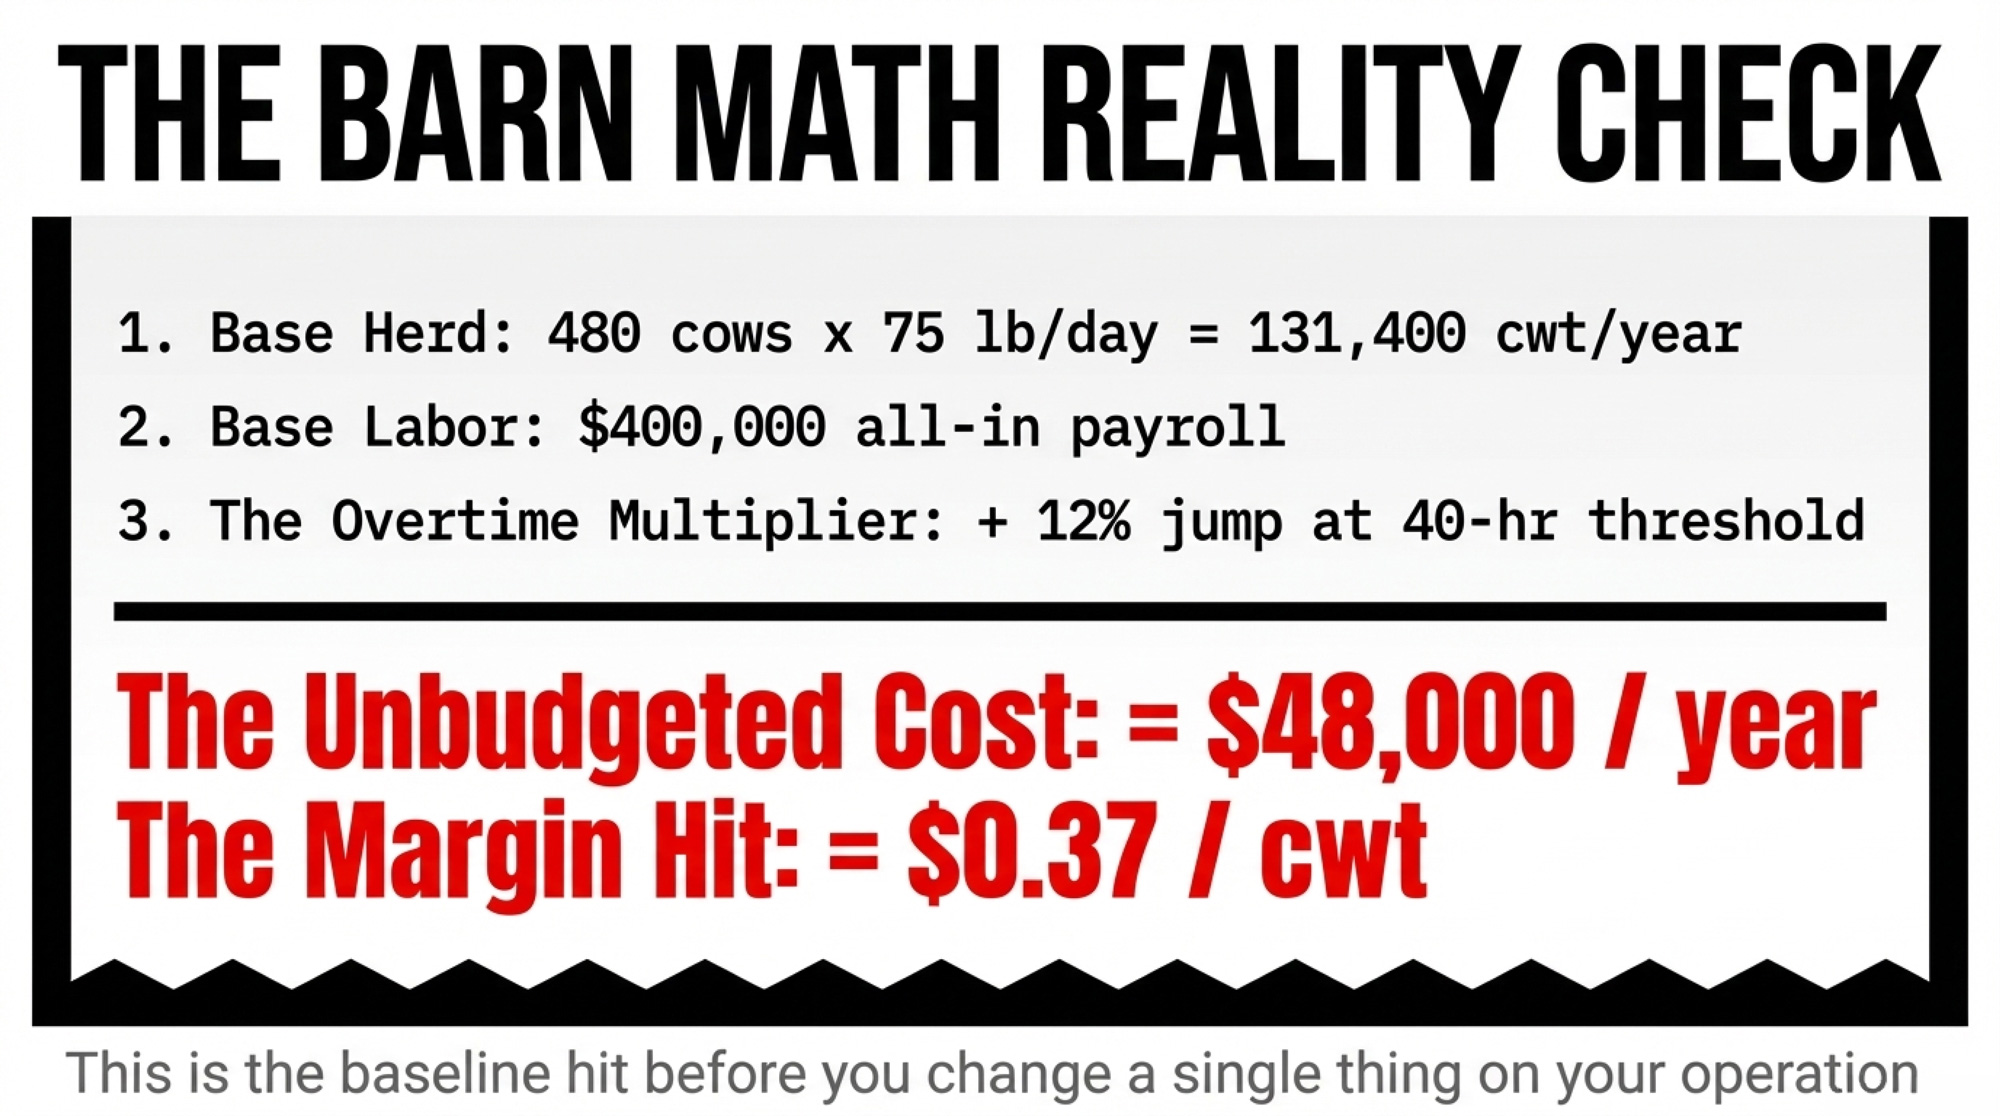
You’re running 480 cows, shipping 75 lb/cow/day. That means:

  • 480 cows × 75 lb/day = 36,000 lb/day
  • Over 365 days: 36,000 × 365 = 13,140,000 lb/year
  • Divide by 100 → 131,400 cwt/year

Your all‑in payroll for parlor and cow care — wages, payroll taxes, basic benefits — is around $400,000. usda

Twelve percent of $400,000 is $48,000. Spread across 131,400 cwt:

  • $48,000 ÷ 131,400 ≈ $0.37/cwt

Call it roughly 36–37 cents per cwt of the new cost you didn’t have last year. That’s the “just pay it” option.

But the Oregon analysis and follow‑up coverage also show what farms actually did in response: opb

  • Cut back individual hours so fewer workers exceeded 40 hours.
  • Hired more workers part‑time to cover the same work.
  • Reshuffled tasks to squeeze milking and cow care into tighter windows.

Workers ended up with higher hourly rates and lower weekly pay. Farms ended up managing more people for the same output. And that’s where the hidden costs start.

How Much Overtime Can Your Operation Actually Carry?

USDA ERS estimates hired labor accounts for roughly 13–15% of total dairy cash expenses on average. A University of Minnesota analysis used by Choices magazine shows that a 10% increase in labor costs can shave about 15% off net income on an average dairy.

The number that really matters isn’t wage per hour. It’s labor cost per hundredweight shipped — and how many pounds each full‑timer helps move out the driveway. A farm paying $18/hour with 1.5 million pounds sold per full‑time equivalent can be in better shape than a neighbor paying $16/hour and moving only 900,000 pounds per worker.

Once you calculate your true all‑in labor cost per cwt — wages, overtime, payroll taxes, benefits, plus a realistic estimate for turnover and any quality losses tied to labor — chances are you land somewhere on this spectrum:
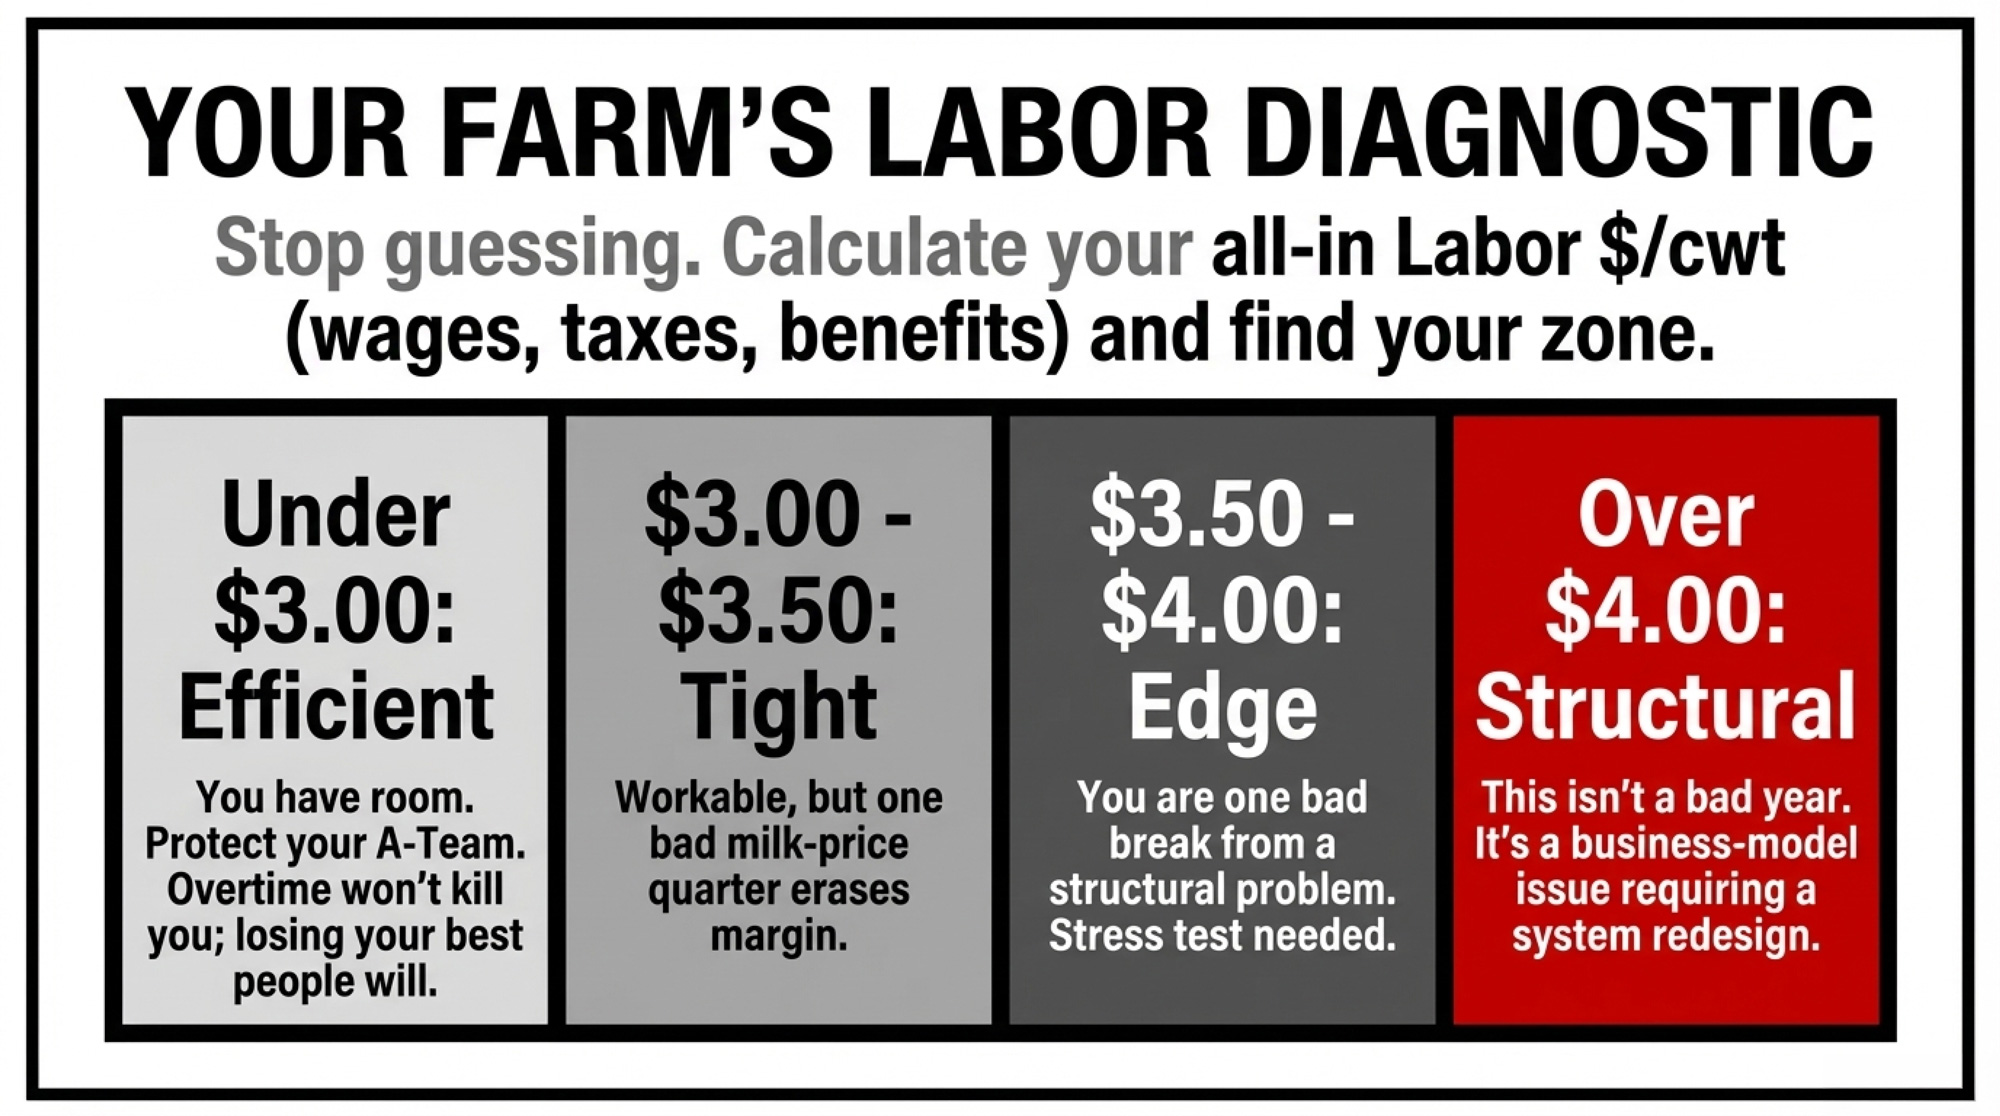
Labor $/cwtZoneWhat It Really Means
Under ~$3.00🟢 EfficientYou’ve got room. Overtime by itself won’t kill you. The real risk is losing your best people.
$3.00–$3.50🟡 TightWorkable, but one bad milk‑price quarter erases margin.
$3.50–$4.00🟠 EdgeYou’re one bad break from a structural problem. Time for a stress‑test.
Above ~$4.00 after a serious cleanup🔴 StructuralThis isn’t a bad year. It’s a business‑model issue that needs a redesign.

Those zones align with MSU and UMN benchmarks and USDA’s own cost‑of‑production work.

One question cuts through the noise:

If milk drops $2/cwt and you lose one key milker in the next 12 months, does your current setup still keep the farm alive?

If the honest answer is yes, then paying overtime to hold a strong crew together might be the cheapest risk management you’ve got.

If the answer is no, overtime is a bridge — not a plan.

What Happens to Your SCC When You Chop Your Milker’s Shifts at 40 Hours?

Your cows don’t read the labor code. They care about one thing: the same person doing the same thing the same way, every milking.
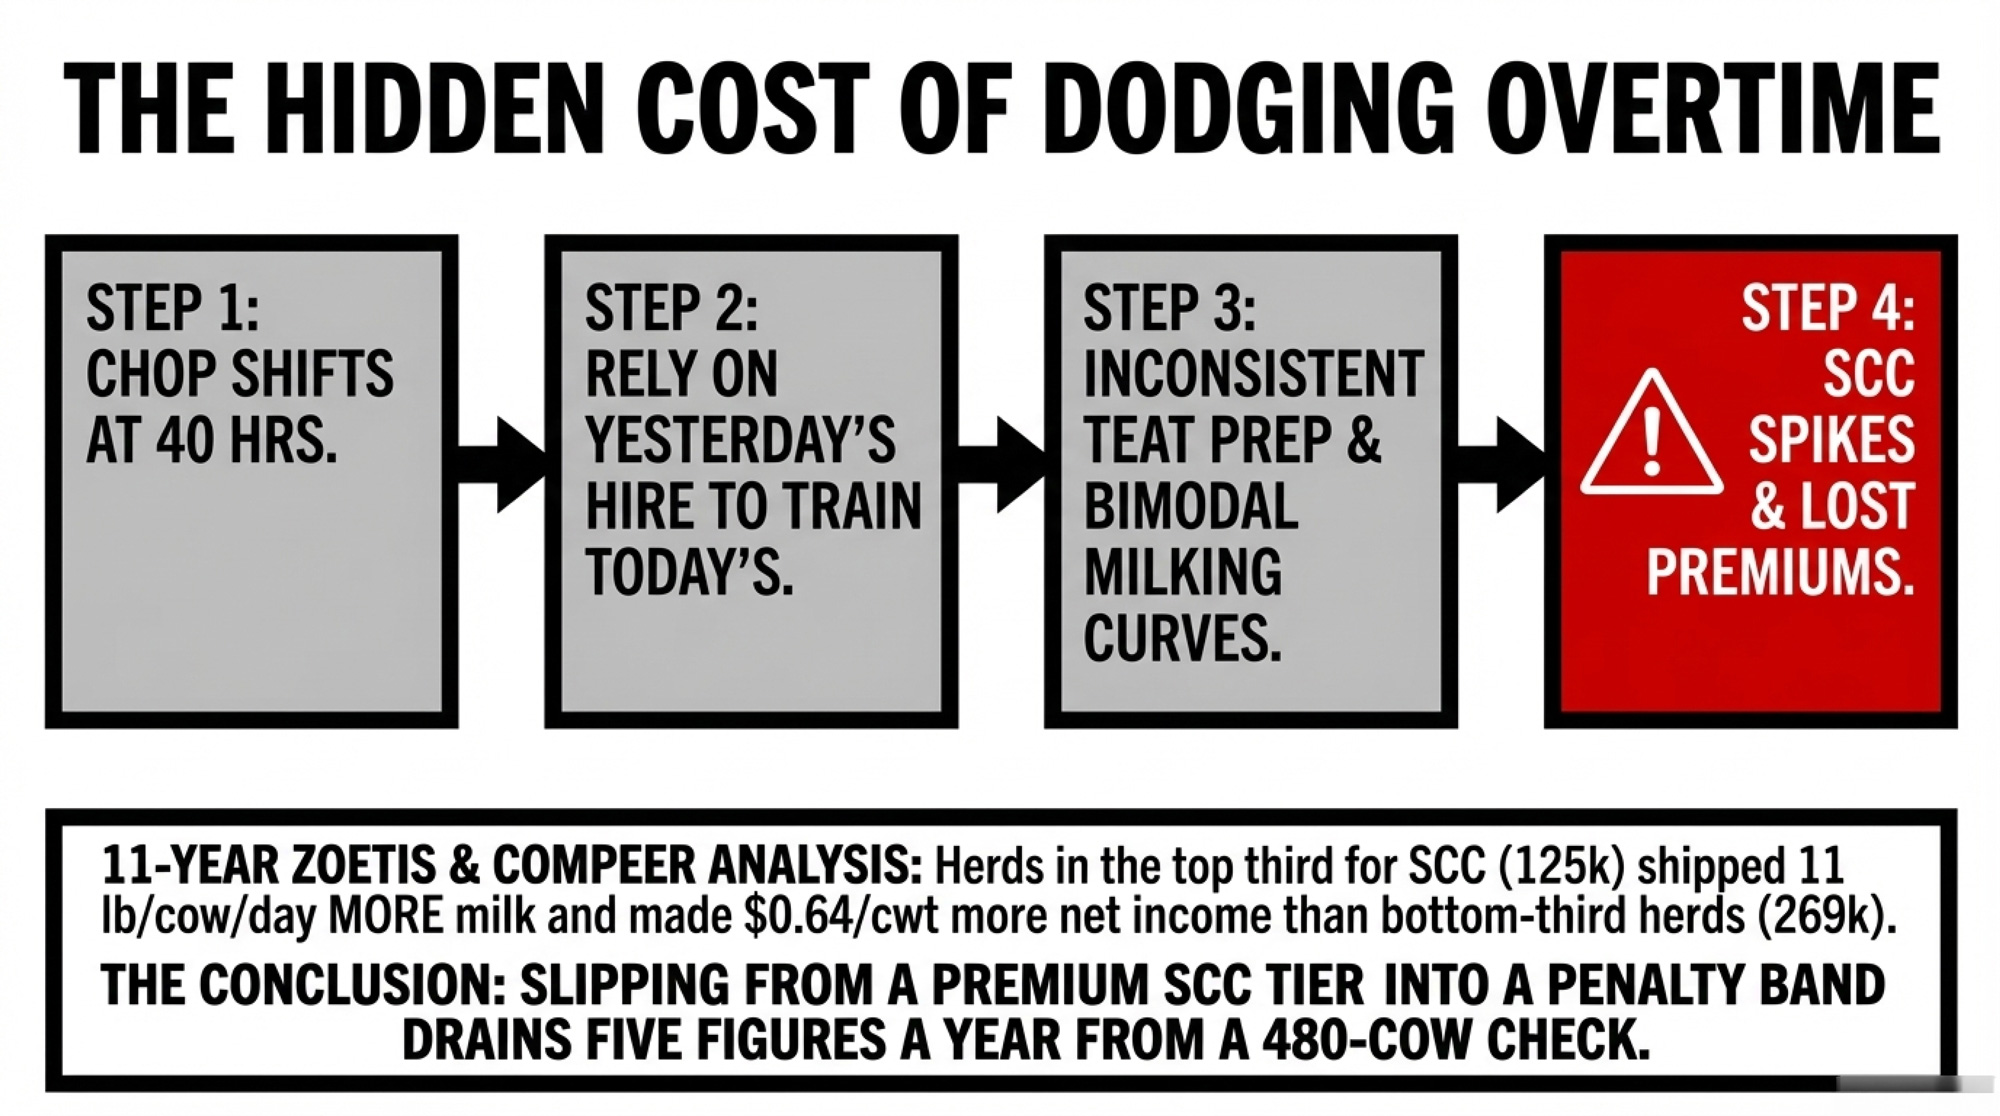
An 11‑year analysis by Zoetis and Compeer Financial found herds in the top third for bulk tank SCC — averaging around 125,000 cells/mL — shipped about 11 lb/cow/day more milk and made $0.64/cwt more net income than herds in the bottom third, which averaged about 269,000 cells/mL. Genetics helps, but that spread is mostly routines and people.

Work from Pamela Ruegg and others has put hard numbers on milking routine: standardized prep and unit attachment generated a 5.5% increase in lactational milk yield compared to inconsistent prep and timing. A separate study across 68 dairy herds found that milker behavior and management explained up to 40% of the variability in bulk-tank SCC among herds.

Michigan State University’s parlor evaluation team gives one example that should make you sit up: a herd with bulk tank SCC in the 80,000–85,000 range was still running 44% bimodal milking events, a sign that cows weren’t letting down properly even though the tank looked great. The parlor looked fine on paper. The milk curves told a different story.

Now overlay overtime.

When you slice shifts to dodge OT, you:

  • Add more people to cover the same parlor hours.
  • Give each person fewer full milking cycles to master.
  • Rely on yesterday’s hire to train today’s.

Rodriguez’s training study, which The Bullvine covered earlier, looked at 112 milkers on 16 farms. A single focused, bilingual on‑farm training session:

  • Moved milker knowledge scores from 49.3% to 67.6%.
  • Cut inadequate teat prep from 69% to 48%.
  • Trimmed milking time by 25–43 seconds per cow.

And yet herds that had SOPs written down for milking but no training showed bulk tank SCC 21,600 cells/mL higherthan herds with no SOPs at all. A three‑ring binder doesn’t milk cows. People do.

Dairy One and processor premium sheets translate that into real dollars: slipping from a premium SCC tier into a penalty/no‑premium band in a 400–500‑cow herd can quietly drain five figures a year from your milk check. The overtime law doesn’t itemize that. Your settlement sheet does.

The Mid‑Size Squeeze

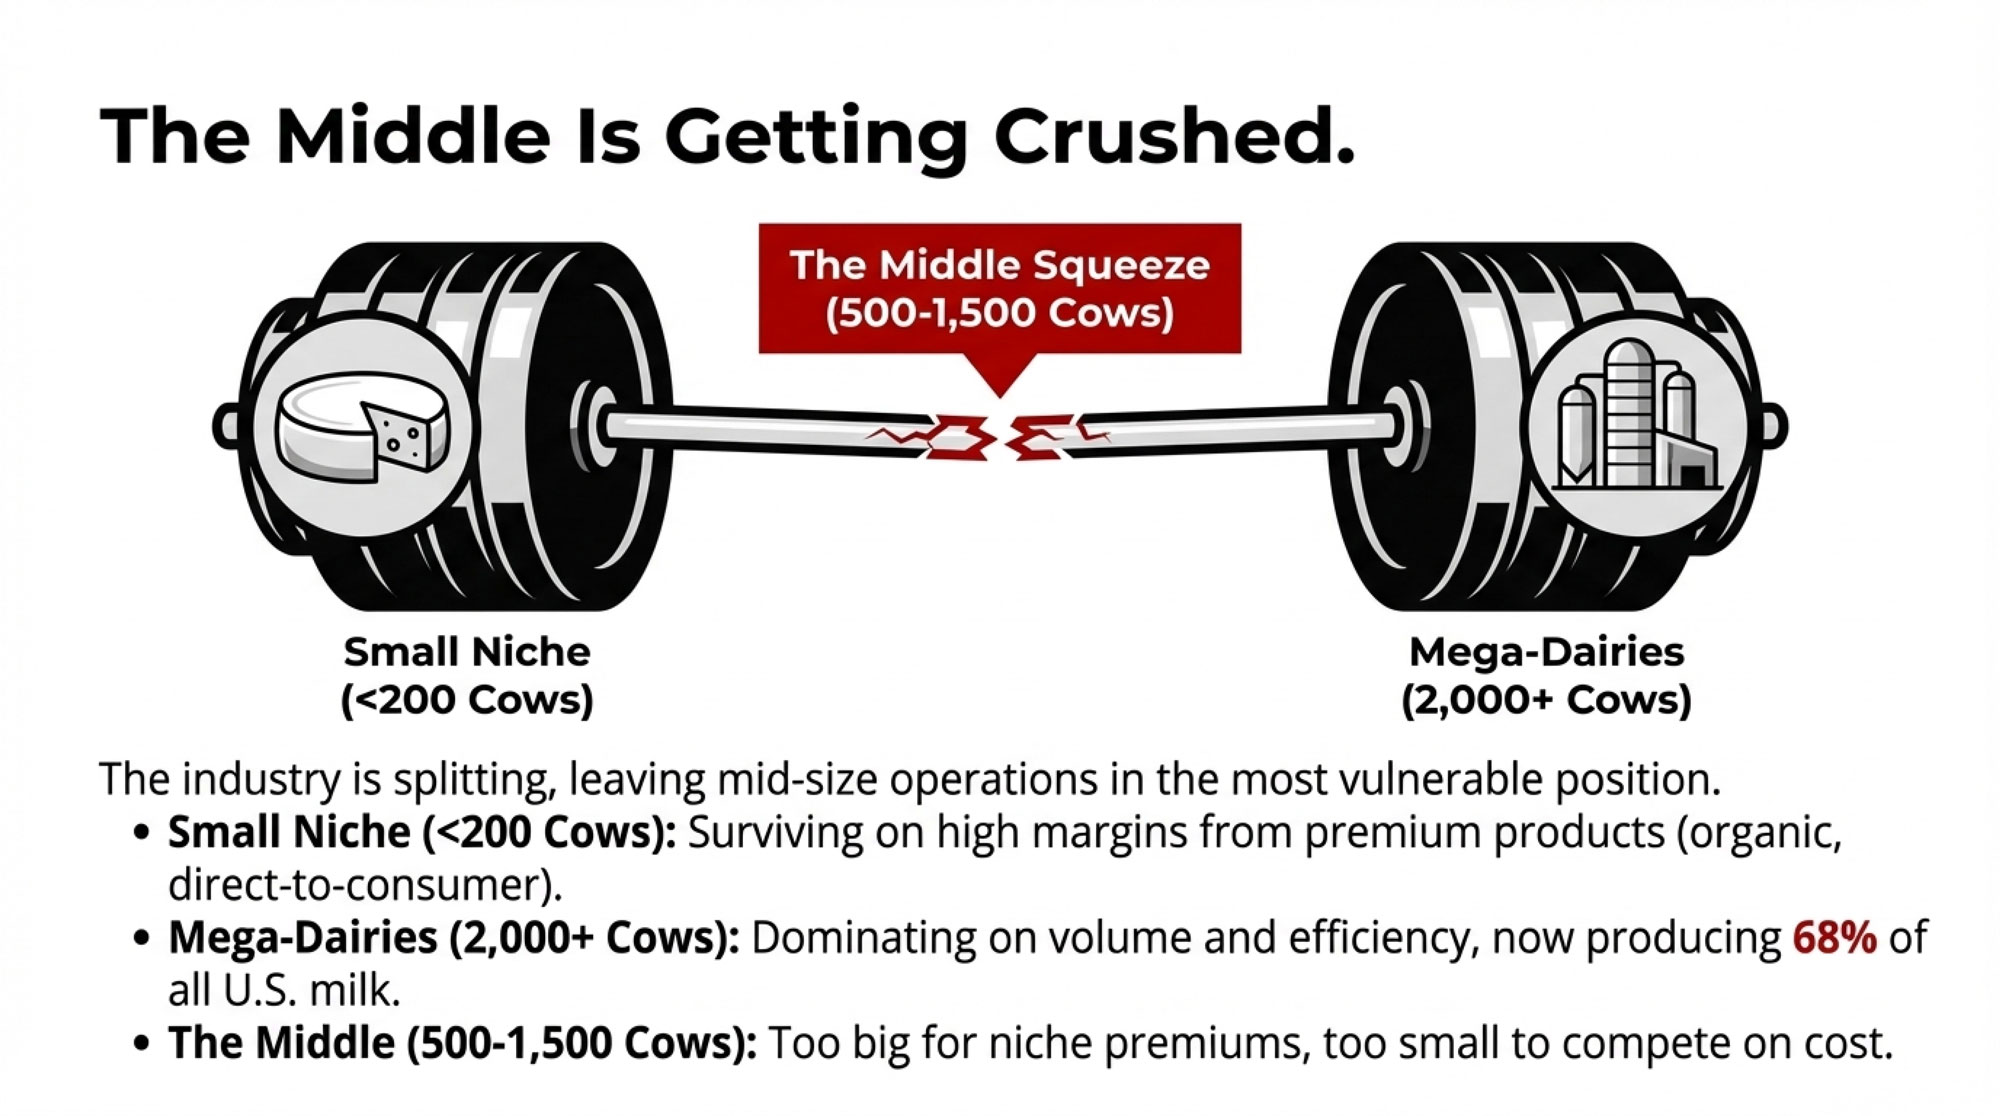
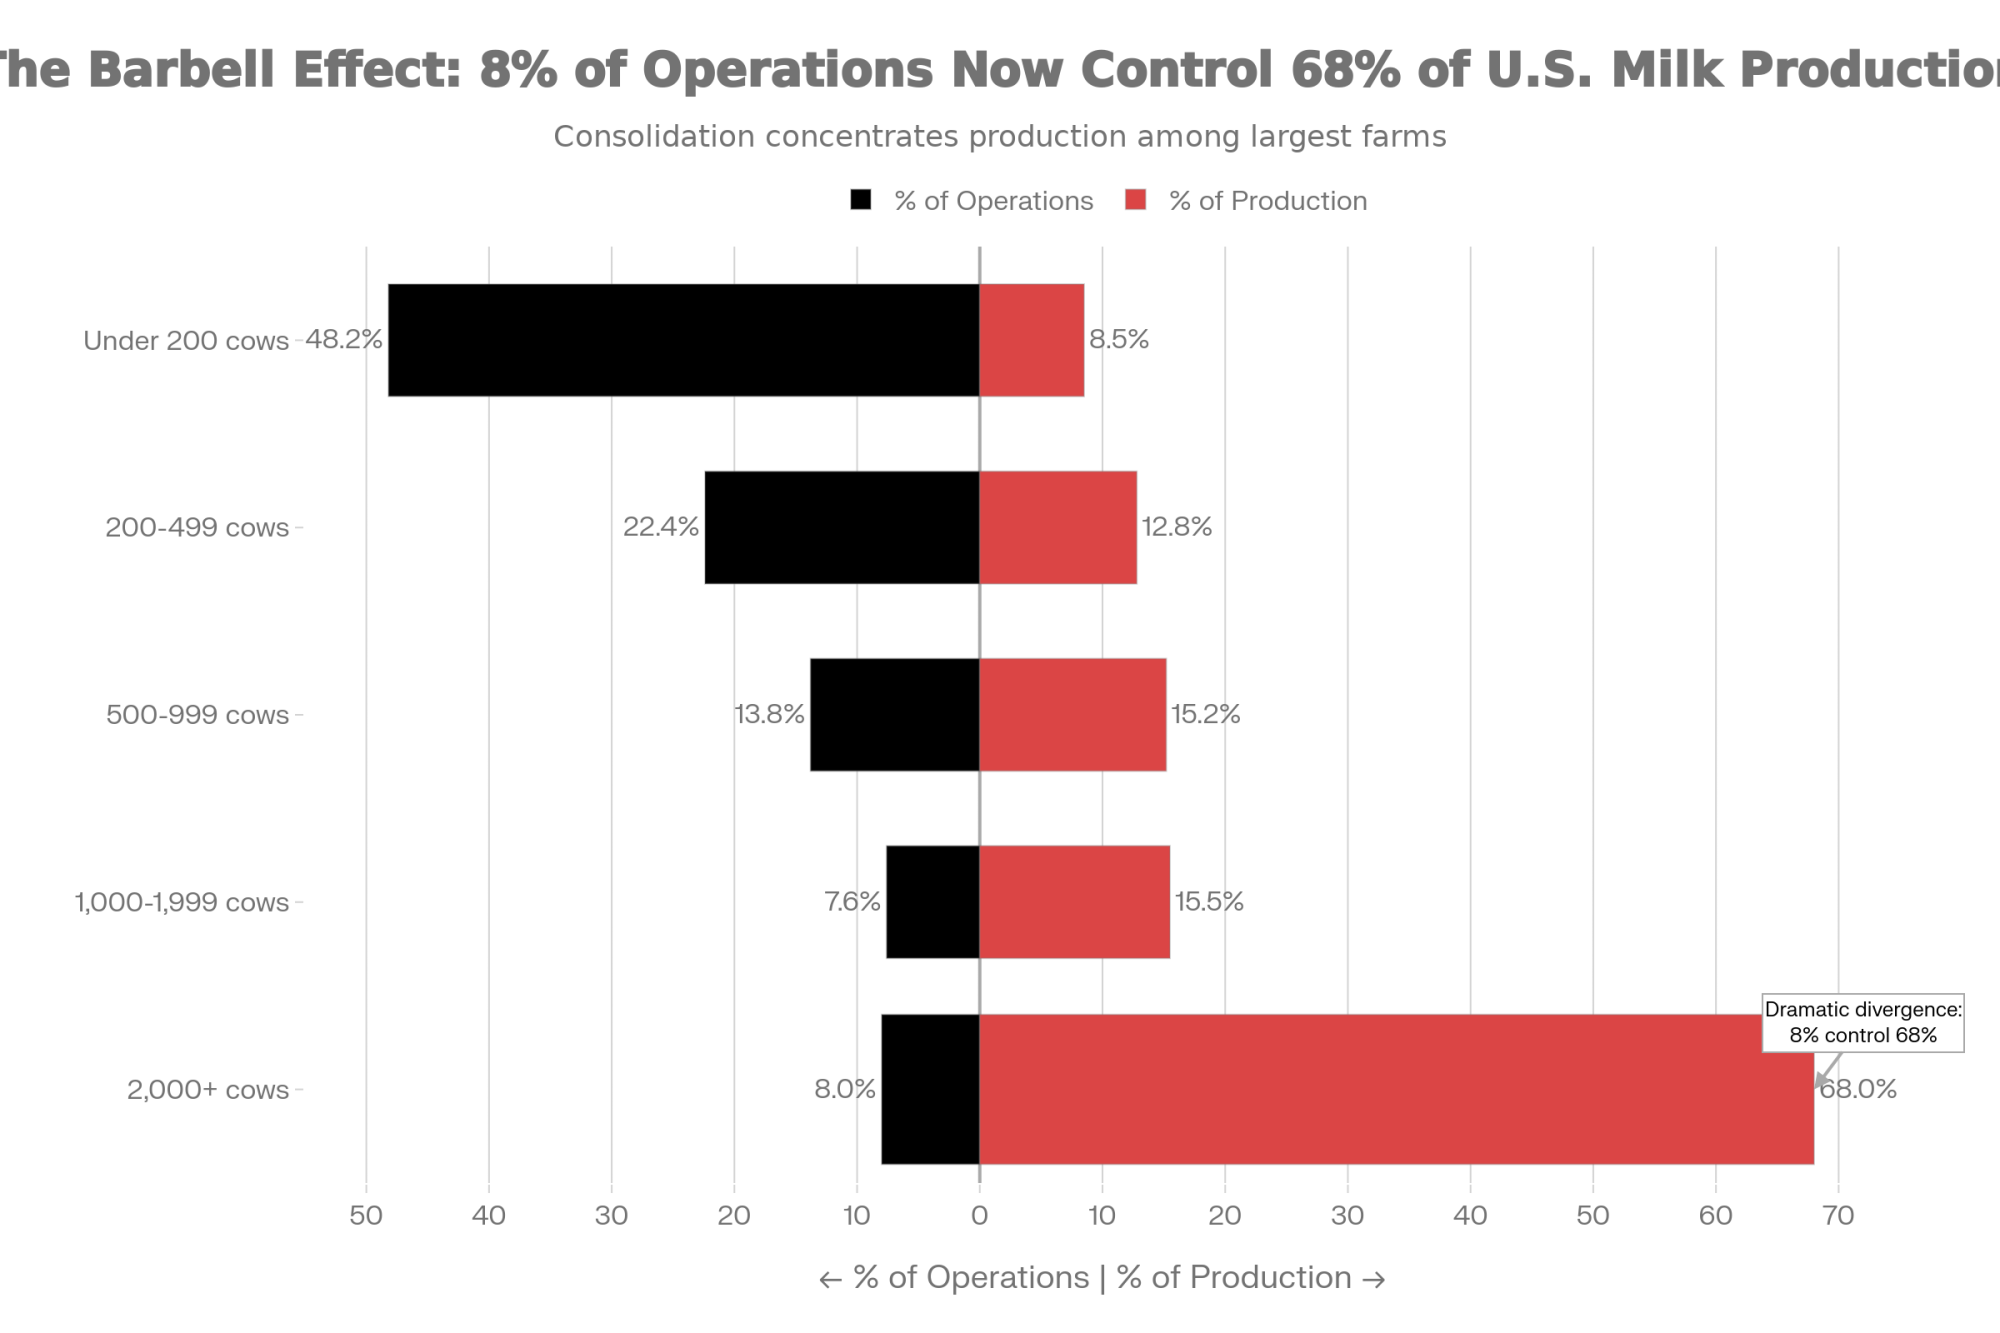
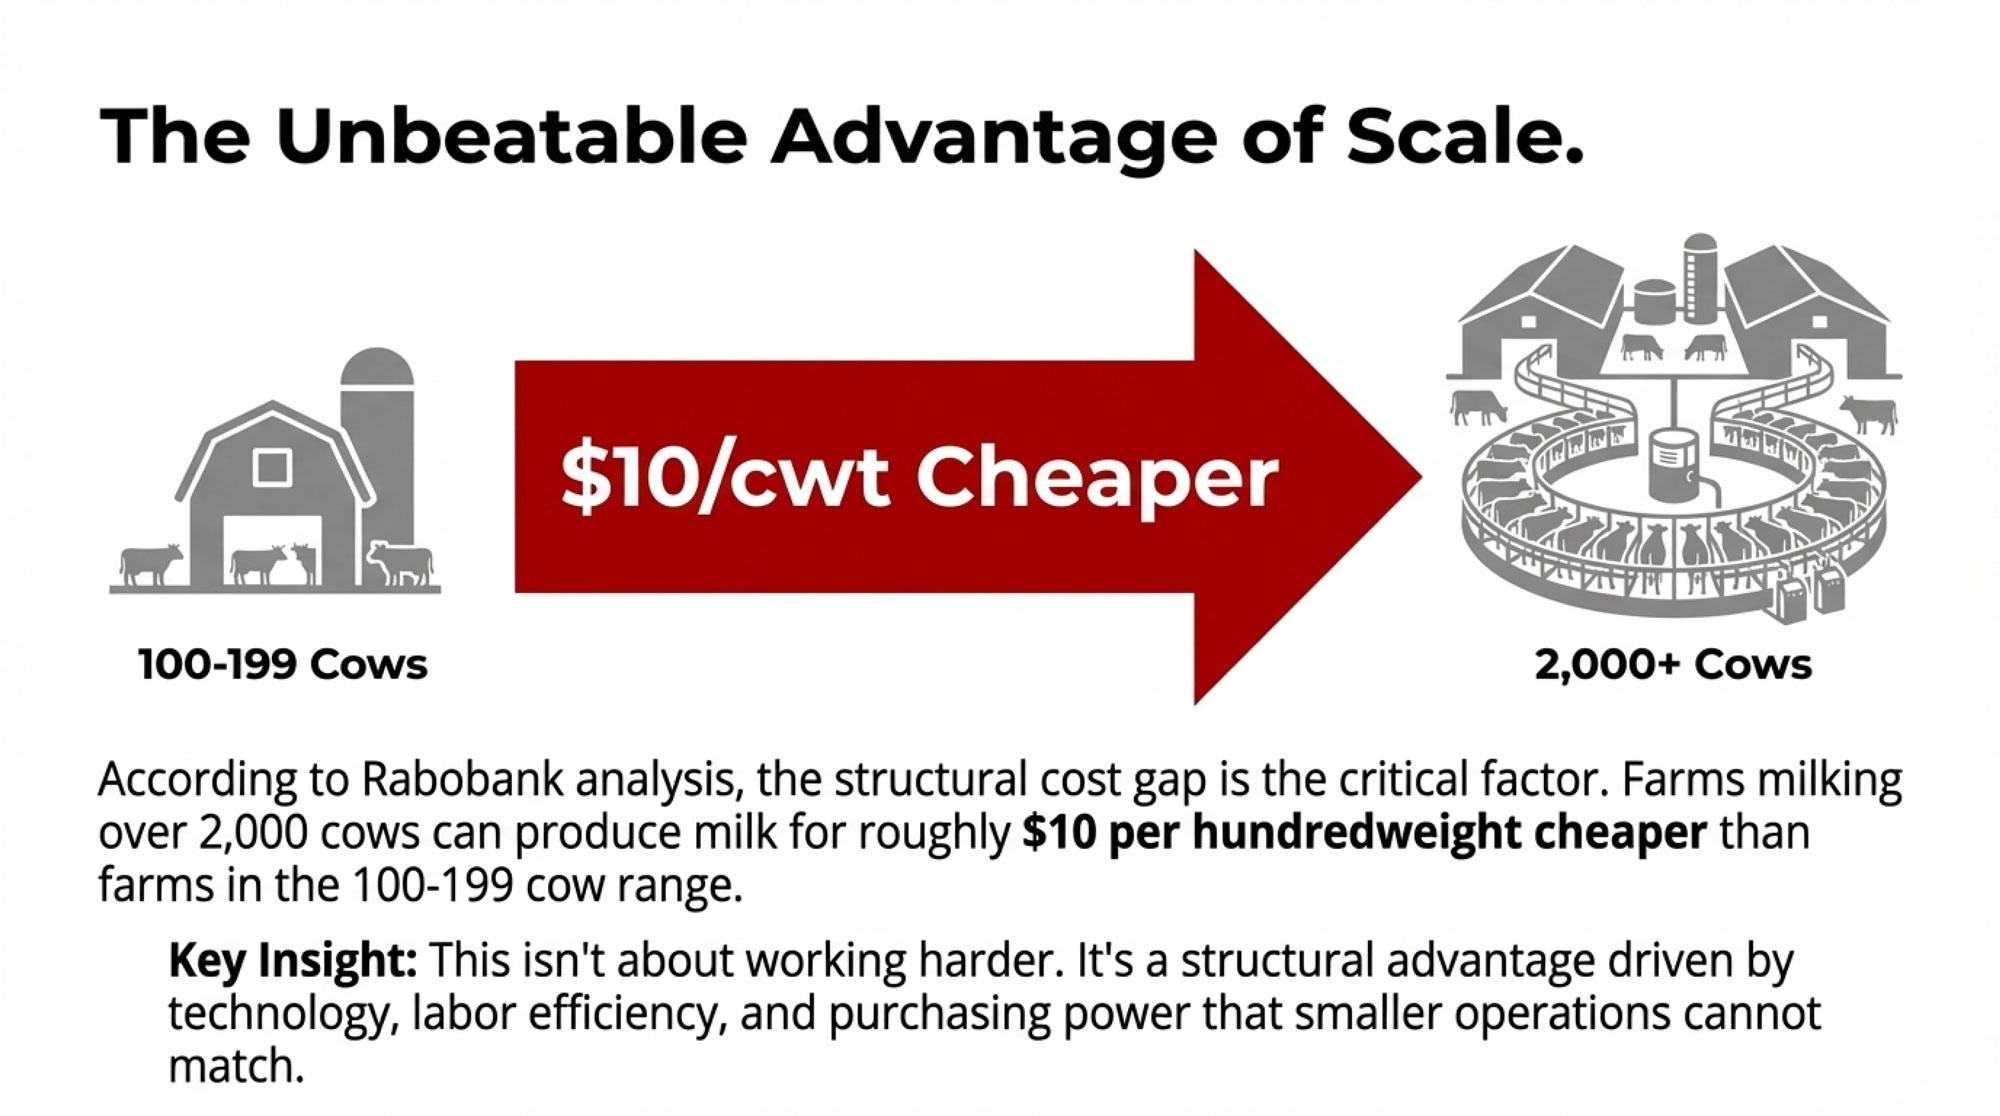
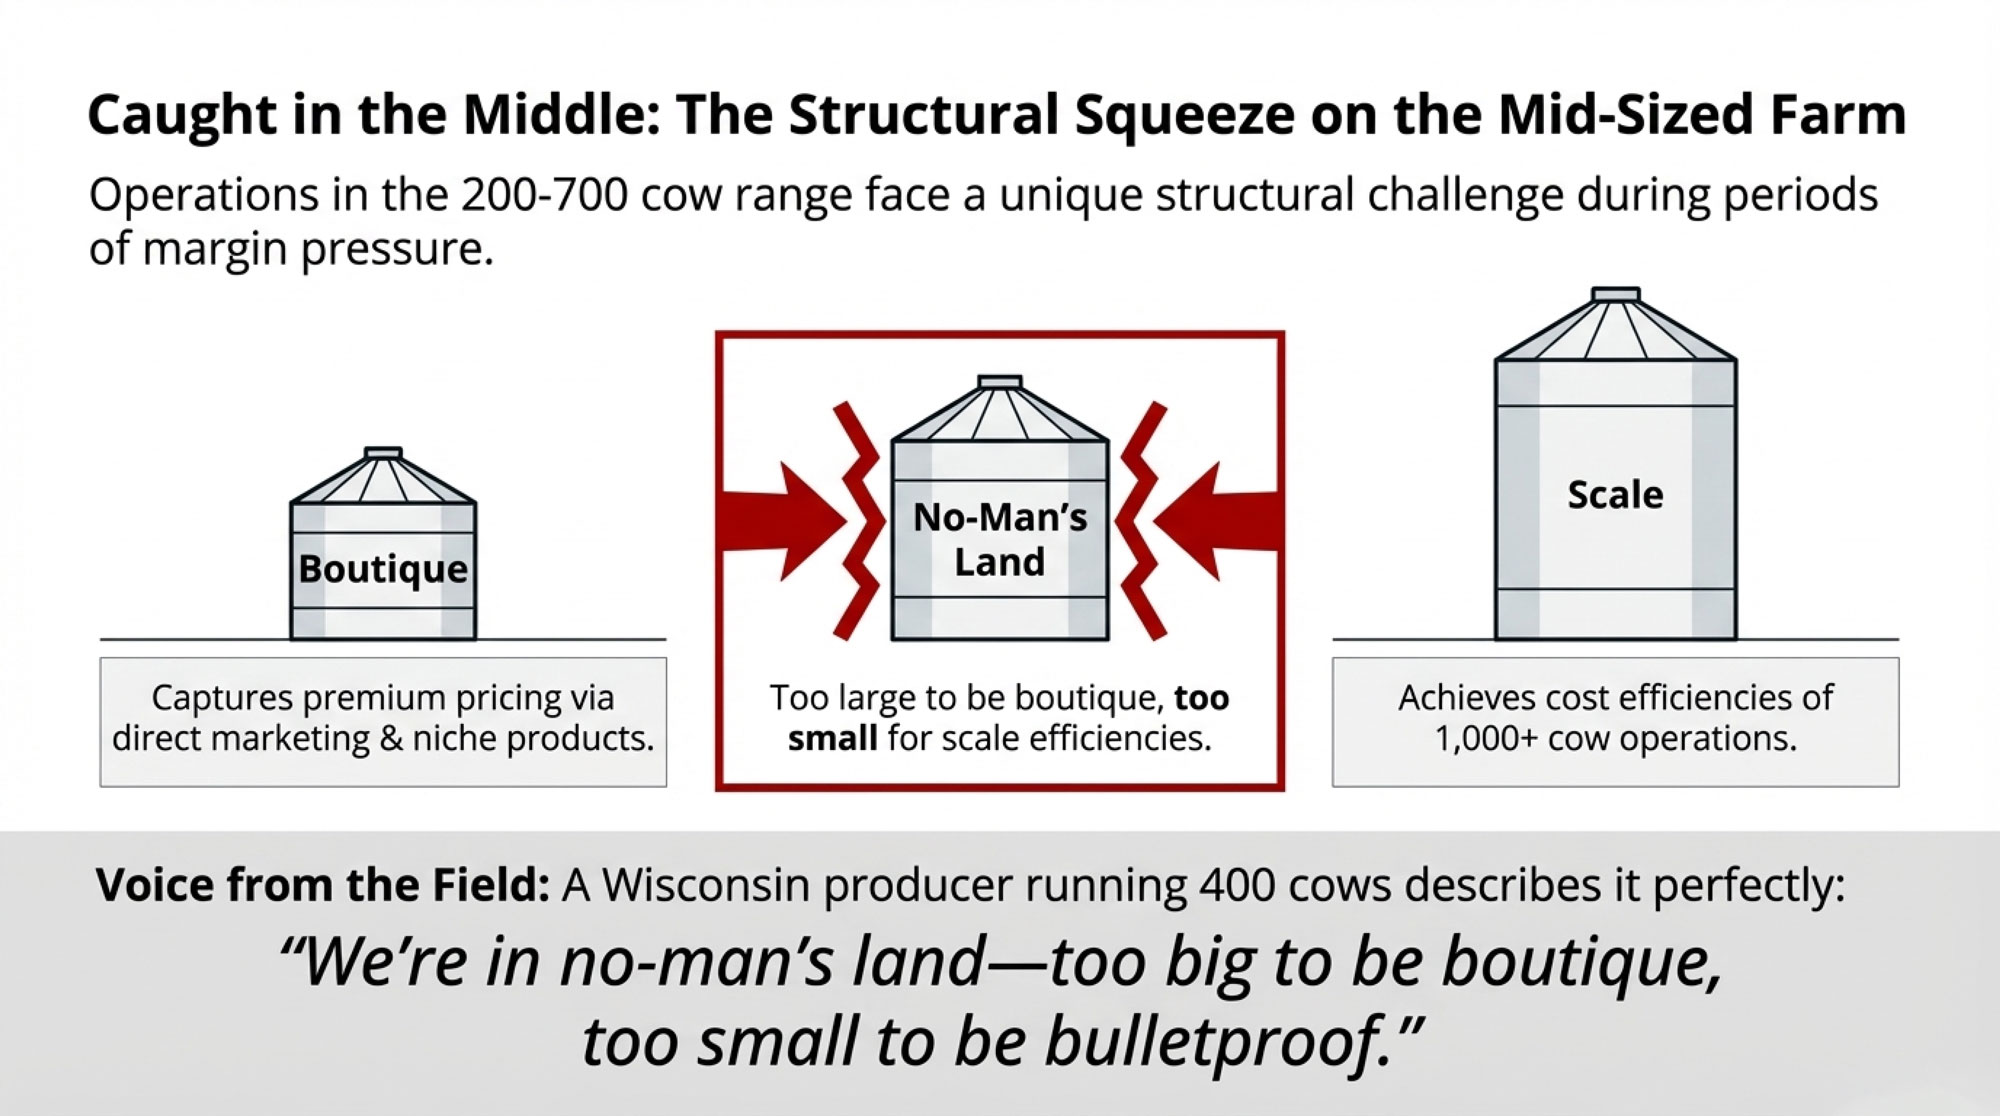
The operations caught in the worst squeeze are in the 200–800 cow range. Too big to cover everything with family and one hired hand. Too small to spread robot installation costs over 2,000–3,000 cows.

Bre Elsey, director of governmental affairs at the Washington Farm Bureau, told Cascade PBS that “agriculture is the second largest industry in the state, and we’re losing them, one by one.” She was talking about family operations — the six‑ to twelve‑employee outfits that can’t casually absorb a $48,000 annual payroll shock without rethinking everything.
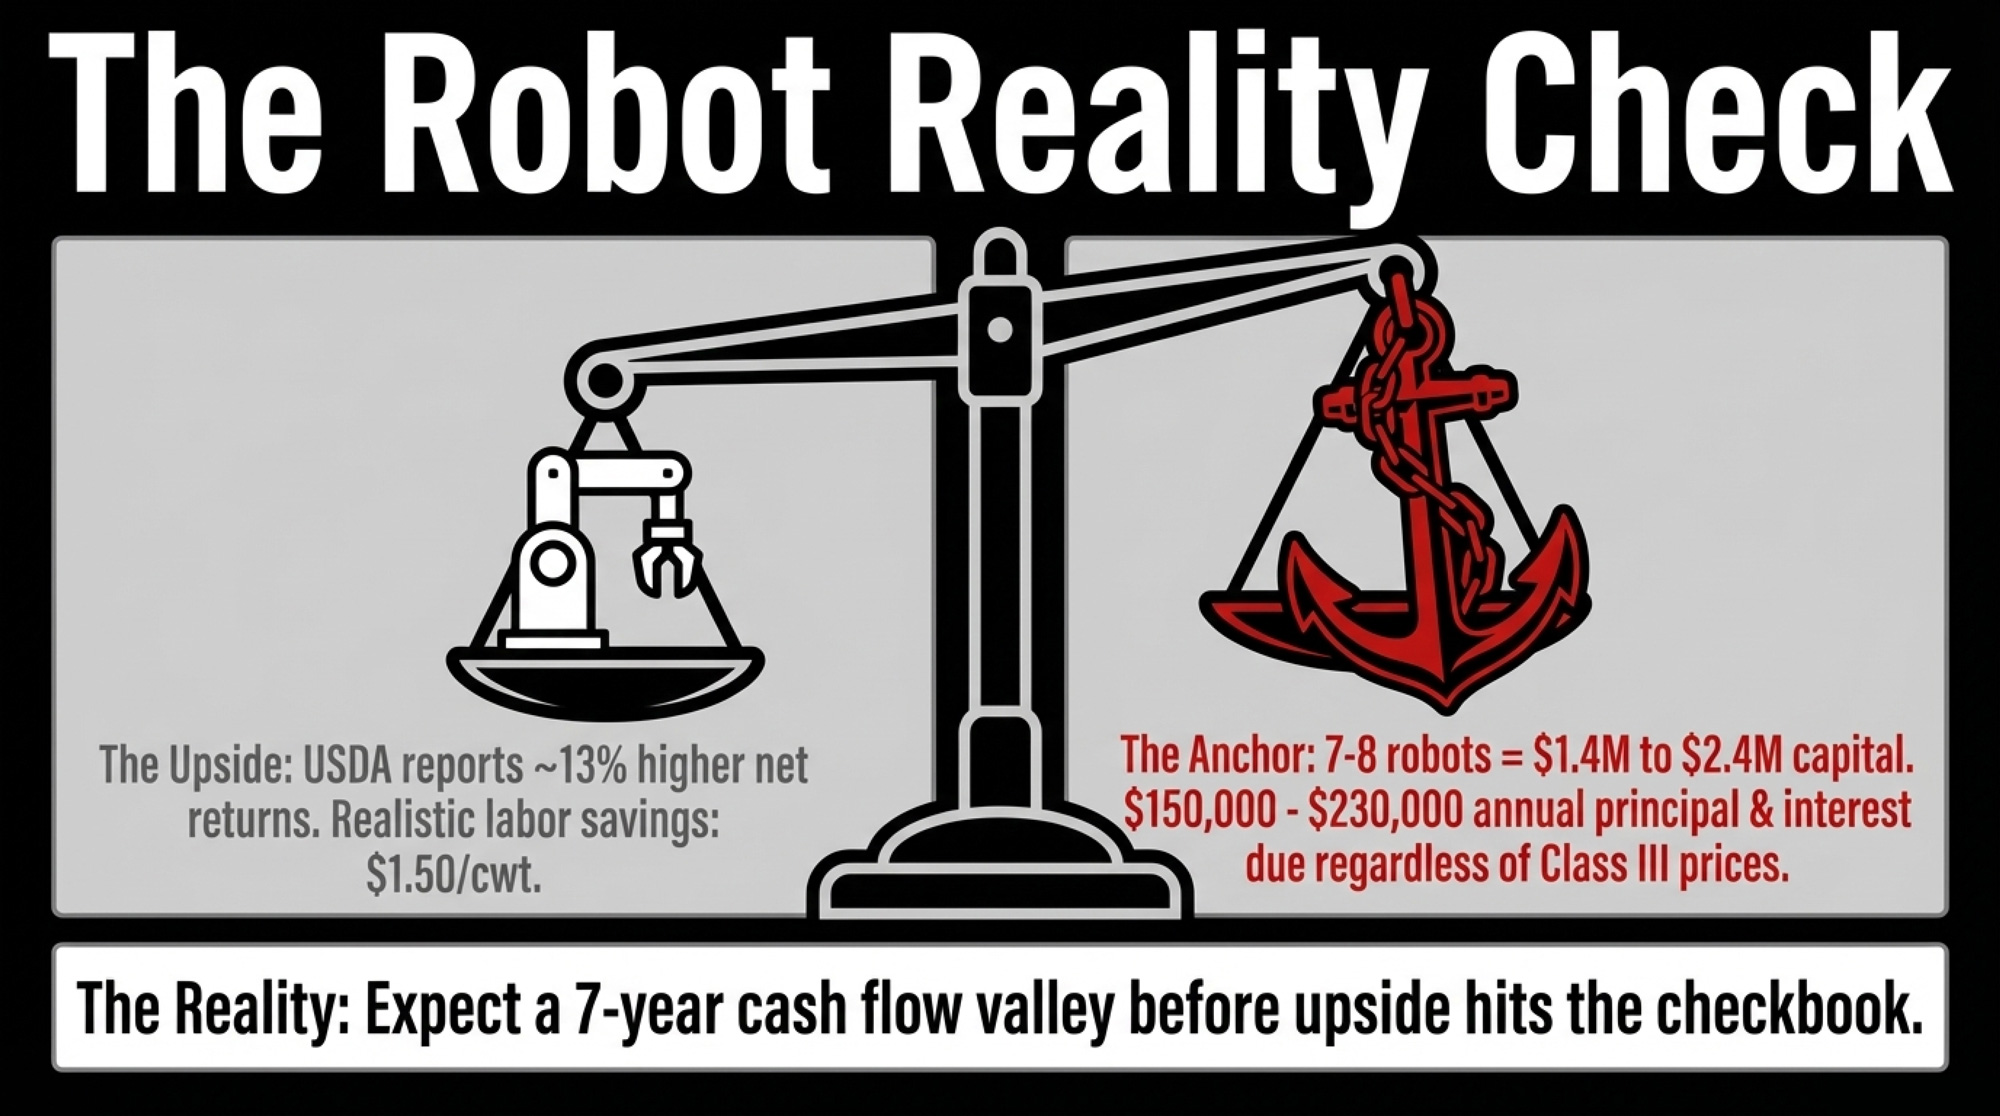
On the robot side, the temptation is real. USDA’s January 2026 report, ERR‑356, suggests farms using automatic milking systems (AMS) can see about 13% higher net returns over time. But Iowa State’s Larry Tranel, whose AMS cash‑flow work underpins a lot of extension talks, shows a typical install running roughly seven years of negative or flat cash flow before that upside shows up in the checkbook.

Scale that to a 480‑cow parlor:

  • You’re looking at 7–8 robots.
  • At $200,000–$300,000 installed per box, that’s $1.4–$2.4 million in capital. 
  • Annual principal and interest on that kind of note can land roughly in the $150,000–$230,000 range at typical 10–15 year terms and current rates. 

Those payments don’t care what Class III does next winter. But for some, the $230,000/year debt is a “reliability tax” they are willing to pay just to stop checking their phone for “I can’t make my shift” texts.

One Bullvine case study laid out what happens when the milk price in the dealer’s spreadsheet doesn’t match reality. A 240‑cow family ran their dealer’s four‑robot proposal at $18 milk instead of $22 and watched the projected milking cost jump from $2.03 to $4.07/cwt. The robots did what they promised. The economics didn’t.

The Cost Nobody Logs Under “Labor”

Here’s the thread that runs through every path you’re considering.

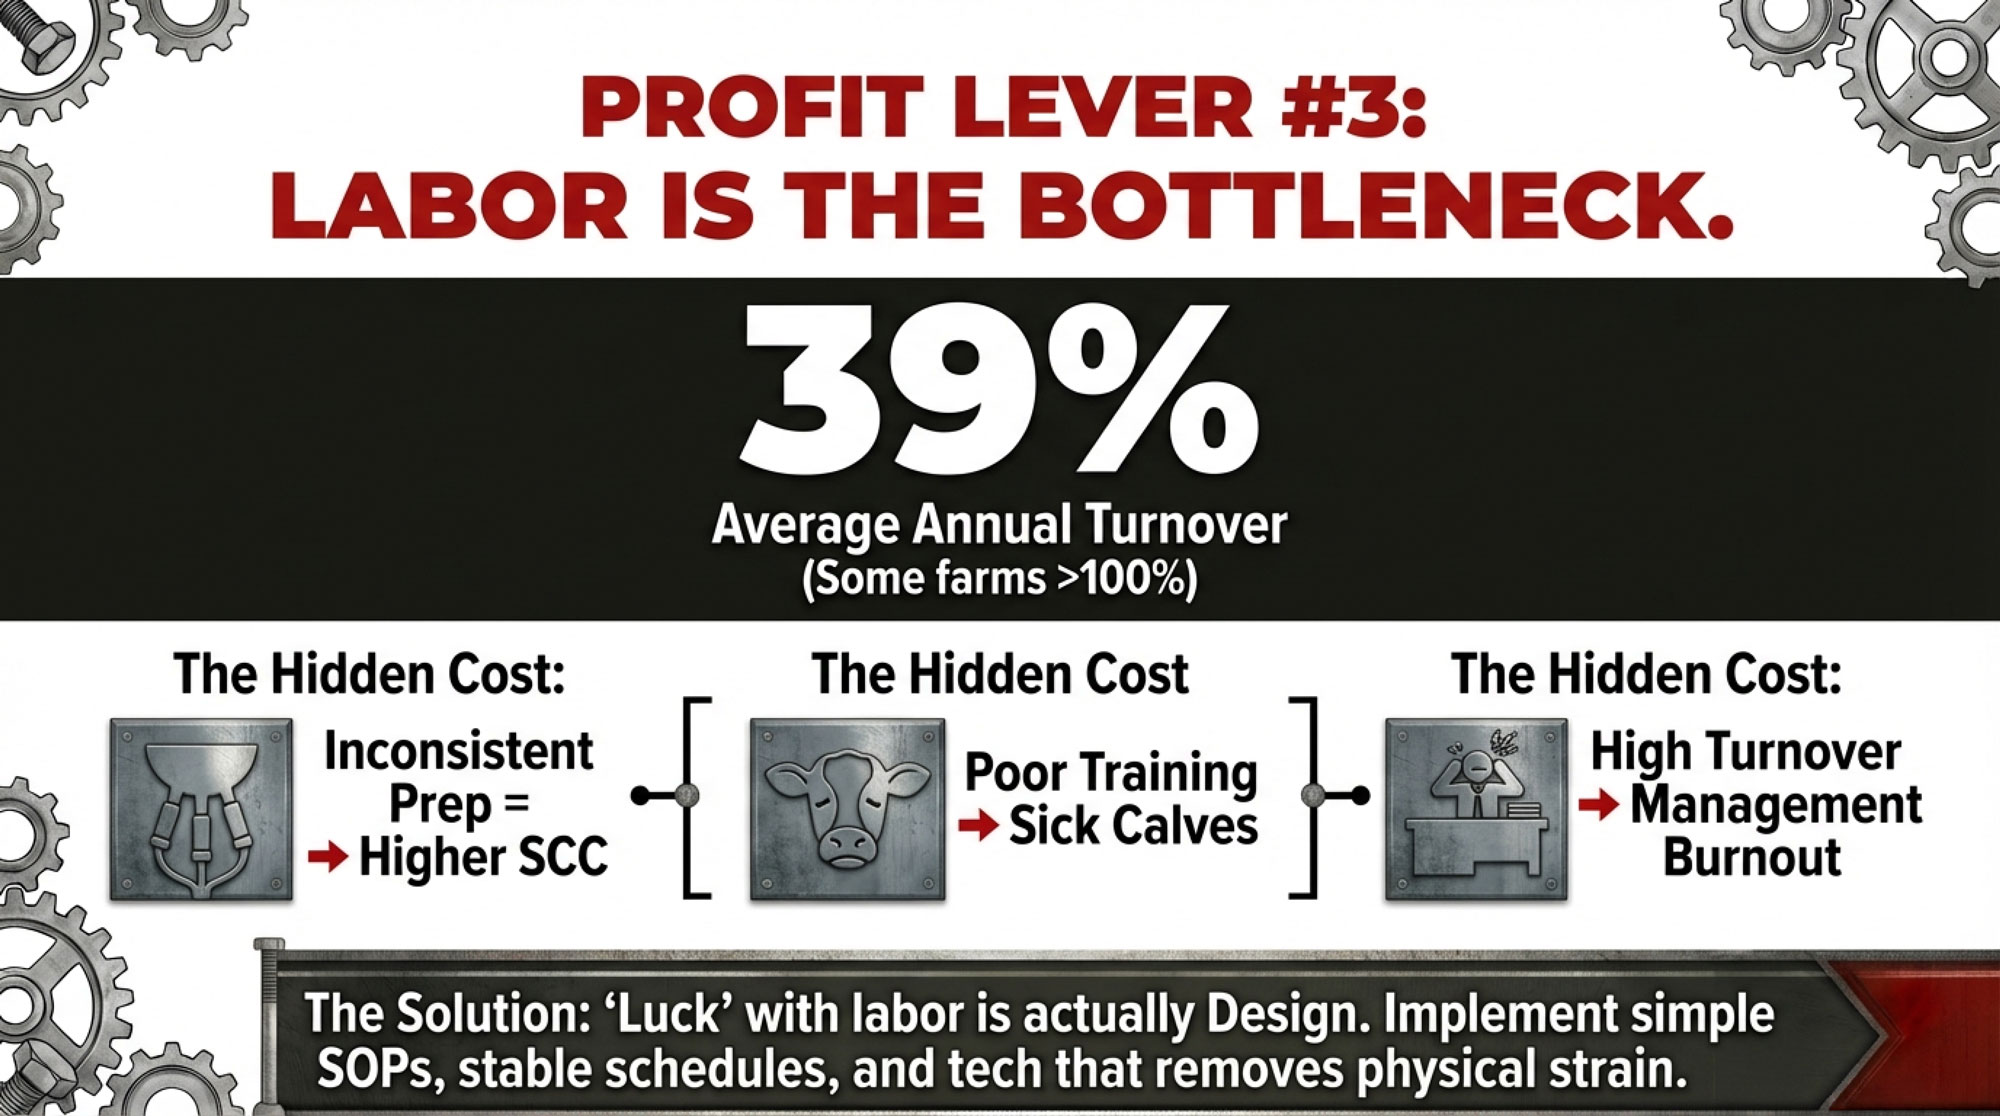
U.S. dairies using hired labor are reporting turnover rates of 30–40% per year. The National Dairy FARM Workforce Development survey reported an average of 38.8%. Extension and HR estimates peg the real cost of replacing a single hourly dairy employee — recruiting, hiring, onboarding, on‑the‑job training, early mistakes, and lost production — at 100–150% of that person’s annual wage.
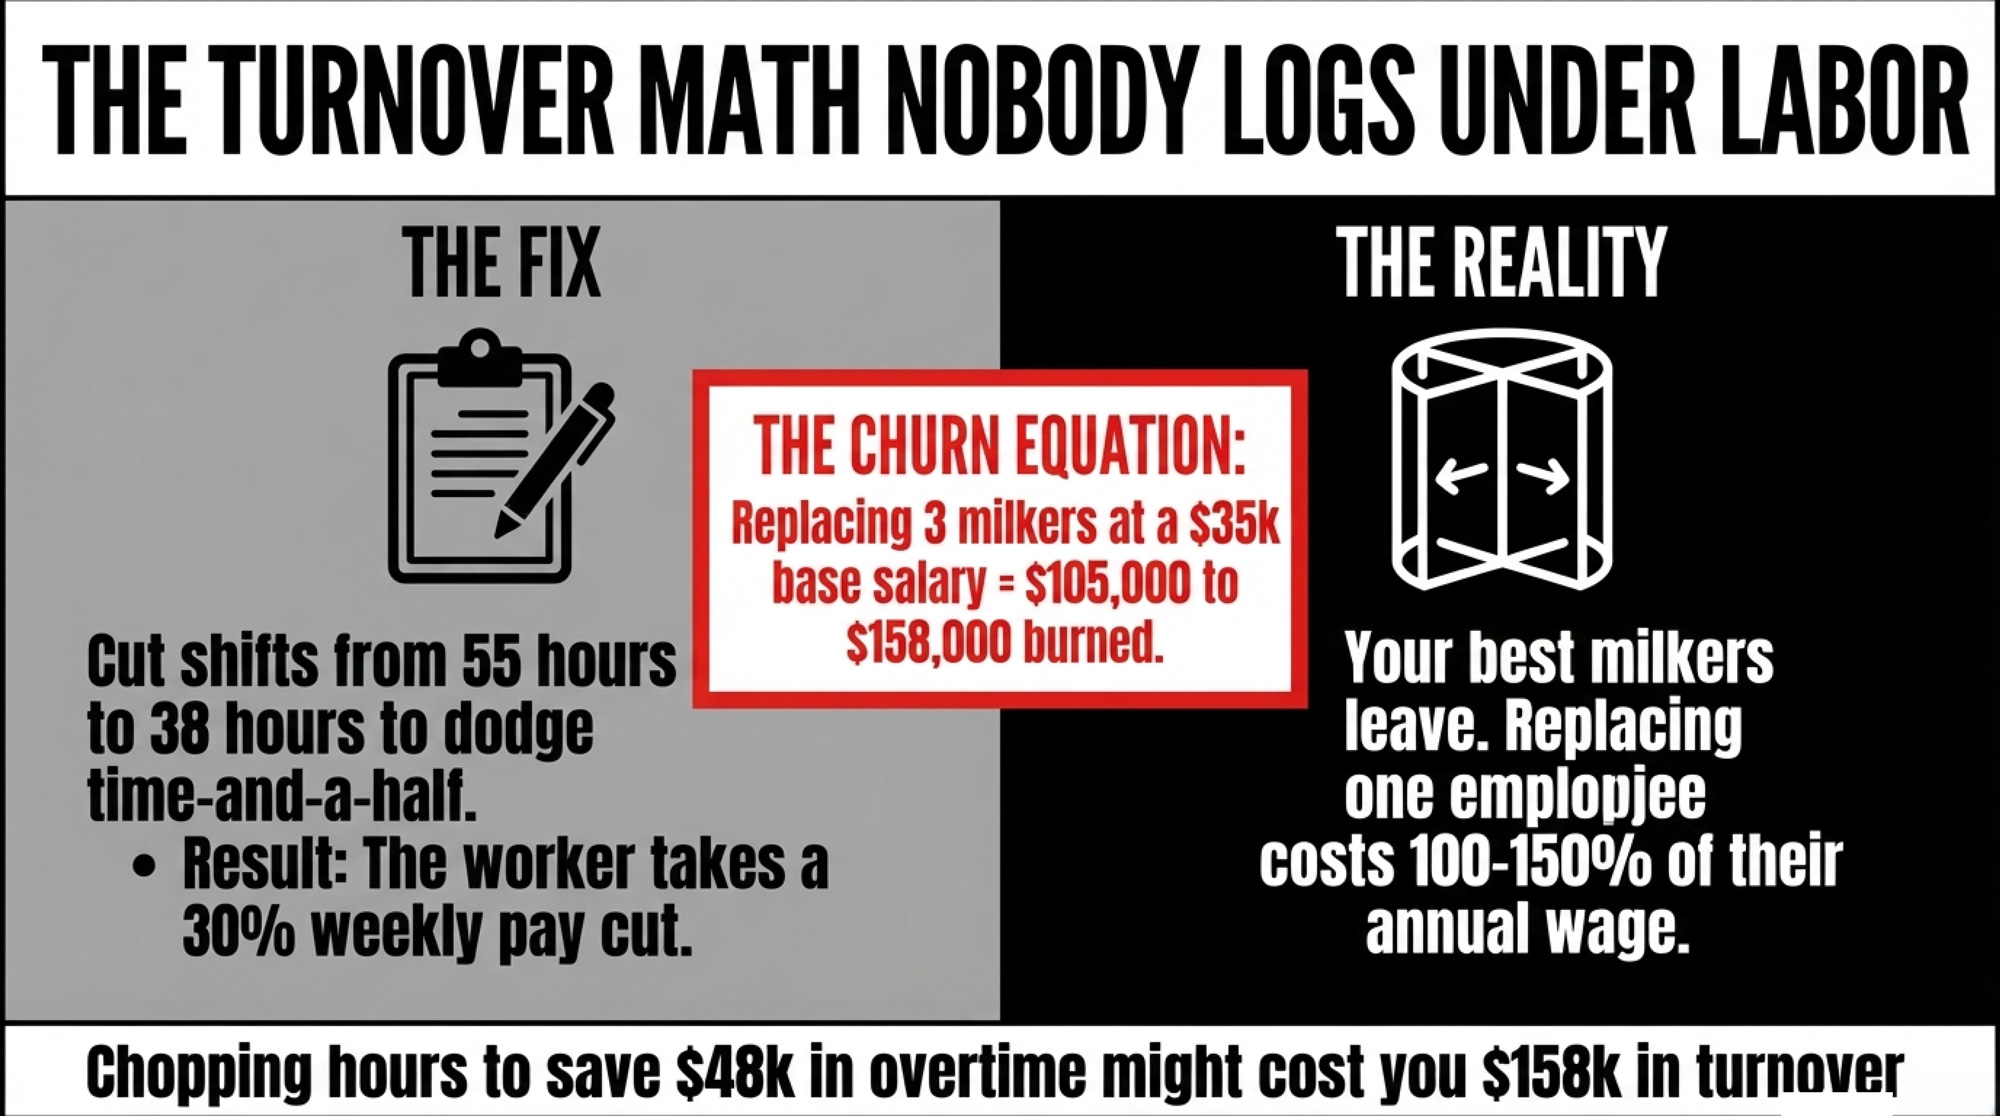
If three milkers leave in a year at $35,000 base pay, you’re effectively burning:

  • 3 × $35,000 × 100% = $105,000 on the low end.
  • 3 × $35,000 × 150% = $157,500 on the high end.

Round it, and you’re somewhere around $105,000–$158,000 in real cost churned through just because you had to refill the same three positions.

Now layer overtime on top.

If your crew was working 55 hours a week at straight time pre‑law and you now cut them to 38 hours at straight time to avoid time‑and‑a‑half, their straight‑time hours just dropped by 31%. That’s roughly a 30% pay cut if the hourly rate doesn’t change. You’ve just handed a good milker a powerful reason to find a steadier income.

So the choice isn’t really “overtime vs robots.” It’s: pay a known premium to keep your best people, or design your system so it quietly pushes them out the door.

ScenarioAnnual Payroll ImpactSCC RiskTraining DisruptionNet Income Hit
Pay overtime, keep A-team (480 cows)+$48,000 (+37¢/cwt)Low — consistent crewMinimal–$48k vs. baseline
Cap hours, trigger turnover (3 exits/yr @ $35k wage)+$105k–$158k replacement costHigh — rotating pitConstant retraining–$105k–$158k + SCC penalty
SCC slip (top → bottom third, 480 cows)$0 added labor cost–$84,096 net income premiumRoutine breakdown–$84k/yr disappears from milk check
Robot install + ramp (Yr 1–5 deficit years)–$100k to –$35k/yr net vs. debtLow once stableHigh during transition–$100k–$200k/yr until Yr 6+

How Much Overtime Can Your Operation Carry? (Economic Question)

If you’re sitting at $2.80/cwt in all‑in labor cost and you’ve got a stable crew, overtime can look like tuition — money you pay to keep the people who make your cows more productive and your SCC more predictable.

If you’re at $3.20/cwt, you’re tight, but you’ve got options. You can absorb some overtime, trim obvious waste, and buy yourself a year or two to decide whether robots or a parlor redesign make sense.

If you run the real numbers and you’re at $3.80–$4.20/cwt even after cleanup, then you’re not dealing with a bad year. You’re looking at a system problem.

The takeaway: don’t guess. Pull your last quarter’s labor spend, include payroll taxes and benefits, divide by cwt sold, and see exactly where you sit on that spectrum. Then look at that number next to your milk price, your interest rate, and your tolerance for a 15% swing in net income.

What Happens to Your SCC When You Chop Your Milker’s Shifts at 40 Hours? (Operational Question)

You’ve seen it in your own tank. When the same three or four people milk every day and follow the routine, SCC trends one way. When you’re swapping new faces into the pit every month, it trends another.

Research from Wisconsin and elsewhere consistently links predictable, low‑stress cow handling with better oxytocin release and more complete milk letdown. MSU’s parlor performance team talks about watching bimodal milking curves — a sign that cows aren’t letting down properly — as closely as you watch vacuum settings.

When you redesign shifts purely around a 40‑hour line, you risk turning your parlor into a revolving‑door training program. The overtime line on your payroll might look cleaner. Your SCC report probably won’t.

Options and Trade‑Offs for Farmers

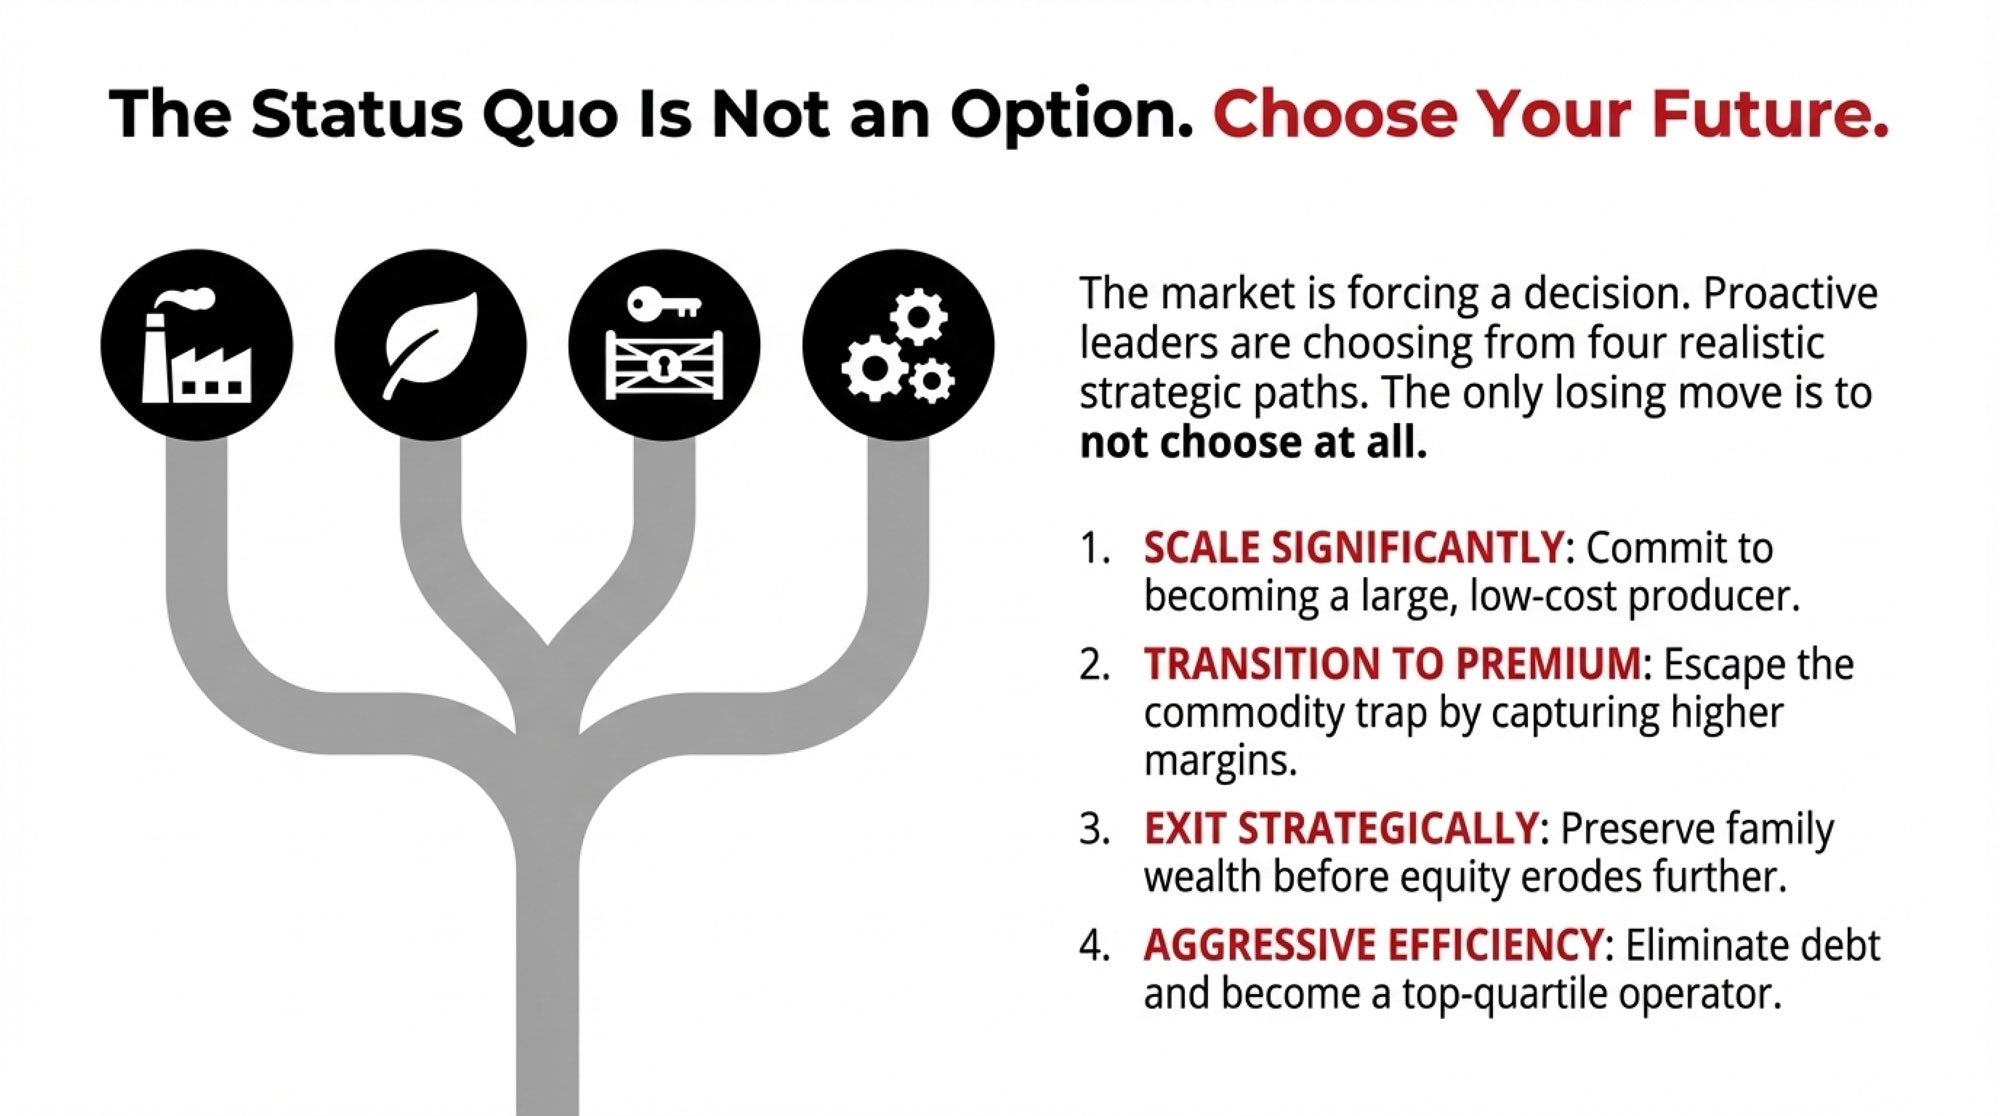
You’ve really got four paths. None is painless. Each one has a breaking point.
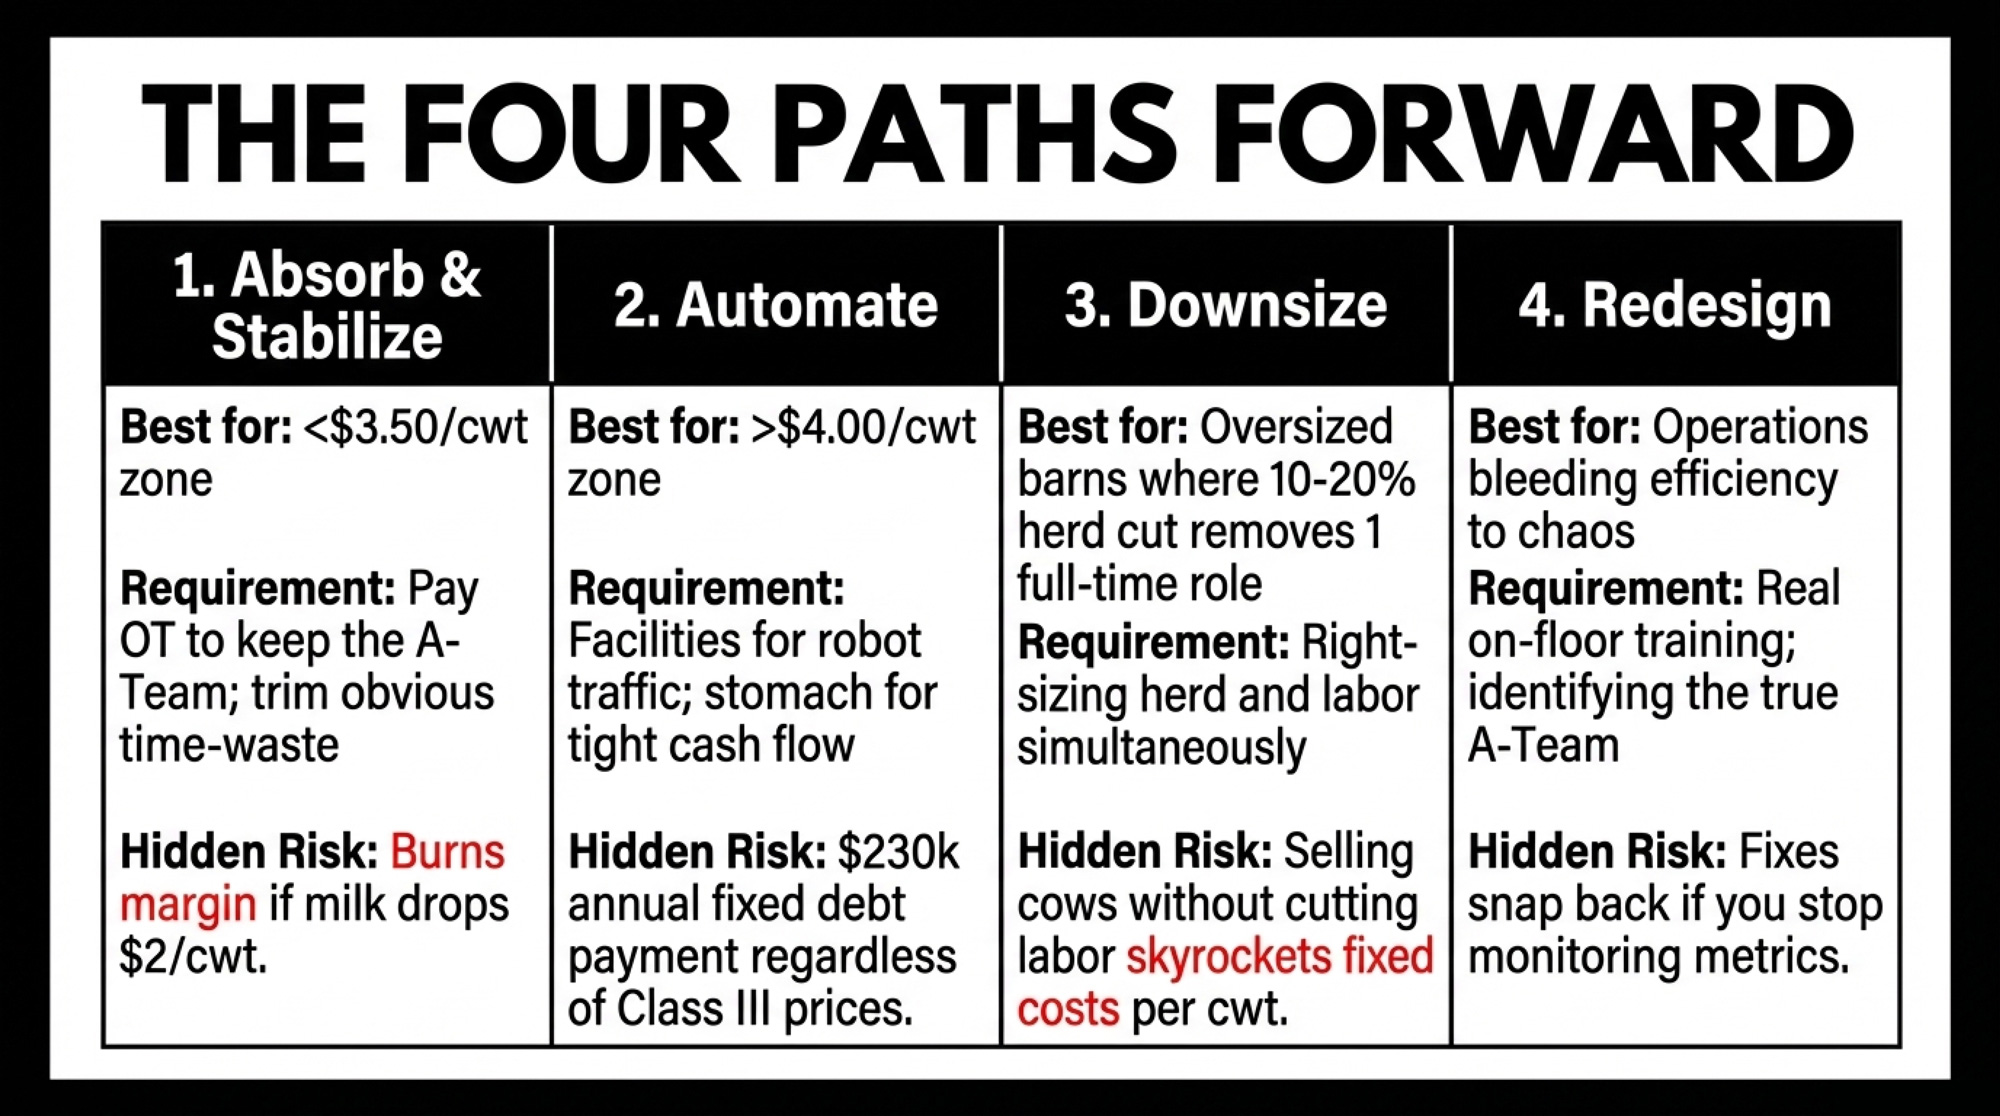
PathBest Fit (Labor $/cwt)Core RequirementAnnual Cost/InvestmentBreak Point
Absorb Overtime< $3.50/cwtStable A-team crew+$48,000/yr (37¢/cwt)$2 milk drop + 1 key milker lost
Automate (Robots)> $4.00/cwt structuralBarn redesign + data discipline$1.4M–$2.4M capital; $150k–$230k/yr P&I7–10 yrs negative cash flow; $16 milk
Downsize HerdAny, if labor not cutRemove ≥ 1 FTE with cows soldCow sale offset; lower productionSpread fixed costs over fewer cwt → $/cwt spikes
Shift Redesign$3.50–$4.00/cwtIdentify A-team + run real training30-day effort; low cash costReverts if not tracked quarterly

Path 1: Absorb Overtime and Stabilize

When it makes sense: Your all‑in labor cost comes in under about $3.50/cwt after a realistic cleanup. Your SCC trends are solid. You’ve got a core group of milkers you trust, and your banker is not excited about you taking on another million‑plus of debt.

What it requires:

  • Treat overtime on your best milkers as a planned investment, not a mistake.
  • Trim obvious time‑waste — double work, jobs that creep into the milking window — instead of cutting the A‑team.
  • Track labor $/cwt quarterly so you see creep before it bites you.

Risks and limits: If milk falls $2/cwt, that extra 36–37 cents of labor burns more of what little margin you’ve got. If your A‑team leaves anyway, you’re paying overtime to a less‑skilled crew and getting worse results.

Path 2: Automate

When it makes sense: Even after cleanup, your labor cost sits above roughly $4.00/cwt, and it’s not a one‑year fluke. Your facilities work for robot traffic. Your balance sheet and stomach can handle 7–10 years of tighter cash flow.

What it requires:

  • Treat robots as a full‑farm system change. Genetics, grouping, fetch strategy, and data use all have to move with it. 
  • Use realistic labor‑savings numbers. The USDA report and large‑herd AMS perception studies both suggest many farms land around $1.50/cwt in real labor savings — not the $3–4/cwt you sometimes see in sales decks. 
  • Stress‑test your payment at a few milk prices and interest rates. Don’t model only your best year.

Risks and limits: Fixed payments in the $150,000–$230,000/year neighborhood for a 480‑cow install — every year, whether Class III is $22 or $16. Tranel’s work suggests roughly seven years before the net‑return upside shows up in the checkbook. You don’t unwind that bet easily.

Path 3: Downsize the Herd

When it makes sense: You can sell 10–20% of your cows and actually remove at least 0.5–1.0 full‑time positionswithout making the remaining crew’s lives impossible. Your barns aren’t so oversized that fewer cows send your fixed cost per cwt through the roof.
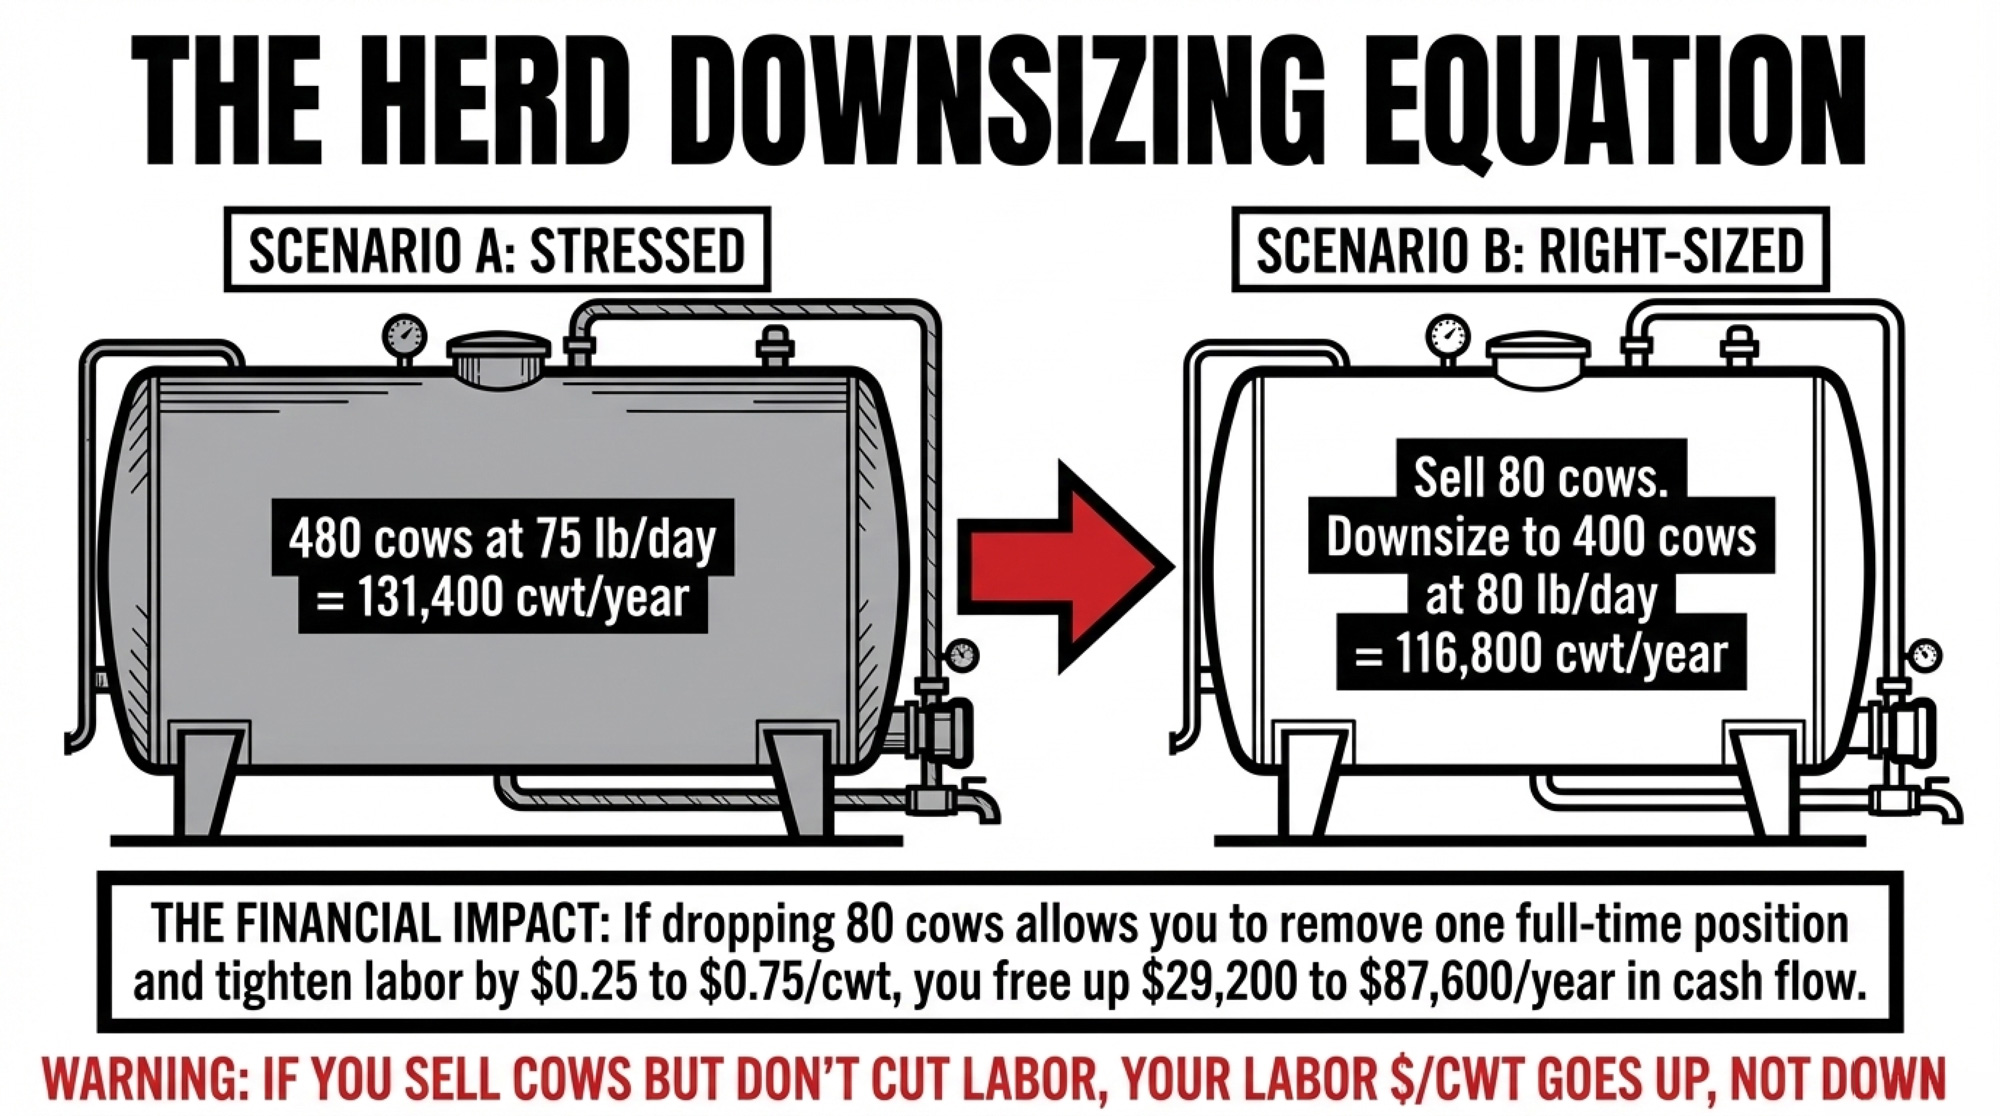
Barn‑floor math: Say you go from 480 cows at 75 lb/day to 400 cows at 80 lb/day.

  • 400 × 80 = 32,000 lb/day
  • Over a year: 32,000 × 365 = 11,680,000 lb = 116,800 cwt

If you cut labor $0.25–$0.75/cwt by removing one position and tightening everything up, you free up $29,200–$87,600/year in cash flow. At the same time, a well‑planned right‑sizing move can keep total margin surprisingly close to where it was.

Risks and limits: If you sell cows but don’t cut labor, you just spread the same barn costs over fewer pounds — your labor $/cwt goes up, not down. And if reproduction or health slips while you’re shrinking, you take a double hit: fewer cows and fewer pounds per cow.

Path 4: Redesign Shifts and Roles — Your 30‑Day Move

When it makes sense: Your biggest problem is chaos, not headcount. Shifts bleed into each other, nobody really owns training, and you’re not confident about where the time is going.

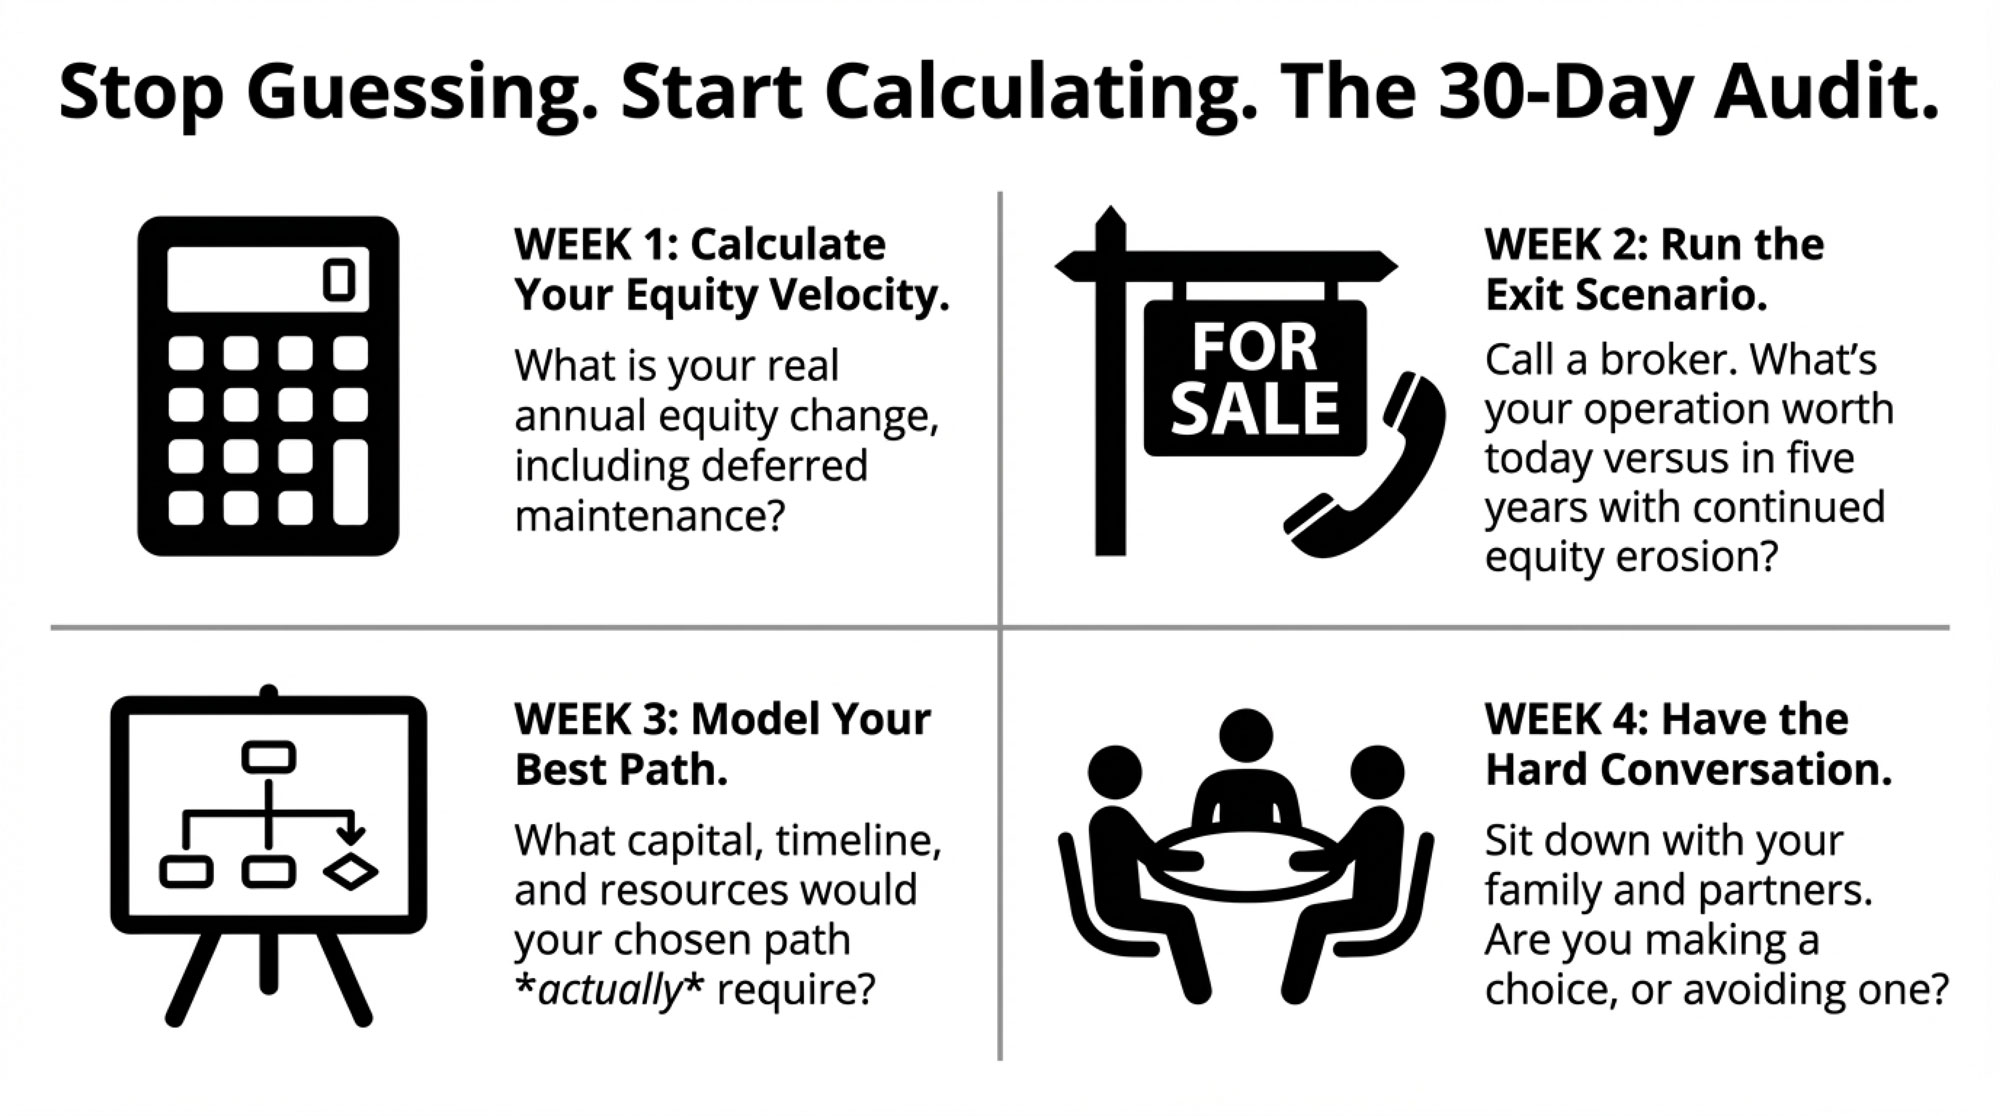
Do this in the next 30 days:

  • Identify your A‑team. These are the two to four milkers whose shifts consistently show better parlor numbers. Don’t just look at speed. Look at SCC trends on their pens, the consistency of their milking curves, and how cows behave around them. Calm, predictable handling boosts oxytocin release and milk letdown; rough or inconsistent handling has the opposite effect. 
  • Run one real milking routine training. Not a laminated sheet. An actual session where someone with credibility watches prep and attachment, corrects in real time, and follows up. Rodriguez showed that one focused session moved knowledge, prep quality, and milking time across 112 milkers. 
  • Audit time‑waste. Walk a few full shifts with a notebook. Where are people waiting? Where do cows get hung up? What jobs are happening in the pit that could happen somewhere else?

Over the next 90 days, track four numbers:

  1. All‑in labor $ per cwt.
  2. Rolling 3‑month SCC.
  3. Milk per cow per day.
  4. Turnover (who leaves, who stays).

If all four move in the right direction and stay there, you’ve changed the system. If they snap back the second you stop watching, you had a good month — not a fix.

Oregon drops from 48 to 40 hours in 2027. New York ratchets down its cap every two years until it hits 40 in 2032. You want to hit those dates with your labor $/cwt and your people in a place where you’re choosing your next move, not having one forced on you.
Key Takeaways

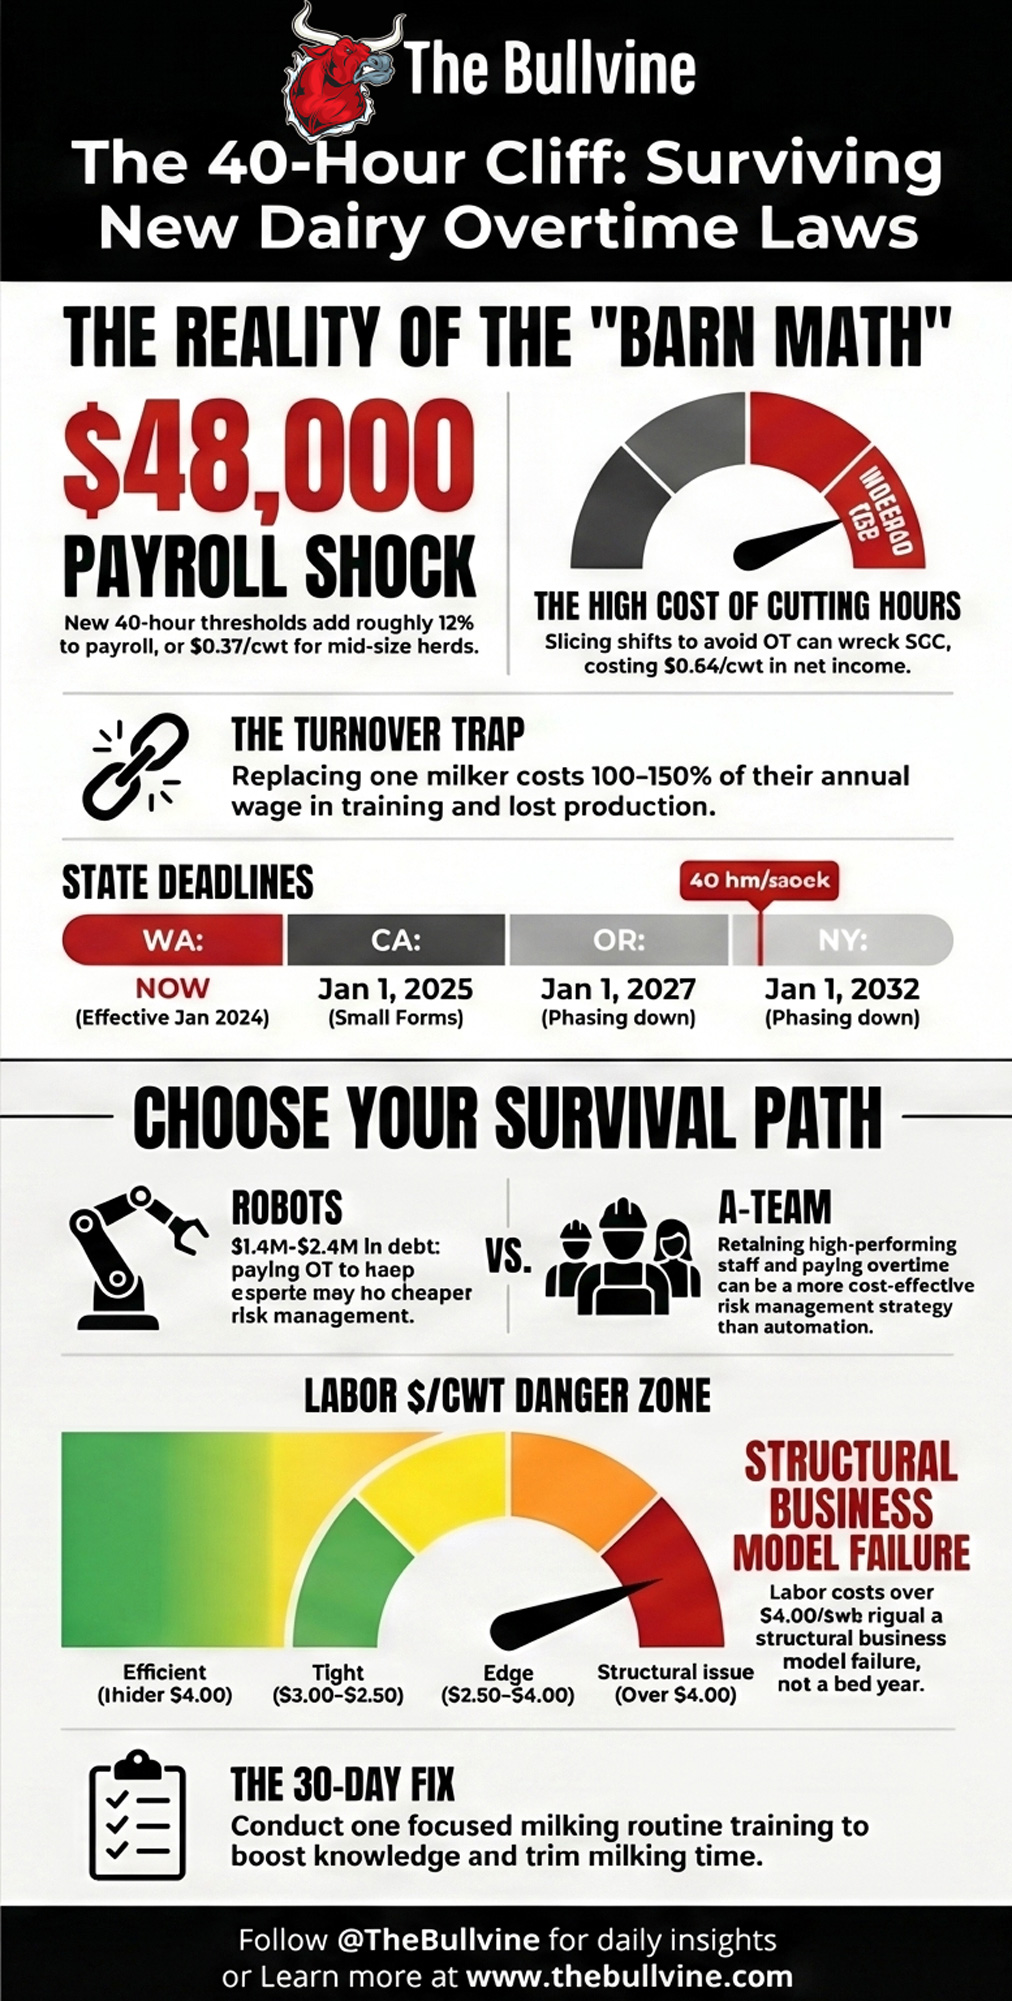
  • If your all‑in labor cost stays above about $4.00/cwt after a serious cleanup, treat that as a structural problem, not a bad year. University of Minnesota modeling suggests a 10% labor increase can slice roughly 15% off net income. At that level, “wait and see” is usually the riskiest strategy. 
  • If you can get that number under about $3.50/cwt and keep it there for 90 days, paying overtime to keep your A‑team together is a defensible choice. You’re buying consistency in your parlor instead of rolling the dice on constant turnover. 
  • If you’re between $3.50 and $4.00/cwt, you’re in the danger zone. You should be running the survival question — $2 milk drop, one key milker gone, 12 months — do we make it? — before doing anything else.
  • If robots are on the table, don’t sign until you’ve modeled 7–10 years of cash flow at realistic labor savings and current interest rates. The 13% net‑return bump in the USDA report is real for many farms. So is the 7‑year cash‑flow valley Tranel’s numbers show. 
  • If you haven’t done a real milking routine training in the past year, that’s your cheapest 30‑day move. It’s a lot less expensive than signing a million‑dollar note or losing two of your best milkers because their hours got chopped. 

The overtime laws aren’t going away. Oregon’s own economists are telling lawmakers dairy payroll will rise about 12%, and the state is moving ahead anyway. California is already at 40 hours across the board. New York has started its slow walk toward 40 by 2032. Washington’s workers went to Olympia to say the law cut their pay, and family farms like Sun‑Ton are still trying to make it work on their side of the fence.

So the real question for your farm isn’t whether any of this is fair.

Pull your last quarter’s timesheets. Calculate your true labor cost per cwt. Then ask yourself this — which version of your operation survives a $2 milk swing, a 40‑hour cap, and one key milker walking out the door?

That answer is your strategy. Everything else is just noise.

And if you want to see exactly how the robot‑versus‑labor numbers shake out at different herd sizes and milk prices — including why one 240‑cow family’s four‑robot proposal doubled their milking cost at $18 milk — we opened the full spreadsheet up for you here:

➡️ The Robot vs. Labor Spreadsheet: When $200,000 in Debt Beats $1 in Overtime — and When It Doesn’t

Complete references and supporting documentation are available upon request by contacting the editorial team at editor@thebullvine.com.

Learn More

The Sunday Read Dairy Professionals Don’t Skip.

Every week, thousands of producers, breeders, and industry insiders open Bullvine Weekly for genetics insights, market shifts, and profit strategies they won’t find anywhere else. One email. Five minutes. Smarter decisions all week.
NewsSubscribe
First
Last
Consent

The $586‑Per‑Kilo Dairy Quota Trap: Why New Ontario Quota at 6% Bleeds Cash Every Year

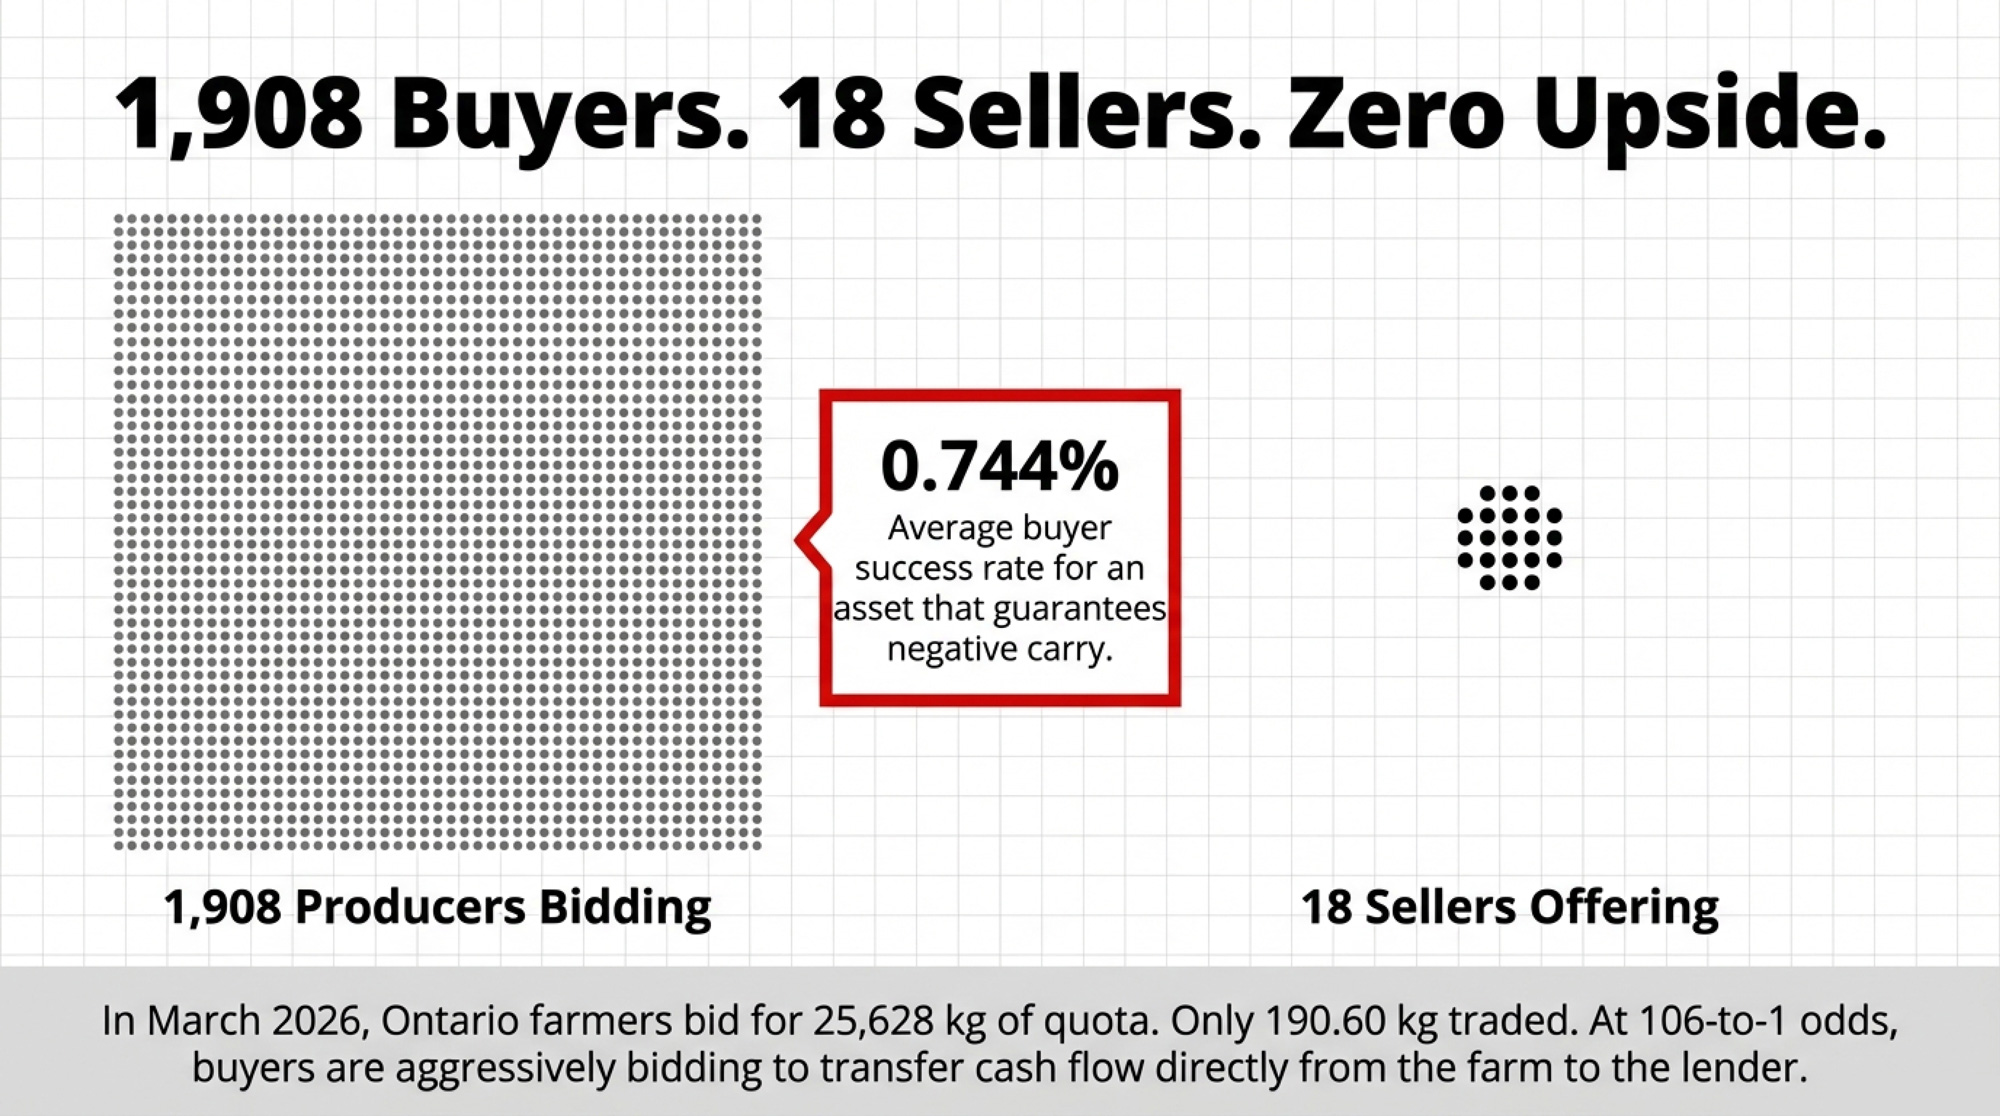
In March, 1,908 Ontario producers bid on quota. Only 190.60 kg traded. Every financed kilogram lost $586 at 6%. The math has flipped — and most farms haven’t noticed yet.

Tim and Amanda Metske ran daily operations on their parents’ 152‑acre Ontario dairy from 2012 to 2018. They invested in quota and cows during those years, working under a family understanding that they’d eventually buy the farm on favourable terms. Martin Metske had discussed a combined price of roughly million — million for the quota, million for the land. But no purchase price, payment terms, or financing structure were ever committed to writing.

When it fell apart, the Ontario Court of Appeal — in Metske v. Metske, 2025 ONCA 418 — awarded $33,700 for tangible improvements, then subtracted a $2,000 counterclaim. Net recovery: $31,700. Six years on a 152‑acre operation carrying millions in Ontario dairy quota, and the court valued the tangible result at less than one kilogram of Alberta quota is worth today.

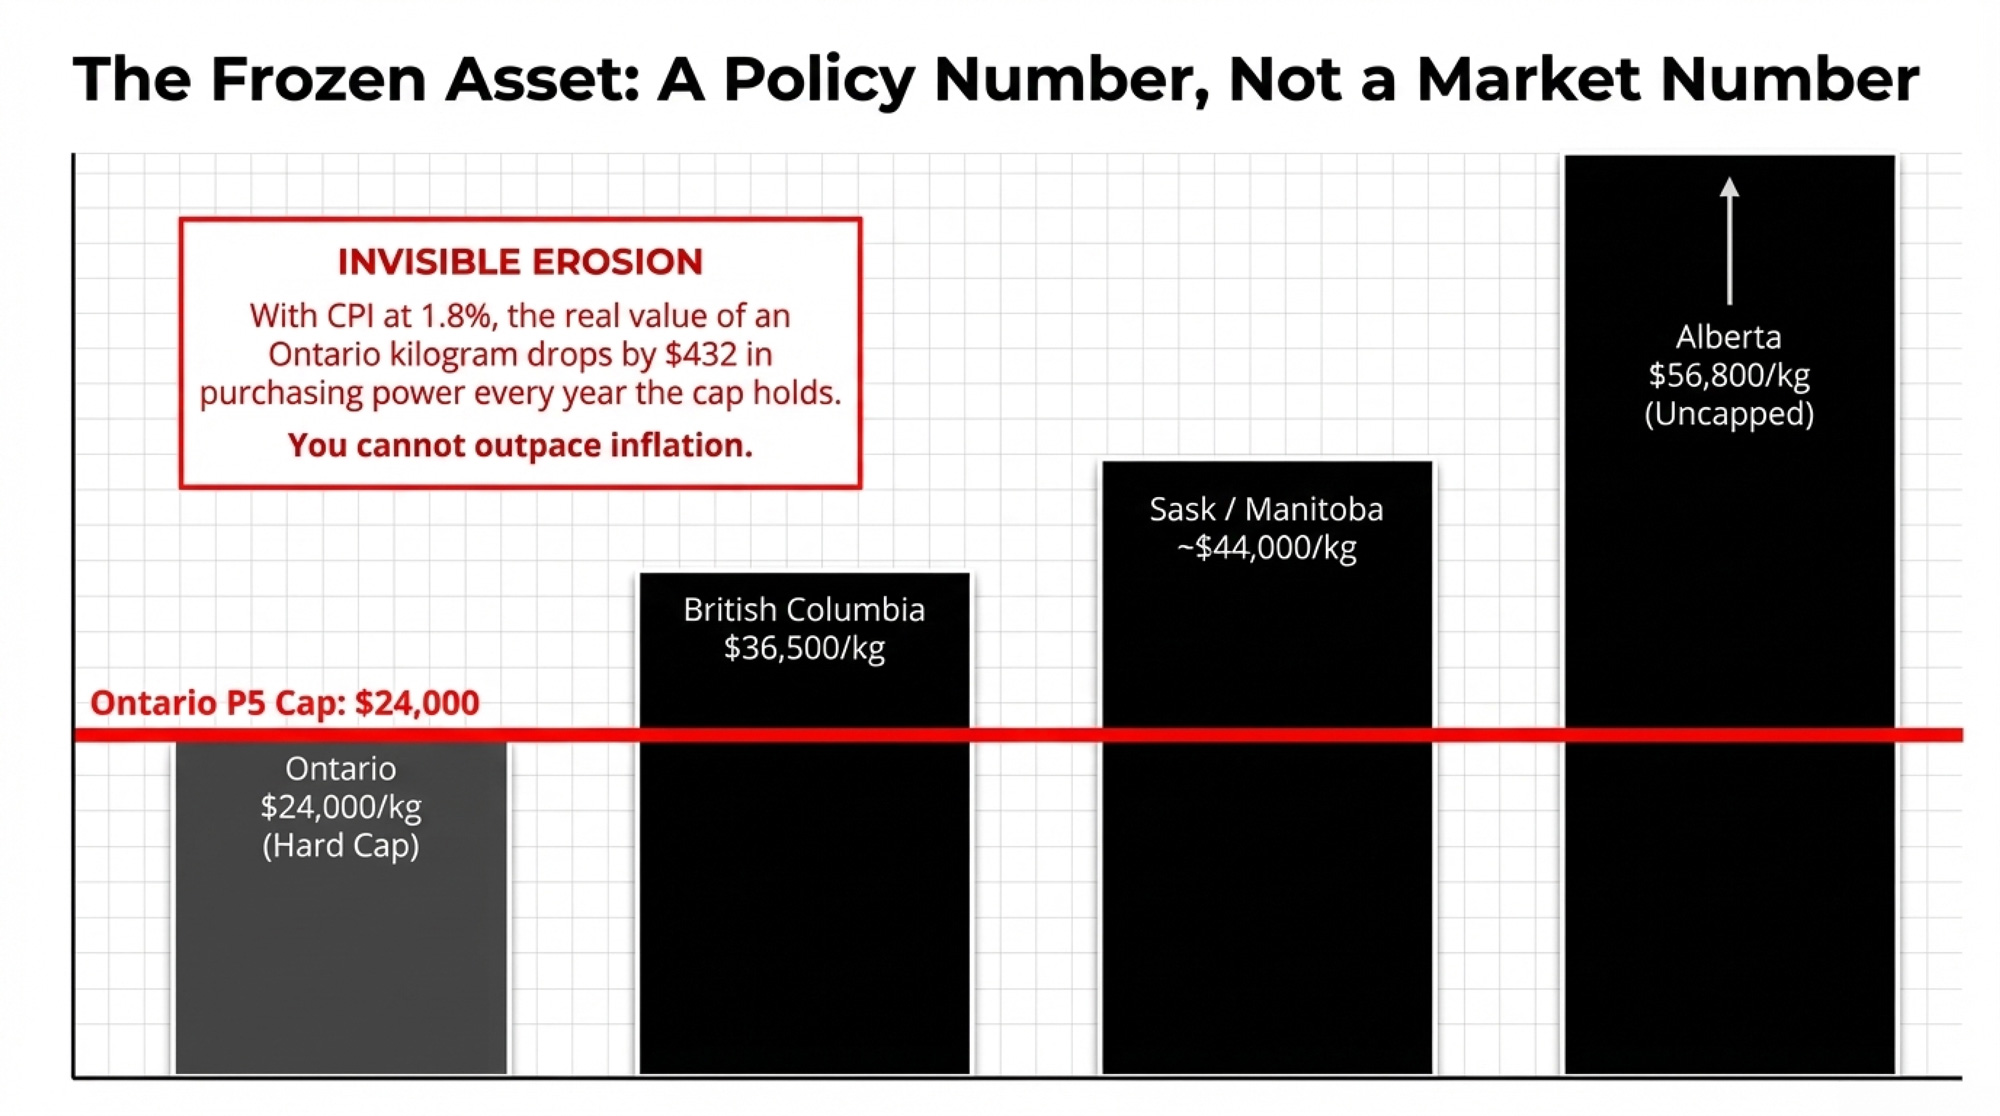
That number matters well beyond one family. It shows how fast sweat equity evaporates on a farm where the P5 quota cap fixes the single largest asset at ,000 per kilogram of butterfat per day — a policy number, not a market number. And right now, the math on buying that asset has quietly turned against anyone carrying debt on it.

1,908 Buyers. 18 Sellers. Zero Upside.

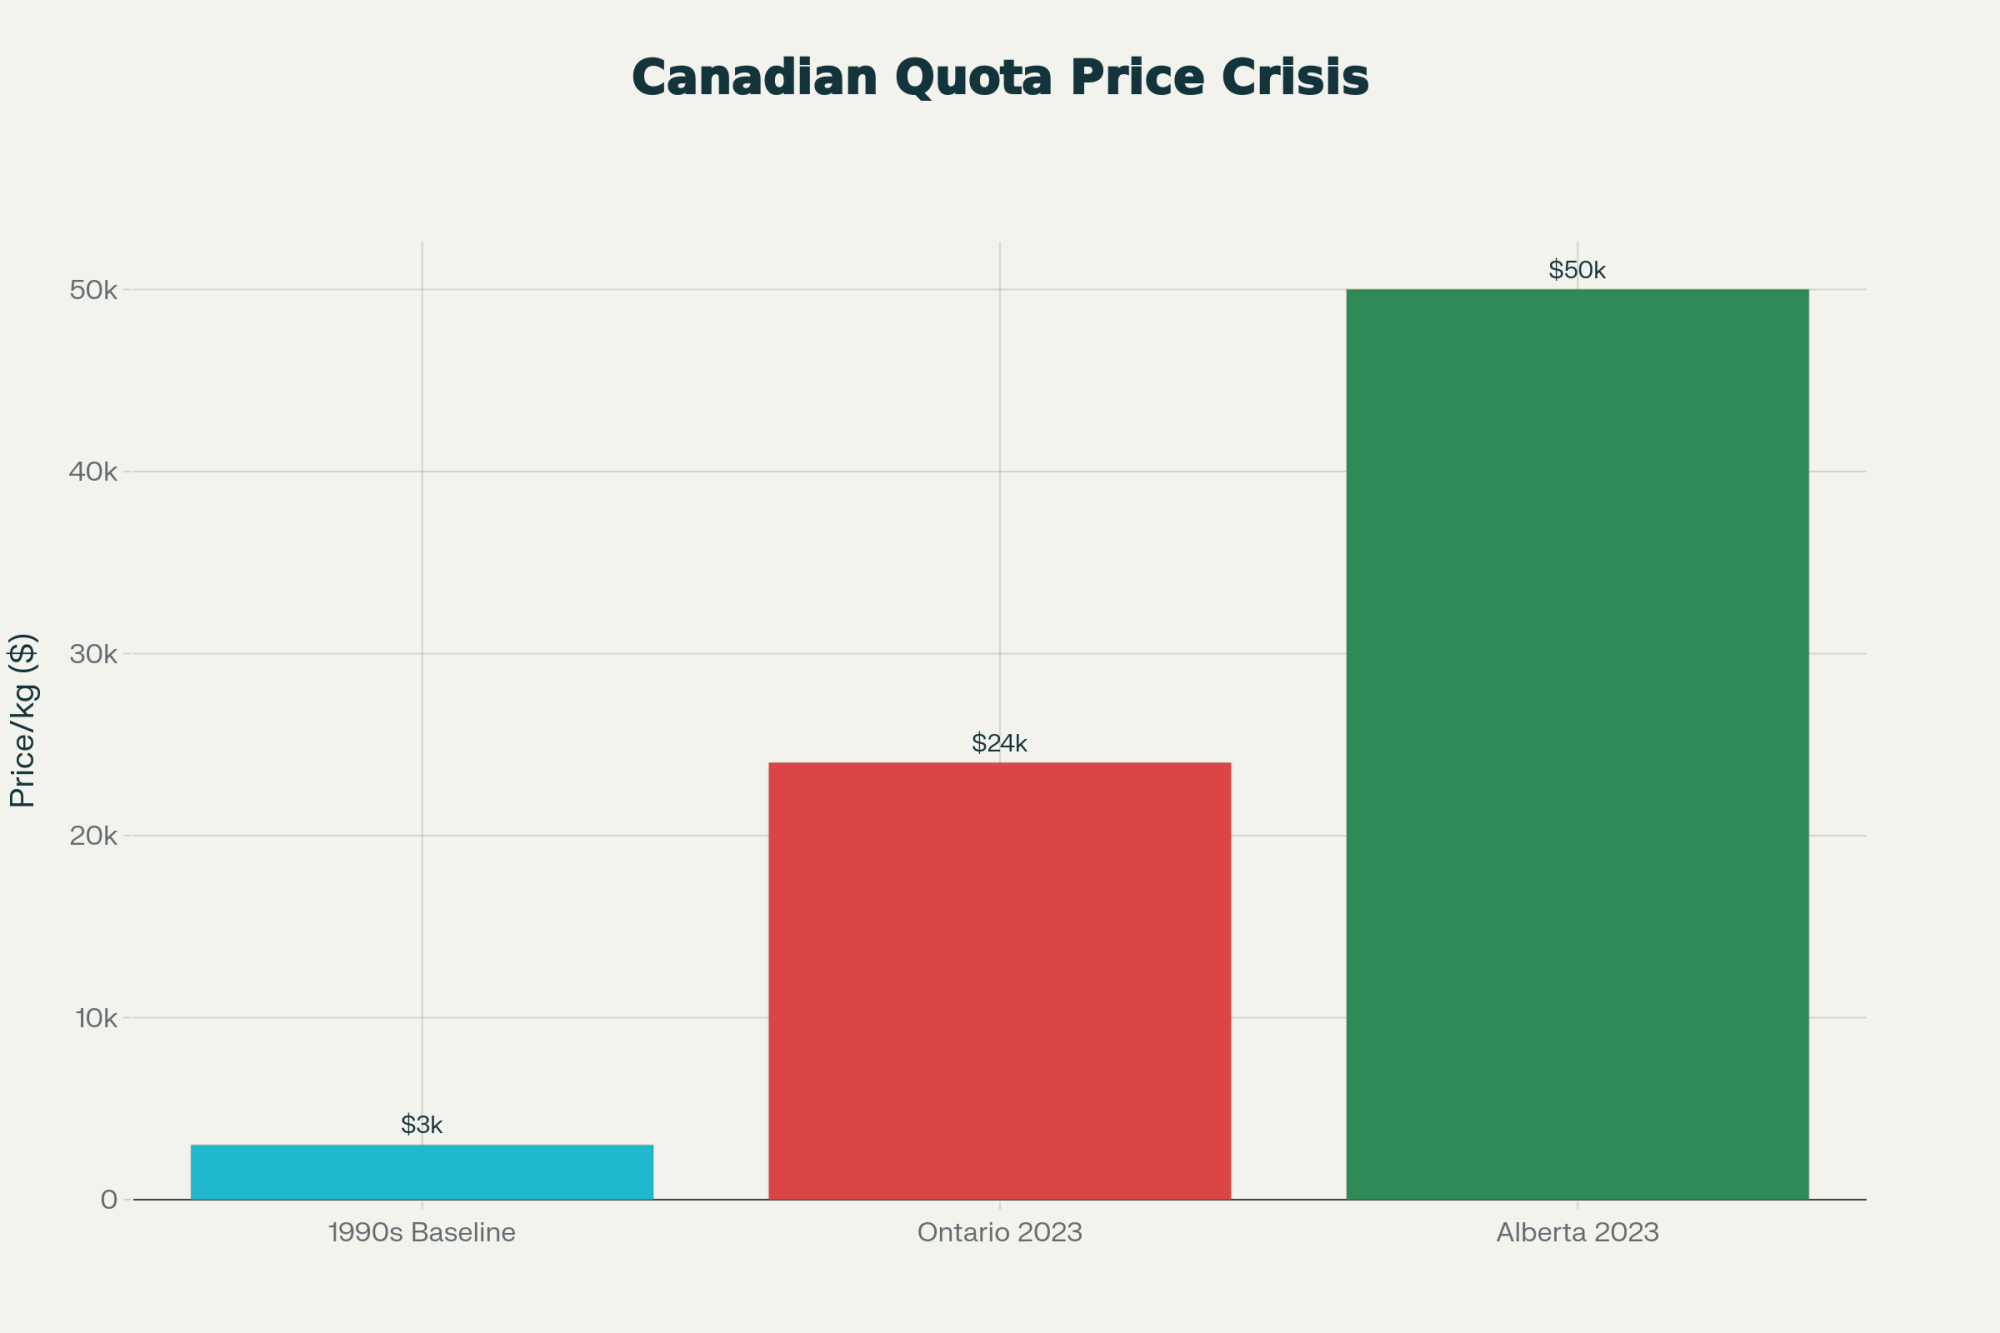
On March 19, 2026, Dairy Farmers of Ontario released the monthly quota exchange results. The numbers are stark: 1,908 producers placed bids to buy. Just 18 offered quota for sale. All kilograms cleared at the $24,000 cap. Of the 25,628 kg bid by buyers, only 190.60 kg actually traded — what DFO’s own summary calls a “0.744% average buyer success rate.”

A month earlier, it was worse. On the February exchange, 1,915 producers tried to buy. DFO needed 191.40 kg to run even the first allotment round, but only 129.27 kg was offered. The exchange was cancelled outright. Not a single kilogram changed hands.

At roughly 106‑to‑1 by producer count, Ontario farmers are bidding into a market where each newly financed kilogram loses about $586 a year at current rates. That’s not building equity. It’s transferring cash flow from the farm to the lender.

Why Ontario Quota Stopped Growing Your Wealth

Before the P5 provinces imposed quota price ceilings, values rose steadily. Ontario prices ranged from roughly $17,000 to $22,000/kg around the 1999/2000 dairy year, according to University of Guelph research, and climbed past $40,000/kg in the 2000s before the caps took hold. That capital gain, layered on top of milk income, made quota one of the best‑performing agricultural assets in the country.

The cap shut off that tailwind. At $24,000/kg, Ontario quota is frozen. It doesn’t climb in a good year, track inflation, or compound. With CPI at 1.8% in February 2026, the real value of each kilogram drops by roughly $432 per year in purchasing power — money you won’t recover as long as the cap holds.

MetricOntarioAlberta
Current Quota Price (Jan–Feb 2025)$24,000/kg (policy cap)$56,648/kg (market price)
Gap vs. Ontario+$32,648/kg
Appreciation PotentialNone (hard cap)Uncapped; market-driven*
Real Value Loss at 1.8% CPI/yr–$432/kg/yrPartially offset by price appreciation
Supply Management SystemP5 / NationalP5 / National
Annual Cash Flow at 6% Financing–$586/kgNegative at same rate; higher income potential
Exit Price for Seller Today$24,000/kg (capped)~$56,648/kg (market)
Asset Class BehaviourFixed liabilityAppreciating asset

Look west for proof that $24,000 is a policy number, not a market number. According to AAFC’s monthly quota trade data, Alberta’s exchange averaged $56,495/kg in January 2025 and $56,800/kg in February. British Columbia — which caps at $35,500/kg — traded at that ceiling in January and at $36,500/kg in February. Saskatchewan and Manitoba traded in the $40,000–$44,000/kg range over the same two months. Ontario sits more than $32,000/kg below Alberta. Same supply management system. Same national milk pool. Radically different asset values.

Is Every Financed Kilogram of Ontario Quota Now Underwater?

Here’s the barn math. Stick it on a sticky note beside your desk.

Take one kilogram of Ontario quota at the $24,000 cap. The Canadian Dairy Commission calculated the 2024 cost of production — indexed to the three months ending August 2025 — at $92.82 per standard hectolitre, up 2.72% from $90.36 the previous year. That iCOP result is what feeds the 2.3255% farmgate price increase effective February 1, 2026.

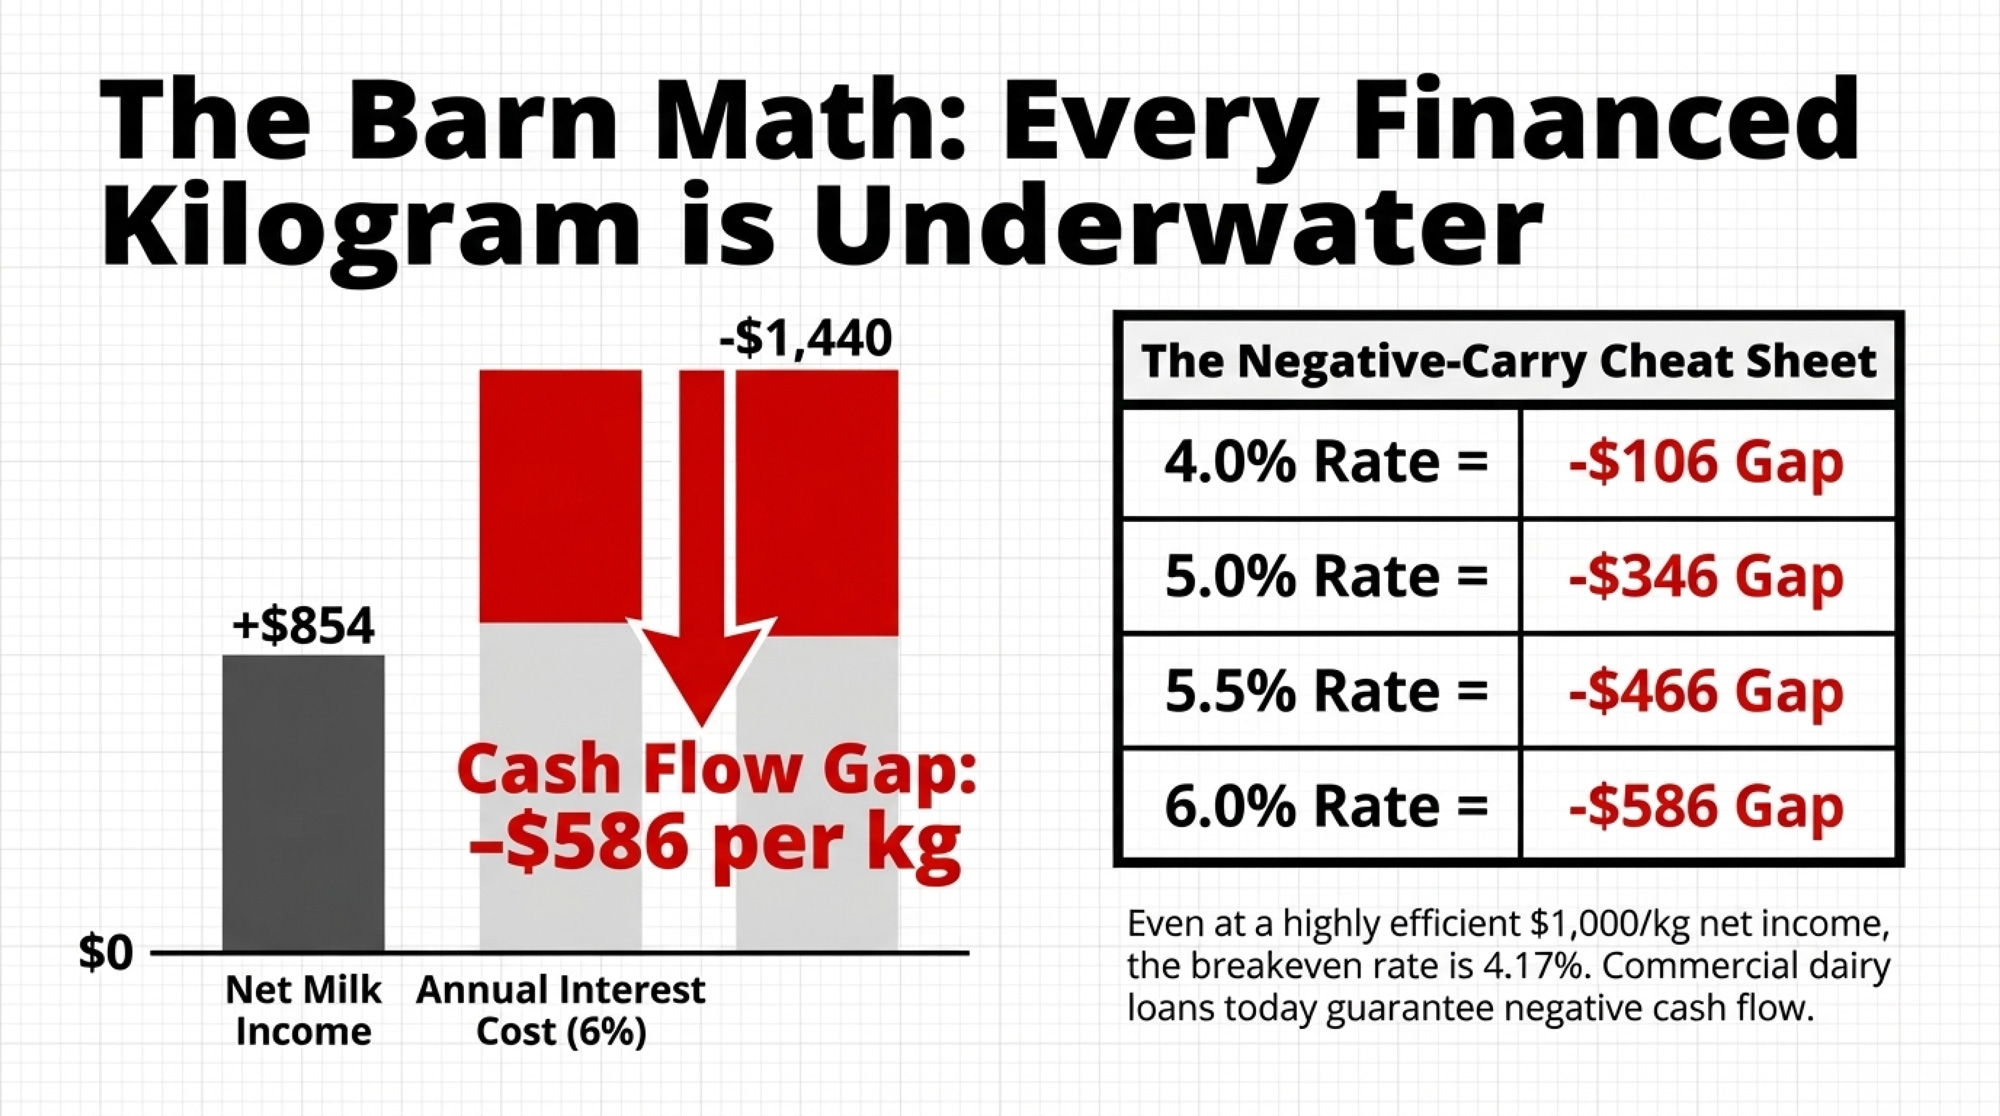
Using current P5 farmgate pricing with that increase baked in, and subtracting cost of production for feed, labour, overhead, and cow depreciation, you land in the ballpark of 4 in net annual milk income per kilogram of quotaon many Ontario herds. That’s The Bullvine’s modeled estimate using current farmgate pricing and recent P5 cost‑of‑production benchmarks — not a DFO or CDC published constant. Your own number will shift with components, feed costs, and overhead. But it’s a defensible mid‑range figure for this math.

The Bank of Canada cut its overnight rate to 2.25% on October 29, 2025, and has held it there through four consecutive decisions — December, January, March — with the next call on April 29. But commercial lenders price quota loans 200–350 basis points above that floor. A rate of 5.5–6% on a quota loan is realistic right now. Nesto’s March 2026 forecast projects no further easing, with bond markets assigning a slight probability of a 0.25% rate hike by October.

Loan RateAnnual Interest Cost/kgEst. Net Milk Income/kgCash Flow Gap/kg/yrRate Needed to Break Even
4.0%$960$854–$106~3.56%
5.0%$1,200$854–$346~3.56%
5.5%$1,320$854–$466~3.56%
6.0%$1,440$854–$586 🔴~3.56%
If $1,000/kg net$1,200 (5%)$1,000–$200~4.17%

At $854/kg net income, there isn’t any commercial dairy loan rate on offer today that makes newly financed Ontario quota cash‑flow positive. Even if you’re running tighter than most and clearing $1,000/kg net, your breakeven is only 4.17%. Where’s your rate sitting right now?

Scale it up. Say you’ve picked up 35 kilograms on the exchange in the past few years, all financed at 6%:

  • 35 × $586 = $20,510 of cash leaving your operation every year
  • That’s interest only. No principal repayment. No new calf barn. Just debt service.

What Did Kyle Horst Find When He Ran His Own Numbers?

Kyle Horst dairy farms with his wife, Jen, and his brother Craig, a school teacher, near Formosa, Ontario. The farm has about 88 kg of butterfat quota, purchased as part of an ongoing operation in 2019.

When Horst enrolled in Chris Church’s Central Dairy Solutions course, he came in carrying the assumption most dairy farmers hold: more milk means more money. Church’s data challenged that head‑on.

“When I started the course, I always thought another litre of milk is obviously more profitable, but he brought that into question with good data,” Horst told Farmtario in August 2025. “I still think high performance through better management is a winner at the end of the day. But simply doing it through added cost is not necessarily financially sustainable.”

Church — DVM, MBA, University of Guelph, and founder of Central Dairy Solutions — spent years as a dairy vet before shifting his focus to farm finance. “I always just figured, as long as we could make more milk, we could make the farm more money,” he told Farmtario. “And that’s about as deep as we’d usually go. And unfortunately, that’s as deep as most of the producers go.” His courses walk Ontario dairies through their quota ranges, from 40 kg to 1,200 kg, using metrics such as operating expense ratio, EBITDA per kilogram of quota, and debt‑service coverage.

Are You Running a Dairy, a Crop Farm — or Both Without Knowing It?

The Terpstra family milks about 420 cows near Brussels, Ontario. Joe farms with his wife Barb, daughter Emily, and son Cole. Joe and Emily both took Church’s course as part of their succession planning. According to Farmtario, the family has moved to monthly financial reviews, with Emily now managing the books.

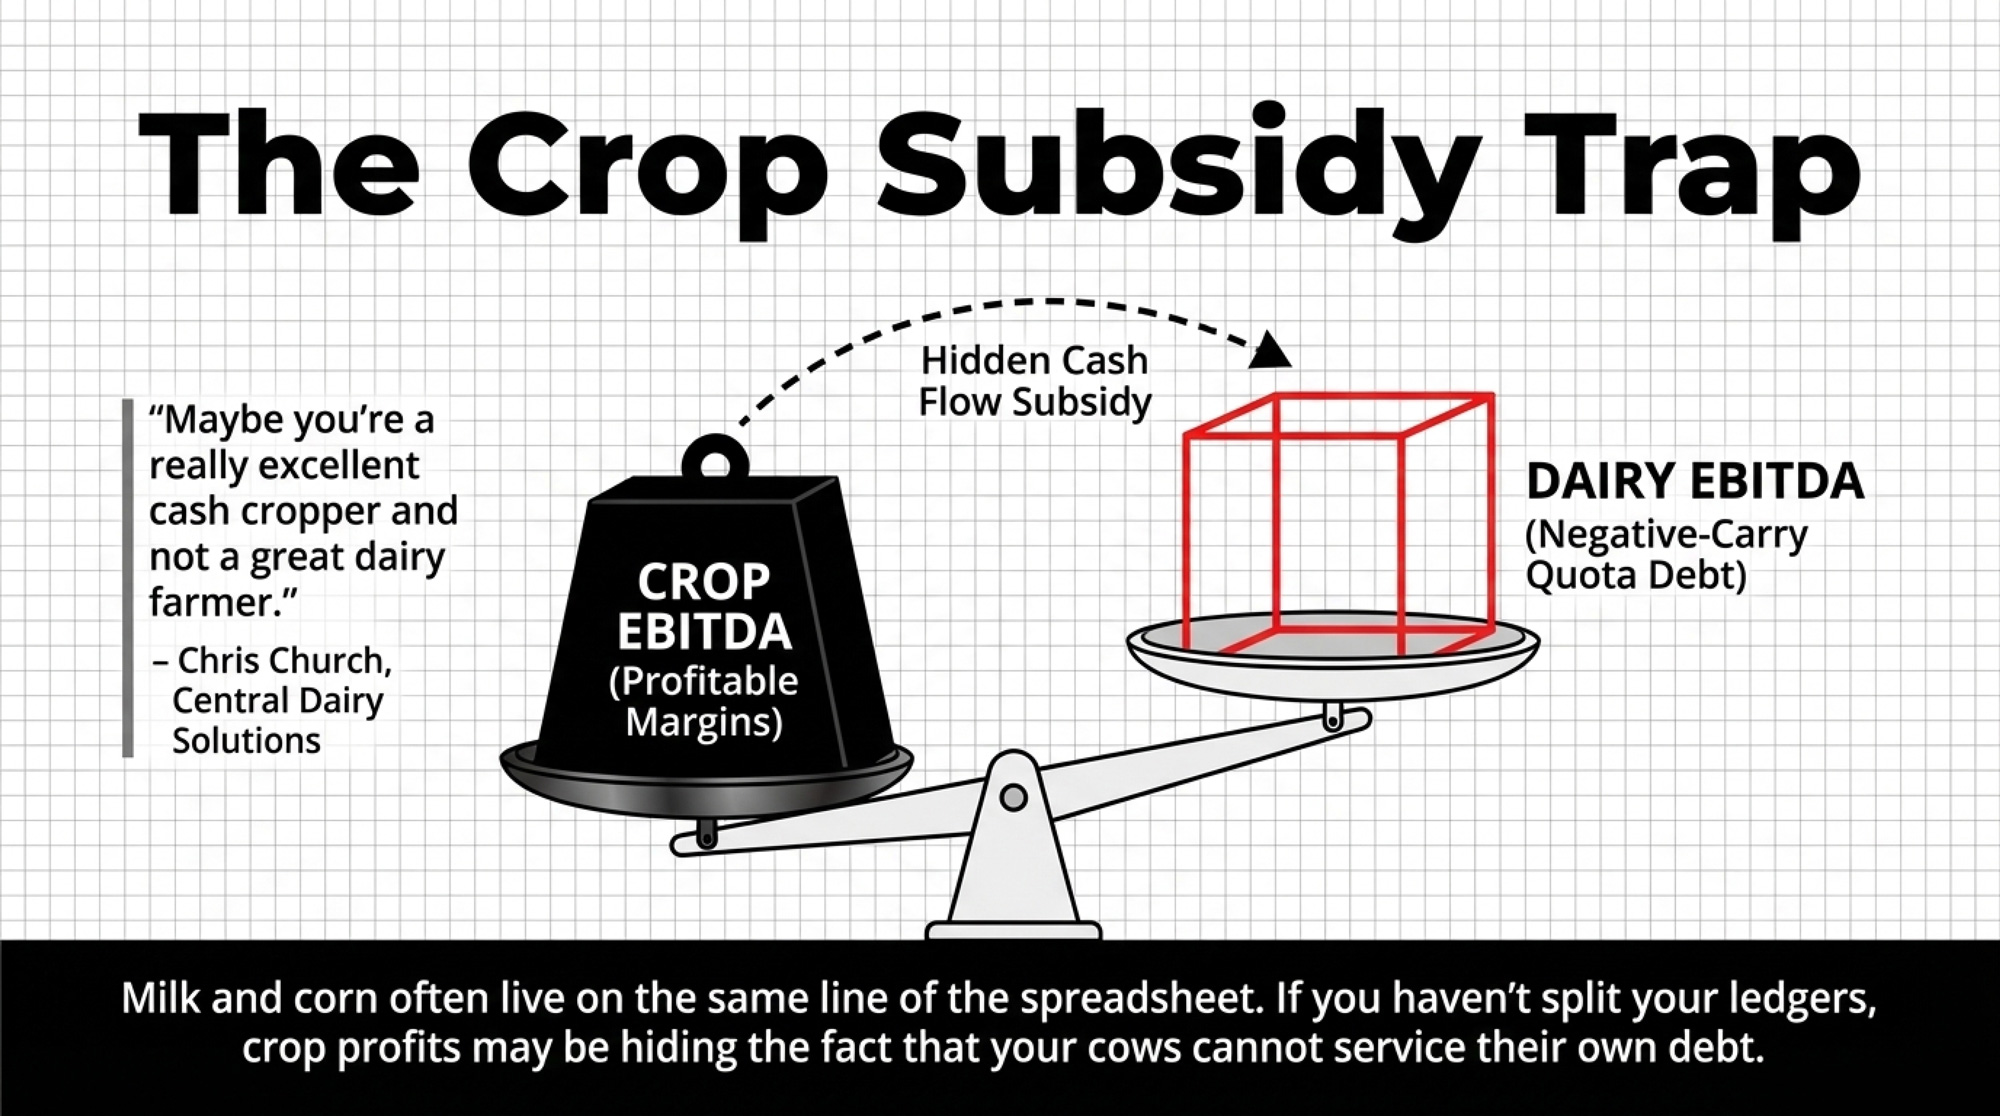
It’s exactly the kind of operation where Church’s framework — splitting dairy EBITDA from crop EBITDA — can reveal whether the cows are actually carrying their own weight or riding on crop margins.

“Maybe you’re a really excellent cash cropper and not a great dairy farmer.”
— Chris Church, Central Dairy Solutions, Farmtario, August 2025

A lot of farms have never actually separated the financial performance of their dairy from that of their cropping operation. Milk and corn live in the same line on the spreadsheet. As long as the overall farm makes the payment, nobody digs deeper.

But when grain prices drop or weather punches your yields, that cross‑subsidy disappears. The dairy suddenly has to stand on its own. If it can’t, that’s when the bank meeting gets tense. And if your dairy numbers and your crop numbers live in the same line — while you’ve also got leveraged quota in the mix — you might be using crop profits to service a dairy business that, on its own, is financing a negative‑carry asset.

The Succession Collision

This is where the Metske ruling, the quota cap, and the interest rate environment crash into each other.

Most Ontario successions assume the next generation will take over quota — structured as a sale, a gradual buy‑in, or a gift with a vendor take‑back. However you paper it, the incoming operator still has to cash‑flow the debt tied to that quota on their own balance sheet.

Run a DSCR on a mid‑size scenario:

  • Quota position: 140 kg of butterfat per day
  • Quota value at $24,000/kg: $3.36 million
  • Financing: 75% at 6%, amortized over 15 years
  • Loan amount: $2.52 million
  • Annual debt service (P+I): ~$255,000
  • Net milk income: 140 kg × $854 = $119,560
  • DSCR: $119,560 ÷ $255,000 = 0.47

Most lenders want at least 1.25. In this scenario, quota income covers less than half the payment. The rest has to come from crops, off‑farm income, parents deferring payments, or more borrowing.

In Metske, the Court of Appeal found the family’s discussions were an “agreement to agree” — too vague to create ownership rights. The parents’ decision to sell their dairy quota separately was held to be a legitimate exercise of autonomy. That’s how six years of contributed labour ended up valued at $31,700.

The P5 boards agreed to increase the saleable quota by 1% as of December 1, 2025, which will slightly dilute your share of the national milk pool. The February 2026 farmgate price bump helps offset that erosion, but doesn’t fix the structural problem: you’re trying to service 5.5–6% money with an asset that isn’t allowed to appreciate.

The Trade Risk Nobody’s Priced In

The CUSMA joint review is underway, and it’s not happening in a vacuum. In March 2026, the Trump administration launched Section 301 trade investigations covering Canada and 59 other economies — focused on forced labour and manufacturing overcapacity — after the Supreme Court struck down IEEPA‑based tariffs, according to CBC. USTR fact sheets and the 2026 Trade Policy Agenda make it clear these investigations will feed into the broader USMCA review.

CBC’s coverage notes that U.S. officials have repeatedly flagged Canadian dairy policies as part of a “non‑exhaustive” list of trade irritants. Dairy isn’t the only target, but it’s very much on the table.

Wiens has repeatedly warned that Canada has already conceded roughly 18% of its dairy market access in past trade deals, and that further access would cut directly into domestic production.

Carney has repeatedly said in public that supply management isn’t up for negotiation.

But a Section 301 investigation is different from a negotiation. It’s a unilateral tool the U.S. can use to justify tariffs without Canadian consent. And here’s the link between trade and succession that deserves attention: if a wider TRQ, retaliatory tariffs, or a forced restructuring devalues the exit ramp, the next generation isn’t just fighting to make the numbers work. They’re fighting over a shrinking pie — sale prices might fall at the same time debt loads stay fixed.

Here’s the stress test you can run on your own numbers: assume a modest 3–5% drop in farmgate price if TRQ access expands or tariffs bite. On a farm already running a negative‑carry quota, that price hit drops directly onto your already‑thin DSCR. If a 3–5% decline pushes you below 1.0, you’re into negative cash flow unless something else gives. The quota can’t bail you out by appreciating. The cap keeps that door shut.

Options and Trade‑Offs for Farmers

Path 1: Pay Down Debt First — Your 30‑Day Action

When it makes sense: You’re carrying quota debt at 5% or higher, and your DSCR is hovering near or below 1.25.

What it requires: One meeting with your lender in the next month. Bring your current loan schedule and ask for a simple ranking: highest to lowest effective interest rate. Then commit your next 12 months of surplus cash to retiring the highest‑cost debt instead of bidding on new quota.

Risk/limits: You won’t grow your quota position while your neighbours might. But right now, negative‑carry quota growth is eating equity. You give up bragging rights to keep your balance sheet intact.

Signals to watch: The BoC has held at 2.25% since October 29. Bond markets currently price a small probability of a rate hike by fall. Even if they cut, commercial quota loan rates would need to drop below roughly 3.6% before newly financed quota stops bleeding cash at $854/kg net income, and below 4.17% even at $1,000/kg. Plug your own numbers into the cheat sheet above.

Path 2: Hold and Optimize What You’ve Got

When it makes sense: Your quota is mostly or entirely paid off, and your net yield per kilogram sits comfortably above your personal opportunity cost.

What it requires: Doing the Church‑style split — separate dairy EBITDA from crop EBITDA and calculate net profit per kilogram of quota. Then tighten the screws on the cost of production: feed efficiency, labour per cow, components, and cull strategy. If you’re earning around $854/kg but could push to $950 through better management, that’s the cheapest “quota purchase” you’ll ever make.

Risk/limits: Inflation quietly erodes your real equity every year the cap holds. At 1.8% CPI, that’s $432/year in real purchasing power per kilogram. You’re not building asset value. You’re milking income from a flat line.

Path 3: Restructure the Succession Before the Bank Does

When it makes sense: You’re within 5–10 years of wanting to step back, and a straight transfer at today’s values and rates produces a DSCR under 1.25 for the next generation.

What it requires: Getting uncomfortable now, not desperate later. Sit down with an ag‑focused accountant and your lender to model alternatives: longer amortizations, revenue‑share structures, vendor take‑backs with interest‑only periods, or partial transfers that let the next generation build equity gradually instead of swallowing a $3‑million loan on day one.

Risk/limits: These structures take time and trust. If you wait until a health scare, a marital split, or a CUSMA/301 shock, you’ll be negotiating with fewer options and less leverage. And here’s the trade risk tied back to your succession: if a 301 finding or wider TRQ devalues quota even 10–15%, the exit ramp the parents are counting on to fund retirement gets shorter — while the next generation faces the same debt load on a less valuable asset.

Path 4: Sell and Redeploy

When it makes sense: Your dairy only cash‑flows when crop income props it up, your debt‑to‑asset ratio keeps climbing, and your kids are lukewarm about taking over.

What it requires: Facing the hardest question in farming: is your equity better deployed in quota, cows, and concrete — or somewhere else? Selling quota into a market where 1,908 buyers are chasing 18 sellers at $24,000/kg turns paper into cash fast. That cash can fund debt elimination, retirement, or a pivot into a different enterprise entirely.

Risk/limits: The risk here is almost entirely emotional. You lose the barn, the routine, the identity. Financially, a controlled exit at the cap is far better than a slow slide into forced liquidation if rates stay stubborn and margins tighten. Right now, 1,900+ buyers are competing for scraps. Last month, the exchange was cancelled because not enough quota even made it to the table. That level of demand won’t last forever.

Key Takeaways

  • If your blended borrowing rate on quota is above ~3.6%, every new kilogram is cash‑flow negative. At 6%, the gap is –$586/kg/year. Even at a net income of $1,000/kg, breakeven is only 4.17%. Plug your own numbers into the cheat sheet before your next exchange bid.
  • If the next generation’s DSCR on quota debt alone falls under 1.25, the succession structure needs to change — not your kid’s work ethic. The Metske ruling shows where “we’ll figure it out later” ends: $31,700 for six years of contributed labour.
  • If you haven’t separated dairy EBITDA from crop EBITDA, you don’t actually know which side of your business is profitable. Church’s Central Dairy Solutions courses are working with Ontario farms from 40 to 1,200 kg — and the answers aren’t always what people expect.
  • If trade pressure devalues the quota even modestly, the exit and entry ramps both get steeper at the same time. Get the succession on paper now, while the exchange is still massively in the sellers’ favour.

What This Means for Your Farm Right Now

Before the next DFO exchange deadline, ask yourself two questions. When was the last time you ran a real DSCR on your quota loans at today’s rates? And what happens to that ratio if the farmgate price slips 3–5% for a year?

Complete references and supporting documentation are available upon request by contacting the editorial team at editor@thebullvine.com.

Learn More

The Sunday Read Dairy Professionals Don’t Skip.

Every week, thousands of producers, breeders, and industry insiders open Bullvine Weekly for genetics insights, market shifts, and profit strategies they won’t find anywhere else. One email. Five minutes. Smarter decisions all week.
NewsSubscribe
First
Last
Consent

Iran War and Hormuz: How $4.16 Diesel Masks a $1.5M Fertilizer Hit on Your Dairy’s Bottom Line

If Iran keeps Hormuz choked, your 500‑cow dairy won’t lose $7K at the fuel tank — it’ll lose $146K in the feed lane.

Executive Summary: The Iran–Hormuz war has shoved U.S. diesel over $4/gal and yanked fertilizer prices sharply higher, but for a 500‑cow Iowa dairy, $4.16 diesel is the distraction — the real 2026 hit is a fertilizer‑driven feed shock. USDA’s 2026 all‑milk price sits near .95/cwt while full‑cost benchmarks for many herds run –/cwt, so a lot of dairies start the year structurally in the red before that feed increase even shows up. In the modeled 500‑cow herd, higher diesel adds roughly ,000 a year, but a realistic .00/cwt jump in feed cost tied to spiking urea and sulfur markets adds about 6,000 — pushing the 24‑month full‑cost shortfall toward .5 million if nothing else changes. That’s exactly why Kansas State economist Gregg Ibendahl argues fertilizer is “by far and away a bigger percent of total farm expenses than what fuel is” when Middle East conflict drives oil higher. The article walks through that barn math step‑by‑step and then gives a 30/90/365‑day playbook: run a 24‑month fertilizer‑shock scenario with your own numbers, set DSCR and working‑capital trip wires with your lender, pair milk‑side tools like DMC/DRP with feed coverage, and use strong cull and land markets as levers instead of last‑minute fire sales. In the end, it forces a decision every 300–700‑cow herd can’t dodge: if feed stays $1.00/cwt higher for the next two years, are you scaling, tightening up to survive, or planning a strategic exit while asset values still work in your favour?

For a typical 500‑cow family dairy based on real Iowa financials near Waterloo, and the 24‑month picture lands at roughly $1.5 million in negative cash flow once a fertilizer‑driven $1.00/cwt feed shock is layered into the barn math.

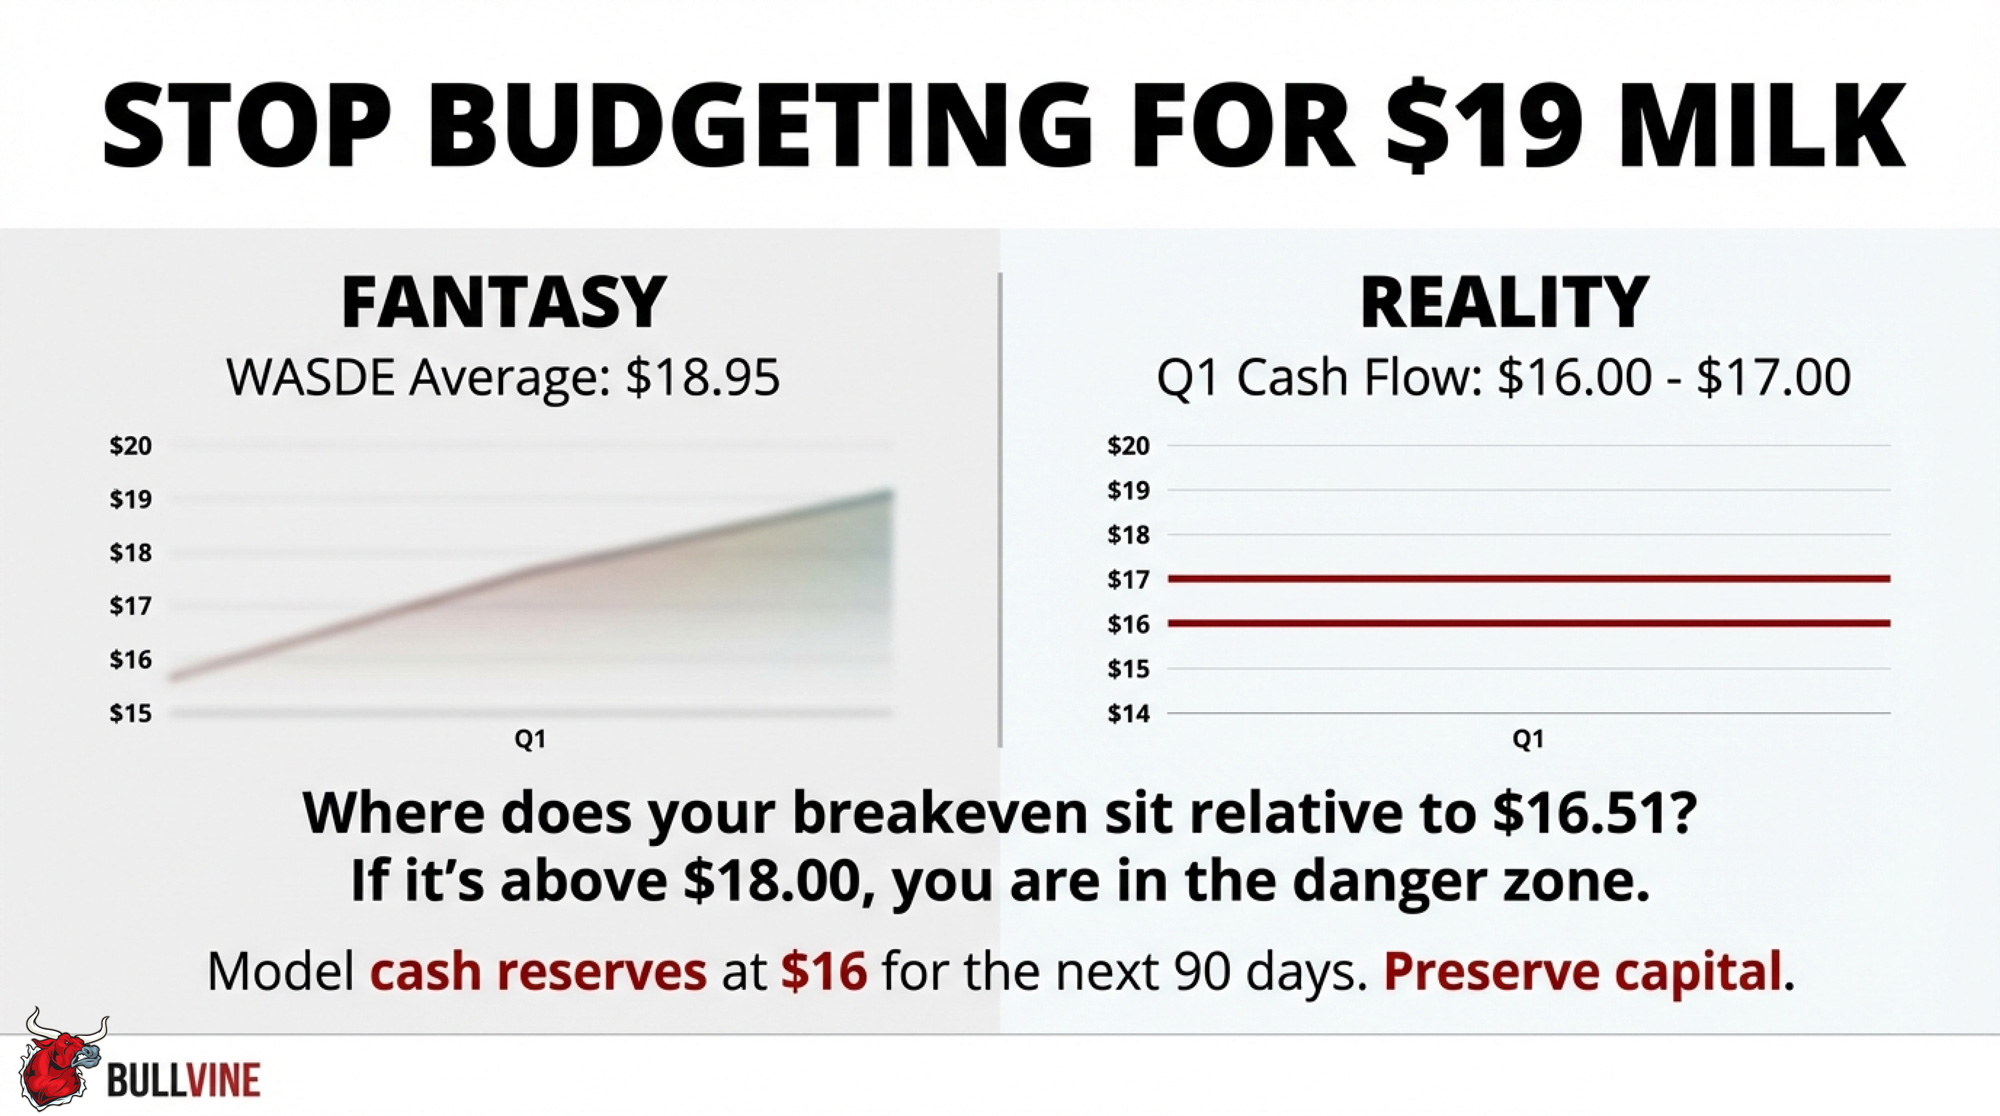
The herd we’re modeling here is a composite, built from the financials of several real Iowa operations. It isn’t one specific farm — but the math is designed to land close to what a lot of 500‑cow Midwest herds are actually facing: home‑grown forage and corn, buying the rest, carrying a normal amount of debt. Diesel at $4.16/gal feels like the obvious villain after the Iran conflict and the Strait of Hormuz closure pushed U.S. diesel prices to their highest level in nearly two years. But when you plug USDA’s $18.95/cwt all‑milk outlook into a 24‑month projection for a herd like this — then add a $1.00/cwt feed increase tied to fertilizer — it isn’t the fuel bill that does the real damage.

From Hormuz Headlines to a Fertilizer Squeeze

The year didn’t start with spreadsheets. It started with fuel tickets.

In late February and early March 2026, Iran’s war and attacks in the region raised the risk of serious disruptions in the Strait of Hormuz, the narrow corridor that handles a large share of global crude and refined product flows. Energy analysts warned it wasn’t just crude at stake — refined products like diesel and jet fuel that transit Hormuz were also in the line of fire, and buyers in Europe and Asia were already scrambling.

By early March, Reuters reported the U.S. national average diesel price hitting $4.04/gal — up 14.7¢ in a single dayand the highest in almost two years. Diesel futures on NYMEX surged more than 60¢/gal in two trading sessions, hitting a two‑year high as Hormuz risk repriced the entire energy complex. Regional rack prices in the Corn Belt climbed accordingly, putting posted farm prices like $4.16/gal across much of Iowa squarely in line with what herds are seeing at the pump right now.

While diesel was getting the headlines, the fertilizer market was moving just as fast — and in a way that cuts much closer to your feed line.

Brownfield Ag News reported that fertilizer bidding in parts of the U.S. was effectively paused as traders tried to price the Iran conflict. Argus Media showed New Orleans (NOLA) urea barge prices jumping from roughly $470/short ton to the $520–$550/st range in about a week, driven by shipping risk and short‑term supply fears. Analysts estimate that a large share of global fertilizer nutrients — roughly one‑third by some trade counts, including around 30% of seaborne urea — normally moves through Hormuz.

Sulfur was already on a tear. Brownfield quoted Fertilizer Institute economist Veronica Nigh, who said sulfur prices had roughly tripled compared to pre‑2022 levels, and that the Iran‑Hormuz situation was “only going to escalate markets” for sulfur‑dependent fertilizers like MAP and DAP. Those higher sulfur and nitrogen costs ripple straight into the N‑P‑K blends that underpin Corn Belt corn production.

Kansas State ag economist Gregg Ibendahl made the same point to Brownfield: fertilizer is “by far and away a bigger percent of total farm expenses than what fuel is.” That’s why he sees fertilizer as the bigger worry if oil stays high — and it’s the core tension driving the dairy feed cost 2026 story this article unpacks.

For a 500‑cow Iowa herd, those headlines don’t show up as lines on a Bloomberg chart. They show up as a much fatter feed‑cost line on the ledger.

Why “We Grow Our Own Corn” Isn’t a Free Pass on Fertilizer Risk

The first pushback you’ll hear at the coffee shop: “We grow our own corn — why should higher fertilizer prices hit our TMR?”

That’s where opportunity cost bites. Even if you never cut a check to a grain buyer, the economic cost of your corn is whatever you could reasonably sell it for in today’s market. If fertilizer pushes the cost of production per bushelhigher, you either:

  • Raise your internal cost of corn in the ration, or
  • Let the “crop side” of the business quietly eat that higher cost so the dairy side can pretend corn is still cheap.

Here’s what that looks like in practice. Say it costs you $4.50/bu to grow corn this year — and the local elevator bid is $5.20/bu. Your TMR is using $5.20 corn whether you wrote a check or not. That extra $0.70/bu flows straight through to feed cost per cwt. On a ration running roughly 55 lb of corn silage equivalent per cow per day across 500 cows, that spread adds up faster than most herds want to admit. And when fertilizer prices spike, the gap between your growing cost and your opportunity cost can widen — or your growing cost itself climbs toward that market price, erasing the discount you thought you had.

Corn budgets from land‑grant economists across the Corn Belt consistently show fertilizer as the single biggest line item in production costs, often topping $200/acre for N‑P‑K when nitrogen prices spike. Iowa and Minnesota extension economists are blunt: when key inputs run higher, the cost per bushel of own‑grown corn rises, whether you sell that corn or feed it yourself.

If you don’t price home‑grown corn at its true opportunity cost, your checkbook might say the dairy is breaking even — but your crop enterprise is quietly subsidizing the cows. In 2026, with fertilizer linked directly to Hormuz risk and global trade, pretending home‑grown corn is insulated from that world is more wishful thinking than risk management.

What Does a $1.00/cwt Feed Shock Really Cost a 500‑Cow Herd?

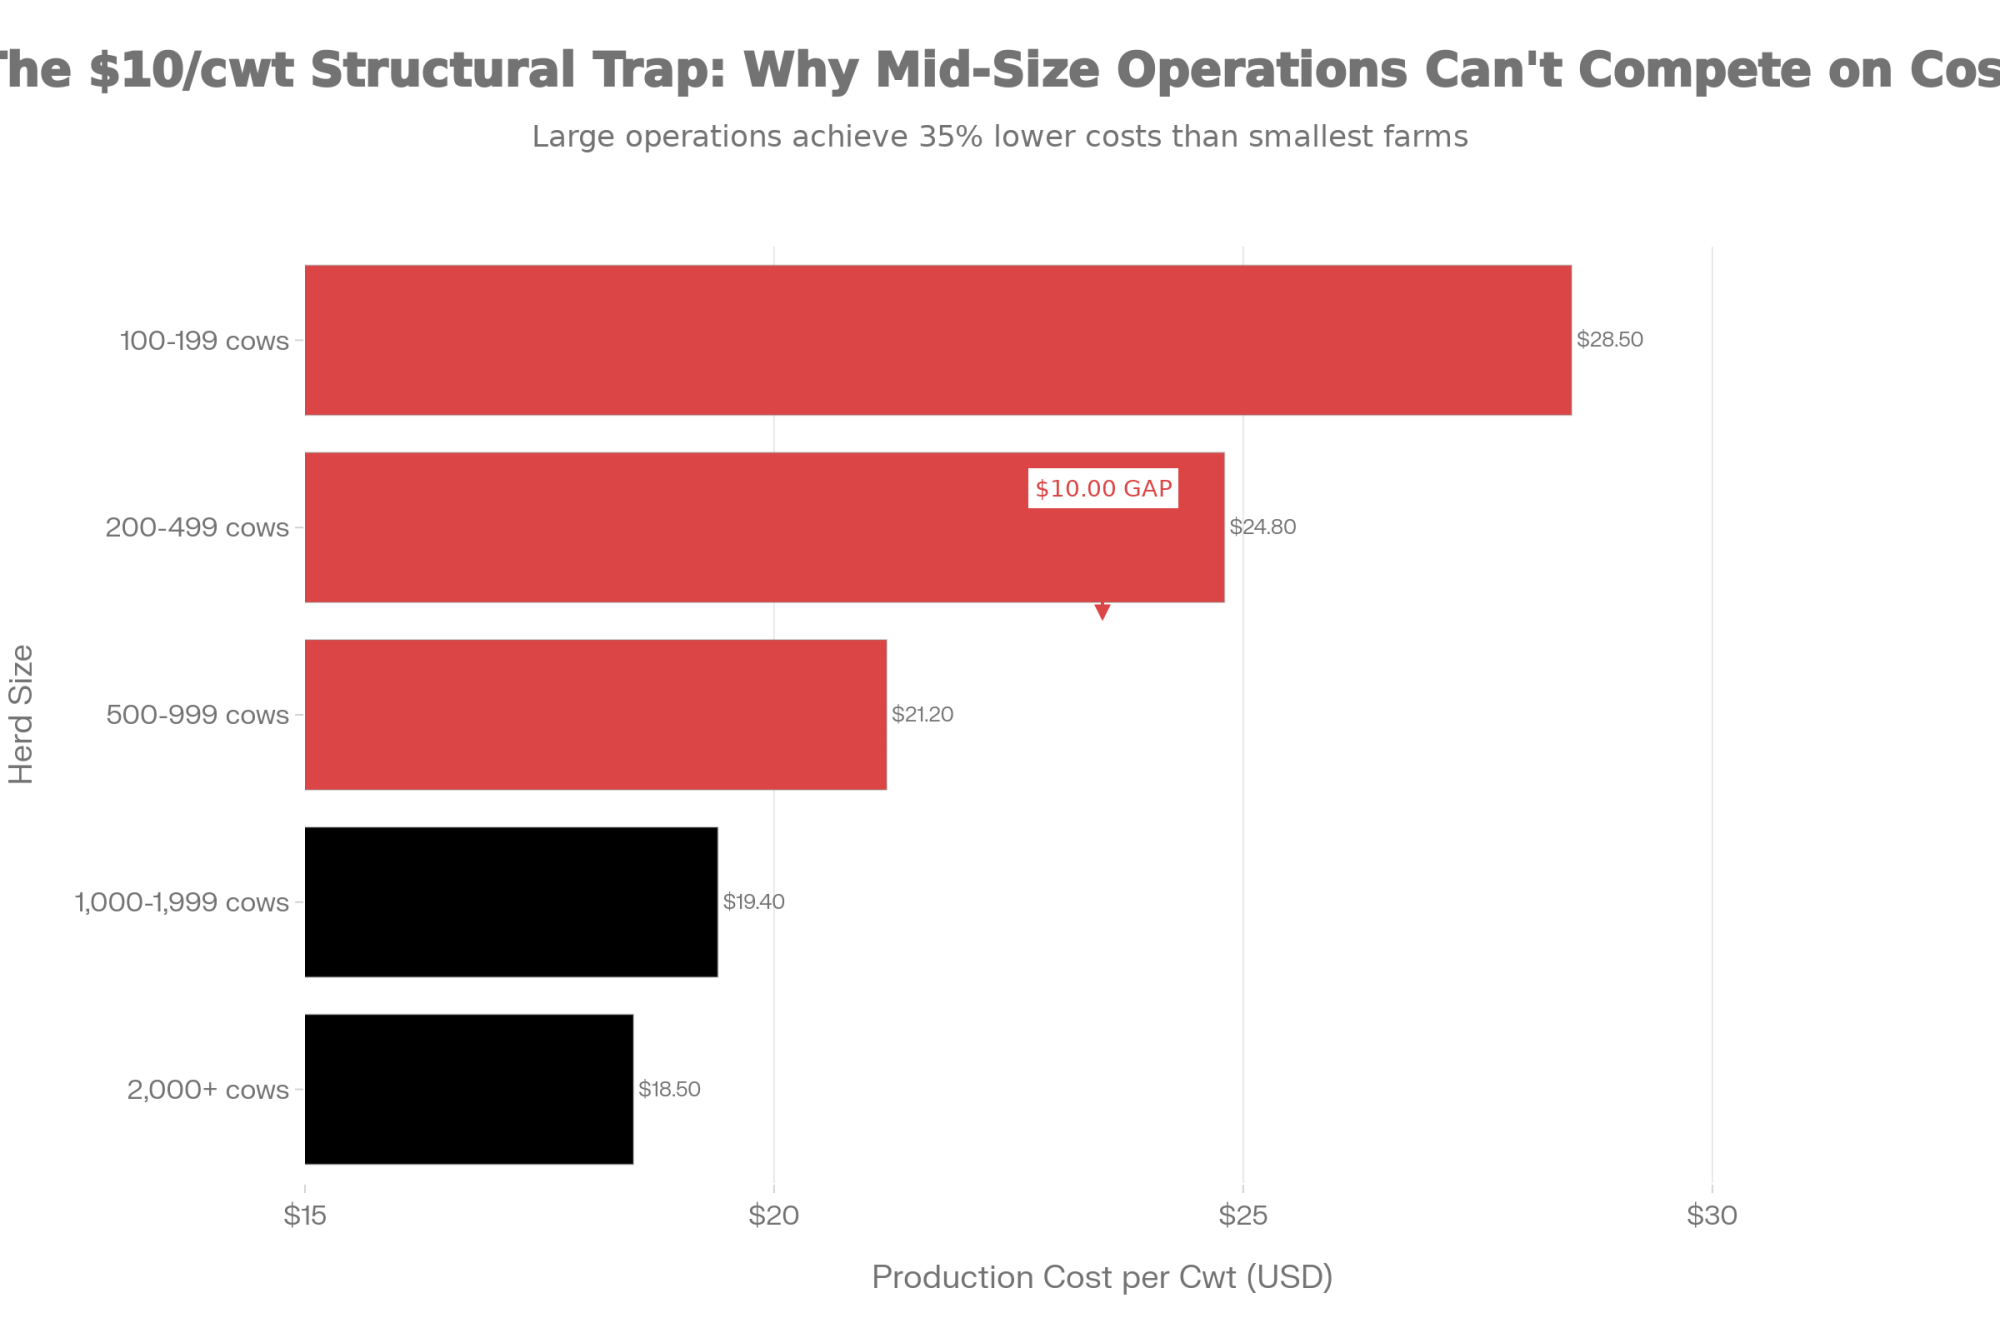
USDA’s February 2026 Livestock, Dairy, and Poultry Outlook pegs the U.S. all‑milk price forecast at $18.95/cwt. At the same time, USDA‑ERS cost‑of‑production data and The Bullvine’s own analysis show average full‑cost benchmarks for large U.S. herds around $19.14/cwt, with the smallest herds north of $42.70/cwt. Even before diesel and fertilizer prices are re‑priced, many dairies start 2026 structurally in the red.

For this modeled 500‑cow herd, the working assumptions look like this, based on 2025 actuals and ERS‑style cost curves:

  • 500 milking cows, averaging 80 lb/cow/day (0.8 cwt/day).
  • Annual shipments ≈ 292 cwt/cow → about 146,000 cwt/year.
  • Milk price assumption: $18.75/cwt (USDA all‑milk less a modest local basis).
  • Full‑cost baseline: $23.00/cwt (feed, labour, interest, repairs, utilities, fuel, depreciation, and unpaid family labour).

The barn math:

  • Milk revenue: 146,000 cwt × $18.75 ≈ $2,737,500/year.
  • Total full cost: 146,000 cwt × $23.00 ≈ $3,358,000/year.
  • Full‑cost shortfall: about $620,500/year.

Before any 2026 shocks, a herd built like this is already staring at roughly $620,500/year in full‑cost red ink. Equity is quietly covering the gap.

How Much Does $4.16 Diesel Actually Add?

USDA‑ERS and extension budgets typically put fuel and oil in the ballpark of $40–$60/cow/year when diesel sits closer to $3.25/gal. For this model, call it $50/cow/year at that lower level.

If the 2026 diesel average ends up at $4.15–$4.20/gal due to Hormuz disruptions and tighter inventories, that’s roughly a 28% increase in fuel costs.

Back‑of‑the‑envelope:

  • Extra fuel cost per cow: $50 × 0.28 ≈  $14/year.
  • For 500 cows: 500 × $14 ≈ $7,000/year.

Seven thousand dollars isn’t nothing. You still feel it every time you fill the tank. But set it beside a $620,000/year full‑cost gap, and it isn’t what decides if your farm is solvent in 24 months.

What Happens When Feed Runs $1.00/cwt Higher?

Feed is where the fertilizer story shows up on the ledger.

Between DMC margin reports and independent economic work, the underlying numbers suggest that many U.S. herds carried total feed costs in the $9–$12/cwt range through 2024–25, depending on ration and region. That’s where this composite herd lands.

Now layer in the fertilizer picture:

  • NOLA urea up $50–$80/st in a week, with barges trading $520–$550/st vs. roughly $470/st the prior week.
  • A large share of globally traded urea and other nutrients — estimates run around 30% — normally transits Hormuz.
  • Sulfur prices have roughly tripled compared to pre‑2022 levels, squeezing MAP/DAP and other sulfur‑dependent fertilizers.

Under that setup, it’s realistic to model total feed ending up $1.00/cwt above 2025 for this herd.

For 146,000 cwt:

  • Extra feed cost: 146,000 × $1.00 = $146,000/year.

Roll that into the full‑cost picture:

  • Effective full cost: $24.00/cwt.
  • New total cost: 146,000 cwt × $24.00 = $3,504,000/year.
  • Gap vs. $18.75 milk: ≈ $766,500/year.
ScenarioAnnual Full-Cost Gap24-Month ShortfallDriver
Baseline (No Shocks)$620,500/year$1,241,000Milk $18.75, Costs $23.00/cwt
With Fertilizer Feed Shock$766,500/year$1,533,000Feed +$1.00/cwt = $146K/year extra
Feed Shock Alone (Incremental)+$146,000/year+$292,000Urea, sulfur, opportunity cost
Diesel Increase (Context)+$7,000/year+$14,000$4.16/gal, 28% above baseline

Stretch it over two years:

  • Without the feed shock, roughly $1.24 million in modeled full‑cost shortfall over 24 months.
  • With the feed shock: roughly $1.53 million over 24 months.

That ~$290,000 difference over two years comes mostly from the fertilizer‑driven feed hit. And the feed shock itself — $146,000/year — is more than 20 times the modeled diesel increase on this herd.

On a cash‑cost basis — just bills paid — you might convince yourself you’re roughly breaking even at $19.00 milk. But once you include economic costs like depreciation, unpaid family labour, and realistic opportunity cost on home‑grown feed, this model says you’re still effectively short about $4.00/cwt. That’s how family equity quietly disappears over a 24‑month run — not in one crash, but in a slow bleed.

Picture three bars side‑by‑side:

  • Diesel at $4.16/gal adds about $7,000/year.
  • $1.00/cwt feed shock adds about $146,000/year.
  • The existing full‑cost gap is about $620,500/year — climbing to $766,500/year with the feed hit, and roughly $1.53 million over two years.

On that chart, the diesel bar barely clears the x‑axis.

The Turn: When Fuel Complaints Become Margin Decisions

Once that 24‑month picture is on the table, the lender conversation shifts — fast. Suddenly, the questions aren’t about fuel surcharges anymore.

The pattern playing out in lender offices across Iowa and Wisconsin this winter looks something like this: a producer walks in focused on $4‑plus diesel and shop bills, and by the time the 24‑month model is on screen, the conversation has shifted to feed cost per cwt, DSCR, and working capital per cow.

In those meetings, the math usually walks through three simple lines:

  • USDA’s $18.95/cwt 2026 all‑milk forecast as the revenue anchor.
  • The herd’s own 2025 full‑cost per cwt is in the $23–$24 range as the base.
  • $0.50–$1.00/cwt feed increase tied to fertilizer and acreage shifts if input prices stay elevated.

Seeing a mid‑six‑figure negative full‑cost margin per year in black and white changes priorities. Diesel stops being the complaint and becomes a line item inside a larger margin plan. The discussion moves from arguing over fuel surcharges to “What are my coverage options on milk and feed?” and “What happens to my DSCR if I don’t move?”

The contrarian takeaway is blunt: in 2026, building your risk plan around diesel alone is a distraction. The combination of sub‑$19/cwt milk, ERS full‑cost benchmarks, and a very realistic $1.00/cwt increase in feed costs is where the survival decision sits.

30/90/365‑Day Playbook for Fertilizer‑Driven Feed Risk

Once you accept a 24‑month picture like this one, the diesel surcharge argument stops mattering. What matters is the timeline.

Next 30 Days: Put the Risk on Paper

1. Run a 24‑Month Fertilizer‑Shock Scenario

Use your actual numbers, not somebody’s averages:

  • Start from 2025 milk shipped and full costs from your own books.
  • For 2026–27, plug in:
    • All‑milk near $18.95/cwt, adjusted for your basis.
    • Total feed at 2025 feed/cwt + $1.00.
    • Non‑feed costs are flat unless you already know they’re moving (labour raises, interest resets, major repairs).

If that model shows a six‑figure annual full‑cost gap, the exact dollar amount matters less than the direction: if nothing changes, equity is doing the work.

2. Ask Your Nutritionist for Two “What‑If” Rations

Skip the small talk. Give them scenarios:

  • Scenario A: corn $0.50/bu higher than your current purchase or opportunity cost; realistic protein prices.
  • Scenario B: corn $1.00/bu higher, similar protein assumptions.

For each, ask for the updated feed cost per cwt and expected milk and components under your conditions. You’re not trying to guess the market. You’re trying to know your Plan B and Plan C before you’re forced into them.

3. Audit Your Fertilizer Exposure with Your Retailer

Sit down and actually map it:

  • Tons of N, P, and K have already been purchased for 2026, and at what prices?
  • Remaining tons still open while NOLA urea and related products trade higher on Hormuz news.
  • Any signals of no bid, allocation, or tonnage caps on nitrogen, phosphate, or sulfur‑linked products from their suppliers.

For a herd like this one, that audit often surfaces an uncomfortable number: a sizable chunk of planned nitrogen for 2026 corn acres still unpriced — one of the key drivers behind the modeled $1.00/cwt feed risk.

4. Write This Number on the Whiteboard

What percentage of your 2026 milk and feed is actually priced or protected today? Write it down next to your current DSCR. If both answers make you uncomfortable, that’s the signal to act on the next two sections — not wait for better numbers.

Next 90 Days: Move from Drift to Defined Trip Wires

5. Put Numeric Trip Wires on the Wall — and Share Them with Your Lender

Exact thresholds vary by lender and operation, but these bands are consistent with how many Midwest ag banks think about DSCR and working‑capital risk:

MetricHealthy (Green)Warning (Yellow)Critical (Red)
DSCR> 1.25×1.0× – 1.25×< 1.0×
Working capital/cow> $600/cow$400 – $600/cow< $300/cow
Feed cost vs 2025Baseline+$0.50/cwt (3 months)+$1.00/cwt (3 months)

The key is for you and your lender to react to the same signals, rather than for them to quietly watch your ratios slip from the other side of the desk.

6. Pair Milk‑Side Tools with Feed‑Side Coverage

Dairy Margin Coverage (DMC) still has a role, but it only protects income over feed and doesn’t touch the sharp rise in non‑feed costs since 2021 — often 15–25% higher once you factor in labour, interest, repairs, and utilities on many herds.

The matched approach that pencils best for a herd in this position:

  • On the milk side, use Dairy Revenue Protection (DRP) and/or forward contracts to put floors under a portion of projected 2026 milk, on top of DMC where it still pencils.
  • On the feed side, layer in cash contracts, HTAs, or options to cover 50–70% of expected corn and protein usage at levels that still work in the 24‑month model.

You give up some upside. In return, you reduce the chance that low milk and high feed hit at the same time and shove your DSCR under 1.0× for multiple quarters.

7. Use Strong Cull Cow Prices as a Strategic Lever

USDA and market reports show record‑high average cull cow prices in 2024, with national averages near $127/cwt, and outlooks suggest 2025 stays historically strong with tight U.S. beef supplies.

In a herd running this model, the logical cull protocol looks like this:

  • Identify the bottom 5–10% of cows by margin — factoring in reproduction, components, health, and feed efficiency, not just volume.
  • Compare the economics of feeding those cows another year at higher feed costs versus shipping them into today’s beef market.
  • Look at how many stalls would be better filled by more profitable cows or left open in a high‑feed‑cost environment.

Fewer cwt shipped in the short term vs. potentially stronger cash flow per stall when feed is expensive. That’s the trade‑off.

Next 365 Days: Decide Whether You’re Scaling, Surviving, or Exiting

If the Iran conflict, Hormuz closure, and tight fertilizer supplies stretch through the 2026 planting and harvest windows, this isn’t just a rough patch. It’s the operating environment for at least one full feed year.

At some point in the next year, most mid‑size herds will be pushed into one of three lanes:

  • Scaler: You see a credible path to lower cost per cwt by growing more cows per worker, better use of parlours and barns, and stronger purchasing power. This demands capital, management depth, and a lender willing to back it. You gain lower unit costs if it works; you give up flexibility and increase exposure if markets turn faster than you can adapt.
  • Survivor: You aim to hold the current scale but treat DSCR, working capital per cow, and feed cost per cwt as non‑negotiable dashboard metrics. That means consistent use of DMC/DRP and feed coverage so you’re managing margins, not just prices.
  • Strategic Exit: You recognize that with $18.95/cwt milk and $23–$24/cwt full costs, your current structure may not carry the risk you’re facing. You use still‑strong land values, elevated cull and replacement prices, and, if necessary, restructuring tools to exit or reshape the business on your own timeline instead of waiting for the bank to decide.

Brownfield and Iowa State survey work describe remarkably resilient Iowa and Corn Belt farmland values into 2024 and 2025, with high‑dollar sales continuing and roughly 80–84% of Iowa farmland reported as debt‑free in recent data. For operations under real margin strain, that resilience is a capital‑preservation lifeline.

If you act before you’ve burned through working capital, strong land values can function as a strategic exit ramp — letting you pay down debt, reposition, or walk away with balance‑sheet strength intact, rather than waiting until the bank is making the decisions for you.

The point isn’t which lane is “right.” It’s that pretending those choices aren’t on the table is the riskiest move of all.

What This Means for Your Operation

  • If your rolling 3‑month feed cost per cwt is already $0.50–$1.00 above your 2025 average, you’re absorbing a fertilizer‑driven feed shock that can add roughly $70,000–$150,000/year to a 500‑cow herd.That’s the scale of risk this article is working with — not just a few cents on diesel.
  • If your 24‑month cash‑flow at roughly $18.95/cwt milk and $23–$24/cwt full costs shows a six‑figure annual gap, you’re effectively financing operations with equity unless you change something. That’s when you have to decide: to scale, to survive, or to exit strategically.
  • If your lender can’t hand you your current DSCR and working capital per cow, you’re making risk calls with less information than they have. Ask for those metrics and agree on trip wires that trigger specific actions — not “we’ll see what happens.”
  • If your risk work focuses only on milk price and leaves feed completely open, you’re betting that fertilizer, corn, and protein behave. The 2026 fertilizer and Hormuz situation suggests that’s not a bet to leave unhedged.
  • If you haven’t given your nutritionist and fertilizer supplier concrete “what if” scenarios to model, your next 30‑day move is simple: book those meetings and come out with backup rations, clear feed‑cost numbers, and a map of how much 2026 fertilizer is already priced.
  • If you’re in the bottom DSCR or working‑capital bands and still planning business as usual, you’re letting the market decide when you hit the wall. Choose your lane while beef, land values, and buyer demand still work in your favour.

Key Takeaways

  • If your total feed cost per cwt ends up more than $1.00 above your 2025 baseline, then on a 500‑cow herd shipping ~146,000 cwt/year, you’re looking at roughly $146,000/year in extra feed cost — a 20× issue compared to the diesel increase in this model.
  • If your full‑cost model at around $18.95/cwt milk and $23–$24/cwt costs stays negative for two years, the real decision isn’t whether you can “tough it out” — it’s whether to scale, survive with tight trip wires, or pursue a strategic exit while asset values still work for you.
  • If you don’t run a 24‑month fertilizer‑shock scenario and set DSCR, working‑capital, and feed‑cost trip wires in the next 30 days, you’re letting the fertilizer and feed markets decide how much equity you burn.

The Bottom Line

The 500‑cow Iowa herd in this article isn’t your farm. But its math looks uncomfortably close to what USDA and ERS numbers imply for a lot of real herds in 2026. Diesel is still going to sting every time you fill the tank. The real question is whether your feed and fertilizer lines are quietly doing far more damage over the next two years.

Pull your 2025 feed cost per cwt, your latest DSCR, and your working capital per cow. Layer in a $1.00/cwt feed increase on a 24‑month projection. What do your own numbers say — and do your current contracts protect you if that’s the path you’re on?

Complete references and supporting documentation are available upon request by contacting the editorial team at editor@thebullvine.com.

Learn More

The Sunday Read Dairy Professionals Don’t Skip.

Every week, thousands of producers, breeders, and industry insiders open Bullvine Weekly for genetics insights, market shifts, and profit strategies they won’t find anywhere else. One email. Five minutes. Smarter decisions all week.
NewsSubscribe
First
Last
Consent

$18.95 Milk, $19.14 Costs: The $287,500 Equity Decision Facing Mid‑Size Wisconsin Dairies

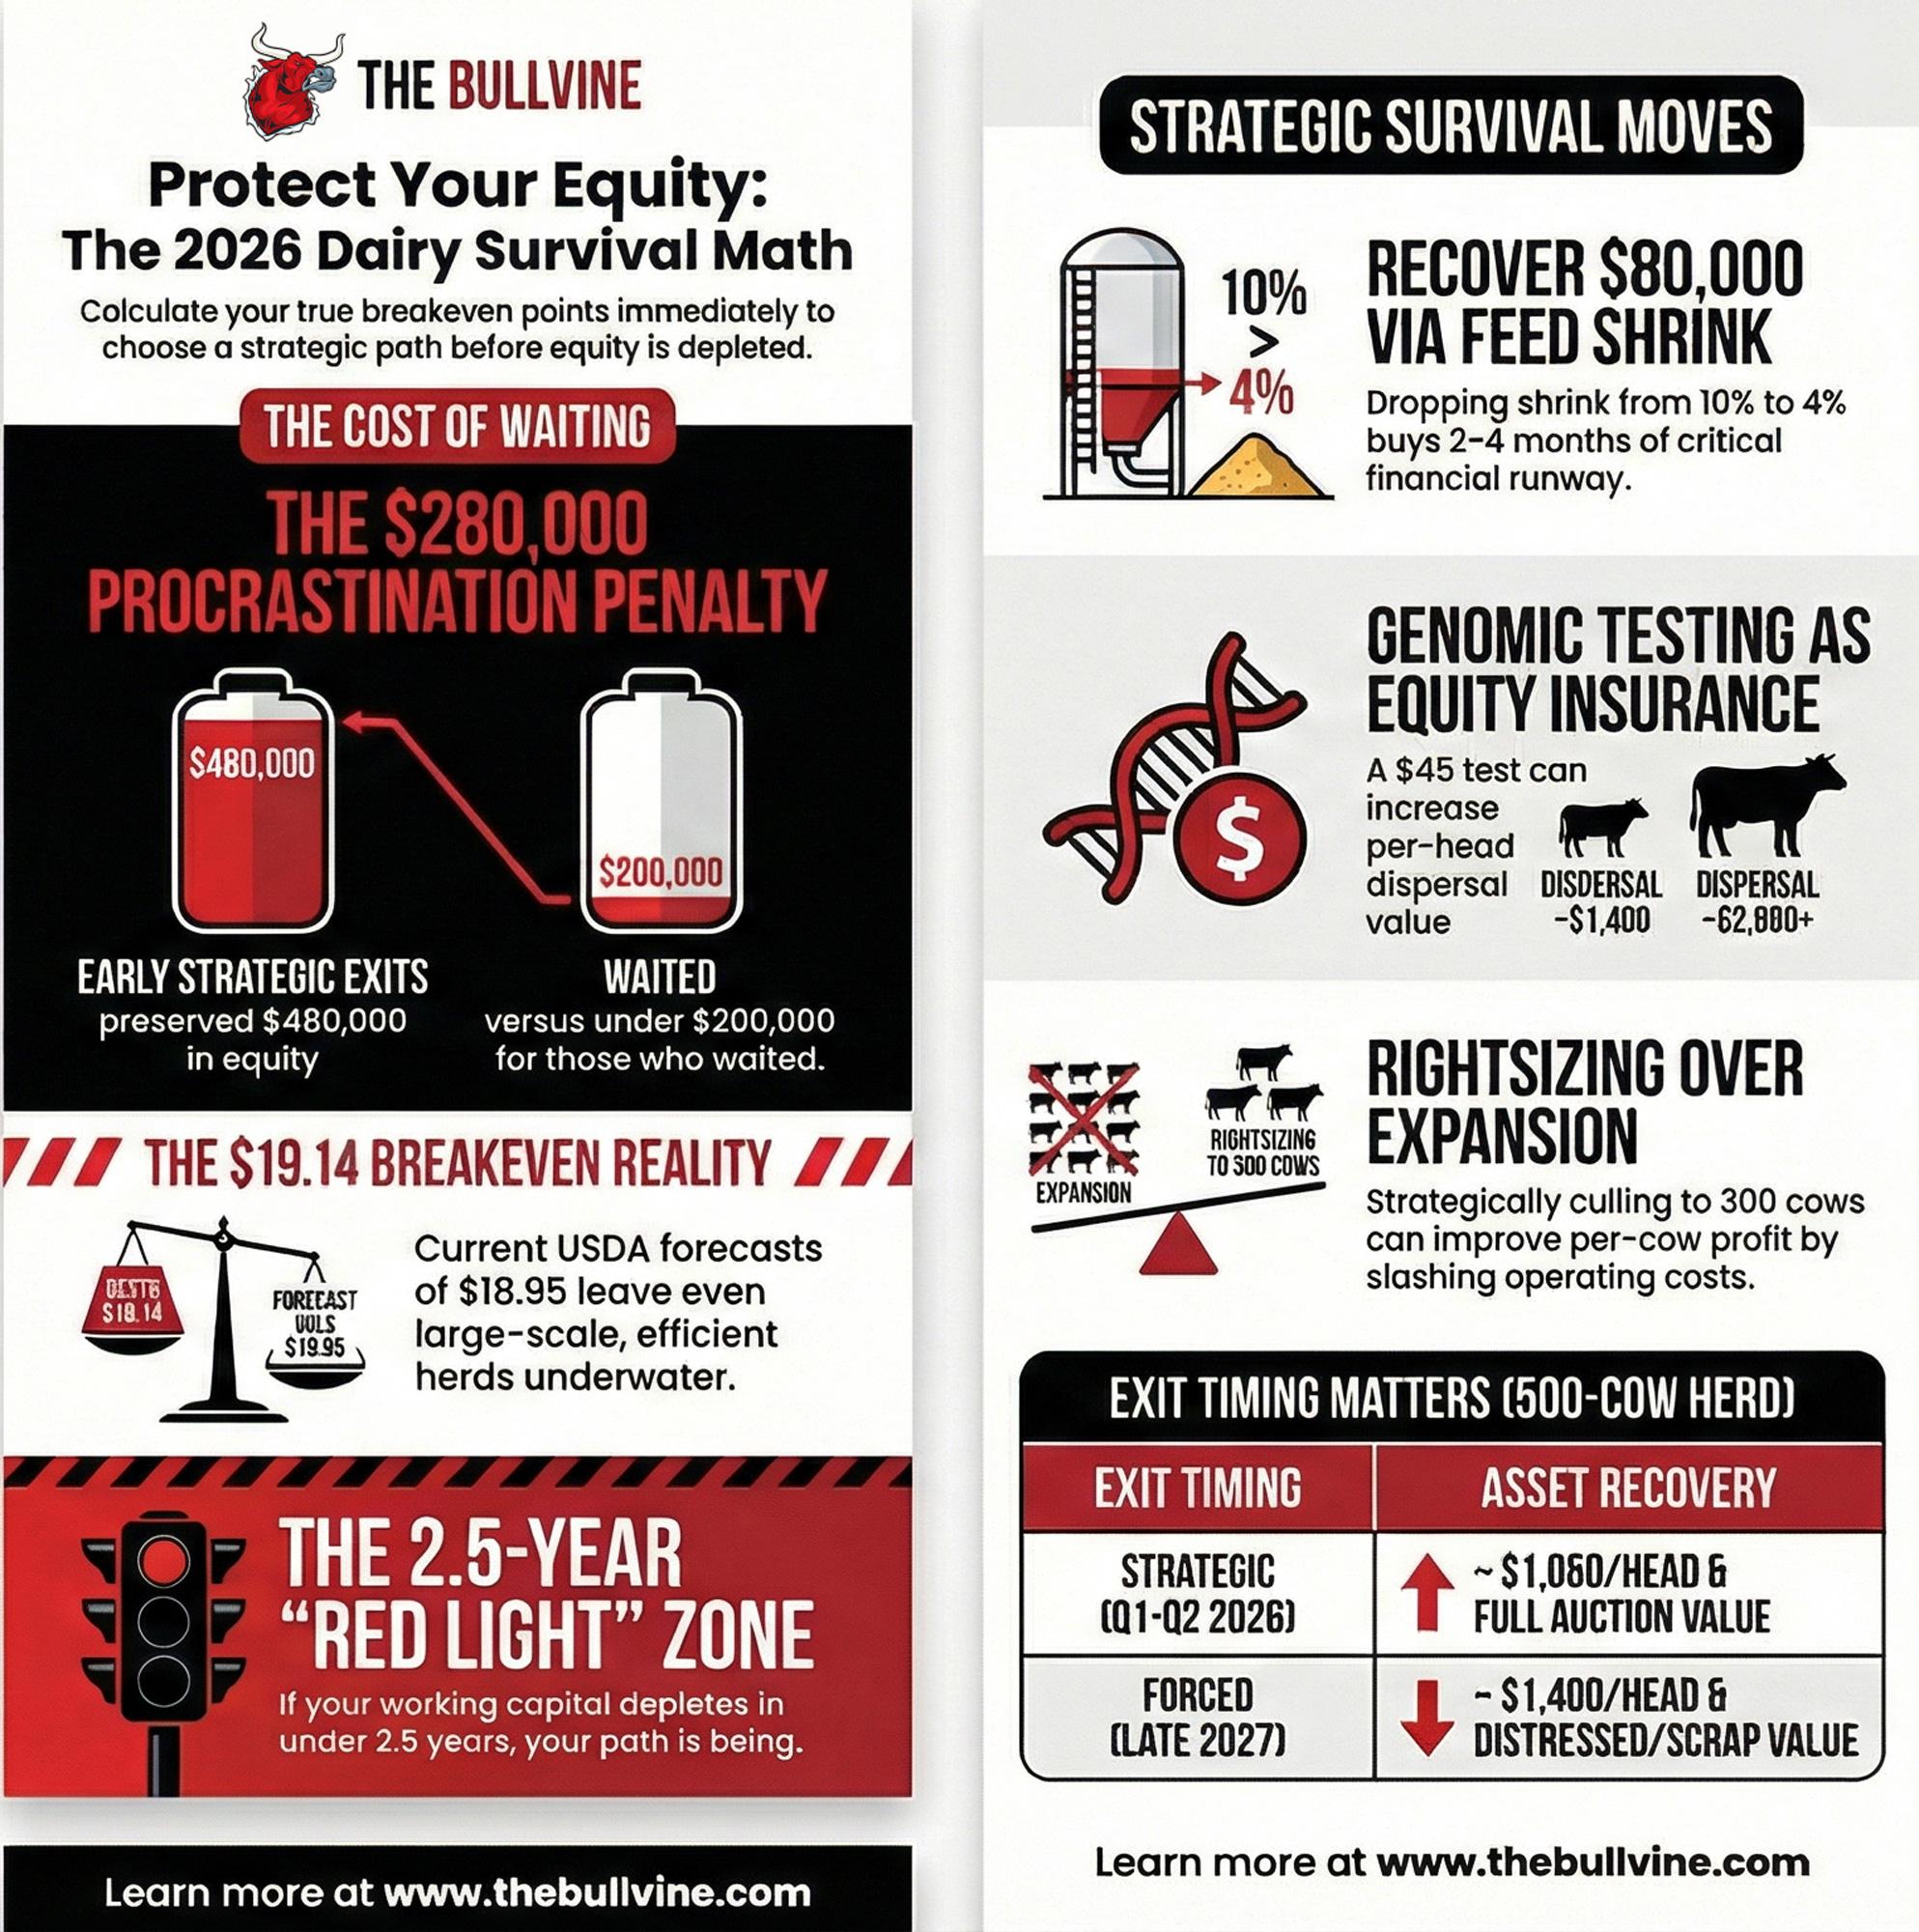
Same milk price. One 500-cow Wisconsin dairy kept $480,000 in equity; their neighbors walked away with under $200,000. The real difference was when they believed their breakeven point and acted on it.

Executive Summary: This feature breaks down the 2026 margin squeeze for 300–800 cow dairies, where January Class III at $14.59/cwt and USDA’s $18.95 all‑milk forecast run into ERS full economic costs of $19.14/cwt for large herds. For a 500‑cow operation at 23,000 lbs/cow, that means a $287,500 annual gap at $16.50 milk versus a $19 breakeven and only break-even at best if the forecast hits. One Wisconsin family believed in math early and preserved about $480,000 in equity through a planned exit, while neighbors on the same milk price ended up with under $200,000. The article shows how tightening feed shrink from 8–12% down toward 4% can recover $50,000–$80,000/year as a 90‑day bridge — enough runway to choose, not react. From there, it walks through four concrete paths for mid‑size herds (strategic exit, specialty pivot, downsizing with contract lock‑in, and internal heifer rebuild), with specific “when it fits/where it backfires” trade‑offs. A closing playbook gives 30/90/365‑day checks on burn rate, DMC coverage, contract timing, and heifer strategy so you can decide, with your own numbers, whether to fight through, right‑size, or sell while equity is still on the table.

Dairy breakeven costs

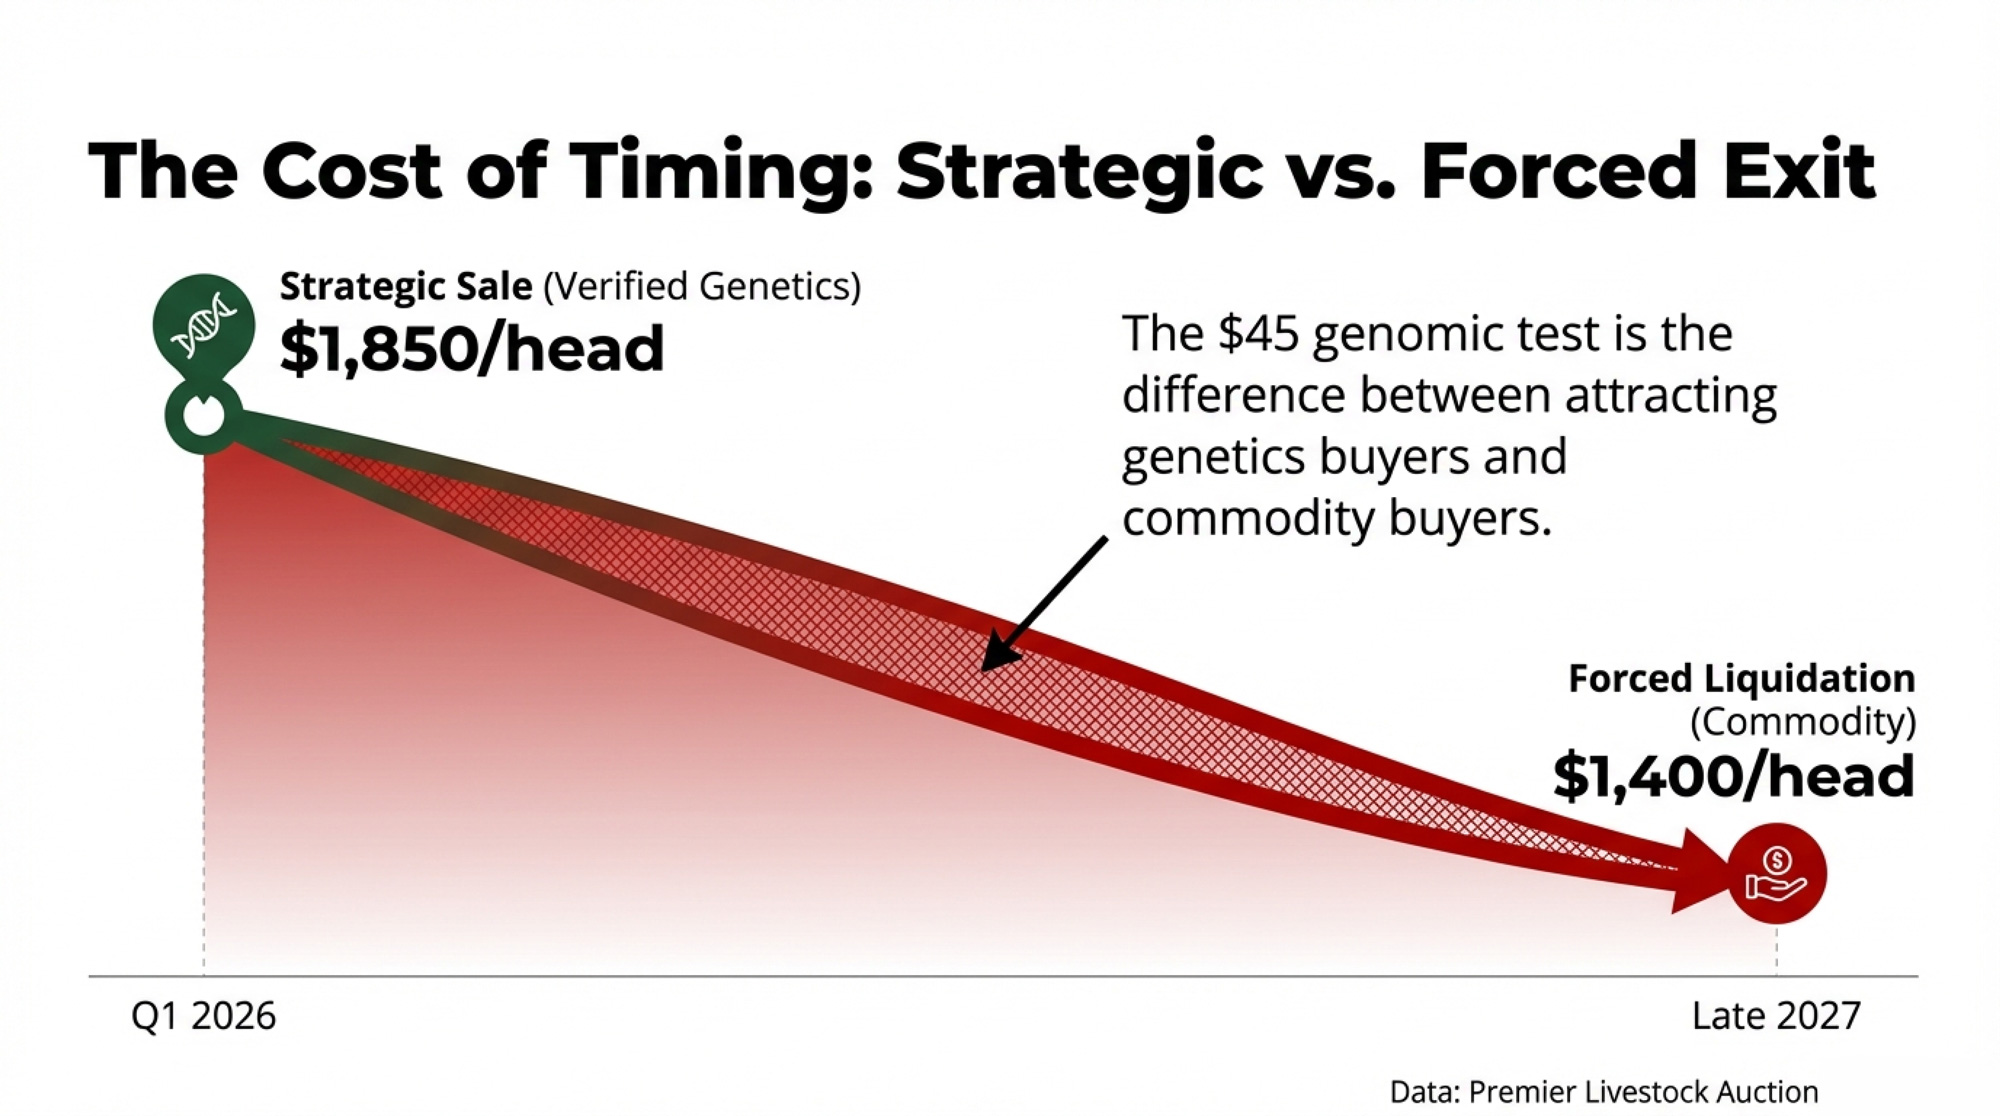
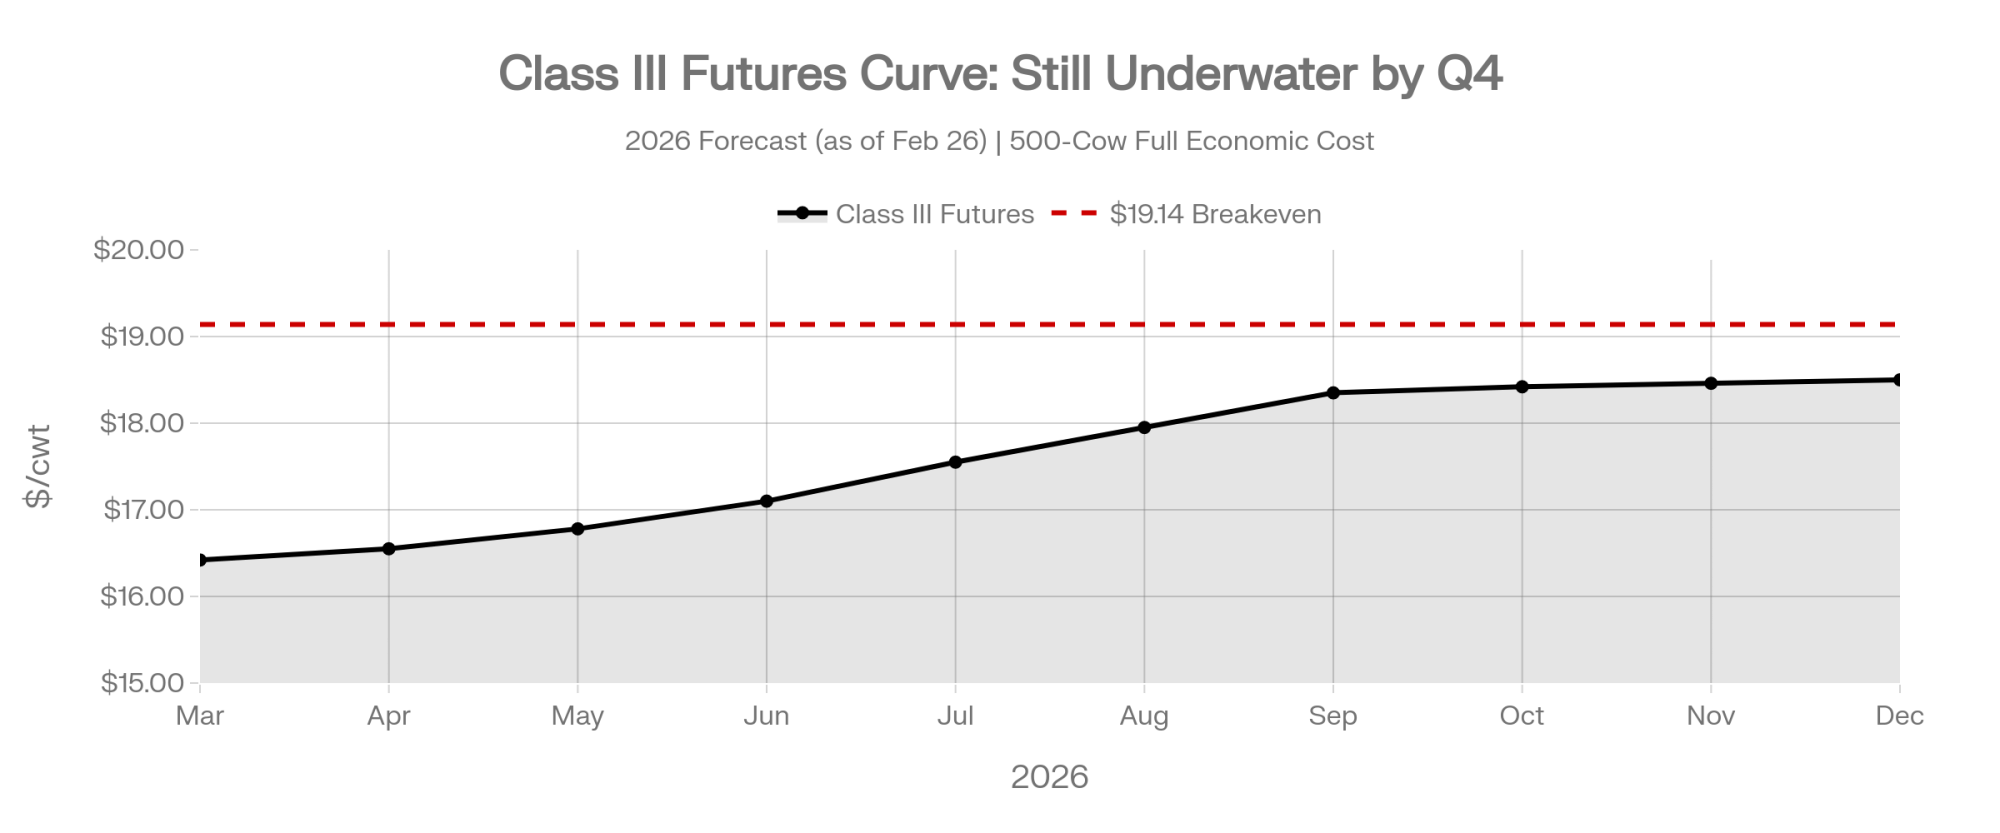
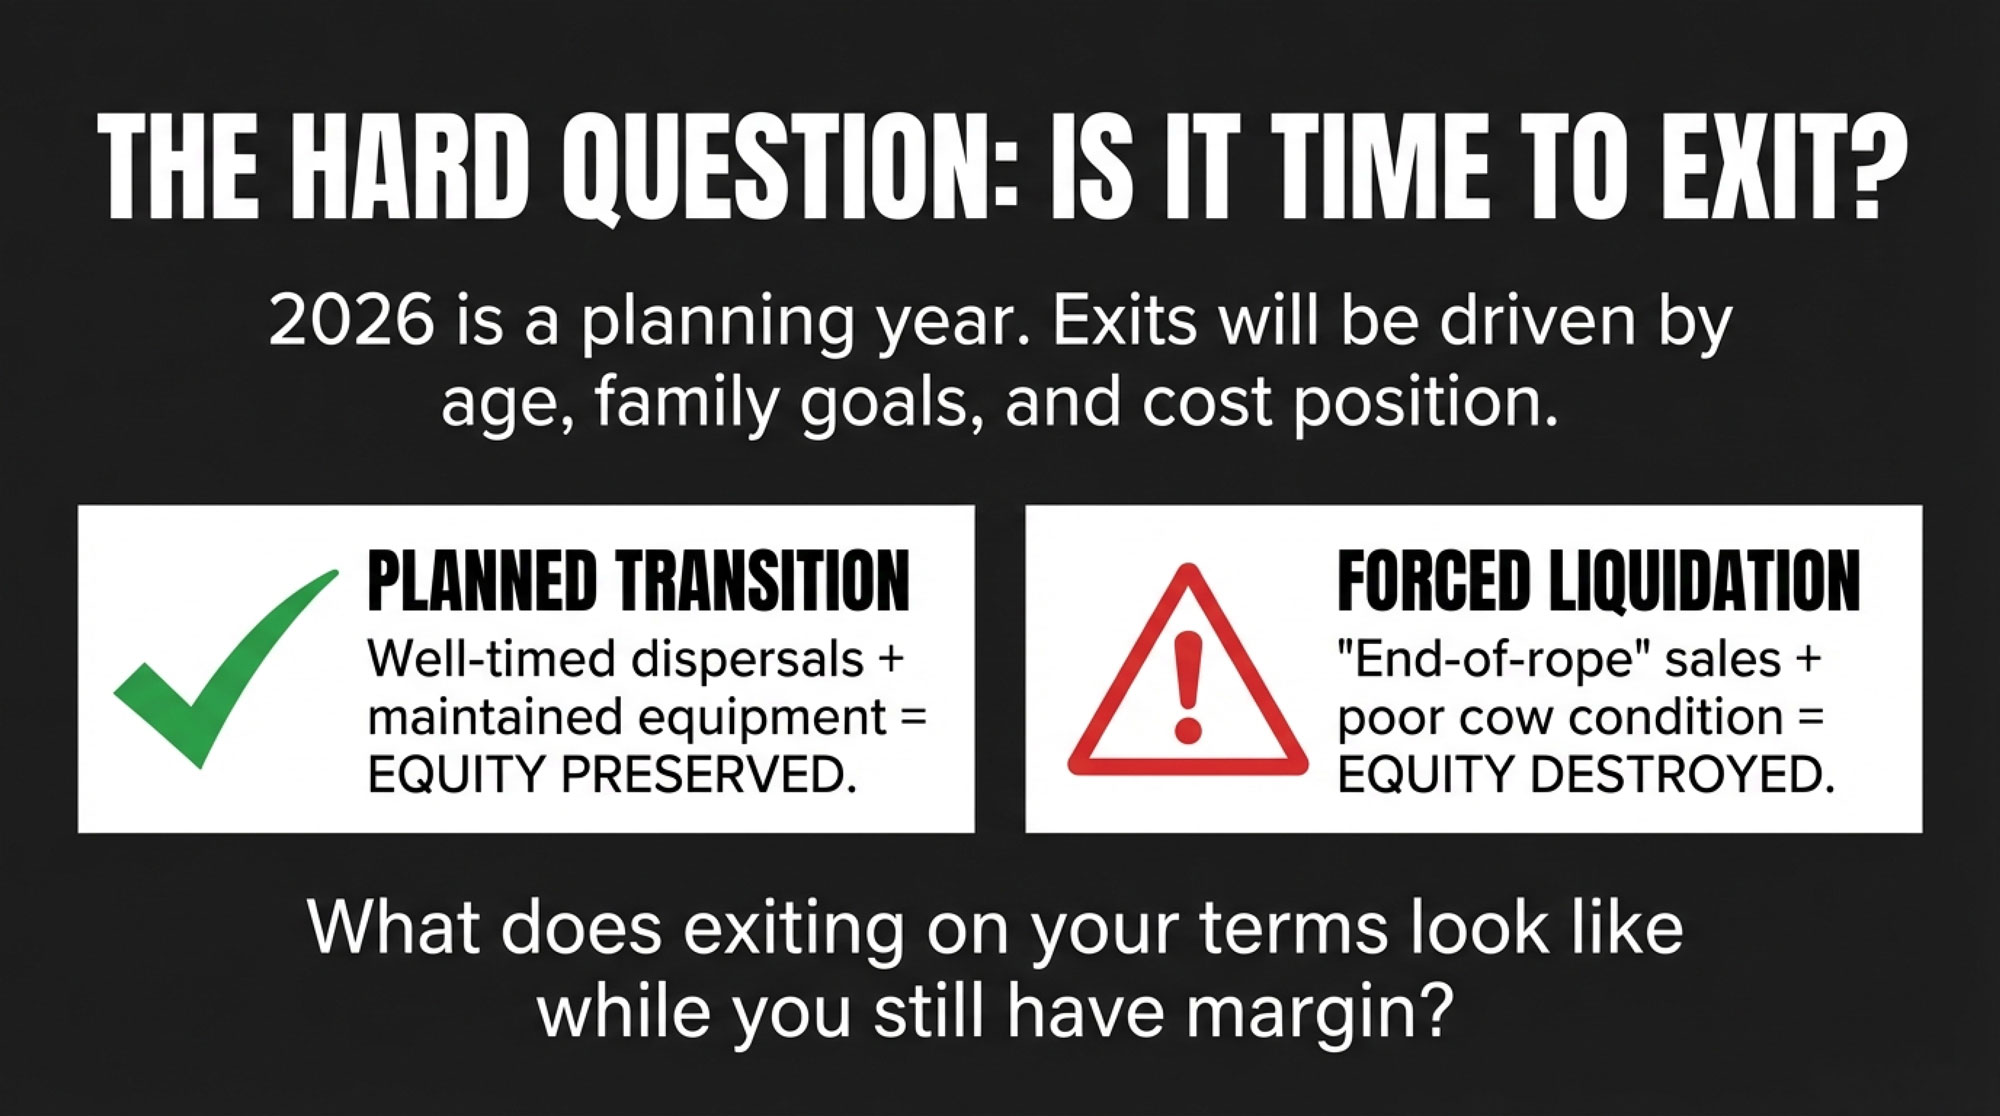
A Wisconsin dairy family ran the same numbers every mid-size operator is running right now: March Class III futures closing at $16.42/cwt on February 26, while their all-in costs ran above $19. They made the call with 8–10 months of runway left. Preserved roughly $480,000 in family equity.

Exit ScenarioTimingCow Value/HeadEquipment RecoveryFamily Equity Preserved
Strategic ExitQ1–Q2 2026 (8–10 months runway left)$1,850Full auction value$480,000
Forced LiquidationLate 2027 (lender-initiated)$1,400Distressed/scrap pricingUnder $200,000
Equity Destruction12–18 month delay−$450/head−40–60%−$280,000
Decision DriverProactive lender audit in MarchGenomic testing ($45/head) before dispersalPlanned vs. distressed auction timingBelieving the math while assets hold value

The family down the road, milking a similar herd, waited. By the time their lender initiated the conversation, the number was under $200,000.

That $280,000 gap isn’t about who’s a better farmer. It’s about who ran the real numbers first — and believed what they showed.

What Does $14.59 Class III Actually Mean for Your Herd?

January’s Class III came in at $14.59/cwt. December was $15.86. USDA’s February WASDE raised the 2026 all-milk forecast to $18.95/cwt — still $2.22 below the revised 2025 average of $21.17.

For a 300-cow herd shipping 69,000 cwt/year, that’s a $153,000 drop in gross milk revenue year over year.

Here’s the walk-through for a 500-cow operation producing 23,000 lbs/cow — that’s 115,000 cwt/year:

  • At $16.50 milk vs. $19 breakeven: $2.50/cwt × 115,000 cwt = $287,500 annual shortfall
  • At $16.50 milk vs. $21 breakeven: $4.50/cwt × 115,000 cwt = $517,500 annual shortfall
  • At $18.95 (USDA forecast) vs. $19 breakeven: Still underwater by $5,750/year — and that’s the optimistic case

Where does your breakeven point sit? Plug it in: (your all-in cost/cwt − milk price/cwt) × annual cwt shipped = your annual shortfall.

Lucas Sjostrom, executive director of Minnesota Milk, framed the oversupply problem driving these prices in a January 2026 interview with the Red River Farm Network: “Although milk is milk, it’s the components that we sell, and we’ve got all sorts of components on the market.” Milk-fat tests averaged 4.32% in 2025, up from 4.24% in 2024, while skim-solids hit 9.12%. More components per pound of milk means more product per pound of milk — and right now the market has more than it can absorb.

One critical distinction: USDA’s ERS puts the full economic cost for the largest operations (2,000+ cows) at $19.14/cwt. That figure includes imputed family labor at market wages and opportunity cost on owned land. Your cash-cost breakeven is typically $3–6/cwt lower, but the ERS number captures the real drain on family wealth, which is what matters when you’re asking whether to stay or go.

The Assumption That’s Breaking Down

For 40 years, “get big or get out” has been dairy’s operating principle. Scale solves margin problems. That was the thesis.

But when ERS data shows the most scaled herds in the country starting 2026 at $19.14/cwt against $18.95 milk, scale alone clearly isn’t solving it.

And some operations read that data and do the opposite of what conventional wisdom prescribes. A 500-cow herd strategically culled to 300 cows, captured strong cull revenue at historically high beef prices, slashed operating costs by 40%, and improved per-cow profitability by tightening management and focusing on its best genetics.

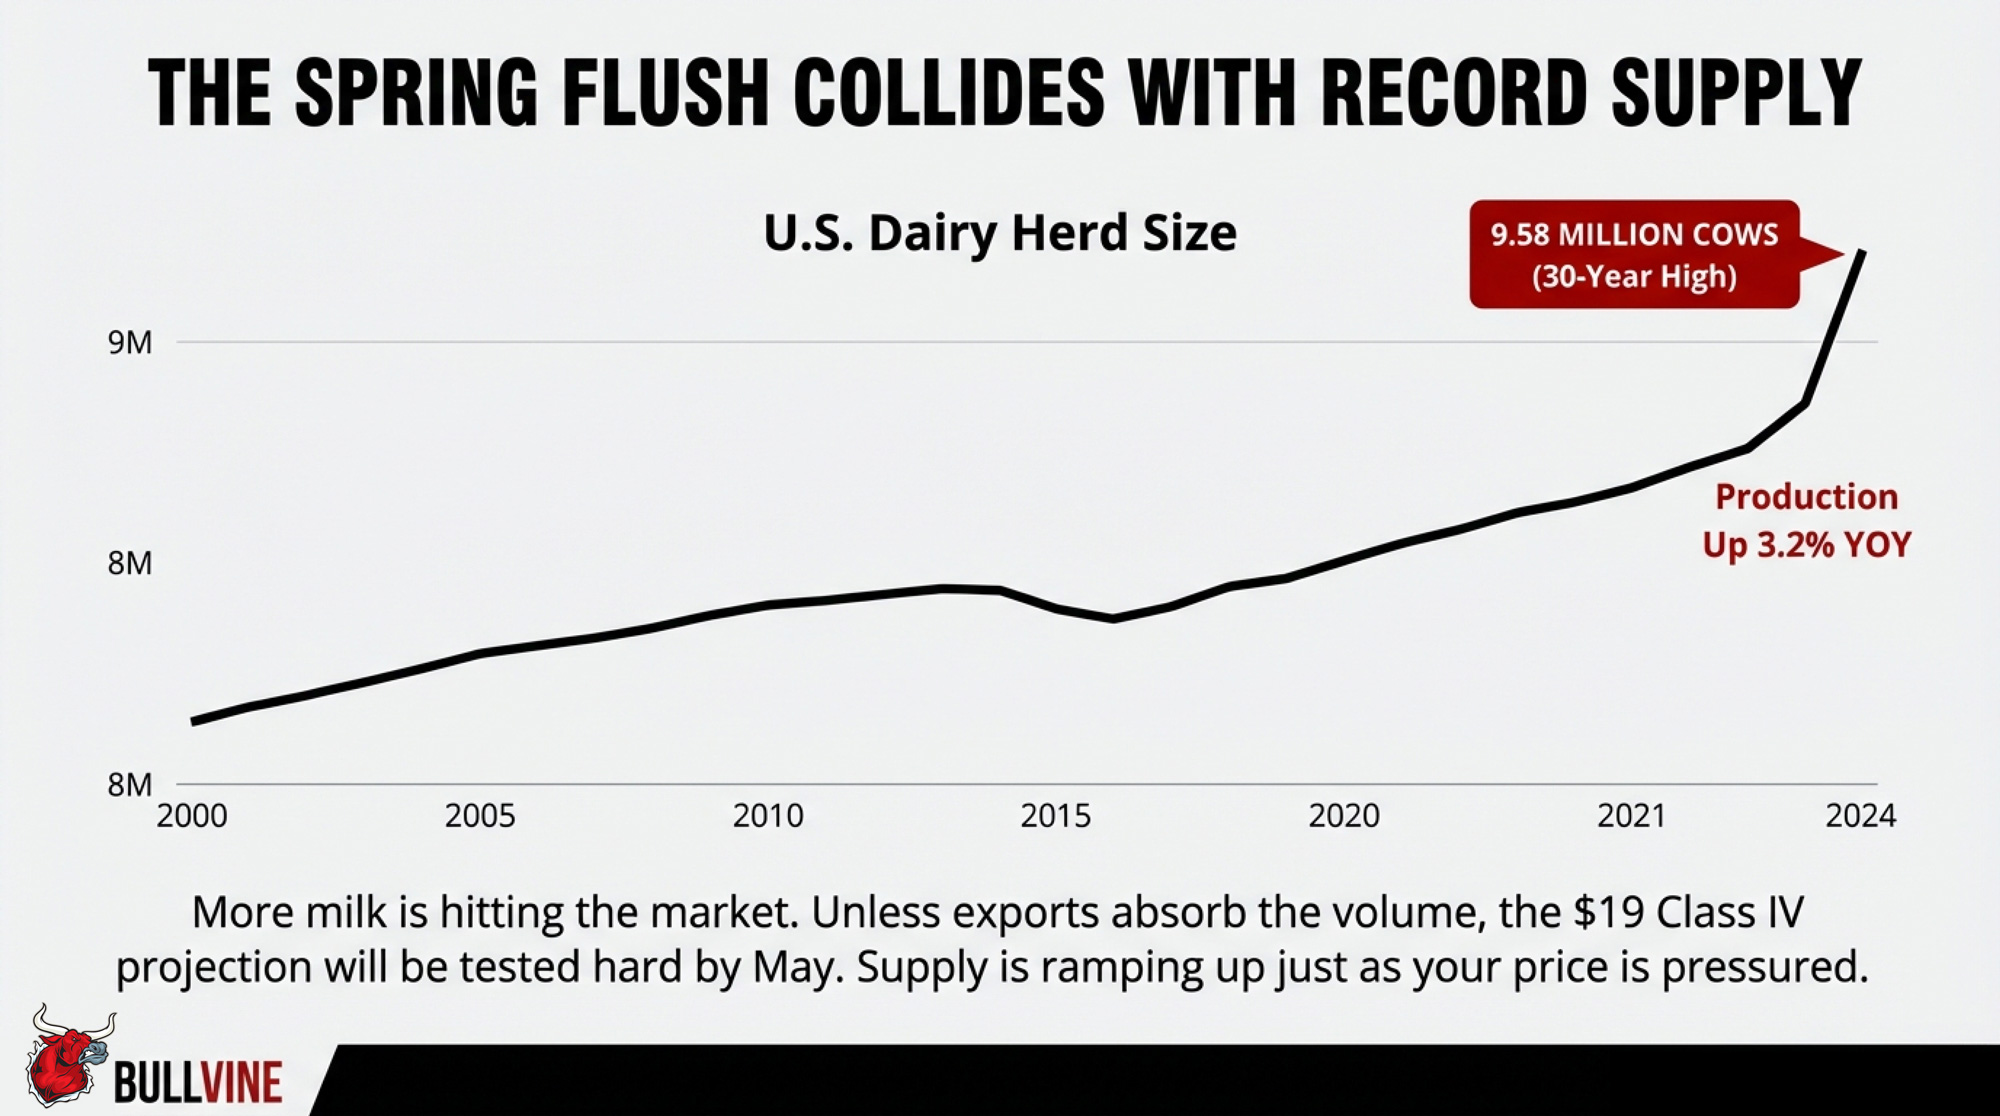
The ERS data also explains why the herd keeps expanding even as margins compress. In 2025, dairy farmers culled fewer cows and expanded the productive herd as new processing capacity came online — 2.81 million fresh cow additions against 2.64 million slaughtered. December’s dairy cow inventory hit 9.567 million head, up 212,000 from a year earlier.

More cows, more components per cow, more total milk — hitting a market already drowning in solids. The contrarian play in 2026 isn’t expansion. It’s strategic right-sizing paired with contract lock-in and cost discipline.

The $584/Cow Bridge to Q4

Before choosing a path — exit, downsize, pivot, or rebuild — you need time to consider it. And the fastest way to buy time without touching herd size, production, or capital is attacking feed shrink.

Dr. Mike Brouk at Kansas State laid it out at the Vita Plus Dairy Summit, and the math still holds: a 500-cow dairy running $7.50/cow/day in feed costs can capture $50,000 or more per year by reducing shrink just 4 percentage points. “Or we can reduce our feed shrink to gain $50,000,” Brouk said. “Comparatively speaking, capturing $50,000 from milk price alone for a 500-cow herd would require an additional 32 cents per cwt for the year.”

That 32-cents-per-cwt equivalent is the number that should stop you. It means shrink recovery at current margins is worth more than most of us will get from the futures curve over the next 6 months.

University of Minnesota Extension’s Jim Salfer documented even larger returns: a 100-cow dairy saves $58,400 annually when moving from high to low shrink—that’s $584/cow. Scale that to 500 cows, and you’re looking at $50,000–$80,000 in recoverable margin, depending on ration cost and starting shrink level.

Most operations run 8–12% total ration shrink. Well-managed herds hit 4% or less. Penn State’s Dr. Lisa Holden describes how the gap opens: procedural drift “creeps in like a fog and bad habits really take root like weeds.” On a 1,000-cow dairy running $8/cow/day ration cost, 8% shrink costs $233,600 annually — cutting it to 4% recovers half of that.

Joe Statz and his brothers showed what’s possible at scale. Their 4,400-cow operation near Marshall, Wisconsin, built a dedicated feed center — a 60,000-square-foot commodity barn with drive-through bays and a centralized mixing system — and dropped shrink from 10% to 2–3%, according to a 2018 Dairy Global report. The documented savings: over $500,000 per year in recovered feed value. Their nutritionist, Todd Follendorf from Cornerstone Dairy Nutrition in Waunakee, put it this way: “Shrink control has been the main reason why we built the whole facility.”

You don’t need Statz-level infrastructure. As The Bullvine reported in November, five targeted improvements — face management, scale calibration, ingredient tracking, right-sized bunkers, and refusal optimization — can recover $100,000+ annually on a large operation for an investment under $20,000.

Here’s why this matters for the survival math: $50,000–$80,000/year in recovered margin is the funding mechanism for whichever path you choose. It doesn’t fix a $287,500 shortfall. But it buys 2–4 months of additional runway — and in a year where the difference between strategic and forced exit is $280,000 in family equity, that extra runway is worth more than anything else you can do in the next 30 days without writing a check.

If you don’t have weighed shrink data from the past 90 days, that’s action item number one this week.

How Bad Is the Survival Math?

David Kohl, professor emeritus of agricultural economics at Virginia Tech, has been warning about the pressure this cycle is putting on lenders. Speaking at the Professional Dairy Producers of Wisconsin annual business conference: “Lenders will be under tremendous scrutiny from regulators this year.”

That scrutiny flows downhill. If your debt-service coverage ratio drops below 1.0, it can trigger technical default — even when payments are current.

Kohl’s metric for self-assessment: calculate your burn rate — how quickly working capital depletes. “You’d like to have a burn rate of 3½ years or more,” he says. “Determining your burn rate gives you some boundaries as to when you have to make some tough decisions. Murphy’s Law is merciless when you don’t have working capital.”

Below 2½ years? That’s what Kohl calls the red-light zone.

Here’s what exit timing looks like for a representative 500-cow operation carrying $2.5–3M in total assets against $1–1.5M in debt:

Exit TimingCow ValueEquipment RecoveryKey Action Requirement
Strategic (Q1–Q2 2026)~$1,850/headFull auction valueProactive lender audit by March
Forced (Late 2027)~$1,400/headDistressed/scrapWaiting for a call from the bank

These are illustrative scenarios for editorial purposes only. Actual values depend on herd genetics, health status, registration, market timing, and regional demand. Assumes Upper Midwest region, mixed owned/rented land, mid-life equipment. Consult your lender, accountant, or ag attorney for operation-specific analysis.

That $1,850/head figure depends heavily on what you’re selling. USDA’s October 2025 Agricultural Prices report showed the price received for milk cows hit a record $3,110 per head nationally. At Premier Livestock & Auctions in Pennsylvania, top-quality springing heifers fetched $2,850–$4,050 at the February 18 sale, with top-quality fresh cows bringing $3,000–$3,800. At their January 27 special heifer auction, open heifers in the 700–850 lb range hit $1,550–$3,000 per head.

But those prices went to cattle with verified quality. Commodity Holsteins with no papers and no genomic data sell at commodity prices. Genomic testing runs roughly $45 per calf and generates about $34 in additional profit per cow per year through better culling and selection decisions. In an exit scenario, that $45 test becomes the difference between your dispersal attracting genetics buyers at $2,850+ per head versus commodity buyers bidding $1,400.

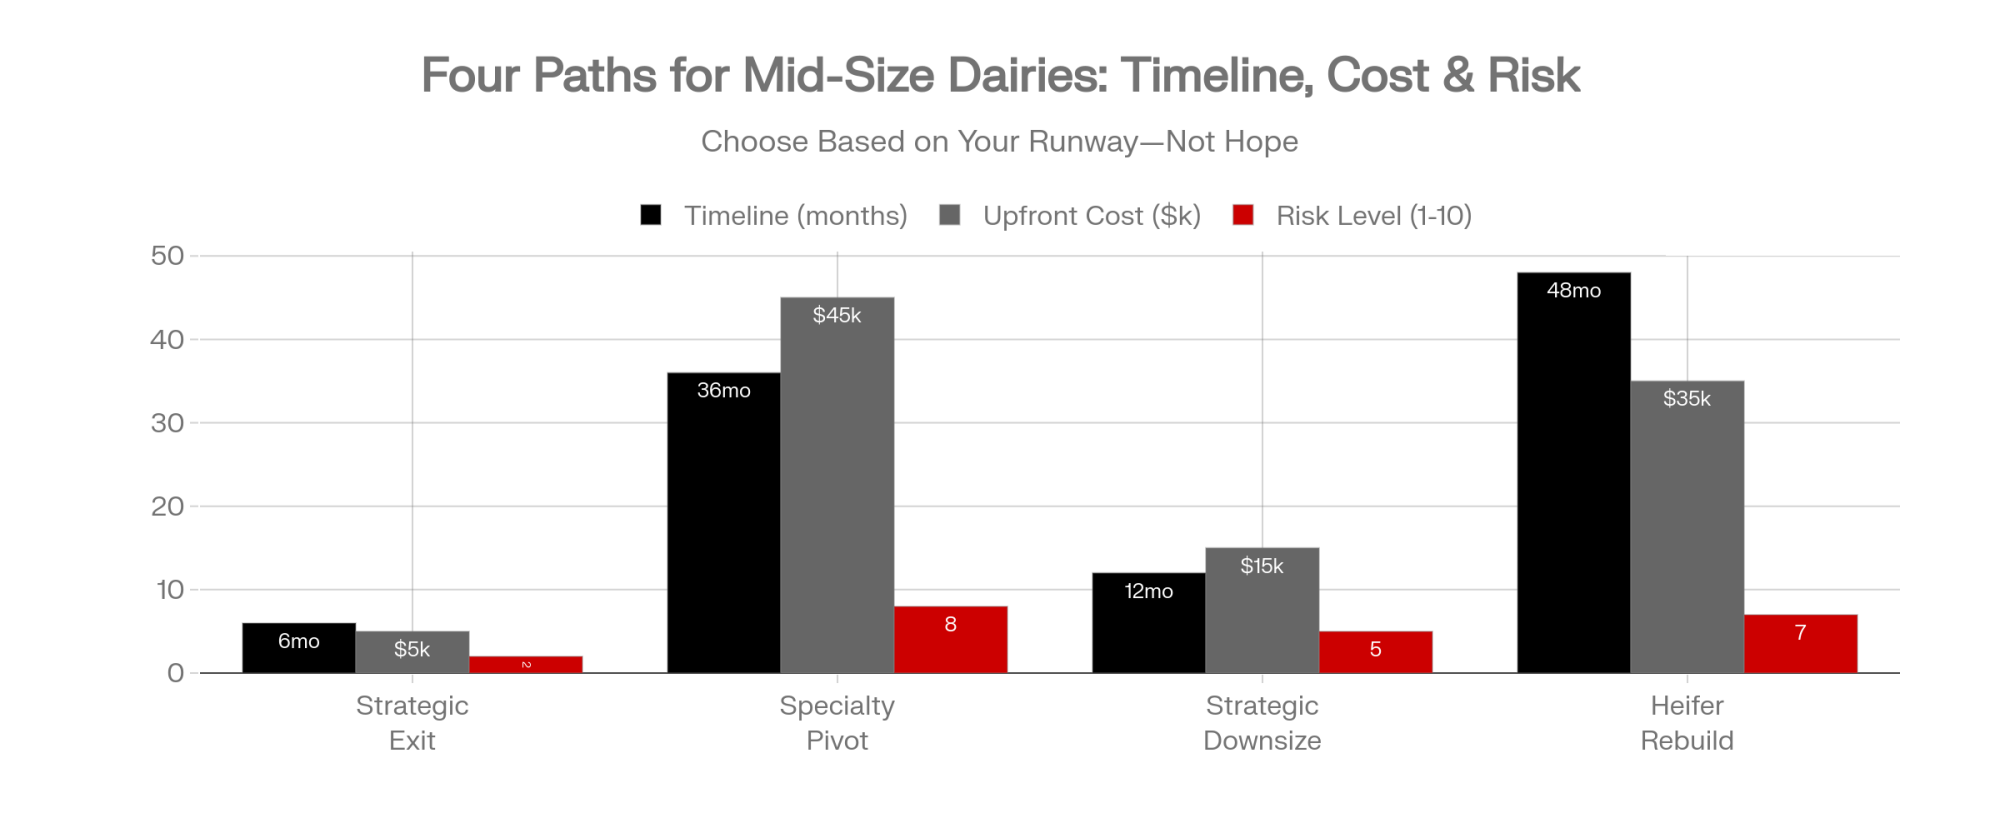
Four Paths — and What Each One Costs

Path 1: Strategic Exit While Asset Values Hold

  • When it fits: DSCR trending below 1.0, burn rate under 2½ years, debt-to-asset above 50%, no succession plan
  • What it requires: Decision by Q2 2026, proactive lender conversation, 6–12 months for proper real estate and cattle marketing, and genomic testing of the herd before the dispersal
  • Where it backfires: Waiting until forced sale can destroy $200,000+ in recoverable equity — and that spread widens when auction markets get crowded
  • Tax angle: Chapter 12 bankruptcy provisions can allow qualifying family farm operations to restructure certain capital gains tax obligations as unsecured debt — consult an ag attorney for specifics

The Wisconsin family we opened with? They chose this path — and started genomic testing the same week they called their lender.

Path 2: Pivot to Specialty/Premium Markets

  • When it fits: Strong component genetics, willingness to reduce herd size, regional processor relationships
  • What it requires: Organic certification (3-year transition), A2 genetic testing (~$40/cow), identity-preserved handling
  • Where it backfires: Premium markets have capacity limits — not everyone can pivot simultaneously.

Path 3: Strategic Downsizing with Contract Lock-In

One Northeast producer interviewed by The Bullvine reduced herd size by roughly 20% in late 2025 and saw per-cow profitability improve as labor costs dropped faster than revenue. Tighter management of fewer, better animals made the difference.

  • When it fits: Labor costs consuming disproportionate margin, cull values historically elevated, processor relationships strong
  • What it requires: Multi-year component premium contracts negotiated before mid-2026
  • Where it backfires: If processor contracts don’t materialize, you’ve shrunk without securing the premium position.
  • Why the window exists: Billions in new processing capacity needs committed milk, but replacement heifer inventories dropped to just 3.905 million head as of January 1, 2026 — that’s 40.8% of productive cows, down from 41.7% a year earlier. CoBank projects this won’t rebound before 2027. That mismatch gives producers unusual contract leverage — for now.

Path 4: Internal Heifer Rebuild

  • When it fits: Currently heavy on beef-on-dairy, strong genetic base, 3–5 year time horizon
  • What it requires: Cutting beef-on-dairy to the bottom 10–15% of the herd, sexed dairy semen on top genetics, accepting 3–4 years of reduced beef-calf revenue
  • The replacement math: Internal rearing costs sit around $2,034/head for Pennsylvania farms and $1,709/headin the Midwest, per Penn State Extension data updated December 2025 (range: $1,411–$2,301). Compare that to $2,850–$4,050 for purchased springers at Premier Livestock’s sale on February 18. The per-head advantage is significant — but raising your own takes 24–26 months to show up in the milking string. The Bullvine’s February analysis of the national heifer paradox — 9.57 million cows, just 3.91 million replacements — shows why the external market isn’t getting easier anytime soon.

Signals That Tell You Which Way This Goes

Class III futures for fall 2026. March Class III closed at $16.42 on February 26. USDA’s annual Class III forecast sits at $16.65 — just 23 cents above where the front month settled. The back half has to do most of the heavy lifting to deliver even that modest average. If September–December contracts move above $18.50 by mid-year, the survival math loosens. They’re currently near the $18.35–$18.46 range — right at the edge, not safely above it.

Culling pace. ERS reports dairy cow slaughter is running above year-ago levels in the first four weeks of 2026, even though the herd is 212,000 head larger. Farmers retained older cows through 2025 to sustain output — now they’re culling them. If culling accelerates, the herd will shrink faster than expected, and milk prices could firm in H2.

Your shrink audit results. If the 90-day measurement comes back at 10%+ and your ration runs $7–8/cow/day, you’re sitting on $50,000–$80,000 in recoverable margin. The Statz Brothers documented it. Brouk at Kansas State calculated it. You can capture it before Q3 — and it funds whichever path you choose.

DMC enrollment. The 2026 Dairy Margin Coverage program, reauthorized through 2031 under the One Big Beautiful Bill Act, closed enrollment on February 26. Tier I coverage now extends to 6 million pounds. December 2025’s margin fell to $9.42/cwt — below the $9.50 trigger — producing the only indemnity payment of the year.

DMC isn’t free money — premiums eat into the payout, and if you’re already locked into forward contracts or carry strong component premiums, the incremental protection may be thin. But for operations running on straight Class III with no hedge, it’s a floor worth having at these margin levels.

What $18.95 Milk Means for Your 500-Cow Operation

TimelineAction ItemWhy It MattersSuccess Metric
This WeekCalculate burn rate: Working capital ÷ monthly shortfallKohl says minimum 3.5 years; below 2.5 years = red-light zoneKnow exact months of runway
This WeekStart measuring feed shrink with actual weightsDifference between 10% and 4% = $50k–$80k/year on 500 cowsBaseline shrink % documented
This WeekConfirm DMC enrollment status (closed Feb 26)December 2025 already triggered $9.42 indemnity—early 2026 could repeatCoverage locked or opted-out decision made
By March 31Stress-test cash flow at $16.50 milk (H1) and $17.50 (H2)January came in at $14.59; March futures at $16.42—if you assumed $19+, you’re wrongUpdated 2026 projections with real futures data
By March 31If considering exit within 18 months: Order genomic testing now$45/head test = difference between $2,850+ genetics buyers vs. $1,400 commodity biddersHerd genomically profiled before dispersal
By March 31Schedule proactive lender auditWisconsin family who exited strategically preserved $480k; neighbors who waited: under $200kMeeting scheduled—on your timeline, not theirs
By June 30Pull full economic cost of production (include market-rate family labor, depreciation, interest)Lender cares about cash cost; family wealth depends on full economic figure—know bothBoth numbers calculated and validated
By June 30Commit to a path: Lock contracts if fighting through, finalize marketing timeline if exitingHeifer shortage window won’t stay open indefinitely—processor leverage exists nowContract signed OR exit timeline finalized
By Dec 31Evaluate whether H2 deliveredIf Sept–Dec Class III average < $18, your 2027 plan needs to start now—not in JanuaryDecision: continue, pivot, or exit

This week:

  • Calculate your burn rate. Working capital ÷ monthly cash shortfall = months of runway. Kohl says you want a minimum of 3½ years. Below 2½ years, you’re in the red-light zone. That single number determines whether you’re choosing your path — or having it chosen for you.
  • Start measuring feed shrink — with actual weights. The difference between 10% and 4% represents $50,000–$80,000 annually on a 500-cow operation. Fastest path to bought time.
  • Confirm your DMC enrollment status. December 2025 already triggered an indemnity at $9.42 — early 2026 could do the same.

By the end of March:

  • Stress-test your cash flow at $16.50 milk through June, $17.50 through December. January came in at $14.59. March futures closed at $16.42. If your projections assumed $19+ milk, they’re wrong. Redo them.
  • If you’re considering an exit within 18 months, order genomic testing now. At $45/head, it’s cheap equity insurance. Schedule the lender audit for March — before they call you.

By June:

  • Pull your full economic cost of production. Include market-rate family labor, depreciation, and interest at current rates. Your lender cares about cash cost; your family’s long-term wealth depends on the full economic figure. Know both numbers.
  • Commit to a path. Lock in processor contracts if you’re fighting through. Finalize your marketing timeline if you’re exiting. The producer leverage window created by the heifer shortage won’t stay open indefinitely.

By December:

  • Evaluate whether H2 was delivered. If the September–December Class III average is below $18, your 2027 plan needs to start now—not in January.

Key Takeaways

  • If your full economic breakeven sits above $19/cwt, USDA’s $18.95 all-milk forecast doesn’t save you.March Class III closed at $16.42 on February 26. The futures curve says H1 2026 is significantly worse than the annual average implies.
  • Decision timing determines equity preservation. The gap between a Q1 strategic exit and a late-2027 forced liquidation can exceed $200,000 in a representative 500-cow scenario. Verified genetics pushes the strategic number toward the top of the range.
  • Feed shrink is your 90-day bridge — not your solution. Kansas State puts recoverable savings at $50,000+ for a 500-cow herd. The Statz Brothers captured over $500,000 annually on 4,400 cows. That buys runway. Use it to fund a path choice, not to delay one.
  • “Get big or get out” is becoming gospel. One Northeast producer improved per-cow profitability by reducing herd size roughly 20%. Another went from 500 to 300 and saw the same pattern. The math worked because the downsizing was strategic — paired with cost discipline and a focus on the best genetics in the herd.

The Bottom Line

That Wisconsin family didn’t have better genetics or cheaper feed than their neighbors. They had a timeline, a spreadsheet, and the willingness to believe what the numbers showed.

Where does your real breakeven sit against $18.95 milk? And how many months does Kohl’s formula say you’ve got?

This article is intended for informational purposes only and does not constitute financial, legal, or tax advice. Data, projections, and scenarios are based on publicly available information as of February 26, 2026, and should not be relied upon as the sole basis for business decisions. Consult qualified professional advisors for guidance specific to your operation.

Complete references and supporting documentation are available upon request by contacting the editorial team at editor@thebullvine.com.

Learn More

The Sunday Read Dairy Professionals Don’t Skip.

Every week, thousands of producers, breeders, and industry insiders open Bullvine Weekly for genetics insights, market shifts, and profit strategies they won’t find anywhere else. One email. Five minutes. Smarter decisions all week.
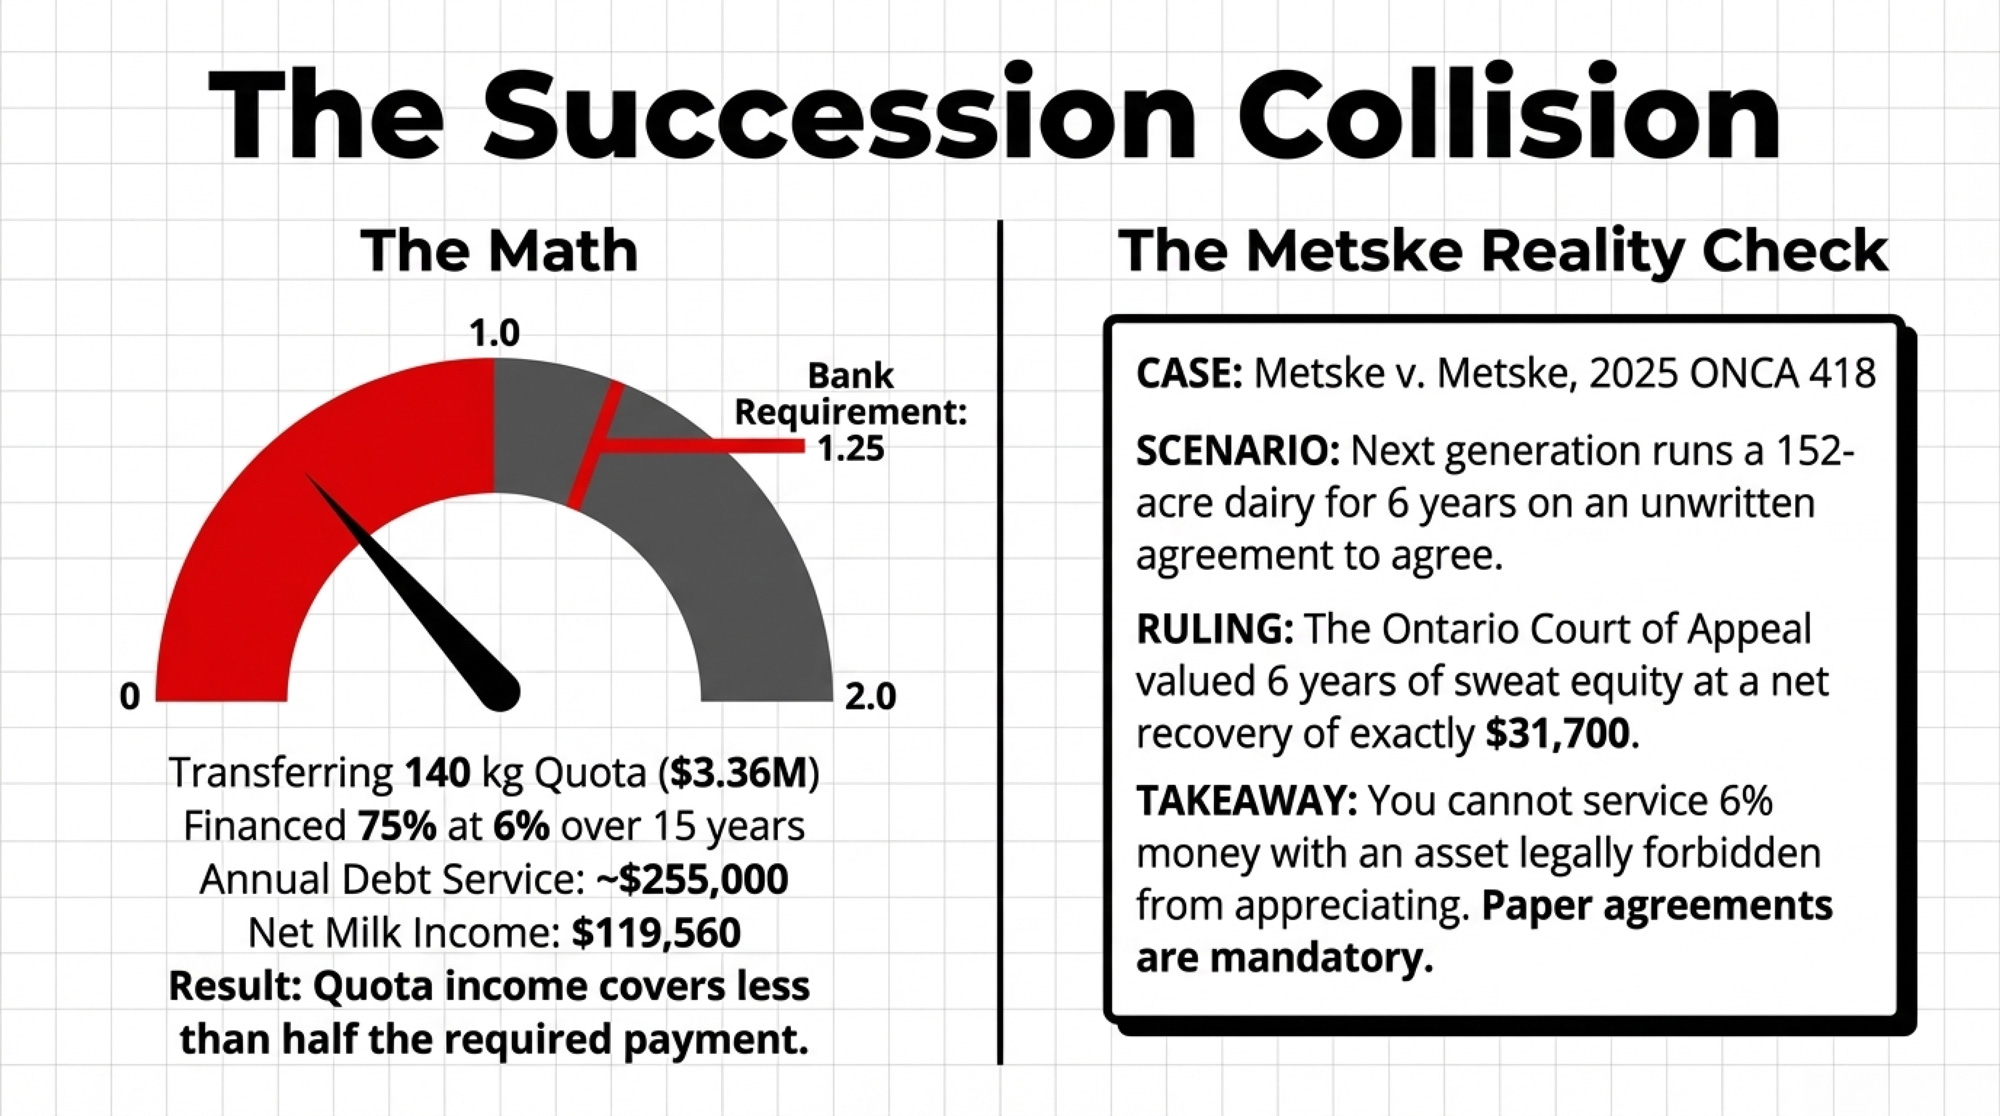
NewsSubscribe
First
Last
Consent

The $3 Milk Trap: How 2026’s Class III–IV Spread Becomes a $382,000 Hit on a 500-Cow Milk Check

One month of DMC at $9.50 could pay several years of premiums. The deadline is Wednesday. Have you actually run the math?

Executive Summary: January’s Class III price fell to $14.59/cwt while March Class IV futures climbed to $19.50, creating a $2.99/cwt spread that works out to about $382,000/year on a 500‑cow herd shipping 70 lbs/cow/day. That gap sits atop June 2025 make‑allowance changes that already skimmed roughly 90¢/cwt from producer checks and is being widened by a global butterfat shortage, a tight U.S. powder market, and a new $75 million USDA butter buy. At the same time, the U.S. dairy herd has grown to 9.58 million cows, the largest in more than 30 years, setting up a spring flush that could pressure prices unless Section 32 purchases and exports keep absorbing product. The one clear positive is Dairy Margin Coverage: with a projected January margin of $7.52/cwt, $9.50 coverage throws off about $1.98/cwt on Tier 1 milk, so a single month’s payment can cover several years of premiums. For a 500‑cow dairy, each combined 0.1% gain in butterfat and protein now adds roughly $46,400/year, making components one of the few levers that improve cash flow without new capital. This article doesn’t just recap those numbers; it walks through barn‑level math and a 30/90/365‑day playbook for lining up DMC enrollment, DRP weighting, component strategy, and Section 179 planning with $16–$17 Class III, not a rosy futures average. It ends with a hard question every producer has to answer: where does your breakeven sit relative to $16.51 Class III, and what are you going to do about it before the DMC window closes?

January’s FMMO Class III price landed at $14.59/cwt — down $1.27 from December and the lowest since July 2023’s $13.77. Part of that’s structural: USDA’s June 2025 make-allowance increases shifted roughly 90¢/cwt from producer checks to processor cost recovery. But the bigger story is what happened on the other side of the class divide.

March Class IV futures settled at $19.50/cwt on February 20 — the same day March Class III settled at just $16.51. That’s a $2.99/cwt same-month spread. Nearly three dollars separating what your milk is worth as butter and powder versus cheese, on the same contract month.

That kind of gap doesn’t just show up on a chart. It shows up on your milk check, your DRP election, and your cash-flow projections for the next 90 days.

Consider a 500-cow freestall shipping 70 lbs/cow/day — the kind of Upper Midwest operation that entered 2026 staring at roughly $90,000 less operating margin than it had the year before. That was before the Class IV spread blew open. Now the question isn’t just “are margins tight?” It’s “which side of the Class III/IV line is your milk landing on?”

$263 Million in Section 32 Purchases — and the Spread Just Got Wider

For that 500-cow operation already staring at a $2.99 class gap, USDA just added fuel to the fire.

On February 19, Secretary of Agriculture Brooke Rollins announced a $263 million Section 32 purchase of dairy and agricultural products. Of that, $148 million goes to dairy — matching the number NMPF requested in late 2025.

The dairy breakdown:

  • $75 million in butter — the first major USDA butter purchase in five years
  • $32.5 million in Cheddar cheese and cheese products
  • $10 million in Swiss cheese
  • $20.5 million in fresh fluid milk
  • $10 million in UHT milk

Traders pushed several CME butter contracts to their daily upper limits on Thursday and Friday. The irony isn’t subtle: a program designed to improve food affordability could temporarily tighten commercial butter supplies and push prices higher. Rush the purchases, and you squeeze an already tight market. Spread them out, and the impact fades. Either way, it lit a fire under Class IV futures that isn’t going out this week.

What Does a $2.99/cwt Class Spread Mean for a 500-Cow Dairy?

The headline number means nothing without per-cow math. So let’s walk it.

A 500-cow herd averaging 70 lbs/cow/day ships roughly 255.5 cwt/cow/year, or about 127,750 cwt annually for the operation.

At March Class IV of $19.50/cwt, that’s approximately $2,491,000 in gross milk revenue annualized at that price. At March Class III of $16.51, it’s roughly $2,109,000.

The same-month gap: $382,000/year. About $31,800/month. $63.66/cow/month.

April’s spread narrows. April Class III settled at $17.30 on February 20, while April Class IV held at $19.50 — a $2.20/cwt spread, or about $281,000 annualized. The futures curve expects some Class III recovery. But March is what’s hitting checks right now.

And no herd receives a pure single-class check. Your milk check is a blend, weighted by your handler’s utilization decisions and the pool. When Class IV runs this far above Class III, depooling accelerates — handlers pull Class IV milk out of the pool because it’s more profitable outside. In Federal Order 30 (Upper Midwest), pooled Class IV producer milk totaled just 1.4 billion pounds in 2025, even as butter and powder production ran strong. Handlers kept that high-value milk outside the pool, and the blend price for everyone who stayed pooled took the hit.

MetricMarch Class III ($16.51/cwt)March Class IV ($19.50/cwt)
Annual Production (500-cow herd, 70 lbs/day)127,750 cwt127,750 cwt
Gross Milk Revenue (annualized at this price)$2,109,000$2,491,000
Annual Revenue Gap+$382,000 🔴
Monthly Revenue Impact$175,750$207,583
Monthly Gap+$31,833 🔴
Per-Cow Monthly Revenue$292.92$345.14
Per-Cow Monthly Gap+$52.22 🔴

Run your own numbers. If the gap between your handler’s blend and what you’d get at pure Class IV pricing is more than $1.50/cwt, the rest of this article matters more to your operation than most.

Three Forces That Won’t Let the Spread Self-Correct

For that 500-cow operation watching the spread widen, three structural drivers suggest it isn’t cooling off by April.

Global fat shortage. GDT Event TE398 — the fourth consecutive price increase — saw butter jump 10.7% to $6,347/MT. Anhydrous milk fat climbed 3.8% to $6,751/MT. Butterfat is tight worldwide, not just in the U.S.

U.S. powder premium over world price. CME spot NDM surged to $1.685/lb during the week ending February 20 — the highest since mid-2022. That sits well above the GDT SMP equivalent of roughly $1.44/lb protein-adjusted. The U.S. powder market is especially tight, and it’s dragging Class IV higher.

Government demand is stacked on top. The Section 32 butter buy adds $75 million in new purchasing power to a market already rationed by price. That’s demand creation at the worst possible moment for anyone hoping Class IV cools off.

CME spot butter jumped 16.5¢ to $1.87/lb for the week, a five-month high. Spot cheddar blocks rose 11¢ to $1.4975/lb — competitive, but nowhere near the butterfat rally. Whey fell 4¢ to $0.68/lb, bucking the trend entirely.

The Spring Flush Math Just Got Worse

That same 500-cow herd’s spring production ramp is about to collide with the largest national herd in over 30 years.

USDA’s January Milk Production report, released February 20, showed total U.S. production at 19.8 billion pounds, up 3.2% year-over-year. The herd itself reached 9.58 million head — up 189,000 cows from January 2025, up 14,000 from December, and the highest total since 1993.

Growth concentrated in the Great Lakes, Texas, and the Northern Plains. Kansas alone added 45,000 cows year-over-year. Wisconsin added 20,000, Idaho 22,000, and Michigan 15,000. On the other side: Washington lost 17,000, Pennsylvania shed 11,000, and New Mexico dropped 8,000. California’s per-cow yields surged 4.6% — from 1,960 to 2,050 lbs/cow in January — with avian influenza fully cleared.

More milk hitting the market should, in theory, ease commodity prices. But the butterfat complex isn’t responding to supply signals the way cheese is. If Section 32 purchases and export demand don’t absorb the extra volume, the futures curve’s $19+ Class IV projection gets tested hard by May, and the spread could narrow from the wrong direction.

But One Thing Already Broke in Their Favor: DMC

Here’s the turn for that 500-cow operation. The safety net they may have treated as an afterthought in 2025 just became the most important enrollment of the decade.

December 2025’s Dairy Margin Coverage margin came in at $9.42/cwt, triggering the first and only payment of 2025 — a thin $0.08/cwt. January doesn’t look thin.

The Center for Dairy Excellence projects the January margin at $7.52/cwt. At $9.50 coverage, that’s a $1.98/cwt indemnity. On 5,000 cwt of monthly Tier 1 production (a 6-million-pound annual allocation), that’s roughly $9,900 in a single month — enough to cover the full year’s premium several times over.

NMPF’s William Loux confirmed the direction: he expects DMC payments through the first quarter and probably through the first half of the year.” USDA projects margins below $9.50/cwt through July.

Enrollment closes February 26. Under the One Big Beautiful Bill Act:

  • Tier 1 expanded from 5 million to 6 million pounds — covering herds up to roughly 250–350 cows at the $0.15/cwt premium for $9.50 coverage.
  • Highest production year from 2021–2023 becomes your new baseline.
  • Six-year lock-in (2026–2031) earns a 25% premium discount — roughly $40,000 in savings on a 300-cow operation over the commitment.

The trade-off is real. You’re committed through 2031 regardless of where margins go. If margins recover to $12+ by 2027, you’re paying premiums on coverage you won’t trigger. But at $7.52 projected margins in January, the payback math is aggressive. If you haven’t enrolled, the decision framework is here.

Components: Where the Real Money Hides at $14.59 Milk

January FMMO component prices tell the story: butterfat at $1.4525/lb and protein at $2.1768/lb. In a $14.59 Class III environment — made worse by the June 2025 make-allowance hike that shifted roughly 90¢/cwt to processor cost recovery — components are the difference between breaking even and bleeding cash.

Component ImprovementAdditional Production (lbs/year)FMMO Price ($/lb)Annual Revenue Gain
0.1% Butterfat12,775 lbs$1.4525/lb+$18,556 🔴
0.1% Protein12,775 lbs$2.1768/lb+$27,809 🔴
Combined 0.1% BF + Protein25,550 lbs+$46,365 🔴
Per-Cow Monthly Impact (500-cow)+$7.73/cow 🔴

Here’s the math on a 500-cow herd shipping 12.775 million lbs/year:

  • Each 0.1% butterfat improvement: 12,775 lbs additional BF × $1.4525/lb = $18,556/year
  • Each 0.1% protein improvement: 12,775 lbs additional protein × $2.1768/lb = $27,809/year
  • Combined 0.1% gain in both: roughly $46,400/year — or $7.73/cow/month

If you’re below 4.0% fat and 3.1% protein, talk to your nutritionist this week. The herds making component gains aren’t spending more per cow — they’re tightening transition protocols, adjusting TMR formulations, and managing bunk time. Those are $46,000 improvements at the cost of management attention, not capital.

What This Means for Your Operation

This week — before February 26:

  • DMC enrollment. At the projected January margin of $7.52/cwt, one month’s indemnity at $9.50 coverage equals $1.98/cwt across your Tier 1 production. USDA projects margins below $9.50 through July. The deadline is Wednesday.
  • DRP weighting review. With a $2.99/cwt same-month Class III–IV spread, your election weighting is the single highest-dollar decision you’ll make this quarter. Call your risk management advisor this week.

Next 90 days — through the spring flush:

  • Model cash flow at $16–$17 Class III, not the $18.95 annual WASDE average. Your March and April checks reflect January and February commodity prices, which were ugly. If your all-in cost of production sits above $18/cwt, model your cash reserve at $16 Class III for Q1 and count the months of runway.
  • Pull your handler’s utilization report. In Federal Order 30, Class IV depooling thinned the pool all through 2025. If you don’t know where your milk is classified, you can’t evaluate whether this spread is working for or against you.
  • Push components hard. At January’s $1.4525/lb butterfat and $2.1768/lb protein, each tenth of a percent in BF and protein combined is worth $46,400/year on a 500-cow herd. Talk to your nutritionist about transition cow protocols and bunk management — that’s where the cheapest gains live.

By year-end:

  • Section 179 planning. The OBBBA raised Section 179 expensing to $2.5 million with 100% bonus depreciation through 2030. But borrowing to buy equipment to save on taxes only works if you can service the debt at $16 milk. Run those numbers with your accountant before your lender does.
  • Watch the July USMCA review. The mandatory six-year joint review hits July 1, 2026. Canada and Mexico bought $3.6 billion in U.S. dairy in 2024 — roughly 44% of the $8.2 billion total export value that year. In 2025, U.S. dairy exports surged to a confirmed $9.51 billion, nearly matching the $9.54 billion record set in 2022. But Canada’s TRQ fill rates still average just 42%. NMPF’s Shawna Morris argues that Canada remains “technically compliant with USMCA’s text, commercially limiting in practice.” If you’re in a co-op with significant North American export exposure, the July outcome shapes your 2027 milk price more than anything on the CME right now.

Key Takeaways

  • If your handler’s blend is more than $1.50/cwt below a pure Class IV value, this spread is actively costing your herd real money.
  • At $7.52/cwt projected January margin, one DMC indemnity month at $9.50 can pay several years of premiums on your Tier 1 volume — but only if you’re enrolled before February 26.
  • Each combined 0.1% gain in butterfat and protein is worth about $46,400/year on a 500-cow herd at today’s component prices.

The Bottom Line

The futures curve says relief is coming. Your January check says it hasn’t arrived yet. That 600-cow Wisconsin freestall operation profiled in The Bullvine’s January analysis — the one facing a $250,000 margin gap between full cost of production and what 2026 futures actually deliver? They stress-tested at $16 milk, trimmed 50–75¢/cwt from their breakeven through tighter heifer programs and lease renegotiations, and showed their lender a plan built off conservative numbers. The lender, seeing they were budgeting off realistic prices and actively adjusting, worked with them on amortization flexibility.

The producers who come out of this spring in good shape won’t be the ones who waited for $19. They’ll be the ones who ran their numbers at $16 and made decisions accordingly.

Where does your breakeven sit relative to $16.51 Class III? That’s the only number that matters this week.

Complete references and supporting documentation are available upon request by contacting the editorial team at editor@thebullvine.com.

Learn More

The Sunday Read Dairy Professionals Don’t Skip.

Every week, thousands of producers, breeders, and industry insiders open Bullvine Weekly for genetics insights, market shifts, and profit strategies they won’t find anywhere else. One email. Five minutes. Smarter decisions all week.
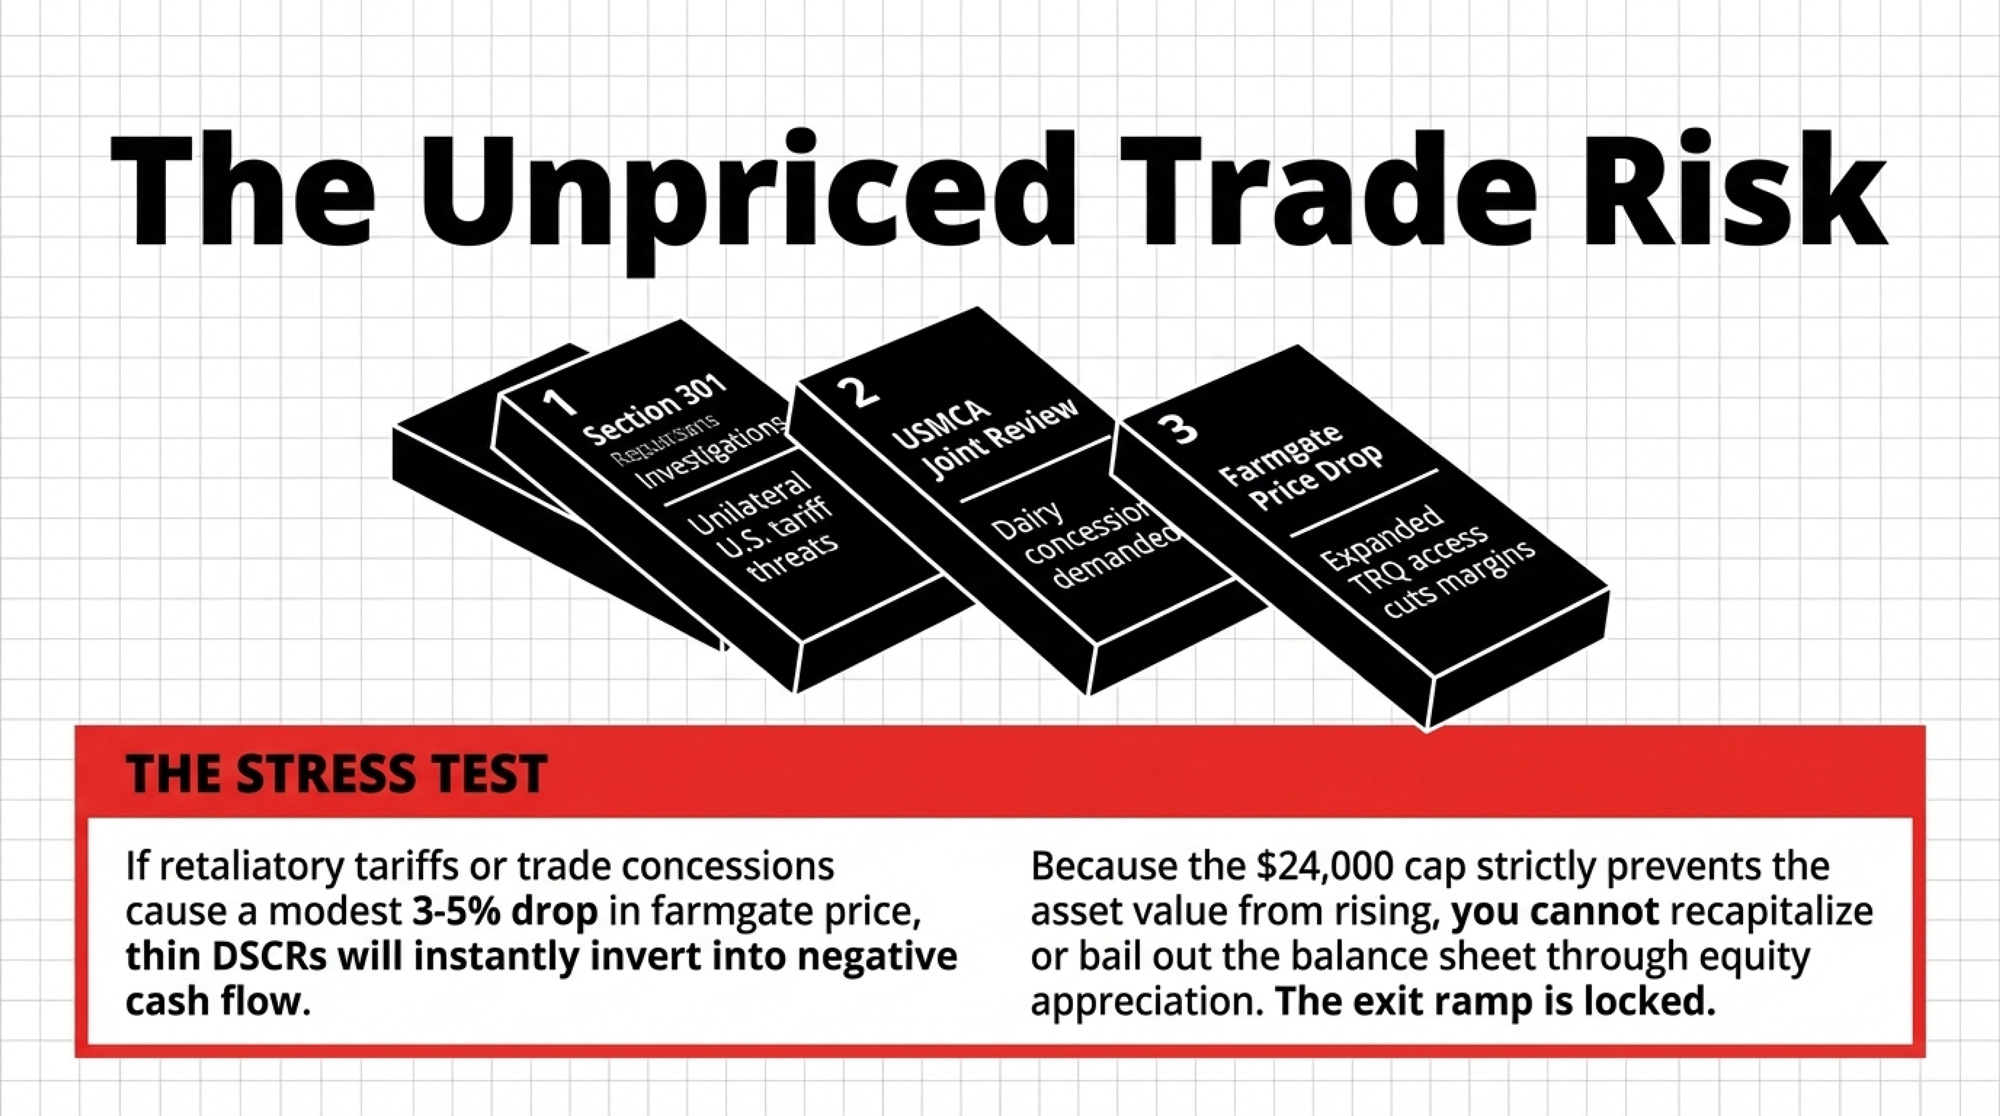
NewsSubscribe
First
Last
Consent

Idaho’s $3.87 Billion Edge: Why Geography Is Beating Management in the West Coast Dairy Wars

The Reynolds family bet half their Idaho farm on dairy. An Oregon neighbor did everything “right” and still bleeds cash. The gap? Up to $600,000 a year in geography, not effort.

Executive Summary: You’re not imagining it — Idaho’s dairy families aren’t just getting lucky, they’re starting every year about $600,000 ahead of similar herds in Oregon and Washington because of feed, labor, and plant math they don’t control. Through the Reynolds family’s R 7 Dairy and the Kircher/Bansen Forest Glen operations, you see how cheap hay, no ag overtime, and billion-dollar-class processing investments in Idaho created a structural edge of $3.10–$4.25/cwt, while Darigold’s $300 million Pasco overrun and $4.00/cwt deductions pushed many Washington members into survival mode. Even a 2,200-cow organic A2 Jersey herd with grazing, a digester, and strong contracts can’t fully outrun a bad zip code once organic feed, overtime rules, and processor margins stack up. This piece doesn’t stop at sympathy; it gives you three concrete paths in a high-cost state — spend millions on robots and automation, pivot hard into ultra-premium contracts, or plan a relocation/exit on your terms instead of the bank’s. It also shows how CDCB’s 2025 Net Merit update — more weight on Feed Saved and fat, less on protein — quietly shifts sire selection from “nice to have” traits to survival filters if you’re fighting high costs. In plain language, it explains why geography now sets your floor, why management and genetics still decide your ceiling, and what decisions you actually have left if your zip code is working against you.

Idaho Dairy Edge

Dave Reynolds didn’t come from dairy. He came from row crops — 2,200 acres of sweet corn seed, silage, wheat, barley, sugar beets, and alfalfa near Kuna, Idaho. He was, by his own admission, “less comfortable with animals.” But his son Tyler took dairy science courses at the University of Idaho and saw what his father couldn’t: the crops they already grew were essentially a dairy ration in the ground. The cows were the missing piece.

When a small dairy nearby went to auction in 2012, every established operator in the valley passed. “For the big dairymen, it was way too old, way too little,” Dave told Capital Press (May 28, 2025). Tyler convinced his father to buy in anyway. They named the dairy R 7 — for the seven members of the Reynolds family.

Today, R 7 Dairy milks more than 700 cows, and dairy accounts for “over half of our business,” Tyler said. “If you include the byproduct beef calves off of it, it’s stronger than that.”

Three hundred miles west in Dayton, Oregon, Robert Kircher and farm owner Dan Bansen run Forest Glen Farms — 2,200 Jersey cows across two operations, certified organic since 1997, shipping specialty milk to Nancy’s Probiotic Foods and Costco’s A2 program. They manage over 1,000 acres of irrigated pasture and 2,000 acres of organic cropland. A 370-kilowatt anaerobic digester generates 3.1 million kilowatt-hours a year for Portland General Electric. By every operational measure, Forest Glen is a textbook.

Here’s what Kircher told Capital Press: “It’s been pretty tough. We’re getting near to what we were seeing pricewise in 2014. But 10 years ago, all your costs were a lot lower.”

The gap between these two operations isn’t inside the parlor. It’s everything outside it.

Idaho’s $3.87 Billion Flywheel

Idaho generated $3.87 billion in dairy farm-gate receipts in 2024 — up 12% from $3.46 billion the year before, according to USDA data cited by the Idaho Farm Bureau (September 2025). Idaho produced 17 billion pounds of milk from 671,000 cows, averaging 25,375 pounds per head — roughly 1,200 pounds above the national per-cow average of 24,178 pounds. Through the first half of 2025, Idaho milk output ran about 7% ahead of the prior year, according to the Idaho Dairymen’s Association.

Texas edged past Idaho for the #3 national production slot in 2024. Rick Naerebout, CEO of the Idaho Dairymen’s Association, told Capital Press he’s confident Idaho will reclaim it — pointing to water constraints already limiting Texas expansion.

The West Coast tells a different story. California’s production dipped in 2024, partly from H5N1 disruptions. Oregon’s output fell 4% to 2.5 billion pounds, cow numbers dropped to 117,000, and the state’s milk value sat at $596 million. U.S. total production was 225.9 billion pounds — down 2% — even as total milk value rose 11% to $50.9 billion.

The Feed Gap No Nutritionist Can Close

You already know feed is your biggest cost. What you might not know is how wide the regional spread has gotten.

National alfalfa hay averaged about $172 per ton in September 2024 (Hoard’s Dairyman, December 2024). The USDA Direct Hay Report showed Good-quality Idaho alfalfa at $190 per ton FOB in late 2025 (USDA AMS, January 4, 2026). For context, NASS reported the 2024 Idaho alfalfa average at $153 per ton — the $190 spot price reflects seasonal and quality variations in the January market. At the Wolgemuth Hay Auction in Leola, Pennsylvania, premium alfalfa/grass mix sold at $320 to $405 per ton — averaging $366 — while premium straight alfalfa brought $305 to $330 (USDA AMS Hay Auction Report #1725, January 14, 2026).

 Idaho (Magic Valley)Pennsylvania (East)Gap
Alfalfa hay, $/ton$190 FOB$305–$405 (avg $366)$115–$215/ton
SourceUSDA AMS Direct Hay, January 4, 2026USDA AMS Auction #1725, January 14, 2026 
Hay cost impact per cwt milk (DMC formula: 0.0137 tons alfalfa/cwt)~$2.60~$5.01$2.50–$3.00/cwt
Annual cost, 1,000-cow herd (at Idaho avg 25,375 lbs/cow)~$660,000~$1,270,000>$600,000/year

Run that spread through the DMC formula — corn at 1.0728 bushels, soybean meal at 0.00735 hundredweight, alfalfa at 0.0137 tons per hundredweight of milk — and the hay component alone creates a feed cost gap of $2.50 to $3.00 per cwt.

For a 1,000-cow dairy producing at Idaho averages (253,750 cwt annually), that translates to north of $600,000 in additional feed costs for the same operation parked in the wrong geography.

University of Illinois dairy scientist Mike Hutjens has benchmarked the value of pushing feed efficiency from 1.4 to 1.5 pounds of milk per pound of dry matter — a genuinely elite gain — at about $0.51 per cow per day, or $186 per cow per year. Real money. Also, less than a third of the per-cow geographic penalty. You can run the tightest ration in Oregon and still lose on feed to an average operation in Jerome.

Labor Law: The Advantage You Can’t Out-Manage

Idaho’s agricultural workers are exempt from overtime under the federal Fair Labor Standards Act, and Idaho imposes no state-level overtime mandate.

That’s not the case next door. California has required ag overtime after 40 hours per week since 2022 for large operations under AB 1066. Washington requires ag overtime after 40 hours — dairy workers have been covered since the state Supreme Court’s Martinez-Cuevas v. DeRuyter Brothers Dairy ruling in November 2020, and all other ag workers since January 2024 under ESSB 5172. Oregon’s House Bill 4002, signed in 2022, currently sets the threshold at 48 hours, dropping to 40 in January 2027 (Oregon Bureau of Labor and Industries).

On a dairy where most employees work 50- to 55-hour weeks, the differential adds roughly $0.60 to $1.25 per cwt. That range is consistent with a Washington-focused study published in Choices (AAEA), which found that dairy farm total wages increased by more than 7% under a 48-hour threshold and by 12% under a 40-hour threshold. Cornell’s Dairy Farm Business Summary documented total labor cost at $3.08/cwt after New York’s 60-hour overtime threshold took effect in 2020, with total wages up 15.9% due to combined minimum wage increases and overtime costs (EB2021-06, October 2021). For Jason and Eric Vander Kooy, milking 1,400 cows near Mount Vernon, Washington, the overtime differential on 50-hour workweeks translates to tens of thousands of dollars annually that an identical Idaho operation simply doesn’t pay. That’s a policy gap, not an efficiency gap.

Worth watching: the federal Fairness for Farm Workers Act has been reintroduced in multiple Congresses (2019, 2021, 2023) to eliminate the FLSA ag overtime exemption. It has failed to advance each time. Moving the other direction, the Protect Local Farms Act (H.R. 240), introduced in January 2025, would pre-empt any state overtime law below 60 hours for ag workers. Neither has passed. For now, the advantage holds.

Stack feed on top of labor. Combined structural disadvantage for the wrong geography:

The Geographic Penalty

Hay component gap: $2.50–$3.00 per cwt

Labor mandate gap: $0.60–$1.25 per cwt

Total structural disadvantage: $3.10–$4.25 per cwt

Before you’ve touched a management lever, hired a consultant, or upgraded a single piece of equipment.

Cost FactorIdahoPacific NorthwestGap (PNW Penalty)
Alfalfa hay, $/ton$190 FOB$305–$405 (avg $366)+$115–$215/ton
Ag overtime rulesExempt (federal)Required after 40–48 hrs+$0.60–$1.25/cwt
Feed cost impact, $/cwt~$2.60~$5.01+$2.50–$3.00/cwt
Total structural penalty, $/cwtBaseline+$3.10–$4.25/cwt
Annual cost, 1,000-cow herdBaseline+$600,000–$800,000/yr

When Processors Pick Your State

Cheap feed and favorable labor law attracted cows to Idaho. Cows attracted processors. Processors attracted more cows. That flywheel now spins at a pace no other Western region can match.

Chobani’s $500 million Twin Falls expansion, announced in March 2025, increases plant capacity by 50% — adding over 500,000 square feet to bring the facility to 1.6 million square feet with 24 production lines. Idaho Milk Products is building a $200 million facility in Jerome. High Desert Milk invested $50 million in 2021. And the University of Idaho’s $45 million CAFE research dairy — billed as the nation’s largest — occupies 640 acres near Rupert in Minidoka County and began milking its first cows in early 2026, with a rotary parlor built to handle up to 4,000 head and plans to ramp to 2,000–2,500 long-term.

Corey Geiger with CoBank put it plainly in July 2025: “The big growth has been coming in Texas, Idaho, Kansas, and South Dakota. That’s most of the growth areas with new dairy processing assets coming online.” The areas with the most growth in milk production aren’t the areas with the highest milk prices — they’re the areas with new processing plant demand.

Now flip the flywheel.

The Darigold Wreck

Darigold’s Pasco, Washington, plant was budgeted at $600 million when the cooperative broke ground in September 2022, promising to “preserve the legacy of nearly 350 multigenerational farms” (Darigold/NDA press release, July 2021). It didn’t go that way. Capital Press reported the plant ran approximately $300 million over budget, citing people familiar with the matter (May 1, 2025). The Chronline characterized the total investment at $900 million (June 4, 2025). Darigold acknowledged cost overruns, blaming inflation, supply-chain issues, changes to building codes, and project complexity.

To cover the shortfall, Darigold imposed a $4.00/cwt deduction on member milk checks — a 20% to 25% cut — for its roughly 250 current members across Washington, Oregon, Idaho, and Montana, down from the nearly 350 cited at the time of the groundbreaking. The breakdown: $2.50 per cwt for construction costs and $1.50 for operating losses, beginning with an initial $1.50 reduction at the end of 2023.

The damage to individual operations has been severe. Dan DeRuyter, milking in Yakima County, Washington, told Capital Press the deductions cost his operation “almost $5 million in the past two years.” John DeJong, whose family shipped to Darigold for 75 years, said it “eliminated investment” and put his dairy in “survival mode.” Jason Vander Kooy laid out his three options: “It’s either we go organic, go on our own, or close the doors” (Capital Press, May 28, 2025).

The 500,000-square-foot plant started taking milk in early June 2025 and began producing powdered milk and butter by August, with a second dryer slated for year’s end. It can process up to 8 million pounds of milk a day. Some of the operations that financed the overrun won’t be around to ship to it.

The Organic Shield — and Its Limits

Forest Glen represents the supposed answer for high-cost regions. Premium products. Contracted buyers. Revenue above the commodity floor.

Organic pay prices vary widely by buyer and program. The Northeast Organic Dairy Producers Alliance reported 2025 farm-gate pay prices ranging from $33 to $45 per cwt for grain-and-pasture-fed dairies, with grass-fed certified operations pulling $36 to $50 per cwt and spot organic loads exceeding $50 per cwt in tight markets. That’s well above the conventional all-milk price — USDA’s ERS Livestock, Dairy, and Poultry Outlook projected the 2026 all-milk average at $18.25 per cwt (January 16, 2026), while the January 2026 WASDE pegged 2026 Class III at $16.35 per cwt, down 70 cents from the prior month’s estimate. Nancy’s Probiotic Foods, based at Springfield Creamery in Springfield, Oregon — a family operation since 1960 — gives Forest Glen a contracted home for organic Jersey milk. The Costco A2 program taps into a market Grand View Research valued at $4 billion in 2024, and projects will reach $11.2 billion by 2030.

So why has the last decade been “pretty tough”?

Because premium pay doesn’t eliminate costs. Organic feed costs more. Three thousand acres of organic cropland take intensive management. Oregon’s overtime rules apply to organic dairies the same as to conventional ones. And the processor captures the bulk of the retail premium — organic farm-gate prices typically land at less than a third of what consumers pay at the shelf. With national organic retail whole milk cresting above $5.00 per half gallon for the first time in April 2025, even a $45/cwt farm-gate check captures a fraction of what the product is worth at the register.

The Kirchers and Bansen make it work because they started nearly 30 years ago, run 2,200 cows to spread overhead, and stack revenue streams beyond milk: registered Jersey genetics, digester electricity, and composted fiber sold to Willamette Valley vineyards as mulch. That’s not a model you replicate from a standing start in 2026.

Revenue/Cost ItemConventional (PNW)Organic (PNW)Net Advantage
Milk price, $/cwt$18.25 (2026 proj.)$45.00 (high-end)+$26.75/cwt
Organic feed premium, $/cwtBaseline+$8.00–$12.00–$8.00–$12.00/cwt
Overtime labor penalty, $/cwt+$0.60–$1.25+$0.60–$1.25No change
Geographic penalty (vs. Idaho), $/cwt+$3.10–$4.25+$3.10–$4.25No change
Beef-on-dairy calf revenue, per head~$1,400~$1,400No change
Net organic advantage after penalties+$6.50–$15.15/cwt

Beef-on-Dairy: Real Revenue, Real Ceiling

Tyler Reynolds told Capital Press that including beef byproduct makes dairy’s share of his revenue “stronger than” half. Stewart Kircher was equally direct: “The impact on the beef market is huge from dairies.”

Day-old beef-on-dairy crossbred calves averaged about $1,400 per head in 2025, according to Laurence Williams, dairy-beef cross development lead at Purina — up from roughly $650 three years earlier (Dairy Herd Management, September 2025). Phil Plourd, president of Ever.Ag Insights, expects financial incentives to “continue to lean toward beef-on-dairy activity, even if it’s not quite as lucrative as today.”

That revenue is real. It’s also cyclical. Budget for it. Don’t build a survival plan around it.

Geography Sets the Floor. Management Sets the Ceiling.

A fair objection to this piece: if geography is the whole game, why do some Idaho dairies fail while some Oregon dairies survive?

Because geography doesn’t replace management — it determines where management has room to work. Tyler Reynolds didn’t just happen to sit on cheap hay. He recognized the dairy ration built into his family’s crop rotation, bought into a facility every big operator passed on, and built a beef-on-dairy revenue stream that pushes his dairy share past 50%. The structural advantage gave him the floor. His decisions were built on top of it.

The same is true on the genetics side. CDCB’s April 2025 Net Merit update increased emphasis on Feed Saved from 12.0% to 17.8% and boosted butterfat from 28.6% to 31.8%, while protein dropped from 19.6% to 13.0%. In high-cost regions where every cent per cwt matters, that shift isn’t academic — it’s survival math. Producers who can’t win on geography are increasingly breeding for components and feed efficiency to close the gap from the cow side, selecting bulls for traits that directly address the structural disadvantage their zip code creates.

But here’s the honest truth: even with elite genetics and Net Merit optimization, the cost gap narrows by hundreds of dollars per cow. The geographic penalty runs into the thousands. Management and genetics are the ceiling. Geography is the floor. And when the floor is $3.10 to $4.25 per cwt below your neighbor’s, the ceiling starts a lot higher, too.

What This Means for Your Operation

If you’re milking in Oregon, Washington, or another region where the structural math works against you, the data points to three paths. None is painless.

Automate and stay. Robotic milking and precision feeding can tighten the gap — current systems run $200,000–$300,000 per unit, each handling 50–80 cows. For a 1,000-cow herd, that’s $3–$5 million in capital. Even in the best-case, automation roughly closes a third to half of the $3.00–$4.00/cwt structural gap. Automation buys time. It doesn’t change the zip code.

Pivot to premium. Organic, A2, grass-fed — they all pay more. Forest Glen proves it works at scale with the right starting conditions: established certification, Jersey genetics, contracted buyers, stacked revenue. If you don’t already have most of that infrastructure, the three-year organic transition means three years of organic-level costs on conventional-level checks. Run that math to the penny before you commit.

Evaluate dairy relocation — seriously. Current asset markets favor sellers. USDA’s July 2025 data puts the national average replacement dairy cow at $3,010 per head, with Idaho at $3,050 and Wisconsin at $3,290. Mike North of Ever.ag told Brownfield in January 2025 that Pacific Northwest animals were moving at “north of $4,000 an animal.” But Idaho farmland in the Magic Valley runs $12,000–$18,000 per acre, with cash rent at $300–$390 in top dairy counties (NASS, 2022). You’re not moving into bargain country. If you’re seriously weighing dairy relocation, run the full capital budget — land, facilities, permits, disruption costs — not just the per-cwt savings on feed and labor.

Whatever path fits, do these things now:

  • Run your actual cost of production per cwt. Include depreciation, family labor at market rates, and the opportunity cost of equity. USDA ERS’s January 2026 outlook projects 2026 all-milk at $18.25/cwt, but Class III futures have slid to $16.35, and CME block cheddar just hit $1.2825 — its lowest since May 2020. If your all-in cost exceeds $18.25, you’re farming upside down. If it exceeds $16.35, the market is telling you something louder.
  • Ask your processor one question—and get it in writing. Will they commit to your volume in 2027 at a price that covers your production costs? Tyler Reynolds is “hoping to expand, but the creamery hasn’t committed.” If the answer is vague, it’s an answer.
  • Run the exit math even if you never use it. Every year you farm at a loss, you’re spending a six-figure piece of your family’s net worth on the choice to keep milking in a place the economics have moved past. That might be the right call. It should be a deliberate one.
  • Factor in the next generation before you commit capital. Rick Naerebout shared that Idaho loses about 10% of its dairy membership a year, often because “the next generation, they see the parents struggling, so they’re not going to continue with farming.” That’s true everywhere. If your kids aren’t in, an expansion note is a bet with no one to carry it.
ScenarioAnnual Operating Loss5-Year Net Worth ImpactExit Option: Sale Value (Today)Expansion Option: Debt + Loss
Baseline (break-even)$0$0
Survival mode–$100,000/year–$500,000Preserve equity, redeploy–$500K equity + $0 debt
Structural disadvantage–$200,000/year–$1,000,000Preserve equity, redeploy–$1M equity + $3–$5M expansion debt
Darigold scenario–$300,000/year–$1,500,000Preserve equity, redeploy–$1.5M equity + $3–$5M expansion debt

The Gap That Isn’t Going Away

What separates the Reynolds family’s trajectory from the Kirchers’ decade of tough economics isn’t effort, intelligence, or cow quality. It’s the cost of hay, the labor code, and the processing flywheel — three forces no individual farmer chose but every individual farmer lives with.

That’s the real driver behind dairy consolidation in the West — the gap between regions now exceeds the gap between the best and worst operators within a region. As far back as 2019, Rick Naerebout wrote in Hoard’s Dairyman that Idaho’s 10 largest owners/partnerships milked 32% of the state’s cows, and the top 20 milked 47%. Those shares have almost certainly grown since. The farms that survive and the farms that grow aren’t necessarily the best-managed ones. They’re the ones sitting on the right side of the structural math.

The numbers don’t care about legacy.

Jason Vander Kooy, watching what he estimates as a decline from around 80 dairy farms in Skagit Valley to roughly 10 over the past two decades, put it in terms that cut through any spreadsheet: “We can trace back dairy farming in our family before Christopher Columbus in Europe. I don’t want to be the last generation, so we’re going to make a go of it” (Capital Press, May 28, 2025).

The families who make their next move based on where the structural math is going — not where their grandfather’s fence line sits — are the ones who’ll still be milking in 2035.

Dig in, pivot, or move. But whatever you do, do it on purpose.

Key Takeaways

  • Where you milk now matters as much as how you milk: Idaho’s cheap hay and no ag overtime create a $3.10–$4.25/cwt advantage — over $600,000/year on a 1,000-cow herd in feed and labor alone.
  • Processors are picking winners and losers: Idaho adds capacity with Chobani, Idaho Milk Products, High Desert Milk, and CAFE, while Darigold’s $300 million Pasco overrun and $4.00/cwt deductions pushed many Washington members into survival mode.
  • Premium doesn’t erase geography; Forest Glen’s 2,200-cow organic A2 Jersey herd with grazing, contracts, and a digester still fights 2014-level milk prices under 2026-level costs.
  • If you’re in a high-cost region, your real choices are to invest heavily in automation, double down on ultra-premium contracts, or design a relocation/exit plan now instead of letting the bank decide later.
  • Genetics is no longer a side note: CDCB’s 2025 Net Merit shift toward Feed Saved and fat turns sire selection into a survival tool for high-cost herds, not just a way to chase show-ring banners.

Complete references and supporting documentation are available upon request by contacting the editorial team at editor@thebullvine.com.

Learn More

The Sunday Read Dairy Professionals Don’t Skip.

Every week, thousands of producers, breeders, and industry insiders open Bullvine Weekly for genetics insights, market shifts, and profit strategies they won’t find anywhere else. One email. Five minutes. Smarter decisions all week.
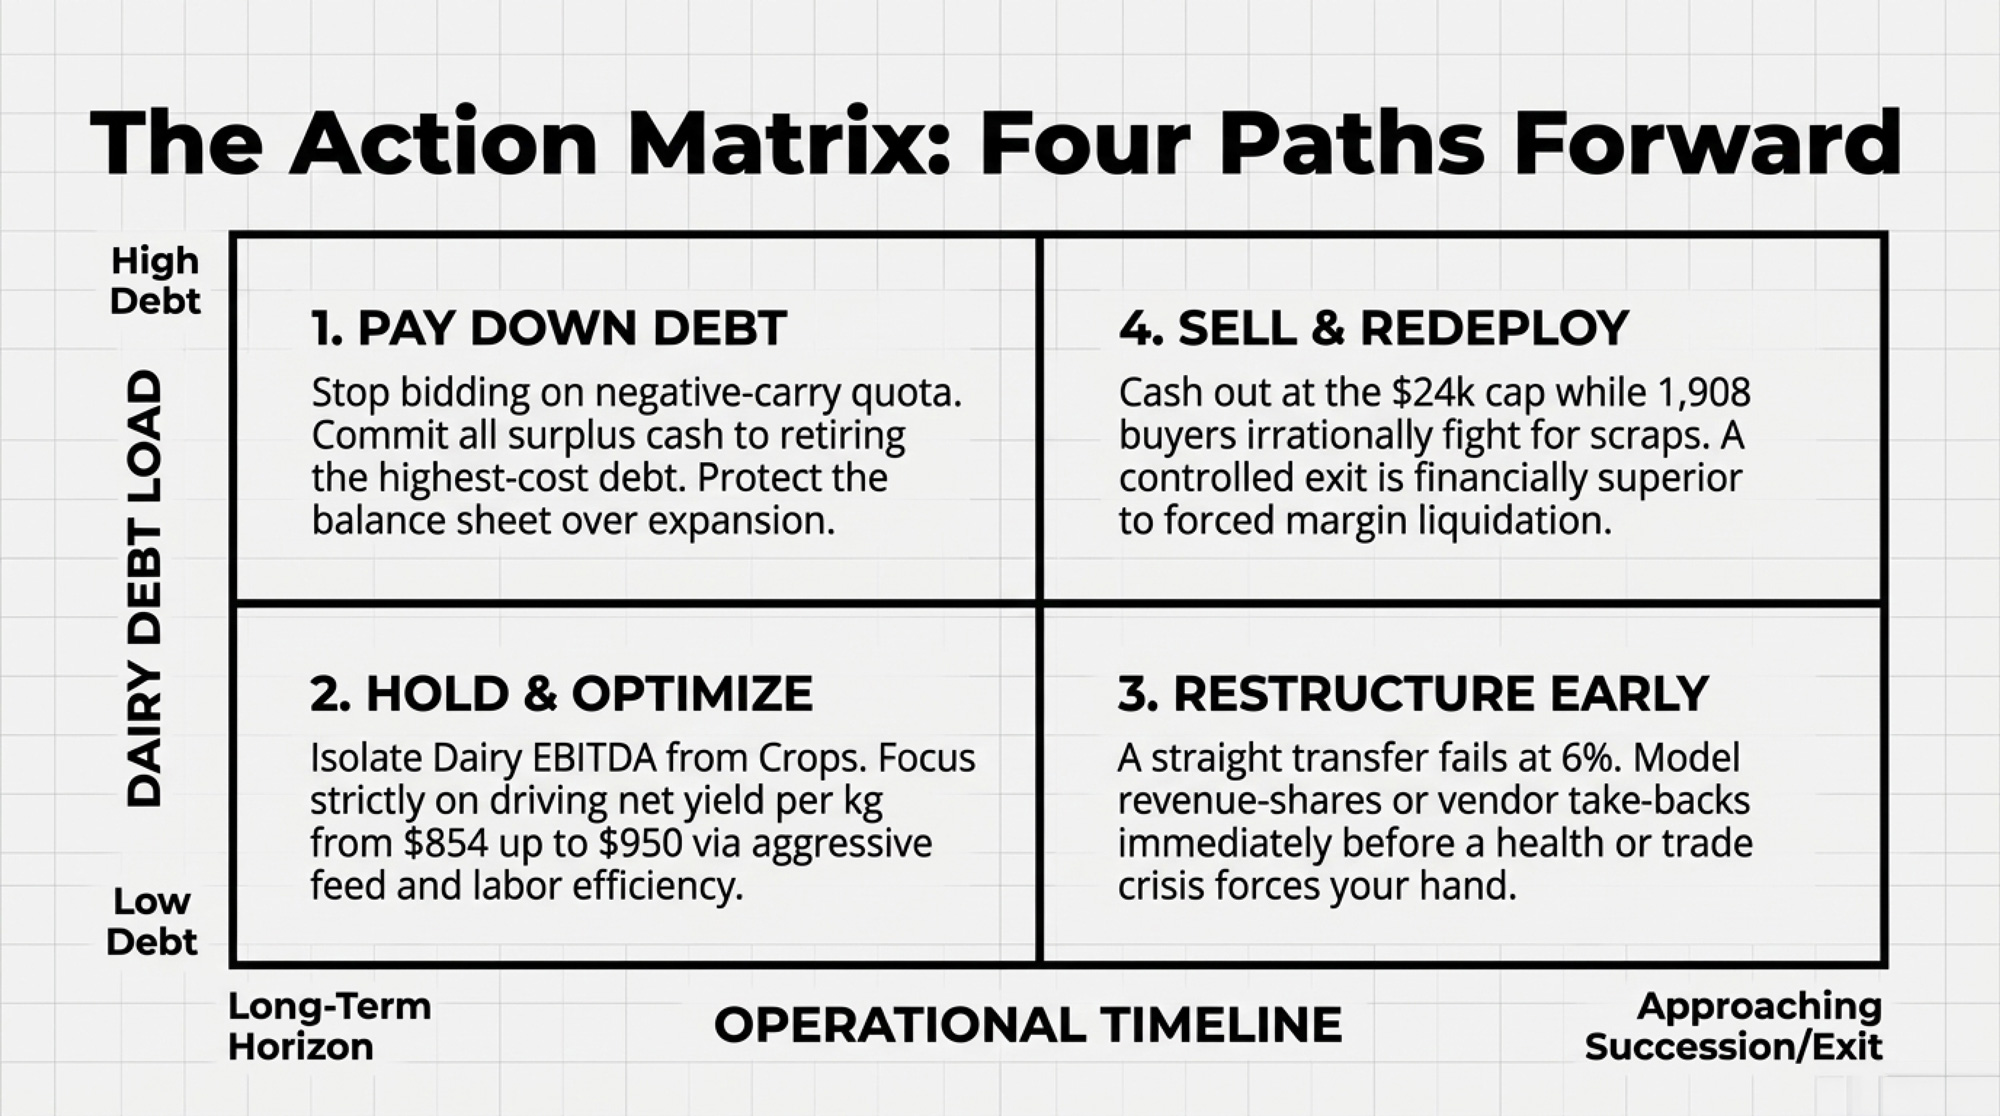
NewsSubscribe
First
Last
Consent

39% of U.S. Dairies Are Gone: Big-Herd Reality and the 3 Survival Lanes That Still Protect Your Margin

39% of U.S. dairies gone in 5 years. Milk production? Still up. The survivors picked a lane. Have you?

Executive Summary: Over the last census period, nearly 40% of U.S. dairies with milk sales disappeared, even as national cow numbers and total milk production held steady – a clear sign that milk has consolidated into fewer, larger herds. The numbers now show that roughly 2,000 farms milking 1,000 cows or more produce close to two‑thirds of U.S. milk and often enjoy cost advantages of up to about $10/cwt over 100‑ to 199‑cow herds, while many smaller herds stay profitable by squeezing more milk solids, labour efficiency, and cow longevity out of every stall. Against that backdrop, the article lays out three realistic “survival lanes” – scale with discipline, an efficiency sweet spot for 150‑ to 800‑cow herds, and niche/value‑added models – and illustrates each with concrete examples from a New York tie‑stall, a Wisconsin freestall, and a New Mexico dry lot. It then dives into genetics and technology as profit levers, showing how DWP$‑driven selection can add $1,000–$1,500 lifetime income over feed cost per top‑quartile cow, and how AMS, collars, sort gates, and feed pushers can either strengthen or weaken margins depending on milk lift, labour changes, and interest costs. Labour and sustainability pressures are treated as hard economics rather than buzzwords, tying turnover, welfare metrics, and Net Zero goals back to cost per cwt and processor relationships. The piece finishes with five direct questions owners can use at the kitchen table to decide which lane they’re really in, which investments to prioritize, and where “doing nothing” might actually be the riskiest move of all.

You know, in the time it took you to raise your current group of two‑year‑olds, almost four out of ten U.S. dairy farms disappeared. That’s not just coffee‑shop talk. USDA’s 2022 Census of Agriculture shows that farms with sales of milk from cows dropped from 40,336 in 2017 to 24,470 in 2022 – a 39% decline – while the national milking herd stayed close to 9.4 million cows and total milk production held in the mid‑220‑billion‑pound range in USDA and industry summaries. 

So the cows didn’t vanish. The milk didn’t vanish. It just moved to fewer barns.

Metric20172022% Change
Dairy Farms (000s)40.324.5−39%
Milking Cows (millions)9.49.40%
Milk Production (bn lbs)215220+2.3%

Looking at this trend, farmers are finding that the industry’s structure has quietly shifted under their feet. USDA economists, Rabobank analysts, and a detailed 2024 review from the University of Illinois farmdoc team all point out that a relatively small group of large herds – those with 1,000 cows or more – now produce roughly two‑thirds of U.S. milk by value.  That farmdoc piece breaks it down very clearly: only about 2,013 farms in the 1,000‑plus‑cow category accounted for around 66% of U.S. milk sales in 2022.  Dairy industry coverage of the same data has gone further, noting that roughly 65% of the nation’s dairy cows now live on farms with 1,000 cows or more. 

Herd SizeFarm Count% of Farms% of MilkVisualization
1,000+ cows2,013~8.2%66%Large, red-bordered segment
500–999 cows~1,800~7.4%~18%Medium grey segment
250–499 cows~3,500~14.3%~10%Smaller segment
50–249 cows~16,000~65%~6%Remaining sliver

Here’s what’s interesting: while farm numbers are falling, consumer demand for dairy hasn’t collapsed. USDA per‑capita use data, summarized by industry outlets, show Americans now drink roughly 120‑plus pounds of fluid milk per person per year – that part’s been sliding for decades – but cheese consumption has climbed into the low‑40‑pound range per person, and butter use has pushed above six pounds per person, around modern‑era record levels.  People haven’t walked away from dairy; they’ve just walked over to cheese, butter, and ingredients. 

When you dig into profitability work from groups like the Kansas Farm Management Association and international dairy efficiency studies, a pattern pops out. High‑profit and low‑profit herds in the same region often receive very similar milk prices. The spread shows up in feed efficiency, butterfat performance, labour cost per hundredweight, fresh cow management in the transition period, and how effectively barns, parlours, robots, and people are actually used. 

And over the last couple of years, with interest rates higher and feed and fertilizer bouncing around, those efficiency gaps have hurt. Coverage in 2023–2024 margins has highlighted how many herds – especially in higher‑cost western regions – have seen their total cost per cwt push toward or above the milk price, with some large western herds facing total costs in the $20–$21/cwt band while milk prices weren’t far above that.  The room for error has gotten pretty thin. 

Taken together, this development suggests something many of us already feel: the system today rewards margin per cwt and solids, not just volume, and certainly not just the fact that we’re milking cows.

That’s where this idea of “survival lanes” actually helps make sense of things.

Looking at This Trend: Three Survival Lanes Most Farms Are Already In

What I’ve found, looking at the Census numbers, USDA reports, Rabobank, and farmdoc analysis – and honestly, just talking with producers from California to New York – is that most viable dairies today are already drifting into one of three lanes:

  • Lane 1: Scale with discipline – big herds, high throughput, a relentless cost‑per‑cwt focus.
  • Lane 2: The efficiency sweet spot – mid‑size herds, sharp management, targeted tech.
  • Lane 3: Niche and integrated – smaller herds leaning on premiums and value‑added strategies.

You don’t have to love those labels. But if you look around your neighbourhood and across the U.S., they’re pretty much what the numbers and the barns are telling us.

Here’s a simple way to picture the lanes while we’re topping up the coffee.

How the Three Lanes Tend to Look

FeatureLane 1: ScaleLane 2: EfficiencyLane 3: Niche/Integrated
Typical Herd Size1,500+ cows150–800 cows50–250 cows
Main FocusCost per cwtMargin per cow & per stallPremium stability
Labour SetupLarger hired teams, formal structureMixed family/staff, targeted techMostly owner/family, a few key hires
Main RiskPolicy, interest, feed & water“Stuck in the middle,” capital creepMarket volatility, buyer dependence

So the real question isn’t “which lane sounds nicest?” It’s “which lane do our barns, our contracts, and our debt load already put us in – whether we’ve said it out loud or not?”

Lane 1: Scale With Discipline

Let’s start with the herds that get most of the headlines. This is the lane of the 2,000‑ to 5,000‑cow operations you see in California’s Central Valley, Idaho’s Magic Valley, the Texas Panhandle, those big New Mexico dry lot systems, and along I‑29.

The 2022 Census, and the way farmdoc and Rabobank have unpacked it, show that the 2,500‑plus‑cow class was the only herd‑size group that actually grew in number between 2017 and 2022. Most smaller herd‑size categories shrank.  Rabobank economists, leaning on USDA cost data, have highlighted that herds milking more than 2,000 cows can operate at total costs around $23/cwt and roughly $10/cwt cheaper than 100‑ to 199‑cow herds in 2022 when you look at all‑in cost per cwt.  That lines up with USDA ERS work documenting that average costs tend to drop sharply as you move into the 1,000‑plus‑cow range. 

Cost‑of‑production benchmarking from large western herds has shown total costs often in the low‑20s per cwt in recent years, with some examples in that $20–$21 range when feed was expensive.  When milk prices were higher and costs were under control, those herds had decent margins. When milk softened, and feed stayed high, there wasn’t much cushion. 

What’s interesting here is that scale really can work, but only if it’s paired with discipline and a clear view of risk. On a 2,500‑cow dry lot in eastern New Mexico or west Texas, a $2/cwt swing in margin can mean hundreds of thousands of dollars a month. Heat stress, water rights, feed price spikes, and regulatory changes all magnify at that scale. Producers in those regions consistently talk about cooling systems, water security, and manure and nutrient plans because they don’t have the luxury of ignoring those things. 

In a lot of western dry lot systems, the focus tends to be on:

  • Reproduction and days open, because milk per stall is everything.
  • Heat abatement – fans, soakers, shades – to keep feed intake and rumination from breaking down during long, hot spells.
  • Feed efficiency and shrink control, given the volume of commodities moving through the yard.
  • Manure and water systems that keep regulators, neighbours, and processors onside.

So if you’re in this lane – or seriously thinking about stepping into it – the question shifts from “should we add more cows?” to “does this next big capital decision lower our cost per cwt or take a major risk off the table over the next 10 or 15 years?” New rotary? Digester? More housing? At that scale, the lens really has to be long‑term margin and resilience, not just filling an empty pad.

Lane 2: The Efficiency Sweet Spot

Now, let’s talk about where a lot of well‑run Midwest and Northeast herds actually live: somewhere between 150 and 800 cows. Solid freestall barns, a mix of family and hired help, and a lot of pride in butterfat performance and cow comfort.

Kansas Farm Management Association comparisons of high‑, medium‑, and low‑profit dairies have shown that the most profitable herds aren’t always the biggest. They’re the ones with higher milk sold per cow, better feed conversion, fewer labour hours per cow, and controlled overhead.  An international study looking at dairy farm performance across countries reached a similar conclusion: technical efficiency – things like milk per cow, feed use, and labour use – plus management decisions explain profitability differences much more than milk price alone. 

Farm IDHerd SizeMilk per Cow (lbs/yr)Net Farm Income per Cow (USD)Region
A28024,500$2,180Wisconsin
B32023,200$1,850Wisconsin
C45025,300$2,310Wisconsin
D52024,800$2,095Iowa
E38026,100$2,480Wisconsin
F65023,900$1,720Wisconsin
G52024,100$1,950Minnesota
H42025,800$2,420Illinois
I48023,500$1,880Iowa
J58026,300$2,550Wisconsin
K39025,900$2,400Wisconsin
L61024,200$1,760Minnesota

In Wisconsin, herds shipping to cheese plants, the paycheque is built on components. Producers are getting paid for butterfat and protein, not just pounds of skim, so milk solids per cow and per stall become the key levers. Hoard’s Dairyman benchmarking and Dairy Herd coverage of component pricing have underlined that top‑profit herds in these markets tend to combine strong fat and protein yields with good herd health and reproduction. 

In many Northeast operations – think 80–150‑cow tie‑stalls or smaller freestalls in New York or Pennsylvania – the economics look surprisingly similar, even if the barns are older. Butterfat performance, SCC, and reproduction determine whether to stay in business or set a dispersal date. The facilities differ; the margin math stays the same. 

What farmers are finding in this lane – especially in those 300‑ to 600‑cow freestalls – is that they don’t need to chase 3,000 cows to be successful. They do need to be absolutely clear about:

  • Butterfat and protein yield per cow and per stall, not just tank weight.
  • Fresh cow management through the transition period – calcium, energy balance, rumen health, and calm, clean calvings.
  • Involuntary cull rates and how long cows stay productive in the herd.
  • Labour per cwt and whether there are too many hands doing too many half‑defined jobs.

Many of the stand‑out herds in this lane use technology as a scalpel, not a shovel. You’ll see activity and rumination collars, some well‑designed sort gates, herd management software that someone actually uses, maybe a feed pusher. But the filter isn’t “is this new and shiny?” It’s “does this clearly move margin per stall and labour per cwt on our farm?” 

Lane 3: Niche and Integrated Models

Then there’s the lane a lot of smaller herds either already operate in or quietly eye: organic, grassfed, A2A2, farmstead cheese, on‑farm bottling, or tight specialty contracts.

A Vermont study of organic dairies, using about ten years of farm‑level data, found that profitable organic farms tended to have strong forage management, controlled purchased feed costs, and organic milk prices that more than covered their higher expenses.  Another paper looking at organic and grassfed dairy farms reported that higher‑producing grass‑based herds typically had better forage quality and more grazing management experience, which reinforces that “grassfed” doesn’t automatically mean low output. 

Economic work on organic and value‑added dairy suggests something else important: these farms often generate more local economic activity per dollar of milk sold because more processing, marketing, and labour occur in the local community.  That matches what many small organic and farmstead operations in Vermont, New York, and the Upper Midwest describe – more local jobs and spend, but also more work per unit of milk. 

So yes, a 100‑cow organic herd in Vermont or a 70‑cow farmstead cheese operation in New York can outperform a 300‑cow conventional herd in terms of income per cwt when premiums, volume, and costs are well managed.  The trade‑off is that you’re not just running a dairy – you’re running a food business with capital‑heavy equipment, regulations, labels, shipping, and customers attached. 

Here’s the honest part about this lane that doesn’t always make it into the glossy stories: it’s not a magic profit button. The farmers who thrive here genuinely enjoy the marketing and relationship side – tastings, farmers’ markets, social media, restaurant accounts – not just the idea of a higher pay price. If you don’t enjoy people, paperwork, and problem‑solving beyond the farm gate, this lane can wear you out fast.

FeatureLane 1: Scale with DisciplineLane 2: Efficiency Sweet SpotLane 3: Niche / Integrated
Typical Herd Size1,500–5,000+ cows150–800 cows50–250 cows
Primary FocusCost per cwt (volume + relentless efficiency)Margin per cow & per stall (quality + management)Premium stability & value-added processing
Labour ModelLarge hired teams, formal shift structureMixed family + staff, targeted technology useMostly owner/family + 2–4 key hires
Tech EmphasisCooling, feed efficiency, herd logistics, data systems at scaleActivity collars, sort gates, feed pushers, parlour automationDirect marketing, on-farm processing, customer relationships
Revenue LeverVolume + operational disciplineComponents (fat/protein) + reproductive health + longevityOrganic/grassfed/A2A2 premiums + direct sales markup
Main Economic RiskPolicy, interest rates, feed/water volatility → margin shrinks fast at scaleStuck in the middle: not big enough for economies of scale, not focused enough on nicheMarket volatility, buyer dependence, capital intensity of processing equipment
Typical Cost per cwt$20–$23 (with discipline)$24–$27 (depending on efficiency)$26–$32 (offset by premiums)

The Economics Behind the Lanes

If we step back from individual barns and look at the bigger picture, USDA’s cost‑of‑production work and ERS research on consolidation are pretty consistent: on average, total cost per cwt falls as herd size increases, at least up into the 1,000‑plus‑cow bracket. Fixed costs and specialized labour get spread over more cows.  That’s a big part of why those large herds have grown their share of the milk. 

At the same time, when you look inside any given size category – this shows up clearly in the Kansas data and the international comparisons – the herds at the top of the profit pile aren’t automatically the biggest ones. They’re the ones with more milk sold per cow, better feed efficiency, and leaner labour use. The laggards often have similar milk prices but higher costs per cwt due to lower yields, poor reproduction, health problems, or poorly organized labour. 

On the organic and value‑added side, the Vermont research and similar studies report that total costs per cwt are usually higher – often in the high‑20s or low‑30s – but strong organic or specialty premiums can still leave attractive margins when stocking rates, forage programs, and processing capacity fit together. 

And in the real‑world conditions of 2023–2025, with feed, fuel, and fertilizer on a roller coaster and interest costs higher, that margin for error has shrunk for almost everyone. Industry analysis has shown how quickly margins swung negative for many herds when feed stayed expensive, and Class III and IV prices dropped back. 

So the old “get big or get out” line is too blunt. The more accurate version is probably closer to: get crystal clear on which economic lane you’re in and manage aggressively for that lane’s realities.

Genetics: Turning Genomic Numbers Into Real Barn Dollars

Let’s shift to genetics for a bit, because this is one of those levers that doesn’t shout at you day‑to‑day but quietly adds up over time.

Since genomic testing really took off around 2009, geneticists and AI organizations have documented significantly faster genetic progress for traits like production, fertility, and health compared with the old, slower progeny‑test system. Peer‑reviewed work in the Journal of Dairy Science has confirmed that when you select on genomic lifetime merit indexes consistently, you see real differences in lifetime performance show up in the parlour and on the cull list. 

Zoetis and Dairy Management Inc. analyzed barn‑level data using the Dairy Wellness Profit Index (DWP$) and found that cows in the top 25% generated roughly £1,300 more lifetime income over feed cost than those in the bottom quartile in a UK study, and about US$1,474 more in comparable U.S. herds.

A more recent study published in the Journal of Dairy Science and summarized by Zoetis looked at 11 U.S. herds and found something that really grabs attention in 2025: cows in the top DWP$ quartile weren’t just more profitable – they also produced milk with about 12.9% lower methane intensity and roughly 9.5% lower manure nitrogen intensity per unit of milk compared with bottom‑quartile cows. 

MetricTop QuartileBottom QuartileDifference% Advantage
Lifetime Income Over Feed Cost (USD)$3,474$2,000+$1,474+74%
Lactations in Herd4.22.8+1.4+50%
Milk Solids per Lactation (lbs)3,2402,580+660+26%
Methane Intensity (kg CO₂e per lb milk)0.921.05−0.13−12.9%
Manure N Intensity (g N per lb milk)4.85.3−0.5−9.5%

So, when you put those pieces together, it’s reasonable – and supported by the field data – to say that in herds using DWP$ as intended, top‑quartile cows can be expected to generate somewhere on the order of $1,000 to $1,500 more lifetime income over feed cost than bottom‑quartile cows.  It’s a range, not a promise, but it lines up across both UK and U.S. studies. 

Now picture a 400‑cow freestall in Wisconsin turning over about 30% of its cows each year – roughly 120 heifers entering the parlour. If genomic testing and DWP$‑based selection mean 80 of those animals land in your top genetic quartile instead of being a random mix, and each of those cows brings in just $1,000 more lifetime income over feed cost, that’s about $80,000 in extra lifetime margin from that one group of replacements.  That doesn’t even count the peace of mind from having fewer train‑wreck cows. 

What I’ve noticed in herds that really make genetics pay is that they do three things clearly:

  • Cheese‑market herds emphasize fat and protein yield, fertility, mastitis resistance, and good feet and legs because those traits show up directly in the milk cheque and cull bill. 
  • Fluid‑market herds in the Northeast and Upper Midwest still value volume, but they’ve learned that better fertility, lower mastitis, and fewer metabolic problems often save more money than chasing a little extra milk. 
  • Robot herds pay close attention to udder structure, teat placement, milking speed, and temperament because they’ve seen, the hard way, how box visits, refusals, and nervous cows turn into lost milk and burned‑out staff. 

Genetics tends to work best when the herd has a simple, written plan that answers three questions:

  1. Which economic index—DWP$, Net Merit, Pro$, or a custom mix—actually reflects how we get paid and why we cull cows?
  2. Who gets sexed semen, who gets conventional dairy, and who gets beef‑on‑dairy, and how does that match our replacement needs and calf market? 
  3. Where does genomic testing clearly earn its keep, and where are we comfortable making decisions without it? 

When you revisit those answers once a year with your vet, nutritionist, and breeding advisor, genetic decisions stop being “we buy good bulls” and start being another tool in your profitability plan.

Robots, Parlours, and Tech That Actually Pays

Now to the topic that comes up at almost every winter meeting: robots versus parlours, and which technology actually pays.

A 2022 feature pulled together several automatic milking system studies and reported that AMS can increase milk production by up to about 12% and reduce milking labour needs by as much as 30% in well‑managed herds. One of the highlighted studies showed robot‑milked cows producing roughly 2.4 kilograms – about 5.3 pounds – more milk per day than parlour‑milked cows, thanks mainly to more frequent milking and tighter routines.  Other research in peer‑reviewed journals and extension materials echoes those possibilities, while repeatedly stressing that results depend heavily on barn design and management. 

On the cost side, Wisconsin Extension’s 2022 “Building Cost Estimates – Ag Facilities” gives some solid ballpark figures that many lenders and consultants are using:

  • Retrofitting an existing parlour typically costs $3,500 to $7,000 per milking stall.
  • Building a new parlour with its own structure, concrete, utilities, and support spaces can cost $28,000 to $36,000 per stall.
  • A complete AMS setup – robots, barns or major renovations, manure systems, and cow‑flow infrastructure – commonly comes in around $12,000 to $13,000 per stall when you add everything together. 

Case studies presented at the Precision Dairy Conference and shared by consultants in North America often cluster AMS projects in the $11,000 to $14,000 per cow range once all related infrastructure is factored in. 

So let’s walk through a realistic example. Take a 240‑cow freestall in Wisconsin or Pennsylvania, considering four robots:

  • Capital outlay: It’s not hard, once you add robots, stall work, some concrete, building adjustments, and basic manure and cow‑flow changes, to end up near $2.5 million in total capital. 
  • Milk lift assumption: Say an extra 5 lb per cow per day. That’s on the optimistic side but consistent with upper‑end AMS study results when barn layout and management are dialled in. 
  • Labour savings: If milking labour is genuinely reorganized, many case farms have reported trimming the equivalent of roughly 1.5 full‑time positions from milking chores. 
  • Annual benefit: With those assumptions and typical milk and wage levels, it’s reasonable to see more than $150,000 per year in combined extra income over feed cost and labour savings. 

In that kind of scenario, the payback math can look pretty decent.

But here’s where a lot of producers quietly nod: in plenty of real‑world AMS installs, the milk lift ends up closer to 2–3 lb per cow, and labour doesn’t truly drop because the farm is short‑staffed elsewhere or the daily schedule never really gets redesigned. Industry case reports and extension consultants have been honest about that.  In those herds, the payback stretches out and sometimes never really hits what the original spreadsheet promised. 

Robots don’t fix a broken schedule or a toxic work culture. They just make those problems more expensive.

That’s why a lot of very profitable 400‑ to 600‑cow herds in the Midwest and Northeast still see their best returns coming from:

  • A well‑designed, efficient parlour that cows move through calmly and quickly.
  • Strong fresh cow management and transition pens that keep problems small and short.
  • High‑quality forage systems and consistent feeding routines that support components.
  • A handful of “workhorse” tech tools that support those systems rather than distract from them. 

Those workhorse tools often include:

  • Activity and rumination collars that improve heat detection and flag health issues early, which multiple studies and field reports have tied to better reproductive performance and lower disease‑related losses. 
  • Feed pushers that keep TMR in front of cows and frequently bump milk a couple of pounds per cow per day in both research and on‑farm results. 
  • Sort gates, in‑line milk meters, and mastitis sensors that make grouping, fresh cow checks, and mastitis detection more systematic and less dependent on one person’s memory. 

For most U.S. herds, the filter that seems to work best is simple: at conservative milk prices and realistic interest rates, can we honestly say this technology will improve dollars of margin per stall and labour per cwt on our farm? If the math only works when everything goes perfectly, it probably belongs on the “someday” list.

Labour: The Bottleneck Behind Everything Else

If there’s one theme that keeps coming up from New York freestalls to Idaho dry lot systems, it’s labour – finding people, keeping people, and getting consistent work from people.

A national survey done under the National Dairy FARM Program’s Workforce Development initiative, with Texas A&M leading the analysis, surveyed more than 600 dairies and found average annual employee turnover around 38.8% on U.S. dairies.  Dairy Herd’s coverage of that work noted that while this isn’t wildly different from some other private‑sector averages, it’s a major challenge for farms that struggle to find and train reliable employees. 

A 2018 paper in the Journal of Dairy Science that examined employee management practices on large U.S. dairies found annual employee turnover ranging from 8% to 144%, meaning some operations were turning over more than their entire workforce in a year.  That level of churn doesn’t just hurt morale. It hits milking consistency, fresh cow monitoring, calf care, and training costs in ways you feel in both the tank and the cheque. 

Extension programs through Cornell PRO‑DAIRY and universities in Michigan and Wisconsin have also highlighted how heavily many dairies rely on immigrant labour, and how housing, immigration uncertainty, language support, and basic management practices influence whether good employees stay.  Producers in those programs often report that high turnover shows up as: 

  • Inconsistent parlour prep and higher bulk tank SCC.
  • Missed early signs in transition cows that later turn into expensive problems.
  • Shortcuts in calf protocols and higher calf morbidity.
  • Lower average milk yield and more stress for owners and managers.
Annual Turnover RateBulk Tank SCC (cells/mL)Fresh-Cow Disease Rate (%)Calf Morbidity (%)Milk Loss per Cow (lbs/yr)Est. Monthly Cost per 300-Cow Herd (USD)
<15% (Low)150K–180K8–12%5–8%200–400$2,500–$4,000
15–30% (Moderate)220K–280K15–18%10–12%600–800$6,500–$9,500
30–50% (High)320K–420K22–28%15–18%1,000–1,400$12,000–$18,000
>50% (Severe)500K+35%+22%+1,800–2,200$22,000–$35,000

What I’ve noticed in operations that seem “lucky” with labour is that luck usually looks a lot like design:

  • Barns and work routines are set up so that on a bad day – when someone is off or quits suddenly – the system still functions safely and adequately, even if it’s not perfect.
  • Core tasks like milking prep, colostrum handling, sick cow checks, and pre‑fresh monitoring have simple written SOPs, and someone actually takes time to train people on them.
  • Technologies like sort gates, collars, and feed pushers are chosen not just for their ROI on paper, but because they remove repetitive or physically punishing tasks that burn people out. 

So the real question for a lot of herds is this: if you put a realistic dollar value on lost milk, extra treatments, extra culls, and your own stress when turnover is high, what would it actually be worth to have a more stable, better‑trained crew? Sometimes the answer looks a lot like higher wages, better housing, more structure – and only then more gadgets.

Environment, Consumers, and Where Policy Is Pointed

Whether we like it or not, environmental and consumer expectations are part of the lane conversation now.

The Innovation Center for U.S. Dairy has laid out a sector‑wide goal for greenhouse‑gas neutrality by 2050 through the Net Zero Initiative, and this goal is supported by life‑cycle assessment work from universities such as Texas A&M. Those LCAs consistently show that most of dairy’s greenhouse‑gas footprint comes from feed production, enteric methane, and manure management. 

What’s encouraging is that many of the steps that shrink that footprint – better feed efficiency, stronger fresh cow management, longer productive lives, fewer involuntary culls – also tend to improve cost per cwt and margins. That DWP$ study is a good example: cows selected for higher DWP$ were more profitable and produced milk with lower methane and manure nutrient intensity per unit of milk. 

On the market side, the shift toward cheese, butter, and other ingredients is prompting more questions from processors and retailers about animal welfare, environmental impact, and traceability. In practice, that’s showing up as programs that ask farms to document things like:

  • Bulk tank SCC and mastitis treatment rates.
  • Lameness levels and reasons cows leave the herd.
  • Transition‑cow performance, stillbirths, and overall cow mortality.
  • Manure-handling practices and, in some programs, basic carbon or nutrient values. 

In Wisconsin and Northeastern plants supplying branded retail milk and yogurt, this is already happening through sustainability questionnaires, on‑farm audits, and sometimes through price incentives or program bonuses for certain performance levels. 

It’s easy to see all of that as “one more thing.” But the flip side is that the metrics processors want to see often align with what already matters for profitability and labour sanity. Getting a handle on your SCC trends, cull reasons, lameness, and transition‑cow outcomes isn’t just for paperwork; it’s also good business.

On‑Farm Processing and Branding: Romantic and Real

For a 90‑cow tie‑stall in upstate New York or a 150‑cow herd in Pennsylvania, it’s natural to look at a successful farmstead cheese maker or local milk brand and wonder if that’s the way through.

University of Vermont and other land‑grant work has followed organic and value‑added farms that improved their financial position by adding on‑farm processing or direct marketing. When there’s strong local demand, and the owners have both the interest and the skill set, on‑farm processing can absolutely lift income per cwt. 

But those same studies are pretty blunt about what it takes:

  • Capital for plant renovations, pasteurizers, vats, coolers, and packaging can easily be in the hundreds of thousands of dollars, even on a modest scale. 
  • Owners suddenly need to learn food safety regulations, distribution logistics, branding, marketing, and customer service – on top of managing cows, crops, and people. 
  • Cash flow in the first few years can be tight, and success depends heavily on the local market and whether someone on the farm truly enjoys the business side. 

So if you’re thinking about going down that road, it really helps to compare two honest scenarios side by side:

  1. Putting that capital and management energy into your own processing and marketing.
  2. Putting the same resources into better forage, higher butterfat performance, stronger fresh cow and calf programs, and labour and tech improvements inside your current marketing channel.

In a lot of case studies, both paths can work. The winner usually comes down to your people and your local market, not just what the spreadsheet says.

Three U.S. Farm Types, Three Practical Paths

To make this less theoretical, let’s walk through three common U.S. farm profiles and talk about where they likely sit and what that suggests.

1. A 100‑Cow Tie‑Stall in Upstate New York

  • Likely lane: efficiency, with a bit of niche potential.
  • Reality: smaller tie‑stall herds in the Northeast are often shipping into competitive fluid and cheese markets, where butterfat levels, SCC, and day‑to‑day consistency can make the difference between staying afloat and calling an auctioneer. 

Practical focus might look like:

  • Pushing butterfat performance and overall component yield through better forage quality, balanced rations, and tight fresh cow management in the weeks around calving.
  • Keeping SCC low and reproduction steady to protect days in milk and minimize involuntary culls.
  • If there’s strong local demand – and someone on the farm genuinely wants to deal with customers – exploring a small, manageable value‑added product like seasonal cream or limited cheese runs, with extension support on food safety and realistic capital budgets. 

2. A 450‑Cow Freestall in Wisconsin

  • Likely lane: efficiency sweet spot.
  • Reality: shipping to a cheese plant under multiple‑component pricing, with a mix of family and hired staff and a typical Upper Midwest forage base. 

Practical focus might include:

  • Using a custom genetic index that emphasizes fat and protein yield, fertility, and health – potentially blending DWP$ or other health‑focused indexes with your pay price and culling patterns. 
  • Running a conservative AMS‑versus‑parlour comparison using Wisconsin cost benchmarks, realistic milk‑lift assumptions, and local wage and labour availability, rather than best‑case numbers from brochures. 
  • Prioritizing tech that clearly improves transition‑cow outcomes, labour per cwt, and data visibility – activity collars, sort gates, feeding tools – before committing to bigger, more complex systems. 

3. A 2,500‑Cow Dry Lot System in New Mexico

  • Likely lane: scale with discipline.
  • Reality: exposed to feed cost swings, water and environmental rules, and a competitive labour market in a hot, dry climate. 

Practical focus could be:

  • Leaning into genetics for fertility, mastitis resistance, and moderate mature size to support longevity and milk per stall under heat stress. 
  • Using beef‑on‑dairy strategically to monetize lower‑end genetics, improve calf value, and avoid raising more replacements than you really need. 
  • Prioritizing capital for cooling, water infrastructure, feed efficiency, and manure management first – the things that hit both cost per cwt and environmental risk – before simply adding more cows. 
  • Building a basic set of sustainability and welfare metrics (SCC trends, cull reasons, lameness levels, manure handling) so you’re ready when processors and lenders start asking tougher questions. 

None of these paths are easy. But each one looks more manageable when you’re honest about which lane you’re really in and what your main constraints actually are.

Five Kitchen‑Table Questions to Print Out

If you’re still here, you’re already thinking harder about this than most. Here are five questions you might want to print and stick on the fridge, office wall, or milkhouse door:

  1. Which lane are we actually in – scale, efficiency, or niche – and do our barns, labour setup, contracts, and debt load truly match that lane?
  2. Do our genetic goals – and how we use sexed, conventional, and beef‑on‑dairy semen – really line up with our milk cheque, our barn design, and our culling reasons, or are we just following the latest sire list?
  3. Which technologies on our wish list can we honestly say will improve dollars of margin per stall and labour per cwt at conservative milk prices and realistic interest rates?
  4. What is high staff turnover actually costing us in lost milk, health problems, training time, and stress – and what would it be worth to have a more stable, better‑trained crew?
  5. If our processor, lender, or a key customer asked tomorrow, what welfare, health, and environmental numbers could we share confidently – and where are the easiest improvements that would cut both costs and emissions?

In a world where nearly 40% of U.S. dairy farms disappeared in just five years, and where roughly two‑thirds of American milk now comes from 1,000‑cow‑and‑up herds, staying “as we’ve always done it” is its own kind of decision. 

What’s encouraging is that the tools to make smarter decisions – good data, solid research, better genetics, and thoughtfully chosen technology – are more available than they’ve ever been. The hard part, as many of us have seen around kitchen tables, shop benches, and barn alleys, is being brutally honest about which lane we’re in, and then steering into it on purpose, with our eyes open, instead of getting dragged there by default.

And if you’re still reading at this point, you’re already acting more like an owner than a passenger. That’s a pretty good place to start.

Key Takeaways

  • The shakeout is real: Nearly 40% of U.S. dairy farms vanished in five years – but the cows didn’t. They moved to fewer, bigger barns while total milk production held steady.
  • Scale helps, but it’s not the only way to win: Herds milking 2,000+ cows can operate about $10/cwt cheaper than small herds, yet mid-size and niche operations stay profitable by pushing components, labour efficiency, and cow longevity harder.
  • Profit separates on efficiency, not milk price: Top-profit herds at any size win on feed conversion, butterfat and protein yield, fresh cow management, and labour per cwt – the milk cheque is usually similar; the cost side isn’t.
  • Genetics and tech pay only when they fit: DWP$-driven selection can add $1,000–$1,500 lifetime IOFC per top-quartile cow; AMS, collars, and sort gates strengthen margins only when milk lift, labour changes, and interest costs actually pencil.
  • Inaction is a decision: Five closing questions help owners identify which survival lane they’re really in – and where standing still may be the riskiest move of all.

Complete references and supporting documentation are available upon request by contacting the editorial team at editor@thebullvine.com.

Learn More

The Sunday Read Dairy Professionals Don’t Skip.

Every week, thousands of producers, breeders, and industry insiders open Bullvine Weekly for genetics insights, market shifts, and profit strategies they won’t find anywhere else. One email. Five minutes. Smarter decisions all week.
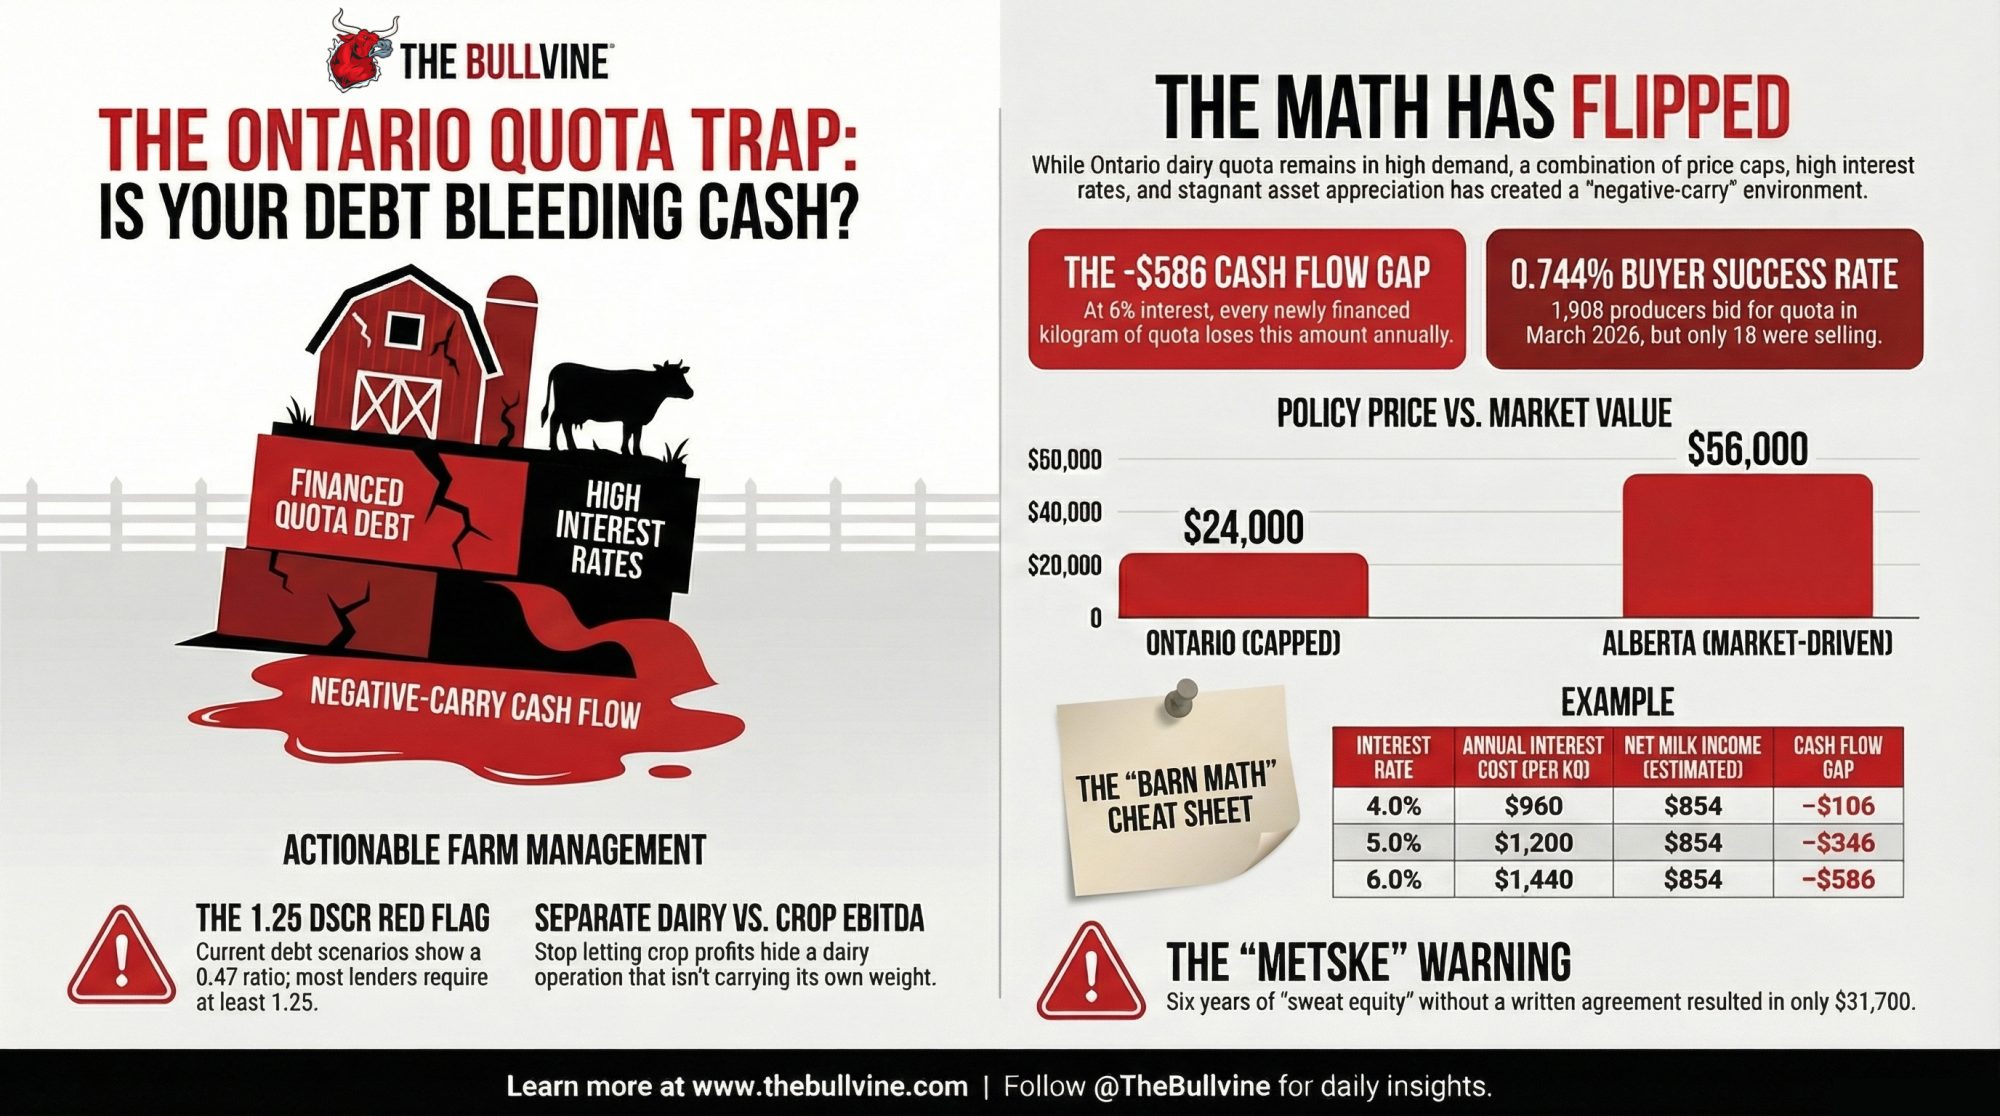
NewsSubscribe
First
Last
Consent

Record Corn Won’t Save You: The $100K Margin Hit Coming for Mid-Size Dairies in 2026

Cheap feed won’t save you. At $19 milk, a 300-cow dairy loses $100K in 2026—even with record corn.

Executive Summary: Cheap feed won’t save you in 2026—and the math proves it. USDA’s January reports confirmed record corn production at 17.021 billion bushels, dropping DMC feed costs to $9–$10/cwt, the lowest since October 2020. But here’s the problem: all-milk prices are forecast to fall from $21.05 to $19.25/cwt, a decline that outpaces feed savings by more than a dollar per hundredweight. For a typical 300-cow dairy, that translates to roughly $90,000–$100,000 less operating margin in 2026 than in 2025. ERS cost data shows the squeeze hits hardest in the middle—herds under 50 cows face $42.70/cwt in total costs, while 2,000+ cow operations run $16–$19/cwt, leaving mid-size dairies caught in between. This is a sorting year: invest in proven efficiency improvements, adjust your business model, or plan an exit while cows and equity are still in good shape.

2026 dairy profit margins

You’ve probably heard the good news by now: corn is cheap, soybeans are plentiful, and your feed bill should finally give you some breathing room in 2026. And honestly? That part’s true.

But here’s what’s been nagging at me—and what I think deserves a real kitchen-table conversation. When you actually run the numbers, cheaper feed doesn’t automatically mean a better year. For a lot of herds, 2026 could mean tighter margins than 2025, not wider ones. The math surprised me when I first worked through it, and I think it’s worth walking through together.

Let me show you what I mean.

The January Numbers That Changed the Conversation

USDA’s January 2026 reports confirmed what the trade had been whispering about: 2025 U.S. corn production hit a record 17.021 billion bushels on a national yield of 186.5 bushels per acre. Brownfield Ag News and Farm Progress both noted these figures came in above nearly all pre-report estimates, which explains why March corn futures dropped more than 20 cents on release day, sliding into the low $4.20s.

Ending stocks jumped to 2.227 billion bushels, up from 2.029 billion just a month earlier. That’s the most comfortable corn supply we’ve had in years. Soybeans tell a similar story: 4.262 billion bushels at a record 53 bushels per acre, with ending stocks around 350 million bushels.

What this means for your feed bunk is straightforward. Dairy Herd reported that DMC feed costs dropped to $9.38 per hundredweight in August 2025—the lowest since October 2020—and DairyReporter’s November analysis showed feed costs expected to stay in that 9–10 dollar band into 2026.

So yes, the feed side genuinely is better. If you’re in a grain-deficit region, this is a different world than the $5-plus corn of recent years.

But here’s where it gets complicated.

The Milk Price Reality

USDA’s current outlook, as reported by DairyReporter and confirmed by Southeast Ag Net, has the U.S. all-milk price averaging about $21.05 per hundredweight in 2025—then dropping to around $19.25 in 2026.

That’s roughly a $1.80 decline in your milk check. And when feed costs only drop by maybe 35–50 cents per hundredweight, the math doesn’t work in your favor.

Analysis published in October 2025 put it bluntly: “Milk Margins Likely to Fall Along with Feed Prices.” CoBank’s dairy analysts commented in early January that dairy markets turned downward in late 2025, and the Class IV futures don’t look encouraging. DairyReporter drew on CoBank’s outlook to note that profit margins for U.S. dairy farmers are expected to tighten in 2026 as rising milk production continues to pressure prices.

This is where herd size and cost structure really start to matter.

The Cost Curve You Need to See

Here’s where the conversation gets real. USDA’s Economic Research Service has been tracking production costs by herd size, and the pattern is stark. Let me lay it out in a way that makes the 2026 implications clear:

Herd SizeTotal Economic Cost ($/cwt)2026 Margin at $19.25 MilkRisk Level
<50 cows$42.70–$23.45 (severe deficit)🔴 Critical
50–99 cows$33.54–$14.29 (large deficit)🔴 Critical
100–499 cows$19–$21$0 to –$1.75 (breakeven/tight)🔴 High
500–999 cows$17–$19$0.25–$2.25 (slim)🟡 Moderate
2,000+ cows$16–$19$0.25–$3.25 (variable)🟡 Moderate

Sources: ERS 2021 ARMS data; ERS 2016 “Consolidation in U.S. Dairy Farming”; Dairy Global February 2025. Note: Costs vary significantly by management quality within each size class—Hoard’s Dairyman has documented low-cost producers in smaller categories matching high-cost producers in larger categories.

The numbers are sobering. ERS economist Jeffrey Gillespie reported that in 2021, the average total production cost was $42.70 per hundredweight for herds with fewer than 50 cows, versus $19.14 for herds with 2,000 or more. Dairy Herd’s summary of ERS consolidation data showed herds under 50 cows at $33.54 per hundredweight compared to $17.54 for 2,500-cow operations in 2016. Dairy Global’s February 2025 feature showed operating costs of $18.44 for small herds compared to $16.16 for the largest operations.

What’s worth noting here is that there’s huge variation within each size class. Low-cost producers running 100–199 cow herds can have total production costs around $19.76 per hundredweight, which puts them right alongside high-cost producers running 2,000-plus cows at $19.63. Management matters as much as scale.

But that table tells you something important: at $19.25 all-milk, a lot of herds in that 100–499 cow range are looking at breakeven or worse, even with cheap feed. And smaller herds? The math is brutal unless you’re among the best managers in your size class.

A 300-Cow Reality Check

Let’s make this concrete with a scenario that probably feels familiar.

Picture a 300-cow Holstein dairy in Wisconsin, Michigan, or Pennsylvania. Freestall housing, parlor milking, solid fresh cow management, respectable butterfat levels. Annual production around 23,000 pounds per cow—that’s 6.9 million pounds of milk per year, or 69,000 hundredweights.

Based on ERS benchmarks and university cost-of-production data, a well-managed herd in this size range typically runs total economic costs in the upper teens to low twenties per hundredweight—call it $19 to $21 when you include all labor, capital, and overhead.

Now do the math:

  • 2025: At $21.05 all-milk, that’s roughly $1–$2/cwt operating margin for well-managed herds
  • 2026: At $19.25 all-milk with maybe 40 cents in feed savings, you’re looking at about $1.30–$1.50/cwt lessmargin than 2025

On 69,000 hundredweights, that translates to $90,000 to $100,000 less operating margin in 2026 than in 2025—even with cheaper feed.

You might still be in the black. But you’re definitely a lot closer to the line.

Why USDA’s Big Corn Number Felt Off on the Ground

It’s worth noting that this record corn number felt like a gut punch to many people actually raising the crop.

Interviews with farmers right after the January WASDE. North-central Kansas producer Shale Porter described the report as “kind of a gut punch,” saying the larger-than-expected production and increased ending stocks created a fresh blow to an already fragile marketing environment.

What I’ve noticed over the years is that this disconnect often traces back to structure and technology. The largest crop farms are much more likely to use GPS guidance, yield monitors, and variable-rate fertilization. When USDA aggregates data to calculate a national average yield, that average gets pulled up by highly managed, highly instrumented acres—even in years when smaller or less-equipped farms are just “average” or worse.

On the dairy side, you see a similar pattern in production costs. The national averages don’t always reflect what’s happening on your specific operation.

Regional Realities: Same Numbers, Different Stories

The same USDA and ERS numbers play out very differently depending on where your milk truck pulls in. Here’s the quick read on each region:

Upper Midwest (Wisconsin, Michigan, Minnesota)

  • Sweet spot: 200–400 cow herds with strong forage programs
  • The X-factor: Home-grown forage quality can make or break competitiveness
  • Many operations blend grazing with TMR for cost control without sacrificing precision
  • University of Wisconsin data shows well-managed mid-size herds can compete with larger neighbors on cost

Northeast (Pennsylvania, New York, New England)

  • Higher land costs and labor, but proximity to dense consumer markets
  • Growing success with direct-to-consumer: farmstead cheese, on-farm bottling, farm stores
  • Class III/IV prices matter less when retail margins drive revenue
  • Penn State and Cornell have documented resilient small/mid-size models

West and Southwest (California, Idaho, Texas, New Mexico)

  • Dominated by 1,000–5,000 cow dry lot and large freestall operations
  • Lowest per-unit costs, highest milk per cow
  • Key vulnerability: Heavy exposure to export markets and Class IV volatility
  • Water and environmental scrutiny are intensifying
  • CoBank noted butterfat oversupply hitting some processors hard

Southeast

  • Heat and humidity are the defining challenge
  • Cow cooling isn’t optional—it’s survival infrastructure
  • Extension research consistently shows robust cooling improves intake, production, reproduction, and butterfat
  • Herds without adequate fans, soakers, and shade see summer production crash
  • Heat stress losses can quickly eat up lower feed costs

Canada

  • Quota changes pricing structure, but not cost fundamentals
  • Larger freestall dairies with automation have lower unit costs than smaller tie-stall herds
  • Canadian Cattlemen coverage shows technology adoption driving cost differences similar to U.S. patterns

The takeaway: national averages set the stage, but your 2026 story depends on your region, your barn, your debt, and your marketing options.

Where Farms Are Actually Moving the Needle

Looking at this trend, farmers are gravitating toward four broad response paths—often combining a couple of them.

1. Tightening the Fundamentals That Still Pay Back Fast

A lot of herds are going back to basics: Where’s the relatively easy money still on the table?

  • Feed efficiency: Extension nutritionists discuss feed efficiency benchmarks that vary by lactation stage and measurement method, with top-performing herds consistently outperforming average operations. At 9–10 dollars per feed cost, even modest improvements can be worth meaningful dollars per cow annually. The tools are management, not marble: consistent TMR mixing, solid feed-push habits, minimizing sort.
  • Reproduction and transition: University economic modeling regularly puts a significant per-cow annual value on better pregnancy rates and fewer transition disorders—once you count extra milk, fewer days open, fewer culls, and lower treatment costs. Getting days open into the 120s instead of the 150s shows up quickly in milk shipped per stall.
  • Mastitis economics: Research consistently shows significant avoidable cost. A 2024 Wageningen University study put typical clinical mastitis costs at $224–$275 per case, while Michigan State work by Dr. Pam Ruegg found costs ranging from about $120 to $330 per cow per case, depending on severity and farm. Hoard’s Dairyman reported similar findings, noting costs of $120 to $350, with an average of around $192. Dropping SCC into the 150–200,000 range protects premiums and usually correlates with steadier production and better butterfat.

What I’ve noticed: lower grain prices give you breathing room to work on these fundamentals without panicking about every extra half-pound of dry matter.

2. Picking a Different Lane: Grazing, Organic, and Specialty

Another group—especially 60–250 cow herds—is asking whether they really want to keep running a pure commodity race.

  • Intensive rotational grazing: Cost-of-production work on grass-based dairies shows that well-managed systems can cut total cost per hundredweight by several dollars compared with comparable confinement herds. Milk per cow runs lower (18,000–22,000 pounds), but when debt is manageable and the grain bill is small, net returns can stack up well.
  • Organic and premium programs: ERS research shows organic operations have substantially higher production costs—sometimes 50 percent more—but receive much higher farm-gate prices when markets are balanced. Some farms layer on grass-fed, A2A2, or animal-welfare certifications for specific branded programs.
  • On-farm processing: University case studies document how small- and mid-size dairies are building resilient businesses on retail margins and consumer loyalty rather than Federal Order checks.

These paths trade commodity risk for marketing and logistics challenges. But for some families, they’re more realistic than trying to quadruple herd size.

3. Teaming Up Instead of Going It Alone

In areas with clusters of mid-size dairies, there’s more serious talk about partnerships.

Dairy Herd’s coverage has highlighted examples of two or three neighboring families forming joint ventures, combining herds, and investing together in more efficient facilities. Think: two 250-cow herds consolidating into one 500-cow freestall with a modern parlor and specialized labor roles.

Common benefits lenders and advisers see:

  • Lower labor hours per cow through specialization
  • Better delivered feed costs buying in semi loads
  • Lower fixed costs per hundredweight across shared infrastructure

Partnerships require trust and clear agreements, but for the “too big to be small, too small to be big” crowd, they’re worth considering.

Response StrategyBest ForKey Actions2026 Margin OutlookRisk
INVESTWell-capitalized, solid-footed herds in viable size range (150–500 cows)Fresh cow facilities, cooling, precision feed systems, robotic parlor prepMargin improves 2027+ as efficiency gains compound; 2026 tight but survivableDebt service if markets weaken further
ADJUSTHerds with land, family labor, and willingness to change model (80–250 cows)Shift to grazing, organic, direct-to-consumer, on-farm processing, dairy partnershipsHigher per-cwt return on lower volume; less commodity-market exposureMarketing complexity; buyer education required
EXITProducers within 5–10 years of retirement; tired operators; no clear successionPlan dispersal while cows/equipment in good condition; family succession or sale-to-neighbor negotiationPreserve equity; exit on your terms while margins still existEmotional; requires discipline not to wait for “better year”

4. Treating 2026 as a Planning Year

For producers within five to ten years of retirement without a clear successor, this discussion hits differently.

Reports suggest many dairy exits in the next decade will be driven by cost position, age, and family goals more than any single bad year. Advisers stress that planned transitions—family succession, sale to a neighbor, well-timed dispersals—preserve more equity than waiting until tough years force rushed decisions.

Auction data indicate that well-organized dispersal sales, held while cows are in good condition and equipment is maintained, regularly outperform “end-of-the-rope” liquidations.

2026 might be the right year to ask blunt questions: What does cash flow look like at $19 milk and $10 feed for another full cycle? And if you’d rather be out in two to five years, what does exiting on your terms look like while you still have margin?

Don’t Lose Sight of Components

With all the feed talk, it’s easy to forget that butterfat and protein still drive a big chunk of your milk check.

Component pricing work shows that butterfat increases can add meaningful revenue—often comparable to or greater than what you’d gain from modest corn price movements on the same volume of milk.

Here’s what’s interesting, though. CoBank’s 2026 outlook noted that butterfat has actually moved to an oversupply situation. Their Knowledge Exchange report from December put it plainly: dairy processors are awash with butterfat, and some have even capped butterfat payment levels on farmgate milk in response. In October, Corey Geiger with CoBank said spot butter markets had dropped almost seventy cents since August 1st due to excess supply.

That underscores why protein may be where the action shifts—and why watching your components still matters even as the market dynamics change.

Fresh cow management sits at the center of component performance. Extension materials consistently show that smooth transitions lead to higher peaks, fewer health problems, better fertility, and stronger components.

The question worth asking: Is there a change in fresh cow management, cow comfort, or milking routine that will pay more in milk and components than you’d ever save squeezing a few more cents from corn?

For a lot of herds, that’s where the biggest upside is hiding.

Your 2026 Checklist

1. Run a realistic 2026 budget.
Use $19.25 all-milk and 9–10 dollar feed costs. Know your actual cost per hundredweight with full labor and overhead. If you’re well north of the upper teens, something has to change.

2. Benchmark where you really stand.
Compare your cost, feed efficiency, reproduction, mastitis rates, and butterfat against ERS benchmarks and regional top-quartile data. Remember what Hoard’s documented: low-cost producers in smaller herds can match the costs of high-cost, large operations. Identify the two or three levers that would move your margin most.

3. Decide: Invest, Adjust, or Exit.

  • Invest in proven improvements—fresh cow facilities, cooling, feed systems
  • Adjust your model—grazing, organic, processing, partnership
  • Plan an exit that protects equity while cows and equipment are still solid

The Bottom Line

2026 doesn’t look like a disaster year, and it doesn’t look like a home-run year. It looks like a sorting year—where clarity and decisions matter most.

Feed is finally in your favor. But milk prices are expected to be below 2025 levels, and most serious margin analyses suggest spreads will tighten for many herds.

The herds that make it through stretches like this aren’t always the biggest. They’re the ones who know their numbers, think beyond the next milk check, and make intentional choices before the market does.

The math this year is universal. What you decide to do with it is personal—written at your own kitchen table, with your own records, and the people you trust sitting there with you.

Key Takeaways

  • Cheap feed won’t save you: Record corn pushed DMC feed costs to $9–$10/cwt, but milk prices are dropping faster—net margin tightens, not loosens
  • $100K on the line: A typical 300-cow dairy loses roughly $90,000–$100,000 in operating margin in 2026 compared to 2025
  • The scale gap is brutal: Small herds face $42.70/cwt total costs vs. $16–$19/cwt for large operations—mid-size dairies are caught in between
  • This is a sorting year: Invest in efficiency, adjust your model, or plan your exit—there’s no standing still in 2026

Complete references and supporting documentation are available upon request by contacting the editorial team at editor@thebullvine.com.

Learn More

The Sunday Read Dairy Professionals Don’t Skip.

Every week, thousands of producers, breeders, and industry insiders open Bullvine Weekly for genetics insights, market shifts, and profit strategies they won’t find anywhere else. One email. Five minutes. Smarter decisions all week.

NewsSubscribe
First
Last
Consent

Mercosur Math: Why 30,000 Tonnes of Cheese is Actually 550 Displaced Herds

Mercosur was sold as “modest.” The math says 550 EU family herds’ milk and a headwind that can shave cents off every litre you ship. Ready to see where you stand?

Executive Summary: EU dairy farmers are walking into the Mercosur era with costs already running hot, milk output basically flat at about 149.4 million tonnes, and some of the toughest environmental and welfare rules anywhere. The “modest” EU–Mercosur deal quietly opens the door to 30,000 tonnes of cheese, 10,000 tonnes of milk powder, and 5,000 tonnes of infant formula on zero‑tariff quotas once it’s fully phased in—roughly 345,000 tonnes of milk when you convert it back to tanker‑loads. That’s the annual production of more than 500 average EU family herds trying to find a home in a market where cow numbers and drinking‑milk use are already slipping. This article walks through that “Mercosur math,” shows what those quota volumes could mean for your milk cheque over a season, and lays out the practical questions every EU dairy should be asking about compliance costs, product mix, and risk‑sharing with processors.

You know that feeling. The milk cheque shows up, it’s lighter than you hoped, the co‑op newsletter says it’s been “a solid year,” and then the radio starts talking about Brussels pushing the EU–Mercosur trade deal across the finish line.

That’s usually when the questions you’ve been parking for months finally bubble up: “So what does this actually mean for my milk price? For our cows? For whether this place is still viable ten years from now?” Those are fair questions. And they deserve more than slogans, whether they’re coming from farm groups or politicians.

So let’s walk through this together. We’ll start with the cost pressure you’re already feeling, then dig into what’s really in the Mercosur dairy package, translate it into tanker loads and euros, and finish with some practical things you can do at the kitchen table over the next 90 days.

Looking at the Cost Gap We’re Up Against

Looking at this trend over the last five years, here’s what’s interesting: every major dairy region has seen costs go up, but not at the same speed or from the same starting point.

AHDB in the UK pulled together a clear summary of Rabobank’s latest global milk production cost work early in 2025. They looked at eight big exporting regions—Argentina, Australia, China, Ireland, New Zealand, the Netherlands, California, and the US Upper Midwest—from 2019 through 2024. Across that group, average total production costs rose about 14%, which works out to roughly 6 US cents more per litre over that period, and more than 70% of that increase occurred between 2021 and 2024, as feed, energy, and labour spiked. Rabobank’s team also highlighted that feed expenses were the main culprit, with average feed bills across those regions up around 19% since 2019.

The same work shows Oceania at the sharp end of low‑cost production. New Zealand and Australia have been neck‑and‑neck for the lowest cost among the eight regions, with a five‑year average total cost of about US$0.37 per litre versus roughly US$0.48 for the others. That’s roughly a 17% advantage for Oceania once you standardise for milk composition and express everything in US dollars. By contrast, production costs in local currencies in the US, the Netherlands, and China rose about 10–20% over that period, around 25% in Australia and New Zealand, and roughly 30–40% in Ireland and Argentina.

What I’ve found, looking across north‑west Europe, is that this lines up pretty well with what many of you are seeing in your own books. Once you add feed, labour, power, interest, and then the cost of complying with environmental and animal‑welfare rules, you’re often looking at a cost base that’s several euros per 100 kg higher than a low‑cost pasture system in New Zealand or some of the better Mercosur herds. Rabobank’s comparisons suggest that on a typical European cost level, that 17% gap can easily translate into a few euros per 100 kg of milk once everything is counted in.

And it’s not that EU cows are managed badly. In most freestall herds in France, Germany, the Netherlands, or Ireland, butterfat performance, fresh cow management during the transition period, and general cow comfort would look very familiar to good herds in Wisconsin or Ontario. What really racks up the bill is what sits around the cows rather than the cows themselves.

So where do those extra euros actually hide:

  • Animal‑welfare and environmental rules that govern cubicle dimensions, stocking densities, bedding, sometimes minimum days on pasture, and increasingly strict slurry and housing rules tied to EU nitrates and climate policy
  • Traceability and food‑safety systems that mean more tagging, sampling, milk recording, and third‑party audits than you’d see in many lower‑regulation exporting regions
  • Labour laws and social charges that make every hired hour more expensive than in much of South America or Oceania

What’s interesting is that when families actually sit down with their accountant and a highlighter, and pull out projects and costs that exist mainly because of regulation—extra lagoon capacity, environmental testing, certification and audit fees, software for traceability systems—it’s common to end up with a compliance bill in the low single‑digits of euro cents per kilo of milk. A recent systematic review of milk quality and economic indicators in dairy farming backs up the idea that quality schemes and regulatory measures are significant cost drivers, even if the exact cents‑per‑litre number varies from farm to farm. It’s not some official EU‑wide metric, but it’s big enough to matter, especially when global prices turn down.

That’s the cost base Mercosur milk and cheese is going to be bumping into.

What’s Actually in the Mercosur Dairy Package?

So, what’s actually in this deal? Because you’ve probably heard everything from “it’s a minor opening” to “it’ll wipe out EU dairy.”

EU trade documents on the EU–Mercosur association agreement, along with analysis from AHDB, all draw a very similar picture. On the dairy side, the agreement adds new duty‑free tariff‑rate quotas (TRQs) for three main products:

  • Up to 30,000 tonnes of cheese per year, where current most‑favoured‑nation tariffs sit around 28%
  • Up to 10,000 tonnes of milk powder per year, also dropping from roughly 28% to zero in‑quota
  • Up to 5,000 tonnes of infant formula per year, down from about 18% duty to zero on those quota volumes

These aren’t switched on at full volume on day one. European Dairy Association commentary notes that cheese quotas are expected to start around 3,000 tonnes in the first year and then step up to 30,000 tonnes by year ten, while milk powder TRQs move from 1,000 to 10,000 tonnes over the same period. Infant formula quotas are phased in to a final volume of 5,000 tonnes.

On the flip side, EU processors gain better access to Mercosur markets—especially Brazil—for European cheeses, powders, and infant nutrition products, plus stronger protection for EU geographical indications, such as key cheese names. That’s why you see support from groups like the European Dairy Association; they’re looking at supermarket shelves in São Paulo as much as at your yard in Brittany.

But if you’re milking cows in Bavaria or western France, the key question isn’t “is this good for EU industrial exports overall?” It’s “what do those tonnes actually mean on the milk side and on my milk cheque?”

Turning Policy Tonnes Into Tanker Loads

This is where the math gets real.

On paper, 30,000 tonnes of cheese doesn’t sound like much when the EU produces close to 150 million tonnes of milk. To get a feel for it, you have to convert that cheese and powder back into the milk that made it.

Cheese makers often use a rule of thumb of roughly 8.5 kg of whole milk to produce 1 kg of semi‑hard cheese, depending on fat and protein levels. For milk powder, typical technical references put whole milk powder at around 7.8 kg of milk per kg of powder and skim milk powder at just over 10 kg; using 9 as a blended average for a basket of powders is a fair shorthand.

If we run those numbers:

  • Cheese: 30,000 tonnes × 8.5 kg milk/kg cheese ≈ 255,000 tonnes of milk equivalent
  • Powder: 10,000 tonnes × 9 kg milk/kg powder ≈ 90,000 tonnes of milk equivalent

Together, that’s roughly 345,000 tonnes of milk equivalent per year, once those quotas are fully ramped up.

Now let’s lay that alongside EU milk production.

A USDA GAIN report on the EU, summarised by Dairy Global, forecasts total EU milk deliveries at about 149.4 million tonnes in 2025, roughly 0.2% below a revised estimate for 2024. That same analysis expects domestic consumption of fluid milk to keep easing and notes that cheese production is likely to edge higher, with more milk being channelled to cheese and powders.

So, into a basically flat pool of around 149–150 million tonnes, you add the equivalent of 345,000 tonnes of milk.

To make that concrete, German data from BZL show that by the end of 2023, Germany had 50,581 dairy cattle holdings—about 2,400 fewer than in 2022—and a national herd of roughly 3.7 million cows, down 2.5% in a year. Average yield was around 8,780 kg per cow, up from 8,504 kg in 2022. On those numbers, a 75‑cow family herd ships roughly 658,500 kg—call it 650 tonnes—of milk per year.

Divide 345,000 tonnes of milk equivalent by 650 tonnes per 75‑cow herd, and you’re looking at the annual output of about 530–550 herds of that size.

No, that doesn’t mean 550 farms will shut their doors the day this deal kicks in. Markets don’t work in straight lines. But you can see why something labelled as a “modest” quota package starts to feel a lot less modest when you translate it into tanker loads and real farms.

And if you turn that into price pressure, here’s a handy way to think about it. Say that extra competition from Mercosur trims the milk price by an average of 1–2 cents per litre over a cycle. On 650,000 litres of milk, that’s €6,500–€13,000 a year. On 2 million litres, you’re talking €20,000–€40,000. It’s not a forecast; it’s just basic arithmetic. But it puts a number on what “a bit more headwind” could mean in everyday cash‑flow terms.

Annual Milk VolumeImpact at 1 cent/LImpact at 2 cents/L
500,000 L€5,000€10,000
650,000 L€6,500€13,000
1,000,000 L€10,000€20,000
2,000,000 L€20,000€40,000

Where the EU Dairy Sector Is Starting From

Before we hang everything on Mercosur, it’s worth being honest about where EU dairy already stands.

The same three threads keep showing up in USDA GAIN summaries, forecast, and national statistics.

First, milk production is flat to slightly down. For 2025, EU milk deliveries are forecast at about 149.4 million tonnes, 0.2% below 2024, as tight margins, environmental restrictions, and disease pressures push some smaller farmers out and cow numbers keep easing.

YearEU Milk Production (M tonnes)German Dairy Farms (thousands)
2019151.264.5
2020150.862.5
2021150.560.4
2022150.153.0
2023149.650.6
2024149.6 (est.)
2025149.4 (forecast)

Second, cow numbers and farm numbers are steadily shrinking. We already talked about Germany losing about 2,400 dairy farmers in 2023, with cow numbers slipping to 3.7 million and average yields rising to 8,780 kg. Similar structural change is underway in France and the Netherlands, even if the exact figures differ.

Third, the product mix is shifting. The same GAIN‑based forecast expects domestic fluid‑milk consumption to continue declining, down by about 0.3% in 2025, while cheese production holds or grows slightly, and more milk heads into cheese and powders.

If you glance across the Atlantic, you see a related pattern. Hoard’s Dairyman recently highlighted that average US butterfat in the national bulk tank has climbed steadily, with annual averages moving from roughly 4.01% in 2021 to about 4.15% in 2023, and monthly data in 2024 showing every month at or above 4.0% fat. That mirrors what many of you are seeing on your own test sheets: cows that used to sit at 3.6–3.7% butterfat now comfortably over 4.0. In the Upper Midwest, for example, butterfat in the federal order serving Wisconsin averaged over 4% for the first time in 2021, driven by the cheese focus in that region.

So the EU isn’t unique. High‑standard dairy regions worldwide are trying to get more value out of every litre—more fat, more protein, more cheese yield—without relying on endless volume growth. The twist is that EU farms are doing it under some of the strictest welfare and environmental rules anywhere, which means their cost of production is higher before they even start.

And if you’re reading this in Wisconsin, Ontario, or Canterbury, you’ll recognise some of these pressures: higher input costs, tighter environmental expectations, more scrutiny from buyers, and a slow drift away from fluid milk into cheese and ingredients. The details differ, but the direction of travel feels familiar.

So What Does This Do to Price?

This is the question everyone wants answered in one number: “How much does Mercosur take off my litre?”

Here’s the honest take: nobody reputable is putting a clean, Mercosur‑only discount into a forecast yet. But there are enough signals to sketch the shape of the impact.

Rabobank’s work on structural costs makes a straightforward point: regions like north‑west Europe, with higher labour, land, and regulatory costs, will face ongoing margin pressure if they’re playing in global commodity markets. The path forward, in their view, is more scale, more differentiation, or both.

Analysis of Rabobank’s 2024 outlook for EU farmers notes that margins are expected to improve compared to the worst of 2022, with an average base price in the high 40s €/100 kg, but it also warns that costs remain elevated and that weaker Chinese demand and low output in Argentina are key uncertainties. AHDB’s own work on 2024–2025 costs underlines that while fertiliser and some purchased feeds have come off their peaks, total production expenses are still well above 2019 levels.

Then you drop Mercosur into that picture. You’ve got a mature, high‑cost market, where milk volume is flattening, and you add a stream of lower‑cost cheese and powder competing at the commodity end. Over time, that acts like a headwind on prices—peaks don’t climb quite as high, and recoveries after a downturn can be slower and shallower.

Farm organisations have been very clear on this. Groups like the European Milk Board and Copa‑Cogeca argue that EU farmers are being asked to meet some of the strictest environmental and animal‑welfare standards in the world while competing against imports that don’t face those same on‑farm obligations. They see the risk that, unless the value chain pays properly for higher standards, more low‑cost imports will tighten already narrow margins and accelerate structural change.

On the other side, the European Dairy Association and export‑oriented processors see opportunities. They’ve publicly welcomed progress on the EU–Mercosur deal, pointing to better access for EU cheeses and ingredients, and stronger protection for European cheese names, as ways to grow value in Mercosur markets. From their perspective, this is about getting more branded EU product onto high‑value shelves abroad.

The short version? For a commodity‑leaning family farm, Mercosur is another weight on a scale that was already tipping toward tighter margins. For a processor with good brands and strong GI‑protected products, it’s a mix of added risk at home and new opportunity abroad. And for the co‑ops and private buyers in the middle, it raises the stakes on how they share risk and reward with suppliers.

In some regions, you’re starting to see buyers offer longer‑term cost‑plus or fixed‑margin contracts on a slice of milk—tying pay‑out more closely to real costs for part of your volume—which is one way to spread the risk between farm and plant. It’s still early days for those models, though. Most of you are still living off the commodity roller coaster.

Mirror Clauses: Why “Same Standards for Imports” Is Harder Than It Sounds

When farmers hear all this, it’s totally understandable that the first instinct is: “Fine—if they want to ship dairy here, make them meet our standards.”

On principle, it feels fair. You’ve invested in better housing, in slurry storage that actually holds enough for the whole winter, in emissions and nutrient management plans, in full traceability. Why should you compete with milk that hasn’t carried the same load?

The catch is that most of what drives your cost is about how things are done, not the physical product you test at the dairy plant. That’s where life gets tricky for mirror‑clause ideas.

You can lab‑test cheese and milk powder for residues, pathogens, and composition. You can’t test a block of cheese for stall dimensions, resting time, or whether the cows had 120 grazing days that year. Those are process standards. They’re invisible at the border.

We’ve already seen how tough that gets with the EU’s deforestation regulation. When Brussels moved to regulate imports linked to illegal deforestation, there was a lot of optimism that satellite imagery and digital tools would make things straightforward. In practice, enforcement has run into mismatches between forest maps and national land registries, patchy local records in exporting regions, and the sheer volume of supply chains that have to be traced. Dairy would have similar traceability headaches, just without the helpful “forest/no forest” satellite contrast.

Trade lawyers also point out that under WTO rules, it’s generally easier to defend restrictions based on what a product is—its composition, safety, or residues—than on production methods that don’t change the product itself. Push too far on telling exporting countries they have to run their barns and manure systems just like Europe does, and you risk a trade dispute that’s hard to win.

There’s also a simple economic angle. If Mercosur exporters really had to meet fully equivalent EU‑level requirements for housing, slurry storage, and emissions—and if those rules were enforced correctly—their cost advantage would shrink. At that point, their appetite for pushing big volumes into an already competitive EU dairy market might cool.

So mirror clauses are likely to make inroads on some clear things—keeping banned substances out of the food chain, tightening traceability on deforestation-linked feed—but they’re not a magic wand for equalising on‑farm standards and costs in the near term.

What’s Going On in Mercosur Dairy?

To keep this fair, we shouldn’t pretend Mercosur is static either.

Brazil and Argentina are the main dairy players in that bloc. Global trade reports and USDA’s “Dairy: World Markets and Trade” show that over the last decade, both countries have increased dairy exports, particularly in whole‑milk powder, cheese, and UHT milk, into neighbouring Latin American markets, North Africa, and parts of the Middle East. Brazil, in particular, has swung between being a net importer and a net exporter depending on domestic demand, currency, and policy.

If you look at typical export‑oriented herds in those regions, you see a lot more pasture and semi‑intensive systems than full concrete‑and‑steel freestalls. Housing tends to be lighter, with cows spending more time on grass and less in enclosed barns. Land and labour costs, in local terms, are generally lower than in north‑west Europe, even allowing for inflation and volatility. Environmental and animal‑welfare rules exist and are evolving, but they don’t yet put the same pressure on stocking rates, slurry storage, or greenhouse gas accounting that EU farmers are now dealing with.

Rabobank’s cost analysis notes that while production costs in Argentina and Ireland have jumped 30–40% in local currency since 2019, farms in low‑cost pasture systems still tend to sit below EU per‑litre costs because they started from a lower base and have fewer regulatory-driven capital investments to service.

From a Mercosur perspective, the EU deal is about locking in stable, rules‑based access to a high‑value market. From Brussels’ perspective, dairy is one moving part in a larger trade‑off that also covers sectors like cars and machinery, where the political stakes are high.

And from your parlour? It’s another external force you can’t control but have to respond to, just like feed markets or weather.

How Some Farms Are Adjusting Their Playbook

So let’s bring this back to the farm gate. Given higher structural costs, flat or slowly easing milk volumes, and this new trade headwind, what can a dairy actually do?

What I’ve noticed, visiting herds and talking with producers in Germany, the Netherlands, France, and Ireland—and comparing notes with folks in Wisconsin or Ontario facing their own pressures—is that farms which seem to be staying a step ahead have a few habits in common.

1. Treating Compliance as a Real Cost, Not Just a Headache

A lot of us complain about regulation, but relatively few actually put a number on it. On the herds that do, the conversation changes fast.

Here’s what that looks like in practice:

  • They list capital projects where regulations were the main driver—extra slurry storage to meet new rules, lagoon covers for emissions, manure separators, stall renovations for welfare standards, upgraded ventilation that goes beyond pure production needs
  • They pull out ongoing expenses that are mostly about compliance—environmental sampling, emissions monitoring, nutrient‑management plans, audit and certification fees, software licences for traceability and quality programmes
  • They estimate the labour hours that go into paperwork and inspections that simply wouldn’t exist in a lower‑regulation environment

When you add those up and divide by litres delivered, you don’t get a perfect number. But you do get a rough compliance cost per 100 kg. On some farms, that works out to just above one cent per kilo; on others, especially right after big environmental investments, it creeps closer to two or three. A 2024 systematic review on milk quality and economic sustainability makes the same point: regulatory and quality‑scheme demands are a real component of total cost, and they vary widely by system and region.

A simple way to start is this: print last year’s accounts, grab a highlighter, and mark anything that’s there primarily because of regulations or certification schemes. On one European case example, that list looked like roughly €12,000 for extra slurry storage, €3,000 for environmental testing and nutrient planning, and €1,500 in audit and certification fees—about €16,500 spread over roughly 800,000 litres. That’s the kind of breakdown that turns “regulation is expensive” into something you can actually talk through with your bank, your advisor, and your buyer.

Compliance Cost ComponentTypical Annual Cost (EUR)Cost Type
Extra slurry storage (beyond production need)€2,000Amortized
Environmental testing & nutrient plans€3,000Recurring
Audit & certification fees€1,500Recurring
Emissions monitoring equipment€1,200Amortized
Traceability software & milk recording€800Recurring
Welfare-driven barn upgrades€3,500Amortized
TOTAL (Annual Equivalent)€12,000Mixed

Once you’ve got your own ballpark compliance cost written down, a few deeper questions come almost automatically:

  • Are we carrying too much fixed compliance infrastructure for the litres we’re producing?
  • Does our current herd size spread those fixed costs sensibly?
  • Are we picking up any premium for the standards we’re already meeting, or are we just ticking boxes?

You don’t have to like the answers. But you can’t manage what you won’t measure.

2. Moving a Slice of Milk Out of the Commodity Stream

The second pattern you see, especially near towns and cities, is farms that accept they can’t compete on cost for every litre, so they move a slice of their milk into a different game.

We’re not talking massive on‑farm bottling plants. A typical success story looks more like this:

  • An 80–120‑cow freestall or loose‑housing herd on the edge of a Dutch town, a German city, or a French provincial centre
  • Modest capital spend—a small pasteuriser, one or two simple cheese vats, decent refrigeration, and either a tidy farm shop or a regular place at local markets
  • A family member who doesn’t mind dealing with customers and local social media

Case studies out of regions like Minas Gerais in Brazil and various European direct‑sale operations show that when everything is set up sensibly, the milk that goes through that direct channel can net 20–40% more per litre than the base co‑op price, after you’ve covered packaging, extra labour, and energy. The majority of milk still goes on the truck. But that 20–40% slice can be the difference between a red year and a black one.

Of course, that’s the best‑case scenario. You probably know someone whose on‑farm processing turned into an expensive, exhausting second job. The key conditions that keep coming up, both in the research and in real herd stories, are:

  • You’re within a reasonable distance of enough customers who value local dairy
  • You keep the product range focused and manageable
  • You run the numbers hard, including your own time and the extra compliance burden

So before you rush out to buy a pasteuriser, it’s worth asking:

  • Are we close enough to a town or city with people who’ll pay more for local milk and cheese?
  • Do we have someone in the family who genuinely likes selling and storytelling, not just milking and scraping?
  • What existing platforms—farmers’ markets, local food shops, online “farm‑to‑door” schemes—could we plug into first, before we build everything ourselves?

If you can line up “yes” answers for those, then looking at a small, seasonal product line—like ice cream or fresh cheese—might be a sensible toe‑in‑the‑water move.

3. Turning Constraints Into a Product Story

In mountain and hill regions, the options look different again. You’re dealing with slopes, short growing seasons, and fragmented fields. Big dry lot systems or 700‑cow freestalls just aren’t realistic on that ground.

What’s encouraging is that some of these farms are still hanging in—and some are thriving—because their milk is tied into PDO or GI cheeses and dairy products with strong regional identities. Studies of mountain dairy systems in the Alps and other upland regions show that farms linked into well‑managed GI value chains often receive higher average prices per kilo of solids than standard commodity milk, though they also face higher production costs and depend more on environmental payments.

In other words, they’ve turned what might look like “inefficiencies”—steep land, traditional breeds, strict building rules—into part of the brand and value story.

If you’re already in one of those regions, or your co‑op is talking about building a new origin or welfare scheme, you might want to ask three blunt questions:

  • What’s the average farm‑gate price difference compared with standard milk for farms actually in the scheme?
  • How many local farms have successfully transitioned into it, and what did they have to change in terms of housing, feeding, or certification?
  • How steady has that premium been through the last couple of price cycles?

Research and farm‑level evidence suggest that in some regions the premium holds up well; in others, it narrows during low‑price periods. Knowing which kind of region you’re in matters before you commit to major changes.

Five Questions for a Winter Night at the Kitchen Table

By this point, it’s easy to feel like the world is throwing too many variables at you at once: global costs, trade deals, standards, climate, and consumer shifts. You can’t fix any of those alone.

What you can do is see your own situation clearly and make a few deliberate moves.

Here are five questions worth scribbling down and working through with whoever shares in the decisions on your farm.

1. What’s our best estimate of compliance cost per 100 kilos?
Grab last year’s accounts and a highlighter. Mark the items that wouldn’t be there—or would be much smaller—if you didn’t have to meet today’s environmental, welfare, and traceability rules: slurry and storage projects, environmental testing, nutrient plans, emissions monitoring, audit fees, and software for quality schemes. Add them up and divide by your litres. It won’t be perfect, but it will turn “regulation is expensive” into a number you can bring to your bank, your advisor, and your processor.

2. Does our current scale fit our region and our system?
Very small herds sometimes survive with low debt and off‑farm income. Very large units spread fixed costs—buildings, slurry, compliance, labour—over a lot of litres. The 60–200‑cow, fully regulated freestall herd is often caught hardest—too big to be a hobby, too small to spread heavy fixed overhead comfortably. Given your land base, labour, building layout, and local rules, are you trying to carry more cows than you can handle efficiently, or is your physical and regulatory infrastructure too big for your current litres?

3. Where does each litre of our milk actually go—and under what contract terms?
Map it out. How much milk goes into pure commodity cheese and powder pools? How much, if any, goes into premium streams—pasture‑based, non‑GMO, organic, higher‑welfare, local‑origin? A good question for your buyer is: “What premium programmes—pasture‑based, non‑GMO feed, higher‑welfare, local—do you offer today, and what would it take for us to qualify?” In some northern EU regions, pasture milk contracts pay an extra one or two cents per litre in exchange for documented grazing days and limits on concentrates, while GMO‑free feed contracts can offer similar premiums if you can show full feed traceability. Not every farm can make those programmes work—but you don’t know until you ask.

4. How much are we relying on emergency support to balance our risk?
The last few years—Covid disruptions, energy price spikes—have shown that EU and national support schemes do appear when things get rough, but they can also be slow and administratively heavy. It’s sensible to argue for better policy. It’s risky to build your whole business plan on the hope that the next crisis cheque will land when you need it. So ask: “If prices were poor for the next two years and no new support arrived, what would we actually do—cut costs, change system, adjust scale, or something else?”

5. Who are we comparing ourselves with, and who can we be honest with?
Benchmarking and business clubs aren’t just a British thing. Chambers of agriculture, levy bodies like AHDB, and private consultants run groups where people share real numbers, not just coffee‑shop talk. In Wisconsin and Ontario, similar business‑focused producer groups have helped farms identify which changes actually move the needle in their systems. If you’re not part of any peer group like that, one practical 90‑day goal after reading this could be: find or form a small circle where you can put actual figures on the table and talk openly about strategy.

If you want a simple starting point for the next three months, it might look like this:

  • Estimate your own compliance cost per 100 kilos.
  • Have a direct conversation with your buyer about premium contract options and what it would take to join one.
  • Commit to at least one meeting—formal or informal—where you compare real numbers with peers instead of just stories.

None of that changes Mercosur. But it does change how exposed—or how prepared—you are for the headwinds it adds to a game that was already getting tougher.

The Bottom Line

The EU–Mercosur deal isn’t going to change what your cows need tomorrow morning. Fresh cows still need careful handling through the transition period, calves still need feeding, and loans still need paying. What it does change is the wind you’re sailing in: a bit more pressure from low‑cost imports in a market where your costs are already high, and your support systems aren’t always fast or generous.

You can’t stop that wind. What you can do is understand it—and then decide what kind of boat you’re in, how you’re trimming your sails, and who you’re rowing with. In a world where none of us can afford to just drift, that’s where your real leverage lies. 

Key Takeaways:

  • “Modest” adds up fast: The Mercosur deal’s 30,000 tonnes of cheese and 10,000 tonnes of powder convert to about 345,000 tonnes of milk, like dropping the annual output of 550 EU family herds into an already flat market.
  • The cost gap is real and structural: Rabobank shows New Zealand and Australia holding a roughly five‑cent‑per‑litre edge, while EU herds carry extra euros in slurry, emissions, welfare, and traceability costs that low‑cost competitors simply don’t pay.
  • Mirror clauses sound fair, but won’t fix it: You can lab‑test cheese for residues—you can’t test it for stall dimensions or grazing days. Process standards are nearly impossible to enforce at the border.
  • Mercosur lands where EU milk is already headed: With EU production flat at 149.4 million tonnes and more milk flowing into cheese and powders as fluid demand fades, the quota volumes compete exactly where margins are thinnest.
  • Your best lever is knowing your own numbers: Farms that can pin down their compliance cost per 100 kg, push buyers on premium contracts, and benchmark honestly with peers will ride this headwind better than those waiting on Brussels to fix it.

Complete references and supporting documentation are available upon request by contacting the editorial team at editor@thebullvine.com.

Learn More

The Sunday Read Dairy Professionals Don’t Skip.

Every week, thousands of producers, breeders, and industry insiders open Bullvine Weekly for genetics insights, market shifts, and profit strategies they won’t find anywhere else. One email. Five minutes. Smarter decisions all week.

NewsSubscribe
First
Last
Consent

The $10/cwt Trap: 8 Dairy Farms Close Every Day – Here Are Your 4 Paths Out

Eight dairy farms close every single day in America. Understanding what’s driving this consolidation—and your options for navigating it—has never been more important.

Executive Summary: Eight dairy farms close every single day in America—and mid-size operations (500-1,500 cows) are taking the hardest hit. USDA Census data shows over 15,200 farms vanished between 2017 and 2022, driven by a $10/cwt cost gap that gives 2,000+ cow operations a decisive structural advantage. This isn’t a price cycle to wait out; it’s a permanent industry transformation, and silence is a losing strategy. This analysis breaks down four realistic paths forward—scale significantly, transition to premium, exit strategically, or pursue aggressive efficiency—with specific capital requirements, timelines, and success factors for each. The essential first move: calculate your “equity velocity” to determine if you’re silently bleeding $400,000+ annually while your balance sheet looks stable. Take the 30-Day Financial Audit Challenge and choose your path before the market chooses it for you.

dairy structural transformation

That number stopped me cold when I first calculated it. Eight farms. Every day. For five years straight.

USDA’s 2022 Census of Agriculture documents the math clearly: U.S. dairy operations dropped from 39,303 in 2017 to 24,082 in 2022—more than 15,200 farms gone in half a decade. The closures slow down during high-price periods, but they never actually stop. And that persistence through both good markets and bad tells us something important: we’re not watching a normal price cycle play out. This is a structural change.

USDA Census data reveals 15,221 dairy farms vanished between 2017-2022—an average of 8.2 operations closing every single day for five years straight, with no slowdown during high-price periods

What’s driving it? Part of the answer showed up in some Canadian grocery pricing data I was reviewing recently. During the period when farm input costs were climbing sharply, food retailer margins expanded rather than compressed. Much of the additional money consumers were paying didn’t flow back to producers. It accumulated in other parts of the supply chain.

Now, I want to be fair here—retailers face their own cost pressures and competitive dynamics. But the pattern illustrates something Dr. Michael Boehlje has written about extensively. He’s a Distinguished Professor Emeritus in Agricultural Economics at Purdue who’s studied farm and agribusiness management for decades, and his analysis suggests that commodity supply chains tend to extract value from the farm level when one segment has more pricing power than another. That’s not an accusation. It’s just how these systems often work.

The question for dairy producers isn’t whether this structural shift is happening—the data makes that clear. The question is what to do about it.

The Barbell Effect: Where the Industry Is Headed

What we’re witnessing isn’t random attrition. It’s a fundamental reshaping of the industry into what economists call a “barbell” structure—growth at both extremes while the middle gets squeezed out.

On one end: Small operations under 200 cows that have carved out premium niches—organic, grass-fed, farmstead cheese, direct-to-consumer sales. They survive on margins, not volume.

On the other end: Large operations running 2,000+ cows with aggressive automation, professional management teams, and cost structures that commodity markets actually support. Rabobank data shows these large operations now account for roughly 68% of U.S. milk production.

In the middle: Operations running 500-1,500 cows that are too big to capture premium pricing but too small to achieve the cost efficiencies of mega-dairies. This is where the structural pressure is most intense—and where farm losses are concentrated.

Operation Size% of Operations% of Milk Production
Under 200 cows48.2%8.5%
200-499 cows22.4%12.8%
500-999 cows13.8%15.2%
1,000-1,999 cows7.6%15.5%
2,000+ cows8.0%68.0%

The Consolidation Numbers Tell a Consistent Story

The trajectory has been remarkably steady across regions and time periods, which is what makes it feel structural rather than cyclical.

The Upper Midwest lost 3,800 dairy operations in five years—a 30.5% collapse that’s double California’s rate, where consolidation has largely stabilized after shifting to mega-dairies decades ago

Wisconsin DATCP licensing data shows the state lost 818 dairy farms in 2019, another 455 in 2023, and roughly 400 more in 2024. Add up the losses since 2019, and you’re past 1,500 operations—gone from a state that still thinks of itself as America’s Dairyland. Minnesota shows similar patterns. So does New York.

What surprised me when I dug into the regional data is how differently this plays out depending on where you’re farming.

Rabobank data shows 2,000+ cow operations produce milk at $18.50/cwt while 500-cow dairies struggle at $21.20/cwt—a $2.70 permanent structural disadvantage that bleeds $270,000 annually on 10 million pounds of production

In California’s Central Valley and the Southwest—Texas, New Mexico, Arizona—consolidation has largely run its course. These regions now operate predominantly with very large dairies, many running drylot systems suited to arid climates, that have achieved cost structures that smaller operations struggle to match. Lucas Fuess, a senior dairy analyst at Rabobank, has noted that farms milking more than 2,000 cows can produce milk about $10 per hundredweight cheaper than farms running 100-199 cows. That’s not a small advantage. Over a year of production, that gap becomes the difference between building equity and burning through it.

The Upper Midwest presents a more complicated picture. You still find significant numbers of 200-800 cow operations in Wisconsin and Minnesota, but the economics are getting harder. The survivors tend to fall into two camps: those scaling toward 1,500+ cows to capture efficiency gains, and those capturing specialty premiums through organic certification, grass-fed programs, or artisan cheese partnerships. The middle ground between those strategies has gotten thin.

The Northeast faces high land costs and increasingly complex environmental regulations—such as nutrient management plans, CAFO permitting requirements, and setback rules that vary from county to county. But proximity to premium urban markets creates opportunities that don’t exist in rural South Dakota. I’ve talked with Vermont and New York producers who’ve built genuinely sustainable businesses through direct sales and value-added products. It requires different skills than commodity production, but the path exists.

Canadian producers operate under supply management, which provides price stability that U.S. farmers can only dream about. But even that hasn’t stopped consolidation entirely. A peer-reviewed study in the Canadian Veterinary Journal documented that Canadian dairy farms decreased by nearly 62% between 1991 and 2011—from over 39,000 operations down to fewer than 15,000. Current government data shows the decline continuing, with farm numbers dropping from about 12,000 in 2014 to roughly 9,250 in 2024.

Several industry analysts—including teams at Rabo AgriFinance and various land-grant universities—have projected that if current attrition rates continue, total U.S. dairy operations could fall into the 8,000 to 12,000 range by the mid-2030s. That’s not a formal USDA forecast, just an extrapolation. But the math isn’t complicated.

Technology and Labor: The Accelerating Factors

Two forces are speeding up the consolidation timeline in ways worth understanding.

Precision dairy technology—robotic milking systems, automated feeding, sensor-based health monitoring—requires significant capital investment but dramatically reduces labor needs per cow. A 2,000-cow operation with modern automation might run with 12-15 employees. Try running 500 cows with proportionally fewer workers, and you’ll find the per-cow labor costs much harder to manage. The technology favors scale in ways that weren’t true twenty years ago.

And then there’s the labor market itself. Finding reliable dairy workers has become genuinely difficult across most regions. The work is demanding, the hours are long, and competition from other industries has intensified. Larger operations can offer better wages, benefits, and more predictable schedules. Smaller operations often rely heavily on family labor—which works until the next generation makes different choices. Larger farms don’t just have more employees; they have HR systems. A 500-cow dairy often lacks the scale to hire an HR manager but is too big for the owner to handle all personnel issues personally. This adds to the “middle squeeze.

That generational piece matters more than we sometimes acknowledge. USDA data consistently shows the average age of farm operators climbing—it’s now 58.1 years for primary operators nationally, according to the 2022 Census. The same Census found that producers aged 65 and older now outnumber those under 35 by more than 4 to 1. And when the current generation steps back, many of those farms won’t continue as dairies, regardless of market conditions.

The Equity Question: What’s Really Happening to Your Balance Sheet

This is the piece I think deserves more attention, because it changes how you think about timing.

Many operations show strong balance sheets on paper. Land values appreciated significantly from 2010-2022. Multi-generational farms often carry substantial equity. But when you calculate what I’ve started calling “equity velocity”—the rate at which that equity is actually changing when you account for everything—the picture sometimes shifts dramatically.

Here’s a concrete example. Say you’re running a 500-cow operation with $5 million in starting equity. Not unusual for an established family dairy in Wisconsin or Minnesota.

THE EQUITY EROSION CALCULATION

In a challenging year, here’s what the math might actually look like:

CategoryAnnual ImpactNotes
Operating loss at negative margins-$140,000Assumes $1.50-2.00/cwt below breakeven
Interest on $3M debt at current rates-$200,000 to -$250,0006.5-8.5% rates vs. 3-4% in 2019-2021
Deferred maintenance-$60,000 to -$80,000Mixer wagon, parlor equipment, facility repairs pushed to “next year”
Working capital drawdown-$30,000 to -$50,000Feed inventory, supplies, cash reserves declining
TOTAL ANNUAL EQUITY EROSION-$430,000 to -$520,000Before major breakdowns, herd health crises, or feed quality issues

That’s potentially half a million dollars gone in a single difficult year. Before any major breakdowns. Before any herd health crises during the transition period with your fresh cows. Before a mycotoxin problem shows up in your feed.

Strong milk price years can reverse the trend. Some operations manage costs far better than others. But if you haven’t run this calculation for your own operation recently, you’re flying blind.

Mark Stephenson at UW-Madison—he’s the Director of Dairy Policy Analysis and received the Distinguished Service to Wisconsin Agriculture award in 2024—has made an observation that stuck with me. Farmers often think of equity as their safety net, he’s noted, but the erosion can happen gradually enough that it’s not obvious until a lender review reveals how much the picture has changed.

What One Producer Learned

I recently talked with a Wisconsin dairy farmer who exited in 2023 after 28 years running a 650-cow operation. He asked that I not use his name—these decisions still carry emotional weight in our communities—but his perspective is worth hearing.

“I had $4.2 million in equity on paper,” he told me. “But when I really calculated the trajectory—the interest costs, the maintenance I kept deferring, my wife’s off-farm income basically subsidizing everything—I could see where things were headed if conditions didn’t improve substantially.”

He sold in early 2023, netting $3.8 million after paying off all debt, and now consults with other operations facing similar decisions.

“The hardest part was telling my dad, who’s 84 and started the place in 1968. But he said something I think about a lot: ‘I built this to take care of the family, not the other way around.'”

That’s not the only path forward, obviously. But it’s one that more operations are considering seriously.

A Different Story: Making the Middle Work

Not every mid-size operation is struggling, though. I spoke with a 400-cow dairy in central Wisconsin—they asked me not to identify them specifically—that’s been consistently profitable through the recent volatility.

Their formula:

  • Aggressive cost tracking (feed costs monitored weekly, not monthly)
  • Premium processor relationship (specialty cheese buyer paying for high-component milk)
  • Zero debt (paid off expansion fifteen years ago)
  • Professional management (next-gen operator returned with agribusiness career experience)

“We’re not getting rich,” the father told me, “but we’re not burning equity either. The key was getting our debt to zero before the interest rate spike. That changed everything.”

Their butterfat runs consistently above 4.2%, which helps with their processor relationship. They’ve invested in cow comfort—good ventilation, proper stall sizing, well-maintained freestall surfaces—and their herd health metrics show it. Fresh cow management is tight. Their transition protocol catches problems early. Nothing fancy, really. Just solid fundamentals executed consistently.

The lesson: The middle isn’t completely dead—but survival requires hitting a specific combination of factors that not every operation can replicate.

Understanding the Macro Picture: Headwinds and Tailwinds

Here’s where the broader farm economy context matters.

USDA’s Economic Research Service projected net farm income around $180 billion for 2025, second only to 2022 in nominal terms. The September 2025 forecast put it at $179.8 billion.

Sounds encouraging, right? The catch is that roughly $40.5 billion of that comes from government payments rather than market returns. And aggregate farm income numbers don’t tell you much about dairy specifically, or about operations of particular sizes in particular regions.

Current Forces Shaping Dairy Economics

HEADWINDS (Working Against You):

  • Interest rates remain elevated compared to the 2010-2021 era—debt service costs have doubled or tripled for many operations
  • Labor availability continues tightening with no relief in sight
  • Input cost volatility (feed, fuel, fertilizer) shows no signs of stabilizing
  • Consolidation momentum means your competitors keep getting more efficient
  • Generational transfer challenges—fewer successors, more complexity

TAILWINDS (Working For You):

  • Strong domestic demand for dairy products remains stable
  • Export market growth has created new outlets (though with added volatility)
  • Premium market expansion—organic, grass-fed, and local continue growing
  • Technology improvements can boost efficiency (if you can afford the capital)
  • Land values remain strong in most dairy regions (supporting equity—for now)

The net effect: Volatility has increased. The spread between good years and bad years has widened. For operations carrying significant debt, that volatility translates directly into financial stress—strong years barely rebuild what weak years destroy.

A Balanced Look at Cooperatives

The cooperative question comes up constantly, and it deserves careful treatment because the reality is more complicated than either critics or defenders usually acknowledge.

Agricultural cooperatives exist to give farmers collective bargaining power—that’s the core purpose behind the 1922 Capper-Volstead Act’s antitrust exemptions. Many cooperatives serve that function well. Organic Valley maintains transparent pricing, ties board compensation to member outcomes, and operates with governance that gives members a meaningful voice.

At the same time, a 2020 federal antitrust lawsuit raised questions about coordination between Dairy Farmers of America and Dean Foods. The case settled without disclosed terms, so we don’t have a definitive legal finding. But asking questions about how large cooperative structures balance processing business interests against member price maximization seems reasonable.

The honest answer: It depends on the cooperative. Smaller regional organizations where members know board members personally tend to maintain strong accountability. Massive organizations representing thousands of farms across multiple states face different structural dynamics.

Questions to ask about your cooperative:

  • How transparent are the pricing formulas in practice?
  • What’s the actual balance between member returns and retained earnings?
  • How are board members compensated, and for what outcomes?
  • When did you last attend a member meeting or vote?

Realistic Strategic Options

For farms in that 500-2,000 cow range—the segment facing the most significant structural questions—here’s how I’d frame the realistic choices. I want to be honest about both the potential and the requirements.

PathCapital NeededRealistic AssessmentTimelineBest Fit
Scale significantly$15-25 million (industry estimates)Achievable for some; requires specific conditions7-12 yearsStrong equity, favorable location, committed next generation
Transition to premium$100-300k working capital + transition periodWorks in the right circumstances4-6 yearsMarket access, suitable land, manageable debt
Strategic exitNone (preserves existing)Often, the financially optimal choice6-18 monthsApproaching transition, eroding position, no clear cost advantage
Aggressive efficiencyMinimal (debt paydown)Requires already being in the top quartileOngoingAlready efficient, moderate debt, family aligned

The Scaling Path

Expanding to 3,000-5,000+ cows can achieve competitive cost structures. But the requirements are substantial: major capital, strong existing equity, location with expansion capacity (land, water, permits, labor), willingness to shift from hands-on farming to managing a 20+ person team, and committed next-generation leadership.

The Dykman Dairy situation in British Columbia offers a cautionary lesson. According to CBC reporting on BC Supreme Court filings from November 2024, the Bank of Nova Scotia sought creditor protection for an operation that had accumulated $75 million in debt. Court documents showed monthly interest payments had climbed to $463,000—a level that became impossible to sustain when conditions tightened.

The underlying economics may have been strained for years. Favorable interest rates just masked the problem until they weren’t favorable anymore.

The Premium Market Path

Current organic milk pay prices range from approximately $33/cwt to $50/cwt, depending on certification and buyer, according to NODPA market reports. Grass-fed certified operations often command $36-50/cwt. Compare that to conventional prices in the high-teens to low-twenties, and the appeal is obvious.

The challenge is the three-year transition period: you’re operating under organic protocols—organic feed costs, pasture requirements, different herd health approaches—while still receiving conventional prices. Feed costs run 40-60% higher during transition. University extension budgets suggest you might need $100,000-300,000 in working capital just to bridge that gap.

Geography matters too. Direct marketing works within 50-100 miles of population centers with consumers willing to pay premiums. If you’re in rural central Wisconsin, your customer base for farmstead products may simply not exist.

The Exit Path

For operations where the next generation has other plans, where structural cost disadvantages can’t realistically be overcome, or where operators are approaching retirement anyway, preserving equity through a well-planned exit often represents the best outcome for family wealth.

The timing math matters enormously. If equity erosion runs $200,000-$400,000 annually, each year of delay reduces the amount the family preserves. Exiting with $4 million is substantially different from exiting with $2 million five years later.

The Efficiency Path

Some operations can position themselves for survival through aggressive cost management and debt elimination. The Wisconsin family I mentioned earlier is proof that it can work.

But this path requires already operating at high efficiency. It leaves essentially no margin for error—one bad year, one major equipment failure, one significant herd health challenge can change the math entirely. And it depends on milk prices eventually improving enough to reward your persistence.

If you’re pursuing this approach, establish clear decision triggers in advance: “If we haven’t reduced our debt-to-asset ratio to X by 2028, we execute Plan B.” Having predetermined benchmarks prevents the gradual slide that happens when hope substitutes for honest assessment.

A Note for Canadian Producers

Supply management provides price stability—Canadian prices typically work out to the low- to mid-$20s per cwt in U.S. dollar terms, notably higher than U.S. commodity prices most years. That matters for planning.

But supply management doesn’t eliminate structural pressures. It changes how they manifest. Quota values represent real equity but have become significant entry barriers for anyone without family connections—you’re looking at millions just for the right to ship milk before buying your first cow.

Trade agreements keep nibbling at the system. USMCA created new access for U.S. dairy products. The federal government announced $1.75 billion CAD over eight years to compensate producers for trade concessions under CETA and CPTPP back in August 2019—an acknowledgment of real economic impacts.

The fundamental questions about financial trajectory, generational transition, and long-term positioning apply north of the border, too. The specific numbers just differ.

The Bullvine 30-Day Financial Audit Challenge

I’m not going to end this piece by suggesting you bookmark some websites. I’m going to challenge you to do something harder.

In the next 30 days, complete this financial audit:

Week 1: Calculate Your True Equity Velocity

Pull your last three years of financial records. Calculate your actual equity change—not the balance sheet snapshot, but the trend. Include operating results, interest costs, deferred maintenance (be honest), and working capital movement. Write down the annual number. If it’s negative, how many years until you hit zero?

Week 2: Run the Exit Scenario

Call a farm real estate broker. Get a realistic market value for your operation—land, quota (if Canadian), livestock, equipment. Subtract all debt. That’s your exit number today. Now subtract your annual equity erosion multiplied by five. That’s your exit number if you wait until 2031. Expect this call to be uncomfortable. A real estate broker’s job is to give you a market truth, not a sentimental one.

Week 3: Model Your Best-Case Path

Pick the strategic option from the table above that fits your situation. What would it actually take to execute? Capital required? Timeline? Success probability based on your honest assessment of your advantages and disadvantages? Write it down.

Week 4: Have the Conversation

Sit down with your spouse, your kids if they’re involved, and your business partner. Share what you learned in weeks 1-3. Ask the question directly: “Are we making a strategic choice, or are we just avoiding making one?”

Resources for Your Audit

  • USDA ERS Farm Income and Wealth Statistics: ers.usda.gov/topics/farm-economy
  • Your state’s land-grant university extension: Search for dairy enterprise budgets specific to your region
  • Farm Credit System: farmcreditnetwork.com for confidential financial assessment
  • Agricultural mediation programs: Available in most states and provinces for transition planning help
  • Canadian Dairy Commission: cdc-ccl.gc.ca for supply management data and producer resources

The Bottom Line

The dairy industry has always demanded resilience. What makes this period different is the structural nature of the transformation underway.

In the 2026 dairy economy, silence is a strategy—usually a losing one.

The farmers I’ve watched navigate these transitions successfully are the ones who did the math, had the hard conversations, and made deliberate choices while they still had good options. The ones who waited until the crisis forced their hand? They walked away with less. Every time.

Choose your path before the market chooses it for you.

KEY TAKEAWAYS

  • The math is brutal: 8 dairy farms close every single day—and mid-size operations (500-1,500 cows) are hit hardest, trapped between premium markets they can’t access and scale economics they can’t achieve
  • The $10/cwt gap is permanent: Large operations (2,000+ cows) now produce 68% of U.S. milk at structurally lower costs—this isn’t a cycle to wait out
  • Your equity may be vanishing: Factor in $3M debt at current rates, deferred maintenance, and negative margins, and you could be bleeding $400,000-$500,000 annually while your balance sheet looks stable
  • Four paths exist—each with a price tag: Scale to 3,000+ cows ($15-25M), transition to premium ($100-300K + 3-year runway), exit strategically while equity holds, or eliminate all debt and operate top-quartile
  • Choose now, or the market chooses for you: Producers who preserved wealth decided early; those who waited walked away with less—every time

Complete references and supporting documentation are available upon request by contacting the editorial team at editor@thebullvine.com.

Learn More

The Sunday Read Dairy Professionals Don’t Skip.

Every week, thousands of producers, breeders, and industry insiders open Bullvine Weekly for genetics insights, market shifts, and profit strategies they won’t find anywhere else. One email. Five minutes. Smarter decisions all week.

NewsSubscribe
First
Last
Consent

The 90-Day Reckoning: What Your Milk Check Is Really Saying About 2026

The math doesn’t care about sentiment. At $15.62 milk and $18.75 costs, a 550-cow dairy burns $36,350/month. What’s your number?

EXECUTIVE SUMMARY: At $15.62 Class III milk and $18.75 all-in costs, a 550-cow dairy burns $36,350 every month—and the math doesn’t care about sentiment. Heifer inventories have hit a 47-year low. Nine consecutive GDT auctions have declined. Over $11 billion in new processing capacity is coming online while farms contract. This isn’t a cycle; it’s a structural reset. For producers with costs in the $17-19 range and limited liquidity, the window to preserve family equity through a controlled transition is roughly 90 days. The frameworks are here—true cost of production, liquidity runway, decision pathways—because knowing your real numbers is the difference between making decisions and having them made for you.

You know how it goes this time of year. You’re wrapping up evening chores, maybe checking futures on your phone while the parlor finishes up, and the numbers just don’t add up the way you need them to.

Class III contracts for early 2026 have been trading in the mid-teens on the CME—January 2026 recently settled around $15.62—and for a lot of operations, that’s a couple of dollars or more below what’s needed to cover everything. Not just feed and labor. Everything. The mortgage, the equipment note, and family living expenses.

Here’s what makes this moment unusual, though. Feed costs have actually come down. Corn’s running around $4.40-4.45 a bushel on the Chicago Board of Trade as of mid-December. Soybean meal’s around $300-320 a ton—well below where it was a couple of years back. Butter inventories look manageable. Domestic cheese demand is holding steady.

So why does the math still feel so difficult?

After spending the past few weeks going through the data—conversations with economists, reports from CoBank and the extension services, watching the Global Dairy Trade auctions—I’ve come to believe that what we’re looking at in early 2026 isn’t just another down cycle. Global supply growth, shifting export dynamics, and significant new processing capacity all arriving at once… these conditions seem likely to reshape dairy’s structure over the next several years.

This isn’t about waiting for prices to recover. It’s about understanding where your operation actually stands—and thinking through your options while they’re still open.

The Numbers Nobody Wants to See

The Global Dairy Trade auctions have been tough to watch lately. The December 16th event marked the ninth consecutive decline, with the index dropping 4.4% according to GDT Event 394 results. The auction before that fell 4.3%. Whole milk powder values have softened enough to create real headwinds for exporters trying to move product internationally.

On the domestic side, butter’s been trading in the mid-$2 range per pound, down from earlier this fall. Block cheese has settled into the mid-$1.60s after pushing toward $1.90 in October, based on CME spot market data. Not terrible, but not where most of us need it to be either.

What’s worth noting—and this is something that’s frustrated a lot of folks—is what’s happening with Dairy Margin Coverage. The program triggered a solid payment in January 2024 when margins dipped below $9.50, according to USDA Farm Service Agency records. Since then? With feed costs lower than they were, the formula shows margins that look healthy on paper, even when your cash flow is telling a very different story.

Danny Munch, an economist at the American Farm Bureau Federation, has spoken to this dynamic. When corn and soybean meal prices drop, the DMC calculation can paint a rosier picture than what many farms are actually experiencing. The safety net’s still there, but the way the formula works means it doesn’t always deploy when you’d expect it to.

💰 THE MATH THAT MATTERS

What margin pressure actually looks like per cow:

At $18.75 all-in cost and $15.50 Class III milk:

  • $3.25/cwt margin loss
  • Average U.S. cow produces ~24,375 lbs/year (that’s from USDA’s December 2025 Economic Research Service forecast)
  • That works out to 244 cwt × $3.25 = $793/cow/year loss

For a 550-cow dairy:

  • $436,150 annual margin shortfall
  • $36,350/month cash burn from milk margin alone

And that’s before you add debt service, family living, and depreciation. You can see why liquidity evaporates faster than most folks expect.

The Heifer Trap

Those of us who’ve been through 2009, 2015-16, and 2018 know what price cycles look like. We’ve navigated them before. But a few things are converging now that really do set this period apart.

The replacement pipeline is running dry. USDA’s cattle inventory data from January 2025 showed dairy replacement heifers over 500 pounds at around 3.9 million head—the lowest since 1978, according to the National Agricultural Statistics Service. That’s a 47-year low. Let that sink in for a moment.

How did we get here? Well, you probably know, because you may have made some of the same decisions I’ve seen across the industry. When beef-on-dairy started penciling out so well, a lot of operations shifted their breeding programs. NAAB data shows beef semen use on dairy operations climbed substantially over the past decade. It made economic sense at the time—those crossbred calves brought good money, and they still do. But it means fewer heifers in the replacement pipeline, and that’s not something that corrects quickly.

CoBank’s August 2025 Knowledge Exchange report projected that heifer inventories will likely tighten further before any meaningful recovery, probably not until 2027 at the earliest. Biology takes time. You can’t speed up gestation.

Export markets have shifted underneath us. China has been building domestic production capacity for years now. USDA Foreign Agricultural Service and OECD-FAO analyses show they’re meeting most of their dairy needs internally these days internally, with imports focused more on specific ingredients than on bulk commodities. That’s a structural change, not a temporary dip.

Several Southeast Asian markets—Indonesia, Vietnam, the Philippines—have also pulled back from where they were a few years ago, according to USDA’s Dairy: World Markets and Trade reports. There’s still an opportunity there, but competition has intensified considerably.

Processing is expanding while farms contract. According to IDFA data released in October 2025, more than $11 billion in new and expanded dairy processing projects are underway across 19 states, with over 50 facilities scheduled to come online between 2025 and early 2028. That represents significant demand for raw milk—but also creates some interesting pressure on the supply side.

This creates a tension that’s worth watching closely. Processors built capacity expecting continued production growth. The heifer shortage complicates that considerably. And margin pressure is affecting decisions across the board. Everyone in the supply chain is working through the same challenges simultaneously.

Editor’s note: We’re working on a follow-up piece—”What Your Milk Buyer Wants You to Know About 2026″—examining how processors are managing supplier relationships during this consolidation period. If you’re a processor willing to share perspective, reach out to us at info@thebullvine.com.

Know Your Real Numbers

I’ve been talking with financial consultants and extension specialists about what metrics matter most right now. Every operation is different—different debt structures, different facilities, different family circumstances—but a few numbers keep coming up in those conversations.

Your Actual Cost of Production

This is probably the most important number you can know. It’s also the one most commonly underestimated.

A farm financial analyst who works with Midwest dairies shared something that stuck with me: most producers he sits down with think they know their cost of production, but once they work through everything carefully, they often find they’re $1.50 to $3.00 higher than they thought. That’s a significant gap when margins are already tight.

A complete picture typically includes:

  • Cash operating costs—feed, fuel, labor, utilities, supplies. For most operations, that’s somewhere in the $10.50-12.50 per hundredweight range, according to Penn State Extension dairy breakeven analyses.
  • Debt service—equipment payments, real estate, operating lines. That can add another $3-5 per hundredweight depending on your situation.
  • Family living—what you actually draw, not what you budgeted. Another $1.50-2.50. And be honest here.
  • Depreciation—what it really costs to maintain and replace equipment and facilities over time. Perhaps $1-2 more.

When you add everything up, many mid-sized operations are running $17.50 to $21.50 per hundredweight all-in. The Penn State Extension dairy breakeven tools, the Wisconsin Center for Dairy Profitability benchmarking data (which compares over 500 farms annually), and the University of Minnesota extension work all show similar ranges.

Regional pricing differences matter here, too. Your mailbox price depends heavily on where you’re located and your Federal Order. California’s quota system creates dynamics different from those in FMMO regions. Upper Midwest producers in Order 30 generally benefit from proximity to processing—Wisconsin’s weighted average hauling charge runs around 47 cents per hundredweight, according to Federal Order 30 market administrator data from May 2025.

Cost Scenario (all‑in)Margin per cwt (USD)Margin per cow per year (USD)550‑cow farm margin per year (USD)Monthly cash flow (USD)
$17.00/cwt-1.00-244-134,200-11,183
$18.50/cwt-2.50-610-335,500-27,958
$20.00/cwt-4.00-976-536,800-44,733

But if you’re in the Northeast under Order 1 or the Southeast under Order 7, you’re facing different math entirely. The June 2025 FMMO reforms increased Class I differentials specifically to reflect the higher cost of servicing fluid markets in those regions—the Southeast saw the largest increase nationally at $1.74 per hundredweight on average, according to USDA analysis. Recently passed intraorder transportation credits are helping offset some of those long-haul costs for Southeast producers, according to Progressive Dairy’s 2025 State of Dairy report. Still, when you’re calculating your margins, make sure you’re using your actual milk check, not a national average.

If your true cost is north of $18 and milk’s in the mid-teens, the gap becomes challenging to manage for very long. You know this already. The question is what to do about it.

The Runway Calculation

This next calculation can be uncomfortable, but it’s genuinely important.

📊 YOUR LIQUIDITY RUNWAY

The Formula: (Available Cash + Remaining Operating Credit) ÷ Monthly Loss at Current Prices = Months of Runway

What It Means:

  • 6+ months: Time to evaluate options strategically
  • 3-6 months: Decisions needed in next 30-60 days
  • Under 3 months: Urgent situation requiring immediate action

Example: $87,000 cash + $140,000 credit line = $227,000 total liquidity At $21,000 monthly loss = 10.8 weeks of runway

Farm finance advisors tell me that many mid-sized operations—the ones in that $18-19 breakeven range—have roughly 3-4 months of liquidity right now. Factor in what’s already been drawn during Q4, and some folks are looking at eight to twelve weeks before things get genuinely difficult.

Can Growth Change the Equation?

Some producers are thinking: if I could get bigger, spread fixed costs over more milk, maybe I could bring my per-hundredweight costs down enough to make this work.

Sometimes that does pencil out. Often it doesn’t.

Here’s one way to think about it: take the investment required—new parlor, additional cows, facility improvements—and divide it by the capital you can realistically access. If that ratio gets much above 2.0, the new debt service often consumes the efficiency gains. I’ve seen operations attempt to grow their way out of margin pressure and find themselves worse off because interest payments exceeded the cost savings they achieved.

What About Premium Markets?

Organic, grass-based, A2—there are genuine opportunities in specialty markets. Premiums in the $22-28 range exist for the right product in the right market.

But transitions require time and capital. Organic certification is a three-year process under the USDA National Organic Program rules. That’s three years of meeting the requirements without receiving the premium. If your liquidity runway is 12 months, that timeline just doesn’t work, regardless of the long-term potential.

One Family’s Experience

Let me share what this analysis looks like in practice. I spoke with a 550-cow dairy in east-central Wisconsin a few weeks ago. The family asked me not to use their names, but they were willing to walk through their numbers openly.

When they sat down in early December to really nail down their cost of production, they initially thought they were at about $17.25. That’s the figure they’d been carrying in their heads. But once they included the equipment loan from their 2021 parlor renovation, actual family health insurance costs, and what they’d really been drawing for living expenses—not the budget, but actual spending—they landed at $18.75.

Their available cash was $87,000. Operating line had about $140,000 remaining. Total liquidity: $227,000.

At current milk prices, their monthly cash burn worked out to roughly $21,000. That gave them about 11 weeks.

“Eleven weeks sounds like almost three months until you realize one of those months is already half gone. We thought we had until spring to figure this out. Turns out we had until mid-February.”

— Wisconsin dairy producer, 550 cows

They’re now working with their lender on an orderly timeline. Not the outcome anyone hoped for. But better to understand the situation in December than to discover it in April when options have narrowed considerably.

Three Paths Forward

Based on where your numbers fall, you’re likely looking at one of three general situations. And I want to be clear about something—these aren’t judgments about management ability. Cost structures reflect decisions made over decades, regional differences, facility age, land costs, and interest rates at the time of financing. This is simply about matching current circumstances to realistic options.

📅 CALENDAR OF NO RETURN: Key Decision Windows

If you’re considering a controlled transition, timing affects value significantly:

DateDecision PointWhy It Matters
Jan 15, 2026Final date to list heifer calves for late-winter salesHeifer calf values typically are strongest before the spring flush; Dairy Herd Management reported Holstein springers hitting $3,500-$4,550 and beef-cross calves commanding $1,200-$1,650 at fall 2025 auctions
Feb 1, 2026Lender conversation deadline for Q1 actionBanks close Q1 books in March; flexibility drops significantly after February conversations
Feb 15, 2026Last reasonable date for Q1 controlled exit planningAllows 6-8 weeks for orderly herd dispersal before the spring flush depresses values
March 15, 2026Point of no return for spring timingAfter this date, you’re competing with spring flush volumes; asset values typically soften as supply increases

These windows assume a controlled transition. Crisis liquidations follow different, more compressed timelines.

SituationKey IndicatorsPrimary Focus
Well-PositionedCosts under $17/cwt, 6+ months liquidity, solid debt coverageStrategic positioning for the consolidation period
Middle GroundCosts $17-19/cwt, 3-6 months liquidity, tight but manageable debtEvaluate controlled transition within 90 days
Immediate PressureCosts above $19/cwt, under 3 months liquidity, debt coverage below 1.0Proactive restructuring or professional consultation

The Strong Position Play

All-in costs under $17, 6+ months of liquidity, solid debt coverage, and a good lender relationship.

This describes a minority of operations currently—more common among larger Western dairies with scale efficiencies and some newer Midwest facilities with recent upgrades. If this is your situation, you have the runway to work through the consolidation period ahead.

What tends to make sense here: lock in feed costs while they’re favorable. Ensure your Dairy Revenue Protection coverage is in place for 2026. Have substantive conversations with your milk buyer about 2026-27 arrangements. If heifer availability improves through processor partnerships—and CoBank reports some buyers are offering co-financing to maintain key supplier relationships—you may be positioned to grow at reasonable terms.

The key discipline is avoiding overextension. The operations that emerged strongest from 2015-16 were often those that stayed conservative even when they had the capacity to expand. There’s wisdom in that.

The 90-Day Window

Costs in that $17-19 range, three to six months of liquidity, and debt coverage that’s manageable but tight.

Many farms fall into this category—probably the largest group, honestly. For this group, the window for a controlled transition that preserves meaningful equity is roughly 90 days.

Financial advisors who work with dairy operations consistently report that farms executing planned transitions early in a downturn preserve significantly more equity than those who wait until circumstances force their hand. The Wisconsin Center for Dairy Profitability has tracked these patterns through multiple price cycles.

Timing matters because asset values—particularly herd values—typically soften when many farms are selling simultaneously. Operations moving in March or April will likely realize stronger prices than those waiting until May or June if exit activity accelerates as some expect. Dairy Herd Management’s fall 2025 auction reports showed Holstein springers commanding $3,500-$4,550 per head and beef-cross calves bringing $1,200-$1,650—but these premiums depend on moving before the market gets crowded.

What does a controlled transition look like? Liquidate heifer calves first while prices remain firm. Market cull cows and productive animals over six to eight weeks rather than all at once. Apply proceeds strategically to debt, prioritizing real estate obligations. Communicate openly with your lender throughout.

I spoke with a regional agricultural lending officer in the Upper Midwest who’s worked with dairy borrowers for over 20 years. His perspective: “We’d much rather work with a producer on an orderly plan than deal with a surprise. When someone comes to us early and says, ‘Here’s what I’m seeing in my numbers, here’s what I’m thinking,’ we can usually find more flexibility than if they wait until they’ve missed payments and we’re both in a corner.”

An operation with $6 million in assets and $4.5 million in debt can potentially preserve $1 million or more in family equity through well-timed management. That’s meaningful capital for whatever comes next—whether that’s a different agricultural venture, off-farm investment, or retirement.

When Restructuring Is the Reality

Costs above $19, less than three months of liquidity, and debt coverage below 1.0.

A growing number of farms find themselves here. For this group, the question isn’t whether restructuring happens—it’s whether you’re making the call or someone else is.

Chapter 12 bankruptcy was designed specifically for family farm operations under the Bankruptcy Abuse Prevention and Consumer Protection Act. It provides court protection for three to five years. Lenders can’t foreclose during that period, and debt typically gets reduced by 30-50%.

An agricultural bankruptcy attorney in Iowa who handles dairy cases offered this perspective: file proactively rather than waiting for your lender to accelerate the note. Farmers who seek advice before they’re in full crisis tend to have better outcomes than those who wait until foreclosure is imminent.

The honest reality with Chapter 12: it works when restructured debt levels actually allow the operation to generate positive cash flow going forward. For situations where even halving the debt wouldn’t create sustainable margins at current milk prices, restructuring may delay the outcome rather than change it. That’s a hard truth, but it’s worth considering carefully.

Hard-Won Wisdom

I reached out to several producers who navigated the 2015-16 downturn to ask what they learned from it. Their perspectives are worth hearing.

A 400-cow producer in upstate New York—he asked to remain anonymous—emphasized the lender relationship: “Your banker isn’t working against you. They don’t want to foreclose—that’s a loss for them too. But they need to know what’s happening. The worst thing you can do is go quiet and let them be surprised.”

A manager at a 2,200-cow operation in California’s San Joaquin Valley offered additional perspective. Scale doesn’t eliminate these challenges, he noted—it changes the arithmetic. “We have more runway because of volume, but we also have more at stake. The weight of these decisions feels the same.”

Several people I spoke with mentioned the difficulty of separating emotional attachment from financial analysis. These are multi-generational operations. Family history, land that’s been worked for decades, identity tied to being a dairy farmer—that’s all profoundly real. But financial calculations don’t account for sentiment. And the operations that survive to transition to the next generation potentially require decisions grounded in numbers.

Where to Find Help

If you’re working through these calculations and want assistance, the land-grant universities offer genuinely valuable tools:

Penn State Extension provides a dairy breakeven cost worksheet that walks through the analysis in detail, available at extension.psu.edu.

The Wisconsin Center for Dairy Profitability has benchmarking tools that compare your numbers against more than 500 farms, accessible through the UW-Madison Division of Extension.

University of Minnesota Extension offers financial planning worksheets through their farm management program.

Your local extension dairy specialist can often sit down with you and work through the numbers—that’s exactly what they’re there to help with. Don’t hesitate to reach out.

For DMC specifically, the USDA Farm Service Agency maintains a decision tool on their website at fsa.usda.gov.

Five Questions to Answer This Week

If you take nothing else from this piece, sit down sometime in the next few days and work through these:

  1. What’s your true all-in cost of production? Not the number you’ve been carrying in your head. The real figure, including debt service, family living, and depreciation.
  2. What’s your actual liquidity runway at current prices? Cash on hand plus remaining credit, divided by monthly losses. Be honest about what you find.
  3. What would need to change for your operation to cash flow at $16 milk? Is that achievable, or would it require changes that aren’t realistic?
  4. When did you last have a substantive conversation with your lender about your financial position? If it’s been more than 90 days, that conversation is overdue.
  5. What does your best realistic outcome look like two years from now? Not the hopeful scenario—the one you’d actually bet money on.

The Road Ahead

If your position is strong, use this time wisely—secure favorable feed costs, strengthen processor relationships, and maintain discipline on growth decisions.

If you’re in that middle ground, recognize that the window for preserving equity through a managed transition is perhaps 90 days. Earlier timing—March or April—will likely yield better outcomes than waiting until mid-summer.

If you’re facing immediate pressure, consult with professionals now, before you’re in crisis. Outcomes improve significantly when decisions are proactive rather than reactive.

The Bottom Line

The dairy industry that emerges from 2026-27 will look different from what we see today. More consolidated. Different economics of scale. That’s a difficult reality to acknowledge—these are real families, real communities, real legacies at stake.

But the market data is clear. The frameworks for decision-making are available. What remains is the hard part: making choices based on numbers rather than hope, and making them while options remain.

The producers I’ve come to respect most aren’t those who never faced difficult decisions. They’re the ones who faced them honestly, made the best choice available with the information they had, and found a way forward.

Whatever path makes sense for your operation, the most challenging choice may be making no choice at all.

KEY TAKEAWAYS 

  • Run your numbers this week: At $15.62 Class III and $18.75 all-in costs, a 550-cow dairy loses $793/cow/year—that’s $36,350 in monthly cash burn.
  • Recognize this for what it is: Heifer inventories at a 47-year low, nine consecutive GDT declines, $11B in new processing capacity arriving. This isn’t a down cycle. It’s a structural reset.
  • Calculate your true cost of production: Include debt service, actual family draw, and depreciation. Most producers discover they’re $1.50-$3.00/cwt higher than the number they’ve been carrying.
  • Know your liquidity runway: (Cash + remaining credit) ÷ monthly loss at current prices = months until decisions get made for you.
  • Act while options remain: For operations in the $17-19 cost range with limited liquidity, the window to preserve family equity through a controlled transition is roughly 90 days. March moves beat June moves.

Complete references and supporting documentation are available upon request by contacting the editorial team at editor@thebullvine.com.

Learn More

The Sunday Read Dairy Professionals Don’t Skip.

Every week, thousands of producers, breeders, and industry insiders open Bullvine Weekly for genetics insights, market shifts, and profit strategies they won’t find anywhere else. One email. Five minutes. Smarter decisions all week.

NewsSubscribe
First
Last
Consent

The Mercosur Reckoning: 10,000 Farmers in Brussels Just Changed the Global Dairy Conversation

When thousands of farmers from across Europe shut down the EU capital, they weren’t just protesting a trade deal. They were raising questions that dairy producers on both sides of the Atlantic would do well to consider.

EXECUTIVE SUMMARY: On December 18, 10,000 farmers from 25 European countries blocked the streets of Brussels and forced a delay of the EU-Mercosur trade agreement—the largest in EU history. The deal would open European markets to 99,000 tonnes of South American beef and 30,000 tonnes of cheese produced at costs 40-60% below EU operations. Here’s why that matters if you’re milking cows in Wisconsin or shipping from Ontario: displaced European production will intensify competition in export markets where North American dairy sells—Mexico, North Africa, Southeast Asia. The timing is challenging. U.S. consolidation continues to accelerate, with 65% of the national herd now on 1,000+ cow operations, and farm numbers falling from 39,000 to 24,000 in five years. European farmers won a postponement until January 2026, but the structural pressures behind both the protest and the consolidation aren’t slowing down. Now is the time to reassess your operation’s exposure to global market dynamics.

There’s something about the sight of hundreds of tractors blocking a major European capital that cuts through the usual trade policy noise. You know how it goes: trade negotiations happen behind closed doors, and by the time farmers hear the details, the framework is already set. But on December 18, 2025, that dynamic shifted in Brussels.

What struck me about last week’s protest wasn’t just its scale—Copa-Cogeca estimated around 10,000 farmers showed up, with some news reports putting the number closer to 20,000. It was the composition. French dairy farmers standing alongside Dutch cattle producers. Polish grain growers are coordinating with Italian beef operations. German dairy cooperatives are working in lockstep with Spanish agricultural unions. Copa-Cogeca pulled off something genuinely rare: unified, cross-border agricultural action.

The target? The EU-Mercosur free trade agreement—25 years in negotiation, and now potentially weeks away from ratification.

What’s Actually in This Deal

Let’s walk through the numbers, because they explain why farmers drove their tractors into the heart of European governance.

Product CategoryMercosur Annual Quota (tonnes)Total EU Production (tonnes)Quota as % of EU Production
Beef99,0007,800,0001.3%
Poultry180,00015,500,0001.2%
Cheese30,00011,200,0000.27%
Milk Powder10,0001,850,0000.54%

The EU-Mercosur agreement would create the world’s largest free trade zone, spanning roughly 780 million consumers across 31 countries. For European agriculture, the provisions are substantial. According to European Commission factsheets released in late 2024, the deal grants Mercosur producers access to EU markets for:

  • 99,000 tonnes of beef annually at reduced tariffs
  • 180,000 tonnes of poultry
  • 30,000 tonnes of cheese duty-free, plus significant milk powder quotas

These aren’t trivial volumes. What stands out here is that the challenge isn’t really the percentage of total EU consumption these imports represent. It’s that they’ll compete directly in commodity beef and dairy segments where European producers already operate on tight margins. The displacement effects tend to concentrate rather than spread evenly across the market.

Understanding the Cost Differential

Here’s where the economics become challenging for European producers—and where North American dairy farmers might recognize some familiar dynamics.

The International Farm Comparison Network tracks dairy production costs across more than 100 countries, and their data helps explain why European farmers view Mercosur competition with such concern. EU production costs typically run somewhere in the €40-50 per 100kg range, while South American producers often operate at costs 40-60% lower. That’s not a gap you can close through better feed efficiency or tighter fresh cow management alone.

The differential is structural. Brazilian and Argentine cost advantages don’t stem from superior efficiency or management practices that European farmers could readily adopt. They reflect fundamental input cost differences.

RegionProduction Cost per 100kg Milk (EUR)Cost vs. EU AveragePrimary Cost Drivers
Netherlands€48+14%Land costs, environmental compliance, labor
Germany€45+7%Animal welfare standards, energy costs
France€42BaselineRegulatory compliance, farm wages
Brazil€22-48%Low land costs, minimal regulation, cheaper labor
Argentina€20-52%Currency advantage, export infrastructure, scale
Uruguay€24-43%Grass-based systems, lower input costs

Land costs tell part of the story. Prime dairy land in the Netherlands or Denmark is many times more expensive than comparable land in Argentina’s dairy regions. I recently spoke with a Dutch producer who’d done the math on expanding his operation—the land costs alone made the numbers nearly impossible to justify.

Labor compounds the picture. EU dairy farm wages, including mandatory benefits and social contributions, are significantly higher than South American dairy labor costs. We’re talking multiples, not percentages.

Then there’s regulatory compliance. Environmental regulations, animal welfare requirements, and food safety standards significantly increase European milk production costs. These are standards that European consumers broadly support—but they entail costs that Mercosur competitors largely don’t bear. Keep in mind, this isn’t about one system being right or wrong; it’s about the competitive implications when different regulatory environments meet in the same marketplace.

Voices from the Protest

The frustration was evident in Brussels. Belgian dairy farmer Maxime Mabille, speaking to reporters during the protest, put it directly:

“We’re here to say no to Mercosur.”

He accused the European Commission leadership of seeking to “force the deal through,” and sharply criticized the decision-making process.

That frustration is real, and it runs deep among producers who feel caught between rising compliance costs and changing market protections. As many of us have seen in our own markets, when farmers feel unheard through normal channels, they find other ways to make their voices carry.

The sentiment echoed across the protest. Farmers from France, Poland, Italy, and beyond raised similar concerns: they’re being asked to compete on price with operations that face fundamentally different cost structures. Whether you agree with their position or not, it’s a question worth taking seriously.

The Enforcement Question

European Commission officials have pointed to “mirror clauses” in the agreement—provisions requiring Mercosur products to meet EU standards—as the answer to farmer concerns. French President Macron has championed these clauses as a means of ensuring fair competition.

Many farmers remain skeptical. And their caution has some historical grounding worth examining.

The USMCA dairy dispute between the United States and Canada offers an instructive parallel—a case study in how trade agreement enforcement can play out differently than expected.

Here’s the background, and you probably know some of this already: When USMCA replaced NAFTA in 2020, U.S. dairy organizations celebrated provisions granting access to 3.6% of Canada’s dairy market through tariff-rate quotas. The U.S. Dairy Export Council projected meaningful market gains once fully implemented.

What actually happened? Canada restructured its quota allocation system in ways that technically complied with USMCA language while producing practical outcomes different from those U.S. negotiators anticipated. The U.S. Trade Representative filed a formal dispute. A USMCA panel ruled in January 2022 that Canada had violated the agreement. Canada was directed to revise its system within 45 days.

Canada complied—by implementing a new allocation methodology. The U.S. filed a second dispute. In November 2023, that panel ruled 2-1 in Canada’s favor, finding the revised system technically compliant.

The result? According to USDA Foreign Agricultural Service data and industry analysis, U.S. exporters have filled just 42% of their allocated Canadian dairy quotas since USMCA implementation—not because of a lack of supply, but because of how the allocation system functions.

Now, reasonable people can disagree about whether Canada acted within its rights or circumvented the agreement’s intent. What’s less debatable is that the outcome differed from what U.S. dairy exporters expected when the agreement was signed. European farmers see potential parallels with Mercosur mirror clauses—standards get written, implementation gets negotiated, and outcomes can diverge from initial expectations. Whether that concern proves warranted remains to be seen.

The View from South America

Something I keep coming back to when analyzing trade disputes: every story has more than two sides. Brazilian and Argentine dairy farmers aren’t operating in some agricultural paradise, even with their cost advantages.

Brazilian agricultural economists note that the dairy sector faces significant infrastructure challenges. Transportation costs to ports can erode much of the production cost advantage. Currency volatility makes planning difficult—the real has moved considerably against the dollar in recent years. And domestic consumption absorbs most production. Brazil isn’t necessarily positioning to flood global markets; they’re working to meet their own growing demand.

Argentina’s situation may be even more challenging. Recent economic reforms have significantly affected Argentine export economics. Argentine farmers face their own structural pressures—just different ones than their European counterparts.

This doesn’t change the competitive dynamics European farmers face. But it’s a useful reminder that agricultural economics rarely produce clear winners, even in seemingly advantageous markets. Dairy farming presents challenges everywhere. The specific difficulties just vary by geography. That’s something producers worldwide can relate to, regardless of which side of any trade agreement they’re on.

The Processor Perspective

Here’s the thing about trade debates—they rarely split cleanly along obvious lines. Not everyone in the European dairy sector views Mercosur with concern. Some processor members of the European Dairy Association see potential opportunities—particularly in sourcing ingredients for value-added products or accessing Mercosur consumer markets for European specialty cheeses.

This split between farmer and processor interests isn’t unique to Europe. North American dairy has long navigated similar dynamics, where processor priorities around ingredient sourcing and market access don’t always align perfectly with producer concerns about farmgate prices. If you’ve sat through cooperative meetings where these tensions surface, you know exactly what I mean—the coffee gets cold while those debates run long. It’s a dynamic worth watching as the Mercosur debate continues, and worth remembering that “the dairy industry” isn’t monolithic in its interests.

Implications for North American Dairy

So what does a European trade fight mean for farmers milking cows in Wisconsin, California, Ontario, or Alberta? More than you might initially think.

The direct exposure isn’t Mercosur products flooding North American markets—tariff structures and USMCA provisions limit that pathway. The indirect effects are more subtle and potentially more meaningful over time.

Consider the dynamics: When Mercosur beef and dairy fill European market demand, that production potentially displaces EU output that previously served those markets. But European dairy infrastructure doesn’t simply shut down. Instead, that displaced production seeks alternative export destinations—the same destinations where U.S. and Canadian dairy currently competes.

Export MarketUS Dairy Exports 2024 (million USD)EU Dairy Exports 2024 (million USD)Market Growth Rate 2024-25
Mexico$1,680$4205.2%
Algeria$245$8908.1%
Egypt$198$7546.7%
Saudi Arabia$156$4234.3%
Indonesia$134$899.4%
Philippines$112$677.8%

Rabobank’s Q4 2025 Global Dairy Quarterly identified the key contested markets:

  • North Africa, particularly Algeria and Egypt, which import significant cheese and milk powder volumes currently supplied by EU, U.S., and New Zealand exporters
  • Southeast Asia, with growing demand for cheese, whey protein, and infant formula
  • Mexico, which remains the largest single export destination for U.S. dairy
  • The Middle East, with its premium dairy markets

When EU exporters facing domestic market pressure redirect to these regions at competitive prices, American and Canadian exporters face a choice: match prices or accept volume adjustments.

For large California operations running thousands of cows with thin margins and significant Class IV exposure, shifts in export market prices can mean the difference between profitability and loss on substantial production volumes. I’ve talked with producers in the Central Valley who watch GDT auction results as closely as their bulk tank readings. Smaller Midwest family operations may feel less direct exposure, but the pricing ripples eventually reach everyone through regional market dynamics.

We’re already seeing some of this in auction data. The final Global Dairy Trade auction of 2025 showed the ninth consecutive price decline, with the GDT Price Index down 4.4% overall. Whole milk powder, skim milk powder, and cheese have all softened from earlier 2025 levels. While many factors influence these prices, the supply-demand balance appears to be shifting.

MonthGDT Price IndexChange from Peak (%)
Jan 20253,5200.0
Mar 20253,480-1.1
May 20253,390-3.7
Jul 20253,310-6.0
Sep 20253,240-8.0
Nov 20253,180-9.7
Dec 20253,040-13.6

The Consolidation Picture

Whatever happens with Mercosur specifically, the broader consolidation trend in dairy continues on both sides of the Atlantic. This affects all of us, regardless of where we’re milking cows.

The USDA’s 2022 Census of Agriculture documented that 65% of the U.S. dairy herd now lives on operations with 1,000 or more animals. The number of U.S. dairy farms fell from approximately 39,000 in 2017 to roughly 24,000 in 2022, even as total milk production continued growing. If you’ve watched neighbors exit over the past decade, these numbers won’t surprise you.

YearTotal Farms (thousands)Herd Share: 1,000+ Cows (%)Herd Share: Under 500 Cows (%)
2012514852
2017395743
2022246535
2025216832

European dairy follows a similar pattern with a time lag. Eurostat data shows EU dairy farm numbers declining 3-4% annually, with production increasingly concentrated in larger, more specialized operations.

YearNumber of Farms (thousands)Average Herd Size (cows)
201085028
201278032
201471036
201664042
201857048
202051054
202246061
202542068

What concerns me—and I think many of you share this—is how consolidation tends to accelerate during periods of margin pressure. Industry analysts have projected that U.S. dairy farm numbers could decline further by 2030 under sustained price compression scenarios.

The mid-size operator—somewhere in that 200 to 700 cow range—faces a particularly challenging structural position. Often, it is too large to capture premium pricing through direct marketing and niche positioning. Sometimes, it is too small to achieve the cost efficiencies that larger operations rely on during thin-margin periods. I was talking with a Wisconsin producer running about 400 cows last month, and he described it perfectly:

“We’re in no-man’s land—too big to be boutique, too small to be bulletproof.”

That segment may undergo significant change in the years ahead.

The Canadian Calculus

Canada’s supply management system provides some insulation but hasn’t prevented domestic consolidation. Research from Dalhousie University’s Agri-Food Analytics Lab, led by Dr. Sylvain Charlebois, projects that Canadian dairy farm numbers will decline from approximately 11,000 today to around 5,500 by 2030—a 50% reduction, even under supply management.

The calculus for Canadian producers is complicated. Quota values represent significant wealth—but also significant debt loads for younger operators looking to expand or enter the industry. Succession planning gets thorny when the next generation looks at those numbers and wonders whether the investment makes sense over a 20-year horizon. And there are real questions about whether the regulatory framework will hold steady through USMCA review cycles.

Canadian producers I’ve spoken with are weighing these factors carefully. The protection supply management offers is real, but it’s not a complete shield against the structural pressures reshaping dairy worldwide. While projections always involve uncertainty, the directional trend appears clear.

Approaches That Are Working

Against this challenging backdrop, certain operational models are demonstrating resilience. They’re worth understanding, even recognizing they don’t apply to every situation.

Value-added processing continues showing strong economics for farms with appropriate geography and capital access. Research on dairy farm diversification consistently finds that operations producing cheese rather than selling commodity milk can capture substantially higher margins per hundredweight. Those combining processing with direct marketing channels—farmers markets, farm stores, local restaurant accounts—often add further value.

For operations seriously exploring this path, facility investment typically ranges from €200,000 to €310,000 or morefor licensed cheese or bottling operations. In the U.S., USDA Value-Added Producer Grants can cover up to $250,000 in eligible costs for working capital, meaningfully improving the feasibility of qualifying operations. The timeline to breakeven generally runs 18-24 months for well-executed transitions—not quick, but achievable with solid planning and realistic expectations.

The key constraint? Geographic proximity to consumers. Direct-to-consumer channels generally work best within 90-120 minutes of significant population centers. Rural operations distant from metropolitan markets face more limited diversification options. A Vermont producer I spoke with last year captured it well:

“Location isn’t everything, but it’s probably 60% of whether value-added pencils out.”

Beef-on-dairy programs are expanding rapidly, particularly in North America. By breeding lower-genetic-merit dairy cows to beef sires, operations generate crossbred calves with meaningfully higher market values than dairy bull calves—while focusing replacement heifer production on their top genetics. Industry observers estimate the segment could produce over 3 million calves annually, as growing acceptance from feeders and packers continues. It’s not a complete solution to margin challenges, but it represents additional revenue without requiring new infrastructure or marketing channels. And for herds with solid reproductive programs already in place, the implementation is relatively straightforward.

Organic and grass-fed specialization maintains premium capture for farms that can meet certification requirements and access appropriate markets. University of Vermont research tracking organic dairy profitability over a multi-year period found that organic farms generated greater net farm revenue than comparable conventional operations in 4 of 5 years studied. The key requirements are geographic access to consumers willing to pay premiums and the management capacity to meet certification standards—which, as anyone who’s gone through organic transition knows, involves a considerable learning curve and attention to detail in pasture management, dry cow protocols, and treatment record-keeping.

None of these represent universal solutions. They require specific combinations of location, capital, management capacity, and market access. But they illustrate that operational choices still create meaningful differences, even in challenging structural environments.

Where Things Stand Now

The December 18 mobilization succeeded in forcing a postponement of the EU-Mercosur vote until at least January 2026. That represents real political achievement—thousands of farmers blocking the EU capital creates attention that decision-makers can’t easily dismiss.

But postponement isn’t resolution. The underlying political dynamics remain largely unchanged. Germany’s industrial sector—automobiles, machinery, chemicals—wants Mercosur market access. Spain and Portugal see export opportunities. The European Commission’s trade directorate remains committed to the agreement.

The real question: Can farmers convert this tactical delay into lasting structural changes?

What farmers achieved is time. How they use that time will determine whether this mobilization produces a lasting impact or merely delays an eventual outcome. The next few months will likely include European Council discussions, parliamentary committee reviews, and continued negotiations over the details of the mirror clause. Those watching closely should pay particular attention to French parliamentary positions—France has been the most vocal opponent, and its stance will significantly shape what happens next.

Copa-Cogeca has announced plans for continued engagement through the winter and spring. National farmer organizations in France, Italy, and Poland are coordinating advocacy efforts. Whether agricultural constituencies can maintain focus and unity long enough to achieve meaningful changes to the agreement—or whether momentum fades and ratification proceeds largely as drafted—remains uncertain. History suggests maintaining coalition unity across months is the harder challenge.

Considerations for Dairy Producers

For European farmers: The Brussels demonstration showed that coordinated agricultural action can still capture political attention. The January 2026 timeline creates a defined window for continued engagement. Maintaining coalition alignment across sectors and borders will likely determine outcomes.

For North American producers, the EU-Mercosur dynamics may create export-market pricing pressure regardless of direct import effects. Planning that accounts for potential commodity price adjustments in contested markets through 2027 seems prudent. Operations with significant export market exposure face the most direct implications.

For all dairy operations: The structural consolidation trend continues. Operations in the 200-700 cow range face particularly complex economics under sustained margin pressure. Strategic decisions made in the next 18-24 months—whether toward scale, toward differentiation, or toward well-planned transition—will shape outcomes for the coming decade.

Questions worth sitting with:

  • What percentage of your operation’s economics depends directly or indirectly on export market pricing?
  • Does your geography realistically support value-added or direct-to-consumer diversification?
  • If pursuing scale, what’s your realistic timeline for achieving those economics?
  • If neither scale nor differentiation fits your situation, what does thoughtful transition planning look like while asset values remain supportive?

These aren’t easy questions. But current conditions make them worth serious consideration.

The Bottom Line

The farmers who gathered in Brussels understand something important: this isn’t really about one trade deal or one protest. It’s about whether agriculture maintains sufficient standing to influence the policies shaping its future meaningfully. What happens in the coming months will affect European farming for a generation—and offers relevant lessons for agricultural communities watching from elsewhere.

KEY TAKEAWAYS:

  • 10,000 farmers just bought time: The December 18 Brussels blockade forced an EU-Mercosur postponement until January 2026. What happens next depends on whether that coalition holds.
  • The cost gap can’t be managed away: South American producers operate at costs 40-60% below EU operations. That’s structural—land, labor, regulatory burden—not an efficiency problem.
  • North American dairy feels this indirectly but meaningfully: Displaced EU production will compete harder in Mexico, North Africa, and Southeast Asia. Those are your export markets, too.
  • Decision time for mid-size operations: With 65% of U.S. cows on 1,000+ head dairies and farm numbers down 40% since 2017, the next 18-24 months will shape outcomes for a decade. Scale, differentiate, or transition—but don’t wait.

Complete references and supporting documentation are available upon request by contacting the editorial team at editor@thebullvine.com.

Learn More:

The Sunday Read Dairy Professionals Don’t Skip.

Every week, thousands of producers, breeders, and industry insiders open Bullvine Weekly for genetics insights, market shifts, and profit strategies they won’t find anywhere else. One email. Five minutes. Smarter decisions all week.

NewsSubscribe
First
Last
Consent

The 18-Month Window: Why Your Lender Knows Your Dairy’s in Trouble Before You Do

The math says 2,800 dairies will close this year. Your lender already knows if you’re one of them. Do you?

There’s a conversation happening in bank offices and cooperative boardrooms right now that most of us aren’t part of—at least not early enough to matter. I was reminded of this recently when talking with a 400-cow operator in central Wisconsin who’d just come from a meeting with his lender. “Nobody told me the runway was this short,” he said. That conversation is really what prompted me to put this piece together.

What I want to walk through today isn’t about whether dairy consolidation is coming, as many of us have observed over recent years, that question has largely been answered by economics. It’s about understanding the timeline and making decisions while meaningful choices still exist. Because there’s a real difference between strategic planning and crisis management, even when the underlying numbers look similar on paper.

What the Current Data Shows

Let’s start with what we actually know. Rabobank’s dairy analysts have been projecting 7 to 9 percent annual farm exits through 2027 in their global dairy outlook reports. On a base of roughly 39,000 U.S. dairy operations, that works out to approximately 2,800 farms closing in 2025 alone.

Now, I want to be clear—that’s a projection, not a guaranteed outcome. Projections have been wrong before, sometimes dramatically. But it aligns with what many of us are observing in our own communities. Wisconsin and Minnesota have seen steady attrition among mid-sized herds. California’s Central Valley operations are navigating their own pressures around water and labor costs. Northeast family dairies face familiar questions about scale and succession. Even in Texas, where dairy has been expanding, the growth is concentrated in larger operations, while smaller producers face the same margin pressures as elsewhere. Pacific Northwest dairies tell similar stories.

What’s particularly noteworthy about this cycle is the picture of processor investment. The International Dairy Foods Association announced in October 2025 that processors have committed more than $11 billion in new and expanded manufacturing capacity across 19 states, with more than 50 individual building projects scheduled through early 2028.

I spoke with a dairy economist last month who offered some useful context: those facilities aren’t being designed for the farm structure we have today—they’re being built for a landscape where the median supplier is considerably larger. That’s neither inherently good nor bad. It’s simply the direction capital is flowing, and understanding that helps inform planning decisions.

The timing also coincides with recent regulatory changes. The Federal Milk Marketing Order amendments took effect in June 2025, and according to American Farm Bureau Federation analysis from September, producers experienced more than $337 million in combined pool value reduction during the first three months under the new rules. Class price reductions from the make allowance changes ranged from 85 to 93 cents per hundredweight.

To put that in practical terms for daily planning: a 300-cow operation shipping around 680,000 pounds monthly is looking at roughly $5,800 to $6,300 per month in reduced revenue—before any operational changes. That’s meaningful money that affects everything from cash flow planning to equipment decisions.

Four Metrics Worth Watching

So how do you assess where your operation actually stands? What I’ve found helpful—and this comes from conversations with producers, lenders, and consultants across different regions—is focusing on four metrics that, taken together, give you a reasonable read on financial trajectory.

Financial MetricHealthy RangeMonitor CloselyHigh Risk
Margin Over Feed Cost$12.00+/cwt$8.50–$11.99/cwtBelow $8.50/cwt
Replacement Rate30–35% annually36–40% annuallyAbove 40% annually
Debt-to-Equity RatioBelow 60%60–75%Above 75%
Component Gap to PremiumWithin 5¢/cwt of threshold6–15¢/cwt below16¢+/cwt below
  • Margin over feed cost is probably the most familiar to all of us. The Dairy Margin Coverage program uses this calculation, and USDA Farm Service Agency data showed margins peaked at $15.57 per hundredweight back in September 2024. Since then, they’ve compressed in many regions. Extension economists generally suggest that when margins drop below about $12 per hundredweight, equity building slows significantly. Drop below $8.50, and many operations start drawing on reserves. But these are benchmarks, not hard rules—a farm with owned land operates on a different baseline than one that pays rent on everything.
  • Replacement rate deserves more attention in financial discussions than it typically receives. Extension programs benchmark healthy rates at 30-35%. When rates push above 35 to 38 percent, it often signals underlying challenges—fresh cow management issues, transition period problems, or breeding decisions that aren’t holding up. What makes this tricky during financial stress is the cascade effect: you keep marginal cows longer, which affects bulk tank components, further tightening margins.
  • Component position matters more now than it did five years ago. With the FMMO changes emphasizing component values differently, farms producing milk below regional butterfat and protein premium thresholds leave revenue on the table each month. The gap varies by market, but in some areas we’re talking 15 to 25 cents per hundredweight—over millions of pounds annually, that adds up fast.
  • The debt-to-equity ratio ultimately determines your lender flexibility. Generally, once you’re above 65 percent, lenders monitor more closely. Above 75 to 80 percent, you’re at the edge of most lenders’ comfort zone. What many producers don’t appreciate is that your lender sees trends in these ratios before you notice them—they’re benchmarking across their entire portfolio.
USDA Dairy Margin Coverage data shows margins peaked at $15.57/cwt in September 2024 and have compressed to the $8.50-$9.00 range by fall 2025—crossing from surplus territory into the crisis zone where operations draw on reserves rather than building equity. Extension economists consistently identify $12/cwt as the threshold where equity building slows significantly, and below $8.50 as the point where financial stress becomes acute. 

A producer I know in Michigan’s thumb region described the replacement rate trap perfectly:

“Trying to save money in ways that actually cost money.”

That observation has stuck with me.

The Scale Economics Question

This is probably the most difficult part of the conversation, but understanding the underlying economics matters for good decision-making. USDA Economic Research Service data has consistently shown that operations with 2,500-plus cows produce milk at roughly $3 to $4 per hundredweight less than farms running 300 to 500 head. Earlier ERS research found farms with 200 to 499 cows realized production costs about 21 percent above average costs at farms with at least 2,500 head.

I want to be thoughtful about how we interpret this, because management quality absolutely matters. A well-run 300-cow operation with excellent forage programs, tight fresh cow protocols, and careful cost control can achieve impressive efficiency. I’ve visited operations that size doing remarkable work—outstanding butterfat levels, minimal death loss, excellent transition cow outcomes. These farms demonstrate what’s possible with focused management.

But even excellent smaller operations typically face a structural cost advantage that’s difficult to overcome fully through management alone. The reasons are fairly intuitive: labor efficiency improves as herds grow, equipment costs spread across more production, feed procurement benefits from volume, and technology investments that don’t pencil at 300 cows become obvious choices at 2,000.

USDA Economic Research Service data reveals that operations with 2,500+ cows produce milk at $7.50/cwt, while 300-499 cow dairies average $10.50/cwt—a permanent structural disadvantage of $3-4/cwt that excellent management can narrow but not eliminate. This isn’t about working harder; it’s about physics: labor efficiency, equipment utilization, and purchasing power all scale non-linearly.

This doesn’t mean mid-sized operations can’t succeed—many do, and through various strategies. But pure commodity milk production at 300 to 700 cows does face structural headwinds that typically require either exceptional efficiency, premium market access, or diversified revenue streams to address effectively.

The scale reality in summary:

  • 2,500+ cow operations: approximately $7-8/cwt production cost
  • 300-500 cow operations: approximately $10.50-11/cwt production cost
  • The gap: $3-4/cwt regardless of management quality

That gap is structural. It doesn’t close on its own through harder work or better decisions.

How Exits Actually Unfold

U.S. Courts data shows 361 Chapter 12 bankruptcy cases were filed in the first half of 2025—a 55 percent increase from the previous year, according to American Farm Bureau Federation analysis. That’s significant, and it’s worth taking seriously.

But here’s some useful context: bankruptcies represent roughly 12 to 13 percent of total farm exits. The rest follow different paths, and the path matters considerably for what families ultimately preserve.

Some operations execute strategic exits—selling while herds are healthy, equipment is maintained, and there’s time to market properly. Farm transition specialists report these families typically preserve considerably more equity than those managing crisis liquidations. The difference often amounts to several hundred thousand dollars, depending on farm size and condition.

Exit PathwayTypical TimelineEquity PreservedDecision ControlFamily Legacy Impact
Strategic Exit(Proactive sale while healthy)12–18 months70–85% of farm valueFull control over timing, buyers, termsPositive: Exit on own terms, resources preserved
Crisis Liquidation(Forced sale under pressure)3–6 months30–45% of farm valueLimited: Time pressure forces discountsMixed: Reduced resources, stressful transition
Chapter 12 Bankruptcy(Court-managed)6–12 months (court-supervised)15–30% of farm valueCourt-supervised: Loss of autonomyNegative: Public record, damaged relationships

Others pursue operational pivots. Beef-on-dairy programs have gained traction across the Midwest, with operations reducing milking herds and breeding maternal animals to beef sires. I recently spoke with a 350-cow producer in eastern Iowa who made this transition 18 months ago—he’s cautiously optimistic about where it’s heading, though he’s quick to note the learning curve was steeper than expected. Some pursue organic certification, though that 18 to 36 month transition creates its own cash flow challenges. Northeast operations near population centers have explored direct sales and farmstead processing. California dairies have developed specialty cheese partnerships. Southwest grazing operations have found niches that work for their land and climate.

These pivots can work well—I’ve seen successful examples across regions. But they require capital investment when cash tends to be tight, and stabilization often takes 12 to 18 months or longer.

And then there are forced liquidations—equipment sold under time pressure, herds moved when buyers understand the circumstances, and real estate that can’t be marketed appropriately. The value erosion in these scenarios is substantial, and often avoidable with earlier planning.

The Information Timing Challenge

One pattern that’s become clearer through conversations with producers, lenders, and advisors is that most operators learn they’re in serious difficulty only late. The familiar progression: milk prices are down, but we’ve weathered down markets before. Margins are tight, but they’ll improve when feed costs moderate. The cooperative newsletter says conditions should stabilize…

Meanwhile, lenders are watching debt service coverage ratios and benchmarking against peer operations. Cooperatives analyzed the implications of the FMMO changes, while producers focused on getting hay put up. Processors investing $11 billion modeled which farm configurations will supply those facilities in 2028.

Farm financial research consistently shows lenders recognize deteriorating dairy operations 6-9 months before producers fully acknowledge the severity—they’re benchmarking your debt service coverage against hundreds of other dairies in their portfolio while you’re focused on daily operations. Processors and co-ops see trouble at months 2-4 through volume trends and quality patterns. By the time financial stress feels undeniable to the producer (months 6-9), the strategic decision window is already half-closed. 

This isn’t coordinated—it’s simply that different actors have access to different information at different times. Lenders see portfolio-wide trends. Cooperatives analyze regulatory changes as part of their core business. Processors model supply chains before major capital commitments.

Research on farm financial decision-making suggests that lenders often recognize deteriorating conditions 6 to 9 months before producers do. That gap represents real dollars—the difference between proactive planning and reactive crisis management.

What Canada’s Experience Suggests

There’s an interesting parallel north of the border worth considering. Dr. Sylvain Charlebois, a food policy researcher at Dalhousie University, has projected Canada could lose nearly half of its remaining dairy farms by 2030. What makes this striking is it’s happening under supply management—the system designed to prevent exactly this outcome.

The economics are instructive. Alberta quota costs have ranged from $52,000 to $58,000 per kilogram on the open exchange, according to provincial marketing board data. For a 100-cow operation, quota value alone can exceed $20 million—before purchasing animals or building facilities.

Consider succession in that context. A next-generation farmer faces quota obligations that can dwarf the productive capacity of what they’re acquiring. Even with Canada’s higher milk prices—roughly double U.S. levels—the math often doesn’t work. Quebec now produces roughly 40 percent of Canadian milk from a province with just over 20 percent of the population.

The insight for U.S. producers isn’t whether supply management is good or bad—reasonable people disagree, and there are legitimate arguments on multiple sides. It’s that price protection alone doesn’t automatically preserve mid-sized operations. Supply management changed the consolidation mechanism without preventing consolidation itself. The underlying economics still favor scale, just through different pathways.

Practical Steps Worth Considering

If you’re running a mid-sized operation and recent milk checks have been lighter than expected, what’s productive? Based on conversations with producers who’ve navigated similar situations, here’s what seems to help.

This week: Calculate your actual margin over feed cost using current figures. Pull recent milk statements, total feed invoices including purchased forages, and run the numbers. Know whether you’re at $11, $9, or somewhere else. This baseline matters before other conversations make sense.

Within a couple of weeks: Have a direct conversation with your lender. Ask specifically: “Based on my current numbers and what you’re seeing across your dairy portfolio, what’s my realistic runway? What trends should I understand? What options do you see for operations like mine?” Good lenders engage honestly with direct questions, and their perspective provides important context.

Within 60 days: Make a directional decision. Not necessarily final, but clarity about which path you’re exploring.

The paths vary by situation. Strategic exit while equity remains—preserving resources for retirement, education, or new directions. Operational pivot toward specialty markets or diversified production—requiring capital investment while credit remains available. Scaling to 1,200-plus cows, where region and finances support it. Partnership with larger operations—trading some independence for stability.

What tends not to work is continuing commodity production at 300 cows while waiting for prices to overcome structural cost differentials. That math rarely resolves through price alone.

The Decision Window

Based on farm financial data and exit patterns, the window for strategic decisions on mid-sized operations typically runs 12 to 18 months from when margins first compress below sustainable levels. After that, options narrow. By month nine or ten of sustained pressure, responses often become reactive rather than proactive.

European research published in the European Review of Agricultural Economics found that only about 5 to 8 percent of at-risk farmers make proactive decisions before circumstances force their hand. Most wait—sometimes for understandable reasons, sometimes because they lack good information earlier.

I mention this as context, not criticism. These decisions involve multi-generational history and deep personal identity. But recognizing your situation while options remain open positions you better than most.

The Bottom Line

The consolidation unfolding in dairy represents structural change—not simply cyclical pressure that patience will outlast. Processors are building infrastructure sized for larger suppliers. Scale advantages of $3 to $4 per hundredweight persist regardless of management quality. Information reaches different actors at different times.

None of this reflects poorly on anyone running a 300-cow operation. The business models that sustained earlier generations operated in different economic environments. That’s industry evolution, even when consequences feel personal.

The families who navigate this successfully will largely be those who recognized their situation early and made strategic choices—not those who recognized it later, when options had narrowed.

The math doesn’t care about your farm’s history. But you do. You have a 60-day window to look at the numbers before your lender makes the decision for you.

Current Dairy Margin Coverage data is available through the USDA Farm Service Agency at fsa.usda.gov. Regional cost-of-production benchmarks can be found through university extension programs, including the Center for Dairy Profitability at UW-Madison, Cornell PRO-DAIRY, and FINBIN at the University of Minnesota. California-specific analysis is available through UC Davis Cooperative Extension. Provincial marketing boards, including Alberta Milk and Dairy Farmers of Ontario, publish Canadian quota pricing. The International Dairy Foods Association tracks processor investment information at idfa.org.

Key Takeaways:

  • Your lender knows first: Financial trouble is visible to lenders 6-9 months before most producers see it—ask about your runway this week
  • The cost gap won’t close: 2,500+ cow operations produce milk $3-4/cwt cheaper; strong management helps, but the structural disadvantage remains
  • Your window is 12-18 months: From first margin compression to limited options—most families recognize trouble too late to act strategically
  • Decide within 60 days: Calculate your actual margins, talk to your lender, and choose a path—exit, pivot, scale, or partner
  • $11 billion says it all: Processor investment in new capacity is designed for larger suppliers; plan accordingly

Executive Summary: 

Your lender likely sees your dairy’s financial trouble 6-9 months before you do—and processors investing $11 billion in new capacity have already decided which farm sizes fit their future. This information gap is costing mid-sized producers critical decision-making time, as Rabobank estimates that 2,800 farms will close in 2025. The economics are structural: USDA data show that operations with 2,500+ cows produce milk at $3-4/cwt less than those with 300-500 cows, a disadvantage that excellent management can narrow but not eliminate. June 2025’s FMMO changes have intensified pressure, pulling $337 million from the producer pool value in three months. For operations experiencing compressed margins, the window for strategic decisions—exit, pivot, scale, or partner—runs 12-18 months before options narrow dramatically. The priority now: know your numbers, talk to your lender, and choose a direction within 60 days.

Complete references and supporting documentation are available upon request by contacting the editorial team at editor@thebullvine.com.

Learn More:

The Sunday Read Dairy Professionals Don’t Skip.

Every week, thousands of producers, breeders, and industry insiders open Bullvine Weekly for genetics insights, market shifts, and profit strategies they won’t find anywhere else. One email. Five minutes. Smarter decisions all week.

NewsSubscribe
First
Last
Consent

The One-Dollar Margin: A Global Wake-Up Call from New Zealand’s Dairy Squeeze

A $9.50 milk price sounds great—until you see the $8.50 break-even. NZ’s one-dollar margin is a wake-up call for dairy farmers everywhere.

Executive Summary: When the world’s lowest-cost milk producers are farming on a dollar of margin, that’s a wake-up call for dairy everywhere. New Zealand’s December 2025 numbers: $9.50/kgMS milk price, $8.50 break-even, one dollar left for debt, drawings, and reinvestment. They’re not alone. Teagasc projects Irish dairy incomes dropping 42% in 2026. UK farmgate prices have fallen below production costs. Rabobank calls global output growth ‘stunning’—the very oversupply compressing margins worldwide. And China’s shift from aggressive importer to tactical buyer has removed the demand safety valve the industry once counted on. The old formula—high prices equal comfortable margins—no longer holds. The farms that make it through will be those building resilience now: feed efficiency, component focus, diversified revenue, right-sized debt. Not growth for growth’s sake. Strategic survival.

When the world’s lowest-cost milk producers are working on about one dollar of operating margin per kilogram of milk solids, that’s worth every dairy farmer’s attention.

That’s exactly where New Zealand finds itself heading into 2026.

Here’s what makes this relevant beyond the Pacific: it’s essentially a real-time stress-test of the global dairy model. From Wisconsin freestalls to Irish grass paddocks to Canterbury’s irrigated pastures, the underlying question is the same.

If New Zealand’s efficient pasture systems can’t maintain comfortable margins at these milk prices, what does that mean for the rest of us?

The narrative has shifted. It’s less about waiting for the next price spike and more about adapting to a new reality—one defined by persistent cost pressure, cautious global buyers, and markets that recover more slowly than they used to.

Understanding the One-Dollar Margin

DairyNZ’s December 2025 Economic Update paints a clear picture.

Farm working expenses have climbed 16 cents to $5.83 per kgMS. Meanwhile, Fonterra revised its 2025-26 farmgate milk price forecast down to a midpoint of $9.50 per kgMS—a notable drop from the earlier $10.00 projection.

DairyNZ puts the break-even milk price for an average reference farm at around $8.50 per kgMS.

That leaves roughly a dollar per kgMS as operating surplus. And that’s before capital repayments, family drawings, or any reinvestment.

Metric2024-25 Season2025-26 SeasonChange
Milk Price ($/kgMS)$10.00$9.50-$0.50
Break-even Cost ($/kgMS)$8.34$8.50+$0.16
Operating Margin ($/kgMS)$1.66$1.00-$0.66
Farm Working Expenses ($/kgMS)$5.67$5.83+$0.16
Interest Costs ($/kgMS)$1.46$1.11-$0.35

Tracy Brown, DairyNZ’s chair and herself a Waikato dairy farmer, offered some measured perspective in their December update: “Profit is still on the table, but the margin gap has clearly tightened, and that means every spending decision on farm needs a harder look.”

That’s a statement worth sitting with.

What This Looks Like on a Real Farm

Think about a fairly typical New Zealand herd—400 cows producing 400 kgMS each. That gives you 160,000 kgMS for the season.

At $9.50 per kgMS, gross milk revenue comes to about $1.52 million NZD. With a break-even point of around $8.50, core operating costs consume roughly $1.36 million.

That leaves approximately $160,000 NZD of operating surplus.

On paper, that’s profit. But reality includes broken gates, aging tractors, and family obligations. The buffer is much thinner than the headline suggests.

I recently spoke with a consultant who works across both New Zealand and Australian operations. His observation: for a 200-cow farm, that surplus might only be $80,000 NZD before tax and drawings. For a 2,000-cow operation, you’re looking at roughly $800,000—but spread across substantially higher fixed costs and larger teams.

Farm SizeProduction (kgMS)Gross RevenueOperating CostsOperating SurplusMargin Per Cow
200 cows80,000$760,000$680,000$80,000$400
400 cows160,000$1,520,000$1,360,000$160,000$400
2,000 cows800,000$7,600,000$6,800,000$800,000$400

The ratio matters more than the headline number. Whether you’re milking 200 or 2,000, everyone’s working with a narrower buffer.

The Takeaway: A $9.50 milk price sounds strong. But with $8.50 break-evens, you’re farming on a dollar of margin—and that dollar has to cover everything else.

Tracing the Cost Increases

Where exactly did those 16 cents go? Understanding the drivers makes them easier to address.

DairyNZ’s Econ Tracker identifies three primary contributors.

Cost CategoryIncrease (¢/kgMS)400-Cow Farm ImpactControllability
Feed Costs+7¢+$11,200Medium – Nutrition strategy
Fertiliser+4¢+$6,400Low – Global commodity
Electricity/Irrigation+2¢+$3,200Low – Fixed infrastructure
Wages+2¢+$3,200Low – Labour market
Repairs/Maintenance+1¢+$1,600Medium – Defer vs invest
Compliance+1¢+$1,600None – Regulatory
Other Operating-1¢-$1,600Variable
TOTAL+16¢+$25,600

Feed costs have risen meaningfully year-on-year across most categories. Palm kernel has been somewhat more stable, but grain and purchased roughage have risen noticeably.

Fertiliser continues to pressure budgets. Phosphate and urea prices remain elevated, driven by energy market dynamics and export restrictions from major suppliers. Teagasc’s Outlook 2026 suggests costs will climb further as the EU Carbon Border Adjustment Mechanism takes effect.

Other operating costs—repairs, freight, wages, fuel, compliance—have all experienced inflation.

The encouraging news? DairyNZ reports that interest costs are easing. Payments are forecast to drop about 35 cents to $1.11 per kgMS for 2025-26.

The catch? Those interest savings are largely offset by increases elsewhere. The budget might show relief on one line, but feed, fertiliser, and operating costs are absorbing it.

For a 200-cow farm, this might mean choosing between replacing an ageing parlour component or making do with repairs. On a 2,000-cow dry-lot operation, it could be the difference between upgrading a feed mixer or deferring that decision another year.

The Takeaway: Feed and fertiliser are eating your interest rate savings before you ever see them.

The Production Paradox

This is where the situation becomes counterintuitive.

New Zealand is currently in its spring flush. DairyNZ reports national milk collections running about 3.4% ahead of last season, with August and October 2025 volumes among the highest on record.

South Island production in October was up 5.7% year-on-year. Customs data shows palm kernel imports are up significantly—a clear indicator that farmers leaned into purchased feed to boost production.

Why does this matter? Because the same pattern is playing out across multiple dairy regions simultaneously.

I’ve been following similar trends in US and European coverage. Where corn or by-products are relatively affordable, there’s considerable temptation to push cows harder to maintain cashflow. Especially when fixed obligations don’t adjust downward just because your milk price does.

At the individual farm level, this appears entirely rational. If you’ve already invested in the parlour, the effluent system, and the bank financing, pushing a few more kilograms through spreads those fixed costs.

But collectively? When New Zealand, the US, Ireland, and parts of Europe all make that same calculation simultaneously, you end up with what Rabobank’s December 2025 commentary described as “stunning” global output growth.

Region2026 Growth ForecastImpact on Global Supply
Argentina+4.0%Aggressive expansion continues
United States+1.3%Steady growth despite tight margins
New Zealand+1.0%Spring flush pushing volumes
European Union0.0%Only major exporter hitting brakes

That additional milk is precisely why price forecasts have moderated.

A Midwest producer I spoke with recently put it simply: “We’re not trying to grow anymore—we’re trying to survive long enough to see the other side.”

The Takeaway: What makes sense on your farm might be making things worse for everyone—including you.

Regional Perspectives

New Zealand’s experience offers the clearest current signal. But similar pressures are emerging across other major dairy regions.

RegionCurrent Margin (2025)2026 ForecastKey Pressure PointCompetitiveness
New Zealand+$1.00/kgMSTight ($0.80-1.00)Feed & fert eating savingsHigh — Pasture based
Ireland€0.115/LSevere (-45%)Butter price collapseMedium — Scale challenges
United KingdomBelow cost (38.5p/L)Further pressureCommodity liquid pricingLow — High costs
United States (DMC)Above $9.50/cwtStable (low feed)Production growthVariable — Regional
European UnionSqueezed — variedContraction likelyChina probe uncertaintyMedium — Policy support

Ireland: Preparing for a Correction

Teagasc’s Outlook 2026 projects that average Irish dairy farm incomes could decline by approximately 42% in 2026. That would take the average income from an estimated €137,000 this year to around €80,000.

Their baseline anticipates milk prices moderating from the high-40s cent per litre range back toward approximately 42 cents.

At 11.5 cents per litre, the average dairy net margin in 2026 is forecast to be down 45% from 2025 levels.

For a 70-hectare, 100-cow family farm, cash surplus after drawings and loan repayments could drop from around €80,000 to closer to €45,000.

That’s manageable if the debt is moderate. For operations that expanded aggressively, the adjustment will be sharper.

The UK: Below-Cost Production

Recent market data shows that farmgate milk prices have fallen below full production costs for many operations.

As of late 2025, Arla’s conventional price sits around 39.21 pence per litre. Müller’s Advantage price drops to 38.5ppl from January 2026.

Industry estimates place all-in production costs closer to the 40-45ppl range.

The picture varies by contract type. Producers on cheese or retailer-aligned arrangements often fare better. But in the commodity liquid segment, some operations are producing milk at a level below full economic cost.

Processors have responded by shifting toward component-based and fixed-volume contracts. Retailers continue to prioritise competitive shelf prices, putting pressure on producers’ margins.

The US: Regional Variations

The American experience differs due to policy structure—and substantial regional variation.

The Dairy Margin Coverage programme has provided meaningful support. The University of Wisconsin Extension reports that through the first ten months of 2023, DMC distributed over $1.27 billion in indemnity payments. That averaged approximately $74,453 per enrolled operation, with around 17,059 dairy operations participating.

But the experience varies dramatically by region.

In California, water costs and environmental compliance add layers of expense that Midwest operations don’t face. Wisconsin operations are navigating processor consolidation and volatility in the cheese market. Northeast producers face declining fluid milk demand and processing capacity constraints.

Larger US herds—1,000 cows and above—are increasingly relying on scale economies and diversified revenue streams. Beef-on-dairy programmes, heifer development, and energy projects are becoming standard.

The Takeaway: The squeeze is global, but every region has its own version. Know your local dynamics.

The China Factor

For two decades, much of dairy’s long-term optimism rested on a straightforward assumption: China would continue buying more.

That assumption deserves recalibration.

New Zealand Treasury’s 2024 dairy exports analysis, Rabobank’s global outlooks, and trade reports identify three meaningful shifts.

Product Category2021 Imports (MT)2024 Imports (MT)ChangeTrend
Whole Milk Powder1,680,000740,000-56%Domestic production surge
Milk Powder (Total)2,580,0001,360,000-47%Structural decline
Skim Milk Powder900,000620,000-31%Domestic substitution
Whey480,000380,000-21%US tariff impact
Cheese140,000170,000+21%Foodservice growth
Butter110,000135,000+23%Bakery sector expansion

Domestic production has expanded substantially. China has invested heavily in large-scale dairy operations. This is structural import substitution, not a temporary measure.

Per-capita consumption growth has moderated. Dairy consumption continues trending upward, but at slower rates than during the expansion years. The steepest part of the adoption curve appears behind us.

Purchasing behaviour has become tactical. Chinese buyers now step back when prices strengthen and increase purchases when value emerges—rather than consistently supporting auctions.

China remains a vital market. But it’s no longer the automatic release valve that absorbs surplus production.

The Takeaway: Don’t count on China to bail out oversupply anymore. That era is over.

What Farmers Are Actually Doing

When margin discussions move from conferences to kitchen tables, what are producers actually changing?

Managing Through Feed

In New Zealand, palm kernel imports are up significantly. Many farmers chose to push production while payout expectations remained near $10/kg MS.

Similar decisions are playing out in US operations where corn and by-products remain relatively affordable.

The logic is straightforward: when principal payments and family expenses don’t flex with milk price, spreading fixed costs across more production can appear to be the only short-term lever.

Strengthening Balance Sheets

New Zealand’s Ministry for Primary Industries notes that some farmers used the strong 2021-2023 payouts to reduce debt rather than adding infrastructure.

That decision is looking increasingly prudent.

On a 200-cow farm, this might translate to directing an extra $20,000 annually toward debt reduction rather than equipment upgrades. On a 2,000-cow operation, it could mean restructuring short-term facilities into longer-term arrangements.

Diversifying Revenue

Beef-on-dairy has become mainstream. Industry analyses suggest crossbred calves can add $100-200 per cow annually, depending on local markets.

Sustainability-linked premiums are emerging as processors develop payment structures tied to documented environmental outcomes.

Even modest additional revenue streams—$50,000-$100,000 annually on a mid-sized operation—can make a meaningful difference when the milk cheque alone isn’t covering the spread.

The Takeaway: Smart operators aren’t just cutting costs. They’re restructuring debt and finding new revenue.

StrategyShort-Term CashflowMargin ImpactRisk LevelBest For
Push Production (Palm Kernel)Improved$0.85/kgMSHigh — Adds to oversupplyHigh debt, large scale
Cut Costs AggressivelyPreserved$1.15/kgMSMedium — Quality risksMedium farms, low debt
Maintain Status QuoSqueezed$1.00/kgMSHigh — Thin bufferNo flexibility
Reduce Debt FirstReduced$1.00/kgMSLow — Future flexibilityStrong balance sheet

Strategic Levers by Scale

Even in challenging margin environments, individual operations retain meaningful levers. They won’t shift global prices, but they determine which side of the margin line you occupy.

Feed Efficiency and IOFC

Research consistently documents substantial variation in feed efficiency—both between herds and within individual herds.

Progress typically comes from:

  • Forage quality management—harvest timing, processing, storage, feedout
  • Fresh cow protocols that establish strong intake patterns during those critical first 30-60 days
  • Active use of income over feed cost metrics as management tools, not retrospective reports

Getting started: On smaller operations, work with a nutritionist to develop simple IOFC reporting by production group. On larger TMR operations, establish monthly review rhythms to identify underperforming groups.

Component Value Capture

As payment systems emphasise solids over volume, butterfat and protein percentages deserve strategic attention.

The value ranges from 75 cents to $1.25 per hundredweight in many component-based systems, even at equivalent volume.

Getting started: Talk with your AI representative about reorienting sire selection toward fat and protein kilograms. Pair that with a nutritionist input on optimising rumen health, not just energy delivery.

Beef-on-Dairy Integration

This has evolved from a niche strategy to standard practice.

Getting started: Begin with market research. Talk with calf buyers about which terminal breeds and calving ease profiles actually command premiums in your area.

Financial Structure

What research keeps showing—across EU and Latin American farms alike—is that how you structure debt often matters as much as how efficiently you produce.

Getting started: Have proactive lender conversations before cash flow challenges emerge. Walk through three-year projections under multiple price scenarios.

The Takeaway: You can’t control global milk prices. But you can control feed efficiency, component focus, revenue diversity, and debt structure.

StrategyImmediate Impact1-Year Margin GainResilienceCapital Required
Feed Efficiency FocusModerate — Slow gains+$0.10-0.20/kgMSHigh — PermanentLow — Nutrition/management
Component OptimizationModerate — Genetic lag+$0.15-0.25/kgMSHigh — PermanentLow — Semen/consulting
Beef-on-Dairy IntegrationHigh — Instant revenue+$0.08-0.15/kgMSMedium — Market dependentLow — Contract only
Aggressive Debt ReductionLow — Reduces cashflow$0/kgMSVery High — Future flexibilityHigh — Requires surplus
Volume Push (Status Quo)High — Spreads fixed costs-$0.05 to +$0.05/kgMSLow — Worsens oversupplyModerate — Feed purchases

What Could Actually Change Things?

If current margin pressure is structural, what developments might shift the trajectory?

Genuine supply contraction would require sustained exits that actually reduce production capacity. We’re seeing accelerating consolidation in parts of Europe, the UK, and Australia. It’s unclear whether the pace is sufficient.

Emerging market demand growth offers longer-term potential in Southeast Asia, Africa, and Latin America. But developing those markets takes time.

Policy and structural changes—such as transition support, improved risk-sharing between processors and producers, and trade agreements—could shift the environment. But political processes move slowly.

None of these are quick fixes. But understanding the possibilities helps inform longer-term positioning decisions.

Key Takeaways

Price levels don’t ensure margin. A $9.50 per kgMS payout with $8.50 break-evens means strong prices can coexist with tight margins.

Volume gains require margin verification. More production can support cashflow while contributing to oversupply. Check IOFC, not just output.

Input decisions carry strategic weight. Feed and fertiliser now warrant careful analysis, not routine repetition.

Revenue diversification has moved mainstream. Beef-on-dairy and sustainability premiums are standard elements, not experiments.

Financial structure shapes survival. Operations that reduced debt during good years enter this period with more flexibility.

Opportunity persists, but looks different. More competition, more selective buying, more scrutiny. Adapt or get squeezed.

The Bottom Line

No individual farm can resolve global oversupply. No policy will quickly restore previous comfort levels.

But careful attention to what New Zealand’s numbers reveal—and thoughtful application regardless of region or scale—can improve the odds of staying on the right side of that one-dollar margin line.

The farms that thrive in 2030 are making decisions right now. Not necessarily to get bigger. But to get more resilient, more diversified, more intentional about where margin actually comes from.

Complete references and supporting documentation are available upon request by contacting the editorial team at editor@thebullvine.com.

Learn More:

The Sunday Read Dairy Professionals Don’t Skip.

Every week, thousands of producers, breeders, and industry insiders open Bullvine Weekly for genetics insights, market shifts, and profit strategies they won’t find anywhere else. One email. Five minutes. Smarter decisions all week.

NewsSubscribe
First
Last
Consent

The Real Reason Dairy Farms Are Disappearing (Hint: It’s Not About Better Farming)

Dairy success isn’t about better farming anymore—here’s the real force changing who survives and who sells out.

The February 2024 USDA report had a number that’s stuck with me: about 1,500 U.S. dairy farms closed in 2023, yet national milk production ticked higher. That’s not just abstract data—it’s what drives our conversations at kitchen tables and farm meetings across the country. Let’s talk through what’s really happening and what it means for the future.

U.S. dairy farming faces an existential consolidation crisis, with farm numbers plummeting from 39,300 operations in 2017 to a projected 10,500 by 2040—a 73% reduction driven by systematic structural advantages favoring mega-operations over traditional family farms, with 1,420 farms disappearing annually as of 2024.

Looking at How the Structure Has Shifted

Start with the numbers, because they’re telling: The 2022 Census of Agriculture shows about 65% of American milk now comes from just 8% of herds—those with over 1,000 cows. Meanwhile, nearly 9 out of 10 farms (the 100–500 cow group) account for only 22% of the supply. In the Northeast and Midwest, that’s still the “standard” size, but the playing field keeps tilting.

As one third-generation Wisconsin farmer shared, “I remember 13 dairies on our road, but now it’s just us. Plenty of the folks who exited were younger managers, not retirees. They just couldn’t get the numbers to work.”

Cost of production varies dramatically by herd size, with the smallest operations facing a devastating $9/cwt disadvantage that translates to $250,000 in annual losses for a typical 600-cow farm—a gap driven by scale advantages in feed purchasing, financing, and regulatory compliance rather than management quality.

Cornell’s Dairy Farm Business Summary for 2022 has it in black and white: the biggest herds report $22–$24/cwt cost of production. For 100–199 cow operations, the range is $31–$33/cwt. In a market where the base price is set by regional blend or federal order, that gap eats margin and equity fast.

Beyond Raw Efficiency: What’s Really Behind Cost Gaps

What’s interesting here is how much of the “efficiency” story isn’t really about cow management or even genetics anymore. I talked to a Central Valley manager running 5,000 cows who summed it up: “We buy grain by the unit train—110 railcars. Our delivered price is CBOT minus basis, sometimes 15 cents lower. My neighbor with 300 cows pays elevator price, plus haul; that’s 40, 50 cents more per bushel.”

It’s not just West Coast operations seeing this. In the Upper Midwest, neighbors share similar experiences. Volume buyers get priority and save dollars, not because they feed cows better, but because they can buy enough at once to command a discount.

Bring in finance, and the gap widens. Published rates show 2,000-cow herds receiving prime plus 0.5%. A 200-cow farm might see prime plus two. On a $1 million note, that’s more than $15,000 a year in extra interest just for being smaller.

Then consider environmental compliance. The latest Wisconsin Department of Ag reports—which many of us turned to during the farm planning season—show the cost of nutrient management, methane compliance, and water permits comes out to 50 cents/cwt for the largest herds, but easily $15/cwt or more for the smallest. It’s the same paperwork, same inspector fee—just spread over far fewer cows and pounds.

The scale advantage isn’t about better farming—it’s about systematic structural advantages that give large operations a $4/cwt cost edge through volume discounts on feed, preferential financing rates, amortized regulatory compliance costs, and labor efficiency, creating a $100,000 annual penalty for a 500-cow farm that has nothing to do with management quality.

The Co-op/Processor Crossover: Facing Up to the Math

Now, here’s where a lot of dinner-table talk turns pointed. Vertical integration with co-ops, especially after big moves like DFA’s $425 million purchase of Dean Foods’ 44 plants, changes the dynamic. Industry estimates now indicate that more than half of DFA members’ milk flows through DFA plants.

There’s no way around it: when your co-op is both your “agent” and your buyer, it faces a built-in conflict. The original co-op job—fight for a fair farm price—collides with the processor’s goal: keep input costs as low and steady as possible.

A Cornell ag econ professor put it bluntly at last year’s co-op leadership workshop: “Co-ops owning plants face incentives that are tough to align. You can’t maximize both farmer pay price and processing margin.” And I’ve seen the evidence myself; the research shows co-ops often have lower stated deductions, but within the co-op group, “other deductions” can vary wildly. As one board member told us, “Transparency on this stuff is hard for everyone, even when we want it.”

Think about it: if your co-op owns the plant, is the negotiation about pay price truly across the table or just across the hallway?

Canadian Lessons: Costs and the Future

Now, Canadian friends watching these trends aren’t immune either. The Canadian Dairy Information Centre’s latest data puts the last decade’s dairy farm reduction at over 2,700, even under supply management. And quota levels are a choke point: In Ontario, with a strict cap, quota changes hands around $24,000 per kilo of butterfat; Alberta’s uncapped market runs up past $50,000.

A young producer near Guelph explained it best: “We want to keep the farm in the family, but the math now is about buying quota at market rate from Dad—he paid $3,000/kilo in the ’90s. I pay $24,000/kilo or more, and start so far behind on cash flow it feels impossible.”

Canadian dairy quota prices have exploded from $3,000 per kilogram in the 1990s to $24,000 in Ontario and $50,000 in Alberta by 2023—a 1,567% increase that creates an impossible generational wealth transfer barrier, forcing young farmers to begin their careers hundreds of thousands of dollars in debt simply to acquire the right to produce milk their parents obtained for a fraction of the cost.

Producers Team Up—and Win

We should all pay attention to how producers abroad have responded. In Ireland, Dairygold tried to drop prices, but farmers quickly networked on WhatsApp. Once they started comparing pay stubs, they discovered inconsistencies—same pickup, same composition, different pay. They organized: “If 200 show up with real data, will you join?” The answer was yes. Six weeks, 600 farmers, and the transparency improved, the price cut was rescinded.

That lesson isn’t just for Ireland. That’s modern farm business—facts and solidarity over rumors and grumbling.

U.S. Adaptation Tactics: What’s Working

Across the U.S., I’ve watched farmers embrace savvy but straightforward approaches. Central Valley producers doubled back to their milk checks and truck bills and found that some paid 20 cents/cwt more for identical hauls. As a group, they pressed for change—and got it.

Midwesterners have started bottling their own milk—Wisconsin’s extension reports show farmgate price benefits of $2 to $4 a gallon, though yeah, getting there takes $75,000 to $100,000 and some serious compliance stamina.

Debt is a fresh challenge in its own right in cow management. Now’s the time to renegotiate any credit above prime plus one. Dropping even one percent on a $2 million note brings $20,000–$25,000 savings straight to the P&L.

Environmental Law: A Sea Change

California’s methane digester rules, fully phased in over the past two years, are a classic case of “scale wins again.” For big operations, $4 million-plus digesters can become a profit center—especially if you trade renewable natural gas credits north of $1 million a year. Small farms? They can’t justify the capital, so the compliance cost splits unevenly—UC Davis economists show $2/cwt for small farms, under 50 cents for the largest.

It’s not about better manure management; it’s about who can amortize the cost.

The Path Ahead: What’s Next in Dairy Consolidation

The USDA’s Economic Research Service expects U.S. dairy farm numbers to dip below 10,000 by the mid-2030s, with Canadian farm numbers also dropping to around 4,000–5,000. That’s the math if nobody changes the model or the market.

But honestly, what gives me hope are examples of when perseverance, innovation, and strategic shifts pay off. In Wisconsin, several smaller herds now sell directly into grass-fed cheese contracts, pulling in a $4/cwt premium (more than make-allotment size, less fight for line space). “We stopped competing with 5,000-cow barns by beating them at their game,” one farmer told me. “We get paid for our story and our butterfat.”

Where To Focus Now

  • Calculate Your Position Honestly. Know your true cost—family living included—against hard local benchmarks. If the numbers don’t lie, accept what you see and plan accordingly.
  • Don’t Go It Alone. From paycheck audits to volume negotiations, the farms that win increasingly do so together.
  • Strategic Awareness Beats Production Alone. The future belongs to those who know how pricing, processing, and consumer trends intersect—and find their “crack” in the system instead of just producing more.

As Tom Vilsack put it at a dairy business roundtable: “We love to say we’re saving family farms, but policy and business choices keep rewarding bigness and consistency.” No matter your model—organic, conventional, something in between—the goal is to find your margin, your allies, and your leverage.

The numbers will keep changing, but one reality holds—those who adapt, share, and innovate stand the best chance. Old rules are being rewritten, and it’s worth being part of that conversation. For deep dives on industry economics, co-op strategy, and farm resilience, visit www.thebullvine.com.

KEY TAKEAWAYS

  • Butterfat numbers and raw efficiency don’t guarantee survival—market scale, price leverage, and transparency do.
  • Question every deduction and demand clarity from your co-op or processor—internal conflicts don’t have to shortchange you.
  • Benchmark your costs with neighboring farms and negotiate together—solo producers rarely win against consolidated buyers.
  • The farms thriving today are adapting: going direct-to-consumer, value-adding, or finding specialized markets to earn more per cwt.
  • Success in modern dairy comes from forward planning, embracing new models, and building your own leverage—not waiting for the system to “fix itself.”

EXECUTIVE SUMMARY:

Dairy’s old rules—“be efficient and you survive”—no longer hold. Drawing on real farm stories and national data, this investigation exposes why scale, access, and co-op consolidation matter more than top cow performance. You’ll see how market power and processor influence—not just farm management—decide who survives and who sells out. With insights from producers challenging these trends, along with practical strategies and benchmarks, this article is a must-read for anyone rewriting their playbook. Get the facts, the framework, and a clear-eyed look at what real success in dairy now demands.

Complete references and supporting documentation are available upon request by contacting the editorial team at editor@thebullvine.com.

Learn More:

The Sunday Read Dairy Professionals Don’t Skip.

Every week, thousands of producers, breeders, and industry insiders open Bullvine Weekly for genetics insights, market shifts, and profit strategies they won’t find anywhere else. One email. Five minutes. Smarter decisions all week.
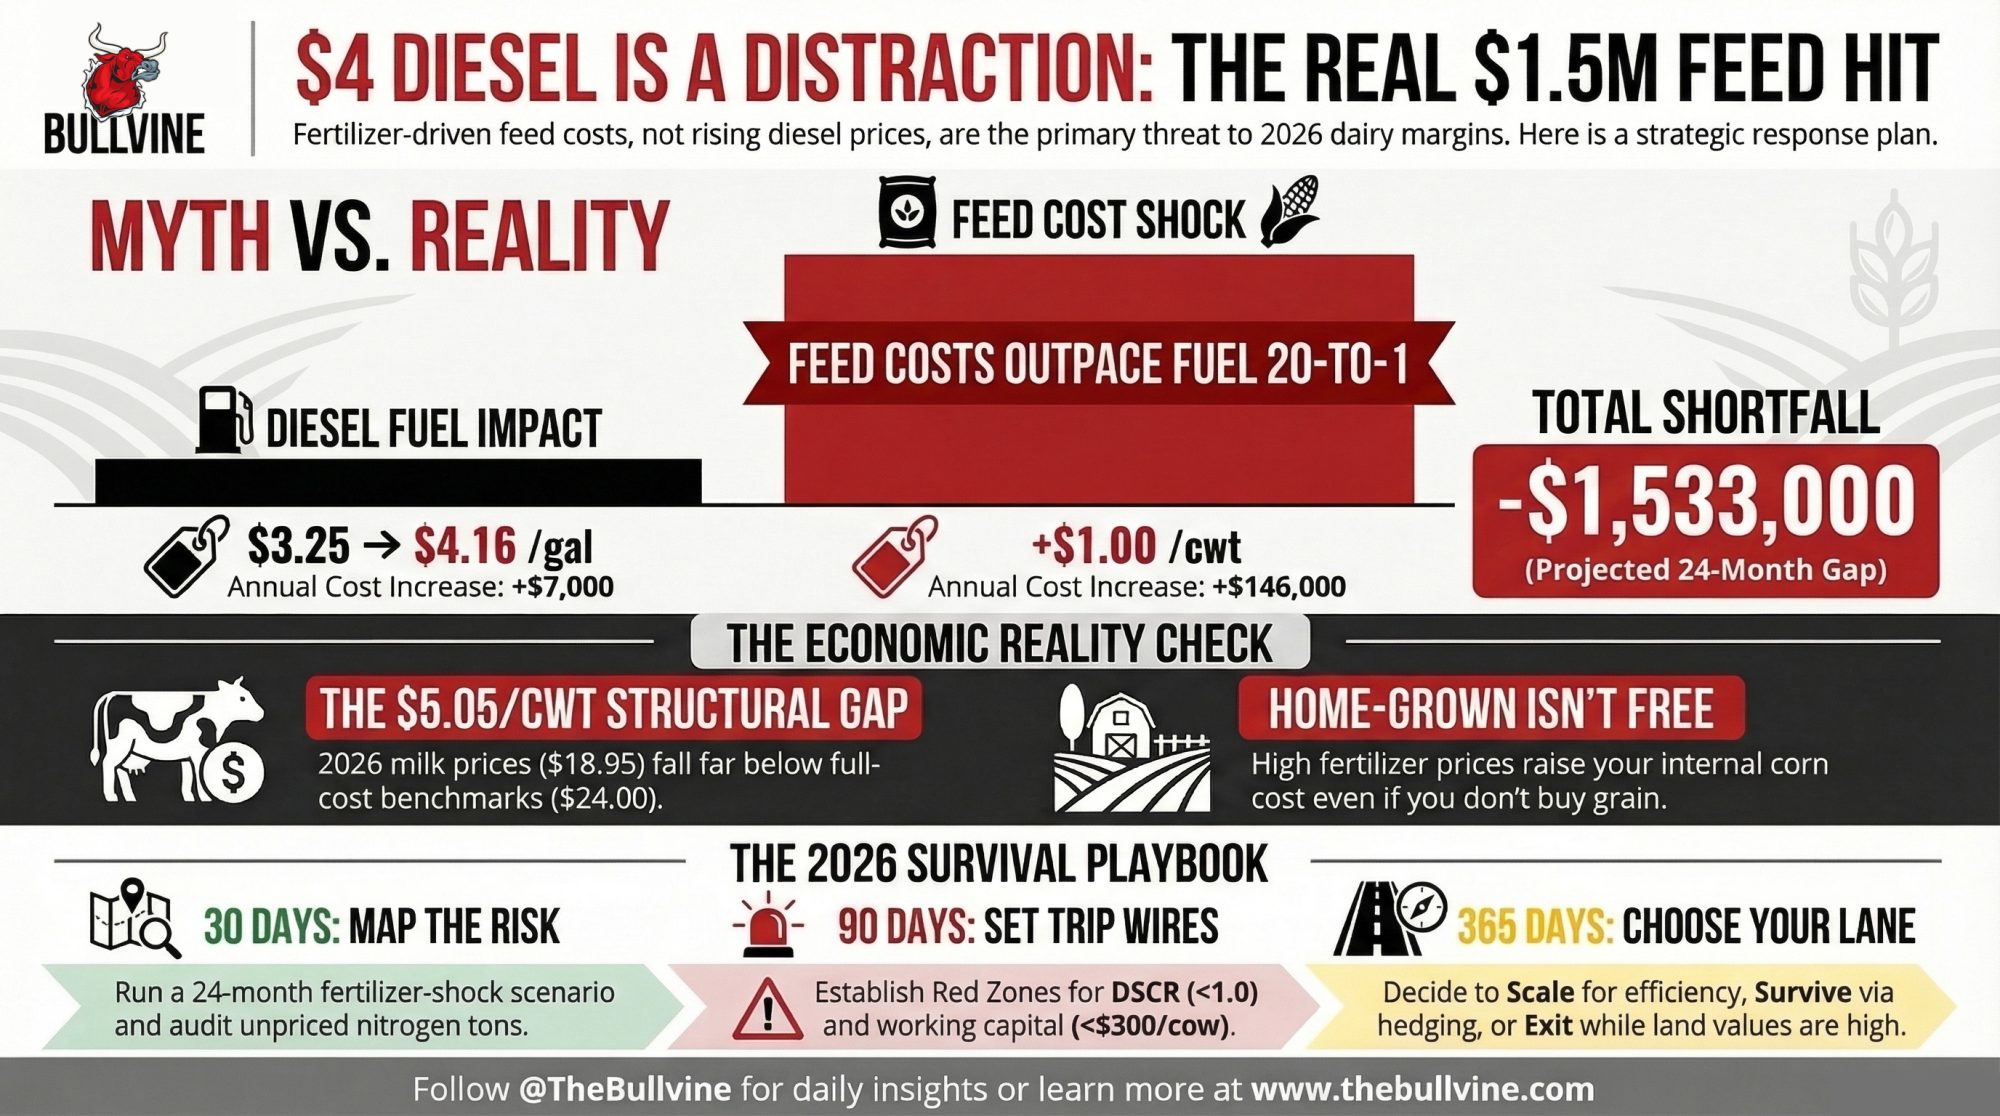
NewsSubscribe
First
Last
Consent

The Dairy Mirage: How the Industry’s ‘Fixes’ Are Finishing Off the Farmer

Every ‘solution’ that claims to save dairy farms was never designed to fix anything — it was built to extract you, one milk check at a time.

You know the line by now. Every time milk prices crash, every time a farm auction makes the local news, somebody shows up with a binder and a slogan. “Efficiency will save you.” “Diversify into organics.” “Join a co-op — strength in numbers.”

I mean, I’ve heard them all. You probably have too. But here’s the thing that nobody in those meetings will ever say out loud — the system isn’t broken. It’s working exactly the way it was built. It just wasn’t built for you.

The math nobody wants to admit

Small dairies lose $6.27 per hundredweight while large operations profit $16.50 on the same product—a $23 gap that exposes the system’s built-in preference for scale over sustainability

Down in Wisconsin, the USDA’s Economic Research Service has been crunching the same numbers for years. Small herds — fewer than 100 cows — produce milk at $42 to $44 per hundredweight. Large herds — 2,000 cows and up — come in at $19 to $20.

That’s a $23 gap that no efficiency app, no robotic milker, and no “farm family tradition” can erase.

I was at a producer meeting in Madison when one co-op board member leaned back and said it plain: “Small dairies are emotionally important, but economically irrelevant.” Brutal. True. That’s the level of quiet truth people at the top already understand but never put in print.

And that’s the problem — your loss is their model.

Where the money actually goes

Let’s put real numbers to this thing.

A 250-cow dairy feeding 50 pounds per head per day spends roughly 0,000 a year on feed, per USDA feed cost indices. Feed companies take 8–12% margins on that. That’s $175,000 to $240,000 every three years transferred out of your pocket before you even pay labor.

Add the bank. The Farm Credit System’s nationwide reports list operating and mortgage interest averaging around 6.8%. On a $900,000 land note and a $300,000 operating loan, that’s about $85,000 a year in interest.

Then your co-op or processor adds another chunk. According to Rabobank’s 2025 Dairy Outlook, most processors net around $3.50 per hundredweight after hauling and processing — that’s $575,000 from your production.

A 250-cow dairy operation sends $1.27 million annually to feed companies, processors, banks, and consultants before the farmer pays for labor or takes home a single dollar—revealing the extraction system that profits from farm losses

So the next time someone says, “You just need to manage costs better,” tell them your losses financed someone else’s record quarter.

An accountant friend of mine told me over lunch, “For every dollar a farm burns in equity, someone up the chain makes six.” That right there should stop the room cold.

Starting with $1,000 in milk value, farmers watch $573 get extracted by feed companies, banks, processors, and consultants—keeping only $427 while upstream stakeholders profit $6 for every $1 of farm equity burned

The organic trap: paying to play

Here’s another shiny “fix” that just doesn’t add up.

Per the USDA’s National Organic Program, converting a farm means running the land chemical-free for 36 months, and feeding cattle organic rations for 12 months before certification. According to Cornell’s 2024 Organic Dairy Cost study, feed costs jump 30–40%, while tank weights drop 8%.

That’s an extra $180,000 in feed, $10,000 in certifications, and about $40,000 in lost yield a year before you even cash a single “organic premium” check.

Dan Richter, milking 220 cows out in Cashton, said it best: “We made it to certification, but we were broke before the first organic load hit the plant.” He’s not alone — Cornell data shows two-thirds of organic transitions never reach sustainable profitability.

What strikes me most? The programs keep rolling anyway. Because suppliers, certifiers, and consultants still make their margin, no matter what happens to the farm.

Equipment-sharing: good on paper, chaos in practice

You hear it at winter extension meetings — “Form an equipment co-op, cut your costs!”

But University of Minnesota Extension found that those shared projects shave about 10% off upfront ownership costs, while downtime climbs 20% and repair expenses eat another 7%.

A producer from Viroqua told me, “We spent more time arguing over whose turn it was to use the chopper than actually chopping.”

And look, that’s not laziness. That’s just how weather and manure work. You can’t partition urgency. The only folks winning from that plan are the sales reps who sold the machinery in the first place.

Component bonuses: chasing nickels, losing dollars

Processors love to brag about “protein incentives.” USDA Dairy Market News says the average premium sits around $1.25 per hundredweight.

The trouble is… that extra protein costs money. Cornell dairy nutritionists peg the annual ration bump at roughly $75,000, plus $15,000 for consultant fees and testing programs.

Best case — you net maybe $20,000.

Meanwhile, processors get exactly what they want — uniform, high-solids milk without buying a pound of extra grain.

Like one New York nutritionist told me quietly at a conference this year: “Protein bonuses aren’t a windfall. They’re a management leash.”

Co-ops: from shields to siphons

People forget the history — co-ops were started to protect producers from predatory processors. But the GAO’s 2024 Cooperative Governance Report revealed that 78% of major U.S. co-ops now use milk-volume voting.

One member equals one vote? Not anymore. It’s cubic tons of milk per vote now.

A 300-cow operator from Brookings County told me, “My co-op makes more on hauling my milk than I make milking the cows.” The sad thing? That’s not hyperbole.

Even the GAO data shows that cooperative processing divisions now generate more operational profit than they do from member payments. Somewhere along the line, the idea of “member-first” flipped to “margin-first.”

The big picture — and it’s not pretty

The USDA’s Agricultural Projections to 2034 project the U.S. will have 12,000–15,000 dairies left by 2030. We’re sitting around 26,000 now.

By 2034, the U.S. will lose 54% of its remaining dairy farms while six processors will control 82% of milk flow and five Holstein sires will dominate 82% of genetics—a consolidation designed to extract, not sustain

Rabobank’s forecast says six processors will control 80% of total U.S. milk flow, while the Council on Dairy Cattle Breeding (2025) reports five Holstein sires now sire 82% of all replacements.

Think about that — market and genetics bottlenecked into half a dozen corporate hands.

And what happens locally? UW–Madison economists calculated that each 100-cow farm loss strips $500,000 from regional rural economies — vet clinics, feed stores, mechanics, and local schools. Drive from Antigo to Arcadia this fall, and you’ll see them: boarded barns, “auction today” signs, and co-ops consolidating routes that used to serve three farms per mile.

That’s not bad luck. That’s a business plan.

“Just one more year…”

You can tell when somebody’s gone from hopeful to cornered — they start saying it. “If we can just make it one more year.”

You know who wants you to “hang on”? The people who profit from delay: bankers, feed mills, processors. Tom Greene calls it “equity farming for other people.”

Every year, small dairies run at a loss, but the rest of the chain keeps cashing checks on time.

That’s the hidden cost of loyalty — the longer you stay, the more they gain.

What you can actually do about it

This part matters because nobody else is going to say it straight.

  1. Call your accountant, not your lender. The bank lives on time. The accountant lives on truth. Ask them to run your net after unpaid family labor and true depreciation.
  2. Get a land appraisal. The American Society of Farm Managers and Rural Appraisers says Midwest farmland finally plateaued in 2025 after years of inflation. If you’re considering an exit, waiting means losing margin.
  3. Run two lists. Stay and lose $100K in equity per year. Exit, keep $2.5 million clean. Math doesn’t lie — it just hurts.
  4. Make the family meeting happen. Don’t wait until the next refinance or co-op contract cycle. This isn’t quitting; it’s protecting what generations built.

If that sounds heavy, that’s because it is. But so is the weight of hope that never pays off.

The inconvenient truth

The real betrayal here isn’t that the system failed small dairy. It’s that it pretended to save it while quietly making money off every stage of its decline.

This whole setup isn’t chaos — it’s choreography. And it plays out just as designed: the smaller farms provide the illusion of diversity, the mid-tier keeps the supply chain full, and the megas consolidate control.

So tomorrow morning, when you’re tightening hoses or scraping the feed alley, stop and look at your milk check before you start another year of “hanging on.” Ask yourself:

“If everyone else is making money off my losses, how long am I willing to play the game?”

Because the truth is — this system isn’t failing. It’s succeeding exactly the way it was designed to. And that’s the part nobody in a suit will ever say out loud.

KEY TAKEAWAYS

  • The dairy system isn’t “broken” — it’s performing exactly as designed. Farmers lose; everyone else wins.
  • The economics are brutal: small farms spend twice what megas do to produce the same milk. Passion doesn’t pay bills.
  • Every so‑called “solution” — co‑ops, consultants, organic programs — is just a polite way to harvest your last dollars.
  • For every dollar of farm equity burned, six show up elsewhere — in feed, finance, or processing profits.
  • The smartest play isn’t hope. It’s strategy: scale, specialize, or sell before the system cashes you out.

EXECUTIVE SUMMARY

The small dairy crisis isn’t some tragic accident — it’s the business model. The USDA’s data shows that small farms make milk for $44/cwt, while megas do it for $20. That’s not competition; that’s a setup. Meanwhile, every “solution” — organic transitions, efficiency programs, co-op loyalty — just keeps you milking long enough for everyone else to get paid. Cornell, Rabobank, and GAO reports show how feed dealers, banks, and processors profit from your losses. For every dollar of farm equity burned, six appear upstream. The system isn’t failing; it’s extracting. So if you’re still hanging on, here’s the real math: scale up, specialize, or get out while there’s still something left to save.

Complete references and supporting documentation are available upon request by contacting the editorial team at editor@thebullvine.com.

Learn More:

The Sunday Read Dairy Professionals Don’t Skip.

Every week, thousands of producers, breeders, and industry insiders open Bullvine Weekly for genetics insights, market shifts, and profit strategies they won’t find anywhere else. One email. Five minutes. Smarter decisions all week.
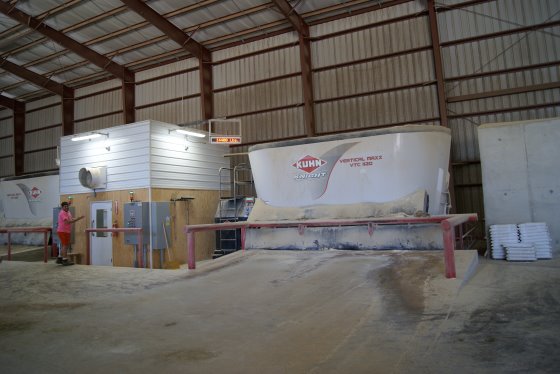
NewsSubscribe
First
Last
Consent

Your Dairy’s 24-Month Countdown: Act Now or Lose $450,000 in Family Wealth

Every Monday you delay, you pay $17,500. Every month: $75,000. Your dairy’s 24-month survival plan starts with three decisions.

Executive Summary: Your dairy has 24 months of equity left, and the decision you make this month will determine whether you preserve $700,000 or exit with $250,000. This crisis differs from all others—China’s self-sufficiency, $11 billion in U.S. processing overcapacity, and the worst heifer shortage since 1978 have created a structural transformation that milk price recovery won’t solve. The math is clear: farms that act now can cut monthly losses from $25,000 to $8,000 through targeted culling, feed optimization, and strategic repositioning, while those waiting 6 months lose $450,000 in family wealth. Success requires three time-bound decisions: immediate liquidity management (30 days), strategic recovery positioning (90 days), and viability determination (180 days). The projected loss of 5,000 U.S. dairy farms by 2028 won’t be random—it will precisely separate those who recognized time as their scarcest resource from those who waited for markets to save them.

dairy survival strategy

I recently spoke with a producer in central Wisconsin who summed up the current situation perfectly: “Everyone’s watching milk prices, but what’s actually keeping me up at night is whether I have the equity to make it to when prices recover.” You know, with CME Class III futures hovering around /cwt for Q1 2026 and feed costs finally moderating with corn near .24/bu according to USDA’s latest reports, you might think we’d all be breathing easier. But conversations across the dairy belt—from Pennsylvania tie-stalls to Texas freestalls—they’re revealing something different.

Here’s what I’ve found after running through financial scenarios with extension folks and reviewing real farm numbers: a representative 500-cow dairy with 0,000 in equity has about 24 months of runway at current burn rates. And the thing that really caught my attention? The difference between taking action now versus waiting six months could preserve roughly $450,000 in family wealth. That’s not speculation—it’s what the math consistently shows when you model different timing scenarios.

The $450,000 Decision Window: Every month you delay action costs roughly $75,000 in family wealth. This isn’t speculation—it’s what the math shows when you model a representative 500-cow dairy burning $25,000 monthly versus taking immediate action to cut losses to $8,000

Understanding the Convergence of Market Forces

Having tracked these cycles since the late ’90s, this downturn feels different. It’s not just one thing we can monitor and respond to—we’re seeing multiple structural shifts happening all at once.

The Perfect Storm Hitting U.S. Dairy Right Now: China’s near-total self-sufficiency killed the global growth story, $11 billion in new U.S. processing capacity needs milk nobody’s producing, and we’re facing the worst heifer shortage in 47 years. This isn’t a cycle you can wait out—it’s three permanent structural shifts happening simultaneously

Take China. Rabobank’s recent dairy quarterly indicates they’ve reached about 85% milk self-sufficiency, up from 70% five years ago. We’re talking about a fundamental policy shift toward food security, not a temporary market adjustment. When StoneX analysts discuss how that Chinese import growth story—the one that fueled global expansion for over a decade—is essentially done, they’re describing a permanent change in how global dairy works.

Meanwhile, and the timing couldn’t be worse, the U.S. processing sector has committed somewhere between $8 and $ 11 billion in new capacity, according to what IDFA’s been tracking. Projects across nearly 20 states, from new cheese plants in Texas to expanded drying capacity up in the Upper Midwest. These facilities will need roughly 7-8 billion pounds of additional milk annually when fully operational by mid-2026.

But here’s what really concerns me: the availability of replacement heifers. USDA’s latest cattle inventory shows we’re at 4.38 million head—the lowest since 1978. The National Association of Animal Breeders reports beef semen sales to dairy farms hit 7.9 million units in 2024, up 58% from 2020. Conventional dairy semen? Down to 6.7 million units. These aren’t just statistics… they represent breeding decisions that’ll constrain expansion capacity for the next 24-36 months.

You know what’s interesting about this cycle? The moderate feed costs—corn at $4.24/bu and alfalfa at $222/ton—are actually extending the adjustment period. Back in 2009, when corn hit $6-7/bu, we saw rapid culling and supply correction. Today’s manageable feed costs let farms sustain negative margins longer. Sounds beneficial, right? Until you consider that it delays the market from rebalancing.

The Economics of Scale: A Widening Divide

MetricLarge Farms (2,500+ cows)Family Farms (500 cows)The Gap
Production Cost per cwt$15.50 – $17.50$19.00 – $21.00$3.50/cwt
Labor Productivity300 cows/worker60 cows/worker240 cows/worker
Labor Cost ImpactBaseline+$1.50 – $2.00/cwt$1.75/cwt
Feed Procurement Advantage15-25% volume discountTruckload pricing$0.50/cwt
Capital Cost per Cow$4,800 – $6,000$7,000 – $9,000$2,500/cow
Transportation Cost$0.35/cwt (concentrated regions)Up to $0.53/cwt$0.18/cwt
Total Structural DisadvantageBaseline+$3.50/cwt$3.50/cwt

The structural cost advantages larger dairies have reached levels that fundamentally change competitive dynamics. Research from Cornell’s ag economics folks and similar extension programs consistently shows that farms with 2,500+ cows achieve production costs of $15.50-17.50/cwt. Meanwhile, 500-cow dairies face costs of $19-21/cwt based on Penn State Extension benchmarking.

And this isn’t about management quality or work ethic—we all work hard. It’s a mathematical reality. Labor productivity data from Michigan State Extension reveal that large farms are achieving ratios exceeding 300 cows per full-time employee through strategic automation and role specialization. Family operations? We’re typically managing 60 cows per worker despite those 70-hour workweeks we all know too well. At prevailing wage rates, that creates a $1.50-2.00/cwt structural disadvantage.

Feed procurement tells a similar story. Farms purchasing railcar volumes access pricing 15-25% below truckload rates—that’s coming from Wisconsin’s dairy profitability analysis. Given that feed accounts for 50-55% of operating costs across multiple university studies, this differential significantly affects competitiveness.

The capital efficiency gap might be the toughest pill to swallow. A 2,500-cow facility requires an investment of about $12-15 million (works out to $4,800-6,000 per cow). A 500-cow operation? That’s $3.5-4.5 million, but $7,000-9,000 per cow. That permanent efficiency differential compounds over time, especially during extended margin pressure like we’re seeing now.

Regional Dynamics: Where Geography Shapes Destiny

Location has become increasingly determinative of dairy viability. Federal Order data reveals growing disparities that we really need to consider carefully.

Pacific Northwest producers—I really feel for these folks—face particularly challenging economics. Milk hauling costs average $0.53/cwt compared to under $0.35/cwt in concentrated production regions. Combined with cooperative assessments and processing distances, a 500-cow dairy in Washington or Oregon starts each month with a $45,000-50,000 disadvantage relative to competitors in more favorable locations.

California presents different but equally significant challenges. Environmental compliance costs producers are reporting range from $35,000 to $40,000 annually—that translates to $0.35-0.40/cwt. During drought years when water allocations drop 50% and you’re buying on the spot market, UC Davis studies indicate additional costs of $0.30-0.50/cwt.

Now contrast that with the Texas Panhandle, which has emerged as this processing hub. Industry estimates suggest the Amarillo region handles over 1,000 milk tanker loads daily within a 300-mile radius. With five major facilities operational by 2026, competitive procurement dynamics actually support local prices while other regions experience discounts.

Southeast producers navigate their own unique challenges—humidity-driven mastitis pressure and heat-stress management costs Northern operations avoid. Yet proximity to metros such as Atlanta and Charlotte creates premium market opportunities that can offset some of the structural disadvantages for entrepreneurial farms.

The Beef-on-Dairy Calculation: Opportunity and Risk

The Beef-on-Dairy Trap: That $280K in extra revenue today? It’ll cost you $406K when you need replacements in 2027. Farms that maximized beef breeding for survival are trading their ability to expand during recovery. The math shows you’re borrowing from your future self—at a terrible interest rate

A fascinating development I’ve observed across multiple regions is how beef-on-dairy transformed from supplemental income to a survival strategy. Some farms report beef-cross calf sales now representing 40-50% of total revenue. With crossbred calves bringing $1,400-1,600 versus $100-200 for dairy bulls according to USDA market reports, a 500-cow dairy breeding half its herd to beef generates an additional $270,000-290,000 annually.

CoBank’s analysis, led by economists including Tanner Ehmke, projects that we’ll face an 800,000-head shortage of replacement heifers during 2025-2026. It reflects breeding decisions made when beef prices peaked and producers—understandably—prioritized immediate cash flow over future replacement needs.

University of Wisconsin dairy economists analyzing optimal breeding strategies suggest maintaining about 50% as the maximum sustainable beef breeding percentage. Farms exceeding this threshold—some reached 60-70% when beef prices peaked—essentially traded current survival for future growth capacity. When margins recover, these farms face either purchasing replacements at projected prices of $3,000-3,500 or foregoing expansion opportunities entirely.

The timing mismatch creates particular challenges. Breeding decisions made today determine replacement availability in 24-28 months, yet milk price recovery and heifer availability peaks likely won’t align. Farms that maximized beef revenue may survive the immediate crisis but will be unable to capitalize on the recovery.

The Compound Effect of Delayed Decisions

Your 24-Month Equity Countdown: Three Paths, One Choice. Farms taking immediate action preserve $658K in equity versus $250K for those doing nothing—a $408K difference determined solely by when you act, not market conditions

Through financial modeling using Farm Credit benchmarks and extension tools, a clear pattern emerges about timing’s impact on outcomes. Consider a representative 500-cow Wisconsin dairy with $850,000 in equity, losing $25,000 per month.

Immediate action—culling the bottom 20% based on income over feed cost metrics—generates approximately $200,000 at current cull cow values of $145-157/cwt while reducing monthly feed costs. Ration optimization to achieve $5.00 versus $6.20 per cow daily, following established nutritional guidelines, saves roughly $16,500 monthly. Combined, these actions reduce monthly losses from $25,000 to maybe $8,000-10,000.

After 24 months, early action preserves $650,000-700,000 in equity. That maintains strategic flexibility for expansion, transition to premium markets, or orderly exit if necessary.

But contrast this with delaying these decisions for six months. The farm burns an additional $150,000 in equity while waiting. Lender confidence erodes as equity ratios decline from 55% to 45%. Credit lines face restrictions. By month 24, the remaining equity of $250,000-$350,000 limits options to a distressed sale or continued deterioration.

That $400,000-450,000 difference? It represents the preservation or destruction of generational wealth, determined solely by the timing of actions.

Monitoring Recovery Signals

While I anticipate a 24-36-month adjustment period based on current fundamentals, several indicators could accelerate the recovery. Systematic monitoring helps separate noise from meaningful trends.

Global Dairy Trade auctions provide a 60-90-day forward indication of U.S. price direction, according to university dairy market research. Recent auctions have shown consecutive declines, but three consecutive stable or rising auctions would suggest the market is bottoming. Single auction movements shouldn’t drive decisions, though—trend confirmation matters.

Rationalizing processing capacity would meaningfully affect timing. Should 2-3 facilities announce closures or extended maintenance by Q2 2026, oversupply dynamics could improve faster than baseline projections. Though given the debt loads these facilities carry, continued operation at reduced utilization seems more probable than closure.

Monthly USDA production reports revealing 2%+ year-over-year declines for consecutive months would signal accelerating supply discipline. Combined with heifer shortages, this could create temporary market tightness.

Feed cost dynamics remain a wildcard. Should corn exceed $5.50/bu for 90+ days, forced culling similar to 2009 could compress the adjustment period to 12-18 months. Climate volatility suggests perhaps a 30-40% probability of significant Corn Belt production challenges within 18 months.

Given these signals, here’s how to position your operation for what’s ahead.

Three Strategic Imperatives for Every Operation

Based on extensive analysis and what I’m seeing in the field, every dairy faces three critical decision points over the coming months. Let me walk you through each one, starting with what needs attention immediately.

Decision One: Immediate Liquidity Management (Next 30 Days)

Successful navigation requires generating measurable cash flow improvement within 30 days. And that means confronting difficult culling decisions based on economic metrics rather than sentiment. Cornell Pro-Dairy benchmarks indicate that cows generating under $5 in daily income over feed cost incur ongoing losses regardless of other attributes.

Here’s what I’d tackle this week: Start by pulling DHIA records and ranking every cow by IOFC. Bottom 20% should be evaluated for immediate culling. Yes, it’s hard to cull that fresh heifer who’s just not performing, but keeping her costs you $150-200 monthly.

Comprehensive cost analysis typically identifies $30,000-50,000 in achievable annual savings through systematic review of all inputs and practices. Whether it’s adjusting mineral programs, renegotiating service contracts, or optimizing breeding protocols—the specific opportunities matter less than systematic identification and capture.

Proactive lender engagement before scheduled reviews demonstrates management capability and preserves relationship quality. The distinction between being viewed as proactive versus reactive often determines credit availability during challenging periods.

Decision Two: Strategic Recovery Positioning (Next 90 Days)

Forward-thinking farms must balance current survival with future opportunity. Breeding strategies warrant immediate adjustment—modeling suggests approximately 45% beef, 50% sexed dairy, and 5% conventional optimally balances current revenue with future replacement needs.

Geographic competitive position requires an honest assessment. Farms facing structural location-based disadvantages of $1.50+/cwt must consider whether operational excellence can overcome permanent cost disparities or if strategic alternatives warrant exploration.

Establishing specific, measurable decision criteria removes emotion from critical choices. Clear thresholds—”If Class III futures for Q3 2026 remain below $17.50 by March, we initiate transition planning”—enable rational rather than reactive decision-making.

Decision Three: Long-term Viability Determination (Next 180 Days)

Within six months, a fundamental strategic direction must be established. Well-positioned farms with adequate equity and replacement capacity should prepare for aggressive expansion during recovery. The 2027-2028 period may offer exceptional growth opportunities for prepared operations.

Dairies near metropolitan markets should seriously evaluate premium market transitions. USDA data confirms organic, A2, grass-fed, and direct marketing can deliver $7-12/cwt premiums that fundamentally alter economic equations. While requiring different skill sets, these models may offer superior risk-adjusted returns.

For farms where mathematics indicate strategic exit preserves maximum family wealth, timing remains critical. The difference between planned transition preserving $700,000 and forced liquidation at $200,000 determines whether next-generation education, career transitions, and retirement security remain achievable.

Practical Monitoring Framework

Successful farms systematically track key metrics. Here’s the dashboard I’m recommending producers review weekly:

Weekly Indicators:

  • Equity burn rate relative to total equity (are you on track with projections?)
  • CME Class III futures curves (watching for sustained moves above $17)
  • Feed cost per cow per day (work with your nutritionist to optimize)

Bi-Weekly Reviews:

  • Global Dairy Trade trends at GlobalDairyTrade.info
  • Local replacement heifer pricing trends
  • Regional basis (your mailbox price versus CME benchmark)

Monthly Analysis:

  • Months remaining until 40% equity threshold
  • USDA milk production reports for supply signals
  • Lender relationship temperature check

Additionally, reviewing Dairy Margin Coverage options (even with elevated premiums), forward contracting above breakeven, maintaining sub-70% working capital utilization per Farm Credit guidelines, and preserving capital through lease-versus-purchase decisions warrant immediate attention.

The Path Forward

After extensive analysis and countless producer conversations, one conclusion emerges consistently. Farms that thrive in 2028 won’t be those that perfectly predicted market timing or price bottoms. They’ll be those that recognized in November 2025 that strategic flexibility remained available, understood that monthly delay costs approximately $75,000 in option value, and made difficult decisions while maintaining equity and credit access.

The U.S. dairy industry will emerge smaller and more concentrated—projections suggest declining from about 33,000 to under 28,000 farms by 2028. Whether your operation participates in that future depends not on milk prices but on acting while meaningful choices remain. Agricultural economists consistently observe that survival often depends less on scale or luck than on the gap between when action was needed and when it was taken. That gap remains bridgeable today, but the window is continuing to narrow.

Look, these conversations—with family, lenders, advisors—they’re never easy. Yet the math remains indifferent to our discomfort, and time continues regardless of readiness. For many of us, the greatest challenge isn’t financial analysis or strategic planning but accepting that wealth preservation may require departing from generational patterns. Observing hundreds of transitions has taught me that strategic repositioning carries no shame—only waiting until strategy becomes desperation. The next 24 months will reshape American dairying more significantly than any period since the 1980s. Success isn’t about fighting this transformation—it’s about positioning yourself appropriately within it. And that positioning needs to begin immediately, not when market signals provide comfort.

Time really has become our scarcest resource in this industry. Those who recognize and act on this reality will determine not just their own futures, but the structure of American dairying for the next generation.

Key Takeaways:

  • Your burn rate reality: You’re losing $25,000/month with 24 months of equity left—but immediate action cuts this to $8,000/month
  • The six-month wealth gap: Act now = preserve $700,000 in family equity. Wait until spring = forced exit at $250,000
  • This week’s three moves: 1) Rank every cow by income over feed cost, 2) Cull the bottom 20%, 3) Call your banker before they call you
  • Decision deadlines that matter: 30 days (stop the bleeding), 90 days (position for recovery), 180 days (commit to expand or exit)
  • Why waiting won’t work: China’s self-sufficient + we overbuilt processing by $11 billion + worst heifer shortage since 1978 = permanent change, not temporary cycle

Complete references and supporting documentation are available upon request by contacting the editorial team at editor@thebullvine.com.

Learn More:

The Sunday Read Dairy Professionals Don’t Skip.

Every week, thousands of producers, breeders, and industry insiders open Bullvine Weekly for genetics insights, market shifts, and profit strategies they won’t find anywhere else. One email. Five minutes. Smarter decisions all week.
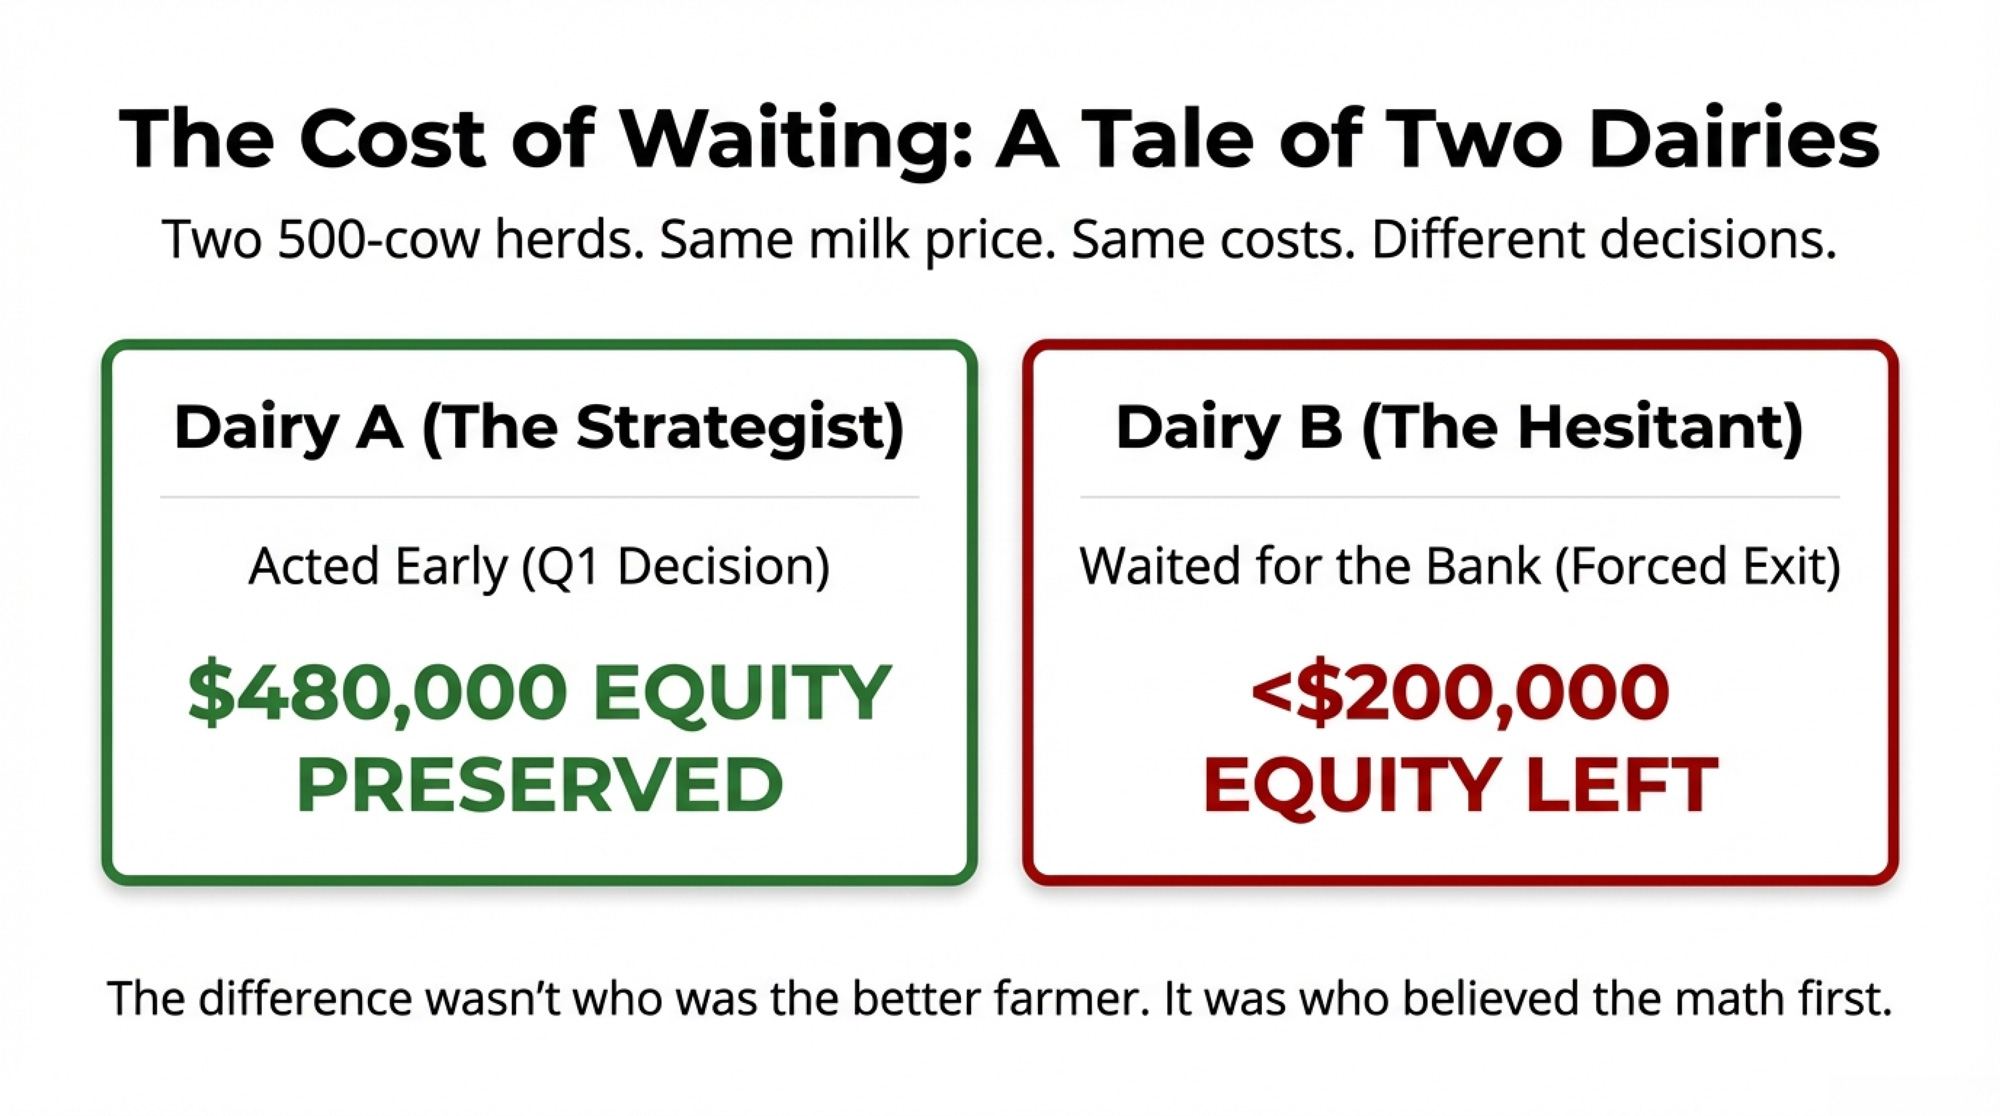
NewsSubscribe
First
Last
Consent

New Zealand Hit Record Production and Started Paying Down Debt – Here’s the $1.7 Billion Signal You’re Missing

When the lowest-cost producer starts hoarding cash, what should you be doing?

EXECUTIVE SUMMARY: What farmers are discovering about New Zealand’s record September production—228,839kg of milk solids, up 3.4%—reveals something crucial about the next commodity cycle. Despite Fonterra paying out $16 billion in returns (30% above last year), Reserve Bank data shows their farmers just paid down $1.7 billion in debt over six months rather than expanding. This disconnect between production strength and conservative positioning mirrors patterns from 2014, right before the last major downturn that saw prices crash to NZ$3.90/kgMS for 18 months. China’s Three-Year Action Plan for cheese production, combined with their historical pattern of cutting WMP imports by 240,000 metric tons once domestic capacity matured, suggests the 2027-2030 period could see similar disruption in cheese markets. Smart operators are already adjusting—Federal Reserve data shows U.S. dairy borrowing remains flat despite strong cash flows, while processors with 70% of milk under long-term contracts are reporting better stability than spot-market dependent operations. Here’s what this means for your operation: the window for strengthening balance sheets and securing stable contracts is open now, but it won’t stay that way past 2026.

You know that feeling when something’s just… off? Milk production’s strong, the neighbor’s adding another barn, equipment dealers can’t keep anything in stock. But there’s this nagging sense that these “good times” are different. I think what’s happening in New Zealand right now might help explain why so many of us are feeling cautious.

So here’s what caught my attention: DairyNZ’s latest production statistics show New Zealand just hit their highest September milk collection on record—228,839 kilograms of milk solids. That’s up 3.4% from last year. And Fonterra announced in their FY25 results that total cash returns to shareholders are approaching sixteen billion dollars, which is roughly 30% more than the previous year.

But—and this is the part that makes you think—Global Dairy Trade auction prices have been sliding for three straight months. The October 7th auction settled at $3,921 per tonne. When production’s surging but prices are softening? That tells you something.

Record production colliding with softening prices—the market signal smart operators aren’t ignoring

Why New Zealand Can’t Actually Choose What They Produce

Here’s what I’ve found most producers outside Oceania don’t really grasp about New Zealand’s system. According to DairyNZ’s seasonal production data, about 84% of their entire national herd calves within a three-month window—August through October. Think about that for a second. Nearly every cow in the country freshening at the same time.

During their spring flush—that’s October through December down there—they’re pushing roughly 60-65% of their entire annual milk volume through processing plants in just three months. Fonterra’s milk collection data shows their plants hit 95% utilization during peak. That’s not efficiency, folks. That’s desperation.

When 84% of your national herd calves in 3 months, you don’t choose what to produce—you spray dry whatever doesn’t fit in the tank

You know what happens then? Industry processing reports show they’re running spray dryers flat out just to keep milk from backing up on farms. According to the Dairy Processing Handbook from Tetra Pak, modern spray dryers typically process 10-15 metric tons per hour, and during New Zealand’s flush, these things run continuously. Day and night.

This is why—and here’s what’s really telling—whole milk powder still represents about 40% of New Zealand’s dairy exports according to USDA’s Foreign Agricultural Service analysis. It’s not because they want to make powder. It’s because when that wall of milk hits, you either spray dry it or dump it. There’s no third option.

For those of us running year-round calving systems, this might seem crazy. But it’s actually both their biggest advantage and their Achilles heel, depending on how you look at it.

New Zealand’s grass-based system delivers the world’s lowest production costs—but that advantage is eroding as climate forces adaptation

China’s Playing the Long Game (Again)

What’s happening with China’s import patterns is fascinating—and honestly, a bit concerning. USDA’s Beijing office analyzed China Customs data and found cheese imports are up over 22% while skim milk powder imports jumped 26%. But whole milk powder? Still declining.

You probably remember what happened with WMP between 2010 and 2018, right? UN Comtrade data shows China kept importing massive volumes while quietly building their own production capacity. Then suddenly—boom—imports dropped from around 670,000 metric tons to 430,000 metric tons. Changed the whole global market.

Now they’re following the same playbook with cheese. China’s Ministry of Agriculture published this Three-Year Action Plan for cheese production development. Their western provinces are already incorporating cheese plants into those massive dairy clusters they’re building. Industry reports indicate China Modern Dairy is producing something like 3,300 tons of raw milk daily now. And get this—their cows are averaging over 13,000 kilograms of production. That’s right up there with good U.S. herds.

Looking at current construction activity tracked by the China Dairy Industry Association, most analysts expect modest import growth through maybe 2026, then watch for new “quality standards” that somehow favor domestic production. By 2027-2030? Well, cheese imports could follow the same path as powder—down 30-40% from peak. Though who knows, right? Economic conditions could speed this up or slow it down. And let’s not forget, precision fermentation and alternative proteins are starting to look more viable every year, though current costs suggest traditional dairy keeps its advantages for commodity uses through at least 2030.

China’s building massive cheese capacity right now—expect ‘quality standards’ that favor domestic production to hit by 2028, just like they did with WMP

Those “Profitable” Margins Tell a Different Story

DairyNZ’s Economic Survey shows New Zealand producers are looking at breakeven costs around NZ$8.66 per kilogram of milk solids. Fonterra’s announced farmgate price is NZ$10.16. So that’s about a NZ$1.34 spread—in our terms, they’re breaking even around $16.50 per hundredweight compared to the $24.55 it costs to produce milk in California according to CDFA’s May cost study.

Sounds pretty good, doesn’t it? But here’s what I find interesting: Reserve Bank of New Zealand data shows farmers just paid down NZ$1.7 billion in debt in six months through March 2025. That’s not expansion behavior. That’s battening down the hatches.

They remember 2015-16. Fonterra’s historical pricing data shows milk prices crashed to NZ$3.90 per kilogram and stayed there for 18 months. A lot of good operators went under during that stretch.

Iowa State research proves it: debt reduction gives you twice the resilience of expansion at cycle peaks—NZ farmers clearly remember 2015

And now you’ve got climate issues on top of everything else. Federated Farmers officials have been calling recent droughts in Waikato and Taranaki some of the worst in decades. When you’re forced to dry cows off early, or you’re taking 20-30% discounts on spot milk because plants can’t handle your flush volumes… suddenly that cost advantage doesn’t look so solid.

University of Melbourne’s Dairy Futures research projects profitability could drop 10-30% by 2040 without successful climate adaptation. But here’s the catch—every adaptation measure costs money and changes your cost structure. Several Canterbury producers I’ve heard speak at field days who invested in irrigation say the same thing: “It saved our production during the drought, but we’re not a low-cost operation anymore.”

Why Farmers Vote for Cash, Not Strategy

This is where cooperative governance gets really interesting. Industry analysis from Rabobank and others suggests Fonterra needs hundreds of millions in capital investment for specialty protein infrastructure if they want to stay competitive as markets evolve.

But when Fonterra put their Flexible Shareholding structure to a vote in December 2021, you know what happened? Official voting results showed 85.16% approval with over 82% turnout—for a proposal that REDUCED capital requirements from one share per kilogram of milk solids to one share per three kilograms. Farmers overwhelmingly voted for more financial flexibility, not strategic investment.

And honestly? I can’t blame them. If you’re running 500 cows and a 50-cent payout increase means $85,000 in your pocket this year, that’s real money. You can pay down debt, fix that mixer wagon that’s been limping along, help your kid with college. Voting to fund some protein plant that might help in eight years—assuming China doesn’t build their own first—that’s a much tougher sell.

What farmers are finding is that democratic governance, while it protects individual interests, can really limit strategic flexibility. And it’s not just Fonterra—I’ve seen the same tensions in cooperatives here in the States.

Climate’s Changing Everything

You know, the relationship between climate and production systems is getting more complicated every year. New Zealand’s whole model depends on predictable pasture growth synchronized with their seasonal calving. Research published in Agricultural Systems shows those patterns are becoming way less reliable.

Every adaptation has trade-offs. Install irrigation? There goes your low-cost advantage. Switch to split calving? Now you need more stored feed. Build bunker silos for drought reserves? Suddenly you’re looking at cost structures closer to what we have here.

I was talking with a Missouri producer at a grazing conference who’s using New Zealand-style rotational grazing on 650 cows. He made a great point: “Their system works perfectly in their climate. But when spring shows up three weeks late—or sometimes not at all—you understand why we do things differently here.”

Another producer from the Northeast who’s running managed intensive grazing on 400 cows added something interesting: “We took the best parts from New Zealand—the paddock system, focusing on grass quality—but adapted it for our reality. Sometimes that means feeding stored forage for five months instead of two. Our butterfat stays strong at 4.0-4.2%, but we’re definitely not low-cost anymore.”

This suggests to me that climate adaptation is forcing everyone’s costs to converge, which could erode New Zealand’s traditional advantage faster than people realize.

What Smart Operators Are Actually Doing

It’s interesting watching what experienced producers are doing versus what they’re saying. Federal Reserve ag lending data shows dairy borrowing is flat or declining across most mature markets despite strong cash flows. Farm Credit System quarterly reports suggest folks who survived 2015-16 are using this windfall to strengthen balance sheets, not build new facilities.

I know several producers who’ve shifted focus from volume to components. They don’t care if they ship 10% less milk if their butterfat hits 4.2% instead of 3.8%. The math just works better, especially when plants are at capacity.

According to the International Association of Milk Control Agencies, processors with 70% or more of their milk under long-term contracts report much better stability than those chasing spot markets. And something else I’m seeing—producer groups working together to secure whey protein extraction agreements. They’re thinking five years out, not five months.

What’s really telling is how the conversation has shifted. Five years ago, everyone was talking expansion and efficiency. Now? It’s all about flexibility and resilience.

Different Regions, Different Opportunities

Where you’re located really shapes your options. Upper Midwest producers, those new cheese plants—Hilmar’s operations in Texas and Kansas, plus others coming online—are creating massive whey streams according to Dairy Foods reporting. Smart producers are already talking to specialty protein processors about capturing that value.

Irish dairy operations have those same grass advantages as New Zealand but they’re closer to premium markets. Ornua’s annual report shows they hit €3.6 billion in revenues in 2024, proving grass-fed products can command serious premiums, especially here in the U.S. where consumers are willing to pay for that story.

Australian producers have their own advantage—they’re closer to Southeast Asian markets that are growing like crazy. Dairy Australia’s export data shows this proximity really matters for fresh products where New Zealand’s extra shipping time creates opportunities.

Here in the Northeast, as many of you know, being close to major cities provides fresh milk premiums that Western operations can’t touch. I heard a Pennsylvania producer at a recent conference say they’re getting $2.50 premiums for local, grass-fed milk going directly to retailers. That completely changes the economics.

And California? Several large operations are dedicating part of their herds to organic or specialty production for Bay Area markets. As one producer put it, “The premium’s worth it when you’re 150 miles from your customer instead of 7,000.”

Timing Is Everything

Looking at construction permits tracked by the China Dairy Industry Association and their published policy documents, domestic cheese production will probably hit serious scale around 2027-2028. Past cycles show market impacts usually show up 18-24 months after capacity comes online, so we’re looking at 2029-2030 as the potential turning point.

Though honestly? Global economic conditions could speed this up or slow it down. And precision fermentation or alternative proteins could throw a wrench in everything, though current costs suggest traditional dairy keeps its advantages for commodity uses through at least 2030.

If this follows previous patterns, we’ll probably see some softness in 2026 that everyone calls “temporary.” By 2027, it’ll be “challenging conditions.” By 2029-2030? That’s when everyone finally admits there’s structural oversupply.

Producers expanding aggressively right now might find themselves in trouble by decade’s end. But those building cash reserves? They could be in position to buy assets at pretty good discounts. As a Wisconsin ag lender specializing in dairy told me recently, “The farms that survived 2015 and bought their neighbor’s operation in 2017—those are the ones we want to work with today.”

What This Actually Means for Your Farm


Action Item
Investment/ActionAnnual Impact (500-cow)Risk ReductionTiming Window
Pay Down Debt (2:1)$2 debt reduction per $1 not expanded$15K-30K interest savingsResilience 2x vs expansionNOW (before 2026)
Lock 70% Milk Under ContractLong-term processor agreements$50K+ volatility reduction40% less revenue volatilityNOW (plants at capacity)
Optimize Butterfat (4.2% vs 3.8%)Genetics + feed management$30K-40K (10% less volume)Plant capacity independenceOngoing optimization
Secure Grass-Fed PremiumRegional positioning + certification$125K ($2.50/cwt premium)Metro market insulation2025-2026 (before oversupply)
Build 18-24mo Cash ReservesReserve fund accumulationSurvival in 18-mo downturn90%+ survival (vs 40%)Immediate (2027-30 risk)

When the world’s lowest-cost producer is pumping flat out despite softening prices, they’re not celebrating—they’re extracting value while they can. That massive payout Fonterra’s making? To me, that looks more like getting cash to farmers while it’s available, not permanent prosperity.

The practical stuff isn’t complicated, but man, it’s hard to execute when milk checks are good. Agricultural economists at Iowa State have shown that paying down debt gives you about twice the resilience compared to expansion investment when you’re at the top of the cycle. Lock in what you can—supply agreements, input contracts, customer relationships. Stability beats optimization when things get volatile.

Most importantly, focus on what you control. You can’t control Chinese policy or weather patterns. But you can control your debt level, your costs, your flexibility.

The Bottom Line

I recently toured a newer 2,000-cow facility in Wisconsin—beautiful operation with all the bells and whistles. Robotic milkers, genetics that would make anyone jealous, feed efficiency that pushes every boundary. The owner mentioned they’re breaking even around $18-19 per hundredweight, expecting to drive that down with volume.

What struck me was the contrast. New Zealand’s breaking even at $16.50 with minimal infrastructure and grass. Chinese cheese plants coming online will probably achieve competitive costs without shipping milk across oceans. Even Fonterra, with every advantage you could want, can’t pivot fast enough because of how their governance works.

The real question isn’t whether any of us can match New Zealand on cost—probably not, given the fundamental differences. The question is whether we’re positioned to survive when cost advantages matter less because everyone’s dealing with oversupply.

What I’ve learned over the years is that the best time to prepare for a downturn isn’t when prices crash. It’s when production records and big milk checks make everyone think the party will never end.

That disconnect between New Zealand’s record production and falling auction prices? That’s not a contradiction. That’s a signal, if you’re willing to see it.

A California dairyman who’s been through four cycles in 35 years said it best at a recent meeting: “The pattern never changes—just the products and countries involved. Right now feels like 2014, right before things got tough. We’re paying down every dollar of debt we can.”

The industry’s at an interesting crossroads. How we navigate the next few years depends on decisions we’re making right now, while things still feel good. So what makes sense for your operation, given what’s coming?

The clock’s ticking, as it always does in this business. But this time, if we’re paying attention to the right signals, we can see it coming.

KEY TAKEAWAYS:

  • Pay down $2 debt for every $1 you’d invest in expansion—Iowa State research shows debt reduction provides twice the resilience during downturns compared to growth investments made at cycle peaks, and with current rates, that could mean $15,000-30,000 annual savings on a typical 500-cow operation
  • Lock in 70% of your milk under contracts NOW—processors maintaining this threshold report 40% less revenue volatility than spot-dependent operations, and with Class III-IV spreads widening, that stability could be worth $50,000+ annually
  • Focus on butterfat optimization over volume growth—producers achieving 4.2% butterfat versus 3.8% are capturing an extra $0.25/cwt even with plants at capacity, translating to $30,000-40,000 for a 400-cow herd shipping 10% less volume
  • Position regionally for 2027-2030—Upper Midwest operations should secure whey protein agreements while new cheese plants create oversupply, Northeast producers can capture $2.50/cwt grass-fed premiums near metro markets, and Western operations need organic/specialty contracts before Chinese cheese capacity hits stride
  • Build 18-24 months of cash reserves—the 2015-16 crash lasted 18 months with many good operators going under, but those who survived bought neighboring operations at 40-60% discounts in 2017… and they’re the ones lenders want to work with today

Complete references and supporting documentation are available upon request by contacting the editorial team at editor@thebullvine.com.

Learn More:

The Sunday Read Dairy Professionals Don’t Skip.

Every week, thousands of producers, breeders, and industry insiders open Bullvine Weekly for genetics insights, market shifts, and profit strategies they won’t find anywhere else. One email. Five minutes. Smarter decisions all week.
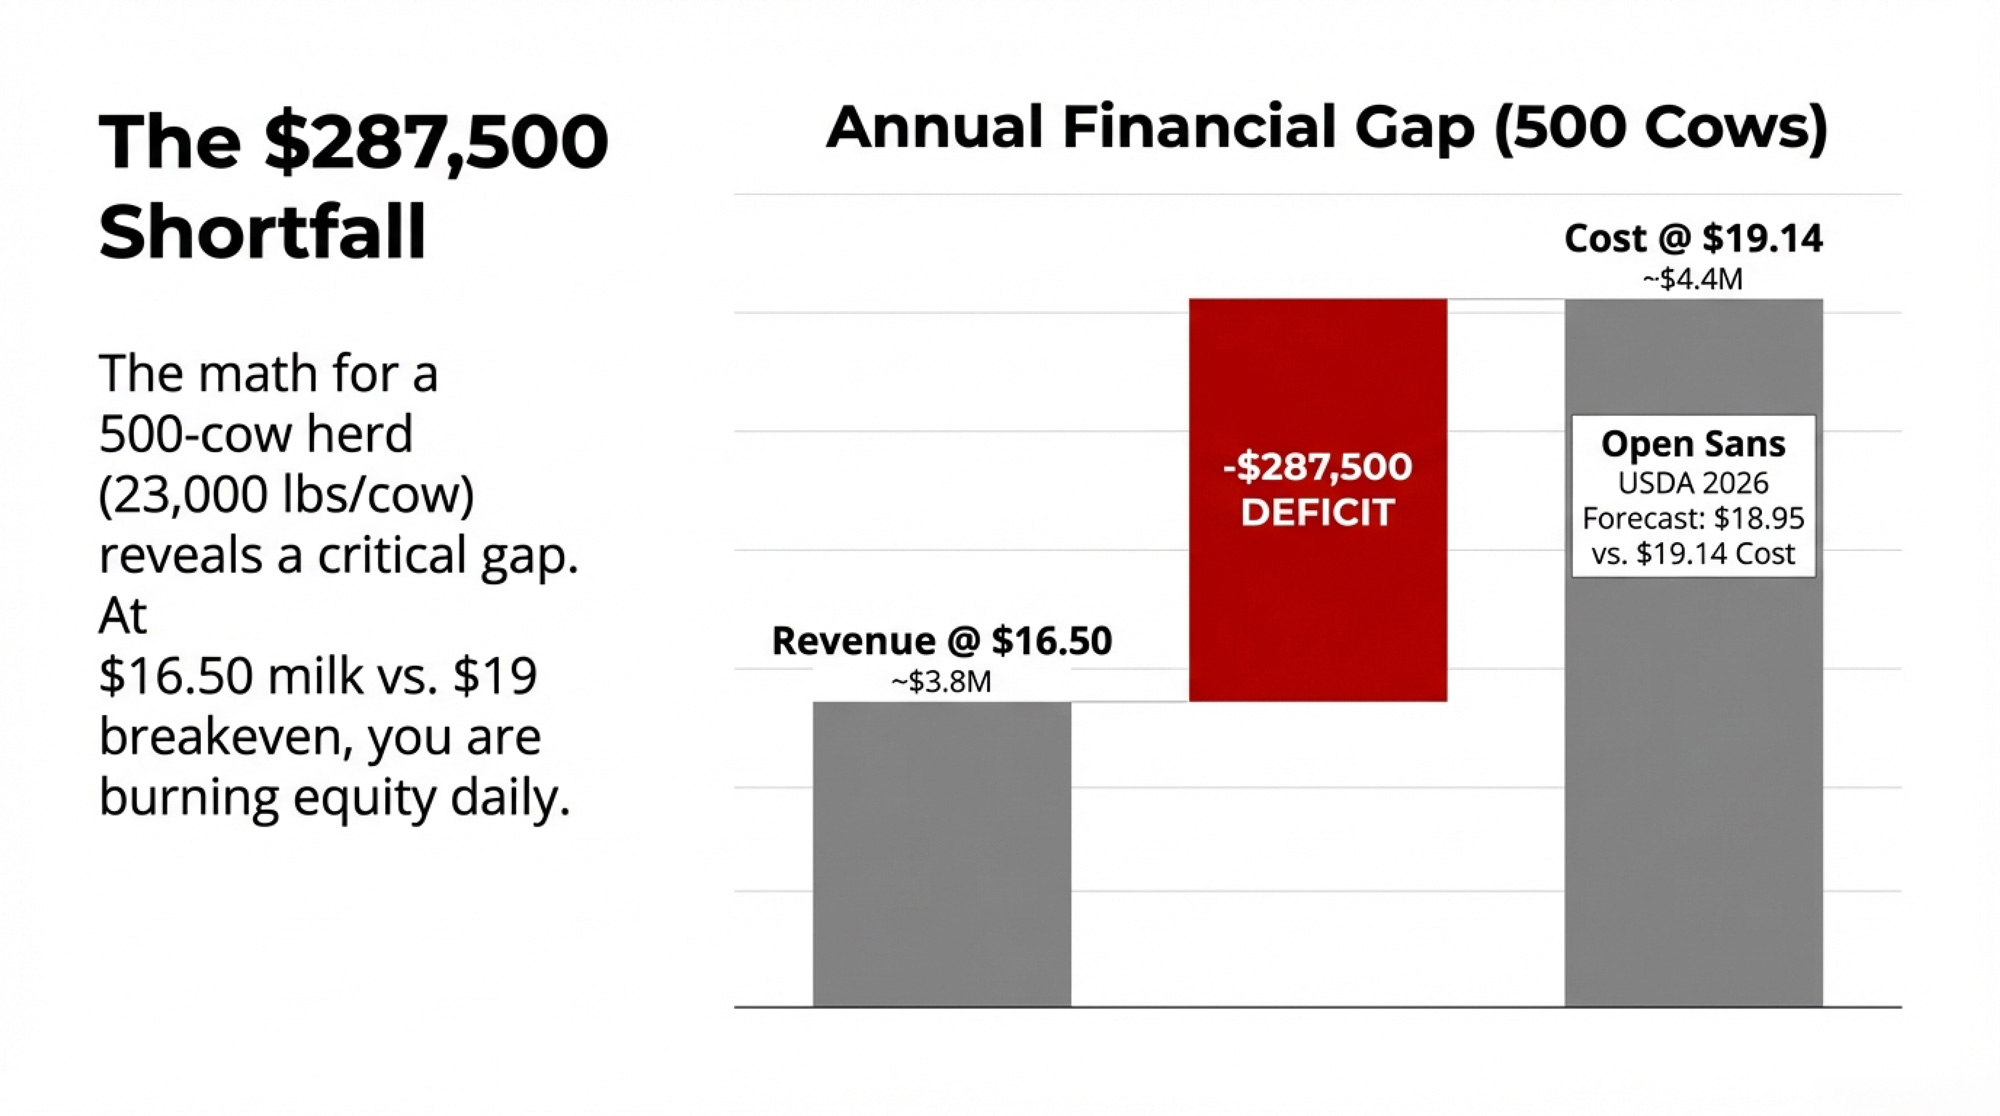
NewsSubscribe
First
Last
Consent

Why This $0.01 Ingredient Costs You $2.00: The Midland Farms Wake-Up Call

Half-cent DHA costs processors $0.01, but you pay $2 extra. Midland Farms just proved why that math no longer works.

EXECUTIVE SUMMARY: What farmers are discovering through the Midland Farms case is that functional milk pricing has been more about market positioning than production necessity. This 23-year-old family processor in upstate New York has just proven that they can deliver Cornell award-winning omega-3 fortified milk at conventional prices while maintaining profitability—something that challenges everything we’ve assumed about dairy economics. Recent Bureau of Labor Statistics data and industry cost analyses reveal that paid-off facilities enjoy advantages of 40 to 80 cents per hundredweight over newer operations, which explains how processors like Midland can fortify milk for half a penny per half-gallon, while others charge consumers premiums of $1.50 to $2.00. Extension specialists across Wisconsin, California, and other major dairy-producing states report that processors are quietly evaluating similar accessible-pricing strategies, with regional pilots likely to emerge by spring 2026. Here’s what this means for your operation: the 18- to 24-month window before major retailers launch functional private label at conventional prices represents both opportunity and urgency—opportunity if you’re positioned with the right processor relationships, and urgency if you’re still relying on premium pricing for basic fortification. The trajectory seems clear, but farmers who recognize these dynamics early and adapt their strategies—whether through volume optimization, true differentiation, or cooperative models—will maintain options while others scramble to adjust.

dairy profit margins

A family-owned processor in upstate New York just proved that omega-3 fortified milk can win quality awards AND sell at conventional prices—what this means for operations like yours

You know how sometimes a single piece of news makes you rethink everything you thought you understood about your market? That’s what happened to me when I heard about Midland Farms taking home Silver at this year’s New York State Dairy Products Contest.

I’ve been tracking dairy economics for over two decades, observing how processors price functional products and how these decisions impact farm-level decisions. But this Midland story? It challenges assumptions I’ve held for years about the relationship between product innovation and pricing.

Here’s what’s got everyone talking: Their Thr5ve milk—fortified with marine-sourced DHA omega-3s, enhanced vitamins A and D, plus improved mouthfeel from skim powder—is selling at the exact same price as regular milk. Not a penny more. On the same shelf, with the same price tag, but offering all those functional benefits, we’ve been told to command premium pricing.

Hugo Andrade, who runs operations at Midland, credits their “excellent milk supply, great farmers and co-ops” for making this work. And you know, that relationship between processor and producer definitely matters. However, what I’ve been learning from extension specialists and economists across the country suggests that there’s something bigger happening here—something about how the economics of processing might be shifting beneath our feet.

The Processing Side of the Story

So here’s what’s interesting about processor economics—and I know this isn’t the usual coffee shop conversation, but bear with me because it affects all of us. Midland’s been running that facility since 2002. Twenty-three years. Their equipment’s paid for, they’re not servicing massive debt, and they don’t have investors demanding quarterly growth.

Compare that to what we’re seeing with the mega-facilities going up. Hundreds of millions in investment. All that capital has to get paid back somehow, right? And we all know who ultimately ends up covering those costs.

The Cost Structure Reality

Facility Depreciation Impact on Processing Costs:

Facility AgeDepreciation as % of Total CostsCost per Hundredweight
New Facility (0-5 years)15-25%$2.40-$4.00
Mid-Age Facility (10-15 years)8-12%$1.28-$1.92
Paid-Off Facility (20+ years)3-5%$0.48-$0.80

Based on industry cost analyses and extension program data

That difference—we’re talking 40 to 80 cents per hundredweight—that’s real money when you’re competing on price.

Labor’s another piece of this puzzle. Bureau of Labor Statistics data from May 2024 show that food manufacturing workers in the Albany-Schenectady-Troy metropolitan area earn median wages of around $19 to $21 per hour. Now, if you’re running a facility near a bigger city, or you’ve got union contracts, those numbers jump considerably. Could be another 30 to 80 cents per hundredweight difference right there.

But here’s the part that really made me think…

The Real Cost of DHA Fortification

Breaking down the premium myth:

  • Actual DHA cost per half-gallon: $0.005 – $0.015
  • Typical retail premium charged: $1.50 – $2.00
  • Markup: 100-400x the ingredient cost

Based on standard fortification levels—those 32 to 50 milligrams of DHA per serving—and wholesale ingredient pricing when buying in bulk, the actual cost to fortify comes out to roughly half a penny to maybe a penny and a half per half-gallon.

Half a penny to a penny and a half. Yet walk into any store and that omega-3 milk costs an extra buck-fifty, sometimes two bucks more. Makes you wonder, doesn’t it?

Why That Cornell Award Matters

What’s particularly noteworthy about Midland winning that Silver is how Cornell runs these competitions. The judges don’t know if they’re tasting a premium brand or a store label. It’s all blind evaluation—they’re running polymerase chain reaction tests for bacterial counts, using trained sensory panels, measuring shelf stability with accelerated aging protocols.

They’re examining the butterfat consistency to the hundredth of a percentage point, evaluating mouthfeel, and testing for off-flavors. Real science, not marketing.

“Quality is quality. The testing doesn’t care about your marketing budget or price point. It measures what’s actually in the bottle.”
— Dairy science professor involved in Cornell competitions

So when a family processor makes private-label brands—Midland does Derle Farms, Cherry Valley, Farm Fresh, several others—when they prove their fortified milk matches or beats products charging twice the price… well, that tells you quality isn’t necessarily tied to price point the way we’ve been led to believe.

The Ingredient Supply Question

Now, you might be thinking what I initially thought—sure, one processor can do this, but if everyone starts fortifying with DHA, won’t the ingredient market go crazy?

Here’s what’s interesting about that. Current estimates put global algal DHA production capacity somewhere between 25,000 and 35,000 metric tons annually. That’s based on the disclosed capacities from major producers—DSM has its Veramaris operation, which it established in collaboration with Evonik in 2019, as well as Lonza, Cellana, and others.

DHA Supply vs. Dairy Demand

The scale perspective:

  • Global DHA production capacity: 25,000-35,000 metric tons/year
  • U.S. fluid milk DHA requirement (if all fortified): 1.5-2.0 metric tons/year
  • Percentage of global capacity needed: <0.01%

For context: Infant formula accounts for approximately half of global algal DHA production

Let me put this in perspective. If we fortified all the fluid milk sold through major U.S. retail channels—using those standard fortification levels—we’d need approximately 1.5 to 2.0 metric tons of pure DHA annually. That’s less than 0.01 percent of global capacity.

And pricing varies significantly with volume. Small purchasers pay substantially more per kilogram than industrial buyers who negotiate annual contracts. We’re talking prices that can drop by half or more when you move from small-batch to industrial-scale purchasing. Additionally, the fermentation technology continues to improve, driving down production costs year over year.

What Other States Are Doing

The extension folks I talk with in Wisconsin and California are watching this Midland situation pretty closely. Wisconsin has increased funding for its Dairy Processor Grant Program. Since 2014, they’ve funded 135 projects, and the Center for Dairy Research at Madison reports that they’re receiving more questions about functional milk formulation than they’ve seen in years.

Out in California, it’s a slightly different angle. Some Central Valley operations I’ve visited recently are exploring what they call “climate-smart nutrition”—tying functional benefits to sustainability messaging. Between the technical support from UC Davis and modernization grants through the Cal State system, they’ve got the infrastructure to experiment.

Of course, this plays differently in the Southeast, where co-op structures vary, or in Mountain states where processor density is lower, but the fundamental dynamics remain pretty consistent. Even in Texas, where rapid growth in dairy has created different relationships between processors and producers, the same questions are being asked. In Florida, where heat stress challenges are unique, processors are exploring functional products as a means to differentiate themselves in a competitive market.

What strikes me is how many processors are quietly running the numbers right now. Not all of them will move forward—some lack operational flexibility, while others are constrained by capital—but the conversations are happening. And that’s new.

What This Means for Your Operation

Let’s get practical here, because that’s what matters. Whether you’re milking 50 cows or 500, this shift is going to affect your milk marketing decisions.

If you’re currently shipping to a processor making premium functional products, it might be time for some frank conversations. The economics we’re seeing—based on what Clayton Christensen documented in his research on disruption—suggest that if processors can deliver quality, functional milk at conventional prices while maintaining margins, then perhaps those claims about needing premium milk but not being able to pay premium prices deserve another look.

Extension specialists report that component premiums in major dairy states commonly range from 40 to 85 cents per hundredweight—varying with butterfat levels, protein content, and somatic cell counts. These aren’t charity payments. They’re processors recognizing they need exceptional raw materials to compete.

Recent analyses from agricultural lenders, as documented in their quarterly reports, consistently show that success concentrates at either end—either cost-efficient commodity production or genuinely differentiated, premium products. The middle ground, where you’re sort of premium at sort of premium prices, is getting squeezed out.

Key Questions to Ask Your Processor

  • What’s the age of your processing facility and debt structure?
  • Are you planning any functional product launches in the next 18 months?
  • How do you calculate component premiums, and will those change?
  • What’s your strategy if major retailers launch a functional private label?

You have a strategic decision coming up. Either optimize for volume—maximizing components, keeping those somatic cell counts low, delivering consistent quality day in and day out—or pursue genuine differentiation through organic, grass-fed, regenerative practices that command real premiums.

The Timeline We’re Looking At

Based on how disruption typically plays out in food categories—Clayton Christensen’s work extensively documented this pattern, and we saw it with Greek yogurt capturing over one-third of the yogurt category within five years—here’s what I think we might see.

The Disruption Timeline

Phase 1 (Now – Spring 2026): Regional pilots in Wisconsin, California

  • Consumer testing of accessible-price functional milk
  • Industry dismisses as “regional quirk”

Phase 2 (Summer-Fall 2026): Regional retailer adoption

  • Wegmans, Meijer, and H-E-B evaluate category opportunity
  • Sales data shows 3-5x velocity vs. premium brands

Phase 3 (Late 2026 – Early 2027): National rollout discussions

  • Major chains commit to functional private label
  • Category of economics shift fundamentally

Historical precedent: Greek yogurt captured over one-third of the yogurt category within five years of mainstream adoption

By late 2026 or early 2027, when a major chain commits to a functional private label at conventional pricing, based on historical patterns, that tends to reshape the entire category pretty quickly.

How Premium Evolves, Not Disappears

What’s encouraging is that premium dairy won’t just vanish—it’ll evolve into something that actually makes sense.

Regenerative production with legitimate third-party certification—programs like Regenerative Organic Certified or Land to Market—creates real constraints that justify premiums. These require fundamental changes to how you farm, taking years to implement. We’re talking verified soil carbon sequestration, biodiversity improvements, the whole nine yards.

What I’m hearing from producers across different regions is that recent transitions to regenerative practices typically involve three-year conversion periods, significant upfront investment, and result in premiums ranging from $1.00 to $1.50 per hundredweight through contractual guarantees. The economics work when you have the right land base and a commitment to see it through.

Ultra-local transparency is another path. Single-farm or micro-regional milk with complete traceability. Some operations are already using blockchain so consumers can see exactly which cows contributed to their milk, when it was processed, and the works. That doesn’t scale to national distribution, which is exactly what protects its value.

Technical innovation continues, too. Ultrafiltration, A2 genetics, and precision fermentation, which require years of careful development and precision fermentation to create novel compounds, necessitate significant capital or proprietary knowledge, creating real barriers.

What probably won’t survive as a premium? Basic fortification. Adding DHA, protein, vitamins—that’s becoming baseline. Like homogenization or pasteurization. Nobody thinks of those as premium features anymore.

Research from Cornell’s Dyson School shows that willingness to pay premiums for basic fortification drops significantly when identical nutrition is available at conventional prices. Maintaining quality consistency across a distributed network won’t be simple, but the economics suggest it’s worth tackling those challenges.

Real Considerations for Real Farms

StrategyInvestment RequiredTime to ROIPremium PotentialRisk LevelKey Advantages
Volume OptimizationLow ($5K-$15K)6-12 months$0.40-$0.85/cwtLowQuick returns, proven model
True DifferentiationHigh ($30K-$250K)3+ years$1.00-$1.50/cwtHighDefensible margins, brand control
Cooperative RenaissanceMedium ($50K-$150K)18-36 months$0.60-$1.20/cwtMediumShared risk, processor margins

I’ve been talking with producers across different regions about how they’re thinking through this shift. What’s emerging are a few distinct strategies that seem to make sense depending on your situation.

Three Strategic Paths Forward

1. Volume Optimization

  • Focus on maximizing components (butterfat 4.0%+, protein 3.3%+)
  • Keep somatic cell counts consistently under 150,000
  • Build relationships with multiple regional processors
  • Target efficiency and consistency over differentiation

2. True Differentiation

  • Invest in regenerative certification (3-year transition, $30-50K investment)
  • Develop on-farm processing capabilities ($150-250K for small-scale)
  • Pursue ultra-local/blockchain transparency models
  • Accept lower volume for guaranteed premiums

3. Cooperative Renaissance

  • Join or form producer-owned processing ventures
  • Capture functional dairy margins at the processor level
  • Share capital requirements and risk across members
  • Maintain control over pricing and market positioning

Some folks are focusing on strengthening relationships with regional processors who are pursuing volume strategies. These processors need a reliable, high-quality supply and often pay meaningful premiums for exceptional components and low somatic cell counts. The math works when you’re optimized for efficiency and consistency.

Others are investing in differentiation that can’t be easily replicated. What I’m hearing from these producers is that they see it as a long-term investment in market position. Yes, it requires time and capital—we’re talking about significant investments in small-scale processing equipment—but it creates lasting value.

There’s also renewed interest in cooperative models. When producers see the margins available in functional dairy, naturally, they start asking why processors should capture all that value. The cooperative tradition runs deep in dairy—maybe this is what brings it back.

Where We Go from Here

What Midland’s shown with their Cornell Silver award isn’t just about one processor’s pricing strategy. They’ve demonstrated that the premium pricing structure for basic nutritional enhancement might be more about market positioning than production necessity.

That’s not meant as criticism—it’s recognition that things are changing. Processors with the right cost structure can profitably deliver enhanced nutrition at accessible prices. Those with different structures need to adapt or find new ways to create value. Both paths can work with the right approach.

For dairy farmers, this creates both opportunity and urgency. Opportunity because processors competing on volume and quality need exceptional milk supplies. Urgency because your current processor relationships might shift significantly as markets evolve.

Building relationships with multiple potential outlets makes sense. Understanding their strategies, cost structures, and market approaches—these conversations matter more than ever. Inquire about facility investments, debt levels, and the company’s strategic direction. This isn’t being nosy; it’s being smart about your business.

The trajectory seems fairly clear: accessible nutrition is on its way to dairy. When major retailers launch functional milk at conventional prices—likely within 18 to 24 months based on historical patterns—the category economics shift fundamentally. The question isn’t whether this happens, but how your operation is positioned for it.

Processors who understand these dynamics are already planning. Farmers who recognize them early maintain options. Those who wait… well, they get what’s left.

What are you seeing in your area? Are processors discussing functional products differently? How are you thinking about positioning as things evolve? I’m genuinely curious about what you’re observing, because these conversations help all of us navigate what’s coming.

While we’re focused on U.S. markets here, it’s worth noting that similar dynamics are emerging in European and Oceanic dairy markets too. Dutch processors are experimenting with accessible-price functional dairy, while New Zealand cooperatives are reevaluating their premium positioning strategies. This isn’t just a regional shift—it’s a global phenomenon.

KEY TAKEAWAYS:

  • Your milk check could increase 40-85¢/cwt by targeting processors pursuing volume strategies who need exceptional components (4.0%+ butterfat, 3.3%+ protein) and consistently low somatic cell counts—these processors recognize that quality raw materials matter more than ever as competition shifts from brand positioning to actual product quality
  • The real DHA fortification cost is $0.005-$0.015 per half-gallon, not the $1.50-$2.00 premium you see at retail—with global algal DHA production at 25,000-35,000 metric tons annually and U.S. dairy needing just 1.5-2.0 tons if fully fortified, ingredient scarcity isn’t the issue processors claim it is
  • Three strategic paths make sense for different operations: Volume optimization for efficiency-focused farms, regenerative certification ($30-50K investment, 3-year transition) for those seeking defensible premiums of $1.00-$1.50/cwt, or cooperative processing ventures ($150-250K small-scale) to capture margins currently going to processors
  • Timeline matters—you’ve got 18-24 months before major retailers likely launch functional private label at conventional prices, based on historical disruption patterns like Greek yogurt’s capture of one-third market share in five years
  • Ask your processor four critical questions now: What’s their facility age and debt structure? Are they planning functional launches? How will component premiums change? What’s their strategy when Walmart launches accessible-price omega-3 milk?

Complete references and supporting documentation are available upon request by contacting the editorial team at editor@thebullvine.com.

Learn More:

The Sunday Read Dairy Professionals Don’t Skip.

Every week, thousands of producers, breeders, and industry insiders open Bullvine Weekly for genetics insights, market shifts, and profit strategies they won’t find anywhere else. One email. Five minutes. Smarter decisions all week.
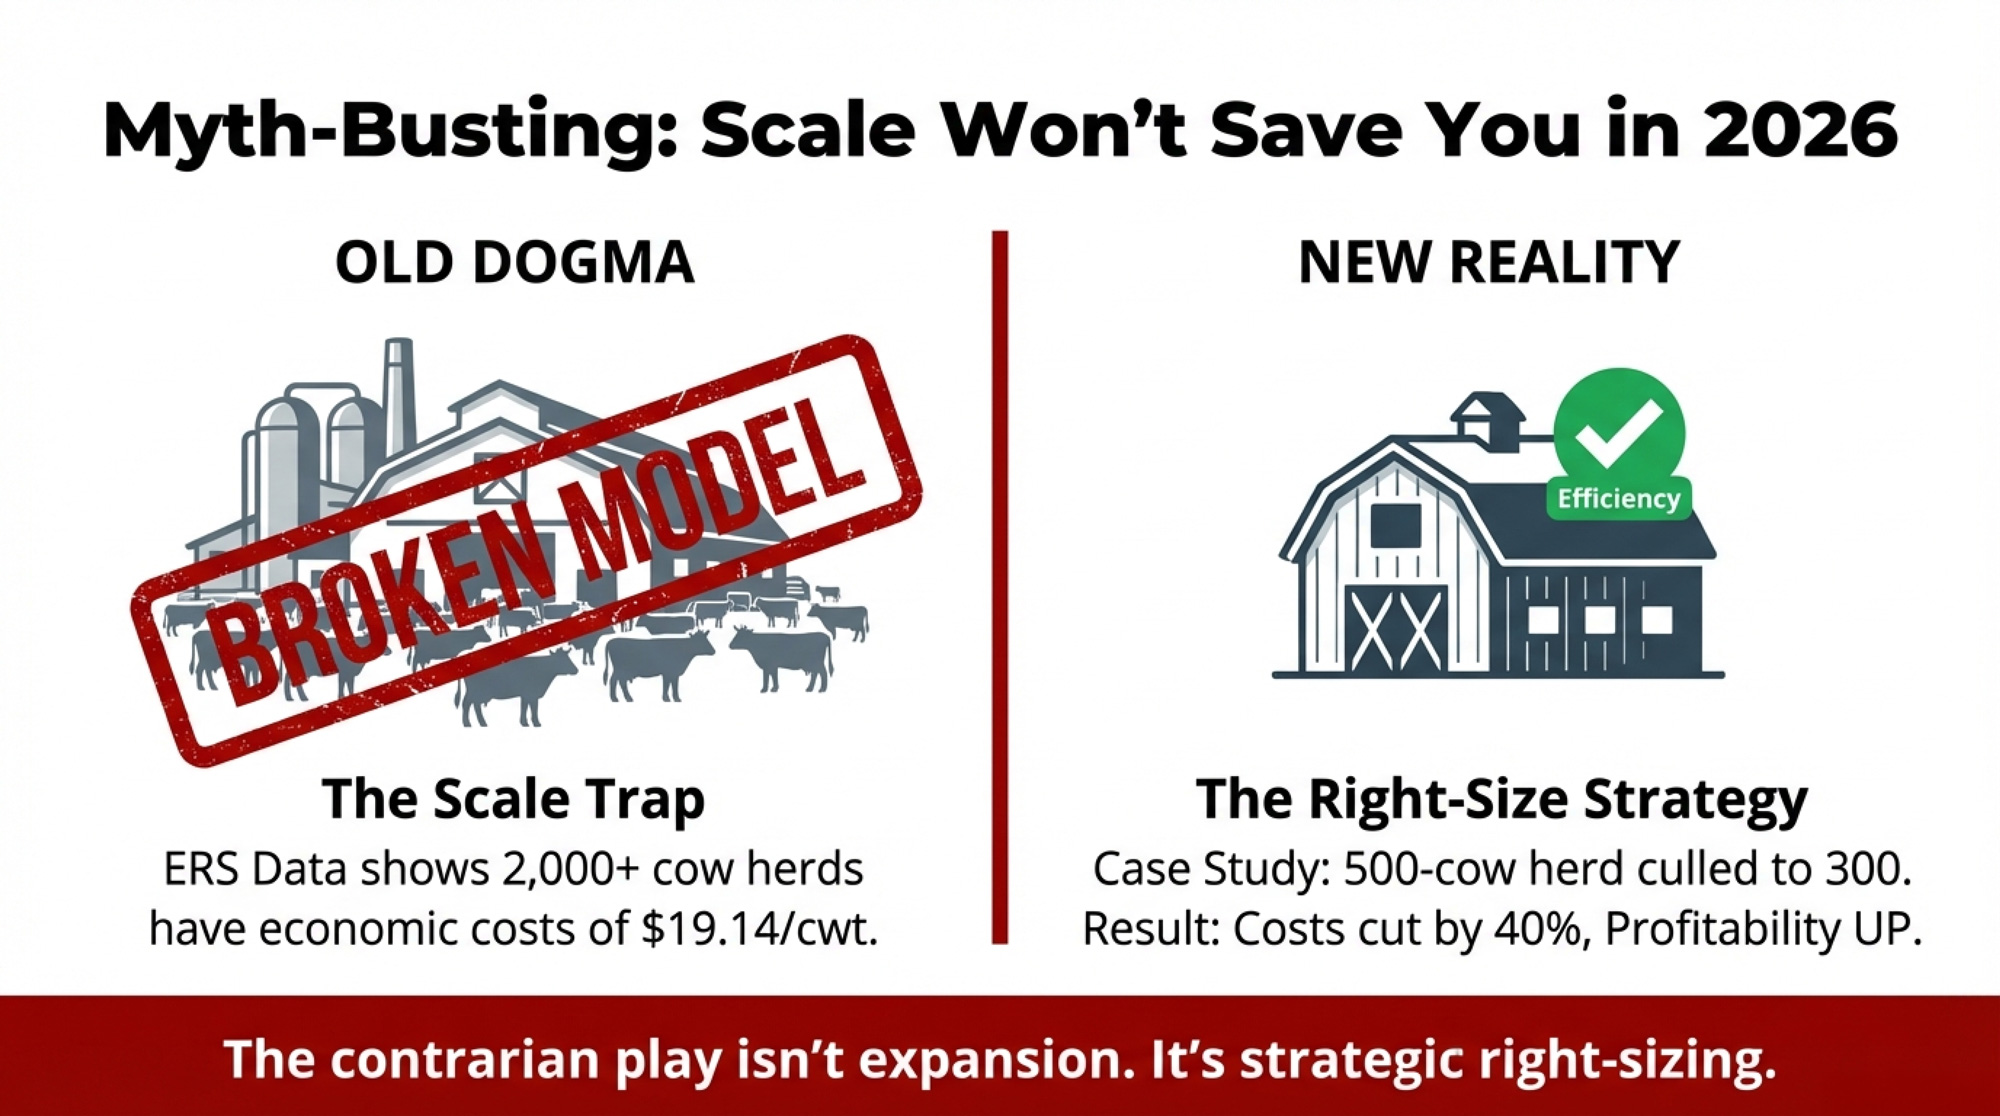
NewsSubscribe
First
Last
Consent

New Zealand’s Crisis Just Killed Market Volatility – And Every Dairy Farmer is Next

Fonterra controls 80% of New Zealand’s milk, but farmers are liquidating assets to survive—your co-op could be next

EXECUTIVE SUMMARY: Here’s what we discovered: The dairy industry’s “market volatility” story is covering up the most sophisticated wealth transfer in agricultural history. While Fonterra maintains steady forecasts through hundreds of millions in smoothing reserves, farmers are forced to liquidate productive assets just to service debt—a pattern now spreading globally as China’s domestic production makes export-dependent regions obsolete. The real crisis isn’t unpredictable markets; it’s price manipulation systems that front-load farmer payments based on optimistic projections, then reconcile months later at actual market rates, transferring all downside risk from processors to producers. Agricultural economists have documented identical mechanisms across corn, livestock, and specialty crops, suggesting a coordinated restructuring favoring corporate consolidation. Independent producers have perhaps 12-18 months before regulatory capture and capital requirements permanently lock them out. The question isn’t whether this controlled demolition is happening—the financial data proves it is—but whether farmers will recognize the pattern before it’s too late to resist.

KEY TAKEAWAYS:

  • Immediate diversification pays: Farmers using transparent fixed-price contracts instead of co-op smoothing systems can eliminate reconciliation shortfalls that average 8-15% below projected advances
  • Document the disconnect: Tracking retail dairy prices vs. farmgate payments reveals margin capture of $0.40-$0.80 per gallon that processors keep while socializing risk to producers
  • Build escape routes now: Direct-marketing capability—even small-scale farm stores or local restaurant contracts—can capture 30-50% premiums over commodity pricing before regulatory barriers get higher
  • Time is running out: Capital requirements for processing alternatives are rising 12-18% annually, while export quota systems increasingly favor established players over independent operators
  • The pattern is spreading: Similar price manipulation mechanisms documented in corn (basis premium capture), livestock (forward contract weighting), and specialty crops signal coordinated agricultural restructuring favoring consolidation

Alright, settle in for this one… because what I’m about to tell you is going to make your blood boil.

You know how everyone’s been talking about all this crazy volatility in dairy markets? Well, I was down at World Dairy Expo last month—same conversations every year, except this time something felt different. Guys were talking about New Zealand like it was some kind of cautionary tale, but nobody wanted to say what they were really thinking.

So I started digging into the numbers. And what I found… Christ, it’s like watching a slow-motion train wreck.

Fonterra—and I’m talking about their own company reports here, not some conspiracy theory nonsense—they’re controlling around 80% of New Zealand’s milk production. Eighty percent! That’s not a cooperative, that’s a monopoly with better PR.

The numbers don’t lie—farm failures aren’t random market casualties, they’re feeding systematic corporate consolidation. Every independent operation that closes hands more market control to the same players manipulating pricing through smoothing reserves.

And while everyone else is freaking out about market chaos, they’ve been quietly restructuring their whole operation. Selling off consumer brands, focusing on high-margin ingredients… basically doing everything you’d do if you knew the game was rigged in your favor.

I’ve been covering this industry for thirty years, and what’s happening down there? It’s coming here. Bank on it.

China Doesn’t Need Our Milk Anymore (And It’s About Damn Time We Admitted It)

So here’s the thing nobody wants to talk about at these industry conferences…

The USDA’s been putting out these Foreign Agricultural Service reports that basically spell out the whole story, but somehow it never makes it into the mainstream trade press. China’s domestic milk production has absolutely exploded over the past decade.

Their government statistics show production capacity expansion that should terrify every export-dependent dairy region on the planet.

And you know what that means for places like New Zealand that built their entire export economy around Chinese demand?

Party’s over, folks.

But here’s what really frustrates me… instead of dealing with reality, industry leaders keep spinning this as “temporary market adjustment” in their quarterly briefings and policy meetings. Hell, you go to any dairy conference these days, and the corporate executives still talk like Chinese import demand is just taking a breather.

A breather? Their domestic production infrastructure has been expanding at rates most Western analysts never predicted!

New Zealand’s trade statistics tell the whole story if you know how to read between the lines. Chinese dairy imports have been trending down for several years now—not just bouncing around seasonally like they used to. This isn’t some temporary blip.

This is permanent market restructuring.

But good luck getting anyone in industry leadership to admit that reality…

The Smoothing Reserve Shell Game (Or: How to Rob Farmers in Broad Daylight)

Okay, this is where it gets really ugly. And I mean really ugly.

Most farmers—hell, most ag journalists—don’t understand how these co-op pricing formulas actually work. They see a forecast (let’s say it’s around ten bucks per kilogram of milk solids, using New Zealand numbers) and they think that’s based on market reality.

The reality is way more complex.

Here’s how the mechanism works, and this comes from looking at how agricultural economists describe these pricing systems:

That forecast isn’t based on current market prices. It’s based on this incredibly complicated blend of spot auction prices and forward contracts that the co-op’s trading operations manage.

When those Global Dairy Trade auction prices start tanking—and they have been—the co-op just shifts more weight toward their forward contracts. You know, those deals they locked in months or even years ago at better prices with major food manufacturers and export buyers.

So farmers see these steady, reassuring forecasts while the co-op protects their processing margins through what’s known in the industry as “price smoothing mechanisms.”

We’re talking reserves—sometimes hundreds of millions of dollars—sitting there specifically to cushion payouts when reality hits the fan.

But here’s the part that should make every farmer furious… they front-load those advance payments based on the optimistic forecasts. Farmers spend that money immediately on operating expenses. Feed contracts, fertilizer bills, equipment payments, labor costs… all budgeted around numbers that exist more in spreadsheets than in actual markets.

Then comes the reconciliation. Usually eight, maybe twelve months later.

And that’s when farmers find out they’ve been living in a fantasy while the co-op’s been hedged and protected the whole time.

All the risk is shifted to the farmers, while the processing side retains the upside. It’s brilliant if you’re a corporate processor. Criminal if you’re a farmer.

The Export License Game That Locks Out Competition

You want to see how the system gets rigged in favor of big players? Look at how New Zealand handles dairy export licensing.

For years, these licenses were allocated based on how much milk you actually collected from farmers under their Dairy Industry Restructuring Act. Made sense—more milk, bigger quota, simple math.

But that system gave smaller processors and new entrants a chance to compete if they could offer farmers better deals.

Well, can’t have that, right?

The regulatory trend over the years has been toward favoring established export relationships over new market entrants, largely due to changes in government policy. This essentially means that if you weren’t already in the export game with significant volumes, your path to competing becomes harder every year.

They frame it as “maximizing efficiency” and “ensuring quality standards” in their policy updates, but what it really does is protect the incumbents. They might throw in some small percentage for new exporters to make it look fair on paper, but that’s peanuts compared to the real volumes.

I’ve seen this pattern across agricultural sectors. Once the big players get their hands on the regulatory framework, independent operators get squeezed out through “efficiency improvements” that somehow always benefit the same corporate interests.

Why China’s Exit Changes the Entire Global Game

Here’s what should keep every dairy producer awake at night…

For twenty years, the entire global dairy expansion was built on one assumption: China’s growing middle class would keep buying more and more imported dairy products. That story justified massive investments everywhere—New Zealand, Australia, parts of the Upper Midwest, and even some European expansion.

But what if the story was wrong?

Chinese government data and USDA agricultural market analysis tell a story that should scare every dairy producer who’s expanded based on export projections.

China didn’t just get better at making milk. They got competitive.

Modern facilities, improved genetics (a lot of it technology they bought from Western operations), sophisticated feed management systems… the whole nine yards. Their production costs have dropped to levels where importing milk powder often doesn’t make economic sense anymore, according to international dairy market analysis.

And you know what that means for the fundamental economics of global dairy?

Everything changes.

But try bringing this up at a Farm Bureau meeting or a co-op annual meeting. Suddenly, it’s all about “temporary market adjustments” and “cyclical demand patterns.” Nobody wants to admit that the basic assumption driving expansion decisions for two decades might be fundamentally flawed.

The Debt Liquidation Death Spiral

This part makes me angry…

Industry publications love talking about how farmers are “improving their financial position” by paying down debt. Makes it sound like smart financial management, right?

That narrative is misleading.

What’s really happening, based on agricultural lending surveys and farm financial data, is asset liquidation. Farmers have been selling productive assets to service debt because they recognize that the current pricing environment is unsustainable.

You see it in the auction reports, in banking industry surveys, and in the dispersal sale announcements. Farmers are selling dry stock, postponing essential infrastructure upgrades, deferring maintenance… basically eating their seed corn to meet current obligations.

Why? Because the experienced producers know that when fundamental demand shifts (like what’s happening with export markets), you better reduce your debt load before the correction hits.

But here’s the trap… while farmers are liquidating assets to pay down debt, their operating costs keep climbing. Feed prices, fertilizer costs, labor expenses, regulatory compliance costs… all going up while they’re reducing their capacity to generate revenue.

That’s not financial strength. That’s managed decline.

And the really ugly part? Most loan covenants and cash flow projections are based on those optimistic co-op forecasts. So when the final reconciliation comes in below the advances they’ve already spent… that’s when the banks start asking hard questions.

The Same Pattern, Different Commodities

What really worries me is how widespread this pattern has become…

You see similar systems in corn and soybean marketing through major processors like ADM and Cargill. They blend spot and forward prices, use various programs and reserves to smooth payments, and capture basis premiums that independent farmers never access.

Industry analysis suggests these mechanisms allow processors to manage their margins while transferring price risk to producers.

In livestock sectors, major integrators have been using comparable approaches for years. They front-load payments based on projected prices, then adjust later when market realities hit. Same basic risk transfer mechanism, just different commodities.

The pattern is evident in cotton markets and other specialty crops. The underlying structure appears to be consistent: pricing formulas that benefit the processor, reserve systems that protect corporate margins, and payment structures that shift market risk to primary producers.

And it works. Really well. For the corporate side.

What gets me is how little this gets discussed in mainstream farm media. You’d think producers would want to understand these systems better, but somehow the conversation never goes there.

Why Independent Producers Can’t Compete (And Why Time’s Running Out)

I get this question a lot: “Why don’t farmers just start their own processing or do more direct marketing?”

Valid question. Here’s the reality…

The capital requirements are crushing, according to equipment suppliers and regulatory compliance experts. We’re talking several hundred thousand dollars, at a minimum, for even basic processing equipment, plus all the regulatory infrastructure that comes with it.

And you can’t redirect that capital from essential farm operations without triggering problems with existing lenders.

Then there’s the knowledge gap. Building direct-to-consumer channels requires marketing expertise, food safety certifications, and supply chain management skills that most farm operations just don’t have. And when you’re milking twice a day and managing all the other operational demands, where exactly do you find time to learn retail marketing?

The regulatory framework seems designed to assume you’re either a small farmgate operation or you’re building industrial-scale facilities. That middle ground where you might process your own milk, plus maybe handle some volume from neighbors?

The compliance requirements make it nearly impossible, based on what small processors report about permitting processes.

Cash flow pressure from existing operations is the killer, though. Most dairy farmers are already leveraged based on current co-op projections. Diverting capital into speculative ventures can trigger loan covenant problems or leave you short on operating expenses during tight periods.

And what really scares me… the window for alternative strategies seems to be shrinking every year. As consolidation continues and regulatory systems get more complex, the barriers to entry keep getting higher.

Who’s Really Winning This Game

Let me be crystal clear about who benefits from all this “market volatility”…

Large processing operations—whether they call themselves cooperatives or corporations—make money regardless of price direction. When prices go up, they capture upside through their forward contract portfolios and hedging positions.

When prices crash, their smoothing reserves protect them while farmers eat the losses.

Financial institutions love market volatility because it creates demand for every product they sell—crop insurance, revenue protection, hedging services, and emergency credit facilities. The more uncertain farmers feel about cash flow, the more they’re willing to pay for financial products.

Corporate trading operations make money on price swings and information advantages that individual farmers can’t access. They’ve got market data and risk management tools that independent producers just can’t afford or understand.

Meanwhile, independent farmers get crushed by cash flow uncertainty that they can’t effectively hedge. Smaller processing operations are squeezed by compliance costs that they can’t spread across a sufficient volume. Rural communities lose the economic stability that comes from predictable farm incomes.

And consumer prices? They keep climbing regardless of what farmers get paid. Funny how that works.

Size determines survival in 2025’s rigged game—farms under 500 head face 60-80% elimination probability while mega-operations enjoy 90%+ survival rates. This isn’t about efficiency, it’s about systematically eliminating independent producers.

What Every Producer Needs to Do (Before It’s Too Late)

Alright, here’s what I think you need to consider if you want to survive what’s coming…

IMMEDIATE ACTIONS (Next 30 days): Stop accepting this “new normal” of engineered volatility. Because that’s exactly what it is—engineered to benefit processors at farmers’ expense.

Diversify your marketing relationships if you possibly can. I don’t care if your family’s been with the same co-op since the 1940s. Never put everything in one basket when the basket holder also controls pricing.

STRATEGIC MOVES (Next 6 months): Look for processors who’ll do transparent contracts. Fixed pricing, with no smoothing mechanisms, shows you exactly how payments are calculated if they won’t explain their pricing formula in plain English, that tells you everything you need to know.

Start documenting the disconnects. Track what you get paid against retail dairy prices in your area. Keep records of forecasts versus actual payments. Those gaps tell the real story of where margins go.

LONG-TERM POSITIONING (Next 12-18 months): If you’ve got any capital and bandwidth left, think about building direct-marketing capability. Even something small—farm store, local restaurants, farmers’ markets. Anything that lets you capture more of what consumers actually pay.

Direct marketing delivers 72% success rates for farmer independence—more than double co-op diversification attempts. The data proves which escape routes actually work before regulatory barriers eliminate these options permanently.

And connect with other producers who are asking these same questions. Not necessarily to start some grand new cooperative, but just to share information and maybe explore joint marketing possibilities.

Time’s running shorter than most people realize.

The Bigger Picture (And Why Every Farmer Should Be Worried)

What’s happening in dairy isn’t unique to our sector. Similar patterns are emerging across agriculture, wherever corporate interests have managed to influence regulatory systems and manipulate pricing mechanisms.

Every year, these systems get more entrenched. More regulatory complexity that favors large-scale operations. Higher financial requirements for market access. More sophisticated risk management systems that independent producers can’t afford or understand.

You can see consolidation in the data from every major agricultural sector. The question isn’t whether it’s happening—it obviously is. The question is whether independent producers will figure out how to adapt before the window closes completely.

Because honestly? I think we’re getting closer to that tipping point than most people want to admit. Maybe not this year, maybe not next year, but sooner than we’d like to think.

Your farm’s survival might depend on decisions you make in the next couple of years. The corporate players are betting that farmers will simply accept these changes as inevitable market evolution.

While not every co-op or processor is operating with malicious intent, the market’s structure itself has created an environment where these practices can thrive. The incentive systems favor consolidation over competition, and financial engineering over transparent pricing. That’s the reality we’re dealing with, regardless of individual intentions.

Prove them wrong.

Complete references and supporting documentation are available upon request by contacting the editorial team at editor@thebullvine.com.

Learn More:

  • Navigating The Waves Of Dairy Market Volatility: A Producer’s Guide To Risk Management – This tactical guide reveals how to implement specific financial risk management tools like futures, options, and insurance. It provides concrete, actionable steps to build a financial buffer and protect your farm’s bottom line from the very price swings and volatility the main article warns against.
  • EXPOSED: The $29.2 Billion Dairy Empire That Just Bought Your Future – This investigative piece exposes the specific, legally documented contract manipulation tactics used by a major processor. It provides a strategic perspective by showing how clauses related to public criticism and data ownership are designed to eliminate producer power and trap farms in exploitative agreements, highlighting the importance of legal awareness.
  • Danone vs. Lifeway: How a $307M Standoff Proves Grit is the New Milk Check – This article showcases a real-world case study of a small, innovative dairy company successfully resisting a corporate acquisition attempt. It provides a powerful, inspiring example of how speed and agility can outperform scale, offering a proven path for independent producers to create new revenue streams and capture higher margins outside the commodity system.

The Sunday Read Dairy Professionals Don’t Skip.

Every week, thousands of producers, breeders, and industry insiders open Bullvine Weekly for genetics insights, market shifts, and profit strategies they won’t find anywhere else. One email. Five minutes. Smarter decisions all week.
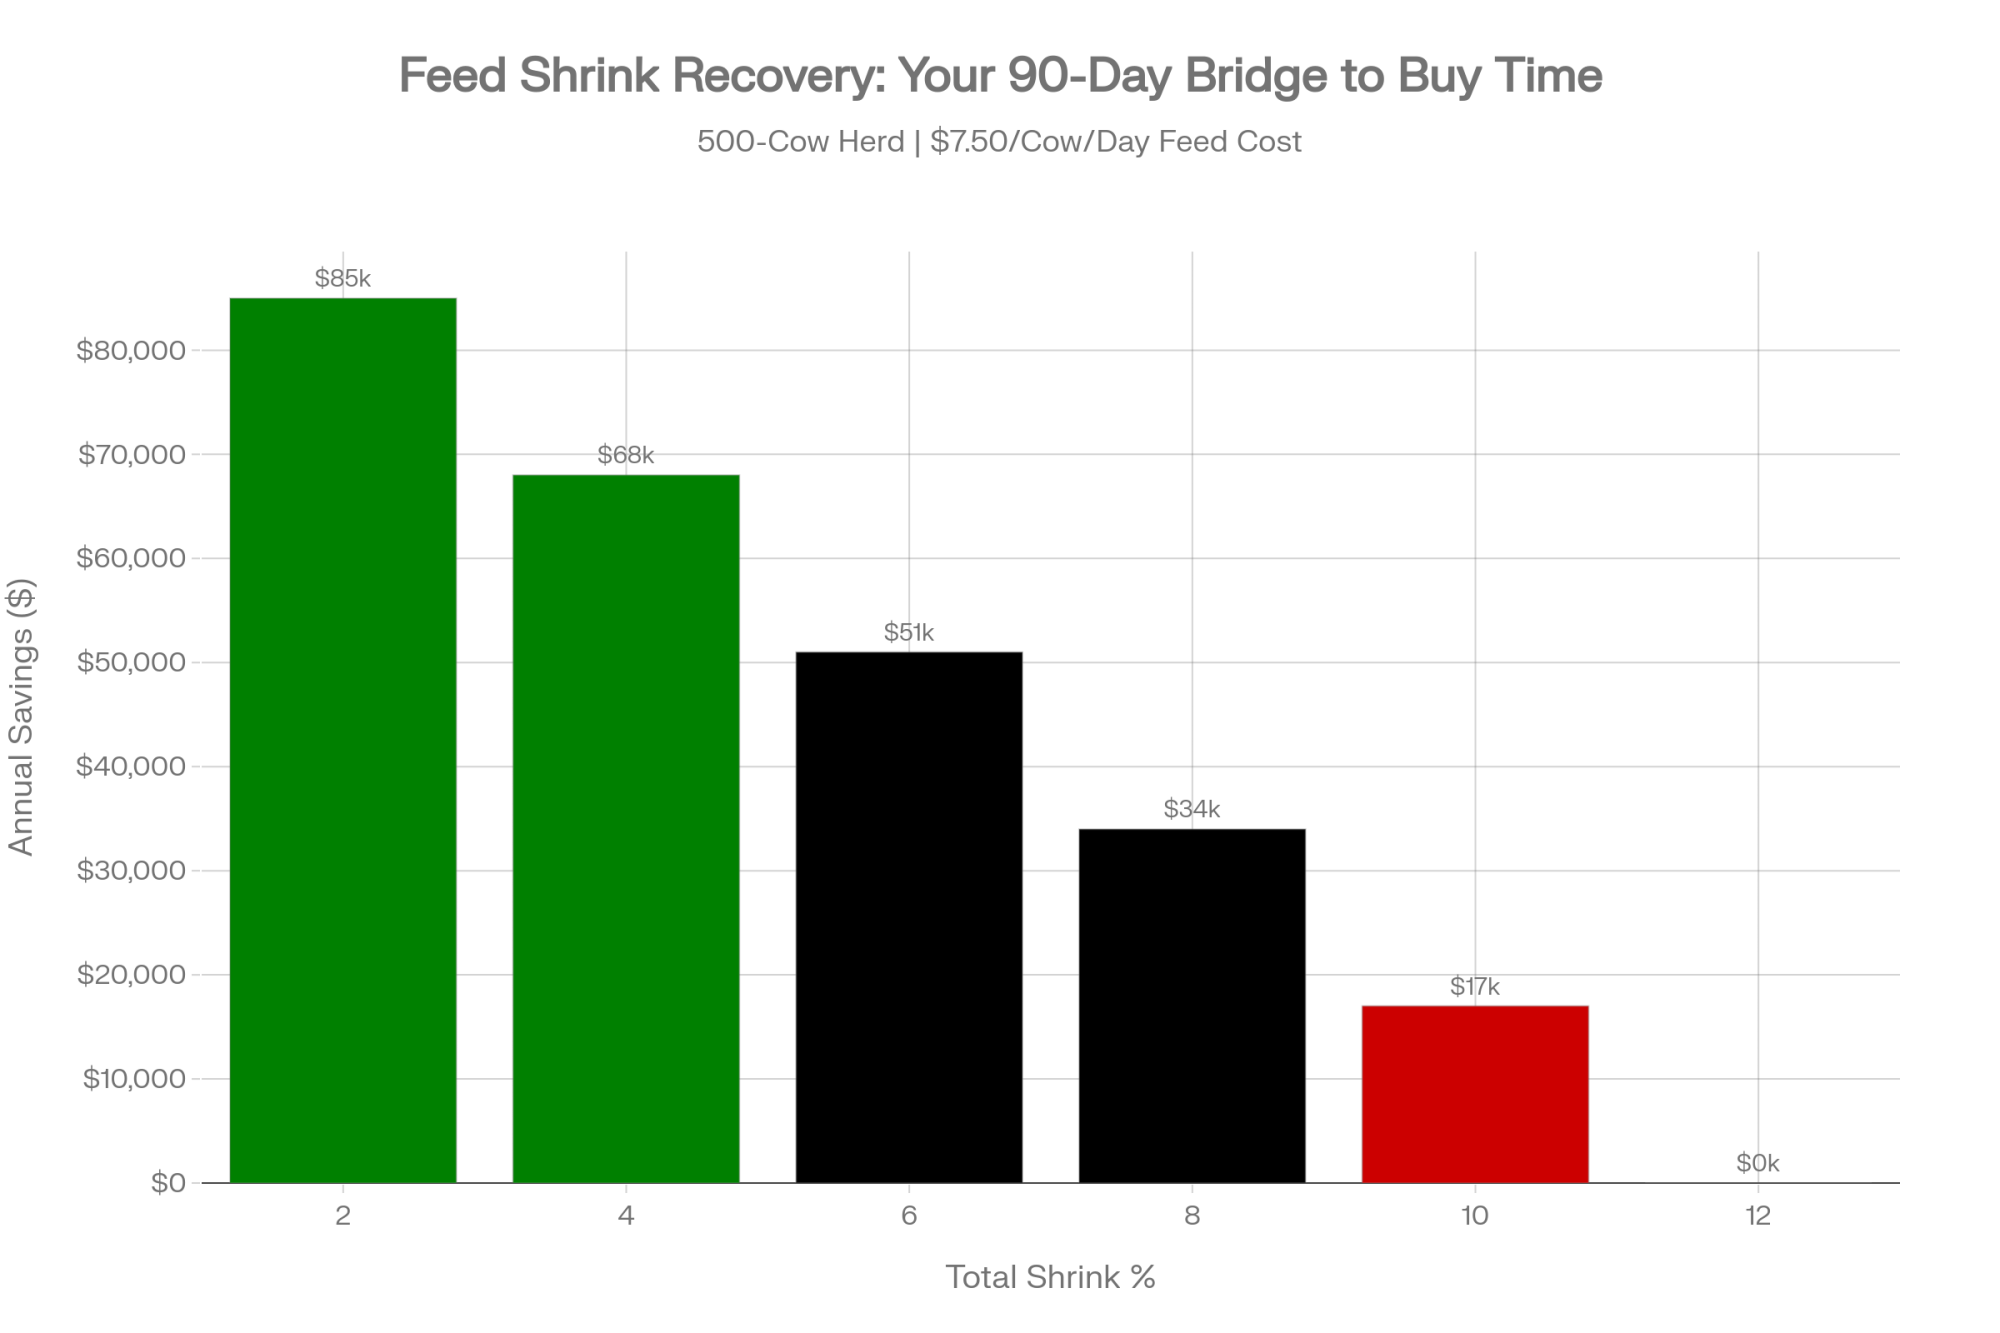
NewsSubscribe
First
Last
Consent

The Buffalo Buzz: Why India’s Dairy Scene is Stirring Up the Global Game

Did you know India produces 69% of the world’s buffalo milk—nearly double US cow production? Imagine the untapped profit potential!

EXECUTIVE SUMMARY: Here’s the thing—India’s buffalo dairy sector controls nearly 70% of global buffalo milk, pumping out over 104 billion kilos a year, while exporting just $1.5 million. The gap is huge. Buffalo milk commands a fat-driven premium of around 90 cents per liter, compared to 60 cents for cow’s. What’s new? AI-driven breeding tech is making waves, boosting milk yields by over 500 kg per lactation and adding roughly $570 income per buffalo (source: IJAS 2025). Yet sensor adoption is still under 5%, so the upside is massive. Farmers in Punjab report AI daughters with better yields and creamier quality, though success rates trail those of cattle. Global demand, especially in Asia, is booming, pushing exports higher. If you want new profit streams, it’s time to rethink buffalos, not just cows, and invest in precision breeding technologies.

KEY TAKEAWAYS:

  • Boost milk by 525+ kg/lactation with AI breeding tech—potentially add $570 revenue per buffalo. Start with heat detection accuracy improvements and reproductive management programs (source: IJAS, 2025).
  • Tap into premium buffalo milk pricing at 90 cents/liter, nearly 50% higher than cow’s milk, by focusing on butterfat-rich genetics and strategic herd nutrition (source: Dairy Market Reports, 2025).
  • Leverage digital tools like rumen sensors and remote vet platforms to cut health costs and improve reproductive success—MoooFarm already connects 15,000 farmers (source: Dairy Global, 2024).
  • Prepare your export game now: Asia’s dairy import demand is massive, but cold chain compliance and traceability tech (think blockchain pilots) are essential to compete (sources: FAO, Dairy Global).
  • Recognize buffalo’s ecological edge with 30% lower emissions per liter than cows—position your operation for future carbon regulations and sustainability premiums (source: Indian Ag Research, EPA).

I was with a farmer in Haryana at dawn recently. He pulled up his phone and said, “Priya’s ready for AI breeding in six hours.” Not guesswork—this little rumen bolus sensor tucked in her first stomach was telling him exactly when she was at her peak heat.

Priya’s a Murrah, India’s superstar breed, kind of like the Holstein but with butterfat that’s nearly double: 7 to 8 percent. This farmer runs his operation at roughly half the cost of many North American dairy operations.

What’s fascinating is that this kind of tech isn’t just staying on the big farms—it’s creeping into the smaller outfits too, shaking up the entire Indian dairy scene.

The Scale of India’s Buffalo Herd

India produces about 69 percent of the world’s buffalo milk—45.8 million buffaloes delivering over 104 billion kilograms annually. That’s just over the whole US annual production of 103 million tonnes.

But here’s where it gets interesting: while AI and sensor technology offer huge benefits, their adoption is still low, sitting at just a few percent according to some estimates. Clearly, there’s a big gap—and an even bigger opportunity.

Buffalo milk commands around 90 cents per liter in the market here—nearly 50% more than cow’s milk prices, which hover near 60 cents a liter. Yet, exports of buffalo milk products linger near $1.5 million annually, tiny compared to the size of the domestic market.

Technology Bridges the Gap

Take a startup like MoooFarm. They’ve connected 15,000 farmers with vets through smartphones—meaning more than two-thirds of herd health issues get managed remotely before they balloon into bigger problems.

Then there’s the real star: CIRB’s rumen bolus sensors quietly gathering data inside the buffalo’s rumen, tracking temperature and gut health, helping farmers catch heat and health issues earlier than ever.

Here’s how that scales in numbers:

BreedButterfat %Daily Milk (Liters)Cost per cwt (USD)
Murrah Buffalo7.5 – 8.08 – 1216 – 20*
US Holstein3.6 – 3.828 – 3518 – 22
European Mix4.0 – 4.220 – 2520 – 25
NZ Friesian4.5 – 4.815 – 1815 – 19

*Note: Indian cost data focuses primarily on feed costs; full farm costs are still being analyzed.

Source: Compiled from Tridge, USDA, and industry data.

Hot Weather, Dry Feed, and Patchy Signals

Farmers in Gujarat know the hit that summer delivers: milk production can dip by up to 25% as green feed dries up pre-monsoon. Meanwhile, internet cuts in Rajasthan make it challenging to get timely vet advice.

But innovation clicks in: a farmer near Mysore invested $50,000 in solar-powered cooling, slashing milk spoilage and paying off the system in under a year.

Building the Digital Backbone

India’s Digital Agriculture Mission put about $340 million into digitizing farming, but coverage isn’t uniform—Punjab leads, others fall behind.

Champions like 23-year-old Preet work tirelessly to train even older farmers on digital technology, which requires patience and persistence.

The Economic Reality of AI Breeding

Data shows AI breeding can lift milk yields by 525 kilograms per animal, roughly adding $570 in revenue—something more grounded and realistic than some of the hype.

Farmers like Sharma in Punjab say their AI daughters produce richer milk, too.

Success rates around 35% for buffalo lag behind cattle rates of 60%—mostly due to cold chain and training gaps.

Export Potential: Challenges and Promise

Buffalo dairy exports are small right now, but don’t overlook Asia’s massive dairy demand—with imports from China, Indonesia, and the Philippines in the billions.

Export challenges? Strict cold chain and food safety standards are a real barrier.

Technologies like blockchain might be the solution—but they’re still in early pilot stages.

Targeted Investment and Farm-Level ROI

The Maharashtra government has allocated $60 million over five years to scale up the adoption of AI, particularly among smallholders.

Case studies from Punjab Agricultural University’s extension programs document that some cooperative farmers with larger buffalo operations (10+ head) achieve positive returns within 6-12 months, although results vary significantly based on local conditions, management quality, and infrastructure availability.

Technology Built for Buffalo

Buffalo aren’t cows. Their udders and milking behaviors demand specialized equipment. That’s why Delmer Group designed machines specifically for buffalo.

Add to that, buffalo heat signs are subtle and slip away fast—lasting 12-18 hours versus cows’ 18-24. That sensor tech is the real lifesaver in accurately timing AI.

Buffalo’s Carbon Advantage

Buffalo milk production emits about 30% less greenhouse gases per liter than cow milk, which should matter more and more as the market demands eco-friendly production.

This isn’t just a feel-good stat—it’s becoming a trade reality.

The Bottom Line

The tech is real, and producers are already seeing returns—though it all depends on local conditions, infrastructure, and how well you manage the basics.

If you’re eyeing exports: competing on price is no longer enough. Brand trust and supply chain transparency are the new currency.

For innovators and investors: this is an opening you can’t afford to miss in a market hungry for buffalo-specific solutions.

The buffalo revolution isn’t coming—it’s here. Dairy leaders can’t afford to ignore this shift.

Complete references and supporting documentation are available upon request by contacting the editorial team at editor@thebullvine.com.

Learn More:

  • Making Sense of Your Herd’s Data – This article provides a tactical guide for turning sensor data into profitable decisions. It reveals practical methods for interpreting health and reproduction alerts, helping you implement the same kind of precision monitoring discussed in the main piece on your own operation.
  • The Global Dairy Market: Are You A Player Or A Spectator? – While the main article highlights India as an emerging competitor, this piece offers a broader strategic view of global market dynamics. It outlines key economic trends and forces you to consider your farm’s position in the international dairy trade.
  • The Genomic Revolution: Are You Breeding for the Future or Just for Today? – Moving beyond the AI breeding discussed in India, this article explores the next frontier: genomics. It demonstrates how to leverage advanced genetic data to build a more resilient, efficient, and profitable herd for future market and environmental challenges.

The Sunday Read Dairy Professionals Don’t Skip.

Every week, thousands of producers, breeders, and industry insiders open Bullvine Weekly for genetics insights, market shifts, and profit strategies they won’t find anywhere else. One email. Five minutes. Smarter decisions all week.
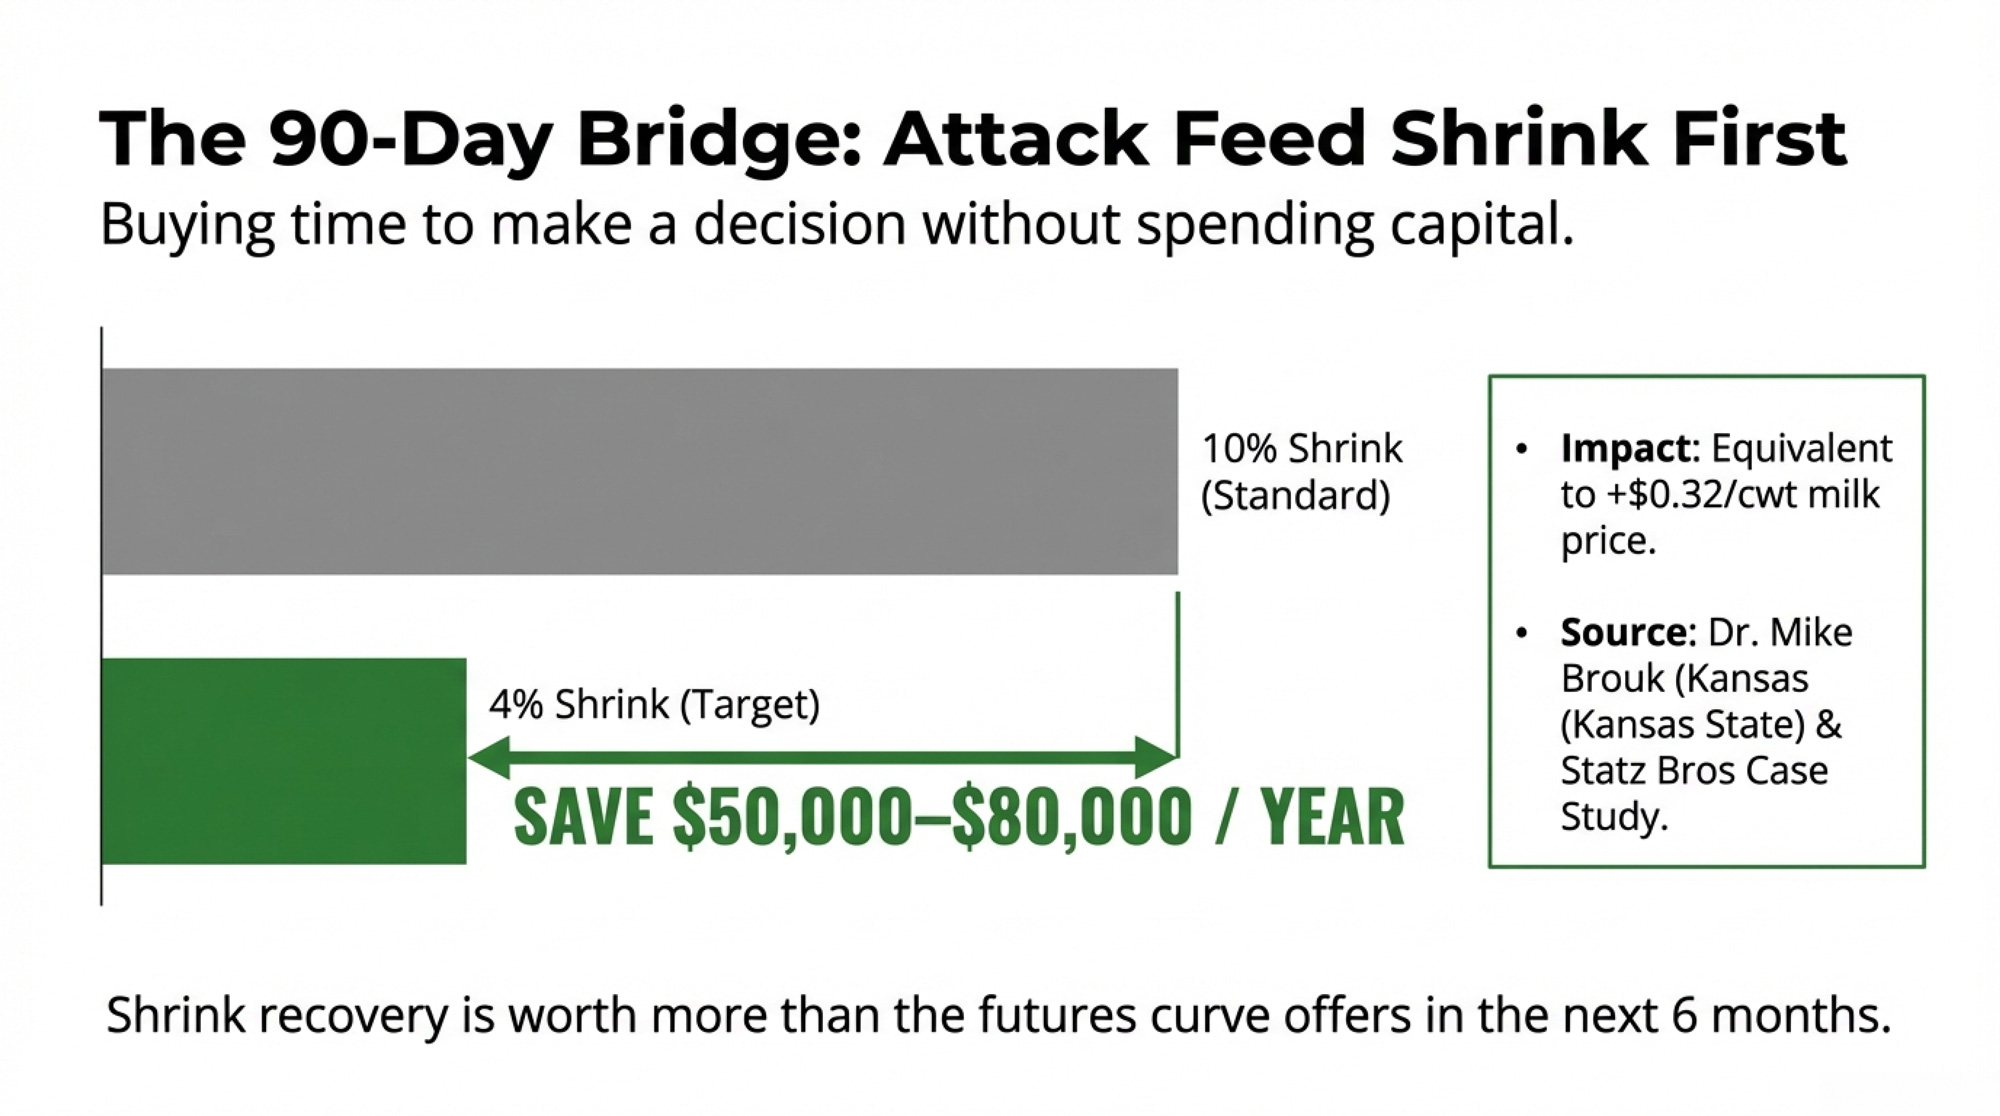
NewsSubscribe
First
Last
Consent

Here’s the Hard Truth About Labor Reform: Why the Farm Workforce Modernization Act Could Finally Fix Your Biggest Headache

Stop bleeding $4,425 per worker replacement, FWMA could slash your 38.8% turnover rate while your neighbors keep hemorrhaging labor costs.

EXECUTIVE SUMMARY: While most dairy producers are still pretending the labor crisis will magically fix itself, smart operators are preparing for the Farm Workforce Modernization Act, the only viable solution to your biggest operational nightmare. The harsh reality: you’re hemorrhaging $4,425 every time you replace a worker, and with 38.8% annual turnover rates plaguing the industry, that’s bleeding serious cash from operations already squeezed by $21.95/cwt milk prices. Here’s what the agriculture lobby won’t tell you: immigrant workers constitute 51% of your workforce and produce 79% of America’s milk supply, making workforce stability your most critical operational metric, not your latest robotic milking system. The FWMA’s year-round H-2A visa access and 3.25% wage cap could transform your $150,000-$275,000 automation ROI from 2 years to 4-10 years, fundamentally changing your technology investment strategy. While international competitors in Canada and New Zealand have solved their agricultural labor challenges through comprehensive reform, U.S. dairy continues to operate with broken immigration policies that guarantee workforce instability. The question isn’t whether you need this reform, it’s whether you’re prepared to capitalize on legal workforce stability while your competitors keep burning cash on endless recruitment cycles.

KEY TAKEAWAYS

  • Workforce Cost Reality Check: Labor represents 14% of total cash expenses and 38.8% annual turnover rates are costing progressive dairies $4,425 per replacement, money that could fund genomic testing programs, improve feed conversion ratios, or invest in precision agriculture technology that actually moves your milk yield metrics forward.
  • Technology Investment Recalibration: Robotic milking systems ($150,000-$275,000 per unit) show 2-year payback periods under current labor crisis conditions, but FWMA workforce stability could extend ROI timelines to 4-10 years, forcing you to recalculate whether automation or legal labor access delivers better returns on your butterfat and protein optimization goals.
  • Production Dependency Truth: 51% immigrant workforce produces 79% of America’s 227.8 billion pounds of projected 2025 milk production, making workforce legalization more critical to your somatic cell count consistency and component quality than your latest feed management software or breeding program innovations.
  • Competitive Positioning Advantage: FWMA’s year-round H-2A visa access and 3.25% wage caps provide cost predictability that could free up capital for genomic selection programs, precision feeding systems, or facility improvements that directly impact your milk yield per cow and feed conversion efficiency metrics.
  • Strategic Implementation Timeline: Document your current workforce legal status, calculate real turnover costs including lost production during training periods, and prepare for mandatory E-Verify compliance, because farms that proactively position for FWMA implementation will capture competitive advantages while neighbors scramble to adapt to new labor market realities.
dairy labor shortage, farm workforce modernization, dairy profitability, milk production costs, dairy industry trends

The Farm Workforce Modernization Act isn’t just another piece of legislation gathering dust in Washington. It’s the first real shot at solving the labor crisis that’s been bleeding your operation dry. With 38.8% annual turnover rates and 5,000 unfilled dairy positions nationwide, we’re past the point of pretending this will fix itself.

Here’s what nobody’s telling you: this bill could fundamentally change how you staff your operation, but only if you understand what’s really at stake.

The Numbers Don’t Lie – Your Labor Crisis is Getting Worse

Let’s face it – your labor situation is a mess, and it’s costing you more than you think. Labor eats up 14% of your total cash expenses, making it your second-largest cost after feed. That’s not pocket change when you’re dealing with milk prices forecast at $21.95 per hundredweight for 2025.

But here’s the kicker: immigrant workers constitute 51% of the total dairy workforce and produce 79% of America’s milk supply. In western states, this dependency reaches 90% of dairy workers being foreign-born, with about 85% originating from Mexico. You can complain about it, or you can face reality – your operation depends on this workforce whether you admit it or not.

“Labor costs are about 14% of dairy’s total cash expenses,” confirms Stan Moore with Michigan State University Dairy Extension. When you’re managing 9.42 million dairy cows producing a projected 227.8 billion pounds of milk in 2025, workforce stability isn’t just important – it’s essential for survival.

Why Current Immigration Policy is Designed to Fail You

The current H-2A guest worker program is useless for dairy operations, and Congress knows it. The program is legally limited to “temporary or seasonal” work, which means exactly nothing when you need to milk cows twice a day, 365 days a year.

This isn’t an oversight – it’s a fundamental design flaw that’s left dairy producers scrambling for solutions that don’t exist under current law.

FWMA: The First Immigration Bill That Actually Gets Dairy

The Farm Workforce Modernization Act does something revolutionary: it acknowledges that dairy farming isn’t seasonal. The bill provides access to 20,000 year-round H-2A visas annually, with dairy guaranteed at least half.

But here’s what makes this different from every other failed reform attempt:

Three-Part Framework That Actually Works:

  • Certified Agricultural Worker (CAW) status for experienced undocumented workers already on your farm
  • Year-round H-2A visa access specifically designed for dairy operations
  • Mandatory E-Verify implementation only after legal pathways are established

“The Farm Workforce Modernization Act stabilizes the workforce, which will protect the future of our farms and our food supply,” states Congressman Dan Newhouse, who co-leads the legislation.

What This Means for Your Bottom Line

Stop thinking about this as an immigration issue – start thinking about it as a business solution. The bill caps Adverse Effect Wage Rate increases at 3.25% annually, giving you cost predictability you’ve never had.

Real Impact on Your Operation:

  • Workforce Stability: Legal status reduces the 38.8% turnover rate that’s costing you thousands in recruitment
  • Technology Decisions: Stable labor could extend payback periods for robotic milking systems from 2 years to 4-10 years, changing your automation calculus
  • Production Consistency: 58% of farmers with automatic milking systems report milk production increases, but only with consistent, trained operators

The Technology Reality Check Nobody’s Discussing

Here’s something the automation evangelists won’t tell you: even with the most advanced robotic systems, you still need skilled workers. Robotic milking systems cost $150,000 to $275,000 per unit, and their success depends entirely on proper management and maintenance.

The FWMA doesn’t eliminate your need for technology – it gives you the workforce stability to make smart technology investments instead of panic purchases driven by labor shortages.

Regional Winners and Losers in the New Labor Landscape

The data reveals a harsh truth: states with favorable labor conditions are winning while traditional dairy regions struggle. Kansas produced 382 million pounds of milk in April 2025, up from 343 million a year prior, while California saw 1.8% declines despite maintaining herd sizes.

You can’t compete if you can’t staff your operation consistently.

Why the Status Quo is Killing Your Operation

Let’s be brutally honest about what’s happening right now. Every month you operate with high turnover, you’re losing money in ways that don’t show up on your P&L:

  • Delayed health monitoring leads to higher somatic cell counts
  • Inconsistent milking procedures reduce component quality
  • Training costs multiply with every new hire
  • Stress and burnout affect your entire management team

“Labor shortage is a big challenge,” confirms Jon Slutsky, owner of La Luna Dairy in Colorado. “Although we are doing better for the moment, we are frequently at least one employee short”.

What You Need to Do Right Now

Stop waiting for perfect solutions. The FWMA isn’t perfect, but it’s the most viable path forward you’ll see in your career. Here’s your action plan:

  1. Document your current workforce: Know exactly who you employ and their legal status
  2. Calculate your real turnover costs: Include recruitment, training, and lost productivity
  3. Engage with industry advocacy: Support NMPF and other organizations pushing for passage
  4. Plan for implementation: Prepare for E-Verify requirements and legal compliance

Bottom Line: Your Future Depends on This

The dairy industry’s workforce crisis isn’t getting better – it’s getting worse. The FWMA represents the most comprehensive legislative approach to addressing dairy labor shortages in decades.

“We thank Representatives Lofgren and Newhouse for reintroducing their bipartisan Farm Workforce Modernization Act. Ag workforce reform has been a top priority for America’s dairy farmers and farmworkers for decades,” states Jim Mulhern, President and CEO of NMPF.

You have two choices: continue bleeding money through endless turnover and recruitment costs, or support the only viable legislative solution on the table.

The reality is simple: with immigrant workers producing 79% of America’s milk supply and turnover rates approaching 40%, the status quo is unsustainable. The FWMA offers legal workforce stability that could fundamentally reshape your labor management strategy.

Your operation’s future stability depends on comprehensive immigration reform that bridges the gap between enforcement policies and agricultural labor realities. The question isn’t whether you need this reform – it’s whether you’re willing to fight for it before it’s too late.

Complete references and supporting documentation are available upon request by contacting the editorial team at editor@thebullvine.com.

Learn More:

The Sunday Read Dairy Professionals Don’t Skip.

Every week, thousands of producers, breeders, and industry insiders open Bullvine Weekly for genetics insights, market shifts, and profit strategies they won’t find anywhere else. One email. Five minutes. Smarter decisions all week.
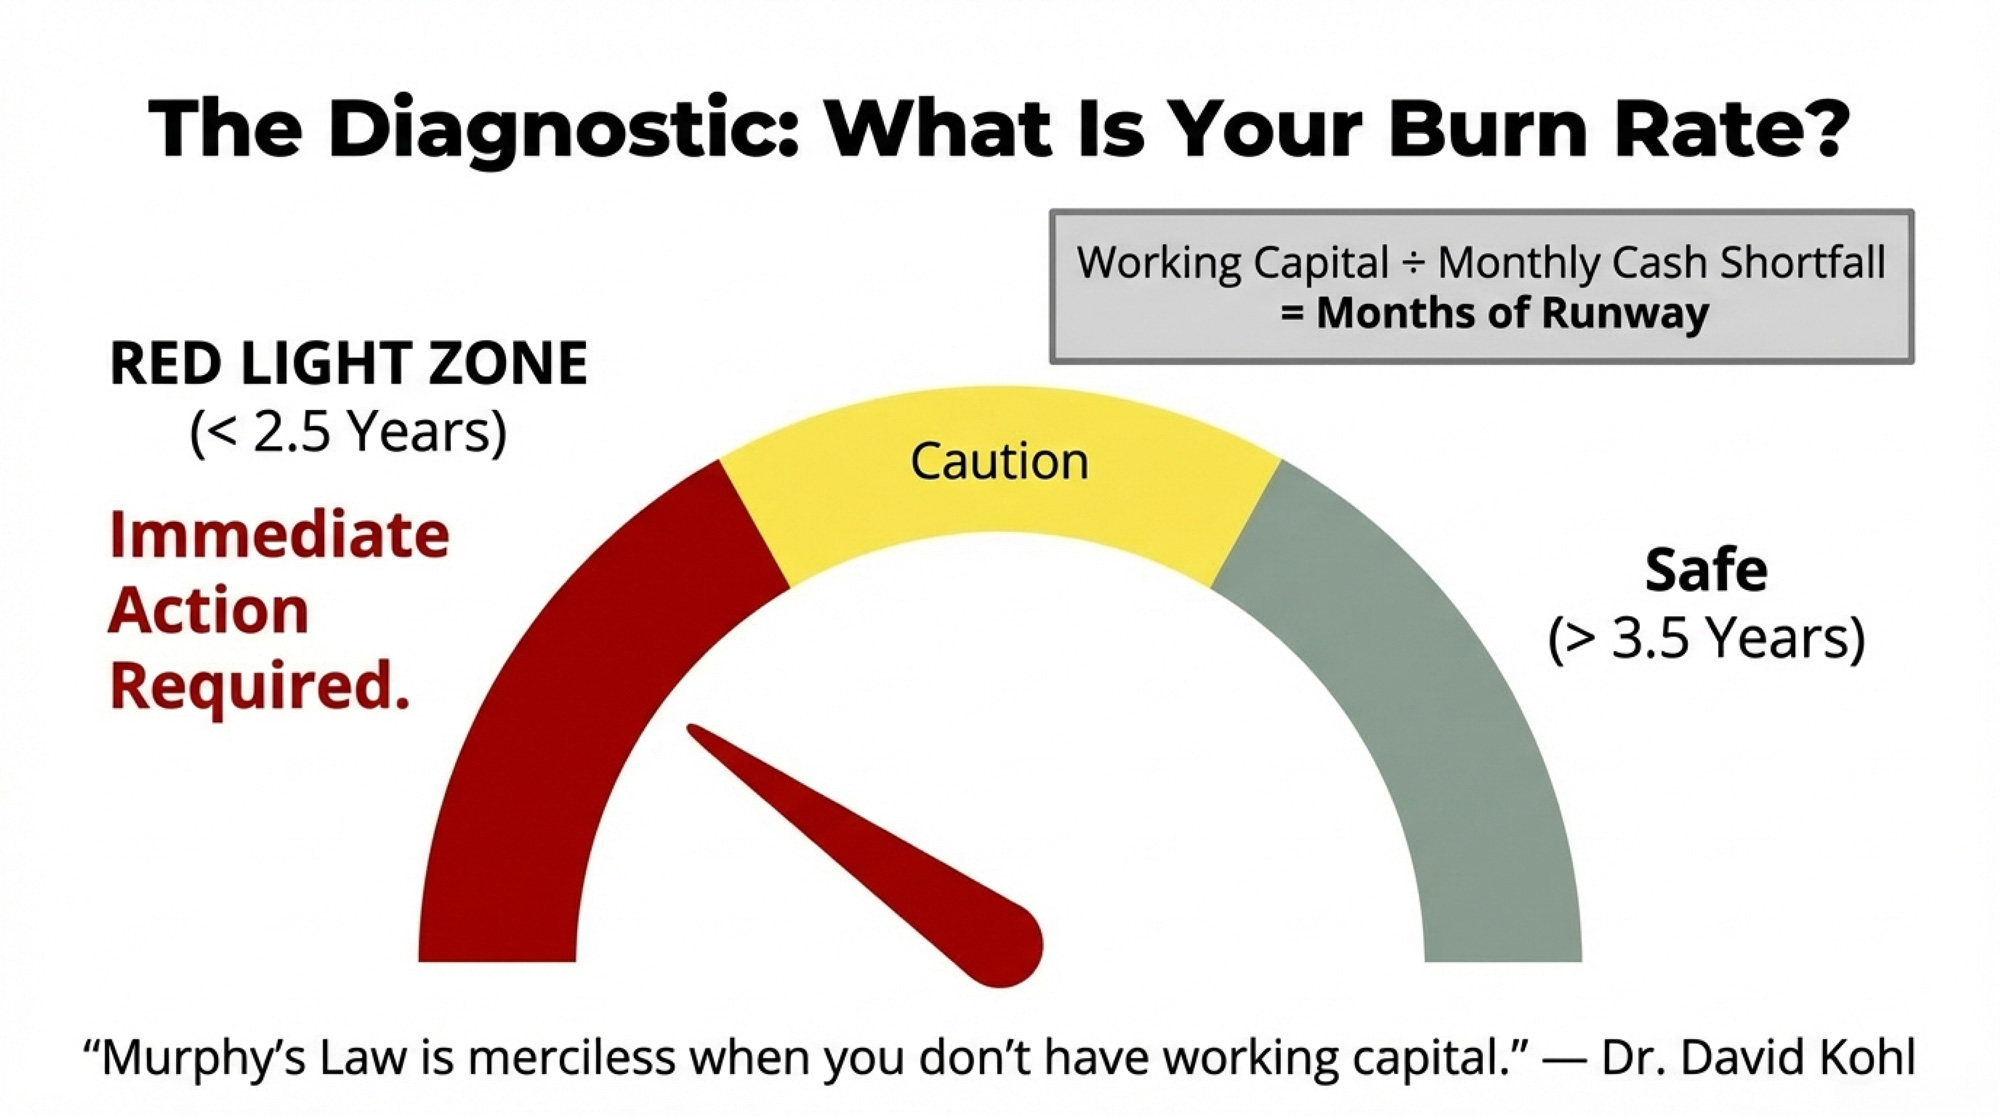
NewsSubscribe
First
Last
Consent
Send this to a friend