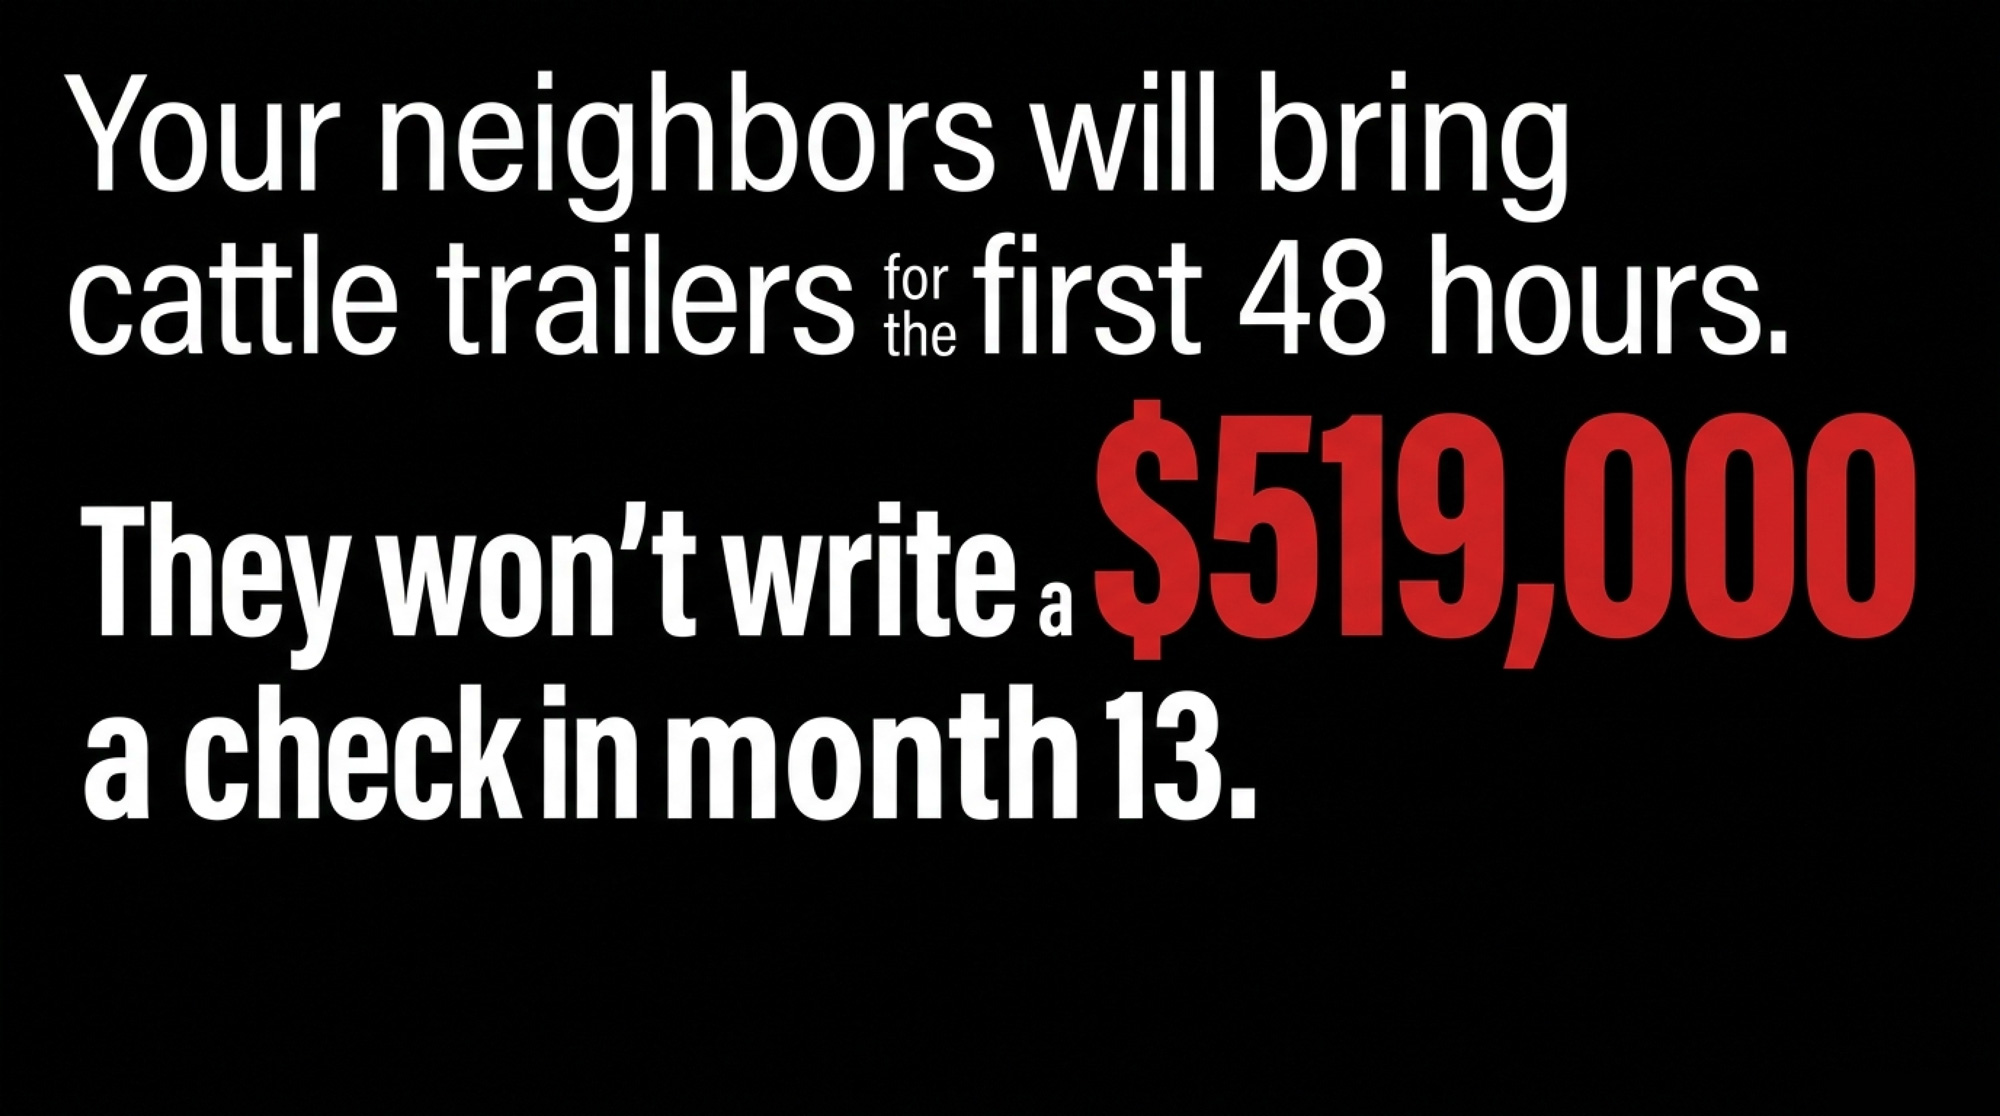
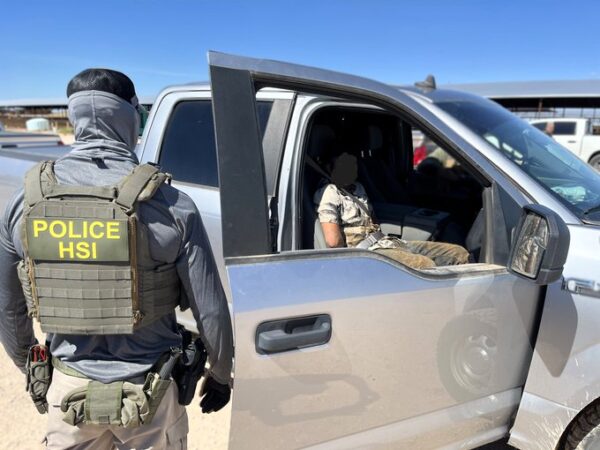
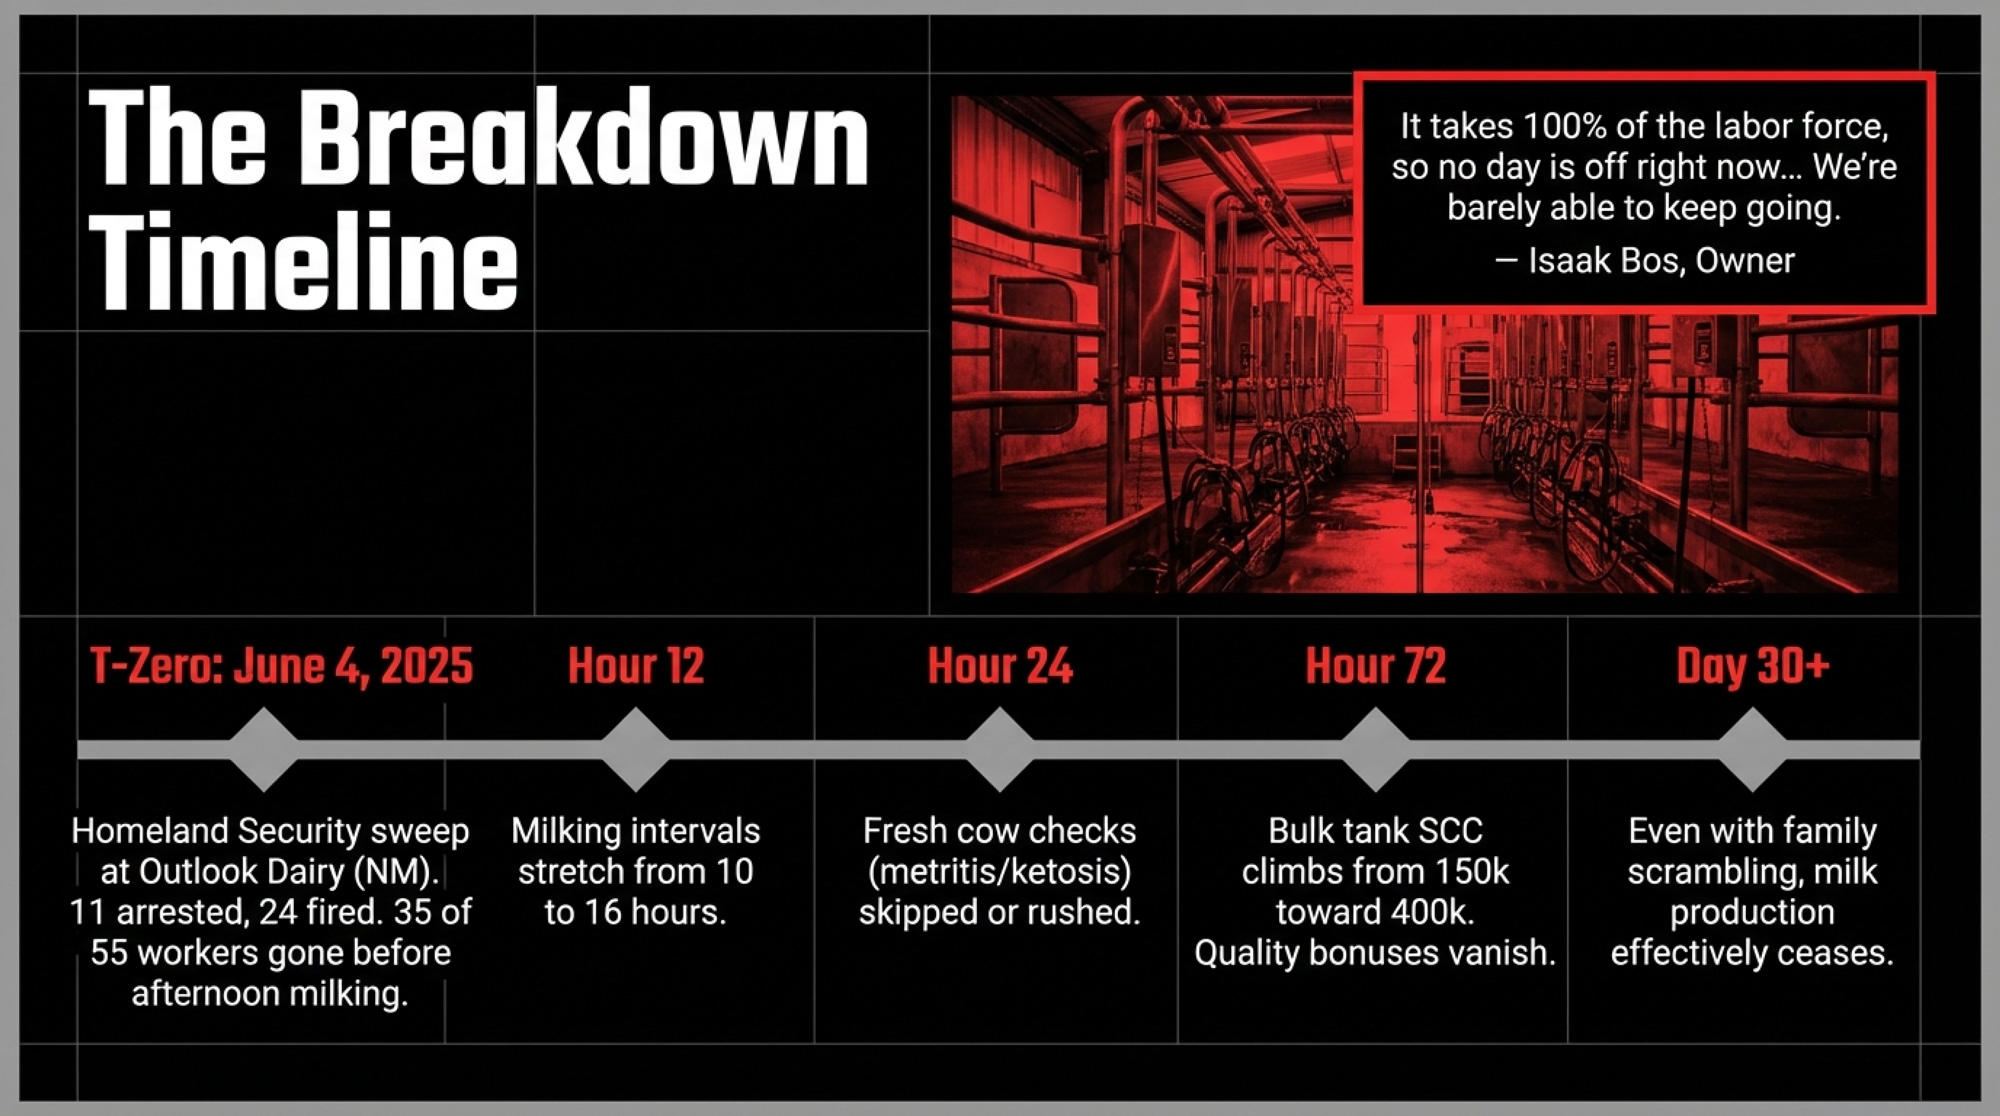
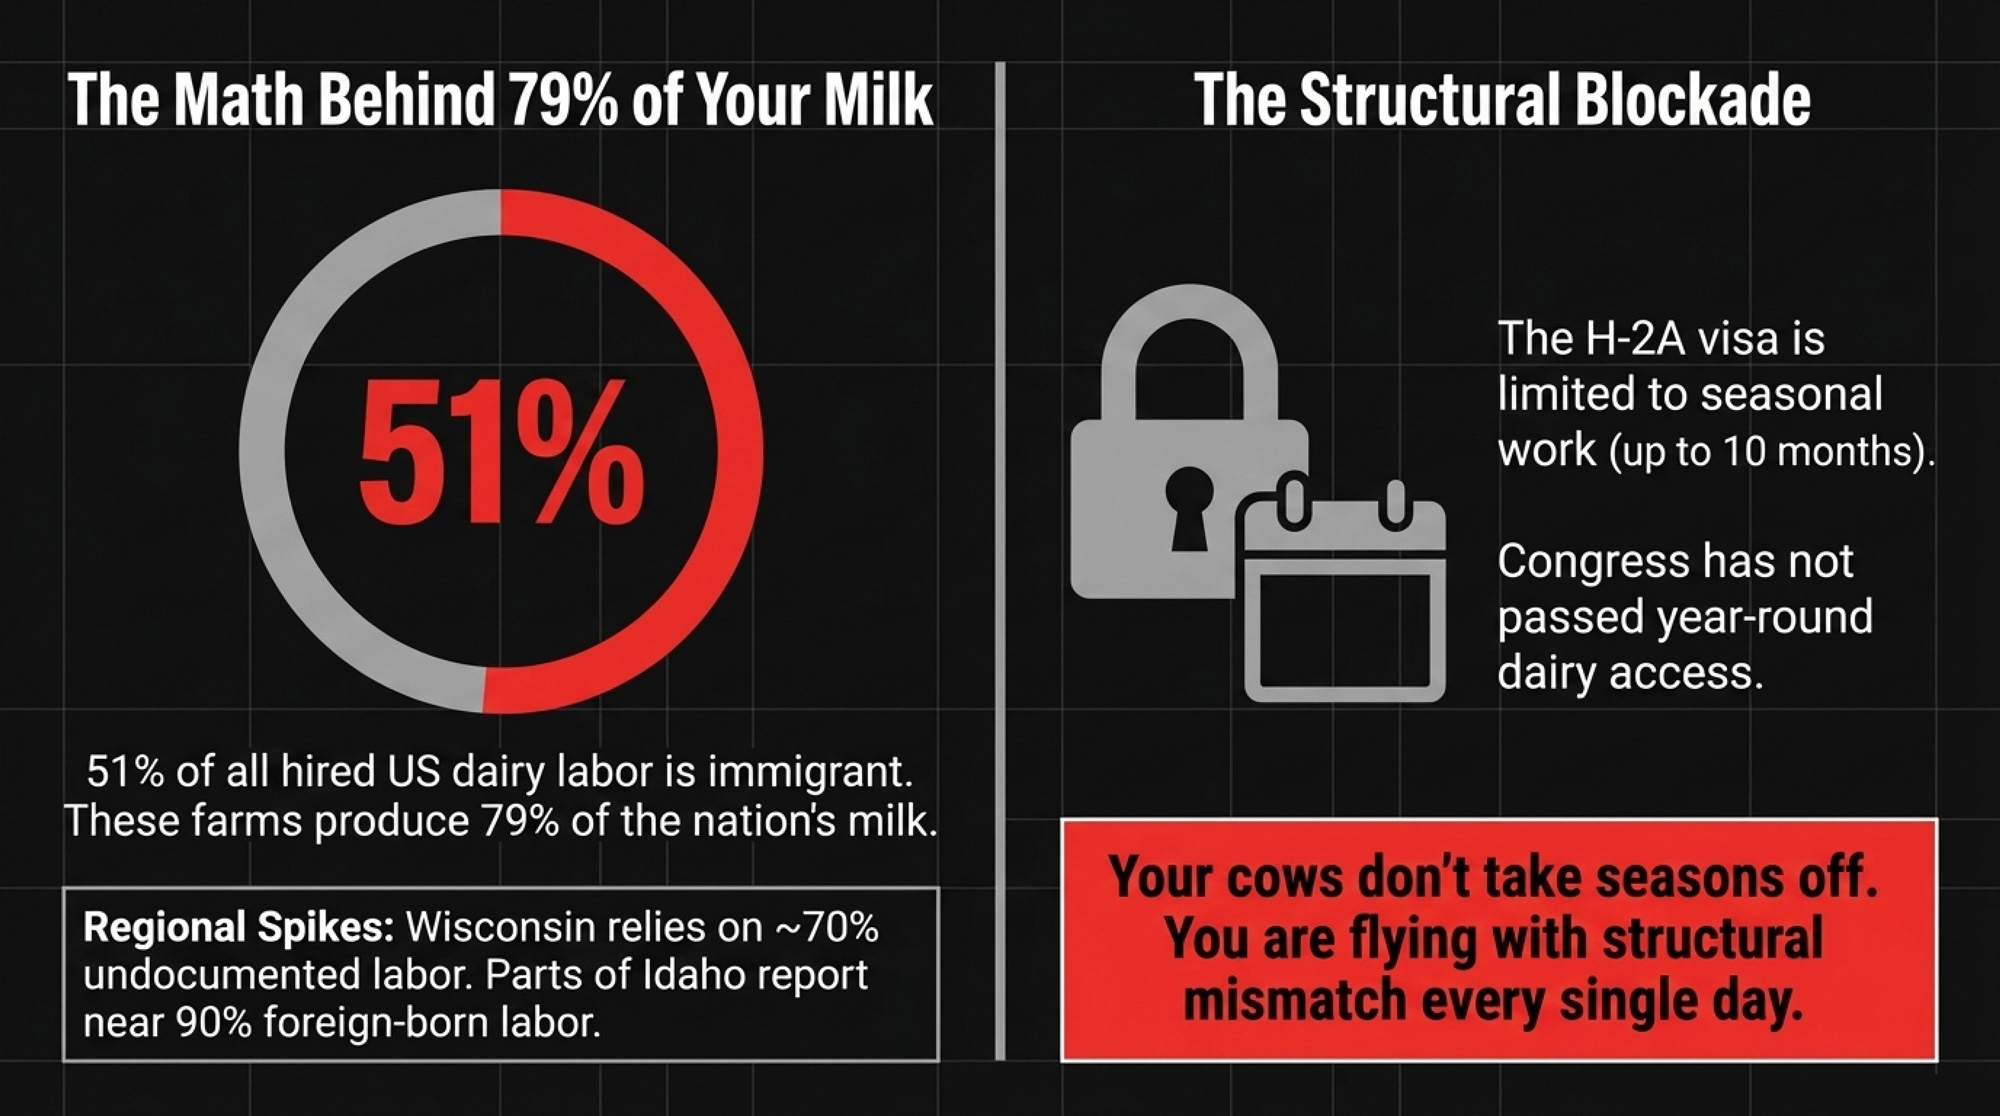
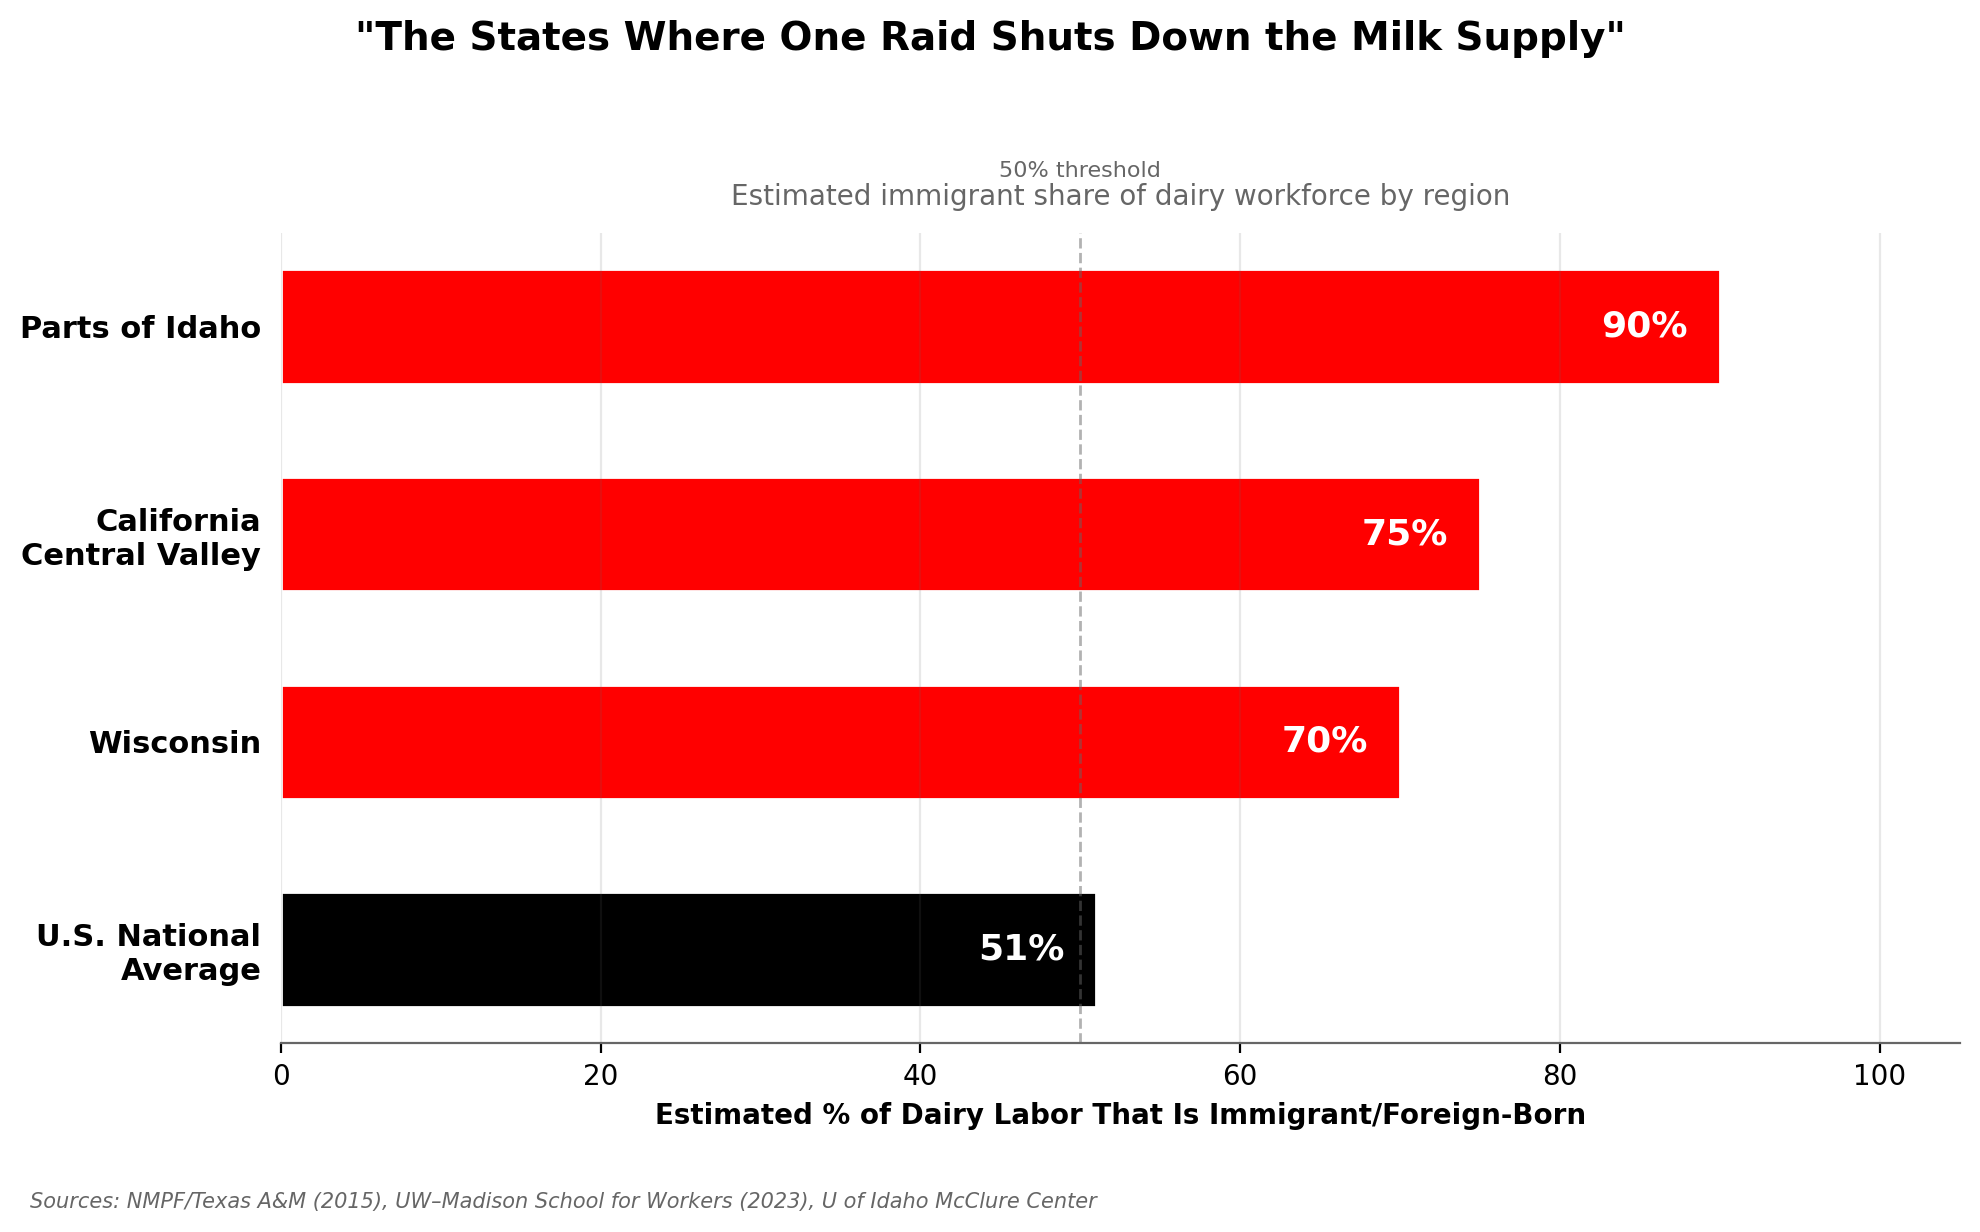
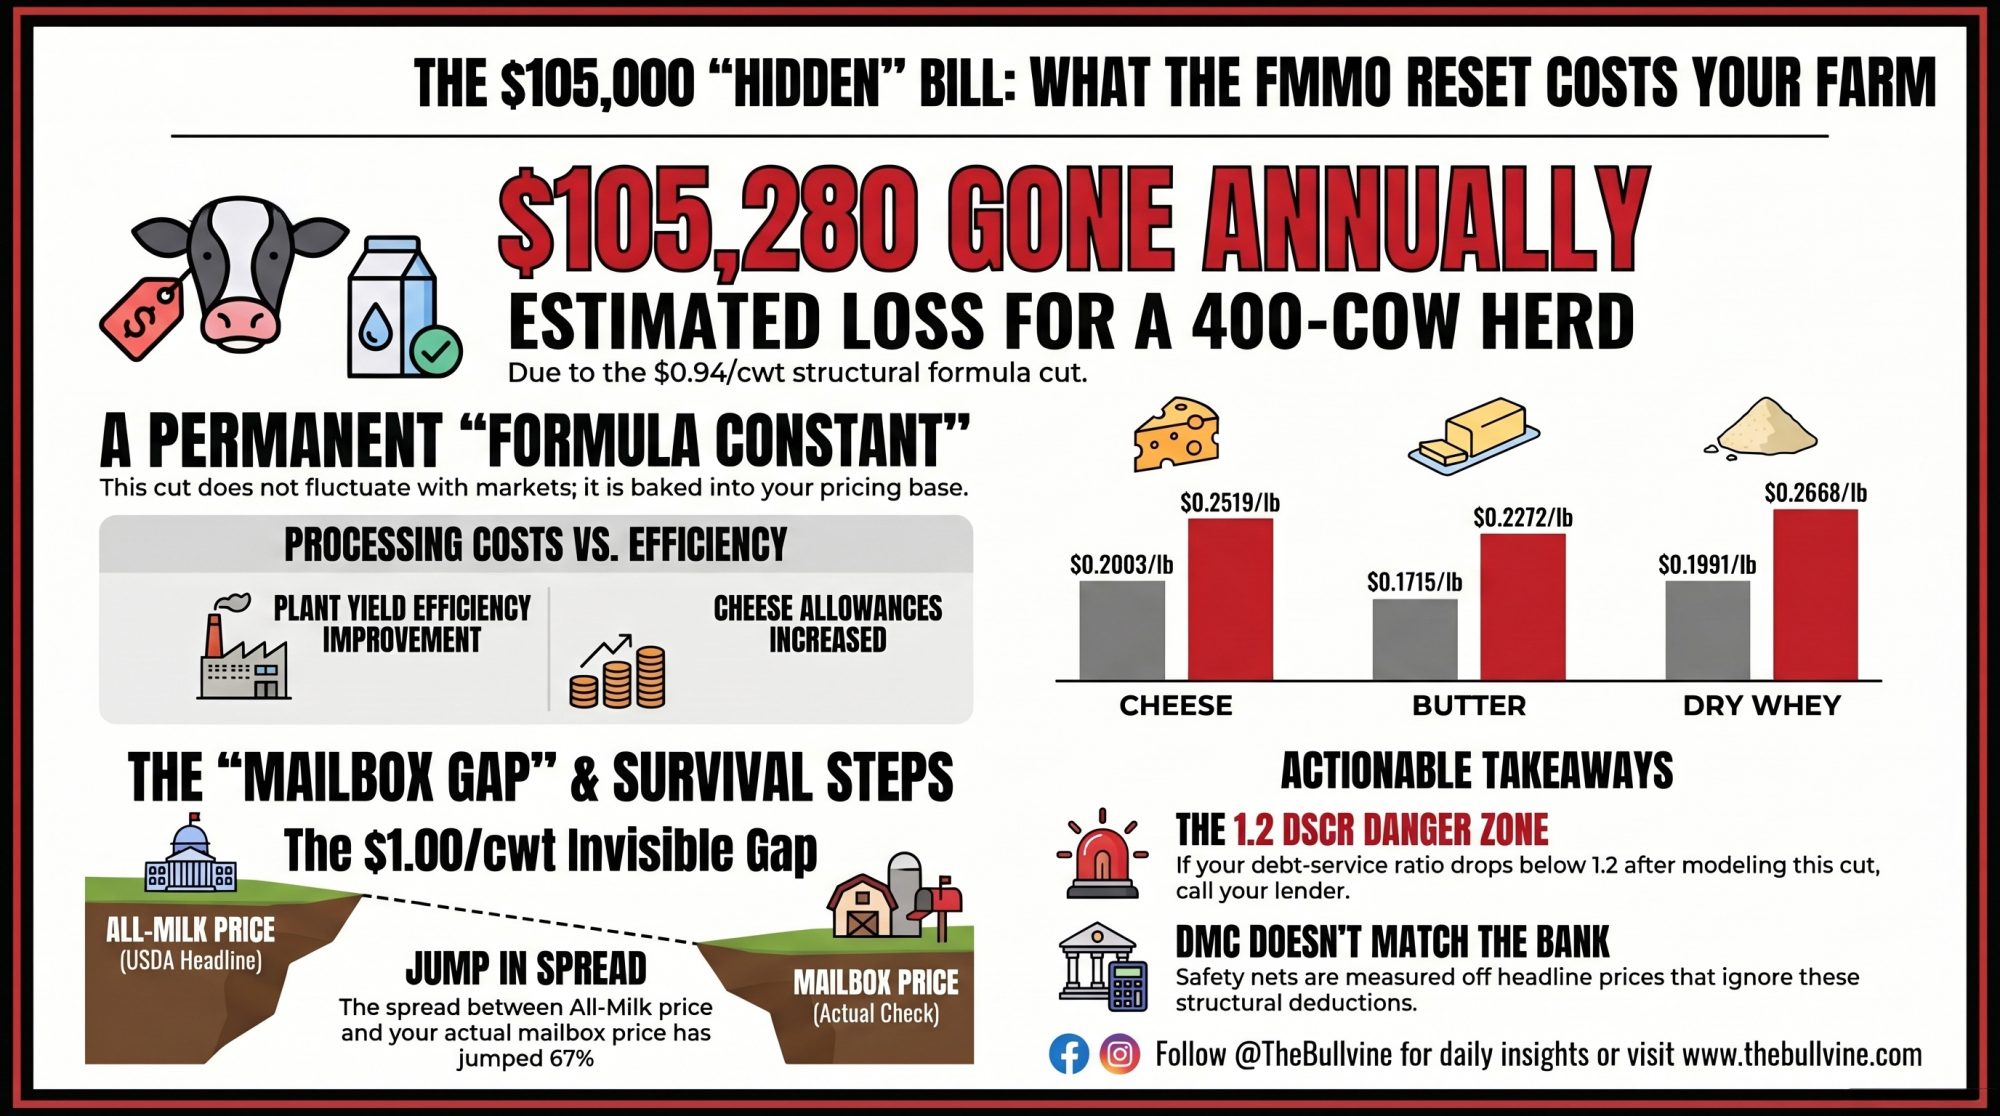
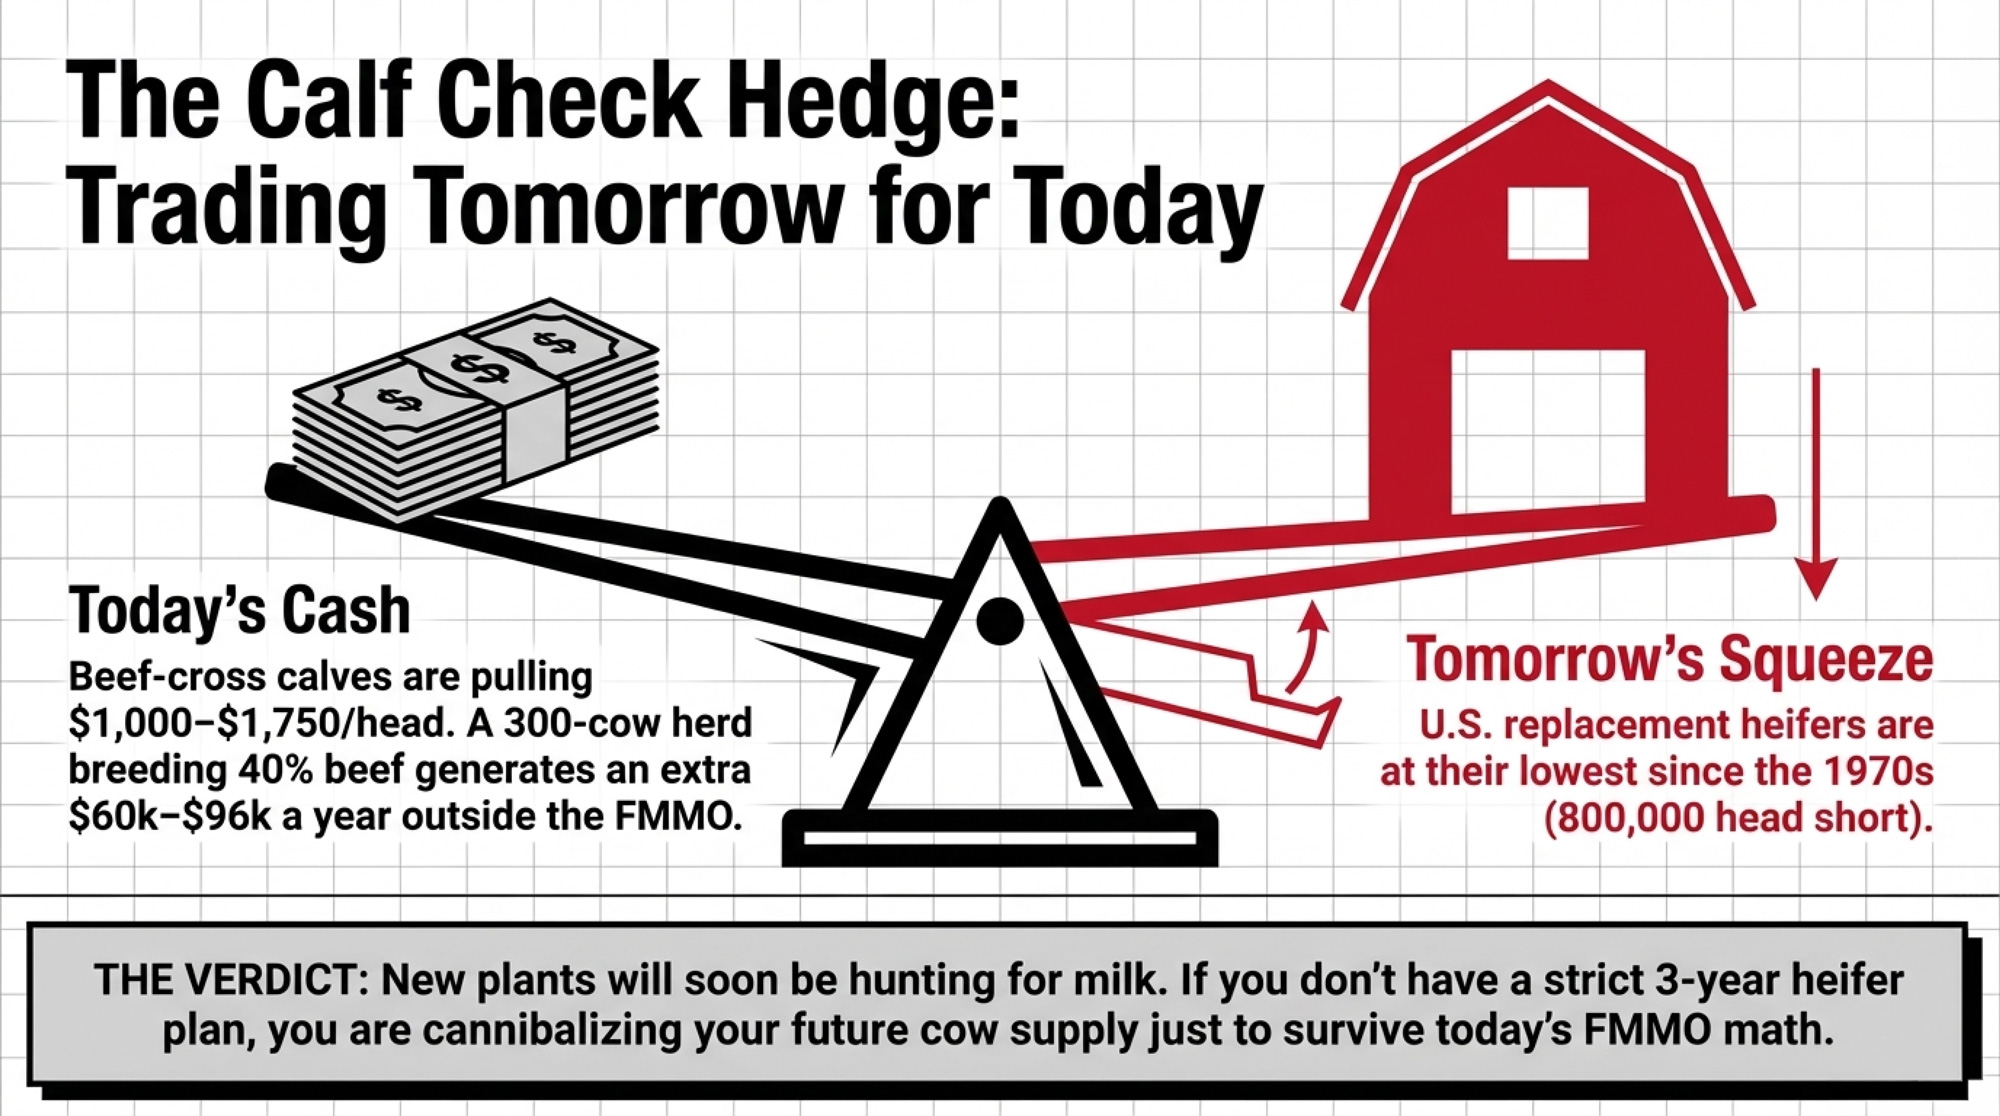
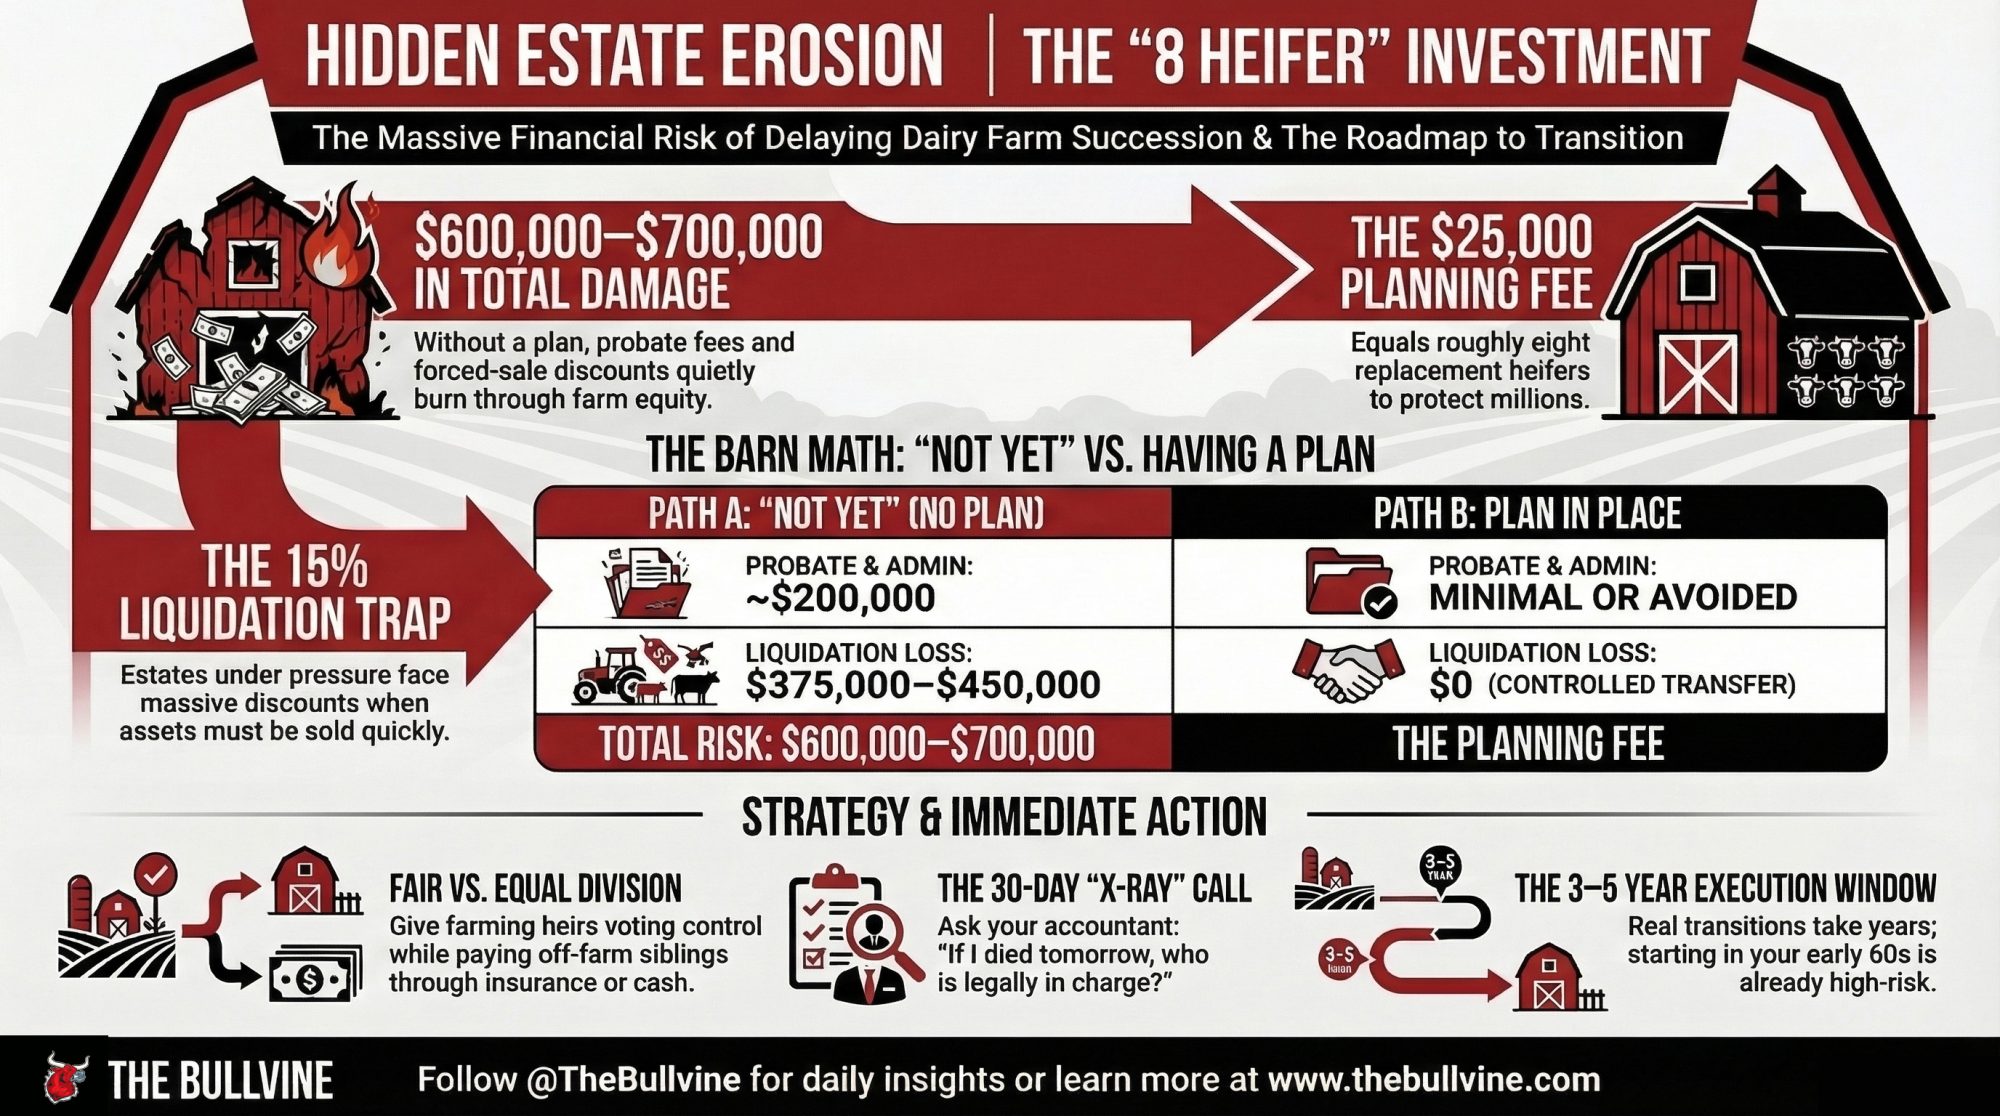
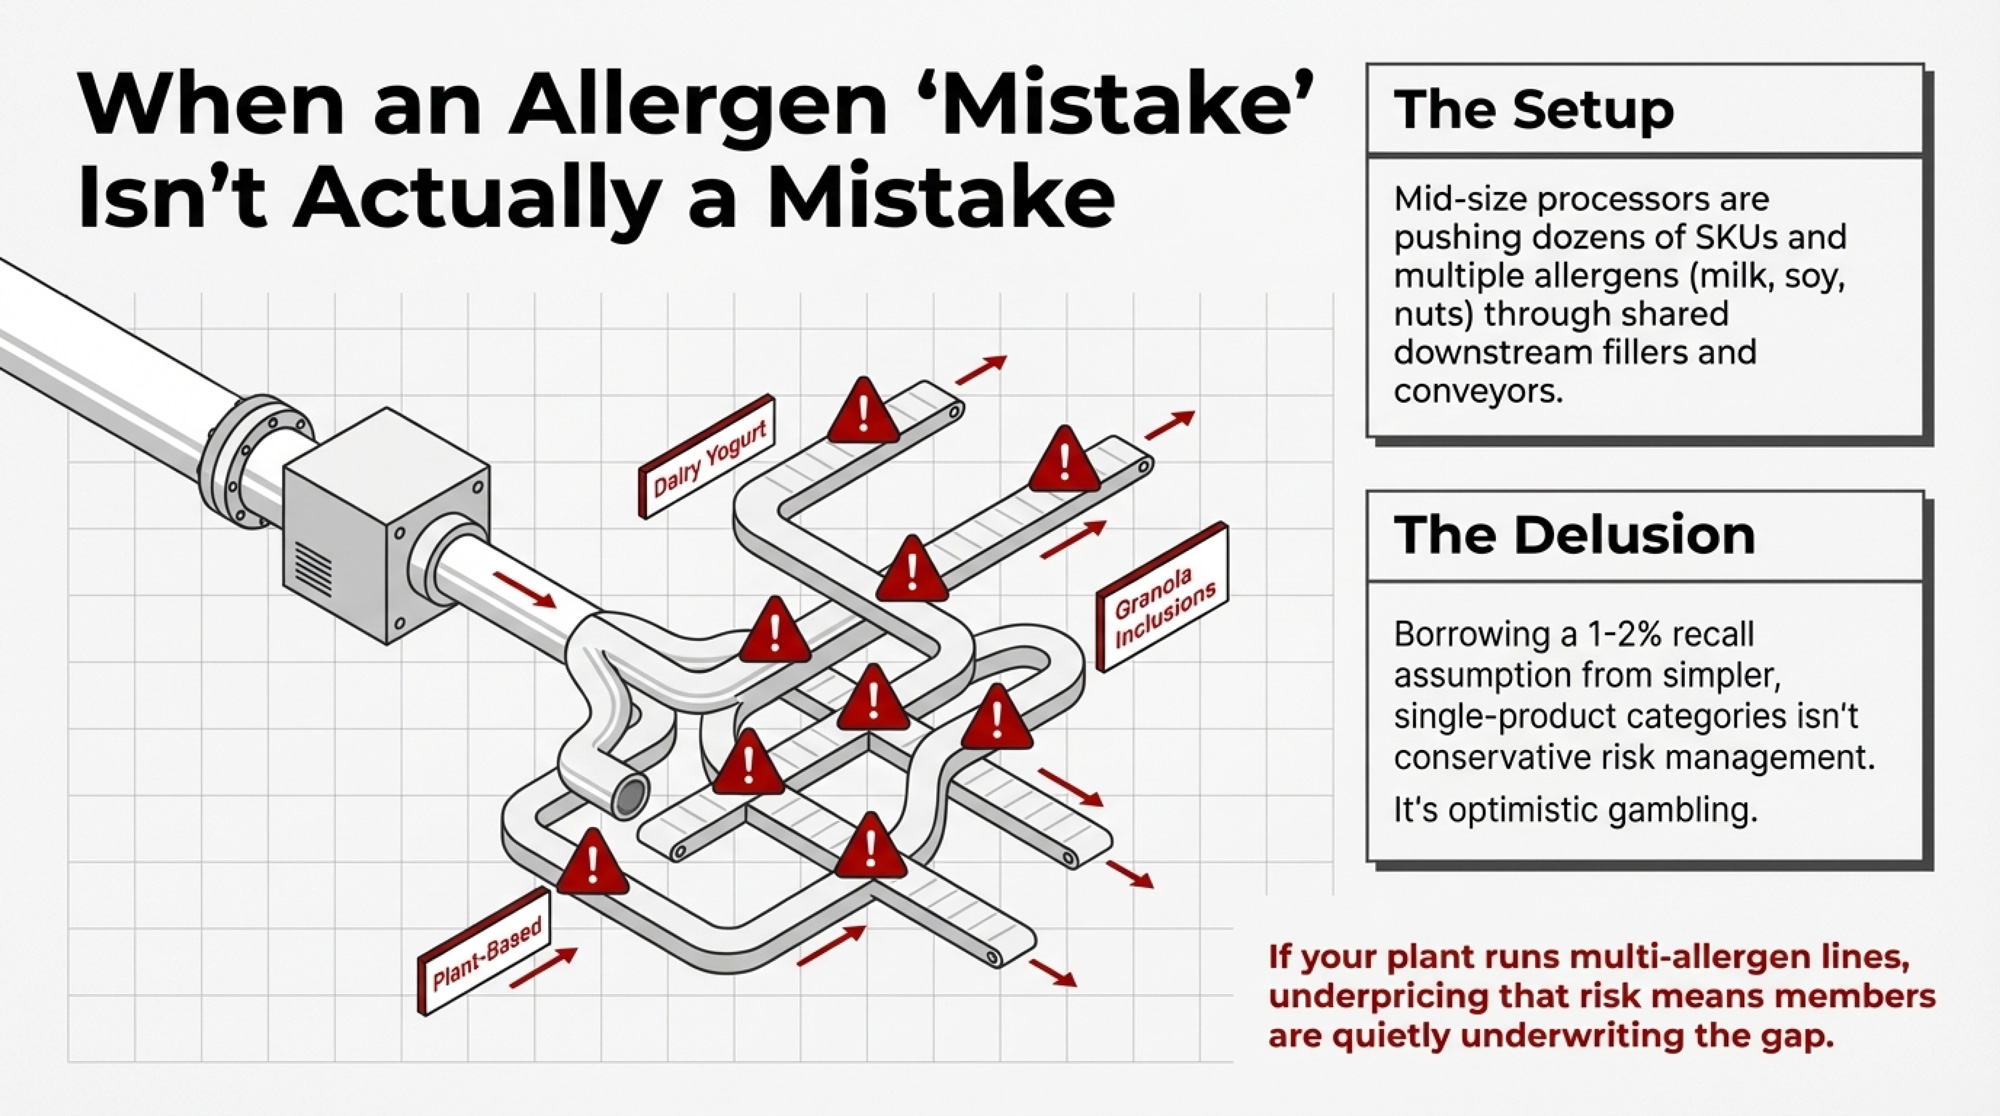
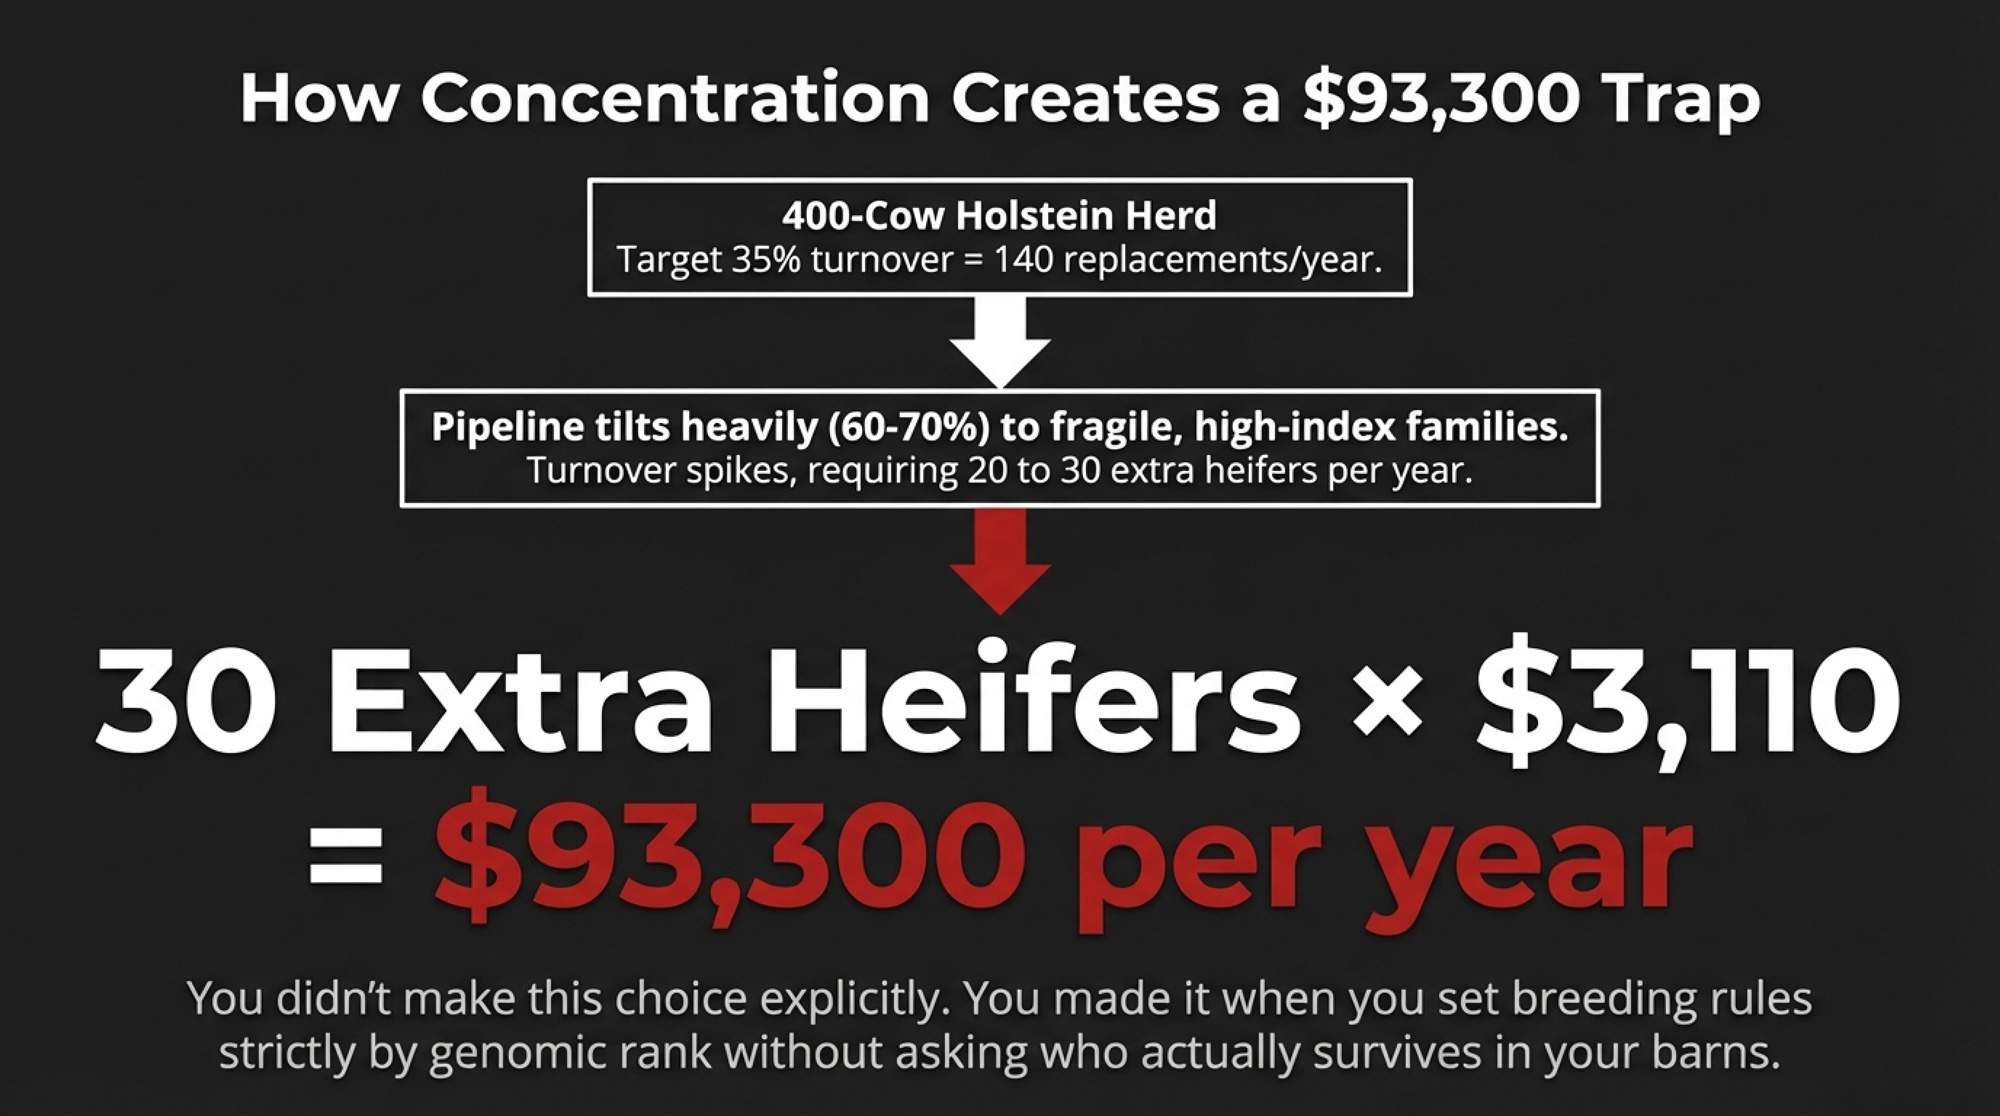
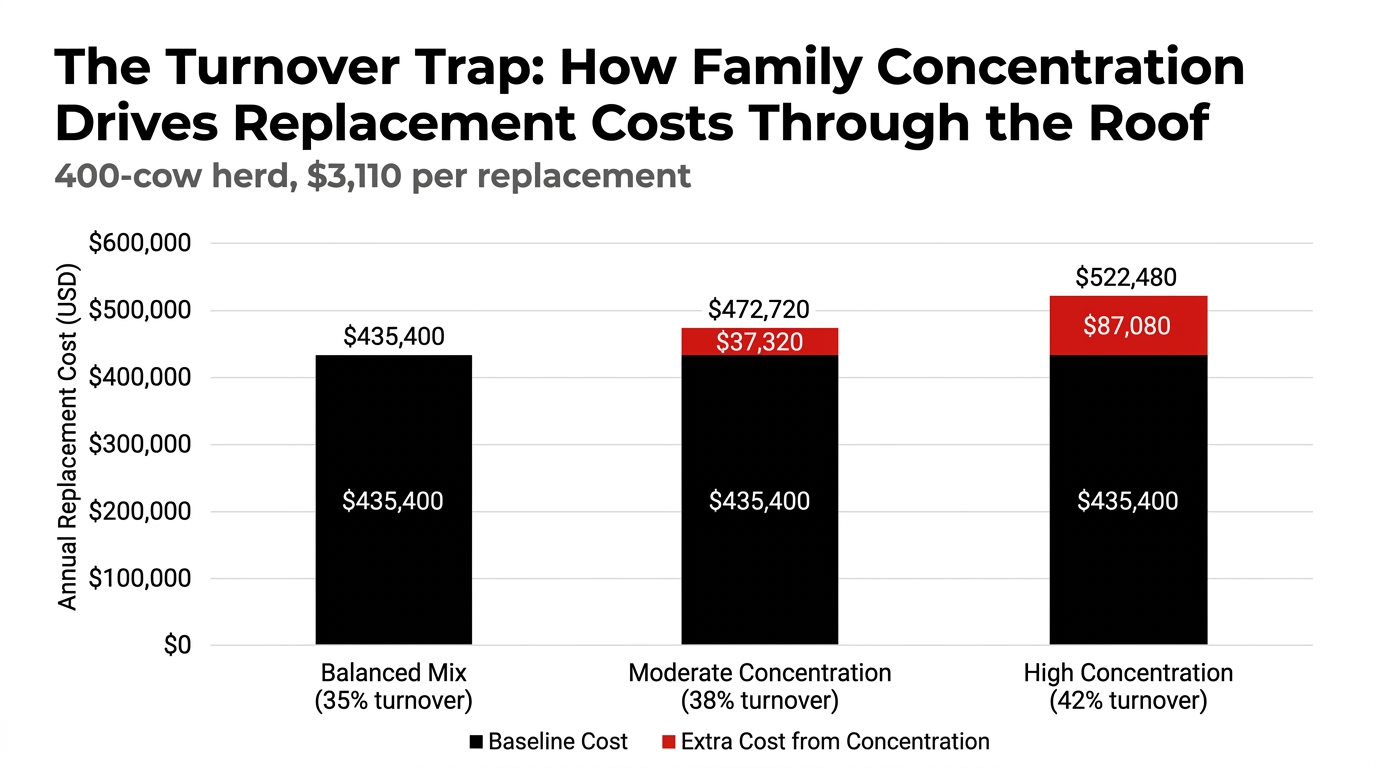
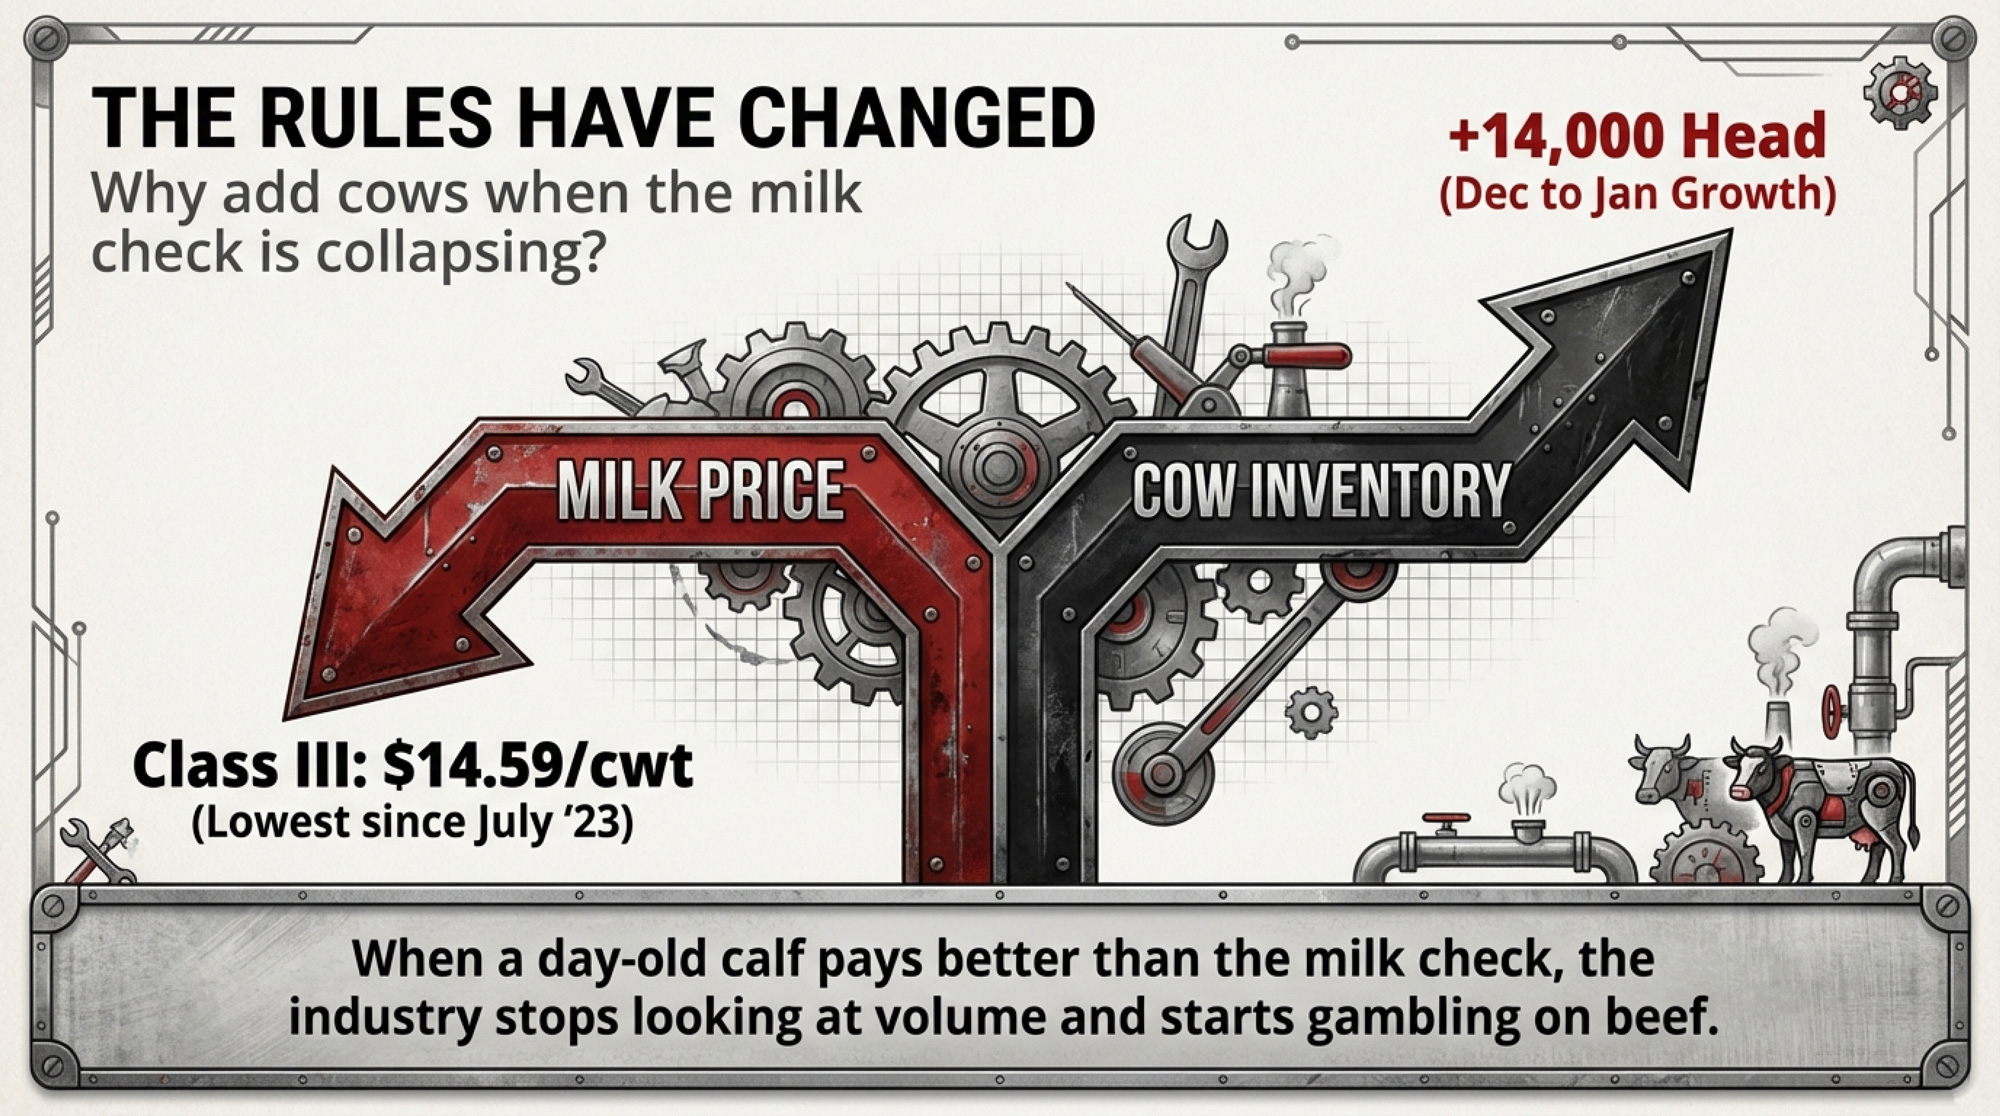
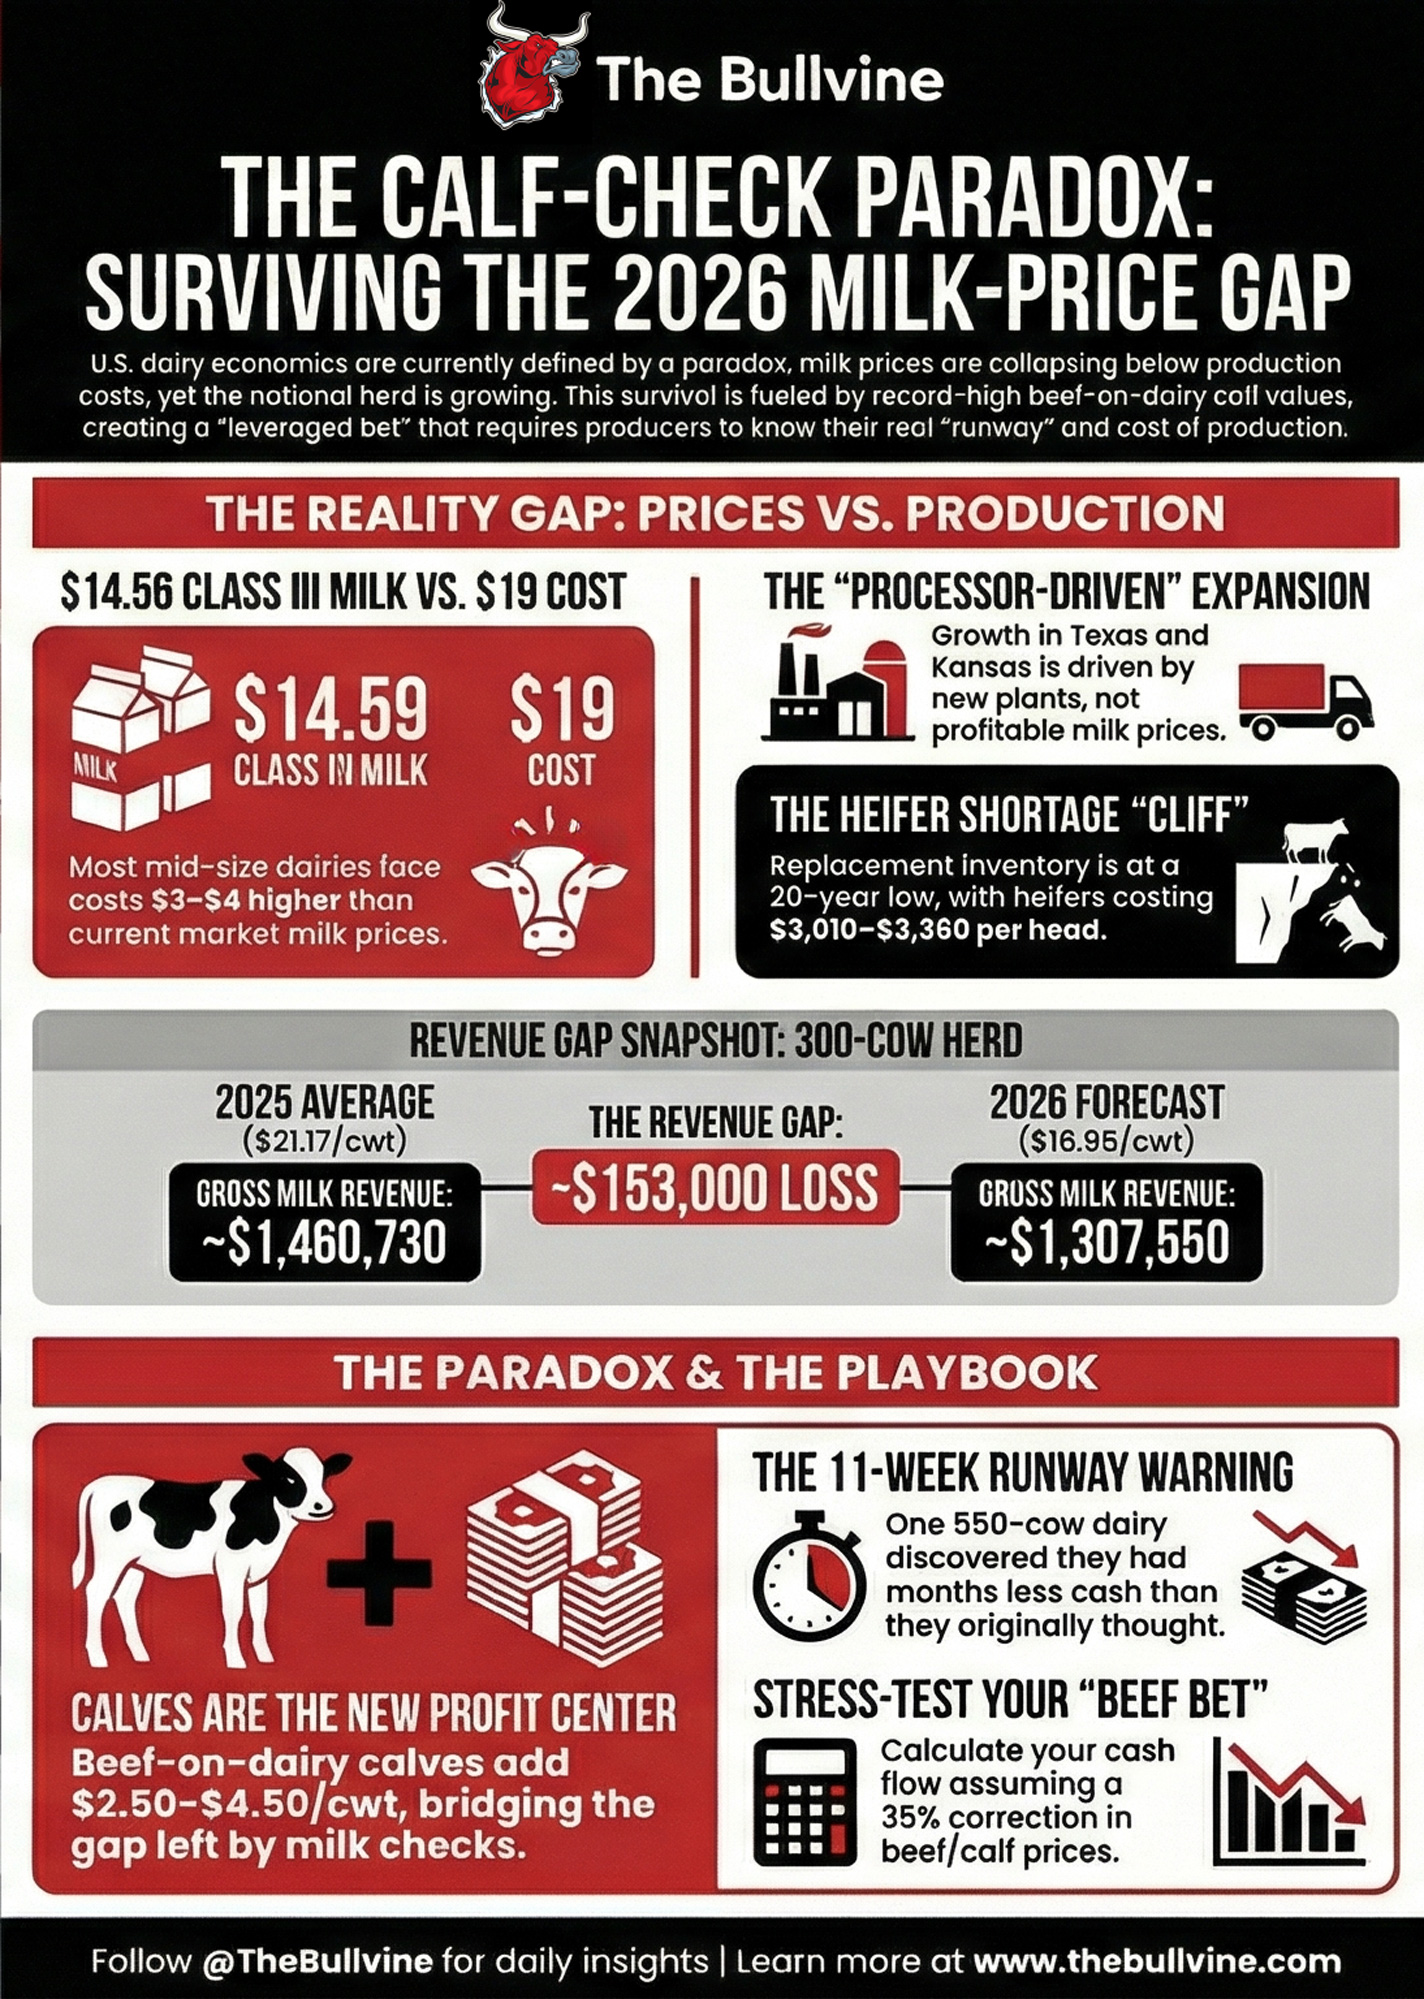
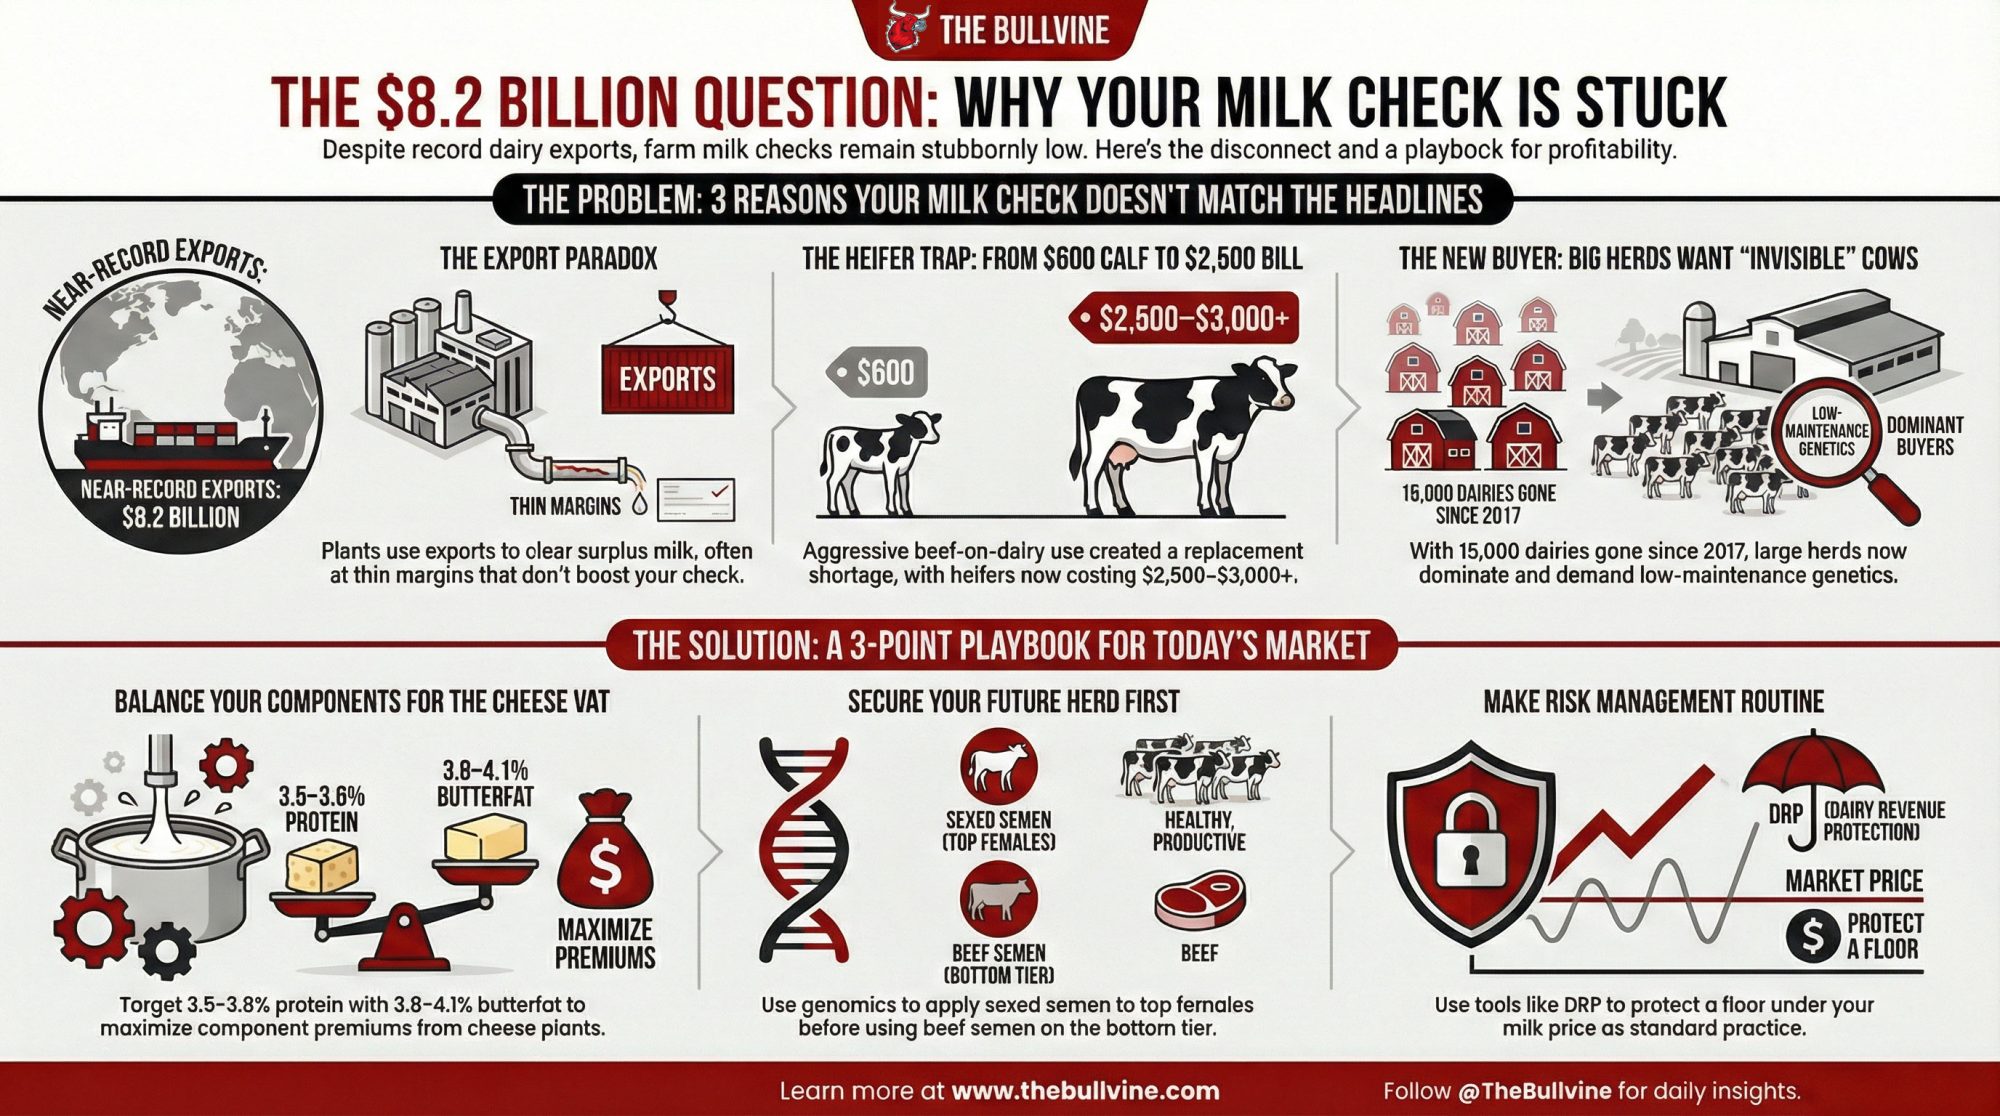
Jarratt logged 69 noncompliance records before the listeria hit. Ten funerals, 7 million pounds pulled, 17 months dark — and the margin damage is already moving upstream to 400-cow herds that never shipped a bad load.
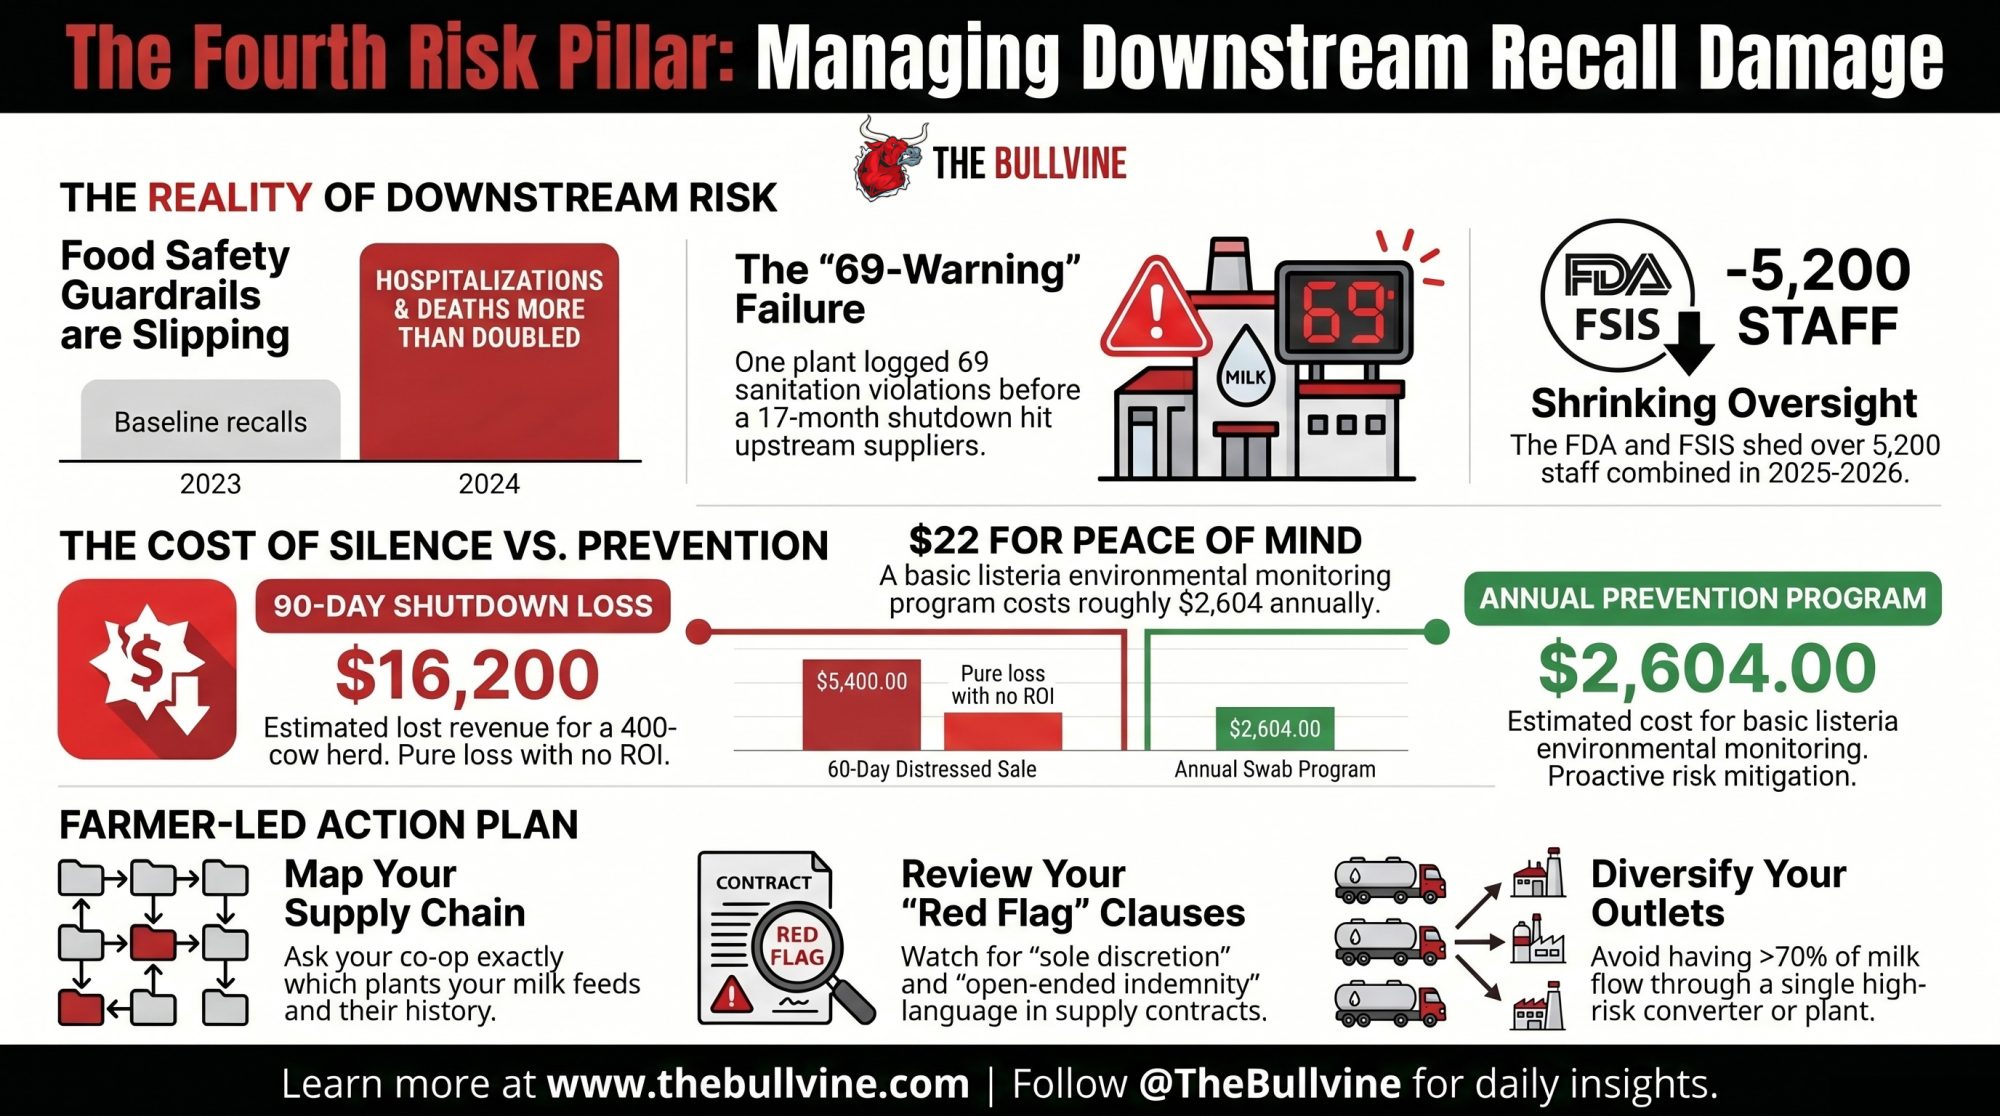
Executive Summary: Boar’s Head’s Jarratt, Virginia plant racked up 69 sanitation noncompliance records before a listeria outbreak killed 10 people, pulled more than 7 million pounds of product, and kept the facility dark for 17 months. That’s one plant in a broader shift: 2024 recall-linked hospitalizations hit 487 and deaths hit 19 — both more than double 2023 — while CDC’s FoodNet quietly de-emphasized listeria as a core target and FDA and FSIS shed over 5,200 staff combined. The dairy side is already in the blast radius — Rizo-López under permanent injunction, Prairie Farms supplemental shakes linked to 14 deaths, and Great Lakes Cheese yanking 1.5 million bags across 31 states on a Class II recall. On a 400-cow herd shipping 300 cwt/day, a 10% downstream intake cut at a $3/cwt discount for 60 days burns about $5,400; a 90-day shutdown scenario runs $16,200 — versus roughly $2,604/year for a basic listeria EMP built on $21.50–$21.86 swabs (Motzer, Trmčić et al., JDS 2025). HACCP self-policing, Talmadge-Aiken enforcement gaps, and co-ops that can’t audit their customers’ drains mean that risk isn’t staying where it was built. If more than 70% of your milk moves through one plant or converter, or your supply contract carries open-ended indemnity and “sole discretion” clauses, you’re carrying downstream plant risk as a fourth pillar next to feed, weather, and price — whether you’ve priced it or not. Read the full piece for the four levers you control, a contract-clause checklist, and the 30-day conversation to have with your co-op before the next recall runs your numbers for you.

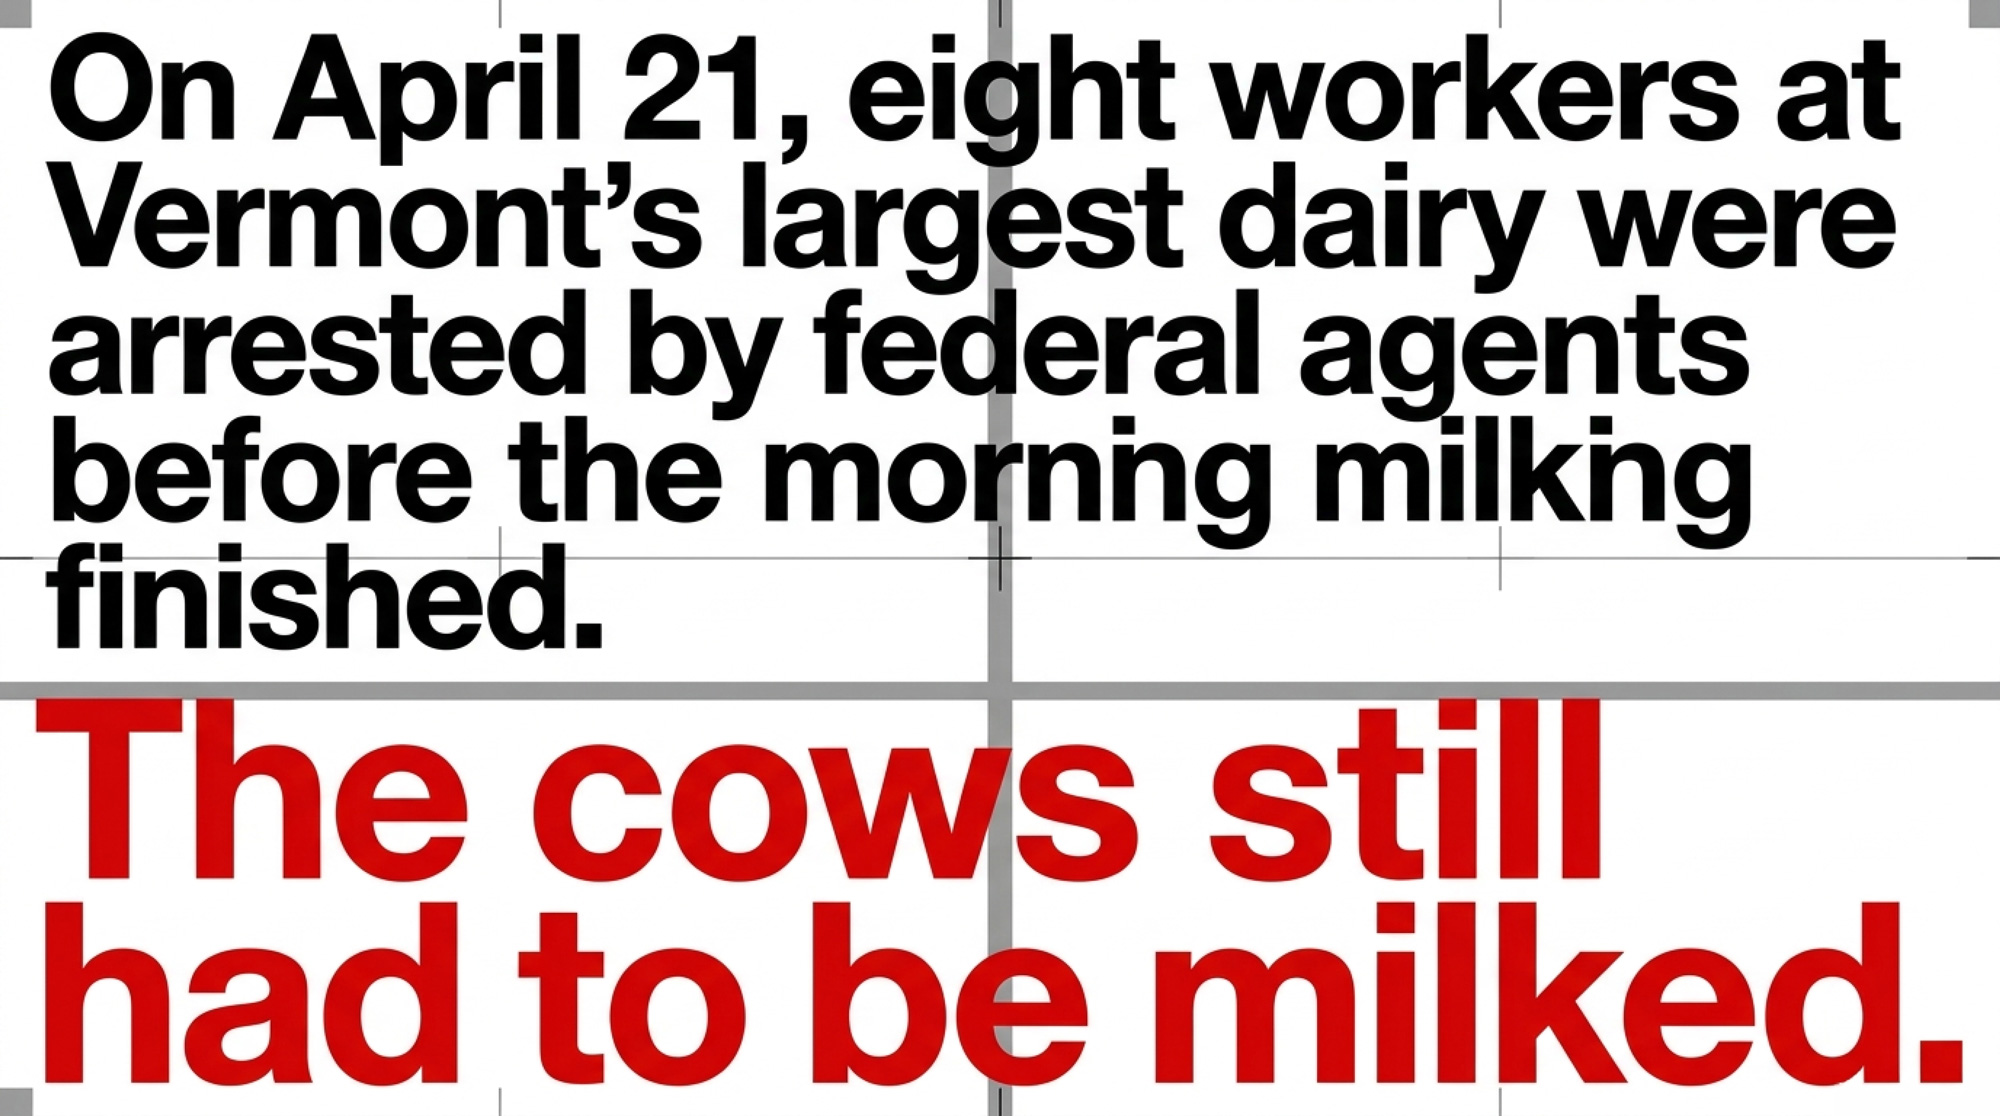
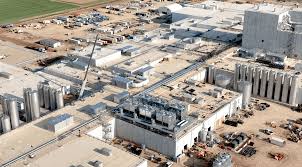
In the twelve months before listeria at Boar’s Head’s Jarratt, Virginia plant killed 10 people across nearly 20 states, inspectors walked that facility and wrote up 69 sanitation noncompliance records. Mold on walls. Insects. Condensation over food‑contact surfaces. Meat residue so caked on equipment the inspectors called it “heavy” and “discolored.” Every finding went in the file. The plant kept running.
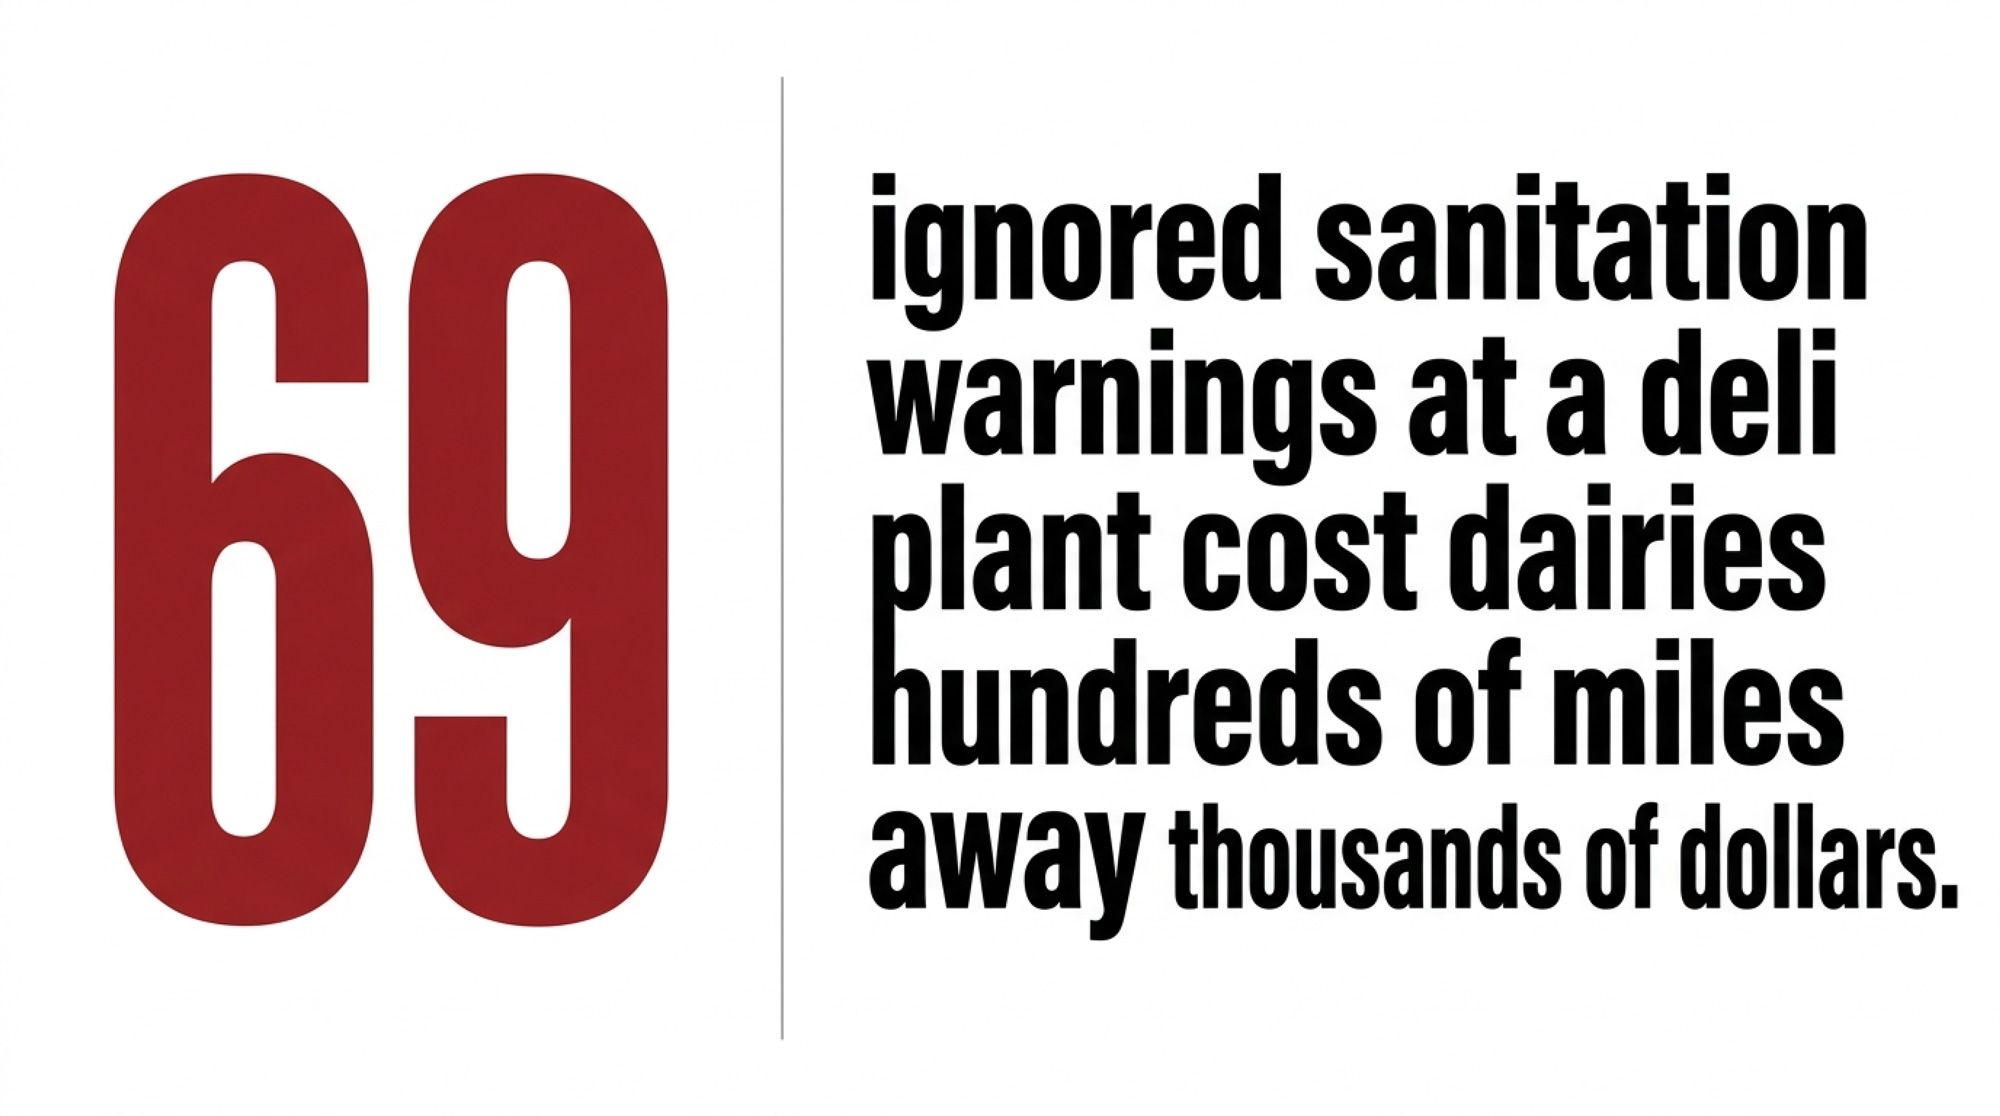
By the time the recall dust settled, more than 7 million pounds of deli meat were off shelves. Jarratt shut down September 13, 2024. Boar’s Head didn’t resume operations until early February 2026 — about seventeen months later — after what the company called “comprehensive upgrades,” including adoption of USDA’s Alternative 2 Listeriacontrol program and the hiring of its first Chief Food Safety Officer, Natalie Dyenson, in May 2025.
Families who lost loved ones will never see those sanitation records the way you just did. And the dairies feeding milk into the same national retail chains and distribution networks absorbed a financial hit from a failure they didn’t create and never saw coming. This is the dairy recall risk story nobody put on your balance sheet — but it’s already there.
What’s Changing in Food Safety — and Why It Lands on You
On paper, food safety has never looked more organized: HACCP plans on every wall, third‑party audits, certificates for everything. On the ground, three guardrails are slipping at once.
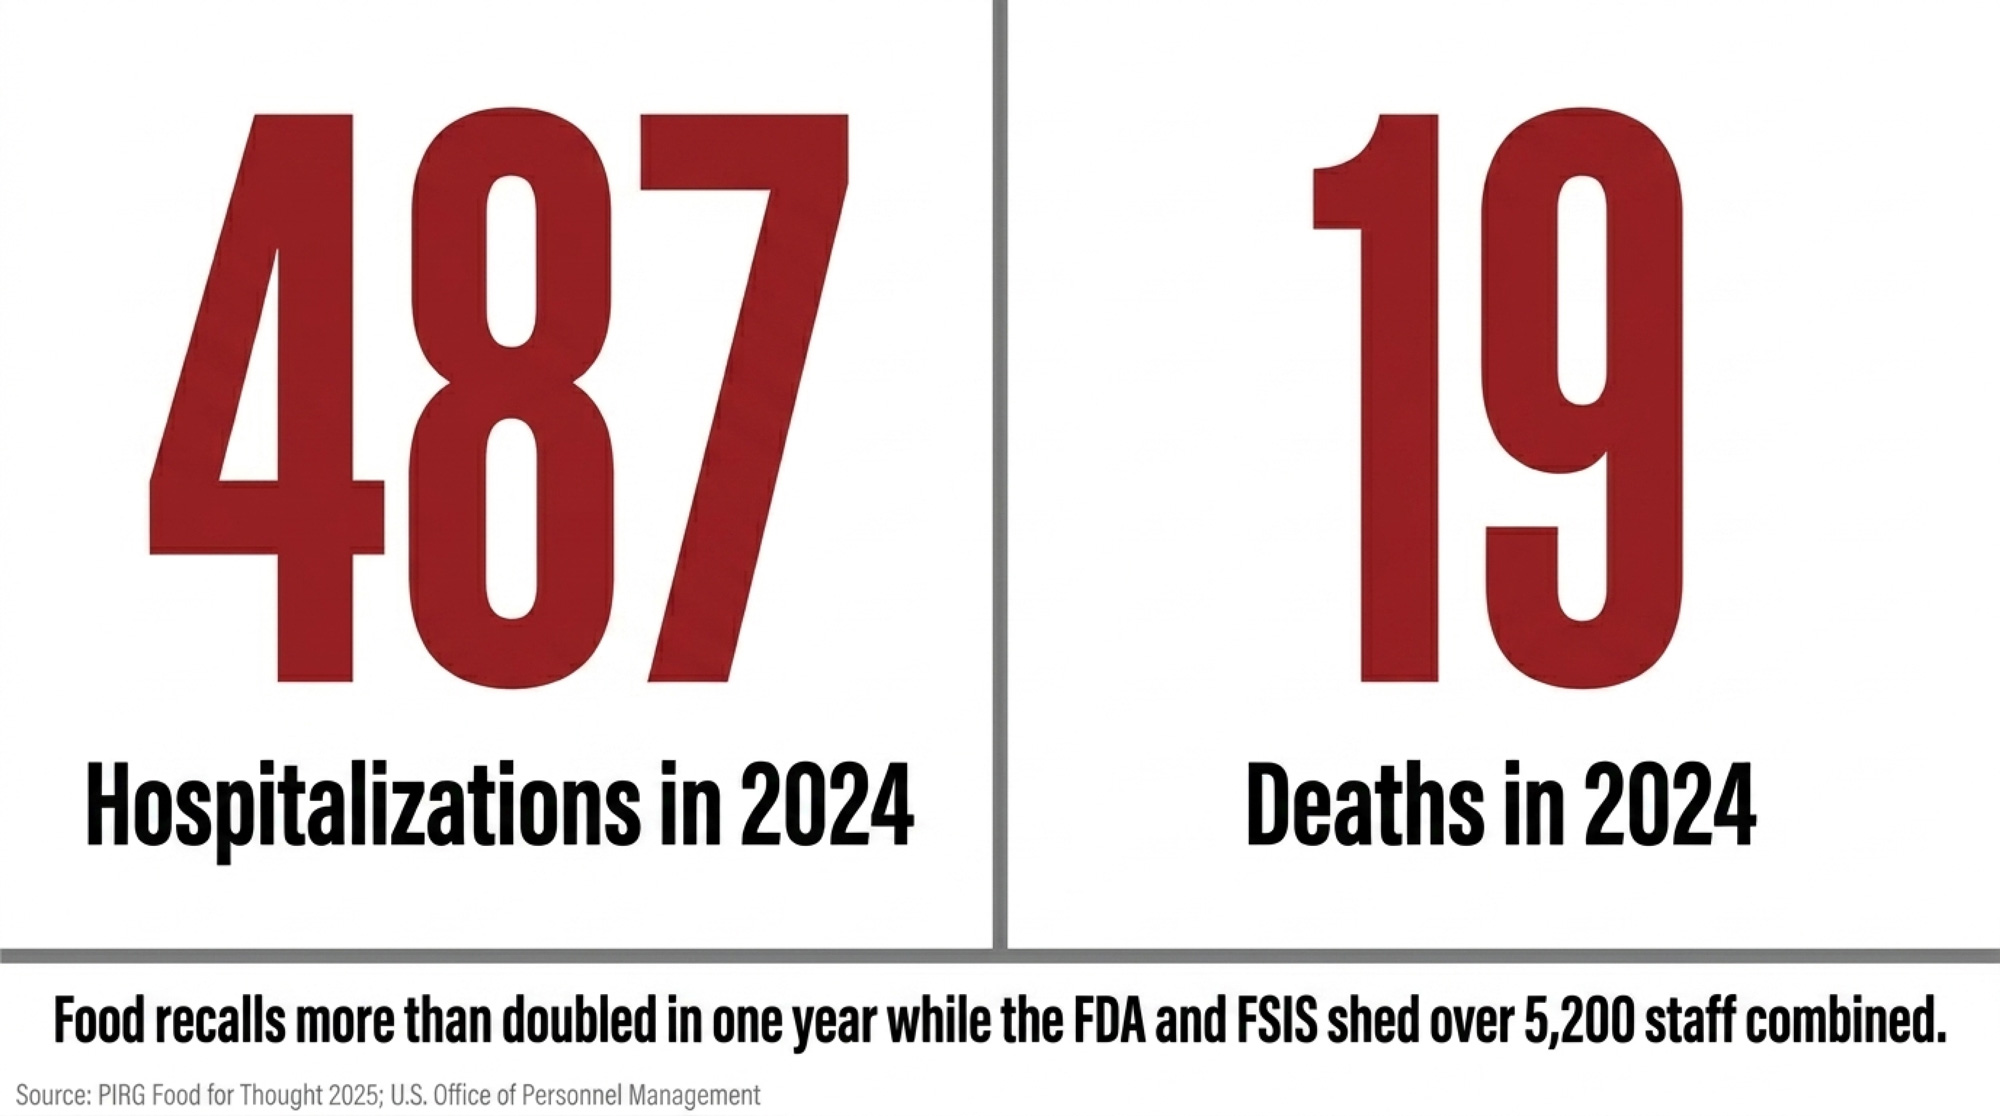
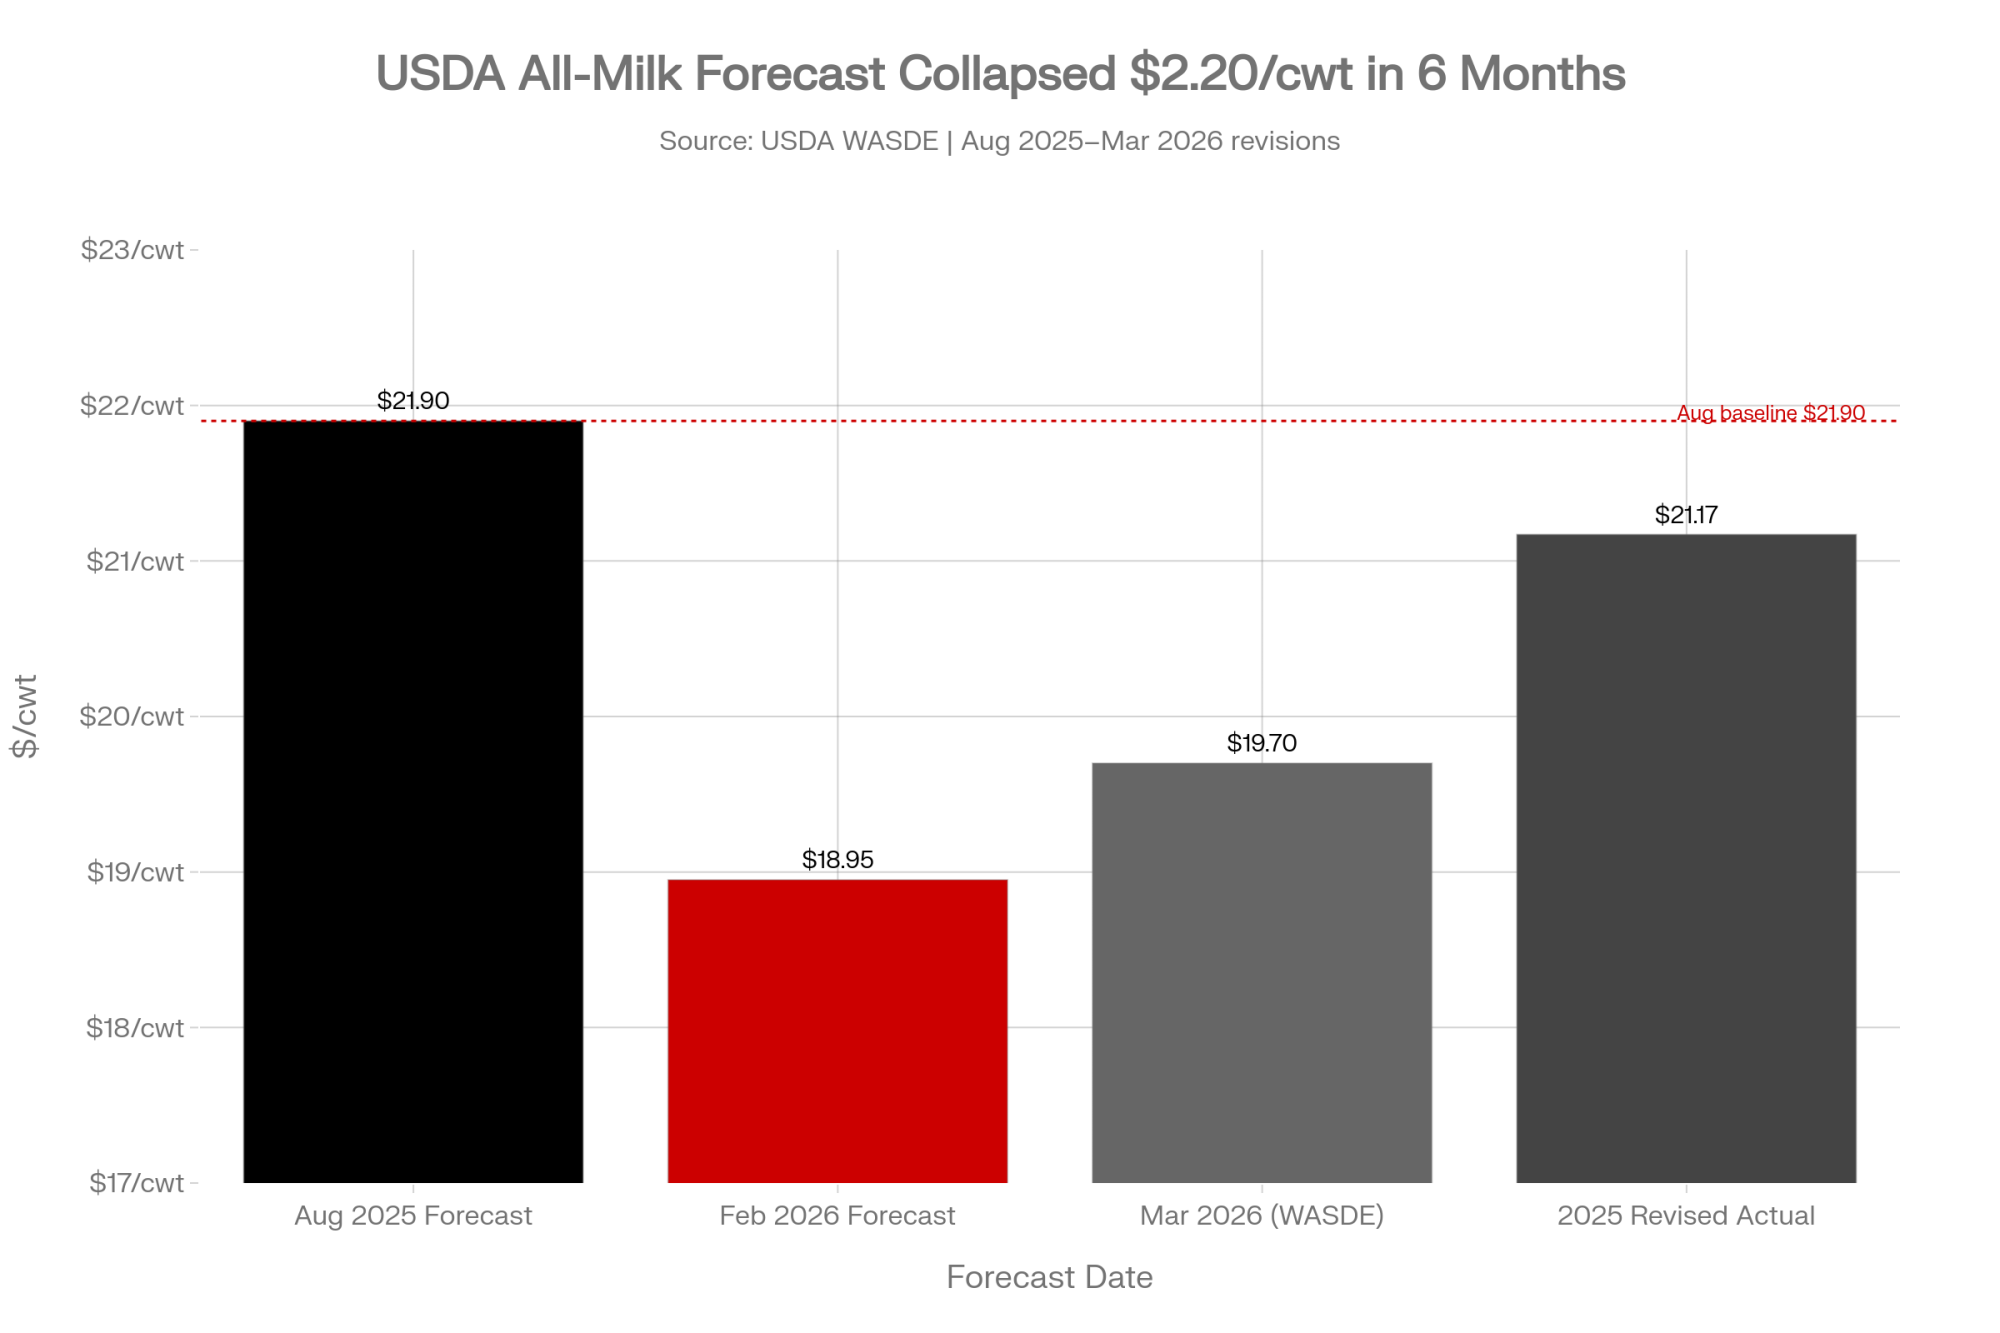
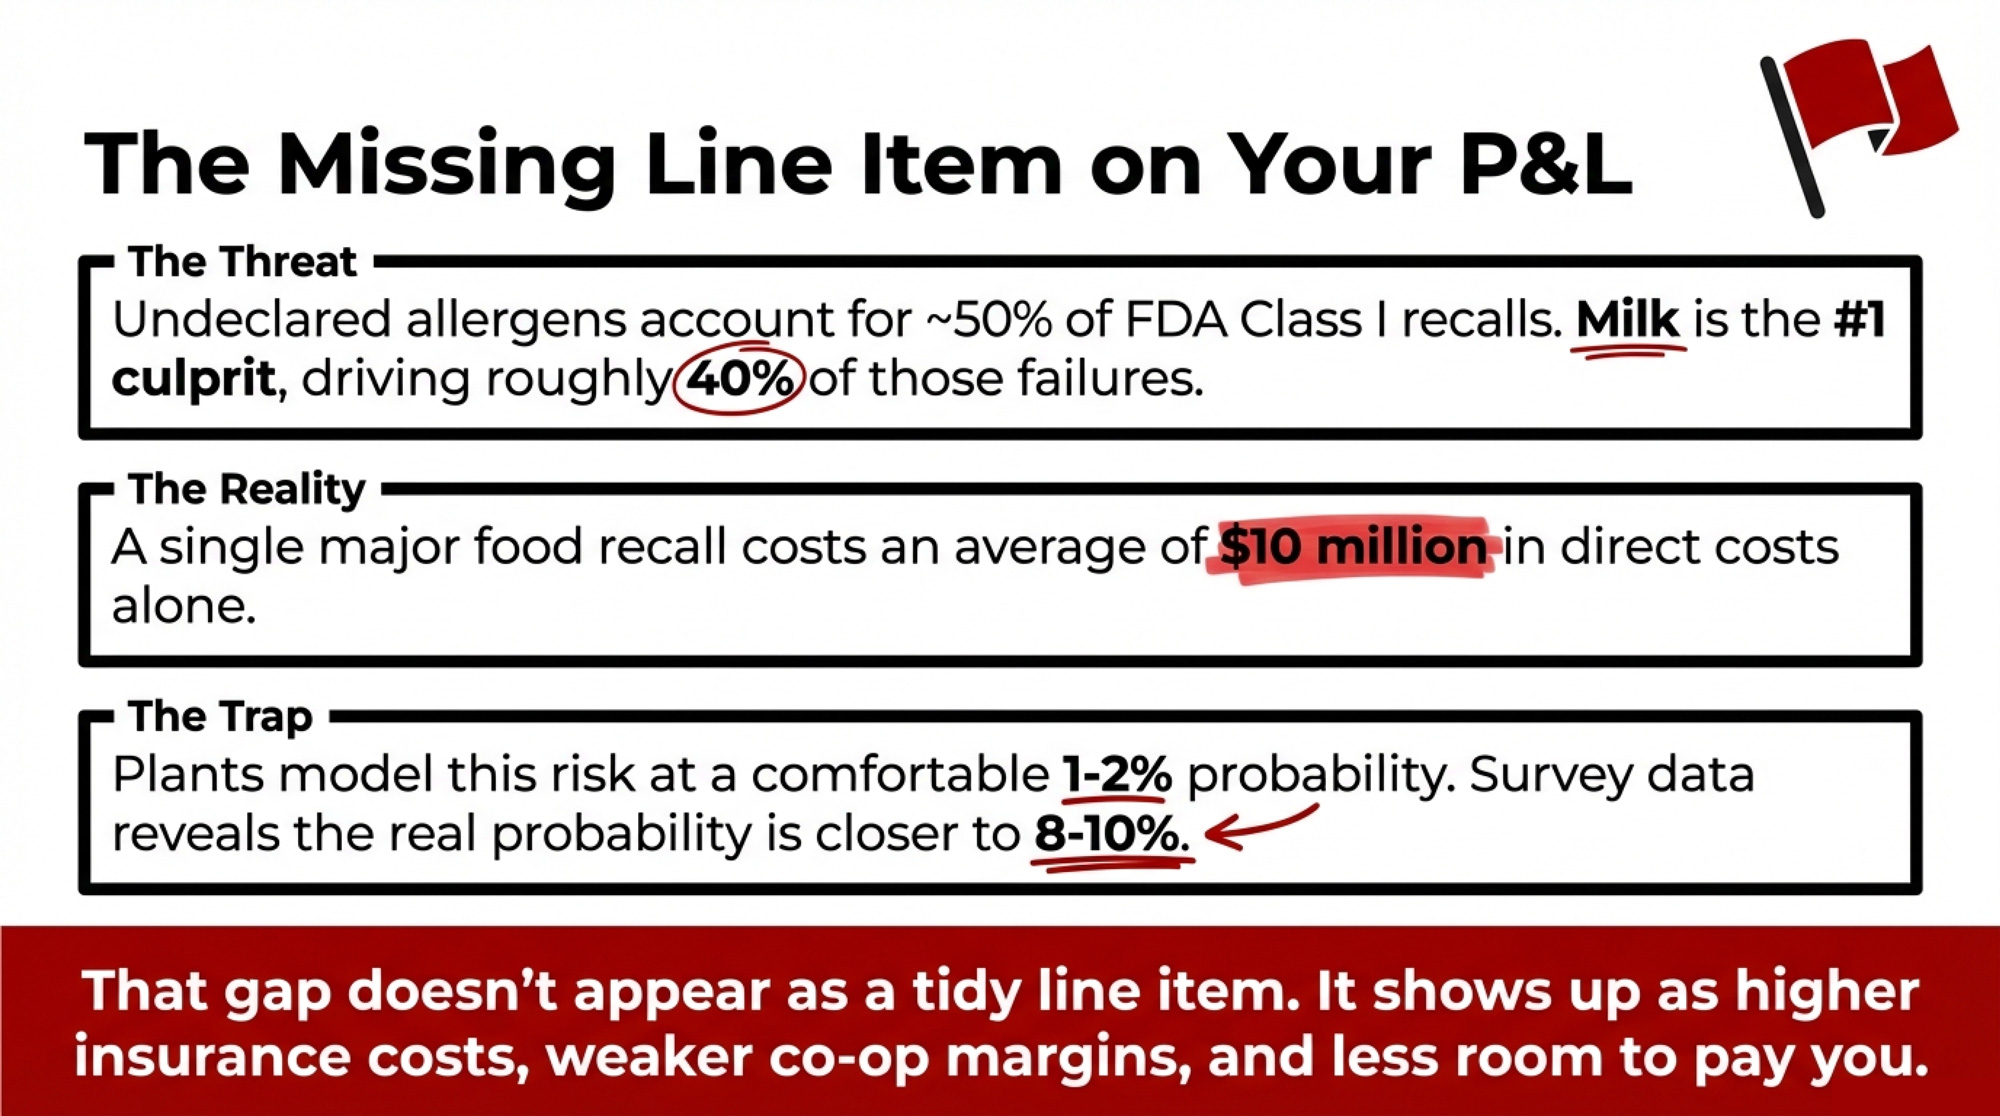
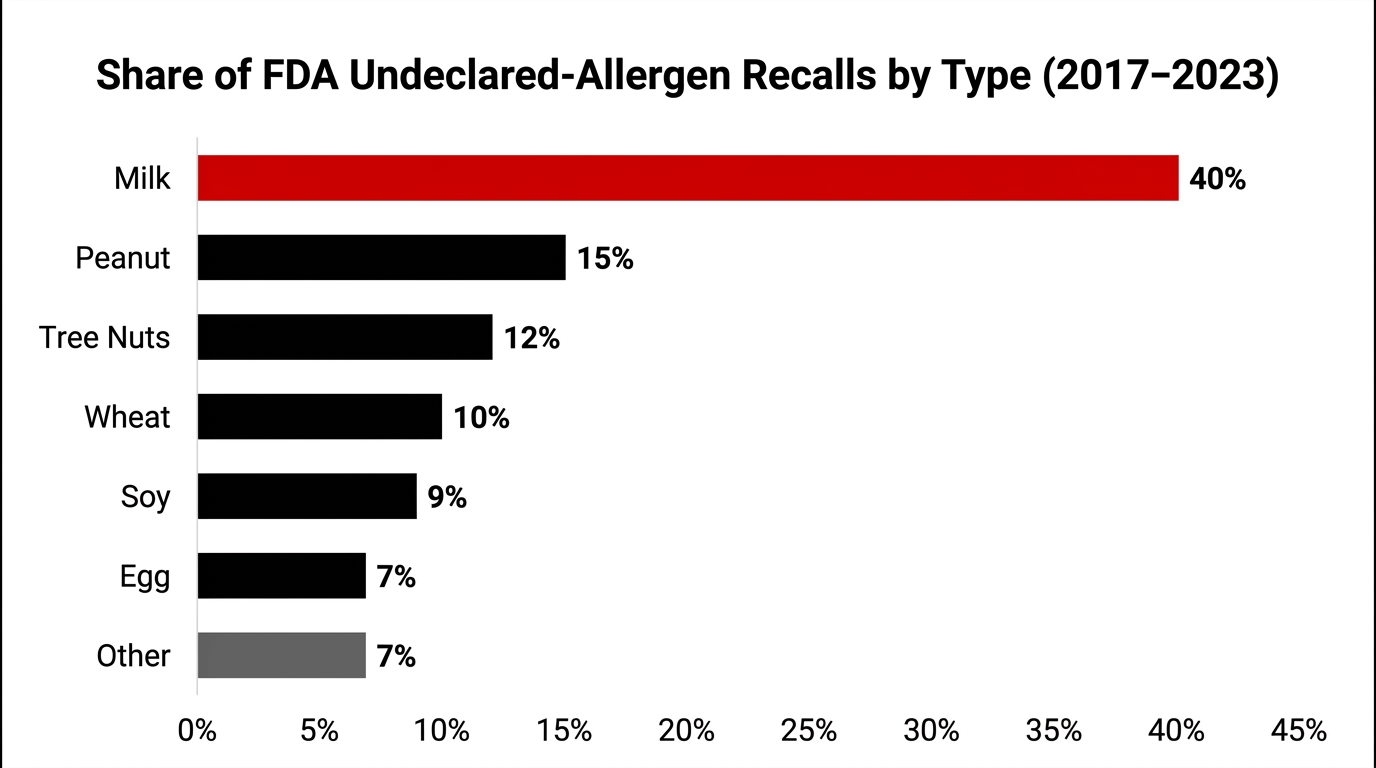
Recalls are getting more severe, not calmer. In 2024, contaminated food in the U.S. led to 487 hospitalizations and 19 deaths — more than double the 230 hospitalizations and 8 deaths tied to recalls the year before, according to PIRG’s Food for Thought 2025 analysis. Bacteria‑related recalls jumped about 41% year‑over‑year, with Listeria monocytogenes alone driving 65 recalls in 2024, up from 47 in 2023.
Before you write this off as a deli‑meat story, remember this: Listeria monocytogenes is the great equalizer. It doesn’t care whether the floor drain is in a ham plant in Virginia or a cheese plant in Wisconsin — it thrives in the same damp, cool environments found in deli processing and dairy bottling halls alike. Dairy‑adjacent products were right in the middle of it. Rizo‑López Foods of Modesto, California — a queso fresco and cotija manufacturer — has been linked to 2 deaths and 26 illnesses across multiple states, and now operates under a permanent injunction barring it from manufacturing until it complies with federal regulations.
A separate outbreak tied to frozen supplemental shakes served in medical and long‑term care facilities sickened 42 people across 21 states and killed 14, with illnesses traced back to products manufactured as far back as 2018. Those shakes were made by Prairie Farms Dairy at its Fort Wayne, Indiana facility under Lyons ReadyCare and Sysco Imperial brands. Read that date again. 2018.
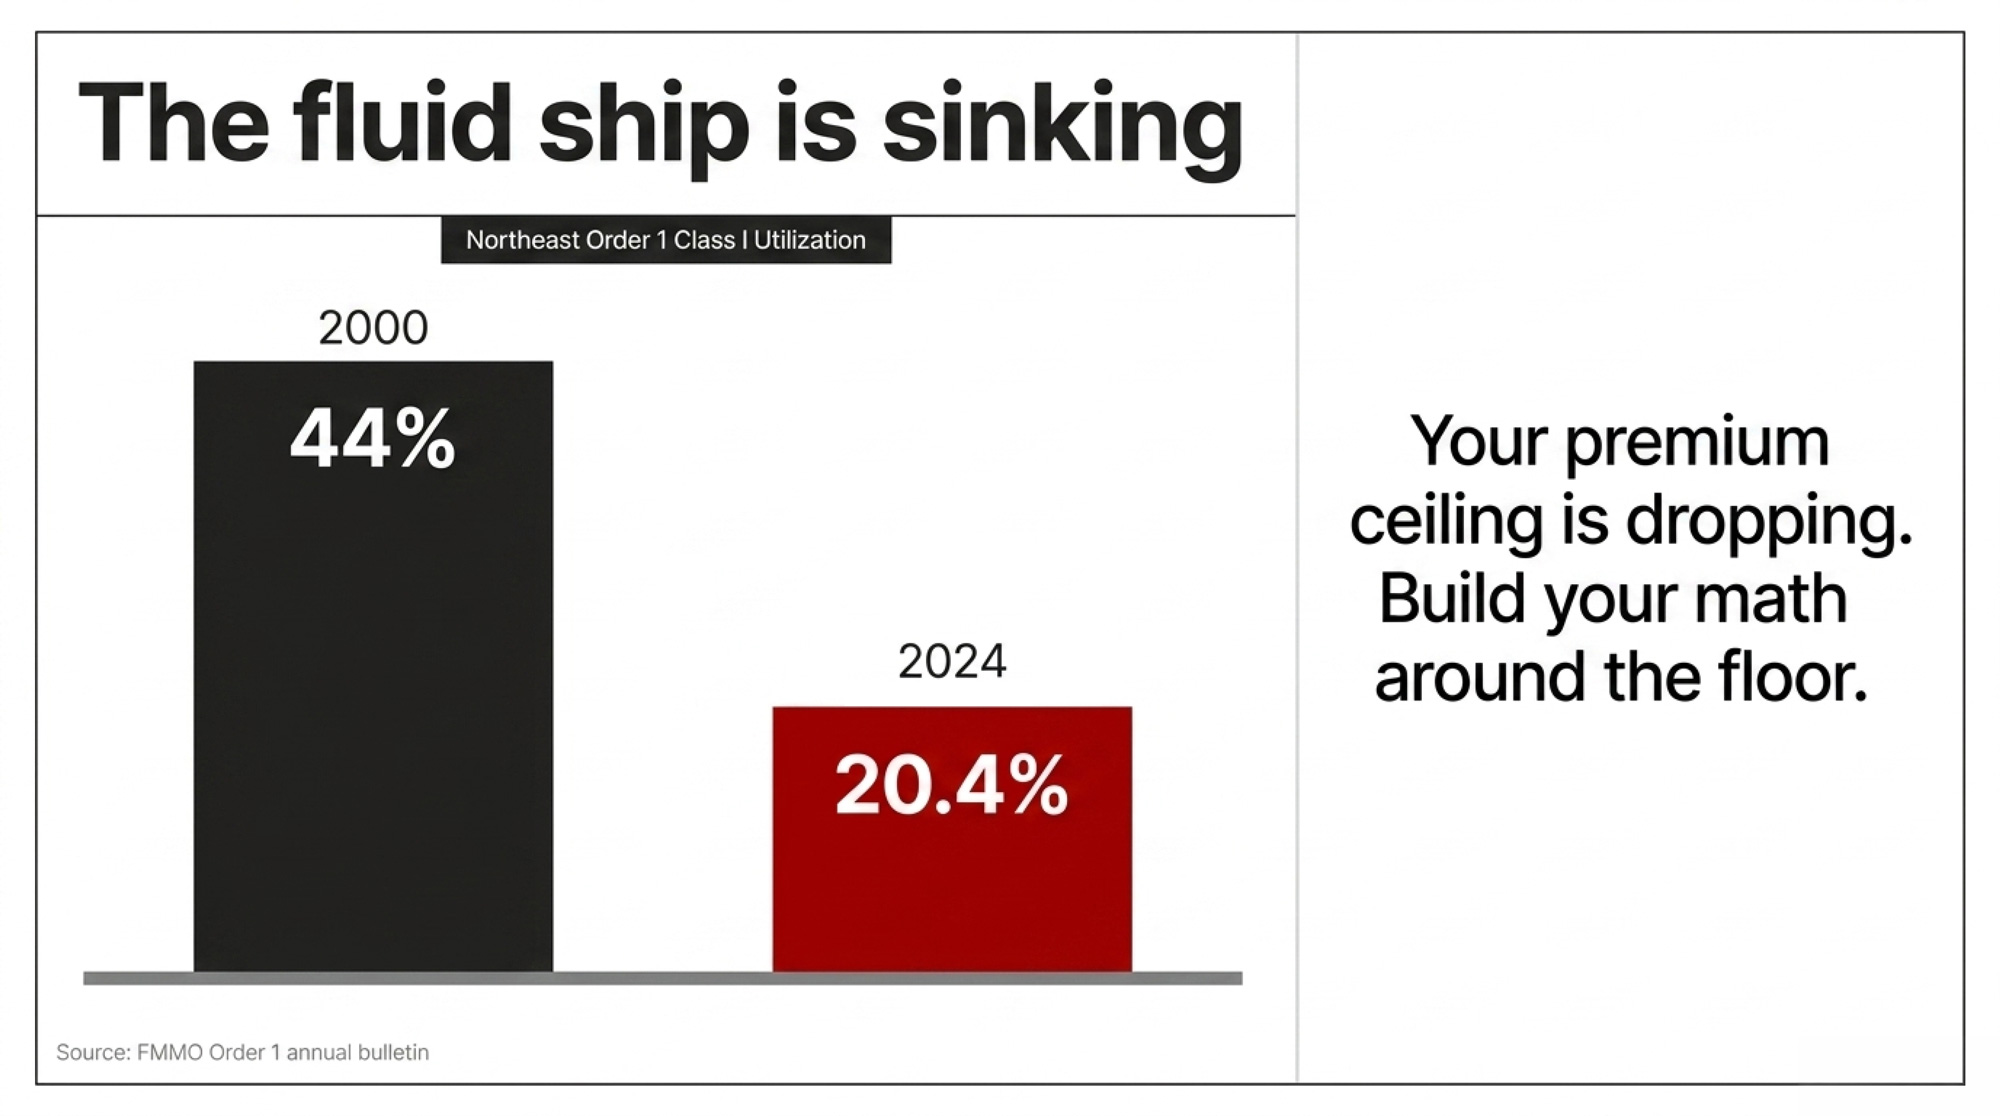
The surveillance net that should catch these problems early is fraying. As of mid‑2025, CDC’s FoodNet narrowed its core annual performance targets to Salmonella and Shiga toxin‑producing E. coli, de‑emphasizing the six other pathogens — including Listeria — that used to sit in the same tier. Listeria is still reportable. But it’s no longer a central FoodNet performance benchmark, and the systematic dragnet that used to pull in listeria cases across 10 sites and flag small clusters is now weaker for exactly the bug driving many of the deadliest recalls.
The people doing the watching are stretched thinner. FDA lost 3,859 employees in 2025 and another 473 in early 2026, while FSIS shed 874 employees — roughly 8% of its workforce — in 2025, according to U.S. Office of Personnel Management data summarized by FoodNavigator‑USA. State and local health departments consistently cite limited staff and delayed lab results as major barriers to investigating suspected outbreaks. Fewer people chasing more signals means the subtle ones — low‑level clusters scattered across counties or months — are the first to get missed.
That’s where dairy recall risk management stops being an FDA problem and starts being yours. More recalls, more severe outcomes, less capacity to catch problems before they blow up. Not just a public‑health story. A milk‑cheque story.
How It Shows Up on a 400‑Cow Dairy
If you’re milking 400 cows, shipping clean milk, and passing every antibiotic and PI test, it’s tempting to look at Boar’s Head or Prairie Farms and think, “That’s their mess. We’re fine.”
But money doesn’t move that way.
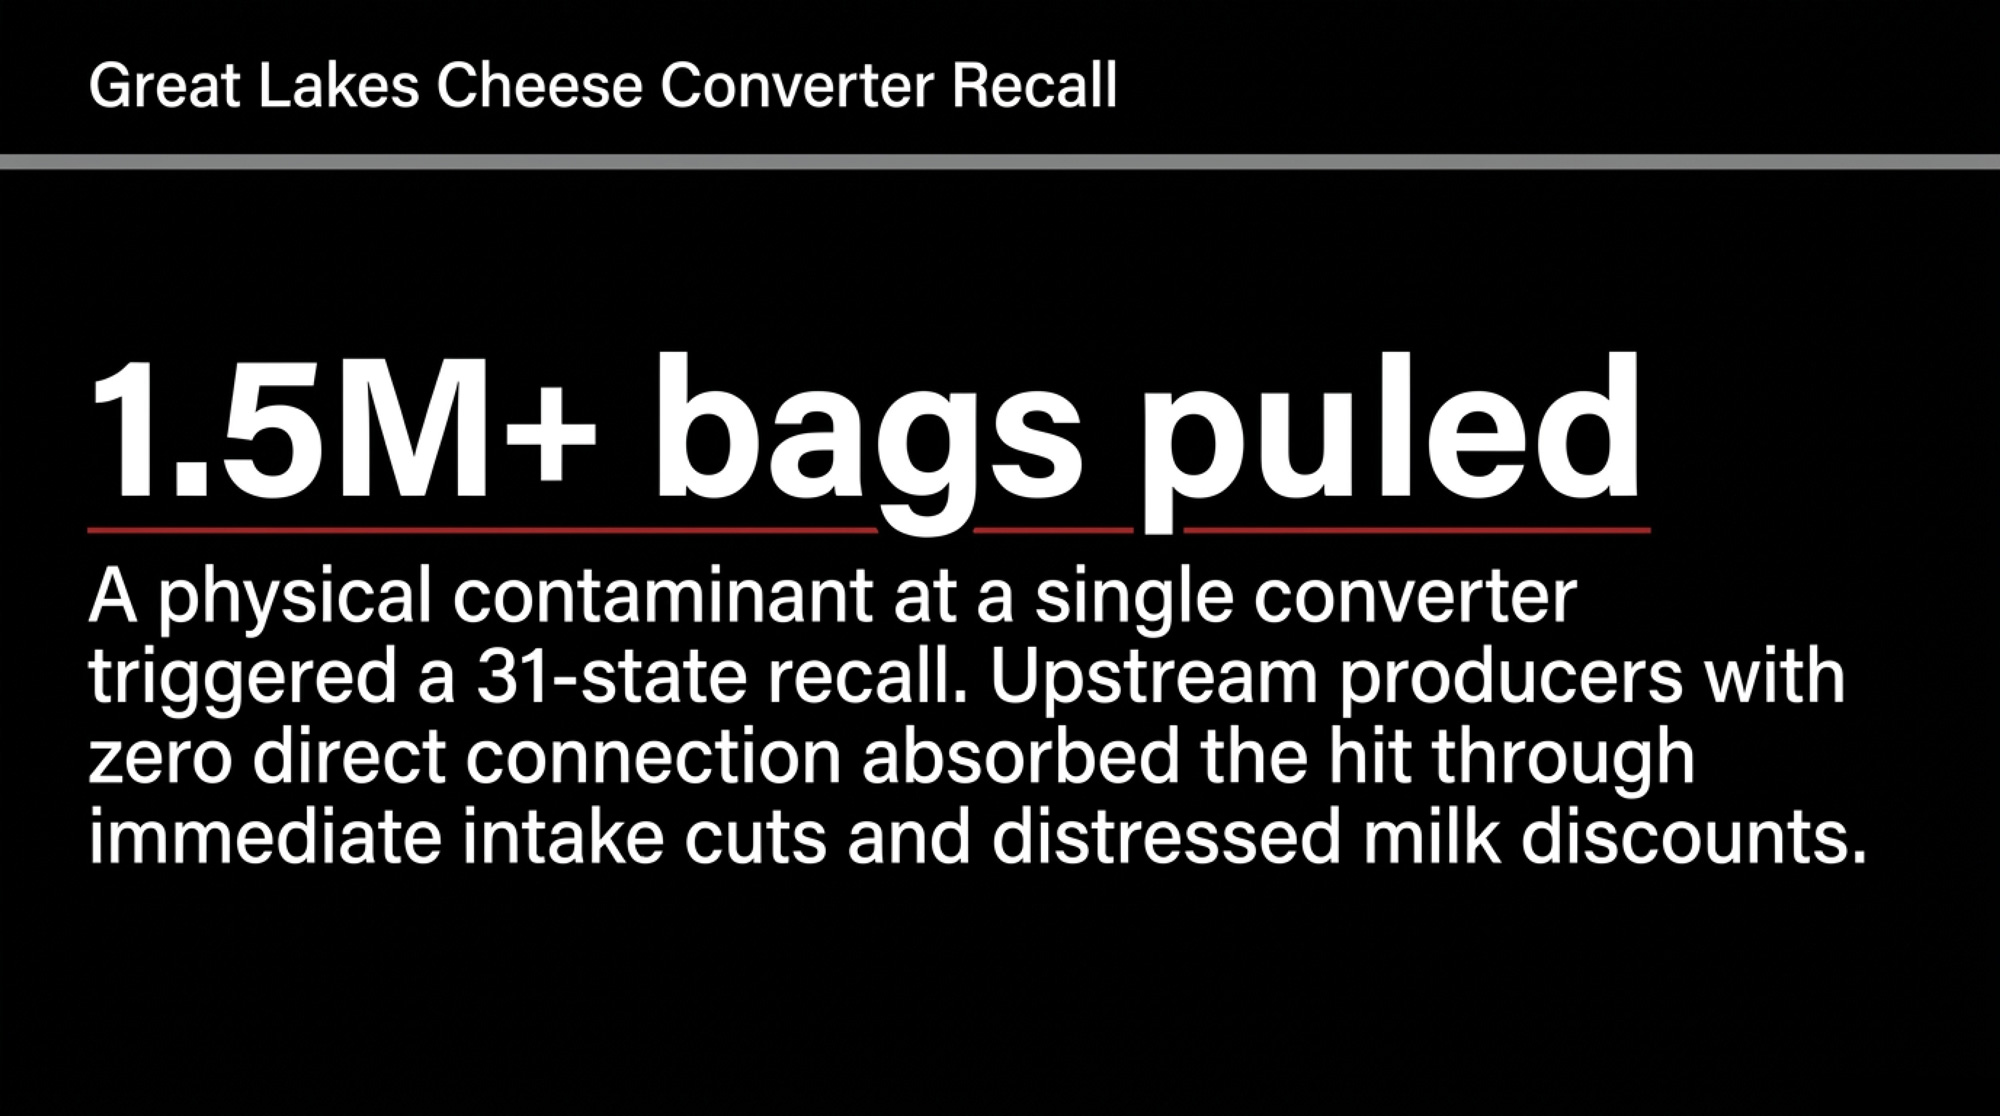
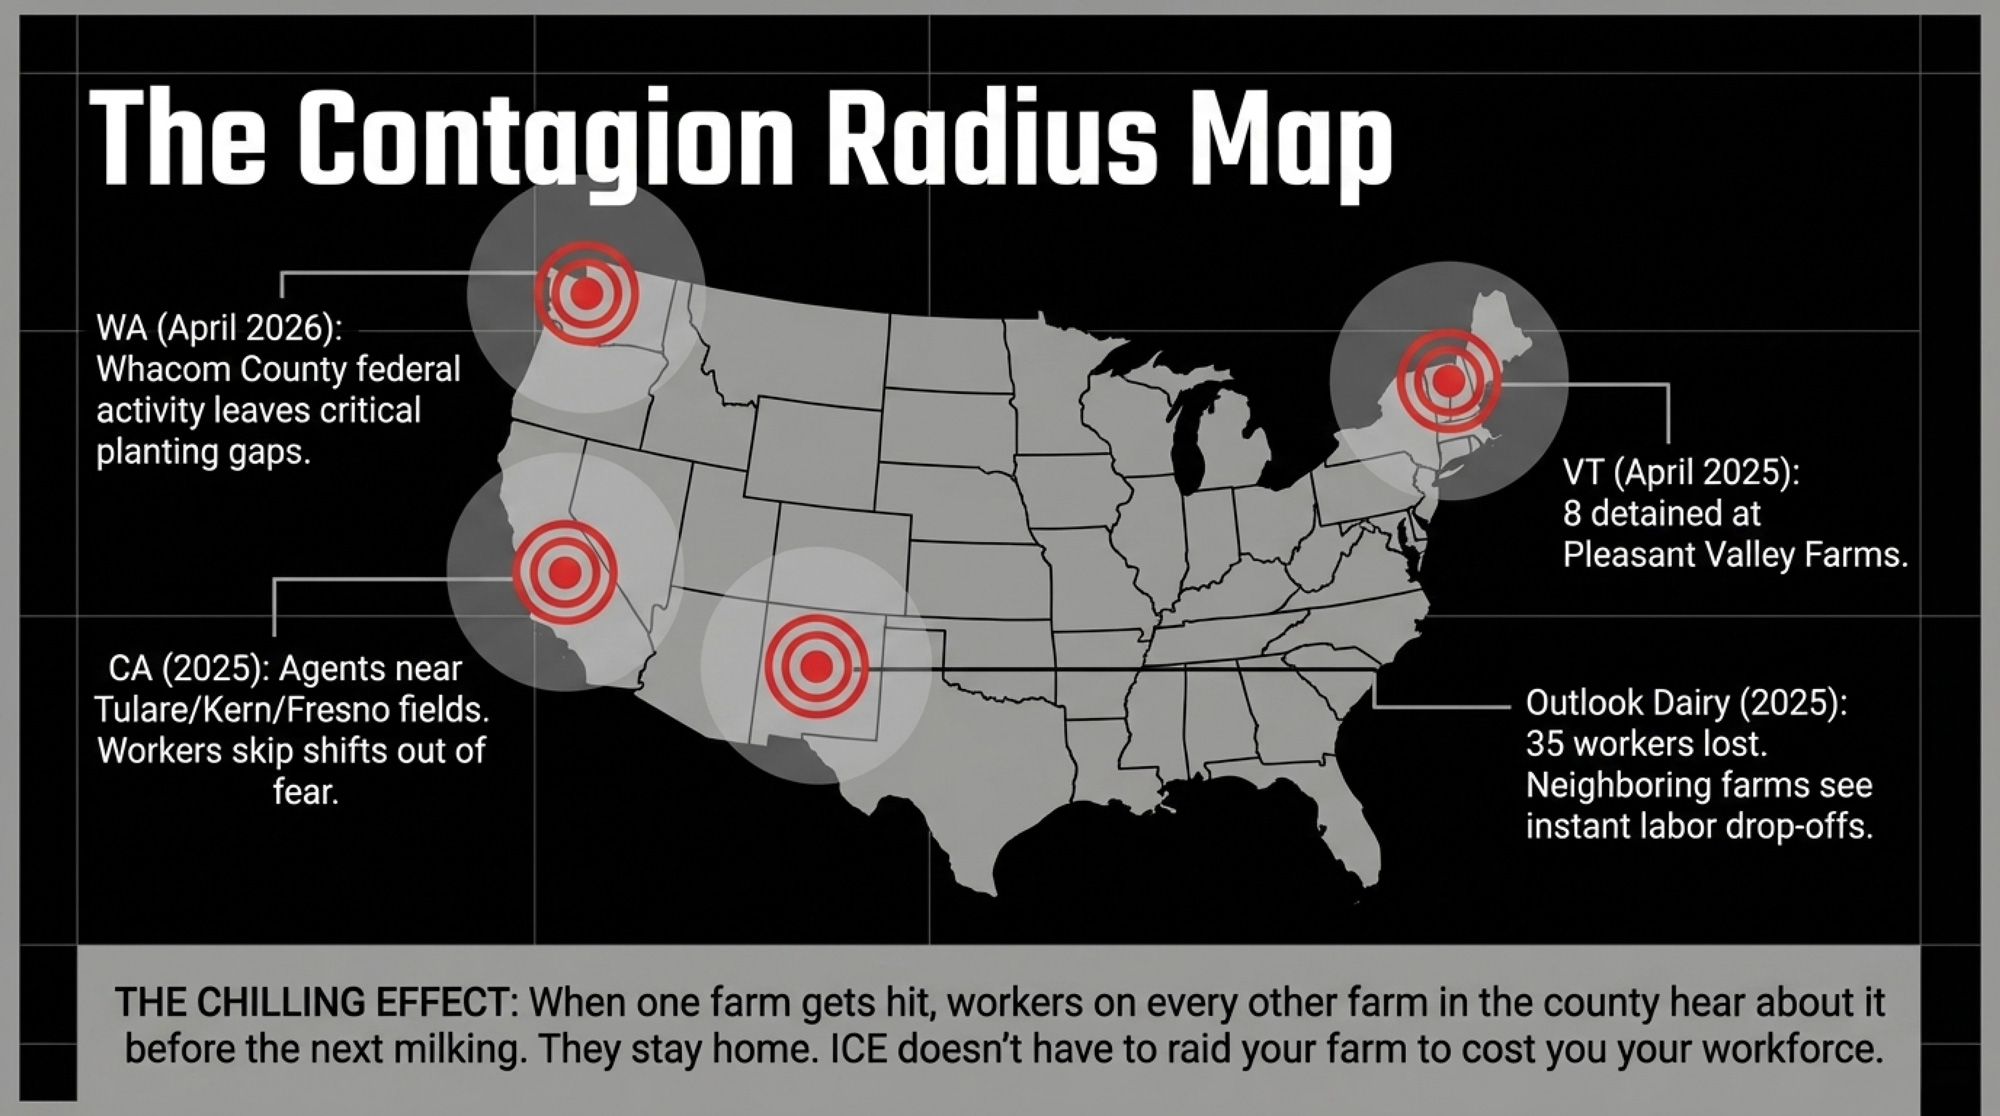
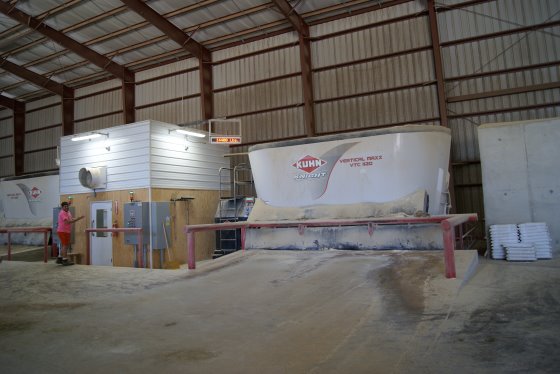
In early October 2025, Great Lakes Cheese initiated a voluntary recall of more than 250,000 cases of shredded and sliced cheese — over 1.5 million bags — sold across 31 states and Puerto Rico under store brands for Walmart, Target, Aldi, Costco, and others after possible metal fragments from a supplier’s raw materials were found in the product. On December 1, 2025, FDA categorized it as a Class II recall, meaning the cheese “may lead to temporary or medically reversible adverse health effects” and the probability of serious consequences is remote. No injuries were reported. Still a massive hit: product write‑offs, recall logistics, lost shelf space, and retailer trust on the line.
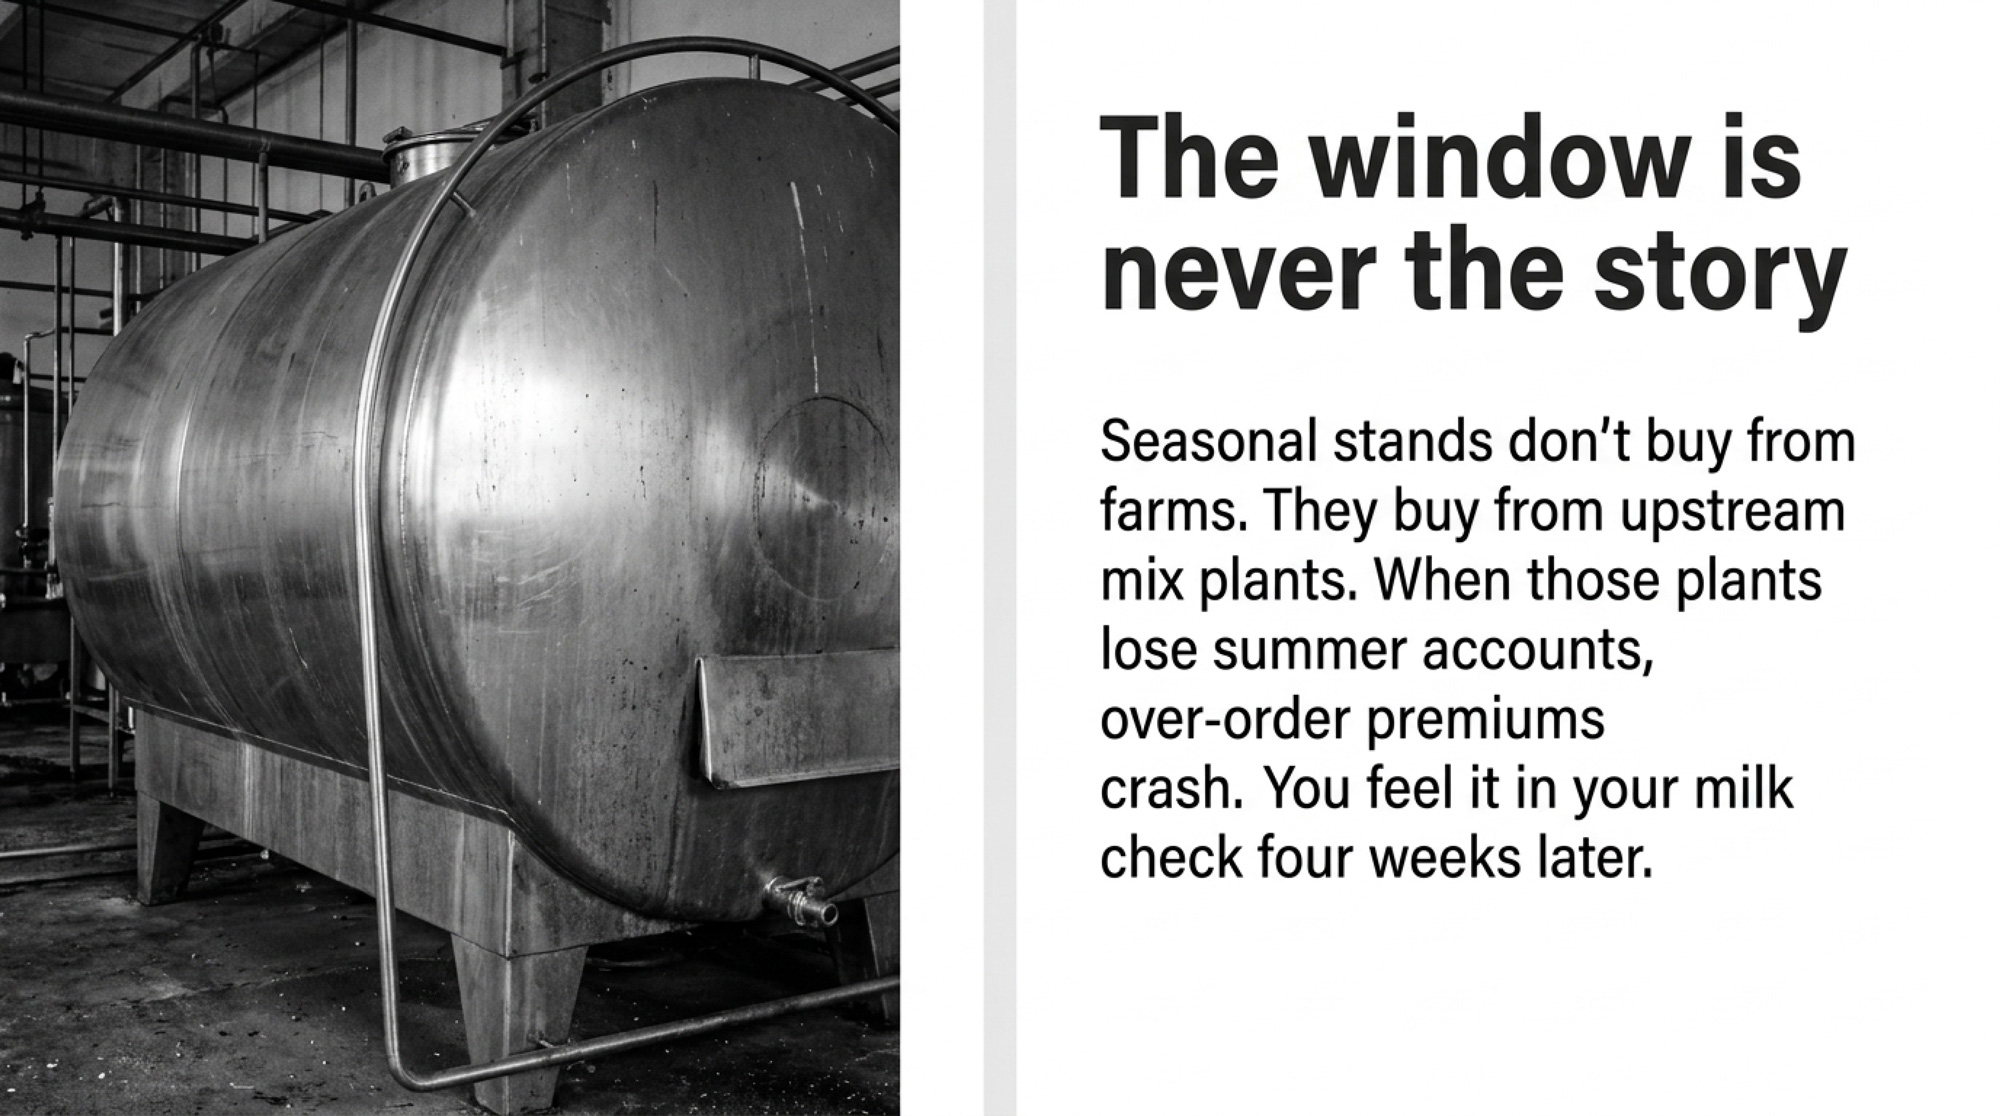
Here’s the part that matters for you. Great Lakes operates primarily as what the industry calls a “converter” — they buy 40‑pound commodity cheese blocks from various suppliers, then shred, slice, and package for retail. When a converter that size pulls back, the ripple moves upstream fast. As The Bullvine reported in December 2025, producers across the Upper Midwest who had no direct relationship with Great Lakes Cheese were already feeling effects — milk intake adjustments, price volatility, and the unsettling realization that something happening several steps down the supply chain was showing up on their bottom line.
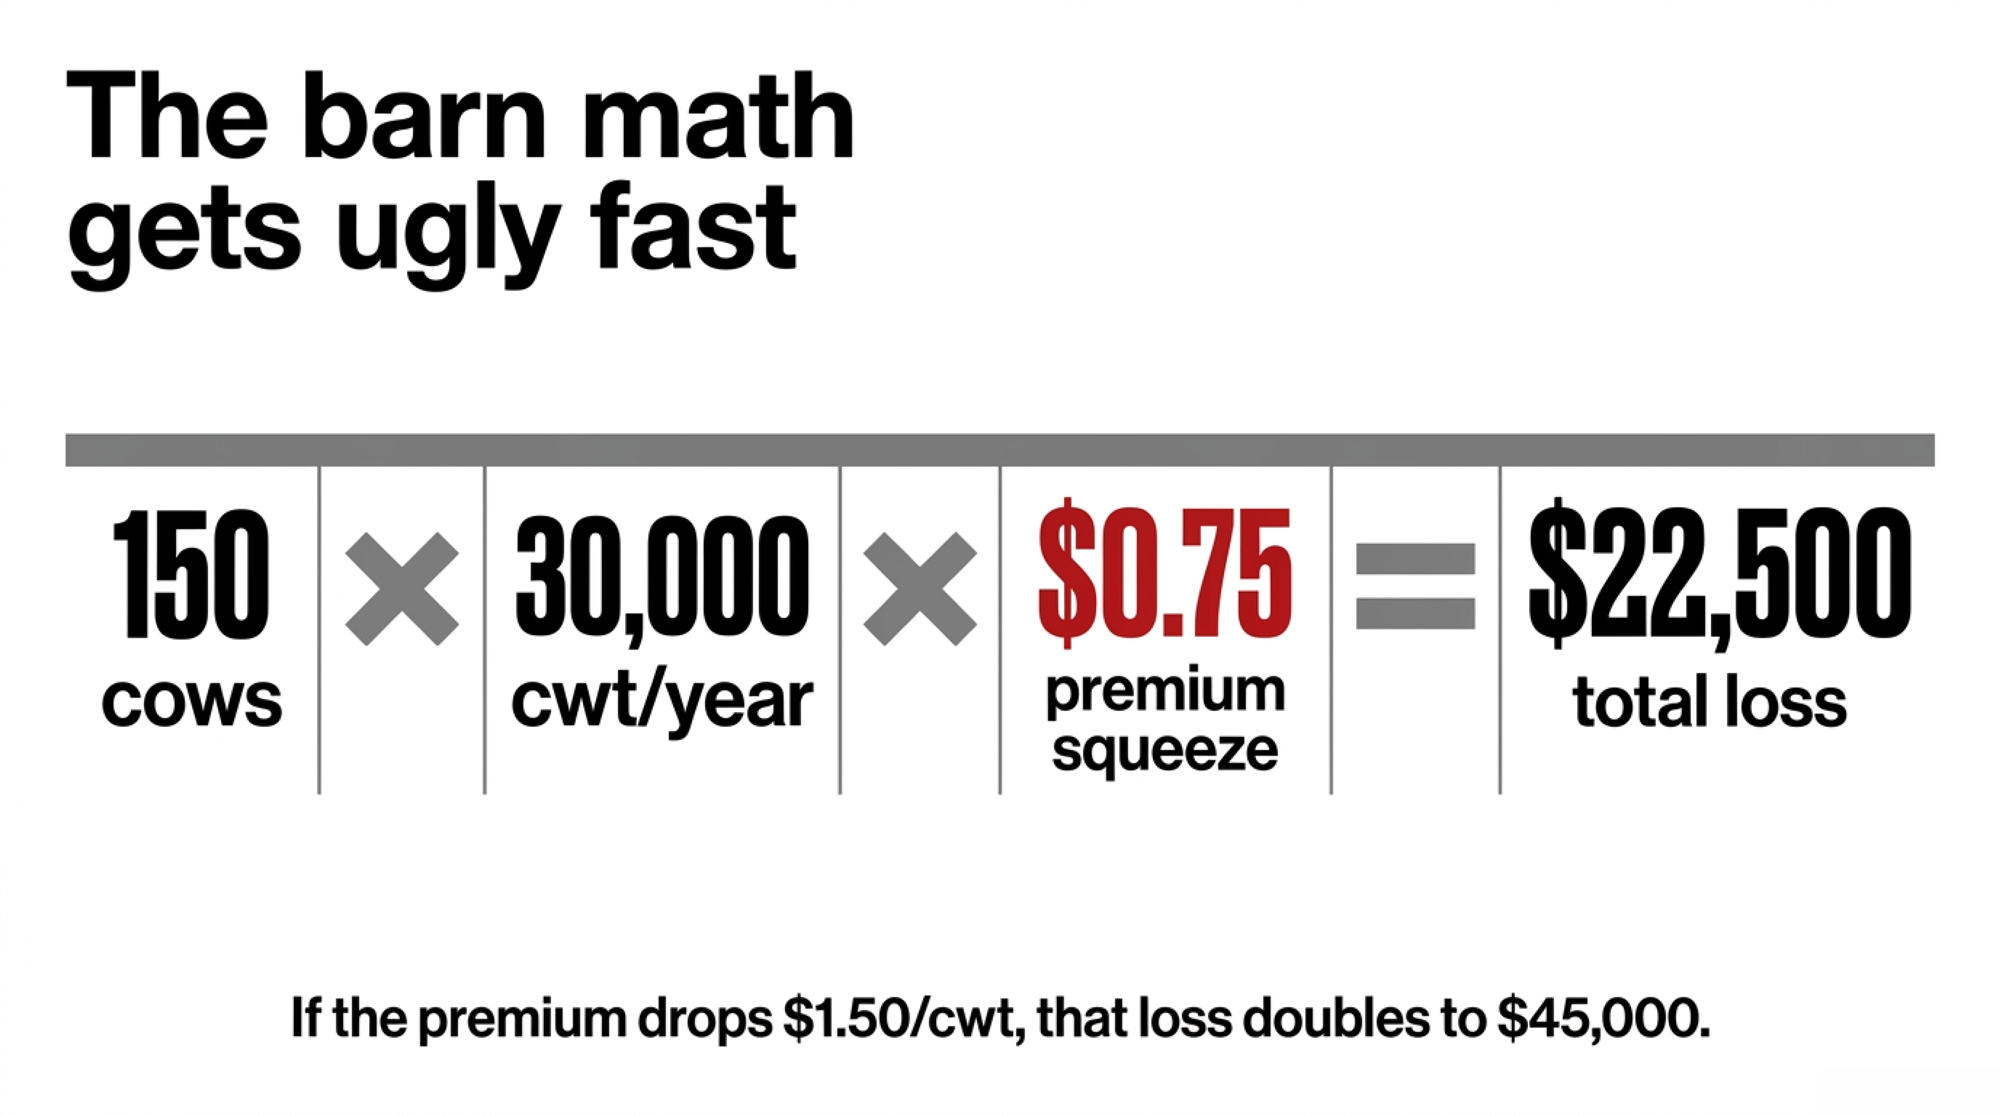
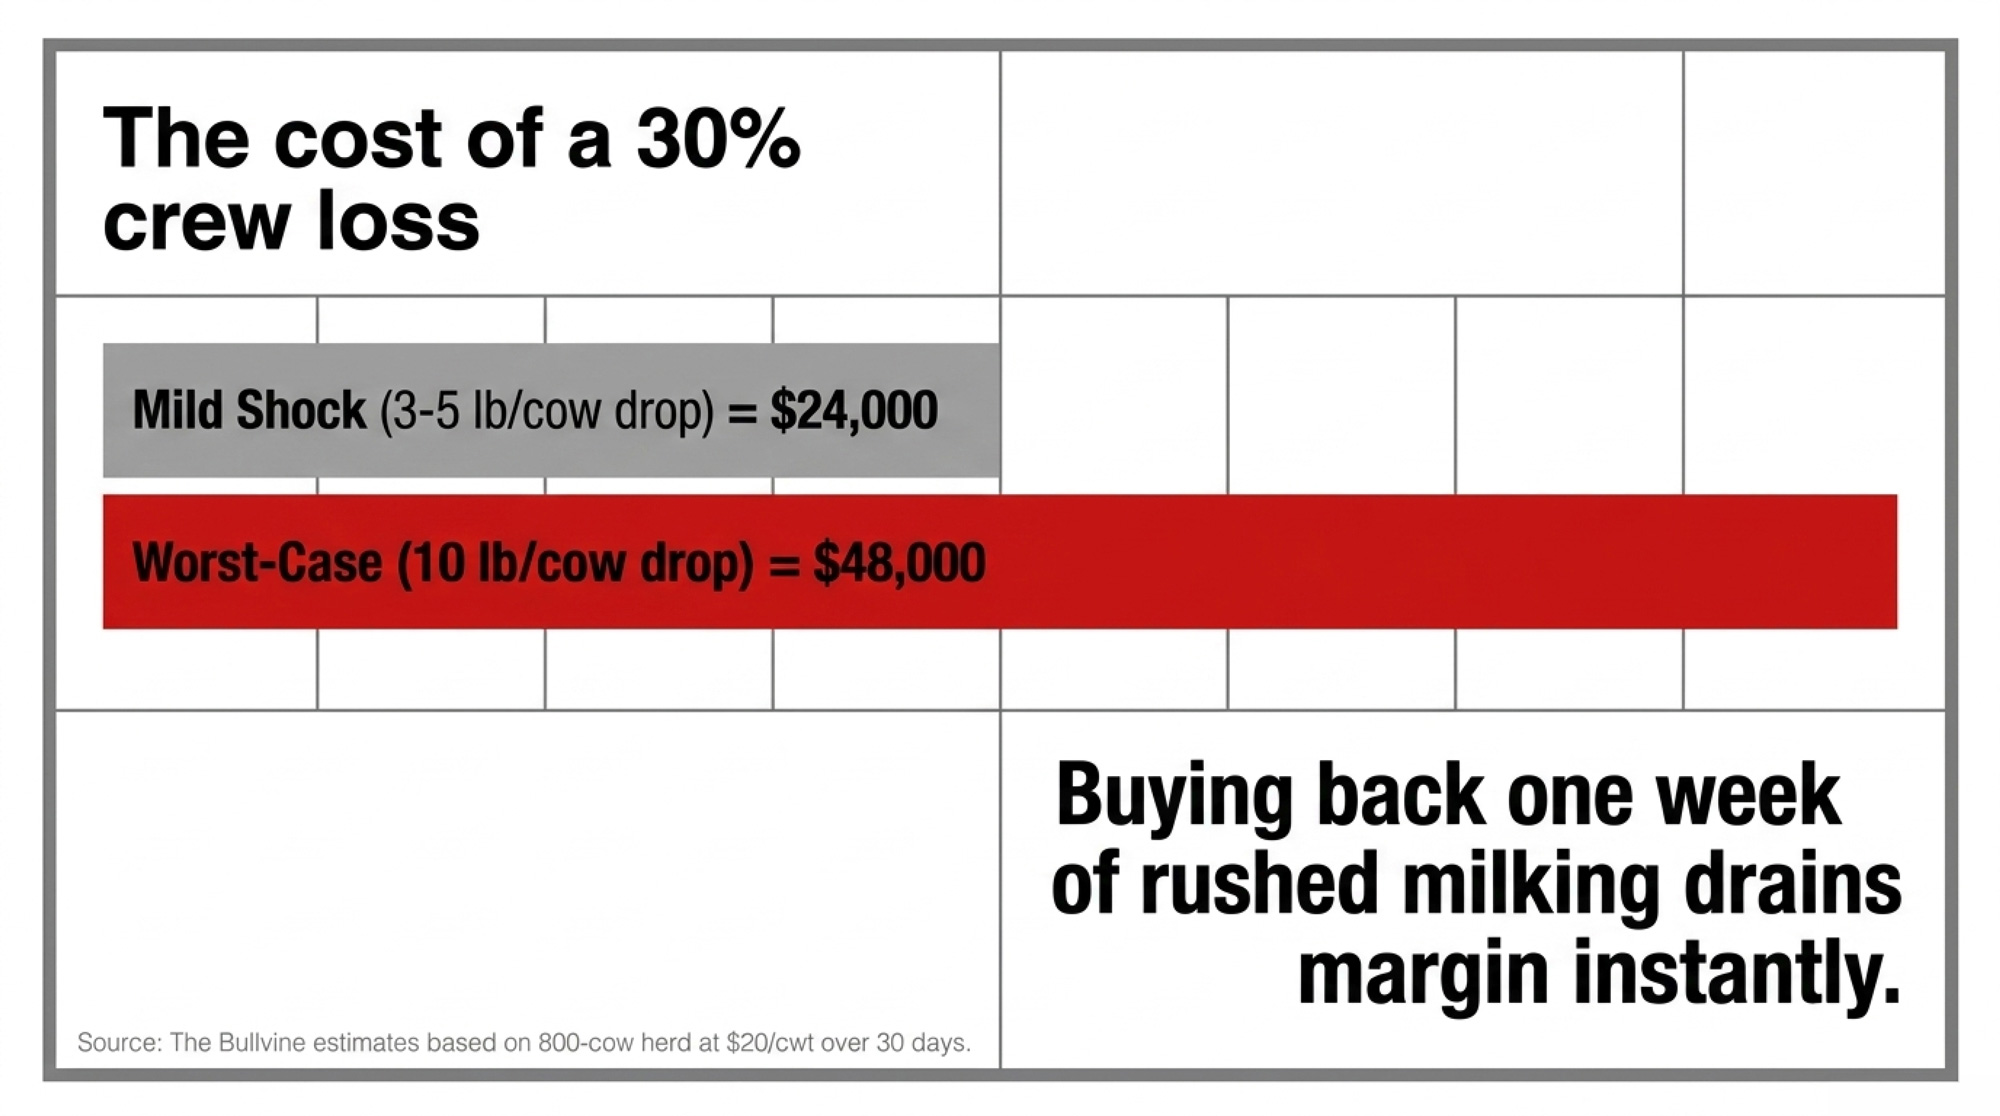
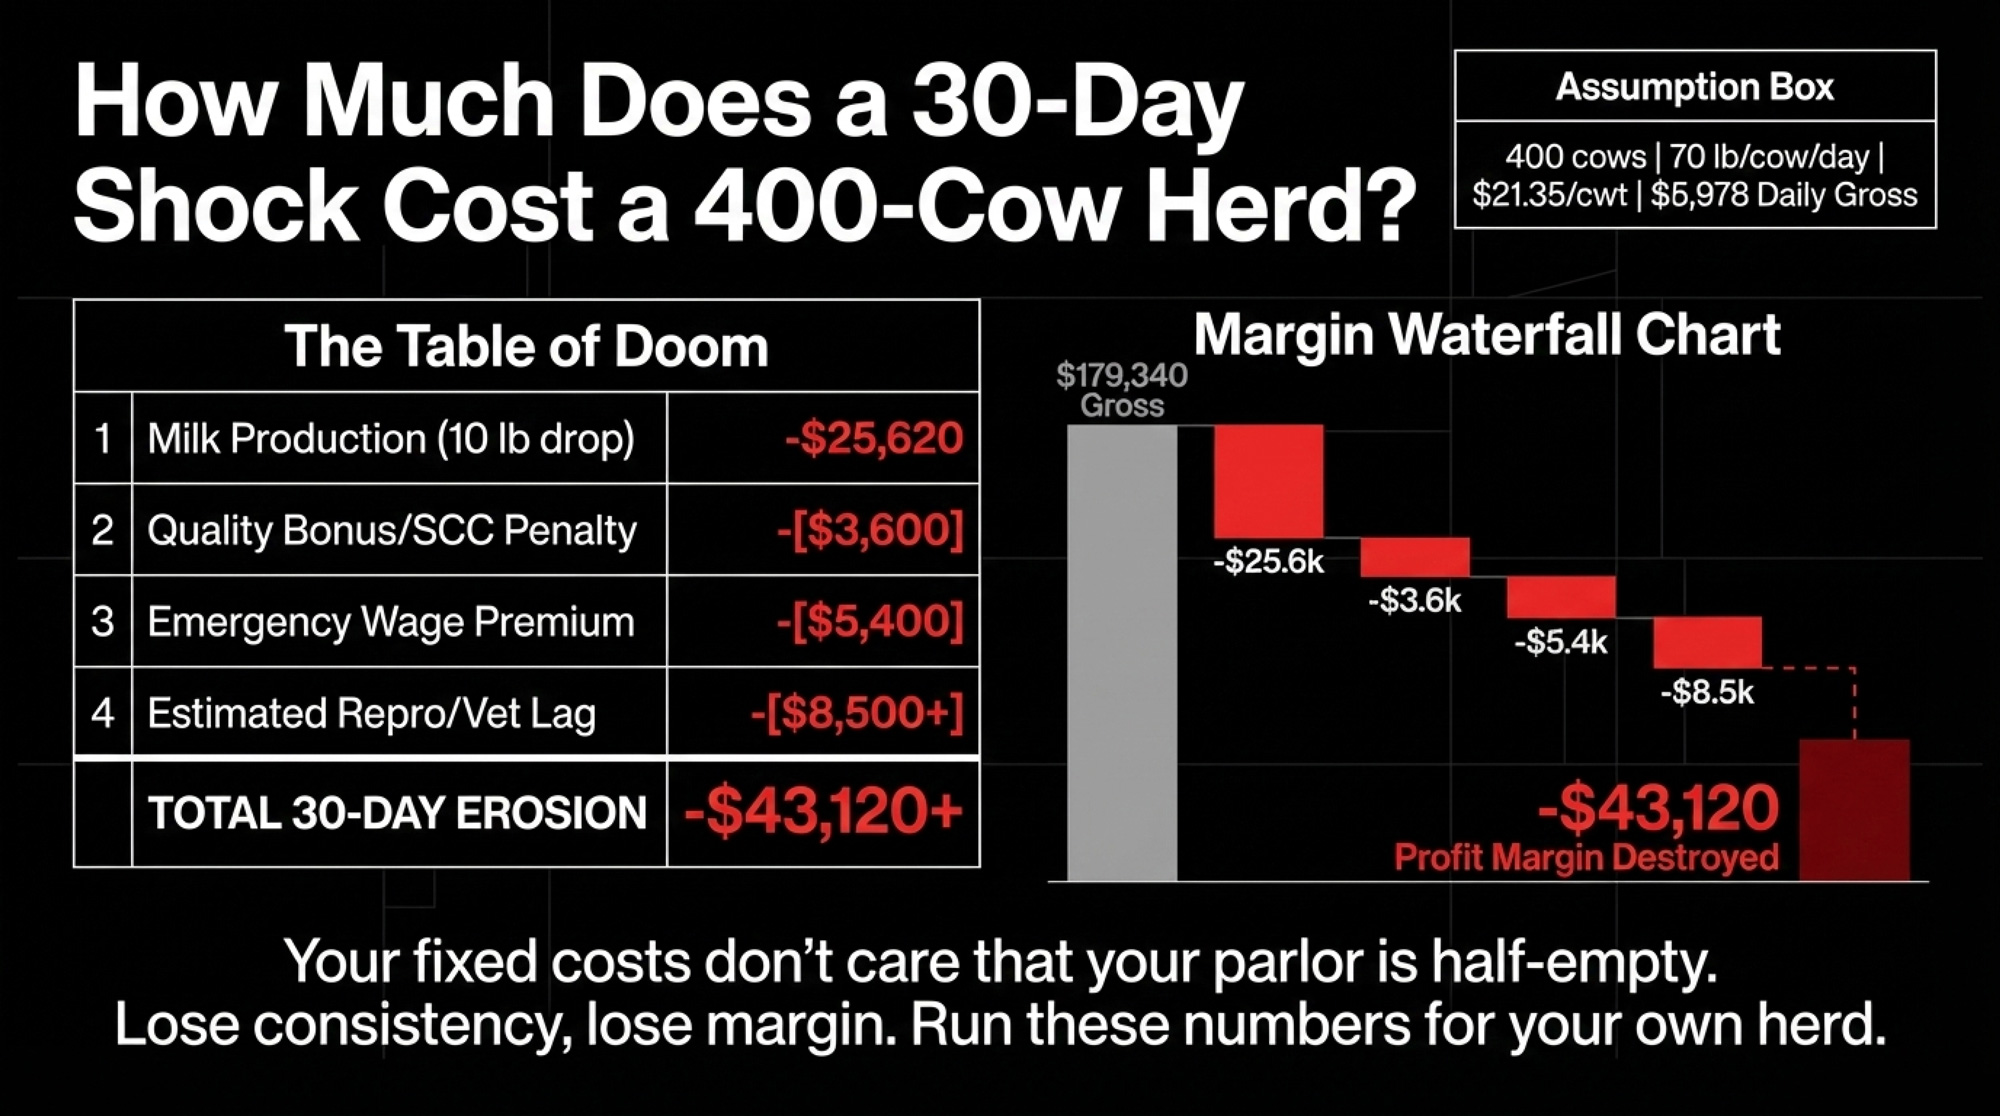
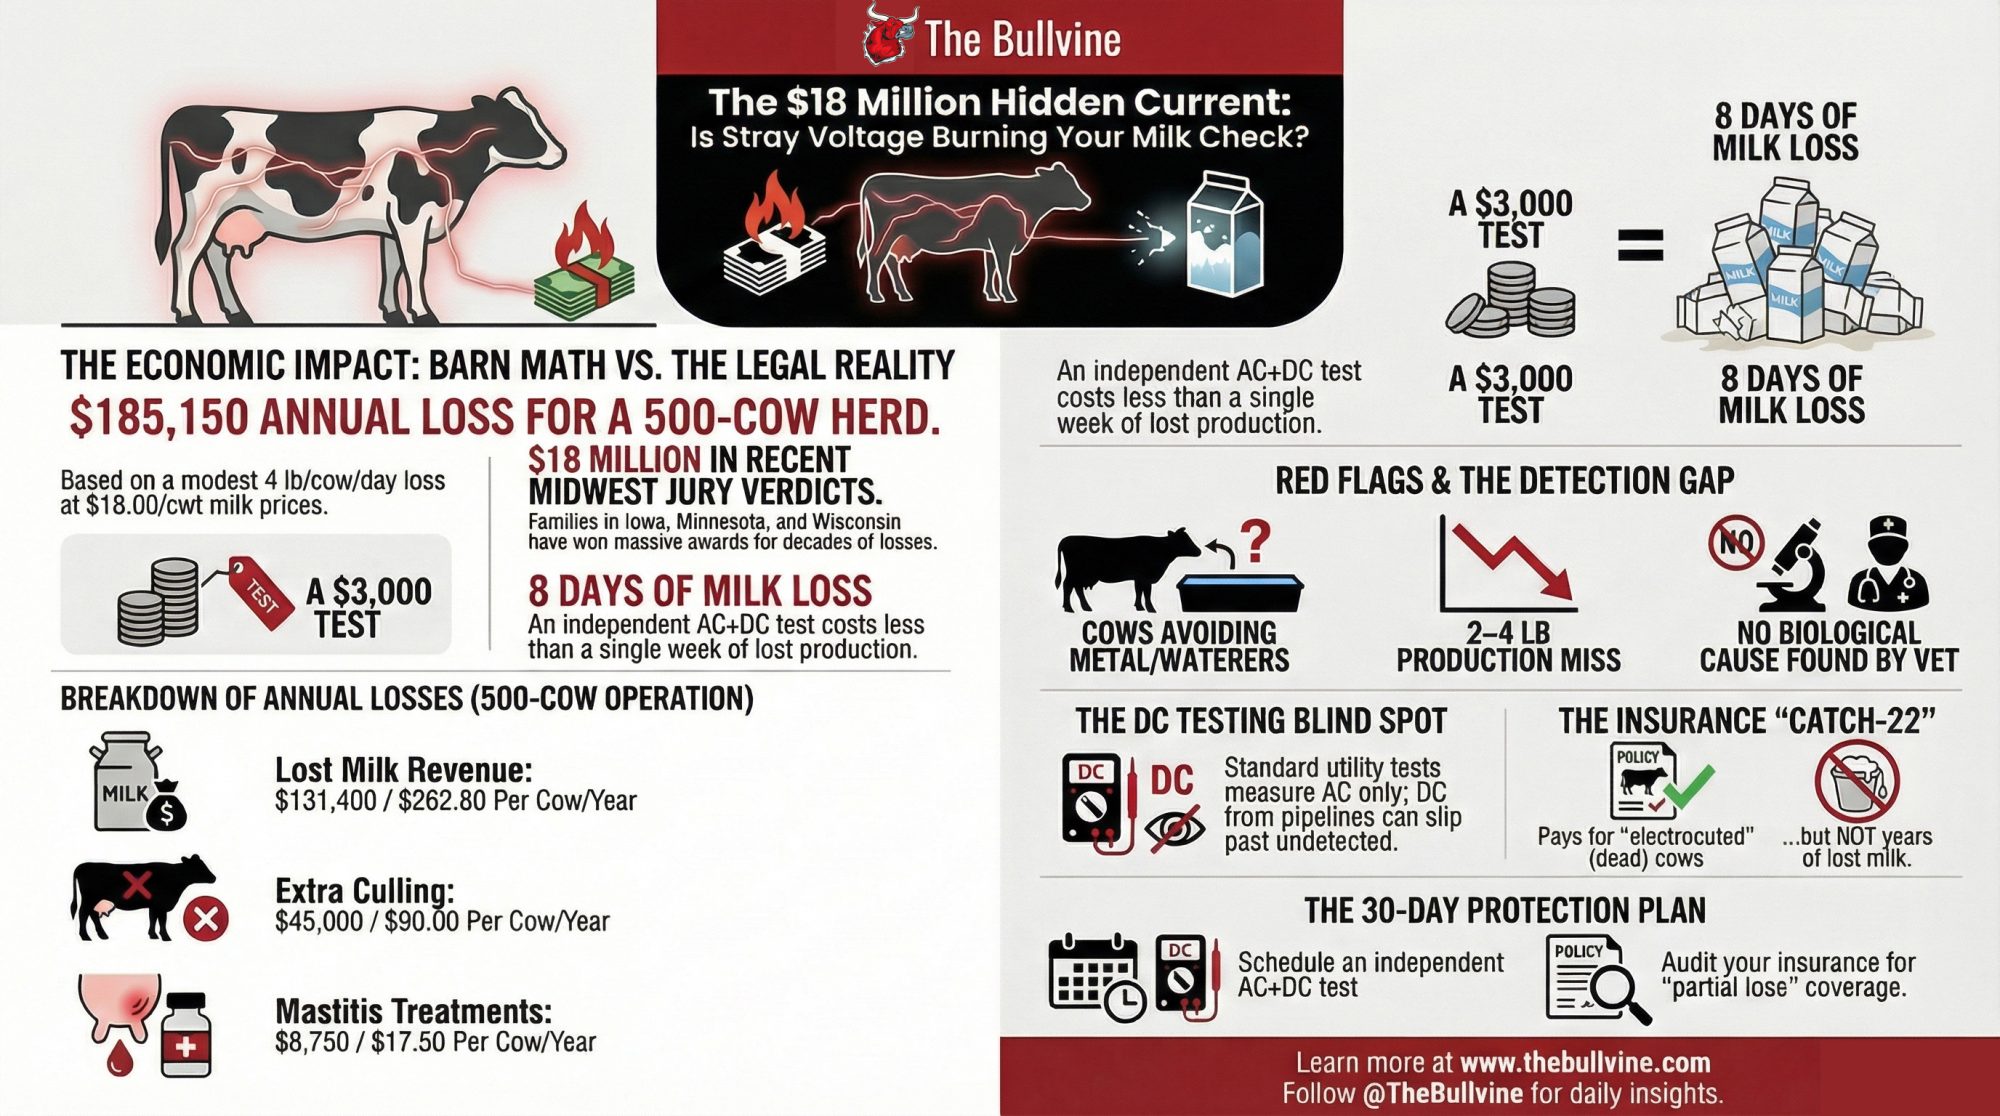
Here’s what that looks like on paper. On a 400‑cow herd averaging 75 lb/day, you’re shipping roughly 300 cwt/day. That 75 lb/day figure is a planning midpoint — adjust up or down for your own rolling herd average. If a downstream recall forces your co‑op to dial you back 10% for 60 days and that 30 cwt/day has to clear into a distressed market at a $3/cwt discount, you’ve just eaten around $5,400 in lost revenue over two months. Nothing to do with your ration, your SCC, or your parlor routine. Something changed in someone else’s plant — the pain still moved upstream.
The Cost of Prevention vs. the Cost of a Recall
| Metric | The “Distressed” Reality (60 Days) | The Prevention Strategy (Annual) |
| Activity | 10% intake cut / distressed sale on a 400‑cow herd | 120 environmental swabs + targeted repairs |
| Daily / Unit Cost | $90.00 / day | $21.70 / swab |
| Total Financial Hit | $5,400.00 | $2,604.00 |
| Business Impact | Pure loss (no ROI) | Risk mitigation / insurance |
Illustrative planning numbers — substitute your own cwt/day and discount.
That’s the mild version — a physical contaminant that didn’t kill anyone. When listeria gets into the mix, like at Jarratt or in those supplemental shakes, the recalls are larger, the shutdowns measured in months instead of weeks, and the retailer reaction harsher. The bigger the shock, the more aggressively cost and risk get pushed back through processors, co‑ops, and finally onto you.
Why the System Fails Upstream Producers
So why does someone else’s listeria problem keep showing up in your pay statement instead of staying where it started? A lot of it comes down to how the rules are written — and what they actually reward.
HACCP is built to reward paperwork first, pathogen control second. Processors write their own hazard analyses and critical control points. Inspectors mostly verify those plans exist and the records are filled out. At Jarratt, USDA’s post‑outbreak review found thermometer calibration records in the plant’s HACCP files didn’t match what devices were actually reading on the floor. On paper, the system looked fine. In the coolers, listeria was quietly doing its job.
Many listeria controls live in sanitation SOPs and environmental monitoring programs rather than as “stop‑the‑line” CCPs that automatically shut down production when a threshold is crossed. If a plant treats listeria as a cleaning nuisance instead of a production‑stop issue, management can understaff cleaning, rush changeovers, and still pass audits because the documentation looks tidy. Jarratt’s reopening under the more stringent USDA Alternative 2 Listeriacontrol program — which adds post‑lethality treatments or increased testing — is itself an admission the plant’s earlier controls weren’t enough.
Talmadge‑Aiken agreements can document problems without forcing plants to stop. Jarratt wasn’t inspected by federal FSIS staff day‑to‑day. It fell under a Talmadge‑Aiken agreement where Virginia state inspectors operated under federal authority.
Layman’s definition: Under Talmadge‑Aiken agreements, state inspectors do the footwork, but they’re technically enforcing federal (USDA) standards. It’s a “partnership” that, as Jarratt proved, can sometimes leave accountability gaps — plenty of paperwork generated, not enough production‑stopping force.
Those inspectors wrote up 69 sanitation noncompliance records between August 2023 and August 2024. Each generated a corrective‑action entry. None triggered the kind of sustained production halt and teardown that might have cleared a persistent listeria problem before those deaths and hospitalizations. Only after the outbreak did USDA promise clearer expectations for oversight, tougher enforcement of federal food‑safety laws, and comprehensive federal training for Talmadge‑Aiken inspectors at that plant — exactly the things most producers assumed were already in place.
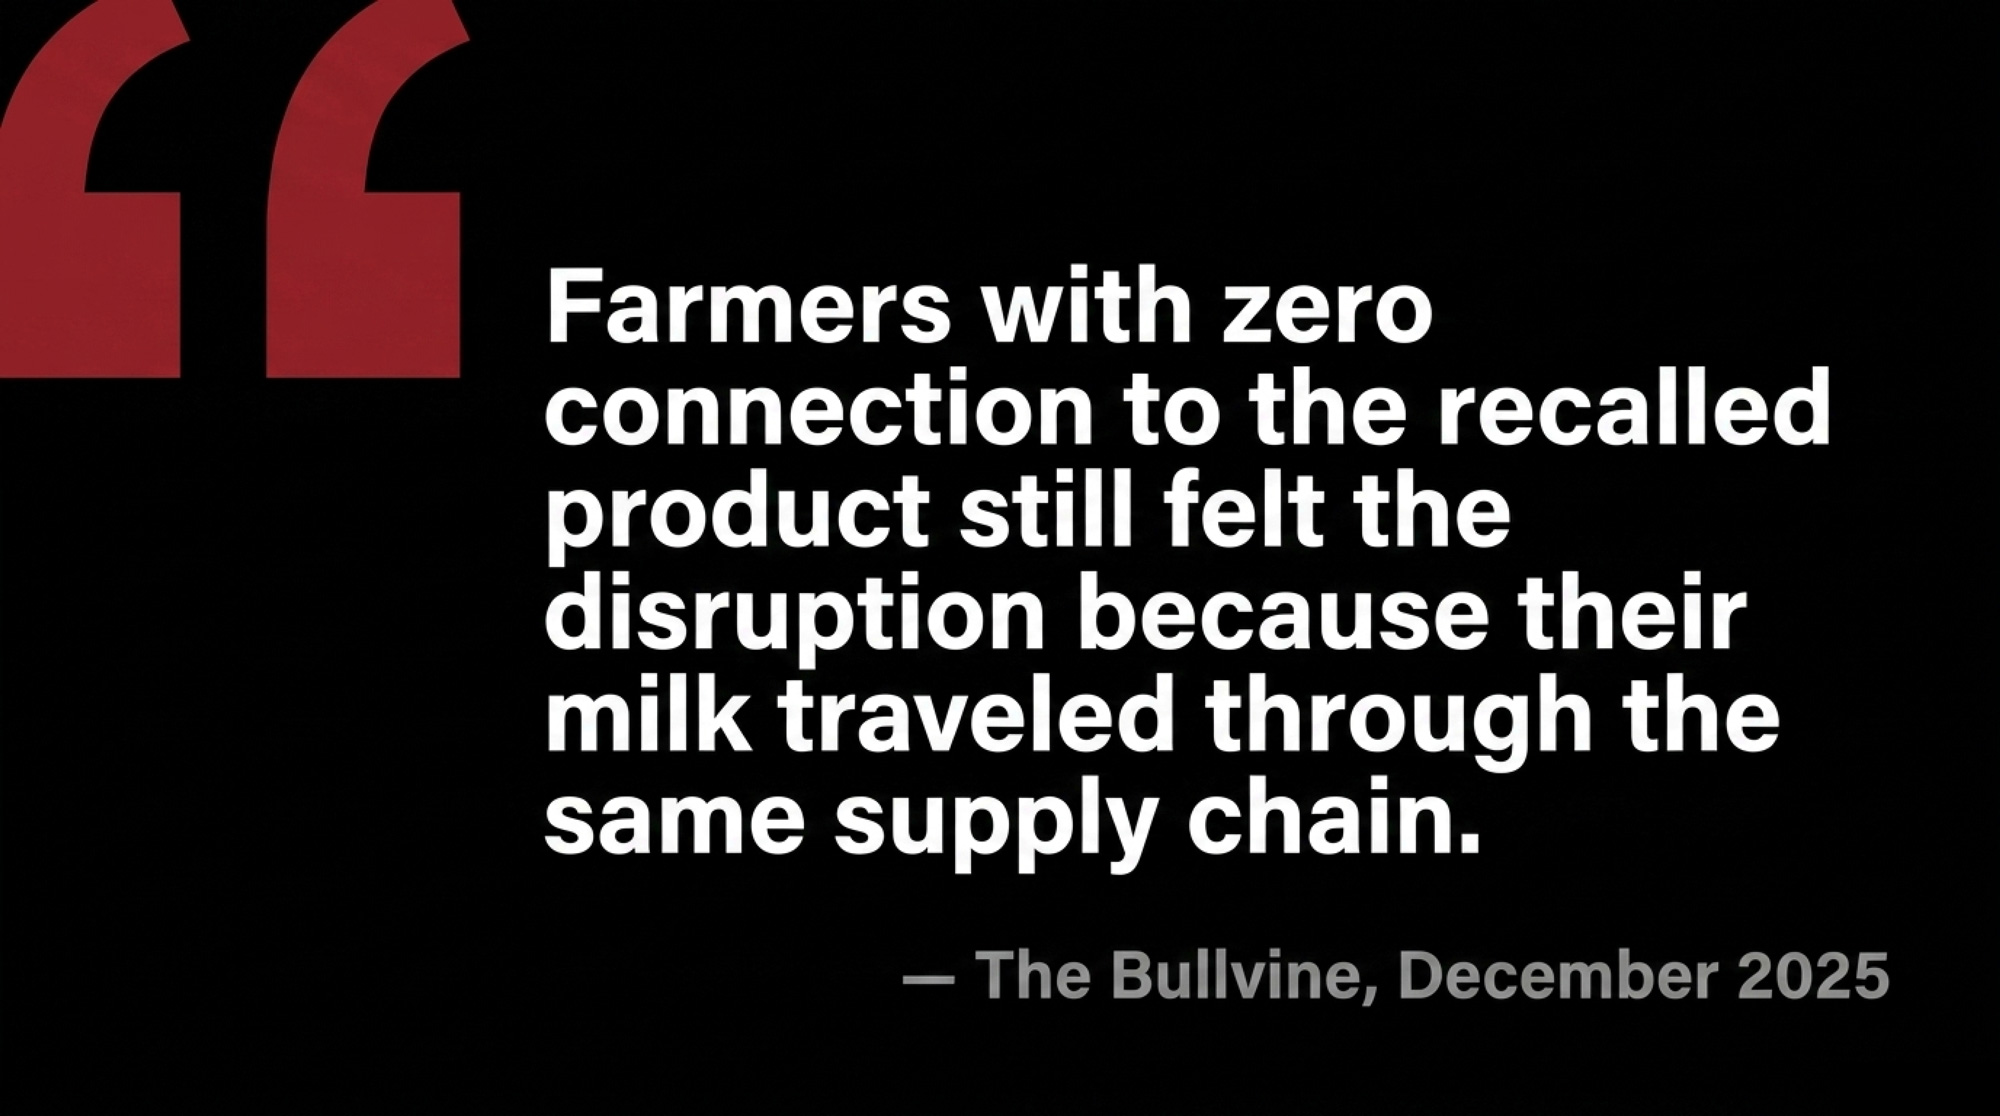
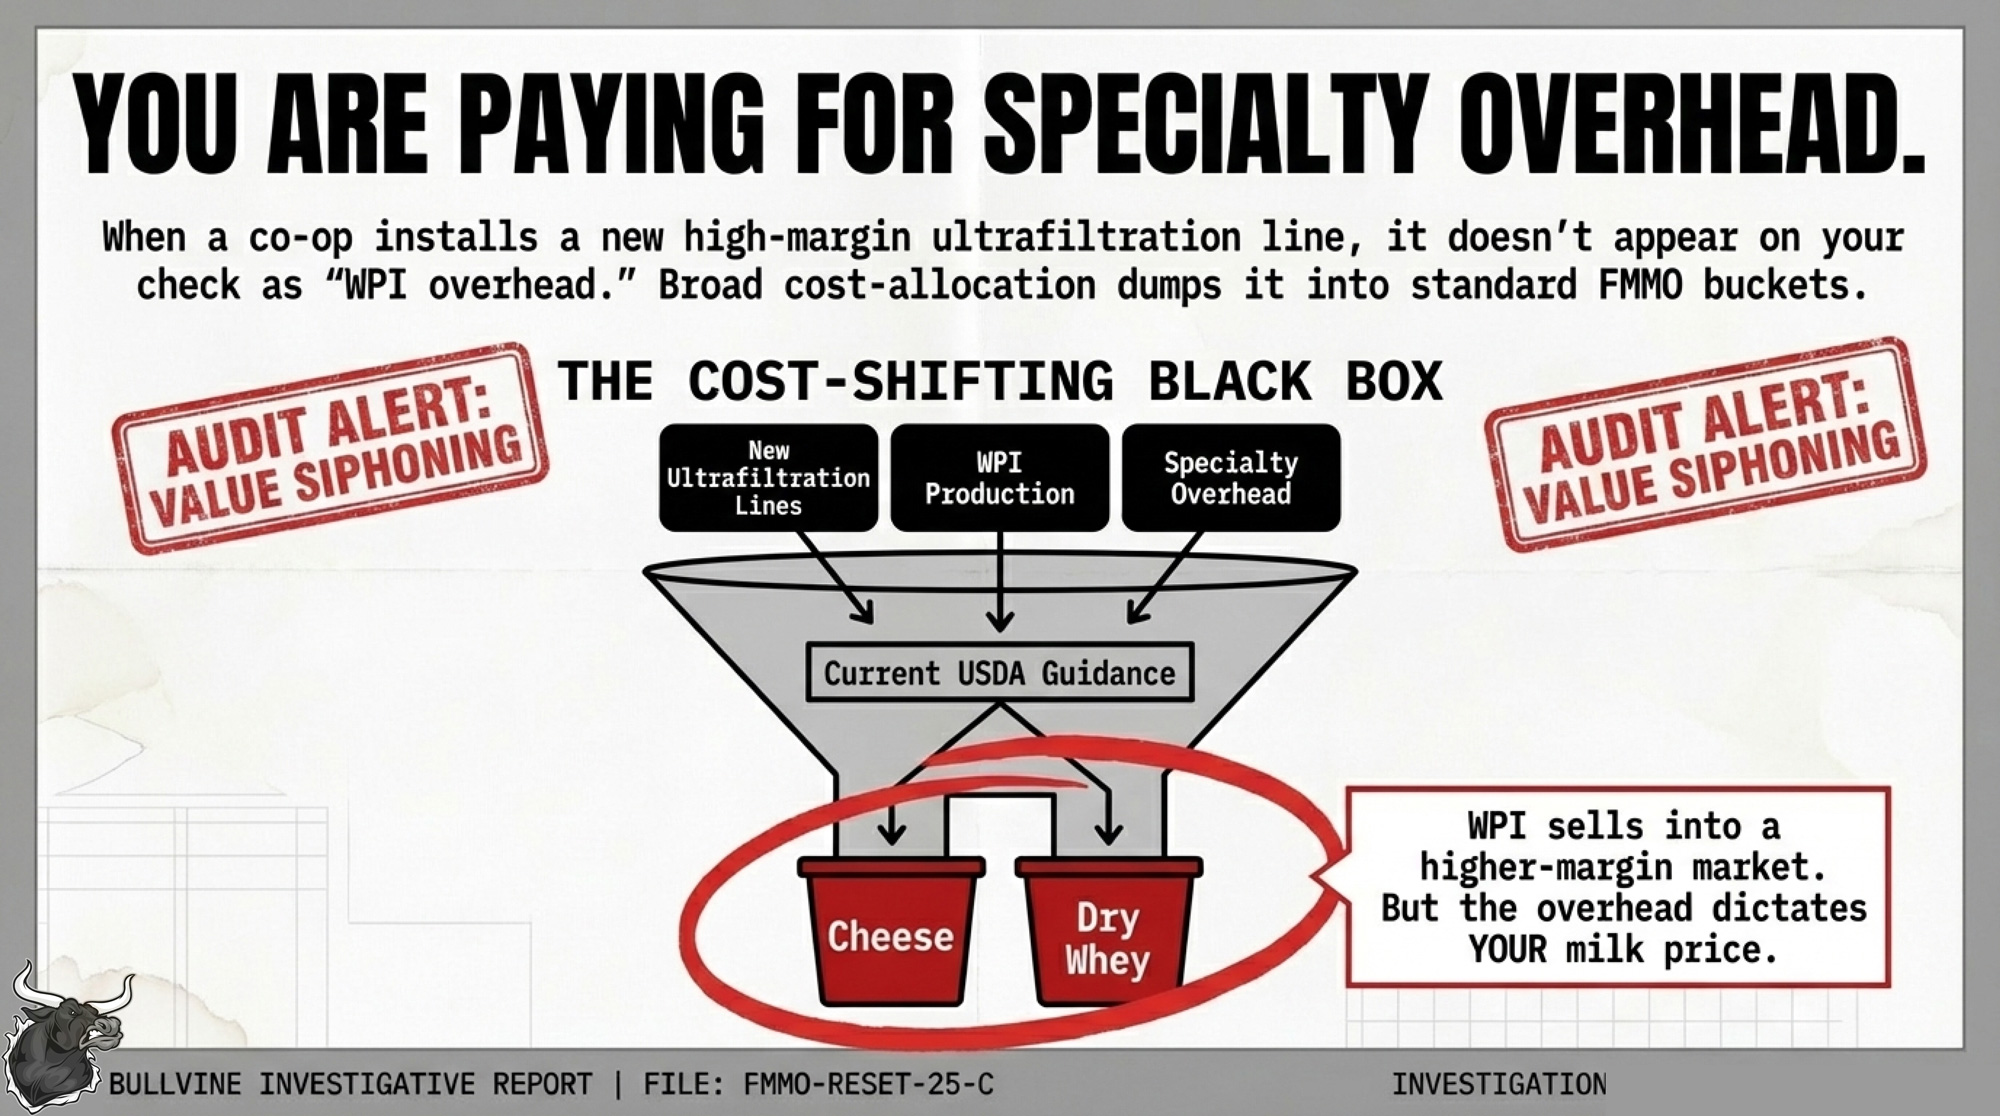
Your co‑op’s job is to move milk and chase price, not audit every converter’s drains. Most co‑ops don’t own the shredders, blenders, and co‑packers where a lot of recall risk actually sits. Their main levers when a customer has a problem are to redirect loads, renegotiate terms, or adjust member intake. They can’t walk into a customer’s plant, rewrite their HACCP plan, or force them to start paying for a real environmental monitoring program. The Great Lakes situation made that dynamic plain: farmers with zero connection to the recalled product still felt the disruption because their milk traveled through the same supply chain.
That’s how 69 ignored warnings at someone else’s plant, or a multi‑year listeria problem in someone else’s product line, quietly turns into intake cuts, lost premiums, and more volatile contracts for you.
What This Rising Dairy Recall Risk Really Means for Your Operation
In practical terms, the biggest food‑safety risk to your business might not be in your bulk tank or your milking routine. It might be the plant your milk flows into, the converter they sell to, and the brand that ends up on the package.
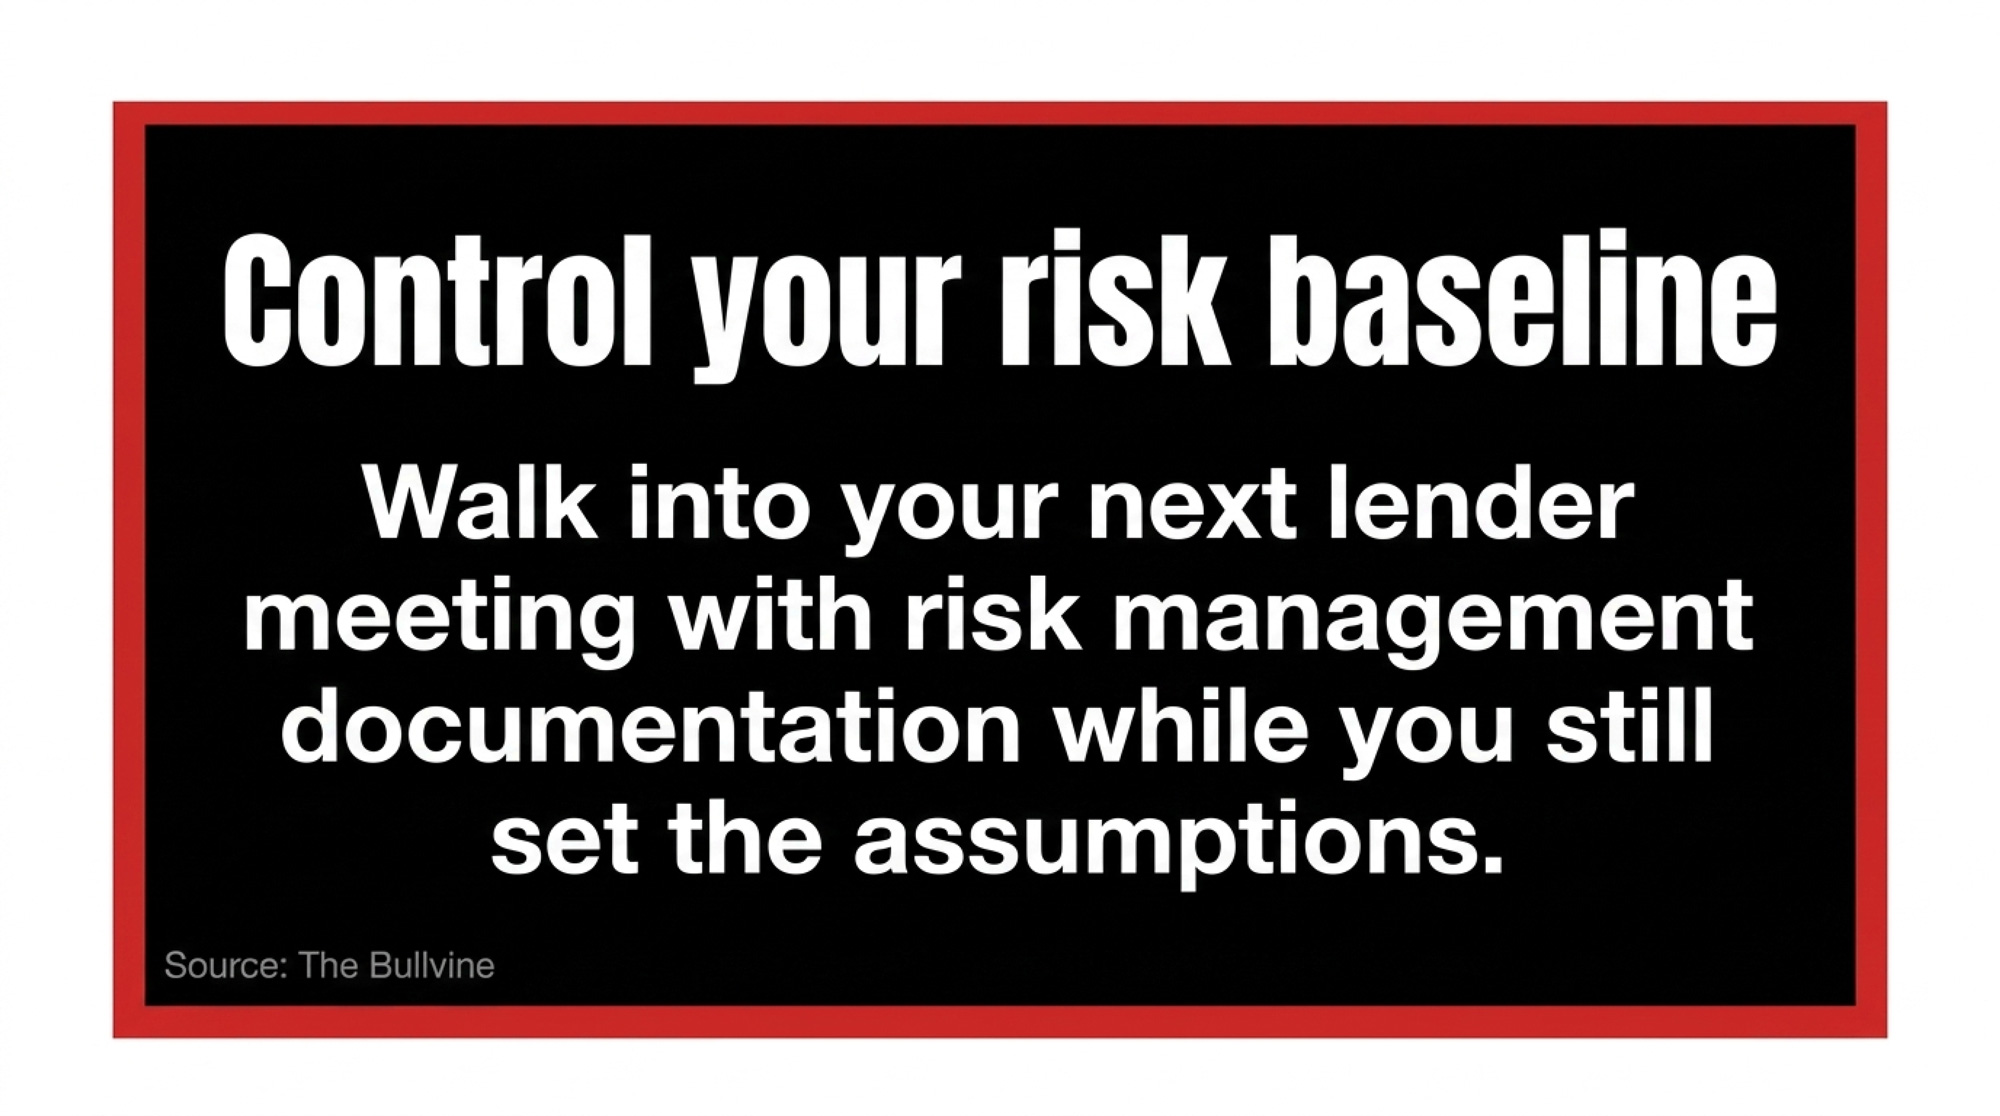
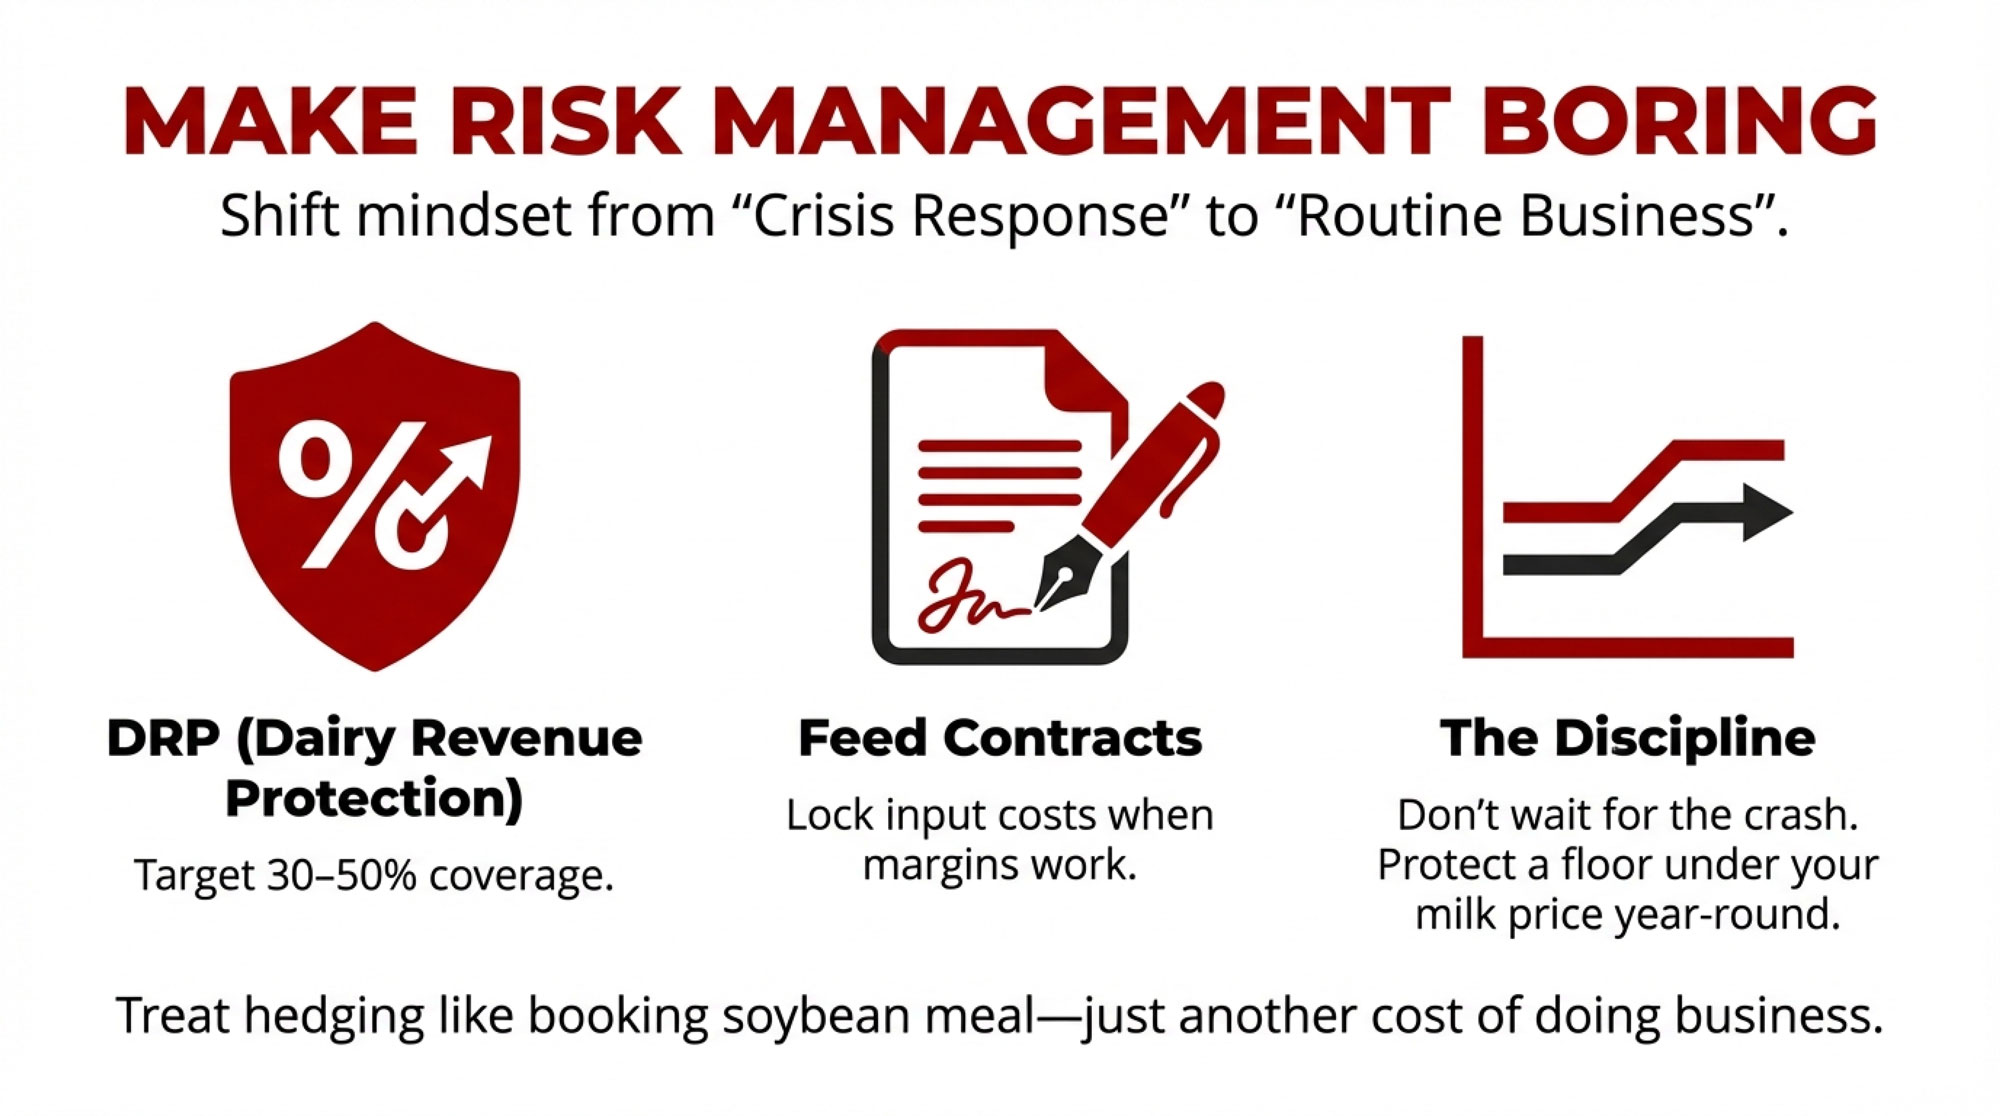
You already manage the risk inside your fence: mastitis, repro, feed costs, weather. You probably use DMC, DRP, or forward contracts to keep milk price swings from wrecking your cash flow. This is a fourth risk pillar sitting alongside those three: downstream plant and contract risk.
It’s uncomfortable because it lives outside your control. But that doesn’t mean you’re powerless. It means you can’t treat “regulation” as a safety net and assume if something were really dangerous, someone would shut it down. Jarratt ran for a year under 69 documented violations. Rizo‑López stayed in business until a permanent injunction followed multiple illnesses and deaths. The Prairie Farms supplemental shake outbreak ran from 2018 case onsets until the FDA closed its investigation in May 2025 with 42 illnesses and 14 deaths on the books.
The system will sometimes leave bad plants running much longer than you’d expect. So you start with the question most of us avoid: how exposed are you if your main plant goes dark?
How Much Could a 90‑Day Plant Shutdown Really Cost You?
Forget Boar’s Head for a second. Picture your own milk truck.
If your primary processor shut down for 90 days — listeria, metal fragments, equipment failure, enforcement action, whatever — what actually happens to your milk? Do you know which plants are your first and second outlets? Could your co‑op redirect your volume within a week? Would you be on full quota, reduced, or dumping? Have you asked?
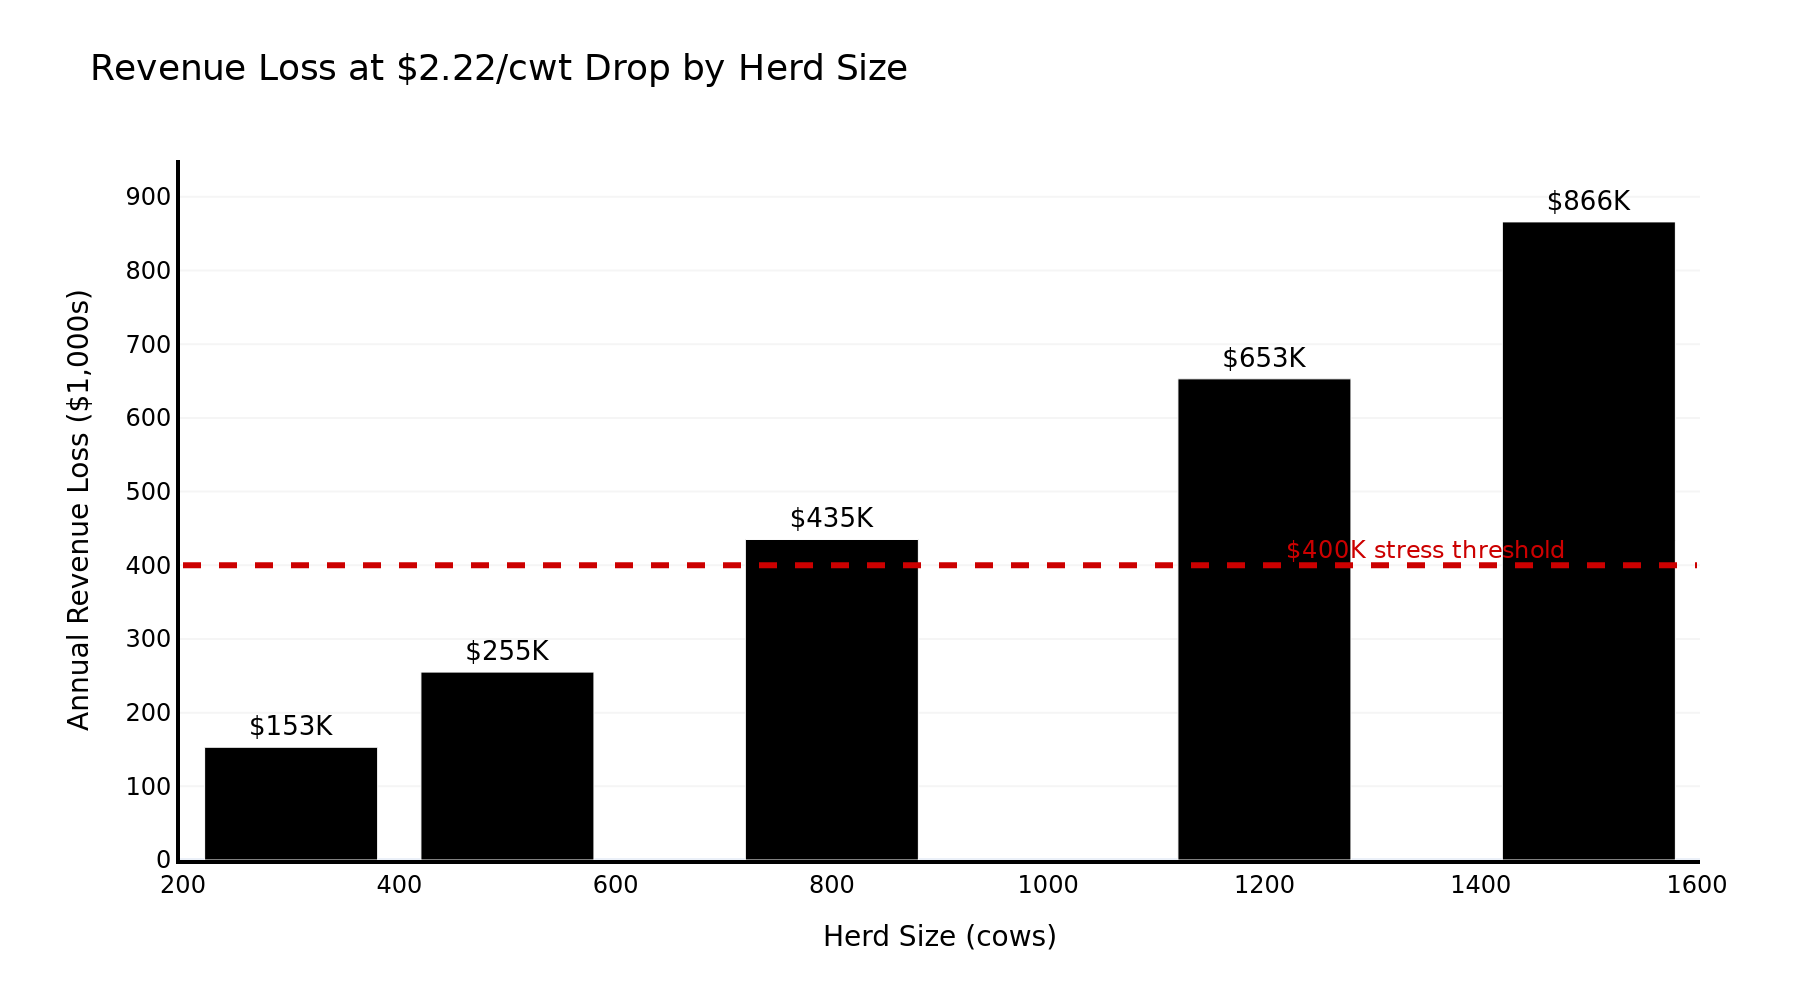
Take that same 400‑cow herd shipping about 300 cwt/day. If 20% of your volume — 60 cwt/day — suddenly has to move into lower‑value channels at a $3/cwt discount for three months, the math looks like this:
- 60 cwt/day × $3/cwt = $180/day
- $180/day × 90 days = $16,200
Plug your own cwt/day and discount to see where you land. You can argue about whether $3/cwt is the right number for your market. You might think your co‑op could shift you into something better. That’s exactly the point. For a lot of farms, those are guesses — not numbers.
As The Bullvine reported in December 2025, the herds that rode the Great Lakes disruption best weren’t necessarily the biggest or fanciest. They were the ones who’d already mapped their supply chain. They already knew:
- Where their milk actually goes
- What backup outlet exists if a plant shuts
- How long they can ride a disruption before it forces ugly decisions
Everyone else found out mid‑crisis.
Is a $22 Swab Test Really Worth More Than Your Premium Channel?
If you do any on‑farm processing — fresh cheese, bottled milk, ice cream, even a modest cream line — the math on basic listeria environmental monitoring isn’t that scary.
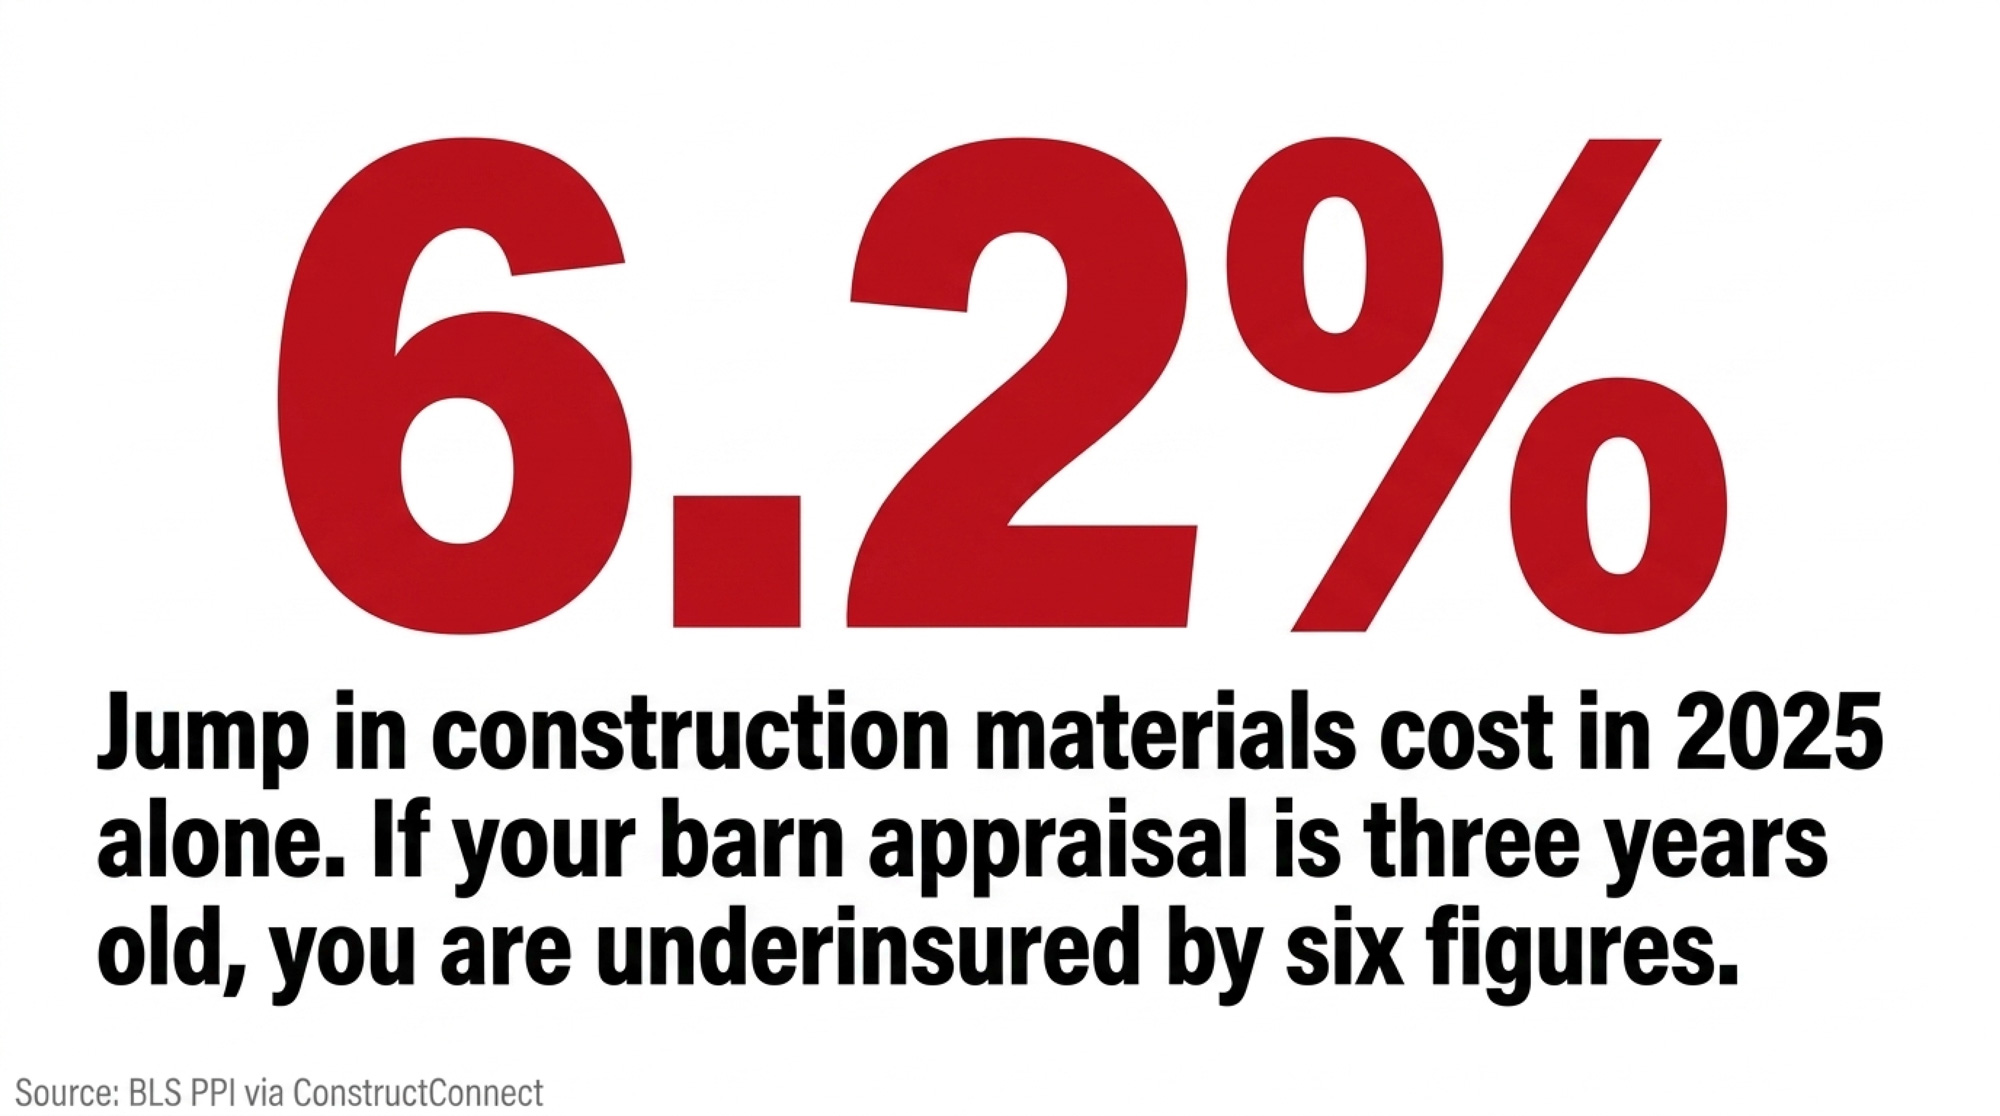
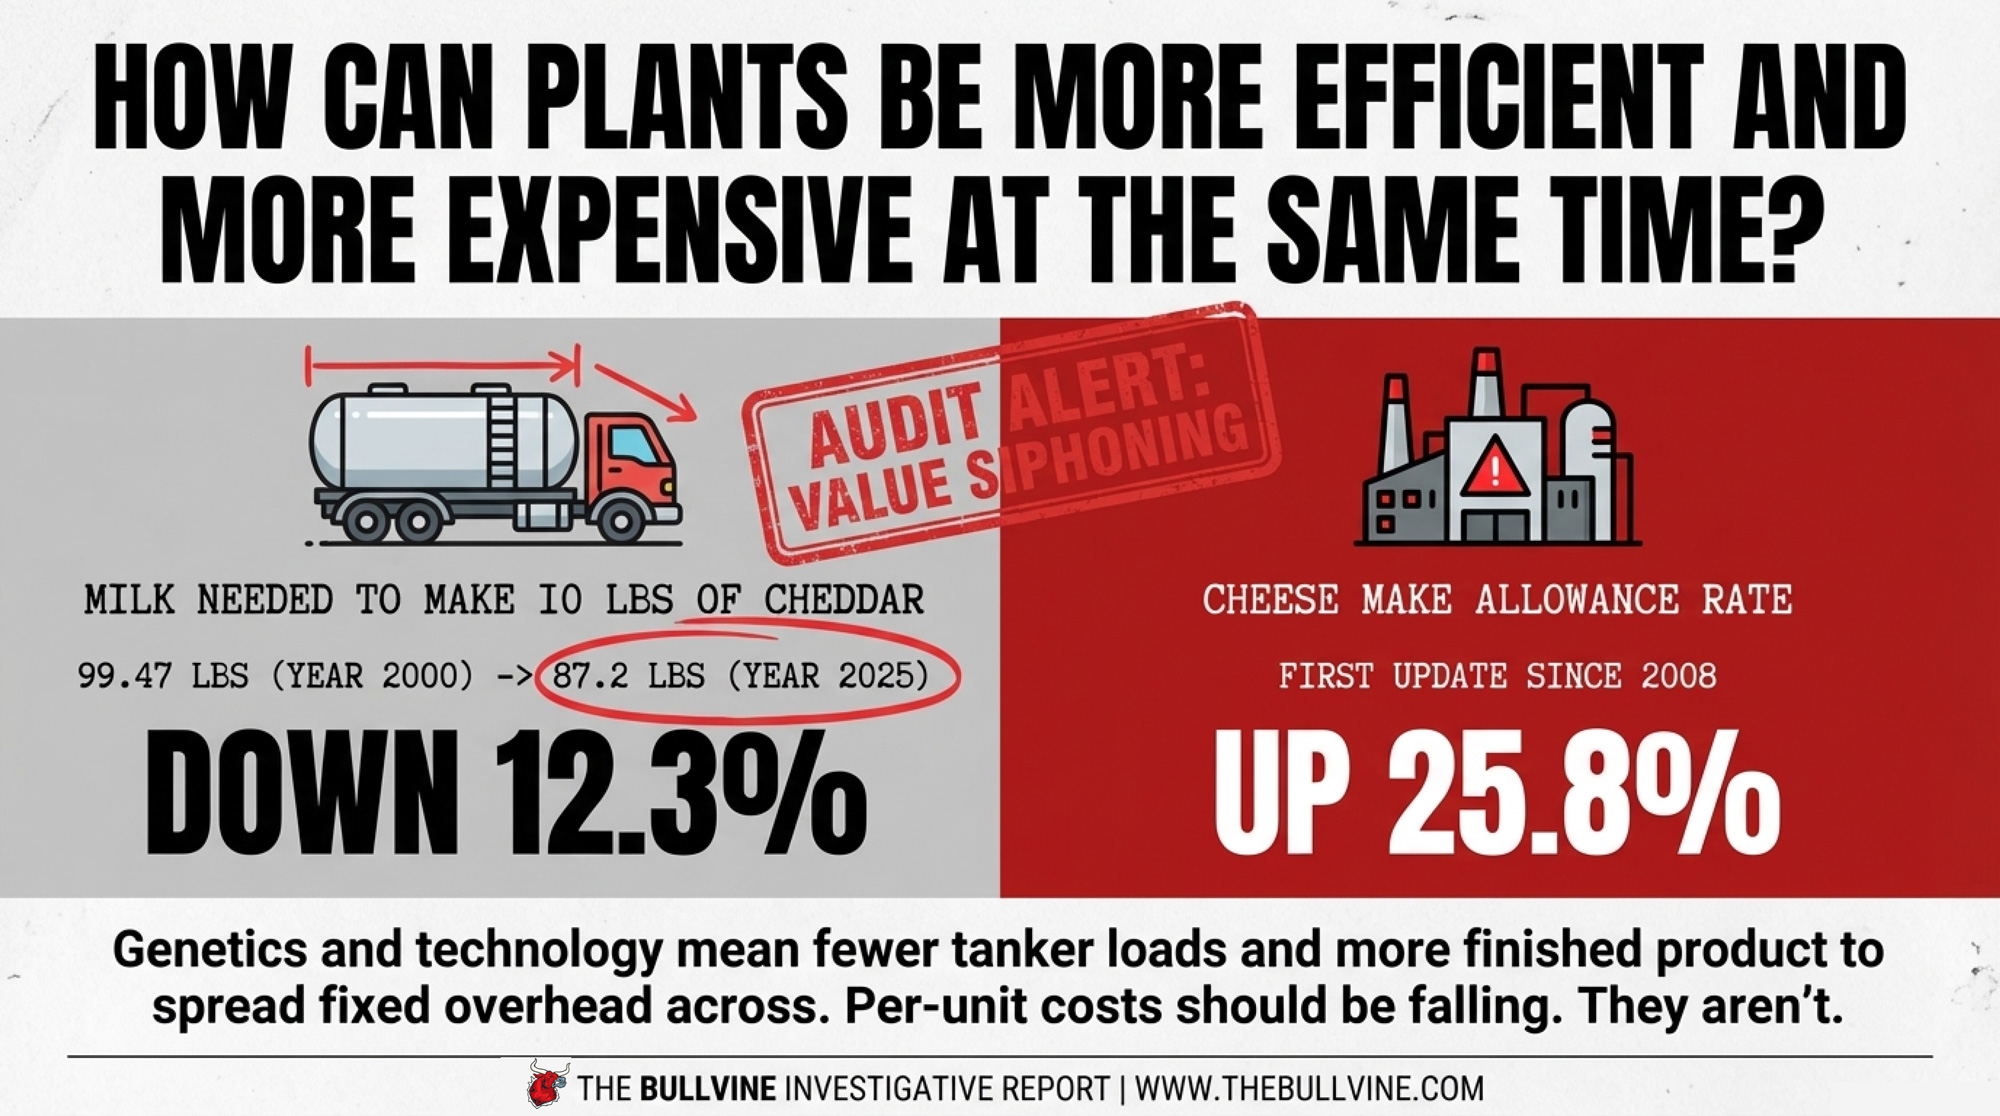
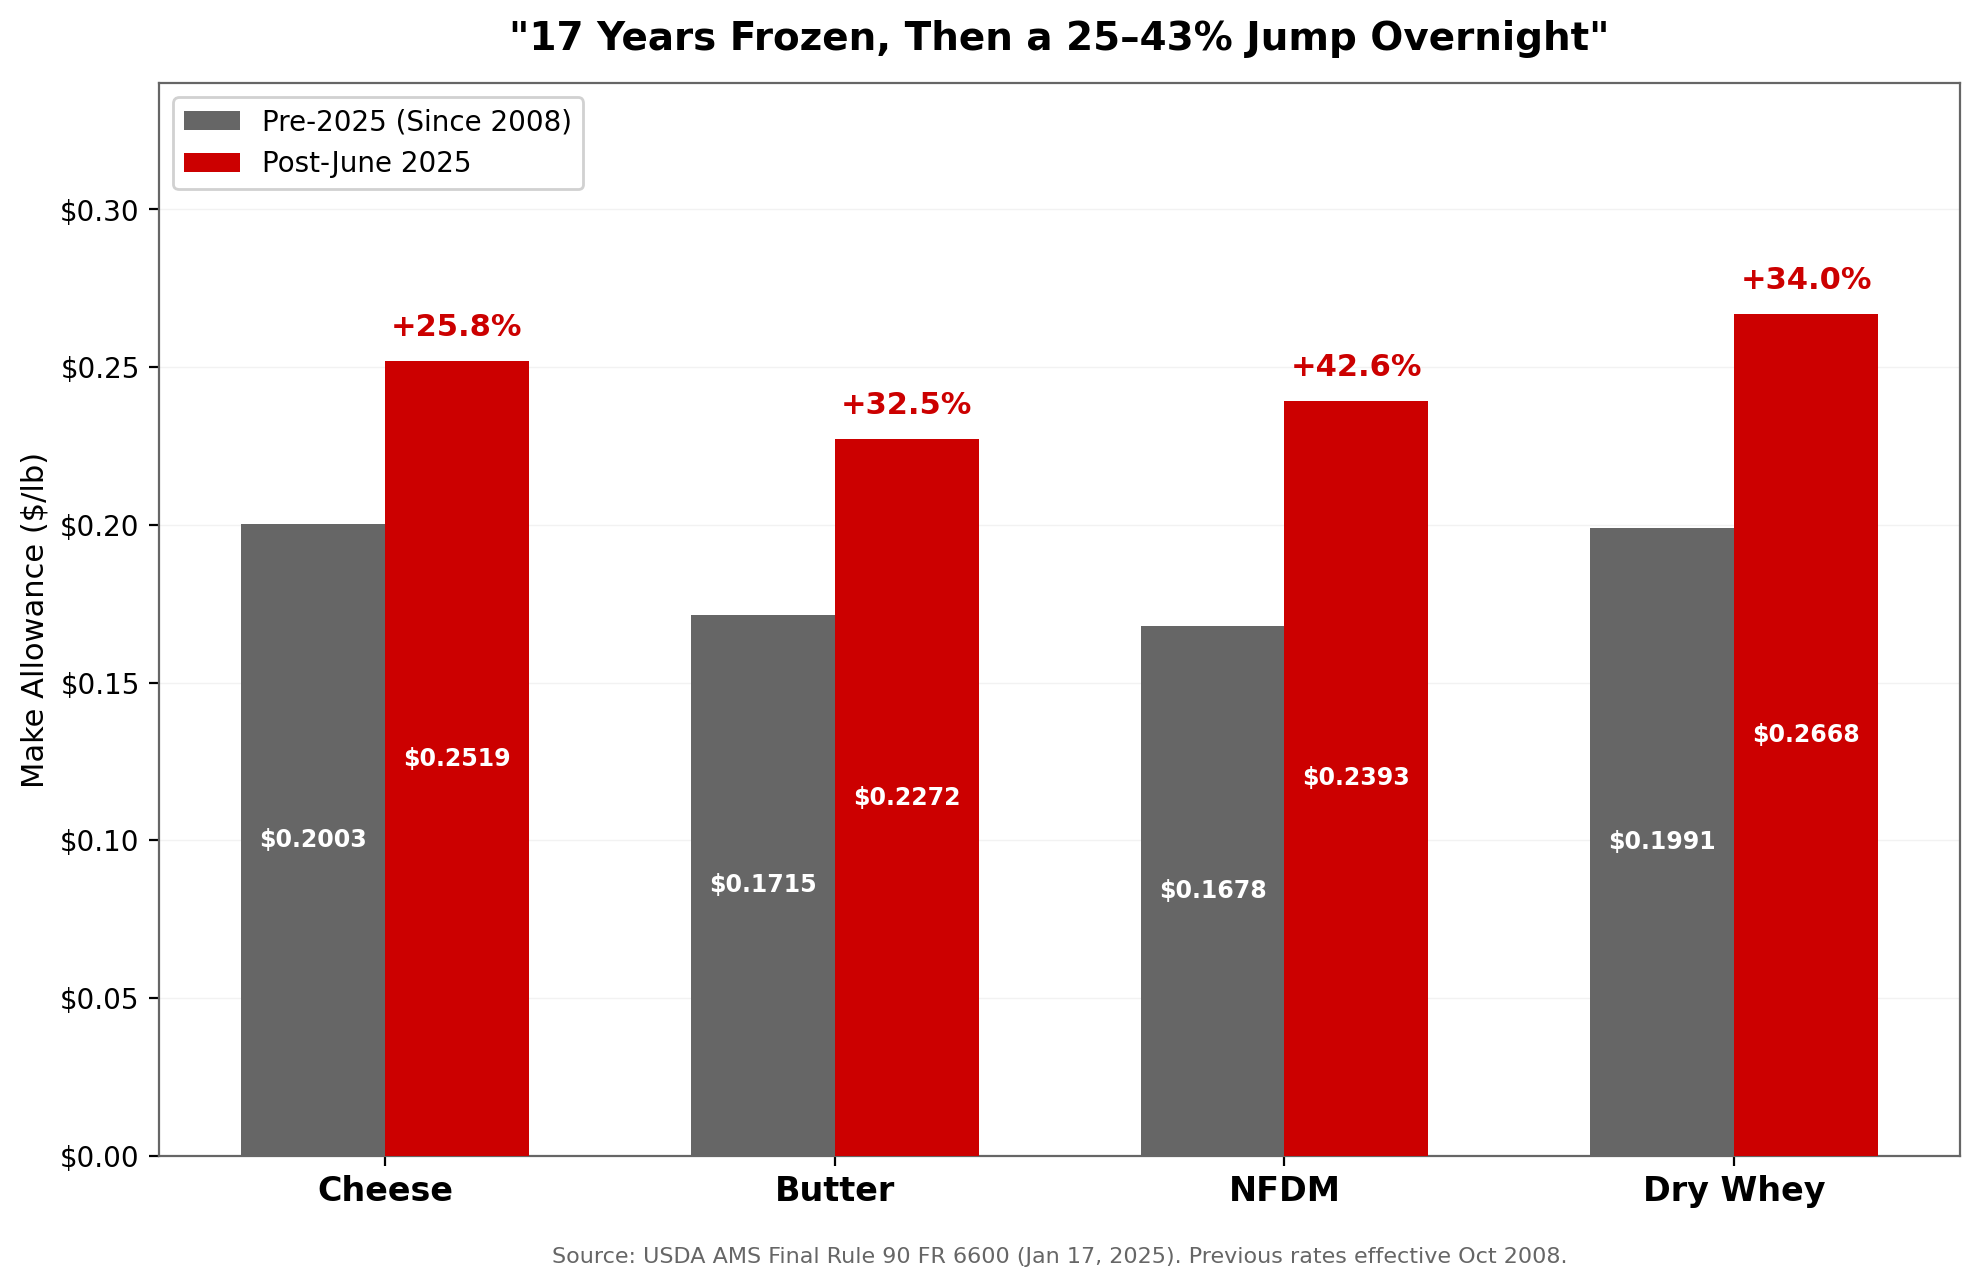
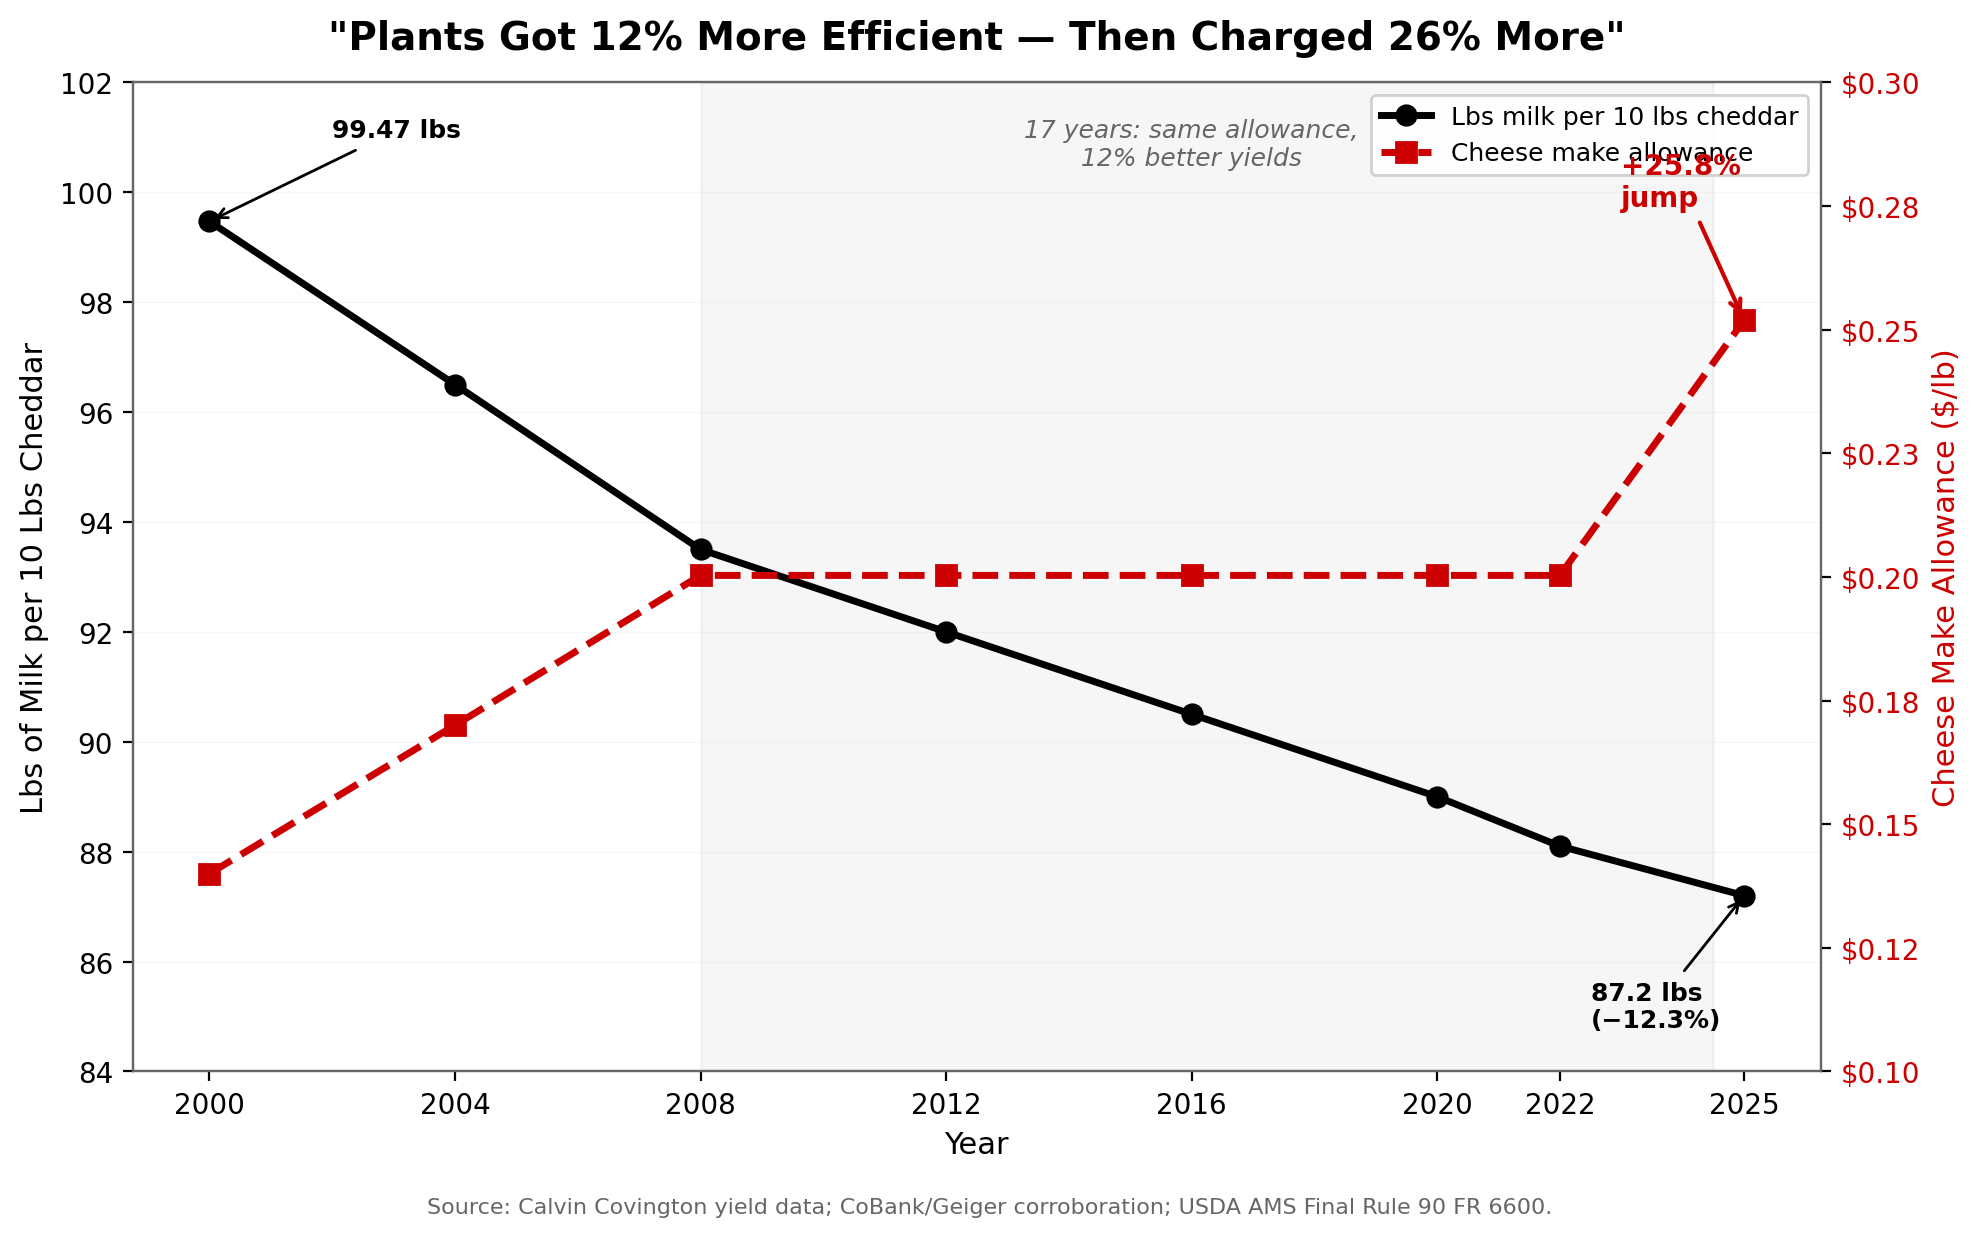
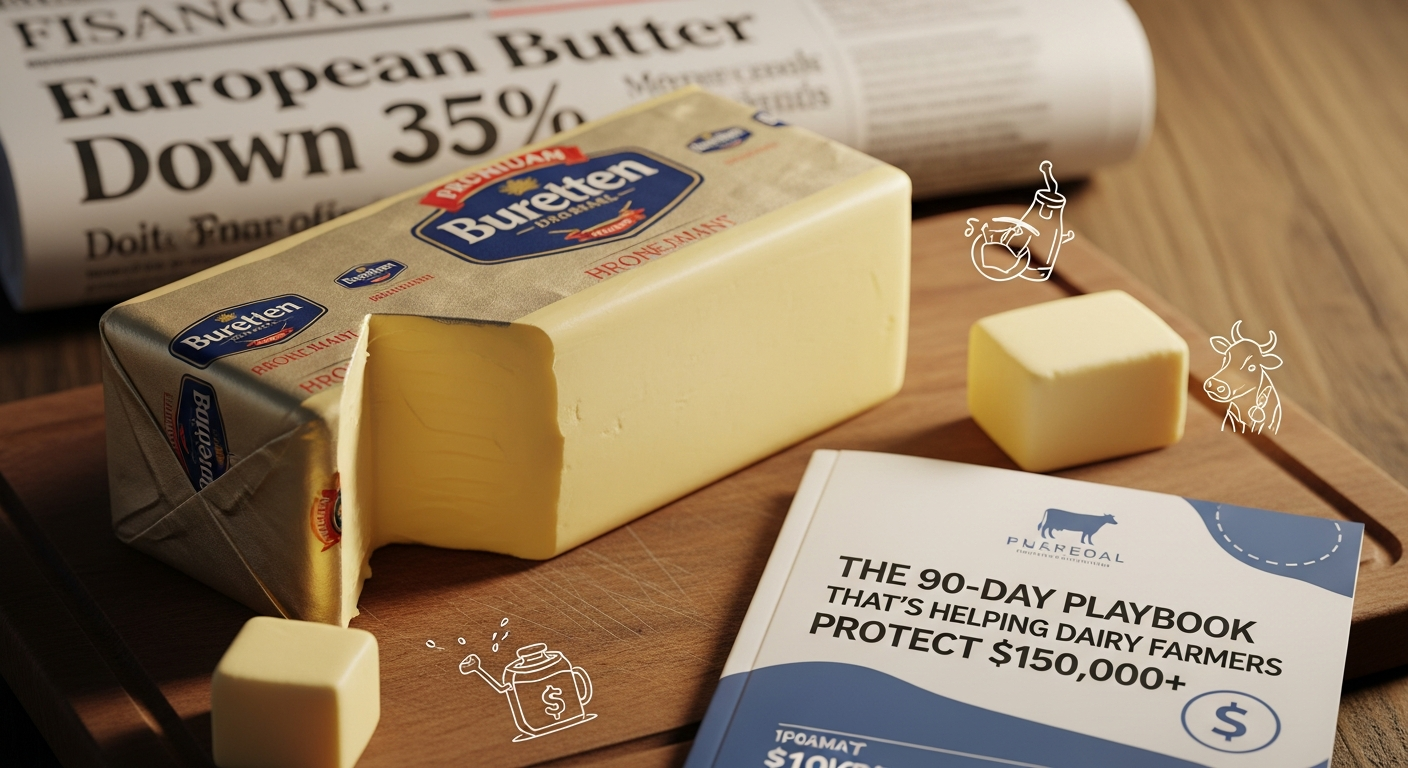
A 2025 Journal of Dairy Science study by Motzer, Trmčić, and colleagues looked at nine small‑ and medium‑sized dairy processors and found total annual environmental monitoring program (EMP) costs ranged from $1,187 to $55,531per plant, depending on size and intensity. The sponge swab and lab fee together ran about $21.50–$21.86 per sample.
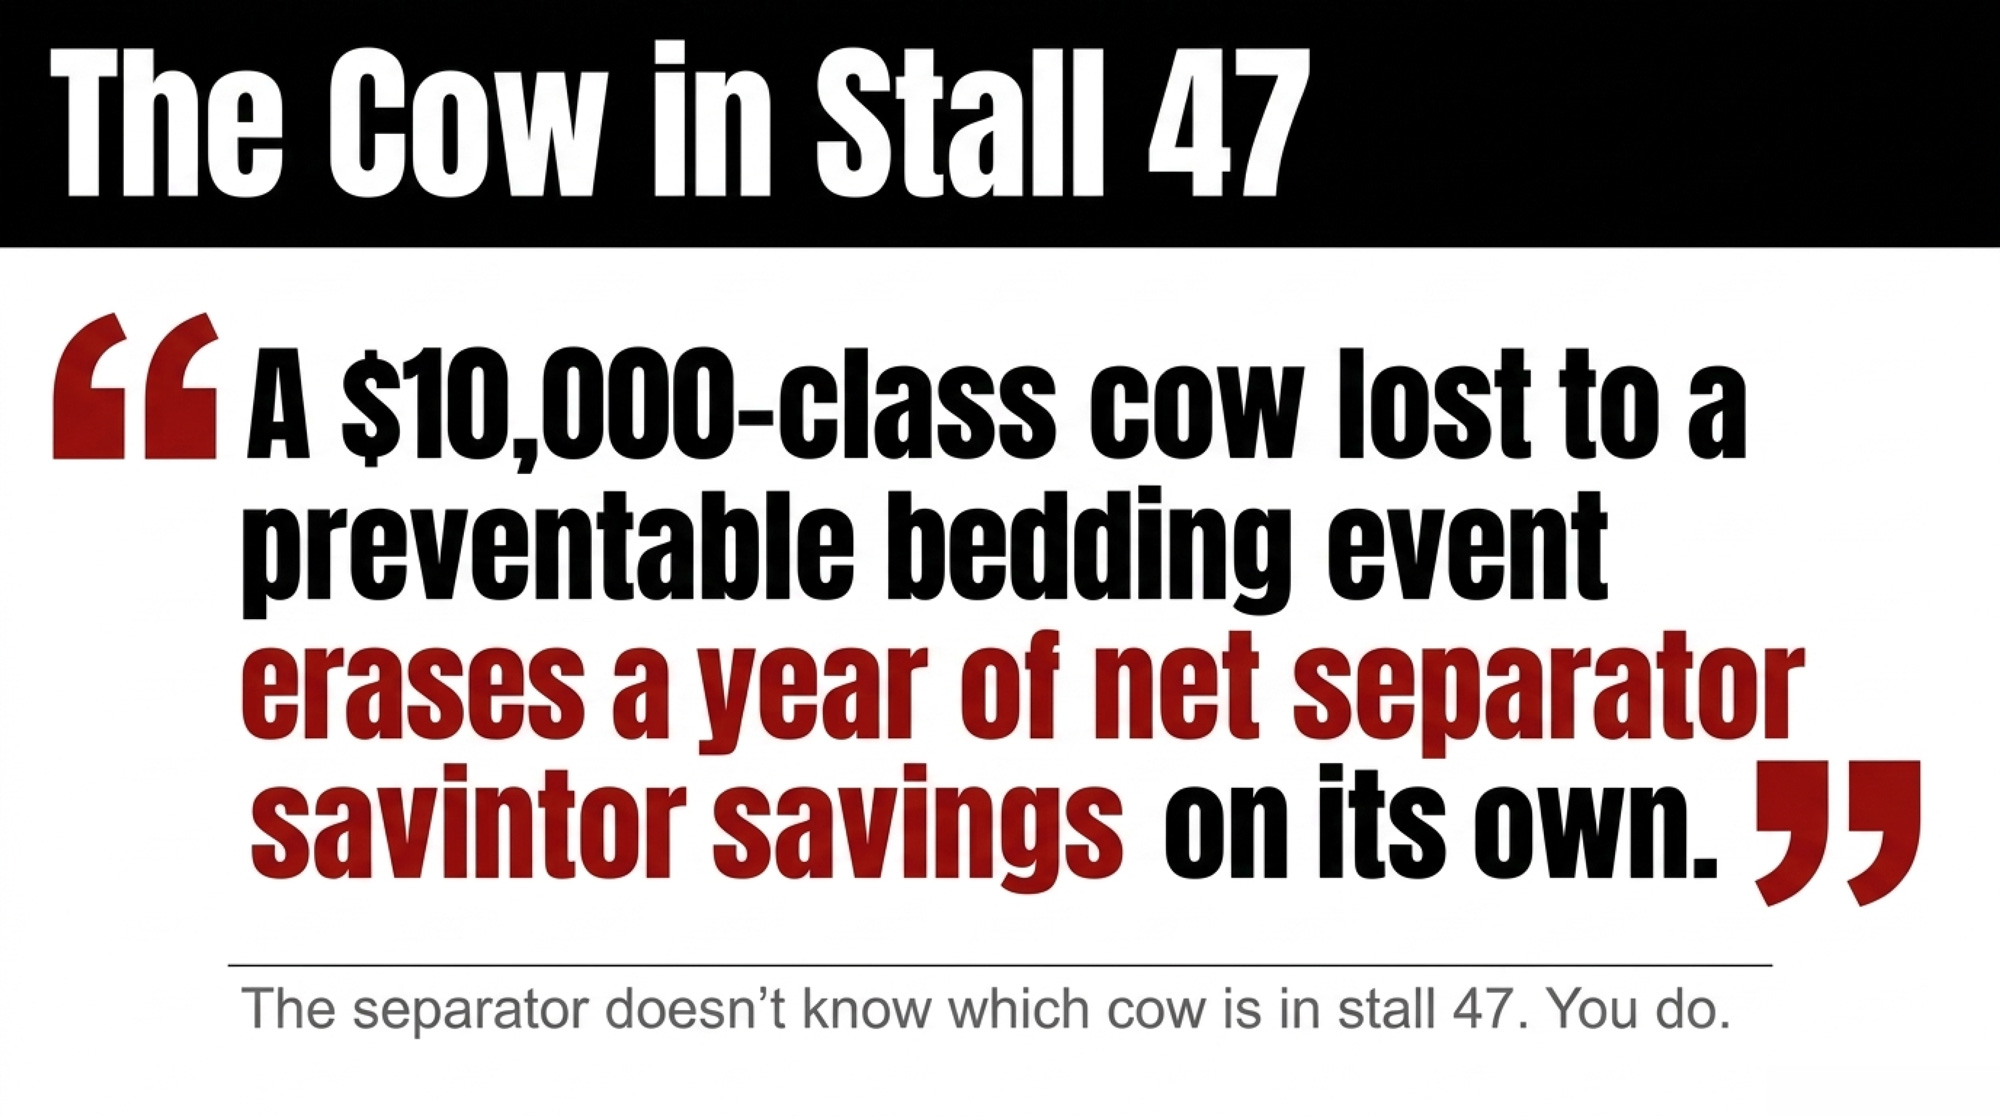
Take 10 targeted swabs a month — drains, floor‑wall junctions, under equipment where it’s always damp — and that’s 120 swabs a year. At roughly $21.70 each, you’re in the ballpark of $2,604 a year. That’s not nothing. But stack it against the $5,400 intake‑cut hit from the earlier two‑month example, and the EMP starts looking less like a line item and more like the cheapest insurance policy you’ll buy all year.
Even if you’re only shipping raw milk, the environmental hygiene logic still applies. Listeria monocytogenes loves cold, wet, nutrient‑rich environments. It forms biofilms on stainless steel and in drains that survive standard sanitizers. Research has shown 10‑day‑old listeria biofilms on stainless steel can resist both quaternary ammonium and chlorine — the same products most parlors and plants rely on every day.
You probably don’t need a full lab in your milk house. But you can:
- Fix cracked concrete and low spots where water pools.
- Get rid of dead‑leg piping and places where milk or wash water sits.
- Keep drains in bulk tank rooms and load‑out areas surgically clean.
- Run a few indicator swabs a year through your vet or local lab as a sanity check that your own environment isn’t part of the problem.
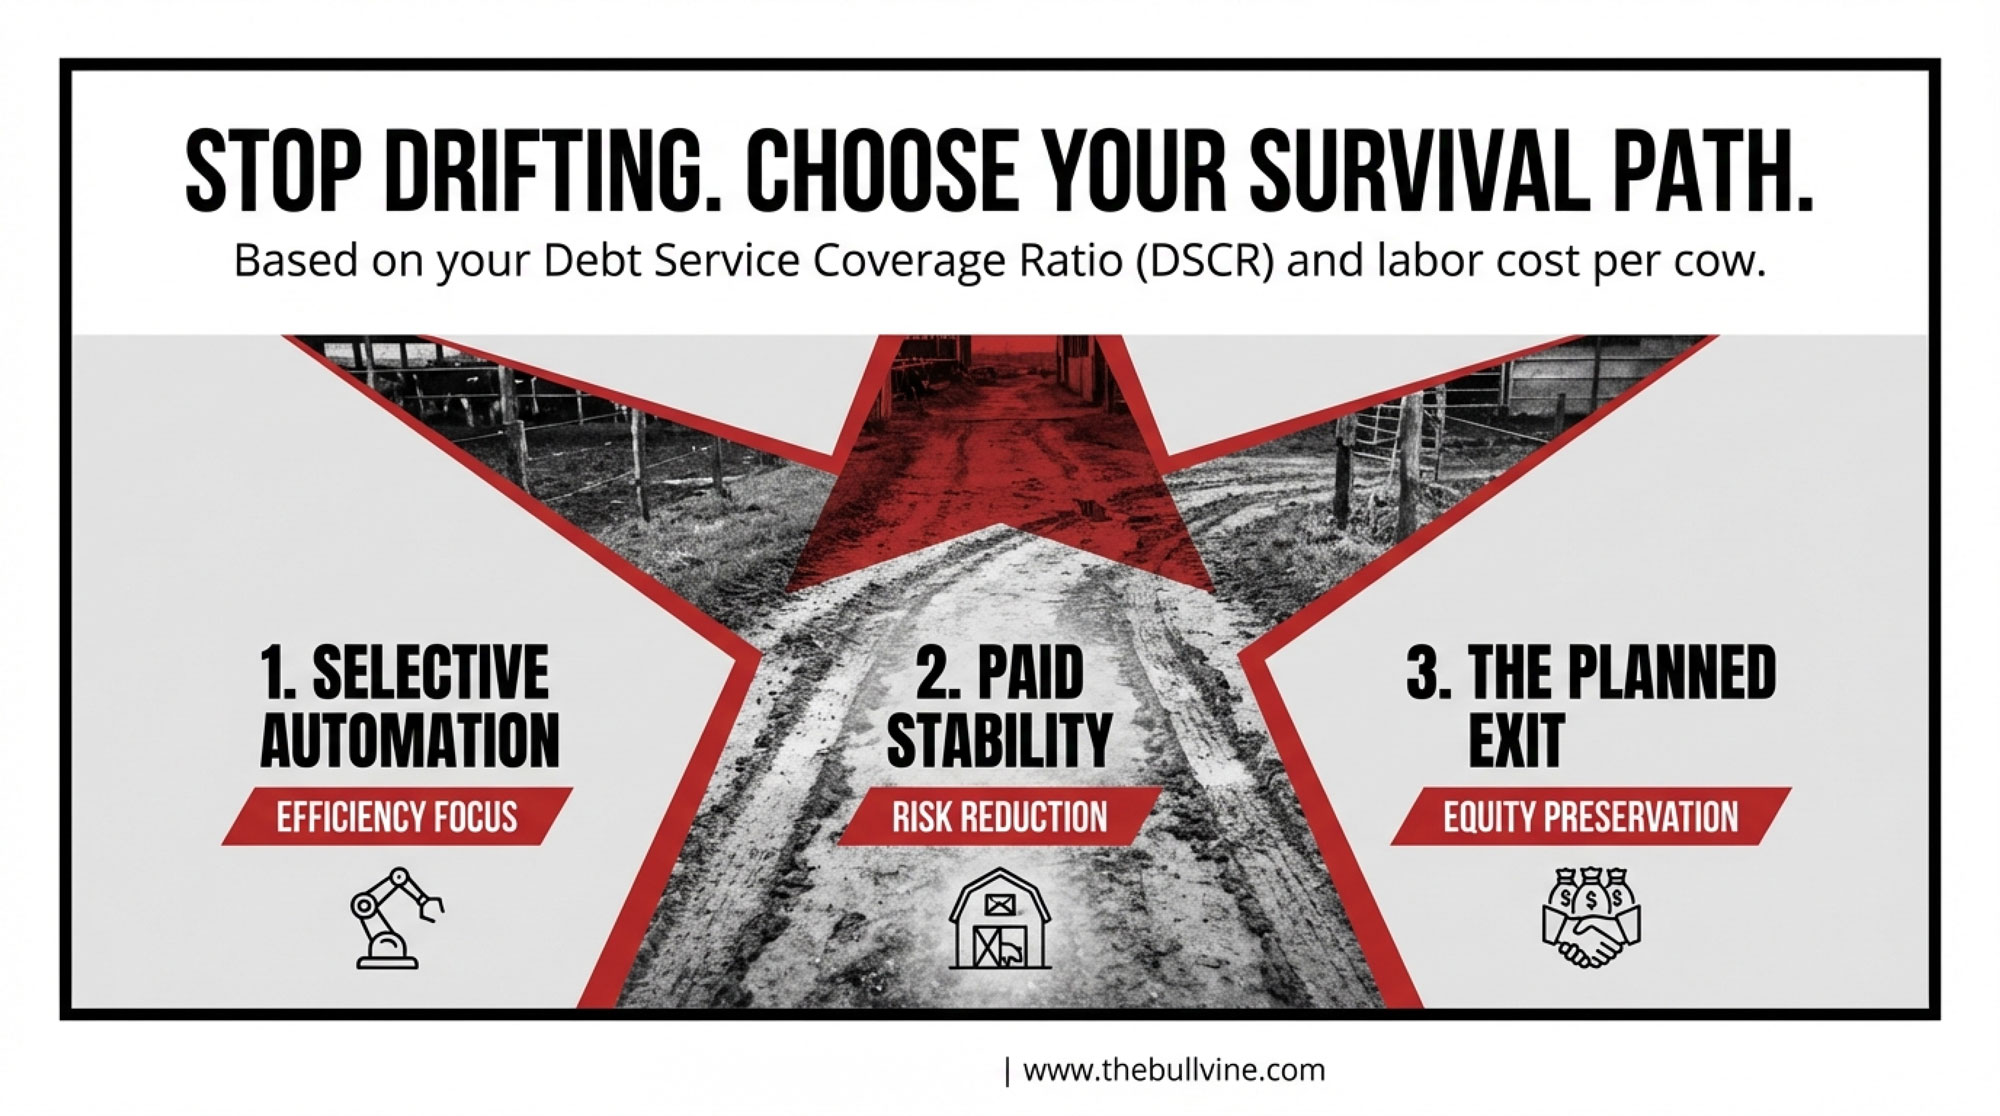
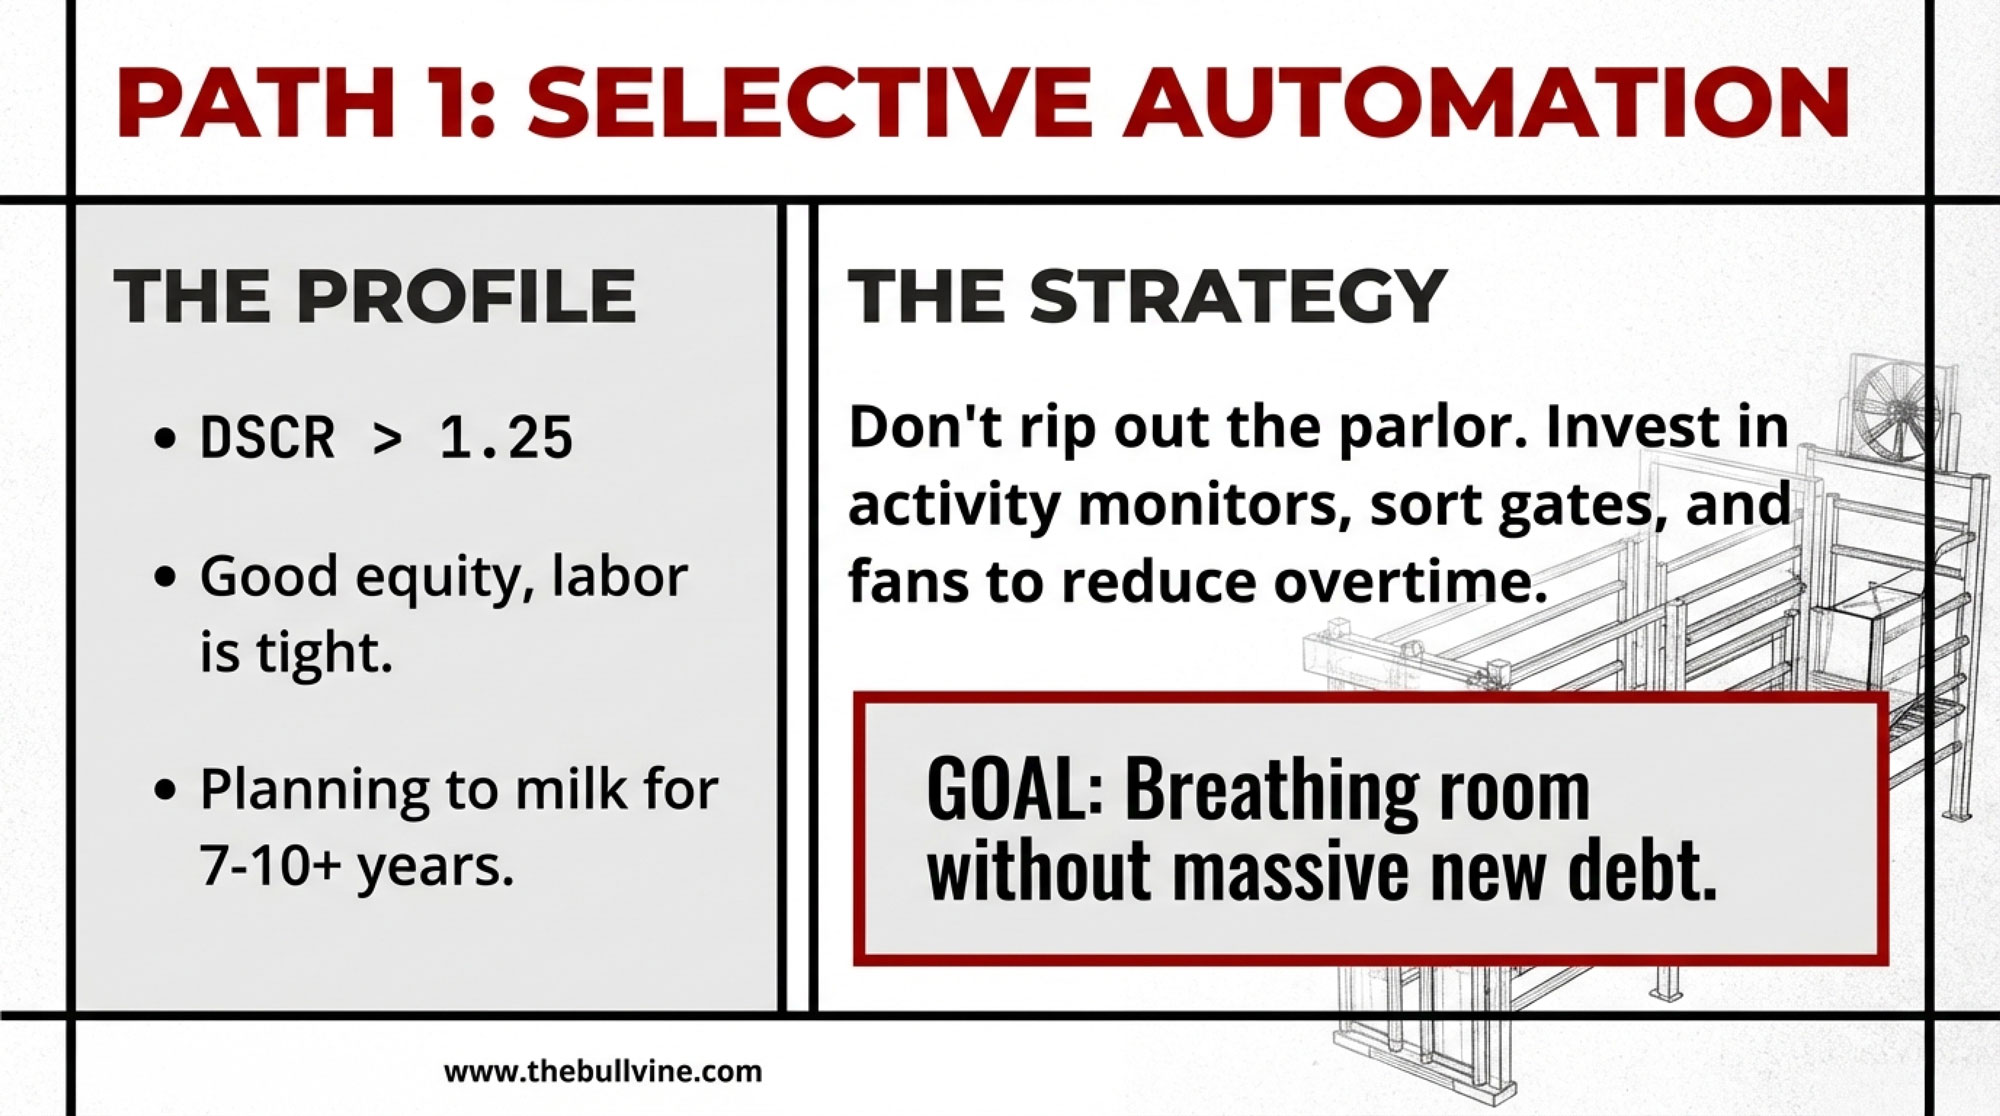
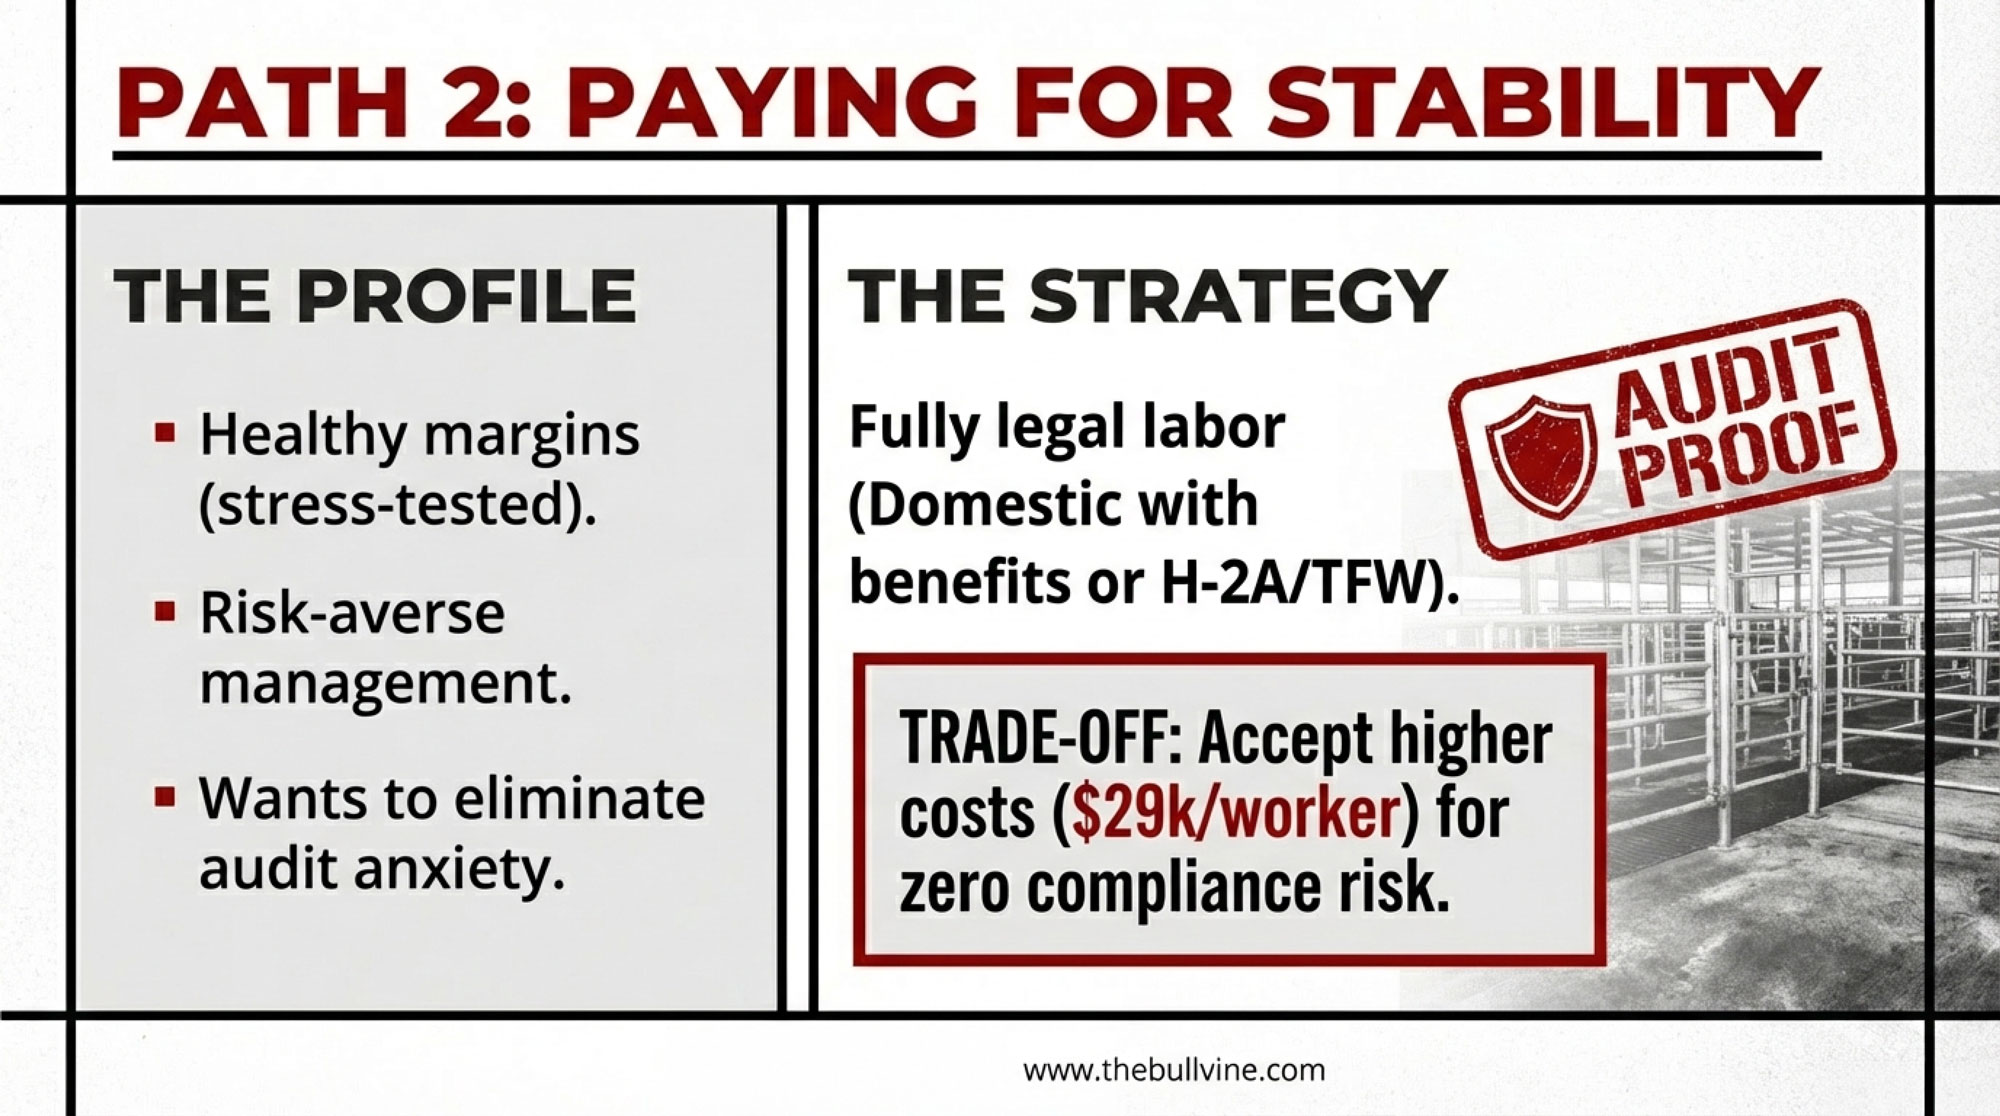
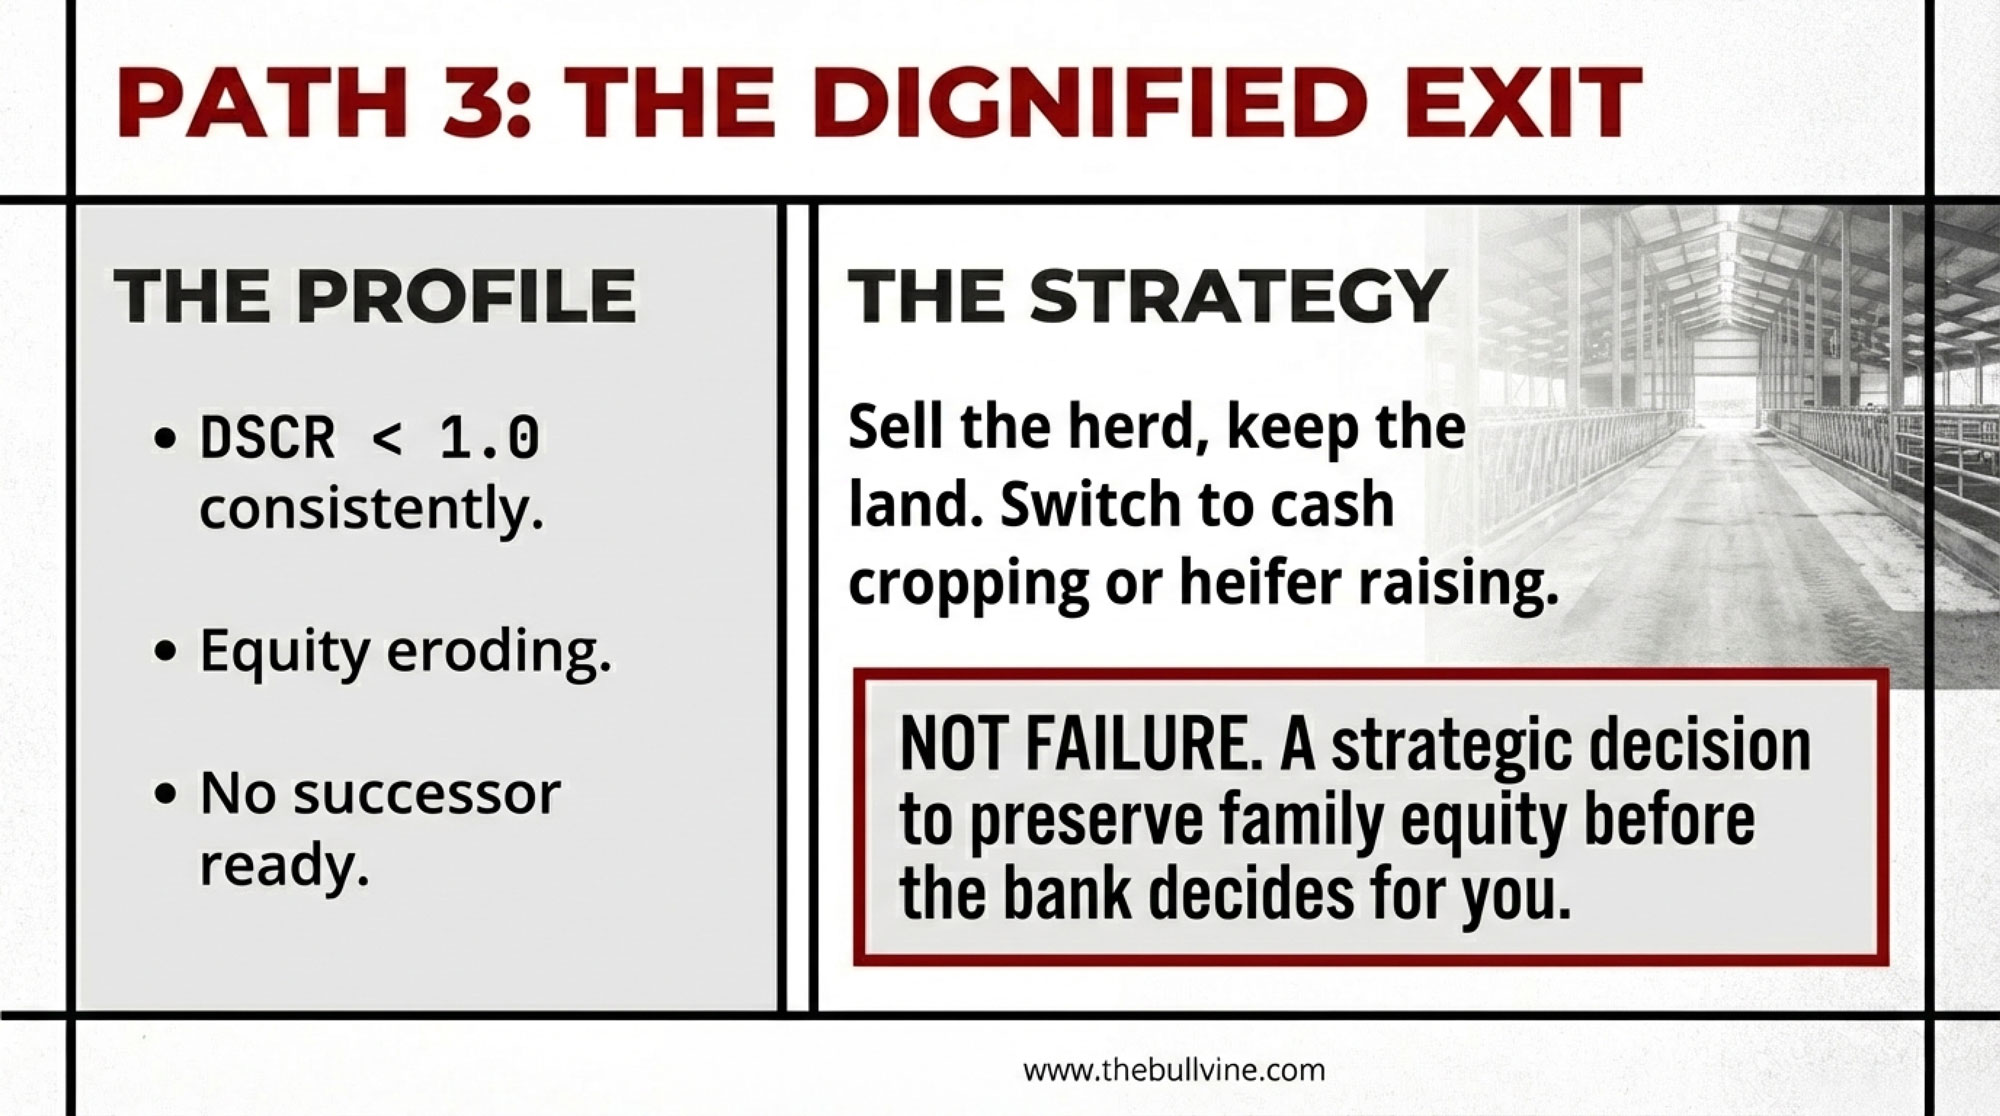
Options and Trade‑Offs for Farmers
You don’t get to rewrite HACCP rules or hire back CDC epidemiologists. You do get to decide how much of this downstream risk you carry blind.
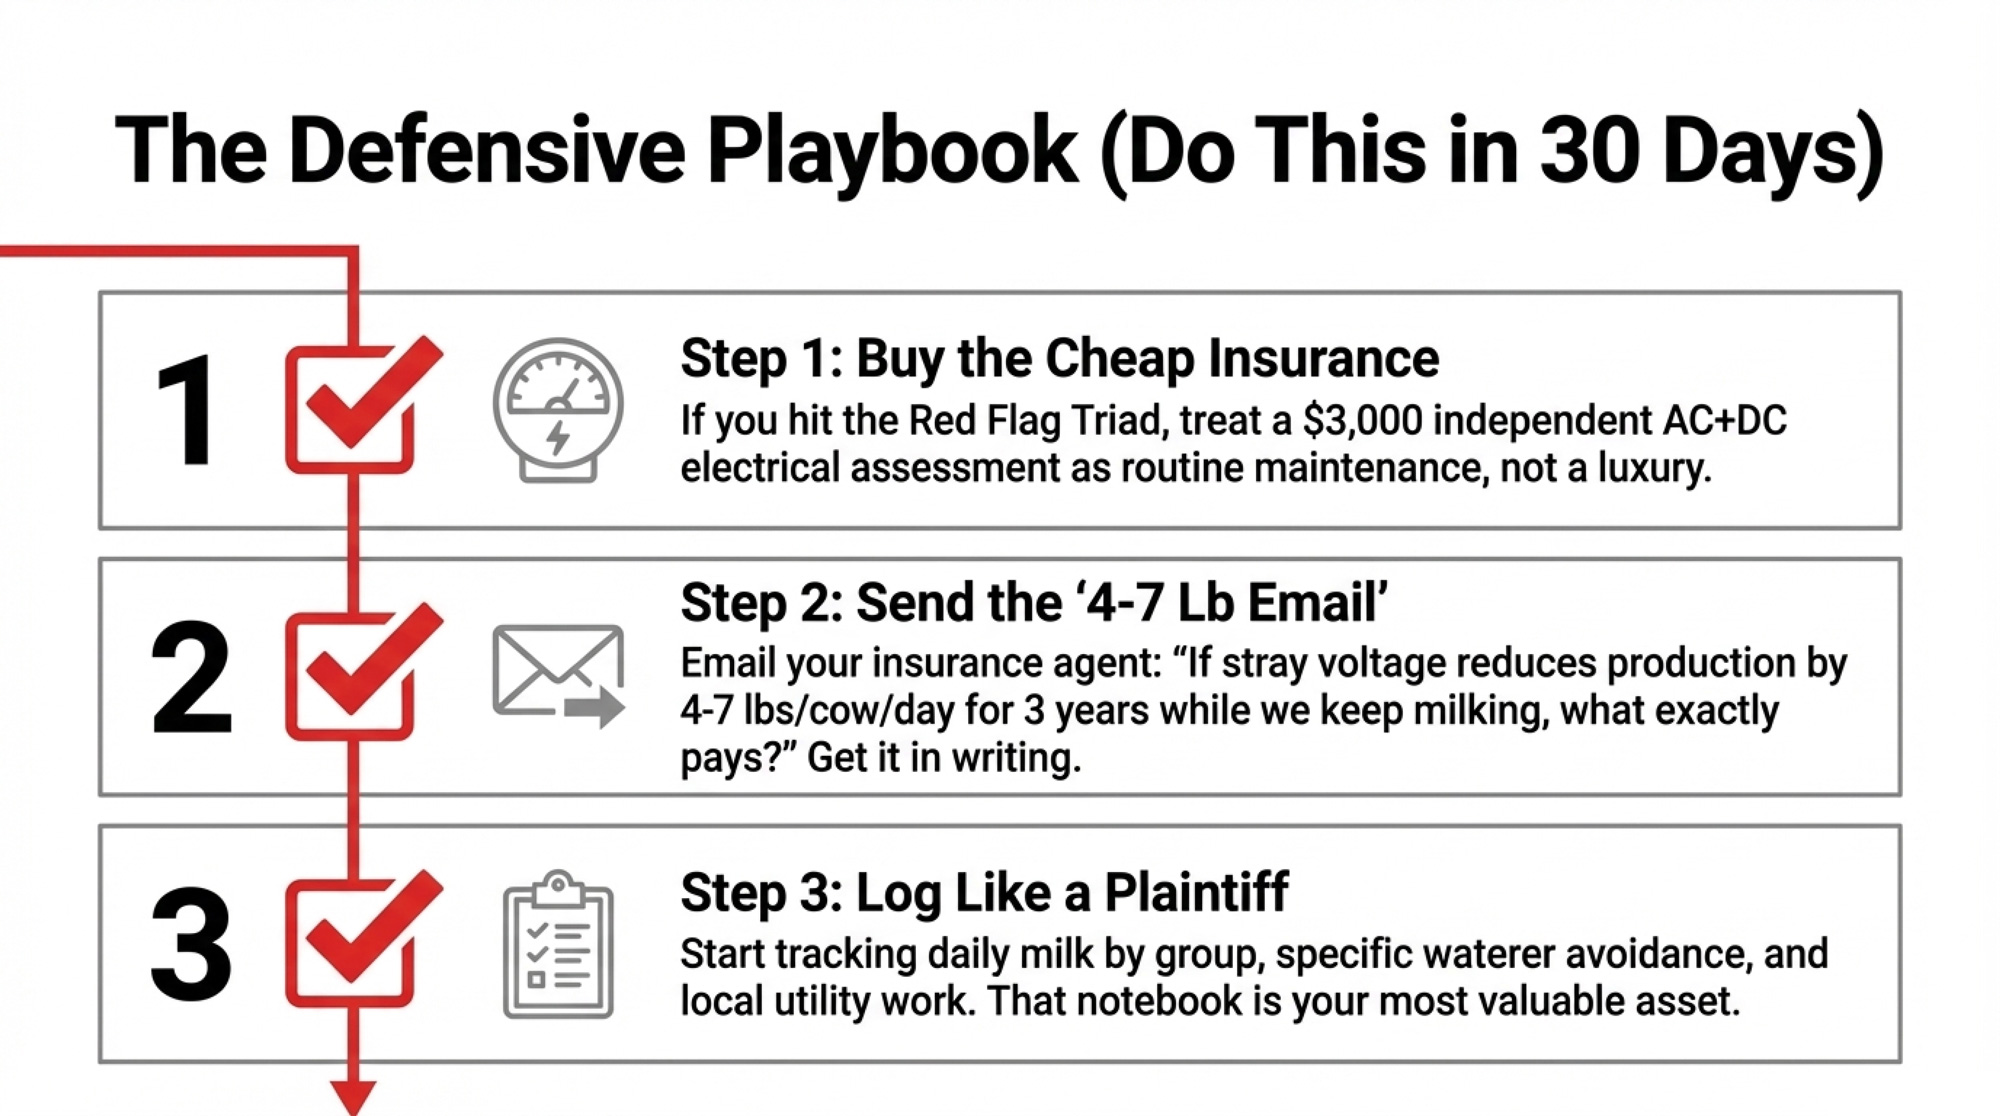
Here are four levers you control.
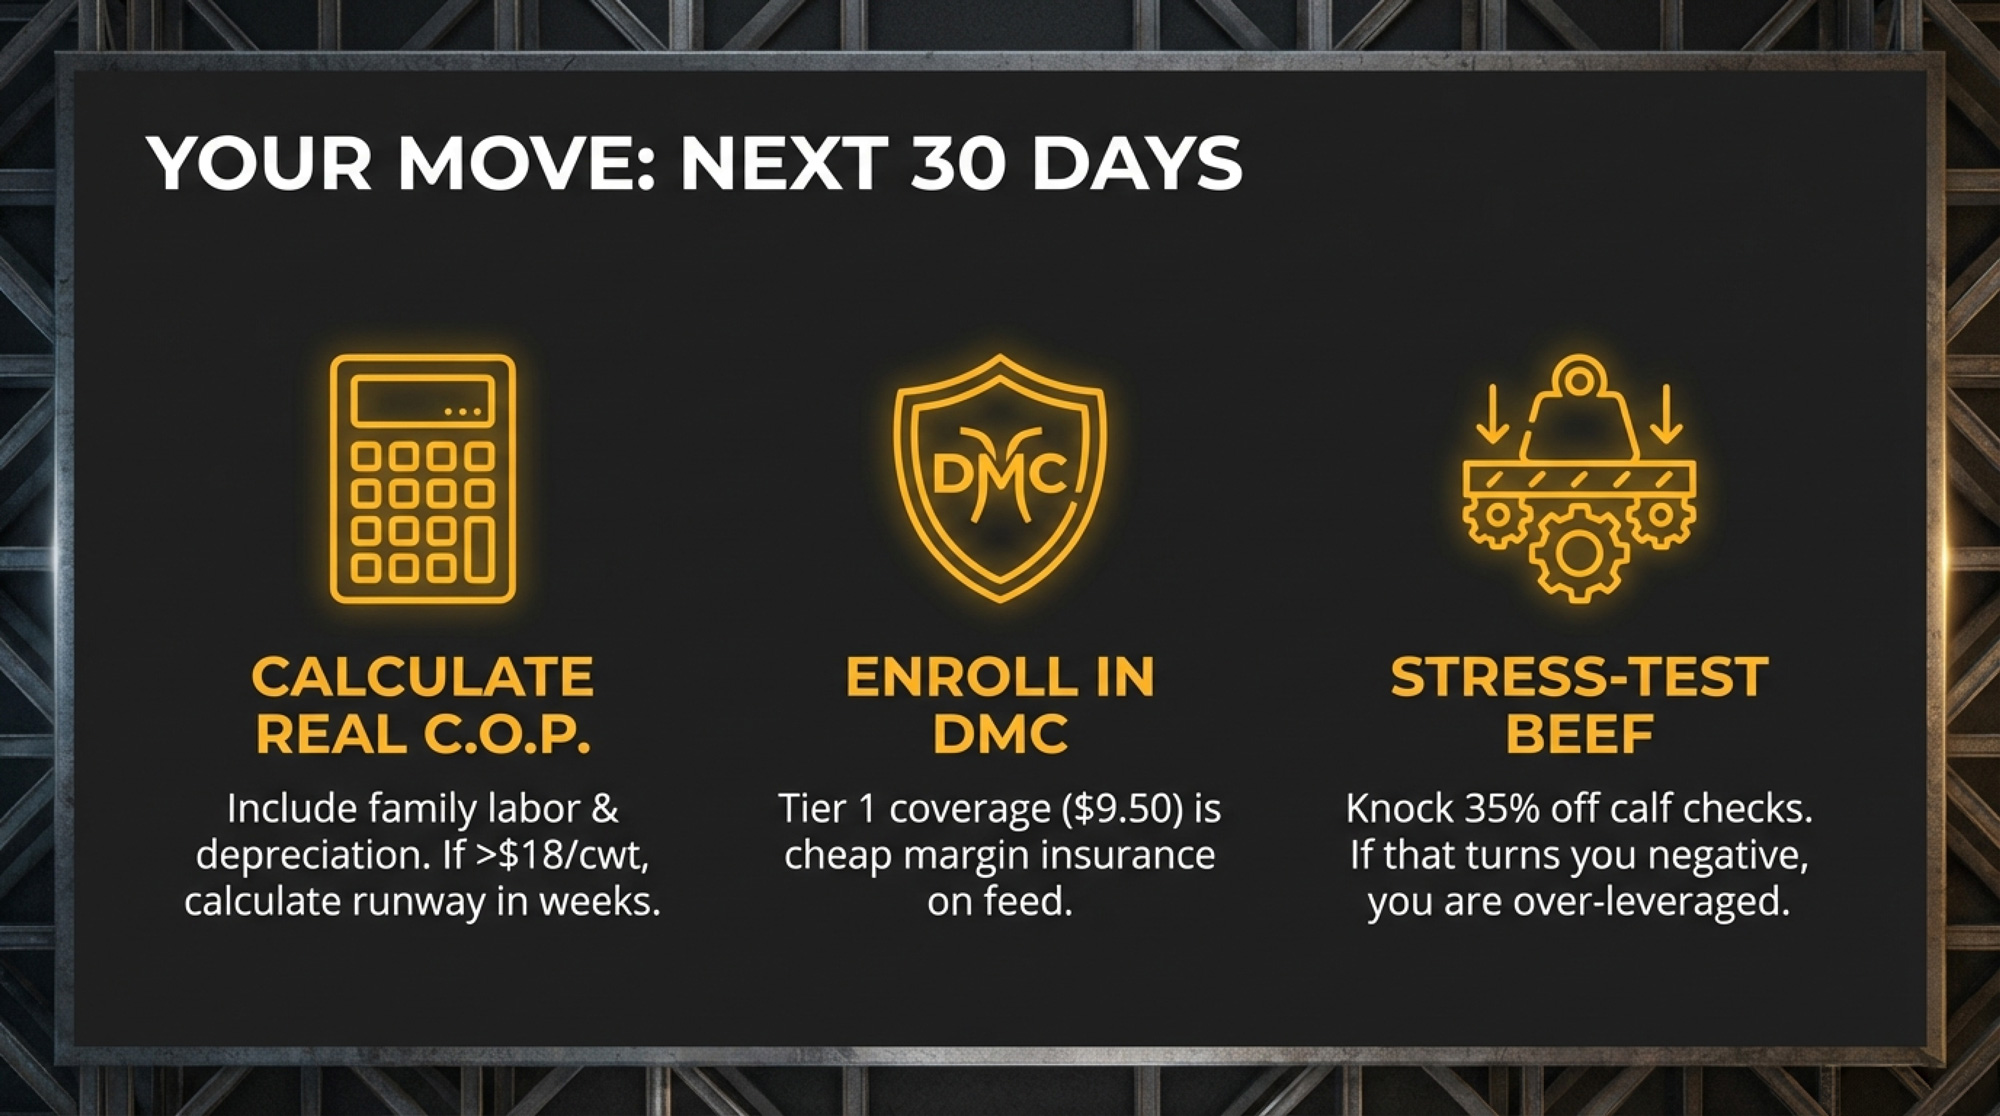
1. Ask where your milk really goes — and do it in the next 30 days.
Within the next month, sit down with your co‑op or buyer and ask three blunt questions:
- Which specific plants does my milk typically go to?
- What products do those plants make — fluid, commodity powder, shredded cheese, RTE meals, infant formula?
- Have those plants or their major customers been involved in recalls or enforcement actions in the last five years?
If the answers are detailed and transparent, that tells you something. If they’re vague or “we don’t really track that,” that tells you something else. As The Bullvine reported in December 2025, the Upper Midwest producers who’d already mapped their supply chain had more room to react than those caught off guard by the Great Lakes ripple.
- When it makes sense: Always — this is the lowest‑cost move you can make.
- What it requires: A phone call and a willingness to listen.
- Risks/limits: You might learn you’re more concentrated than you thought. That’s uncomfortable, but ignorance doesn’t make the risk go away.
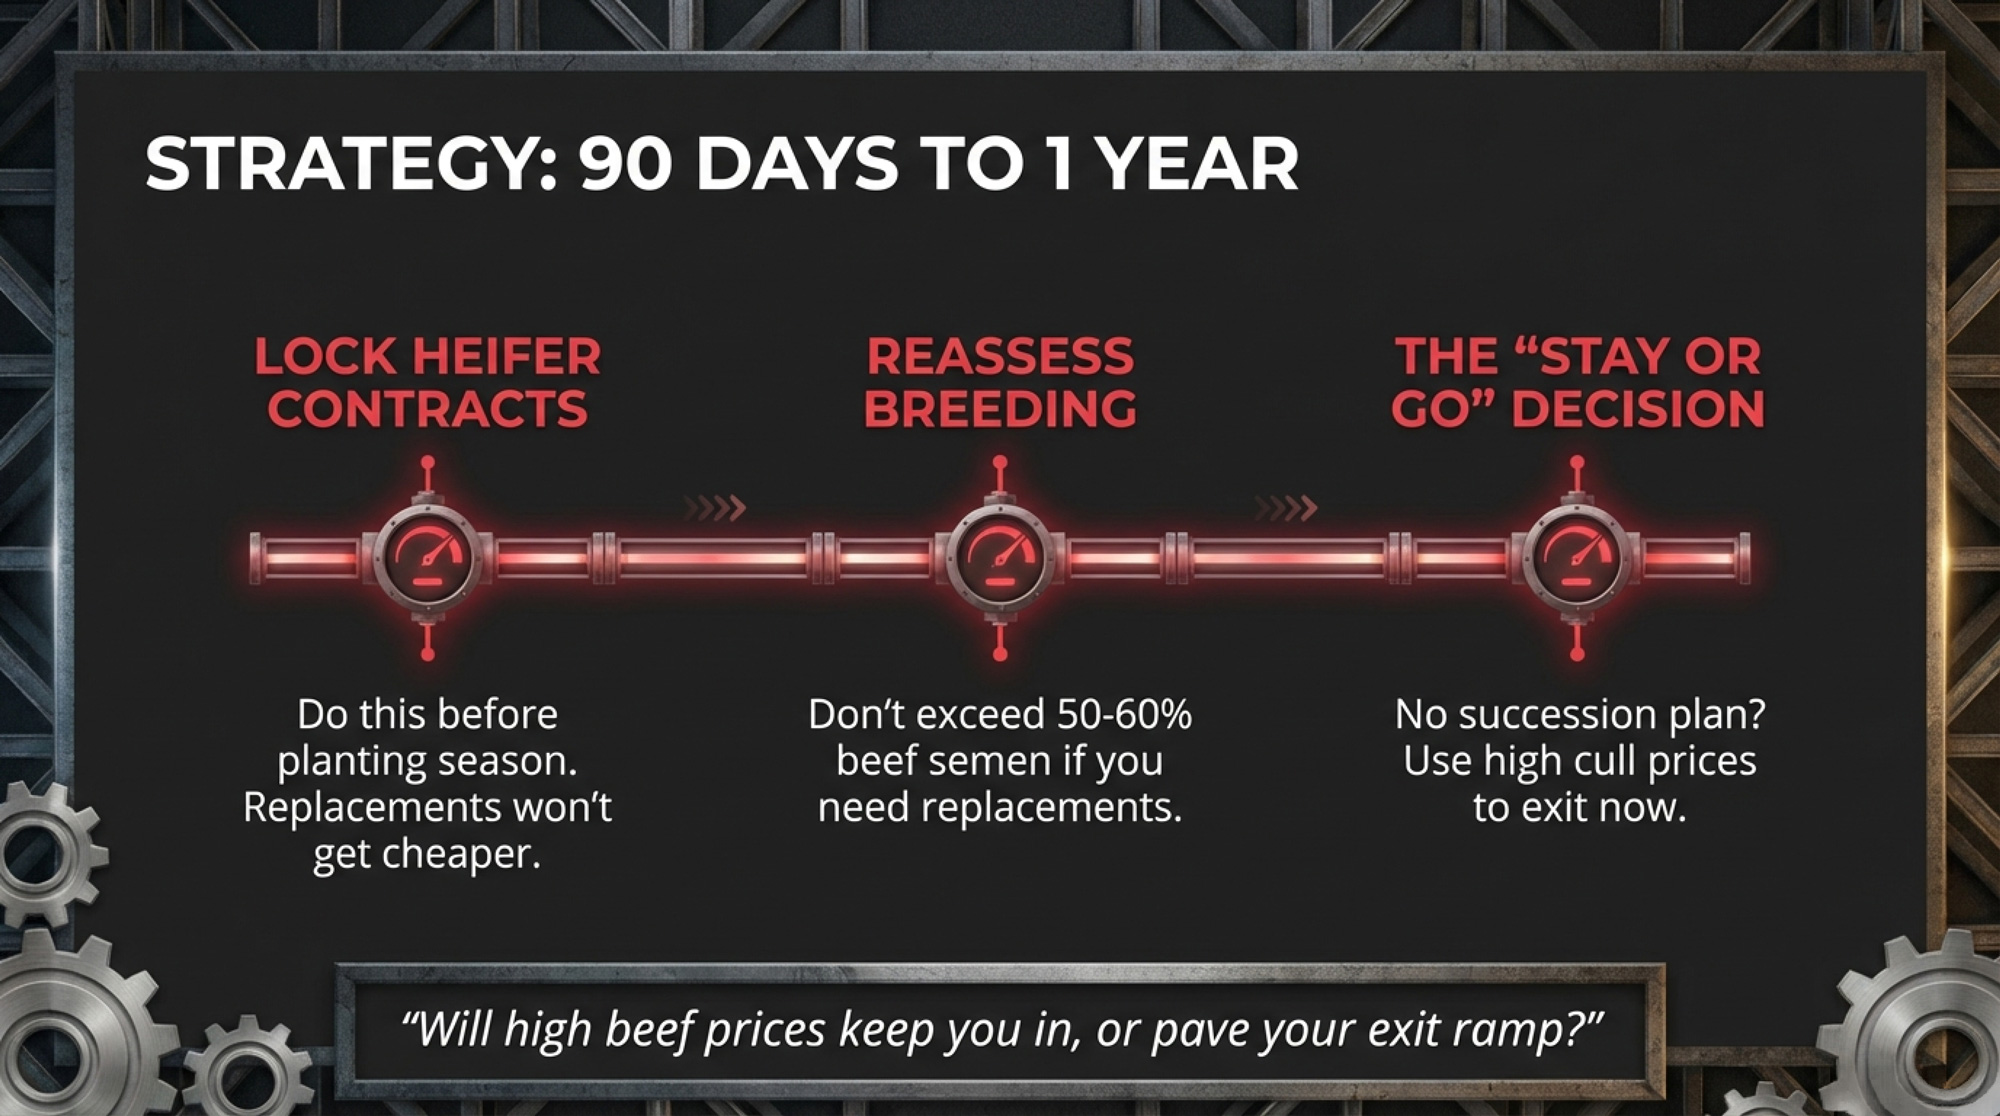
2. Don’t put all your volume into one high‑blast‑radius channel.
If 80–100% of your milk is tied to one plant — or flows through a single converter like Great Lakes that feeds dozens of retail brands across 31 states — you’re more exposed than a neighbour whose milk is split across fluid, cheese, and powder.
You might still choose the higher‑risk, higher‑premium outlet. Just treat it like you treat forward contracting: consciously, with eyes open.
- When it makes sense: When you have any say in program enrolment or buyer mix.
- What it requires: Understanding where your milk ends up and being willing to say “no” to all‑in deals that pay a bit more but concentrate your risk.
- Risks/limits: Diversifying outlets can mean giving up some premium today for more resilience tomorrow. Only your balance sheet can answer if that trade works.
3. Read your contracts like they were written for the day after a recall.
If you’re in any kind of direct‑supply or specialty program, pull out your milk supply agreement and look for three phrases:
- “Indemnify and hold harmless” — especially if it covers “any contamination‑related loss,” not just issues you directly control.
- “Sole discretion to adjust volume or price” — particularly for vague triggers like “market disruption” or “customer quality concerns.”
- Fuzzy definitions of “non‑compliance” that could include someone else’s ingredient failure or a downstream recall.
Those phrases don’t automatically make a contract bad. But they do shift more risk onto you when something goes wrong down the line.
- When it makes sense: Any time a contract is renewed or a new premium program is pitched.
- What it requires: A careful read, maybe a conversation with your lender, accountant, or a lawyer who’s seen these clauses before.
- Risks/limits: Pushing back may cost you a premium or a buyer. Accepting them without understanding may cost you much more later.
4. Match your own risk controls to your exposure over the next year.
If you run a farmstead creamery or sell direct, a basic listeria EMP — 5–10 swabs a month in the highest‑risk spots — is reasonable at about $2,604 a year. If you only ship raw milk, focus on environmental fixes: eliminate standing water, repair broken surfaces, and make sure the path from bulk tank to tanker is as close to biofilm‑free as you can make it.
Think of this as sliding a dial. The more your milk ends up in high‑risk, high‑value products, the more it makes sense to spend a little to make sure your own environment isn’t the weak link. Boar’s Head just spent seventeen months and serious capital retrofitting Jarratt with the kind of environmental monitoring they should have had all along. A basic version of that same principle costs you $2,604.
- When it makes sense: Over the next 12 months, especially if you’re adding processing or targeting premium RTE channels.
- What it requires: Some cash, time, and honesty about “gross spots” you’ve been ignoring.
- Risks/limits: You might find something you have to fix. That’s the whole point.
Key Takeaways
- If more than about 70% of your milk flows through a single plant or converter, treat that as a red‑line concentration level and run the 90‑day shutdown math on your own numbers before the next recall runs it for you.
- If your co‑op or buyer can’t clearly tell you which plants your milk feeds and what their recall history looks like, assume nobody is actively managing that risk on your behalf — and start asking tougher questions this month.
- If your supply contract includes open‑ended indemnity language and “sole discretion” volume or price cuts after “market disruptions,” flag it for review before you count on that premium holding.
- If a 10–20% intake cut at a $3/cwt discount for 60–90 days would put you in a cash‑flow bind, compare that number to a $2,604 EMP or some concrete and drain repairs — and decide which one is really “too expensive.”
- If your milk ends up in RTE products, fresh cheeses, or supplemental shakes, treat environmental testing around the bulk tank room as part of the cost of being in that market, not an optional extra.
The uncomfortable truth is this: you can run a tight herd, ship clean milk every day, and still get sideswiped because a plant you’ve never walked through treated listeria like a paperwork problem instead of a reason to stop the line.
Complete references and supporting documentation are available upon request by contacting the editorial team at editor@thebullvine.com.
Learn More
- Heat Kills Bird Flu: Are You Doing Enough to Protect Your Dairy Operation? — Adopt specific heat treatment parameters and biosecurity protocols revealed by Cornell research to neutralize H5N1 risks. Arms your operation with precise temperature/time targets that protect workers, calves, and bulk tank integrity during active outbreaks.
- The $125‑Million Recall Precedent: How the 2025 Formula Crisis Exposes Dairy’s Contract and Milk Cheque Risk — Reevaluate your milk marketing agreements as global buyers shift risk classification for post-pasteurization ingredients. Exposes the $125-million financial ripple effect of ingredient failures and why your current contracts may leave your margin unprotected.
- The Digital Dairy Revolution: How IoT and Analytics Are Transforming Farms in 2025 — Secure your bulk tank integrity using in-line sensors that detect quality shifts before they impact your cheque. Demonstrates how new sensor platforms turn passive monitoring into proactive mitigation, shielding your eligibility for high-value premium markets.
 The Sunday Read Dairy Professionals Don’t Skip.
 The Sunday Read Dairy Professionals Don’t Skip.
Every week, thousands of producers, breeders, and industry insiders open Bullvine Weekly for genetics insights, market shifts, and profit strategies they won’t find anywhere else. One email. Five minutes. Smarter decisions all week.