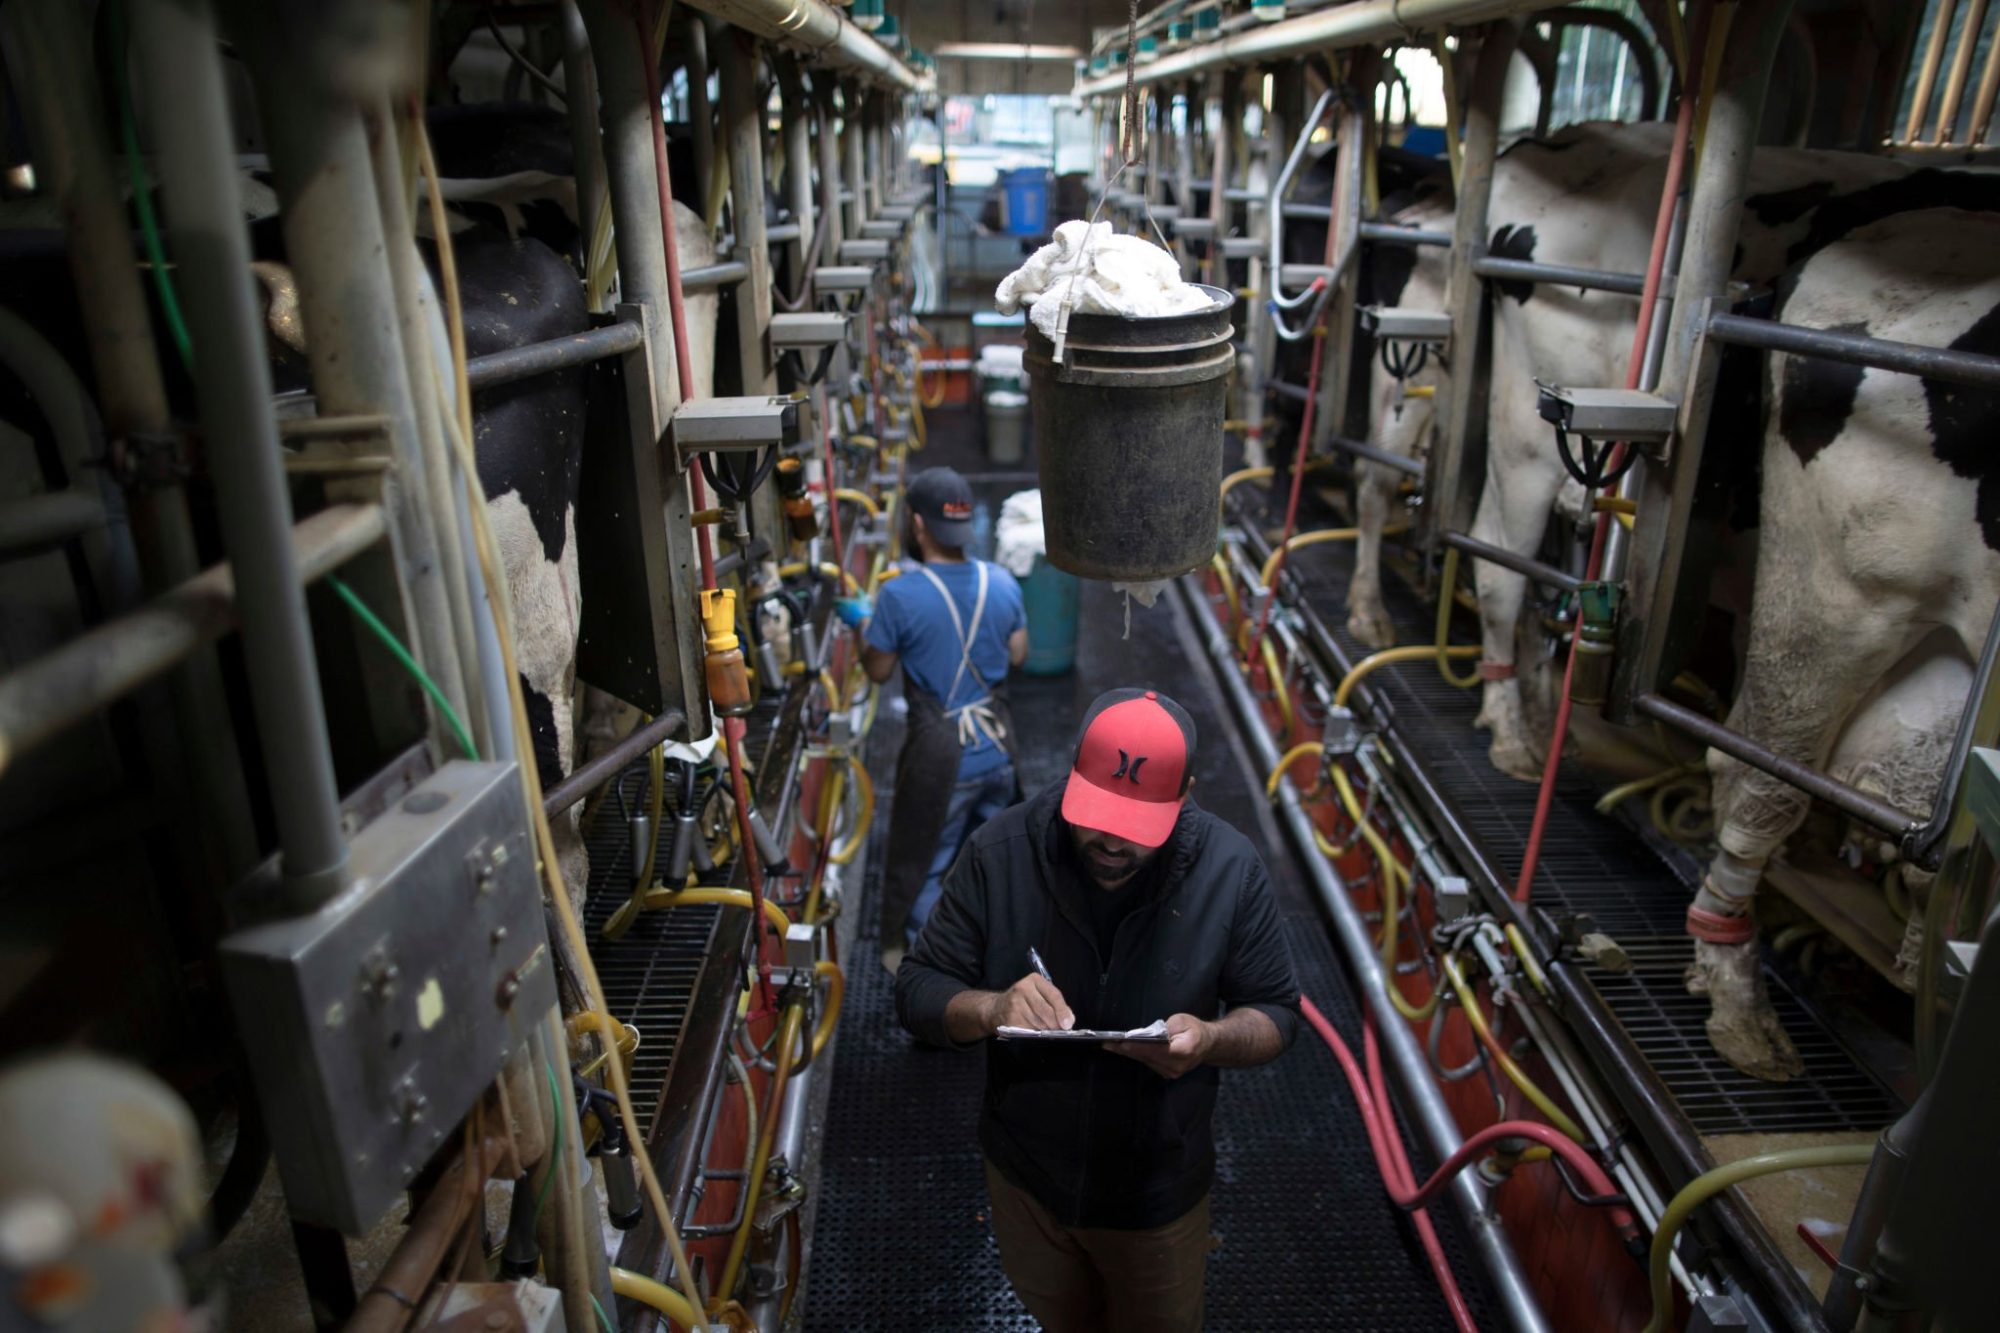

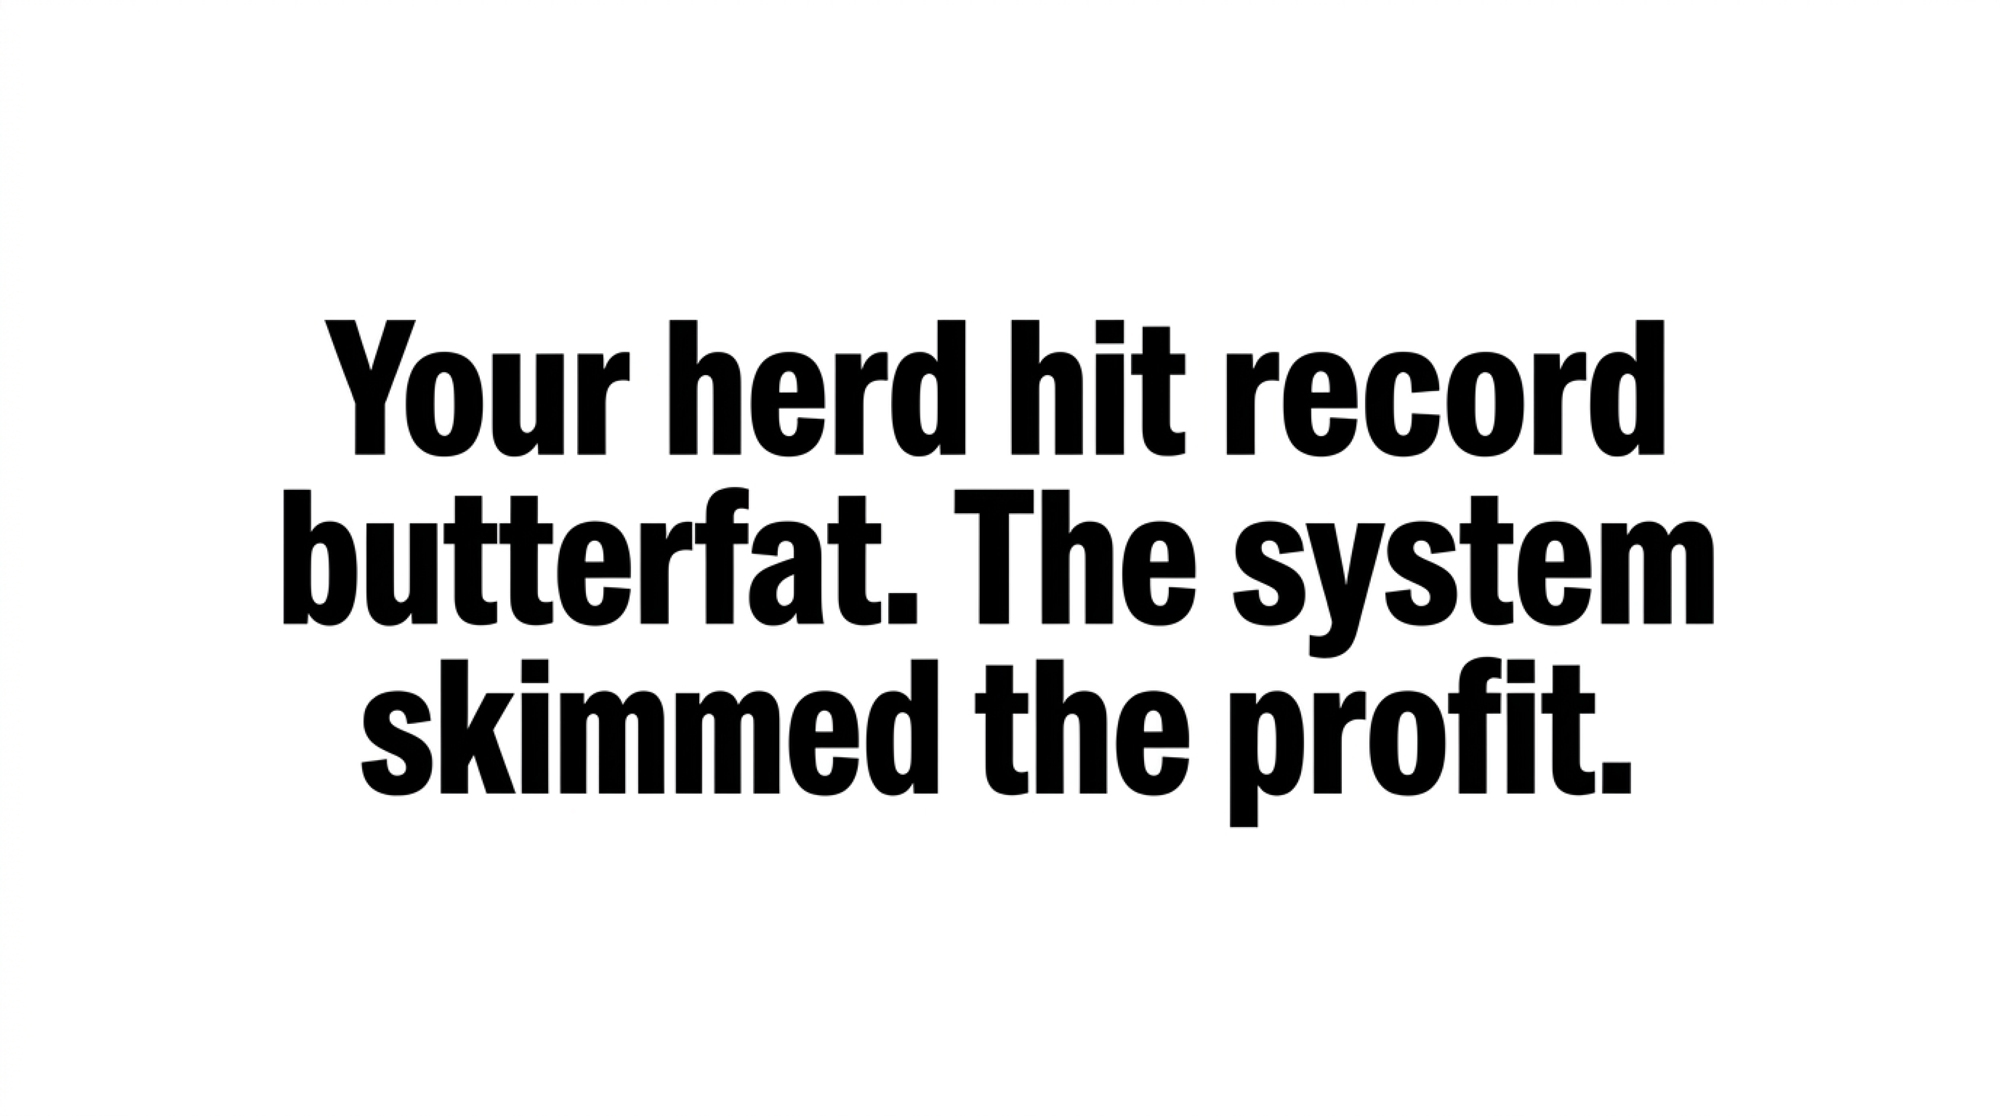
Your herd hit 4.24% butterfat. The system changed the rules, skimmed 90¢/cwt and $337M, then let retailers cash the story your milk never tells.
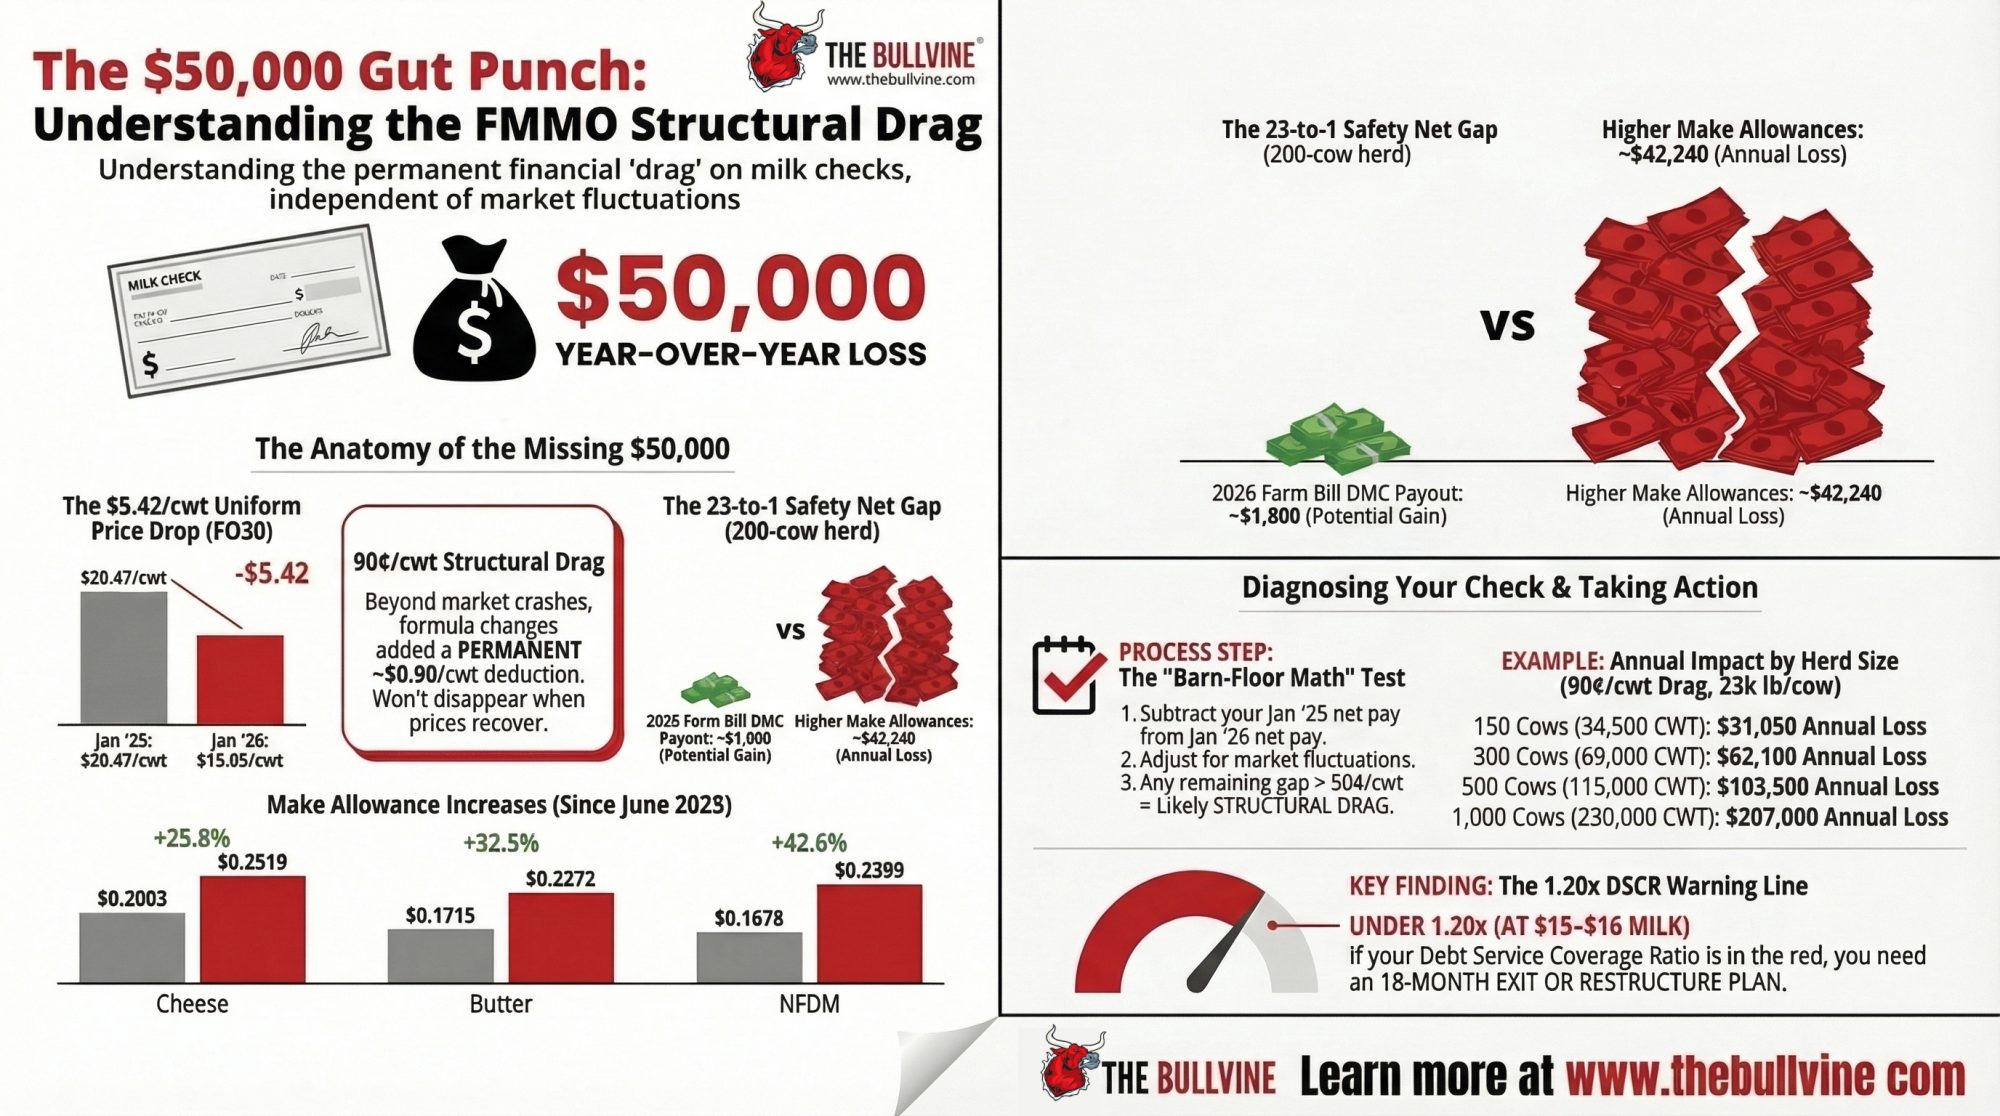
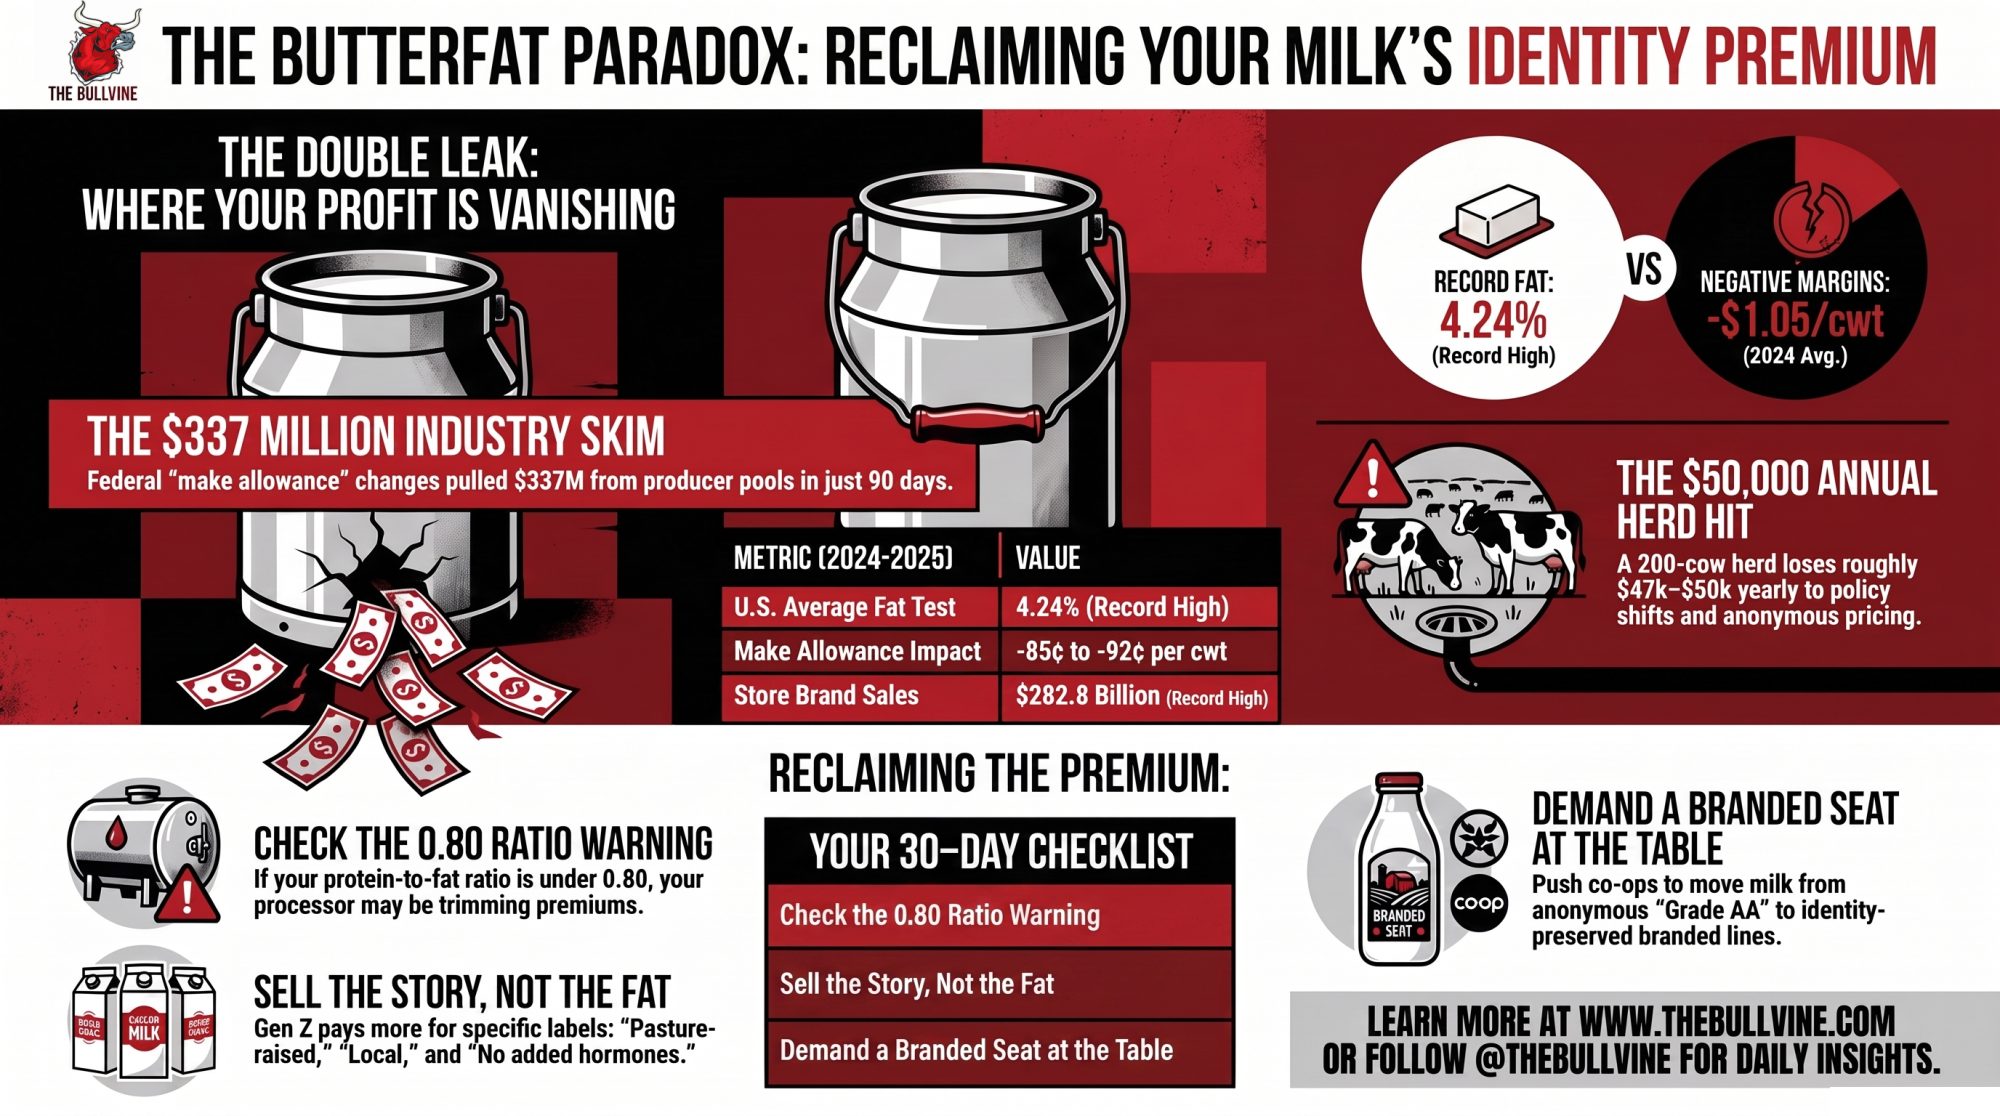
Executive Summary: Make allowances pulled $337 million out of producer pool revenues in 90 days, while your herd’s butterfat climbed to record levels and your milk check went the wrong way. Higher fat test (4.24% U.S. average in 2024) and record butter use didn’t translate into a stronger butterfat premium because FMMO formulas skimmed roughly 85–92¢/cwt, and most co-ops still dump fat into anonymous “Grade AA” or private-label butter, where retailers keep the provenance money. On a 200‑cow herd shipping about 75 lbs/day, that policy shift alone pencils out to roughly $47,000–$50,000/year, before you even count the second leak — the branded premium your practices could earn but that never shows up on the package. Meanwhile, younger buyers and the Journal of Dairy Science data say they’ll pay more for butter tied to “no added hormones,” pasture-raised claims, and a real local story, and processors like Kerrygold are already cashing in with named family farms while your co-op treats identity as optional. The move is blunt: document your herd’s attributes, push your processor or co-op to recognize where your fat actually goes, and use barn math plus a 30‑day checklist to decide whether certification, a branded buyer, or a carefully scoped creamery pulls more of that premium back into your own milk check.

In late 2018, a Pennsylvania dairyman named Nelson Troutman grabbed a paintbrush and wrote “Drink Local Whole Milk 97% fat free” across a plastic-wrapped round bale, then dropped it at the edge of his property. No agency. No trade-association budget. Just paint and a message people could repeat in one breath. That bale grew into 97 Milk, a farmer-run nonprofit, and it helped drag whole milk back into school cafeterias — a fight that ended when President Trump signed the Whole Milk for Healthy Kids Act into law on January 14, 2026.
Your herd is cranking out record butterfat, Gen Z is actively paying more for dairy with a real origin story, and the butterfat premium that should follow all that fat is barely reaching your bulk tank. You’ve got the power to tell your story and capture that value.
The Record You Set — And the Cheque That Didn’t Follow
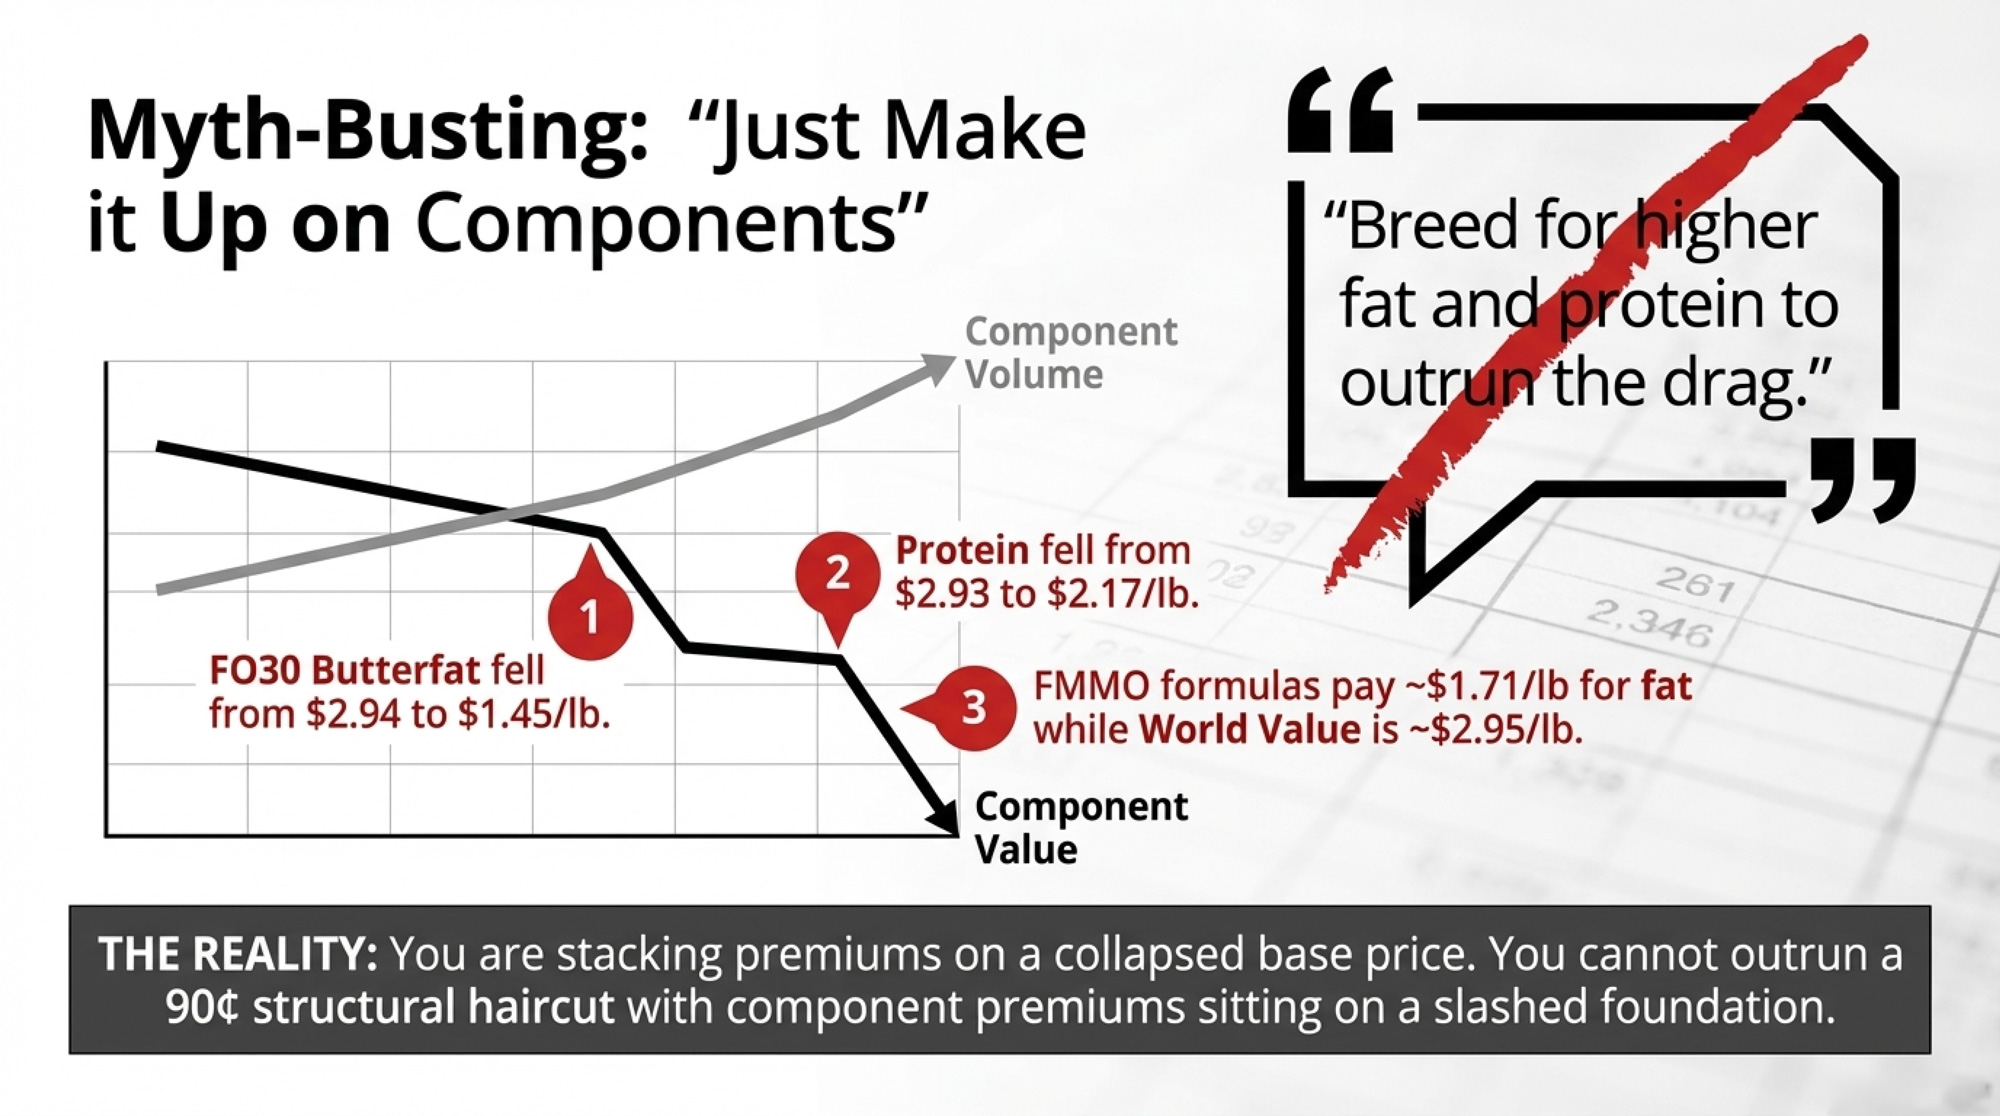
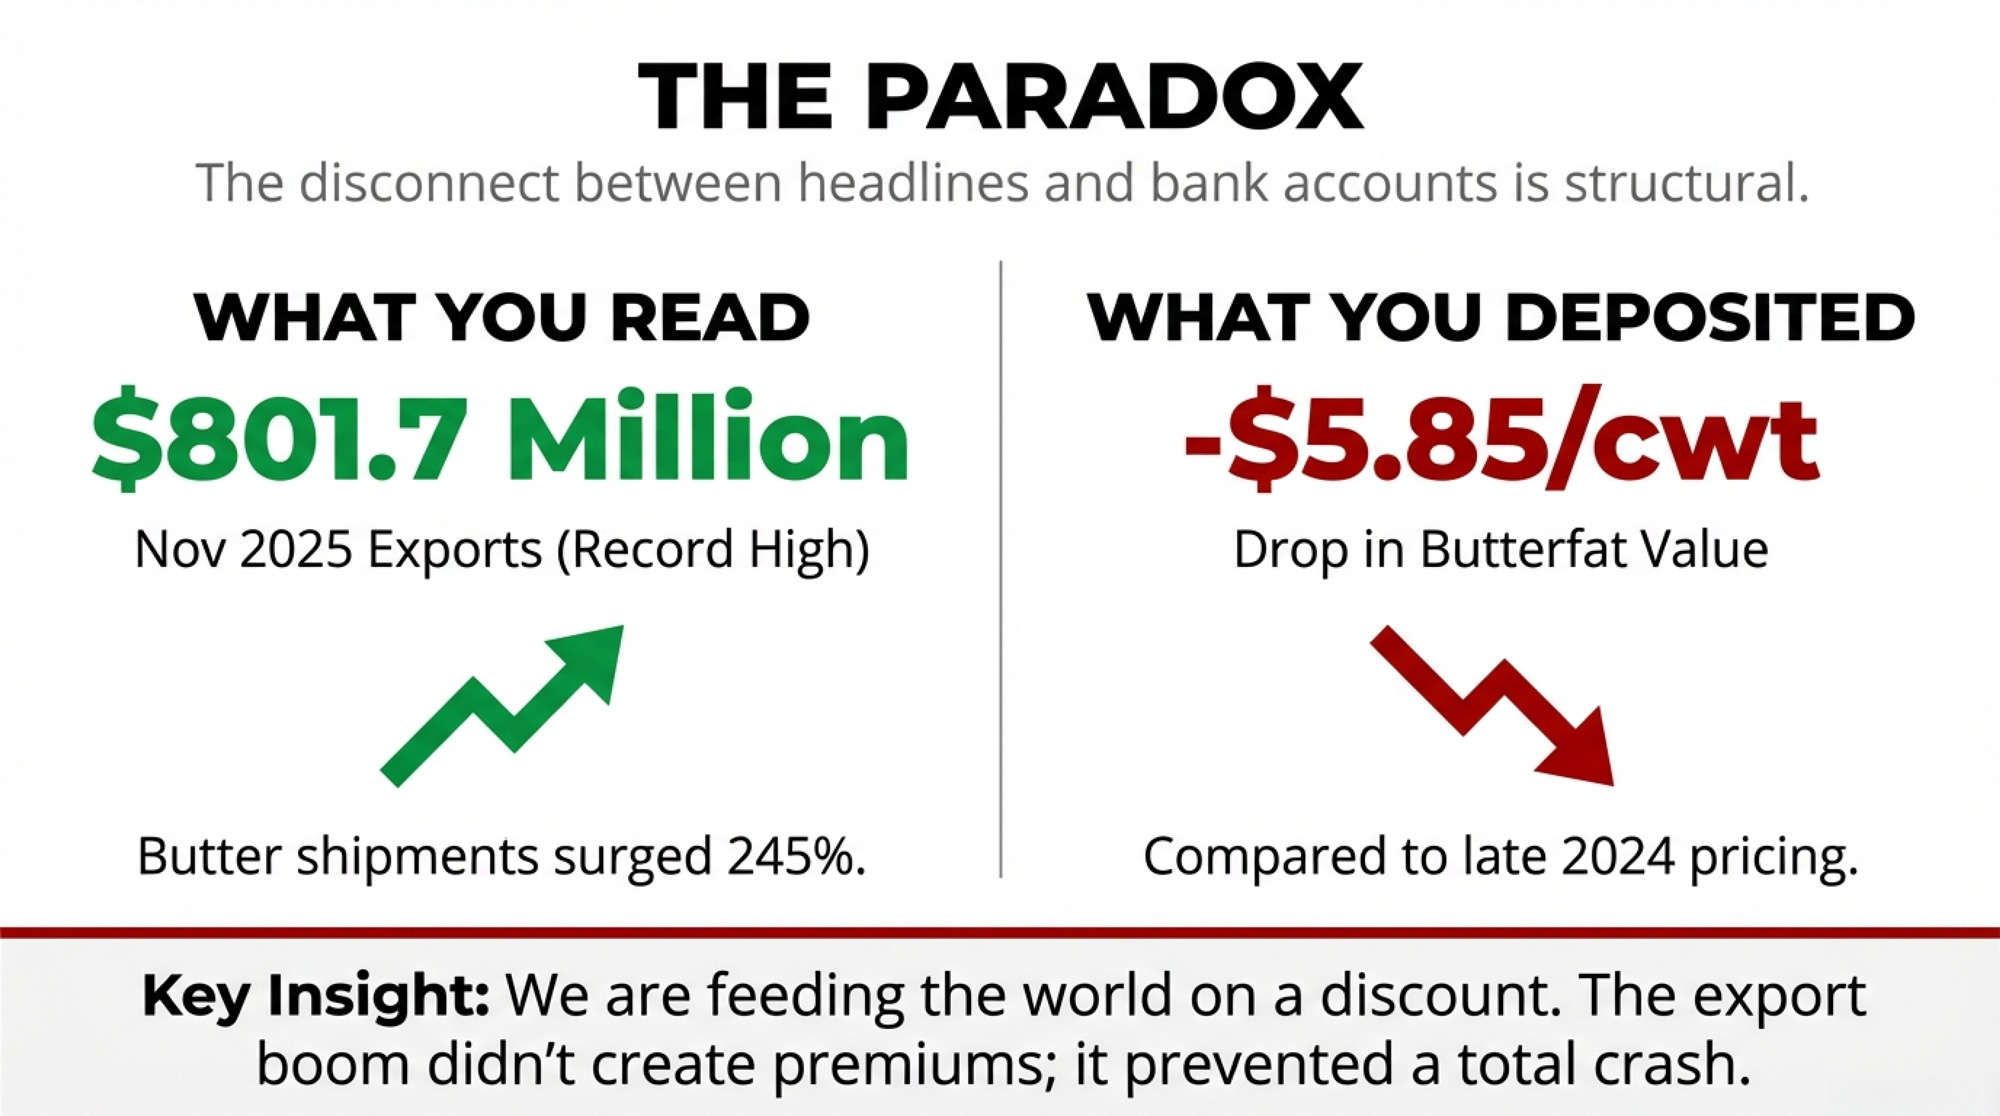
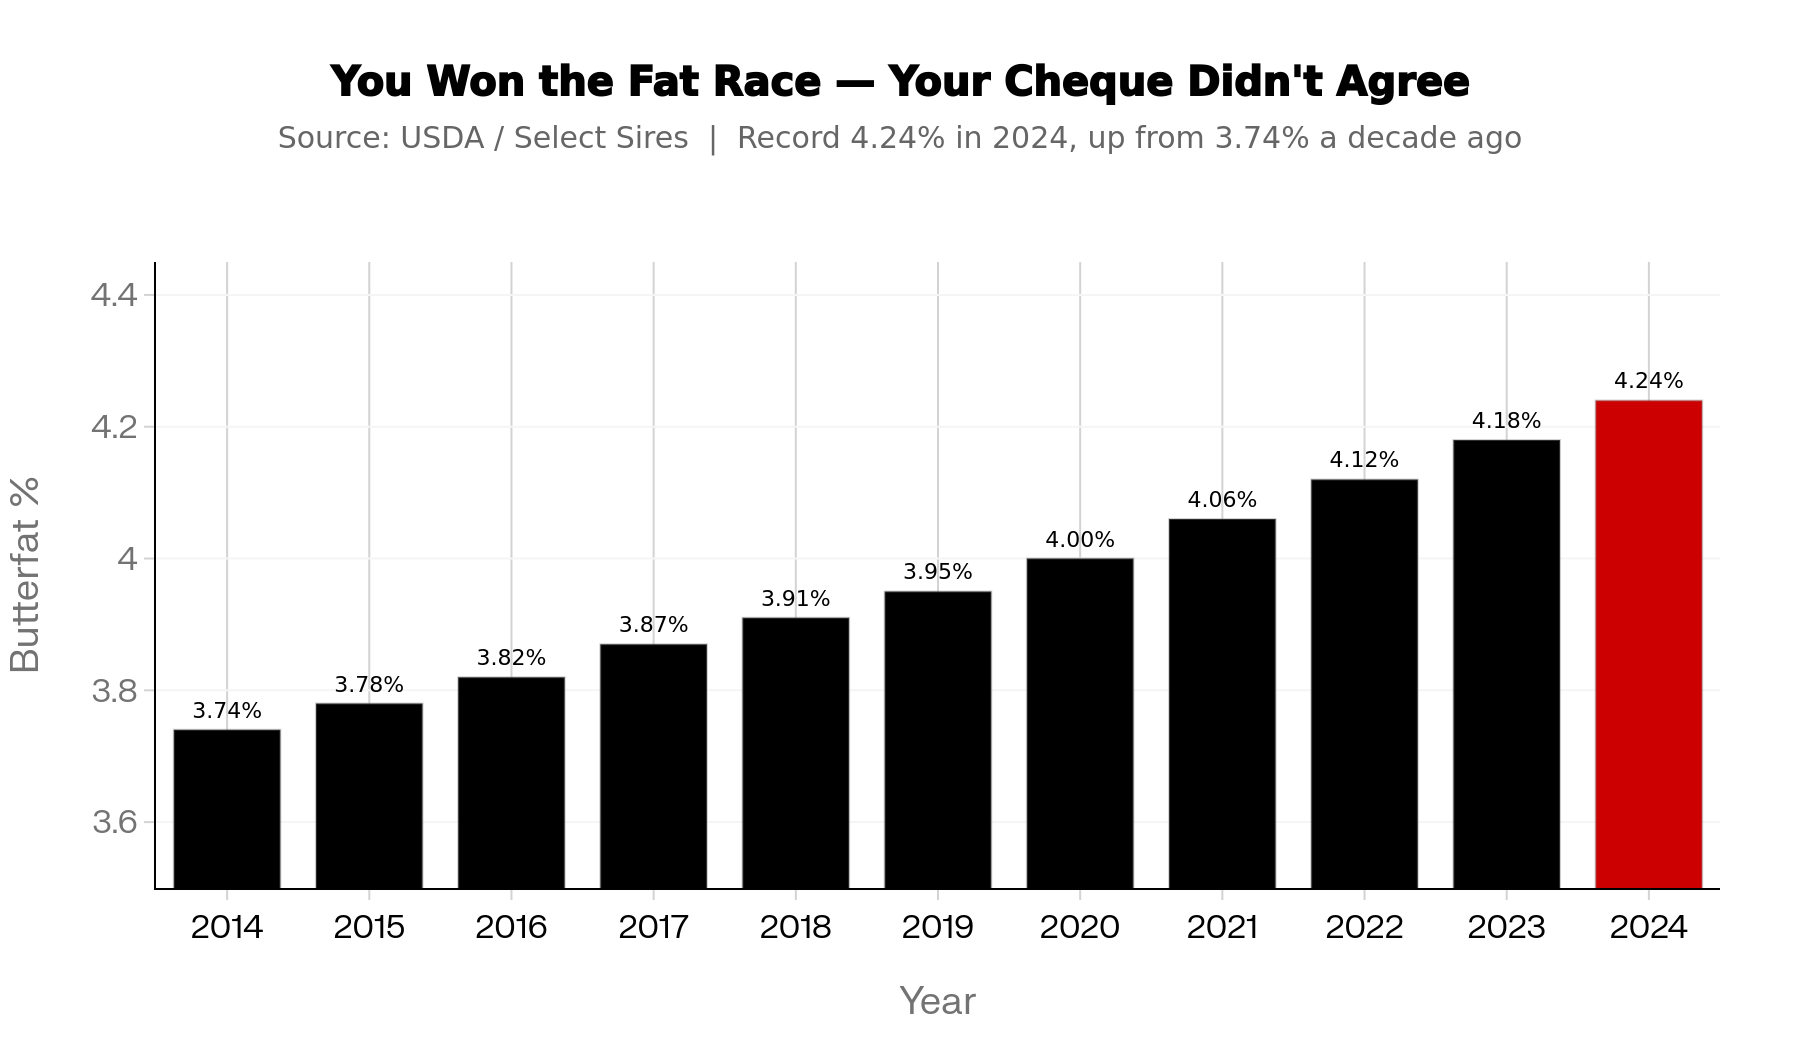
You bred for fat. You won. The U.S. average fat test hit 4.24% in 2024, up from 3.74% a decade earlier, per USDA figures compiled by Select Sires — and on a pounds-of-fat-per-cow basis, that’s roughly a 15% climb over the stretch. Butter consumption backed it up, hitting a record of 6.8 pounds per person in 2024, per IDFA and USDA’s Economic Research Service. On paper, the trait everybody chased is finally paying off.
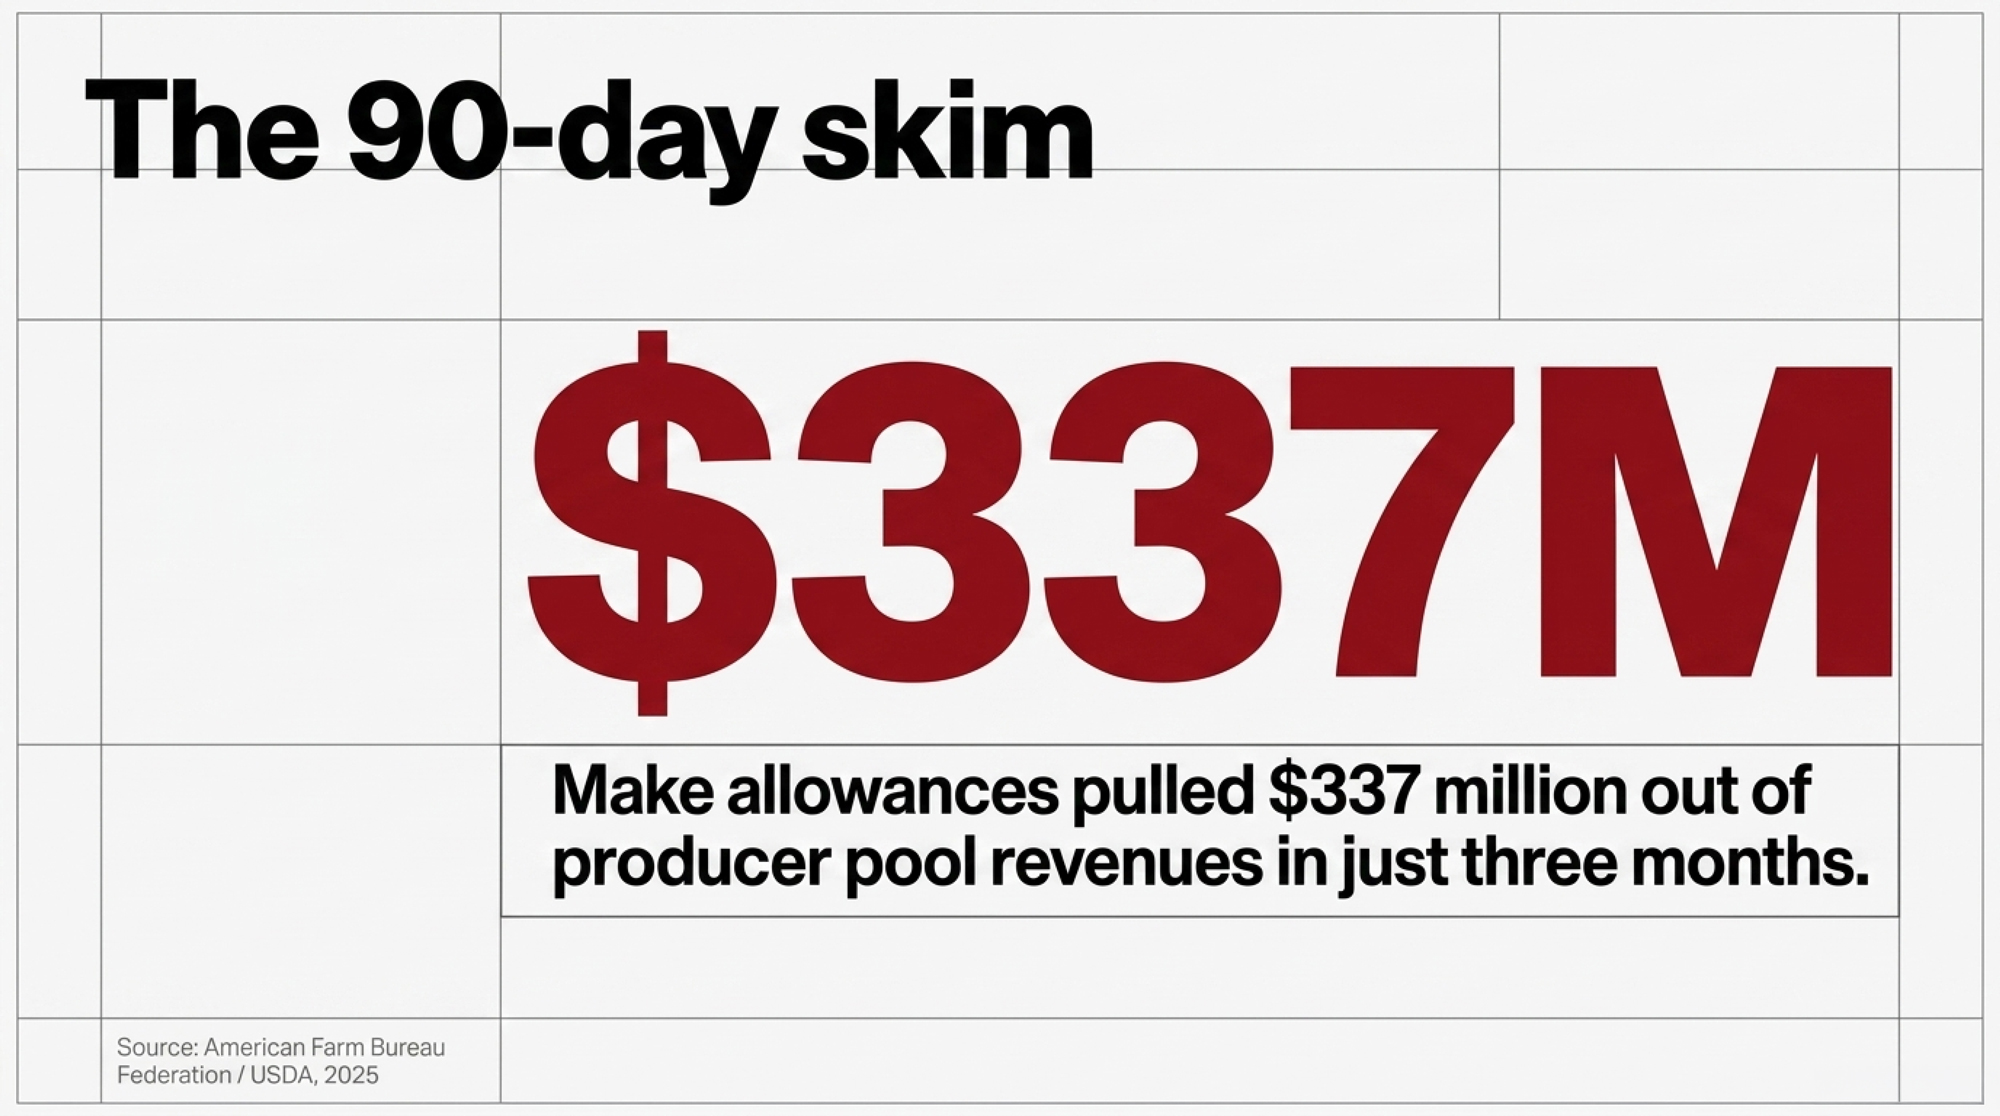
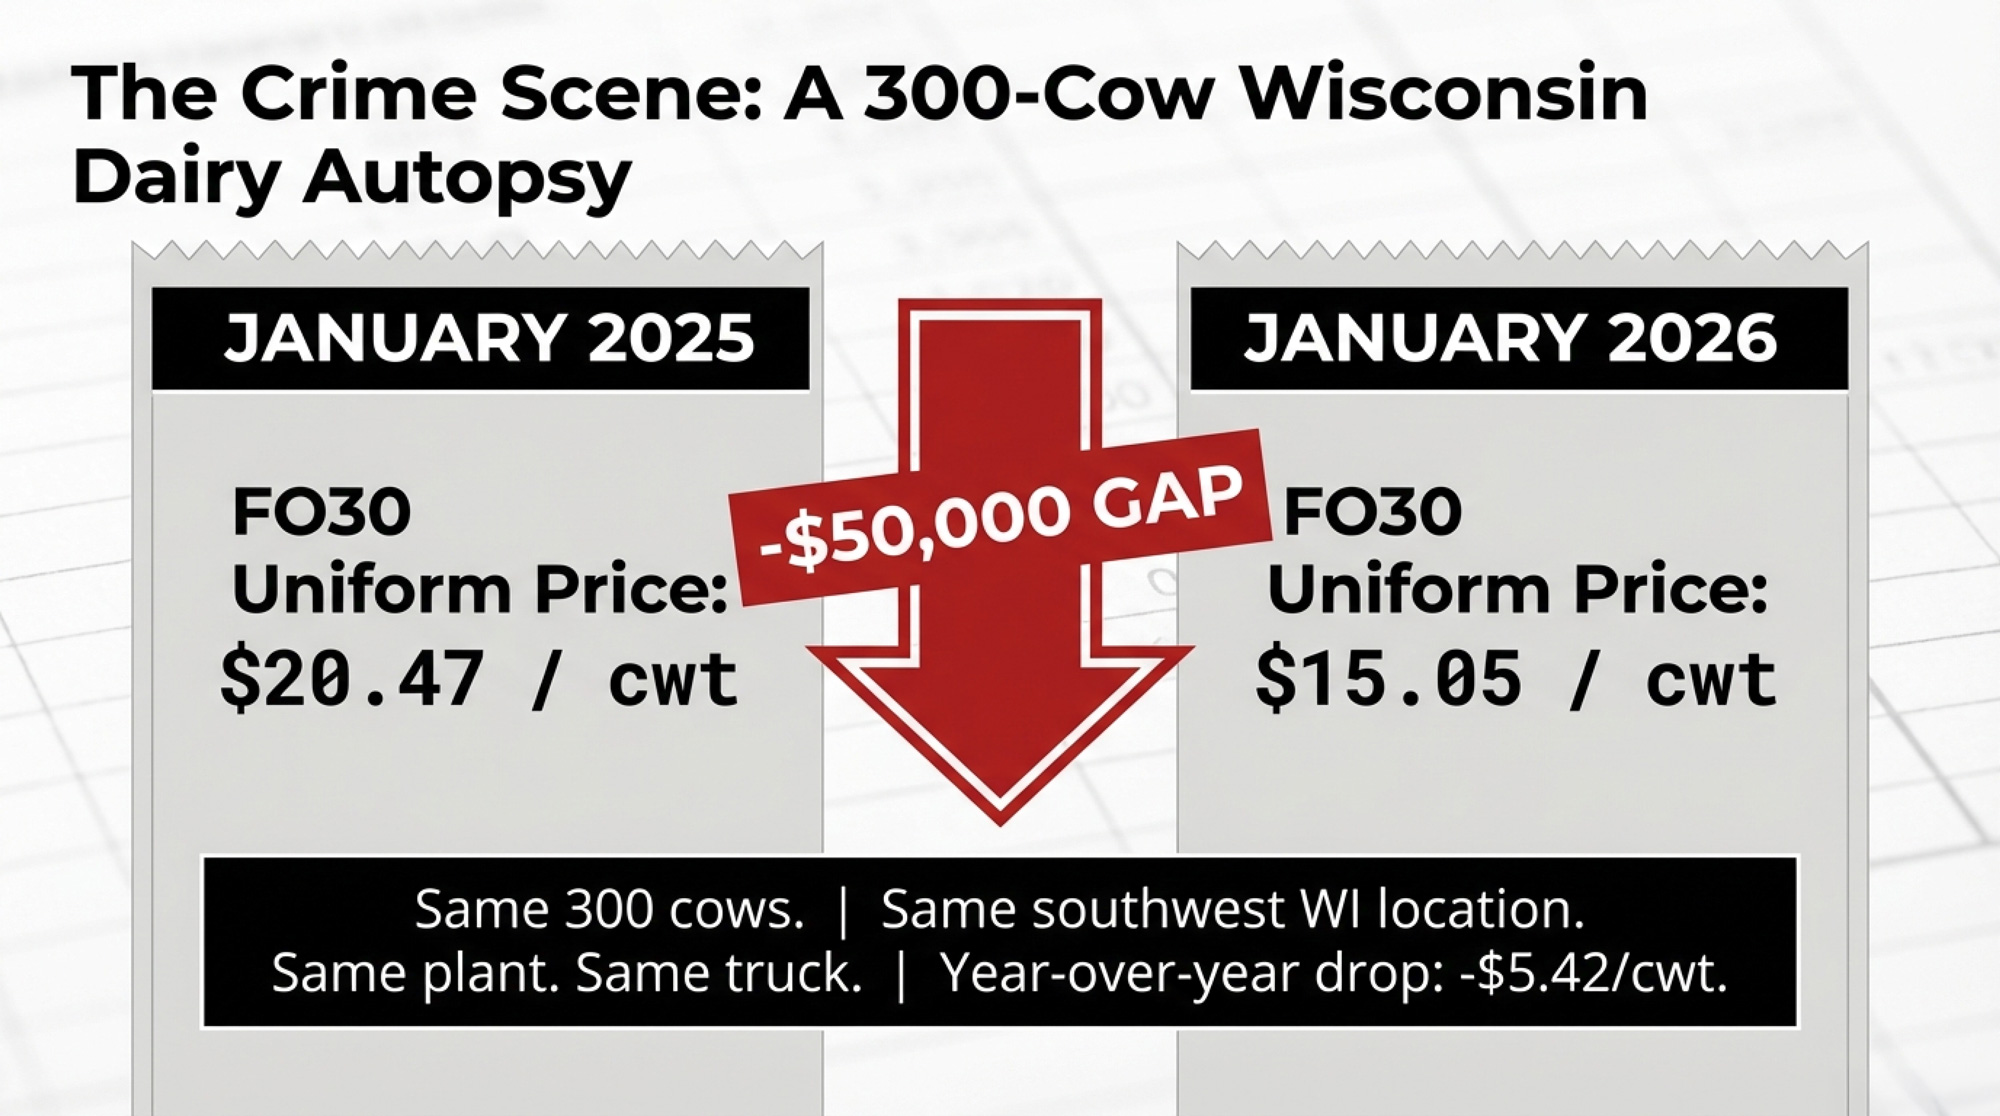
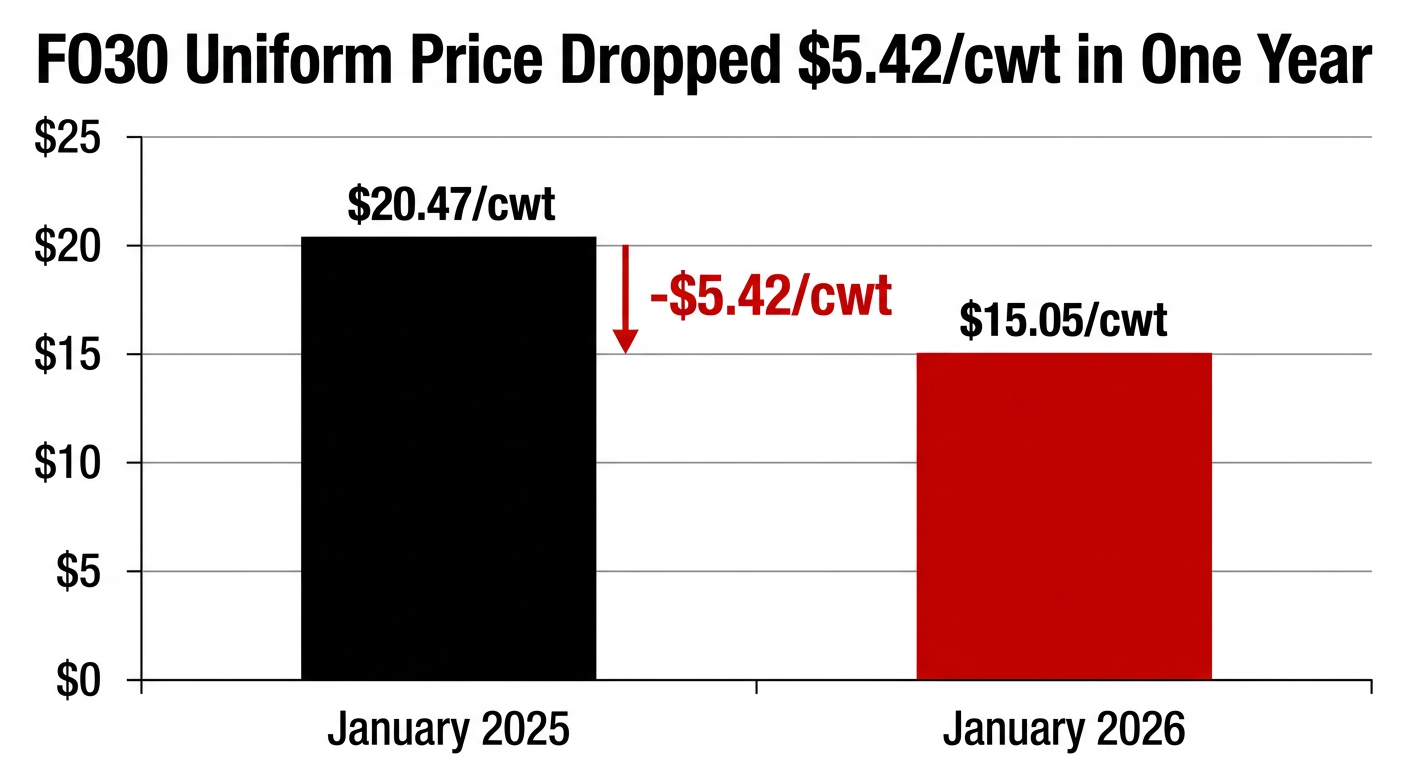
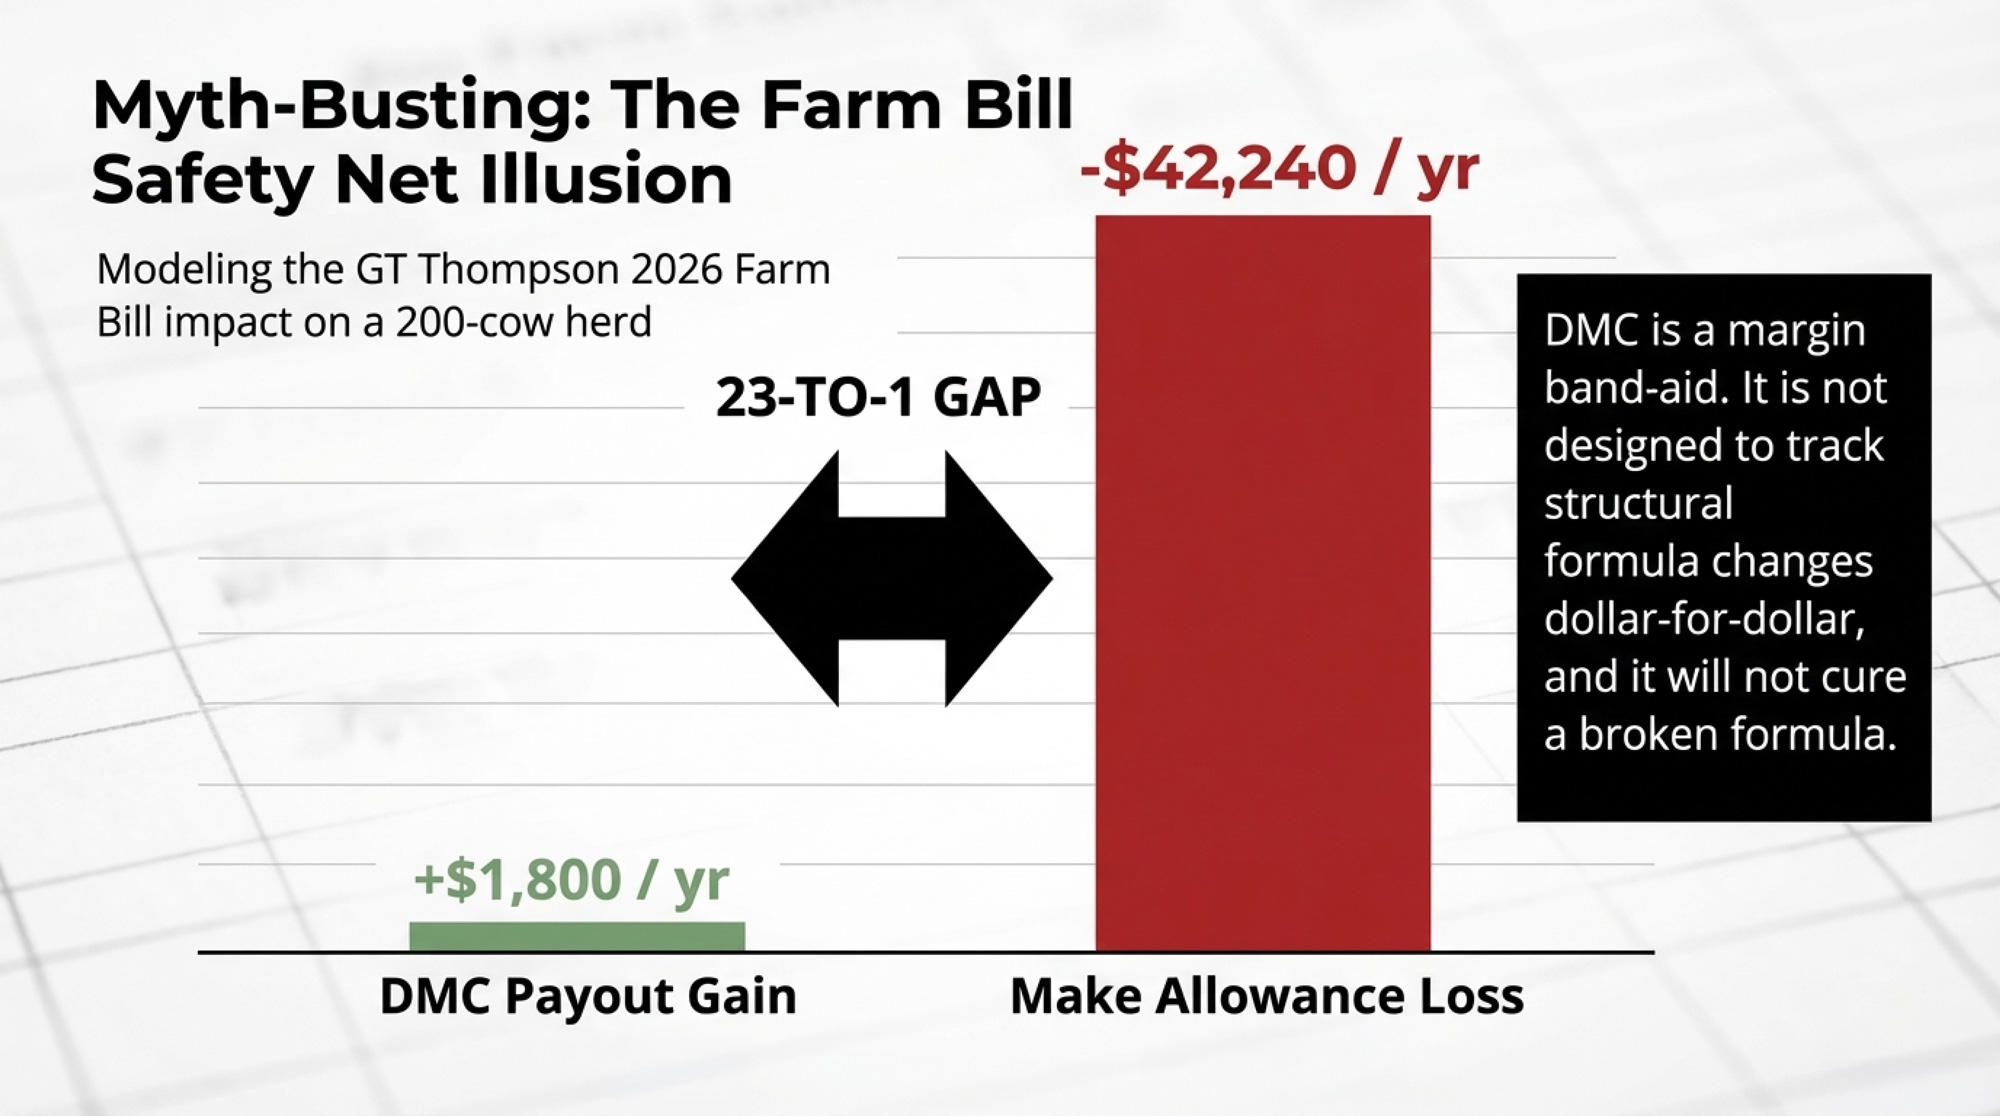
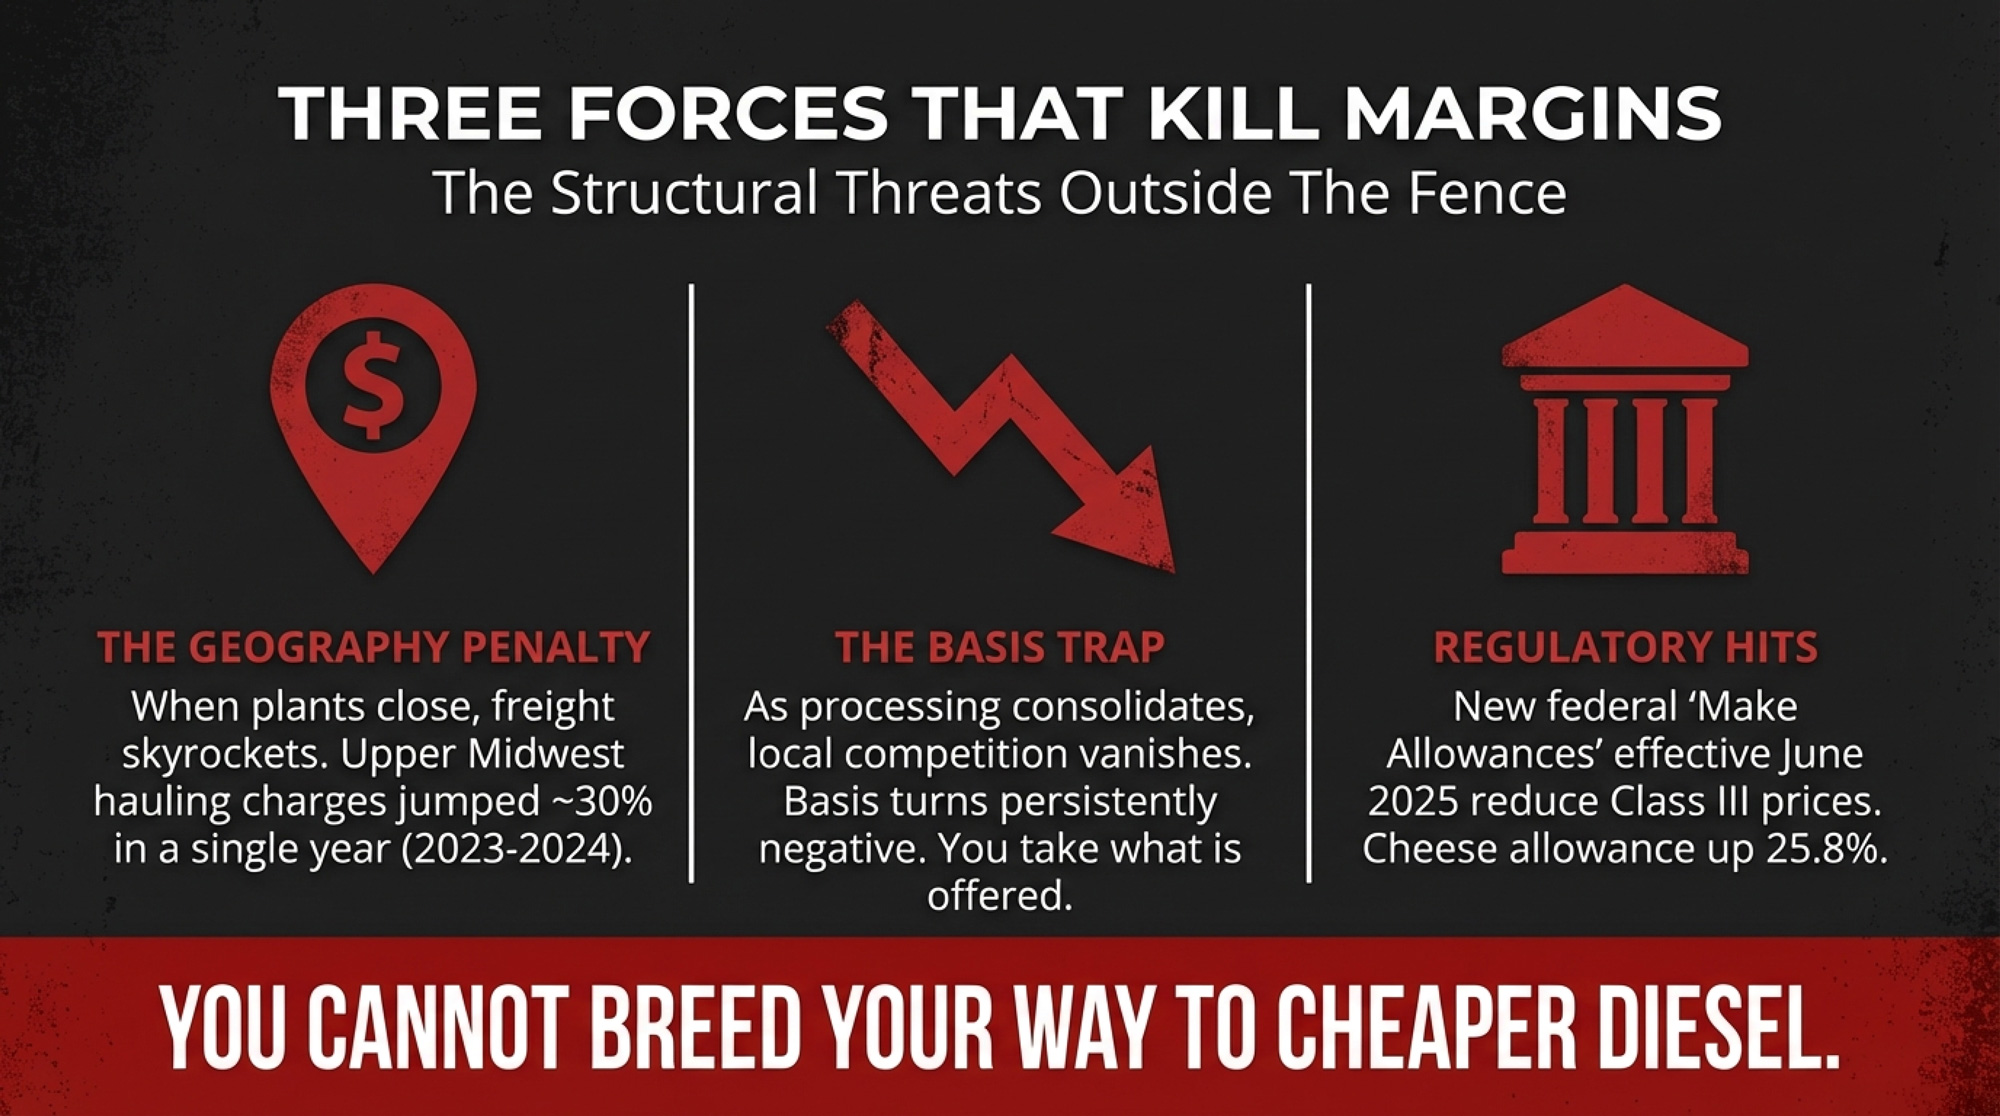
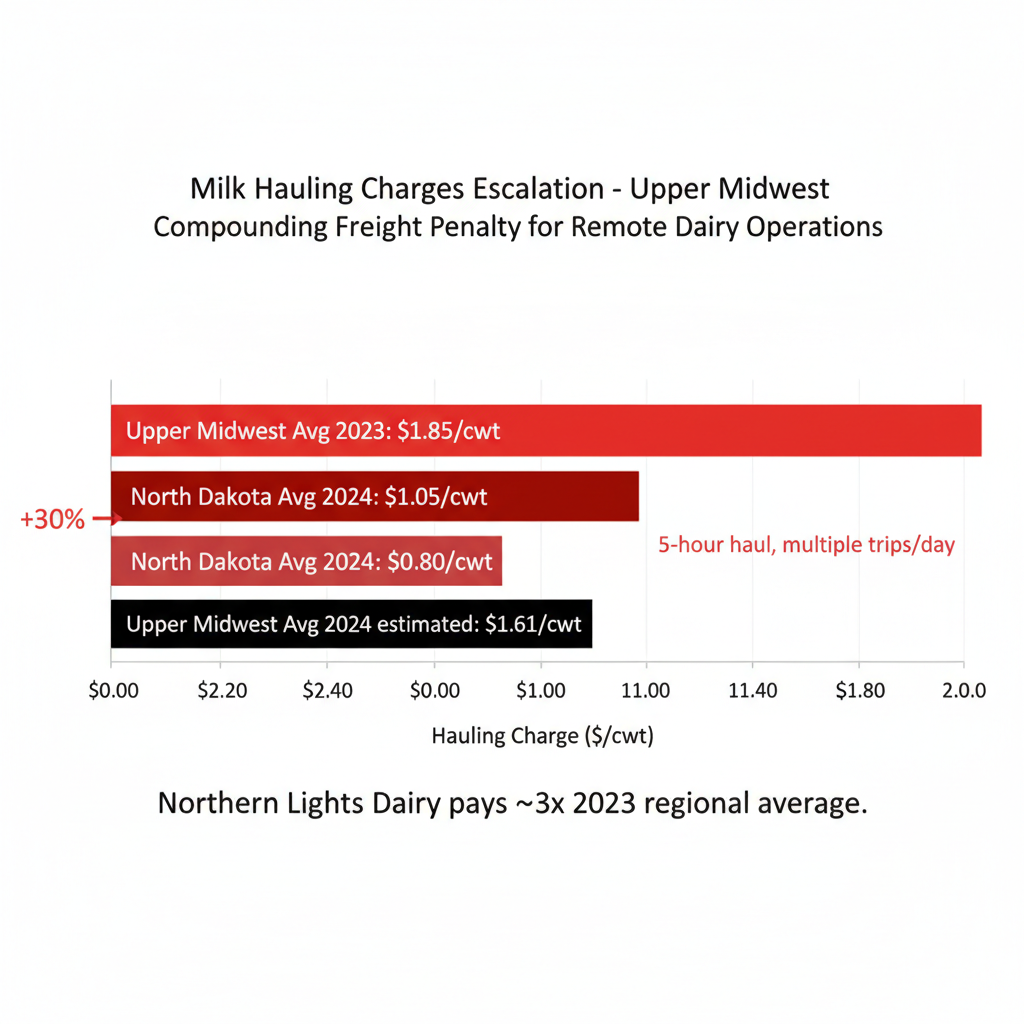
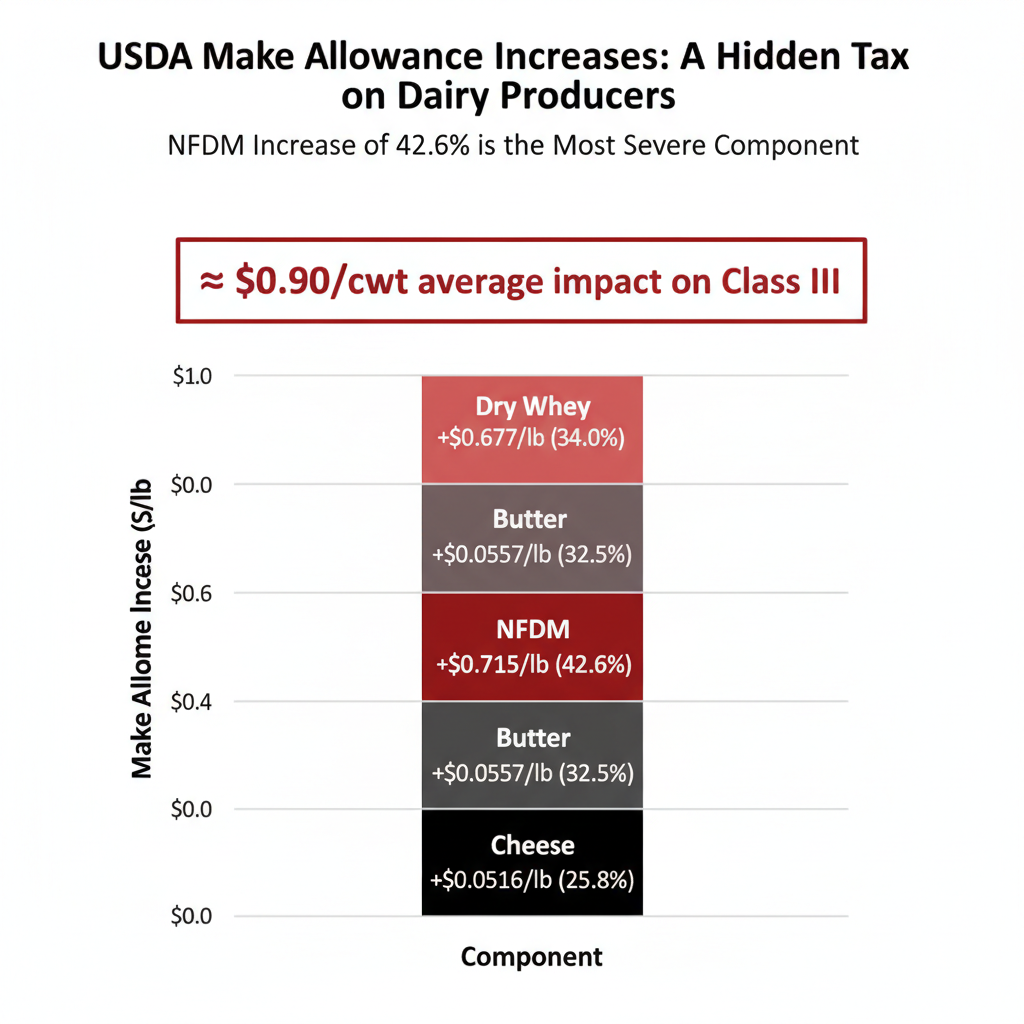
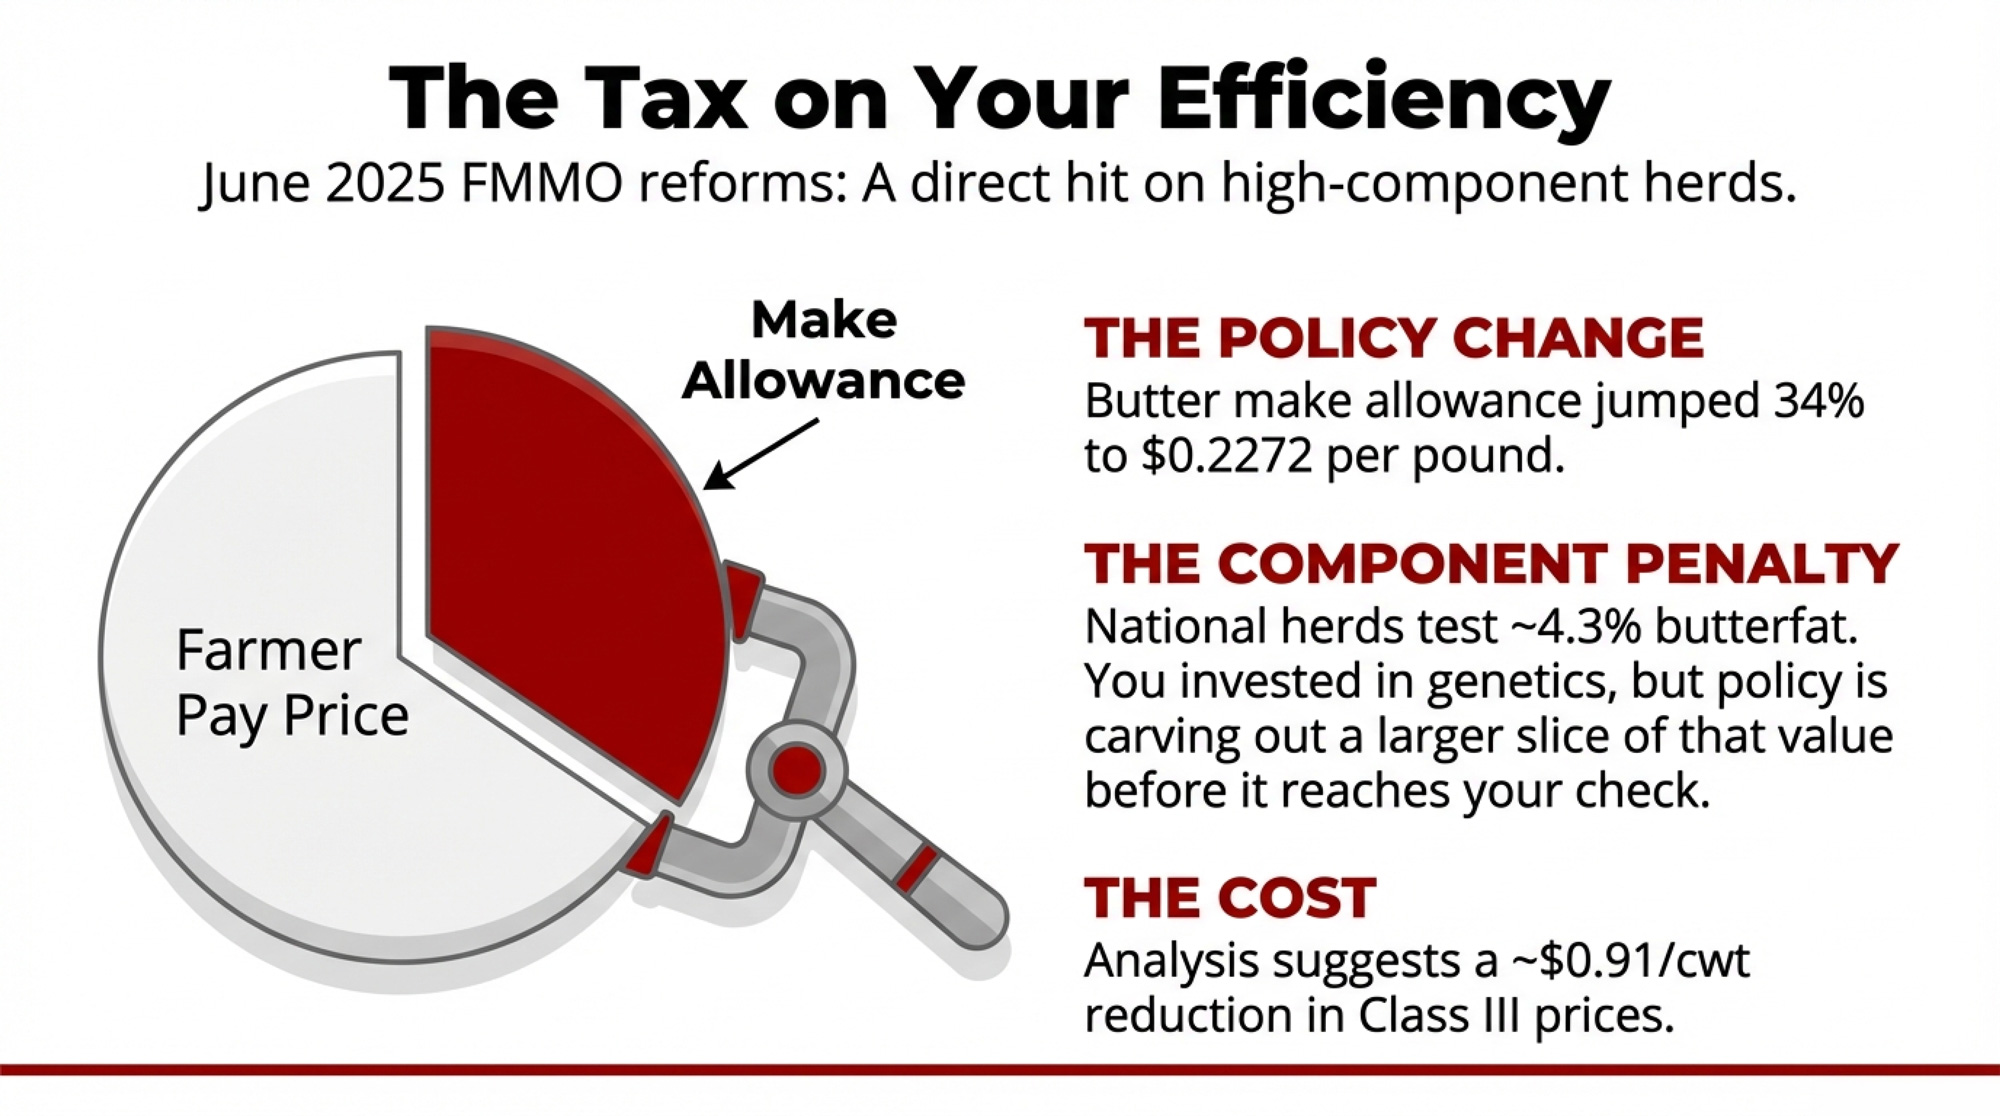
Then the reward structure moved. When USDA raised the make allowances baked into all 11 Federal Milk Marketing Orders on June 1, 2025, the American Farm Bureau Federation ran the damage. Economist Danny Munch’s Market Intel report, published September 2025, found the change cut class prices by 85 to 93 cents per hundredweight and pulled $337 million out of producer pool revenues in the first three months. That’s AFBF’s model built on USDA data — not a USDA headline number — and it’s worth saying plainly so nobody mistakes whose math it is. If you want the full $337 million make-allowance breakdown, it’s worth the read before your next contract talk.
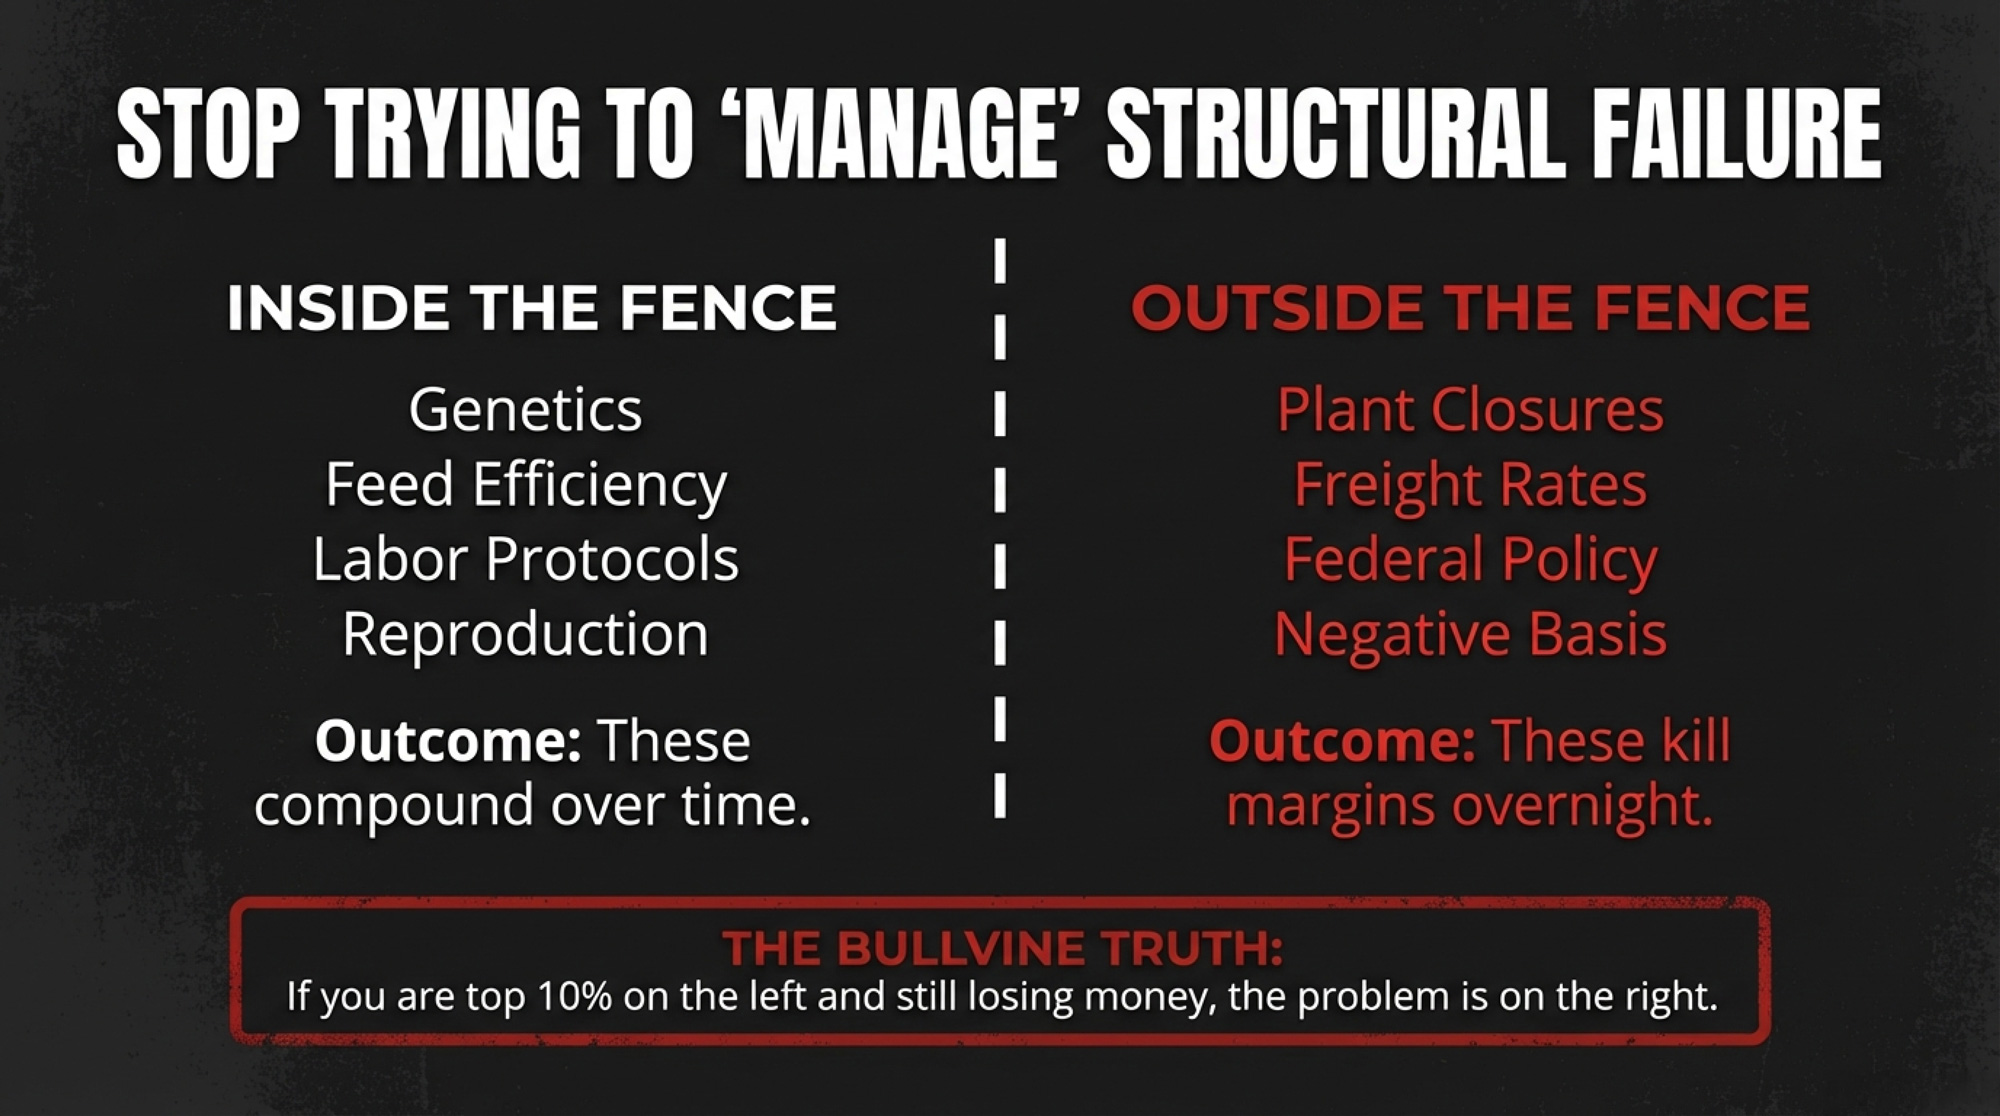
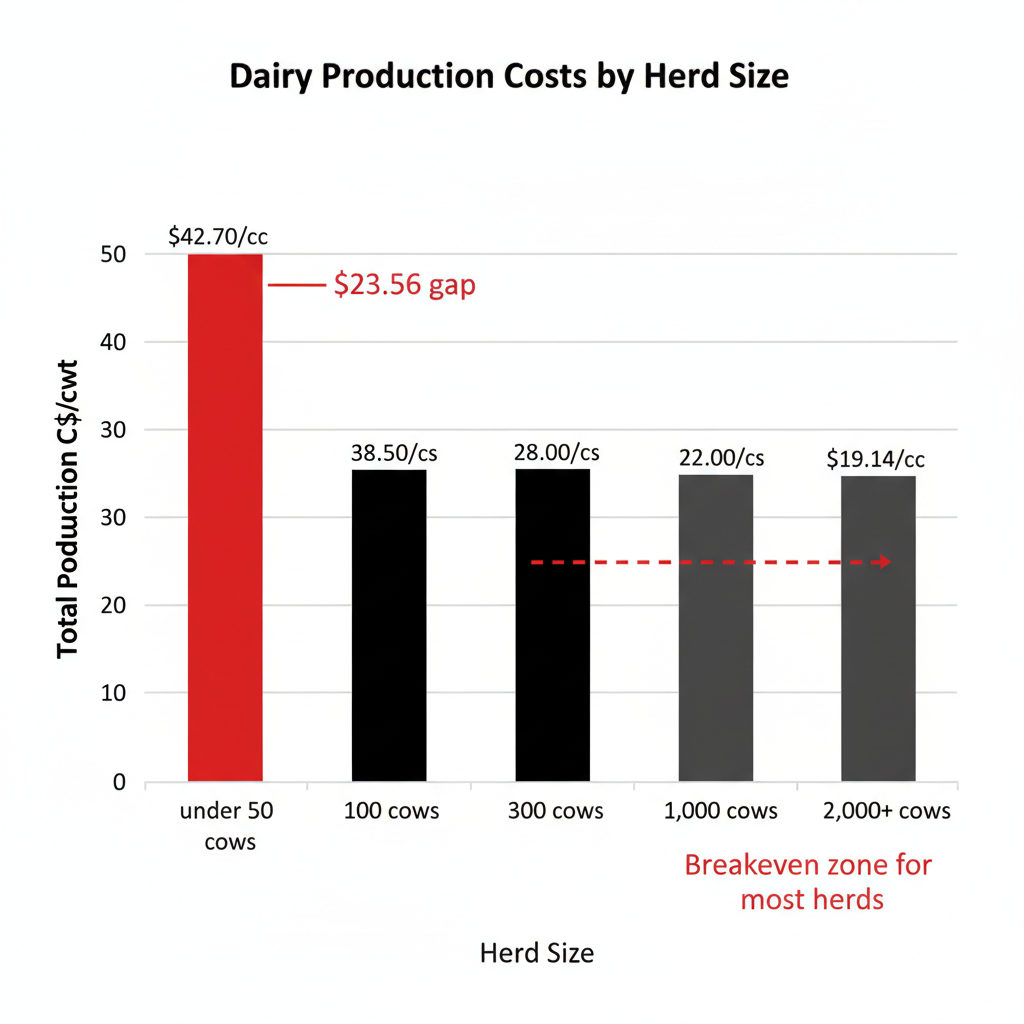
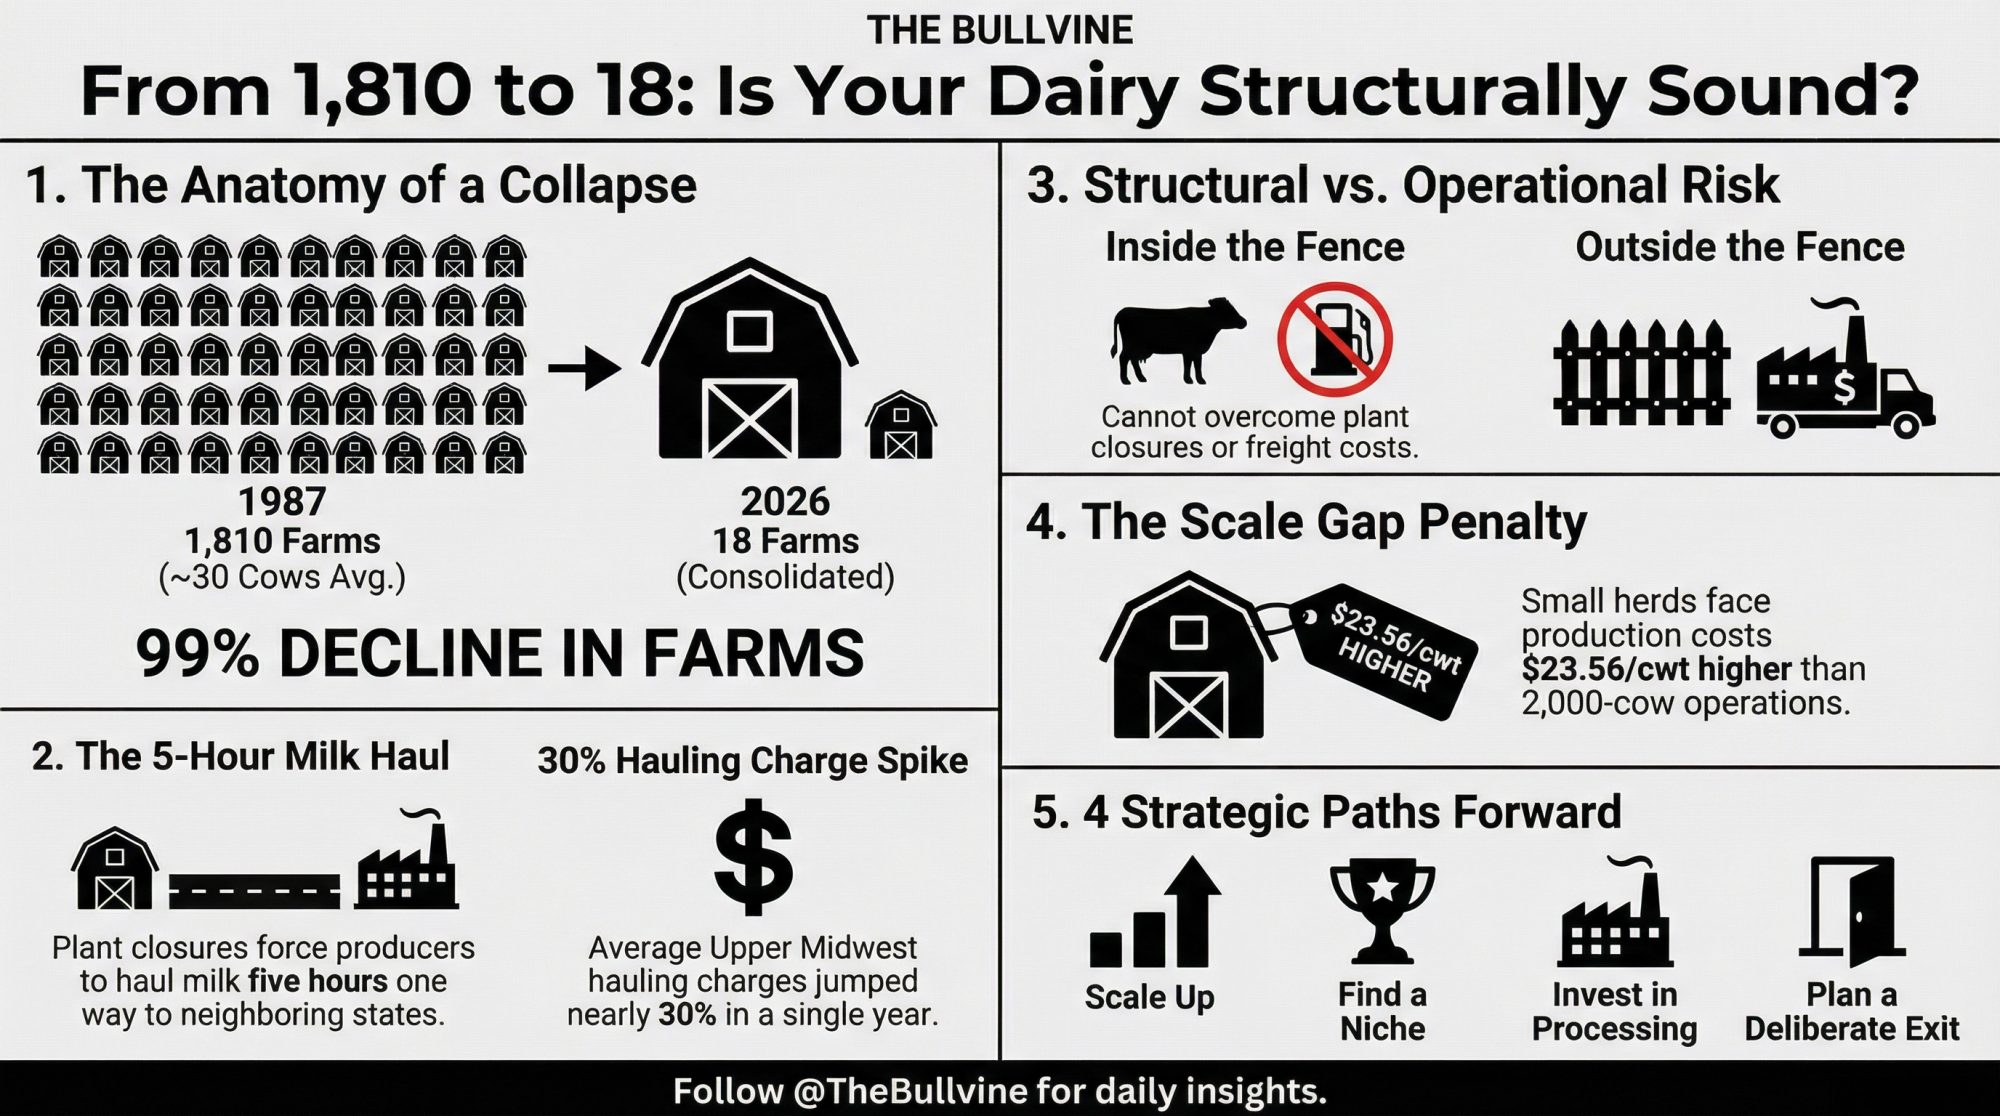
So you’ve got a paradox in the tank. Record components, and margins that went the wrong way. AFBF’s read of USDA cost data put the average U.S. dairy near –$1.05/cwt in 2024 — roughly $23.65/cwt in costs against a $22.60 all-milk price. Champion fat, negative margin. That’s the squeeze this whole piece is about.
What Winning With Gen Z Actually Looks Like
Look one shelf up from the commodity case. Kerrygold’s 2026 “Make It Gold” campaign doesn’t argue saturated fat — it leads with Irish grass-fed cows, gold foil, and the idea that ordinary food glows when you upgrade it. Behind the mood sits a concrete supply story: roughly 14,000 Irish farm families in a grass-based system. The origin is the product. When they flew creators to Ireland to walk the pastures, they weren’t selling fat percentages — they were selling something a 25-year-old wants to put on the counter and post.
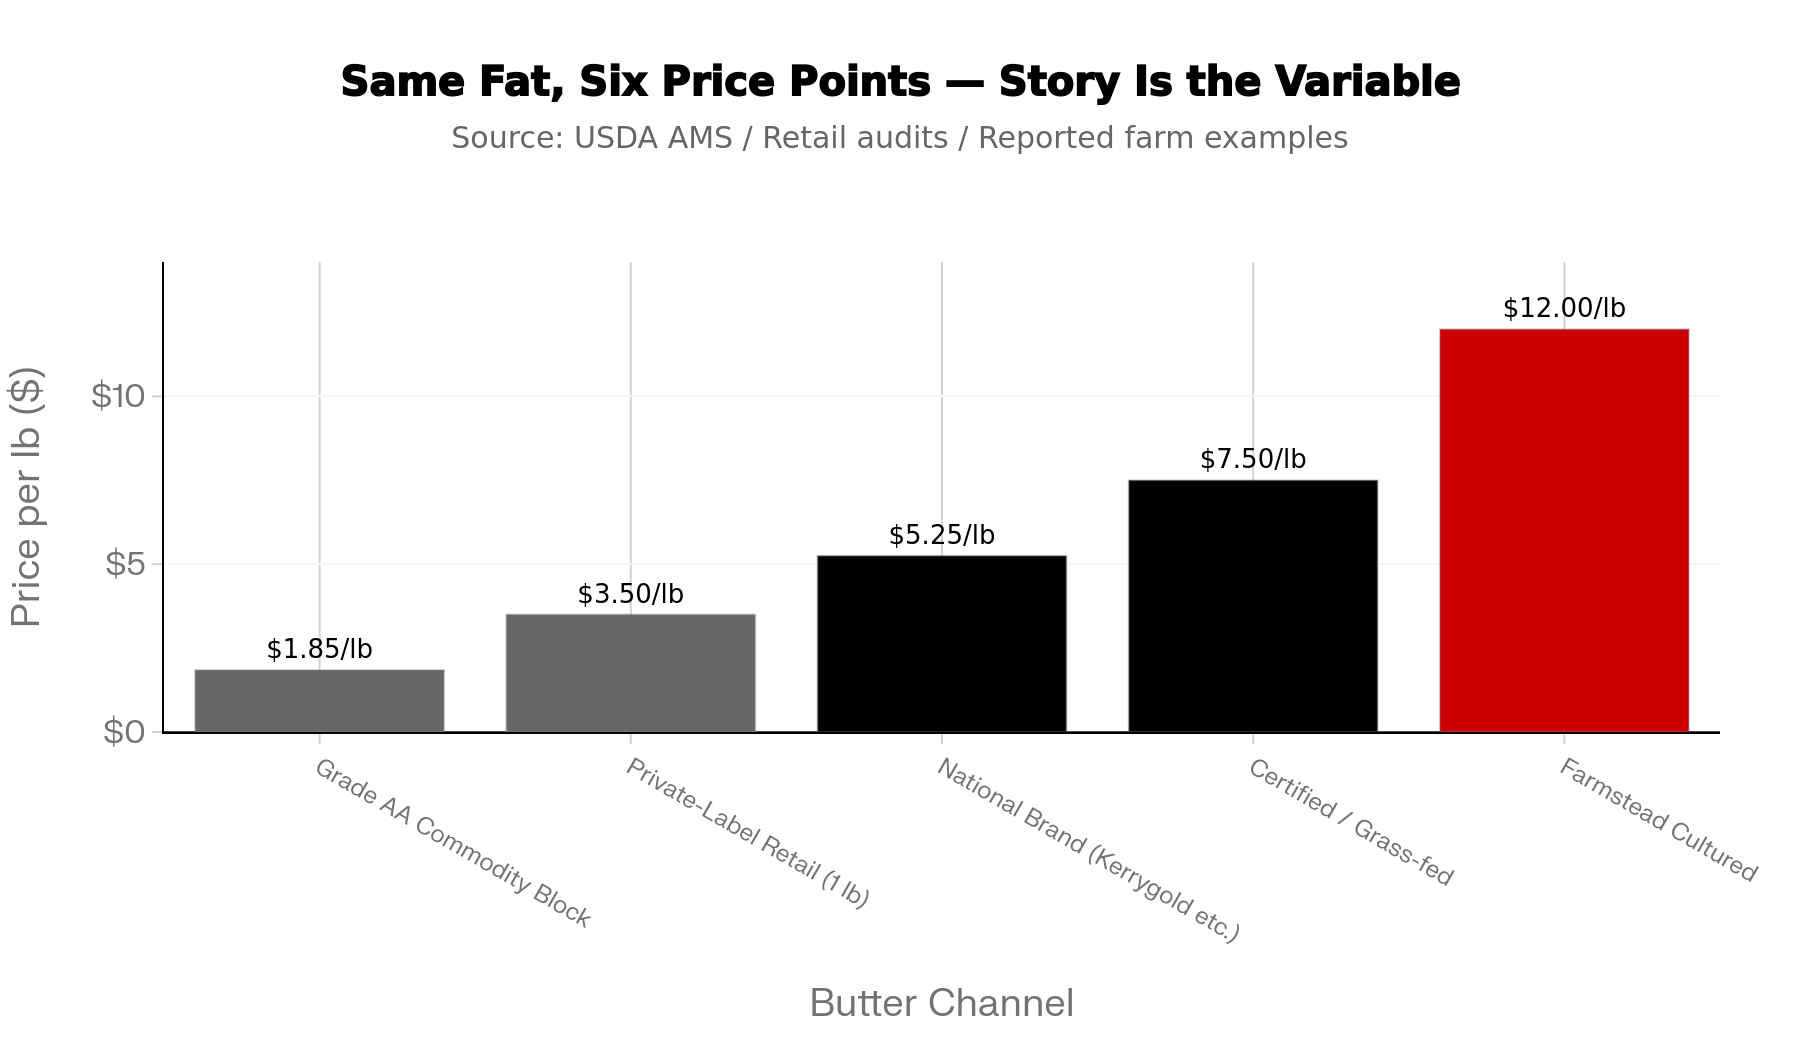
Now come home. One Vermont farm working with a local creamery has reported cultured butter around $24 a poundat farmers’ markets, from cream near 40% butterfat, cultured overnight. That’s one reported example, not a typical price. But it’s the same fat that goes anonymously into a commodity block somewhere else — wildly different payday. The difference isn’t the milk. It’s whether anyone bothered to attach a name and a place to it.
Younger buyers back this with their wallets. They shop by mood and values, not by aisle, and Ipsos research summary found brand values that match a shopper’s own rank among the top three purchase drivers across every generation. They’ll pay for a story. Commodity butter doesn’t have one to tell.
How Much Is Anonymous Butter Costing Your Herd?
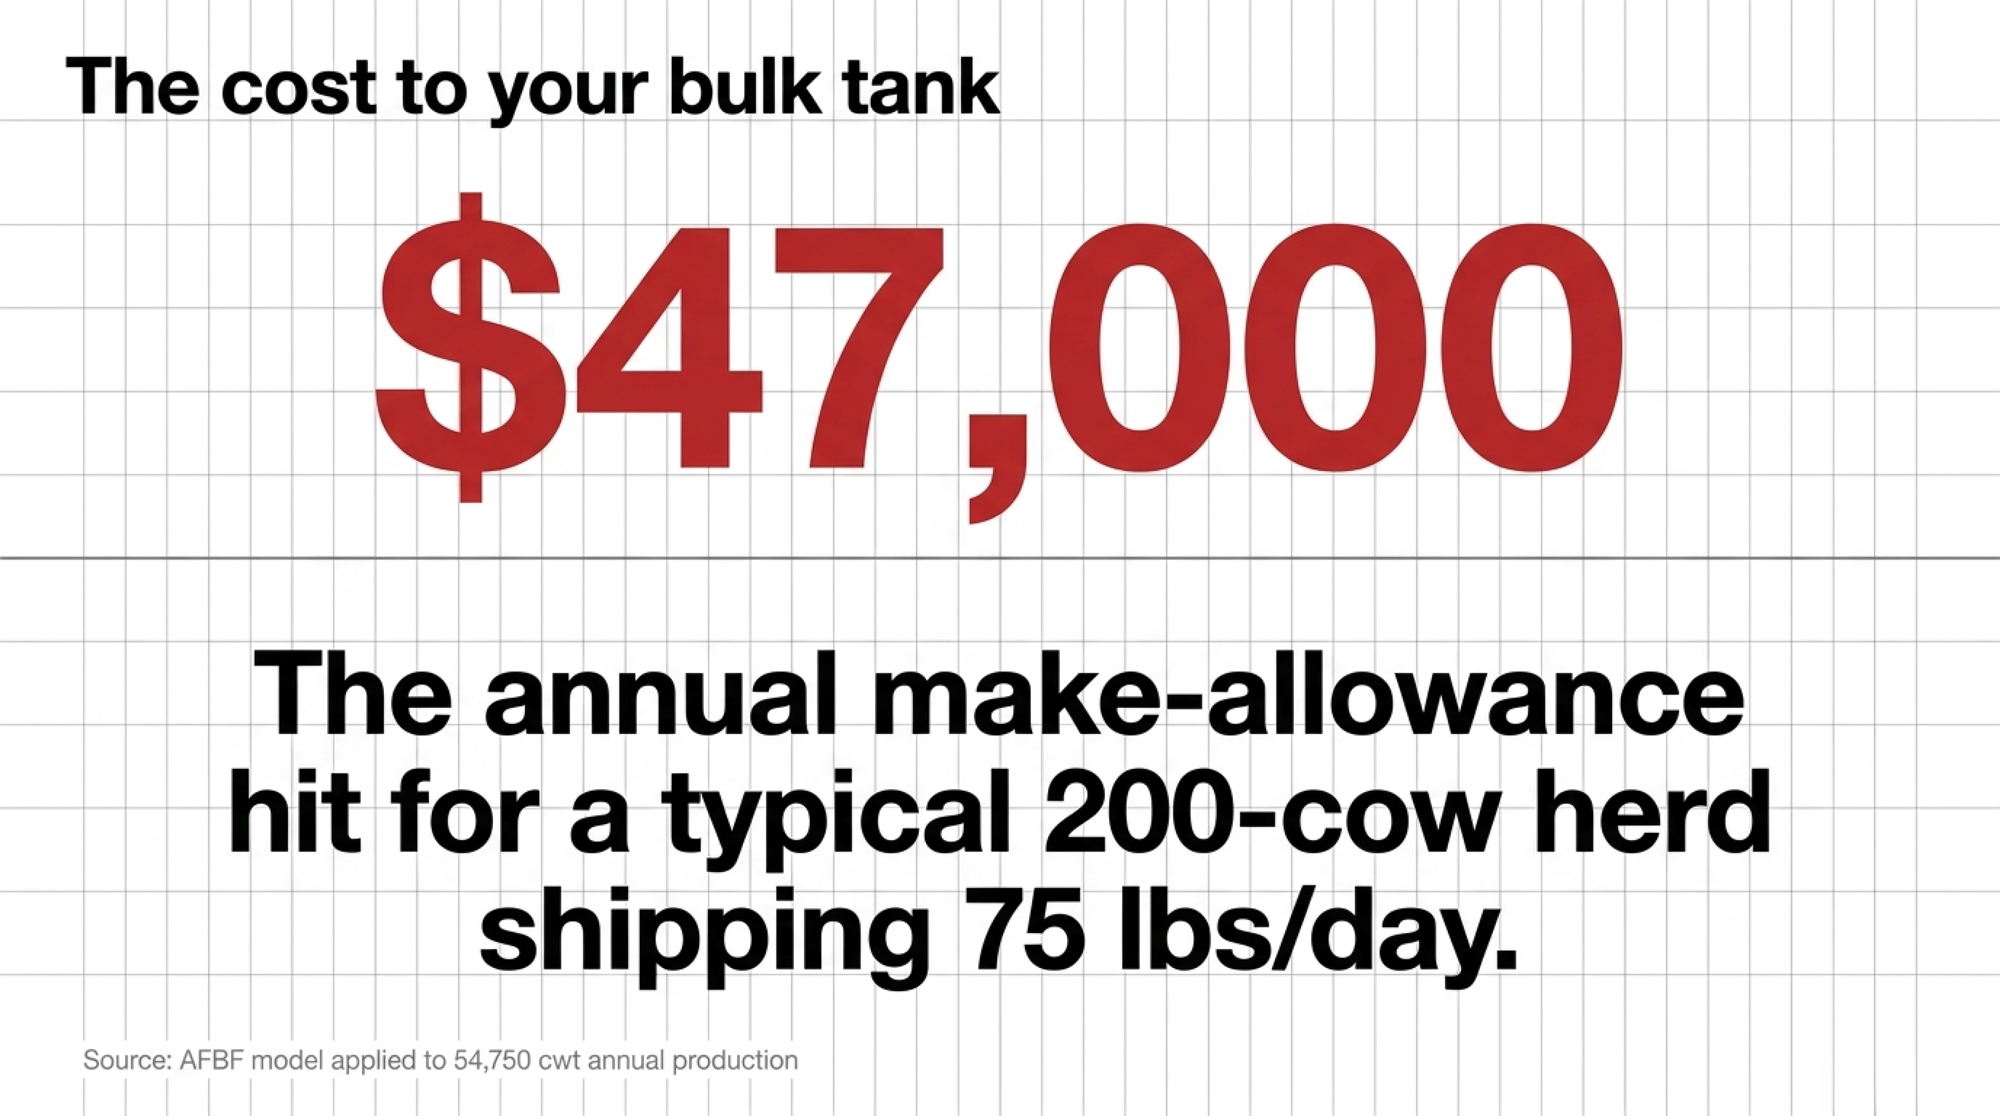
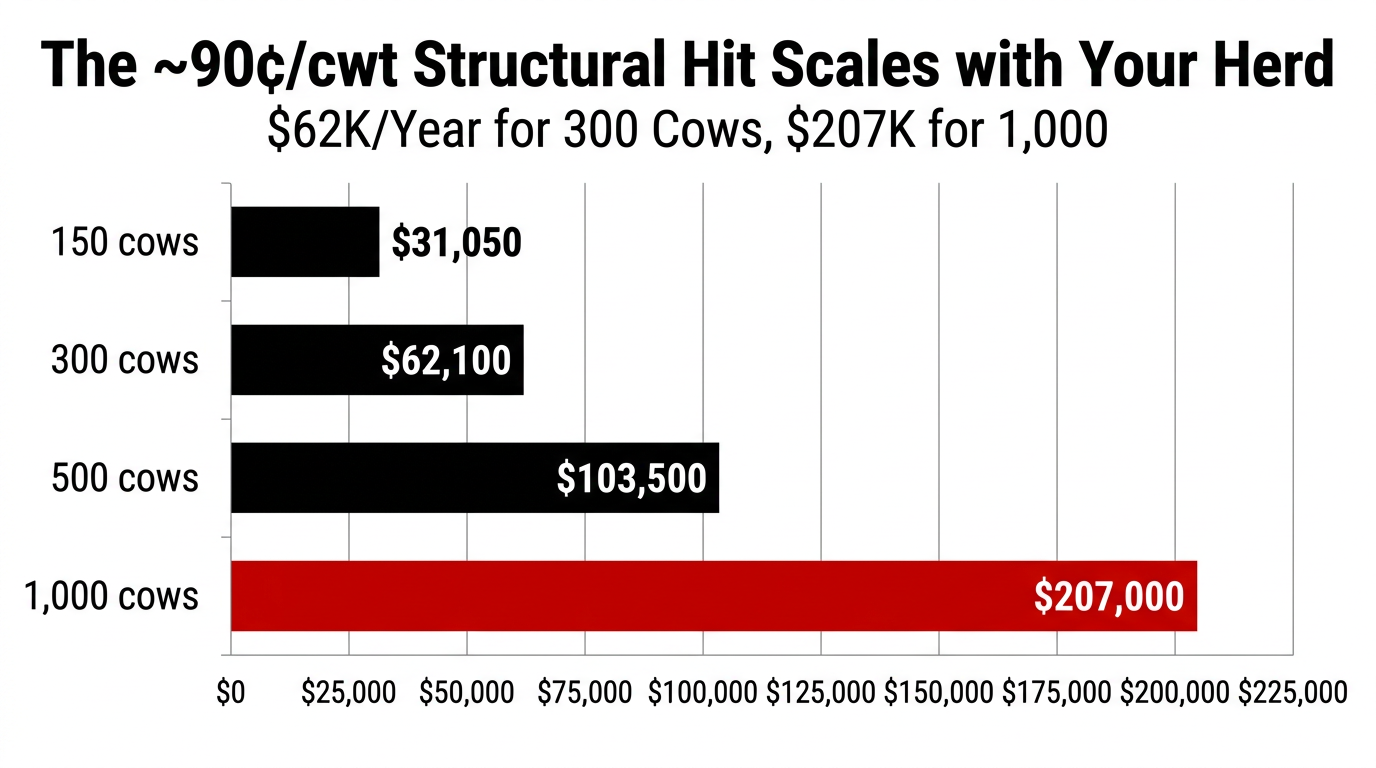
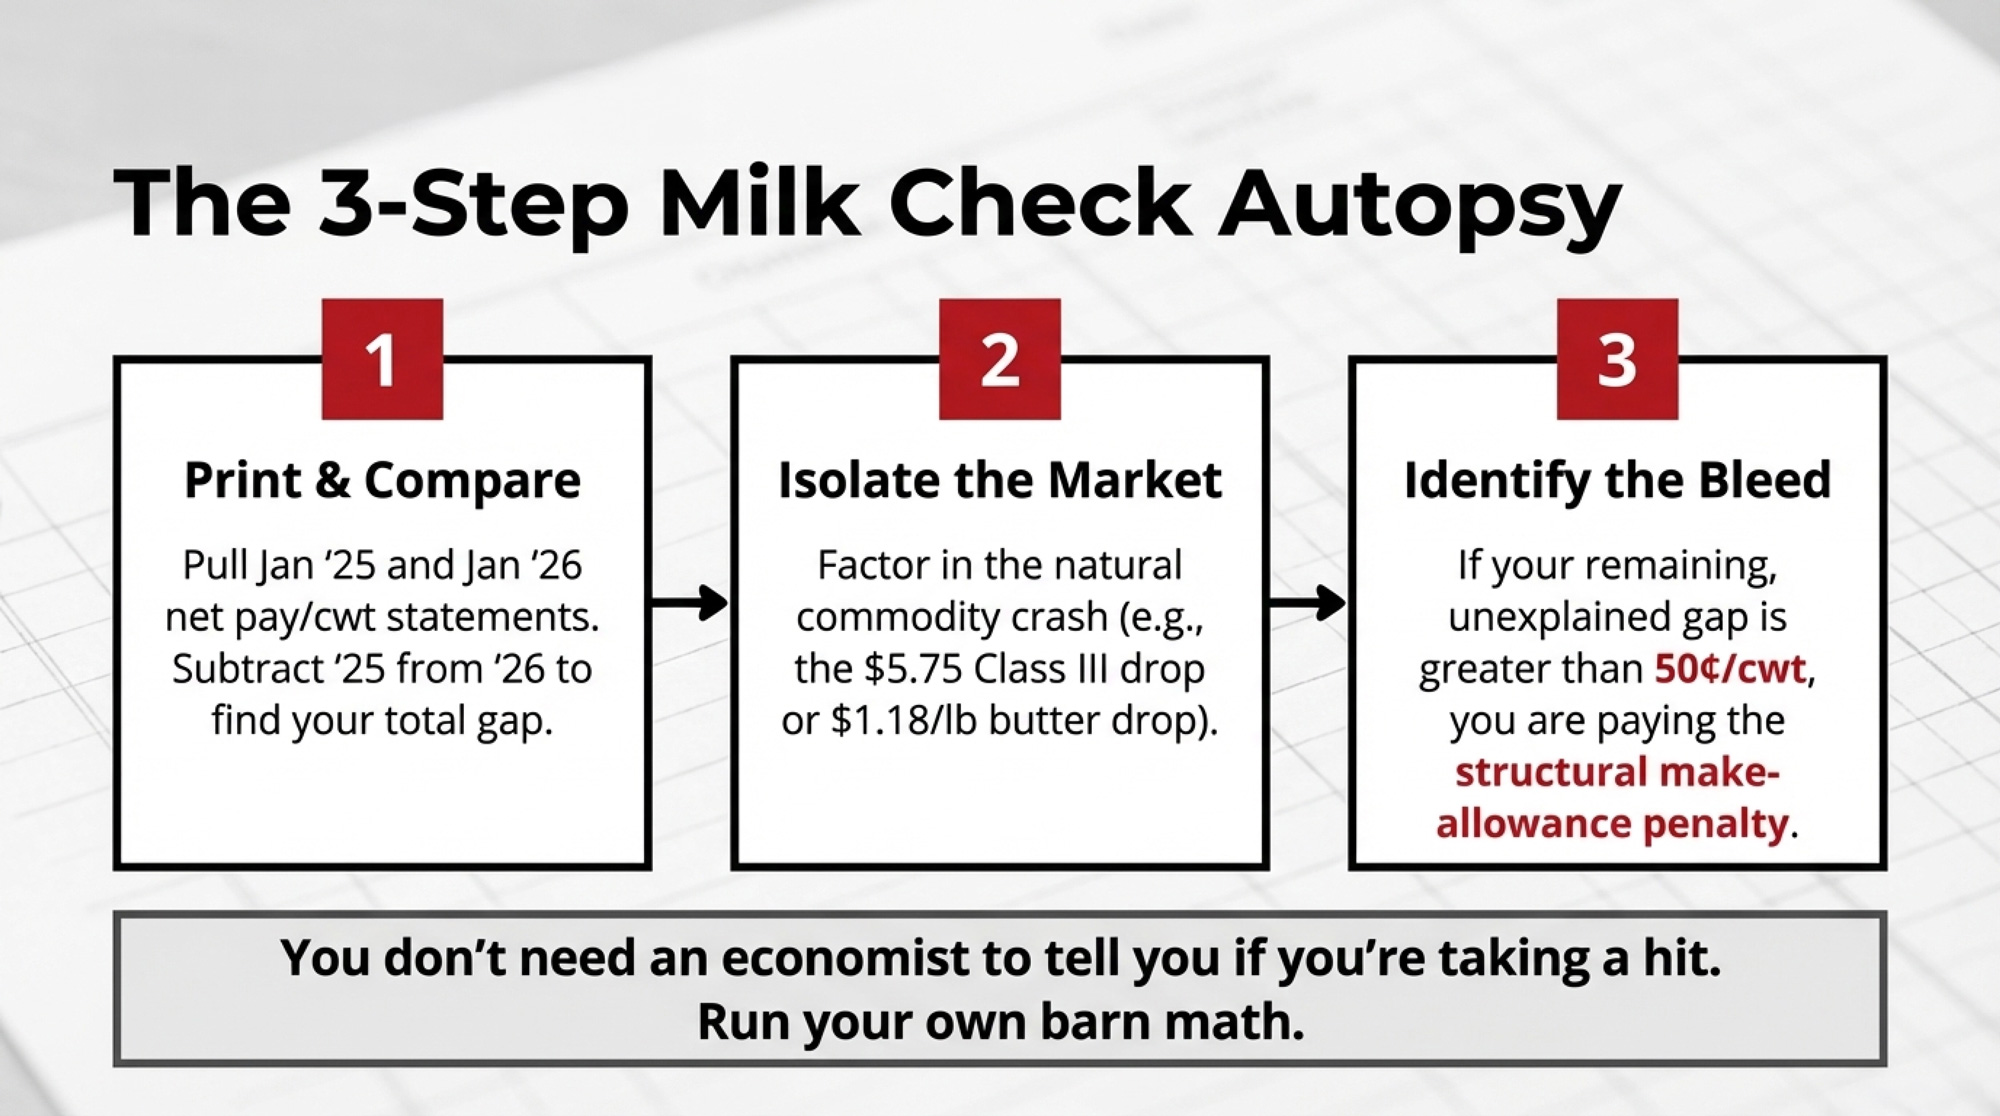
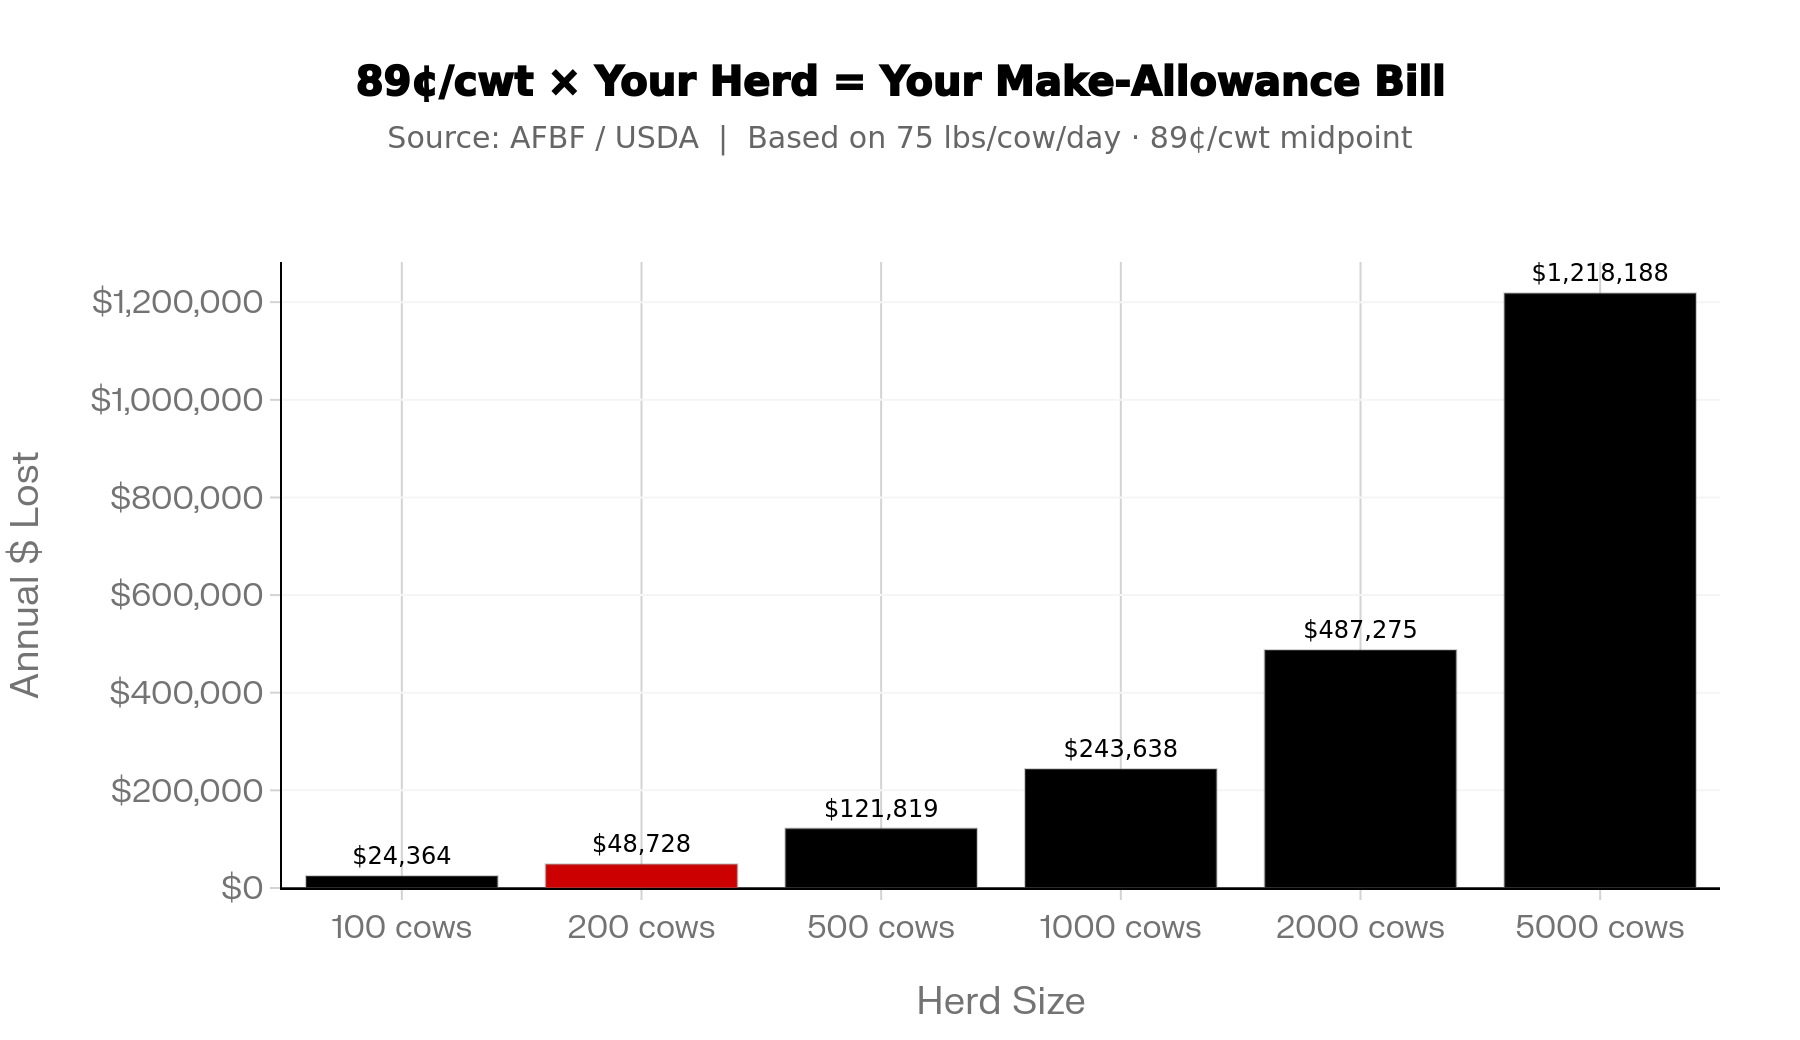
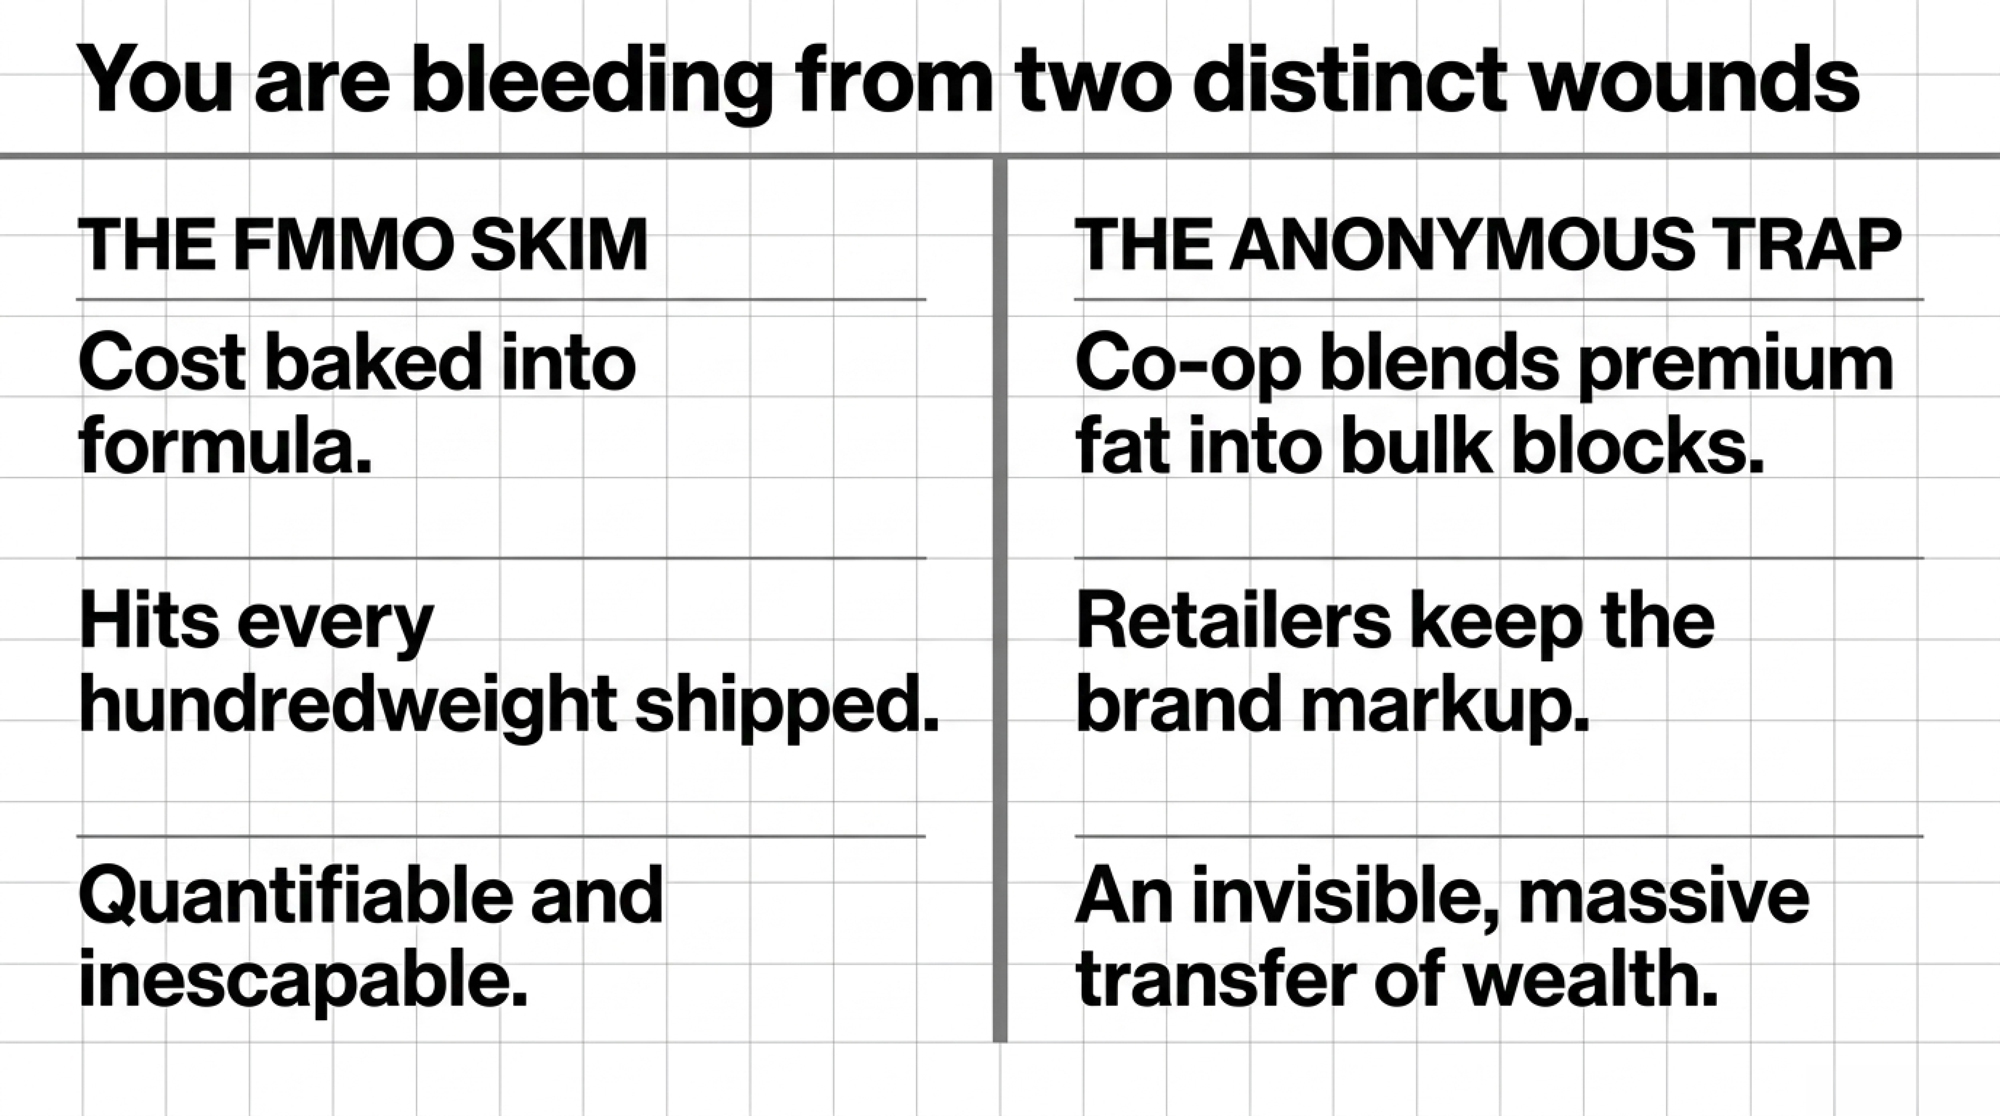
You’re bleeding from two different wounds, and it pays to know which is which — because they don’t come from the same place. Leak one is the make-allowance hit, and it’s already quantified. Take a 200-cow herd shipping 75 lbs/day — call it 54,750 cwt of milk over a year. That 85–92¢/cwt skim works out to roughly $47,000 to $50,000 over twelve months, and it lands on every hundredweight you ship, not just your fat. Run your own herd size through it; it scales fast.
Leak two is a different animal, and nobody sends you a statement for it. It’s the branded premium you never chase in the first place. Private label keeps taking share — U.S. store-brand sales hit a record $282.8 billion in 2025, up 3.3% and growing roughly triple the pace of national brands, per PLMA and Circana. When your co-op ships an anonymous pound into one of those store brands, the provenance premium a named product would earn doesn’t vanish — it lands in the retailer’s ledger, not yours. That’s the quiet transfer: you make the branded value, and someone with a logo prices it.
The honest caveat: there’s no clean public number for exactly how many cents per pound a story adds to butter at the co-op level. The direction of that transfer, though, isn’t in doubt.
Why Your Co-op Isn’t Dumb — The System Pays It to Stay Quiet
None of this happens because co-op leaders can’t picture a brand. It happens because anonymity is the rational move given how the system was built. USDA describes dairy co-ops as farmer-owned businesses that market member milk, balance supply, and pay back by volume — a structure engineered to make a pound from one plant swap cleanly for a pound from another. Interchangeable is efficient. It’s also the exact opposite of what sells to a generation that wants to know who made the thing.
Stack consolidation on top. GAO’s 2019 review found that as co-ops grow and buy into processing, “competing interests may make farmers feel that they have lost control over the cooperative’s priorities” — the plant wants cheap milk, you want more for it. And here’s the wrinkle most producers never see: because of how bloc voting works in FMMO referenda, your co-op can cast your ballot for you, so you may never have personally voted on the rule that cut your pay. So many co-ops default to low-risk private-label and bulk butter contracts — even as a few have started building branded lines — which caps how much identity premium they capture. The Cornucopia Institute has made the consumer side plain: private-label products are anonymous by design, even as shoppers increasingly want to know where their food comes from.
And the research is already done. A 2024 Journal of Dairy Science study found the label claims that actually moved buyers were “produced without added hormones,” “made with milk from our pasture-raised cows,” and “made locally” — all beating generic “family farm” language. A companion study found people define “local” by region or state and attach real emotional weight to it. The signal’s been sitting there. Most co-op butter just never puts it on the front of the pack.
| Label Claim | Typical Co-op Private Label | Typical National Brand | Moves Buyer (JDS 2024 Data) | Provenance Premium Potential |
|---|---|---|---|---|
| “Produced without added hormones” | Rarely | Sometimes | Yes — top driver | High |
| “Pasture-raised cows” | Rarely | Occasionally | Yes — top driver | High |
| “Made locally / regional origin” | No | No | Yes — emotional weight | High |
| “Family farm” (generic) | Sometimes | Common | Weak — below specifics | Low–Medium |
| Grade AA / USDA shield | Standard | Standard | No purchase lift | None |
| Named farm / individual story | No | Kerrygold, some brands | Yes — Gen Z driver | Highest |
Is Your Best Trait Quietly Working Against You?
Watch this twist, because a lot of high-fat herds haven’t clocked it. Butterfat has grown at roughly twice the pace of protein. The national protein-to-fat ratio has slid to about 0.77, down from the 0.82–0.84 range that held steady for years — and below the 0.85–0.90 window a lot of cheese plants want. You can be a butterfat champion and still be misaligned with where your processor actually makes money.
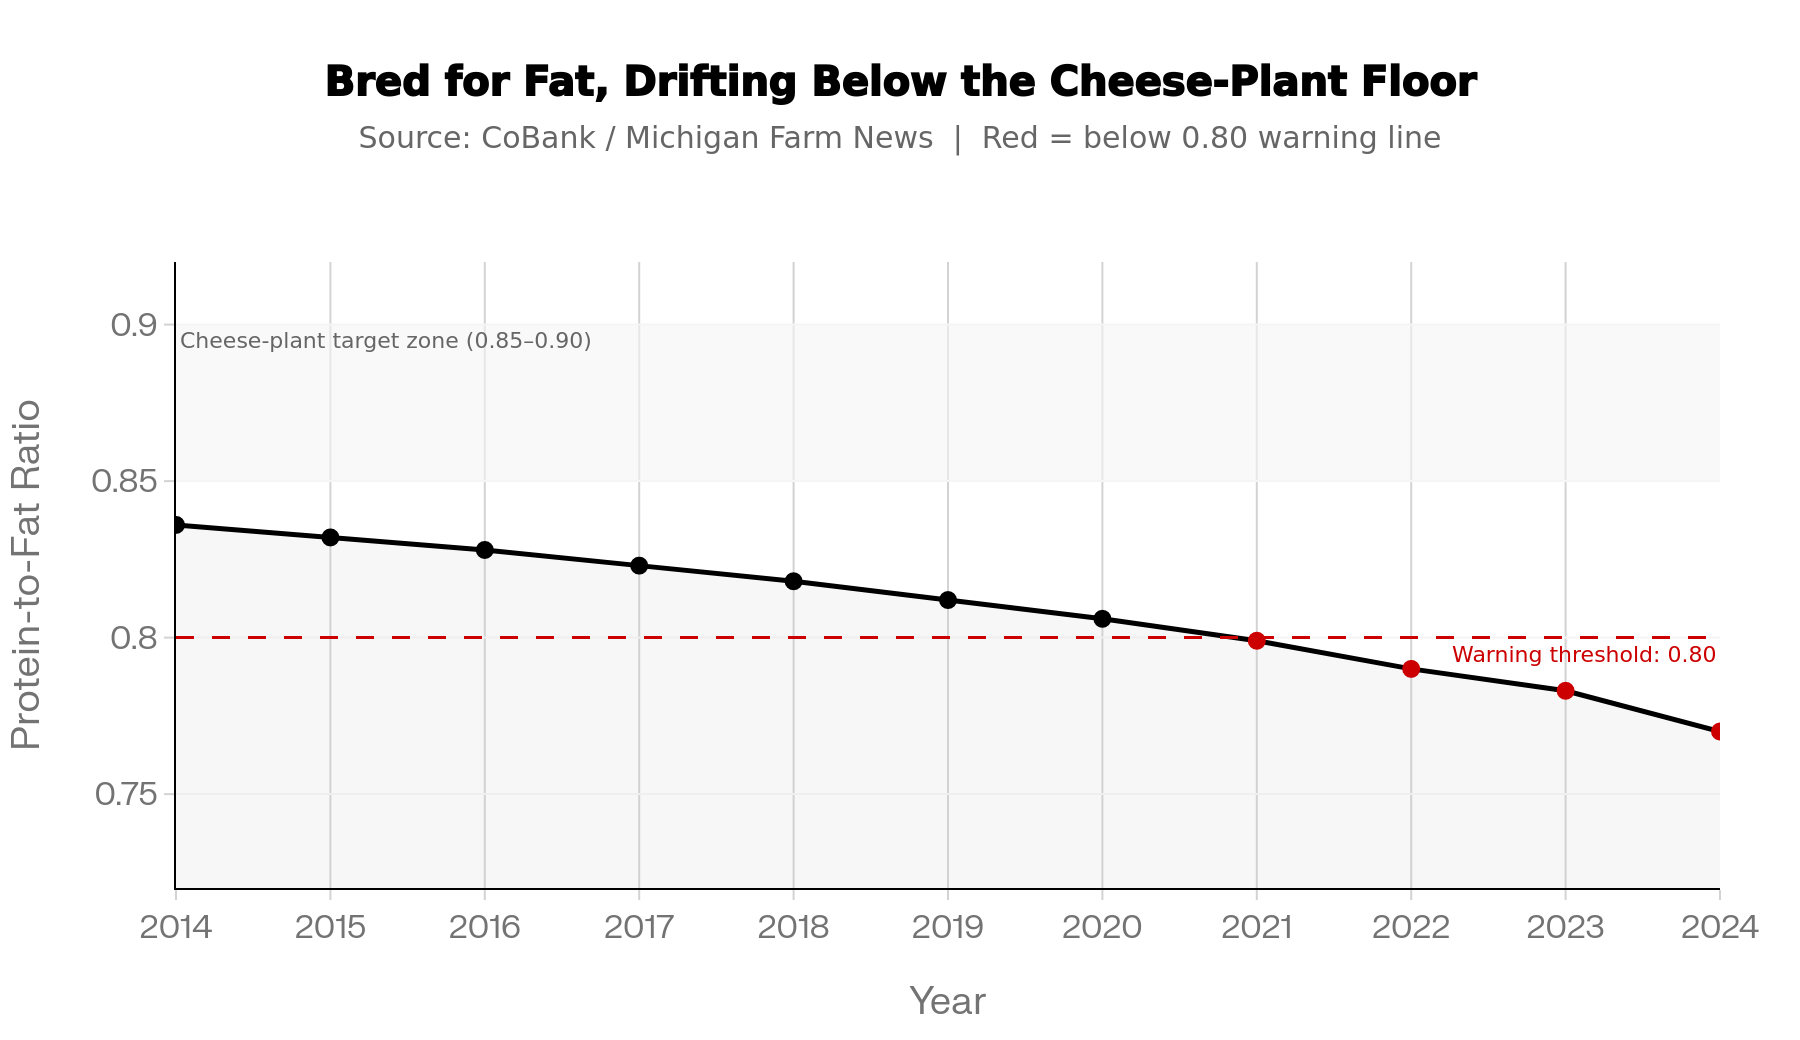
Bullvine reporting has documented at least one processor group trimming premiums on high-fat milk in late 2025. CoBank’s Corey Geiger has argued that protein is poised to overtake fat on milk checks, simply because processors need more of it. The decade you spent breeding up fat is only an asset if the product it feeds carries an identity worth paying for. Pull your last 24 months of DHIA records and run your own protein-to-fat math — if you’re drifting under 0.80 and shipping to a cheese plant, treat that as your own warning line and run the numbers.
Options and Trade-Offs for Farmers
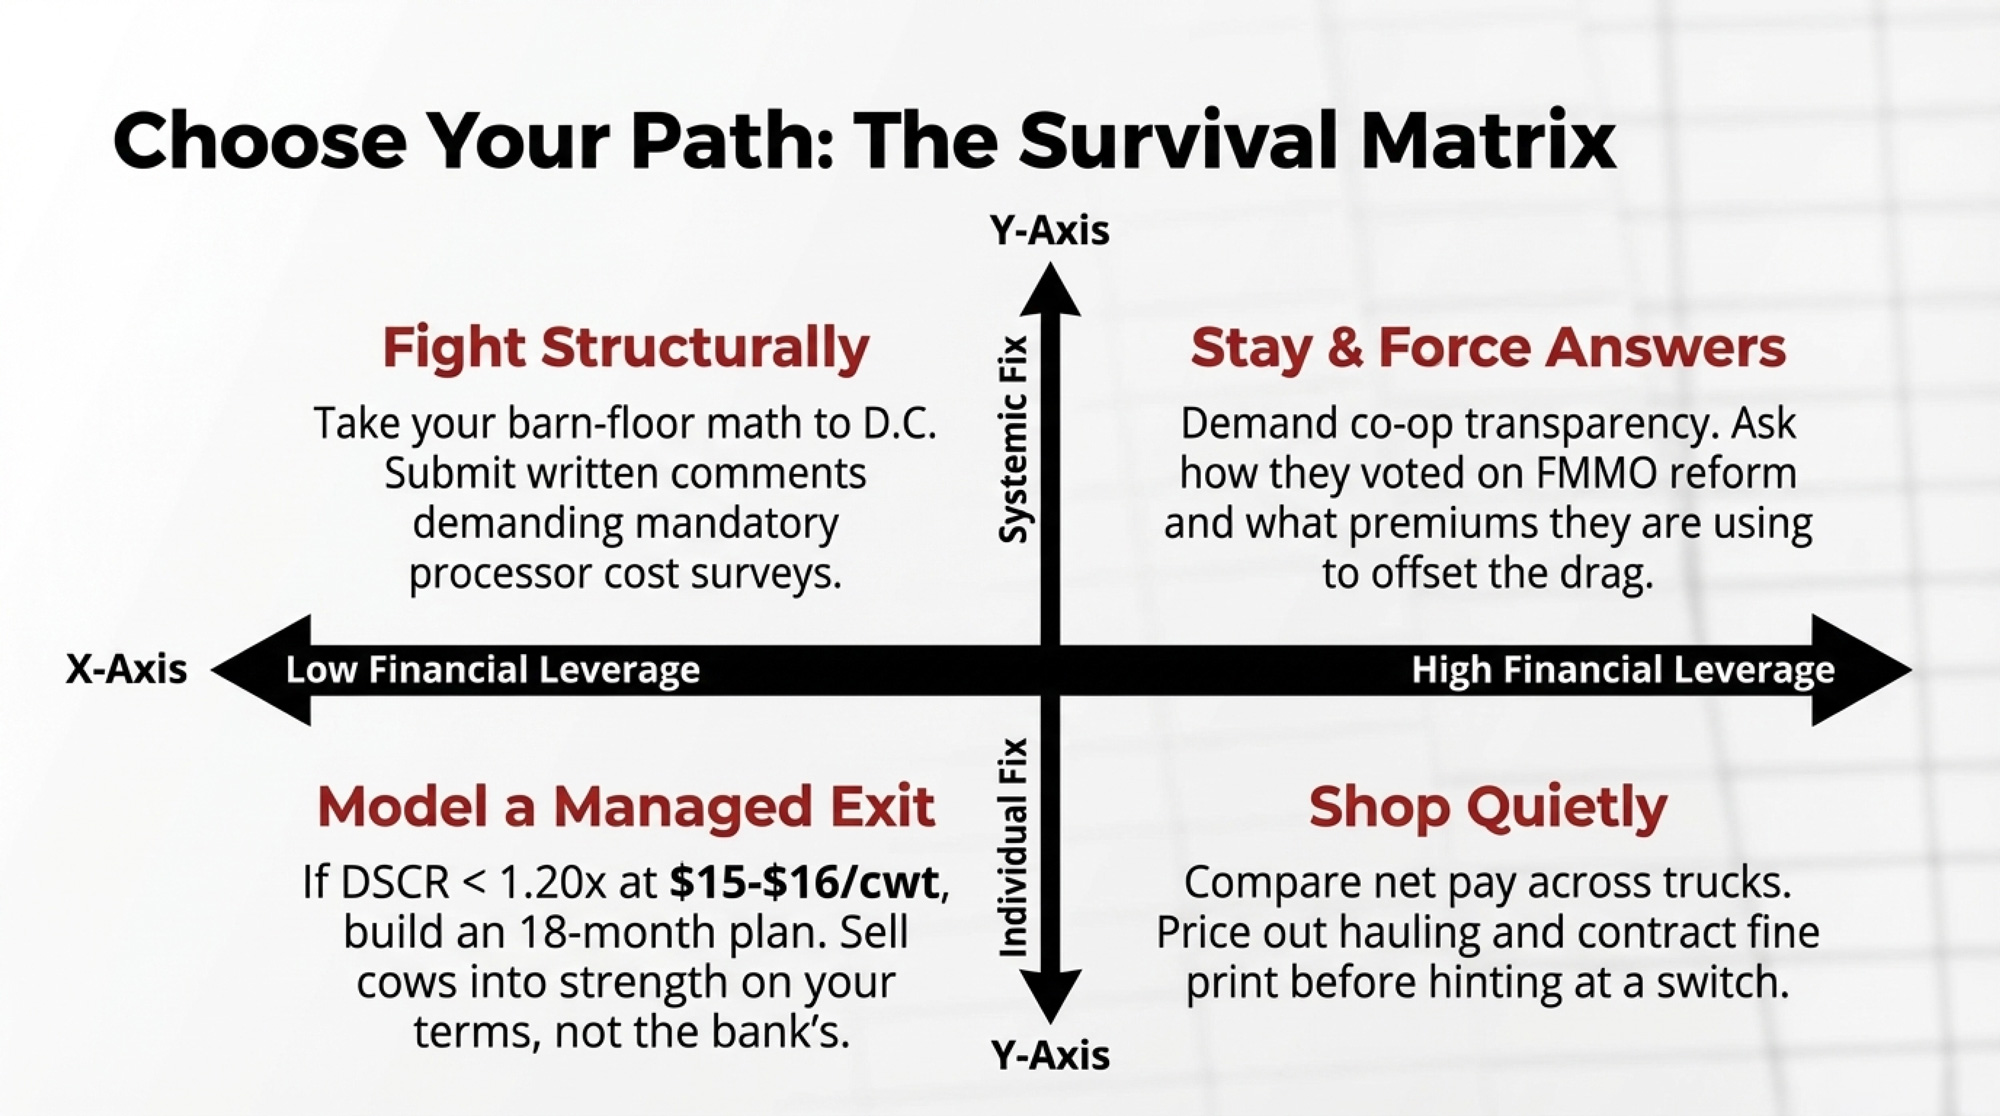
No single fix here, and the right move depends on where you sit. Four real paths:
| Path | Works Best When | Capital Required | Key Risk (RED = Critical) | Time to First $ |
|---|---|---|---|---|
| Branded processor contract | Herd already has real attributes (pasture, cert, region) | Low — records + cert fee | Premium captured by brand margin, not your contract | 3–6 months |
| Farmstead / creamery | Near a provenance-paying market; labor bandwidth exists | High — equipment + processing hours | Complexity swamps the dairy (Kyle Clark case) | 12–24 months |
| Third-party certification | Practices already solid; volume supports audit cost | Medium — cert fees + audit | Low volume makes ROI negative | 6–12 months |
| Push co-op to brand | On co-op board; willing to make it a governance priority | None from producer | Co-op defaults to bulk/private-label without board pressure | 24–36 months |
- Take your story to a branded processor — start this month. If your herd already carries a genuine attribute (pasture access, a welfare cert, high test, a distinct region), document it and put it in front of the buyer you ship to. Works when you’re on a component grid but your practices are invisible in the pay formula. Requires records and maybe a certification. Fails when the premium gets written into the brand’s margin instead of your contract — so get it in writing.
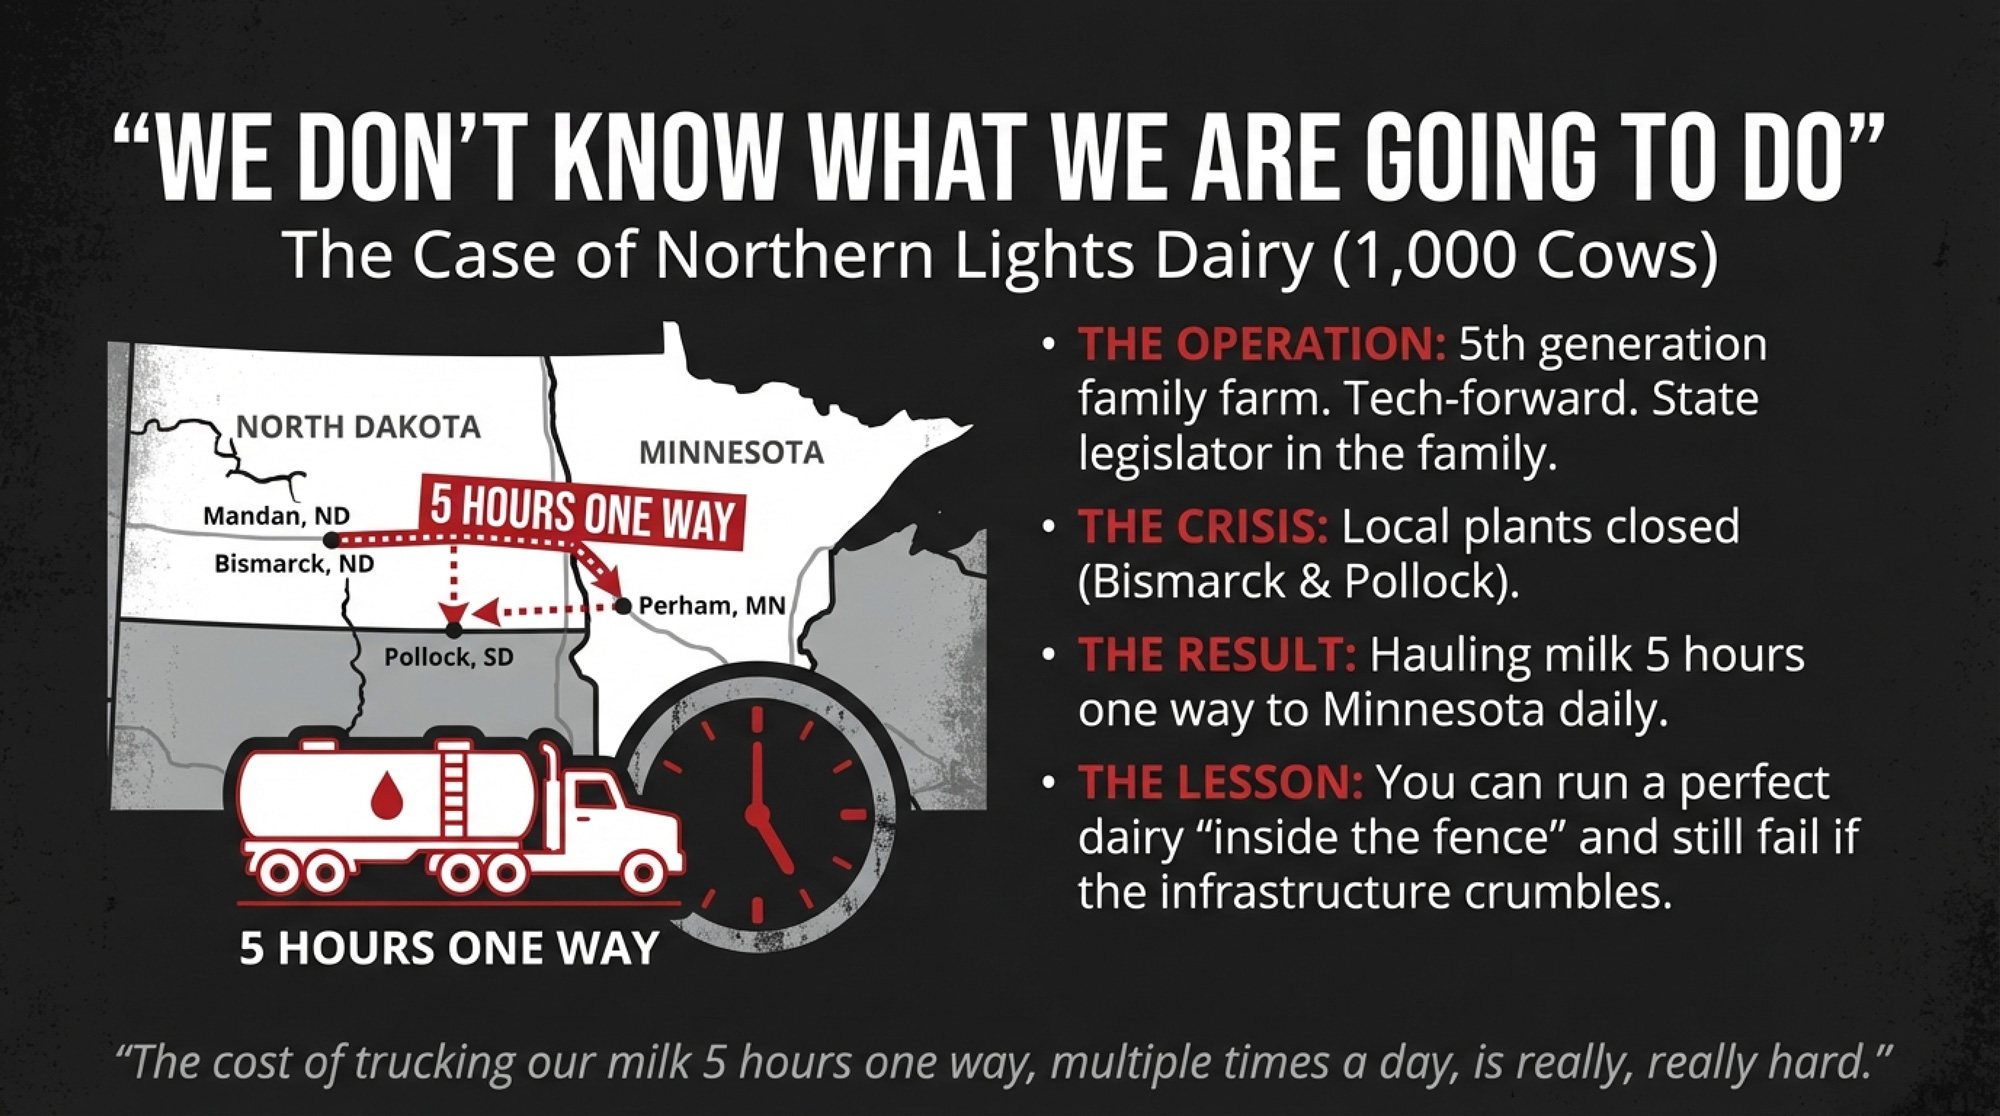
- Go value-added or farmstead — but walk in with your eyes open. Kyle Clark ran the creamery at Clark Farms, his family’s fifth-generation dairy in Delhi, New York, for six years before pausing production in January 2026 while keeping nearly 300 cows milking. He didn’t fail on demand — he told AllOtsego he stopped because “it became too much to manage to his standards,” and filed the closure as a temporary status with the state, hoping to try again. He was running 120,000–150,000 lbs of milk a month through five 16-hour days a week with a crew he says should’ve been 10 people. Works when you’re near a market that pays for provenance, and you’ve got the labor bandwidth. Requires serious capital plus the processing and delivery hours stacked on top of a full dairy workload. Fails when the complexity swamps you, even with the accounts coming in.
- Use certification as a credibility shortcut. Only about 14% of consumers strongly trust dairy labels, but an “excellent”-rated welfare certification drove a $2.63 per half-gallon premium in one documented Bullvine case. Works when your practices are already solid and need third-party proof. Fails when volume’s too low to cover the audit costs.
- Push your co-op to own the story. The forward signal is real: cultured and European-style formats keep pulling away from commodity, with new products like Lifeway’s Probiotic Kefir Butter hitting shelves in early 2026. A co-op that treats story as a governance decision — not a marketing afterthought — is the only player with the scale to build a regional butter brand you’d actually see reflected in your cheque. It’s the path Kyle Clark couldn’t carry alone at Clark Farms, but a co-op has the balance sheet an individual creamery doesn’t.
Your 30-Day Checklist
Skip the strategy deck. Here’s what to actually do:
- Call your processor. Ask which product your fat goes into — commodity block or a branded line — and whether your grid reflects the difference.
- Graph your protein-to-fat ratio. Last 24 months of DHIA. Drifting under 0.80 and shipping to a cheese plant? That’s your self-check trigger.
- Document your attribute. Pasture, welfare cert, region — get it on paper this month. The label claims that move buyers are specific; undocumented earns you nothing at the pay window.
- Price the full creamery load before you build one. Capital plus labor, not just demand — the wall Kyle Clark hit.
- Run the certification math. A $2.63/half-gallon lift only pencils out at real volume.
- If you’re on a co-op board: put “who owns the story” on the agenda as strategy, not marketing.
Key Takeaways
- If your herd’s shipping around 200 cows and 75 lbs/day, plan on roughly $47K–$50K/year gone from make allowances alone — that’s not optional math to ignore.
- If your protein-to-fat ratio is sliding under ~0.80 into a cheese plant, you’ve bred for a trait the current grid doesn’t fully value; pull your DHIA and run that check this month.
- If your milk goes into anonymous butter or private label, assume the provenance premium is landing in someone else’s ledger; document your pasture, welfare, and local story before you ask for more money.
- If you’re serious about pulling the butterfat premium back into your own milk check, treat “who owns the story” as a board-level decision — processor, co-op, cert, or creamery — rather than just a marketing line.
So sit with this one. When a 25-year-old picks up a pound of your co-op’s butter, is there a single reason on that package to feel anything at all? Troutman moved a whole industry with a paintbrush and a hay bale — nobody’s really picked up that brush for butter the way he did for whole milk. If your package gives that shopper no reason to care, that’s not a problem TikTok fixes. It’s an identity problem, and someone downstream is already cashing the story you didn’t tell.
Run Your Numbers
Component Value Tracker — Plug in your herd’s real fat, protein, and P:F ratio to see what one-tenth of a point is actually worth on your check, where your ratio sits against the 0.75 compression line, and how much component revenue you’re leaving on the table at national averages. Print the lender-ready summary before your next contract talk.
Complete references and supporting documentation are available upon request by contacting the editorial team at editor@thebullvine.com.
Learn More
- The USDA Formula Change No Milk Check Explains — Arms you with a concrete budget roadmap to absorb the 90¢/cwt permanent regulatory cut, exposing how the June 2025 FMMO make-allowance adjustment skims up to $262,000 annually from a 1,000-cow herd.
- Protein Will Drive Your 2026 Milk Check: Are Your Components Still Built for the Butterfat Era? — Delivers the critical market data showing why a national protein-to-fat ratio slump to 0.77 forces cheese plants to trim premiums, guiding long-term herd positioning away from excess fat.
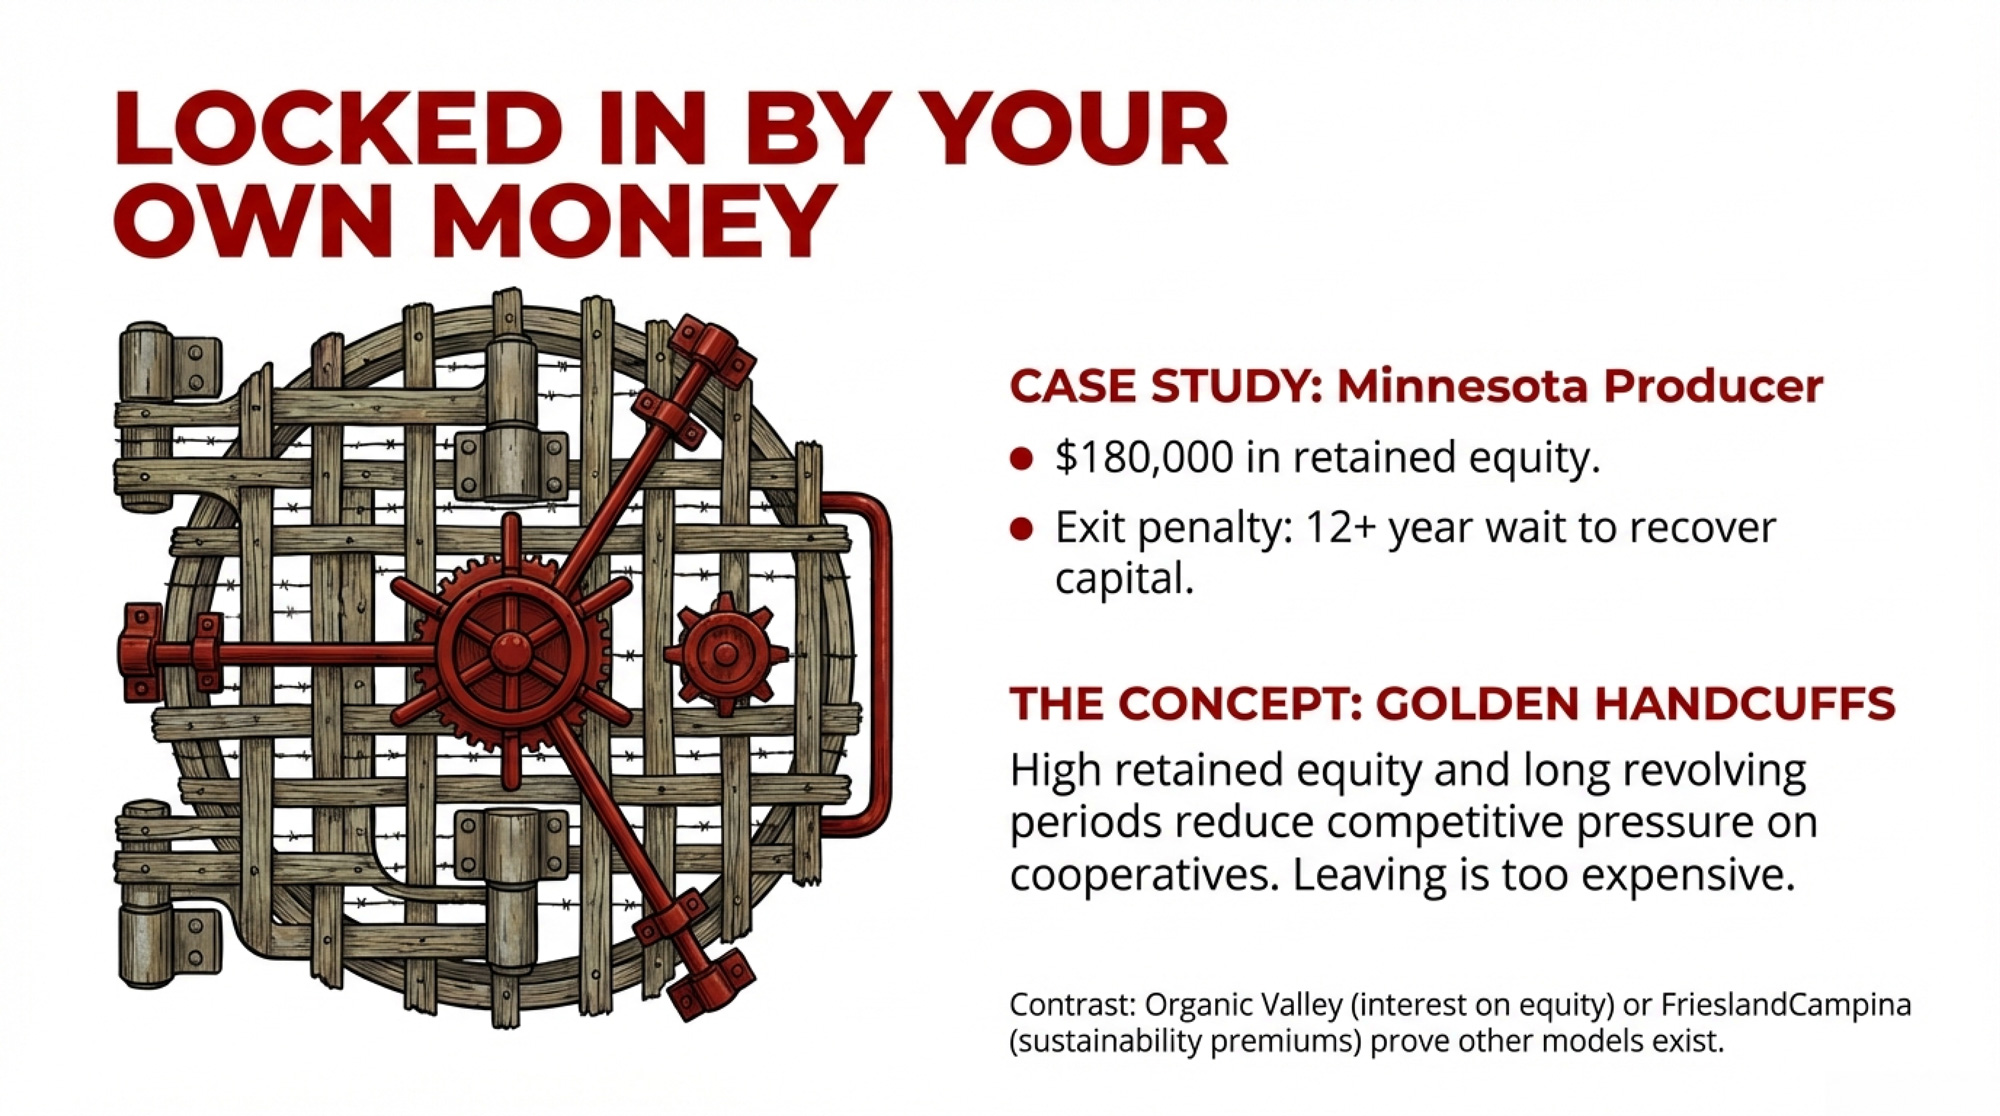
- A $241M Verdict Hit a Dairy Co-op Because One Sentence Was Missing — Breaks down the devastating nine-figure litigation liability that flows directly into member equity retains and mailbox prices, dismantling the assumption that massive corporate co-ops keep your personal assets insulated.
 The Sunday Read Dairy Professionals Don’t Skip.
 The Sunday Read Dairy Professionals Don’t Skip.
Every week, thousands of producers, breeders, and industry insiders open Bullvine Weekly for genetics insights, market shifts, and profit strategies they won’t find anywhere else. One email. Five minutes. Smarter decisions all week.