


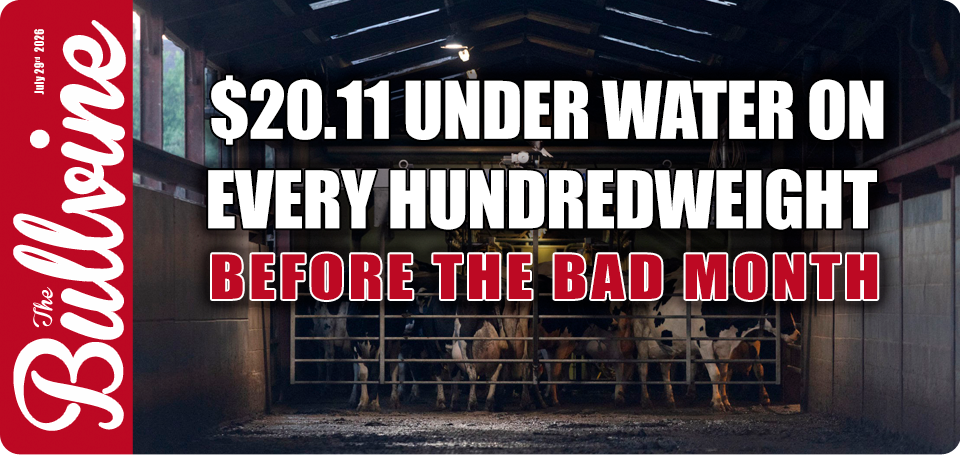





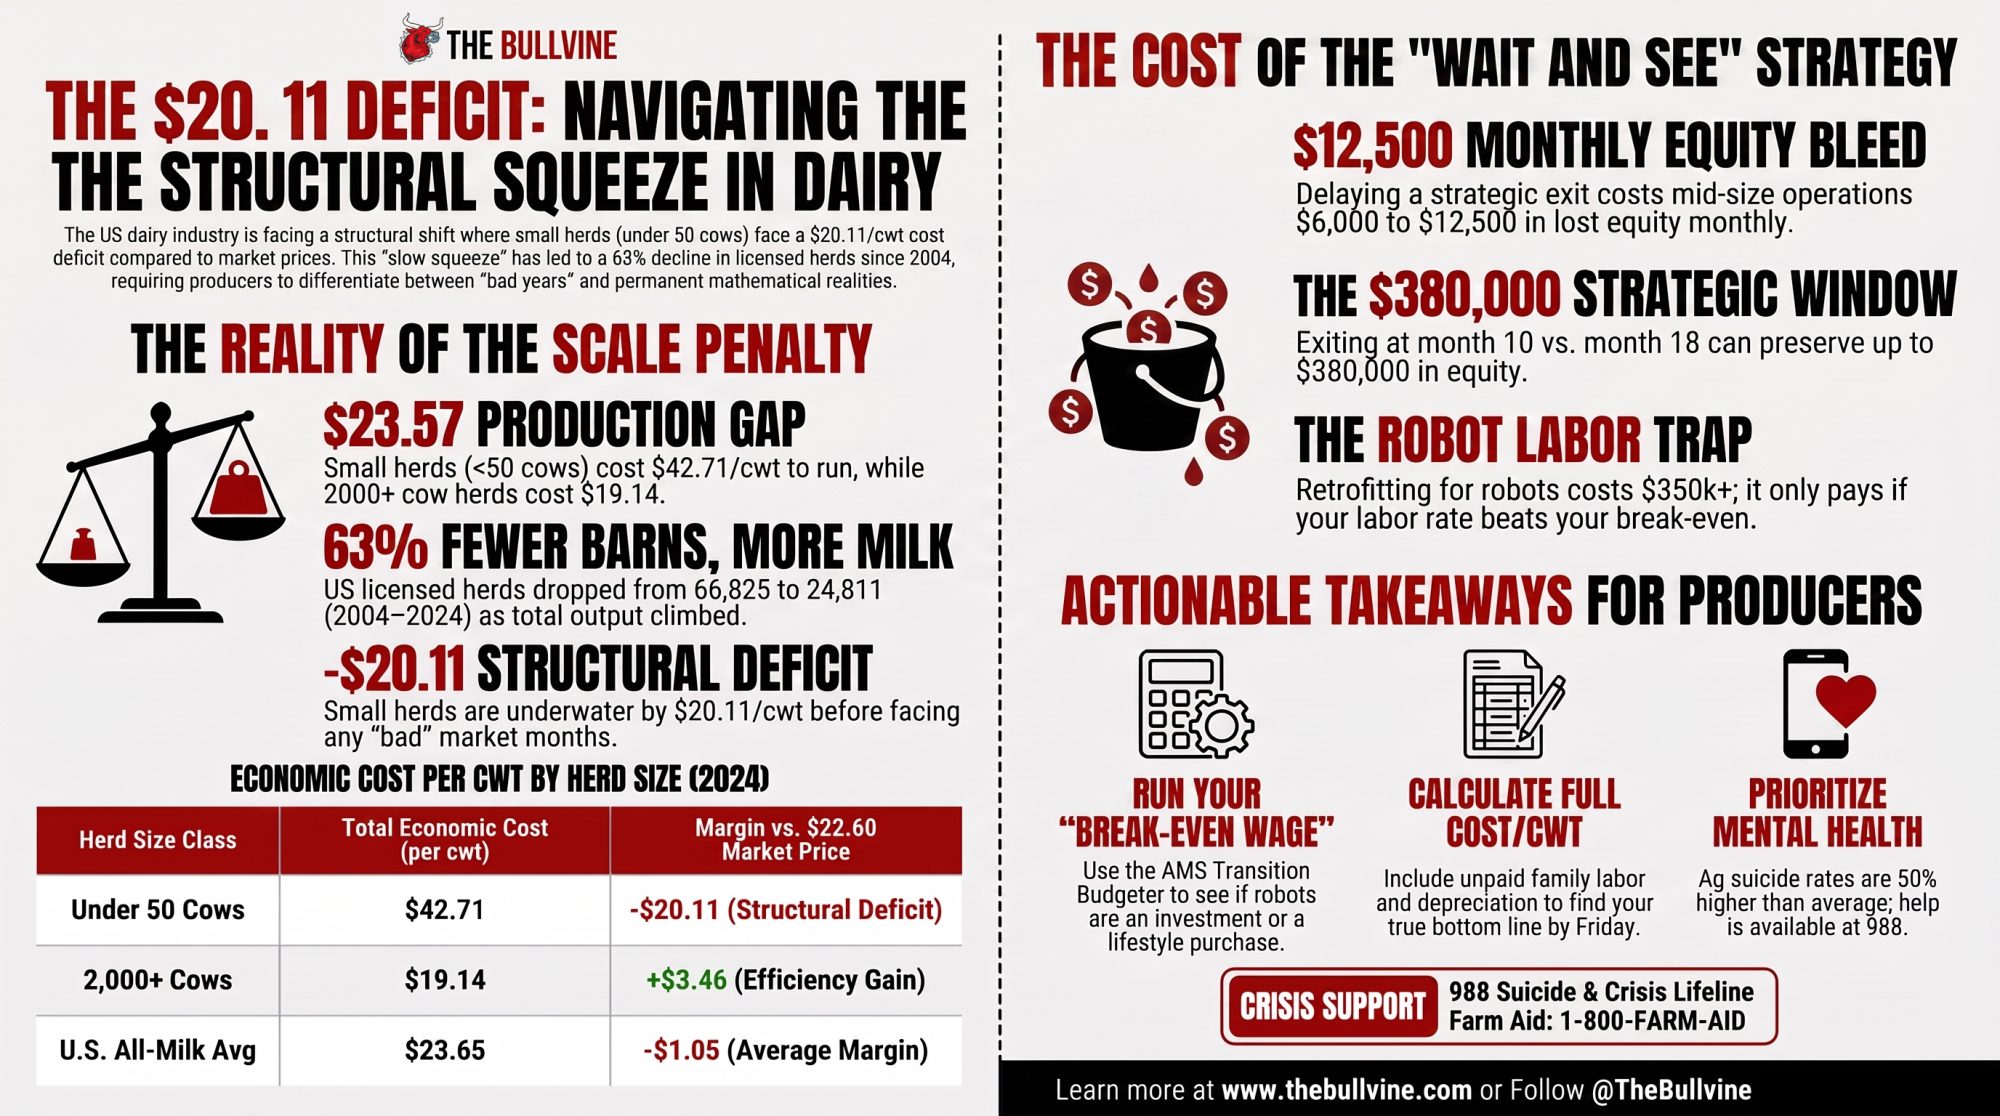
This isn’t the bad year. $42.71/cwt to make it, $22.60 to sell it — and that gap quietly moves $6,000 to $12,500 off your balance sheet every month you wait.
Picture a kitchen table in western Wisconsin at 11 p.m. No single family here — this is the version thousands of small operations are living right now. The accountant’s printout is still sitting there: interest, feed, the quote for the new manure pit. The 40-cow tie-stall out the window is lit up like always, bulk tank humming like it plans to outlive everybody. And the family already knows the number in the bottom corner doesn’t work. They’ve known for a while. They just can’t say it out loud yet.
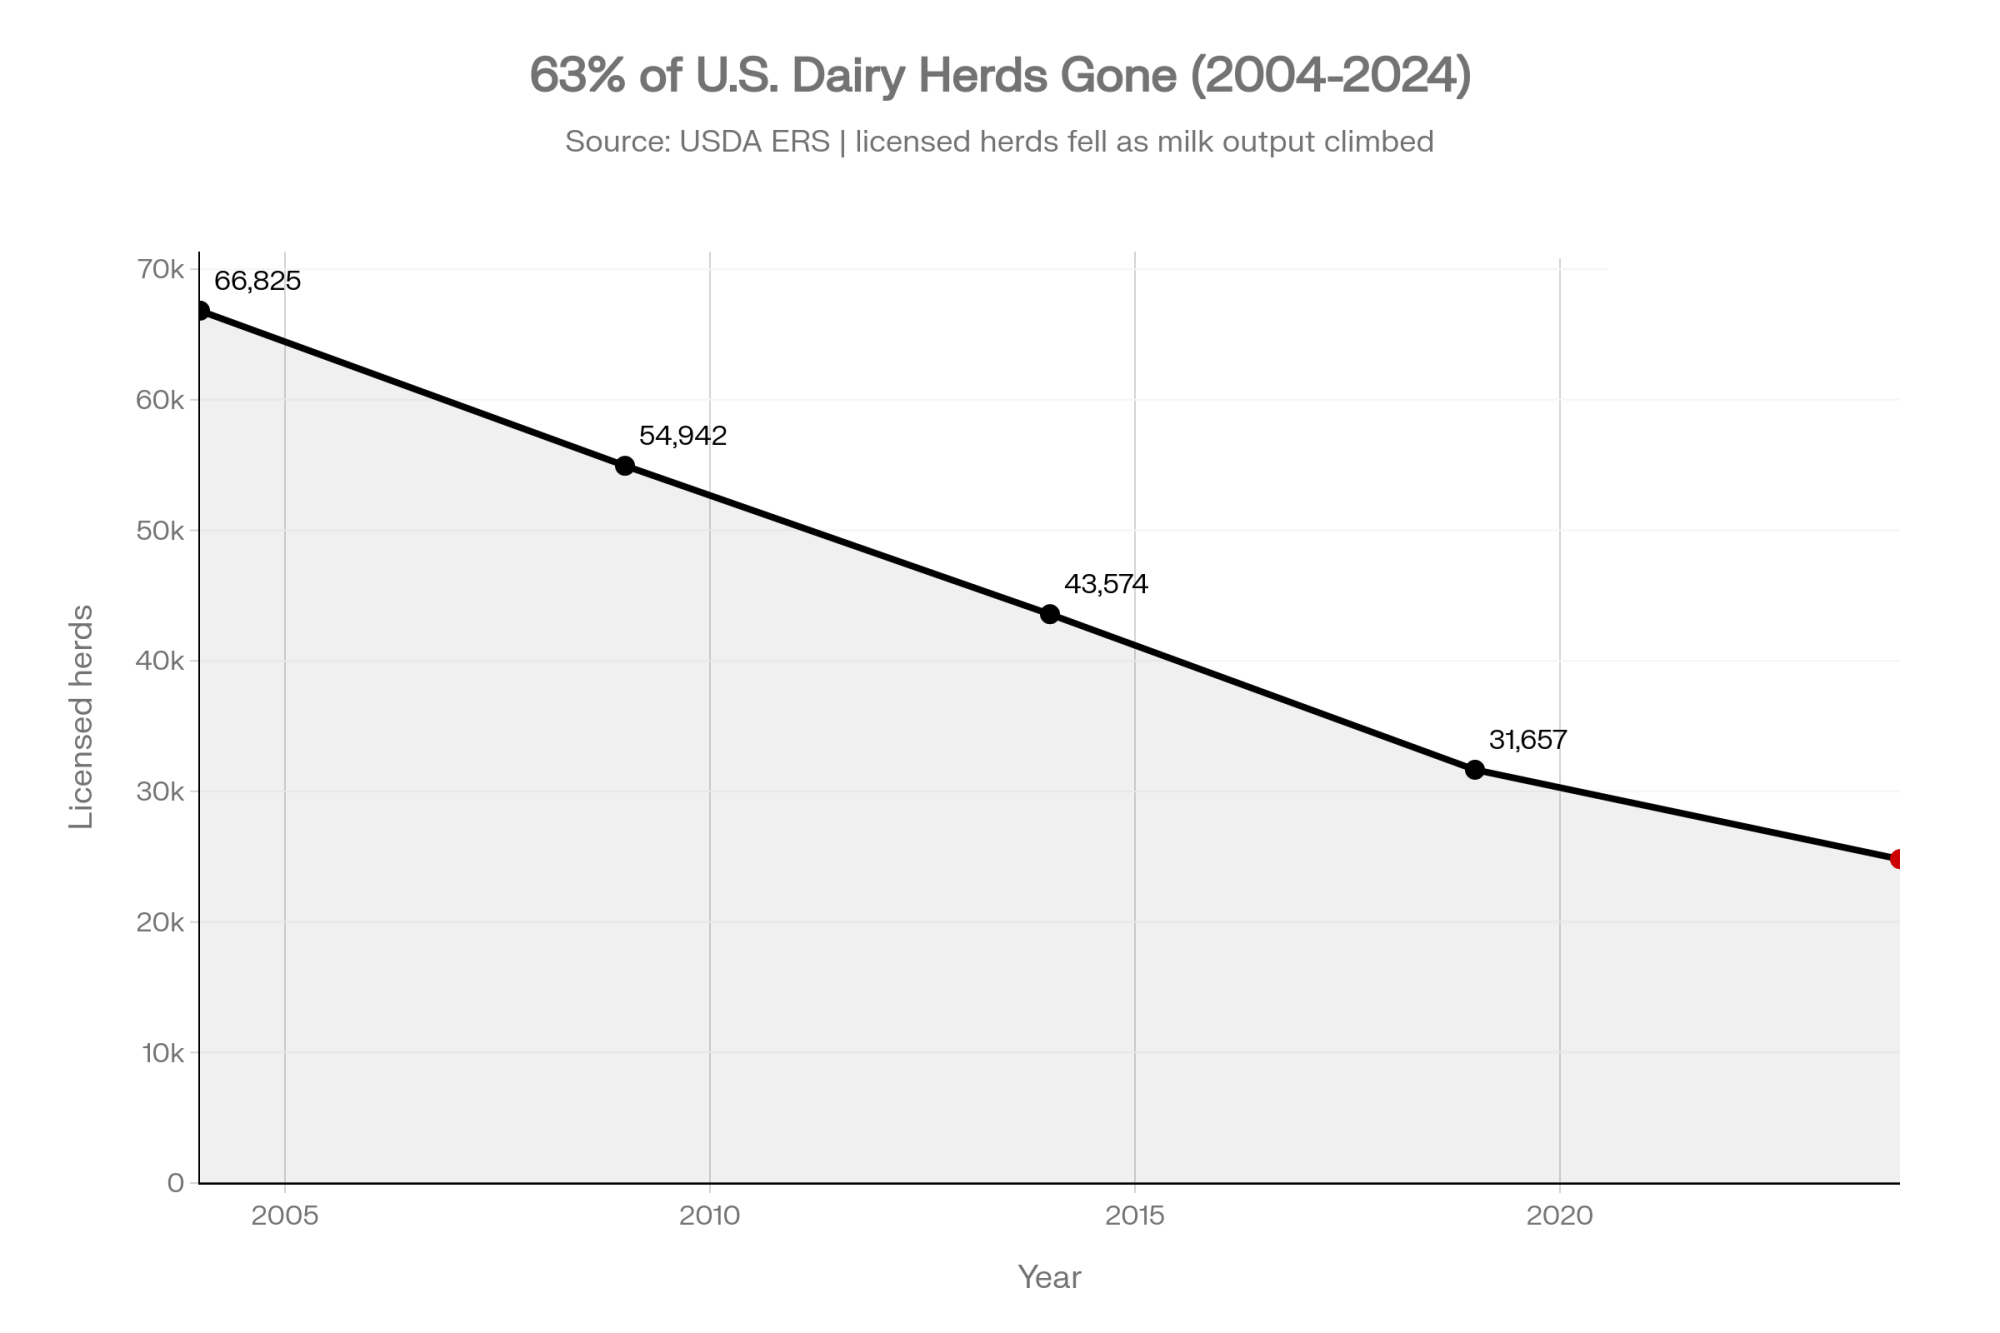
That’s the real story behind dairy’s disappearing barns. Not a market crash — a slow squeeze that plays out one delayed decision at a time. The U.S. shed about 63% of its licensed dairy herds between 2004 and 2024, from 66,825 to 24,811, even as total milk output continued climbing, per the USDA’s Economic Research Service. More milk. Fewer barns. And a lot of families deciding whether tonight’s the night they finally run the numbers for real.
What’s Actually Squeezing the 40-Cow Barn
The cost curve turned against small herds, and it isn’t turning back. ERS, using 2021 ARMS data updated in August 2024, lays the scale penalty out plainly:
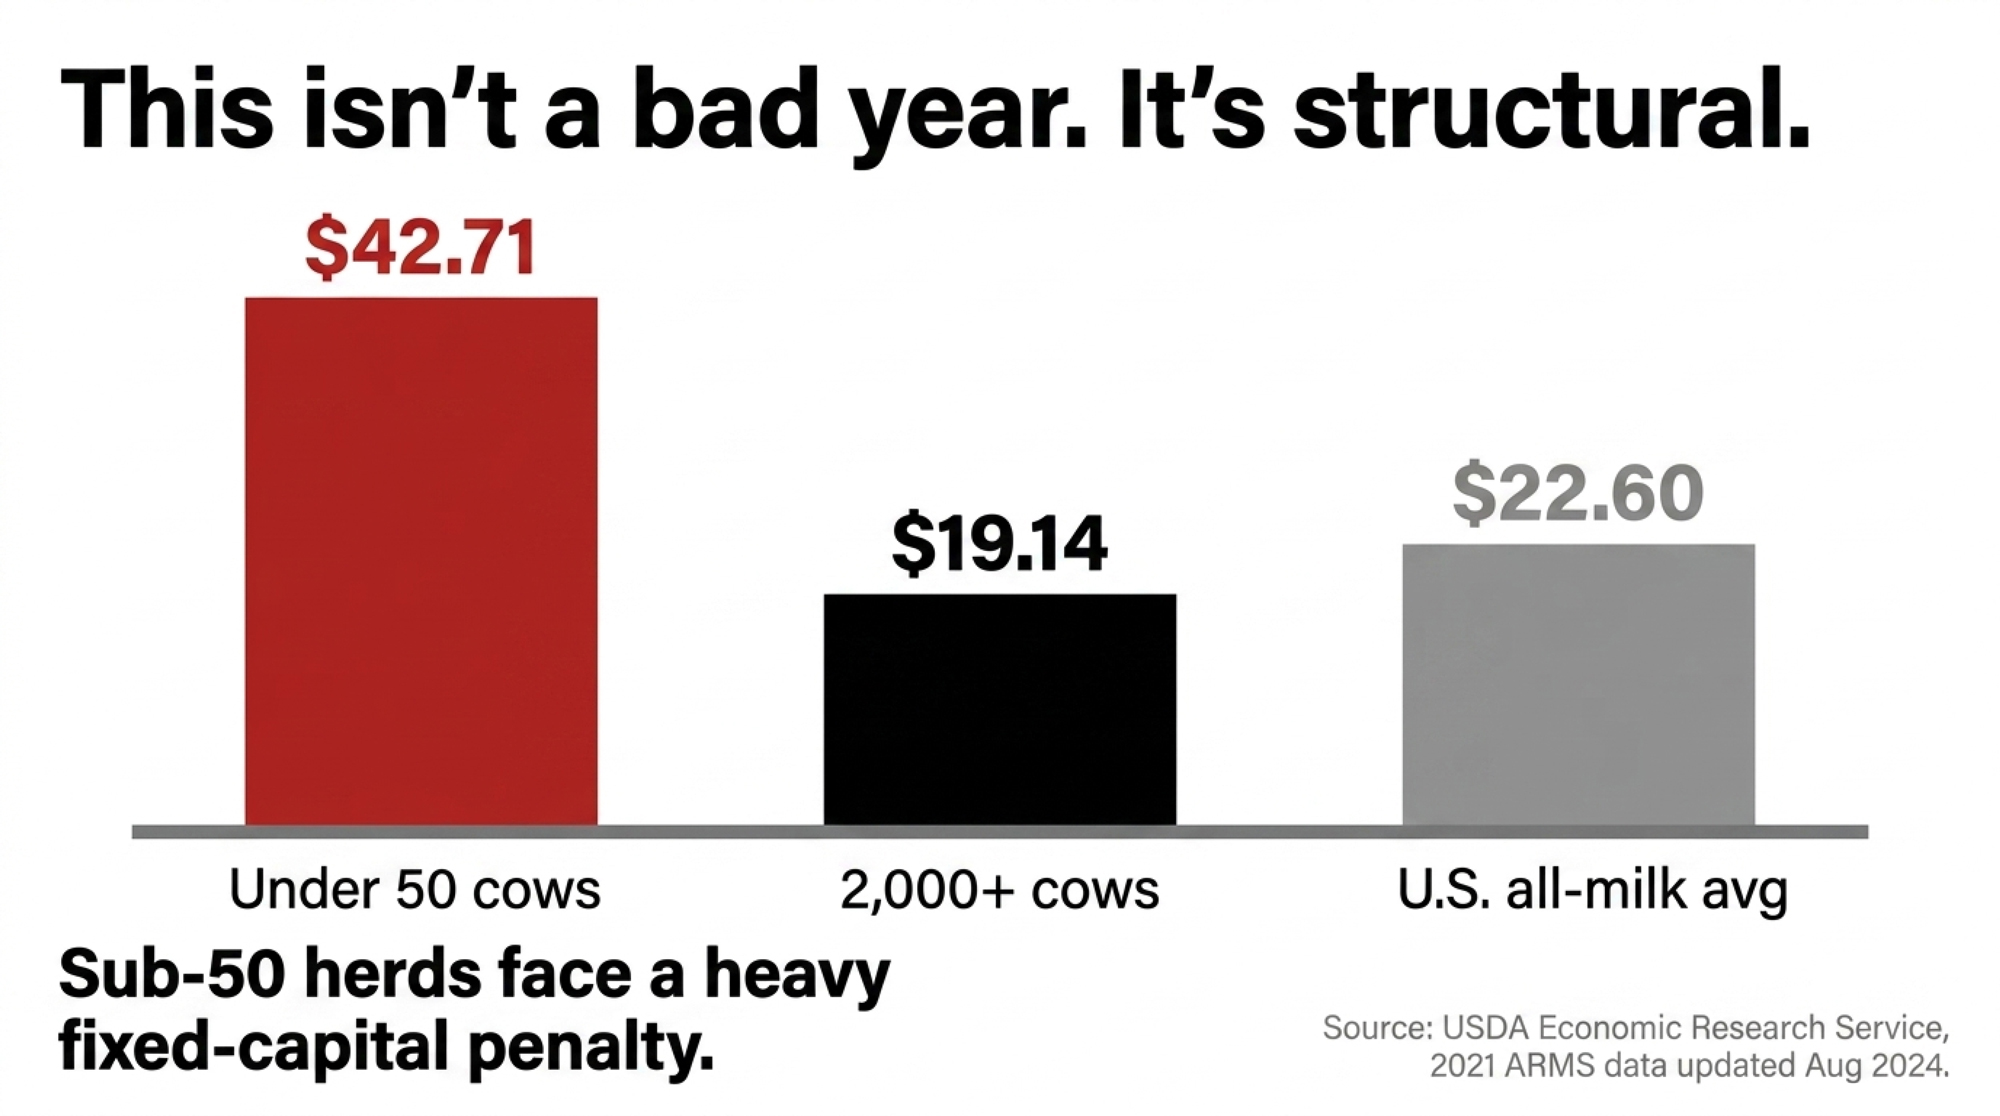
| Herd Size Class | Total Economic Cost (per cwt) | The Reality Check |
| Under 50 cows | $42.71 | Heavily penalized by fixed capital overhead |
| 2,000+ cows | $19.14 | Fixed costs distributed across volume |
| U.S. all-milk avg (2024) | $22.60 | Leaves sub-50 herds with a roughly –$20.11/cwt structural deficit |
Read that bottom row twice. A sub-50-cow herd is underwater by $20.11 on every hundredweight before anyone talks about a bad month. The American Farm Bureau’s read of ERS data shows even the average U.S. dairy ran total costs near $23.65/cwt against that $22.60 all-milk price in 2024 — a real margin around –$1.05. Big herds felt it. Small ones felt it worse.
This isn’t a bad year. It’s structural. The farms getting squeezed hardest are the 40- to 120-cow operations, especially those with older facilities and upcoming capital bills. Big herds spread their fixed costs over far more milk. A tie-stall can’t. And there’s no policy cavalry coming — you cannot have cheap, abundant retail milk and keep the same number of 40-cow tie-stalls. Eventually the structural math wins.
How This Plays Out at the Kitchen Table
Here’s the pattern University of Wisconsin–Madison Extension warns about: a farm loses equity for several years, everyone hopes prices turn, and hanging on can become a continual drain on the equity that’s left. The lender usually sees it first — monthly financials instead of annuals, an operating line that won’t clear. The family sees it last.
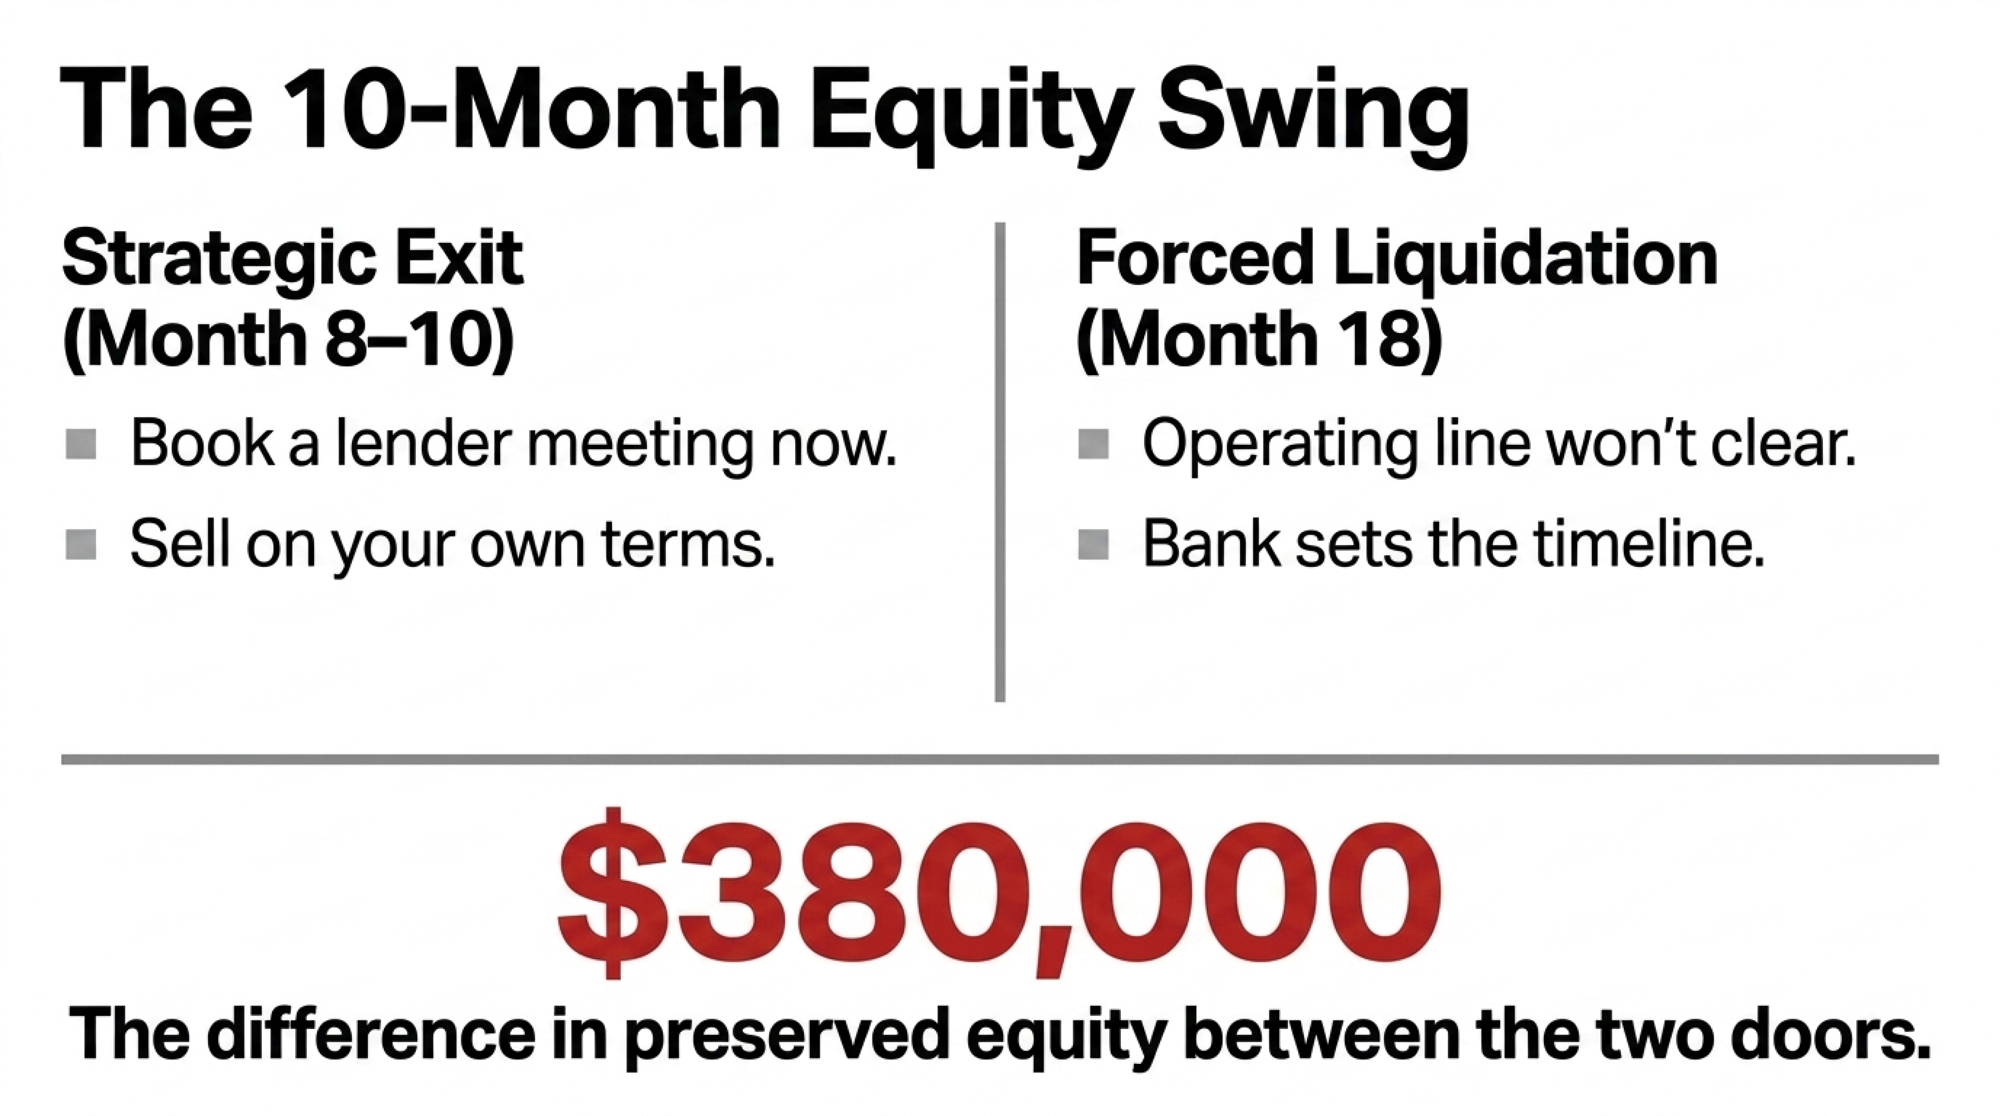
Run the barn math. Our own breakdown of the exit-timing problem found roughly an 18-month window between the first consistent inability to pay bills on time and a forced sale — and a swing of about $380,000 in preserved equity between exiting strategically around month eight to ten and getting liquidated at month 18. Depending on asset mix and land position, we’ve seen that strategic-exit figure run as high as $480,000. We laid out the full month-by-month countdown separately. Your number will be your own — but its direction won’t surprise your lender.
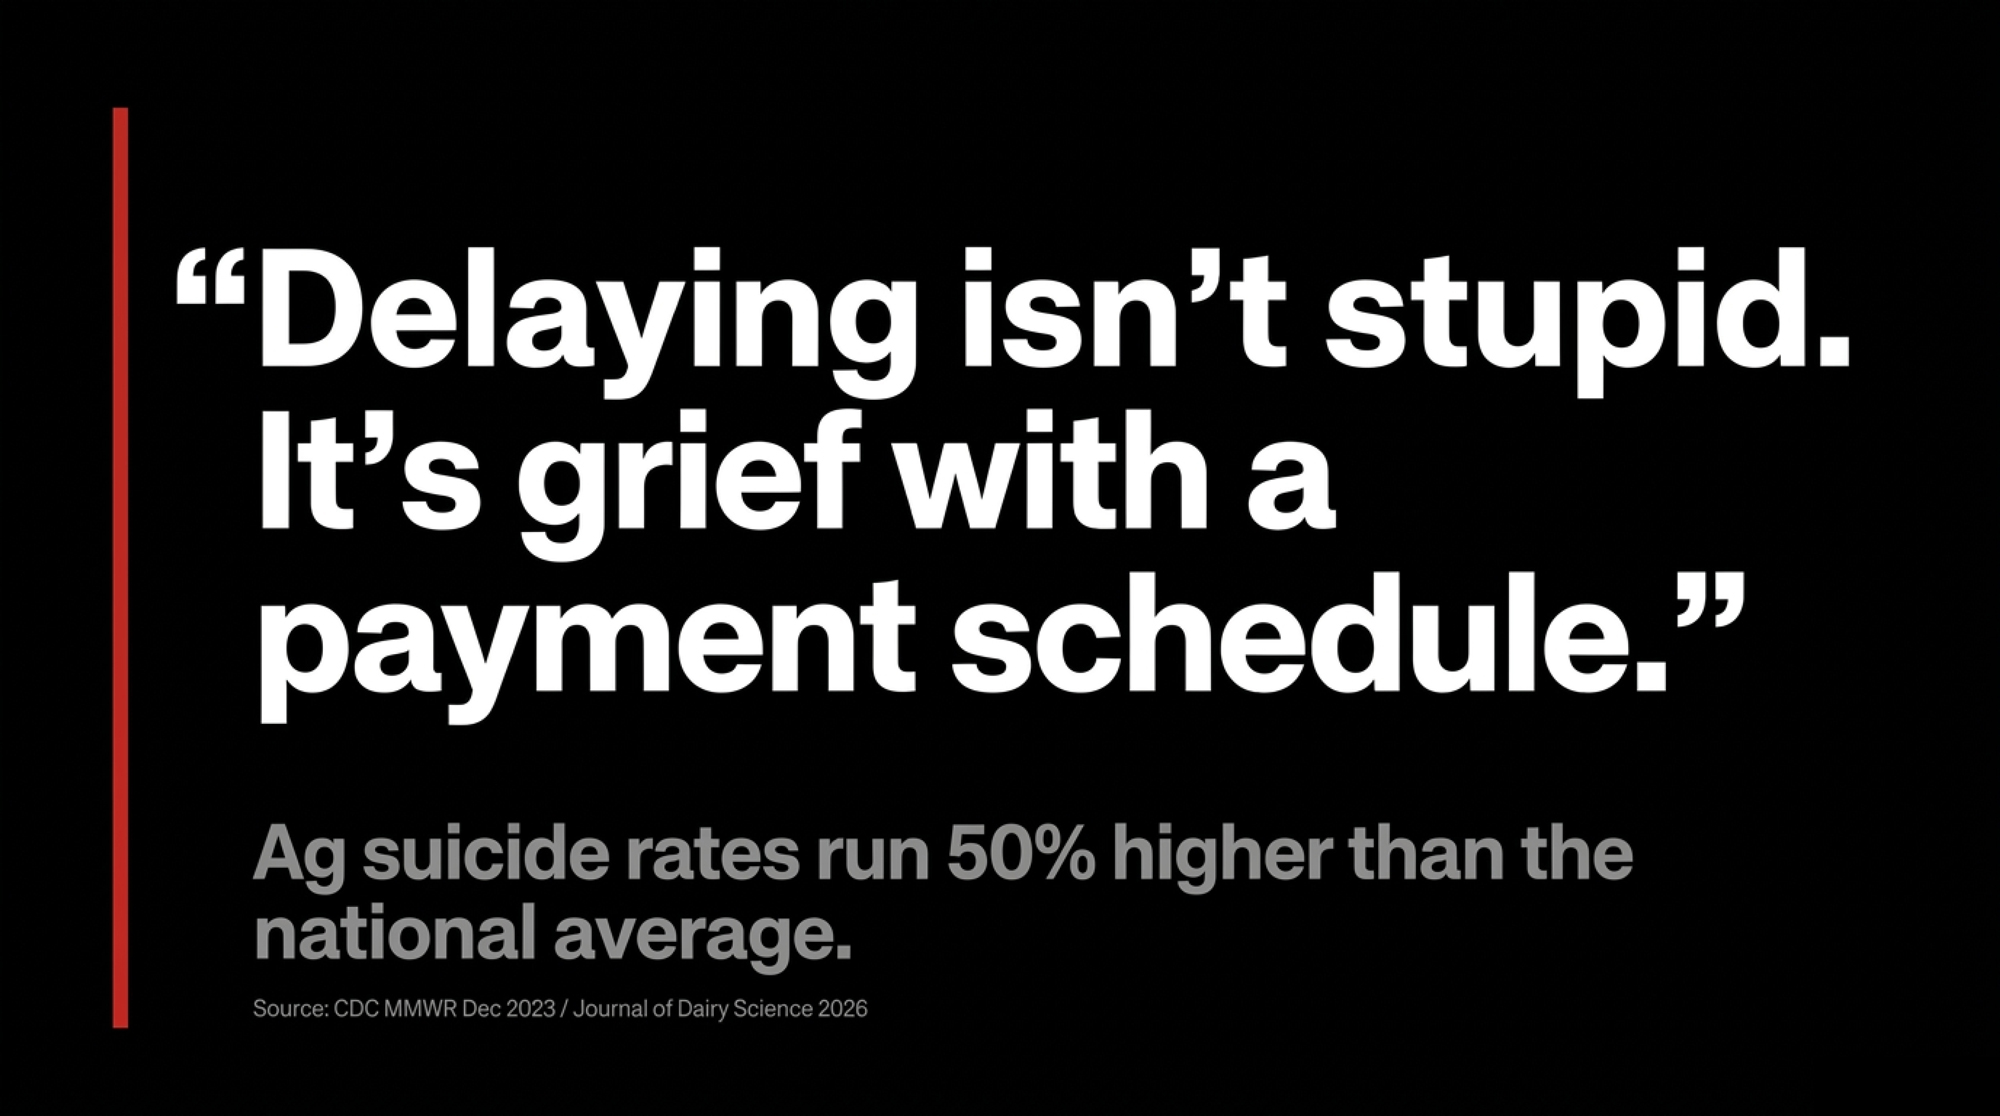
So why do families who can do that math sign up for another year anyway? Because they’re not optimizing the same thing the spreadsheet is. The spreadsheet counts dollars. You’re counting your back, your marriage, your kids’ options, and whether you’re still “the dairy farm” on Monday morning. And the load is measurable: CDC’s most recent occupational data, published in MMWR in December 2023 using 2021 death records from 49 states, put men working in agriculture, forestry, fishing, and hunting at 47.9 suicides per 100,000 against 32.0 for all working-age men — about 50% higher. A 2026 cross-sectional survey in the Journal of Dairy Science found roughly 16% of dairy farmers screening above the clinical cutoff for anxiety. Under that kind of load, people reach for immediate relief rather than long-term ROI. Delaying isn’t stupid. It’s grief with a payment schedule.
And if that weight is landing hard tonight, you’re not the only one. The 988 Suicide & Crisis Lifeline is free and staffed around the clock, anywhere in the U.S. — call or text 988. Farm Aid’s hotline connects farm families to financial and legal help at 1-800-FARM-AID. And if you’re in Arizona, Colorado, Connecticut, Missouri, Montana, Oregon, Pennsylvania, Texas, Virginia, Washington, or Wyoming, the AgriStress Helpline is answered by people trained specifically in ag stress — call or text 833-897-2474.
How Much Does Waiting 30 Days Actually Cost?
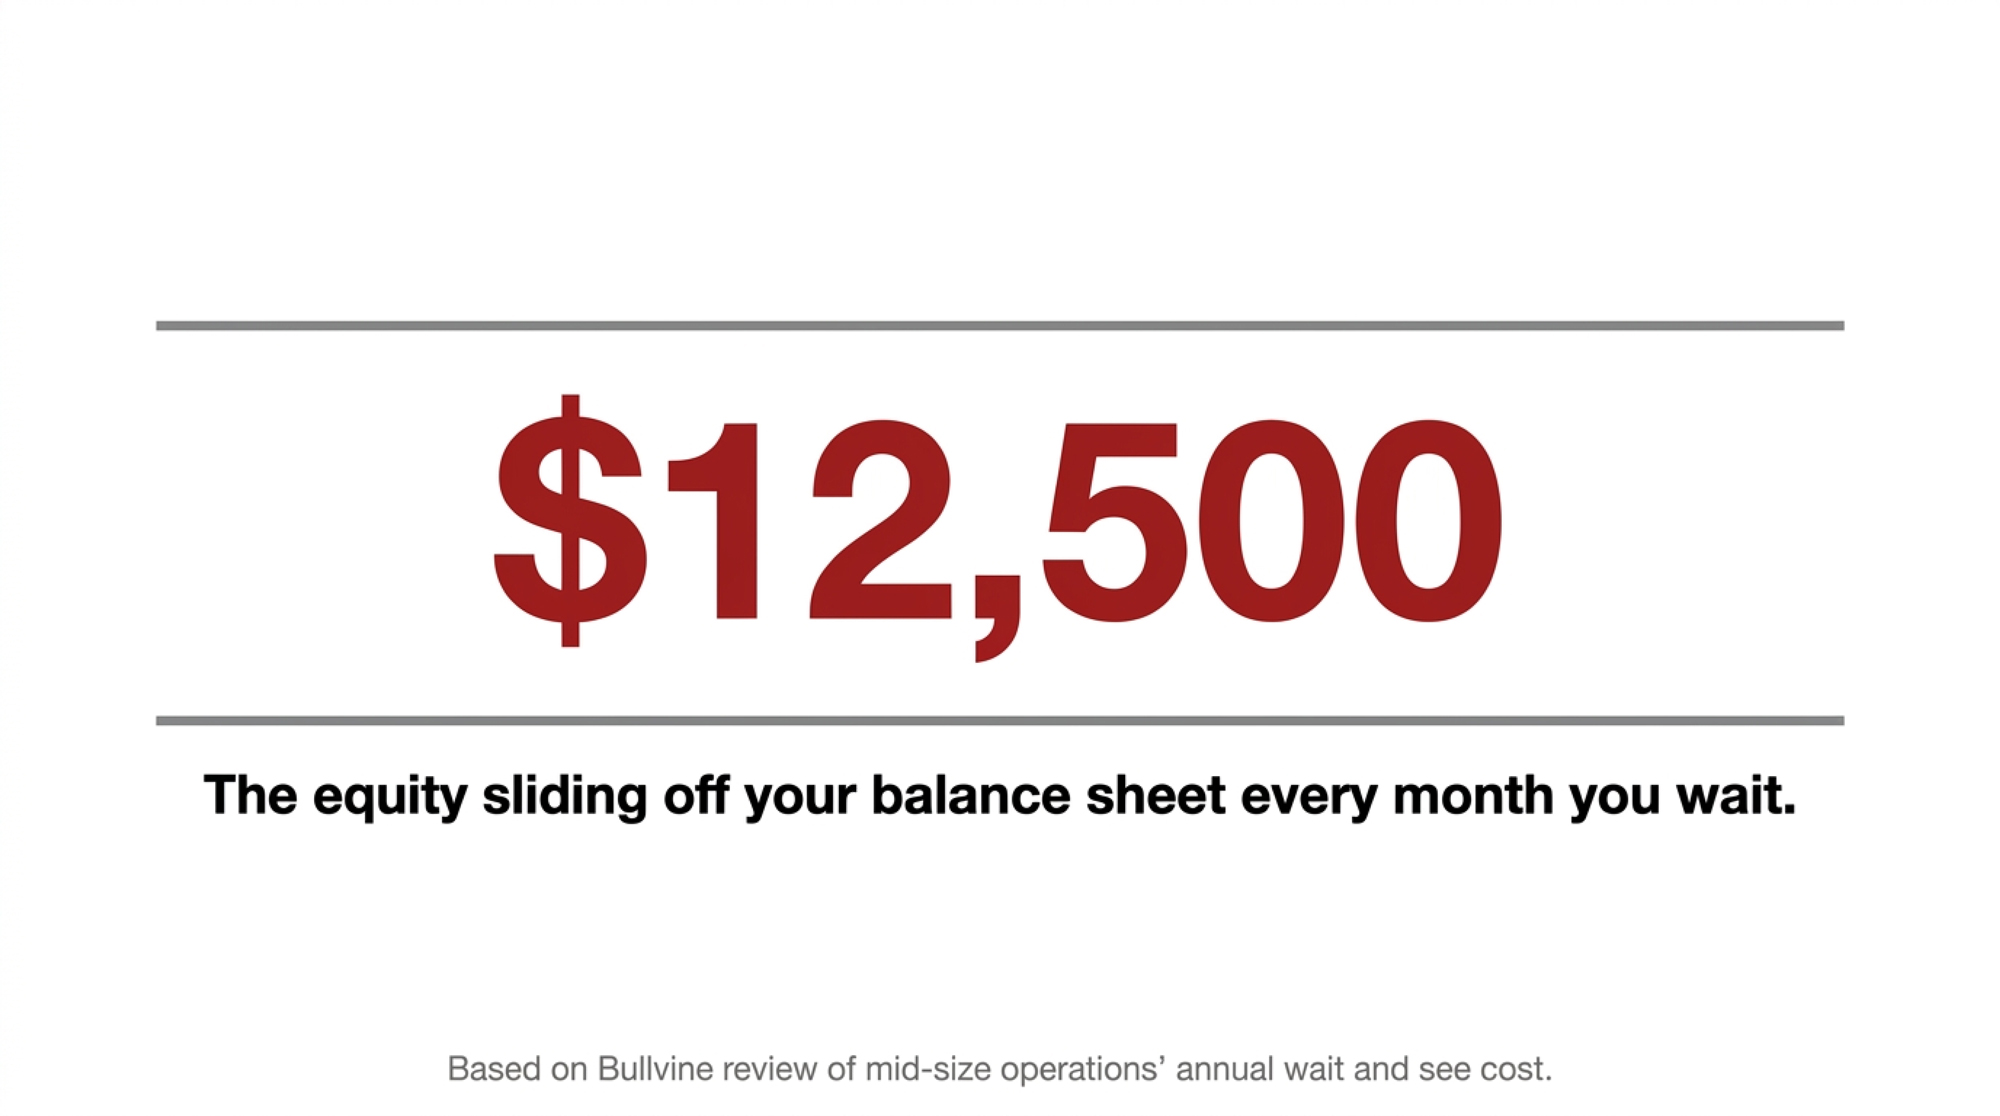
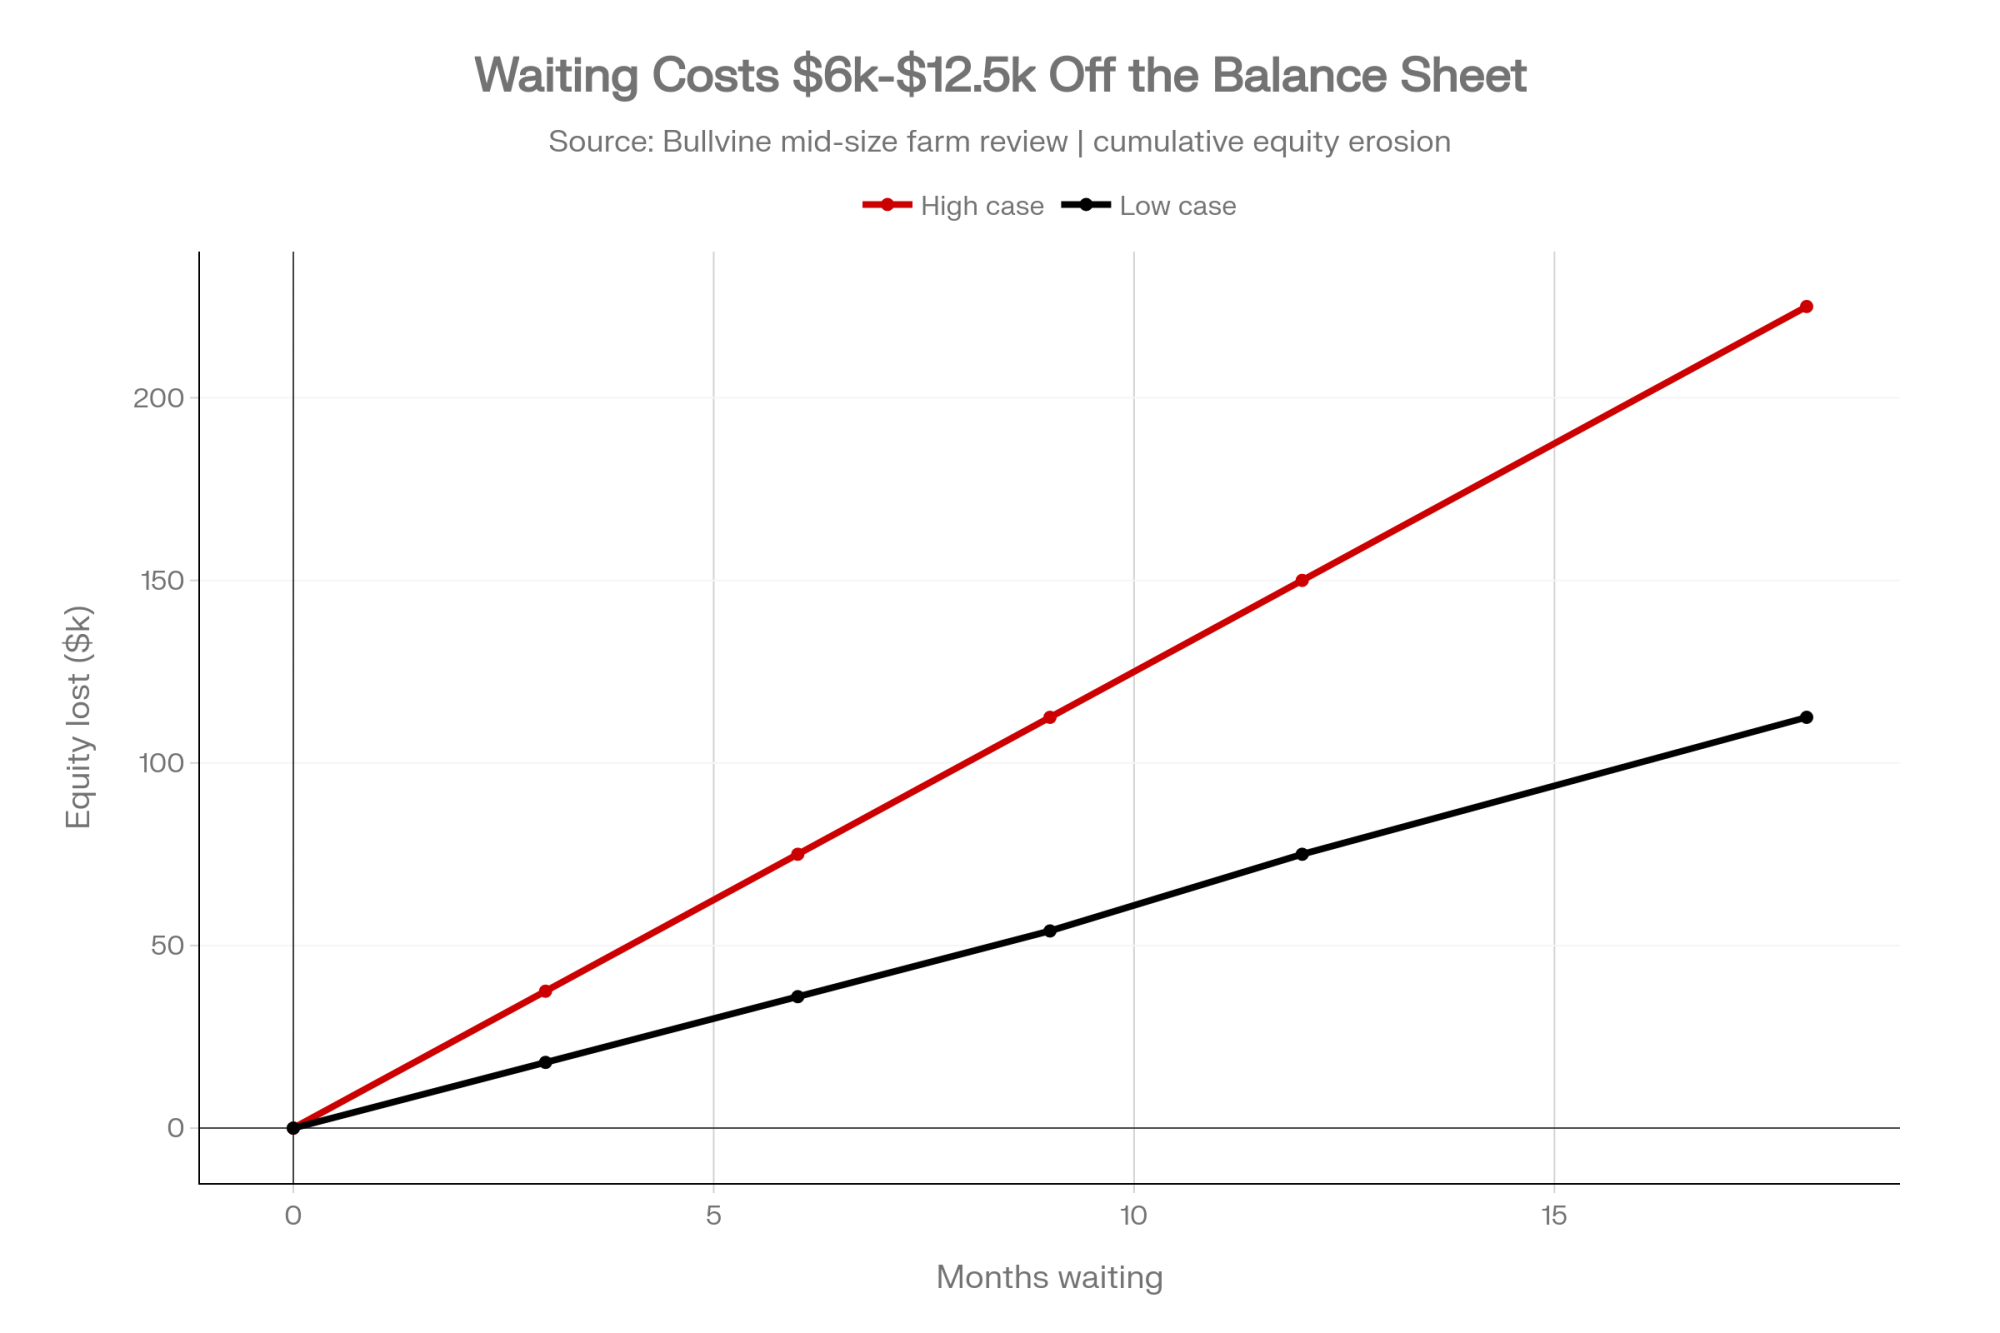
More than it feels like at the time. Bullvine’s review of mid-size operations put the annual “wait and see” cost at $75,000 to $150,000 in eroded equity — about $6,000 to $12,500 a month sliding off your balance sheet while you decide. It’s not a dramatic number on any single Tuesday. That’s exactly what makes it dangerous — it never trips an alarm loud enough to force the call.
So the honest question isn’t “can we make it another year?” It’s “what is this specific year costing us in net worth, and are we choosing that price on purpose?” If you can’t answer that tonight, that’s your 30-day job: pull your last 12 months of financials and put a real number on the drain. Then sit with your lender and an extension farm-management adviser before the bank sets the timeline for you. That one meeting is the whole difference between a strategic exit and a forced one.
The Mechanics Nobody Puts on the Whiteboard
The trap is that too much of a small barn’s cost is fixed per farm instead of variable per cow. The roof, the pipeline, the bulk tank, the manure storage — you need all of it whether you’re milking 40 cows or 140. Regulators expect those systems to hit modern standards no matter your output. So the per-cow capital bill on a small herd stays brutal, and there’s no volume underneath it to soften the blow.
So the obvious move is to automate your way out of the labor. That’s where most of these families are looking right now, and it deserves a hard number instead of a brochure. University of Minnesota Extension’s Jim Salfer found robot herds cut labor cost per hundredweight to about $1.40–$1.50, versus $2.34 for conventional herds — real savings. But the whole question is what your labor was costing you in the first place, and that number moves the answer more than anything a dealer will show you.
What’s Your Break-Even Wage?
This is the number that decides the robot question, and almost nobody knows theirs. It’s the effective hourly cost of the robot doing the milking. UW-Madison’s rule of thumb is blunt: if your actual labor cost is higher than your break-even, the transition is profitable. If it’s lower — or you’re paying family labor nothing on paper — the robot doesn’t pay for itself on margin, whatever else it does for you.
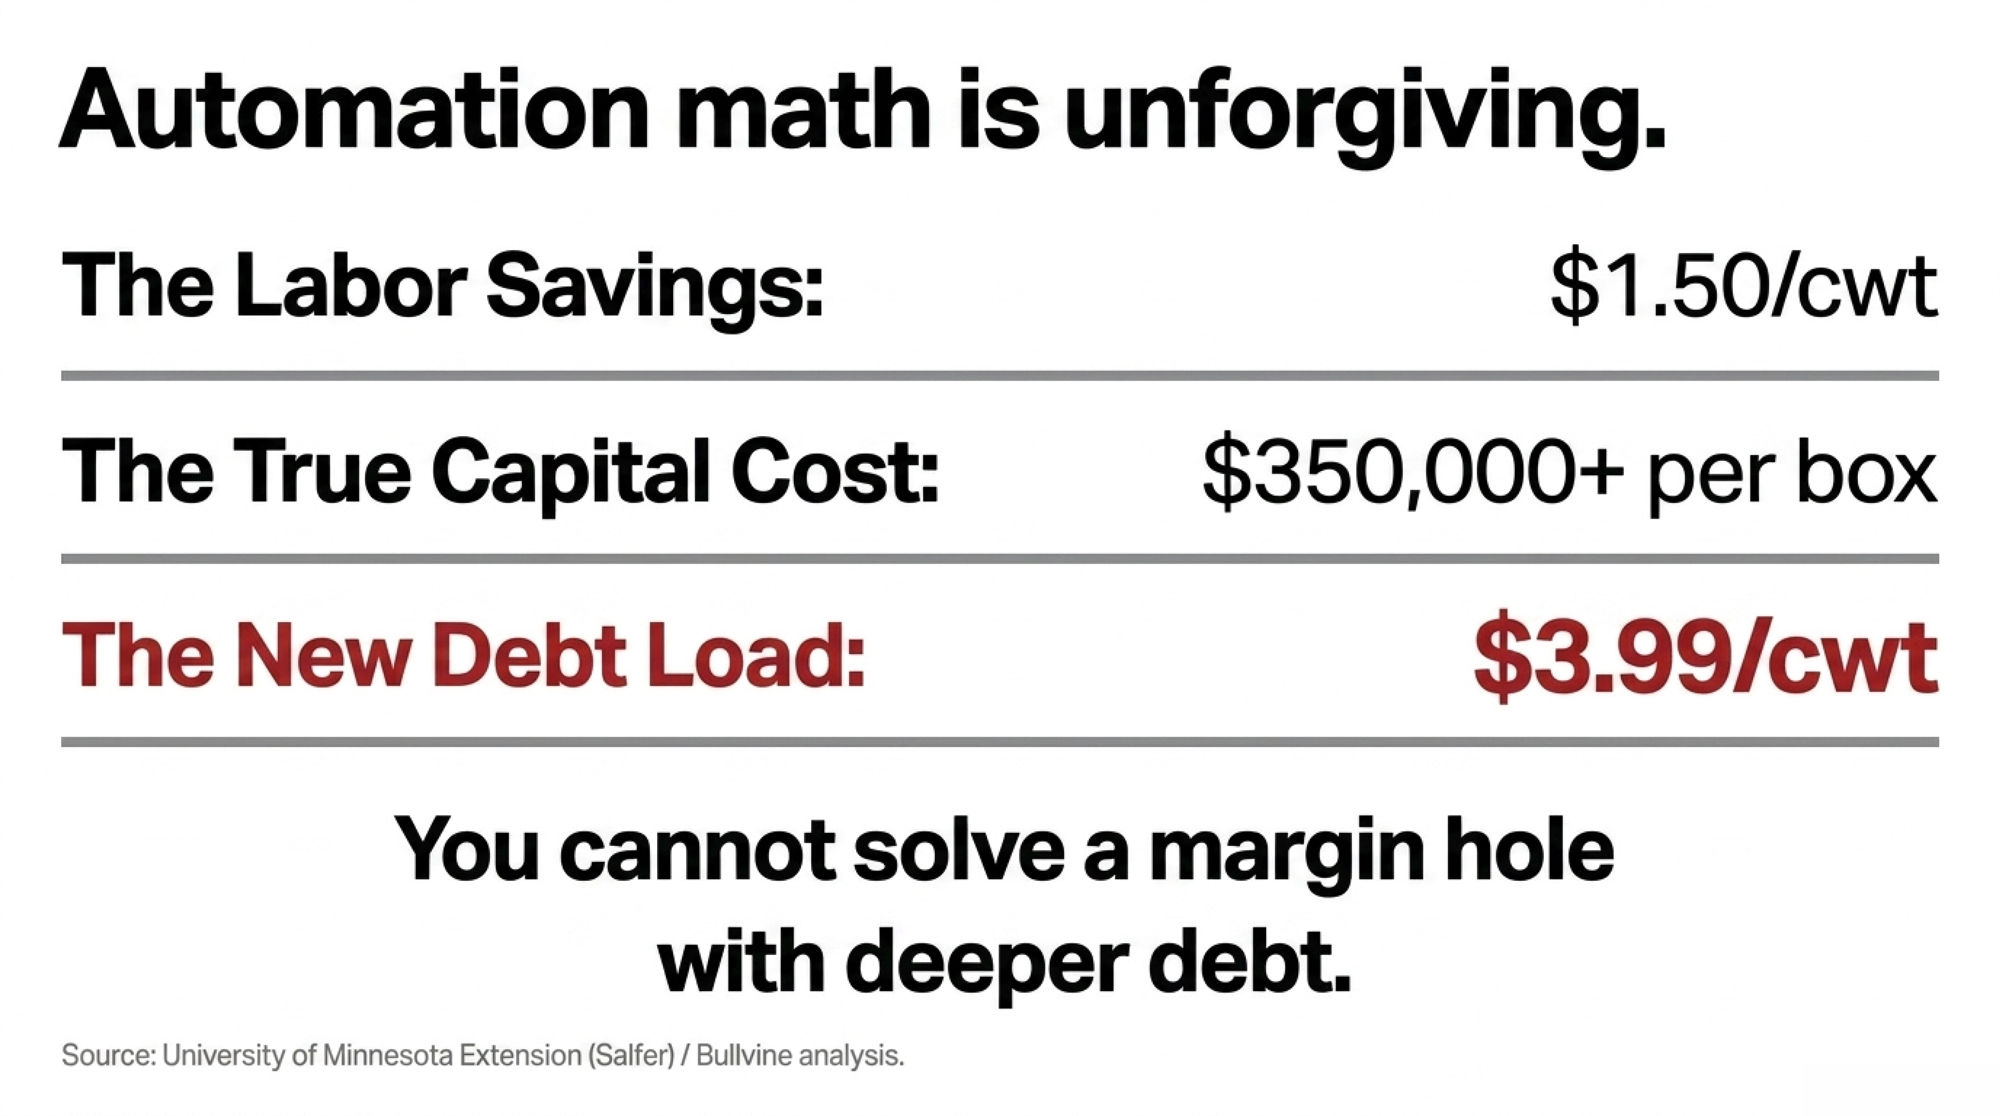
First, the capital you’re committing:
- The base cost: $200,000 to $250,000 per box, uninstalled.
- The true cost: $350,000+ once you pour concrete, update the wiring, and retrofit an older barn.
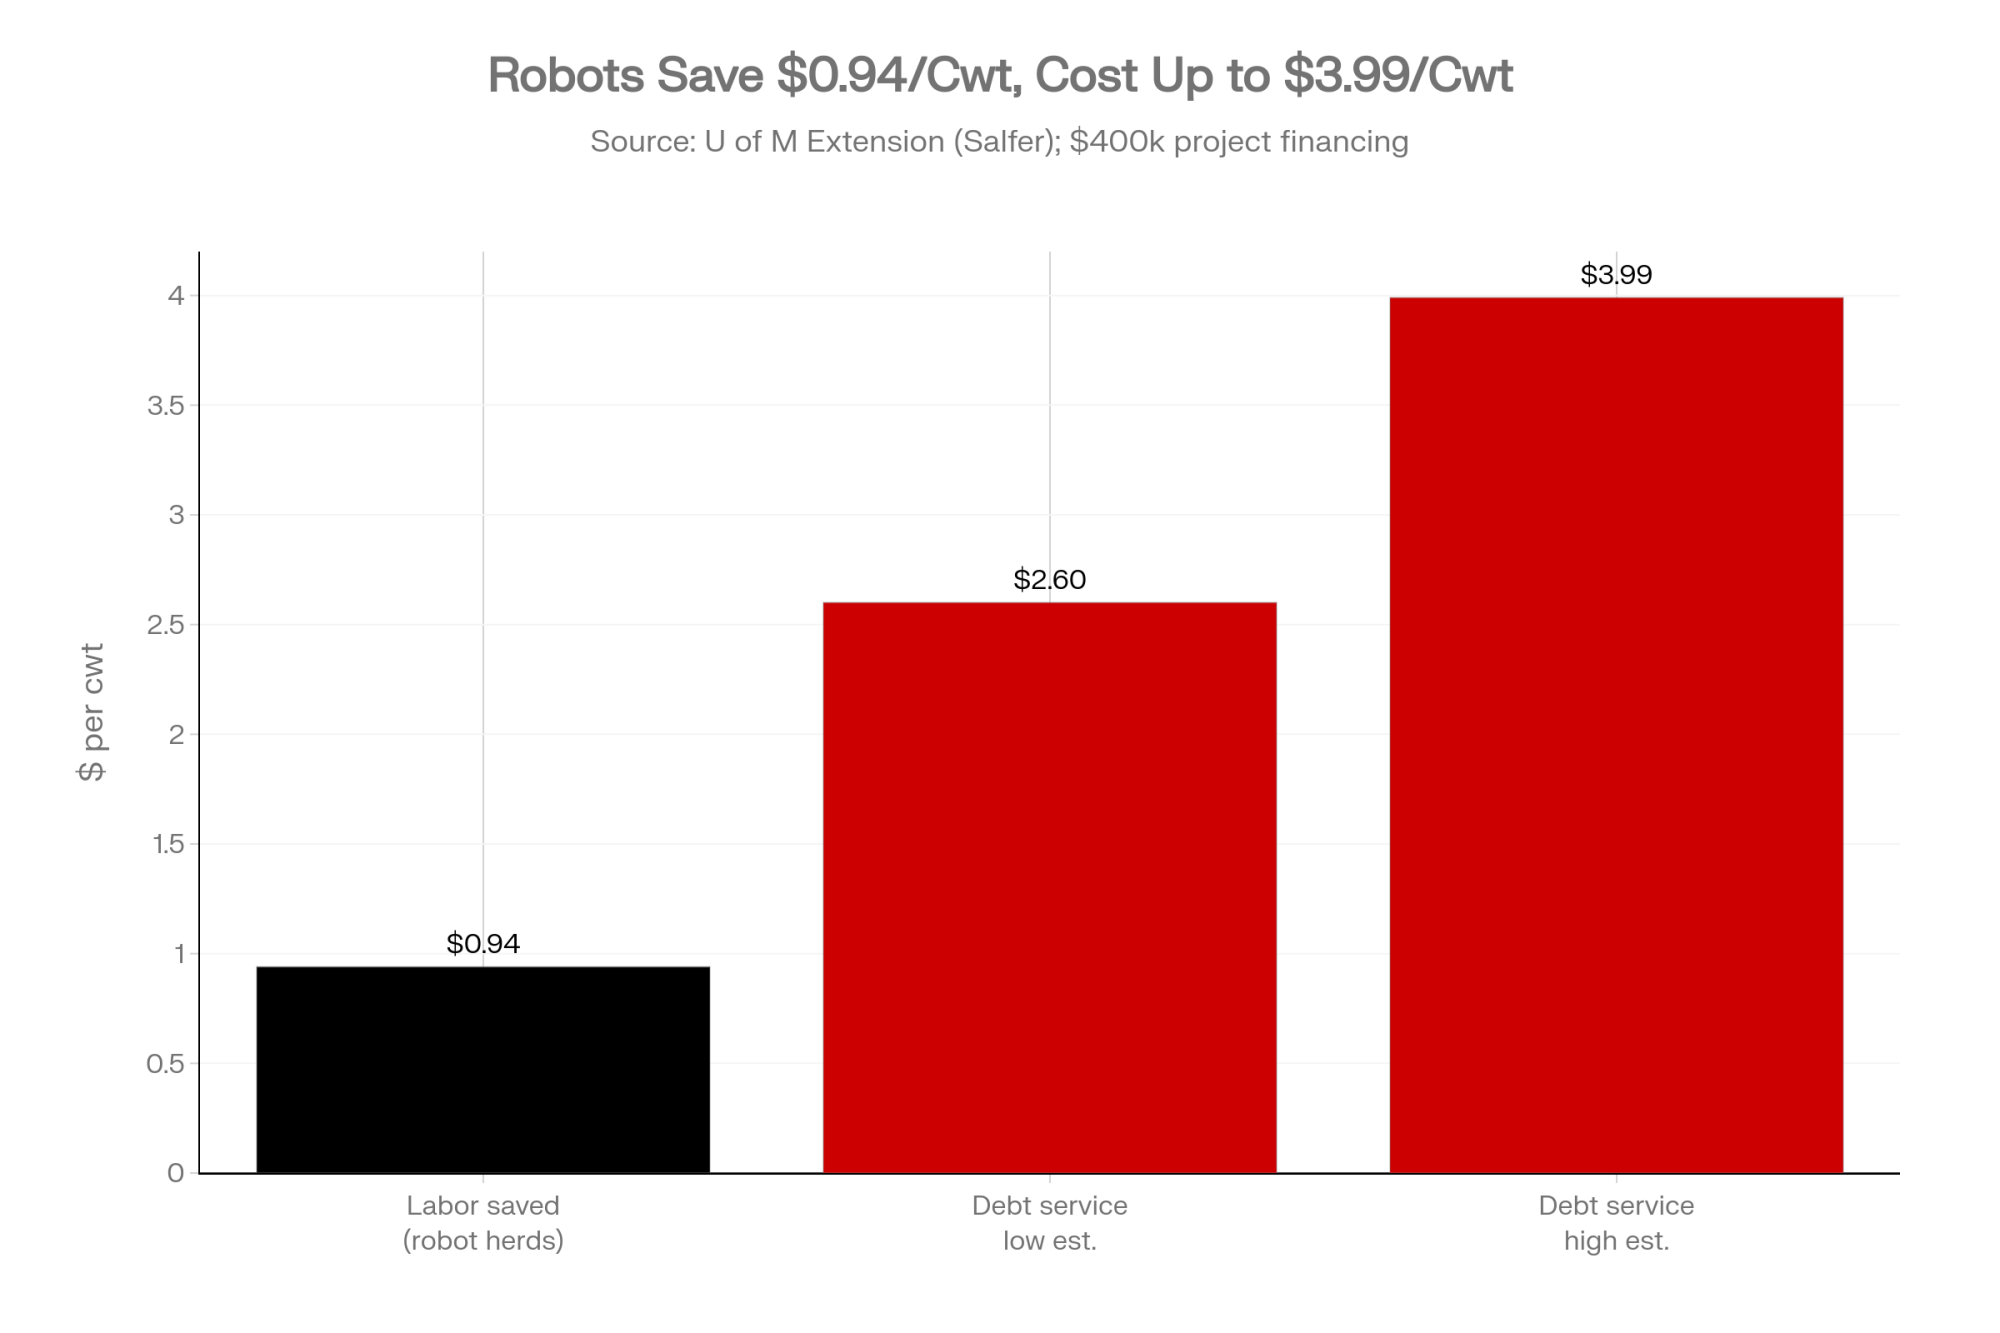
- The debt load: financing a $400,000 project can add $2.60 to $3.99/cwt in fixed debt service. If you’re only saving $1.50/cwt in manual labor, you’ve just dug a deeper margin hole to solve a lifestyle problem.
- The capacity math: each box handles roughly 55–65 cows. Fall short of filling it, and that same debt spreads over less milk — the per-cow bill climbs fast on a small herd.
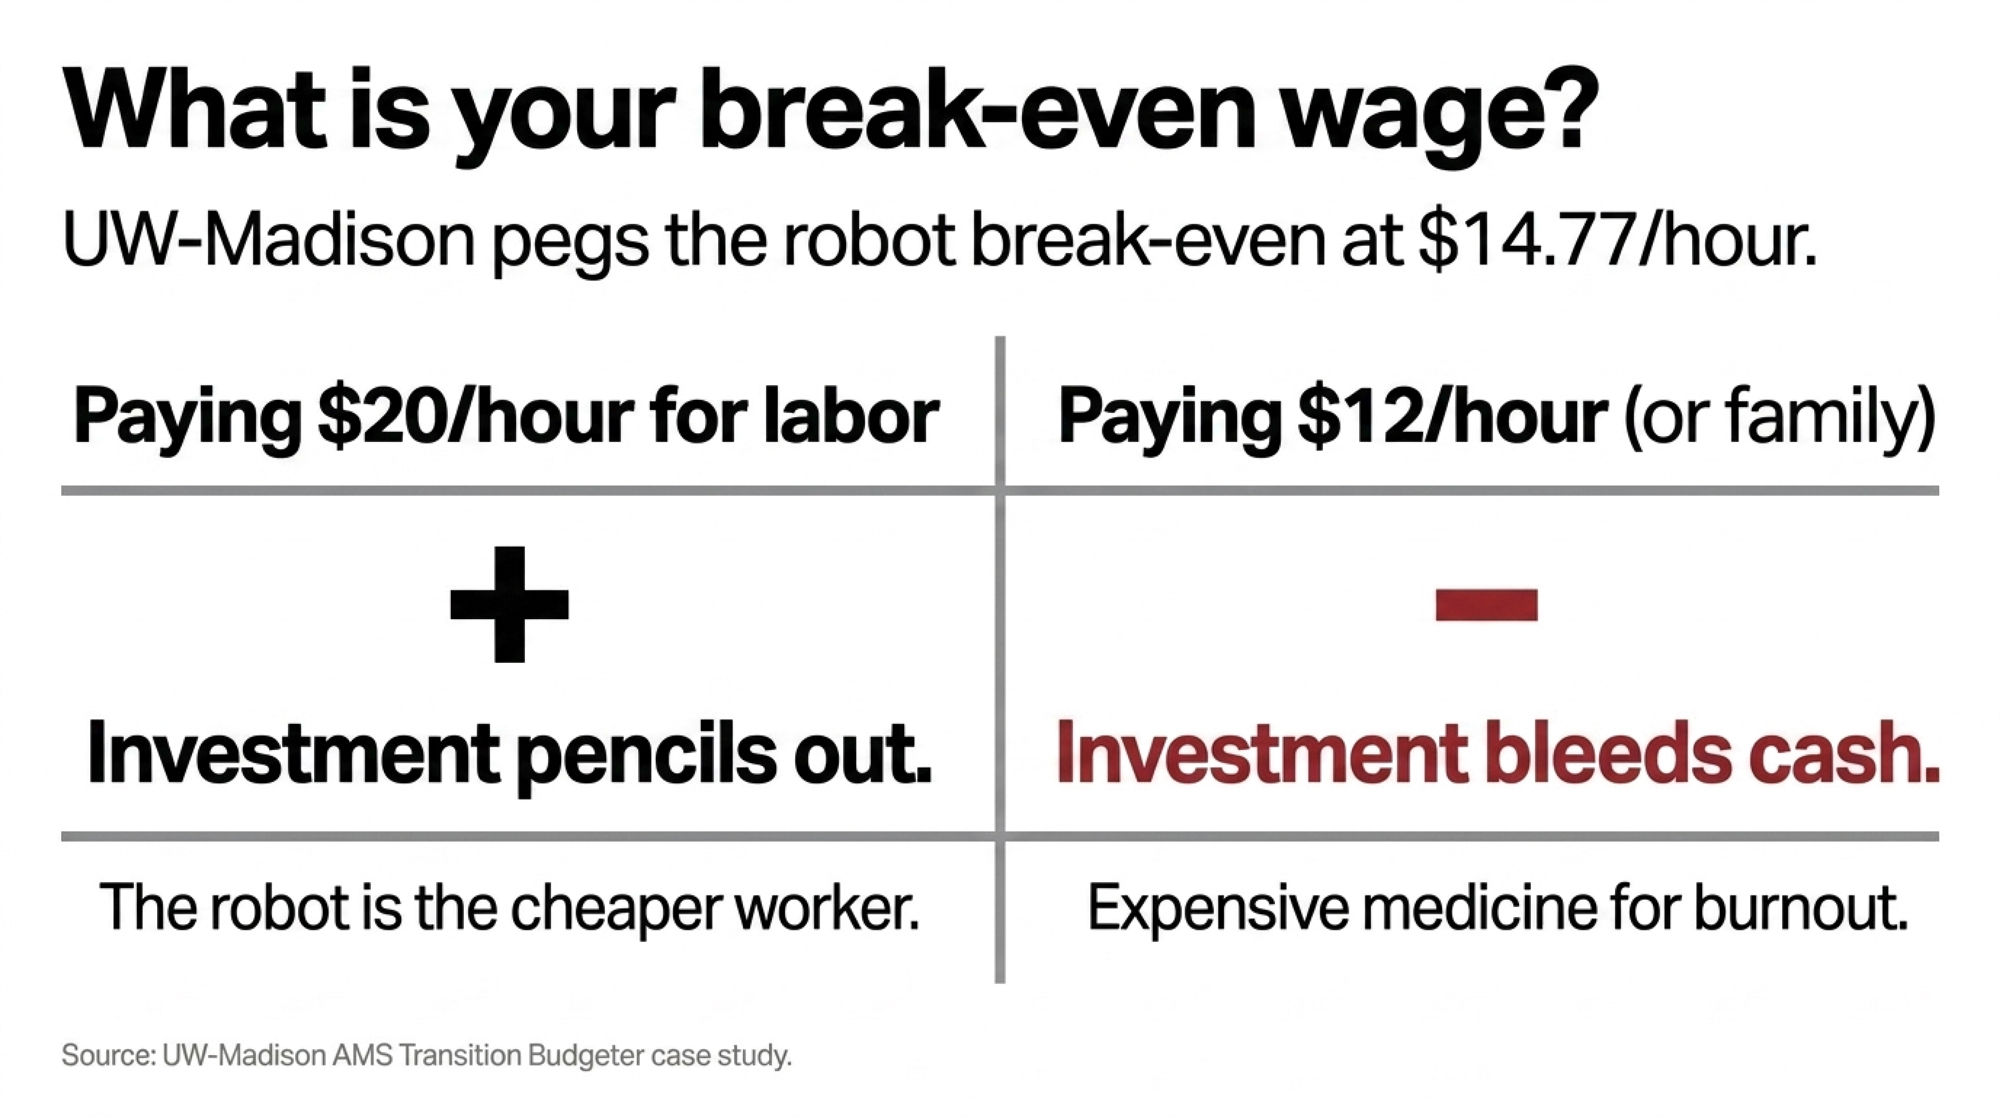
Now the break-even. The published numbers span a wide range, and that range is the actual lesson:
| Scenario | Break-even labor wage | What drives it |
| Salfer, Journal of Dairy Science — robots vs. a well-run parlor | ~$27/hour | A genuinely efficient parlor is a hard benchmark to beat |
| UW-Madison’s 120-cow case study — 2 robots, 12 hrs/day milking, 5% yield lift | $14.77/hour | Heavy labor hours displaced, plus a production response |
Both are right. In UW’s case, the farm was already paying $20.00/hour against a $14.77 break-even — the robot was the cheaper worker, so the investment penciled. Run that same farm at $12/hour hired labor and the machine becomes the expensive option overnight. Nothing about the robot changed. The wage did.
That’s why you cannot borrow somebody else’s break-even number — and why guessing is how families end up signing the wrong note.
UW-Madison’s Dairy Management program built the tool that calculates yours. The AMS Transition Budgeter, developed by Dr. Victor Cabrera and released in February 2026, is free and web-based. It doesn’t recalculate your whole farm — it looks only at what changes. You enter herd size, your real labor cost, your quoted robot price and financing, and it runs a 15-year simulation: labor saved and yield gained on one side, loan payments, maintenance, electricity, and pellet cost on the other. It returns your break-even wage on a gauge, tells you what year cash flow turns positive, and stress-tests the whole thing against a milk-yield miss or a rate increase.
Run it before a dealer runs their version. And note what UW’s own sensitivity analysis found: milk yield and labor rate swing the outcome hardest. In their case study, a farm that fails to deliver the assumed 5% production lift watches a $20,000 annual gain disappear. Robots don’t manage cows for you. They just milk them more often, and only if the cows cooperate.
Is a Robot a Business Decision or a Life Raft?
Both can be legitimate. But they’re not the same decision, and pretending they are is exactly where families get hurt. Iowa State economist Larry Tranel ran the real amortization on a two-robot setup. Here’s what the cash flow looks like in the early years:
| Line item | Amount (annual) | What it means |
| System financed | $400,000 at 5.50% over 7 years | The starting hole |
| Ownership cost | ~$62,000/yr | Depreciation, interest, repairs |
| Loan payment | ~$69,000/yr | Cash out the door |
| Net financial benefit | ~$1,400/yr (early years) | What the robot gives back at first |
| Net cash-flow gap | –$8,776/yr | The red-ink years before payoff |
Note: ownership and loan costs share interest, so these rows don’t sum to the net — the –$8,776 is Tranel’s reported net cash-flow figure, not the sum of the lines above.
USDA’s January 2026 ERR-356 report finds that robots lift net returns by about 13% on average — but Tranel’s cash-flow work is a reminder that the average arrives after the 7-year robot cash-flow hole. Tranel and UW-Madison reach different answers because they assume different things. Which is the whole argument for running your own numbers instead of adopting somebody’s headline.
Extension will tell you this part straight. UW’s own guidance says that if you’re relying on cheap family labor, robots may not pay off financially — though they may still pay off in quality of life, and that’s a value the tool deliberately leaves for you to decide. Read that again, because it’s the honest version of the sales pitch. If the answer is “we’ll always be 60 cows” and your break-even lands above what you’re actually paying, the robot is a lifestyle purchase with a known annual price tag. It might still be worth every dollar to save your back and keep your family in the barn. Just call it what it is. The mistake isn’t buying the robot — it’s signing a six-figure note to buy time when the business underneath it is already underwater.
That debt isn’t capex anymore. For a family that’s exhausted and can’t find help, it’s emergency medicine.
Options and Trade-Offs
Most 40-to-80-cow families aren’t picking from a long menu. They’re choosing between a few hard doors.
| Path | Capital Required | Where It Fails | Equity Outcome |
| Stay small and lean | Near zero | One shock — a knee, a tractor, a price dip | Slow bleed at $42.71/cwt cost |
| Go weird on purpose | $50k–$250k | Second business; 143-hr weeks reported | +$2–$4/gal, burnout risk |
| Scale into viability | $1M–$5M+ | Rates and cycles get meaner with leverage | $1–2/cwt miss = 5 figures/yr on 300 cows |
| Exit on your terms now | Zero | Emotionally hardest door in the barn | +$380k–$480k preserved vs. month-18 sale |
- Stay small and lean. Works if your debt’s low, you genuinely want this life, and family labor is healthy and willing. Requires brutal honesty about your full cost of production — unpaid labor and depreciation included. Where it fails: one shock, a blown knee or a dead tractor or a price dip, turns “barely working” into a slow equity bleed.
- Go weird on purpose. On-farm processing, direct sales, high-component or niche milk. It can lift your farmgate return meaningfully — University of Wisconsin extension figures cited by Bullvine put the bump from bottling your own at $2 to $4 a gallon. But it’s not a guaranteed escape hatch. Clark Farms ran an on-farm creamery for six years, serving dozens of accounts, then shut it down and kept milking. As Bullvine reported, the operation was running a 143-hour work week — the labor load, not the product, was the sticking point. Where it fails: it’s a second business — food and hospitality with cows attached — and the burnout is real. Line up committed buyers before you spend a dollar on infrastructure.
- Scale into viability. Triple or quadruple the herd so fixed costs spread. It’s a capital commitment that commonly runs into the millions, and it takes a real appetite for risk — a $1–2/cwt miss on a 300-cow herd runs into five figures a year, real money on a herd carrying that much debt. Where it fails: rates and price cycles get a lot meaner with that much leverage.
- Exit on your own terms — this month. If you’ve run negative on a full-cost basis for a couple years, book the lender-plus-adviser meeting now. This is the 30-day move, and it’s the one that preserves the most equity. Your state extension service will connect you with a transition specialist, confidentially and usually free of charge.
Three Questions to Answer Before the Week Is Out
Skip the recap. Sit down with these three, and be honest about the answers:
- Do I actually know my full cost per hundredweight right now — unpaid family labor and depreciation counted — and how close is it to that $42.71 small-herd ceiling? If you can’t answer this by Friday, that’s the whole problem in one sentence. UW-Madison’s Dairy Enterprise Budget spreadsheet will get you there in an evening.
- Do I know my own break-even labor wage, or am I working off a number I read somewhere? The AMS Transition Budgeter will answer it with your own numbers in one sitting. Anything less than your real number, and you’re negotiating a six-figure note on a guess.
- Who at my kitchen table is quietly funding the barn — and do they know it’s a decision, not an accident? If a spouse’s town job is the reason the milk check still clears, that’s a conversation to have on purpose.
One note for Canadian readers: the cost figures above are U.S. math, and you’re not paid on a $/cwt all-milk price. Supply management gives you a softer landing — predictable pricing and real quota equity you can actually sell. But the shape of the curve still looks uncomfortably familiar. Canada went from 12,007 dairy farms in 2014 to 9,256 in 2024 while the national herd barely moved. Quota protects farm income, not farm numbers. Same direction, gentler slope.
The Last Light in the Barn
The milk trucks will keep rolling down these roads. In five years, they’ll have fewer lanes. The question in front of your family isn’t whether the squeeze is coming — the ERS cost tables settled that one. It’s whether you make your next move on purpose, eyes open and equity intact, or let a banker make it for you eighteen months from now.
So pull that printout back out. Put a real number on what this year is costing you — not in stress, in dollars — and then decide which door your balance sheet can actually carry. We’re breaking down the full cost-per-cwt model by herd size, plus the exit timeline that preserves the most equity, in next week’s Bullvine Weekly. That’s where the real numbers live.
Should You Expand, Hold, or Exit?
5 questions. 60 seconds. Get your signal.
Learn More
- Retrofit or New Robot Barn? The $17,000‑Per‑Cow Choice That Can Lock Canadian Tie‑Stall Herds Into Bad Cow‑Flow Under the 2027 Code — Breaks down the hidden $17,000-per-cow gap between retrofitting existing facilities and clean-sheet construction. Delivers real 15-year labor and cow-flow math to prevent locking your herd into 275 extra fetch hours annually.
- Your Dairy’s 18-Month Countdown: The $480,000 Difference Between Strategic Exit and Forced Sale — Arms you with the exact month-by-month financial timeline between first operating losses and bank liquidation. Maps the decision window to preserve $380,000 to $480,000 in equity through a planned exit before lenders dictate terms.
- The Cheap Feed Trap: Why the Wall of Milk Won’t Break and How to Protect Your Margins — Exposes how high milk-to-feed ratios create a false profit signal that masks mounting global oversupply. Delivers a three-step culling framework to eliminate unprofitable passengers while cull values remain near historical highs.
 The Sunday Read Dairy Professionals Don’t Skip.
 The Sunday Read Dairy Professionals Don’t Skip.
Every week, thousands of producers, breeders, and industry insiders open Bullvine Weekly for genetics insights, market shifts, and profit strategies they won’t find anywhere else. One email. Five minutes. Smarter decisions all week.




