







The difference showed up in tissue, not on the scale — and only in calves already eating enough starter to use it. Here’s what to measure first.
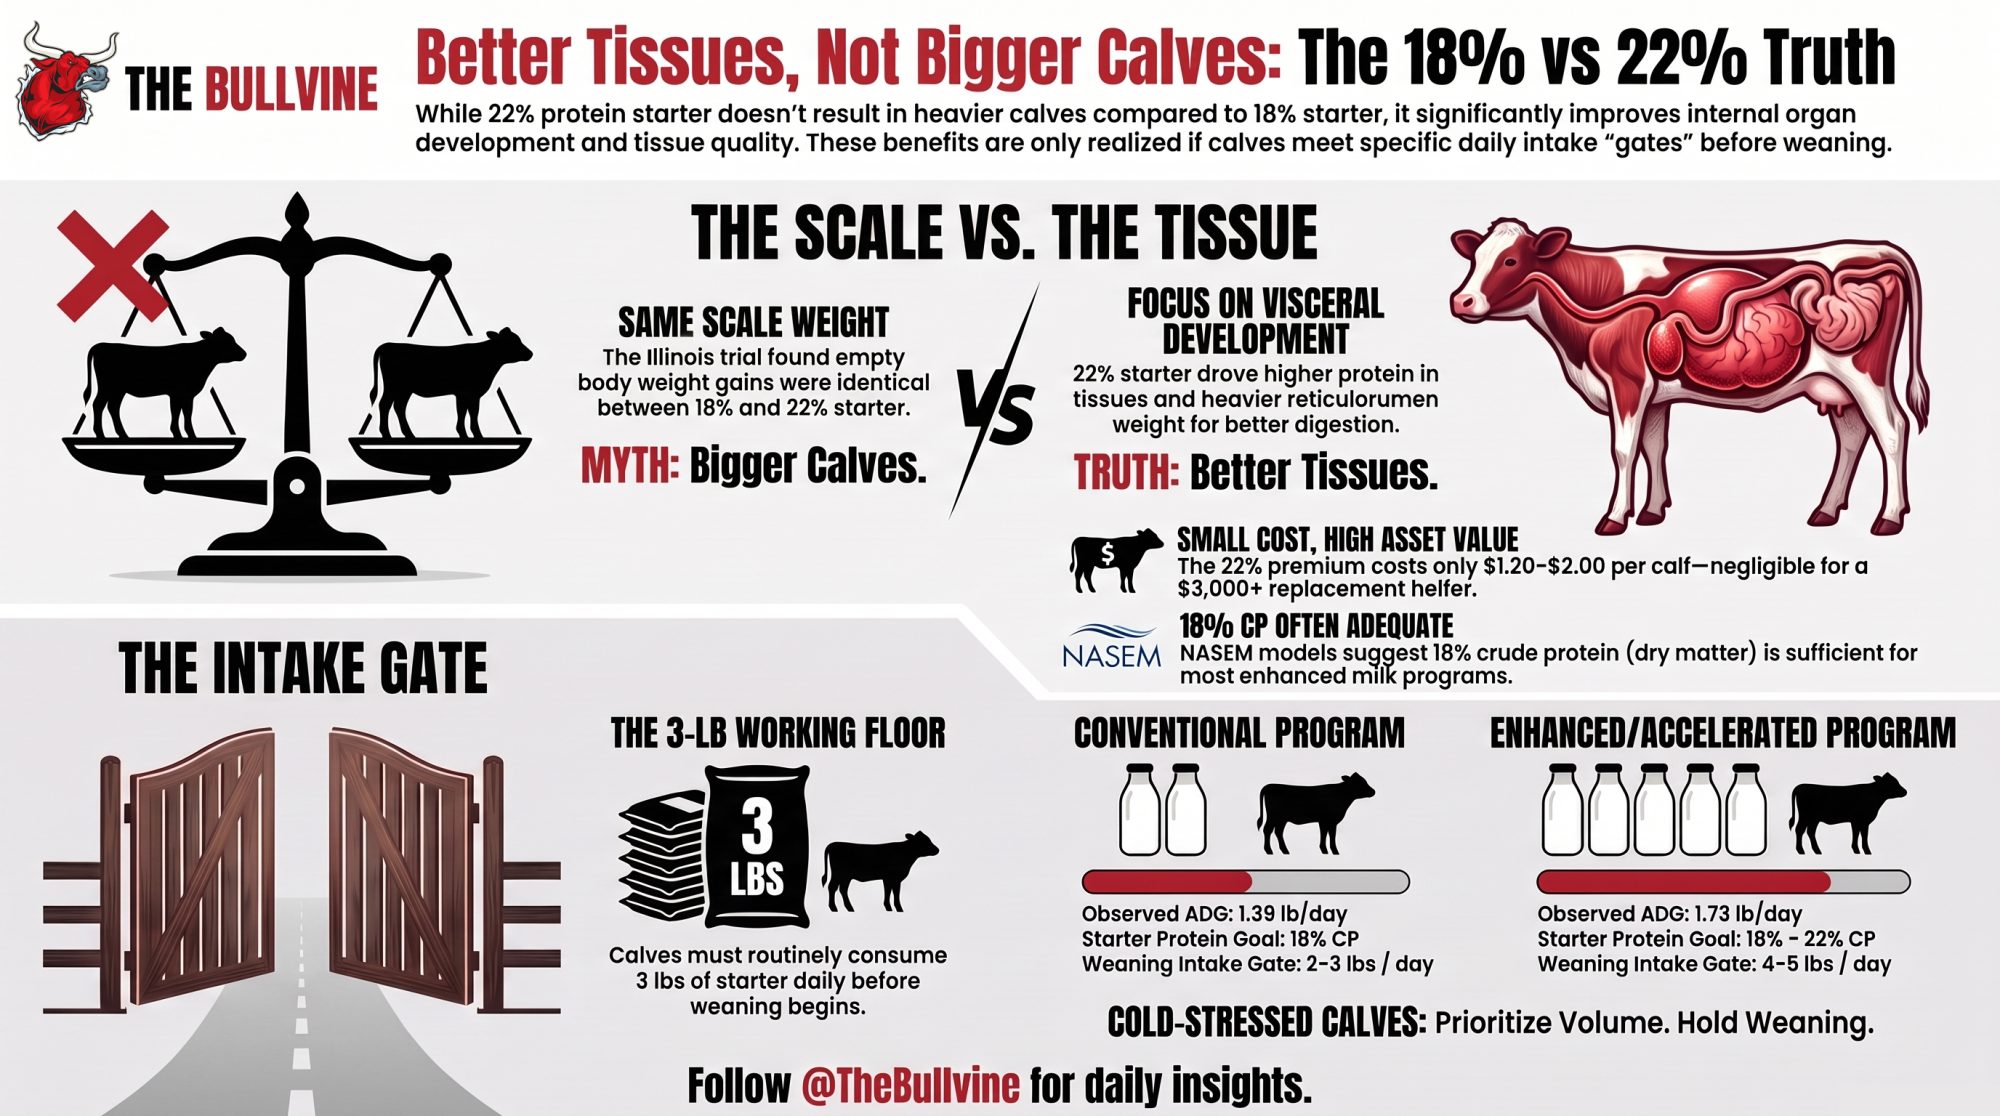
When Jennifer Stamey Lanier, James Drackley and their colleagues at the University of Illinois ran Holstein calves on 18% and 22% crude-protein starters, they found something the marketing rarely mentions. Empty body weight gains between the two starter groups weren’t different.
Read that again before your next feed conversation. The study most often cited to justify a 22% starter did not produce heavier calves.
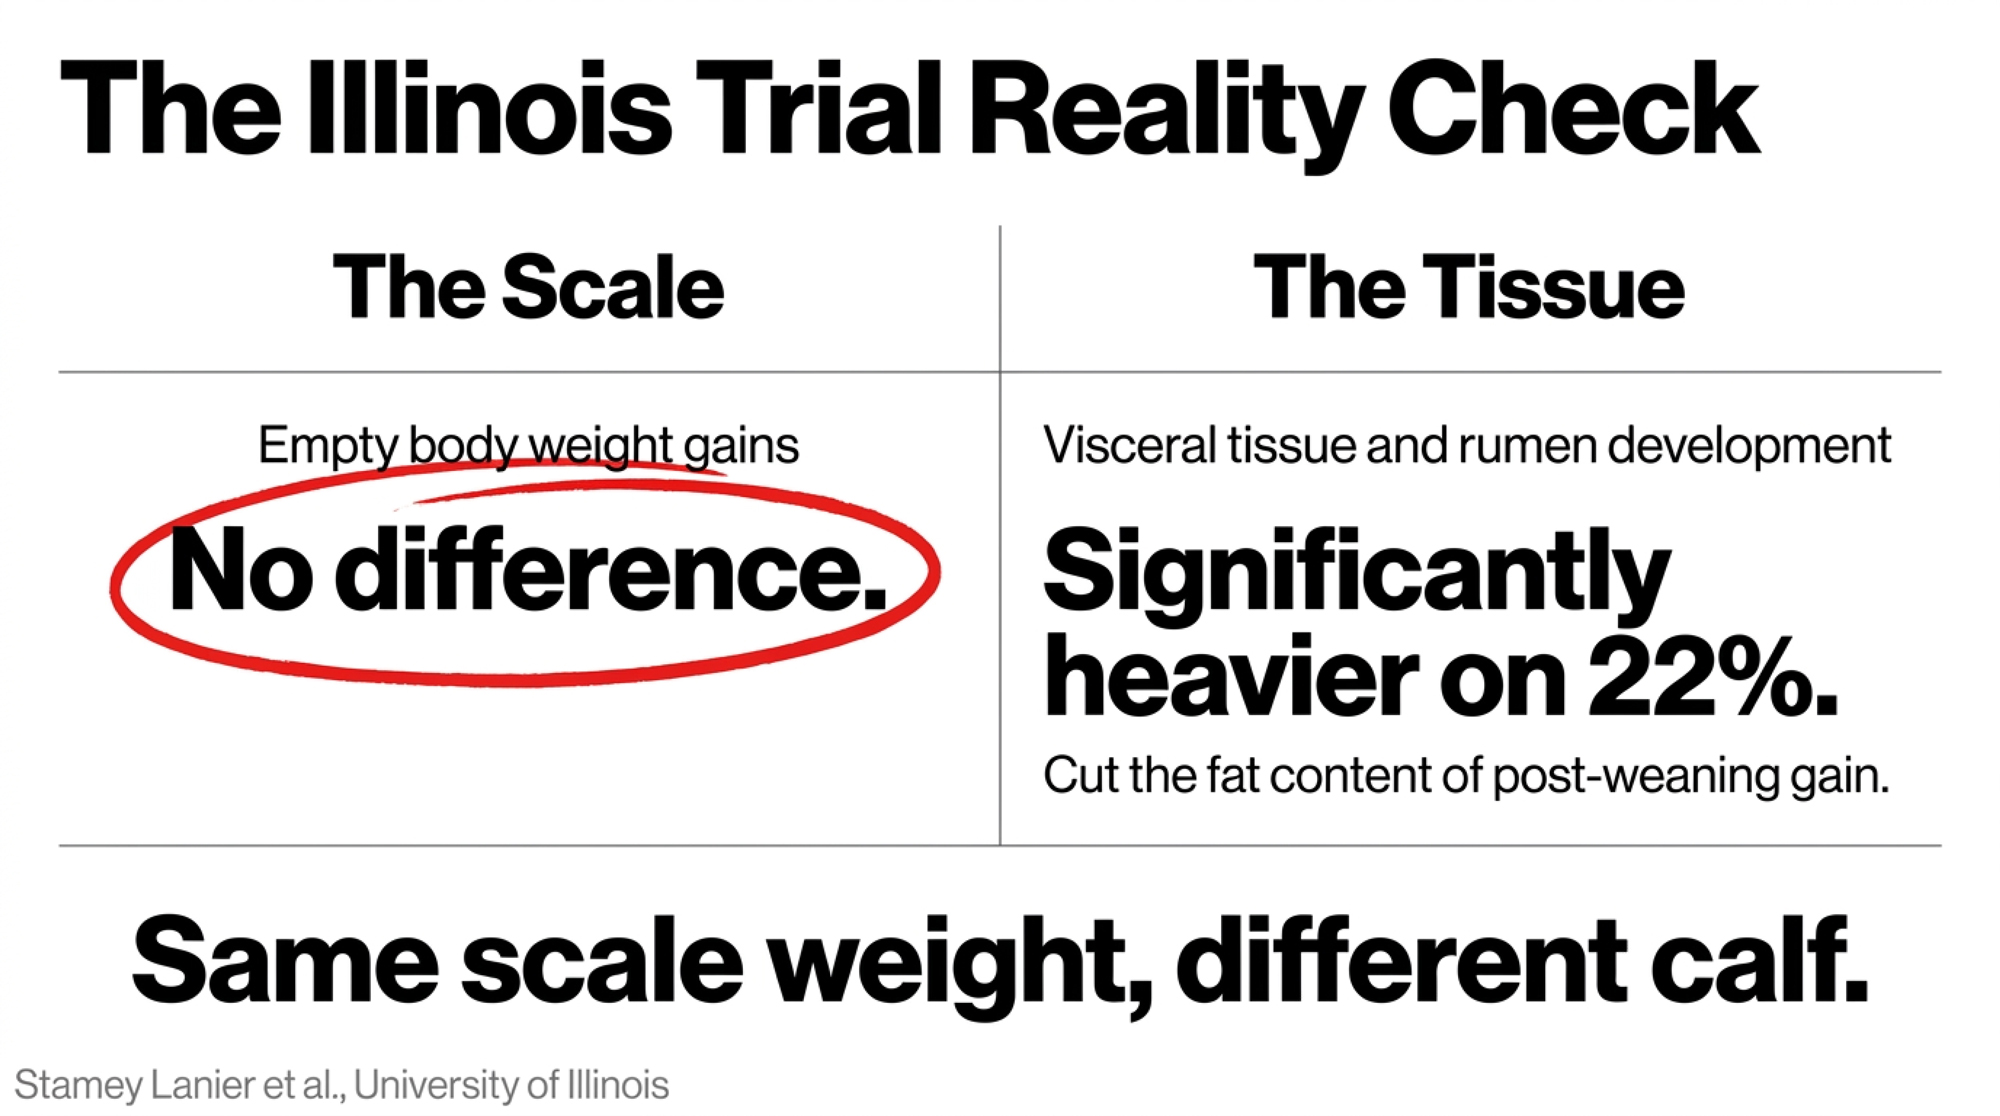
What it did show is more interesting, and more useful. The higher-protein starter drove greater visceral tissue gains and cut the fat content of gain during the post-weaning period. Same scale weight, different calf. That distinction is where the 18-versus-22 decision actually lives — and it only matters if calves are eating enough starter to make it real.
What the Illinois Trial Actually Tested
The design matters, because it’s the part that gets flattened in sales conversations.
Stamey Lanier, McKeith, Janovick, Molano, Van Amburgh and Drackley ran calves from birth to 10 weeks across both a conventional and an enhanced milk-replacer program, crossing that with two starter protein levels. The starters were formulated at 18% and 22% CP on an as-fed basis — the numbers you’d read off a tag. Analyzed, they came back at 22% and 26% on a dry-matter basis, equal to 19% and 23% as fed.
Body weight gain was greater for calves on the high milk-replacer program. It was unaffected by starter protein. Average weekly starter intake didn’t differ between the enhanced treatments either.
Where the higher-protein starter showed up was in composition and organ development — heavier reticulorumen tissue, more total protein in calves on high milk replacer plus high-CP starter, and greater plasma BHB supporting gastrointestinal development.
And here’s a line worth carrying into your next nutritionist meeting. The authors note that the NASEM model suggests 18% CP on a dry-matter basis should be adequate for calves fed enhanced milk replacer. The researchers testing the higher-protein starter said that out loud in their own paper.
Bullvine Bottom Line: The Illinois work supports 22% as a tissue-quality and rumen-development play under a high milk program. It does not support 22% as a weight-gain shortcut, and the researchers themselves flag 18% as potentially adequate.
The Long-Term Numbers Are Real — And Contested
The reason anyone cares about early-life nutrition at all traces back to Cornell.
Fernando Soberon, Michael Van Amburgh and colleagues examined test-day records in a 2012 Journal of Dairy Science study. In the Cornell herd, each additional 1 kg/day of pre-weaning average daily gain was associated with 850 kg more first-lactation milk. In the commercial herd, that figure came in at 1,113 kg. Their 2013 symposium analysis reported 42.9 kg more first-lactation milk per 100 g/day increase in pre-weaning nutrient intake.
Those are associations within study populations, not a promise attached to a feed tag.
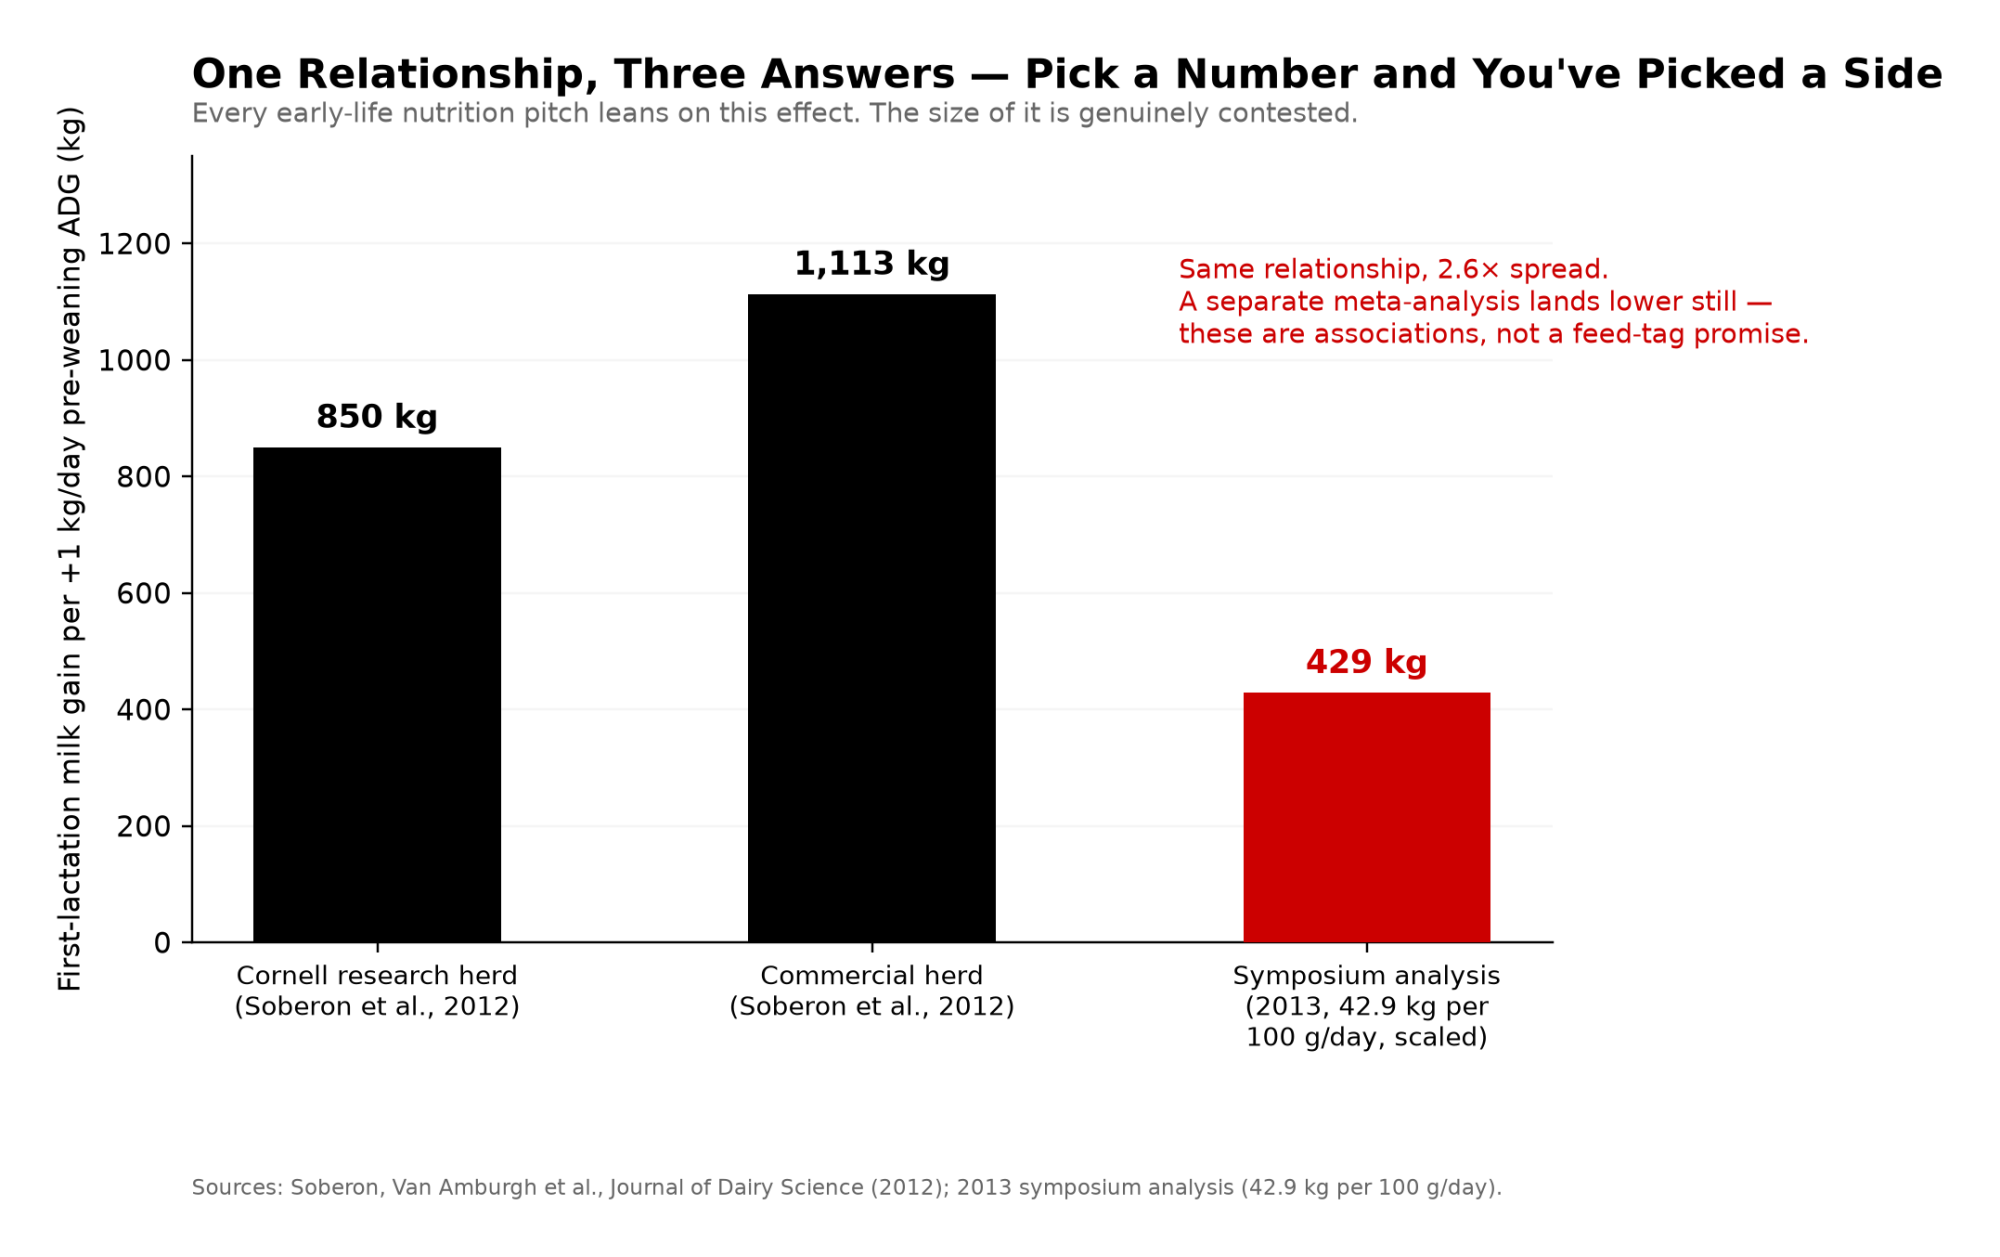
The effect size is also genuinely contested. A separate meta-analysis of pre-weaned calf nutrition and growth produced more modest estimates of the same relationship. That disagreement isn’t a reason to ignore early-life nutrition. It’s a reason to stop treating one number as settled and start measuring what happens in your own barn.
The First Question Is Intake, Not Protein
Jim Quigley’s threshold gives you a better starting point than any tag.
His 15 kg cumulative non-fiber carbohydrate benchmark asks whether the calf has eaten enough fermentable carbohydrate for the rumen to carry more of the load once milk drops. For a starter running 50–55% NFC on a dry-matter basis at roughly 90% DM, that works out to about 30–33 kg — 67–73 lb — of cumulative starter as fed.
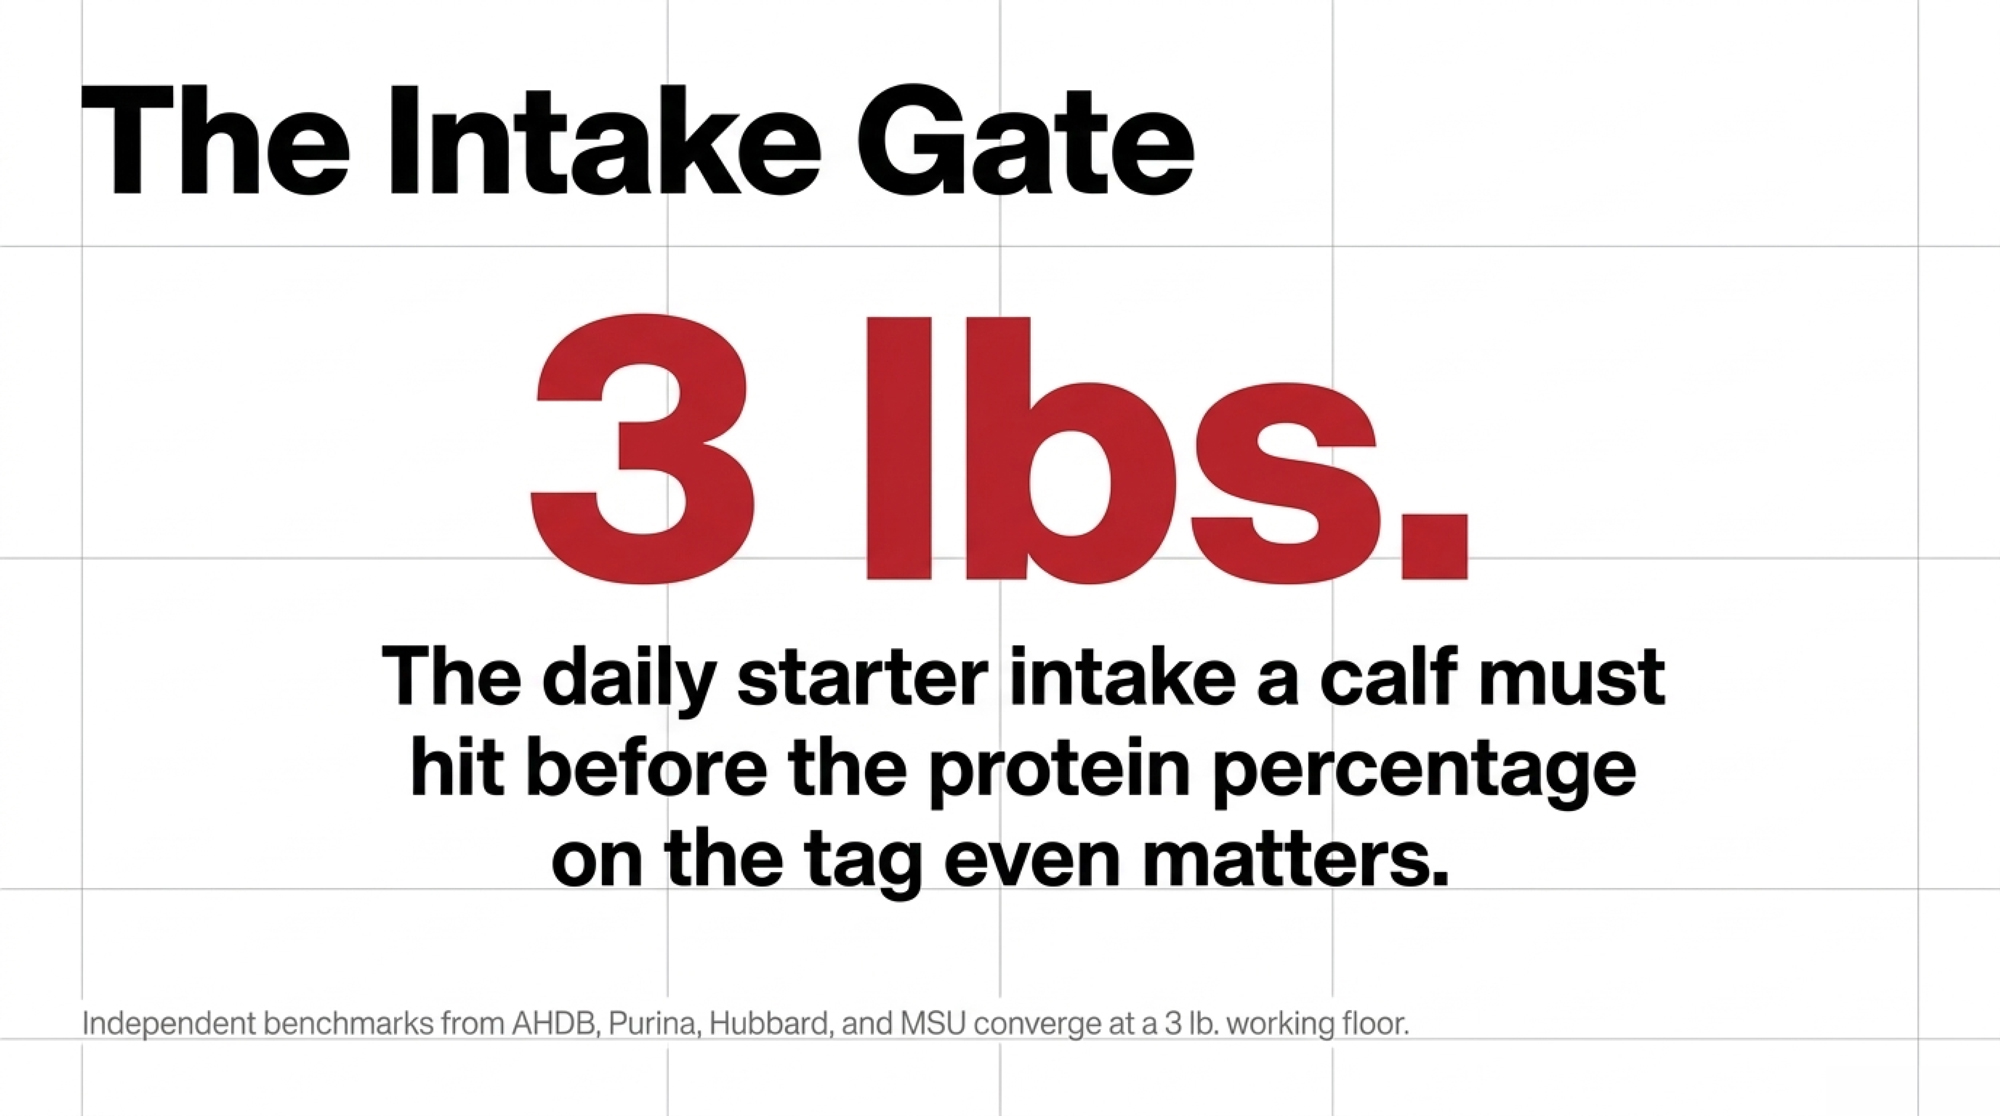
Daily benchmarks converge from four independent directions. AHDB puts a group ready to wean when calves are routinely consuming 1.5 kg per head per day of high-quality starter — about 3.3 lb as fed. Michigan State Extension puts early-weaned calves at 2–3 lb/head/day and accelerated-program calves at 4–5 lb/head/day. Call 3 lb your working floor.
That MSU split is the number most barns miss. The more milk you feed, the more starter a calf needs to be eating before you take that milk away.
On protein level, the NASEM 2021 guidance is a range rather than a single answer: 18–24% CP for large-breed calves, depending on the ratio of milk replacer to starter intake and your average daily gain goal. Which is another way of saying the tag can’t be evaluated without knowing the rest of the program.
Why Calendar Weaning Creates Trouble
Eight weeks is convenient. It lines up labor, grouping, deliveries, and calf movement. Convenience hides a weak transition when calves are still eating starter inconsistently.
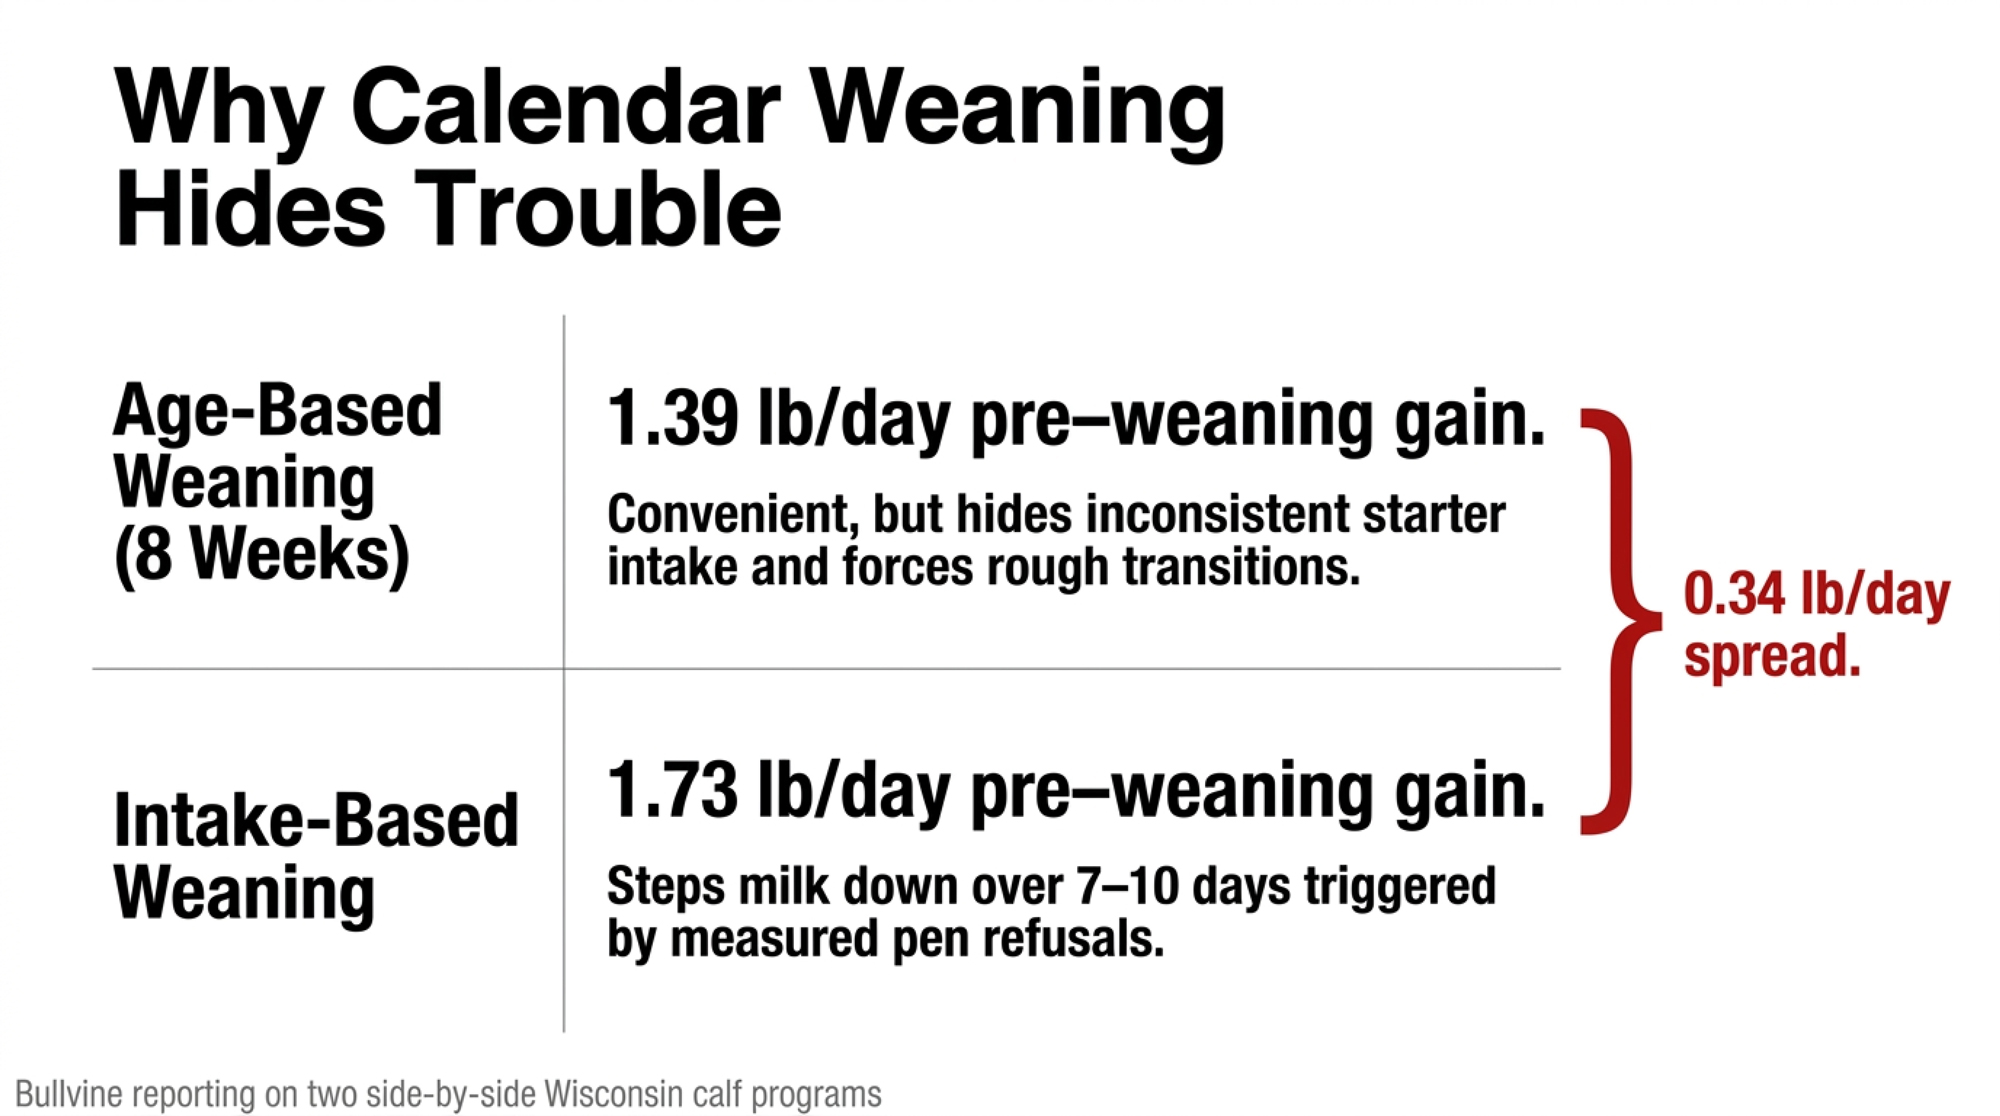
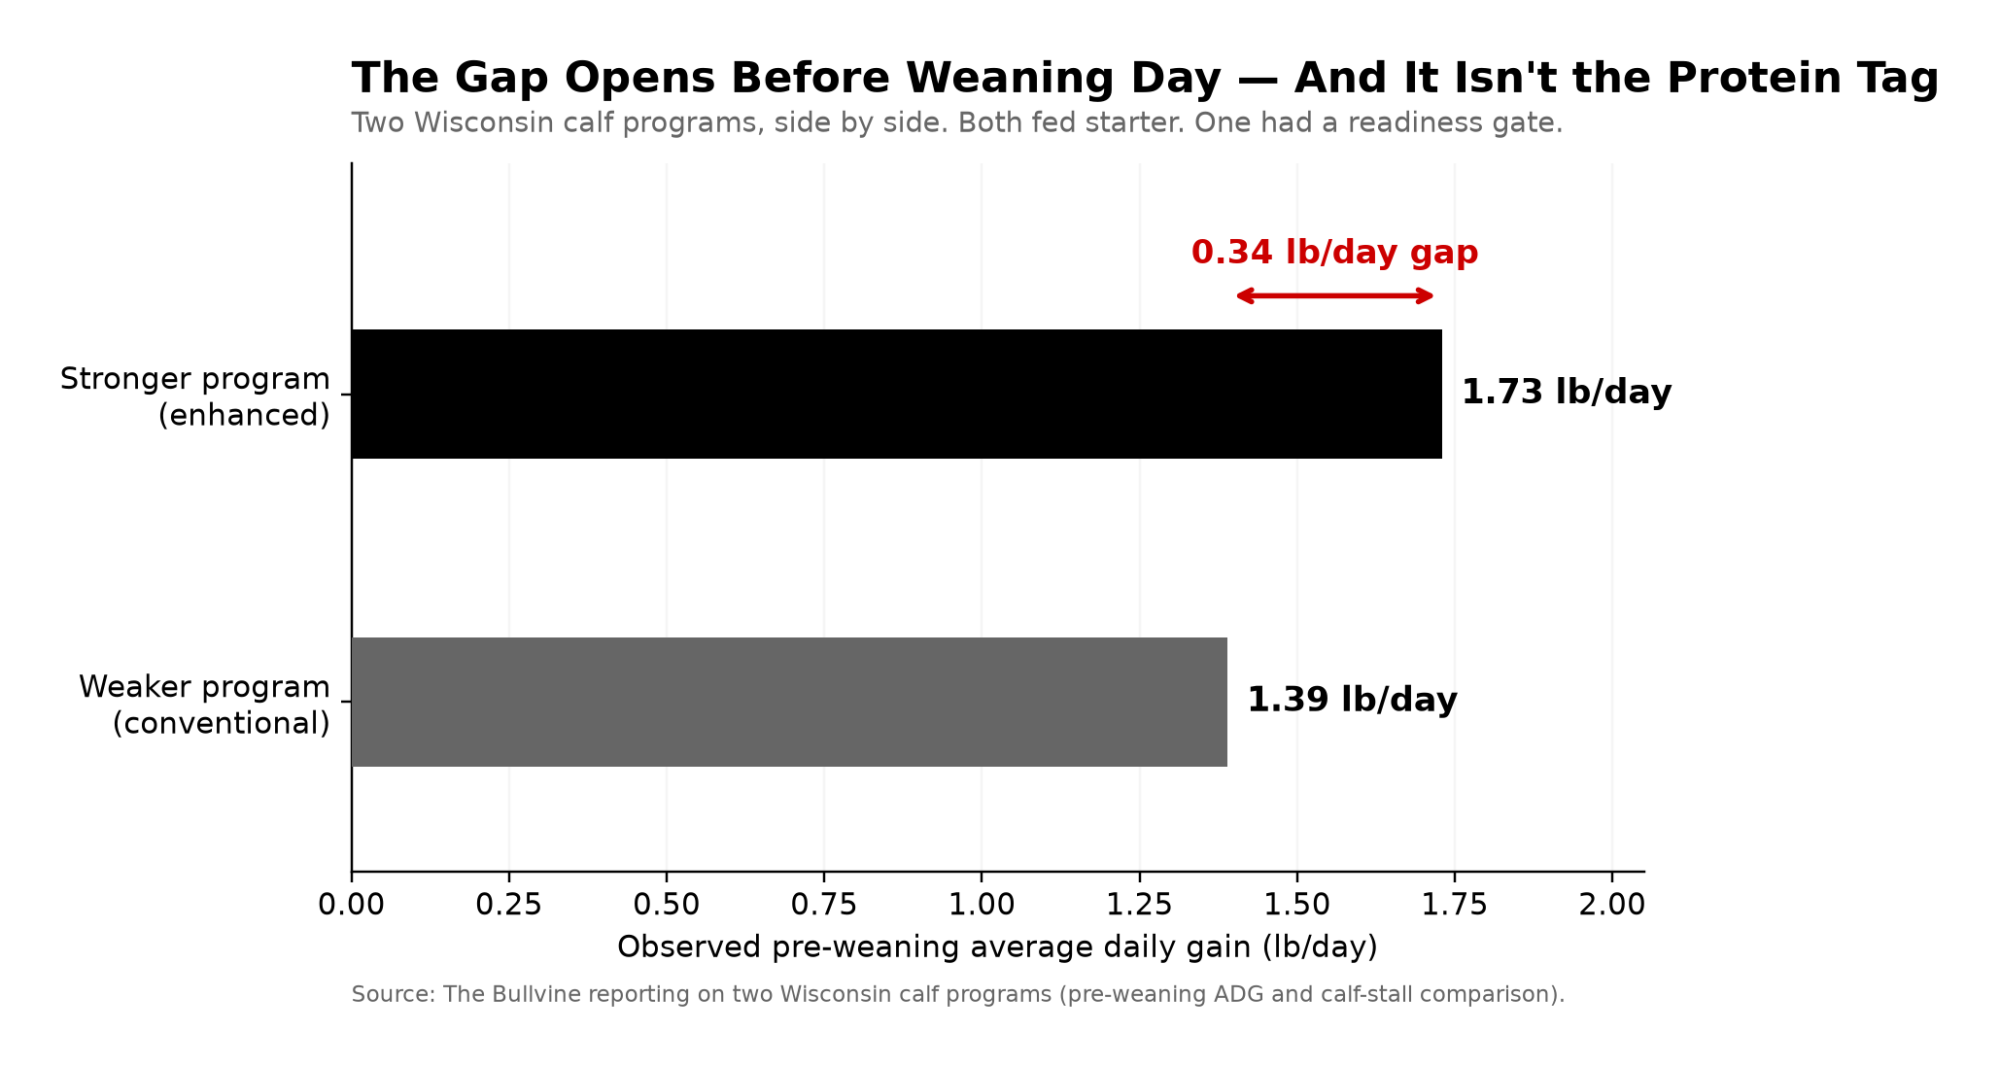
Bullvine reporting on two Wisconsin calf programs, side by side, found the gap opens early: 1.73 lb/day pre-weaning gain on the stronger program against 1.39 lb/day on the weaker one, a 0.34 lb/day spread. The recommendation from that data was to switch the weaning trigger from age alone to starter intake plus age, stepping milk down over 7 to 10 days rather than pulling it.
Measure by pen if individual tracking isn’t practical. Offer a known amount, measure refusals at the same time next morning, divide by head count, write it on the pen board.
That gives your calf team something better than “they’re old enough.” It also tells you whether the protein you’re already paying for is being eaten in enough volume to matter — which is the only reason the cost math below is worth running. If you want the full mechanics, we’ve broken down how starter intake should guide weaning separately.
Is the Premium Worth It on Your Delivered Price?
The gap between 18% and 22% starter moves with supplier, ingredients, freight, medication, and region. There’s no honest national premium to print, so use your own quotes.
| Scenario | Premium spread ($/ton) | Starter consumed (lb) | Added cost per calf | Share of a $3,100 heifer |
|---|---|---|---|---|
| Low-end quote, threshold intake | $35 | 68 | $1.19 | 0.04% |
| Typical spread at the intake gate | $40 | 70 | $1.40 | 0.05% |
| Wide spread, strong intake | $50 | 75 | $1.88 | 0.06% |
| Fed through the post-weaning window | $40 | 100 | $2.00 | 0.06% |
| Common planning error | $40 | 55 (assumed, not measured) | $1.10 — understates real cost | 0.04% |
Cost per calf = [(22% price per ton − 18% price per ton) ÷ 2,000] × total lb consumed.
Run it at the consumption level your intake gate actually implies. If calves are eating to that 67–73 lb cumulative threshold, a $40/ton delta over 70 lb is $1.40 per calf. A $35/ton delta over 68 lb is $1.19. A $50/ton delta over 75 lb is $1.88. Feed to 100 lb through the post-weaning window at $40/ton and you’re at $2.00.
The cost side stays small across the whole range. The milk side is where honesty matters.
USDA’s August 2026 Livestock, Dairy, and Poultry Outlook revised the all-milk forecast down 15 cents to $19.85/cwtfor 2026, with 2027 at $19.80. National benchmarks — not your mailbox price, component schedule, or basis. Use them as a sensitivity assumption:
Potential gross value per heifer = (milk response in lb ÷ 100) × your milk price per cwt.
The multiplication is easy. Choosing an honest response assumption is the hard part, and the Illinois data won’t hand you one for starter protein alone.
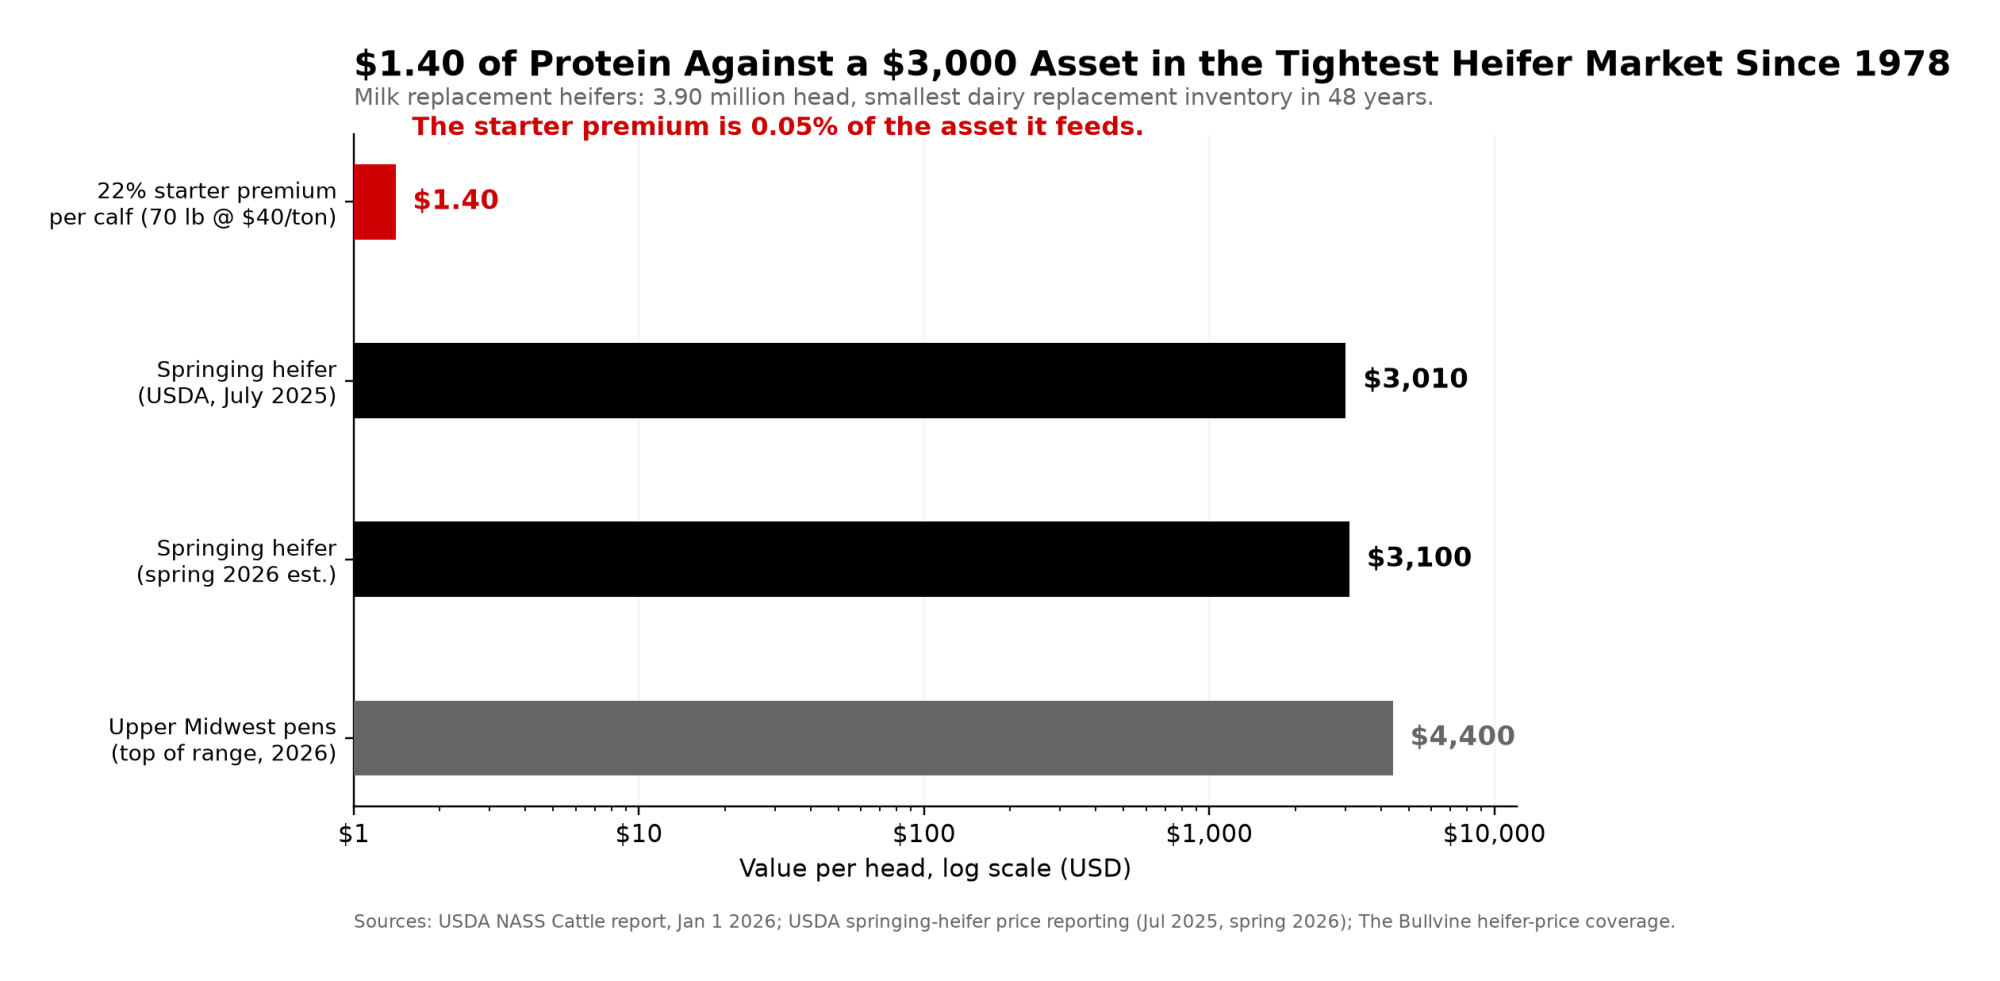
Now put a dollar of starter in context. USDA NASS’s January 1, 2026 Cattle report put milk replacement heifers at 3.90 million head, down again from the previous year and the smallest dairy replacement inventory in 48 years. USDA reporting had springing heifers at $3,010 nationally as of July 2025, with spring 2026 figures near $3,100 and Upper Midwest pens running $3,400–$4,400.
Against a $3,000-plus asset in the tightest replacement market since 1978, a dollar-forty of starter is not where your risk lives. The risk is a heifer that doesn’t arrive in good shape.
How Do You Run the Pen-Board Check This Month?
You don’t need a research station. You need consistent records on two comparable groups.
Day 1–30: Weigh calves at birth and weaning, or apply heart-girth estimates consistently. Track starter offered and refused by pen for at least three weeks around expected weaning. Record the milk step-down date and the actual intake number at that point.
Day 31–90: Audit treatment events through the transition window. Compare delivered feed cost per calf against weaning weights and average pen intake across both groups.
Day 91–365: Measure breeding readiness — stature and weight at 12–13 months — to see whether the earlier gains held. First-lactation milk belongs in that longer analysis, with enough animals per group that you’re not drawing conclusions from three standout heifers and one rough pen.
Don’t change every variable at once. Hold housing, calf-care routine, and weaning procedure steady, and document anything else that shifts. Otherwise you won’t know what moved the result.
Options and Trade-Offs
Stay with 18% and fix the first bottleneck. This fits when intake is inconsistent, calves transition roughly, or nobody’s built a reliable weight record yet. The Illinois authors themselves point to NASEM guidance that 18% CP on a DM basis may be adequate even under enhanced milk feeding. What it requires is unglamorous: clean water, fresh starter, dry bedding, measured intake, readiness-based weaning. The limit is real — as your gain targets climb toward the top of that 18–24% NASEM range, the adequacy assumption gets thinner. Within 30 days: establish baseline pen intake and weaning weights before changing a thing.
Move to 22% inside a defined growth program. This fits when you’re deliberately feeding for stronger early growth and calves already clear the intake gate. Expect what the research actually found — better visceral development and leaner gain composition, not a heavier calf on the scale. The risk is paying a premium while health, housing, or labor consistency does the real damage. It’s worth reading that against the full replacement-heifer cost model before you commit. Within 30 days: run one 18% and one 22% group under the same documented protocol, nothing else different.
Upgrade formulation quality before chasing the protein number. This fits when calves sort feed, leave fines, or eat erratically. Grain processing, protein source, palatability, and batch consistency can matter more than the guarantee on the tag. Premium textured starters use flaked grains and roasted soybeans for bypass protein, with prebiotic and probiotic package in both the 18% and 22% versions — so the comparison runs against your program and delivered cost, not the CP number alone. The trade-off: better physical form lifts acceptance but won’t fix a badly timed weaning. Within 30 days: put two samples side by side with your calf team and score form, fines, intake, refusals, and manure before converting the barn.
Sponsored Post
At a Glance: Matching Starter Protein to Your Program
ADG column shows observed field values from Bullvine program reporting, not recommended targets.
| Liquid nutrition level | Observed pre-weaning ADG | Starter CP guidance | Weaning intake gate |
| Conventional | 1.39 lb/day observed | 18% CP, lower end of the NASEM 18–24% range | ≥2–3 lb/day, 3 consecutive days |
| Enhanced / accelerated | 1.73 lb/day observed | 18% may suffice per NASEM; 22% shifts tissue composition, not gain | ≥4–5 lb/day, 3 consecutive days |
| Cold-stressed | Maintenance demand rises before gain does | Prioritize intake volume over CP percentage | Hold weaning; add 50 g/day of milk powder for each 5°C below the thermoneutral zone |
Key Takeaways
- If a rep cites the Illinois study to sell you weight gain, the paper doesn’t support it — empty body weight gains didn’t differ between 18% and 22% starter.
- If large-breed calves aren’t routinely eating about 1.5 kg — 3.3 lb — per head per day, fix intake before you touch the protein number.
- If you feed a higher plane of liquid nutrition, your intake gate moves to 4–5 lb/day, not 3.
- If you want the tissue-composition benefit, you need the high milk program too — the Illinois effects showed up under enhanced nutrition, not on their own.
- If delivered price decides it, run cost-per-calf at your real consumption level — 70 lb, not 55 — and expect $1.20 to $2.00 at typical spreads.
The decision isn’t whether 18% is dated or 22% is premium. It’s whether the feed in front of the calf matches the program you’re actually running, and whether she’s eating enough of it to care.
That same fit question waits at the grower phase, where early gains either hold through breeding or quietly disappear. Next installment.
Before you pay for another point of protein, walk out to the pen board. What does it say your calves ate yesterday?
Complete references and supporting documentation are available upon request by contacting the editorial team at editor@thebullvine.com.
Learn More
- Emily Miller-Cushon’s Physics-to-Dairy Pivot: Pair Housing’s 130g/Day Gain Edge and $3,300/Heifer Savings— Arms you with housing protocols that drive early solid feed intake through social facilitation, delivering 130 grams per day more gain and protecting $9,900 annually in replacement inventory on a 300-cow dairy.
- $3010 Heifers, 30% Labor Jumps: The Mid-Size Dairy Survival Crisis — Breaks down the structural 75% surge in replacement costs that makes skimping on calf transition protocols financial suicide while operating in the tightest heifer market since 1978.
- The $500,000 Precision Dairy Gamble: Why Most Farms Are Being Sold a False Promise — Dismantles automated feeding tech hype to show why basic management beats six-figure hardware, exposing the real ROI gap before you trade pen-board discipline for expensive electronic calf sensors.
 The Sunday Read Dairy Professionals Don’t Skip.
 The Sunday Read Dairy Professionals Don’t Skip.
Every week, thousands of producers, breeders, and industry insiders open Bullvine Weekly for genetics insights, market shifts, and profit strategies they won’t find anywhere else. One email. Five minutes. Smarter decisions all week.
