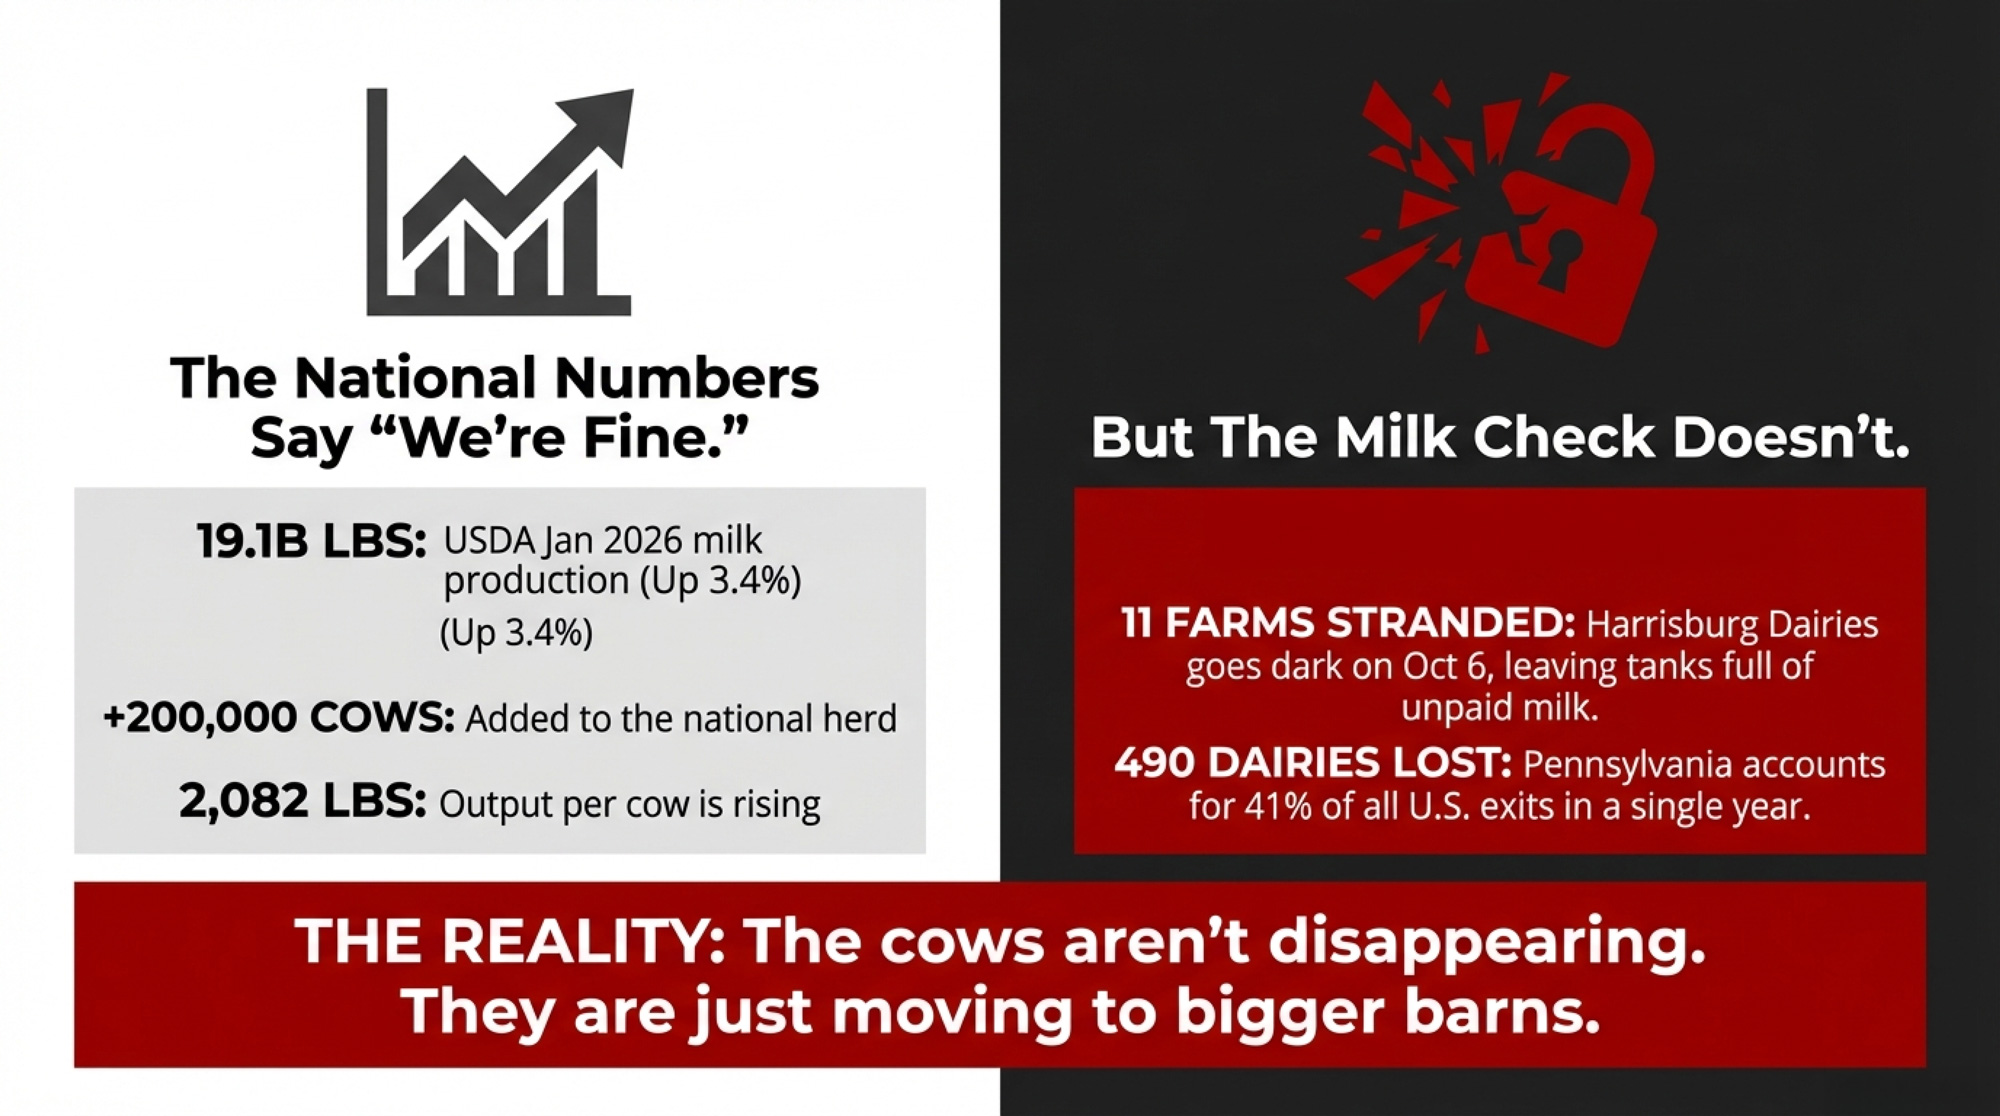
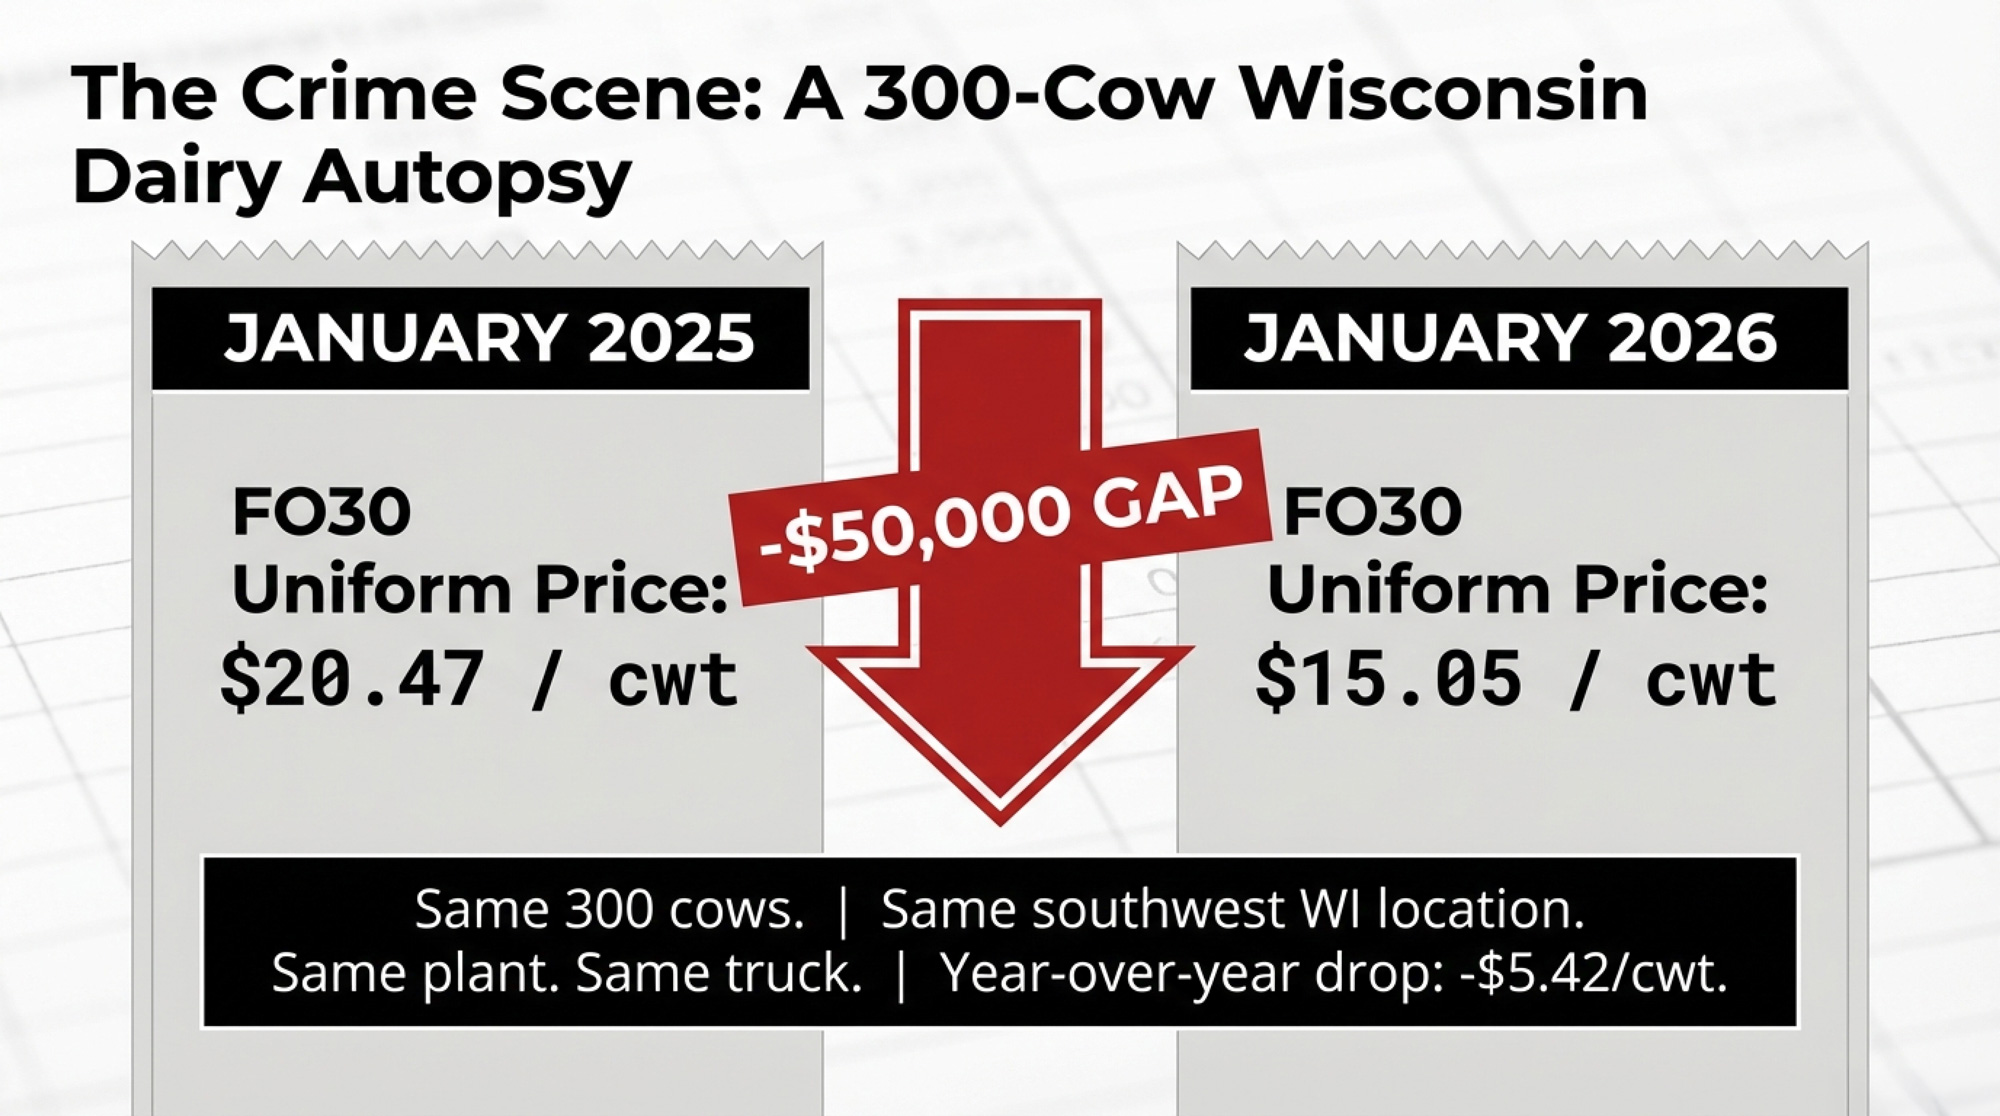
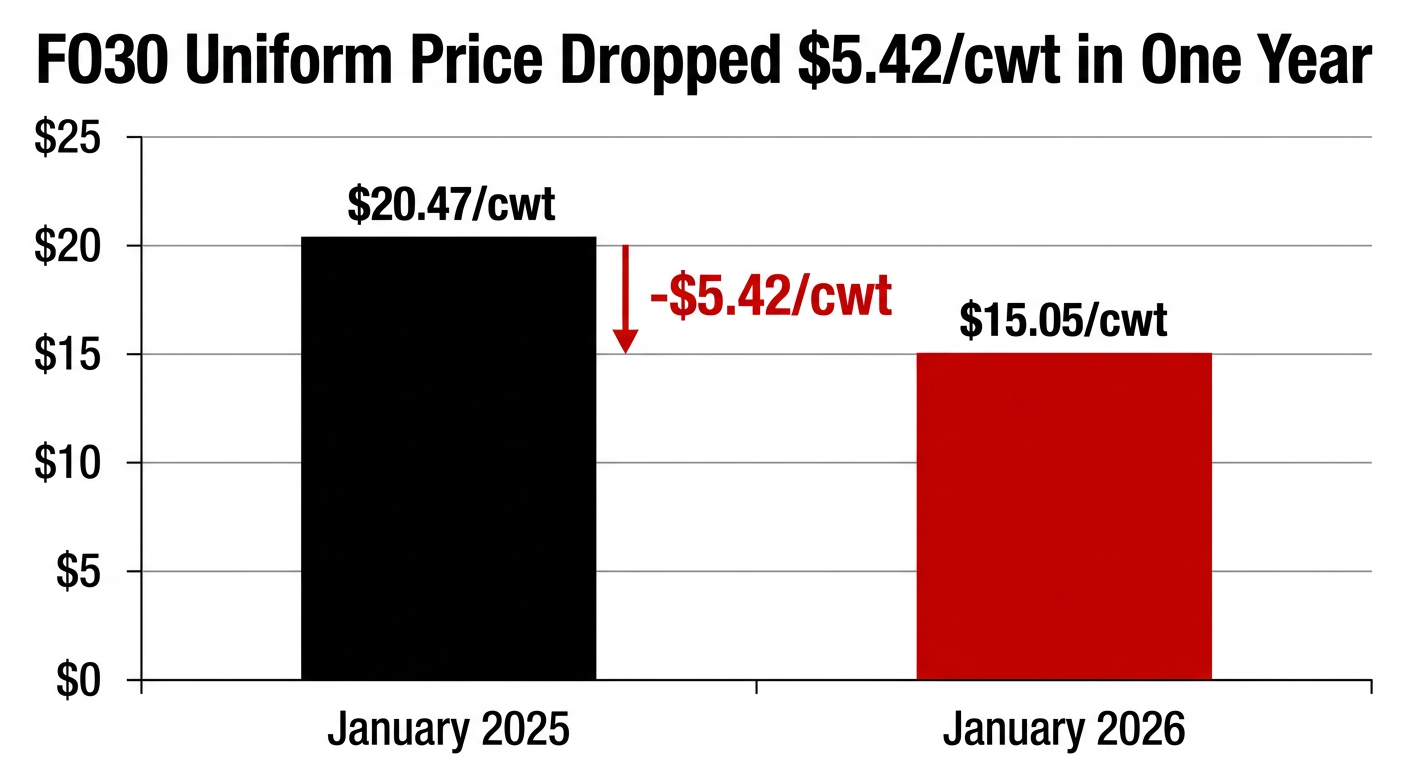
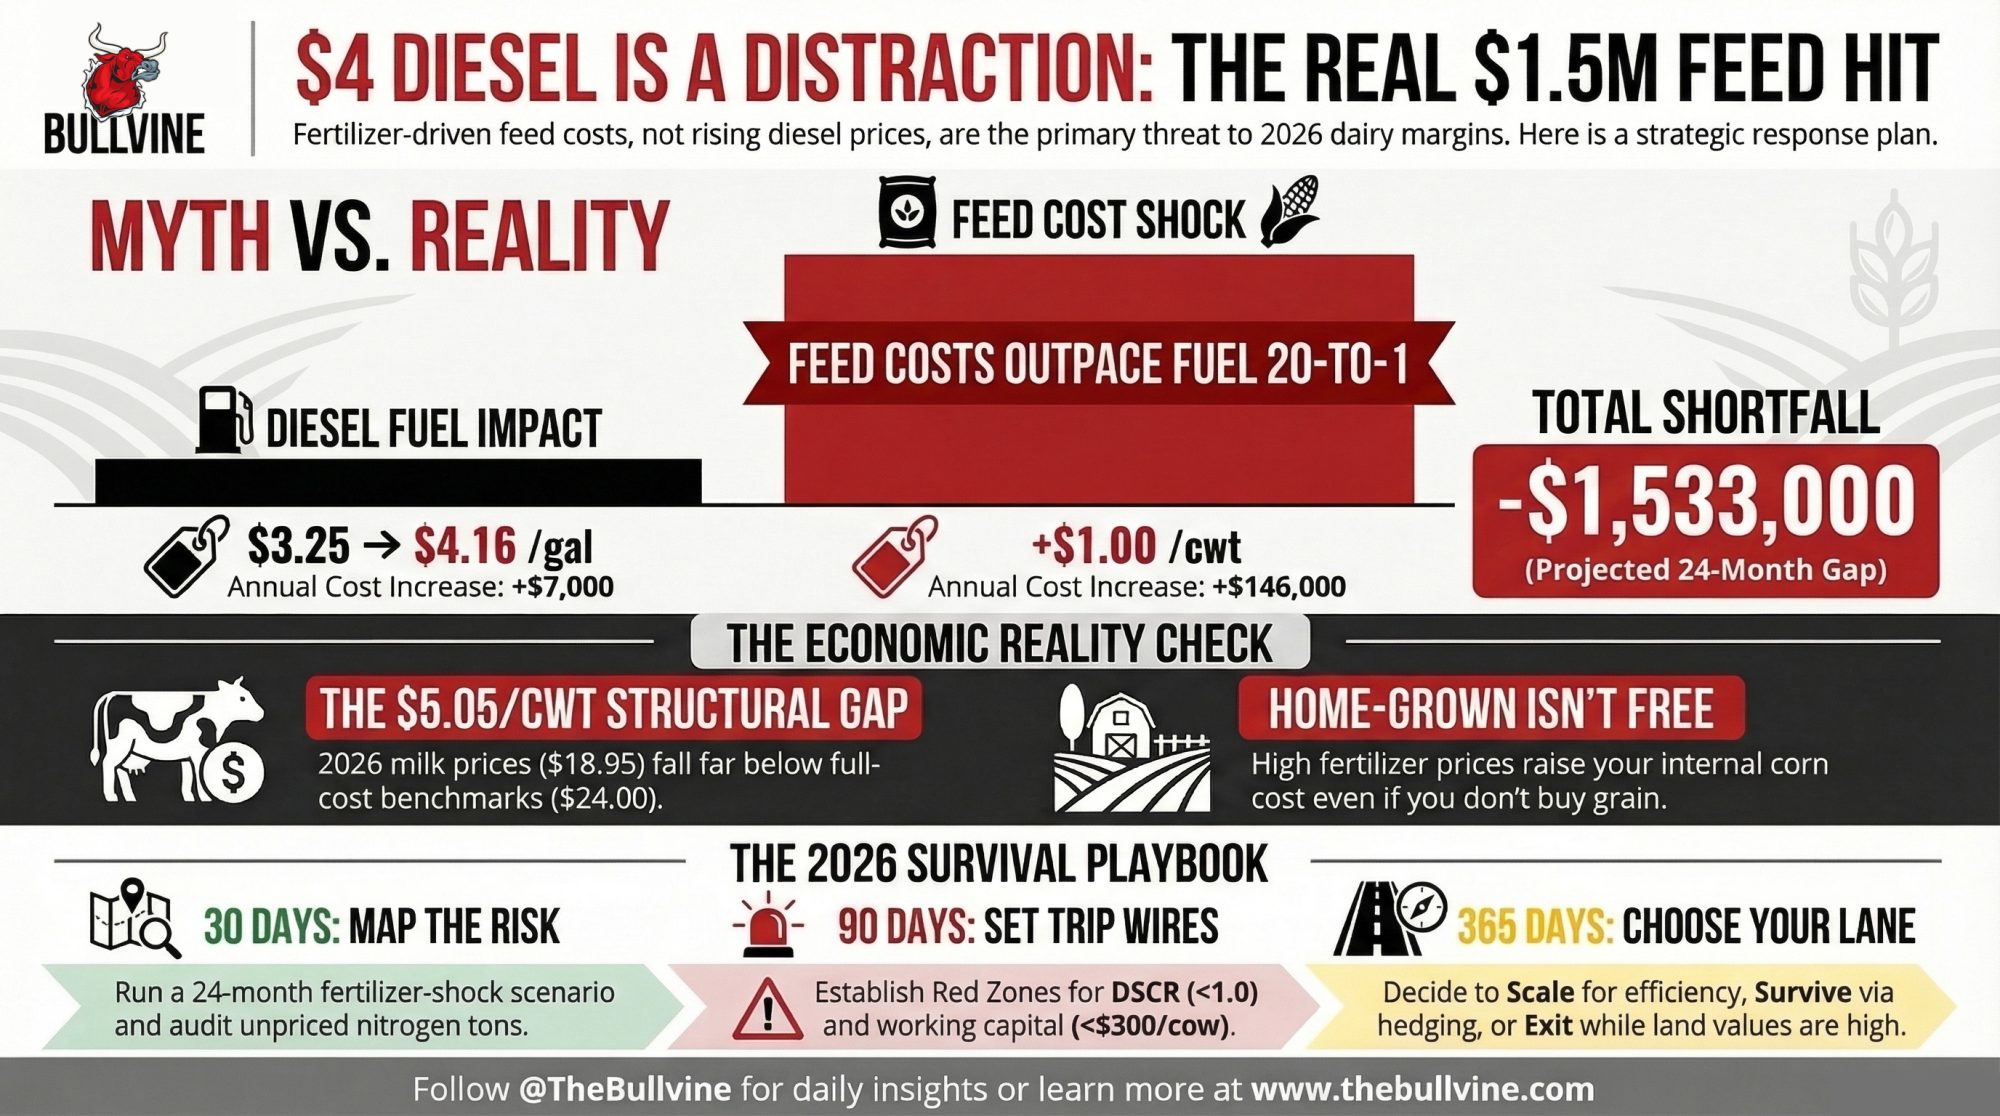
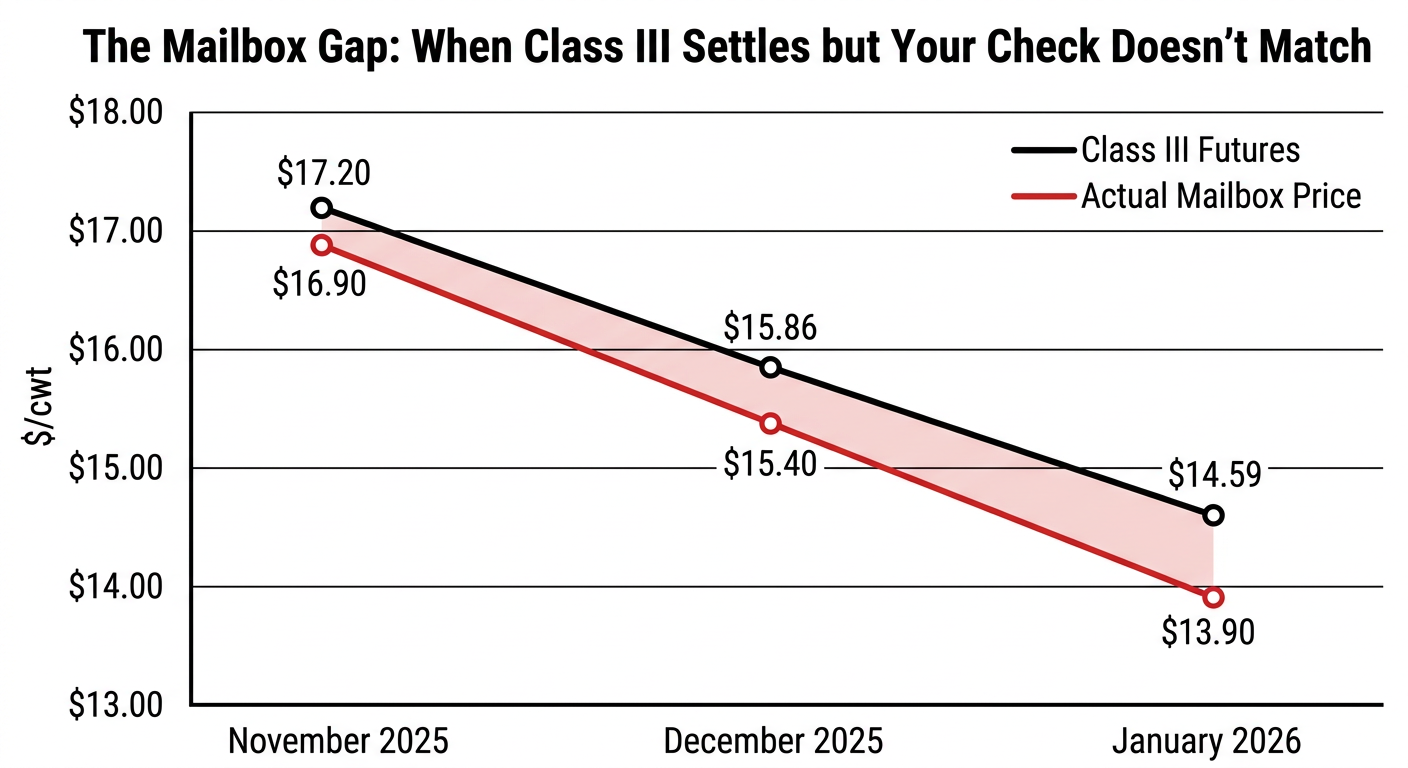
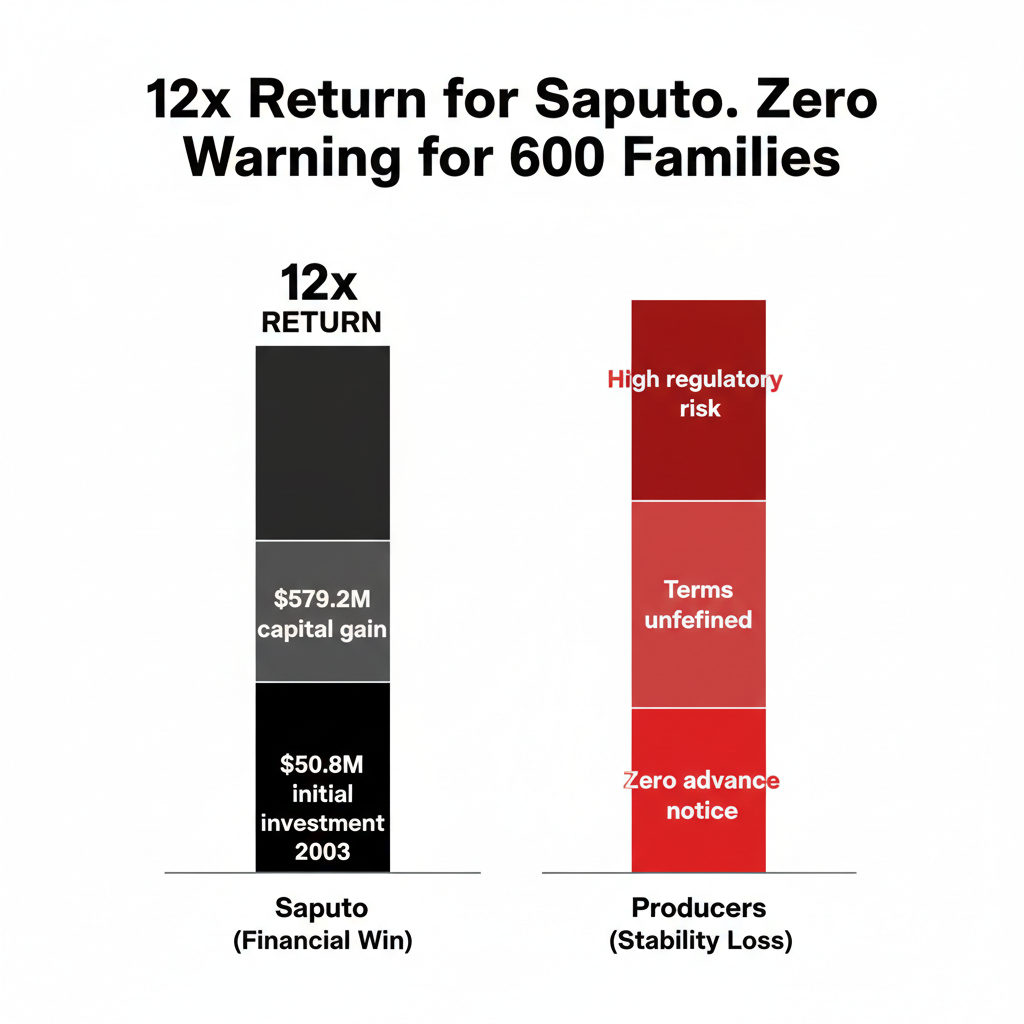
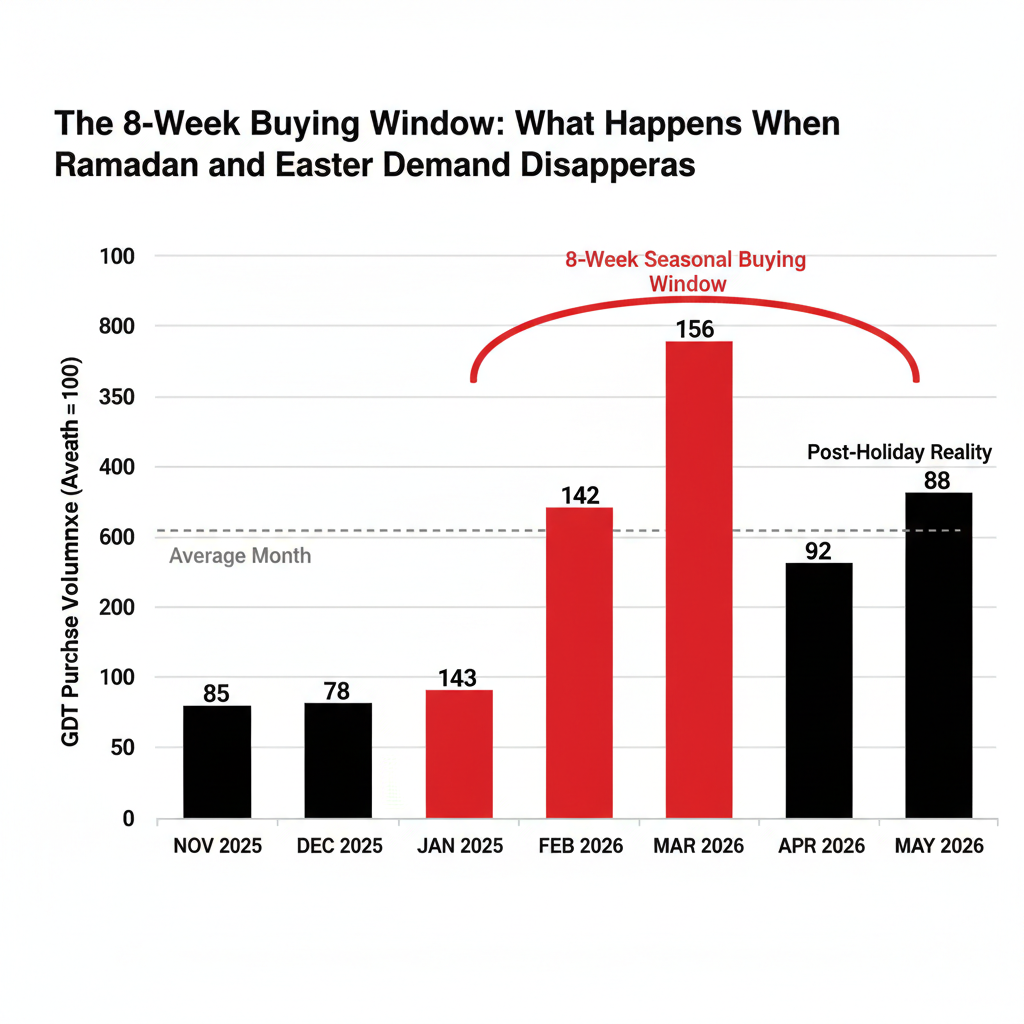
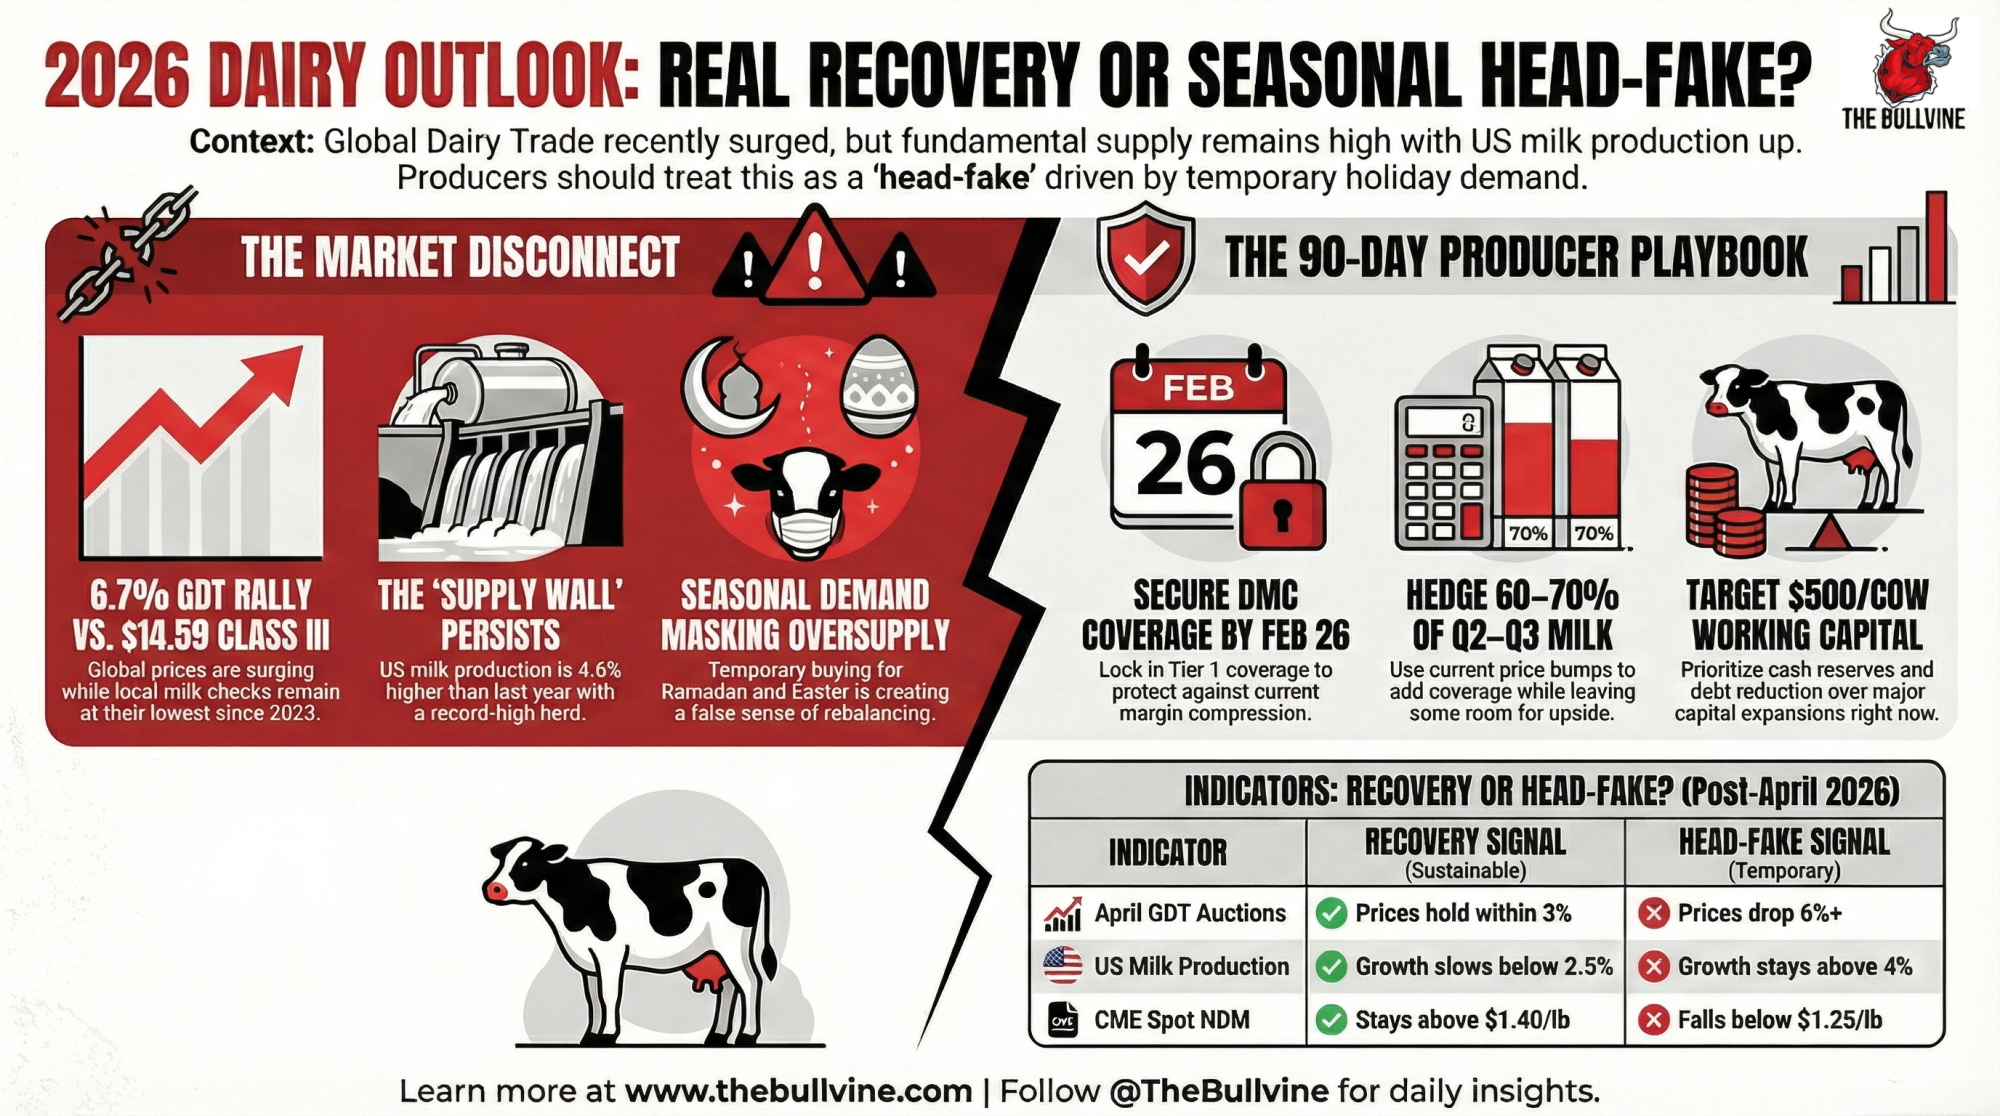
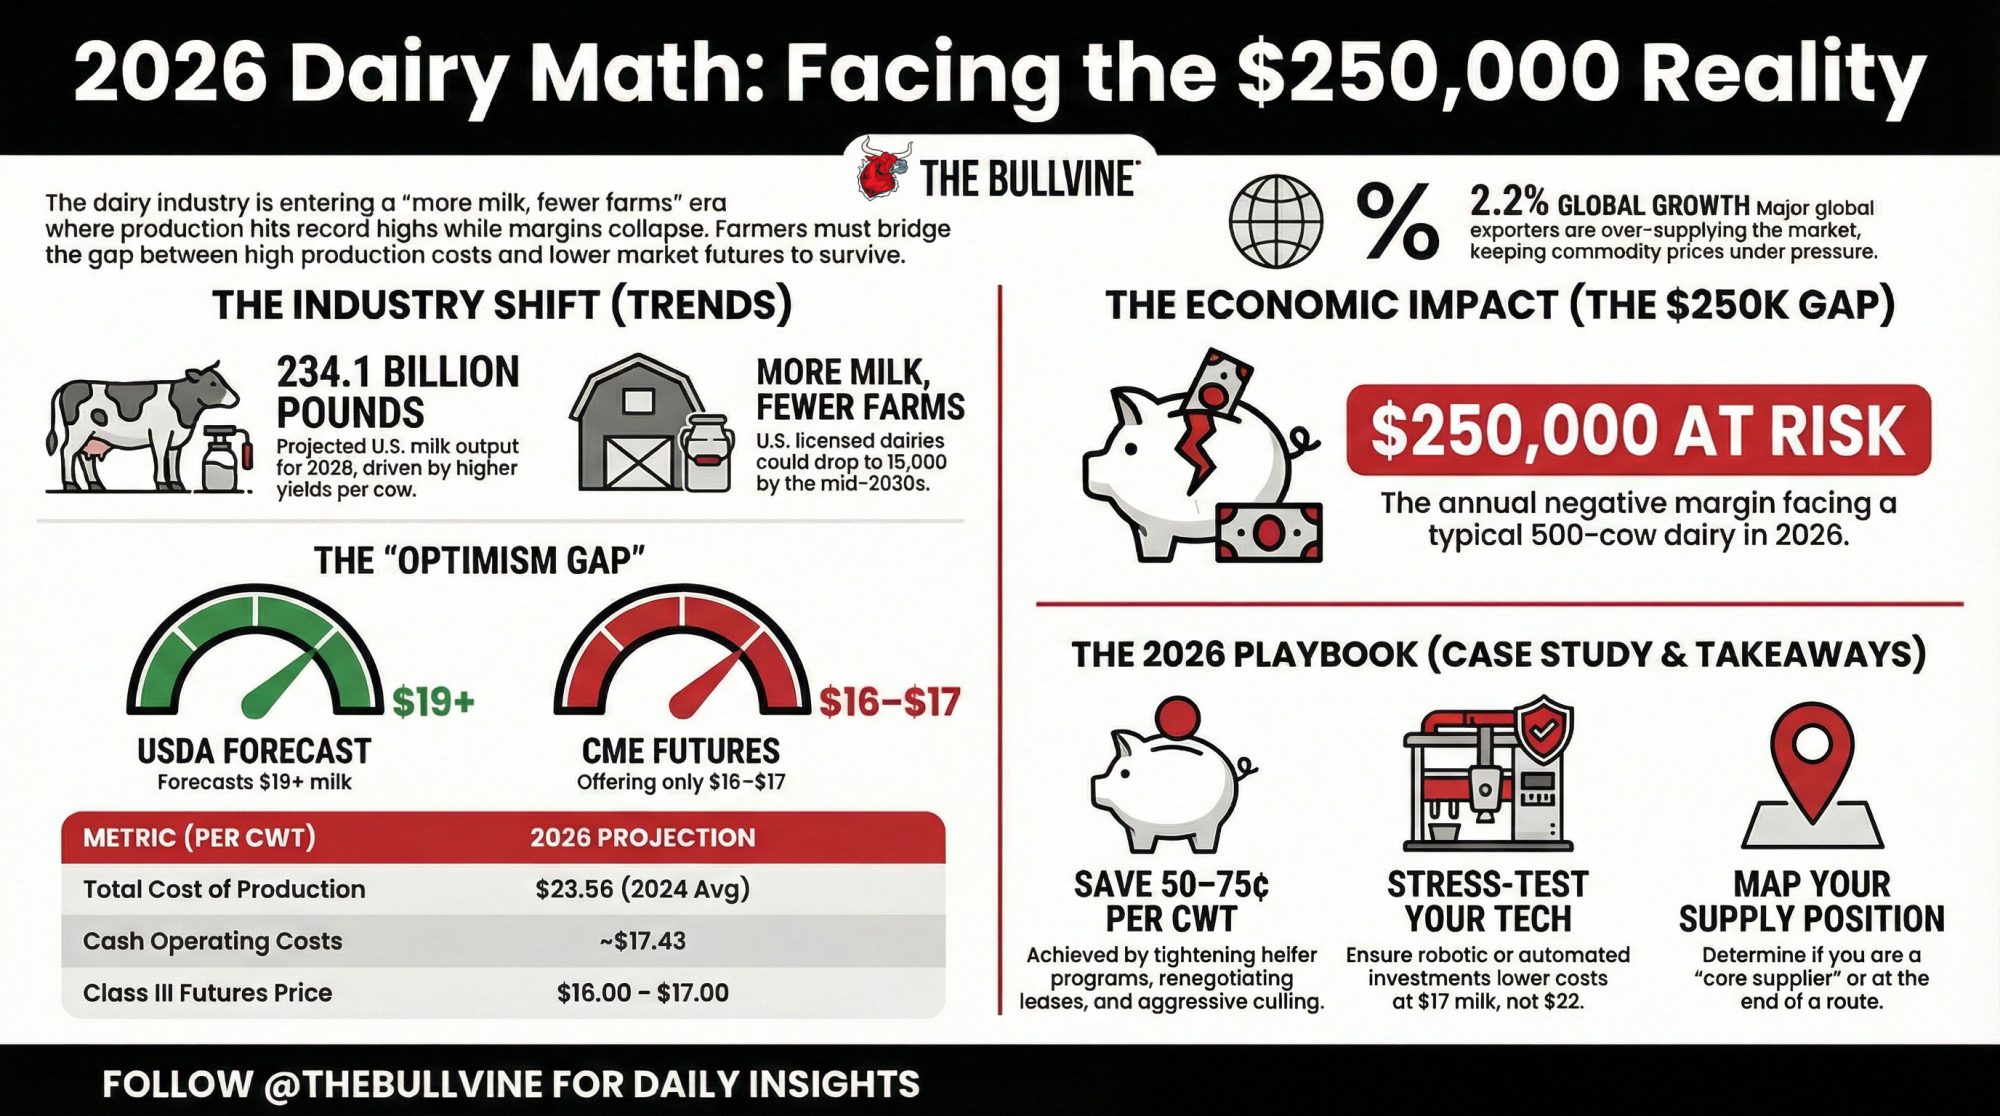
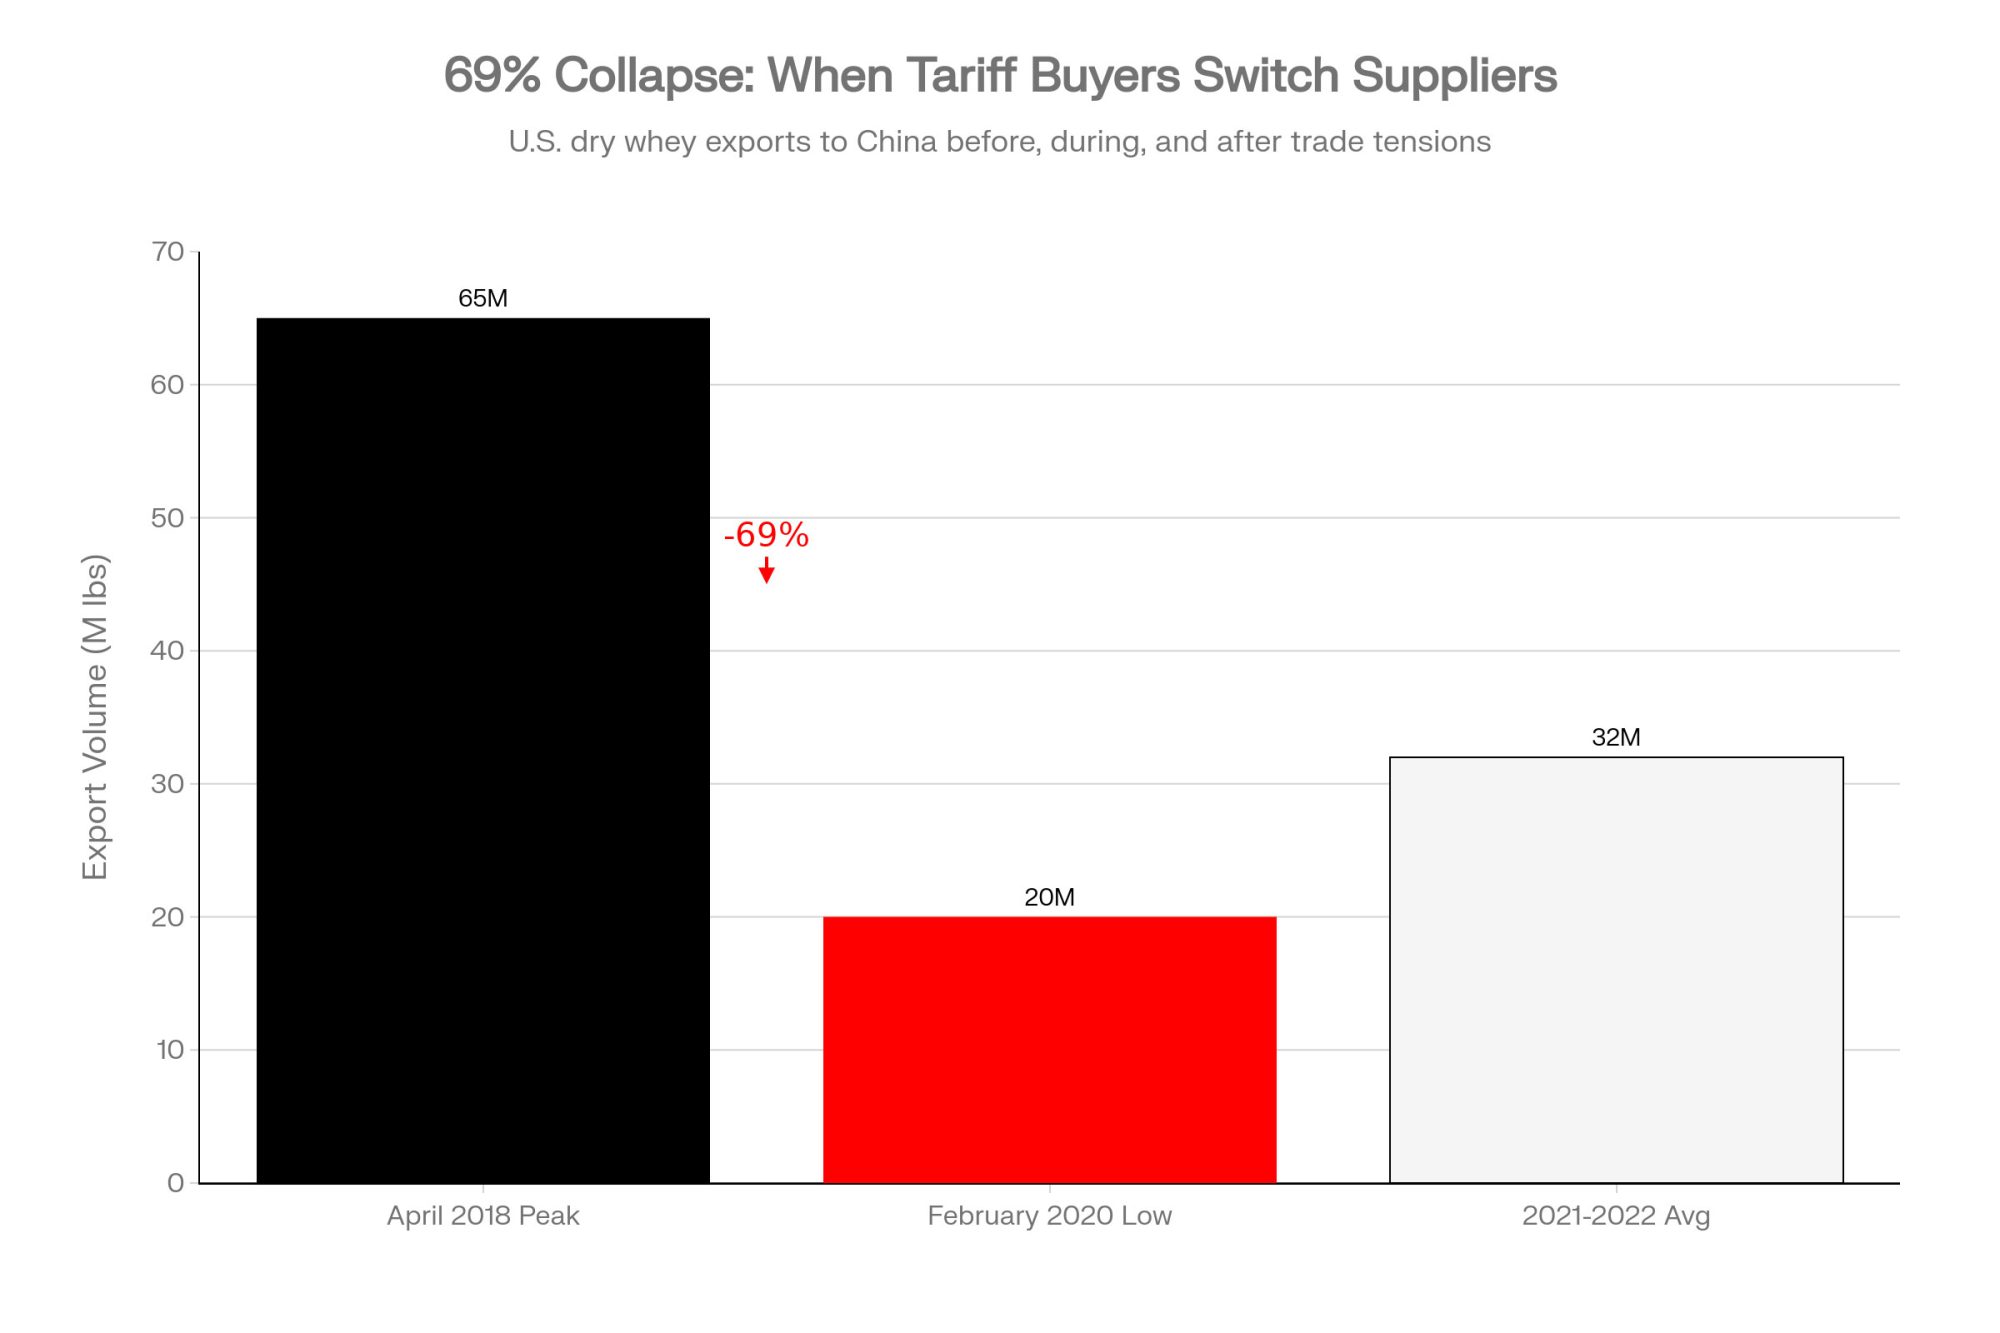
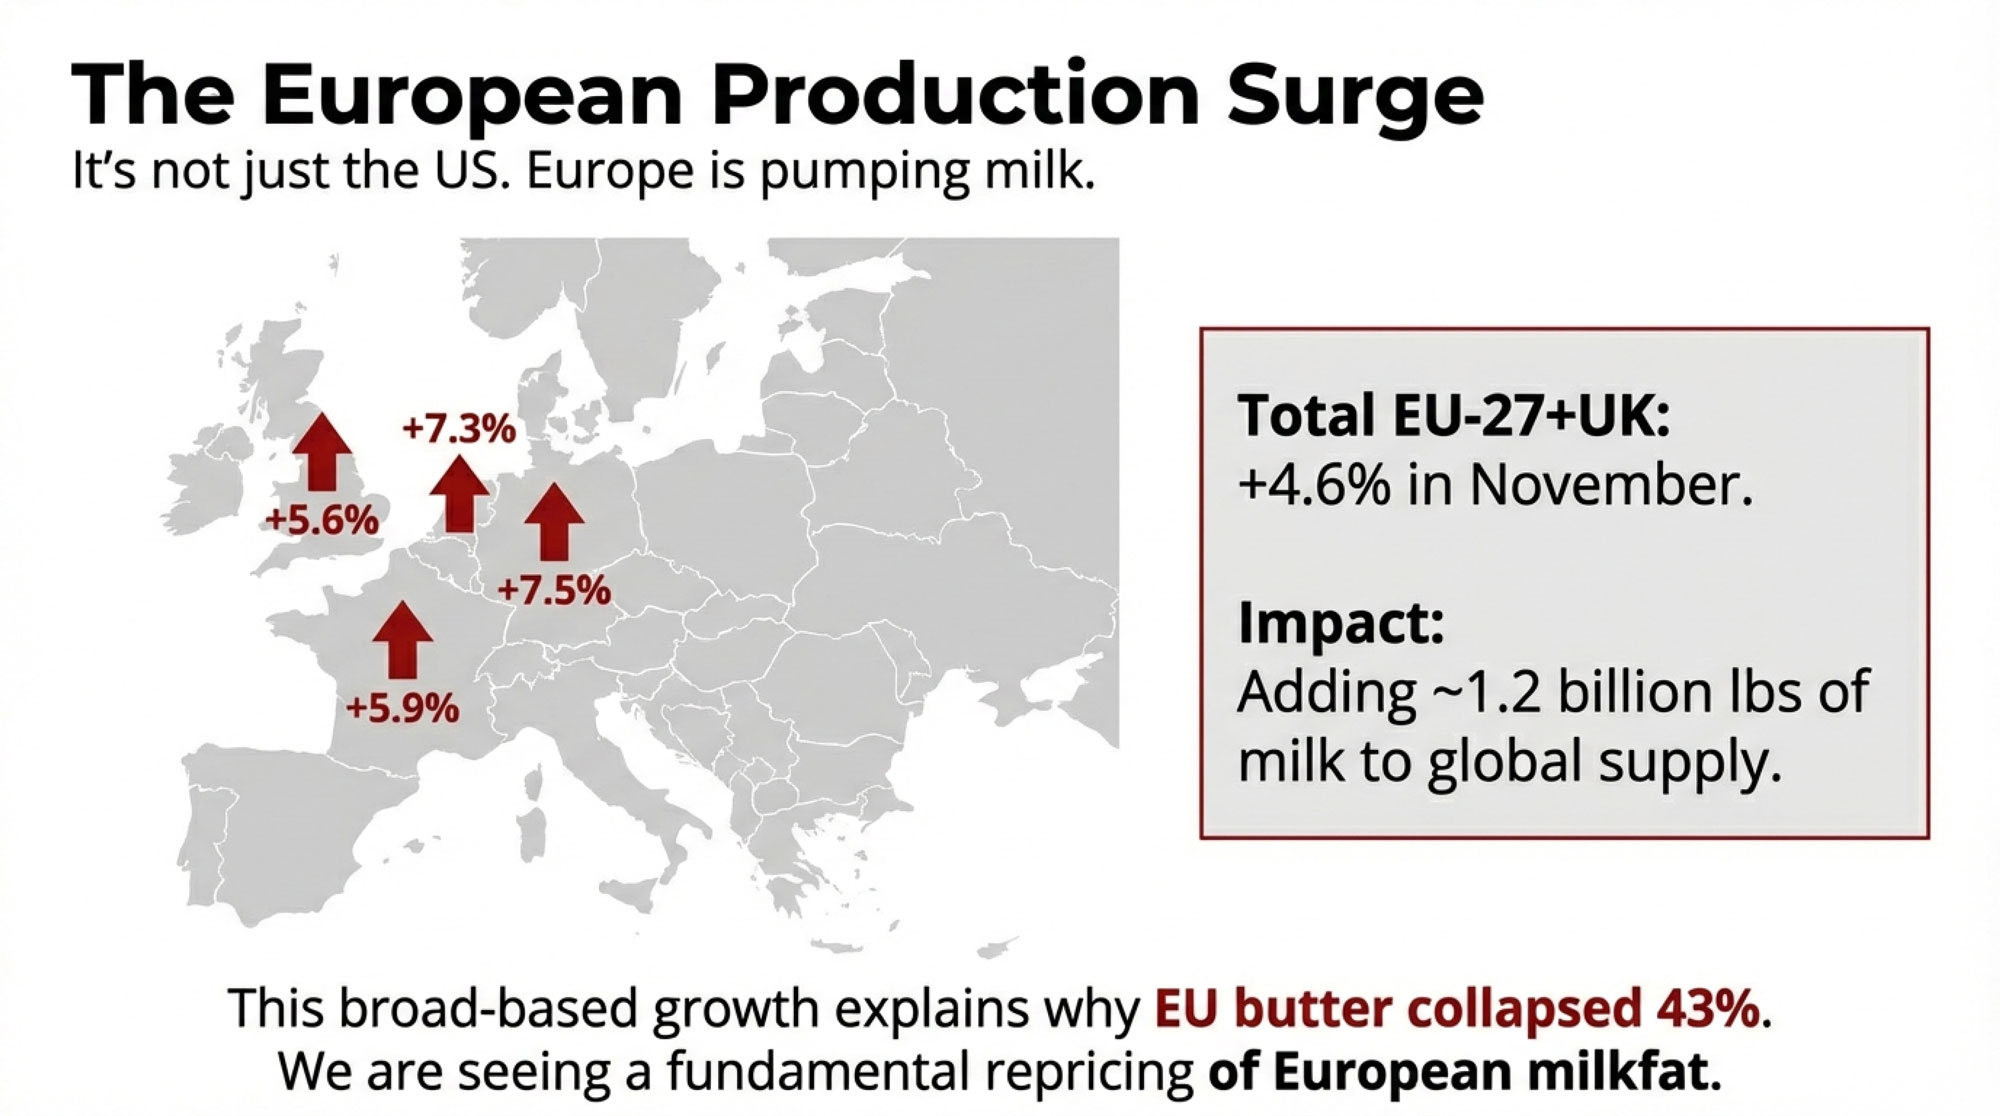
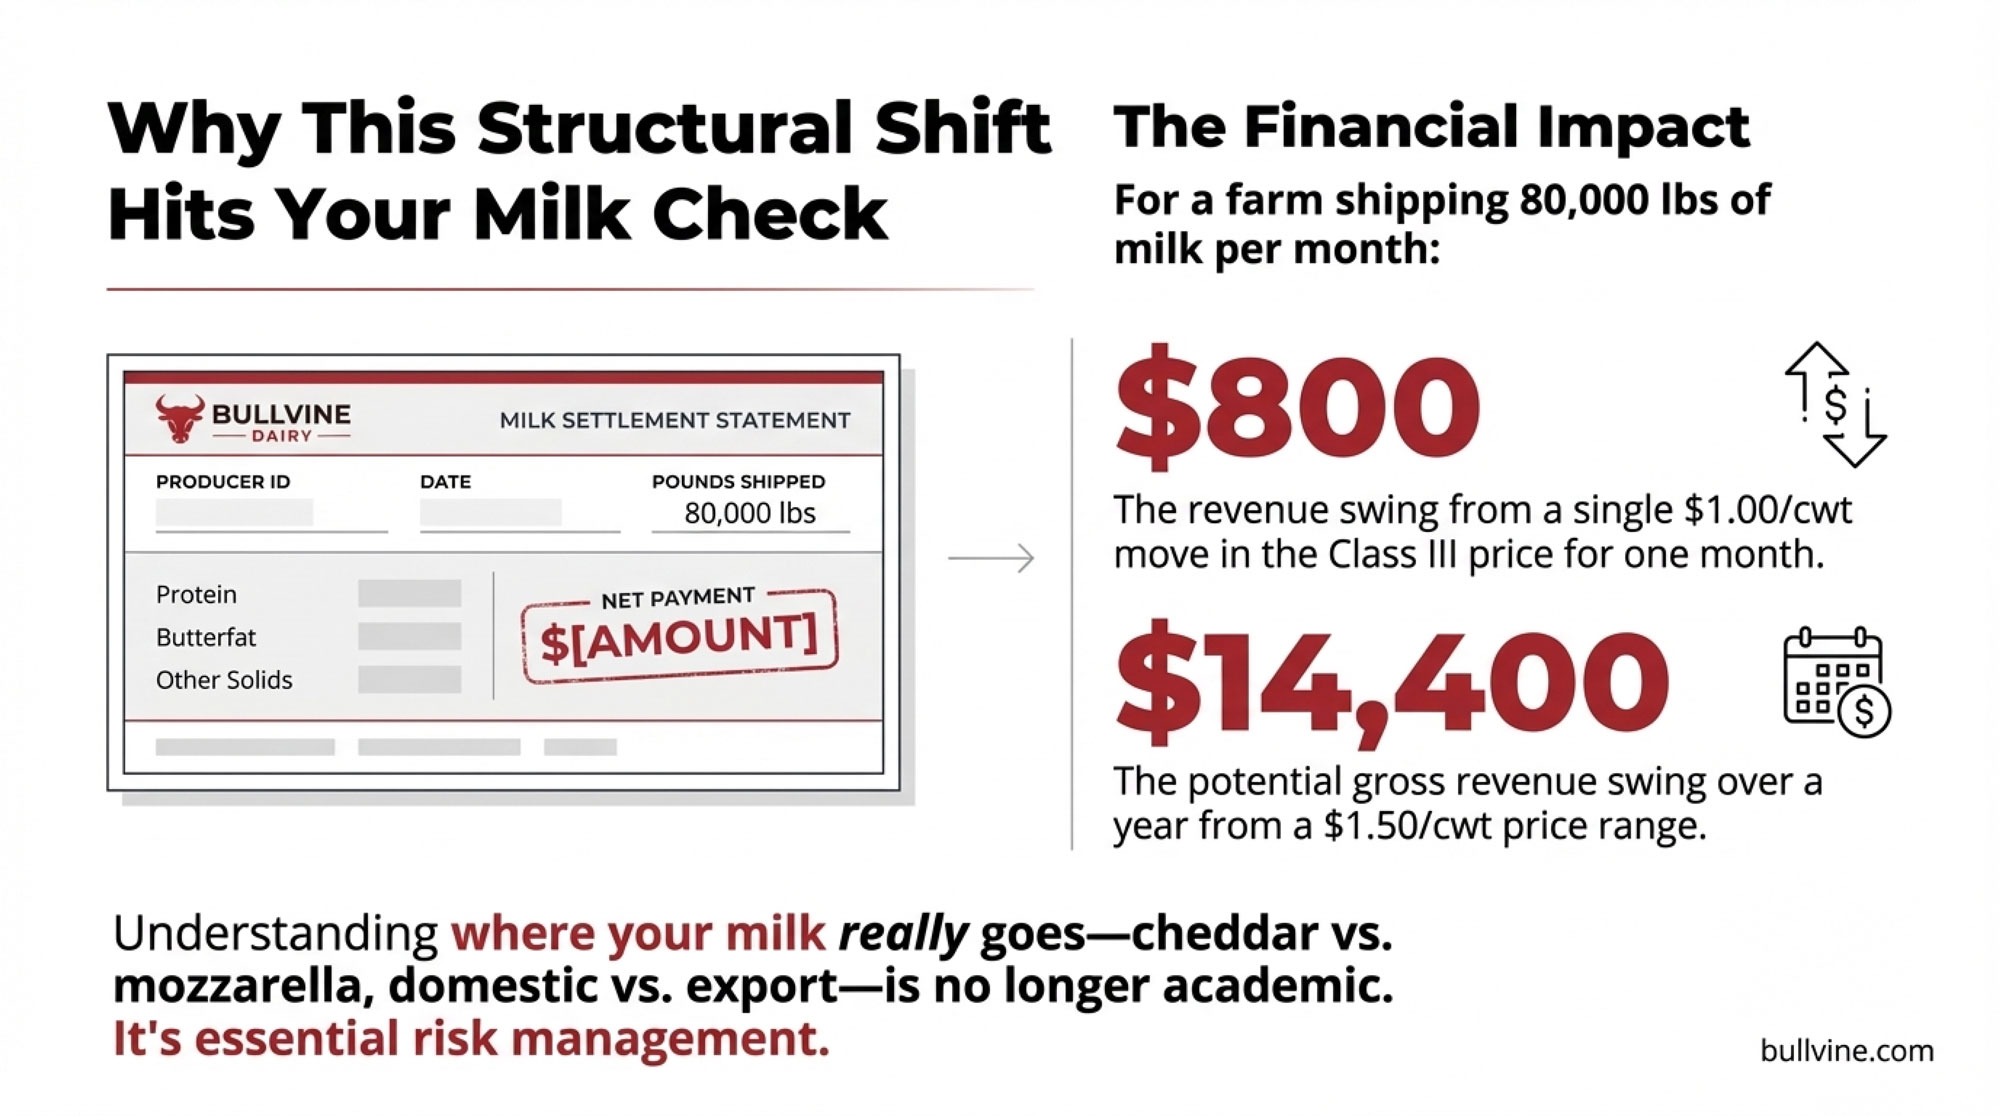
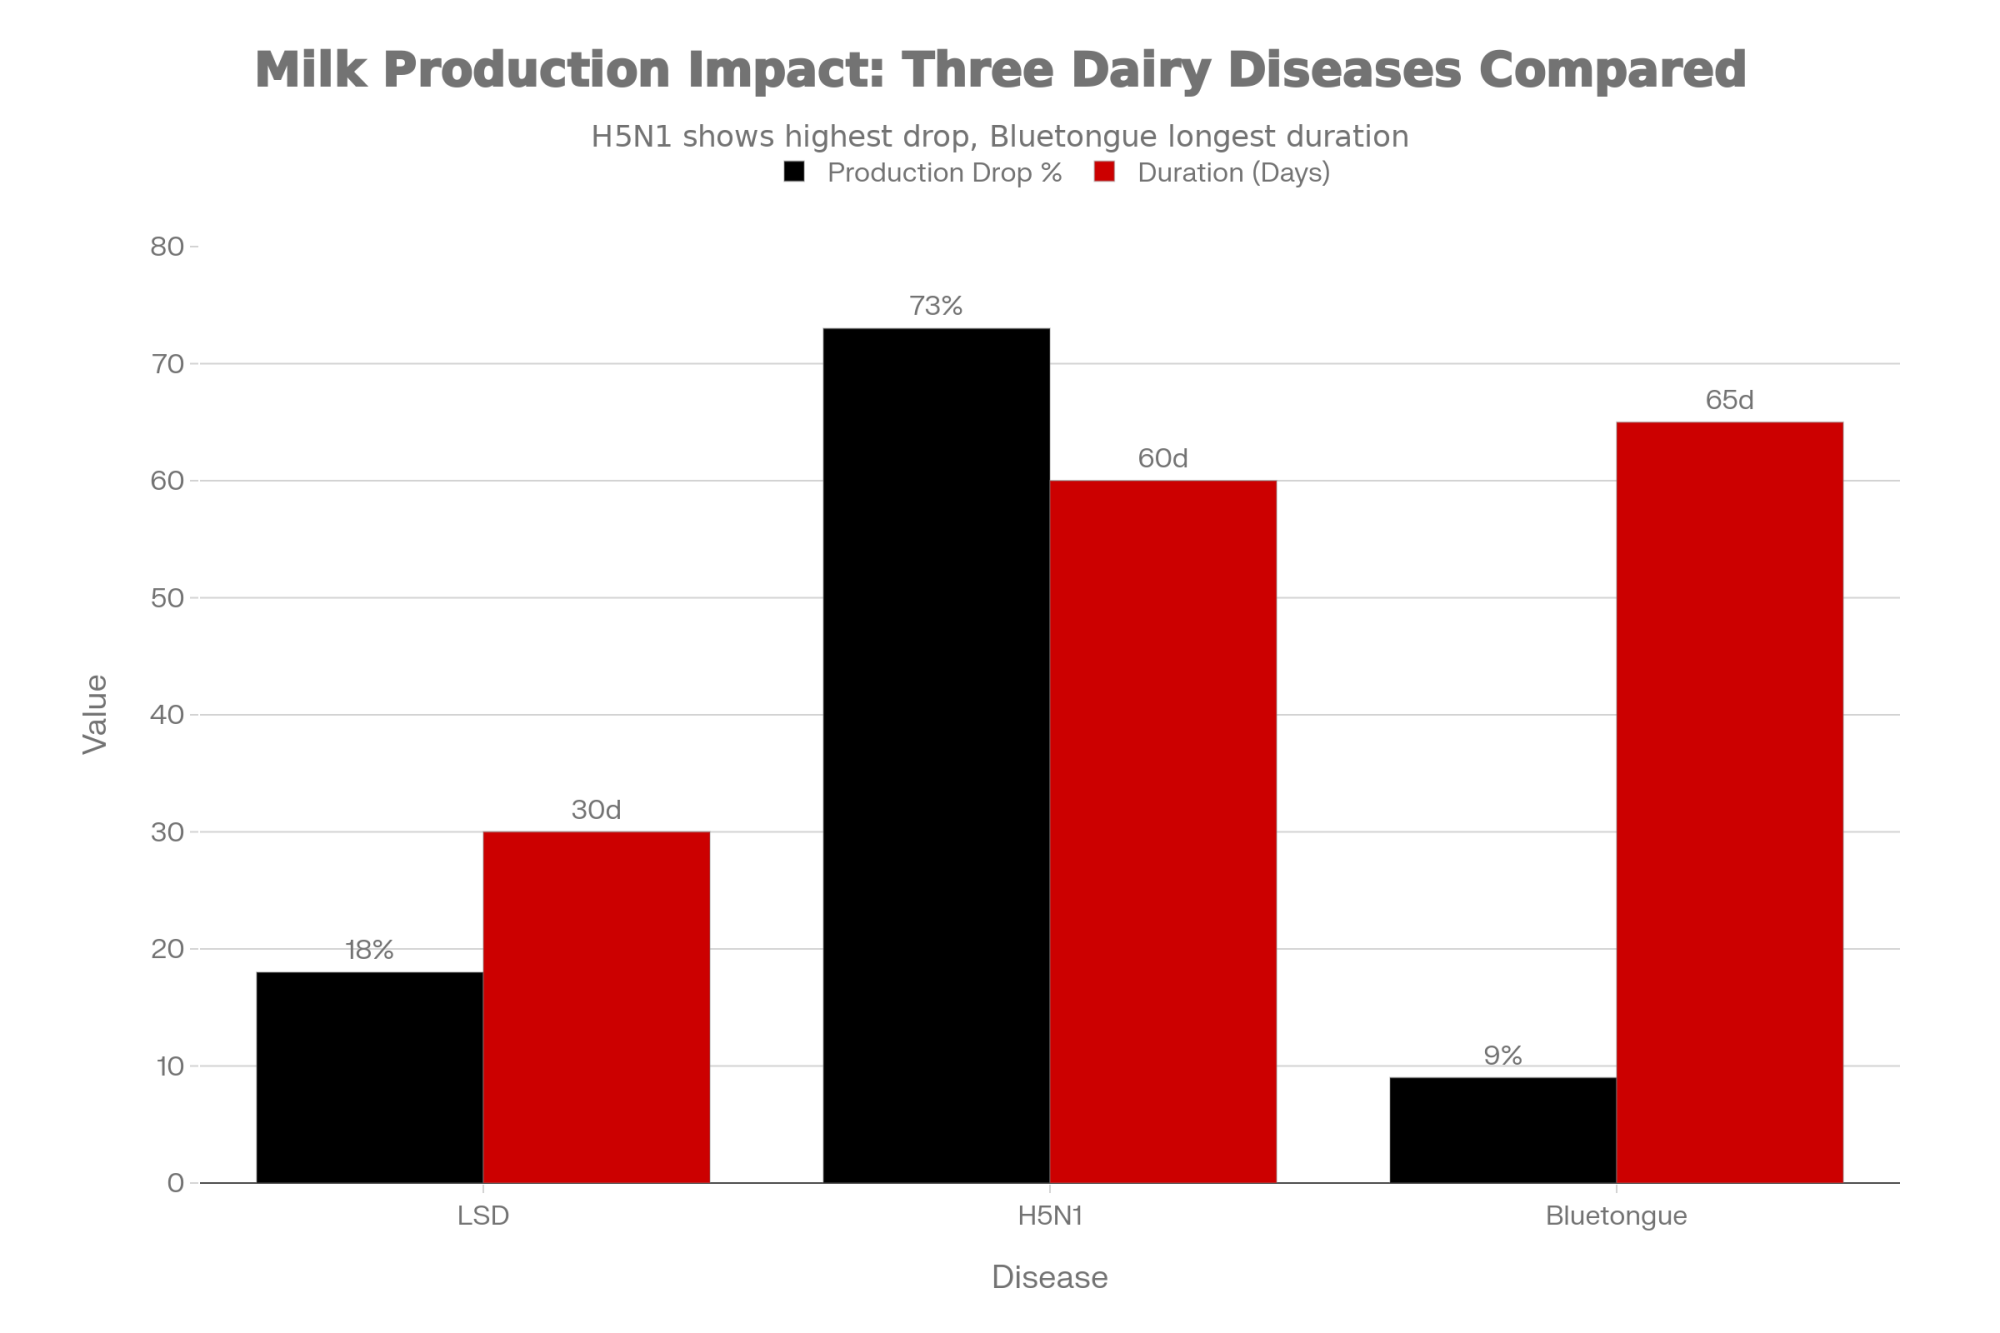
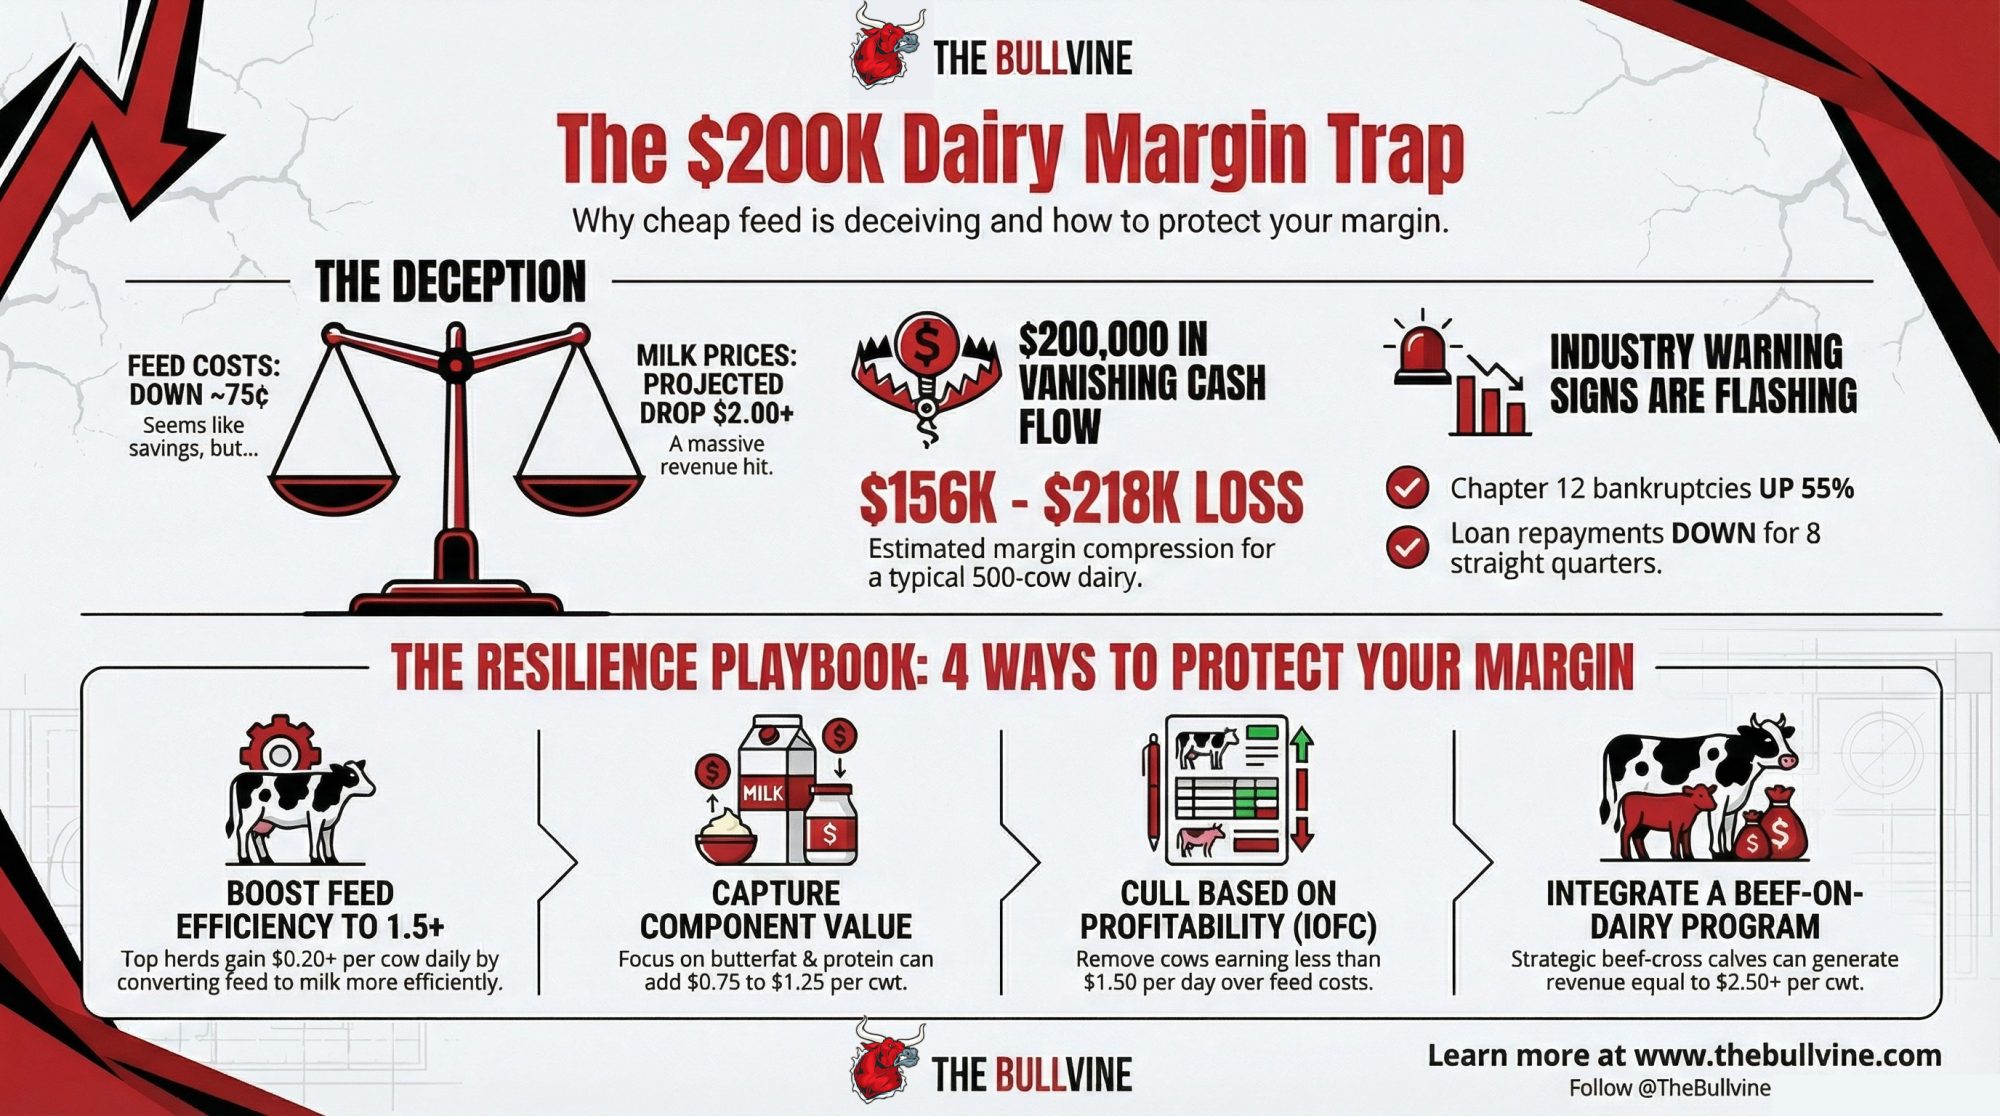
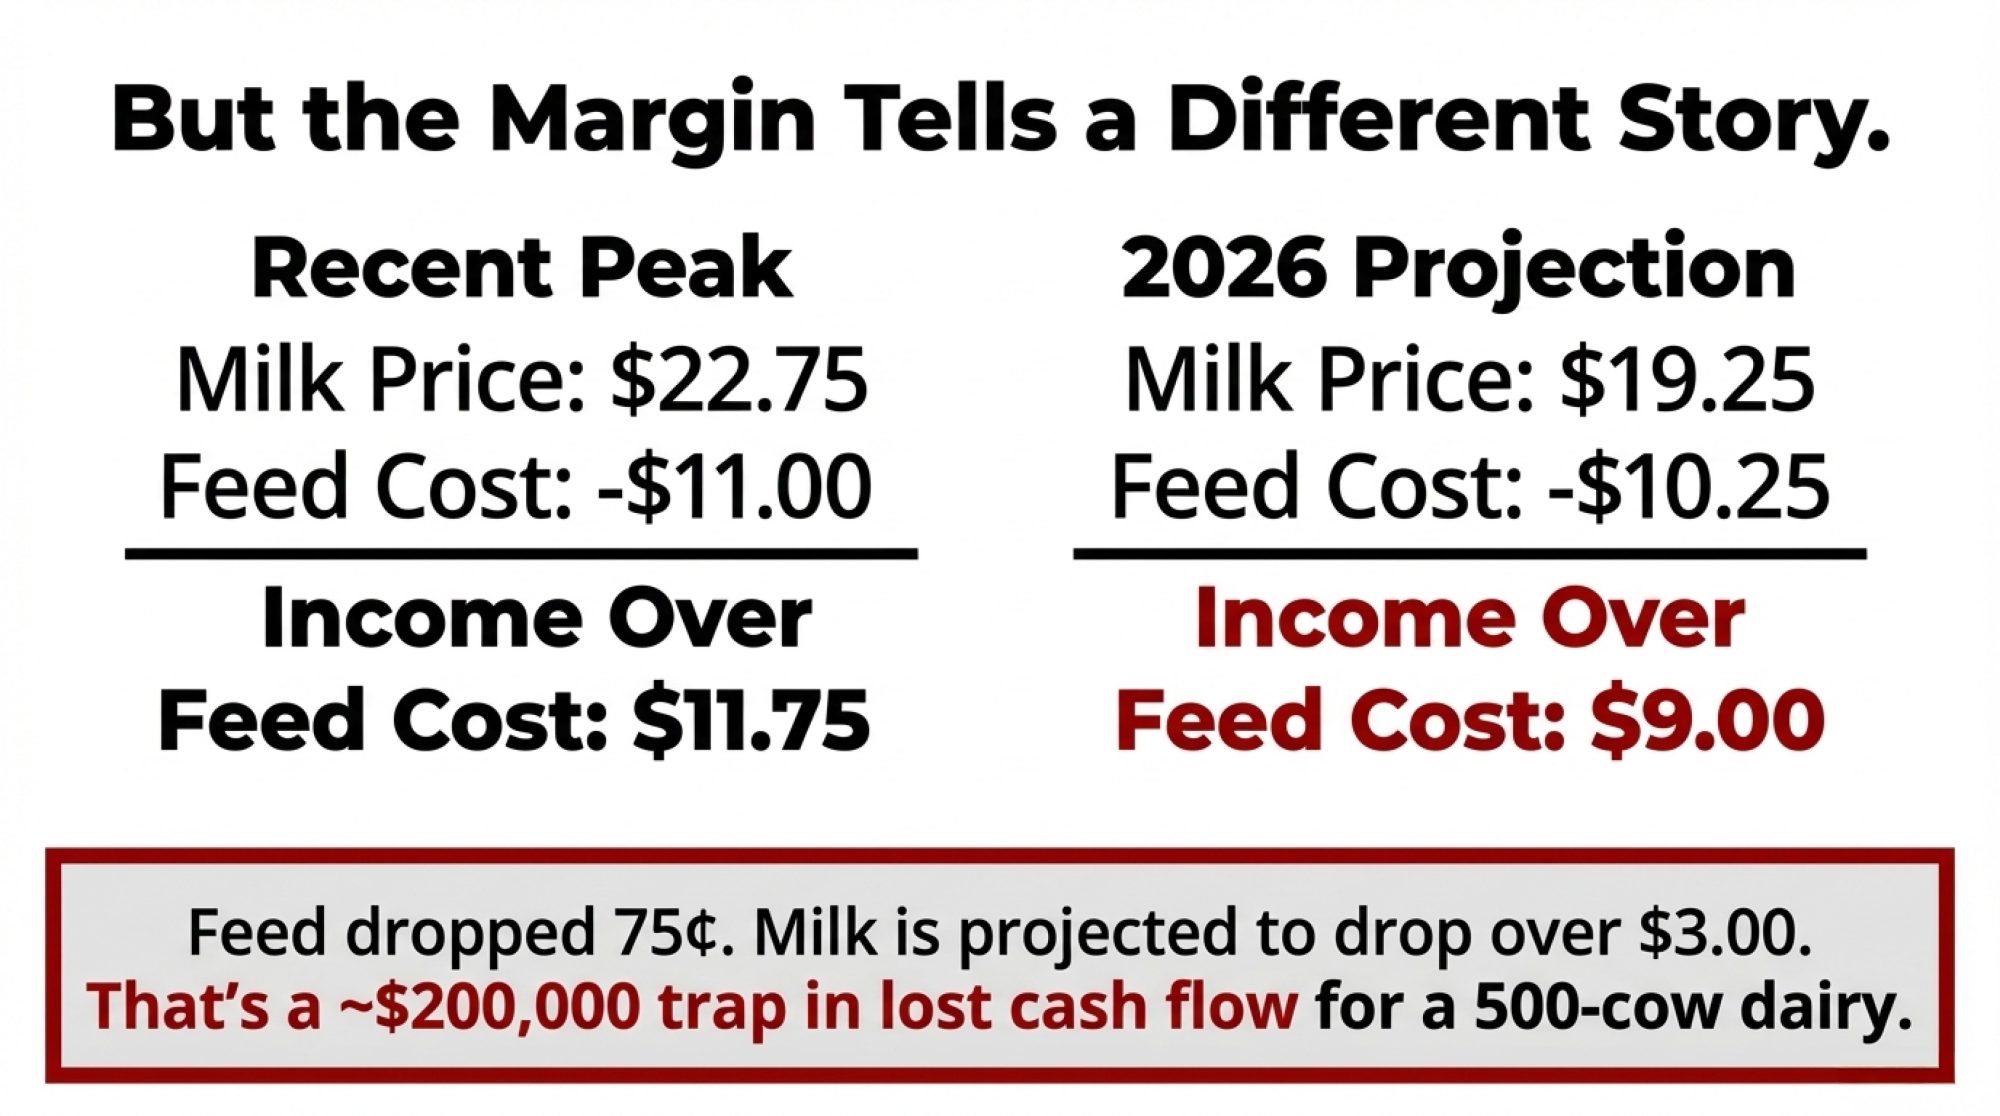
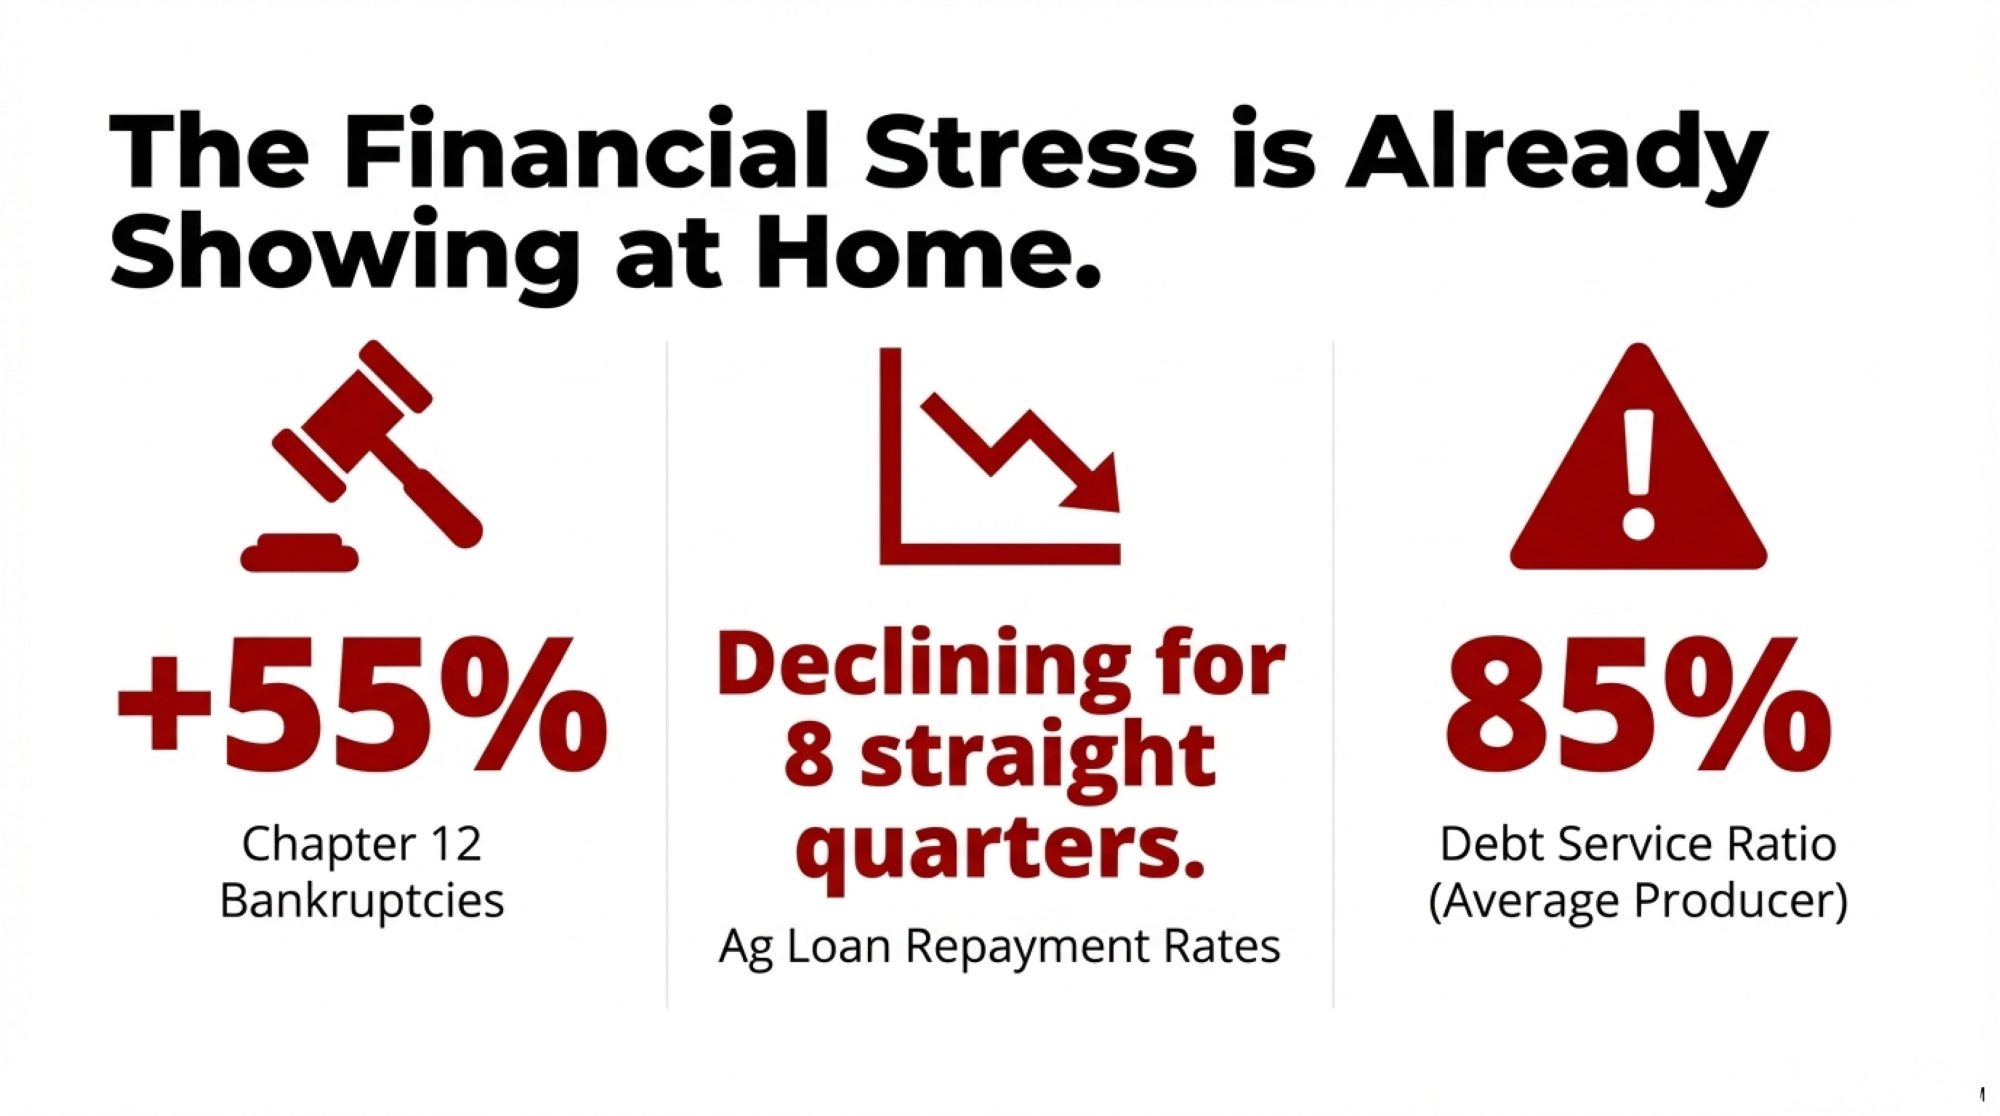
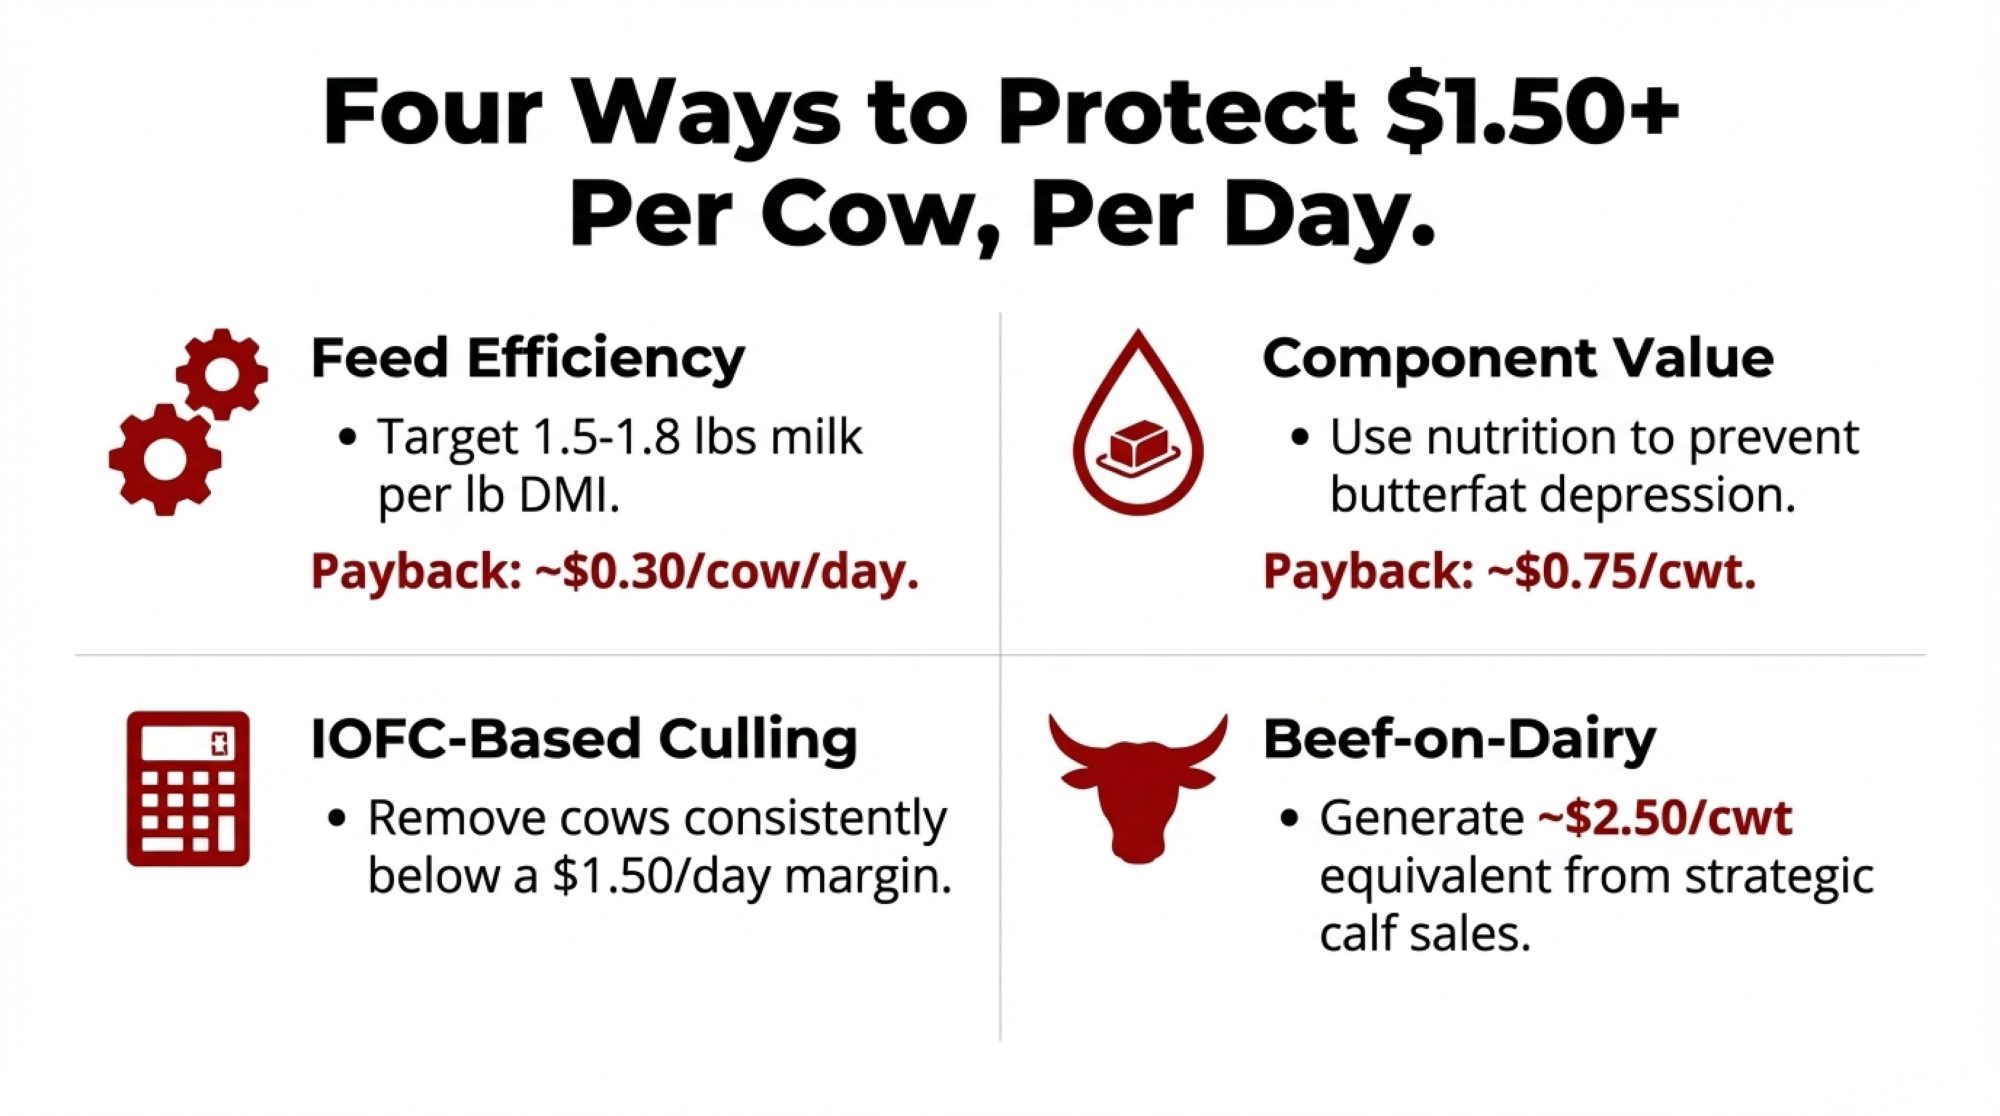
January exports hit a record 12% jump. Your milk check rose 4%. That $0.40/cwt gap isn’t abstract — on 500 cows, it’s $54,750 a year walking out the door.
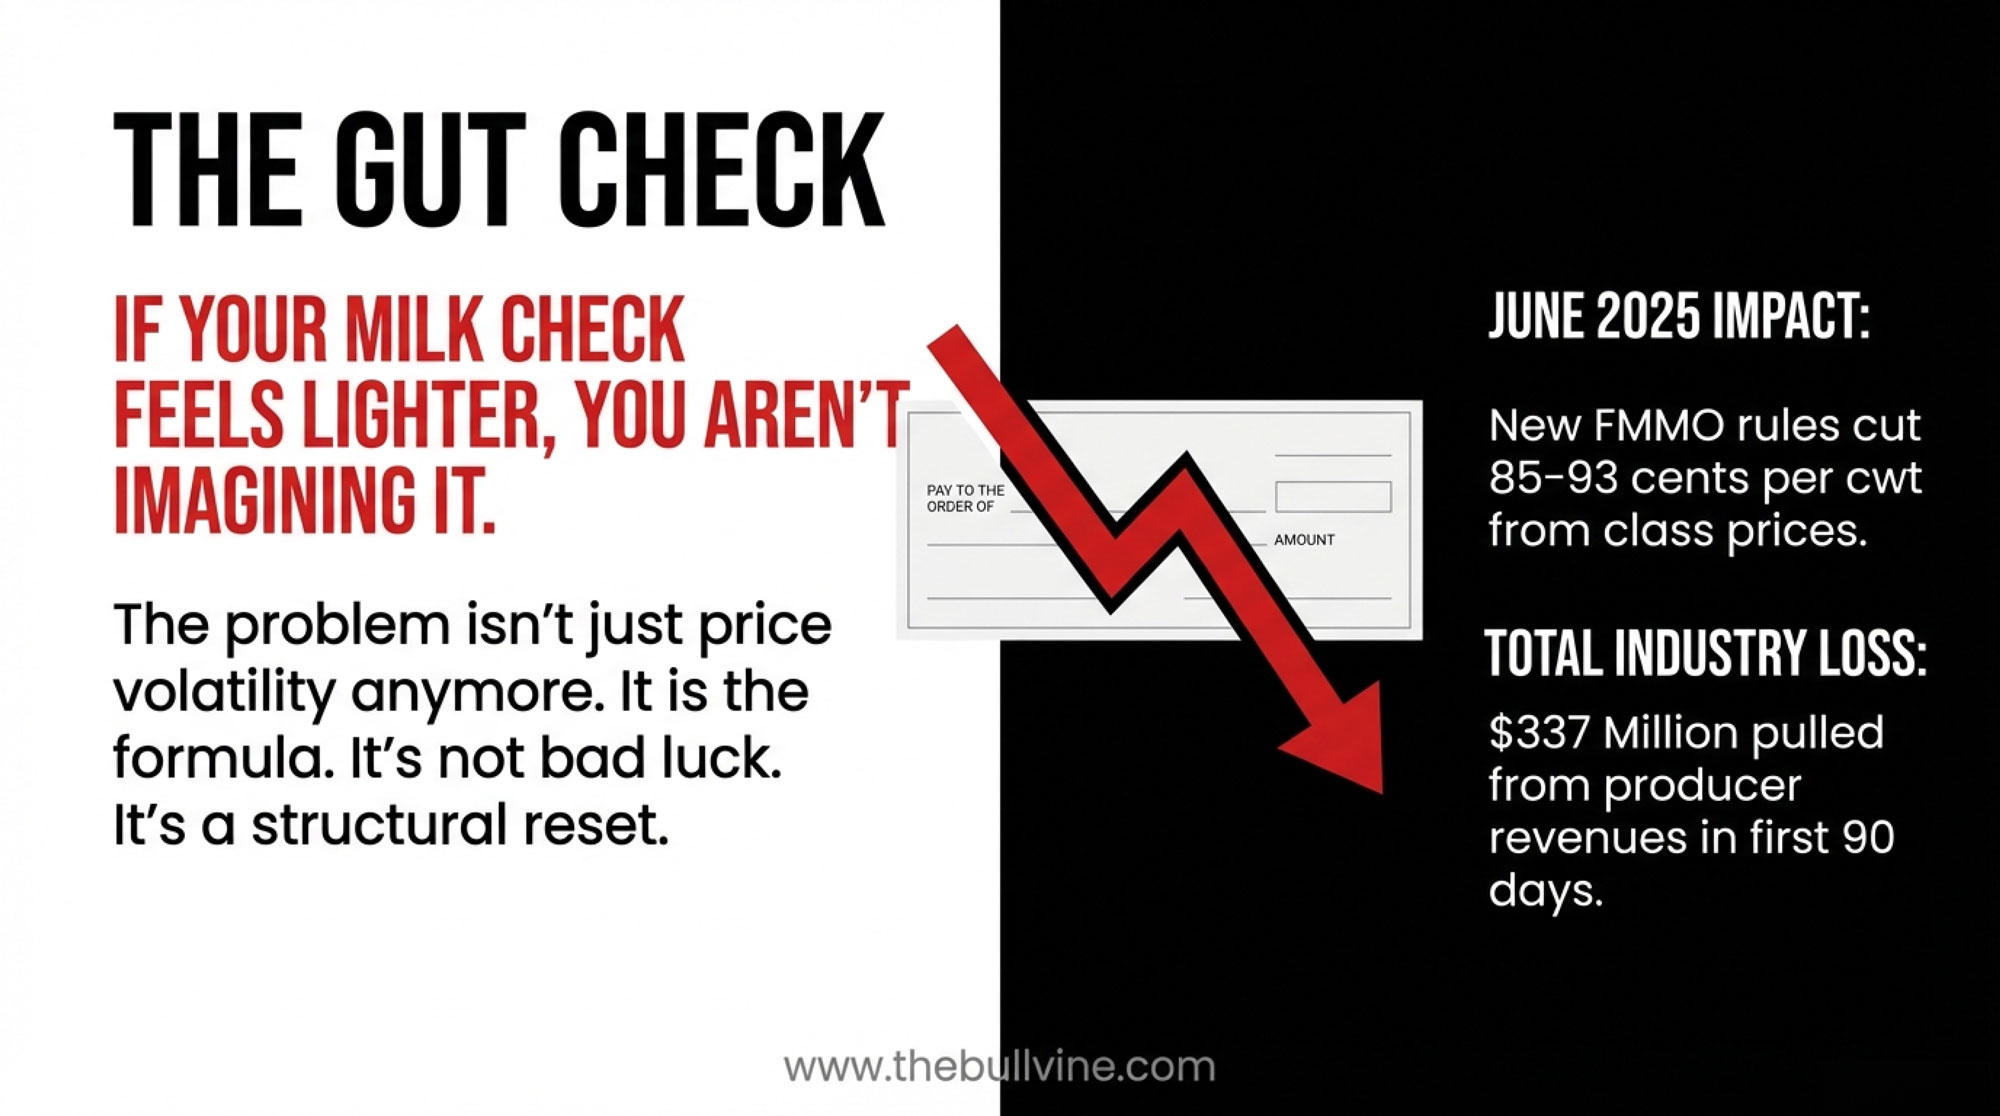
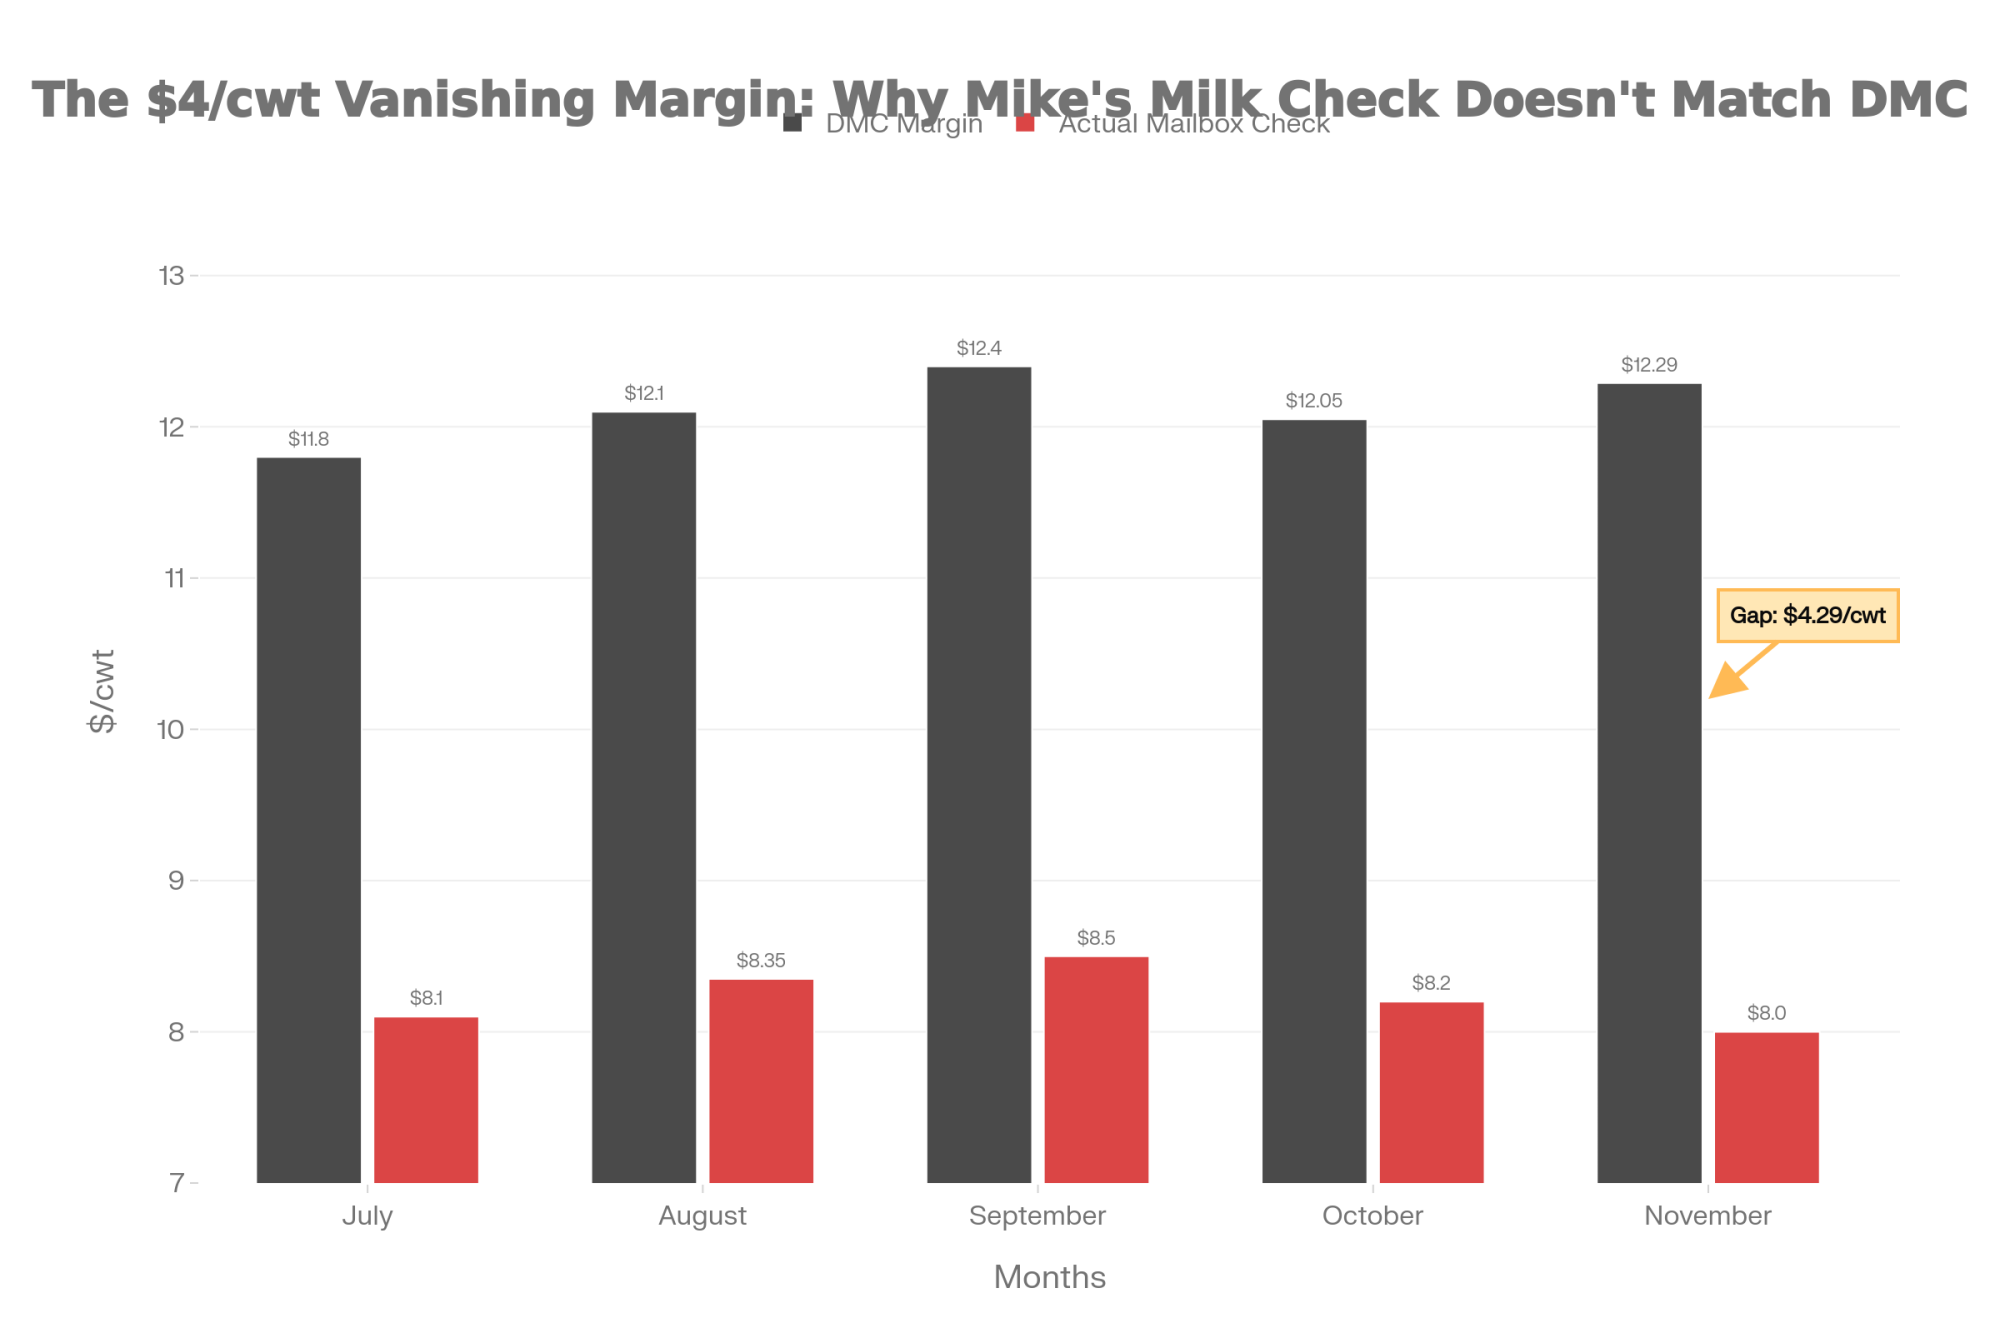
Executive Summary: U.S. dairy exports shattered records in early 2026 — January volume up 12%, February cheese at an all-time 58,406 MT — but the gap between what the world pays and what hits your mailbox keeps widening. ADC estimates the all-milk-to-mailbox spread has grown roughly $0.40/cwt since the FMMO make-allowance changes took effect; on a 500-cow herd, that’s about $54,750 a year not reaching the bulk tank. NFDM hit $2.06/lb on April 9 — highest since January 2014 — as protein gets pulled into yogurt, UF milk, and high-margin whey instead of dryers. Mexico and Canada account for 44% of U.S. dairy export value ($3.6 billion), and the USMCA formal review is set for July, with Canada’s quota system still unresolved. The full article walks through the barn math on both sides of that gap, lays out 30- and 90-day checks you can run against your own numbers, and flags the corridor and contract risks that could move your check before year-end.
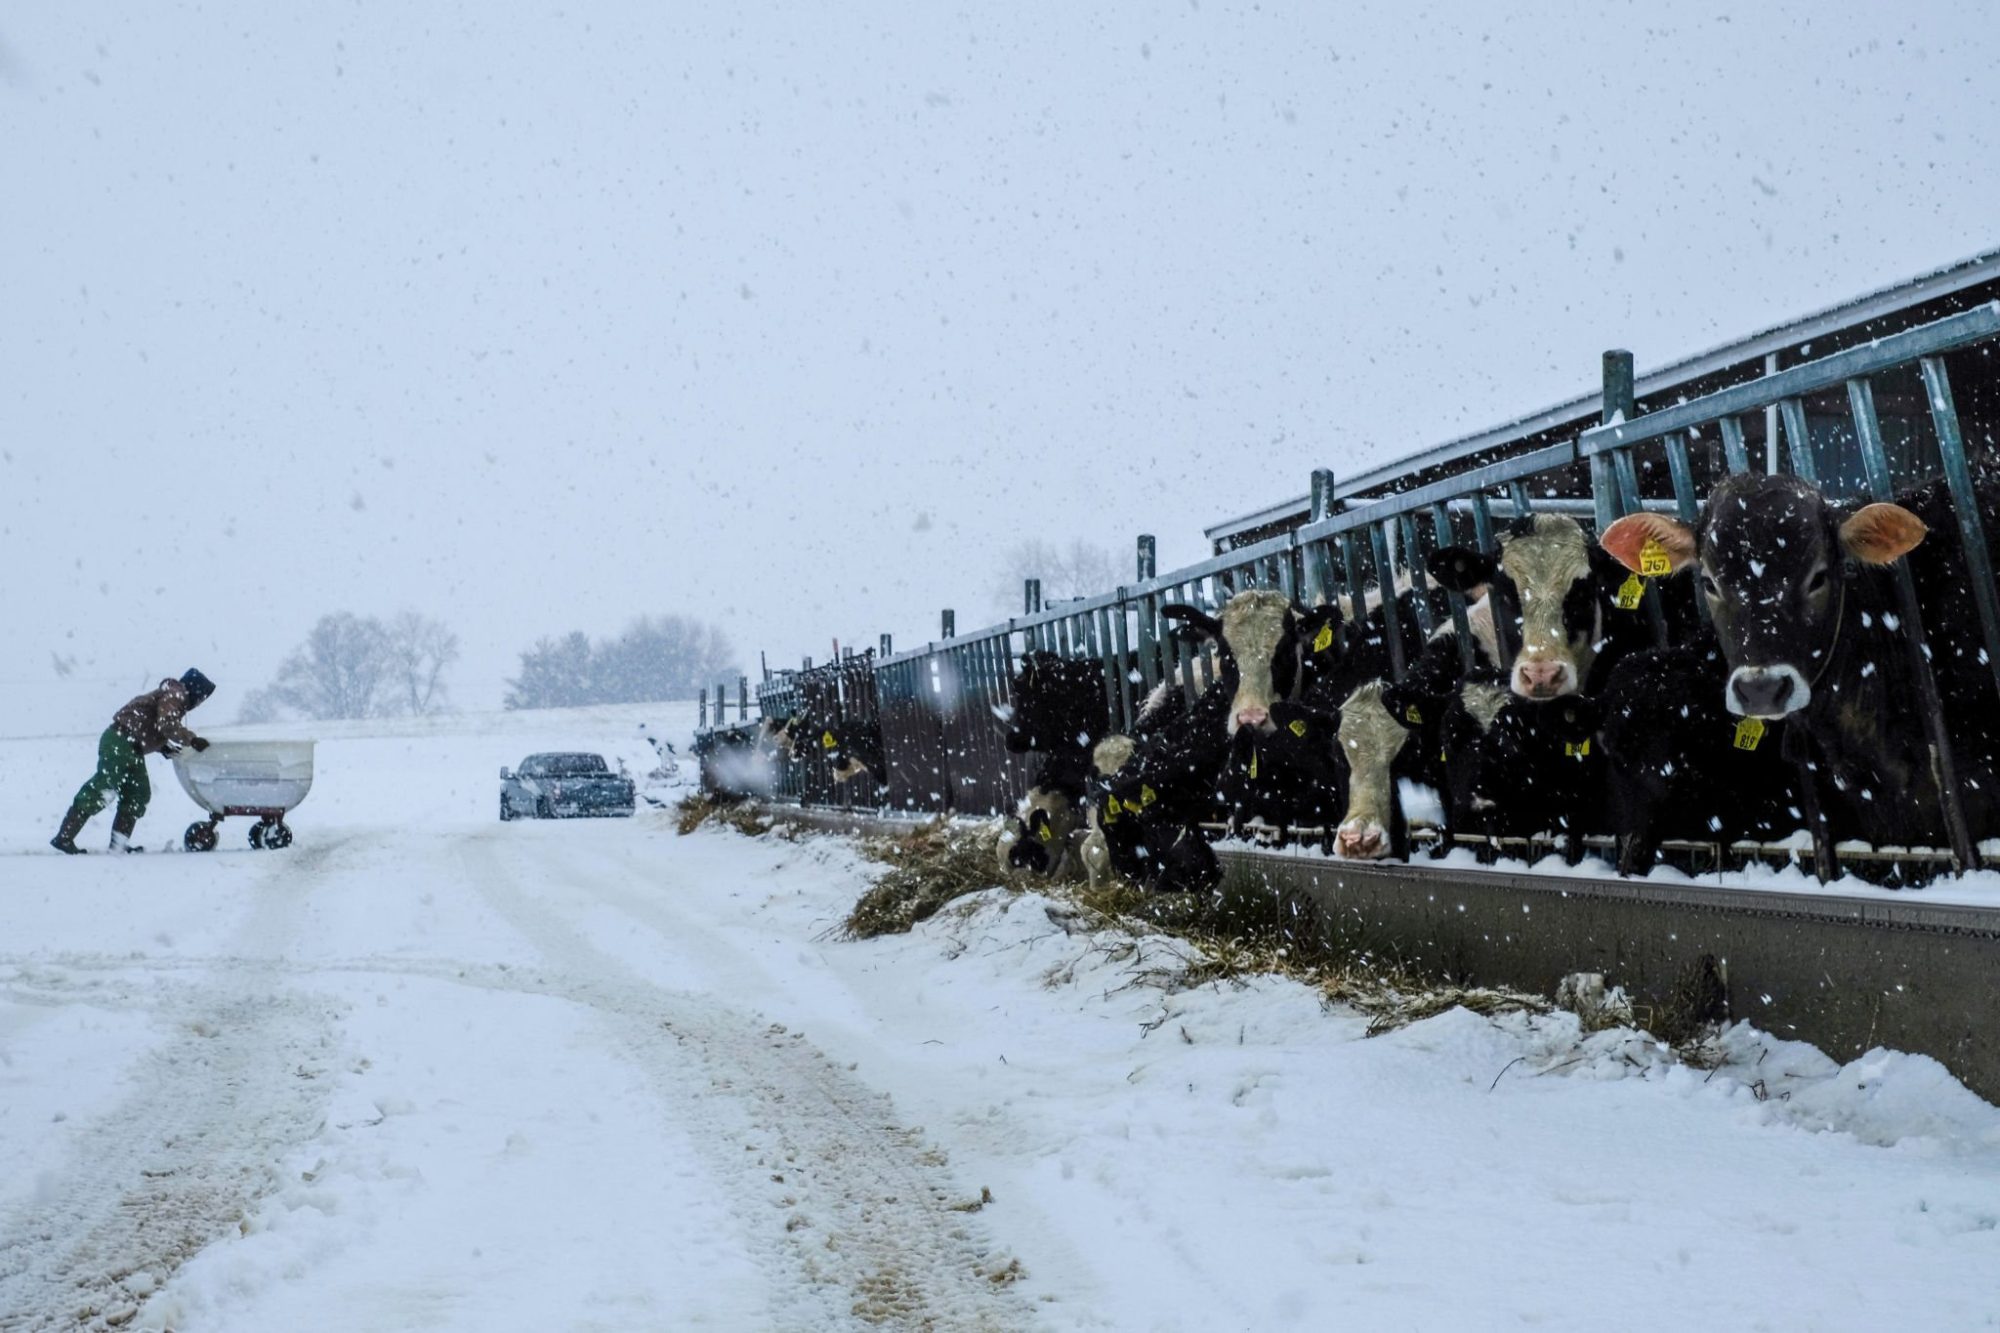
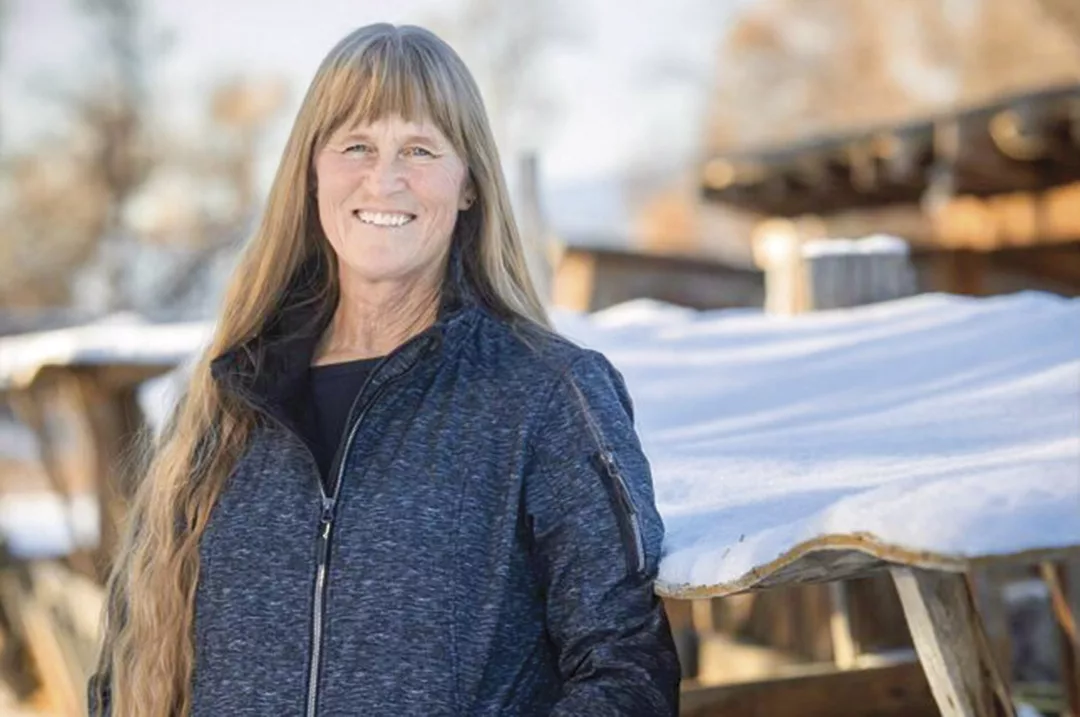
Becky Nyman, fourth-generation dairy farmer and USDEC chair, at Nyman Dairy Farm’s 1,200-cow operation in Hilmar, California. Nearly 1 in 5 pounds of U.S. milk now leaves the country — and Nyman’s fighting to make sure the value reaches the farms that produce it.
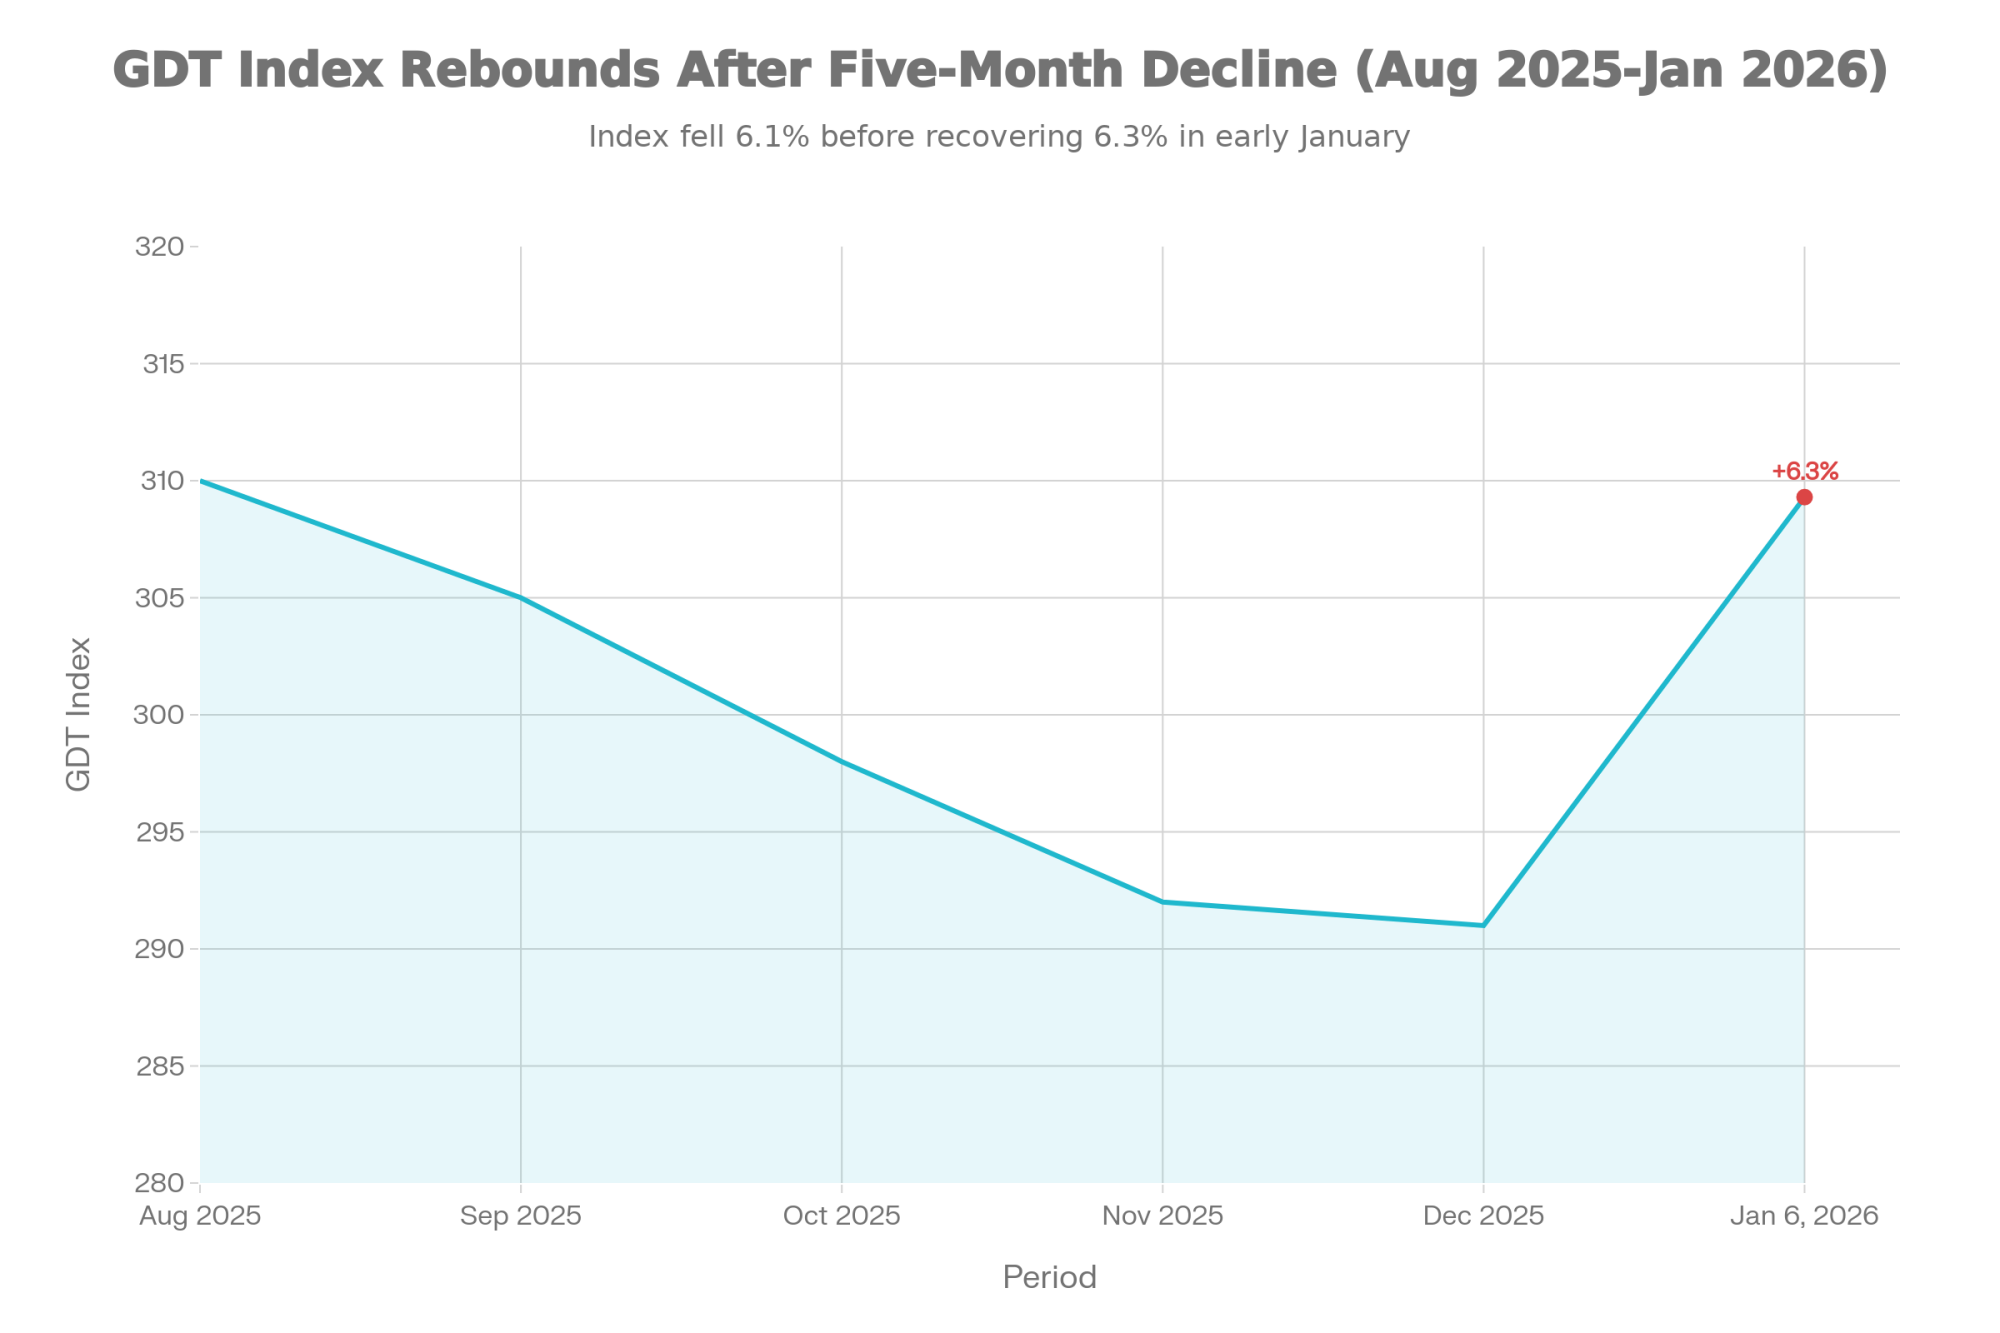
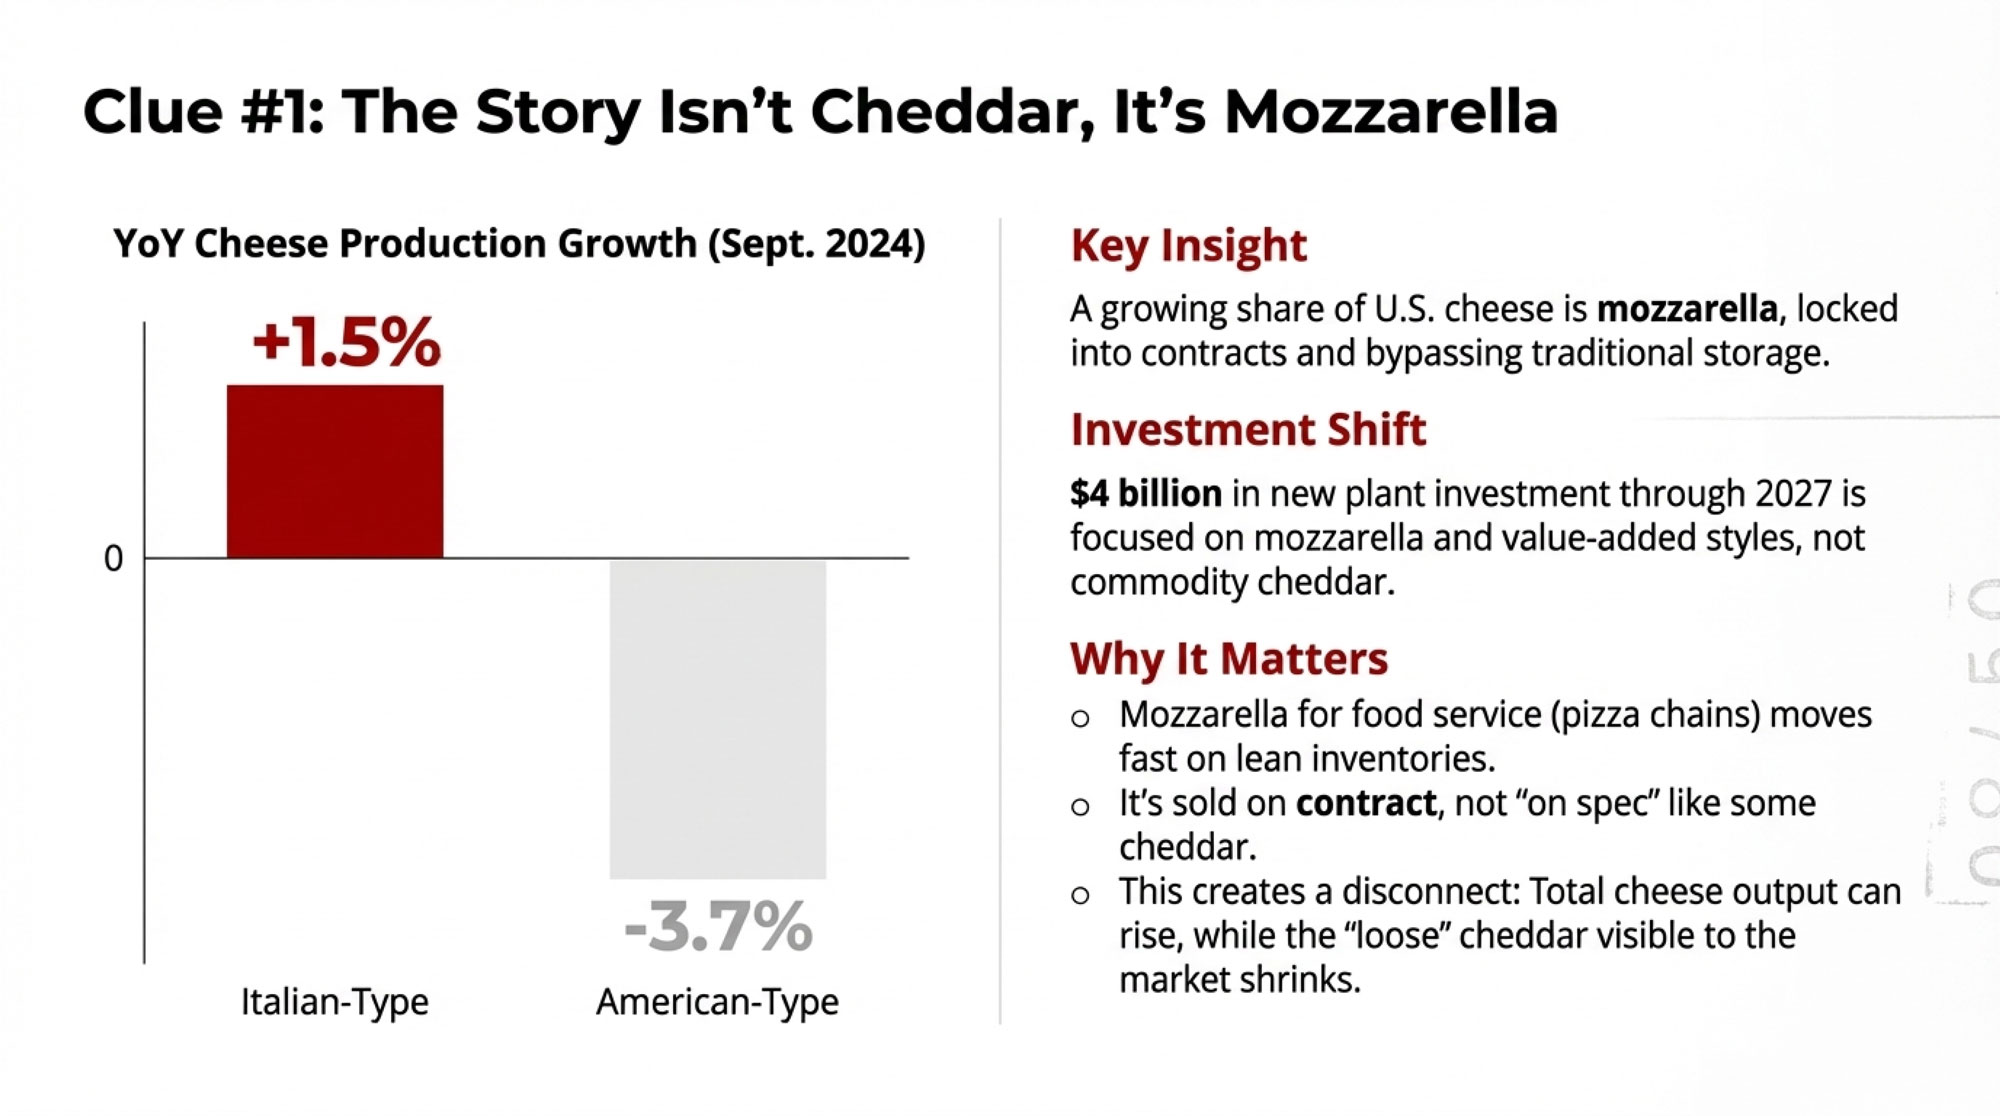
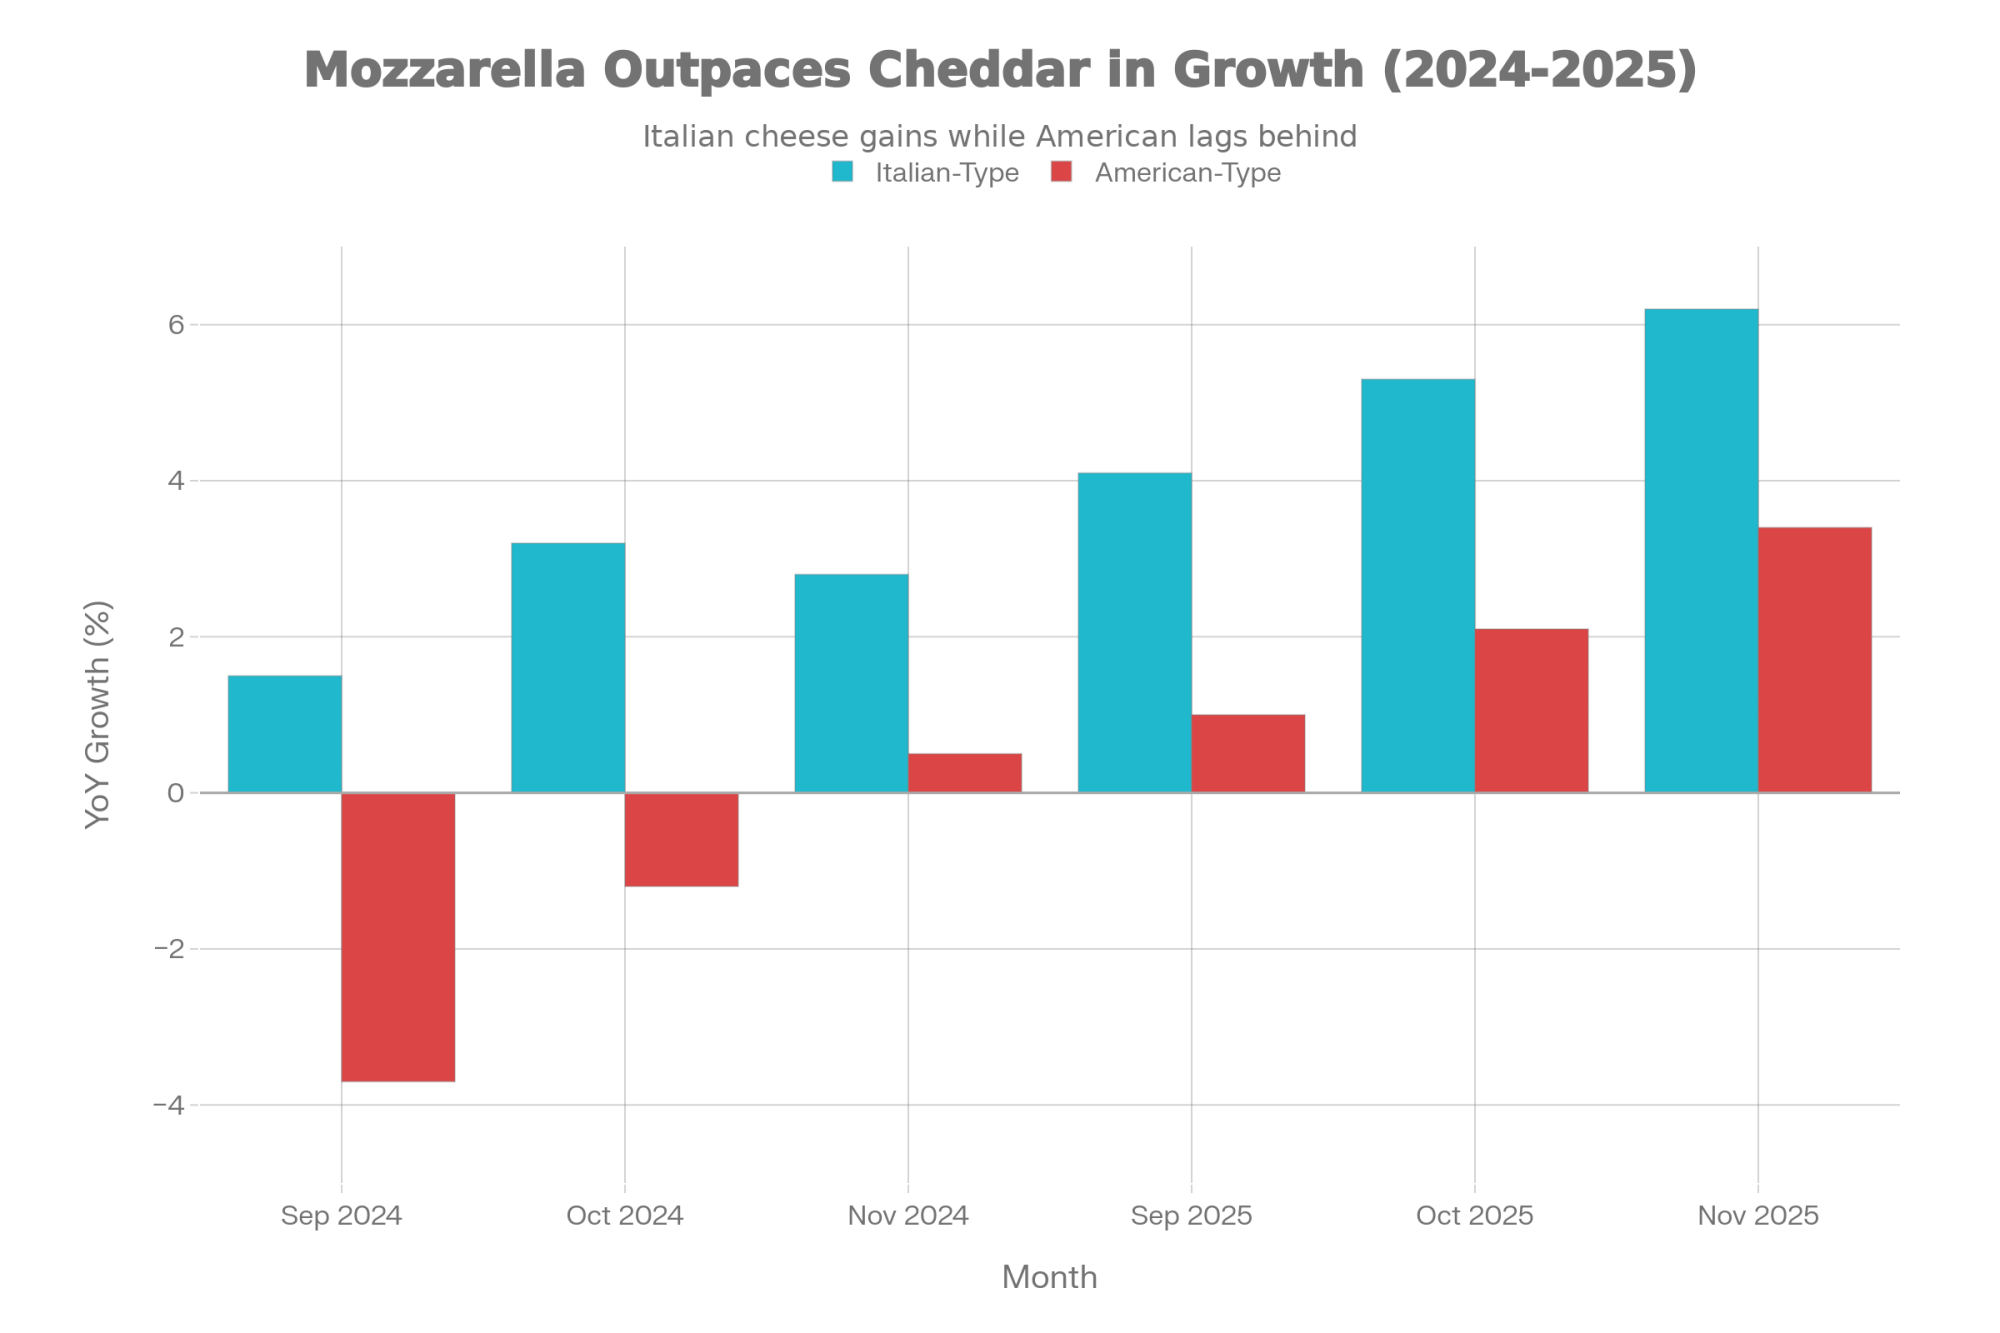
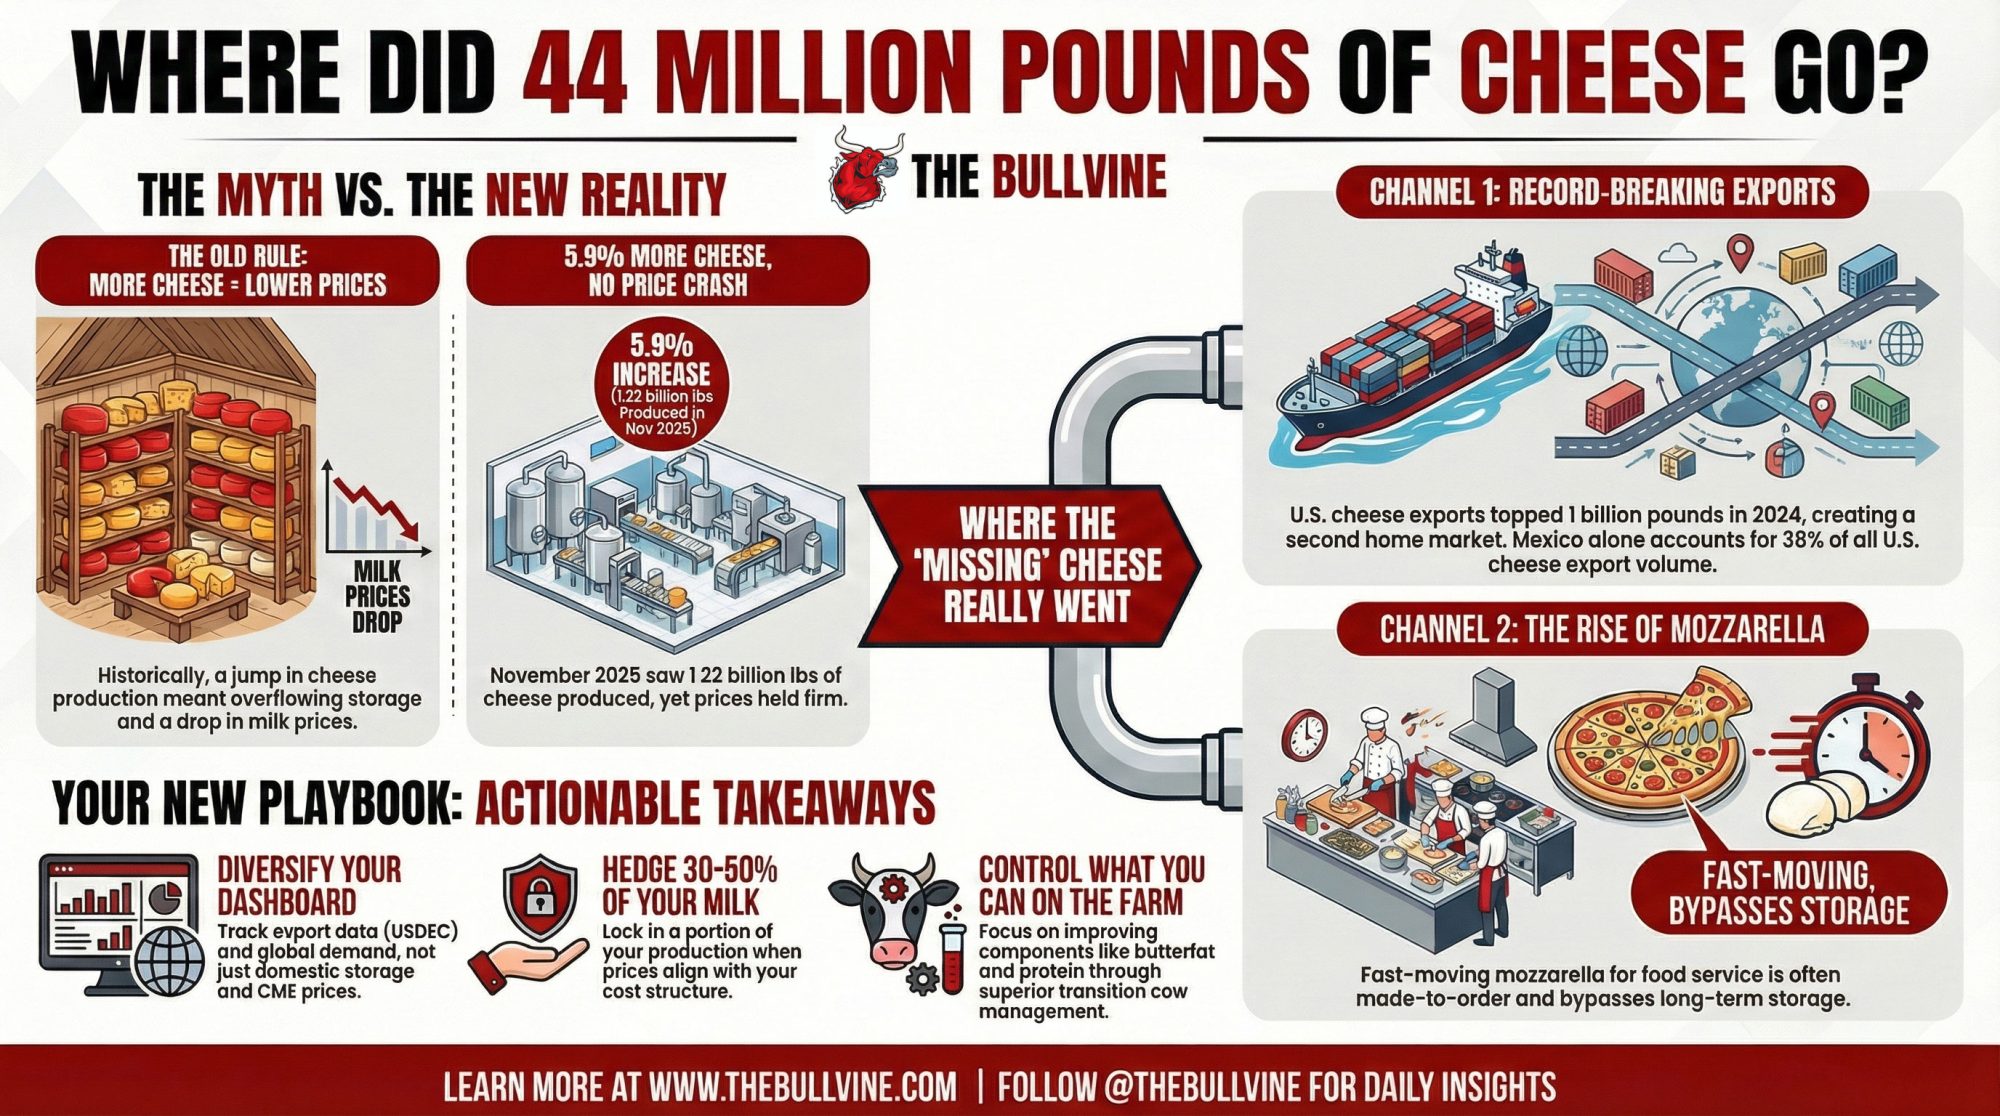
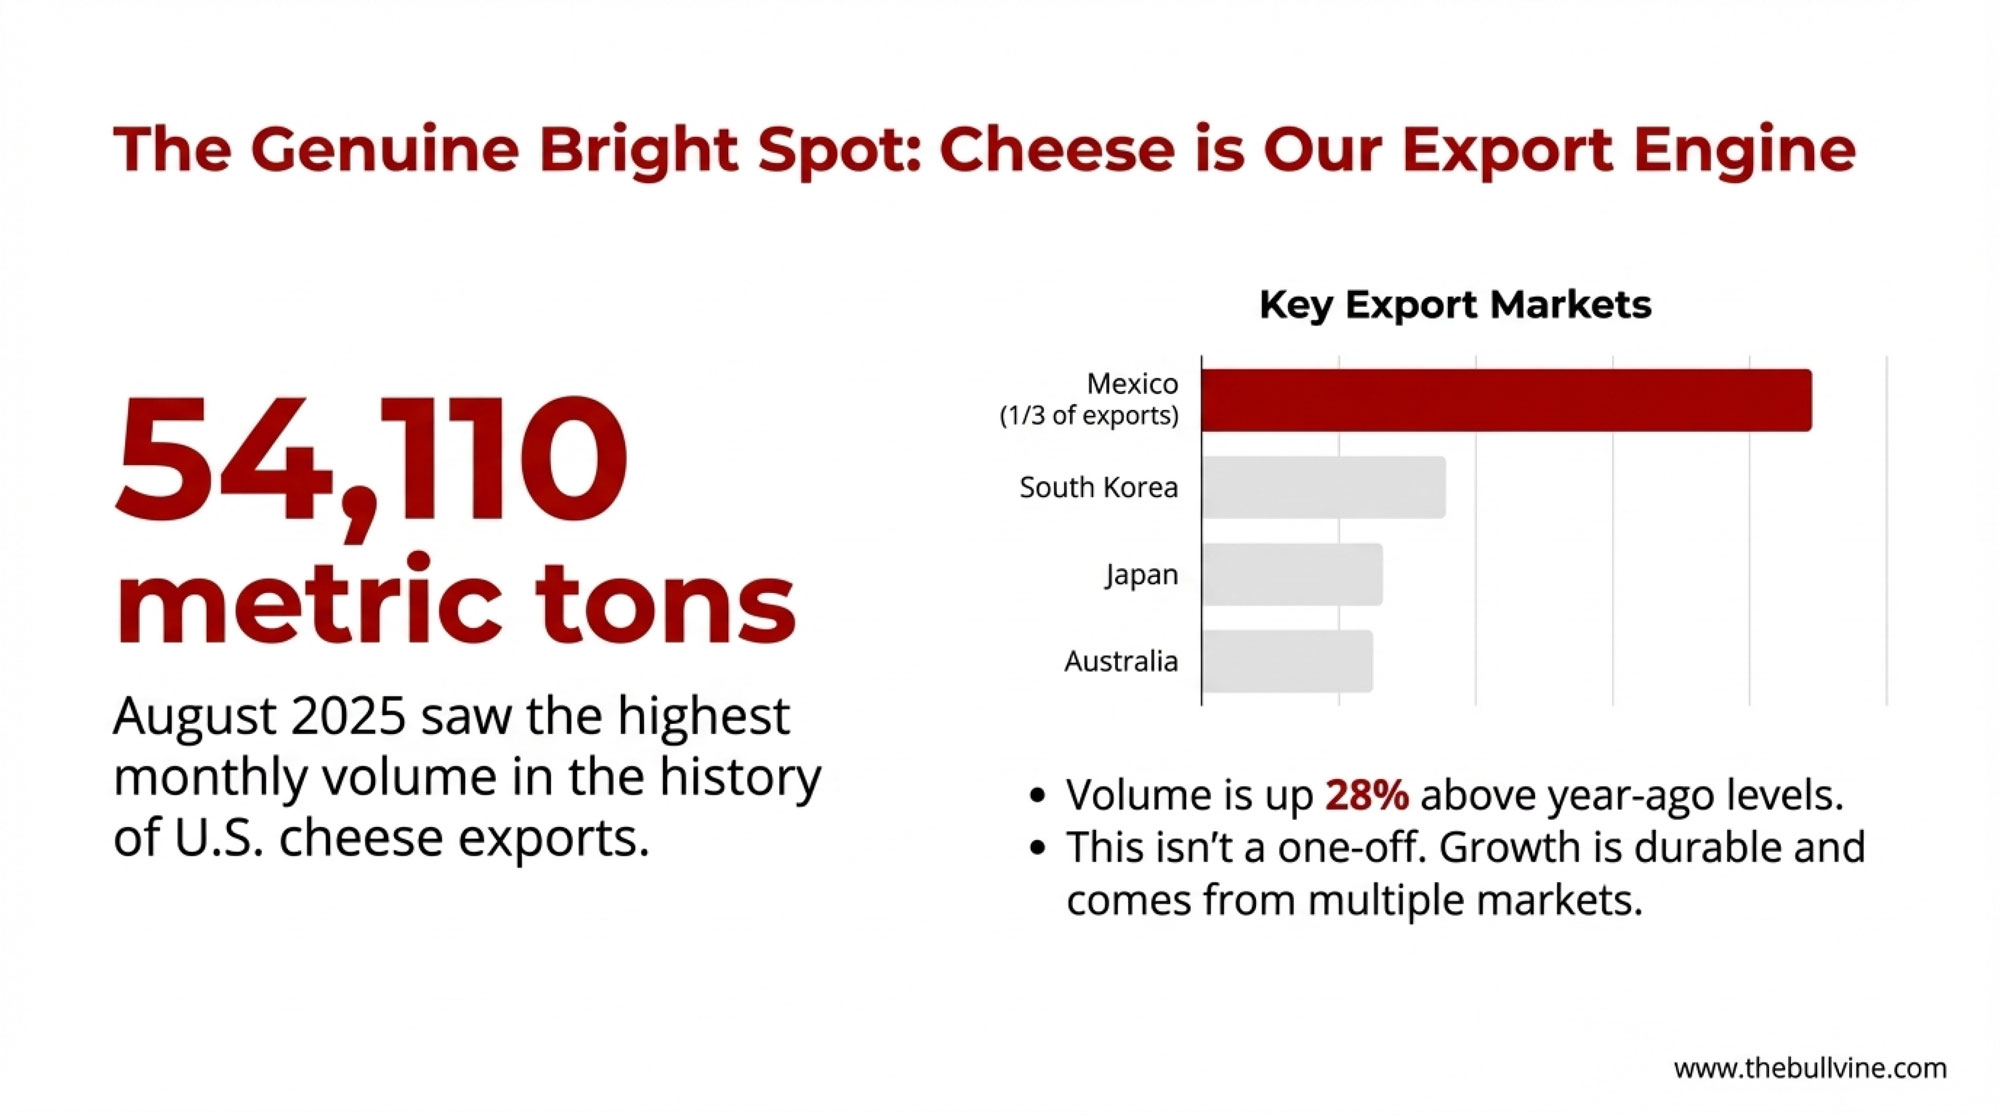
In January 2026, U.S. dairy export volume jumped 12% year‑over‑year on a milk solids equivalent basis — the biggest January ever recorded, according to USDEC data released March 12. February was even stronger: cheese exports hit an all‑time monthly high of 58,406 metric tons, 30% above last year and 6% above the previous record set in November 2025.
That’s nine straight months of year‑over‑year volume growth — with the most recent four all in double digits. By any measure, the world wants more American dairy than at any point in history. Yet while January volume climbed 12%, export value rose just 4% — to $740 million — and February’s value, at an estimated $804 million, was “only” up 11%.
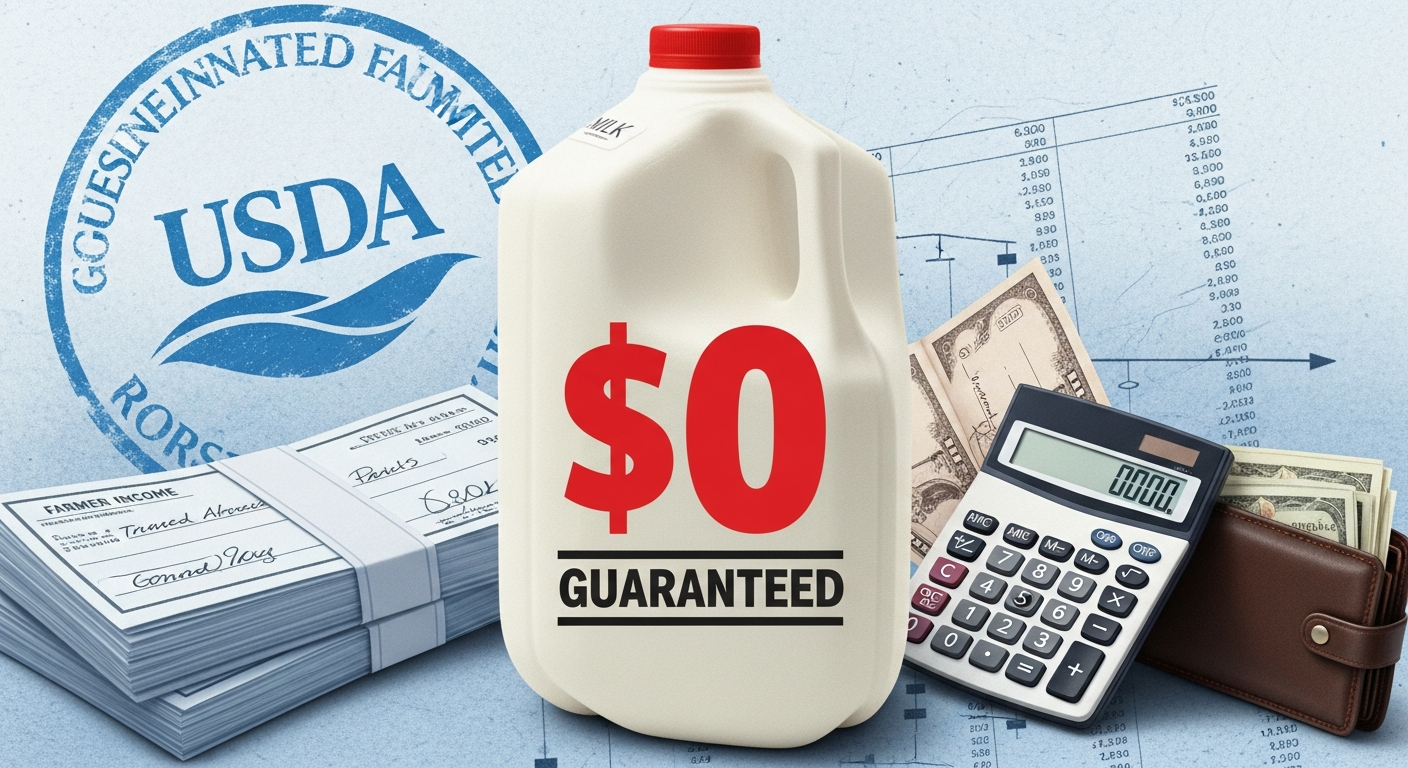
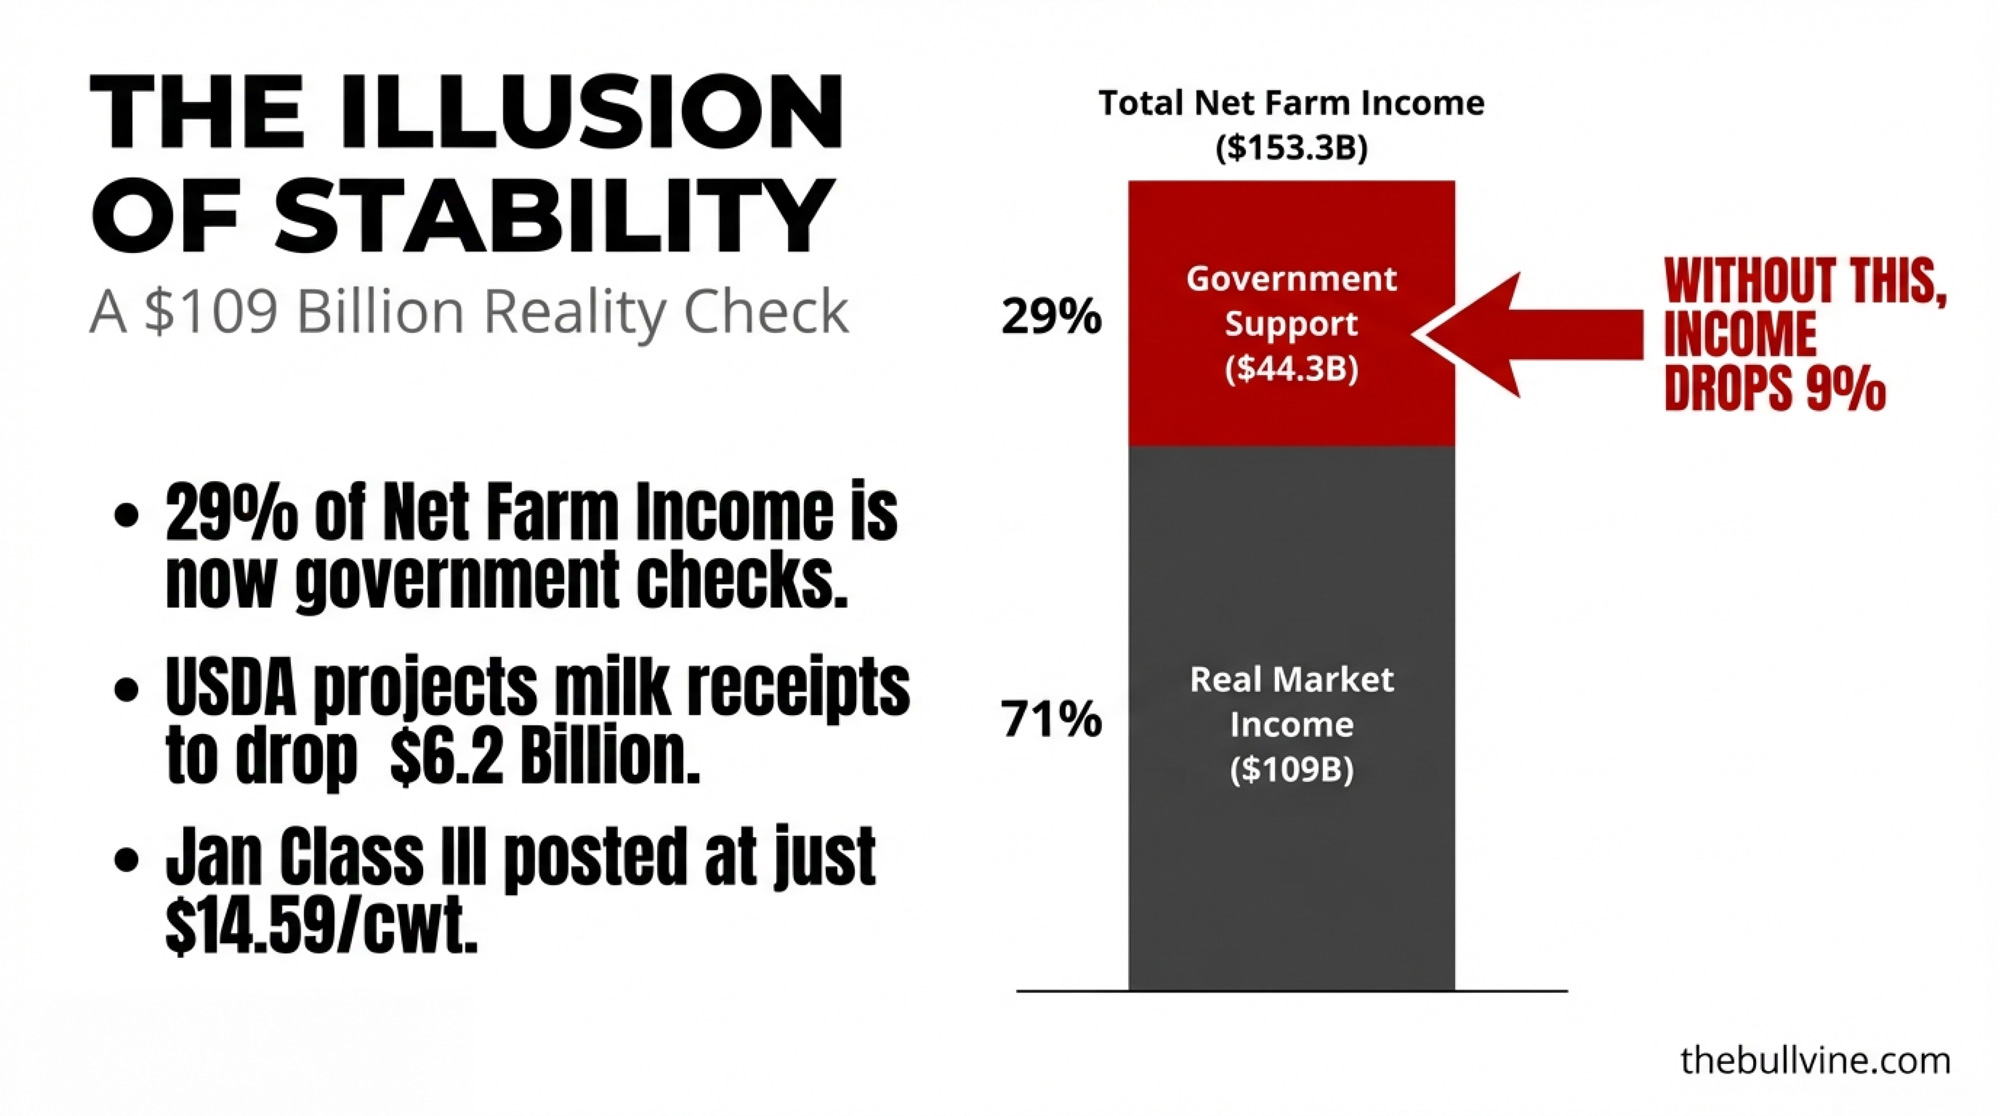
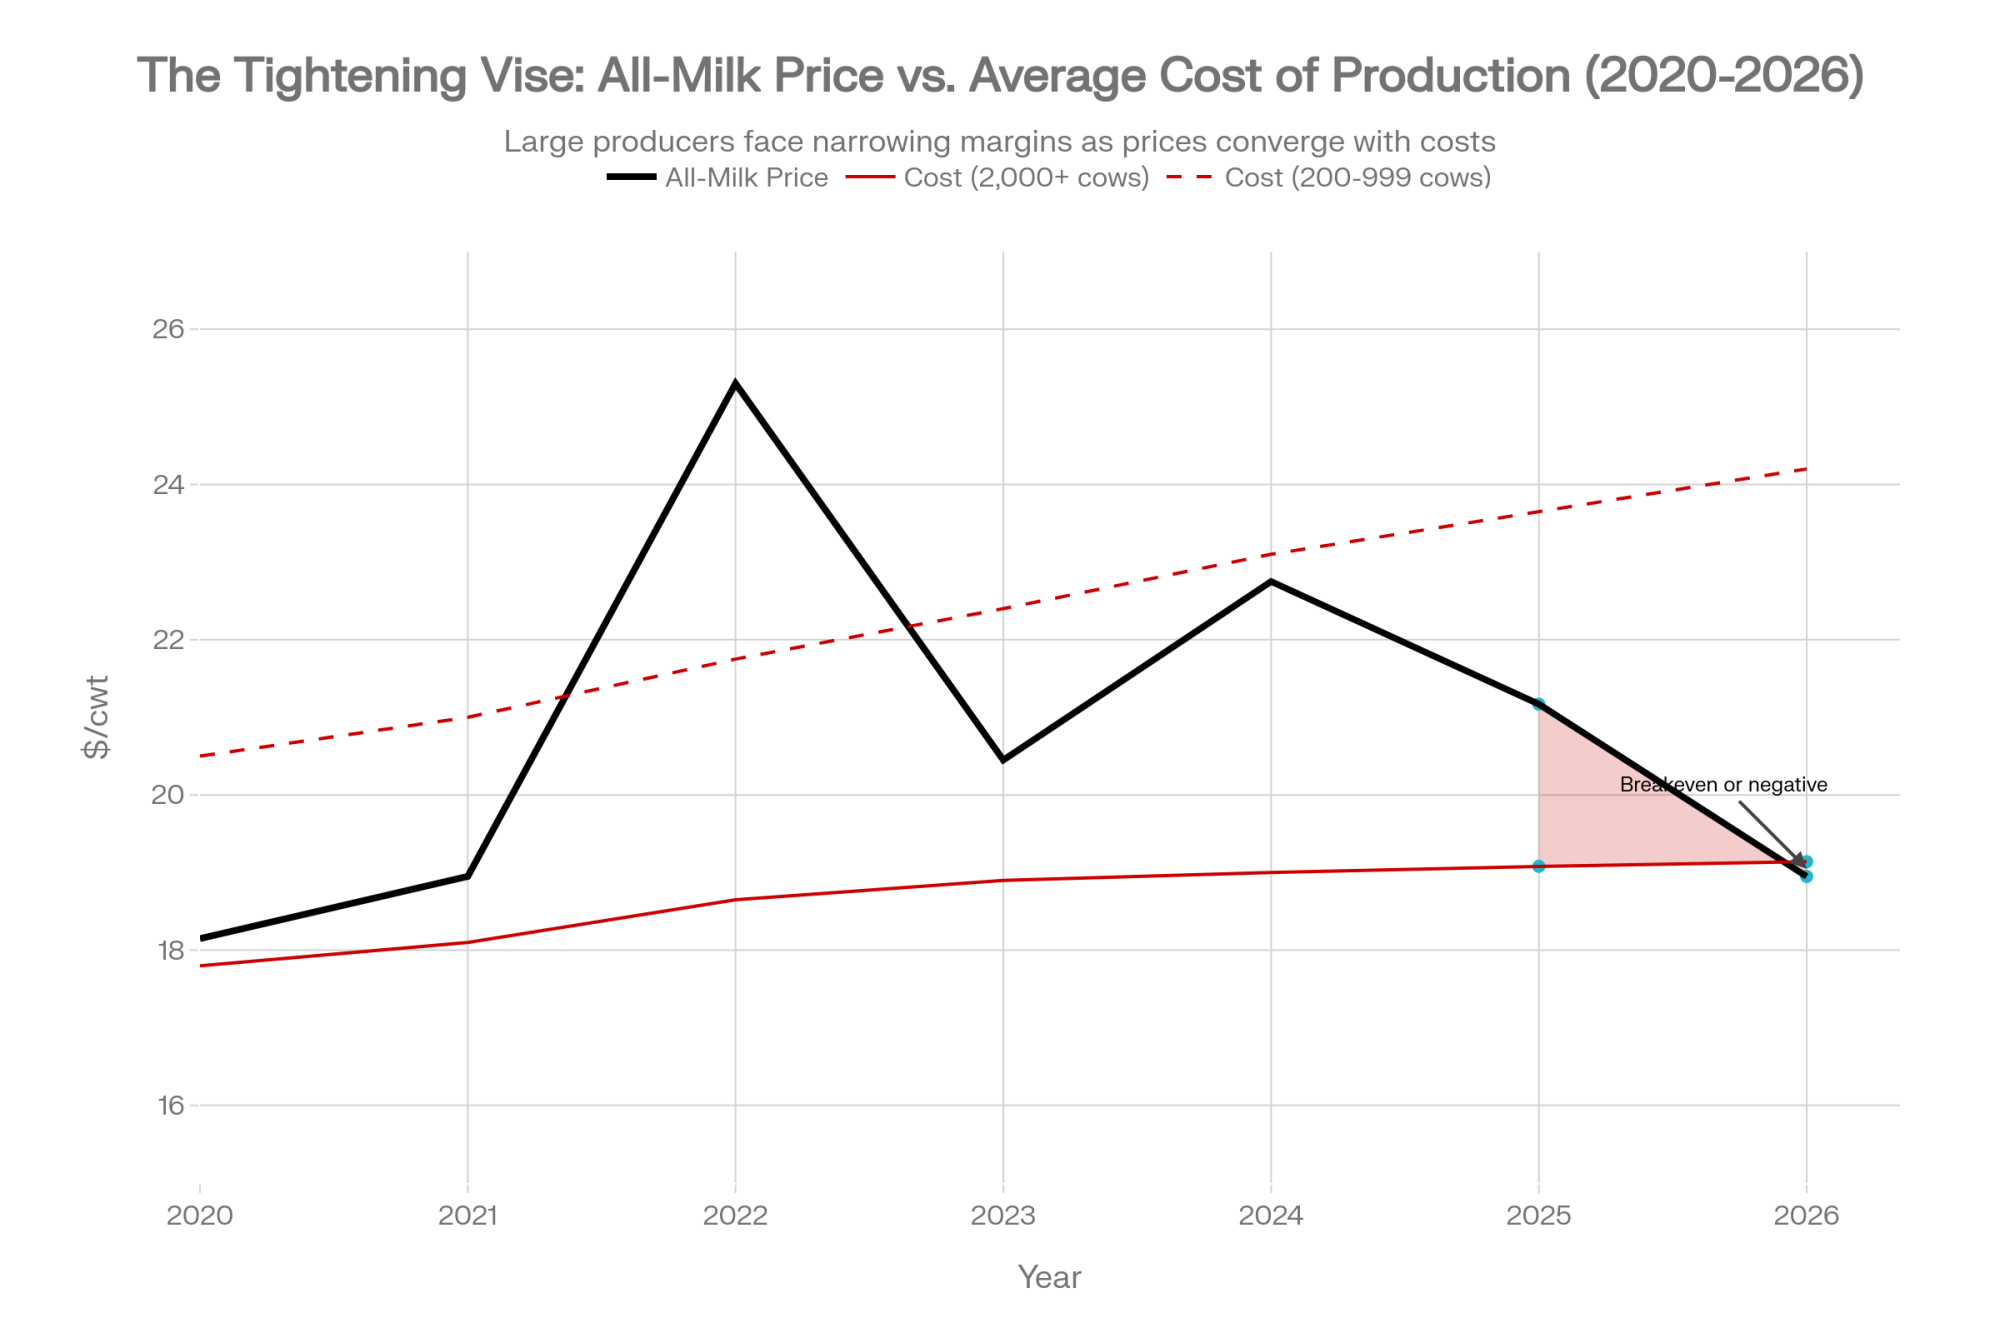
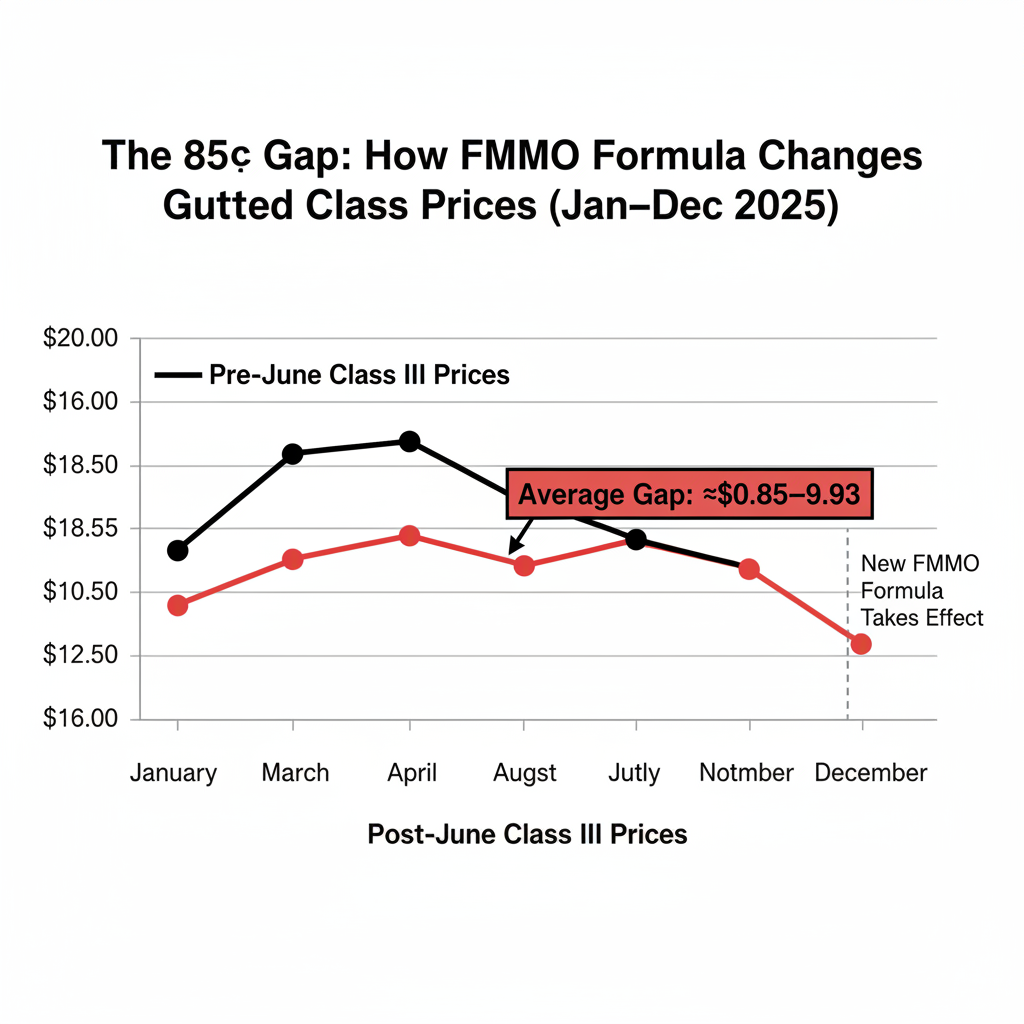
At the same time, the gap between your all‑milk price and what actually shows up in the mailbox has widened. According to the American Dairy Coalition (ADC) — a producer advocacy group tracking FMMO pricing impacts — that spread has averaged roughly $1.00/cwt since the 2025 make‑allowance changes, up from what ADC calculates as a ~$0.60 baseline. The export boom is real. Whether it’s reaching your bulk tank is a different equation entirely.
The spread isn’t static, though. USDA data showed it at $0.85/cwt in September 2025, and Progressive Dairy reported ~$0.96/cwt in January 2024 — before the FMMO amendments took effect. The gap varies by month, marketing order, and class utilization. ADC’s $0.60 baseline represents their chosen reference period, not a fixed historical average. The direction is real. The exact magnitude depends on where you sit.
What Did 30 Years of USDEC Actually Buy Your Herd?
In 1995, U.S. dairy was playing defense — worried about cheap Oceania imports, leaning on domestic price supports, skeptical that Americans could compete globally. Then, a handful of stakeholders created the U.S. Dairy Export Council with checkoff funding. That bet paid off beyond anyone’s projections.
Here’s how the scoreboard reads:
1995 export value: $656 million (per USDEC)
2024 export value: $8.32 billion — a 1,168% increase from the 1995 baseline (per USDEC’s 30th‑anniversary accounting; USDA FAS reports $8.2 billion for the same period — the gap likely reflects product‑scope differences)
2025 export value: $9.63 billion — a 15% jump over 2024 (per USDEC press release, February 24, 2026)
1995 share of U.S. milk production exported: a small fraction of total production, per USDA/ERS
2025 share of U.S. milk production exported: nearly 20% (per USDEC)
2025 MSE volume: 2.32 million metric tons — second‑highest on record, behind 2022’s 2.41 million MT
“We’ve gone from a minor player to a leading global supplier,” says USDEC president and CEO Krysta Harden, per the organization’s 30th‑anniversary blog. “We’re now positioned to become the No. 1 global exporter of dairy products.”
Nearly 1 in 5 pounds of U.S. milk now leaves the country. For a 500‑cow herd shipping 75 lb/cow/day, roughly 100 cows’ worth of your production depends on buyers in Mexico City, Jakarta, or Riyadh.
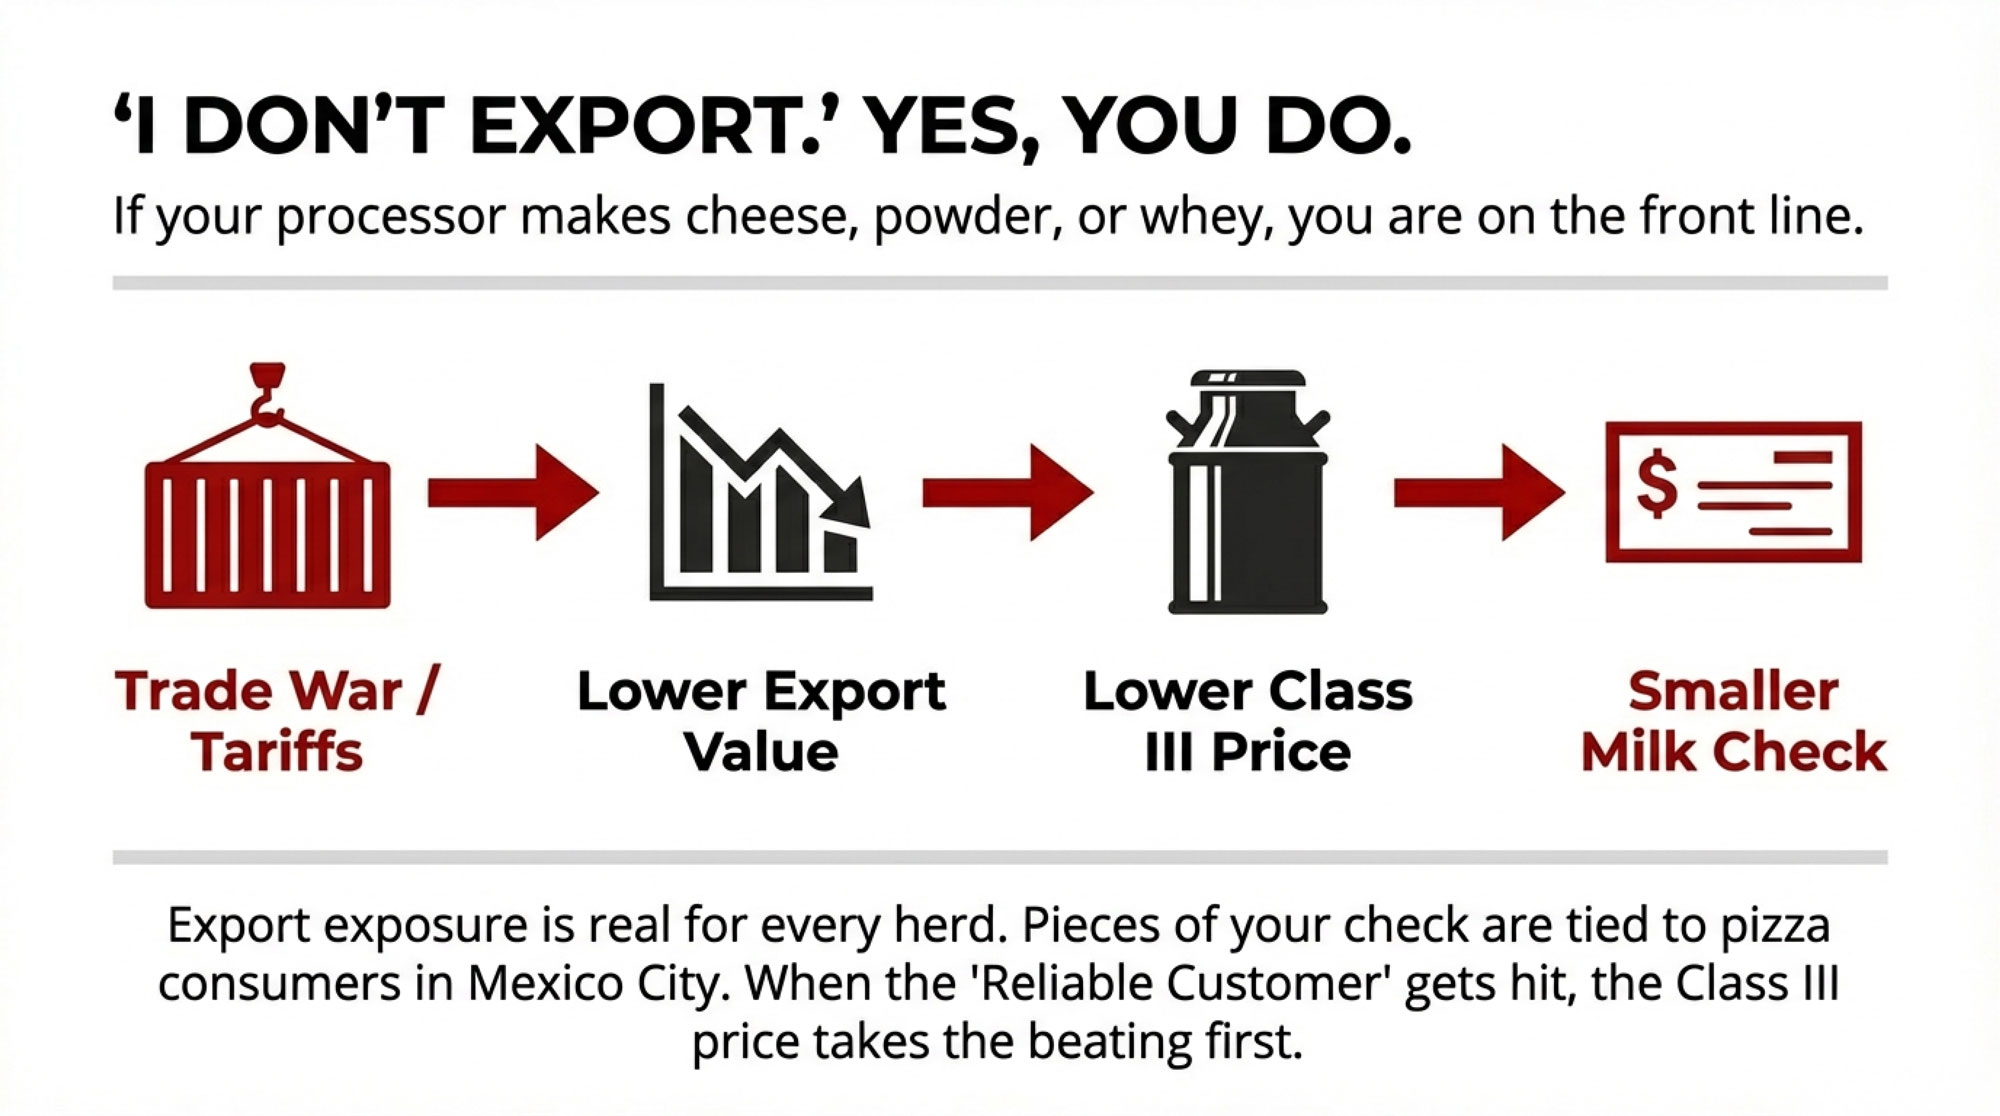
If you don’t think of yourself as an exporter, the math says otherwise.
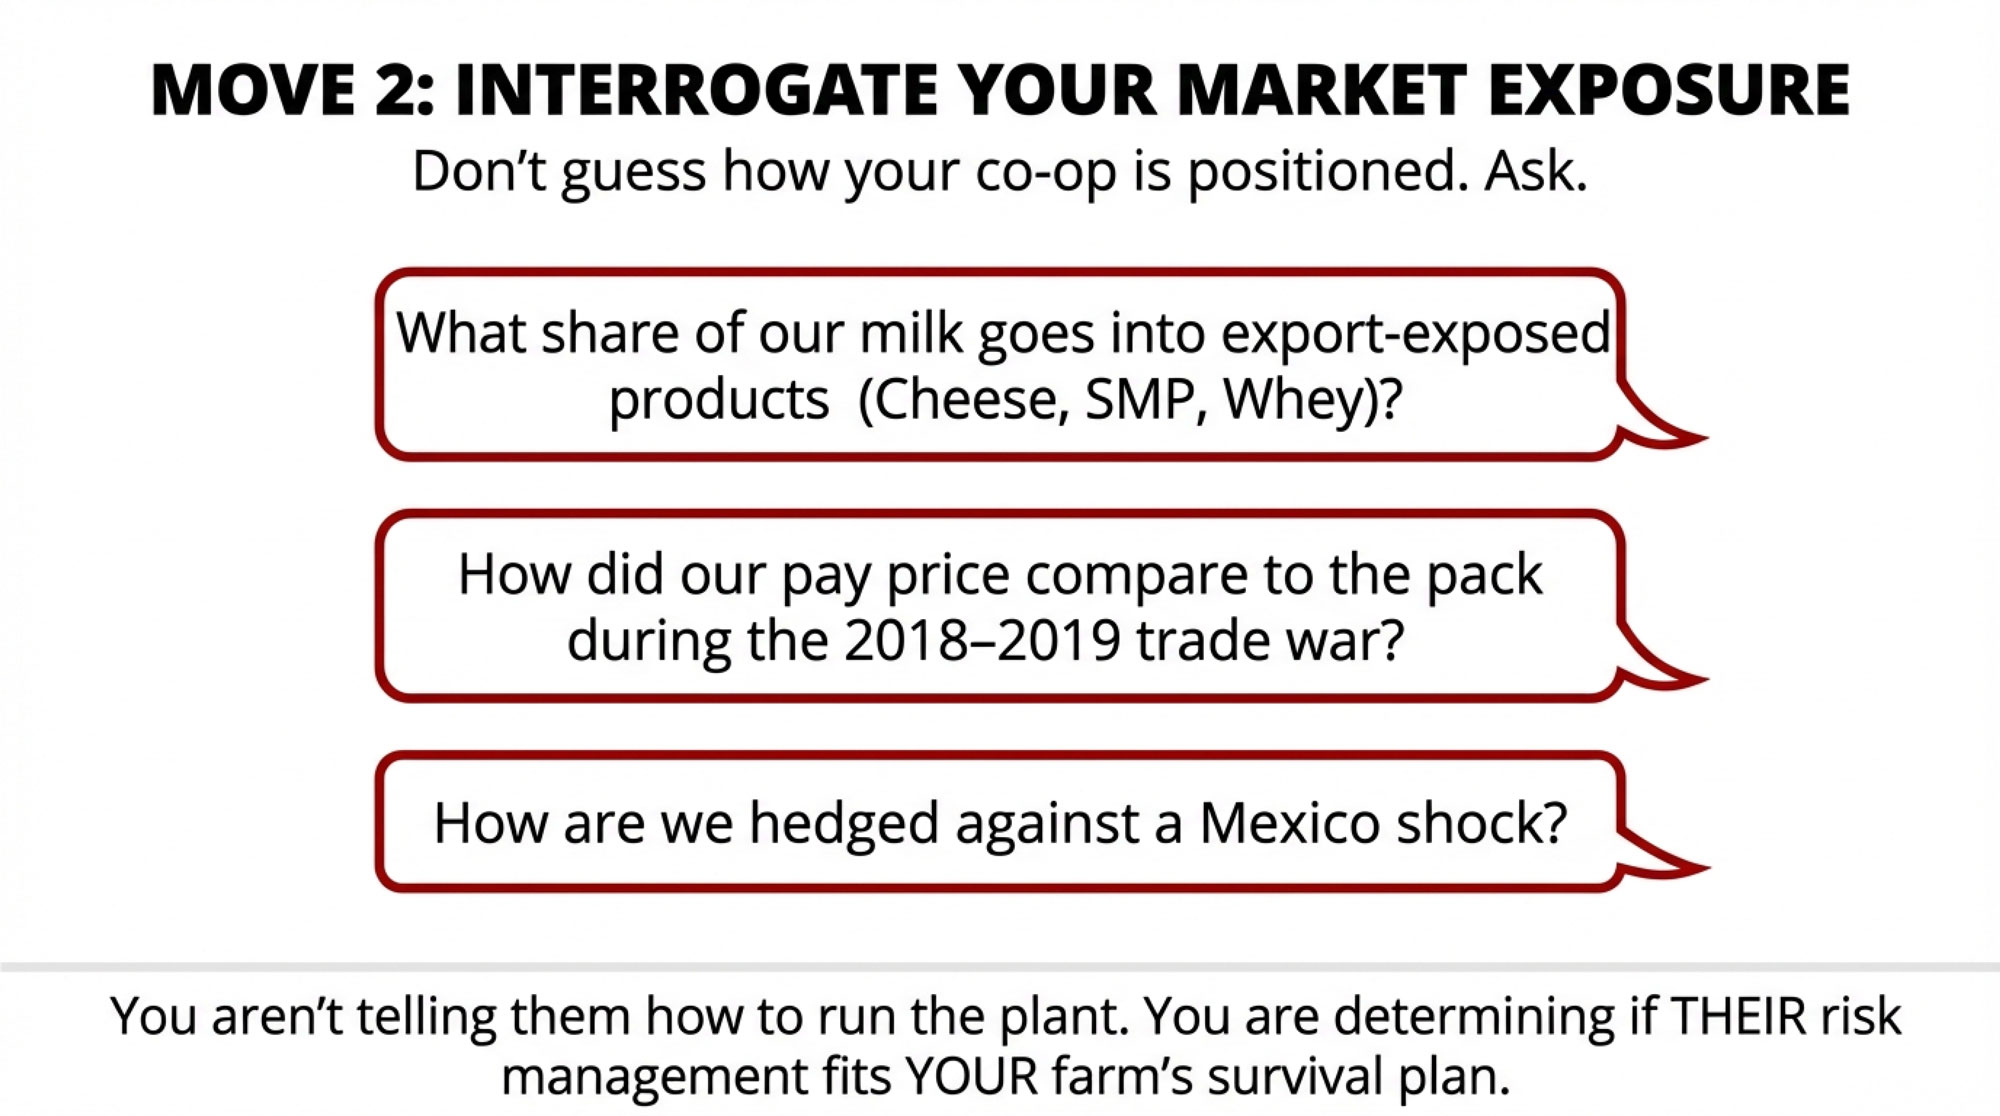
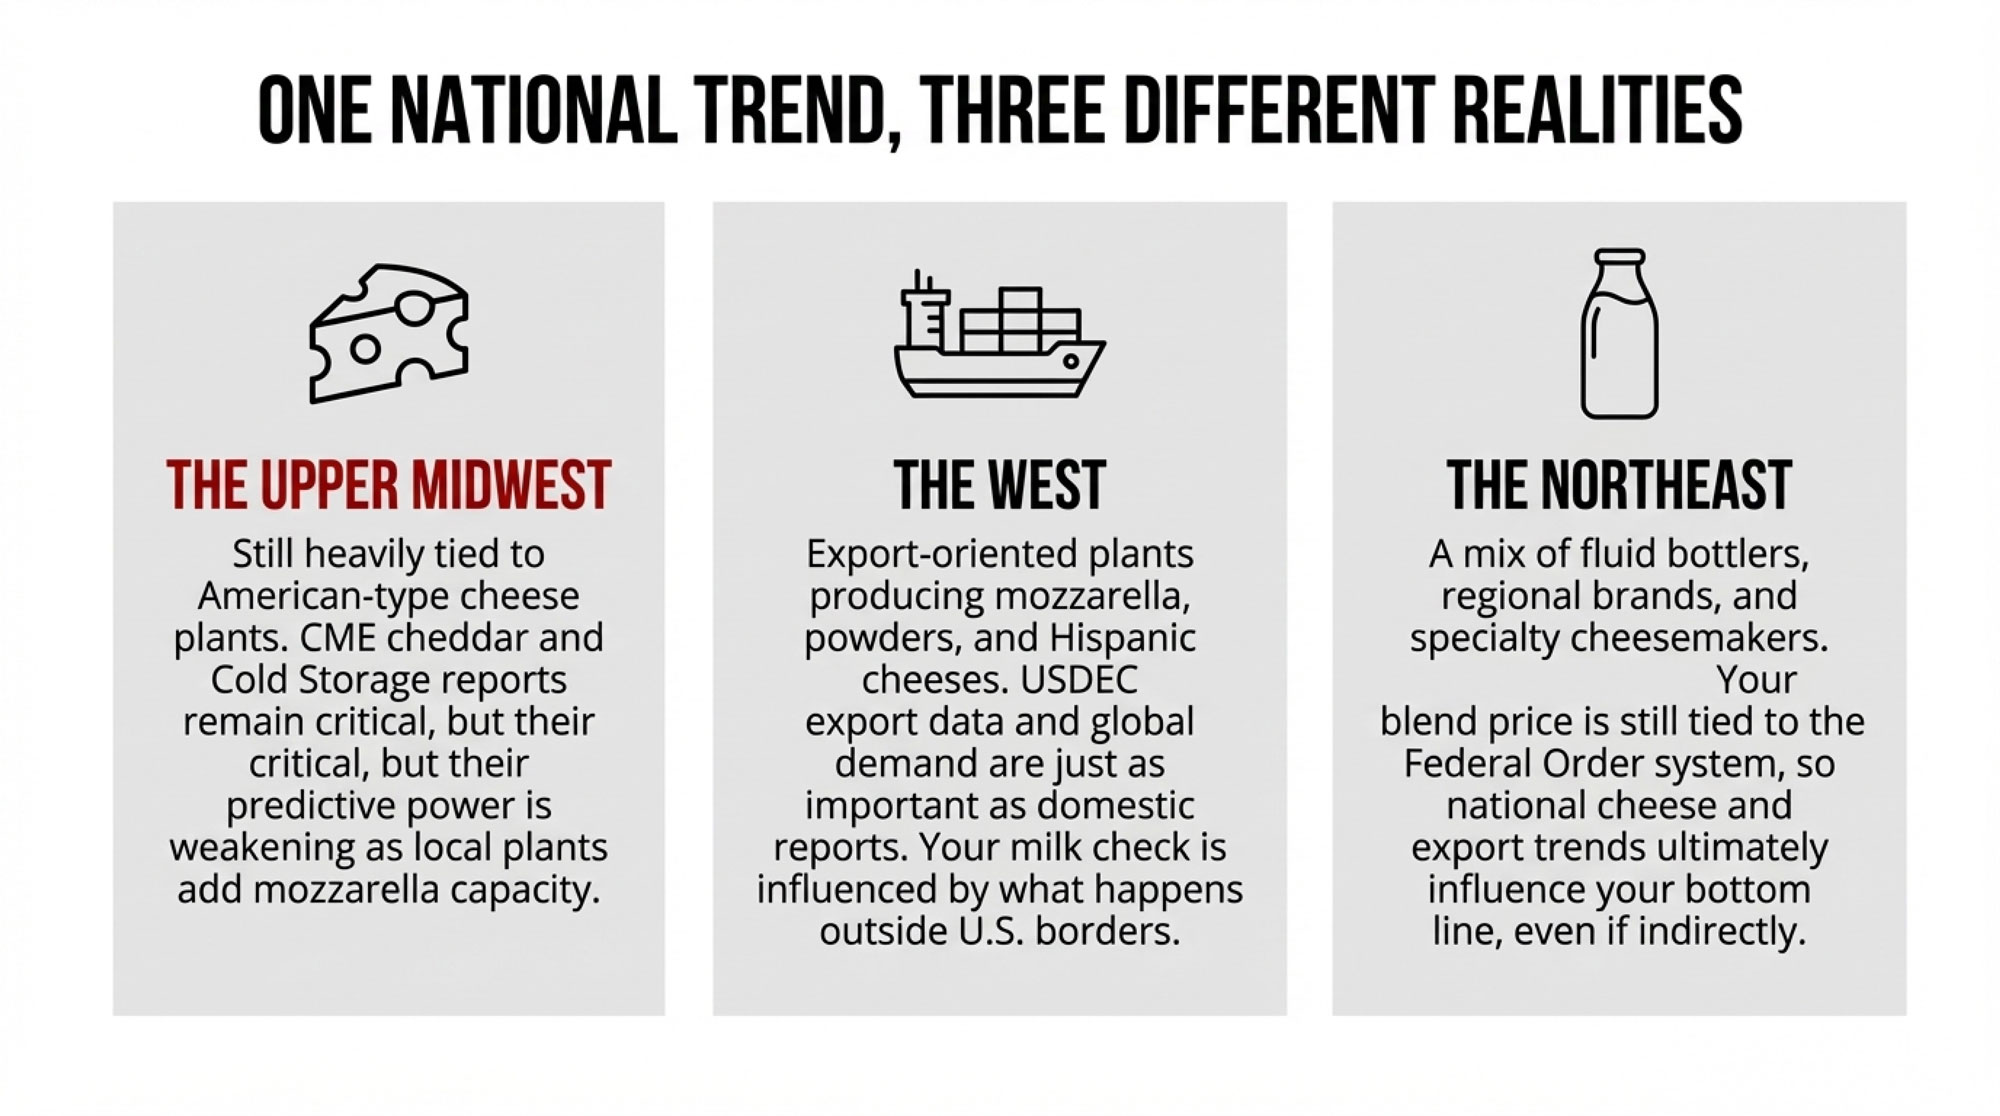
The Export Boom vs. Your Milk Check
The headline numbers tell a story of historic growth. But the question that matters to your operation is simpler: Is any of this actually reaching your mailbox?
<span style=”color:red”>Cash leaving the tank</span>
NFDM Spot Price
~$1.20–$1.42/lb (late 2025)
$2.06/lb (April 9, 2026)
↑ 12-year high
Feb 2026 Cheese Exports
44,928 MT (Feb 2025)
58,406 MT (all-time record)
↑ +30% YoY
New Processing Capacity
—
$11B into 53 facilities (2025–2028)
↑ IDFA pipeline
*The 1,368% figure measures 1995→2025. USDEC’s 30th‑anniversary figure of 1,168% uses the 2024 endpoint of $8.32B.
USDA AMS began consistently tracking mailbox prices in the mid‑1990s, but pre‑amendment spread data is volatile by month and order. ADC’s ~$0.60 baseline is their reference; USDA data shows the spread was already around $0.85–$0.96 at various points before the amendments. The growth in exports is staggering. But the growth in the gap between your gross price and your net check deserves equal attention.
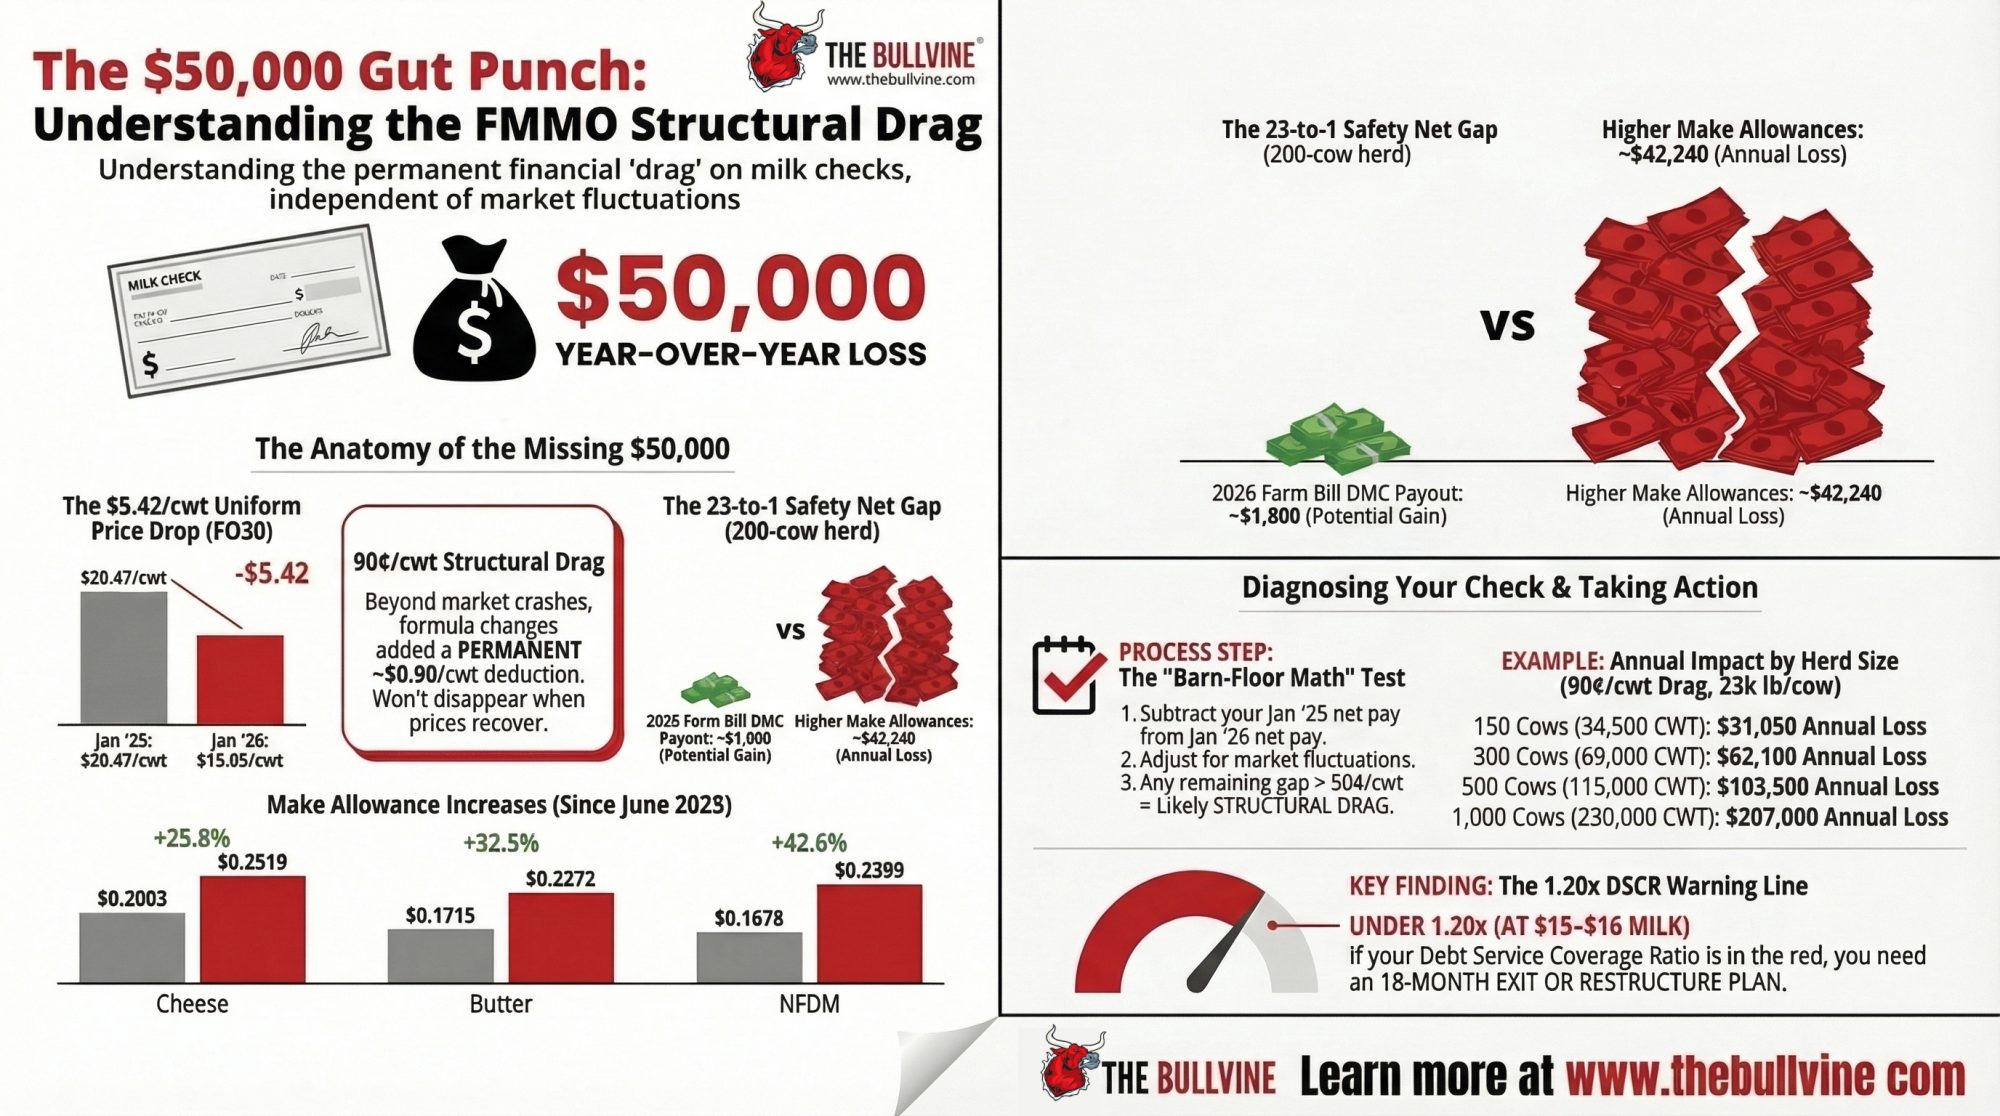
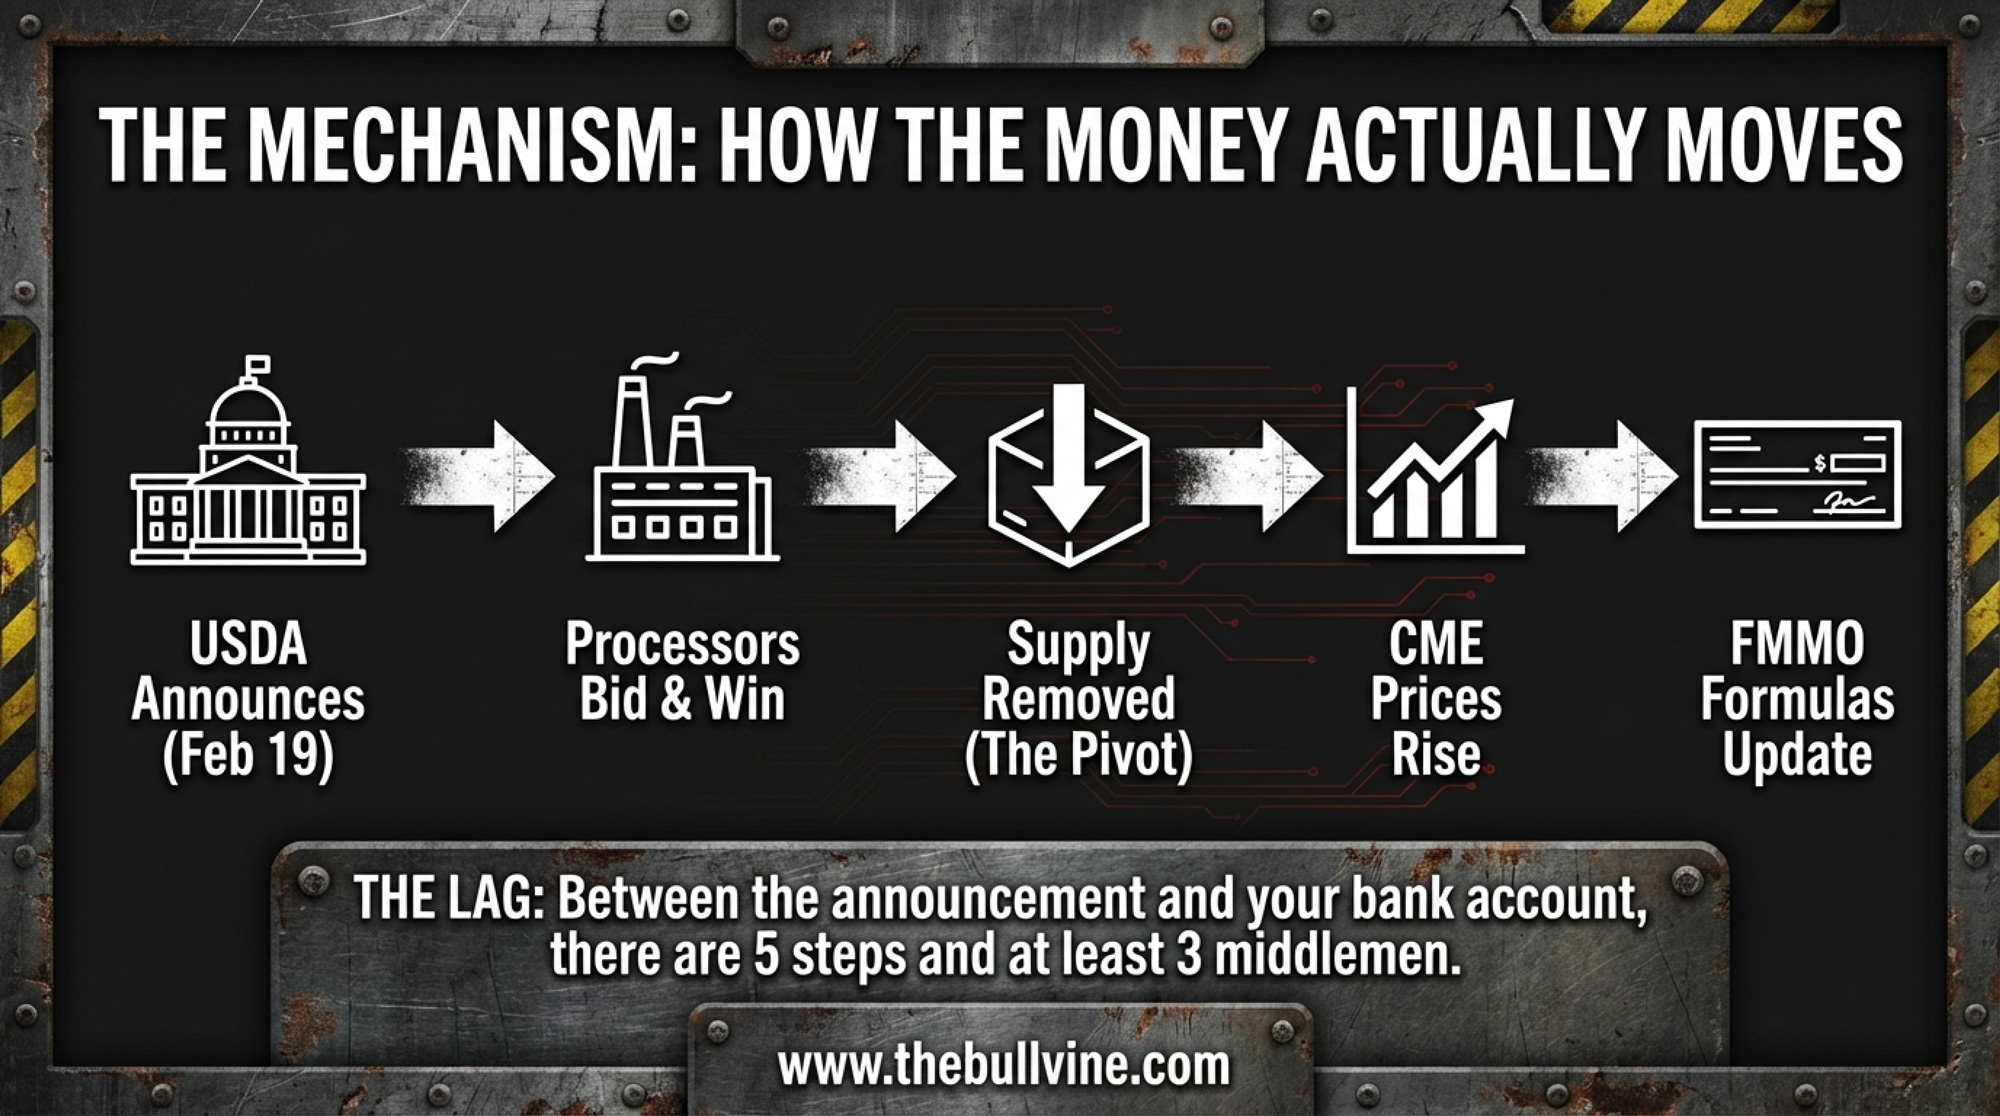
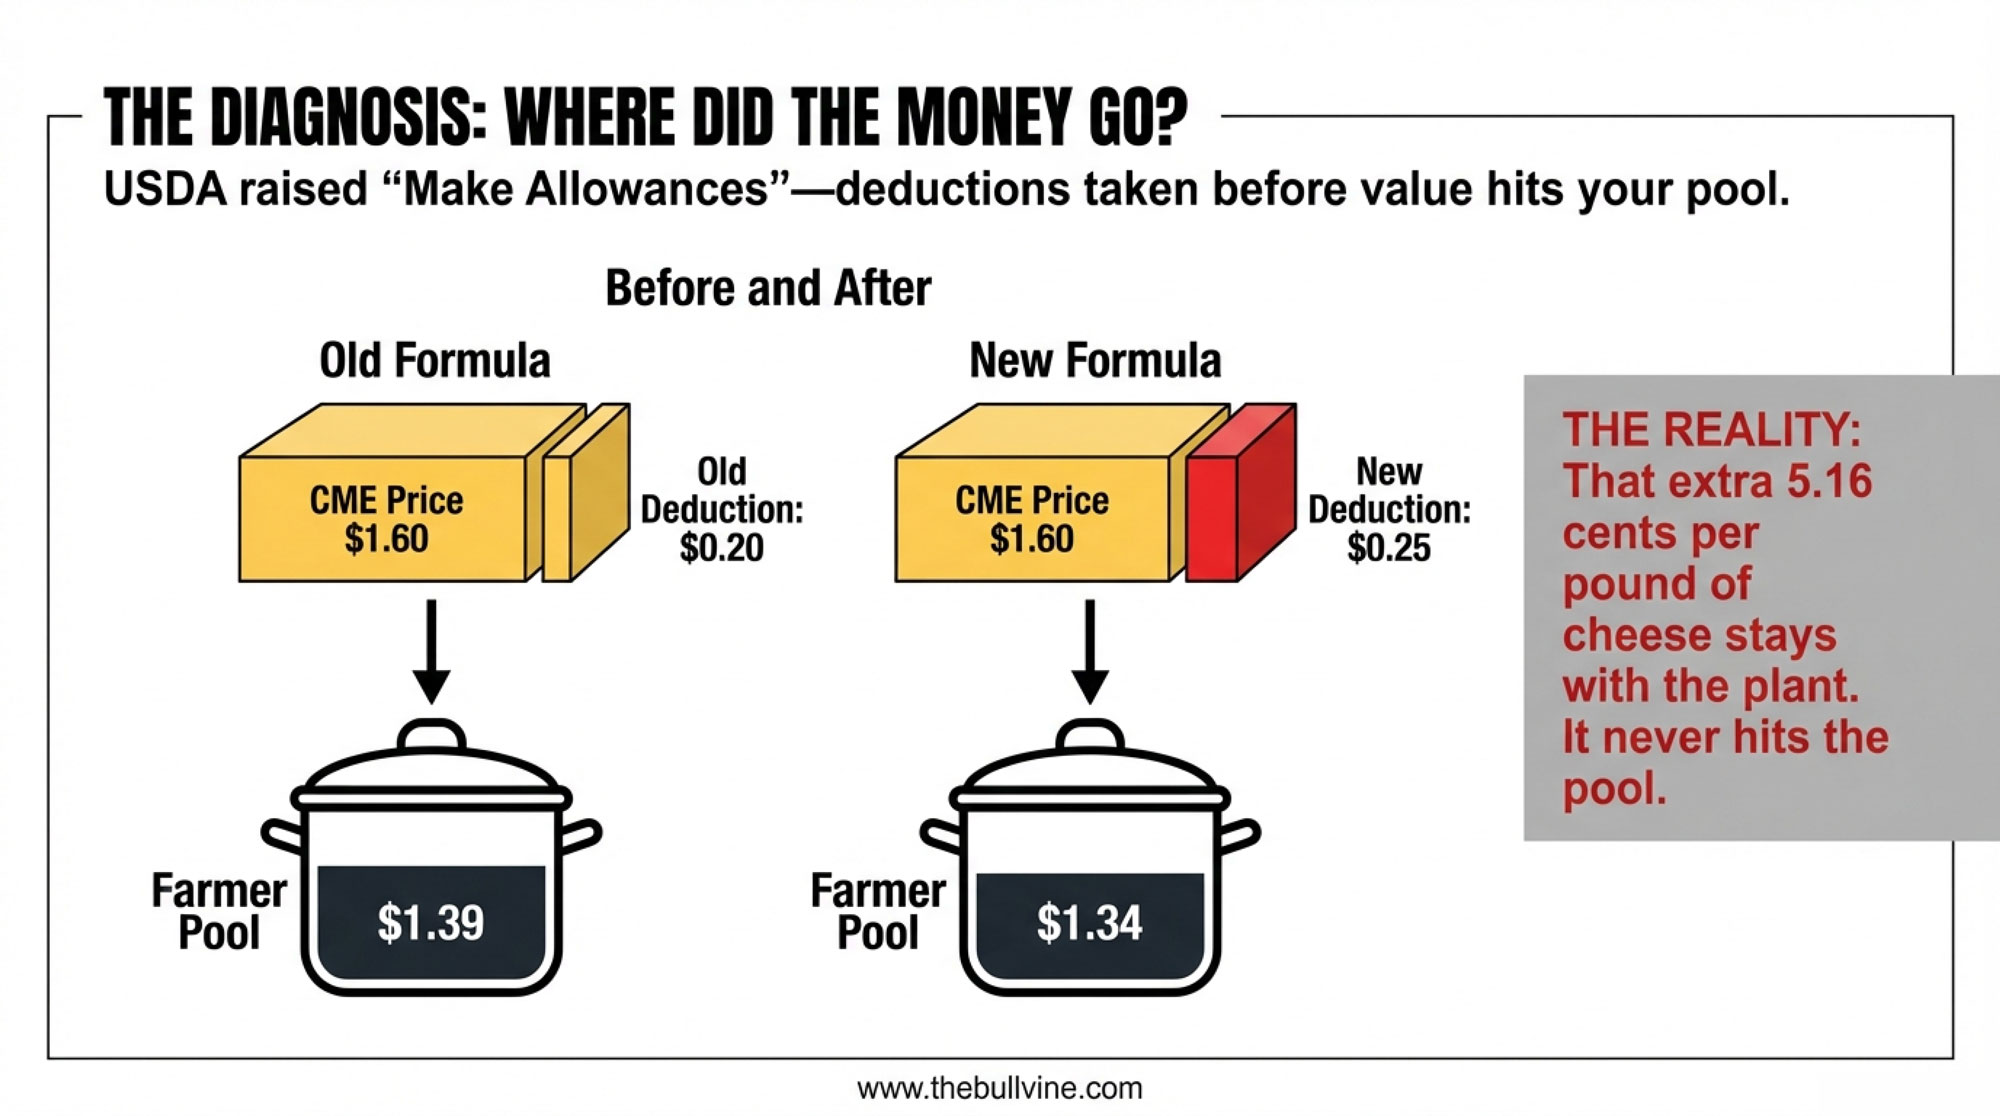
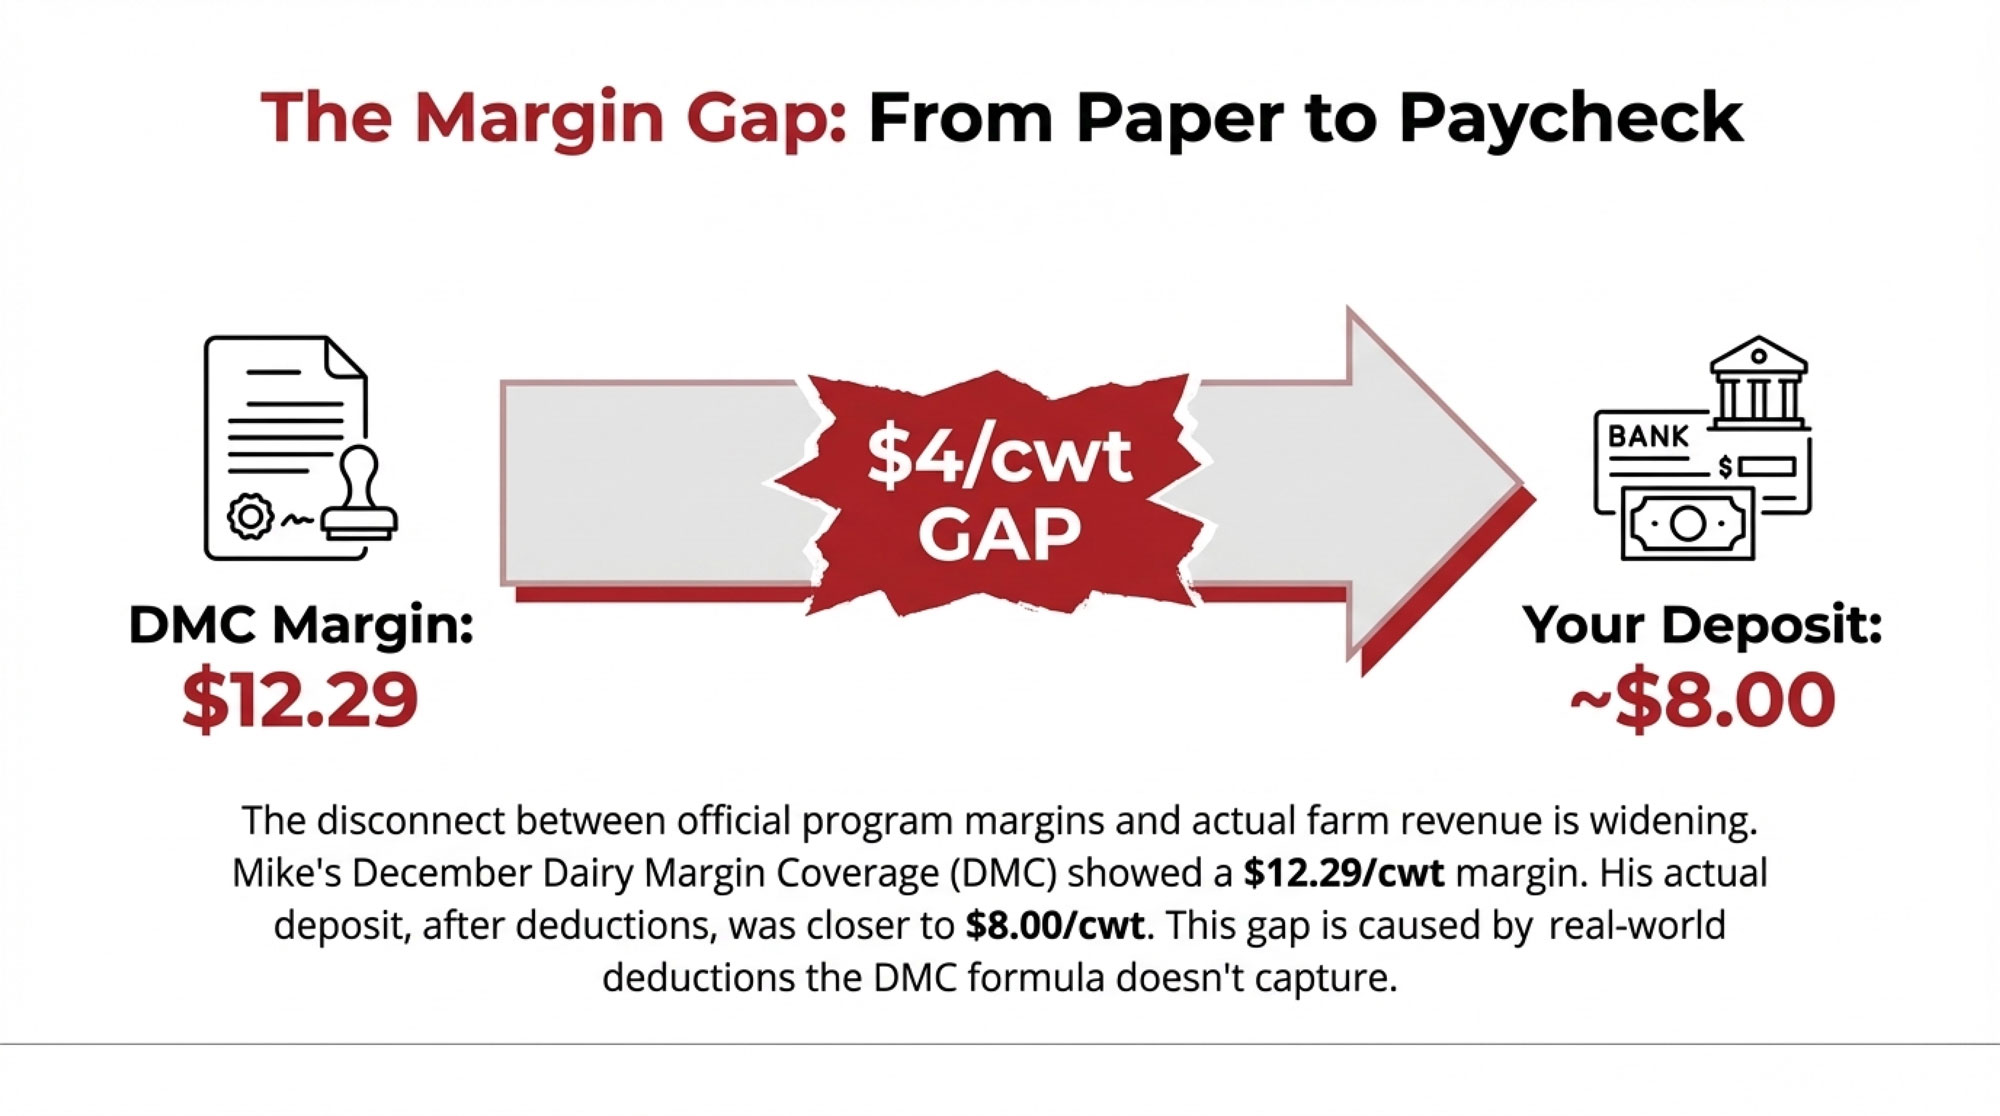
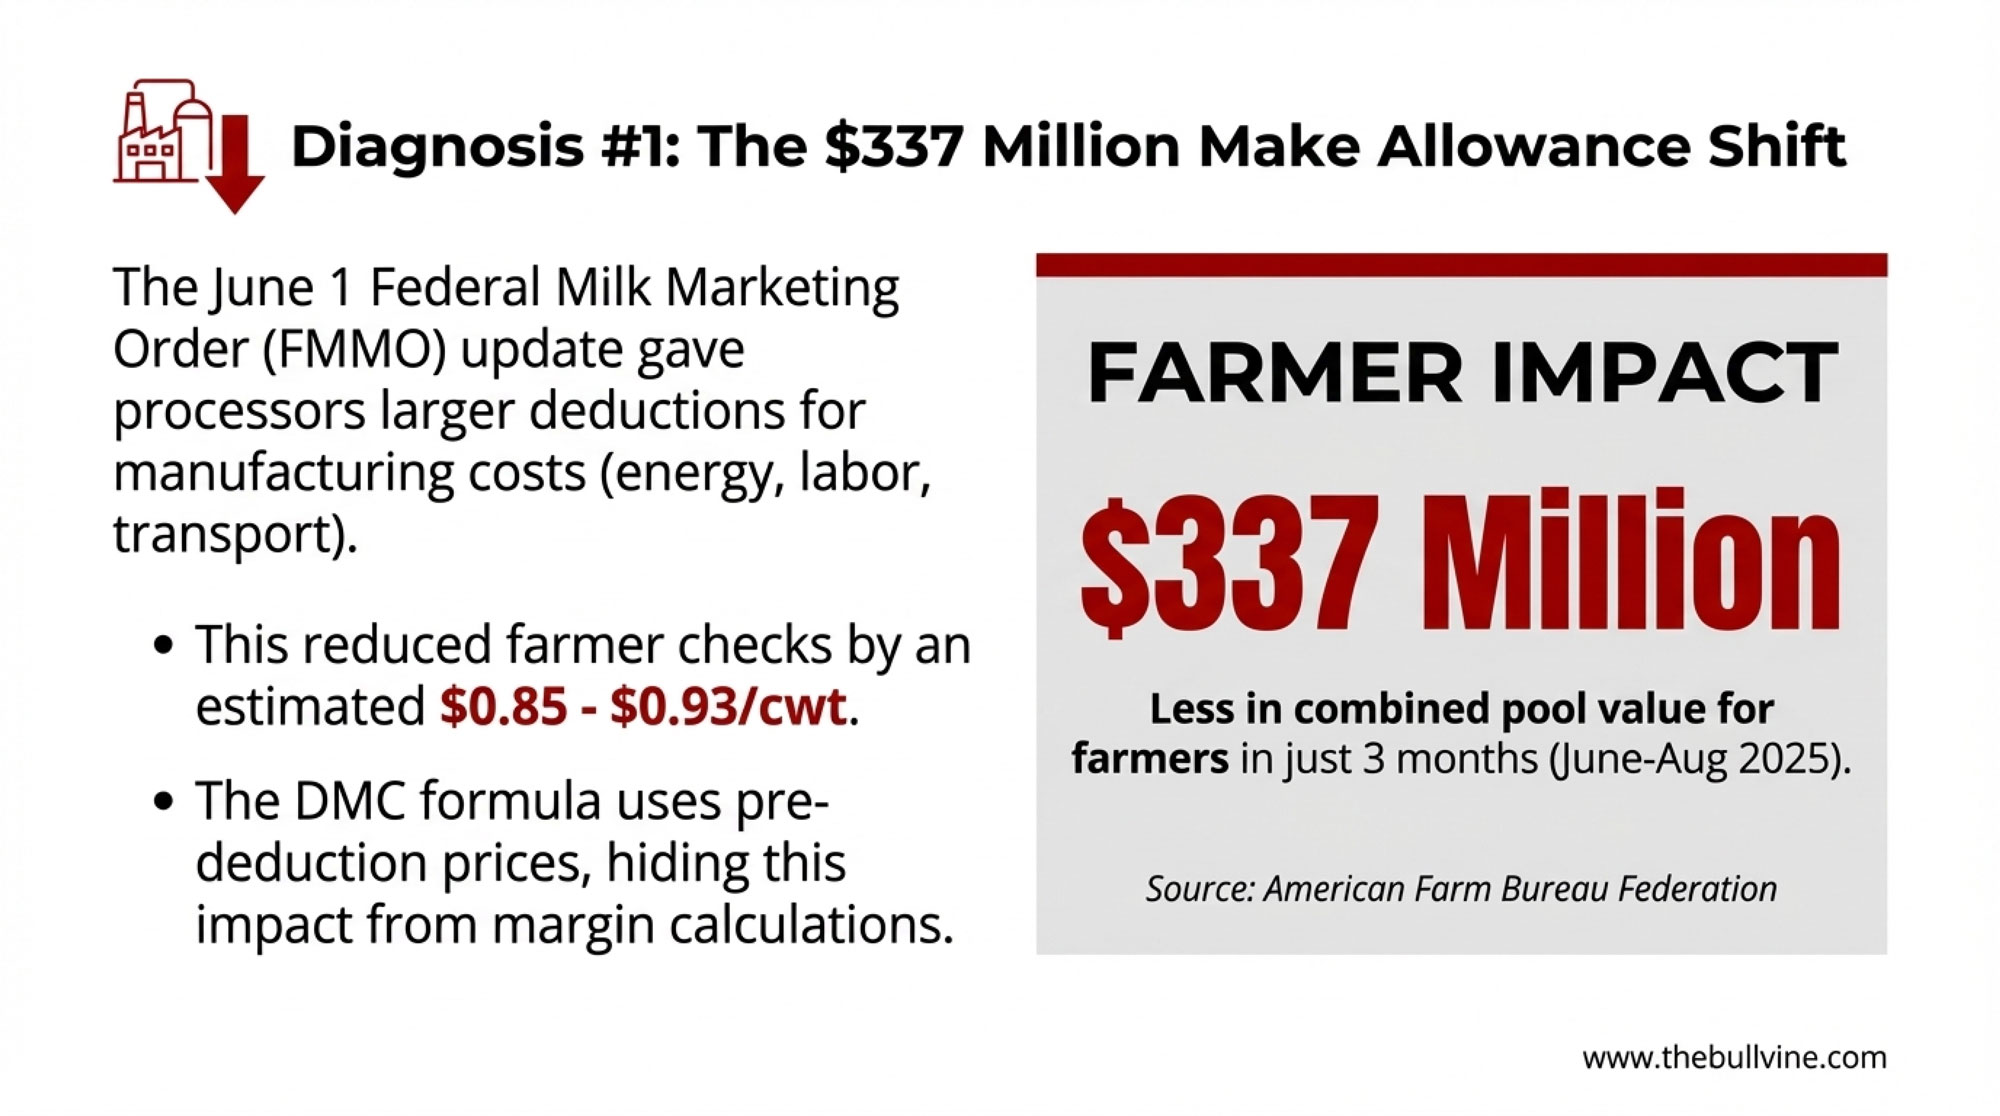
Make Allowance — In Plain English The make allowance is the credit built into FMMO pricing formulas that covers processors’ costs of turning raw milk into cheese, butter, powder, or whey. When USDA raises the make allowance, your minimum regulated price drops — even if the retail or export price of cheese doesn’t change. Think of it as the toll between your bulk tank and the marketplace. In 2025, that toll got significantly more expensive.
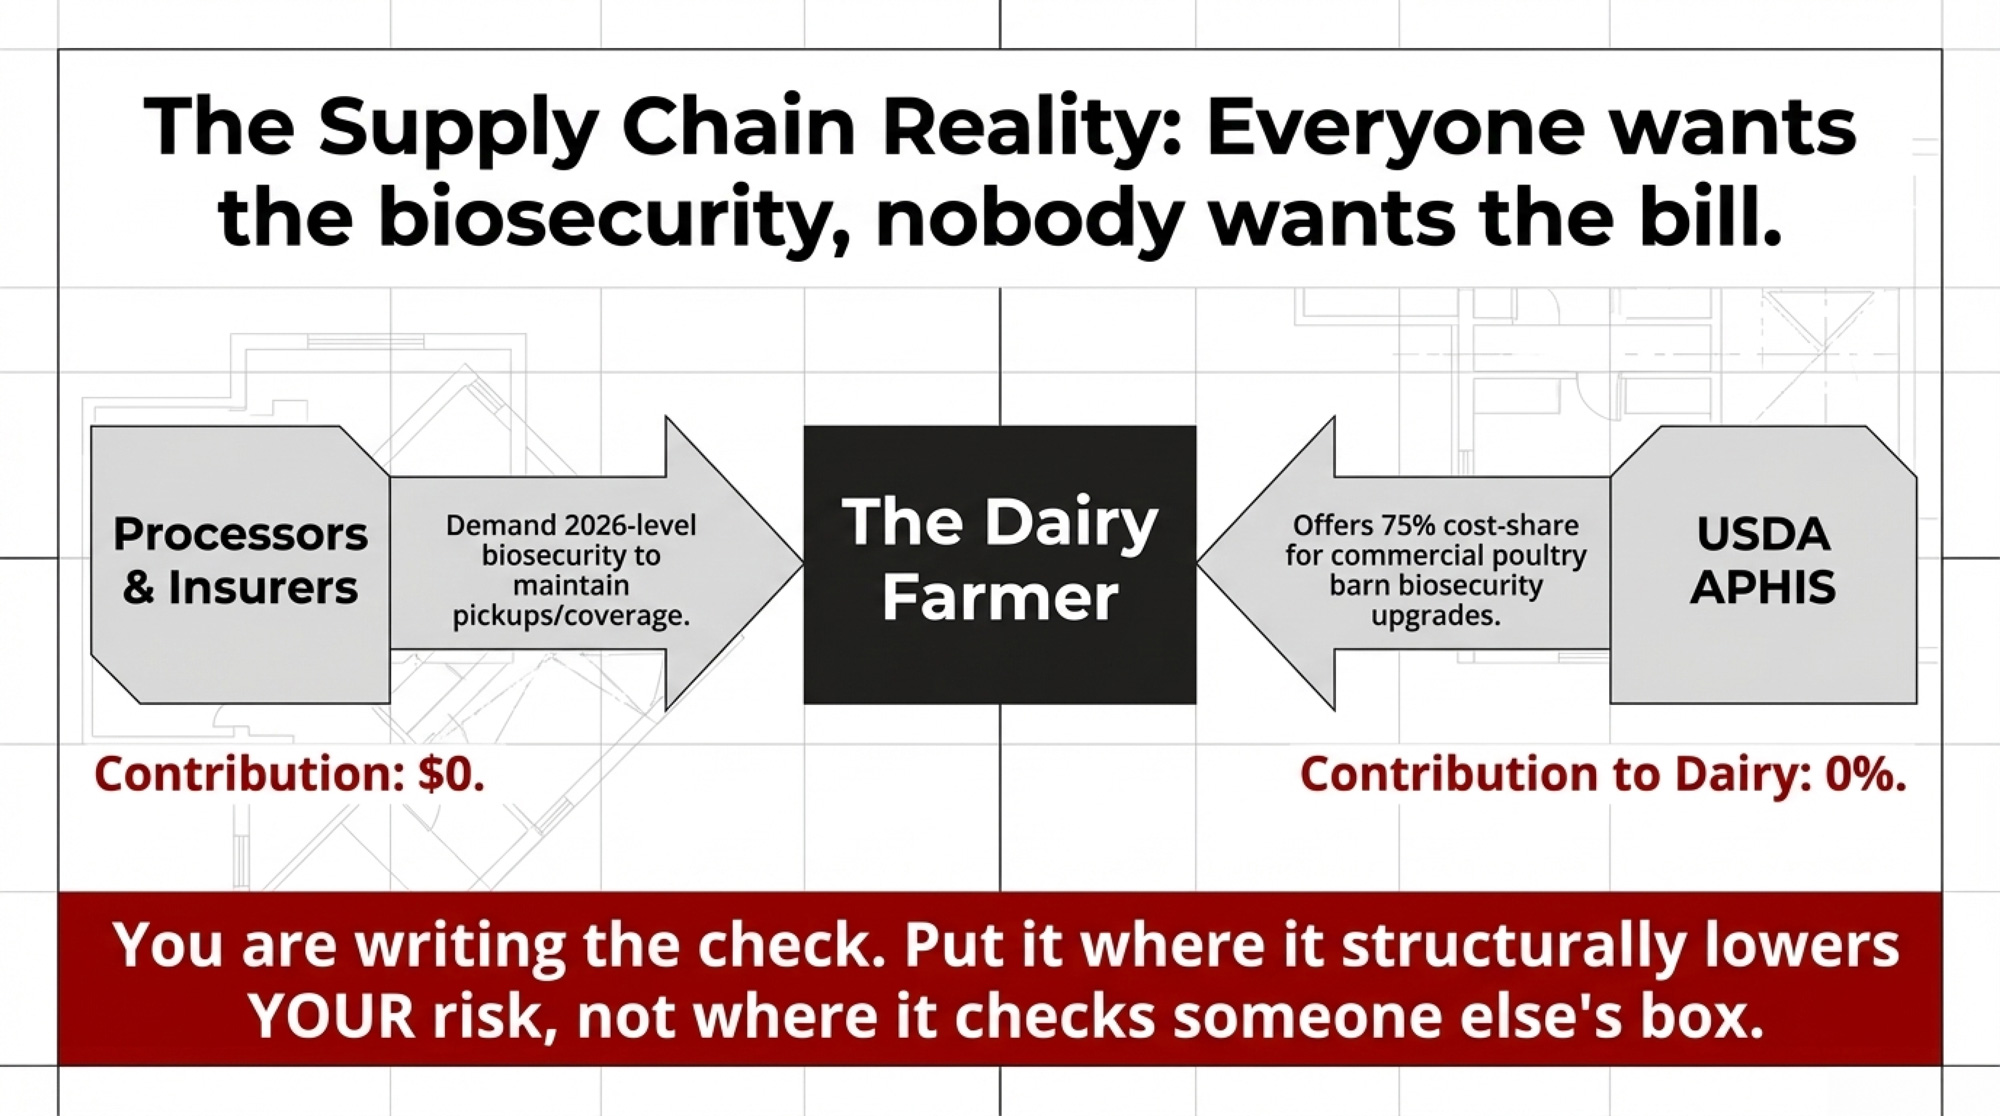
The $0.40/cwt Question: Who’s Capturing the Export Gains?
Record volumes should mean a better check. So why doesn’t it feel that way?
The volume–value gap in January isn’t a mystery — it’s a trailing indicator. Falling U.S. cheese and butter prices in Q4 2025 dragged down the value of shipments contracted months earlier. February’s 11% value jump shows the market correcting. But the real disconnect is domestic, not global.
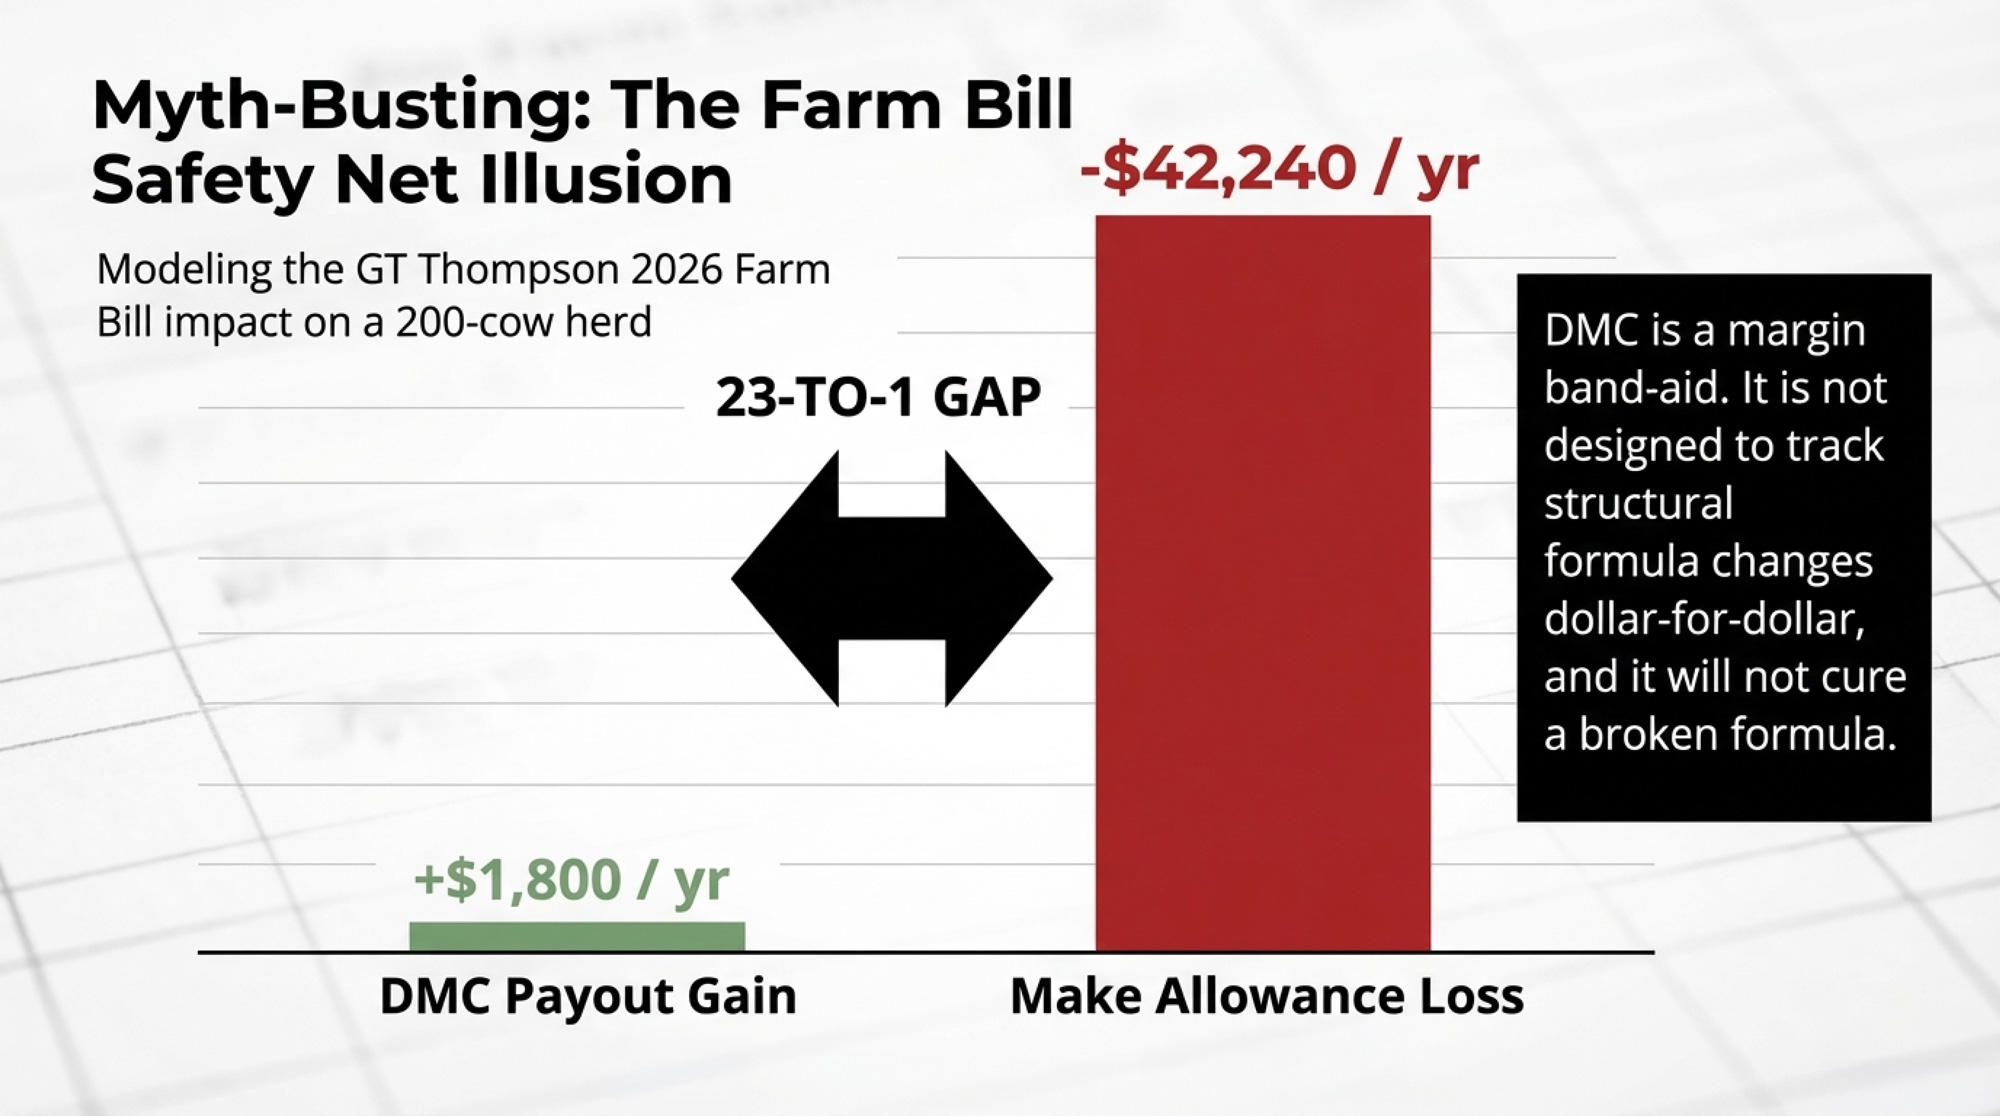
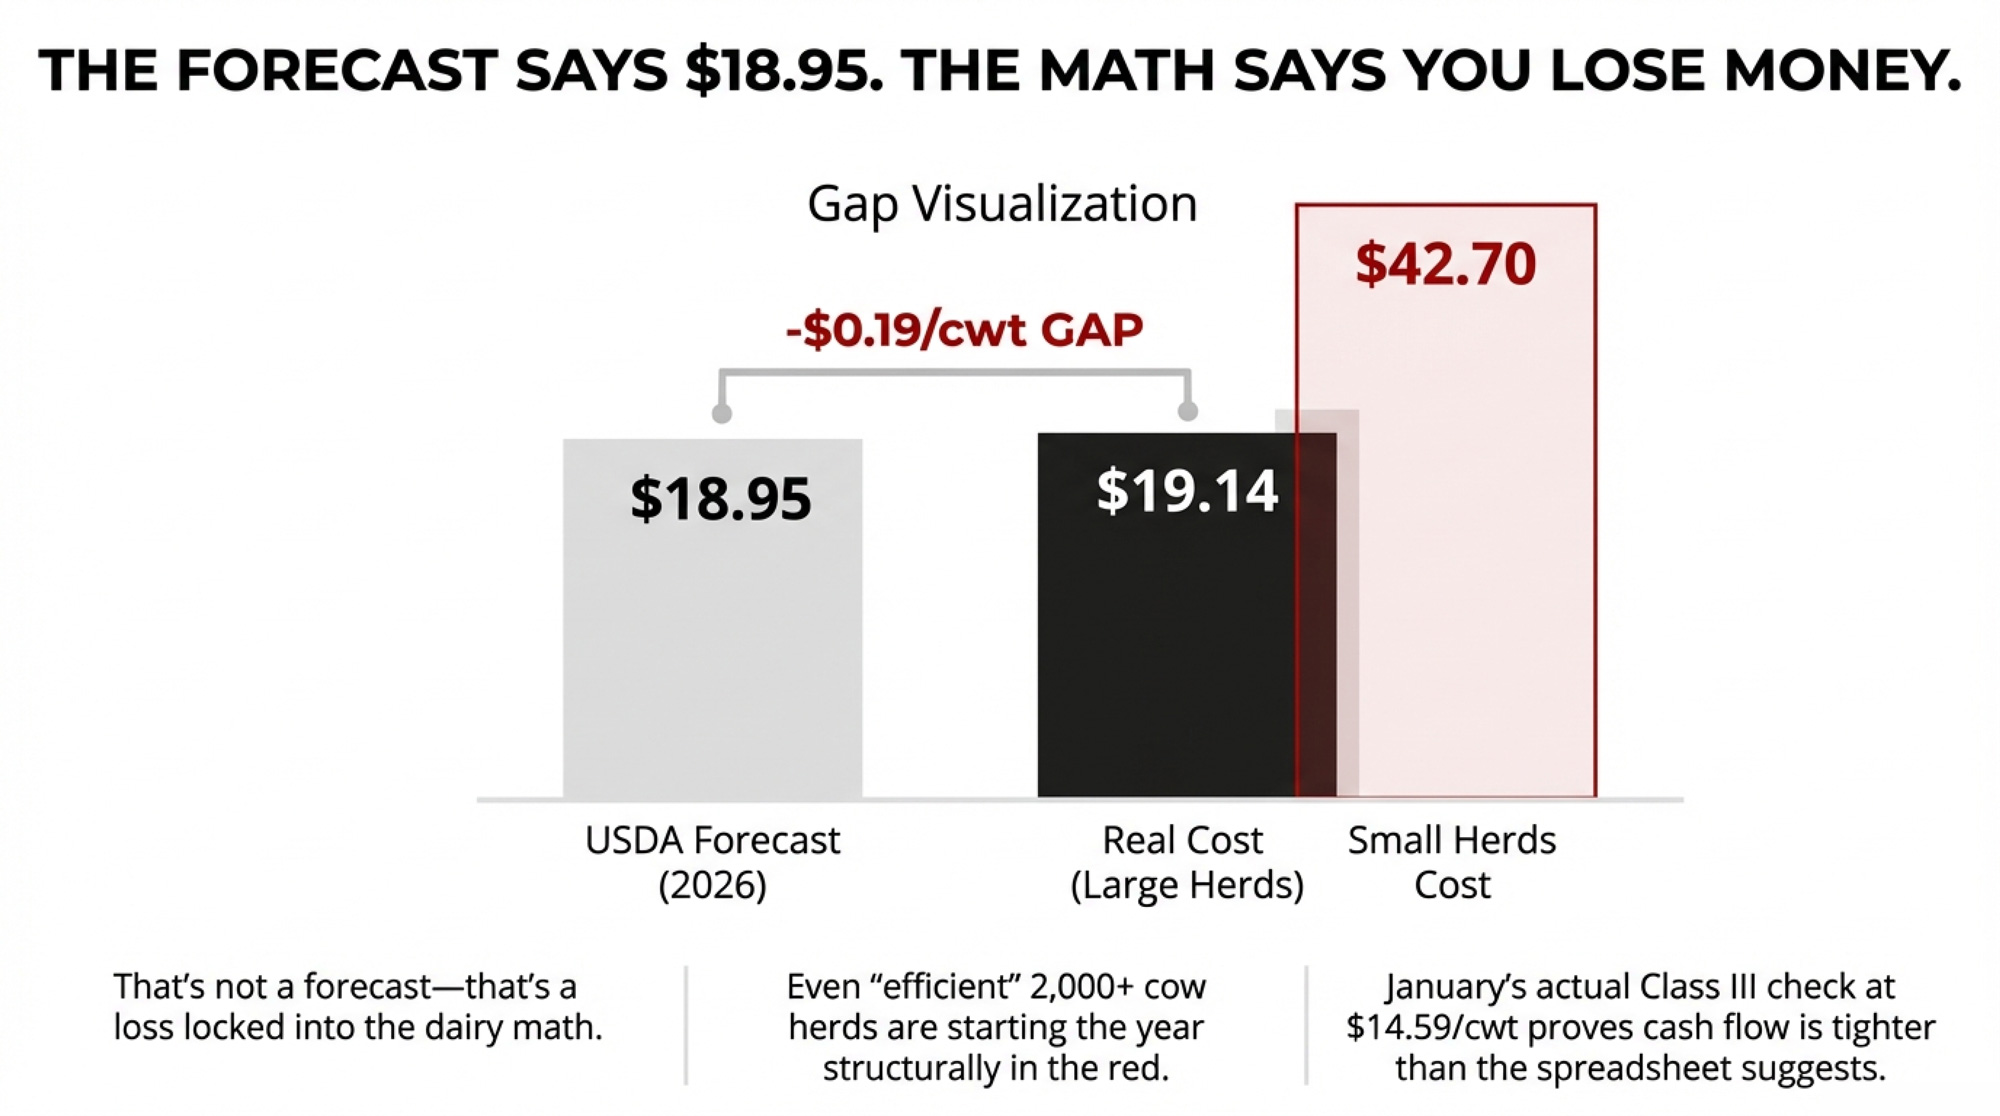
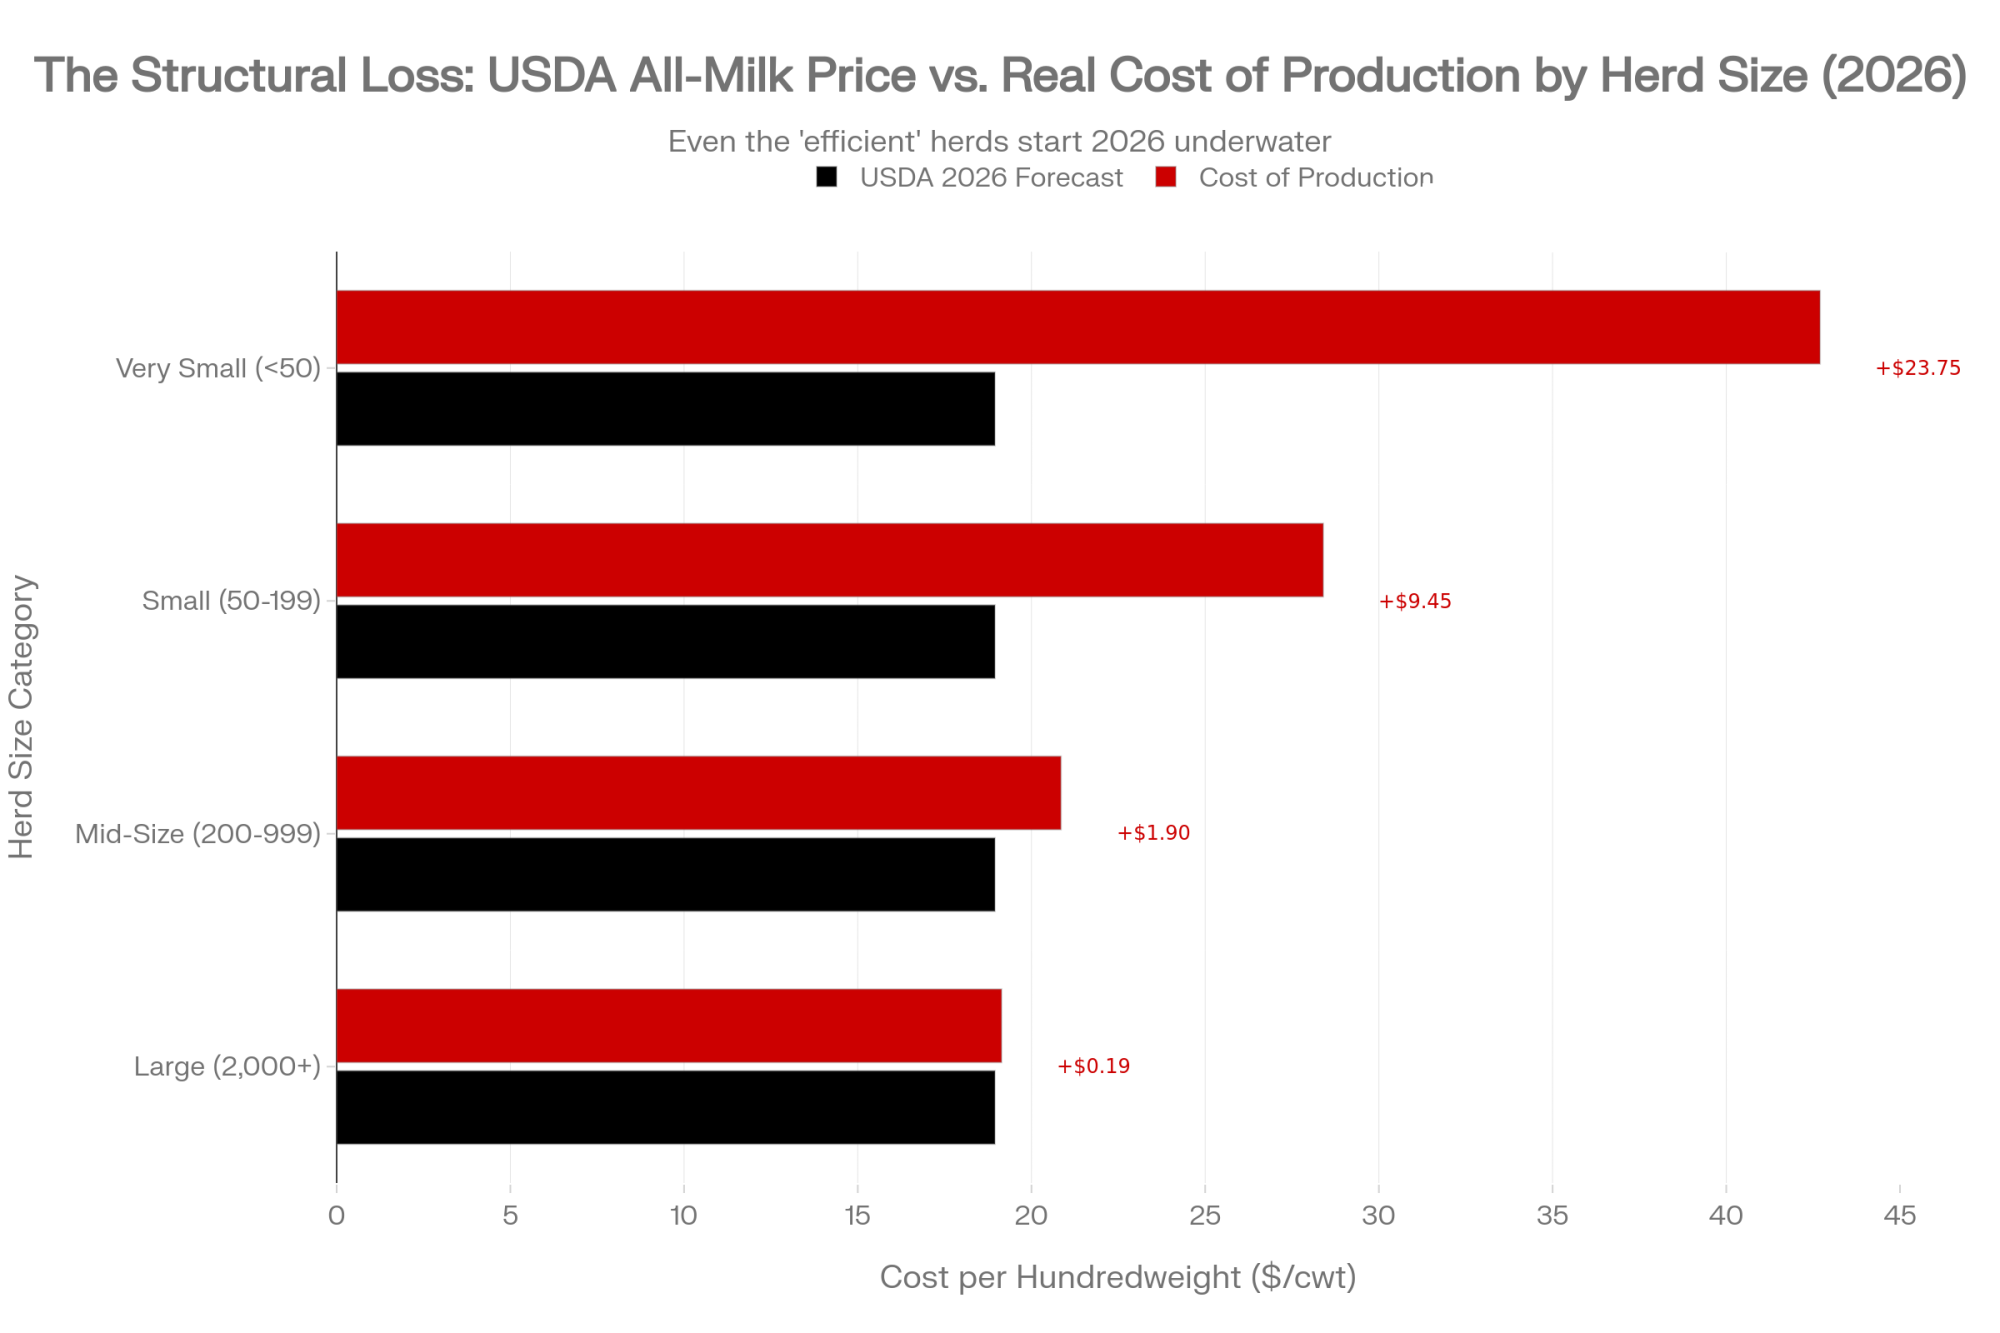
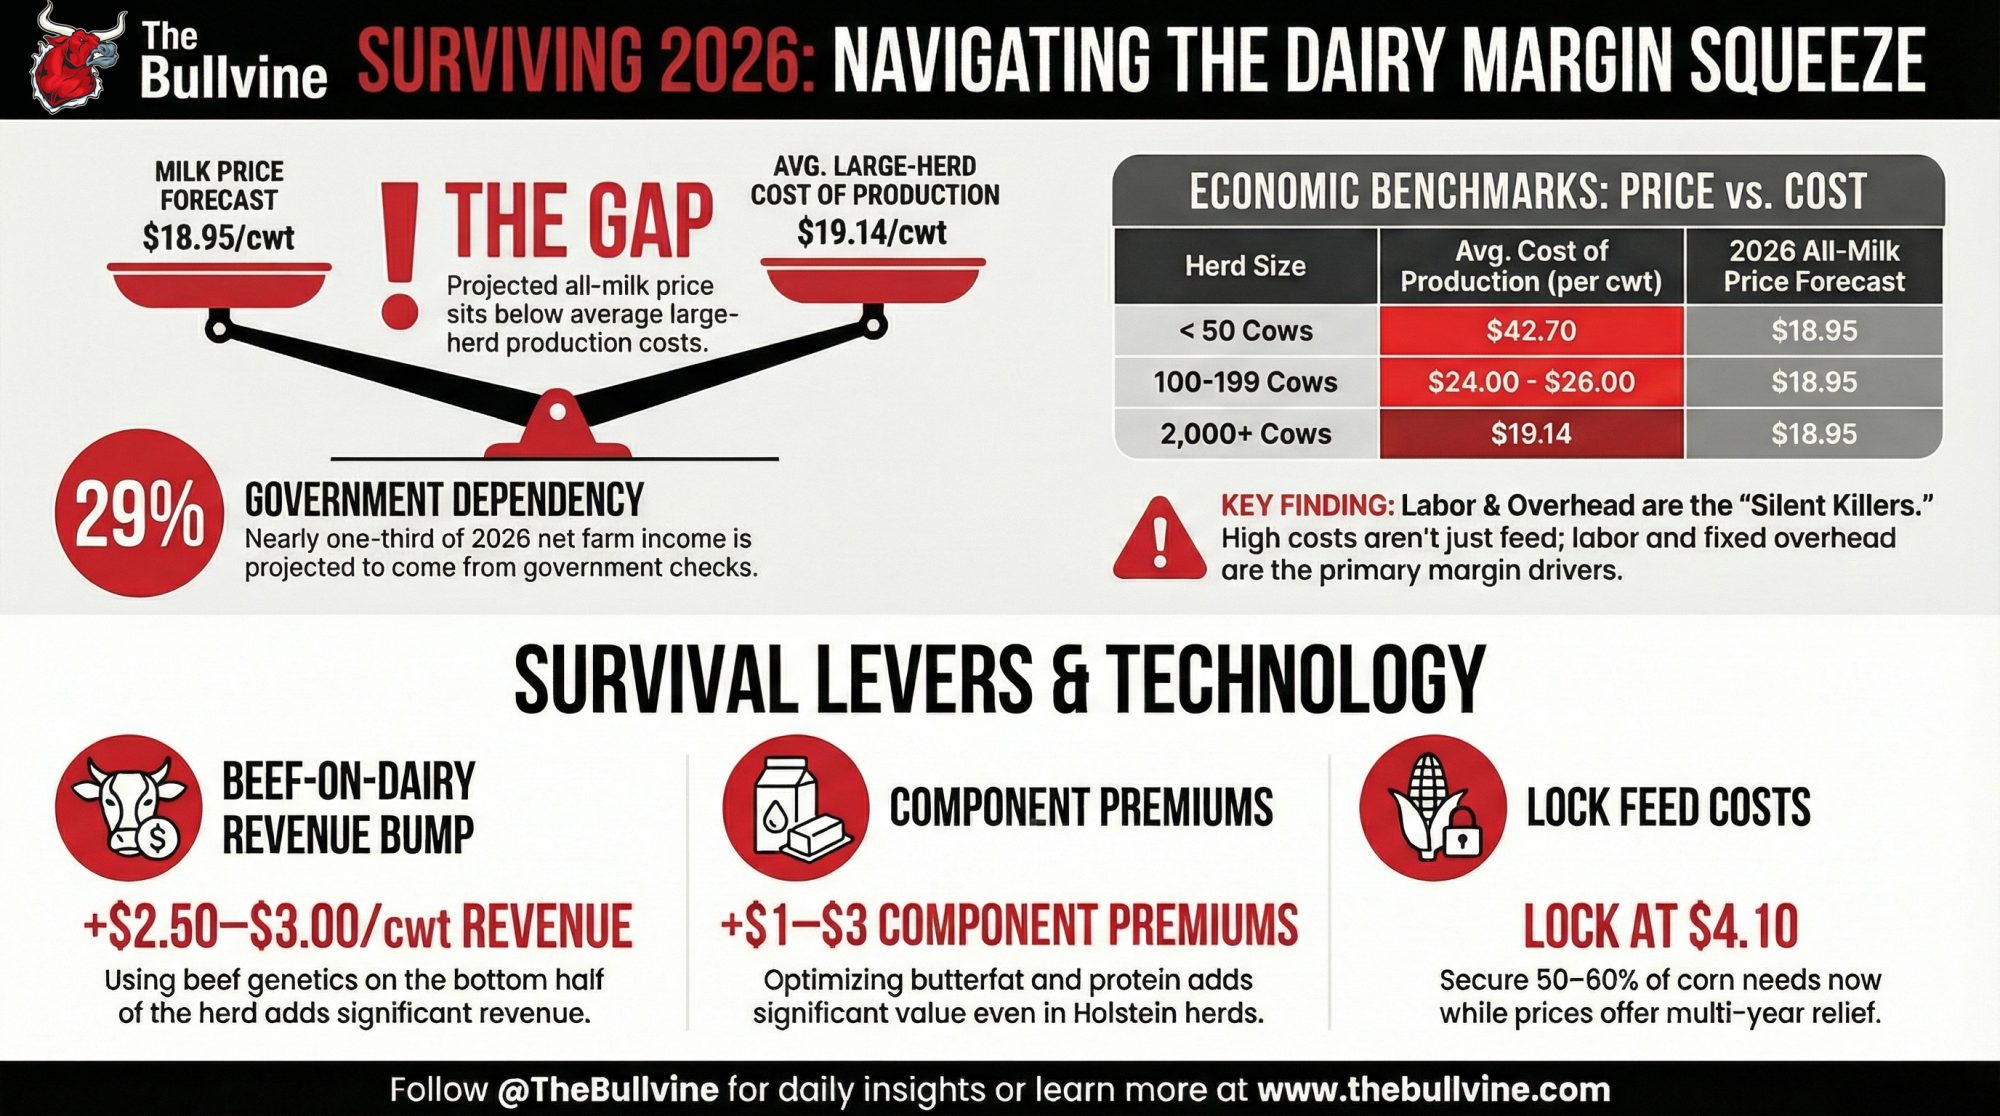
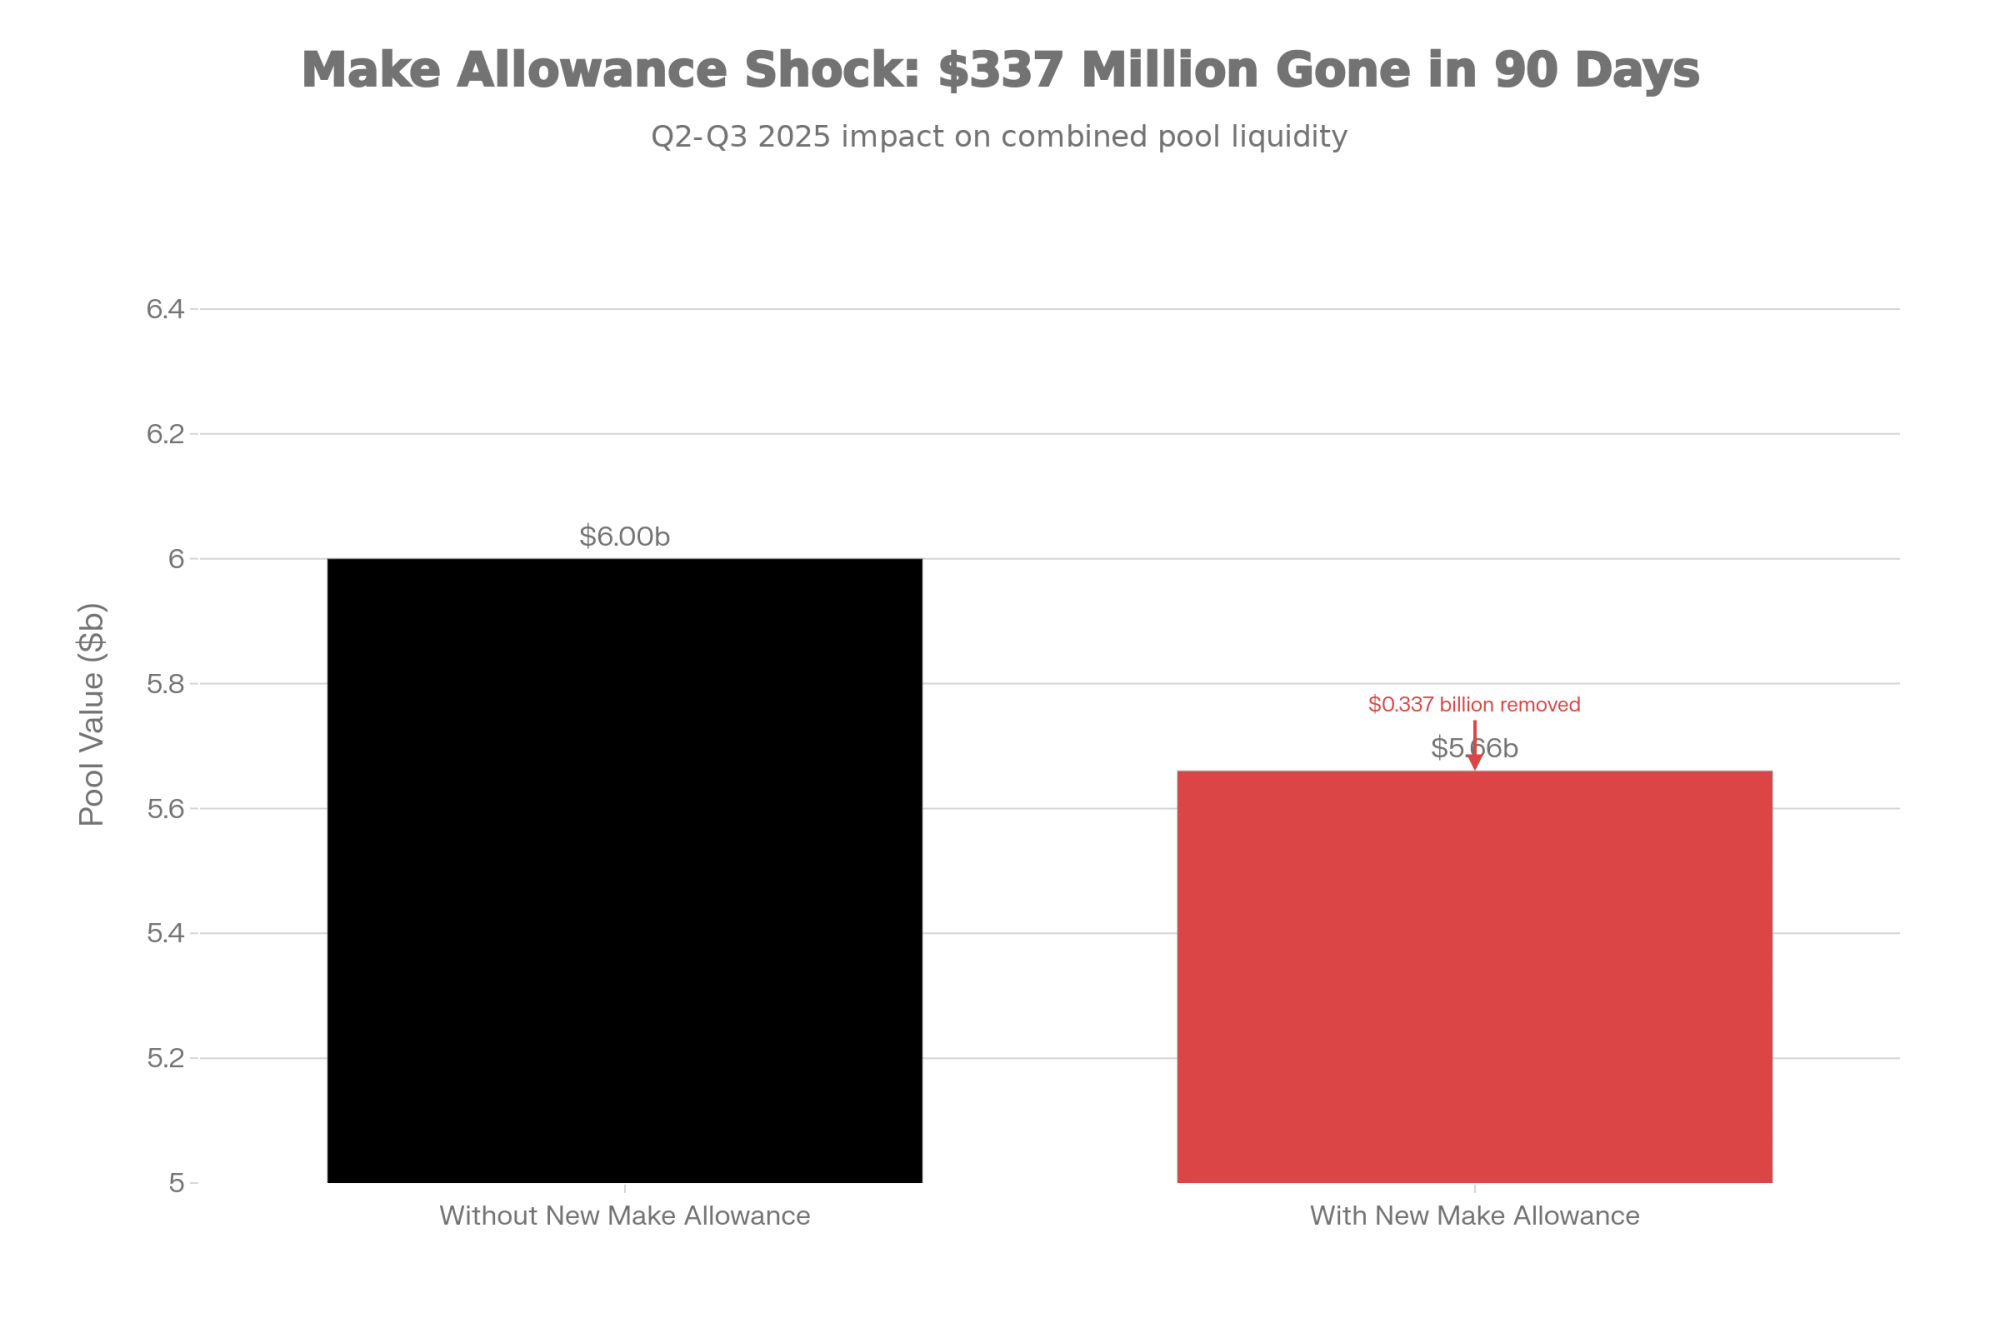
Following the 2025 FMMO amendments — which took effect June 1 and December 31, 2025 — make allowances climbed across products in line with USDA’s final decision. Analysts estimate the aggregate impact on the milk check at about $5.04/cwt when you sum the per‑pound changes across butter, cheese, NFDM, and dry whey. ADC’s analysis of the first eight months under the new rules estimates that processor gross margins increased 26% to 39% and minimum milk values paid to farmers dropped approximately 5% — figures ADC derived from USDA pricing data, though the methodology hasn’t been independently audited. IDFA has not publicly disputed or confirmed ADC’s calculations.
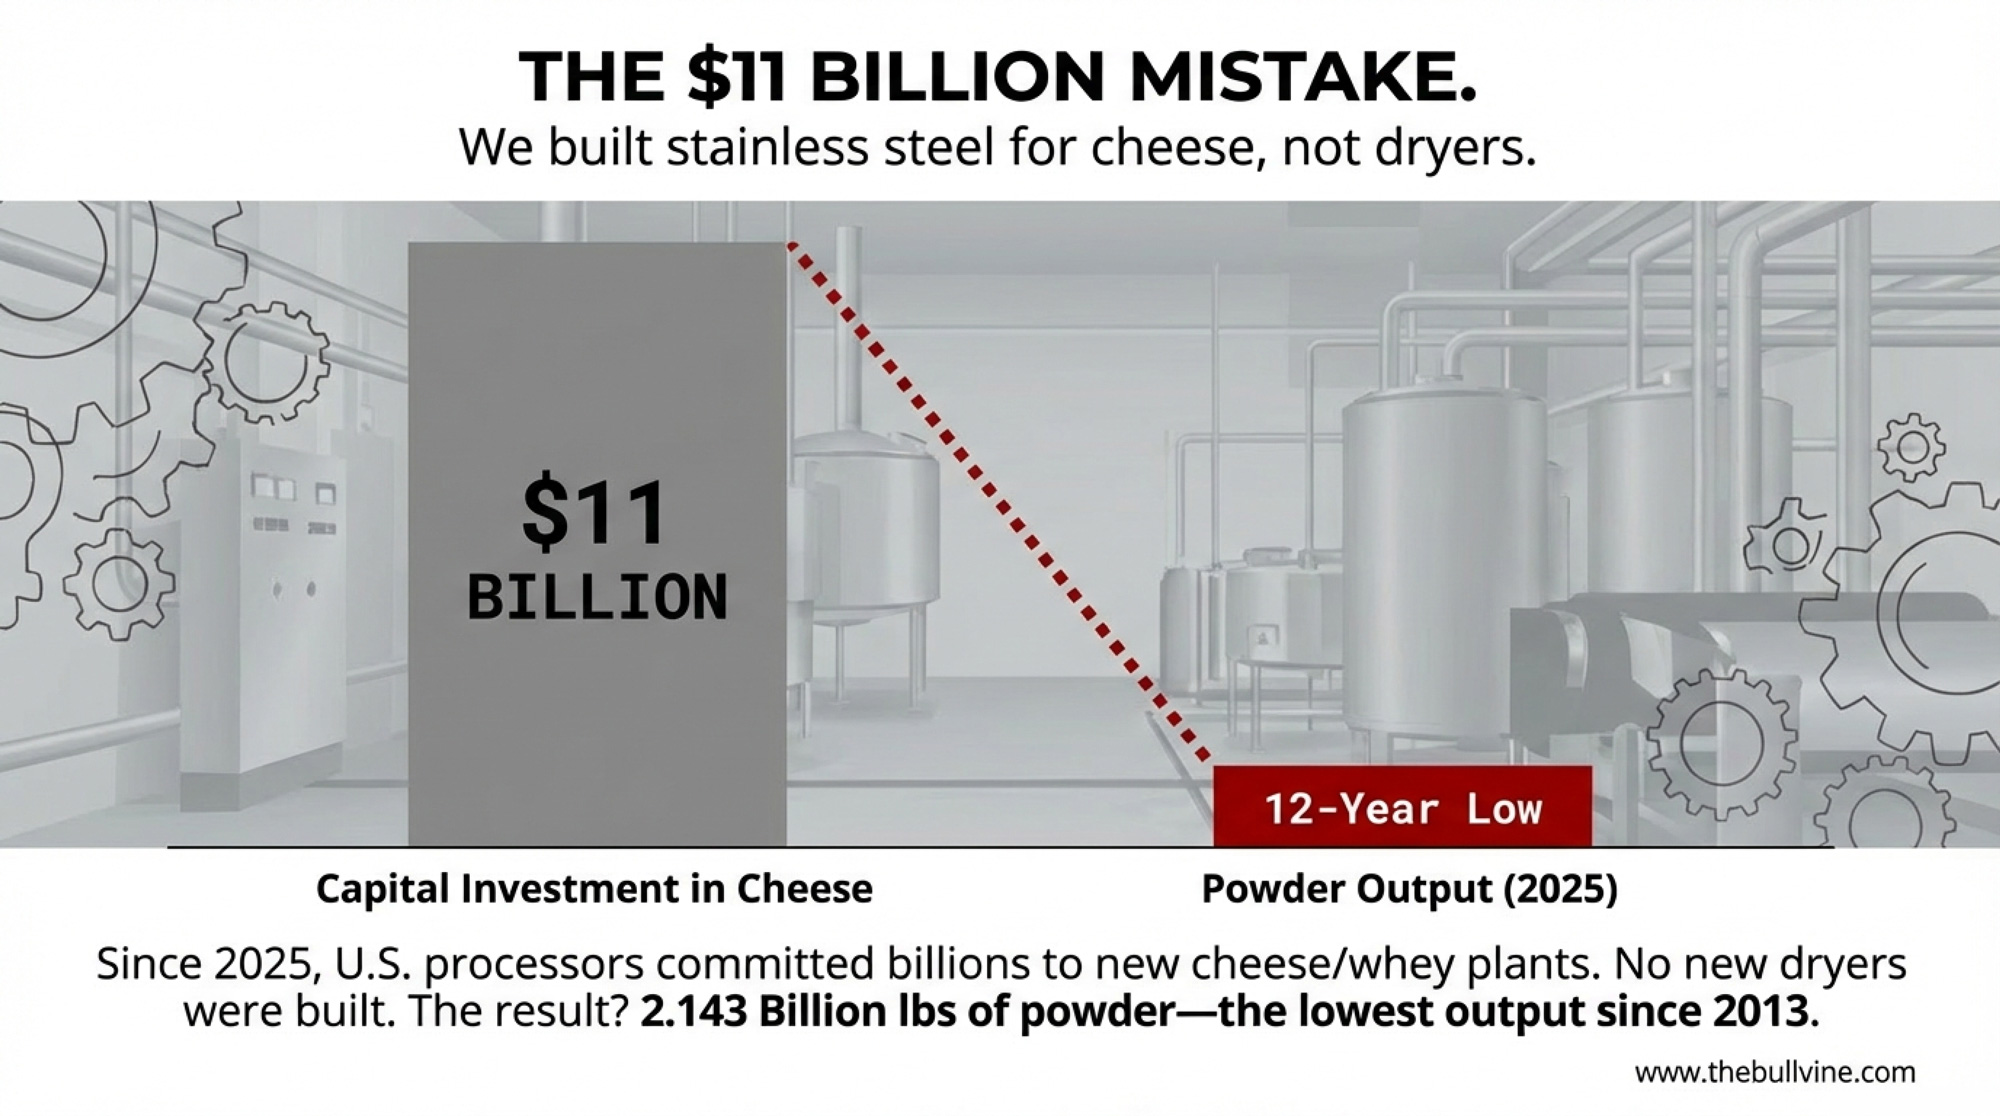
IDFA supported the increase, noting the rates hadn’t been adjusted since the last FMMO hearing process in 2007–2008. And there’s a reason processors pushed hard for it: IDFA president and CEO Michael Dykes told Dairy Herd and other outlets that more than $11 billion is flowing into 53 new or expanded dairy manufacturing facilities across 19 states, slated to come online between 2025 and 2028. These are the plants physically creating the export products, driving the boom. Without that investment, the boom doesn’t exist.
ADC’s counterargument: farmers shouldn’t be subsidizing those plants through formula deductions that widen the gap between the all‑milk price and the mailbox — a gap that, ADC argues, many producers don’t fully see when they look at their checks. Both sides have a point. The question is where the line sits — and right now, it’s moving in one direction.
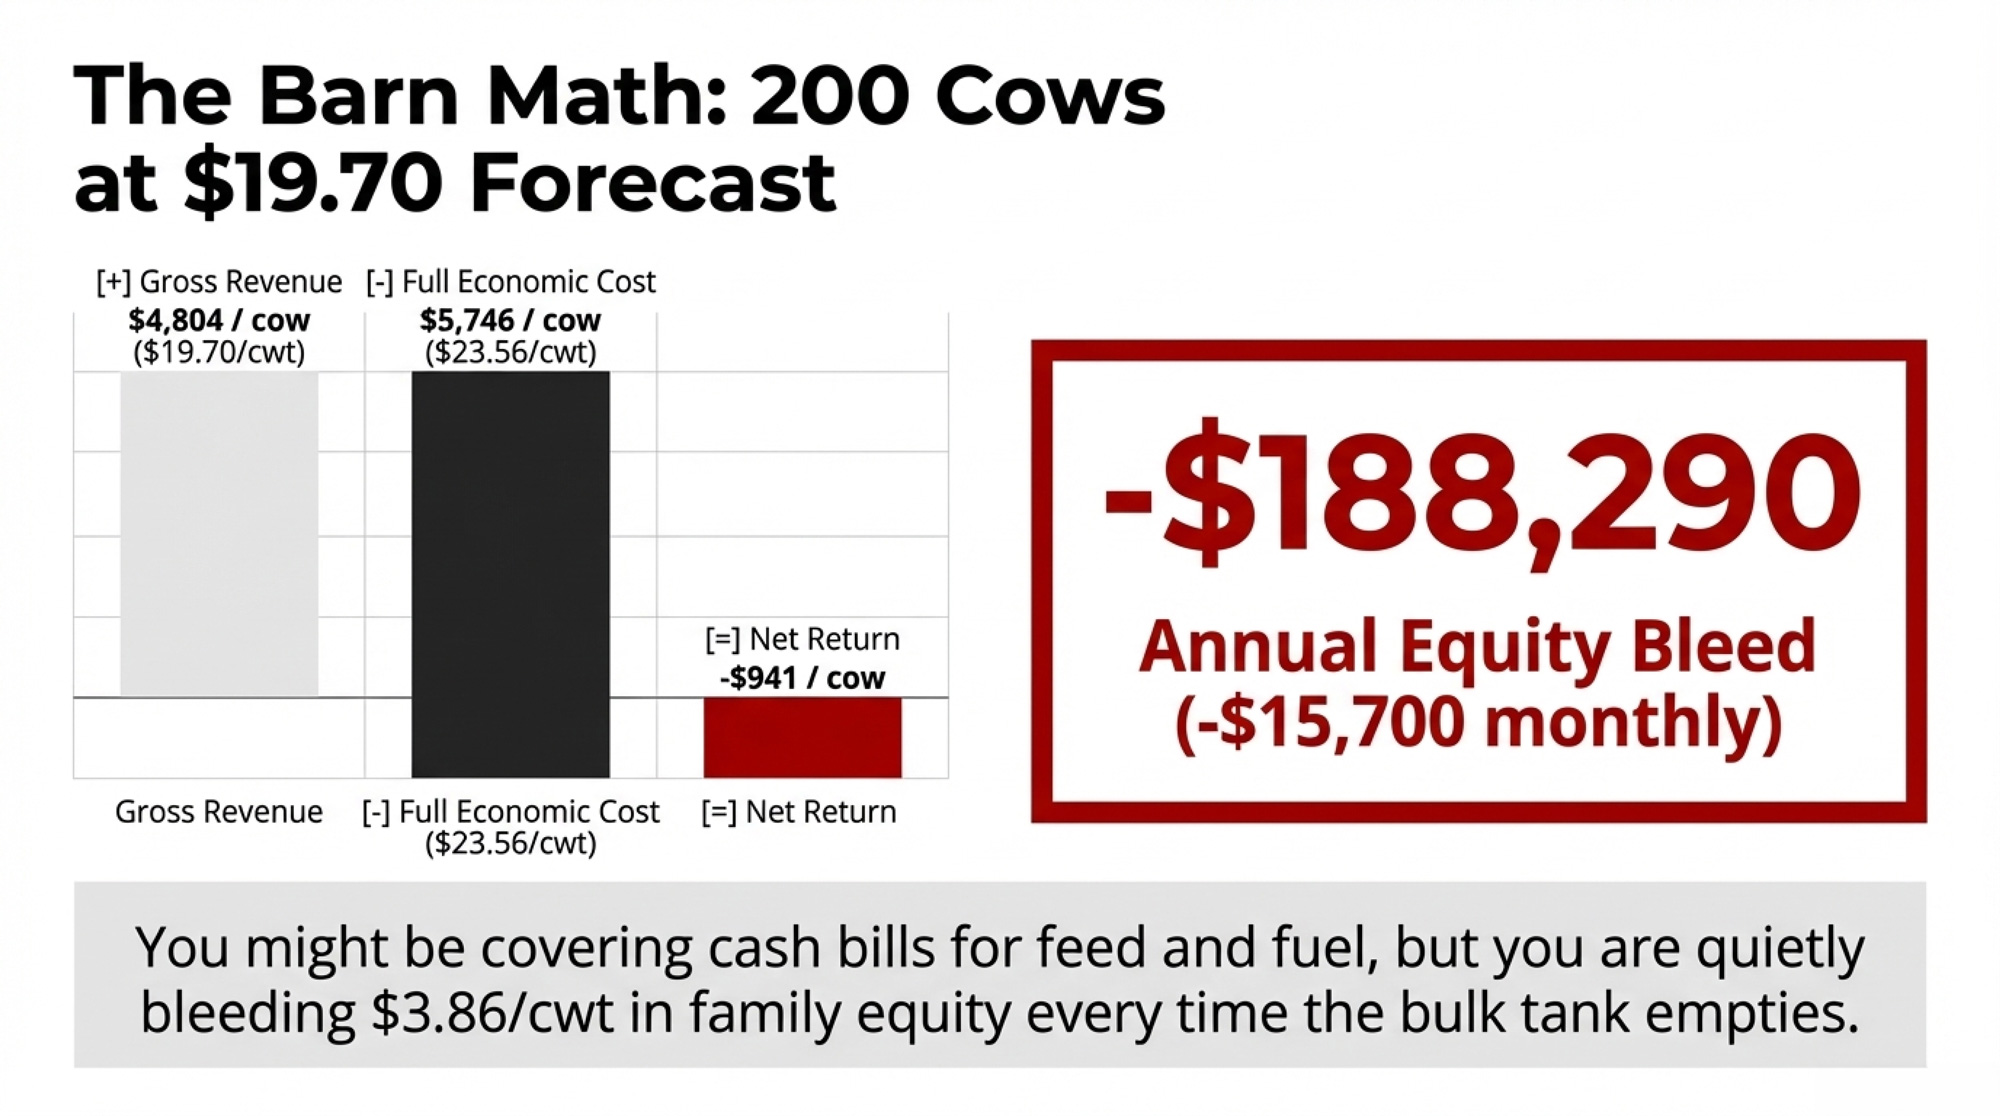
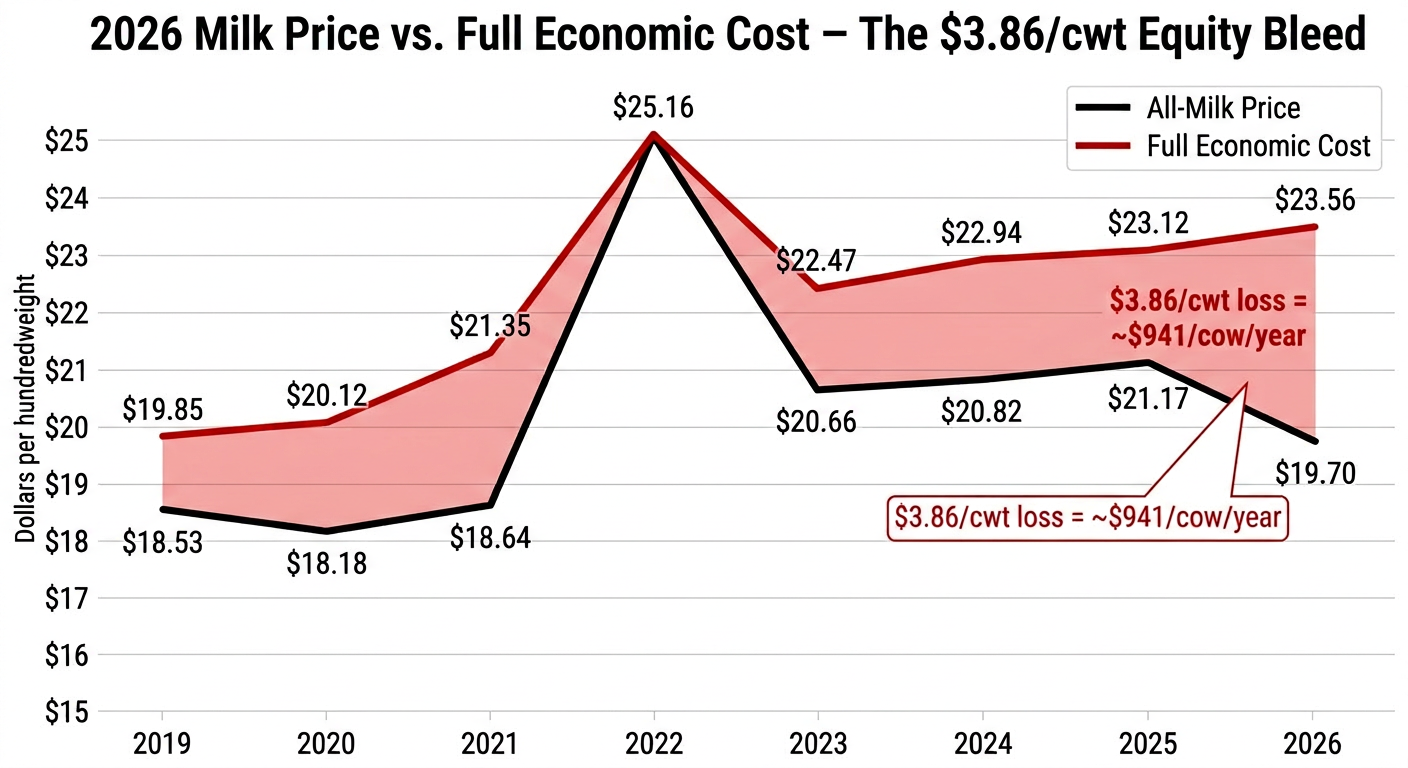
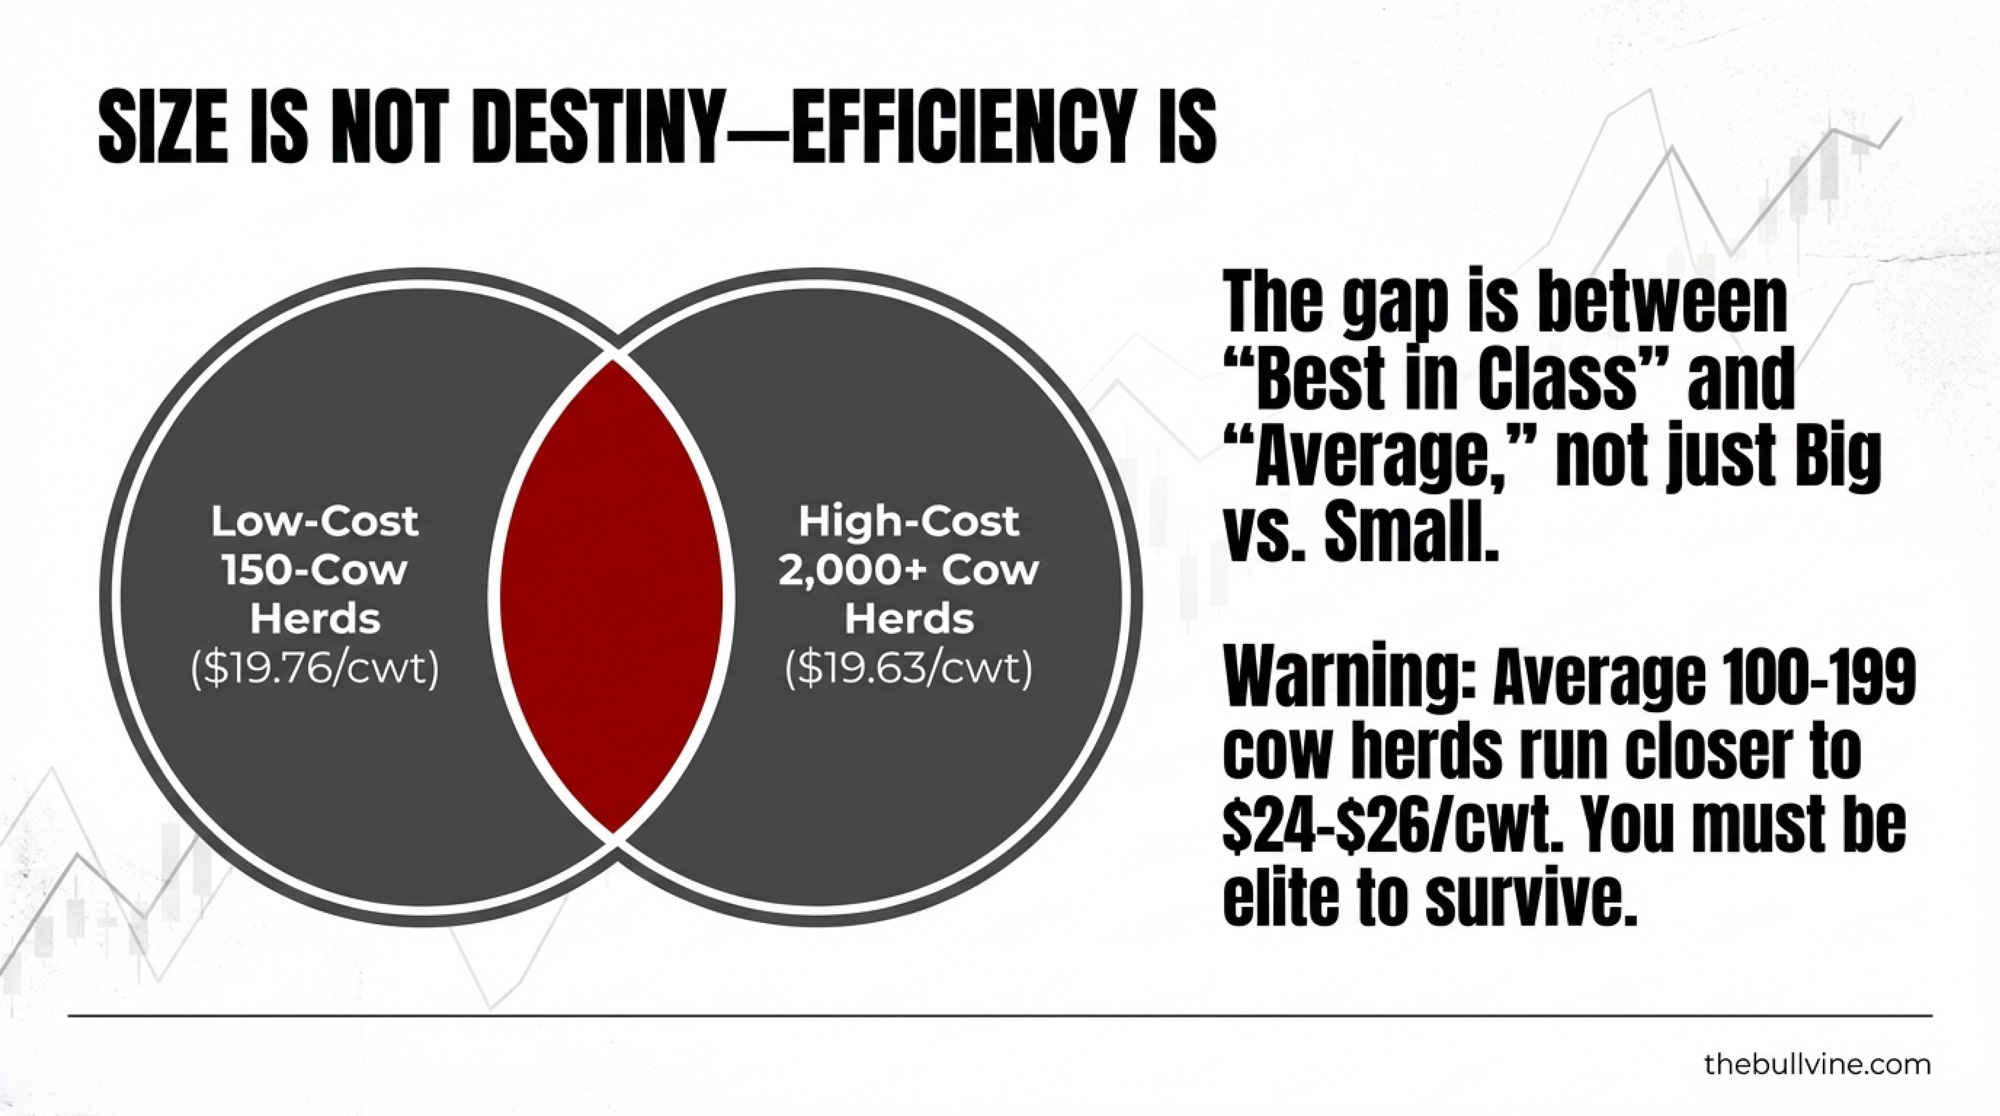
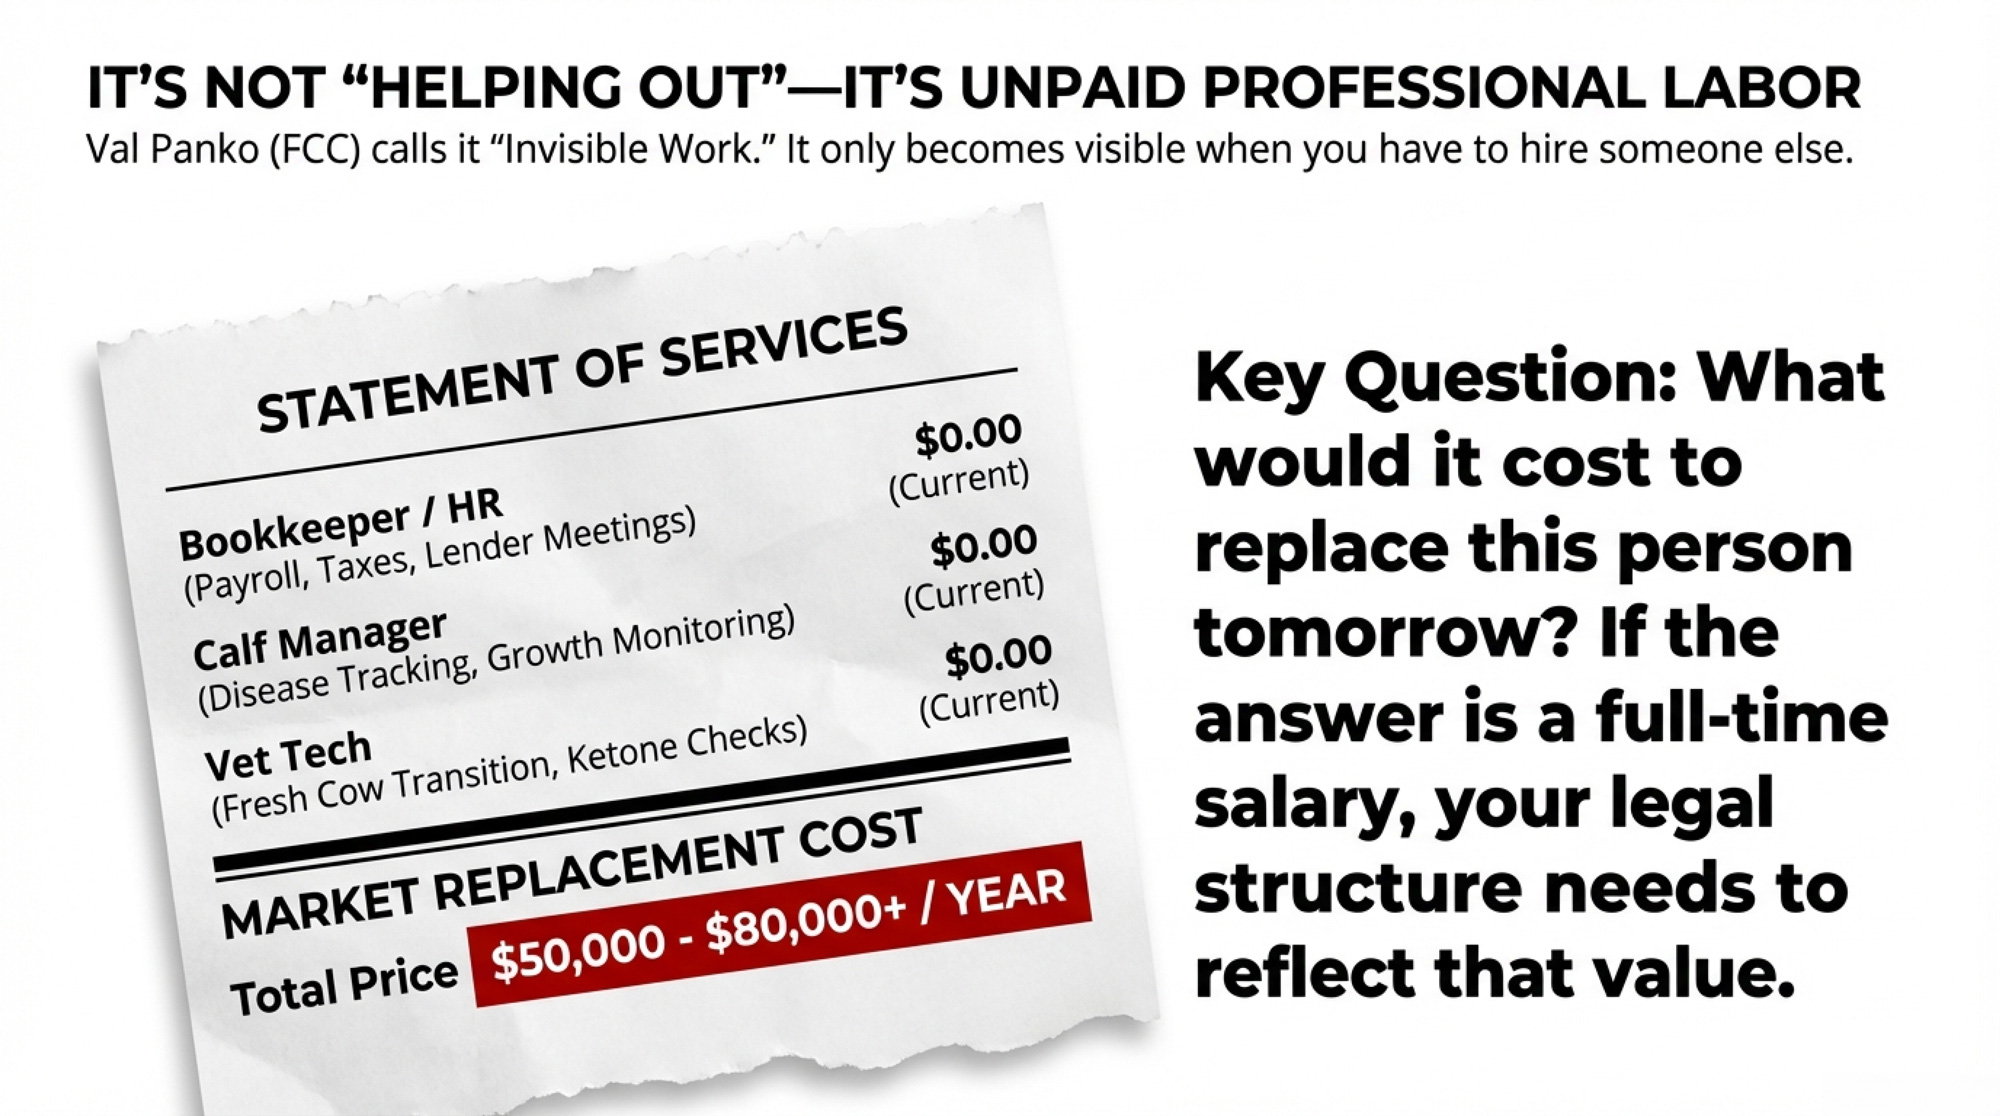
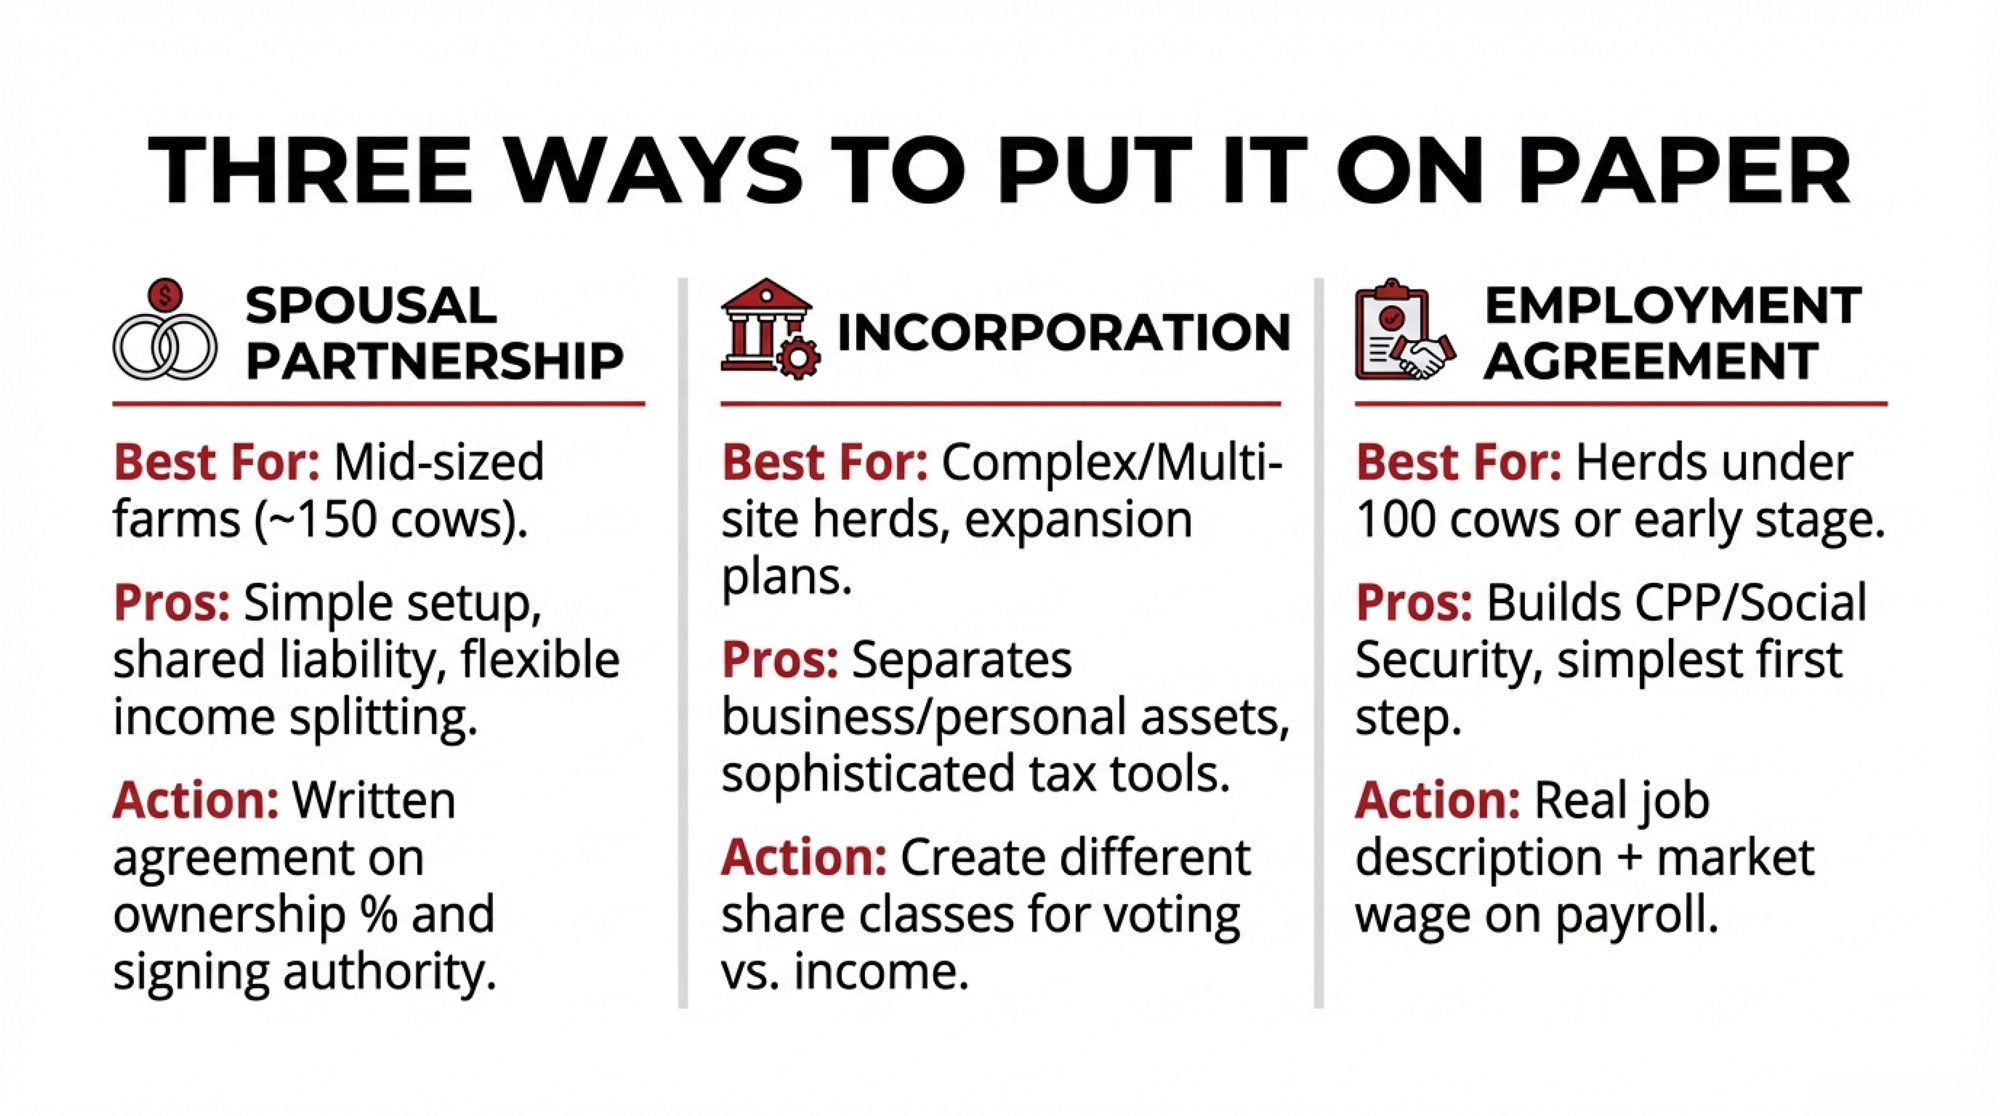
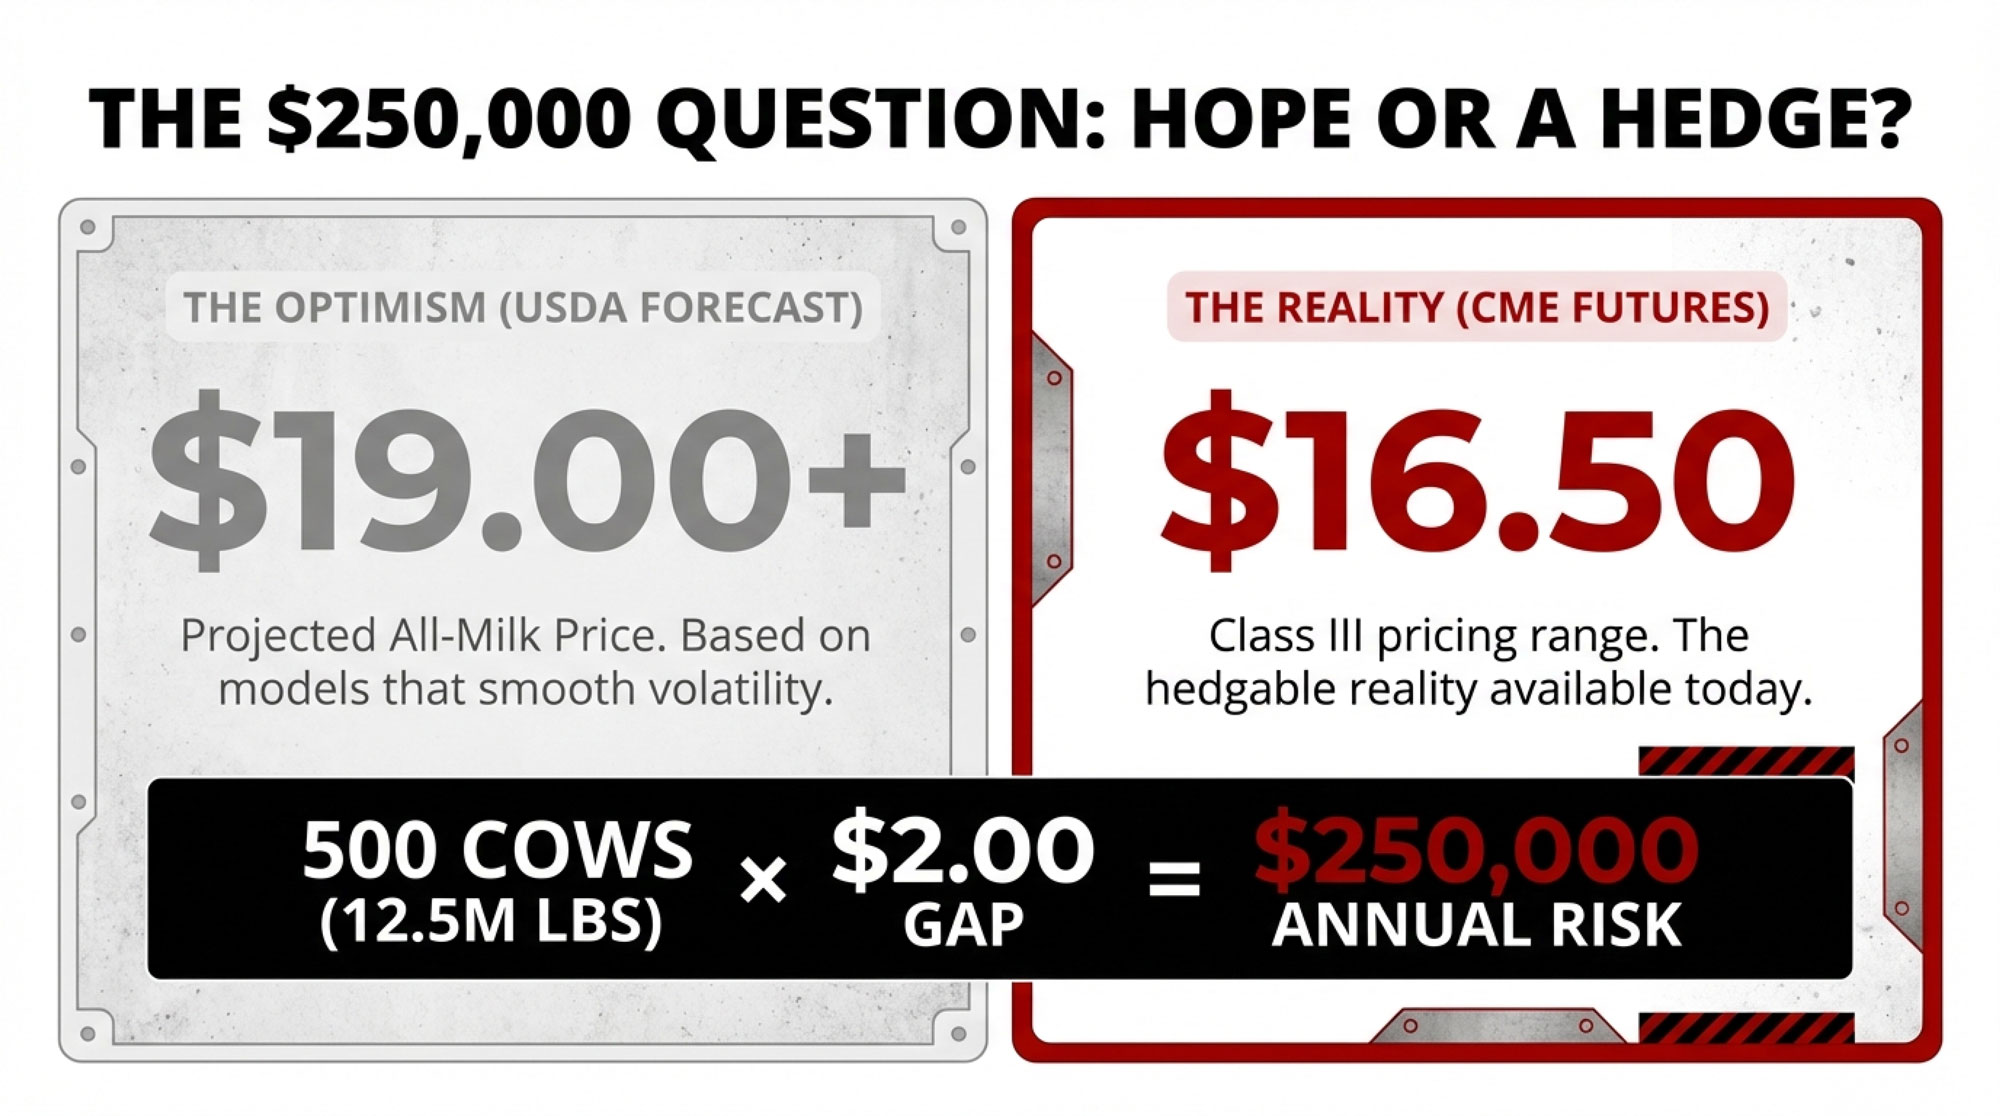
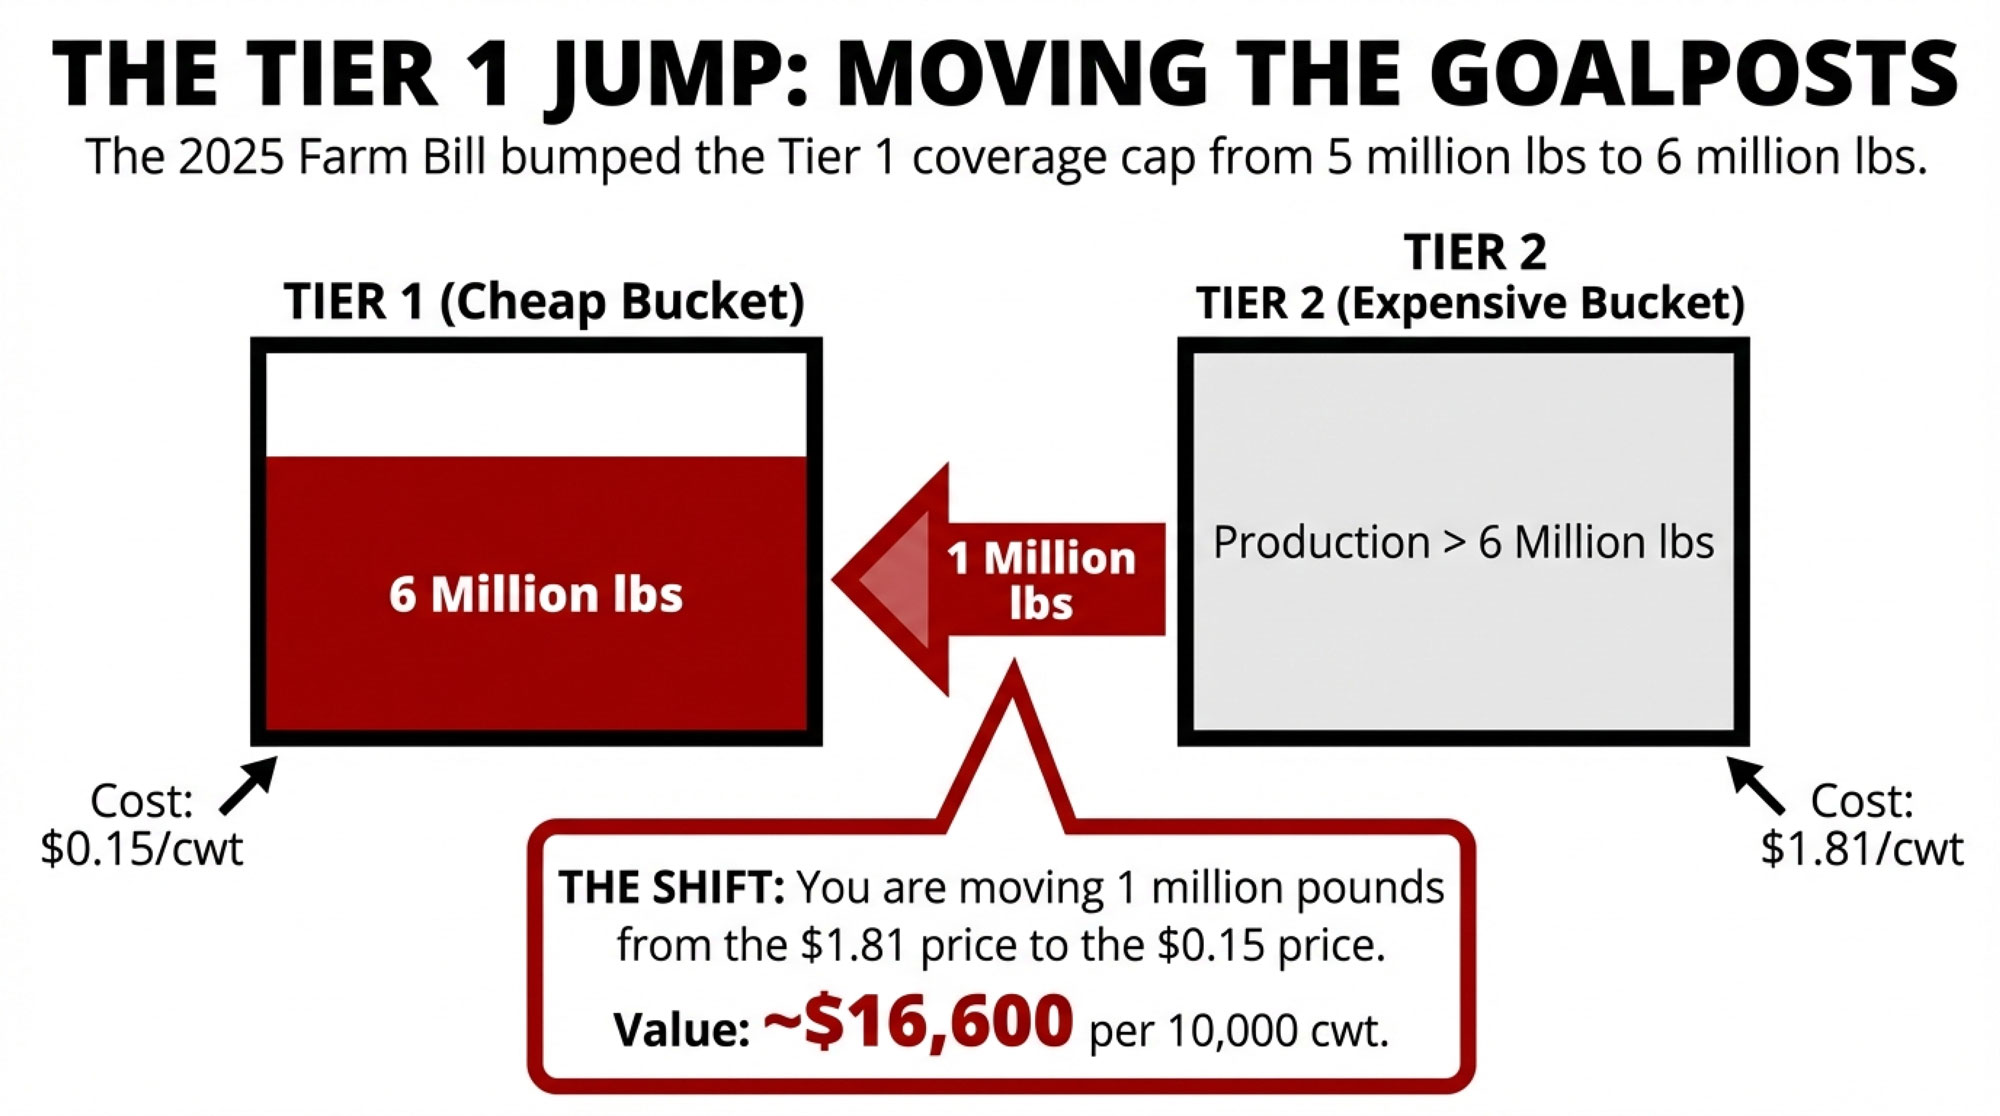
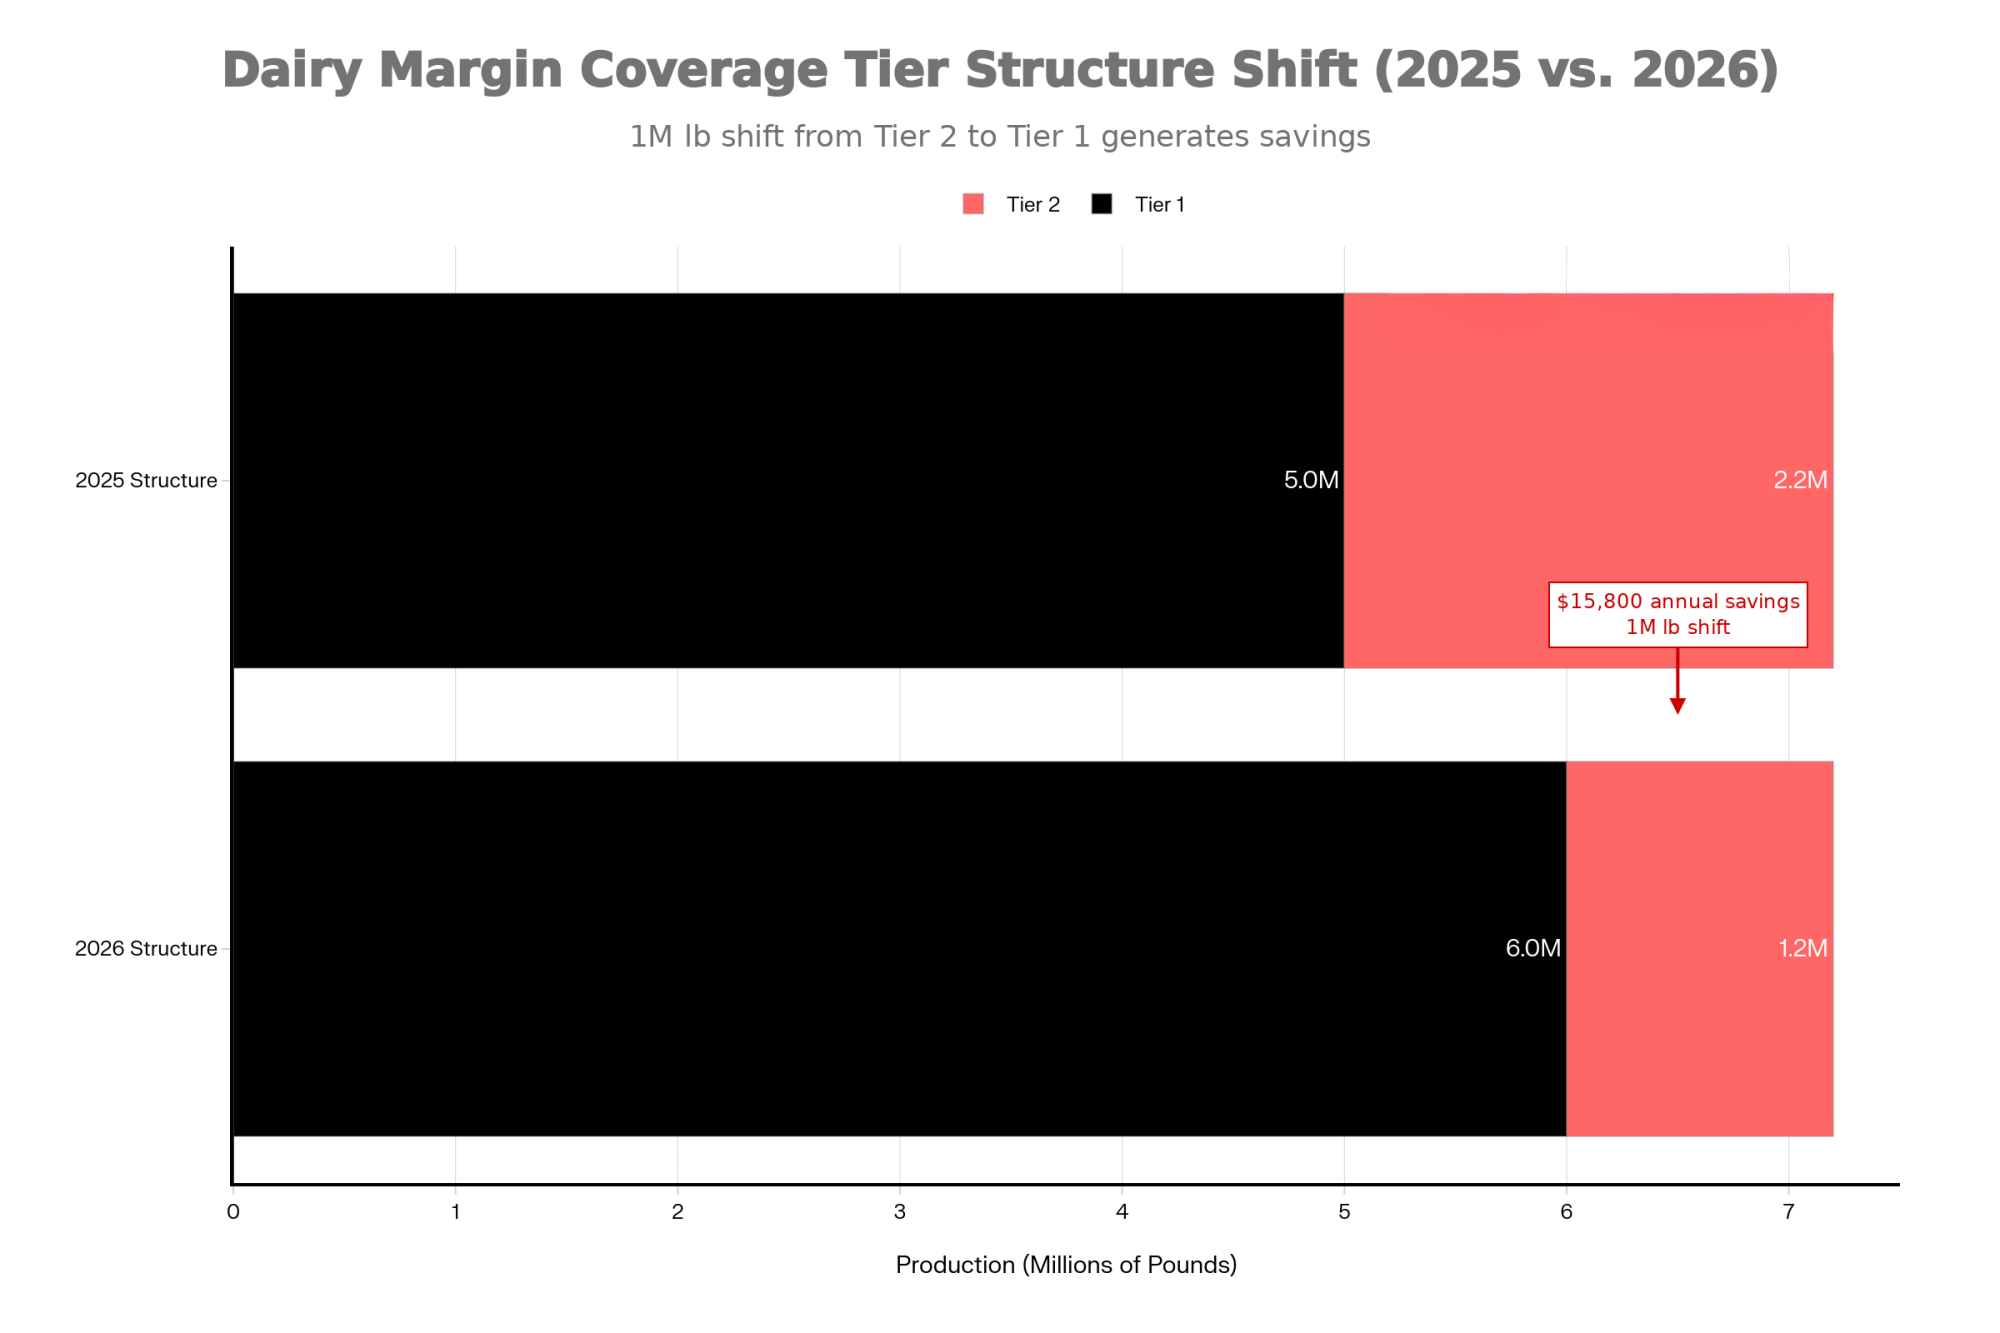
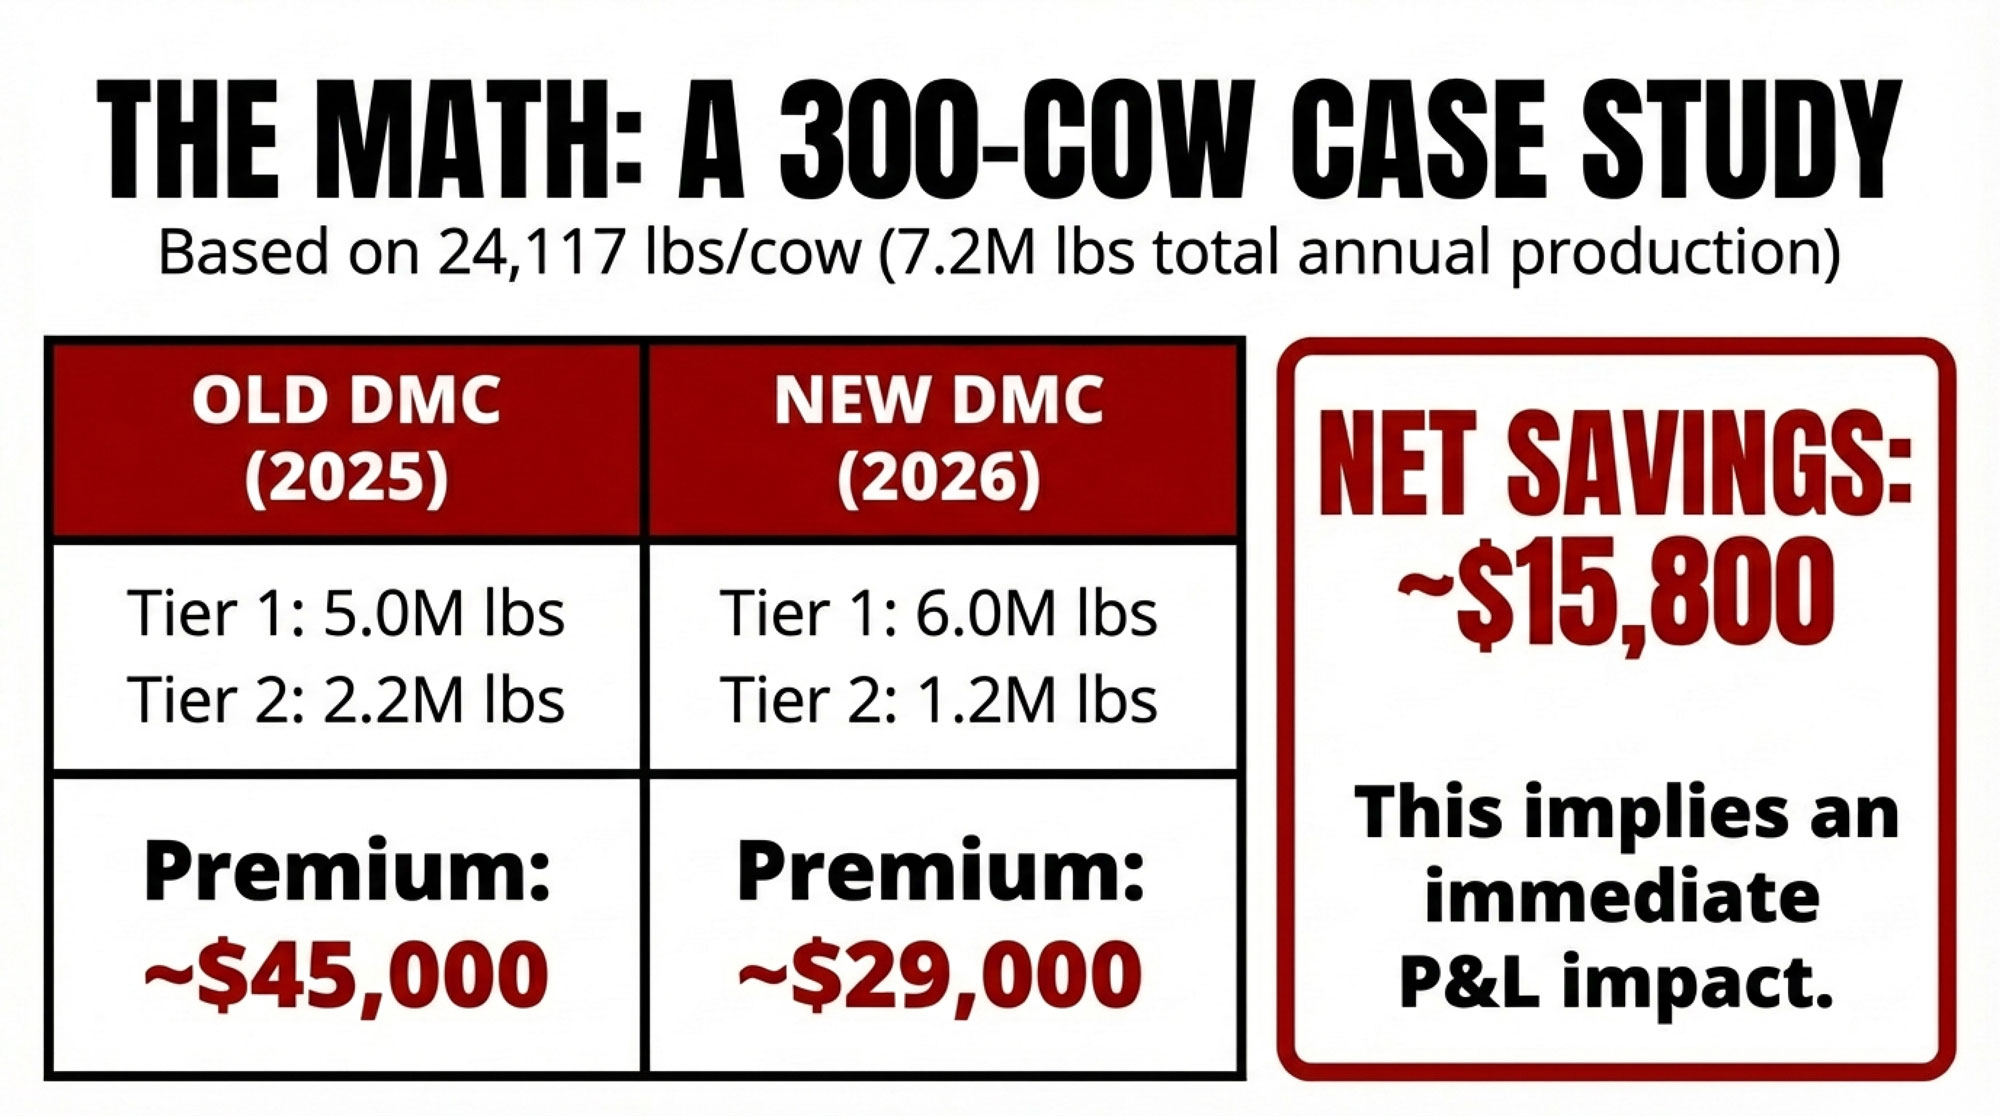
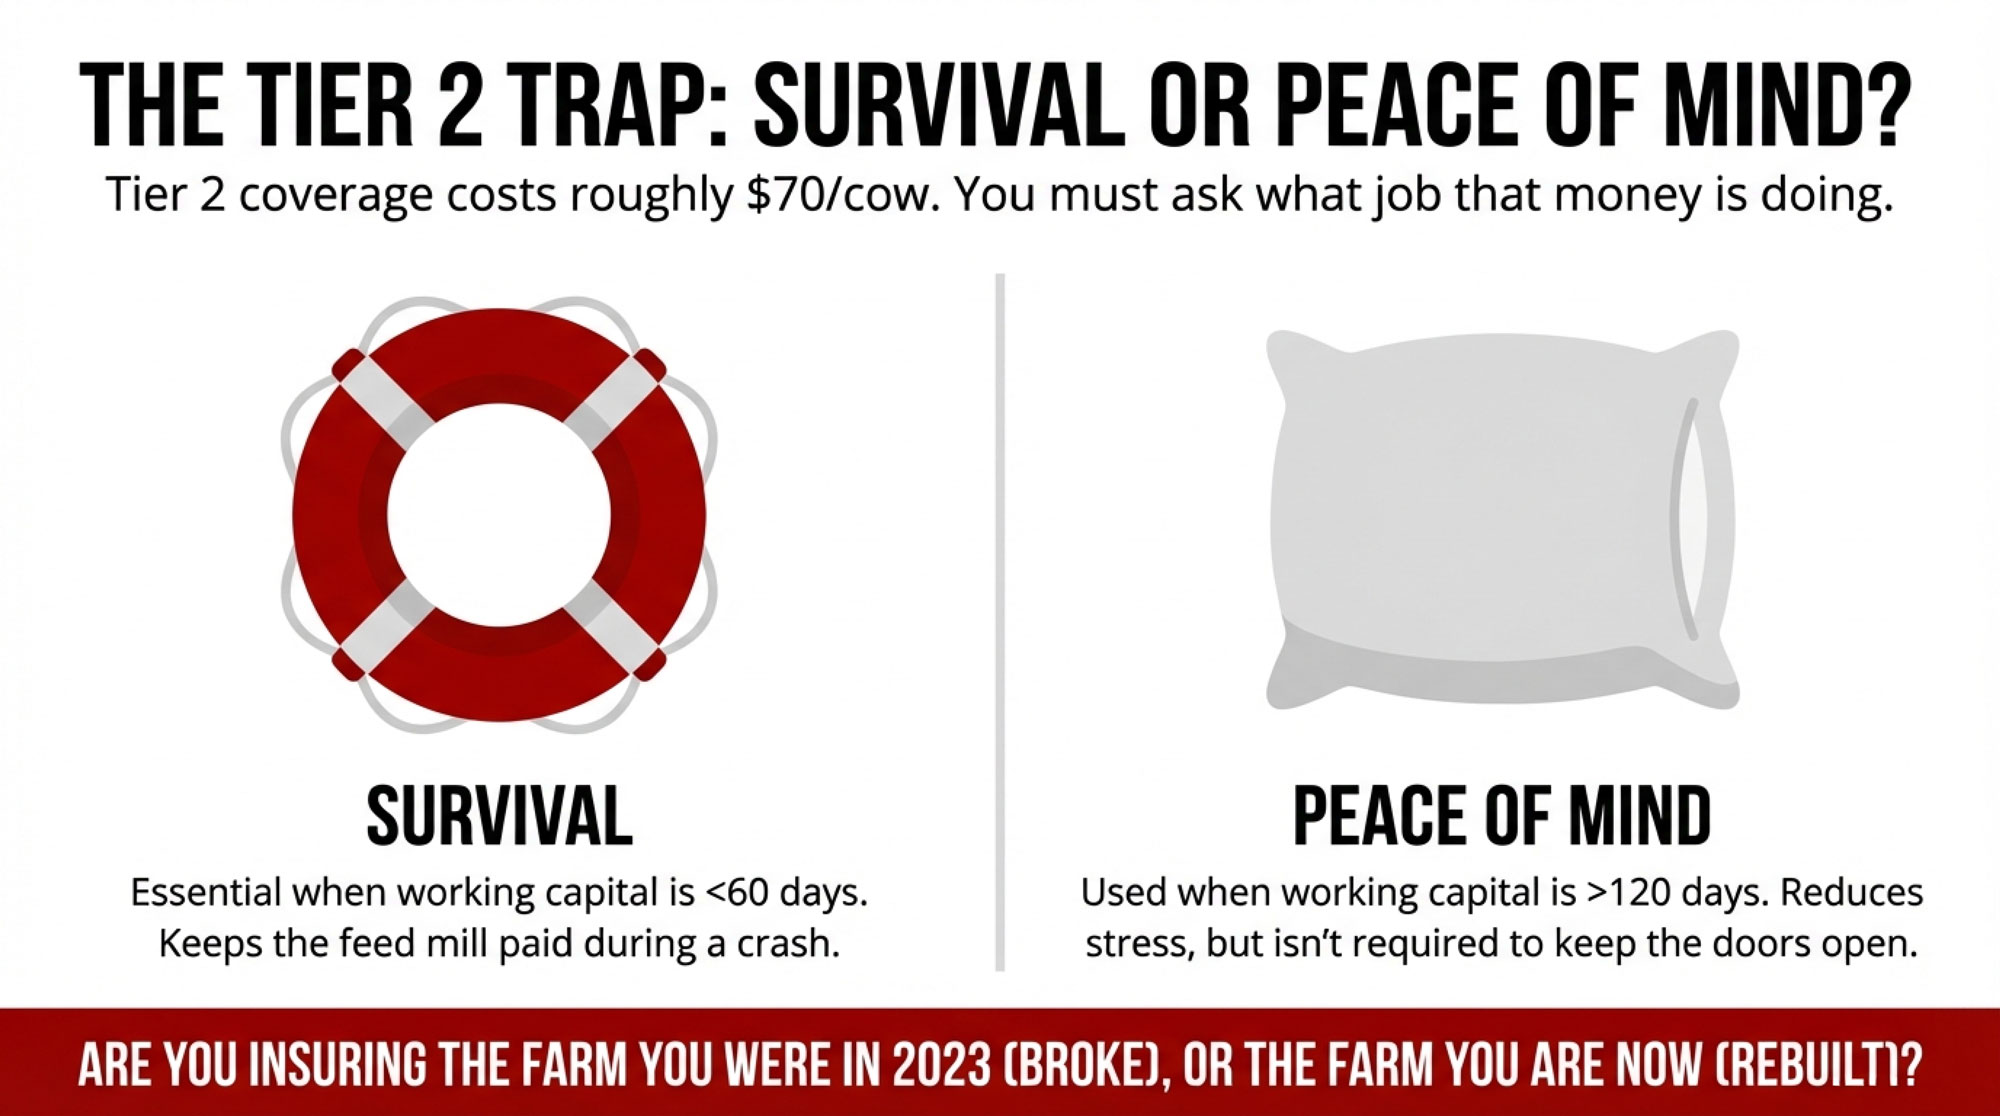
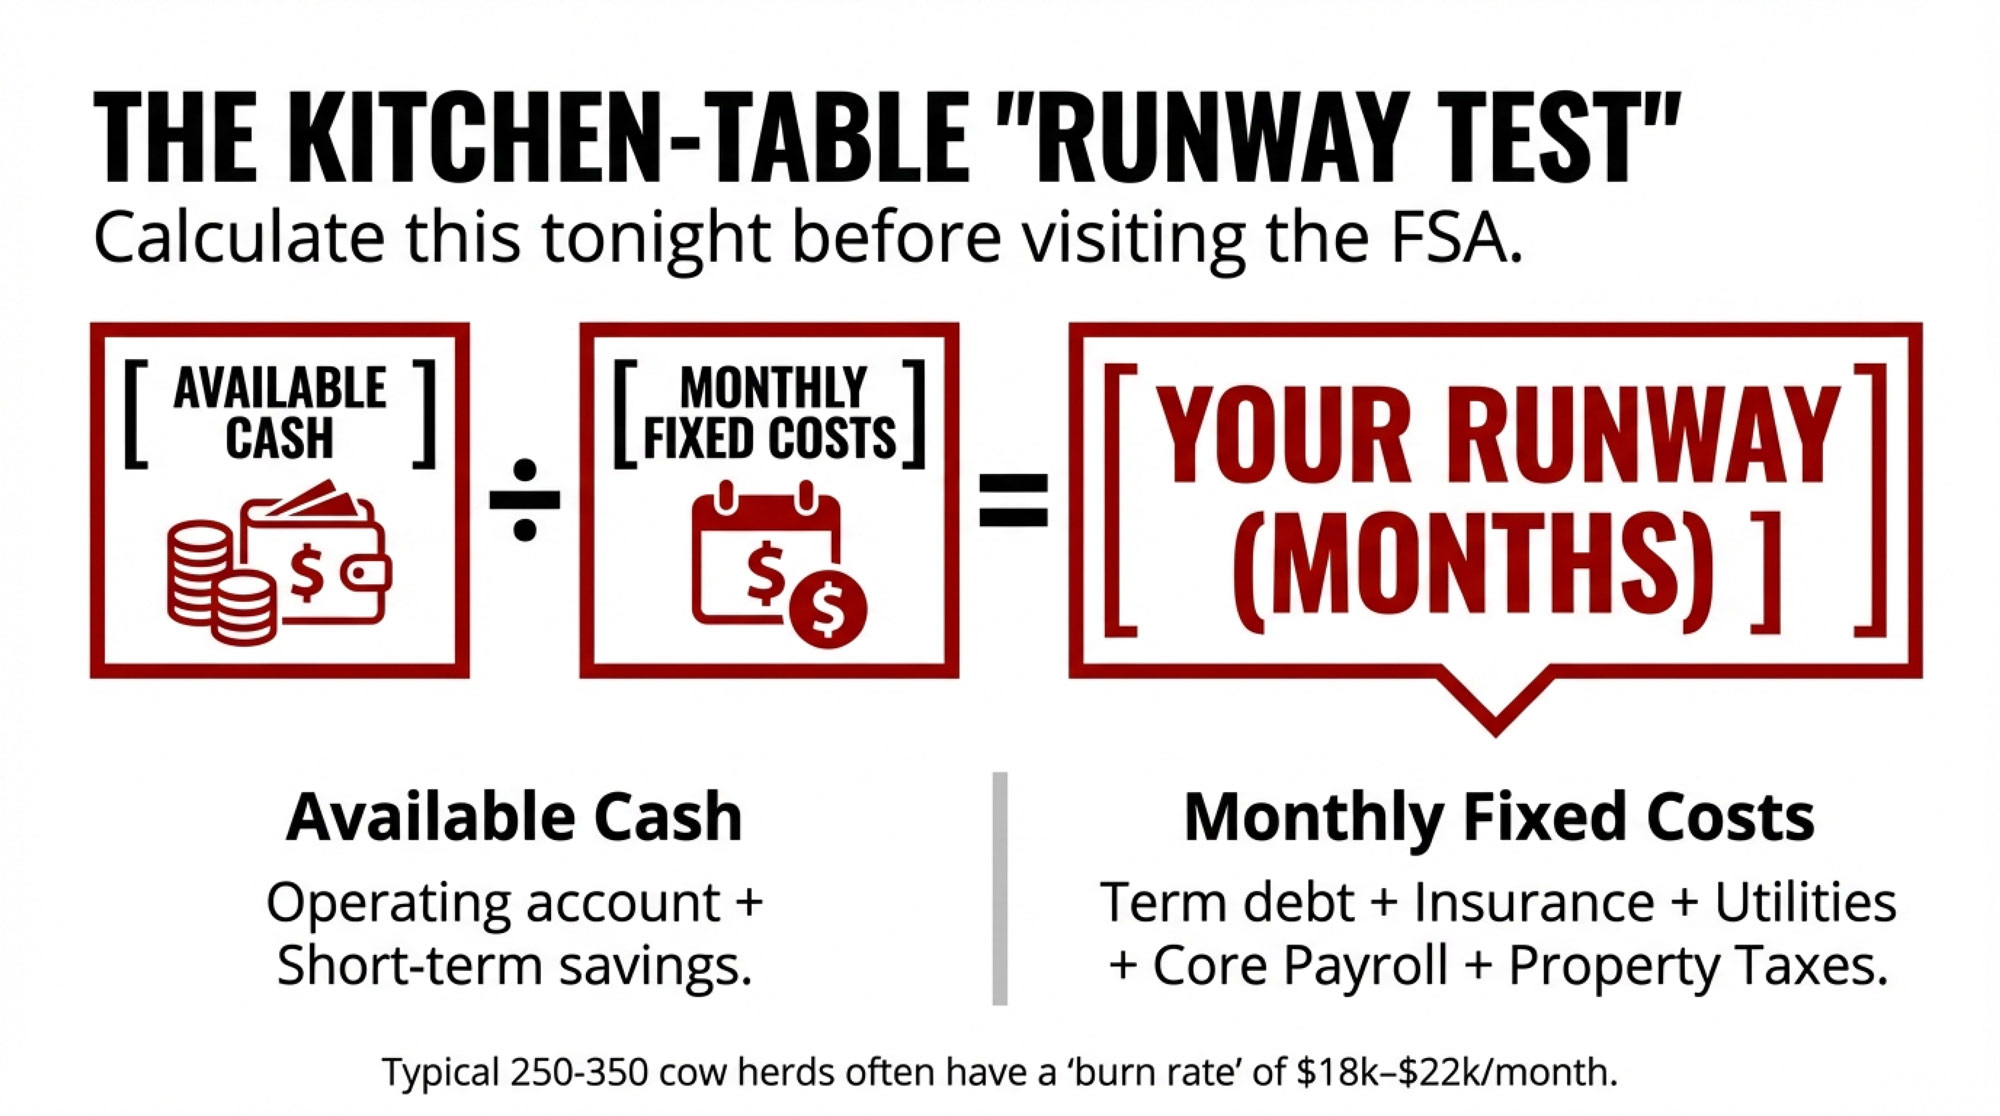
What Does a $0.40/cwt Increase Look Like on a 500‑Cow Herd?
Becky Nyman — a fourth‑generation dairy farmer from Hilmar, California, and chair of the USDEC board — doesn’t sugarcoat the stakes. “Trade creates opportunities for farmers to stay on the farm,” she said at the 2026 USDEC Annual Membership Meeting. “With 96% of the global population living outside our borders, the opportunity to grow is immense.”
But Nyman is equally clear that exports aren’t charity. They’re the foundation of the modern milk check. And that foundation only works if the pricing system actually delivers those gains to the parlor — not just to the plants.
For any producer who runs their own barn math against ADC’s numbers, there’s a legitimate question: how much of the export boom is actually reaching the milk check that funds next month’s feed bill?
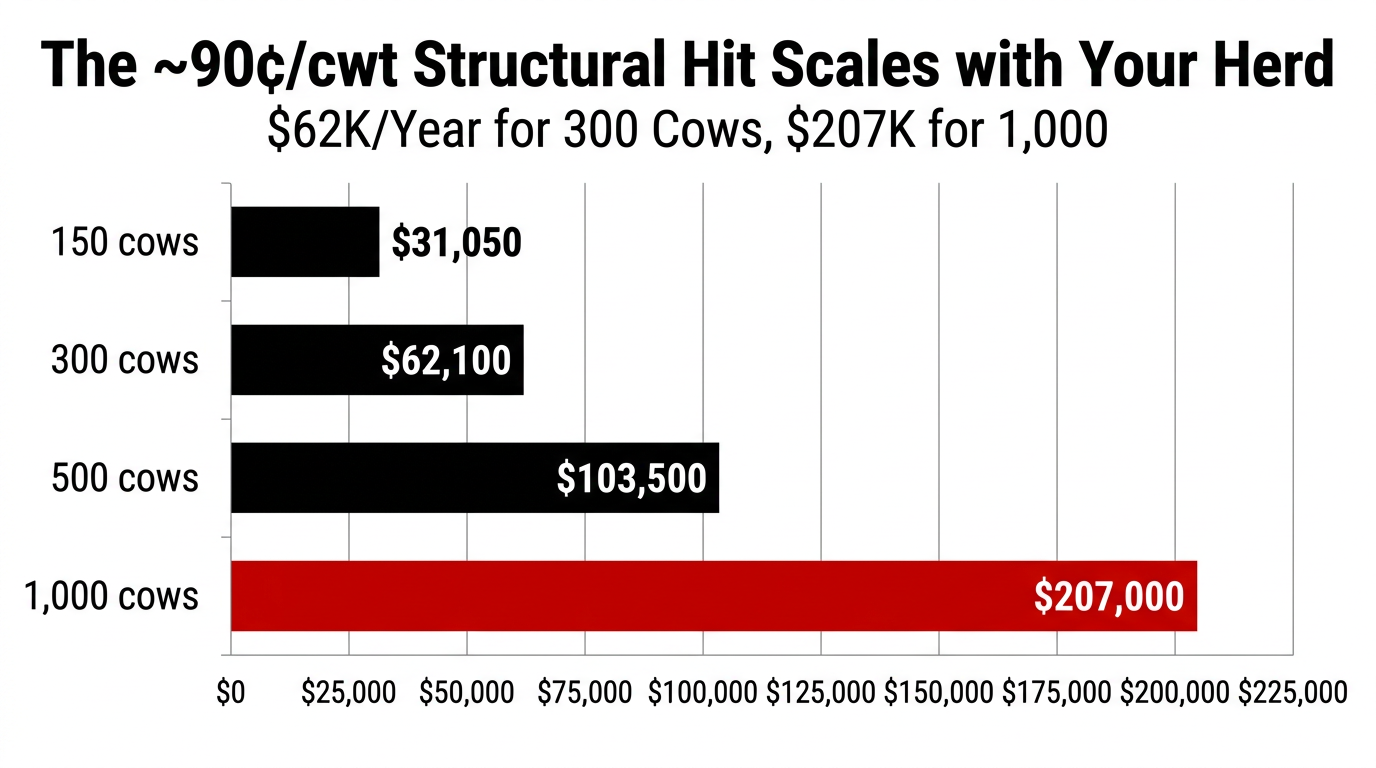
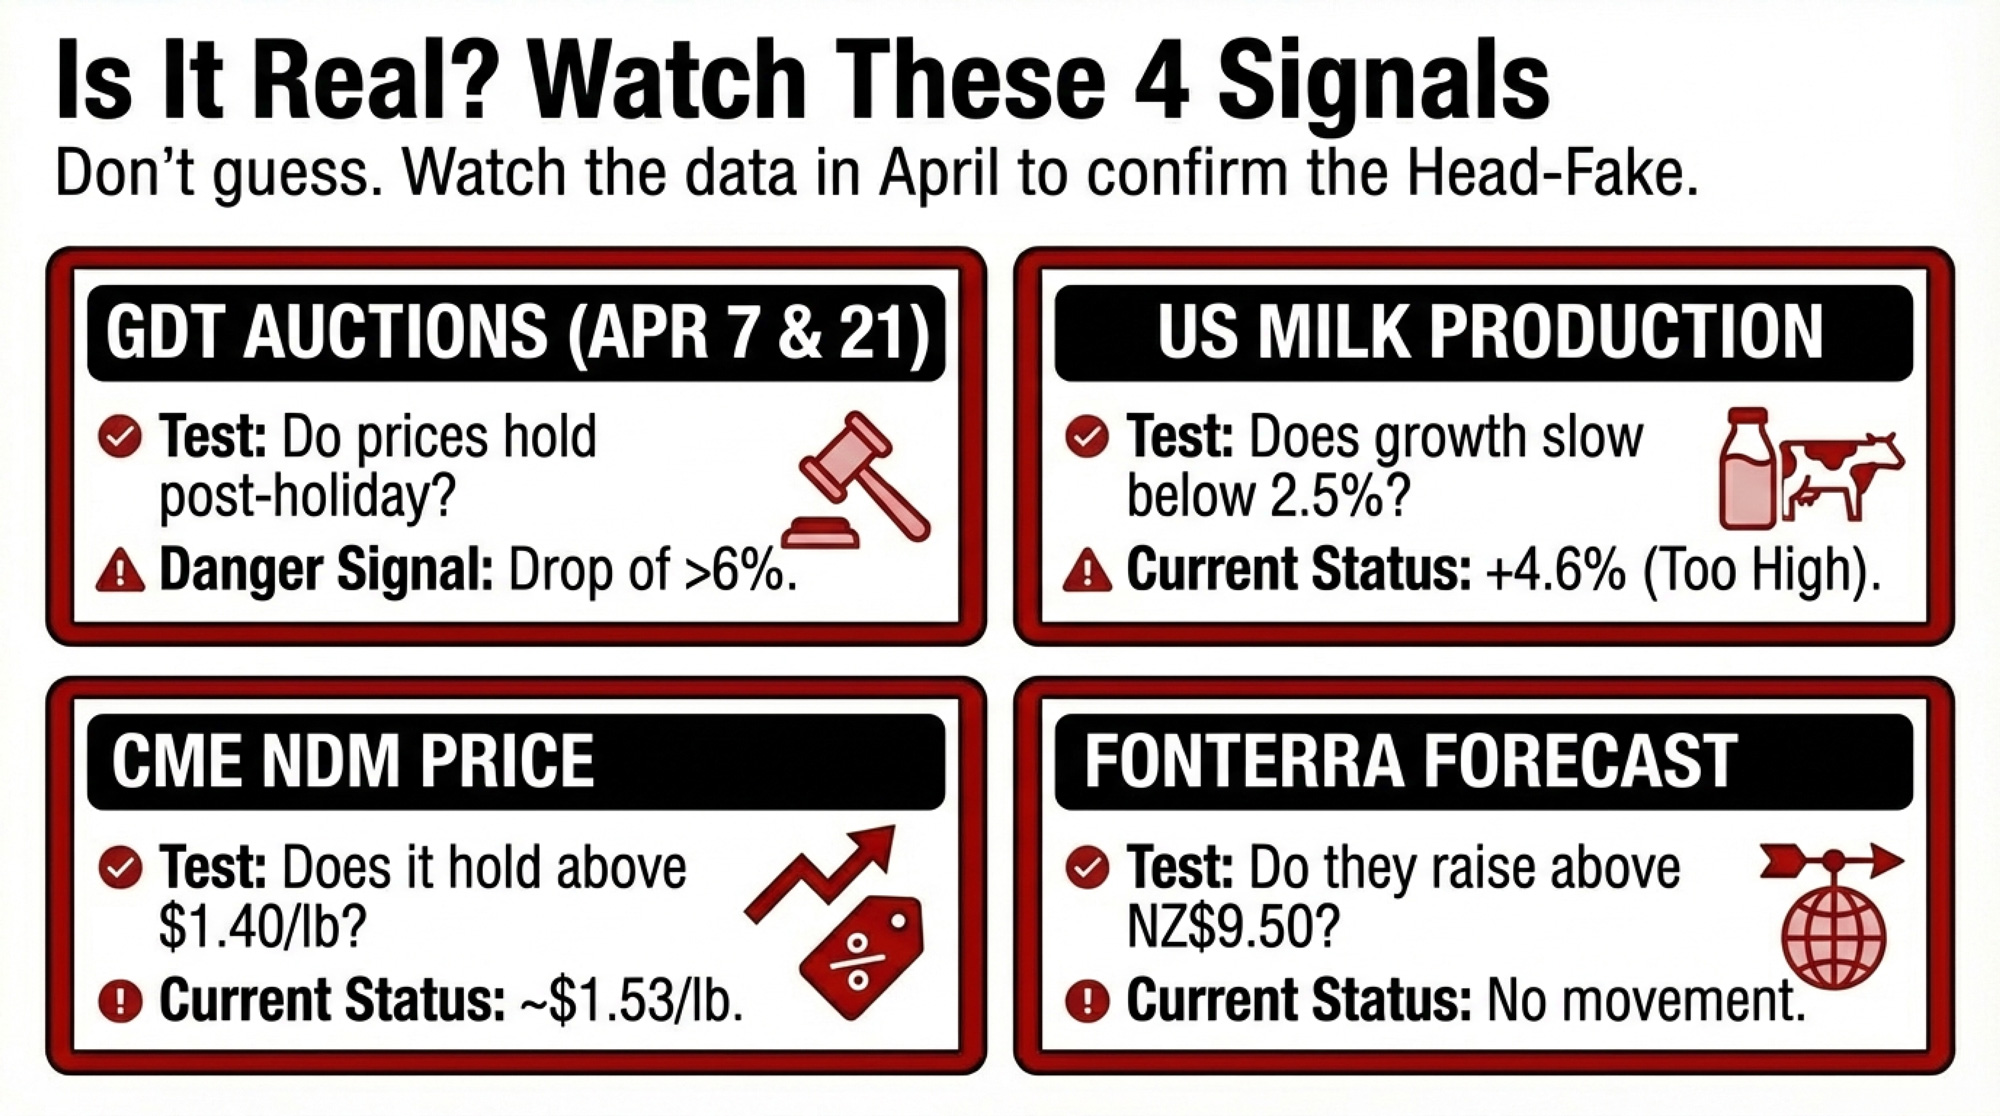
ADC calculates that the all‑milk‑to‑mailbox gap has widened by about $0.40/cwt since the FMMO changes took effect. Again, the baseline varies by source and timeframe, but the direction of widening is consistent across the data.
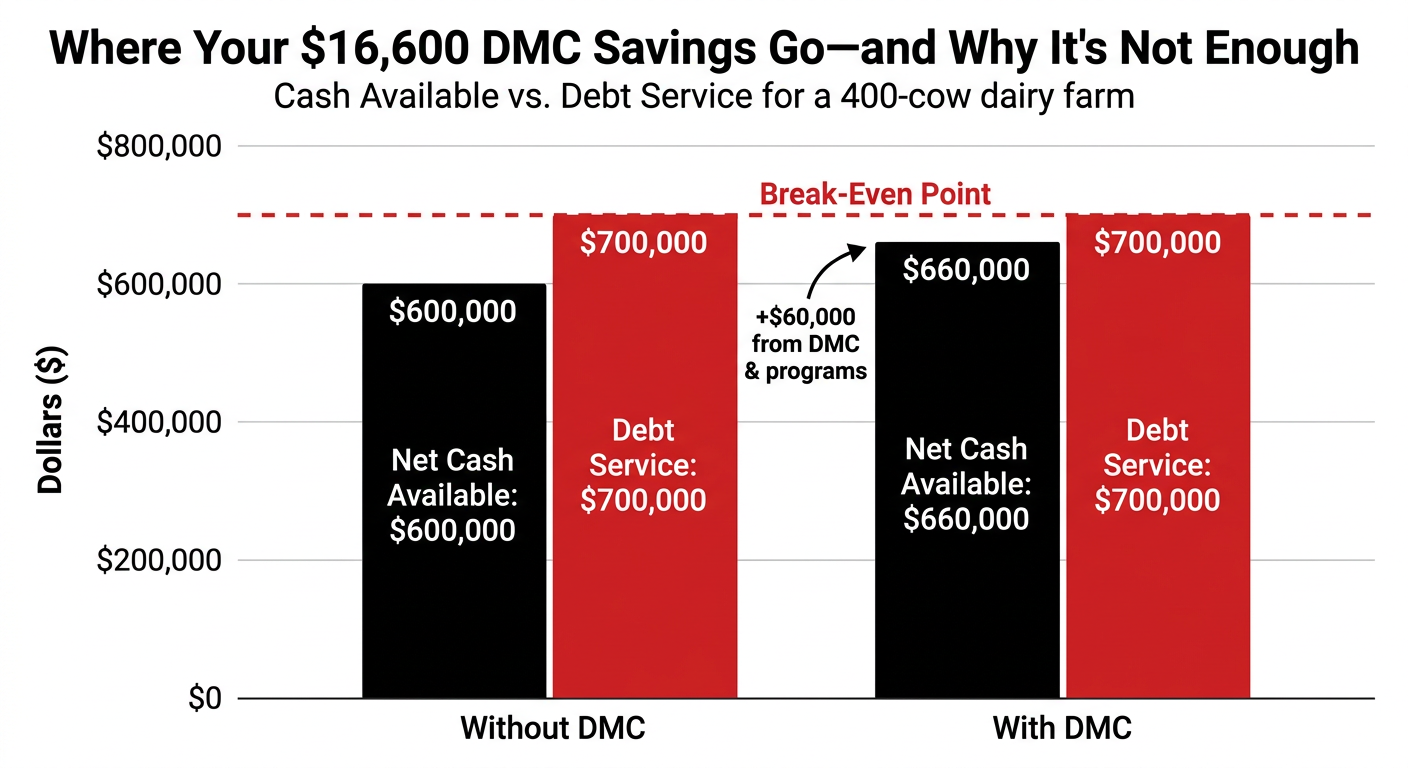
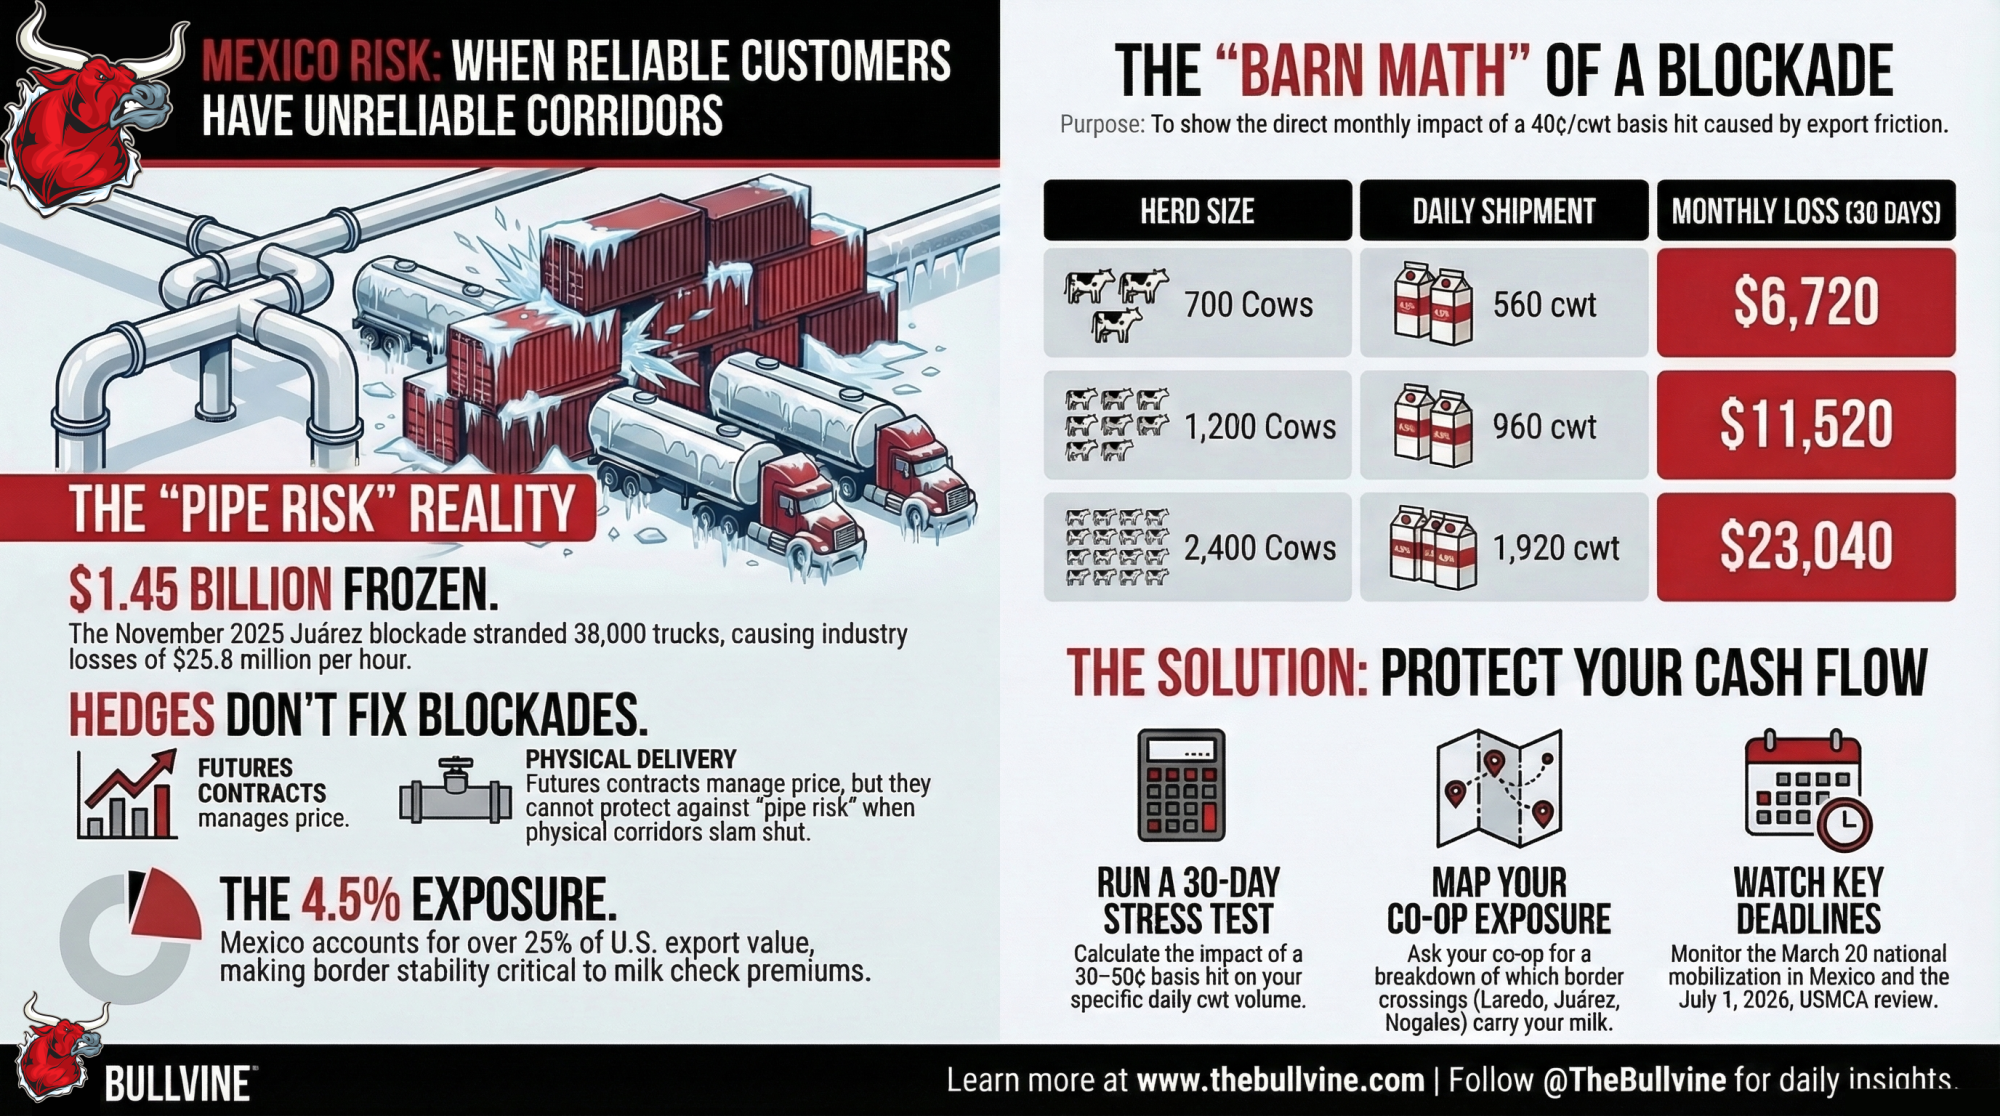
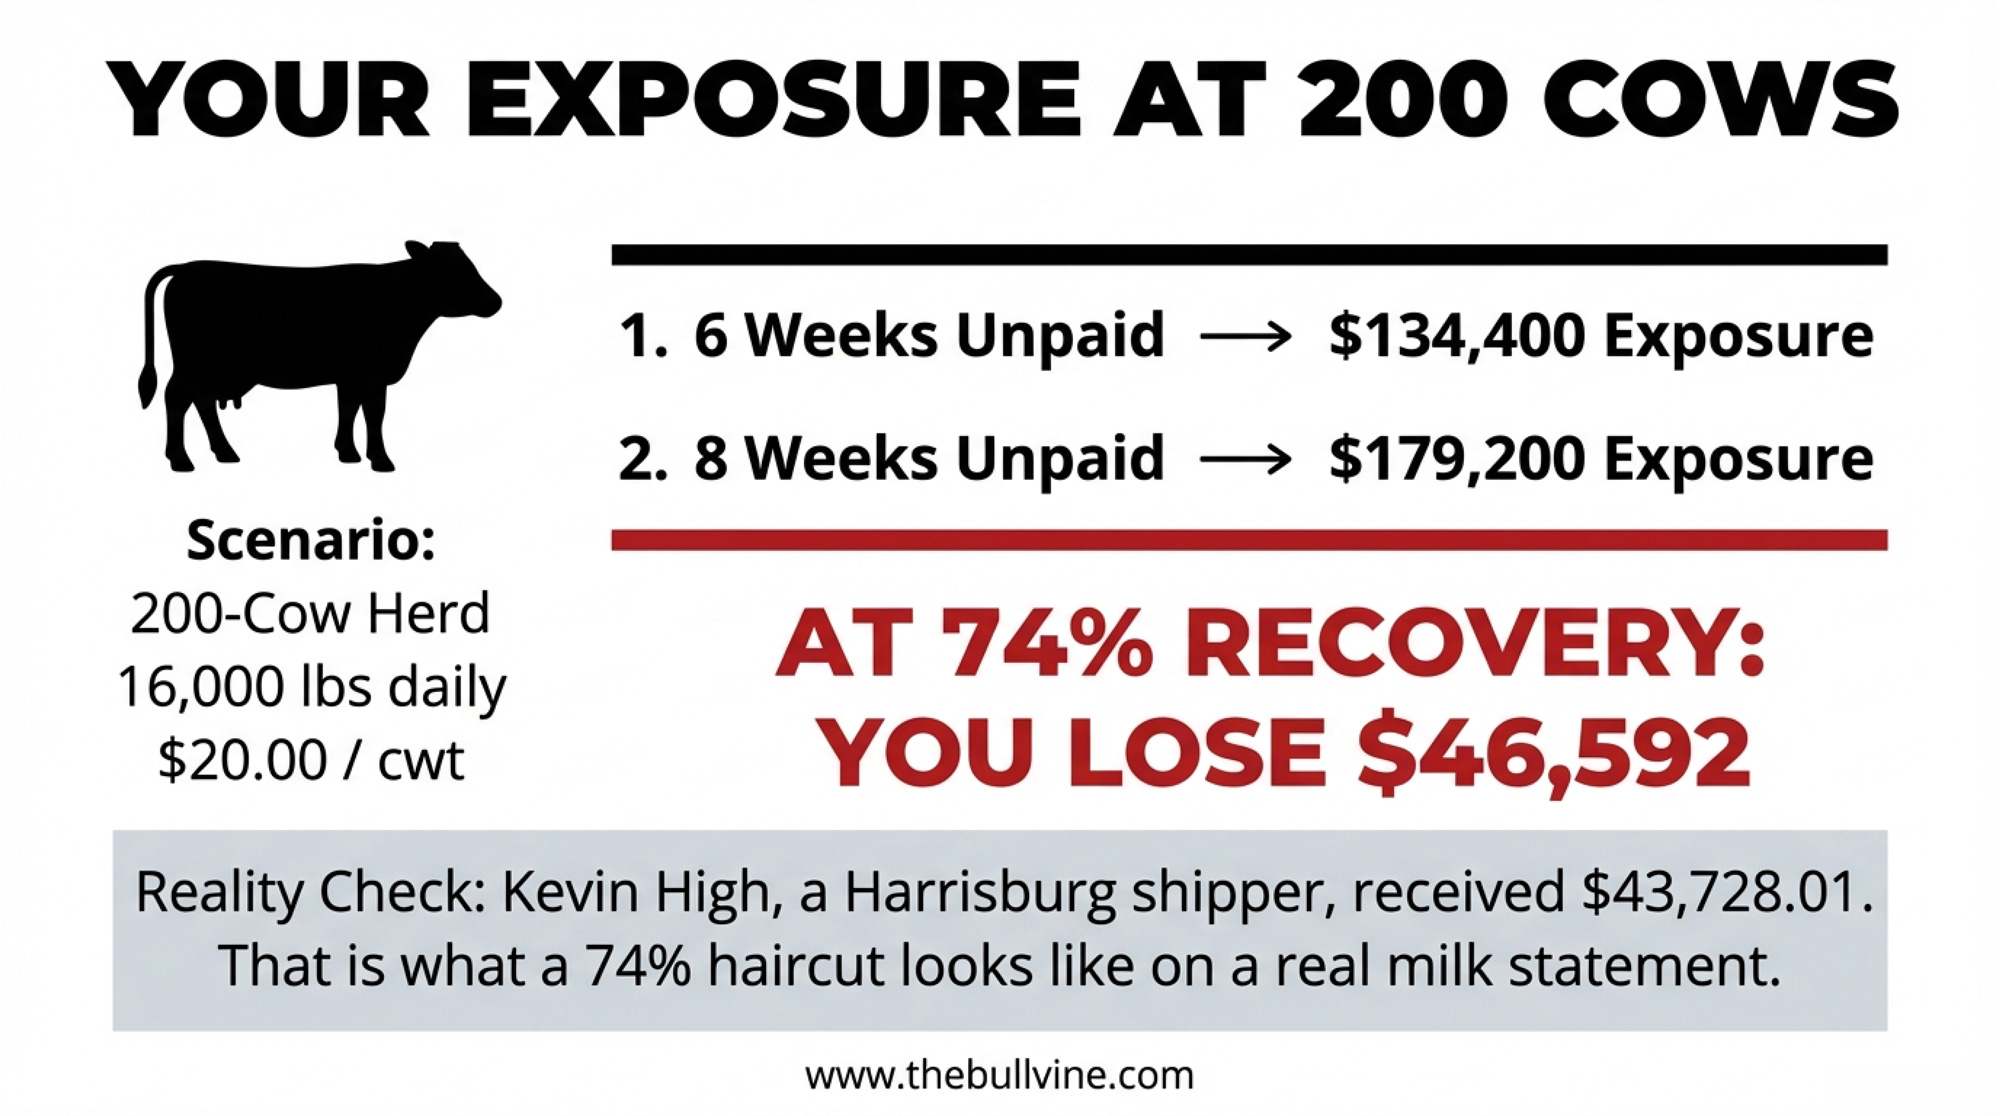
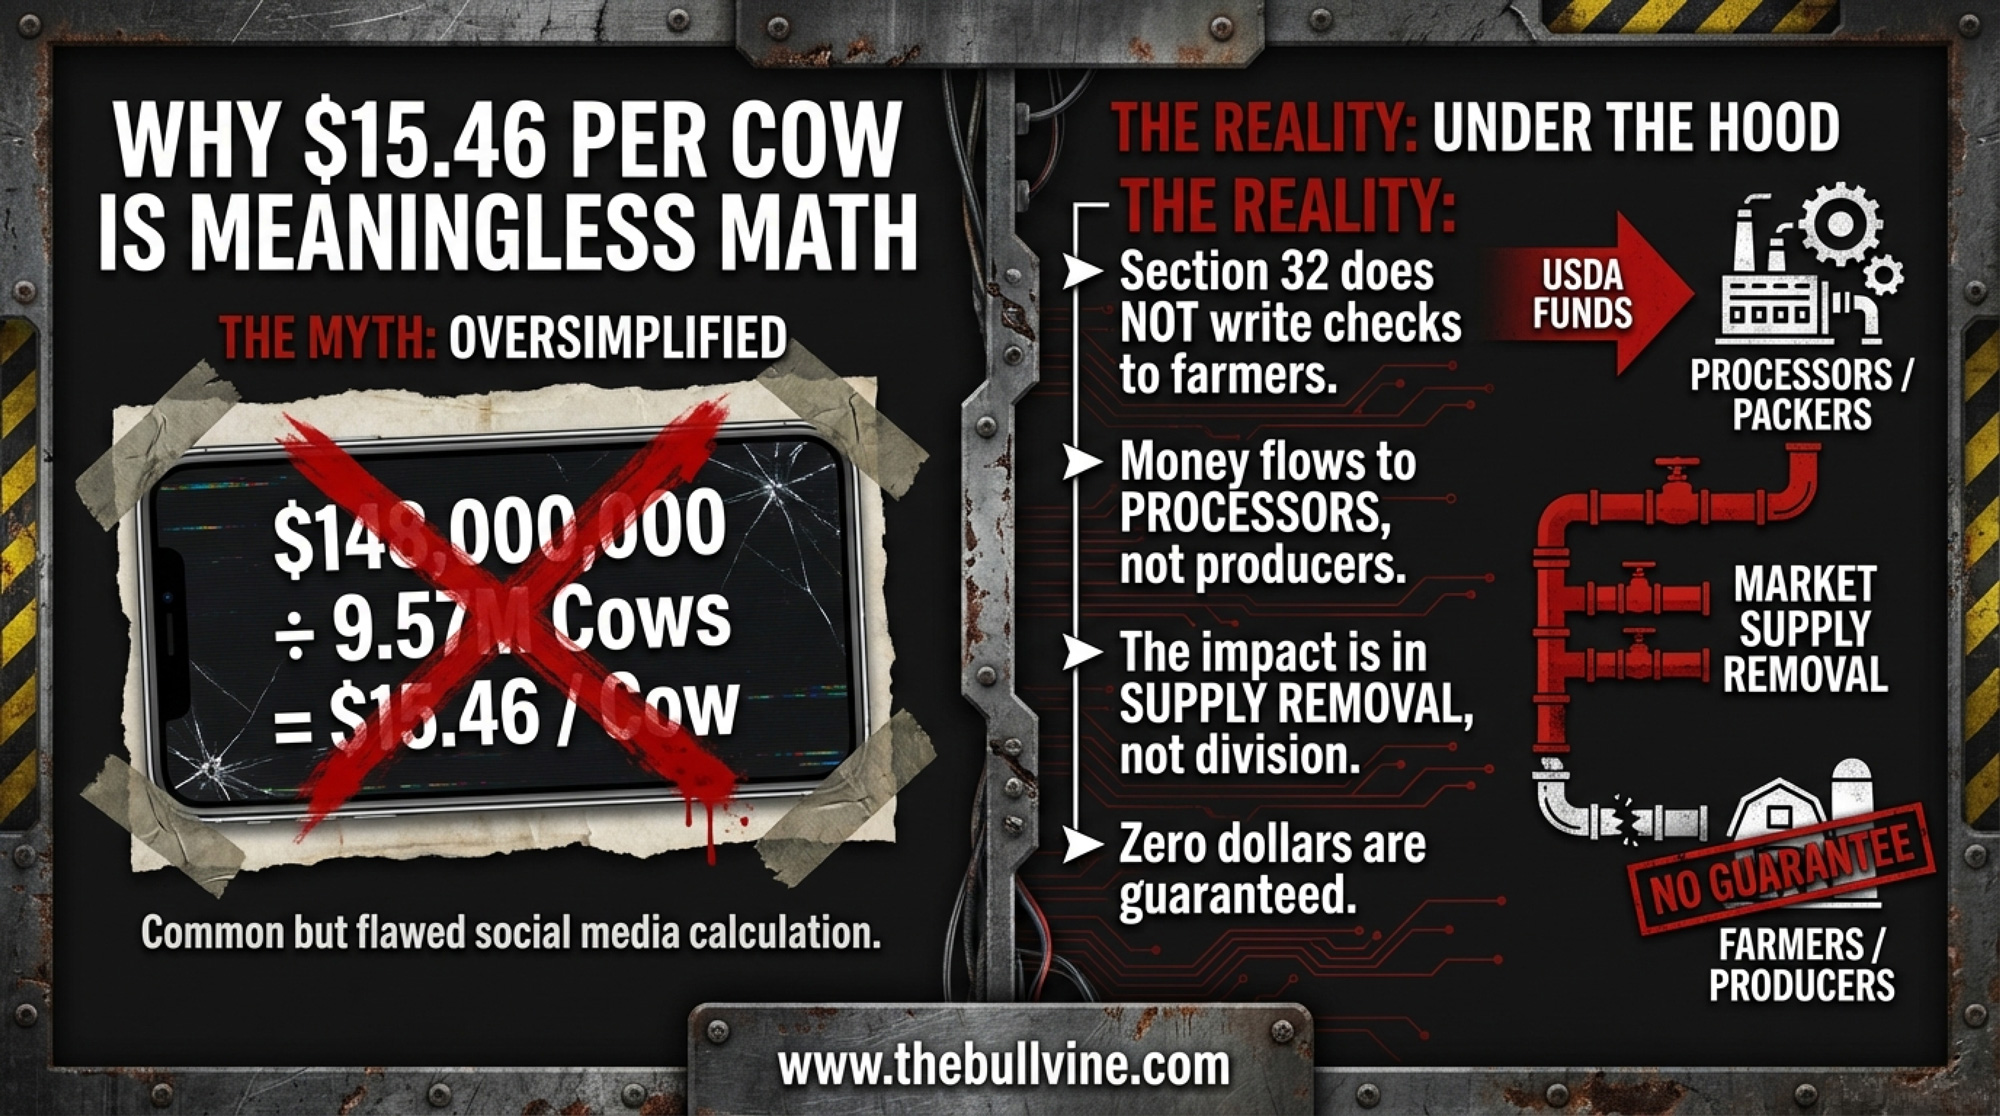
THE $54,750 QUESTION — Barn Math for a 500‑Cow Herd
Herd size: 500 cows
Shipped per cow per day: 75 lb (adjusted for dry cows, culls)
The $0.40/cwt increase (post‑FMMO amendment, per ADC): 375 cwt × $0.40 = $150/day → $54,750/year
The full $1.00/cwt gap (total all‑milk to mailbox spread, ADC post‑amendment avg): 375 cwt × $1.00 = $375/day → $136,875/year
The $0.40 figure represents ADC’s estimated increase since the FMMO amendments were enacted. The $1.00 figure is ADC’s total gap estimate, including deductions that were in place before. Which number fits your operation depends on your marketing order, class utilization, and co‑op pool distribution. Plug in your own herd size and shipped volume.
Picture a 500‑cow Central Valley operation sitting down with its lender this spring. That $54,750 isn’t theoretical — it’s the difference between a line‑of‑credit buffer and a conversation nobody wants to have in July. And the lender’s looking at the same export headlines you are, wondering why the check doesn’t match the story.
For a 1,500‑cow Western operation shipping 85 lb/cow/day, scale accordingly: the $0.40 increase alone runs roughly $186,000 per year. Under ADC’s numbers, that’s money that’s no longer showing up in the mailbox.
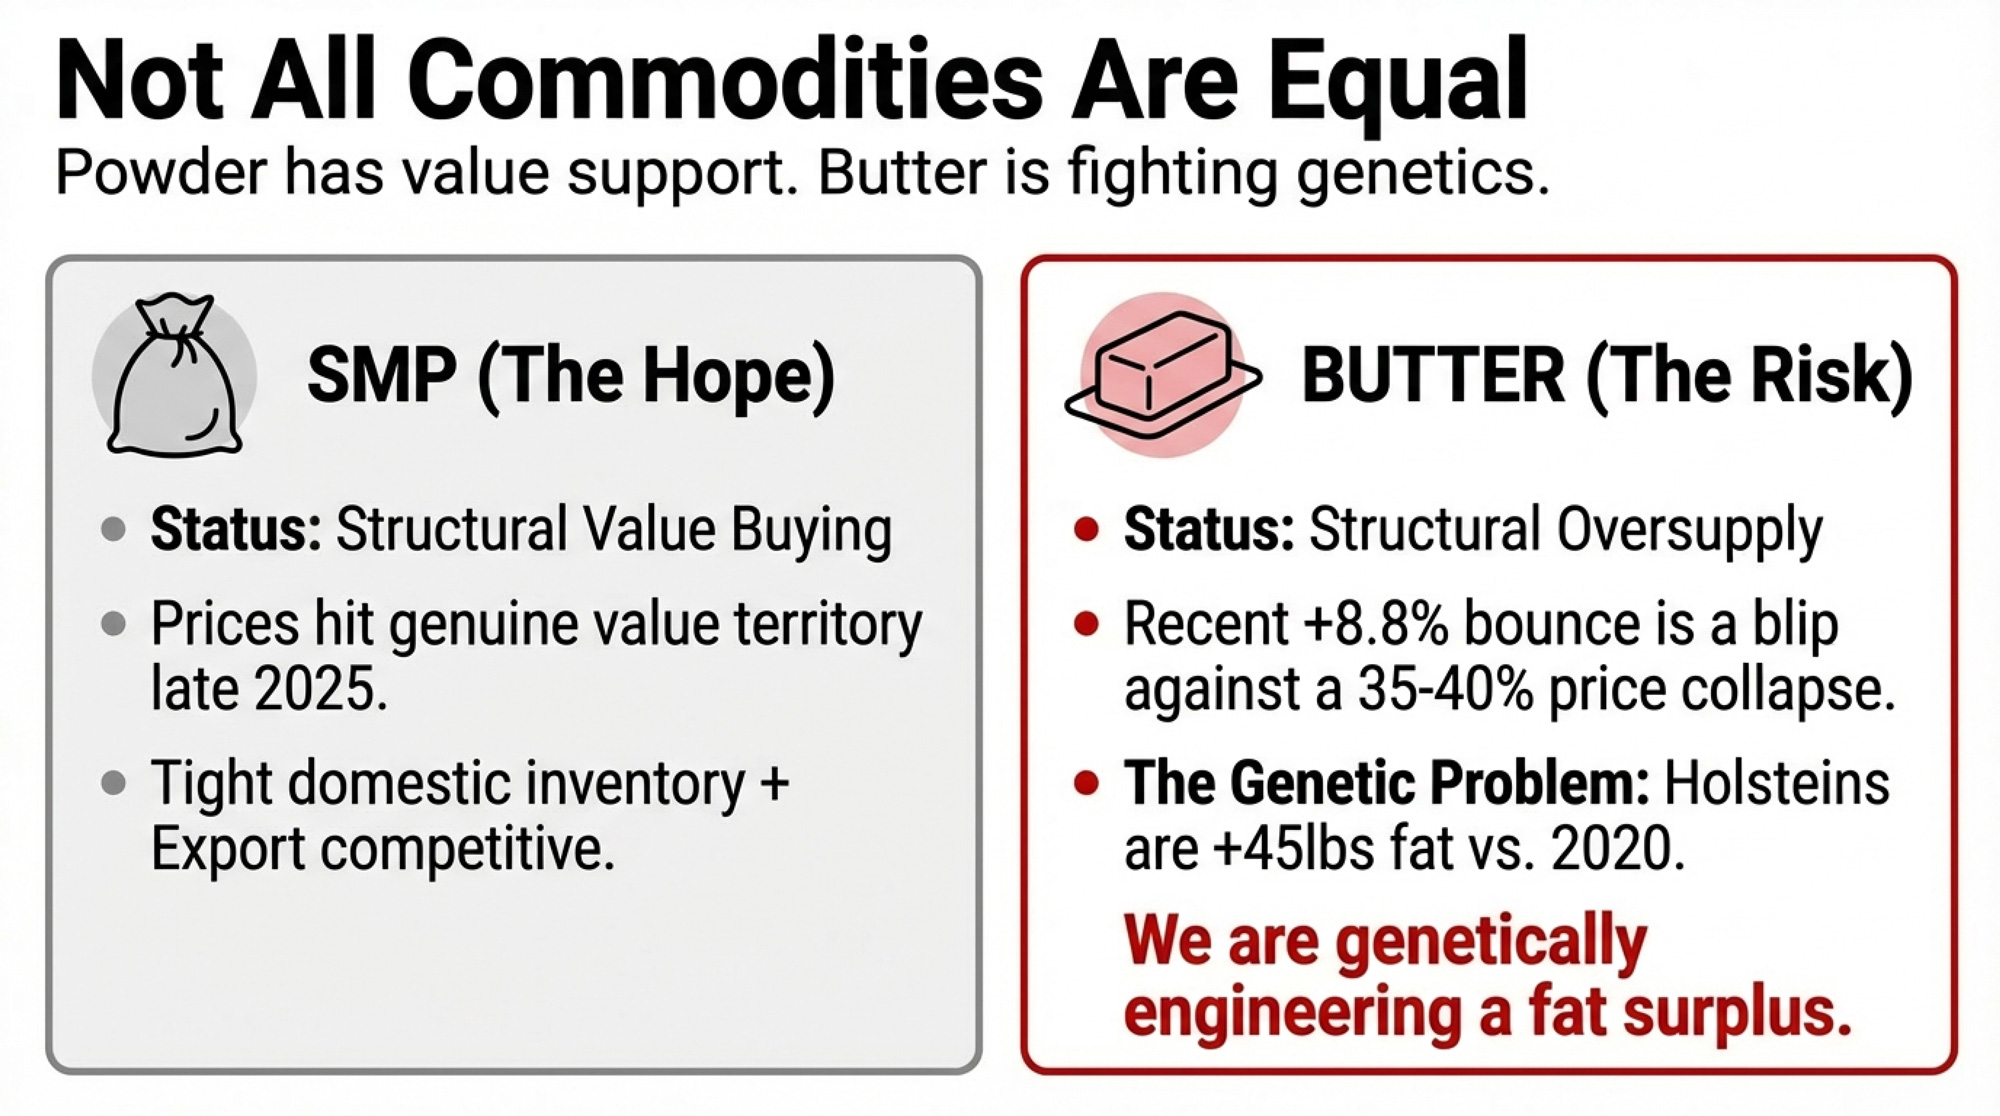
How the Fat Boom and Protein Craze Change What Your Processor Wants
Two structural trends are reshaping what the world buys from U.S. dairy — and both land differently depending on your components and your processor’s export mix.
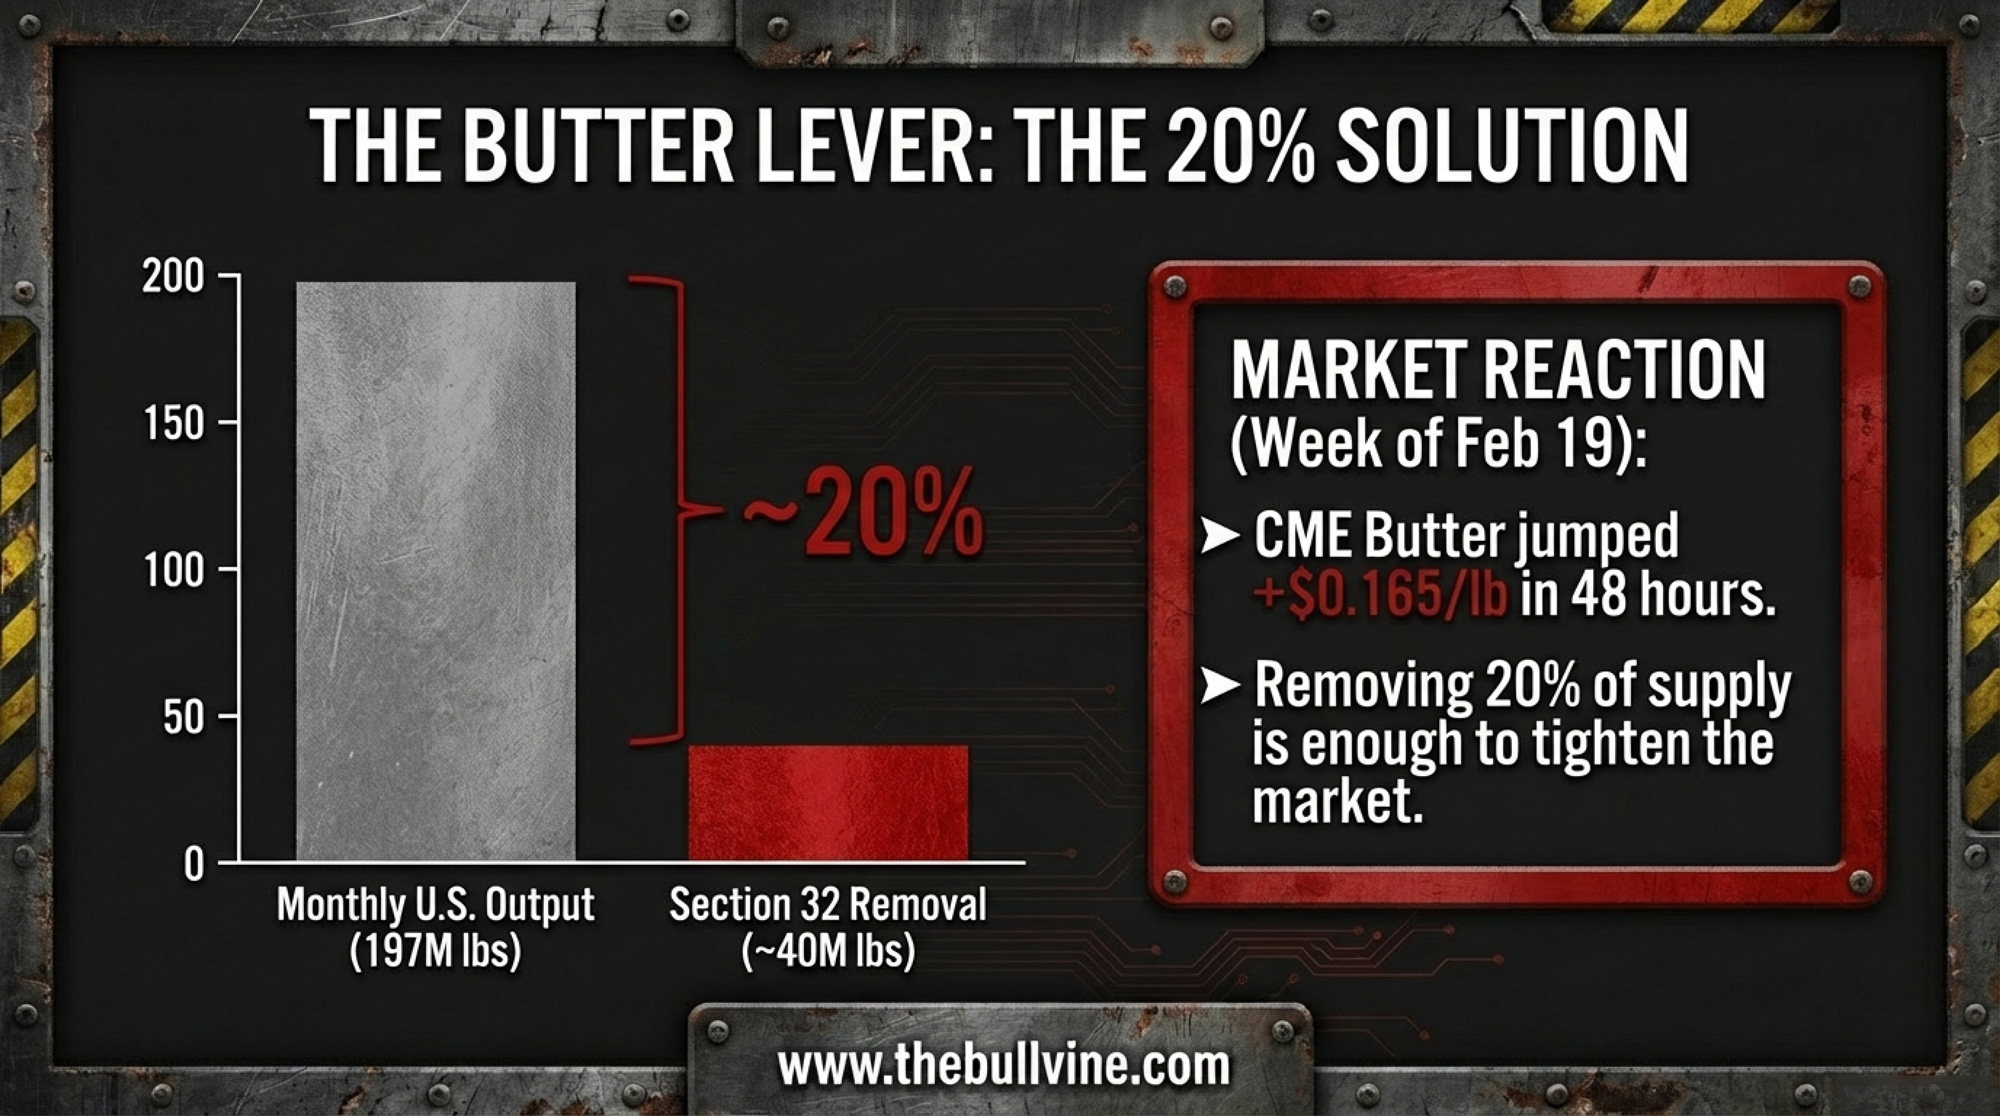
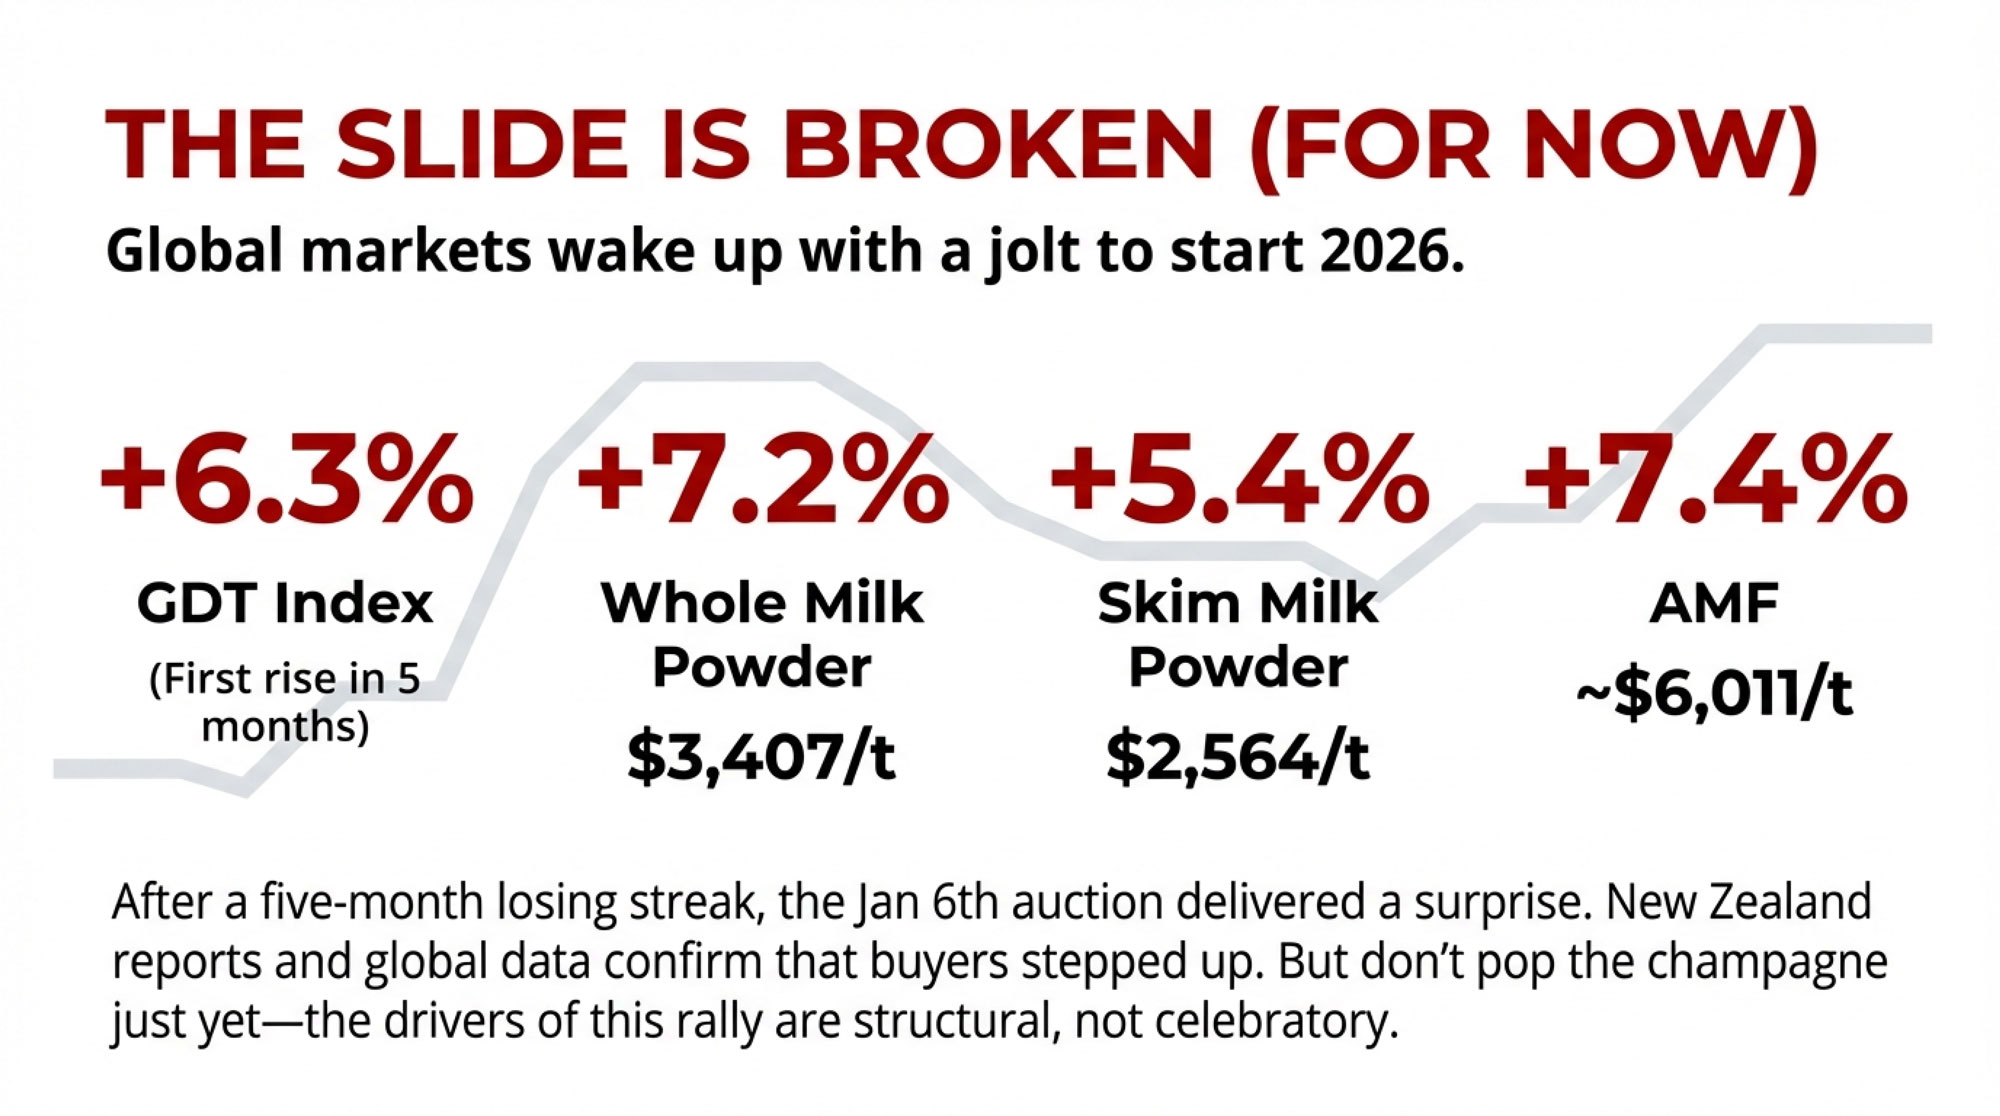
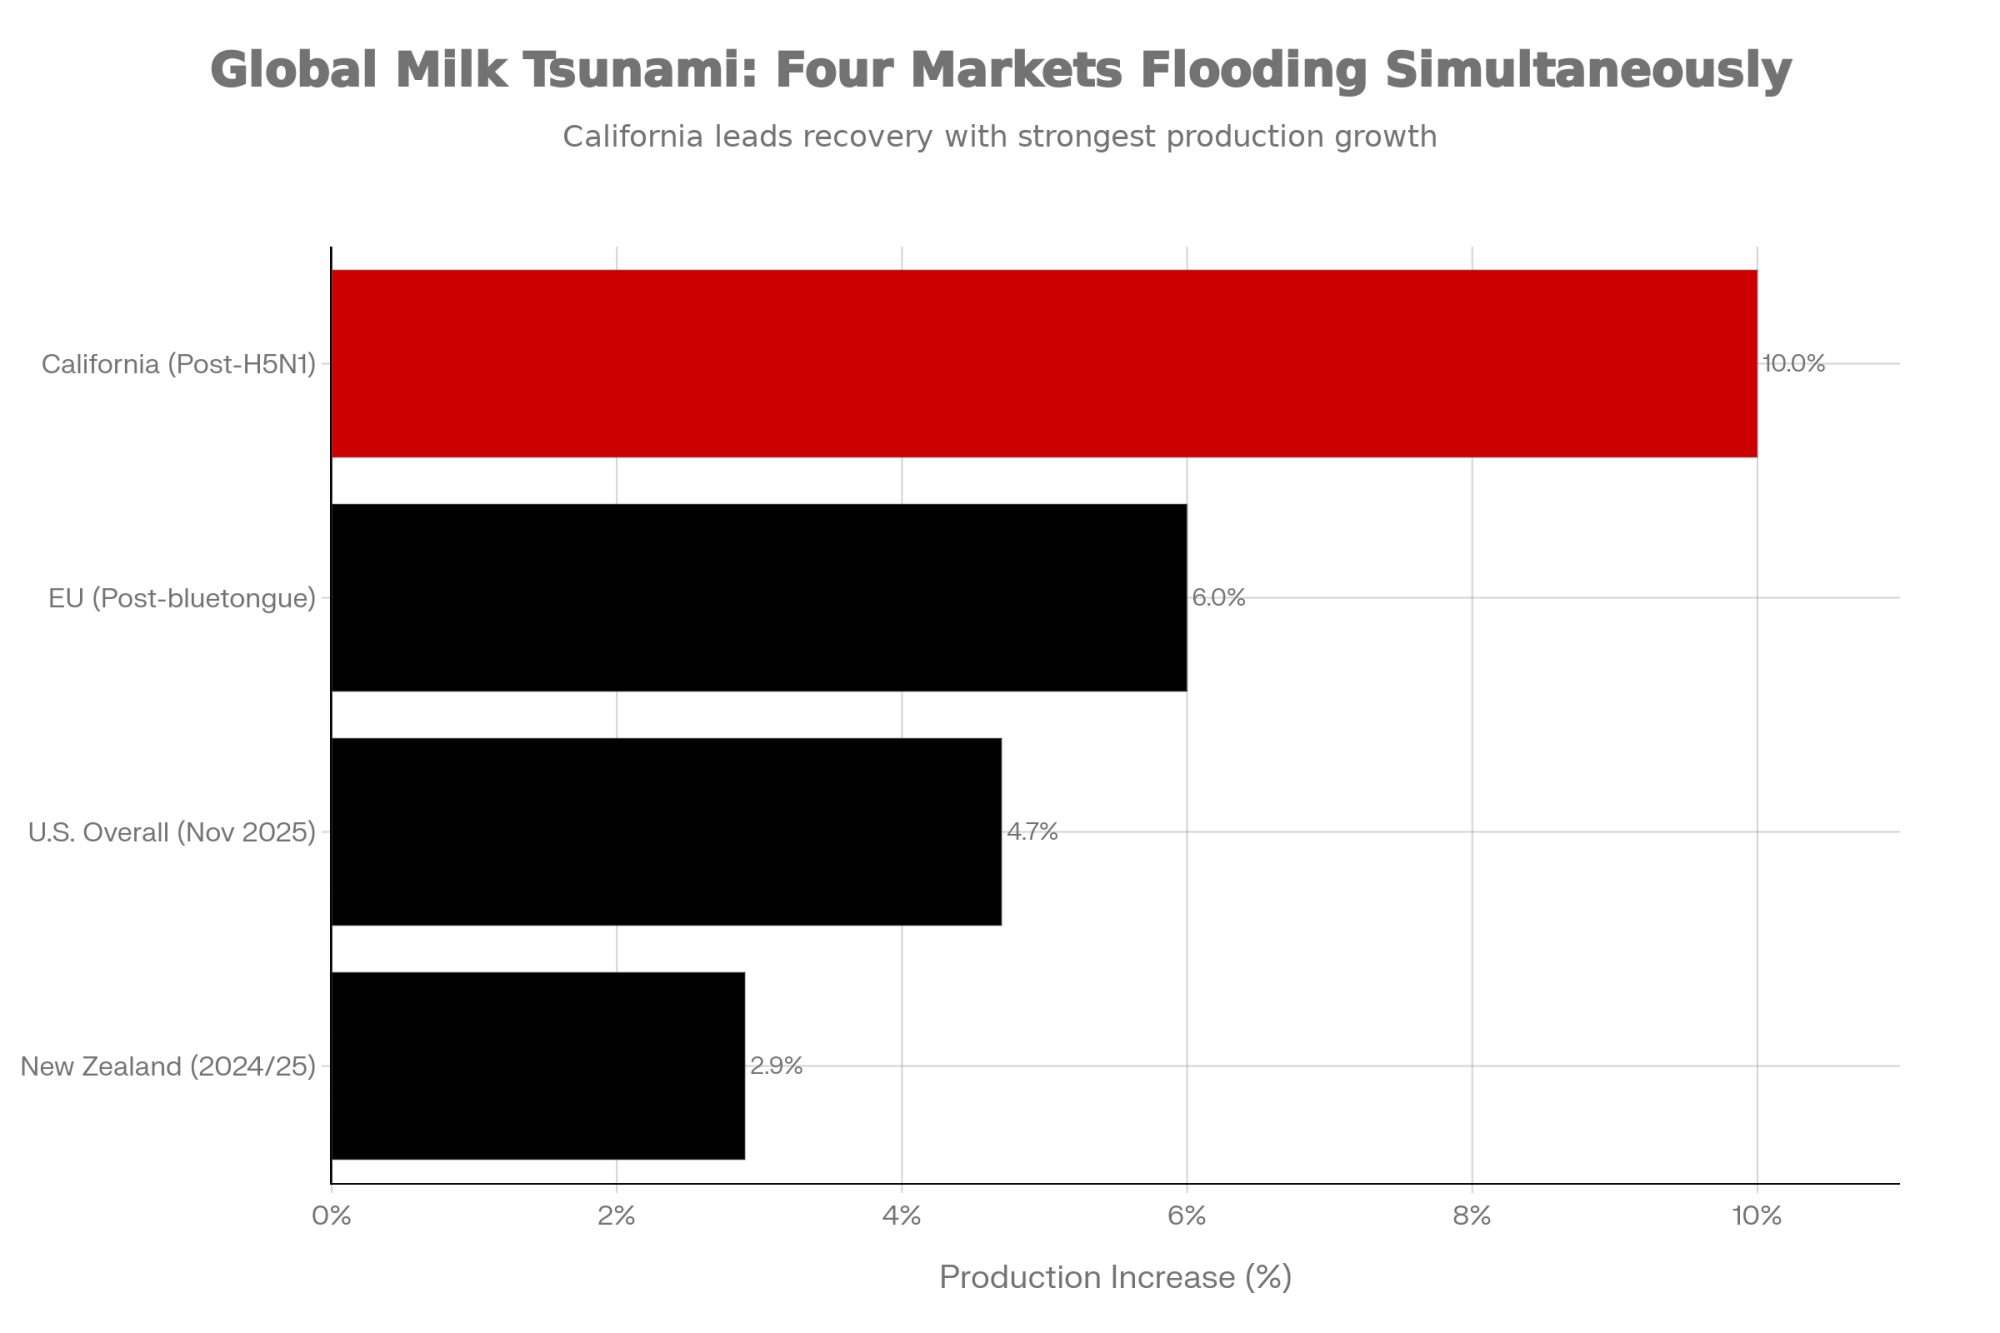
The fat boom. U.S. herds hit record butterfat levels in 2025, with total butter production up and inventories initially swelling. That surge helped push butter prices below $1.50/lb in late 2025, but aggressive exports helped clear the surplus. By late February 2026, butter inventories stood at 253.8 million pounds — down 17% from a year earlier, per the USDA Cold Storage report released March 24.
The tighter supply triggered a brief spot‑price spike above $2.10/lb on March 2, driven partly by “new crop” trade rules limiting eligible inventory. But butter has since settled back into the $1.73–$1.82 range as of early April.
For Central Valley operations — where butterfat tests typically run above the national average and processors export heavily to Mexico and Asia — more fat is a double‑edged dynamic. Nyman’s Hilmar operation sits in the middle of that corridor. Higher demand for what those herds produce, but tighter competition for the processing capacity to turn it into exportable products.
The protein craze. High‑quality whey proteins and milk protein isolates are getting pulled out of traditional spray dryers and into high‑margin products: Greek yogurt, cottage cheese, ultrafiltered milk, and protein‑enriched drinks. USDEC data indicate that high‑protein whey exports set a record in 2025 and remained strong into the new year.
The protein pull has a flip side. Nonfat dry milk production has dropped, and the squeeze is showing in prices.
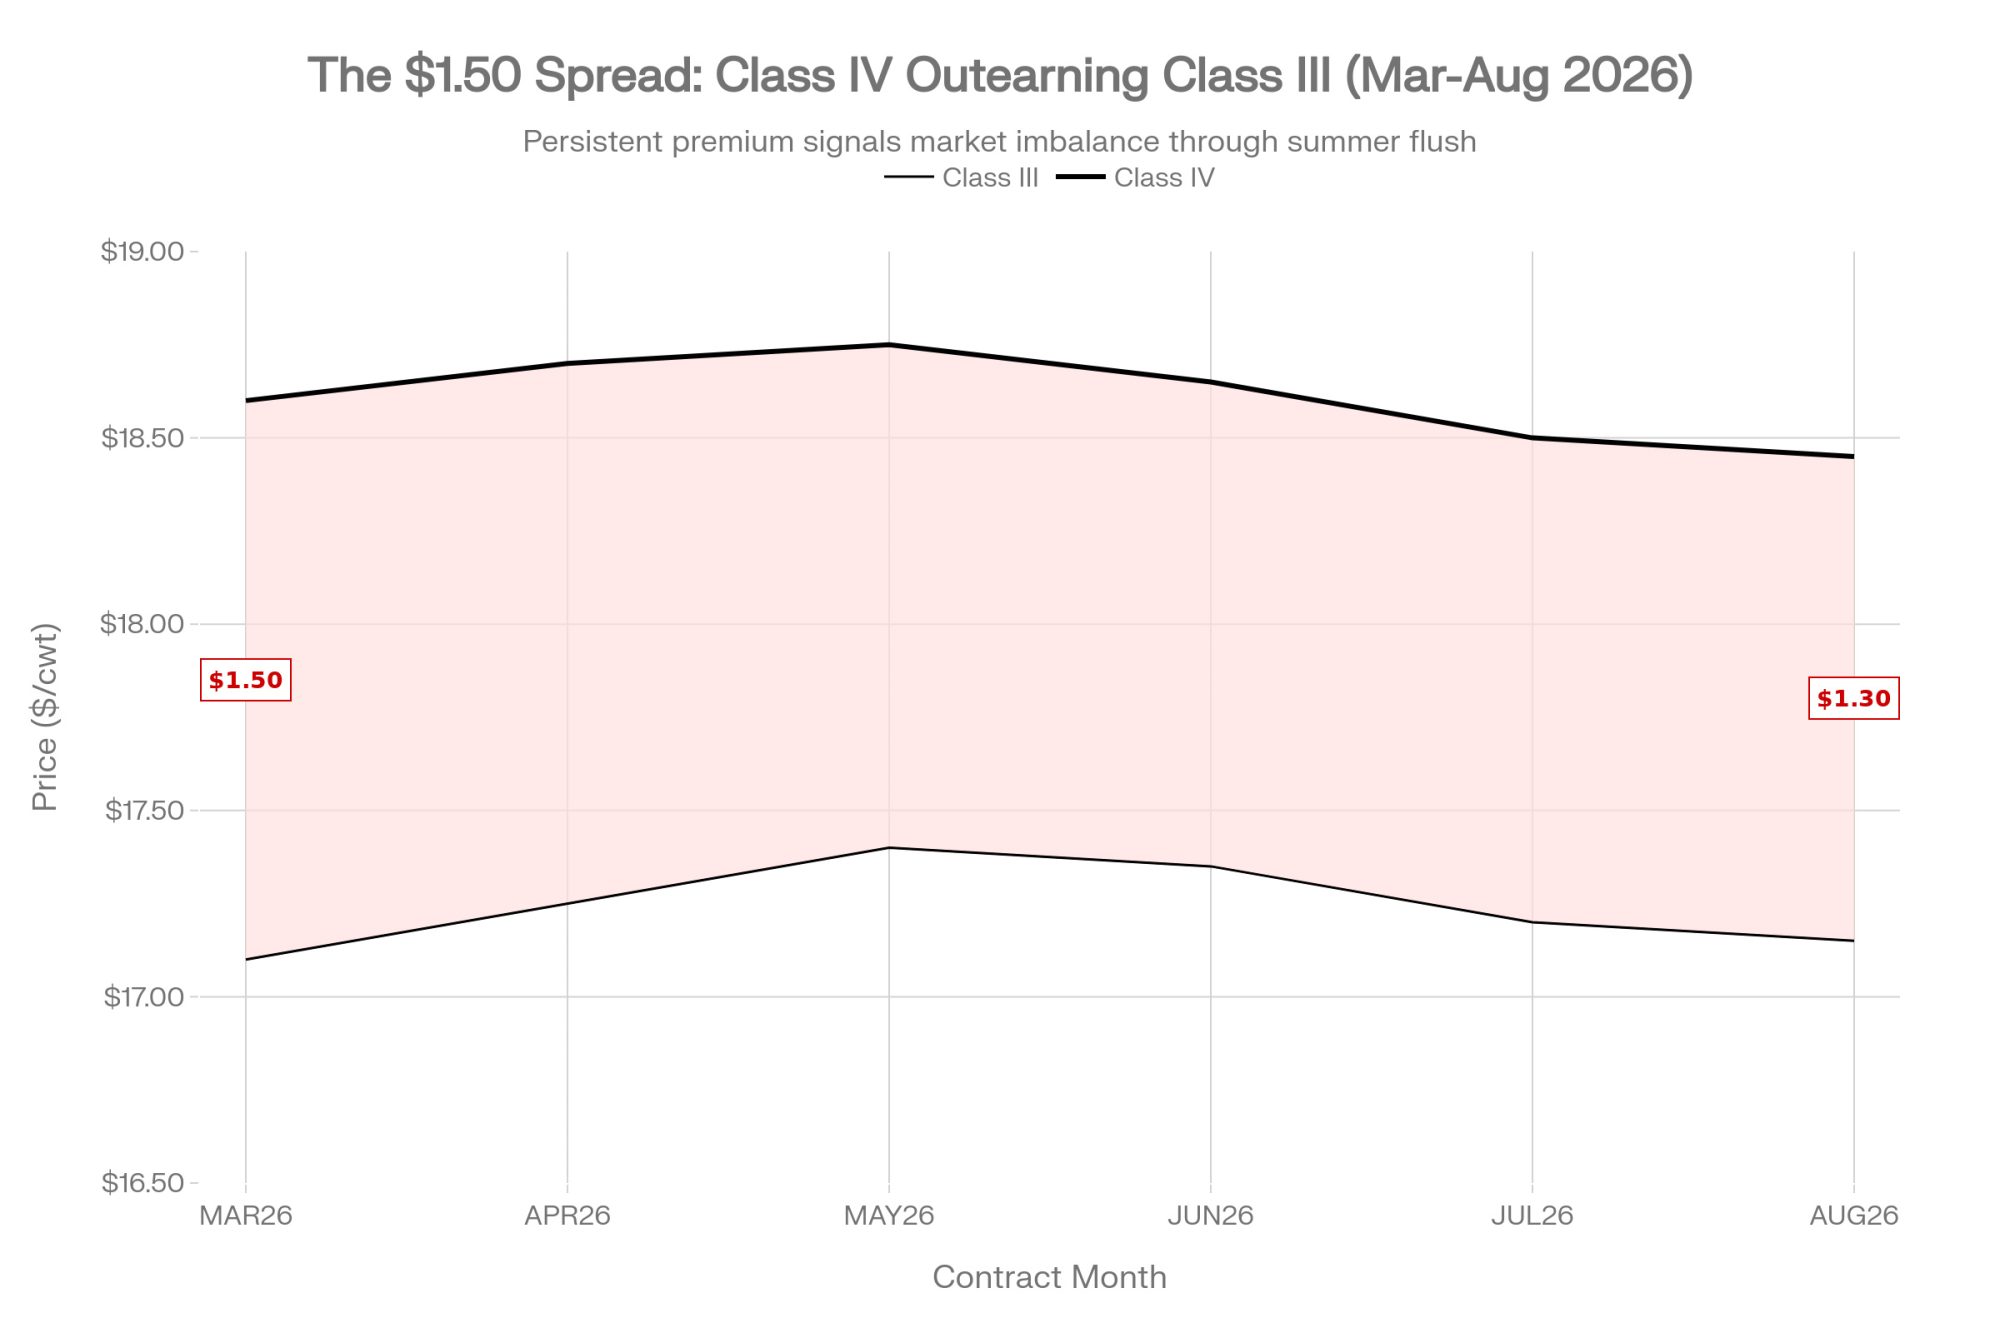
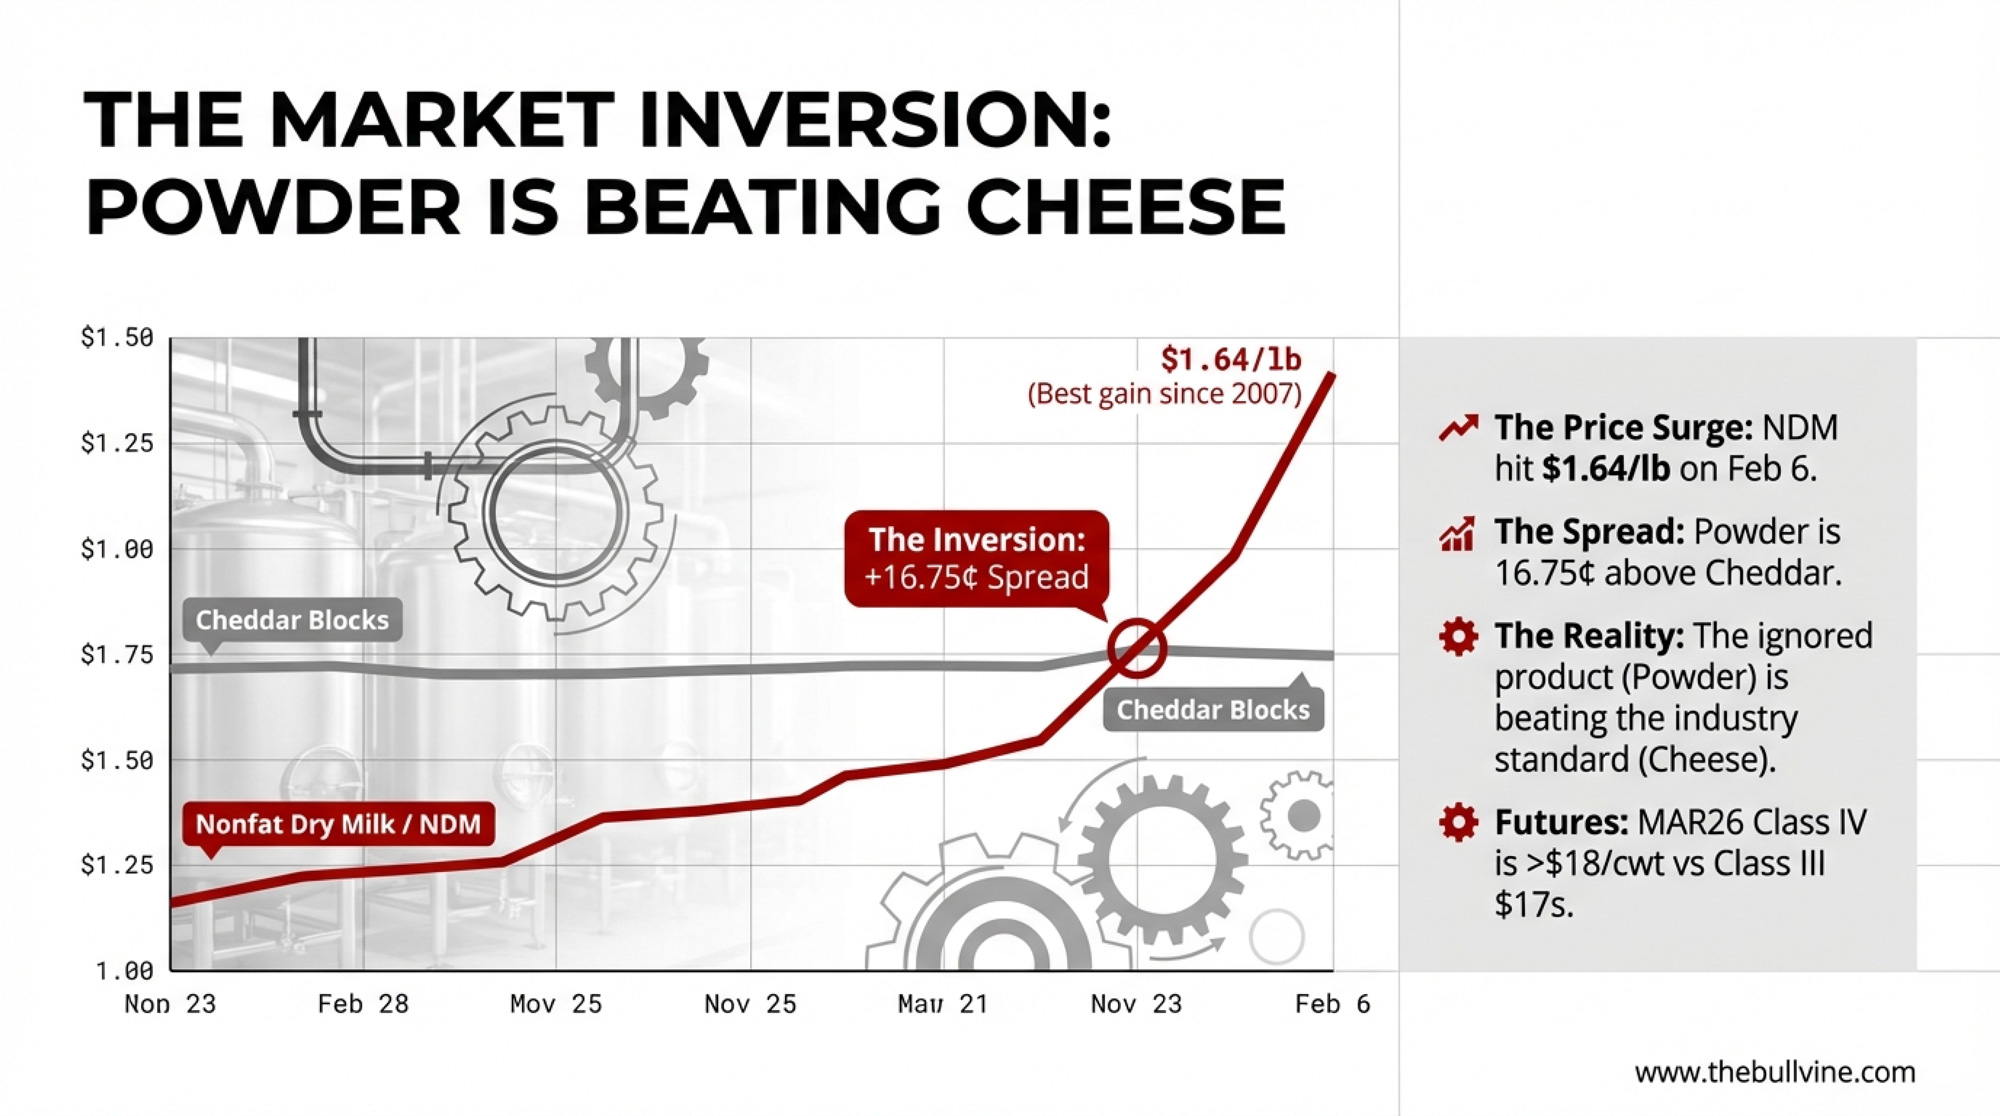
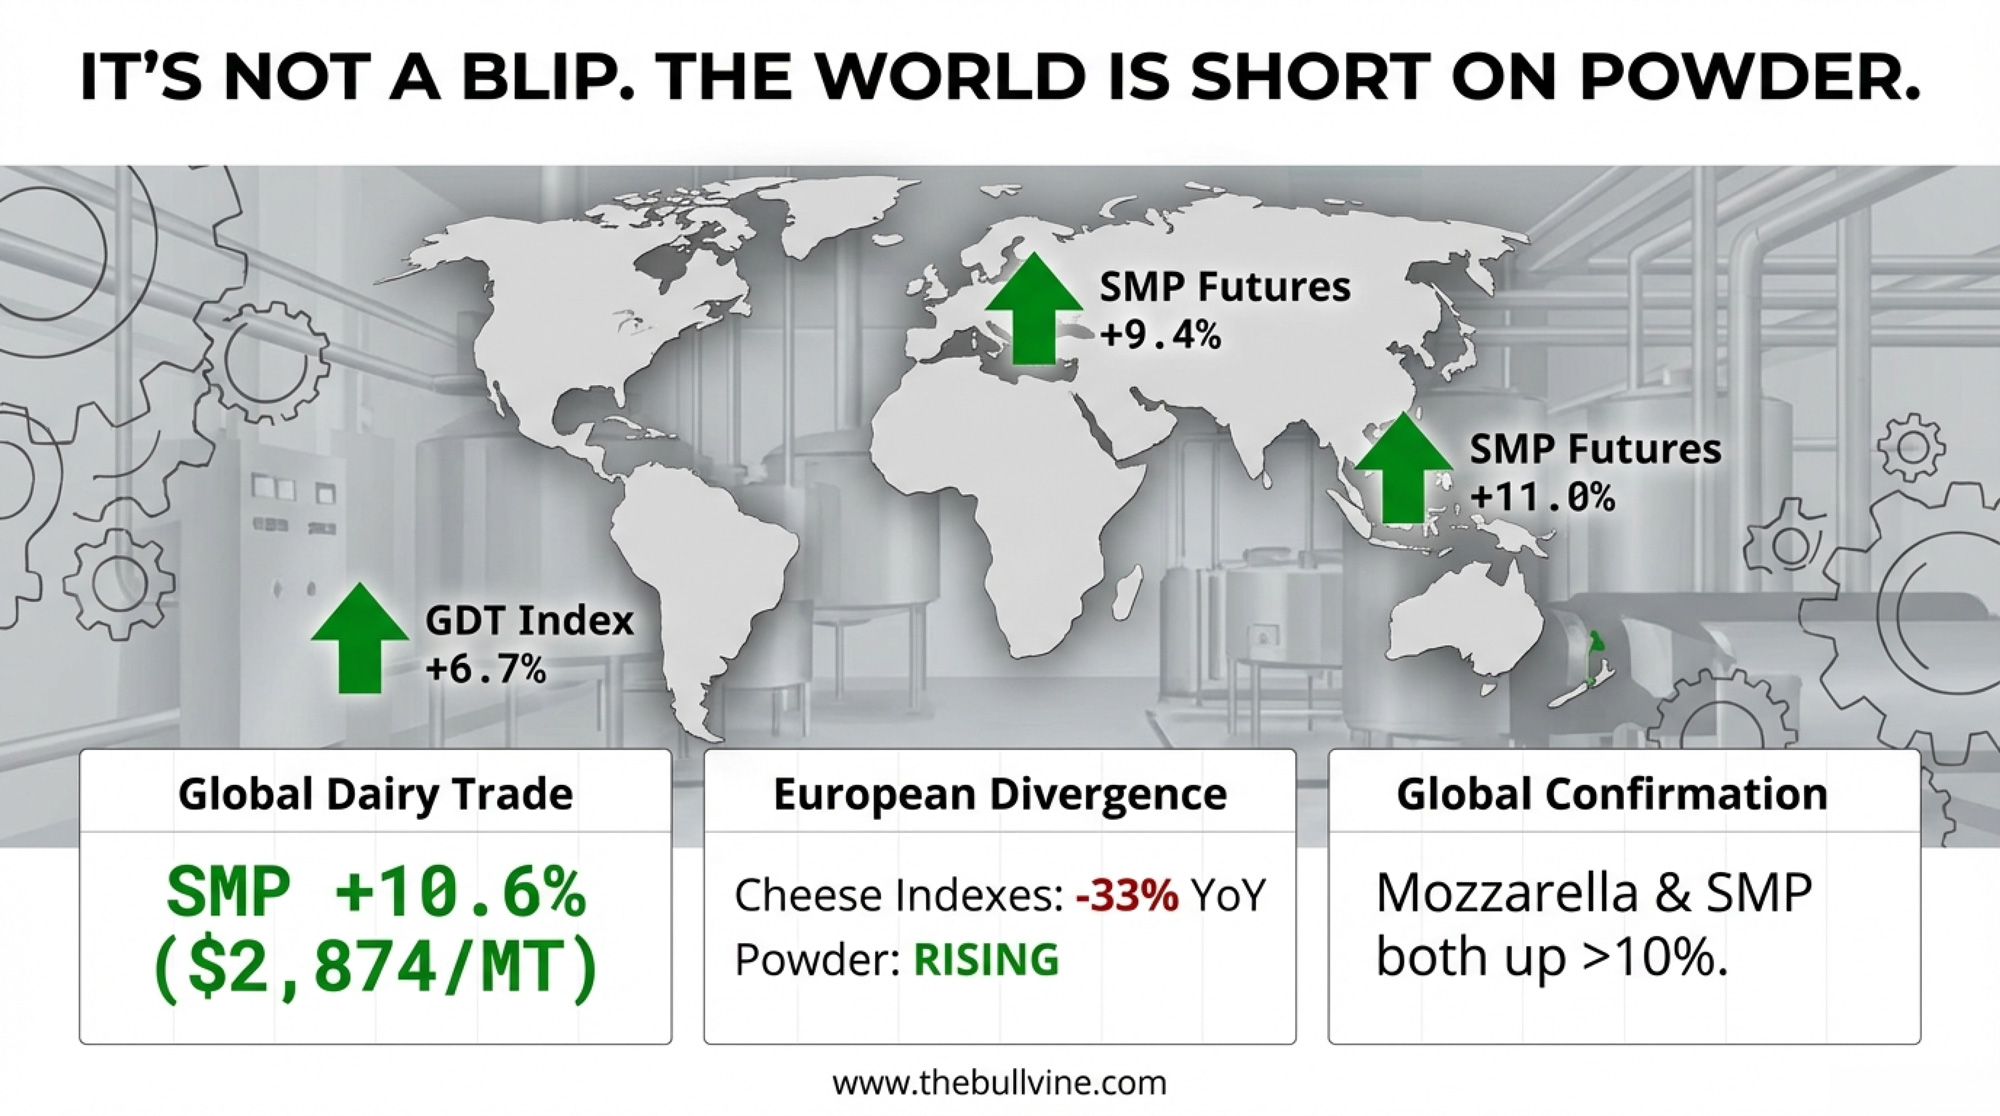
The $2.06 signal: CME spot NFDM hit $2.06/lb on April 9 — the highest level since January 2014, when it traded at $2.075. NFDM briefly topped $2.00 in mid‑2022 but never reached the current level. U.S. powder has been trading at a significant premium to both Oceania and European SMP, with many Asian bids running below domestic CME NFDM prices — often by a single‑digit cents‑per‑pound discount, as trade analysts note.
That premium reflects a successful value‑chain pivot. It also prices U.S. suppliers out of cost‑sensitive markets in Southeast Asia and Africa — the exact regions where the long‑term volume growth lives.
If your co‑op’s protein premium has moved meaningfully since 2023, it’s worth revisiting how you’re feeding for protein — not just fat. The market’s telling you which component it’ll pay up for.
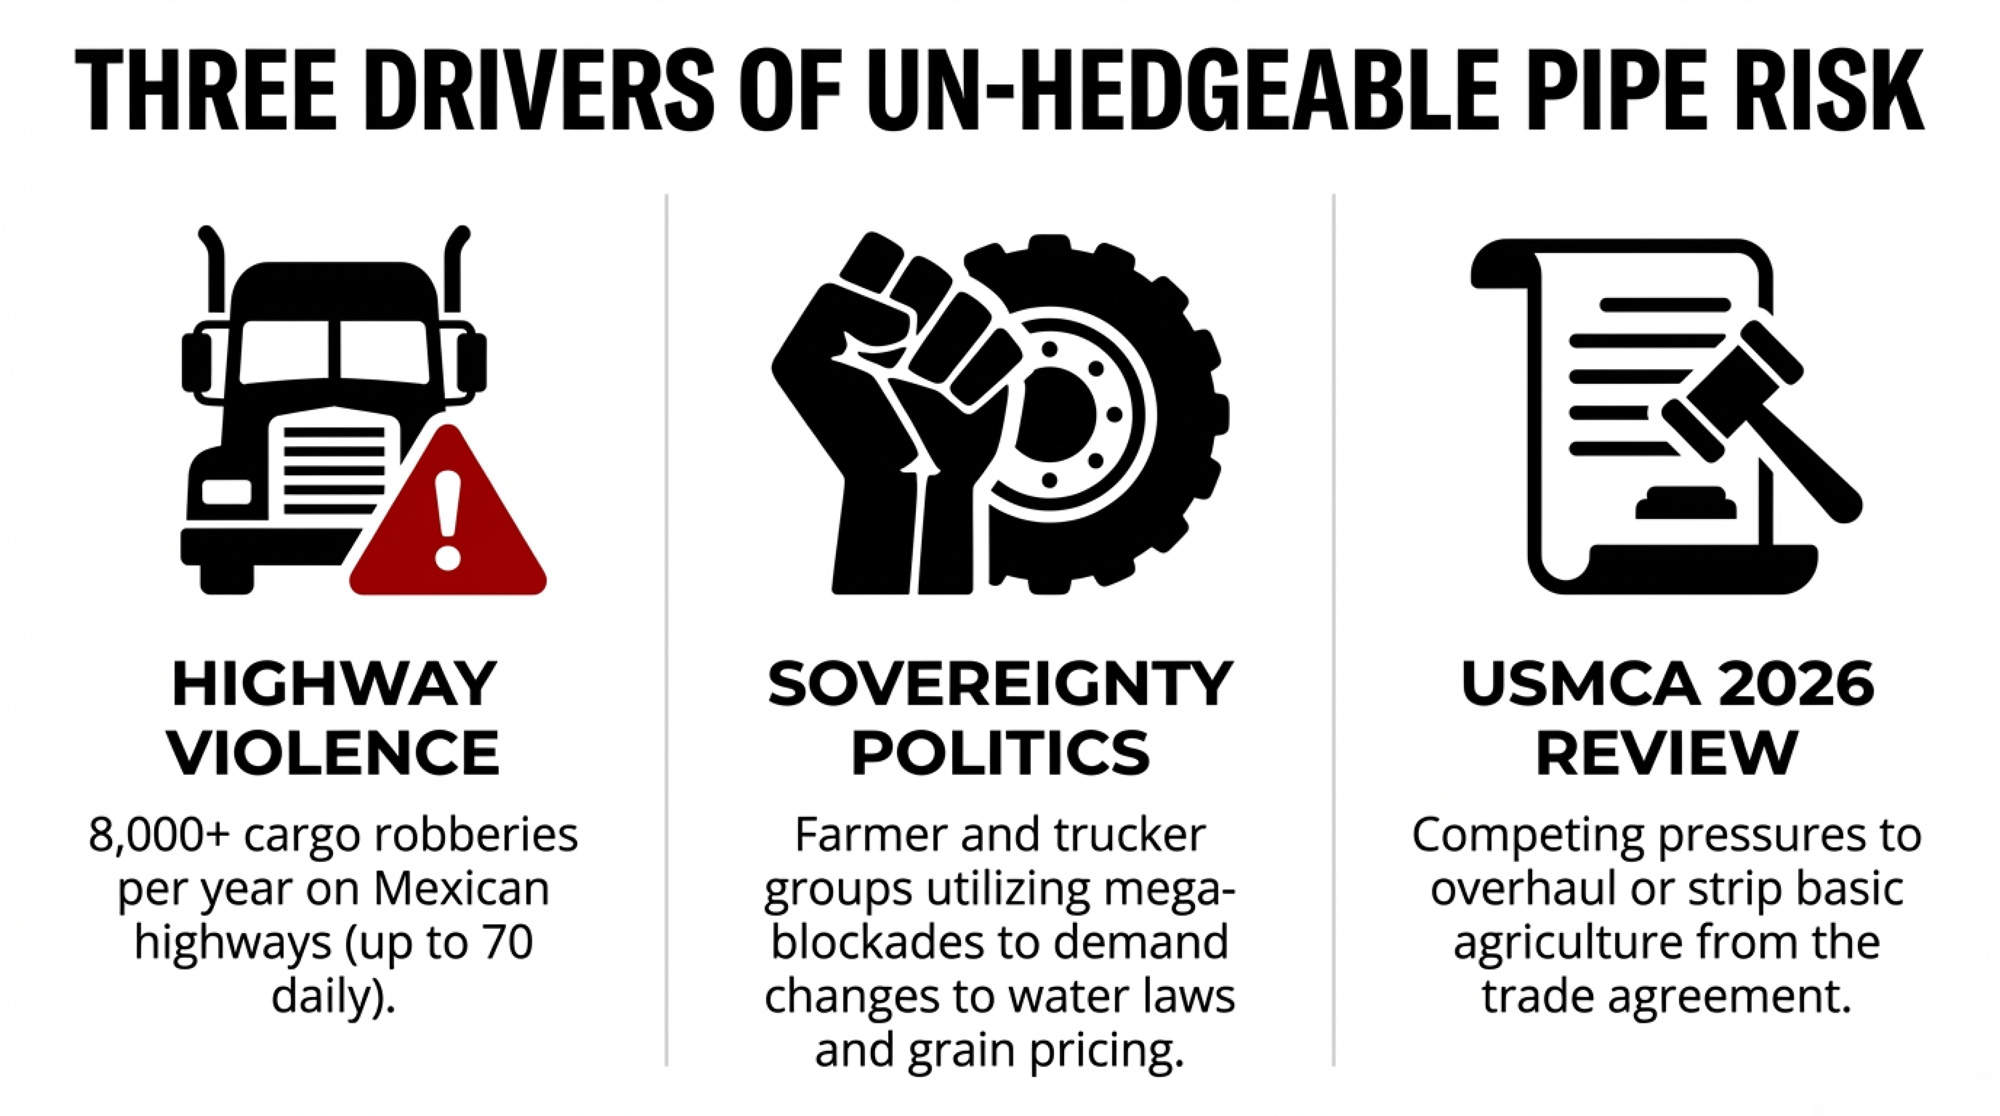
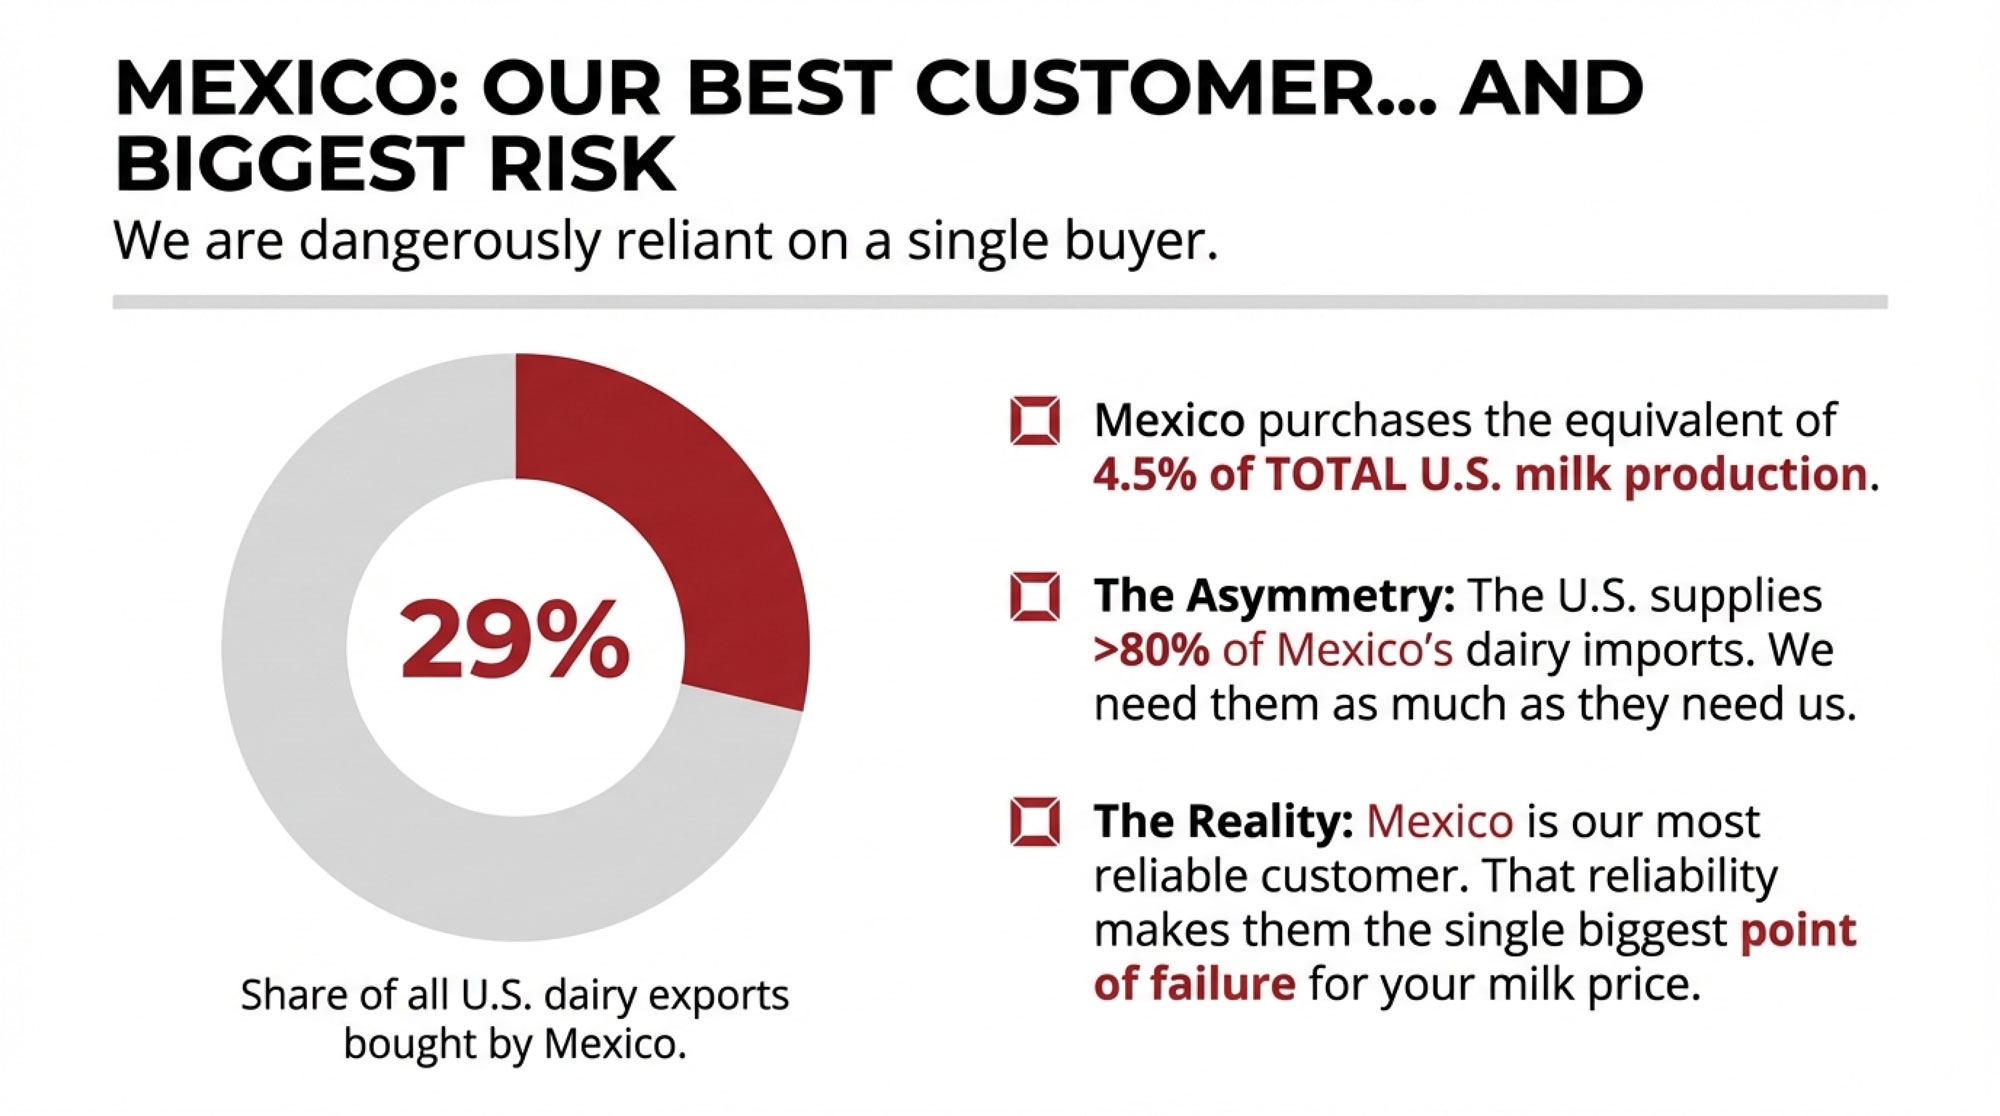
Where Does 27% of Your Export Revenue Go — and What Could Disrupt It?
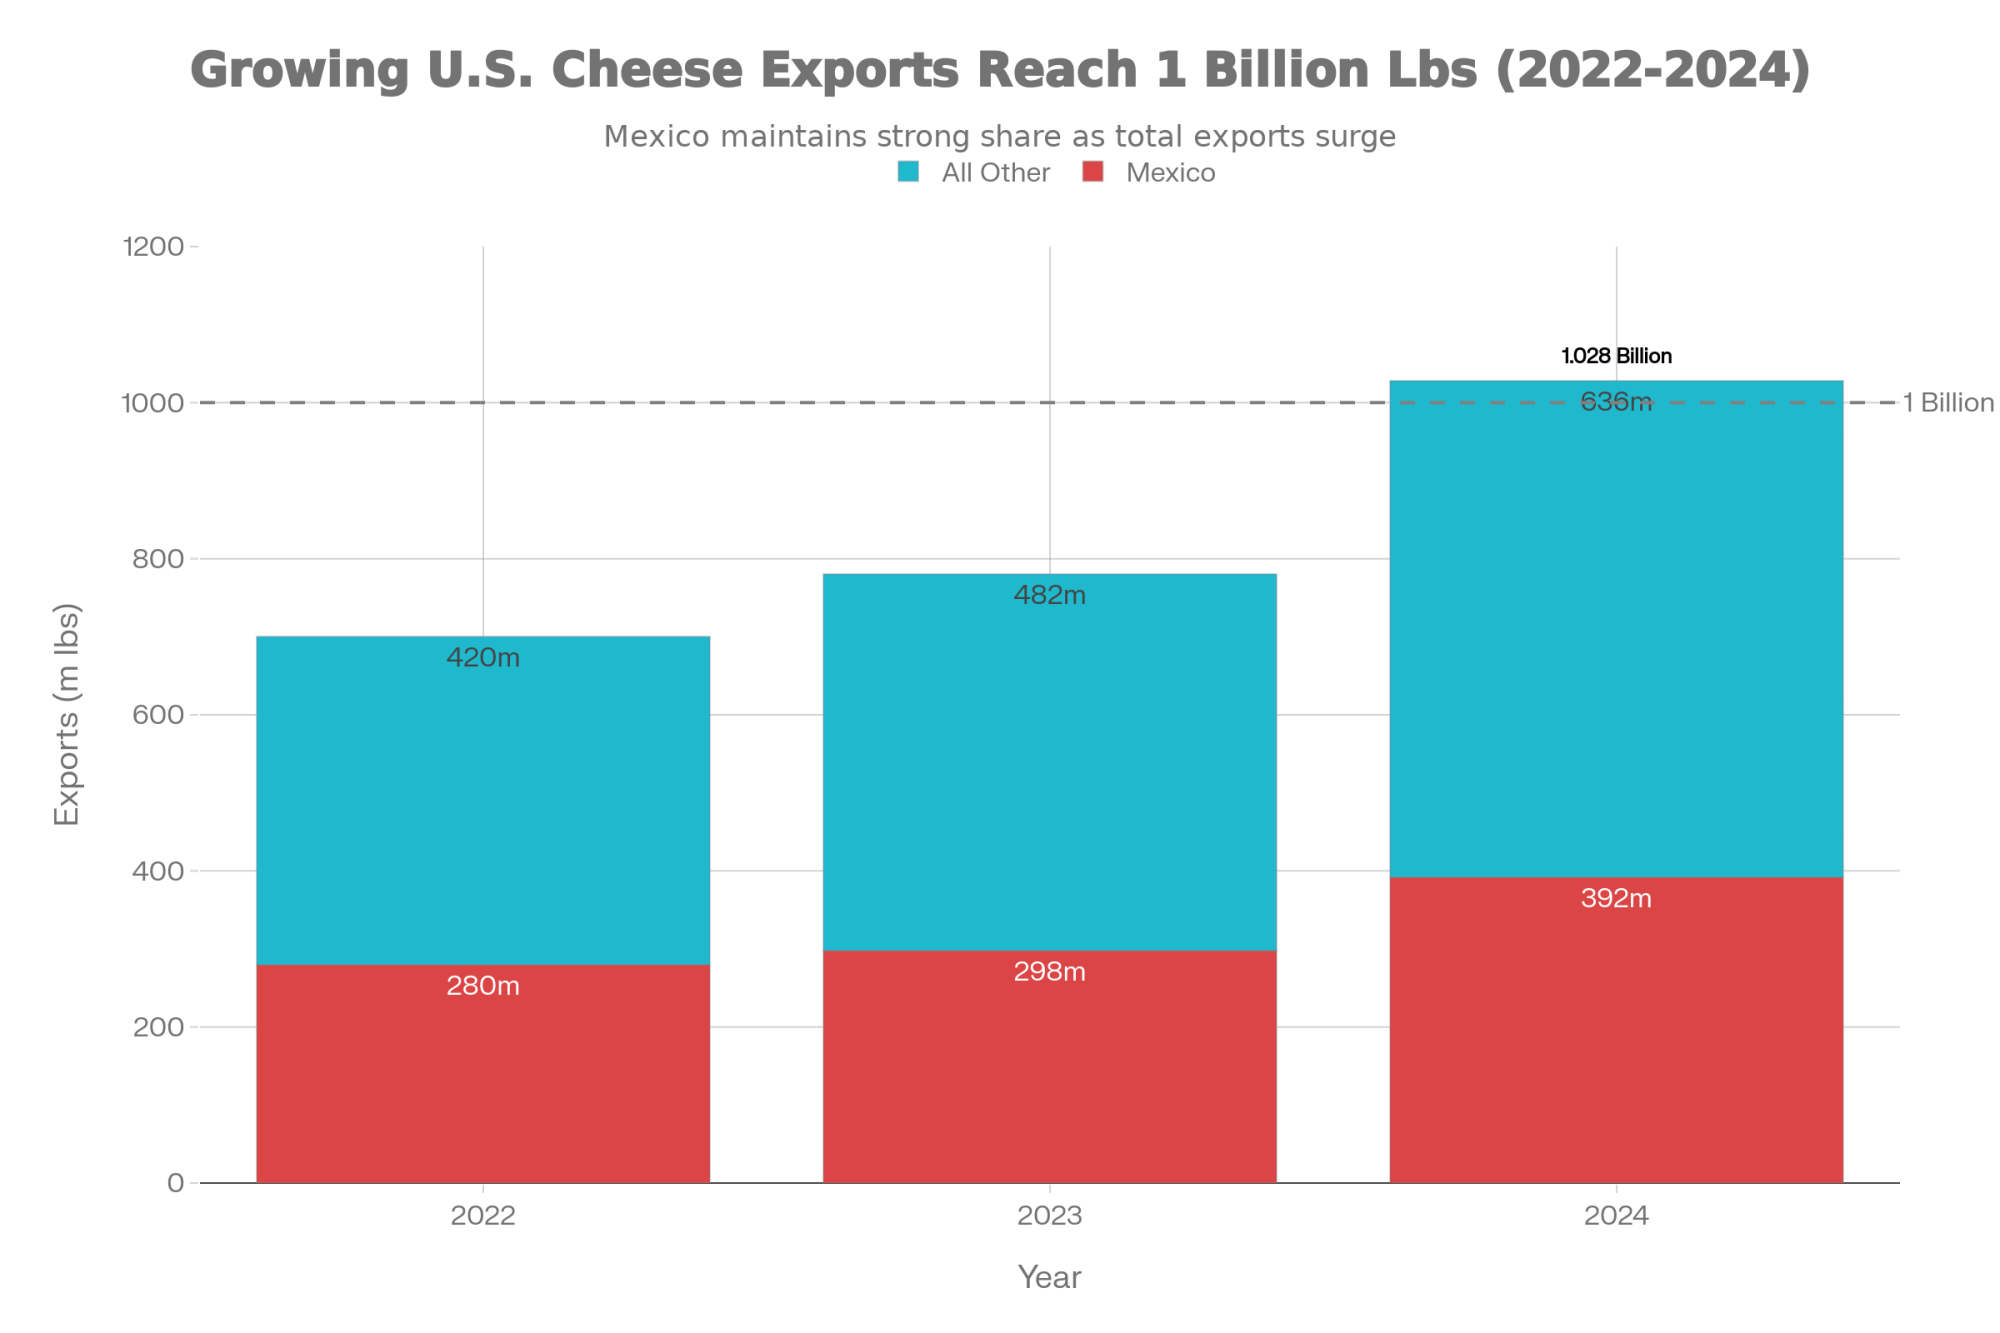
Mexico remains the No. 1 destination for American dairy, accounting for roughly a quarter of total export value in recent years and about $2.5–$2.6 billion in 2025, based on USDEC country‑level tracking and USDA trade data. Fresh cheese volumes to Mexico nearly tripled in February 2026, and total cheese shipments were up 38%. Proximity, rail logistics, and decades of partnership between USDEC, NMPF, and Mexican dairy organizations make this corridor remarkably durable.
The Middle East is surging, too. According to USDEC trade data, butter shipments to MENA jumped dramatically in February, and total MSE volume to the region climbed sharply in the first two months of 2026. Southeast Asia continues to grow — NFDM/SMP shipments to the region rose significantly in January, and the U.S. Center for Dairy Excellence in Singapore, launched in 2019, has become a critical bridge connecting American suppliers with Asian customers through its sensory labs and demo kitchens.
In Indonesia, the government’s Free and Nutritious School Meals initiative is being rolled out to tens of millions of students and other vulnerable groups, with Rabobank estimating it could eventually serve around 83 million recipientsand require more than 2 billion liters of milk annually at full implementation. Indonesia currently relies on imports for more than 80% of its dairy supply, according to USDEC and Agri‑Pulse reporting.
USDEC, NMPF, and the Consortium for Common Food Names are leaning into that gap. In April 2025, U.S. and Indonesian officials signed a landmark dairy agreement that set a framework to boost dairy trade and support public nutrition, complementing joint work on the school meals program. In February 2026, the U.S. and Indonesia signed a new agreement that eliminates tariffs on all U.S. dairy exports, recognizes U.S. regulatory oversight, and commits to protecting common cheese names — explicitly building on the U.S.–Indonesia Dairy Partnership launched in 2024 and joint work on the Free and Nutritious School Meals initiative.
Nyman knows what it takes to build that access. As she shared, a high‑level trip to China brought her into a Ministry of Commerce meeting where trade barriers dominated the conversation. She chose to speak as a producer first — about community, about how dairy farmers worldwide share more in common than divides them. The minister, she recalled, used her words to find common ground.
That kind of moment doesn’t show up in USDEC’s export spreadsheets. But it’s part of why those spreadsheets keep growing.
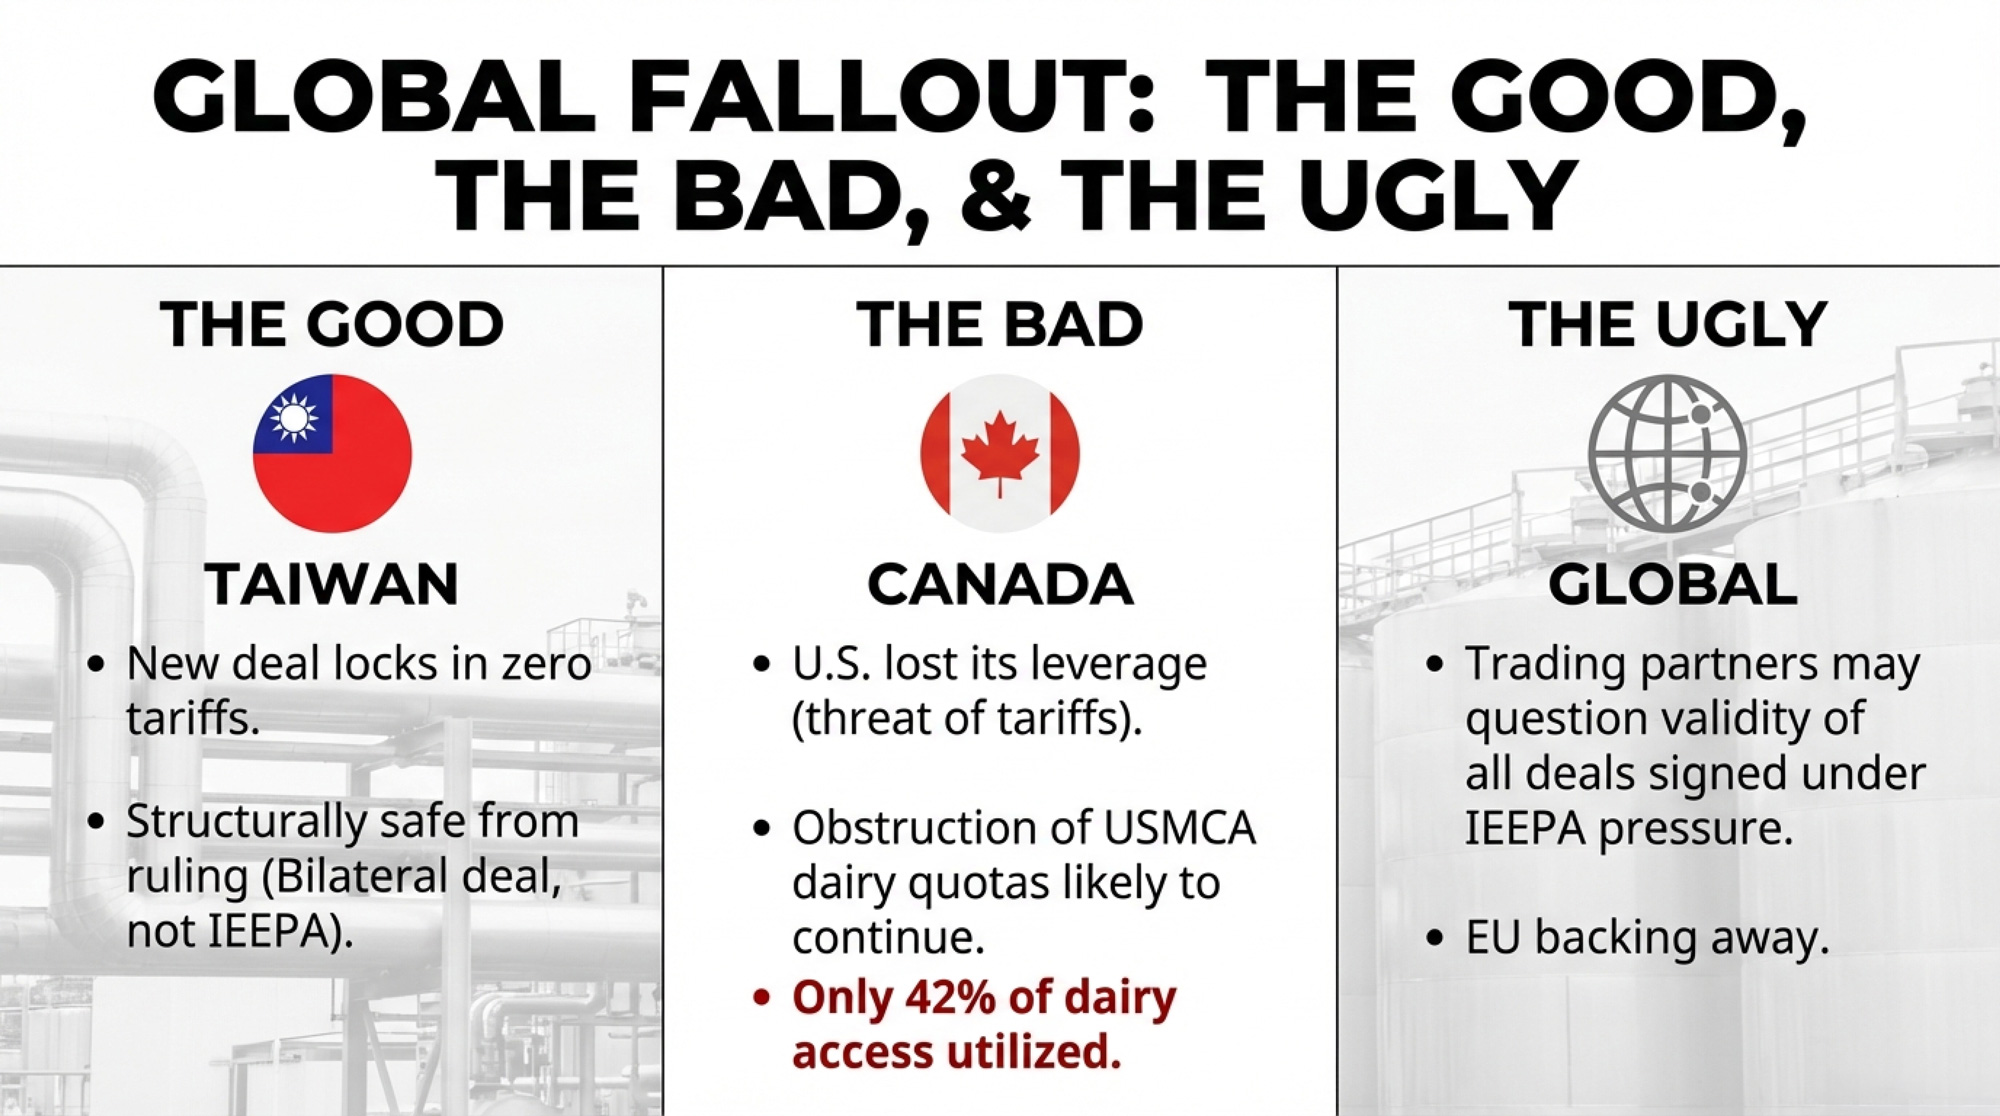
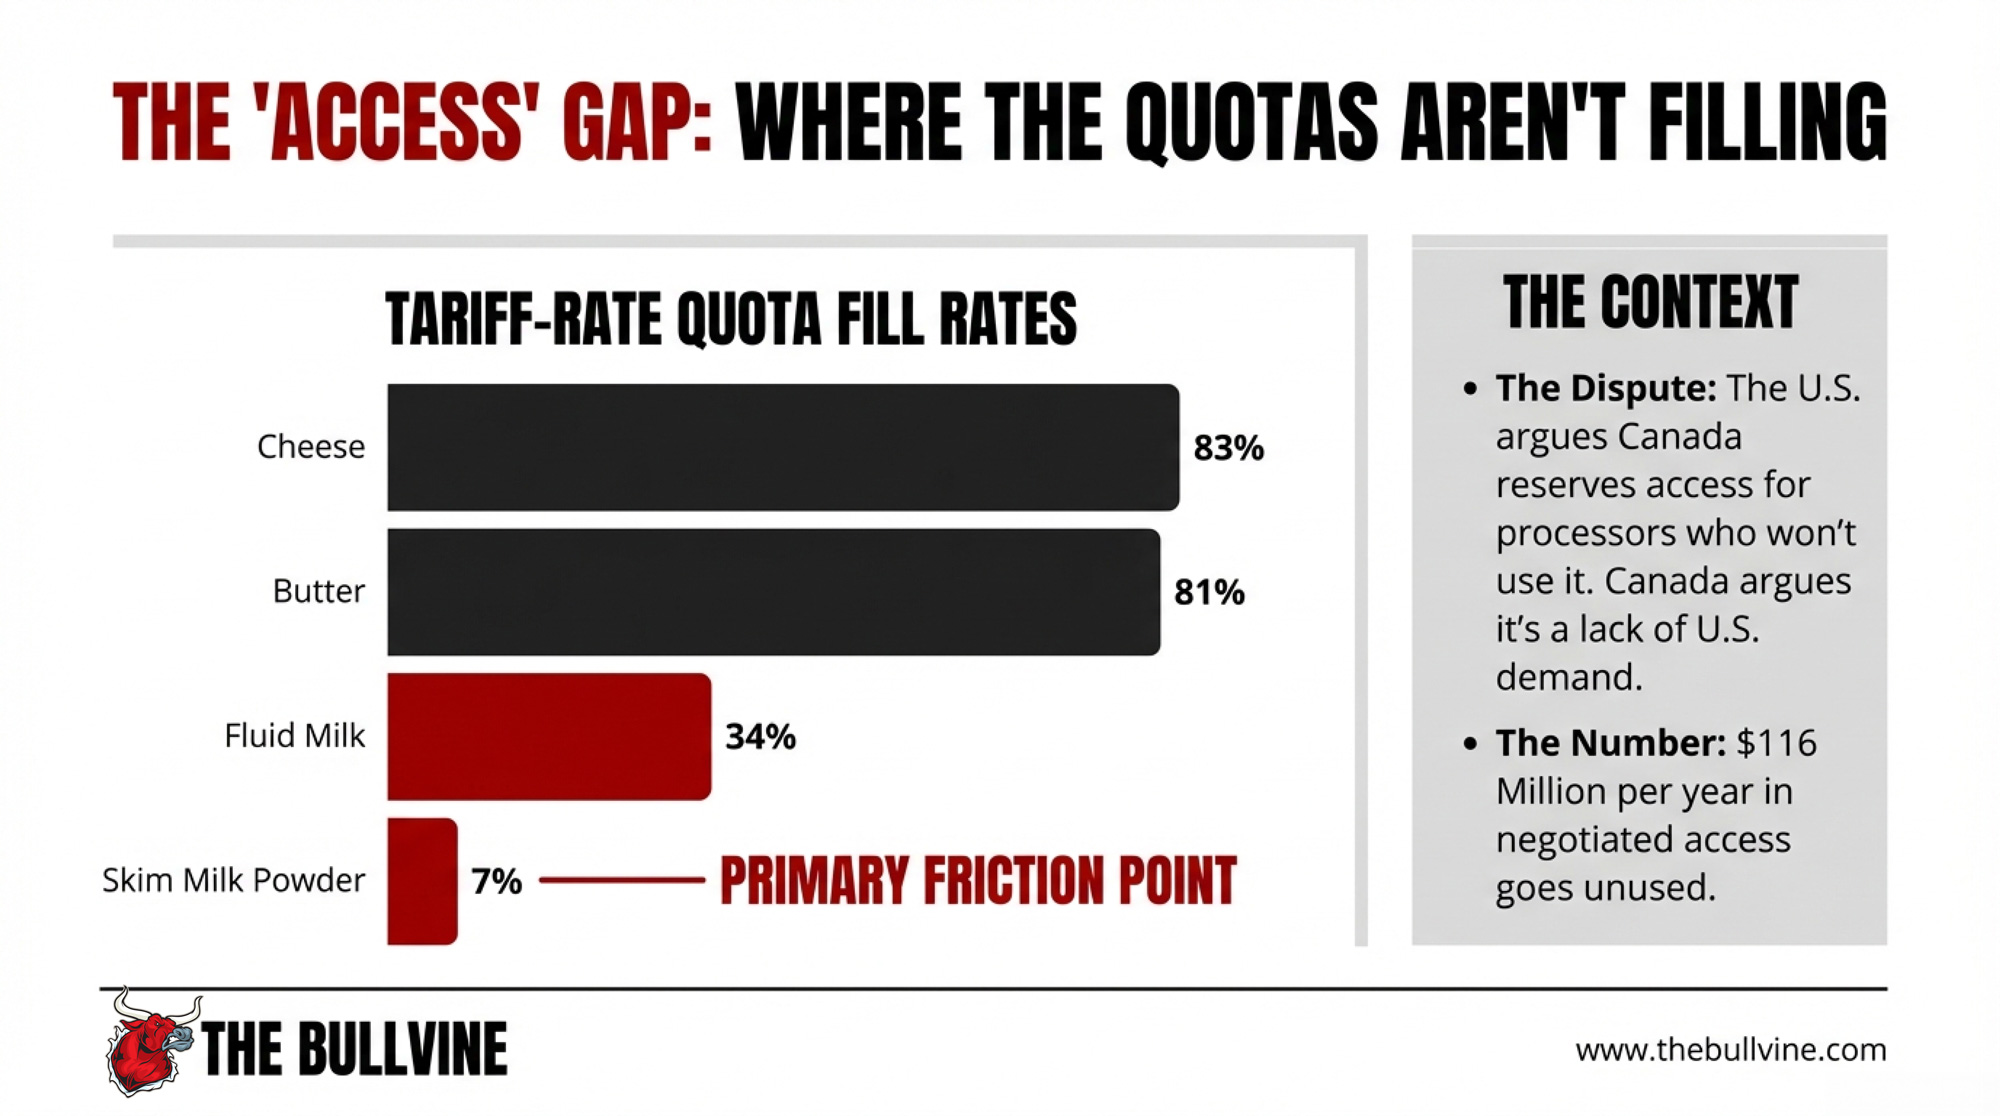
The July risk: U.S. dairy exports to Mexico and Canada exceeded $3.6 billion last year, accounting for 44% of total export value, according to USDEC and NMPF. The USMCA formal review is set for July 2026, with Canada’s quota system and tariff dynamics still unresolved. If Mexico’s corridor were disrupted by even 10–15%, the impact on pool prices would ripple well beyond the co‑ops that ship directly south of the border. For operations that depend heavily on Class III and IV utilization, even a modest shock in the Mexico corridor can show up as a meaningful hit to pool values and basis — especially stacked on top of already‑wider make allowances.
If more than a third of your plant’s volume goes to Mexico or Canada, that July review is a contract‑risk date, not just a policy headline.
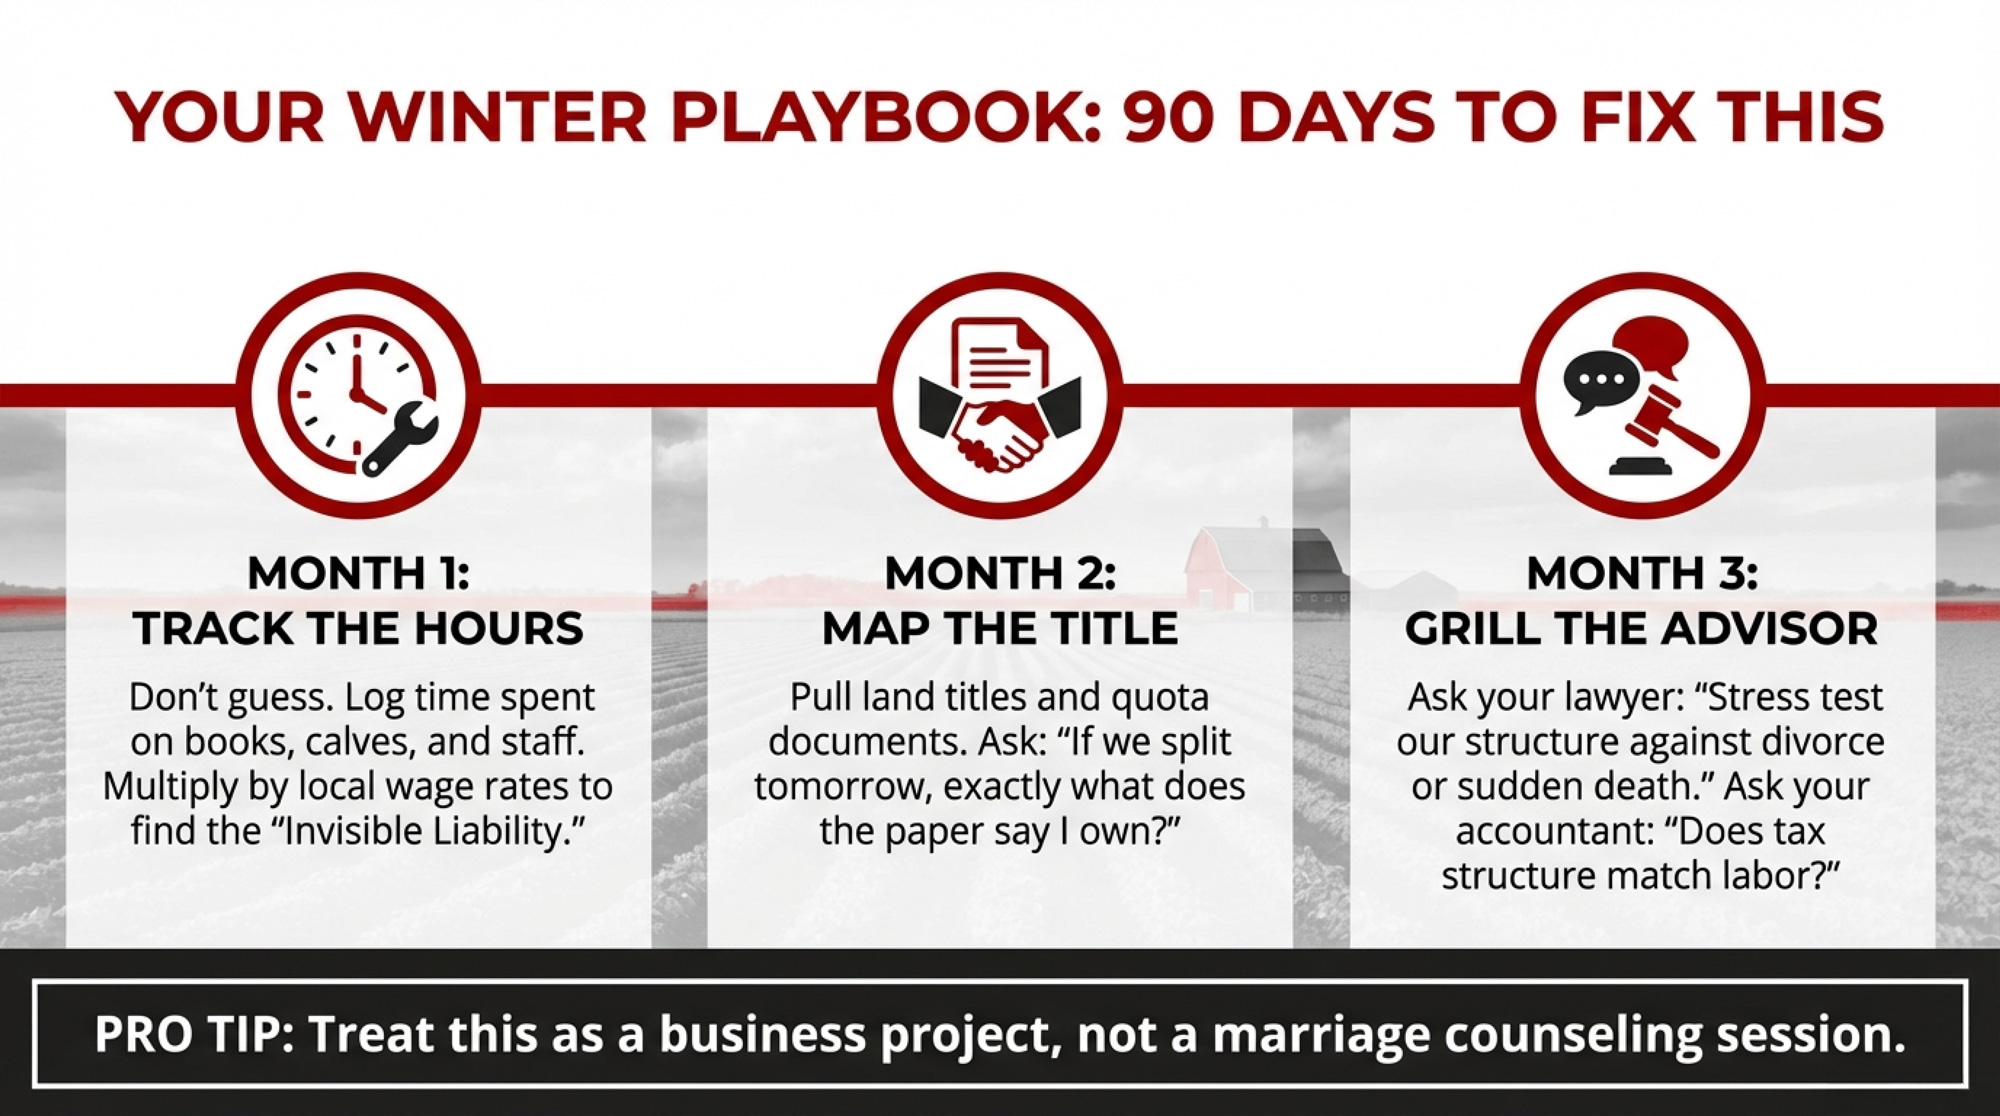
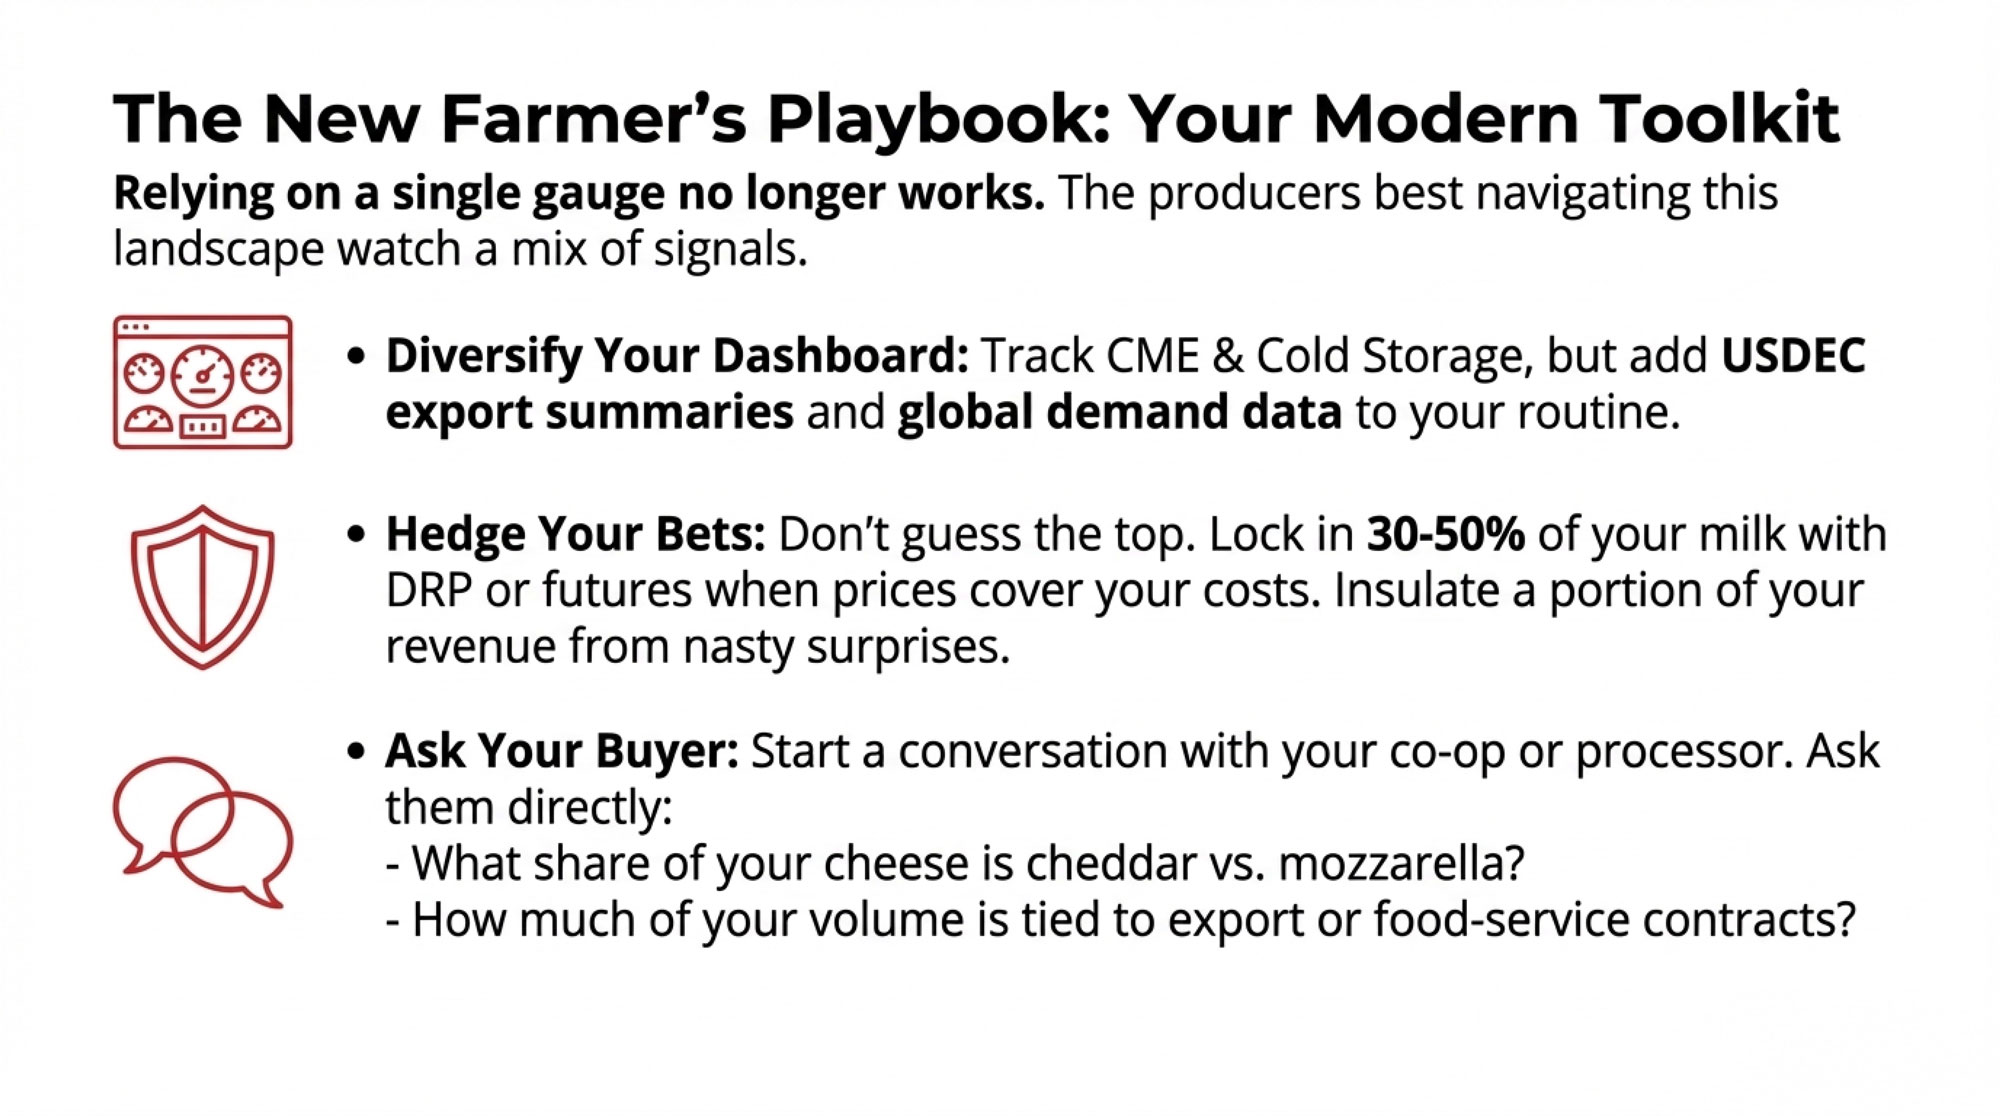
What This Means for Your Operation
In the next 30 days:
Pull your last 12 milk checks. Calculate the effective gap between your all‑milk price and your mailbox price, month by month. Compare Q1 2026 to Q1 2025. Don’t guess — run the numbers.
If the gap has widened more than $0.50/cwt since mid‑2025, bring that number — not a complaint, the actual calculation — to your next co‑op meeting or processor conversation. If it hasn’t widened, your marketing order and class utilization may be buffering you, but know that the next FMMO hearing cycle could change that.
Ask your processor or co‑op what share of their sales moves to export markets and which regions. If more than 30% of their volume is export‑dependent, you’re more exposed to trade disruption than the average FMMO pool assumes. That’s not a reason to panic — it’s a reason to know your DMC enrollment status and your processor’s contract notice period.
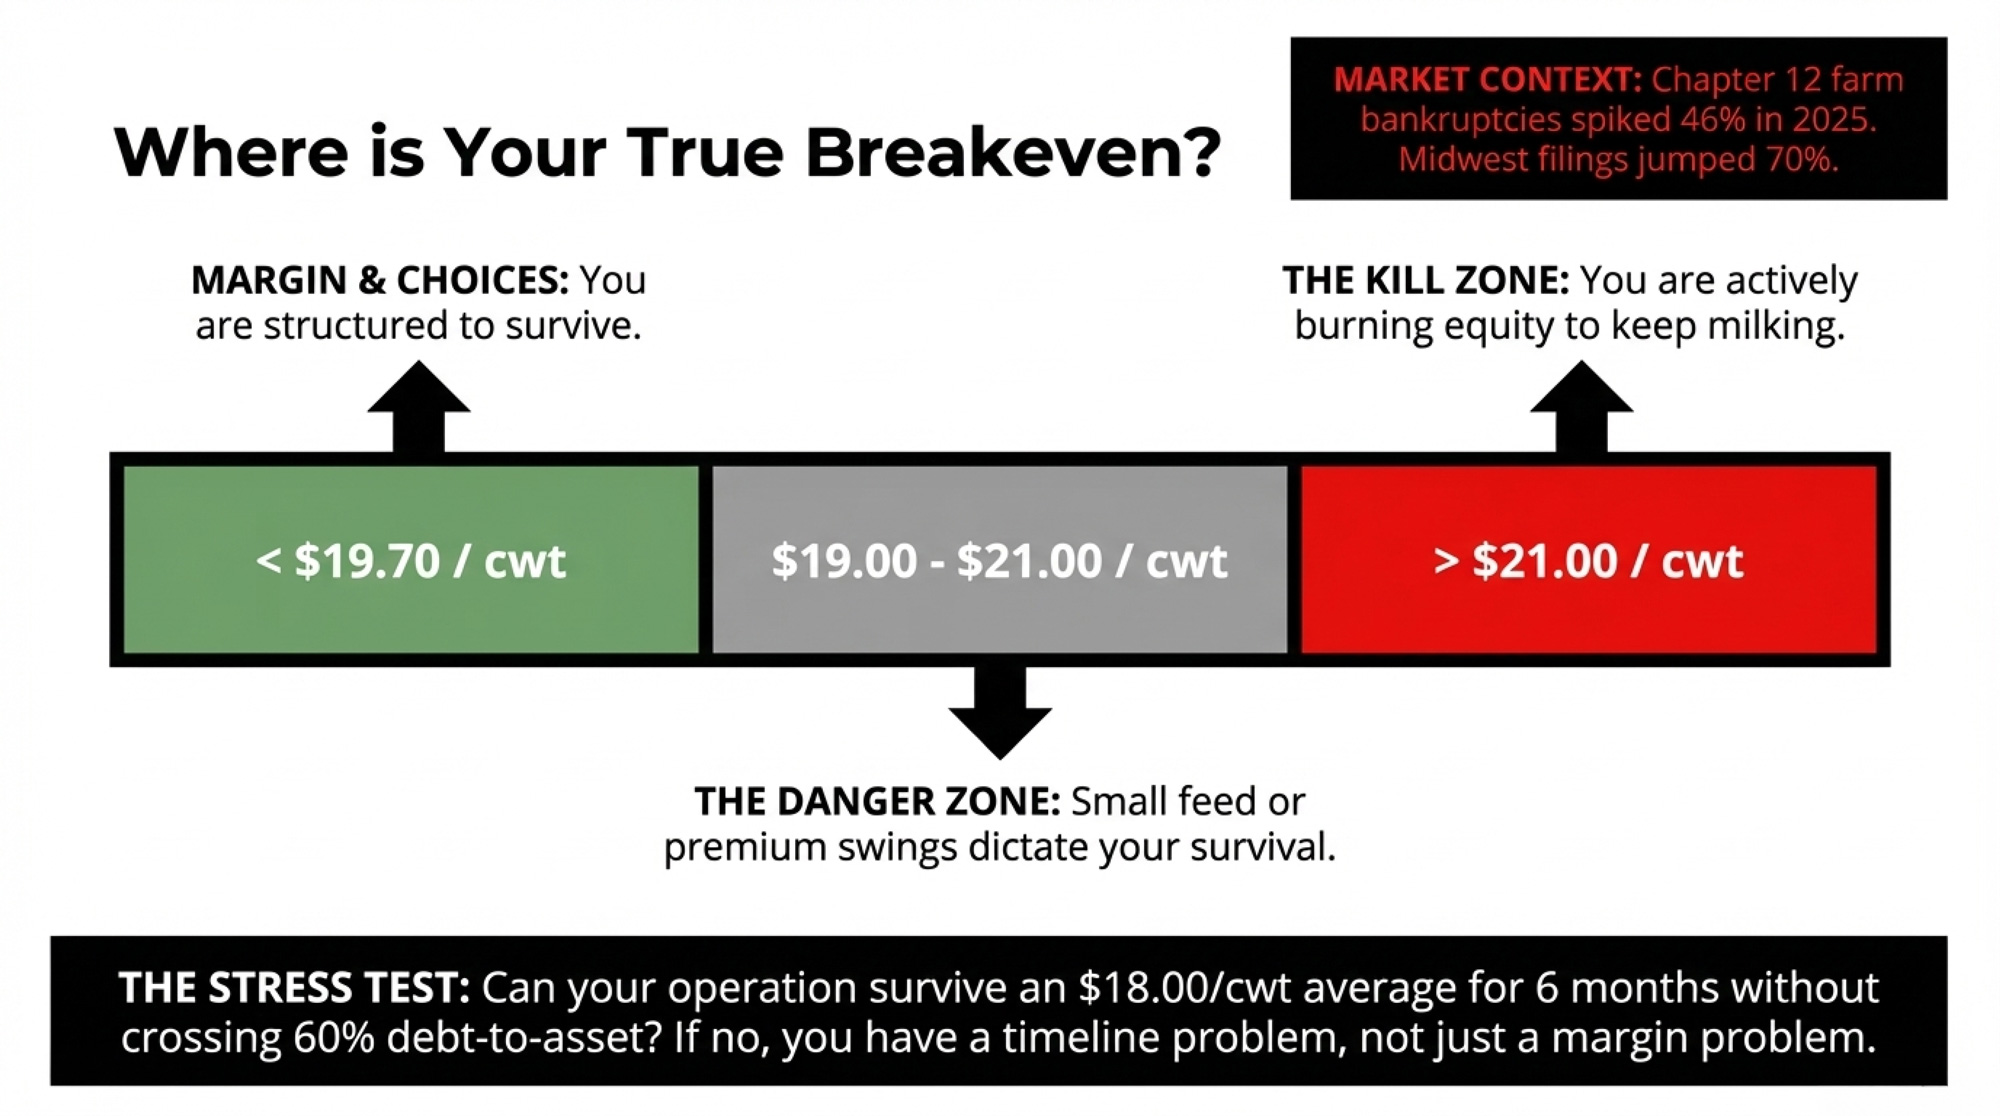
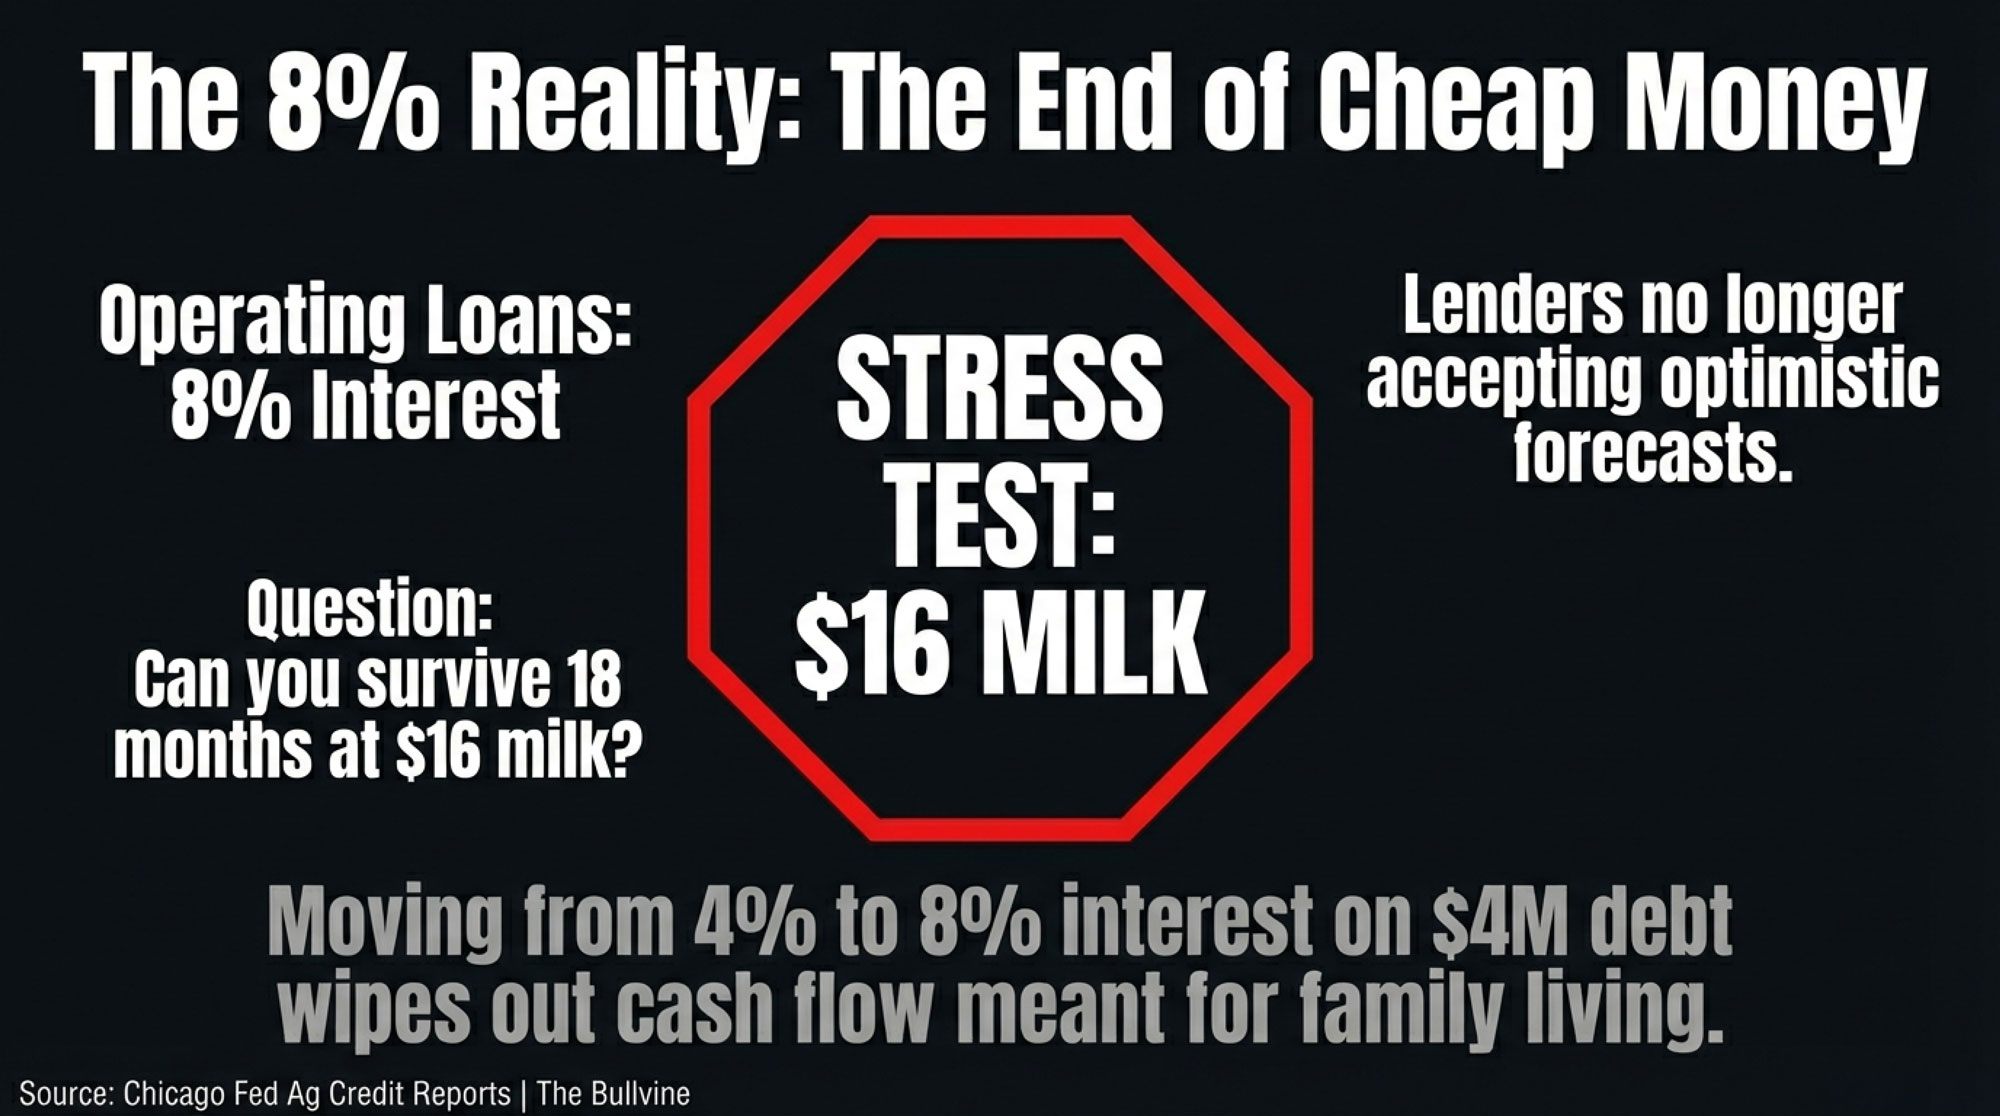
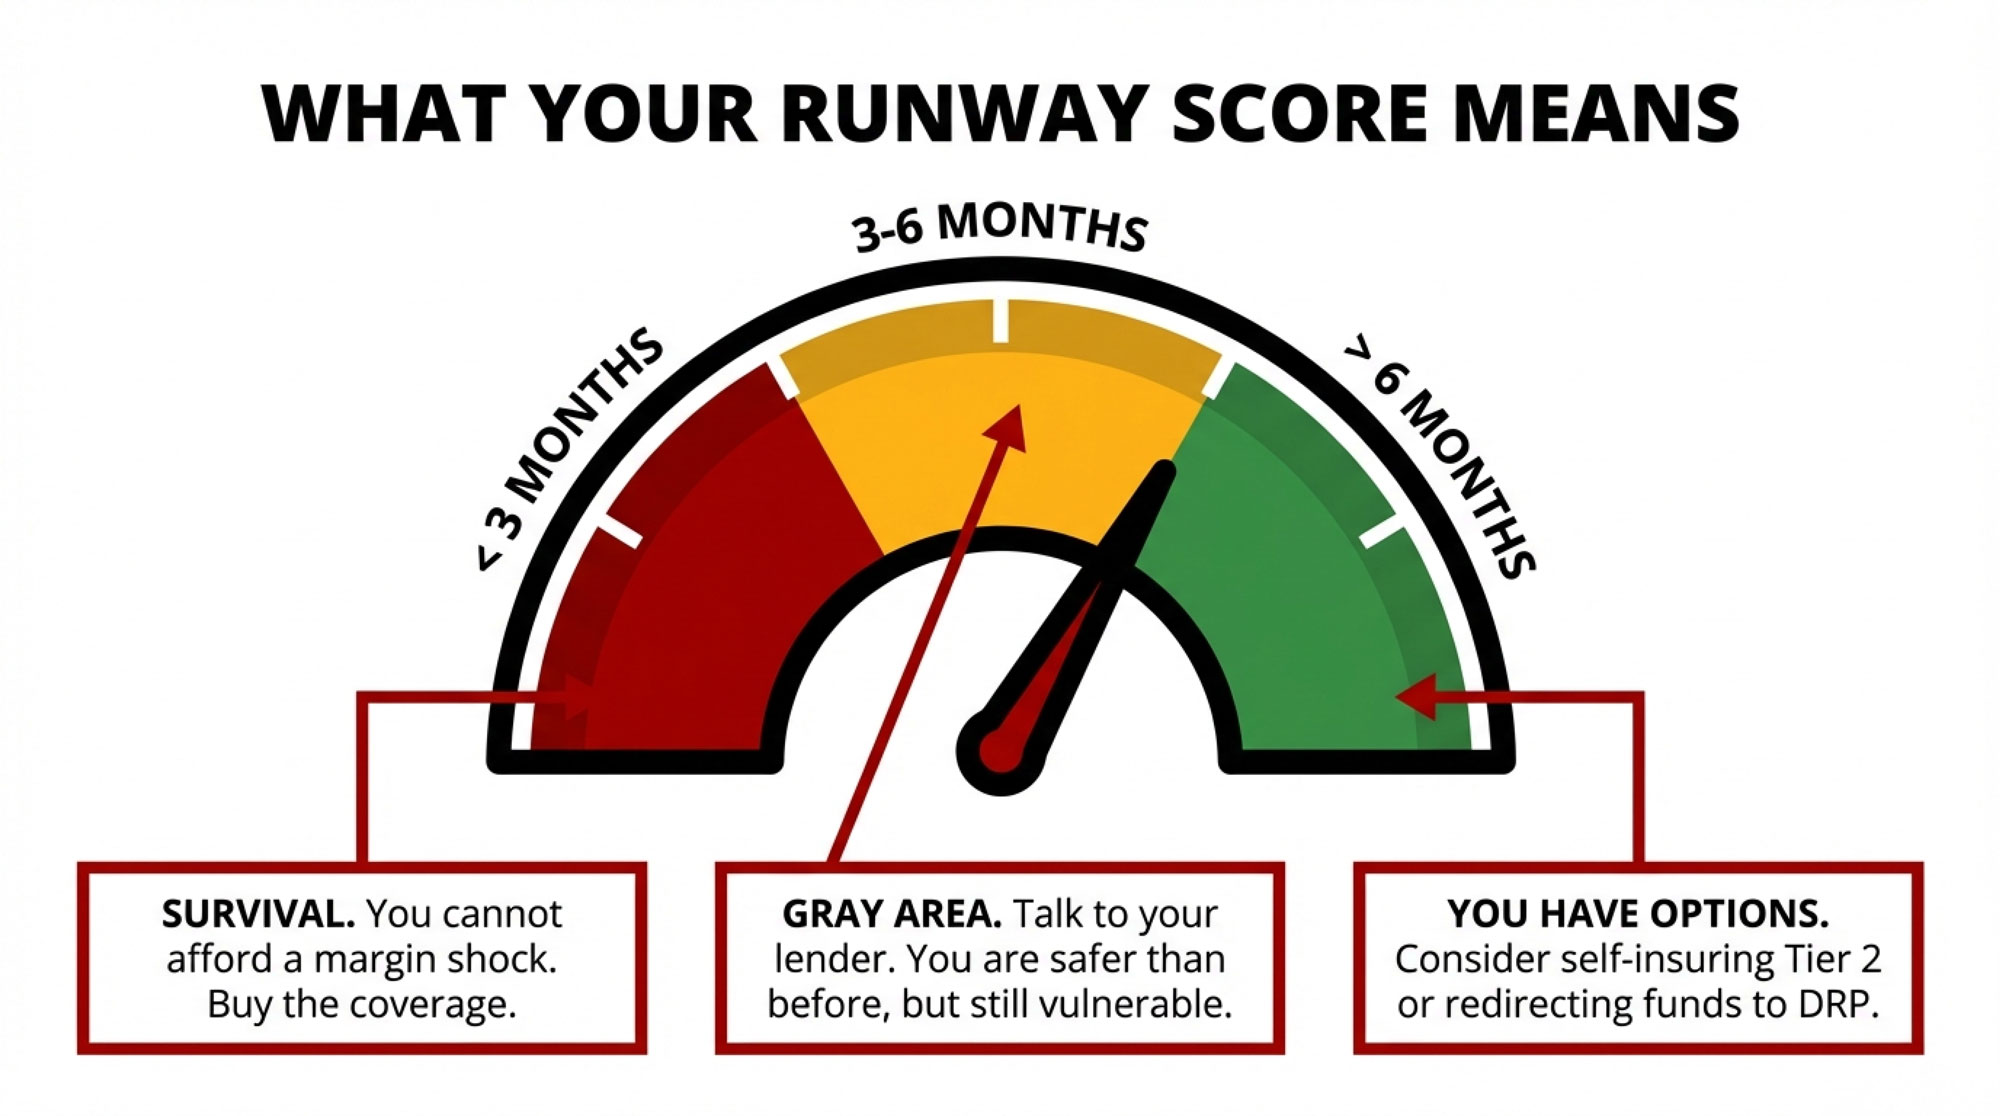
Stress‑test at an all‑milk price of $18/cwt. Model your operation’s breakeven at $18/cwt for six months. If you flinch at that number, your banker probably does too — and it’s better to have that conversation on your terms than theirs.
In the next 90 days:
Revisit your component goals with your nutritionist. Align butterfat, protein, and SCC targets against where your processor’s export mix is actually heading — not where it was three years ago. If your processor is shipping more cheese and whey protein than they were in 2023, your feeding and genetics program should reflect that.
If your rolling 12‑month butterfat sits below 4.0% and protein below 3.2%, you’re probably leaving money on the table in a market that rewards components over volume. Review genetics, nutrition, and grouping strategies with your advisor.
Mark July 2026 on your calendar. The USMCA review is the single most consequential trade‑policy event of the year for your milk check. Mexico and Canada represent 44% of the U.S. dairy export value. You should know what’s at stake before the headlines tell you.
Key Takeaways
The export boom is real — and so is the pricing gap. Record Q1 2026 volumes confirm accelerating global demand, but the widening spread between all‑milk and mailbox means the gains aren’t landing dollar‑for‑dollar. On a 500‑cow herd, ADC’s estimated $0.40/cwt widening works out to roughly $54,750/year in additional deductions under the new FMMO math. Run it for your herd.
Components are the strategy, not a bonus. Fat and protein drive the highest‑margin export categories — cheese, butter, and high‑protein ingredients. NFDM just hit $2.06/lb, the highest since 2014, because protein is being pulled into higher‑value products. If your herd is still optimized for volume, you’re misaligned with where the money is going.
Mexico is the linchpin, and July is the deadline. Indonesia, MENA, and Southeast Asia are growing fast, but Mexico and Canada together account for 44% of U.S. dairy export value. Any USMCA disruption hits harder than most producers expect — and the formal review is three months away. If your processor ships heavily into that corridor, it’s your risk too.
The Bottom Line
Nyman likes to point out that per‑capita dairy consumption in parts of Asia runs 50–60 pounds per person, compared to roughly 600 in the U.S. The growth potential is abroad. It’s real. But potential doesn’t pay bills — pricing formulas do.
“The world needs what we produce,” Nyman said. “And together, we’re making sure they can access it.”
That access is the result of 30 years of work. What matters now — for the next 30 and for the next milk check — is whether your contracts, components, and cost structure are set up to capture the value when it arrives. Or whether someone else captures it first. Where does your breakeven sit if Mexico stumbles or make allowances widen again?
Complete references and supporting documentation are available upon request by contacting the editorial team at editor@thebullvine.com.
The Triple Cushion Trap: Why 2025’s Strong Margins Won’t Save You in 2026 – This strategic forecast reveals why relying on beef-on-dairy premiums and cheap feed is a dangerous game. It delivers a roadmap for repositioning your herd’s genetics and cost structure before 2026’s projected margin compression erases current equity gains.
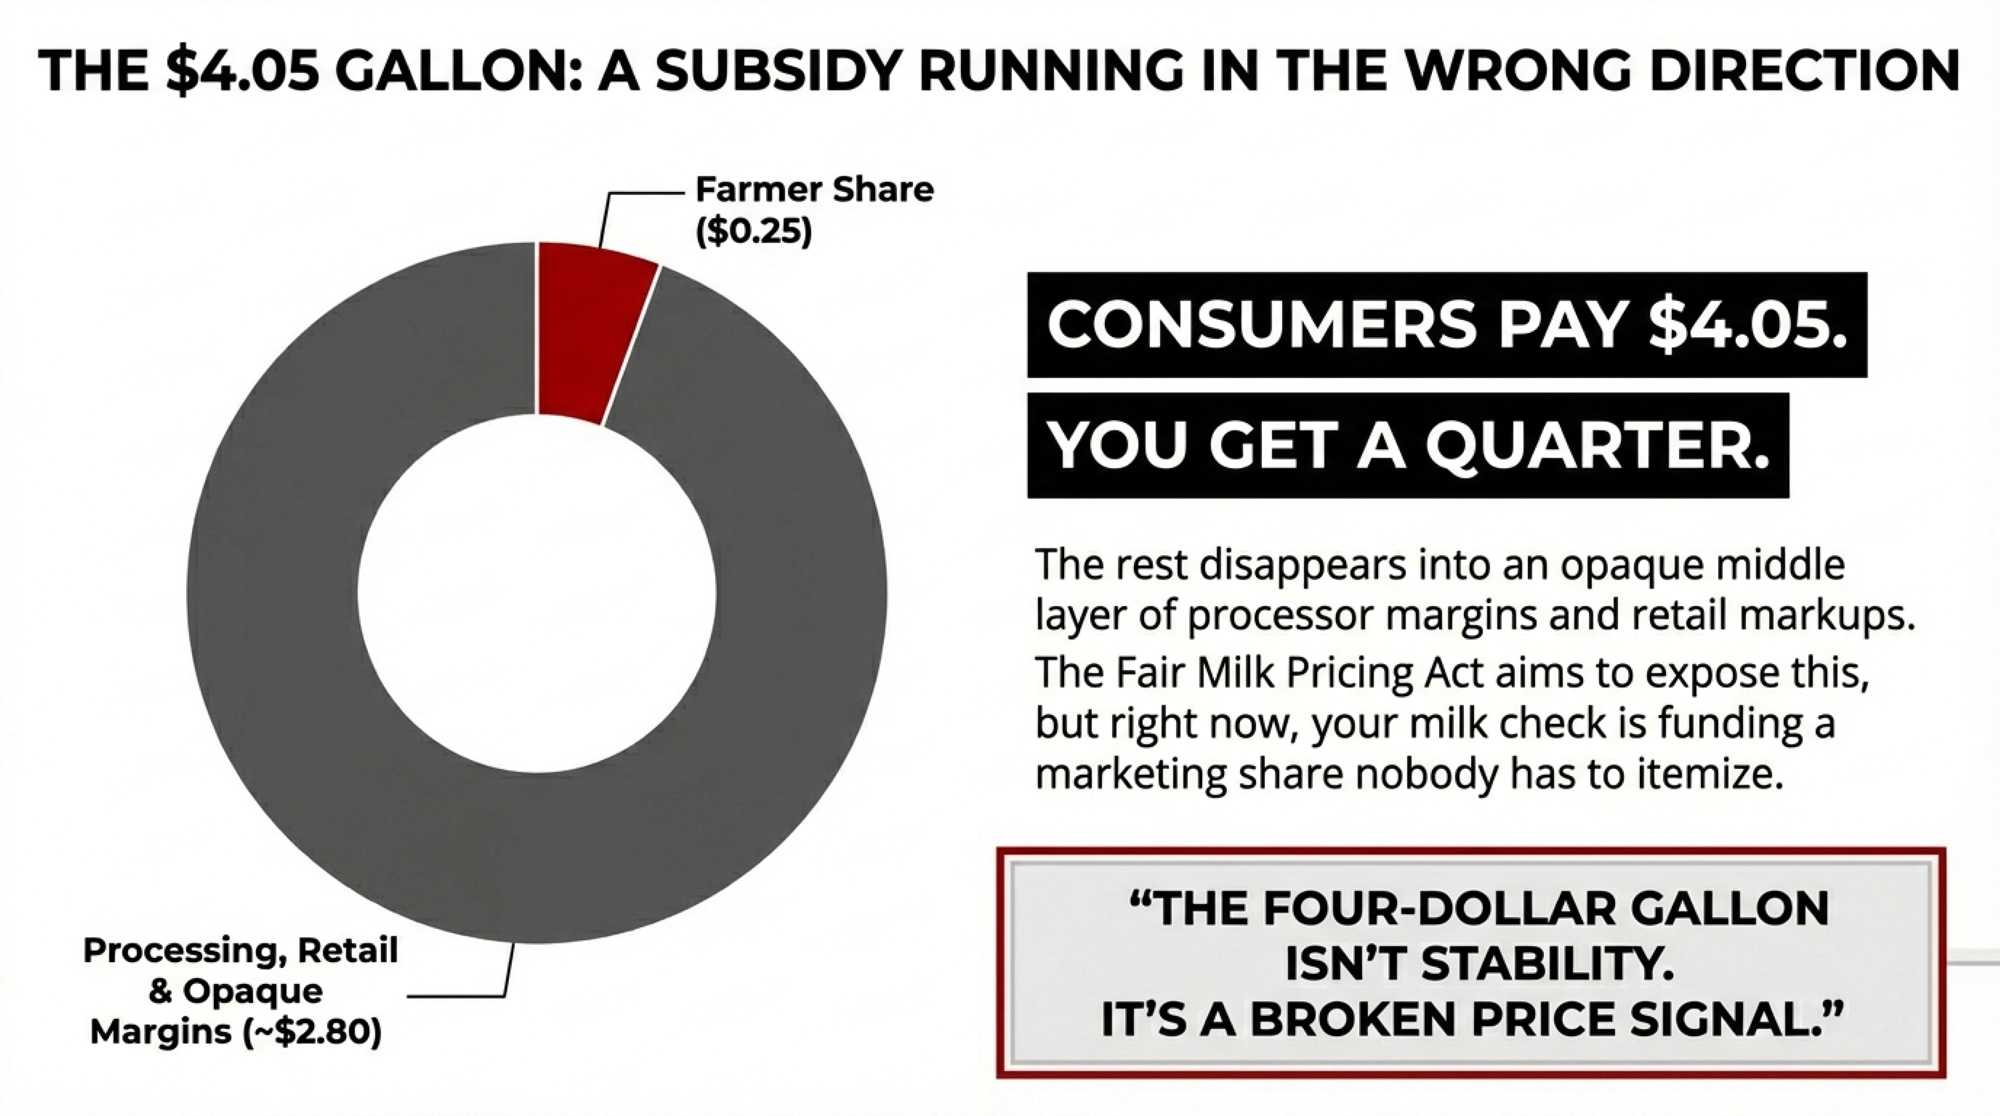
Gold Medal Margins: Italy Turns Less Milk into €22.8B. You’re Stuck at $18.95. – This case study breaks down unconventional value-multiplier strategies that successfully decouple farm revenue from commodity volume. It reveals how shifting your focus from “pounds of milk” to “finished product value” can secure significant per-unit premiums.
The Sunday Read Dairy Professionals Don’t Skip.
Every week, thousands of producers, breeders, and industry insiders open Bullvine Weekly for genetics insights, market shifts, and profit strategies they won’t find anywhere else. One email. Five minutes. Smarter decisions all week.
Your lender is already running the Q3 margin math. Here’s how to beat them to it.
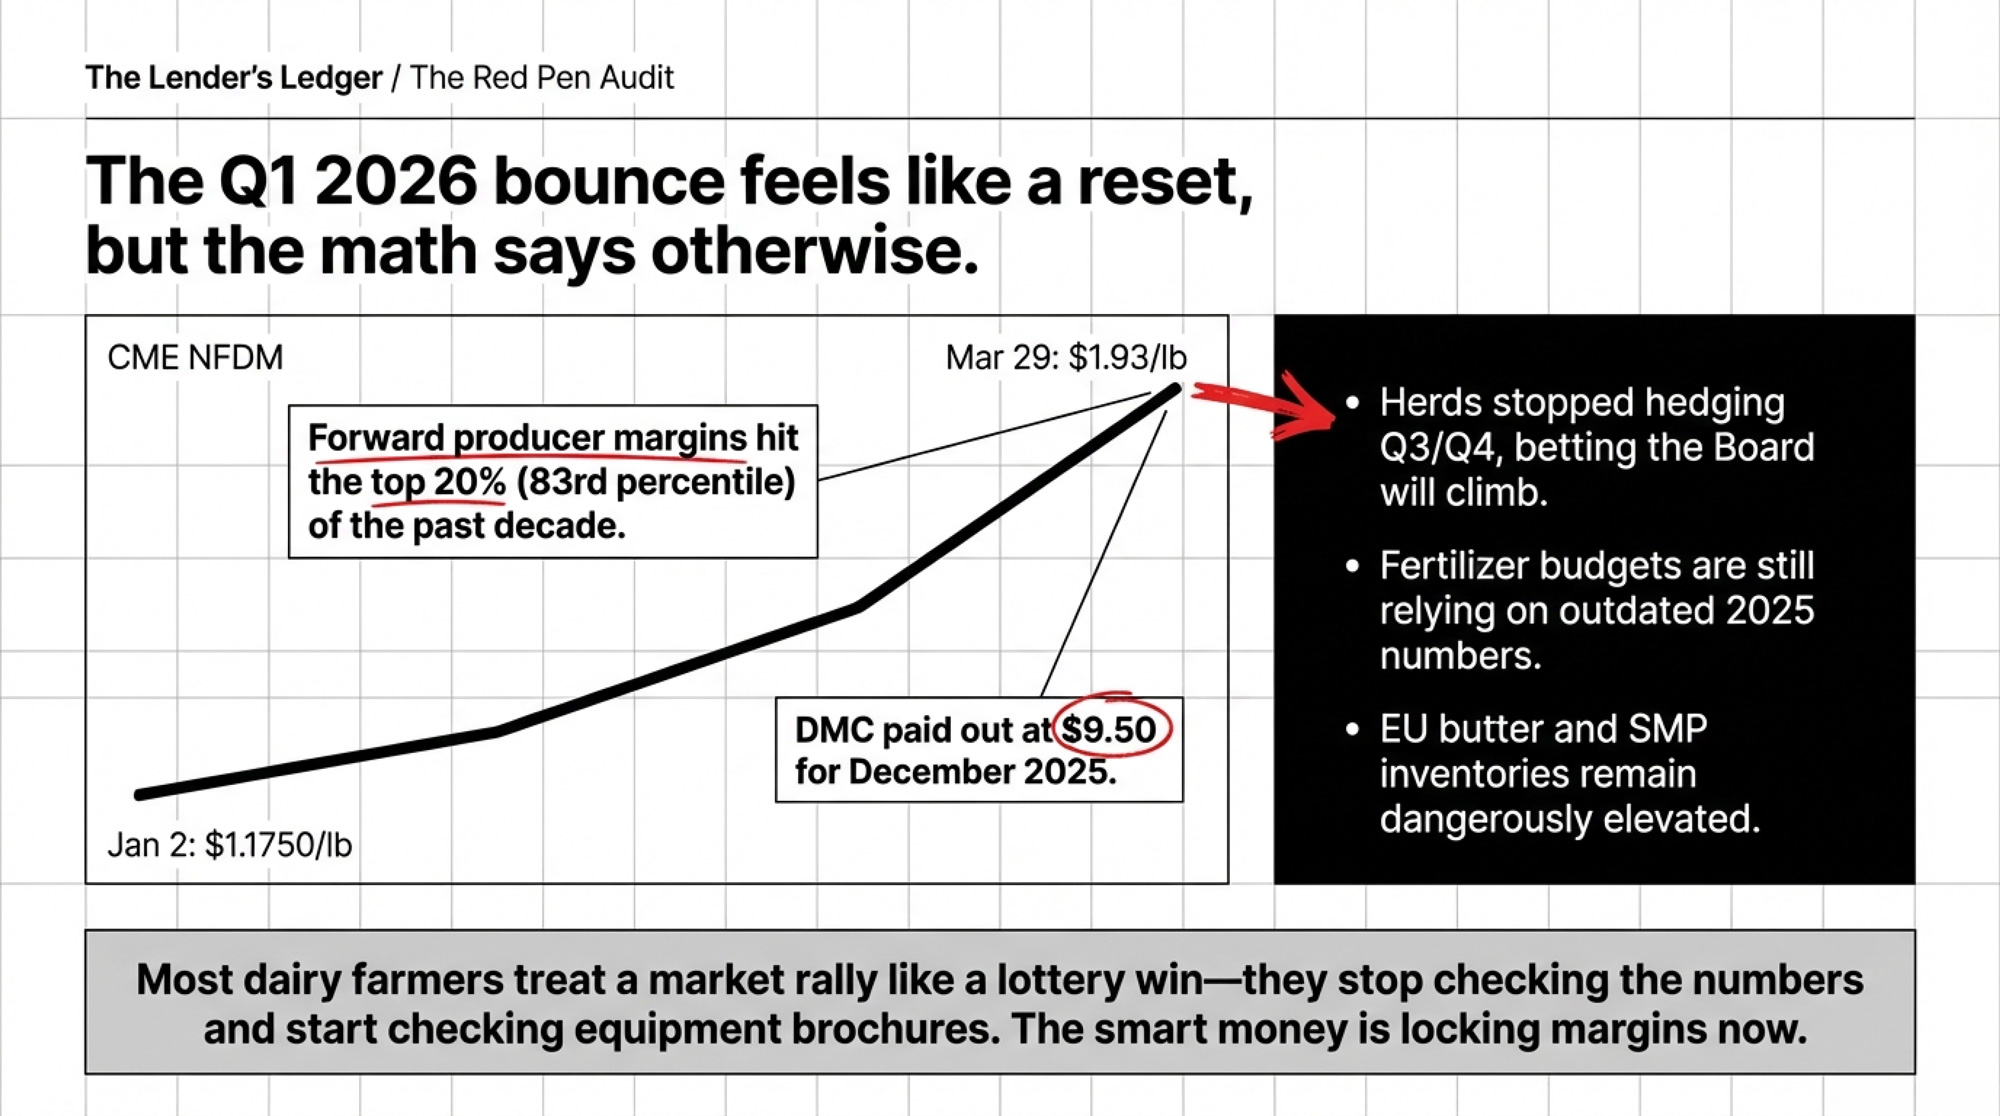
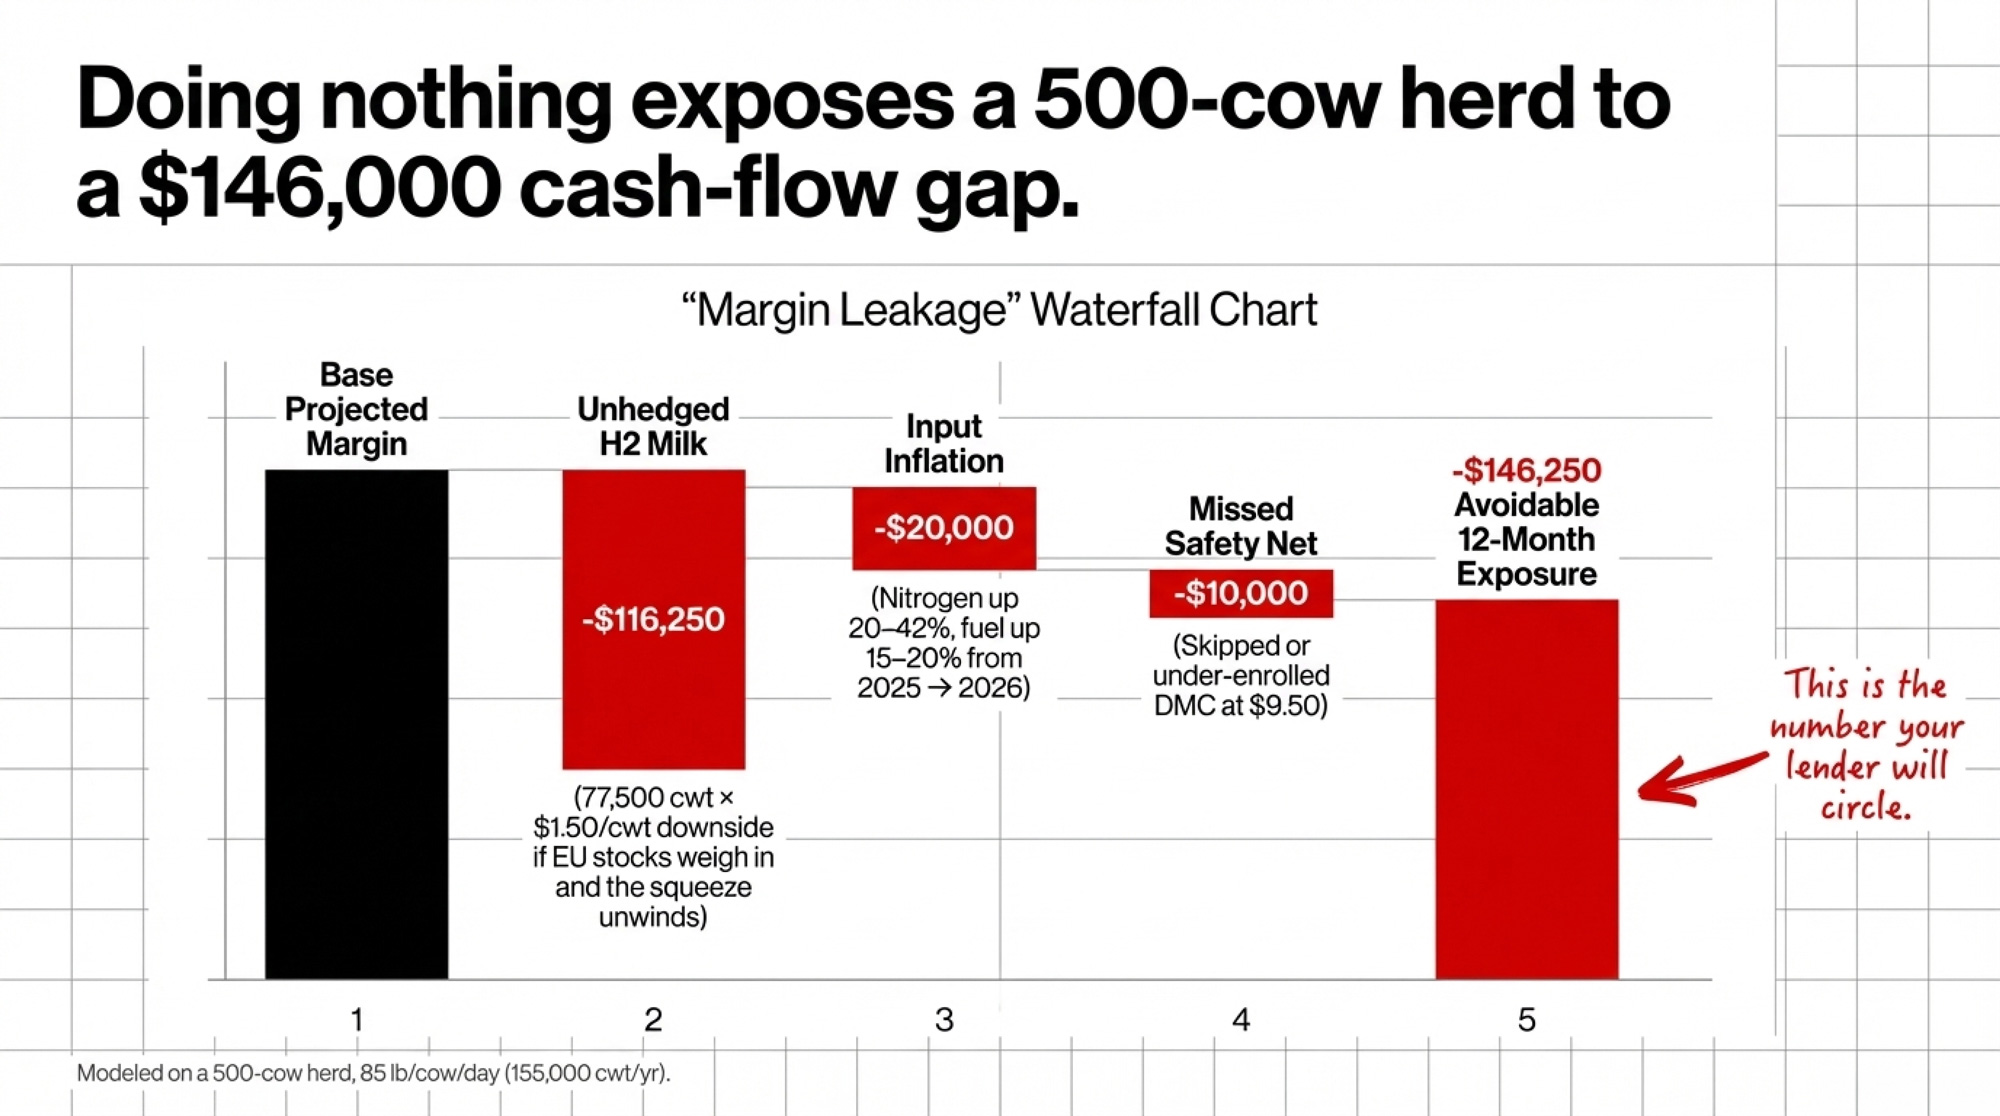
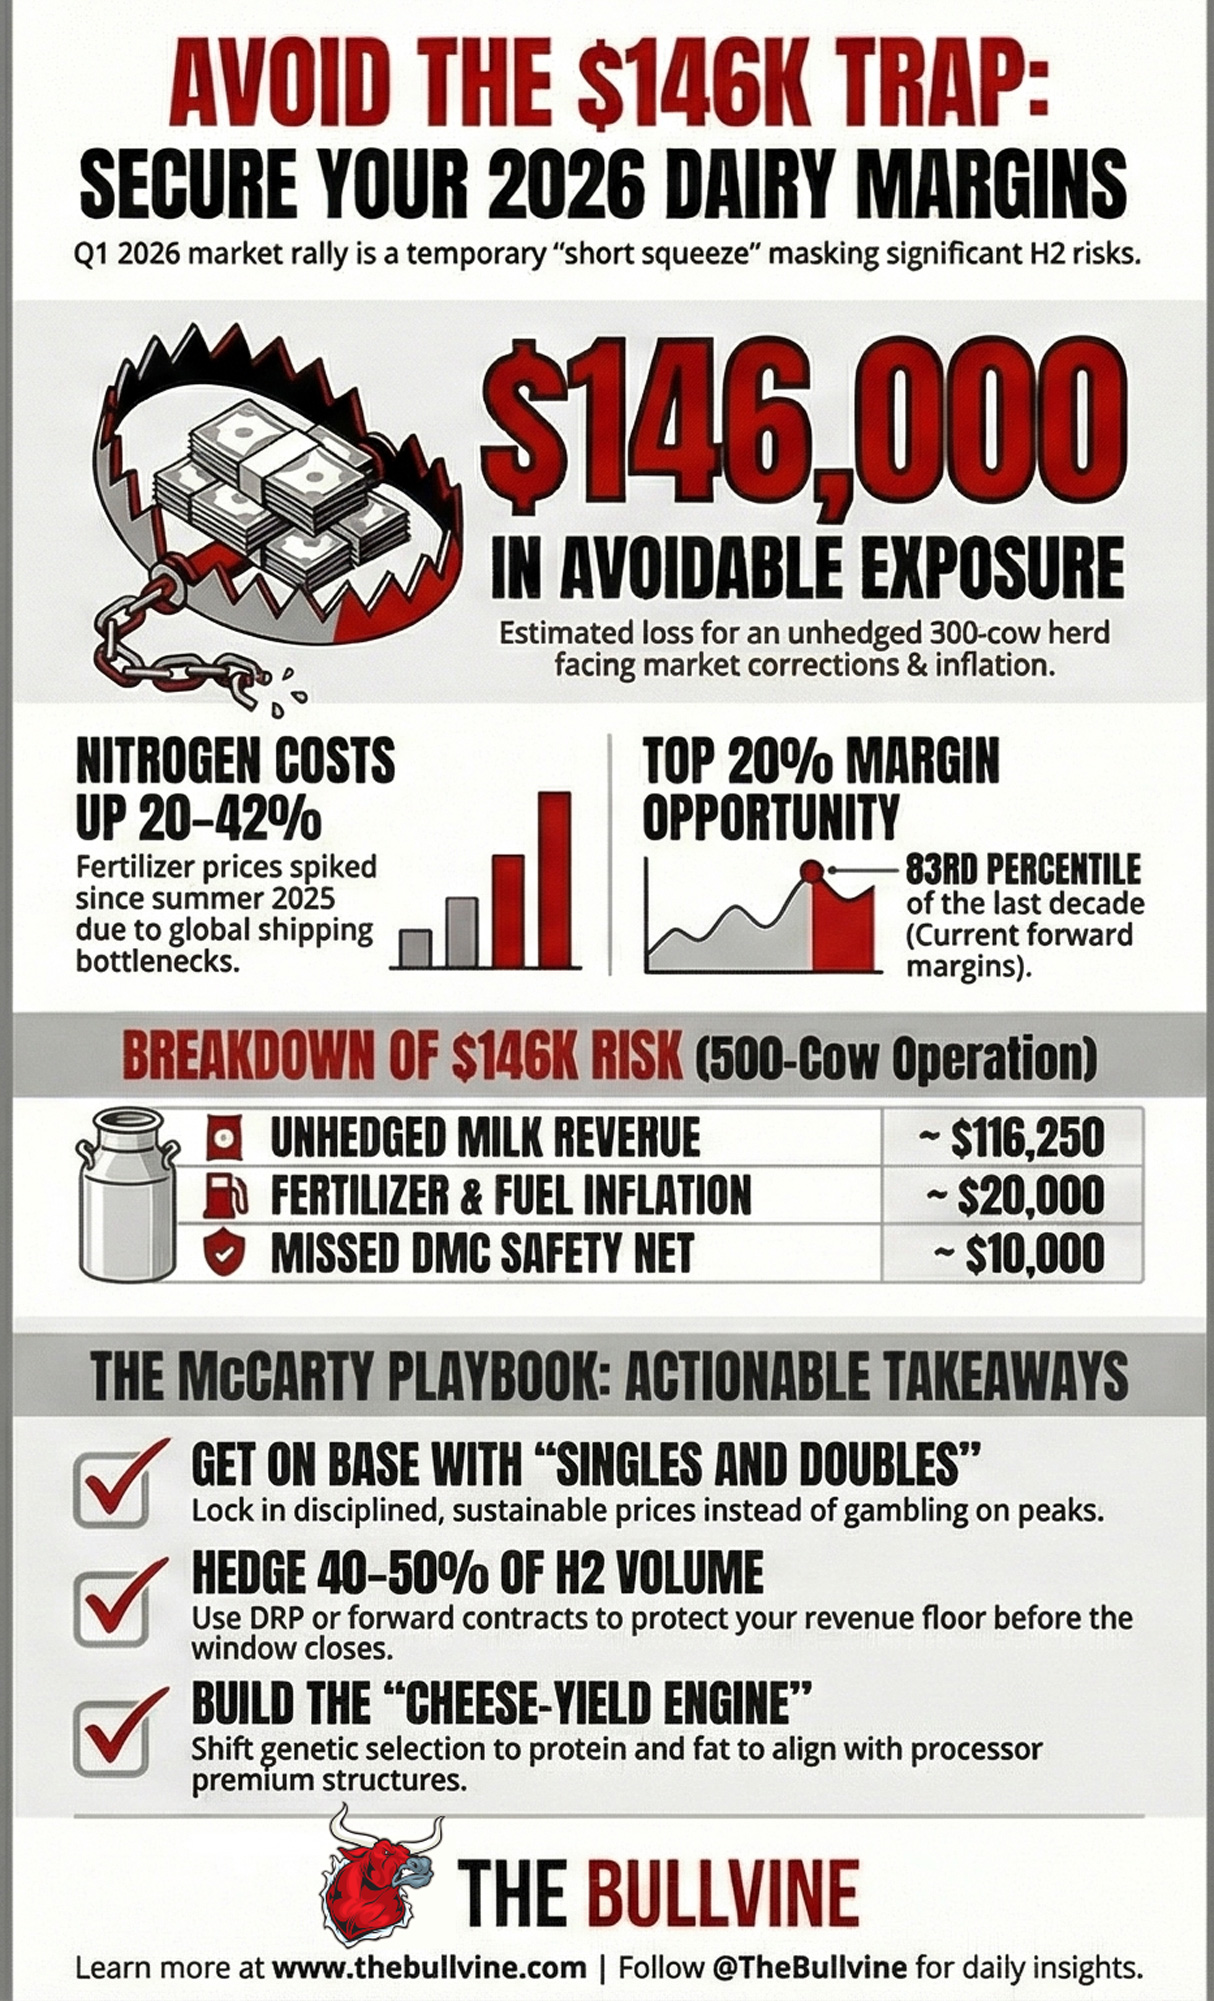
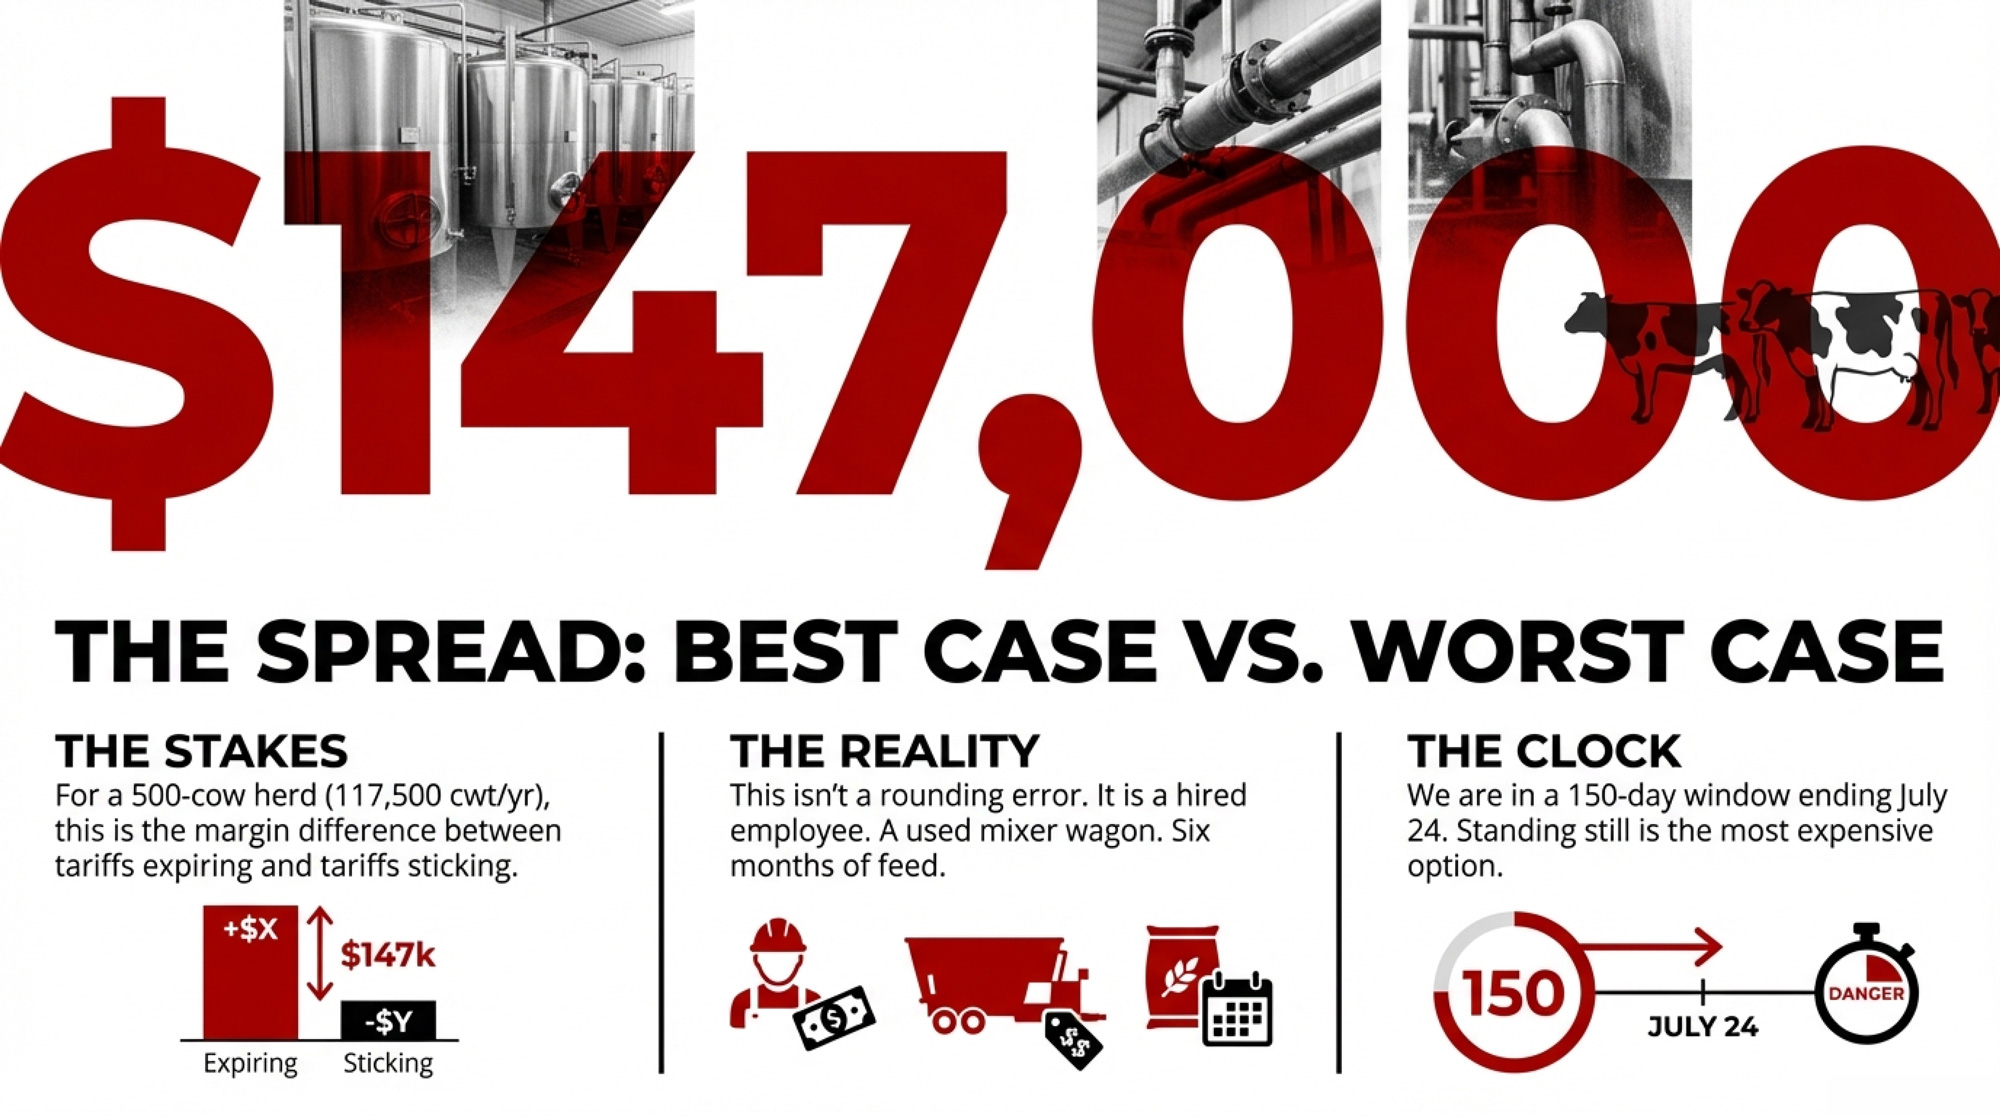
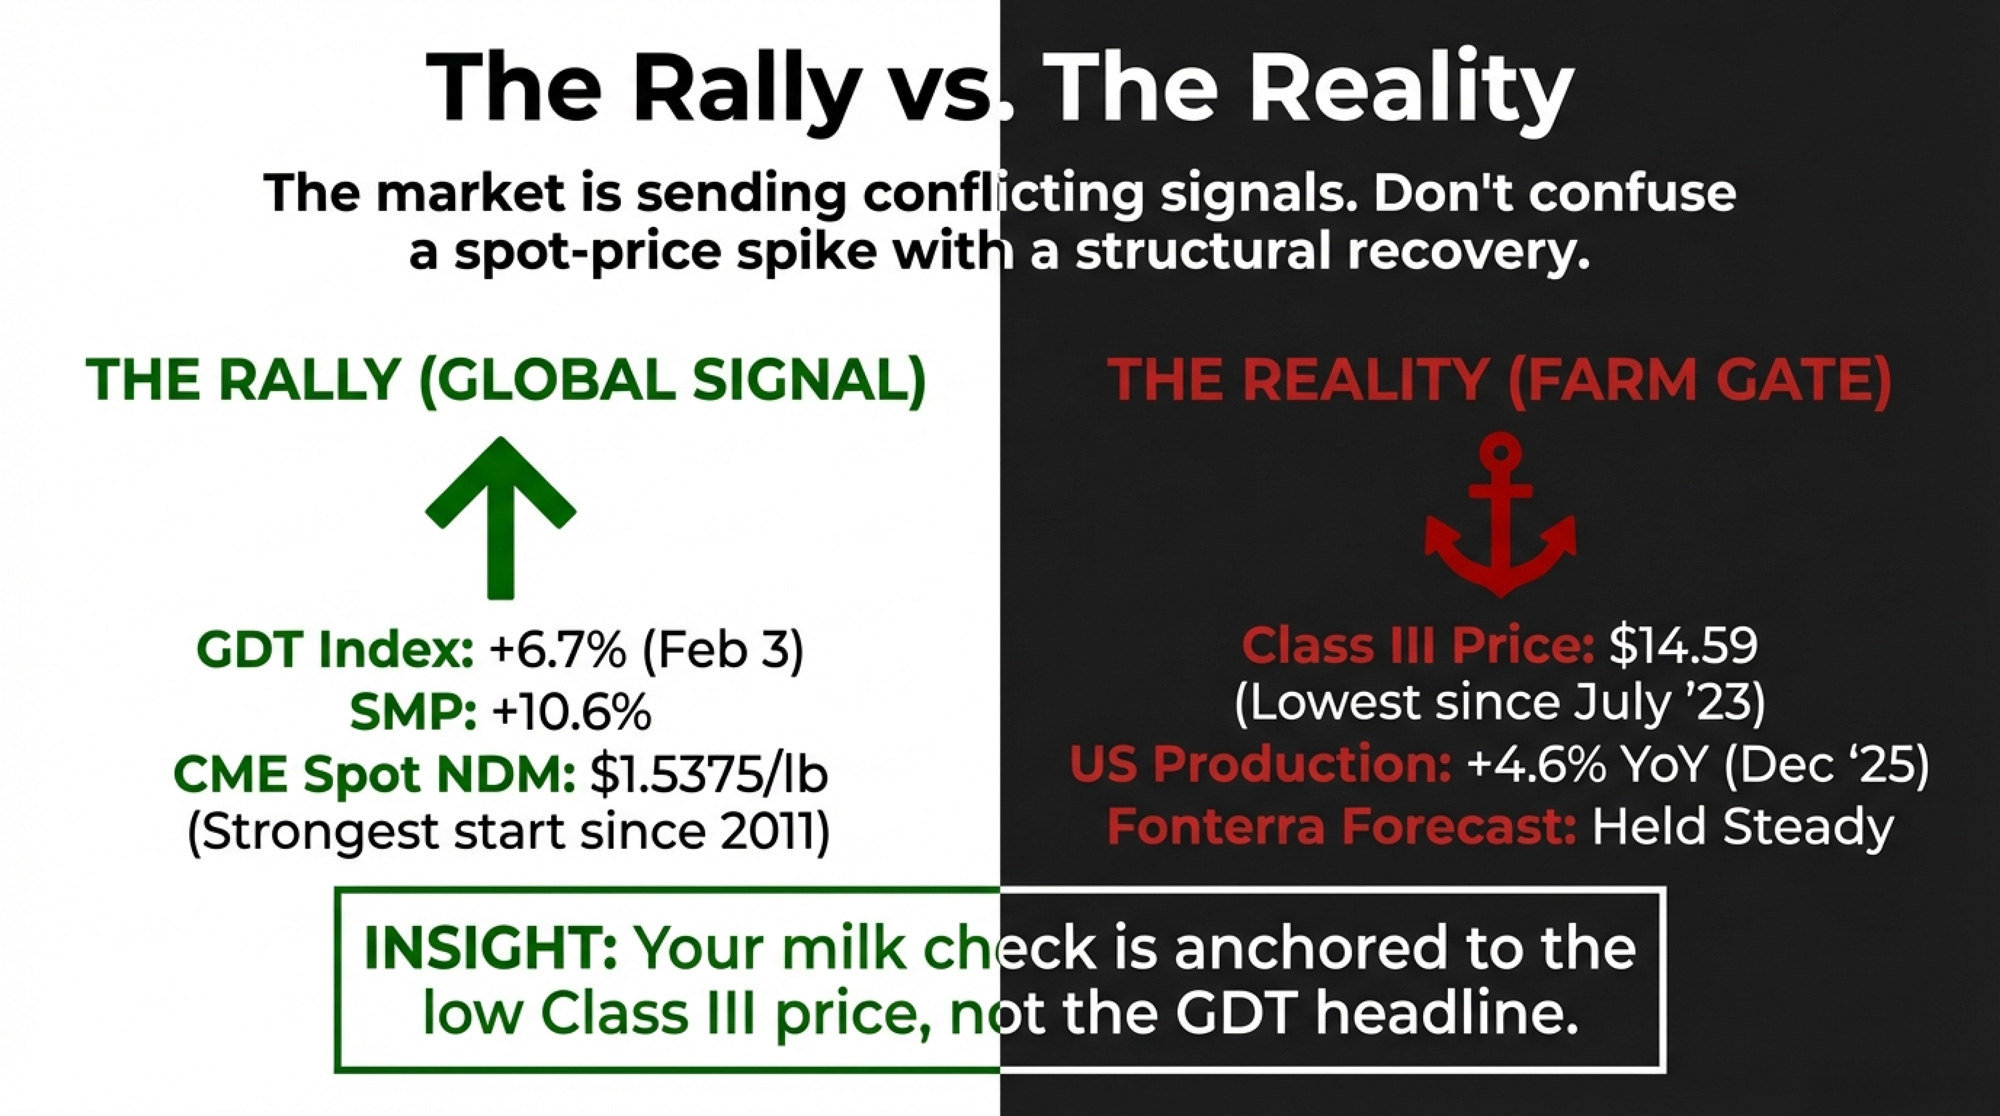
Executive Summary: Forward dairy margins from March 2026 onward sit above the 83rd percentile of the past decade — and most herds haven’t locked a pound of H2 milk. The Q1 rally that pushed CME NFDM from $1.1750 to $1.93 in under three months wasn’t a fundamental demand reset — it was a short squeeze layered on Hormuz-related double-ordering, and both forces are already fading. On a 500-cow herd, leaving H2 unhedged while running 2025 input numbers creates roughly $146,000 in avoidable exposure: $116,250 in unprotected milk revenue plus $20,000-plus in fertilizer and fuel inflation most budgets haven’t absorbed yet. Central Illinois nitrogen alone is up 20–42% since last summer, depending on source. EU butter and SMP stocks remain heavy, and the late-March GDT Pulse auction already softened. Inside: the full barn math on that $146K, a three-sentence lender script for your Q2 review, and a 30/90/365-day playbook for buying floors while the window’s still open. If your stress-case H2 DSCR sits below 1.2x, read this before your next lender meeting — not after.
Most dairy farmers treat a market rally like a lottery win — they stop checking the numbers and start checking the equipment brochures. Ken McCarty isn’t most farmers. While the rest of the industry basks in the glow of the Q1 2026 bounce, the smart money is already bracing for the $146,000 trap waiting in the H2 tall grass. If you aren’t mathing your margin right now, your lender is about to do it for you — and you won’t like their answer.
McCarty’s family had key energy costs locked years in advance as part of a long‑term risk strategy with their processor and partners. Boring. Disciplined. And worth serious money on a multi‑site family dairy of their size. His philosophy boils down to one line: get on base. Lock in a price you can live with before the market hands you something you can’t.
HighGround Dairy’s Q1 2026 Producer Market Update pegs forward producer margins from March 2026 onward above the 83rd percentile of the past decade — top‑20% territory. At the same time, nitrogen costs have climbed 20–40%from late‑summer 2025 levels, European butter and SMP stocks are heavy, and most 2026 fertilizer invoices haven’t fully landed in cash‑flow plans yet. For a 500‑cow operation that rides the rally, changes nothing, and walks into Q3 unhedged, the math points to roughly $146,000 in avoidable exposure over the next twelve months.
That’s the number your lender is going to circle in red.
Why the Q1 Bounce Feels Safe — and Isn’t
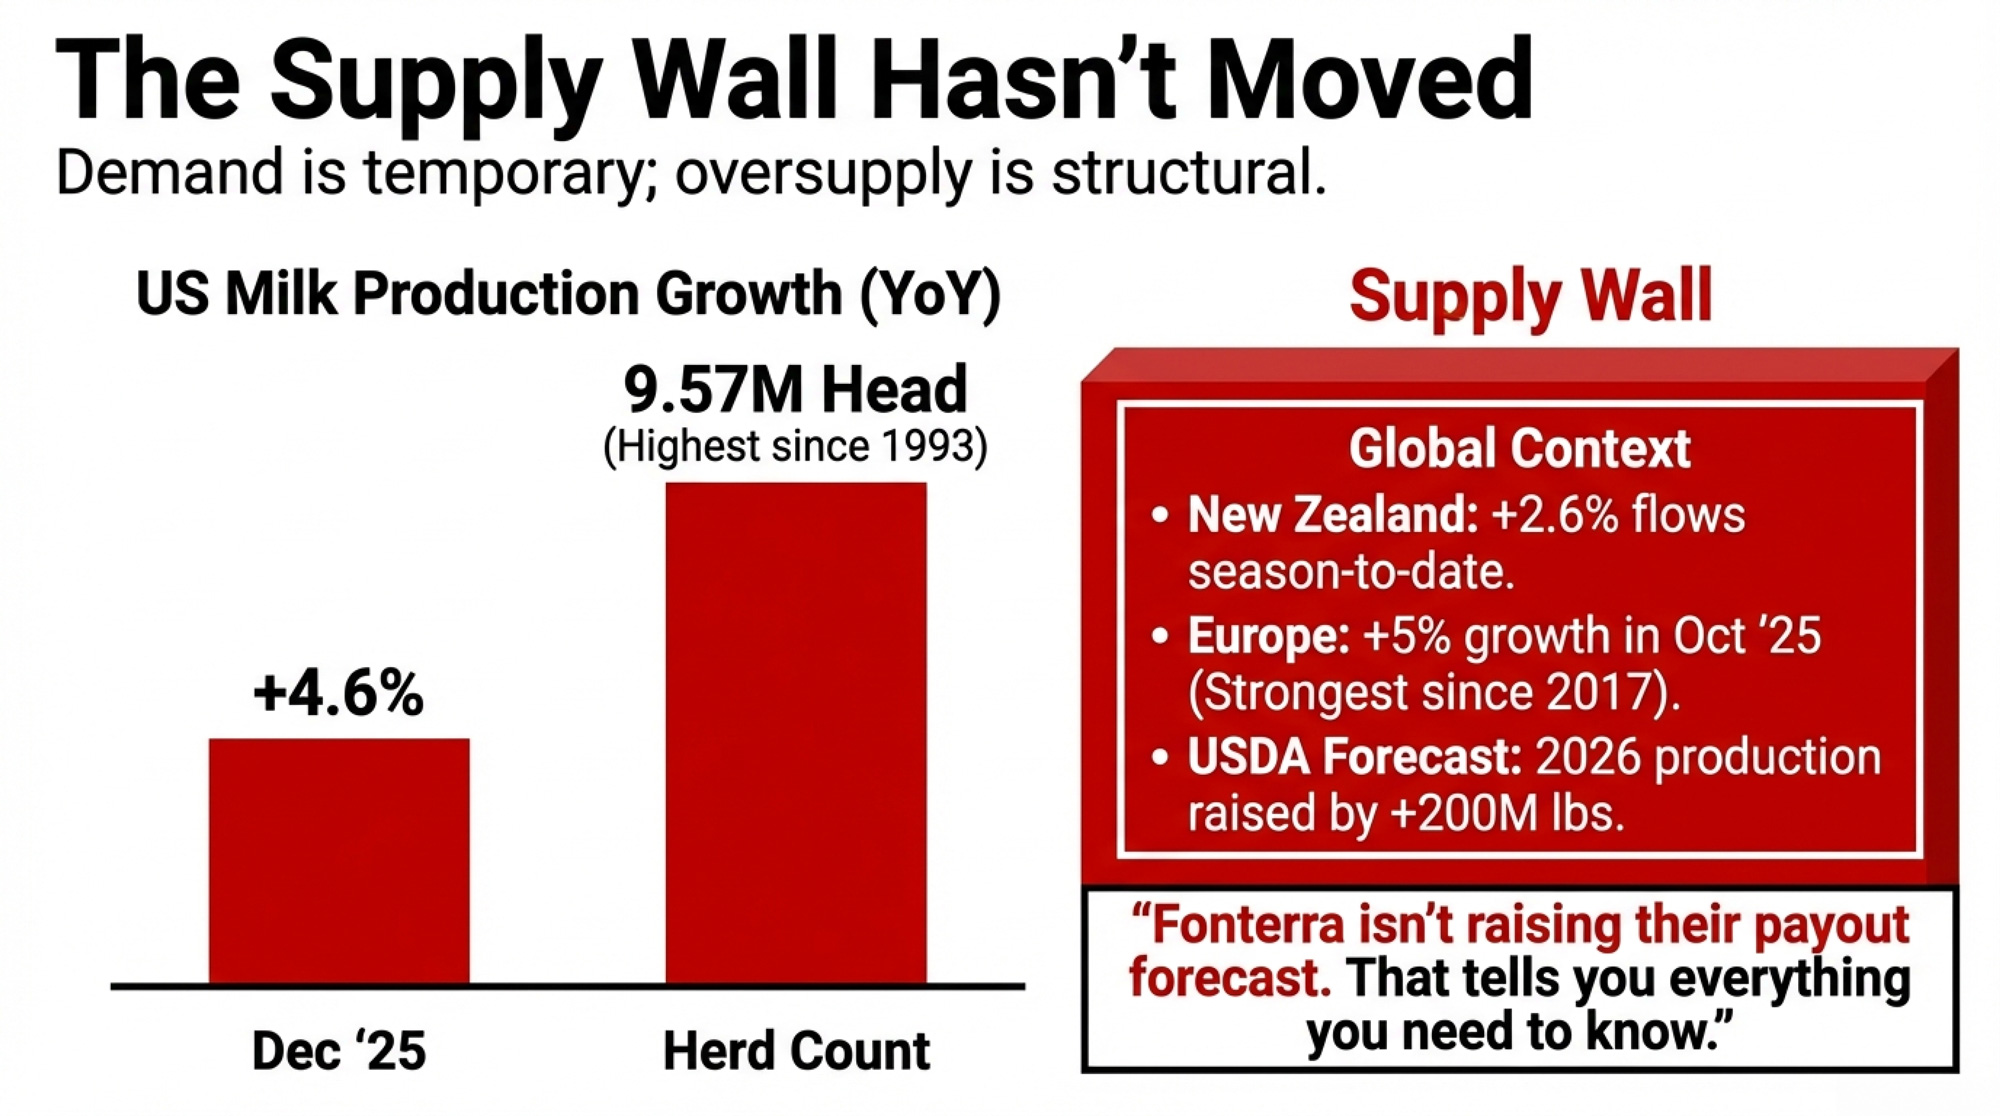
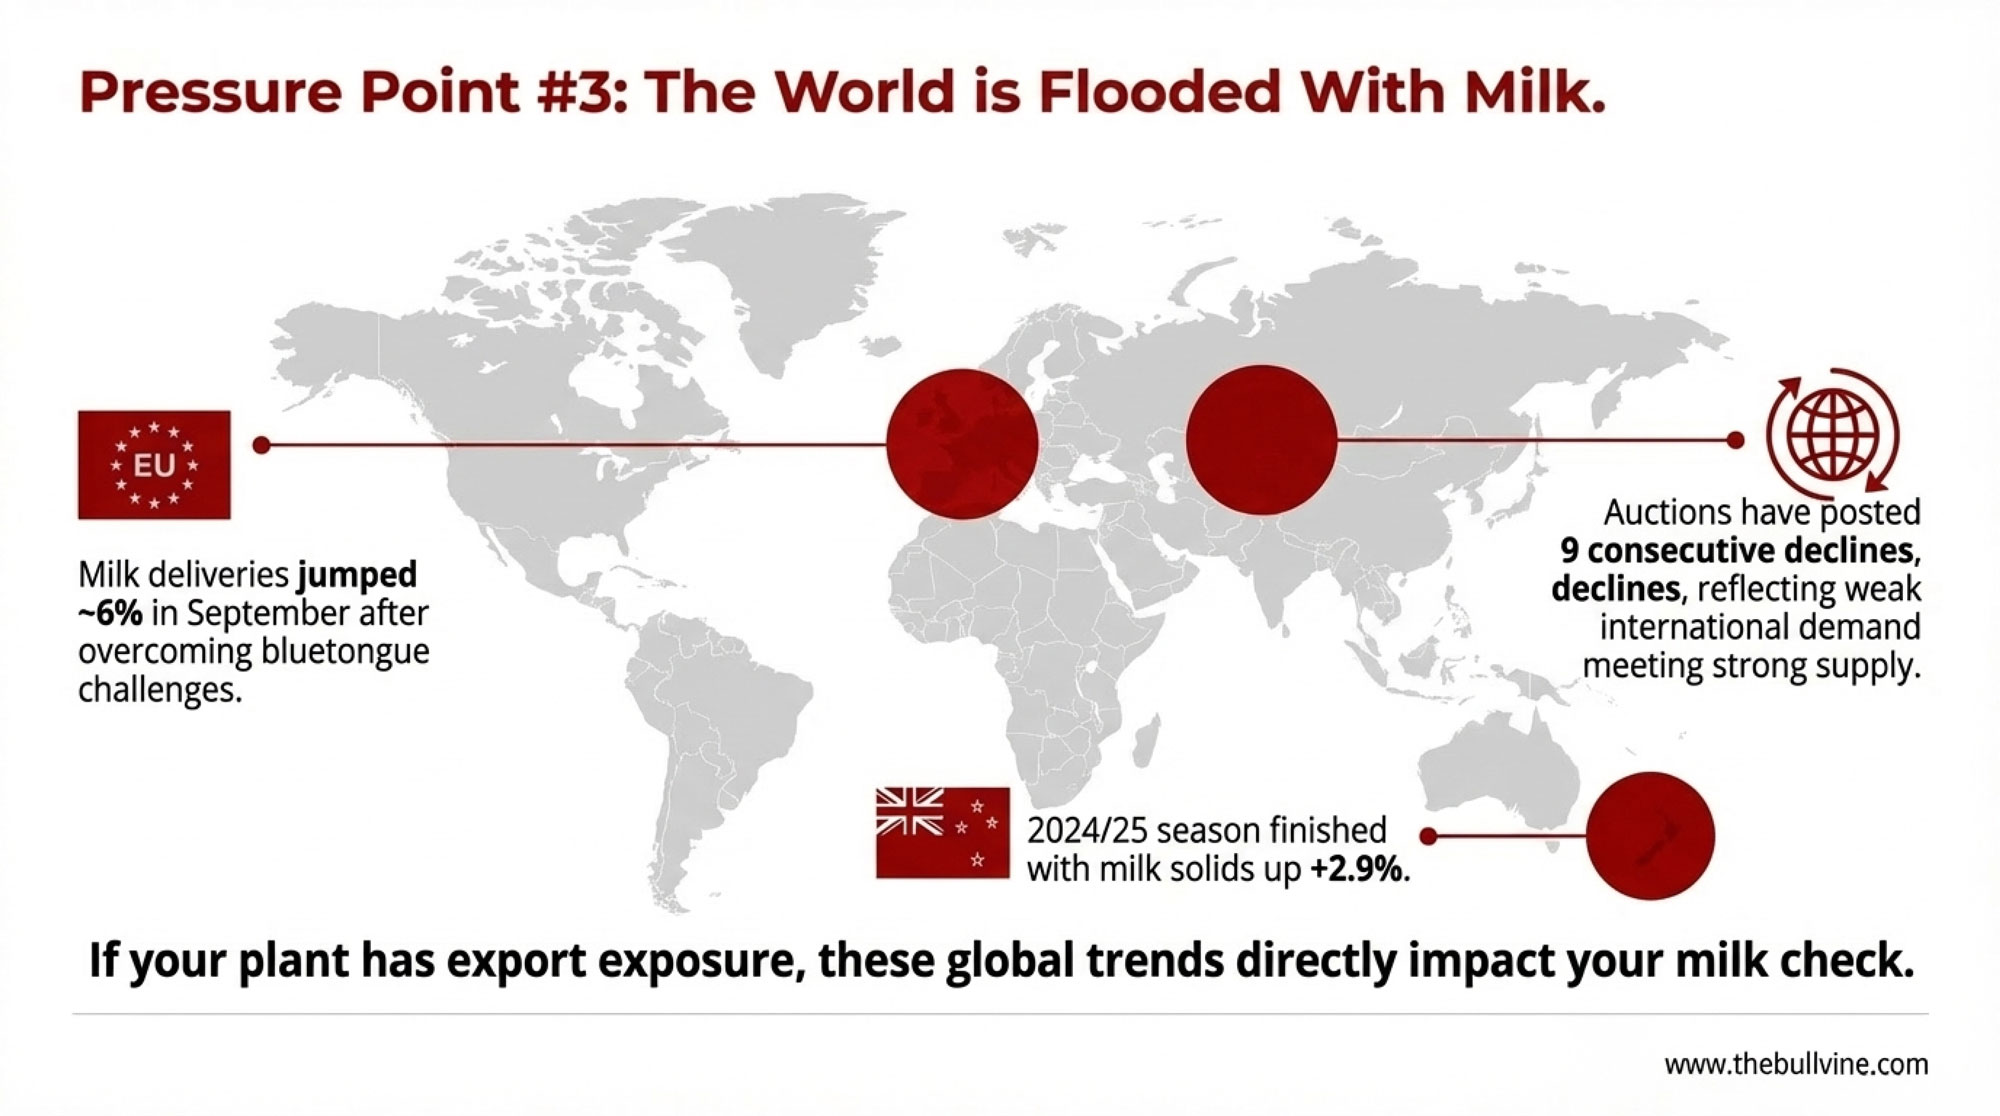
Through late 2025, the consensus called for a “tsunami of milk” in 2026. EU production ran well above year‑earlier levels in Q3 and Q4, with Germany and France driving much of the growth. USDA kept nudging U.S. production forecasts higher. Simple story: too much milk, weaker Mailbox Prices ahead.
Then Q1 didn’t follow the script.
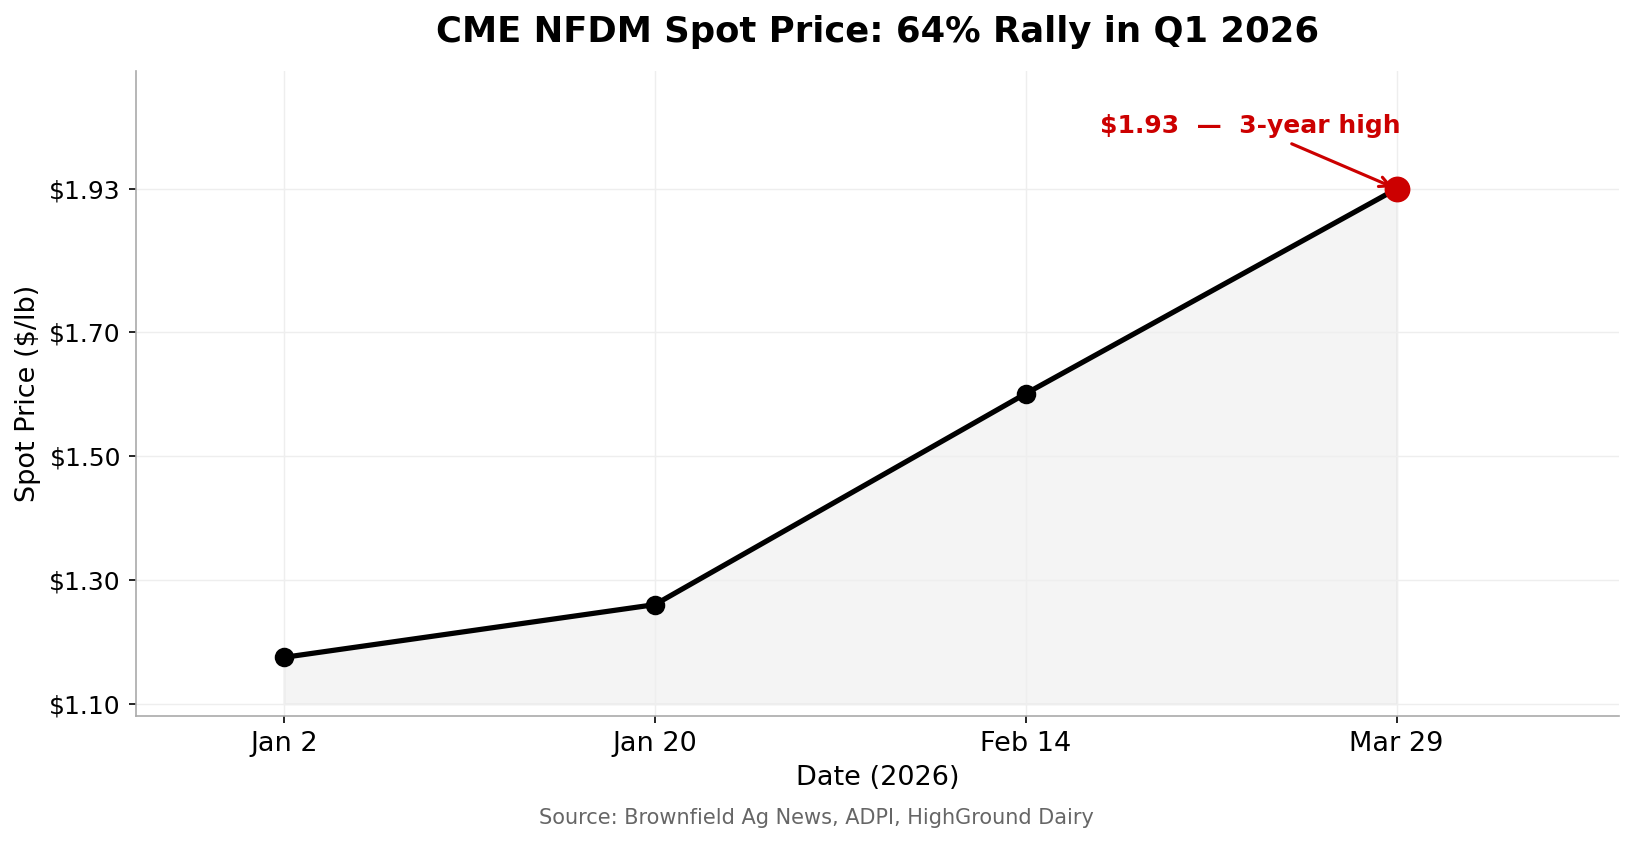
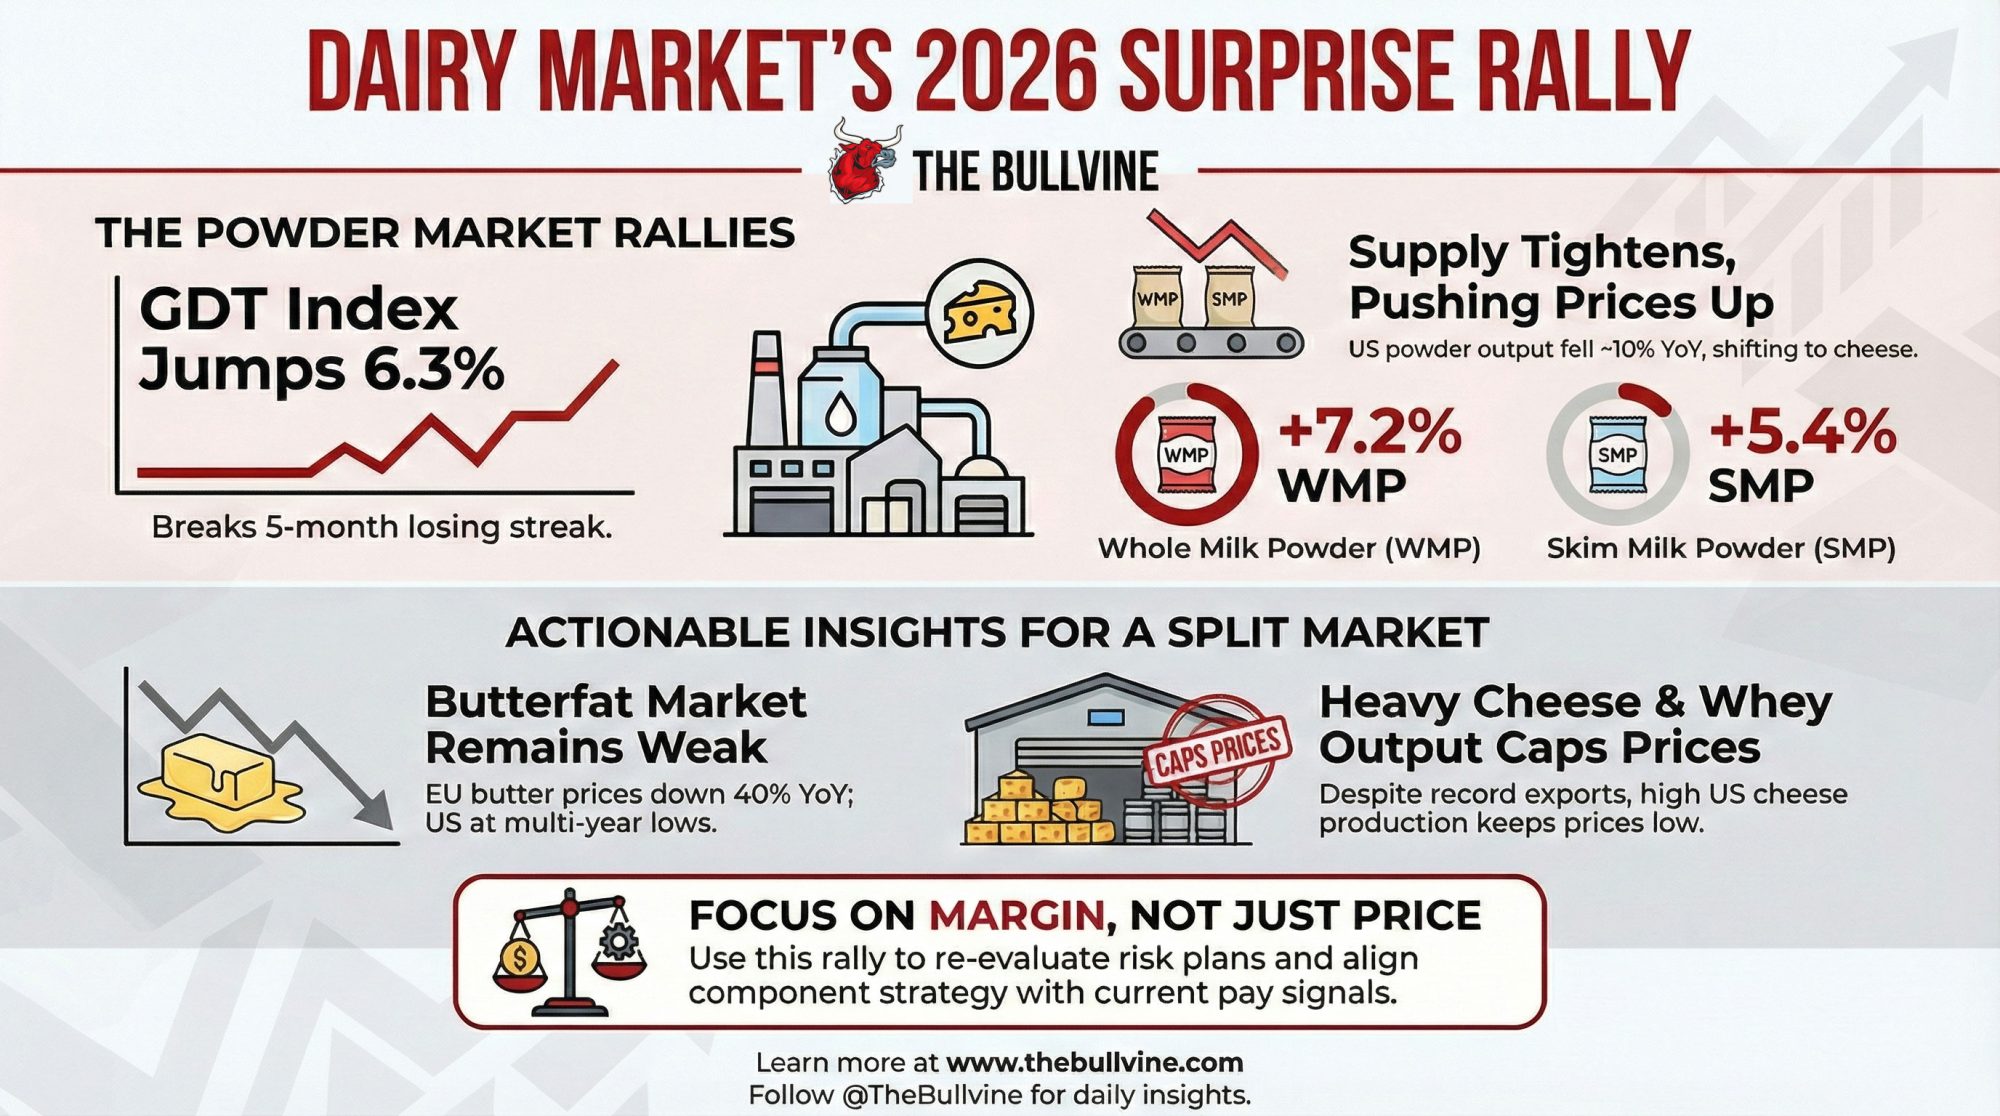
At the first 2026 Global Dairy Trade auction (Event 395), the GDT Price Index jumped 6.3%— snapping a string of declines stretching back to August 2025. A February auction posted another strong gain, driven by whole and skim milk powder. On the Board, CME spot nonfat dry milk opened the year at exactly $1.1750/lb on January 2, according to Brownfield Ag News. By January 20, Federal Order 30 data had it at $1.26/lb. ADPI’s January Dairy Economist Ingredient Outlook confirmed CME NFDM rallied to the mid‑$1.40s by month’s end. By early February, HighGround pegged it at $1.60/lb — a gain of nearly 40% in a matter of weeks. And by March 29, Brownfield had it at $1.93/lb, the highest level since mid‑2022. That kind of move makes you forget what’s sitting on the other side of summer.
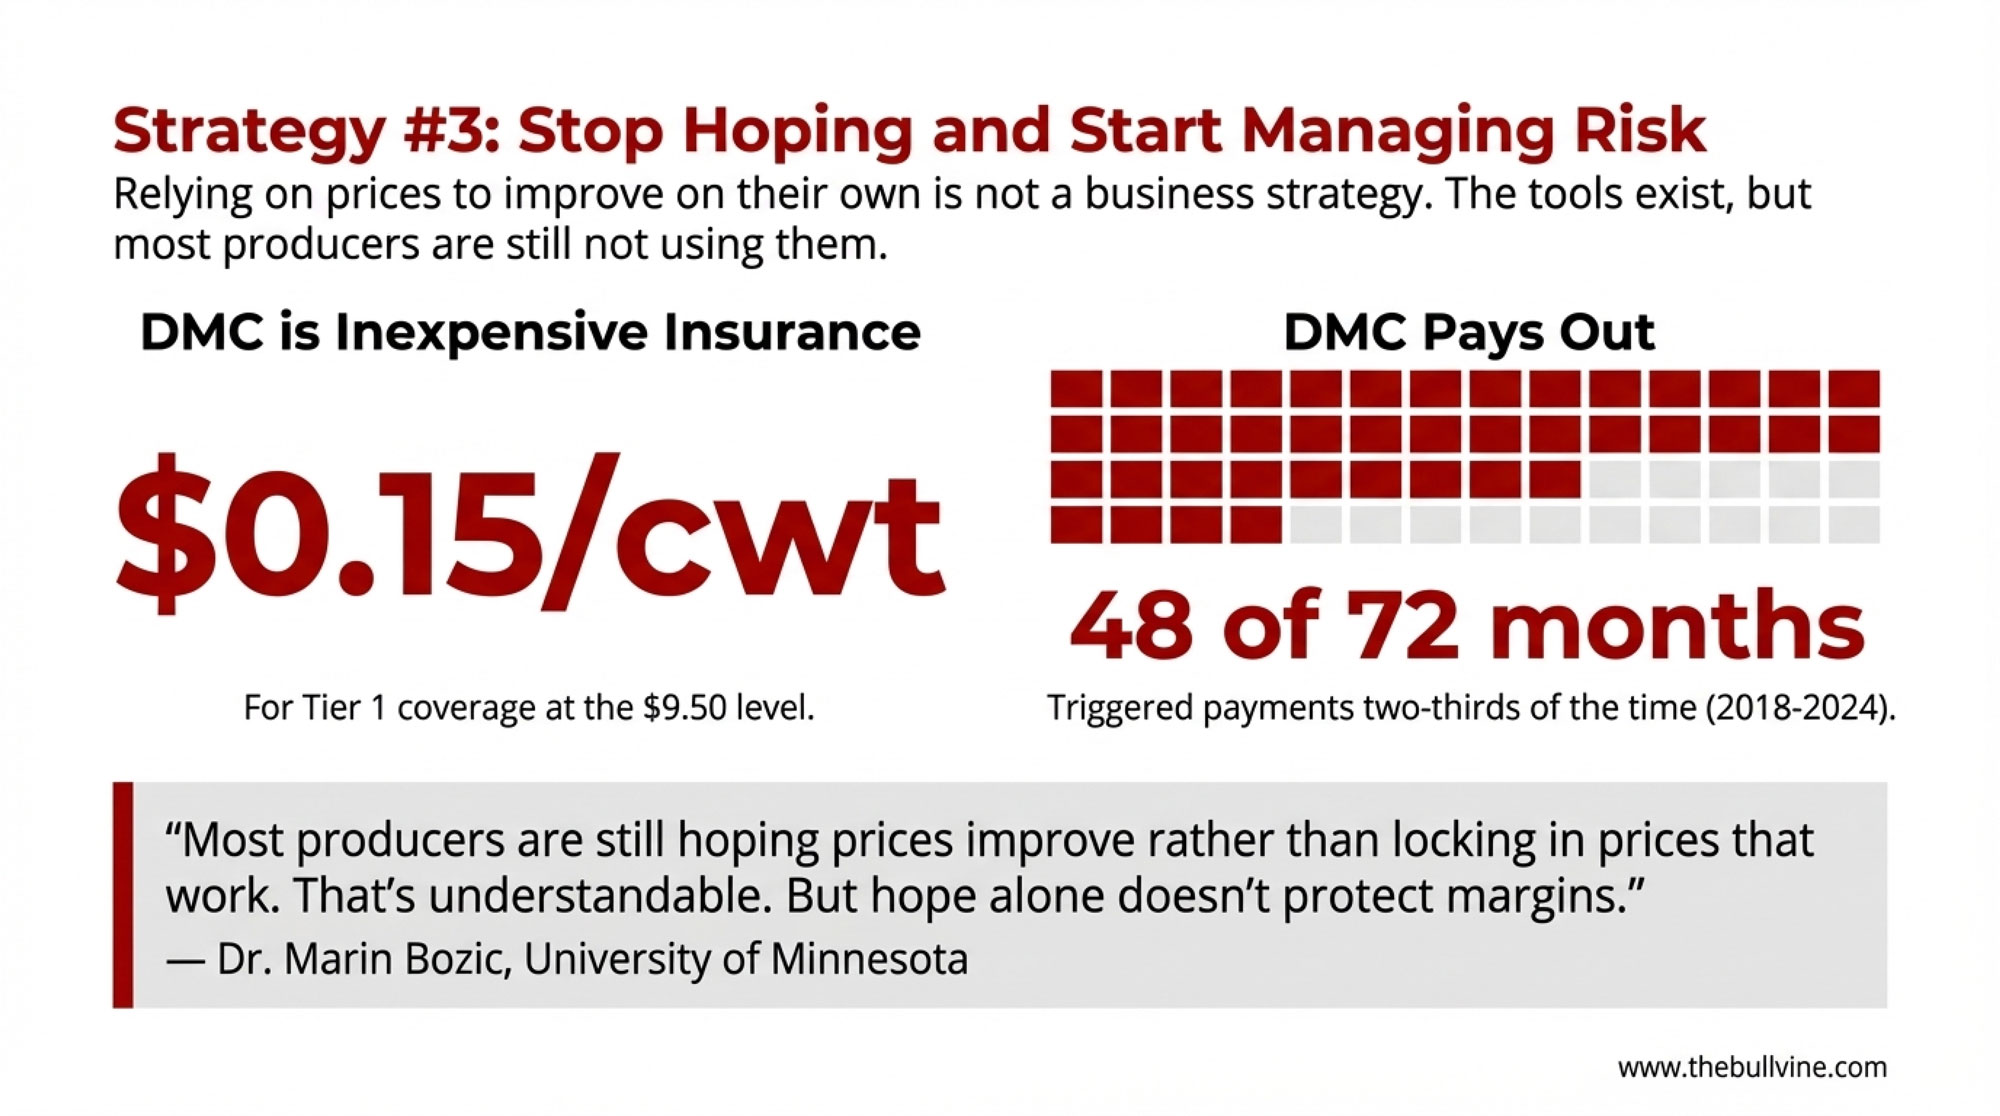
On the farm, it finally felt like a break. USDA’s Dairy Margin Coverage program paid out for December 2025 at the $9.50 coverage level — the first and only DMC payment for all of 2025. Cheques improved. Beef calf revenue stayed solid. After a rough 2023–24 stretch, you could almost breathe.
And that’s exactly when the trap tends to spring. The same Q1 that boosted your mailbox also:
Encouraged some operations to treat 2026 DMC coverage as optional because “things were turning around.”
Tempted herds to leave Q3 and Q4 completely unhedged, betting the Board would keep climbing.
Buried the fertilizer bomb — nitrogen climbing 20–40% on the back of the Iran–Hormuz conflict.
Masked the reality that EU butter and SMP inventories were still elevated, and European weekly milk intakes remained strong.
The market handed you a chance to lock in margins in the top fifth of the last decade, whether you treat that like McCarty did with energy — or like a feel‑good moment that looks great on a Q1 statement and ugly by October — is the question this piece is built around.
The Quick Math: Where $146,000 Disappears on a 500‑Cow Herd
Here’s the summary for the barn‑aisle scroll. This is a 500‑cow herd, 85 lb/cow/day, roughly 155,000 cwt per year.
Risk Category
Inputs
Exposure
H2 milk revenue left unhedged
77,500 cwt × $1.50/cwt downside
≈ $116,250
Fertilizer + fuel inflation (2025 → 2026)
N up 20–40%; fuel up ~15–20%
≈ $20,000 (illustrative, based on central IL prices)
Missed DMC safety net
Skipped or under‑enrolled at $9.50
≈ $10,000 (illustrative)
Total avoidable 12‑month exposure
≈ $146,000
That’s the gap between “we bought a floor when the math was there” and “we rode it and hoped.” Now let’s walk through the arithmetic.
How Much H2 2026 Milk Should You Lock?
Take that 500‑cow herd. At 85 lb/cow/day, you ship roughly 155,000 cwt per year. The second half alone:
155,000 cwt ÷ 2 ≈ 77,500 cwt in H2.
HighGround’s Q1 update shows forward margins from March onward sitting above the 83rd percentile of the last ten years. That’s the window your risk advisor is waving their arms about. You don’t have to lock every pound — but leaving them all uncovered is a choice with a price tag.
Stay conservative. Assume you could lock an H2 Class III/all‑milk equivalent $1.50/cwt higher than a plausible Q3 downside if EU inventories weigh in and the squeeze unwinds:
77,500 cwt × $1.50/cwt = $116,250
That’s $116,250 of Mailbox Price you could have “on base,” as McCarty would say, if you’d bought a floor while margins were rich. And $1.50/cwt isn’t an edge case. The Board has moved more than that inside a single year, more than once.
[Pro‑Tip] Don’t wait for your DRP agent to call. Pull your own H2 cwt number this week. Multiply by $1.50. Write it down. That’s what you’re wagering by doing nothing.
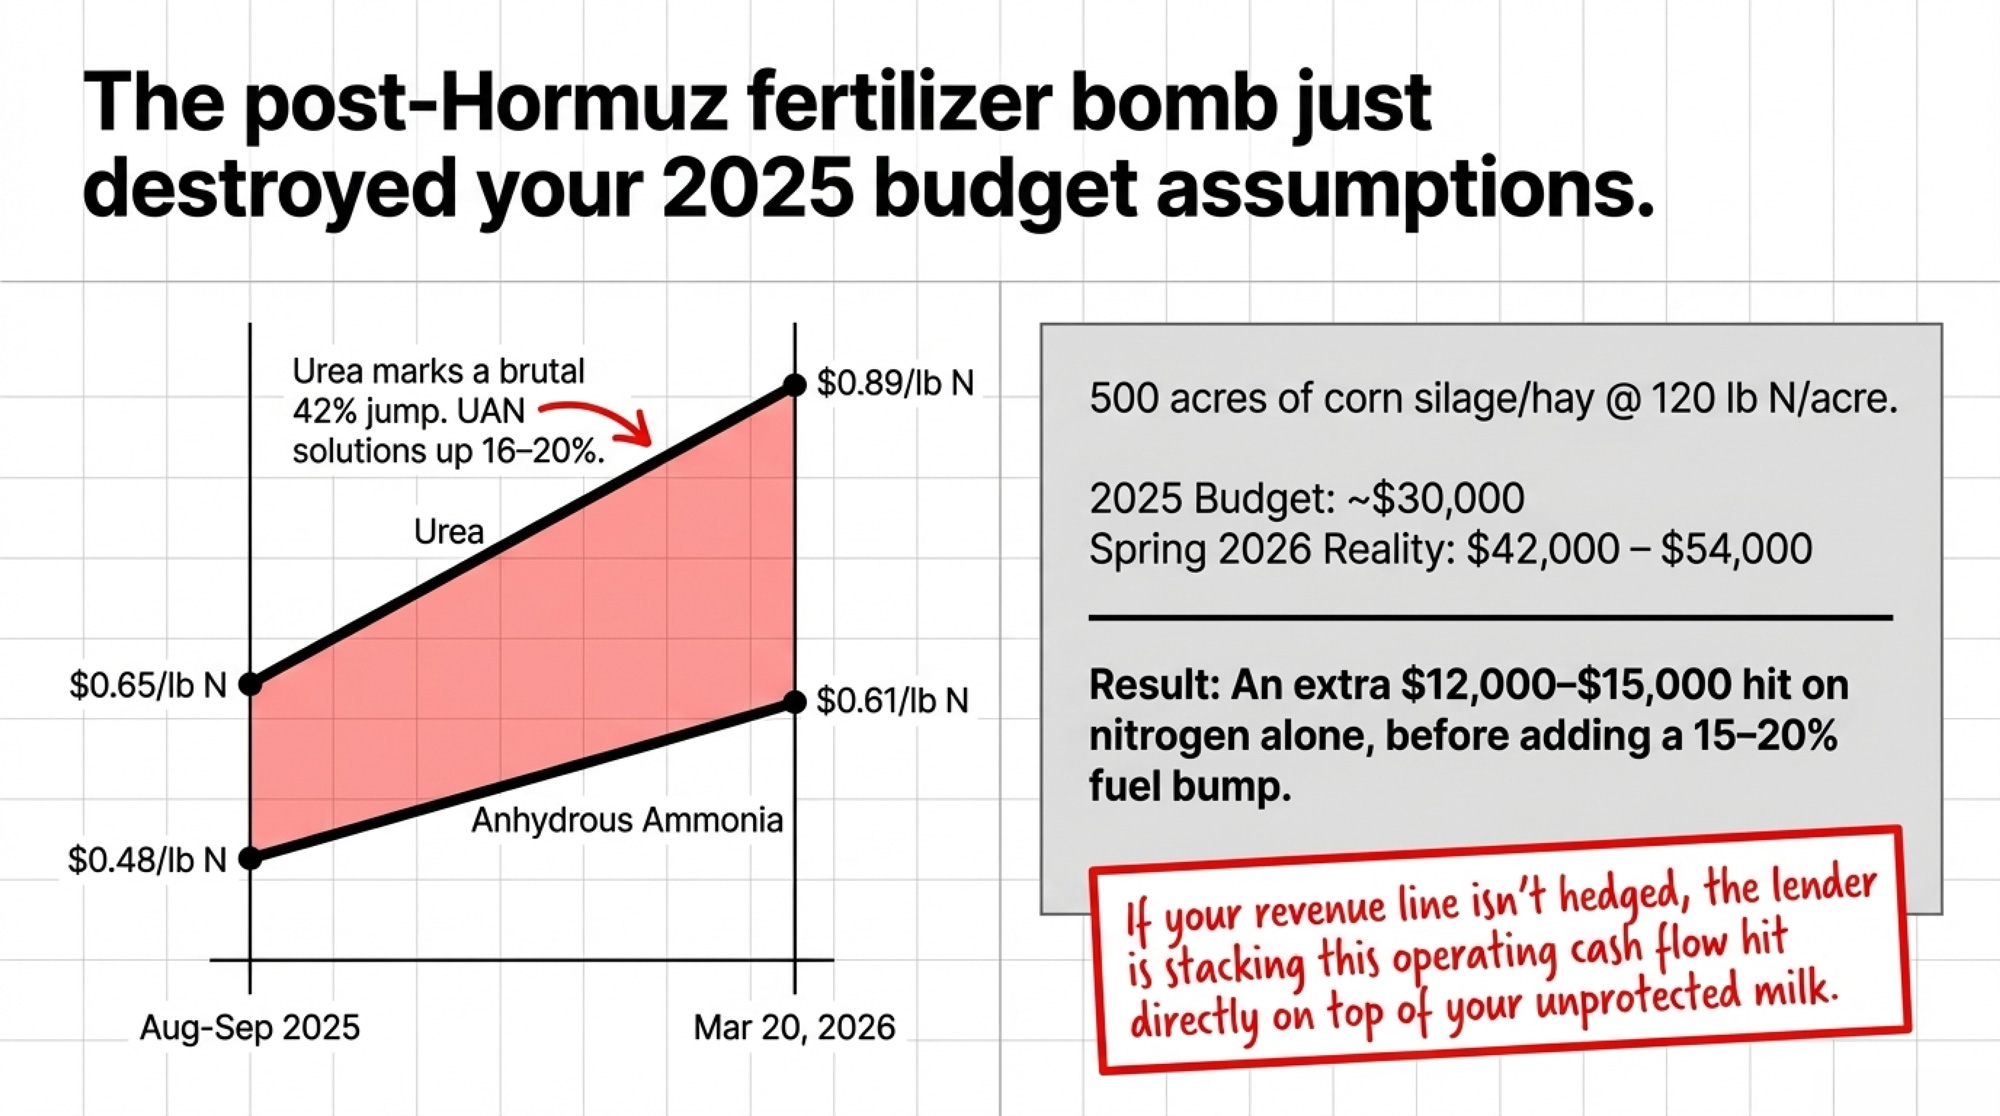
The Fertilizer Bomb After Hormuz
Now stack that revenue risk against your 2026 input reality.
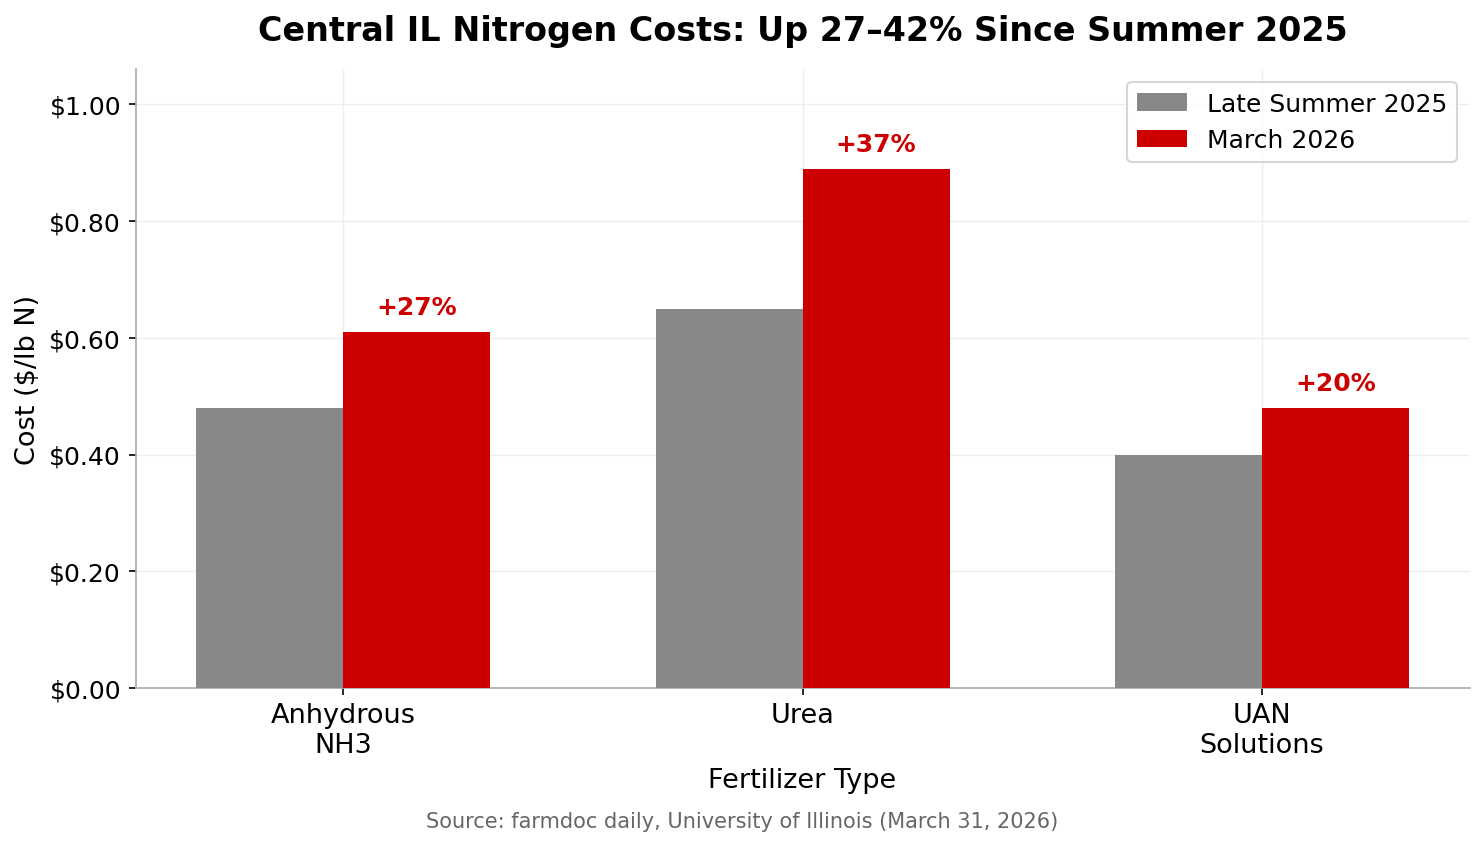
The Iran–Hormuz conflict bottlenecked nitrogen exports from a major urea and ammonia‑producing region. Sulfur shipments — a key feedstock for phosphate fertilizers — snarled, too. University of Illinois’ farmdoc daily analysis (March 31, 2026) tracked how fast that hammered central Illinois prices:
Anhydrous ammonia: roughly $0.48/lb N in Aug–Sep 2025 → $0.51 in February → $0.61/lb N by March 20, 2026.
Urea: around $0.65/lb N in late summer 2025 → $0.89/lb N by March 20 — about a 42% jump, the steepest of any major N source.
UAN solutions: up roughly 16–20% over the same stretch.
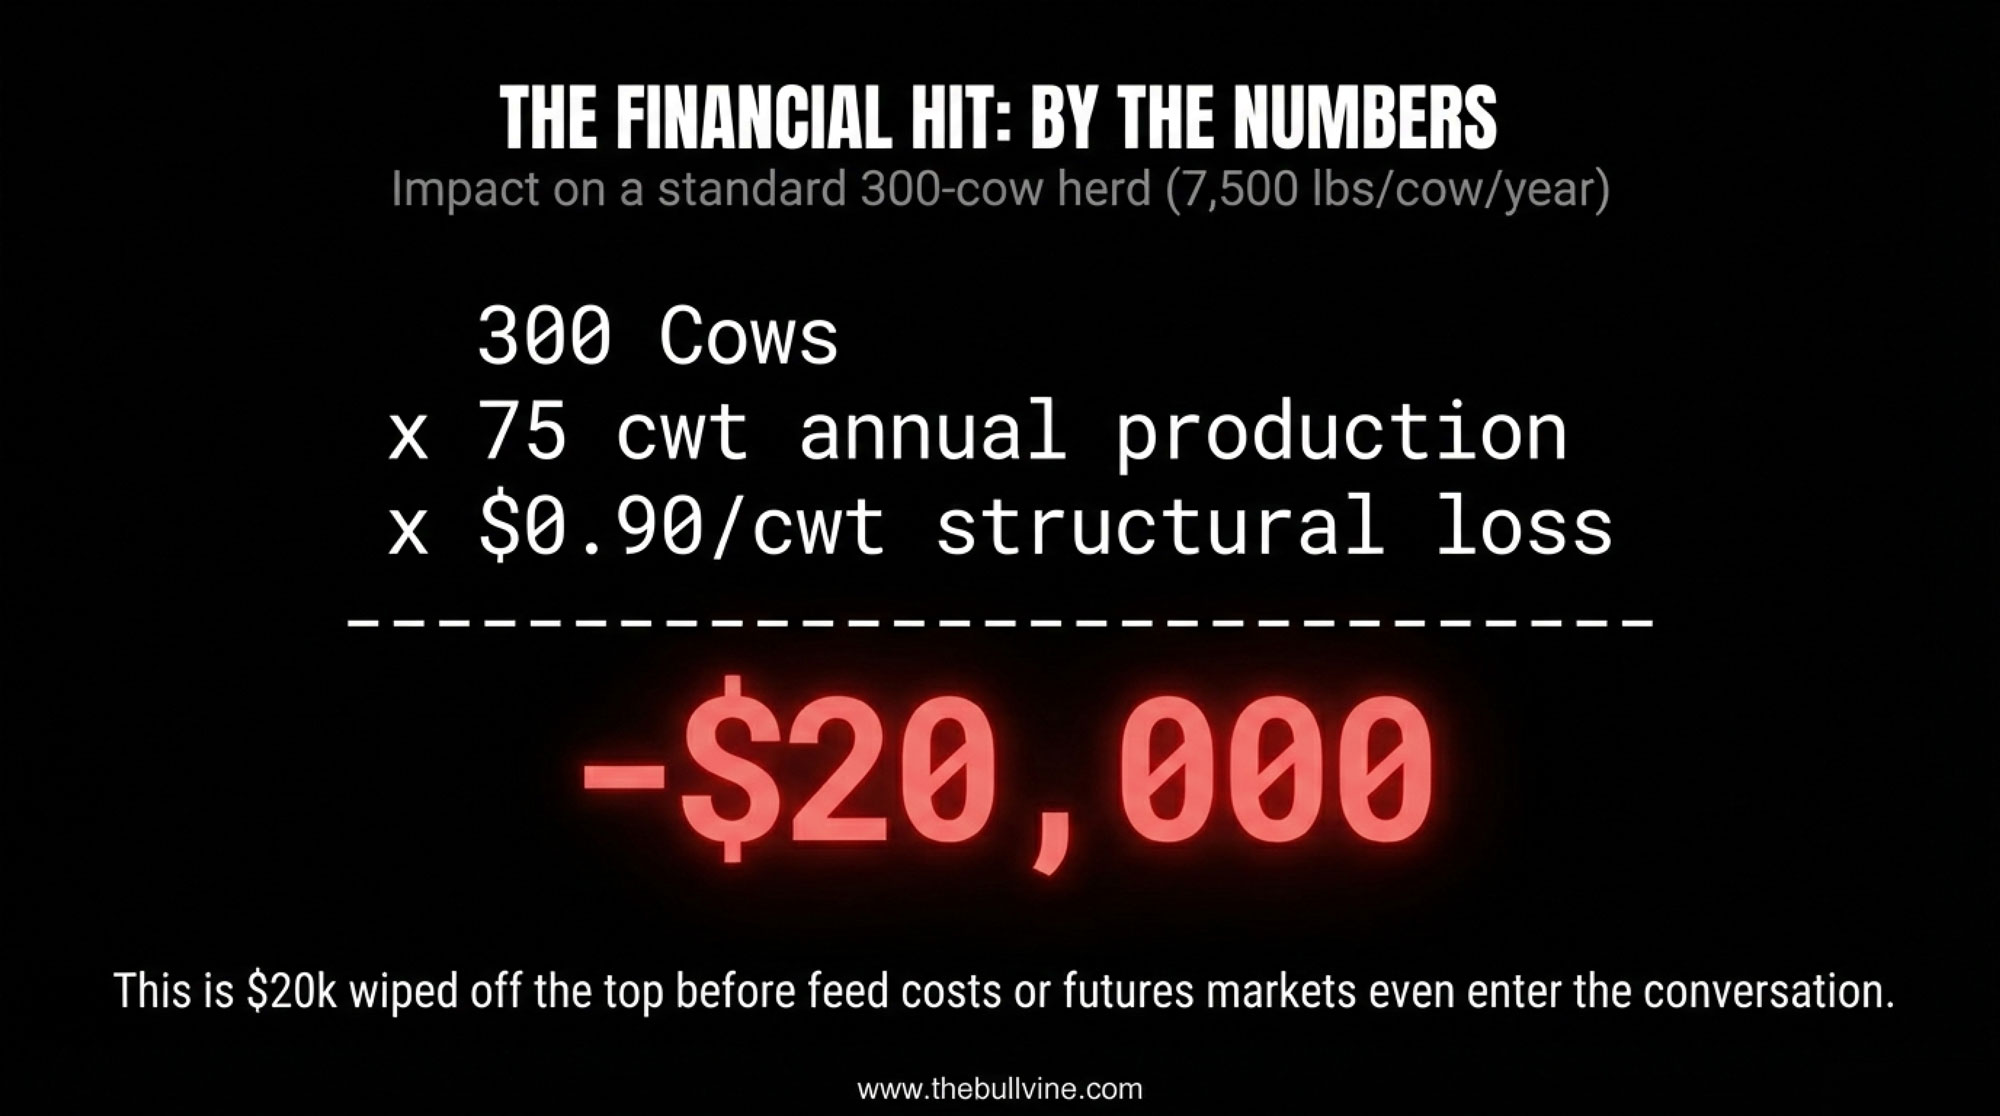
2025 N budget: 500 ac × 120 lb N × $0.50/lb N ≈ $30,000 Spring 2026 reality: 500 ac × 120 lb N × $0.70–$0.90/lb N ≈ $42,000–$54,000
An extra $12,000–$15,000 on nitrogen alone. Layer on phosphate, potash, and a 15–20% fuel bump on a dairy burning 6,000+ gallons per month, and you’re conservatively in the $20,000 neighbourhood of additional 2026 cash cost. Those N numbers are central Illinois; your local market may differ, but the direction has looked similar across most U.S. regions.
[Lender’s View] Your lender sees that ,000 fertilizer gap as a direct hit to operating cash flow — and if your revenue line isn’t hedged, they’re stacking it on top of the unprotected milk. That’s how a “good year” turns into a covenant conversation.
The Safety Net You May Have Skipped
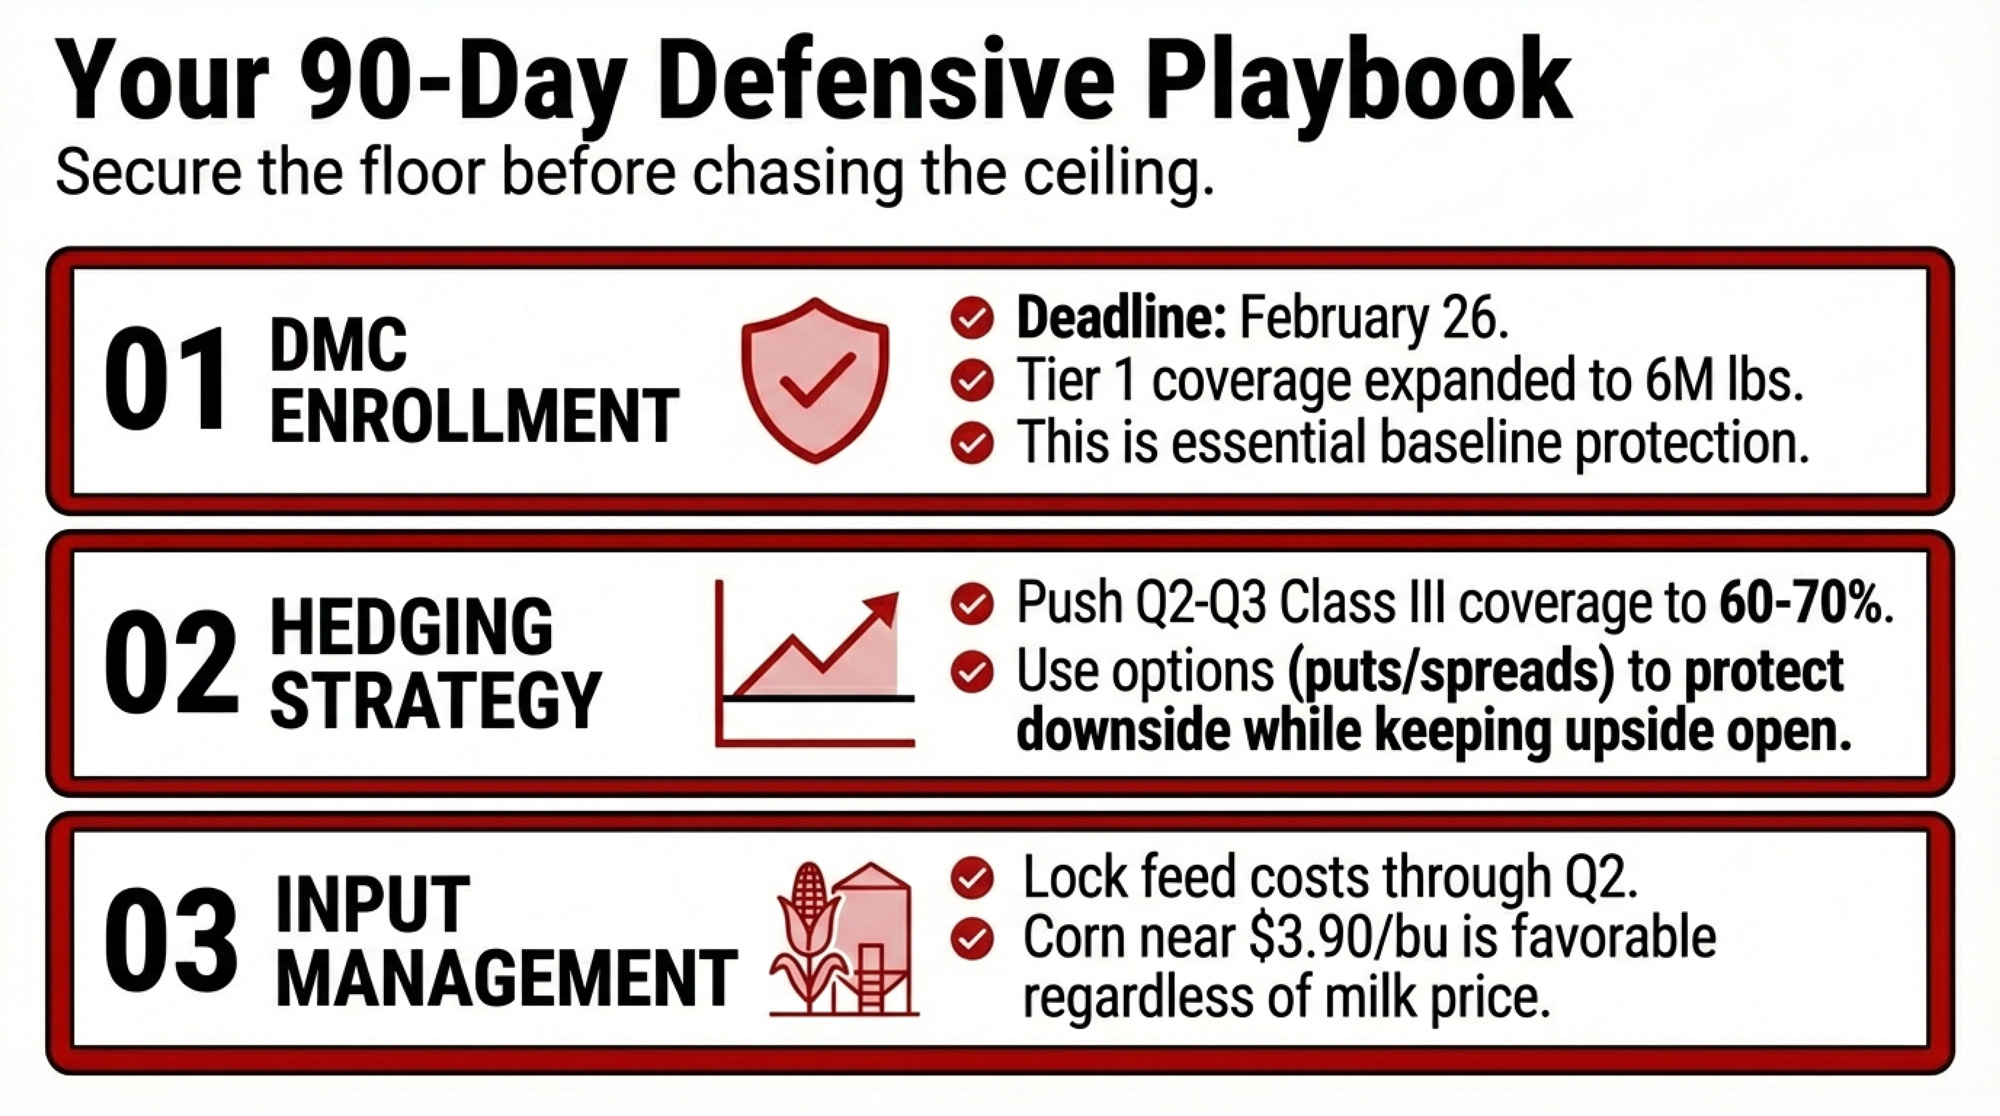
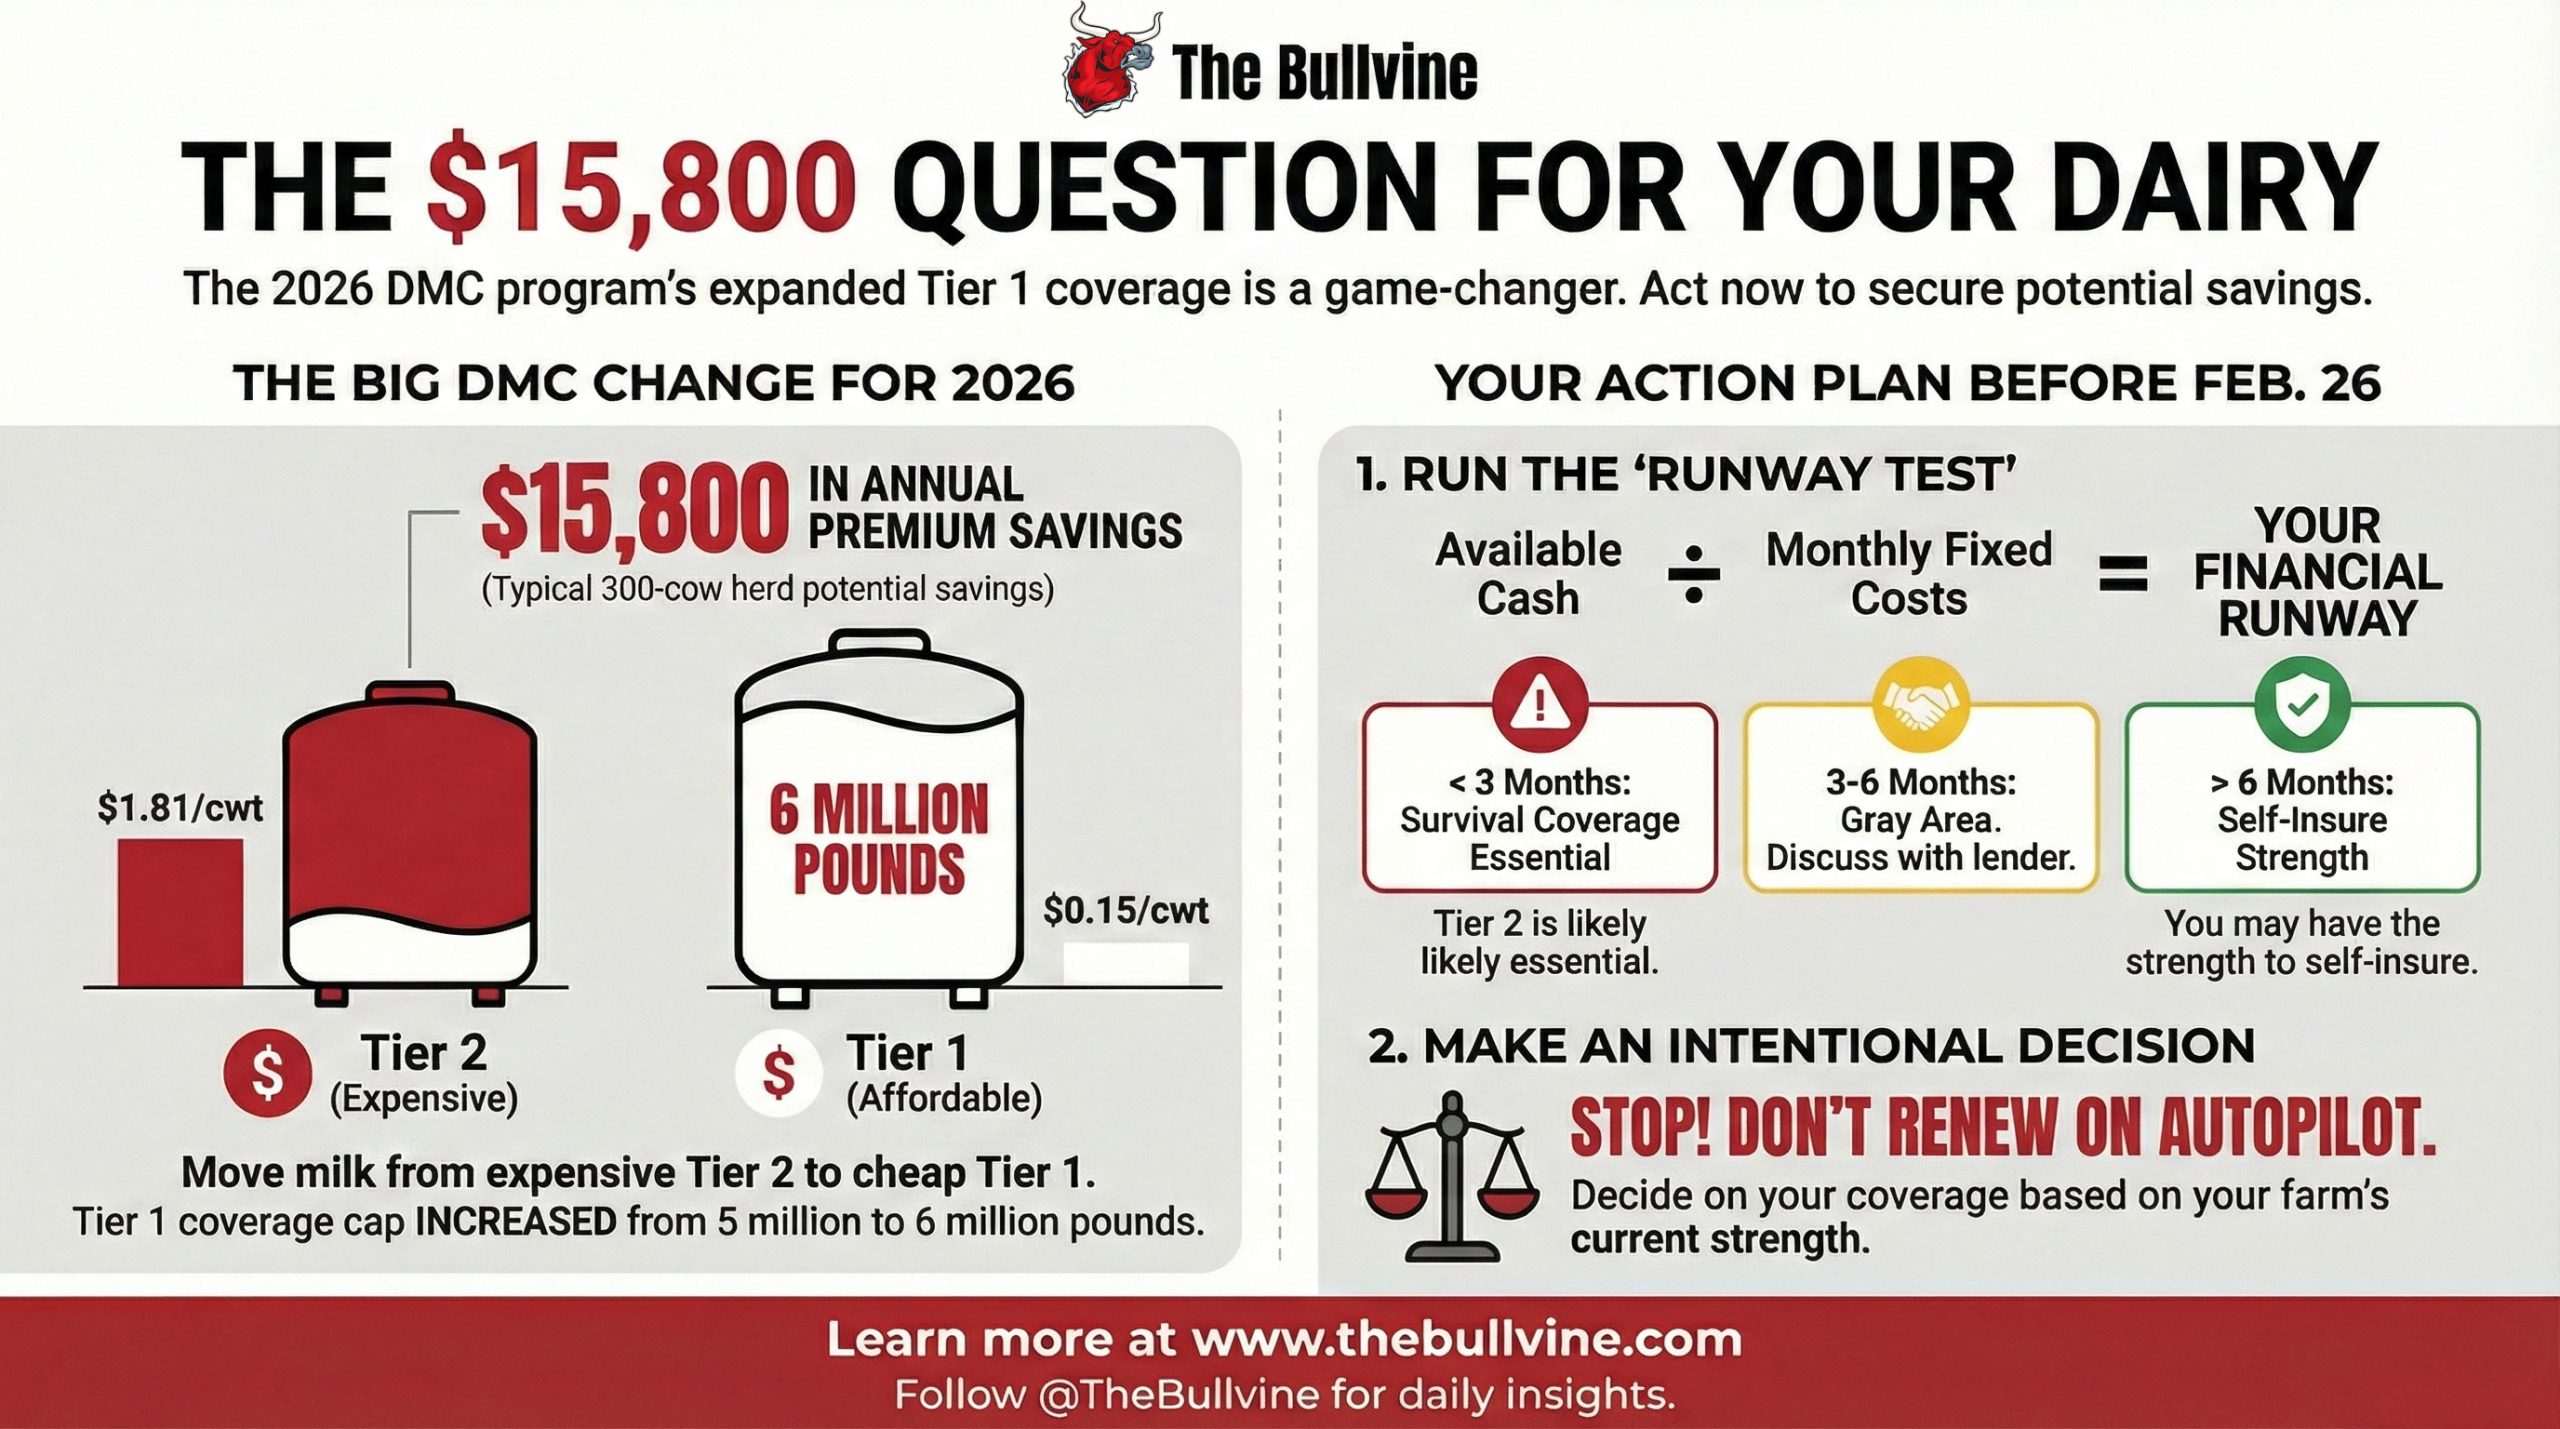
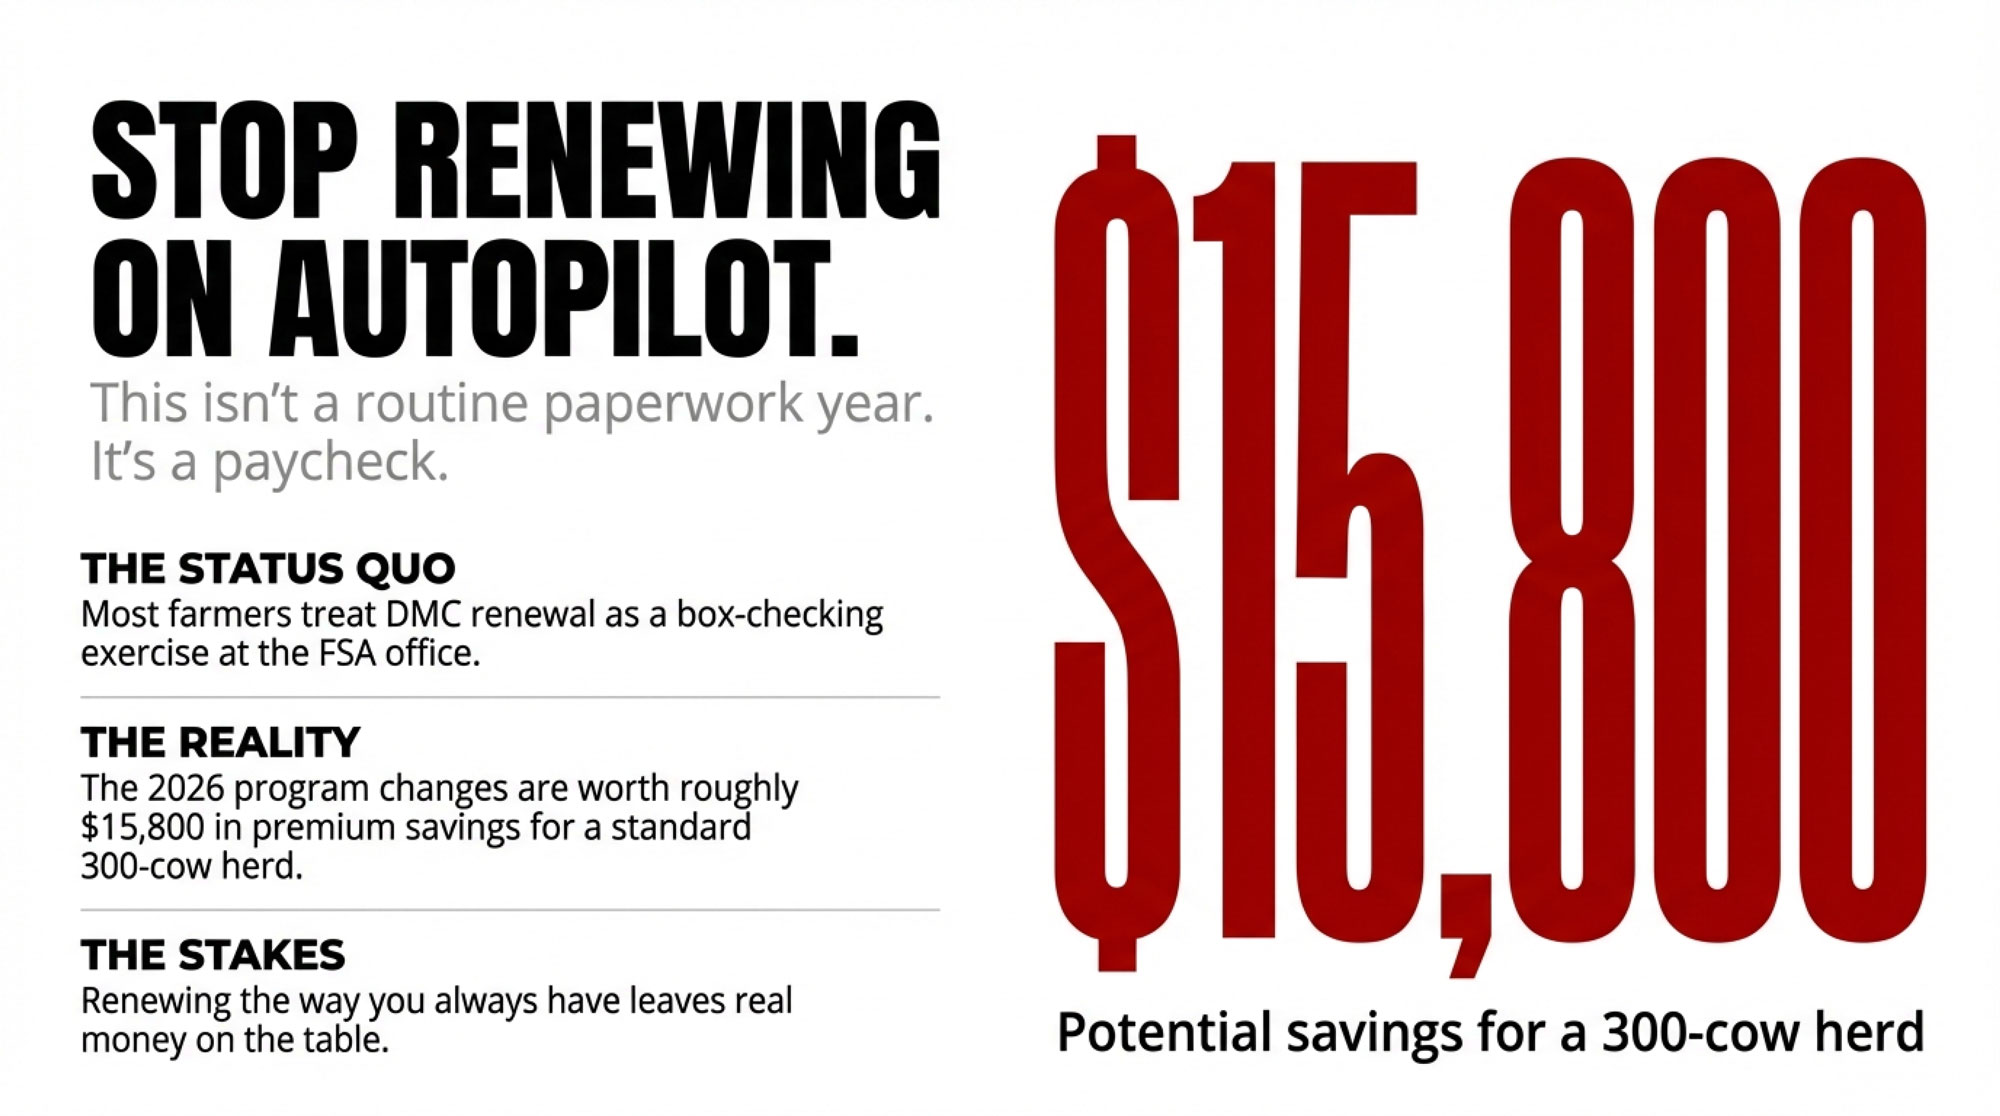
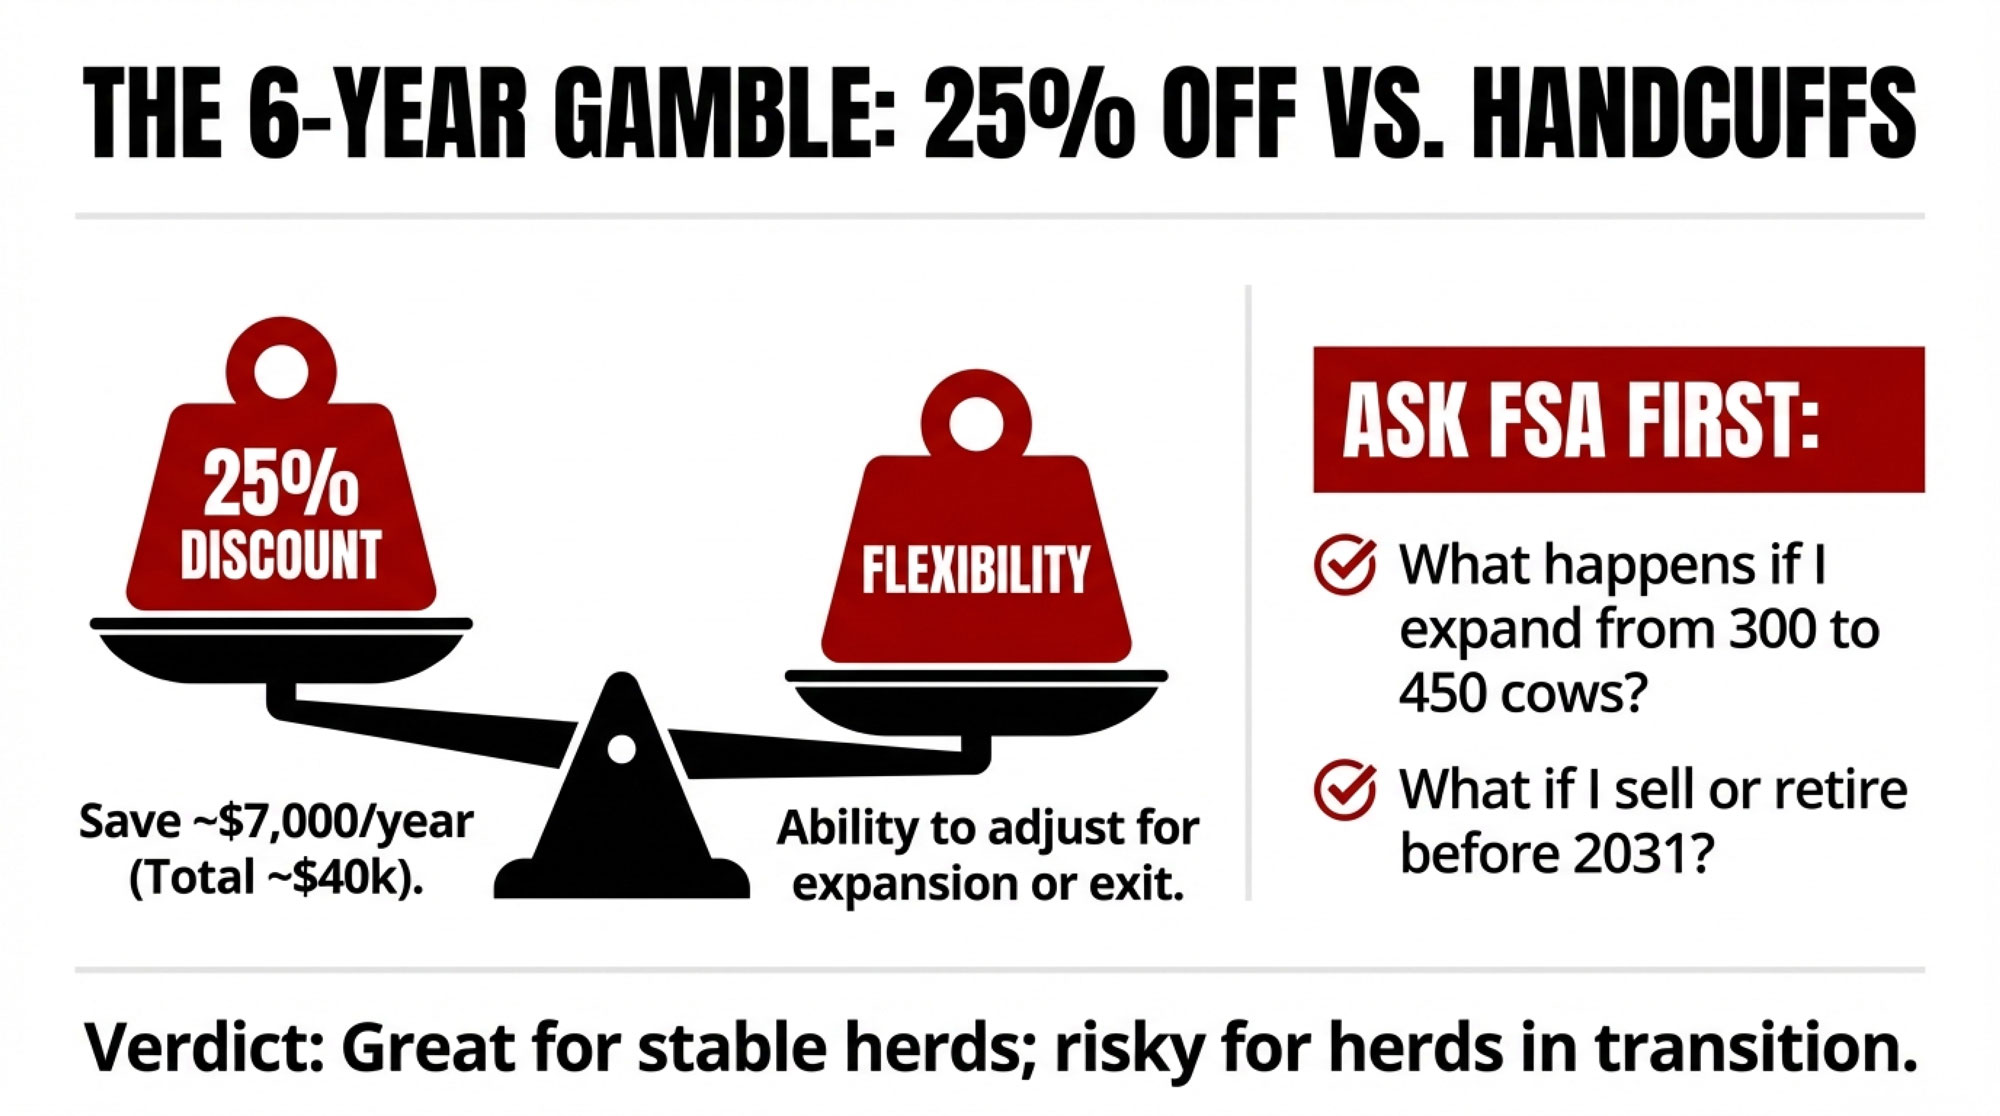
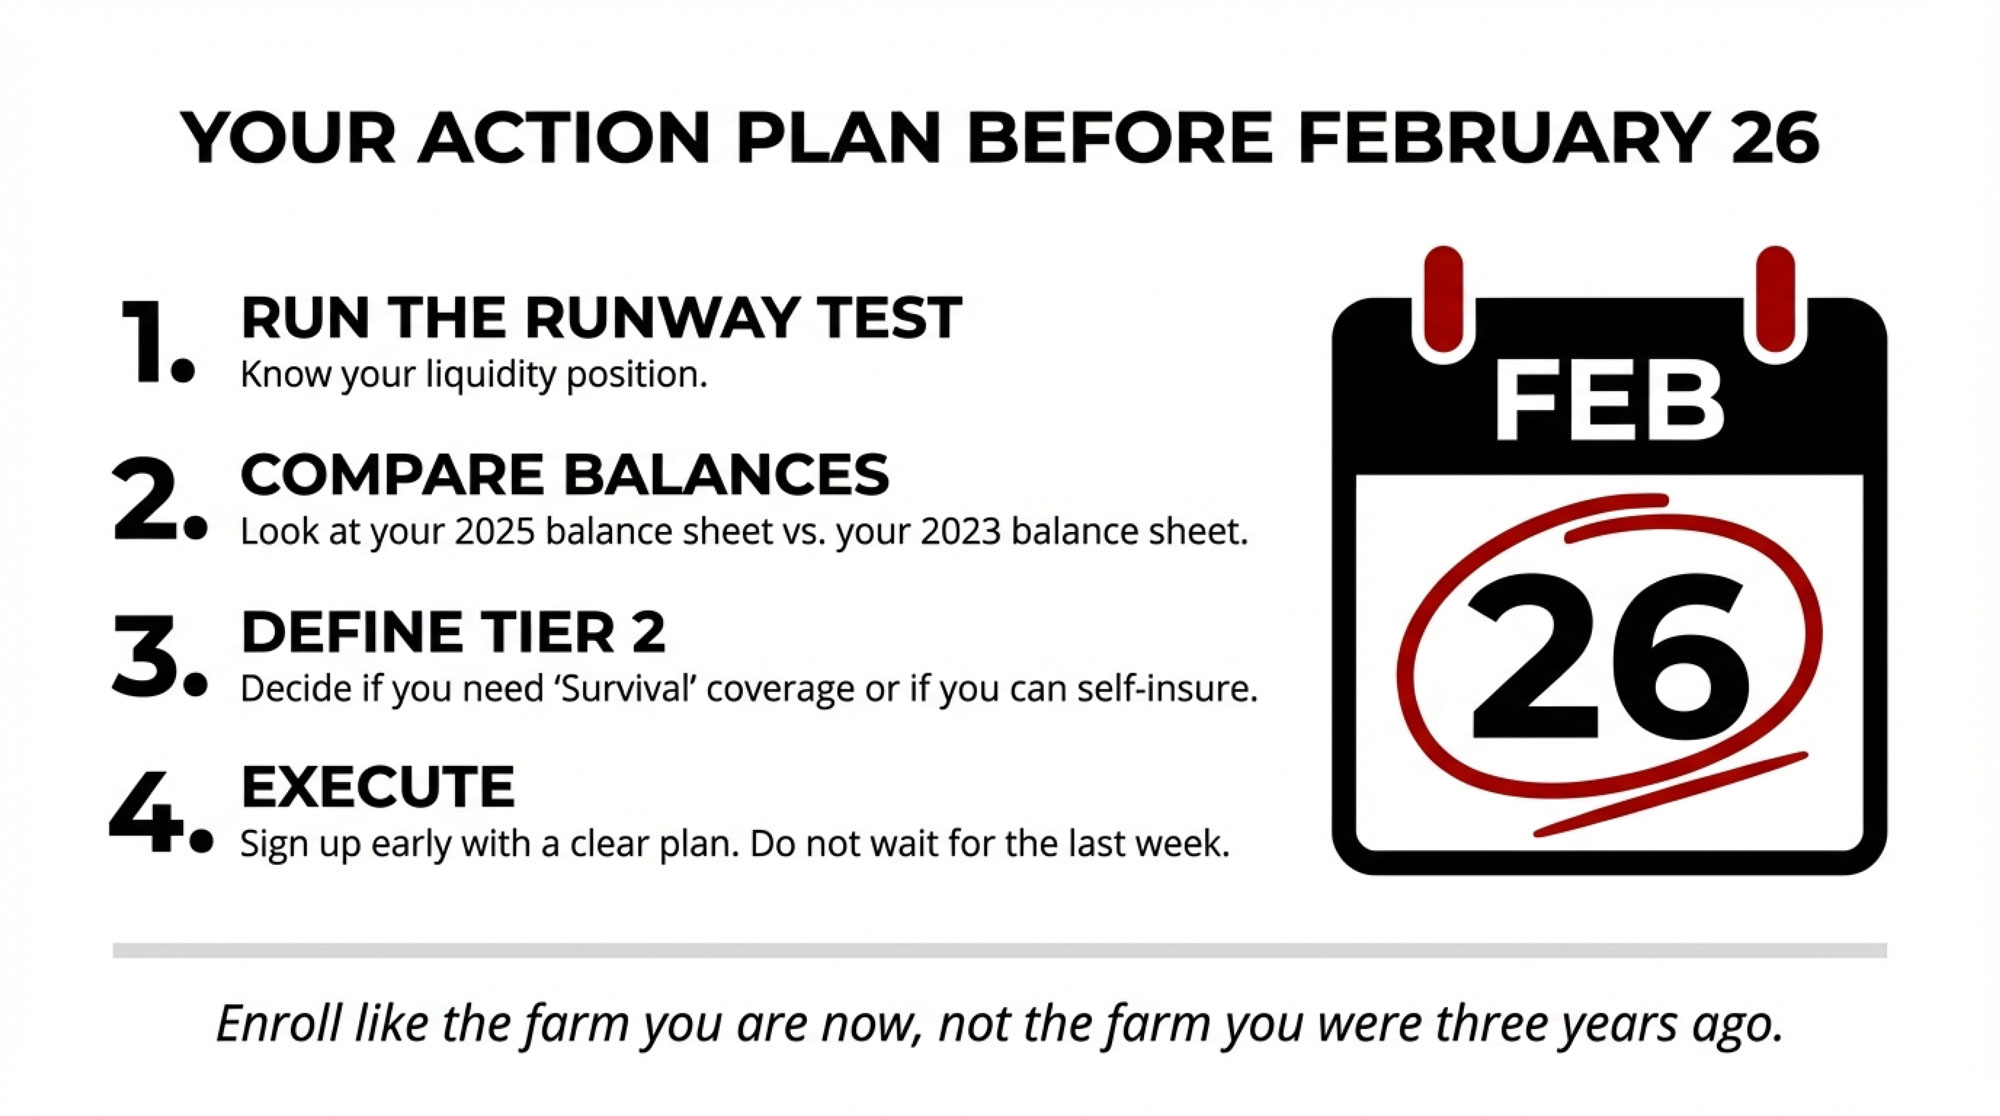
Brownfield reported on February 23 that 2026 DMC enrollment would close on February 26. Dairy Herd’s “11th‑Hour Trigger” coverage confirmed that December 2025’s margin triggered a payment at the .50 level — the lone DMC cheque for all of 2025. Producers who’d locked coverage when things looked worst saw real money early in 2026.
Those who watched the Q1 rally and figured “maybe we don’t need this” risked missing the only meaningful safety‑net payment of the year. On a 500‑cow herd, even a modest DMC payout reaches into five figures once you multiply per‑cwt across shipped volume. We’ll use roughly $10,000 as an illustrative figure — your actual number depends on your coverage tier and pounds.
What Actually Drove the Board — and Why It Probably Won’t Drive Q3
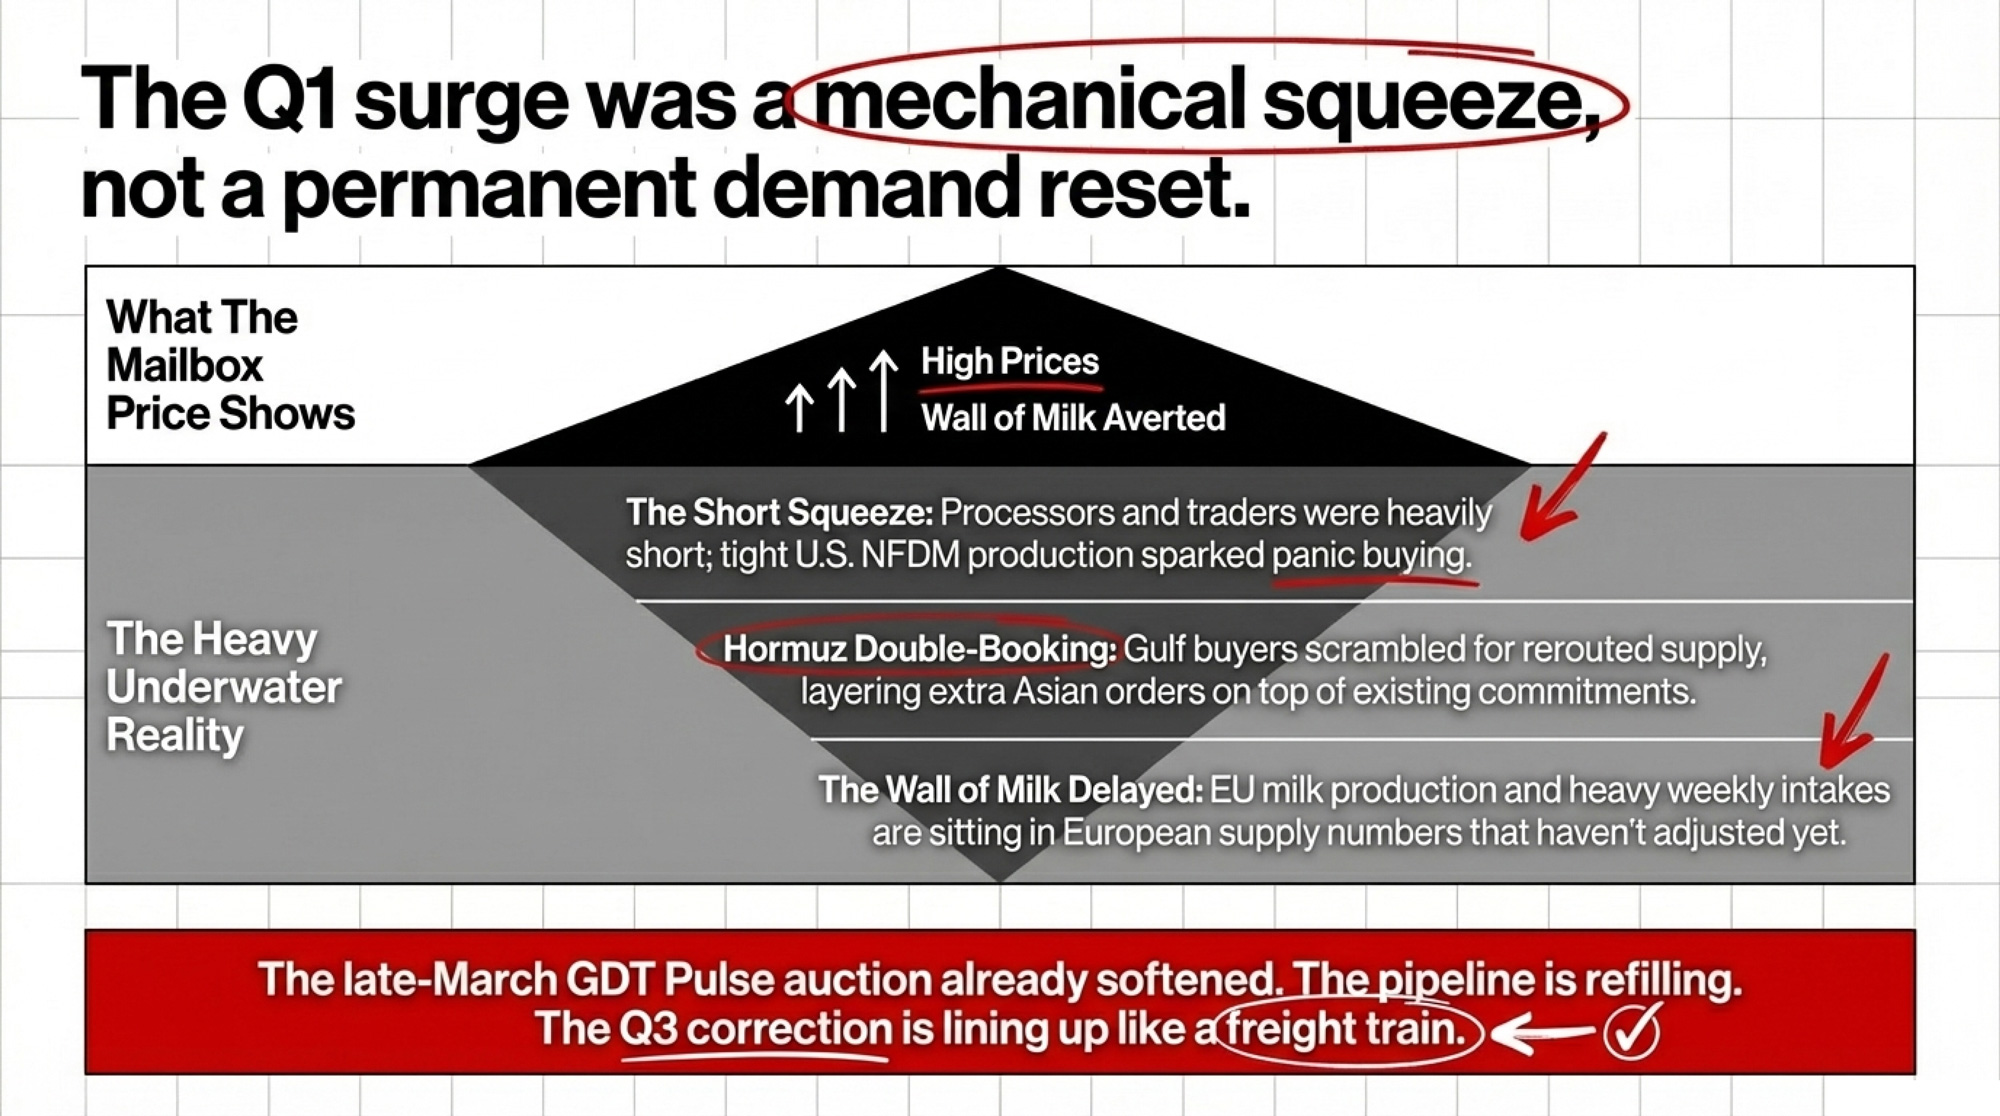
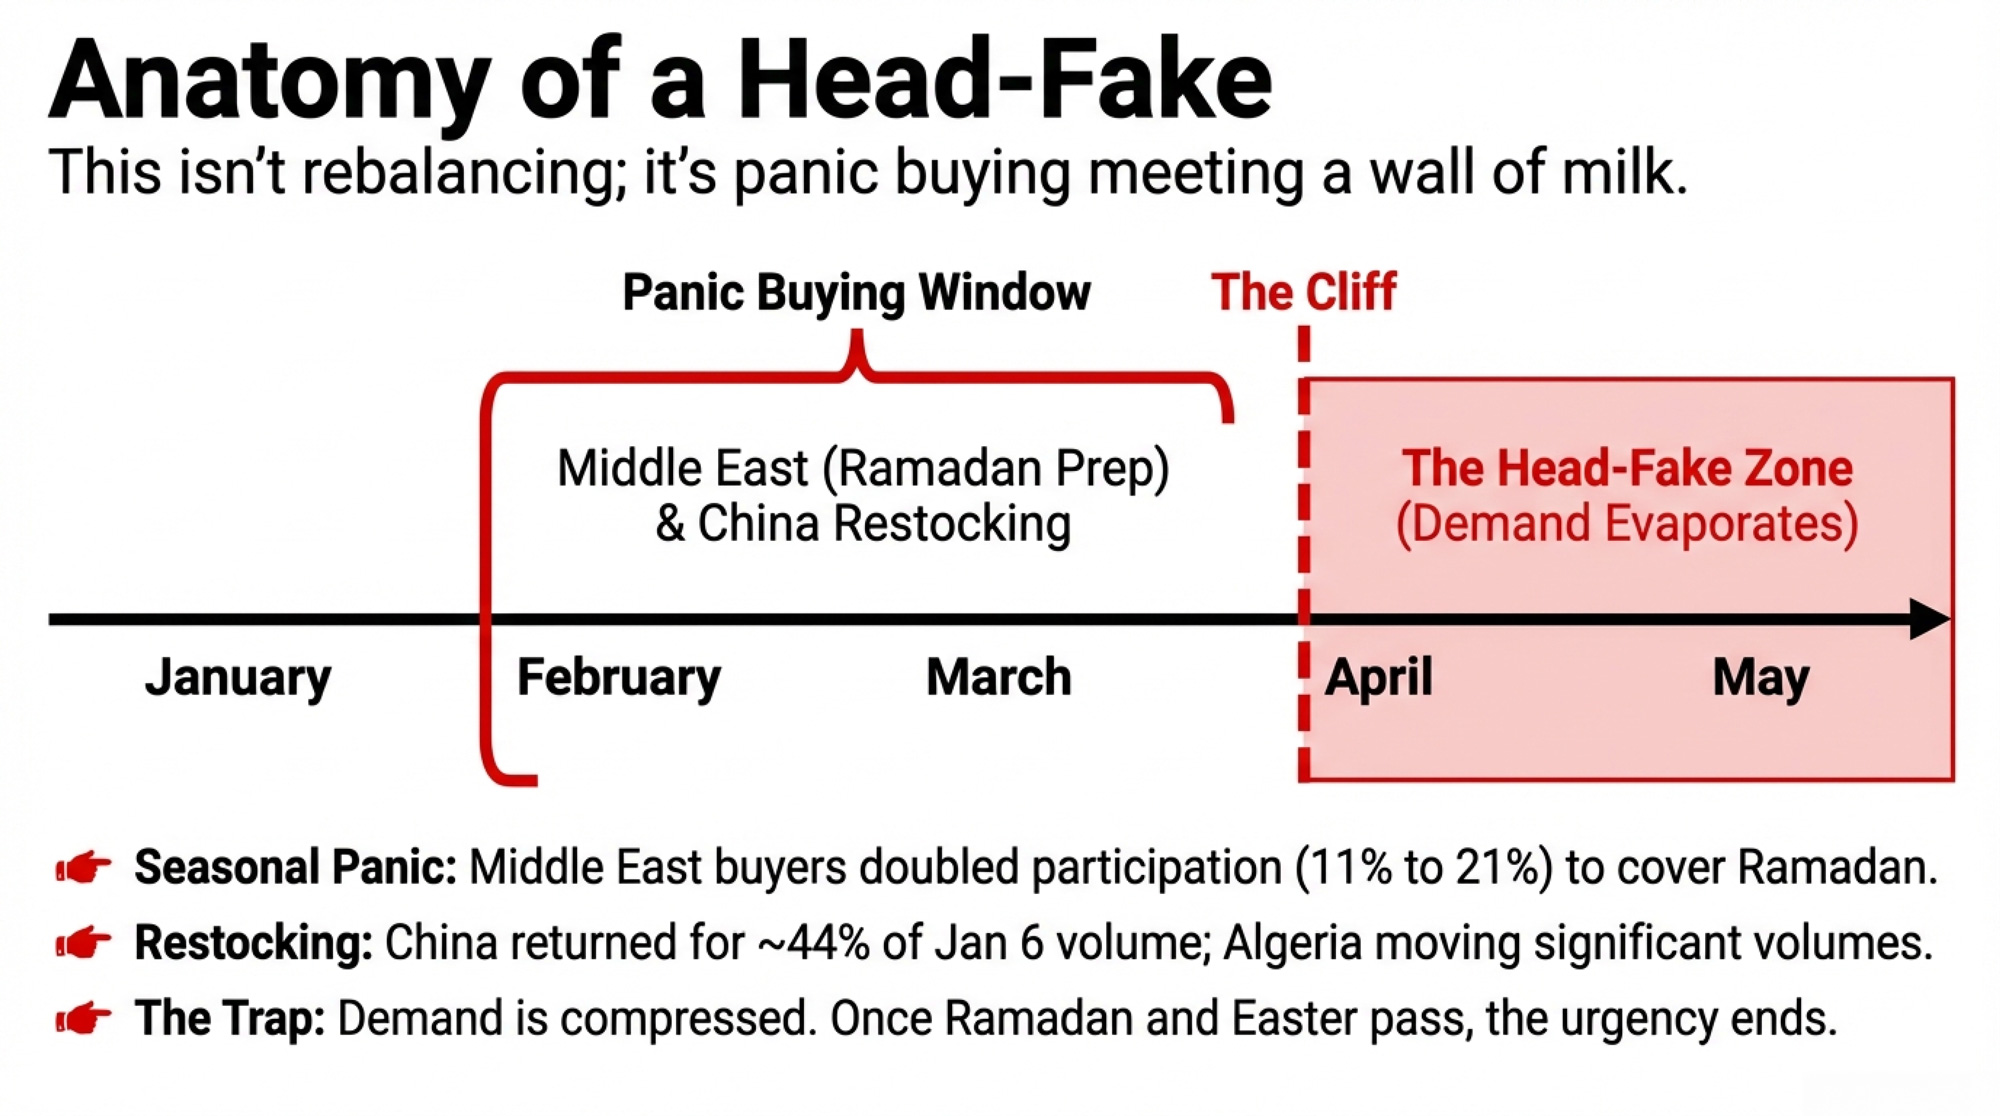
The Q1 surge wasn’t “strong demand” in the way a rising Mailbox Price implies. There were too many shorts and too many late buyers crammed into the wrong side of the trade at the same time.
Coming into 2026, processors and traders were heavily short, counting on the wall‑of‑milk story to keep the Board pinned. End users had taken minimal forward coverage. Non‑China importers had already stepped up powder purchases in late 2025 when prices were weak. When tight U.S. NFDM production — after two years of milk shifting toward cheese and high‑protein ingredients — left less powder available than anyone had modeled, shorts scrambled. Buyers scrambled. Short‑covering stacked on top of real demand pushed prices higher.
Then Hormuz blew up. Gulf buyers scrambled for rerouted supply. Analysts report that some Asian buyers waiting on delayed European products turned to the U.S. and New Zealand to avoid running short, effectively layering extra orders on top of existing commitments. That double‑booking created a temporary demand bulge on top of the short squeeze — the kind of pattern that lifts a GDT index 6–7% in one event and then fades once the pipeline refills.
By late March, the GDT Pulse auction had already softened. EU butter prices eased. Reports across Europe described butter and SMP stocks as significantly higher year‑over‑year. Rabobank’s Q1 2026 Global Dairy Quarterly, summarized by AHDB, suggested EU milk production may contract about 0.9% in the second half — but emphasized the lag between lower farmgate prices and actual volume response.
The Q3 correction is lining up like a freight train, and a lot of herds are standing on the tracks with a Q1 smile. The wall of milk didn’t crash into Q1 the way early bears predicted. But it didn’t vanish, either. It’s sitting in European supply numbers that haven’t adjusted yet. If panic buying fades, Gulf shipping normalizes, and EU intake stays firmer than models expect, the mechanical rally that saved your Q1 Mailbox Price sets you up for an H2 where Class III and IV give back part of the gains.
The only part of your revenue that holds up is the part you already took off the table. That’s the setup McCarty’s risk plan was built for. Not market timing. Just getting on base before the pitch changes.
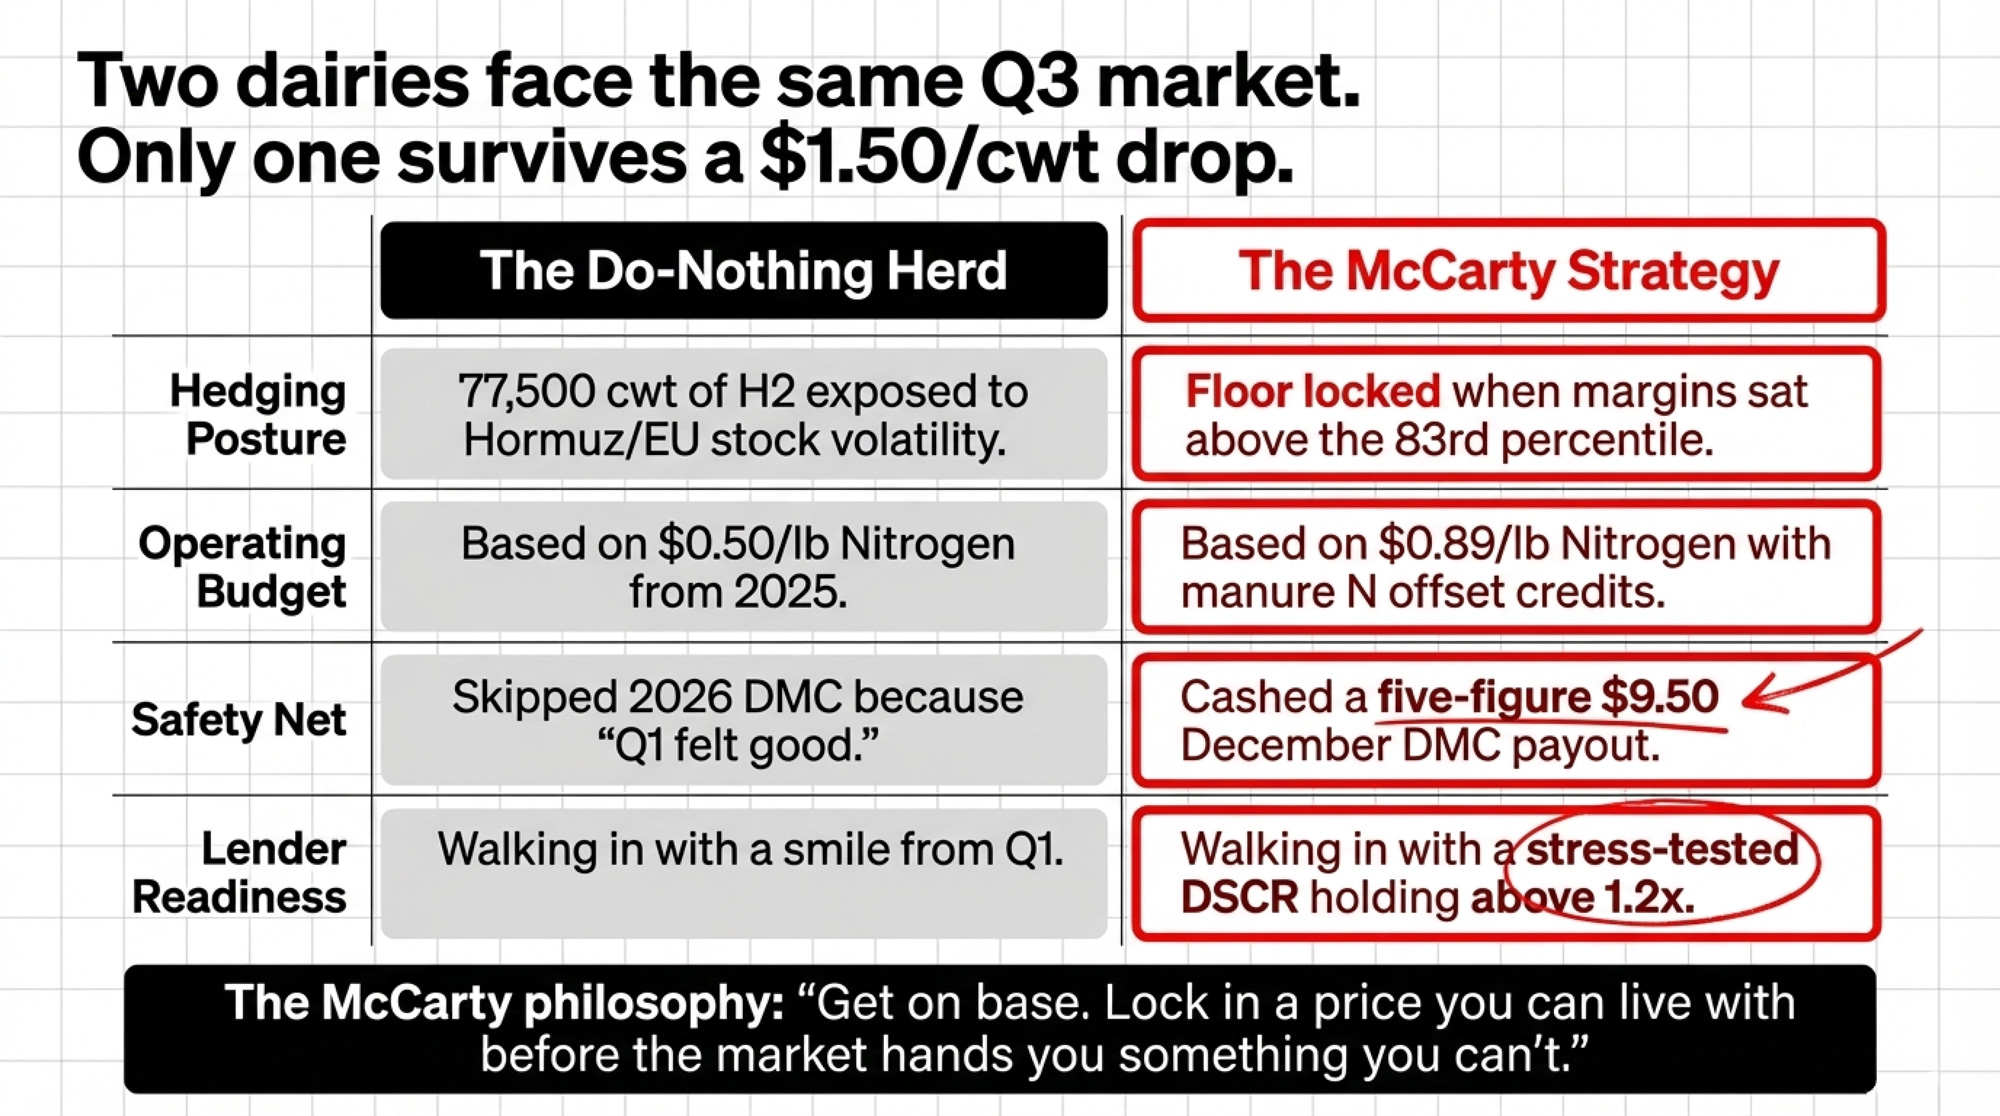
McCarty’s Singles and Doubles vs. the “Do Nothing” Herd
McCarty’s approach isn’t clever. It’s a risk philosophy that survives cycles. His family took a long‑term view with their processor to stabilize key costs — energy, feed, equipment — years in advance. Not flashy. Deliberate. When diesel blew up in 2022, they weren’t scrambling. They were executing a plan they’d already paid for.
Right now, a lot of 500‑cow operations are in the opposite position:
Q1 felt good, so 2026 DMC got treated as a “maybe.”
DRP and forward contracts are sitting on the “we really should call our agent” list.
Fertilizer and fuel are budgeted off 2025 numbers, not current March 2026 quotes.
One operation walks into their lender meeting with DRP confirmations, and a fertilizer pre‑buy that proves H2 floor revenue covers term debt even in a stress case. Another walks in with a smile from Q1, a budget using last year’s N prices, and 77,500 cwt of H2 production exposed to whatever EU butter stocks and Hormuz do next.
Same rally. Very different December.
Metric
Hedged Operation (McCarty Model)
Unhedged Operation (“Do Nothing”)
H2 2026 Milk Floor ($/cwt)
Locked ~$19.50–$20.00 via DRP floors at 83rd-pct margins
Riding spot — exposure to $1.50+/cwt downside if Board corrects
Q3/Q4 Volume Protected
40–60% of 77,500 cwt (~31,000–46,500 cwt)
0 cwt — fully exposed to market move
2026 Nitrogen Budget ($/lb N)
Current quotes: $0.70–$0.89/lb (anhydrous/urea blend)
2025 budget: ~$0.50/lb — understated by 40%+
Fertilizer Cash-Flow Gap
~$0 — pre-bought or properly budgeted
~$12,000–$15,000 underfunded on N alone
DMC Enrollment Status
$9.50 coverage confirmed before Feb 26 deadline
Skipped — “things were turning around”
H2 DSCR (Stress Case)
Holds at 1.2x+ even if Board gives back $1.50/cwt
May fall below 1.2x — covenant conversation risk
Lender Meeting Posture
Walks in with DRP confirmations + updated budget
Walks in with Q1 smile and 2025 numbers
December 2026 Outcome
Stable margins; singles and doubles locked in
Six-figure exposure if Q3 correction materializes
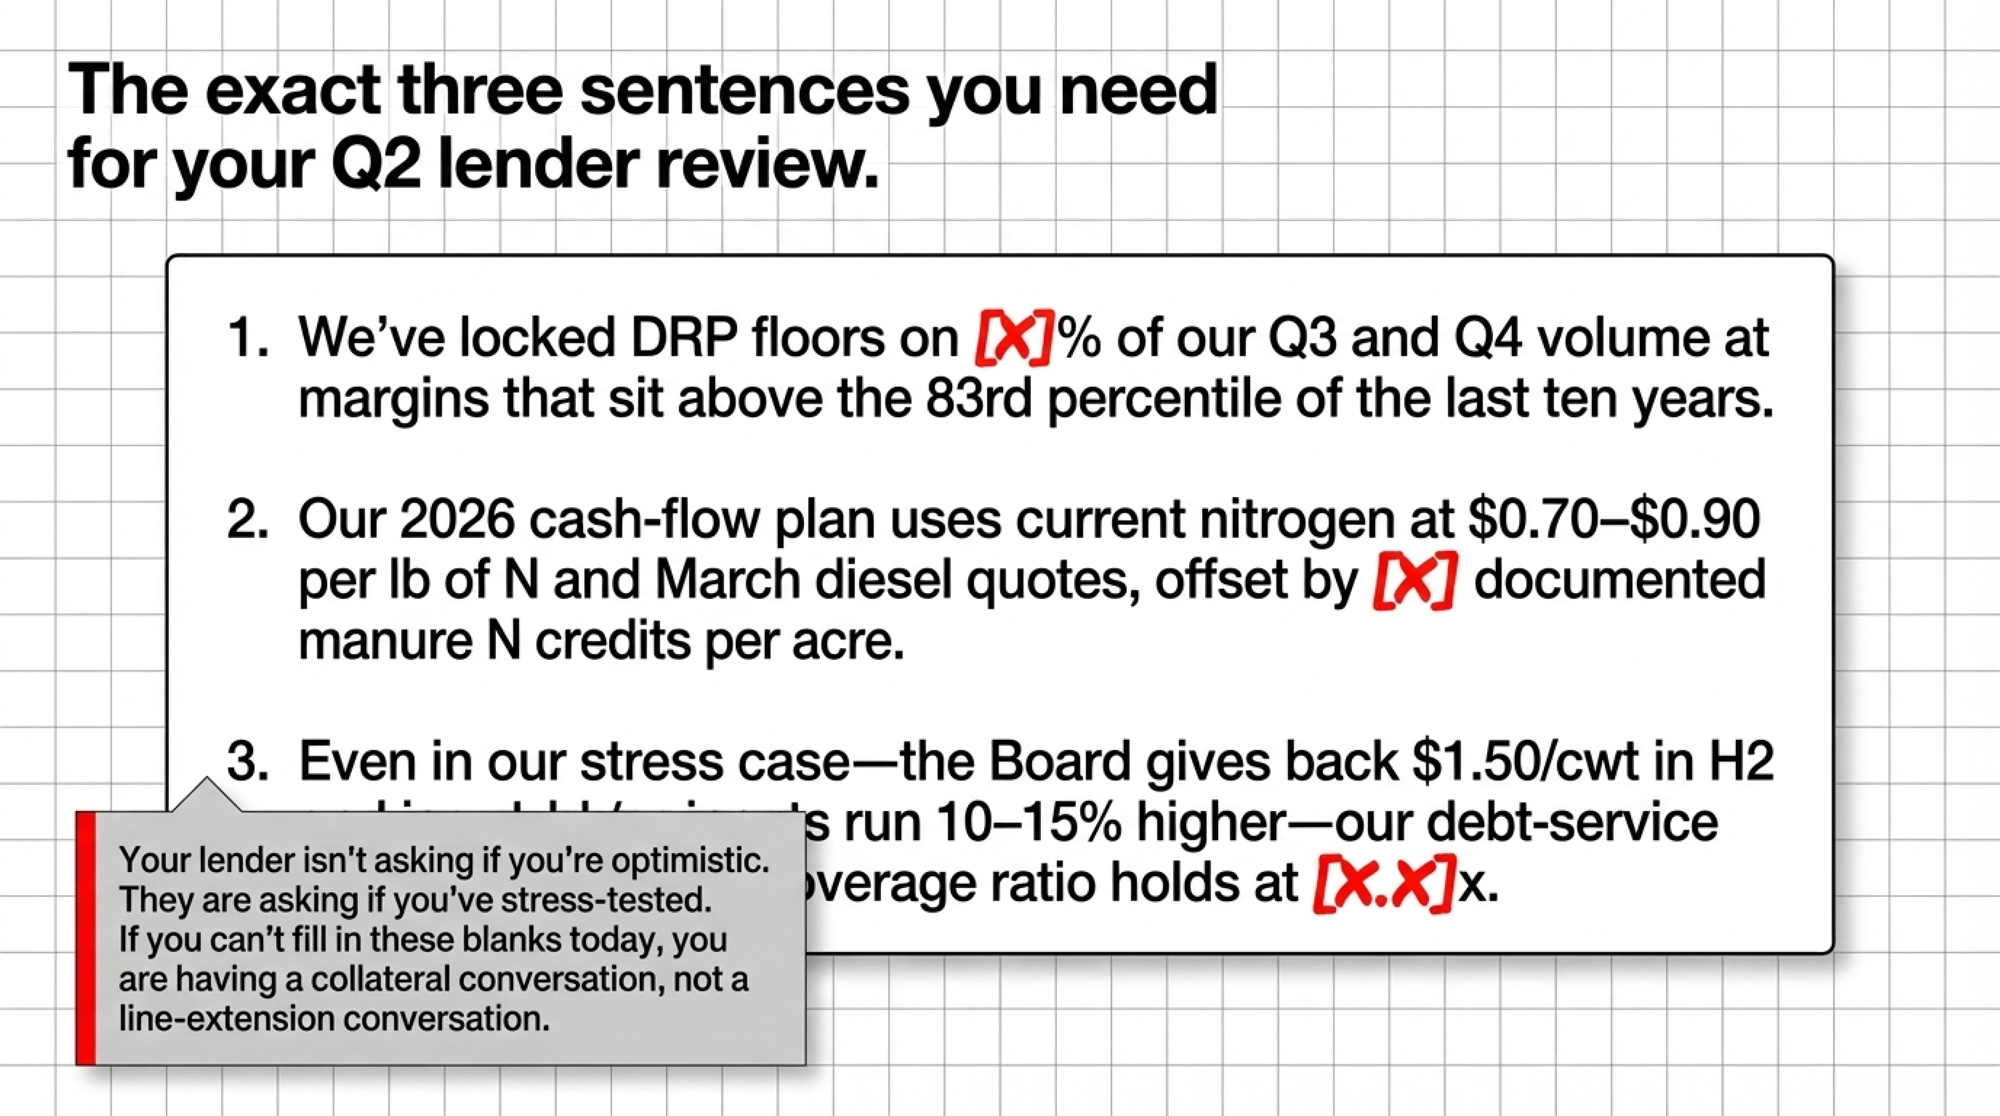
Three Sentences to Bring to Your Lender
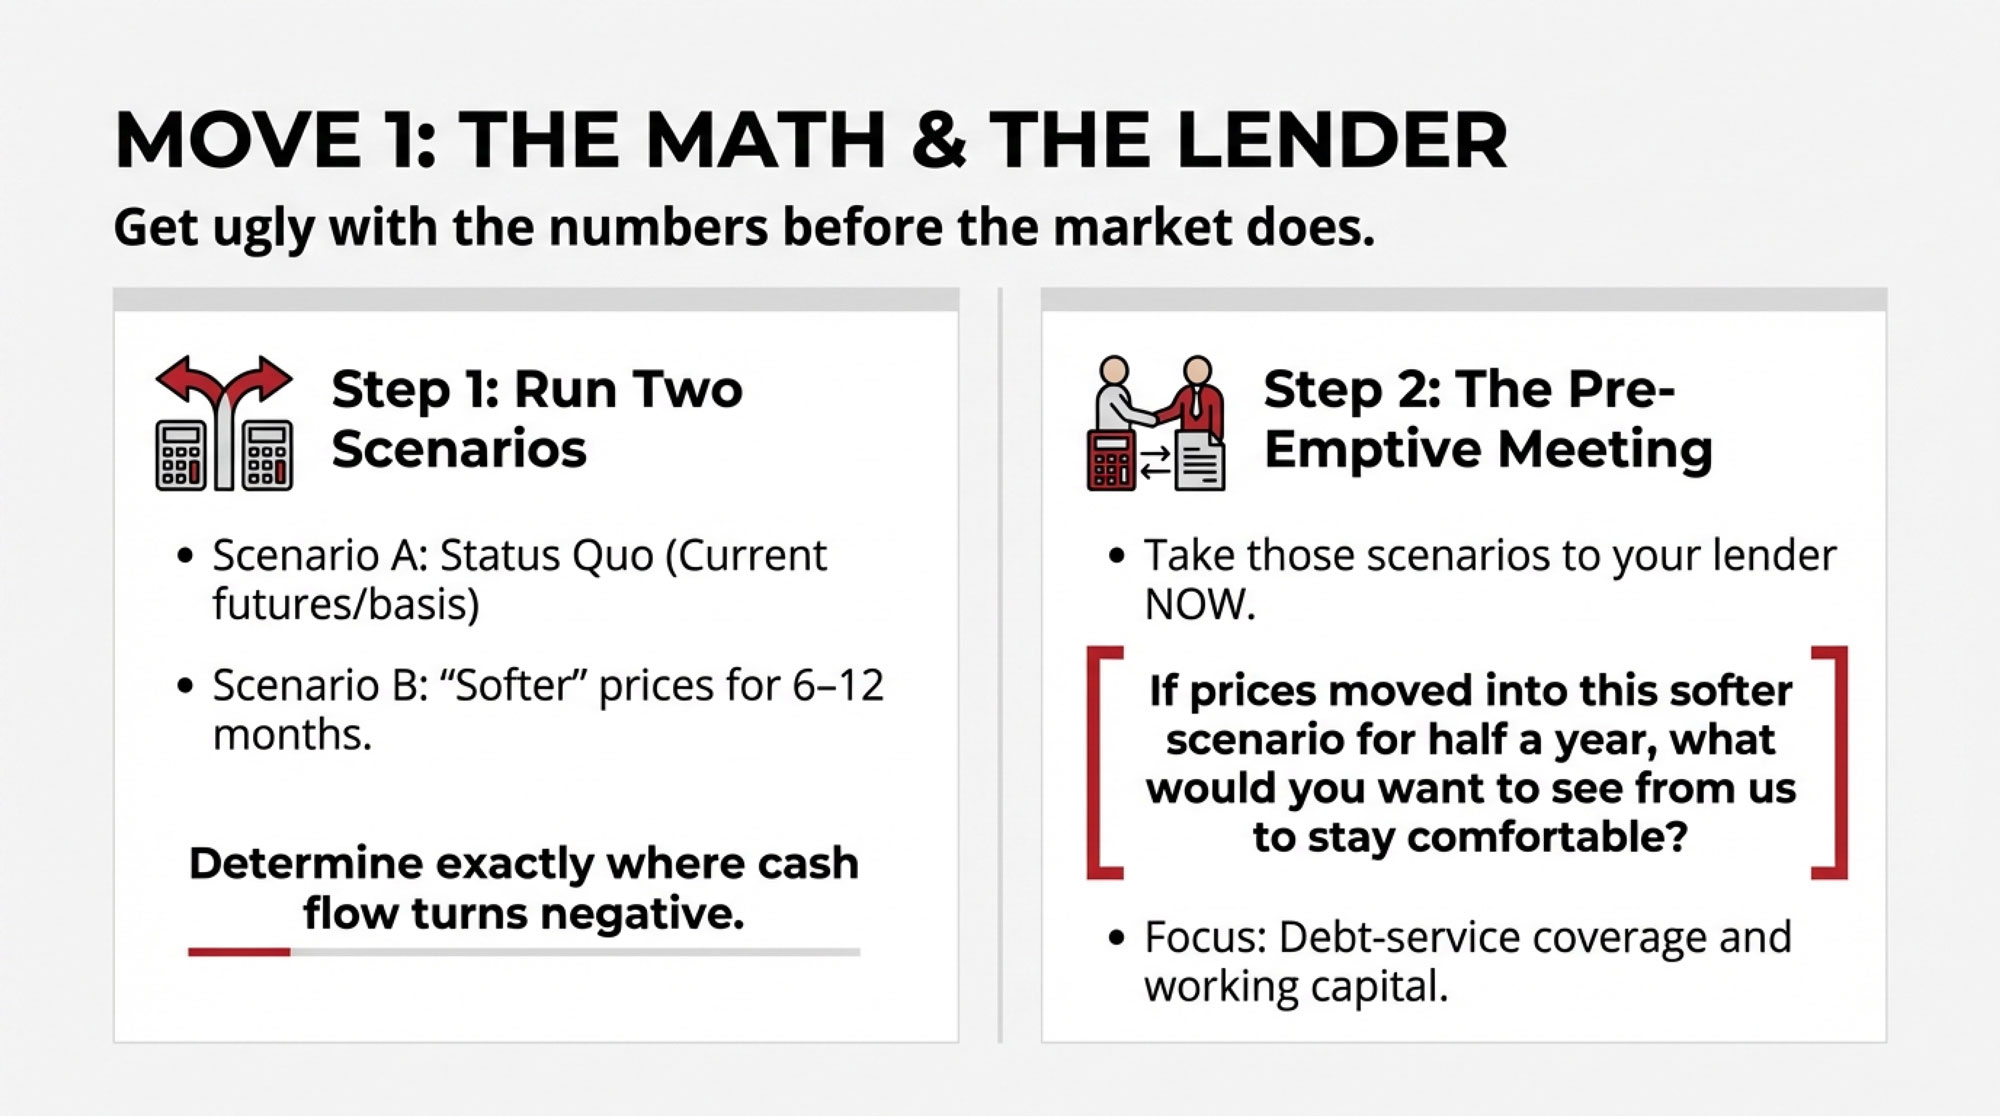
The headline promises lender math. Here’s how to deliver it in your Q2 review. Walk in with your numbers already run and say:
Sentence 1: “We’ve locked DRP floors on [X]% of our Q3 and Q4 volume at margins that sit above the 83rd percentile of the last ten years, based on HighGround’s Q1 producer update.”
Sentence 2: “Our 2026 cash‑flow plan uses current nitrogen at $0.70–$0.90 per lb of N and March diesel quotes — not 2025 numbers — and we’ve offset part of that with documented manure N credits per acre.”
Sentence 3: “Even in our stress case — the Board gives back $1.50/cwt in H2 and inputs run another 10–15% above current — our debt‑service coverage ratio holds at [X.X]x.”
[Lender’s View] Your lender isn’t asking whether you’re optimistic. They’re asking whether you’ve stress‑tested. These three sentences — backed by actual confirmations and an updated budget — tell them you have. That’s the difference between “extending your line” and “let’s talk about your collateral.”
If you can’t fill in those blanks today, that’s the problem this article is about.
The 30/90/365‑Day Playbook
Action Item
Deadline/Window
Risk if Skipped
Priority
Buy DRP floors on 40–50% of H2 volume
Next 30 days (while margins at 83rd pct)
$116,250 unprotected milk revenue (500-cow herd)
🔴 Critical
Rebuild 2026 input budget with current quotes
Next 30 days
$12–15k+ fertilizer gap; lender sees 2025 numbers
🔴 Critical
Run manure N credits with agronomist
Next 30 days
Miss $30–45/acre savings (up to $13,500 on 300 ac)
🟠 High
Build base + stress H2 margin sheet (DSCR)
Next 90 days
Don’t know if stress DSCR < 1.2x until lender flags it
🟠 High
Ask processor 3 blunt questions (milk end-use)
Next 90 days
Shipping into a plan you don’t understand
🟠 High
Drop bottom-protein bulls; tighten sire stack
Next 90 days
Calving volume-heavy heifers into 2028 component market
🟠 High
Cull by protein yield; deploy beef semen on tail
Next 365 days
Herd drifts away from cheese-yield premium
🟡 Medium
Align risk calendar to DRP sales/DMC deadlines
Ongoing
Buy protection when desperate, not when optimal
🟡 Medium
Basis + alternatives review before contract renewal
Next 365 days
Miss co-op leverage window or consolidation shift
🟡 Medium
You won’t fix all of this in one phone call. But you can move from “hoping” to “protecting” over the next year.
Next 30 Days
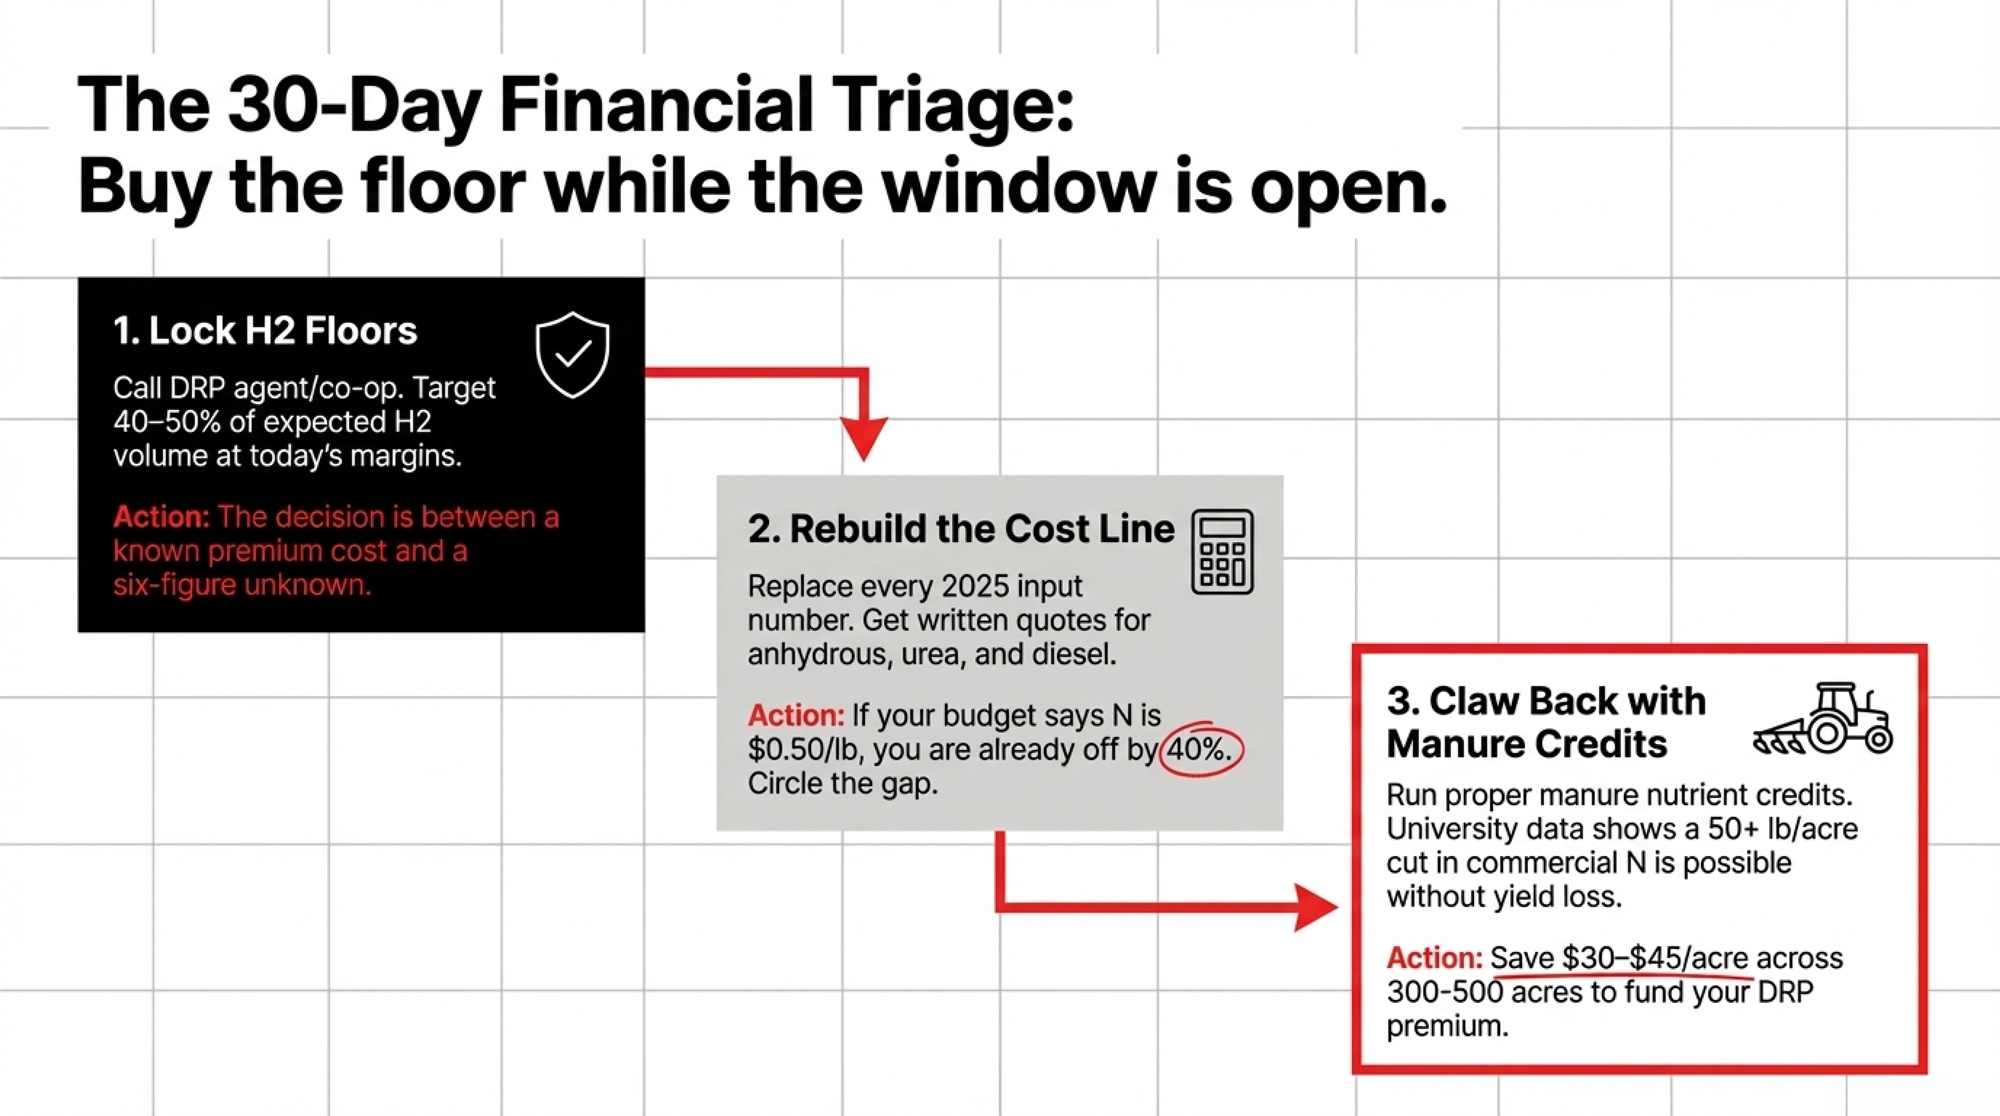
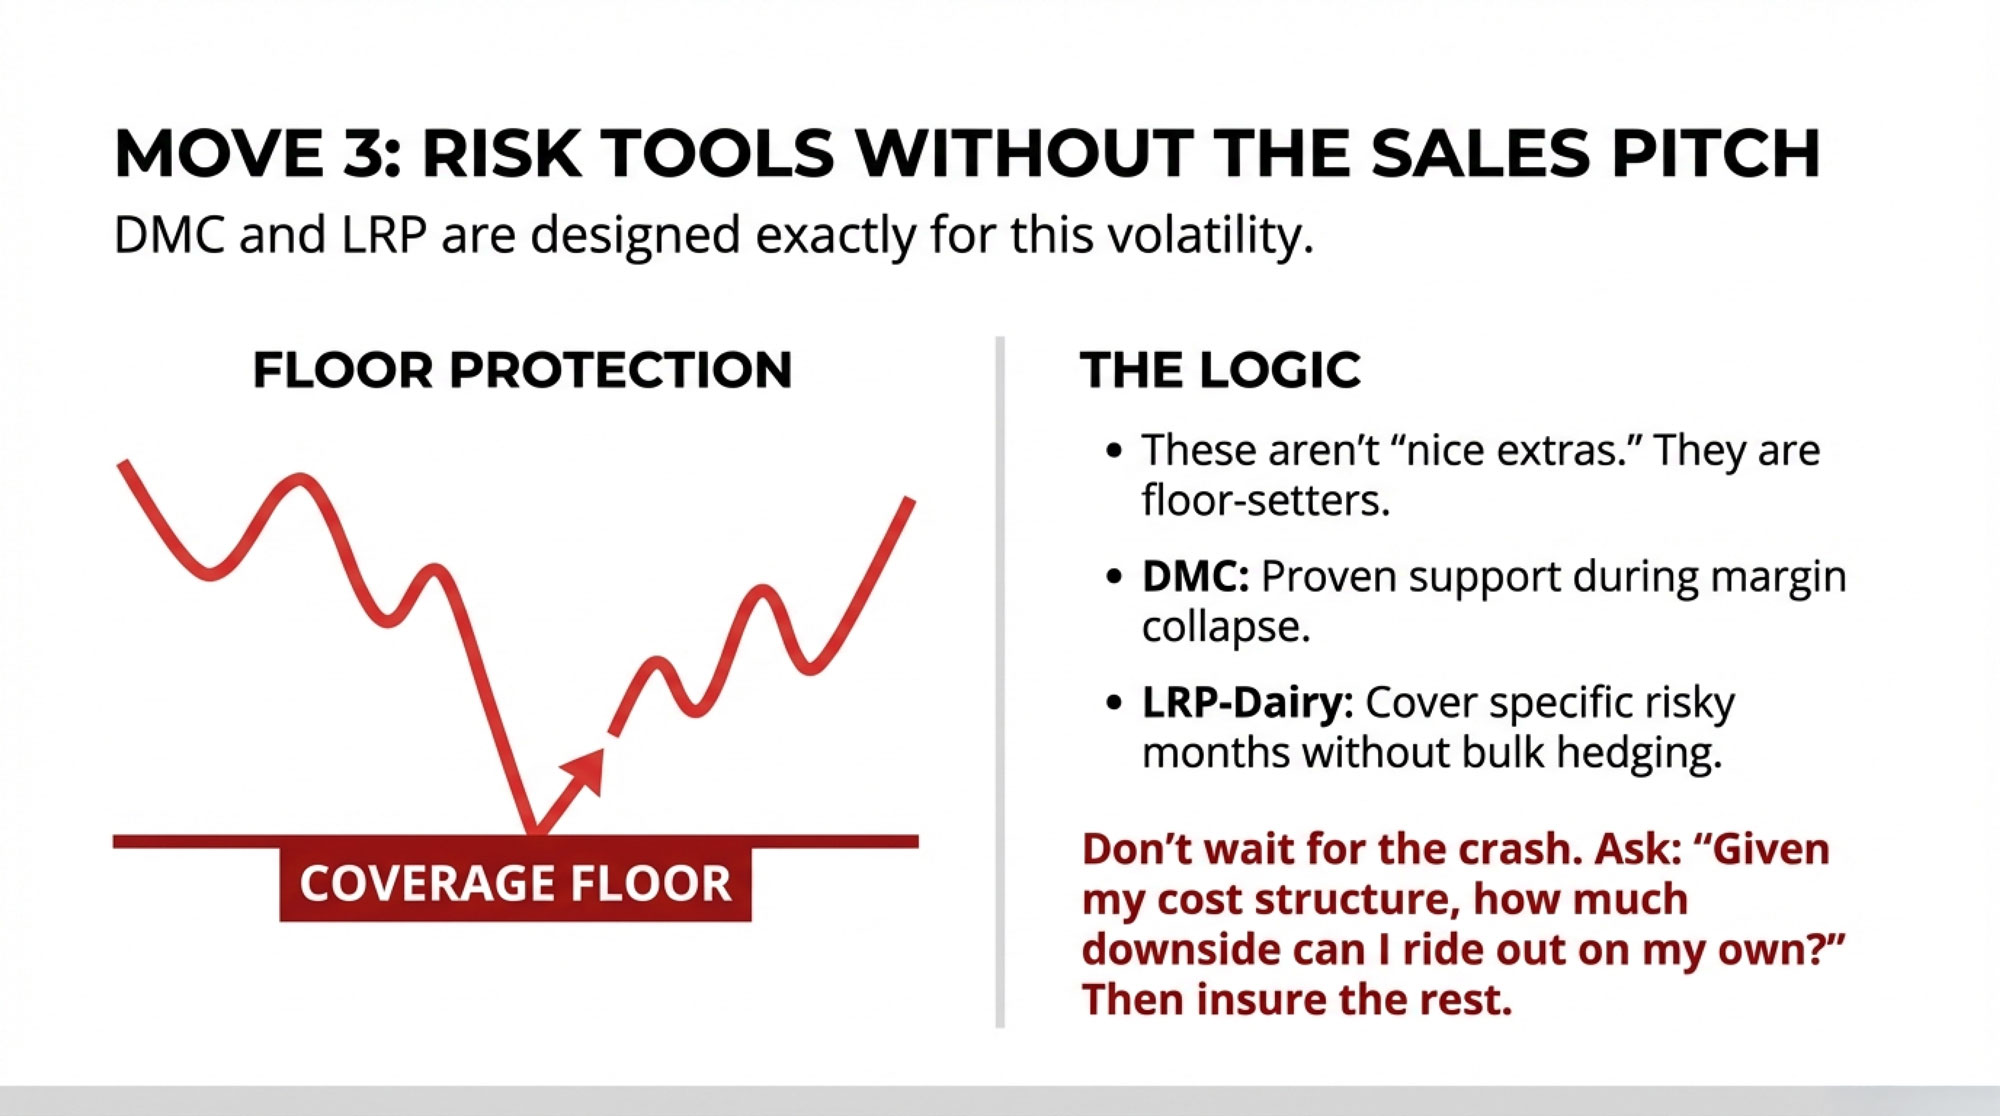
1. Buy a floor under a meaningful chunk of your H2 milk. Call your DRP agent or co‑op risk advisor and get Q3/Q4 quotes. Target at least 40–50% of expected H2 volume at today’s margins. If your cheque is heavily component‑based, look at the component blend option so your hedge matches your actual milk. DRP isn’t free — you’re paying a premium or giving up upside. But the decision right now is between a known cost and a six‑figure unknown.
2. Rebuild your 2026 cost line with current quotes. Get written nitrogen quotes for anhydrous, urea, and UAN at current $/lb N. Pull current diesel offers. Replace every 2025 input number in your cash‑flow plan. Circle the gap. If your 2026 budget still shows N at $0.50/lb, you’re already off by 20–40%.
3. Use manure N to claw back some of that increase. Have your agronomist run a proper manure nutrient credit for each field getting manure. University and extension work show farms with real nutrient management plans can cut commercial N by 50+ lb/acre on some fields without losing yield, which at current N prices saves $30–$45/acre. Across 300–500 acres, that’s enough to fund a chunk of your DRP premium.
[Pro‑Tip] Run all three before your Q2 lender review. Walking in with DRP confirmations, updated N quotes, and a manure credit plan is the difference between asking for patience and proving a plan.
Next 90 Days
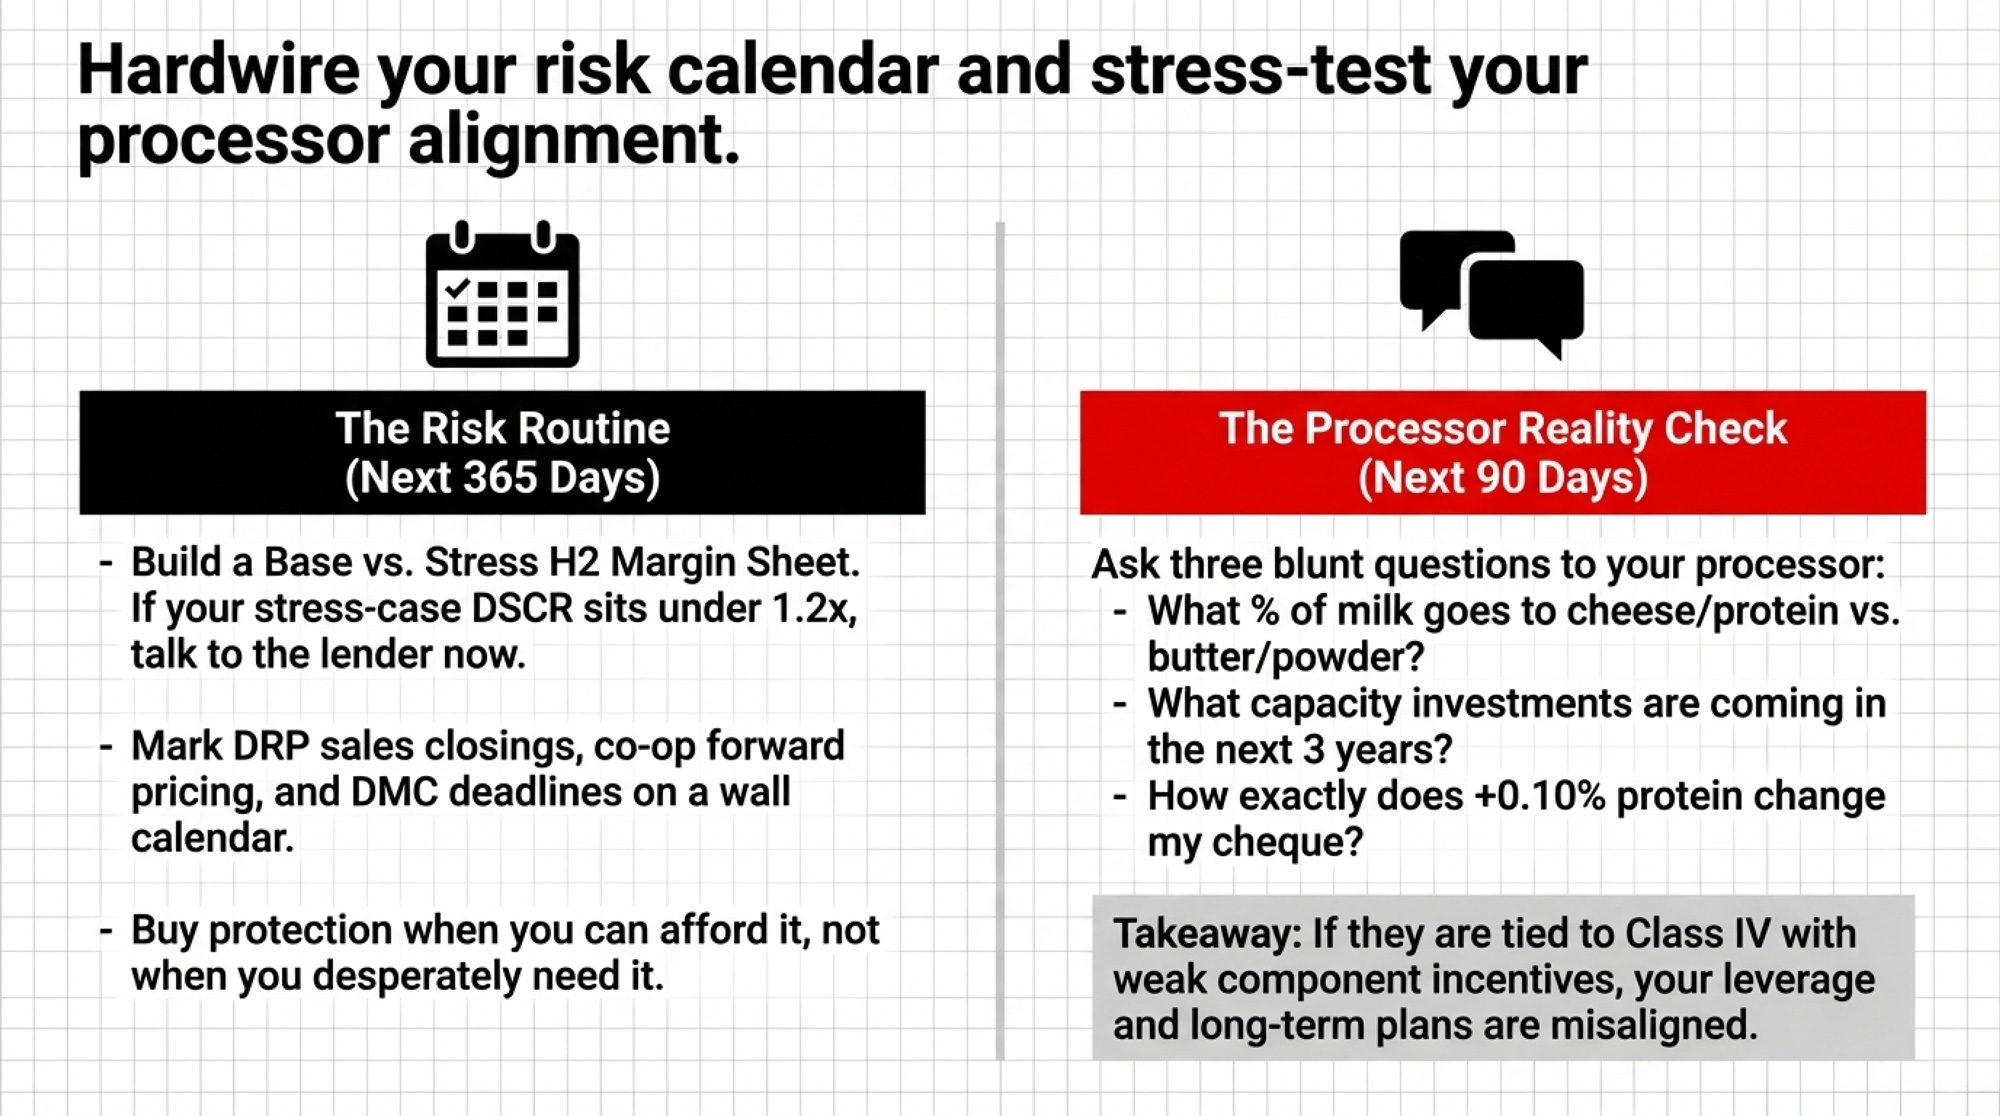
4. Build a base vs. stress H2 margin sheet. July–December, two columns: base case (hedged floor + updated 2026 inputs) and stress case (same floors + another 10–15% on feed/fertilizer/fuel). Calculate a rough debt‑service coverage ratio in both. If your stress‑case DSCR sits under about 1.2x, have that conversation with your lender before numbers tighten — not after.
5. Ask your processor three blunt questions. What percentage of your milk ends up in cheese and protein ingredients versus butter and powder? What cheese and high‑protein capacity investments are they making over the next three years? If you bring them milk that’s +0.10% protein and +0.15% fat, what does that do to your cheque? If the answers show they’re structurally tied to Class IV butter/powder with weak component incentives, you’ve learned your long‑term plans, and theirs may not be aligned — and that’s a conversation you can’t keep deferring.
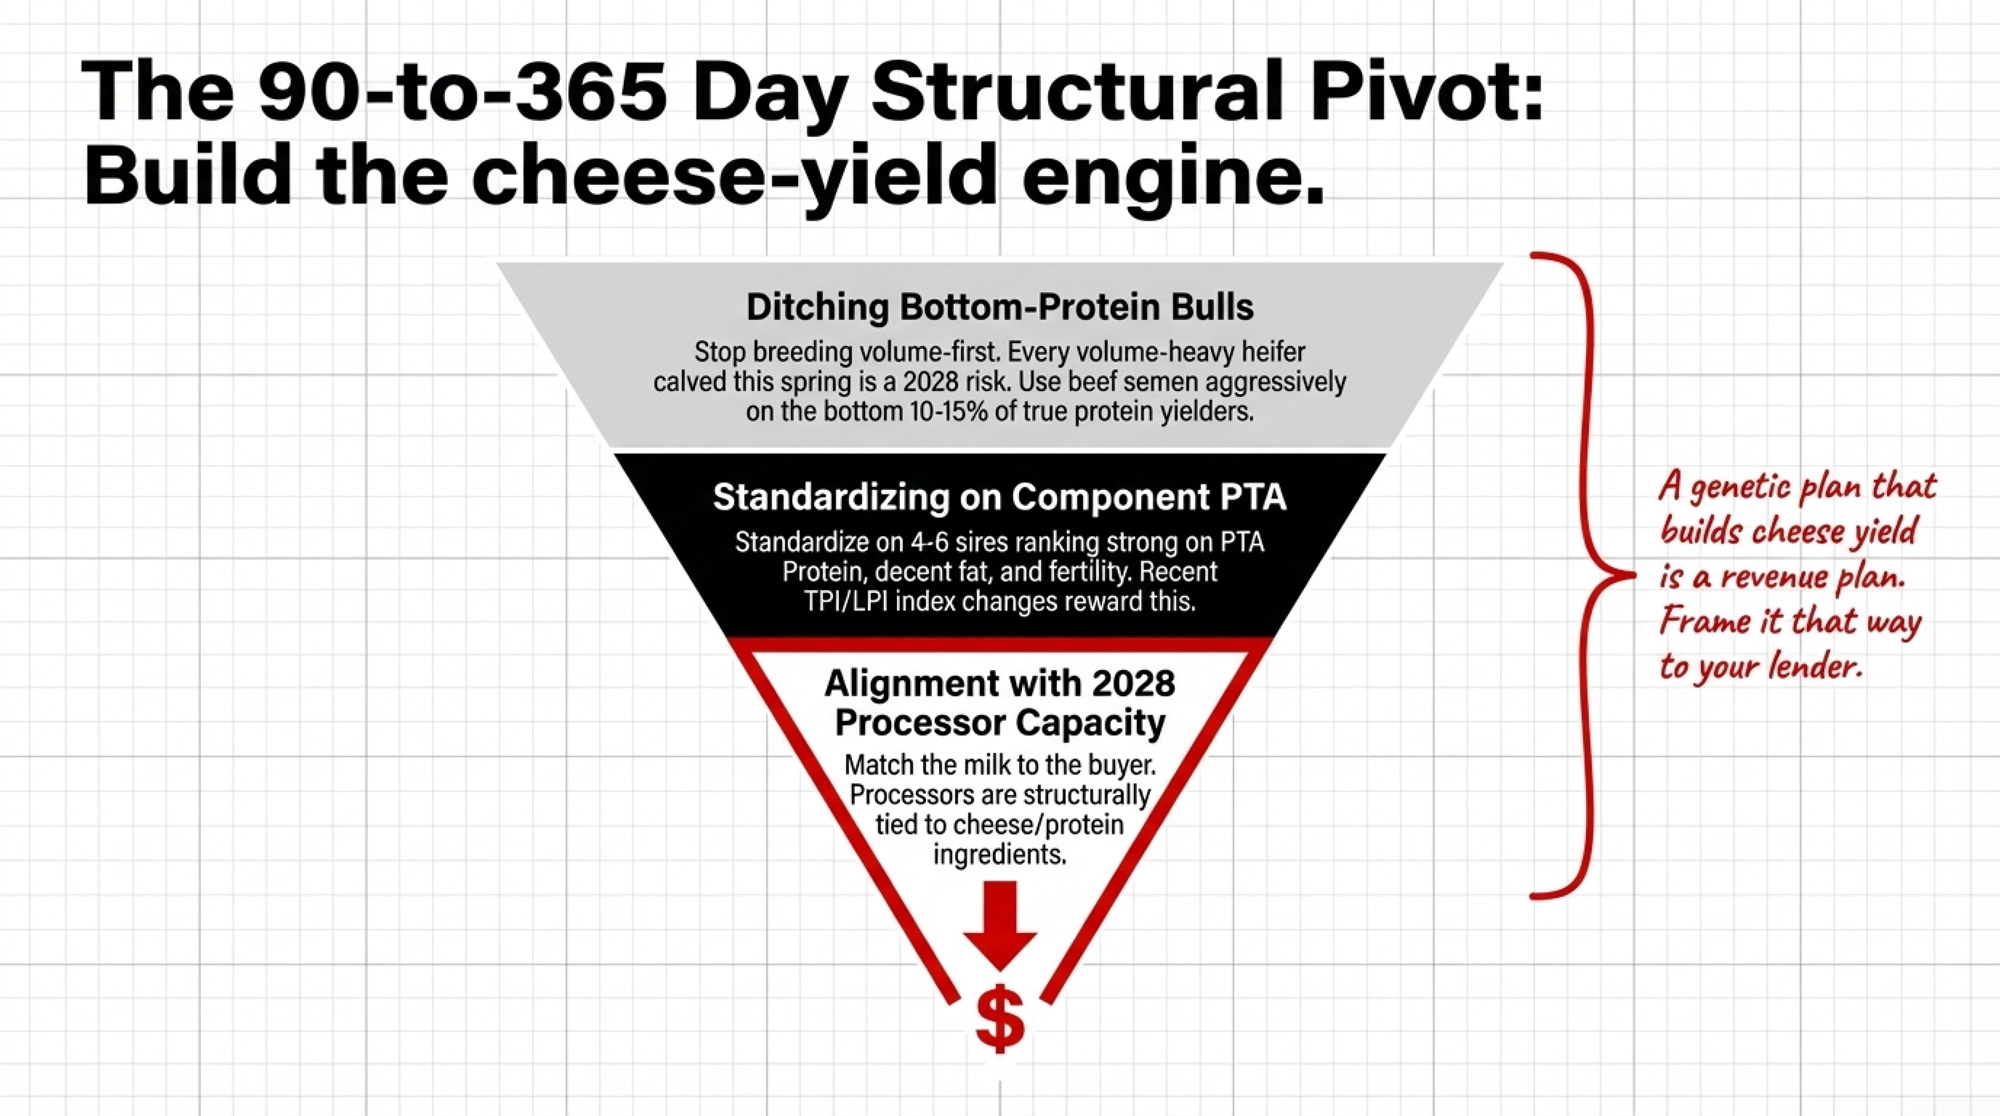
6. Build the cheese‑yield engine — starting with your sire stack. If your herd isn’t building the cheese‑yield engine of 2028, you’re breeding further out of line with a market that’s paying for protein and cheese yield, not liters. Every volume‑only heifer you calve this spring pushes you in the wrong direction in a Q3 2026 market that rewards components. Drop the bottom protein bulls. Standardize on 4–6 sires that rank strong on PTA Protein, decent fat, and good fertility. Recent TPI and Canadian LPI index changes increased the protein’s weight because processors and pricing structures are doing the same.
[Lender’s View] Your lender may not care which bull you use. But they absolutely care whether your revenue per cwt is trending toward or away from what your processor actually pays premiums for. A genetic plan that builds cheese yield is a revenue plan — frame it that way.
Next 365 Days
7. Cull with composition in mind. Use 12‑month test‑day data to flag cows in the bottom 10–15% for true protein yield. Let low protein be the tiebreaker when you’re on the fence. Use beef semen aggressively on genetic bottom‑end cows. You’re ratcheting the herd toward the milk your best buyers pay best for — one breeding decision at a time.
8. Align your risk calendar to your cash‑flow pinch points. Mark DRP quarterly sales closing dates, co‑op forward pricing windows, and DMC enrollment deadlines on a wall calendar — with your own “two weeks before” internal target for each. Buy protection when you can afford it, not when you desperately need it and can’t.
9. Run a basis and alternatives review before your next contract renewal. Have an advisor compare what you’ve actually received — net of hauling and premiums — versus what you’d get from a more component‑friendly buyer within realistic hauling distance. Part of that review: understand where the consolidation window is heading for your region and your processor. The leverage you have today isn’t guaranteed tomorrow.
What This Means for Your Operation
If you’re running 400–600 cows and haven’t locked any Q3/Q4 milk, roughly half your H2 volume is exposed to the kind of $1.50/cwt downside this article walked through. Pull your own H2 cwt, multiply by $1.50, and decide if you can absorb that hit without changing plans.
If your 2026 budget still uses 2025 nitrogen and fuel prices, you’re planning with the wrong year. Update those line items this month. If the gap exceeds one good month of milk cheques, your cash‑flow plan needs surgery — not a Band‑Aid.
If your co‑op can’t clearly explain how your milk fits their cheese and high‑protein strategy, you’re shipping into a plan you don’t fully understand. You don’t have to jump ship — but you need to know how much of your 2028 Mailbox Price depends on their capacity bets, not yours.
If your stress‑case H2 DSCR comes in under ~1.2x, your lender sees you as tight. Walk in with proof you’ve acted — DRP floors, updated budgets, manure credits — not just a good attitude.
If you’re still breeding volume‑first and protein‑second, every volume‑heavy heifer you calve this spring is a 2028 risk. Changing bulls and tightening culling is the cheapest way to start building the cheese‑yield engine. Low‑debt operations with strong cost structures may have more room to stay partially uncovered — but even they should be running the stress case, not just assuming the Q1 rally is the new normal.
Your 30‑day check: Pull your projected H2 2026 milk volume (cwt). Multiply by $1.50/cwt. Write that number next to your updated 2026 fertilizer + fuel increase. That spread is what you’re betting on if you do nothing. Now try filling in the three blanks from the lender script above.
Key Takeaways
Unhedged H2 milk plus outdated input budgets is a six‑figure bet that the Q1 rally was more than a mechanical squeeze. Very few 500‑cow herds can afford to be wrong on that bet twice.
DRP and DMC are the difference between having a floor under your Mailbox Price when Q3 softens and hoping the Board doesn’t move too fast. Skipping them in 2026 is a cash‑flow decision, not a paperwork decision.
Aligning genetics toward protein isn’t optional anymore. The herds that start building for cheese yield now see it in 2027–2028 cheques. The herds that don’t stay aligned with a slower‑growing, lower‑value part of the market.
Your lender’s question six months from now won’t be “Did you enjoy the rally?” It’ll be: “What floors did you buy, how does your DSCR hold in a stress case, and what’s your plan if the Board gives back $1.50 by October?”
The Q1 2026 rally gave you something real — not just better cheques, but a window to lock H2 margins at top‑20% levels while everyone else was still smiling at the Board.
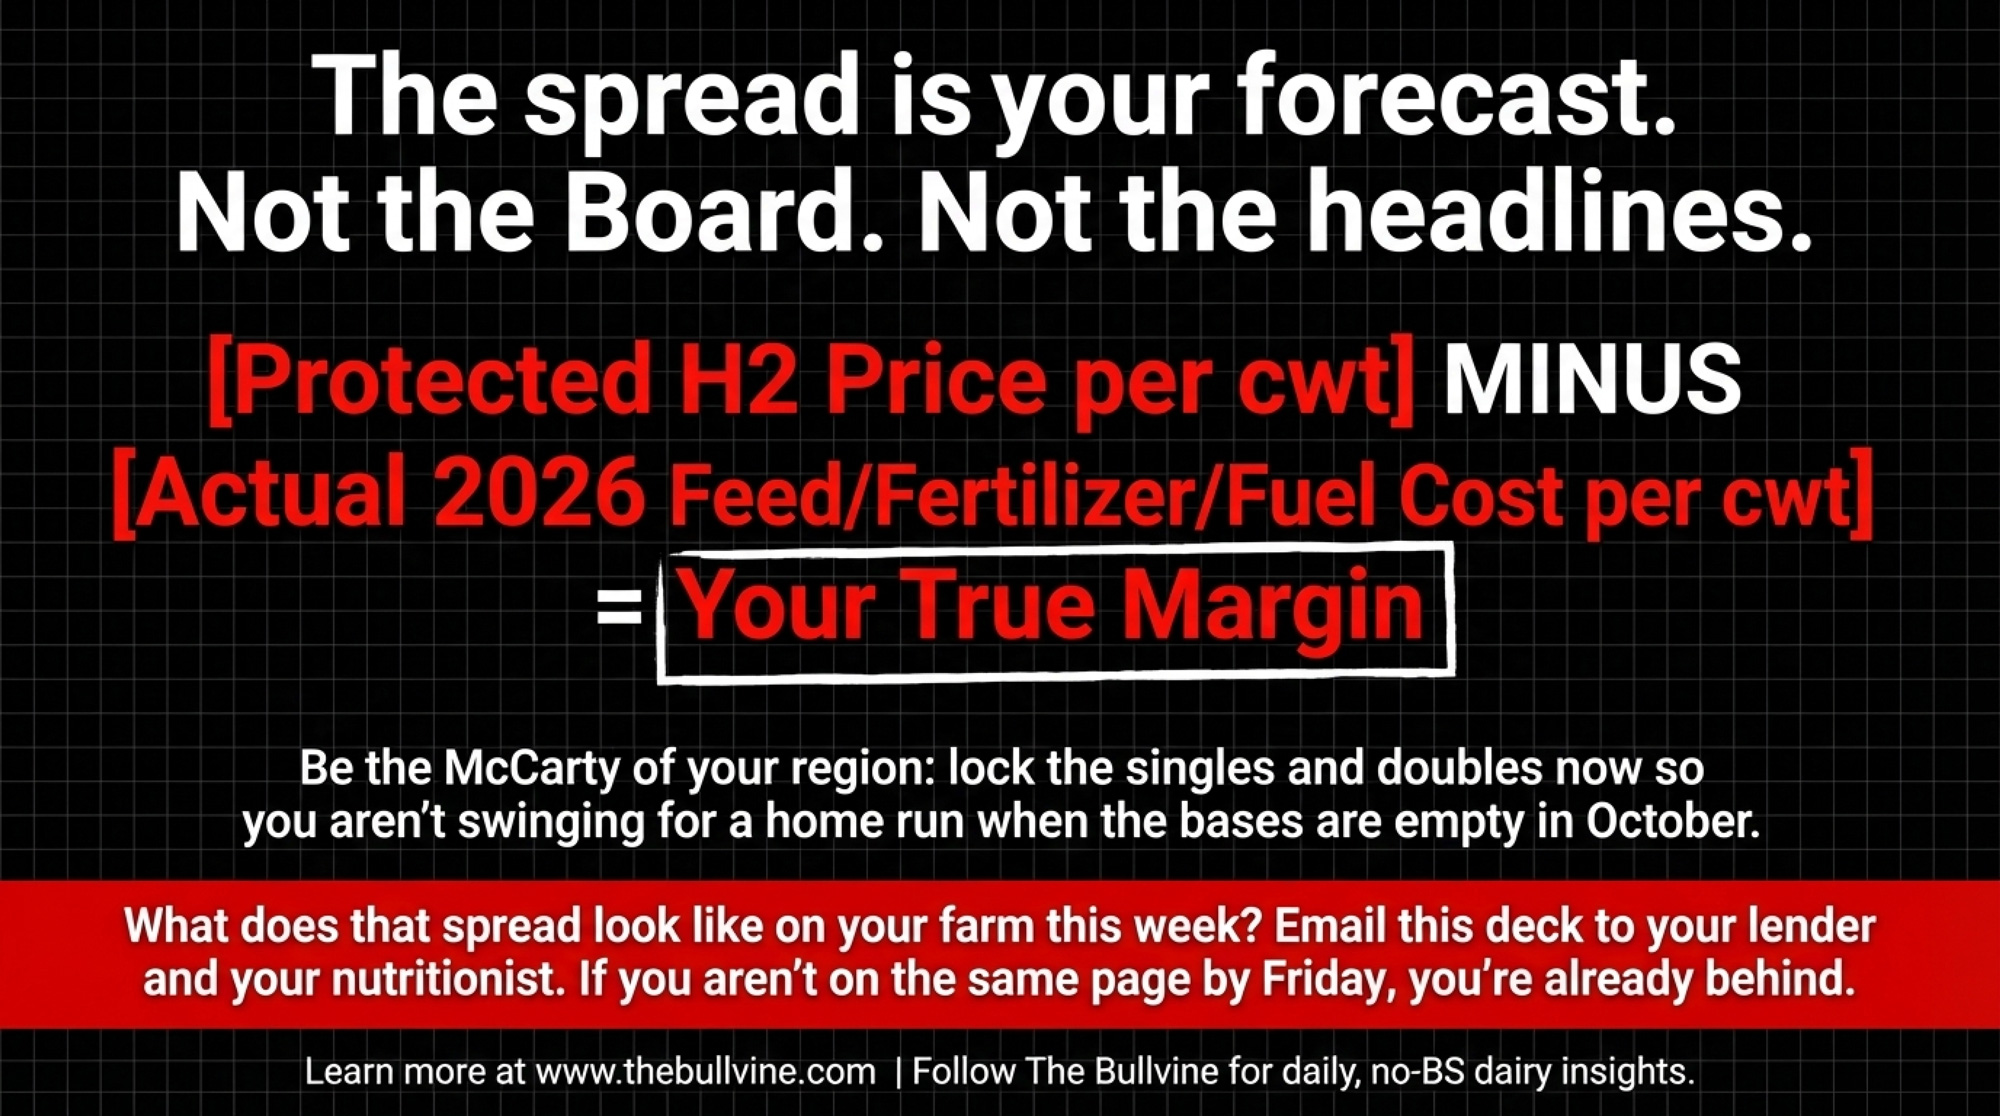
Before that window closes, pull two numbers: your protected H2 milk price per cwt and your actual 2026 feed + fertilizer + fuel cost per cwt based on this month’s quotes — not last year’s. Put them side by side. That gap is your forecast. Not the Board. Not the headlines. Not the feeling you got when that Q1 cheque hit.
Be the McCarty of your region: lock the singles and doubles now so you aren’t swinging for a home run when the bases are empty in October.
What does that spread look like on your farm this week?
Email this to your lender and your nutritionist. If you aren’t all on the same page by Friday, you’re already behind.
Complete references and supporting documentation are available upon request by contacting the editorial team at editor@thebullvine.com.
Every week, thousands of producers, breeders, and industry insiders open Bullvine Weekly for genetics insights, market shifts, and profit strategies they won’t find anywhere else. One email. Five minutes. Smarter decisions all week.
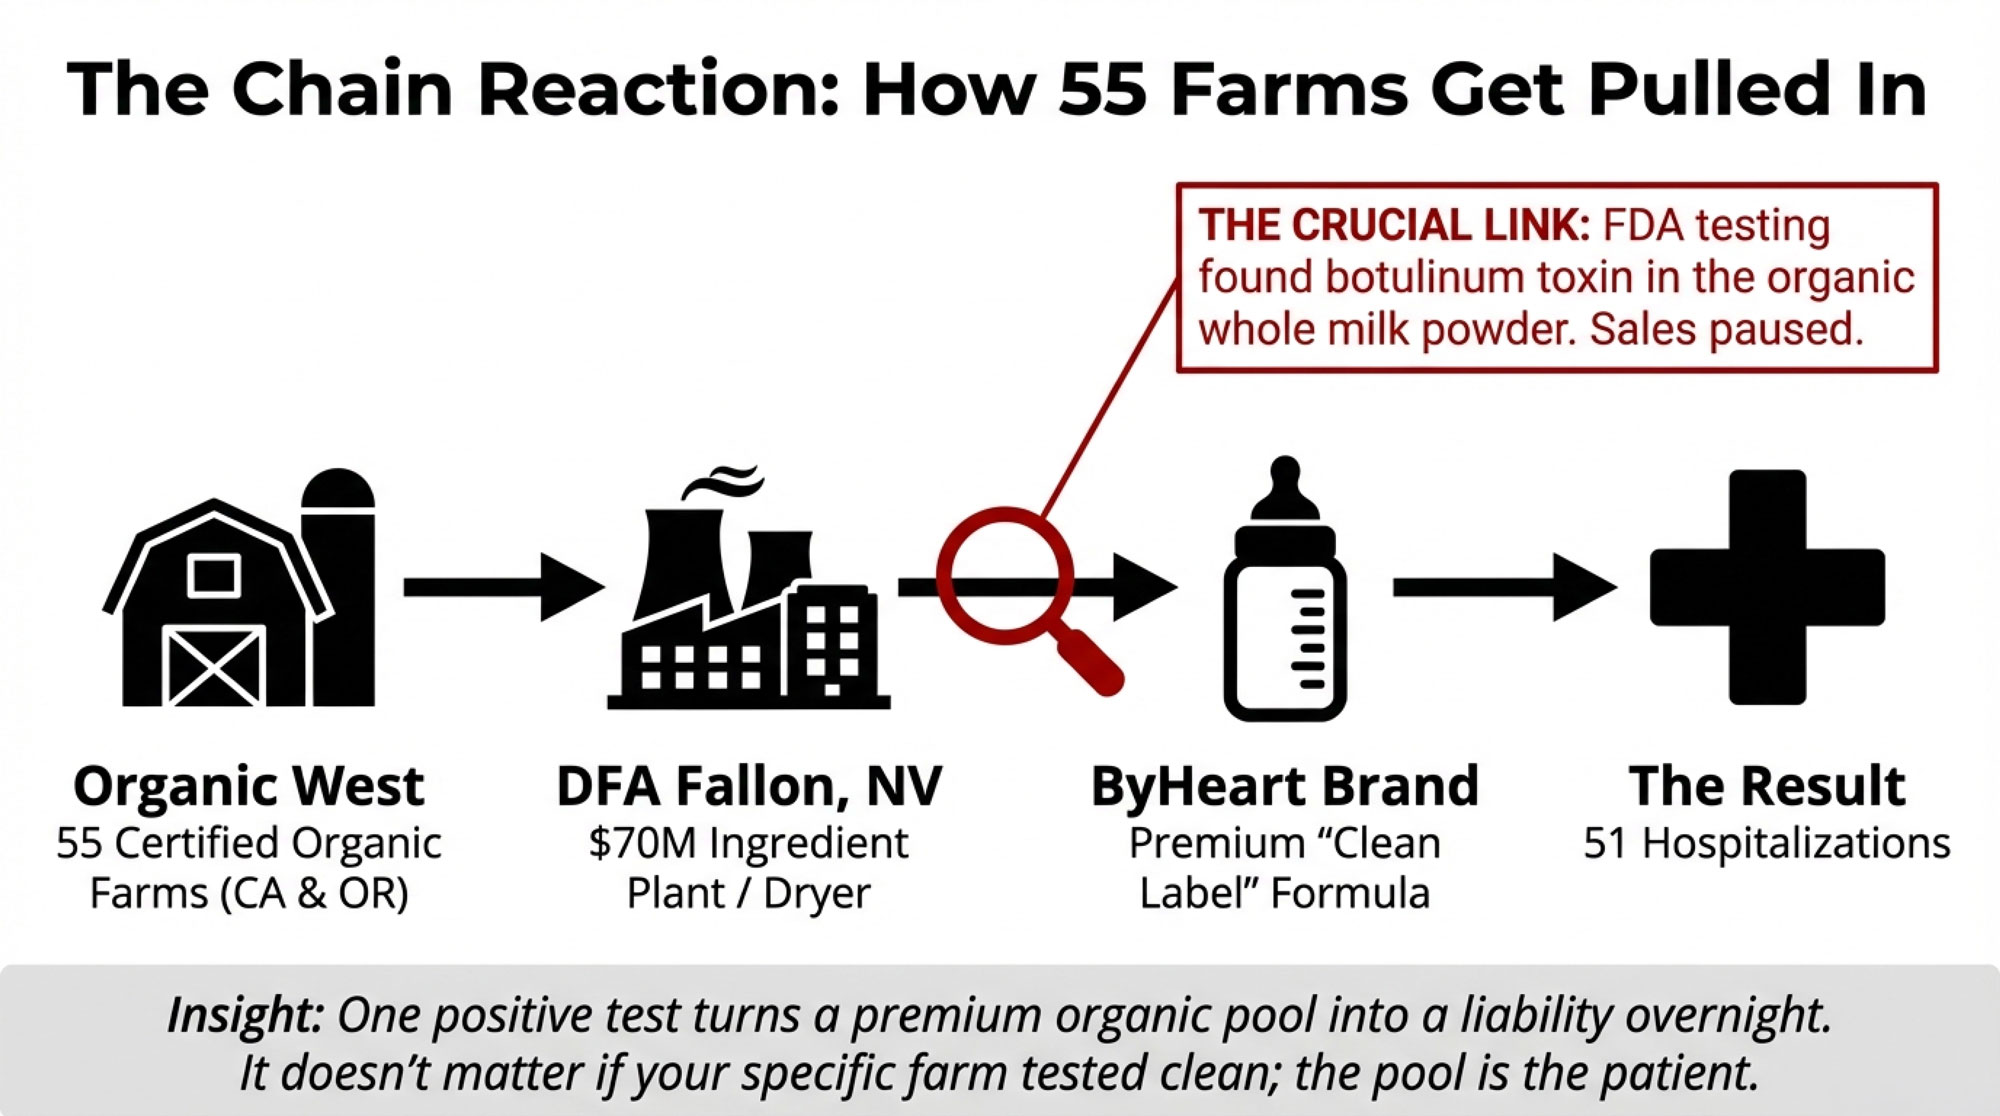
RAW FARM has weathered 7 outbreaks and 15 recalls. Could your 400‑cow herd survive even one hit like that?
Executive Summary: RAW FARM, the California raw‑milk giant formerly known as Organic Pastures, has been linked to seven outbreaks and 15 recalls since 2006, including a current E. coli O157:H7 raw cheddar investigation that’s sickened seven people in three states. CDC’s 2025 report on “dairy farm A” — widely identified as RAW FARM — logged 171 Salmonella illnesses and 22 hospitalizations, with 70% of cases in kids, showing how hard raw milk hits families when something goes wrong. On your farm, peeling 10% of a 400‑cow herd into raw or direct sales can look like an extra $580,000–650,000 a year, until you price in a realistic $3 million outbreak hit and see how much of that premium disappears. In our barn‑math Punch Test, that $3 million spread over 10 years adds about $8.33/cwt at 3,000 cwt/month — and a painful $25.00/cwt if you’re only moving 1,000 cwt/month. If your liability policy carries the ISO or AAIS raw‑milk exclusions insurance consultant Casey Roberts has flagged, that punch comes out of your equity, not your insurer’s cheque. Dog Mountain Farm in Washington put $75,000 into a USDA‑certified raw goat dairy and then found its carrier had quietly dropped raw‑milk coverage — a reminder that you can lose the safety net even before you have a claim. This article uses RAW FARM’s history, simple per‑cwt math, and a three‑path playbook to help you decide whether your own raw milk premium is strengthening your balance sheet or just turning into a $3 million gamble.
RAW FARM’s position on the current FDA investigation (March 21, 2026) Statement provided to The Bullvine by RAW FARM CEO Mark McAfee, March 21, 2026
“At Raw Farm our highest priority is nourishing our consumers with safe, Truly Raw, bioactive rich, non-thermalized, French Style, 60 day aged raw cheese. That is why we operate an on-farm pathogen lab. We get confirmation of negative pathogen status before any products are sold. Every batch of raw milk we produce is pathogen free before it becomes Truly Raw aged cheese where it is tested again before release. The FDA action is unfounded and not associated with our raw cheese. We know this because every batch of milk and cheese was tested individually. Three of the seven suspected illness cases denied ever consuming our raw cheese. This is data from PULSENET and collected over nearly 8 months of time. Two of the seven were seen at a hospital, the rest recovered at home. All of our tests and the state tests of products, both now and for the last year, have all tested negative. There is NO Recall and there is NO Outbreak associated with our raw cheese. We have the hard data to prove it. The last claimed illness was nearly two months ago. This action is misleading, unfounded and premature. No investigation has been concluded as required by the Food Safety Modernization Act. There is no threat to public health. If there was, we would be the first to act immediately.”
Editor’s note: McAfee also provided The Bullvine with test documentation including a CAHFS (CDFA) final lab report dated March 19, 2026 showing no detection of Campylobacter, Listeria, Salmonella, or STEC in sampled RAW FARM raw butter, raw cheese, and raw kefir; and RAW FARM’s own qPCR results from 11 retail cheese samples purchased March 17–18, 2026, all negative for E. coli O157:H7. These results reflect the specific lots and dates sampled. FDA’s investigation — based on whole‑genome sequencing of clinical isolates from patients whose illnesses date from September 2025 to February 2026 — remains open. As of this update, FDA confirms that no RAW FARM cheddar cheese products from the relevant time period have tested positive for E. coli.
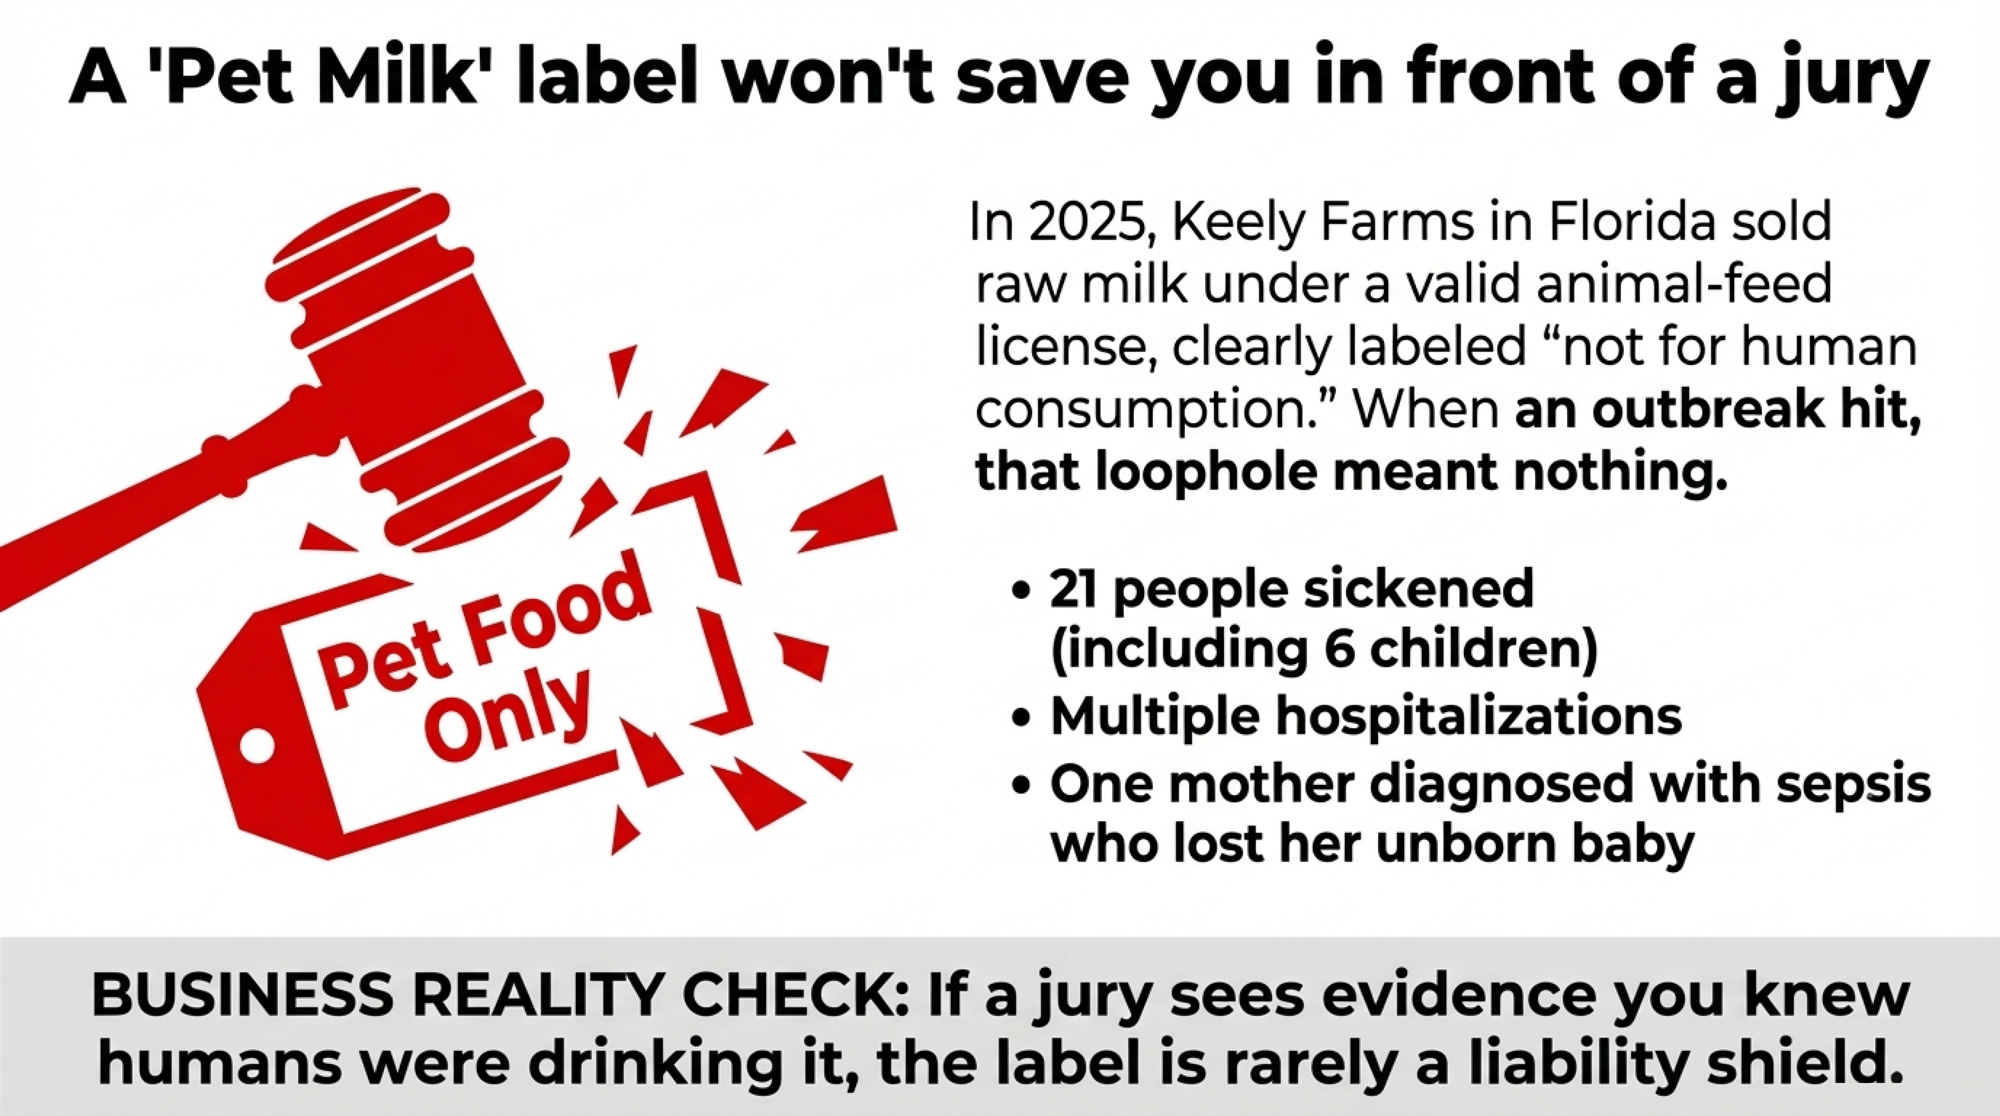
On March 14, the FDA posted the kind of notice that keeps direct‑sales dairies awake: an E. coli O157:H7 outbreak investigation tying illnesses in California, Florida, and Texas to RAW FARM raw cheddar cheese — not fluid raw milk, which RAW FARM sells only within California. Seven people confirmed sick across three states, with illnesses dating back to September 1, 2025. Two hospitalized. Four of the seven are children — median age three, youngest just one year old. RAW FARM CEO Mark McAfee told The Bullvine that only three of the seven patients reported eating RAW FARM cheese, and that the others identified different brands or locally purchased raw milk in other states.
The FDA recommended that RAW FARM voluntarily recall its raw cheddar. The company refused. RAW FARM President Aaron McAfee told Brownfield Ag News the farm was “not participating in a voluntary recall because they believe the claims are false,” pointing to internal testing at every stage from cow to cheese vat to finished product. In a March 16 consumer statement and in correspondence with The Bullvine, CEO Mark McAfee emphasized that the FDA action was a consumer alert, not a mandatory recall, and that no pathogens have been found by FDA, CDC, or CDFA in any RAW FARM product tested in connection with this event. A CAHFS lab report dated March 19, 2026, provided to The Bullvine by McAfee, confirmed no STEC, Salmonella, Listeria, or Campylobacter in sampled RAW FARM raw butter, raw cheese, and raw kefir. Some retailers pulled the cheese anyway — they didn’t wait for RAW FARM to decide.
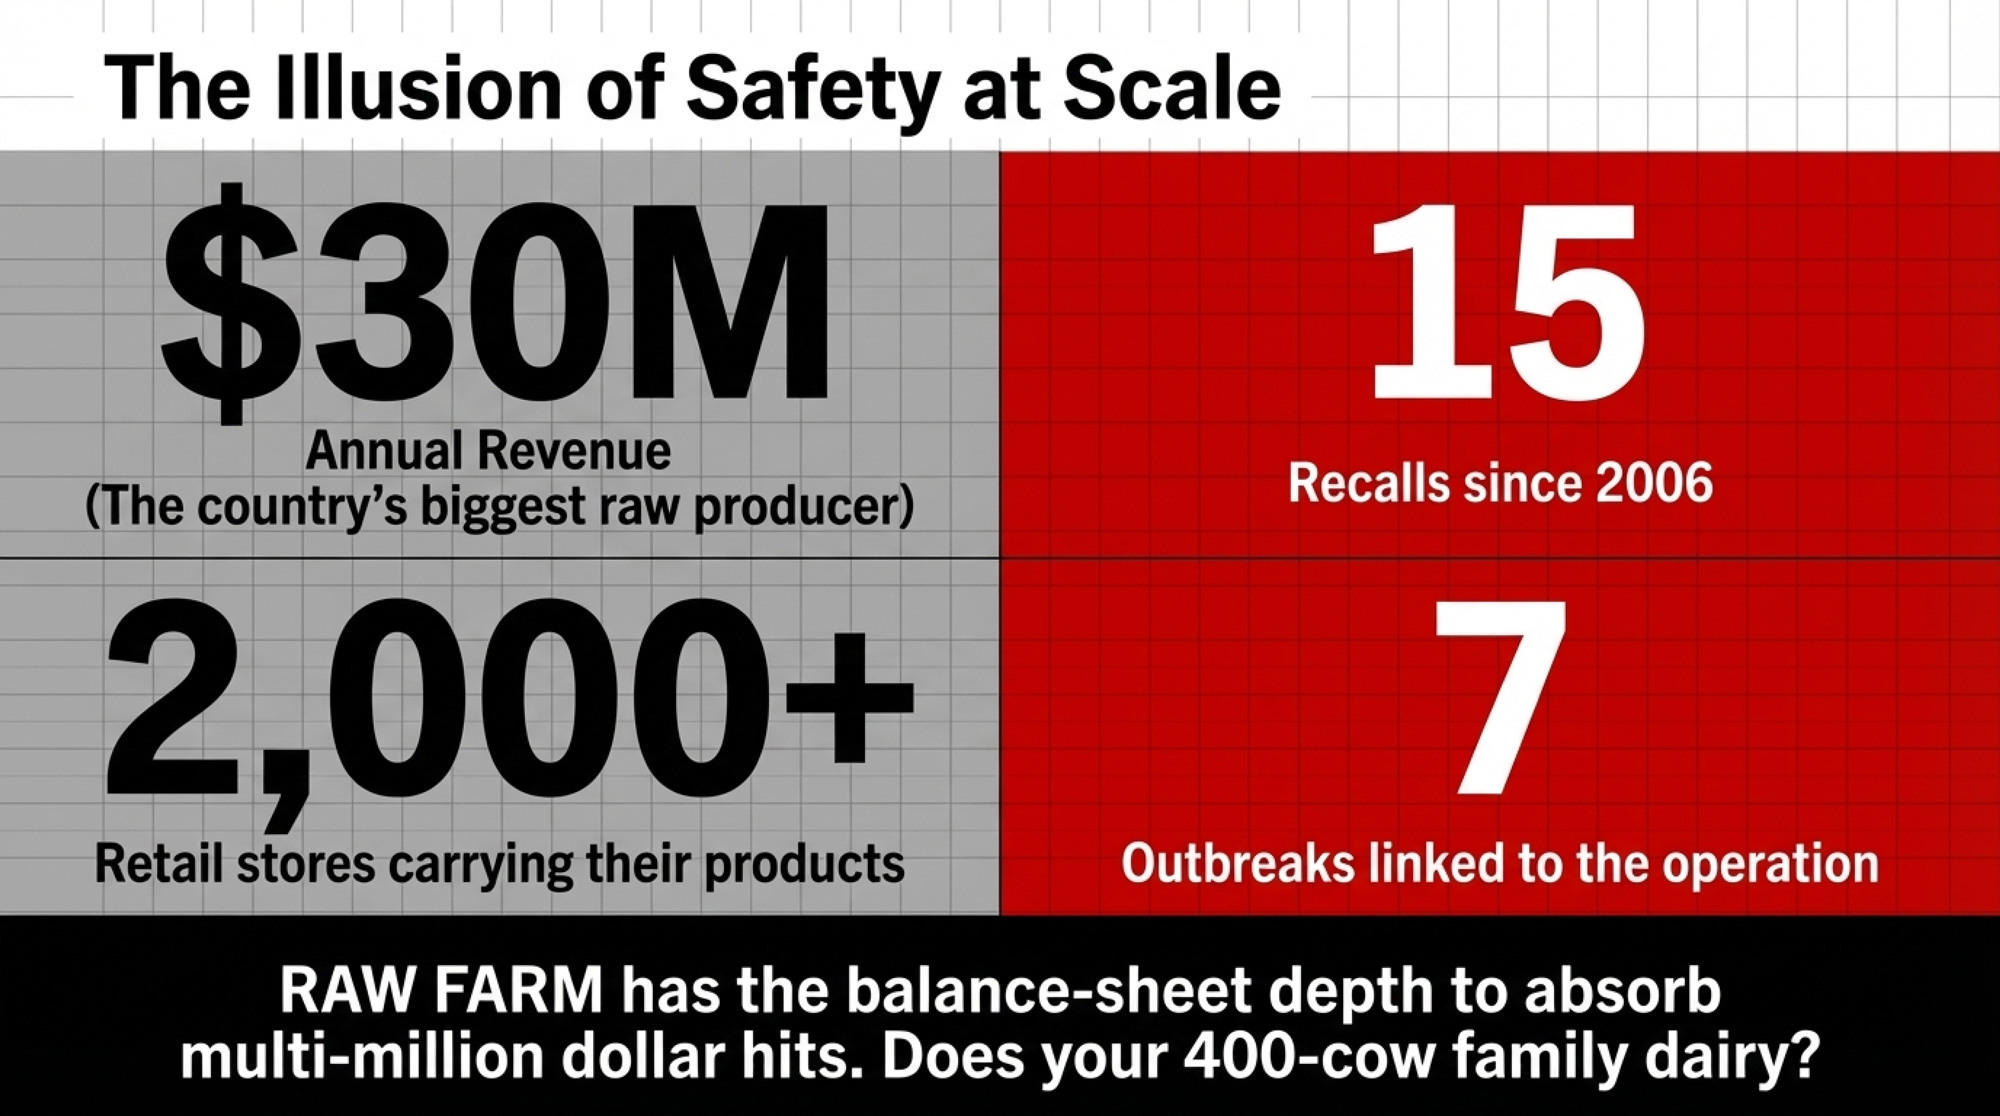
Whole-genome sequencing confirmed that the E. coli strains from the sick are genetically closely related, suggesting the patients were likely exposed to the same source. McAfee disputes the sufficiency of this evidence, arguing that WGS and PulseNet epidemiological data are investigative tools, not proof of causation, and that FDA has not performed a root‑cause analysis — including finding pathogens in any RAW FARM product — as he contends is required under the Food Safety Modernization Act. If you sell anything direct — raw milk, farmstead cheese, on‑farm yogurt — this isn’t just someone else’s PR crisis. It’s a case study in what the risk curve looks like when a raw‑dairy operation scales to about $30 million in annual revenue over two decades.
15 Recalls, 7 Outbreaks, and a $30 Million Brand
RAW FARM isn’t a cottage creamery that stumbled into trouble. Under the Organic Pastures name — rebranded to RAW FARM in 2020 after dropping organic certification — the McAfee family built what Forbes in December 2024 called “the country’s biggest producer of raw milk,” with sales exceeding million. Their operation spans about 800 acres near Fresno, California, housing around 1,200 cows according to Mark McAfee’s own account to the New York Times during the current investigation. Before the bird flu quarantine disrupted production, the LA Times reported that 1,800 cows across two farms — Fresno and Hanford — were affected in December 2024.
As of early 2025, KFF Health News reported RAW FARM products available in nearly 2,000 stores, with raw cheddar distributed nationally. Labels emphasize wellness positioning — RAW, A2/A2, TESTED, NON‑GMO, CERTIFIED HUMANE — signaling a premium, health‑conscious brand.
A documented legal and regulatory history
According to federal court records and reporting by Food Safety News and Marler Clark, Organic Pastures pleaded guilty in 2008 to two federal misdemeanor counts of introducing misbranded food into interstate commerce. A federal Permanent Injunction followed in 2010. By July 2023, a U.S. District Court found violations of that injunction, and Mark McAfee accepted a Consent Decree — as reported by Food Safety News in its coverage of United States v. Organic Pastures Dairy Co.
A case history compiled by the plaintiff firm, Pritzker Hageman, citing FDA and state health department records, lists at least 15 recalls and seven outbreaks involving Organic Pastures/RAW FARM products since 2006. Brownfield Ag News has separately reported that the operation has had “more than 10” recalls. RAW FARM has disputed the link between some illnesses and its products but has not publicly challenged those recall counts.
Outbreaks span two decades. A 2006 E. coli outbreak sickened four children ages 7 to 10; all were hospitalized, according to Pritzker Hageman’s case tracking. In 2011, five children ages 1 to 5 fell ill with E. coli — three developed hemolytic uremic syndrome. Campylobacter clusters in 2012 sickened 10 people, six of them kids. A 2016 E. coli outbreak sickened six more children.
The largest documented event
CDC’s MMWR report on the 2023–24 Salmonella outbreak, published in July 2025, anonymized the source as “dairy farm A.” Subsequent reporting by the LA Times, Marler Clark, and Pritzker Hageman has identified “dairy farm A” as RAW FARM. RAW FARM has publicly challenged parts of the FDA and CDC investigations into its products but has not, to date, issued a specific public statement accepting or rejecting that identification.
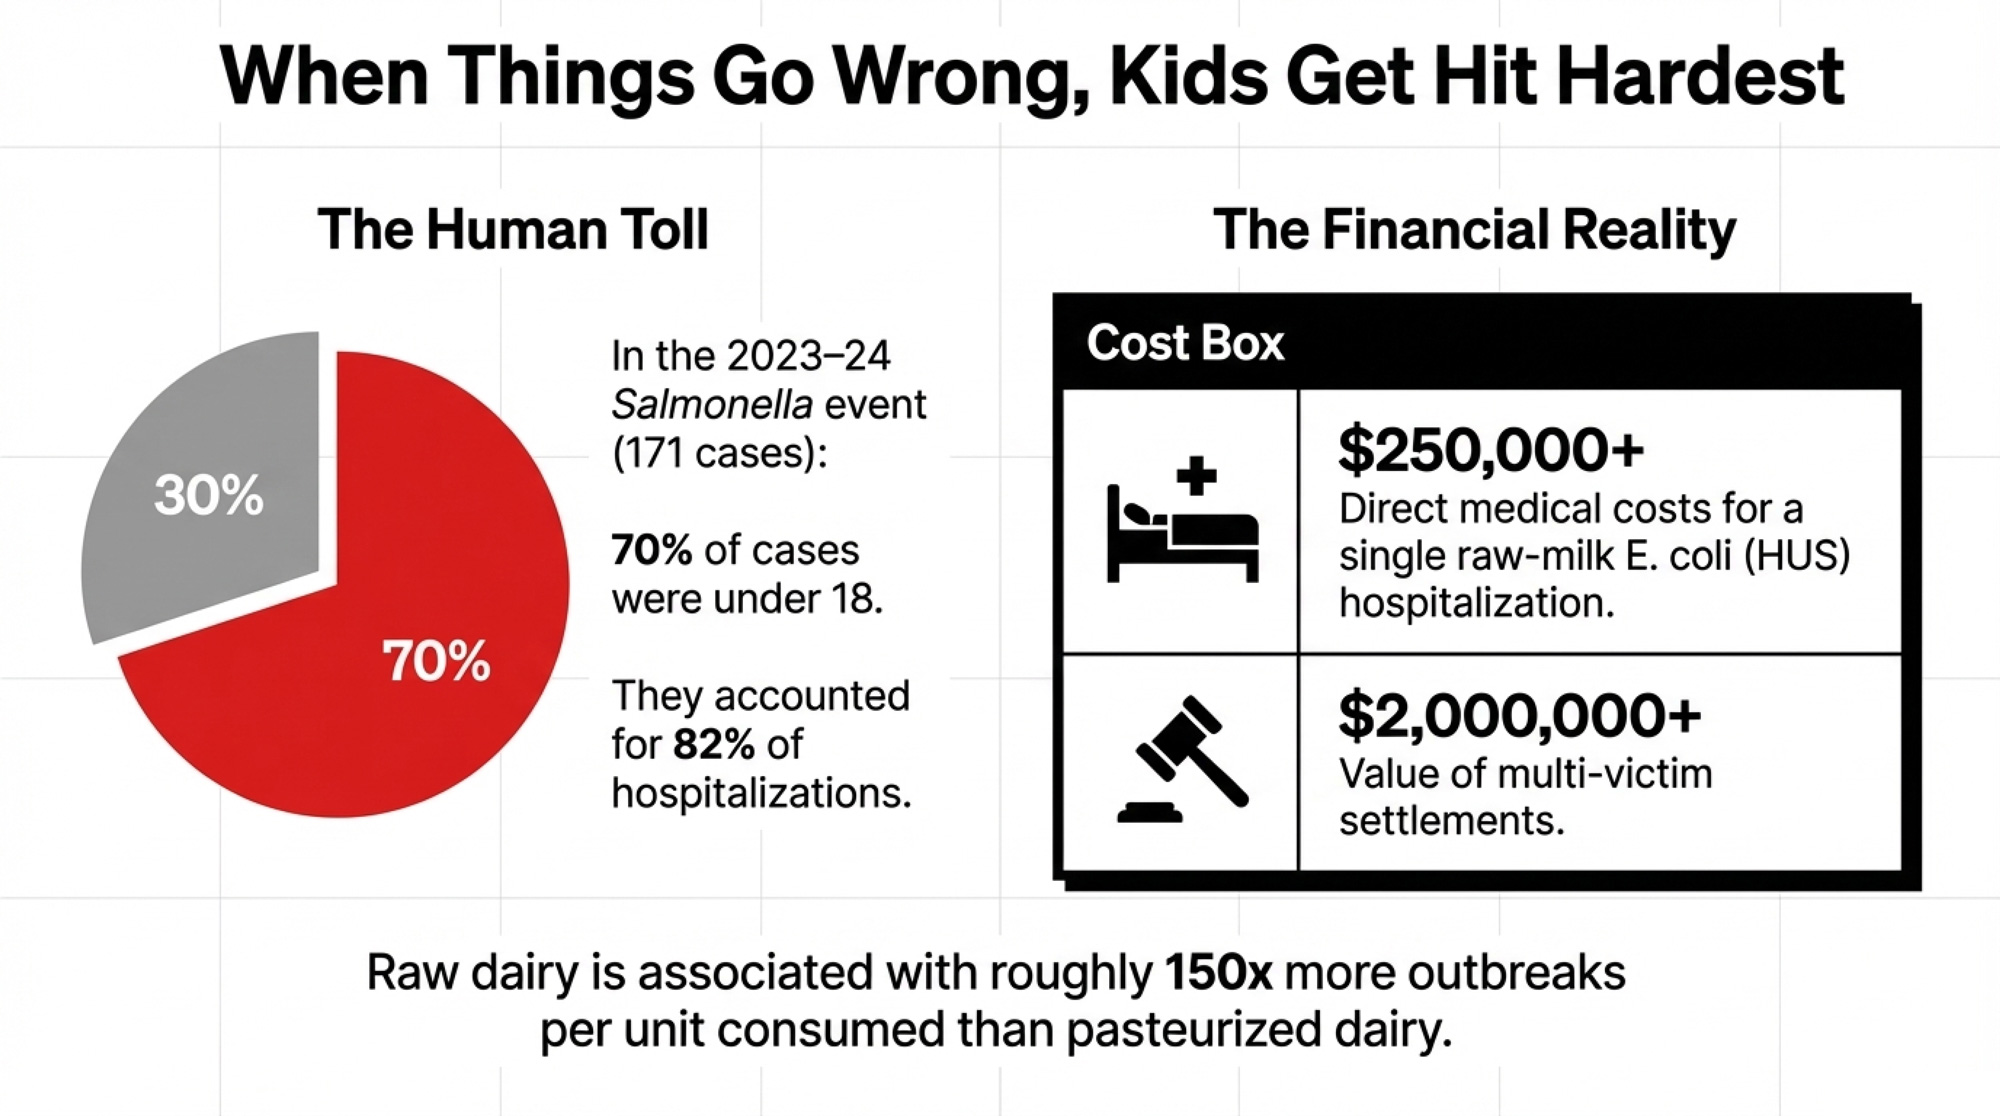
CDC’s MMWR reported 171 outbreak‑associated illnesses across California and four other states, with 22 hospitalizations. Case profile: 70% of all cases and 82% of hospitalizations were among children and adolescents under 18, with a median age of seven. Four product samples tested positive by whole genome sequencing, including raw‑milk cheese aged 60 days, the very aging period FDA allows for interstate raw cheese sales.
A CDC‑linked analysis of U.S. outbreak data from 1993–2006, published in Emerging Infectious Diseases, found that raw dairy was associated with roughly 150 times more outbreaks per unit consumed than pasteurized dairy. Demand keeps climbing —January 2024 media coverage quoted raw‑milk advocates saying demand has “dramatically increased” across the U.S. and Canada.
California already has one of the tighter raw‑milk regulatory frameworks in North America — Grade A inspection, mandatory pathogen testing, and warning labels. Notably, CDFA has not taken independent enforcement action on the current FDA investigation, and McAfee points to this as evidence that California’s own regulators do not see grounds for action. Even with that framework and a company of RAW FARM’s size and experience, the broader outbreak history shows that risk doesn’t disappear.
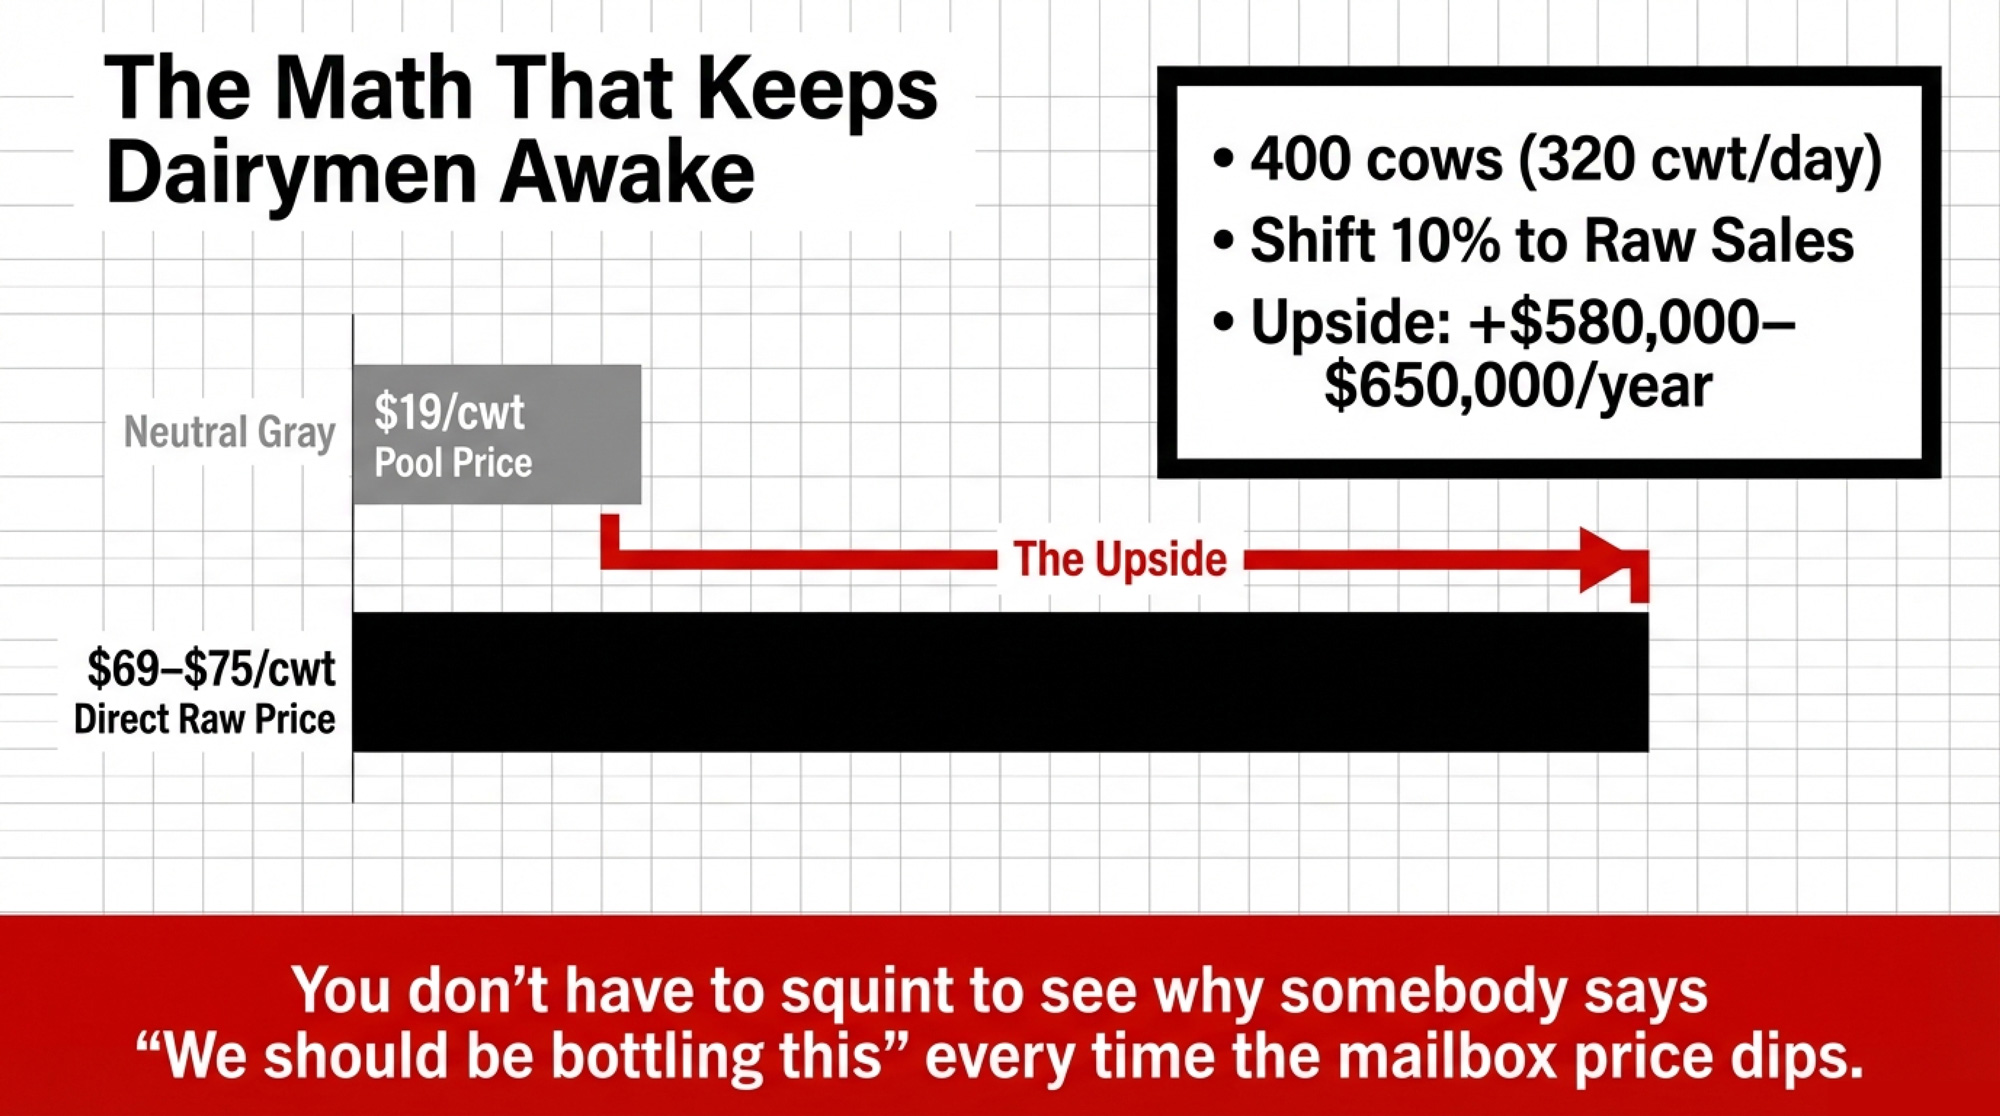
Does the Raw Milk Premium Really Look Too Good to Walk Past?
Take a 400‑cow herd averaging 80 lb per cow per day. That’s 32,000 lb — 320 cwt — shipped daily. Peel off 10% into direct‑sales products, and you’re moving about 11,680 cwt a year through your own bottle, vat, or farm store.
Pool that at $19/cwt, and it brings in roughly $221,900. Raw/direct at an illustrative $69–75/cwt — accounting for retailer margins and a mix of fluid and cheese — clears roughly $806,000–876,000 on the same volume. That’s a premium of 0,000–650,000 a year on just a tenth of your milk. You don’t have to squint to see why somebody says “We should be bottling this” every time the mailbox price dips.
Now, lay RAW FARM’s documented history beside those numbers. According to Pritzker Hageman’s tracking, seven outbreaks over twenty years work out to one every 2.9 years. Fifteen recalls are roughly one every 16 months — a frequency that, in our view, raises hard questions about how manageable raw‑dairy risk really is at scale, even at a company that outlets like Forbes have described as the country’s biggest raw‑milk producer. RAW FARM disputes links between some of these events and its products and notes that the current investigation involves raw cheese specifically, not fluid raw milk.
A ‑million‑revenue operation has fundamentally different financial resilience than a 400‑cow family dairy with –3 million in total annual revenue. If an operation at RAW FARM’s scale takes a hit, its balance sheet has a lot more room to absorb it than most family farms ever will. That’s the number most spreadsheets politely ignore.
How Much Risk Per Cwt Are You Actually Carrying?
By processing and selling direct, you keep the money the plant would’ve taken — packaging margin, brand premium, part of the retailer spread. But the risk mechanics blend probability and severity in ways that aren’t intuitive.
CDC and peer‑reviewed data show that unpasteurized dairy — fluid milk and cheese combined — causes many more outbreaks per unit consumed than pasteurized dairy. Kids get hit hardest — in the 2023–24 Salmonella event linked by multiple outlets to RAW FARM, 70% of the 171 cases were under 18, and 82% of hospitalizations were children and adolescents, per CDC’s MMWR. RAW FARM has publicly challenged parts of the investigations into its products.
Outbreak Event
Total Ill
% Children / Adolescents
Hospitalizations
% Hosp. Were Kids
Worst Outcome
2006 E. coli (Organic Pastures)
4
100% (ages 7–10)
4
100%
All 4 hospitalized
2011 E. coli (Organic Pastures)
5
100% (ages 1–5)
3
100%
3 developed HUS
2012 Campylobacter
10
60% (6 of 10)
Not reported
—
Cluster across multiple households
2016 E. coli
6
100% (children)
Not fully reported
—
CDPH recall triggered
2023–24 Salmonella (“Dairy Farm A”)
171
70% under 18
22
82%
Multiple pediatric hospitalizations
2025–26 E. coli O157:H7 (raw cheddar)
7 (confirmed)
57% (4 of 7)
2
Not specified
Median age 3; youngest age 1
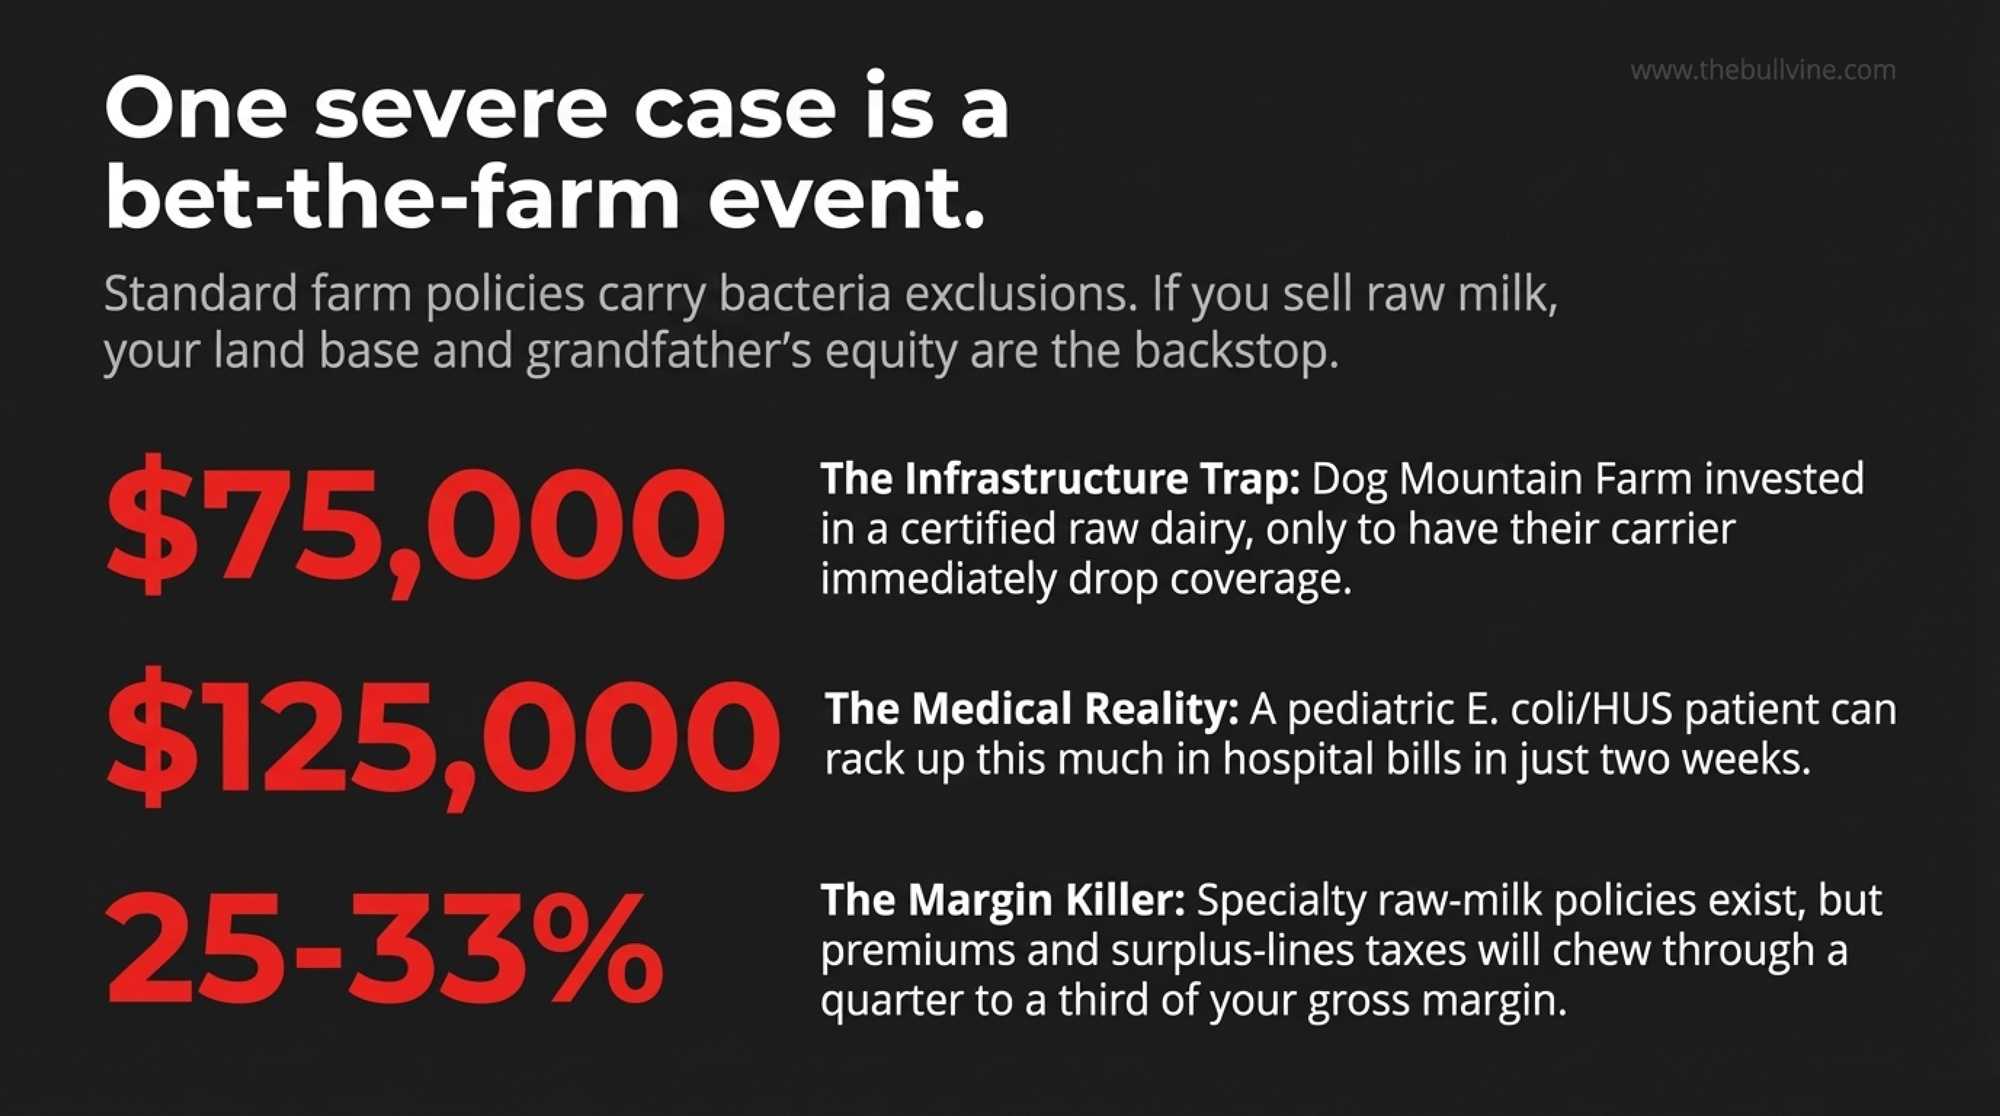
Serious cases are expensive. One child’s HUS hospitalization in the 2006 E. coli outbreak associated with Organic Pastures topped $250,000 in direct medical costs alone, according to case records cited by Marler Clark. Pritzker Hageman has described winning over $2 million for a single raw‑milk E. coli client.
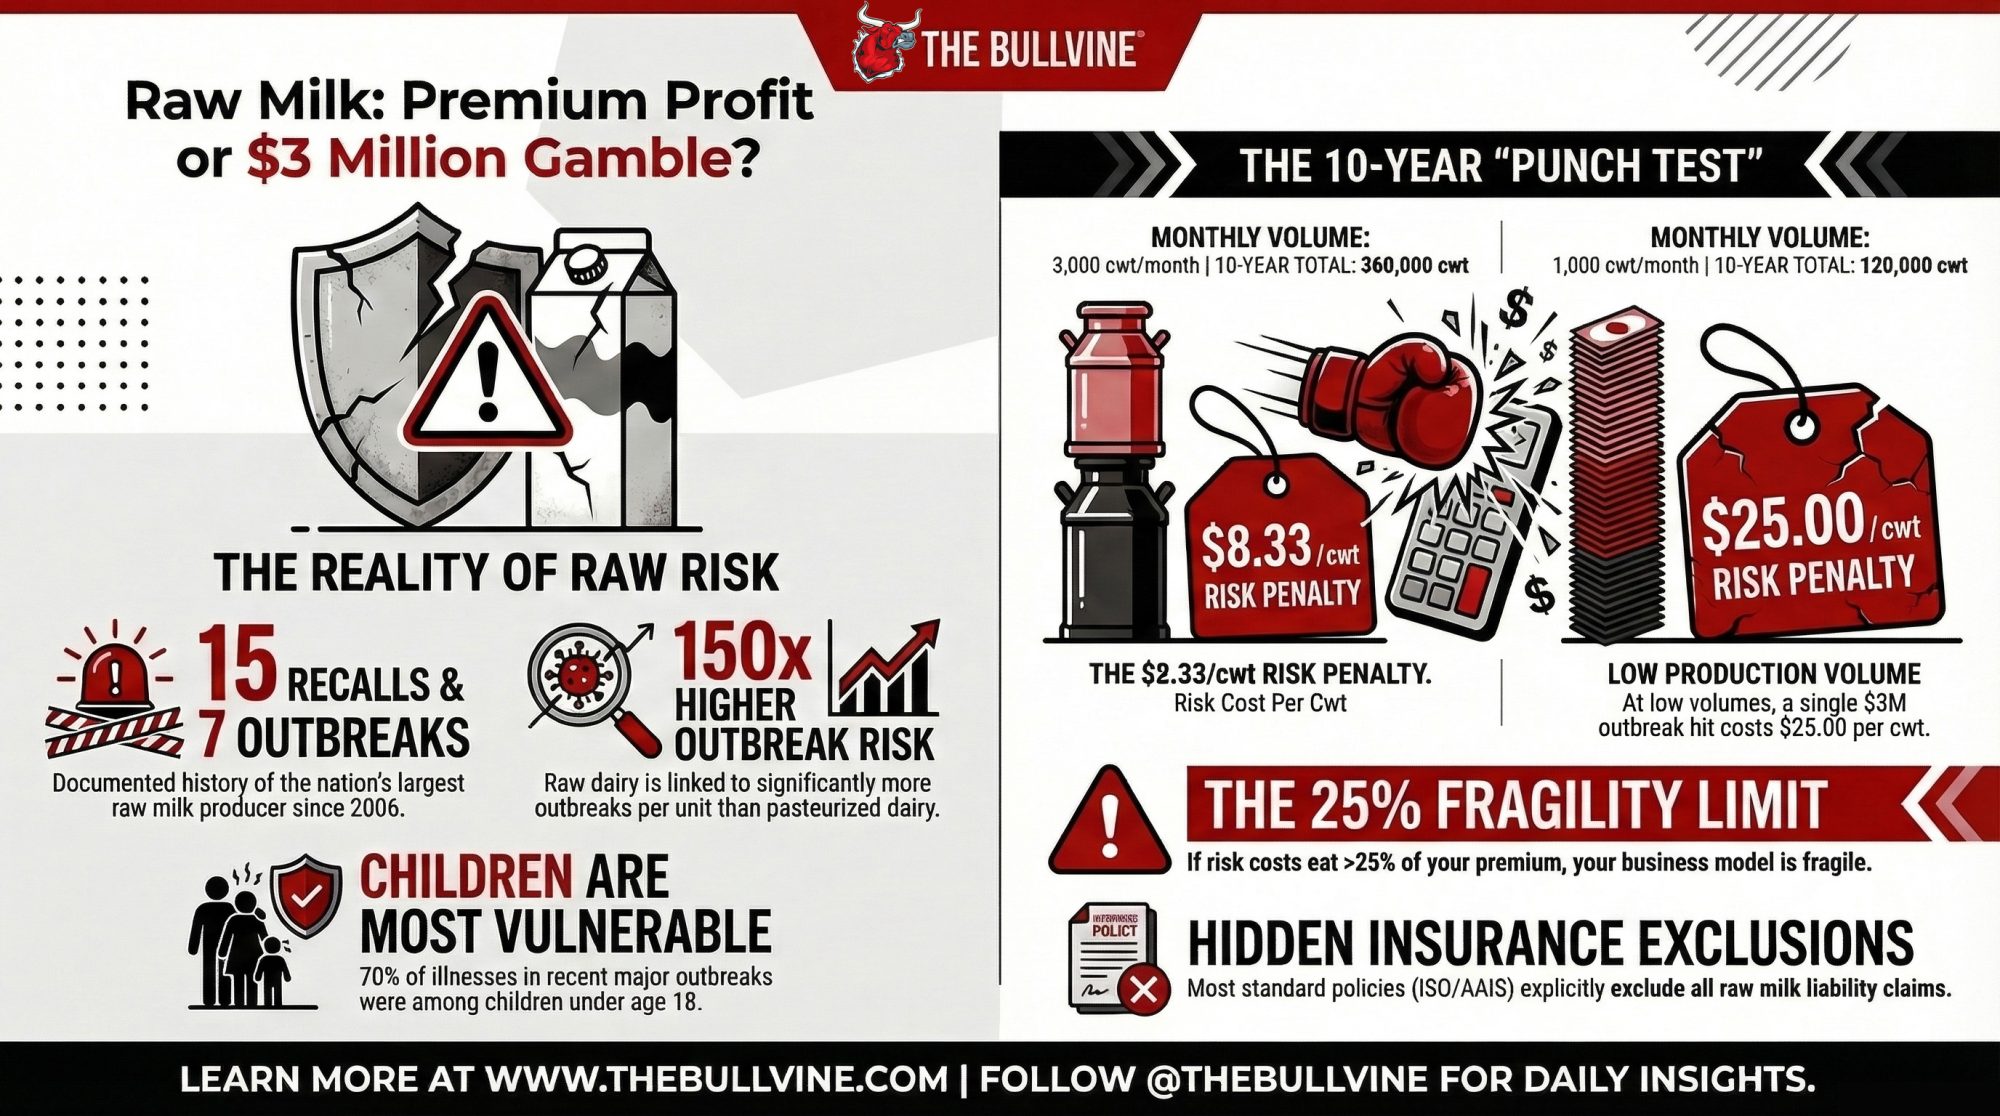
Now put that into barn math. Say you’re holding a $50/cwt premium over pool — a farm‑gate around $70 vs a $20 pool cheque. Maybe $3–5/cwt goes to testing, QA, and compliance.
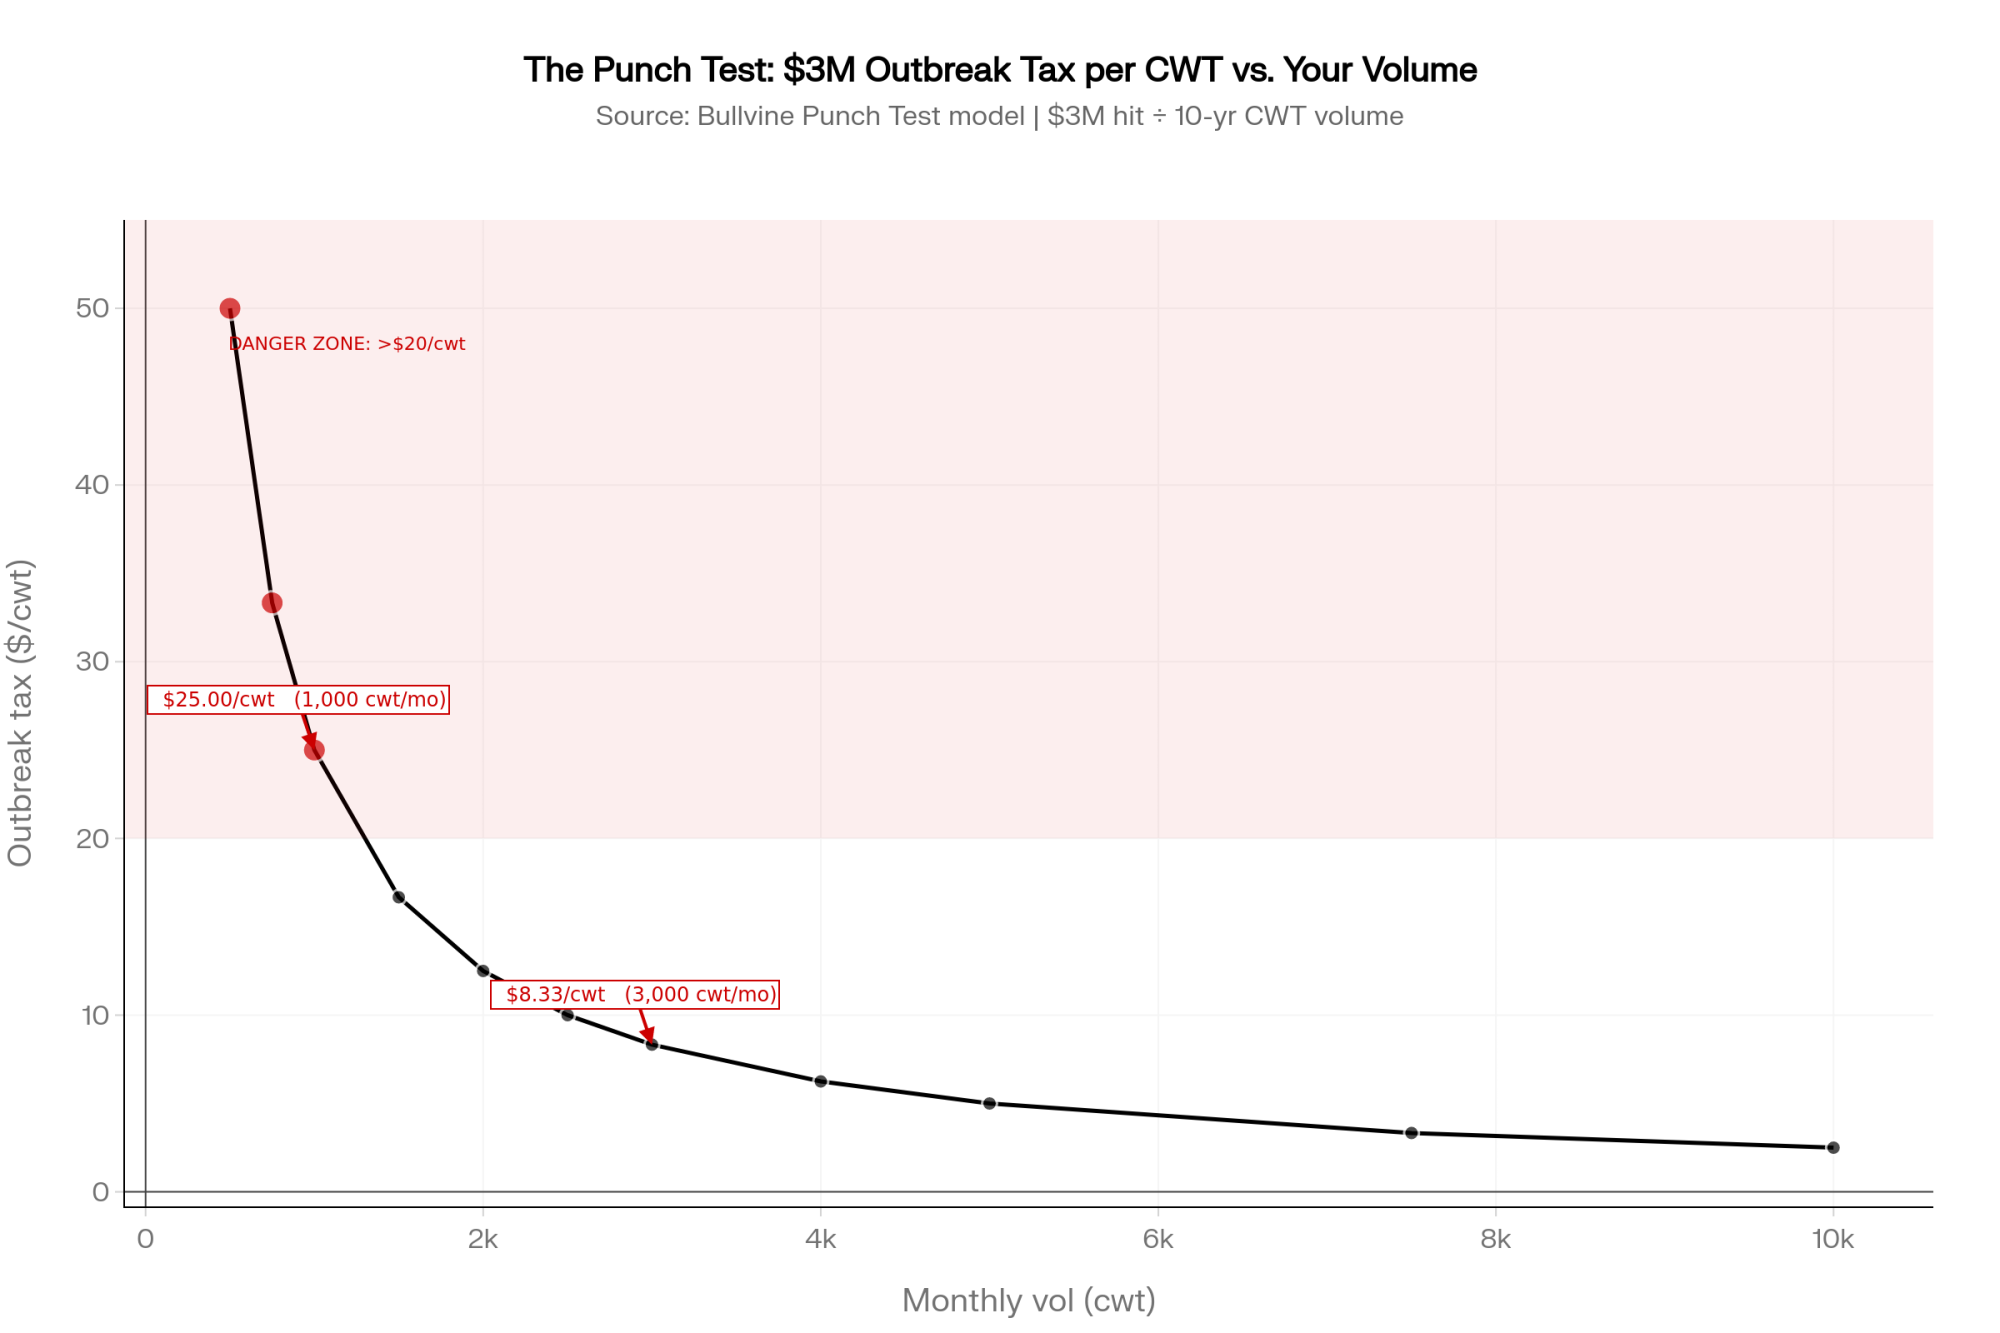
Layer in the outbreak tax. At higher volumes — around 36,000 cwt/year — a $3 million hit spread over ten years adds roughly $8.33/cwt. At 2,500,000 ÷ 360,000, you land closer to $6.94/cwt; shift the assumed hit up to $3 million, and you’re in that $8‑and‑change range. At 12,000 cwt/year, that same $3 million hit works out to $25.00/cwt. Most people never put that number on paper.
Combined, testing overhead and outbreak tax easily eat up roughly $8.50–$ 13/cwt at high volume. At lower volume, it can run $20–30/cwt. If your real premium is closer to $30–35 than $50, you’re in a game where the math only works as long as you never take the punch.
We broke down how processing premiums actually strengthen the balance sheet rather than stretch it in our look at Nebraska’s $186 million gamble.
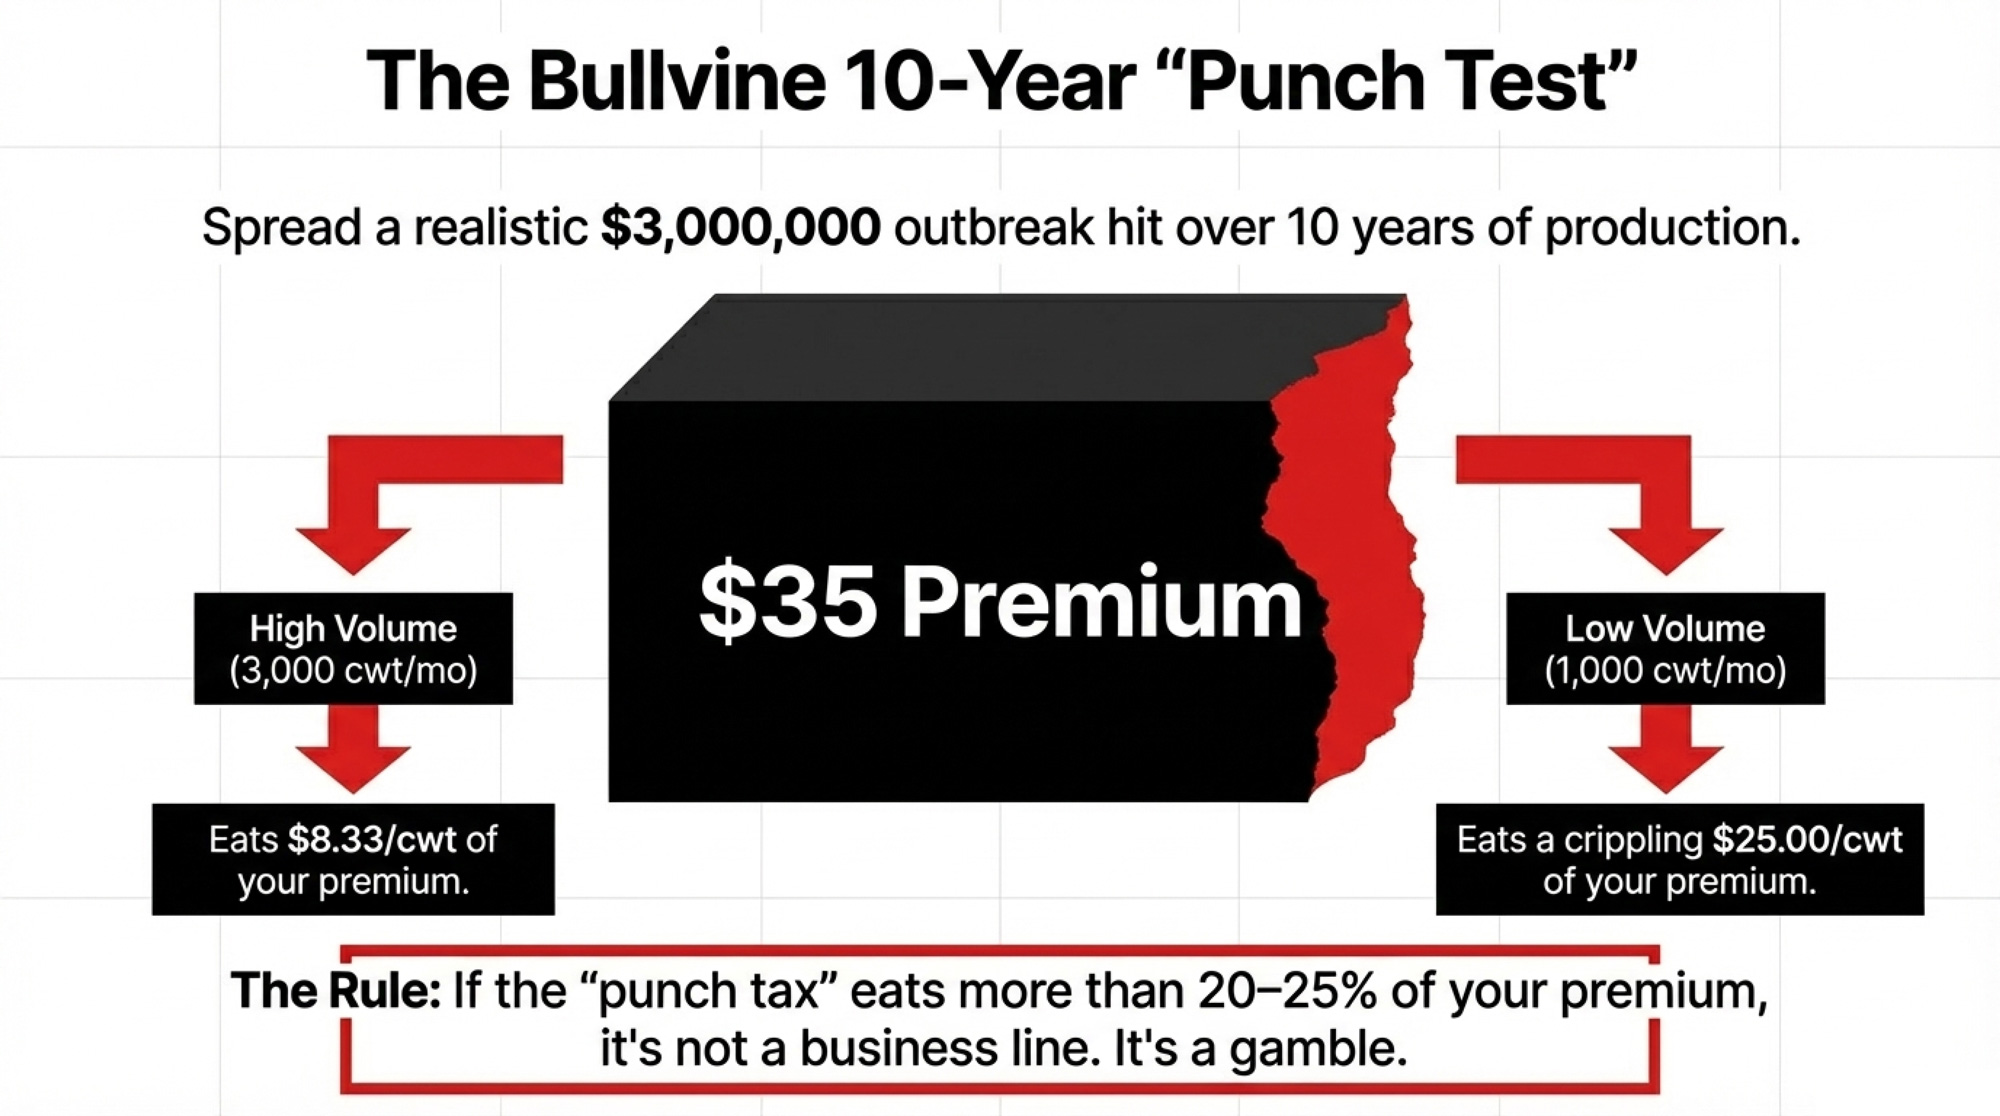
The Bullvine 10‑Year Punch Test
Step 1. Estimate a single realistic outbreak hit: $3 million all‑in (legal fees, settlements, lost business, brand damage). That’s a round but defensible number when you look at HUS hospitalization costs and multi‑victim settlements in raw‑milk cases.
Step 2. Calculate your 10‑year projected raw/direct volume in cwt. Example: 3,000 cwt/month = 360,000 cwt over a decade.
Step 3. Divide: $3,000,000 ÷ 360,000 = $8.33/cwt.
Step 4. Compare that to your premium over pool. If the punch tax eats much more than about 20–25% of your premium, the economics start to look more like a gamble than a farm business. At a $35/cwt premium, $8.33 is just under 24% of your upside spoken for.
Step 5. Run it at your real volume. A smaller line at 1,000 cwt/month: $3,000,000 ÷ 120,000 = $25.00/cwt — more than 70% of a $35 premium. Scale matters. So does honesty.
Swap in your own premium and monthly volume here. Don’t guess — pull last year’s numbers and do the math.
Is Your Policy Written for the Product You’re Actually Selling?
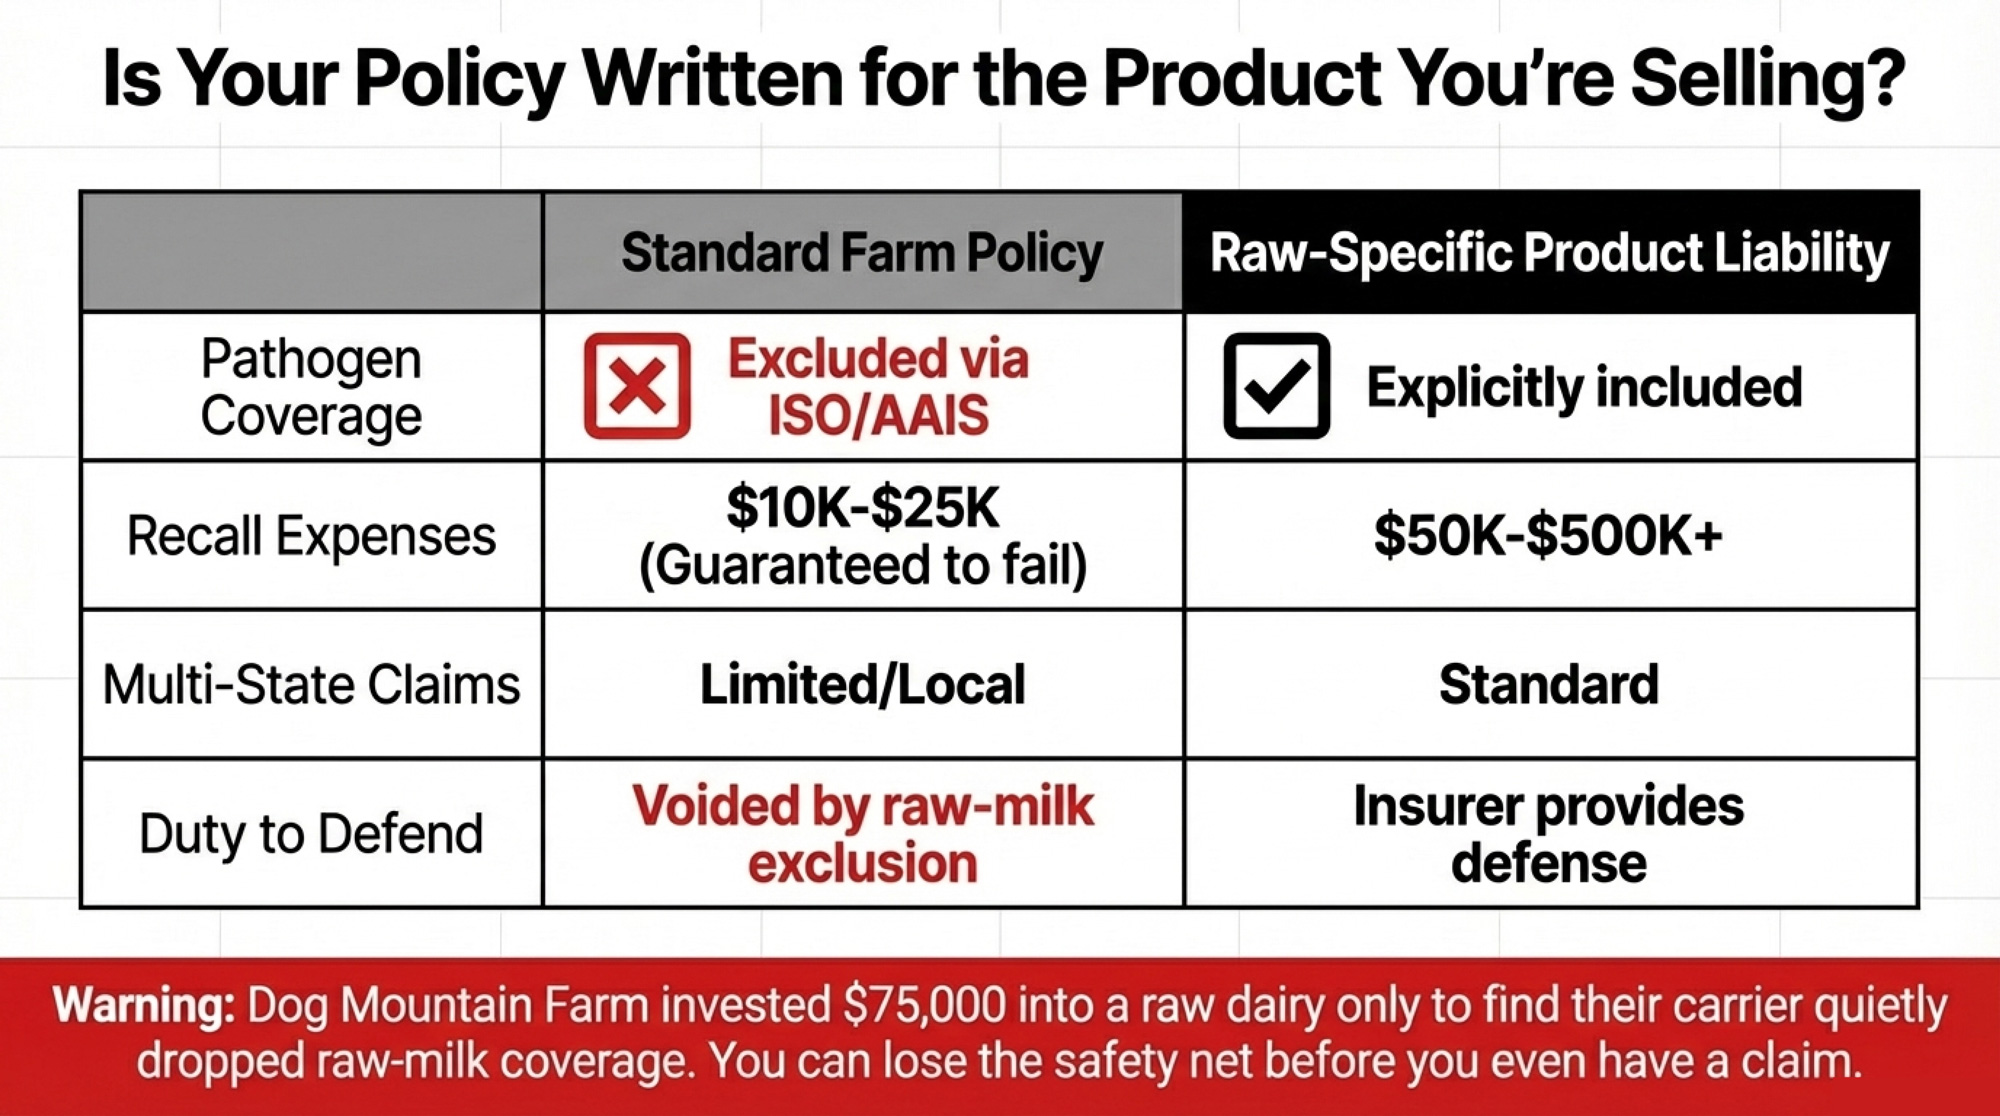
This question decides whether an outbreak is “a terrible year” or “we’re selling the home farm.” And it’s not hypothetical — producers have discovered this the hard way. Dog Mountain Farm near Carnation, Washington, invested ,000 in a USDA‑certified raw goat milk dairy and then learned their carrier had dropped their raw‑milk coverage, according to Food Safety News. Owner Cindy Krepky was left searching for a replacement policy after her carrier dropped raw‑milk coverage. Denver insurance broker Kendall Turner told the same outlet that it’s “become very difficult for dairy farms to obtain liability coverage for the sale of raw milk” — and that “the insurance company sometimes has more rules than the state.”
Before you scale — before you sell the first gallon — pull your policies and get this answered in writing:
Does our liability and umbrella coverage explicitly include unpasteurized milk and raw‑milk cheeses we sell directly or through retailers, with no special exclusions or lower sub‑limits for foodborne illness?
Both ISO and AAIS publish standard raw‑milk exclusions that insurers bolt onto farm liability policies. Insurance risk consultant Casey Roberts, writing in IRMI in October 2025, reviewed these exclusions and compared them to “a total pollution exclusion” in how completely they shut out raw‑milk claims.
ISO’s farm liability exclusion reads: “This insurance does not apply to… ‘Bodily injury’, ‘property damage’, ‘personal injury’ or ‘advertising injury’ resulting from the production, processing, distribution, bottling, transportation or selling of raw or unpasteurized milk.”
AAIS’s version (GL 4000 01 17) is similarly broad, excluding bodily injury or property damage “arising out of the consumption of” raw milk or raw milk products. One national farm insurer’s proprietary endorsement goes further — excluding “any duty we have to defend ‘suits’” arising from raw milk. They won’t pay, and they won’t show up in court with you.
Roberts described these exclusions as designed to “completely exclude” all raw‑milk liabilities. If your policy has any version of this language, your headline coverage limit doesn’t apply to your raw line.
Standard Farm Policy vs. Raw‑Specific Product Liability
Feature
Standard Farm Policy
Raw-Specific Product Liability
Pathogen coverage
❌ Typically excluded via ISO/AAIS raw-milk endorsement
✅ Explicitly includes raw & unpasteurized products
Raw-milk exclusion language
Applies: “does not apply to…production, processing, distribution…of raw or unpasteurized milk” (ISO)
No exclusion; raw products named and covered
Recall expense limit
$10K–$25K per event (BOP/GL standard)
$50K–$500K+ via standalone recall endorsements
Multi-state claims
❌ Limited; written for local operations
✅ Designed for distribution beyond farm gate
Duty to defend
⚠️ May be voided by raw-milk exclusion endorsement
✅ Insurer provides legal defence — contractually
Annual premium cost indicator
Lower (raw risk not priced in)
Higher — but reflects actual exposure
Real-world example
Dog Mountain Farm: $75K invested, coverage dropped silently
Policies explicitly named by product line
Within the next 30 days, do this: pull every policy and endorsement touching liability and products. Search for “raw,” “unpasteurized,” “high‑risk food,” “foodborne illness,” and “direct‑to‑consumer.” Get a clear, written answer from your agent on what’s covered and what truly raw‑inclusive coverage would cost at your current volume.
If that exercise leaves you queasy, that’s the most useful thing you’ll learn this month.
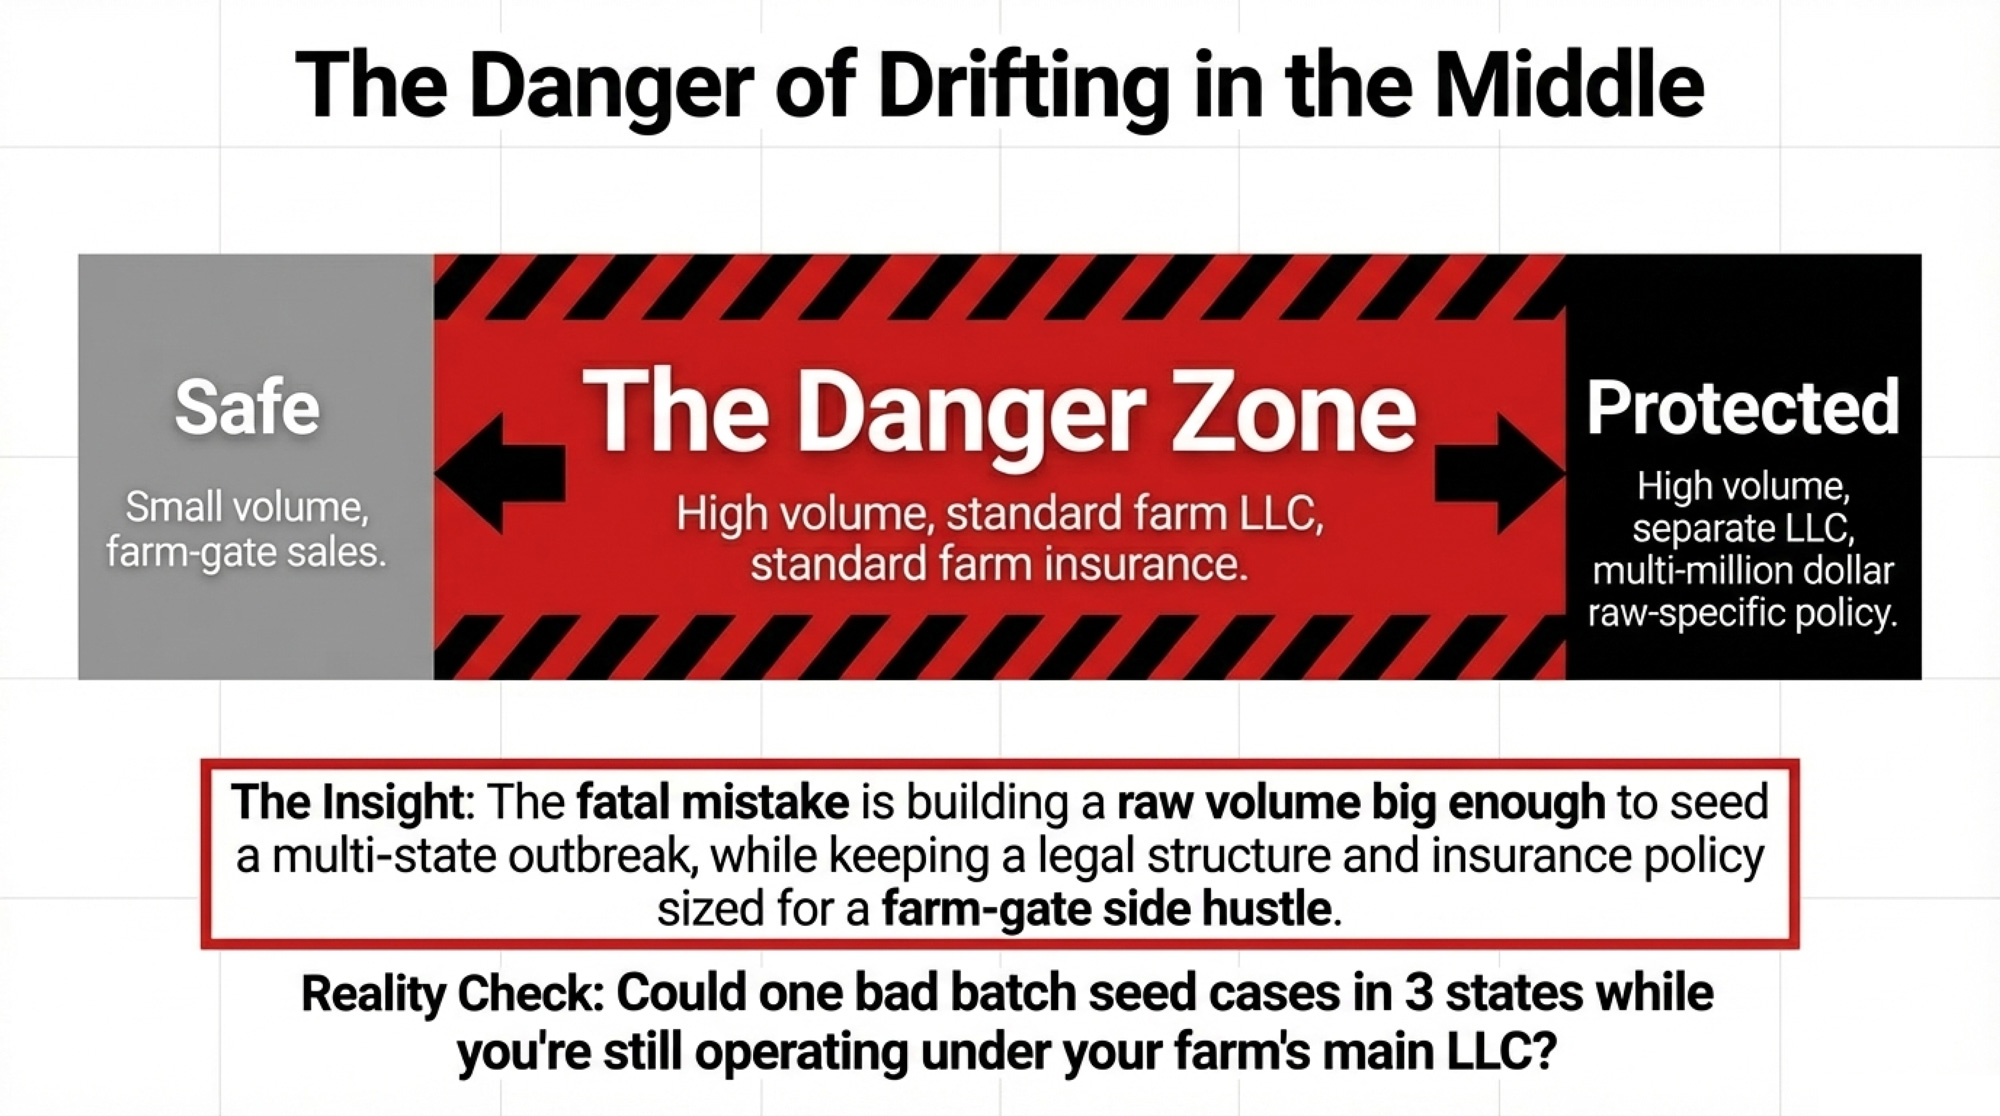
Once you run the Punch Test on your own numbers and stare your coverage in the face, you’re basically picking one of three paths. None is automatically right or wrong. The danger is drifting in the middle — raw volume big enough to seed a multi‑state outbreak, but structure and coverage still sized for a farm‑gate side hustle.
Dimension
Path A — Capped Local Premium
Path B — True Business Line
Path C — Stay Out / Lower-Risk Value-Add
Monthly volume
Under 500 cwt/mo
500–10,000+ cwt/mo
Any — raw not the vehicle
Annual raw revenue (illustrative)
<$415K
$415K–$8.3M+
N/A (pasteurized or genetics premium)
Punch tax exposure
Low (<$5/cwt at 500 cwt/mo)
$8.33–$25/cwt (volume-dependent)
Zero outbreak tail risk
Required liability coverage
Policy explicitly covering raw; local scope
Multi-million, no raw exclusion; recall coverage; multi-state
Standard farm policy adequate
Legal entity structure
Farm store side operation acceptable
Separate legal entity essential
N/A
Food-safety program required
Basic SOPs + traceability
HACCP, pathogen testing, environmental monitoring
Standard GMP
Multi-state outbreak risk
Low if volume capped
High — you ARE a multi-state operator
None
Capital at stake
Manageable; core farm protected
Farm + processing assets at risk without structure
Core farm protected
Who this fits
Smaller family dairies with strong local retail
Operations targeting $1M+ raw/direct revenue
Farms prioritizing risk-adjusted ROI
Ask yourself three questions:
Volume: Is your raw/direct line under 500 cwt/year, between 500–10,000, or above 10,000?
Coverage: Does your liability policy explicitly name and cover raw/unpasteurized products — yes, no, or “I don’t know”?
Structure: Is your raw/direct operation in a separate legal entity from your land and cows?
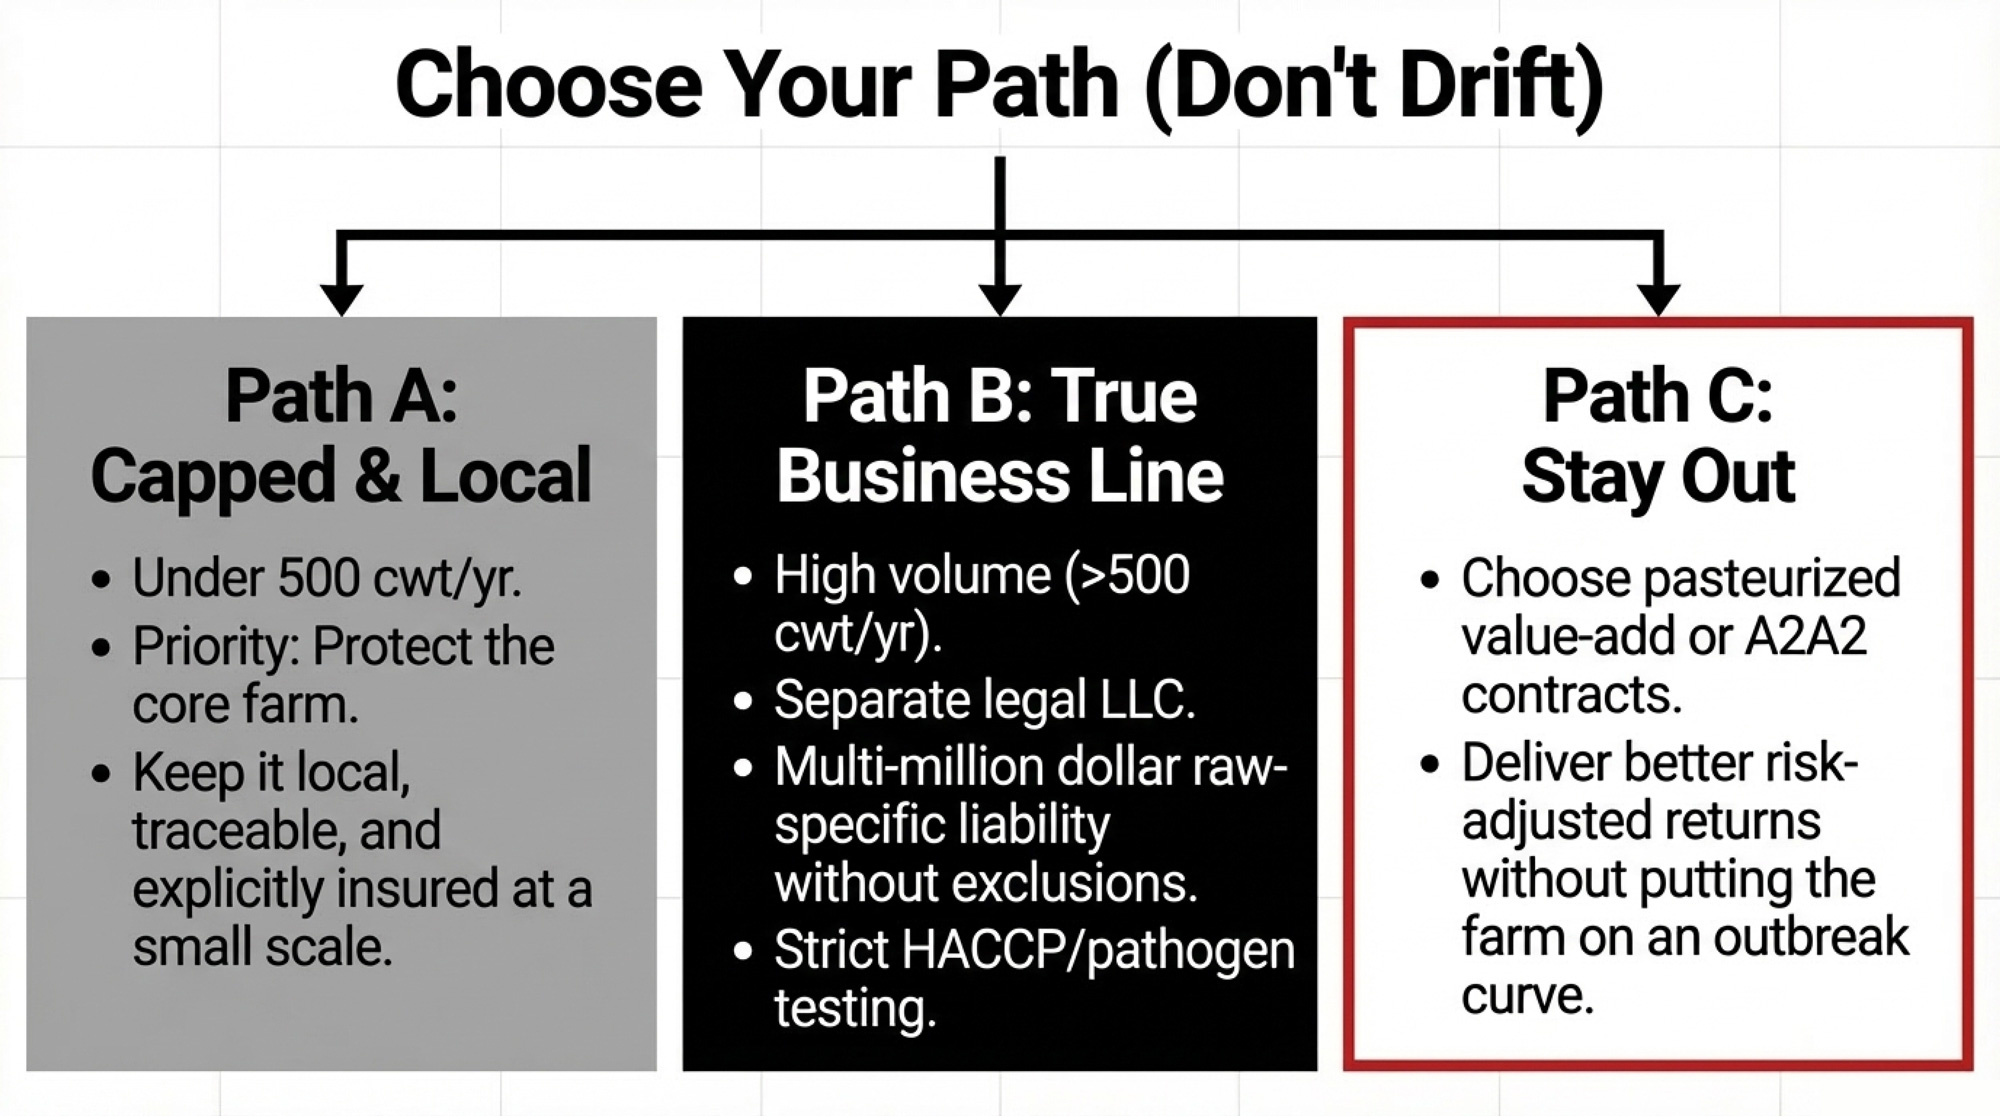
Under 500 / yes / doesn’t matter much at this scale → Path A. Above 500 / yes/yes → Path B. Any other combination — especially “I don’t know” on coverage — means you’re in the gap.
Path A: Keep raw as a capped, local premium outlet
You want better cash flow on a small slice of production. Priority: protecting the core farm. Keep volume below the band where one bad batch seeds cases in multiple states. Sell through channels you can trace and recall fast — your own farm store, subscription boxes, a handful of local shops. Build basic but real testing and SOPs, backed by a policy that explicitly covers raw products at your actual volume.
Within 30 days, confirm in writing that your current policy covers your raw products. Put a one‑page recall plan on paper — who you call, how you trace the product, how you notify customers.
Path B: Build raw/direct as a true business line
You’re aiming for serious volume — thousands of cwt, multiple products, multi‑state retail. That takes entity structure, separating land and cows from processing risk; liability limits in the multi‑million range with no raw-exclusion limits; recall coverage; and a real food‑safety program: HACCP plan, pathogen testing, environmental monitoring, and traceability from cow to consumer. RAW FARM reached about $30 million in revenue, and its outbreak history, as documented by the FDA, CDC, and multiple news outlets, shows that scale alone doesn’t eliminate risk.
You gain margin and brand value. You give up the ability to treat an outbreak as “local noise” — every misstep is now a multi‑state event.
Within 90 days, sit down with a food‑savvy attorney and your lender. Walk them through the Punch Test with your actual numbers. Ask both: “Would you be comfortable if we doubled this line next year?”
Path C: Stay out or choose lower‑risk value‑add
Your risk tolerance or capital doesn’t line up with the downside. Other value‑add playbooks — A2A2 contracts, branded but pasteurized on‑farm processing, genetics‑driven component premiums — might deliver better risk‑adjusted returns without putting your farm on a raw‑milk outbreak curve.
Once a year, if you chose Path A or B, revisit your Punch Test numbers, your policy, and your outbreak plan. If the answers don’t still hold, reclassify yourself honestly. RAW FARM’s documented history shows that the twentieth year can look a lot like the first.
What This Really Means If You’re Already Selling Raw
RAW FARM’s case also illustrates a different tension: a producer can run thousands of negative tests and still face an FDA investigation driven by clinical WGS data. Whether you think that’s overreach or proper surveillance, the financial and reputational exposure is real either way. If your policy has any form of raw‑milk exclusion and you’re selling beyond very small, local volumes, you’re effectively self‑insuring a multi‑million‑dollar risk — whether you’ve priced that into your premium or not. If your raw/direct premium per cwt doesn’t clear your punch‑tax number plus real testing and QA costs, that line isn’t adding resilience to your operation — it’s just moving risk from the co‑op’s balance sheet onto yours.
If your Punch Test shows more than about a quarter of your premium disappearing into outbreak risk and overhead, that’s a yellow light. And if one bad batch at your current volume could seed cases in multiple states while your entity structure and insurance still look like a farm‑store side gig, that’s a hard red light.
Key Takeaways
If the Punch Test shows more than about 20–25% of your raw/direct premium per cwt going to outbreak risk, the economics say your line is fragile. At 1,000 cwt/month, a single $3M hit works out to $25.00/cwt — over 70% of a $35 premium.
If your liability policy contains any ISO or AAIS raw‑milk exclusion, your stated coverage limit does not apply to your raw line. Get that confirmed in writing within 30 days. Dog Mountain Farm’s $75,000 investment in raw production became uninsurable overnight — and they only found out after the carrier dropped them.
If one bad batch at your current volume could seed cases in multiple states, but your structure and coverage are still sized for farm‑gate sales, you’re in the gap. Upgrade the structure and coverage or cap volume.
If your lender and lawyer both look uncomfortable walking through a large‑scale outbreak scenario with your numbers, believe them. Their discomfort is a better risk signal than your most enthusiastic raw customer’s praise.
The Bottom Line
RAW FARM built a $30‑million brand, ran one of the most tested raw programs in the country — including an on‑farm PCR pathogen lab that McAfee says has generated more than 14,000 negative tests since September 2025 — and operated under California’s tighter oversight. Federal and state records, as compiled by CDC, FDA, and Pritzker Hageman’s case tracking, describe multiple outbreaks and recalls involving Organic Pastures/RAW FARM products over two decades, with more than 200 illnesses documented and some children developing hemolytic uremic syndrome. RAW FARM disputes links between some events and its products. In the current investigation, no pathogens have been found in any RAW FARM product tested to date by FDA, CDFA, or the company itself — though the implicated lots consumed by patients between September 2025 and February 2026 may no longer be available for testing. A company of that size has the balance‑sheet depth to absorb far more risk. Your 400‑cow family dairy, with a multi‑generational legacy tied to that land, almost certainly does not.
Run the Punch Test, pull your policies, and have that conversation this month. If the numbers hold up and your structure matches the risk, build it right. When they don’t? That’s valuable information too — and a lot cheaper to learn now than from a state health department.
We’re building the full cost‑per‑cwt model by herd size and product mix in a Tier 3 economics feature, paired with a Tier 2 food‑safety playbook on entity structure, policies, and recall plans. That’s where the deeper spreadsheets and checklists will live.
Update, March 21, 2026: RAW FARM CEO Mark McAfee responded directly to The Bullvine, providing test data from CDFA’s CAHFS laboratory, RAW FARM’s on‑farm qPCR lab, and a consumer‑facing statement dated March 16, 2026. His positions — including that only three of seven patients reported consuming RAW FARM cheese, that all pathogen tests are negative, and that FDA acted without a root‑cause analysis — have been incorporated into this article above. The Bullvine has reviewed the test documents provided; readers can contact RAW FARM directly for complete test records. The FDA’s investigation remains open.
Complete references and supporting documentation are available upon request by contacting the editorial team at editor@thebullvine.com.
The Triple Cushion Trap: Why 2025’s Strong Margins Won’t Save You in 2026 – Exposes the structural shifts in beef-on-dairy premiums and feed costs that threaten long-term stability, delivering a strategic decision framework to help you reposition equity and diversify revenue before current market cushions inevitably deflate.
Every week, thousands of producers, breeders, and industry insiders open Bullvine Weekly for genetics insights, market shifts, and profit strategies they won’t find anywhere else. One email. Five minutes. Smarter decisions all week.
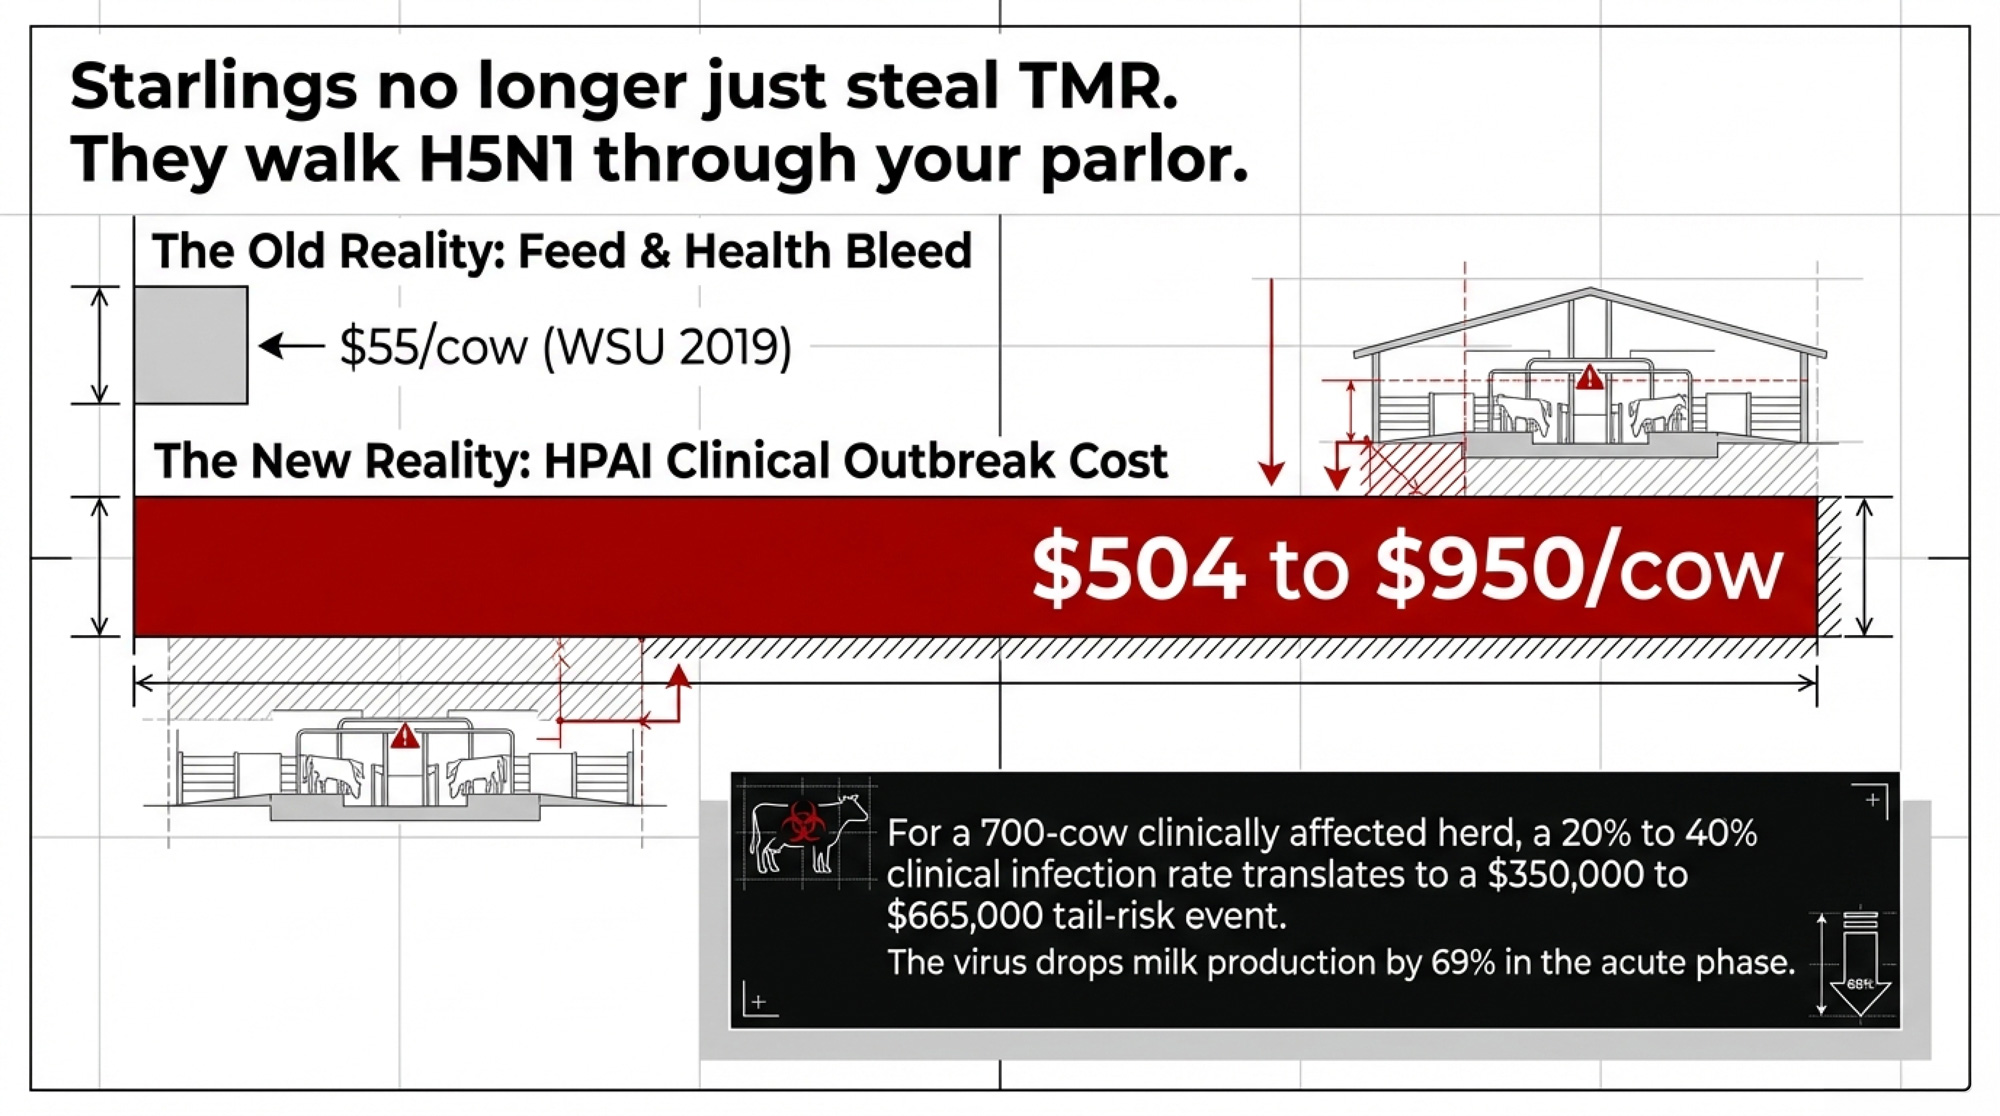
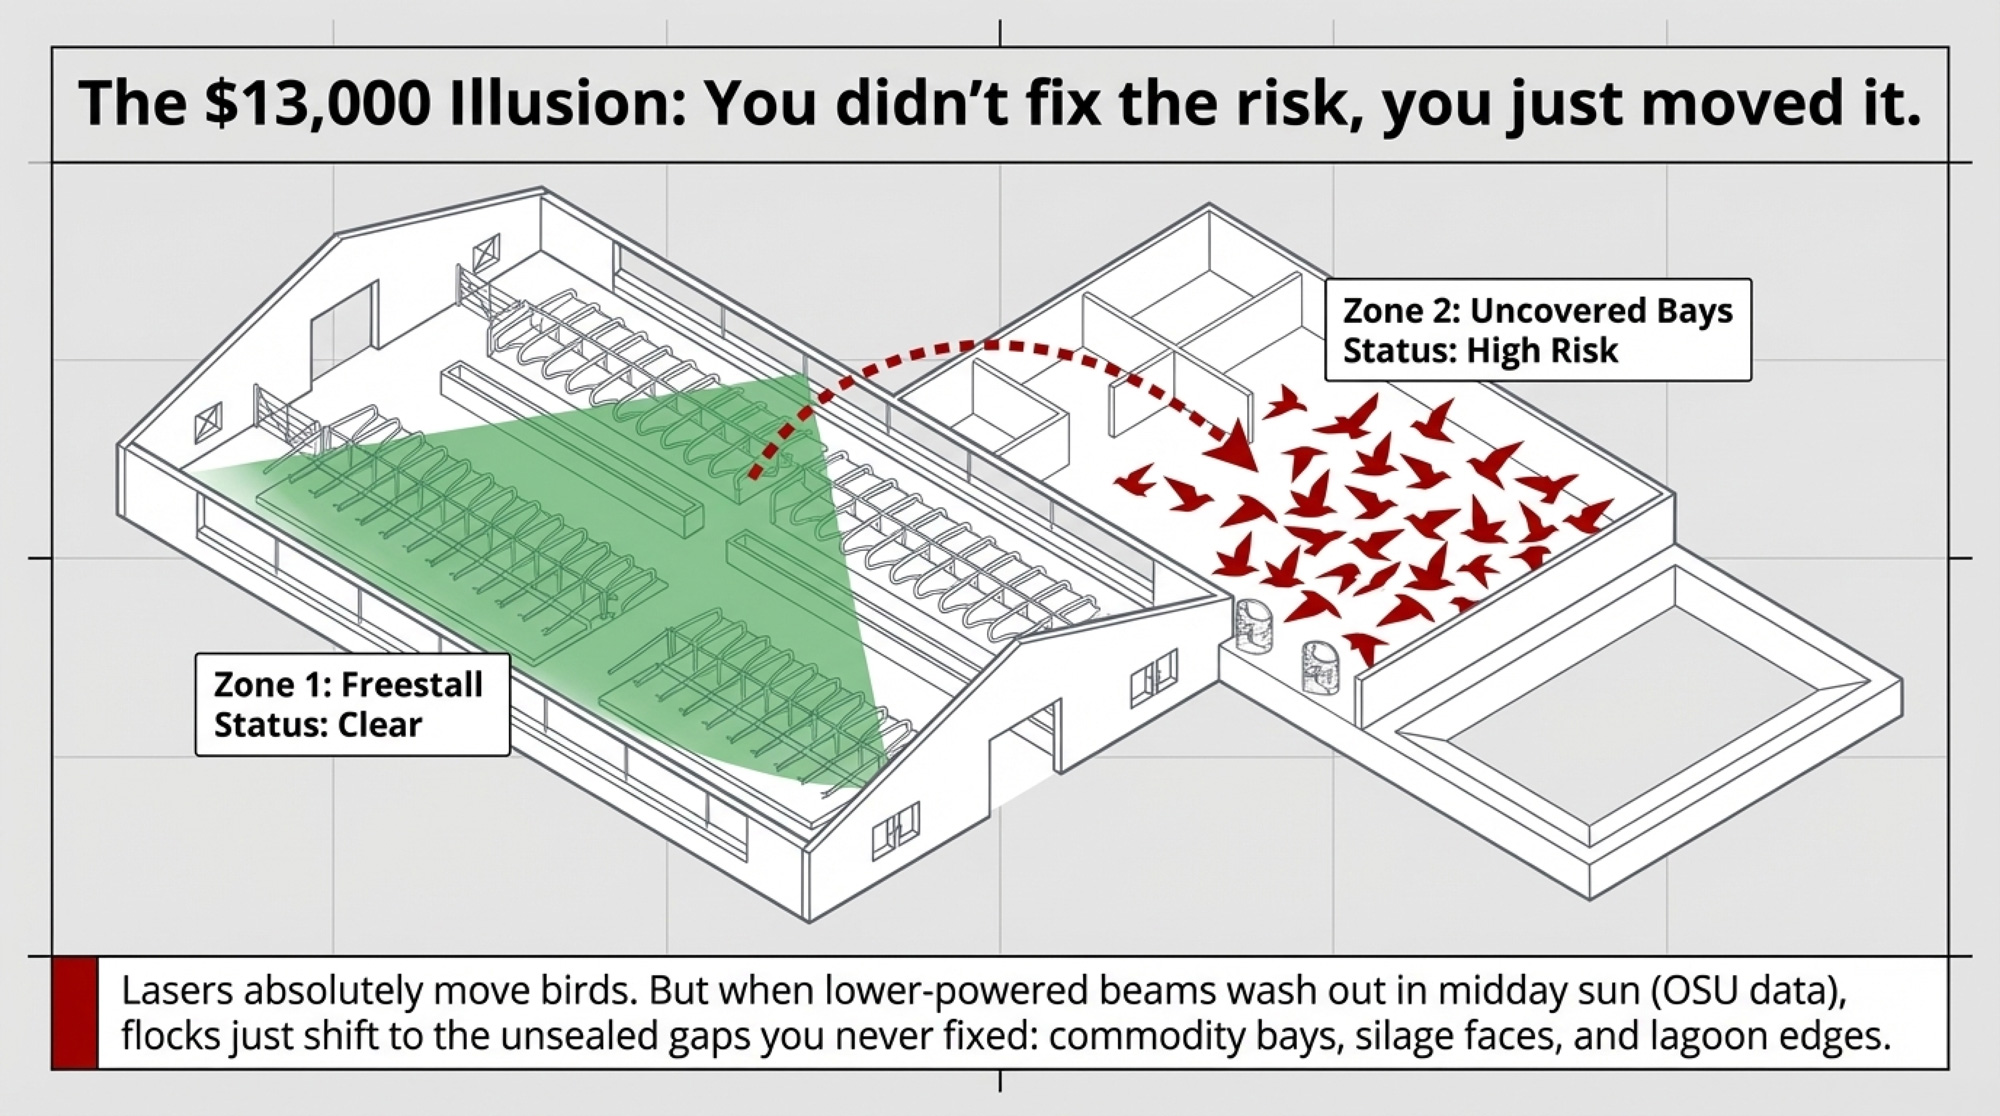
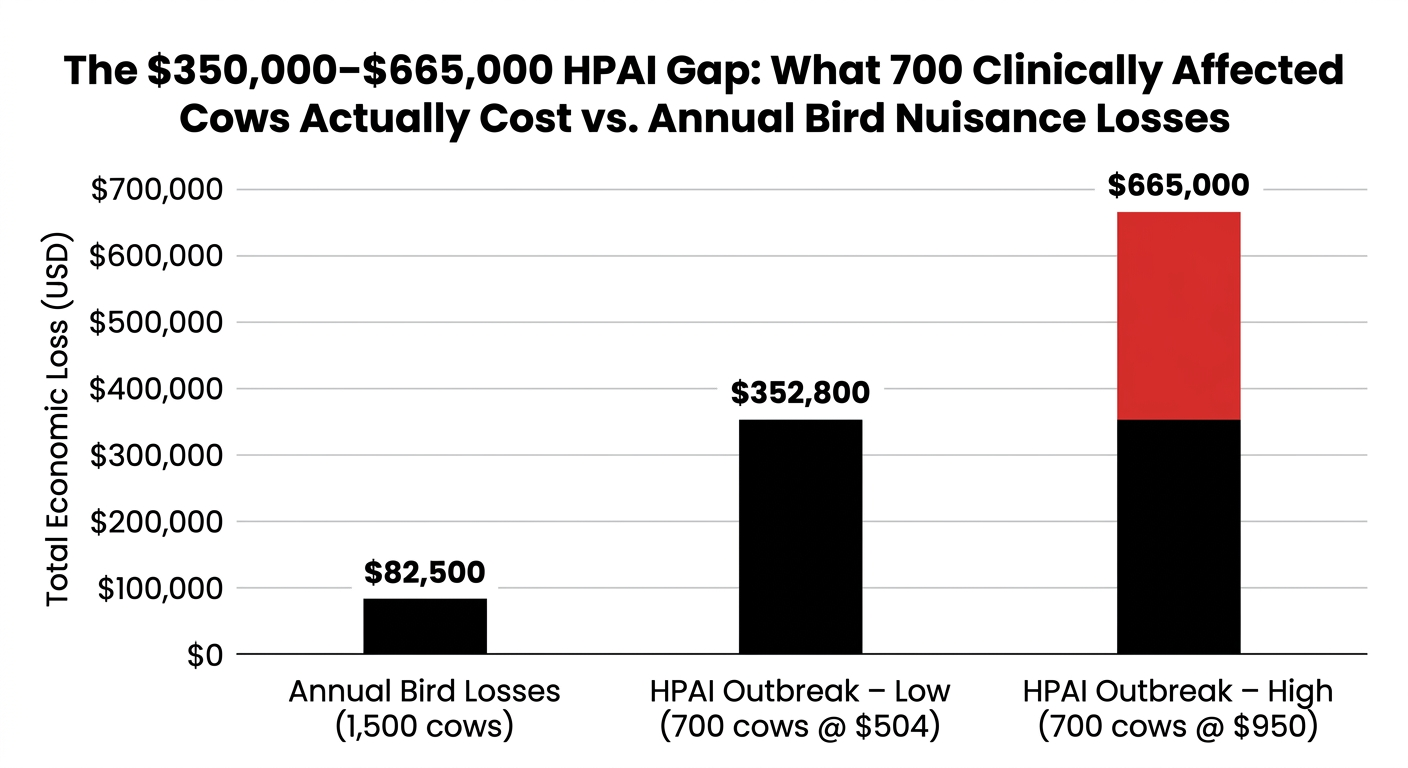
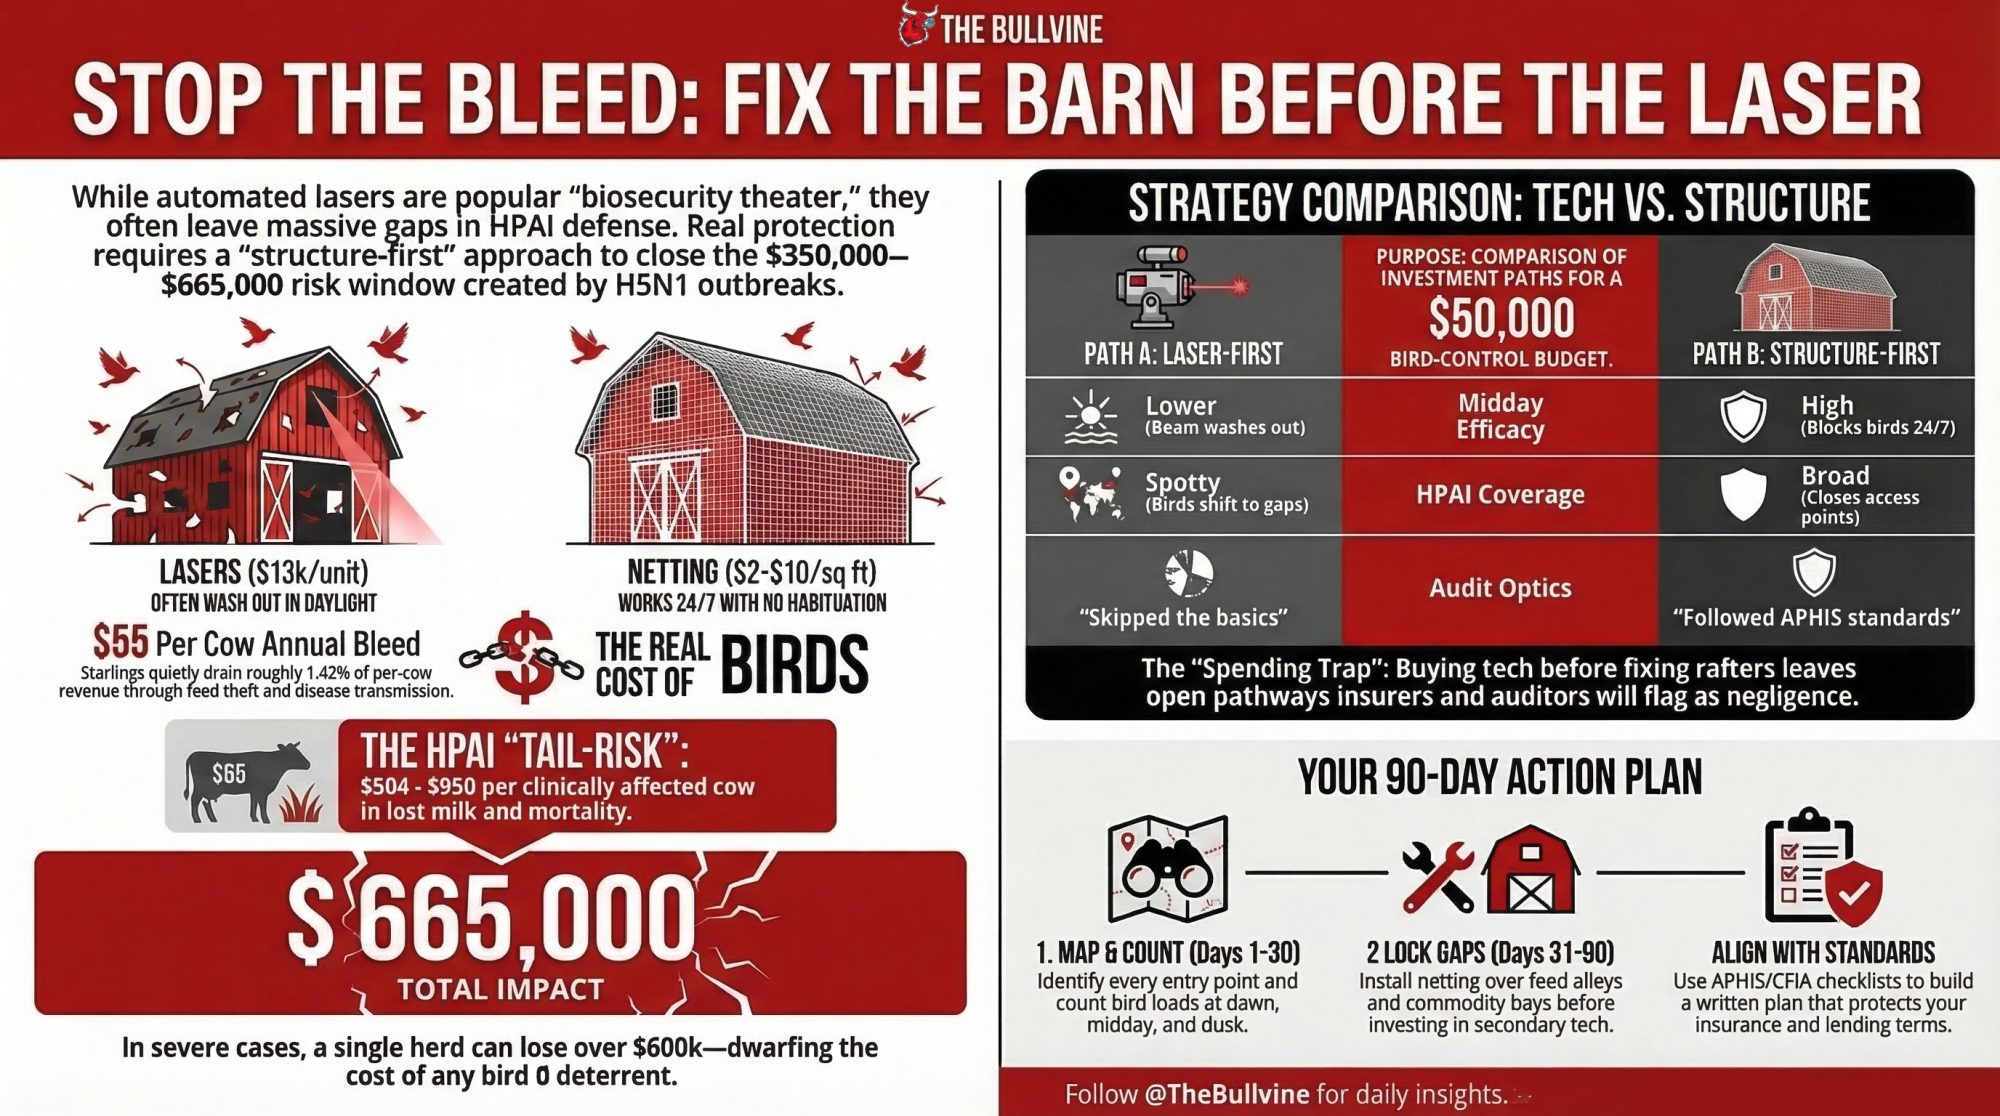
A $13,000 laser vs a $665,000 HPAI hit. If your rafters are still open, that beam is just expensive biosecurity theater.
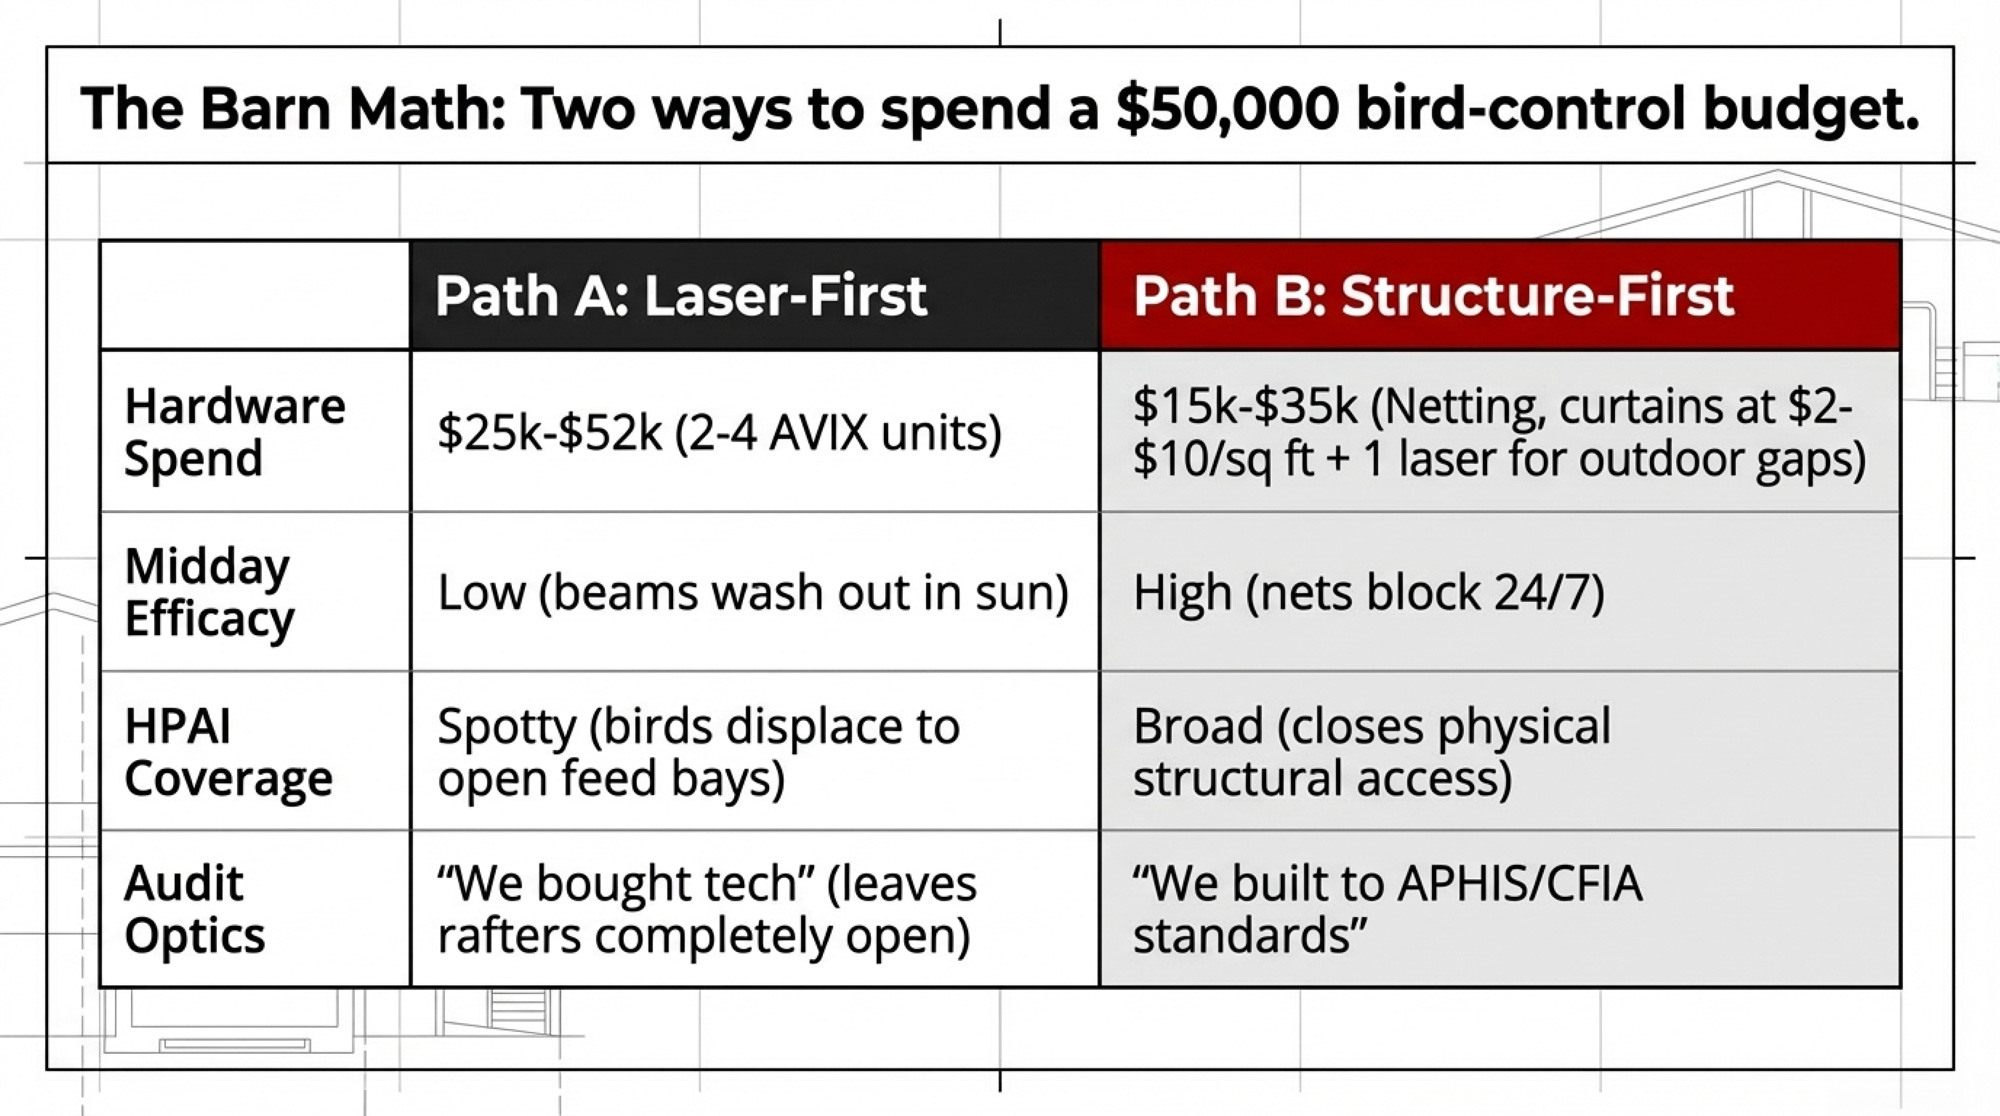
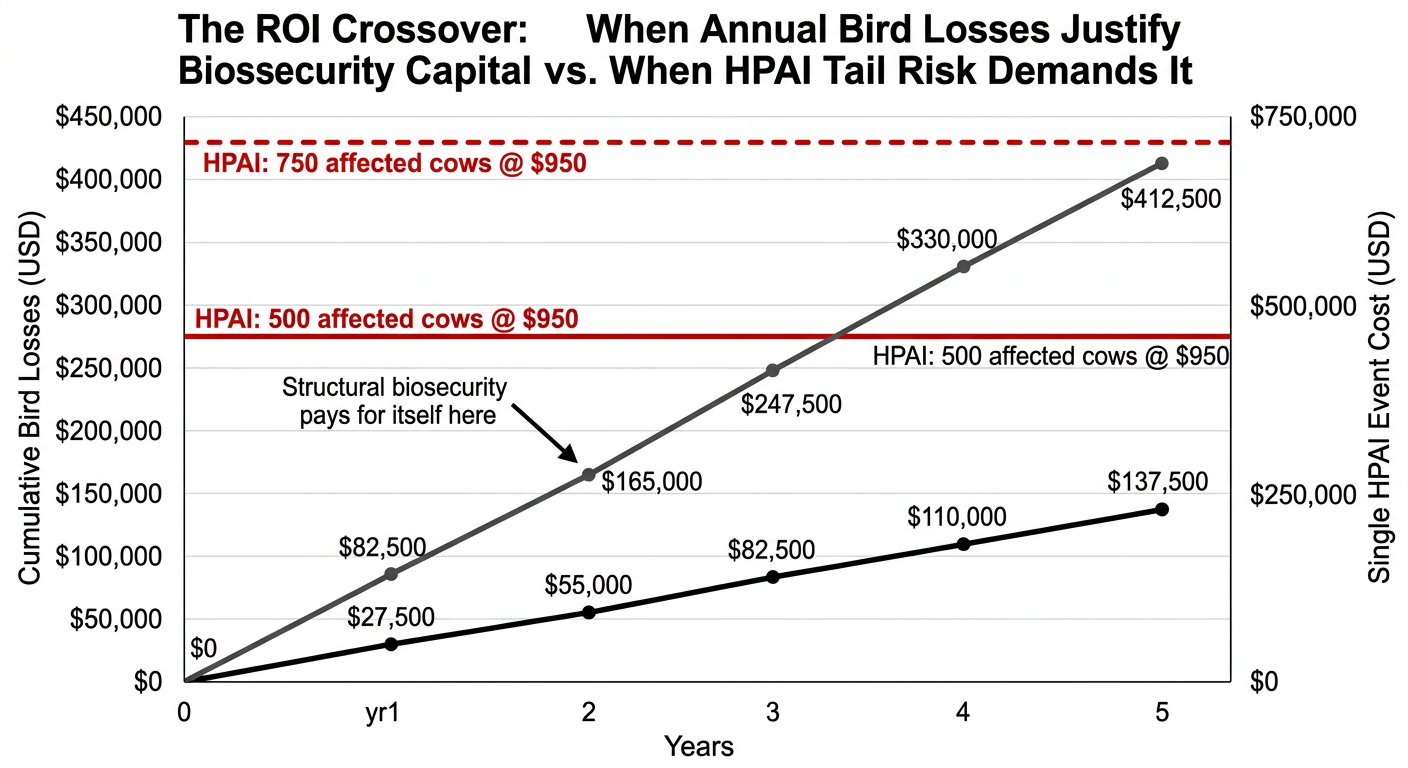
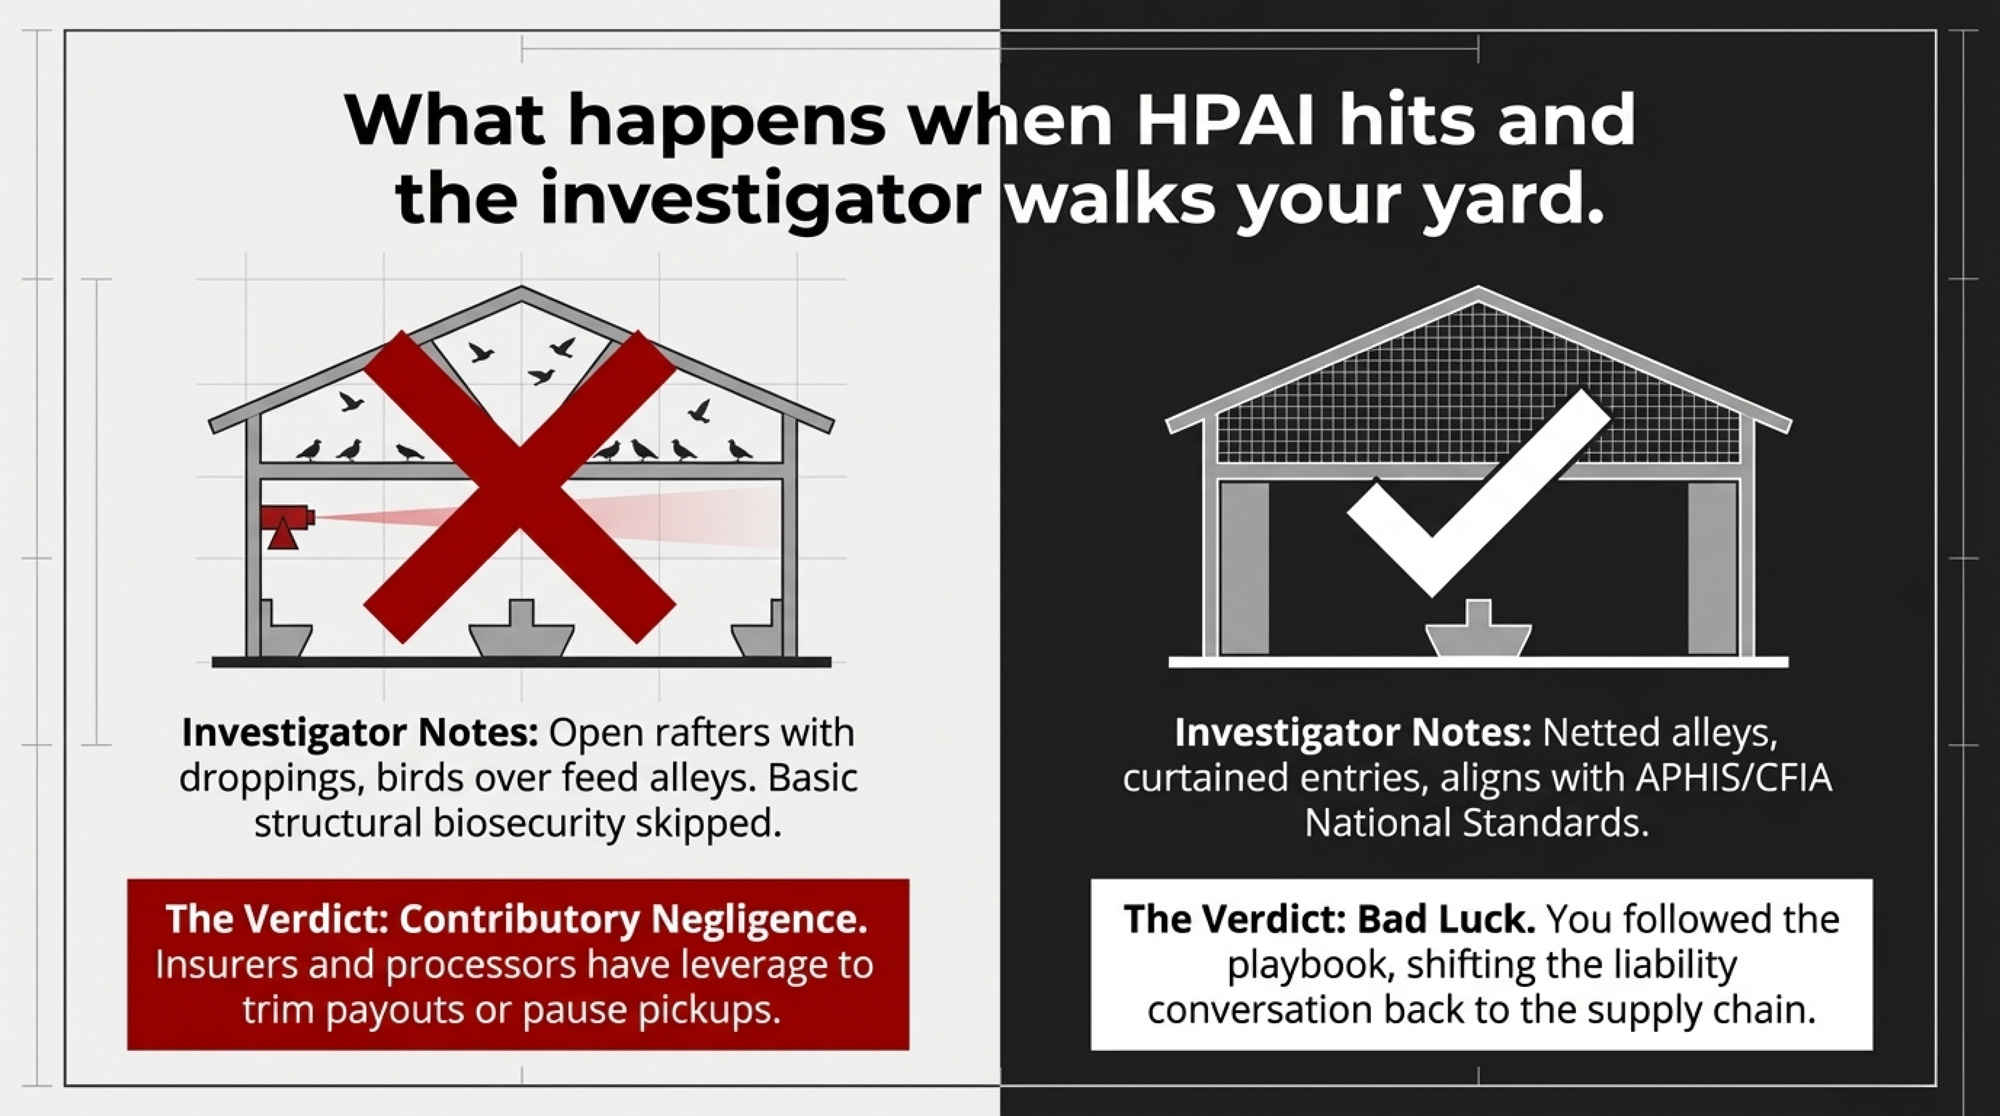
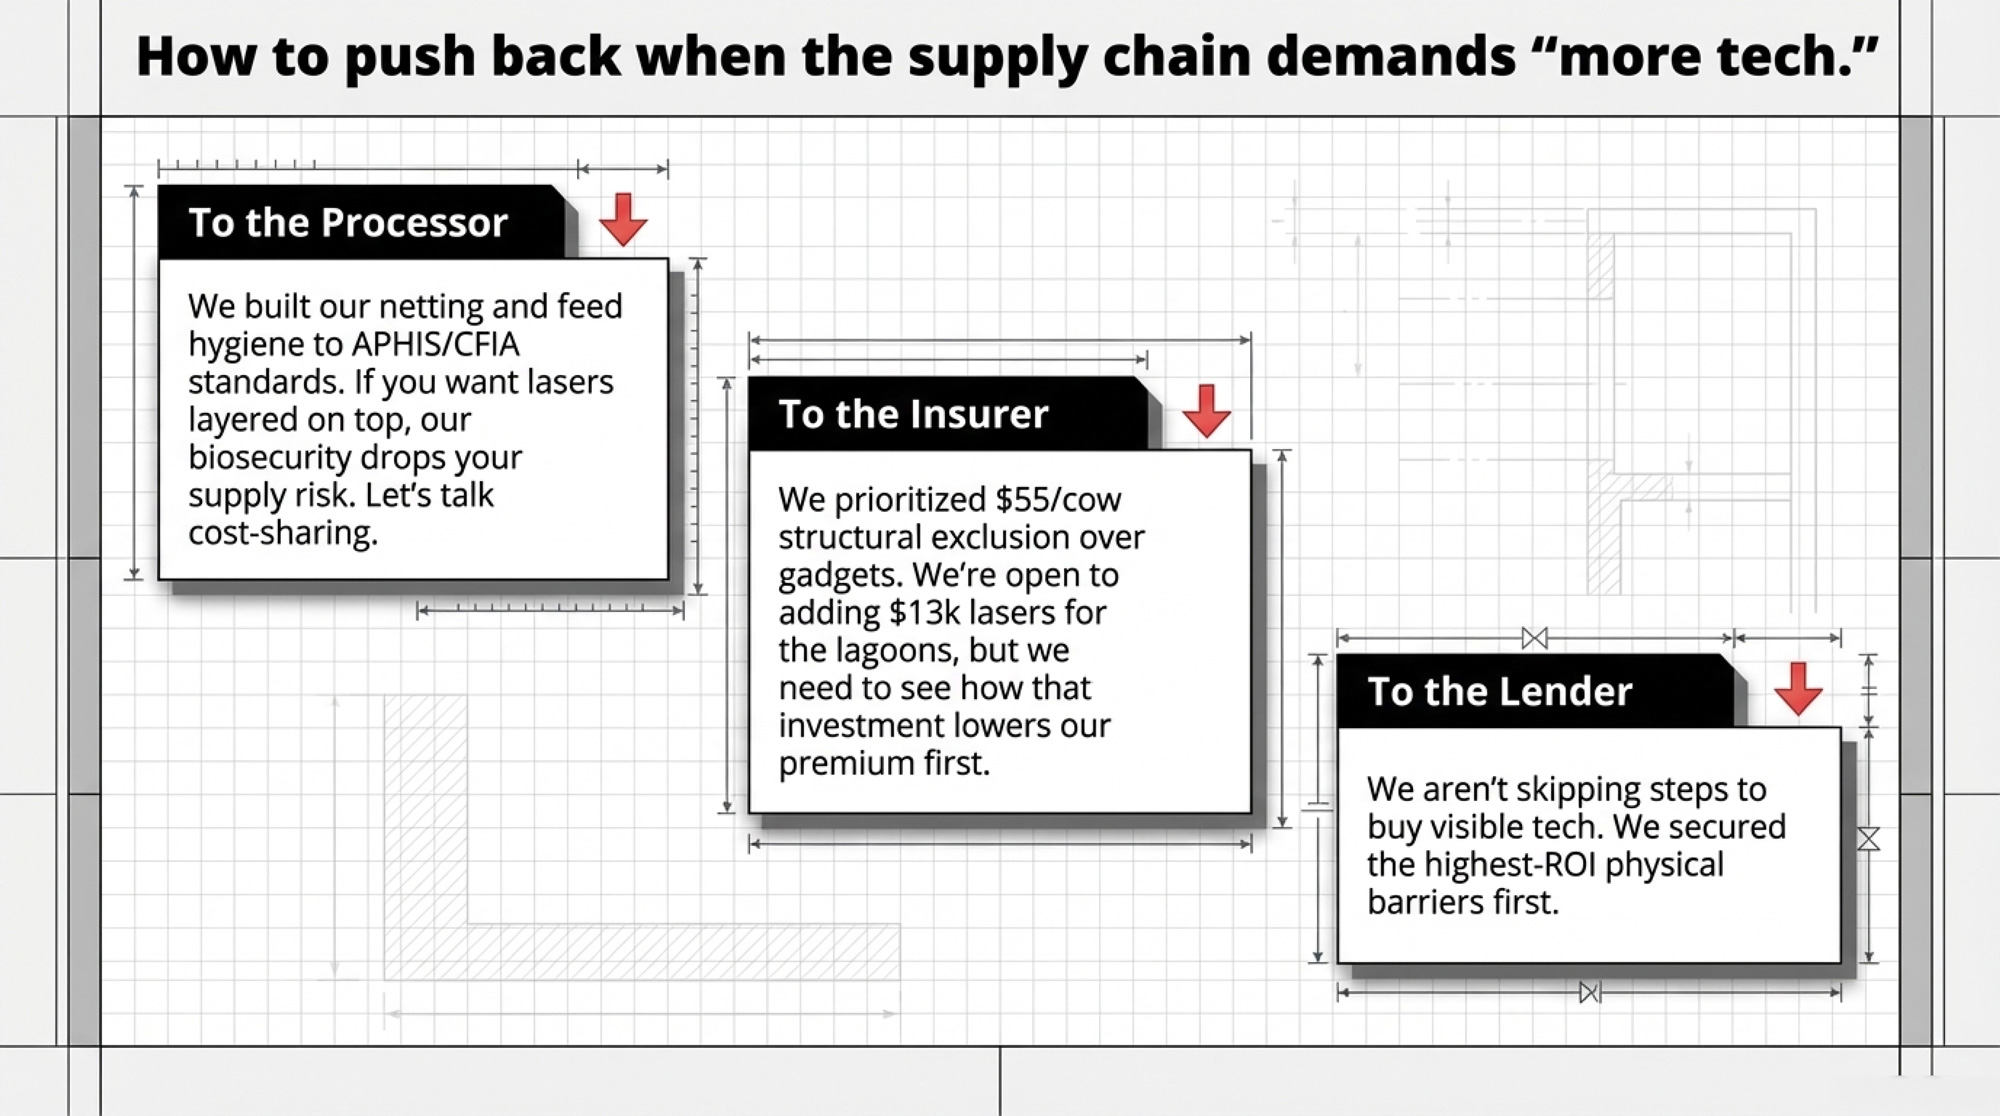
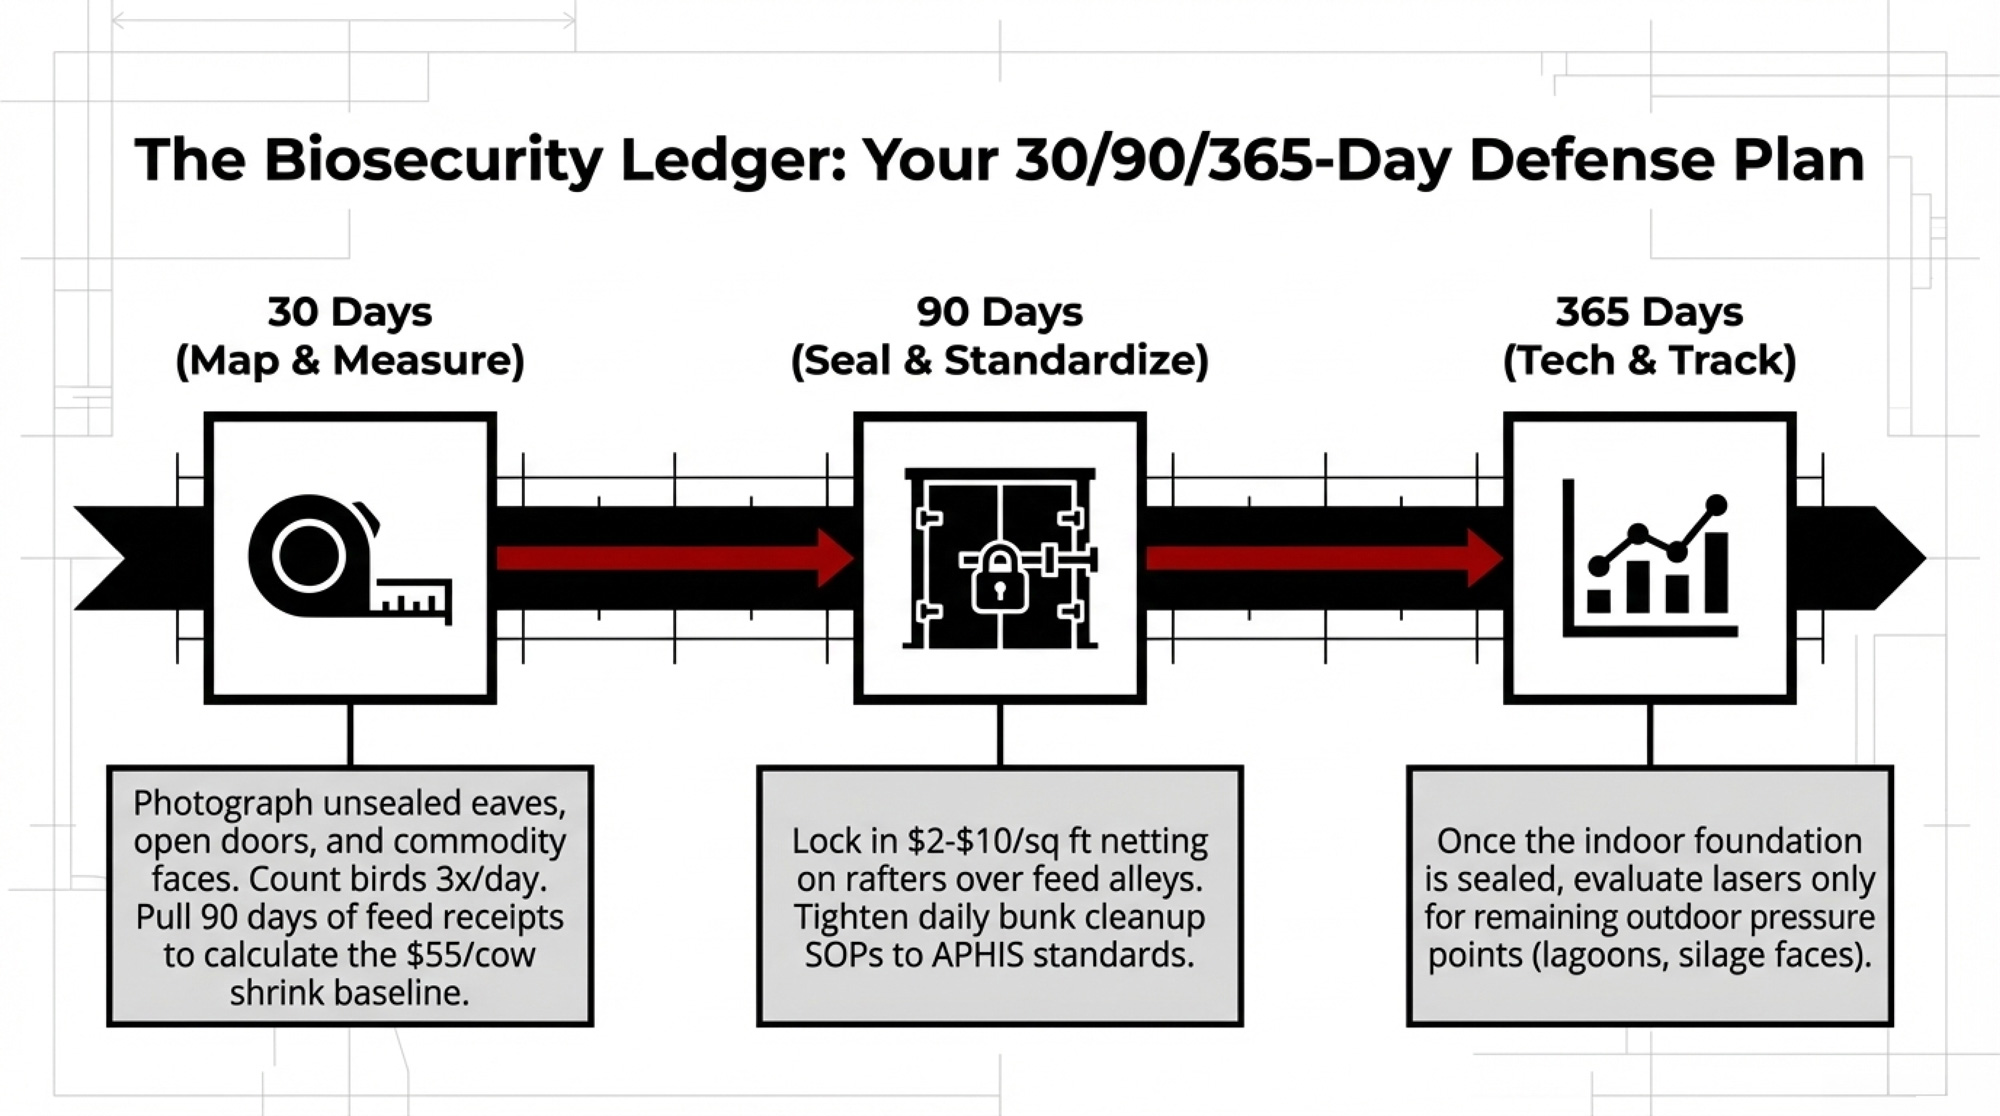
Executive Summary: HPAI just turned bird control from a frustrating starling problem into a $350,000–$665,000 tail‑risk decision for your herd. On one side, the data says starlings quietly drain about $55/cow/year from feed and health; on the other, recent US H5N1 outbreaks have cost $504–$950 per clinically affected cow, with some herds losing nearly 40% of those cows within two months. Lasers run $12,500–$13,104 per unit and absolutely move birds — but only where the beam hits, and OSU tests show performance drops fast in full daylight and uncovered areas. USDA APHIS and CFIA/ProAction both put netting, curtains, sealed feed, and bunk hygiene ahead of gadgets, which is the opposite of the “laser‑first” sales pitch you’re hearing right now. This feature walks through the barn math on a $50,000 bird‑control budget, showing how a structure‑first plan closes real HPAI pathways while a laser‑first plan mostly shifts birds to the gaps you never fixed. You also get concrete negotiation scripts for processors, insurers, and lenders, plus 30/90/365‑day checks you can run off your own bird counts, feed‑shrink, and herd size. The blunt takeaway: if you buy the $13,000 laser before you buy the netting, you didn’t fix HPAI risk — you just made it more expensive.
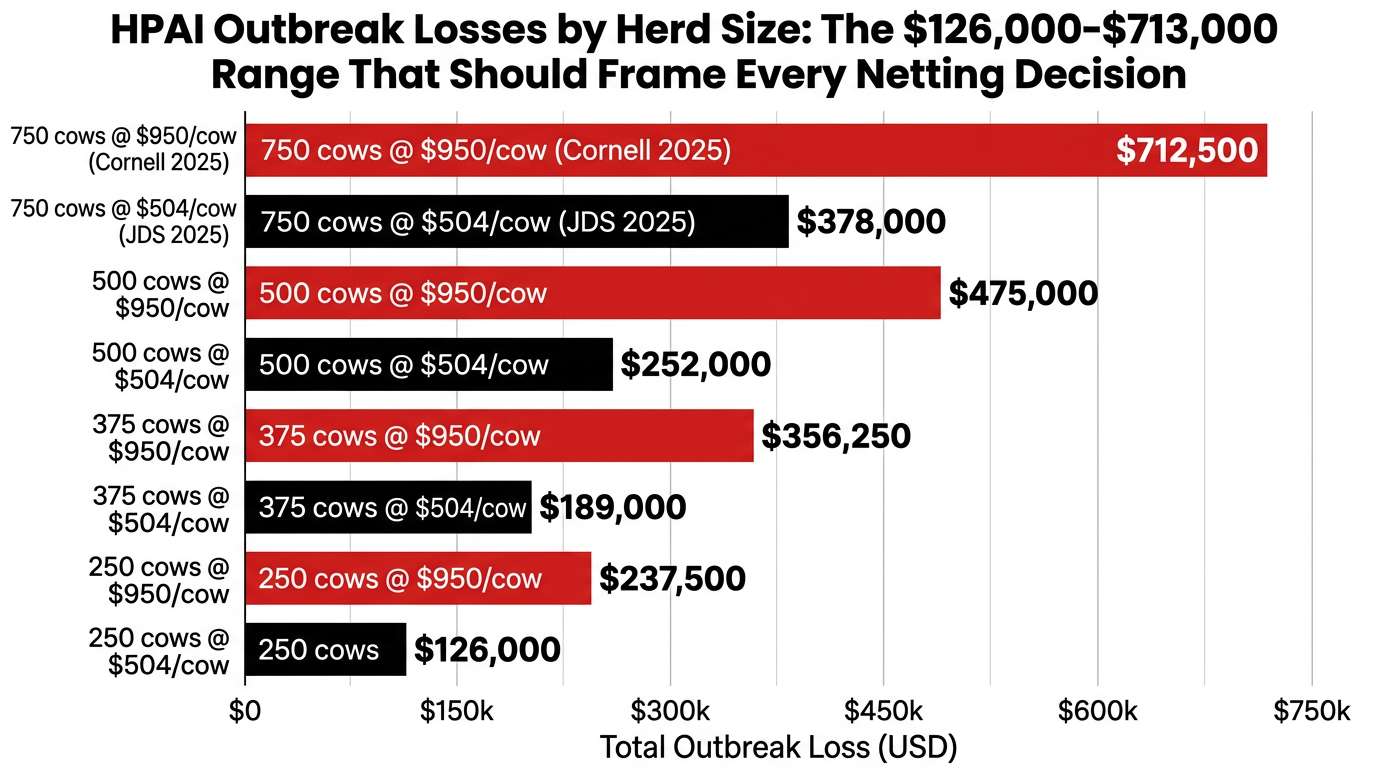
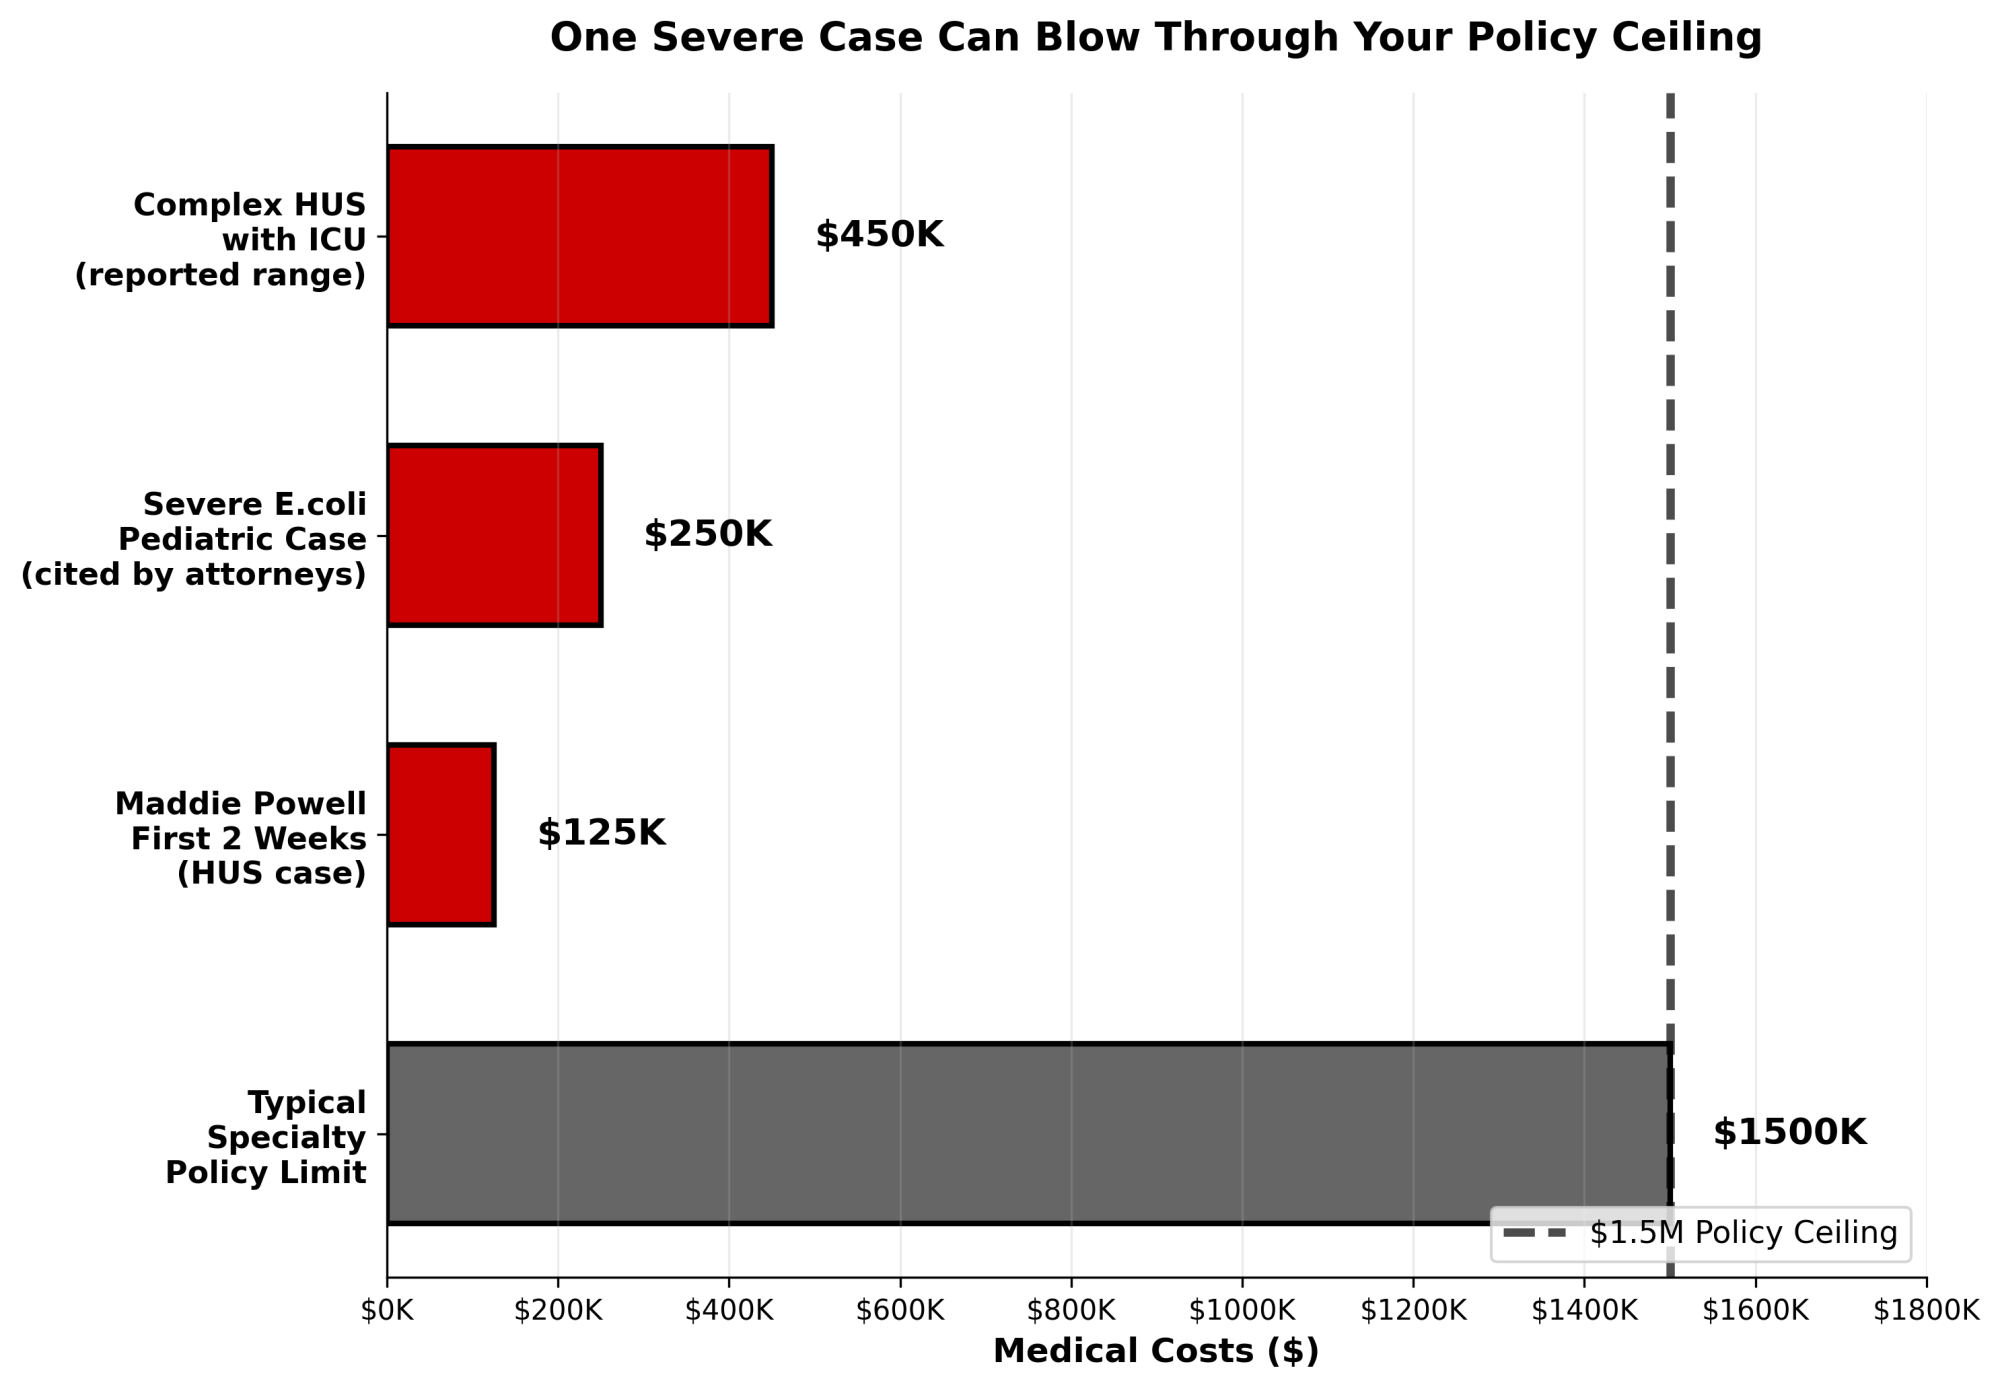
In 2026, a green laser sweeping through your freestall looks like a biosecurity win. It impresses visitors, makes a great social clip, and ticks the ‘technology’ box on someone’s checklist. But if the rafters over your feed alley are still open and your commodity bay isn’t sealed, that same beam could leave a 0,000–5,000 hole in your HPAI defense plan — the range of losses when roughly 700 cows are clinically affected at 4–0 per head.
The technology isn’t the problem. The spending order is.
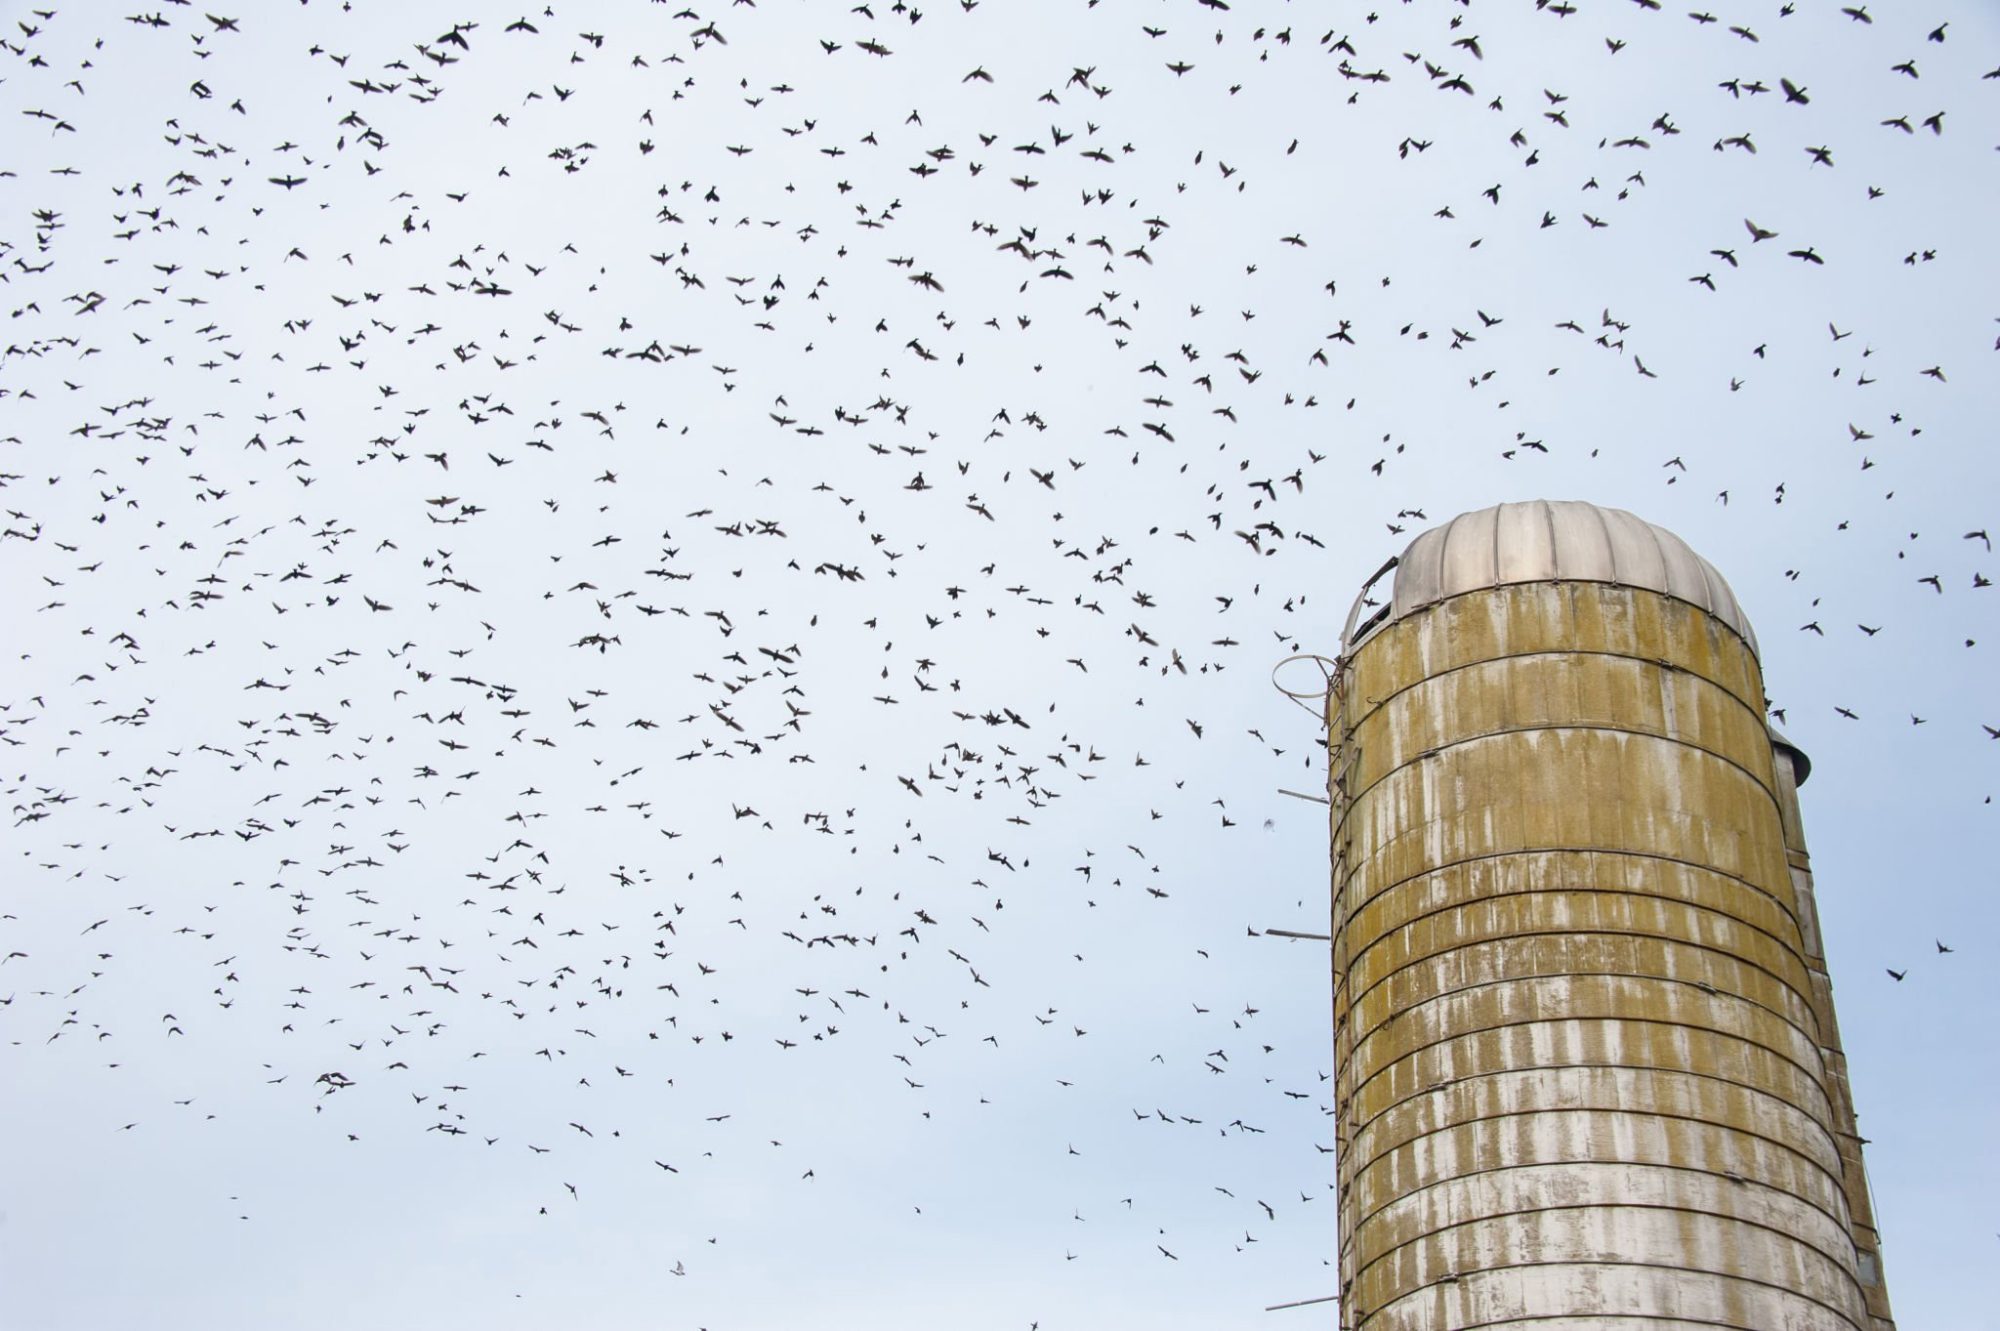
Bird Control Group’s most-watched dairy video tells part of the story. An anonymous Idaho operation was bleeding an estimated $150,000 to $200,000 per year to starlings — feed eaten and fouled, milk suppressed across the herd. They installed an AVIX Autonomic laser in the stables; the green beam swept once, and thousands of birds exploded from the rafters while the cows barely flicked an ear. It looks like a $200,000 problem fixed in 30 seconds.
That clip is doing a lot of selling right now. As HPAI has turned wild birds from a nuisance into an existential biosecurity risk, more dairies are signing five‑figure laser quotes while leaving barn doors open, commodity bays unsealed, and feed hygiene stuck where it’s always been. The question isn’t whether the laser works. It’s whether following that Idaho playbook actually protects your margin — or makes your biosecurity look good on paper.
The $55 Per Cow Bleed You Never See on the Milk Check
A 2019 Washington State University survey of dairy operators — published in PLOS ONE — put average bird-related losses at about .90 per cow per year, roughly 1.43% of per‑cow revenue, not a worst‑case number. A 3,000‑cow herd is closer to $164,700. It’s not “barn on fire” money on any single day. It’s constant margin erosion that never gets its own line item.
The same survey tied daily bird counts above 10,000 birds to higher self‑reported rates of Johne’s disease and Salmonella on those dairies. The researchers pointed directly to European starlings as vectors that move fecal material and pathogens among feed, water, and cattle. Starlings aren’t just stealing your TMR. They’re walking pathogens from bunks to troughs to parlor approaches — and through every pen in between.
That’s the background bleed. Then HPAI came along and changed the math entirely.
What an HPAI Outbreak Actually Costs a Herd
If lasers were just about feed loss, you could argue about payback and move on. H5N1 in dairy cows is a different conversation.
Armin Elbers and his team at Wageningen University & Research ran one of the strongest independent tests on automated laser bird deterrents. On a Dutch free‑range poultry farm in a high‑risk avian influenza zone, they ran a laser system for 28 days and saw 98.2% overall reduction in wild bird visits — 99.7% for waterfowl and 96.1% for passerines like starlings and sparrows, with no habituation in that window. For a poultry site, that’s a serious result — and a best‑case outcome in a very controlled, non‑dairy context.
But the HPAI math that matters to you lives in the dairy studies that followed.
A 2025 Journal of Dairy Science “growing risk” analysis estimated H5N1 losses at about 4 per clinically affected cow (90% credible interval: 2–7), including milk reduction, replacement, treatment, and reduced feed intake. For a modeled 500‑cow herd with about 32% of cows affected over a 45‑day outbreak, they estimated total losses around $79,145, or about $158 per cow averaged across the entire herd, with 92.3% of losses due to reduced milk yield.
A Nature Communications paper from Cornell’s College of Veterinary Medicine in July 2025 looked at a roughly 3,900‑cow Ohio herd that experienced a real H5N1 outbreak. Their economic model came back much uglier: about $950 per clinically affected cow, and about $737,500 in total outbreak costs for that one herd. On the milk side, clinically affected cows lost a cumulative 901.2 kg over the 60 days post‑diagnosis, compared with a typical loss of up to 18 kg from common bacterial mastitis — roughly 50 times as much.
Cornell’s team documented 777 clinically affected cows in that Ohio herd and found that “almost 40% (298) left the herd in the first two months following the outbreak, either through death or early removal.” CIDRAP’s summary of the same study notes that clinically affected cows dropped from roughly 77 lb/day to about 24 lb/day during the acute phase — a 69% decline — with lower production persisting over the full 60‑day analysis window.
In that Ohio case, about 20% of the herd’s cows were clinically affected. Early reports from Michigan outbreaks suggest cumulative clinical incidence may be higher in some herds, possibly around 30%, but peer‑reviewed data there are still thin, and herd responses vary.
The gap between $504 and $950 per cow is real. It reflects different herds, methods, and severity. But even the low end is devastating. To show what this looks like in real dollars, take a hypothetical 700 clinically affected cows. Using the JDS figure, that’s 700 × $504 = $352,800. Use Cornell’s number, and you’re at 700 × $950 = $665,000.
That range — roughly $350,000 to $665,000 — is what should frame every bird‑control decision you make right now. Not “does the laser work?” but “what happens to my farm when the virus gets through anyway?
And that $665,000 ceiling? It’s actually a floor. Cornell’s $950 figure explicitly tracks direct losses — milk reduction, mortality, and early culling — over a 67‑day window. It doesn’t count breeding setbacks, lost quality premiums, or the genetic value of high‑genomic animals you’re forced to cull because a quarter dried off. When Cornell’s own researchers flag those exclusions, it’s reasonable to assume the true per‑cow cost in severe cases could approach $1,700 or more in total economic impact, which would push the tail risk on 700 clinically affected cows from $665,000 to well north of $1.2 million.
Who Actually Pays for Dairy HPAI Biosecurity?
A single AVIX Autonomic Mark II unit retails for $12,500-$13,104 from US distributors, based on 2024–2025 listings. Most dairies don’t have just one pressure point. Covering barns, feed alleys, commodity approaches, and lagoon edges usually means two to four units — roughly $25,000 to $52,000 in hardware, plus mounting, installation, wiring, and replacement bulbs over time.
iChase, whose AI‑driven system layers camera detection and automated targeting on top of a green laser, says typical dairy customers see $20,000–$35,000 in annual savings with a 7–12-month payback, based on its 2025 marketing ahead of IPPE 2026. That’s their claim, not a peer‑reviewed result, but it’s part of the sales pitch you’re hearing.
Here’s the part that doesn’t show up in the brochures.
Your processor doesn’t call to say “thanks for the laser.” They call to say they need HPAI test results before Tuesday — and their supplier manual reserves the right to suspend pickup if you don’t meet whatever standard they’ve set this month. Your lender prices disease risk into your interest rate and covenants, but isn’t offering to split the cost of netting or deterrents. Your insurer benefits from lower claim probability but keeps full discretion to deny or trim payouts if “recommended biosecurity measures” weren’t maintained — language APHIS and provincial frameworks keep expanding.
USDA APHIS offers free, voluntary biosecurity assessments for poultry operations and, in its current HPAI programs, will share up to 75% of the costs to fix the highest‑risk biosecurity concerns identified on those farms — including structural improvements. Those cost‑share dollars are aimed squarely at commercial poultry barns, not dairy; APHIS’ own FAQ on the program explicitly says dairies are not included in the 75% cost‑share.
You’re the one writing the check. Everyone else keeps the lever.
The Assumption the Laser Quote Needs You to Skip
Here’s the uncomfortable angle: birds are a structural problem first and a technology problem second. A lot of farms are being nudged to flip that order — often by marketing that starts with tech and works backwards.
Ryan Slaughter, a Research Assistant at Ohio State University South Centers, has tested laser bird deterrents across OSU research centers and commercial vineyards. His team’s summary of why lasers outperform static deterrents is blunt: the constantly moving beam matters. The “randomness of the oscillation means birds are unable to notice a pattern, which otherwise would render it useless.” That’s a real advantage over scarecrows, reflective tape, and noise cannons.
But their work also exposes something vendors tend to gloss over. The system only works where the beam actually hits — and their 2023 update noted that lower‑powered green lasers “may not be visible enough during the daytime,” which leads to uneven results when you need coverage in full sun.
Lasers don’t reach every rafter, every open door, every ledge above a commodity bay where birds roost between feedings. When a flock is spooked out of one illuminated zone, they don’t leave your property. They move to the part of your site where there’s still feed and no laser: commodity bays, silage faces, lagoon edges, and unsealed entries.
Go back to that Idaho dairy. The laser cleared the stables. Great. But those birds still needed somewhere to sit and something to eat. Was the commodity bay screened? Were rafters netted in other barns? Did the farm already have feed hygiene dialed in?
Those details are missing from the video. They’re not missing from your risk.
USDA APHIS dairy H5N1 guidance and CFIA’s National Standard both hammer the same basics: keep wild birds away from feed and water, close structural gaps, and tighten traffic and hygiene — with deterrent tech as a layer on top, not a substitute. Dairy Farmers of Canada built its mandatory proAction biosecurity module on that national standard in 2019. The alignment across both countries is consistent: reduce attractants, block access, then deter what’s left.
Laser marketing often flips that sequence — starting with gadgets and treating structure as an optional add‑on.
Netting, curtains, sealed storage, daily bunk cleanup — that’s the boring stuff everyone tries to skip. It also works at noon in July the same way it does at dusk in January. No habituation. No subscription. No beam path.
What a $50,000 Bird‑Control Budget Can (and Can’t) Do About HPAI
Here’s where the barn math separates the “laser‑first” story from a “structure‑first” strategy.
Start with the baseline feed and health bleed from birds, using the WSU average:
Now overlay the HPAI tail risk, using both the conservative JDS number and the higher Cornell number:
HPAI tail‑risk scenarios (affected cows × per‑cow loss estimate):
Clinically affected cows
At $504/cow (JDS 2025)
At $950/cow (Cornell 2025)
250
$126,000
$237,500
500
$252,000
$475,000
750
$378,000
$712,500
Even the conservative JDS number is several times larger than your likely bird‑control budget. To make it concrete, say you’re milking 1,500 cows and assume 25% might be clinically affected in a bad outbreak. That’s 375 cows.
Low end (JDS): 375 × $504 = $189,000.
High end (Cornell): 375 × $950 = $356,250.
That’s one event. One unlucky intersection between your herd and a migratory flock looking for feed or water.
Now put that against two ways to spend $50,000 on birds.
Path A: Laser‑First
Hardware: 2–4 AVIX units at $12,500–$13,104 each → $25,000–$52,000 plus install.
Coverage: Strong impact where the beam hits, but green light washes out in bright sun; OSU’s experience with lower‑powered units shows mixed midday results.
Risk: Birds shift to non‑illuminated areas — commodity bays, open entries, lagoon edges — where they can still bring H5N1 in or foul feed.
Optics: Visibly “high‑tech.” But open rafters with droppings behind a laser head are hard to explain to an investigator.
Path B: Structure‑First
Hardware: Netting, curtains, and sealed storage on the highest‑risk zones — rafters over feed alleys, commodity bay faces, open parlor approaches. Real‑world installed costs typically range from $2 to $10 per square foot,depending on ceiling height and complexity.
At that range, $15,000–$35,000 can meaningfully close big gaps in a typical freestall and commodity area.
Coverage: Works 24/7 in any weather or light. No habituation. No blind spots where birds can sit directly over feed or cows.
Layering: Use the remaining $15,000–$35,000 (if any) on one laser to cover outdoor zones such as lagoons or silage faces, where structure is more challenging.
Optics: When APHIS or CFIA auditors walk in, you can point to standards and say, “We built to your book.”
Side by side, it looks like this:
Factor
Path A: Laser‑First
Path B: Structure‑First
Initial hardware spend
$25,000–$52,000 (2–4 AVIX units + install)
$15,000–$35,000 (netting/curtains/SOPs) plus one laser with remaining budget
Midday efficacy
Lower — beam less visible in bright sun; birds can still work non‑illuminated feed
High — netting/curtains block birds 24/7 regardless of light
HPAI risk coverage
Spotty — depends on where beam reaches at dawn/dusk
Broad — closes structural access points across footprint
Bird displacement
Birds move to open areas: bays, lagoons, outside feed; feed loss and virus pathways persist there
“We bought tech” but left rafters/bays open; easy for others to argue basics were skipped
“We followed APHIS/CFIA standards” and then added tech; much stronger story if HPAI hits
On this math, structure first comes out ahead on every line that matters — total cost, feed recovery, HPAI exposure, and negotiating position if something goes wrong.
What Happens When HPAI Hits a Laser‑First vs. Structure‑First Farm
Both farms can still get hit. Wild birds don’t read SOP binders. But what investigators find when they walk your yard determines everything that happens next.
Structure‑first farm. Inspectors see netted rafters, curtained entries, clean bunks, covered ingredient storage, and controlled water sources. It aligns with the wildlife‑exclusion and feed‑hygiene measures emphasized in USDA APHIS dairy H5N1 guidance and the CFIA National Standard. The storyline is, “you were unlucky, despite doing the right things.” That farm can sit across from its processor and insurer and say, “We followed your playbook. If you want more technology layered on top, that’s a shared‑investment conversation.”
Laser‑first farm. Inspectors see open rafters with droppings, birds roosting over feed alleys, exposed commodity faces, and one or two laser heads sweeping obvious paths. The conclusion writes itself: basic structural biosecurity wasn’t prioritized. That perception makes it easier for insurers to argue contributory negligence, for processors to tighten terms or pause pickups, and for lenders to question management judgment.
Same virus. Same type of herd. Similar per‑cow milk losses. The difference is whether your capital choices make HPAI look like bad luck — or like an avoidable management gap.
Stakeholder
Who Pays for Upgrades?
Who Benefits if Risk Drops?
What Leverage Do You Have?
Dairy Producer (You)
100% of capital cost — netting, curtains, lasers, labor, feed SOPs
Lower outbreak risk; reduced insurance claims; continued processor contracts
Demand cost-sharing — if processor/insurer wants higher biosecurity, show them Path B math and ask how it shows up in premiums/contracts/rates
Processor / Co-op
$0 — but reserves right to suspend pickups or tighten terms if HPAI hits your county
Zero contractual obligation — can mandate biosecurity standards without contributing capital
Insurer
$0 — premiums price in disease risk, but no cost-share for mitigation
Lower claim probability; stronger defense against “contributory negligence” arguments if outbreak occurs
Discretion to deny claims if “recommended biosecurity measures” (APHIS/CFIA guidance) weren’t followed
Lender / Ag Bank
$0 — biosecurity capex may affect your loan covenants and cash-flow projections
Lower default risk; stronger collateral value; easier to defend loan portfolio to regulators
Can price risk into interest rates without sharing mitigation costs
USDA (Poultry Ops)
Poultry gets 75% federal cost-share for structural biosecurity fixes identified in APHIS assessments
Lower national HPAI prevalence; reduced indemnity payouts; trade-partner confidence
Dairy excluded from cost-share — APHIS FAQ explicitly says dairy not eligible for 75% program
How to Talk to Your Processor, Insurer, and Lender About Bird Control
When your processor’s field rep or your lender’s ag banker brings up bird control — and more of them are — the conversation usually goes one way: “Have you looked into lasers?” Sometimes that’s honest advice. Often, it’s someone else’s risk department checking a box with your money.
Here’s how you flip that conversation without sounding defensive.
If the processor raises biosecurity expectations:
We’ve invested in structural exclusion and feed hygiene aligned with USDA APHIS dairy H5N1 guidance and the Canadian National Biosecurity Standard: netting over feed alleys, curtained entries, daily bunk cleanup, covered ingredient storage. We’re documenting with photos and bird counts. If you’d like us to add laser technology on top of that, we see that as a shared investment — your supply risk drops when our biosecurity improves, and we think the capital should reflect that.”
If the insurer asks about bird‑control measures:
“We can show you a written biosecurity plan built around structural exclusion — netting, sealed entries, feed hygiene SOPs, and regular bird counts — aligned with the wildlife‑exclusion measures in APHIS dairy H5N1 guidance.” We’re open to adding automated deterrents for outdoor zones, but those units are a $12,500–$13,104 per‑head investment that reduces your claims risk as much as it protects our herd. We want to talk about how that gets shared or shows up in our premium.”
If the lender questions biosecurity capex:
“We started bird‑control spending with the highest‑ROI items — netting and tighter feed management — that directly reduce our $55/cow annual bird‑loss exposure and line up with national standards. Laser units are on the roadmap for outdoor zones once that foundation is in place. We’re not skipping steps to buy the most visible technology first.”
You’re not refusing tech. You’re putting it in the right order and asking others who benefit from lower risk to participate in the cost.
What Dairies Should Do Before Fall Migration
In the next 30 days
Map every structural entry point. Walk your barns and bays. Doors that stay open, unsealed eaves, rafter cavities, exposed commodity faces — photograph each one. That’s your real bird‑control problem, not the number on a laser quote.
Count your birds three times a day. Dawn, midday, and dusk for five straight days. Note species, rough counts, and exactly where they land and feed. If you can’t describe your worst day in numbers, you don’t have a purchasing decision. You have a guess.
Pull 90 days of feed receipts and do the shrink math. Compare delivered vs. what actually went in front of cows. If your gap sits much above 3–5% and you’re watching flocks on the bunk, you’ve just put a dollar tag on your baseline bird cost.
🚩 Red flag: If your processor or lender is pushing you to “do something about birds” and you can’t answer those three questions, that conversation is being driven more by their risk checklists than by your numbers.
In the next 90 days
Lock in netting and curtains on the worst zones. Start with rafters over feed alleys, commodity bay faces, and open parlor approaches. Installed bird‑exclusion netting typically runs $2–$10 per square foot, depending on height, structure, and region — use that range to sanity‑check quotes, but prioritize coverage and durability over the very lowest bid.
Tighten feed hygiene SOPs. End‑of‑day bunk cleanup, refusal removal, covered ingredient storage, and a simple photo log of problem spots. APHIS guidance and national standards both highlight this as core, not optional — and this is exactly what insurers and regulators will look at if H5N1 is in your county.
Align your written plan with published standards. Use USDA APHIS dairy H5N1 biosecurity checklists and CFIA’s National Standard (or ProAction in Canada) as your templates. Being able to put those documents on the table and say “we built to this” changes the tone of every tough conversation.
✅ Opportunity: Once you can show your processor and insurer that you’ve aligned with published dairy biosecurity guidance on structure and management, it’s a lot easier to say, “We’ve done the foundational work. If you want lasers added, let’s talk about cost‑sharing.”
Over the next 12 months
Evaluate lasers after you’ve closed the obvious gaps. Once you’ve netted the rafters, sealed entries, and tightened feed hygiene, look at where birds still congregate — lagoons, open lots, silage faces. That’s where an AVIX head or an AI‑aimed system like iChase actually adds incremental coverage instead of replacing common sense.
Benchmark and document your progress. Re‑count birds at 6 and 12 months. Re‑run your shrink. Keep before/after photos. That record becomes your leverage in every future premium discussion, renewal, and claim.
What This Means for Your Operation
Don’t start with the gadget. Your first decision isn’t “Which laser?” It’s “Where are birds actually roosting and feeding, and which of those spots can I close with netting, curtains, or steel?”
Use $55/cow as your baseline loss check. Multiply your herd size by $55. If the capex you’re considering is bigger than two years of that baseline and you still have open rafters and bays, you’re out over your skis.
Run the HPAI worst‑case using your own herd size. Take a realistic clinically affected‑cow count — 20–30% of your herd, based on the Ohio and early Michigan experience — and multiply by both $504 and $950. If the low end doesn’t get your attention, check your math.
Separate the foundation from the extras. Netting, curtains, sealed feed, and hygiene are the foundations. Lasers are extra coverage. If anyone tries to reverse that, slow the decision down until your structural list is done.
If you already bought lasers, backfill the basics. A laser in your yard isn’t wasted. But if you skipped structural work to get it, your next dollar belongs in netting, sealing, and feed hygiene so the virus doesn’t just land where the beam doesn’t reach.
In the next 30 days, make one phone call. Ask your processor, insurer, or lender one specific question: “If we invest in structural biosecurity upgrades tied to APHIS/CFIA guidance, how does that show up in our premiums, contracts, or rates?” Their answer tells you how much of this risk they’re willing to share.
Key Takeaways
If you’re about to spend $25,000–$52,000 on bird control, the first two‑thirds of that budget should be in nets, curtains, doors, and feed hygiene. Lasers belong on top of that, not instead of it.
HPAI losses modeled between $504 and $950 per clinically affected cow dwarf the annual $55/cow bird‑loss bleed — which is exactly why you need your bird‑control spend anchored in structural biosecurity, not just tech that looks impressive.
Poultry barns can tap 75% federal cost‑share on some biosecurity upgrades; dairy barns cannot. That’s all the signal you need on who the supply chain expects to pay for your risk mitigation.
The Bottom Line
Your best leverage after an HPAI event is a paper trail showing you followed APHIS/CFIA structural and management guidance — not a single video of a green beam clearing a feed alley.
If processors want to mandate 2026-level biosecurity, they need to stop offering 1990-level contracts. It’s time to move bird control from the ‘producer expense’ column to the ‘supply chain security’ column.
Processors, lenders, and insurers all benefit when your bird load drops and your HPAI risk goes down. But until someone else starts writing a cheque, you need to put every dollar where it actually lowers your tail risk, not just where it checks a box.
The next time you look at a laser quote, the real question isn’t “Can I afford this?” It’s “What am I not fixing if I buy this first?”
Complete references and supporting documentation are available upon request by contacting the editorial team at editor@thebullvine.com.
Methodology Note HPAI loss estimates come from a 2025 Journal of Dairy Science modeling paper on H5N1 in US dairy herds and a 2025 Nature Communications case study of a 3,900-cow Ohio herd, using their reported per-cow and total economic impact ranges. Bird-loss estimates use a 2019 PLOS One survey of Washington State dairy producers on starling damage. Laser performance and pricing references draw on Wageningen UR laser trials in poultry, Ohio State University laser field work and extension summaries, and 2024–2025 AVIX and iChase distributor pricing/marketing materials, which are treated as vendor claims, not independent evidence. USDA APHIS dairy H5N1 guidance, CFIA’s National Standard, and Dairy Farmers of Canada’s proAction biosecurity module provide the structural-biosecurity standards cited here. All per-cow and herd-level math is illustrative and based on the ranges in those sources; your numbers will vary with herd size, management, region, and severity.
Learn More
H5N1’s Second Bill: The 90-Day, 0.5-SPC Fertility Hit Most Herds Miss – This guide reveals the hidden $10,000/quarter reproductive drain that follows the initial milk crash, arming you with tactical breeding management shifts to protect your conception rates when subclinical infections linger in your herd.
Beyond Efficiency: Three Dairy Models Built to Survive $14 Milk in 2026 – This strategic analysis exposes why volume-only growth is a dead end in the current market, delivering three proven operating models that prioritize liquidity and risk-diversification to keep your equity safe through the next price cycle.
Every week, thousands of producers, breeders, and industry insiders open Bullvine Weekly for genetics insights, market shifts, and profit strategies they won’t find anywhere else. One email. Five minutes. Smarter decisions all week.
Harrisburg dark Oct 6. 11 farms stranded, unpaid milk piling up. 19.70 $/cwt? $188k yearly bleed for 200‑cow herds. State scorecard + 30‑day paths inside.
When Harrisburg Dairies shut down for good on October 6, 2025, the trucks just stopped coming. At least 11 or 12 family farms and their haulers were suddenly sitting on weeks of shipped milk with no check and no clear backup buyer. That was one regional bottler, one weekend — and a preview of what 19–20 $/cwt milk looks like when the math and the processor power both turn against you.
When the National Numbers Say “We’re Fine” — But Your Milk Check Doesn’t
In Canadian research led by the University of Guelph’s Dr. Andria Jones‑Bitton, roughly one in four farmers said they’d had thoughts of suicide in the previous 12 months, often during winter when stress, debt, and dark days all pile up. Now look at the U.S. scoreboard. USDA NASS says total farm numbers fell from 1,880,000 in 2024 to 1,865,000 in 2025 — that’s 15,000 farms gone in a single year across all sectors. At the same time, January 2026 milk production in the 24 major dairy states hit about 19.1 billion lb, up 3.4 % from a year earlier.
USDA ERS estimates 2025 U.S. milk production at around 231.5 billion lb, roughly 2.5% higher than 2024. WASDE‑669 then calls for a 2026 all‑milk price of 19.70 $/cwt, down from 21.17 $/cwt in 2025. On a 300‑cow herd shipping about 69,000 cwt/year, that 1.47 $/cwt drop alone carves roughly 101,000 $ out of your annual milk check before you do anything wrong. You feel that in every feed‑mill statement, every delayed repair, every time you tell yourself you’ll talk to the bank “after planting.”
Meanwhile, the cows keep coming. In January 2026, the 24 major milk states reported about 9.15 million cows, roughly 200,000 head more than a year earlier. Average output hit 2,082 lb/cow for the month, 24 lb higher than January 2025. NASS licensed‑herd time series show dairy operations have fallen by well over half in two decades, yet national milk production is still climbing. The cows aren’t disappearing — they’re moving into big barns that can afford to live on 19‑dollar milk by spreading fixed costs and risk over thousands of stalls.
Add to the balance sheet. USDA ERS projects farm sector debt of around $ 624.7 billion for 2026, with interest expenses of $33 billion . Every tiny rate bump siphons a few more cents per cwt off your milk check and hands it to the bank before you pay feed, fuel, or yourself. That’s the backdrop to Harrisburg Dairies going dark — and the bigger question hanging over your yard: are you already in the kill zone at 19.70 $/cwt?
The Q1 2026 Dairy Consolidation Scorecard
The USDA’s 2025 “Farms and Land in Farms” summary provides total farm numbers by state. NASS Milk Production supplies state cow inventories and volumes. Put those together, and you can see where consolidation is running hot versus just simmering. Color codes here are based on annual dairy farm loss: RED = >4 %/year, YELLOW= 2–4 %/year, GREEN = <2 %/year. Farm counts are estimated from total farms and dairy cow numbers — directionally right, but not the same as the USDA’s licensed‑herd census.
Color
State
Est. Farms (2025)
YoY Farm Change
Milk Prod (B lb)
YoY Prod Change
Avg Herd Size
Consolidation Velocity
🟢
California
1,175
-1.8%
41.8
+0.4%
1,850
STABLE
🔴
Wisconsin
5,580
-4.3%
31.8
+1.1%
245
ACCELERATING
🟢
Idaho
345
-1.4%
18.2
+5.5%
1,680
STABLE
🔴
Texas
310
-4.6%
18.2
+6.9%
4,000
ACCELERATING
🟡
New York
2,390
-3.9%
15.8
+1.2%
260
STABLE
🔴
Michigan
970
-4.5%
12.4
+3.4%
550
ACCELERATING
🔴
Minnesota
1,810
-5.2%
11.2
+1.0%
240
ACCELERATING
🔴
Pennsylvania
~3,700
-11.7%(41% of U.S. exits)
10.1
-0.8%
~115
ACCELERATING
🟢
New Mexico
110
-2.2%
7.7
-1.0%
2,100
DECELERATING
🟡
Washington
275
-2.6%
6.8
+1.1%
920
STABLE
🟡
Ohio
1,320
-3.4%
5.8
+2.1%
195
STABLE
🟡
Iowa
790
-2.5%
5.7
+0.7%
275
STABLE
🟡
Kansas
180
-3.8%
4.8
+17.2%
1,250
ACCELERATING
🟡
South Dakota
140
-2.9%
4.5
+9.5%
1,300
ACCELERATING
🟢
Colorado
105
-1.9%
5.4
+3.9%
1,550
STABLE
Analysis of USDA’s licensed herd counts says the quiet part out loud: using USDA’s original 2024 baseline, the U.S. lost about 1,202 dairies in 2025, and 490 of them were in Pennsylvania — an 11.7 % drop that accounts for 41 % of all U.S. dairy exits. When four out of every ten closures are in one state and state milk still sits at near 10.1 billion lb, you’re not watching a gentle reshuffle. You’re watching cows stay while barns and families disappear.
Where Is the Processing Money Going — And What Does It Do to Your Milk Check?
If you want to know where your future mailbox price is set, follow the stainless steel, not just the blend price.
Kansas is the clearest example right now. NASS and ERS report Kansas milk output jumped roughly 17.2% in a single year, driven largely by Hilmar Cheese’s new plant in Dodge City. Hilmar has about $600 millionsunk into that site, with a capacity of around 12.5 million lb/day when fully ramped, a level it essentially reached in early 2025. A plant like that doesn’t just “add capacity.” It creates gravity. Cows, corn silage, employees, and bankers all start orbiting Dodge City.
Texas and Idaho are locked in a fight for third place nationally. In 2025, Idaho’s roughly 350 dairies shipped about 18.26 billion lb, just ahead of Texas at 18.21 billion lb. But Texas has the bigger forward pipeline: Leprino’s Lubbock cheese complex — targeting roughly 1 billion $ in total investment — is phasing in through 2026, and Walmart’s fluid plant in Robinson, TX, is sourcing directly from regional farms for Great Value and Member’s Mark bottling. Those facilities want big, steady loads. That shapes what your co‑op can pay, even if your milk never hits their silos.
Up the I‑29 corridor, South Dakota shows how a single expansion can remake a region. State milk production is up around 9.5 %, tied heavily to Valley Queen’s expansion at Milbank, which doubled capacity to roughly 8 million lb/day and is expected to pull in another 25,000–30,000 cows over 2025–2026. Across the High Plains and mountain states, average herd sizes run from roughly 1,700 to more than 2,000 cows, with plenty of outfits milking 4,000 head in the Texas Panhandle.
If you’re milking 150–400 cows into a commodity pool, your milk is being priced in a world built for 2,000‑cow barns tied to 600‑million‑dollar plants. You may hate that. You still have to decide how you’re going to live in it.
Where Are Farms Bleeding Out Fastest — And Can Sub‑500‑Cow Herds Survive This Math?
While stainless steel moves west and south, the traditional milksheds are losing barns first and fastest.
NASS data for the Northeast/Mid‑Atlantic corridor (Maine through Maryland) show hundreds of dairy exits in 2025, and Farmshine’s breakdown of USDA-licensed herd numbers says that, using the original 2024 baseline, 41 % of all U.S. dairy exits were in Pennsylvania alone. That’s 490 dairies gone and an 11.7 % hit to the state’s dairy farm count in one year. State milk output only slipped about 0.8 % to roughly 10.1 billion lb, which tells you exactly what’s happening: cows are staying, they’re just changing barns and addresses.
ERS’s February 2026 cost‑of‑production work (ERR‑334) explains why this is hitting smaller herds first. For herds under 50 cows, full economic cost — cash expenses plus depreciation, unpaid labor, and opportunity cost — sits above 42.70 $/cwt. In the 100–499‑cow bracket, total economic costs cluster roughly between 19 and 21 $/cwt once you count everything, not just the checks you write. At a 19.70 $/cwt all‑milk forecast, any mid‑size herd with a true breakeven near 21.00 is losing about 1.30 $/cwt, even if there’s still something left after paying feed and fuel.
That pressure is showing up in the courts. According to U.S. Courts data summarized by the American Farm Bureau Federation and university analysts, 315 Chapter 12 farm bankruptcies were filed in 2025, up 46 % from 216 in 2024. The Midwest region logged 121 cases, while the Southeast recorded 105, and filings in both regions rose roughly 70 %year‑over‑year. When you hear neighbors say, “We just need one good year,” this is the backdrop — a lot of farms tried to wait that year out and met their lender and their lawyer instead.
Region
2024 Filings
2025 Filings
Midwest
71
121
Southeast
62
105
Other Regions
83
89
Total
216
315
The Hidden Story: Georgia’s Rise and New Mexico’s Floor
Not every growth story comes with sand and center‑pivots.
Georgia quietly led the Southeast in 2025. NASS numbers and extension analysis show the state adding around 3,000 cows and boosting milk output by about 7.8% to roughly 2.09 billion lb, while losing only five dairies. The anchor is Walmart’s 350‑million‑dollar bottling plant in Valdosta, which opened in December 2025 and now supplies more than 650 Walmart and Sam’s Club stores across the Southeast with private‑label milk sourced from regional farms. If you’re milking in Alabama or the Florida panhandle and telling yourself, “This region’s done for dairy,” Georgia is the counter‑example — the plant showed up, and the cows followed.
On the other side, New Mexico looks “stable” in the scorecard — small further farm loss, flat‑to‑slightly‑negative milk — but only because the hard part already happened. Years of contraction stripped out almost every sub‑1,000‑cow operation and left a landscape dominated by 2,000‑plus‑cow barns shipping into a handful of plants. If you’re a 200‑cow operator in Wisconsin or Pennsylvania, New Mexico isn’t an oddity. It’s a possible future — after your region has already done a lot of painful shrinking.
What Does 19.70 Milk Actually Look Like on Your Farm?
Let’s get out of the abstract and into numbers you can map onto your own herd.
Say you’re milking 200 cows in Wisconsin or Pennsylvania. USDA’s 2025 numbers say the average U.S. cow shipped about 24,390 lb — that’s 243.9 cwt per cow per year.
Barn Math: 200 Cows at 19.70 Milk
Revenue side (all‑milk forecast 19.70 $/cwt):
Milk per cow: 243.9 cwt
Gross revenue per cow: 243.9 × 19.70 = 4,804.83 $/cow
Total herd revenue (200 cows): 960,966 $
Cost side (full economic cost, ERS/Illinois FBFM example):
Total economic cost per cwt: 23.56 $/cwt
Total cost per cow: 23.56 × 243.9 = 5,746.28 $/cow
Total herd cost (200 cows): 1,149,257 $
Bottom line:
Net return per cow: 4,804.83 − 5,746.28 = –941.45 $/cow
Annual net loss: –188,290 $
Monthly equity bleed: about –15,700 $/month
That’s at 19.70 $/cwt. You’re probably covering cash bills for feed, fuel, and vet — ERS benchmarks often put cash operating costs in the mid‑to‑high teens per cwt. The grain mill gets paid. The TMR still runs. Maybe you chip away at some old payables.
Year
All-Milk Price ($/cwt)
Full Economic Cost ($/cwt)
2019
18.53
19.85
2020
18.18
20.12
2021
18.64
21.35
2022
25.16
24.89
2023
20.66
22.47
2024
20.82
22.94
2025
21.17
23.12
2026
19.70
23.56
But you’re not paying yourself a fair wage. You’re not truly replacing equipment. You’re not paying for the capital already sunk into cows and concrete. And you’re quietly moving about 3.86 $/cwt of value — the gap between full economic cost (23.56) and forecast price (19.70) — out of your equity column every time you ship a hundredweight.
Line Item
Per Cow ($/cow/year)
200-Cow Herd ($/year)
REVENUE
Milk production (cwt/cow/year)
243.9 cwt
48,780 cwt
All-milk price ($/cwt)
$19.70
$19.70
Gross milk revenue
$4,804.83
$960,966
Cull cow & calf revenue
$285
$57,000
Total Revenue
$5,089.83
$1,017,966
COSTS (Full Economic)
Feed (purchased + homegrown)
$2,850
$570,000
Labor (paid + unpaid family)
$1,125
$225,000
Replacement heifers
$620
$124,000
Fuel, utilities, repairs
$485
$97,000
Vet, breeding, supplies
$310
$62,000
Interest & debt service
$245
$49,000
Depreciation (facilities, equipment)
$385
$77,000
Opportunity cost (equity, land)
$526
$105,200
Total Economic Cost
$6,546.28
$1,309,257
NET RETURN
-$1,456.45
-$291,290
Monthly equity bleed
-$121/cow/month
-$24,274/month
If your basis is weak or your SCC premiums are off by 0.25–0.50 $/cwt, the hole gets deeper. That “one good heifer every 23 days” image isn’t an exaggeration — this example is roughly burning that value, whether you see it on a statement or not.
Where Does Your Real Breakeven Sit — and How Long Can You Live Below It?
This is the question everything else hangs on. You can’t decide whether to scale, specialize, or exit until you know what a hundredweight actually costs you.
Pull the last 12 months of real numbers: feed (including home‑grown at market value), fuel, repairs, vet, breeding, interest, insurance, taxes, family living, and a realistic wage for your time. Divide by shipped cwt, not “produced” milk. If that all‑in number is:
Under 19.70 $/cwt — you have margin and choices.
Around 19–21 $/cwt — you’re in the gray zone where small changes in milk price or feed cost swing you from black to red.
Above 21 $/cwt — you’re already in kill‑zone territory. The longer you run like this, the more equity quietly disappears.
Then stress‑test at 18.00 $/cwt for six months. That’s not a fantasy — January 2026 Class III printed at 14.59 $/cwt, February only improved to 14.94, before basis, hauling, and deductions. At an 18‑dollar average for half a year, can your operation stay under about 60 % debt‑to‑asset and avoid burning more than 15 % of your equity? If the honest answer is “no,” you’ve got a timeline problem, not just a margin problem.
What Can You Realistically Change in the Next 30 Days?
You don’t rebuild a cost structure overnight. You can absolutely change its trajectory in a month.
In the next 30 days, you can:
Sit down at the kitchen table for two hours with last year’s numbers and build your real cost per cwt on paper or with your advisor. That one session changes how you look at every other decision.
Re‑draw your breeding plan so beef semen only hits cows you don’t want daughters out of, and your highest‑merit cows only see high‑profit dairy sires.
Mark cull candidates using both production and genetics — cows sitting in the bottom slice of NM$ who are also lagging in components or fertility.
Call your co‑op or plant rep and ask bluntly what basis, premiums, or volume commitments are likely to look like over the next 12–24 months in your exact area.
You don’t have to decide in 30 days whether to build a 500‑stall barn. You do have to decide whether you’re going to keep feeding cows that don’t pencil at 19‑dollar milk.
How Do You Use Beef‑on‑Dairy as a Tool, Not a Trap?
Beef‑on‑Dairy has been the hottest “extra margin” lever in a lot of parlors and robot rows. Trade and extension reports still talk about beef‑cross calves bringing up to around 1,400 $ a head in some programs when the genetics and weights are right. Spread across your total shipped cwt, that can effectively add 2–3 $/cwt worth of value if you’re consistent and disciplined.
But there’s a hidden tax: replacements. USDA’s price series and industry coverage show dairy replacement heifers averaging around 3,010 $/head by mid‑2025, up from roughly 1,140 $ in 2019 — about a 160 % jump in six years. So every time you chase a high‑priced beef‑cross calf instead of a heifer, you’re betting that Future‑You can afford to buy back the genetics you’re not making today.
The smart way to play Beef‑on‑Dairy in a 19‑dollar world is as a lever, not a life raft:
Aim beef semen at your low‑merit cows first, not your best.
Keep beef to roughly a quarter to a third of your breedings so you don’t starve your replacement pipeline.
Pair it with a genetics plan, not just a cash‑flow band‑aid.
The calf checks feel great. The real test is whether your replacement math still works 18–24 months from now when those heifers should be freshening.
Can Genetics Keep You Off the Auction Block?
Feed, bedding, and power hit every cow the same. Genetics is where you decide which cows deserve a spot on your TMR.
USDA‑ARS is blunt about Net Merit: NM$ is a measure of lifetime profit. It’s built to rank animals by net dollars they’re expected to return, not just yield. When you genomic test and line your cows and heifers up by NM$ or your co‑op’s profit index, you’re looking at who’s likely to pay their way — and who’s just eating.
At 19–20 $/cwt milk, you can’t afford to carry a long tail of passengers. Practical steps:
Sort your cows and heifers by NM$ or your chosen index and print the list.
Circle the bottom slice — whatever percentage your gut can handle — and ask, cow by cow, “Does she justify another lactation, another breeding, or another year’s feed?”
Get especially honest about the heifers stuck in the bottom half of your genomic ranking. In this environment, raising a low‑merit heifer to calving is often worse than selling her and keeping the cash.
You don’t have to chase sky‑high GTPI or build a show string. You do have to stop feeding genetics that have no realistic shot at paying their way under the margins USDA is telling you to expect.
How Do You Use DMC and Risk Tools Without Fooling Yourself?
The 2026 Dairy Margin Coverage enrollment window ran from January 12 to February 26, 2026, so by now, you either locked it in or you didn’t. Under the updated rules, Tier I coverage now extends up to 6 million lb of production history per year — plenty to blanket a 200–500‑cow herd at realistic production levels.
ERS’s LDP‑M‑380 shows how quickly the DMC margin can move when feed and milk don’t play nice together. In late 2025, margins slid close to trigger levels as milk softened while feed costs remained stubbornly high. If you enrolled, those Tier I checks won’t magically turn a structurally unprofitable herd into a winner, but they can plug real holes when margins squeeze hard.
If you didn’t enroll, now’s the time to sit down with your lender and risk‑management advisor and talk about Dairy‑RP, forward contracts, or co‑op tools — not when your Class III mailbox price is already starting with a “1,” and your equity chart is pointed straight down.
What DMC and risk tools cannot do is change the basic fact that if your full cost sits above the price line, you’re selling equity every time the tank empties.
Options and Trade-Offs for Farmers
Here’s where the rubber meets the lane. There are only a few real paths. The math above is what each path is working against.
Path
When It Makes Sense
Key Actions (Next 30–90 Days)
What You Gain
What You Give Up / Risk
1. Fix Cost Structure
Full cost within 1–2 $/cwt of forecast price; solid facility; debt manageable; willing to cut ruthlessly
– Run true cost/cwt with advisor- List specific cuts (rent, machinery, low-merit cows)- Hunt SCC/component premiums- Stress-test at $18/cwt for 6 months
Survival without major capital; preserve equity; keep optionality for next move
Can cut into burnout if you don’t know when to stop; only works if gap is ≤2 $/cwt
2. Scale or Align
In growth corridor (TX, KS, SD, ID, Southeast); processor adding capacity; willing to leverage up or commit volume long-term
– Contact plant/co-op for volume contracts- Model expansion to 500–1,000+ cows- Secure basis guarantees or premiums- Line up financing with lender
Lose flexibility; high leverage = faster pain if Class III tanks; stuck in contract even if milk crashes
3. Specialize & Strip Overhead
Region won’t support mega-scale; real niche demand (A2A2, grazing, on-farm bottling, local brand); you like marketing
– Match genetics/cow type to niche- Cut anything not serving the premium- Build direct customer pipeline- Get comfortable with people, not just cows
Swap FMMO risk for niche margin; can feel like 22–23 $/cwt effective price; differentiation protects you
Customer risk replaces market risk; lose a key buyer = scramble; requires marketing skills most don’t have
4. Plan Strategic Exit
Full cost clearly >21 $/cwt; worn out; no clear successor; equity preservation matters more than legacy
– Price cows & heifers NOW (3,010 $ heifers, 1,800–2,000 $ cows vs. 1,400 $ distressed)- Model liquidation value vs. forced sale- Talk to family, lender, lawyer- Set timeline before bank sets it for you
Preserve 30–40% more equity than distressed sale; protect family balance sheet; exit with dignity
Emotional cost is brutal; end of generational identity; no second chance if you wait too long and values crash
Path 1: Fix the Cost Structure (Start in the Next 30 Days)
When it makes sense You’ve got a solid facility, decent cow flow, and debt that isn’t already crushing you. You’re willing to cut pet expenses and sacred cows — literal and figurative — if the numbers say they should go.
What it takes You do a full, honest cost‑of‑production run — no “back of the napkin,” no ignoring family living. You list specific cuts or changes: maybe it’s dropping one rented parcel that never pays, changing TMR ingredients, or burning down non‑productive machinery. You hunt for easy nickels: better components, SCC premiums, co‑op quality bonuses.
The limits You can cut your way into survival. You can also cut your way into burnout if you don’t know where to stop. This path works best when your full cost is within 1–2 $/cwt of the forecast price and the barn math says you can close that gap.
Path 2: Scale or Align — If Your Region Wants More Milk
When it makes sense You’re in a growth corridor — Texas Panhandle, I‑29, Idaho, parts of the Southeast — where processors are actively adding capacity and courting new milk.
The play You either add cows significantly or tie your existing string into a long‑term supply relationship. That might be a direct contract with a cheese plant, a guaranteed‑volume arrangement through your co‑op, or a barn expansion that moves your average cost per cwt down as you fill stalls.
The catch You gain a better basis and potentially more stable premiums. You give up flexibility and take on more fixed costs. If Class III spends another year flirting with the mid‑teens, highly leveraged big herds feel that pain faster and harder than smaller, lightly leveraged ones.
Path 3: Specialize and Strip Overhead
When it makes sense You’re in a region where you’ll never out‑scale the 4,000‑cow outfits, but there’s real demand for something different — higher components, grazing‑based milk, A2A2, on‑farm processing, or a branded local product.
What it requires You match your genetics, cow type, and farm layout to that niche. You cut anything in your cost stack that doesn’t feed the niche premium. You get comfortable with marketing and people, not just cows.
The trade‑off You swap FMMO risk for customer risk. Lose a key buyer, and you’re scrambling. But if the niche is real — and if you execute — you can turn a 19‑dollar commodity environment into something that feels more like 22–23 $/cwt on your milk check.
Path 4: Plan an Exit While Cows and Heifers Are Still Worth Real Money
When it makes sense Your full‑cost number is clearly above 20 $/cwt, you’re worn out, and the successor plan is blurry or non‑existent.
What it looks like You look straight at the current replacement and cull values. In 2025, replacement heifers averaged around 3,010 $, and many good cows would bring 1,800–2,000 $; in a forced or distressed liquidation, those numbers can slide toward 1,400 $ for cows. That’s a 450 $/head swing. Across 300 cows, that’s roughly 135,000 $ that either lands in your bank account or disappears if you wait too long.
The hard part Emotionally, this is the toughest path. Practically, it can be the one that protects the most family equity and gives the next generation the best footing — whether they farm or not.
Key Takeaways
If your full‑cost breakeven is above 21 $/cwt, 19.70 milk isn’t a rough patch — it’s a slow equity bleed. Either fix the cost, add a margin, or set a clear exit timeline before the bank or your health sets it for you.
If you’re in a processing growth zone and your true cost per cwt is competitive, scaling or aligning with a plant can turn 19‑dollar milk into a workable long‑term play — but only if you respect the leverage and build a genetics pipeline that keeps replacements affordable.
If your proof sheets show a long tail of low‑NM$ or low‑index cows and heifers, feeding them is a choice — culling the bottom slice and only raising replacements from the top half of your ranking is one of the cleanest ways to lift dollars per cwt without adding a single stall.
If you can’t run your own barn math in the next 30 days, you’re flying blind — the biggest risk to your operation isn’t the market, it’s not knowing exactly where your kill zone starts in dollars per cwt.
The Bottom Line
The farm is what you do; it isn’t who you are. The numbers in this scorecard are brutal, but they’re about a system — debt, policy, processors, and markets — not your worth as a producer, a parent, or a neighbor. If walking through this math makes your chest tight or your stomach knot up, that’s not weakness. That’s your body saying the load is heavy. Talk with someone you trust — spouse, vet, lender, neighbor. And if it feels like too much, you can call or text 988 in the U.S., or reach out to farm‑focused supports like Farm Aid or Do More Ag, and talk to someone who understands what you’re carrying.
Then, with your own cost per cwt and best‑guess 12‑month milk price written down in front of you, decide: are you going to fix, scale, specialize, or exit? And before six more milk checks hit the mailbox, what single move — cull list, genetics plan, risk‑management conversation, or succession step — are you willing to make so your herd doesn’t quietly slide deeper into the kill zone?
Complete references and supporting documentation are available upon request by contacting the editorial team at editor@thebullvine.com.
Learn More
Maximizing Your Milk Check: The 2025 Guide to Component Pricing – Stop leaving money in the parlor. This guide exposes the specific component thresholds required to outrun rising input costs and delivers a tactical roadmap for adjusting rations to capture every possible premium on your next check.
The Year of the Great Divide: Navigating Dairy Consolidation – Secure your operation’s future against aggressive structural shifts. This analysis breaks down the economic forces hollowing out the middle market, arming you with the long-term positioning strategies needed to survive the next five years.
Precision Breeding: Using NM$ to Outrun the Commodity Trap – Outrun the commodity trap with data-driven selection. This deep dive reveals how leveraging Net Merit (NM$) and genomic testing creates a high-efficiency herd, giving you a decisive competitive advantage in a low-margin environment.
The Sunday Read Dairy Professionals Don’t Skip.
Every week, thousands of producers, breeders, and industry insiders open Bullvine Weekly for genetics insights, market shifts, and profit strategies they won’t find anywhere else. One email. Five minutes. Smarter decisions all week.
50K vanished from WI 300-cow dairy’s Jan check. Von Ruden blames FMMO make allowances. Yours?
Executive Summary: In January 2026, a 300-cow Wisconsin dairy watched $50,000 vanish despite shipping the same milk to the same plant under the same management. This massive revenue hemorrhage is the direct result of the FMMO’s new “make-allowance” deductions—a structural 90¢/cwt tax that processors now skim off the top before you see a dime. While the industry touts federal “safety nets,” the cold math reveals a brutal 23-to-1 gap where DMC pennies cannot stop formula-driven dollar losses. This is not a market anomaly; it is a fundamental wealth transfer from the barn to the plant that your own co-op likely bloc-voted into existence. To survive, producers must audit their statements, isolate their specific “hidden drag,” and demand immediate accountability from leadership before their equity evaporates. Your January check wasn’t just a disappointment—it was a warning shot for an 18-month fight for survival.
At the National Farmers Union’s 124th annual convention this March, Wisconsin Farmers Union president Darin Van Ruden stood up in a delegate session and dropped a number that stuck: about $50,000. That’s how much less a 300‑cow dairy operator in southwest Wisconsin received on his January 2026 milk check compared with January 2025, according to Van Ruden.
He told Brownfield Ag News this wasn’t a model herd or a spreadsheet example. It was a neighbor he’d spoken with the week before — 300 cows, southwest Wisconsin, same plant, same truck, roughly $50,000 gone in one month. The cows didn’t change. The formulas did.
From $20.47 to $15.05: What Changed in a Year
Before you argue about anyone’s $50,000, look at the numbers every FO30 producer faced.
The Upper Midwest FMMO (Order 30) statistical uniform price for January 2025 was $20.47/cwt. In January 2026, it was $15.05/cwt — a year‑over‑year drop of $5.42/cwt. That’s the base reality under every milk check in the order.
Commodity prices did plenty of damage. CME butter’s monthly average price slid from $2.6042/lb in January 2025 to $1.4266/lb in January 2026, down about $1.18/lb — roughly a 45% crash. Cheddar blocks dropped from $1.8954/lb to $1.4003/lb, a 26% hit. FO30’s January Class III price followed that slide, falling from $20.34/cwt in 2025 to $14.59/cwt in 2026 — off $5.75.
Product
Jan 2025 Price
Jan 2026 Price
Change
CME Butter
$2.6042/lb
$1.4266/lb
–$1.18/lb (–45%)
Cheddar Blocks
$1.8954/lb
$1.4003/lb
–$0.50/lb (–26%)
FO30 Class III
$20.34/cwt
$14.59/cwt
–$5.75/cwt (–28%)
FO30 Class I Util
7.7%
7.7%
No blend cushion
And FO30 is built to feel that pain harder than most. Class I made up just 7.7% of pooled producer milk in the order in 2025 — the lowest share of any federal order. Almost everything else is Class III and IV. When cheese and butter break, there isn’t much Class I volume to pull the blend up.
Handlers behaved exactly how you’d expect in that setup. In January 2026, FO30’s producer price differential was $0.46/cwt, and an estimated 2.6 billion pounds of eligible milk weren’t pooled — more than the 1.4 billion that stayed in the pool. When more milk sits outside the pool than inside it, you don’t have a healthy pricing system. You have a blender that’s barely plugged in.
Where the Missing 90¢/cwt Really Went
That $5.42/cwt drop in FO30’s uniform price is not all structure. A big chunk is just a miserable butter and cheese month. But there’s a permanent piece baked into your check now, and that’s the make‑allowance jump.
Make allowances are the manufacturing‑cost numbers USDA subtracts from surveyed cheese, butter, powder, and whey prices in the FMMO formulas. When those numbers go up, class prices go down by the same amount. USDA’s modernization package raised the allowances effective June 1, 2025:
Product
Old make allowance
New make allowance
Change
Cheese
$0.2003/lb
$0.2519/lb
+5.16¢ (25.8%)
Butter
$0.1715/lb
$0.2272/lb
+5.57¢ (32.5%)
NFDM
$0.1678/lb
$0.2393/lb
+7.15¢ (42.6%)
Dry whey
$0.1991/lb
$0.2668/lb
+6.77¢ (34.0%)
American Farm Bureau Federation economist Danny Munch ran those new allowances through 2020–2023 markets. His Market Intel analysis found that higher make allowances alone would have lowered average FMMO class prices by about $0.92/cwt for Class III, $0.85/cwt for Class IV, $0.89/cwt for Class I, and $0.85/cwt for Class II. That’s not worst‑case. That’s the average.
AFBF then looked at what that would have done to pool values. Over just three months — June through August — higher make allowances stripped about $337 million out of producer pools nationally, including roughly $64 millionfrom the Upper Midwest, $62 million from the Northeast, and $55 million from California. That’s money that would’ve been in milk checks under the old formulas.
Yes, USDA did throw some offsets into the same package. The final rule restores the “higher‑of” Class I mover, revises Class I differentials, and updates composition factors so higher‑solid milk gets recognized at 3.3% protein and 9.3 lb SNF instead of the old 3.1/8.7. But timing matters. Make allowances went up on June 1, 2025. The composition factor change didn’t kick in until December 1, 2025. For six months, producers received the full cost increase with no solid‑adjustment relief.
If you want the deeper class‑by‑class walk‑through, The Bullvine’s own FMMO Reset analysis uses AFBF’s numbers to show how that roughly 90¢/cwt drag plays out across orders and herd sizes. The short version: there’s now a structural discount sitting in your class prices that won’t disappear just because butter has a good month.
How Much Did the FMMO Rewrite Actually Cost Your January Milk Check?
Now let’s get close to home.
Take the herd Van Ruden talked about: 300 cows in southwest Wisconsin. If that operation is shipping about 85 lb/cow/day in January, that’s roughly 7,905 cwt in 31 days.
FO30’s statistical uniform price dropped $5.42/cwt from January 2025 to January 2026. The straight arithmetic on that herd looks like this:
7,905 cwt × $5.42/cwt = $42,845 less on the check, just from the change in the uniform price at test.
But FO30’s “at test” milk isn’t 3.5% butterfat. In January 2026, pooled butterfat averaged 4.52%, with protein at 3.42%. At the same time, the butterfat component price fell from $2.9487/lb in January 2025 to $1.4525/lb in January 2026 — a collapse of $1.4962/lb. That hits all the butterfat you’ve bred and fed for above 3.5%.
Layer in premium changes. Plants facing lower class prices and higher make allowances have every reason to trim or restructure volume incentives, quality bonuses, and over‑order payments. You don’t see those cuts in a USDA bulletin. You see them when your “other credits” line shrinks.
When you add the FO30 uniform‑price drop, the butterfat collapse on high‑component milk, and likely premium erosion, you’re suddenly right in the neighborhood of Van Ruden’s $50,000 example for a 300‑cow herd. The exact number belongs to that family. The order‑level math says the story is believable.
Now pull out the structural part. AFBF’s modeling suggests that higher make allowances alone cut FMMO class prices by roughly 90¢/cwt. Here’s what that looks like across herd sizes at 23,000 lb/cow annual production:
Herd size
Annual cwt
90¢/cwt drag/year
Monthly drag
150 cows
34,500
$31,050
$2,588
300 cows
69,000
$62,100
$5,175
500 cows
115,000
$103,500
$8,625
1,000 cows
230,000
$207,000
$17,250
That’s what “structural” means. Those dollars disappear off the table every year until formulas, cost surveys, or utilization change. Markets might add to or subtract from that. The drag itself stays.
And when you park that drag next to the Farm Bill safety net? The Bullvine’s GT Thompson 2026 Farm Bill pieceshows a 200‑cow herd gaining roughly $1,800/year in improved DMC payouts while losing about $42,240/year from higher make allowances. That’s a 23‑to‑1 gap. For every dollar DMC gives back, the formula takes twenty‑three.
How Much Did the Formula Change Actually Cost Your January Check?
Now it’s your turn.
Step 1: Put a real number on your January‑over‑January price.
Grab your January 2025 milk statement. Take net pay (after hauling, dues, and fees) and divide by total cwt shipped. Write that number down.
Do the same for January 2026.
Subtract 2025’s $/cwt from 2026’s $/cwt. That difference is your real‑world January drag.
Step 2: Separate what the market did from what the formula did.
Look at the same FO30 numbers Van Ruden’s neighbor faced:
Class III price: $20.34/cwt → $14.59/cwt (down $5.75).
Butter: about $2.60/lb → $1.43/lb (down roughly $1.18/lb).
If your $/cwt drop is roughly in line with those moves, most of your pain is “just” the butter and cheese crash. Whatever you can’t explain with those class‑price and butter moves is where the structural make‑allowance hit and co‑op decisions are hiding.
Step 3: Put a number on the “hidden” part.
If your unexplained gap sits under 30–40¢/cwt, your buyer might already be buffering some of the structural drag with premiums or patronage.
If it’s over about 50¢/cwt, especially in Class III‑heavy orders like the Upper Midwest and Central, you’re almost certainly feeling that ~90¢/cwt structural penalty from higher make allowances plus whatever your plant adjusted in premiums.
You don’t need an economist to tell you if Van Ruden’s neighbor is alone. That three‑step math will answer the question for your own barn.
Step
Calculation
Your Number
1
Jan 2026 net $/cwt – Jan 2025 net $/cwt
$ ______
2
FO30 uniform price drop (baseline: –$5.42/cwt)
–$5.42/cwt
3
Butterfat price collapse (–$1.50/lb on 4.52% avg)
~$ ______ /cwt
4
Unexplained gap (Step 1 minus Steps 2 + 3)
$ ______
5
If unexplained gap > 50¢/cwt: Structural drag + premium cuts likely
Can You Recapture 90¢/cwt Through Components, or Is This a Permanent Loss?
A lot of advisors will tell you the path is simple: “Just make it up on components.”
There’s truth in that — up to a point. FO30 herds have pushed components hard. Pooled butterfat averaged 4.52% and protein 3.42% in January 2026. The December 2025 composition factor change in the final rule now prices “standard” milk at 3.3% protein and 9.3 lb SNF, up from 3.1/8.7, so you finally get some formula credit for the progress you’ve already bred and fed.
If you’re behind that bar, there’s money on the table. Picking up 0.1–0.2% protein through sire selection, grouping, and ration tuning in a decent Class III month can add 20–25¢/cwt. That’s real.
But look at what happened to the underlying prices you’re stacking that on. In January 2026, the protein price in FO30 was $2.1768/lb, down from $2.9307/lb a year earlier. Butterfat went from $2.9487/lb to $1.4525/lb. You’re trying to outrun a 90¢/cwt structural haircut with component premiums that are themselves sitting on a lower base.
And the system still doesn’t pay you full world value for the fat you ship. In The Bullvine’s butterfat deep‑dive, we showed FMMO formulas paying around $1.71/lb for butterfat at a time when Global Dairy Trade butterfat equivalents were closer to $2.95/lb — a gap north of $1.20/lb. You can crank out more fat, but the pricing system captures barely half its export value for you.
What about DMC? The 2026 Farm Bill draft raises Tier I coverage to 6 million pounds — roughly 260 cows at 23,000 lb —, but anything you ship beyond that is in Tier II or uncapped. USDA and Progressive Dairy coverage show the program helping when margins collapse, but even in “tight” years, the realistic annual benefit is low thousands of dollars on a 200‑cow herd — against roughly $42,240/year lost to higher make allowances in the GT Thompson example. DMCs aren’t designed to track structural formula changes dollar-for-dollar. It’s a margin band‑aid.
So yes, push components. Yes, use DMC intelligently. Just don’t fool yourself into thinking you can component your way out of a 90¢ structural discount that hits every cwt you ship.
Options and Trade-Offs for Farmers
You can’t undo June 1, 2025, on your own. You can decide how you’re going to respond to what it did to your check.
Path 1: Stay Put and Force the Conversation (Your 30‑Day Move)
This path fits if your co‑op or buyer has generally been fair on hauling, basis, and access, and you’ve got some runway.
Here’s the 30‑day checklist:
Print your January 2025 and January 2026 milk statements.
Calculate your net $/cwt for each and the gap between them.
Highlight the part you can’t explain with Class III, Class IV, and butter moves.
Bring those pages to your next district or annual meeting and ask three straight questions:
How did we vote in the FMMO modernization referendum — yes, no, or bloc‑voted by the co‑op?
How much did higher make allowances cost our pool in 2025 and 2026, in dollars and cents per cwt?
What are we doing — via premiums, over‑order pricing, or patronage — to push some of that value back toward member checks?
The risk with this path is time. The FMMO hearing process that produced this package took years. Nobody should be promising a quick redo.
Path 2: Shop Quietly for a Better Milk Check
This path makes sense if you’re consistently 50–60¢/cwt behind neighbors shipping similar milk to another buyer, and you have leverage left — equity, cow quality, location.
You’d need to:
Compare net pay — after hauling, dues, and fees — with producers on other trucks.
Price out hauling, quality penalties, balancing charges, and contract fine print before you even hint at switching.
Equity factor that might get stranded if you leave a co‑op for a proprietary processor.
There’s real upside if another buyer structurally pays closer to class value. But you give up governance and some safety if milk markets get ugly. And in some regions, the “different” hauler still leads back to the same corporate plant.
If you want a sober look at how chasing a higher pay price can still leave you in a margin trap, pair this piece with The Bullvine’s coverage on $14.59 milk against $20‑plus/cwt cost of production — the DSCR math isn’t pretty.
Path 3: Model a Managed Exit While You Still Have Leverage
Nobody wants to be the one to say this, but here it is: some operations already know $15–16/cwt milk with a 90¢ structural drag, and current debt loads won’t pencil long term.
This path fits if:
Your DSCR is stuck under roughly 1.20× at $15–16 uniform prices, and you’ve been there more than a quarter.
You’re putting bills in a stack instead of paying them as they arrive.
Your lender has already started asking for more “updated” projections.
You’d need to:
Build an 18‑month cash flow projection at today’s price levels and at one or two “what if” scenarios.
Sit down with your lender now, not when covenants are already broken.
Price what a step‑back or exit looks like while cull cow and beef‑cross prices are still decent.
Selling cows into strength on your terms almost always preserves more equity than waiting until the bank’s credit committee decides you’re done. It’s ugly. It still beats pretending the structural drag doesn’t exist.
Path 4: Fight the Structural Battle Beyond Your Farm Gate
If the problem is structural, part of the solution has to live in D.C. hearing rooms and comment dockets.
This path fits if:
You can keep the wheels on long enough to care what FMMO 2030 looks like.
You’re angry enough to turn your drag number into testimony, not just coffee‑shop talk.
It looks like:
Submit written comments to USDA the next time pricing hearings or make‑allowance surveys open up, with your herd size, order, and real $/cwt drag front and center.
Pushing your state associations and co‑ops to take specific positions: mandatory processor cost surveys, automatic adjustments tied to verified costs, and a path for make allowances to come down if costs do.
Using Farm Bill touchpoints — like the GT Thompson draft — to argue that a $1,800/year DMC fix against a $42,240/year make‑allowance hit isn’t “modernization.”
You won’t see these efforts reflected in your next milk check. But if producers don’t show up with barn‑floor math, the only numbers on the table will come from people whose margins just got protected.
Key Takeaways
If your unexplained January‑over‑January gap is more than about 50¢/cwt after you factor in Class III, Class IV, and butter moves, treat that as structural drag — not just a bad month. That’s the make‑allowance change and premium structure, and it will hit every cwt you ship until something changes in the formulas or your contracts.
If your DSCR can’t stay above roughly 1.20× at $15–16/cwt uniform prices, you need a written 18‑month plan — not just hope for “better milk.” That’s the line where most lenders start looking harder at restructuring or collateral.
If your co‑op or buyer can’t explain how they voted on FMMO reform and what they’re doing to offset the drag in one clear conversation, treat that as a data point. You have every right to know how your volume was cast and where the money went.
If you missed the 2026 DMC sign‑up, don’t miss the 2027. Run the USDA or AFBF decision tools against your own margins at $15.05 blend and $14.59 Class III, then decide ahead of enrollment how much coverage is worth paying for.
Print the Statements Before Your Next Meeting
Somewhere in southwest Wisconsin, a 300‑cow operation walked into 2026 shipping milk to the same plant in an order where average butterfat hit 4.52% — and opened a January check roughly $50,000 lighter than the year before, if Van Ruden’s account is right. About 90¢/cwt of that hit came from the pricing formula changing underneath them. The rest came from a butter-and-cheese crash that FO30 is structurally exposed to. Only one of those problems is guaranteed to cycle back on its own. fb
Before your next co‑op or lender meeting, do the thing most people keep putting off. Print your January 2025 and January 2026 statements. Run your own $/cwt math. Circle the part you can’t explain with commodity moves. Then lay those pages on the table and ask:
“If this is what the new rules did to my milk check, what’s our plan to change that math?”
If you want to go past envelope math into full spreadsheets — region‑by‑region drag, component strategy, DSCR stress tests — The Bullvine’s FMMO Reality Check analysis and Farm Bill/DMC coverage are built for that deeper dive. Next month, we’ll run this same barn math on a 1,000‑cow Upper Midwest herd and see whether scale fixes the equation — or makes the hole bigger.
Complete references and supporting documentation are available upon request by contacting the editorial team at editor@thebullvine.com.
Learn More
More Milk, Fewer Farms, $250K at Risk: The 2026 Numbers Every Dairy Needs to Run – Stop guessing and start calculating with this essential 2026 playbook. It reveals how mid-size herds can close a $250,000 margin gap by sharpening culling and heifer programs, giving you the immediate tactical advantage to outrun negative cash flow.
Every week, thousands of producers, breeders, and industry insiders open Bullvine Weekly for genetics insights, market shifts, and profit strategies they won’t find anywhere else. One email. Five minutes. Smarter decisions all week.
If Iran keeps Hormuz choked, your 500‑cow dairy won’t lose $7K at the fuel tank — it’ll lose $146K in the feed lane.
Executive Summary: The Iran–Hormuz war has shoved U.S. diesel over $4/gal and yanked fertilizer prices sharply higher, but for a 500‑cow Iowa dairy, $4.16 diesel is the distraction — the real 2026 hit is a fertilizer‑driven feed shock. USDA’s 2026 all‑milk price sits near .95/cwt while full‑cost benchmarks for many herds run –/cwt, so a lot of dairies start the year structurally in the red before that feed increase even shows up. In the modeled 500‑cow herd, higher diesel adds roughly ,000 a year, but a realistic .00/cwt jump in feed cost tied to spiking urea and sulfur markets adds about 6,000 — pushing the 24‑month full‑cost shortfall toward .5 million if nothing else changes. That’s exactly why Kansas State economist Gregg Ibendahl argues fertilizer is “by far and away a bigger percent of total farm expenses than what fuel is” when Middle East conflict drives oil higher. The article walks through that barn math step‑by‑step and then gives a 30/90/365‑day playbook: run a 24‑month fertilizer‑shock scenario with your own numbers, set DSCR and working‑capital trip wires with your lender, pair milk‑side tools like DMC/DRP with feed coverage, and use strong cull and land markets as levers instead of last‑minute fire sales. In the end, it forces a decision every 300–700‑cow herd can’t dodge: if feed stays $1.00/cwt higher for the next two years, are you scaling, tightening up to survive, or planning a strategic exit while asset values still work in your favour?
For a typical 500‑cow family dairy based on real Iowa financials near Waterloo, and the 24‑month picture lands at roughly $1.5 million in negative cash flow once a fertilizer‑driven $1.00/cwt feed shock is layered into the barn math.
The herd we’re modeling here is a composite, built from the financials of several real Iowa operations. It isn’t one specific farm — but the math is designed to land close to what a lot of 500‑cow Midwest herds are actually facing: home‑grown forage and corn, buying the rest, carrying a normal amount of debt. Diesel at $4.16/gal feels like the obvious villain after the Iran conflict and the Strait of Hormuz closure pushed U.S. diesel prices to their highest level in nearly two years. But when you plug USDA’s $18.95/cwt all‑milk outlook into a 24‑month projection for a herd like this — then add a $1.00/cwt feed increase tied to fertilizer — it isn’t the fuel bill that does the real damage.
From Hormuz Headlines to a Fertilizer Squeeze
The year didn’t start with spreadsheets. It started with fuel tickets.
In late February and early March 2026, Iran’s war and attacks in the region raised the risk of serious disruptions in the Strait of Hormuz, the narrow corridor that handles a large share of global crude and refined product flows. Energy analysts warned it wasn’t just crude at stake — refined products like diesel and jet fuel that transit Hormuz were also in the line of fire, and buyers in Europe and Asia were already scrambling.
By early March, Reuters reported the U.S. national average diesel price hitting $4.04/gal — up 14.7¢ in a single dayand the highest in almost two years. Diesel futures on NYMEX surged more than 60¢/gal in two trading sessions, hitting a two‑year high as Hormuz risk repriced the entire energy complex. Regional rack prices in the Corn Belt climbed accordingly, putting posted farm prices like $4.16/gal across much of Iowa squarely in line with what herds are seeing at the pump right now.
While diesel was getting the headlines, the fertilizer market was moving just as fast — and in a way that cuts much closer to your feed line.
Brownfield Ag News reported that fertilizer bidding in parts of the U.S. was effectively paused as traders tried to price the Iran conflict. Argus Media showed New Orleans (NOLA) urea barge prices jumping from roughly $470/short ton to the $520–$550/st range in about a week, driven by shipping risk and short‑term supply fears. Analysts estimate that a large share of global fertilizer nutrients — roughly one‑third by some trade counts, including around 30% of seaborne urea — normally moves through Hormuz.
Sulfur was already on a tear. Brownfield quoted Fertilizer Institute economist Veronica Nigh, who said sulfur prices had roughly tripled compared to pre‑2022 levels, and that the Iran‑Hormuz situation was “only going to escalate markets” for sulfur‑dependent fertilizers like MAP and DAP. Those higher sulfur and nitrogen costs ripple straight into the N‑P‑K blends that underpin Corn Belt corn production.
Kansas State ag economist Gregg Ibendahl made the same point to Brownfield: fertilizer is “by far and away a bigger percent of total farm expenses than what fuel is.” That’s why he sees fertilizer as the bigger worry if oil stays high — and it’s the core tension driving the dairy feed cost 2026 story this article unpacks.
For a 500‑cow Iowa herd, those headlines don’t show up as lines on a Bloomberg chart. They show up as a much fatter feed‑cost line on the ledger.
Why “We Grow Our Own Corn” Isn’t a Free Pass on Fertilizer Risk
That’s where opportunity cost bites. Even if you never cut a check to a grain buyer, the economic cost of your corn is whatever you could reasonably sell it for in today’s market. If fertilizer pushes the cost of production per bushelhigher, you either:
Raise your internal cost of corn in the ration, or
Let the “crop side” of the business quietly eat that higher cost so the dairy side can pretend corn is still cheap.
Here’s what that looks like in practice. Say it costs you $4.50/bu to grow corn this year — and the local elevator bid is $5.20/bu. Your TMR is using $5.20 corn whether you wrote a check or not. That extra $0.70/bu flows straight through to feed cost per cwt. On a ration running roughly 55 lb of corn silage equivalent per cow per day across 500 cows, that spread adds up faster than most herds want to admit. And when fertilizer prices spike, the gap between your growing cost and your opportunity cost can widen — or your growing cost itself climbs toward that market price, erasing the discount you thought you had.
Corn budgets from land‑grant economists across the Corn Belt consistently show fertilizer as the single biggest line item in production costs, often topping $200/acre for N‑P‑K when nitrogen prices spike. Iowa and Minnesota extension economists are blunt: when key inputs run higher, the cost per bushel of own‑grown corn rises, whether you sell that corn or feed it yourself.
If you don’t price home‑grown corn at its true opportunity cost, your checkbook might say the dairy is breaking even — but your crop enterprise is quietly subsidizing the cows. In 2026, with fertilizer linked directly to Hormuz risk and global trade, pretending home‑grown corn is insulated from that world is more wishful thinking than risk management.
What Does a $1.00/cwt Feed Shock Really Cost a 500‑Cow Herd?
USDA’s February 2026 Livestock, Dairy, and Poultry Outlook pegs the U.S. all‑milk price forecast at $18.95/cwt. At the same time, USDA‑ERS cost‑of‑production data and The Bullvine’s own analysis show average full‑cost benchmarks for large U.S. herds around $19.14/cwt, with the smallest herds north of $42.70/cwt. Even before diesel and fertilizer prices are re‑priced, many dairies start 2026 structurally in the red.
For this modeled 500‑cow herd, the working assumptions look like this, based on 2025 actuals and ERS‑style cost curves:
Total full cost: 146,000 cwt × $23.00 ≈ $3,358,000/year.
Full‑cost shortfall: about $620,500/year.
Before any 2026 shocks, a herd built like this is already staring at roughly $620,500/year in full‑cost red ink. Equity is quietly covering the gap.
How Much Does $4.16 Diesel Actually Add?
USDA‑ERS and extension budgets typically put fuel and oil in the ballpark of $40–$60/cow/year when diesel sits closer to $3.25/gal. For this model, call it $50/cow/year at that lower level.
If the 2026 diesel average ends up at $4.15–$4.20/gal due to Hormuz disruptions and tighter inventories, that’s roughly a 28% increase in fuel costs.
Back‑of‑the‑envelope:
Extra fuel cost per cow: $50 × 0.28 ≈ $14/year.
For 500 cows: 500 × $14 ≈ $7,000/year.
Seven thousand dollars isn’t nothing. You still feel it every time you fill the tank. But set it beside a $620,000/year full‑cost gap, and it isn’t what decides if your farm is solvent in 24 months.
What Happens When Feed Runs $1.00/cwt Higher?
Feed is where the fertilizer story shows up on the ledger.
Between DMC margin reports and independent economic work, the underlying numbers suggest that many U.S. herds carried total feed costs in the $9–$12/cwt range through 2024–25, depending on ration and region. That’s where this composite herd lands.
Now layer in the fertilizer picture:
NOLA urea up $50–$80/st in a week, with barges trading $520–$550/st vs. roughly $470/st the prior week.
A large share of globally traded urea and other nutrients — estimates run around 30% — normally transits Hormuz.
Sulfur prices have roughly tripled compared to pre‑2022 levels, squeezing MAP/DAP and other sulfur‑dependent fertilizers.
Under that setup, it’s realistic to model total feed ending up $1.00/cwt above 2025 for this herd.
For 146,000 cwt:
Extra feed cost: 146,000 × $1.00 = $146,000/year.
Roll that into the full‑cost picture:
Effective full cost: $24.00/cwt.
New total cost: 146,000 cwt × $24.00 = $3,504,000/year.
Gap vs. $18.75 milk: ≈ $766,500/year.
Scenario
Annual Full-Cost Gap
24-Month Shortfall
Driver
Baseline (No Shocks)
$620,500/year
$1,241,000
Milk $18.75, Costs $23.00/cwt
With Fertilizer Feed Shock
$766,500/year
$1,533,000
Feed +$1.00/cwt = $146K/year extra
Feed Shock Alone (Incremental)
+$146,000/year
+$292,000
Urea, sulfur, opportunity cost
Diesel Increase (Context)
+$7,000/year
+$14,000
$4.16/gal, 28% above baseline
Stretch it over two years:
Without the feed shock, roughly $1.24 million in modeled full‑cost shortfall over 24 months.
With the feed shock: roughly $1.53 million over 24 months.
That ~$290,000 difference over two years comes mostly from the fertilizer‑driven feed hit. And the feed shock itself — $146,000/year — is more than 20 times the modeled diesel increase on this herd.
On a cash‑cost basis — just bills paid — you might convince yourself you’re roughly breaking even at $19.00 milk. But once you include economic costs like depreciation, unpaid family labour, and realistic opportunity cost on home‑grown feed, this model says you’re still effectively short about $4.00/cwt. That’s how family equity quietly disappears over a 24‑month run — not in one crash, but in a slow bleed.
Picture three bars side‑by‑side:
Diesel at $4.16/gal adds about $7,000/year.
A $1.00/cwt feed shock adds about $146,000/year.
The existing full‑cost gap is about $620,500/year — climbing to $766,500/year with the feed hit, and roughly $1.53 million over two years.
On that chart, the diesel bar barely clears the x‑axis.
The Turn: When Fuel Complaints Become Margin Decisions
Once that 24‑month picture is on the table, the lender conversation shifts — fast. Suddenly, the questions aren’t about fuel surcharges anymore.
The pattern playing out in lender offices across Iowa and Wisconsin this winter looks something like this: a producer walks in focused on $4‑plus diesel and shop bills, and by the time the 24‑month model is on screen, the conversation has shifted to feed cost per cwt, DSCR, and working capital per cow.
In those meetings, the math usually walks through three simple lines:
USDA’s $18.95/cwt 2026 all‑milk forecast as the revenue anchor.
The herd’s own 2025 full‑cost per cwt is in the $23–$24 range as the base.
A $0.50–$1.00/cwt feed increase tied to fertilizer and acreage shifts if input prices stay elevated.
Seeing a mid‑six‑figure negative full‑cost margin per year in black and white changes priorities. Diesel stops being the complaint and becomes a line item inside a larger margin plan. The discussion moves from arguing over fuel surcharges to “What are my coverage options on milk and feed?” and “What happens to my DSCR if I don’t move?”
The contrarian takeaway is blunt: in 2026, building your risk plan around diesel alone is a distraction. The combination of sub‑$19/cwt milk, ERS full‑cost benchmarks, and a very realistic $1.00/cwt increase in feed costs is where the survival decision sits.
30/90/365‑Day Playbook for Fertilizer‑Driven Feed Risk
Once you accept a 24‑month picture like this one, the diesel surcharge argument stops mattering. What matters is the timeline.
Next 30 Days: Put the Risk on Paper
1. Run a 24‑Month Fertilizer‑Shock Scenario
Use your actual numbers, not somebody’s averages:
Start from 2025 milk shipped and full costs from your own books.
For 2026–27, plug in:
All‑milk near $18.95/cwt, adjusted for your basis.
Total feed at 2025 feed/cwt + $1.00.
Non‑feed costs are flat unless you already know they’re moving (labour raises, interest resets, major repairs).
If that model shows a six‑figure annual full‑cost gap, the exact dollar amount matters less than the direction: if nothing changes, equity is doing the work.
2. Ask Your Nutritionist for Two “What‑If” Rations
Skip the small talk. Give them scenarios:
Scenario A: corn $0.50/bu higher than your current purchase or opportunity cost; realistic protein prices.
Scenario B: corn $1.00/bu higher, similar protein assumptions.
For each, ask for the updated feed cost per cwt and expected milk and components under your conditions. You’re not trying to guess the market. You’re trying to know your Plan B and Plan C before you’re forced into them.
3. Audit Your Fertilizer Exposure with Your Retailer
Sit down and actually map it:
Tons of N, P, and K have already been purchased for 2026, and at what prices?
Remaining tons still open while NOLA urea and related products trade higher on Hormuz news.
Any signals of no bid, allocation, or tonnage caps on nitrogen, phosphate, or sulfur‑linked products from their suppliers.
For a herd like this one, that audit often surfaces an uncomfortable number: a sizable chunk of planned nitrogen for 2026 corn acres still unpriced — one of the key drivers behind the modeled $1.00/cwt feed risk.
4. Write This Number on the Whiteboard
What percentage of your 2026 milk and feed is actually priced or protected today? Write it down next to your current DSCR. If both answers make you uncomfortable, that’s the signal to act on the next two sections — not wait for better numbers.
Next 90 Days: Move from Drift to Defined Trip Wires
5. Put Numeric Trip Wires on the Wall — and Share Them with Your Lender
Exact thresholds vary by lender and operation, but these bands are consistent with how many Midwest ag banks think about DSCR and working‑capital risk:
Metric
Healthy (Green)
Warning (Yellow)
Critical (Red)
DSCR
> 1.25×
1.0× – 1.25×
< 1.0×
Working capital/cow
> $600/cow
$400 – $600/cow
< $300/cow
Feed cost vs 2025
Baseline
+$0.50/cwt (3 months)
+$1.00/cwt (3 months)
The key is for you and your lender to react to the same signals, rather than for them to quietly watch your ratios slip from the other side of the desk.
6. Pair Milk‑Side Tools with Feed‑Side Coverage
Dairy Margin Coverage (DMC) still has a role, but it only protects income over feed and doesn’t touch the sharp rise in non‑feed costs since 2021 — often 15–25% higher once you factor in labour, interest, repairs, and utilities on many herds.
The matched approach that pencils best for a herd in this position:
On the milk side, use Dairy Revenue Protection (DRP) and/or forward contracts to put floors under a portion of projected 2026 milk, on top of DMC where it still pencils.
On the feed side, layer in cash contracts, HTAs, or options to cover 50–70% of expected corn and protein usage at levels that still work in the 24‑month model.
You give up some upside. In return, you reduce the chance that low milk and high feed hit at the same time and shove your DSCR under 1.0× for multiple quarters.
7. Use Strong Cull Cow Prices as a Strategic Lever
USDA and market reports show record‑high average cull cow prices in 2024, with national averages near $127/cwt, and outlooks suggest 2025 stays historically strong with tight U.S. beef supplies.
In a herd running this model, the logical cull protocol looks like this:
Identify the bottom 5–10% of cows by margin — factoring in reproduction, components, health, and feed efficiency, not just volume.
Compare the economics of feeding those cows another year at higher feed costs versus shipping them into today’s beef market.
Look at how many stalls would be better filled by more profitable cows or left open in a high‑feed‑cost environment.
Fewer cwt shipped in the short term vs. potentially stronger cash flow per stall when feed is expensive. That’s the trade‑off.
Next 365 Days: Decide Whether You’re Scaling, Surviving, or Exiting
If the Iran conflict, Hormuz closure, and tight fertilizer supplies stretch through the 2026 planting and harvest windows, this isn’t just a rough patch. It’s the operating environment for at least one full feed year.
At some point in the next year, most mid‑size herds will be pushed into one of three lanes:
Scaler: You see a credible path to lower cost per cwt by growing more cows per worker, better use of parlours and barns, and stronger purchasing power. This demands capital, management depth, and a lender willing to back it. You gain lower unit costs if it works; you give up flexibility and increase exposure if markets turn faster than you can adapt.
Survivor: You aim to hold the current scale but treat DSCR, working capital per cow, and feed cost per cwt as non‑negotiable dashboard metrics. That means consistent use of DMC/DRP and feed coverage so you’re managing margins, not just prices.
Strategic Exit: You recognize that with $18.95/cwt milk and $23–$24/cwt full costs, your current structure may not carry the risk you’re facing. You use still‑strong land values, elevated cull and replacement prices, and, if necessary, restructuring tools to exit or reshape the business on your own timeline instead of waiting for the bank to decide.
Brownfield and Iowa State survey work describe remarkably resilient Iowa and Corn Belt farmland values into 2024 and 2025, with high‑dollar sales continuing and roughly 80–84% of Iowa farmland reported as debt‑free in recent data. For operations under real margin strain, that resilience is a capital‑preservation lifeline.
If you act before you’ve burned through working capital, strong land values can function as a strategic exit ramp — letting you pay down debt, reposition, or walk away with balance‑sheet strength intact, rather than waiting until the bank is making the decisions for you.
The point isn’t which lane is “right.” It’s that pretending those choices aren’t on the table is the riskiest move of all.
What This Means for Your Operation
If your rolling 3‑month feed cost per cwt is already $0.50–$1.00 above your 2025 average, you’re absorbing a fertilizer‑driven feed shock that can add roughly $70,000–$150,000/year to a 500‑cow herd.That’s the scale of risk this article is working with — not just a few cents on diesel.
If your 24‑month cash‑flow at roughly $18.95/cwt milk and $23–$24/cwt full costs shows a six‑figure annual gap, you’re effectively financing operations with equity unless you change something. That’s when you have to decide: to scale, to survive, or to exit strategically.
If your lender can’t hand you your current DSCR and working capital per cow, you’re making risk calls with less information than they have. Ask for those metrics and agree on trip wires that trigger specific actions — not “we’ll see what happens.”
If your risk work focuses only on milk price and leaves feed completely open, you’re betting that fertilizer, corn, and protein behave. The 2026 fertilizer and Hormuz situation suggests that’s not a bet to leave unhedged.
If you haven’t given your nutritionist and fertilizer supplier concrete “what if” scenarios to model, your next 30‑day move is simple: book those meetings and come out with backup rations, clear feed‑cost numbers, and a map of how much 2026 fertilizer is already priced.
If you’re in the bottom DSCR or working‑capital bands and still planning business as usual, you’re letting the market decide when you hit the wall. Choose your lane while beef, land values, and buyer demand still work in your favour.
Key Takeaways
If your total feed cost per cwt ends up more than $1.00 above your 2025 baseline, then on a 500‑cow herd shipping ~146,000 cwt/year, you’re looking at roughly $146,000/year in extra feed cost — a 20× issue compared to the diesel increase in this model.
If your full‑cost model at around $18.95/cwt milk and $23–$24/cwt costs stays negative for two years, the real decision isn’t whether you can “tough it out” — it’s whether to scale, survive with tight trip wires, or pursue a strategic exit while asset values still work for you.
If you don’t run a 24‑month fertilizer‑shock scenario and set DSCR, working‑capital, and feed‑cost trip wires in the next 30 days, you’re letting the fertilizer and feed markets decide how much equity you burn.
The Bottom Line
The 500‑cow Iowa herd in this article isn’t your farm. But its math looks uncomfortably close to what USDA and ERS numbers imply for a lot of real herds in 2026. Diesel is still going to sting every time you fill the tank. The real question is whether your feed and fertilizer lines are quietly doing far more damage over the next two years.
Pull your 2025 feed cost per cwt, your latest DSCR, and your working capital per cow. Layer in a $1.00/cwt feed increase on a 24‑month projection. What do your own numbers say — and do your current contracts protect you if that’s the path you’re on?
Complete references and supporting documentation are available upon request by contacting the editorial team at editor@thebullvine.com.
The New Dairy Playbook: 5 Trends Redefining Profitability in 2025 – Future-proof your revenue streams by discovering how to neutralize rising labor and interest costs. This playbook breaks down the ROI on automated feeding and beef-on-dairy premiums, transforming your operation into a high-margin, data-driven profit engine starting today.
The Sunday Read Dairy Professionals Don’t Skip.
Every week, thousands of producers, breeders, and industry insiders open Bullvine Weekly for genetics insights, market shifts, and profit strategies they won’t find anywhere else. One email. Five minutes. Smarter decisions all week.
Raw milk is legal in 32 states — and still 840× more likely to make someone sick than pasteurised milk. The law may say ‘yes.’ Your insurer might already be saying ‘no.’
Executive Summary: Raw milk looks like an easy side hustle, but the Keely Farms case in Florida shows how fast it can turn into a bet‑the‑farm liability. In 2025, a raw-milk outbreak linked to Keely left 21 people sick, including six children, and led to a lawsuit from a mother who says she nearly died and lost her unborn baby. At the same time, only about 3.2% of Americans drink raw milk, yet unpasteurised dairy is linked to an estimated 96% of dairy-related illnesses and an 840× higher risk of illness than pasteurised milk. Insurers have responded by carving raw milk out of standard farm policies, dropping some producers entirely, and pushing specialty coverage that can chew through 20–30% of the typical $31,200 gross margin from a 100‑gallon‑per‑week raw-milk stream. Real-world cases — from Dog Mountain Farm’s $75,000 raw‑milk investment that lost its insurer to pediatric HUS patients with six‑figure hospital bills — show how quickly one claim can erase the upside. This article walks producers through concrete checks on policy exclusions, co‑op contracts, and cost‑of‑production math, then lays out safer ways to tap “wellness” demand through pasteurised value-add, genetics, and efficiency. The core message is simple: before you bottle a drop of raw milk, treat it like a high‑stakes business decision, not a casual side hustle.
You’re being pulled in two directions right now: the desperate need for margin and the terrifying reality of liability.
In August 2025, the Florida Department of Health identified Keely Farms Dairy in New Smyrna Beach as the likely source of raw milk linked to 21 cases of E. coli and Campylobacter — including six children under 10 and seven hospitalisations. Officials said the illnesses stretched back to January, and news coverage describes at least two patients with severe complications. One of those patients was Rachel Maddox of Seminole County, who said she contracted Campylobacter while caring for her toddler after the child drank raw milk she’d purchased from a store in Longwood, Florida. “I became very ill — and I mean the sickest I’ve ever been in my life,” Maddox told News 6 in 2025. “I came really close to dying, and our son did die.” Her 20-week fetus did not survive, and Maddox was diagnosed with sepsis.
Keely Farms labelled its products “not for human consumption” and sold them under Florida’s pet‑food exemption. According to state records and reporting, the farm held a valid animal‑feed licence with no cited compliance issues at the time. Farm manager Keely Exum said in an emailed statement that the dairy was “blindsided” by the DOH announcement: “The Department of Health has not informed Keely Farms of any investigation or administrative action.” The Farm-to-Consumer Legal Defense Fund, which assisted with the farm’s legal response, reported that the DOH never visited the farm, never collected on-farm samples, and never notified the farmer before issuing its public statement. FTCLDF’s public records requests seeking the underlying data went unanswered. The farm did not respond to phone and email messages from The Associated Press.
That legal label didn’t stop people from drinking the milk. Maddox told News 6 she’d asked about the “for consumption by animals” label at the store and was told “that was a technical requirement to sell ‘farm milk.'” She didn’t question further. State and media reports make clear that many buyers were consuming the product despite the labelling — and the label didn’t prevent Keely Farms from being named in the outbreak investigation.
Business Reality Check #1: In a courtroom, a “Pet Milk” label is often viewed as a “wink-and-nod” agreement; if a jury sees evidence that you knew (or should have known) humans were drinking the product, that label rarely acts as the liability shield producers hope it will be.
Business Reality Check #2: Keely Farms was cleared — negative lab tests, passed inspection, lawsuit dropped. The farm still spent months defending itself against national headlines triggered by a press release with no on-farm investigation. Being right doesn’t make you whole.
In August 2025, national food‑poisoning law firm Ron Simon & Associates, along with Orlando‑based Newsome Law, filed the first lawsuit in Seminole County on behalf of Maddox. Keely Family Farms filed a motion to dismiss, arguing the complaint didn’t identify facts showing contamination or describe any “root-cause investigation of illness,” and that its labelling complied with Florida Department of Agriculture requirements.
The farm’s own independent lab tests — conducted by CentralStar (PCR testing, August 8 and 15, 2025) and the Florida Department of Agriculture (culture, August 12, 2025) — came back negative for both Campylobacter and E. coli across multiple samples. The FDACS routine inspection cleared the farm. Four days after Keely filed its motion to dismiss, Maddox voluntarily dropped the case. No formal notice of violation, shutdown order, or administrative proceeding was ever initiated against the farm.
That outcome should concern raw-milk producers as much as the outbreak itself. Keely Farms was ultimately cleared — negative lab results, passed inspection, case dropped. But by that point, the farm had already endured months of national headlines, a high-profile lawsuit from a major food-poisoning firm, and the kind of reputational damage that no lab result can undo. You don’t have to lose in court for raw milk to become a bet-the-farm event. You just have to get named.
A 2025 National Agricultural Law Center update reports that 32 states allow raw‑milk sales when certain conditions are met, while 18 still ban it outright. Three states — Arkansas, Utah, and North Dakota — enacted laws updating their raw‑milk regulation in 2025 alone. As of early 2026, several more state legislatures have bills moving. You’re feeling that pressure: wellness‑minded customers asking why they can’t buy “real” milk at the farm, homesteaders paying double‑digit prices per gallon, and social feeds full of raw‑milk reels.
The premium looks real. But the “ghost” liabilities sitting behind it — in your insurance policy, your co‑op contract, your lender relationship, and your social licence to operate — can quietly swallow that $31,200 before it ever hits the bottom line.
What’s Actually Changing — and Why It Lands on Your Yard
Raw milk has shifted from fringe wellness fad to active policy and public‑health battleground. A CDC‑linked risk‑modelling study estimated that from 2009 to 2014, unpasteurised milk was consumed by about 3.2% of the U.S. population and unpasteurised cheese by 1.6%, yet an estimated 96% of illnesses from contaminated dairy products were caused by unpasteurised milk and cheese.
Per serving, consumers of unpasteurised dairy were about 840 times more likely to get sick and 45 times more likely to be hospitalised than those consuming pasteurised dairy. If the share of unpasteurised consumption doubled, outbreak‑related illnesses were projected to rise by roughly 96%.
Dairy type
Share of US population consuming
Share of outbreak illnesses
Illness risk per serving
Hospitalisation risk
Pasteurised milk & cheese
~96.8% / 98.4%
~4%
Baseline (1×)
Baseline (1×)
Unpasteurised milk & cheese
3.2% / 1.6%
~96%
≈840× higher
≈45× higher
On the consumer side, raw‑milk advocates talk about “alive” enzymes, gut health, and European “farm‑milk” allergy studies. They show beautiful jars and frothy latte shots. They rarely mention the 840× number.
Agencies are blunt. A 2012 Pennsylvania Campylobacter outbreak sickened 148 people across four states; investigators concluded that consumer avoidance of raw milk was the only way to prevent similar events. A CDC report published in July 2025 documented a Salmonella Typhimurium outbreak linked to commercially distributed raw milk that sickened people across California and four other states between September 2023 and March 2024 — one of the largest raw‑milk outbreaks in recent U.S. history.
And then there’s H5N1. In 2024, USDA confirmed that highly pathogenic avian influenza was circulating in U.S. dairy cattle, and the FDA warned consumers that the virus could be shed into raw milk from infected cows. By December 2024, the USDA ordered mandatory H5N1 testing of raw milk. A January 2026 veterinary case report documented a cat’s death linked to consuming recalled raw milk from a California dairy — the kind of headline that turns a food‑safety debate into a kitchen‑table panic.
That’s the tension you’re sitting in. Your customers see jars and “natural.” Your risk partners see 840×, Salmonella, and H5N1.
How Does the Raw‑Milk Margin Really Look on a 200‑Cow Herd?
Let’s run the barn math everybody’s whispering about but not writing down.
Say you’re milking around 200 cows, shipping roughly 75 pounds per cow per day. That’s about 15,000 pounds — roughly 1,750 gallons — leaving in the tanker every day.
Now carve out a small raw‑milk stream:
You bottle 100 gallons of raw milk a week.
Over a year, that’s 100 × 52 = 5,200 gallons.
If you can reliably get a $6‑per‑gallon premium over what that volume would bring in your normal cheque, you’re looking at $31,200 in extra gross revenue.
You’ve shifted about 5–7% of your annual volume into a higher‑margin channel. Real money on a 200‑cow herd. It’s also the point where you stop being “just” a supplier and start acting like a high‑risk food business in your own right.
Now layer in the risk side — and pay attention to the dates, because this isn’t new.
Back in 2014, Hoard’s Dairyman reported that more insurers were classifying raw milk as too risky to cover. That trend hasn’t softened. According to Food Safety News (October 2014), Farm Bureau–owned Rural Mutual Insurance Co. in Wisconsin sent notices in 2012 to farm policyholders stating that their coverage “does not provide for the sale and/or distribution for offsite consumption of unpasteurized (commonly called raw) milk from cows, sheep, and goats for human consumption.” Not barn‑talk gossip. A specific exclusion in black-and-white.
Published reporting documents a pattern across the industry:
Flat refusals to cover farms that sell raw milk for off‑farm consumption.
“Raw milk and raw milk products” exclusion endorsements — like the one documented by the Allegany Group — that carve those claims out of otherwise standard farm policies.
Broad bacteria or contaminant exclusions can be used to deny any foodborne illness claim.
Re‑insurers are watching too. Tami Griffin, deputy national director for Aon Risk Solutions’ Food Systems, Agribusiness & Beverage Group, told Food Safety News that raw‑milk sales are “definitely on the radar of insurance companies” and that “I have heard some carriers are not willing to provide coverage for those selling it.”
Dog Mountain Farm near Carnation, Washington, learned what that looks like in practice. The farm had invested $75,000 in a USDA‑certified raw goat milk dairy — and then found out its carrier was dropping raw‑milk coverage. Owner Cindy Krepky said the farm would continue its other operations — cider, apple butter, 15 varieties of apples, pears, and quince — while hunting down a carrier willing to insure the raw goat milk business. Seventy‑five thousand dollars in infrastructure, and the insurance market pulled the rug.
Specialty raw‑milk liability policies do exist. Denver broker Kendall Turner says coverage is still possible, but that “the insurance company sometimes has more rules than the state.” Producers and brokers report that meaningful raw‑milk coverage can run into the five‑figure range per year once limits, fees, and surplus‑lines taxes are added.
On that 5,200‑gallon scenario, a realistic specialty premium could chew through 20–30% of your $31,200 gross margin before you’ve bought a single cap or label.
Most specialty policies carry $1–2 million per‑occurrence limits. To understand how fast you can hit that ceiling, consider the case of five‑year‑old Maddie Powell in eastern Tennessee. In 2018, Hoard’s Dairyman reported that Maddie developed hemolytic uremic syndrome (HUS) — a potentially fatal kidney disease — after drinking raw milk linked to an E. coli outbreak. She was on dialysis within 24 hours of admission, endured six blood transfusions, two surgeries, and spent weeks in the hospital, in and out of intensive care. Her mother, Cassie Powell, told Food Safety News that medical bills topped $125,000 in just the first two weeks, with the hospital room alone running $6,000 per day. Food safety attorneys cited in the same reporting pointed to other pediatric E. coli/HUS patients whose bills reached $250,000 and over $450,000 before discharge. A 2014 Food Safety News analysis concluded that treatment of a child or senior with severe E. coli O157:H7 or Listeria complications “not uncommonly” results in direct medical costs exceeding $1 million — deciding to go without coverage “literally a bet-the-farm kind of decision.”
One severe case bumps right against your policy ceiling. And if you’re not carrying specialty coverage — and your farm policy excludes raw milk or bacteria — you’re using your land base, barns, and family equity as the backstop.
On a 200‑cow herd, one raw milk lawsuit isn’t just betting your milk cheque. It’s betting the equity your grandfather spent 40 years building.
Coverage Scenario
Standard Farm Liability
With Raw Milk Exclusion
Specialty Raw Milk Policy
Slip-and-fall on farm
✓ Covered
✓ Covered
✓ Covered
Contaminated bulk tank milk (to processor)
✓ Covered
✓ Covered
✓ Covered
Customer sick from raw milk sold off-farm
Likely EXCLUDED
EXCLUDED
✓ Covered ($1–2M limit)
E.coli outbreak traced to your raw milk
Likely EXCLUDED
EXCLUDED
✓ Covered (if limits sufficient)
Annual premium (estimated)
$2,000–$4,000
$2,000–$4,000
$6,000–$9,000
Your exposure on $250K claim
$250,000 (self-insured)
$250,000 (self-insured)
$0 (if within limits)
How Much of a Raw Milk Lawsuit Would Your Insurance Actually Cover?
If you’re anywhere near selling raw milk, this is the first number you need. Not the last.
Pull your current farm‑liability policy and look for three things:
Any endorsement that mentions “raw” or “unpasteurized” milk or dairy products, including pet food, and “not for human consumption” language.
Any broad exclusions mentioning “bacteria,” “contaminants,” or “foodborne illness.”
How your umbrella coverage “follows form” — because if the underlying policy excludes raw‑milk risk, the umbrella usually does too.
Then email your broker one question you can screenshot and save:
“How would this policy respond if someone got sick from raw milk I sold off the farm?”
If the answer is vague, or if you spot clear raw‑milk or bacteria exclusions, assume your current policy won’t stand behind a raw‑milk claim. Ruhl Insurance in Pennsylvania puts it plainly on their blog: “Many farm insurance companies will not write a policy for a farmer who sells raw milk; therefore, if you decide to undertake this business pursuit, you should expect your options of where to obtain coverage for your farm to shrink.”
Get an actual quote for specialty raw‑milk liability. Don’t guess. Put the premium beside your barn‑math gross margin.
If your specialty liability bill eats more than about 25–33% of your projected raw‑milk gross margin, you’re effectively self‑insuring a significant slice of catastrophic risk. The question you’re really answering at that point isn’t “Can I sell raw milk?” It’s “Am I comfortable using my family’s land and barns as collateral for somebody else’s food‑safety risk?”
What Happens to Your Market When the Farm Down the Road Gets Named?
You might decide you’ll never touch raw milk. That doesn’t mean the farm five miles over feels the same way.
In Florida, state officials publicly identified Keely Farms as the likely outbreak source — before conducting an on-farm investigation and despite the farm’s own lab tests later coming back negative. Coverage emphasised that the farm operated under a legal pet‑food licence but that many customers were drinking the milk anyway. For most consumers, the nuances of lab results and dropped lawsuits don’t register. They read: “raw milk from a Florida farm made people sick.” Full stop.
Public‑health responses after outbreaks almost always reach beyond the farm named in the press release:
State‑level warnings that explicitly call out raw milk as higher risk and advise people not to drink it.
Tighter scrutiny of raw‑milk permits and sometimes more frequent inspections of other dairies in the same region.
Calls from medical, consumer, and industry groups to tighten raw‑milk regulations or stall new legalisation efforts.
In Wisconsin, concern over the potential damage of a single outbreak to the state’s dairy reputation was one reason cited when Governor Jim Doyle vetoed a raw‑milk bill. “We have worked successfully over the last seven years to modernize Wisconsin’s dairy industry,” Doyle said in his veto statement. “An outbreak of disease from the consumption of raw milk could harm our reputation for providing healthy dairy products, and damage the entire industry.” That’s social licence to operate in action: the informal permission society gives an industry to do its work. When a high‑profile child hospitalisation makes the evening news, history shows regulators and activists push for tougher rules on all small‑ and mid‑size dairies — not just the one that sold the milk.
Co‑ops build this into their risk calculus. In May 2010, the CROPP Cooperative — the farmer‑owned organisation behind Organic Valley — voted to prohibit its member dairies from selling raw milk as a side business. The initial board vote was 4–3; a subsequent vote went 7–0 to cap any raw‑milk sales at no more than 1% of a member’s volume. CEO George Siemon told Grist at the time: “It’s not a fun issue here. Everyone on the board drinks raw milk.” An estimated 10% of Organic Valley’s member farms — roughly 150 to 200 dairies — were selling raw milk at the time. For those members, the choice was stark: stay in the co‑op or chase raw‑milk premiums, but not both. The board’s concern, as reported by Food Safety News and the Northeast Organic Dairy Producers’ Association, was straightforward: if one Organic Valley member’s raw milk triggered a public outbreak, the fallout could tar the entire brand.
Even if you ship to a different buyer, your neighbour’s decision matters. When raw‑milk headlines hit a region, buyers revisit supplier lists, side businesses, and contract clauses around “uniform marketing,” “conduct that harms the co‑op,” or “damage to brand and markets.” One farm’s raw‑milk gamble can mean more paperwork, more audits, and less patience from your own processor — even if every drop you ship is Grade A into the tanker.
What About Those Allergy and Asthma Studies?
You’ve probably heard the line: “Farm kids who drink raw milk don’t get asthma.” Like most simple stories, the truth is more complicated.
The large European PARSIFAL and GABRIELA studies did find that children growing up on or near farms and consuming farm milk had lower rates of asthma and allergies. One PARSIFAL analysis reported that farm‑milk consumption was associated with about a 26% reduction in asthma, 33% reduction in hay fever, and up to 58% reduction in food allergy compared to kids who didn’t drink farm milk.
Raw‑milk marketers often flatten that to: “Raw farm milk protects kids from allergies.” The researchers did not say that.
The PARSIFAL authors are explicit: their study “does not allow evaluating the effect of pasteurized vs. raw milk consumption” because they had no objective verification of how farm milk was handled at home. Farm kids breathe barns, dust, animal microbes, and everything else in the environment, along with whatever’s in the milk. That’s the “farm effect” — not just “raw milk.”
Follow‑up work points to multiple possible mechanisms: fatty‑acid profiles, whey proteins, milk‑fat‑globule membrane components, dust‑bound particles, even microRNAs — not just live bacteria. Independent reviewers have reached a consistent bottom line: there is a real association between farm‑milk consumption and lower allergy/asthma rates, but that doesn’t mean drinking raw milk is a safe or recommended prevention strategy.
A 2024 Foodfacts review summarising PARSIFAL, GABRIELA, and related work puts it plainly: the evidence “doesn’t prove a protective effect of raw milk consumption,” and the scientists behind the farm‑milk effect explicitly caution that raw farm milk “cannot be recommended” as a preventive measure.
When a customer tells you they want raw milk for their kid’s allergies, the evidence‑based answer is uncomfortable but simple: the “farm effect” is real, and the path forward is to isolate the protective components — not to ignore the 840× risk and pour raw milk for children. That’s a pasteurised product opportunity, not a raw‑milk justification.
Paths That Keep Your Insurer in the Picture
Other paths keep pasteurisation — and your coverage — intact.
Branded pasteurised, your name on the bottle
You’ve got some capital, extra labour, and local customers who want “your” milk with your farm name on it. State dairy‑plant licensing, a HACCP‑style QA system, a small pasteuriser and packaging line, and time to build accounts — that’s the investment. But you can sell cream‑top whole milk, chocolate milk, drinkable yogurt, soft cheeses, ice‑cream mix — all pasteurised, all within frameworks your insurer recognises. The 143‑hour weeks at Clark Farms show what the real math of on‑farm creamery ROI looks like — it’s not glamorous, but the liability picture is completely different.
The catch: you take on inventory risk, marketing, and customer service. If you under‑estimate your time or over‑estimate demand, the margin disappears. But what doesn’t happen is a public‑health investigation with your farm’s name attached.
Breed into the wellness premium instead of bottling around it.
Your processor already pays for components. What if you captured the wellness‑market demand inside a pasteurised, regulated system? Align sire selection, culling, and heifer strategy to hit A2A2, higher components, grass‑fed, organic, or non‑GMO programs — leaning harder on genomic testing and mating programs to shift herd profile. You get paid a premium on every load, not just what you can bottle. Instead of selling raw “A2 milk” directly from the tank, you ship to brands that pay for it, with pasteurisation and QA sitting between you and end consumers.
The trade‑off: organic and grass‑fed limit feed options and stocking rates. Niche programs can lose premium if the market shifts or too many herds pile in. But the regulatory and liability profile is night‑and‑day compared to raw.
Tighten COP before chasing “sexy” revenue.
Maybe the answer isn’t a new product at all. If side hustles look attractive mainly because the base business is barely breaking even, start with a hard COP review — your nutritionist, accountant, and lender in the same conversation. Feed efficiency, shrink, heifer numbers, replacement strategy, and targeted automation.
Here’s the barn math: for a 200‑cow herd shipping about 54,750 cwt per year, trimming $0.50/cwt from COP is worth roughly $27,000 per year. At $0.75/cwt, it’s about $41,000. Same neighbourhood as the raw‑milk gross margin — without any of the outbreak-and-lawsuit tail risk. It also lowers your breakeven, which directly strengthens your debt‑to‑asset picture. Not Instagram‑friendly. Just a quieter, more resilient balance sheet. If you want to see how mid‑size dairies are crunching the 2026 margin math, that’s worth reading alongside this.
On‑farm experiences and curated boxes
If you’re in a region with strong local‑food energy and your family is comfortable having people around, there’s a different way to harvest the trust that draws customers to raw milk. Partner with other farms for CSA‑style boxes or local‑food bundles featuring your pasteurised dairy. Lean into education, transparency, and your story. You deepen your social licence by showing urban neighbours where their food comes from, and your insurer doesn’t flinch.
Know yourself before you build the parking lot, though. If your location is remote, your labour is stretched, or the family isn’t keen on hosting, agri‑tourism adds stress rather than margin.
Key Takeaways
If your raw‑milk liability premium quote comes in above 25–33% of your projected raw‑milk gross margin,you’re effectively self‑insuring a significant chunk of catastrophic risk. That should trigger a hard rethink — not a “maybe it’ll be fine.”
If your co‑op or processor contract includes “uniform marketing,” “harm to co‑op,” or broad “conduct” language — and you don’t have explicit written approval for raw‑milk side sales — assume they can force a choice between staying in the truck line and filling jars. Organic Valley already drew that line in 2010 for 150–200 of its member farms. Ask in writing before you buy equipment.
If your current farm‑liability policy has a raw‑milk or bacteria exclusion endorsement, treat that as no coverage for exactly the risk you’re adding. Dog Mountain Farm invested $75,000 before discovering the coverage wasn’t there. Your backstop is your own equity — land, barns, and everything you’ve built.
If the wellness crowd is what’s pulling you, breed toward A2A2 or other specialty traits and capture that demand through pasteurised, branded programs. The consumer gets what they want. You keep your coverage.
If you’re using European allergy studies to justify a raw‑milk business decision, re‑read the original research. The scientists behind PARSIFAL and GABRIELA explicitly say raw farm milk cannot be recommended as an allergy‑prevention tool. That’s not an opinion. It’s their conclusion.
The Bottom Line
Raw milk isn’t something your cousin argues about on Facebook anymore. A 2025 legal review counts 32 states that allow raw‑milk sales in some form, three states updated their laws in 2025, and more bills are moving in 2026. The access question is being answered. The liability question isn’t.
Within the next 30 days, pull your insurance policy, your co‑op or processor contract, and your most recent balance sheet out of the drawer. Email your broker, your field rep, and your lender one question each: “How would this policy or contract respond if I started selling raw milk from this farm?” If any of those answers makes your stomach tighten, you’ve already got more clarity than most people bottling straight from the tank.
The full cost‑per‑cwt model comparing raw milk, pasteurised value‑add, and specialty‑contract strategies across different herd sizes is the kind of deeper math that deserves its own piece — and it’s coming. Some gambles you can make on gut feel. This one deserves real numbers.
Complete references and supporting documentation are available upon request by contacting the editorial team at editor@thebullvine.com.
211,000 More Dairy Cows. Bleeding Margins. The 2026 Math That Won’t Wait. – Exposes the structural “beef-on-dairy” trap and the massive supply shifts redefining the next three years. This analysis reveals how to position your herd’s genetics today to capture processing premiums and avoid the looming structural margin squeeze.
Why the A2 Boom Bypassed Heritage Breeds – And What’s Actually Working – Reveals the precise genetic roadmap to capturing wellness-market premiums without the catastrophic liability of raw milk. This guide breaks down the A2A2 volume requirements and delivers the math on segregation to secure your farm’s future.
The Sunday Read Dairy Professionals Don’t Skip.
Every week, thousands of producers, breeders, and industry insiders open Bullvine Weekly for genetics insights, market shifts, and profit strategies they won’t find anywhere else. One email. Five minutes. Smarter decisions all week.
Your 400‑cow herd can “win” $16,600 on DMC in 2026 and still sit at 0.9x DSCR the minute your banker deletes those dollars from the cash‑flow.
Executive Summary: In 2026, a typical 400‑cow U.S. herd can save about $16,600 in DMC premiums on 6 million pounds — roughly $41.50 per cow — and still sit at 0.9x debt‑service coverage once the banker removes DMC and other program dollars from the cash‑flow. The piece shows the barn math step‑by‑step: $1.66/cwt DMC premium savings, $18.95/cwt all‑milk outlook, and $18–21/cwt true breakeven costs that leave many mid‑size herds below the 1.15–1.25x DSCR comfort band lenders want. It argues that when DSCR clears only 1.0–1.1x with DMC included, DMC has shifted from a safety net to a crutch for a business model that doesn’t pencil. From there, it outlines three realistic branches for 300–500‑cow herds: a turnaround to get “no‑program” DSCR above 1.2x, a reshape into a leaner or premium model, or a staged transition that uses DMC, FSA, and EQIP to protect equity and control timing instead of waiting for the bank to decide. The article also shows which farm‑bill tools actually move your cheque, showing where FSA loan limit increases, EQIP/methane funding, DNIP, and school milk changes genuinely move your milk cheque” or “your margins. It closes with a simple test every operator can run over the next 30 days: calculate DSCR with and without DMC, and ask whether your lender would continue financing the version that stands on its own.
A lot of 400‑cow U.S. dairies look “saved” by the 2026 farm bill on paper. Strip out DMC and other program dollars, and some of those same farms are sitting at about 0.9x debt‑service coverage — not generating enough cash to cover principal and interest on their own.
That’s exactly where a composite 400‑cow freestall operator we’ll call ‘Mark’ lands in 2026. His freestall saves roughly $16,600 a year on Dairy Margin Coverage premiums thanks to the new Tier 1 expansion — about $41.50 per cow. Early‑2026 Extension analysis suggests several months of $1‑plus/cwt DMC indemnities on covered milk if margins track the 2019–2023 pattern at the kitchen table, that looks like protection.
Across the lender’s desk, once his banker, Julie, pulls DMC and other program dollars out of the cash flow, the number is simple: around 0.9x DSCR. Without government support, the cash flow doesn’t fully cover annual debt service.
All numbers and policy tools in this piece refer to U.S. non‑quota herds operating under federal programs (DMC, FSA, EQIP, DNIP).
Composite scenario built from producer and lender patterns, Extension data, and ag‑lending benchmarks — not a single real named farm.
“The Farm Bill Saved Us”… Or Did It?
Mark looks a lot like many mid‑size family dairies in 2026. He milks 400 cows, ships about 11 million lbs/year — roughly 110,000 cwt. Two capital projects sit behind him: a parlour upgrade and manure system work, both financed when rates were low and now reset to higher levels. His labour mix mirrors the broader industry — a 2015 Texas A&M/National Milk Producers Federation study estimated immigrant workers account for roughly 51% of U.S. dairy labour and produce close to 79% of the nation’s milk.
On the policy side, he’s done everything right in the new farm‑bill world:
Maxed Tier 1 DMC at $9.50/cwt on the expanded 6 million lbs production history limit, after USDA raised Tier 1 from 5 to 6 million pounds and allowed history updates to each farm’s highest year from 2021–2023.
Locked in the six‑year DMC commitment with a 25% premium discount on Tier 1 premiums from 2026 to 2031.
Layered revenue protection on part of his milk to catch the downside that the DMC formula doesn’t see.
On paper, that’s a safety‑net success story. The deeper math tells a different story.
DMC history between 2019 and 2023 shows the margin trigger paying indemnities in roughly half the months at $9.50 Tier 1 coverage, per Farm Bureau and Extension DMC analyses. But in months where the official DMC margin sat near $12/cwt, many farms were still unprofitable once non‑feed costs were layered in. USDA ERS 2021 ARMS data puts the full economic cost of production at roughly $20.54/cwt for 500–999‑cow U.S. herds and $19.14/cwt for herds of 1,000+. Multi‑state Extension work — including UW–Madison benchmarks for mid‑size Wisconsin dairies — lands full costs around –19/cwt.
For Mark, the picture snaps into focus:
A realistic, fully loaded breakeven in the high‑teens to low‑$20s/cwt.
A DMC margin trigger that calls the farm “covered” as long as income over standardized national feed costsstays above $9.50/cwt — with no view of labour, interest, energy, or family draw.
The comfortable story in a lot of 2026 farm‑bill coverage: “With the new DMC and FSA tools, mid‑size dairies are finally protected.”
The minute Mark’s scenario hits a DSCR calculator, that story flips.
What Does the 2026 DMC Expansion Really Do for a 400‑Cow Herd?
Four changes matter most for a herd like Mark’s:
Tier 1 coverage jumps to 6 million lbs of production history, up from 5 million.
Production history can be updated to the farm’s highest annual marketings from 2021, 2022, or 2023.
A six‑year lock‑in offers a 25% discount on Tier 1 premiums if you enroll in the same coverage from 2026 to 2031.
Tier 1 premiums for $9.50 coverage: $0.15/cwt (before the lock‑in discount).
The Premium Math: Where $16,600 Comes From
Swap in your own production numbers:
Extra milk moving from Tier 2 to Tier 1: 1,000,000 lbs (the new 6M minus the old 5M cap).
Old Tier 2 premium at $8.00 coverage (comparable risk level): $1.81/cwt.
That’s money you keep whether DMC pays a dime in indemnities. If 2026 margins track the 2019–2023 pattern, total indemnities could add tens of thousands more, depending on how long margins remain below the $9.50 trigger.
Real cash. The kind that catches up feed bills and keeps the operating line from going deep red.
But the catch is what DMC pays on. It’s the margin over the standardized feed, not the full cost of production. Farm Bureau’s March 2026 analysis calls it a “vital backstop showing its limits” for exactly this reason — it never sees the gap between a $9.50 margin and a $20‑plus all‑in cost on many farms.
So when Julie runs 2026 projections on Mark’s herd, she does it two ways:
With DMC and other program income in the numerator.
Without any program income at all.
That’s where the 0.9x shows up.
What Does a 0.9x DSCR Really Mean for a 400‑Cow Herd?
Herd: 400 milking cows, ~27,500 lbs/cow/year → 11 million lbs, or 110,000 cwt.
Milk price scenario: USDA’s February 2026 WASDE puts the annual all‑milk forecast near $18.95/cwt. Once basis and component adjustments hit the cheque, the realized price can land several dollars lower.
Full cost of production: $18–21/cwt depending on herd size, efficiency, and region (USDA ERS 2021 ARMS; UW Extension mid‑size Wisconsin benchmarks).
Annual debt service: In this composite, Mark carries $600,000–900,000 in annual P&I — roughly $1,500–2,250 per cow. That’s not a national average; it’s a realistic range from lender examples and recent mid‑size capital projects.
For DSCR, lenders go back to basics:
(Milk and other income − cash expenses) ÷ annual principal and interest.
The Lender’s Circle
Julie slides the printout across the desk and circles two numbers:
Neither number in that table clears the band. One looks less alarming.
The Turn: Is DMC Your Backstop or Your Business Model?
That question is Mark’s turn, and for a lot of 300–500‑cow operations, reading the same headlines.
The comfortable narrative has sounded like this: DMC is stronger and cheaper. FSA operating and ownership loan limits are higher. Conservation and methane dollars are flowing. Farm Credit and the American Bankers Association have pushed for FSA to raise guaranteed operating loan limits toward $3 million, arguing lenders need those levels to keep financing modern farms.
For a dairy with a solid DSCR, that’s true — higher guaranteed limits unlock better terms and responsible restructures. For a 0.9x herd like Mark’s, the math goes another way:
If your bankable DSCR only works when program dollars are in the numerator, DMC has drifted from being a backstop to a core revenue stream.
Rolling the operating line for another year isn’t risk management at that point. It’s a timing decision on when — and how — the operation changes or exits.
Three Branches — None Start with “Hope DMC Keeps Paying”
Once the math is on paper, most 400‑cow herds in this band end up with three branches.
Branch 1: Turnaround — Get DSCR Above 1.2x Without Programs
Mark’s in this lane if “no‑program” DSCR can realistically climb to ≥1.2x within 12–24 months through specific moves: a disciplined cull plan that raises milk per stall; a concrete labour change that lowers non‑feed cost/cwt; selling non‑core assets to knock down debt per cow. In that world, DMC works as designed — a floor under feed‑margin risk, not a permanent revenue line.
Branch 2: Reshape — Change What the Cows Produce
If Mark can’t get there on cost cuts alone, he may still change the model: move into a premium lane with documented, contractual component or identity‑preserved premiums that actually show up on the cheque; simplify the capital footprint so fixed costs match realistic revenue.
The red line stays put: if the reshaped model still needs DMC to get DSCR to 1.0x, that usually looks more like buying time than fixing core economics.
Branch 3: Use the Tools to Stage a Stronger Exit
The hardest conclusion. For many families — Mark’s included — this isn’t spreadsheet math. It’s a barn your grandfather built, and it’s where your kids learned to drive a skid steer.
But the farm‑bill tools aren’t about keeping a struggling model alive indefinitely. They’re about choosing the timing, the terms, and the shape of what comes next on your schedule, not your lender’s:
Use DMC indemnities and premium savings to pay down the ugliest debt first.
Use FSA‑backed refinancing to restructure into a form that works for a buyer, successor, or landlord in a 2–3 year window.
Consider EQIP/energy projects only if they raise resale or lease value without adding obligations the next operator won’t want.
Choosing this path isn’t failure. It means you’re writing the next chapter, not waiting for the bank to write it for you.
What This Means for Your Operation
If you’re in the 300–500‑cow band and this feels uncomfortably close:
Within 30 days, run the “no‑program” DSCR test. Bring your last 12 months of milk cheques, a full cost‑of‑production breakdown (including labour at replacement cost), and your P&I schedule. Calculate DSCR with and without DMC. If it’s below 1.0x without programs, you’re looking at a business‑model question, not just a rough year.
Use the next 90 days to decide which branch you’re really on. If no combination of realistic cost cuts and genuine premiums gets DSCR to ≥1.2x without programs, you’re in “reshape or transition” territory. Better to name that now than let the bank name it in 18 months.
Treat DMC as protection, not entitlement. Max out Tier 1 and lock in the six‑year discount. Then ask: “Does this business stand on its own if DMC pays nothing for two years?”
Handle FSA like a scalpel, not a shovel. Model what happens to DSCR if you only restructure existing debtversus if you add new principal. If a new loan doesn’t improve your no‑program DSCR, it’s not expansion money — it’s extra risk.
Pick EQIP and energy projects that move cost per cwt. Plate coolers, VFDs, targeted manure improvements — cost‑share can cover 50–75% on smaller projects in some states. Full‑scale digesters mostly belong to herds with thousands of cows and corporate advisory teams. If a project doesn’t clearly lower $/cwt or raise asset value within three years, it’s probably not your project.
Build your risk plan around your own cheque. DNIP and school whole‑milk rules are demand‑side tailwinds. Most of those program dollars flow through retailers and processors first, touching your milk cheque only indirectly.
Make labour your first policy response. Immigration isn’t fixed in this farm bill, but it’ll decide more 400‑cow futures than any DMC tweak. Hang on to your core crew and keep compliance tight.
Farm Bill Tool
Direct Impact on Your Cheque
Action for 400-Cow Herds
DMC Tier 1 expansion
$41.50/cow/year premium savings
✅ Max out immediately. Lock in 6-year discount.
DMC indemnities (when triggered)
$15–30/cow (varies by margin)
✅ Enroll at $9.50 coverage. Don’t count on it as income.
FSA operating loan limit increases
Indirect (better terms if DSCR ≥1.2x)
⚠️ Use to restructure, not to add debt if sub-1.0x DSCR.
EQIP cost-share (plate coolers, VFDs)
$5–15/cow (one-time savings on projects)
✅ Take it if project lowers $/cwt within 3 years.
DNIP & school milk programs
$0 direct (flows through processors)
❌ Demand-side tailwind. Doesn’t change your cheque in 2026.
Full-scale anaerobic digesters
$50–200/cow (only for 1,000+ cow herds)
❌ Skip. Needs corporate advisory team, not 400-cow scale.
Methane funding (small projects)
$8–20/cow (manure improvements)
⚠️ Consider if resale value increases. Not for survival cash.
Key Takeaways
If your DSCR sits below 1.0x without DMC, you’re past a rough‑year problem. You’re looking at a business‑model question the 2026 farm bill can’t fix on its own.
DMC’s ~$16,600 in premium savings ($41.50/cow) and likely 2026 indemnities are real — but they’re a backstop on margin over feed, not on total cost per cwt. Use them to buy time for decisions, not as a permanent source of income.
Higher FSA loan limits only win if they lower your no‑program DSCR or make a future sale/transfer cleaner. If they increase total debt on a sub‑1.0x operation, they accelerate an exit.
Choosing to transition isn’t choosing to fail. If no credible scenario gets your no‑program DSCR above 1.0x, the farm‑bill tools let you control timing, protect your family’s equity, and hand over something cleaner than a foreclosure.
The Bottom Line
At the end of a meeting like this, Julie slides the printout back across the desk and circles the two DSCR numbers. One with DMC, one without.
If DMC went away tomorrow and 2026 milk stayed near the USDA’s $18.95/cwt all‑milk forecast, what would your own DSCR be — and would your bank still lend into that model?
Complete references and supporting documentation are available upon request by contacting the editorial team at editor@thebullvine.com.
$18.95 Milk & The 0.53x DSCR: Why Your Banker Is Already Moving Without You – Exposes the “Information Gap” between your barn and the credit analyst’s desk during $18.95 milk projections. Delivers a 90-day strategy to protect your equity by leading lender conversations with specific, math-backed turnaround targets.
AI and Precision Tech: What’s Actually Changing the Game for Dairy Farms in 2025? – Reveals how precision feeding and AI-driven health monitoring are slashing input costs by 25% on mid-size herds. Bridges the gapbetween traditional management and the high-tech efficiency required to push your “no-program” DSCR back into the black.
The Sunday Read Dairy Professionals Don’t Skip.
Every week, thousands of producers, breeders, and industry insiders open Bullvine Weekly for genetics insights, market shifts, and profit strategies they won’t find anywhere else. One email. Five minutes. Smarter decisions all week.
Mexico just proved it can park 38,000 trucks and almost run out of milk. Has your co‑op ever shown you that risk map?
Farmers and truckers block a commercial highway in Chihuahua during Mexico’s November 2025 “megablockade.” At the Ciudad Juárez–El Paso crossing, roughly 38,000 trucks stalled — and dairy was the first product to nearly run out.
December Class III settled at $15.86/cwt. January dropped to $14.59 — the lowest since July 2023, according to Dairy Star. Those are price moves your hedge is built to handle. But if your co‑op sells heavily into Mexico, your mailbox came in shorter than even those numbers explain. And nothing on the futures screen told you why.
The answer was 1,500 miles south, stuck in traffic at Ciudad Juárez.
In late November 2025, farmer and trucker groups across Mexico launched what they called a “megablockade” — shutting highways and occupying customs facilities in at least 17 states. The National Front for the Rescue of Mexican Farmland (FNRCM), the National Association of Carriers (ANTAC), and the Movimiento Agrícola Campesino (MAC) targeted corridors in Chihuahua, Sinaloa, and Zacatecas, as well as routes radiating from Mexico City. At the Ciudad Juárez–El Paso crossing — Mexico’s busiest commercial border zone — FreightWaves reported roughly 38,000 trucks stranded, delaying about US.45 billion in exports and causing industry losses of around US.8 million per hour.
Dairy was the first product to run short. Iván Pérez Ruiz, president of the Juárez Chamber of Commerce, told news reporters that previous blockades “nearly resulted in a complete shortage of dairy products, with milk and cheese being the most impacted.” María Teresa Delgado Zárate of Index Juárez estimated daily export losses at $250 million. Manuel Sotelo Suárez of CANACAR warned the city was “very close to running out of supplies.”
That’s the heart of this story. You hedge prices like an adult. But the Mexico border isn’t a permanent green light — it’s a high‑beta pipeline that can slam shut with one national protest call. The risk hiding in your milk check isn’t about what Class III settles at. It’s about what happens between that settlement and your mailbox when the road closes.
CoBank Called Mexico “Reliable.” Three Weeks Later, Juárez Froze.
In December 2024, CoBank published a report called “Mexico Has Become America’s Most Reliable Dairy Customer.” Lead dairy economist Corey Geiger laid out the numbers: Mexico accounts for more than one‑fourth of total U.S. dairy export value and buys roughly 4.5% of U.S. milk production. In 2023, U.S. dairy exports to Mexico hit 1.38 billion pounds on a milk‑solids basis — a 42% increase over the prior decade. Mexico’s per-capita dairy consumption has grown about 50 pounds since 2011, and U.S. exports now cover more than 80% of Mexico’s dairy deficit. CoBank estimates one in six tanker loads of U.S. milk ends up overseas, and processors have committed around US$8 billion in new capacity coming online soon.
From a demand standpoint, Mexico really has behaved like an anchor customer. The pipes getting product there are another story.
On November 23–24, 2025, ANTAC, FNRCM, and MAC rolled out coordinated blockades before dawn. Mexico News Daily reported on November 27 that “mega-blockades” were in their fourth day, choking truck access to U.S. ports of entry. Maquiladora plants went into technical stoppages. Around 30,000 workers sat on downtime. Shippers were told to expect 10 or more days of delays even after protesters cleared the roads. News outlets reported the dairy sector faced “operational paralysis,” and by the time a third blockade was announced in December, the backlog from earlier rounds still hadn’t cleared.
Interior Minister Rosa Icela Rodríguez announced a deal on November 27 — working groups in exchange for suspending the blockades. FNRCM and ANTAC called it a truce, not a surrender. They’ve already circled the next date.
On March 3, 2026, UnoTV reported that FNRCM and ANTAC called a national mobilization for March 20 — two weeks from today — including highway blockades and actions in Mexico City. The CNTE teachers’ union announced a national strike for March 18–20, which will overlap with other strikes. MexicoBusiness.news confirmed the call on February 27. Mexico Solidarity described it as a mobilization for “food sovereignty and agricultural transformation,” with farmers demanding that basic grains be removed from the USMCA.
That’s a planned action, not a historical event. But it tells you blockades are a deliberate political tool now — not a one‑off tantrum. And the people who really control your milk check aren’t all sitting at your co‑op’s head office.
How Does This Actually Hit Your Milk Check?
The broader numbers were already ugly before the blockades started. October 2025’s U.S. average mailbox dropped 85¢ in a single month to $18.70/cwt — $5.58 below the same month a year earlier, according to USDA NASS data. Upper Midwest producers on FMMO 30 held up better, averaging $19.74 in September and roughly $19.25 in October. But reports already documented a $1.30/cwt gap nationally between the statistical all‑milk price and what farmers actually received, driven by depooling, component math, and co‑op deductions.
For co‑ops whose Mexico-bound product was stuck at Juárez, that gap had one more driver the data didn’t itemize.
Here’s the sequence: bridges close or crawl for days. Even after protesters leave, backlogs add another 10 days of friction. Plants scramble — rerouting loads through Nogales or Nuevo Laredo, shoving product into lower‑value domestic channels, piling inventory, and hoping buyers wait. Class III still settles where it settles. Your hedge does what it’s supposed to on that screen. But the gap opens in the co‑op’s margin. And when that margin gets squeezed, the co‑op pulls the levers it controls: export premiums, quality incentives, over‑base pricing, intake policies.
The basis risk lands on you.
Here’s the barn math. A 1,200‑cow herd at 80 lb/day ships 960 cwt/day. If the co‑op’s effective pay price runs 40¢/cwtbelow your hedge‑implied price for 30 days, that’s 960 × $0.40 × 30 = US$11,520. A 700‑cow herd shipping 560 cwt/day at the same gap: US$6,720. At 2,400 cows, closer to US$23,000. Plug in your own daily cwt and see where you land.
Those aren’t predictions. They’re scenarios built off the scale you just watched at Juárez — where Delgado Zárate estimated $250 million a day in export losses and Pérez Ruiz said dairy nearly ran out. The kind of surprises that show up in the mailbox, not on the futures app. With dairy economist Bill Brooks of Stoneheart Consulting estimating 2026 income over feed costs at $10.14/cwt — down $2.30 from 2025, per Dairy Star — there’s not much cushion between a rough month and the 2026 margin math that makes every basis surprise harder to absorb.
Why Can’t Your Price Hedge See a Blockade Coming?
Hedging tools handle price risk. There’s no ticker for “pipe” risk — no DRP endorsement that covers Juárez running at half capacity or 8,000 cargo robberies a year on Mexican highways.
Three forces are driving the border risk your hedge account can’t touch.
Cargo theft and highway violence. El País reported in December 2025 that cargo trucks in Mexico suffer at least 8,000 robberies per year — 21 a day — and more than 80% involve violence against the driver. ANTAC says the real figure is 54 to 70 thefts daily because most go unreported. Concamin estimates cargo theft costs around 15 million pesos per day.
Water, grain, and food sovereignty politics. In October 2025, FNRCM paralyzed highways and rail lines in 17 states, demanding higher grain prices and opposing changes to Mexico’s General Water Law. FNRCM leader Marco Antonio Ortiz Salas publicly alleged that the CME and transnational grain companies were “manipulating markets.” No evidence supported that specific claim — but the grievances are real enough to park tractors on bridges, and they’re at the core of the March 20 call.
The 2026 USMCA review. Under Article 34.7, the USMCA must undergo a joint review by July 1, 2026. On January 5, the National Milk Producers Federation said it and the U.S. Dairy Export Council are “advancing a coordinated strategy to ensure the agreement delivers on its promises to U.S. dairy producers.” More than 120 U.S. agricultural groups want an extension with minimal changes. Mexican farm movements want the opposite — basic grains removed from the agreement entirely.
Your hedge locks in a price. The fact that Mexico is both your co‑op’s most “reliable” customer and one of its riskiest corridors — that’s what you have to decide what to do with.
What Should You Ask Your Co‑op Before March 20?
You can’t control FNRCM or ANTAC. You can control how blindly you’re exposed to them.
Start with the exposure question. Ask for a simple 12‑month breakdown: what percent of total solids are exported, what percent goes to Mexico, and how much of that moves through Pharr, Laredo, Ciudad Juárez, or Nogales. CoBank’s data show that Mexico buys more than a quarter of the U.S. dairy export value. If your co‑op can’t ballpark which bridges carry your milk, that’s worth raising at the next member meeting.
Then make them walk through a scenario. Say Juárez runs at half capacity for 30 days, including backlog time. Which plants pull back intake first? Which products get priority for limited export slots? In what order do they adjust premiums, quality incentives, and over‑base pricing? You’re not asking them to predict the future. You’re asking whether they’ve done the same “what if?” work you do before locking in feed.
The USMCA review adds a harder edge. NMPF confirmed in January that it’s pushing for stronger enforcement of market‑access commitments. Mexican farm movements are treating July 1 as a pressure point. Ask your board what assumptions they’re making about Mexico volumes through 2027 — and how those interact with the $8 billion in new processing capacity CoBank flagged.
If the only chart they show you is “exports up and to the right,” ask what happens when the road under that chart closes for a few weeks. For the families who’ve already decided the farm is worth fighting for, the answer matters.
How Does This Change What You Do on the Farm?
Macro risk is interesting. The bank and the feed mill still want their money on time.
Cash flow isn’t just about price anymore. With 2026 income over feed at $10.14/cwt, a surprise basis hit is the difference between a month you ride out, and a month you’re juggling which bill to delay. Within the next 30 days, pull your last 12 months of milk checks, calculate your average daily cwt shipped, and model what happens if your mailbox comes in 30¢/cwt worse than your hedge implied for 30 days. Then do the same at 50¢/cwt. Turn each into a dollar number and ask: could we ride this without breaking covenants?
If the answer makes your stomach tighten, sit down with your lender before March 20. Say: “Here’s what these scenarios look like for us. If something like this happens because of a border event, what would you want to see from us?” That’s not panic. That’s the conversation a lender expects to have before trouble arrives, not after.
Your hedge strategy may need one more trigger. You probably adjust coverage when futures move sharply, or big USDA reports drop. Consider adding one more: the gap between your hedge‑implied price and the actual mailbox. If that gap widens beyond 30–50¢/cwt for two consecutive checks, it doesn’t automatically mean “Mexico.” But it’s a red flag to ask your co‑op whether pipeline issues are in the mix and to re‑check your cash‑flow plan for the next 60–90 days.
Expansion decisions carry new questions. If you’re adding cows or signing a longer‑term supply deal, ask how those decisions tie into Mexico exposure. “How dependent is this plant on exports through Juárez?” and “What exactly did you do on premiums during the November 2025 blockades?” won’t make every marketer smile. But they’re the questions a lender would ask if they were sitting where you are.
Options and Trade‑Offs for Farmers
You don’t get to vote on Mexico’s water law or who parks a tractor on a bridge. You do get to choose how much of that volatility you carry.
Path 1: Treat Mexico as a high‑beta outlet — and price it in. This makes sense if your co‑op is genuinely good at export business and you have enough financial cushion for occasional rough patches. It requires knowing how much of your co‑op’s volume goes to Mexico and building a realistic risk haircut into long‑range margin expectations. You still get stung in bad years. If blockades become seasonal, the “occasional rough patch” becomes a pattern.
Path 2: Run a 30‑day border stress test — this month, before March 20. This is the move if you’re mid-size, have real debt, and have limited shock absorbers. Use your actual daily cwt and run two scenarios — basis 30¢/cwt and 50¢/cwt worse for 30 days. Put those dollar numbers next to your cash‑flow plan and covenants. Book a conversation with your lender this week.
Path 3: Push for a written co‑op border playbook. If you’re committed to your co‑op and want fewer surprises, ask the exposure questions in member meetings, where they’re recorded. Push for a border‑risk section in the annual business update: exposure by crossing, disruption scenarios, and the order in which premiums change. If Pérez Ruiz can tell the media that dairy nearly ran out at his city’s crossing, your co‑op can tell you how much of your milk was heading there. The USMCA review deadline — July 1, 2026 — makes this more urgent, not less.
Path 4: Align your risk advisors around pipes, not just prices. In your next risk call, say: “Let’s talk specifically about basis moves when pipelines jam — blockades, plant outages — and what that looks like in our numbers.” In your next lender meeting: “Are you factoring Mexico corridor risk into how you look at our credit?”
Key Takeaways
If your co‑op sells a meaningful share of solids into Mexico through one or two crossings, treat border risk as its own line on your 2027 plan — not just “export.”
If your mailbox comes in 30–50¢/cwt below what your hedge implied for two consecutive checks, call your co‑op and ask whether pipeline issues are in the mix.
If your co‑op can’t tell you what share of its Mexico volume flows through Pharr, Laredo, Juárez, or Nogales, push for that exposure map before you sign a major expansion or supply contract.
If a 30‑day stress test at 40¢/cwt basis hit would strain your cash flow or covenants, talk to your lender now — not after March 20.
The Bottom Line
Your hedge account sees the price side of your risk. The Mexico border has quietly become one of the most important pipe risks in North American dairy, concentrated in a handful of crossings where organized groups have already proved they can park 38,000 trucks and push dairy to the brink of shortage in days.
The question isn’t whether somebody will line up on those crossings again. They’ve already circled March 20. Whether you find out how exposed you are from a slide at a co‑op meeting, a conversation with your lender, or the next milk check that doesn’t match what you modeled — that part is up to you.
Complete references and supporting documentation are available upon request by contacting the editorial team at editor@thebullvine.com.
Learn More
The $4/cwt Your Milk Check Is Missing – And What’s Actually Working to Get It Back – Stop the bleeding in your mailbox price by identifying the structural make-allowance hits and regional deductions currently scalping your margin. It delivers a hard-nosed checklist to recover value through component gold-rushes and smarter beef-sire selection.
The Texas ESL Boom: How Smart Producers Are Turning Consistency into Contract Power – Reveals how the ESL boom is weaponizing milk quality data into contract leverage, shifting the profit center from bulk volume to 90-day shelf-life predictability. It identifies the high-tech supply chains that will dominate the landscape through 2030.
The Sunday Read Dairy Professionals Don’t Skip.
Every week, thousands of producers, breeders, and industry insiders open Bullvine Weekly for genetics insights, market shifts, and profit strategies they won’t find anywhere else. One email. Five minutes. Smarter decisions all week.
OSHA priced six dead dairy workers at $246,609. Wayne County priced one dead dairyman at 75 tractors and weeks of unpaid chores.
Reed Hostetler was 31, co-owner of L&R Dairy in Marshallville, Ohio, and father of three kids under five. On March 5, 2025, he was killed in an accident involving the manure pit at the family farm.
Within days, the same barn where Reed and Abby Hostetler had been married was pressure-washed, scraped, and transformed into a funeral venue — by neighbours who showed up without being asked. An estimated 75 to 100 tractors, trucks, semis, and implements lined the road outside Grace Church in Wooster, organized by local farmers and custom harvesters, according to Farm and Dairy. Weeks later, people were still arriving before dawn to feed calves and clean pens, then leaving before anyone could thank them.
A mourner rests a hand on the Krone forage harvester bearing Reed Hostetler’s name outside the barn-turned-church at his March 12 funeral on the family dairy.
We tracked six dairy crises across five years and four structural threats — climate, immigration enforcement, workplace safety, and processing collapse. Different regions, different triggers, same lesson: operations with community infrastructure before the crisis recovered faster than those without.
When the River Turned a Dairy Region Into a Lake
On November 14, 2021, an atmospheric river dumped a month’s worth of rain on British Columbia’s Fraser Valley in 48 hours. The Nooksack River breached into Sumas Prairie — one of Canada’s most productive dairy regions — and the B.C. The Dairy Association reported more than 600 farms affected, with thousands of animals stranded.
Abbotsford Fire Chief Darren Lee told CBC News the flooding moved at a rate he’d never seen in 30 years of emergency services. B.C. Agriculture Minister Lana Popham said she’d been on video calls with farmers who had dead cattle visible behind them.
The community response started before the government’s. Sumas Prairie farm women Jimi Meier and Alison Arends launched a Facebook donation page that collected more than $470,000 in hay, feed, equipment, and cash — tracked through a 2022 Rotary Club accounting. Dairy families from the Fraser Valley, Chilliwack, and Vancouver Island drove in feed while roads were still partially impassable.
Dr. Lisa McCrea Hemphill, a veterinarian who documented the disaster for the Western Canadian Dairy Seminar in 2024, put it bluntly: the 2021 event “was not the first of its kind for Sumas Prairie and it will not be the last.”
In November 2021, the atmospheric river put 3.5 feet of water in U&D Meier Dairy #1’s parlour and sent 14 loads of milk down the drain (top). By December 2025, pumps, planning, and a neighbour network built from that loss kept stalls dry and cut the damage to a single missed pickup (bottom).
The people who showed up first knew which farm had a flatbed, which neighbour had generator power, and which operation kept extra feed on hand. That informal network — built over years of milk truck routes and co-op meetings — was the actual first responder. For the full story of how Sumas Prairie dairy families turned three floods into a rebuild blueprint, read “Three Floods, One Lifetime”.
What Happens When 35 Workers Disappear in One Morning?
June 4, 2025, at Outlook Dairy in Lovington, New Mexico. ICE officers detained 35 workers in what the Albuquerque Journal described as a targeted enforcement operation. Owner Isaak Bos told the Journal the workers had provided false documentation, and the dairy was cooperating fully with the investigation — the dairy itself was not accused of wrongdoing. But the operational hit was immediate: Bos said milking and feeding “effectively ceased” for a period after the detentions.
Replacing a 35-person crew in Lea County — one of the most remote dairy regions in the country — isn’t a phone call. It’s a months-long rebuild.
What the Outlook Dairy story exposed isn’t about one farm’s hiring practices — Bos made clear the dairy cooperated fully and wasn’t accused of wrongdoing. It’s about an industry-wide labour structure that everyone in dairy knows, and almost nobody talks about publicly. NMPF’s 2015 economic analysis with Texas A&M estimated immigrants account for 51% of all U.S. dairy labour, and dairies employing immigrant workers produce 79% of the nation’s milk supply. Dr. Robert Hagevoort of New Mexico State University, speaking at the Dairy Cattle Reproduction Council in late 2024, said he believes the true percentage is even higher — that study’s a decade old, and dairy’s reliance on immigrant labour has only deepened.
What happened next: family members, office staff, and local teenagers traded summer plans for scraping alleys and attaching milking units. Neighbours from surrounding operations covered shifts. Three days later, at a town hall in Hobbs, Governor Michelle Lujan Grisham heard about the impact firsthand. “It is a real issue, and I’m very worried about it,” she told the Albuquerque Journal.
Nobody had a playbook for “ICE raid response.” They built one in real time. The full account of how Lovington built a response from nothing goes deeper into the labour math and what happened in the months after.
The Three-Day Rule — and the Road That Broke It
Most tragedies in farm country follow a pattern: three days of intensity, three weeks of fading attention, then silence — while the family is still trying to figure out how to milk cows and raise three kids alone.
Wayne County broke that pattern after Reed Hostetler’s death.
Shuttle buses ran from Marshallville Park to the barn funeral. Local companies brought gravel to shore up the lane. A phrase circulated — “Lead Like Reed” — and it served as a decision rule, not a bumper sticker. If something needed doing — calves to feed, kids to watch, hay to chop — people didn’t wait to be asked. They just did it.
Green Elementary’s PTO, led by president Shelly Baumgardner, organized a “Dine to Donate” night at a local restaurant, using a student day-off incentive to bring in more families and raise money for the Hostetlers. Groceries, diapers, and hot meals kept arriving for weeks. As Abby told Farm and Dairy: ‘It has shown me that when our community needs help, help comes. And… the next time our community needs help, I will be there and I will show up.
What made Wayne County different wasn’t that people cared more than anywhere else. It’s that the support network was already there. People had been helping each other with harvest, calving, and equipment breakdowns for years. Reed’s reputation — the kind of guy who’d show up in someone else’s barn without being asked — was the deposit. The community’s response was the withdrawal.
Six Workers Dead in Minutes — and the Fines OSHA Proposed
Five months after Reed’s death, the same hazard — manure gas — killed six workers at Prospect Valley Dairy in Keenesburg, Colorado.
On August 20, 2025, according to OSHA’s investigation, a pipe connected to the manure management system disconnected, releasing hydrogen sulfide. One worker went down almost immediately. Then five more went in to save him. All six died. The Weld County coroner confirmed toxic gas exposure as the cause of death.
The victims: Alejandro Espinoza Cruz, 50, of Nunn, and two of his sons — Oscar Espinoza Leos, 17, and Carlos Espinoza Prado, 29. Jorge Sanchez Pena, 36, was related to the family by marriage. Ricardo Gomez Galvan, 40, and Noe Montanez Casanas, 32, rounded out the toll. A father, two sons, and three more men — gone in minutes.
“They were extremely hardworking and humble,” Tomi Rodriguez, an outreach worker for Project Protect Food System Workers, told CPR News. “They were a very united family.”
OSHA cited three businesses in February 2026, classifying the violations as “serious” — not “willful.” Total proposed fines across all three entities came to $246,609 — about $41,000 per life lost. The largest single penalty: $132,406 to Prospect Ranch LLC, the entity operating Prospect Valley Dairy. OSHA calculates fines per violation, not per fatality, but the math is hard to ignore either way.
All citations remain proposed and subject to employer contest. Prospect Ranch LLC has not publicly commented on the citations beyond the formal contest process.
Attorney Sam Cannon of Cannon Law in Fort Collins, representing four of the victims’ families, told KUNC: “We’re no nearer figuring out why this system malfunctioned.” He added: “Family members deserve to understand why this system was operating when it wasn’t safe.”
That impulse — I’m going in after him — is the rawest form of community response. Workers risking their lives for a friend, a father, a coworker. But this story doesn’t have Wayne County’s arc. In Keenesburg, the community showed up with condolences, a benefit dance, and organized services for the families, as the Colorado Sun reported.
Wayne County’s sustained, months-long operational support — the before-dawn chore crews that were still running weeks later — requires a pre-existing infrastructure that not every community has in place when a crisis hits. That gap isn’t about generosity. Every road has generosity. It’s about whether the relationships were already built. For the full OSHA citation breakdown and what the industry hasn’t done, that piece walks through every violation, every dollar, and the confined-space fix that costs less than two cows.
What Does Your Road Look Like When There’s Nobody Left to Call?
Not every crisis arrives with sirens. Some arrive as a letter from your processor.
North Dakota went from 1,810 dairy farms in 1987 to 18 by early 2026 — a 99% decline in less than four decades, per USDA Census data and the Holle family’s own count. That collapse left the state with almost no local processing infrastructure. The Holle family runs Northern Lights Dairy, a 1,000-cow operation about 12 miles south of Mandan — one of just 18 Grade A dairy farms left in the state. After Prairie Farms closed its Bismarck plant in 2023 and DFA ceased operations at Pollock in 2024, the Holles were forced to find a new market for their milk twice in 30 months. They now ship to a Bongards plant in Perham, Minnesota — a five-hour haul, one way.
The Holle family — Andrew, Jennifer, and their four children — at their fifth-generation Northern Lights Dairy south of Mandan, North Dakota. They milk 1,000 cows and haul every load five hours to Minnesota. When we asked what comes next, their answer was: “We don’t know what we are going to do.
But the Holles aren’t waiting for an answer to find them. The family is exploring adding on-farm processing — Dawson Holle, their son and a state representative who sits on the House Agriculture Committee, told the North Dakota Monitor the family has plans for a processing plant, though the timeline remains uncertain. And two new large-scale dairies announced for eastern North Dakota along the I-29 corridor are projected to bring $122–$227 million in annual gross revenue to the state, according to a December 2025 NDSU Extension analysis. The 18 farms still standing aren’t just surviving — they’re building the infrastructure that disappeared around them.
Agriculture Commissioner Doug Goehring has publicly noted that “with no other processors nearby, those dairies will likely pay for shipping longer distances that will be deducted from their milk checks.” Every extra mile eats into the milk check — and the further you haul, the harder it gets to pencil out staying in business.
And when a herd sells out in a region this thin, there’s nobody to absorb the loss — no neighbour to take on heifers, no local market for the genetics, no route density to keep the hauler coming.
From 1,810 farms to 18 is what community infrastructure looks like after it’s gone. For the full 1,810-to-18 diagnostic, including the Holle family’s testimony and the processing closures that cornered them, that piece is the warning label.
How Do You Spot the Farm That’s Quietly Going Under?
Not every crisis shows up as a manure pit or a flood. Some show up as yards that don’t look quite like they used to. Ration sheets that haven’t been updated in weeks. A kid who quietly steps back from 4-H. A familiar face missing from the co-op meeting — not once, but three meetings running.
University of Guelph researchers have documented what most producers already sense: farmers carry higher levels of stress, depression, anxiety, and burnout than the general population. Financial pressure and workload consistently top the list. CDC studies published in the agency’s Morbidity and Mortality Weekly Report — including Peterson et al. (2020) analyzing 32 states and Sussell et al. (2023) covering 49 states — have consistently found suicide rates among agricultural workers significantly elevated compared with the general working population. Earlier state-level studies found the disparity to be two-fold or higher when measured against the broader population.
The rescue in this story isn’t dramatic. It’s a vet walking back to the truck after a DA, leaning on the door instead of climbing in, and saying, “You look worn out. How are you really holding up?” It’s a retired dairyman feeding calves three mornings a week without being asked. It’s the neighbour who notices the late barn lights and calls — not texts, calls — to say, “I’ll swing over. Put the coffee on.”
Those interventions buy something that doesn’t show up on any milk statement: time to think clearly. When stress is driving your decisions, you’re more likely to make rushed calls on genetics, culling, expansion, or exit that feel necessary in the moment but leave you with fewer options six months out. The data behind why dairy farmers face a 3.5× higher suicide risk — and what the people closest to them can actually do — goes deeper than any headline.
What Does a Lost Herd Actually Cost Your Road?
Here’s a piece of math most people skip. When a 250-cow herd sells out, you don’t just lose one family’s income. You lose roughly 6.4–6.8 million lbs of annual milk volume on the truck route — that’s 250 cows at 70–75 lbs/day, every day of the year — and your processor starts thinking about rationalizing pickups and consolidating drop points.
That exit takes an estimated $8,000–$15,000/year in genetics purchases with it — semen, embryos, show heifers — money that supported your local AI tech and breed association. Gone, too, are an estimated 50–100 hours of informal labour and equipment sharing per year that nobody tracks but everybody depends on. And you lose one seat at the co-op board, one voice at herd improvement days, one barn where kids learned to fit calves for the ring.
On a 200-cow herd, a single missed milking costs roughly $1,100–$1,400 in lost milk alone — January 2026 Class III hit $14.59/cwt per USDA AMS, the January all-milk price came in at $17.50/cwt per USDA Agricultural Prices (Feb. 27, 2026), and USDA’s February WASDE forecasts $18.95/cwt all-milk for the full year. That’s before the SCC spike and mastitis risk that compounds for days afterward. If your neighbour’s crisis means your backup milker no longer exists, that math applies to your bulk tank too.
Community isn’t charity. It’s risk management you can’t buy from an insurance company.
What You Can Build in 30 Days
You can’t control floods, raids, pit gases, or processor closures. You can control whether anyone on your road faces one alone.
Build a phone tree this week.
Eight to ten names — neighbours, church, co-op, school. Who calls whom in the first 15 minutes after an accident, barn fire, or sudden death? Write it down in the milk house. Tape it next to the bulk tank. This costs nothing and takes one evening. If you can’t fill 8 names without thinking hard, that tells you something.
Check three farms this month.
Not by text. By call or visit. “How are you doing — really?” Be ready for the answer to take longer than you planned. If a yard on your road has been slipping — gates not closed, lane rough, a familiar face missing from meetings — that’s not “busy.” That’s a signal. The earlier you show up, the more steering room exists.
Know your backup processor before you need one.
If your only buyer closes or tightens terms, where does your milk go tomorrow? Contact your co-op or marketer to request a contingency routing plan. The Holle family at Northern Lights Dairy didn’t get a warning. Neither will you.
Put mental health on the agenda — out loud.
At your next discussion group, dairy association meeting, or men’s breakfast, share one real story. Be the person who goes first. In the U.S., Farm Aid’s hotline (1-800-FARM-AID) connects you with staff who understand agriculture. In Canada, the Do More Agriculture Foundation maintains a current directory of crisis lines and counselling by province. If a conversation turns serious and you’re worried about someone’s safety, the 988 Suicide & Crisis Lifeline (U.S.) and Crisis Services Canada (1-833-456-4566) are 24/7.
Give your kids a crisis role
4-H and FFA clubs can own comfort jobs — cards, freezer meals, calf chores. Clear roles mean kids grow up knowing how to show up. And the families that keep their kids connected to 4-H, shows, and herd improvement days through the rough years are quietly protecting the infrastructure that decides who’s still farming in a decade.
Not Every Road Has a Wayne County
This piece would be dishonest if it pretended that every road has that kind of response waiting to be activated.
Some barns are too far apart for quick drop-ins. In some regions, most families work full-time off-farm, and there aren’t extra hands available. Pride keeps good people from speaking up until they’re closer to the edge than anyone’s comfortable with. And sometimes the structural forces — processing deserts, debt loads, a market that doesn’t want your milk at any price — are bigger than anything a neighbour with a skid steer can fix.
Farmer suicide — rates significantly elevated compared with the general working population, per Sussell et al. in CDC’s MMWR (December 2023) — isn’t something you solve with casseroles. It requires professional support, funded infrastructure, and an industry culture that treats “I’m not okay” as maintenance, not weakness.
But here’s what six stories across five years and six provinces and states prove: operations with community infrastructure before the crisis recovered faster — financially and operationally — than those without it. That’s not soft thinking. That’s business continuity.
Key Takeaways
If you can’t name 8 people who’d be in your yard within 15 minutes of a crisis, you don’t have a phone tree. Build one this week — it’s the single cheapest piece of risk management on your operation.
If you don’t know your second processor option, call your co-op or marketer this month and ask for contingency routing. The Holles didn’t get a warning.
If a yard on your road has been slipping for a month, that’s not “busy.” Call — not text — and ask one honest question. Early is always cheaper than late.
If missing one milking costs you $1,100–$1,400 and you don’t own standby power, know whose generator you’d borrow and whether it’s wired to connect. Virginia Tech Extension’s standby generator guide walks through the sizing math.
Whose lane are you turning into tonight?
Randy Roecker is training milk haulers to spot the signs that a farmer is in trouble — because haulers are the last person on every road, every other day. That story is worth 10 minutes of your time. And if the deeper economics of processor loss, generator ROI, or what it really costs your road when another herd exits — that’s the kind of analysis we build out in The Bullvine Weekly and our Tier 2 management playbooks. North Dakota’s 1,810-to-18 collapse is the diagnostic tool.
Tonight, the only math that matters is the distance between your lane and the next one over.
The $11 Billion Reality Check: Why Dairy Processors Are Banking on Fewer, Bigger Farms – Reveals the structural shift in global processing that favors mega-dairies, helping you position your operation for the next three years. Breaks down why 80% of future supply is already pre-secured, allowing you to secure your contract before regional consolidation closes your window.
Six Colorado Dairy Workers Dead. OSHA’s Price: $41,101 a Life—and No Jail Time. – Exposes the deadly “rescue chain” math and the $450 technology fix that prevents confined-space fatalities. Delivers an immediate safety framework that integrates with herd management software, turning a catastrophic liability risk into a documented, insurance-ready competitive advantage.
The Sunday Read Dairy Professionals Don’t Skip.
Every week, thousands of producers, breeders, and industry insiders open Bullvine Weekly for genetics insights, market shifts, and profit strategies they won’t find anywhere else. One email. Five minutes. Smarter decisions all week.
You think the worst day is when the truck stops. For 15 Harrisburg shippers, the real hit came later — when $985,012 in milk became a risk of a bankruptcy clawback.
Executive Summary: Harrisburg Dairies’ October 2025 shutdown left 15 Pennsylvania farms owed $985,012 for milk that was already sold, with the state’s bond and security fund covering only about 74% of that total. That shortfall exposes the real limits of Pennsylvania’s Milk Producers’ Security Act on a working dairy — it’s built to cover roughly 40 days of milk, not the six to eight weeks of arrears many producers quietly carry. When the company filed Chapter 11 in February 2026, it opened a 90‑day clawback window that could yank money back out of farms’ accounts for checks they’ve already cashed. The article walks through barn‑level math for a 200‑cow herd and a 300‑cow herd so you can plug in your own numbers and see exactly what a 74% recovery means in dollars. It then uses the Dean Foods precedent to explain, in practical terms, how ordinary‑course, subsequent‑new‑value, and contemporaneous‑exchange defenses can cut clawback exposure. The core mindset shift is simple: the Board optimizes for system stability, but you have to optimize for your own balance sheet. The back half is a concrete 30/90/365‑day playbook — from setting a hard limit on unpaid milk, to lining up a backup buyer, to stress‑testing whether your cash flow can survive a three‑month revenue gap if your processor ends up looking like Harrisburg.
$985,012. That’s the total owed to 15 central Pennsylvania dairy farms when Harrisburg Dairies permanently ceased operations on October 6, 2025, according to Pennsylvania Milk Marketing Board executive secretary Betsy Albright in state milk board records and local coverage from October 2025. The company’s security bond and collateral covered $730,942.29 — roughly 74 cents on every dollar owed. The other 26 cents? That’s the gap the system wasn’t built to close.
Rob Barley chairs the PMB and co-owns Star Rock Farms, a 1,500-cow Lancaster County operation. When Harrisburg Dairies went dark on Monday, October 6, at least five farms were still actively shipping to the plant — bulk tanks with nowhere to go. “We will do everything possible that the law will allow to help farmers receive the maximum amount of funds available,” Barley told reporters in October 2025. Note the qualifier: what the law allows. All five farms have since been accepted by cooperatives operating in the area, according to Barley. But the milk they’d already shipped and never been paid for — that’s a separate problem.
On November 5, 2025, the PMB issued Official General Order A-1021 directing the pro rata distribution of the Harrisburg Dairies security fund and collateral bond proceeds. Kevin High, one of the 15 shippers, was awarded $43,728.01. That’s what 74 cents on the dollar looks like on one farm’s milk statement.
Then, on February 20, 2026, Harrisburg Dairies filed Chapter 11 in Pennsylvania’s Middle District Court (Case No. 1:26-bk-00474, Chief Judge Henry W. Van Eck), represented by Robert E. Chernicoff of Cunningham and Chernicoff PC. Court filings show nearly $4.6 million in assets against roughly $3.6 million in liabilities, primarily loans from Mid Penn Bank, which has filed a Request for Notice. Only about five employees remain, with a pending payroll of $7,624. WGAL reported on February 24 that the company has identified a prospective buyer and is seeking to use cash collateral to reorganize. First Day Motions filed on February 23 included requests for cash collateral use, assurance of utility service, and pre-petition payroll, with an expedited hearing set for February 26 at the Sylvia H. Rambo U.S. Courthouse in Harrisburg.
That filing triggered a second wave of financial exposure — the 90-day preference clawback — that could force farms to return payments they’ve already deposited and spent.
What Actually Breaks When the Truck Doesn’t Show Up
A 200-cow dairy produces roughly 16,000 pounds of milk per day. Without a scheduled pickup, the bulk tank is full in 48 hours. The cows don’t stop. The feed bill doesn’t pause. Every gallon dumped destroys revenue, with the cost already incurred.
But the cascade goes deeper than a full tank. Farmers reported that hauling deductions withheld from their milk checks were not being forwarded to haulers. So the driver who’s supposed to pick up Tuesday’s milk has his own cash-flow crisis — and no obligation to keep showing up for a defunct processor’s route. The weekly payment that was supposed to arrive under the PMB’s special order? It stopped.
Most of these farms were already six to eight weeks behind on payments when the plant went dark. Finding a new buyer takes weeks, and the first check from a cooperative takes a month or more. The real revenue gap isn’t six to eight weeks. It’s closer to 10 to 12 from the last real payment to the first new check.
One producer told reporters he’d “calculated the risk in staying with Harrisburg Dairies given the prior late payment citations and continued lapses in their required weekly payments.” He stayed anyway. “It’s also a dream, of sorts, to be shipping to a local brand,” another anonymous producer explained. That loyalty — to a 94-year-old local processor — kept them shipping right up until the truck stopped coming. It’s the same generational pull that keeps families tied to the loyalty that keeps a family shipping to the same buyer for generations even when the math says otherwise. And some farms may have stayed simply because route geography, co-op-based programs, or timing barriers left them without a realistic alternative.
How Far Does Pennsylvania’s Milk Security System Actually Go?
Pennsylvania’s Milk Producers’ Security Act requires licensed dealers to file a surety or collateral bond equal to a minimum of 75% of the highest aggregate amount owed to all producers for 40 days during the preceding 12 months. A smaller subset of the roughly 193 dealers licensed by the Board participates in a security fund, posting a minimum 30% bond and making monthly contributions of 2¢ per hundredweight. As of April 2024, the fund held more than $3 million, with more than $100 million in total collateral and surety bonds across all dealers. Pennsylvania is one of only a few states that provide this type of buyer-default protection — worth remembering if you’re shipping to a proprietary plant outside PA.
For Harrisburg, Albright confirmed in news reports that the available security instruments totaled $730,942.29 — against $985,012 owed. The statute is clear: “the moneys available shall be divided pro rata among producers.” No floor. No minimum payout per farm. Kevin High’s $43,728.01 payout shows exactly what that haircut looks like.
Bottom line: The system covers roughly 40 days of exposure. When a dealer falls further behind than that before anyone pulls the trigger, the math breaks.
Running the Numbers: Your Exposure at 200 Cows
Take a 200-cow herd averaging 80 pounds per cow per day at $20/cwt:
Daily production: 16,000 pounds
Weekly milk revenue: roughly $22,400
Six weeks behind: $134,400 in unpaid milk
Eight weeks behind: $179,200 in unpaid milk
At 74% recovery, you’re eating $34,944 to $46,592 that no security fund will cover
The 15 Harrisburg farms averaged roughly $65,700 each in total unpaid milk, some substantially more. At a 74% recovery rate, the average unrecovered loss per farm is around $17,000. Plug in your own herd size. At 300 cows, eight weeks at $20/cwt is $268,800. At 74% recovery, you’re absorbing nearly $70,000 in losses.
Herd Size (cows)
Total Unpaid (8 weeks @ $20/cwt)
74% Recovery (Security Fund)
Unrecovered Loss
100
$89,600
$66,304
$23,296
200
$179,200
$132,608
$46,592
300
$268,800
$198,912
$69,888
500
$448,000
$331,520
$116,480
750
$672,000
$497,280
$174,720
Could Your Dairy Farm Get a Clawback Letter After Harrisburg Dairies’ Bankruptcy?
The October closure broke daily operations. The February 20 bankruptcy filing broke the legal recovery. Under 11 U.S.C. § 547, payments made during the 90 days before a Chapter 11 filing are considered “preference” payments. The bankruptcy estate can demand repayment of those payments.
Harrisburg’s 90-day window reaches back to approximately November 22, 2025. Any partial payments clearing old balances during that window could be subject to clawback demands — from farms that were already underwater.
This isn’t hypothetical. When Dean Foods filed Chapter 11 in November 2019 — a collapse The Bullvine covered extensively, from the $850 million DIP financing to how two years of changes led to two major bankruptcies — approximately 500 independent former Dean milk suppliers received demand letters from ASK LLP, a St. Paul, Minnesota firm authorized to pursue preference actions as of September 1, 2020. About 100 of those letters went to Pennsylvania dairy farmers alone. AFBF called the letters “a predatory shakedown,” and General Counsel Ellen Steen demanded ASK withdraw them within 10 business days.
Three defenses cut that exposure — sometimes to zero:
Ordinary course of business: If that December check looks like how you’d always been paid — same lag, same method — courts often side with you. For milk, where everyone knows standard pay cycles, this defense is strong.
Subsequent new value: Kept shipping after that payment and never got paid for the later milk? That unpaid “new value” offsets the preference dollar-for-dollar. Got a $28,000 check in December but shipped another $25,000 in unpaid milk afterward? Real exposure drops to $3,000.
Contemporaneous exchange: If the payment and the milk delivery were roughly simultaneous, there’s no old debt to claw back.
The critical detail from the Dean precedent: the PMMB — working with the Pennsylvania Attorney General’s office and ASK LLP — developed standardized declaration forms that farmers could submit instead of full financial records. ASK agreed to accept the declarations and close files for producers who demonstrated ordinary-course-of-business payments. Board Secretary Carol Hardbarger credited cooperation from the AG’s office, the Center for Dairy Excellence, and the PA Farm Bureau for enabling the quick resolution, a sentiment echoed by Barley.
If Harrisburg Dairies’ estate pursues similar preference actions, that Dean playbook is your template. Don’t pay. Don’t ignore. Get a bankruptcy-savvy ag attorney, pull 12–18 months of invoices and payment dates, and respond with: “We’re evaluating defenses. Extend the deadline.” The broader processor concentration problem driving these collapses — and what your options actually look like — is something we broke down in the consolidation math reshaping who buys your milk.
What Do Dean Foods, Borden, and Harrisburg Dairies Have in Common?
Here’s the uncomfortable pattern: in each of these cases, regulators had documented evidence of deterioration months before the collapse — and chose to keep the processor operating.
Harrisburg Dairies was under a weekly payment order since September 2023. By May 2025, the PMB had evidence of violations dating back to at least December 2024 and found grounds to revoke the dealer’s license. They chose not to. “Doing so would not serve the best interests of the Pennsylvania dairy industry,” the Board ruled on May 7, 2025, according to PMMB Sunshine Meeting minutes from May 7, 2025 and local coverage summarizing the Board’s decision. The Board’s decision reflected a structural tension built into the Act itself: revoking a license protects producers from future losses but can strand current shippers with no buyer at all.
Instead: stricter conditions, a higher bond, and weekly payments at 110% of the previous month’s lowest class price. “They lost a big customer. There wasn’t much we could do but give them the 28 days. We also made sure someone could take the milk from those farms,” Barley told news reports in July 2025. Pennsylvania has limited processing capacity, and the alternative to an imperfect processor is sometimes no processor at all. Doug Eberly, PMB chief counsel, confirmed the termination approval was narrow: “This is not a blanket approval — it applies only to this particular volume loss.”
Two consequences followed. Arrears stretched from two to three weeks behind in mid-July to six to eight weeks by early October. And milk volume continued to flow through a processor whose bond covered only 74% of producer exposure.
The common assumption: “If it gets really bad, the Board will shut them down before I get too exposed.”
Collapse Indicator
Dean Foods (2019)
Borden (2020)
Harrisburg (2025)
1. Payment Terms Deteriorate
Failed Oct 2019 Class I obligations before Nov 12 filing
Needed court permission to pay Dec 2019 milk bills
Weekly payment order since Sept 2023, violated for months
2. Company Shrinks to Survive
Closed 6+ facilities, carried >$1B net debt
Filed Ch 11 in Jan 2020 citing debt load
Lost Whole Foods (229K lbs/wk), terminated 7 farms July 2025
3. Regulatory Involvement Escalates
Active FMMO issues, public scrutiny
Court oversight of payments
PMB payment order, license revocation debate
The data says otherwise. The Board optimizes for system stability — keeping enough processing capacity alive so farms have somewhere to send milk tomorrow. You need to optimize for your own balance sheet.
Three signals showed up 6–12 months before each of these collapses:
Payment terms deteriorate and never recover. Not one late check — a new, worse normal. Dean failed to make October 2019 Class I obligations to most regional FMMOs in the month before its November 12 filing, according to The Milkweed. Harrisburg’s weekly order was violated for months before closure.
The company shrinks to survive. Harrisburg lost its Whole Foods Market contract — 229,116 pounds per week — then terminated seven Lebanon County farms in July 2025 to match the volume loss. Dean closed at least a half-dozen facilities and carried more than $1 billion in net debt as of its November 2019 filing. The Walmart second-plant story tells that same tale from the other side — 18 months after Walmart’s first plant opened, Dean filed.
Regulators become characters in the story. Payment orders, missed pool payments, PMB hearings, and special oversight. Borden needed court permission to pay the December 2019 milk bills. When your buyer’s name starts appearing regularly on regulatory hearing agendas, treat it as a serious risk signal — not a guarantee of failure, but a pattern that preceded every processor collapse examined here.
The moment you see all three on the same timeline, stop asking “Will they make it?” Start asking “How fast can I move my milk?”
Your Buyer Just Got a Payment Order. Now What?
If your processor is on a payment order right now, you’re in the window where Harrisburg’s farms found themselves in mid-2025. Here’s the playbook they wish they’d had.
This week (30-day actions):
Document everything. Pull 12–18 months of milk statements, deposit dates, component data, and payment timelines. This is your evidence for ordinary-course and new-value defenses if clawback letters arrive.
Know your number. Calculate your unpaid balance in dollars and days. Set a hard threshold: “We will not carry more than 30 days of unpaid milk with this buyer.” For a 200-cow herd at $20/cwt, that’s roughly $96,000. If that figure makes your stomach turn, you have your answer.
Make two phone calls. Contact at least two alternative buyers — co-ops or other plants in your draw. Ask bluntly: “If my current buyer fails, how fast could you start picking up?” The farms that moved before October had already started those conversations. The ones still there on October 6 were caught without a backup.
Next 90 days:
Call your lender before they call you. Your operating lender is watching the same PMB orders you are, updating your risk profile without telling you. Say this: “Here’s our exposure, here’s our Plan B, here’s the working capital we’ll need for a 60-day cash gap. Are you in or out?”
Stress-test for a three-month revenue gap. Harrisburg’s farms were 6–8 weeks behind at closure, then waited another month-plus for first checks from new buyers. That’s roughly 90 days of revenue disruption. If your operation can’t survive that without the banker making survival decisions for you, your financial structure needs work, regardless of processor risk. We’ve written extensively about the liquidity buffer that separates farms that survive a revenue gap from those that don’t.
This year (365-day actions):
Track your buyer’s regulatory record. PMB sunshine meeting minutes and docket entries are public. Harrisburg’s problems were documented for over two years before closure. Treat those filings like forward-price signals.
Red flag: Your buyer is on a payment order AND has lost a major customer or closed a facility in the past 12 months. That’s two of three collapse indicators active.
If your buyer is more than 21 days behind on payment, your exposure already exceeds the PA Milk Security Act’s 40-day bond coverage window — and the gap widens every week you keep shipping. Run the math from the 200-cow example above with your own herd size.
If you received any payment from a distressed processor within the 90 days before their bankruptcy filing, pull your records now. Your ordinary-course-of-business defense depends on documentation you can produce — not on what you remember.
If your processor has been on a payment order for more than six months, you’re past the warning-signal stage. Two of Harrisburg’s three pre-collapse indicators (deteriorating terms + regulatory involvement) are already active. The only question is whether the third (shrinking to survive) has started.
The Number That Decides Who Survives the Transition
Consider two operations on the same route in Harrisburg. Same buyer, same October 6 closure. The one with modest debt and three months of breathing room rides it out — switches to a cooperative, absorbs the equity retained on the new milk check, moves on. The one with maxed-out operating credit and razor-thin liquidity hits a 60-day payment gap, and suddenly the banker — not the co-op — is making the survival call.
Processor risk and leverage risk are the same animal when the plant goes dark.
That anonymous Harrisburg producer who told news reports he’d “calculated the risk in staying” — he did the math and stayed. The bond covered 74 cents. Kevin High’s $43,728.01 check from the PMB tells you what the 74 cents actually buys. The other 26 cents is a hard lesson in the distance between what the system promises and what it delivers.
Pull your last three milk statements. How many days behind is your buyer right now? Multiply your daily production by that number, then by your pay price. That’s your current uninsured exposure — and the only forecast that matters before Tuesday’s truck doesn’t show up.
Days Behind
100 Cows
200 Cows
300 Cows
500 Cows
750 Cows
15 days
$12,000
$24,000
$36,000
$60,000
$90,000
21 days
$16,800
$33,600
$50,400
$84,000
$126,000
30 days
$24,000
$48,000
$72,000
$120,000
$180,000
45 days
$36,000
$72,000
$108,000
$180,000
$270,000
60 days
$48,000
$96,000
$144,000
$240,000
$360,000
Complete references and supporting documentation are available upon request by contacting the editorial team at editor@thebullvine.com.
Learn More
The 18-Month Window: Why Your Lender Knows Your Dairy’s in Trouble Before You Do – Reveals the specific financial benchmarks your banker uses to flag insolvency months before you do. This guide arms you with the exact healthy, warning, and high-risk ranges for debt-to-equity and margin-over-feed costs to protect your credit.
Every week, thousands of producers, breeders, and industry insiders open Bullvine Weekly for genetics insights, market shifts, and profit strategies they won’t find anywhere else. One email. Five minutes. Smarter decisions all week.
New Mexico can track every cow that left Woodcrest Dairy. It can’t tell you which bottle their milk ended up in. That gap is your problem too.
Sometime in 2025, roughly 2,000 dairy cows left Woodcrest Dairy near Roswell, New Mexico — not to be confused with the New York breeding operation of the same name, known for Select Sires’ Woodcrest King DOC. Livestock records reviewed by KOB-TV show that those Roswell animals were sold to Harry Dewit of Westland Dairy in Clovis. KOB-TV reported that the sale occurred shortly before the release of an undercover video from the facility. There is no public evidence indicating Dewit was aware of the pending investigation at the time of the transaction. Federal business filings list Dewit — a past Innovative Dairy Farmer of the Year honoree who milks 4,400 cows at High Plains Dairy in Texas — as CEO of Blue Sky Farms and as a director and treasurer of Select Milk Producers, the cooperative that helped launch the Fairlife milk brand before Coca-Cola acquired full ownership in 2020. Dewit has not been named as a defendant in the federal welfare lawsuit, and no public allegations of wrongdoing have been made against him personally.
Here’s the problem that should keep every co-op member awake tonight: New Mexico has no system for tracking which dairy’s milk ends up in which branded bottle on which store shelf. That’s not a welfare story. That’s a supply chain story. And it has direct implications for every producer whose milk moves through a cooperative network.
The $21 Million Promise
In 2022, Fairlife and Coca-Cola paid $21 million to settle a class-action lawsuit accusing the company of misleading consumers with marketing that suggested cows received “extraordinary care and comfort.” The companies denied wrongdoing but agreed to implement animal welfare standards and third-party audits as part of the court-approved settlement.
Animal Recovery Mission says those reforms didn’t work. ARM alleges its operative — hired as a milker at Woodcrest and later promoted to the birthing and medical units — recorded footage from December 2024 through approximately March 2025 that ARM describes as showing workers striking cows with shovels and wrenches, forcing metal rods down animals’ throats, and dragging calves through dirt. These allegations, first reported publicly by ARM and subsequently by KOB-TV (February 22, 2026), are now part of a federal lawsuit proceeding in the Central District of California. The Bullvine has not independently verified them, and no criminal charges have been filed as of publication. ARM presented its findings to six agencies — the Chaves County Sheriff’s Department, the New Mexico Livestock Board, the FDA, the New Mexico Department of Agriculture, the USDA, and the FSIS — in May 2025, before going public. ARM says it has investigated other dairies linked to Fairlife in the past.
Fairlife says Woodcrest was not a supplier during 2024 or 2025. ARM’s investigation claims Woodcrest was “directly tied to Coca-Cola’s bottling operations in Dexter, NM, with frequent raw milk pickups by Ruan Trucking.” Those two claims are difficult to reconcile — and the federal lawsuit will likely examine exactly how Fairlife defines “supplier” and whether the cooperative pooling structure creates connections the company’s statement doesn’t acknowledge.
Where Did the Cows Go?
This is where the welfare story becomes a supply chain story — and where The Bullvine’s angle diverges from every other outlet covering this.
KOB-TV’s investigation traced the roughly 2,000 cows from Woodcrest to Westland Dairy, which operates within the Select Milk Producers network. NM Livestock Board investigative records show that by early summer 2025, Woodcrest’s pens were empty, and remaining animals were set to be sold within weeks. Cows from that redistribution remain within the broader Select Milk cooperative framework. But here’s the gap: New Mexico doesn’t track milk from individual dairies to retail brands. The state can trace cows — livestock records document the transfers. What it can’t trace is the milk those cows produce once it enters the cooperative pipeline.
Translation: if a Fairlife bottle tests clean for safety, nobody is required to know whose cows produced it. That’s a food safety system, not a brand integrity system.
The FDA’s FSMA Food Traceability Rule, which took effect January 20, 2026, addresses traceability for high-risk foods — but fluid milk isn’t on the Food Traceability List. Ultra-filtered products like Fairlife’s fall into a regulatory gap: the Pasteurized Milk Ordinance addresses safety, but farm-to-brand sourcing remains voluntary and processor-controlled. The industry’s Innovation Center for U.S. Dairy has built traceability infrastructure, but it’s designed for processor-lot tracking and recall response — not for answering the question “which farm’s milk is in this bottle?”
New Mexico runs roughly 95 dairy operations milking approximately 240,000 cows as of 2024, down from 150 farms a decade ago — a 37% decline even as the state’s cow numbers fell 26% from 323,000 (USDA 2025). Average herd size exceeds 2,500 — among the largest in the nation. These are big operations where co-op relationships and brand supply chains matter enormously to the bottom line. And New Mexico’s mailbox milk prices already run roughly $2.00/cwt below the national average — among the lowest in the country, according to USDA data. When your base price is already that thin, the brand premium isn’t a bonus. It’s your margin.
Metric
New Mexico
U.S. National Average
Mailbox Price Disadvantage
$2.00/cwt BELOW national avg
—
Operating Dairies (2014→2024)
150 → 95 farms (−37%)
−26% nationally
Cow Inventory (2014→2024)
323K → 240K (−26%)
Slight increase nationally
Average Herd Size
2,500+ cows (among largest in U.S.)
~350 cows
Can Your Co-op Prove Your Milk Is Clean?
That’s the question this story forces into the open. And the honest answer, for most co-op members, is probably not.
Select Milk Producers — a cooperative of 99 family dairy farm members based in Texas and New Mexico — said in a statement to KOB-TV: “Select Milk Producers is committed to the highest standards of animal care.” In court filings, Select argues that plaintiffs have not shown Woodcrest was supplying milk to Fairlife at the time of the alleged abuse. Fairlife has similarly stated that Woodcrest was not a supplier during 2024 or 2025 and said its supplying farms are subject to animal welfare standards and third-party audits.
The structural problem remains: when cows transfer between operations within the same cooperative network — as 2,000 did from Woodcrest — and when state regulators can’t trace milk to brands, the burden of proving supply chain integrity falls on the processor’s word. Not on verifiable records. Not on independent audit trails.
The owner of Woodcrest declined to comment on camera to KOB-TV and distanced himself from Fairlife, directing questions to his former co-op, Select Milk Producers. According to KOB-TV’s reporting, Select Milk did not respond to specific questions about Dewit’s business affiliations or the co-op’s role in the sale of the cows.
If you’re a co-op member — in New Mexico or anywhere — this matters to you even if your operation has never been within 1,000 miles of Roswell. The question isn’t whether you treat your cows right. The question is whether your co-op can prove, with documentation, that the milk carrying a premium brand label actually came from farms that met that brand’s welfare standards. The Woodcrest situation raises the question of whether most can.
Double Legal Exposure in the Same District
The welfare lawsuit isn’t the only legal problem facing Select Milk Producers in federal court in New Mexico.
In a separate case (Othart Dairy Farms LLC et al v. DFA Inc. et al, No. 2:22-cv-00251, filed April 2022), dairy farmers including Othart Dairy Farms of Veguita, New Mexico, along with Pareo Farm, Desertland Dairy of Vado, Del Oro Dairy of Mesquite, Bright Star Dairy, and Sunset Dairy alleged that DFA and Select Milk conspired through their Greater Southwest Agency to suppress milk prices paid to producers in New Mexico and portions of Texas, Arizona, Kansas, and Oklahoma from January 2015 through at least June 2025. Judge Margaret Strickland ruled the case could proceed in March 2024. A $34.4 million settlement — $24.5 million from DFA and $9.9 million from Select Milk — received preliminary judicial approval in the summer of 2025. Neither cooperative admitted liability. The complaint alleged that DFA and Select controlled at least 75% of all raw Grade A milk in the Southwest, and that more than 85% of the region’s milk moves through cooperatives.
Beyond the settlement payments, both co-ops agreed to dissolve Greater Southwest Agency — the joint marketing entity the lawsuit alleged was the main vehicle for the conspiracy — and to implement antitrust training for marketing staff and better pay transparency for members (August 2025). DFA has a history of antitrust litigation. The cooperative paid $140 million to settle a price-fixing suit in the Southeast in 2013 (without admitting liability) and $50 million in the Northeast in 2015 (also without admission). Combined with the Southwest settlement, DFA’s total antitrust settlement obligations across three regions now exceed $225 million.
Two federal lawsuits in the same district, involving the same cooperative network — one alleging welfare failures in the supply chain, the other alleging price suppression. Whether that’s a coincidence or something more structural is a question Select Milk’s members deserve to ask. The Bullvine explored the real math behind who controls your milk check in “The American Dairy Heist: Who Really Owns Your Milk Check.”
The Barn Math
Here’s where this gets personal for your operation. Brand-premium milk programs — Fairlife included — typically command $1.50 to $2.50/cwt above commodity pricing for qualifying farms (exact premiums vary by contract and aren’t publicly disclosed). On a 1,000-cow herd producing at New Mexico’s state average of 24,717 lbs/cow/year, a $2.00/cwt premium works out to roughly $494,000 per year.
That premium exists because consumers pay more for a brand that promises higher welfare standards. A welfare investigation — at your farm, your co-op partner’s farm, or anywhere in your cooperative’s supply chain — puts the brand at risk. And when that happens, the premium is what evaporates. Not the base milk price. The premium. In a state where mailbox prices already sit $2.00/cwt below the national average, that premium isn’t extra income — it’s the difference between positive margins and red ink. The question isn’t whether you can afford traceability — it’s whether you can afford not to have it. (For more on how management alone can’t close the gap when structural economics shift, read “Exposing Dairy’s Biggest Lie: Management Can’t Save You.”)
Herd Size
Annual Production (lbs)
Premium Value ($2.00/cwt)
Potential Loss
500 Cows
12,358,500
$247,170
A New Tractor
1,000 Cows
24,717,000
$494,340
A New Parlor Wing
2,500 Cows
61,792,500
$1,235,850
The Entire Margin
And here’s the other number worth sitting with: that $34.4 million price-fixing settlement — in which, again, neither cooperative admitted liability — covers roughly 8,000 producers who marketed milk during the affected timeframe (per the settlement class definition). That works out to approximately $4,300 per farm before legal fees. The potential brand-premium loss from a welfare scandal dwarfs that. Unlike a one-time settlement, premium erosion compounds every month the brand stays damaged.
What Corporate Statements Actually Tell You
Fairlife’s position, stated to KOB-TV and multiple other outlets: “Woodcrest Dairy in New Mexico is not a supplier to fairlife” during the period in question, and the company has “zero tolerance for animal abuse.” Select Milk Producers maintains it is “committed to the highest standards of animal care.”
These are the corporate statements as provided. But note what they don’t address: the structural traceability gap. Saying Woodcrest “is not a supplier” is a claim about a business relationship. And in an industry where “not a supplier” can have multiple contractual meanings — not a direct supplier, not during a specific period, not under a particular agreement — the precision of the language deserves closer scrutiny than the reassurance it may offer. That traceability gap isn’t Fairlife’s creation — it’s a structural feature of how cooperative milk marketing works in most states. But it does mean that corporate assurances about supply chain integrity rest on voluntary self-reporting rather than on independently verifiable records.
The judge overseeing the welfare case recently dismissed certain claims against Coca-Cola and Select Milk but allowed others tied to Fairlife’s branding and consumer assurances to proceed. Plaintiffs have been given time to amend their complaint. On the state level, KOB-TV confirmed the Livestock Board has an active investigation — spokesperson Belinda Garland told the station, “The Woodcrest Dairy is an ongoing investigation in this agency,” adding, “We’ll hold them accountable if we feel that we have probable cause and the evidence to support it.” Garland noted that proving extreme animal cruelty can be difficult, particularly when allegations surface after the fact. The Chaves County Sheriff’s Office referred the matter to the NM Livestock Board. Woodcrest Dairy itself has since shut down — pens empty, cows dispersed across the network.
Within 30 days: Audit your own audit. Call your cooperative and ask three questions: Who selects your third-party welfare auditor? How often are audits conducted? Can you get the most recent audit summary for every farm in your pool? Get the answers in writing. If your co-op can’t or won’t answer, that tells you something.
Audit Question
Why This Matters
Red Flag Answer
Who selects your third-party welfare auditor?
If the co-op picks its own auditor, independence is compromised. Best practice: member-elected oversight board selects auditor.
“Management handles that” or “We don’t know”
How often are member farms audited?
Annual audits are industry standard for premium brands. Less frequent = gaps where problems can develop undetected.
“Every 2-3 years” or “Only problem farms get audited”
Can you access audit summaries for every farm in your pool?
If you can’t see audit results, you can’t verify supply chain integrity. Transparency = accountability.
“That’s confidential” or “Only management sees those”
Does your marketing agreement address brand-contamination risk from other member farms?
Without explicit clauses, you carry exposure from other farms’ welfare failures but have no legal recourse for lost premiums.
“We don’t have specific language on that” or “Never thought about it”
Within 90 days: Review your marketing agreement. Look for brand-contamination clauses — language that addresses what happens to your premiums if another member farm in your supply chain gets investigated. If that language doesn’t exist, you’re carrying risk you haven’t priced. Talk to your ag attorney.
Within 12 months: Push for traceability infrastructure. This is the harder conversation, and it costs money. Canada’s DairyTrace program, launched in 2021, tracks individual animals from birth to disposal — it’s a livestock traceability system, not a milk-to-brand system — and it’s further than what most U.S. cooperatives have built. The real gap is at the processor level: can your co-op’s system document which farms’ milk went into which branded product on which date? The Woodcrest situation raises that question for every cooperative in the country. That gap is a business risk that will only grow as consumers, regulators, and plaintiffs’ attorneys get more sophisticated about dairy supply chain questions. If you’re rethinking your operation’s positioning in that environment, “Transform Your Dairy Before Consolidation Decides for You” maps out the decision framework.
The trade-off is real. Better traceability protects premiums but adds cost. Voluntary industry programs are cheaper to implement but harder to defend in court. And waiting for regulators to mandate traceability means you’re letting someone else set the terms.
Key Takeaways
If your co-op can’t tell you who audits its member farms or when, your premium is built on trust, not verification. That’s fine until it isn’t.
If your milk marketing agreement doesn’t address brand-contamination risk from other member farms, you’re exposed. The Woodcrest situation shows how one operation’s investigation can call into question the entire cooperative network’s brand relationships.
The traceability gap is real and unregulated. Most states — including New Mexico — can’t trace milk from individual farms to retail brands. That means the burden of proving “clean” supply chains rests entirely on processor self-reporting. Ask yourself: Is that enough?
Two federal lawsuits in the same cooperative network raise questions that Select Milk’s members deserve to ask. When your co-op is simultaneously settling antitrust claims and facing welfare allegations, governance isn’t optional — it’s fiduciary.
The Gap Nobody’s Closing
The dairy industry spent decades building a system optimized for food safety and efficient pooling. That system works — it moves milk safely from farm to shelf on an enormous scale. But it wasn’t built to answer the question premium branding now requires: whose milk is this, and can you prove the cows that produced it were treated as the label promises?
Woodcrest Dairy is shut down. The cows are dispersed across the Select Milk network. The lawsuits are proceeding in narrowed form after some claims were dismissed and others allowed to continue. And somewhere between Roswell and a Fairlife bottle on a grocery store shelf, there’s a traceability gap that no settlement check, no third-party audit, and no corporate press statement has closed.
Your operation might never make national news. But your co-op’s ability to prove where your milk went — and that it came from farms meeting the standards your brand premiums depend on — is now a question with a dollar sign attached. Can yours?
Executive Summary:
A New Mexico welfare investigation at Woodcrest Dairy has exposed a deeper problem: once 2,000 cows were sold out of that herd, nobody could clearly trace which branded products their milk now supplies. Fairlife and Coca-Cola previously paid $21 million to settle animal welfare marketing claims and now say Woodcrest wasn’t a supplier in 2024–25, while ARM’s undercover footage and new federal filings paint a murkier picture of what “supplier” actually means in this system. At the same time, Select Milk Producers is dealing with a separate $34.4 million price-fixing settlement it reached with DFA in the Southwest, without admitting liability, after farmers accused it of using a joint agency to hold down milk checks. For you, the real risk isn’t the courtroom drama — it’s what happens to brand premiums that can be worth around $494,000 a year on a 1,000-cow New Mexico herd if a welfare scandal hits your co-op’s supply chain. Because New Mexico can trace cattle movements but not milk from farm to brand, most co-op members still can’t independently prove where their milk went or whether every supplying farm actually met a premium label’s welfare standards. This piece breaks down that traceability gap and gives you concrete moves — from grilling your co-op on audit practices in the next 30 days to stress-testing your marketing agreement for brand-contamination clauses — so you’re not finding out about your exposure when the premium disappears.
Update, 25/02/2026: Fairlife responded to The Bullvine’s request for comment. A Fairlife spokesperson stated: “Woodcrest Dairy is not a supplier to fairlife, which means no milk from this dairy is received by fairlife for fairlife products.” Fairlife did not address questions regarding the transfer of approximately 2,000 Woodcrest cows to Westland Dairy, milk-to-brand traceability within cooperative pools, Harry Dewit’s role within Select Milk Producers, or the company’s welfare verification process.
This article is based on published reporting by KOB-TV (February 22, 2026), federal court filings, USDA data, and other public sources cited throughout. Fairlife’s and Select Milk Producers’ positions are presented as stated to KOB-TV and in court filings. Harry Dewit has not been named as a defendant in the federal welfare lawsuit.
Learn More
Exposing Dairy’s Biggest Lie: Management Can’t Save You – Stop chasing marginal efficiencies while your foundation crumbles. This breakdown reveals why “perfect” management fails when structural economics shift—and arms you with the strategy to pivot before the market forces the move for you.
The American Dairy Heist: Who Really Owns Your Milk Check? – How much of your check is lost to cooperative “pooling” and marketing fees you never approved? This deep dive exposes opacity in your payout and delivers the leverage needed to challenge your board’s status quo.
Every week, thousands of producers, breeders, and industry insiders open Bullvine Weekly for genetics insights, market shifts, and profit strategies they won’t find anywhere else. One email. Five minutes. Smarter decisions all week.
The Supreme Court struck down one set of tariffs and set a 150‑day clock. For a 500‑cow herd, the spread is $147,000. Where does your breakeven sit?
Executive Summary: The Supreme Court’s 6–3 ruling in Learning Resources, Inc. v. Trump killed all IEEPA-based tariffs and replaced them, for now, with a 15% Section 122 surcharge on a 150‑day clock that ends July 24. For a 500‑cow dairy shipping 117,500 cwt a year, Cornell economist Charles Nicholson’s model says the difference between tariffs gone, a 15% replacement that sticks, or continued uncertainty is about $147,000 in annual margin — enough to hire a person or cover six months of feed. At the same time, a new U.S.–Taiwan deal locks in zero dairy tariffs, while Canada’s ongoing obstruction of USMCA dairy TRQs now faces less U.S. leverage after the ruling, even as exporters still fight to use roughly 42% of the access they were promised. CBP has collected $133.5 billion in IEEPA tariffs through late 2025, and Penn Wharton estimates up to $175 billion could be refunded with interest, raising a blunt question: will processors keep that money, or pass any of it back down the chain? In the next 30 days, producers need to lock in or adjust 2026 Dairy Margin Coverage before the February 26 deadline; over the next 90–365 days, they should stress‑test breakevens against $18‑class futures, press co‑ops on export plans to Canada, Mexico, and Taiwan, and treat July 24 as a hard decision line for contracts and capital plans. Put simply, the Court didn’t eliminate tariff risk — it turned your milk check into a 150‑day countdown in which standing still is the most expensive option.
$147,000. That’s the gap between the best and worst scenarios facing a 500-cow dairy between now and July 24 — the day the replacement tariffs expire, or don’t. The Supreme Court’s 6-3 ruling on February 20 in Learning Resources, Inc. v. Trump didn’t end the tariff fight. It moved it to a different legal lane with a ticking clock.
Ted Vander Schaaf milks 1,250 Holsteins near Kuna, Idaho. He told the Senate last week that U.S. trade leverage was slipping — that countries were already gaming the system before the Court weighed in. Four days later, Chief Justice Roberts wrote the majority opinion, confirming what Vander Schaaf had seen in his bulk tank: the legal foundation of the tariff regime had never been solid.
Now every dairy producer in the country faces the same question Vander Schaaf does. Not whether the tariffs are gone—they’re not. Whether the replacement tariffs hold, and what your milk check looks like if they don’t.
What the Court Killed — and What It Didn’t
The ruling was definitive on one point: IEEPA does not authorize tariffs. Period. Roberts, joined by Gorsuch, Barrett, Sotomayor, Kagan, and Jackson, wrote that the power to “regulate importation” as granted to the president in IEEPA does not embrace the power to impose tariffs. The statute contains no reference to tariffs or duties, and no president in IEEPA’s 49-year history had ever used it this way.
What’s gone: every IEEPA-based tariff. The country-by-country reciprocal rates — up to 34% on China, 25% on certain Canadian and Mexican goods, and the 10% baseline on everybody else. All invalidated. The administration issued an executive order the same day stating these tariffs “shall no longer be in effect and, as soon as practicable, shall no longer be collected.”
What’s still standing: Section 232 tariffs (national security — steel, aluminum), Section 301 tariffs (unfair trade practices — existing China tariffs on specific goods), and antidumping/countervailing duties. These operate under separate statutory authority and weren’t touched by the ruling.
[INTERNAL LINK: “The American Dairy Heist: Who Really Owns Your Milk Check” → Suggested anchor text: “the margin chain between your bulk tank and the shelf”]
And then there’s the replacement.
The 150-Day Clock: Why Section 122 Probably Won’t Survive
Within hours of the ruling, Trump announced a 10% tariff on imports from around the world under Section 122 of the Trade Act of 1974. A day later, he bumped it to 15% — the statutory maximum. Section 122 allows temporary import surcharges for up to 150 days to address “fundamental international payments problems.”
Here’s the problem: the U.S. doesn’t have one.
Peter Berezin, chief global strategist at BCA Research, put it bluntly on February 20: “A balance of payments deficit is not the same thing as a trade deficit. You cannot have a balance of payments deficit if you have a flexible exchange rate.” Bryan Riley, director of the National Taxpayers Union’s Free Trade Initiative, made the same argument: Section 122 was written for a fixed exchange-rate world that hasn’t existed since 1973. The statute has never been invoked. Not once in 52 years.
The Peterson Institute for International Economics laid out the technical case in a February 22 analysis. Under a floating exchange rate, potentially insufficient private financial inflows are remedied by currency depreciation, which puts domestic assets and exports “on sale” and precludes a balance-of-payments deficit before it starts. The U.S. has a large supply of attractive financial assets and faces no difficulty financing its current account deficits.
Even the administration’s own lawyers argued during the IEEPA case that Section 122 was no substitute for IEEPA because balance-of-payments deficits are “conceptually distinct” from trade deficits.
So the replacement tariff’s legal foundation is arguably weaker than the one the Court just demolished. And it expires on July 24, 2026 — 150 days from the February 24 effective date — unless Congress votes to extend it. Both the House and Senate have already passed bills disapproving of the IEEPA tariffs. Extension looks dead on arrival.
Rep. Mike Flood (R-NE) underscored the point: “The ruling underscores Congress’s responsibility and obligation to set tariff policy.”
What happens after July 24? The administration has signaled it will initiate Section 301 investigations against multiple trading partners and may accelerate pending Section 232 investigations. Those routes require investigations and findings of fact—a process that can take months, even on an expedited timeline. There will be a gap.
$147,000 Three Ways: What Your 500-Cow Dairy Looks Like Under Each Scenario
Cornell’s Charles Nicholson projected at the January 2025 Dyson Agricultural and Food Business Outlook conference that the combination of tariffs, deportations, and potential nutrition spending cuts could produce a billion loss in U.S. dairy profits over four years. That’s a combined-policy number, not tariffs alone — but tariff-driven retaliation from Mexico, Canada, and China was the biggest single driver.
“If you pick a trade fight with our major export destinations — Mexico, Canada, and China — and they decide to retaliate, that has some substantive negative implications for dairy farms and processors,” Nicholson said.
The SCOTUS ruling scrambled the assumptions underneath that projection. Here’s how the math lands on a 500-cow operation producing 235 cwt/cow/year — 117,500 cwt of annual production. Plug your own herd size, and you can scale these directly.
For context: Class III milk settled at $15.07/cwt on February 19 — the last trading day before the ruling. That’s up from a $14.53 low on February 3, but still well below the $17–18 range where Q2 and Q3 2026 futures are currently trading on the CME.
Retaliatory tariffs from Mexico, Canada, and China unwind. Export demand recovers. Class III and Class IV futures adjust upward as export-driven cheese and powder demand returns to the pre-tariff trajectory. Nicholson’s model suggests milk prices recover by 2027, with the 2025–26 damage partially absorbed.
Estimated price impact: +$0.75 to +$1.25/cwt above current baseline Your 500-cow math: 117,500 cwt × $1.00/cwt midpoint = +$117,500/year
This is the best case—and it’s not guaranteed. It depends on trading partners actually unwinding retaliatory measures, which Ian Sheldon at Ohio State warns is far from certain.
The 15% across-the-board tariff stays through July 24. Retaliatory tariffs remain partially in place. Some trading partners renegotiate, others slow-walk. Class III price stays compressed. Input costs (equipment, parts, and some feed additives) remain elevated due to the 15% surcharge.
Estimated price impact: -$0.50 to -$1.00/cwt below pre-tariff baseline. Your 500-cow math: 117,500 cwt × -$0.75/cwt midpoint = -$88,125/year
Section 122 is challenged in court. Trading partners pause compliance with existing deals. Processors can’t price forward contracts. Futures volatility spikes. Co-ops hold back on premiums.
Estimated price impact: -$0.25 to -$0.50/cwt from uncertainty discount alone. Your 500-cow math: 117,500 cwt × -$0.25/cwt (conservative) = -$29,375/year in margin compression — before any tariff-driven price move lands
Scenario
Legal Status
Milk Price Impact (per cwt)
Annual Margin Impact (500 cows, 117,500 cwt)
What That Buys
1. Tariffs Gone
IEEPA dead, Section 122 expires, no replacement
+$1.00
+$117,500
Hired employee + equipment down payment
2. 15% Replacement Holds
Section 122 survives or transitions to 301/232
-$0.75
-$88,125
6 months of feed costs vanish
3. Uncertainty Limbo
Legal challenges, policy chaos, no clear signal
-$0.25
-$29,375
Used mixer wagon—gone
Spread (Best vs. Worst)
—
$1.75/cwt
$147,000
The gap between survival and exit
The spread between Scenario 1 and Scenario 2: roughly $147,000 per year on a 500-cow dairy. That’s not a rounding error. That’s a hired employee. A used mixer wagon. Six months of feed.
For Vander Schaaf’s 1,250-cow operation, multiply accordingly. The stakes scale linearly.
Is the Taiwan Deal Safe from the Ruling?
The U.S.–Taiwan trade agreement, signed on February 13, eliminates tariffs on all U.S. dairy products and preempts nontariff barriers. Taiwan is the third-largest destination for U.S. fluid milk exports. USDEC president and CEO Krysta Harden called it a deal that “improves our competitiveness compared to other suppliers.”
Good news: this deal is structurally safe from the SCOTUS ruling. It’s a bilateral trade agreement negotiated under standard trade authority, not an IEEPA executive order. The legal basis is entirely separate.
But context matters. The deal was negotiated while IEEPA tariffs of 20%+ gave the U.S. significant leverage. With the baseline tariff now at 15% under Section 122 — and likely headed to zero after July 24 — Taiwan’s incentive to maintain generous terms may shift. For now, the agreement stands, and it’s a genuine win for U.S. dairy exporters in Asia.
The bigger question is what Ohio State’s Sheldon flagged on February 22: “A lot of countries are now questioning the validity of the deals that they signed.” The EU was already backing away. Countries that negotiated under the threat of 34% tariffs may no longer feel bound by the same terms now that the threat has been invalidated.
For dairy specifically, Taiwan is the bright spot. But it’s a $300 million market, not a $3 billion one. Mexico and Canada are where the volume lives — and both of those relationships just got more complicated.
Canada’s TRQ Gambit Gets New Cover
This is where the ruling connects directly to what Vander Schaaf told the Senate. Canada has been obstructing USMCA dairy tariff-rate quotas since the agreement took effect. Only about 42% of the dairy access the U.S. negotiated under USMCA is actually being utilized — not because American producers aren’t trying, but because Canada’s allocation system effectively locks out retailers, food service operators, and other importers who would actually bring in American product.
The U.S. won the first USMCA dispute panel in January 2022. Canada made “insufficient changes.” The U.S. filed a second dispute. The panel ruled Canada hadn’t acted unreasonably — a devastating outcome for American dairy exporters.
Now the SCOTUS ruling removes the 25% fentanyl-based IEEPA tariff that was the biggest stick the U.S. had against Canada outside of USMCA’s own dispute mechanism. The 15% Section 122 tariff explicitly exempts USMCA-compliant goods, so it provides no additional leverage.
Sheldon’s warning lands hardest here. If countries are questioning the validity of deals signed under IEEPA pressure, Canada has even less reason to move on dairy TRQ compliance. The legal mechanism still exists — but the political leverage that made enforcement credible just evaporated.
For producers whose co-ops or processors export to Canada, this is a 365-day watch item. Canada’s dairy TRQ year runs August 1 through July 31, with allocation announcements typically published in the months prior. If fill rates stay where they are, the $200 million in theoretical access remains exactly that — theoretical.
The Refund Question: $133.5 Billion and Counting
One angle that hasn’t gotten enough attention in dairy media: the Court didn’t just stop future IEEPA tariffs. It invalidated all of them retroactively. Every importer who paid IEEPA duties is entitled to refunds plus interest.
U.S. Customs and Border Protection reported $133.5 billion in IEEPA tariff collections through December 14, 2025. The Penn Wharton Budget Model estimates the total refund liability — including collections through February 2026 and accrued interest — at up to $175 billion. That makes this potentially the largest single government refund event in U.S. history, affecting roughly 301,000 importers across 34 million import entries.
For dairy specifically, processors who imported ingredients, packaging materials, or equipment subject to IEEPA tariffs can file Post Summary Corrections on unliquidated entries or administrative protests on liquidated entries within 180 days. The legal authority for refunds is clear. The timeline for actually getting money back is not — CBP generally liquidates entries within 314 days, and the volume of claims will be enormous. Interest accrues at approximately 3–4% annually from the deposit date, but small businesses are already warning they can’t wait months for bureaucratic processing.
If your processor has been passing through tariff surcharges on imported inputs, ask them directly: when do those surcharges come off, and will any refund savings flow back to the farm gate? The answer will tell you a lot about where you stand in the value chain.
Refund Category
Who’s Eligible
Estimated Exposure
Timeline to Receive
What to Ask Your Processor
Imported Ingredients
Processors who paid IEEPA duties on whey, lactose, specialty proteins
$8–12B (dairy-specific est.)
180–365 days (CBP backlog)
“When do tariff surcharges come off our milk check?”
Packaging & Equipment
Processors, suppliers
$2–4B (across food/ag sectors)
180–365 days
“Will refund savings flow back to farm gate pricing?”
Total IEEPA Refund Pool
301,000 importers across all sectors
$175B
Unclear—largest government refund in U.S. history
“Are you sharing refunds, or keeping them above my milk check?”
Direct Farm Impact
Dairy producers
Zero automatic pass-through
Depends on processor transparency
Call your co-op today
What This Means for Your Operation
Timeline Window
Key Decision
Action Item
Risk If You Wait
Data Point to Watch
Next 30 Days (Now – Mar 24)
DMC 2026 enrollment
Lock in Tier 1 coverage (6M lbs) at 25% discount for 2026–2031
Miss expanded coverage; pay higher premiums in 2027
Class III Feb 3 low: $14.53/cwt
Next 90 Days (Now – May 24)
Forward contract evaluation
Model margin against Scenario 2 (15% tariff holds); consider locking Q3 production
July volatility spike when Section 122 expires—contracts tighten
CME Q3 2026 futures: $18.26–$18.35/cwt
90–150 Days (May 24 – July 24)
Export contract renegotiation
Press co-op on Mexico/Canada export commitments; ask about Taiwan volume
Don’t wait for clarity. The 150-day window is the decision window. Here’s what to do with it:
In the next 30 days:
Re-run your DMC enrollment math. The 2026 signup deadline is February 26 — two days from now. This year’s enrollment includes expanded Tier 1 coverage at 6 million pounds (up from 5 million) and a new option to lock in coverage levels for 2026–2031 at a 25% premium discount. With Class III sitting at $15.07/cwt and the $14.53 low from early February still fresh, this isn’t optional. Contact your local FSA office today.
Call your co-op or processor. Ask two questions: (1) Are they passing through any tariff-related surcharges on imported inputs, and when do those come off now that IEEPA duties are being refunded? (2) What does the 15% Section 122 tariff mean for their export commitments to Mexico or Canada?
If you’re carrying equipment or parts debt tied to tariff-inflated prices, check whether you’re eligible for a refund. Your dealer or equipment supplier should know.
In the next 90 days:
Model your margin against Scenario 2 (15% replacement holds). Class III Q3 2026 futures are currently trading in the $18.26–$18.35/cwt range on the CME. If those hold, consider locking in a portion of production before the Section 122 expiration creates another volatility spike around July 20. If they soften toward $17, the risk-reward on forward contracts shifts.
Watch Section 301 investigation announcements. If the administration fast-tracks dairy-related investigations (such as China dairy ingredients), new tariffs could land before old ones fully unwind.
In the next 365 days:
Track Canada’s next dairy TRQ allocation cycle. The TRQ year runs August 1 through July 31, with allocations announced in the months prior. If fill rates stay below 50%, your co-op’s Canadian export margin is getting squeezed, whether you see it on your milk check or not.
Monitor whether the Taiwan bilateral actually moves dairy volume. USDEC’s initial framing was optimistic. Check against actual trade data by Q4 2026.
If your processor ships to Mexico, ask them what happens to their purchase commitments if the Section 122 tariff goes to zero with no replacement. Mexico’s retaliatory posture could shift in either direction.
Key Takeaways
The Supreme Court killed IEEPA tariffs and dropped dairy into a 150‑day, 15% Section 122 experiment that likely can’t stand past July 24.
On a 500‑cow, 117,500‑cwt herd, the gap between tariffs gone, a 15% replacement, or ongoing limbo is roughly $147,000 in annual margin.
Taiwan is now a zero‑tariff bright spot, but Canada’s USMCA TRQ games just got new cover, leaving as much as 58% of U.S. dairy access to Canada stranded on paper.
Importers have paid $133.5 billion in IEEPA tariffs, with refund exposure up to $175 billion — if your processor doesn’t drop tariff surcharges or share savings, that’s real margin left above your milk check.
The only safe “wait and see” is on Twitter; on the farm, the next 30–365 days are for re‑running DMC, stress‑testing breakevens against $18‑class futures, and renegotiating contracts with July 24 circled in red.
The Bottom Line
Pull your last three milk checks. Calculate your per-cwt margin at current input costs. Class III hit $14.53 on February 3 — a 52-week low. If that’s not the bottom but the new floor, what exactly are you changing before July 24?
Vander Schaaf told the Senate the leverage was slipping. The Court agreed. What you do with the 150-day window between now and July 24 is the only part of this you control.
Complete references and supporting documentation are available upon request by contacting the editorial team at editor@thebullvine.com.
More Milk, Fewer Farms, $250K at Risk: The 2026 Numbers Every Dairy Needs to Run – Reveals the $250,000 margin gap currently threatening 500-cow operations and delivers a survival checklist for $17-milk scenarios. It prepares your balance sheet for the 2026 “biological trap” by benchmarking full economic costs against tightening futures.
Every week, thousands of producers, breeders, and industry insiders open Bullvine Weekly for genetics insights, market shifts, and profit strategies they won’t find anywhere else. One email. Five minutes. Smarter decisions all week.
The USMCA review hits July 1. Two dairy farmers — one in Idaho, one in Québec — are watching the same deadline with completely different balance sheets at stake. Here’s the barn math for both sides of the border.
The U.S. dairy industry told the Senate this week that Canada is blocking roughly $200 million per year in dairy market access it promised under the USMCA — called CUSMA in Canada. Spread that number across American production, and the farm-level impact lands around five cents per hundredweight. Before Congress approved this deal, the U.S. International Trade Commission projected it would boost dairy exports to Canada by 43.8% — about $227 million once fully implemented (USITC Publication 4889, April 2019). Both countries are spending enormous political capital on a fight where the per-farm stakes are far smaller than either side’s press releases suggest.
On February 12, Ted Vander Schaaf delivered that case to the Senate Finance Committee. Vander Schaaf milks approximately 1,250 Holsteins near Kuna, Idaho, on 1,400 acres of forage, is a third-generation member-owner of the Northwest Dairy Association (the co-op behind Darigold), and board member of the Idaho Dairymen’s Association. “Market access that exists only on paper does not support farm families, pay employees, or justify new investment,” he told the Committee. And then the line that landed: “A firm base depends on Canada upholding their end of the bargain”.
About 1,500 kilometres northeast, Daniel Gobeil runs Ferme du Fjord in La Baie, Québec — deep in Saguenay-Lac-Saint-Jean — with about 125 lactating cows across more than 1,000 acres of barley, oats, and soybeans (DFC). Gobeil is Vice-President of Dairy Farmers of Canada and President of Les Producteurs de lait du Québec. When Vander Schaaf told the Senate that Canada isn’t upholding its end of the bargain, the implications land directly on operations like his.”
What’s Actually on the Table This July
The USMCA hits its first mandatory joint review by July 1, 2026, as required by Article 34.7. All three countries decide: extend the agreement for 16 years (to 2042), continue with annual reviews until the 2036 expiration, or walk away. U.S. Trade Representative Jamieson Greer left no ambiguity in December 2025: “Could it be exited? Yes, it could be exited. Could it be revised? Yes. Could it be renegotiated? Yes. That is the purpose of that clause, and all of those things are on the table”.
Dairy is the loudest file in the room—and the most organized. On February 4, NMPF and USDEC co-launched the Agricultural Coalition for USMCA, an industry-wide push to strengthen and renew the agreement. When the deal was signed, it opened about 3.6% of Canada’s dairy market as tariff-rate quota access — roughly US$200 million per year across 14 product categories. But those quotas aren’t filling. The overall average fill rate was just 42% in 2022/23, with 9 of 14 TRQs below half the negotiated value. More current data tells a split story:
Product
Fill Rate
Period
Cheese (all types)
83%
2024 calendar year
Butter & cream powder
81%
2023/24 dairy year
Industrial cheese
59%
2024
Milk powders
57%
2024
Fluid milk
34%
Cumulative
Skim milk powder
7%
Cumulative
Note: Globe & Mail figures reflect CUSMA-specific TRQs. USDA FAS data may include quotas across all trade agreements (WTO, CETA, CPTPP), which explains the variance in cheese fill rates between sources. Both are accurate within their reported scope.
Cheese and butter fill reasonably well. It’s the fluid milk and powder categories dragging the average, and those are the categories where the allocation system faces the strongest U.S. criticism. Canada argues some TRQs go unfilled because American exporters haven’t generated sufficient demand — a demand problem, not an allocation barrier. The U.S. counters that the allocation system suppresses demand by restricting who can import. A Texas Tech University causal impact study found the actual USMCA boost came in at 34% ($519 million cumulatively) — real growth, but below the USITC’s 43.8% projection, partly because “Canada’s allocation of these quotas mostly favors its own processors over U.S. exporters”.
By our math, 0 million in annual TRQ access times the 42% fill rate — roughly 6 million per year in negotiated access goes unused. That’s a lot of money from the lobby’s podium. It’s a different number from the barn.
Metric
Lobby Number
Barn Number
Total annual unused TRQ access
$200M (promised) / $116M (unused at 42% fill)
—
Spread across 227B lbs U.S. production
—
$0.05/cwt
Impact on 150-cow farm (36,000 cwt/yr)
—
$1,800/year
Impact on 500-cow farm (120,000 cwt/yr)
—
$6,000/year
Impact if export lift adds $0.10–0.15/cwt
“Game-changer” (NMPF)
$3,600–$5,400/year (150-cow)
Average U.S. dairy cost of production
—
$19–23/cwt (USDA)
February 2026 all-milk forecast
—
$18.95/cwt (WASDE)
Who’s Pushing — and Who’s Pushing Back
The U.S. says Canada designed its allocation system to block imports by reserving 80–85% of many TRQs for domestic processors who had little incentive to use them. A USMCA dispute panel ruled in the U.S.’s favour in January 2022 and ordered changes. Canada rewrote the rules. A second panel, reporting on November 24, 2023, found, by a two-to-one decision, that Canada’s revised system didn’t technically breach USMCA. The dissenting panelist argued Canada’s narrow eligibility rules “significantly limit a large number of other Canadian importers who would be eager to bring U.S. dairy products to Canada”.
On December 2, 2025, 74 bipartisan House members from dairy states, including New York, Washington, Wisconsin, and California, wrote to Greer urging him to use the 2026 review for enforcement. “NMPF and USDEC — led by President and CEO Gregg Doud, the former Chief Agricultural Negotiator at USTR — have described Canada’s TRQ policies as ‘manipulative’ and accused Ottawa of ‘circumvention’ of USMCA’s dairy export disciplines.” Vander Schaaf told senators the U.S. exported approximately $9 billion in dairy products in 2025, including a record 559,000 metric tons of cheese through November. The trajectory is up. The frustration is that Canada isn’t absorbing its share.
On the Canadian side, Prime Minister Mark Carney responded directly in December 2025. Supply management is “not on the table,” — and he answered the English-language question in French. That’s a message aimed squarely at Québec.
DFC President David Wiens — who milks about 240 cows with his brother Charles near Grunthal, Manitoba — told MPs the combined impact of CUSMA, CETA, and CPTPP means roughly 18% of Canada’s domestic dairy demand is now met by imports. When CUSMA was signed, DFC projected that cumulative concessions would displace one in five Canadian dairy products — amounting to $1.3 billion in annual farm-gate losses once fully phased in. Both sides believe they’re defending survival — $1.14 billion in U.S. dairy exports to Canada in 2024, a record, and part of a $3.6 billion flow to Mexico and Canada that accounts for 44 percent of total U.S. dairy export value. On the other side: CA$4.8 billion in federal compensation flowing to supply-managed sectors.
Why the Same Commodity Pays Two Different Mortgages
The single biggest difference between Vander Schaaf’s milk check and Gobeil’s: how the price gets set.
In the U.S., the base price flows from Class III/IV futures and commodity markets. USDA’s February 2026 WASDE projects the all-milk annual average at US$18.95/cwt — but January’s Class III came in at just $14.59/cwt. The back half of the year has to do heavy lifting to hit that average. The safety net is Dairy Margin Coverage: insurance, not a guaranteed price. Over the last five years, U.S. all-milk prices swung from roughly $16.20 in 2020 to $27.10 in 2022 — an $11/cwt range.
Year
U.S. All-Milk Price (US$/cwt)
Canadian Equivalent (US$/cwt)
2020
$16.20
$28.00
2021
$18.10
$28.50
2022
$27.10
$30.00
2023
$20.60
$29.20
2024
$22.40
$29.60
2025
$21.50 (est.)
$29.40
2026
$18.95 (forecast)
$30.10 (forecast w/ 2.3% increase)
In Québec, the Canadian Dairy Commission surveys actual production costs each year and adjusts the farmgate price to cover them. The formula: 50% of the change in the indexed cost of production, 50% of the change in the consumer price index. That produced the 2.3255% farmgate increase effective February 1, 2026 — tied to input costs and inflation, not commodity markets in Chicago. Canadian farmgate prices move in a narrow band, roughly US$28–30/cwt equivalent at the 2025 average exchange rate, against that $11 U.S. swing.
But that stability comes stapled to a different kind of risk. In the P5 provinces — Ontario, Québec, New Brunswick, Nova Scotia, and PEI — quota trades at a cap of CA$24,000 per kilogram of butterfat per day. A cow producing 1.2–1.3 kg BF/day means a per-cow quota value around CA$28,800–$31,200. In western Canada, it’s higher — Alberta’s quota traded at CA$56,495/kg BF/day in January 2025, and Manitoba’s at CA$44,000. On Gobeil’s 125-cow Québec farm, that’s roughly CA$3.6–3.9 million in quota value — an asset that exists only as long as Ottawa keeps defending it.
One system charges you in income volatility. The other charges you in political risk locked inside your balance sheet.
What Does the USMCA Review Mean for a 150-Cow Wisconsin Dairy?
Here’s where the barn math gets humbling. Spread across 227 billion pounds of annual U.S. production, the raw math on $116 million in unused TRQ access works out to about $0.05/cwt nationally. Five cents.
Take a 150-cow Wisconsin dairy producing 24,000 lbs per cow. That’s 36,000 cwt per year. At $0.05/cwt, full TRQ enforcement is worth roughly $1,800 annually. Scale to a 500-cow operation producing 120,000 cwt, and it’s $6,000 — still not survival money.
But trade access lifts demand signals across the domestic market. Cornell dairy economist Charles Nicholson, working with Wisconsin’s Mark Stephenson, estimated that each additional 1% of U.S. dairy components exported lifts the all-milk price by about $0.12/cwt (95% CI: half a cent to $0.24/cwt). Their own conclusion: “it would be appropriate to be cautious in estimating the magnitude of price impacts from US dairy exports.” As exports grow, supply grows roughly in step.
Herd Size
Annual Production (cwt)
Direct TRQ Impact ($0.05/cwt)
Optimistic Export Lift ($0.10–0.15/cwt)
Total Potential Gain
Cost of Production ($/cwt)
2026 Forecast ($/cwt)
Margin Gap
150 cows
36,000 cwt
$1,800/yr
$3,600–$5,400/yr
$5,400–$7,200/yr
$19–23
$18.95
−$0.05 to −$4.05
500 cows
120,000 cwt
$6,000/yr
$12,000–$18,000/yr
$18,000–$24,000/yr
$19–21 (scale advantage)
$18.95
−$0.05 to −$2.05
1,250 cows(Vander Schaaf)
150,000 cwt
$7,500/yr
$15,000–$22,500/yr
$22,500–$30,000/yr
~$19 (scale advantage)
$18.95
−$0.05
Apply that framework. Filling the remaining $116 million wouldn’t move the export needle by a full percentage point. Even at the generous end of Nicholson’s range, you’re looking at $0.10–$0.15/cwt in total price lift. On 36,000 cwt, that’s $3,600 to $5,400 per year for our 150-cow Wisconsin dairy.
Set that against cost reality. USDA ERS data (2021 ARMS survey, published July 2024) shows farms with 2,000+ cows averaging $19.14/cwt in full economic cost, while herds under 50 cows hit $42.70/cwt. Analysts pegged mid-size net cost of production at $22.64/cwt. A 150-cow operation in that $19–23/cwt range — receiving a forecast of $18.95 — is treading water or running red before trade even enters the picture. An extra $1,800 to $5,400 helps. It won’t flip a negative-margin farm into a positive one.
What a Nickel Means for a 125-Cow Québec Quota Farm
Now flip the border. If those TRQs fill completely, cheese is already at 81–83%, so the real incremental pressure comes from powder and fluid categories. On 125 cows producing roughly 27,500 cwt per year, a nickel-per-hundredweight hit works out to about $1,375 annually. Ottawa cushions that — CA$1.2 billion over six years through the Dairy Direct Payment Program alone for CUSMA. Minister Bibeau confirmed in November 2022 that the combined package across three trade deals reaches CA$4.8 billion.
But every round of “access goes up, Ottawa writes a bigger cheque” adds weight to a political question. That CA$4.8 billion comes from general federal revenue — Canadian taxpayers. FCC’s 2026 dairy outlook advises producers to “continue focusing on what they can control on the farm” until the details of the CUSMA review are known. Sensible. It’s also what you say when you don’t know how the politics will break.
The bigger exposure isn’t the milk cheque. It’s the balance sheet. A 20% decline in quota value on Gobeil’s 125-cow operation at the P5 cap means roughly CA$720,000–$780,000 in equity gone. If you’re running 500+ cows in Alberta at CA$56,495/kg BF/day, your exposure is roughly double the P5 math. Your stress test looks different.
Are These Farmers Actually on Opposite Sides?
The easy version — American dairy vs. Canadian dairy, free market vs. supply management — misses what’s happening to both of them.
Vander Schaaf’s 1,250-cow Idaho operation and Gobeil’s 125-cow Québec farm are both getting squeezed by the same forces — processors, retailers, global commodity traders — and dealing with it through completely different systems. The American system absorbs that pressure through farmer income. The Canadian system absorbs it through government spending and quota valuation. Neither pushes the pressure back up the chain to the players who actually control pricing power.
If both sides “win” their version of the 2026 review — full TRQ enforcement for the U.S., intact supply management plus compensation for Canada — it doesn’t fix either farmer’s structural problem. It determines who bleeds a little slower.
The Border Math, Side by Side
Metric
150-Cow Wisconsin Dairy
125-Cow Québec Dairy
Price mechanism
Class III/IV futures + commodity markets
CDC formula (50% COP + 50% CPI)
Farmgate price (5-year range)
~US$16.20–$27.10/cwt (2020–2022)
~US$28–30/cwt equivalent
2026 price signal
$18.95/cwt forecast (WASDE Feb 2026)
2.3255% increase eff. Feb 1, 2026
Annual production
~36,000 cwt
~27,500 cwt
USMCA impact (full TRQ enforcement)
+$1,800–$5,400/yr
−$1,375/yr (before compensation)
5-year price volatility
~$11/cwt swing
~$2–4/cwt swing
Safety net
DMC + crop insurance
Supply management + CA$4.8B federal compensation
Balance-sheet risk
Land + cows + equipment
Land + cows + equipment + ~CA$3.6–3.9M quota
The math doesn’t pick a winner. It shows two different bills for the same thing: stability.
What You Can Do Before July
If you’re milking in the U.S.:
Enroll in DMC before February 28. Tier 1 coverage expanded from 5 million to 6 million pounds under the One Big Beautiful Bill Act (signed July 4, 2025). At $9.50 coverage, you’re paying $0.15/cwt in premium. Lock in for six years (2026–2031) at a 25% premium discount — but that means you can’t adjust if your herd grows or margins recover. If you’re above 6 million lbs (roughly 275+ cows at the national average production), Tier 1 covers only a fraction. Talk to your risk management advisor about Dairy Revenue Protection or Livestock Gross Margin for the rest.
By spring: Run a survival scenario at US$17–18/cwt with your lender. If your breakeven sits above $18, work the restructuring math before margins compress — not after.
Before July: Ask your co-op: “What percentage of our milk ends up in Canada or Mexico, and what’s our contingency if USMCA stalls?” Mexico and Canada purchased $3.6 billion in U.S. dairy products in 2024, accounting for 44 percent of total U.S. dairy exports.
If you’re milking in Canada:
Pull your own cost-of-production numbers and compare them against the CDC’s national average. If you’re not participating in COP surveys, you’re relying on your neighbours’ data while your livelihood depends on the results.
Watch the protein shift. FCC’s 2026 dairy outlook flags that both P5 and WMP are restructuring producer pay to incentivize more protein and less butterfat. If your herd tests 4.5% BF and 3.4% protein, you’re roughly neutral. Push butterfat higher without matching protein, and your gross revenue could drop by 1.2% under the new WMP structure. Factor that into breeding and ration planning alongside trade uncertainty.
By spring, model a 20% decline in the quota value with your lender. Not because that’s likely — but because you should know the answer before you need it. If you’re carrying debt against quota collateral, ask what their haircut assumptions are. FCC’s 2026 dairy outlook is worth reading alongside your balance sheet.
Before July: Watch two signals. First, CDC pricing bulletins — are they still citing cost of production and CPI as drivers, or are words like “affordability” or “competitiveness” creeping in? That language shift is your early-warning system. Second, provincial quota exchange reports. In January 2025, Ontario moved 405.98 kg BF/day at the CA$24,000 cap. Firm volume at the cap means the market believes the system holds. Watch for softening.
Both sides: Don’t let the trade conversation be somebody else’s problem. Your milk check is already a trade document.
Key Takeaways:
The USMCA dairy fight is huge in headlines ($200M–$1.14B), but the farm‑level effect is small: roughly 5¢/cwt or $1,800–$5,400/year for a 150‑cow U.S. herd.
Canadian supply management trades income stability for political and balance‑sheet risk: US$28–30/cwtstability on the milk cheque, but CA$3.6–3.9M in quota equity exposed to Ottawa’s trade decisions.
Full TRQ enforcement and a “win” for U.S. dairy won’t rescue a negative‑margin farm; survival still comes down to cost control, risk management (DMC/DRP/LGM), and co‑op strategy.
For Canadian producers, the real USMCA/CUSMA risk isn’t this year’s milk price; it’s possible quota repricing, so you need to stress‑test a 20% equity hit with your lender.
If you don’t know your co‑op’s export exposure, your breakeven, or your quota‑value stress line, you’re flying blind into the 2026 review — your milk cheque is already a trade document.
The Bottom Line
Vander Schaaf delivered his testimony and returned to his Idaho operation. Gobeil, 1,500 kilometres north, leads the organization representing every Québec dairy farmer who’ll feel whatever the July review decides. Both face the same July deadline. Both will judge the outcome by the deposit on their next milk cheque. The question for you isn’t which system is better — it’s whether you know your own numbers well enough to plan around whatever comes out of that review.
When the USMCA review panel reports this summer, we’ll re-run the barn math for both sides of the border in our Border Math series. What does your co-op’s export breakdown look like? What’s your breakeven?
Updated Feb 23, 2026: Headline revised for clarity. Daniel Gobeil was not interviewed for this article. Farm-level analysis is based on publicly available DFC data applied to representative Québec dairy operations.
Updated Feb 23, 2026: Headline revised for clarity. Daniel Gobeil was not interviewed for this article. Farm-level analysis is based on publicly available DFC data applied to representative Québec dairy operations.
Complete references and supporting documentation are available upon request by contacting the editorial team at editor@thebullvine.com.
Every week, thousands of producers, breeders, and industry insiders open Bullvine Weekly for genetics insights, market shifts, and profit strategies they won’t find anywhere else. One email. Five minutes. Smarter decisions all week.
NMPF asked USDA for exactly $148 million in dairy purchases last November. On February 19, USDA delivered — to the dollar. That’s not luck. That’s the advocacy pipeline working. Who benefits?
Executive Summary: USDA has approved $263 million in Section 32 food purchases, including $148 million for dairy — the exact figure NMPF asked for last November and the largest dairy round since the COVID programs. That money goes to processors for butter, cheese, and milk, not directly to farms, so any benefit shows up only if it lifts CME prices enough to move FMMO component values on your milk check. Butter is the main story: $75 million at current prices pulls roughly 40 million pounds — about 20% of a typical month of U.S. butter output — out of the commercial market, and CME butter already jumped $0.165/lb during the announcement week. The $32.5 million cheddar buy, by comparison, removes only about 1.7% of a month’s cheese production, so it’s unlikely to change protein checks on its own materially. For high‑butterfat herds, a sustained $0.10/lb increase in butterfat value can add more than $1,500/month per 200 cows, but only if the rally holds and your co‑op’s component premiums pass that value through. The article breaks down that barn math, compares this purchase to earlier Section 32 and COVID‑era interventions, and provides a 30/90/365‑day playbook so you can track CME butter, scrutinize your component statement, and adjust your risk‑management strategy in response to this one‑time demand boost.
$148 million. That’s the dairy industry’s share of USDA’s $263 million Section 32 purchase announced on February 19, 2026 — and it’s the exact figure the National Milk Producers Federation requested in a letter to USDA last November. Not one dollar more. Not one dollar less.
Every ag newswire ran the number. Secretary Brooke Rollins called it “delivering wholesome, real food to Americans while injecting critical dollars into local economies”. NMPF President and CEO Gregg Doud said the purchases “will provide important relief to producers who will benefit from the additional demand”. The International Dairy Foods Association applauded. Headlines everywhere.
But here’s what nobody’s explaining: Section 32 doesn’t write checks to dairy farmers. It buys finished products from processors. Between that $148 million announcement and your milk check, there are five steps, at least three middlemen, and zero guaranteed dollars. Let’s walk through what this purchase actually buys, who actually gets paid, and what it could — could — mean for the price of your milk.
What USDA Is Actually Buying
The $148 million breaks down into five commodity categories, and the allocation tells you exactly where USDA sees the deepest surplus problem:
Butter: $75 million (50.7% of dairy total)
Cheddar cheese: $32.5 million (22.0%)
Fresh fluid milk: $20.5 million (13.9%)
Swiss cheese: $10 million (6.8%)
UHT (shelf-stable) milk: $10 million (6.8%)
Butter dominates. That’s not random — it’s where the price crash has been worst. NMPF specifically noted that these are “the first major butter purchases in five years.” The remaining $115 million in the broader announcement covers non-dairy commodities: dried beans ($25 million), split peas ($24 million), fresh pears ($15 million), walnuts ($15 million), lentils ($14 million), chickpeas ($12 million), and pecans ($10 million).
Dairy got the single largest allocation of any category. That matters.
How $148 Million Became the Number
This wasn’t a surprise. NMPF sent USDA a letter last November requesting exactly $148 million in dairy purchases. What followed, in NMPF’s own words, were “extensive conversations and further official communication with USDA”. When the announcement dropped on February 19, it matched the request to the dollar.
Gregg Doud — NMPF’s president and CEO since September 2023, a former Chief Agricultural Negotiator under President Trump’s first term, and a Kansas farm kid who still runs cattle — framed it as demand support: “Dairy farmers have shared in the struggles faced throughout the agricultural economy.”
That’s the advocacy pipeline working. NMPF identified the surplus problem, built the case with USDA, and delivered a specific ask. Whether you’re an NMPF member co-op shipper or not, this is what organized lobbying looks like when it produces results. The question is whether those results reach your bulk tank.
If you ship to an NMPF member co‑op, this is your dues at work; if you don’t, you’re still riding the same CME prices, just without the direct contract upside.
What Is a Section 32 Purchase and How Does It Work?
Section 32 of the Agricultural Adjustment Act of 1935 authorizes the USDA to buy surplus U.S.-produced agricultural products for two purposes: stabilize farm markets and supply food to federal nutrition assistance programs.
Here’s the mechanism, step by step:
USDA’s Agricultural Marketing Service issues Purchase Program Announcements.
Approved vendors — processors, not farmers — submit bids.
USDA awards contracts to winning bidders.
Processors deliver products to food banks and nutrition programs.
The purchased volume exits the commercial market, reducing available supply.
That fifth step is where farm‑level impact starts, in theory. Removing surplus from the market tightens supply, which supports commodity prices on the CME, which flows through FMMO formulas into component pricing, which eventually — weeks to months later — appears on your milk check.
Five steps. None of them is “USDA writes a check to a dairy farmer.” This is a market-support mechanism, not a direct payment. That distinction matters.
The Per-Cow Reality Check: Why $15.46 Is a Meaningless Number
You’ll see this math on social media: $148 million ÷ 9.57 million U.S. dairy cows = $15.46 per cow. Sounds underwhelming, right?
It’s also completely irrelevant. Section 32 doesn’t distribute money per cow. It removes the product from the market. The $15.46 figure tells you nothing about the actual price-support effect, which depends on how much volume gets pulled, from which markets, at what prices, and how CME traders respond.
The per-cow math is a useful headline killer, though. And that’s the point: $148 million sounds massive until you spread it across the national herd. The real impact isn’t in the division. It’s in the market math.
Butter vs. Cheese: One Big Lever, One Tiny One
This is where the numbers get interesting. The $75 million butter purchase is the headline within the headline. Here’s why.
Butter math: At CME cash butter prices of $1.8700/lb on Friday, February 20, 2026, $75 million buys roughly 40 million pounds of butter. December 2025 U.S. butter production was 204 million pounds, according to USDA NASS’s Dairy Products report released on February 5, 2026. Full-year 2025 butter output hit 2.36 billion pounds — an average of about 197 million pounds per month. That $75 million purchase removes roughly 20% of one month’s productionfrom the commercial market.
Metric
Butter
Cheddar Cheese
Purchase Amount
$75 million
$32.5 million
Pounds Purchased
~40 million lbs
~21.7 million lbs
Typical Monthly Production
~197 million lbs
~1.28 billion lbs
% of Monthly Output Removed
20.3%
1.7%
Likely CME Price Impact
$0.10–0.15/lb
$0.01–0.02/lb
Twenty percent is significant. It’s not catastrophic-surplus territory, but it’s enough to tighten the market meaningfully — especially with butter already climbing. CME cash butter opened the announcement week at $1.7050 on Tuesday and closed Friday at $1.8700, a $0.165/lb gain in four trading sessions. That’s not all Section 32 — other factors are in play — but the timing is hard to ignore.
Cheese math: The $32.5 million cheddar purchase at roughly $1.50/lb buys about 21.7 million pounds. December 2025 total cheese production was 1.28 billion pounds. That’s barely 1.7% of one month’s output. Meaningful for cheddar specifically, but a rounding error for the broader cheese market.
The takeaway: If you’re a high-butterfat herd, this purchase tilts in your favor. If your income depends more on protein and cheese prices, the direct effect is minimal. Butter is the big lever here. Cheese is noise.
How Much Will This Actually Affect Milk Prices?
Now for the barn math that connects the announcement to your component statement.
Start with butter. If the Section 32 purchase contributes even $0.10/lb to sustained butter price support — and the $0.165/lb rally this week suggests that’s conservative — here’s what it means at the farm level:
The Class IV butterfat price is derived directly from CME butter. A $0.10/lb butter increase translates to roughly $0.10/lb on your butterfat component price. For a 200-cow herd shipping 23,000 lbs/cow/year at 4.1% butterfat:
Monthly milk shipped: ~383,333 lbs
Monthly butterfat lbs: ~15,717 lbs
Value of $0.10/lb BF increase: ~$1,572/month, or $18,860 annualized
For a 400-cow herd at the same test? Double it: roughly $3,144/month.
That’s real money — if the butter rally holds and if your co-op’s component premiums reflect it. Two big ifs.
Now cheese. A $32.5 million purchase removing 1.7% of monthly production might support block prices by $0.01–0.02/lb at best. On your protein check, that’s almost invisible.
Bottom line: This purchase is a butterfat story. Your Class IV components — butterfat specifically — are where the action is. If your herd tests 3.6% fat, the impact is noticeably smaller than at 4.2%. Run it with your own numbers.
Why Now — and How Does This Compare?
Butter prices crashed from roughly $2.50/lb in mid-2025 to around $1.50/lb by January 2026 — a 40% decline in six months. CME cheese blocks were sitting at $1.45/lb before the announcement week. Global milk production — what analysts have called the “wall of milk” — has been pressuring commodity prices across the board.
NMPF called this the first major butter purchase in five years. That’s significant context. For comparison:
2020 COVID-era: USDA purchased roughly $1.33 billion in dairy products across multiple programs, including about $100 million/month in Section 32 alone. That removed an estimated 238 million pounds of cheese and 64 million pounds of butter over the year.
2020 Section 32 specifically: A $120 million cheese-and-butter purchase removed about 23 million pounds of cheese and 3.6 million pounds of butter per month.
January 2026: USDA bought $80 million in specialty crops under Section 32 — no dairy in that round.
At $148 million, this is the largest single-round Section 32 dairy purchase outside of COVID emergency spending. It’s substantial. It’s also one-time, not recurring. The 2020 program ran for months. This is a single injection.
The Market Already Moved
Here’s what happened on the CME the week of the announcement:
Commodity
Tue 2/17
Wed 2/18
Thu 2/19 (Announcement)
Fri 2/20
Weekly Change
Butter ($/lb)
$1.7050
$1.7050
$1.7800
$1.8700
+$0.1650
Blocks ($/lb)
$1.4500
$1.5000
$1.5100
$1.4975
+$0.0475
Barrels ($/lb)
$1.4500
$1.4700
$1.4700
$1.4900
+$0.0400
NFDM ($/lb)
$1.5900
$1.5975
$1.6225
$1.6850
+$0.0950
Butter jumped $0.075/lb on announcement day alone and added another $0.09 on Friday. That’s a two-day move of $0.165/lb — the kind of swing that moves component checks. Blocks and barrels gained modestly. NFDM surged nearly a dime on the week.
The market is pricing in the volume removal. Whether it holds through March and April — when the actual Purchase Program Announcements are issued, and contracts are awarded — is the open question.
What $148 Million in Section 32 Purchases Means for Your Component Check
Check your butterfat test. This purchase overwhelmingly favors high-BF herds. At 4.0%+ test, the butter rally has meaningful upside for your Class IV components. At 3.5%, the effect is roughly half as large.
Watch CME butter through March. If butter sustains above $1.85/lb through mid-March, the Section 32 volume removal is working as intended. If it fades back below $1.70, the purchase wasn’t enough to absorb the surplus.
Don’t expect cheese miracles. The $32.5 million cheddar purchase is too small relative to monthly production (1.28 billion pounds in December alone ) to meaningfully move block or barrel prices. Your protein check won’t feel this.
Know the timeline. USDA hasn’t issued the Purchase Program Announcements yet. Approved vendors still need to bid. Contracts need awarding. Product needs to ship. The actual volume won’t leave the commercial market for weeks, possibly months.
Ask your co-op. Does your cooperative supply USDA commodity programs? If so, this purchase directly increases demand for your co-op’s output. If not, you’re relying entirely on the indirect price-support effect.
Review your risk coverage. DRP (Dairy Revenue Protection) is available for purchase on any business day when prices are published on RMA’s website — there’s no fixed quarterly enrollment window. If butter holds its rally, Class IV DRP coverage premiums will rise as expected revenue increases. Locking in current premium levels sooner rather than later may make sense for Q2 and Q3 2026 quarters. Separately, DMC enrollment for 2026 closed February 26 — if you missed it, DRP is your remaining federal safety-net option.
Your 30/90/365-Day Playbook
Timeline
What to Track
Key Threshold
Action If Threshold Met/Missed
This Week
USDA AMS Purchase Program Announcement
Announcement posted
Read for delivery windows, product specs, quantity breakdowns
30 Days
CME butter & cheese block prices
Butter holds above $1.85/lb
Price support working; below = surplus bigger than $75M can fix
90 Days
Your co-op component statement (April/May)
BF premium reflects butter rally
If butter held but BF premium flat = question for co-op field rep
365 Days
Total 2026 Section 32 dairy purchases vs. 2024/2025
Second round announced
Signals structural surplus, not seasonal—NMPF pipeline now recurring
This week: Read the USDA AMS Purchase Program Announcement when it posts. It will specify exact product forms, quantities, and delivery windows. That’s when you’ll know whether this is a 60-day buy or a 6-month program.
30 days: Track CME butter and cheese block prices. The $1.85/lb butter threshold is your marker. Above it, the purchase is supporting prices. Below it, the surplus is bigger than $75 million can fix.
90 days: Pull your co-op component statement for April or May. Compare your butterfat premium to January and February. If butter held above $1.85 through March and your BF premium didn’t move, that’s a question for your co-op field rep.
365 days: Compare the total 2026 Section 32 dairy purchases to 2025 and 2024. If USDA comes back for a second round, it signals the surplus problem is structural, not seasonal — and that NMPF’s advocacy pipeline is becoming a recurring feature of dairy price support.
Key Takeaways
USDA’s $148 million dairy allocation under Section 32 is exactly what NMPF asked for last November and marks the largest non‑COVID dairy purchase in five years.
None of that money arrives as a farm check — it pays processors, and the only way you see it is if it pushes CME prices high enough to lift FMMO component values on your milk check.
Butter is where it bites: $75 million pulls roughly 40 million pounds — about 20% of a typical month of U.S. butter output —, and CME butter already moved $0.165/lb higher during the announcement week.
The cheddar piece is small by comparison: $32.5 million removes only about 1.7% of a month’s cheese production, so don’t expect a big protein or Class III bump from this round alone.
If your herd ships 4%‑plus butterfat, a sustained $0.10/lb increase in butterfat value can add more than $1,500/month per 200 cows, which makes watching butter hold above roughly $1.85/lb and checking how your co‑op adjusts component premiums a key decision point.
The Bottom Line
$148 million isn’t a rescue. It’s a market lever—and specifically, a butter lever. NMPF asked for it, USDA delivered it, and the CME responded with a $0.165/lb butter rally in 48 hours. Whether that holds depends on what happens when the actual contracts hit and the product starts moving.
Pull your last component statement. Find the butterfat line. Now add $0.10/lb and multiply by your monthly butterfat pounds. That’s the upside scenario from this purchase — not $148 million divided by your herd size, but butter price × your components × time.
Complete references and supporting documentation are available upon request by contacting the editorial team at editor@thebullvine.com.
The Wall of Milk: Making Sense of 2025’s Global Dairy Crunch – Reveals the structural supply collision between the U.S., EU, and New Zealand that is currently capping your upside. This strategic analysis exposes the “biological trap” of beef-on-dairy and helps you position your operation for the next three years.
Genetic Revolution: How Record-Breaking Milk Components Are Reshaping Dairy’s Future – Delivers a deep dive into the genomic surge that “pre-loaded” the national herd for record butterfat. It identifies the emerging genetic traits—from feed efficiency to methane indexes—that will determine which dairies remain competitive through the 2030s.
The Sunday Read Dairy Professionals Don’t Skip.
Every week, thousands of producers, breeders, and industry insiders open Bullvine Weekly for genetics insights, market shifts, and profit strategies they won’t find anywhere else. One email. Five minutes. Smarter decisions all week.
Your milk goes to one processor. Overnight, they sell 80% to a stranger. That’s not a what‑if — it’s what 600 Argentine dairy families woke up to today.
Executive Summary: Saputo is selling 80% of its Argentine dairy division to Peru’s Gloria Foods in a deal that values the business at C$855 million (about US$630 million), while keeping a 20% stake. Overnight, control of Argentina’s largest milk processor — 11.6% of the nation’s industrial milk and collections from more than 600 farms — shifts to a buyer that’s been sued for abusing its power with producers in Chile, fined in Colombia for adding whey to “whole” milk, and accused of monopolistic practices in Peru. Farmers shipping to Saputo’s Rafaela and Tío Pujio plants learned about the deal from a press release instead of a phone call, and they still don’t know if Gloria will keep their contracts, prices, and pickup schedules intact. They’re dealing with that gut punch in a sector where SanCor has just entered creditor protection and co‑ops’ share of Argentina’s milk has collapsed from roughly 34% to about 3%, leaving most producers tied closely to a single processor. Add in Gloria’s aggressive acquisition run and rising debt‑service costs at its Peruvian holding company, and you have a new owner that’s highly motivated to manage margins hard once the ink dries. This article walks you through what’s happening to those 600 Argentine dairy families — and gives you a concrete playbook to check whether your own processor contract would protect you if the company you ship to sold tomorrow without warning.
Saputo Inc. announced today that it’s selling 80% of its Argentine dairy division to Gloria Foods — the dairy arm of Peru’s Grupo Gloria — for an enterprise value of C$855 million. That works out to roughly US$630 million, including assumed debt, though Peruvian business media report the equity purchase price closer to US$500 million. Saputo expects net proceeds after tax of approximately C$543 million (US$400 million). The company keeps a 20% minority stake. The deal covers two processing plants, the La Paulina, Ricrem, and Molfino brands, and a milk collection network serving more than 600 dairy farms across Santa Fe and Córdoba provinces, according to Argentine agricultural media, including LA17 and Bichos de Campo.
This is what dairy processor consolidation risk looks like in practice. Those 600 families weren’t part of the conversation — and the company taking over has a record across Latin America that every producer, Argentine or not, ought to understand before this deal closes around mid-2026.
If you read nothing else this month, pair this with our recent piece on the four questions every dairy producer should ask about processor dependency. What’s happening in Argentina right now is a textbook case of what that audit is designed to prevent.
How Saputo Built Argentina’s Top Dairy Operation — Then Walked Away
Saputo entered Argentina in November 2003 by acquiring Molfino Hermanos S.A. from Molinos Río de la Plata for US$50.8 million. At the time, Molfino was the country’s third-largest processor — two plants, roughly 850 employees, about US$90 million in annual revenue. Over 23 years, Saputo turned that into the country’s number-one operation.
The OCLA 2023/24 industry ranking — based on reported and estimated daily milk reception by industrial processors, published annually — had Saputo processing an average of 3,650,288 liters per day, or 12.5% of national industrial milk volume. By the most recent OCLA 2024/25 ranking (published July 2025), that figure had dropped to 3.53 million liters daily, or 11.6% of the national total. Still number one, ahead of Mastellone (La Serenísima) at 3.15 million liters and 10.8%, but the decline hints at the pressures behind Saputo’s decision to sell. In the last four quarters, the Argentine operation generated approximately C$1.2 billion in revenue — about 7% of Saputo’s consolidated total.
When SanCor — once Argentina’s cooperative giant — entered a deep financial crisis beginning in 2017 (as SanCor put it in its February 2025 court filing), Saputo moved quickly. The company absorbed the freed-up milk supply and routinely offered prices better than competitors’. Producers followed the money. You would have too.
And then SanCor’s story got worse. On February 2, 2025 — just ten days before today’s Gloria announcement — SanCor formally filed for concurso preventivo de acreedores (creditor protection proceedings) at the Commercial Court in Rafaela, Santa Fe, carrying approximately US$400 million in debt. SanCor now processes just 409,163 liters daily, barely 1.4% of national production, down from its peak of 1.2 million. The region’s dairy infrastructure isn’t just shifting; it’s transforming. It’s being completely restructured.
Saputo’s dominance also created structural dependency. The practical effect was that Saputo’s price signals shaped the broader regional market — when the biggest buyer in the milkshed moved, everyone else followed. That arrangement works fine. Right up until the company at the center decides to leave.
CEO Carl Colizza’s press release language was corporate but clear: “This divestiture enhances our financial flexibility and supports targeted reinvestment in platforms that offer the highest growth opportunities.” Translation: take a roughly 12-fold return on a 23-year investment (US$630M enterprise value on a US$50.8M entry) and redeploy capital somewhere with fewer currency crises.
600 Families, No Advance Notice
Here’s what we know about how this landed on the ground. As of publication — hours after the announcement — there’s been no reported communication from Gloria Foods to Argentine producers. No new contract terms. No timeline for meetings. No word on whether existing payment schedules, quality premiums, or pickup logistics will change. Infocampo described the news as a “sacudón” — a jolt — to the Argentine dairy chain.
Several cooperatives sit squarely in Saputo’s milkshed. Cooperativa Tambera Central Unida in San Guillermo, Santa Fe — managed by Javier Clemente — delivers milk to five processing companies, including Saputo. Clemente has spoken publicly about producer autonomy in the region: “The one who decides where their production goes is the member, because the milk belongs to whoever produces it.” He made those remarks before the Gloria deal was announced. His cooperative is now directly affected, and whether that principle holds when a Peruvian conglomerate replaces a Canadian one is the question nobody can answer yet.
Cooperativa Agrícola Santa Rosa, also near San Guillermo and managed by Martín Guruceaga, works with approximately 60 farms across a 40-kilometer radius. Guruceaga has described the area simply as “una zona tambera” — a dairy zone where the community and the industry are one and the same. UNCOGA, a federation of nine cooperatives spanning central-west Santa Fe and central-east Córdoba, operates across the heart of Saputo’s collection territory.
These cooperatives are the closest thing to a collective voice that affected producers have. But the cooperative system itself has been hollowed out. Cooperative share of Argentine milk reception dropped from 34% in 1995 to roughly 3%today, according to the OCLA 2024/25 industry ranking. That means most of those 600-plus farms negotiate individually with their processor. When that processor changes without warning, individual leverage is essentially zero.
“The dairy sector and the country will only grow when the producer grows, because the producer is the one who carries the activity in their blood.” — Daniel Oggero, APLA executive committee, El Litoral, July 2015
Oggero made that statement during a blockade of Saputo’s Rafaela plant by western Santa Fe dairy farmers protesting milk price cuts. Those words land differently today, when the producer’s voice in the transaction was exactly zero.
Why Saputo Sold — And What Gloria’s Track Record Shows
Understanding both sides of this deal matters if you’re trying to figure out what comes next.
Why Saputo left: This isn’t a distressed sale. Through FY26, Saputo’s efficiency program has been delivering: Q1 operating cash flow hit C$317 million (up 66% year-over-year), adjusted EBITDA reached C$417 million (up 12.7%), and the company has been buying back shares aggressively. Saputo reported net losses of C$250 million through the nine months ended December 2024, driven largely by writedowns and hyperinflation accounting adjustments tied to Argentina — but the underlying business is profitable and improving. Saputo chose to leave. That tells you how the company views Argentine risk-reward going forward.
Who Gloria is: Gloria Foods is the dairy platform of Grupo Gloria, a Peruvian conglomerate with more than 7,000 employees across Peru, Chile, Bolivia, Argentina, Colombia, and Ecuador. President Claudio Rodriguez called the Saputo acquisition “a milestone within the strategy of sustained growth in Latin America.” The expansion has been rapid: Soprole in Chile from Fonterra for approximately US$644 million (completed April 2023), Ecuajugos from Nestlé in Ecuador (2024), and now Saputo Argentina.
But that growth has come with a trail of regulatory actions and producer-relations disputes. Not one-offs. A pattern across multiple countries.
In Peru, former AGALEP (national dairy farmers’ association) president Javier Valera publicly described Gloria’s market behavior as monopolistic. His successor, Nivia Vargas, accused the company of offering infrastructure only to larger-volume farms — deliberately fragmenting producer associations and undermining collective bargaining. Gloria has also fought a Peruvian government decree requiring evaporated milk be made from fresh milk. AGALEP leadership says that regulation underpins demand from an estimated 450,000 Peruvian dairy farmers.
In Chile, Gloria’s subsidiary Prolesur faces a lawsuit admitted by the national competition tribunal (TDLC) on January 30, 2025. Plaintiff Chilterra S.A. alleged abuse of dominant position, specifically that Prolesur imposed “unjustified prices through arbitrary and unverifiable criteria”—a system plaintiff Ricardo Ríos described as designed to create total producer dependence.
In Colombia, the Superintendencia de Industria y Comercio fined Gloria, along with Lactalis, Hacienda San Mateo, and Sabanalac in February 2025 for adding whey protein (lactosuero) to products labeled as whole pasteurized milk. The basis: INVIMA laboratory studies from 2019–2020 detected elevated caseinomacropeptide levels — a marker indicating whey protein had been added to a product labeled as pure milk. Gloria’s penalty was US$2.2 million. The company has appealed.
Country
Action / Dispute
Year
Status / Penalty
Peru
Former AGALEP president accused Gloria of monopolistic behavior; producers claim infrastructure access limited to large farms, fragmenting associations
Ongoing
No formal penalty; producer relations remain strained
Chile
Prolesur (Gloria subsidiary) sued for abuse of dominant position—”unjustified prices through arbitrary criteria” designed to create producer dependence
2025
Lawsuit admitted by TDLC competition tribunal Jan 2025; pending resolution
Colombia
Fined for adding whey protein to “whole” milk; INVIMA labs detected elevated caseinomacropeptide (adulteration marker)
2025
US$2.2 million fine; Gloria appealed
Puerto Rico
Exited market entirely after regulatory challenges made operations “unworkable”
2025–26
Complete market withdrawal
Gloria reports investing approximately S/718 million — roughly US$190 million (S/ refers to Peruvian soles) — between 2012 and 2023 in a farmer development program. That figure comes from Gloria itself and hasn’t been independently audited, but the investment claim is on the record. In Puerto Rico, the company exited the market entirely in 2025–2026 after what it described as regulatory challenges that made operations unworkable.
Does any of this predict what happens in Argentina? Not necessarily. Different market, different regulations, different competitive dynamics. But the holding-level financial picture adds context. Holding Alimentario del Perú reported net losses of S/124.9 million (roughly US$33 million) in 2023 and S/62.2 million (~US$16 million) through nine months of 2024, according to Peruvian securities filings. Financial expenses surged from S/123.7 million in 2022 to S/399.5 million in 2023. A company whose debt-service costs tripled in one year is under pressure, even if the core dairy business is profitable.
Nobody’s saying assume the worst. But you’d be wise to ask very specific questions before closing day.
What This Means for Your Operation
This section is about dairy processor risk — and it applies whether you’re milking cows in Córdoba or Ontario or Wisconsin.
Contract Protection
What It Does
Argentine Status
Your Action This Week
Ownership-change clause
Requires new buyer to honor existing contract terms or provides renegotiation window
Missing for most producers
Pull your supply agreement; search for “assignment,” “change of control,” or “transfer” clauses
Minimum notice period
Guarantees 30–90 days’ written notice before contract termination or major changes
Missing for most producers
Check termination section; if absent, negotiate 60-day minimum before any ownership transfer
Unknown—producers waiting for Gloria communication
Verify whether your agreement specifies payment continuity; if not, add it
Secondary buyer relationship
Diversifies risk by routing 10–30% of production to alternative processor
Not common in concentrated markets
Identify regional cheese makers or co-ops; formalize even small-volume backup contract
Collective bargaining vehicle
Cooperative or producer association negotiates on behalf of group
Exists (UNCOGA, cooperatives) but weakened by 3% co-op market share
Join or re-engage with local co-op; coordinate questions for new buyer through group
Regulatory review trigger
Large acquisitions require competition-authority approval, sometimes with producer-protection conditions
Pending—Argentine CNDC reviewing deal
Monitor CNDC decision; if conditions imposed, ensure enforcement mechanisms exist
If you’re in Saputo’s Argentine collection zone: Your contract is the document that matters now. Does it include an ownership-change clause? A minimum notice period? A payment guarantee? If yes, those terms should carry over. If not — or if you don’t have a written agreement at all — you’re negotiating from scratch with a company you’ve never dealt with. Contact your cooperative this week. The latest SIGLEA data (December 2025) shows Argentine farm-gate milk prices averaging AR$476.60 per liter — up only about 8% year-over-year in nominal terms, while costs have continued to rise, putting margins under pressure. Any disruption in payment terms during a processor transition hits harder when margins are already thin.
If you’re a North American Saputo supplier: This looks like an emerging-market exit, not a signal about Saputo’s core North American business. The company is investing in U.S. capacity and showing improving domestic margins. Your situation is structurally different. But the underlying lesson is universal — if your supply agreement doesn’t survive a processor sale, you’re carrying the same risk these Argentine families just discovered. You just haven’t been tested yet.
If you sell to any dominant processor, anywhere: Here’s the math that matters. If one company handles more than 60% of your milk and your agreement has no ownership-change clause, you’re structurally identical to those 600 Argentine families. Geography doesn’t change that equation. What changes it is your contract.
The trend behind this deal — processor consolidation reshaping producer relationships globally — isn’t slowing down. In the past three years, Fonterra sold Soprole to Gloria, Nestlé sold Ecuador operations to Gloria, Savencia acquired Williner in Argentina, and Lactalis bought Dairy Partners Americas. Every transaction meant producers discovering, after the fact, that their buyer had changed.
Four Moves Before Closing Day
1. Pull your supply agreement and read it this week. Look for three things: the termination notice period, the ownership-change transfer provision, and the payment guarantee. If any are missing, that’s your negotiating priority before the new owner takes over. Not after.
2. Engage through your cooperative — and accept the trade-off. UNCOGA, Productores Unidos de Rafaela, and the San Guillermo cooperatives are the existing vehicles for collective action. A unified set of questions to Gloria about contracts, payment terms, and collection schedules carries more weight than 600 separate phone calls. Yes, coordinated engagement could be perceived as adversarial before the relationship starts. Move forward anyway. Silence is worse than friction.
3. Explore a second buyer relationship. Around Córdoba and Santa Fe, small and medium cheese makers (PyMEs queseras) have historically offered competitive raw-milk prices. Diversifying even a portion of production reduces concentration risk. The trade-off is real: approaching alternative buyers pre-closing could signal distrust to Gloria, and logistics with smaller processors are more complex. But having options is always the right strategy. And here’s your trigger — if Gloria hasn’t communicated directly with producers within 60 days of closing, that’s your signal to formalize a secondary buyer relationship. Not explore one. Formalize it.
4. Watch Gloria’s first 90 days after closing. Do they communicate directly with producers? Honor existing terms? Provide timeline certainty? Those are positive signals. Prolonged silence — producers still waiting for a phone call weeks after operational control transfers — tells a different story. What Gloria actually does will matter more than anything in a press release.
Three Signals Between Now and Mid-2026
Argentine regulatory review. This deal requires approval from Argentine authorities. At 11.6% of the national industrial milk volume, the competition authority (CNDC) could attach conditions. Any requirements imposed on Gloria regarding producer terms or pricing would be of enormous importance.
Gloria’s outreach to producers. The single most revealing signal. The company knows 600-plus families are waiting. Whether Gloria reaches out proactively or waits for producers to come to them will tell you which version of Gloria is showing up in Argentina.
Payment performance. SIGLEA reported Argentine farm-gate milk prices at AR$476.60 per liter in December 2025 — up only about 8% year-over-year in nominal terms, while production costs have continued climbing, according to OCLA. Gloria’s ability and willingness to maintain competitive pricing after closing will be the metric that matters most to every producer in the collection zone. Everything else is words on paper.
The broader context here — what processor consolidation means for producer survival — was one of the defining themes of 2025 dairy coverage.
Your Processor Risk Checklist
Audit your contract this week. No ownership-change clause, no defined termination notice, no payment guarantee means you’re carrying processor risk whether you’re in Córdoba or Ontario, or Wisconsin.
Know your single-buyer number. Over 60% of your milk to one processor without contractual protections? You’re in the same structural position as those Argentine families. The difference is timing — you can fix it before the press release drops.
Research your processor’s parent company. Financial pressure at the holding level — like debt-service costs tripling in a year — eventually filters down to producer terms. This applies to your processor too.
Don’t wait for the phone call. If you’re in Saputo’s Argentine collection zone: contact UNCOGA, your regional cooperative, or APLA (headquartered in Suardi, Santa Fe) this week. Ask collectively about contract continuity, payment schedules, and collection logistics. A coordinated ask is harder to ignore.
For North American Saputo suppliers wondering if you’re next: The evidence points to an emerging-market exit driven by Argentine macro conditions, not a systemic pullback. Saputo’s domestic numbers are moving in the right direction. But read your contract. Know what survives a sale.
If you know Argentine producers, share this. If you’ve toured dairy operations in Santa Fe or met producers from the Rafaela corridor at genetics events, connect them with this information. The more that circulates, the better everyone’s decisions get.
The Bottom Line
Guruceaga calls his part of Santa Fe “una zona tambera.” A dairy zone. It sounds simple until you sit with what it means: the cows and the community are the same thing. When the processor changes, the community changes with it.
The hardest part of what happened today isn’t the deal. It’s the sequence. A press release in Montreal. A wire story picked up in Lima. A notification on a phone in a milking parlor somewhere between Rafaela and Tío Pujio. And then the question that 600-plus families are asking right now — the same question every producer who depends on a single buyer should be asking before their turn comes:
Does my contract survive this?
If you don’t know the answer, you already know what to do this week.
Key Takeaways
Saputo is selling 80% of its Argentine dairy division to Gloria Foods for a C$855 million (≈US$630 million) enterprise value, keeping a 20% minority stake.
That puts Argentina’s largest processor — 11.6% of industrial milk and collections from 600‑plus farms — in the hands of a buyer that’s been sued for abuse of dominance in Chile, fined in Colombia over adulterated “whole” milk, and accused of monopolistic behavior in Peru.
Farmers supplying Saputo’s Rafaela and Tío Pujio plants learned of the sale from the media, not from their processor, and, as of today, have no firm answer on whether Gloria will honor their current contracts, prices, or pickup schedules.
With SanCor in creditor protection and co‑ops’ share of Argentina’s milk shrinking from roughly 34% to about 3%, most producers are now highly dependent on a single buyer when decisions like this drop.
If more than 60% of your milk goes to one processor and your contract is silent on ownership changes, you’re carrying the same processor‑risk those 600 Argentine families just discovered — and you should be auditing that agreement this week, before your own “press‑release moment” arrives.
Complete references and supporting documentation are available upon request by contacting the editorial team at editor@thebullvine.com.
More Milk, Fewer Farms, $250K at Risk: The 2026 Numbers Every Dairy Needs to Run – Exposes the $250,000 annual margin gap facing mid-sized dairies and reveals how to position your operation for 2026’s “more milk, fewer farms” reality. This strategic analysis identifies the specific leverage points needed to survive increasing processor consolidation.
Every week, thousands of producers, breeders, and industry insiders open Bullvine Weekly for genetics insights, market shifts, and profit strategies they won’t find anywhere else. One email. Five minutes. Smarter decisions all week.
USDA says 2026 milk is $18.95. ERS says your costs are $19.14. That’s not a forecast — that’s a loss locked into the dairy math.
Executive Summary: USDA’s February WASDE now projects $18.95/cwt all‑milk for 2026, but ERS cost‑of‑production numbers still put average 2,000‑plus cow herds at $19.14/cwt and the smallest herds near $42.70/cwt, so a lot of dairies are starting the year structurally in the red. January’s actual Class III check at $14.59/cwt explains why your cash flow feels even tighter than the forecast suggests. At retail, a gallon of whole milk still sits around $4.05, with farmers getting only 25¢ of the dairy dollar and an opaque $2.40–$2.80 slice going to processing and retail that the Gillibrand‑Collins Fair Milk Pricing for Farmers Act tries to drag into the light. For many herds, beef‑on‑dairy calf and cull checks worth about $4.50/cwt are what plug the hole, even as they drain the replacement pipeline and push heifer prices over $3,000/head. The article uses a 550‑cow Wisconsin dairy to show how an honest cost‑of‑production run, fast culling decisions, and debt restructuring turned an 11‑week runway into something survivable. Then it hands you a four‑lane playbook — tighten components, lock in DMC/DRP, get in front of your lender, or consider exiting while asset values hold — with clear thresholds and stress‑tests so you can see, in dollars, which path actually fits your operation.
⚠️ DMC ENROLLMENT CLOSES FEBRUARY 26 — 15 DAYS FROM TODAY Tier 1 coverage is now available up to 6 million pounds at $9.50/cwt. A six‑year commitment (2026–2031) under the One Big Beautiful Bill Act (OBBBA) cuts your premiums by 25%. That cap covers roughly a 270‑cow herd at 22,000 lbs/cow. If you’re eligible and not enrolled yet, you’re on the clock. Source: USDA Farm Service Agency, Secretary Rollins’ Jan. 12 announcement, farms.com, and Penn State/Extension enrollment summaries.
USDA’s February 10 WASDE briefing shows the 2026 all‑milk price at $18.95/cwt, down $2.22/cwt from the revised 2025 average of $21.17/cwt. That’s roughly $153,000 in lost gross milk revenue for a 300‑cow herd shipping 69,000 cwt a year. The same USDA‑ERS data behind that WASDE also say this: on a full‑cost basis, even the biggest, “efficient” herds average 19¢/cwt above the new all‑milk price, while sub‑50‑cow herds sit more than $23/cwt higher than that $18.95.
The $4.05 Gallon and the Broken Price Signal
Here’s the number that should make you stop and stare for a second.
The national average price of a gallon of whole milk in December 2025 was $4.05, essentially unchanged from four years earlier. Over that same period, food‑at‑home prices climbed about 23%, according to BLS CPI data. Eggs jumped. Beef jumped. Milk stayed pinned. Consumers got a better deal on your product than on almost anything else in the grocery store.
USDA’s Economic Research Service tracks how that retail dollar gets split. In 2024, dairy farmers captured 25¢ of every retail dairy dollar, up a bit from 23¢ in 2023 but down from 28¢ in 2022. Back in 1980, the farm share sat near 52¢; by 1999, it was around 32¢. For fluid milk specifically, ERS pegs the 2024 farm share at 49%. With the 2026 all‑milk forecast now at $18.95, that share is drifting toward the low 40s.
Here’s how your slice of that $4.05 gallon changes at three price points:
Your share of the $4.05 gallon (fluid milk)
Price Scenario
Farm Value per Gallon
Your Share
Goes to Processing & Retail
2025 all-milk avg ($21.17/cwt)
$1.82
44.9%
$2.23
2026 all-milk forecast ($18.95/cwt)
$1.63
40.2%
$2.42
Jan 2026 Class III actual ($14.59/cwt)*
$1.25
31.0%
$2.80
*Class III is always lower than the all‑milk blend, which includes Class I & II. January’s all‑milk will be higher than $14.59, but the direction is the same. Farm values converted at 1 gallon ≈ 8.6 lbs; all‑milk and Class III from USDA WASDE/AMS, retail from BLS.
That bottom row is the punch in the gut. At January’s actual Class III, $2.80 of every $4.05 gallon goes to processing and retail. And here’s the part that should bother you: ERS only tells you the farm share versus “marketing share” — it doesn’t break that $2.80 into processor margins, retail markups, transportation, or packaging. It’s one big opaque slice.
2025 will be remembered as a year of “margin capture through arbitrage in the middle of the supply chain. Dairy markets worked—just not for dairy farmers. Senators Kirsten Gillibrand (D‑NY) and Susan Collins (R‑ME) responded by introducing the Fair Milk Pricing for Farmers Act (S.581) in February 2025, which would require audited dairy processor cost surveys every two years under the Agricultural Marketing Act of 1946. Until something like that passes, your milk check is funding a mid‑chain marketing share nobody has to itemize.
That’s not a neutral market adjustment. It’s a price discovery system that keeps the shelf price stable, preserves every margin between your bulk tank and the dairy case, and hands the entire “flex” to your end of the deal. The four‑dollar gallon isn’t stability. It’s a subsidy running in the wrong direction.
The 234.5‑Billion‑Pound Elephant in the Room
So if the money’s not showing up in your milk check, where is all this milk coming from?
USDA’s January Livestock, Dairy, and Poultry Outlook had 2026 milk output at 234.3 billion pounds on 9.555 million head, averaging 24,520 lbs/cow. The February WASDE nudged that up to 234.5 billion pounds, citing a slightly larger herd and continued productivity gains. November 2025 production was already running 4.5% above the prior year, with 211,000 more cows on feed and per‑cow output up 2.1%.
On the consumer side, that $4.05 national average hides a range from roughly $3.50/gallon in parts of the Midwest to more than $4.80 in some Northeast urban markets. The 2022 annual average peaked closer to $4.20 after mid‑year spikes above $4.30, then slid back and basically flat‑lined. And as we outlined in “USDA Says $18, Futures Say $16: The $150K Gap That’s Rewriting 2026 Dairy Budgets,” spot and futures markets have consistently priced a weaker Class III than USDA’s annual averages suggest.
The February WASDE bumped all‑milk to $18.95 and Class III to $16.65/cwt, up 30¢ from January’s $16.35 forecast. But January’s actual Class III was still $14.59, and December’s was $15.86. That means the back half of 2026 has to do a lot of heavy lifting to deliver the annual average USDA now has in its spreadsheet.
How This Lands on a Real Operation
Let’s bring this down to barn level.
A 550‑cow Wisconsin dairy recently sat down with a farm financial counselor through an Extension‑affiliated program and pulled a full cost‑of‑production analysis. The producer thought his all‑in cost was about $17.25/cwt. When the spreadsheet included market‑rate family labor, real depreciation, current interest on all repriced debt, and health insurance, the true number came back at $18.75/cwt — right in line with UW Extension’s $18–$19/cwt benchmarks for mid‑size herds in the region. That $1.50 gap represented roughly $200,000 in annual losses he hadn’t really accounted for.
The cash‑flow picture was worse. Total liquidity: $227,000. Monthly burn at current prices: about $21,000. That’s eleven weeks of runway, not the five or six months he’d been carrying in his head.
Here’s what changed everything. Within 48 hours, he:
Culled his 10 worst feed‑to‑milk converters, bringing in roughly $22,000 in cash and cutting daily feed cost by about $85.
Walked into his lender’s office with a 12‑month projection at $18/cwt and a real cost‑of‑production sheet.
Negotiated reamortization on equipment debt (from seven years to twelve) and four months of interest‑only on real estate.
The lender said yes. Monthly burn dropped from $21,000 to roughly $13,500. Same cows. Same parlour. New math.
That 48‑hour response is the difference between survival and bankruptcy in this kind of year. Not new genetics. Not a magic ration. Not a unicorn contract. Just running the real numbers, believing what they tell you, and moving beforethe runway disappears.
Most producers who lose their operations in a down cycle don’t lose them because the math was impossible. They lose them because they ran the math three months too late. The difference between “tight but okay” and “weeks from the wall” is often just one honest accounting exercise.
The Beef Check Holding It All Together
On a growing number of dairies, the milk margin alone isn’t keeping the lights on. Beef is.
High Ground Dairy’s October 2025 analysis — based on a representative 1,000‑cow model — estimates beef‑related income north of $4.50/cwt of milk shipped, with seven of the next twelve months projected above $5.00/cwt. Those forward numbers are modeled, not guaranteed, but they reflect what you’ve seen in your own calf checks and cull slips.
On that 300‑cow herd shipping 69,000 cwt, $4.50/cwt in beef income adds up to about $310,000 a year — coming from the cattle market, not the milk market. Strip it out and ask honestly whether your milk margin alone services your current debt with all‑milk at $18.95 and Class III at $16.65.
That beef check didn’t come free. CoBank’s August 2025 Knowledge Exchange report, authored by Corey Geiger and drawing on NAAB data, notes that beef semen sales into dairy nearly tripled from 2.5 million units in 2017 to 7.9 million in 2024. Conventional dairy semen sales fell hard over the same period.
Every beef‑cross pregnancy is terminal. No heifer behind it.
USDA’s January 2025 Cattle report shows dairy replacement heifers at a 20‑year low of 3.91 million head, down 18% from 2018. Geiger’s analysis highlights how that shortage shows up in prices: average dairy heifer values of $3,010/head in July 2025, up 164% from $1,140 in April 2019, with top sales in California and Minnesota clearing above $4,000/head. CoBank projects the heifer inventory will shrink by another 800,000 head over the next two years before stabilizing.
So yes, the beef check is saving a lot of balance sheets in 2026. It’s also mortgaging your replacement pipeline for the next three to four years.
When Beef Softens—Stress‑Testing the Safety Net
Cattle markets move in cycles. CattleFax’s outlook at CattleCon 2026 in Nashville earlier this month put the average 2026 fed steer price at $224/cwt, roughly steady with 2025, and cull cows around $155/cwt. COO Mike Murphy called current levels “near cyclical highs” and described a slow, measured expansion phase, as high input costs and producer demographics cap herd rebuilding.
That suggests beef could stay supportive through 2026. But that’s not an excuse to skip the stress test.
A 30–40% drop in beef prices — well within range for a down cycle — would shave roughly $90,000–$125,000 off that $310,000 in annual beef revenue on a 300‑cow herd. You’d feel it on both sides: beef‑on‑dairy calf checks shrink, and cull revenue falls, while replacement heifers remain tight and expensive. Heifers won’t suddenly get cheap just because beef does; the structural shortage is baked in.
CoBank’s August 2025 work also points out that dairy producers have effectively “hoarded” about 611,600 cows from slaughter since Labor Day 2023, compared to the trend. If beef softens enough that everyone starts shipping at once, those cows hit the rail together — and the cull market falls harder. That’s how a softening beef market can turn from a warning sign into a full‑on margin squeeze.
The Canada Contrast
North of the border, the Canadian Dairy Commission boosted the farm‑gate milk price 2.3255% effective February 1, 2026. The CDC’s formula is straightforward: half the change in indexed cost of production (up 2.7%) plus half the change in CPI (up 1.9%).
Two pieces of that matter if you’re milking cows in the U.S.:
When beef revenue is strong, it flows into Canada’s COP index as an offset, dampening their milk price increases. When beef weakens, the formula moves in the other direction. The system self‑corrects.
The CDC cost formula includes feed, labor, and energy. DMC only looks at feed. Every non‑feed cost that’s blown out since 2022 — labor, interest, insurance, repairs — is invisible in your U.S. safety net.
Of course, Canada’s stability comes at a high price. Ontario quota traded above $24,000 per kilogram of butterfat per day in 2025. That locks out new entrants and caps growth. But if the question is whether you can make a five‑year investment decision without guessing where Class III will land next January, the Canadian model offers something the U.S. structure doesn’t: a rulebook.
Four Paths—and What Each One Costs
Strategy
Upfront Cost / Action
Monthly Cash Impact
Long-Term Trade-off
Best Fit If…
Component Optimization
Ration/genetics adjustment
+$0.58/cwt (down from +$0.98 in 2025)
Feed cost now, fat revenue later—only if BF price recovers
Your plant pays component premiums & you can wait for BF rebound
DMC/DRP Enrollment (by Feb 26)
Premium ~$1,500–$3,000/yr for $9.50 Tier 1 (25% discount if 6-yr commit)
+$0.30–$0.60/cwt margin support (feed only)
Doesn’t cover labor, debt, energy squeeze
You’re ≤270 cows, feed is your main cost pressure, & you’re not enrolled
Lender Restructuring
Time + full COP analysis
−$2,390/mo (example: $500k note, 7→12 yr)
+$115,600 extra interest over loan life
Cash flow is tight (<6 mo runway) but operation is viable at $18–$19 milk
Strategic Exit
Appraisal, auction, legal fees
Lump-sum: cull/heifer/land at current highs
You’re out of dairy
3-yr projection at $18.95 milk leaves you with less equity than exiting now
1. Component Optimization
Breeding and feeding for butterfat has been the go‑to growth lane. But the payoff depends entirely on when you’re selling that fat.
Butterfat premium: same herd, two prices (400‑cow herd, 23,000 lbs/cow, 3.8% → 4.2% BF = 36,800 extra lbs fat/year)
If you’re still budgeting on 2025 butterfat prices, you’re overstating your 2026 margin by about $0.40/cwt before you even start the mixer. If your plant pays on straight hundredweight with no component bonus, the math is even uglier—you’re carrying the extra feed cost without seeing the fat check.
Trade‑off: Components still matter, but the days of butterfat bailing out every hole in the budget are on pause until that $/lb recovers.
2. Risk Management Enrollment—Before February 26
This one’s on a hard deadline.
The One Big Beautiful Bill Act (OBBBA) reinstated the Dairy Margin Coverage program for 2026–2031 and expanded Tier 1 coverage to 6 million pounds of production history at up to $9.50/cwt margin coverage. Producers who lock in all six years get a 25% premium discount, according to the University of Minnesota Extension’s January 27 enrollment guide. Production history is based on your highest marketings from 2021, 2022, or 2023.
Six million pounds covers roughly a 270‑cow herd at 22,000 lbs/cow. Everything above that needs to be managed with DRP, futures, or options. LRP can backstop your calf and cull revenue.
Trade‑off: DMC only sees feed costs. If your margin squeeze is coming from debt service, labor, or energy, DMC checks help the feed side, but don’t fix the whole picture. Minnesota producers should also look hard at the state’s DAIRI program, which ties about $3 million in state funds to DMC participation.
3. Lender Engagement—Early, With Real Numbers
The Wisconsin producer’s experience is the template.
Showing up with a full cost‑of‑production sheet, a 12‑month cash flow at $18–$19 milk, and a specific restructuring ask is a completely different conversation than showing up after you’ve bounced a check.
Reamortization math: $500,000 note at 7.5%
Metric
7-Year Term
12-Year Term
Difference
Monthly payment
$7,670
$5,280
−$2,390/mo (−31%)
Annual debt service
$92,040
$63,360
−$28,680/yr
Total interest paid
$144,200
$259,800
+$115,600
You buy yourself $2,390/month of breathing room. It costs you about $115,600 in extra interest over the life of the loan. That’s the price of survival time. It might be the smartest money you ever “spend” — or a trap that keeps you grinding at breakeven for another decade.
4. Strategic Exit While Asset Values Hold
Cull cows are still historically strong. Heifers are historically tight. Land values in a lot of dairy regions are still holding.
That convergence won’t last forever. A controlled dispersal while beef and heifer markets stay firm may protect more family equity than grinding through three more years of thin or negative margins.
Trade‑off: Put hard numbers on “stay” vs. “go.” If a realistic three‑year plan at $18.95 all‑milk and $16.65 Class III leaves you with less net worth than exiting this year at today’s cull, heifer, and land prices, you’re not just hanging on — you’re burning equity.
What This Means for Your Operation
Pull your full economic cost of production this month. Include market‑rate family labor, depreciation, interest at current rates, and insurance. If you’re a mid‑size Upper Midwest herd and your real COP is above $19/cwt, the new $18.95 all‑milk forecast still leaves you below water on a full‑cost basis, even before you stress‑test beef.
Re‑run your 2026 plan at $18.95 all‑milk and $16.65 Class III. Use the February WASDE numbers, not January’s $18.25. Then layer in what you’ve actually been paid so far — January’s $14.59 Class III and your local basis. If your DSCR drops below 1.0 in that scenario, the lender conversation needs to happen in the next 30 days, not after planting.
Enroll in DMC before February 26 if you’re eligible. At $9.50/cwt, Tier 1 on 6 million pounds with a 25% premium discount is cheap margin insurance for the feed side of your budget. DMC won’t solve your whole problem, but it’s a mistake to leave it on the table if you qualify.
Stress‑test your dependence on the beef check. Take your last 12 months of calf and cull revenue per cwt. Knock it down 40%. If your operation swings from positive to negative cash flow on that single change, you’re not just a dairy — you’re a leveraged beef play.
Reprice your component strategy at January 2026 values. Don’t carry 2025’s $2.44/lb into a world where butterfat is paying $1.45/lb. If your component‑chasing feed cost doesn’t pencil at $0.58/cwt extra revenue, adjust the ration or the breeding plan.
Count your runway honestly. Total cash + undrawn operating line, divided by true monthly burn rate, gives you months of runway. Under six months means it’s time to call the lender, the nutritionist, and your Extension economist. Under three months means you’re in triage.
Key Takeaways
USDA’s February WASDE raised the 2026 all‑milk forecast to $18.95/cwt, but ERS puts average 2,000‑plus cow herds at $19.14/cwt and the smallest herds near $42.70/cwt. That means even the “efficient” size class is essentially breakeven on a full‑cost basis. 1
January’s actual Class III at $14.59/cwt and December’s $15.86 are still well below the new annual averages. If your budgets quietly assume the back half of 2026 will bail out the first half, you’re betting against recent history.
Dairy farmers’ share of the retail dairy dollar slipped from 28¢ in 2022 to 25¢ in 2024, while the average gallon price stayed near $4.05. Consumers didn’t feel the pain; the middle of the chain kept its cut; your share shrank.
The beef check is doing more work than most producers are comfortable admitting. High Ground Dairy’s model shows $4.50+/cwt in beef income, and CoBank’s data tell you that money came from a replacement pipeline that’s now 800,000 heifers short and 164% more expensive.
The decisions you make in the next 30 days — DMC enrollment, lender conversations, cull strategy, and whether to chase components at 2026 prices — matter more than whether USDA’s March WASDE adds or subtracts another 25¢. You don’t control the forecast. You do control how quickly you move when the math changes.
The Bottom Line
Where does your real breakeven sit against $18.95 all‑milk and $16.65 Class III, and how many months of runway do you have if beef softens and Class III spends more time in the mid‑fourteens than USDA’s spreadsheet suggests? That’s the comparison worth making before you load tomorrow morning’s first unit.
If you or someone you know in agriculture is experiencing stress or crisis, confidential support is available 24/7: the Suicide and Crisis Lifeline (call or text 988); the Farm Aid Hotline (1‑800‑FARM‑AID); or the AgriStress Helpline, Canada (1‑866‑267‑6255).
Complete references and supporting documentation are available upon request by contacting the editorial team at editor@thebullvine.com.
Learn More
The 90-Day Reckoning: What Your Milk Check Is Really Saying About 2026 – Stop guessing your liquidity and master the “burn rate” calculation that separates survival from insolvency. This breakdown arms you with a 90-day tactical roadmap to overhaul cash flow before interest rates and low Class III prices exhaust your credit.
Dairy’s Bold New Frontier: How Forward-Thinking Producers Are Redefining the Industry – Weaponize the 15-20% productivity gains found in “connected barns” where AI and robotics finally break the labor squeeze. This guide reveals how forward-thinking producers are using technology to thrive in a high-cost environment that punishes traditional management habits.
The Sunday Read Dairy Professionals Don’t Skip.
Every week, thousands of producers, breeders, and industry insiders open Bullvine Weekly for genetics insights, market shifts, and profit strategies they won’t find anywhere else. One email. Five minutes. Smarter decisions all week.
$18.95 milk, $19.14 costs, 29% of income from government checks. If any one of those moves against you, what happens to your dairy?
Executive Summary: USDA’s February outlook has 29% of U.S. net farm income coming from government checks in 2026, with $44.3 billion in payments propping up a farm economy that would otherwise drop to about $109 billion in net income. At the same time, the February WASDE raised the 2026 all‑milk price to $18.95/cwt, while USDA‑ERS cost‑of‑production data put average 2,000‑plus cow herds at $19.14/cwt and the smallest herds near $42.70/cwt. For a 300‑cow, 23,000‑lb herd, that price reset from $21.17 to $18.95 still means roughly $153,000 less gross milk revenue before you even count feed, labor, and debt. This article walks the math by herd size, then lays out four real levers you can pull — beef‑on‑dairy, component premiums, feed cost protection, and risk‑management tools like DMC — with the upsides and trade‑offs spelled out in plain language. It uses real operations and named analysts to show how those choices are playing out on the ground, from McCarty Family Farms’ genomic beef‑on‑dairy strategy to DFA’s $2.50–$3.00/cwt revenue bump and Ever.Ag’s “street fight” warning. It finishes with concrete thresholds and questions for sub‑200, 200–999, and 1,000‑plus cow herds so you can see whether you’re running a market‑based margin, a subsidy‑dependent margin, or whether it’s time to use today’s strong cattle markets to exit on your own terms.
Twenty-nine cents of every dollar of U.S. net farm income now comes from government payments. For dairy, those numbers hit even harder. USDA’s February 4 forecast projects $44.3 billion in direct payments for 2026 — up 45% from roughly $30.5 billion in 2025, according to USDA-ERS data analyzed by the American Farm Bureau Federation. Strip those payments out, and net farm income drops to approximately $109 billion, representing a roughly 9% real decline from 2025’s non-government income, per Econbrowser’s analysis.
The headline — $158.5 billion in net cash farm income — looks stable. Almost comfortable. But USDA forecasts dairy milk receipts dropping $6.2 billion (12.8%) this year. And while today’s February WASDE raised the 2026 all-milk price to $18.95/cwt — up 70 cents from January’s projection — January’s actual Class III still posted at just $14.59/cwt. The forecast improved. The checks haven’t caught up yet.
The $25 Billion Revision Nobody Expected
Start with what happened to 2025. USDA cut last year’s net farm income estimate by $25 billion, from $179.8 billion projected in September, down to $154.6 billion. Production expenses got revised up to $473.1 billion. Government payments came in about $10 billion below earlier projections, at $30.5 billion versus a September estimate near $40.5 billion.
AFBF’s Danny Munch, co-author of the Farm Bureau’s Market Intel analysis, called this “a generational downturn rather than a temporary slowdown.” Total farm debt is projected at $624.7 billion for 2026, up $30.8 billion (5.2%), with the debt-to-asset ratio climbing from 13.49% to 13.75%.
Where are those aid dollars going? Purdue University’s Ag Economy Barometer found that a majority of farmers report using government payments primarily to pay down existing debt — not to reinvest.
Dairy’s Revenue Problem — Even After Today’s WASDE Bump
Today’s February WASDE brought some relief. USDA raised all 2026 dairy product price forecasts — cheese up 2 cents to $1.6050/lb, butter up 7 cents to $1.68/lb, NDM up 11 cents to $1.3150/lb, and whey up 2 cents to $0.69/lb. The result:
All-milk price: Raised to $18.95/cwt for 2026, up 70 cents from January’s $18.25 projection. That’s still down $2.22/cwt from the revised 2025 average of $21.17. Better than last month. Still a significant revenue hit.
Class III: Raised to $16.65/cwt, up 30 cents from $16.35. Class IV got the bigger bump — up $1.25 to $15.70/cwt — largely on stronger NDM and butter price assumptions. But January’s actual Class III of $14.59 and December’s $15.86 are both well below the new annual average, meaning the back half of 2026 needs to do a lot of heavy lifting for your budgets.
Milk production: Raised to 234.5 billion pounds, up 200 million from January’s estimate. The national herd was up 202,000 head year over year in Q4 2025, with December production running 4.6% above the prior year. RFD-TV noted output “driven by the largest milk cow herd in decades and higher per-cow productivity.”
DMC margins: January’s Dairy Margin Coverage margin is projected at $7.57/cwt — a full $1.93 below the $9.50 trigger. That’s the first meaningful DMC payout since December 2025 and signals the kind of margin compression producers should plan for, not just hope for.
Month
All-Milk Price ($/cwt)
Feed Cost ($/cwt)
Actual Margin ($/cwt)
DMC Payout at $9.50 Coverage
Dec 2025
$14.59
$6.02
$8.57
$0.93
Jan 2026
$14.35
$6.78
$7.57
$1.93
Feb 2026 (proj)
$15.10
$6.85
$8.25
$1.25
Mar 2026 (proj)
$15.80
$6.90
$8.90
$0.60
Apr 2026 (proj)
$16.20
$7.00
$9.20
$0.30
May 2026 (proj)
$17.00
$7.15
$9.85
$0.00
Jun 2026 (proj)
$17.50
$7.20
$10.30
$0.00
Munch told Brownfield Ag News the receipts decline “would put dairy down about 35% over five years.” CoBank’s Corey Geiger noted butterfat production was running 5–6% above year-ago levels heading into 2026, volume even strong demand can’t easily absorb. The February WASDE’s butter price raise to $1.68/lb signals USDA sees some floor forming, but that’s still well below 2024 peaks.
Mark Stephenson at UW-Madison put it plainly in an April 2025 Bullvine interview: “Operations with weaker financial positions or higher production costs could face heightened pressure, potentially leading to further consolidation within the sector.”
The $23.56 Cost-of-Production Gap — And Why Feed Isn’t the Problem
USDA’s Economic Research Service published updated cost-of-production estimates by herd size in August 2024, based on the 2021 ARMS dairy survey. The spread: $42.70/cwt for herds under 50 cows. $19.14/cwt for operations with 2,000 or more. A $23.56 gap. And at $18.95 all-milk, even the lowest-cost tier is essentially breakeven on a full economic basis.
The instinct is to blame the feed. But feed costs account for a surprisingly small share—roughly $3/cwt or less. USDA’s own report to Congress showed feed differing by less than $1/cwt between mid-size and the largest herds. Agri-benchmark’s international analysis (using 2016 ARMS data, directionally consistent with the 2021 update) confirmed the pattern: feed and other direct costs differ by only about 28% across size classes. The real drivers sit elsewhere.
Cost Category
<50 cows
50-99 cows
100-199 cows
200-999 cows
2,000+ cows
Labor
$12.00
$8.50
$5.20
$3.10
$2.20
Feed
$3.50
$3.40
$3.20
$3.00
$2.90
Overhead
$15.20
$10.80
$7.60
$4.50
$3.10
Other Direct
$5.00
$4.30
$3.80
$3.20
$2.80
Opportunity Cost (Land, Capital)
$7.00
$5.50
$4.20
$3.10
$2.44
TOTAL ($/cwt)
$42.70
$32.50
$24.00
$16.90
$19.14
Labor eats the biggest piece. Small herds carry roughly $12/cwt in labor costs — mostly imputed value of unpaid family hours. Large operations run about $2.20/cwt. Nearly $10 of the gap is from one line item. And larger farms generally pay higher cash wages. NASS Farm Labor data shows livestock worker wages rising roughly 7% per year in both 2021 and 2022, reaching $16.52/hr by October 2022. The cost advantage comes from output per labor dollar—not lower pay.
Overhead is the silent killer. Barns, parlors, mixers, insurance — a 50-cow dairy needs roughly the same equipment categories as a 2,000-cow operation. But the big barn spreads those fixed costs across 40 times as much milk. Agri-benchmark found that overhead costs decrease approximately fivefold from the smallest to the largest herds.
Productivity per cow compounds everything. A 2,000-cow herd pushing 24,000–25,000 lbs/cow generates 30–40% more milk per stall, per parlor turn, per dollar of overhead than a 50-cow herd at 15,000–16,000 lbs. That compounds every other cost advantage.
These are national averages. Regional differences matter for a lot of herds: Western large-herd operations in Idaho, the Texas panhandle, or California’s Central Valley face different overhead structures — water, environmental compliance, land prices — than Upper Midwest grazing operations in Wisconsin or proximity-to-market herds in the Northeast. Top-quartile producers within each size class typically run $3–$5/cwt below these averages, per the ARMS data.
The Finding That Cuts Both Ways
Here’s where the data gets genuinely interesting. Hoard’s Dairyman’s analysis of the 2021 ARMS data (Table 9) found that low-cost producers in the 100–199 cow range operate at $19.76/cwt. High-cost producers in the 2,000-plus range run $19.63/cwt. Essentially identical.
The best-managed 150-cow dairy can match the average cost structure of a 2,000-cow operation. So the question isn’t whether you’re big enough. It’s whether you’re sharp enough.
Ask a Wisconsin 150-cow operator who benchmarks through Farm Business Management whether size is destiny, and you’ll get a different answer than the national averages suggest. But flip it around: the average 100–199 cow herd runs closer to $24–$26/cwt. Even with today’s bump to $18.95 milk, the distance between “best in class” and “average” in that cohort is the difference between a thin margin and a steady cash drain. Bradley Zwilling at the University of Illinois Farm Business Farm Management Association confirmed this in January 2026: Illinois operations can “squeak out a profit margin” on a cash basis, he told Brownfield Ag News, but “from an economics standpoint, we’ve got lots of negative numbers.”
For many operations, that gap — between cash-basis survival and full economic viability — is a significant part of the 29% government payment dependency measured at the national level.
How One Kansas Operation Reads the Numbers
When Ken McCarty looked at the cost-of-production math, the direction was clear long before the latest USDA revision. McCarty Family Farms, a roughly 20,000-cow operation in Colby, Kansas, has genomically tested more than 75,000 females since 2018. Their rule is simple: the top half by genomic index gets dairy semen; the bottom half gets beef — no exceptions.
That discipline matters when you see the $2.50–$3.00/cwt in added non-milk revenue that DFA’s chief milk marketing officer Corey Gillins says beef-on-dairy is generating across about 70% of their membership. McCarty markets beef-cross calves as day-olds — eliminating the feed and labor burden rather than retaining ownership. According to Laurence Williams, Purina’s dairy-beef cross development lead, day-old beef-on-dairy calves now average roughly $1,400 per head, up from about $650 three years ago — and Hoard’s Dairyman confirmed in March 2025 that dairy-beef calf prices “continued to skyrocket, reaching historical highs” nationally.
“The value of genomic testing has evolved over time,” McCarty has said — a characteristically understated way of describing a system that generates real revenue from what used to be a bottom-of-the-barrel calf. Farm Journal named McCarty Family Farms the 2025 Leader in Technology for exactly this kind of integration.
Four Margin Levers — And What Each One Costs You
Beef-on-dairy. The McCarty model works, but it demands investment: genomic tests run about $40–$50 per calfthrough providers like Zoetis or Neogen for medium-density panels, per The Bullvine’s November 2025 analysis. Lower-density tests start as low as $15–$38, but commercial dairies optimizing beef-on-dairy splits typically need the fuller panels. The trade-off: overcommit to beef sires and you risk a replacement shortage — with dairy replacement heifers at $3,010 per head nationally as of July 2025 per USDA, that’s an expensive gamble. Wrong sire selection on calving ease creates problems that erase the revenue gain entirely.
Component premiums. Gillins notes rising component values are adding $1–$3/cwt to milk checks, even in Holstein herds. Today’s WASDE bump in cheese (+2¢/lb), butter (+7¢/lb), and NDM (+11¢/lb) supports that thesis short-term. The trade-off: component improvement requires consistent nutrition programs and genetic changes that take 2–3 lactations to express. Medium-term play, not a quick fix.
Feed cost protection. Corn at $4.10/bushel (USDA’s January WASDE season-average farm price) remains genuine multi-year relief — and today’s February WASDE raised corn exports to a record 3.3 billion bushels without materially moving price forecasts. Locking 50–60% of Q2–Q3 needs now protects against upside risk. The trade-off: if grain falls further, you forgo additional savings. But at current levels, the floor matters more than the ceiling for cash flow.
Risk management enrollment. DMC enrollment for 2026 is open. With January’s margin projected at $7.57/cwt — $1.93 below the $9.50 trigger — the program is already paying. The February WASDE price bump may narrow DMC payouts in later months, but margins remain tight enough to justify coverage. The trade-off: premium costs are real, and DRP basis risk varies by plant and FMMO class.
The Consolidation Math Keeps Running
The 2022 Census of Agriculture recorded roughly 24,000 dairy operations — down 39% from 2017. DFA projects just 5,100 member farms by 2030. Cows from exiting operations are absorbed by expanding members in growth regions — Idaho, southwest Kansas, Michigan, and, increasingly, southern Georgia and northern Florida.
Ever.Ag Insights president Phil Plourd doesn’t sugarcoat what’s ahead. “It is a street fight, in terms of figuring out ways to stay relevant, to get more productive, to stay ahead of the curve, to manage risk better.” And the beef market adds a wild card: “Will high beef prices make producers stay — keep the quasi cow-calf thing going — or will they make them go, use high cattle prices to pave the exit ramp? There’s no way to know for sure.”
Hanging over everything: baseline projections from FAPRI at the University of Missouri show total government payments potentially falling from about $53 billion in FY25 to $32 billion by FY27 as temporary programs expire. FAPRI director Pat Westhoff confirmed in the institute’s April 2025 baseline that the longer-term outlook “shows a return to a downward trajectory in 2026,” and Terrain’s John Newton separately told Brownfield in May 2025 that 2025 incomes are “being propped up by over $30 billion dollars in government subsidies and disaster relief” with “no relief packages factored in the 2026 projections.”
CBO’s own February 2026 farm programs baseline shows dramatically higher near-term spending on crop programs — underscoring the cliff that forms when ad hoc payments expire. A $21 billion drop.
Signals to Watch This Quarter
February WASDE follow-through — USDA raised all 2026 dairy prices today, with all-milk up 70 cents to $18.95. But January’s actual Class III of $14.59 and December’s $15.86 are both well below even the old annual forecast. The question for your budgets: can the second half of 2026 actually deliver the recovery USDA’s annual average implies?
Spring Class III/IV divergence — Class IV got the biggest WASDE bump (+$1.25 to $15.70), while Class III moved only 30 cents to $16.65. Watch whether that spread continues widening, because it shifts risk for operations on Class III-heavy pay plans.
NASS March Milk Production report — will confirm whether herd expansion is accelerating past 202,000 head or plateauing. USDA raised 2026 production to 234.5 billion pounds today. RFD-TV notes that higher slaughter rates suggest some adjustment has begun, but beef-on-dairy revenues are softening the immediate exit signal.
DFA and regional co-op component premium announcements — any reductions signal processors repricing the butterfat surplus Geiger flagged.
What This Means for Your Operation
If you run fewer than 200 cows: Your most important number right now is full economic cost of production — including family labor, depreciation, and return on capital. Compare it to the USDA-ERS benchmarks from the 2021 ARMS. If you’re above $25/cwt, the gap to $18.95 milk is still over $6/cwt — roughly $140/cow annually on a 20,000-lb herd. Today’s WASDE bump helps at the margins, but it doesn’t close that gap. The Hoard’s data shows the best operators in your size class run below $20—where does yours sit? And if your dairy is part of a diversified operation, the COP threshold shifts — but the question of whether the dairy enterprise stands on its own economics still matters for long-term capital allocation.
If you run 200–999 cows: A 300-cow herd averaging 23,000 lbs/cow produces roughly 69,000 cwt annually. The updated all-milk price decline from $21.17 to $18.95 — a $2.22/cwt drop — means approximately $153,000 in gross lost milk revenue versus 2025. Component premiums and marketed volume adjustments may reduce the net hit to $100,000–$130,000 for many operations, but the math is still unforgiving. Beef-on-dairy, component optimization, and feed cost protection are your most accessible near-term levers. Run the numbers before spring breeding decisions lock in.
If you run 1,000-plus cows: Your cost structure likely generates some market-based margin at $18.95 milk — the 2,000+ average of $19.14 is now just 19 cents above the all-milk price. Razor-thin. Stress-test against $16.65 Class III— where the February WASDE now projects the 2026 average — and check your debt service coverage ratio at that level. If DSCR is thinning toward 1.25 or below, talk to your lender now, not after a bad quarter forces the conversation.
Key Takeaways
Pull your full economic cost of production this month. Compare honestly to the $18.95 milk, the new February WASDE all-milk figure. That single comparison tells you whether your operation generates market-based margin or subsidy-dependent margin.
Calculate your government payment share of the 2025 net income. If it’s approaching 25–30%, model what your books look like if payments fall by a third, which FAPRI baseline projections and CBO’s February 2026 farm programs baseline both suggest could happen as ad-hoc programs expire.
Evaluate beef-on-dairy economics. At $2.50–$3.00/cwt added revenue across DFA’s membership, the entry cost ($40–$50/head genomic testing through Zoetis or Neogen, plus sexed semen) has a short payback — but only if you have the heifer pipeline to support it. With replacements at $3,010/head nationally as of July 2025, every breeding decision carries more weight than it used to.
Lock feed costs while corn sits near $4.10. It won’t close a revenue gap alone, but it protects cash flow against the one input you can actually control right now.
If your margin is structurally negative even at $18.95 milk and with feed relief, model exit timing now. Replacement heifers hit $3,010/head nationally in July 2025, up from $2,660 in January 2025 and $1,720 in April 2023, per USDA data. Strong cull cow prices mean a planned dispersal captures far more value than a forced one later. The risk: if you sell alongside a wave of other exits, buyer fatigue compresses values before you close. Planning beats reacting.
Track USDA’s quarterly replacement heifer prices. If the national average drops back below $2,500, it’s a signal the exit window may be narrowing faster than it looks on paper.
Asset/Income Source
Planned Exit (2026)
Forced Exit (2027-28 Scenario)
Value Difference
Replacement Heifer Price
$3,010/head
$2,200/head
-$810/head
Cull Cow Price
$140/cwt (1,300 lb)
$95/cwt (1,300 lb)
-$585/head
Dairy Equipment (% of replacement)
75-85%
45-60%
-25-30%
Herd Sale (300 cows)
~$903,000 (replacements)
~$660,000 (replacements)
-$243,000
Cull Value (80 culls/yr)
~$145,600
~$98,800
-$46,800
Land (if owned, $/acre premium)
Strong farmland demand
Softening as exits increase
-10-15%
The Bottom Line
The 29% is a national average. Your number is the one that matters. Today’s WASDE brought the all-milk forecast up 70 cents — welcome news, but not a rescue. And if you haven’t compared your full economic COP to your neighbor’s in the last twelve months, spring 2026 — with DMC paying, feed at multi-year lows, and breeding decisions ahead — is the time to do it honestly.
Complete references and supporting documentation are available upon request by contacting the editorial team at editor@thebullvine.com.
Learn More
Beyond the Milk Check: How Dairy Operations Are Building $300,000 in New Revenue Today – Stop the bleeding and start building a $300,000 revenue buffer. This operational breakdown delivers the exact tactics—from feed shrink management to strategic beef breeding—needed to stabilize your cash flow before market volatility erases your 2026 margins.
Beef-on-Dairy’s $3,000 Trap: 800,000 Missing Heifers and Who Pays the Bill – Expose the hidden risks in the industry’s biggest shift. This deep dive reveals the 800,000-heifer shortage that’s redefining replacement economics, arming you with the data to navigate $3,000 price tags and out-maneuver competitors in a tightening market.
The Sunday Read Dairy Professionals Don’t Skip.
Every week, thousands of producers, breeders, and industry insiders open Bullvine Weekly for genetics insights, market shifts, and profit strategies they won’t find anywhere else. One email. Five minutes. Smarter decisions all week.
If more than half your milk goes to one plant and you don’t have a 72-hour Plan B, this story is about you.
Executive Summary: An Argentine processor, Lácteos Verónica, collapsed in 2025–26, leaving about 150 dairy families with roughly $60 million in unpaid milk and 3,843 bounced checks, while one small tambo that switched buyers early limited its losses. That story, paired with Dean Foods’ 2018 contract terminations, shows how even strong herds get wrecked when most of their milk goes to a single buyer, and the money stops. The article backs this up with current data on Argentina’s consolidation, rising U.S. Chapter 12 filings, roughly 1,420 U.S. dairy farms lost in 2024, and Wisconsin’s drop to about 5,100 herds, arguing that processor risk—not imports—is the real fault line under 2024–2026 margins. For your farm, it boils processor risk into a four-question audit: how concentrated your milk check is, how many days of true cash runway you have, whether you’d act on early warning signs, and who can take your milk within 72 hours if your current buyer fails. It offers practical markers—like targeting 90 days of operating reserves and keeping any one buyer below 50% of your volume, where the market allows—while being honest that some regions have only one realistic plant. The piece finishes by tying the math back to legacy, contrasting families who waited for “patience” with those who moved while they still had choices, and leaves you with a simple challenge: if your processor stumbled tomorrow, would you be Sedrán—or her neighbors?
In April 2025, an Argentine dairy processor started falling behind on payments to its farmers. By mid-year, the checks weren’t just late—they were bouncing. Within months, Lácteos Verónica owed roughly $60 million to about 150 dairy families across Santa Fe province, according to reports from iProfesional and AgroLatam in January 2026. Whether it’s a dairy processor payment default in South America or a contract termination in the Midwest, the math doesn’t change — if you’re shipping most of your milk to one buyer right now, this is a case study in processor risk that could play out anywhere.
Here’s the question worth sitting with: if your processor stopped paying next month, would you have 90 days of oxygen and a Plan B—or would you be feeding cows for free while waiting on lawyers?
April 2025: When Lácteos Verónica Went Silent
Producer Cecilia Sedrán works 60 hectares and runs a small tambo (dairy farm) near San Genaro, Santa Fe. Her family produces about 1,500 liters of milk a day and had been shipping to Lácteos Verónica since 2011, as she described in interviews with both TN Campo (December 2025) and Bichos de Campo (November 2025). No off-farm income. No government backstop.
“Somos dos familias las que vivimos de esto. Lo que generamos todos los días es lo que reinvertimos. No tenemos otro ingreso.”
(“We’re two families that live off this. What we generate every day is what we reinvest. We have no other income.”) — Cecilia Sedrán to TN Campo, December 2025
In mid-2025, Lácteos Verónica’s checks started bouncing — and didn’t stop. Records from Argentina’s central bank, the BCRA, show exactly 3,843 checks to producers rejected by banks. Trucks still rolled. Milk was still left on the farm. Money didn’t show up.
Sedrán’s family switched processors by July 2025 — months before many of their neighbors acted, according to Bichos de Campo. That move limited their exposure to roughly one month of unpaid milk. Other tambos around San Genaro stayed on the route, hoping things would turn. TN Campo reported in December 2025 that some farms now carry unpaid balances above 100 million pesos — around $100,000 USD at early-2026 parallel-market rates (Argentina maintains official and parallel currency markets; the parallel rate, used here, is the rate most commercial transactions actually reference) — and several have already closed or stand on the brink.
“Lo único que nos dicen es que tengamos paciencia.”
(“The only thing they tell us is to have patience.”) — as reported by TN Campo, December 2025
Dean Foods Did This in 2018 — Without the Bounced Checks
Argentina can feel like a world away from Wisconsin or Pennsylvania. But the underlying risk is the same.
Sedrán’s farm isn’t a hobby. Two families depend on it, as she told TN Campo. When Lácteos Verónica stopped paying, there was no Chapter 12 bankruptcy protection, no Dairy Margin Coverage, no FSA disaster loan to bridge the gap. Just a brutally simple choice: keep feeding cows and hope the processor catches up, or find another buyer before cash and credit run dry.
U.S. producers faced a softer-packaged version of the same thing when Dean Foods — then the largest milk processor in the country — terminated contracts with more than 100 farms across Indiana, Kentucky, Pennsylvania, Ohio, New York, Tennessee, North Carolina, and South Carolina in early 2018. As Jayne Sebright, executive director of Pennsylvania’s Center for Dairy Excellence, told Farm and Dairy at the time, the cancelled suppliers were “excellent family farms” — including “young dairy families that have really invested in their farms.”
They weren’t bad operators. They were good dairies tied to the wrong buyer at the wrong time.
The real difference? U.S. farms at least had a structured legal path and some federal program options. Sedrán’s neighbors had bounced checks and a processor literally telling them to “have patience.”
The Comparison: Why This Matters to You
You might think Argentina’s economy is a special case of chaos. But look at the mechanics of the failure. It’s the same plumbing, just a different leak.
Risk Factor
Argentina — Lácteos Verónica (2025–26)
United States — Dean Foods (2018)
The Warning
3,843 bounced checks (BCRA data)
Sudden contract termination notices
The Fallout
≈$60 million USD in unpaid milk across ~150 tambos; 3 plants paralyzed (Suardi, Lehmann, Totoras); ~700 workers at risk (per AgroLatam, Jan 2026)
100+ farms across 8 states forced to find new buyers within ~90 days; multiple plants closed or sold
The Safety Net
Ineffective — legal processes exist but take years while inflation erodes value; producers are told to “have patience.”
Lácteos Verónica defaulted on payments already owed — milk that had already left the farm. Dean Foods cut ties going forward—devastating, but a different kind of pain. Both left producers scrambling for somewhere to ship milk within days.
The Reality Check: On a 300-cow herd shipping 90 lbs/cow at $18/cwt, a 30-day payment failure is a $145,800 hole in your balance sheet. That isn’t a “bad month” — for many, that’s the end of the road.
Herd Size
Daily Production
Milk Price
Monthly Production Value
30-Day Payment Hole
100 cows
75 lbs/cow
$18.00/cwt
$40,500
$40,500
300 cows
90 lbs/cow
$18.00/cwt
$145,800
$145,800
500 cows
85 lbs/cow
$18.00/cwt
$229,500
$229,500
750 cows
88 lbs/cow
$18.00/cwt
$356,400
$356,400
1,000 cows
90 lbs/cow
$18.00/cwt
$486,000
$486,000
Roberto Perracino, president of Santa Fe’s Meprosafe producer group, told LT9 radio in late December 2025: “El año empezó muy bien, con buenos precios y rentabilidad que permitían pensar en invertir. Pero desde mitad de año todo se desmoronó.” (“The year started very well, with good prices and profitability that allowed you to think about investing. But from mid-year, everything collapsed.”)
He added that while annual inflation ran about 30%, milk prices recovered only 8%, while feed, fuel, and silage costs jumped by 25% to 70%.
You’ve seen that movie. Think 2014 highs sliding into the 2015–16 gut punch, or the optimism of late 2022 crashing into 2023’s margin squeeze. The difference in this Argentine case is the snap: solid margins in Q1, followed by a processor meltdown before year’s end. No slow fade. A cliff.
Argentina’s Processor Crisis Is America’s Preview
Argentina has already sprinted decades down the consolidation road the U.S. is still running on. Perracino himself put it plainly on LT9: the country went from 35,000 tambos in the 1970s to fewer than 9,000 today.
Metric
Argentina
United States
Peak dairy farms
~35,000 tambos (1970s, per Meprosafe/Perracino)
648,000 farms with dairy cows (1970, USDA ERS)
Current farms
9,013 tambos (end of 2025, OCLA/SENASA)
~24,470 dairy operations (2022 Ag Census)
Decline from peak
~74%
~96%
Avg cows/farm (Argentina)
~166 cows in 2025, up from ~162 in 2024
Similar “bigger survivors” pattern
OCLA data show that just 6.3% of Argentine farms now hold 27.6% of the cows and produce more than a third of the country’s milk. When that much volume is concentrated in a handful of big units, one decision in a boardroom reshapes an entire region’s milk market. And the mid-sized family tambos? They’re negotiating from the weak side of the table every single time.
Wisconsin knows the feeling. The state starts 2026 with about 5,100 licensed dairy herds — 5,115 to be exact, according to USDA NASS data based on Wisconsin DATCP’s Dairy Producer License list as of January 1, 2026. That’s down from more than 15,000 in the early 2000s. The Hartwig family is one example among many. When low prices nearly forced them to sell their Wisconsin herd in 2019, a local banker helped them restructure and survive, as the Milwaukee Journal Sentinel reported. Not every family gets that kind of lifeline.
Farm bankruptcy filings have climbed hard across the sector. American Farm Bureau Federation analysis of U.S. district court data shows 216 Chapter 12 farm bankruptcy filings in 2024 — up 55% from 2023. In 2025, that number hit 315, up another 46%. These are all-farm filings, not dairy-specific, but 120 of the 2024 cases were in the 24 major dairy states — and the Midwest dairy belt saw the steepest increases. Meanwhile, USDA data put 2024 dairy farm losses at around 1,420 licensed herds nationally — roughly a 5% drop in a single year.
Same pattern everywhere: mid-sized family dairies getting squeezed between thin farmgate margins and concentrated buyers who have options when you don’t.
Legacy at Risk: When the Tambo Is More Than a Business
Strip this down to dollars, and you miss the deeper loss.
Argentine coverage of the Lácteos Verónica crisis doesn’t just talk about pesos and liters. It talks about legacy. Many Santa Fe tambos have been in the same families since the 1960s and 1970s, often tracing back to Italian and Spanish immigrant settlers. As TN Campo reported in December 2025: “Para muchas familias, el tambo es un legado de generaciones. Hoy, sin ingresos y con deudas en aumento, varios deben abandonar la actividad.” (“For many families, the dairy farm is a generational legacy. Today, without income and with debts mounting, many must abandon the activity.”)
That kind of loss can’t be captured in a spreadsheet. And it plays out the same way in Wisconsin, Pennsylvania, or anywhere else a family’s identity is tied to land and livestock.
This Wasn’t an Import Story
You’ll hear folks pin Argentina’s dairy pain on “cheap imports.” The numbers don’t support that.
Argentina is a net dairy exporter. Argentine Agriculture Ministry data show 2025 dairy export value at $1.69 billion — the strongest performance in 12 years — with roughly 27% of total milk production going to export markets. Imports of milk powder and other dairy products remain small relative to what Argentina ships out.
The damage in this story came from inside the chain:
A major processor overextended and ran out of cash, racking up 3,843 bounced checks and tens of millions in unpaid milk.
Payments to farmers stopped while plants tried to keep running on fumes.
Smaller and mid-sized suppliers with no financial buffer absorbed the losses first.
That’s not a trade-war tale. It’s a processor-risk tale. And it’s worth separating the two, because U.S. dairies sit on the exact same fault line: a small number of large processors, thin margins, and no guarantee the company taking your milk today will still be solvent in three years.
Trade agreements like the EU–Mercosur deal and newer U.S.–Argentina frameworks do change long-term competitive dynamics. But in Sedrán’s case, the crisis didn’t start with someone else’s powder. It started with her own buyer’s balance sheet blowing up.
What This Means for Your Operation
This is where the story stops being about Argentina and becomes a planning session for your own farm. Four questions. Write down your honest answers.
Risk Factor
The Question
High Risk 🚨
Lower Risk ✓
Buyer Concentration
What % of your milk goes to one processor?
> 50% to single buyer
< 50%; multiple outlets
Cash Runway
How many days of operating expenses do you have in reserves?
< 30 days liquid cash
≥ 90 days accessible reserves
Early Warning System
Would you act on warning signs—or wait and hope?
“We’ll give them time”
Written response plan; quarterly processor health check
72-Hour Plan B
Who can take your milk within 3 days if your buyer fails?
No answer / “I’d have to call around”
Written list: alt plants, haulers, pricing
1. How exposed are you to one processor?
Pull your last 90 days of milk checks. If more than 50% of your volume went to a single buyer for that entire stretch, you’re effectively single-sourced.
In some regions, that’s just reality — one major plant within hauling range. But calling it “normal” instead of “high-risk” is exactly how good farms end up in the same spot as Sedrán’s neighbors.
If your number is north of 50%, start thinking about secondary outlets (co-ops, smaller plants, direct-to-consumer channels), contract terms that give you at least some flexibility, and how fast you could actually re-route part of your volume if you needed to. The goal isn’t to blow up a good relationship. It’s to stop pretending concentration doesn’t change the risk math.
2. What’s your cash runway?
Sedrán limited the damage because she had enough cash and credit to stop shipping while she found another buyer. Many of her neighbors didn’t, so they kept feeding cows for free.
Aim for at least 90 days of operating expenses in accessible reserves. On a 500-cow herd, that often means something like $250–$300 per cow in cash or near-cash, depending on your cost structure. Not a magic number — a starting point.
If you’re sitting at 20–30 days right now, don’t beat yourself up. Set a concrete goal to add 5–10 days of cushion each quarter for the next 18–24 months. Slow, boring progress beats “we’re fine” right up until you’re not.
3. Would you see the warning signs — and act?
Sedrán’s neighbors all saw signs: payment dates slipping, checks clearing more slowly, and local media reporting on the company’s financial troubles. Some took action. Others waited, hoping things would turn. You know which group came out ahead.
On your farm, warning signs might include payment schedules being “restructured,” vague responses when you ask about plant capacity, or rumors that your buyer is closing facilities in other states.
Pro-Tip: Watch the “Smoke” If your processor is a private company, ask your lender if they have seen a change in the speed of deposits from that specific entity. Bankers often see the “smoke” (slower clearing times) months before the “fire” (bounced checks).
Once a year, sit down with your lender, accountant, or advisor for a “processor health check.” Pull whatever public data you can — annual reports, credit ratings, news on plant expansions or closures. Ask the blunt question: is this buyer growing, stable, or shrinking? And what would we do if they suddenly “restructured” procurement?
4. What’s your 72-hour Plan B?
If your processor stopped paying tomorrow, who could realistically take your milk in 72 hours? Not six months. Three days.
Write it down: names of alternate plants or co-ops, haulers who could move milk there, rough price expectations in a distressed situation, and how many days you could afford to dump or divert before the bleeding matters.
Put that one-page plan in the same drawer as your emergency vet contacts and power-outage protocol. Make sure at least one other person on the farm knows it exists and where to find it.
Sedrán had enough runway and local options to move quickly. Her neighbors are now pursuing legal claims for their unpaid milk, according to Argentine press reports.
Your Processor Risk Checklist
Print this. Stick it on the office wall. Do the homework before you need to.
[ ] Identify your exposure: Is more than 50% of your milk going to one buyer? Pull 90 days of milk checks and find out.
[ ] Calculate your runway: Do you have 90 days of operating expenses in accessible cash or credit? If not, what’s the gap — and what’s your quarterly plan to close it?
[ ] Monitor the vibe: Are payments slowing down? Is communication getting vague? Schedule an annual “processor health check” with your lender or advisor.
[ ] Draft your 72-hour Plan B: Who gets the milk if the gate stays locked tomorrow? Write down names, haulers, and timelines. One page. Keep it where someone else can find it.
Key Takeaways
Processor failure is not abstract: Lácteos Verónica’s collapse left about 150 Argentine dairy families with roughly $60 million in unpaid milk and 3,843 bounced checks, while one family that switched early limited its loss to about a month.
The same pattern is already on your doorstep, with Dean Foods’ 2018 cuts, rising Chapter 12 filings, roughly 1,420 U.S. dairy farms gone in 2024, and Wisconsin down to about 5,100 herds showing how fast good operations can be stranded when most of their milk goes to one buyer.
For your farm, processor risk boils down to four questions: how concentrated your milk check is, how many days of true cash runway you have, whether you’ll move on warning signs, and who can take your milk within 72 hours if your current buyer stops paying.
The practical targets in this piece are simple but hard to ignore: aim for at least 90 days of operating reserves, keep any single buyer under 50% of your volume where markets allow, and put a written 72‑hour Plan B in the same drawer as your emergency vet numbers.
In the end, the difference between still milking and fighting over unpaid checks wasn’t luck or genetics—it was whether a family treated processor risk as a real threat and acted before hope was their only plan.
The Bottom Line
Cecilia Sedrán didn’t wait to find out how that bet would play out. She moved while she still had choices.
Do you?
Complete references and supporting documentation are available upon request by contacting the editorial team at editor@thebullvine.com.
Learn More
The Triple Cushion Trap: Why 2025’s Strong Margins Won’t Save You in 2026 – Gain an immediate survival checklist for the 2026 transition. This piece delivers a hard-hitting audit of contract terms and labor efficiency, arming you with specific management shifts needed to bridge the margin gap before financial cushions deflate.
The 18-Month Window: Why Your Lender Knows Your Dairy’s in Trouble Before You Do – Reveal the invisible timeline lenders use to grade your operation’s viability. This insight exposes how proactive planning preserves 40% more equity than waiting for a crisis, delivering the strategic advantage of choosing your own exit terms.
Four Farms Exit Daily: The $100K Decision Reshaping Dairy Survival – Arm yourself with unconventional revenue plays like beef-on-dairy and genomic precision that shift annual math by six figures. It breaks down why management effort alone can’t fix structural losses, delivering the innovation roadmap required to stay solvent.
The Sunday Read Dairy Professionals Don’t Skip.
Every week, thousands of producers, breeders, and industry insiders open Bullvine Weekly for genetics insights, market shifts, and profit strategies they won’t find anywhere else. One email. Five minutes. Smarter decisions all week.
17 days to the DMC deadline. Class IV is $1.50/cwt above Class III. If your DRP is weighted heavily on III, you’re insuring a check that doesn’t exist.
Executive Summary: NDM hit $1.64/lb on Friday — its best week since 2007 — putting milk powder 16.75¢ above Cheddar blocks. That’s not a blip. U.S. dryers produced just 2.143 billion pounds of NDM/SMP in 2025, the weakest since 2013, while the industry poured $11 billion into cheese plants that need more milk but don’t make powder. GDT confirmed the global story on February 3: the index surged 6.7%, SMP jumped 10.6%, and all seven product categories gained. The Class III/IV spread now sits at roughly $1.50/cwt—and every month you don’t restructure your DRP or optimize components, you’re subsidizing that spread from your own check. DMC enrollment closes February 26. Below: 4 moves before the deadline, the three structural constraints keeping powder tight, and the single production number that tells you whether this rally is real.
Nonfat dry milk surged 18¢ in a single week to settle at $1.64/lb on Friday, February 6 — the highest CME spot price since August 2022 and the strongest weekly gain since May 2007. That puts milk powder a full 16.75¢ above Cheddar blocks and within pennies of butter. For the first time in years, the product that the U.S. processing sector largely ignored is outpricing the one the entire industry was built around.
By Friday, MAR26 Class III futures were trading above $17/cwt through year-end, while Class IV — emboldened by surging NDM — was in the high $18s/cwt. DMC enrollment closes February 26. Just 17 days from today. Spring flush is six to eight weeks out.
Kevin Krentz, president of the Wisconsin Farm Bureau and a roughly 600-cow operator near Berlin, WI, knows what pool disadvantage feels like. He testified at the USDA Federal Milk Marketing Order hearing on August 31, 2023, that negative PPDs reached $9/cwt, costing his operation nearly $200,000 during the PPD crisis. The current Class III/IV spread is opening a similar gap — and the decisions you make about DRP coverage, component targets, and handler alignment right now determine which side of it you land on.
GDT Surges 6.7%: Powder and Mozzarella Lead a Clean Sweep
The Global Dairy Trade auction (TE397) on February 3 delivered a 6.7% jump in the price index — the third consecutive gain — with the average winning price firming to $3,830/MT across 24,034 tonnes sold and 175 bidders participating. SMP leapt 10.6% to $2,874/MT, and mozzarella matched it at +10.6% to $3,694/MT. Those two categories matter most for U.S. powder and cheese pricing.
Butter surged 8.8% to $5,773/MT, with Solarec’s Belgian C2 butter hitting $4,950 — up 9.6% from two weeks ago. AMF gained 5.0% to $6,524, WMP rose 5.3% to $3,614, cheddar added 3.8% to $4,772, and lactose ticked up 1.5% to $1,410. Trade commentary attributed part of the rally to Chinese restocking ahead of the Lunar New Year and seasonal MENA demand ahead of Ramadan, though GDT doesn’t disclose buyer-country data.
Phil Plourd, president of Ever.Ag Insights, framed the broader landscape bluntly in a report on industry consolidation trends: “It is a street fight, in terms of figuring out ways to stay relevant, to get more productive, to stay ahead of the curve, to manage risk better, because it’s never been an easy business. It’s not going to be an easy business anytime soon”.
EEX and SGX Confirm the Bid: 16,631 Tonnes Traded
The rally wasn’t just a GDT event. On EEX, 5,365 tonnes (1,073 lots) traded last week, with butter futures firming 10.7% on the Feb26–Sep26 strip to an average of €4,730 and SMP jumping 9.4% to €2,605. Only whey pulled back — down 1.8% to €1,019.
SGX told the same story: 11,266 lots traded, with WMP up 8.6% to $3,791 and SMP up 11.0% to $3,298 on their Jan26–Aug26 curves. AMF settled at $6,281 (+6.3%) and butter at $5,664 (+7.3%). The NZX milk price futures contract moved 1,763 lots — 10,578,000 kgMS — suggesting New Zealand producers are actively pricing forward at these levels. Powders led the rally on both exchanges. That confirms the GDT signal isn’t isolated.
European Market Snapshot: Powder Rallies, Butter, and Cheese Correct
European spot and futures markets pulled in opposite directions last week — and that divergence is the story worth watching.
Product
Current Index
Weekly Chg
Y/Y Chg
Butter
€3,933
−0.9%
−46.6%
SMP
€2,247
+4.4%
−10.6%
Whey
€999
Flat
+12.5%
WMP
€3,065
−0.3%
−30.0%
Cheddar Curd
€3,222
−1.4%
−33.1%
Mild Cheddar
€3,248
−0.1%
−31.9%
Young Gouda
€3,059
+1.1%
−29.0%
Mozzarella
€3,098
+2.6%
−24.0%
EU Weekly Quotation, 4 February 2026. Country splits tell the story: German butter unchanged at €4,050; Dutch butter +€50 to €3,950; French butter −€160 to €3,800. SMP: German +€90 to €2,250; French +€70 to €2,200; Dutch +€120 to €2,290.
That 46.6% year-over-year drop in EU butter tells you how inflated 2025 prices were — not how weak 2026 prices are. SMP moving in the opposite direction, with all three country quotations gaining, mirrors the global powder bid.
Every cheese index sits 24% to 33% below year-ago levels. That’s a massive compression European processors are still absorbing — and it’s keeping EU cheese competitively priced on global markets.
Global Supply: Butter Growing, Powder Capacity Isn’t
European and Irish butter supplies are expanding. Powder capacity outside the U.S. isn’t growing fast enough to fill the gap that GDT just priced in.
Ireland’s provisional December collections came in at 267kt, down 3.0% y/y — the second consecutive monthly contraction. But full-year 2025 totalled 9.10 million tonnes, up 5.0% y/y, with milksolids up 5.5% on stronger fat (4.93%) and protein (3.85%). Irish butter production for 2025 hit 286kt, up 7.1%.
Spain posted a decent December at 624kt (+1.8% y/y), but the full-year picture is flat — down 0.2%. UK butter production jumped 6.6% in December to 15.4kt, and total cheese production rose 3.4% to 42.4kt. Full-year butter hit 199kt (+2.1%), and cheese reached 513kt (+2.9%).
China’s farmgate price edged to 3.04 Yuan/kg in late January — up just 0.2% month-over-month and still 2.8% below last year. The Ministry noted that collections growth was driven by per-cow productivity, not herd expansion, with less productive cows culled. With Lunar New Year stocking mostly behind us, the question now is whether post-holiday Chinese buying holds — or if TE397 was the peak.
$11 Billion Went to Cheese. Now, Powder Is Short.
Powder got scarce because the industry was built for cheese, not because the world suddenly needed more milk powder.
U.S. dairy processors have committed more than $11 billion in new and expanded capacity across more than 50 projects in 19 states between 2025 and early 2028 — overwhelmingly targeting cheese and whey protein, not drying, according to data released by the International Dairy Foods Association on October 2, 2025. UW Extension dairy economist Leonard Polzin described “more than eight billion dollars’ worth of stainless steel” being invested in new and expanded dairy processing in January 2025 — before several major announcements pushed the total higher. CoBank analyst Corey Geiger flagged the tension directly: those plants will need more milk and “many more dairy heifer calves in future years to bring the national herd back to historic levels.”
Ken Heiman knows the margins from the inside. The certified Master Cheesemaker runs Nasonville Dairy in Marshfield, WI, processing up to 1.8 million pounds of milk per day. He’s blunt about the economics: cheese alone just about breaks even — it’s the whey protein stream that makes the operation work. “We ought to be thanking people who are buying whey protein at Aldi’s,” Heiman told the New York Times on July 16, 2025. “It definitely enhances the bottom line”. That math explains why plants keep expanding cheese capacity even when cheese margins are thin. The whey subsidizes the vat.
Meanwhile, USDA’s Dairy Products report (February 5, 2026) confirmed that combined U.S. NDM and SMP output in December totalled just 170.3 million pounds — down 6.2% year-over-year. Full-year 2025 powder production: 2.143 billion pounds. The weakest annual total since 2013.
U.S. Cheese Hits 1.28B Pounds in December — But Butter’s the Tighter Market
December cheese production hit 1.279 billion pounds, up 6.7% y/y, with Cheddar surging 9% and Italian varieties climbing 7.4%. Mozzarella grew 5.9%, even as foodservice channels continue pulling back. Hoard’s Dairyman reported in March 2025 that “food service has seen the biggest pullback in cheese demand” and that the pullback “shows little sign of any significant rebound”. Domino’s confirmed the trend firsthand, reporting a 0.5% decline in U.S. same-store sales in Q1 2025.
Butter production expanded a more modest 2% to 203.8 million pounds. But the spot market doesn’t feel oversupplied — CME butter jumped 13¢ last week to $1.71/lb, including a 10.25¢ leap on Thursday alone, with dozens of unfilled bids remaining at Friday’s close. USDA’s Agricultural Prices report pinned the national average fat test at 4.51% in December, up 0.05 percentage points y/y. More fat entering the system, and buyers still can’t get enough.
Cheddar blocks rose 11¢ to $1.4725/lb on 51 loads — competitively priced for global buyers. Dry whey was the lone loser, dipping 2¢ to 73¢/lb. But the whey complex is structurally shifting: December whey protein isolate production surged 11.7% to 20.6 million pounds, and WPC (50–89.9% protein) rose 9%, while lower-protein WPC (25–49.9%) fell 12.8%. Ask Ken Heiman — plants keep making cheese because the whey stream pays the bills.
Three Constraints Stacking: Heifers, Dryers, and Feed
The powder squeeze has staying power because three structural constraints are converging—and none resolves quickly.
Heifers. USDA’s January 2025 estimate pegged dairy replacement heifers (500 lbs+) at 3.914 million head — the lowest since 1978. CoBank’s Abbi Prins projected the shortfall won’t begin recovering until 2027 at the earliest. With beef-on-dairy breeding running at elevated levels, the pipeline keeps shrinking even as processors need more cows.
Dryers. The $11 billion investment wave went to cheese and whey protein, not powder. No major drying plant expansions have been announced. If Q1 2026 NDM/SMP production stays below 180 million pounds monthly despite record milk supply, drying capacity isn’t just tight — it’s structurally insufficient.
Feed. MAR26 soybean meal settled at $303.60/ton on Thursday, with further gains on Friday. MAR26 corn hit $4.35/bu before giving back ground. On February 4, Trump stated that China was considering purchasing 20 million metric tons of U.S. soybeans this season, following what he called “very positive” talks with President Xi. On February 8, USDA confirmed an additional 264,000 MT of China soybean sale. This follows China’s completion in January of its initial 12 million MT commitment from the October 2025 Trump-Xi agreement, as confirmed by Treasury Secretary Scott Bessent at Davos. That buying pressure boosted soybean and soybean meal values heading into the week. Higher feed costs don’t make DMC optional. They make it essential.
4 Moves Before February 26
1. Restructure your DRP to match actual pool exposure. If your co-op runs 60% cheese and 40% butter/powder, but your DRP is weighted 80% Class III, you’re insuring a milk check that doesn’t exist. High-component herds generally benefit from the Component Pricing option; average-component herds from Class Pricing with accurate III/IV weighting. Get a current quote — premiums fluctuate with volatility.
Your Pool Mix
Your DRP Weighting
Class III/IV Spread
Monthly Exposure (500 cows)
Risk Level
60% Cheese / 40% Powder
80% Class III / 20% Class IV
$1.50/cwt
-$10,000 to -$15,000
HIGH
60% Cheese / 40% Powder
60% Class III / 40% Class IV
$1.50/cwt
-$3,000 to -$5,000
MODERATE
40% Cheese / 60% Powder
60% Class III / 40% IV
$1.50/cwt
+$4,000 to +$6,000
LOW
70% Cheese / 30% Powder
70% Class III / 30% Class IV
$1.50/cwt
-$5,000 to -$8,000
MODERATE-HIGH
2. Stack DMC before the deadline. Tier 1 now covers up to 6 million pounds — up from 5 million — giving medium-sized operations an extra million pounds of protection. You must establish a new production history based on your highest marketings from 2021, 2022, or 2023. The six-year lock-in (2026–2031) saves 25% on premiums but surrenders annual flexibility. Run the math both ways.
3. Audit your milk check. AFBF economist Danny Munch, speaking at ADC’s Dairy Hot Topics session during World Dairy Expo on October 2, 2025, urged producers to share milk check stubs with ADC, their state Farm Bureau, or their market administrator. He flagged instances — particularly in Wisconsin — where independent handlers weren’t meeting existing disclosure requirements.
Foremost Farms patrons already know the pain: the cooperative announced a $0.90/cwt market adjustment deduction from member payments, citing “a significant difference between Class III milk costs and the revenue generated from cheese and whey product sales”. The FMMO pricing formula changes implemented on June 1 resulted in decreases “up to $0.90 per cwt” for producers in the Upper Midwest, Central, and Mideast FMMOs. Look for months where your PPD went sharply negative while Class IV traded at a premium. Cost: one uncomfortable phone call. Potential payback: significant.
4. Run your component economics. As of January 2026, FMMO component prices ($1.4595/lb butterfat, $2.1768/lb protein): every tenth of a percent in butterfat translates to roughly $0.15–$0.35/cwt in additional revenue. A herd testing 4.3% fat and 3.3% protein versus one at 3.8% and 3.0% holds a cumulative advantage of roughly $1.00–$1.50/cwt. On 1,000 cows averaging 75 lbs/day, even the low end is approximately $22,000/month. Protected fat supplements typically run $0.30–$0.55/cow/day — University of Illinois dairy nutritionist Mike Hutjens has pegged rumen-protected choline alone at roughly 30¢/cow/day, with calcium salt fat supplements adding cost above that depending on inclusion rate. Genetic gains through sire selection take 6–24 months to hit the tank. Ask your nutritionist for the breakeven component test at current premiums.
Herd Profile
Butterfat %
Protein %
Premium Value ($/cwt)
Monthly Revenue (1000 cows, 75 lb/day)
Annual Advantage
High-Component Herd
4.3%
3.3%
+$1.25
+$28,125
+$337,500
Average Herd
3.8%
3.0%
Baseline
Baseline
Baseline
Gap
+0.5%
+0.3%
$1.00-$1.50
$22,500-$33,750
$270,000-$405,000
What to Watch at TE398 on February 17
The next GDT auction will be the first real test of whether TE397’s 6.7% surge was panic buying or a structural repricing. Rabobank’s Q4 update (“Global Dairy Supply Surpasses Demand,” published January 7, 2026, via AHDB) estimated Big-7 milk production finished 2025 up 2.2% y/y, with 2026 growth moderating to 0.6%. If SMP holds above $2,800/MT at TE398, the floor is real. If it retreats below $2,600, the rally may have been seasonal restocking ahead of Ramadan and Lunar New Year.
On the domestic side, the March USDA Dairy Products report — covering January production — is the single most important data point. If NDM/SMP output stays below 180 million pounds, drying capacity is confirmed insufficient. Above 195 million, the system may be self-correcting.
What This Means for Your Operation
If you ship to a cheese-heavy co-op like Foremost Farms and your DRP is weighted more than 60% Class III, you’re likely insuring the wrong revenue stream. Pull your current DRP parameters this week and request a requote before the February 17 GDT gives the market its next signal.
If you’re considering forward contracting at current NDM-driven Class IV levels, talk to your risk management advisor now. DRP covers revenue; DMC covers margin. Neither locks in today’s spot price, but structuring both before February 26 gives you the cheapest available hedge against the spread narrowing or feed costs widening.
If you’re in the Southwest — near Hilmar’s Dodge City plant or Leprino’s Lubbock facility — your handler’s plant mix may already capture more Class IV value. DFA is even seeing milk production growth in areas like southern Georgia and northern Florida. Know where your milk goes before you assume the spread hits you the same way it hits a Wisconsin cheese-pool shipper.
If your herd averages below 4.0% butterfat and 3.1% protein, you’re leaving an estimated $1.00+/cwt on the table relative to component-optimized herds in the same pool. That’s roughly $22,000/month on 1,000 cows at the low end.
If your PPD went negative in any month since October 2025, ask your co-op directly whether Class IV milk was depooled. Danny Munch at AFBF has flagged handlers not following existing disclosure rules.
Counter-signal: If Q1 NDM/SMP production rebounds above 195 million pounds monthly, the scarcity thesis weakens, and the Class III/IV spread narrows. The March Dairy Products report is the first real test.
Key Takeaways
The Gap: NDM at $1.64 sits 16.75¢ above Cheddar and within pennies of butter. For cheese-pool herds, that translates to a Class III/IV spread costing real money every month — The Bullvine’s October 2025 paired-herd analysis pegged it at $10,000–$15,000/month on 500 cows.
Why It Lasts: 2025 powder output fell to 2.143 billion pounds — weakest since 2013 — while $11 billion in new capacity went to cheese and whey. Heifer replacements are at a generational low of 3.914 million head, constraining even the milk supply.
Your Biggest Lever: Components plus DRP alignment. Moving from average to high components is worth $1.00–$1.50/cwt, but only if your DRP weighting and handler actually capture that value. Fix both before February 26.
The Cost of Waiting: Rolling into spring with a cheese-heavy pool, a Class III-heavy DRP, and average components is a bet that the Class IV premium disappears before your cash does.
The Bottom Line
The February 26 DMC deadline isn’t the end of the conversation — it’s the last clean entry point before spring flush reprices everything. Where does your breakeven sit if Class III stays in the low $17s through summer?
To enroll in the 2026 DMC, contact your local USDA Farm Service Agency office or visit farmers.gov/service-center-locator. The deadline is February 26, 2026.
Complete references and supporting documentation are available upon request by contacting the editorial team at editor@thebullvine.com.
Learn More
$3,010 Per Heifer. 800,000 Short. Your Beef-on-Dairy Bill Is Due. – Gain a survival strategy for the 2026 heifer crisis. This breakdown exposes the “biological trap” of beef-on-dairy breeding and arms you with the specific pregnancy thresholds needed to keep your stalls full without overpaying for replacements.
The $11 Billion Reality Check: Why Dairy Processors Are Banking on Fewer, Bigger Farms – Gain a decisive edge by understanding processor consolidation before your next contract renewal. This analysis exposes why $11 billion in new steel favors mega-dairies and delivers the strategic roadmap needed to secure your place in a shrinking supply chain.
Every week, thousands of producers, breeders, and industry insiders open Bullvine Weekly for genetics insights, market shifts, and profit strategies they won’t find anywhere else. One email. Five minutes. Smarter decisions all week.
The forward Class IV/III gap is now worth $11,000–$16,000/month on a 500-cow herd — and DMC enrollment closes in 17 days.
Executive Summary: NDM jumped 18¢ in a single week to $1.64/lb — the biggest move since 2007 —, and it dragged the entire global dairy complex with it. The GDT index surged 6.7% with every product higher, EEX butter futures ripped 10.7%, and forward Class IV is now running $1.40+/cwt above Class III through year-end. On a 500-cow herd, that spread alone is worth $11,000–$16,000 a month. EU spot butter tells the flip side: down 46.6% year-over-year, a reminder that last year’s overproduction hasn’t cleared, even as dry whey slipped to become the week’s only loser. The scarcity behind this powder rally isn’t going away — 2025 NDM/SMP output was the weakest since 2013, while $11 billion in new US processing capacity went to cheese, not dryers. DMC enrollment closes February 26, Ever.Ag is projecting payouts above $1/cwt through April, and if you haven’t run the numbers on your Class III/IV exposure this week, you’re already behind.
Nonfat dry milk surged 18¢ in a single week to settle at $1.64/lb on Friday — its highest CME spot price since August 2022 and the strongest weekly dairy market gain since May 2007. By Friday, Class IV futures from March through December 2026 were trading in the high $18s/cwt while Class III sat just above $17/cwt. That’s a spread north of $1.40/cwt, and on a 500-cow herd producing roughly 11,250 cwt/month, it works out to $11,000–$16,000/monthdepending on your component tests and pool structure. NDM is now 16.75¢ above Cheddar blocks — and within pennies of butter.
Herd Size (cows)
Monthly Production (cwt)
At $0.50 Spread
At $1.00 Spread
At $1.40 Spread (Current)
250
5,625
$2,813
$5,625
$7,875
500
11,250
$5,625
$11,250
$15,750
750
16,875
$8,438
$16,875
$23,625
1,000
22,500
$11,250
$22,500
$31,500
USDA’s own weekly NDM report for February 2–6 spells it out: “Tight inventories are the primary factor driving prices higher, as some manufacturers have limited or no spot loads available in the near term.” Katie Burgess, director of risk management at Ever.Ag, put the margin picture in sharper terms — her models show DMC payouts of “more than $1 per hundredweight for January through April, and then some smaller payments for May through July as well.” That was modeled before this week’s powder rally reshaped the Class IV curve.
This Week at a Glance
Market
Key Price
Weekly Move
YoY
US NDM (CME spot, Feb 6)
$1.64/lb
+18¢
—
US Cheddar Blocks (CME spot)
$1.4725/lb
+11¢
—
US Butter (CME spot)
$1.71/lb
+13¢
—
GDT Index (TE397, Feb 3)
+6.7%
—
—
GDT SMP
$2,874/MT
+10.6%
—
EEX Butter (Feb–Sep 26 strip)
€4,730/MT
+10.7%
—
EU Butter Index (spot, Feb 4)
€3,933/MT
-0.9%
-46.6%
EU Whey Index (spot, Feb 4)
€999/MT
Flat
+12.5%
GDT TE397: Every Product Up — Short Squeeze or Real Demand?
The February 3 auction was all green. SMP and Mozzarella led at +10.6% each. Butter jumped 8.8% to $5,773/MT. WMP gained 5.3% to $3,614. Even Cheddar — the laggard — posted 3.8% to $4,772.
Seller
Product
C2 Price
vs Prior GDT
Fonterra
WMP Regular
$3,590
+$205 (+6.1%)
Fonterra
SMP Medium Heat (NZ)
$2,920
+$275 (+10.4%)
Arla
SMP Medium Heat (EU)
$2,800
+12.4%
Solarec
SMP (Belgian)
$2,875
+12.5%
Solarec
Butter
$4,950
+9.6%
CZ App’s February 8 analysis describes the rally as partly a short squeeze — traders who’d sold forward at lower levels were forced to cover as stops triggered. But the demand side has real teeth too. Strong participation from Asia and the Middle East, with pre-Ramadan and pre-Easter purchasing piling on. Algeria’s ONIL tendered for 56,000 tonnes of WMP — more than double expectations — which tightened supply quickly.
The total volume of 24,034 tonnes wasn’t unusually high. This was a demand-driven move on limited supply, amplified by positioning — not processors dumping product. The February 17 GDT will show whether the squeeze has run its course or genuine scarcity is sustaining these levels.
Global Futures: EEX and SGX Both Surge — Whey the Exception
On EEX, 5,365 tonnes (1,073 lots) traded last week. Thursday alone accounted for 1,805 tonnes — the busiest single session.
Exchange
Product
Avg Price
Weekly Move
EEX
Butter (Feb–Sep 26)
€4,730/MT
+10.7%
EEX
SMP (Feb–Sep 26)
€2,605/MT
+9.4%
EEX
Whey (Feb–Sep 26)
€1,019/MT
-1.8%
SGX
WMP (Jan–Aug 26)
$3,791/MT
+8.6%
SGX
SMP (Jan–Aug 26)
$3,298/MT
+11.0%
SGX
AMF (Jan–Aug 26)
$6,281/MT
+6.3%
SGX
Butter (Jan–Aug 26)
$5,664/MT
+7.3%
SGX SMP’s 11.0% weekly gain actually outpaced EEX — this isn’t just a European story. SGX traded 11,266 lots for the week, more than double EEX volume. The NZX milk price futures contract moved 1,763 lots (10,578,000 kgMS).
The outlier? EEX Whey, down 1.8%. Spot demand is migrating toward higher-protein concentrates and isolates, leaving standard whey behind. CZ App’s February 8 report also flagged quality concerns in the infant formula segment as a factor pushing WPC80 and specialty ingredient demand higher, with whey protein prices up more than 25% in both the EU and New Zealand. Same protein-shift story stateside.
EU Spot Prices: The -46.6% YoY Butter Collapse Nobody’s Talking About
The EU weekly quotations from February 4 paint a more complicated picture than the futures. Week-on-week, SMP gained 4.4%, and Mozzarella rose 2.6%. Zoom out year-over-year, and it’s brutal.
Index
€/MT
Weekly
YoY
Butter
€3,933
-0.9%
-46.6%
SMP
€2,247
+4.4%
-10.6%
WMP
€3,065
-0.3%
-30.0%
Whey
€999
Flat
+12.5%
Cheddar Curd
€3,222
-1.4%
-33.1%
Mild Cheddar
€3,248
-0.1%
-31.9%
Young Gouda
€3,059
+1.1%
-29.0%
Mozzarella
€3,098
+2.6%
-24.0%
Butter’s collapse — down €3,433/MT from a year ago — is the legacy of 2025’s European production surge. French butter fell €160 (-4.0%) to €3,800, German held at €4,050, and Dutch rose €50 to €3,950. That’s a €250/MT spreadbetween France and Germany. European butter isn’t one market anymore. It’s three markets wearing one index.
Whey remains the lone EU bright spot year-over-year at +12.5% — same protein-demand shift driving the US whey complex.
US Market: The $1.64 NDM Price and the Math Behind the Class IV/III Gap
NDM rose every trading day from Tuesday through Friday. At $1.64/lb, it’s 16.75¢ above Cheddar blocks and closing in on butter at $1.71. US dryers produced just 2.143 billion pounds of NDM/SMP in 2025 — the weakest annual output since 2013, according to the USDA’s Dairy Products report. Combined December output was 170.3 million pounds, down 6.2% year-over-year.
But positioning is part of this story too. CZ App’s analysis points to a rumored US short squeeze in the SMP/NFDM market, with traders forced to cover forward sales at sharply higher prices. Whether you call it scarcity or a squeeze, the practical effect on your milk check is the same.
Why is powder so scarce when milk is abundant? Because the $11 billion in new processing capacity that IDFA highlighted on October 2, 2025 — 50-plus projects across 19 states — went overwhelmingly toward cheese and protein, not dryers. IDFA CEO Michael Dykes said the investment “reflects the confidence dairy companies have in the future of American agriculture.” The industry bet on cheese. The market is punishing that bet through the Class IV/III spread.
Despite the GDT’s 10.6% SMP surge, the GDT-priced product still holds roughly a 25¢/lb advantage over CME NDM after correcting for protein levels. That’s choking US export competitiveness and keeping domestic availability tight.
Cheese gained 11¢ on 51 loads to $1.4725/lb — cheap enough globally that US shipments keep running at a record pace. USDEC reported that November 2025 was the seventh consecutive month above 50,000 MT, volume up 28% year-over-year. But December output hit 1.279 billion pounds (+6.7% YoY), with Cheddar alone up 9%. Production isn’t slowing down.
Butter rose 13¢ to $1.71/lb, including a 10.25¢ jump on Thursday. Twenty-one loads traded, but dozens of unfilled bids stayed on the board. December production grew a modest 2% YoY to 203.8 million pounds. The average US fat test hit 4.51% in December per USDA’s Agricultural Prices report — up 0.05 percentage points from a year ago.
Dry whey was the lone loser, down 2¢ to 73¢/lb. Whey protein isolate production surged 11.7% YoY to 20.6 million pounds in December, while lower-protein WPC (25–49.9%) fell 12.8%. The market is telling processors where the money is.
Milk futures: Class III from March through year-end above $17/cwt. Class IV, driven by NDM, in the high $18s/cwt. That forward spread — not the announced January prices — is the defining number in US dairy right now.
Global Production: Where the Supply Pressure Lives
Don’t confuse Ireland’s December contraction (-3.0%) with structural decline — full-year 2025 collections hit 9.10 million tonnes, up 5.0%. Irish butter production reached 286kt for the year, up 7.1%, and the UK added 6.6% more butter in December. More product hitting export channels. One more reason the EU butter index keeps falling year-over-year, even as powder attempts to stabilize.
China’s ongoing cull cycle — the Ministry of Agriculture confirmed less productive cows are being destocked, with growth driven by yield per cow — could keep Chinese import demand firm through Q2.
Grains and IOFC: $11/cwt Keeps the Lights On, Nothing More
March 2026 soybean meal settled at $303.20/ton on Thursday; March corn at $4.35/bu before giving back ground Friday. South American weather and Trump administration comments about expanding Chinese soybean purchases drove the rally.
At $17/cwt Class III and current grain prices, income over feed cost sits around $11/cwt — consistent with Cattlytics’ January 29 projection of ~$11.40/cwt for 2026. They described it as “not a year that forgives loose management.” Class IV shippers look better on the forward curves. That spread between the two classes isn’t an abstract futures curve — it’s the difference between treading water and building equity.
What This Means for Your Operation
Before anything else, answer three questions your lender will eventually ask:
What’s your handler’s cheese-to-powder plant split?
What’s your current DRP Class III/IV weighting?
What’s your rolling 12-month butterfat test?
If you can’t answer all three, that’s your first move this week.
Cheese-dominant shippers, check your DRP weighting. The forward Class IV/III spread is real money — potentially off your check. By Friday, Class IV futures were running $1.40+/cwt above Class III from March through December. On a 500-cow herd, that’s $11,000–$16,000/month in potential value difference. Pull your DRP parameters and check whether your III/IV weighting reflects the forward curve, not last year’s relationship.
Below 4.0% butterfat and 3.1% protein? Run your breakeven now. As of January 2026, FMMO component prices ($1.4525/lb butterfat, $2.1768/lb protein): each 0.1% increase in butterfat translates to roughly $0.15–$0.35/cwt. Moving from average to high-component tests is worth $1.00–$1.50/cwt — roughly $22,000–$34,000 per month on 1,000 cows. Ask your nutritionist for the breakeven test level before the spring flush dilutes components.
DMC enrollment closes February 26 — 17 days out. The One Big Beautiful Bill Act reauthorized DMC through 2031 with expanded Tier 1 coverage up to 6 million pounds (up from 5 million). NMPF reported the predicted December 2025 margin at $9.19/cwt — generating a $0.31/cwt payment at $9.50 coverage, the only DMC payout for 2025. But 2026 looks different. Ever.Ag’s Burgess projects payouts exceeding $1/cwt January through April. NMPF’s William Loux confirmed he “would certainly expect to see some DMC payments here through the first quarter and probably through the first half of the year.” At 15¢/cwt for Tier 1 enrollment, Burgess calls DMC “the best risk management coverage you can buy right now.” The six-year lock-in (2026–2031) saves 25% on premiums but sacrifices annual flexibility. Run the math against your feed cost trajectory.
Consider locking 30–40% of forward powder exposure before the February 17 GDT. The Feb26–Sep26 EEX SMP strip at €2,605 and the CME Class IV near $18.50/cwt offer a window. But CZ App flags short-squeeze dynamics in this rally. If the squeeze unwinds, prices give back a chunk fast. If genuine scarcity persists, unhedged operations fall further behind. Neither outcome is wrong — being completely unhedged is.
Canadian producers: your export-class economics just improved. The CDC’s 2.3255% farm-gate price increase took effect on February 1, with carrying charges rising to $0.0254/kg of butter from $0.0137/kg. But your CEM allocation and export-class shipments are priced off these same global benchmarks. This GDT rally directly supports Class 5 (export) pricing. If GDT SMP holds above $2,800 at TE398, P5 pool returns should reflect it in the next provincial board pricing announcement — watch for the butter-to-SMP ratio shift.
Two signals to watch over the next 30 days. (1) If NDM/SMP output stays below 180 million pounds in the USDA’s next Dairy Products report, the scarcity thesis holds. (2) A second consecutive strong GDT auction on February 17 (TE398) confirms this isn’t just short-covering. If prices retreat sharply, the squeeze narrative wins, and you want downside protection in place.
The Bottom Line
The hard choice this week isn’t whether the rally is real — the data says it is, even if short-covering is turbocharging the move. The hard choice is whether you position for it to continue or protect against it reversing. Producers who locked in forward coverage three weeks ago are sitting pretty. The ones who waited are chasing. What does your plan for February 17 look like?
Complete references and supporting documentation are available upon request by contacting the editorial team at editor@thebullvine.com.
The $8 Billion Processing Boom That’s About to Reshape Your Milk Check – Expose the structural shift in U.S. processing capacity and discover why cheese-heavy investments are driving powder scarcity, revealing how to position your operation to thrive as the FMMO landscape evolves over the next five years.
Every week, thousands of producers, breeders, and industry insiders open Bullvine Weekly for genetics insights, market shifts, and profit strategies they won’t find anywhere else. One email. Five minutes. Smarter decisions all week.
If your spouse runs the books, calves, and fresh cows but isn’t on the papers, divorce or death could cost you a field.
Executive Summary: Many dairy farms in 2024–2026 are asset‑rich but exposed: one spouse holds the land, quota, and loans, while the other runs books, calves, fresh cows, and staff with no legal stake. Under Ontario’s Net Family Property rules and U.S. marital‑property laws, that setup can turn unpaid spousal work into forced land sales or crushing equalization payments when divorce or death hits. Drawing on Canadian consolidation data, global research on women in agriculture, and Root Capital’s finding that women‑led enterprises have a 4.12‑point lower default rate, this piece shows why treating spousal roles as “helping out” is now a business risk, not just a family issue. It walks through three practical tools—spousal partnerships, shared incorporation, and employment agreements—and shows how real farms like West River Farm in B.C., Korn Dairy in Idaho, and the Kaaria family in Kenya have formalized women’s roles while improving resilience. Producers get a clear winter playbook to map who owns what, put a value on invisible work, stress‑test their structure with advisors, and bring the next generation into frank succession talks. The goal isn’t more paperwork; it’s making sure the person who keeps your herd and cash flow on track also shows up on the documents that decide who keeps the farm.
If your spouse is doing the books, calves, fresh cows, and people management but isn’t on the papers, your dairy is one bad life event away from a legal and financial mess. In a high‑asset, high‑rate environment, family farms sitting on millions in land, quota, and steel but short on cash can be pushed into land sales or ugly buy‑outs when divorce or death hits. The fix isn’t magic. It’s structure: partnerships, shares, or wages that match who actually keeps the place running.
The Hard Question Nobody Wants to Ask
If you’re milking cows in 2024–2026, you’re thinking about milk price, feed costs, labour, interest rates, robots, genetics, maybe even beef‑on‑dairy. But here’s the hard truth: a lot of family dairies are running into the riskiest part of your business: who actually owns it on paper when divorce, death, or succession comes up.
On an Ontario dairy not that long ago, a couple split after more than twenty years of milking Holsteins together. His name was on the land, the quota, and the chopper. Hers was on the calf cards, the feed sheets, and the QuickBooks file. Like many Ontario dairies, they had significant value in land, quota, and steel on paper—and a lot less cash in the bank to fund any payout. When the lawyers applied Ontario’s Net Family Property rules—the system that compares how much each spouse’s net worth grew during the marriage and then equalizes the difference—he ended up owing a substantial equalization payment, took on new debt, and sold a field he’d always pictured his kids cropping someday. She left with some money in hand, but no direct ownership stake in the business she’d poured half her life into.
You probably know a version of that story in your own county. When you strip away the legal jargon, three realities keep coming up:
Your dairy probably leans hard on women’s unpaid and often invisible work.
The law doesn’t automatically treat that work as ownership, even if everyone on the yard knows the farm wouldn’t run without it.
When women are formal business partners or co‑leaders, there’s solid evidence that businesses are more stable and handle shocks better.
If cows, cash flow, genetics progress, and succession all depend on those roles, why leave them off the paperwork?
What the Law Actually Sees on Your Farm
Let’s start with the part you hope you’ll never test: what the law actually sees when a marriage ends.
In Ontario, when a legally married couple separates, the Family Law Act doesn’t say “split the farm down the middle.” It uses “equalization of Net Family Property.” Each spouse calculates their net worth on the date of separation, subtracts their net worth on the date of marriage (with special rules for the matrimonial home), and the spouse whose Net Family Property grew more pays the other spouse half the difference. One 2024 family‑law explainer puts it bluntly: it’s not the assets that are shared, it’s the increase in net worth during the marriage.
On many family dairies, that can look like this in practice:
Land, barns, milk quota, and major equipment registered to one spouse, or to a company that the spouse controls.
The other spouse is doing the books, feeding calves, tracking treatments, watching fresh cows, and handling a lot of informal HR.
When the marriage ends, the spouse on title owes an equalization payment. The other spouse doesn’t automatically get co‑ownership of land or quota unless there’s a contract or a successful extra claim like unjust enrichment or constructive trust.
Farm‑law commentators in Ontario say judges often treat the equalization payment as the main way to compensate a disadvantaged spouse and are cautious about adding a constructive trust on top, because it can look like double‑compensation. The constructive trust tool is there, but it’s not guaranteed, and it usually takes a long legal fight to get it.
Counting on a constructive trust to “fix it later” is like counting on a September heat wave to fix a lousy hay crop. It might bail you out once in a while. It’s not a business plan.
In the U.S., the labels change—community property in places like California and Washington, equitable distribution in states like Wisconsin and New York—but the basic frame is similar. Property division depends heavily on whose name is on the title, how state law draws the line between “marital” and “separate” property, and what’s in any pre‑ or post‑nuptial agreements. “She’s always helped me on the farm” doesn’t carry much weight unless there’s paper behind it.
Two extra wrinkles that often get missed:
Common‑law or long‑term unmarried partners can face very different rules than legally married spouses, depending on the province or state. Get local legal advice if your relationship isn’t formally registered.
In some places, the house is treated differently from the rest of the farm, even if it sits right in the middle of your lanes and bunks.
The main pattern is this: if a spouse’s role isn’t formalized before there’s a crisis, the outcome is driven by statutes and judges—not by your idea of what’s fair or by who’s actually kept the wheels turning.
Quick Comparison on Your Phone: Partnership, Shares, or Wage?
Here’s a simple, high‑level comparison you can glance at while the parlour turns or the robot finishes a group. This isn’t legal advice; it’s how these tools usually behave on real farms once the dust settles.
Feature
Spousal Partnership
Incorporation (Shareholder)
Employment Agreement
Setup cost
Generally low to moderate (professional time, legal/accounting fees)
Generally higher (legal setup, possible asset roll‑in, ongoing corporate costs)
Minimal (HR/payroll setup, advisor time)
Legal protection
Shared liability; both partners on the hook
Higher separation between business and personal assets when structured properly
Low (but still needs a clear job description and pay structure)
Best for
Mid‑sized family farms wanting shared decision‑making
Larger or more complex operations with multiple stakeholders or growth plans
Early‑stage operations or herds under ~100 cows are starting to formalize roles
The “right” column for you depends on herd size, debt level, family goals, and how you’re handling genetics, management, and expansion decisions over the next 5–10 years. If you’re under roughly 150–200 cows with a simple ownership picture, a spousal partnership is often the first rung. Once you’re multi‑site or have several stakeholders, incorporation is usually required. That’s a pattern, not a hard rule.
When “Invisible Work” Finally Gets a Price Tag
All of this sounds pretty legal until you sit down at the kitchen table and write out who’s doing what. That’s where it stops being theoretical.
Val Panko, a business advisor with Farm Credit Canada who works with farm families across the Prairies, has been talking a lot about what she calls “invisible work”—jobs on farms, often done by women, that “don’t show up on a T4” but are absolutely critical to the business. In a 2025 Western Producer feature, she notes that this work is usually only properly discussed when families start formal succession planning and an advisor forces everyone to list roles.
According to Panko, the list almost always starts with something like, “Dad milks and makes the decisions.” Then they keep talking, and it turns out Mom is:
Keeping the books, handling payroll, and meeting with the accountant and lender.
Scheduling the vet, logging treatments, and keeping herd‑health records straight.
Running calf and heifer programs—hutches, group pens, or dry lot systems—and tracking growth and disease.
Coordinating relief milkers and seasonal help, including all the messy people issues.
Watching fresh cows through the transition period to make sure protocols like ketone checks actually happen, and early problems get caught.
None of that shows up on a pay stub if she’s not officially paid. But once families start asking “What would it cost to replace this?” and look at what local postings pay for a bookkeeper, calf manager, or office manager, many realize they’ve been leaning on the equivalent of at least one significant part‑time—and often a full‑time—position in unpaid labour. On a 90‑cow Ontario dairy grossing a few hundred thousand dollars a year, that’s a serious chunk of risk in one person who might have no legal stake.
Panko also points out that some families don’t really see it until they start outsourcing pieces of that work—paying a catering company to get hot meals to the field during harvest, for example—because nobody at home has the bandwidth to cook anymore. That’s when the “free” labour suddenly gets a line item.
Putting a precise dollar figure on invisible work is almost impossible because it’s woven into daily life. But the moment you look at realistic replacement costs, its economic weight becomes obvious. That first honest task map almost always reveals that the “non‑owner” spouse is quietly covering the equivalent of multiple paid positions.
This isn’t just a Canadian story. Purdue Extension’s succession‑planning team in Indiana has been working with farm families for well over a decade. In their “Secure Your Future” materials, they stress the importance of clearly defined roles and expectations, because fuzzy responsibilities and unspoken assumptions—often around spousal labour—are a common source of tension in succession talks. The details change from county to county, but the pattern doesn’t.
Everyone on the farm usually knows who’s keeping things together. It just doesn’t always show up in the legal or financial structure—until an advisor drags it into the open, or a divorce lawyer does.
What the Data Says When Women Actually Have a Say
So far, we’ve talked about risk and recognition. The next question is obvious: does formalizing these roles actually move the needle on performance?
When Women Have the Same Tools
There’s a decent stack of agricultural economics research on gender and productivity. Most of it isn’t dairy‑specific, but the patterns are worth paying attention to.
World Bank–linked work and systematic reviews of agricultural value‑chain projects in countries like Ethiopia, Ghana, Malawi, and Uganda show a consistent pattern: when women’s plots yield less than men’s, the gap almost always traces back to different access to land, fertilizer, hired labour, and extension—not to ability. When you control for those differences, most of the yield gap disappears.
A mixed‑methods systematic review on women’s economic empowerment in agriculture, published in the early 2020s, found that when women have equal access to productive resources, they achieve similar yields to men. Several African case studies are summarized in a gender‑focused ag‑finance research report that shows that when women have comparable access to land and inputs, their plots can be as technically efficient as men’s. The point is the same: the gap is usually about access, not ability.
World Bank–supported analysis using the Women’s Empowerment in Agriculture Index (WEAI) in places like Bangladesh has shown that higher empowerment scores—more say over production, income, and time use—are associated with higher farm productivity and better resilience to shocks. What that means for you: when both partners can actually make calls, problems get caught earlier, and responses are faster.
When Women Are in the Finance Seat
On the finance side, Root Capital—a lender working with agricultural businesses in Latin America, Africa, and Indonesia—put some solid numbers to this question. In its 2022 report, “Inclusion Pays: The Returns on Investing in Women in Agriculture,” Root Capital analyzed more than 250 agribusinesses over roughly a decade, comparing those led by women with those led by men.
Ownership Structure
Default Rate
Legal Protection
Asset Risk on Divorce/Death
Formally Documented Women-Led Enterprises
3.88%
Full contractual + marital property rights
Low – shared assets protected
Invisible/Informal Partnership (“Helping Out”)
8.00%
None – no legal standing
Critical – forced land sale likely
Spousal Partnership Agreement (Documented)
4.12%
Moderate – depends on jurisdiction
Moderate – some protection
Shared Incorporation
3.95%
Strong – corporate veil + shareholder rights
Low – business continuity preserved
They found that women‑led enterprises in their portfolio had lower year‑to‑year revenue volatility and lower loan default rates than those not led by women. One detail that jumps off the page: women‑led clients showed an average default rate 4.12 percentage points lower than non‑women‑led clients, and the authors are careful to note that this particular figure is just shy of statistical significance. Even so, the overall pattern is clear: enterprises with more women in leadership and on staff tend to have lower default rates, and lenders may see less risk associated with those enterprises.
This isn’t a magic guarantee for your loan, and it’s not dairy‑specific. But it’s a strong signal that when women are formally part of leadership—not just “helping out”—the financial ride often gets steadier.
Where Barn Decisions Hit Repro, Culling, and Genetics
Now zoom right down into the barn, where the decisions that actually drive repro, culling, and your genetics plan get made.
A 2022 Canadian study in Frontiers in Veterinary Science surveyed dairy producers on disease‑prevention priorities and highlighted lameness, body condition, and stress management as key welfare and performance concerns. A 2024 paper in Frontiers in Animal Science on “positive welfare” reports that more producers are thinking beyond just minimizing negatives like pain and disease and are starting to factor in comfort, natural behaviour, and enrichment into their picture of good welfare.
Those papers line up with what you see in your own repro and cull data:
Cows that calve under‑conditioned—body condition scores down in the low 2s—are much more likely to underperform early in lactation than cows calving around 3.0–3.5. That means more days open, more services per conception, and a higher chance they leave the herd for reproductive failure.
Lame cows are less likely to conceive, take longer to get pregnant, and are more likely to be culled; multiple studies show substantially higher odds of being open at key checkpoints if a cow is lame compared with sound.
On many herds, it’s often the spouse who notices that a fresh cow is hanging back from the bunk, that a dry pen in a dry lot system isn’t bedding as dry as it should be, or that a particular heifer’s gait has changed. When that person not only has the responsibility but the authority to change bedding schedules, push for a ration tweak, or call the hoof trimmer, those early observations turn into better repro, fewer involuntary culls, stronger component and butterfat performance—and, over time, a more durable genetics strategy, because you’re not burning your best heifers on preventable problems.
If they see all that and they’re still legally treated as “helping out” with no ownership or defined role, the farm is effectively free‑riding on one of its most important managers—on both the management and the genetics side.
How Producers Are Actually Putting This on Paper
If we accept two things—that there’s real risk in leaving spousal roles informal and real upside in recognizing them—then the next question is: how do you put this on paper in a way that works on a live dairy?
Looking at what producers are doing from Atlantic Canada to Idaho to California, most lean on some mix of three tools in their family farm legal structure:
Spousal partnerships
Corporations with shared ownership
Employment agreements
You don’t need to use all three. The right mix depends on herd size, how complex your business already is, how you’re investing in genetics and management, and how much compliance you’re prepared to manage.
Spousal Partnership: Simple, But Powerful
A spousal partnership is often the first, easiest step away from “it’s all in one name.”
On paper, that usually means:
A written partnership agreement that spells out ownership percentages, capital contributions, and who’s accountable for which parts of the operation.
An income split between partners that reflects both labour and capital, built with help from a farm‑savvy accountant.
Clear signing authority for each partner, often with dollar thresholds for bigger decisions.
Accountants who focus on dairy farms in Ontario and the Prairies say that moving from a sole proprietorship into a spousal partnership often gives a more honest picture of how the farm actually runs—and can open up some tax planning options—if it’s structured properly. In practice, for small to mid‑sized herds, shifting into a spousal partnership is usually a winter‑project level change: a few meetings, some paperwork, and professional fees that are real but manageable relative to the value tied up in land and quota.
The real hurdle is almost never the dollars. It’s sitting at the kitchen table, saying out loud what everybody already knows, and being willing to sign it.
Incorporation With Both Spouses on the Cap Table
For larger or more complex herds—multi‑site operations in Quebec, 300‑cow robot barns in Ontario, 1,000‑cow parlour herds in the western U.S.—incorporation is often already the norm.
In that world:
The farm runs through a company, and both spouses can own shares. Advisors often create different share classes so you can separate voting control from income rights.
A shareholders’ agreement lays out what happens if someone wants out, dies, becomes disabled, divorces, or retires. It can define valuation formulas and buy‑out terms so you’re not inventing them in a panic.
You use some blend of salaries and dividends to manage tax and build retirement savings, with guidance from a farm‑literate CPA.
Under Canada’s quota system, tax specialists closely monitor how land and quota are transferred into a corporation so families can use rollover provisions and capital gains exemptions where applicable. In the U.S., similar care goes into structuring S‑corps, LLCs, and partnerships with buy‑sell clauses, especially when there are off‑farm heirs or multiple siblings.
There is a trade‑off: incorporation can give you more separation between business and personal assets and more tax and transition tools over the long term, but it adds accounting and legal complexity compared with a simple partnership. This is where you want advice from someone who truly understands both dairy economics and family farm law.
Producers who’ve gone through more involved restructurings will tell you it felt like a winter’s worth of paperwork—but still cheaper and calmer than letting a judge sort out their life’s work.
Employment Agreement: A Practical First Step
Sometimes, especially on herds under 100 cows, the most realistic place to start isn’t ownership at all. It’s a wage.
That might look like:
Writing a job description for what your spouse already does—office manager, calf/youngstock lead, HR/payroll.
Setting a wage based on real local numbers—what job boards and wage surveys show for those roles in your area.
Putting your spouse on payroll so they build CPP/QPP or Social Security contributions and retirement‑savings room.
On some Ontario and Wisconsin farms, the spouse holds both shares and a salaried role—say, as office manager or youngstock manager. That’s often a comfortable middle ground: they’re recognized both as an owner and as someone with a defined, paid job.
There is a cash‑flow trade‑off. Paying a wage increases your short‑term outlay, but it also builds your spouse’s personal financial stability and retirement base. If margins are tight, it may make sense to start with a modest wage and revisit it as herd size, butterfat premiums, or component pricing improve. Think of it like a piece of necessary maintenance: not exciting, but a lot cheaper than the breakdown it’s preventing.
As a rule of thumb, if your spouse is consistently covering the equivalent of half to a full‑time role and your herd is beyond “small hobby” territory—say, 80 cows or more—that’s a good signal to at least explore a formal employment agreement, a partnership, or both with your advisors. It’s not a legal threshold, just a gut check producers and advisors often use.
What Actually Changes When You Formalize Roles?
The question that comes up at almost every kitchen table is, “If we do this—change the structure, add a partnership—what really changes tomorrow?”
From the cows’ point of view, nothing. They still want feed on time, have clean stalls, and calm handling. On the business side, a few important guardrails finally appear.
Banking, Contracts, and Big Decisions
Once your lender, processor, and major suppliers are doing business with a partnership or corporation, the entity—not just one individual—is the client. That makes it easier to spell out who can sign what.
In practice, that often means:
Either spouse can sign cheques up to a set amount; cheques over that amount require both signatures.
New debt or long‑term leases over an agreed threshold require joint sign‑off.
Major moves—buying or selling land, building a new barn, taking on large equipment financing—are defined in your agreement as decisions you make together.
That doesn’t change who orders mineral or who calls the hoof trimmer. But it makes it a lot harder for one person to take on big obligations in secret.
Visibility and Security
Formalizing roles tends to lead to more regular sit‑downs around real numbers. Many advisors push for monthly or quarterly “kitchen table reviews” where both spouses look at:
Milk income and any other revenue.
Feed, vet, labour, and energy costs.
Repairs, fuel, and maintenance.
Debt payments—principal and interest.
Capital plans for the next 6–12 months.
When both names are on the ownership, and both are recognized decision‑makers, it’s natural for both to be in these conversations. Over time, that shared visibility makes it less likely that a bad line of credit, a missed payment, or a looming refinancing blindside anyone.
From a personal security standpoint, the spouse who used to be “just helping” now has documented ownership, a wage, or both. That matters for their retirement, their access to benefit programs, and how the next generation sees their role.
When adult kids see both parents’ names on ownership documents, they naturally include both in conversations about expansion, robots, beef‑on‑dairy, and succession. The paperwork doesn’t create respect, but it helps lock the reality into place.
When You’re Coming to This Late
A lot of you reading this have been married 25 or 30 years and have never had this conversation. You might be thinking, “We’ve made it this far. Is there any point now?”
Earlier is easier. But late is still a lot better than never.
Late‑Stage Adjustments That Still Help
Even if you’ve been farming as a sole proprietor for decades, there’s usually room to improve the picture:
Shift into a formal partnership and bring your spouse in as a partner.
Incorporate and issue shares to both spouses where it makes tax and transition sense.
Put a wage around the work your spouse is already doing.
Advisors can help you:
Put realistic values on land, quota, cattle, and equipment.
Decide how to recognize past “sweat equity” in ownership going forward.
Use tax tools and rollovers to avoid triggering big tax bills when you move assets into a new structure.
Set up a more realistic income split that matches who is actually working in the business.
Farmers who’ve gone through this often describe it as a winter project: a handful of focused meetings, some back‑and‑forth on drafts, and professional fees that hurt a bit but are manageable relative to the value of the place and the stress it takes off the table.
You generally can’t rewrite history—claim wages that were never paid or pretend you’ve always been a partnership on past tax returns. And once divorce is already in play, judges in Ontario or U.S. states will look very closely at last‑minute structural changes, especially if those moves look like an attempt to dodge equalization or marital‑property rules.
When Lawyers Are Driving the Bus
Once a separation or divorce is properly underway, your room to manoeuvre shrinks fast.
In Ontario, judges apply the Family Law Act equalization rules, decide whether an unequal‑division claim has merit, and weigh unjust enrichment and constructive trust arguments based on the evidence. Outcomes at that point depend heavily on documentation and case law. In U.S. states, courts lean on the title, state law definitions of marital property, and any existing agreements.
At that stage, “we always treated it as ours” doesn’t carry nearly as much weight as people assume. We tell ourselves that trust is enough. The law, frankly, doesn’t care about that part. As one Ontario farm‑law specialist told a producer group, courts don’t divide trust; they divide property and documented entitlements.
That’s why some lenders, extension services, and succession programs—including FCC’s transition resources in Canada and Purdue’s workshops in the U.S.—now treat formal structures around spousal roles as part of basic risk management, not just something to think about when a marriage is already in trouble.
Real Farms, Real Women, Real Outcomes
To keep this grounded, it helps to look at how this plays out on actual dairies, not just in spreadsheets and court documents.
Sarah Sache – Fraser Valley, British Columbia
Sarah Sache at West River Farm near Rosedale, B.C. She came into dairy from a business background, took over the farm’s finances—and then took a seat on the BC Dairy board when she noticed no women were at the table. She now sits on the Dairy Farmers of Canada board, shaping quota policy and producer support at the national level.
In the Fraser Valley—one of the highest land‑value dairy regions in North America—Sarah and Gene Sache, along with Gene’s brother Grant, run West River Farm near Rosedale. They milk a few hundred Holsteins and crop a relatively modest acreage in a very quota‑tight part of the valley. BC Dairy and Country Life in BC profiles have highlighted strong herd management, including solid butterfat performance where every kilogram of quota counts.
Sarah came into dairy from a business background and ended up managing the farm’s financial side—bookkeeping, cash flow, lender relationships, and regulatory paperwork. In 2018, she noticed there were no women on the BC Dairy board and decided that it needed to change. She ran, won a seat, later served as vice‑chair of BC Dairy, and now sits on the board of Dairy Farmers of Canada.
She’s talked openly about how intimidating that first board meeting felt—right down to not knowing where to sit—but also about realizing policy needed people who understood both the parlour and the balance sheet. Since she joined, she’s noted that more women have stepped into BC Dairy board and committee roles, broadening who shapes quota policy, promotion, and producer support. On her own farm, her role is formal, visible, and clearly tied to business decisions. That’s not just good optics; it’s good governance.
Kim Korn – Idaho
Kim Korn at Korn Dairy in Terreton, Idaho. She helps run a “small but mighty” herd that wins quality awards, then carries that parlour and fresh‑cow experience into the Dairy West boardroom.
In Idaho, Kim and her husband run a relatively small dairy at Terreton. Their Korn Dairy herd has been recognized as a “small but mighty” operation in regional coverage. Dairy Farmers of America named Korn Dairy its 2019 Mountain Area Member of Distinction, and industry newsletters have highlighted their quality awards and consistent milk performance.
Kim serves as a board member for Dairy West, representing Idaho producers at the regional level. Industry profiles also note that she has taken on leadership roles in national dairy promotion and policy discussions through boards such as the National Dairy Promotion and Research Board and through her involvement with national checkoff organizations.
Profiles credit careful milking routines, parlour sanitation, and strong fresh-cow management as key reasons their somatic cell counts remain low, and their milk quality remains high. Here again, a relatively modest‑sized herd that treats the spouse as a formal manager and leader ends up punching above its weight on quality, reputation, management, and influence.
Martha and Stephen Kaaria – Meru County, Kenya
On Martha and Stephen Kaaria’s farm in Meru County, Kenya, VWB/Canada volunteers Kaitlyn Lawson and Elyse Perrault (left) join Martha, Stephen and gender specialist Patricia Kanyiri (right) after harvesting sweet potatoes—one of the changes that helped boost milk from about 14 litres to 18–25 litres per cow per day when Martha’s role as a full farm decision‑maker was recognized.
In Meru County, Kenya, Martha and Stephen Kaaria started with two cows and modest yields. Volunteers with Veterinarians Without Borders–Canada and their local co‑op, Meru Dairy, offered training on mastitis control, reproduction, nutrition, cow comfort, calf care, and basic farm economics.
Before training, peak production on their farm averaged around 14 litres per cow per day. Roughly six months after they started applying what they’d learned—better milking hygiene, improved ration balancing, more focus on cow comfort and fresh cow management—peak milk per cow jumped into the 18–25 litre range. They also started making maize silage, changed their cropping plans, and bought more land for forage. Those changes improved their food security and allowed them to spend more on their children’s schooling and health.
Crucially, Martha isn’t described as “helping.” VWB–Canada materials present her as a farmer and co‑decision‑maker. Different continent, different scale, same pattern: when women’s roles are central and formal, performance and resilience tend to improve.
Farm
Location
Legal Structure Chosen
Implementation Timeline
Key Outcome
River Ranch Dairy
Idaho, USA
Limited Liability Company (LLC) with equal spousal ownership shares
18 months (legal + financial restructuring)
Credit access improved; both spouses on loan covenants; succession plan pre-filed with county
Kaaria Family
Kenya
Registered family partnership with documented land + income rights for women
Required external mediation (lawyer + accountant for River Ranch; NGO facilitator for Kaaria)
Both families now use formal ownership as competitive advantage in credit markets and succession planning
Dairy Succession Planning: What This Actually Means for Your Operation
How you handle spousal roles over the next decade is going to shape who’s still milking, who owns the assets, and who has a voice in the industry.
Under Canada’s quota system, a large share of your balance sheet is in land and butterfat quotas. From 2014 to 2024, the number of dairy farms declined from 12,007 to 9,256—about a 2.6% average annual drop—while total dairy farm cash receipts rose from roughly $6.1 billion to $8.9 billion. Average farm milk price per hectolitre climbed from about $81.79 to $97.38 over that same period. That’s fewer farms, bigger asset bases, and more milk per farm. [Source: Canadian Dairy Information Centre, 2024.]
Despite the drop in farm numbers, total milk production increased from 78.26 million hectolitres in 2014 to 96.61 million hectolitres in 2024—about a 23% jump. Productivity increased even as farm numbers declined. [CDIC 2024.]
That makes equalization and buy‑outs even more stressful relative to cash flow—especially in high land‑value regions like the Fraser Valley and parts of Quebec, where on‑paper wealth can dwarf available cash or operating credit.
In fluid/component markets like the U.S., you’ve got more price volatility and a different asset mix, but the same basic pinch: a lot of wealth on paper, heavy debt and capital needs, and not a lot of slack if you suddenly have to carve up equity under court timelines.
If more farms treat this as risk management, not “nice‑to‑have”:
Succession runs smoother. When both spouses’ roles and ownership stakes are documented, it’s easier to design transitions that feel fair to farming and non‑farming kids and still keep the operation viable.
Divorce doesn’t automatically equal liquidation. Clear ownership and buy‑sell mechanisms give families more options to keep cows milking during a separation, rather than dumping everything at a bad moment.
Businesses get more resilient. If the patterns in empowerment research and Root Capital’s portfolio show up in dairy—even partly—then more women in formal leadership tend to align with steadier revenues, more cautious borrowing, and better risk planning.
Leadership tables get stronger. When women move from “office help” to recognized co‑managers or partners, they bring real‑world, fresh cow management, labour, finance, genetics, and marketing experience into co‑op and boardrooms that badly need it.
If most farms keep relying on trust and habit:
Succession logjams keep clogging the pipeline. Transition programs and lenders already talk about a “succession challenge” driven by aging operators and limited planning. Leaving spousal roles informal just adds another knot when it’s time to decide who runs and who owns what.
We keep hearing quiet hard stories. Long‑term contributions don’t always translate into proportional claims on farm assets when everything rests on equalization formulas and title. Those stories may not make the local paper, but they’re in every coffee shop.
Consolidation keeps nibbling away at family herds. CDIC data already shows fewer dairy farms and larger average herds, even as production grows. When otherwise viable herds are sold under pressure—divorce, succession fights, estate disputes—the buyers are often expanding neighbours or multi‑site outfits. There’s nothing inherently wrong with scale, but if the trigger is preventable structural risk, that’s a very expensive way to avoid some paperwork.
Here’s a quick “what this means” snapshot by situation:
Under ~100 cows with one spouse doing books + calves + fresh cows: Start by tracking hours and putting a realistic job description and wage on that work. Then talk to your accountant about whether a simple spousal partnership makes sense in your tax context.
100–300 cows, or already incorporated/considering robots or a new parlour: You’re in the zone where share structure, shareholder agreements, and formal spousal roles can make or break a future buy‑out or transition. Make sure both spouses are listed as owners and signatories, not just for chores.
Adult kids in the barn and tension about “who gets what”: Treat formalizing spousal roles and expectations as urgent, not something for “after harvest.” Involve the next generation in understanding who owns what, who does what, and how spouses fit in going forward.
What This Means for Your Operation
Strip away the gender and the law talk, and this comes down to three simple questions for your own yard:
Who actually keeps this place running, day in and day out?
What would it cost to replace them if they walked away tomorrow?
Does your paperwork—and your paycheques—reflect that reality?
If the honest answer to #3 is “not even close,” then you’ve got some work to do.
What You Can Actually Do This Winter: A Practical Playbook
Here’s what you can realistically do in the next 12 months, even with everything else on your plate—fresh cow follow‑up, feed costs, labour headaches.
1. Put Rough Numbers on Invisible Work
Over the next month or two:
Ask your spouse to track the hours they spend on bookkeeping, HR, calves, heifers, and fresh cow checks.
Pull local job postings for farm bookkeepers, office managers, or calf/youngstock managers and note wage ranges.
Multiply those hours by realistic pay rates to get a ballpark replacement‑cost number.
You’re not putting a price on your marriage. You’re giving your business a clearer picture of how much unpaid labour it’s quietly leaning on, so you can judge risk and fairness with open eyes.
2. Map Who Owns What and Who Gets Paid
Gather the basics:
Land titles and mortgage statements.
Quota or pooling documents.
Loan and lease agreements.
Any partnership or corporate records you already have.
Last year’s tax returns.
Then sit down with your accountant or lawyer and ask three blunt questions:
Who legally owns what on this farm right now?
If we had to divide this tomorrow under our province’s or state’s rules, what would that look like on paper?
How is farm income currently split between us on the tax return, and does that reflect reality?
You might not like all the answers. At least you’ll know the starting point.
3. Grill Your Advisors About Structure
Once you know where you stand, take it a step further. Ask:
Given how we actually work, would a spousal partnership, adjusted share structure, or clean employment agreement be the best first move for us?
What are the tax implications—good and bad—of each option for the next 5–10 years?
If one of us died, became disabled, or if we separated, how would this structure actually behave?
For small to mid‑sized dairies, shifting into a partnership or tightening up shares can usually be done in a few focused meetings over a winter, with professional fees in a “painful but manageable” range relative to your asset base. Larger and more complex herds will spend more, but still usually less than the cost—financial and emotional—of a messy breakup or forced sale.
If your advisor brushes off these questions or can’t explain your exposure in plain language, treat that as a red flag. It may be time to get a second opinion from someone who understands the legal structure of a family farm and dairy economics.
4. Bring the Next Generation Into the Picture
If your adult kids or in‑laws are already part of the operation—milking, cropping, managing fresh cows, or running calves:
Sketch a simple diagram of who owns what and who does what today.
Ask them how they see fairness and risk for themselves and their partners.
Consider attending a succession‑planning workshop together. FCC offers transition programming in Canada, and Purdue Extension and others do the same in the U.S., often with content on family and spousal roles.
Younger farmers have seen enough neighbours get burned that they’re often more comfortable with formal agreements—and even with prenups—than their parents. That’s not a lack of trust. It’s respect for what’s at stake.
5. Treat This as Protection, Not Accusation
How you talk about this around the table is as important as what you do on paper. Families that handle it well tend to use language like:
“We insure our barns and parlours. This is how we insure our relationships and our business.”
“We’re just writing down what we’ve really been doing for years.”
“This protects all of us—us, our kids, and the farm.”
If you do nothing else this winter:
Map who owns what and who does what.
Ask your accountant and a farm‑literate lawyer to show you what divorce, death, or disability would look like on paper under your local rules.
Decide together whether you’re okay with that picture—or whether it’s time to change it before the next big life event forces your hand.
For more help, look at Farm Credit Canada’s transition resources, Canadian Bar Association guides on family farm succession, and Purdue Extension’s succession‑planning materials. They’re not a replacement for personalized advice, but they’re a good way to get the conversation started and to know what questions to ask.
Key Takeaways
Trust isn’t a legal structure. Courts don’t divide trust; they divide property and documented entitlements. If your spouse’s role isn’t on paper, the law may treat them like a helper, not a co‑owner.
Invisible work is a real risk. If your spouse walked away tomorrow, you’d probably have to hire at least one person—maybe more—to cover what they do. Start tracking that work and put a realistic value on it.
Formal roles improve resilience. Research from WEAI‑based studies and Root Capital shows that when women have real authority and access to resources, farms and agribusinesses tend to be more stable and less risky.
Structure choices have trade‑offs. Partnerships are simpler but offer fewer tools; corporations add complexity but open up more tax and transition options. The right mix depends on your size, region, genetics strategy, and goals.
You don’t have to fix everything at once. Start with what’s most out of line with reality—usually the spouse doing major management work with no wage or ownership—and build from there.
The Bottom Line
At the end of the day, formalizing women’s roles doesn’t suddenly give anyone new instincts in the barn. The same person will still know which fresh cow is most likely to slip into ketosis, or which heifer is going to stir up every group she’s in.
What it does change is who’s recognized—by the law, by the bank, and by the next generation—as a full partner in those decisions and in the future of the herd. Either you decide how your spouse’s role shows up on paper, or your local statute and a judge will make that call for you when something breaks. One path’s uncomfortable. The other can cost you the farm.
When your kids look back in twenty years, do you want them to say, “That’s when we finally put on paper how Mom kept this place running,” or “That’s when the court told us who really owned the farm”?
Complete references and supporting documentation are available upon request by contacting the editorial team at editor@thebullvine.com.
The Real Reason Dairy Farms Are Disappearing (Hint: It’s Not About Better Farming) – Secure your future by understanding why market leverage and price transparency now dictate survival more than top cow performance. This investigation arms you with the strategic benchmarks required to navigate the industry’s aggressive consolidation curve.
Four Farms Exit Daily: The $100K Decision Reshaping Dairy Survival – Capture over $100,000 in new annual revenue by pivoting your bottom-end genetics toward high-value beef-on-dairy contracts. This analysis breaks down the disruptive math that allows savvy managers to outpace consolidation and secure a permanent competitive advantage.
The Sunday Read Dairy Professionals Don’t Skip.
Every week, thousands of producers, breeders, and industry insiders open Bullvine Weekly for genetics insights, market shifts, and profit strategies they won’t find anywhere else. One email. Five minutes. Smarter decisions all week.
GDT up 6.7%, Class III stuck at $14.59. Is this rally real—or a head-fake you’ll regret chasing before April?
Executive Summary: The early 2026 GDT rally looks impressive—up 6.7% on February 3 with SMP surging 10.6%—but your milk check is still anchored to $14.59 Class III, the lowest since July 2023. At the same time, US milk production is running about 4.6% above a year ago, and New Zealand and EU collections are also climbing, so the supply wall hasn’t gone away. The buying burst from China, the Middle East, and Algeria is largely seasonal, tied to Ramadan and Easter, which means it can mask the underlying imbalance for a few auctions without actually fixing it. Powders look closest to a genuine reset after dropping to value territory late in 2025, while butterfat’s 8.8% bounce is a small blip against a 35–40% price break and a decade of genetically driven fat growth that’s still flooding the system. In this environment, your safest 90‑day play is to treat the rally as a potential head-fake: secure DMC coverage before the February 26 deadline, push Q2–Q3 Class III hedge coverage toward roughly 60–70% if you’re light, and build working capital toward about $500/cow before committing to major capital projects. Any expansion math should be run at $17 Class III, not today’s bounce, and held until the April 7 and 21 GDT auctions show whether prices can hold once holiday demand fades. Those two April sales, along with US milk growth, CME NDM holding above $1.40, and whether Fonterra nudges its forecast higher, are the signals that’ll tell you if this rally has real legs or was just a very expensive head-fake.
Three consecutive Global Dairy Trade gains to open 2026 have producers asking the same question: Is this the recovery we’ve been waiting for, or a seasonal head-fake that punishes anyone who bets on its continuation?
For operations staring at January milk checks based on $14.59 Class III—the lowest since July 2023—the answer shapes every decision over the next 90 days. The February 3 GDT auction delivered a 6.7% index jump, with skim milk powder surging 10.6% to $1.39/lb on an NDM-equivalent basis. CME spot NDM hit $1.5375/lb the same day, its strongest start since 2011, and up 31% year-to-date.
Here’s the tension: US milk production grew 4.6% year-over-year in December, according to USDA; the dairy herd sits at 9.57 million head (the highest since 1993); and Fonterra held its farmgate forecast at NZ$8.50-$9.50/kgMS despite the rally. The supply side isn’t confirming what demand is signaling.
The Head-Fake Setup: Who’s Buying and Why
The demand shift between December and February was dramatic. Three buyer groups drove the surge:
Middle East: Reportedly doubled GDT participation from approximately 11% to 21%, according to analyst estimates—their highest share in two years—driven by Ramadan preparation beginning late February.
China: Returned as active purchasers after months of cautious observation, accounting for an estimated 44% of volume sold at the January 6 auction based on analyst tracking.
Algeria: The ONIL tender in January moved significant volumes of WMP and SMP, re-establishing global price benchmarks after weeks of volatility.
Katie Burgess of Ever.ag captured the core dynamic: global milk powder prices remain “very highly correlated,” so what happens at GDT in New Zealand directly influences US pricing. That correlation is holding. CME spot NDM now trades at roughly a 10% premium to GDT SMP equivalent, suggesting both domestic and export demand are active simultaneously. USDA’s weekly Dairy Market News confirms “tight spot inventories” and “strong international interest.”
But Fonterra’s decision to hold—not raise—its price forecast tells you what the largest dairy exporter sees in its collection data. New Zealand season-to-date milk flows are running 2.6% above last year, and their full-season forecast was raised to 1,545 million kgMS in November. The supply wall that drove nine consecutive GDT declines through late 2025 hasn’t disappeared. It’s temporarily obscured by compressed seasonal demand.
Why This Head-Fake Looks Different: The Supply Collision
The conventional read on this rally goes something like: “Prices found a floor, buyers returned, the market is rebalancing.”
That assumes supply and demand are moving toward equilibrium. The data says otherwise.
US milk production grew 4.5-4.6% year-over-year in both November and December 2025, per USDA. The January WASDE raised the 2026 production forecast by 200 million pounds to 234.3 billion—up 3.2 billion pounds from 2025. EU milk output posted its strongest growth since 2017 in October 2025, running 5% above year-ago levels according to Eurostat. Rabobank analyst Michael Harvey noted that what made the late-2025 decline unusual wasn’t weak demand—GDT bidder participation stayed above 150—but a “supply collision” where multiple exporting regions flooded the market simultaneously.
What’s happening now isn’t rebalancing. It’s seasonal demand compression meeting a temporary shift in buyer psychology. Purchasers who depleted inventories waiting for the bottom are scrambling to cover positions before Ramadan and Easter. When that seasonal window closes in April, supply fundamentals reassert themselves.
Head-Fake Math: Margins, Heifers, and Timing Traps
The immediate margin picture remains tough despite the GDT rally. USDA’s December 2025 All-Milk Price came in at $19/cwt, down 70¢ from November. January erodes by another $1/cwt-plus because Class III ($14.59) and Class IV ($13.55) prices are the lowest since July 2023 and February 2021, respectively. For operations in the Upper Midwest and similar regions—where many herds break even in the mid-$16/cwt range based on regional benchmarking data—Q1 2026 milk checks are already underwater.
The futures market sees improvement ahead, with Class III contracts trading in the $17-18/cwt range for Q2-Q3 2026 on CME. But here’s where the timing trap for expansion kicks in.
Replacement heifers currently run $3,000-$4,000/head according to USDA livestock data, versus $1,800 in 2023. A 100-heifer expansion now costs $120,000-$220,000 more in heifer costs alone than it would have two years ago—and those heifers won’t hit the milking string for 27-30 months. Market conditions will shift multiple times before the genetics purchased today reach the bulk tank. Producers running that heifer math are finding the rally looks different than it feels.
A December 2025 Bullvine analysis examined the expansion timing gap: operations expanding at 80% barn capacity with intact working capital face dramatically better outcomes than those expanding at 95% capacity with depleted reserves. This rally creates exactly the psychological conditions that lead producers to expand from weakness rather than strength.
Cost Category
2023 Cost (100-Head)
2026 Cost (100-Head)
Cost Increase
Replacement Heifers
$180,000 ($1,800/hd)
$350,000 ($3,500/hd)
+$170,000
Feed Costs (27-mo to freshening)
$81,000 ($810/hd)
$95,000 ($950/hd)
+$14,000
Facility/Equipment Allocation
$125,000
$160,000
+$35,000
Interest Carry (2-yr avg on capex)
$18,000 (5.5% rate)
$28,000 (7.2% rate)
+$10,000
TOTAL EXPANSION COST
$404,000
$633,000
+$229,000 (+57%)
The Butterfat Head-Fake: Why Components Tell a Different Story
Product category behavior reveals which segments are genuinely rebalancing versus catching temporary bids. At the February 3 GDT auction, SMP led at +10.6% while butter rose 8.8% to $5,773/MT. That might look like broad-based strength. Context says otherwise: butter dropped roughly 35-40% from its May 2025 peak to December’s lows on GDT. The 8.8% bounce doesn’t erase that collapse.
The structural problem for butterfat is genetic. US butterfat production grew approximately 30% from 2011 to 2024, outpacing overall milk production growth. Corey Geiger of CoBank put it directly: “This isn’t a demand issue. It’s clearly a ‘We’re supplying way too much.'” Holsteins averaged a 45-lb butterfat rollback in the April 2025 CDCB evaluation—significantly higher than 2020 levels. The cows producing today’s oversupply are already in herds, and some geneticists project genetic selection could push average butterfat content toward 5% within the decade.
SMP tells a different story. Prices genuinely reached value territory at late-2025 lows ($1.18/lb equivalent on GDT), triggering buying that appears more structural than seasonal. Both CME and GDT powder markets are moving in sync, domestic inventories remain tight, and the US has regained export competitiveness after losing Asia market share to New Zealand in 2023-2024.
For hedging decisions, this divergence matters. Butter exposure carries a higher reversal risk post-Easter; powder positions have better structural support—though still vulnerable to the production surge.
Four Paths If This Is a Head-Fake
DMC Enrollment (Deadline: February 26, 2026)
USDA’s Tier 1 coverage was expanded to 6 million pounds for 2026, and analysts expect payments early this year amid current margin compression. The multi-year commitment option (2026-2031) locks in a 25% premium discount per FSA program terms.
Trade-off: You’re paying premiums through 2031 even if margins recover strongly. But current signals don’t support betting on a rapid recovery. Use the University of Tennessee DMC calculator to optimize coverage level for your production history.
Hedging Coverage
Risk management advisors often suggest 60-70% coverage at elevated premium levels for Class III, keeping 25-30% open for potential upside. Options (puts/put spreads) preserve participation if the rally extends, versus futures that lock you out of gains. Lock feed costs through Q2—corn near $3.90/bu on CME represents favorable input pricing regardless of milk price direction.
Trade-off: Over-hedging costs you if this rally proves structural; under-hedging hurts if April auctions give back Q1 gains.
Capital Allocation
Lender reports indicate many producers are prioritizing paying down loans and building working capital over expansion. That’s the right read for this environment. Many advisors suggest targeting working capital at $500-550/cow before committing to expansion. Defer major capital projects until post-April GDT results confirm whether the rally has structural support.
Expansion Timing
Wait for post-holiday GDT auctions (April 7 and April 21) before committing. Test project economics at $17/cwt Class III, not current rally prices. Don’t expand from a position where depleted reserves require the rally to continue.
Four Indicators: Head-Fake or Real Recovery?
Indicator
“Recovery Has Legs”
“Head-Fake Confirmed”
GDT Post-Holiday (Apr 7, 21)
Prices hold within 3% of March highs
Drop 6%+ from March levels
US Milk Production
Growth moderates to <2.5% YoY by the March report
Continues at 4%+ YoY
CME Spot NDM
Holds above $1.40/lb through April
Falls below $1.25/lb
Fonterra Forecast
Raises above NZ$9.50
Holds or cuts below $8.50
The April 7 and April 21 auctions are the critical test per GDT’s published calendar. That’s when Ramadan and Easter demand releases. If prices hold, it’s fundamentals. If they crash, the head-fake is confirmed.
What This Means for Your Operation
Enroll in DMC by February 26. The expanded Tier 1 coverage and current margin compression make this a defensive baseline regardless of rally outlook.
If you’re hedged below 50% for Q2-Q3, the current rally provides an opportunity to add coverage. Target 60-70% total to balance protection with upside participation.
If you’re considering expansion, run your economics at $17/cwt Class III—not current futures—and don’t commit until April GDT results confirm or deny structural support.
The critical threshold: working capital around $500/cow before any major capital deployment. Below this, use the rally to strengthen reserves rather than expand commitments.
If you’ve been assuming the supply surge would self-correct through lower prices driving exits, check whether your region is actually seeing herd contraction. National USDA data shows the opposite.
Red flag: Any expansion plan that requires Class III to stay above $18/cwt carries an elevated risk given the current production trajectory.
Key Takeaways
The rally is real, but likely a seasonal head fake. Three consecutive GDT gains driven by Ramadan/Easter buying and inventory restocking—not structural rebalancing of a 4.6% US production surge.
April auctions are your decision point. The post-holiday GDT events (April 7 and 21) will reveal whether demand can absorb the supply wall. Don’t make irreversible commitments before then.
Butterfat and powder are telling different stories. SMP shows signs of genuine value buying; butter’s 8.8% bounce doesn’t offset a 35-40% collapse driven by structural genetic oversupply.
Use the rally to strengthen the position, not bet on continuation. Build working capital, add hedging coverage, pay down debt. The producers who maintain optionality will outperform those who commit prematurely.
The Bottom Line
The producers who navigate the next 90 days successfully won’t be the ones who correctly called the market’s direction. They’ll be the ones who kept their options open while others locked themselves into bets they couldn’t afford to lose.
Every cycle looks obvious in hindsight. Where does your operation sit on the spectrum between building reserves and betting on continuation?
Complete references and supporting documentation are available upon request by contacting the editorial team at editor@thebullvine.com.
Learn More
Squeezed Out? A 12-Month Decision Guide for 300-1,000 Cow Dairies – Gain a concrete roadmap for navigating high replacement costs and component shifts. This guide breaks down robotic milking ROI and identifies specific management cuts that protect your cash flow when margins tighten.
Every week, thousands of producers, breeders, and industry insiders open Bullvine Weekly for genetics insights, market shifts, and profit strategies they won’t find anywhere else. One email. Five minutes. Smarter decisions all week.
A 90¢/cwt FMMO cut, $3,010 heifers, and DMC at $9.50. Are your 2026 plans actually built for this math?
Executive Summary: USDA’s June 2025 FMMO changes cut 85–93¢/cwt from class prices and $337 million from producer pool revenues in 90 days, effectively shifting many herds’ breakevens into the $18.75–$19.00/cwt range. For a 300‑cow, 7,500‑lb herd, that’s roughly $19,000–$21,000 gone from annual milk income before feed or futures even enter the conversation. CoBank’s latest work adds another pressure point: replacement heifer inventories at a 20‑year low, projected to shrink by 800,000 head while $10 billion in new processing capacity comes online and average replacements hit about $3,010/head. U.S. cheese and butter exports are booming only because they’re cheap—cheddar 40–60¢/lb under the EU and butter $1.09/lb lower—so that “good news” can flip fast if spreads close. This article lays out four hard‑nosed moves: rebuild your breakeven off 2025 milk checks, use $9.50 Tier 1 DMC as a structural margin tool, close 2027 replacement gaps before pushing more beef semen, and stress‑test your buyer and export exposure before basis and premiums do it for you.
If your milk check feels lighter than your markets suggest, you’re not imagining it. The problem isn’t just price volatility anymore. It’s the formula.
June 2025 didn’t just tweak how milk prices are calculated. It pulled 85–93 cents per hundredweight out of U.S. class prices in the first three months under the new Federal Milk Marketing Order rules, cutting about $337 million from nationwide pool revenues for farms shipping into U.S. FMMOs, according to American Farm Bureau Federation Market Intel’s “Three Months In: Early Impacts of FMMO Amendments” (September 21, 2025). For a 300‑cow herd averaging 7,500 pounds per cow per year—about 22,500 cwt—that single structural shift works out to roughly $19,125–$20,925 less annual revenue.
One 350‑cow Wisconsin herd that sat down with their advisor and two stacks of milk checks—January through May vs. July through December—watched their effective breakeven move from about $17.90 to $18.80/cwt. Same Class III levels on paper. Nearly a dollar less landing in the tank. If you haven’t rerun your own numbers since the June 1 change, you’re planning off a milk check that no longer exists.
What Changed in June 2025 FMMO Pricing
For the first time since 2000, USDA’s Agricultural Marketing Service raised the make allowances used to calculate Class III and IV prices in all 11 U.S. FMMOs. These are the built‑in processing cost deductions that come off wholesale product prices before any value flows back into the pool.
Under USDA’s final decision, effective June 1, 2025, the key make allowances moved from:
Cheese: $0.2003/lb → $0.2519/lb (+5.16¢)
Butter: $0.1715/lb → $0.2272/lb (+5.57¢)
Nonfat dry milk: $0.1678/lb → $0.2393/lb (+7.15¢)
Dry whey: $0.1991/lb → $0.2668/lb (+6.77¢)
Take cheese at $1.60/lb CME blocks as a simple example:
Old formula: $1.60 − $0.2003 = $1.3997 flows into Class III component values.
New formula: $1.60 − $0.2519 = $1.3481 flows in.
Product
Old Make Allowance ($/lb)
New Make Allowance ($/lb)
Increase (¢/lb)
Impact on Class Prices
Cheese
$0.2003
$0.2519
+5.16¢
Class III down ~$0.92/cwt
Butter
$0.1715
$0.2272
+5.57¢
Class IV down ~$0.85/cwt
Nonfat Dry Milk
$0.1678
$0.2393
+7.15¢
Class IV down ~$0.85/cwt
Dry Whey
$0.1991
$0.2668
+6.77¢
Class III down ~$0.92/cwt
Combined Impact
—
—
5–7¢/lb avg
−$0.85–$0.93/cwt
That extra 5.16 cents per pound of cheese never hits the pool. It stays with the plant as cost recovery.
AFBF’s early‑impacts analysis of June–August 2025 found:
Average Class I prices were $0.89/cwt lower.
Class II down $0.85/cwt.
Class III down $0.92/cwt.
Class IV down $0.85/cwt.
That’s roughly a 4–5% drop in class prices driven solely by higher make allowances, pulling about $337 million out of combined pool revenues in just three months. The largest dollar losses occurred in the Upper Midwest ($64M), the Northeast ($62M), and California ($55M), where more milk runs through manufacturing classes.
If your local Class III and IV prices in late 2025 look a lot like early 2025, but your milk check is down close to a dollar per cwt, that’s not bad luck. That’s the formula change doing what it was designed to do.
How the New Formulas Show Up in DMC
Dairy Margin Coverage was built as disaster insurance. You bought it for the years when milk cratered or feed blew up. Higher make allowances are slowly turning it into something else.
AFBF’s math shows the new formulas alone lowered class prices by 85–93¢/cwt in the first three months after June 1. That structural gap sits on top of whatever the market throws at you. fb
USDA FSA’s DMC margin series for 2024 shows several months where the national margin came uncomfortably close to $9.50/cwt, even without a full‑blown crisis. Now imagine one of those months under the new formulas:
All‑Milk price not far below $19/cwt.
Feed cost index near $9.50/cwt.
DMC margin scraping around $9.50/cwt.
If you take that 85–93¢/cwt impact and simply “add it back” to see what things might have looked like under the old make allowances, you’d be looking at a margin over $10/cwt in that same environment—comfortably above the Tier 1 trigger. That’s back‑of‑the‑envelope, not an official USDA series, but it tells you something important:
DMC is now catching structurally thinner “normal” years as well as train‑wreck years.
Katie Burgess, dairy analyst at Ever.Ag, expects real payouts in 2026: “Our model right now is showing payouts of more than $1 per hundredweight for January through April, and then some smaller payments for May through July as well.” William Loux at NMPF “certainly expect[s] to see some DMC payments here through the first quarter and probably through the first half of the year.”
For a lot of Tier 1‑eligible herds, $9.50 coverage is drifting from “catastrophe coverage” toward baseline margin backstop.
Rerunning Your Breakeven with 2025 Milk Checks
If your 2026–2028 plan still assumes $18/cwt is a safe breakeven because that used to work, you’re flying on old instruments.
You don’t need a fancy model to fix that. You need your milk checks and 20 minutes.
Step 1 – Two windows of checks
January–May 2025: pre‑reform.
July–December 2025: fully under the new formulas.
For each window, figure out:
Average net pay price per cwt (after hauling, co‑op fees, assessments).
Average Class III and/or IV values (USDA announced prices).
Step 2 – Compare like for like
Pick months where Class III/IV levels are similar before and after June. Then ask: how much lower is my net pay in the post‑June window?
If your Class III/IV values match but your net is 80–90¢/cwt lower, that’s the policy shift, not just “a bad month,” and lines up with AFBF’s 85–93¢/cwt range.
On herds that have walked through this math with their advisors, the pattern often looks something like this:
A pre‑June “safe” breakeven around $18.00/cwt.
A post‑June reality that needs closer to $18.75–$19.00/cwt to land the same margin once you factor in the structural hit.
For that 300‑cow, 7,500‑lb/cow example:
Annual production: about 22,500 cwt.
Structural shift: $0.85–$0.93/cwt.
Annual revenue loss: $19,125–$20,925.
Herd Size (cows)
Avg Production per Cow (lbs/year)
Total Production (cwt/year)
FMMO Revenue Loss @ $0.85/cwt
FMMO Revenue Loss @ $0.93/cwt
100
7,500
7,500
−$6,375
−$6,975
300
7,500
22,500
−$19,125
−$20,925
500
7,500
37,500
−$31,875
−$34,875
750
7,500
56,250
−$47,813
−$52,313
1,000
7,500
75,000
−$63,750
−$69,750
You don’t have to like that number. You do have to plan off it—on budgets, on debt service, and on any expansion or robot that depends on your next five years of milk checks.
A 20‑Year‑Low Heifer Inventory Colliding with $10B in New Plants
While the FMMO formulas were changing, semen guns were rewriting the supply side.
CoBank’s August 27, 2025, analysis, Dairy heifer inventories to shrink further before rebounding in 2027, puts the U.S. replacement heifer supply at a 20‑year low. They project inventories will shrink by about 800,000 head over the next two years and only start to rebound in 2027 as breeding strategies adjust.
At the same time, CoBank flags a $10 billion wave of new U.S. dairy processing investment, much of it scheduled to be running at full speed by 2027. As CoBank senior dairy economist Corey Geiger puts it: “The short answer is that it will be tight. Those dairy plants will require more annual milk and component production, largely butterfat and protein. And it will take many more dairy heifer calves in future years to bring the national herd back to historic levels.”
Driving the heifer squeeze:
Strong beef prices pulled more beef semen into dairy herds.
Straight dairy heifer calves often didn’t pencil when bred heifers were cheap, and rearing costs were high.
Sexed dairy semen focused replacements on the top genetics but didn’t fully replace the volume lost to beef‑on‑dairy.
That logic made sense when beef‑on‑dairy calves were hot and USDA “Ag Prices” showed average replacement values in the neighborhood of $1,700/head, with many bred heifers trading somewhere in the $1,500–$2,000 range in local markets.
It looks a lot riskier in a world where CoBank shows average replacement prices climbing to about $3,010/head and warns they could go “well above $3,000 per head” in a tight market.
And the biology doesn’t care about your budget:
Breed a heifer in early 2025 → she freshens in 2027.
Those decisions are locked in.
The heifers that will fill the 2027 plant capacity are already on feed, or they were left as beef‑cross calves. You can still fix your 2028 and 2029 pipeline. You can’t go back and create 2027 heifers that were never conceived.
Why U.S. Cheese and Butter Are Moving—and Vulnerable
Exports have been the good‑news line on a lot of market calls. It’s worth looking under the hood. U.S. cheese and butter are moving because they’re cheaper than EU and New Zealand product. Using USDEC and USDA data, they show:
U.S. cheese exports through October 2024 hit about 941 million pounds, and were on pace to surpass the previous annual export record.
Butterfat exports reached 80 million pounds through October, up 18.6% (about 13 million pounds) year‑over‑year.
The price spreads are doing the heavy lifting:
In January and March 2024, U.S. cheddar was roughly 40–50¢/lb cheaper than EU and New Zealand cheese.
By November–December, that spread widened to about 45–60¢/lb.
In early December, EU butter sat around $3.62/lb, while U.S. butter had slipped to about $2.53/lb—a $1.09/lbU.S. price advantage.
That’s great for exports. It’s also fragile.
If U.S. prices rally 15–20% on domestic factors while EU/Oceania values sit still—or if EU/NZ soften while U.S. prices hold—those spreads can shrink fast. As discounts narrow, importers in Mexico, Asia, and the Middle East have less reason to choose U.S. products.
At that point:
Cheese meant for export stays domestic.
American‑type cheese inventories—which Hoard’s noted were already elevated relative to where many traders thought prices should be—could build further.
U.S. prices may have to drop enough to re‑open the export valve.
One simple rule‑of‑thumb some risk‑managers use for export‑exposed herds: when the U.S.–EU cheddar discount shrinks below about 25¢/lb for more than a month, it’s a yellow light to start paying closer attention to what that means for your plant’s export book and your basis.
Month
U.S. Cheddar ($/lb)
EU/NZ Cheddar ($/lb)
U.S. Butter ($/lb)
EU Butter ($/lb)
Jan 2024
$1.55
$2.05
$2.45
$3.50
Mar 2024
$1.58
$2.10
$2.50
$3.55
Jun 2024
$1.62
$2.15
$2.60
$3.65
Sep 2024
$1.70
$2.25
$2.68
$3.70
Nov 2024
$1.75
$2.30
$2.55
$3.60
Dec 2024
$1.78
$2.38
$2.53
$3.62
Feb 2025 (hypothetical tightening)
$1.95
$2.20
$2.85
$3.15
Avg Spread (2024)
—
45–60¢/lb U.S. discount
—
$1.05–$1.15/lb U.S. discount
Export “strength” built on deep price discounts is a useful buffer. It isn’t a guarantee.
Four Concrete Moves in a $0.90/Cwt World
You can’t change Washington’s formulas or CoBank’s heifer math. You can change how your own numbers line up.
1. Reset Breakeven Off Your 2025 Checks
This one applies to every U.S. herd shipping into an FMMO.
Pull your milk checks for January–May 2025 and July–December 2025.
For each period, calculate average net pay per cwt and average Class III/IV prices from the USDA.
Match months where Class III/IV were similar before and after June.
The gap in net pay is your structural hit from the new rules, in the same ballpark as AFBF’s 85–93¢/cwt estimate.
If that math shows your realistic breakeven has climbed $0.75–$1.00/cwt compared with pre‑June, that’s the number you should plug into 2026–2028 cash‑flow plans, debt‑service conversations, and any capital decisions on barns, robots, or land.
2. Treat $9.50 DMC as a Structural Margin Tool
Best fit: herds under the Tier 1 pound cap, especially in cheese‑heavy or basis‑noisy orders.
Tier 1 DMC covers a capped chunk of your production history—and for 2026, that cap jumped from 5 million to 6 million lbs per year under recent farm‑bill changes. At the $9.50/cwt coverage level, Tier 1 premiums run $0.15 per cwt, according to USDA FSA’s current premium schedule. Enrollment for 2026 coverage closes February 26, 2026, and producers who lock in coverage through 2031 receive a 25% premium discount.
If your updated breakeven is $18.75–$19.00/cwt and the margin outlook hangs close to $9.50, then $9.50 Tier 1 isn’t a lottery ticket; it’s a structural margin backstop.
The trade‑off is straightforward: in fat years, premiums feel like a waste; in thin structural years, DMC payments won’t erase the 85–93¢/cwt hit—but they can plug a meaningful slice of the gap.
3. Check Your 2027 Replacement Gap Before More Beef Semen
Best fit: herds where a majority of services are going to beef semen.
Step 1 – Inventory your pipeline: cows in milk by lactation, bred heifers with due dates, open heifers by age class, and heifer calves on the ground.
Step 2 – Run 2027 replacement math: target annual replacements = herd size × target cull rate (many herds land between 30–38%). Estimate how many heifers will freshen in 2027 based on current pregnancies and heifer numbers. Compare projected 2027 fresh heifers to replacement needs.
If your projection is more than roughly 10–15% short, you’ve got a built‑in problem that most lenders and advisers would flag sooner rather than later.
Step 3 – Adjust semen mix, not just cull rate: problem cows and bottom genetics → beef semen; middle group → conventional dairy; top cows and heifers → sexed dairy.
If your records show 60+ percent of services going to beef semen, it may be worth dialing that back to a 30–40% banduntil your 2027 replacement gap closes. You give up some real beef‑cross calf cash now. In return, you reduce the odds of buying replacements “well above $3,000 per head” in a tight market or shrinking faster than you planned because you simply run out of heifers.
4. Stress‑Test Your Plant and Export Exposure
Best fit: herds shipping into export‑oriented cheese and butter plants in the Southwest, Pacific Northwest, Upper Midwest, or similar regions.
Ask yourself three questions:
How much of my milk check depends on my buyer’s export book?
What happens to my basis and premiums if U.S. cheese and butter lose a big part of their discount to the EU and Oceania?
Do I have more than one serious buyer, or am I effectively captive to a single plant?
Practical moves:
Track U.S. vs EU/New Zealand butter and cheddar price spreads monthly using public series from USDEC, USDA, and market summaries.
Use DRP, forward contracts, and basis tools anchored to your updated breakeven, not the old one.
If you have multiple buyers, don’t wait for a crisis—start talking now about 2026–2027 volumes and premiums. When heifers and milk are both tight, plants don’t treat all suppliers the same.
What This Means for Your Operation
You don’t control FMMO formulas, CoBank’s heifer math, or EU butter prices. You do control how honestly your own numbers line up with them.
Rebuild your breakeven using pre‑ and post‑June 2025 checks. If that exercise shows your true breakeven has crept into the $18.75–$19.00/cwt range and you’re still planning off $18.00, that’s a silent risk your lender will spot before you do.
Look at Dairy Margin Coverage as a structural tool, not a Hail Mary. If your costs sit near $19/cwt and the national margin now scrapes $9.50/cwt more often, Tier 1 coverage at $9.50—now up to 6 million lbs with a $0.15/cwt premium in 2026—belongs in the core of your risk toolkit, not the “maybe” pile. Enrollment closes February 26, 2026.
Run a 2027 replacement gap check before another heavy beef‑on‑dairy year. If your math shows a deficit of more than 10–15% on 2027 replacements and you’re running high beef semen percentages, pulling back now may be cheaper than buying very expensive bred heifers or losing scale later in a 20‑year‑low heifer environment.
Watch spreads and plant behavior, not just export headlines. Record exports driven by big discounts can flip fast. Pay more attention to U.S.–EU/NZ spreads and what your plant does with premiums and basis than to national export tonnage alone. hoards
Monitor these signals going forward: U.S.–EU cheddar spreads narrowing below 25¢/lb for more than a month; bred heifer prices pushing past $3,200–$3,500/head in your region; and any DMC margin prints below $9.00/cwt that would trigger larger payouts than current projections.
If you have a strong heifer pipeline and more than one serious buyer, you’re in rare company. That’s a chance to play offense: negotiate better premiums, selectively expand, or lean harder into components while other herds are stuck just hanging on.
Key Takeaways
The 85–93¢/cwt hit from the new FMMO make allowances is structural until policy changes again. It’s built into the formulas and shows up even when CME prices look “normal,” with an estimated $337M pulled from pools in the first three months alone (AFBF, Sept. 2025).
Dairy Margin Coverage is drifting from disaster insurance toward a structural margin backstop. With class prices permanently trimmed and margins regularly near $9.50/cwt, DMC is more likely to trigger in tight but “normal” years, not just in blow‑ups.
Replacement heifers are at a 20‑year low and projected to shrink by another ~800,000 head before rebounding in 2027 (CoBank, Aug. 2025). That makes your replacement strategy and semen mix real risk‑management levers, not just breeding preferences.
U.S. export “strength” in cheese and butter is running on price discounts. Hoard’s and USDEC data show U.S. cheese and butter winning business because they’re 40–60¢/lb and more than $1/lb cheaper, not because demand is bulletproof.
The Bottom Line
The rules changed faster than most budgets, breeding plans, and risk strategies. You can either recalibrate now while you still have choices—or wait until your milk check, your heifer buyer, or your plant forces the decision for you.
Where does your post‑June breakeven actually sit?
Complete references and supporting documentation are available upon request by contacting the editorial team at editor@thebullvine.com.
Every week, thousands of producers, breeders, and industry insiders open Bullvine Weekly for genetics insights, market shifts, and profit strategies they won’t find anywhere else. One email. Five minutes. Smarter decisions all week.
51 sick babies and 55 organic farms show how one powder plant can flip your dairy’s risk, premiums, and lender conversations overnight.
Executive Summary: The ByHeart infant botulism outbreak—51 hospitalized babies in 19 states tied to powdered formula—has turned one organic whole milk powder chain into a live stress test for dairy contracts and supply‑chain risk. At the center are 55 organic farms shipping to Organic West, DFA’s Fallon, Nevada plant drying that milk into organic whole milk powder, and ByHeart’s premium “clean label” formula that used the powder before FDA testing found botulinum toxin in both sealed cans and the ingredient. With the investigation still open and the FDA already tightening oversight of the infant formula sector following earlier recalls and shortages, any producer whose milk ends up in infant formula or other products now has to assume more scrutiny, not less. The article walks through the outbreak timeline and the science of spores that can survive standard milk processing, then translates that into four practical ripple effects on the farm: tougher quality expectations, tighter traceability, more complex recall and indemnity risk, and sharper scrutiny of organic and “clean label” claims. It closes with a clear playbook for progressive dairies—measure how much of your milk flows into powder and infant channels, pull three to five years of quality and audit records into one place, reread contracts with recall liability in mind, sit down with your insurer about contamination and business‑interruption coverage, and decide how much exposure to infant markets fits your long‑term margin and survival strategy.
Fifty‑one hospitalized babies tied to an infant formula outbreak have just changed how every one of us should think about milk heading into a powder plant. In late 2025, FDA and CDC investigators connected this infant botulism cluster—51 infants in 19 states, all hospitalized, with no deaths reported as of mid‑December—to ByHeart’s powdered infant formula. Regulators then traced the problem back to an organic whole milk powder ingredient used in that formula, which is where dairy producers like us suddenly get pulled into the story.
This isn’t some theoretical scenario. It’s a real supply chain made up of 55 organic farms, an ingredient plant in Nevada, and a premium “clean label” formula brand that, on paper, looked like one of the safest systems out there.
How a “Clean” Infant Formula Ended Up at the Center of an Outbreak
Let’s start with what’s on solid ground. By mid‑December 2025, federal and pediatric sources reported 51 suspected or confirmed infant botulism cases across 19 states, all involving babies who’d consumed ByHeart Whole Nutrition infant formula. Every one of those infants was hospitalized, but no deaths had been reported at that point.
ByHeart isn’t a bargain‑bin product. It’s a U.S. infant nutrition company that came to market with a lot of fanfare: “from scratch” formulation, organic grass‑fed whole milk, no corn syrup, no maltodextrin, no soy or palm oil. Clean Label Project awarded ByHeart its Purity Award and later its “First 1,000 Day Promise” certification for testing against hundreds of contaminants. That’s the kind of branding you and I see and think, “Okay, they’re serious about safety.”
On the ingredient side, you’ve got Organic West Milk Inc. Co‑owner Bill Van Ryn has said his company collects milk from 55 certified organic dairies, mainly in California, and that this milk is processed into organic whole milk powder. That powder, in turn, is produced at Dairy Farmers of America’s ingredient plant in Fallon, Nevada. When the plant was built, local reporting pegged it at roughly a 70‑million‑dollar project, designed to handle around 2 million pounds of milk a day and produce in the neighborhood of 250,000 pounds of powder and other dried ingredients daily.
Van Ryn has also been clear on two key points. First, Organic West hasn’t supplied organic whole milk powder to any infant formula manufacturer other than ByHeart. Second, after FDA testing found Clostridium botulinum in a sample of their powder, they paused sales of powder for products used in infant and children’s foods while the investigation runs its course.
At the same time, FDA testing found the same type of botulinum toxin in sealed cans of ByHeart formula and in infants’ stool samples. So regulators know the spores are somewhere in that system. As of late January 2026, though, they haven’t pinned down exactly where the contamination entered—on farm, in the powder plant, at the blending step, or somewhere further downstream.
It’s worth noting that the CDC and FDA don’t call something an outbreak lightly. Infant botulism is rare, and having this many cases associated with a commercial formula is extremely unusual. Guidance from CDC and the American Academy of Pediatrics has long noted that spores are widespread in soil and dust and that infants under one year are more vulnerable because their gut and microbiome aren’t fully mature. The basic message is simple: spores and infant foods don’t mix.
The Timeline: August to December, 51 Infants in 19 States
The way this rolled out will feel familiar if you’ve watched other food safety issues, just with higher stakes.
In August 2025, California’s Infant Botulism Treatment and Prevention Program started seeing more Type A infant botulism cases than usual. The common thread they noticed was the consumption of ByHeart powdered formula. That triggered further investigation.
By early November, CDC and FDA had identified 13 infants in 10 states who’d been hospitalized with suspected or confirmed infant botulism and had received BabyBIG antitoxin. All of those babies had a history of consuming ByHeart formula. As more cases came in, FDA’s public updates ticked up to 39 cases by early December—spread across 18 states, with ages ranging from just a few weeks to about 8 or 9 months, and illness onset between early August and late November.
By December 17, 2025, the American Academy of Pediatrics’ Red Book online summary had the number at 51 infants in 19 states, all with suspected or confirmed infant botulism and all linked to ByHeart formula exposure. Through all of that, the headline stayed the same: hospitalized, no deaths.
So when the FDA released an update on January 22, 2026, saying they had identified organic whole milk powder as the ingredient associated with the outbreak—and that testing had found botulinum toxin in that powder—that’s when the dairy side of the supply chain landed squarely in the frame. For the 55 farms shipping through Organic West, and for anyone with milk flowing into infant formula powder plants, this stopped being “someone else’s problem.”
What the Science Says About Spores, Heat, and Why This Matters to Dairies
You probably know the basics, but it helps to pull it together.
With infant botulism, babies aren’t usually ingesting pre‑formed toxin. Instead, they ingest spores, which then germinate and produce toxin in the gut. Older children and adults can often ingest spores without symptoms because their gut environment is more mature and resistant to colonization.
The problem for us on the milk side is that Clostridium botulinum spores are built to survive. Scientific work and public‑health guidance agree: spores are highly heat‑resistant. Standard milk pasteurization and typical spray‑drying conditions do not reliably destroy them. It takes more severe treatments—like those used for shelf‑stable canned foods—to inactivate spores consistently, and that’s not how we process fluid milk or most powders.
Pathogen or Spore
Standard Milk Pasteurization (161°F, 15 sec)
Spray-Drying (160–200°F typical)
What It Actually Takes to Kill
Present in ByHeart Outbreak?
Salmonella
✓ Killed
✓ Killed
161°F+ for 15 sec
No—destroyed by pasteurization
Listeria
✓ Killed
✓ Killed
161°F+ for 15 sec
No—destroyed by pasteurization
Cronobacter
✓ Killed
✓ Killed
161°F+ for 15 sec
No—destroyed by pasteurization
E. coli O157:H7
✓ Killed
✓ Killed
155°F+ for 15 sec
No—destroyed by pasteurization
Clostridium botulinum SPORES
✗ SURVIVES
✗ SURVIVES
250°F+ for 3+ min (pressure canning)
YES—found in powder & sealed cans
Bacillus cereus spores
✗ Survives
✗ Survives
250°F+ for extended time
Not reported
Historically, most infant botulism cases have been linked to environmental exposure and honey, not commercial formula. So the track record for the formula has been quite good. But when you look at the FDA’s published focus on powdered formula safety, it has leaned heavily on organisms such as Cronobacter and Salmonella. This outbreak is a hard reminder that spores are a different challenge. They don’t behave like standard bacteria, and they can ride along in dust, soil, and dried residues in ways that are easy to underestimate.
For farms shipping to ingredient plants serving infant markets, that matters. It’s not just about plate counts, fresh cow management, and keeping butterfat levels where they need to be. It’s also about whether your milk and your plant’s environment are being managed with spore risk in mind, even if the odds of a problem are low.
Mapping the Chain: From Organic Herds to Fallon
Let’s walk through the supply chain as credible reporting has laid it out.
On the farm end, 55 certified organic dairies ship to Organic West. Many of these are in California’s main organic regions, with at least some milk coming in from outside the state, such as Oregon. These are full‑time commercial herds, not hobby operations. They’ve gone through organic certification, pasture requirements, and the paperwork that comes with chasing organic premiums rather than just taking a basic blend price.
Organic West then moves that milk into DFA’s Fallon ingredient plant in Nevada. That facility was promoted as a major anchor for regional dairy when it was built. Contemporary coverage described roughly $70 million in capital investment, the capacity to handle about 2 million pounds of milk per day, and finished output of about a quarter‑million pounds of powder and other dried ingredients per day. Economic development folks projected that the area herd would need to grow significantly to feed the plant, and that the regional dairy sector could see a sizable boost as the plant ramped up.
From Fallon, the organic whole milk powder goes out as an ingredient. In ByHeart’s case, they use that powder at blending and packaging facilities in multiple states to make finished infant formula. That formula is then sold nationwide. That’s how a problem at the ingredient level can end up with 51 sick babies across 19 states: one product, one brand, lots of distribution.
Supply-Chain Stage
Entity
Volume/Scale
Contamination Entry Risk
Who Controls Quality Here?
Your Farm’s Visibility
1. Farm
55 certified organic dairies (CA, OR)
Unknown total volume
Soil, dust, feed, environment
Individual farm protocols
HIGH
2. Collection
Organic West Milk Inc. (Bill Van Ryn)
Pooled multi-farm milk
Tanker hygiene, cross-contamination
Hauler + farm coordination
MEDIUM
3. Processing
DFA Fallon, NV ingredient plant
~2M lbs milk/day → ~250K lbs powder/day
Plant environment, dryer surfaces, packaging
DFA plant SOPs + FDA oversight
LOW
4. Ingredient Supply
Organic West powder to ByHeart
Unknown tonnage to infant formula only
Warehouse storage, handling, moisture
Ingredient supplier + buyer specs
VERY LOW
5. Formula Blending
ByHeart facilities (multiple states)
National distribution scale
Blending equipment, other ingredients
ByHeart manufacturing SOPs
NONE
6. Retail/Consumer
Nationwide (19 states affected)
51 hospitalized infants (Dec 2025)
Post-production handling (rare for spores)
Retailers + consumer storage
NONE
FDA’s public position is careful but clear. They’ve reported that organic whole milk powder used in ByHeart formula tested positive for botulinum toxin, and that they believe the ingredient supplier is likely where contamination entered the chain. At the same time, they’ve emphasized that the investigation is ongoing and that they’re still working to determine exactly where and how spores got into the system. So while Organic West and DFA Fallon are under extra scrutiny, regulators have not issued a final ruling on the specific contamination issue.
From Van Ryn’s vantage point—and many of us can relate—he’s stressing that a positive test in a powder sample doesn’t automatically prove that the milk leaving his farm or any of the 55 farms was the original source. Somewhere between the cow, the tanker, the dryer, the warehouse, and the formula blender, spores found a way in. The job now is to figure out where.
What This Means If Your Milk Goes Into Powder or Infant Products
If you’re one of those 55 farms, or your milk runs into a similar system somewhere else, there’s a tough reality: from a buyer’s or regulator’s vantage point, they see the pool, the plant, and the product more than your individual track record.
Those farms are still milking. Their organic milk can be redirected into other organic products, such as fluids, cheese, yogurt, and various powders. But that infant formula outlet, which probably helped justify the cost and effort of organic certification and all the detail that goes into feed, dry cow, and transition management in organic herds, is effectively shut off for now. That’s real opportunity cost, even without putting a dollar value on it.
Many Midwest producers will recognize the feeling from other situations: you can be doing a great job on your own place—sound fresh cow programs, strong transition period performance, consistent components—and still get caught up in problems that start at a plant or in another part of the chain. In Wisconsin, for instance, herds shipping to specialty plants have had to live with added oversight because of issues at the plant, even when their own farm tests were clean.
Here, the worry for those 55 families isn’t just this month’s test results. It’s the next lender meeting, the next renewal conversation, the next buyer negotiation. Will lenders and buyers still view them as low‑risk suppliers a year or two from now? Or will there always be a quiet mental note attached: “This milk shipped into the ByHeart chain during the botulism investigation”?
The other piece is premiums. Organic whole milk powder used in infant and specialty ingredient markets generally trades above conventional nonfat dry milk and standard whole milk powder. You don’t need a specific spread to know that losing or clouding that outlet tightens margins. USDA price data and market commentary have consistently shown that organic powders command higher prices than their conventional counterparts; that’s part of why farms put up with the extra requirements.
For some of these families, the question isn’t just about this year’s milk check. It’s whether the farm they hoped to pass on will still be welcome in the highest‑value markets ten years from now.
Four Ripple Effects for Anyone Shipping Into Powder or Infant Ingredients
What many of us have seen, watching how the FDA handles food incidents, is that a case like this sends ripples through the entire sector. For anyone whose milk ends up as powder or an ingredient in infant products, four of those ripples matter a lot.
1. Quality Programs Will Tighten
If your milk, or your co‑op’s milk, finds its way into powder that feeds infant or pediatric products, expect more questions. Processors are likely to push harder on:
How suppliers are approved.
What documentation is on file.
Whether there’s any on‑farm testing or extra audits tied to high‑risk outlets.
It’s not about assuming farms are doing something wrong. It’s about buyers understanding that the FDA now has fresh evidence of spores in an ingredient used in a sensitive product, and that everyone in that chain will be scrutinized more carefully next time. They’ll want more than “we meet requirements” when it comes to plant hygiene, environmental monitoring, and escalation when something looks off.
2. Traceability Has to Be Airtight
The work the FDA and CDC have done on this outbreak shows they can trace from hospital beds back to brands, lots, ingredients, and facilities. If your paper trail—hauler tickets, plant receipts, lab results—is scattered across different desks and systems, you’re behind where buyers and regulators are going.
Traceability is the supply‑chain version of watching fresh cows closely in the transition period. When something goes wrong, you need to be able to quickly and clearly see where your milk went and what its quality profile looked like over time. That’s what gives you a fighting chance to show your farm has been doing its part.
3. Contracts and Insurance Will Turn Into Homework
Premium markets bring premium liability. In 2023, the FDA sent warning letters to several infant formula manufacturers, including ByHeart, over Cronobacter control and plant sanitation. Those letters came months after inspections and findings, and during that time, plants and suppliers alike were operating under a cloud.
If your milk is tied into infant or high‑risk ingredient markets, it’s worth pulling your contracts and policies out of the drawer and asking a few blunt questions:
If there’s a recall, who pays for product destruction and logistics when the dust settles?
If a buyer has to pause purchases while they deal with regulators, what happens to your milk check during that time?
Can your co‑op or processor pass legal costs or settlements down to member farms if a case gets ugly?
If your exposure to these markets is modest and your contracts spell out recall and indemnity in a way you can live with, you may decide the trade‑off is acceptable. If a big share of your milk is in these channels and the contract language is vague or one‑sided, that’s a signal to either push for clearer terms or re‑think how much exposure you’re willing to carry.
4. “Organic” and “Clean Label” Will Draw More Scrutiny
One of the ironies here is that this outbreak happened in a brand sold as cleaner and more thoroughly screened than the competition. That doesn’t mean organic or “clean label” is unsafe. But it does mean organic dairies and ingredient plants will feel more scrutiny.
Consumers often treat organic labels as a shortcut for “safer” or “more natural.” When something like this hits the news, retailers, regulators, and parents start asking tougher questions about what’s behind the label:
How is the supply chain actually controlled?
What’s different about how these plants manage environmental and spore risk?
Producers in those markets will feel that in the form of more documentation requests, tighter specifications, and, sometimes, more probing conversations with auditors and buyers.
How Long Does This Hang Over a Supply Chain?
Recent infant formula incidents tell us these investigations don’t wrap up in days. They run for weeks or months, from the first cluster of cases through inspections, product sampling, environmental testing, and finally public warning letters or closing summaries.
Here, we’re talking about:
51 infants.
19 states.
One branded formula manufacturer, an ingredient plant, and a multi‑farm organic pool.
FDA has said it’s still working to determine whether there’s a common source of contamination and exactly where it sits in the chain. Meanwhile, ByHeart has recalled all its powdered infant formula and told parents not to use it. For everyone connected to that chain, that means living with regulators’ attention until they decide the story is closed.
For the 55 farms shipping to Organic West, that “limbo” looks like talking with lenders, accountants, and family members about what happens if that premium infant formula outlet doesn’t come back soon—or comes back with new requirements and tighter testing. In Midwest and Northeast operations, many folks know that feeling from times when a cheese plant or processor has had a major issue, and everyone in the patron pool has had to live with new testing regimes and contract changes.
All of this unfolds while feed bills, staff wages, and loan payments keep rolling in, right on schedule.
So What Do You Actually Do on Your Farm?
You can’t control the FDA. You can’t control exactly how a plant handles its environmental monitoring. But you can decide how much exposure to these markets you want in your business model, and how prepared you’ll be if your name ever shows up in an investigator’s notes.
Here’s a practical way to think about it.
LOW Exposure (<10% volume to powder/infant)
HIGH Exposure (>30% volume to powder/infant)
STRONG Documentation (3–5+ years records)
QUADRANT 1: Low Risk, Well-Positioned- Limited downside in recall- Can prove cleanliness to lenders- Premium markets optional- Action: Monitor & maintain
QUADRANT 2: High Exposure, Defensible- Significant premium upside- Can defend farm if investigated- Still vulnerable to plant failures- Action: Review recall liability, add interruption coverage
WEAK Documentation (<3 years records)
QUADRANT 3: Low Risk, Under-Prepared- Minimal immediate threat- Can’t prove history if asked- Lender confidence at risk- Action: Build documentation file NOW
QUADRANT 4: HIGH RISK, FLYING BLIND- Major premium exposure + weak defense- Can’t prove cleanliness in investigation- Lender nightmare if recall hits- Action: URGENT—exit infant markets OR fix docs/contracts
1. Map Your Exposure
Sit down and answer three simple questions:
Does any of my milk go into powder?
Does any of that powder end up in infant or pediatric products?
Roughly what share of my total volume is tied up in those higher‑risk outlets?
If only a small share of your milk flows into these channels and you’re comfortable with your buyer’s programs, you may decide your main job is to keep doing the basics well—milk quality, herd health, clean transition management—and to stay tuned to how your buyer responds to this case.
If a big chunk of your milk—say, a quarter or more—is tied into powder or infant ingredients, it’s reasonable to treat that as a high‑exposure segment of your business. That doesn’t mean you should walk away from it. But it does mean you should spend some time understanding the contracts, insurance, and documentation requirements for that segment.
2. Build a Documentation File You Can Put on the Banker’s Desk
On many farms, lab reports and records are scattered. Some with the vet, some in the co‑op’s system, some on paper in the office. If you’re in sensitive markets, it’s worth pulling that into one place.
A practical target is to be able to show three to five years of:
Milk quality records (SCC, PI counts, standard screens your buyer runs).
Any relevant environmental or product test results your processor shares.
Audit reports if you’re organic or in other quality programs.
Many buyers and insurers are already thinking in multi‑year horizons when they assess risk. If you’re above roughly 30% exposure to powder or infant ingredients and can’t pull together at least three solid years of documentation, it’s a sign you’re in a high‑risk corner of the grid from a paperwork standpoint, even if your day‑to‑day practices are excellent.
3. Read the Contracts You Signed
It’s not fun work, but it’s cheaper to read contracts with a cup of coffee than with a lawyer on the phone.
Look specifically for:
Indemnity and recall language—who pays for what.
Suspension clauses—what happens to your milk if purchases are paused.
Cost‑sharing for legal defense, settlements, or extra testing.
If you find terms that would be devastating for your farm in a worst‑case scenario, that doesn’t necessarily mean you have to bail on the market. But it does mean you should decide whether to:
Ask for changes or clarifications.
Limit how much of your volume you expose to that channel.
Set aside reserves or add insurance to backstop that risk.
Contract/Insurance Question
✓ Good Answer (Protects Farm)
✗ Dangerous Answer (Exposes Farm)
Where 55 ByHeart Farms Likely Stood
1. Who pays for product destruction in recall?
Processor/co-op covers; farm only liable if proven source
Farm pays pro-rata, regardless of fault
Likely pro-rata = liable even if not at fault
2. What happens to milk check if plant pauses purchases?
This is the fine print your lender and insurer will want to understand if something goes sideways.
4. Talk With Your Insurer Like a Risk Partner
Make sure your agent understands:
That some of your milk may be going into powder and possibly infant products.
What coverage do you have for product recall, contamination, and business interruption tied to food safety issues.
Ask directly: “If my milk ends up being part of an investigation—even if it’s never proven to be the source—how would this policy respond?” Better to have that conversation now than in the middle of a crisis.
5. Decide How Far You Want to Go on Extra Testing
Some farms, especially larger ones with significant exposure to infant ingredient markets, may decide to partner with their buyer on additional testing or environmental monitoring. That can:
Strengthen your position with risk‑sensitive buyers.
Give you more data about what’s happening in your part of the chain.
But it also:
Costs time and lab money.
Can raise tough questions if the results are borderline, even when you’ve done nothing wrong.
There’s no universal right answer. It comes down to your scale, your markets, your tolerance for risk, and your relationship with your processor.
The Trade-Off You Can’t Dodge
For Bill Van Ryn and those 55 organic families, the coming months will determine whether they’re remembered as farms that got swept up in a rare supply‑chain event or as the case everyone points to when they talk about infant formula risk. In the meantime, they’re still doing what all of us do: milking cows, managing fresh cow groups, balancing rations for butterfat and components, and keeping up with bills and certifications.
If your milk runs into similar pipelines, your real decision isn’t whether risk exists. It’s whether you want that risk as part of your business model—and, if you do, how intentional you’re going to be about managing it.
Staying in high‑value powder and infant markets usually means better pricing than a generic blend check, but it also brings more paperwork, more questions, and more eyes on your operation and your buyer’s plant. Stepping away from those markets means giving up some upside but also sleeping a bit easier when you read stories like this.
So if you only have time for a short checklist over coffee, here’s where to start in the next 30 days:
Find out exactly how much of your milk ends up as powder or infant/pediatric products, and through which plants.
Sit down with your processor and insurer to walk through contracts, recall liability, and coverage tied to food safety events.
Pull your lab and audit records into one place, so you’re not scrambling if someone asks for them under pressure.
You don’t need to panic. But you do need to decide how much of this risk you’re willing to own—and then build your playbook around that choice.
At the end of the day, a ‘Clean Label’ doesn’t protect your equity—only a clean contract does. Don’t wait for the FDA to audit your life; audit your own risk before the next tanker pulls into the yard.
Key Takeaways
51 babies, 19 states, one ingredient: FDA found botulinum toxin in ByHeart infant formula and in the organic whole milk powder used to make it—the entire supply chain is now under investigation.
55 organic farms in one pool, all under the same microscope: Milk from certified organic dairies flows through Organic West to DFA’s Fallon, Nevada plant, then into ByHeart’s premium formula. One positive test implicates them all.
Spores survive what kills most pathogens: Clostridium botulinum spores can persist through pasteurization and spray-drying—standard milk quality programs aren’t designed to catch this risk.
Contracts, premiums, and lender confidence are all on the table: Expect tighter traceability, tougher quality audits, more complex recall and indemnity language, and sharper scrutiny of organic and “clean label” claims.
Your 30-day playbook: Map your milk’s path into powder and infant products, consolidate 3–5 years of quality and audit records, review contract recall clauses, and sit down with your insurer about contamination and business-interruption coverage.
Complete references and supporting documentation are available upon request by contacting the editorial team at editor@thebullvine.com.
Learn More
Don’t Get Burned: The Producer’s Guide to Negotiating Watertight Milk Contracts – Exposes the lethal fine print in modern supply agreements and delivers a step-by-step negotiation framework. Use these tactics to shield your equity from lopsided recall liabilities before the next market disruption hits your milk check.
The $50,000 Biofilm Crisis Your ATP Test Will Expose – Reveals how hidden pathogen reservoirs in your equipment bypass standard wash cycles and identifies the advanced monitoring tools that catch them. Mastering this tech prevents catastrophic grade-outs and secures your reputation as a top-tier supplier in high-scrutiny markets.
The Sunday Read Dairy Professionals Don’t Skip.
Every week, thousands of producers, breeders, and industry insiders open Bullvine Weekly for genetics insights, market shifts, and profit strategies they won’t find anywhere else. One email. Five minutes. Smarter decisions all week.
500-cow dairy. $17 Class III. $250,000 negative margin. That’s 2026 math for farms still budgeting at USDA’s $19 forecast. The gap is real. Is your plan?
Executive Summary: For 2026, the core math is brutal: many 500‑cow dairies face up to a $250,000 annual margin gap between their full cost of production and what 2026 Class III futures will actually pay. USDA projects U.S. milk output climbing to about 231.4 billion pounds in 2025 and 234.1 billion pounds in 2026, even as licensed dairy herds keep dropping, confirming we’re in a “more milk, fewer farms” era, not a supply crunch. Rabobank’s Q4 Big‑7 analysis shows global exporters finished 2025 around 2.2 percent ahead of 2024 on a milk‑solids basis, so the world is long on milk and short on comfortable margins. Using farmdoc’s detailed cost work, the article walks through how full costs in the low‑$20s per hundredweight collide with $16–17 futures and what that means in dollars per farm, not just theory. A 600‑cow Wisconsin case study then illustrates how tightening heifer programs, sharpening culling, and revisiting land and lease costs can pull breakeven closer to realistic price levels. The piece closes with a concrete 2026 playbook—know your true cost, map your position in your processor’s supply network, stress‑test technology and expansion plans, and decide whether to grow, hold, or exit before the market decides for you.
If you sit down with the latest milk report and a cup of coffee, one thing really jumps out: we’re producing more milk than ever, but fewer farms are doing the work. USDA’s latest Livestock, Dairy, and Poultry Outlook puts U.S. milk production at about 231.4 billion pounds in 2025 and roughly 234.1 billion pounds in 2026, driven by higher yields per cow and modest herd growth in key dairy regions like the Upper Midwest, High Plains, and West. It’s worth noting that these gains come on top of already high production, not a rebound from a crash.
What’s interesting is what happens when you overlay that with herd numbers. USDA and its Economic Research Service have shown that licensed U.S. dairy herds fell from just over 70,000 in 2003 to around 34,000 by 2019—a drop of more than 50 percent—while total milk output hit record levels. More recent compilations of USDA data suggest the national dairy herd still averaged about 9.34 million cows in 2024, very close to recent years. So the story isn’t “less milk.” It’s “fewer farms producing more milk.”
What farmers are finding is that 2026 isn’t just another down year in the usual cycle. It’s part of a broader reset in who produces milk, where it gets produced, and what kind of financial structure sits under the barns and dry lot systems that do the work. Let’s walk through that together, the way we’d talk it through at a producer meeting or over coffee at the kitchen table.
Month
USDA Forecast
CME Class III Futures
$ Gap (500-cow herd @ 12.5M lbs/yr)
Jan 2025
$21.50
$17.25
$259,375
Apr 2025
$21.00
$16.75
$265,625
Jul 2025
$20.50
$16.50
$250,000
Oct 2025
$19.75
$16.25
$218,750
Jan 2026
$19.25
$17.00
$140,625
Apr 2026
$19.00
$16.75
$156,250
Jul 2026
$18.75
$16.50
$140,625
Oct 2026
$18.50
$16.25
$140,625
Looking at This Trend: More Milk, Softer Prices, Heavier Surplus
Looking at this trend from altitude, the first thing to square is production versus price.
USDA’s economists, in their December 2025 and January 2026 outlooks, raised milk production forecasts but trimmed price expectations. Their latest numbers put the 2025 U.S. all‑milk price a little above $21 per hundredweight, and the 2026 all‑milk forecast in the high‑$19 range, after cutting it by more than a dollar from earlier in 2025 as production estimates came up. At the same time, CME markets have often priced 2026 Class III futures in the mid‑$16 to low‑$17 range, something that’s been highlighted in market columns and Bullvine analysis as a significant gap between what you can actually hedge and what older headline forecasts implied.
On the global side, Rabobank’s Q4 2025 dairy report—summarized by AHDB—estimated that combined milk production from the “Big 7” exporters (EU, UK, U.S., New Zealand, Australia, Brazil, and Argentina/Uruguay) finished 2025 about 2.2 percent ahead of 2024 on a milk solids basis. Rabobank’s analysts noted that all the major exporters were expected to remain in growth at least through early 2026, and that this strong supply, coupled with fragile demand in some markets, was likely to keep dairy commodity prices under pressure into 2026. Reports following the Global Dairy Trade auctions in late 2025 back this up, showing butter and powder prices struggling to sustain rallies whenever stock levels and new-season milk flow signal ample supply.
So the data suggests we’re not in a world where “there isn’t enough milk.” We’re in a world where there’s plenty of milk, and the question is who is producing it and at what margin.
Structurally, the long‑term pattern hasn’t changed. USDA’s consolidation work and independent reporting show licensed dairy herds cut roughly in half between 2003 and 2019, while national production increased. 2024 statistics, based on USDA numbers, put average cow numbers around 9.34 million head, confirming that cow numbers remain near recent levels while farm numbers keep sliding. The Bullvine’s own projection, simply extending those herd-loss trends forward, estimates the U.S. could be down to about 15,000 licensed dairies by the mid‑2030s and fewer than 10,000 by mid‑century if closure rates don’t slow. That’s our math, not USDA’s, but it aligns closely with the direction of the underlying data.
Year
Licensed Dairies
Total Milk Production (B lbs)
Avg Herd Size (cows)
2003
70,000
170
95
2008
52,000
191
147
2013
41,000
200
183
2019
34,000
215
250
2024
~16,500
231.4
1,400
2026 (proj)
~15,000
234.1
1,560
The Expansion Squeeze: When Yesterday’s Good Plan Meets Today’s Math
Now let’s pull this down from the global and national level to something many of you have lived through: expansions that looked safe at $22–23 milk and 3–4 percent money.
In 2022, the U.S. all‑milk price averaged in the mid‑$25s per hundredweight, setting a new record and surpassing the previous peak from 2014. Butterfat performance was heavily rewarded in many pay programs, and farms with strong components were seeing exceptional checks. Feed costs were high, but by late 2023, USDA and market economists were already projecting some relief in corn and soybean meal prices as supply caught up.
So a lot of 300‑ to 700‑cow herds—especially in regions like Wisconsin, New York, Ontario, and parts of the West—made expansion decisions that looked very reasonable on paper:
Grow from 300 to 500 or 600 cows by adding a new freestall barn or expanding a dry lot system.
Install or update manure storage to match the new scale.
Run the numbers at 25,000–26,000 pounds per cow per year, shipping 12–15 million pounds annually.
In many budgets, operating costs (feed, labor, vet and breeding, fuel, repairs, bedding, utilities) are penciled in at $12–13 per hundredweight, and term debt service at 3–4 percent, adding another $2–3 per hundredweight. At $22–23 milk, the pro formas left room for family living and reinvestment. Extension enterprise budgets from Midwestern and Northeastern universities show similar cost structures for well‑managed freestall herds in that size range.
Then the conditions moved.
USDA’s updated outlooks have since trimmed price expectations. All‑milk is now projected at a bit above $21 for 2025 and high‑$19s for 2026. Futures markets have often only offered $16–17 for Class III futures in 2026. And interest costs—the piece many of us took for granted when rates were near historical lows—have roughly doubled on new and repriced loans. Farm finance reports and Federal Reserve district surveys show a clear shift toward mid‑single- and even high-single-digit rates for operating lines and floating‑rate term loans.
The farmdoc daily “Economic Review of Milk Costs in 2024 and Projections for 2025 and 2026” is helpful here. That work found that:
Average total costs of production in 2024—including feed, non‑feed, and ownership costs—ran about $23.56 per hundredweight, while average milk price received was $21.63, implying negative economic returns.
Cash costs (feed plus non‑feed operating) alone were around $17.43 per hundredweight.
Projections for 2025 and 2026 show lower milk prices and only modest cost relief, suggesting continuing pressure on margins.
So, in many cases, the full cost of production for mid‑size herds (including a realistic family draw and depreciation) lands somewhere in the upper‑teens to low‑20s per hundredweight. If your cost is, say, $18.50 and the futures market is offering $17, you’re looking at a $1.50 gap. On a 500‑cow herd shipping 12.5 million pounds a year (125,000 hundredweight), that’s roughly $187,500 in annual negative margin. At a $2 gap, it’s around $250,000.
What I’ve noticed, visiting farms and looking at DHIA and processor data, is that in many barns, the cows are actually doing well. Butterfat performance is often better than it was a decade ago. Fresh cow management during the transition period has improved, with more consistent protocols and monitoring. Reproductive programs are tighter. The stress is coming from the financial side of the ledger, not a sudden collapse in cow performance.
When a Dairy Quits: Where Cows, Land, and Steel Actually End Up
Used equipment dealers, export channels, neighboring farms
Online auctions (Machinery Values, etc.)
50–75% (depends on age, condition)
We don’t enjoy talking about dispersals, but if we’re honest, they show us where the industry is really going.
On the cow side, the pattern is pretty similar across regions:
Larger neighboring herds—say 1,000–3,000 cows—often line up early to purchase the top end of the herd, either privately or on sale day. They’re after younger cows with strong components and healthy records, they can drop straight into their freestalls or dry lot systems.
Growing areas like South Dakota, Idaho, western Kansas, and parts of Texas have been bringing in cows from other regions to fill new or expanded facilities. USDA‑NASS and trade coverage show double‑digit herd growth in some of these states over the past decade.
Livestock dealers purchase whole herds, sort animals into different quality groups, and send better cows into herds that are still expanding while moving lower‑tier animals into dairy‑beef and cull markets.
Recent data from Wisconsin Extension indicates that total U.S. cow numbers have remained in the 9.3–9.5 million head range, even as herd numbers have continued to fall. That shows what many of us see: the cows are staying in the system, just on fewer farms.
On the land side:
Neighboring dairies and crop farms frequently step in to buy ground for forage, grain, and manure application. This is especially common in the Upper Midwest, Ontario, and parts of the West, where land is still predominantly agricultural.
In areas on the edge of urban growth—think parts of the Northeast, Ontario’s Golden Horseshoe, or near mid‑sized cities in the Midwest—developers sometimes buy former dairy land for residential or commercial use. Once that happens, that acreage is effectively gone from the production base.
Farmland investment funds and family offices have become a notable presence, purchasing land and leasing it back to operators. Rabobank and USDA research on farmland markets have pointed out that institutional investors are attracted to farmland’s inflation‑hedging properties and targeted rental yields in the four to five percent range.
I’ve noticed a fairly consistent pattern in conversations: a family decides to exit, an investor group buys the land, and a larger local dairy leases it. The exiting family converts land equity into cash and steps out of day‑to‑day production; the remaining operator expands access to acres without tying up more capital.
The infrastructure—parlors, barns, lagoons—is often the hardest part to repurpose. Older parlors designed for 150–300 cows don’t always match the layout that a 2,000‑cow freestall or dry lot system wants today. Extension engineers and consultants sometimes point out that the salvage value is mainly in pumps, gates, and some steel, with much of the rest written down. Tractors, TMR mixers, loaders, and manure equipment generally move at a discount, but there’s more of a market for them, and export channels help in some cases.
So, in many cases, cows and land get absorbed into the next phase of the industry. The mid‑size dairy footprint doesn’t always.
What Farmers Are Finding About Processor and Co‑op Strategies
Looking at this trend from the processor side fills in the rest of the picture.
Over the last several years, we’ve seen significant new cheese and whey capacity come online or announced in states like Michigan, Texas, Kansas, Idaho, and South Dakota. Industry outlets and USDA outlooks describe these plants as handling very large daily intakes—often in the millions of pounds—with high levels of automation and the flexibility to switch product mix as markets move. They are typically located in areas with strong concentrations of large herds and room for further growth.
At the same time, smaller or older plants in areas with declining milk supplies or many small suppliers have been targets for rationalization, mergers, or closure. Examples have appeared in parts of the Northeast and Upper Midwest, as well as in the UK and Europe, where processors are consolidating into fewer, larger sites to improve efficiency.
From a cost standpoint, the logic is hard to argue:
Hauling 200,000 pounds a day from a handful of large stops costs less than collecting the same volume from dozens of small herds.
Plants closer to full capacity spread fixed costs over more pounds, improving processing margins.
Regions with larger, more consolidated herds provide a more predictable supply.
USDA structural reports and co‑op communications both reflect the same reality: co‑ops and processors are losing farm suppliers faster than they’re losing milk volume. Many have said some version of “we’re losing members, but we’re not losing milk,” especially in boardroom and annual meeting contexts. The data backs that up.
This development suggests that supply chains are being built around a smaller number of larger anchor herds, with smaller and mid‑size operations fitting in where they align with route plans, quality needs, and regional strategy. It doesn’t mean the end of 60‑ or 200‑cow farms—especially those tied to niche markets or local processing—but it does change the economic current they’re swimming against.
The “Optimism Gap”: USDA Forecasts vs. What You Can Actually Hedge
Now let’s look at something that quietly drives a lot of stress: the difference between official price forecasts and the numbers you can actually put on a hedge or forward contract.
USDA’s all‑milk price projections, as published in WASDE and the Livestock, Dairy, and Poultry Outlook, are built from models that connect anticipated production, stocks, exports, and domestic use. For late 2025 and into 2026, those projections cluster around $ 21+ in 2025 and the high $19s in 2026.
On the other side, the CME Class III futures curve has, for much of late 2025 and early 2026, priced many 2026 contracts in the mid‑$16 to low‑$17 band. Dairy market writers and analysts have noted that this is a substantial and persistent gap, especially as processors remain cautious about forward contracting at higher levels.
Economists at Cornell and Illinois who evaluate USDA forecast performance and farm-level decision tools have emphasized that futures prices tend to adjust more quickly to new information, while institutional forecasts can lag a bit or smooth volatility. In extension meetings, their message to producers has generally been: “Use USDA and co‑op forecasts as scenarios, but build your cash flow around what you can realistically hedge.”
That’s the essence of what The Bullvine highlighted in its own “USDA Says $18, Futures Say $16” analysis—if your plan assumes $19–20 milk but the market will only let you lock in $17, the difference on a 500‑ or 600‑cow herd is often $200,000–$250,000 a year in gross revenue. That can be the difference between staying ahead of your principal and tapping the operating line to get through the year.
So a practical approach for 2026 is to:
Treat the hedgable futures price (plus your realistic basis and component premiums) as your conservative planning number.
Use USDA all‑milk projections as higher‑price scenarios to test what happens if things break your way.
Be honest about whether your current business model only works at the top of the range, or also works at the conservative end.
A 600‑Cow Wisconsin Case: Turning Data into Decisions
To make this less abstract, let’s look at a composite case based on several real herds in central Wisconsin.
This farm:
Milks 600 Holsteins in a freestall setup with a double‑12 parlor.
Averages around 26,000 pounds per cow per year.
Maintains butterfat performance near 4.1 percent and protein about 3.2 percent, with strong emphasis on fresh cow management and the transition period.
Expanded from 400 to 600 cows in 2022, financing a new barn and lagoon at just under 4 percent interest.
In late 2025, their lender suggested a “stress test” for 2026 and 2027, given the revised USDA forecasts and the futures strip. Working with a dairy business specialist from extension, they pulled their last two years of numbers and calculated:
Cash cost per hundredweight (feed, labor—including unpaid family labor at a fair rate—vet and breeding, fuel, repairs, bedding, insurance, interest, property taxes).
Full cost per hundredweight after adding depreciation and a realistic family living draw.
Their full cost landed in the high‑$18s per hundredweight, very close to the range highlighted by the farmdoc 2024 cost study for similar Midwestern herds.
Then they ran three simple price cases:
Forecast case: all‑milk equivalent of about $19.25 per hundredweight.
Market case: Class III‑based price of $17, adjusted for their herd’s typical basis and component premiums.
Stress case: $16 milk for half the year, plus a 10 percent bump in purchased feed costs.
At $19.25, they could service debt, cover family living, and maintain a modest cash buffer. At $17, they were hovering near breakeven—some months slightly positive, some slightly negative—depending on how tight they ran repairs and how well cows performed. At $16 plus higher feed, they would burn through most of their working capital inside about 12–15 months if nothing changed.
Instead of ignoring that, they made several specific adjustments:
Tightened their heifer program by raising fewer replacements and using more beef semen on lower‑tier cows, reducing heifer raising costs while capturing dairy‑beef value on calves.
Renegotiated a high cash‑rent land lease, bringing it closer to local averages and lowering their per‑cwt land cost.
Became more disciplined about culling cows with chronic health issues or consistent component underperformance, even if daily milk looked decent.
Those changes didn’t drop their cost by $3, but they shaved an estimated 50–75 cents per hundredweight. That pulled the $17 scenario from marginal into manageable. Their lender, seeing that they were budgeting off conservative price assumptions and actively adjusting, was more comfortable working with them on amortization and covenant flexibility.
The point isn’t that this particular mix of moves is right for every farm. It’s that using the numbers honestly can shift you from “hoping things turn” to actively managing risk.
Practical Questions for 2026: What to Ask Before You Decide Your Next Move
What farmers are finding is that the most important work in 2026 isn’t guessing the exact milk price—it’s asking the right questions about their own operations. Here are four sets of questions that keep coming up in conversations with producers, lenders, and advisors.
1. What’s our true cost of production—and where’s our red line?
You probably know this already, but in a tighter environment, it’s crucial to get beyond ballpark guesses:
What is our cash cost per hundredweight?
When we add depreciation and a realistic family living draw, what is our full cost per hundredweight?
At what milk price do we cover all that? At what price do we start eroding equity, and how long can we keep doing so before we reach a level we’re not willing to cross?
Tools from land‑grant universities and farm business programs can help you calculate this accurately, drawing on your actual records rather than averages. Knowing that threshold doesn’t solve the problem, but it gives you a clear frame for every other decision.
2. Where do we sit in our regional supply network?
In California, a 1,500‑cow freestall near a major cheese or powder plant is in a very different situation than a 200‑cow tie‑stall in rural Vermont that’s at the end of a route. In eastern South Dakota or western Kansas, where new plants are coming online, and herd numbers have grown quickly, a 700‑cow herd might be seen as a stable core supplier. In other regions with shrinking cow numbers and plant closures, a similar herd might feel much more exposed.
Questions worth asking include:
Are we one of the larger suppliers on our milk route, or one of the smallest?
Has our pickup frequency changed in recent years, and what does that signal about our fit in the logistics plan?
Are processors investing in our area, or consolidating capacity elsewhere and stretching routes to reach us?
Understanding your position doesn’t force you into one path, but it should influence whether your strategic focus is on careful growth, diversification (like on‑farm processing or specialty components), or planning a transition while you still have strong equity.
3. How do we feel about partnerships and outside capital?
In recent years, more dairy families have explored models where they don’t own every acre and every building themselves. That might look like:
Selling some or all land and leasing it back from an investor, freeing up capital while staying in production.
Entering a joint venture with a processor, co‑op, or private investors to build new facilities, with the family managing cows and staff.
Having the next generation step into a management role on a larger, investor‑backed freestall or dry lot operation with opportunities for equity over time.
Rabobank’s farmland and agribusiness work, and USDA financial analyses, note growing interest in these structures, especially in areas where land prices outpace what dairy cash flow alone can support. They are not right for everyone, but for some families, they offer a way to stay in dairy without carrying all the capital risk.
The key is to:
Use advisors who understand both dairy and finance.
Carefully review contracts (with ag‑savvy legal counsel) and model returns under conservative milk prices.
Make sure everyone in the family understands what’s being traded: more external capital and potentially more stability, in exchange for sharing control.
4. Do our “efficiency” investments really reduce cost per cwt at today’s prices?
Robotic milking, automated feeding, in‑line sensors, and cow‑level health and activity monitors are becoming standard in many herds—from Ontario robotic barns to European pasture‑based systems. Research in journals like Frontiers in Veterinary Science and extension trials show that well‑managed robotic milking systems can maintain or improve milk yield, udder health, and cow longevity, and often reduce reliance on parlor labor.
What’s important is not whether the technology can work—it often does—but whether it lowers your cost of production under realistic price and herd-size scenarios.
Before committing to a major system, it’s wise to:
Run a multi‑year partial budget with your lender and advisor, including capital cost, maintenance, software, and realistic labor savings.
Test cost per cwt at $16–17 milk, not just at $20–22.
Ask how the economics change if you end up milking fewer cows than planned or if labor markets ease.
If the numbers still work under those conditions, the investment can be a strategic advantage. If they only work under best‑case assumptions, it may be better to wait.
Strategic Path
Best If…
Capital Required
Risk Level & Key Success Factors
GROW (Expand herd & facilities)
You’re already one of the larger suppliers on your route; processor/co-op signaled support; you have 1,500+ cows in mind; management is scalable
$3–5M for 300-cow addition (barns, parlor, lagoons); assume 4–5% interest
HIGH RISK — Requires lowest cost structure, strong operator-to-cow ratio, processor loyalty; vulnerable to price drops and refinancing pressure if rates stay elevated
HOLD (Stay at current size, tighten costs)
Your herd is 300–600 cows; you’re well-positioned on milk routes; you can cut 50–75¢/cwt via heifer & culling discipline; cash flow is adequate
Minimal capital(operational improvements only); $0–200K for facility upgrades
MODERATE RISK — Requires disciplined management, willingness to make tough culling/staffing decisions; protects equity while riding out cycle
EXIT (Planned dispersal, preserve equity)
Your debt is aging; you have young family members not joining the farm; land value is strong; you want to exit while equity is high
None (in fact, generates cash); selling costs ~5–8% of asset value
LOW CAPITAL RISK, HIGH EMOTIONAL RISK — Requires family alignment, tax planning, and post-farm vision; timing is critical (sooner better before margins compress further)
PIVOT (Niche/value-added, on-farm processing, or partnership model)
You’re in high-population area (Northeast, Ontario) with direct-to-consumer or specialty market access; or seeking joint venture with processor/investor
$500K–$2M (depends on model: direct-sales infrastructure vs. co-packing partnership)
MODERATE-HIGH RISK — Requires new skill sets (marketing, regulatory, finance), smaller volumes compensated by higher margins; longer payback window
The Bottom Line: Choosing Your Path, Not Having It Chosen for You
So where does this leave you in 2026?
The data from USDA, Rabobank, and farm-level cost studies all point in the same direction: there’s plenty of milk in the system, both in the U.S. and globally. Production is expected to grow, even as farm numbers continue to decline. Futures markets are less optimistic about price than some earlier official forecasts, and interest costs remain a real weight on expansion-era debt. That combination creates real pressure, especially for mid‑size family operations that expanded in 2022–2023.
What’s encouraging is that the situation doesn’t dictate a single outcome. Some farms will choose to grow into the new scale with eyes wide open, focusing on cost control, strong relationships with processors, and careful use of risk‑management tools. Others will hold their size and trim costs and wait for clarity. Some will decide that an orderly exit, with strong equity preserved for the next generation—whether in dairy or another sector—is the right move.
What I’ve noticed, looking back over multiple cycles, is that the farms that come through in the best shape aren’t always the largest or the most automated. They’re the ones that:
Know their true cost of production at realistic price levels.
Understand their place in their regional supply chain.
Are honest with themselves and their families about how much risk they’re willing to carry.
And make deliberate choices early, rather than waiting for lenders, processors, or circumstances to make the choice for you.
As you think about the next 12–24 months, the most valuable step might not be a new piece of equipment or another pen of cows. It might be a quiet evening with your numbers, a futures chart, and a notepad—asking, “Where are we at $17 milk? How long can we live there? And what do we want our story to look like five years from now?”
That kind of clarity won’t make 2026 easy. But it can make it yours.
KEY TAKEAWAYS
$250,000 margin gap: USDA forecasts $19+ milk; futures offer $16–17. For a 500-cow dairy, that’s a quarter-million dollars a year on the line.
More milk, fewer farms: U.S. output heads toward 234 billion pounds in 2026. The cows aren’t leaving; the farms are.
Many breakevens are already underwater: Farmdoc’s 2024 analysis shows full costs in the low-$20s/cwt. At $17 Class III, that’s negative margin math.
50–75¢/cwt is within reach: A 600-cow Wisconsin case shows targeted cuts to heifer programs, culling lag, and lease costs can close the gap—no expansion required.
Decide before 2026 decides for you: Know your true cost at $17 milk, map your processor position, and choose your path—grow, hold, or exit—while you still can.
Complete references and supporting documentation are available upon request by contacting the editorial team at editor@thebullvine.com.
Learn More
The Hidden Contract Clause That Could Cost Your Dairy $55,000 in 2026 – Arms you with a 30-day action plan to dodge massive liability shifts in new 2026 milk contracts. Exposes the $55,000 hidden cost of allergen compliance and delivers the negotiation leverage needed to protect your net profit.
211,000 More Dairy Cows. Bleeding Margins. The 2026 Math That Won’t Wait. – Reveals the structural “biological trap” of beef-on-dairy that’s keeping margins low despite collapsing heifer inventories. Breaks down the 2026 reset, allowing you to position your herd’s genetics before the next $11 billion processing wave hits.
Every week, thousands of producers, breeders, and industry insiders open Bullvine Weekly for genetics insights, market shifts, and profit strategies they won’t find anywhere else. One email. Five minutes. Smarter decisions all week.
Tariffs stripped $2.6B from dairy farms last time. Use the next 60 days—or your milk check will make the decision for you.
Executive Summary: Tariffs stripped an estimated 2.6 billion dollars from U.S. dairy farms during the last China trade war, and today Mexico alone buys about 29 percent of all U.S. dairy exports while relying on the U.S. for more than 80 percent of its imported dairy. Using current data from USDA‑FAS, USDEC and CoBank, the article shows how that dependence on a few big buyers turns Washington’s tariff tools into direct Class III and milk‑check risk for every herd tied to cheese, powder, and whey markets. China’s experience—export value dropping to 377 million dollars and whey shipments collapsing 69 percent after retaliatory tariffs—illustrates how fast demand can vanish and how slowly it comes back once buyers switch to competitors like the EU. Against that backdrop, the piece lays out a plain‑spoken 60‑day decision window: put two price scenarios on paper, meet once with your co‑op and once with your lender, and use USDA/extension guidance to decide how DMC, LRP‑Dairy, and succession timing fit your risk tolerance. Written in a peer‑to‑peer, “over coffee” voice, it gives progressive dairy producers a clear, credible playbook to manage tariff risk before their milk check makes the decisions for them.
You know, if we were sitting down over coffee at World Dairy Expo or at a winter meeting in Ontario, with producers from Wisconsin freestalls, New York tiestalls, and California dry lot systems all at the table, I’d probably start with this: all the talk about presidential “emergency” tariff powers might sound like it belongs in Washington, but the impact doesn’t stay there. It flows through export channels and, sooner than most of us would like, it shows up in the milk check you’re depositing at home.
In early 2025, President Donald Trump signed executive orders imposing 25 percent tariffs on most goods from Mexico and Canada and 10 percent on goods from China, creating fresh uncertainty for U.S. dairy exporters and the farms that ultimately depend on those markets. Cornell University’s Charles Nicholson, Ph.D., an adjunct associate professor in the Charles H. Dyson School of Applied Economics and Management, told the Dyson Agricultural and Food Business Outlook conference that “if you pick a trade fight with our major export destinations… that has some substantive negative implications for dairy farms and processors”. What really made people sit up was his estimate that Chinese retaliatory tariffs alone cost U.S. dairy farms about 2.6 billion dollars in lost revenue from 2019 through 2021.
What’s interesting here is that this isn’t just a policy debate. It’s about timing, concentration risk, and how much room you’ve got to maneuver before that next shock hits your milk price.
Let’s walk through what the data actually shows.
Looking Back: What 2018–2019 Really Taught Us
Looking at this trend, the 2018–2019 tariff period remains the clearest case study we’ve got on how quickly things can change.
On the Mexico side, USDA’s Foreign Agricultural Service published a GAIN report in June 2018 showing that Mexico responded to U.S. steel and aluminum tariffs with retaliatory tariffs on a range of U.S. products, including multiple cheese tariff lines. That report laid out how certain U.S. cheese categories were hit with new tariff rates starting June 5, 2018, and then increased again on July 5, with some lines moving into the 20–25 percent range depending on the specific HS code. That shift happened in a matter of weeks, not years.
On the China side, the U.S. Dairy Export Council tracked the fallout as Beijing rolled out its own retaliatory measures. Cheese Reporter, summarizing USDEC’s January 2020 export review, noted that for the 12 months from December 2018 through November 2019, the value of U.S. dairy exports to China totaled about 377 million dollars—a roughly 47 percent decline from the prior 12‑month period. That’s a big haircut on a single key market.
In an April 2025, after China imposed a 20 percent retaliatory tariff on U.S. dry whey in 2018, U.S. dry whey exports to China dropped 69 percent from their April 2018 peak to their February 2020 low, measured on a 12‑month rolling basis. That’s not just noise; that’s a major demand hole for a key by‑product that helps pay the bills in a lot of cheese and whey plants.
As many of us have seen, once those kinds of volumes start moving, they don’t necessarily come back quickly. And if you wait to react until your milk check clearly reflects the problem, you’ve already given up most of your best options.
Mexico: Our Best Customer… and a Big Point of Exposure
You probably know this already, but the more recent numbers really drive home how central Mexico has become to U.S. dairy.
Citing USDA‑FAS data, it was reported that by September 2024, Mexico’s purchases accounted for 29 percent of all U.S. dairy product exports on a value basis. That same piece noted that the United States supplied Mexico with over 80 percent of its imported dairy products in 2024. So from Mexico’s side, the U.S. is the dominant supplier. From the U.S. side, Mexico accounts for close to a third of dairy export value.
CoBank’s December 2024 report, “Mexico Has Become America’s Most Reliable Customer for U.S. Dairy Exports,” put it into milk terms. Their analysts calculated that Mexico purchases the equivalent of about 4.5 percent of total U.S. milk production through imported dairy products and ingredients. Corey Geiger, CoBank’s lead dairy economist, noted that Mexico runs a dairy product deficit of roughly 25–30 percent each year, and that the U.S. supplies over 80 percent of that shortfall.
USDA‑FAS projections reinforce the idea that this isn’t going away overnight. In its May 2025 “Dairy and Products Semi‑annual – Mexico” report, FAS forecast Mexico’s fluid milk production to increase about 1 percent to 13.9 million metric tons in 2025 and projected similar modest growth in consumption. That same report highlighted that processors are expected to increase milk powder imports as they continue to favor lower‑cost raw materials for manufacturing.
What the data suggests is an asymmetric relationship:
For Mexico, U.S. dairy is the dominant source of imports, but those imports sit on top of a large and growing domestic production base.
For the U.S., Mexico is the single largest export destination—accounting for around 29 percent of total dairy export value and a major share of cheese, powder, and other products.
So when CoBank calls Mexico “America’s most reliable customer” for U.S. dairy exports, they’re leaning on hard numbers. But Nicholson’s warning comes back into focus too: if trade tools get used aggressively and provoke retaliation in a market that important, the downside for U.S. dairy farms and processors is substantial.
Key Numbers Worth Knowing
Looking at the numbers pulled together by USDA‑FAS, USDEC, and CoBank, a few datapoints really frame the risk:
Mexico’s share of U.S. dairy exports: about 29 percent by September 2024, based on USDA‑FAS trade data.
U.S. share of Mexico’s dairy imports: over 80 percent of imported dairy products in 2024, per USDA‑FAS data reported by CoBank.
Share of U.S. milk exported to Mexico: roughly 4.5 percent of U.S. milk production equivalent, according to CoBank’s 2024 analysis.
U.S. dairy export value to China (Dec 2018–Nov 2019): about 377 million dollars, a 47 percent decline from the prior 12‑month period, per USDEC numbers reported by Cheese Reporter.
Dry whey exports to China: a 69 percent drop from the April 2018 peak to the February 2020 low on a 12‑month rolling basis after China imposed a 20 percent retaliatory tariff, as documented by Hoard’s Dairyman.
Estimated U.S. dairy farm revenue loss from China tariffs (2019–2021): about 2.6 billion dollars, according to Nicholson’s analysis cited by Cornell.
Those numbers alone explain why tariff talk matters to your bottom line, even if all your cows are standing in a barn thousands of miles from the border.
China’s Lesson: When Demand Doesn’t Fully Come Back
Now let’s swing back to China, because what happened there is a warning about long‑term demand, not just short‑term pain.
USDEC’s review, as quoted in Cheese Reporter’s 2018–2019 tariff lessons column, showed that by 2017–2018, China had grown into a key destination for U.S. dairy—especially whey and other ingredients. Then the retaliatory tariffs hit. As mentioned earlier, USDEC’s tally showed the value of U.S. dairy exports to China fell to about $ 377 million in the 12 months from December 2018 through November 2019, a 47 percent drop from the previous year.
2025 whey analysis dug deeper into the ingredient side. With a 20 percent retaliatory tariff on U.S. dry whey, exports to China dropped 69 percent from that April 2018 peak to a February 2020 low, using a rolling 12‑month comparison. During that period, it was noted that Chinese buyers shifted toward more EU dry whey, which wasn’t facing the same tariff penalty.
Nicholson and other trade economists have pointed out that once buyers qualify alternative suppliers and re‑tool supply chains, not all of that business returns when tariffs ease or exemptions appear. A two‑ or three‑year disruption can change the growth path of a market for much longer than that.
For U.S. producers, the key lesson is simple: when tariffs push a major buyer to diversify, some of that lost demand can become permanent.
So, Where Does This Leave Your Farm?
So, with all of that in mind, what does this actually mean when you walk back into your parlor or robot room?
First, it means export exposure is real, whether you’ve ever thought of yourself as an “export farm” or not. If your milk goes to a cooperative or processor that makes cheese, nonfat dry milk, whey, or other export‑oriented products, then pieces of your check are indirectly tied to people buying pizza in Mexico City or feed products in Asia. The concentration numbers—Mexico taking 29 percent of U.S. dairy export value and importing the equivalent of 4.5 percent of U.S. milk output—make that pretty clear.
Second, it means that when tariffs and trade headlines start moving from talk to action, you don’t have unlimited time to react. The 2018–2019 episode showed that retaliatory moves can go from announcement to significantly lower export values in less than a year, and in the case of whey, the effect on shipments was both steep and persistent. That’s why thinking in terms of a “window” makes sense—there’s a period where you can still get ahead of it.
Third, it means that planning and conversations matter as much as any single policy announcement. And that part’s under your control.
Questions to Bring to Your Co‑op or Buyer
Looking at this trend, one of the healthiest shifts in the last few years is that more producers are asking pointed, respectful questions about how their milk buyer is positioned.
For co‑op members in the Upper Midwest, for example, where a lot of milk heads into cheese vats, it’s worth asking your board or management:
Roughly what share of our milk is going into export‑oriented products like cheese, skim milk powder, and whey, given the national export patterns CoBank and USDEC have outlined?
During the 2018–2019 tariff period, how did our average pay price compare to other buyers in our federal order—were we generally ahead, behind, or about in the pack?
What kinds of tools does the co‑op use today—hedging, product diversification, long‑term contracts—to buffer members from sudden export demand shocks?
If you’re shipping to a proprietary plant in Idaho or California that sells into both domestic and export markets, the questions are similar. You’re not trying to tell them how to run the business; you’re trying to understand how your farm fits into their risk picture.
Industry groups like the Wisconsin Cheese Makers Association have recently highlighted how trade tensions and export barriers shape decisions at cheese and whey plants, including product mix and market focus. Those kinds of articles make good conversation starters and show that processors are thinking about this, too.
And I’ve noticed that when producers come to meetings with numbers and questions rather than just frustration, the conversation usually improves for everyone.
Sitting Down With Your Lender Before There’s a Fire
What many lenders have said in interviews with dairy media and farm‑management educators is pretty consistent: the best conversations happen before there’s a cash‑flow emergency.
You don’t need perfect forecasts to have a useful meeting. What you do need are a few grounded scenarios you can walk through together:
One based on today’s outlook, using current futures and your local basis.
One that assumes a noticeable softening in prices for six to twelve months—something that would squeeze margins but not necessarily be catastrophic.
You might not know all your ratios off the top of your head, but you can bring a simple printout or spreadsheet with you:
Herd size and average production per cow.
Your recent butterfat performance and component levels.
Rough cost per hundredweight from your last farm financial review.
Current term debt schedule and operating line limits.
Then you can ask very practical questions:
“If prices moved into this softer scenario for half a year, what would you want to see from us to stay comfortable with our operating line?”
“Are there any term loans we could look at restructuring in advance to give us more breathing room on cash flow if things get choppy?”
Farm Credit associations and other ag lenders often publish their own dairy outlooks and risk‑management articles, and university extension programs pick them up and discuss them. Skimming one or two of those ahead of time can help you frame what your lender is already worrying about.
What’s encouraging is that lenders generally don’t expect perfection. They expect awareness and a plan.
Thinking About Risk Tools Without the Sales Pitch
Programs like Dairy Margin Coverage and Livestock Risk Protection are designed for exactly the kind of volatility we’re talking about.
USDA’s Farm Service Agency has documented how DMC payments supported participating farms during the margin collapses of 2020, especially for operations that chose higher coverage levels up to the Tier I cap of 5 million pounds per year at 9.50 dollars per hundredweight. USDA’s Risk Management Agency, in its LRP‑Dairy materials, explains how producers can buy coverage on expected milk prices for specific months, with indemnities paid when actual index values fall below the coverage level, allowing smaller‑volume coverage than traditional futures or options.
The data and case examples shared by land‑grant extension programs—like those from UW–Madison, Penn State, and Ohio State—suggest these tools tend to work best when they’re part of a thought‑out risk plan rather than a last‑minute scramble. Extension economists and dairy business management specialists have walked through examples of aligning DMC coverage with the cost of production and using LRP‑Dairy selectively on a portion of milk to cover the riskiest months.
So instead of treating these programs as “nice extras” or something you only look at when prices are already ugly, it’s worth asking yourself:
“Given my cost structure and butterfat performance, how much downside can I realistically ride out on my own?”
“Beyond that point, what portion of my milk do I want to insure, and with what mix of tools that I actually understand?”
Your local extension educator, FSA staff, and crop insurance agent can help you look at USDA summaries of past payouts and current premium tables so you’re making decisions based on numbers, not anecdotes.
If Exit Is on the Horizon, Timing Still Matters
This is a tough topic, but it’s part of the real conversation on a lot of farms, especially in regions like the Northeast and Upper Midwest, where farm numbers have been under pressure for years.
In some operations—where the next generation is unsure about taking over or where the main operators are dealing with health issues—the question isn’t just “how do we ride out another tough year?” It’s also “if we’re going to be done sometime in the next five to ten years, when and how do we want that to happen?”
Cull cow and bred heifer prices have gone through stronger periods recently, supported in part by tighter beef supplies and the growing use of beef‑on‑dairy genetics, which can improve the value of crossbred calves and cull animals. Farm‑management articles and extension transition resources from universities in Wisconsin, Pennsylvania, and Ontario have noted that planned dispersals in reasonably firm cattle markets often preserve more equity than forced liquidations after prolonged low‑margin periods and mounting debt, based on farm case studies and lender feedback.
The exact dollars will vary herd by herd. But the pattern is consistent enough that it’s worth a kitchen‑table discussion if you’re in that stage:
“If we did decide to exit in the next few years, what conditions—milk price, cattle price, debt level—would make that feel like a planned move rather than a last‑ditch sale?”
“What level of equity do we want to protect for the family, whether that’s land, retirement savings, or off‑farm investments?”
Extension farm‑transition specialists have checklists and meeting templates that can help you structure those conversations and bring everyone into the loop before circumstances force decisions.
It Might Not Be 2018–2019 All Over Again… But It’s Worth Being Ready
It’s worth noting that not every tariff scare becomes a full‑blown crisis.
USDA‑FAS’s 2025 outlook for Mexico shows continued growth in domestic dairy production and ongoing demand for imported powders and cheese, even in the face of broader trade tension. CoBank’s analysis frames Mexico as a structurally reliable customer for U.S. dairy, given its persistent deficit and heavy reliance on the U.S. supply. Trade press coverage has also highlighted that some announced tariff measures end up delayed, modified, or partially offset by exemptions and side deals, which can soften the blow for agriculture.
What’s encouraging is that the U.S. dairy sector has adapted to shocks before. Exporters have shifted product mixes and markets, processors have invested in new capabilities, and producers have improved fresh cow management, feed efficiency, and overall cost control in response to tough years. That doesn’t mean it’s easy; it means it’s possible.
At the same time, the data from the last tariff cycle—and Nicholson’s 2.6‑billion‑dollar loss estimate—are a reminder that when major markets pull back, the financial damage can be both large and long‑lasting. That’s why this isn’t about predicting doom; it’s about deciding how you want to be positioned if the road gets rough.
A Simple 60‑Day Framework You Can Actually Use
Metric
Current Outlook
Softer Scenario (6–12 mo)
Change
Class III Milk Price ($/cwt)
$18.50
$16.00
–$2.50
Butterfat Premium ($/lb)
$2.10
$1.85
–$0.25
Feed Cost per Cow/Day
$9.25
$9.50
+$0.25
Est. Margin per Cow/Day
$3.20
$1.15 ⚠️ RED
–$2.05
So, over the next couple of months, here’s a straightforward way to put all this into practice without turning it into a full‑time project.
Put two price scenarios on paper. Use your own numbers—your butterfat performance, average production per cow, and local basis. Start with something close to today’s outlook based on current futures. Then sketch a second scenario in which prices are meaningfully softer for 6 to 12 months. You don’t need to be perfect; you just need to see roughly where cash flow turns from positive to negative and what that looks like in dollars per month.
Take those scenarios to one meeting with your co‑op or buyer. At a member meeting in Wisconsin, a one‑on‑one with a field rep in New York, or a call with a plant in the West, use the Mexico and China numbers as a backdrop and ask: “If export markets got choppy like they did in 2018–2019, how would that likely show up in our pay price, and what options would you have beyond just dropping the check?” Co-op and processor leaders have been talking publicly about trade risk and export barriers in venues like the Wisconsin Cheese Makers Association and national dairy policy forums—referencing those discussions shows you’re paying attention.
Take the same scenarios to one meeting with your lender. Sit down with your banker or Farm Credit officer and say: “Here’s what our cash flow looks like at these two price levels. If the softer scenario showed up for half a year, what would you want to see from us to stay comfortable? Are there things we could adjust now to give both of us more confidence?” Dairy‑focused lenders interviewed by farm media and extension often point to debt‑service coverage, working capital, and equity as the main gauges they watch. Ask them which ones they’re watching on your operation.
Ask good questions about risk tools. With your extension educator, FSA office, or insurance agent, walk through how DMC and LRP‑Dairy actually performed in 2020 and other recent years for farms your size, using USDA and extension summaries as your guide. You’re not committing on the spot; you’re making sure you understand what they can realistically do for your operation and the costs involved.
If succession or retirement is a live topic, name the “trip wires.” If the family’s talked about being “done at some point,” put rough thresholds on paper—maybe a certain milk price, debt‑to‑asset ratio, or cattle value—and discuss at what point a planned exit might be better than pushing through at any cost. Extension farm‑transition specialists and case studies from Wisconsin, Pennsylvania, and Ontario can give you examples of how other families have navigated those choices.
None of this requires you to guess which tariff will be announced next or how Mexico or China will respond. It just puts you in a better position to decide, rather than react.
Closing Thoughts: Deciding While You Still Have Room
As many of us have learned, nobody—whether it’s USDA, USDEC, your co‑op, or your lender—has quite the same focus on your farm’s future as you do. They all bring tools and information to the table, but they’re looking across hundreds or thousands of farms, not just yours.
What’s encouraging is that you don’t need to control court decisions, trade negotiations, or election outcomes to tilt the odds a bit more in your favor. You can use this “60‑day window” idea as a reminder: there is a period between policy talk and milk‑check pain where you still have room to adjust your plan.
If things stay relatively calm, you’ll have invested some time in understanding your operation better and strengthening relationships with the people who help finance and market your milk. If tariffs and trade disputes start biting into exports again, you’ll be glad you didn’t wait for your milk statement to tell you there was a problem.
Because once the damage is printed on that check, you’re not really deciding anymore. You’re reacting.
Right now, you still have room to decide.
Key Takeaways
$2.6 billion lost: Chinese retaliatory tariffs alone cost U.S. dairy farms an estimated $2.6B in revenue from 2019–2021, per Cornell economist Charles Nicholson.
29% in one market: Mexico buys about 29% of all U.S. dairy exports and relies on the U.S. for over 80% of its imported dairy—one trade dispute could ripple through the entire sector.
Demand doesn’t snap back: After China imposed 20% tariffs on U.S. dry whey, exports dropped 69% and buyers shifted to the EU; much of that volume never fully returned.
You have a 60-day window: From tariff announcement to milk-check impact is roughly 60–90 days—enough time to run price scenarios, schedule one meeting each with your co-op and lender, and review your DMC/LRP position.
Decide now or your check decides later: Farms that act in the window keep their options open; farms that wait until the damage prints are already reacting instead of choosing.
Complete references and supporting documentation are available upon request by contacting the editorial team at editor@thebullvine.com.
Learn More
The Hidden Contract Clause That Could Cost Your Dairy $55,000 in 2026 – Reveals how to navigate 2026’s new allergen liability clauses that threaten 44% of your net profit. It arms you with a 30-day action plan to audit contracts, benchmark costs, and protect your operation’s financial viability.
Every week, thousands of producers, breeders, and industry insiders open Bullvine Weekly for genetics insights, market shifts, and profit strategies they won’t find anywhere else. One email. Five minutes. Smarter decisions all week.
Cheap feed is a trap. Every cow that should’ve been culled is still milking—and $14 Class III is the price we’re all paying.
EXECUTIVE SUMMARY: Class III is testing $14. EU butter crashed 43% year-over-year. Cheddar blocks hit $1.29—their lowest since May 2020. Welcome to synchronized oversupply: EU-27+UK November milk surged 4.6%, the U.S. dairy herd is near a 30-year high, and cull rates are at historic lows because $4.25 corn makes even marginal cows cash-flow positive. That’s the trap—cheap feed was supposed to ease the pain, but it’s keeping underperforming cows in barns across the industry and delaying the correction prices desperately need. GDT Pulse finally showed signs of life Sunday (WMP +1.0%, SMP +2.1%), but until someone starts culling, $14 milk isn’t going anywhere.
Futures Markets: Still Searching for a Floor
The futures boards told a grim story last week—and frankly, nobody’s quite sure where the bottom is yet.
EEX European Futures moved 4,550 tonnes (910 lots), with Wednesday posting the busiest session at 1,905 tonnes. Butter futures took the worst of it. The Jan26-Aug26 strip dropped 4.5% to average €4,199. SMP held up better, down just 0.2% to €2,200, while whey slipped 0.7% to €1,021.
Over on the SGX Asia-Pacific exchange, volume ran heavier at 15,116 lots—dominated by WMP at 12,287 lots. The Jan26-Aug26 curves tell you pretty much everything about current sentiment:
Product
Average Price
Weekly Change
WMP
$3,359
–1.2%
SMP
$2,703
–0.8%
AMF
$5,821
–1.4%
Butter
$5,278
–0.1%
What’s particularly notable on the CME is how Class III futures tested sub-$14 territory multiple times last week. January through May contracts all notched life-of-contract lows before bouncing slightly Friday. February settled at $15.05—down a dime on the week. Class IV fared worse, with February closing at a brutal $13.86, down a nickel.
For producers who don’t actively trade futures, here’s why those life-of-contract lows matter: they signal that professional traders—people who make a living betting on where milk prices are headed—see no near-term catalyst for recovery. When the market establishes new lows across multiple contract months simultaneously, it’s pricing in an extended period of pain.
What this means for your operation: If you’re not already penciling out cash flow at $15 Class III and $14 Class IV through mid-year, you’re planning with the wrong numbers. DMC payments look increasingly likely for January through at least April, according to analysts at Ever.Ag.
European Quotations: The Butter Collapse Continues
The weekly EU quotations released January 14 painted a picture of a market still trying to find its footing after months of oversupply pressure.
Butter took another beating. The index dropped €171 (–3.9%) to €4,237. French butter got hit hardest—down €513 (–10.6%) to €4,310 in a single week. German and Dutch butter held steadier at €4,300 and €4,100 respectively.
Here’s the number that should grab your attention: EU butter is now down €3,176 (–42.8%) year-over-year. That’s not a correction. That’s a fundamental repricing of European milkfat. I’ve been covering dairy markets for years, and you rarely see a commodity give back nearly half its value in twelve months without some structural shift underneath.
SMP actually showed some strength—climbing €38 (+1.9%) to €2,085. German SMP rose €45 to €2,085, Dutch jumped €100 to €2,100, while French slipped €30 to €2,070. Still, SMP sits 17.3% below year-ago levels, so “strength” is relative here.
Whey eased €5 (–0.5%) to €996, though it’s actually up €123 (+14.1%) year-over-year. That makes whey one of the few genuine bright spots in European dairy commodity markets right now.
Cheese indices were mixed:
Commodity
Current Price
Weekly Δ
Y/Y Δ
Market Status
Strategic Note
EU Butter
€4,237/100kg
–3.9%
🔴 –42.8%
CRISIS
Demand collapse
Class III (CME)
$13.95/cwt
–0.7%
🔴 –32.0%
CRISIS
Life-of-contract lows
Cheddar Block
$1.29/lb
–1.9%
🔴 –27.5%
WEAK
Multi-year lows
SMP (EU)
€2,085/100kg
+1.9%
🟡 –17.3%
WEAK
Algeria returning
WMP (GDT)
$3,359/MT
–1.2%
🟡 –18.5%
WEAK
Pulse bounce +1.0%
Nonfat Dry Milk
$1.255/lb
–0.8%
🟡 –14.2%
STABLE
Mexico demand OK
Whey (CME)
73.5¢/lb
+4.8%
🟢 +14.1%
STRENGTH
Protein demand high
Milk Price (U.S. avg)
$14.05/cwt
–0.7%
🔴 –30.5%
CRISIS
Feed savings insufficient
Corn (March)
$4.25/bu
–4.5%
🟢 –52.0%
STRENGTH
Record crop relief
USDA’s Dairy Market News describes European conditions as “orderly” and “measured”—values are cautiously higher to start the year after what can only be called the bloodbath of Q4 2025.
GDT Pulse: Finally, a Sign of Life
Sunday’s GDT Pulse Auction (PA098) delivered the first meaningful uptick we’ve seen in months (Global Dairy Trade, January 18, 2026).
Fonterra Regular C2 WMP won at $3,395—up $35 (+1.0%) from the last full GDT event and up $240 (+9.0%) from the previous pulse auction. That’s a real move, not just noise.
Fonterra SMP Medium Heat – NZ came in at $2,660, up $55 (+2.1%) from the last GDT and up $165 (+8.4%) from pulse.
Arla SMP Medium Heat – EU hit $2,485, up $95 (+4.0%) from the last GDT.
Total volume was modest at 2,358 tonnes with 54 bidders participating. The question everyone’s asking: genuine trend change, or dead cat bounce?
Tomorrow’s GDT Event TE396 will be the real test. Fonterra’s offered volumes:
Product
Volume (MT)
WMP
15,588
SMP
5,630
Butter
1,920
AMF
2,680
Cheddar
540
Butter and AMF volumes were adjusted for Cream Group Flex at 15% applied to C1 and C2, while total milkfat supplied remains unchanged on the forecast. What I’ll be watching closely is whether the buying interest that showed up Sunday sticks around when larger volumes hit the auction block.
U.S. Spot Markets: Whey Holds While Everything Else Sinks
CME spot trading told a mixed story last week.
Butter bounced off multi-year lows, climbing 5.5¢ to $1.355 per pound. That’s still near the basement, but at least the bleeding stopped for now.
Cheddar blocks kept sinking, down 2.5¢ to $1.29—a level we haven’t seen since May 2020. Twenty loads traded, bringing the YTD total to 63 loads—a record for early January. When you see that kind of spot volume combined with falling prices, people are desperate to move product. That’s not a healthy market dynamic.
Nonfat dry milk slipped a penny to $1.255. Demand from Mexico is improving, and inventories are “tight” according to USDA’s Dairy Market News, but it wasn’t enough to hold the line.
Whey was the standout, rallying 3.5¢ to 73.5¢. Strong demand for whey protein concentrates is driving this—Dairy Market News reports some cheese processors are actually ramping up production “ultimately to produce more whey as prices and demand of whey protein concentrates remain high.”
Let that sink in for a moment: they’re making cheese not because cheese demand is strong, but because they need the whey. That’s a complete inversion of traditional dairy economics, and it tells you something important about where the real demand growth is happening right now.
The Culling Connection: Why Cheap Feed Is Delaying Recovery
Cheap corn isn’t just helping your margins—it’s keeping marginal cows in the herd longer and delaying the supply correction that would help prices recover.
The numbers are stark. Dairy cow culling dropped to historic lows through the first half of 2025, down 7.3% from the same period in 2024 (Southern Ag Today, January 13, 2026). The seven-month total through July was the lowest since 2008 (eDairy News, August 2025). Even as milk prices slid through the fall, weekly dairy cow slaughter through the last four weeks of 2025 was only slightly above year-earlier levels (USDA Livestock, Dairy, and Poultry Outlook, January 2026).
Why aren’t producers culling more aggressively?
Two factors, and they’re both working against a price recovery:
First, cheap feed makes borderline cows profitable enough to keep. When corn was running $6+, and soybean meal was north of $400, that seven-year-old cow giving 60 pounds was bleeding money. At $4.25 corn and $290 meal, she’s suddenly cash-flow positive—barely. So she stays. Multiply that decision across thousands of operations, and you’ve got an oversupply situation that won’t self-correct.
Second, the heifer shortage makes replacement expensive. Beef-on-dairy economics have drained the replacement pipeline. Springer heifer prices are at or near records, and with 800,000+ fewer dairy heifers in the system (Dairy Herd Management, November 2025), producers can’t easily replace culled cows even if they wanted to. Cull rates dropped to 29.6% in 2024—well below the typical 35-37% turnover that supports strategic herd improvement (Dairy Herd Management, August 2025).
The U.S. dairy herd now sits at approximately 9.49 million head—near the highest level since the early 1990s. USDA’s January Livestock, Dairy, and Poultry Outlook revised the annual dairy cow inventory to 9.490 million head and projects the herd will remain large well into 2026.
What’s interesting here is the game theory at play. Every individual producer benefits from keeping their cows in milk when feed is cheap. But collectively, those decisions are extending the timeline for everyone’s price recovery. It’s a classic tragedy of the commons, playing out in real-time across American dairy barns.
The strategic response some progressive operations are taking: Rather than culling primarily based on age or reproductive metrics, they’re calculating income over feed cost (IOFC) for each cow and moving out animals consistently below $1.50 per cow per day (The Bullvine, December 2025). That’s the math-based approach that makes sense when feed is cheap, but margins are thin.
Cow Profile
Prod’n (lbs)
BF/Protein
Daily Revenue
Daily Feed
Daily IOFC
Decision
Cow A: 4yr, 75# prime
75
3.8% / 3.2%
$10.50
$8.20
$2.30
✅ KEEP
Cow B: 6yr, 65# good
65
3.7% / 3.1%
$9.10
$7.80
$1.30
🔶 BORDERLINE
Cow C: 7yr, 55# fading
55
3.6% / 3.0%
$7.70
$7.40
$0.30
🔴 CULL
Cow D: 5yr, 70# solid
70
3.8% / 3.2%
$9.80
$8.00
$1.80
✅ KEEP
Cow E: 8yr, 48# poor
48
3.5% / 2.9%
$6.72
$7.10
–$0.38
🔴 CULL
Cow F: 3yr, 82# premium
82
3.9% / 3.3%
$11.48
$8.40
$3.08
✅ KEEP
Don’t expect a supply-side correction to rescue prices anytime soon. The cows that would have been on trucks six months ago, when feed was expensive, are still in stalls today. That’s good for individual cash flow in the short term, but it’s extending the pain for everyone.
The Production Surge: Why This Is Happening
November milk collections confirm what the futures already priced in—global oversupply is real and accelerating.
European Production Explosion
EU-27+UK pumped out 12.94 million tonnes in November, up 4.6% year-over-year. To put that in perspective, that’s nearly 1.2 billion pounds more milk than November 2024—equivalent to adding all of Michigan’s November production to the global supply, plus change.
Country
Nov 2025 Production (kt)
Y/Y Growth
Key Signal
Germany
2,643
+7.5%
🔴 Highest absolute growth
France
1,954
+5.9%
Steady surge
UK
1,329
+5.6%
Post-Brexit stabilization
Netherlands
1,145
+7.3%
🔴 Second-highest % growth
Poland
1,089
+5.3%
Eastern EU leading
Belgium
375
+10.1%
🔴 Highest % growth—warning sign
Denmark
449
+0.7%
Only modest growth
EU-27+UK TOTAL
12,940
+4.6%
1.2B lbs MORE than Nov 2024
Cumulative EU-27+UK production through November hit 150.75 million tonnes, up 1.9% year-over-year after adjusting for the leap year. Milksolid collections were up 5.2% in November alone, which tells you butterfat and protein content are running strong across European herds.
French milksolids jumped 6.6% in November, with cumulative 2025 collections at 1.63 million tonnes (+1.5% y/y). French butter production hit 28.3kt in November (+0.8% y/y), with YTD production up 5.2% to 337.6kt.
Danish milksolids were up 1.5% in November, with cumulative collections at 431kt (+2.7% y/y).
What I find notable is how broadly based this European production surge is. It’s not just one country driving the numbers—Germany, France, the Netherlands, Poland, and the UK are all posting substantial gains. That kind of synchronized growth is rare, and it explains why European commodity prices have fallen so hard.
U.S. Production Outlook
USDA kept their 2025 forecast unchanged at 115.70 million tonnes in the January WASDE—a 2.4% increase over 2024. But they raised the 2026 forecast, citing “higher production per cow” as the primary driver (USDA WASDE, January 2026). If realized, that’s another 1.3% increase on top of an already elevated base.
Spot milk loads traded as much as $4 under Class III last week (Dairy Market News). When processors are paying that far below class price for spot loads, it tells you they have all the contracted milk they need—and then some.
Where’s the Demand? Following the Money
The good news: low prices are finally attracting buyers. The bad news: it’s not enough yet.
Algeria is back in the market. ONIL, their national dairy purchase program, is bidding for milk powder again. That’s significant—Algeria is historically one of the world’s largest SMP importers, and their return to active purchasing is exactly what you’d expect when global prices fall this far.
Chinese buyers are consistently attending GDT auctions. Chinese SMP inventories dropped to a one-year low in November, so merchants may need to step up purchases even though domestic consumption remains soft. It’s worth noting that Chinese dairy demand has been disappointing for nearly two years now, so I’d want to see sustained buying before getting too optimistic.
EU exports surged 12.3% in November:
Product
Y/Y Change
Key Destinations
SMP
+39.6%
Algeria, Egypt, Saudi Arabia, Morocco
Butter
+14.9%
Most destinations except S. Korea, China
Cheese
+8.9%
Japan, Korea, and China improved
WMP
+33.2%
—
Casein
+66.8%
—
U.S. exports are holding firm. The U.S. is currently the least-expensive global supplier for cheese and butter, shipping enough product abroad to keep inventories in check despite record output (Dairy Market News). For cheese, domestic demand is “solid,” and export demand is “strengthening.” For butter, Dairy Market News reports that “interest from international buyers is keeping domestic bulk butter spot loads tight.”
This is actually one of the more encouraging aspects of the current market. Demand isn’t collapsing—it’s growing. The problem is that production is growing faste than it isr.
Feed Markets: The One Bright Spot
USDA’s January WASDE dropped a bombshell on corn markets (USDA WASDE, January 13, 2026).
Corn yield came in at a record-shattering 186.5 bushels per acre—half a bushel higher than December estimates. Total production hit 17.021 billion bushels, smashing the previous record by 11%.
Ending stocks jumped to 2.227 billion bushels, on par with stockpiles from 2016-2019 when corn averaged roughly $3.50 per bushel. That historical comparison gives you a sense of where corn prices might be headed if demand doesn’t materialize.
March corn dropped 20¢ on the week to settle at $4.25 (CME Group). March soybean meal closed at $290 per ton, down $13.70.
What this means for your operation: Feed costs are genuinely cheap—the lowest since October 2020 on a DMC basis (Ever.Ag). But here’s the math problem that keeps coming up: milk prices are dropping faster than feed costs are falling. A 35-50¢ per cwt feed savings doesn’t offset a $1.80 drop in the all-milk price.
The record corn crop is a real relief for your feed bill. But if you’re counting on cheap feed to save your margins while milk stays at $14-15, rerun those numbers.
Product
Sunday Pulse PA098
Previous GDT
Y/Y (Jan 2025)
TE396 Watch
WMP (C2)
$3,395 (+1.0%)
$3,360
$3,155 (+7.6% y/y)
Needs to hold $3,350+
SMP (MH)
$2,660 (+2.1%)
$2,605
$2,495 (+6.6% y/y)
Needs to hold $2,600+
Butter
$5,395 (est.)
$5,150
$5,820 (–7.3% y/y)
Watch for $5,200 support
Cheddar
$3,270 (est.)
$3,310
$3,760 (–13.0% y/y)
Critical: Hold above $3,200
The Week Ahead: What to Watch
Tuesday, January 20: GDT Event TE396 results. This is the auction that matters. If WMP and SMP can hold or extend Sunday’s gains with larger volumes on offer, we might actually be seeing a floor form. If they give it all back, buckle up for more pain.
The GDT Floor Test — What to Look For on Tuesday, Jan 21
🔴 FLOOR FAILURE SCENARIO: • WMP falls below $3,350 (gives back Sun gain + more) • SMP drops below $2,600 (momentum breaks) • Volume is weak (less than 2,000 MT total) → Result: Expect further selling; $14 milk locks in
🟡 CRITICAL THRESHOLD: If Butter holds $5,200–$5,300 on larger volumes (TE396 has 1,920 MT offered), that signals structural demand at lower price levels—a genuine floor signal.
Key data releases this week:
New Zealand December milk collections — Will signal if Fonterra’s production growth is moderating heading into the back half of their season
U.S. December milk collections — Confirms whether the herd expansion continued through year-end
Chinese December dairy imports — Tests whether inventory drawdowns are translating to actual purchases
The Bullvine Bottom Line
Tomorrow’s GDT auction is the market’s next referendum. If WMP and SMP hold Sunday’s gains, we might have found a floor. If they give it back, prepare for $14 Class III to stick around through spring.
Here’s the uncomfortable reality that this week’s data makes clear: cheap feed is keeping this market oversupplied longer than it otherwise would be. Every producer making the individually rational decision to keep marginal cows in milk is collectively extending everyone’s price recovery timeline. It’s nobody’s fault exactly, but it’s everybody’s problem.
The strategic question for your operation isn’t whether to keep milking—it’s whether you’re keeping the right cows milking. Run those IOFC calculations. That seven-year-old giving 45 pounds might be cash-flow positive at $4.25 corn, but she’s dragging down your herd average and, in a small way, dragging down everyone’s milk price too.
Watch the GDT numbers on Tuesday. And if you haven’t maxed out your DMC coverage at $9.50 for 2026, the enrollment deadline is February 26. Based on where futures are trading, those payments are looking increasingly likely through at least mid-year.
Key Takeaways
Pandemic-level prices are back: Class III testing $14. Cheddar blocks at $1.29. EU butter down 43% y/y. This is what three continents overproducing at once looks like.
Cheap corn is the problem, not the solution: At $4.25/bu, even marginal cows stay cash-flow positive. Every cow that should’ve been culled months ago is still milking—and that’s delaying the correction we all need.
The herd won’t shrink on its own: U.S. dairy cows near a 30-year high. Cull rates are at historic lows. Springer heifers are too expensive to replace aggressively. Until that changes, oversupply persists.
GDT finally has a pulse: WMP +1.0%, SMP +2.1% on Sunday’s Pulse auction. Tomorrow’s TE396 is the real test—if it holds, we might have found a floor.
Your move: Budget $15 Class III through Q2. Max out DMC at $9.50 before the Feb 26 deadline. And calculate IOFC on every cow in your barn—because $4 corn doesn’t make a 45-lb cow worth her stall.
Complete references and supporting documentation are available upon request by contacting the editorial team at editor@thebullvine.com.
Learn More
The $200K Dairy Margin Trap: What Cheap Feed Won’t Tell You About 2026 – Gain immediate margin enhancement by mastering the “math over sentiment” approach. This breakdown reveals how weekly NIR forage analysis and rigid IOFC-based culling thresholds recover hidden losses before cheap feed masks your true operational inefficiency.
USDA Says $18, Futures Say $16: The $150K Gap That’s Rewriting 2026 Dairy Budgets – Avoid a six-figure budgeting disaster by understanding why USDA projections and futures markets are currently $2 apart. This analysis arms you with the “stress-test” methodology required to protect your equity against the volatile price realities of 2026.
211,000 More Dairy Cows. Bleeding Margins. The 2026 Math That Won’t Wait. – Disrupt the cycle of overproduction by exposing how beef-on-dairy premiums have hijacked traditional culling logic. It delivers a new genetic playbook focused on protein-first selection (CM$) to restore your herd’s profitability in a volume-saturated market.
The Sunday Read Dairy Professionals Don’t Skip.
Every week, thousands of producers, breeders, and industry insiders open Bullvine Weekly for genetics insights, market shifts, and profit strategies they won’t find anywhere else. One email. Five minutes. Smarter decisions all week.
Is a $2 milk misread hiding a $150,000 hole in your 2026 budget? This is why USDA and futures don’t agree.
Executive Summary: USDA’s latest outlook has 2026 all‑milk in the high‑$18s, while Class III futures sit closer to the mid‑$16s—a $2–$3/cwt gap that can wreck a budget if you pick the wrong anchor. For a 300‑cow herd shipping about 75,000 cwt, that difference is a $150,000–$225,000 swing in annual revenue. At the same time, U.S. cheese and butterfat exports are hitting records only because we’re pricing below Europe and New Zealand, so strong export volume doesn’t automatically mean strong farm‑gate prices. Long‑term shifts in butterfat performance, protein levels, and roughly $10 billion in new processing capacity are changing what kind of milk plants want and how they reward components. Layer on 7–8% interest rates and tougher lender stress tests, and 2026 becomes a year where you can’t afford optimistic milk guesses or loose capital math. This feature gives you a five‑step playbook to budget off the right signals, lock in sensible feed margins, demand $17‑milk payback from new projects, tune components to your plant, and use risk tools that actually fit your herd size and region.
There’s a point every winter when you sit down with the books, look at that cash‑flow sheet, and think, “Alright… what does this year really look like?” Heading into 2026, that question carries a little more weight than usual.
What’s interesting here is that, for a 300‑cow herd shipping roughly 7.5 million pounds a year—about 25,000 pounds per cow—that question isn’t theoretical at all. Turn that into hundredweights, and you’re sitting near 75,000 cwt. If one version of your plan leans on a mid‑$16 Class III milk check and another counts on something closer to a high‑$18 all‑milk average, you’re staring at roughly a $150,000 to $225,000 swing in annual revenue just from a $2–$3 per cwt difference in price.
For a family dairy—whether that’s in Grey‑Bruce, the St. Lawrence Valley, or central Wisconsin—that’s the difference between “we can finally fix some stuff” and “we’re just keeping the lights on.” So let’s walk through why the signals are so far apart, and more importantly, how to plan in a way that doesn’t bet the farm on any one forecast.
Looking at This Trend: USDA vs. the Futures Screen
On one side of the ledger, you’ve got USDA’s official outlooks. In the January 2026 World Agricultural Supply and Demand Estimates (WASDE), USDA pegs the 2025 all‑milk price at about $21.15 per cwt and the 2026 all‑milk price closer to $18.25 per cwt, tying that downgrade to softer cheese prices and slightly higher per‑cow production and overall output. Most analysts sum that picture up as higher milk supplies and somewhat softer prices by 2026.
At the same time, USDA’s Livestock, Dairy, and Poultry Outlook projects U.S. milk production around 230.0 billion pounds in 2025 and 231.3 billion pounds in 2026, with modest gains in milk per cow pushing total output higher. That production path is part of why USDA trimmed its Class III and IV expectations later in 2025.
On the other side of your phone, you’ve got what buyers and sellers are actually trading.
Month
USDA All-Milk
Class III Futures
Spread (USDA – Futures)
January
$18.25
$15.85
+$2.40
February
$18.25
$15.92
+$2.33
March
$18.25
$16.10
+$2.15
April
$18.25
$16.25
+$2.00
May
$18.25
$16.15
+$2.10
June
$18.25
$16.00
+$2.25
July
$18.25
$15.95
+$2.30
August
$18.25
$16.05
+$2.20
September
$18.25
$16.20
+$2.05
October
$18.25
$16.30
+$1.95
November
$18.25
$16.15
+$2.10
December
$18.25
$16.05
+$2.20
If you pull up USDA Dairy Market News’ weekly report from early January 2026, you see Class III futures for many 2026 months hovering in the mid‑$16s, with some contracts slipping toward the mid‑$15s and others flirting with the upper‑$16s. In the same report, spot cheddar blocks are described in the low‑$1.30s per pound, a long way from the $2‑plus levels that showed up briefly in 2022.
So you’ve got two honest but different stories:
USDA’s forecast world says: “Given our assumptions, all‑milk should average in the high‑$18 to low‑$20range in 2026.”
The futures world says: “Given what participants are willing to lock in today, Class III looks more like the mid‑$16s, with plenty of caution baked in.”
Once you plug in your local basis and your butterfat performance and protein, that’s where the $2–$3 per cwt planning gap really shows up.
In barn after barn I walk through—from east coast tie‑stalls to Wisconsin freestalls and dry lot systems out west—I’m seeing a quiet but important shift. More conservative farms are starting to let the Class III strip anchor their budgetsand treat USDA’s all‑milk numbers as possible upside, not the default assumption. The bank account, after all, settles off cheques tied to real markets and pooling, not the top end of a forecast chart.
Exports on Fire: The Cheese and Butterfat Paradox
Now let’s slide over to exports, because they’re doing a lot of heavy lifting right now.
The U.S. Dairy Export Council (USDEC) reports that in August 2025, U.S. cheese exports were 28% higher than a year earlier, making it a record August for cheese shipments. Cheddar exports jumped roughly 140% compared to August 2024, helped by new cheese capacity and aggressive pricing. Every major region except Canada bought more U.S. cheese, with South Korea particularly strong.
Butterfat performance in exports has been even more dramatic. USDEC and Brownfield data show that:
Butter exports were up about 190% year‑over‑year in August 2025.
Anhydrous milkfat (AMF) exports climbed roughly 198% over the same period.
Overall butterfat exports nearly tripled, with strong growth across Asia and the Middle East.
Total U.S. dairy export volume in August 2025 was up around 3%, while export value climbed about 17% to roughly $831.5 million.
In that Brownfield piece, William Loux, vice president of global trade analysis at USDEC, said, “We are in for probably almost certainly a record cheese year again here in 2025. We had a record year in 2024, we had a record year in 2022, so basically three out of the last four years we’ve set new records.” Hoard’s Dairyman and USDEC export reviews reinforce that U.S. cheese exports have surpassed 1 billion pounds in multiple recent years, underscoring our role as a long‑term global cheese supplier.
From one angle, that all looks fantastic. The catch is the price tag attached to those wins.
Farm Credit East’s 2025–26 dairy outlook notes that U.S. butter prices have often been discounted compared to EU and New Zealand butter, which draws buyers but keeps domestic butter prices on a shorter leash. CoBank’s dairy export commentary adds that U.S. cheese has likewise tended to trade below comparable EU and Oceania cheeses to capture and hold certain markets.
Corey Geiger, lead dairy economist for CoBank, explained that when European cheddar prices eased toward the equivalent of about $1.50 per pound in 2025, U.S. exporters often needed cheddar closer to $1.30 per pound to stay competitive in some export tenders. It’s not a fixed rule for every sale, but it captures the general spread.
So the export paradox looks like this: U.S. cheese and butterfat are setting volume records and keeping plants busy, but much of that demand is being bought at discount pricing, not at rich premiums. Great for clearing product and avoiding butter or powder mountains. Less great if you’re counting on exports alone to pull Class III into the high teens.
Product
YoY Volume Increase
Price vs. EU Baseline
Price vs. NZ Baseline
Cheese
+28%
87% (€1.30 vs €1.50)
90% (€1.30 vs €1.44)
Butter
+190%
85% ($1.42 vs $1.67)
88% ($1.42 vs $1.61)
AMF
+198%
83% ($1.38 vs $1.66)
86% ($1.38 vs $1.61)
Powder
+12%
91% ($0.88 vs $0.97)
92% ($0.88 vs $0.96)
Butterfat Performance, Protein, and What’s Really Changing in the Tank
Now let’s step out of the export office and back into the milkhouse.
Looking at this trend over time, the component story on U.S. farms has been remarkable. Analysts’ pooled data show that from 2010 to 2024, total U.S. milk production in pounds grew by about 15.9%, while total butterfat pounds climbed by about 30.6%. Average butterfat tests moved from roughly 3.80% into the low‑4% range during that period.
By early 2025, butterfat production was running 3–4% higher year‑over‑year, even though total milk volume was up less than 1%. That’s a huge butterfat performance story.
CoBank’s report “While U.S. Leads Milk Component Growth, Butterfat May Be Growing Too Fast” adds a global lens. It notes that over about a decade, U.S. butterfat levels increased roughly 13%, while comparable gains in the EU and New Zealand were closer to 2–3%. Over the same period, U.S. protein rose from just over 3.1% to about 3.29%, roughly a 6% bump.
The U.S. is growing components faster than many of our global competitors, and those components are increasingly what matter in dairy markets. That’s a genuine advantage for cheese, butter, and protein ingredients.
Here’s where it gets more complicated. CoBank points out that butterfat has led the milk check in eight of the last 10 years, creating what they call a “tremendous butterfat boom.” Genetics, nutrition, and even fresh cow managementhave been tuned to push fat as far as possible because, most years, it paid.
Now, CoBank and others are asking whether we might have overshot in some systems. Their report warns that if butterfat and protein keep growing at current rates, processors will face rising costs to either back extra fat out or add protein to meet cheese and ingredient specs, which “ultimately reduces competitiveness on the export front.” Geiger noted that in some markets “we’ve just got a little bit too much extra supply of butterfat,” which has helped pull butter prices down, even though consumption is still solid.
If you’re still breeding and feeding like butterfat is the only game in town, your plant’s pay grid and the export reality might be telling you a different story.
Our own genetics features and CoBank’s component work both highlight herds that are now selecting more for pounds of fat and protein, total solids, and better protein‑to‑fat ratios, especially where plants pay on cheese yield and casein‑related traits. In those systems, the winning milk isn’t just high‑fat; it’s balanced for yield and specs.
Academic work backs that up. An economic study from Brazil on milk pricing found that under component‑based payment systems, protein often carries greater marginal economic weight than fat because of its role in cheese yield and solids content. A 2024 review in Foods (MDPI) on “Emerging Parameters Justifying a Revised Quality Concept for Cow Milk” argues that modern milk quality needs to account much more for functional properties—especially protein fractions—than in the past.
On the ground, what many herds are finding is that in cheese markets, shifting from something like 4.1% fat and just over 3.0% protein toward a more balanced 3.8–3.9% fat and 3.2%+ protein can produce better checks when plants truly pay on solids and yield. In those systems, you often see meaningful gains in revenue per hundredweight, because protein is better rewarded and excess fat isn’t discounted as heavily.
Getting there usually means:
Working with your nutritionist on amino acid balance, not just crude protein.
Investing in forage quality and consistency, so cows can express both butterfat and protein potential.
Tightening fresh cow management and the transition period, so cows hit high intakes fast without metabolic wrecks.
On the genetics side, more herds are using genomic tools to line up sire selection with processor needs—whether that’s cheese yield, powder specs, or value‑added fluid. In Upper Midwest and Northeast cheese sheds, some producers are building custom indexes that place greater weight on protein pounds and cheese yield traits, rather than on total milk or butterfat percent.
If you’re in a quota system like Canada, the pricing grid and quota rules are a bit different, but the core idea still holds: aligning your component profile—both fat and protein—with what your board and processors value is one of the cleanest ways to grow revenue without adding cows.
Herd Profile
Butterfat %
Protein %
Milk Check $/cwt
Annual Revenue (75,000 cwt)
Competitive Edge
Current: Butterfat-Maximized
4.10%
3.00%
$16.50
$1,237,500
Commodity baseline; excess fat discounted by plants
Next 18 months; gradual shift in offspring profile
Work with processor on pay grid alignment
Co-op/Buyer
Q1 2026
Confirm premiums for balanced profile; lock terms
Global Supply: No Built‑In Shortage Riding to the Rescue
Now let’s zoom out to the world map.
USDA’s 2025–26 Livestock, Dairy, and Poultry Outlook and coverage on The Dairy Site indicate that U.S. milk output is projected at about 230.0 billion pounds for 2025 and 231.3 billion pounds in 2026, up slightly as milk per cow continues to creep higher. That extra milk is part of why the agency trimmed its Class III and IV expectations heading into late 2025.
Global summaries suggest a similar pattern among major exporters:
EU milk production is generally steady to modestly higher, constrained by environmental policies but supported by improved margins in some regions.
New Zealand and Australia have seen output rebound amid better weather and more favorable cost structures.
South America—especially Argentina and Brazil—has pockets of growth tied to currency and feed dynamics.
There are always local headaches, but nothing that looks like a synchronized global production crash. From a price standpoint, that means there isn’t an obvious global shortage brewing to “save” the market for us. Any stronger price story in 2026 is more likely to come from demand growth and product mix than from the world suddenly running short of milk.
Processing Capacity: New Stainless, New Rules of the Game
Looking at this trend on the processing side, it’s clear that a lot of serious money still believes in the long‑term North American dairy story.
CoBank estimates that roughly $10 billion in new or expanded dairy processing capacity is slated to come online through about 2027, with a heavy emphasis on cheese, butter, whey, and other protein ingredients. In a late‑2024 interview, Geiger said more than $8 billion of that investment is expected to be operating by 2026, with over half targeted at cheese and whey.
You can see that on the ground:
In Wisconsin and Minnesota, new and expanded cheddar and mozzarella plants are chasing domestic pizza demand and export markets.
In the Texas Panhandle and High Plains, big complexes built around freestalls and dry lot systems in Texas, Kansas, and eastern New Mexico are designed to run high‑component milk into large cheese and ingredient plants.
In the Northeast, investments like the Fairlife ultra‑filtered milk plant in Webster, New York, and expansions in yogurt and value‑added fluid plants that need consistent, high‑component milk.
In Idaho and California, continued investments in cheese and powder position those states as key suppliers to both domestic and export buyers.
CoBank notes that we don’t yet have enough cows to max out all this new stainless, and that’s intentional—plants are being built for where the industry is going, not where it was five years ago. Their analysis also emphasizes that the next efficiency gains won’t just be about scale, but about getting the protein‑to‑fat ratio right for the products being made.
Locally, that creates split realities:
If you ship into a newer or aggressively expanding plant that pays on components or cheese yield, you may see stronger over‑order premiums, solids incentives, and long‑term supply agreements. Farm Credit East reports that in parts of the Northeast, over‑order premiums of $0.75 to $1.50 per cwt have been common where plants are pulling hard for high‑component milk.
If you ship to a plant with limited capacity growth or a narrower product mix, you may feel more of the overall supply pressure and less of that premium pull.
From a distance, this wave of investment is a huge vote of confidence in the future of North American milk. At the farm gate, it also means that if demand doesn’t keep pace, processors will push utilization and volume, which can lean on commodity prices even while local premiums improve for the “right” kind of milk.
Looking ahead a bit beyond 2026, it’s also worth keeping an eye on FMMO modernization debates and evolving component pay structures, because those policy and pricing shifts will sit atop the same stainless and component dynamics we’re discussing today.
Credit Tightening: Planning in an 8% Money World
Now bring the lender back into the kitchen conversation.
Ag credit reports from the Chicago Federal Reserve show that by late 2023 and into 2024, average farm operating loan rates in that district had climbed to about 8.5% at their peak and then eased slightly to just over 8%, while farm real estate loan rates sat roughly in the mid‑7% range. Purdue ag finance updates and related summaries note that these are the highest farm borrowing costs since the mid‑2000s.
CoBank’s financial statements shows higher provisions for credit losses in 2025 compared to the very low levels of 2021–2022, which is another way of saying lenders are paying much closer attention to risk again. Nobody is slamming the door on dairy, but the days of cheap money and easy approvals are over for now.
On many dairies—from 60‑cow parlors in New England to 2,000‑cow freestalls in Idaho—the lender conversation now revolves around three questions:
What if milk averages mid‑$16s instead of high‑$18s for the next 12–18 months?
Does this capital project still pencil at 7–8% interest and realistic feed and labor costs?
What’s the plan if 2026 turns out “just okay” instead of strong?
For a 300‑cow operation carrying $4–5 million in total debt, moving from roughly 4% to 7–8% interest can add tens of thousands of dollars in interest expense each year, depending on amortization and structure. That’s money that used to be available for principal, repairs, or family living.
I’ve heard more than one banker say their informal stress test now is: “Would you still be comfortable at $16 milk for 18 months?” It’s not a forecast; it’s a guardrail. In a year where USDA and the futures board don’t agree, and exports are strong but price‑sensitive, that kind of discipline matters.
If milk spends half the year at your budget price, do you have anything in place to prevent it from crushing cash flow?
Planning in a $17‑ish World: Five Strategies That Are Working
So with all those moving pieces—USDA vs. futures, record exports at discount prices, big component shifts, new stainless, and 8% money—the practical question is: what do you actually do when you sit down with your 2026 plan?
Here are five strategies that are working on real farms right now.
1. Let the Class III curve anchor your budget
One approach that’s gaining traction is straightforward: build your base budget off the Class III futures strip, and treat USDA’s all‑milk forecast as upside.
If the average of the next 6–12 Class III contracts is sitting in the mid‑$16s, you can:
Use that futures‑based number as your core milk price in the plan, then apply your historical mailbox basis and component performance.
Build a second scenario using something closer to USDA’s high‑$18 to low‑$20 all‑milk range and ask, “If we actually see that, what would we change about capital and risk decisions?”
In a 150‑cow family tie‑stall in Ontario or Vermont, that upside scenario might be where a parlor retrofit or bunk upgrade moves ahead. In a 1,200‑cow freestall in Wisconsin or New York, it might be where the next phase of stall renovation or manure handling upgrades makes sense.
Either way, the survival plan—the one your lender sees first—is built around the futures‑anchored price, not the rosiest forecast on the page.
2. Take advantage of a friendlier feed market—without getting greedy
The good news is that feed isn’t the villain it was a couple of years ago.
Corn has generally traded in the high‑$3 to low‑$4 per bushel range, and soybean meal in the high‑$200s to low‑$300s per ton, a long way from the spikes of 2022. USDA’s Dairy Margin Coverage calculations show that by late 2025, the feed‑cost portion of the DMC margin had improved to its best levels since about 2020 as grain and protein prices eased.
That gives you a window to lock in some feed at workable prices.
A middle‑ground approach many herds are using looks like this:
Lock in 60–75% of core purchased feed—corn, soybean meal, key by‑products—for the next 6–9 months.
Keep 25–40% open to allow for ration tweaks, herd-size adjustments, or price improvements.
Avoid locking 100% for a full year unless your operation is very stable, and you’re comfortable with that risk.
For smaller and mid‑size herds, DMC remains a valuable safety net. USDA and extension analyses show that higher coverage levels on the first 5 million pounds have paid out in multiple low‑margin years since the 2019 redesign. For larger herds, Livestock Gross Margin for Dairy (LGM‑Dairy) offers a subsidized way to insure a futures‑based milk‑over‑feed margin.
Research from universities like Wisconsin and Kansas State shows that herds using a rules‑based margin strategy—consistent use of DMC, LGM‑Dairy, futures, and options around target margins—tend to see less income volatility than herds that act only when markets get scary. You’re not trying to pick the exact bottom; you’re trying to avoid being naked when both milk and feed move against you.
3. Make every capital project pass a $17 milk test
In an 8% money world, every barn, parlor, and piece of iron has to earn its keep.
A simple rule that works well is: if a project can’t pay for itself at about $17 milk and today’s interest rates within 5–7 years, it probably belongs on the “later” list.
Project Type
Capital Cost
Cash Flow @ $16/cwt
Cash Flow @ $18/cwt
Payback @ $17 (yrs)
Recommendation
Parlor upgrade (60 cows/hr to 90)
$280,000
$22,400
$38,500
5.2
PROCEED—labor payoff in peak season; health spillover
New VMS (50-cow system)
$450,000
-$8,200
$12,600
>10
DEFER—milking labor gains don’t offset cost at $16 milk
Freestall renovation + new bedding
$165,000
$18,900
$28,400
4.6
PROCEED—cow comfort drives milk/reproduction ROI
Manure handling (solid separator + storage)
$220,000
$14,200
$22,100
5.8
PROCEED—compliance + nutrient value; essential
New feed mill automation
$95,000
$11,500
$16,800
3.1
PROCEED NOW—fastest payback; ration consistency ROI
Robotic feed pusher (2 units)
$180,000
$3,400
$8,200
8.1
DEFER—marginal labor benefit; wait for $18+ milk
For 100–250‑cow family herds, that tends to move projects that protect daily performance and cow health to the front:
Milking system reliability and throughput
Manure handling that keeps you compliant and efficient
Ventilation, bedding, and stall comfort
Functional fresh cow and transition facilities
“Nice‑to‑have” projects that don’t clearly move milk, health, or labor safety can wait.
For 500–1,500‑cow freestall or dry lot systems, the numbers are bigger, but the logic is the same:
Use mid‑$16–$17 milk in your cash‑flow, not $19 or $20.
Plug in realistic feed, labor, and 7–8% interest from your lender.
Sit with your lender and run a $16 milk stress test for 12–18 months before you sign.
Lenders are more eager to support capital when they see conservative assumptions and honest downside modeling, not just best‑case spreadsheets.
Letting Components – and Fresh Cows – Carry More of the Load
Components are a lever you can pull without adding cows or concrete.
Butterfat pounds have grown about 30.6% since 2010, compared with 15.9% growth in total milk, and that butterfat output was running 3–4% higher year‑over‑year in early 2025 while milk barely budged. We also know from CoBank that butterfat has accounted for most milk checks over the last decade, driving a butterfat boom, and that protein has risen about 6% in the same period.
At the same time, CoBank, Geiger, and academic work on milk quality argue that processors—especially cheese plants—need a more balanced protein‑to‑fat ratio to optimize yields and manage standardization cost. So the farms that do best are often those that produce strong but not extreme butterfat with rising protein, not just the highest fat test in the county.
On the cow side, that typically means:
Investing in fresh cow management and the transition period so cows hit peak intake without a wreck.
Tuning amino acid balance instead of endlessly raising crude protein.
Focusing on forage quality and consistency so you’re not fighting the ration every week.
On the genetics side, CoBank’s report and Bullvine’s own component‑ratio work highlight herds using genomic tools and custom indexes that weight butterfat, protein, total solids, and cheese-yield traits, especially where plants pay on solids and yield.
If you’re under Canadian supply management, the pricing grid and quota rules are a bit different, but the same principle applies: match your component profile to what your board and processors value most.
Using Risk Tools That Fit Your Scale
Month
2023 High
2023 Low
2023 Close
2024 High
2024 Low
2024 Close
2025 YTD High
2025 YTD Low
2025 YTD Close
Jan
$18.20
$16.80
$17.10
$17.50
$15.80
$16.40
$16.80
$15.20
$15.65
Feb
$18.60
$17.20
$17.50
$17.80
$16.10
$16.70
—
—
—
Mar
$18.90
$17.60
$18.20
$18.10
$16.40
$17.10
—
—
—
Most producers don’t want to live on a futures screen, and they don’t need to. But in a year when USDA and the board are a couple of bucks apart, and interest is high, having no risk plan is a risk in itself.
A practical, scale‑friendly approach looks like this:
Once a month, glance at Class III and IV futures and ask whether things are better, worse, or about the same as when you built your plan.
Talk with your co‑op or buyer about forward‑pricing pools or risk programs where they handle the hedging, and you commit a portion of your milk.
If you’re in the 1,000‑cow‑plus range, consider working with a risk adviser who uses rules and target margins, not just hunches.
University extension work on dairy risk management consistently shows that herds using structured, rules‑based programs with DMC, LGM‑Dairy, futures, and options have smoother income over time than herds reacting sporadically when markets look scary.
The key is to pick tools that fit your scale, comfort level, and co‑op structure, not to copy whichever strategy your neighbor talks about the loudest.
Different Farms, Different Realities
As you know, the same Class III price can feel very different two roads over.
For 100–250‑cow family herds in regions like New England, Maine, Wisconsin, New York, and Pennsylvania, the biggest pain points are usually cash flow, debt service, and family labor. Conservative price assumptions, sensible feed coverage, and smart use of DMC (or quota‑aligned tools in Canada) often do more good than chasing every 20‑cent move. On‑farm processing or direct marketing can be powerful for some, but only where there’s real local demand and labor capacity.
For 250–800‑cow operations across the Upper Midwest, Northeast, and parts of the West, working capital, component income, and labor efficiency tend to move the needle fastest. Lenders in these regions often say they’re most comfortable when they see:
Budgets run at $16–$17 milk
At least some margin protection in place
A capital program paced for 7–8% money, not cheap‑money days
For 1,000‑cow‑plus herds—multi‑site freestalls, big dry lot systems in the West and Southwest—processors care a lot about consistency, quality, and risk profile. Multi‑year supply deals, basis arrangements, and structured hedge programs can smooth income if they’re built around realistic margins and checked regularly.
Across all sizes, the farms that tend to come out of tight cycles with options left are usually the ones that:
Know their true cost of production
Are honest with themselves and their lenders about leverage
Make small, early adjustments when margins pinch instead of waiting for a crisis
The Short Version
If we were at a winter meeting in Listowel or Tulare and you slid your coffee across the table and said, “Alright, just give me the quick list,” here’s how I’d boil it down:
Plan off the futures strip, not the prettiest forecast. Use the 6–12‑month Class III average—roughly the mid‑$16s right now—as your base and treat USDA’s higher all‑milk projections as upside, not your starting point.
Lock in some feed while it’s reasonable. With corn and soybean meal back in more manageable ranges and DMC margins much better than in 2022, it makes sense to protect part of your feed so a spike doesn’t wreck your year.
Make capital prove it works at $17 milk and 8% interest. Any barn, parlor, or equipment upgrade that doesn’t pencil at about $17 milk and current rates within 5–7 years needs a tough second look before you sign.
Let components and fresh cow management do more of the lifting. Butterfat performance is strong, and protein’s value is rising in many pay systems. Align your ration, fresh cow management, and genetics with the component blend your plant or board actually pays for.
Have the hard conversations early. Sit down now—with your lender, co‑op, nutritionist, and family—while there’s still time to tweak the plan instead of scrambling later.
The Bottom Line
The encouraging part of all this is that the long‑term demand story for North American dairy remains strong. USDEC numbers and Bullvine coverage show record or near‑record cheese and butterfat exports, and through three quarters of 2025, U.S. butterfat exports were up triple digits in volume, with butter export value surpassing prior full‑year records. CoBank’s $10‑billion stainless estimate—and the plants you can actually drive past—show processors still betting big on future milk.
You don’t have to operate like milk will stay at $16 forever—but you can’t afford to build a 2026 plan that only works at $20, either.
Before March, sit down with: (1) your lender, with a $16–17 milk stress‑tested budget; (2) your nutritionist, with explicit butterfat and protein targets; and (3) your co‑op or buyer, with a specific risk‑tool and contract conversation. If the last couple of decades have taught anything, it’s that the better stretch does come back around. The herds still standing when it does are the ones that took years like 2026 seriously, planned conservatively, and kept just enough powder dry to move when the wind finally shifted in their favor.
Key Takeaways
Mind the $150K gap: USDA forecasts 2026 all‑milk near $18.25/cwt; Class III futures sit in the mid‑$16s. For a 300‑cow herd, budgeting off the wrong number is a $150,000+ mistake.
Record exports, discount prices: U.S. cheese exports jumped 28% and butterfat nearly tripled in August 2025—but we’re winning volume by pricing below the EU and New Zealand, not by earning premiums.
Protein is catching up to fat: Butterfat led the check 8 of 10 years, but cheese plants now want balanced protein‑to‑fat ratios. Herds shifting to 3.8–3.9% fat with 3.2%+ protein are seeing better component checks.
$17 milk is the new capital test: At 7–8% interest and lenders stress‑testing at $16 milk, any project that doesn’t pay back at ~$17 milk within 5–7 years belongs on the “later” list.
Act before March: Budget off futures (not USDA), lock 60–75% of feed for 6–9 months, stress‑test every capital decision, align components with your plant’s pay grid, and put risk tools in place that match your scale.
Complete references and supporting documentation are available upon request by contacting the editorial team at editor@thebullvine.com.
Learn More
The $15,800 DMC Decision Every Dairy Needs to Make Before February 26 – Stop leaving cash on the table. This breakdown reveals the exact math behind the $15,800 DMC advantage and delivers a step-by-step method to protect your 2026 margins before the February 26 enrollment deadline.
Every week, thousands of producers, breeders, and industry insiders open Bullvine Weekly for genetics insights, market shifts, and profit strategies they won’t find anywhere else. One email. Five minutes. Smarter decisions all week.
DMC averaged $74K per farm in 2023. In 2026, it got $15,800 better for 300-cow herds. Claim it by February 26—or miss it.
Executive Summary: DMC’s Tier 1 cap just jumped from 5 million to 6 million pounds. For a 300-cow dairy, that single change is worth roughly $15,800 in annual premium savings—money most producers will leave on the table because they’ll renew the way they always have. Before the February 26 deadline, you need to answer one question: Is Tier 2 coverage (about $70/cow, or $20,000/year) still survival insurance, or has your balance sheet improved enough since 2023 that it’s become expensive peace of mind? A quick runway test—available cash divided by monthly fixed costs—tells you where you stand. If you’ve rebuilt working capital and your operation is stronger than it was three years ago, your DMC strategy should reflect that. The $15,800 is there. The only question is whether you’ll claim it.
You know how it goes. You swing by the FSA office, renew your Dairy Margin Coverage more or less on autopilot, and get back to what actually matters—watching fresh cow performance, keeping an eye on butterfat levels, and making sure the transition period isn’t causing problems. In most years, that routine hasn’t hurt too badly.
This year’s different, though.
For the 2026 coverage year, FSA has bumped the Tier 1 coverage limit from 5 million pounds up to 6 million pounds. That’s straight from USDA’s official DMC program page, and they announced it at the Farm Bureau convention earlier this month. The expansion came through in the 2025 farm bill—the “One Big Beautiful Bill,” as it’s been called in the trade press—which also extended DMC through 2031.
Here’s what’s interesting about that change. The folks at Adams Brown, who spend their days running dairy financials, put out an article back in November showing what happens when you shift an extra million pounds from Tier 2 into Tier 1. For a lot of 250- to 350-cow herds, we’re talking premium savings solidly in the five-figure range.
So this year, doing “what we’ve always done” really is a decision. Not just a formality.
What Actually Changed in DMC for 2026?
Let me walk through this piece by piece, because the structure matters.
Starting in 2026, that first 6 million pounds of your production history qualifies for Tier 1 coverage. You can pick coverage levels from $4.00 up to $9.50 per hundredweight, in half-dollar increments. And here’s the part that makes Tier 1 so attractive—at the $9.50 level, you’re paying just $0.15 per cwt. That’s from UW-Madison’s DMC policy updates, and the 2026 DMC premium rates haven’t changed on the Tier 1 side from previous years.
Everything above 6 million falls into Tier 2. The coverage there tops out at $8.00 per cwt, and the premium at that level runs about $1.81 per cwt according to the same UW tables.
So any hundredweight you can move from Tier 2 down into Tier 1? You’re trading a $1.81 premium for a $0.15 premium. That’s roughly $1.66 per cwt difference.
Over a million pounds—10,000 cwt—that works out to around $16,600 in potential premium savings. Real money.
One more thing worth noting: FSA is also requiring all operations enrolling for 2026 to establish a new production history using the highest annual production from 2021, 2022, or 2023. That’s on FSA’s program page and confirmed in Adams Brown’s farm bill summary. If your herd has grown since you last updated, this could work in your favor.
Putting This in Cow Terms
It helps to anchor this in actual herds rather than abstract numbers.
The average U.S. milk production in 2023 came in at 24,117 pounds per cow, up about 30 pounds from 2022. Using that benchmark, 300 cows at average production gives you roughly 7.2 million pounds annually. That’s a pretty common profile in freestall operations across the Midwest and Northeast.
Year
Tier 1 (Lbs)
Tier 1 Premium/cwt
Tier 2 (Lbs)
Tier 2 Premium/cwt
2025
5.0M
$0.15
2.2M
$1.81
2026
6.0M
$0.15
1.2M
$1.81
Under the old DMC structure, that 300-cow herd had 5 million pounds in Tier 1 and 2.2 million in Tier 2. Under the 2026 rules, it’s 6 million in Tier 1 and only 1.2 million in Tier 2.
Run those volumes through current FSA premium rates at 95% coverage, and here’s what you get:
The old structure cost that herd roughly $45,000 a year in premiums—about $7,100 for Tier 1, nearly $38,000 for Tier 2. The new structure? Roughly $29,000—around $8,500 for Tier 1, about $20,700 for Tier 2.
Metric
Old DMC (2025)
New DMC (2026)
Tier 1 Cap
5.0 Million Lbs
6.0 Million Lbs
Tier 1 Premium ($9.50)
$0.15 / cwt
$0.15 / cwt
Tier 2 Premium ($8.00)
$1.81 / cwt
$1.81 / cwt
Annual Premium (300 Cows)
~$45,000
~$29,000
Net Savings
–
$15,800
That’s approximately $15,800 in annual premium savings. Just because more milk now qualifies for the cheaper coverage tier.
Adams Brown’s worked examples hit the same ballpark when they model what happens as production shifts from Tier 2 to Tier 1. This isn’t a cosmetic tweak—it genuinely moves the needle.
Herd Size (Cows)
Annual Production (Lbs)
2025 Premiums
2026 Premiums
Savings
200
4.8M
~$32,500
~$20,800
~$11,700
300
7.2M
~$45,000
~$29,000
~$16,000
400
9.6M
~$57,500
~$37,000
~$20,500
500
12.0M
~$70,000
~$45,000
~$25,000
600
14.4M
~$82,500
~$53,000
~$29,500
What 2023 Taught Us About DMC
You probably remember 2023 without needing much prompting. But it’s worth looking at what DMC actually did that year, because it shapes how a lot of us think about coverage now.
UW-Madison’s 2024 program review showed that DMC margins fell below the $9.50 coverage threshold in 11 out of 12 months during 2023. Several months landed in the mid-$4 to low-$5 per cwt range—some of the weakest margins we’d seen since the program started.
Month
All Milk Margin ($/cwt)
Tier 1 Payment @ $9.50 Coverage ($/cwt)
Jan
$4.80
$4.70
Feb
$5.20
$4.30
Mar
$4.50
$5.00
Apr
$5.80
$3.70
May
$6.20
$3.30
Jun
$6.50
$3.00
Jul
$6.10
$3.40
Aug
$5.90
$3.60
Sep
$5.40
$4.10
Oct
$4.70
$4.80
Nov
$4.30
$5.20
Dec
$4.60
$4.90
On the payment side, UW-Madison reported that total indemnity payments for 2023 topped $1.27 billion across about 17,059 enrolled operations. That worked out to an average of roughly $74,453 per farm, with about 74.5% of eligible dairies participating.
For producers at the $9.50 coverage level, monthly payments often exceeded $2 per cwt during the worst stretches. Dairy Herd Management described 2023 as a year when DMC was “in the money” almost continuously for herds with higher Tier 1 coverage.
When USDA first rolled out the DMC decision tool in 2019, it partnered with UW-Madison on its development. At the time, Mark Stephenson—then Director of Dairy Policy Analysis at UW—said DMC “offers very appealing options for all dairy farmers to reduce their net income risk due to volatility in milk or feed prices.”
That sounded promising then. 2023 showed what it looks like in real dollars.
So when producers say they’re not going through another margin crash without full coverage, that’s not paranoia. It’s memory. Those DMC payments kept operating loans current, and feed mills paid on a lot of farms.
What’s easy to miss, though—and this is where the 2026 DMC calculation gets interesting—is that many herds used the stronger margins of late 2023 and 2024 to rebuild. Working capital came back. Debt got paid down. Break-even costs dropped.
The Farm You Were vs. The Farm You Are Now
Here’s what I’ve noticed working through this with producers over the past few months.
Going into 2023, a lot of mid-size herds—the 250- to 350-cow operations—were carrying tight balance sheets. Farm-management reports and lender dashboards commonly showed working cash in the $50,000 to $100,000 range, debt service coverage ratios hovering around 1.1 to 1.25, debt-to-asset ratios in the mid-40% to low-50% band, and break-even milk prices pushing toward $19 or $20 per cwt in higher-cost regions.
University finance specialists had been flagging that profile as vulnerable for a while. Any combination of lower milk prices, poor forage quality, or spiking feed costs could push those farms into serious stress.
Fast forward to now, and the picture often looks different. The herds that stayed in business—especially those that collected DMC payments and caught the firmer milk prices of 2024—often rebuilt working capital into the $200,000 to $300,000 range or higher. Debt service coverage ratios improved into the 1.4 to 1.6 band. Debt-to-asset ratios drifted back toward the high 30s or low 40s. Break-even prices fell into the $17 to $18 range, with better forage and tighter overhead.
When you put the last few years of financials side by side, the “farm we were in 2022” and the “farm we are in 2025” can look quite different—even if your gut still feels like it’s living in 2023.
So, before you check those boxes at FSA, are you setting up DMC for the farm you were, or the farm you are now?
What Job Is Tier 2 Actually Doing?
This is where conversations tend to get interesting.
In my experience, Tier 2 ends up playing one of two roles. It’s either survival coverage or peace-of-mind coverage. Both are legitimate. The key is knowing which job it’s doing for you this year.
Indicator
Tier 2 = Survival Coverage
Tier 2 = Peace-of-Mind Coverage
Working Capital (Days of Expenses)
<60 days
>120 days
Debt Service Coverage Ratio
<1.25
>1.40
Debt-to-Asset Ratio
>50%
<40%
Break-Even Milk Price
>$19/cwt
<$18/cwt
Tier 2 Annual Cost (300-cow herd)
~$20,000–$21,000 (Critical)
~$20,000–$21,000 (Discretionary)
Decision
Must Keep Tier 2
Can Scale Back or Self-Insure
When Tier 2 is survival coverage
Tier 2 belongs in the “must-have” column when a farm is financially fragile. Extension finance programs and lenders typically flag farms with working capital covering less than 60 days of expenses, debt service coverage consistently below 1.25, debt-to-asset ratios above 50%, or break-even milk prices creeping toward $19 or higher.
As many of us have seen in Wisconsin freestalls and Western dry lot systems alike, it doesn’t take much to chew through limited cash when you’re that tight. A weather-damaged corn silage crop. Protein prices jumping. A dip in the milk check. On those farms, Tier 2 payments can literally be the difference between riding out a rough stretch and falling behind on bills you can’t afford to miss.
When Tier 2 becomes peace-of-mind coverage
On stronger farms, Tier 2 plays a different role.
When working capital covers 120 days or more of fixed costs, when debt service coverage holds comfortably above 1.4, when leverage sits under 40%, and when break-even prices have moved down into the $17 to $18 range—a farm can shoulder more of its own margin risk without immediately threatening survival.
In that situation, Tier 2 becomes more about smoothing income and reducing stress than about keeping the doors open. The protection is real, but the farm isn’t dependent on those checks to stay solvent.
What Tier 2 actually costs
Back to our 300-cow example. That extra 1.2 million pounds above the Tier 1 cap falls into Tier 2.
Using FSA’s premium table at $8.00 coverage and 95% coverage percentage, premiums on that Tier 2 slice run about $20,000 to $21,000 per year. Spread across the herd’s total production, you’re looking at roughly 28 to 29 cents per cwt, or about $70 per cow per year.
Some operations look at that $70 and say, “That’s a cheap price for peace of mind.” Others—particularly those with longer runway and stronger cash flow—start asking whether that money might work harder paying down principal, upgrading cow comfort, or buying targeted Dairy Revenue Protection for specific high-risk quarters.
A Kitchen-Table Runway Test
So how do you figure out where you actually stand without building a massive spreadsheet?
A lot of university educators and lenders have gravitated toward a simple runway test. It’s not perfect, but it’s surprisingly useful for getting your bearings.
Step one: Grab your most recent bank statement showing your operating account and any short-term savings. Pull your latest term-debt statement with the monthly principal and interest. Have a recent milk check handy.
Step two: Estimate your monthly fixed “burn.” Start with your total monthly term-debt payments, then add the costs that don’t disappear when margins drop—insurance, utilities, property taxes averaged over the year, core payroll for people you realistically can’t cut. Farm-business programs in Wisconsin, Minnesota, and New York commonly see 250- to 350-cow dairies with monthly burns in the $18,000 to $22,000 range, though it varies by region and setup.
Step three: Divide your available cash by that monthly burn.
That gives you your runway—the number of months you can keep essential bills paid if margins drop and stay ugly.
Extension risk-management materials generally talk about 3 to 6 months of working capital as a minimum target, with more than 6 months representing a strong buffer.
In practice:
Less than 3 months: Tier 2 is probably still survival coverage for your operation.
3 to 6 months: Gray area—time for a careful conversation with your lender.
More than 6 months: There’s room to discuss self-insuring part of that Tier 2 risk.
What’s encouraging is that many Midwest operations running this exercise over the past year have been surprised to find their runway longer than they expected. Not everyone, but enough that it’s changed the tone of the Tier 2 conversation.
Gray area. Stronger than tightest farms, not yet confident.
CONSULT YOUR LENDER — Decision depends on debt structure & farm trajectory
>6 months
Strong. Solid buffer.
YOU HAVE OPTIONS — Can max Tier 1, skip/scale Tier 2, test self-insurance
How Bigger Herds Layer Their Risk Tools
For larger operations—500 cows, 1,000 cows, and up—the DMC discussion usually sits inside a broader risk-management framework.
UW-Madison’s 2025 DMC update explicitly notes that “DMC may be combined with DRP or LGM-Dairy to form a more comprehensive risk management framework.” And that’s exactly what we’re seeing in practice.
The pattern in a lot of Wisconsin freestalls and Western systems looks something like this: Use Tier 1 DMC at $9.50 for the first 5 to 6 million pounds as a base safety net. Add Dairy Revenue Protection on a portion of remaining production to lock in revenue floors for specific quarters, especially when futures markets and local basis look shaky. Use Livestock Gross Margin-Dairy selectively when feed cost risk is particularly high.
Risk Management Agency materials show that DRP adoption has been ramping up among larger herds since its 2018 launch. DMC serves as the first layer; DRP and LGM target more specific risks for volumes above Tier 1.
For bigger operations, Tier 2 is one option among several for covering extra production—and the decision about how much to buy sits alongside questions about DRP quarters and feed hedging.
The Six-Year Lock-In: Discount or Commitment?
Now let’s talk about the multi-year option, because it deserves a careful look.
The discount
Under the 2025 farm bill changes, producers can enroll in DMC for a six-year period—2026 through 2031—and receive a 25% discount on premiums throughout. That’s confirmed on FSA’s official program page and in Adams Brown’s farm-bill breakdown.
For our 300-cow example, where annual premiums under the new structure run about $29,000, a 25% discount brings that down to roughly $22,000 per year. That’s around $7,000 in annual savings, or more than $40,000 across six years.
The commitment
The catch—and it’s worth thinking through—is that multi-year enrollment isn’t designed as a “sign now, adjust freely later” arrangement.
USDA describes it as providing stability for both producers and the program. The detailed rules around mid-stream changes are best confirmed with your local FSA office, but the general idea is clear: you’re trading some future flexibility for a lower bill today.
Questions worth asking before you sign
If you’re considering the multi-year option, here are the conversations to have at FSA:
“If we expect to grow from 300 cows to 450 cows over the next six years, how does our coverage and premium obligation evolve?”
“If we sell, retire, or transfer the operation before 2031, what happens to the remaining years?”
“If our risk tolerance changes and we want to adjust Tier 2 coverage after a couple of years, what are our options?”
For stable herds with clear long-term plans, the multi-year discount can be a very good fit. For farms facing major transitions—expansion, succession, shifts in business model—staying year-to-year and letting coverage evolve with the operation might make more sense.
The main thing is asking these questions before you sign.
Why February 26 Should Be the Finish Line, Not the Starting Gun
According to FSA, the 2026 DMC enrollment deadline is February 26. Enrollment opened January 12.
What I’ve noticed is that the farms getting the most from DMC treat that deadline as the last day to finalize paperwork on a decision they’ve already worked through—not the day they first start asking what changed.
By mid-January, most dairies are already deep into year-end review. You’re looking at your 2025 income statement and balance sheet. You know how forage turned out. You’ve got a feel for where feed and milk markets might be headed. That’s exactly when DMC strategy belongs in the conversation.
FSA staff consistently say the strongest sign-up meetings happen early in the window, when producers arrive with their questions already answered. It’s the last-week crunch—when everyone’s buried and just trying to avoid missing the deadline—that leads to “just do what we did last year” decisions, even when the farm’s financial picture has shifted significantly.
What If You Cut Tier 2 and 2026 Turns Ugly?
This is the question that sits in the back of everyone’s mind. And honestly, it should.
If you look at your 2025 results, decide you’re strong enough to drop or scale back Tier 2, and then 2026 turns into another rough year, will there be mornings when you wish those Tier 2 checks were coming?
Of course. That’s the nature of insurance. Regret always shows up loudest after the fact.
So instead of asking whether you’ll regret it if the worst happens—because that answer is almost always yes—it’s more useful to ask:
Given our current runway, debt service coverage, leverage, and break-even, could we realistically survive another difficult margin year using Tier 1 DMC, our cash reserves, and existing credit without Tier 2?
How much margin risk are we truly comfortable carrying ourselves now, compared to what we could carry going into 2023?
For some farms, after putting the real numbers on the table with their lender, the answer is still: “We’re not quite there yet. Tier 2 is survival coverage for us.”
For others—especially those sitting on more than six months of runway and strong debt service coverage—the answer moves closer to: “We can shoulder more of this ourselves now, and those Tier 2 dollars might work harder somewhere else.”
A test-year approach for stronger herds
What’s emerging in some extension workshops is a “test-year” strategy. It goes like this:
Max out the expanded Tier 1: 6 million pounds at $9.50.
Skip Tier 2 for one coverage year.
Move the money you would have spent on Tier 2 premiums—around $20,000 in the 300-cow example—into a dedicated reserve account earmarked for margin shocks.
If 2026 turns rough, that reserve plus Tier 1 payments gives you a self-funded cushion. If 2026 is decent, you’ve effectively paid that premium to yourself and strengthened your working capital.
It won’t fit everyone, and it absolutely should be run past your lender first. But it shows how stronger balance sheets and a more generous Tier 1 structure are giving some farms more options, not fewer.
Your Action Plan Between Now and February 26
Let me bring this back to the kitchen table.
Tonight or this week:
Run your runway test. Grab your bank and loan statements and figure out how many months of fixed costs your current cash covers.
Pull your key ratios. Look at where your debt service coverage, leverage, and break-even landed for 2025.
Run scenarios with USDA’s DMC Decision Tool. It’s available on FSA’s website and was developed with UW-Madison specifically to help producers compare coverage options using their own production history.
Over the next week or two:
Decide what job Tier 2 is doing. Is it still survival coverage for your operation, or has it shifted into peace-of-mind territory you might resize?
Talk with your lender. Bring your runway number and ratios. Ask whether your current position can support self-insuring some risk.
Ask about multi-year enrollment at FSA. Get clear on what a six-year commitment would mean for your situation.
Before February 26:
Choose your 2026 structure intentionally. Decide your Tier 1 and Tier 2 levels, whether you’re going year-by-year or locking in for six years, and how that fits with any DRP strategy.
Walk into FSA with a plan. Use your appointment to execute a decision you’ve already made, based on good information.
The Bottom Line
DMC remains one of the most cost-effective safety nets under the U.S. milk check. But the opportunity in 2026 isn’t just to get enrolled.
It’s to enroll like the farm you’ve become—not the farm you were before 2023—and to line up your coverage with the cows you’re milking, the numbers on your books, and the level of risk you can genuinely live with now.
The 2026 DMC deadline is February 26. If you don’t run this math before then, the odds are high you’ll either overpay for coverage you don’t need, or underinsure a risk your balance sheet still can’t carry.
Neither is where any of us want to be.
Key Takeaways:
$15,800 is hiding in your 2026 DMC renewal. The Tier 1 cap jumped from 5 million to 6 million pounds—shifting a million pounds from $1.81/cwt premiums down to $0.15 for 300-cow dairies.
Most producers will miss it. They’ll renew on autopilot without realizing the program changed. Don’t be most.
Tier 2 runs $70/cow. Is that survival coverage—or an expensive habit? If your balance sheet is stronger than it was in 2023, the answer has likely changed.
Run the runway test. Cash on hand ÷ monthly fixed costs. Under 3 months = Tier 2 is still essential. Over 6 months = you have real options.
February 26 deadline. The $15,800 is there. Claim it—or leave it on the table.
Complete references and supporting documentation are available upon request by contacting the editorial team at editor@thebullvine.com.
Learn More
April 2025 Dairy Risk Management Calendar – Reveals the precise steps to layer DMC with Dairy-RP and Chicago puts, arming you with a tactical risk calendar that prevents devastating coverage gaps when market floors shift during the high-stakes Q3 and Q4 windows.
The Triple Cushion Trap: Why 2025’s Strong Margins Won’t Save You in 2026 – Exposes the temporary nature of 2025’s profit cushions, delivering a strategic roadmap to rebuild working capital and restructure debt before the broader industry consolidation and margin-compression cycle hits full force in late 2026.
Every week, thousands of producers, breeders, and industry insiders open Bullvine Weekly for genetics insights, market shifts, and profit strategies they won’t find anywhere else. One email. Five minutes. Smarter decisions all week.
The first 2026 GDT rally is real—but the farms that win from it will be the ones already managing margin, not chasing price.
Executive Summary: Global dairy got a welcome jolt to start 2026 when the first GDT auction pushed the index up 6.3%, led by stronger whole and skim milk powder prices, after a long stretch of weaker events. Behind that headline, the shift is being driven less by a demand boom and more by tighter powder supply: New Zealand offered less product, and US plants have cut powder output by roughly 10% year‑on‑year as milk moves into cheese and high‑protein ingredients instead. At the same time, EU butter prices around €4,400 per tonne, sizeable EU butter stocks, US butter stuck in the mid‑$1.30s, and heavy cheese and whey production all remind us that the world is still working through a “wall of milk,” even if it looks different in Europe, North America, Oceania, and China. Futures markets in Europe and Singapore are quietly confirming this firmer tone, but most official outlooks still point to only modest milk price gains against relatively high input and finance costs. For farmers, this combination means the rally is useful but not a rescue: the biggest wins will come from tightening margin‑management plans, rechecking butterfat versus protein strategy against current pay programs, and using tools like dairy‑beef where local buyers can genuinely support it. In short, this is a moment to use better prices to strengthen your position, not a signal that the hard part of this cycle is behind us.
You know those weeks when the market finally gives you something other than bad news? The first Global Dairy Trade auction of 2026 was one of those weeks. The January 6 event pushed the GDT Index up 6.3 percent, according to official GDT results and confirmed by NZX Dairy Insights. That broke a five-month slide that had been wearing on everyone’s nerves.
GDT Index Snaps Five-Month Slide—But Don’t Mistake a Rally for a Recovery
Before we dig into what’s driving all this, here are the numbers that matter most right now:
GDT Price Index: Up 6.3% at Event 395, the first increase since August 2025
Whole Milk Powder: Up 7.2% to roughly $3,407 per tonne
Skim Milk Powder: Up 5.4% to about $2,564 per tonne
Anhydrous Milkfat: Up 7.4% to around $6,011 per tonne
US Spot NDM: Reached $1.265 per pound for the week ending January 9
EU Butter Reference: Around €4,408 per tonne, down roughly 40% year-on-year
CME Spot Butter: Trading in the mid-$1.30s per pound, near multi-year lows
CME Dry Whey: Slipped into the low-70-cent range per pound
New Zealand and global dairy reports told the same story: less product on offer from Oceania and stronger demand from Asia and the Middle East combined to move the needle. Average winning prices at GDT moved into the mid-$3,500-per-tonne range, which was a welcome change from the drift we’d been seeing.
What’s encouraging is that this is the first time in a while we’ve seen both fat and powder move up together in a meaningful way. It doesn’t mean the year is saved. But it does tell us the market still responds when supply tightens, and buyers step forward.
Powder’s Quiet Turn: Less Balancing, More Bite
Looking at the powder side of this rally, you start to see some interesting structural changes at work. In early January, US spot nonfat dry milk climbed into the mid-$1.20s per pound. The T.C. Jacoby Weekly Market Report, which draws heavily on CME and USDA data, pegged the weekly average at $1.265 per pound for the week ending January 9. That’s a real improvement from where we sat late last year.
At the same time, USDA’s Livestock, Dairy, and Poultry Outlook still points to modest US milk growth for 2026. The October projections have national production rising from around 231 billion pounds in 2025 to 234 billion pounds in 2026, driven by a slightly larger herd averaging just under 9.5 million cows and higher yield per cow. On the surface, you’d expect “more milk” to mean softer powder prices, not firmer.
So what changed? On the production side, you see, we’re simply not making as much powder as we used to. That same Jacoby report highlighted October US nonfat/skim production at just under 150 million pounds, about 10 percent below the same month a year earlier. The analysts described it as one of the lighter October figures they’ve seen in recent years based on USDA’s monthly time series.
Metric
October 2025
October 2024
Change
YoY %
Total US Milk Production
19.25B lbs
18.98B lbs
+270M
+1.4%
Nonfat Dry Milk (NDM) Output
148.5M lbs
165.0M lbs
-16.5M
-10.0%
US Cheese Production
286M lbs
271M lbs
+15M
+5.5%
Whey Protein Streams
42M lbs
38M lbs
+4M
+10.5%
On the ground, plants are using their dryers less as a balancing tool. With all the new cheese vats and high-protein lines that have come online across the Midwest and West over the past few years, extra milk that would have gone to powder a decade ago is now more often going into cheese or specialty proteins. A plant manager in the Central Plains told me recently, “If I can put a load into cheese or a protein stream, I’ll do it before I even think about the dryer.” That attitude is becoming pretty common.
Now put that together with the GDT story. Ahead of the first 2026 auction, New Zealand sellers cut back their offered volumes of whole and skim milk powder compared with earlier events, according to NZX Dairy Insights. Milk collections there aren’t running away, and co-ops are managing volume more tightly. Buyers still came to the table, and between that and tighter US production, the whole powder market suddenly looked a lot less heavy than it did in the fall.
So the data suggests this powder rally isn’t just a random bounce. It’s built on less supply meeting stable-to-better demand. The open question is how long that balance holds.
What The Futures Are Whispering
If you sit down with anyone who lives in the risk-management world, they’ll tell you the futures curves matter. And right now, they’re quietly backing up what we’re seeing in spot markets.
On the European Energy Exchange, skim milk powder futures for the early-to-mid-2026 months moved into the low € 2,200-per-tonne range right after the GDT lift. That’s a few percent higher than where they sat in late December. Whey futures edged higher, too, though not by as much.
Over in Singapore, which has become a key hub for hedging Oceania-linked product, whole milk powder futures for the January–August window climbed into the upper-$3,300s per tonne, with skim in the high-$2,600s to low-$2,700s. Anhydrous milkfat and butter futures there saw even stronger percentage gains after the auction.
Why does any of this matter at the farm level? Because these are the curves your co-op or processor looks at when they’re deciding whether to lock in export deals. On Wisconsin farms that ship into export-focused co-ops, and in California plants that rely heavily on overseas powder sales, marketers are much more willing to write business when EEX and SGX curves are firm and active. Those deals, in turn, show up in premiums, base prices, and risk-sharing programs.
You might never place a futures order yourself, but it’s worth knowing that the people pricing your milk are watching those screens every day.
Butterfat: Valuable In Theory, Awkward In Practice
Now, let’s talk butterfat, because this is where many of us feel a disconnect between the “fat is back” headlines and the actual pay stub.
In Europe, the composite butter price, based on Dutch, German, and French quotations, has been around €4,408 per tonne in early January. That’s a bit better than December, but still about 40 percent below where it was a year ago. Vesper’s late-2025 analysis estimated EU butter surpluses at roughly 93,700 tonnes across the first three quarters of 2025, with production up more than 86,000 tonnes year-on-year. That’s a lot of butter to work through, and Vesper expects prices to slip below €4,000 per tonne in the first quarter of 2026.
Product / Region
Price (Current)
Price (Year Ago)
YoY Change
Status
EU Butter Composite
€4,408/tonne
€7,347/tonne
-€2,939
⚠️ -40.0%
US Spot Butter (CME)
$1.37/lb
$2.15/lb
-$0.78
⚠️ -36.3%
US Class III (Cheese)
~$18.50/cwt
~$17.80/cwt
+$0.70
↑ +3.9%
NYS Protein Milk Price
~$19.25/cwt
~$18.10/cwt
+$1.15
↑ +6.4%
In the US, it’s a different flavour of the same challenge. Spot butter at the Chicago Mercantile Exchange has started 2026 in the mid-$1.30s per pound. Butter at $1.3750 on January 1, and Ever.Ag’s early-January “Margin Matters” commentary described it as testing multi-year lows. USDA data show butter production in late 2025 still running ahead of year-ago levels, even after accounting for strong cream usage elsewhere in the system.
Exports, interestingly, have improved. Late-2025 export summaries from USDA and dairy trade coverage show US butter shipments several times larger than the year before and strong growth in anhydrous milkfat exports as well. International buyers are clearly taking advantage of the discount on US fat relative to European and New Zealand product.
Domestically, the picture is nuanced. Consumers haven’t gone back to low-fat diets. USDA production reports show yogurt and cottage cheese output growing in recent years, while ice cream and sour cream have been flat to slightly down. So people are still comfortable with fat, but they seem to prefer it when it’s paired with protein or cultures.
What does that mean for butterfat levels on your farm? Over the last decade, many herds have pushed fat up through better fresh cow management, strong transition programs, and careful ration work. On Northeast and Upper Midwest farms, it’s not unusual now to see rolling herd averages north of 4.0 percent fat. But with butter this cheap, the extra dollars you spend chasing an extra few points of fat may not pay back like they did when butter was at $2.50 or more.
That doesn’t mean you stop caring about fat. It does mean it’s worth sitting down with your nutritionist and milk statement to see whether your current component strategy still lines up with how your buyer is paying today. On some Ontario and New York farms, for instance, processors are quietly putting more emphasis on protein because of where their products – yogurt, cheese, high-protein drinks – are headed. That shifts the economics.
Cheese And Whey: Strong Demand, Full Vats
Cheese has been the main growth engine for the US dairy industry in recent years, as many of us have seen. USDA’s 2025 production data shows total cheese output running several percentage points ahead of the previous year, with some months close to 6% growth. New plants in places like Michigan, Texas, and Idaho are very visible examples of that expansion.
On the price side, CME block Cheddar has been trading in the low-$1.30s per pound to start 2026, down from the $1.60–$1.80 range that held for much of last spring and summer. During that higher-price period, US cheese exports set record or near-record volumes in several months, especially into Mexico and parts of Asia, according to USDA export statistics.
Metric
Current Status
Year Ago
Change
Implication
US Total Cheese Production
+6.0% YoY
Baseline
Higher volume
Supply exceeds domestic + export growth
US Cheese Exports
Record+ to Mexico & Asia
Year-ago baseline
Record volumes
Demand is real, but can’t absorb all new production
So why are prices back down? It comes back to volume. Even when exports are “record,” they still only take a slice of total output. The rest has to be eaten domestically or stored. When production grows faster than both domestic use and exports, prices simply don’t have much room to move higher.
Whey is part of this story. Protein demand hasn’t gone away. In fact, consumer research and nutrition studies from the last few years show continued growth in demand for high-protein foods and supplements. Dairy proteins remain a central ingredient in many sports and wellness products.
But every pound of cheese brings whey with it. Processors tend to strip out the higher-value fractions – whey protein concentrates, and isolates – and those markets remain fairly tight. The commodity dry whey that’s left, though, has been under pressure. To start 2026, CME dry whey has slipped into the low-70-cent range per pound, lower than it was in early autumn. Industry analyses point to several months where dry whey output has run ahead of the previous year, adding to stocks.
So, as with butterfat, the headline (“protein is hot”) doesn’t always tell you what’s happening at the commodity end. The details of how your milk is used – commodity cheese, specialty cheese, high-value protein ingredients – matter a lot when it comes back to your mailbox.
The Wall Of Milk: It Doesn’t Look The Same Everywhere
Region
Nov Collection (Local Unit)
YoY % Change
YTD Trend
Key Driver
Germany
+5.0%
↑
Slightly behind 2024 YTD
Higher milksolids (4.1% fat, 3.5% protein)
Italy
+3.5%
↑
Positive YTD
Solid seasonal strength
Spain
-2.0%
↓
Positive YTD
Lower volume, but higher solids
Ireland
-2.1%
↓
Strong YTD lead
Spring flush strength carrying year
Australia
-2.2%
↓
Behind 2024 YTD
Beef prices, weather, cow numbers under pressure
New Zealand
~Flat
→
N/A (seasonal producers)
Tight GDT offerings, managed supply
China
+3.2%
↑
Above 2024 (cautious)
Farmgate prices linked to global powder; selective demand
We all hear about the “wall of milk,” but when you look region by region, it doesn’t look uniform at all. Here’s what the latest data show:
Germany: November milk collections came in close to 5 percent higher than a year earlier, with milksolids up even more, thanks to butterfat around 4.1 percent and protein near 3.5 percent. But year-to-date, Germany is still slightly behind 2024 because the early months were weaker.
Italy: November collections were roughly 3.5 percent higher year-on-year, with milksolids up about 4 percent.
Spain: November volumes were down a couple of percent, yet cumulative milk solids ticked higher as fat and protein percentages improved.
Ireland: November milk was down just over 2 percent while still holding a solid lead in year-to-date milk and solids thanks to a strong spring flush.
Australia: November production was around 875,000 tonnes, more than 2 percent lower than a year earlier, and season-to-date volumes are also behind. Dairy Australia and analysts like Bendigo Bank have been open about the drivers: strong beef prices, weather challenges, and structural issues are all making it harder to rebuild cow numbers.
New Zealand: Ahead of the January auction, local analysts talked about lower milk collection forecasts and reduced whole and skim milk powder offerings compared with previous events, per NZX Dairy Insights. When those smaller catalogs arrived at GDT, and buyers still wanted volume, prices responded quickly.
China: Official data put December farmgate milk prices in major producing provinces around 3.03 Yuan per kilogram, slightly higher than in November and a few percent above the year before. Academic studies have shown that Chinese raw milk prices have become more tightly linked to international powder prices as imports have grown. When global powder is weak, Chinese farmers feel it quickly; when international prices firm, Chinese buyers become more active, but step by step.
So the global “wall of milk” is really a patchwork. Some bricks are growing, some are shrinking, some are fairly static.
A Practical Playbook For The Year Ahead
Let’s bring this back to the farm office and the kitchen table. What do we do with all this?
1. Use The Powder And Fat Lift To Recheck Your Risk Plan
With powder and fat both stronger than they were in the fall, this is a reasonable time to revisit your risk-management approach. You don’t need to swing for the fences.
You might:
Talk with your co-op or buyer about locking in a portion of your spring or early-summer milk if Class IV or powder-linked prices offer margins that work for your cost structure.
In the US, review Dairy Revenue Protection and Dairy Margin Coverage again. University of Wisconsin dairy economists have repeatedly noted that these tools can provide a useful safety net when both milk and feed are volatile.
Mark Stephenson, director of dairy policy analysis at the University of Wisconsin, has been emphasizing for years that producers shouldn’t wait for the “perfect” price. “If you can lock in a margin that covers your costs and leaves something reasonable, that’s worth serious consideration,” he’s noted in recent extension presentations. That kind of thinking – focusing on acceptable margins instead of a perfect price – often serves farms better over the whole cycle.
2. Make Sure Components Match Today’s Pay Signals
Over the past decade, a lot of energy has gone into improving butterfat levels through fresh cow management, solid transition programs, and refined rations. Many herds have made impressive gains. But with butter pricing where it is right now, it’s worth asking whether every extra pound of butterfat is paying back the way it did a few years ago.
Take a recent milk cheque and ask yourself:
How is each unit of butterfat valued compared to protein?
Has your processor or co-op changed those relative values in light of current market conditions?
On some Wisconsin and Northeast farms, nutritionists are still prioritizing high-fat content but also placing greater emphasis on protein yield and overall cow health, especially as processors lean into higher-protein products like yogurt, cottage cheese, and protein-enriched milks. The point isn’t to back off on fat, but to ensure your component strategy aligns with today’s economics, not yesterday’s.
3. Lean Into Dairy-Beef Only Where The Market Can Absorb It
Beef-on-dairy has grown very quickly. Farm Bureau Market Intel analyses and USDA data show that many herds are using beef semen strategically on lower-genetic dairy cows. That’s generating a lot more crossbred calves than we had ten years ago.
When everything is lined up – sire choice, health programs, and marketing channels – those calves often bring a clear premium over straight Holstein bull calves. Feedlot operators in the US and Canada have said publicly that well-bred dairy-beef crosses can perform better on growth and carcass traits than traditional Holstein steers. University research from institutions like Penn State and Kansas State supports that.
But not every region is set up the same way. On parts of the Northeast and some more remote Western areas, producers still report challenges finding reliable buyers willing to pay a premium for crosses. So it’s important to match your breeding strategies to your local marketing reality.
Before expanding beef-on-dairy, it’s worth a very practical conversation with your calf buyer or local feedlot:
What specific genetics are they looking for?
What health standards and documentation do they require?
What kind of premium can they realistically sustain over time?
Those answers will tell you whether dairy-beef is a valuable outlet or a potential headache in your area.
4. Think In Margins, Not Just In Class Prices
We all look at the headline Class III and IV prices. They’re a quick barometer. But as recent years have reminded us, margin per hundredweight is what keeps the lights on.
Recent USDA projections suggest that while milk prices may stay under pressure, feed costs are off the extreme highs we saw not long ago. Corn and soybean meal are still volatile, but not at the peaks that squeezed margins so brutally in 2022. That changes the math.
Period
Class III Milk Price ($/cwt)
Corn Price ($/bu)
SBM Price ($/ton)
Estimated Margin ($/cwt)
Q3 2024
$17.50
$3.45
$315
+$2.10
Q4 2024
$17.20
$3.65
$325
+$1.85
Jan 2026 (Est. post-GDT)
$18.25
$3.55
$318
+$2.45
2-Year Historical Average
$18.80
$3.20
$290
+$3.10
Peak (2022)
$23.50
$6.85
$480
-$0.50
This season, it’s useful to:
Update your cost of production with your adviser, including interest, labor, and repairs.
Talk with your lender about how much downside you can realistically handle before major changes would be needed.
Decide ahead of time what actions you’ll take if milk or feed prices cross certain thresholds, rather than waiting until stress is high.
Farms that understand their true margin – not just the milk price – tend to make steadier decisions when things get choppy.
5. Keep An Eye On Global Signals, Without Letting Them Drive Every Move
Global benchmarks like GDT, EU wholesale prices, and futures on EEX and SGX have become regular reference points for processors. That doesn’t mean you need to live in the data, but it does help to have a basic feel for where those numbers are.
A practical approach might be:
Glancing at a simple GDT summary after each event to see if WMP, SMP, butter, and AMF are rising or falling.
Following one or two reliable sources for EU butter and SMP price trends.
Asking your co-op rep once or twice a year how closely your local prices track these global indicators.
That way, when you hear “GDT was up six percent this week,” you already have some sense of what that might mean for export-linked values and, eventually, for your own milk cheque.
The Bottom Line
Stepping back, this early-January rally has given the industry something it’s been lacking: a little bit of positive momentum. Powder and fat have come off their lows. Futures markets in Europe and Asia have acknowledged that shift. And we’ve seen that when supply tightens, and buyers stay active, prices can still move.
At the same time, we’re not out of the woods. Milk production across key exporting regions is still ample. Cheese and whey output remains heavy. Butter stocks in Europe are comfortable. Chinese demand looks better than it did, but it’s still cautious rather than aggressive. And on many farms – from smaller family dairies in the Northeast to large dry lot systems in the Southwest – the milk cheque still feels tight for the amount of capital and effort involved.
While the rest of 2026 is far from written, early indications suggest this may be a year where small, smart moves matter: a slightly better hedge, a ration that protects components without overspending, a breeding plan that matches local markets, a stronger relationship with your buyer. None of these alone will transform a balance sheet, but together they can make a meaningful difference.
What’s particularly noteworthy is that we’re starting this year from a place of pressure, but not panic. The supply side will adjust over time. Some regions will scale back faster than others. As that plays out, the operations that keep a clear eye on margins, stay flexible, and base decisions on solid information will be the ones best positioned to benefit when the market finally swings more decisively back in favour of producers.
And that’s why conversations like this – whether at the kitchen table, in the barn office, or over coffee at a conference – still matter. We’re all trying to read the same signals and make the best decisions we can for our herds, our families, and our businesses in a very interconnected dairy world.
Key Takeaways :
The slide is broken—for now. GDT kicked off 2026 with a 6.3% rally, whole milk powder up 7.2%, skim up 5.4%. First increase in five months.
Supply, not demand, is driving it. US powder output fell ~10% year-over-year in October as milk shifts to cheese and protein streams. New Zealand also trimmed GDT offerings.
Fat markets aren’t following. EU butter stocks near 94,000 tonnes, US butter in the mid-$1.30s—don’t expect butterfat to carry your cheque like it did in 2022.
Futures confirm the turn. EEX and SGX dairy curves have firmed, giving processors more confidence to lock in export deals that eventually flow back to farm prices.
Act now, not later. Use this window to tighten margin plans, recheck your component strategy against current pay signals, and push dairy-beef only where local buyers genuinely support it.
Complete references and supporting documentation are available upon request by contacting the editorial team at editor@thebullvine.com.
Learn More
The Four Numbers Every Dairy Producer Needs to Calculate This Week – Deliver immediate financial clarity with a hard-hitting framework to calculate your true breakeven and liquidity runway. This operational audit arms you with the exact numbers needed to decide between aggressive expansion or a strategic pivot.
Squeezed Out? A 12-Month Decision Guide for 300-1,000 Cow Dairies – Exposes the structural shifts crushing the traditional “middle” of the industry and delivers a strategic roadmap for the next 12 months. Master the heifer inventory crisis and align your herd with the coming protein-heavy pay programs.
Dairy Tech ROI: The Questions That Separate $50K Wins from $200K Mistakes – Reveals the unvarnished math behind automation to stop you from making a $200,000 mistake. This breakdown of “robot sweet spots” and connectivity requirements identifies the high-ROI tools that actually drive efficiency in today’s labor-tight environment.
The Sunday Read Dairy Professionals Don’t Skip.
Every week, thousands of producers, breeders, and industry insiders open Bullvine Weekly for genetics insights, market shifts, and profit strategies they won’t find anywhere else. One email. Five minutes. Smarter decisions all week.
More cheese, no price crash: did 44 million pounds of U.S. cheese really ‘disappear’ in November—and what does that do to your milk check?
Executive Summary: U.S. cheese production jumped 5.9% to 1.22 billion pounds in November 2025, and milk output rose 4.7%—yet Cold Storage stocks didn’t hit new records, and Class III held firmer than the old “more cheese = lower prices” rule would predict. The reason is structural: roughly 40 to 50 million pounds of cheese flowed through channels that bypass traditional inventory tracking—contract mozzarella for food service, record exports exceeding 1 billion pounds in 2024 (led by Mexico at 38% of volume), and fast-turn value-added products. CME cheddar and Class III now reflect a shrinking share of total U.S. cheese, which means producers relying on those signals alone are flying partially blind. Midwest cheddar-heavy farms still need Cold Storage and CME, but Western and export-linked operations should track USDEC export data and global demand just as closely. The playbook: diversify your indicators, hedge 30–50% of your milk when prices fit your cost structure, ask your buyer how much of their output is cheddar vs. mozzarella vs. exports, and invest in components and transition-cow management—the variables you actually control. The cheese didn’t vanish; the market just evolved faster than many mental models could keep up.
Forty‑four million pounds. That’s not a rounding error; that’s a pretty good sign that the way U.S. dairy moves is changing on us, and you can feel it in your milk check long before you sit down with the latest USDA report.
Looking at the hard numbers first keeps everyone honest. In its Dairy Products report released January 6, 2026, USDA’s National Agricultural Statistics Service says total natural cheese production, excluding cottage cheese, was 1.22 billion pounds in November 2025, 5.9% higher than in November 2024. At the same time, USDA Cold Storage data describe cheese inventories as substantial but still below the “record cheese in cold storage” mark set back in October 2023, when stocks hit about 1.46 billion pounds and made headlines as an all‑time high.
So the data suggests production moved up sharply, but stocks didn’t jump to fresh record levels alongside it. When you put that 5.9% year‑over‑year increase on a 1.22‑billion‑pound base next to “high but not record” storage language, you end up with a rough, implied gap on the order of tens of millions of pounds—somewhere in that 40‑ to 50‑million‑pound neighborhood of cheese that got made in November but didn’t show up as a big extra bulge in the Cold Storage number most of us still watch.
Production climbed 6% year-over-year while Cold Storage stayed below 2023 records—the 40-to-50-million-pound monthly gap is real, and it’s structural
And you know, this isn’t happening in a year when milk is just muddling along. USDA’s Milk Production report released December 22, 2025, puts November output in the 24 major dairy states at 18.1 billion pounds, up 4.7% from November 2024, with total U.S. production at 18.8 billion pounds, up 4.5% on the year. Recent media reports have all noted how quickly both cow numbers and production per cow rose in 2025 compared with 2023–24. On top of that, work on milk composition and efficiency, along with extension discussions from programs like Wisconsin, Cornell, and Penn State, continues to show gradual gains in butterfat performance and protein levels, tied to better fresh-cow management, tighter transition‑period protocols, and greater focus on cow comfort and ration design.
So the milk is there, and the components are there. But the old, simple pattern—more milk, more cheese, more cheese piling up in storage—just doesn’t jump out of the latest reports the way it used to, and that’s where the story really starts to matter for your milk check.
Looking at This Trend Without the Noise
What farmers are finding, when they actually sit down with a coffee and walk through the USDA reports, is that the November numbers make a lot more sense once you separate “how much we made” from “where it went.”
On the production side, the story is pretty straightforward. USDA’s November 2025 Dairy Products summary lays it out plainly: total cheese output (excluding cottage cheese) was 1.22 billion pounds, 5.9% above November 2024 and 3.4% below October 2025. Earlier Dairy Products releases in 2025, and coverage in Brownfield and Cheese Market News describe “more cheese and butter, less whey and powder” and solid year‑over‑year growth across much of the cheese complex, which lines up with what a lot of you have seen in plant‑level reports. Reports has also noted that as butterfat and protein levels in the milk pool have trended higher, more cheese can be produced from every 100 pounds of milk.
On the inventory side, USDA Cold Storage reports and late‑2023 commentary from Brownfield make it clear that October 2023 remains the record high for cheese in storage, at around 1.46 billion pounds. Later updates through 2024 and into 2025 talk about “heavy” or “ample” stocks but don’t flag new records, which fits with what we see in the market: plenty of cheese around, but not a repeat of that 2023 peak.
When you put those two pieces together, the math keeps pointing in the same direction. Production is up sharply. Inventories aren’t pushing into new record territory. The difference—again, roughly that 40‑ to 50‑million‑pound range in a month like November, when you ballpark it—is being absorbed somewhere other than long‑term storage. The real question is where it’s going, and that’s where things start to get interesting.
Channel
Estimated Monthly Volume (Million lbs)
% of Gap
Why It Bypasses Cold Storage
Export Programs
15–20
35–40%
Moves plant → port consolidator → container; not surveyed in NASS commercial stocks
Contract Mozzarella (Food Service)
12–18
25–35%
Tight delivery schedules for pizza chains; lean inventories, frequent shipments
Fast-Turn Value-Added Products
5–8
10–15%
Shredded blends, cheese ingredients, protein-fortified products sold B2B with short lead times
Direct Retail & Private Label
3–5
6–10%
Moves quickly through retailer DCs; minimal time in commercial cold storage
Looking at this trend, what’s interesting is that the cheese telling the story isn’t cheddar; it’s mozzarella.
USDA’s breakdowns for Italian‑type and American‑type cheeses in the Dairy Products reports show multiple recent months when Italian‑type cheese—including mozzarella—grew faster than total cheese, while American‑type cheese, including cheddar, lagged behind or even slipped below year‑ago levels. September 2024 total cheese production was about 1.16 billion pounds, up slightly from 2023, with Italian‑type cheese up 1.5% year‑over‑year at 487 million pounds and American‑type cheese down 3.7% from a year earlier. That same USDA snapshot showed butter production at 159 million pounds, up 11.3% on the year; nonfat dry milk production up 14.3%; and skim milk powder down 21.4%, which suggests plants are actively shifting cream and skim between product streams as markets move.
From a technical angle, researchers at places like the University of Wisconsin’s Center for Dairy Research and other dairy science groups have explained that low‑moisture mozzarella for pizza is designed for fast movement rather than long aging. The functional shelf life and performance window for pizza mozz are shorter than those for many cheddar styles, and large food‑service buyers—national pizza chains, regional restaurant distributors—try to run lean inventories with regular, frequent deliveries rather than big piles of cheese sitting in a freezer somewhere.
Month
Italian-Type Cheese
American-Type Cheese
Sep 2024
+1.5%
-3.7%
Oct 2024
+3.2%
-1.2%
Nov 2024
+2.8%
+0.5%
Sep 2025
+4.1%
+1.0%
Oct 2025
+5.3%
+2.1%
Nov 2025
+6.2%
+3.4%
On the ground, what I’ve noticed—and it lines up with what you hear in risk‑management workshops and plant visits—is that mozzarella lines are often heavily tied to contracts. Plants usually have a pretty tight handle on what their core accounts need week to week and month to month, whether that’s a national chain program, a regional distributor, or a long‑term export deal, and they run those vats accordingly. They’re not churning out mozzarella “on spec” the way some cheddar used to move; they’re filling orders that are already on the books.
Cheddar’s role is shifting at the same time. USDA data shows American‑type cheese growing more slowly than “all cheese” in several months, and in some cases running below year‑earlier levels while Italian‑type keeps climbing. Analysis of cheese markets and export opportunities has also highlighted about $ 4 billion in new cheese plants slated to come online through 2027, with new facilities already taking milk in Kansas and Texas and more expansions underway in the Upper Midwest, along the East Coast, and in the West. Company announcements and industry reporting emphasize mozzarella, Hispanic cheeses, and other value‑added styles as key outputs from many of these investments, often alongside powders and concentrated fat and protein ingredients.
This development suggests a structural disconnect that a lot of you are feeling in your milk checks. The CME spot market and the Class III milk price formula still lean heavily on cheddar blocks and barrels plus dry whey, as research on U.S. dairy futures, price transmission, and market integration has documented. When a growing share of U.S. cheese production is mozzarella and other styles that are locked into contracts or export channels, and a smaller share is “loose” cheddar available to show up in CME trading and Cold Storage, total cheese production and CME‑visible cheddar supply just aren’t tied together like they used to be.
To put some numbers behind that feeling, think about a farm shipping around 80,000 pounds of milk in a month. Each one‑dollar move in Class III is roughly 800 dollars up or down in gross revenue for that month, because 80,000 pounds is 800 hundredweights. On a 500‑cow freestall in the Midwest, that’s a noticeable swing. On a 3,000‑cow dry lot system in the Southwest, you multiply that impact several times over. So the way cheese moves—cheddar versus mozzarella, domestic versus export—flows straight back to your bottom line.
Herd Size / Type
Monthly Milk Volume (lbs)
Impact of $1.00 Class III Move (Monthly)
Impact of $1.50 Range Over 12 Months (Annual)
% of Typical Net Margin
80-cow grazing (Northeast)
80,000
$800
$14,400
~12–15%
500-cow freestall (Midwest)
500,000
$5,000
$90,000
~10–13%
1,200-cow (Western/Midwest)
1,200,000
$12,000
$216,000
~9–12%
3,000-cow dry lot (West)
3,000,000
$30,000
$540,000
~8–11%
And if you zoom out a bit, a $1.50 per hundredweight range over a year on those same 80,000 pounds a month adds up to about $14,400 of gross revenue, swinging one way or the other. That’s real money when you start lining it up against feed bills, interest payments, or the cost of upgrading fresh cow facilities.
Exports: The Other Big Piece of the Puzzle
What farmers are finding, when they look beyond domestic reports, is that exports are quietly soaking up a lot of that “extra” cheese.
Media reports in early 2025 that U.S. cheese exports through November 2024 reached 1.028 billion pounds, the first time they’d crossed the billion‑pound mark. Mexico alone accounted for 392 million pounds of that total, roughly 38% of all U.S. cheese exports, and increased its cheese imports from the U.S. by 32% compared with the same period in 2023. The Bullvine’s own coverage of that milestone drew on USDEC and USDA Foreign Agricultural Service data and noted that South Korea, Japan, Central America, and several Middle Eastern buyers also increased their cheese purchases from the U.S., helping push exports over that threshold.
Year
Mexico
All Other Destinations
Total
2022
280 million lbs
420 million lbs
700 million lbs
2023
298 million lbs
482 million lbs
780 million lbs
2024
392 million lbs
636 million lbs
1,028 million lbs
A 2024 export review in Progressive Dairy and Dairy Processing reported that total U.S. dairy export value reached about 8.2 billion dollars in 2024, with cheese exports totaling roughly 508,808 metric tons—about 1.12 billion pounds—an improvement of around 17% over 2023. That same coverage highlighted Mexico and Canada together taking more than 40% of U.S. dairy export value, with Mexico importing about 2.47 billion dollars’ worth of U.S. dairy products and Canada around 1.14 billion. USDEC’s own summaries reinforce that cheese has become a leading export item by volume and value for the U.S. in recent years, especially into North American and Asian markets.
In plain language, those buyers are acting like a second home market for U.S. cheese. That’s the kind of demand that can absorb a lot of “extra” product before it ever shows up as a big stock build in Cold Storage.
So if you step back from the individual line items, it’s pretty clear where a big chunk of that “missing” 40‑ to 50‑million‑pound gap in a month like November can go. It doesn’t stick around in domestic Cold Storage because much of it simply leaves the country through export channels.
Physically, export cheese tends to follow a different path than domestic retail cheese. It often moves from the plant to a specialized consolidator or a warehouse near a port, then into refrigerated containers bound for overseas destinations, spending relatively little time in the broad commercial cold‑storage facilities that NASS surveys for its stock reports. The same pattern holds for concentrated butterfat products—anhydrous milk fat and high‑fat blends—produced for export or industrial customers, which are usually sold under contract and don’t always show up neatly in the familiar “butter in cold storage” figures.
Fast‑Moving Channels and Value‑Added Products
What’s interesting here is that exports aren’t the only thing changing how cheese and components move. Domestic distribution has been evolving right alongside the global story.
Industry reporting has highlighted the growing share of cheese and dairy ingredients moving through food‑service and business‑to‑business channels, supported by regular, frequent shipments and lean inventory strategies. Major restaurant chains and broadline distributors often prefer multiple smaller deliveries rather than big, infrequent loads, especially when they’re dealing with shredded mozzarella, custom blends, or ingredient cheeses tailored to specific food manufacturers.
At the same time, research reviews and applied nutrition work are documenting steady growth in value‑added fluid and high‑protein dairy products—filtered milks, protein‑fortified beverages, and specialty dairy drinks—that build on higher butterfat and protein levels in the milk supply. Several recent and planned processing projects in states like Kansas and Texas, highlighted by regional agribusiness outlets, are designed to produce both cheese and higher‑value components, capturing more value from butterfat and protein rather than simply pushing volume into commodity powder and bulk butter.
All of this lines up with what many of us have seen on the ground over the last decade: that old “production minus stocks” rule of thumb used to capture a big chunk of what was happening in the market. Today, it describes a smaller slice. The milk still gets turned into product, and the product still gets sold, but more of it is moving through channels—export programs, contract‑driven mozzarella lines, food‑service and ingredient streams, and value‑added beverages—that don’t create large, slow‑moving inventories in the specific warehouses USDA tracks as “cheese in cold storage.”
How This Feels in Different Milksheds
The national data might be the same on paper, but it sure doesn’t feel that way on every farm. Regional context matters a lot, and it’s worth talking about that openly.
In Wisconsin operations and across much of the Upper Midwest, a large share of milk still goes into plants with substantial American‑type cheese capacity, even though many of those plants have added Italian‑type and specialty cheese lines in recent years. Many Midwest producers will tell you they still watch Cold Storage reports and CME cheddar prices almost like a weather forecast, because historically those numbers have been tightly linked to local basis and premiums—a relationship regional market updates and extension economists in that area often highlight. As more capacity in the Midwest shifts toward mozzarella and specialty cheeses, though, that one‑to‑one connection gets noisier. The indicators still matter; they just don’t explain everything the way they used to.
In California and the broader West, a lot of major plants built or expanded over the last decade were designed from day one with exports and value‑added production in mind. These facilities commonly produce mozzarella, Hispanic cheeses, milk powders, and concentrated fat and protein ingredients for both domestic and international customers, a pattern that shows up repeatedly in Western market updates and company announcements. Western producers shipping to those plants are often just as focused on export program health, port congestion, and global demand as they are on Cold Storage or the latest Dairy Products report, because their milk checks are heavily influenced by what’s happening outside U.S. borders.
In the Northeast, quite a few smaller and grazing‑based family farms still ship to fluid bottlers, regional brands, or specialty cheesemakers. Their daily reality revolves around local retail demand, co‑op policies, and regional brand strength, which is a story you see in provincial and state‑level dairy board and market reports. Even so, their blend prices and over‑order premiums still flow out of a federal order system tied back to national Class I, III, and IV values, which respond to the same production, inventory, and export trends we’ve been walking through.
For Canadian readers operating under supply management, it’s worth noting that while quota systems and Canadian Dairy Commission programs do buffer day‑to‑day volatility at the farm gate, the same global trends in cheese exports, product mix, and component emphasis still influence processor investment decisions and trade pressures that show up in national board discussions and long‑term policy debates.
So, as many of us have seen, one size doesn’t fit all. The November numbers are the same across the country—and, in many ways, across the border too—but the way they land in your mailbox depends heavily on who’s buying your milk, what they’re making with it, and how much of their business leans on cheddar, mozzarella, Class III versus Class IV, exports, or value‑added products.
Region / Milkshed
Dominant Cheese Types
Primary Price Signals to Watch
Export Exposure
Hedging Priority
What Keeps You Up at Night
Midwest (WI, MN, IA)
Cheddar, some mozzarella
CME blocks/barrels, Cold Storage, Class III futures
Moderate (15–25% of volume)
CME Class III options, DRP
Cold Storage builds, cheddar oversupply
West (CA, ID, NM, TX)
Mozzarella, Hispanic cheeses, powders
USDEC exports, global powder prices, Class III & IV
High (30–45% of volume)
Class III/IV combo, export contract hedges
Mexico demand swings, port delays, trade disputes
Northeast (PA, NY, VT)
Regional brands, specialty, fluid
Class I differentials, regional blend price, over-order premiums
Low (5–15% of volume)
Basis contracts, limited futures
Fluid demand decline, retail brand strength, local co-op health
What Farmers Are Finding Helps in This Environment
So, sitting here over coffee, the real question is: what do you actually do with all this?
One thing I’ve noticed, and it matches what land‑grant risk‑management programs are teaching, is that relying on a single gauge doesn’t work very well anymore. Watching only cheese production, or only Cold Storage, or only the Class III board is a good way to be surprised. The producers who seem most comfortable navigating this changing landscape tend to watch a mix of signals—USDA Milk Production and Dairy Products reports, Cold Storage updates, USDEC and USDA export statistics, plus the information they get from their buyers and co‑ops.
That’s why much of the extension work focuses on partial hedging strategies rather than “all in” or “all out” approaches. The idea isn’t to guess the exact top or bottom; it’s to lock in a portion of your milk—often something in that 30% to 50% range—for a few months ahead when futures or Dairy Revenue Protection coverage levels line up with your cost structure, and leave the rest open to the market. That way, a nasty price surprise doesn’t hit 100% of your volume, but you’re not completely locked into a price that might look too low if markets rally later. For a 500‑cow herd shipping around 80,000 pounds a month, covering even a third of that volume means several hundred hundredweights are insulated if Class III falls apart for a few weeks, which can be the difference between a bad month and a really rough one.
Of course, none of those tools are free. Hedging carries costs and margin requirements, and stepping up your risk‑management program means investing more time in tracking markets and working with advisors. Improving fresh cow management and the transition period requires investing time, training, and often capital in facilities, rations, or monitoring, as on-farm case studies and extension bulletins regularly point out. But when you line those costs up next to the revenue swings that come with a volatile Class III and the kind of structural shifts we’re seeing in cheese markets, a lot of farms are deciding it’s worth putting at least some of those tools to work.
On top of price tools, butterfat performance and protein yield are still right at the center of most advisory conversations, and for good reason. Research and on‑farm work from programs such as Penn State, Cornell, and Wisconsin consistently show that better transition‑period management, less stress on fresh cows, and careful ration balancing are among the most reliable levers you’ve got for improving components and overall milk value. You can’t control where CME cheddar settles next week. You absolutely can influence how your cows come through calving, what their transition period looks like, and how efficiently they convert feed into fat and protein.
It’s also worth talking directly with your buyer or co‑op. Producers who ask questions such as, “Roughly what share of your cheese output is cheddar versus mozzarella or other styles?” and “How much of your volume is tied to export programs or food‑service contracts?” usually walk away with a much clearer picture of what drives their basis and premiums. You’re not asking them to hand over their business plan; you’re trying to understand whether your milk check is more exposed to CME cheddar swings, changing export demand, or shifts in domestic retail and food‑service patterns.
If you want to get even more practical, here are a few simple starting points producers are using:
If you’re a Midwest farm heavily tied to cheddar: Keep a close eye on CME block and barrel prices, USDA Cold Storage cheese stocks, and Class III futures, and ask your co‑op how much of their output is still commodity cheddar versus mozzarella or specialty styles. That helps you judge how quickly a cheddar price break could hit your basis compared with a neighbor shipping to a plant with a more mixed product portfolio.
If you’re shipping to a Western plant focused on mozzarella and exports: Add USDEC export summaries, global cheese price comparisons, and port or logistics updates to your watch list, and ask how much of your milk ends up in export programs under long‑term contracts. That gives you a better handle on how trade disputes, freight issues, or foreign demand swings might show up in your mailbox, even when domestic stocks look comfortable.
If you’re a smaller Northeast or grazing‑based operation: Track Class I, III, and IV prices plus regional blend prices, and talk with your buyer or co‑op about how their product mix—fluid, regional brands, or specialty cheese—feeds back into your over‑order premiums. That helps you see whether your check is more sensitive to local fluid demand or to the same cheese and export forces driving the national conversation.
For co‑ops and processors, the same November data push in a similar direction. Channel mix is now a strategic decision, not just an operational detail. Knowing how much of your product mix goes into retail grocery, food‑service, industrial ingredients, and export programs helps you decide which data streams you absolutely need on your dashboard—Cold Storage, Dairy Market News, Global Dairy Trade auctions, USDEC export statistics, scanner data for retail cheese and butter, and even global futures where appropriate. It’s why more co‑ops and plants are building simple internal dashboards that put USDA production and inventory reports next to export volumes and global price indices, something extension economists and industry consultants have been encouraging in board‑room and planning sessions.
The Bottom Line
What’s encouraging in all this is that the system isn’t broken; it’s evolving.
We’ve got more milk and more cheese than we did a year ago, according to the USDA’s Milk Production and Dairy Products reports for November 2025. Butterfat performance and protein levels have improved on many farms after years of work on genetics, fresh-cow management, and the transition period, a trend reflected in both research and industry commentary. U.S. cheese exports have pushed past the billion‑pound mark for the first time, with Mexico and a growing list of other countries playing major roles, as documented by USDEC‑linked trade summaries. New plants worth billions of dollars are coming online, many of them designed to make mozzarella and other value‑added cheeses along with powders and concentrated components for both domestic and global markets.
So when someone says, “Forty‑four million pounds of cheese disappeared in November,” you know the cheese didn’t vanish. It moved through channels that our old mental shortcuts don’t always capture very well—contract‑driven mozzarella destined for pizza ovens, record‑level export programs, fast‑turn food‑service and ingredient sales, and value‑added dairy products that don’t pile up in the Cold Storage bins we all grew up watching.
If you keep that bigger picture in mind while you’re checking USDA reports, talking with your buyer, and planning your own risk and herd management, you’ll be in a better spot to decide what to lock in, what to leave open, and where to invest your time and dollars—whether that’s tightening transition‑cow protocols, tweaking rations to support stronger butterfat performance, or asking a few more pointed questions at your next co‑op meeting about where your milk really goes once it leaves the yard.
Key Takeaways:
Production up, stocks flat: November 2025 cheese hit 1.22 billion pounds (+5.9% YoY), yet Cold Storage didn’t set new records—roughly 40-50 million pounds moved through exports, contract mozzarella, and fast-turn channels that bypass traditional tracking.
Exports are a second-home market: U.S. cheese exports topped 1 billion pounds in 2024 for the first time; Mexico took 38% of the volume, absorbing supply before it piles up in storage.
CME cheddar no longer tells the whole story: Class III reflects a shrinking slice of total U.S. cheese—if Cold Storage and block prices are your only signals, you’re flying partially blind.
Regional exposure varies: Midwest cheddar-heavy farms still need CME and Cold Storage; Western and export-linked operations should weight USDEC data and global demand equally.
Control what you can: butterfat performance, transition-cow protocols, partial hedging (30-50%), and knowing where your milk actually goes matter more than guessing where cheddar will settle next week.
Every week, thousands of producers, breeders, and industry insiders open Bullvine Weekly for genetics insights, market shifts, and profit strategies they won’t find anywhere else. One email. Five minutes. Smarter decisions all week.
You’re bleeding $80/cow every month, and the industry just added 211,000 more cows to make it worse. 5 moves to make before spring.
Executive Summary: Every month you wait, you’re losing $80 per cow. Class III has crashed from $20 to $15.86 since spring—and the industry just added 211,000 cows to make sure it stays there. California’s rapid H5N1 recovery, surging EU production, and strong New Zealand output have created a global oversupply that isn’t easing anytime soon. Need replacements? Quality springers now cost $4,000-plus amid the tightest heifer pipeline in 20 years. Add $4.40 corn to the equation, and margins are getting crushed from every angle. Here’s what’s actually driving the squeeze—and five specific moves to protect your operation before spring.
The U.S. dairy industry just added 211,000 cows in 12 months—the largest herd since 1993, according to USDA NASS—at the exact moment Class III prices dropped from $20 to $15.86 per hundredweight. Meanwhile, anyone trying to expand is staring at $4,000 springers and the tightest heifer supply in two decades. That collision of forces is going to define 2026 economics for operations of every size, whether you’re milking 80 cows in Vermont or 8,000 in the Central Valley.
Let me walk through what the numbers actually show and what the producers who are navigating this successfully are doing differently.
The Production Surge Nobody Can Ignore
USDA NASS confirmed that November 2025 milk production in the 24 major states hit 18.1 billion pounds—a 4.7% jump from the prior year. Nationwide, we’re looking at 18.8 billion pounds, up 4.5% year-over-year. For context, that’s the kind of production growth that typically takes two to three years to accumulate. We got it in twelve months.
And California’s recovery has accelerated the math. After H5N1 hammered the state through late 2024 and into 2025—federal livestock program records indicate roughly 75% of commercial herds experienced infections at some point—production is now running more than 10% above year-ago levels. November 2024 represented a 20-year production low for California. The turnaround has happened faster than most analysts expected, and all that milk is flowing back into national markets.
Class III milk prices have collapsed from $20.50 to $15.30 per hundredweight in just 12 months—a 25% decline that’s costing dairy producers $80-90 per cow monthly across all operation sizes
Here’s what this means for your check: at $15.86 Class III versus $18.50 three months ago, that’s roughly $80-90 per cow per month in lost revenue for a typical Holstein operation. On a 200-cow herd, you’re looking at $16,000-18,000 less coming in between now and spring—assuming prices don’t drop further.
Herd Size
Monthly Loss ($80/cow)
Spring Loss (3 months)
Annual Impact
50 cows
$4,000
$12,000
$48,000
100 cows
$8,000
$24,000
$96,000
200 cows
$16,000
$48,000
$192,000
500 cows
$40,000
$120,000
$480,000
1,000 cows
$80,000
$240,000
$960,000
2,500 cows
$200,000
$600,000
$2,400,000
The Heifer Bottleneck Is Real
This is the constraint that will shape expansion decisions over the next three years, so let’s dig into it.
USDA data shows approximately 26.7 heifers expected to calve per 100 milk cows—the lowest ratio in at least two decades. Total dairy heifers expected to calve in 2025? Just under 2.5 million head, the lowest since USDA began tracking this metric.
The heifer-to-cow ratio has declined to a 20-year low of 26.7 per 100 cows, creating a replacement crisis that explains why quality springers now cost $4,000+ and why expansion-minded producers need to source animals immediately
The economics driving this aren’t mysterious. Ag Proud market reports show beef-cross calves bringing $1,100-1,400 at many auctions, sometimes higher for well-bred Angus or Limousin crosses. Straight dairy heifers? Often $300-500 unless they come from high-genomic programs with strong marketing. When beef-on-dairy creates that much value differential, producers make rational decisions about their breeding programs.
I was talking with a Wisconsin producer last month who’s running about 70% beef semen across his herd. His logic is straightforward: the premium on those crossbred calves more than offsets the cost of purchasing replacements when he needs them. For his operation and cash flow, that math works.
Metric
Beef-Cross Calf
Raise Own Dairy Heifer
Buy Springer
Calf Sale Value
$1,250
$400
N/A
Heifer Raising Cost (to calving)
$0 (sold)
$2,200
$0
Purchase Price (springer)
N/A
N/A
$4,000
Net Economics per Head
+$1,250
-$1,800
-$4,000
Value Differential
Baseline
-$3,050 vs beef
-$5,250 vs beef
A Northeast producer I know takes the opposite approach—she’s kept her replacement program intact because she doesn’t want to be buying springers at $4,000 when she needs them. Her calculation: the heifer she raises for $2,200 all-in is worth $1,800 more than the one she’d have to buy.
Both strategies can pencil out. The question is which matches your operation’s cash flow, facilities, and expansion timeline.
The practical implication: quality springer replacements now command $3,500-4,000 or more in many markets. If you’re planning any expansion over the next 18-24 months, heifer sourcing needs to be part of your planning conversation this month. The animals aren’t available in the numbers we’ve historically seen.
Global Oversupply Compounds the Problem
Four major dairy-producing regions are simultaneously flooding global markets with increased production—California up 10%, EU up 6%, U.S. overall up 4.7%, and New Zealand up 2.9%—creating synchronized oversupply that’s crushing milk prices worldwide
It’s not just U.S. production running hot. The latest AHDB market review shows EU milk deliveries jumped around 6% in September after the bloc worked through its bluetongue challenges. DairyNZ and LIC statistics show that New Zealand’s 2024/25 season finished with total milk solids production up 2.9% to 1.94 billion kilograms.
The Global Dairy Trade auctions have posted nine consecutive declines now, reflecting strong global supply meeting softer demand from key importing regions. If you’re shipping to a plant with export exposure—and that includes many operations in Wisconsin, Idaho, and the Southwest—those GDT results eventually flow back into your mailbox price.
For Canadian producers watching from across the border, the U.S. production surge creates its own dynamics. American oversupply tends to intensify pressure on USMCA access negotiations and affects cross-border pricing signals, even within the quota system.
California’s role amplifies these dynamics domestically. The state produces roughly 18% of U.S. milk, but here’s what really matters for price discovery: California Dairies Inc. alone churns over 480 million pounds of butter annually (about 23% of U.S. production), and the state manufactures the largest share of nonfat dry milk powder in the country. When California production swings, commodity pricing moves for everyone.
The Butter Paradox
Here’s something that looks like good news until you understand what’s actually happening.
USDEC data shows butter exports surged in 2025. January alone was up 41% year-over-year, and through the first nine months, total butterfat exports soared 149%.
Sounds great, right? Here’s the catch: U.S. prices had dropped enough to compete in markets we typically can’t reach. Brownfield Ag News reports CME spot butter trading around $1.375 to $1.40 per pound as we moved into January—a long way from the $3.00-plus prices we saw during the supply squeeze.
We were essentially selling butter globally because domestic prices made us competitive, not because we’d developed new market access. That’s fundamentally different from export growth driven by structural demand improvement. When global prices strengthen, that business disappears.
Cheese Exports: The Genuine Bright Spot
If you’re looking for actual strength in the dairy complex, cheese exports tell a legitimately positive story.
USDEC confirmed that August 2025 reached 54,110 metric tons—the highest monthly volume in the history of U.S. cheese exports. That’s 28% above year-ago levels, and the growth has come from multiple markets rather than depending on any single buyer.
Mexico remains our foundation, accounting for roughly a third of total U.S. cheese exports, according to USDEC trade data. But South Korea, Japan, and Australia all posted strong growth in the first half of 2025. The fundamentals here—growing global demand, improved U.S. product quality, established market relationships—look durable.
One constraint worth watching: USTR data shows USMCA quota utilization is still around 42%, suggesting meaningful upside if Canadian market access improves. That’s a trade policy question beyond any individual producer’s control, but it represents real unrealized potential.
The GLP-1 Demand Question
GLP-1 drugs have some dairy economists predicting significant demand shifts. The actual data tells a more nuanced story, concerning in specific categories but not the catastrophe some suggest.
Kaiser Family Foundation polling indicates about 12% of American adults have used a GLP-1 medication at some point, with roughly 6% currently taking one. That’s real market penetration.
Cornell University and Numerator recently published detailed grocery purchasing data on this population. Households with GLP-1 users reduced cheese purchases by 7.2% and butter by 5.8%. They cut sweet bakery items and cookies by 6-11% across categories.
Here’s how I’d frame this practically: it matters, but it’s not an existential threat—yet. The protein density of dairy actually positions products like Greek yogurt and cottage cheese favorably for consumers who are eating less but prioritizing nutrient-dense foods.
Where I’d watch more carefully is high-fat categories. If GLP-1 adoption reaches the 15-24% levels Morgan Stanley projects for the early 2030s, premium ice cream and butter-heavy applications could face meaningful headwinds. Worth factoring into long-term product mix thinking, but not a reason to panic about 2026.
Current Price Reality
Let’s be direct about where we are.
According to USDA’s official Class and Component Price announcements, December Class III came in at $15.86/cwt—January futures point to the low-to-mid $15 range. That’s the math when production expands as quickly as it has.
The Class III to Class IV spread has been particularly notable. December showed Class III at $15.86 versus Class IV at $13.64—a $2.22 gap favoring cheese markets over butter and powder. If you’re a Class IV shipper, you’ve felt that spread directly in your check. Geography and market assignment matter more than usual right now.
On the feed side, corn has been trading around $4.40 per bushel according to Trading Economics futures data. USDA projects an average farm price around $4.00 for the 2025/26 marketing year, which would provide some relief—but that’s not guaranteed.
What to Do Before Q2
Based on the data and the producer conversations I’ve been having, here are five moves worth considering before spring:
Run your break-even calculation this week. Know exactly what Class III price puts you underwater. If you haven’t updated this math since prices were $20, you’re operating blind. Have contingency triggers ready—what do you cut first at $15? At $14?
Audit your heifer pipeline now. Calculate your replacement availability for the 2027-2028 calving. If you’re below 28 heifers per 100 cows, start sourcing conversations immediately. Set a price ceiling before you need animals urgently—desperation buying at $4,500 in twelve months is a lot more expensive than planned purchasing at $3,800 today.
Evaluate your beef-on-dairy math quarterly. The premium calculation shifts with calf prices and heifer availability. A 70% beef semen strategy that worked at $1,400 crossbred calves might need adjustment if those prices soften. Don’t set-and-forget your breeding program.
Review feed cost protection. With corn at $4.40 and possible relief toward $4.00, evaluate whether forward contracts make sense for Q1-Q2 before spring planting volatility. Locking in $4.25 corn looks smart if prices spike; it looks expensive if they fall to $3.80. Know your risk tolerance.
Examine your processor relationship. If you’re Class IV-dependent and watching checks come in $2.20 below Class III equivalents, it’s worth exploring whether component shipping options or processor alternatives exist in your region. Not every operation has flexibility here, but some do and aren’t using it.
The Bottom Line
The operations that navigate the next 12-18 months successfully won’t be the ones waiting for prices to recover on their own. They’ll be the ones who used this window to lock in replacement animals before the shortage intensifies, controlled feed costs where possible, and knew their break-even to the penny.
Dairy has always been cyclical. Strong production, recovering global supply, and moderating prices—we’ve been through this pattern before. What’s different this time is the heifer constraint underneath it all. The industry can’t simply expand out of tight margins when replacement animals don’t exist.
That constraint will eventually support prices. But “eventually” might be 2027 or 2028. The question is whether your operation’s financial position lets you wait that long—and whether you’re taking the steps now that position you to expand when the cycle turns.
The fundamentals of dairy demand remain constructive. Protein consumption is growing. Convenience continues driving category growth. Despite years of plant-based competition, real dairy holds its market share.
Those realities matter. But so does the math of $15.86 Class III with $4.40 corn and $4,000 springers. The producers who acknowledge both—the long-term demand strength and the short-term margin pressure—are the ones making decisions right now that they won’t regret in 2027.
Key Takeaways
You’re bleeding $80/cow monthly — Class III crashed to $15.86; that’s $16,000 vanishing from a 200-cow herd before spring
211,000 cows added in 12 months — Largest U.S. herd since 1993; prices won’t recover until supply corrects
Springers hit $4,000+ — Tightest heifer pipeline in 20 years; replacement economics have flipped
Global milk keeps flooding in — California +10%, EU +6%, New Zealand +3%; no relief coming in 2026
5 moves to make now — Know your break-even, source heifers before desperation, reassess beef-on-dairy, lock feed, review your processor
Complete references and supporting documentation are available upon request by contacting the editorial team at editor@thebullvine.com.
Learn More
Beef-on-Dairy’s $6,215 Secret: Why 72% of Herds Are Playing It Wrong – Master the precise breeding ratiostop-tier herds use to thrive and secure an immediate cash flow advantage. This breakdown arms you with the math to capture $700 premiums per calf without sacrificing your future replacement pipeline.
The 90-Day Dairy Pivot: Converting Beef Windfalls into Next Year’s Survival – Convert fleeting beef premiums into long-term resilience before the 2026 market shift hits your balance sheet. This analysis delivers the component-focused economic strategy and processor relationship audit required for survival in a $17 milk environment.
Every week, thousands of producers, breeders, and industry insiders open Bullvine Weekly for genetics insights, market shifts, and profit strategies they won’t find anywhere else. One email. Five minutes. Smarter decisions all week.
Military helicopters dropping vaccines. Farmers in riot gear standoffs with police. A disease that jumped 300 kilometers in weeks despite aggressive containment. France’s lumpy skin disease crisis is writing the playbook for foreign animal disease preparedness in real time—and the rest of us get to learn before it’s our turn.
EXECUTIVE SUMMARY: Six months after France confirmed its first case, lumpy skin disease has exploded to 113 outbreaks and 3,300 cattle culled—with military helicopters deploying vaccines and riot police confronting farmers who’ve blockaded roads rather than surrender herds to mandatory slaughter. This disease has never reached North America, but France’s crisis is exposing failures that matter everywhere: veterinary surge capacity that couldn’t scale, cold chain logistics that collapsed under pressure, and a culling-first policy that shattered the farmer trust essential for disease surveillance. When reporting sick cattle means losing everything, producers stop reporting—and containment becomes impossible. EFSA research shows that vaccination outperforms culling even when vaccines aren’t perfect, yet France chose aggressive depopulation anyway. The economic precedent is sobering: India lost $2.44 billion to endemic LSD in two years; Canada spent 22 years rebuilding export markets after BSE. For North American producers—especially those with genetics programs dependent on trade—the window to establish biosecurity protocols, quarantine procedures, and veterinary relationships is now, while there’s still time to prepare rather than improvise.
You know, there are moments when agricultural policy stops being abstract and becomes deeply, painfully human. December 12, 2025, was one of those moments.
Police in riot gear faced off against hundreds of farmers who had barricaded a small farm in France’s Ariège region with chopped trees, hay bales, and sheer desperation. Tear gas filled the evening air. The standoff wasn’t about wages or trade policy—it was about cattle marked for slaughter in the name of disease control.
What made the scene even more gut-wrenching? The farm belonged to two brothers. One had agreed to the government’s culling order. The other refused. That division within a single family tells you something about the impossible choices this disease is forcing on people across the French countryside.
And for those of us watching from North America, Australia, or anywhere else still free of lumpy skin disease, France’s unfolding crisis offers something genuinely valuable: time to learn before the same pressures arrive at our gates.
QUICK REFERENCE: Know the Threat Landscape
Lumpy Skin Disease
H5N1 (Avian Influenza)
Bluetongue (BTV-3)
Primary Vector
Biting insects (stable flies, midges, mosquitoes)
Direct contact, aerosol, contaminated equipment
Culicoides biting midges
Species Affected
Cattle, buffalo
Dairy cattle, poultry, wild birds
Cattle, sheep, goats, deer
Current Spread
France: 113 outbreaks (Dec 2025)
US: ~1,790 herds/18 states (Dec 2025)
Netherlands, Belgium, France, UK, Germany
Incubation Period
4-14 days (up to 28 days)
2-5 days (in cattle)
5-20 days
Milk Production Impact
Significant (18%+ drop in affected animals)
Severe: ~73% drop at peak; ~2,000 lbs cumulative loss/cow over 60 days
How a Single Case Became 113 Outbreaks in Six Months
Here’s where the timeline gets troubling.
LSD first appeared in Western Europe when Italy confirmed a case in Sardinia on June 21, 2025—the European Commission’s Animal Disease Information System flagged it almost immediately. Six days later, France confirmed its first positive case on a dairy operation near Chambéry in the Alpine department of Savoie, as Dairy Global reported at the time.
French authorities moved fast, I’ll give them that. Vaccination campaigns launched by mid-July. Protection zones extending 50 kilometers went up around affected areas. The response looked impressive on paper:
Over 220,000 cattle vaccinated within two months, according to Reuters
Mandatory movement restrictions across affected regions
Military logistics deployed by December, including transport aircraft and army medical personnel
And yet by mid-December, Reuters was reporting 113 confirmed outbreaks with approximately 3,300 cattle culled. The disease had spread from two eastern departments to span regions across the country—including southwestern areas near the Spanish border, more than 300 kilometers from where it started.
The disease jumped containment lines that should have held. What happened? The answer isn’t any single failure. It’s a cascade of interconnected problems that overwhelmed even a well-resourced system.
CLINICAL SIGNS: What LSD Looks Like in Your Herd
Early Warning Signs (First 1-2 Days):
High fever exceeding 40.5°C (105°F), sometimes reaching 41°C (106°F)
Characteristic Signs (Days 7-14 Post-Infection, can extend to 21 days):
Firm, raised skin nodules 2-5 cm in diameter
Nodules appear on the head, neck, limbs, udder, genitalia, and perineum
Nodules involve skin, subcutaneous tissue, and sometimes underlying muscle
Nasal discharge becomes thicker (mucopurulent)
Excessive salivation
Limb swelling and brisket edema
In Calves:
More severe clinical presentation than adults
Higher mortality risk, especially in calves under 3 months
Generalized weakness and diarrhea
Report any suspected cases immediately to your state/provincial veterinarian
Sources: WOAH, Merck Veterinary Manual, Animal Health Australia
The Infrastructure Gap Nobody Talks About
One of the most important lessons coming out of France—and this applies to all of us—involves the difference between having resources on paper and actually deploying them under pressure.
France has world-class veterinary infrastructure. The ANSES laboratory network ranks among Europe’s best. The animal health surveillance system is sophisticated and well-funded. What France lacked, and what most countries lack, is surge capacity.
Vaccine supply became the first bottleneck. France had to access the European stockpile after the first case appeared rather than drawing on pre-positioned reserves. That created delays—days in some areas, weeks in others.
The veterinary workforce was the second constraint. If you’re already struggling to get your herd vet out for a routine visit, imagine what happens when your whole region needs emergency vaccinations. Dairy Global reported in 2023 that of Germany’s roughly 22,000 practicing veterinarians, only about 3,500 still work with agricultural livestock. France faces similar ratios. When mass vaccination required hundreds of additional personnel, the civilian system simply couldn’t scale.
Cold chain logistics emerged as the third challenge. Distributing temperature-sensitive live attenuated vaccines to remote rural areas proved harder than planned. By December, Reuters confirmed the French government had brought in military transport aircraft specifically because civilian logistics couldn’t keep pace.
What’s interesting here is that none of these constraints were invisible beforehand. Agricultural ministries across Europe have documented veterinary workforce shortages for years. But there’s often a significant gap between recognizing a structural problem and having a solution ready when a crisis hits.
The practical takeaway for those of us elsewhere? Even countries with excellent veterinary services face significant delays when novel diseases appear. Operations with established biosecurity protocols and regular veterinary relationships will respond faster than those depending entirely on government systems.
Unlike many viral diseases, LSD spreads mainly through biting insects that carry virus particles on their mouthparts—not through the air or direct animal contact.
Mosquitoes (Aedes aegypti, Culex species) — Can retain virus 6-10 days
Biting midges (Culicoides species) — Field evidence of involvement
Why This Matters for Biosecurity:
Vector control (fly management, standing water elimination) directly reduces transmission risk
Disease can spread without animal-to-animal contact
Infected insects can travel significant distances, especially with the wind
Peak transmission occurs during warm, wet conditions when vector populations surge
Minor Transmission Routes:
Direct contact with infected animals (considered inefficient)
Contaminated equipment or fomites (limited evidence)
Semen from infected bulls (documented but uncommon)
Sources: WOAH, PMC research (Paslaru et al. 2022), EFSA
What This Means for Your Genetics Program
For operations with significant genetics investments—AI programs, embryo transfer work, show herds, or A2A2 breeding programs—LSD introduces complications that go well beyond direct animal health.
Here’s the reality: The Canadian Food Inspection Agency has confirmed that importation of live cattle or water buffalo from LSD-infected countries is prohibited outright. Semen and embryos collected more than 60 days prior to an outbreak may be eligible, but only following case-by-case evaluation. That’s not “business as usual”—that’s bureaucratic uncertainty at exactly the wrong moment.
The international standards are even more restrictive. WOAH’s Terrestrial Code requires donor animals to have been resident for six months in an LSD-free country or zone before embryo collection can begin. For semen, PCR testing on blood samples is mandatory at commencement, conclusion, and at least every 28 days during collection.
What does this mean practically? If LSD ever reaches North America, operations with high-value genetics face immediate complications: AI studs would need to implement enhanced testing protocols, export markets would close pending disease-free certification, and movement restrictions could strand valuable animals in the wrong locations. Premium genetics programs—particularly those reliant on international trade—face heightened exposure to these disruptions.
Australia’s response to Italy’s outbreak offers a preview. Within days, the Australian Department of Agriculture removed Italy from its LSD-free country list and suspended imports of bovine fluids and tissues, as Dairy Global reported. That’s how fast market access disappears.
What the Balkans Actually Did (It’s Not What You’ve Heard)
French officials have pointed to southeastern Europe’s successful LSD eradication from 2015-2018 as justification for aggressive culling. But looking closer at what Greece, Bulgaria, and Serbia actually did reveals a more nuanced story—and honestly, it’s one that should inform how we think about disease response.
When LSD spread across the Balkans beginning in 2015, affected nations achieved eradication within about three years. That success is often attributed primarily to stamping-out policies. The evidence, though, tells a different story.
Mass vaccination was the primary tool, not culling.
According to the WOAH Regional Representation for Europe, Bulgaria became the first country in the region to achieve 100% cattle vaccination coverage—by July 15, 2016. By 2017-2018, regional vaccination coverage exceeded 70% across all affected countries, with EFSA reporting over 2.5 million animals vaccinated annually to maintain that level of protection.
And here’s the key finding from the European Food Safety Authority’s 2016 analysis: “Vaccination has a greater impact in reducing LSDV spread than any culling policy, even when low vaccination effectiveness is considered.”
That’s significant. The modeling showed vaccination mattered more than culling even when the vaccines didn’t work perfectly. Greece—often cited as the culling success story—actually implemented vaccination as its primary strategy, while selectively using targeted depopulation.
Now, this doesn’t mean France’s current approach is wrong. Every outbreak involves different circumstances, trade considerations, and policy factors that aren’t always visible from the outside. But the Balkan experience does demonstrate that vaccination-centered strategies work against LSD when implemented at scale and sustained over time.
When Farmer Trust Breaks Down, Surveillance Dies
This might be the most important lesson from France, and it doesn’t show up in epidemiological models. It’s about psychology as much as biology.
By December 2025, the relationship between French farmers and authorities had deteriorated badly:
Farmers in southwestern France organized highway blockades with over 60 tractors
Some producers physically prevented vaccination teams from accessing properties
Reports emerged of farmers declining to report suspected cases
By mid-afternoon on December 19, Le Monde reported the Interior Ministry counted 93 protest actions nationwide involving nearly 4,000 people and 900 tractors
The economic pressure driving this isn’t hard to understand. French agricultural unions have documented that many farmers were already facing severe financial strain before LSD appeared. When total herd depopulation becomes the standard response to a positive test, farmers face an impossible choice: report disease and lose everything, or stay silent and hope.
It’s worth recalling what the FAO advised during the Balkan response back in 2017, as quoted by Dairy Global: “Stamping out—the proactive culling of all animals on an infected farm—should be used as a last resort because stamping out can have a drastic impact on farmers’ livelihoods, particularly those of smallholders.”
What makes this dynamic so dangerous for disease control is that effective surveillance depends entirely on voluntary reporting. The moment farmers believe that calling a veterinarian will lead to the loss of their entire operation, the information flow stops. Cases go unreported. Disease spreads invisibly. And containment becomes exponentially harder.
Here’s the trade-off France is learning—painfully: Vaccination protects herds but may delay disease-free certification. Aggressive culling accelerates certification but destroys farmer trust and surveillance cooperation. And the second trade-off may be worse.
The Endemic Scenario: What’s Really at Stake
In France’s substantial dairy sector, an important question is being discussed in industry circles: What happens if eradication fails?
Countries where LSD has become endemic offer sobering guidance.
India’s experience since 2019 illustrates the potential scale. A March 2025 study in Frontiers in Veterinary Science used stochastic modeling to estimate economic losses from LSD at approximately $2.44 billion over 2022-2023, with Rajasthan alone experiencing annual losses of around $314 million.
Thailand’s ongoing management since 2021 shows the persistent costs of endemic disease. Research published in Frontiers in Veterinary Science this past January found per-farm financial impacts ranging from $349 on farms that avoided outbreaks—covering vaccination and prevention costs—to $727 on farms that experienced active infections, including treatment and production losses. And those costs continue indefinitely.
For France specifically, endemic status would likely mean:
Loss of disease-free certification affecting cattle export markets
Restrictions on the genetics trade, including semen and embryo shipments
Ongoing vaccination expenses across the national herd
Competitive disadvantage relative to disease-free neighbors
Now, some argue that endemic management is economically preferable to aggressive eradication—that the costs of culling and farmer resistance outweigh the costs of living with the disease. There’s a case there for countries where LSD is already widespread. But for North American producers? We still have a disease-free status. And when BSE hit Canada in 2003, it took nine years to regain access to beef exports to South Korea and Peru, and a full 22 years before Australia reopened to Canadian beef in July 2025, according to CFIA. That certification represents real value that’s easy to take for granted until it’s gone.
Dairy Cattle Disease 2025: LSD in Context
France’s LSD crisis isn’t occurring in isolation—it’s part of a broader pattern of emerging disease pressures reshaping risk calculations for livestock producers worldwide. Understanding this context helps explain why France’s response capacity was already stretched thin when LSD arrived.
H5N1 in US dairy cattle emerged in March 2024, and by December 2025, CIDRAP reported cases in approximately 1,790 herds across 18 states. What’s striking is the production impact—peer-reviewed research in Frontiers in Veterinary Science found that affected cows experienced approximately a 73% decline in milk production at peak infection, with cumulative losses averaging around 2,000 pounds per cow over 60 days.
Bluetongue BTV-3 re-emerged in the Netherlands in September 2023 and spread to Belgium, France, the UK, and Germany. Infected cattle experience roughly 2 pounds of lost production per cow per day for 9 to 10 weeks.
Epizootic Hemorrhagic Disease affected over 4,500 French farms by summer 2024—creating overlapping response demands before LSD even appeared.
But here’s what makes LSD different: Unlike H5N1 (which poses human health concerns driving rapid government response) or bluetongue (which European producers have managed through multiple outbreaks), LSD is genuinely novel to Western Europe. There’s no institutional memory, no existing vaccination infrastructure, no producer experience recognizing early signs. France is writing the playbook in real time.
Disease
Milk Drop %
Duration
Loss per Cow
Human Risk
Current Spread
Lumpy Skin Disease
18%
Variable
Significant
None
113 farms (FR)
H5N1 Avian Flu
73% ⚠️
60 days
~2,000 lbs ⚠️
Yes
1,790 herds (US)
Bluetongue BTV-3
8-10%
9-10 weeks
~140-200 lbs
None
Multiple EU
What Prepared Producers Are Doing Right Now
Against this backdrop, forward-thinking operations are taking practical steps—not out of panic, but out of recognition that preparation before a crisis beats improvisation during one.
Biosecurity fundamentals that actually matter:
Written quarantine protocols. New animals are isolated for a minimum of 21 days before joining the main herd, with dedicated equipment and documented testing requirements. Having this written and posted matters when you’re making decisions at 3 a.m. during a crisis. You know how it goes—everyone assumes someone else wrote it down.
Controlled access management. Single farm entrance, where feasible; visitor logs; foot baths at barn entries; and defined biosecure zones. A producer in Wisconsin’s dairy corridor mentioned that making biosecurity part of the morning routine—the same crew member checks gates and foot baths before first milking every day—made consistency almost automatic.
Vector control. Given LSD’s insect-borne transmission, fly management is particularly important. Eliminating standing water, maintaining manure management, and using appropriate insecticides during peak vector season all reduce transmission risk.
Established veterinary relationships. Farms with trusted, ongoing relationships with their veterinarians respond more quickly when concerns arise. Your herd vet should know your operation well enough to spot when something seems unusual.
Insurance review. Here’s something worth checking: most standard livestock mortality policies don’t explicitly cover losses from foreign animal diseases like LSD. Specialized policies may include provisions for border closure and disease-related depopulation, but coverage varies significantly. Worth a conversation with your agent before you need to file a claim.
Neighbor communication networks. Informal information sharing between nearby operations often identifies emerging concerns faster than official channels. A quick text from down the road beats a government bulletin by weeks.
Canada’s proximity to the evolving US H5N1 situation makes foreign animal disease preparedness particularly relevant right now. The Canadian Food Inspection Agency offers comprehensive biosecurity planning resources at inspection.canada.ca, including province-specific guidance and self-assessment tools.
One thing worth noting: provincial veterinary contacts and disease reporting protocols differ by region. Ontario requires immediate reporting of serious animal health risks—within 18 hours—through OMAFRA’s Agricultural Information Contact Centre at 1-877-424-1300, while western provinces have different reporting structures and timelines. Having your specific provincial contacts documented before you need them eliminates uncertainty when timing matters.
As of December 2025, CFIA has implemented proactive import measures following Europe’s LSD outbreaks, including restrictions on live cattle, certain dairy products, and germplasm from affected countries. The agency’s stated priority: “Preventing the introduction of LSD into Canada is critical because the disease can spread quickly and significantly impact cattle production and trade.”
What I’ve noticed talking with producers across different provinces: the operations that feel most confident about their preparedness aren’t necessarily the largest or most technologically sophisticated. They’re the ones where someone took time to work through the “what if” scenarios before circumstances made that planning urgent.
The Insight That Ties Everything Together
Looking at France’s crisis—the surveillance challenges, the economic pressure, the farmer frustration, the infrastructure gaps—one pattern emerges that underlies everything else:
The operations that survive aren’t the ones that improvise best. They’re the ones who decided their protocols, triggers, and response plans before the crisis arrived.
France improvised. The government moved from one approach to another as circumstances evolved. Farmers found themselves caught between compliance and survival. Veterinarians ended up in impossible positions. When nobody has pre-committed frameworks, confusion fills the gap. And confusion is lethal to disease control.
The farms that will navigate the next decade successfully won’t necessarily be the most optimized or the most efficient in normal times. They’ll be the ones with biosecurity protocols already documented, veterinary relationships already established, neighbor networks already communicating, and financial reserves already set aside.
That’s not paranoia. That’s pattern recognition from what’s actually happening—right now—in France, Thailand, India, and increasingly across the global dairy sector.
Key Takeaways
On what France teaches:
Surge capacity matters more than baseline infrastructure
Biosecurity protocols are most valuable when they exist before they’re needed
Financial reserves matter enormously in a world of recurring disease pressures
On disease response dynamics:
Vaccination-centered strategies have demonstrated effectiveness against LSD at scale
Farmer trust is essential infrastructure—systems that undermine trust undermine themselves
The gap between “response started” and “disease controlled” can stretch for months
On taking action this week:
Complete a biosecurity assessment using available checklists
Establish written quarantine protocols and post them where they’ll be followed
Decide your operational tripwires while your head is clear
The Bottom Line
France is still fighting. Whether eradication remains achievable or France must adapt to endemic management will become clearer in the coming months.
But for those of us elsewhere, France has already provided the lesson that matters most: the time to prepare is before disease arrives, before trust collapses, before you’re making existential decisions at 3 a.m. with no playbook.
The producers who act on that lesson—who spend a few hours this week on biosecurity, who document their protocols, who build their networks—will be the ones still standing when the next challenge arrives.
And in this era of expanding disease pressures, the next wave is always coming.
For biosecurity planning resources, Canadian producers can access CFIA’s farm assessment tools at inspection.canada.ca. US producers can find guidance through the FARM Program at nationaldairyfarm.com and through state extension services. We’ll continue following France’s LSD situation and its implications for global dairy operations.
The Day LSD Crossed the Channel: Why This Changes Everything for Dairy Producers – Breaks down the 10:1 ROI of proactive vaccination and delivers the strategic leverage needed to outpace outbreaks. Position your operation for the next three years by auditing vector management systems that slash potential six-month recovery timelines.
Genetic Game-Changer: How 115 Genes Could Save Dairy Farmers Millions in TB Losses – Reveals the groundbreaking DNA roadmap for breeding naturally resistant herds. Secure a long-term competitive advantage by implementing precision genomic selection that slashes future testing costs by $120 per heifer and eliminates the need for reactive culling.
The Sunday Read Dairy Professionals Don’t Skip.
Every week, thousands of producers, breeders, and industry insiders open Bullvine Weekly for genetics insights, market shifts, and profit strategies they won’t find anywhere else. One email. Five minutes. Smarter decisions all week.
You know that moment—scrolling to the bottom of your milk statement, already doing the math in your head? Mike Boesch’s DMC said $12.29. His deposit said $8.
Executive Summary: Dairy producers everywhere are doing the math twice lately—and they’re not wrong. There’s a $4/cwt gap between what DMC margins show on paper and what’s actually hitting farm accounts. The causes stack up fast: make allowance increases that cost farmers $337 million in just three months, regional price spreads running nearly $7/cwt, and component formula changes that blindsided many operations. Milk keeps flowing despite the pressure—expansion debt doesn’t pause for soft markets, and the lowest heifer inventory since 1978 makes strategic culling nearly impossible. With USDA projecting $18.75/cwt All-Milk prices for 2026, margin relief likely won’t arrive until late 2027. The producers gaining ground are focusing on what they can control: component-focused genetics, beef-on-dairy programs built on smart sire selection, and risk management tools that most operations still aren’t using.
You know that feeling when the numbers on paper don’t quite match what’s hitting your bank account? Mike Boesch, who runs a 280-cow operation outside Green Bay, Wisconsin, put it well when we talked last month. He pulled up his December milk statement, scrolled straight to the bottom—like we all do—and there it was. His Dairy Margin Coverage paperwork showed a comfortable $12.29/cwt margin. His actual deposit? After cooperative deductions, component adjustments, and those make allowance changes that kicked in last June, he was looking at something closer to $8/cwt.
“I keep two sets of numbers in my head now. The one the government says I’m making, and the one my checkbook says I’m making. They’re not the same number.” — Mike Boesch, Green Bay, Wisconsin (280 cows)
He’s far from alone in this experience. I’ve been talking with producers from California’s Central Valley to Vermont’s Northeast Kingdom over the past few months, and I keep hearing variations of the same observation. There’s a growing disconnect between what the formulas say margins should be and what’s actually landing in farm accounts. Understanding why that gap exists—and what you can do about it—has become one of the more pressing questions heading into 2026.
The Math That Isn’t Adding Up
Year
Corn ($/bu)
Soymeal ($/ton)
All‑Milk ($/cwt)
2023
6.54
430
22.50
2024
5.10
380
21.80
2025
4.00
300
21.35
Here’s what makes this situation so frustrating for many of us. Feed costs dropped meaningfully through 2025. Corn’s been trading in the low $4s per bushel—USDA’s November World Agricultural Supply and Demand Estimates report projected $4.00 for 2025-26—down considerably from that $6.54 peak we saw in 2023. Soybean meal’s been running in the high $200s to low $300s per ton through fall. For most operations, that translates to real savings on the feed side.
But milk revenue softened faster. USDA National Agricultural Statistics Service data shows September’s All-Milk price came in at $21.35/cwt, with Class III at $18.20. That’s below what many of us were hoping for at this point in the year.
What I’ve found talking to producers and running through numbers with nutritionists and farm business consultants: even with clearly lower feed costs, the decline in milk revenue has offset—and in many cases more than offset—those feed savings. The specifics vary by operation. Your ration, your components, and your cooperative’s pricing structure all matter. But the pattern holds across a lot of different farm types.
Mike’s take stuck with me: “I saved money on feed. But I lost more on milk. The feed savings felt like winning a $20 scratch ticket after your truck got totaled.”
Where Your Money Is Actually Going
So what’s creating that $4/cwt gap between calculated margins and received margins? It comes down to several deductions that the DMC formula doesn’t capture.
The Make Allowance Shift
When the Federal Milk Marketing Order updates took effect on June 1, processors received larger deductions for manufacturing costs. American Farm Bureau Federation economist Danny Munch analyzed the impact, and his findings show the higher make allowances reduced farmer checks by roughly $0.85-0.93/cwt across the four main milk classes.
Key Finding: $337 Million Impact
Farm Bureau’s Market Intel analysis found that farmers saw more than $337 million less in combined pool value during the first three months under the new rules—that’s June through August alone.
Scenario
Pool Value ($ billions)
Without new make allowance
6.00
With new make allowance
5.66
Source: American Farm Bureau Federation, September 2025
I talked with a Midwest cooperative field rep who asked to stay anonymous, given how sensitive pricing discussions can be. His perspective added some nuance worth considering: “Nobody wanted to make allowances to go up. But processing costs genuinely increased—energy, labor, transportation. The alternative was plant closures, and that would have helped nobody. It’s a situation where producers and processors both feel squeezed.”
He raises a fair point. The processing sector faced real cost pressures, and there’s a legitimate argument that updated make allowances were overdue. That said, the timing has been difficult for producers already navigating softer milk prices.
What’s worth understanding here is that the DMC formula uses pre-deduction prices. So your calculated margin looks healthy, while your actual check reflects those higher processor allowances.
Regional Pricing Reality
DMC uses national average milk prices, but anyone who’s compared notes with producers in other states knows the spread can be significant.
The Regional Price Gap: Same Month, Different Reality
Region
Approximate Mailbox Price
Variance
Southeast (Georgia)
~$26.00/cwt
+$4.65
Northeast (Vermont)
~$22.80/cwt
+$1.45
Upper Midwest (Wisconsin)
~$21.50/cwt
+$0.15
Pacific (California)
~$20.40/cwt
-$0.95
Southwest (New Mexico)
~$19.20/cwt
-$2.15
Source: USDA Agricultural Marketing Service Federal Order mailbox prices, Fall 2025
The regional story plays out differently depending on where you’re milking cows. Upper Midwest producers deal with cooperative basis adjustments and seasonal hauling challenges. California’s Central Valley operations face water costs that have fundamentally changed their cost structure—some producers there tell me water now rivals feed as their biggest variable expense. Southwest operations running large dry-lot systems have entirely different economics.
The Component Pricing Shuffle
Here’s one that caught a lot of producers off guard: the June 2025 FMMO changes removed 500-pound barrel cheddar from Class III pricing calculations. Now, only 40-pound block cheddar prices determine protein valuations—the USDA Agricultural Marketing Service confirmed this in their final rule.
Sounds technical, I know. But when barrels were trading higher than blocks—which they were in early summer—that switch affected producer checks. The rationale was to reduce price volatility and better reflect actual cheese market conditions, though the timing meant lower payments for many during that transition period.
Stack all of these together, and you get that $4-5/cwt gap between what DMC says you’re earning and what you’re actually receiving.
The Production Paradox
One thing that keeps coming up in conversations: if margins are this tight, why does milk keep flowing?
USDA NASS data shows national production running 1-4% above year-earlier levels in many recent months. July 2025 came in 3.4% higher than July 2024, totaling 19.6 billion pounds nationally.
At the same time, we’re watching a steady structural decline in dairy farm numbers. USDA has documented this trend for years—thousands of farms exiting nationally over the past decade, with several hundred closing each year just in heavily dairy states like Wisconsin.
Expert Insight: Leonard Polzin, Ph.D. Dairy Economist, University of Wisconsin-Madison Extension
“What we’re seeing is expansion commitments made in 2022-2023 when margins looked completely different. That debt doesn’t care about today’s milk prices. Producers have to keep milking to service those loans.”
There’s also the heifer situation. Replacement heifer inventory has dropped to 3.914 million head—the lowest level since 1978, according to USDA cattle inventory reports and confirmed by Dairy Herd Management coverage. Producers who might otherwise strategically cull their way to a smaller herd can’t easily replace the animals they’d be selling.
And then there’s processing. Since 2023, substantial new cheese processing capacity has come online—much of it financed through long-term USDA Rural Development loans requiring consistent milk intake. Those plants need milk regardless of farmgate prices.
For your operation: the supply response to low prices is likely to be slower than historical patterns suggest. If you’re planning around industry-wide production cuts that are expected to boost prices by late 2026, a longer timeline may be more realistic.
Why the Export Safety Valve Is Stuck
I’ve had producers ask when China might start buying again. Honestly? That valve is essentially closed for the foreseeable future.
Between 2018 and 2023, China added roughly 10-11 million metric tons of domestic milk production—equivalent to around 24-25 billion pounds. Rabobank senior dairy analyst Mary Ledman noted that’s almost like adding another Wisconsin to their domestic supply. The result? Self-sufficiency jumped from about 70% to 85% during this period.
China’s Dairy Transformation: The Numbers
Metric
Before (2018)
After (2023)
Change
Self-sufficiency
~70%
~85%
+15 pts
WMP imports
670,000 MT/yr avg
430,000 MT
-36%
Impact on competitors
—
7% of NZ production was displaced
—
Sources: Rabobank/Brownfield Ag News
This wasn’t market fluctuation—it was deliberate government policy. And they’re not walking it back. In July 2025, China’s Dairy Association announced plans to maintain at least 70% self-sufficiency through 2030.
For U.S. producers, this represents a structural shift. Other markets—Southeast Asia, Mexico, and parts of the Middle East—continue to show growth potential. But that traditional “surplus absorption” mechanism that China provided? It’s significantly smaller than it used to be.
What’s Actually Working: Four Strategies From the Field
Enough about challenges. Let’s talk about what’s actually moving the needle on margins.
Getting Paid for Components
Sarah Kasper runs a 340-cow operation in central Minnesota that she transitioned to component-focused management three years ago. Her approach: genomic testing on every replacement heifer, sire selection emphasizing butterfat and protein over milk volume, and ration adjustments optimizing for component production rather than peak pounds.
“We dropped about 1,200 pounds of production per cow. But our component premiums more than made up for it. We’re getting paid for what processors actually want.” — Sarah Kasper, Central Minnesota (340 cows)
University of Minnesota Extension dairy economic analyses document component premiums ranging from $120 to $ 180 per cow annually for operations achieving above-average butterfat and protein levels. With genomic testing running $30-50 per animal, the return on investment can be meaningful—especially compounded over multiple generations.
What processors increasingly want is component value, not volume. April 2025 USDA data showed cheese production up 0.9% year-over-year while butter production fell 1.8%—processors are routing high-component milk toward their highest-margin products.
The Beef-on-Dairy Opportunity
This strategy has seen remarkable adoption. CattleFax data reported by Hoard’s Dairyman shows there were about 2.6 million beef-on-dairy calves born in 2022, up from just 410,000 in 2018. CattleFax projects that it could grow to 4-5 million head by 2026.
The economics are fairly straightforward. Use sexed dairy semen on your top-performing cows to secure replacements, then breed the remaining 60-70% of your herd to beef genetics. A dairy bull calf might bring $200-400. A well-managed beef cross with the right genetics and colostrum management can fetch $900-1,250 through direct feedlot relationships, according to Iowa State University Extension beef-dairy market reports.
Beef-on-Dairy Economics: Per-Calf Comparison
Scenario
Calf Value
Semen Cost
Net Advantage
Dairy bull calf
$250
$8-15
Baseline
Beef cross (average genetics)
$700
$15-25
+$435
Beef cross (premium genetics + direct marketing)
$1,100
$20-35
+$830
Note: Values vary significantly by region, genetics quality, and buyer relationships Sources: Iowa State Extension; Hoard’s Dairyman market reports
But here’s where genetics selection really matters—and where I see a lot of operations leaving money on the table.
Research published in the Journal of Dairy Science in 2025 found the average incidence of difficult calving in beef-on-dairy crosses runs around 15%. But breed selection makes a significant difference: data from the Journal of Breeding and Genetics shows Angus-sired calves had only 7% calving difficulty compared to 13% for Limousin when looking at male calves.
Beef Sire Selection: The Calving Ease vs. Carcass Quality Tradeoff
Here’s the tension every producer needs to understand: beef sires selected for ease of calving and short gestation are often antagonistically correlated with carcass weight and conformation, according to research in Translational Animal Science.
Priority 1 — Protect the Cow:
Calving Ease Direct (CED): Select from the top 25% of beef sires
Birth Weight EPD: Lower is generally safer for dairy dams
Gestation Length: Angus adds ~1 day vs. Holstein; Limousin adds 5 days; Wagyu adds 8 days
Priority 2 — Optimize Calf Value:
Frame Size: Moderate-framed bulls generally produce more feed-efficient animals
Ribeye Area (REA) EPD: Higher values improve carcass muscling
Marbling EPD: Targets quality grade premiums
Yearling Weight EPD: Predicts growth performance
Sources: Journal of Dairy Science (2025); Penn State Extension; Michigan State Extension; Translational Animal Science
A Hoard’s Dairyman survey found that most dairies currently prioritize conception rate, calving ease, and cost when selecting beef sires—but feedlot and carcass performance traits aren’t priorities for most farms yet. Michigan State Extension notes this is a missed opportunity: selecting for terminal traits that improve growth rate and increase muscling should be a priority.
The bottom line from peer-reviewed research: sire selection for beef-on-dairy should firstly emphasize acceptable fertility and birthweight because of their influence on cow performance at the dairy; secondarily, carcass merit for both muscularity and marbling should receive consideration.
Tom and Linda Verschoor, who run 1,200 cows near Sioux Center, Iowa, started their beef-on-dairy program in 2022 with this balanced approach. “We figured out we only need about 35% of our herd for replacements,” Tom explained.
They report that in 2024, they generated roughly $185,000 more revenue from beef-cross calves than they would have from traditional dairy bull calves. Results will vary depending on genetics quality, calf care, and buyer relationships. But the opportunity is real for operations set up to capture it.
Actually Using the Risk Management Tools
This is where I see one of the biggest gaps between what’s available and what producers actually use.
DMC Tier 1 coverage costs $0.15/cwt, with a $9.50/cwt margin protection on the first 5 million pounds. University of Wisconsin-Extension analysis shows that from 2018-2024, DMC triggered payments in 48 of 72 months—about two-thirds of the time. Average net indemnity ran $1.35/cwt during payment months. It’s essentially catastrophic margin insurance at minimal cost.
Scenario
Covered Milk (million lbs/year)
Net Avg Indemnity ($/cwt in pay months)
Approx. Extra Margin per Year ($)
No DMC enrollment
0
0.00
0
DMC Tier 1 at $9.50 margin
5
1.35
45,000
Beyond DMC, Class III futures and options let you establish price floors. If your break-even is $16/cwt and you can lock $17/cwt through futures, you’ve reduced margin uncertainty—even if it means giving up potential upside.
Expert Insight: Marin Bozic, Ph.D. Dairy Economist, University of Minnesota
Bozic often reminds producers at risk-management meetings that relying on prices to improve on their own simply isn’t really a strategy. Most producers are still hoping prices improve rather than locking in prices that work. That’s understandable. But hope alone doesn’t protect margins.
Finding Premium Channels
The spread between commodity milk and premium markets continues widening:
Organic certified:$33-50/cwt depending on region and buyer (USDA National Organic Dairy Report)
Grass-fed certified:$36-50/cwt with current supply shortages (Northeast Organic Dairy Producers Alliance)
Value-added processing: On-farm yogurt or cheese production can generate meaningful additional margin, though capital requirements are real
I’m hearing from processors that organic supply is currently short in the Northeast and Upper Midwest—there’s genuine demand if you can make the transition work.
USDA NOP certification; organic feed sourcing; no prohibited substances
Strong processor demand in the Northeast, Upper Midwest; fewer options in the Southwest
Grass-fed
12-18 months
Third-party certification (AWA, PCO, or equivalent); pasture infrastructure
Works best with existing grazing infrastructure; limited in western dry lot operations
On-farm processing
12-24 months
State licensing; food safety compliance; marketing/distribution capability
Strong local food demand helps; it requires entrepreneurial capacity beyond milk production
Sources: USDA Agricultural Marketing Service; Northeast Organic Dairy Producers Alliance; Penn State Extension
The transition timeline matters. Organic requires three years of certified organic land management before you can sell organic milk—and you’ll need reliable organic feed sourcing, which can be challenging and expensive depending on your region. Grass-fed certification moves faster but requires pasture infrastructure that not every operation has. On-farm processing offers the highest margin potential but demands skills well beyond dairy farming.
Whether these channels make sense depends on your land base, labor situation, existing infrastructure, and appetite for marketing complexity. They’re not right for every operation, but for those with the right setup, the premium differential is substantial.
What the Analysts Are Actually Saying About 2026
Let me share what the forecasts show, because realistic timeline expectations matter.
Producer conversations often reference recovery by “late 2026.” The analyst forecasts suggest a more gradual path.
2026 Price Outlook: Key Forecasts
Source
2026 All-Milk Forecast
Assessment
USDA December WASDE
$18.75/cwt
Down from $20.40 (Nov)
2025 Actual
$21.35/cwt
Baseline comparison
Rabobank
“Prolonged soft pricing through mid-to-late 2026”
StoneX
Production slowdown not until Q2-Q3 2026
Here’s the key difference: analysts are describing prices “bottoming out” in early to mid-2026. That means the decline stabilizes—not that prices bounce back to 2024 levels. Most forecasts suggest meaningful margin recovery is more likely a late-2027 development.
This isn’t cause for panic. Markets are cyclical, and conditions will eventually improve. But it does suggest planning for an extended timeline.
The Conversation Worth Having
For producers with potential successors, this margin environment brings important conversations into focus. University of Illinois Extension notes that less than one in five farm owners has an estate plan in place. The Canadian Bar Association found 88% of farm families lack written succession plans.
Expert Insight: David Kohl, Ph.D. Professor Emeritus, Virginia Tech
Kohl emphasizes that families starting succession talks early navigate transitions more smoothly than those who wait until circumstances force the conversation.
His framework:
Know your actual numbers — true break-even, debt maturity, realistic equity position
Find out what your kids actually want — not what you assume
Lay out options honestly — status quo, restructuring, strategic exit, or succession
You’re not solving everything in one meeting. You’re getting information on the table.
The Bottom Line
“I’m not pretending the math is good right now. But I’ve stopped waiting for someone else to fix it. We enrolled in DMC at the $9.50 level, we’re breeding 60% of our herd to Angus, and we had that kitchen table conversation with our son over Thanksgiving. First real talk about whether he wants this place.”
He paused. “I’d rather know where we stand than keep guessing. At least now we’re making decisions instead of just hoping.” — Mike Boesch
That’s really the choice in front of all of us right now. The margin environment is challenging—that’s just the reality for the foreseeable future. But producers who understand the dynamics, assess their positions honestly, and implement available strategies aren’t just getting through this period; they’re succeeding. Some are building advantages that will serve them well when conditions improve.
The math is difficult. It’s not impossible. The difference comes down to whether you’re making decisions based on information or just waiting to see what happens.
Key Takeaways
The $4/cwt gap is real—and it’s not your math. Make allowances, regional spreads, and formula changes explain why your milk check doesn’t match your margins.
$337 million left producer pockets in 90 days. June’s make allowance increases pulled that from the pool values before summer ended.
Plan for a long haul. USDA projects $18.75/cwt for 2026—a meaningful margin recovery likely won’t show up until late 2027.
Don’t count on production cuts to save prices. Expansion debt keeps cows milking, and the lowest heifer inventory since 1978 limits strategic culling.
The wins are in the details. Component premiums, smart beef sire selection, and actually enrolling in DMC at $9.50—that’s where producers are finding margin.
Complete references and supporting documentation are available upon request by contacting the editorial team at editor@thebullvine.com.
Learn More:
The Beef-on-Dairy Wake-Up Call: What Some Farms Are Still Missing – Provides a tactical roadmap for using genomic testing to identify high-value beef-cross candidates while avoiding the “purity trap,” helping producers turn a potential liability into a six-figure revenue stream.
Every week, thousands of producers, breeders, and industry insiders open Bullvine Weekly for genetics insights, market shifts, and profit strategies they won’t find anywhere else. One email. Five minutes. Smarter decisions all week.
Feed dropped 75¢. Milk dropped $2. That’s not savings—that’s a $200K trap.
EXECUTIVE SUMMARY: Everyone’s celebrating cheap corn—but the math tells a different story. USDA projects 2026 milk at $19.25/cwt while feed costs have dropped only modestly, creating net margin compression of $1.25-1.75/cwt—that’s $156,000 to $218,000 in lost cash flow for a 500-cow dairy. New Zealand’s lowest-cost producers see what’s coming: they paid down $1.7 billion in debt this year rather than expand. Top U.S. operators are responding with feed efficiency gains, component optimization, IOFC-based culling, and beef-on-dairy programs that can protect $1.50+ per cow daily. With Chapter 12 bankruptcies up 55% and ag lenders reporting eight straight quarters of declining repayment rates, the window for strategic positioning is narrowing. The question isn’t whether margins compress in 2026—it’s whether you’ll position your operation before they do.
You know that feeling when everything looks fine on paper, but something in your gut says otherwise?
It’s the kind of conversation happening at kitchen tables across dairy country right now. The milk check looks okay—maybe even decent by recent standards. Feed costs have come down. The cows are milking well.
And yet something feels off.
That instinct isn’t wrong.
The FAO has been tracking global food prices for decades, and its November numbers tell an interesting story. The overall Food Price Index has dropped for three consecutive months, and the dairy sub-index has declined for five straight months.
New Zealand just posted a 17.8% production surge in their early season, according to their Dairy Companies Association data. U.S. milk output keeps climbing, too.
What’s worth understanding—and this is something many of us tend to underestimate—is the timeline between when these global signals show up and when they hit our milk checks.
Generally speaking, we’re looking at about six to eight months.
So the softening that started this fall? It’s likely showing up in Q2 and Q3 2026 checks.
Mark Stephenson, who spent years as Director of Dairy Policy Analysis at the University of Wisconsin-Madison before his recent retirement, studied these price transmission patterns extensively throughout his career. His research documented this lag across multiple market cycles.
The movement in international powder and butter prices isn’t really a question of whether it affects domestic markets—it’s more about when and how much.
USDA’s November World Agricultural Supply and Demand Estimates projects the all-milk price at $19.25 per hundredweight for 2026. That’s a meaningful change from the $22-24 range that many operations built their budgets around during stronger periods.
So what are the producers who’ve navigated these cycles before actually doing about it?
The Feed Cost Conversation That’s Missing Something
Walk into any farm supply store or dairy meeting right now, and you’ll hear some version of the same reassurance: “At least feed costs are down.”
And that’s true.
Corn is trading around $4.37 per bushel on the Chicago Board of Trade as of early December. Soybean meal is running around $310-$315 per ton. The DMC feed cost calculation is in a favorable territory compared to recent years—no question about that.
But here’s what that conversation often leaves out.
When milk prices were $22.75, and feed costs were about $11.00 per hundredweight, producers captured roughly $11.75 in income over feed costs.
Run the same math with 2026 projections—$19.25 milk and lower feed costs—and that margin still compresses to around $9.00.
Feed improved by maybe seventy-five cents. Milk dropped by more than two dollars.
The net effect is still a $1.25 to $1.75 per hundredweight margin compression for most operations.
On a 500-cow dairy producing 125,000 hundredweight annually, that’s $156,000 to $218,000 in reduced cash flow. Real money that has to come from somewhere—whether that’s reduced family living, deferred maintenance, or tighter input decisions.
Michael Dykes, who leads the International Dairy Foods Association as their President and CEO, put it well in a recent industry briefing. Lower feed costs are helpful, no question, but they’re best understood as breathing room to make strategic moves—not as a solution to margin pressure.
I recently spoke with an Upper Midwest nutritionist who put it more directly:
“I’ve got producers telling me they’re holding off on decisions because corn is cheap. That’s exactly backwards. Cheap corn is the opportunity to lock in favorable feed contracts and build some cushion—not permission to wait and see what happens.”
The timing matters here.
Producers who lock in Q1 and Q2 2026 feed contracts now, while basis levels remain favorable, capture that advantage regardless of what happens to spot markets later. Those who wait may find the window has closed.
It’s worth running the numbers with your feed supplier at a minimum.
What’s Actually Happening in Export Markets
The China situation deserves more attention than it typically gets in domestic dairy discussions, even for producers who don’t think of themselves as export-dependent.
Why does this matter to all of us? The economics tell the story.
The current reality is pretty stark.
U.S. dairy products face total tariffs of 84 to 125 percent in China following the trade escalation that peaked in April 2025—China’s Ministry of Finance and Reuters covered this extensively at the time.
New Zealand, by contrast, completed their Free Trade Agreement phase-in on January 1, 2024, and now ships dairy to China at zero percent tariff.
The market share shift has been significant.
While exact percentages shift quarter to quarter, the direction is clear: New Zealand has captured the lion’s share of China’s powder imports while U.S. product faces what amounts to a prohibitive tariff wall.
That displaced volume didn’t disappear—it backed up into domestic markets.
Even producers selling exclusively to domestic processors feel this effect, as Mary Ledman at Rabobank has pointed out in her global dairy market analysis. She’s been tracking these patterns as their Global Dairy Strategist for years now.
When export channels close, that milk has to go somewhere. It adds supply pressure that affects everyone, even if indirectly.
The regional effects aren’t uniform, though.
California and Idaho operations—traditionally more export-oriented through Pacific Rim trade—feel this more acutely than Upper Midwest producers whose milk flows primarily into domestic cheese markets.
I spoke with a Wisconsin cheesemaker recently who said his plant’s order book looks fine through mid-2026, but he’s watching West Coast capacity closely because displaced milk eventually tends to find its way east.
What’s particularly noteworthy is how New Zealand producers are responding to their advantageous position.
Despite favorable prices and strong production conditions, Kiwi farmers repaid NZ$1.7 billion in debt in the six months through March 2025 rather than expanding. ANZ Bank and New Zealand’s rural news outlets have been tracking this closely.
When the world’s lowest-cost producers choose balance sheet repair over growth during historically good times… well, it suggests they’re preparing for extended market softness.
That’s a signal worth paying attention to.
Reading the Financial Signals
Several data points help distinguish what’s happening now from typical cyclical patterns.
Chapter 12 farm bankruptcy filings—the specialized bankruptcy provision for family farmers—hit 216 cases in 2024, up 55 percent from the prior year. The American Farm Bureau Federation has been tracking federal court records on this, and the first half of 2025 saw additional filings running well ahead of 2024’s pace.
Context matters here. Bankruptcy filings alone don’t tell the whole story—they can reflect access to legal resources, regional legal practices, and individual circumstances as much as broad economic conditions.
But the trend is notable.
Geographic patterns show particular stress in California, Iowa, Michigan, Kansas, and Wisconsin—a mix of traditional dairy regions and areas affected by specific challenges, such as avian influenza and water constraints.
Debt service coverage ratios tell a related story.
Farm Progress recently reported on data from the Minnesota FINBIN farm financial database showing that the average producer had a concerning coverage ratio of around 85 percent in 2024—meaning operations were generating only 85 cents for every dollar of debt service obligation.
The remaining gap has to come from equity drawdown, off-farm income, or loan restructuring.
What concerns many lenders is the compounding effect.
Interest costs have roughly doubled over the past three years as rates have reset. An operation that was comfortable at 3.5 percent interest faces a completely different equation at 7.5 percent—as many of us have experienced firsthand.
The Federal Reserve Bank of Chicago’s Q3 2025 agricultural credit survey found 38 percent of banks reporting lower repayment rates—the eighth consecutive quarter of deterioration. More than two-thirds of lenders expect farmland values to flatten or decline in 2026.
None of this predicts any individual operation’s future—every farm has its own circumstances, strengths, and challenges.
But it does suggest the industry overall is experiencing stress levels that reward careful financial planning over optimistic assumptions.
The Expansion Paradox
One of the more counterintuitive aspects of current markets—and something I find genuinely interesting to think through—is why production keeps growing despite weakening price signals.
The biological reality is that dairy expansion decisions made two to three years ago are just now showing up in production numbers.
Heifers conceived in early 2023 are entering milking strings in late 2025. Facilities that broke ground during strong margins in 2023 and 2024 are now completing and being populated.
Once those commitments are made—once the cows are bred, raised, and the facilities built—the production is essentially locked in.
Debt service creates similar momentum.
Operations carrying expansion loans need to maintain production to meet their obligations. Reducing herd size often costs more than continuing to milk at marginal profitability, especially when the alternative is triggering loan covenant violations.
Christopher Wolf, the E.V. Baker Professor of Agricultural Economics at Cornell, has written thoughtfully about this dynamic. The economics of stopping are often worse than the economics of continuing.
That’s not irrational behavior—it’s responding logically to the debt structure and fixed-cost reality that exist in most operations.
Processing capacity investment adds another layer.
More than $11 billion in new U.S. dairy processing capacity is under construction or recently completed—IDFA released a detailed report in October covering 50-plus projects across 19 states.
That processing investment creates a regional demand pull that can support local expansion even when broader markets are oversupplied. A producer within hauling distance of a new plant in Dodge City or along the I-29 corridor faces different economics than one in a region without recent processing investment.
I’ve been hearing about this regional divide increasingly this season.
In Texas and New Mexico, where several major cheese and powder facilities have opened or expanded, local producers report being actively recruited with multi-year contracts.
Meanwhile, some Northeast producers describe tighter relationships with their cooperatives—fewer premium opportunities and more pressure on base pricing.
Same industry, very different regional realities.
What Successful Producers Are Doing Differently
Conversations with producers navigating current conditions successfully reveal consistent patterns. These aren’t revolutionary changes requiring massive capital—they’re an intensified focus on fundamentals.
1. Feed Efficiency Optimization
Top-performing herds are achieving feed efficiency ratios of 1.5 to 1.8 pounds of milk per pound of dry matter intake. The industry average sits around 1.4.
The Impact: Each tenth of a point improvement translates to roughly $0.20 to $0.30 per cow/day in margin enhancement.
The Tactic: Weekly NIR analysis on forages (~$15/sample) allows for immediate ration adjustments, rather than guessing between monthly tests.
I recently spoke with a Wisconsin producer who started as a custom heifer raiser before transitioning to his own milking herd. He described implementing weekly NIR testing on every forage load.
“The payback is maybe ten to one in ration accuracy,” he said. “We were basically guessing before.”
Most producers I’ve talked with see measurable results within 45 to 60 days—though individual results vary based on starting point and forage variability.
2. Component Value Capture
Producers focusing on butterfat performance and protein levels report capturing an additional $0.75 to $1.25 per hundredweight compared to volume-focused approaches.
The Tactic: Using rumen-protected choline during transition periods and summer heat stress (~$0.08/cow/day) to prevent butterfat depression.
The genetic piece is a longer-term play—daughters of high-component sires won’t hit the milking string for two-plus years—but the nutritional interventions can show results within a milk test cycle or two.
Worth having a conversation with your nutritionist about current ration fatty acid profiles and where component optimization opportunities might exist for your herd.
3. Strategic Culling Based on IOFC
Rather than culling primarily based on age, reproduction metrics, or production levels, progressive operations calculate income over feed cost for each cow and move out animals that are consistently below $1.50 per cow daily.
The Shift: “A seven-year-old cow giving 60 pounds might look fine on paper,” one herd manager at a 1,200-cow Minnesota dairy told me. “But when you run her actual IOFC with her feed intake and health costs, she’s sometimes underwater. We’re making decisions on math now, not sentiment.”
For operations without individual cow feed intake data (which is most of us), pen-level IOFC calculations still identify which groups are carrying the herd versus dragging it down.
Most herd management software can generate these reports with minimal setup.
4. Beef-on-Dairy Integration
Producers systematically breeding bottom-tier genetics to beef sires report equivalent revenue of $2.50+ per hundredweight from crossbred calf sales.
The Math: A straight Holstein bull calf might bring $150. A beef-cross brings $1,000 or more based on current USDA feeder cattle reports.
The Genetics Play:Use genomic testing or breeding values to identify the bottom 20-30% of your herd’s genetic merit. Breed those animals to proven beef sires with good calving ease scores, and establish buyer relationships before calves hit the ground.
This is where your genomic data becomes a direct revenue driver—not just a breeding tool.
Operations that treat beef-on-dairy as an afterthought leave money on the table compared to those who plan the program strategically.
The Emerging Structure: Two Viable Paths
Looking at where the industry appears headed over the next three to five years, a structural pattern is emerging that’s worth understanding—even if it raises uncomfortable questions.
The data increasingly suggests two economically viable models:
Large-scale efficiency operations—generally 1,500 cows and above—achieving production costs in the $14 to $17 per hundredweight range through scale economics, technology adoption, and processing relationships.
USDA’s Economic Research Service cost-of-production data confirms that this scale advantage has widened over the past decade. Many of these operations use dry-lot systems or hybrid facilities to maximize throughput efficiency.
Premium-differentiated operations—typically 50 to 500 cows—capturing $4 to $8 per hundredweight premiums through organic certification, grass-fed positioning, or direct-to-consumer channels.
These require proximity to metro markets and significant transition investment, but create a margin cushion independent of commodity prices.
Operations in the middle face the most challenging economics under the current market structure.
This isn’t a judgment about the value of family-scale dairy farming or the communities these farms anchor. It’s an observation about where the current market structure creates clearer paths forward.
Regional variation matters significantly.
A 300-cow dairy in Vermont with Boston market access faces different options than a similar-sized operation in central Wisconsin without nearby premium channels.
A Framework for Evaluation
For producers working through these questions—and most of us are—several considerations help clarify the path forward.
For operations considering expansion:
Is there processing capacity within 200-300 miles actively seeking suppliers?
Is replacement heifer availability realistic? National inventory sits at roughly 3.9 million dairy replacement heifers 500 pounds and over—the lowest absolute level since 1978, according to USDA’s January 2025 Cattle report. The heifer-to-cow ratio of 41.9% is the lowest since 1991.
Can production costs realistically reach sub-$17 per hundredweight at expanded scale?
What do debt service requirements look like at current interest rates, not 2021 rates?
For operations considering premium positioning:
Is there a metro market within a reasonable distance with demonstrated premium demand?
What’s the realistic timeline? Organic certification alone typically takes three years under USDA National Organic Program rules.
Does the land base and climate support pasture-based systems?
Is there family interest in direct marketing relationships?
For operations evaluating the current position:
What’s the actual debt service coverage ratio at projected 2026 milk prices?
When do loans mature, and at what interest rate reset?
Has the processor offered multi-year supply contracts?
What’s the true breakeven with full cost accounting—including family labor and reasonable return on equity?
These aren’t comfortable questions.
But they’re better asked now than answered by circumstances later.
The Timing Reality
One thread runs through conversations with producers, lenders, and analysts who’ve navigated previous downturns: timing matters more than most people acknowledge.
Producers who assess their position and make strategic decisions during 2025 and early 2026—while milk prices are still serviceable, while cull cow prices remain historically strong—retain meaningfully more options than those who wait.
December through February: Run your real numbers. Calculate the actual DSCR at $19.25 milk. Have the honest conversation with your lender—most good lenders appreciate proactive communication.
This is also the window for DMC enrollment decisions. If you haven’t reviewed your coverage levels against projected margins, now’s the time. LGM-Dairy is worth a conversation with your insurance agent, too, especially for operations wanting more flexible coverage options.
February through April: Make feed decisions. Lock contracts if the math works. Implement efficiency improvements that deliver results by summer.
Spring 2026: Evaluate first-quarter performance against projections. Adjust culling strategy based on actual margins. Make the bigger strategic calls with real data rather than hope.
The Bottom Line
The dairy industry has navigated challenging transitions before, and it will again.
The producers who came through previous cycles strongest were generally those who saw conditions clearly, made decisions based on their specific circumstances, and acted while they still had choices.
That window is open now.
The question is what each of us does with it.
The Bullvine provides market analysis and industry perspective for dairy producers worldwide. This article reflects conditions and data available as of early December 2025. Individuals should consult their own financial advisors, lenders, and Extension specialists when making significant business decisions. Every farm’s situation is unique, and the right path forward depends on factors only you and your advisors can fully evaluate.
KEY TAKEAWAYS
The Trap: Feed dropped 75¢. Milk dropped $2. That’s not savings—that’s $200K in vanishing cash flow for a 500-cow dairy.
The Global Signal: NZ farmers paid down $1.7 billion in debt instead of expanding. The world’s lowest-cost producers expect extended softness.
The Warning Signs: Chapter 12 bankruptcies up 55%. Ag loan repayments have been declining for 8 quarters straight. Financial stress is accelerating.
What Top Producers Are Doing: Capturing $1.50+/cow/day through feed efficiency, component optimization, IOFC-based culling, and beef-on-dairy integration.
The Window Is Now: Cull values are strong. Milk checks are still serviceable. Lenders are still flexible. Make strategic decisions while you still have options.
Complete references and supporting documentation are available upon request by contacting the editorial team at editor@thebullvine.com.
The $228,000 Exit Strategy Reshaping Dairy – Uncovers the “Section 1232” tax provision behind the recent surge in Chapter 12 filings, explaining how strategic bankruptcy is helping retiring producers preserve equity rather than losing it in traditional sales.
Robot Revolution: Why Smart Dairy Farmers Are Winning – Analyzes the 2025 ROI of automated milking systems beyond simple labor savings, providing a blueprint for the “efficiency-at-scale” model that allows family operations to compete with larger consolidators.
The Sunday Read Dairy Professionals Don’t Skip.
Every week, thousands of producers, breeders, and industry insiders open Bullvine Weekly for genetics insights, market shifts, and profit strategies they won’t find anywhere else. One email. Five minutes. Smarter decisions all week.
What the End of Government Relief Really Meant—and How Smart Farms Are Turning Uncertainty Into Opportunity
EXECUTIVE SUMMARY: From Shutdown to Showdown: How Dairy’s 2026 Wake-Up Call Is Redefining Survival” details how the end of the government shutdown set the stage for a year of unprecedented challenge—and opportunity—in the dairy sector. Instead of relief marking the finish line, the reopening exposed new processor contract demands, profit headwinds from make allowance adjustments, and a high-stakes shift to protein-centric pricing, all verified through university extension findings and current market data. The article demonstrates how farms that capitalize on narrow timing windows, lean into peer networks, and embrace collaborative learning are gaining margin and flexibility amidst change. Practical checklists, region-specific examples, and expert-backed insights make it useful at the barn and the boardroom table alike. By weaving in both the pressures and pathways open to all sizes of operation, the story embodies The Bullvine’s commitment to presenting real decisions, not just headlines. In the end, it shows that survival—and success—are less about official relief and more about being prepared to adapt, connect, and strategize for what 2026 brings next.
You know, as much as we all soaked in the relief of those USDA payments and the delayed Milk Production reports this past fall, the lesson of the moment is clearer than ever: what matters most heading into 2026 is how quickly and thoughtfully we respond to the challenges—not just what help the government sends. What I’ve noticed—confirmed by producers in Wisconsin, Florida, and even out west—is that “relief” doesn’t make the difference for your bottom line. It’s how you move with the changing facts, the shifting contracts, and the farm realities in front of you.
Pull up a stool. Here’s how that’s actually playing out in barns, co-op meetings, and balance sheets, with credible trail markers for farms of all sizes.
Speed Kills (Complacency): Margins in the Data Gaps
What farmers are finding is that, in this climate, the winners are the ones ready to act. When the USDA’s October Milk Production report was missing for weeks, extension specialists and loan officers across the Midwest were fielding anxious calls. Herds that moved quickly—hedged milk at $17.35/cwt right after the report, or locked in feed at $4.10—wound up with $2,000-$2,500 more on every 500 cows compared to those who waited. CME and Wisconsin extension data both show how waiting for “certainty” can shrink margins before you even see the warning.
It’s not luck. It’s keeping your strategy loose, your phone handy, and your local data bookmarked. Fresh cow management, feed contracts, and market windows—they all demand being both alert and decisive, especially as 2026 approaches.
Make Allowance Leaks: When Efficiency Quietly Costs You
The Allowance Shift: June 2025 Make Allowance Increase Transfers ~$0.50/cwt from Producer Milk Checks to Processor Margins
Let’s lay out the dollars and cents. Thanks to FMMO make allowance changes last summer, about $82 million annually has shifted from producer checks into processor cost recovery, according to the American Farm Bureau and university research. That hits particularly hard for 400-600 cow herds in the Midwest, where $8,000-$15,000 in value quietly vaporized from family budgets in 2025 alone. While vertically integrated co-ops sometimes recoup some through patronage, for most, these quieter cost shifts are exactly what force new choices—do we hold, reinvest, cut inputs, or consider transitioning out?
The lesson? It’s time to double down on IOFC, watch every transition group closely, and look at every feed and labor line as a matter of survival, not just habit.
Premium Contracts: New Growth, New Hurdles
The Processor Divide: Expanded Capacity and Premium Contracts Favor Large Operations—Small Farms Face Component Quality Barriers Worth $4.40/cwt
Let’s get real about processor expansion. Yes, IDFA and DFO confirm $11 billion in new milk-processing capacity, but the “growth” headlines come with some fine print. Today’s direct contracts expect you to consistently deliver volume (often 1,000+ cows), protein over 3.2%, and sub-Grade A somatic cell counts.
Why the clampdown? Processors need stable, high-quality components to secure export and retail channels, invest in automation, and deliver on food safety for globally diverse buyers. UW reports and field officers say this shift is now woven into most new plant supplier specs.
It’s not all doom. Farms who began investing in butterfat genetics, precision feed systems, and herd data management years ago are fielding more calls, not fewer. Those focusing just on short-term barn expansion are finding that you can’t rush a protein curve or a culture of quality management. Extension and Minnesota case studies show that slow, steady moves—targeting milk components and recordkeeping upgrades first—put herds in the fast track for premium deals.
December’s 3.3% Rule: Protein as the Baseline
Speed Kills Complacency: How Quick Response to Market Data Translates to $1,400+ More Per 500 Cows
Here’s what’s interesting: this year’s biggest structural shift might be USDA’s new baseline for protein—up from 3.1% to 3.3% (USDA Final Rule). It’s been a long time coming, and peer-reviewed research had foreshadowed the change for several years. Genetics, feeding, and savvy fresh cow management have all nudged national averages upward. But it’s the local impacts—from blend checks to contract premiums—that hit home.
What does that mean practically? A 0.2% difference in protein, per 100 cows, adds up to $400-800 in annual check value, per the latest Midwest and Ontario extension data. Above 3.3%? You’re in the bonus column. Below? Now’s the time to pull out the ration notes and see where you can tweak, swap, or invest before the next round of pricing hits.
More importantly, more farms are opening up the books—digitizing records, crowdsourcing advice in peer groups, and trading input strategy tips without fear of “giving away secrets.” As more transition into 2026, collaborative learning is proving, in the field and in extension trials, to be a margin driver as real as any piece of steel.
Transition Planning: The Strongest Exit Isn’t Running—It’s Timing
One of the biggest takeaways this year is that transition can be a strength, not a sign of retreat. USDA NASS land reports peg the Midwest ground firmly above $25K/acre; extension planners increasingly help herds time “retirement” or partner transitions before the next storm hits. The real win? Leaving with financial options and the pride of calling the shot on your terms.
Herds still thinking big? UW and DFO studies show that the best results come when expansion is built on several years of component improvement and a fresh-cow strategy—not as a panic reaction to price. Dry lot and fresh group upgrades, pooled input efforts, and peer feedback show up again and again in success stories.
And for those holding steady, including herds in the 200-700 cow bracket, “optimization” is earning a new respect. Peer networks and beef-on-dairy strategies (with calves bringing $400-600, latest UMN data) are now front-line tools, and regular peer benchmarking is ensuring that the smartest changes don’t just sit on paper—they get put into practice.
Are You Fast Enough for 2026?
Pulling together farmer panels and co-op roundtables, it’s clear: being nimble, not just knowledgeable, is the new shield against margin loss. Extension economic analysis calls it “window management”—profits are made in these small, rapid openings, not in broad trends or after-the-fact decision meetings.
Facing Protein Gaps? Your Action Checklist
Bring three years of production and component records to a dairy-literate advisor.
Model the value and cost of boosting protein (and the status quo if you don’t).
Sit down with a local extension or farm business group—where are your best, region-specific levers hiding?
Use your peer network: tested approaches and hard-learned lessons are worth more than a new gadget.
So if there’s one sure thing heading into our “2026 wake-up call,” it’s that resources, relationships, and rapid response matter. Let’s keep those mugs full and the learning real—together, we’ll keep setting the pace for the next curve in dairy.
KEY TAKEAWAYS:
Farms that respond swiftly to new information—securing prices or input deals as data shifts—routinely outperform those waiting for a “clear signal.”
The new normal: Processor contracts and milk pricing now demand higher protein, stricter quality, and more documentation, making management upgrades and peer collaboration must-haves.
Smart transition planning—whether exiting, scaling, or realigning—can be a competitive edge, helping farm families lock in value rather than react to crises.
Operational resilience is increasingly about connecting with peer networks, bulk-buying alliances, and benchmarking tools—not just individual innovation.
For 2026, the most resilient farms will be those that adapt fastest to changing rules, seize learning opportunities, and stay proactive in their markets.
Complete references and supporting documentation are available upon request by contacting the editorial team at editor@thebullvine.com.
Every week, thousands of producers, breeders, and industry insiders open Bullvine Weekly for genetics insights, market shifts, and profit strategies they won’t find anywhere else. One email. Five minutes. Smarter decisions all week.
Warning: Today’s cheese collapse confirms what smart money already knows – milk’s heading for $16. Action plan inside.
Executive Summary: Today’s 8-cent cheese collapse to $1.5525 sent an unmistakable message: the U.S. dairy industry has entered a margin crisis that smart money says could stretch into 2027. With Europe undercutting our prices by 10 cents, Mexico pulling back orders, and domestic production inexplicably up 4.2%, we’re producing into a black hole. The numbers are sobering – Class III milk heading for $16.50 means your January check drops $3/cwt, translating to $7,500 less monthly revenue for a typical 300-cow operation. At these prices, even well-run dairies lose $1,500 daily. But here’s what 30 years in this industry has taught me: the operations that act decisively in the first 90 days of a crisis are the ones that survive. Those waiting for markets to ‘come back’ typically don’t make it. Your December milk check isn’t just a number anymore—it’s a referendum on whether your operation has what it takes to weather the storm ahead.
Today’s Market Summary Table
Product
Close
Change
Trading Activity
Cheese Blocks
$1.5525/lb
↓ $0.08
4 trades ($1.5775-$1.6275)
Cheese Barrels
$1.6450/lb
↓ $0.03
No trades
Butter
$1.5000/lb
Unchanged
3 trades ($1.49-$1.50)
NDM
$1.1575/lb
↑ $0.0025
No trades
Dry Whey
$0.7500/lb
Unchanged
No trades
You know that sinking feeling when you check the CME report and see red numbers everywhere? That’s exactly what happened today. Block cheese crashed 8 cents to close at $1.5525 per pound—and here’s what’s interesting, it happened on relatively heavy trading with four separate transactions recorded by the Chicago Mercantile Exchange spanning from $1.5775 to $1.6275, according to today’s CME cash market report. Barrels weren’t far behind, falling 3 cents to $1.6450, though notably without any recorded trades.
What I’ve found particularly telling is how butter stayed frozen at $1.50 with three trades in a tight range, while nonfat dry milk barely budged, climbing just a quarter-cent to $1.1575 with zero trading activity. Days like this tell us something important about where we’re headed. And honestly? It’s time we had a serious conversation about what this means for your December milk check.
Reading the Tea Leaves in Today’s Trading Patterns
Here’s something many of us miss when we just glance at the closing prices—the bid-ask spreads are telling a much bigger story. You probably know this already, but when the gap between what buyers are willing to pay and what sellers are asking widens dramatically, it usually means traders can’t agree on where prices should settle.
Today’s cheese block market saw those four trades bouncing between $1.5775 and $1.6275, but—and this is crucial—CME floor sources report that we had only one bid against one offer at the close. That’s not healthy price discovery; that’s a market running on uncertainty. In my experience working with Chicago traders, when you see heavy block volume with falling prices but no barrel activity, it often means processors are dumping inventory before year-end accounting.
The 8-Cent Collapse Captured: From $1.64 trading range into $1.55 settlement across four institutional block trades. This waterfall pattern signals that major traders are repricing dairy fundamentals downward—the classic setup for extended weakness.
The weekly totals back this up dramatically: 14 block trades this week versus zero for barrels, according to CME weekly volume data. You know what really concerns me? The order book shows just one bid each for blocks and barrels, creating virtually no floor under this market. Compare that to butter, where we’re seeing four offers—sellers everywhere, but buyers have vanished. It’s worth noting that this setup typically precedes another leg lower, especially when remaining buyers finally capitulate.
How Global Markets Are Boxing Us In
So here’s where things get complicated—and you’ve probably noticed this in your own export conversations if you’re dealing with cooperatives. European butter futures trading at €5,070 per metric ton on the European Energy Exchange work out to about $2.29 per pound at current exchange rates. That’s now competitive with our prices, and according to USDA Foreign Agricultural Service data, they’re capturing business we desperately need.
What I find particularly troubling is New Zealand’s positioning on the NZX futures exchange. Their whole milk powder at $3,440 per metric ton signals aggressive pricing to capture Asian market share, based on Global Dairy Trade auction results. And with EU skim milk powder at €2,075 per metric ton—that’s about $1.04 per pound—they’re undercutting our NDM by over 10 cents. In many cases, that’s enough to make a U.S. product completely uncompetitive globally.
Now, Mexico has traditionally been our safety net. USDA trade data shows they account for about 25% of U.S. dairy exports. But here’s what’s changed: the peso weakened by 8% against the dollar this quarter, and according to Conasupo (Mexico’s national food agency), domestic production is ramping up. Several processors I’ve talked with in Wisconsin report Mexican buyers are pulling back on November purchases.
Southeast Asia was supposed to pick up that slack, but USDA attaché reports from Vietnam and Indonesia indicate those markets are currently oversupplied with cheaper product from New Zealand and Europe. And the dollar… well, that’s another story entirely. Federal Reserve data shows it’s near 52-week highs, and research from the International Dairy Federation shows that every 1% rise in the dollar index typically drops our dairy exports by 2-3%.
Feed Markets: The Silver Lining Gets Thinner
Here’s one bright spot, though it’s getting dimmer by the day. According to CME futures settlements, December corn closed at $4.3550 per bushel, with March futures at $4.49. That’s manageable. Soybean meal’s recovery to $322 per ton from Monday’s $316.80 keeps feed costs somewhat reasonable, based on CBOT trading data.
But—and this is a big but—the milk-to-feed ratio is deteriorating fast. Cornell’s Dairy Markets and Policy program calculates that at current prices, income over feed costs could drop below $8 per hundredweight by January. University of Wisconsin Extension analysis confirms that for most operations, that’s below breakeven.
The regional differences are striking, too. USDA Agricultural Marketing Service basis reports show Midwest producers near corn country seeing sub-$4 local cash prices. Meanwhile, California Department of Food and Agriculture data indicates that West Coast producers are facing $5-plus delivered corn. For hay, USDA’s Agricultural Prices report puts the national average at $222 per ton, but Western Premium Alfalfa runs $280 and up according to the latest USDA hay market news.
Production Growth: The Numbers We Can’t Ignore
USDA’s National Agricultural Statistics Service finally released that delayed September milk production report on November 10th, and the numbers are… well, they’re sobering. Twenty-four state production hit 18.3 billion pounds, up 4.2% year-over-year. The national herd added 235,000 cows over the past year, while production per cow jumped 30 pounds to 1,999 pounds per month.
What’s really eye-opening is where this growth is concentrated. Kansas leads with 21.1% growth, South Dakota’s up 9.4%—those new processing plants that Dairy Foods magazine has been covering are pulling massive expansion. Looking at efficiency gains, Michigan State University Extension reports their state’s cows are averaging 2,260 pounds per month. That’s 260 pounds above the national average.
The 261-Pound Survival Gap: Michigan’s elite herds average 2,260 lbs/month while national average sits at 1,999. That efficiency gap translates to $15/day cost per marginal cow. When Class III drops to $16.50, every pound counts—operations with production per cow below 1,950 face economic extinction.
The combination of improved genetics—documented in Journal of Dairy Science studies—optimized nutrition protocols from land-grant university research, and modernized facilities, as tracked by Progressive Dairy, has pushed biological limits higher than we thought possible. Here’s the reality check from talking with nutritionists: when your neighbors are achieving these yields, you either match them or risk getting priced out.
Remember all those cheese plants that broke ground in 2023? Kansas Department of Agriculture confirms three major facilities, Texas Department of Agriculture lists two, and South Dakota’s Governor’s Office announced another two. We’ve added 10 billion pounds of annual processing capacity since 2023, according to estimates from the International Dairy Foods Association. These plants have 20-year USDA Rural Development financing that requires running near capacity—this structural oversupply won’t resolve quickly.
The Structural Trap: Four new cheese plants in 2023 plus six more in 2024-2025 added 10 billion pounds of capacity. These debt-financed facilities must operate near 95% utilization to service 20-year USDA Rural Development loans. Current market demand: 46 billion pounds. Result: 5+ billion pounds annual oversupply locked in through 2030. Price recovery impossible without facility closures—and that doesn’t happen voluntarily.
What This Means for Your December Check
Let’s talk straight about where Class III milk is headed. With November futures already at $17.16 on the CME and December futures implying further weakness according to today’s settlements, several dairy economists I respect are projecting $16.50 or lower by January.
December Check Reckoning: A 300-cow operation at $16.50 Class III faces $7,500 monthly revenue loss. That’s $900 daily. January will be worse.
At $16.50 Class III with current feed costs, the University of Minnesota’s dairy profitability calculator shows the average 100-cow dairy loses about $1,500 per day. If we hit spring flush with these prices… well, that’s going to force some tough culling decisions. Today’s spot prices, when run through USDA’s Federal Milk Marketing Order formulas, translate to January milk checks down $2.50 to $3.00 per hundredweight from October.
For a 300-cow dairy shipping 65,000 pounds daily, that’s $7,500 less monthly revenue. Farm Credit Services reports from the Midwest indicate banks are already tightening credit as dairy loan portfolios deteriorate. The Federal Reserve’s October Agricultural Credit Survey shows agricultural loan demand rising while repayment rates fall—if you haven’t locked in operating lines for 2026, today’s price action just made that conversation much harder.
What’s particularly concerning is that our traditional escape route isn’t available. USDA Foreign Agricultural Service data shows China’s imports down 18% year-over-year, Mexico’s pulling back, as I mentioned, and Southeast Asian markets are oversupplied. Without export demand absorbing 15-20% of production—which has been the historical average according to U.S. Dairy Export Council analysis—domestic markets face crushing oversupply through 2026.
Tomorrow Morning’s Practical Action Plan
So what do we do about all this? Here’s my thinking on practical steps based on conversations with risk management specialists and successful producers who’ve weathered previous downturns.
On the hedging front, if we get any bounce above $17.00 for Q1 2026 Class III, I’d seriously consider locking it in. Several commodity brokers I trust are recommending ratio spreads—selling two February $16 puts to buy one February $18 call, which limits your downside while maintaining upside potential. For feed, the consensus among grain merchandisers is to buy March corn under $4.40 and meal under $320 while you can.
Operationally, extension dairy specialists are unanimous: it’s time for aggressive culling. Penn State’s dairy management tools show that every marginal cow below 60 pounds per day is costing you money at these prices. Push breeding decisions to maximize beef-on-dairy premiums while they last—Superior Livestock Auction data shows those crossbred calves bringing $200 to $300 premiums.
Review every feed ingredient for substitution opportunities. University of Wisconsin research demonstrates that optimizing your grain mix can save $5 per ton without sacrificing production—that equals $50,000 annually for a 500-cow dairy. And here’s something many producers hesitate to do but really should: schedule that lender meeting now, before year-end financials force their hand.
Prepare cash flow projections showing survival through $16 milk—Farm Financial Standards Council guidelines suggest they need to see that you’ve faced reality. Several ag finance specialists recommend considering sale-leaseback arrangements on equipment to generate working capital before values drop further.
The 90-Day Reckoning: From November 12 market shock through February 10, every day counts. The red danger zone shows when critical decisions must occur. Operations that delay past December 15 face compromised options by January spring flush. Historical dairy downturns show: decisive action in days 1-90 determines survival probability. The clock started November 12.
The Bottom Line
You know, I’ve been through the 2009 crisis, the 2015-2016 downturn, and 2020’s volatility. What we’re seeing today isn’t just another cycle. Today’s 8-cent cheese collapse, combined with global oversupply data and production growth trends, confirms the U.S. dairy industry faces what could be a two-year margin squeeze.
Looking at the fundamentals—global markets oversupplied according to Rabobank’s latest dairy quarterly, domestic demand softening per USDA disappearance data, and production still growing at 3-4% annually—prices have further to fall before this corrects. The harsh reality, according to agricultural economists at several land-grant universities, is that we could see 5-10% of operations exit by the end of 2026.
Your December milk check has become more than a financial report—it’s a survival test. But here’s what’s encouraging from studying previous downturns: operations that adapt quickly, that make hard decisions now rather than hoping for recovery, those are the ones that emerge stronger. The question facing every producer tonight is simple but profound: will your operation be among the survivors?
What I’ve learned from 30 years of watching these cycles is that the difference between those who make it and those who don’t often comes down to acting decisively in moments like this. Tomorrow morning, when you’re doing chores, think about which camp you want to be in. Then act accordingly.
Key Takeaways
This isn’t a blip—it’s a reckoning: Today’s 8-cent cheese crash to $1.5525 with only one bid standing confirms we’re entering a 2-year margin squeeze. Class III hits $16.50 by January.
The world has turned against U.S. dairy: Europe’s 10 cents cheaper, Mexico’s pulling back, and our 4.2% production growth is flooding a shrinking market. Exports can’t save us this time.
Efficiency gaps will force consolidation: When Michigan averages 2,260 lbs/cow and you’re at 1,900, the math is fatal—every marginal cow costs you $15 daily at these prices.
Your banker already knows: Today’s CME report just flagged every dairy loan in America. Schedule that meeting now with realistic projections, not wishful thinking.
History’s lesson is clear: In 2009 and 2015, farms that acted decisively in the first 90 days survived. Those that waited for “normal” to return didn’t make it. Which will you be?
Learn More:
This Isn’t Your Normal Dairy Downturn – Here’s Your 60-Day Action Plan – This tactical guide provides the immediate 60-day survival plan for the crisis outlined in our report, detailing proven strategies for culling, financial tracking, and component optimization that are working for producers right now.
Every week, thousands of producers, breeders, and industry insiders open Bullvine Weekly for genetics insights, market shifts, and profit strategies they won’t find anywhere else. One email. Five minutes. Smarter decisions all week.
Canada won the trade panel. The U.S. has the sunset clause. July 2026 decides who blinks first in the $850M dairy standoff.
EXECUTIVE SUMMARY: Wisconsin dairy farmers are asking a simple question: Where’s the Canadian market access USMCA promised five years ago? The U.S. industry says Canada blocked $850 million in opportunities by allocating import quotas to processors who won’t use them, keeping fill rates at just 42%. Canada counters they’re following the rules—winning a November 2023 panel to prove it—and argues American dairy simply isn’t competitive in their market. With 1,420 U.S. farms closing last year while Canadian producers protect quota investments worth $30,000 per cow, both sides face existential stakes. July 2026 changes everything: the USMCA sunset clause means all three countries must actively agree to continue, or $780 billion in annual trade enters dangerous uncertainty. This analysis presents both perspectives fairly and provides specific strategies based on your farm size—because regardless of who “wins,” every North American dairy operation needs to prepare for what comes next.
As we approach the July 2026 USMCA review, the U.S. dairy industry is building their case while Canada defends its position. Here’s what both sides are saying—and why it matters for dairy farmers across North America.
You know what’s interesting? When you talk to Wisconsin producers these days, there’s this deep frustration that just keeps coming up. Five years after the USMCA promised meaningful Canadian market access, they’re still waiting. And it’s not just Wisconsin—this sentiment’s spreading across the entire U.S. dairy belt, setting up what could be quite a showdown come July 2026.
So here’s what’s happening. The International Dairy Foods Association filed this formal complaint in October to the Trade Representative, and when you combine that with five years of trade data from both USDA and Canada’s Global Affairs department… well, the U.S. industry’s making a pretty specific case. They’re talking about roughly $850 million in export opportunities that haven’t materialized, all while 1,420 American dairy operations shut down last year, according to the USDA’s count.
But here’s the thing—and this is important—Canada sees this completely differently. They won that November 2023 dispute panel, and they’re saying they’re following the agreement just fine. Understanding both perspectives has become essential for anyone trying to make sense of what’s coming.
What the U.S. Industry Says Was Promised vs. What They Got
Let me walk you through the American dairy sector’s position. It starts with the International Trade Commission’s 2019 assessment, which projected we’d see about $227 million in additional annual exports under USMCA’s dairy provisions.
The way U.S. producers see it, they were expecting:
Access to 3.6% of Canada’s dairy market through 14 different quota categories
Complete elimination of those Class 6 and 7 pricing schemes within six months
Export caps keeping Canadian skim milk powder and milk protein concentrates at 35,000 metric tons annually
Import quotas going to actual importers, not Canadian processors
Now, according to Canada’s own Global Affairs data and those USMCA panel findings, what actually happened looks quite different.
What were the average quota fill rates from 2022 to 2023? Just 42% across all categories. Nine of those 14 categories never even hit 50% utilization. And that January 2022 USMCA panel—they found that Canada had allocated between 85% and 100% of its quota shares to Canadian processors. American farmers argue these processors have about as much incentive to import competing U.S. products as… well, let’s just say not much.
Here’s what really gets American producers going—this Class 7 pricing business. Sure, Canada technically eliminated it like they promised. But then—and the University of Wisconsin’s dairy economists have documented this—similar pricing dynamics popped up under Class 4a. The U.S. sees that as a way to get around its USMCA commitments.
“You get on a phone conversation with some of these folks that have been farming for five and six generations. How do you say I can’t help you? That becomes very tough.” – Bill Mullins, Mullins Cheese
Quick Reference: Understanding Key Trade Terms
TRQ (Tariff Rate Quota): Think of it as a two-tier system. A certain amount gets in at low or zero tariffs. Above that? You’re looking at 200-315% tariffs for Canadian dairy.
Supply Management: Canada’s comprehensive dairy system since 1972—combines production quotas, price supports, and import controls.
Class Pricing: Canada’s milk classification system that sets different prices based on how the milk’s used—and this is where things get contentious.
Why Canada Defends Supply Management So Fiercely
You know, when you really look at Canada’s dairy system, you start to understand why they’re so protective of it. Agricultural economists at Université Laval have documented how it works through three integrated pieces:
First, there’s production quotas that limit what each farmer can produce. Then you’ve got price supports keeping farmgate values at about 1.5 to 2 times what we see in the U.S. And finally, those import barriers—we’re talking 200% to 315% on anything over quota.
This whole framework’s supporting about 9,000 Canadian dairy operations that generate close to CA$20 billion in annual economic activity, according to Dairy Farmers of Canada’s latest report.
Mark Stephenson over at UW-Madison’s dairy policy program explains it well: “The fundamental incompatibility is that supply management requires import control to function. Asking Canada to provide meaningful market access is essentially asking them to dismantle the system piece by piece. From their perspective, that’s existential.”
And here’s something to consider—Canadian producers have invested around CA$30,000 per cow in quota value according to their provincial milk boards. That’s not just an operating expense. That’s retirement savings, succession planning, and their kids’ inheritance. No wonder they defend it so fiercely.
How American Farmers See the Economic Stakes
For U.S. producers, the Grassland Dairy situation from 2017 is still a really raw issue. It kind of exemplifies their broader concerns about Canadian trade practices.
When Canada introduced that Class 7 pricing targeting ultra-filtered milk, Grassland Dairy had to terminate contracts affecting about a million pounds of daily production across 75 Wisconsin farms. Bill Mullins from Mullins Cheese—he took on eight of those displaced operations even though his plants were already near capacity. His words still resonate.
Here’s what keeps U.S. producers up at night:
Wisconsin Center for Dairy Profitability data shows your average 200-cow operation generates about $87,000 in annual net income. If you lost $56,000 in potential export revenue—that’d be each farm’s theoretical share of that $850 million—you’re looking at a 64% income hit.
Wisconsin dairy operations averaged just $0.87 per hundredweight in net margins during 2023
At those margins, farms facing reduced market access could hit insolvency within 30 months
New York dairy producers have been pretty vocal about their frustration, arguing they’re seeking the market access they were promised, not handouts. One Cayuga County operator mentioned how expansion decisions are basically on hold until there’s clarity about Canadian market availability.
Canada’s Counter-Argument: Why They Say They’re Complying
Now here’s where it gets really interesting—Canada’s perspective on USMCA compliance is fundamentally different from the U.S.’s.
First off, Canada won that November 2023 USMCA dispute panel ruling. The panel found 2-1 that Canada’s revised allocation methods based on market share didn’t violate USMCA provisions. That’s a big deal—it validated Canada’s position that their implementation, while maybe not what the U.S. expected, technically complies with the agreement.
The way Canadian officials see it, several key points counter U.S. arguments:
On those low quota fill rates, they argue this reflects market conditions and U.S. producers’ inability to meet Canadian market requirements, not administrative barriers. They say importers are free to source from the U.S. if the products are competitive.
On processor allocations: Canada maintains that allocating quotas based on historical market activity is legitimate and non-discriminatory. It doesn’t explicitly exclude any type of importer.
On Bill C-202: Rather than overplaying their hand, Canada sees that June 2025 legislation—where 262 of 313 MPs voted to prohibit dairy concessions—as a democratic expression of national consensus. All parties supported it. From their perspective, that’s sovereign policy choice, not a negotiating tactic.
Dairy Farmers of Canada has consistently maintained that supply management represents more than just an economic system—they see it as ensuring food security and stable farm incomes across rural Canada. Pierre Lampron, who served as DFC president through 2024, expressed confidence at their annual meeting that the government understands this broader context.
Timeline: Key Dates Leading to July 2026 Review
January 2026: Monitor for ITC preliminary findings on protein dumping investigation
March 2026: ITC final report delivers—this could be game-changing evidence
May-June 2026: Industry positioning intensifies, Congressional pressure peaks
July 1, 2026: USMCA joint review—decision on extension or annual review mode
Here is the data from the image converted into a table:
Two Countries, Two Systems
Aspect
U.S. System
Canadian System
Farm Closures (2024)
1,420 operations (5% decline)
Stable/protected
Quota Investment per Cow
$0
$30,000
Price Stability
Volatile (market-based)
Guaranteed (1.5-2x U.S. prices)
Market Access Barriers
None domestically
High tariffs (200-315%)
Export Opportunities
Growing but constrained by Canada
Limited by supply management
The Political Leverage Game for 2026
Both sides are positioning themselves for July 2026 with some distinct strategic advantages.
What the U.S. Industry Has Going For It
The timing of the ITC investigation is no accident. The International Trade Commission investigation into Canadian dairy protein dumping delivers findings in March 2026. That’s just four months before the review—giving U.S. negotiators the federal agency documentation they need right when they need it.
The sunset clause creates real pressure. USMCA requires all three countries to actively confirm they want to extend the agreement in July 2026. If they don’t, we’re looking at uncertainty over $780 billion in annual bilateral trade.
Congressional backing matters. Bipartisan pressure from dairy-state legislators provides the U.S. industry with political support to push enforcement demands.
Canada’s Strategic Position
Legal victories count. That November 2023 panel ruling provides Canada with legal cover for its current practices. They can say, “Look, we went through dispute settlement and won.”
Political unity is powerful. Bill C-202’s overwhelming parliamentary support shows that protecting supply management goes beyond party politics in Canada.
The broader relationship provides leverage. Canada can point to integrated North American supply chains—especially in automotive and energy—to resist dairy-specific pressure.
Three Scenarios and What They Mean for Different Farm Sizes
Supply management has survived 30+ years of trade fights. Betting the farm on a breakthrough? That’s a 30% probability play. Smart money plans for the 45% scenario: more paperwork, same barriers, modest improvements at best
Looking at how things are shaping up, here’s what seems most likely and what it means for your operation:
Scenario 1: More Incremental Changes (45% probability, if you ask me)
Canada agrees to better reporting and maybe some monitoring mechanisms, but keeps its fundamental allocation approaches. The U.S. claims progress, Canada keeps supply management intact. Quota fill rates? They probably stay about the same.
What this means by farm size:
Under 100 cows: Focus on local markets and direct sales. Canadian access won’t materialize in meaningful ways for you anyway. Consider value-added products where you control the whole chain.
100-500 cows: Keep flexibility for quick pivots. Maybe maintain current production, but don’t expand based on export hopes. Watch Southeast Asian opportunities instead.
500+ cows: You’ve got scale to weather this, but don’t count on Canadian markets in your five-year plans. Consider leading industry advocacy efforts—you’ve got the most to gain if something breaks loose.
Scenario 2: Real Enforcement Mechanisms (30% probability)
If those ITC findings are compelling and U.S. negotiators credibly threaten not to renew, Canada might accept automatic penalties for under-utilization or mandatory non-processor allocations. That could deliver partial yet meaningful improvements in access.
Preparation steps if this happens:
Get your export documentation systems ready now
Build relationships with potential Canadian buyers
Understand Canadian labeling and standards requirements
Consider partnerships with existing exporters to learn the ropes
Scenario 3: A Standoff (25% probability)
Neither side budges much. The agreement goes into annual review mode, creating ongoing uncertainty but avoiding immediate disruption. Both industries operate under this cloud of potential future changes.
Risk management if we hit a standoff:
Maximum Dairy Margin Coverage enrollment becomes essential
Lock in feed costs wherever possible
Diversify buyer relationships domestically
Don’t make major capital investments based on export assumptions
Who’s Pushing for What: The Players Making Things Happen
Let me tell you about the organizations driving this whole thing, because understanding who’s involved helps make sense of the dynamics.
On the U.S. side, you’ve got some heavy hitters:
The International Dairy Foods Association—they’re the ones who filed that October 2025 complaint. They represent processors, and they’re pushing hard for what they call an end to protectionist measures. They want binding enforcement, and they want it now.
National Milk Producers Federation lobbied hard for that ITC investigation. They’re your farmer cooperatives, and they keep hammering on automatic penalties for non-compliance. They’ve got members losing money, and they’re not shy about saying so.
The U.S. Dairy Export Council is more technical—they document barriers, provide negotiating support, and help with the nuts and bolts. Edge Dairy Farmer Cooperative represents those Midwest producers, and they’re great at putting farm-level impacts front and center.
On Canada’s side, it’s equally organized:
Dairy Farmers of Canada maintains they’re fully complying with USMCA. They’ve got a consistent message: supply management is legitimate policy, and they’re following the rules.
Les Producteurs de lait du Québec—now these folks have serious clout. They represent Quebec’s 4,877 dairy farms, and in Canadian federal elections, Quebec matters. A lot.
Provincial marketing boards coordinate the defense while implementing those quota allocation systems that the U.S. finds so frustrating.
Market Alternatives: What Some Smart Operators Are Doing
While this U.S.-Canada dispute dominates headlines, some American producers are zigging, while others are zagging. Take this example—a California operation recently told me they doubled their Vietnam exports in 18 months. “The middle class there is exploding,” they said. “They want quality dairy, and there’s no quota games to navigate.”
Industry data from USDEC backs this up—U.S. dairy exports to Vietnam and other Southeast Asian countries keep climbing year over year. Vietnam, Thailand, and the Philippines—they’re importing more dairy each year. No supply management system to work around. Just straightforward business based on quality and price.
You know what’s interesting about these markets? They’re growing fast enough that even mid-size operations can find niches. Specialty cheeses, high-quality milk powders, and even fluid milk in some cases. The logistics are getting better every year, too.
Seven months. Four critical milestones. $780 billion in annual trade hanging in the balance. This is how the March 2026 ITC report becomes the leverage point that forces Canada’s hand—or blows up USMCA
The Bottom Line: No Easy Resolution in Sight
That $850 million figure the U.S. dairy industry keeps citing? That’s their calculation of lost opportunities. Canada disputes both the number and the whole premise. Five years of USMCA implementation have revealed fundamental disagreements about what the agreement actually requires and what compliance entails.
Canada’s supply management system has survived more than 30 years of trade negotiations. Honestly? It’ll probably survive this challenge too. The question isn’t whether USMCA will fully open Canadian dairy markets—nobody really expects that. It’s whether the 2026 review might produce some incremental changes that partially address U.S. concerns while keeping Canada’s core system intact.
The way American producers see it, success means binding enforcement mechanisms with automatic penalties. The way Canada sees it, success is maintaining supply management’s essential structure while offering enough procedural adjustments to avoid a broader trade confrontation.
Come July 2026, we’ll see whether these positions can be reconciled—or whether North American dairy trade stays defined by promises unfulfilled and expectations unmet. Either way, it’s going to be interesting to watch. And whatever happens, we’ll all need to adapt our operations accordingly.
One thing’s for sure—whether you’re milking 50 cows or 5,000, whether you’re in Wisconsin or Quebec, this dispute affects the entire North American dairy landscape. Understanding both sides helps us all prepare for whatever comes next.
The Bullvine continues tracking developments from both perspectives as we approach the July 2026 USMCA review. For ongoing analysis, visit www.thebullvine.com.
KEY TAKEAWAYS
Both sides have valid arguments: U.S. proves Canada allocates 85% of quotas to processors who won’t import (42% fill rate); Canada’s November 2023 panel win says that’s technically legal
Real farms, real consequences: 1,420 U.S. operations closed waiting for promised access, while Canadian farmers defend $30,000/cow quota investments—everyone has skin in this game
July 2026 is unprecedented leverage: The sunset clause means all three countries must actively agree, or $780B in trade enters chaos—first time the U.S. can credibly threaten the whole relationship
History suggests incremental change: Supply management survived 30+ years of trade fights; expect minor adjustments, not market revolution
Your operation, your strategy: Under 100 cows = stay local; 100-500 = maintain flexibility; 500+ = lead advocacy while developing Asian markets where actual growth exists
Complete references and supporting documentation are available upon request by contacting the editorial team at editor@thebullvine.com.
Learn More:
Your 2025 Dairy Gameplan: Three Critical Areas Separating Profit from Loss – While the main article covers external market risk, this guide provides internal operational control. It reveals specific tactics for optimizing silage, nutrition, and transition cows to improve your cost of production and financial resilience.
Every week, thousands of producers, breeders, and industry insiders open Bullvine Weekly for genetics insights, market shifts, and profit strategies they won’t find anywhere else. One email. Five minutes. Smarter decisions all week.
To provide the best experiences, we use technologies like cookies to store and/or access device information. Consenting to these technologies will allow us to process data such as browsing behavior or unique IDs on this site. Not consenting or withdrawing consent, may adversely affect certain features and functions.
Functional
Always active
The technical storage or access is strictly necessary for the legitimate purpose of enabling the use of a specific service explicitly requested by the subscriber or user, or for the sole purpose of carrying out the transmission of a communication over an electronic communications network.
Preferences
The technical storage or access is necessary for the legitimate purpose of storing preferences that are not requested by the subscriber or user.
Statistics
The technical storage or access that is used exclusively for statistical purposes.The technical storage or access that is used exclusively for anonymous statistical purposes. Without a subpoena, voluntary compliance on the part of your Internet Service Provider, or additional records from a third party, information stored or retrieved for this purpose alone cannot usually be used to identify you.
Marketing
The technical storage or access is required to create user profiles to send advertising, or to track the user on a website or across several websites for similar marketing purposes.
To provide the best experiences, we and our partners use technologies like cookies to store and/or access device information. Consenting to these technologies will allow us and our partners to process personal data such as browsing behavior or unique IDs on this site and show (non-) personalized ads. Not consenting or withdrawing consent, may adversely affect certain features and functions.
Click below to consent to the above or make granular choices. Your choices will be applied to this site only. You can change your settings at any time, including withdrawing your consent, by using the toggles on the Cookie Policy, or by clicking on the manage consent button at the bottom of the screen.
Functional
Always active
The technical storage or access is strictly necessary for the legitimate purpose of enabling the use of a specific service explicitly requested by the subscriber or user, or for the sole purpose of carrying out the transmission of a communication over an electronic communications network.
Preferences
The technical storage or access is necessary for the legitimate purpose of storing preferences that are not requested by the subscriber or user.
Statistics
The technical storage or access that is used exclusively for statistical purposes.The technical storage or access that is used exclusively for anonymous statistical purposes. Without a subpoena, voluntary compliance on the part of your Internet Service Provider, or additional records from a third party, information stored or retrieved for this purpose alone cannot usually be used to identify you.
Marketing
The technical storage or access is required to create user profiles to send advertising, or to track the user on a website or across several websites for similar marketing purposes.


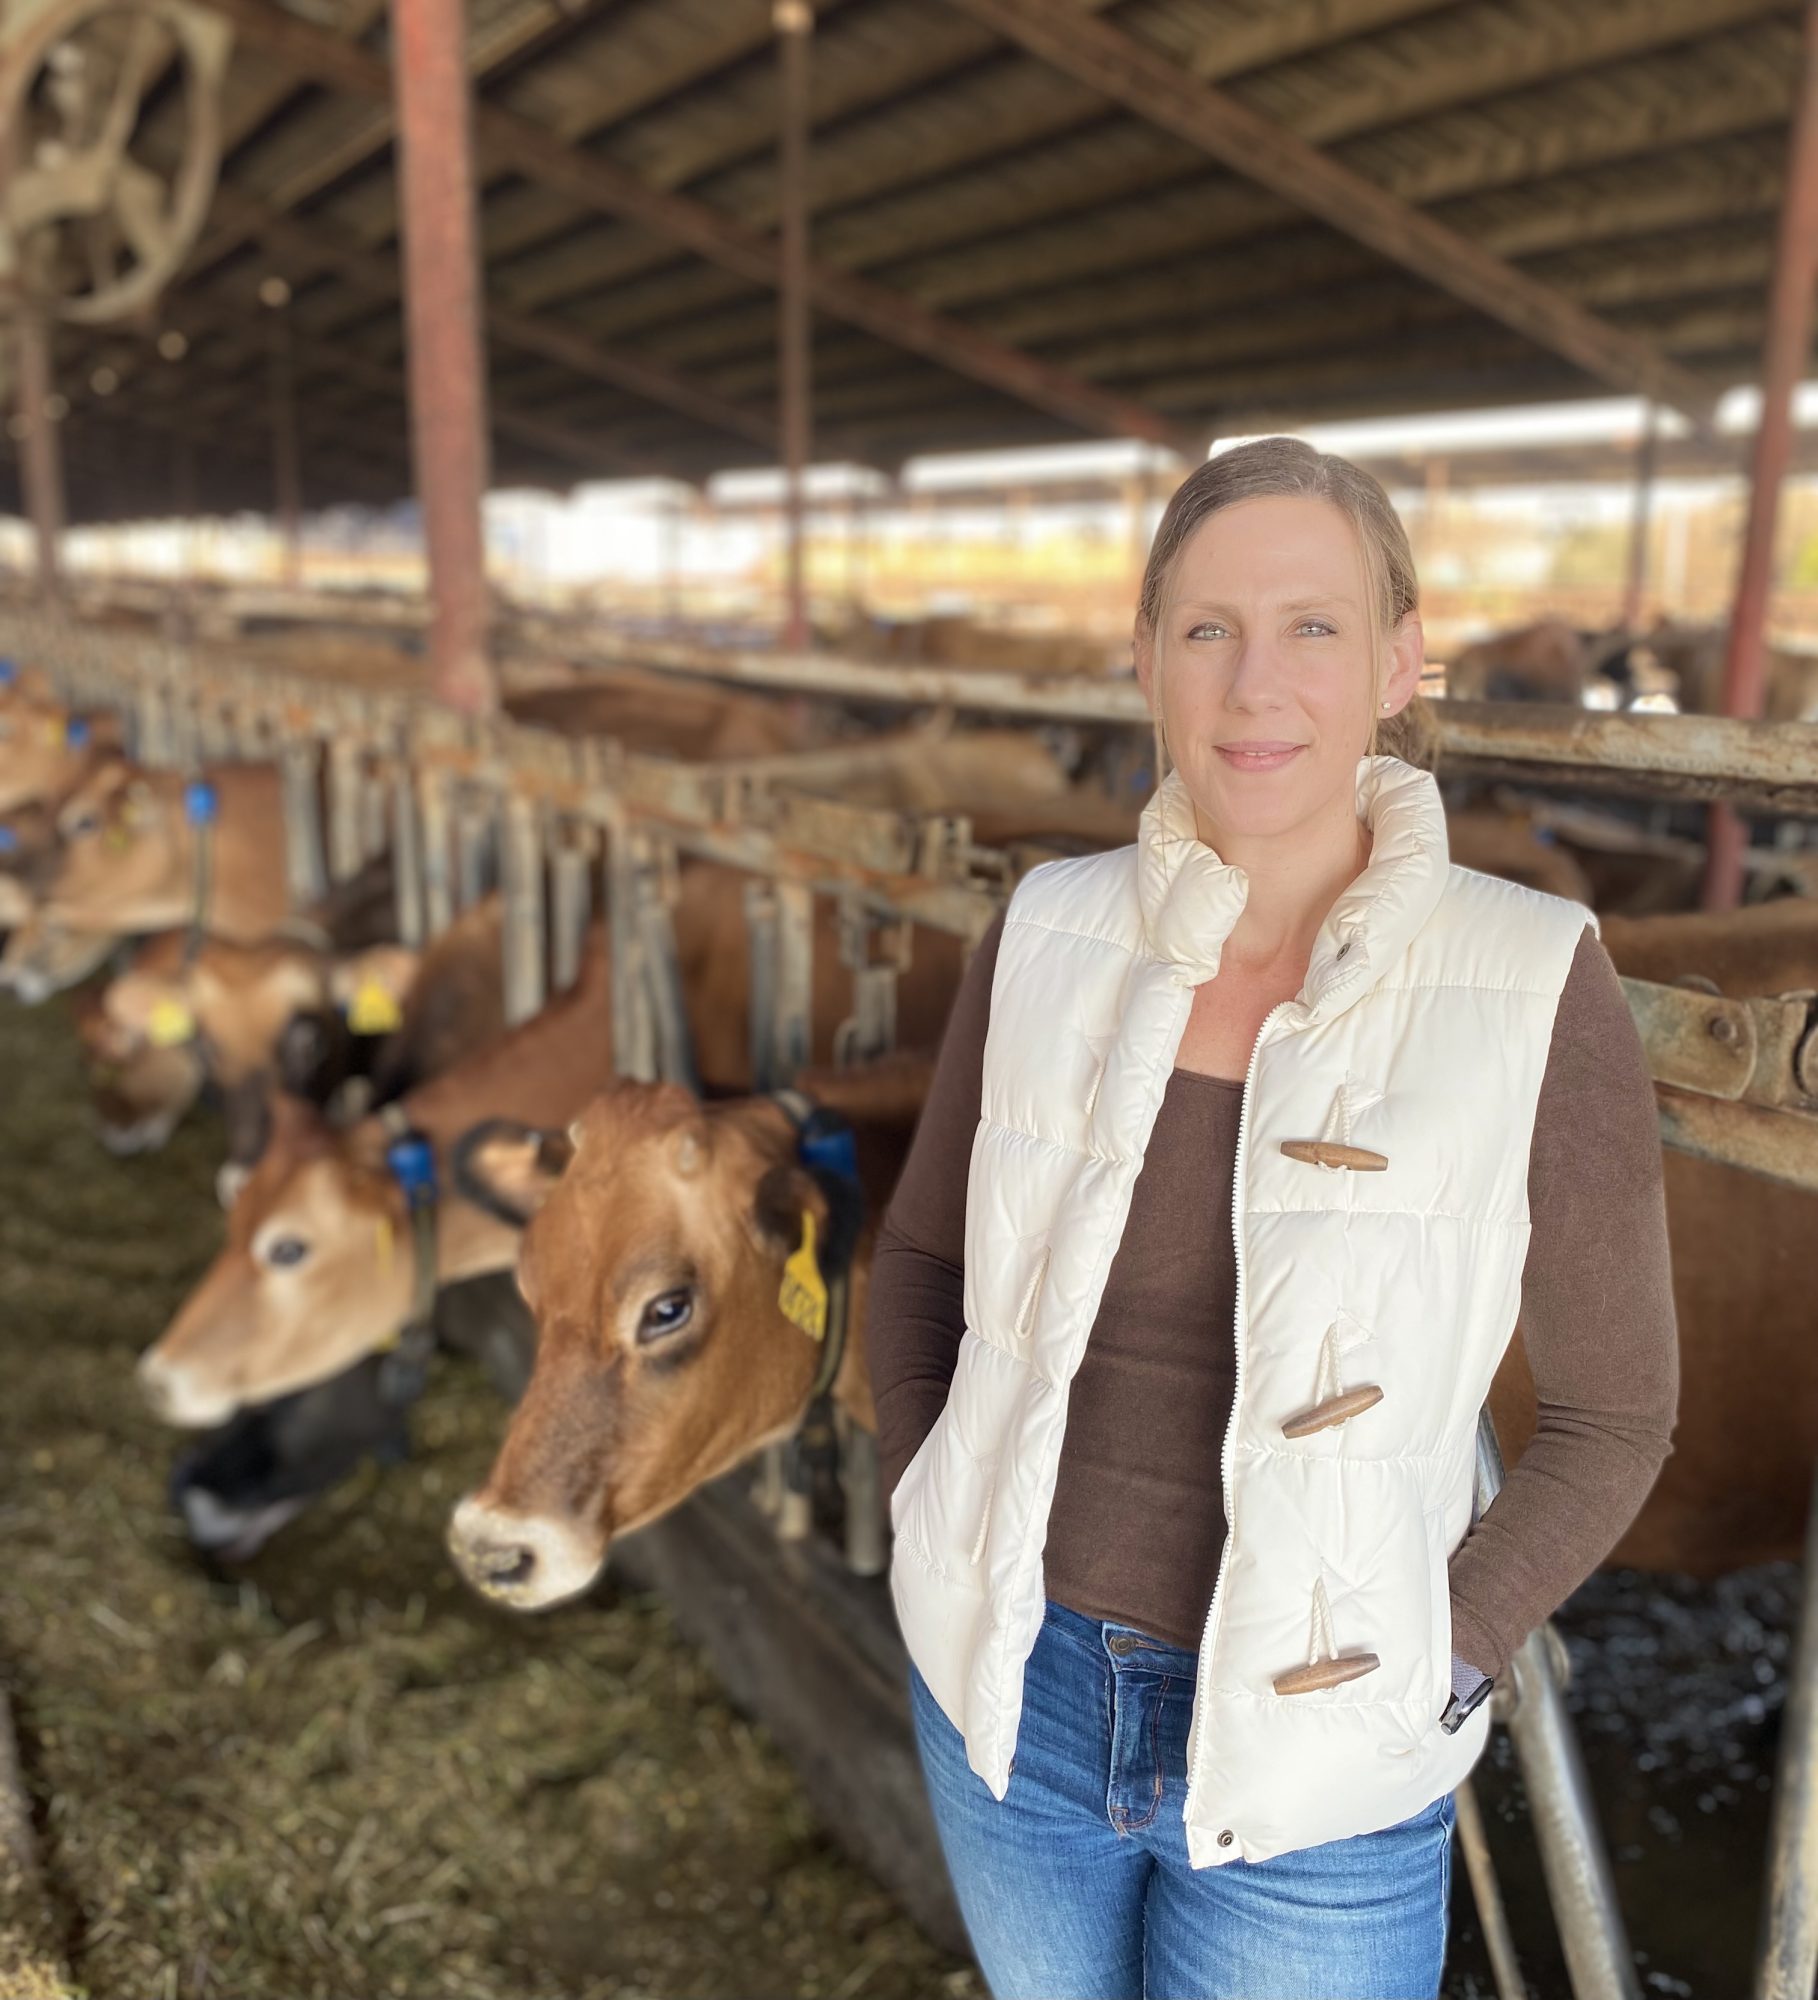
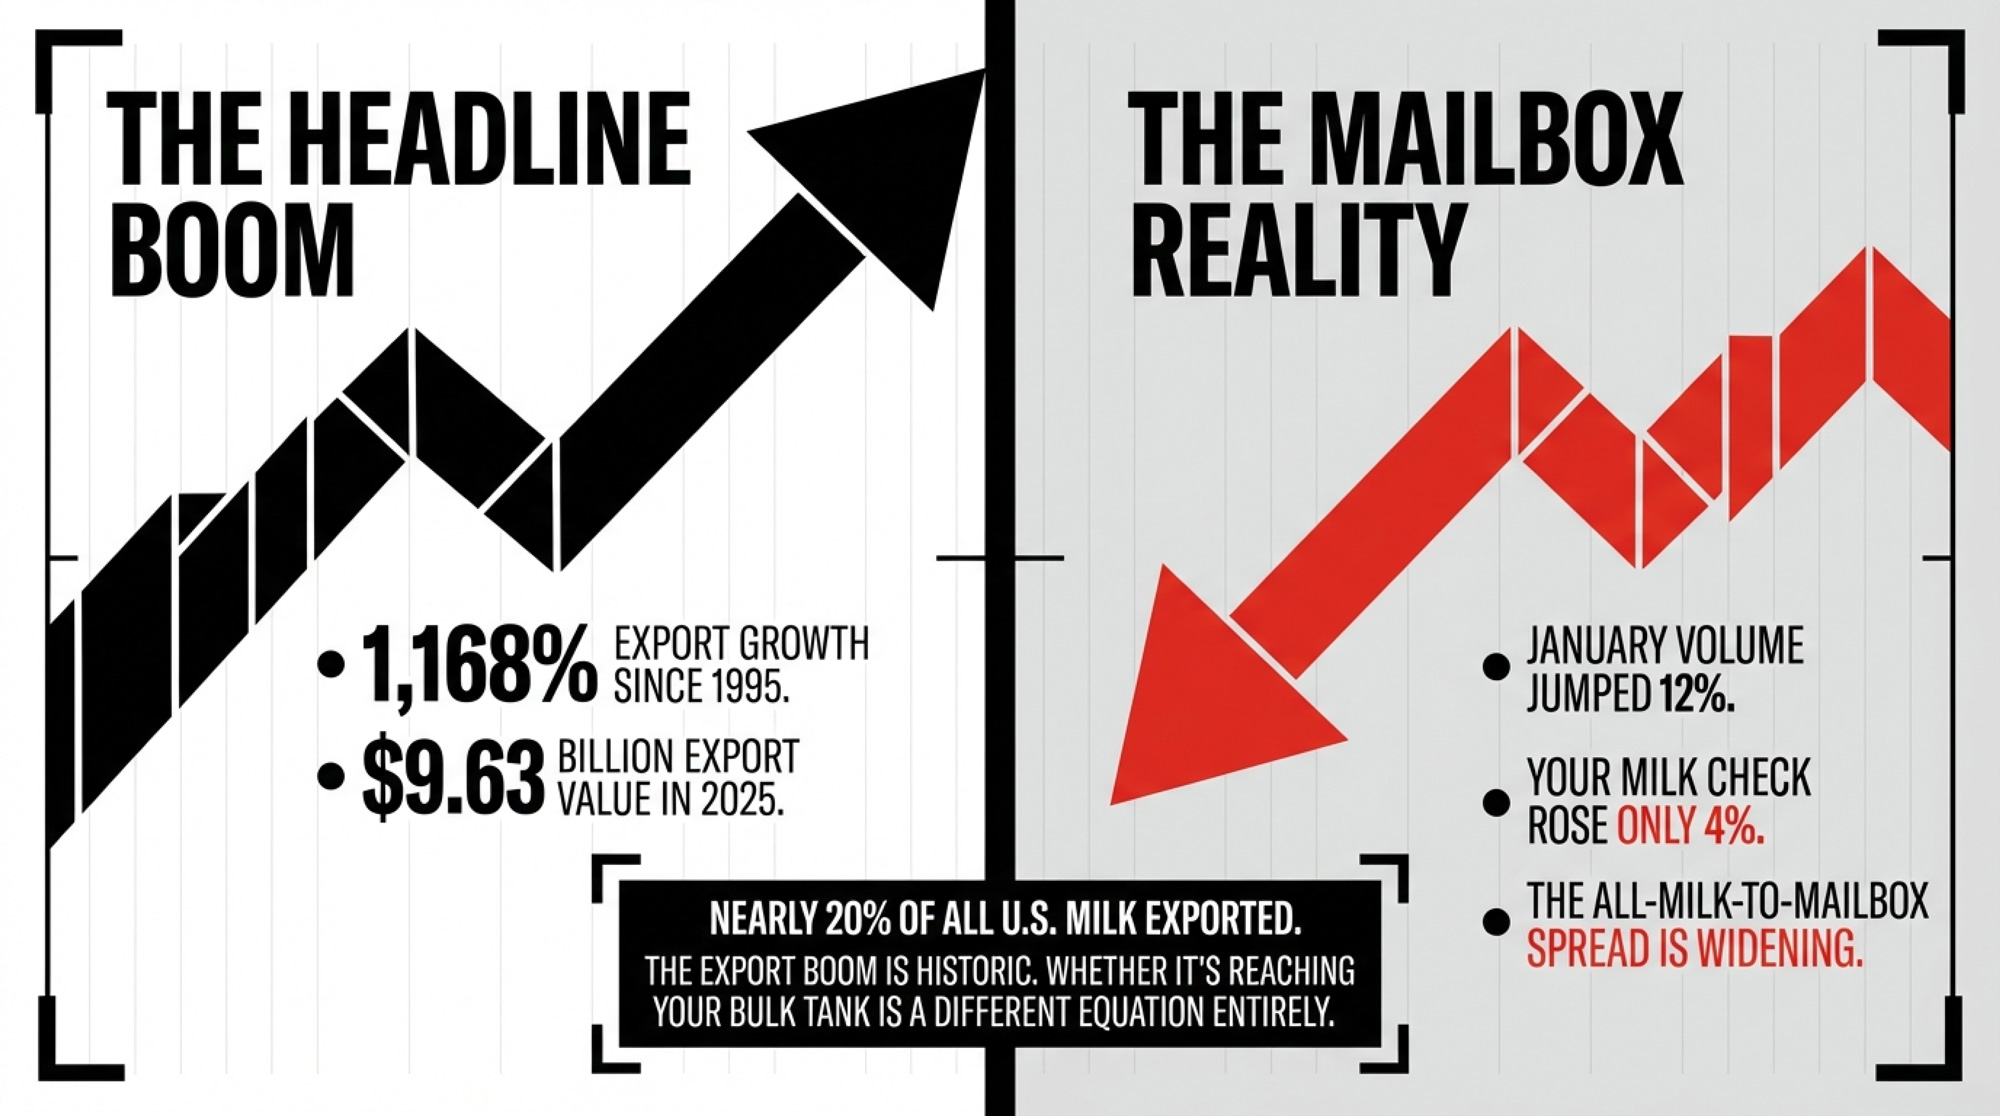
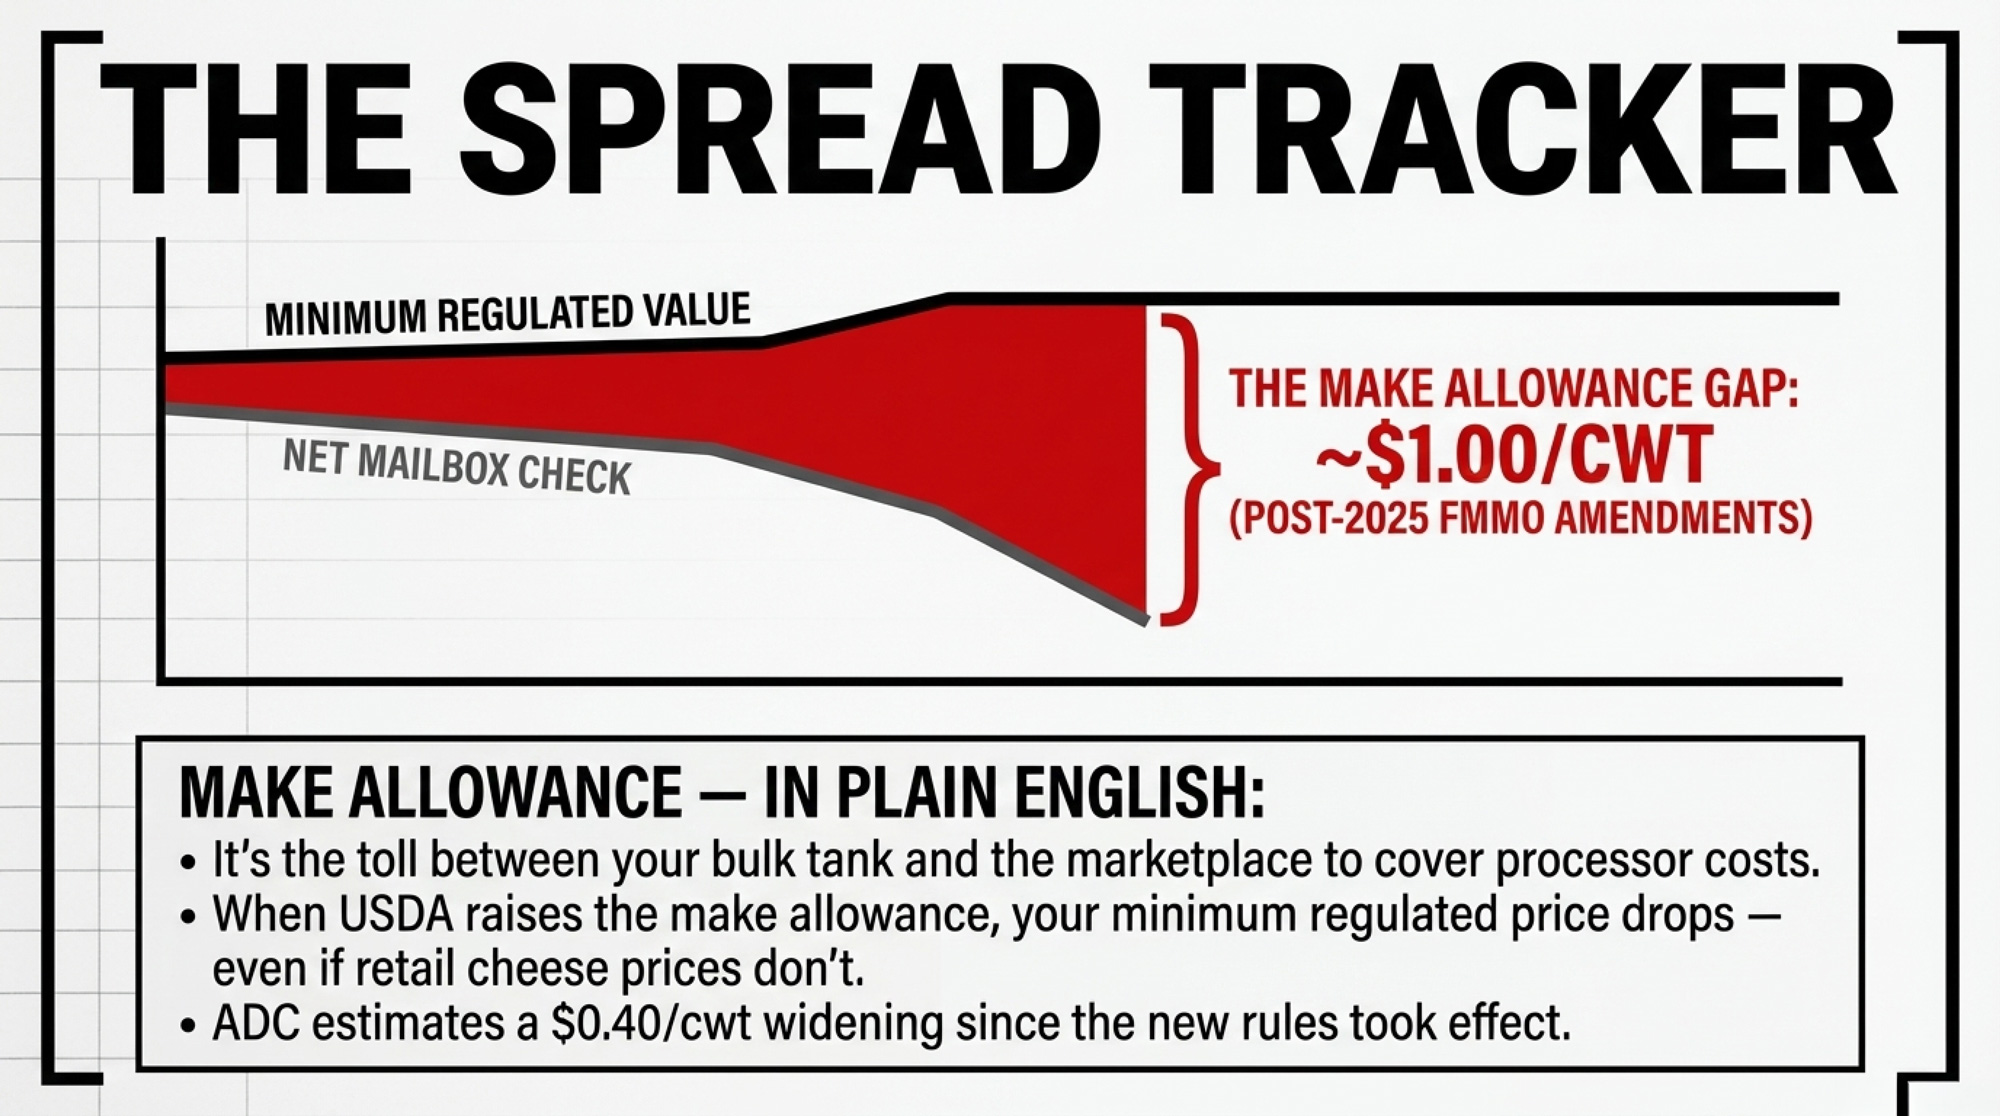
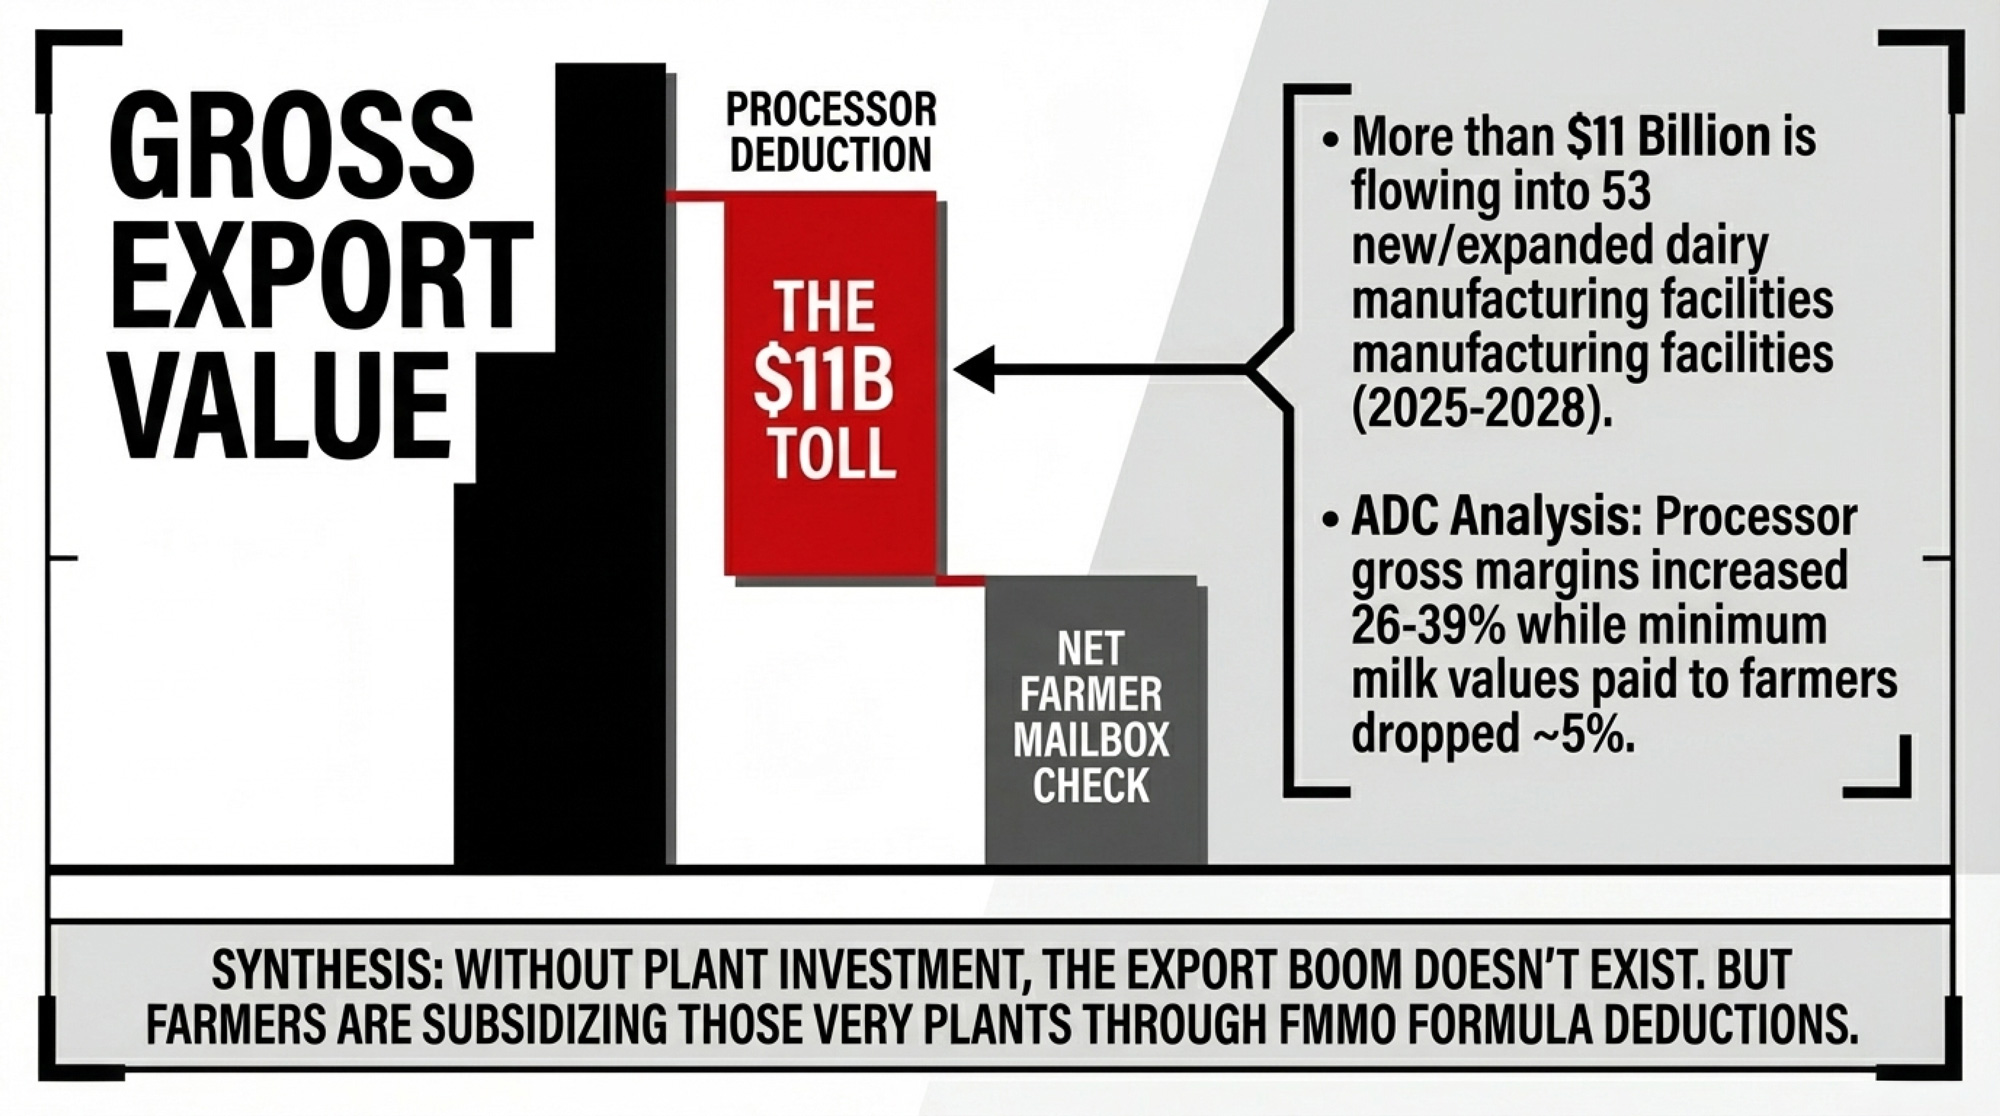
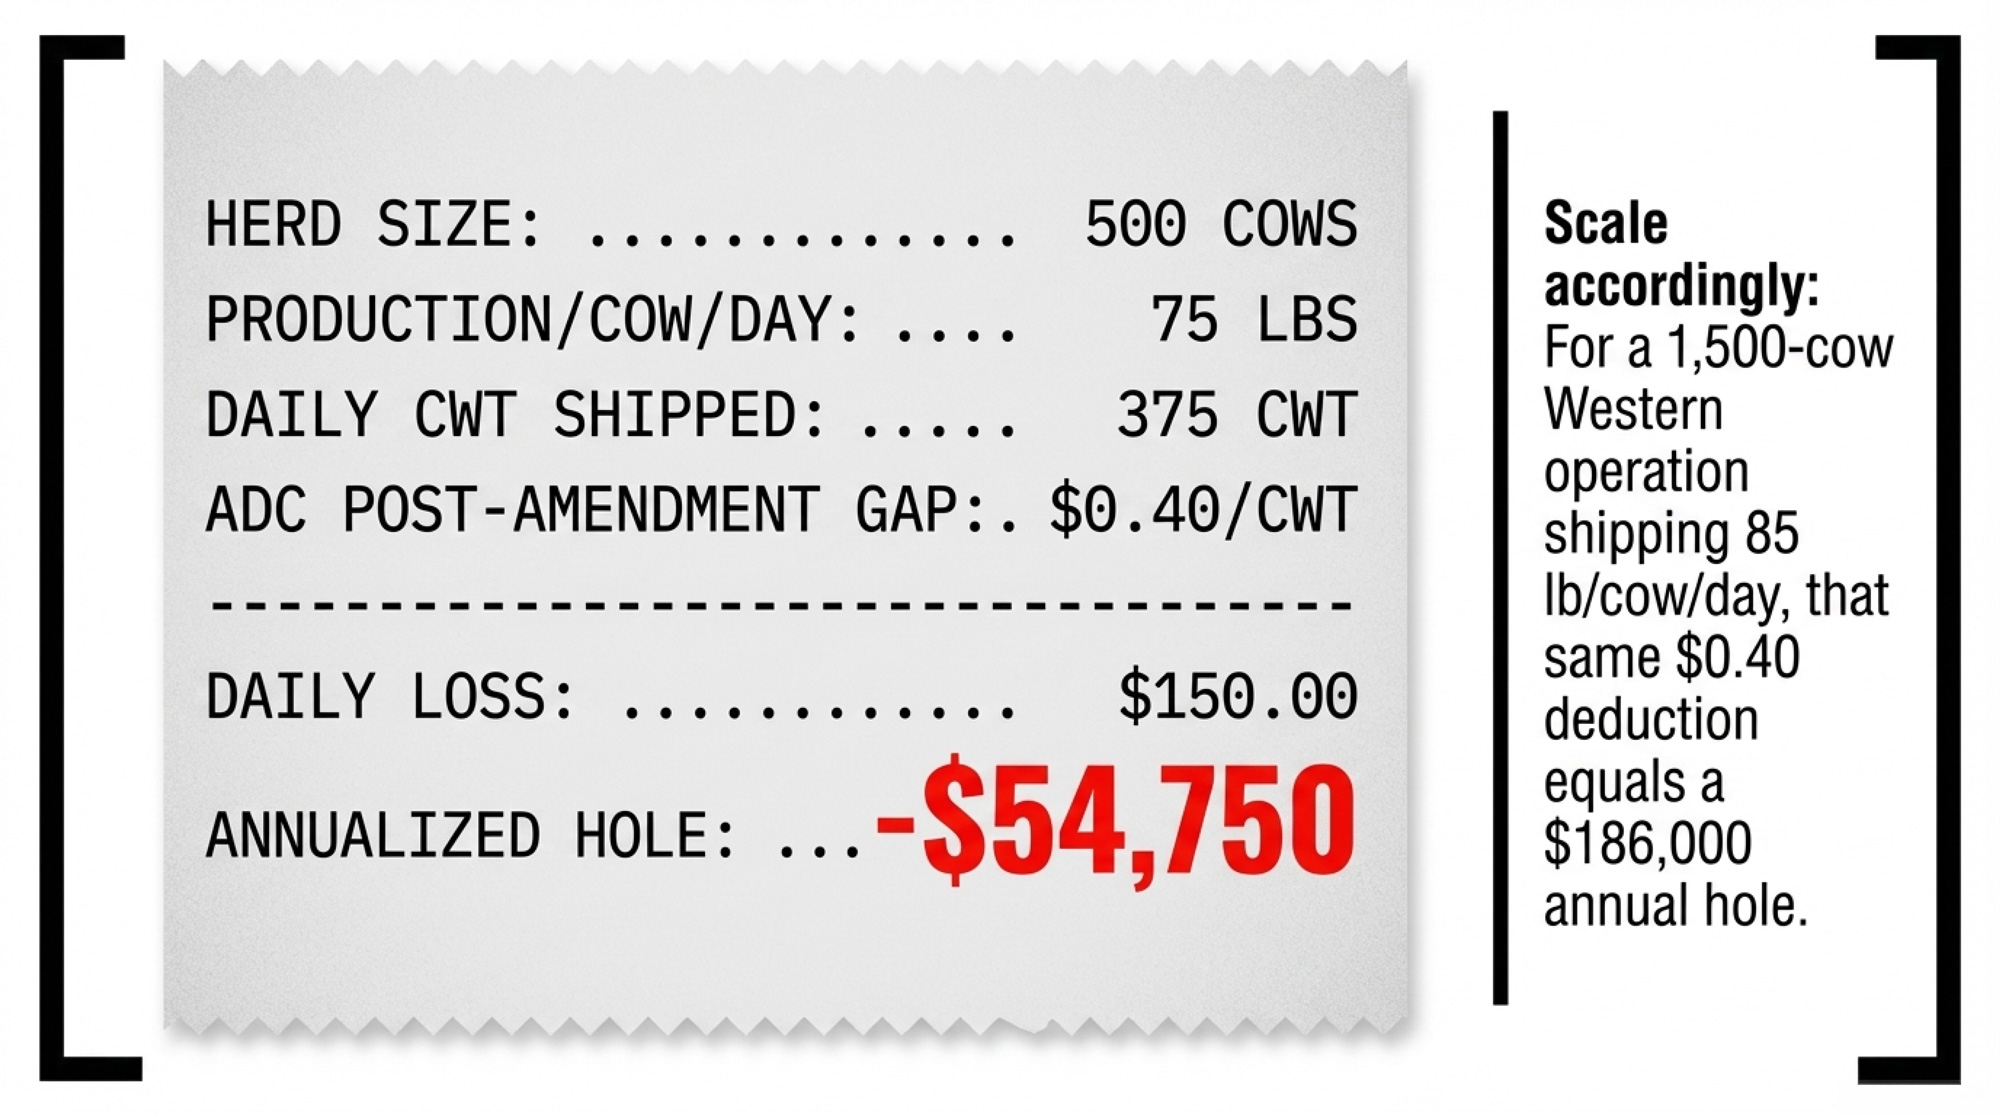
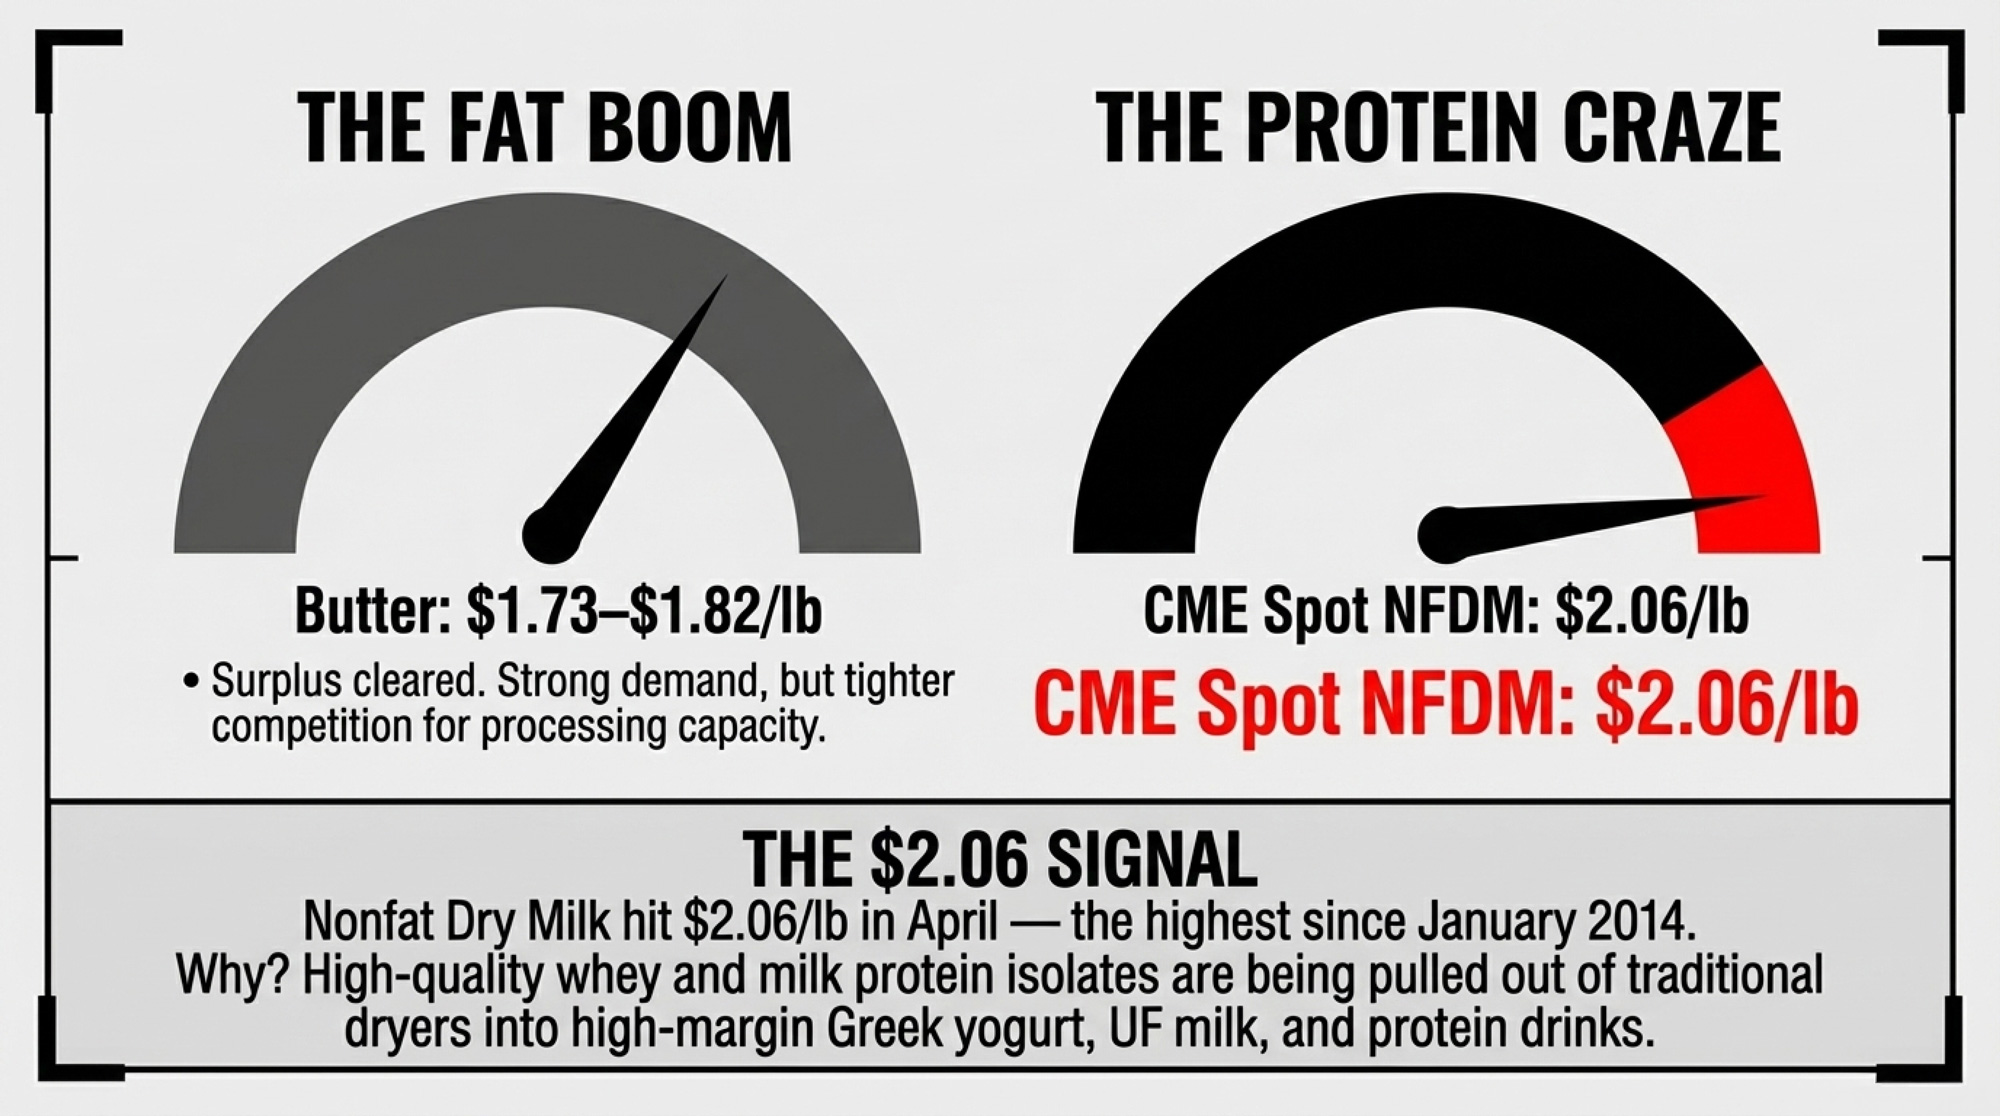
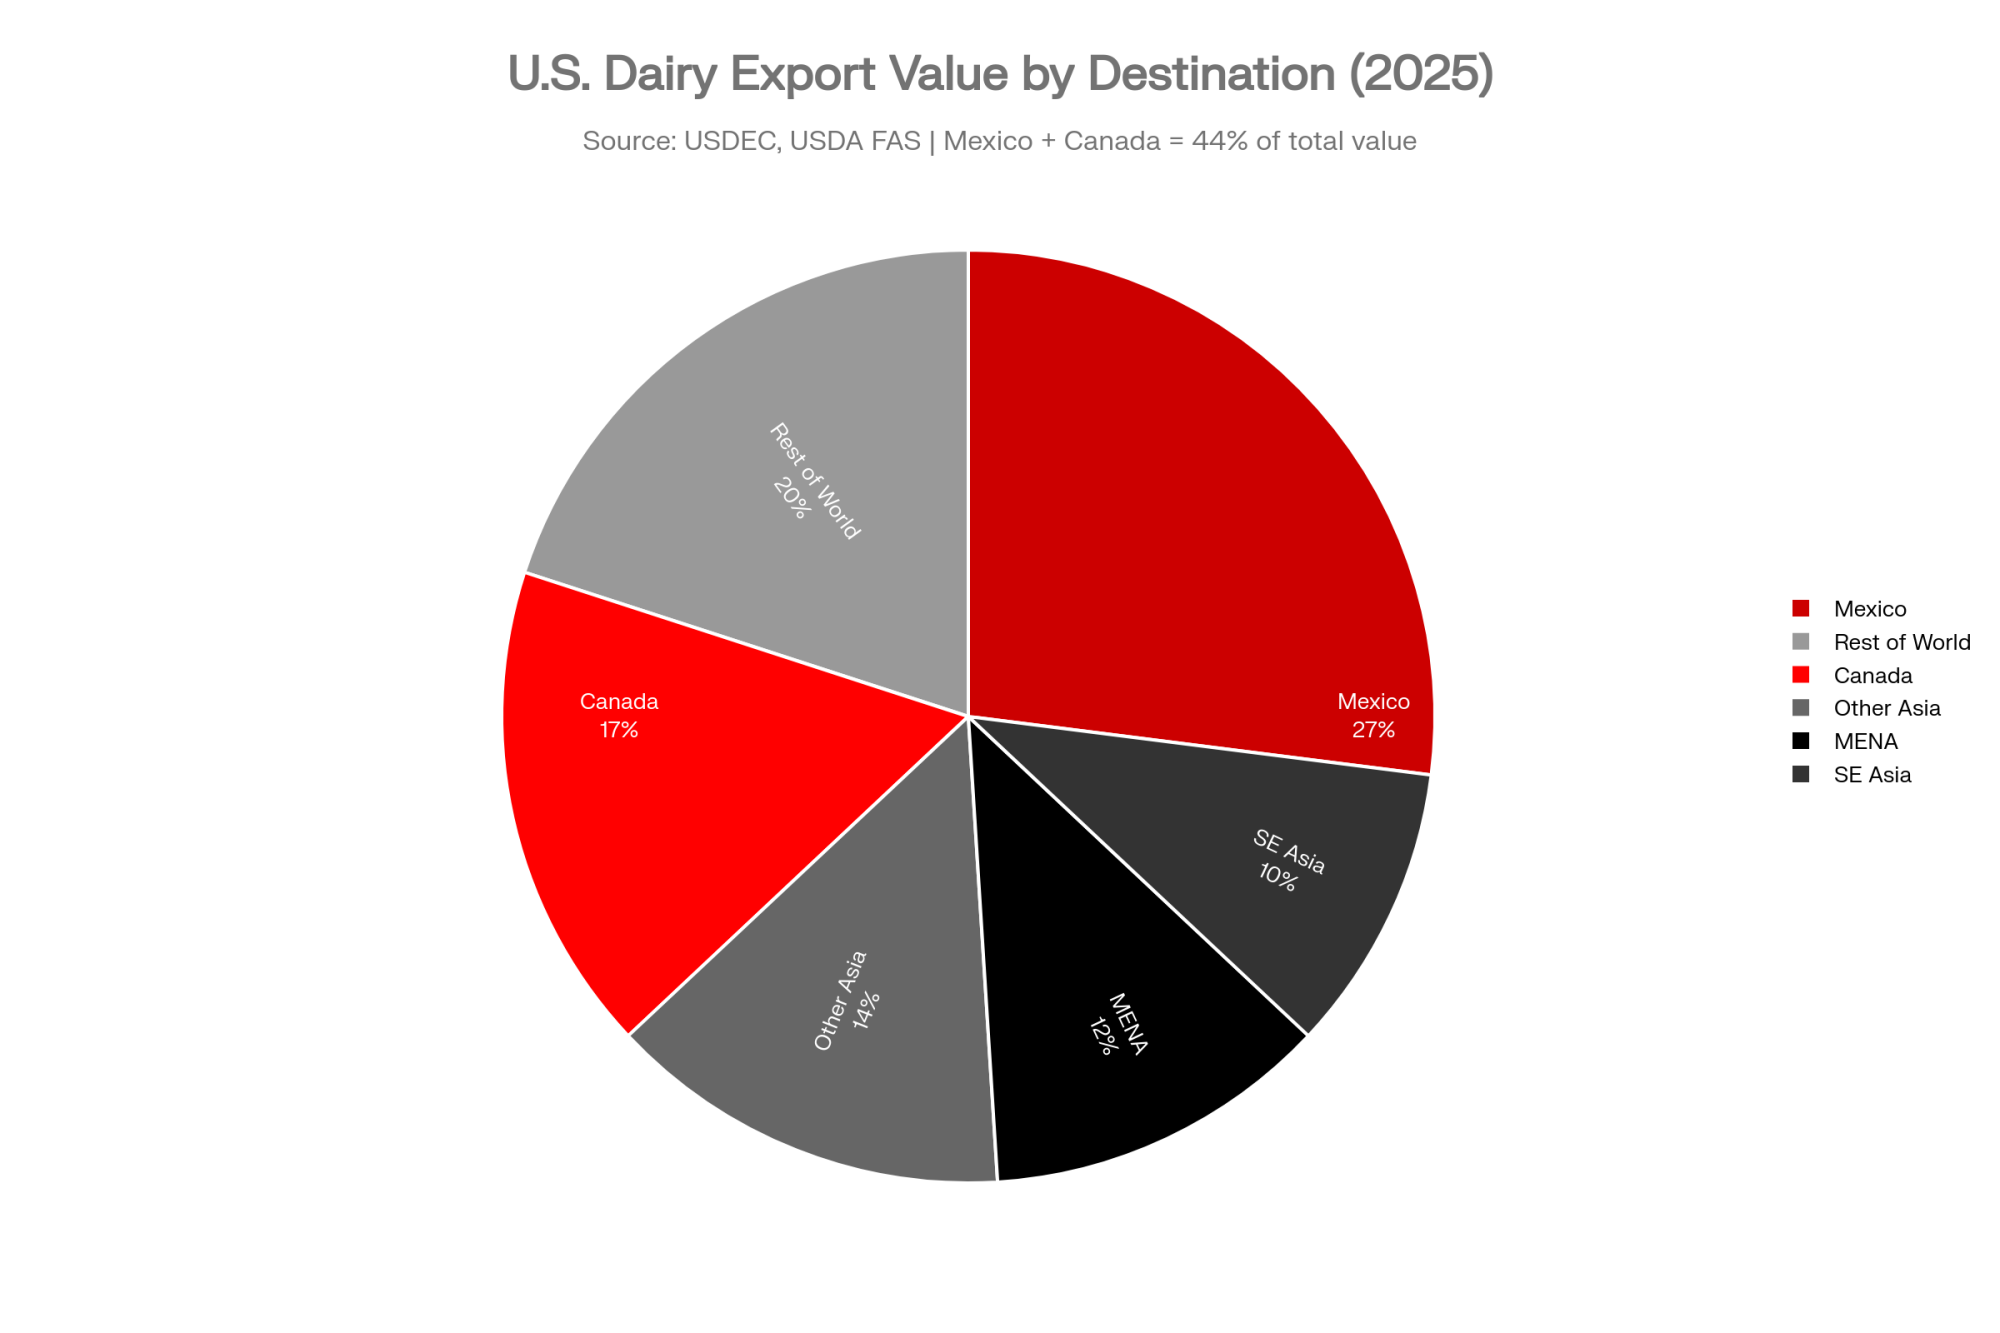
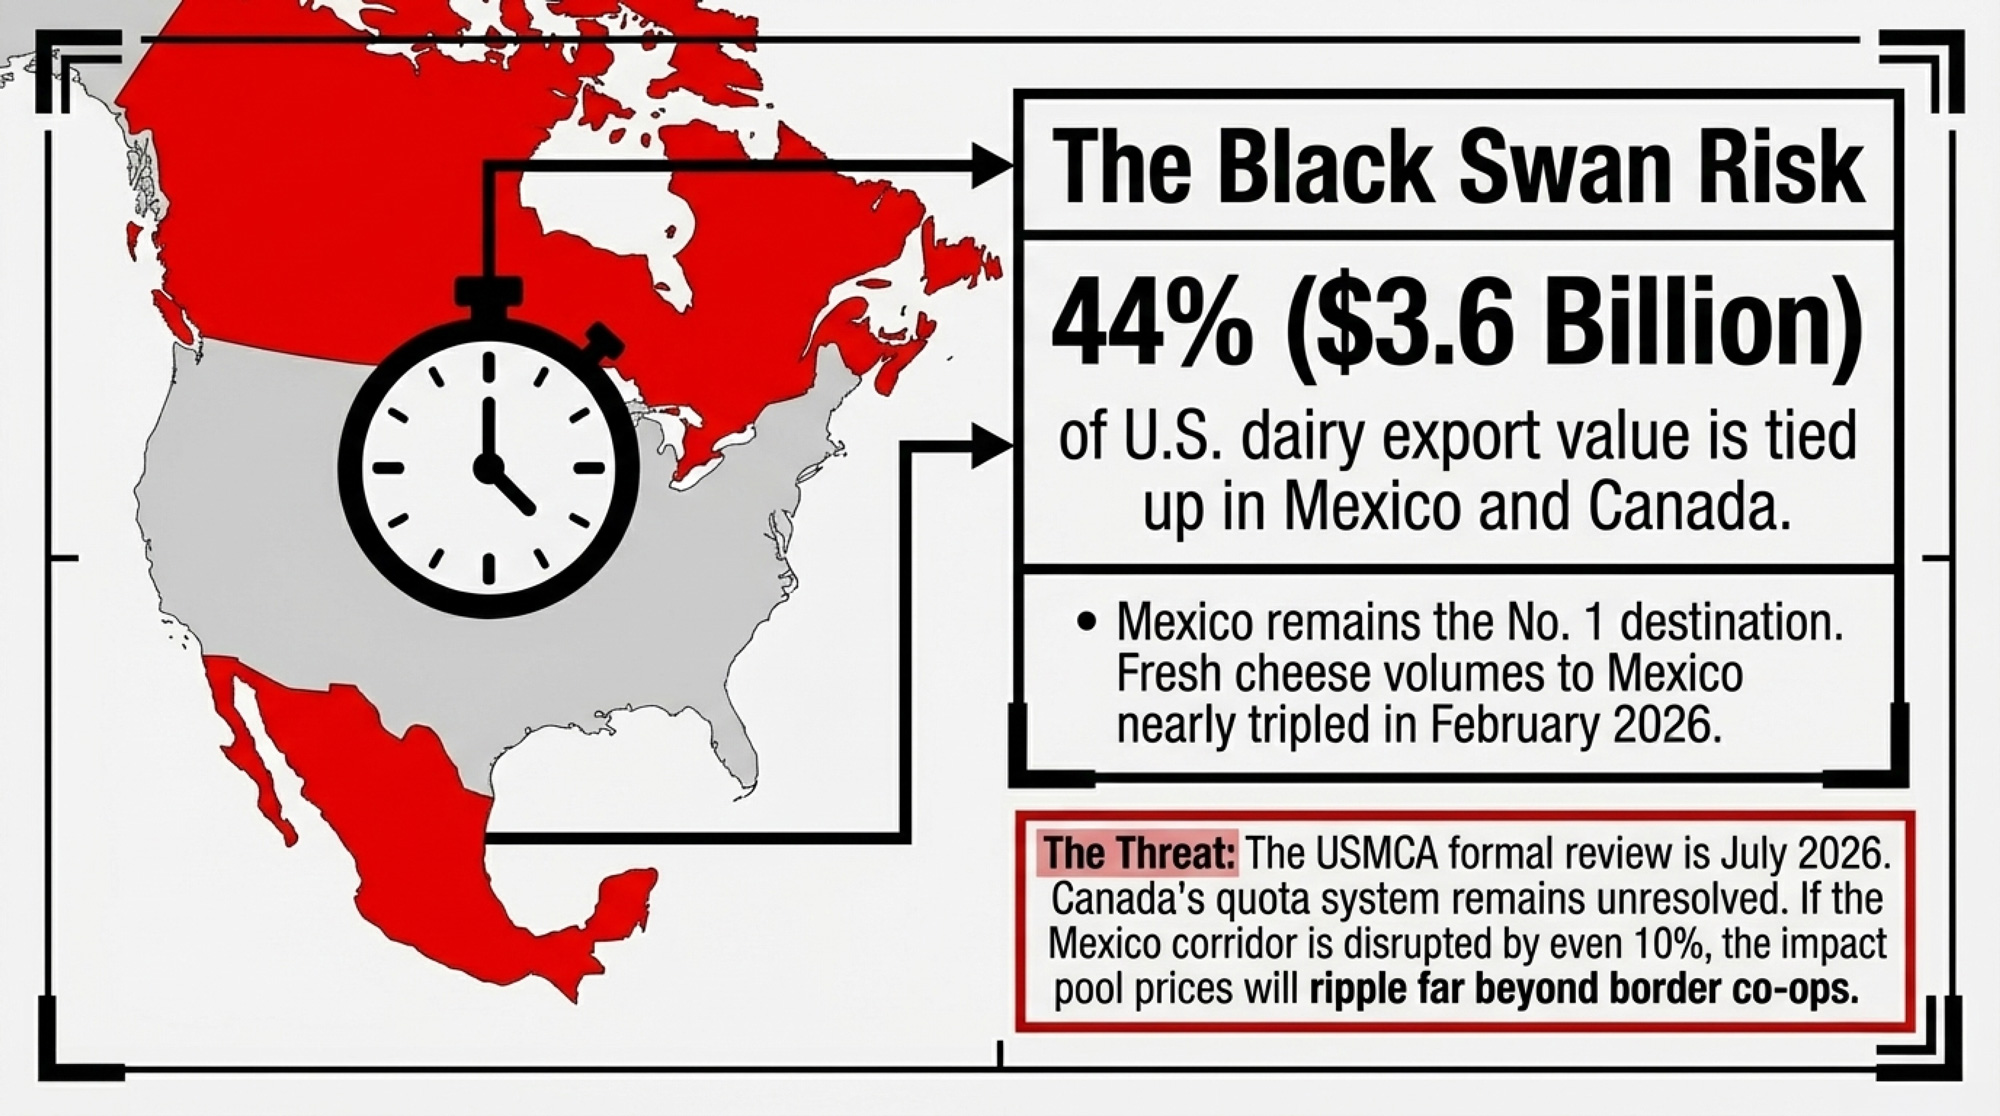
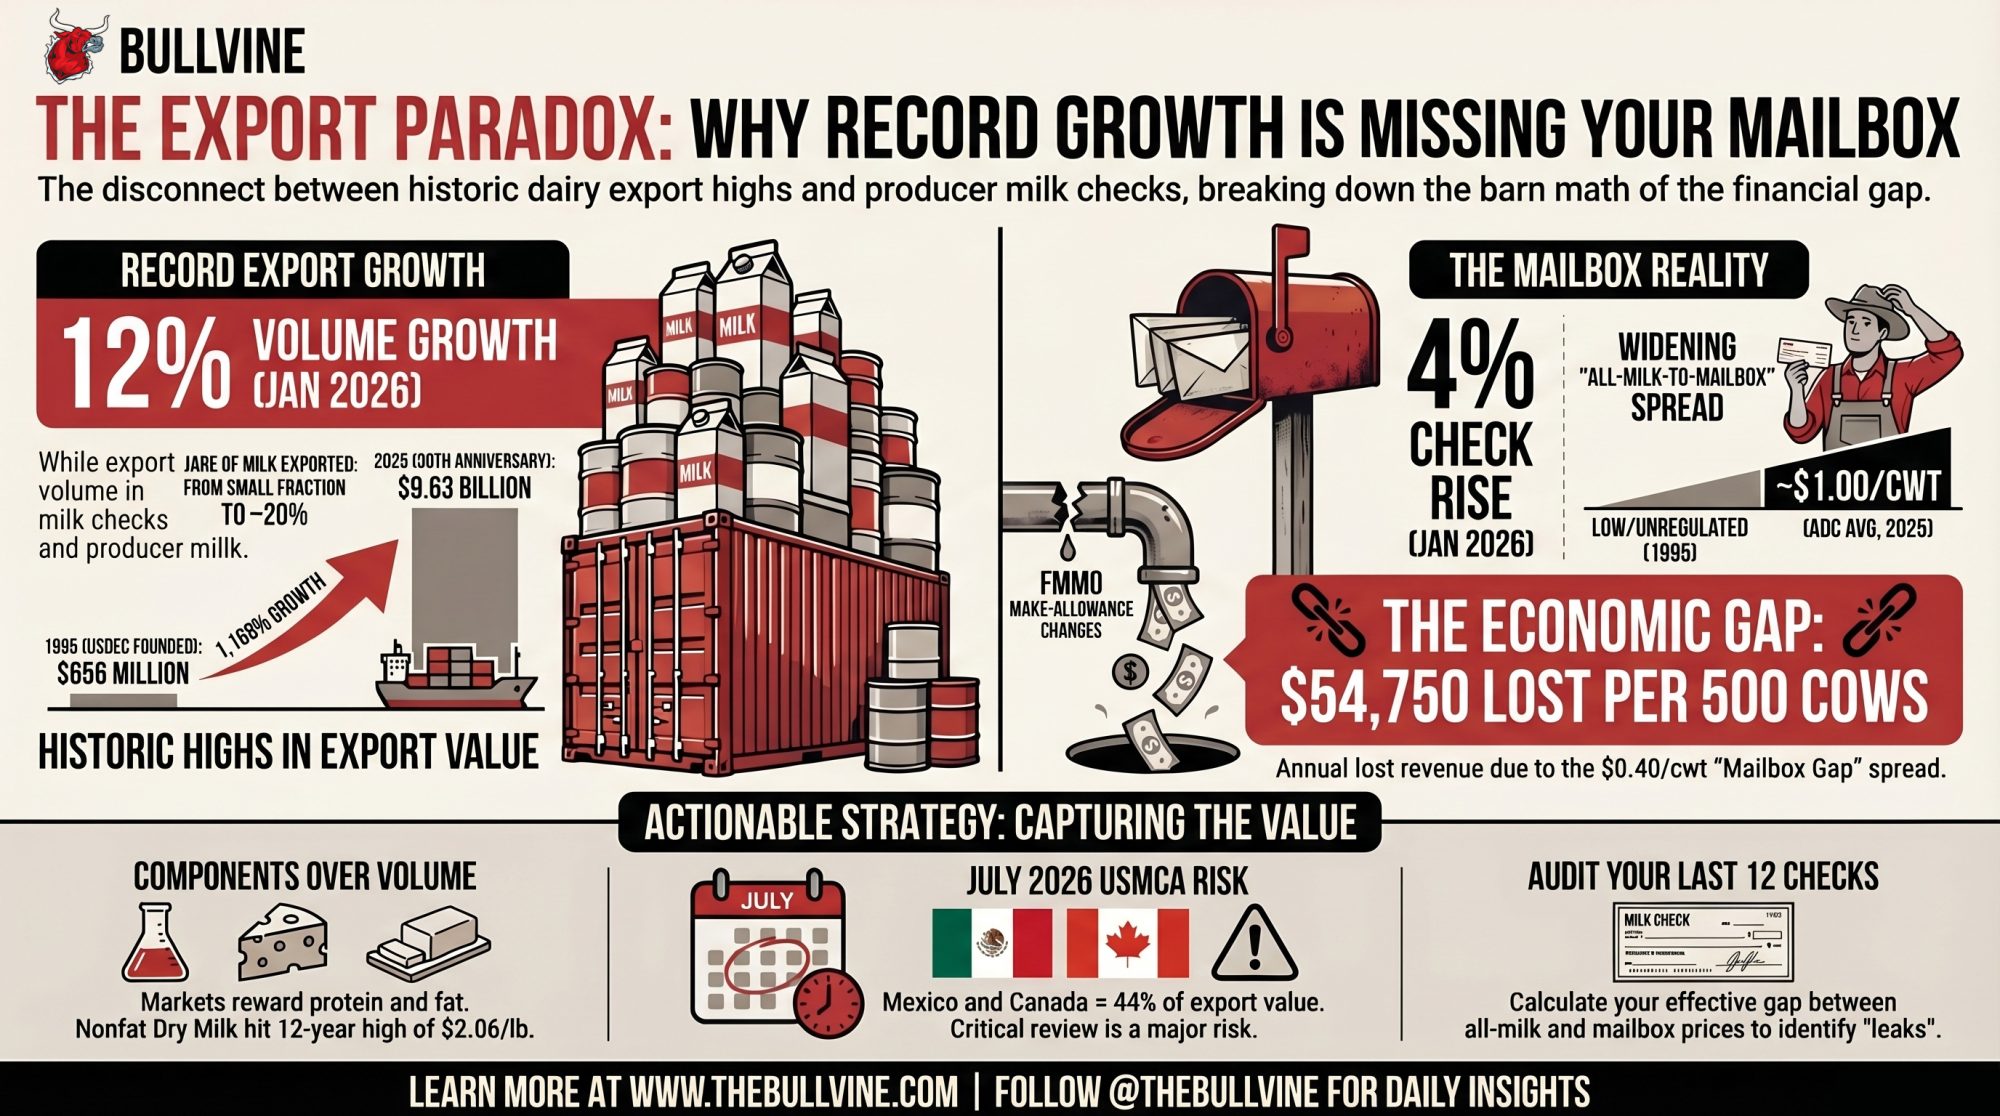
 The Sunday Read Dairy Professionals Don’t Skip.
 The Sunday Read Dairy Professionals Don’t Skip.