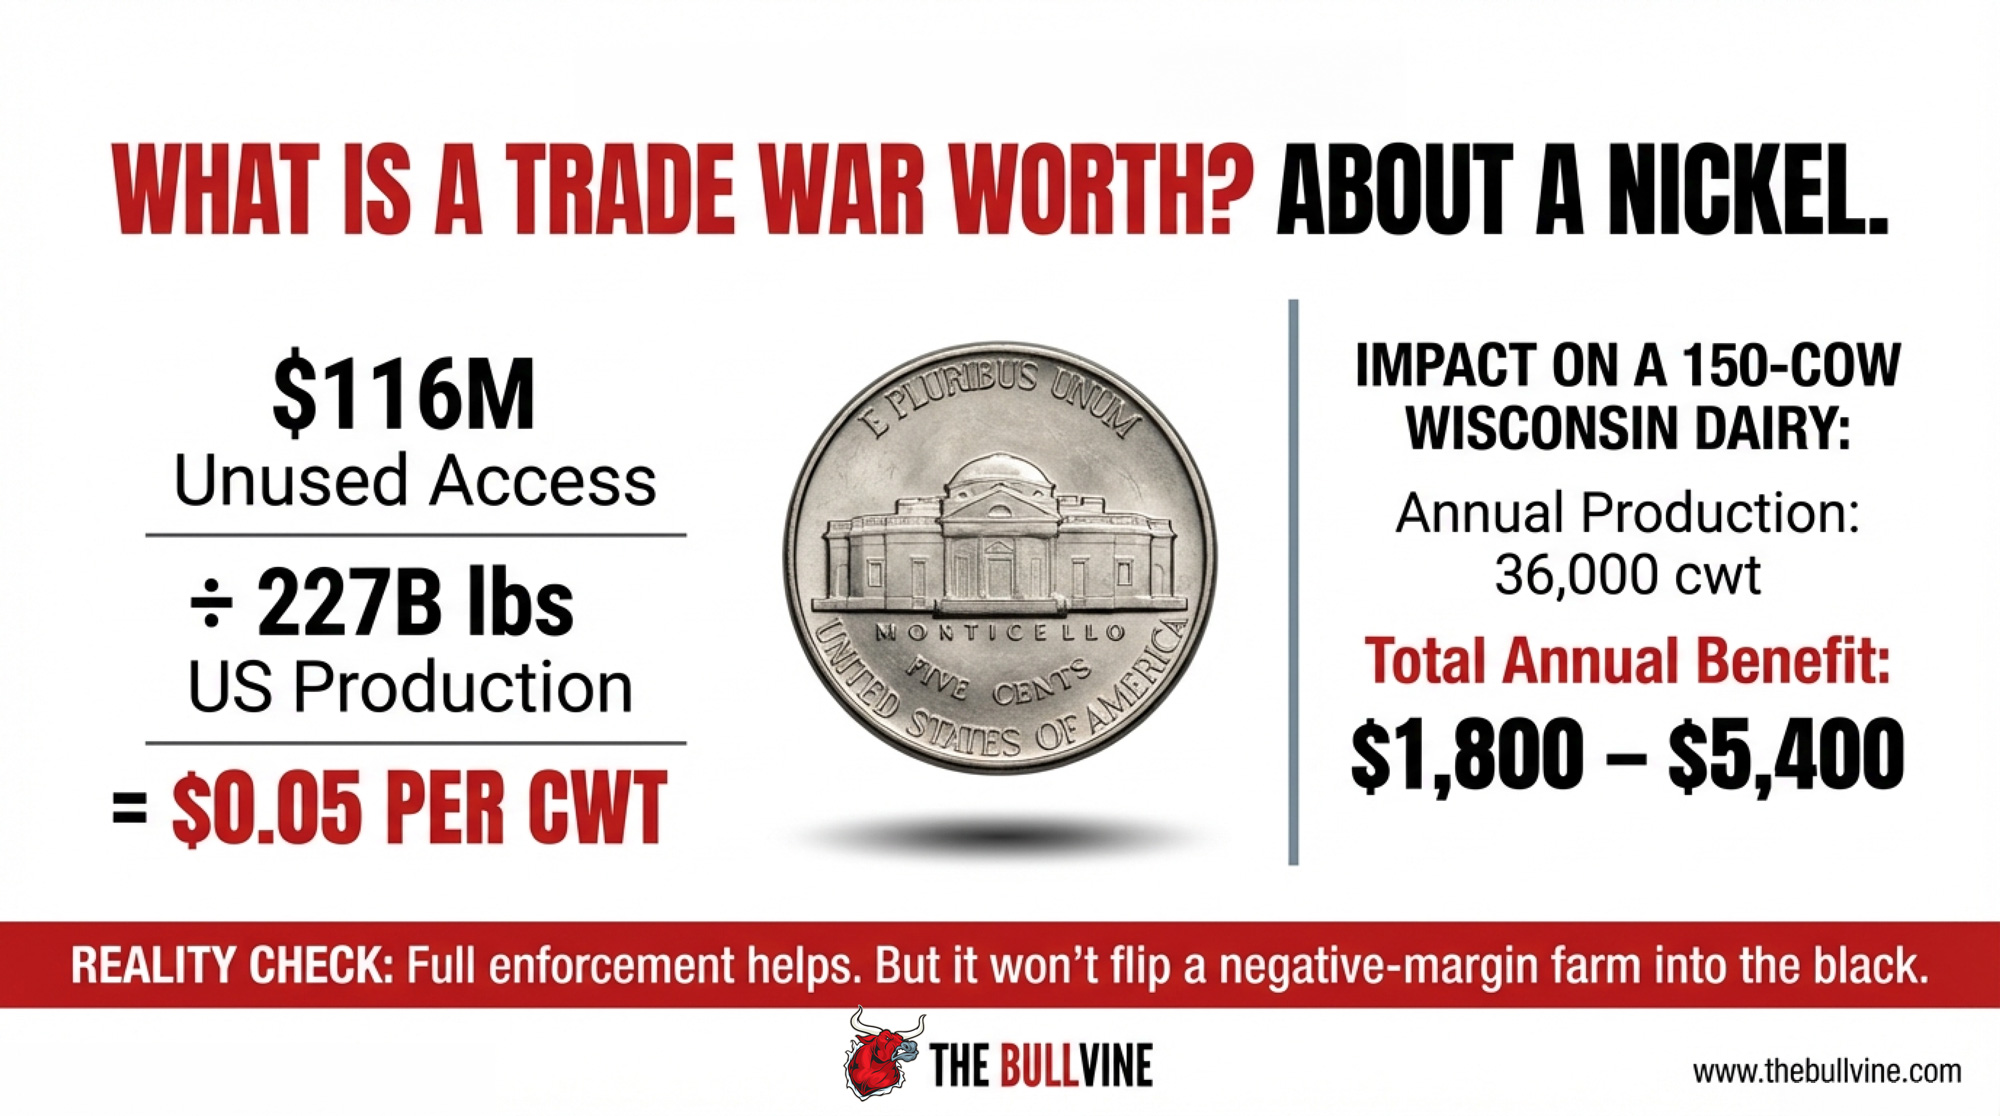
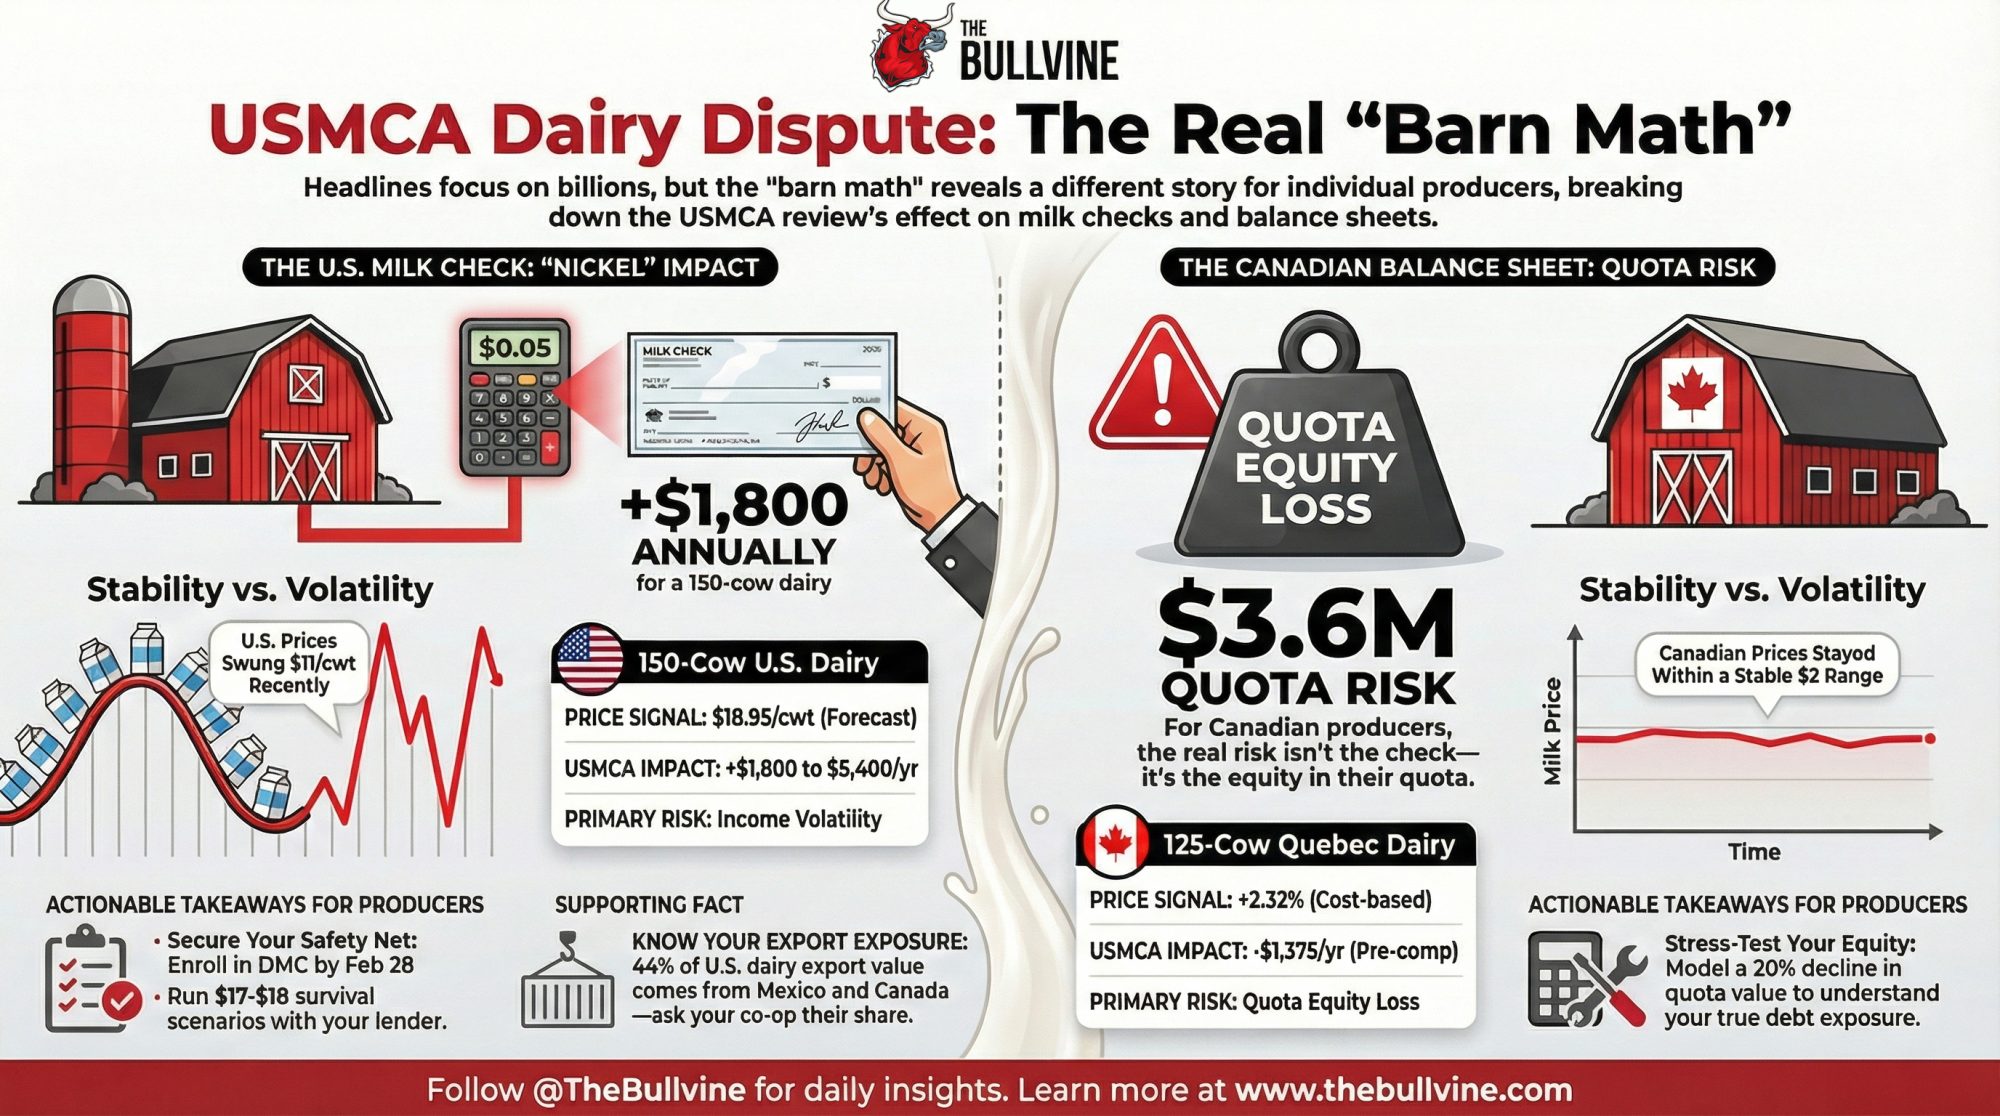
Two USMCA dairy fights are on the table this month. One’s worth about a nickel a cwt. The other swings $170K on a 600-cow herd — and nobody at the table is naming it.
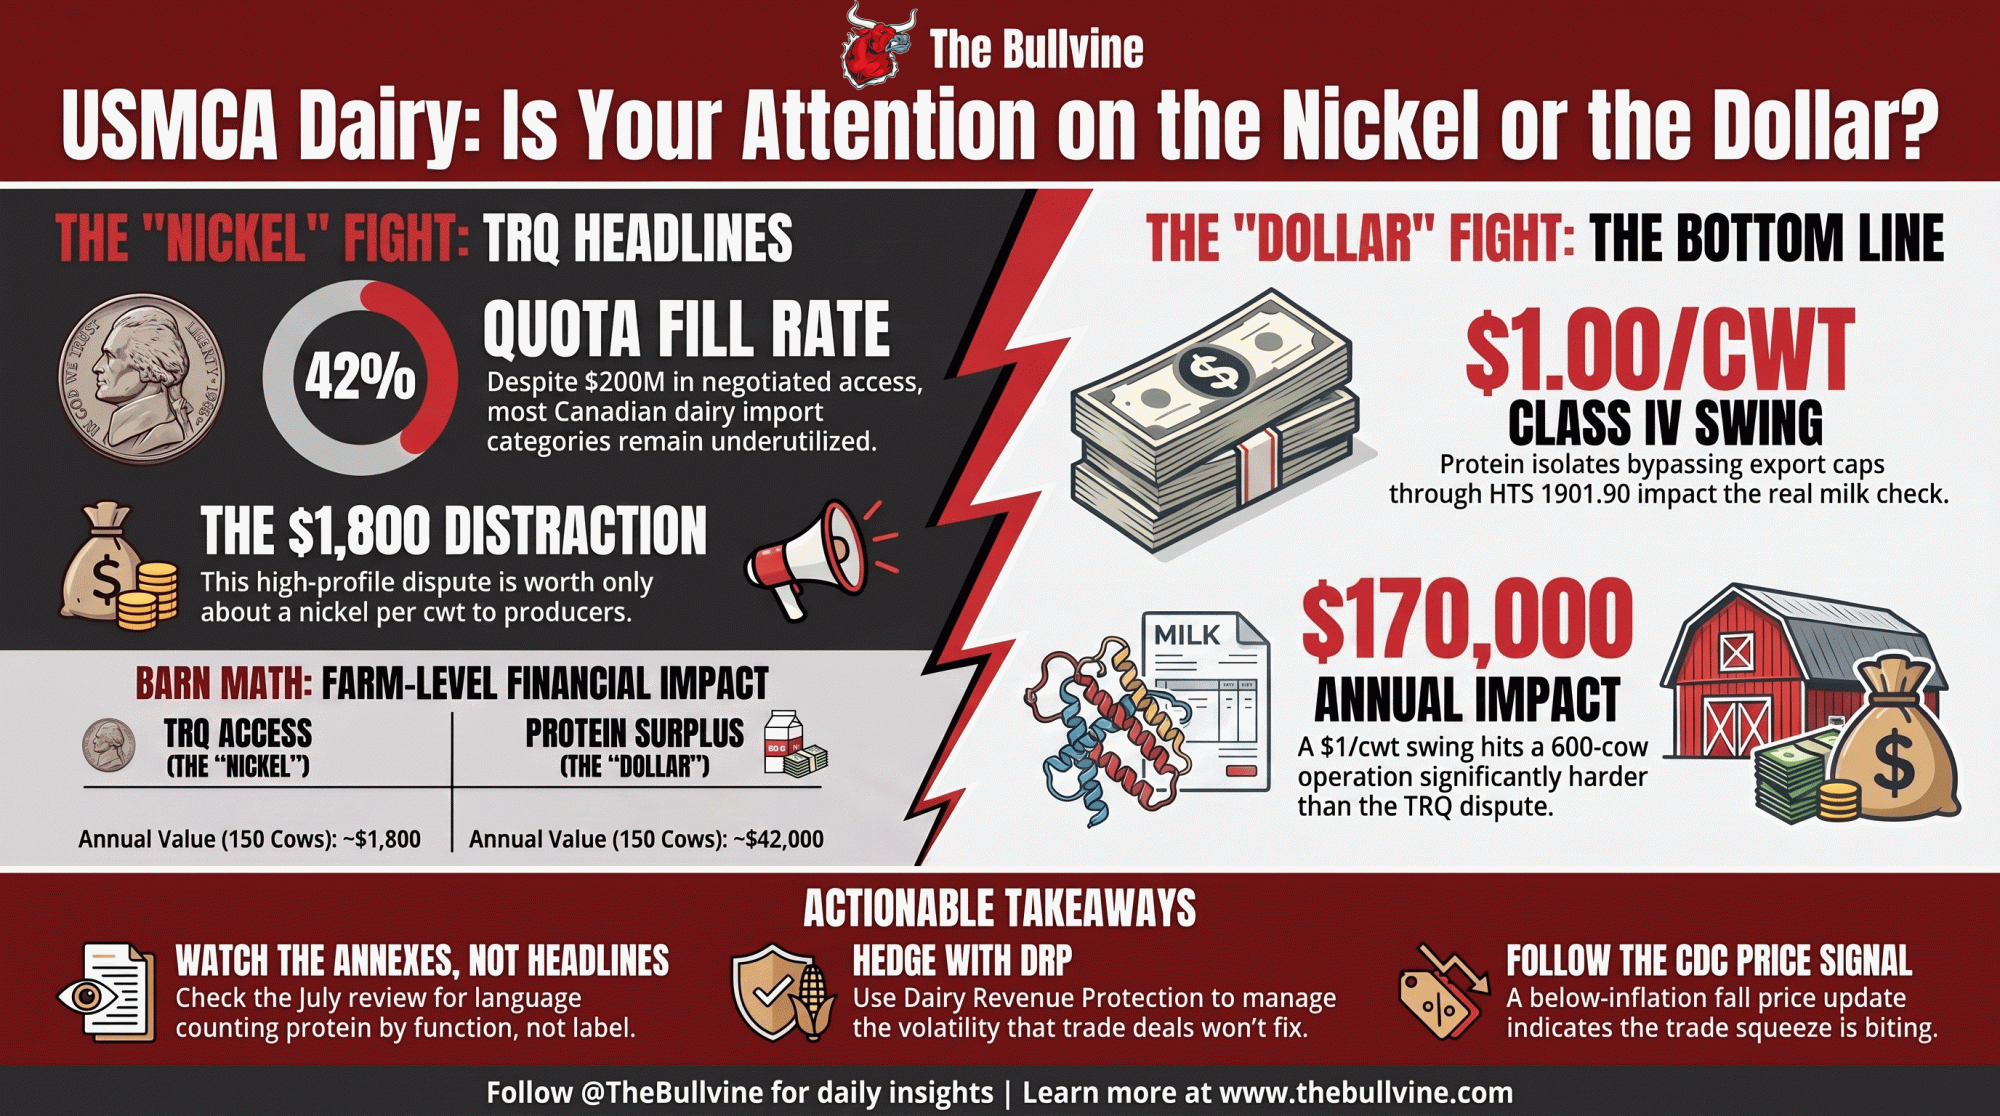
Executive Summary: On July 1, USTR declined to renew USMCA in its current form, reopening the dairy file — and both governments are loudly fighting over the wrong number. Washington wants the $200 million in annual access Canada allegedly never delivered (TRQ fill sits near 42%, with 9 of 14 categories under 50%), but spread across US milk production that’s worth about a nickel a cwt — roughly $1,800 a year on a 150-cow dairy. The fight that actually moves your milk check is the quiet one: Canada’s structural protein surplus moving into the US under uncapped codes like HTS 1901.90, leaning on Class IV. On a 600-cow herd, a $1/cwt Class IV swing is $170,000 a year — and even on a 150-cow herd it’s about $42,000, still an order of magnitude past the TRQ nickel. US Class IV shippers should read the cap annex language, not the fill-rate headlines, when the July round drops; Canadian producers sitting on ~CA$2.5M in quota equity behind Bill C-202 should watch the CDC’s fall price signal. The number to watch isn’t 42% — it’s whether the new text counts protein by what it does, not what the label says.
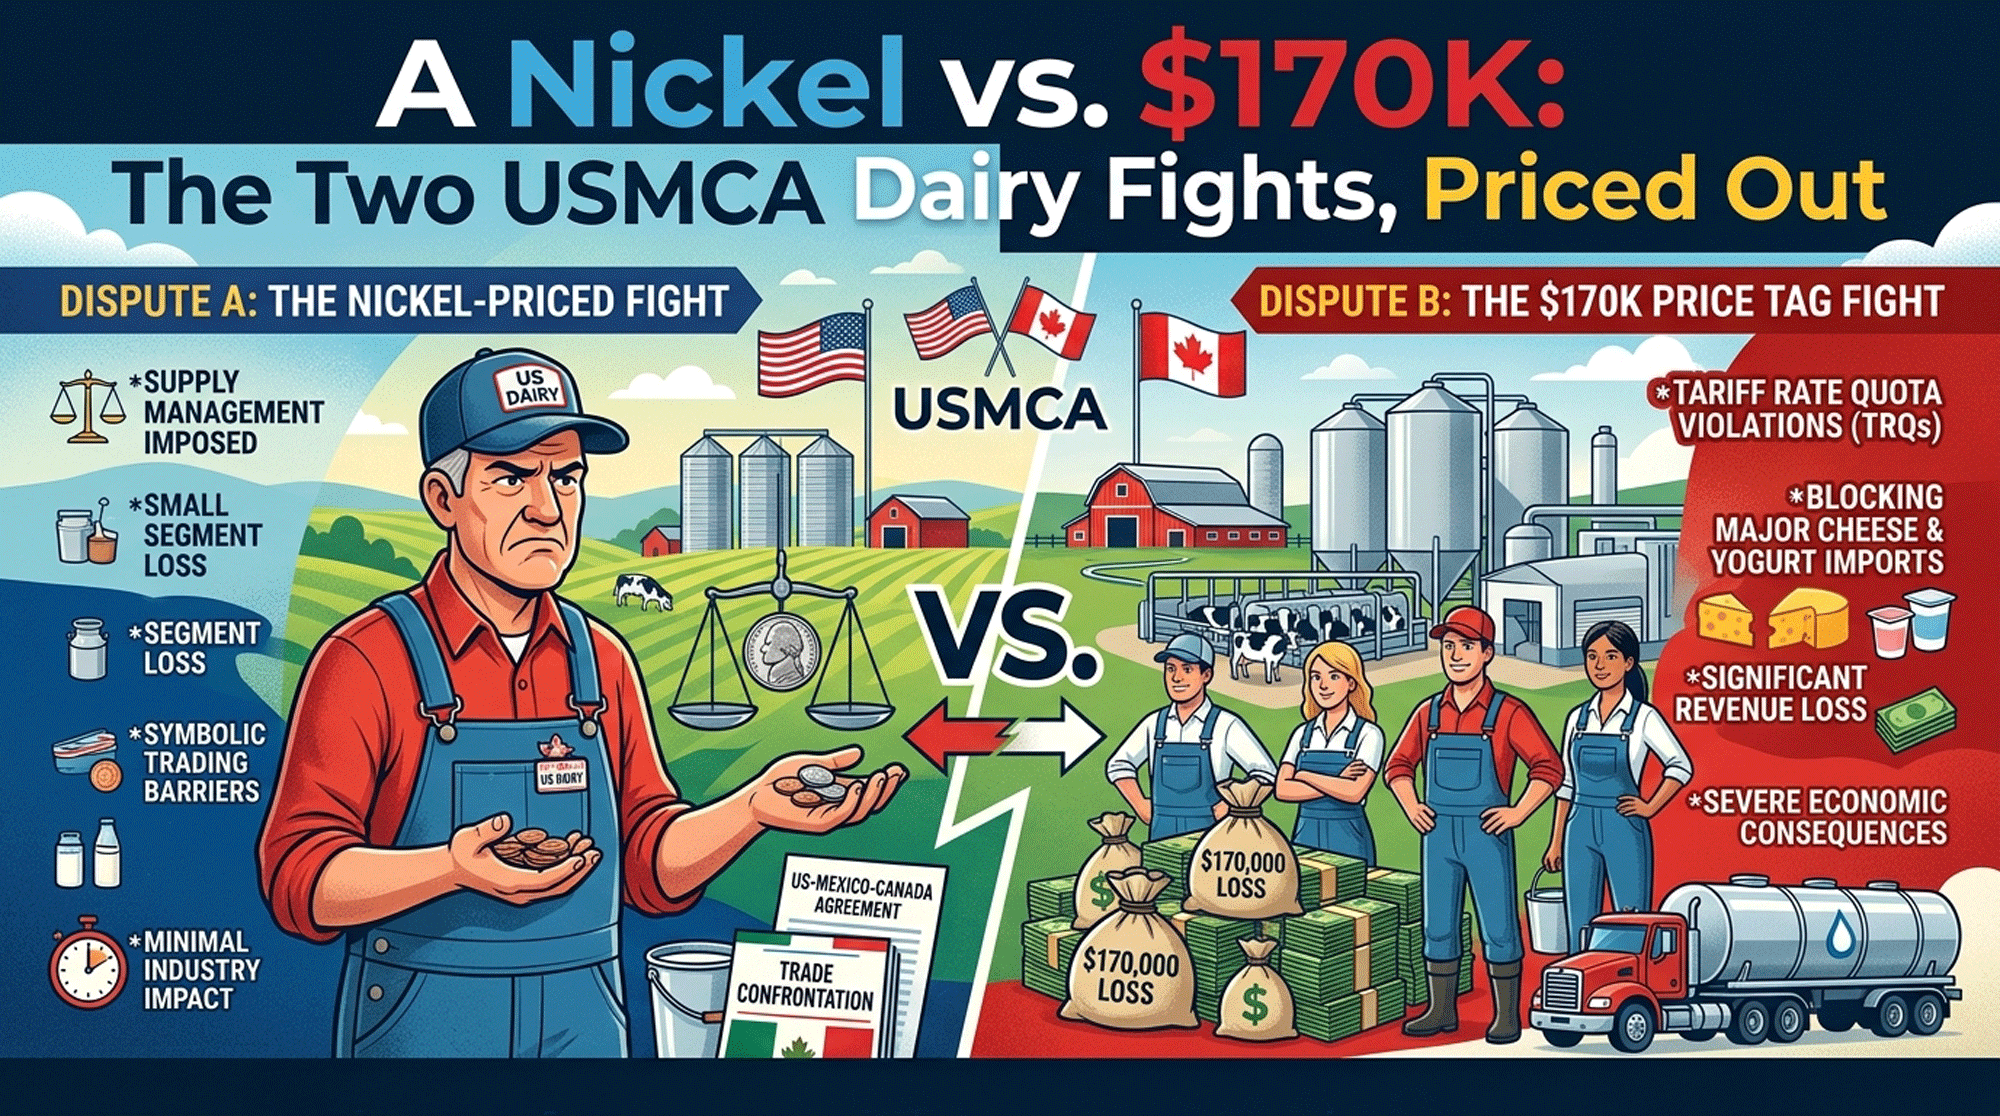
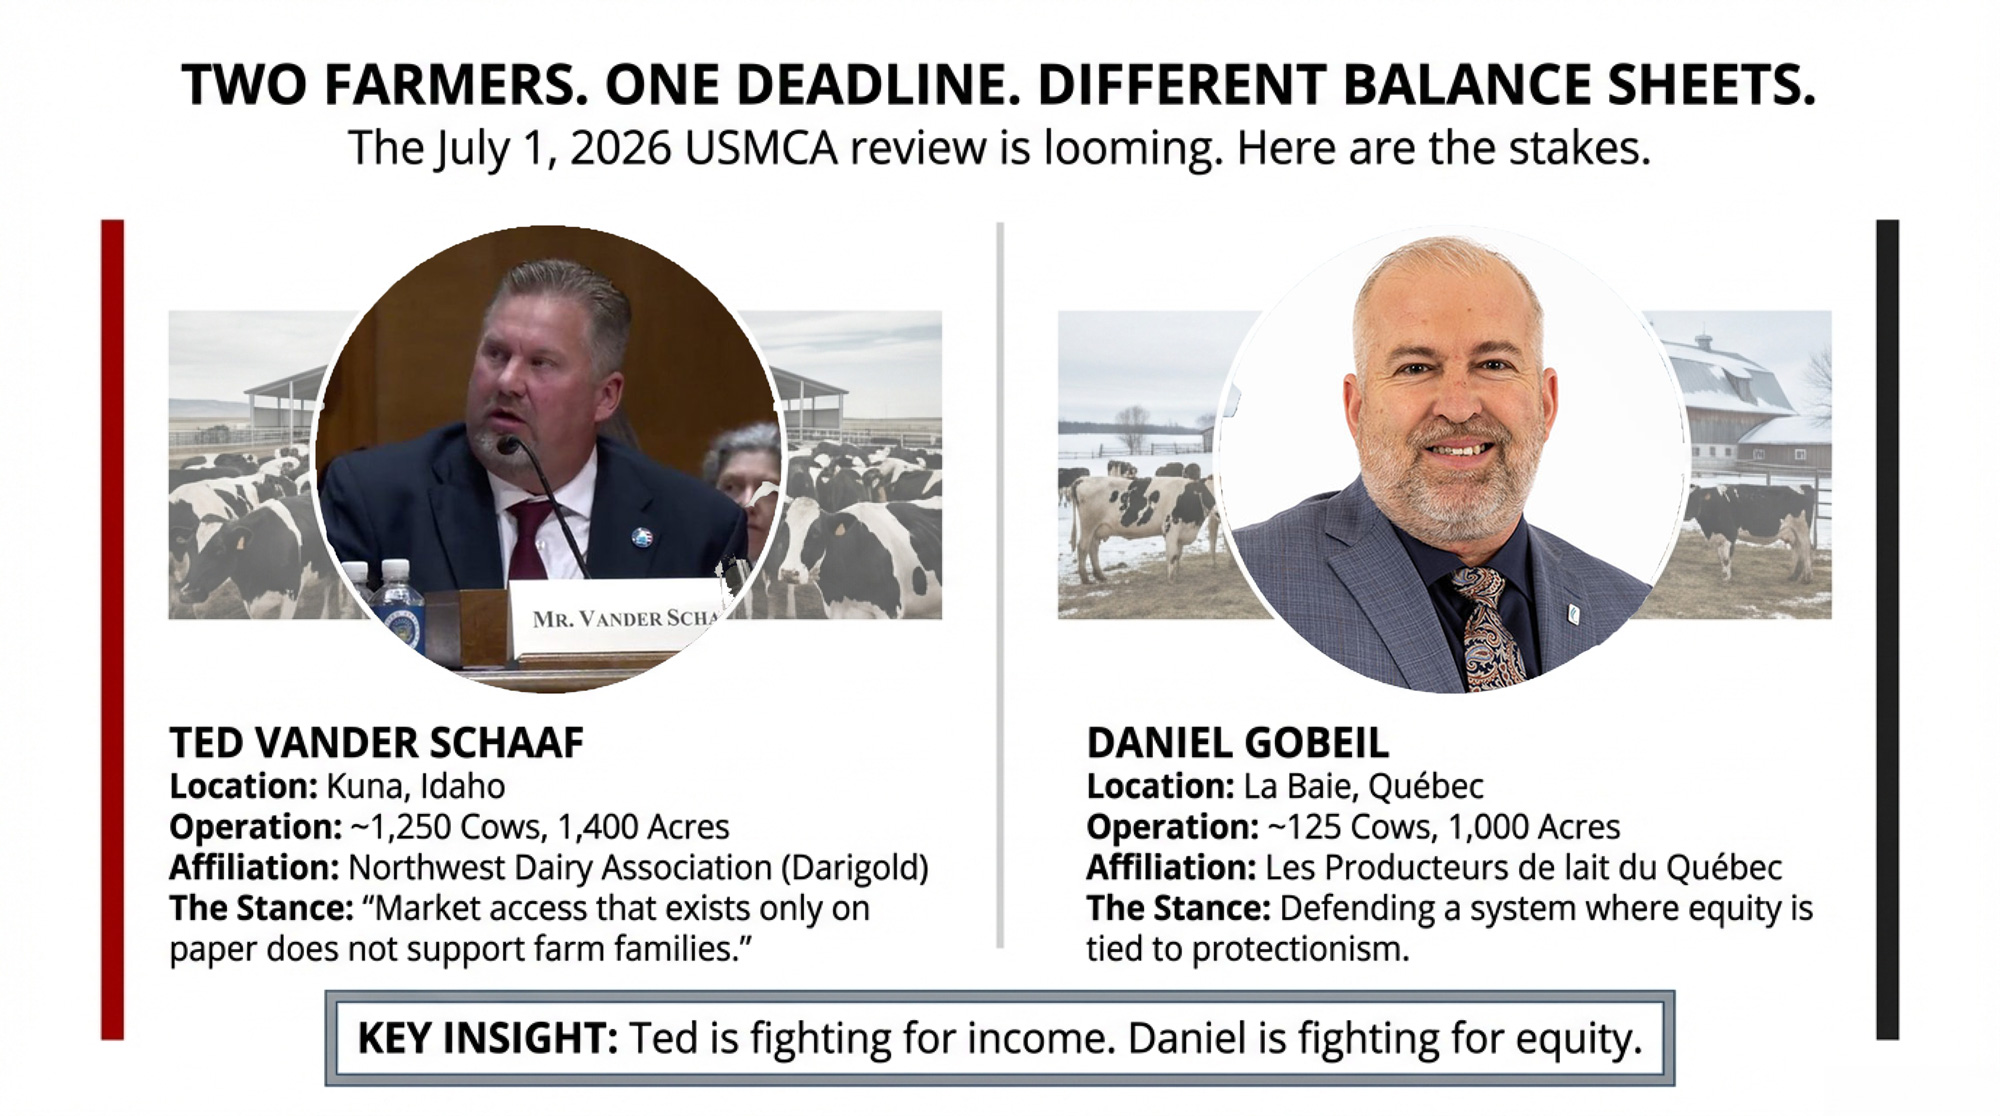
On February 12, 2026, Ted Vander Schaaf sat in front of the U.S. Senate Finance Committee and made the case that Canada isn’t delivering the dairy market access it promised under USMCA. Vander Schaaf milks about 1,250 Holsteins in Idaho and is a member-owner of Northwest Dairy Association, the co-op behind Darigold — so the outcome hits his own milk check. USMCA promised American dairy roughly US$200 million a year in new tariff-free access into Canada. Six years in, most of that access sits unused. That’s the fight you’ll see in every headline about the July review.
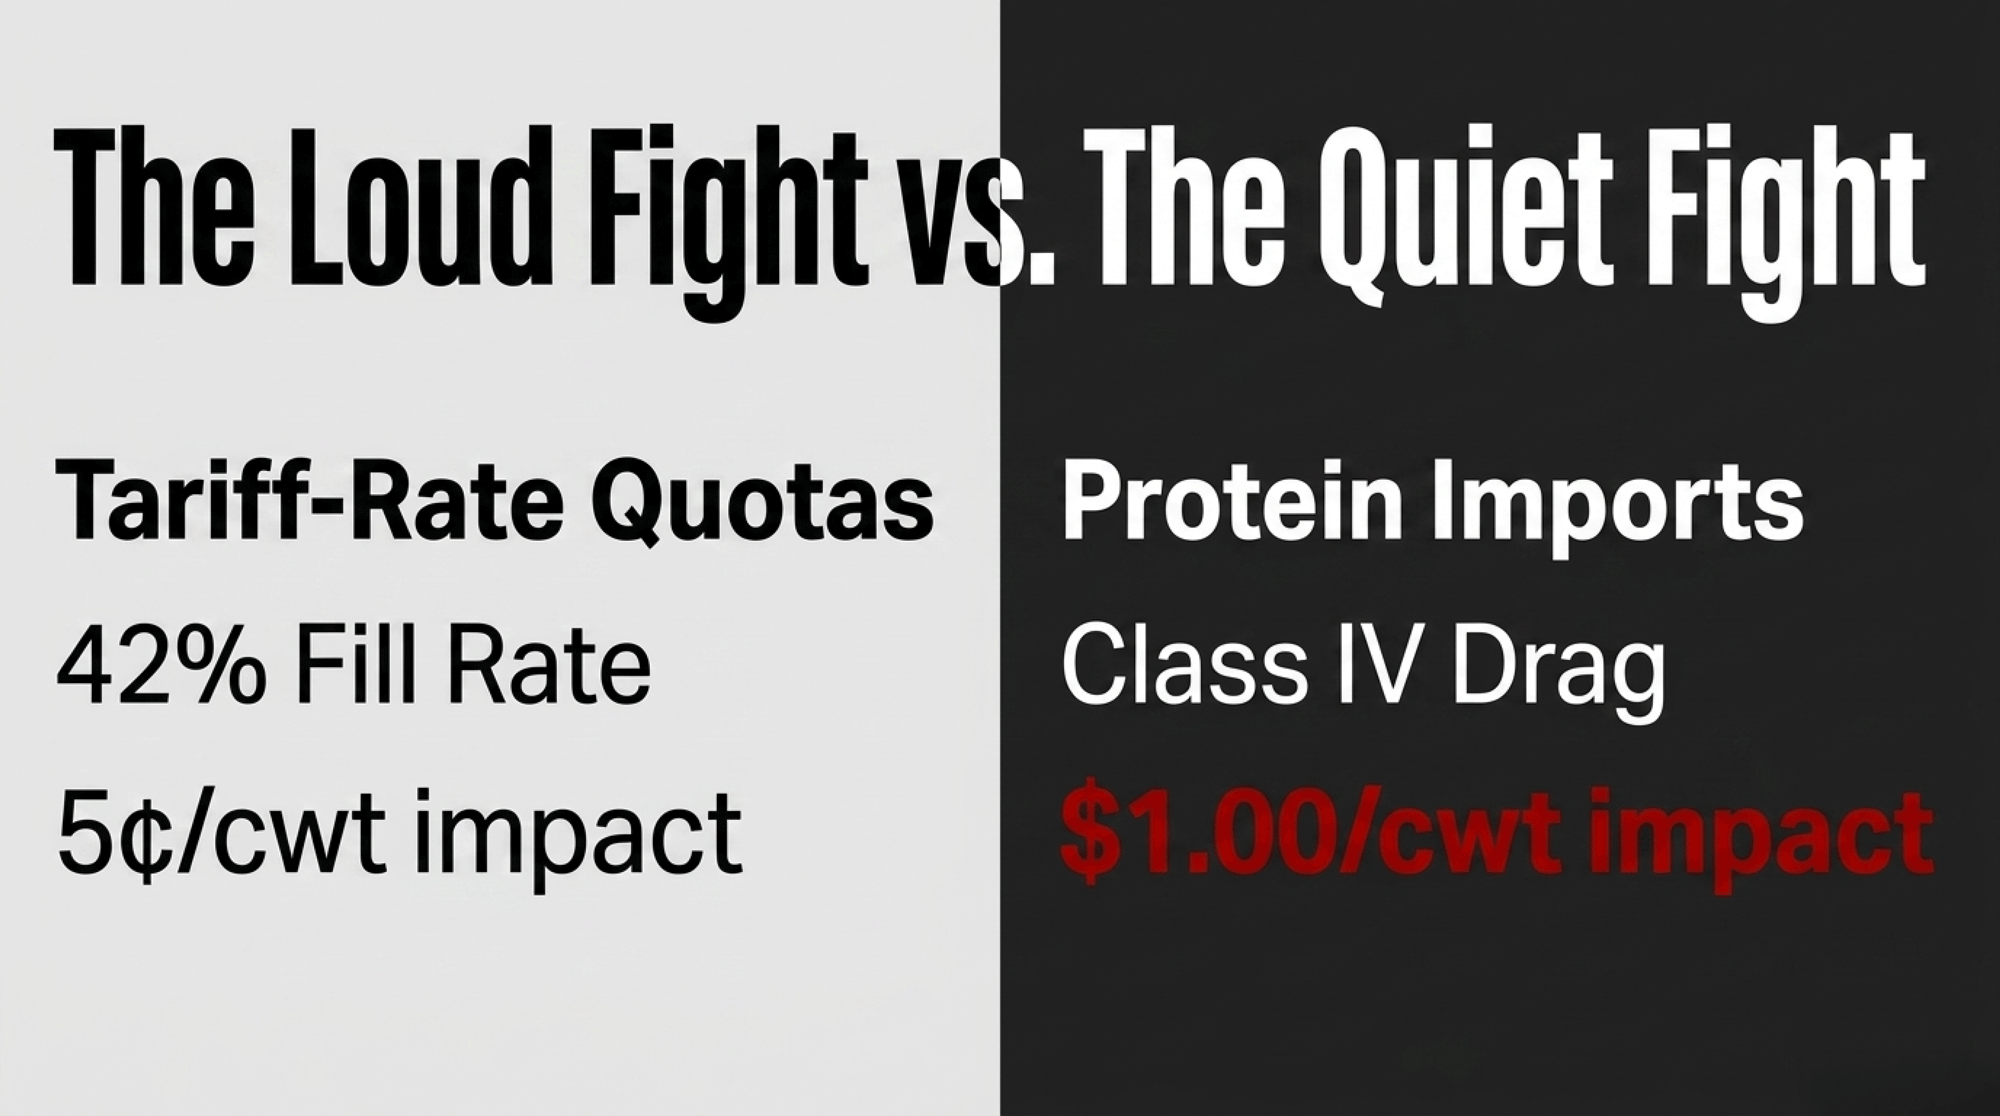
Here’s the part nobody puts on the podium. Divide that full $200 million across the 231.7 billion pounds of milk the U.S. produced in 2025, and you get about 8.6 cents a hundredweight — and that’s the gross headline figure, the whole tariff benefit if every dollar of it reached the farm. It doesn’t. That $200 million is processor-and-exporter margin at the border; the slice that flows back to producer milk checks, after processing, freight, and the fact that barely 42% of the quota even fills, realistically lands near a nickel a cwt — roughly $1,800 a year on a 150-cow dairy. It’s real money. It’s just not the money that decides whether your barn pencils out. The fight that actually moves your milk price is quieter, buried in a tariff code, and almost nobody’s naming it (Federal Milk Marketing Order data).
What’s Changing and Why
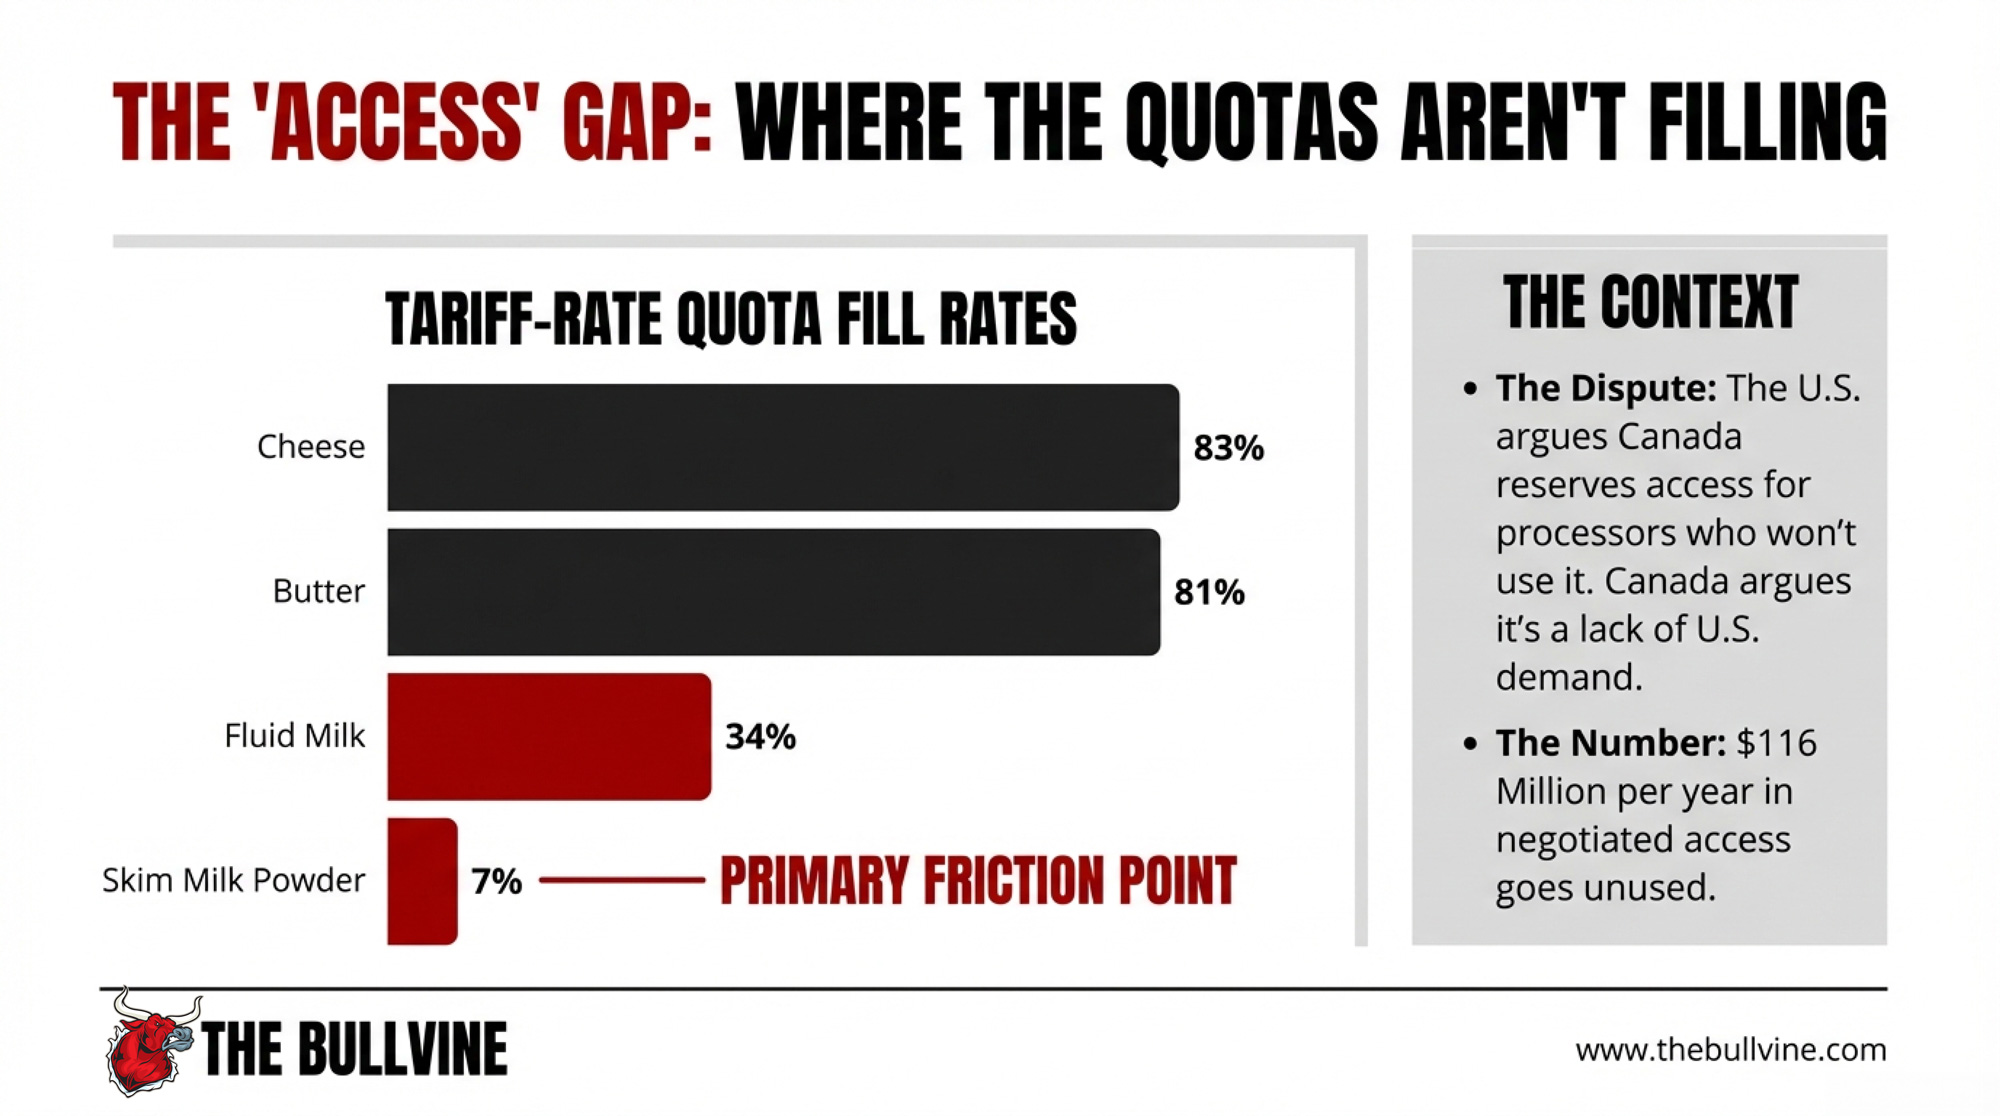
On July 1, 2026, USMCA hit its first mandatory joint review — and the U.S. Trade Representative confirmed Washington “did not agree to renew the USMCA in its current form,” though the agreement stays in force while talks continue. Within hours, U.S. dairy groups accused Canada of ignoring its commitments, Canada said it’s holding up its end, and another negotiating round got scheduled for this month. The flashpoint is Canada’s tariff-rate quotas — the TRQs. USMCA handed U.S. dairy 14 separate TRQ categories, each a set tonnage of milk, cream, cheese, or powder that can cross the border duty-free.
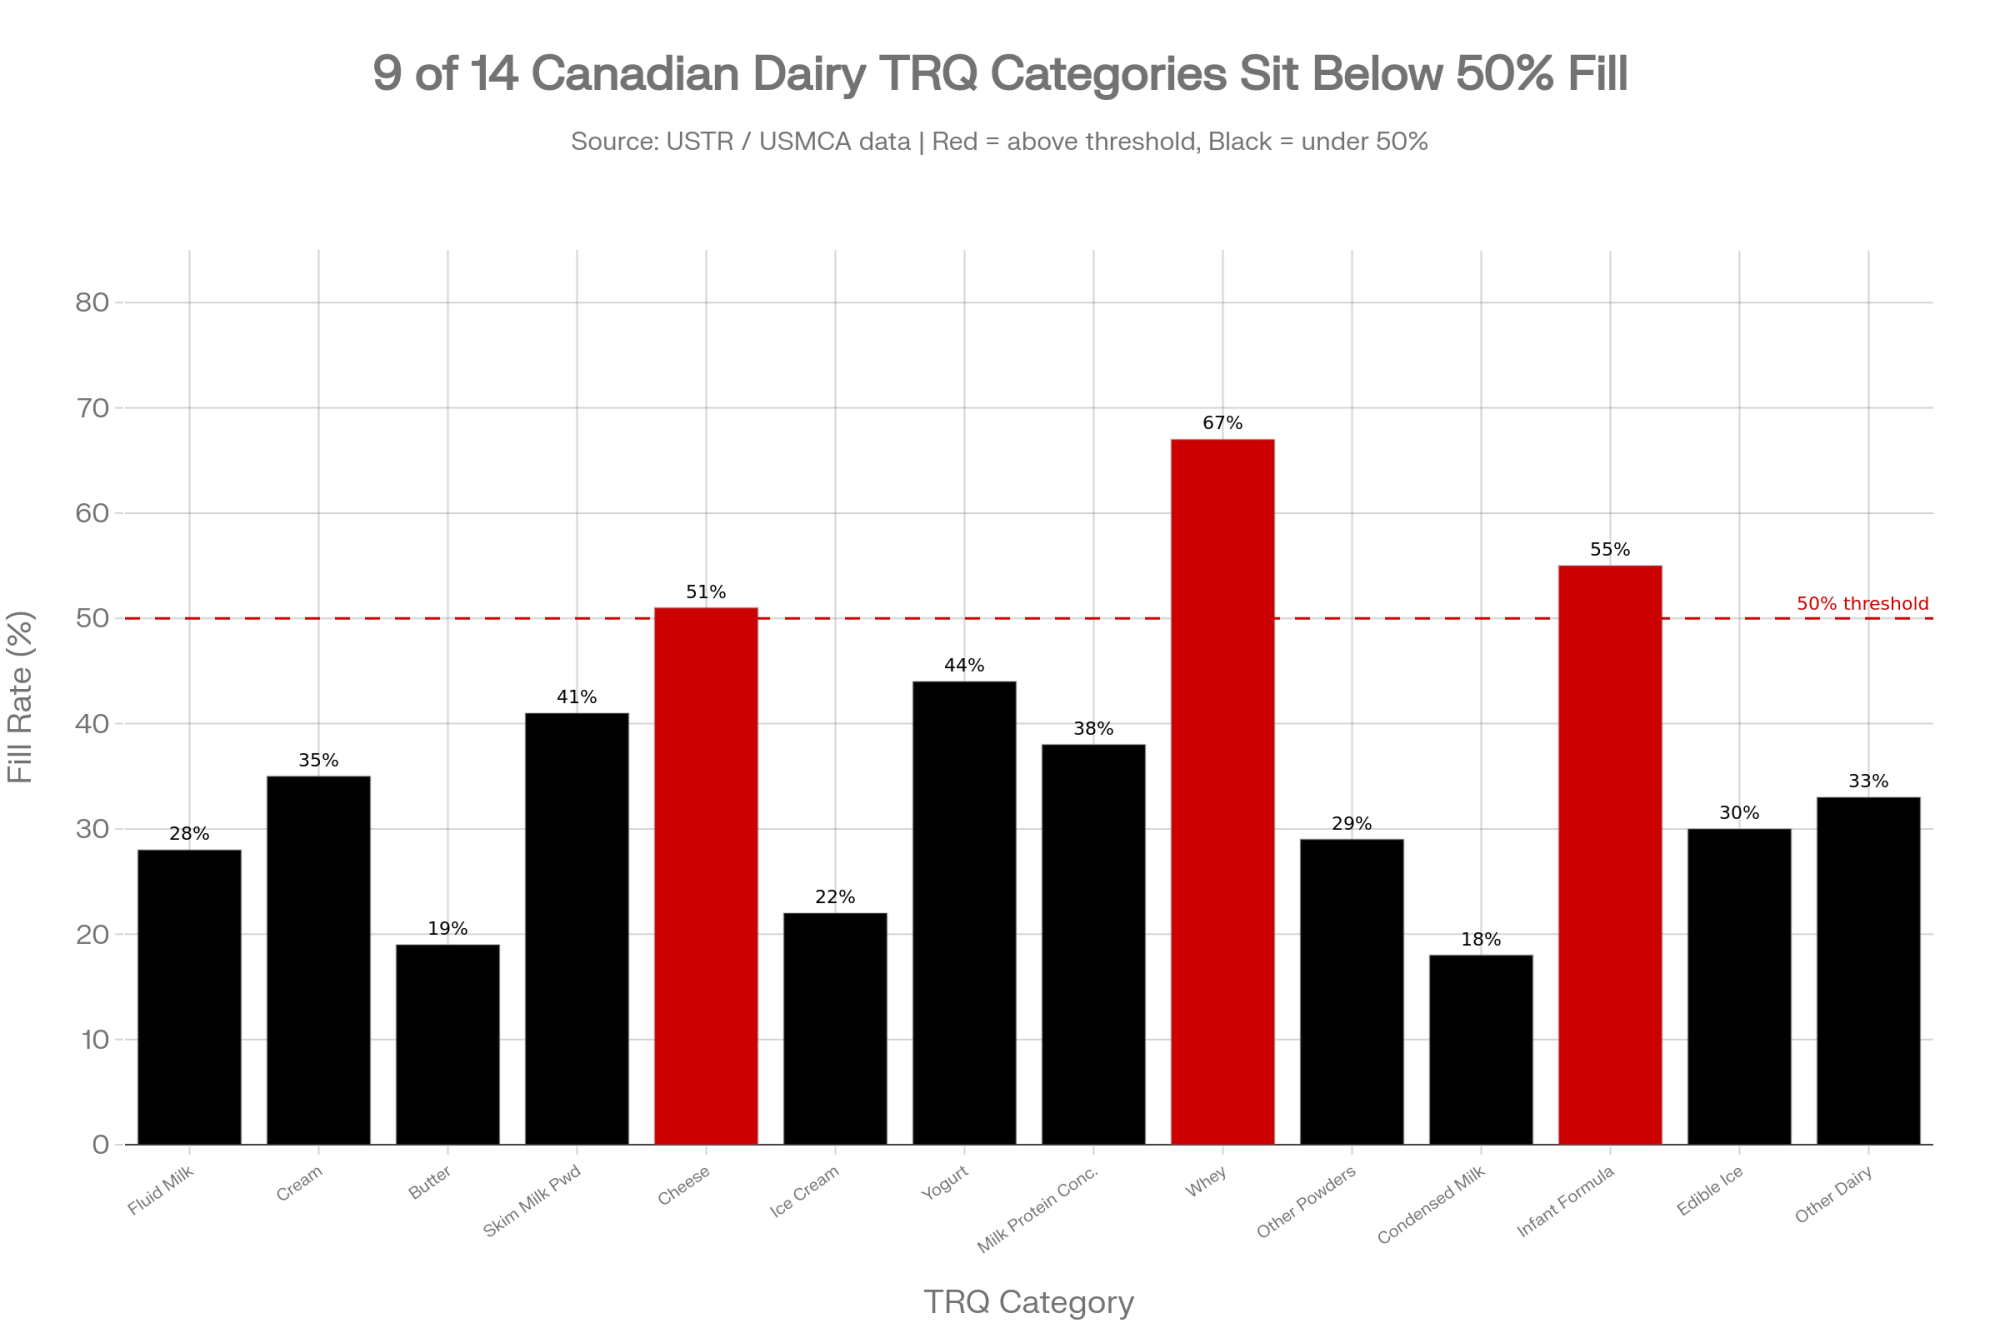
The catch is that those quotas barely get used. U.S. exporters have filled about 42% of their allocated Canadian dairy quotas since the deal took effect, with 9 of the 14 categories sitting under 50%. The U.S. argument: Canada hands most of the import licenses to its own processors, who’ve got no reason to bring in competing American product. Canada’s counter is that trade is growing fine — total U.S. dairy exports to Canada climbed to US$1.31 billion in 2025, up 78% since 2020. Keep those two numbers apart, because the debate constantly blurs them: the $1.31 billion is total two-way sales, most of it flowing through channels that never existed in the TRQ fight; the $200 million is the new, negotiated access USMCA was supposed to open on top of it. Trade grew. The specific quotas Americans bargained for still don’t fill.
So the U.S. did what you do when you think a deal’s been broken. It went to dispute settlement — twice. It won the first panel in January 2022, which found Canada had breached the agreement by reserving TRQ pools exclusively for processors. Canada rewrote its rules. A second panel in November 2023 ruled 2-1 that the rewrite didn’t violate USMCA, with one panelist dissenting that Canada’s narrow eligibility rules still shut out importers who’d bring retail-ready American product to Canadian shelves. Two rounds of litigation. One win each. And the fill rate barely moved. As UC Davis economists put it, the dispute is “mainly the result of politics, and the economic benefits at issue are relatively small” (International Trade Insights).
How This Plays Out on Real Farms
Now the quiet fight — the one with real dollars behind it.
Canada’s supply management sets milk production to match domestic butterfat demand. Produce milk for its fat, though, and you generate a pile of leftover protein and skim solids. A U.S. International Trade Commission report released in late May 2026 said it plainly: Canada’s quota system creates “a domestic structural surplus of nonfat milk solids components,” and its pricing “unlinks its relatively high farmgate price of milk from the price that processors pay for milk components” through regulated “price discrimination”. In plain terms, Canadian processors can buy that surplus protein at prices below the regulated farmgate value and move it into export channels (U.S. Dairy Export Council).
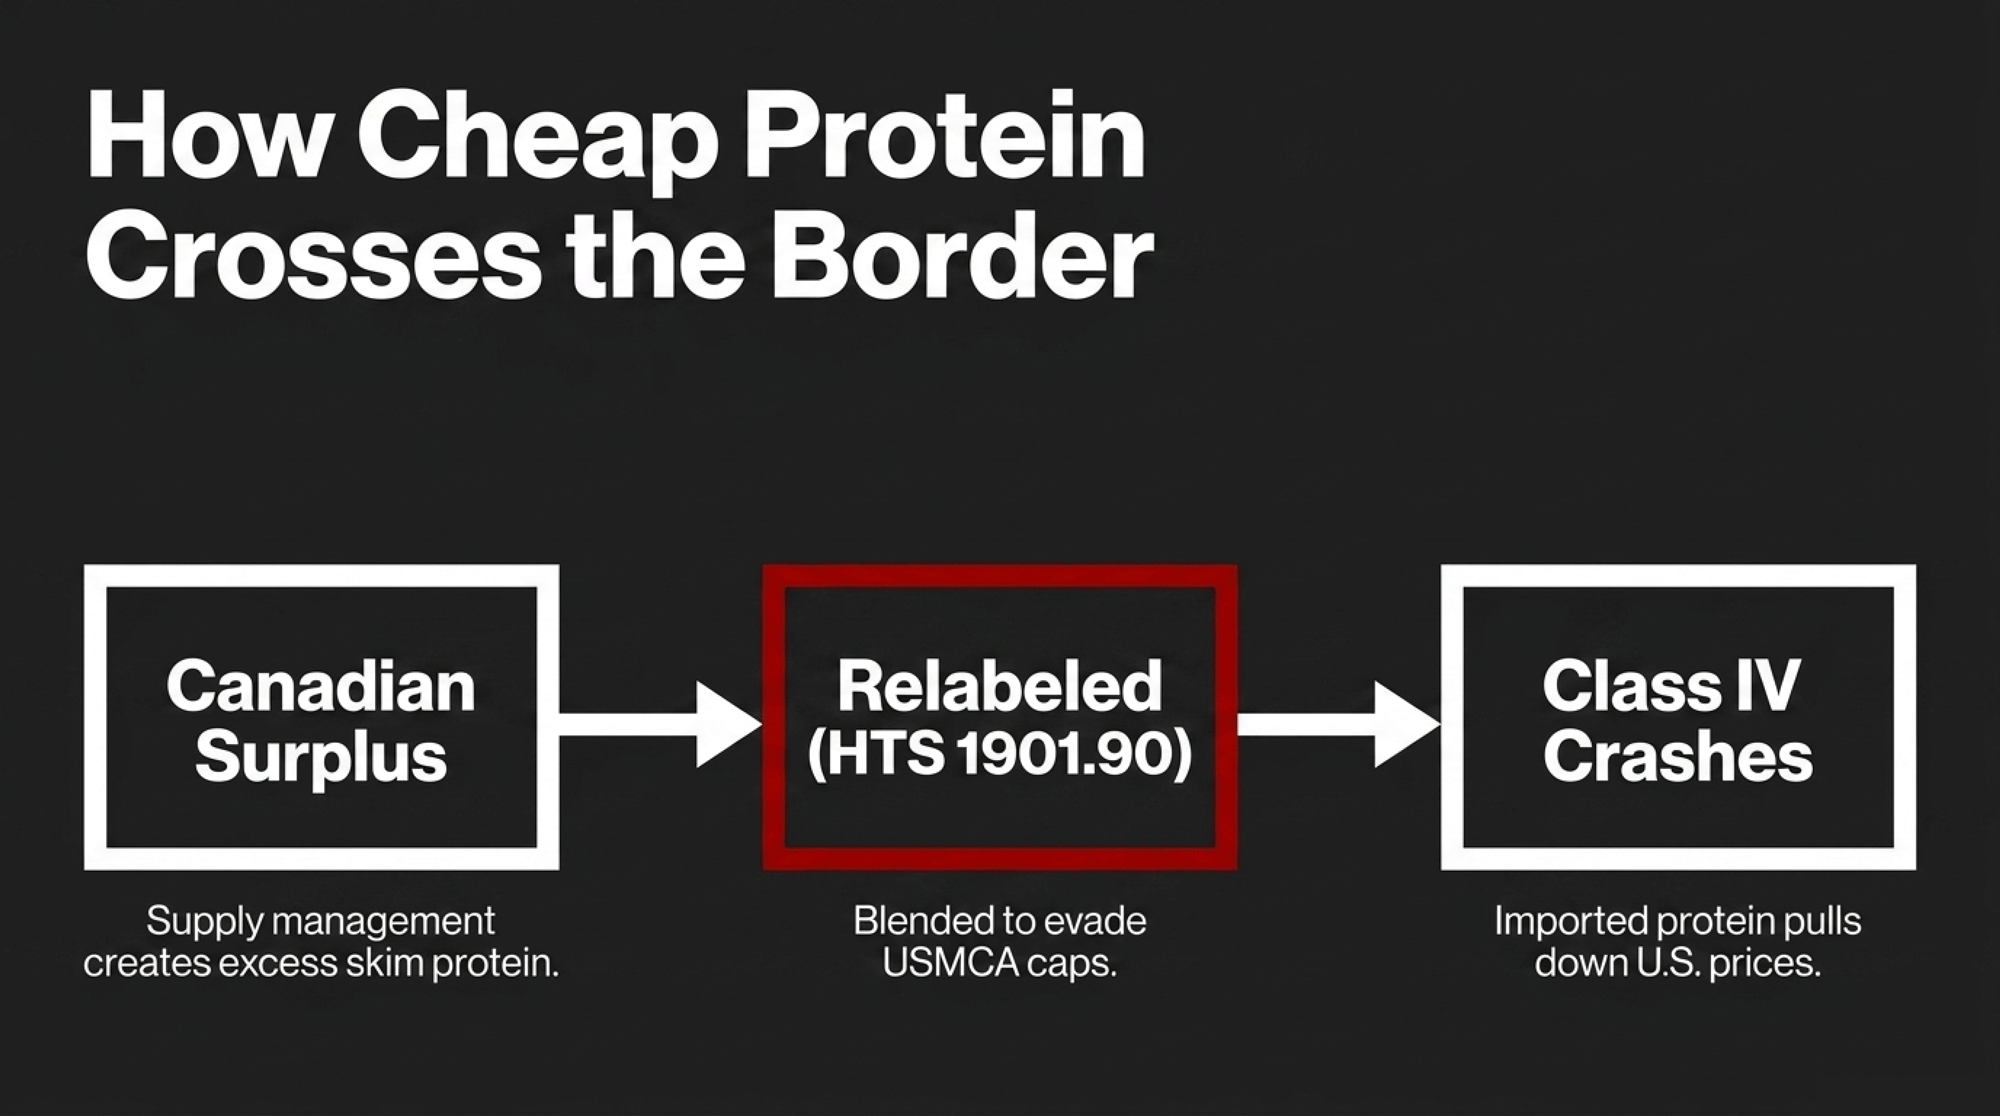
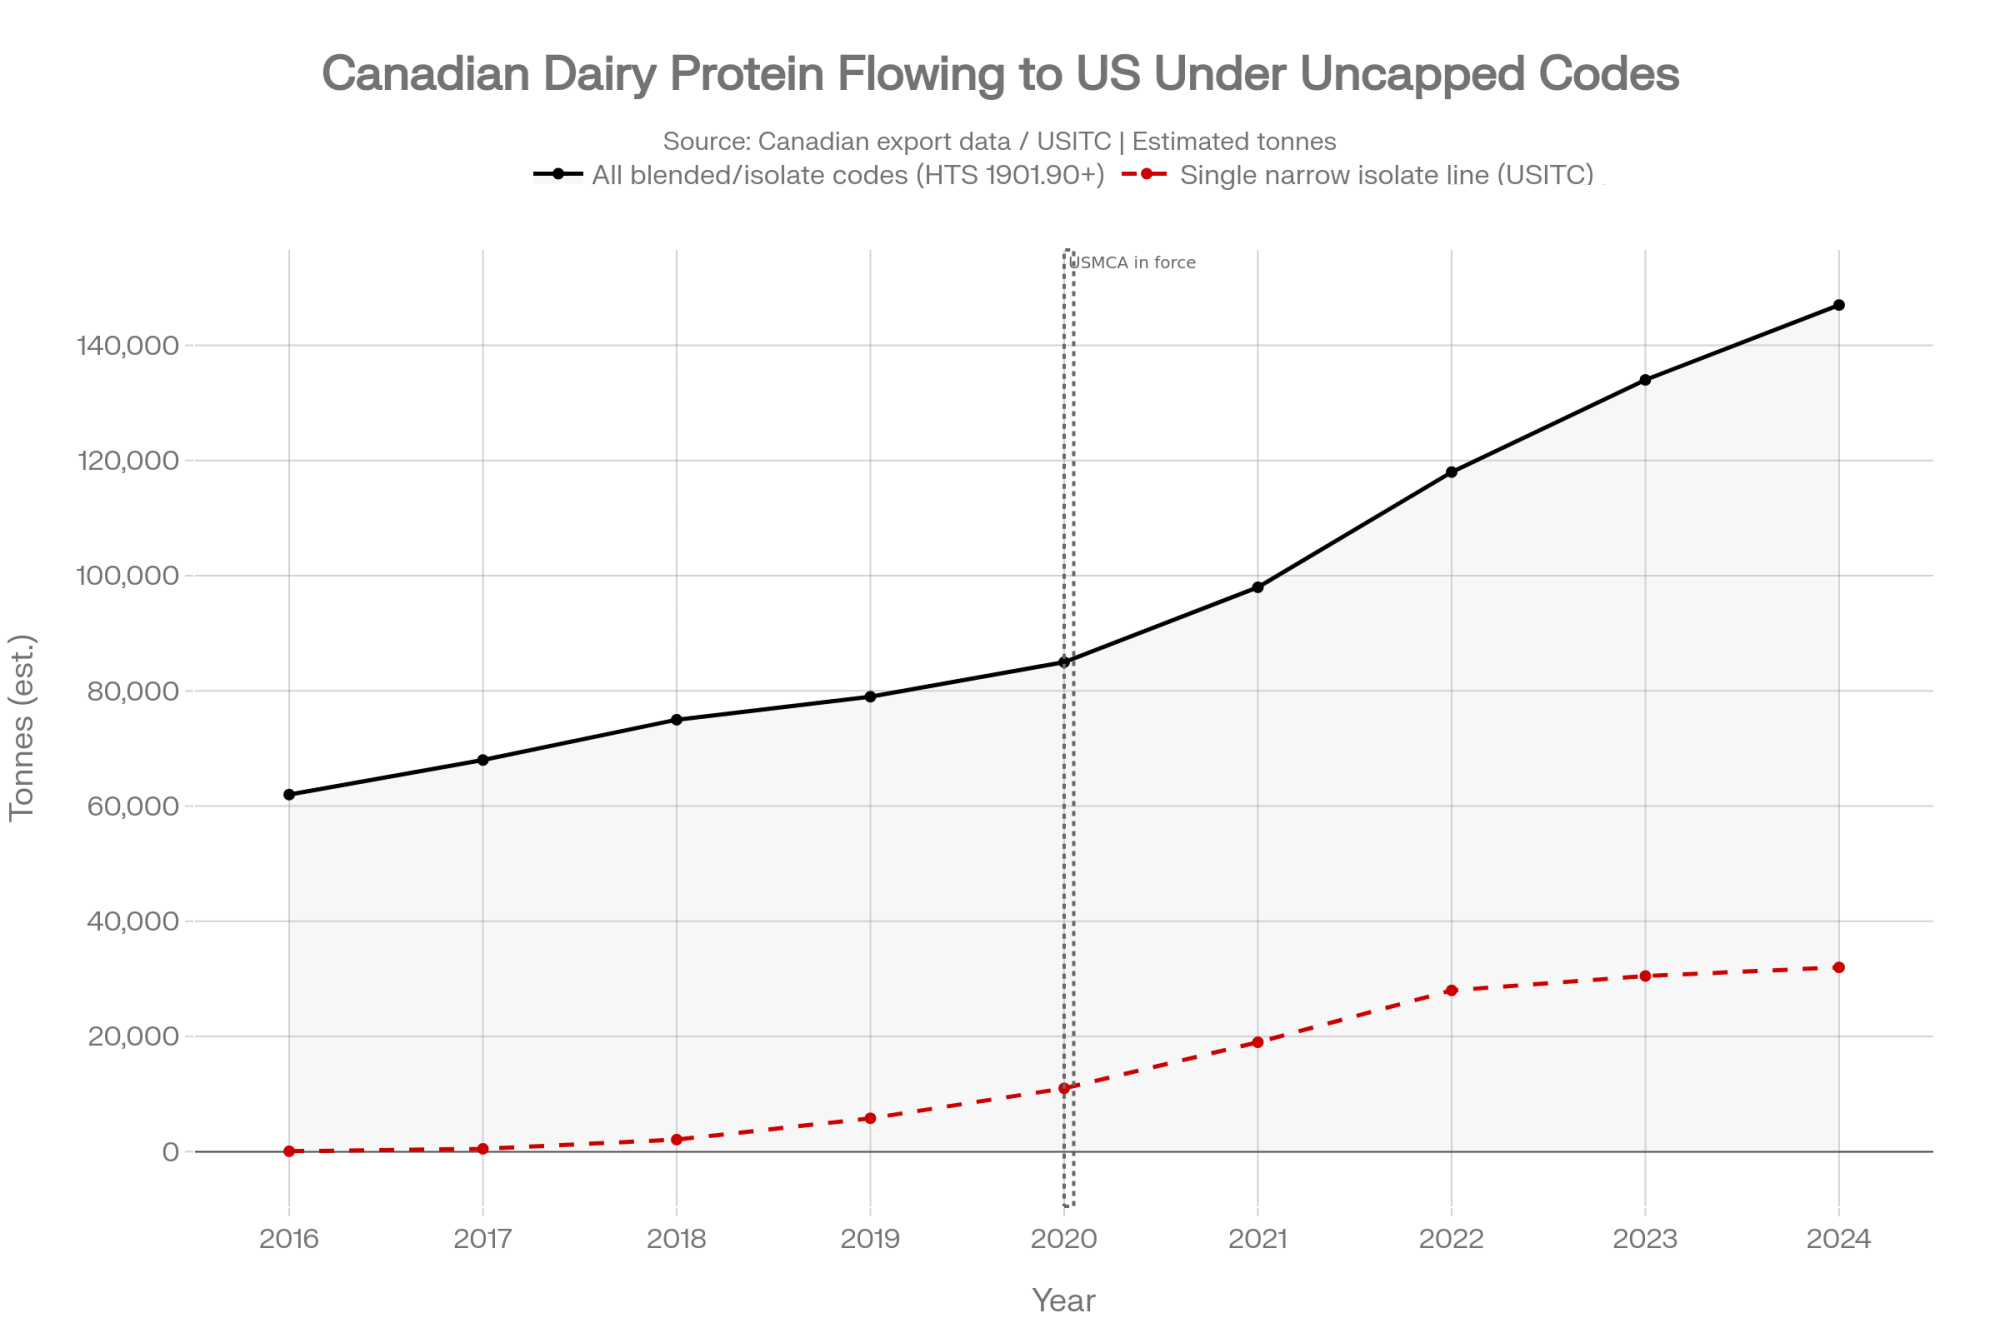
USMCA was built to cap exactly this. It limits Canada’s skim milk powder and milk protein concentrate exports to 35,000 tonnes, with a C$0.54/kg surcharge above that line. But the caps only bite on some product codes. A growing share of that surplus is exported as blended dairy products and protein isolates — classified under Harmonized Tariff Schedule (HTS) code 1901.90 and similar headings that USMCA’s disciplines don’t cover. Those classifications are lawful and long-standing under Canadian customs rules; whether USMCA should cover them is exactly what the U.S. wants renegotiated. Bullvine estimates roughly 147,000 tonnes of total milk solids moved into the U.S. under these broad blended-product codes in 2024 — up from an estimated 77,000 tonnes before USMCA — based on Canadian export data. That’s the wide bucket. Inside it, the USITC clocked one narrow protein-isolate line jumping from 76 tonnes in 2013–2015 to over 32,000 tonnes by 2022–2024 — a single HTS heading, not the whole flow, which is how you get two figures at very different scales in the same story (The Bullvine).
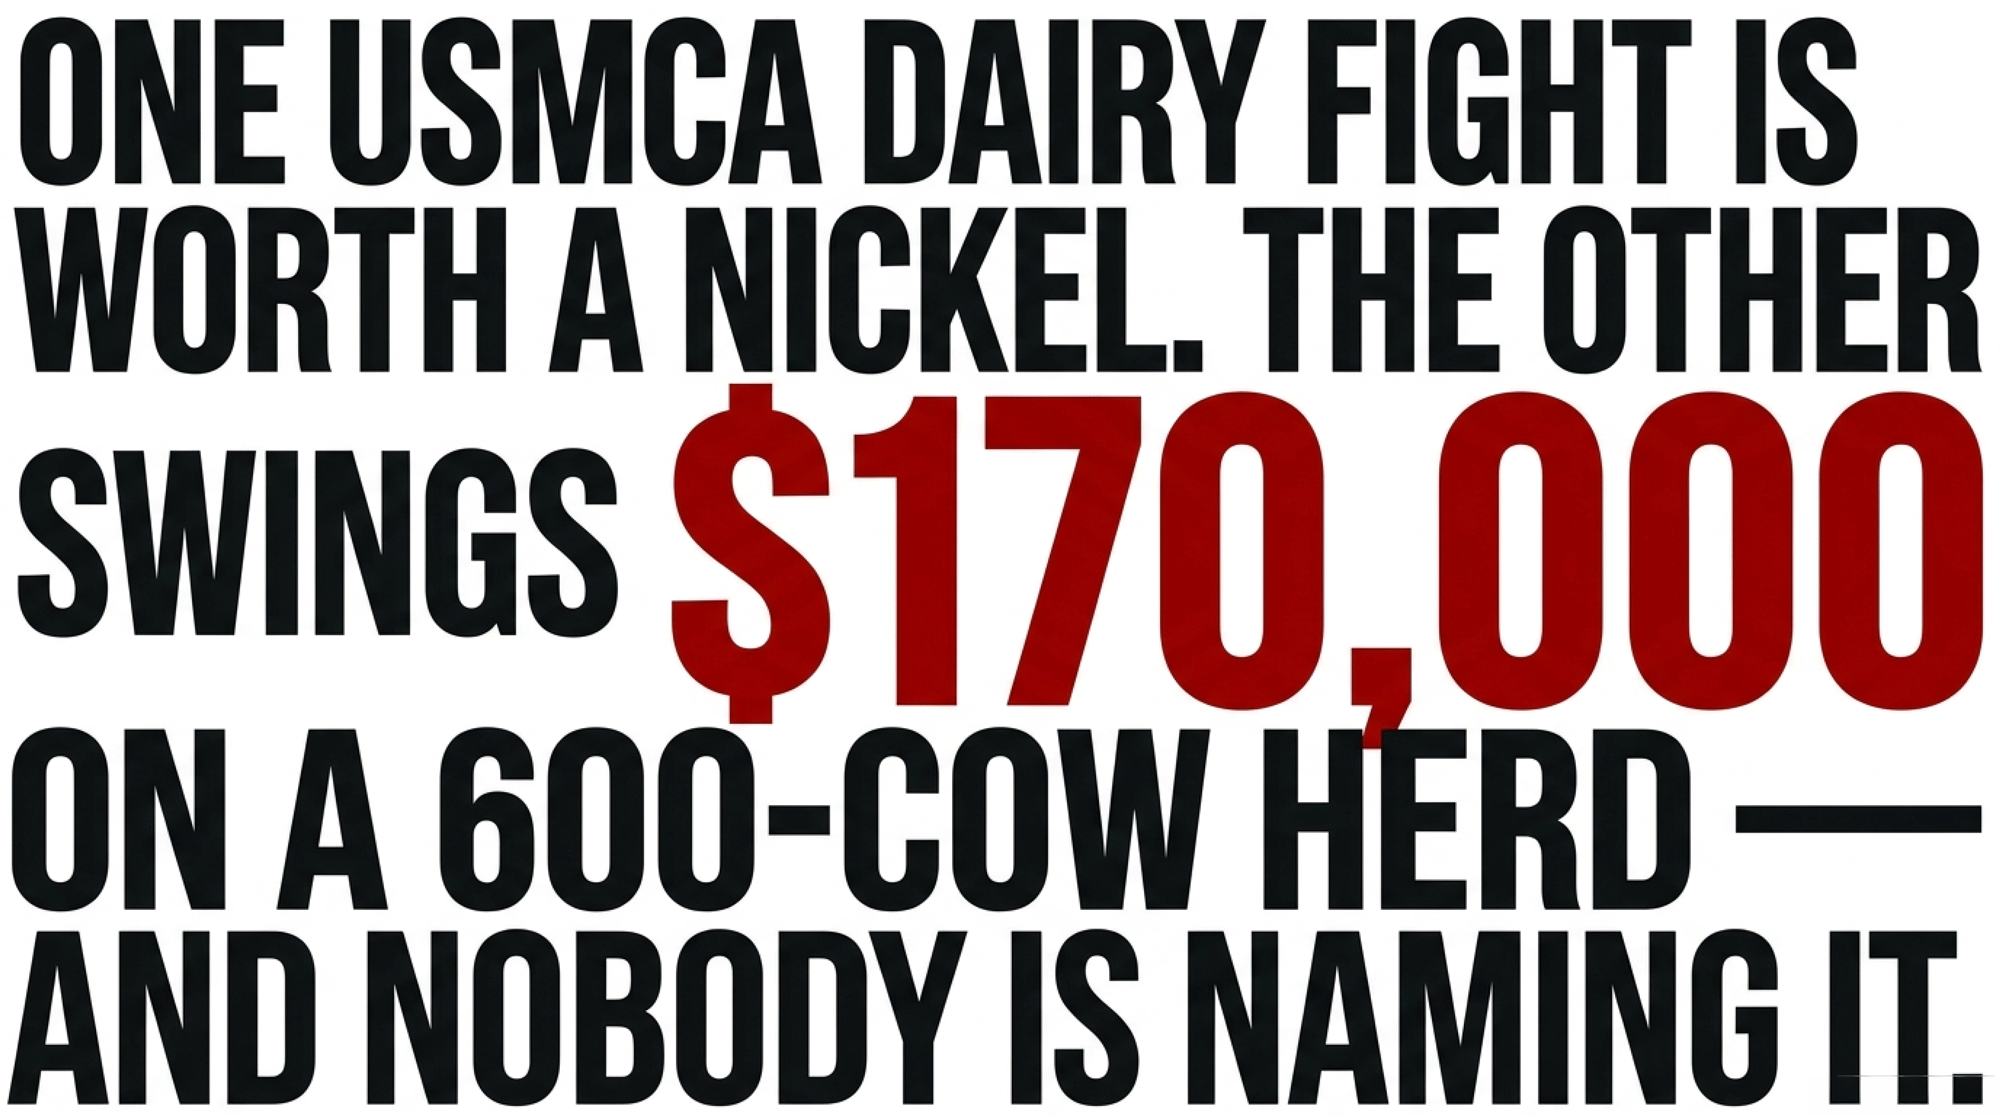
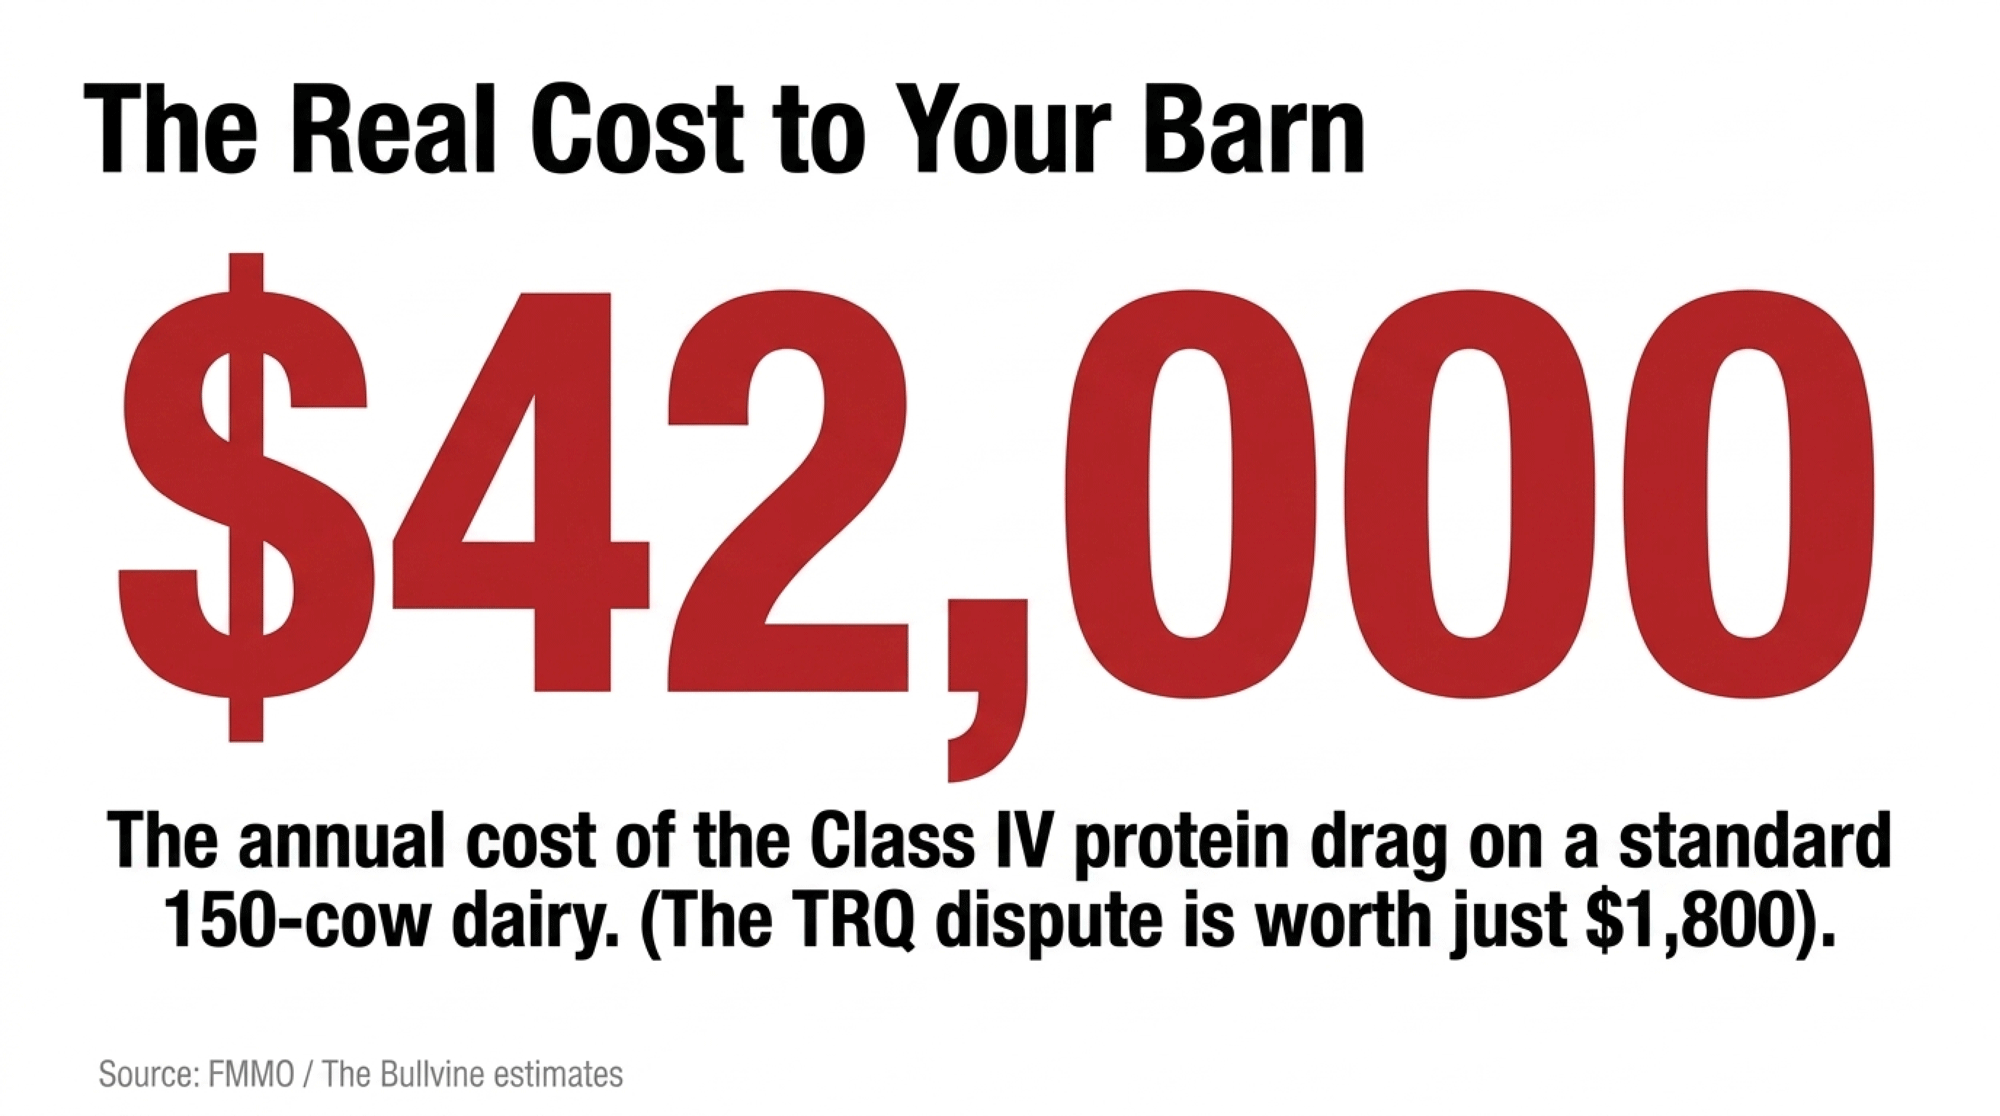
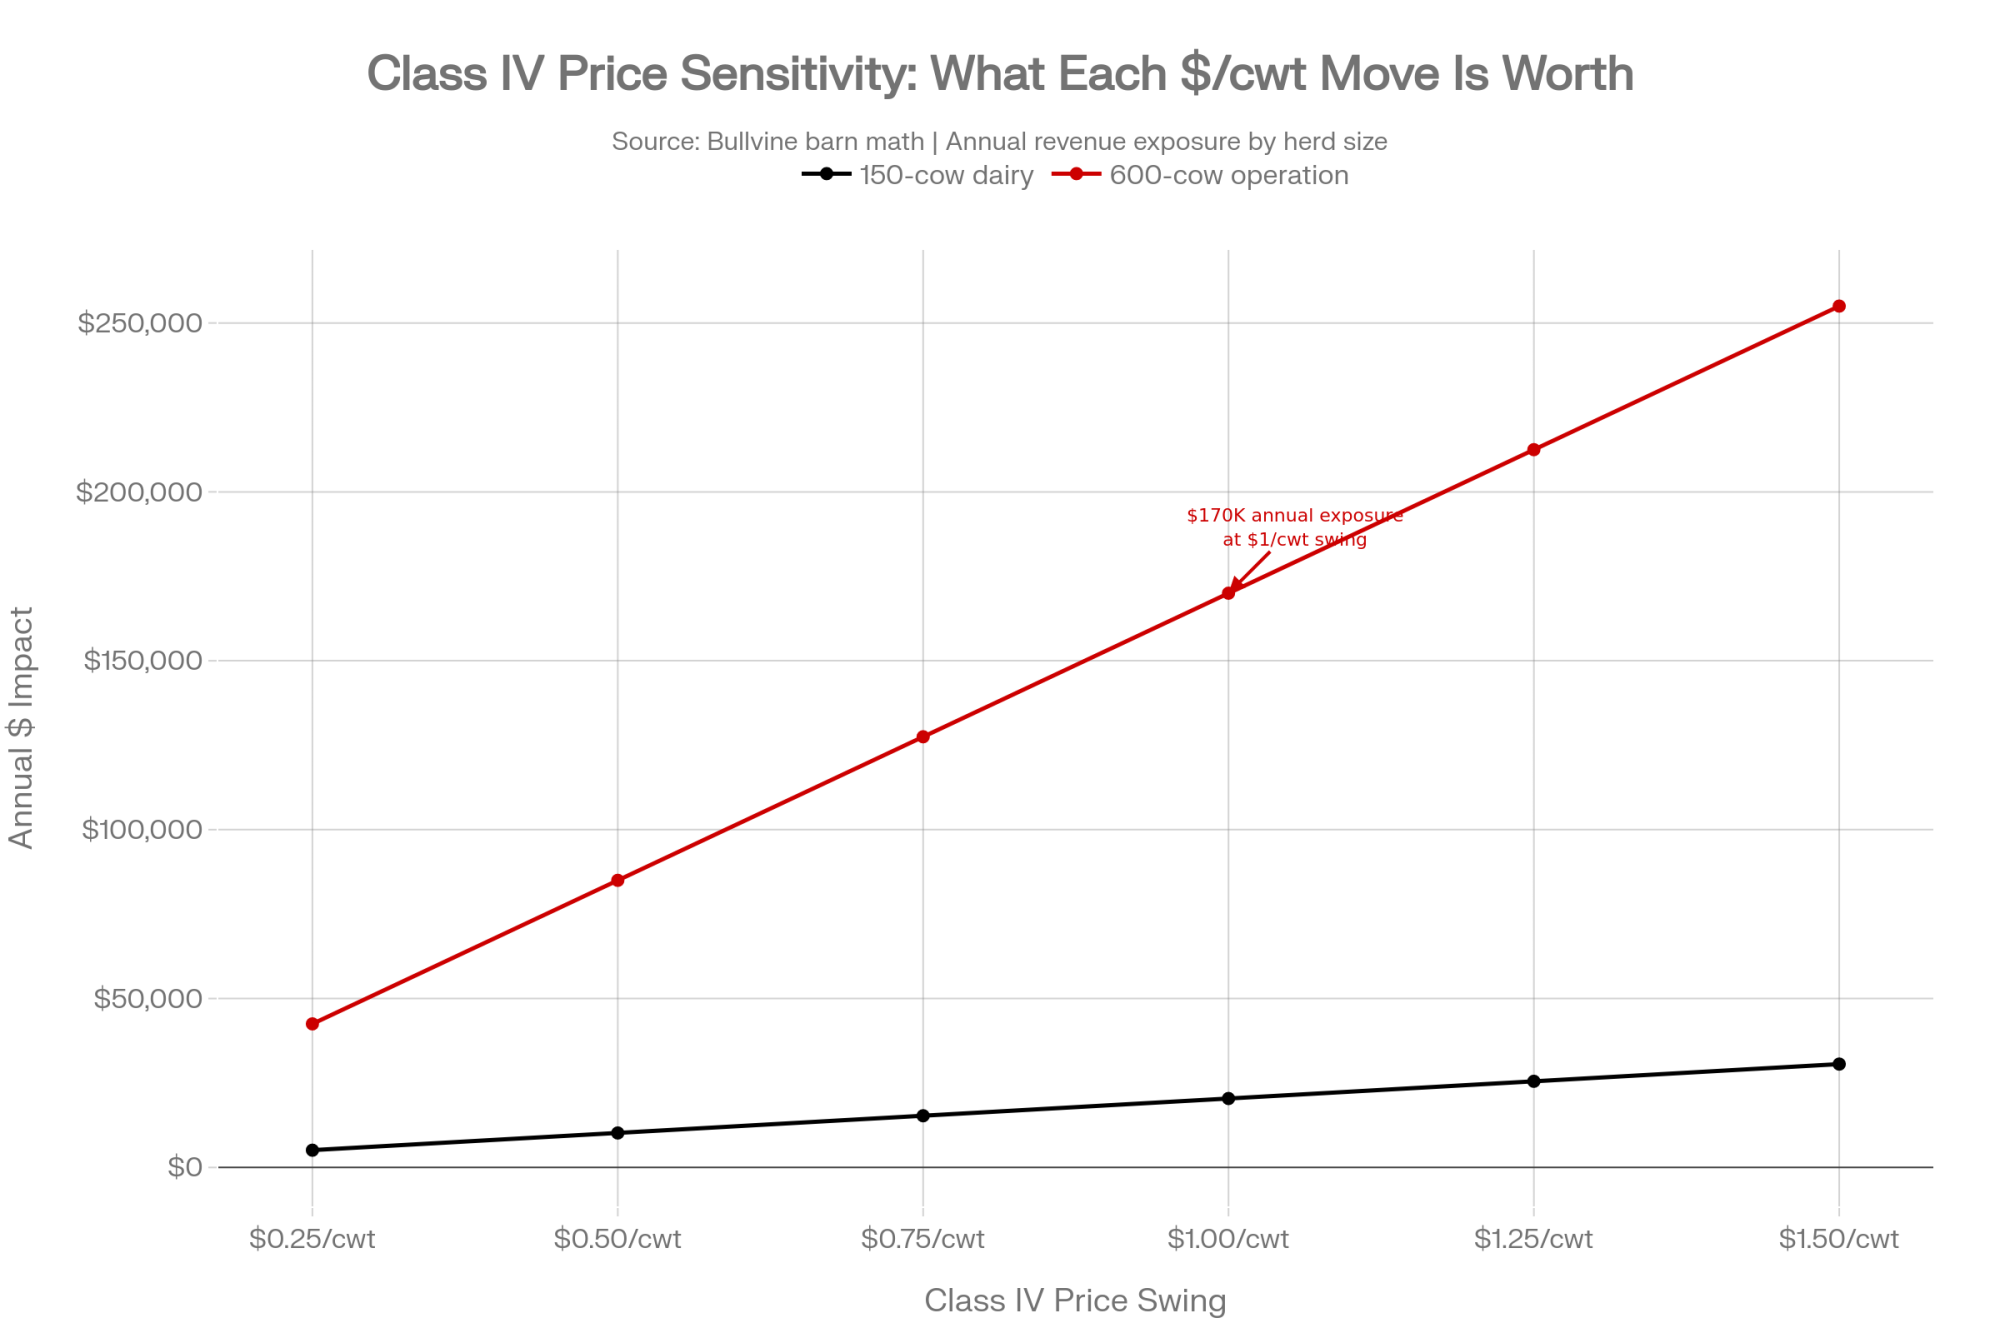
Here’s the barn math that flips the story. That extra low-priced protein leans directly on U.S. Class IV — and because Class IV pricing is driven heavily by nonfat dry milk and skim powder values, cheap imported protein pulls the whole class down with it. On a 600-cow herd shipping about 170,000 cwt a year — a high-output Western operation running well above the 2025 U.S. average of 24,390 lbs/cow — a $1.00/cwt swing in your milk price is worth roughly $170,000 a year; even a half-dollar move runs about $85,000. And this isn’t a big-herd trick: run that same $1/cwt swing on the 150-cow dairy from the TRQ example and it’s still about $42,000 a year — versus the $1,800 that fight is worth. Same barn, same year, two fights. One’s worth a nickel. The other moves a full dollar — and it’s the one nobody’s negotiating.
The Mechanics Behind the Outcomes
Why does the loud fight get all the airtime while the expensive one hides in a customs table? Because TRQs come with a clean headline and a clear villain: “Canada promised $200 million and delivered 42%.” That fits on a bumper sticker. The protein story needs you to sit through structural surplus, regulated pricing, and Chapter 19 tariff classification — none of which trend on anybody’s feed (U.S. Dairy Export Council).
The classification piece is the whole game. Classic skim milk powder sits under Chapter 04 dairy headings, the ones USMCA disciplines with caps and surcharges. But Canada’s border agency has long allowed that a product with added ingredients — a “preparation predominantly based on” dairy — can be classified under Chapter 19 instead. A U.S. customs ruling shows the kind of product in play: a blend of 56% skim milk powder and 44% milk fat, treated as a food preparation rather than a dairy product. Same solids. Different code. Outside the fence. Legal — and, from the U.S. side, exactly the point (Canada Border Services Agency).
| Attribute | Chapter 04 (Classic Dairy) | Chapter 19 (Food Preparations — HTS 1901.90) |
|---|---|---|
| Typical products | Skim milk powder, MPC, butter, cheese | Blended dairy powders, protein isolates with added ingredients, food prep bases |
| Example composition | >97% milk solids, no added non-dairy ingredients | 56% skim milk powder + 44% milk fat with permitted additions |
| USMCA cap applies? | ✅ Yes — 35,000-tonne cap + CA$0.54/kg surcharge above threshold | ❌ No — sits outside USMCA Chapter 3 dairy disciplines |
| Canadian export volume trend (est.) | Regulated; constrained by cap | ~147,000 tonnes into US (2024 est., up from ~77,000 pre-USMCA) |
| U.S. legal challenge status | Settled; two dispute panels completed | USITC Section 332 probe opened July 2025 — allegation, not finding |
| Price impact channel | Limited — capped volume constrains floor pressure | Direct — uncapped volume leans on US NDPSR and Class IV price |
| What renegotiation would do | Already covered; tighten fill enforcement | Extend cap language to cover “protein by function” — the real ask |
The U.S. isn’t leaving that argument to trade lawyers. In July 2025, the USITC opened a Section 332 probe into whether Canadian exporters are evading the caps by blending or relabeling surplus proteins — an allegation Canada disputes and the panel record so far hasn’t upheld. New Zealand and Australian dairy groups joined U.S. groups in a January 2025 joint call, arguing that Canadian processors’ access to structurally cheap surplus protein “is distorting its export of a range of dairy products”. Dairy Farmers of Canada, for its part, has publicly held that the current terms are sufficient and that Canada is meeting its USMCA obligations. When three exporting nations point at the same door, it’s not a rounding error — but it’s a policy fight over what the rules should cover, not a finding that anyone broke them. If you want the full walk-through of how the two panels changed the rulebook without changing the trucks, that’s its own story.
For the deeper backstory on how Canada’s system holds the line, see our supply management coverage hub — clean legal wins, messy farm realities.
How Much Does Chasing the Loud Fight Actually Cost You?
Run the honest calculation. If your operation spends real attention — advisor hours, association dues, mental bandwidth — tracking every TRQ headline, you’re chasing a nickel. Even a best-case doubling of enforcement takes that 150-cow herd from $1,800 to maybe $5,400 a year. UC Davis economists went further, concluding that fixing TRQ allocation would likely “do little to nothing” for the makeup of Canadian dairy imports, because U.S. product still loses on price and logistics against Canada’s own processors (The Bullvine).
That doesn’t make the TRQ fight pointless. Precedent matters, and a deal you can’t enforce isn’t a deal. But if you’re a producer deciding where to point your worry this month, don’t confuse the fight that fills press releases with the one that fills your milk check. Where does your breakeven actually sit right now — and which of these two numbers would move it?
| Fight | The Mechanism | 150-cow Value/yr | 600-cow Value/yr | Who Controls the Outcome | What to Watch |
|---|---|---|---|---|---|
| TRQ Fill Rate | 14 quota categories; ~42% average fill; US argues Canada reserves licenses for domestic processors | ~$1,800 | ~$7,200 | USTR / Global Affairs Canada negotiators | Fill rate improving past 50% in new allocation rules |
| Protein Reclassification (Class IV) | Surplus Canadian protein moving as HTS 1901.90 blends, outside USMCA caps; leaning on Class IV NDPSR | ~$42,000 (red flag) | ~$170,000 (red flag) | USMCA annex language in July round | Whether “isolate” or “protein by function” appears in new cap text |
| DRP Hedge (US) | Dairy Revenue Protection; Q1 2026 indemnities avg $1.12/cwt vs $0.28/cwt premium | Net ~$14,280 value | Net ~$57,120 value | Farm-level decision | Q2 2026 premium resets |
| Canadian Quota Carry | CA$24K–$27K/kg butterfat; 6% commercial rate; milk margin ~CA$854/kg — negative net carry | ~–CA$586/kg held | ~–CA$586/kg held | FCC rates + CDC price signal | Fall 2026 CDC farmgate announcement |
| US Dairy Exports to Canada (total) | Two-way flow growing; US$1.31B in 2025, up 78% since 2020 — but not the negotiated TRQ access | Diffuse / indirect | Diffuse / indirect | Broader trade environment | Separate from TRQ dispute |
Is Canada Actually Getting What It Paid For?
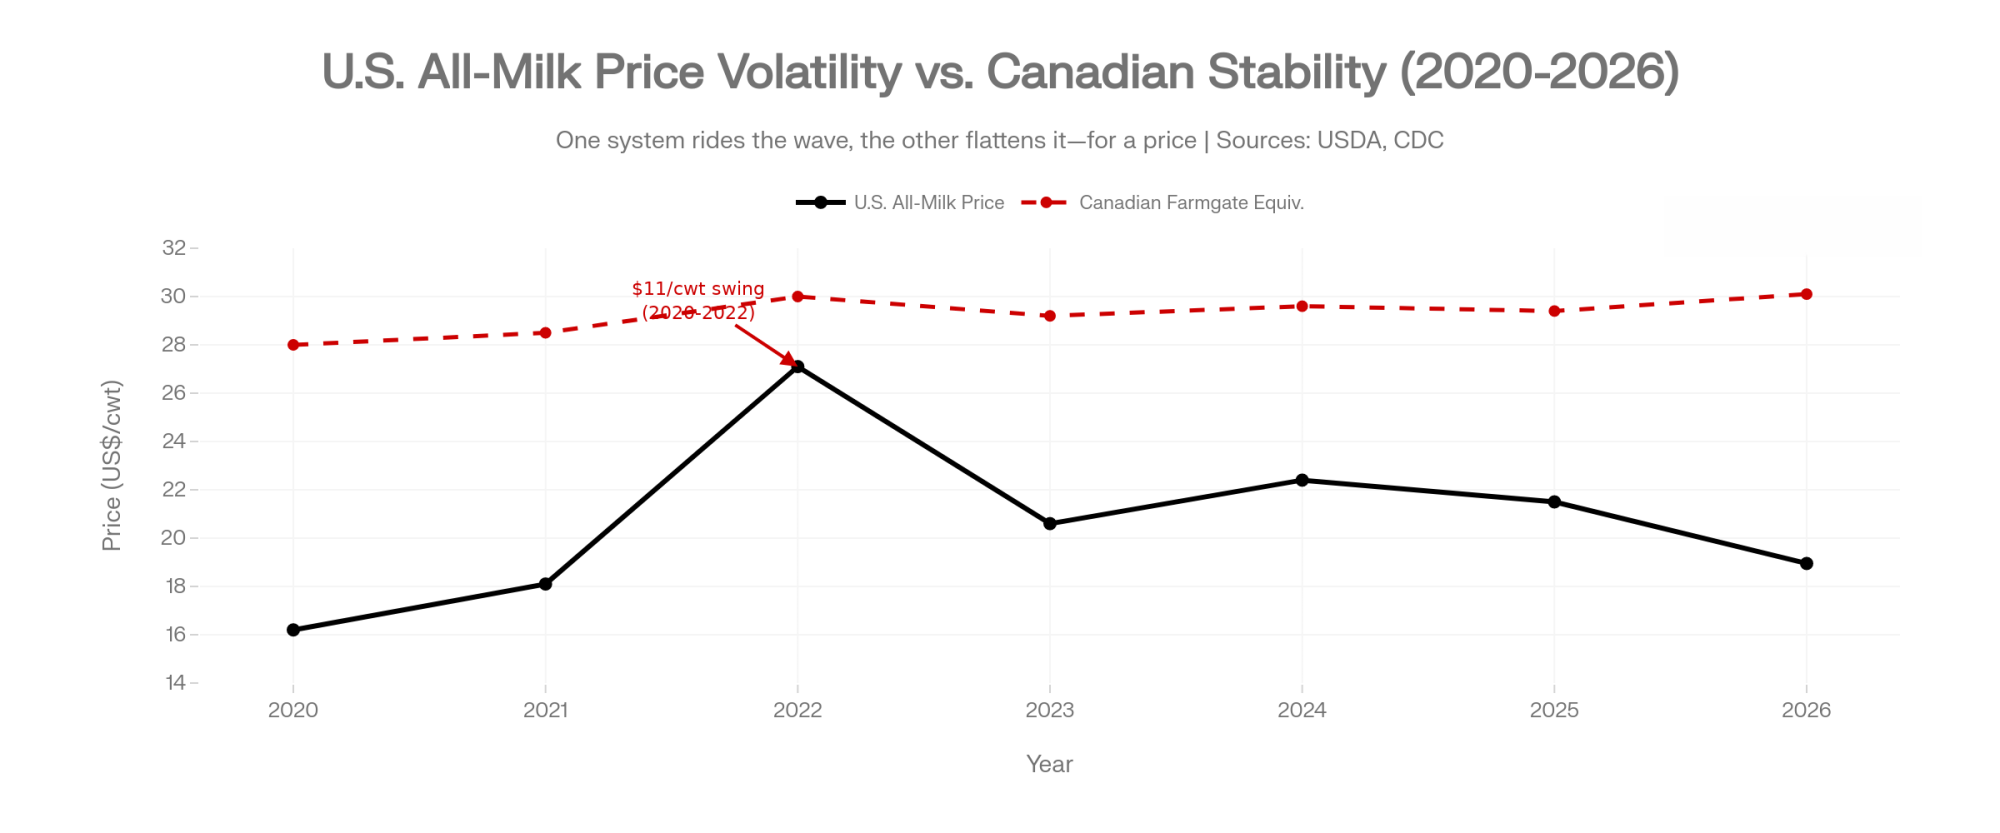
Not quite — and that’s the part neither government says out loud. Canada bought stability with supply management: administered prices, no wild swings, and no reliance on the direct subsidies U.S. farmers lean on. That stability isn’t abstract. Farm Credit Canada’s 2026 reporting pegs mid-size quota holdings near CA$2.5 million, at CA$24,000 to CA$27,000 per kilogram of butterfat — an 85-cow Quebec herd carrying multi-million-dollar quota equity before you count a single cow or barn. Daniel Gobeil, who milks in Quebec and heads Les Producteurs de lait du Québec, put the mood plainly at his group’s 2025 annual meeting: “There is very strong consensus in Quebec on the importance of keeping supply management intact and protecting our sector” (Les Producteurs de lait du Québec).
That’s not abstract politics to a producer sitting on that balance sheet. When Bill C-202 passed, Dairy Farmers of Canada welcomed “any effort aimed at ensuring no further supply managed concessions are made in trade negotiations”. And in April 2026, with the review bearing down, Gobeil delivered a line — in French, roughly translated — that should tell every producer where the pressure sits: on the government’s promise to hold firm, “we’ll judge them on the results”. Translation from the kitchen table — don’t let anyone bargain away the asset I’ve mortgaged my farm to buy (Les Producteurs de lait du Québec / Newswire).
But the same global cost shocks hitting Idaho are hitting Quebec. Feed, labour, and debt service don’t care which pricing system you’re under. Rabobank’s analysts have been projecting 7–9% annual farm exits across North America through 2027 — on a base of roughly 39,000 U.S. operations, that’s somewhere between 2,700 and 3,500 farms closing in a single year, driven by margin compression, not border tonnage. That’s why Parliament passed Bill C-202 — locking supply management out of the negotiation entirely — and it received Royal Assent on June 26, 2025, before the review talks even opened. When you’re sitting on CA$2.5 million in quota, a law that stops anyone from writing down the asset reads less like protectionism and more like a seatbelt (Parliament of Canada, LEGISinfo).
Options and Trade-Offs for Farmers
You can’t negotiate the treaty. You can read the signals coming out of the review and position for them. Here’s what producers on both sides are watching and doing.
U.S. Class IV shippers — read the cap language, not the fill data (do this within 30 days)
- The signal: Whether USTR and Global Affairs Canada rewrite the protein disciplines to count all high-protein dairy — blends and isolates included — against the cap (National Milk Producers Federation).
- When the July round drops documents: Read the annexes, not the press release.
- Works when: You’re Class IV-heavy.
- Requires: Someone reading trade text.
- Risk: The language stays vague — which tells you the coverage gap isn’t closing, and that’s worth knowing too.
U.S. producers — hedge the volatility no treaty will fix
- The signal: HighGround Dairy’s Q1 2026 Dairy Revenue Protection results reported estimated indemnities averaging $1.12/cwt against premium costs of $0.28/cwt.
- Works when: Your breakeven’s tight.
- Risk: Premiums are a real cost, and DRP smooths volatility rather than erasing it.
Canadian producers — stress-test the quota-heavy balance sheet
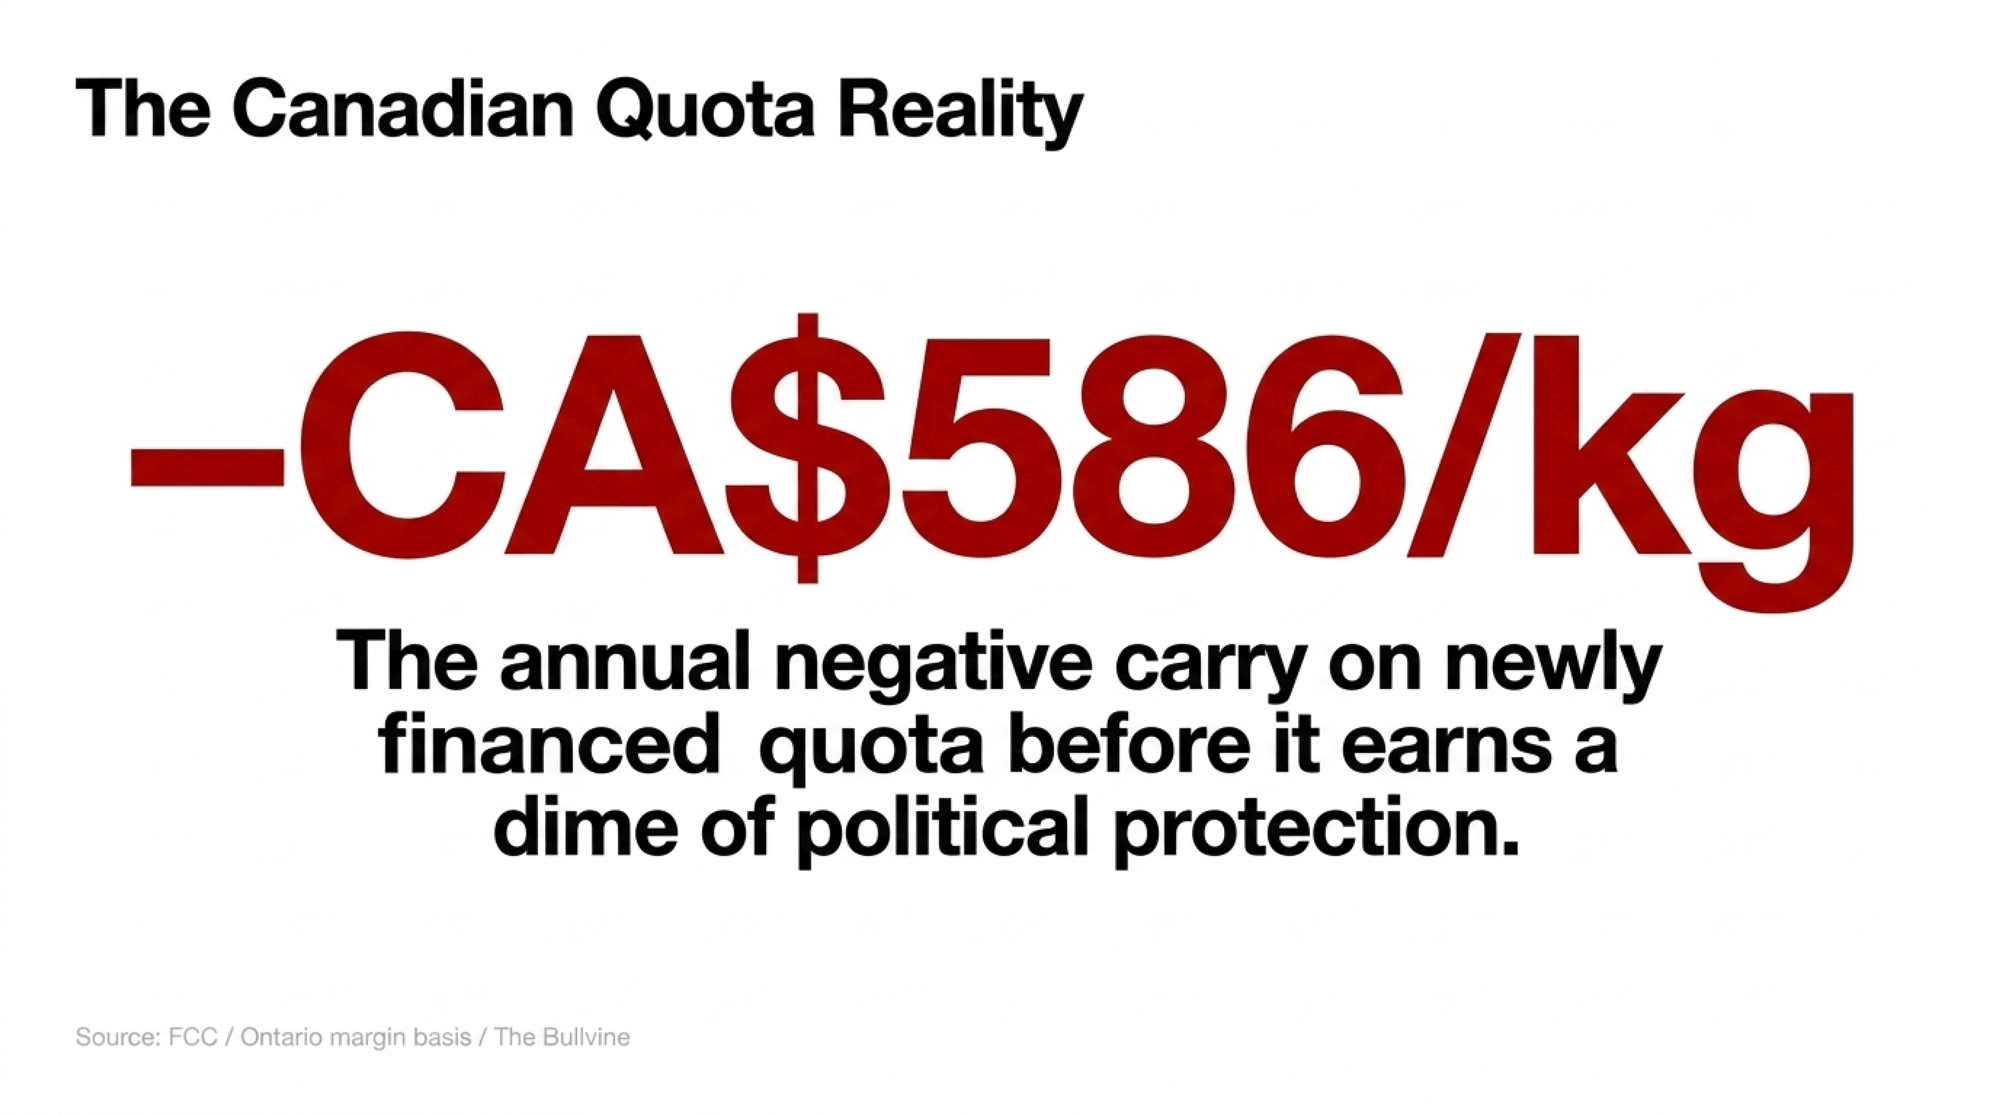
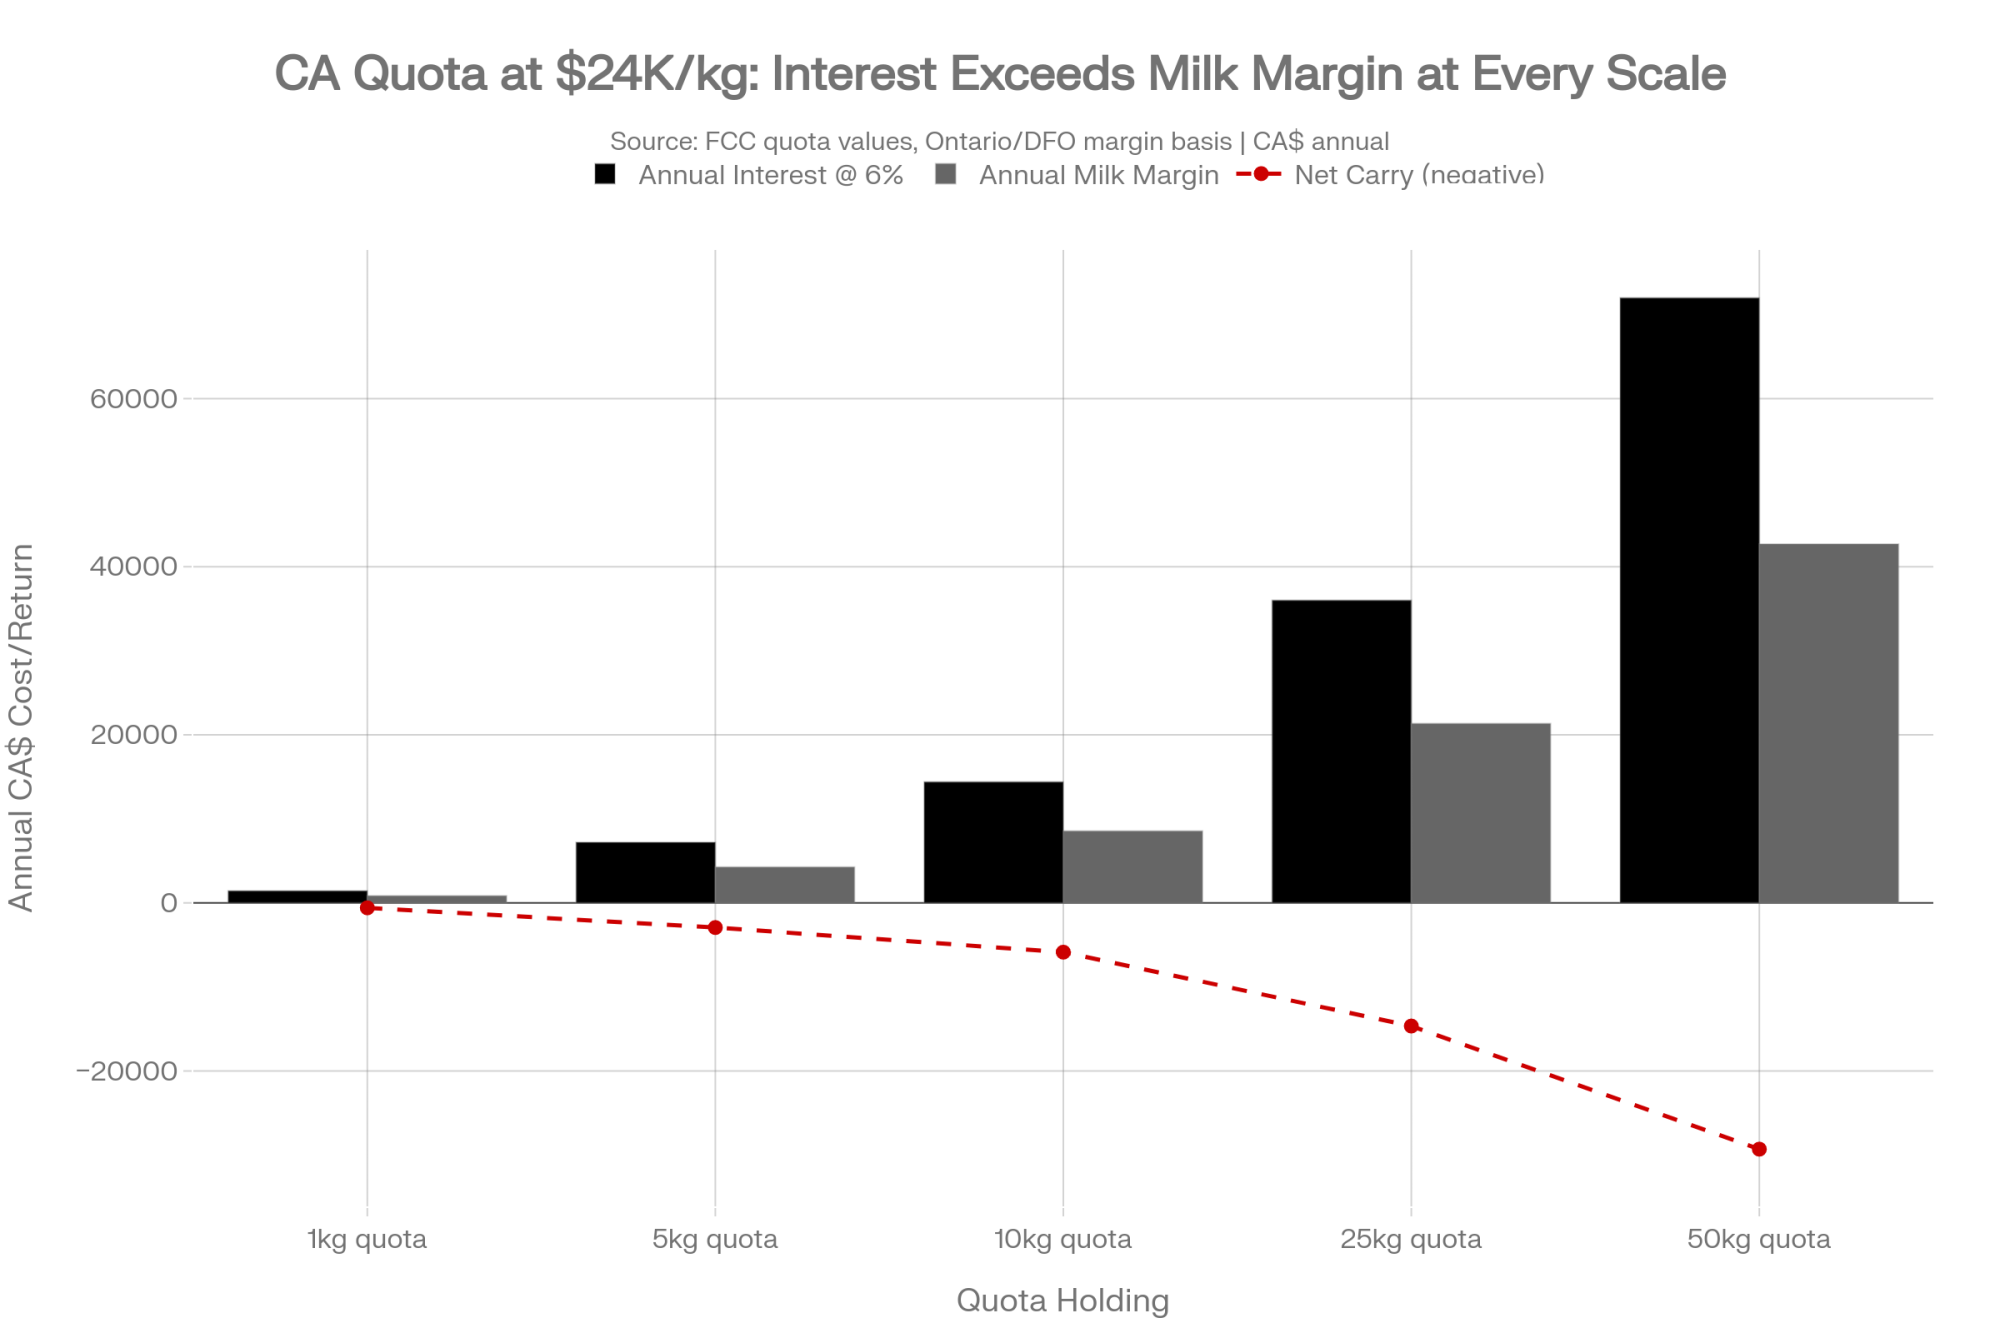
- The signal: Take the CA$24,000/kg quota cap and finance it at a 6% commercial rate — that’s CA$1,440/kg a year in interest alone. Net the roughly CA$854/kg that kilo of butterfat earns in blended milk margin against it, and you’re carrying about –$586/kg a year in negative carry on newly financed quota until the milk pays it back. (Farm Credit Canada quota values; Ontario/DFO margin basis — see FCC dairy sector updates.)
- Works when: You’re weighing any expansion or succession move.
- Risk: A system that wins legal arguments can still leave you exposed to input costs no trade law touches.
Everyone — treat the CDC’s fall price announcement as a pressure gauge
- The signal: For Feb. 1, 2026, the Canadian Dairy Commission raised farmgate prices 2.3255% through its National Pricing Formula. Watch this fall’s number for Feb. 2027 (Canadian Dairy Commission).
- How to read it: A formula-consistent bump says Canada feels its system’s intact; a below-inflation move hints the trade pressure is starting to bite.
To pressure-test your own position, run a DSCR on your quota before the next expansion decision.
Key Takeaways
- If you’re Class IV-exposed, judge the July review by one thing: whether the cap language starts counting protein by what it does, not by what the label says (NMPF).
- If you ship in the U.S., run your DRP math this month — Q1 2026 indemnities averaged $1.12/cwt against $0.28/cwt premiums, and volatility won’t wait for a trade deal.
- If you farm under supply management, price quota equity into every succession and expansion decision. At CA$24,000/kg and 6%, newly financed quota nets about –$586/kg a year before it earns a dime of political protection (FCC).
- Put the CDC’s fall announcement on your calendar. A below-formula move is the clearest tell that Canada feels the trade squeeze (Canadian Dairy Commission).
- Before the next TRQ headline pulls your attention, ask whether you’re tracking a nickel or a dollar. The math isn’t close.
The July round will generate a stack of statements calling itself a win. The real test is whether the annex language behind those statements ever mentions the word “isolate” — because that’s the sentence that decides whether you should start modeling Class IV upside or file another press release with better formatting. Gobeil said he’ll judge Ottawa on the results; you should judge the whole review the same way. So pull your last twelve milk checks and ask which of these two fights actually shows up in the numbers.
We’re breaking down the full protein-reclassification mechanism and a Class IV sensitivity model by herd size in next week’s Bullvine Weekly — that’s where the barn-level numbers live. For the groundwork now, here’s the full margin and DRP playbook.
Run Your Numbers
Dairy Profit Projector — This article says a $1/cwt Class IV swing is worth $170K on 600 cows and $42K on 150. The Dairy Profit Projector turns that into your number: drop in your herd, milk price, and ration to see 12-month margin, breakeven, and margin per cwt or hL — US or Canadian.
Editor’s note: The farm operations sized in the barn-math examples — a 150-cow reference dairy, an 85-cow Quebec herd, and a 600-cow Class IV shipper — are modeled composites used for illustration. Named individuals (Ted Vander Schaaf, Daniel Gobeil) and all dollar figures are sourced as cited. The nickel/cwt realized figure is a Bullvine estimate haircutting the gross 8.6¢/cwt tariff benefit for farmgate pass-through and the ~42% fill rate; the –$586/kg net-carry figure is a Bullvine calculation from Farm Credit Canada quota values and an Ontario milk-margin basis; the 147,000- and 77,000-tonne reclassified-solids figures are Bullvine estimates from Canadian export data, with the USITC’s 32,000-tonne figure being one narrow HTS line inside that broader bucket. The tariff classifications described are lawful under current Canadian customs rules; the U.S. reclassification-evasion claim is an allegation under USITC investigation, not an established finding, and the underlying dispute is over what USMCA should cover, not whether any party has broken the law.
Complete references and supporting documentation are available upon request by contacting the editorial team at editor@thebullvine.com.
Learn More
- The $15,800 DMC Wake-Up Call — Arms you with a programmatic margin hedging roadmap to secure federal safety nets, shielding your cash flow from sudden Class IV baseline drops while optimizing your monthly net revenue by minimizing premium drag.
- The $850 Million Dairy Standoff: What U.S. and Canadian Farmers Need to Know Before July 2026 — Exposes the macro trade policies and long-term regulatory frameworks driving the cross-border trade impasse, allowing strategic planners to position multi-million-dollar herd assets ahead of impending trade adjustments.
- Ted Vander Schaaf Wants $1.14 Billion in Canadian Access to Actually Work; Daniel Gobeil’s Quebec Farm Math Says the Fight is Worth a Nickel — Dismantles corporate political rhetoric by mapping high-level trade expectations against real-world farm ledger margins, revealing the exact point where institutional policy fails to move your domestic milk pricing.
The Sunday Read Dairy Professionals Don’t Skip.

Every week, thousands of producers, breeders, and industry insiders open Bullvine Weekly for genetics insights, market shifts, and profit strategies they won’t find anywhere else. One email. Five minutes. Smarter decisions all week.