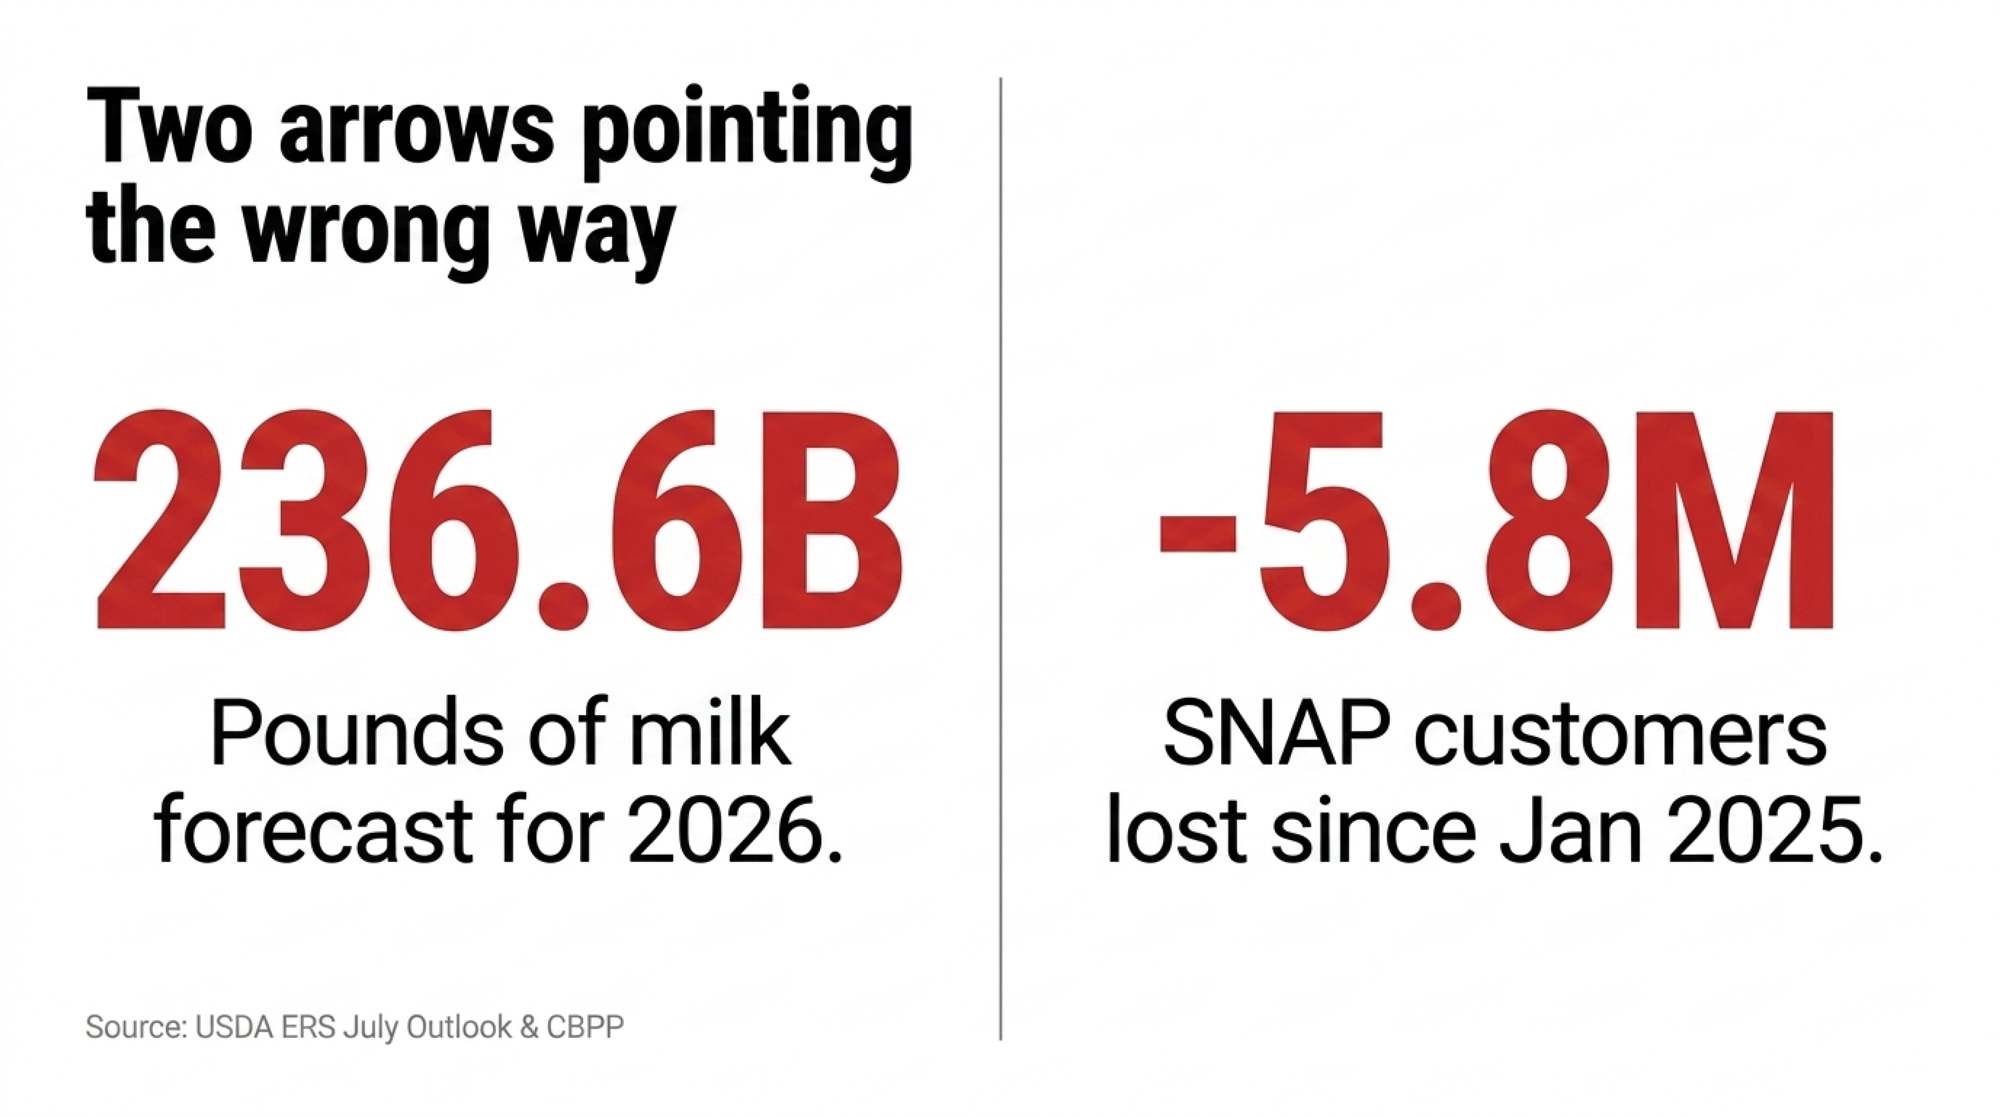
USDA’s bringing 236.6 billion pounds of milk to market while more than 5.8 million of your best dairy customers disappear from SNAP — and almost nobody is running that math.
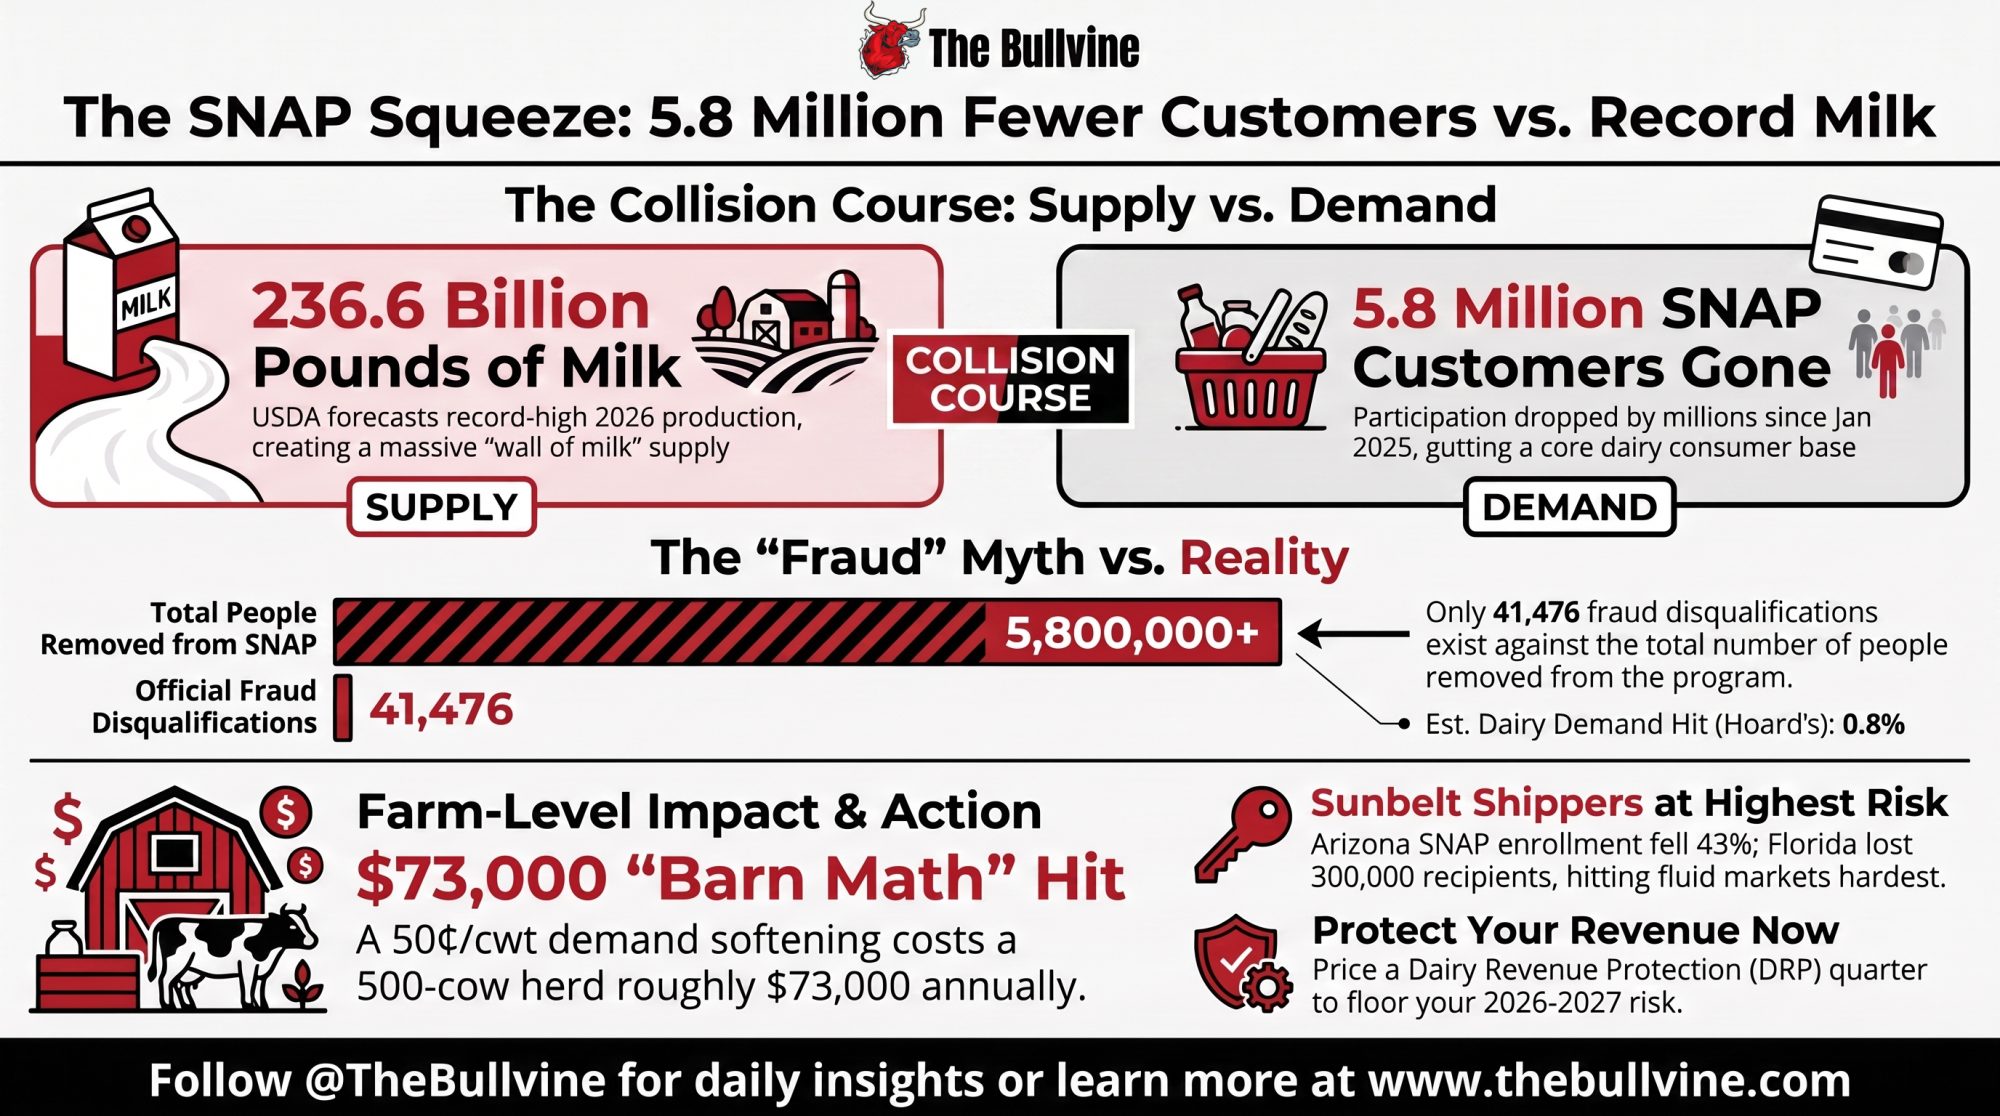
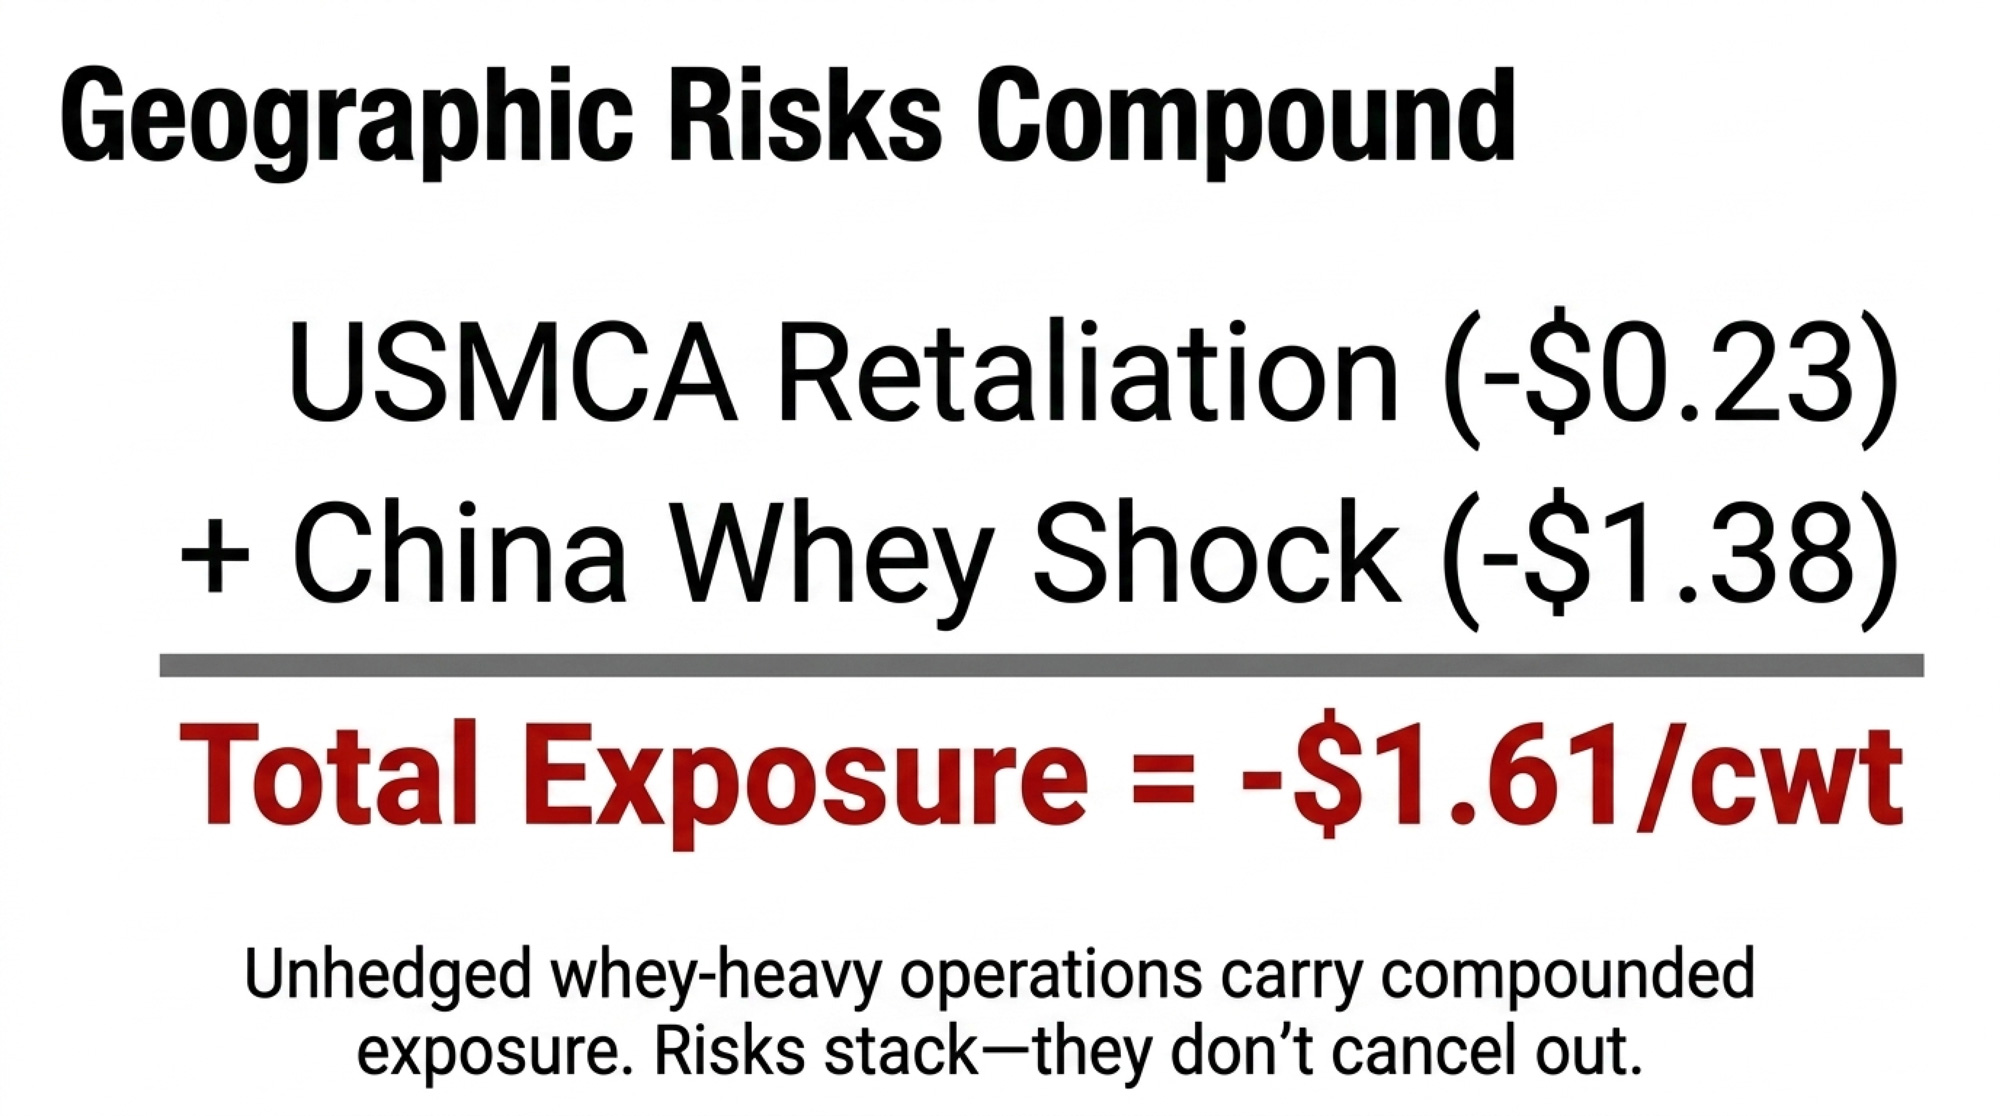
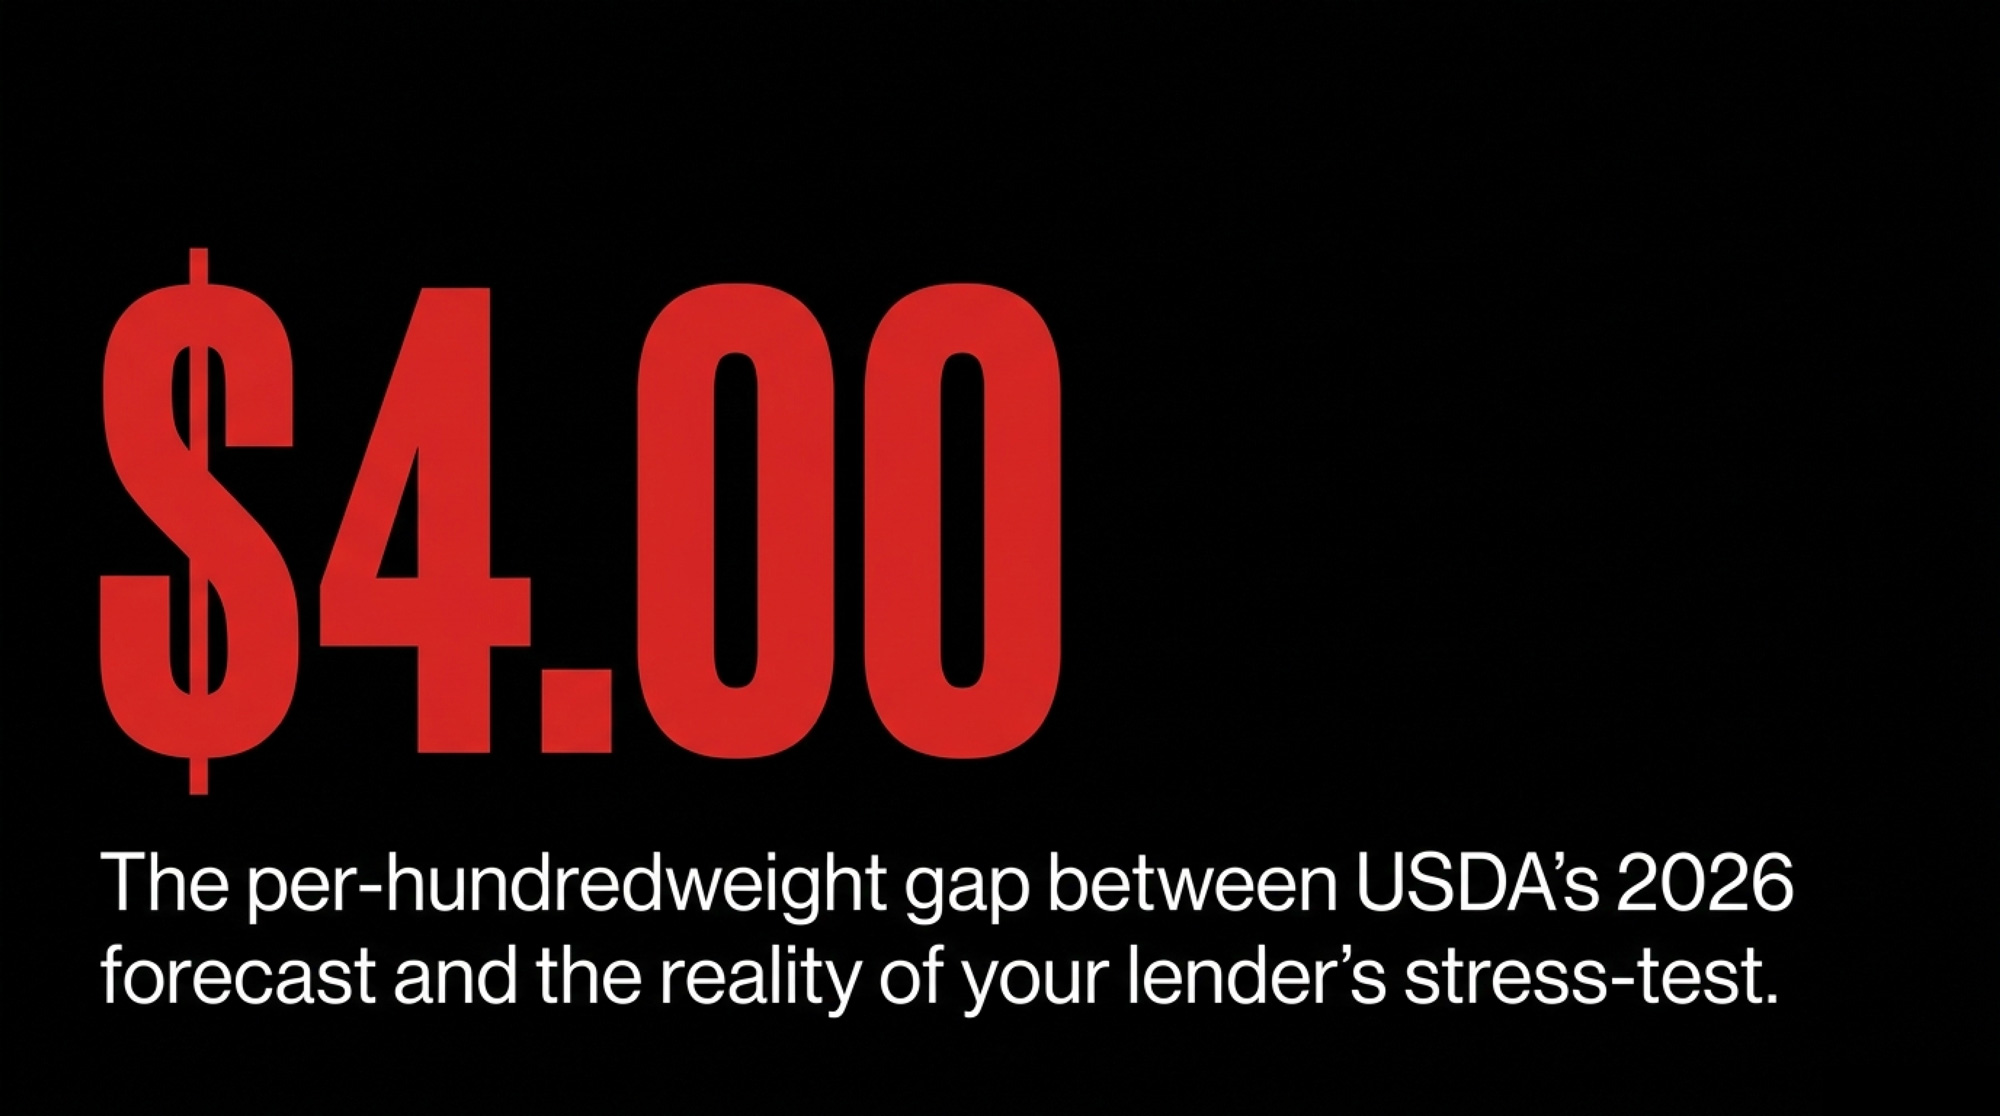
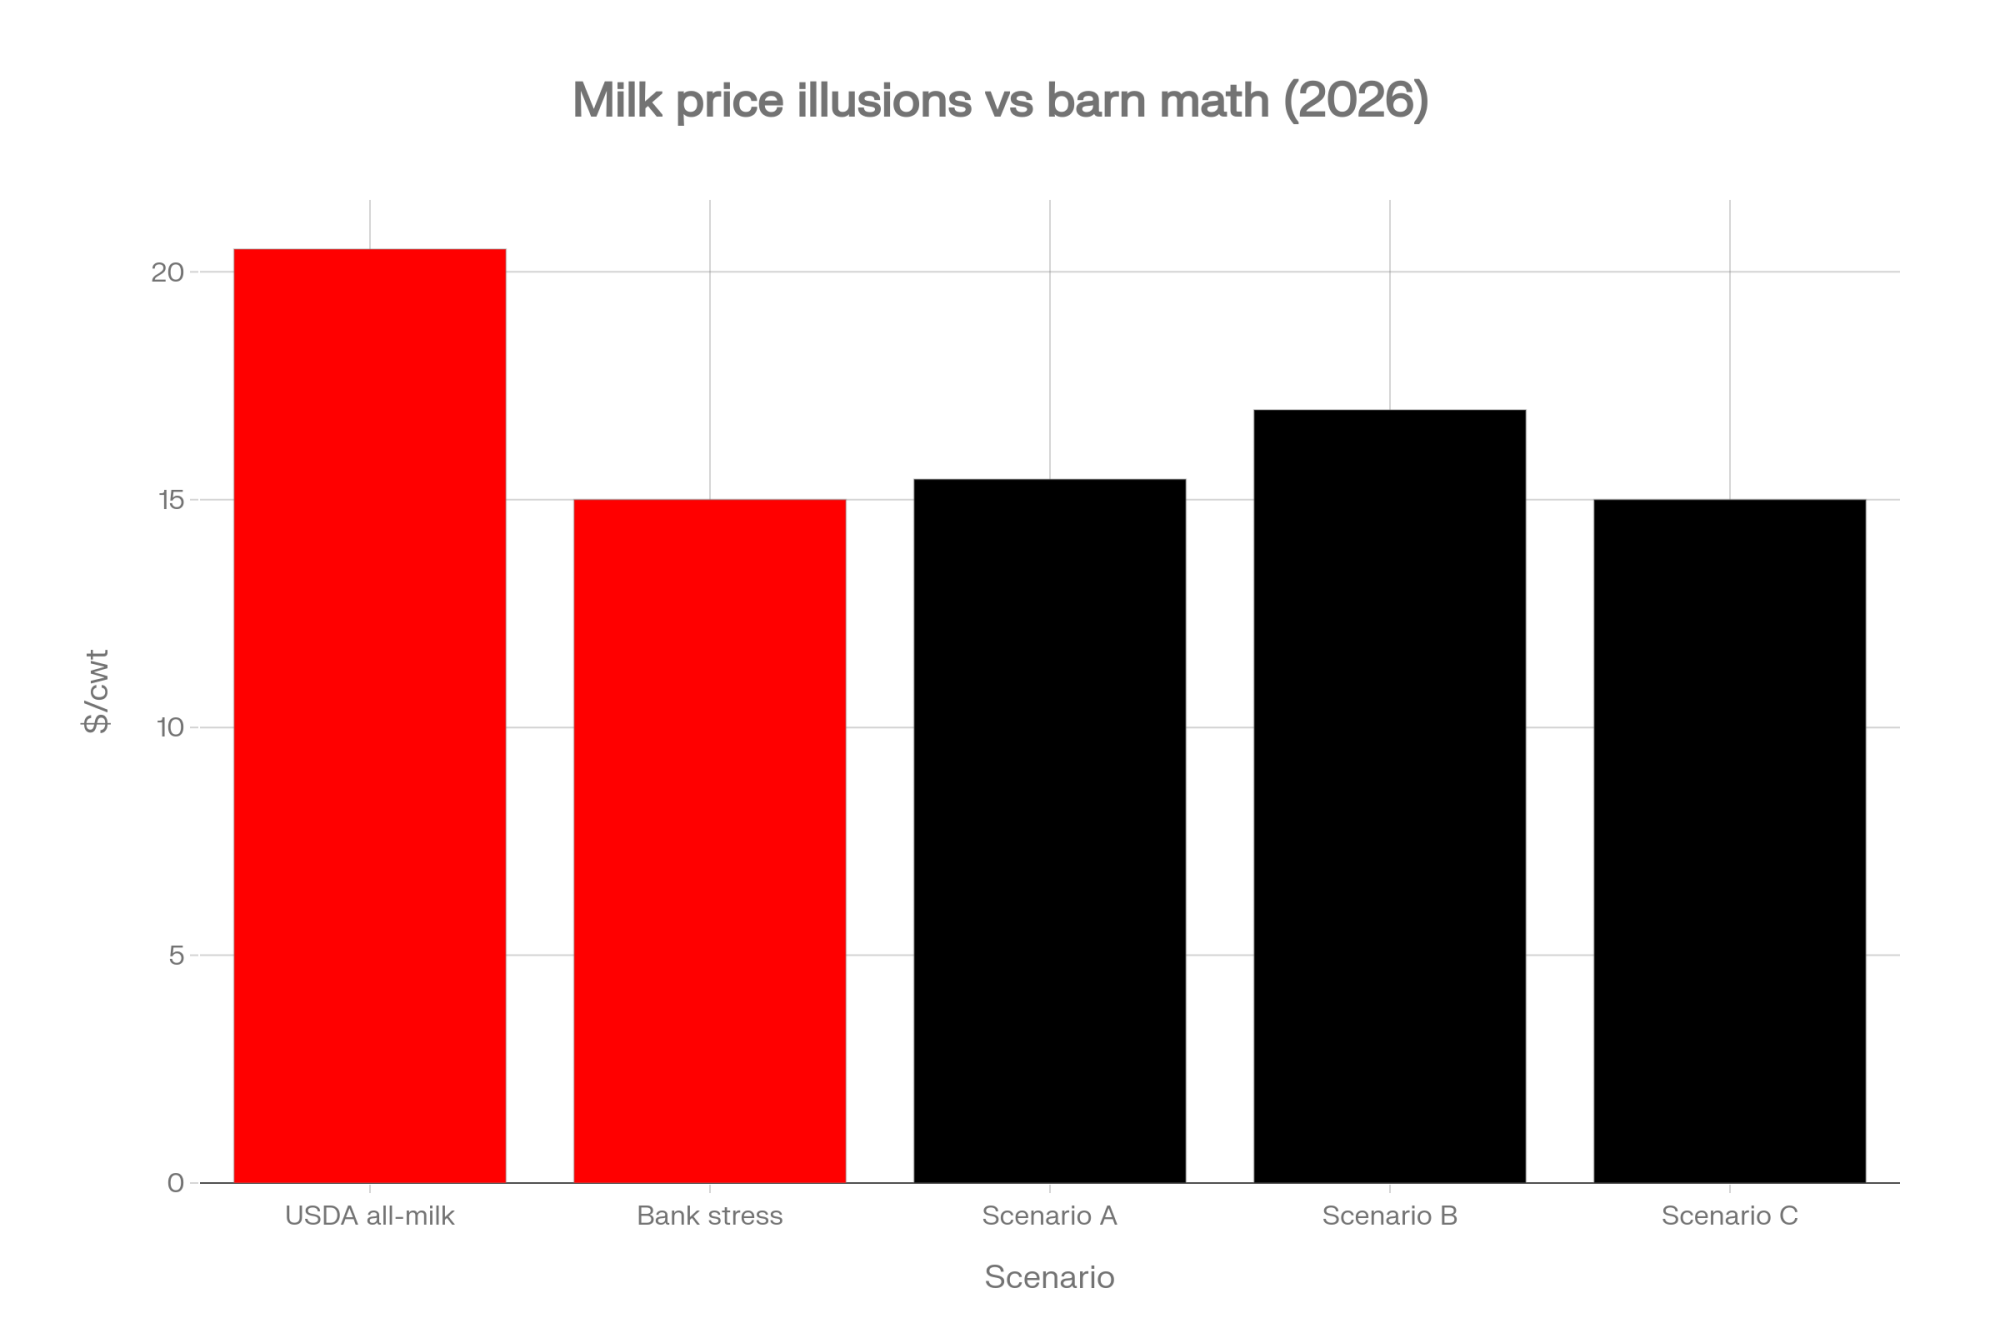
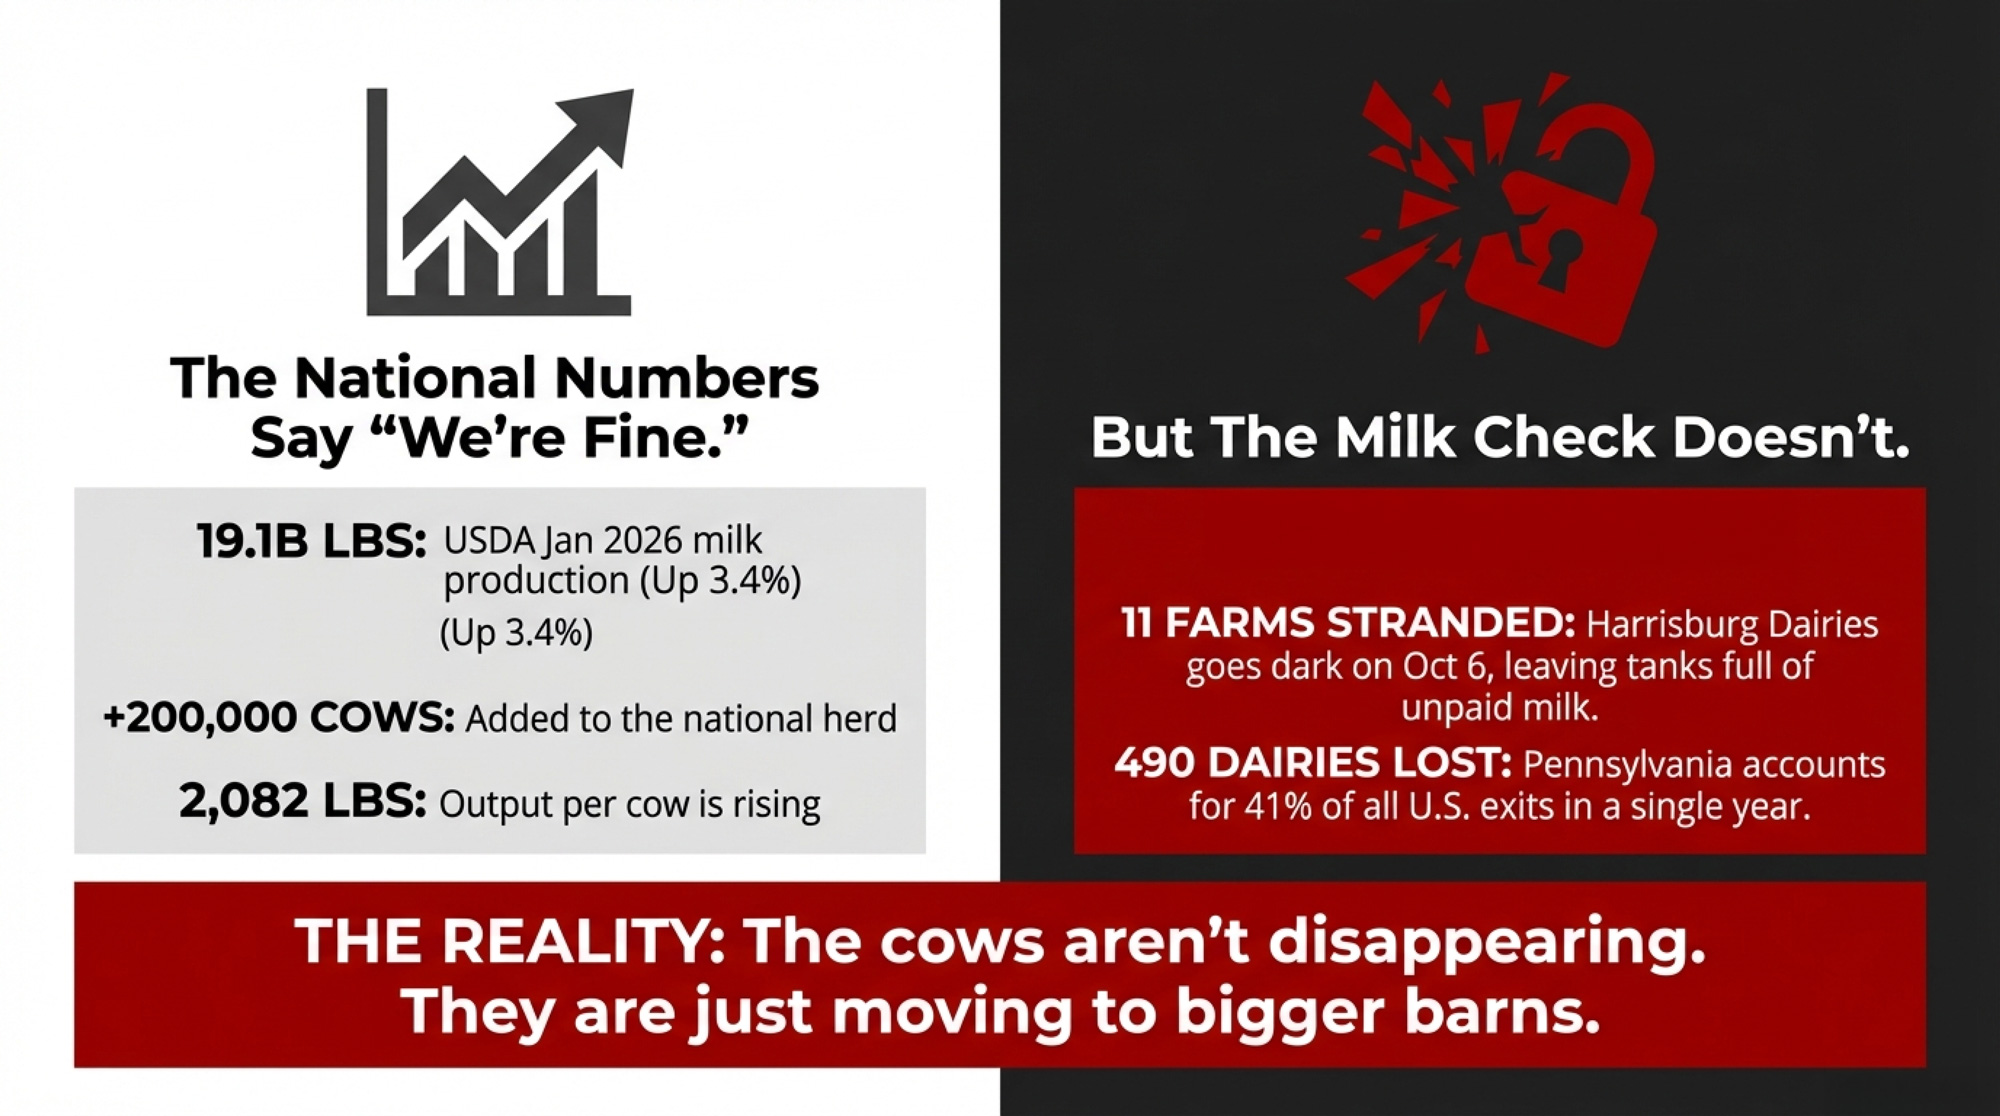
Executive Summary: USDA’s forecasting a record 236.6 billion pounds of milk in 2026 — right as more than 5.8 million people have dropped off SNAP since January 2025, gutting one of the biggest buyers of basic dairy in the country. That matters because SNAP households over-index on fluid milk and make up roughly a third of U.S. grocery sales, so when their benefits get cut, the demand hit lands squarely in the low-margin, high-volume staples you ship. Washington’s calling it a fraud crackdown, but the math doesn’t hold — 41,476 fraud disqualifications can’t explain 5.8 million people gone, which means this is structural demand loss, not housekeeping. Hoard’s pegged a 28% SNAP cut at roughly a 0.8% dairy-demand hit — sounds like a rounding error until it stacks on record supply and $20.00/cwt all-milk. On a 500-cow herd, even a 50¢/cwt demand-driven softening runs about $73,000 off the top in a year, and the exposure isn’t even — Arizona shed 43% of its caseload and Florida lost nearly 300,000 recipients, so Sunbelt fluid shippers are standing closest to the fire. If you’re budgeting 2027–2028 on a stable domestic floor, this is your cue to price a DRP quarter now and ask your co-op exactly where your milk lands.
Editor’s note: The 500-cow Phoenix-corridor operation described below is a composite scenario modeled from multiple Sunbelt fluid-market dairies, not a single named farm. Every market, policy, and financial figure in this article is real and sourced.
Picture a composite 500-cow dairy shipping into the Phoenix retail corridor — a stand-in for the Sunbelt fluid-market operations facing this squeeze. Nothing’s changed in the barn — same cows, same components, same trucks rolling out at dawn. But in the stores that move that milk, something’s shifting under the surface. Arizona’s SNAP caseload fell 43% in a single year — the steepest state-level drop in the country after the new federal rules took hold — and the corner grocers in lower-income ZIP codes felt it first. That kind of operation won’t ever see a line item called “SNAP” on its milk check. It’ll just see a domestic floor that isn’t holding the way it used to — and by the time it does, the price path is already set.
That’s the story dairy hasn’t been telling itself. SNAP — the program most of us still call food stamps — has quietly been one of the biggest buyers of basic dairy in the country. And right now it’s contracting hard, at the exact moment USDA is forecasting a wall of milk. Record supply. Softening prices. A demand floor with a crack in it. Three arrows, all pointing the same way.
What’s Changing and Why
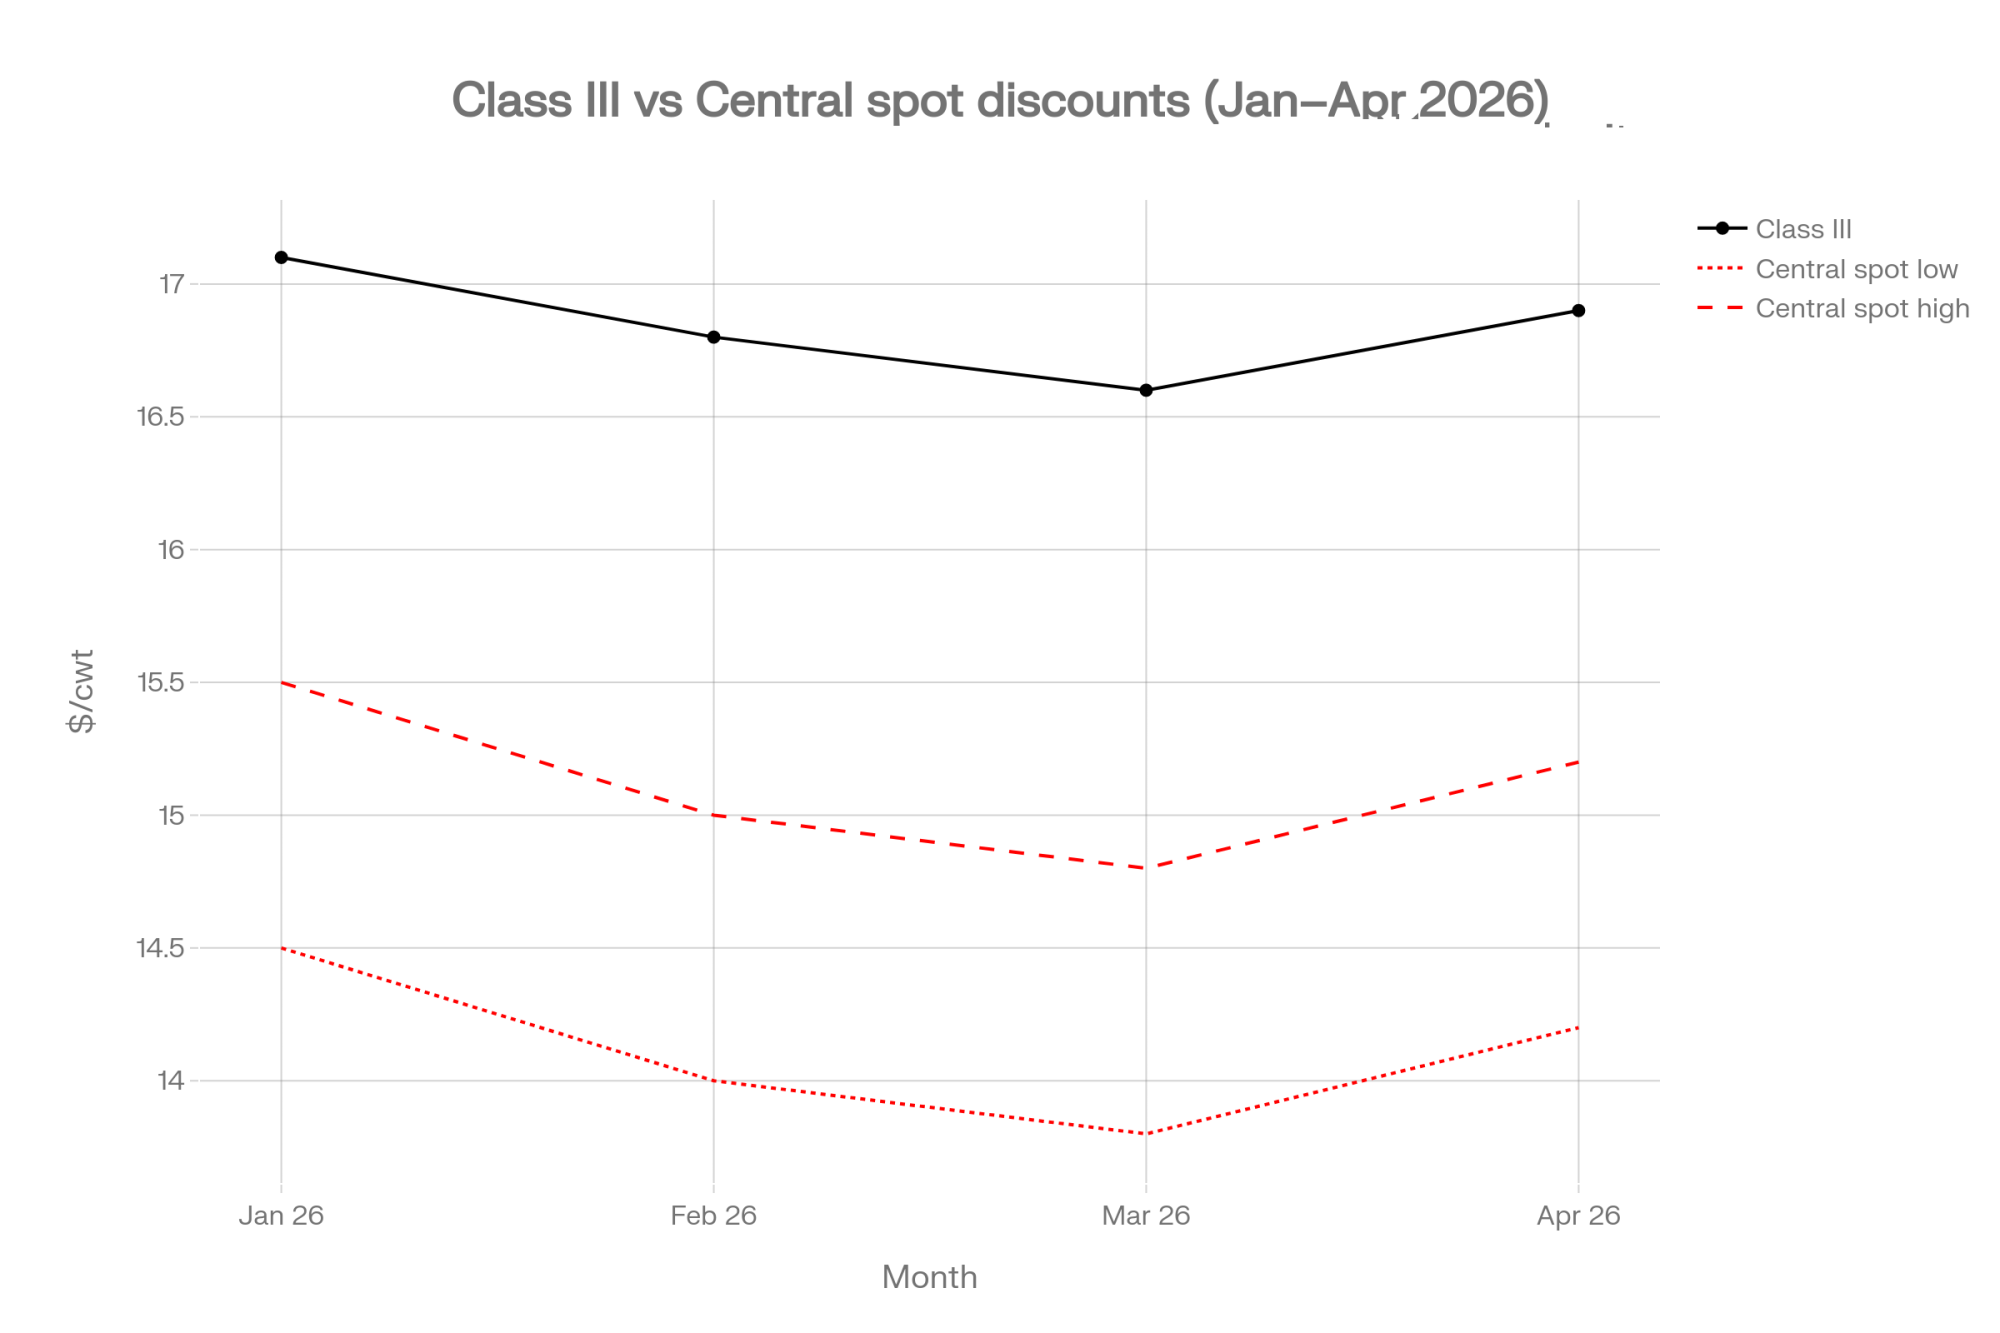
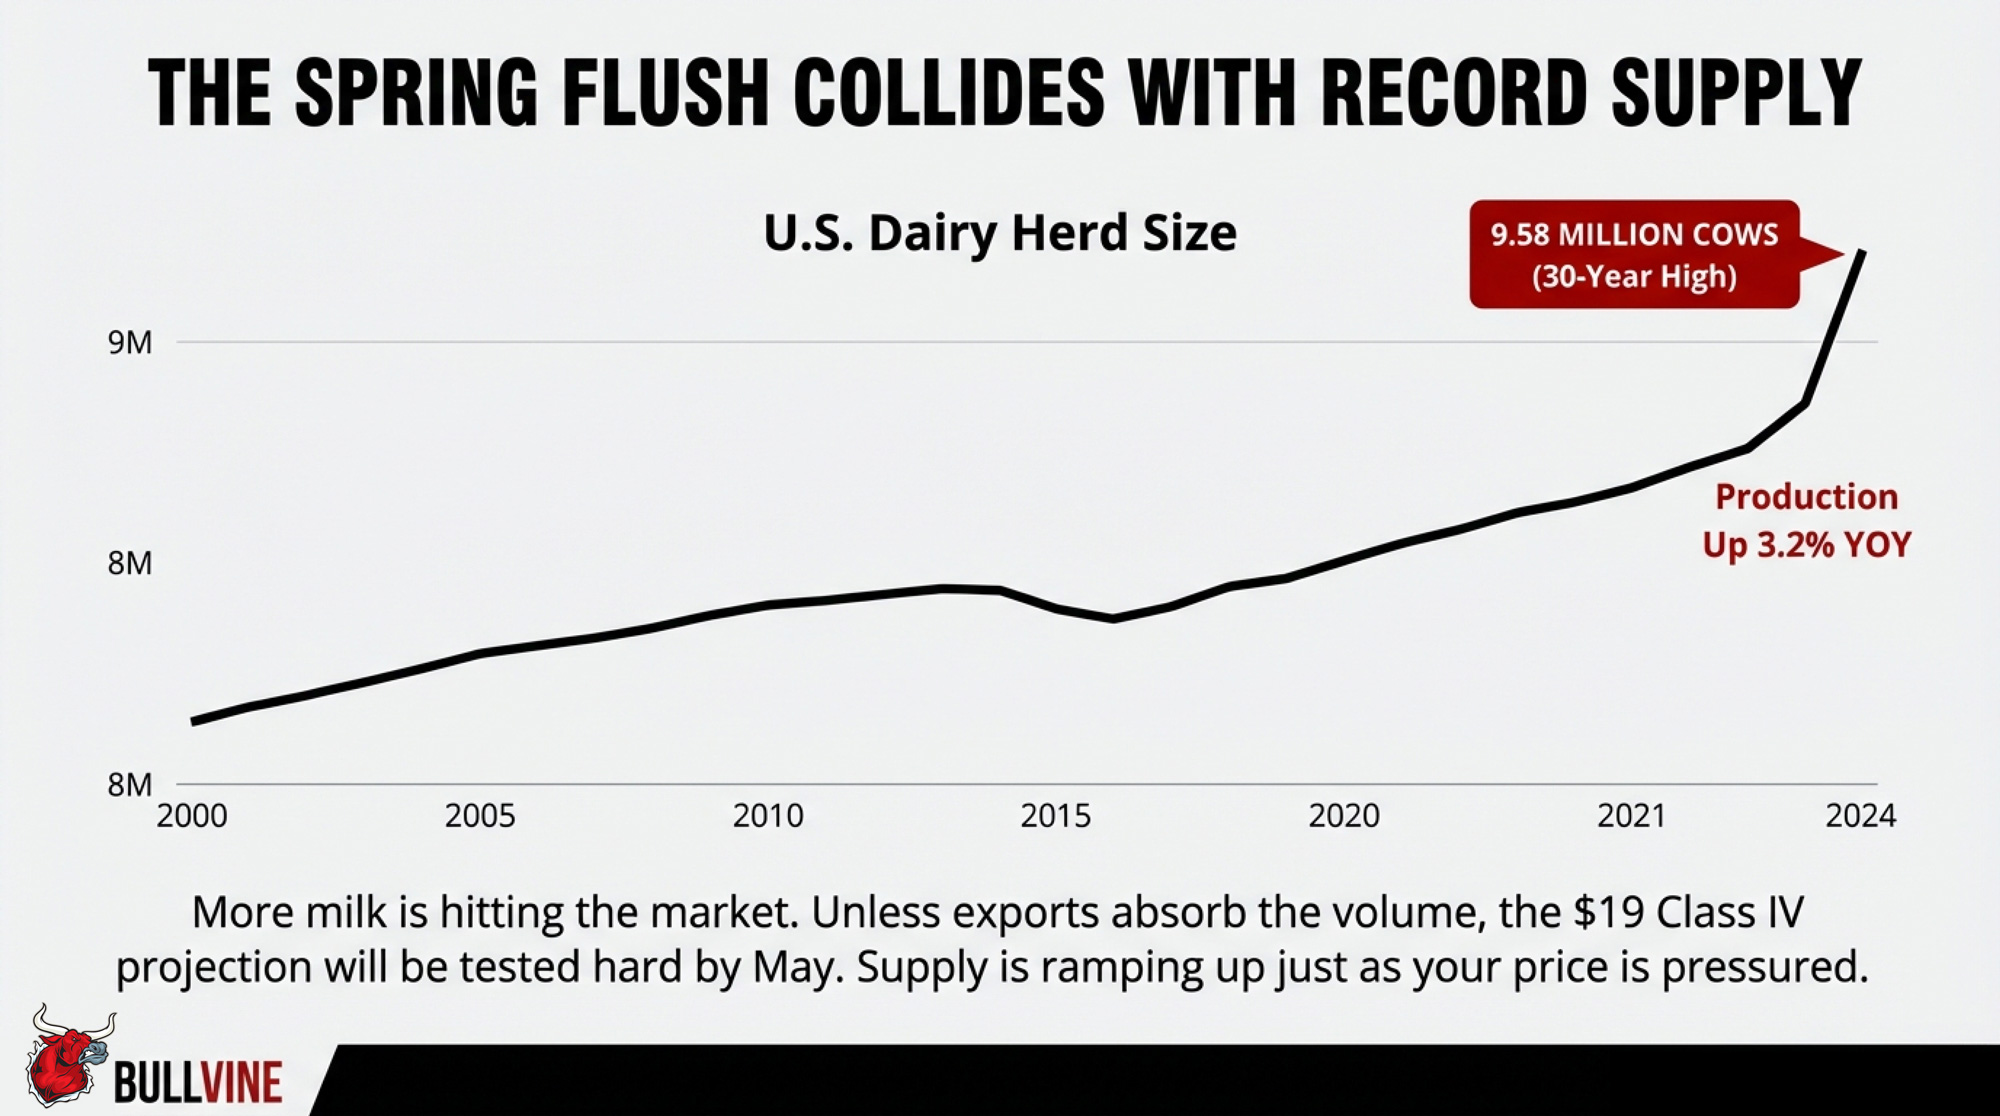
Start with the supply side, because that part isn’t in dispute. USDA’s Economic Research Service pegs 2026 U.S. milk production at 236.6 billion pounds, climbing to 238.1 billion in 2027. More cows, more milk per cow, low cull rates — this is a deliberate expansion, not an accident. And more milk means softer prices. As of its July 2026 outlook, ERS put the 2026 all-milk forecast at $20.00/cwt — 70 cents below its prior estimate — with cheese expected to “overhang the market this year and next.”
Now the part almost nobody in dairy has priced in. SNAP participation dropped from roughly 42.8 million people in January 2025 to 37,011,096 by April 2026 — a fall of more than 5.8 million people. Most of that came after July 2025, when the reconciliation law (H.R. 1, the “One Big Beautiful Bill Act”) kicked in. The Center on Budget and Policy Priorities found March 2026 participation already sitting 4.7 million below the fiscal 2025 average — bigger than the Congressional Budget Office’s own forecast.
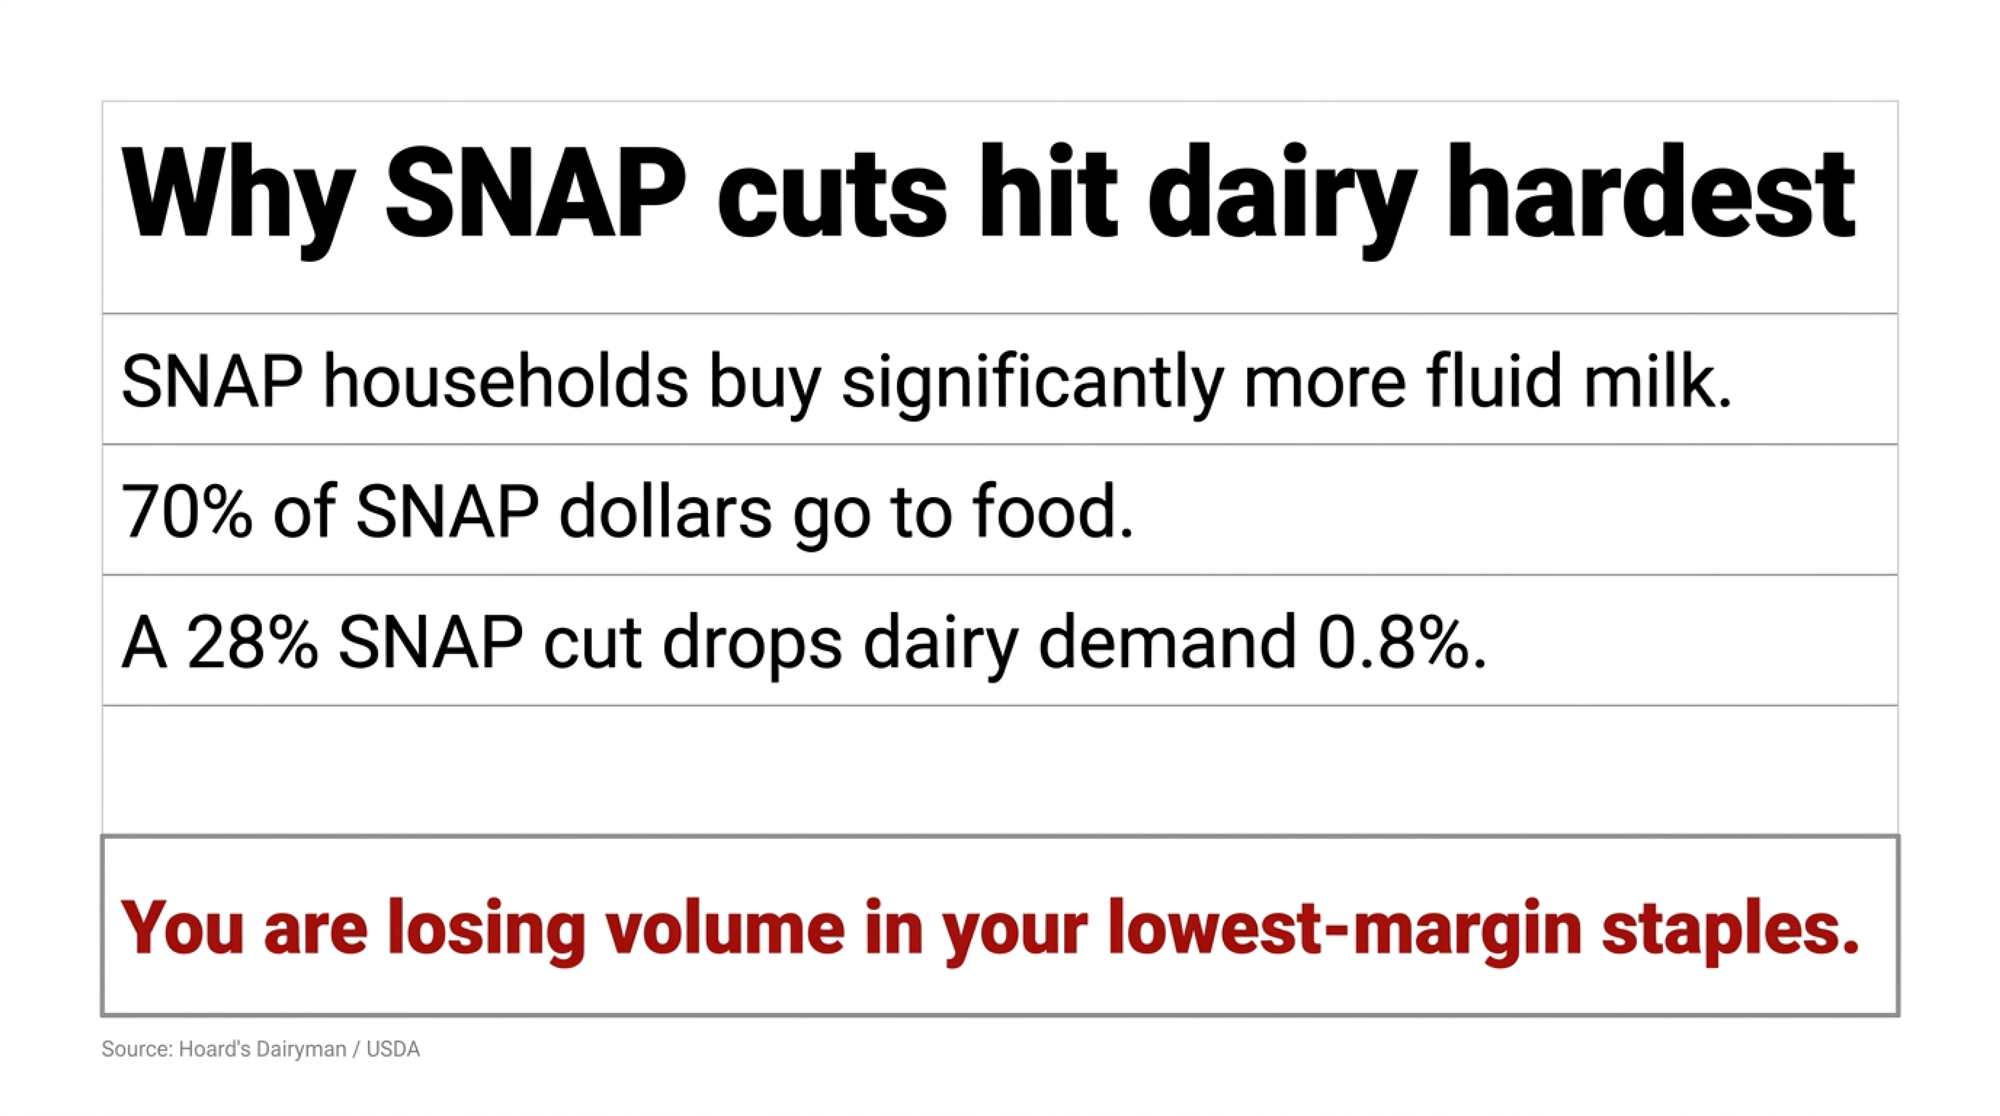
Here’s why that lands on dairy in particular. SNAP households make up about a third of U.S. retail grocery sales, and roughly 70% of SNAP dollars go to food and beverages. They spend 23–26% more per year on packaged food and drink than non-SNAP households, and USDA data show they buy more fluid milk — partly because they’ve got more kids at the table. Milk sits dead center in the SNAP staple basket. When that basket shrinks, dairy’s standing in the blast radius.
How This Plays Out on Real Farms
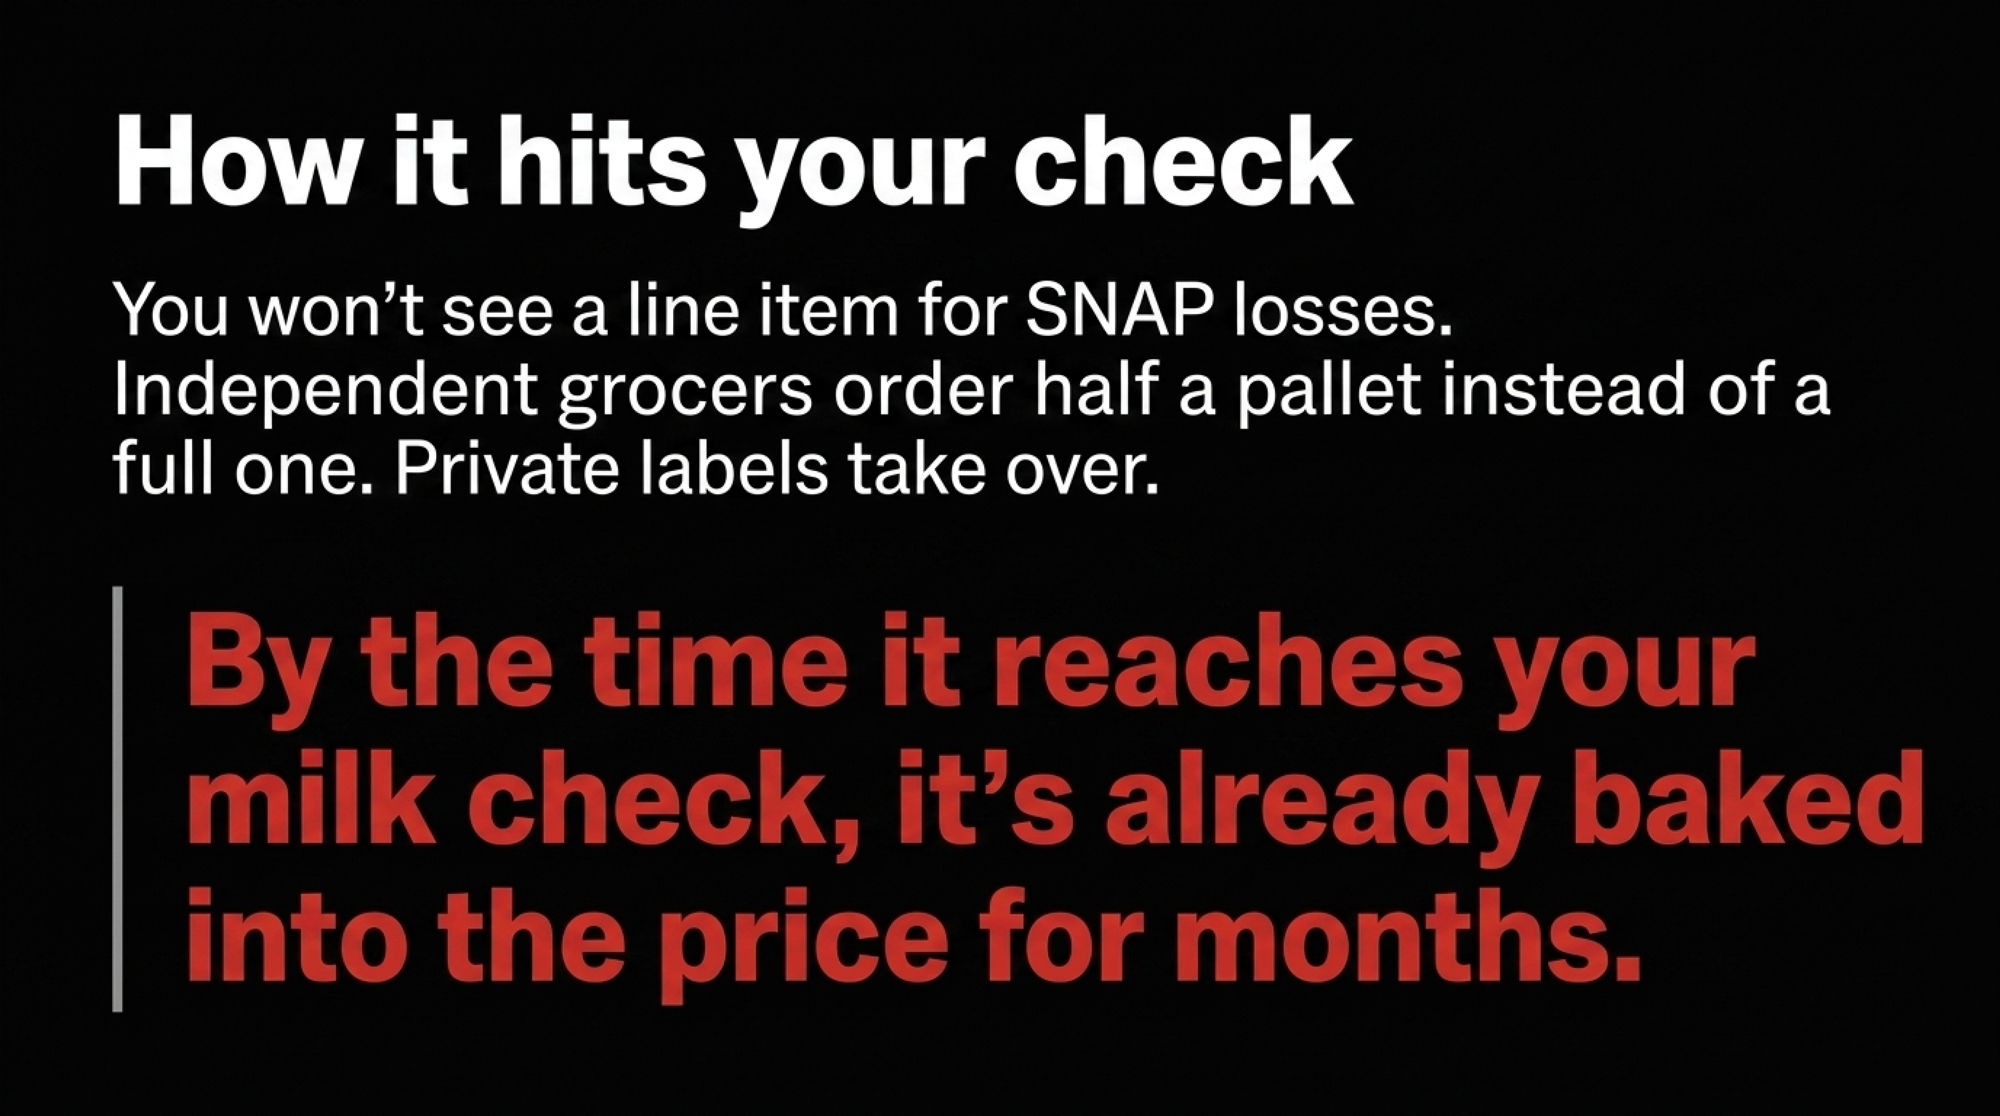
The uncomfortable part is that this arrow doesn’t hit like a bad futures print. It hits slow. First, a retail partner mentions SNAP weeks are running flatter. Then private-label picks up more of the shelf. Then the independent grocer who used to move a pallet of gallons a week moves half — and nobody sends you a memo about it. By the time it reaches your milk check, it’s already baked into the price for months.
So how big is the hit, honestly? Nobody has a cleanly measured number yet, and you should be wary of anyone who claims they do. But Hoard’s Dairyman ran the math back in June 2025: using SNAP’s share of at-home food spending, they estimated a 28% cut in benefits would trim total U.S. dairy demand by about 0.8%. Sounds like a rounding error. It isn’t — not when it lands on top of record supply.
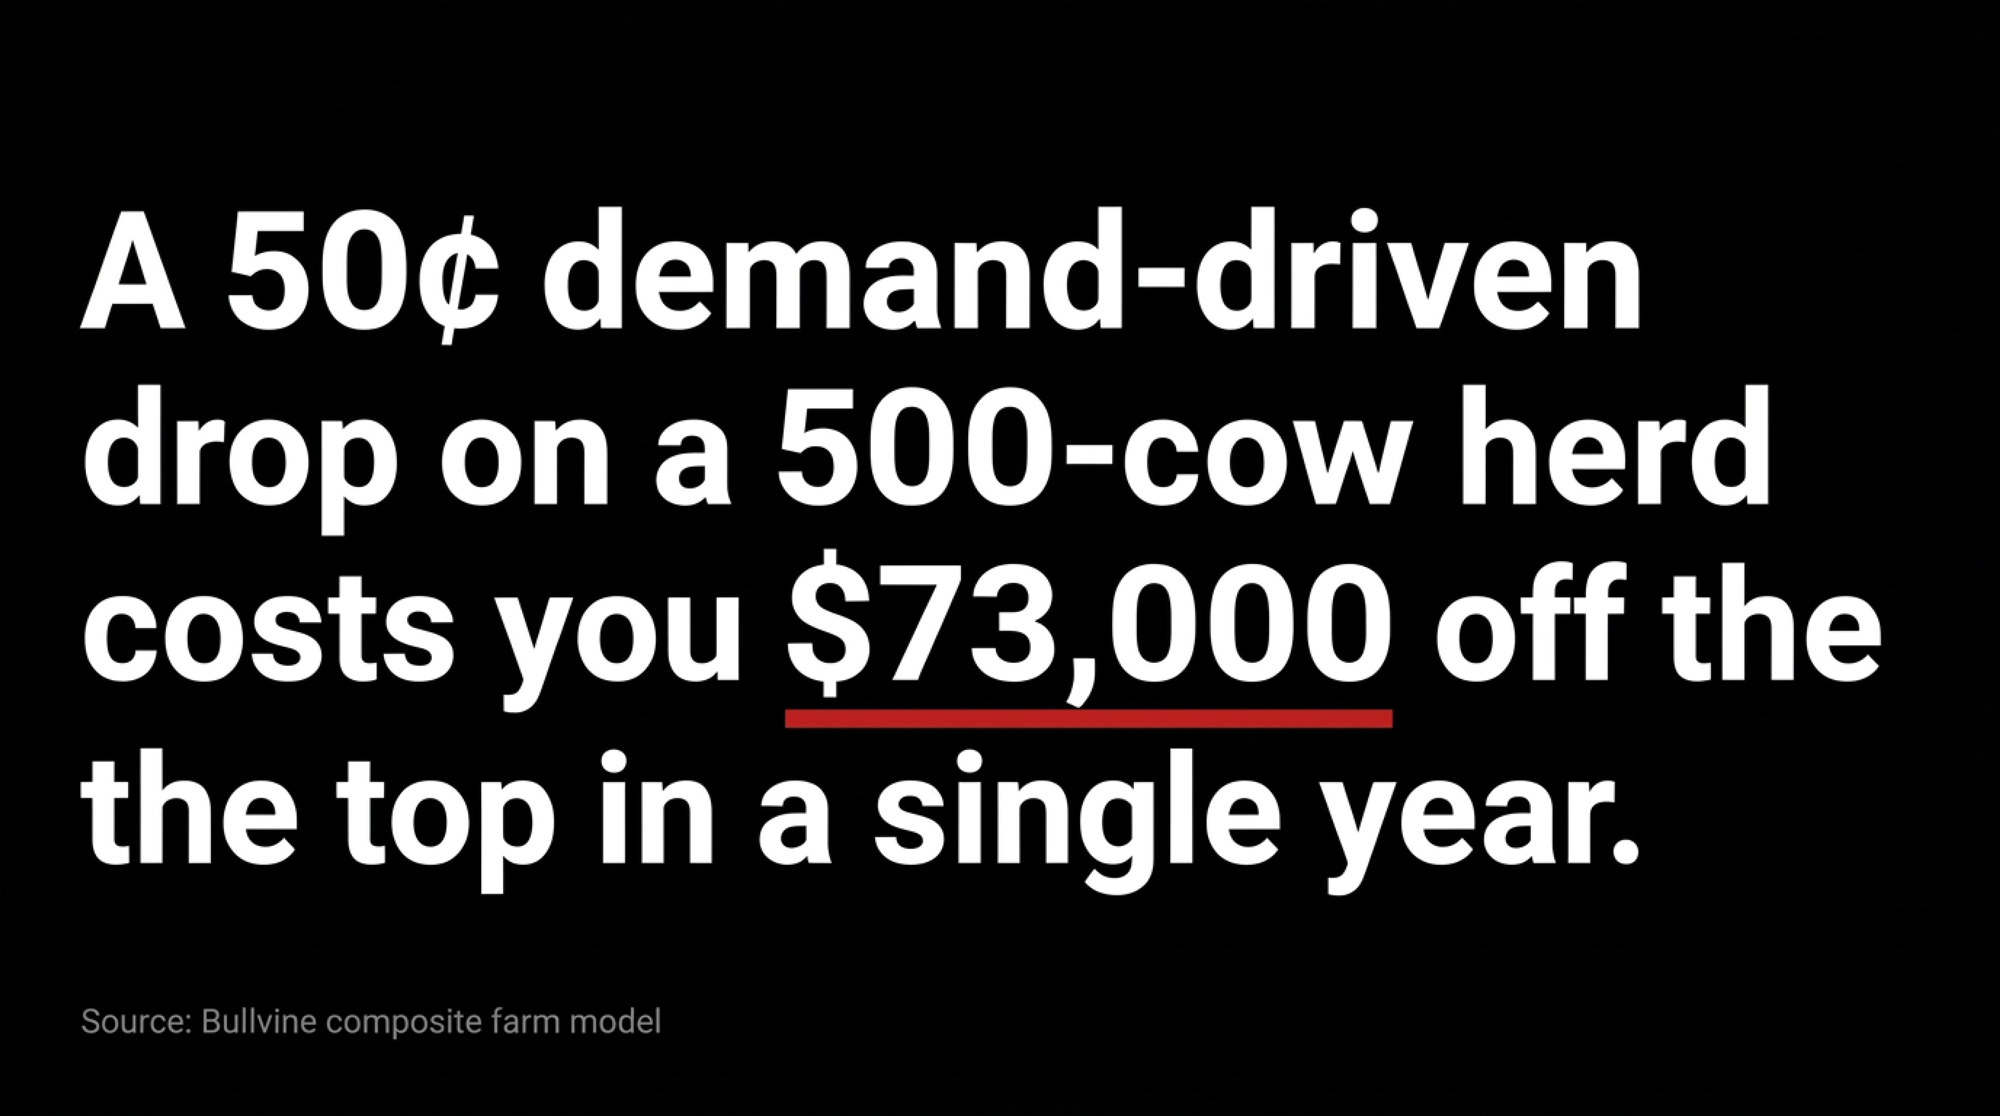
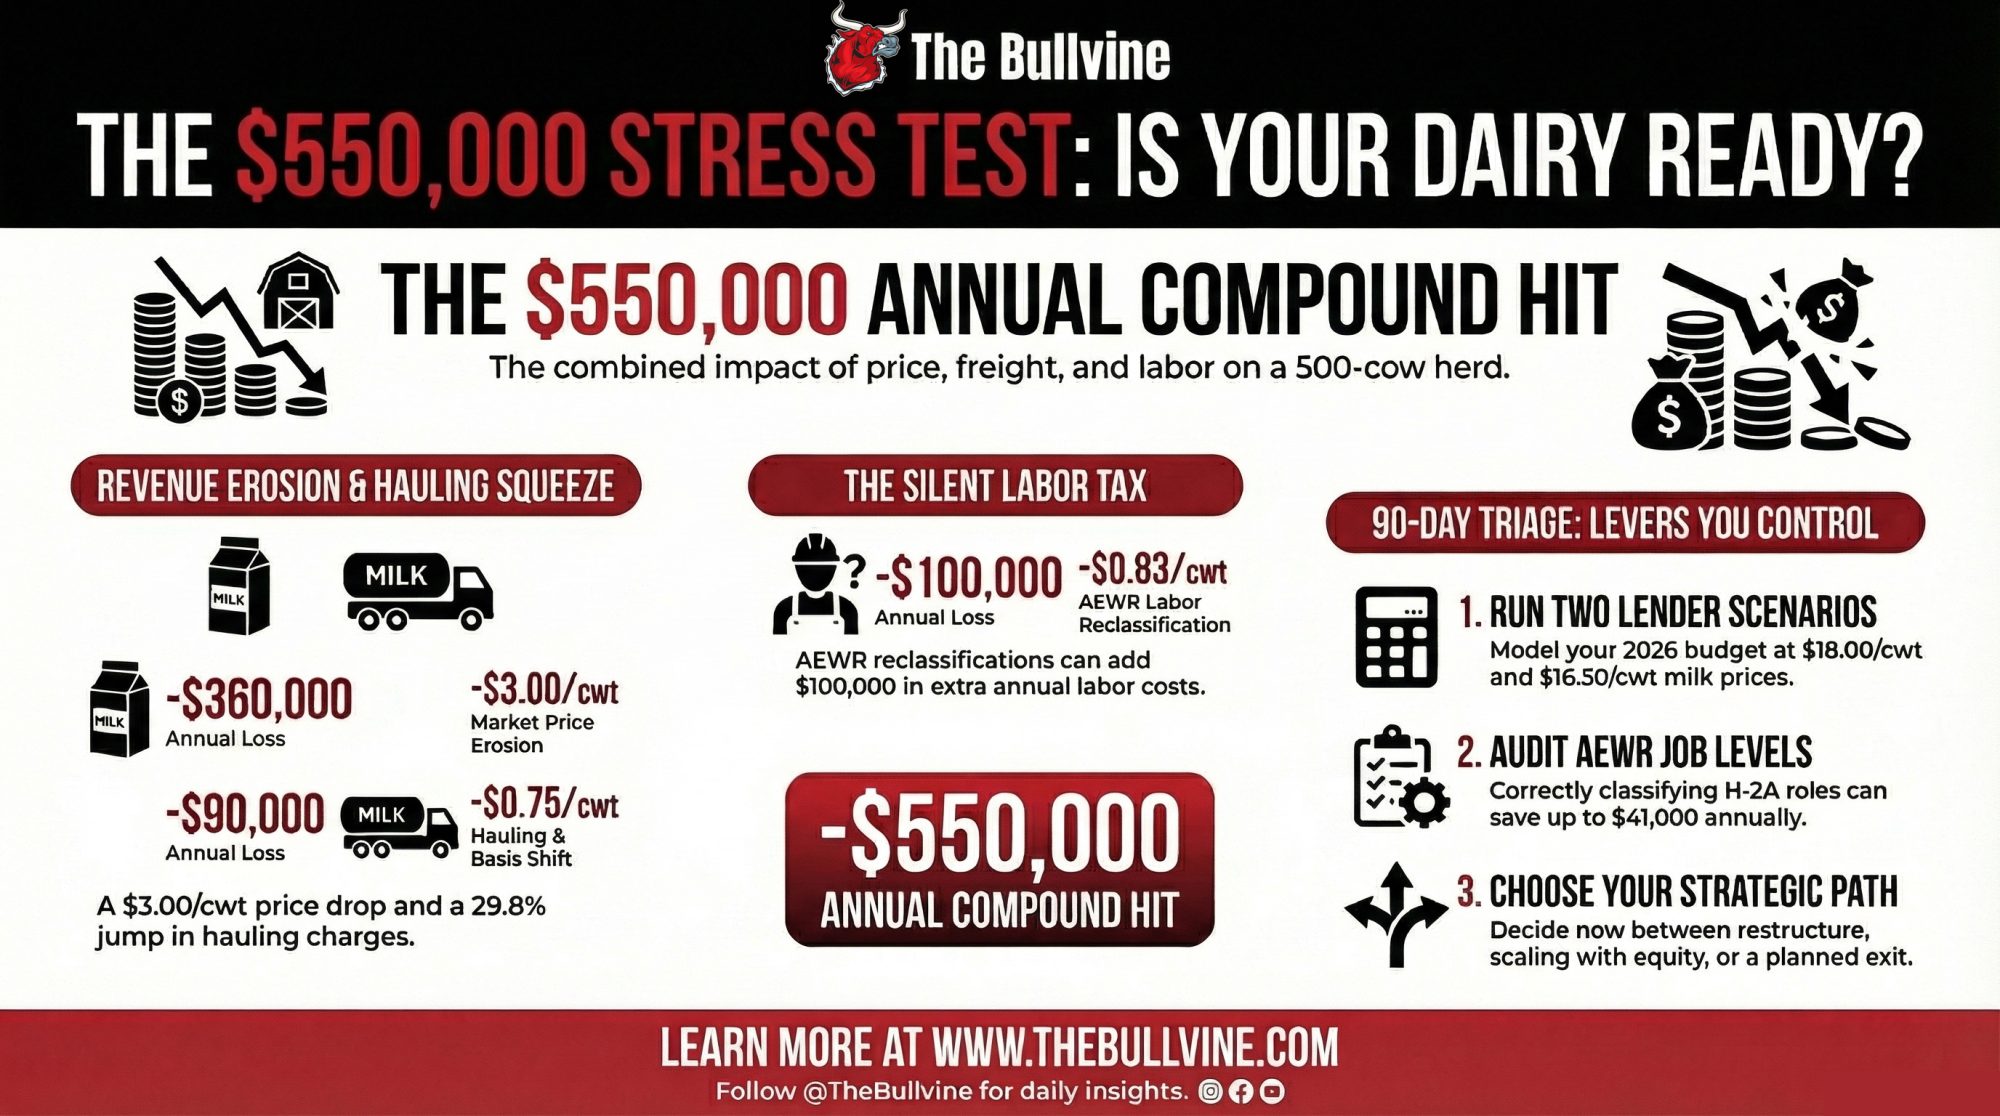
💡 Barn-Math Box500-cow herd × ~80 lbs/cow/day ≈ 14.6 million lbs/year. A demand-driven softening of even 50¢/cwt on that volume ≈ $73,000 off the top in a single year. Treat it as an illustration, not a forecast — it’s the swing a weak domestic floor helps cause, stacked on top of the $250K-plus risk The Bullvine already flagged for mid-size herds running their 2026 numbers.
Is the “Fraud” Story Costing You More Than You Think?
Here’s where a lot of producers get talked out of paying attention. The official line from USDA Secretary Brooke Rollins is that SNAP is shrinking because of fraud reduction and a stronger economy — nearly 4.3 million people cleaned off the rolls. It’s a tidy story. And if it’s mostly fraud, there’s nothing structural to plan around — the whole thing becomes housekeeping.
The numbers don’t back that up. You don’t need an economics degree to see the gap:
41,476 people disqualified from SNAP for fraud (USDA, FY2023) — under 1% of the 42 million on the program.
5,800,000+ people gone from the program since January 2025.
As the AP’s fact-check put it: fraud “is insufficient to explain such a drastic reduction in participation.”
USDA also points to tighter work requirements and a stronger labor market — not fraud alone — as reasons for the decline. And that’s exactly the point for your operation. Whether it’s work rules, paperwork friction, or the benefit-formula changes in H.R. 1 — which CBO scored as cutting participation by 2.4 million people a month on average through 2034 — the people leaving are the same either way. FRAC calls it “a deliberate policy design”. Those aren’t fraudsters walking out of the dairy aisle. They’re customers — families who lost food help, which is exactly why the demand they represented was real.
The Mechanics Behind the Outcome
Strip away the politics and the mechanism is simple. Fewer people on SNAP means fewer dollars flowing into the exact staple categories — fluid milk, basic cheese, yogurt — where dairy has the least room to raise price and the most volume to move. It’s not a demand shock you can hedge with a single futures contract. It’s a slow leak in the floor everyone assumed was solid. Fluid milk was already sliding before any of this — see the longer arc in where domestic dairy demand is really heading, and the deeper policy backstory in SNAP Cuts Target $267 Billion: Here’s What Dairy Farmers Aren’t Being Told.
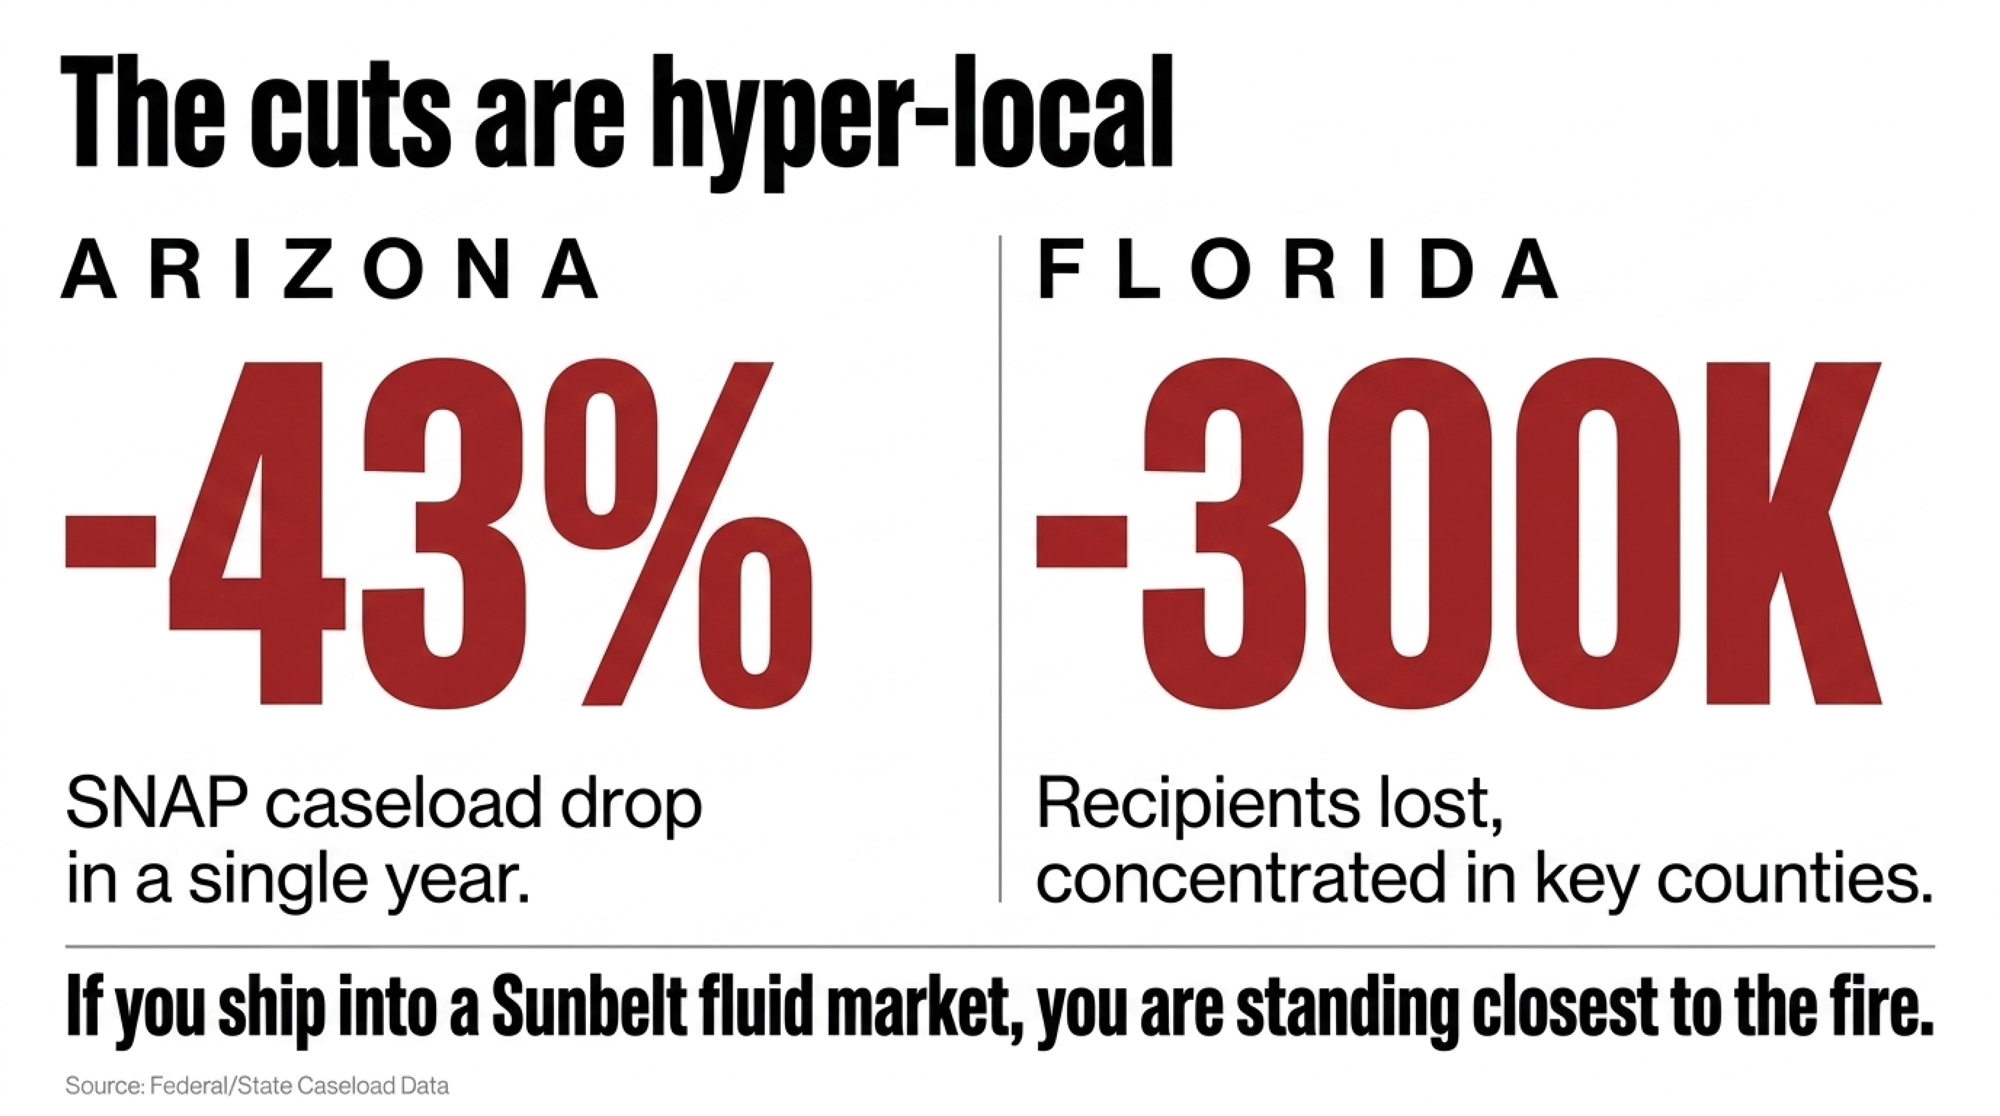
And the geography matters as much as the total. The cuts aren’t spread evenly — they’re concentrated in specific states and specific counties. Florida lost nearly 300,000 recipients, with the sharpest declines in Monroe and Collier counties. Arizona shed 43% of its caseload in a year. If your milk moves through a Sunbelt fluid market, your exposure looks very different from a herd shipping into a cheese plant in the Upper Midwest. Same national number, wildly different farm-level consequence.
Exposure Factor
Sunbelt Fluid Shipper (AZ/FL corridor)
Upper Midwest Cheese Shipper
SNAP caseload decline
43% (AZ), ~18% (FL) image.jpg
~8% (regional est.)
Primary product
Fluid milk (staple basket)
Cheese / value-added
SNAP demand sensitivity
High — over-indexes on fluid
Lower — export & VAP buffer
Pricing power on volume
Thin (low-margin staple)
Moderate (differentiated)
Near-term tailwind
Limited domestic floor
Exports growing through 2027 Bullvine Four-Row Tier-Mix Template v1.md
What Can You Actually Do About It This Month?
You can’t lobby your way out of this one — that ship has largely sailed. But you can stop treating domestic demand as a fixed given and start managing it like the variable it’s become. A few paths producers and co-ops are weighing right now:
Feature
Dairy Revenue Protection (DRP)
Dairy Margin Coverage (DMC)
2026 availability
Open — rolling quarterly
Closed Feb 26, 2026
Protects
Milk revenue
Margin over feed
Next action window
This month (July)
Re-enroll ~Jan 2027
Tier 1 ceiling
N/A
Expanded 5M → 6M lbs
Best for
Flooring a specific exposed quarter
Smaller volumes, $9.50 tier
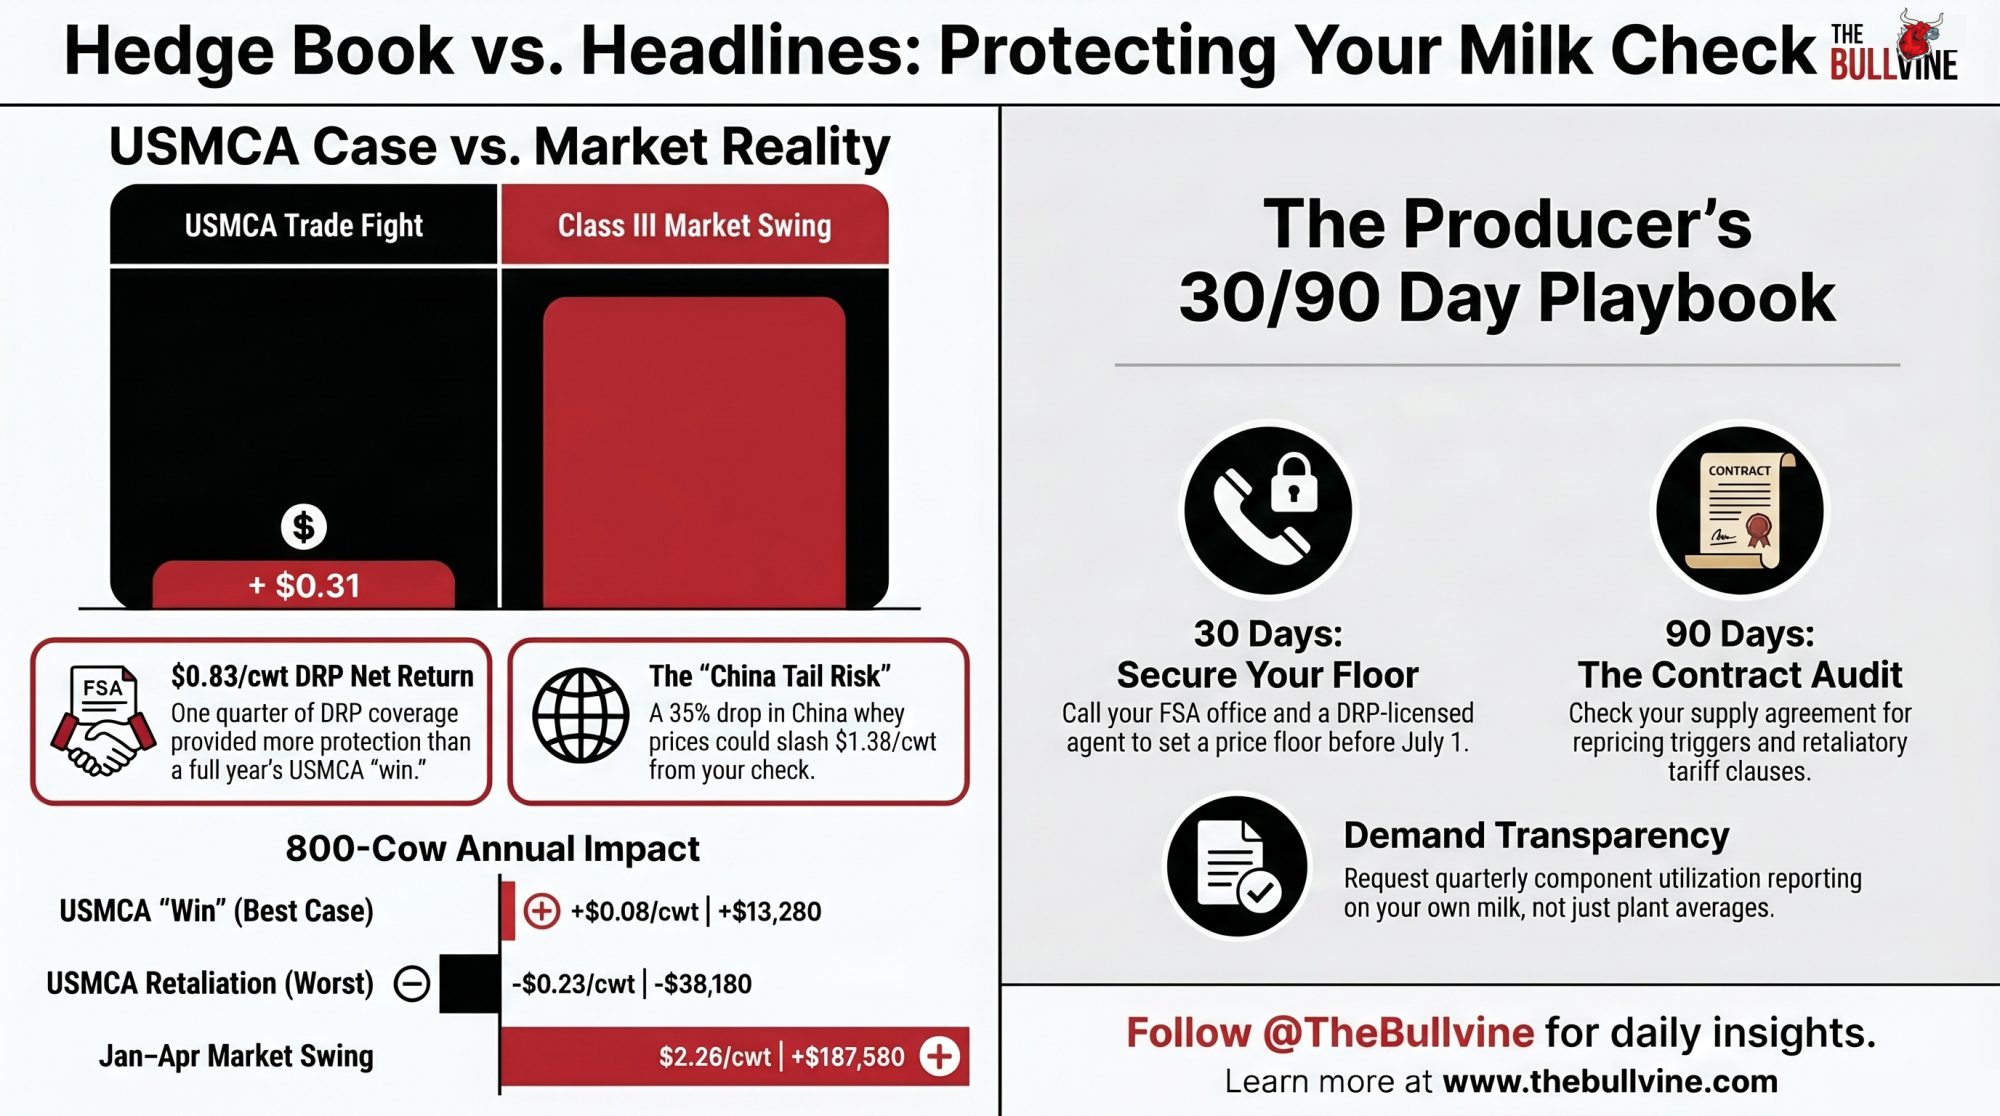
Price a Dairy Revenue Protection quarter — this is the 30-day move. DRP sells through USDA’s Risk Management Agency and your crop insurance agent on a rolling quarterly basis, so, unlike DMC, it’s a tool you can actually act on in July, not just in the January window. When it makes sense: if you want to floor a specific quarter’s milk revenue against a softening domestic market. What it takes: a call to a livestock insurance agent and a look at the current quarterly endorsements. The catch: it protects revenue, not margin over feed, and premiums move with the market — so run the quarter you’re most exposed on first.
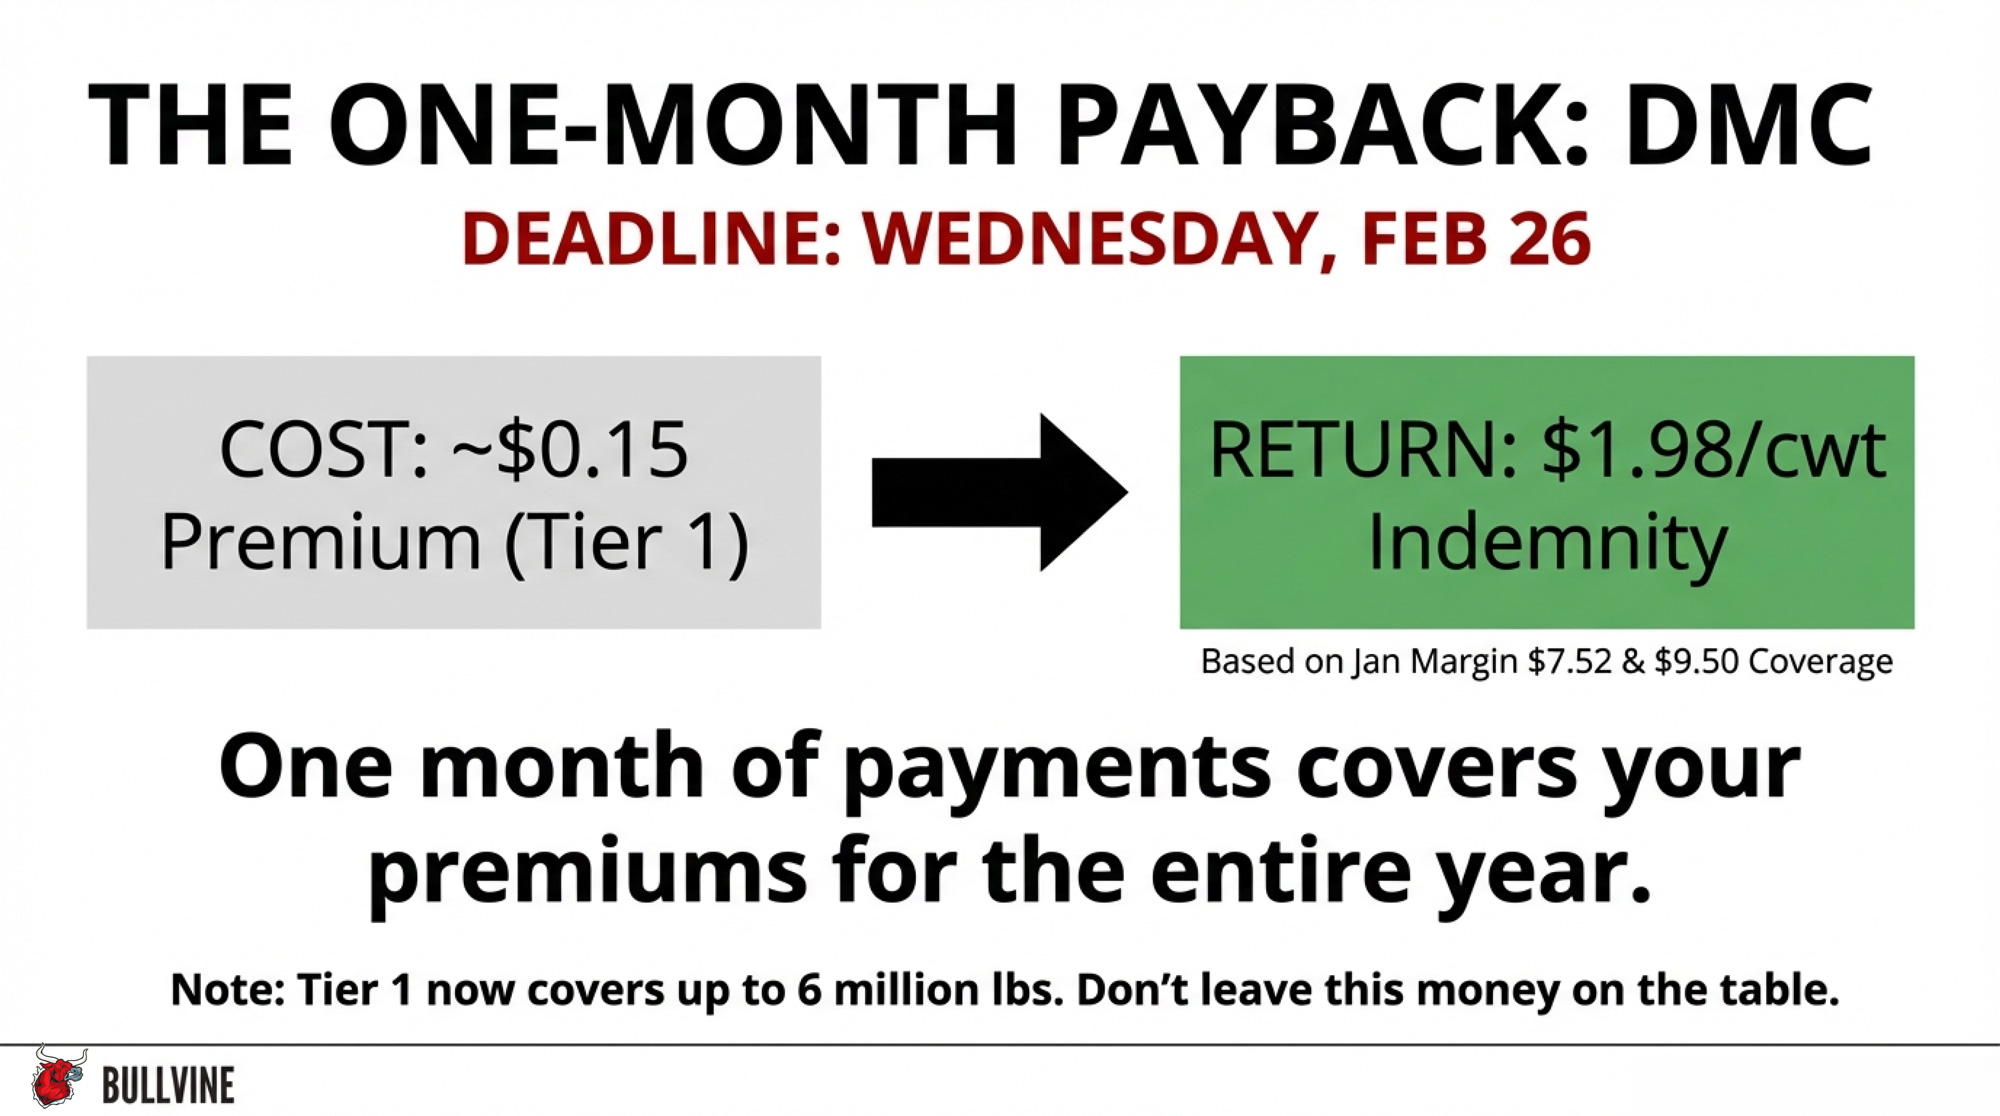
Mark the 2027 DMC window and re-run your numbers now. The 2026 Dairy Margin Coverage enrollment closed February 26, 2026, so you can’t sign for this year — but coverage runs through 2031, the Tier 1 production ceiling expanded from 5 to 6 million pounds, and the $9.50 tier triggered payments early in 2026. When it makes sense: almost always, for smaller volumes. What to do now: pull your 2021–2023 marketings and price the $9.50 tier so you’re ready the day the next window opens, typically in January.
Engage co-op leadership on channel risk. Push your co-op or processor to tell you where your milk actually lands — how much moves through the small independent grocers most exposed to benefit cuts versus value-added and export-ready channels. When it makes sense: on a 2–3 year horizon, and it starts with a single conversation. What it takes: raising channel-level SNAP exposure at your next board or patron meeting and asking for the data in writing. The trade-off: shifting toward more resilient channels can cost you flexibility and near-term price — but exports are projected to keep growing through 2027, which is the tailwind here. It’s a co-op-scale decision, not a solo one, which is exactly why leadership has to own it.
Key Takeaways
If you ship into Arizona or Florida retail corridors, ask your buyer this month what share of your volume moves through SNAP-heavy stores — those markets are shrinking fastest.
If your co-op can’t tell you your channel-level SNAP exposure, that blind spot is itself a risk — put it on the agenda at your next board or patron meeting.
The question isn’t whether record milk and shrinking food aid are converging. The data says they already are. It’s whether your operation’s demand assumptions can survive being honest about it. So here’s the one worth sitting with tonight: if you pulled last year’s milk check and asked “how much of this leaned on customers who are no longer on SNAP,” would you even know where to start looking?
Run Your Numbers
Dairy Profit Projector — Take that 50¢/cwt demand-softening scenario and put it against your own herd. The Projector turns milk price, feed cost, and ration assumptions into IOFC, breakeven milk price, and 12-month whole-herd margin — so you find out where your floor really sits before the market tests it.
Complete references and supporting documentation are available upon request by contacting the editorial team at editor@thebullvine.com.
Learn More
The Hidden Contract Clause That Could Cost Your Dairy $55000 in 2026 — Arms you with a 30-day tactical audit to spot new liability transfers in processor contracts before July deadlines hit. Learn how allergen indemnification clauses threaten $15,000 to $55,000 in annual net profit on 500-cow operations.
211000 More Dairy Cows. Bleeding Margins. The 2026 Math That Won’t Wait. — Exposes the structural trap where $1,300 beef-on-dairy calf premiums keep low-margin cows in stalls, starving replacement pipelines to a 20-year low. Master the genetics protocol needed to protect your herd’s true $19.80/cwt breakeven.
Every week, thousands of producers, breeders, and industry insiders open Bullvine Weekly for genetics insights, market shifts, and profit strategies they won’t find anywhere else. One email. Five minutes. Smarter decisions all week.
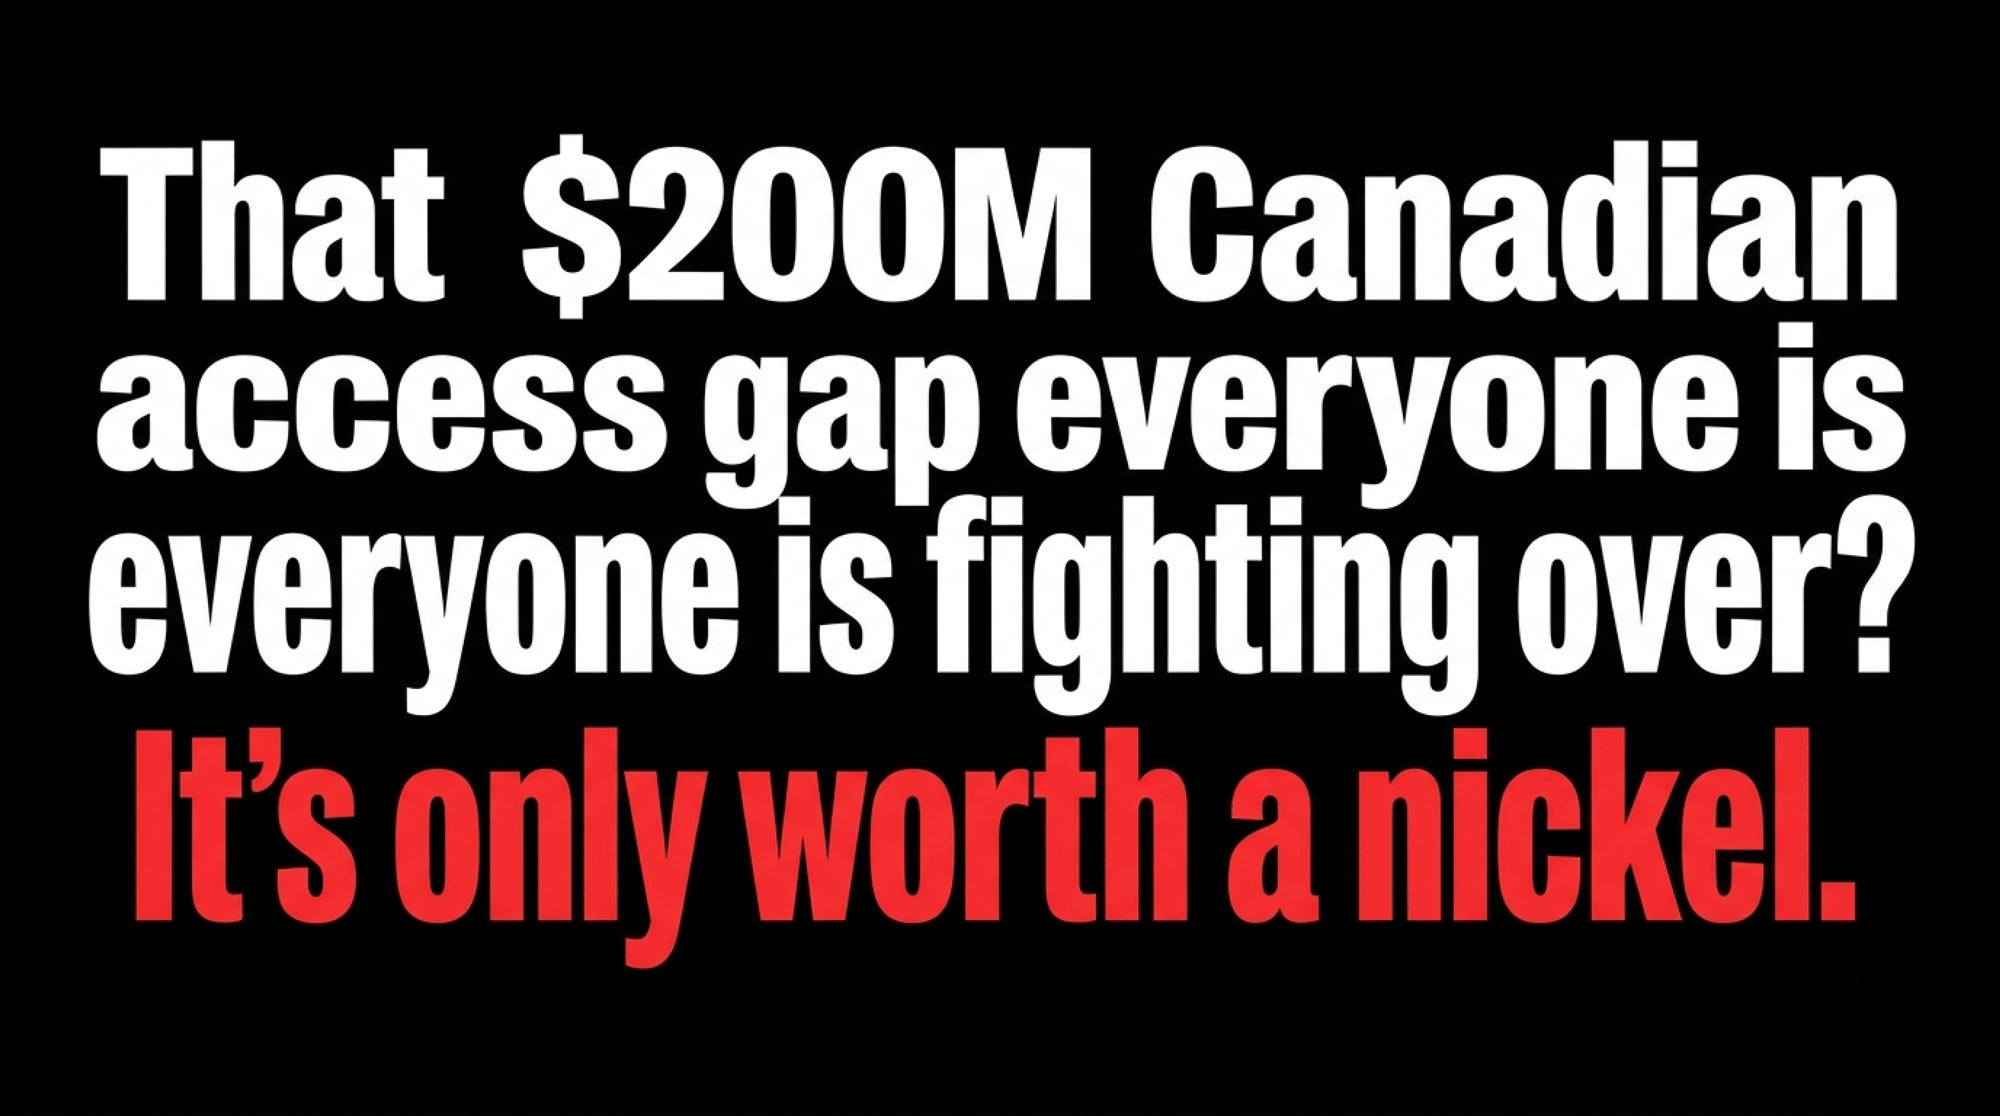
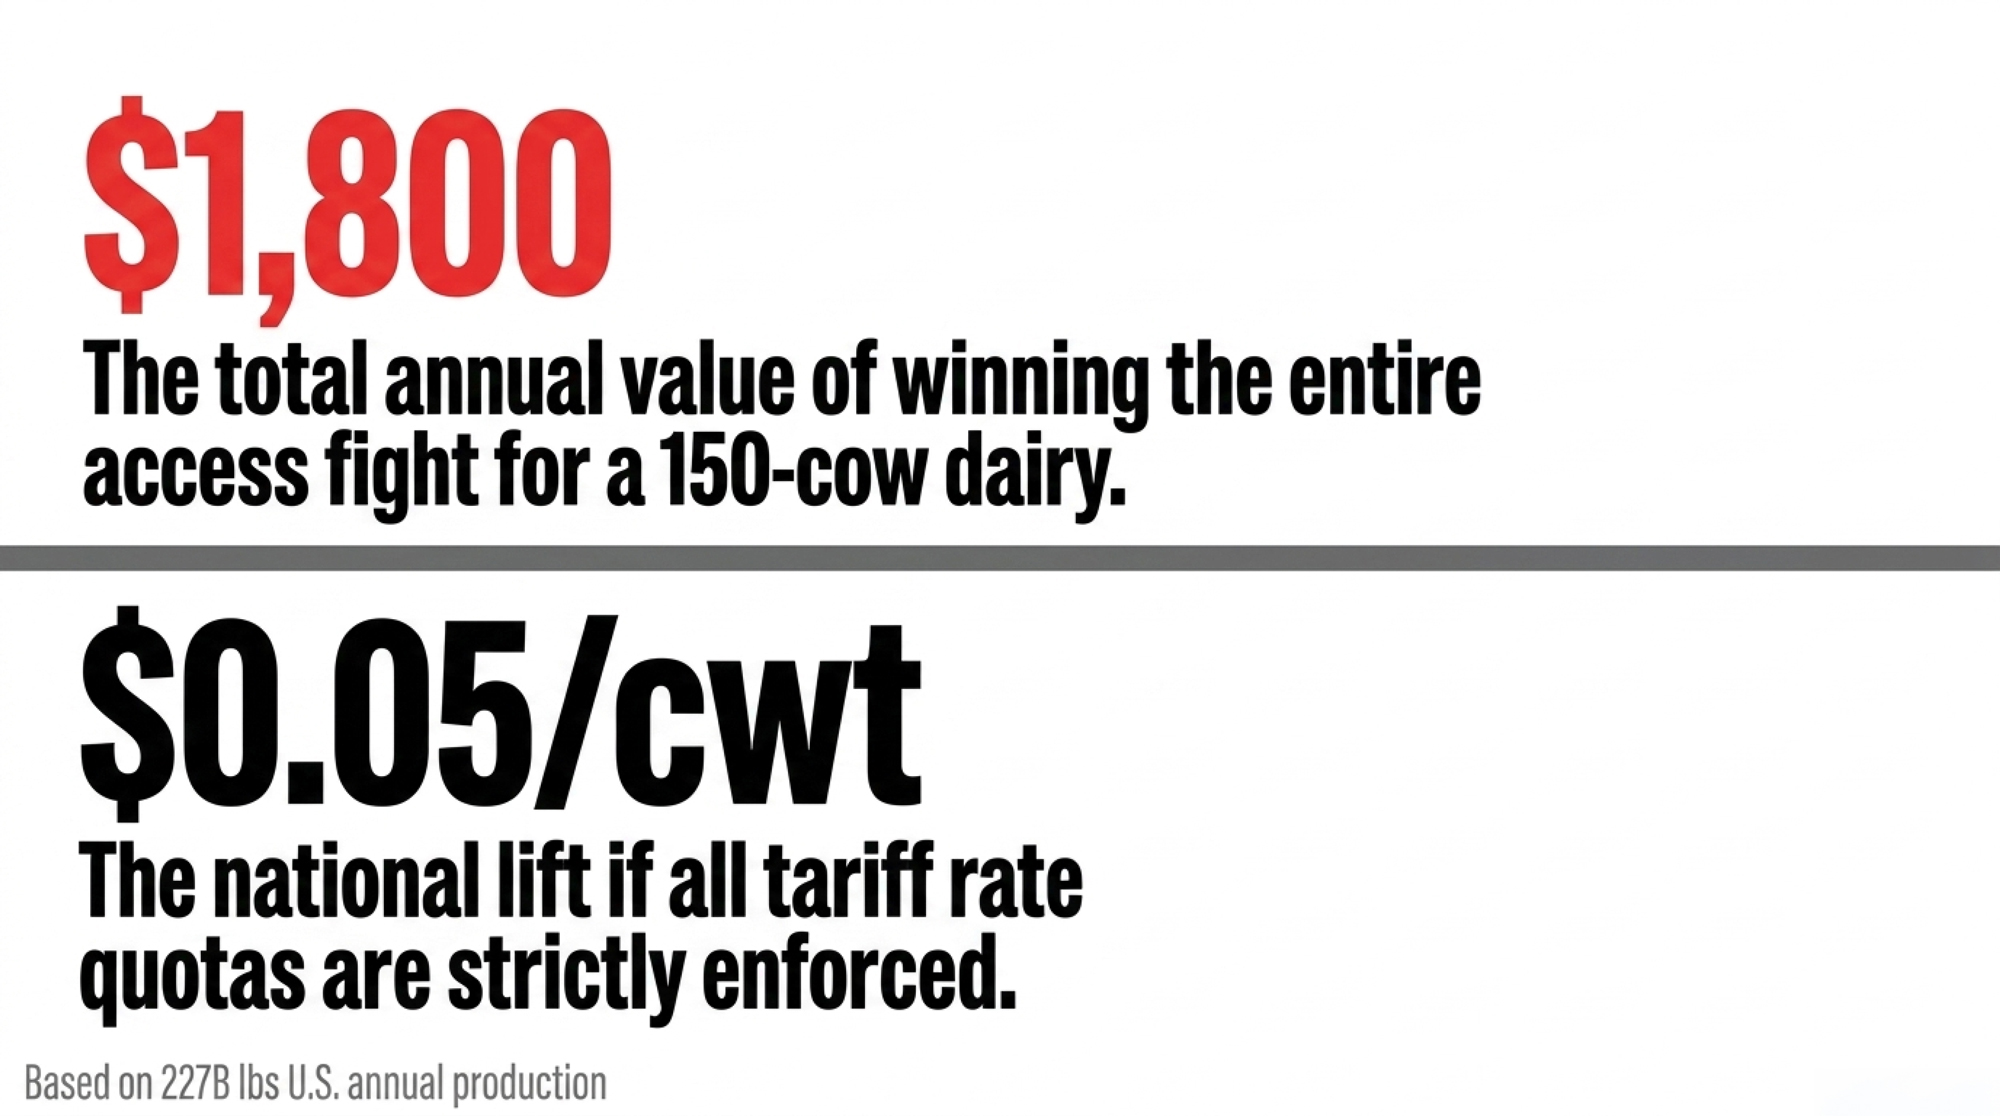
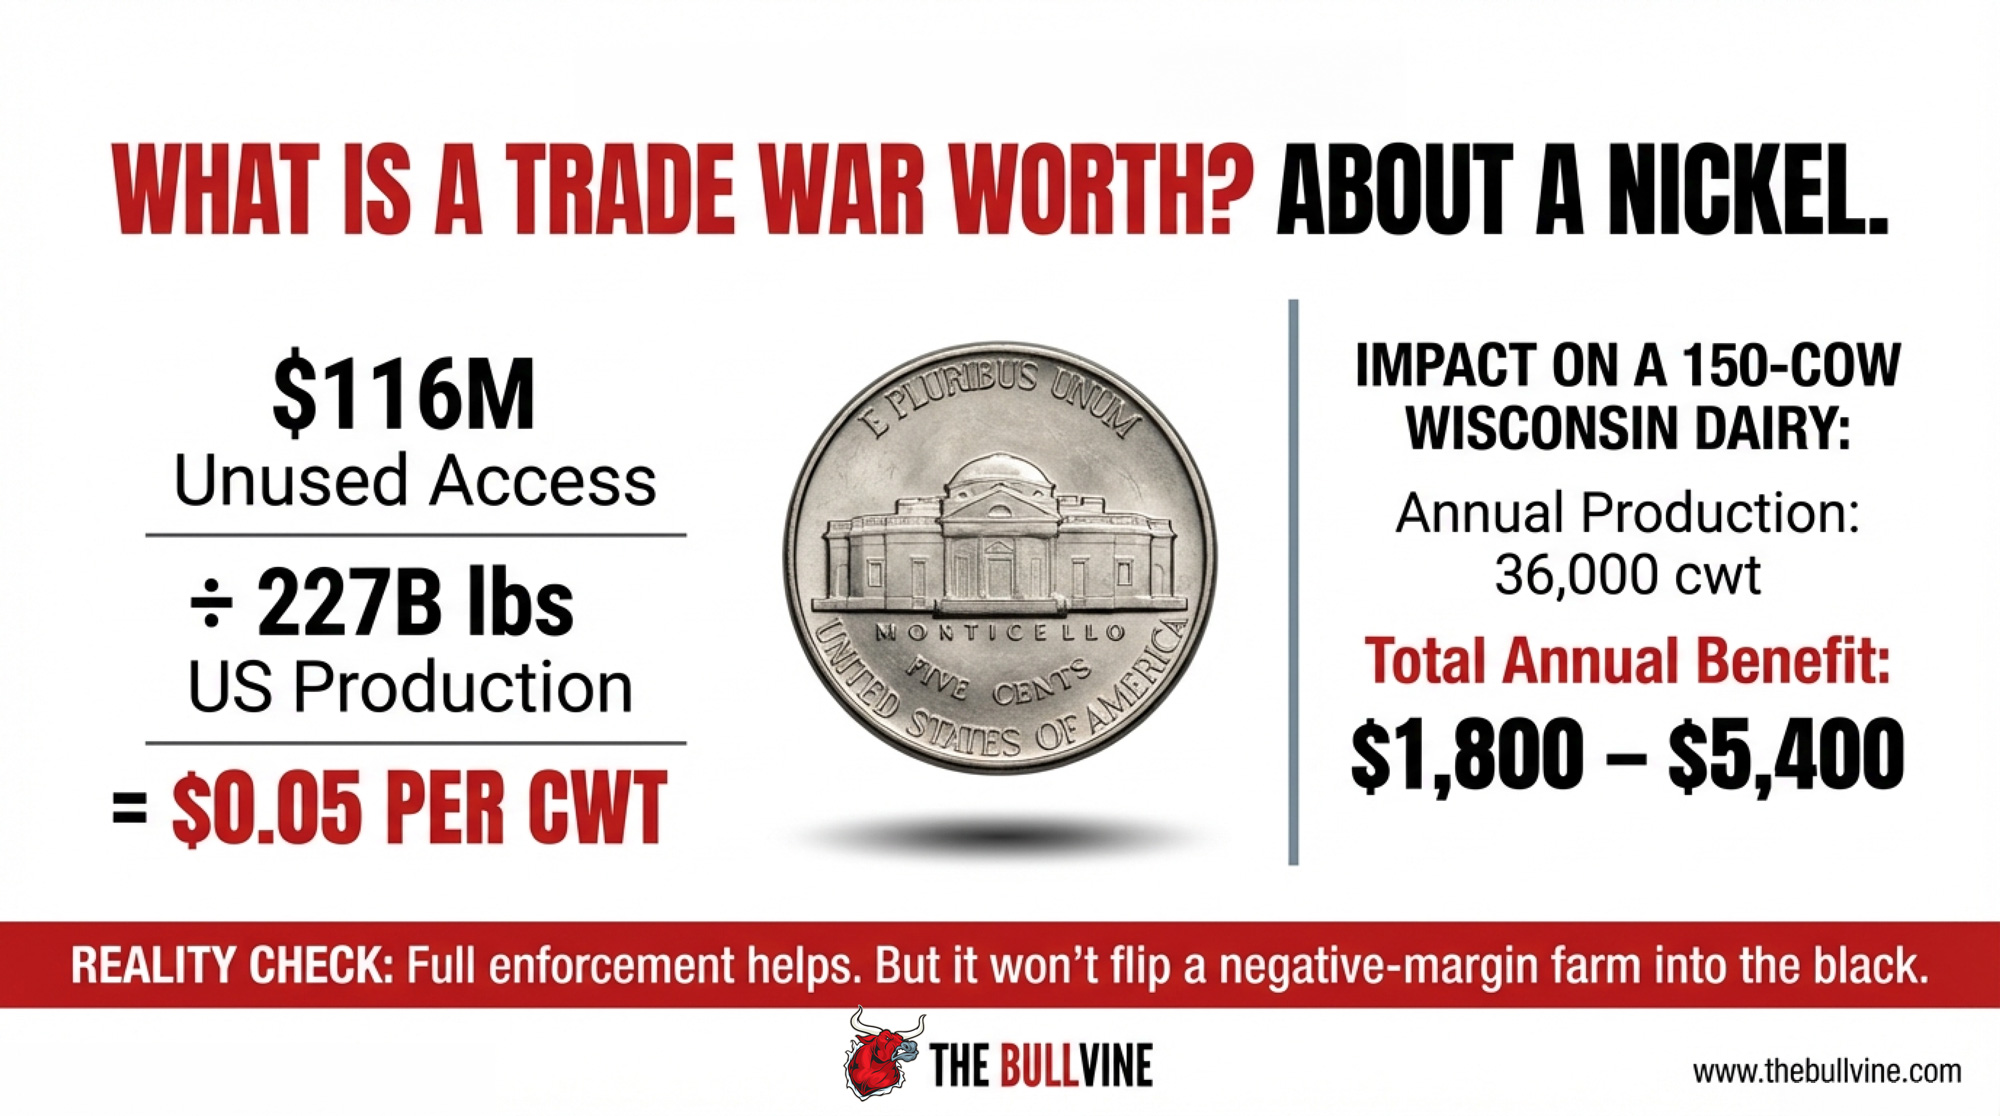
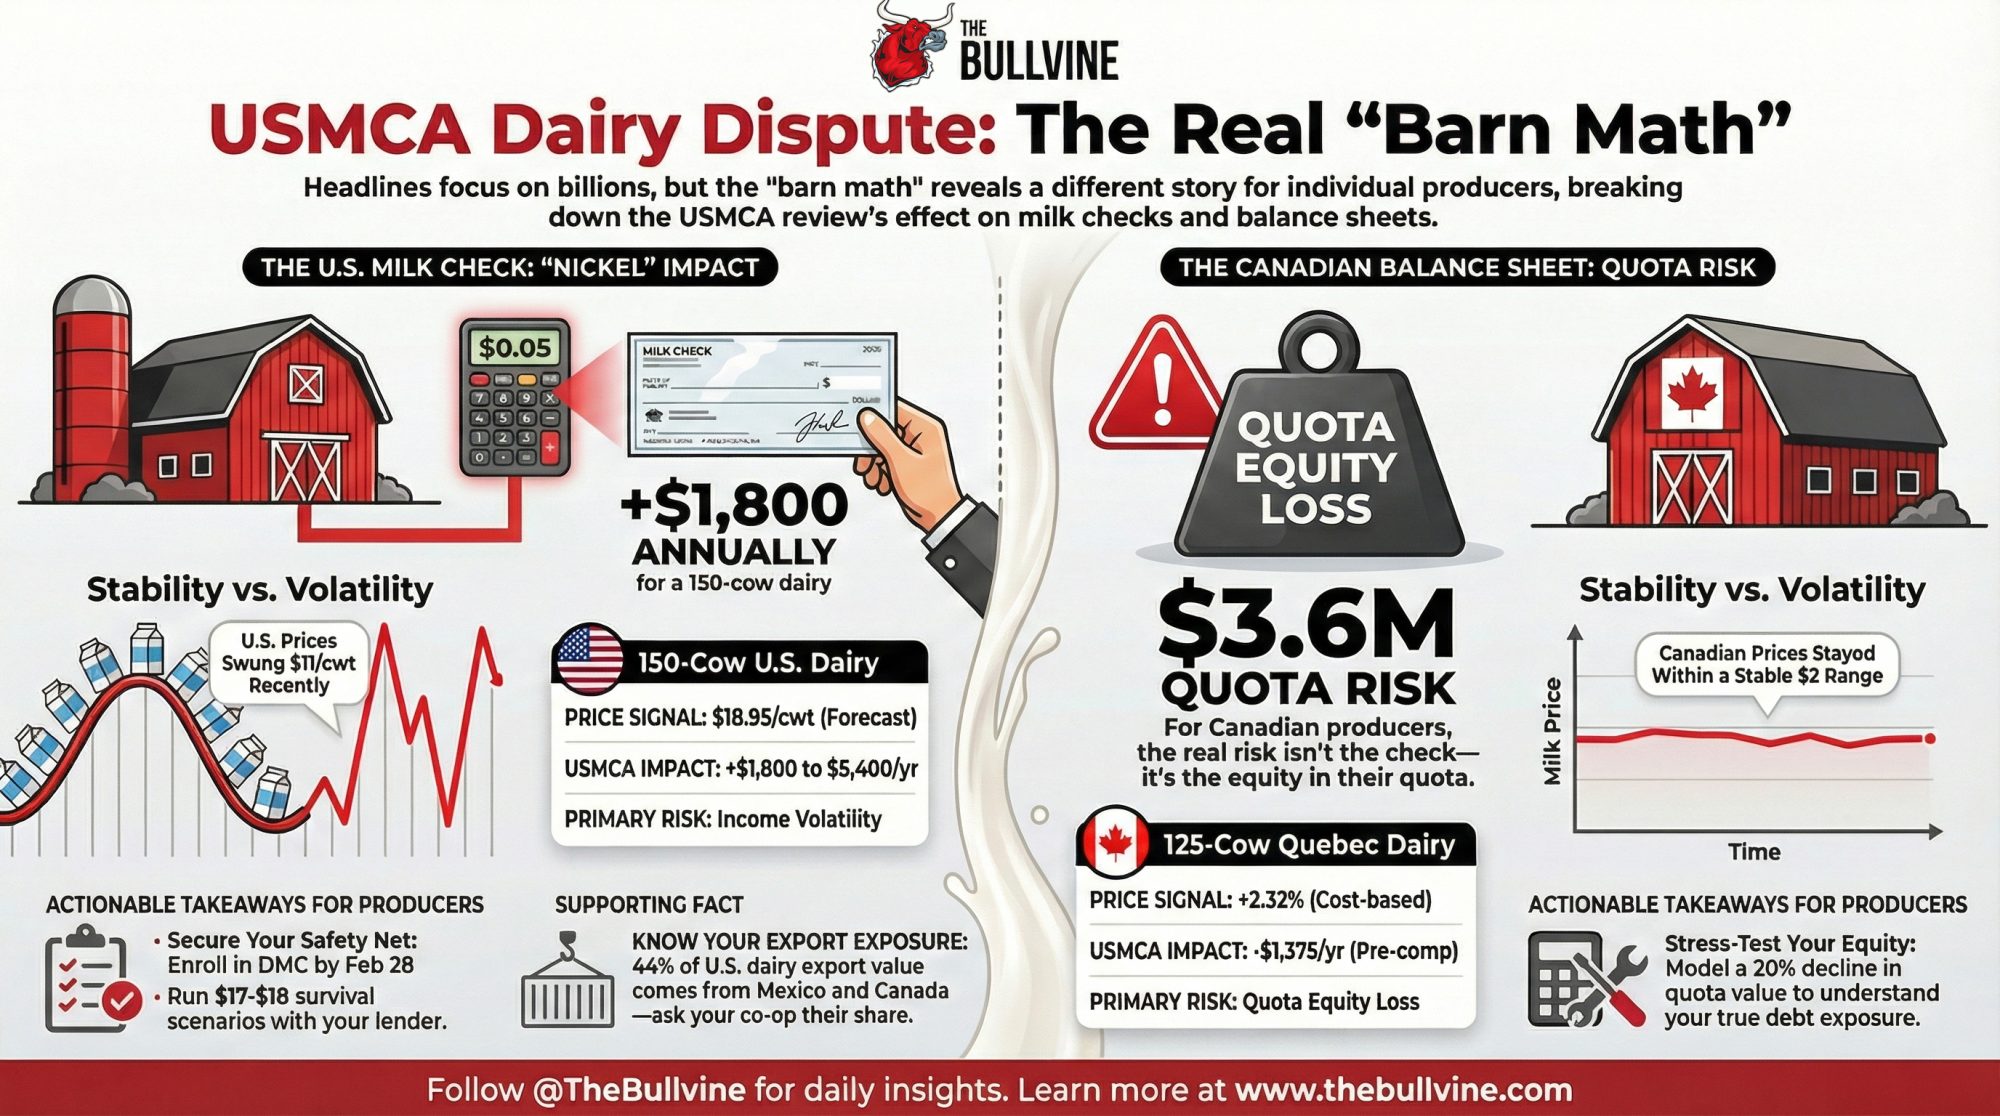
Spread that $200M across 227 billion pounds of U.S. milk and full TRQ enforcement pencils to about a nickel a cwt — $1,800 on a 150-cow dairy. The real Class IV hit is hiding elsewhere.
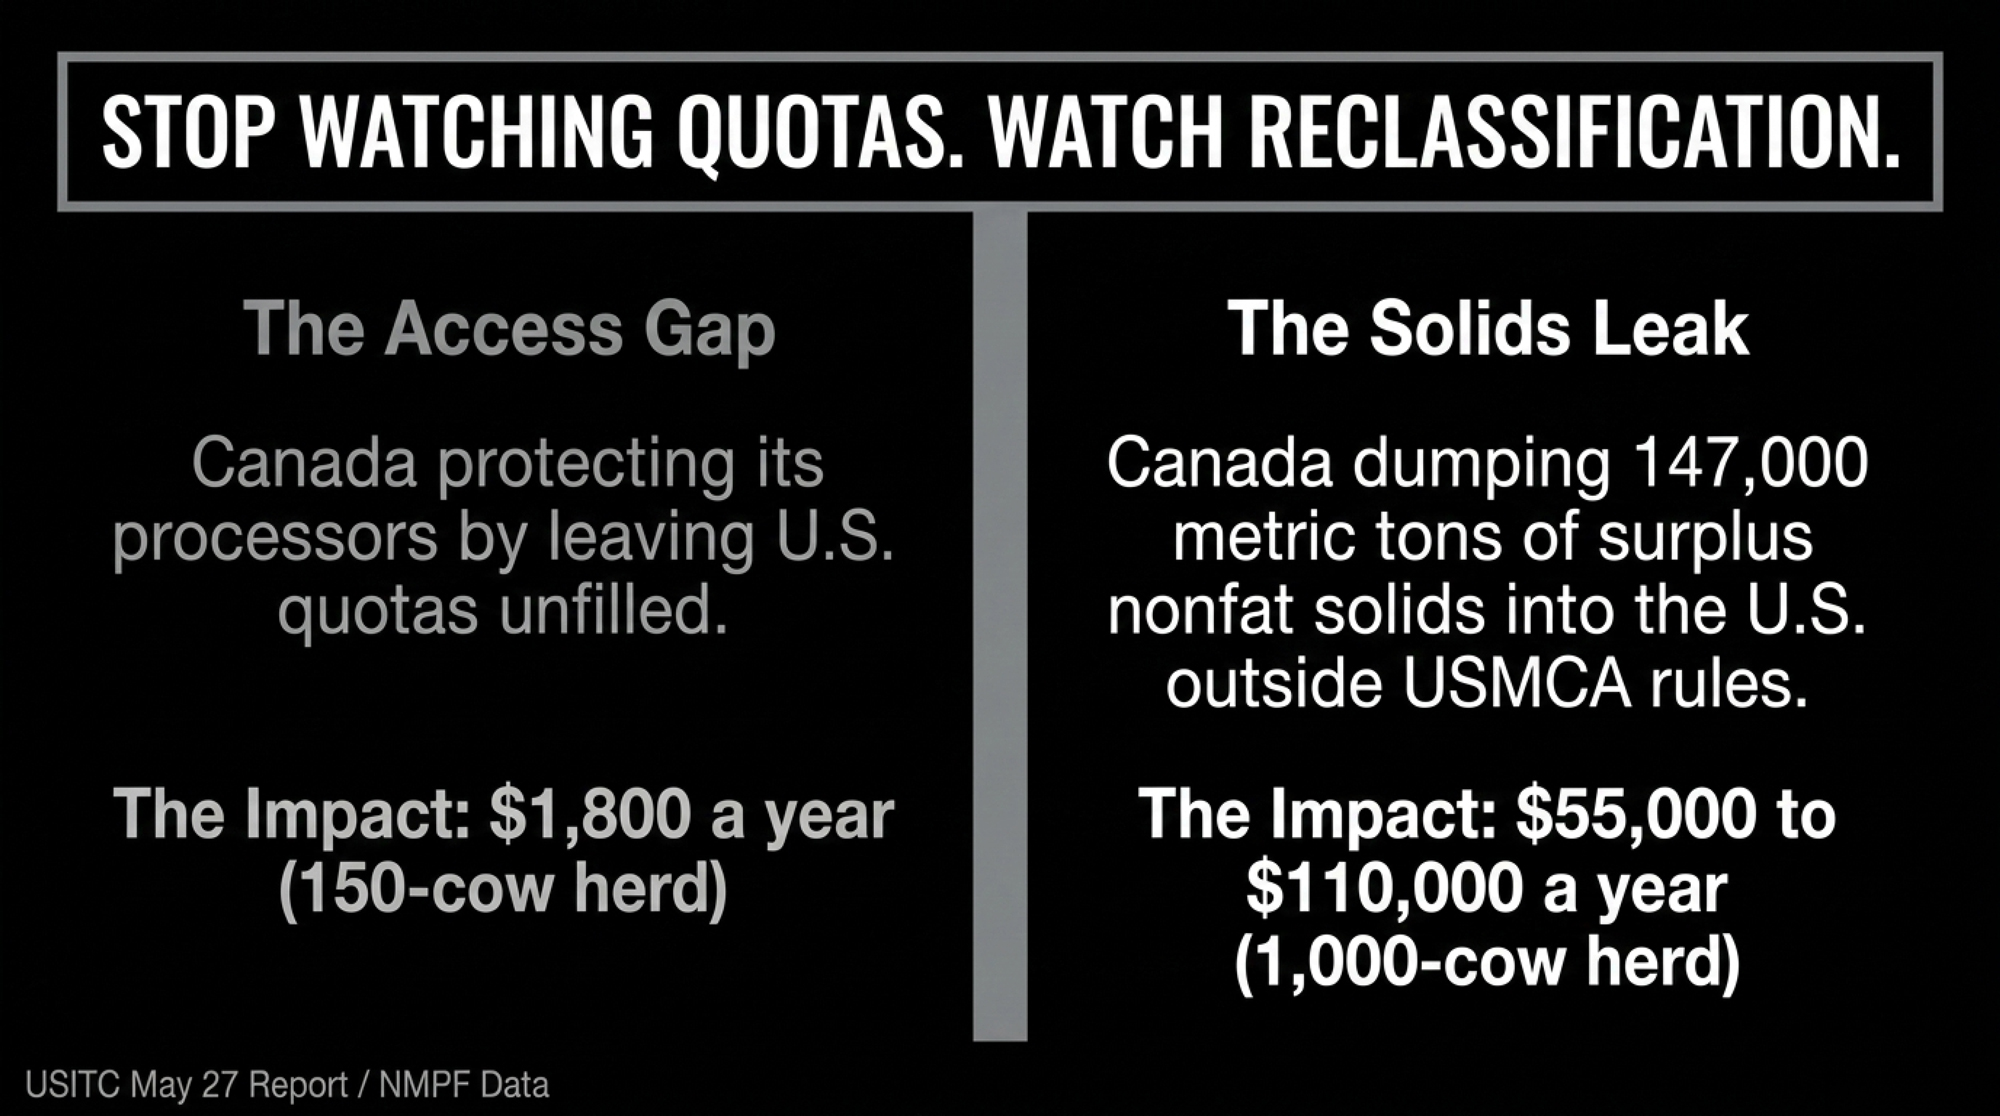
Executive Summary: When NMPF and USDEC walk into the July 1 USMCA review demanding Canada honor that $200 million in promised dairy access, here’s what they won’t put on the slide: spread across 227 billion pounds of U.S. milk, full TRQ enforcement is worth about a nickel a hundredweight — roughly $1,800 a year on a 150-cow dairy. The money that actually moves your Class IV check is the reclassification leak: 147,000 metric tons of Canadian milk solids landed in the U.S. in 2024 under HTS codes that sit outside USMCA, and the USITC confirmed May 27 they’re priced to suppress your floor. Reverse even half of that and a 1,000-cow Wisconsin dairy picks up $55,000; a full dollar of Class IV lift puts it at $110,000. Flip the border and the same reform threatens C$127,000 in quota equity on an 85-cow Quebec herd — which is why DFC’s Daniel Gobeil is fighting to keep supply management off the table behind Bill C-202. With USDA’s May WASDE pegging 2026 all-milk at $19.70, two moves matter before July: price your DRP coverage now, and stress-test any 2027 expansion below $20 instead of betting it on a Canadian win. Then watch one number — if this fall’s CDC price adjustment lands flat instead of another 2.33% bump, the review had teeth.
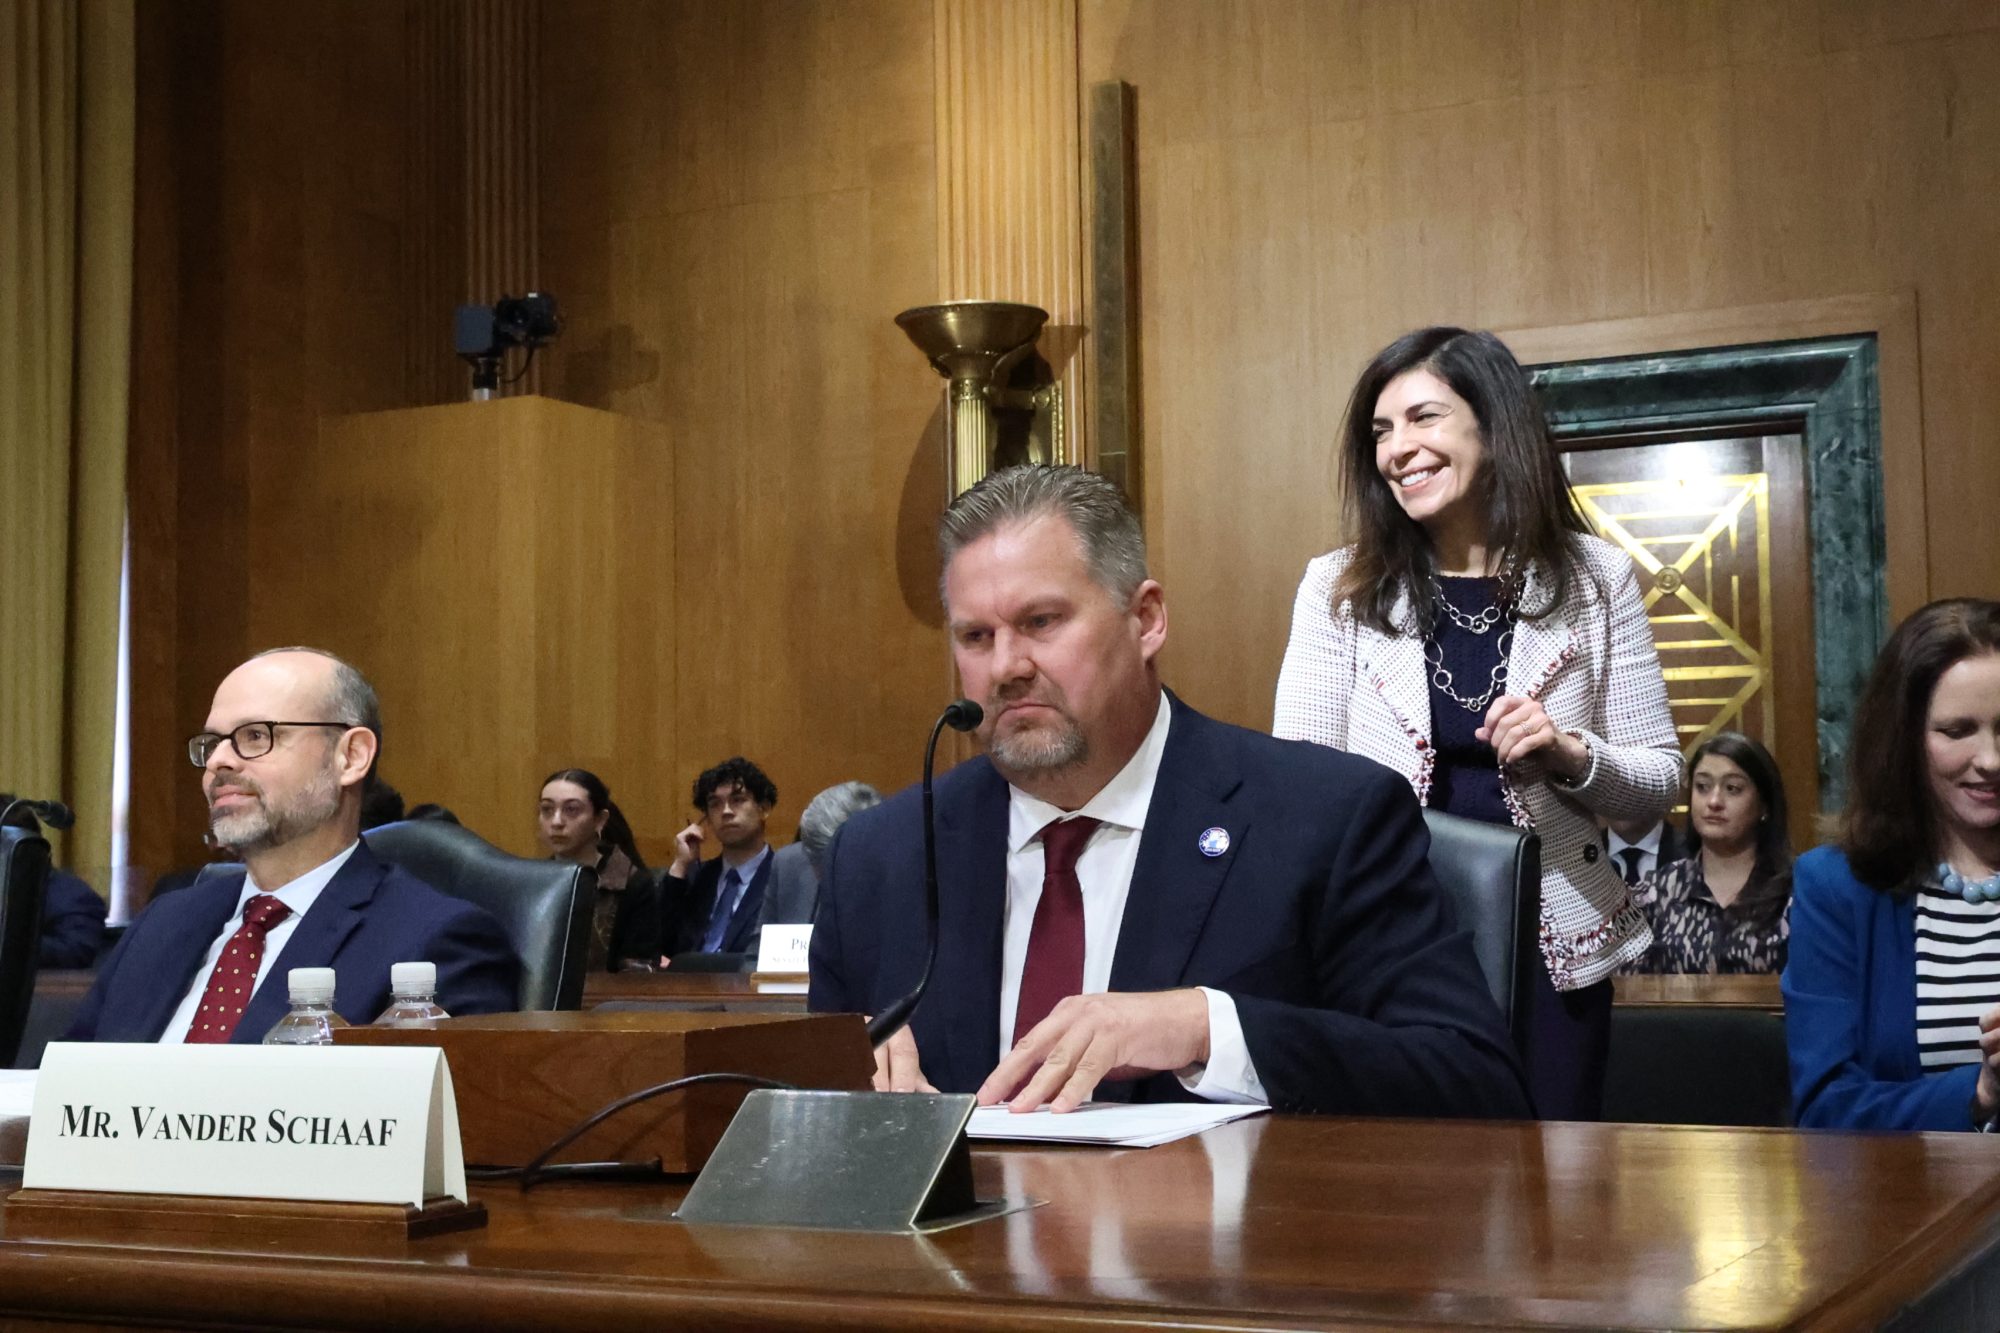
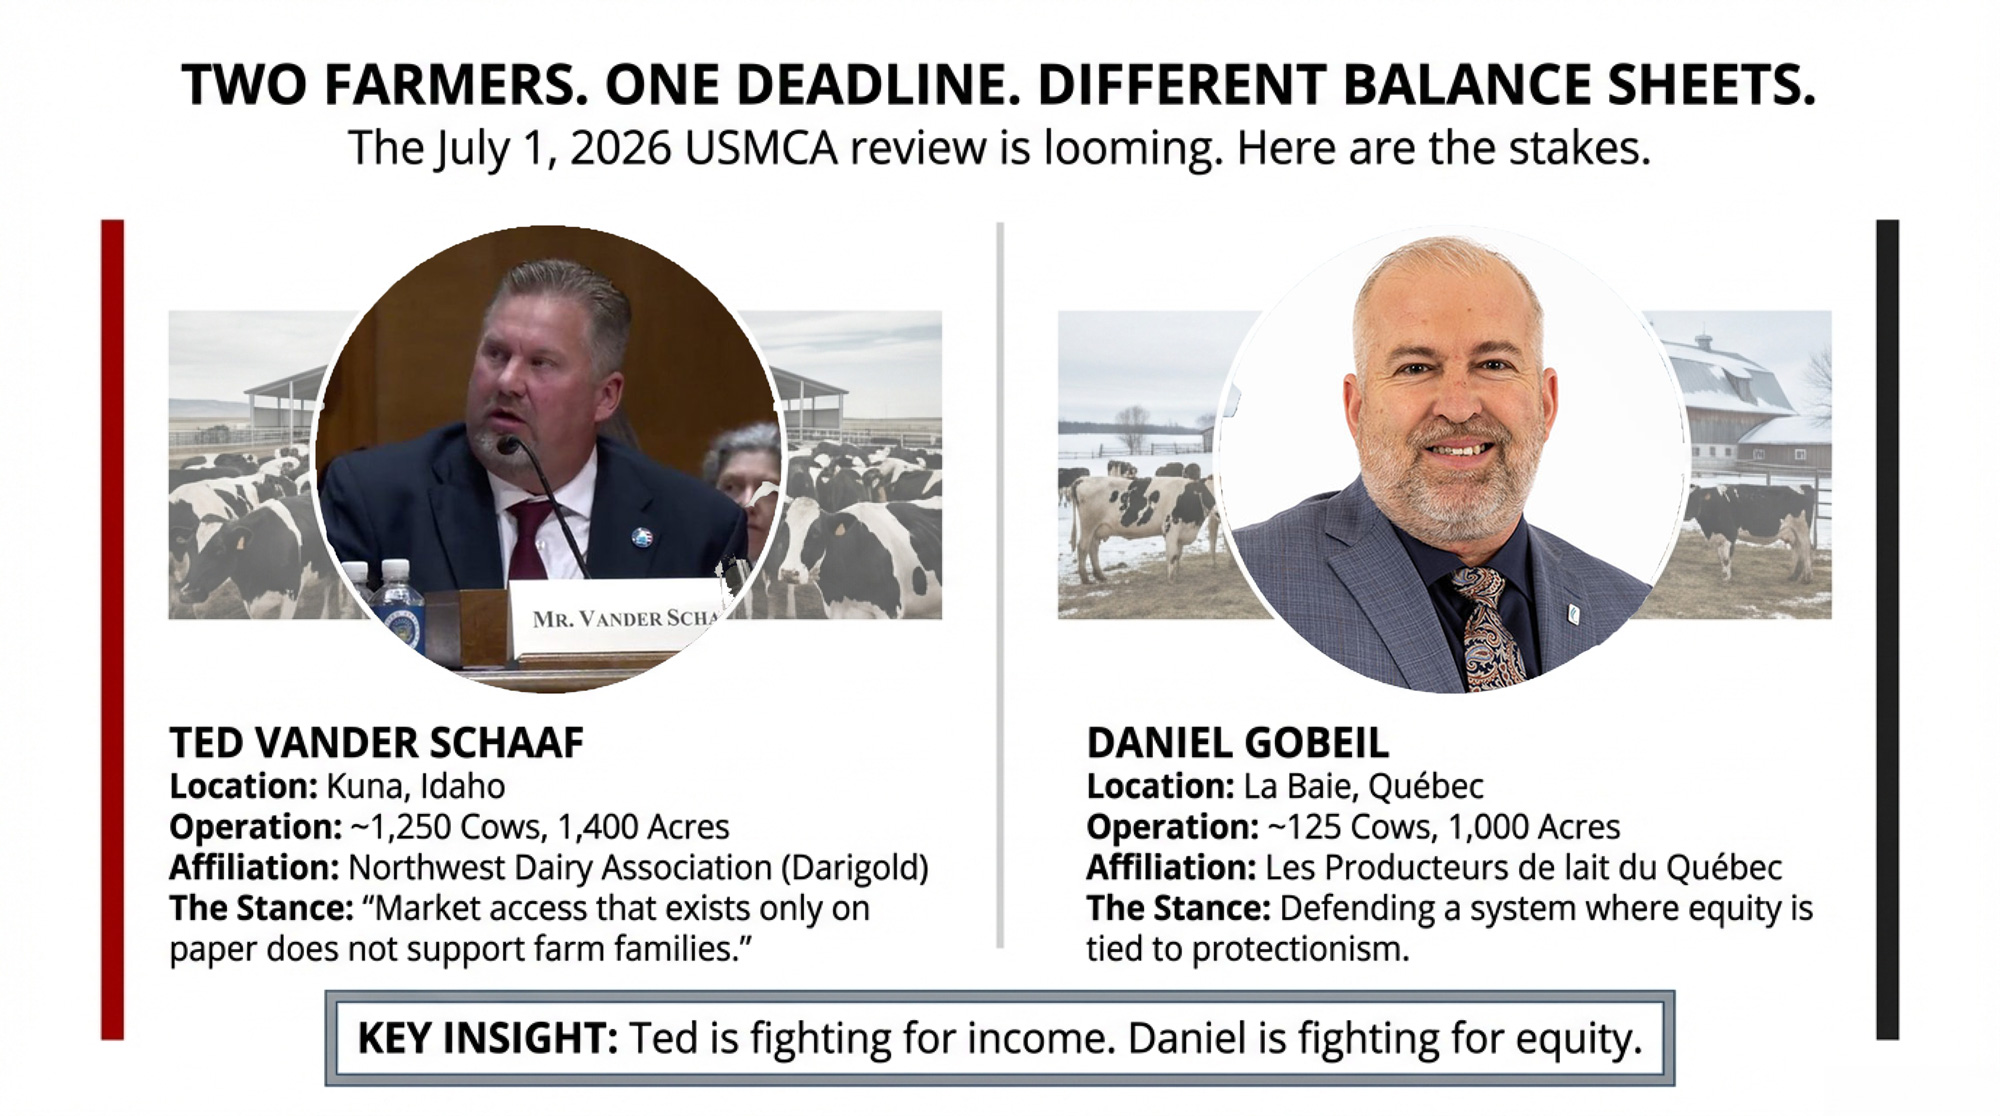
When Ted Vander Schaaf testified before the Senate Finance Committee on February 12, 2026, his message was one that most U.S. dairy producers have felt in their milk checks for years: Canada isn’t delivering the dairy market access it agreed to under the USMCA. Vander Schaaf farms in Idaho and owns his share of Northwest Dairy Association, the co-op behind Darigold. He was testifying for the U.S. Dairy Export Council and the National Milk Producers Federation, the two groups leading the charge into the July 1, 2026, USMCA review.
His testimony focused on the access gap — the roughly $200 million a year in Canadian market access that the USMCA promised and that Canada has largely walled off. That’s a real problem. But it’s not the one doing the most damage to your Class IV price. The bigger suppressor has been running quietly since 2020; it doesn’t violate a single quota commitment, and the USITC just put it on the record this week. If you ship Class IV or powder, this is the mechanism worth understanding before July — because the review will either address it or it won’t, and you’ll want to know which one happened.
What’s Actually Changing Heading Into July
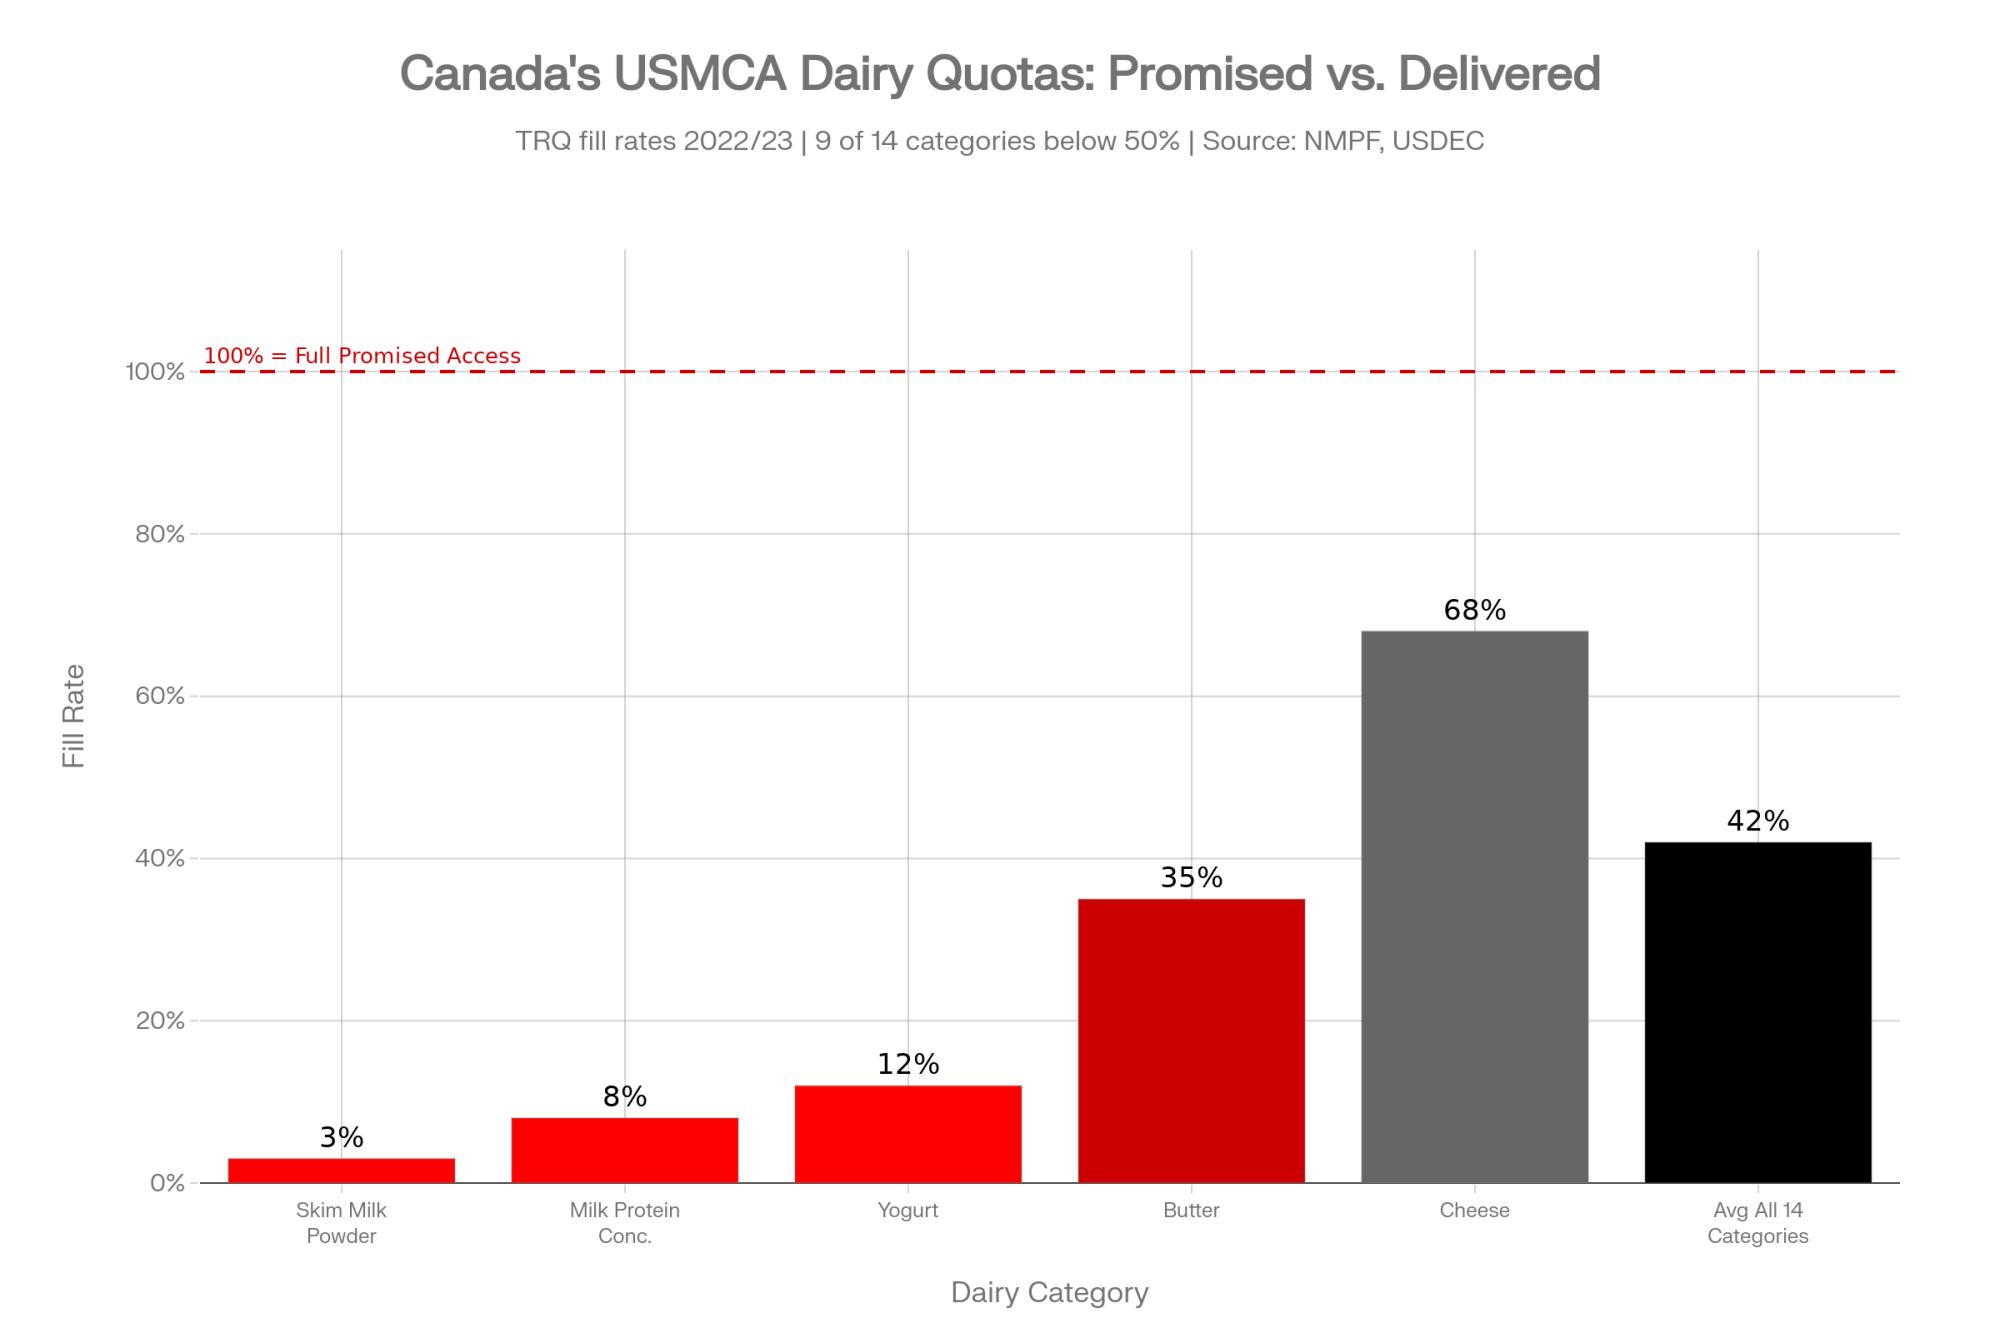
USMCA gave U.S. dairy 14 separate tariff rate quota categories into Canada when it took effect in July 2020. Everything within quota enters duty-free. Everything over quota hits a tariff wall — 201% on skim milk powder, 298.5% on butter. Those over-quota rates are prohibitive by design. So the whole game comes down to one question: are the quotas actually getting filled?
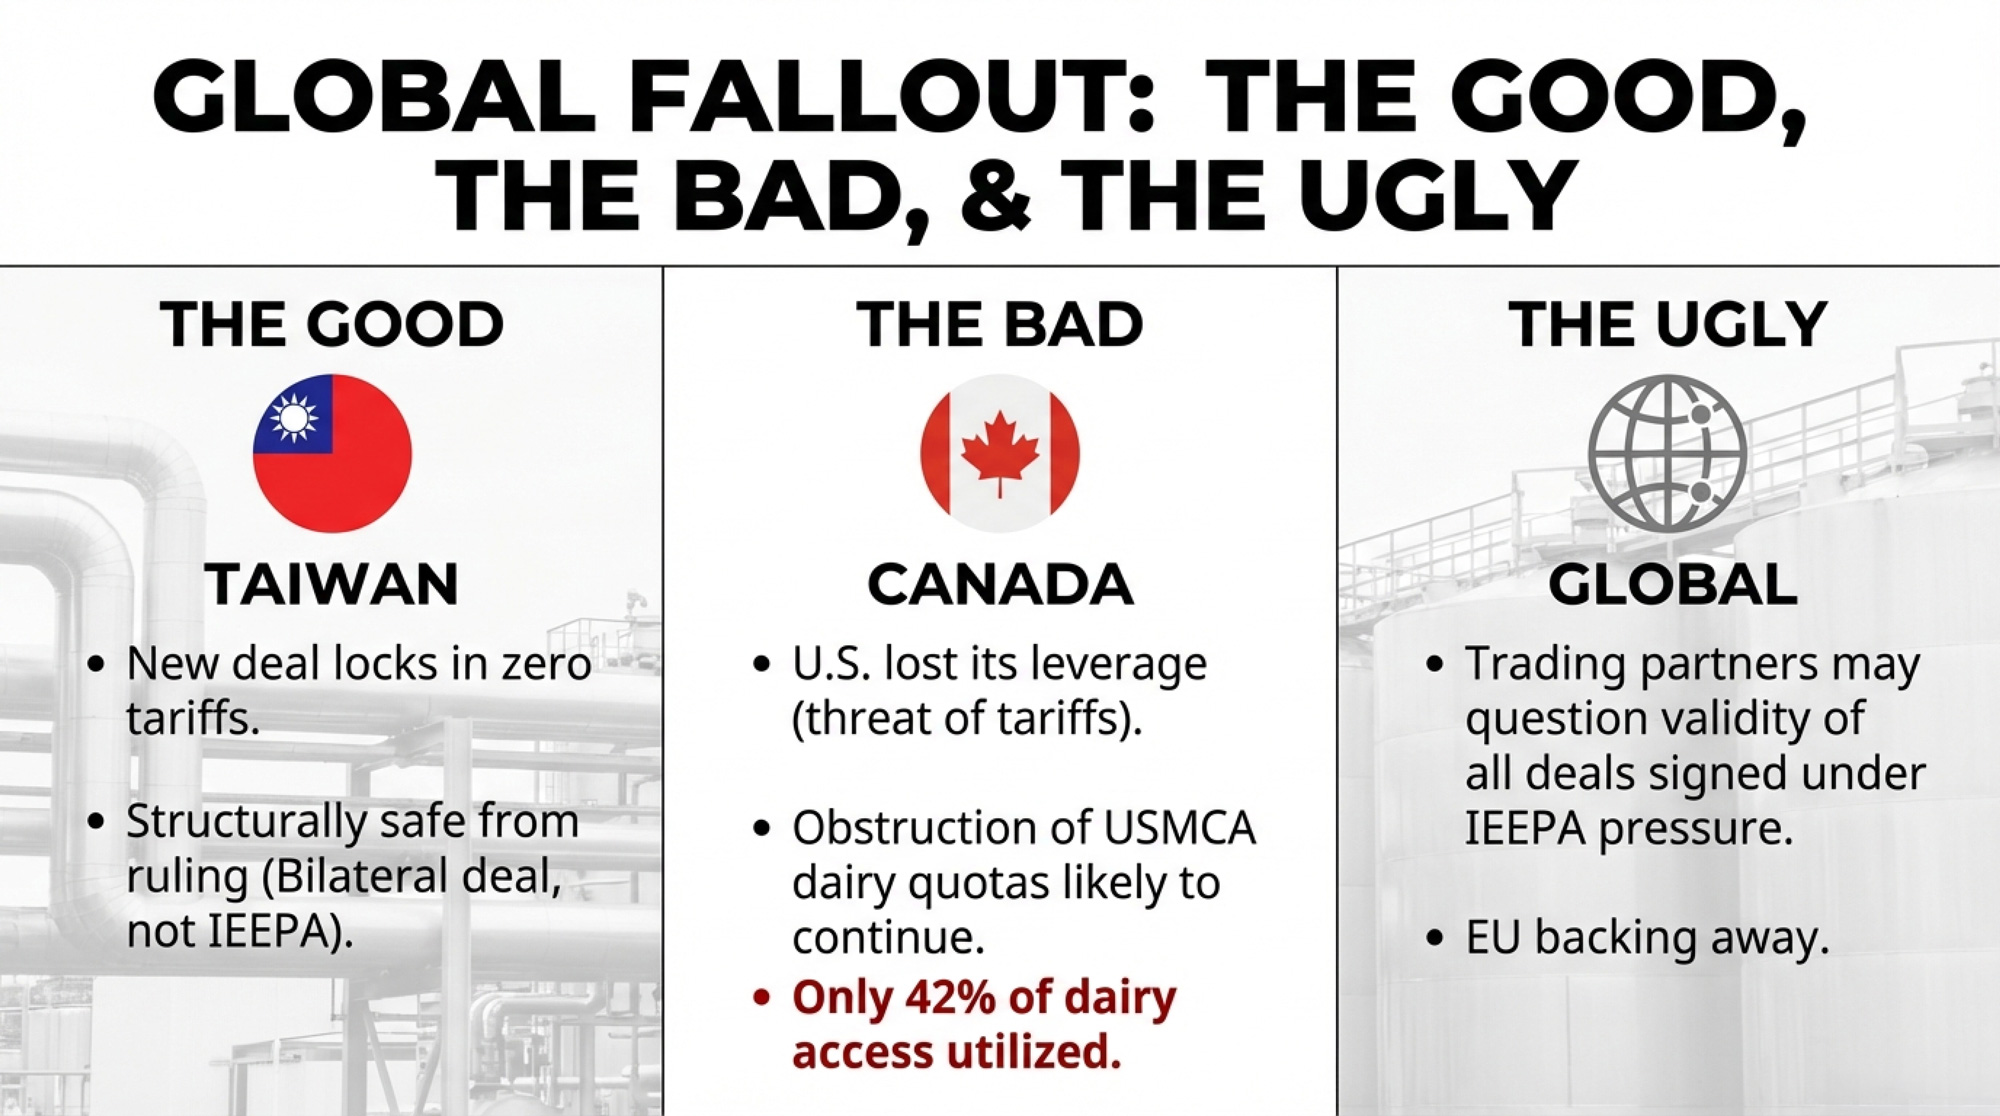
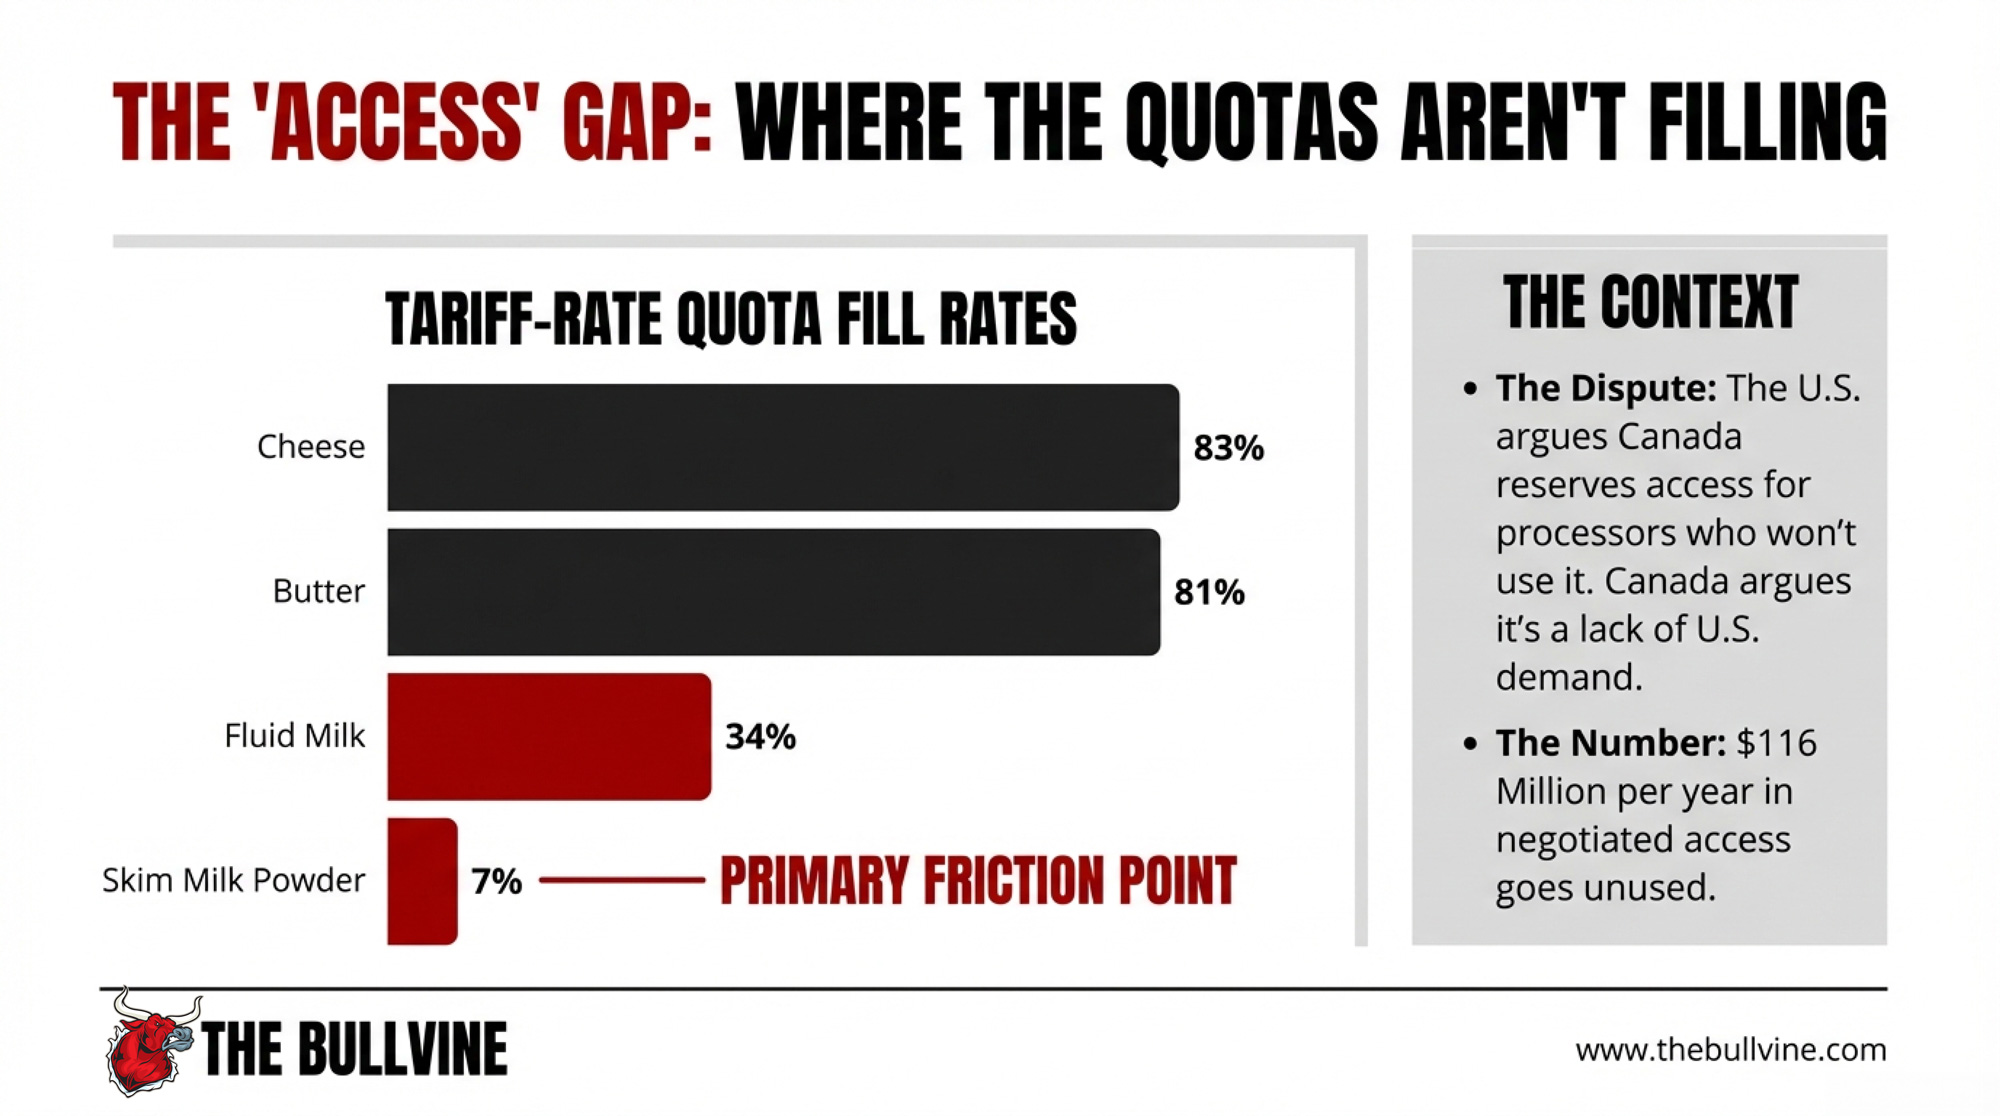
Mostly, no. Across the deal’s life to date, the average fill rate across all 14 categories has been around 42%, and 9 of the 14 sit below 50%.
Cheese moves reasonably well at 83% fill. Butter at 81%. But skim milk powder is stuck at 57%, cream at 51%, and yogurt at a dismal 12%.
The quotas exist on paper. Commercial access mostly doesn’t — because Canada hands the bulk of those quotas to its own processors, who have zero reason to import competing U.S. product.
That’s the access fight, and it’s worth having. NMPF and USDEC have pushed it hard, including a formal complaint that led to a 2022 dispute panel decision before Canada rewrote the rules and won the second round in 2023. But here’s the part that hits your milk check more directly than any empty quota: what Canada ships into the U.S. market, not what it refuses to let in.
Don’t Confuse the Access Gap With the Price Hit
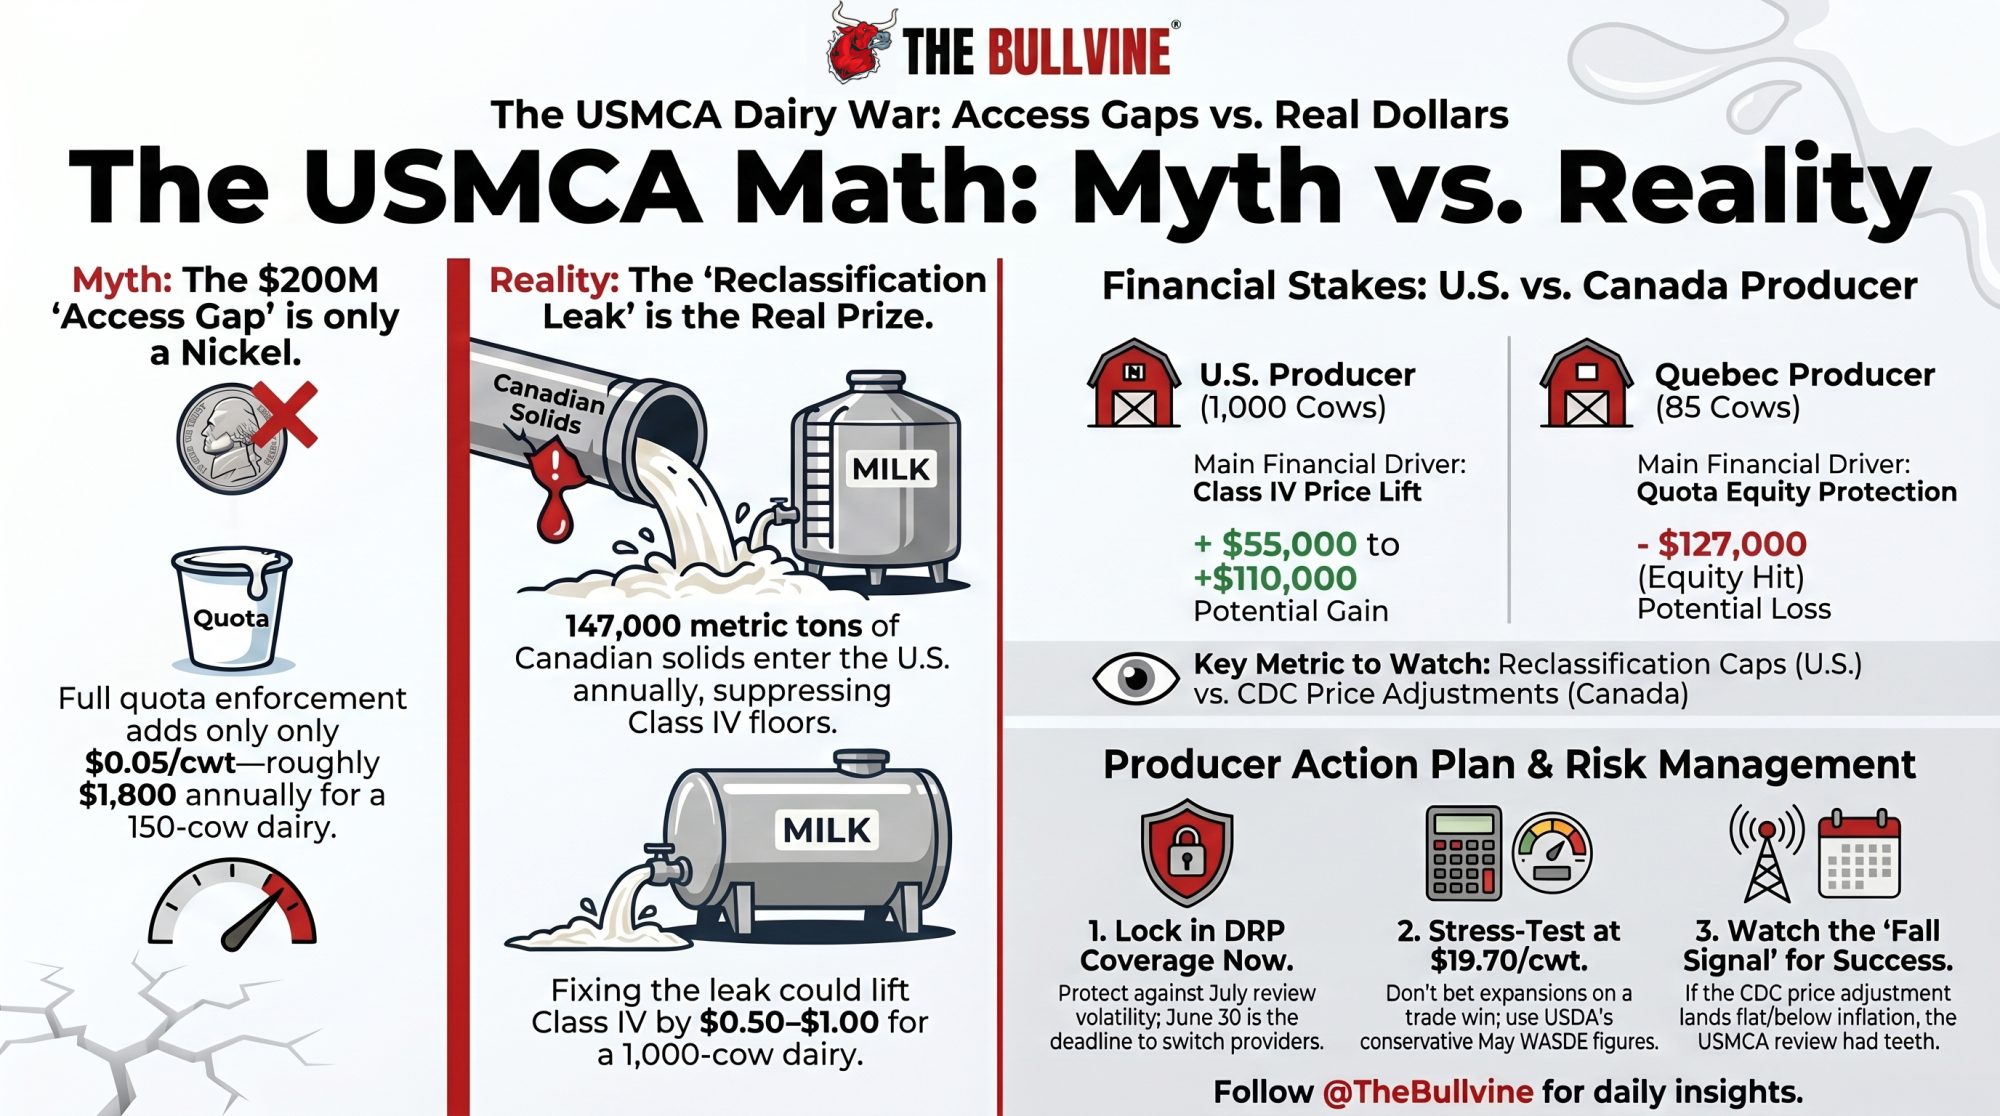
Before going further, one honest correction — because the $200 million number gets thrown around in ways that oversell it. Spread that unused access across the roughly 227 billion pounds the U.S. produces a year, and full TRQ enforcement is worth about $0.05/cwt nationally — a back-of-envelope figure, since not every dollar of access converts cleanly to your farm-gate price. Call it a nickel. On a 150-cow Wisconsin dairy producing 24,000 lbs per cow — about 36,000 cwt a year — winning the entire access fight pencils to roughly $1,800 a year. Real money, but not the kind that changes how you run the place.
So if the access gap is a nickel, why does any of this matter to your bottom line? Because the access fight isn’t where the money is. The money is in what Canada ships south, at suppressed prices, under codes nobody’s enforcing. That’s a different mechanism, and it’s bigger.
How This Plays Out on Real Farms
Canada’s supply management system is built around butterfat. Set the price high, control the supply to match what Canadians actually eat in butter and cream. The catch is that every kilogram of butterfat comes bundled with proteins and lactose — the nonfat solids — that the domestic market doesn’t soak up at that managed price. Canada has to move the surplus somewhere.
Before the USMCA, it went through regulated export channels with disciplines attached. After USMCA, a quieter door opened: the surplus moves into tariff codes that sit outside the agreement’s rules. Dairy skim blends and fat-filled milk powder — that’s HTS code 1901.90, for anyone checking — jumped from 77,000 metric tons before USMCA to 166,000 metric tons by 2024. Of that, 147,000 metric tons landed in the United States. A separate protein code went from roughly 76 metric tons a year to 32,000. The product changed classification. The milk solids didn’t.
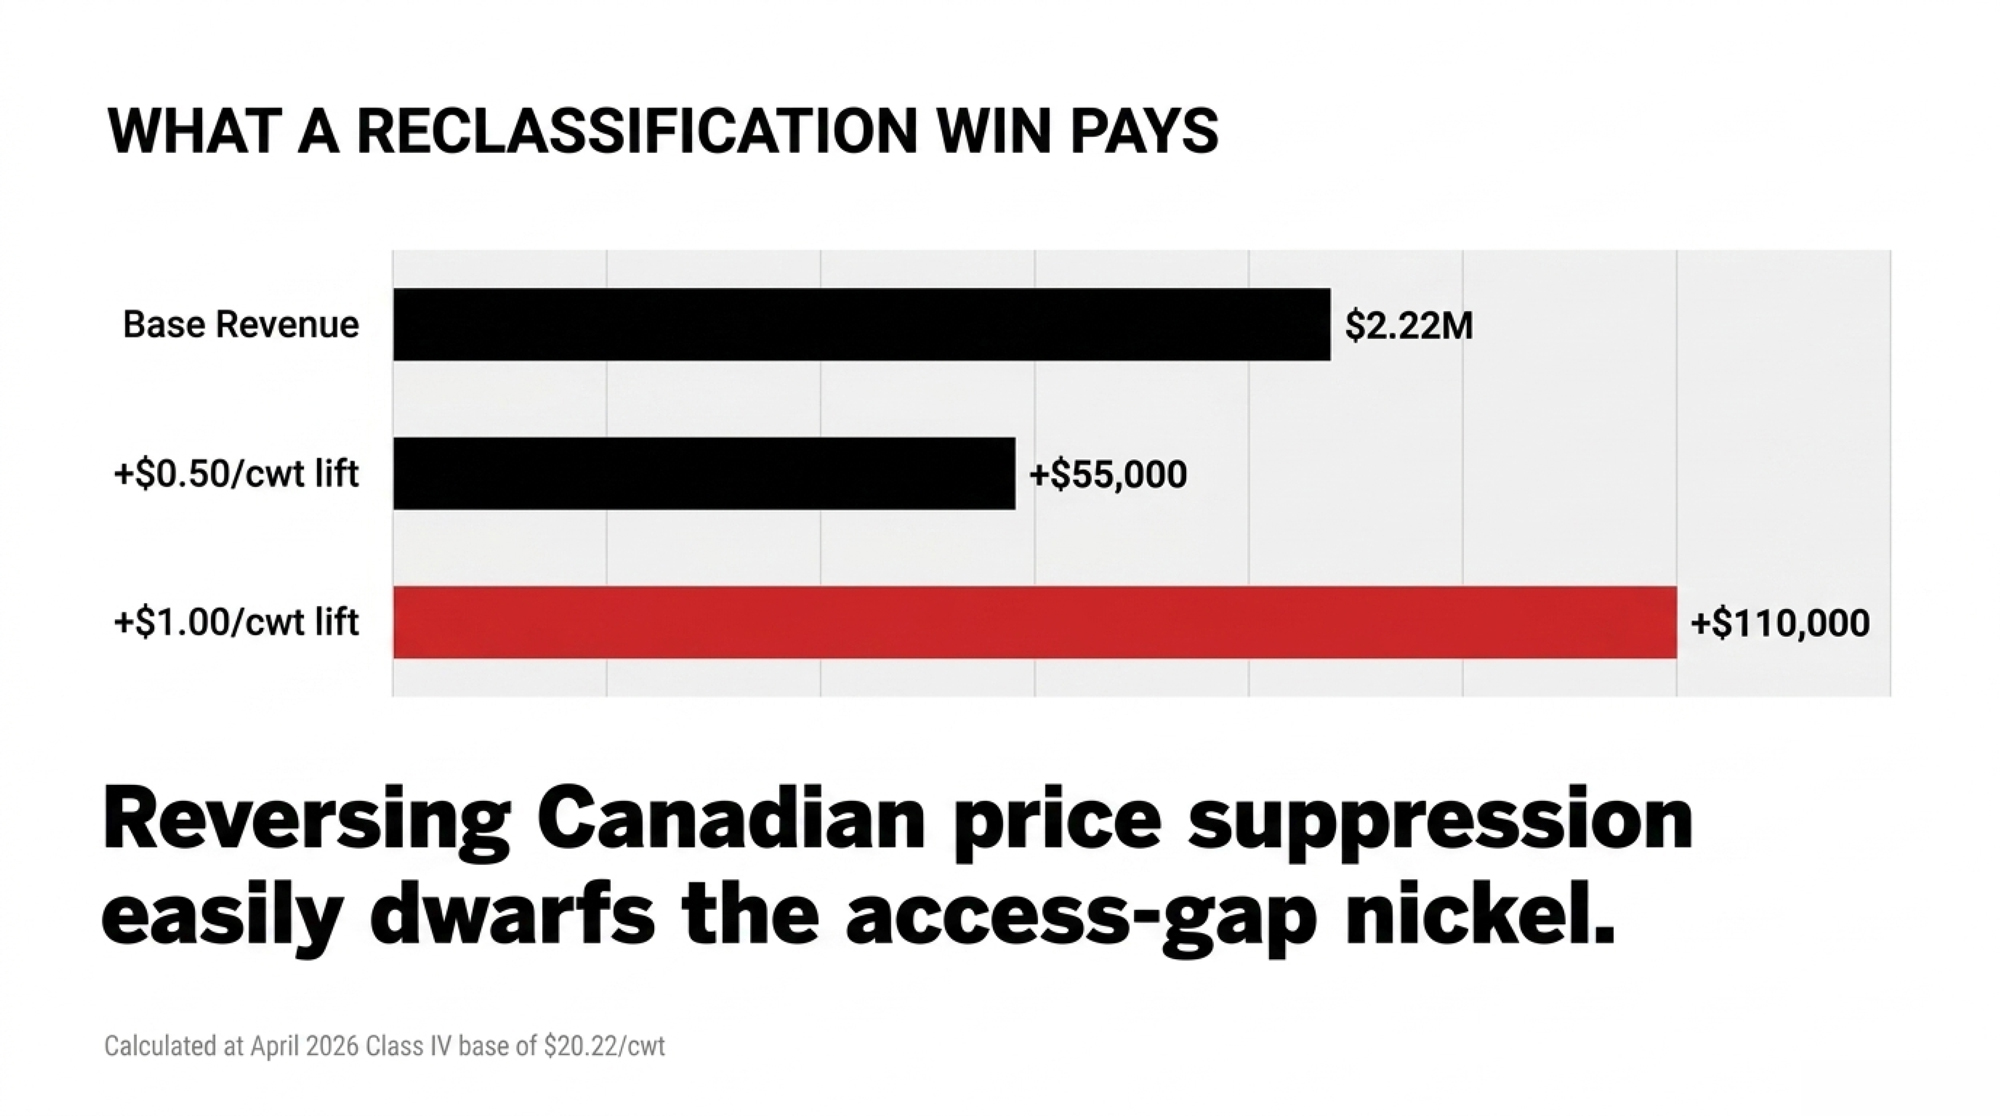
That volume competes head-to-head with U.S.-produced nonfat dry milk and skim powder. It pushes down the clearing price. And that clearing price is what sets your Class IV floor. Run the math on it. Take a 1,000-cow Wisconsin dairy and put a conservative 110 cwt of Class IV-bound milk per cow on the books — not total production, just the share headed to Class IV — that’s about 110,000 cwt a year. At April 2026’s Class IV price of $20.22/cwt, that’s roughly $2.22 million in Class IV revenue. If reversing that suppression lifts Class IV by even $0.50/cwt, you’re looking at $55,000 more on the year. A full dollar puts it at $110,000. That dwarfs the $1,800 access-gap nickel, which is exactly why NMPF’s third ask is the one that matters.
This isn’t abstract in Green Bay. BelGioioso Cheese — the Wisconsin specialty maker that ships product both north and south of the border — hosted the Farmers for Free Trade USMCA roundtable on May 7, 2026, putting processors, producers, and Rep. Tony Wied in the same room ahead of the review. BelGioioso President Gaetano Auricchio and VP of Foodservice & Export Frank Alfaro sat on that panel alongside Amber Horn Leiterman, a dairy farmer and Land O’Lakes member-owner of Hornstead Dairy. The panel pointed squarely at Canada’s tariff rate quota system and what they called the offloading of artificially low-priced milk solids as the enforcement gaps the July review has to fix.
Here’s why a cheesemaker cares about a skim-powder problem. Cheese is the one category actually working at 83% fill, so the access side is largely fine for them. But every Wisconsin processor competing for milk is bidding against a Class IV price that imported Canadian solids help hold down — the USITC found the surplus moves at suppressed prices, even if the exact drag in any single month is hard to isolate. Fix the reclassification leak, and the whole nonfat-solids complex firms up. That’s the rising tide a cheese plant feels even when its own TRQ category is full.
The Mechanics Behind the Numbers
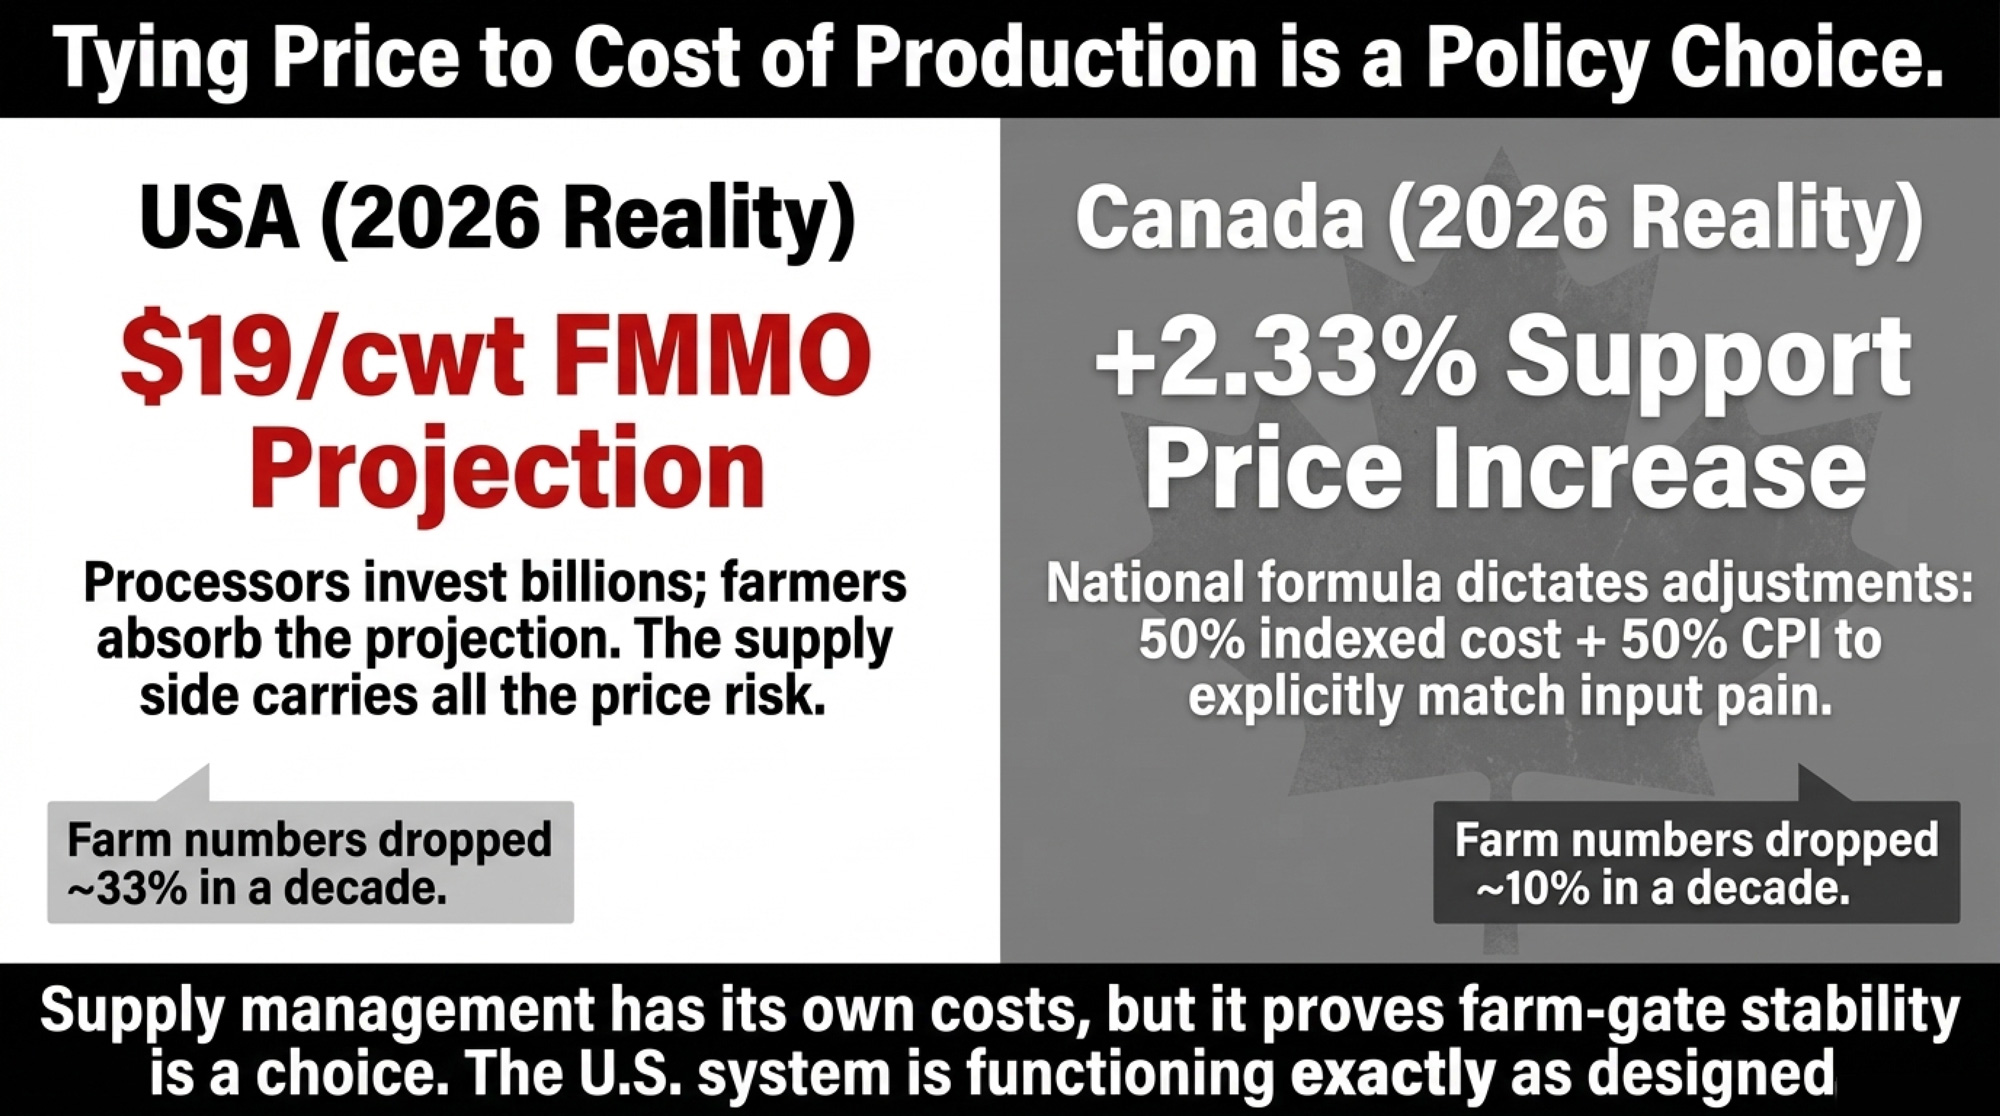
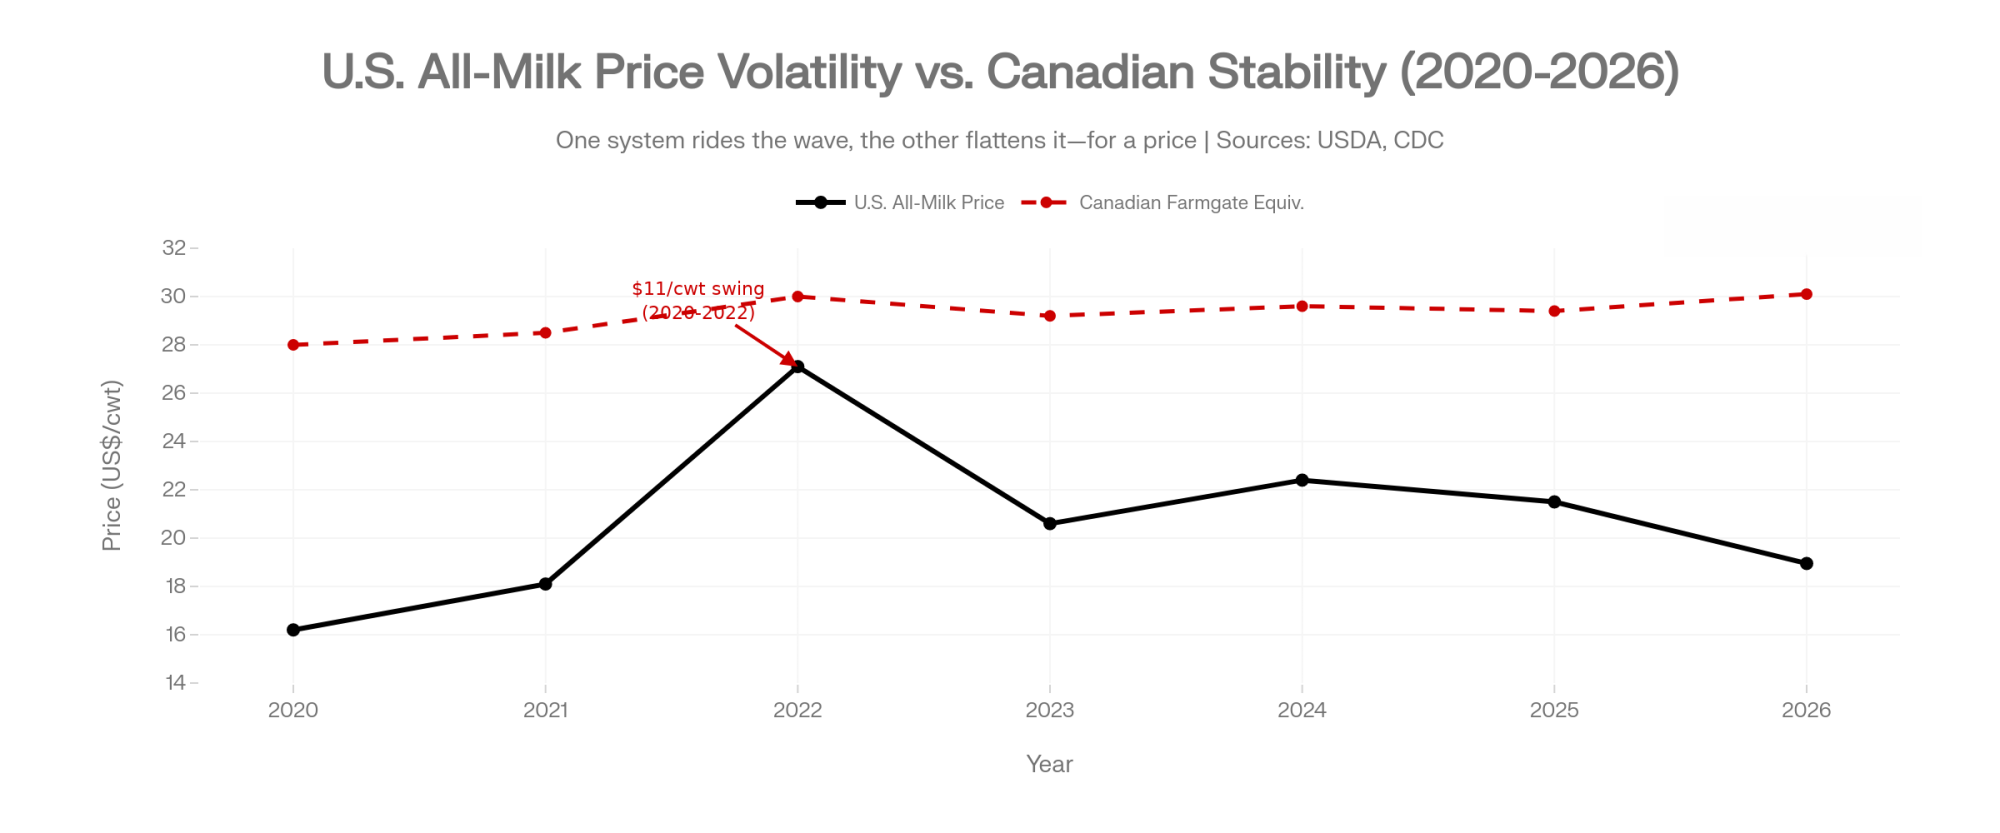
Canada’s farmgate price doesn’t float on the market. The Canadian Dairy Commission (CDC) sets it using a formula that’s half cost of production, half consumer price index, adjusted once a year.
The U.S. vs. Canadian Price Disconnect (Spring 2026)
Metric
U.S. (Wisconsin, 1,000-cow)
Canada (Quebec, 85-cow)
Farmgate Price
$20.22/cwt (Class IV, Apr 2026)
~$29/cwt equivalent (C$90.72/hL)
Price-Setting Mechanism
Market-determined via USDA class pricing
CDC formula (50% CoP + 50% CPI)
Structural Price Gap
—
~$8–9/cwt structural premium over U.S.
Quota Asset Value
None — no quota system
C$2.55M balance sheet (106 kg daily quota × C$24,000/kg)
5% Quota Value Hit
N/A
~C$127,000 in equity erased
Class IV Revenue (est.)
~$2.22M/yr (110 cwt/cow × 1,000 cows)
N/A — supply-managed pool
$1.00/cwt Class IV Lift
+$110,000/yr
Creates pressure on quota confidence
Key Risk
Reclassified Canadian solids suppressing Class IV floor
NMPF export cap wobbles C$24,000/kg quota cap
July Review Stance
Push for reclassification cap + quota reform
Bill C-202 blocks further supply management concessions
A hectolitre runs about 2.2 cwt of milk, so the per-cwt conversion bridges the two systems directly.
That gap is the whole point of supply management, and Canada makes no apology for it.
“The U.S. has already secured substantial tariff-free access under the deal.” — David Wiens, President, Dairy Farmers of Canada (March 8, 2025)
The trouble for U.S. producers is that this system inherently generates more nonfat solids than Canada can use at that high price, and the surplus moves south at suppressed values under codes that sit outside USMCA. NMPF pegs the value of Canadian dairy protein exports benefiting from this pricing structure at over $740 million a year.
The USITC report released May 27 added the piece that matters most for July. It confirmed what NMPF and USDEC have long argued: Canada’s milk production quotas, designed to match domestic supply and demand, generate surplus nonfat solids that move into export markets at suppressed prices. U.S. dairy groups have specifically pointed to ventures like the Vitalus Nutrition–Gay Lea Foods partnership in Manitoba, built to process dairy ingredients including milk protein, as the kind of capacity that turns that surplus into export product. USTR Jamieson Greer has the report in hand walking into the review.
What’s at Stake for a Quebec Barn?
Flip the border, and the math runs the other way. Quebec milks roughly 40% of Canada’s cows, and a typical supply-managed dairy there runs around 85 milking cows — well under the 105-cow national average, and a long way from the 1,000-cow Wisconsin operation up top.
That farm’s whole financial model rests on two things:
A farmgate price near C$90/hectolitre.
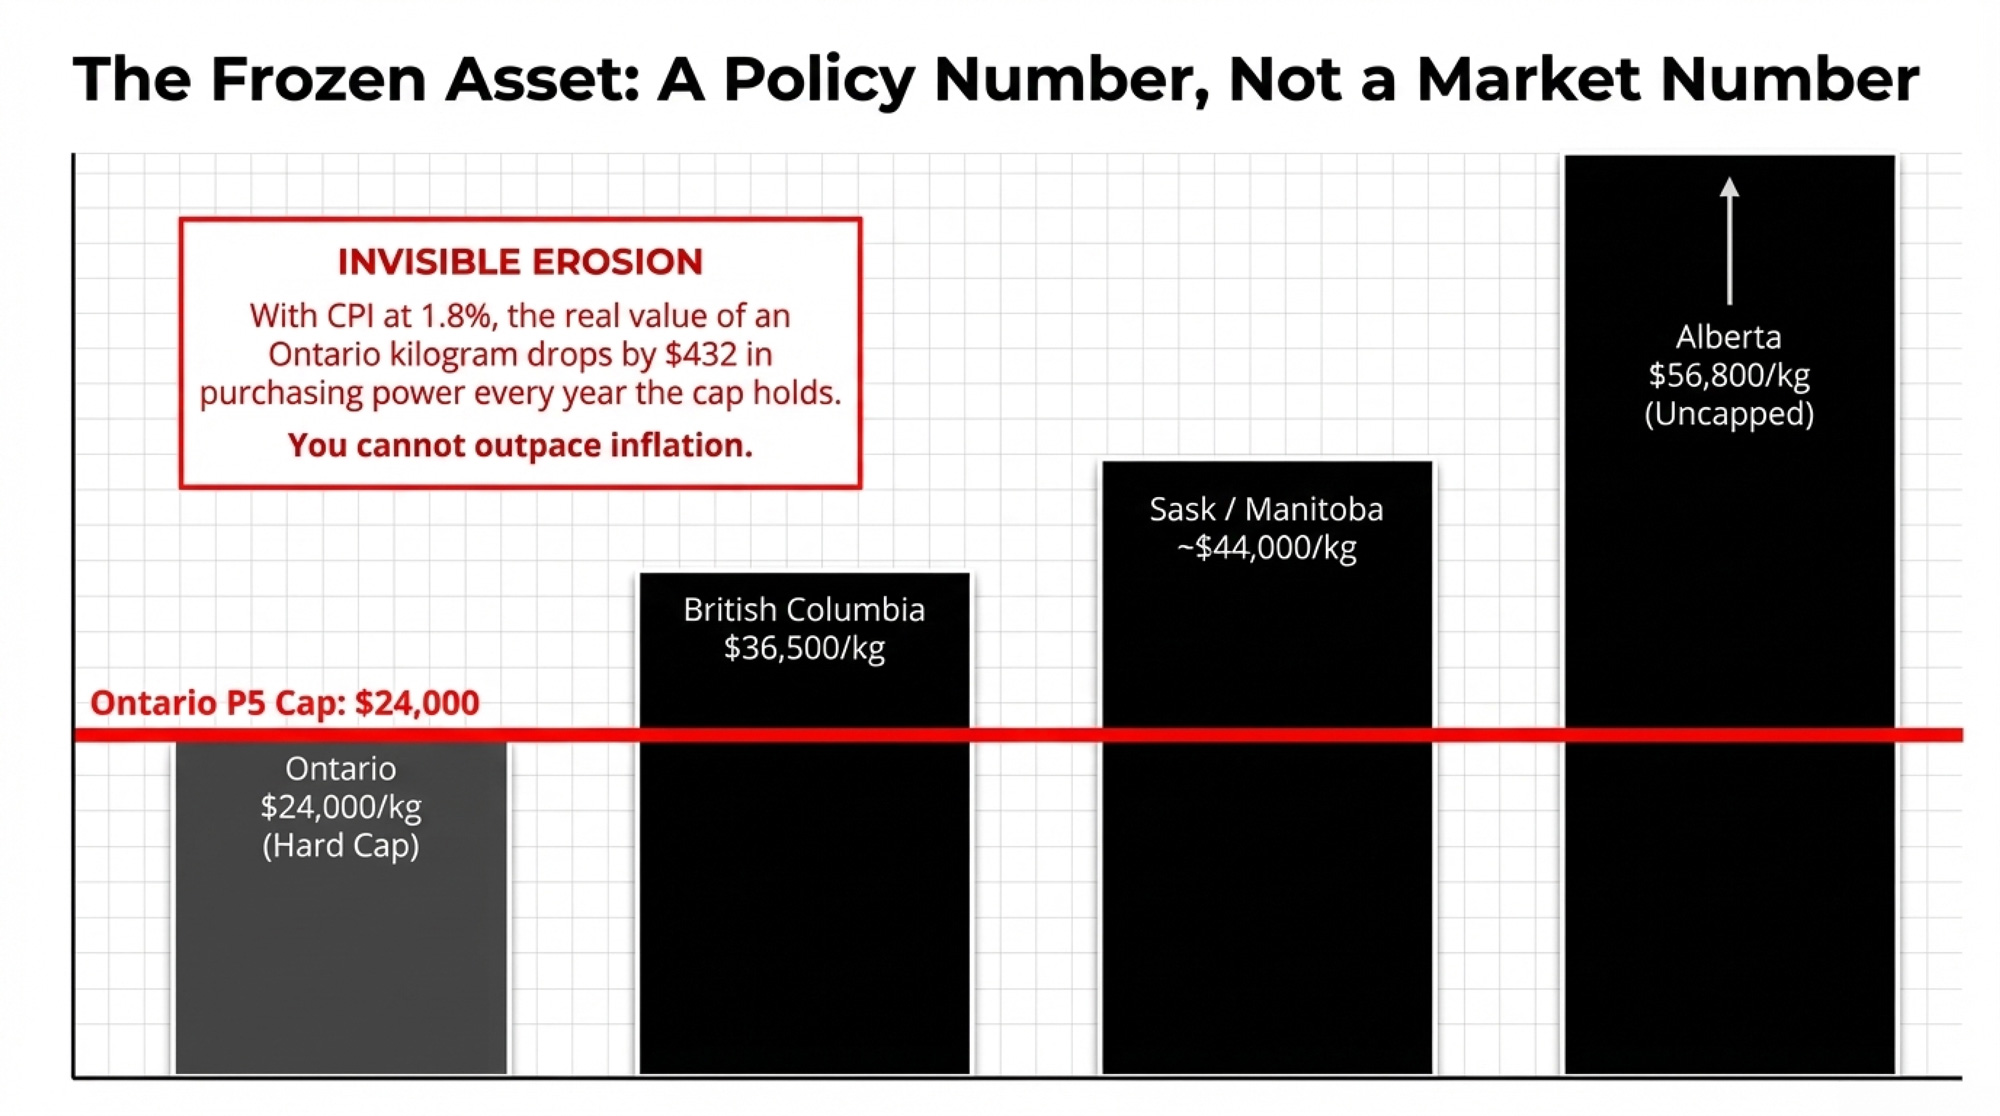
The quota itself — the legal right to ship that milk, which trades at a capped C$24,000 per kilogram of daily butterfat across the P5 pool.
Both are products of the system U.S. negotiators want to crack open. Now run that quota number as an asset.
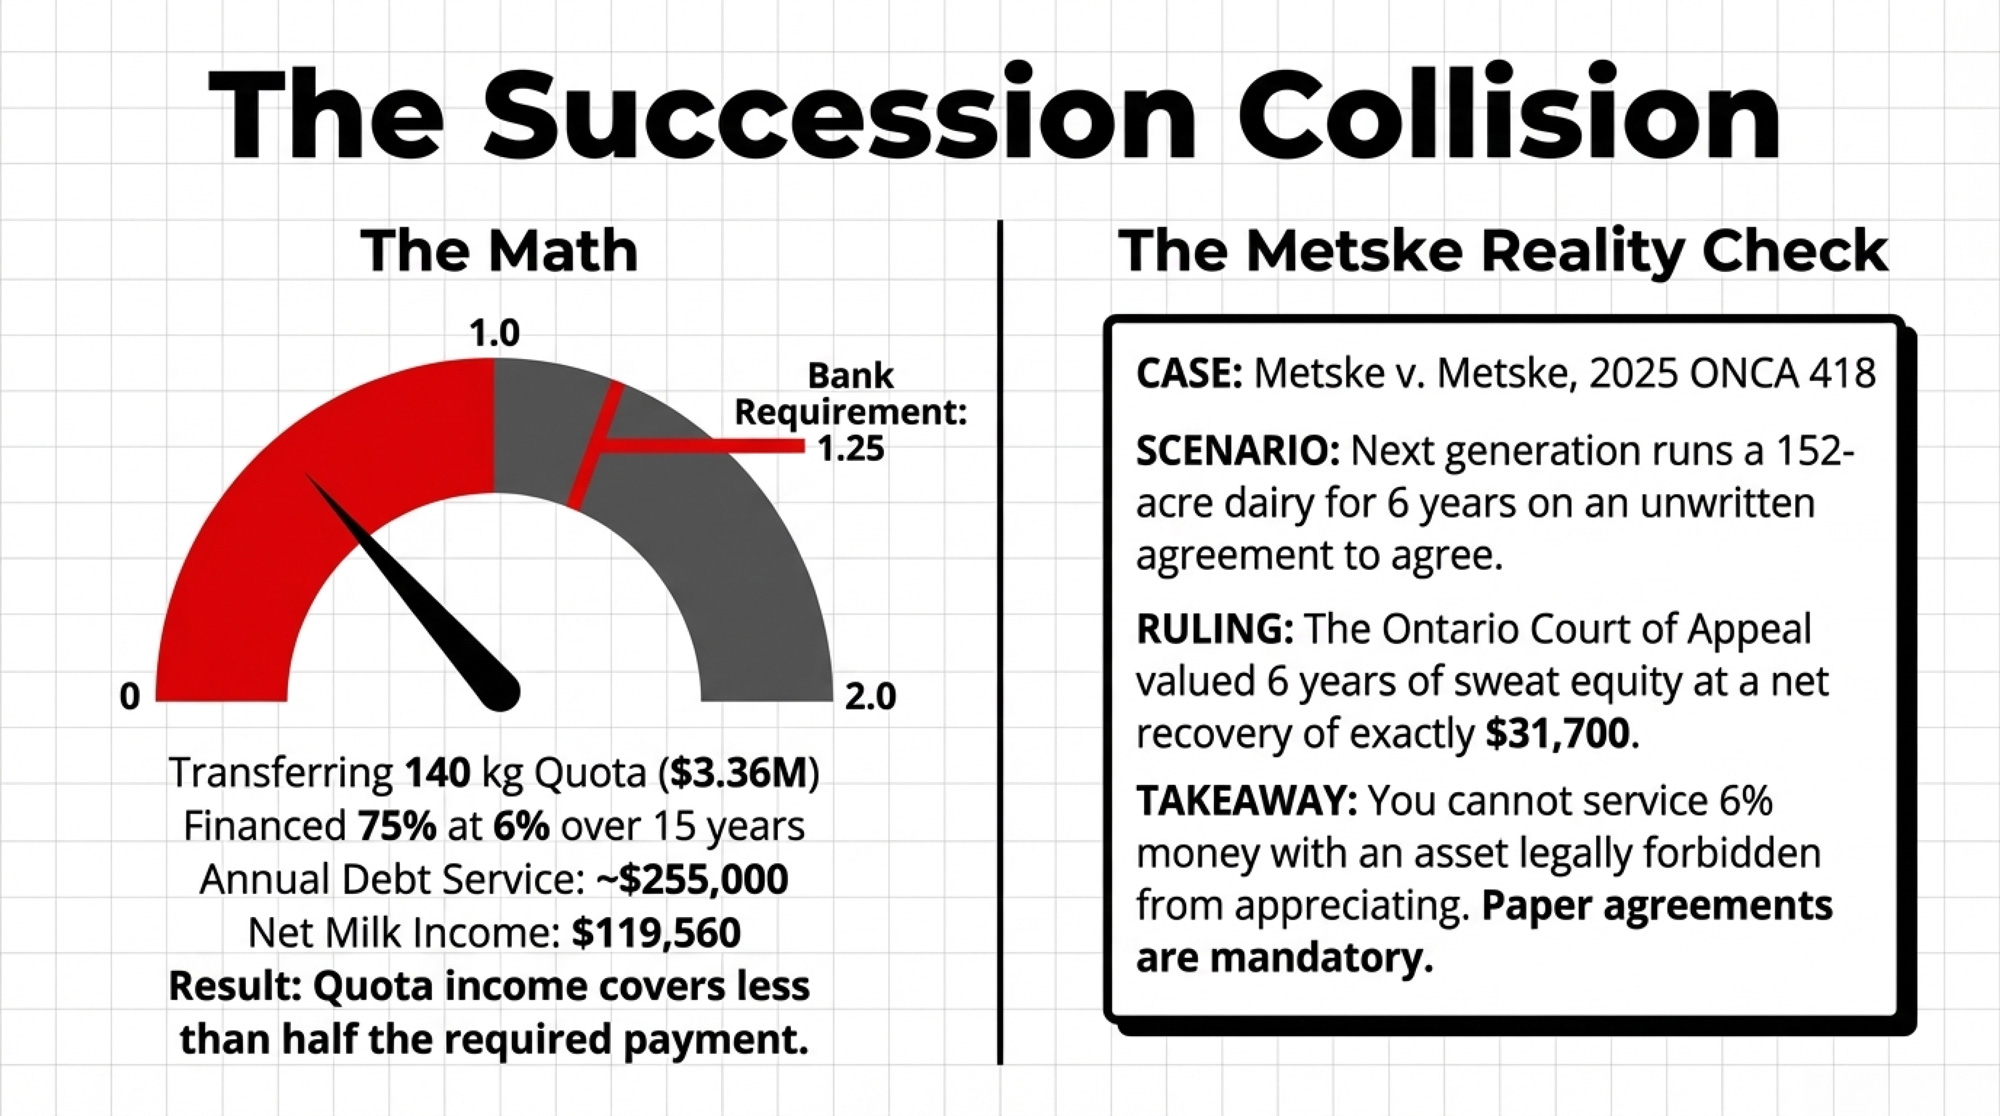
Quebec Quota Value Breakdown (85-Cow Herd Example) 85 cows × 1.25 kg butterfat/day = 106 kg daily quota* 106 kg × C$24,000 cap = C$2.55 million in balance-sheet equity
That’s not milking equipment or land. That’s the single largest line item, and its value rests entirely on confidence that the managed price holds.
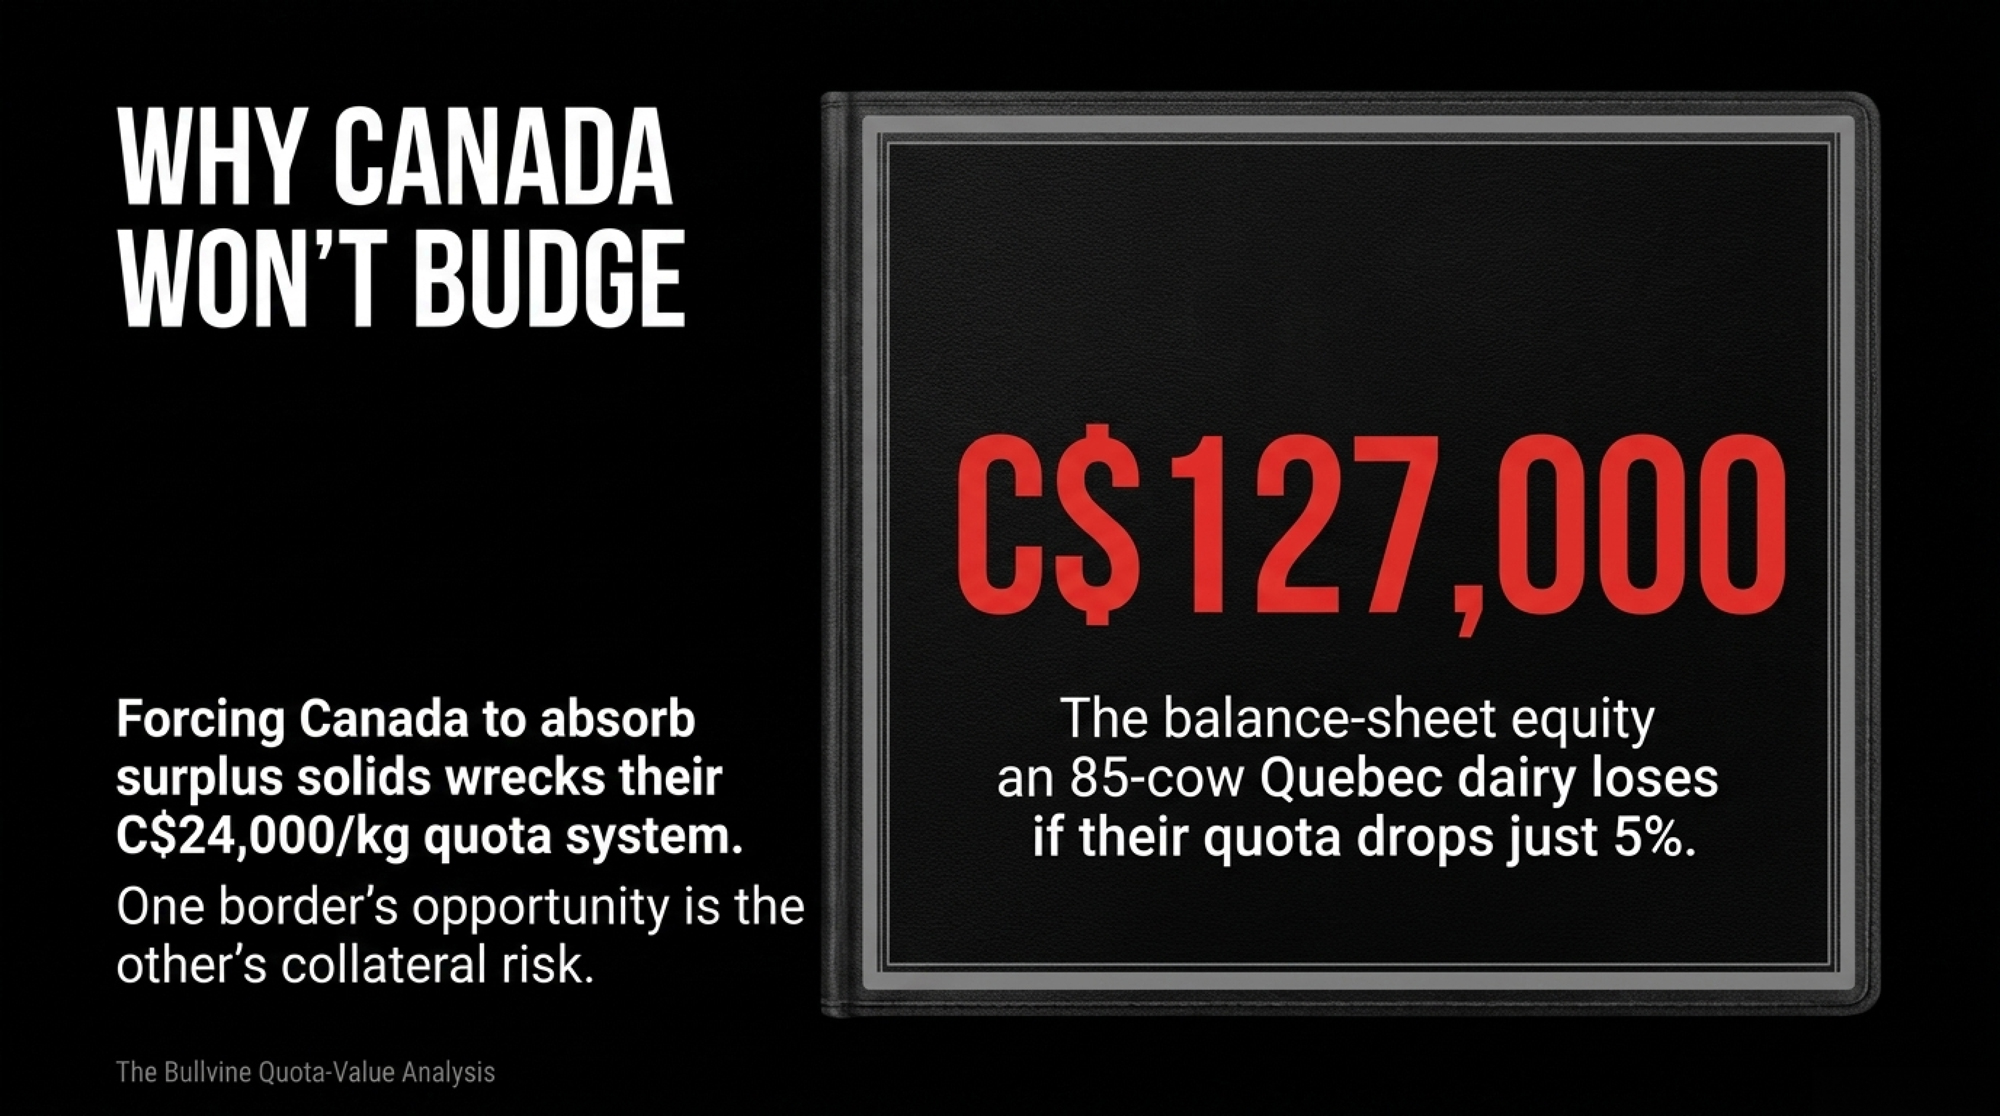
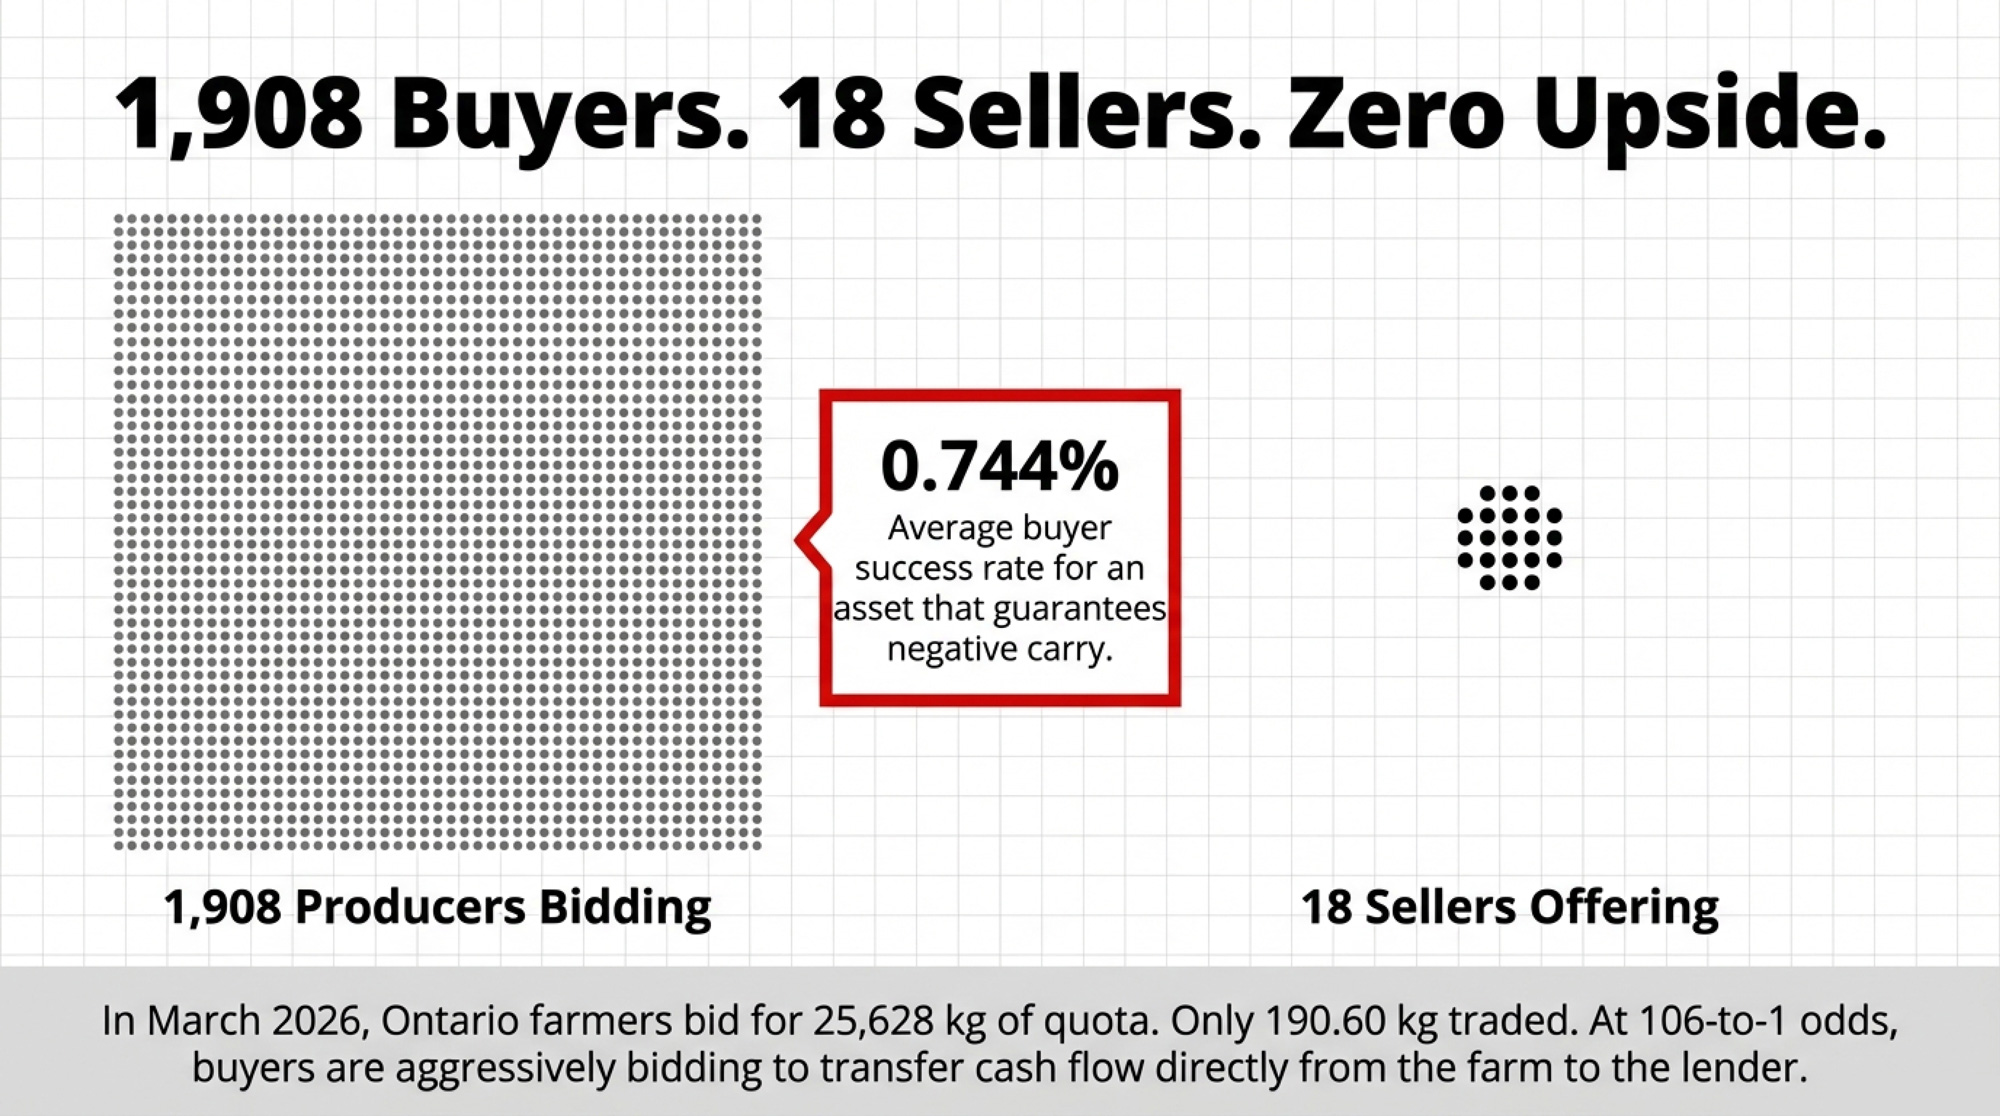
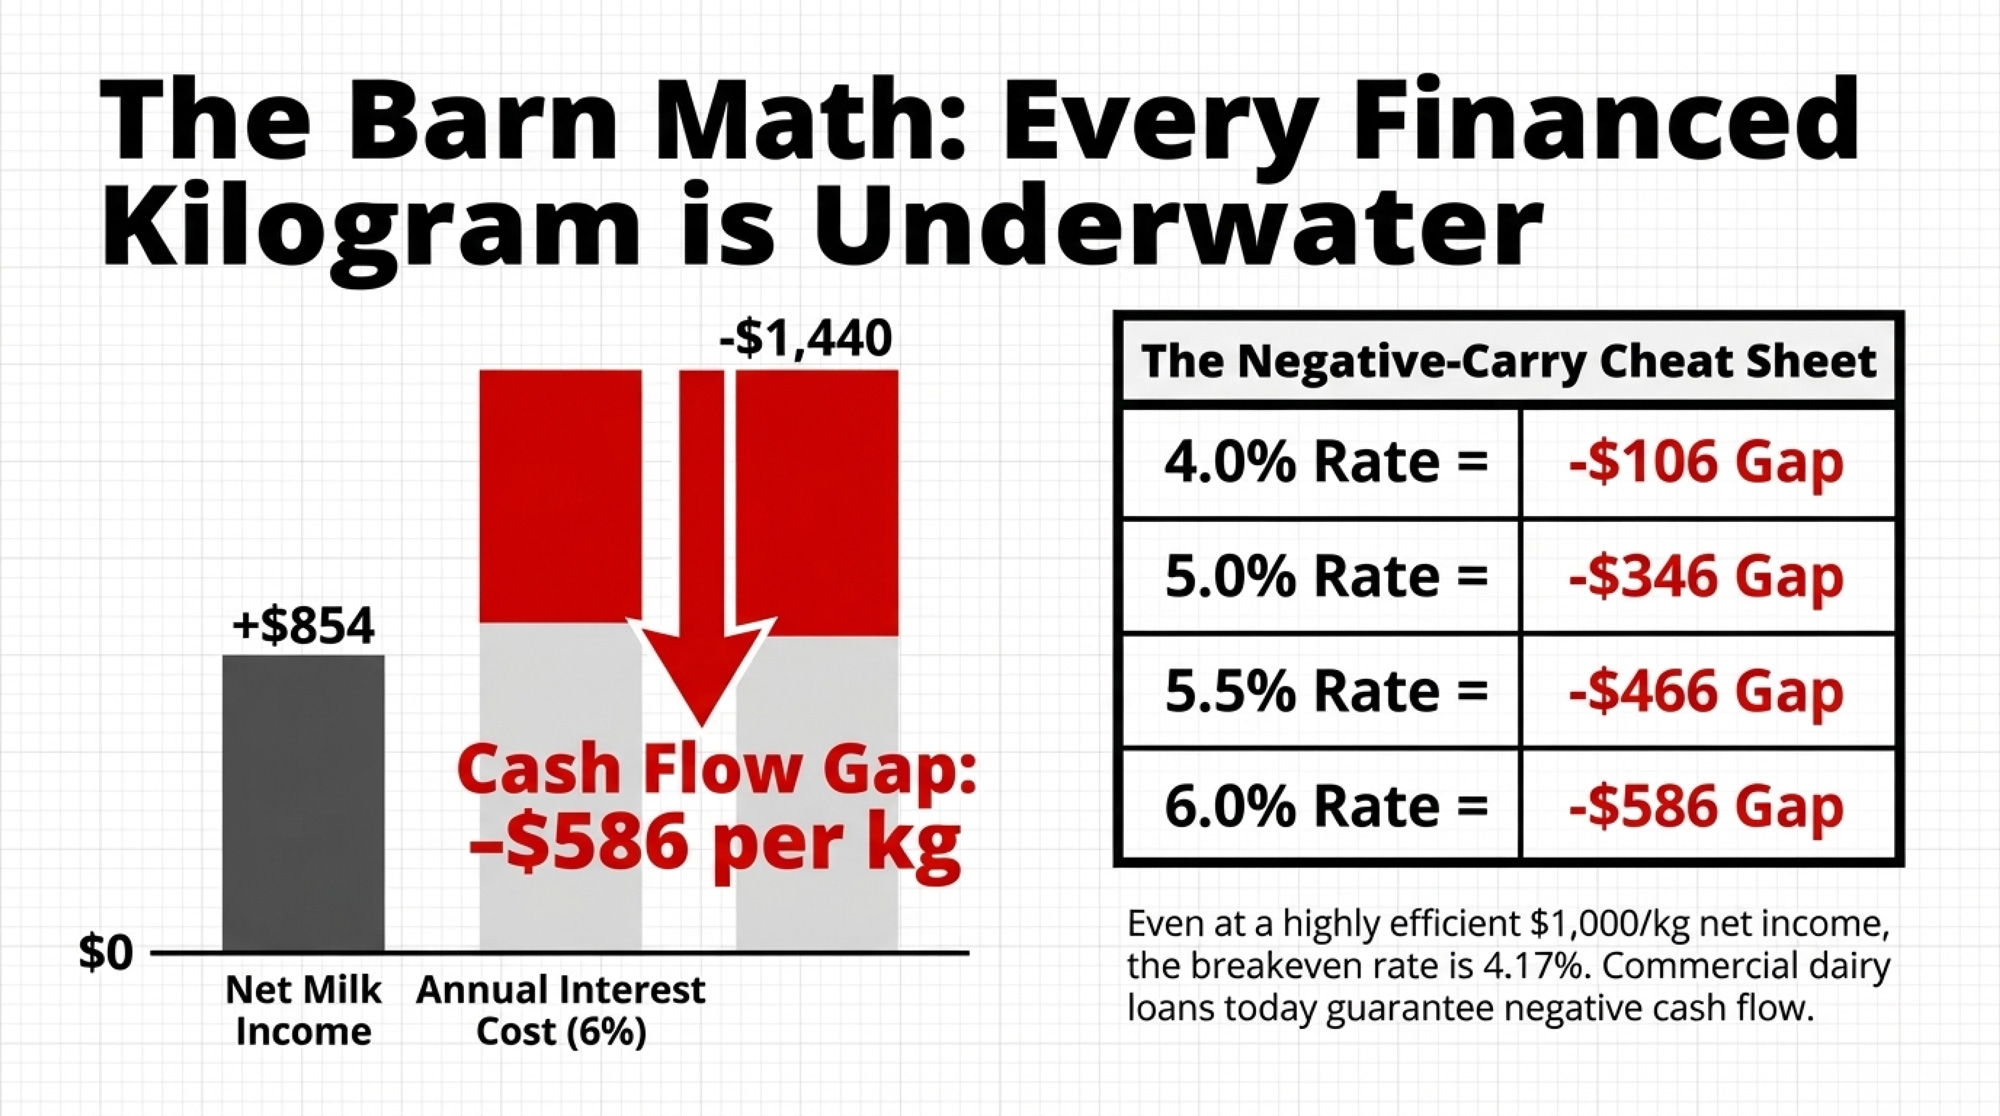
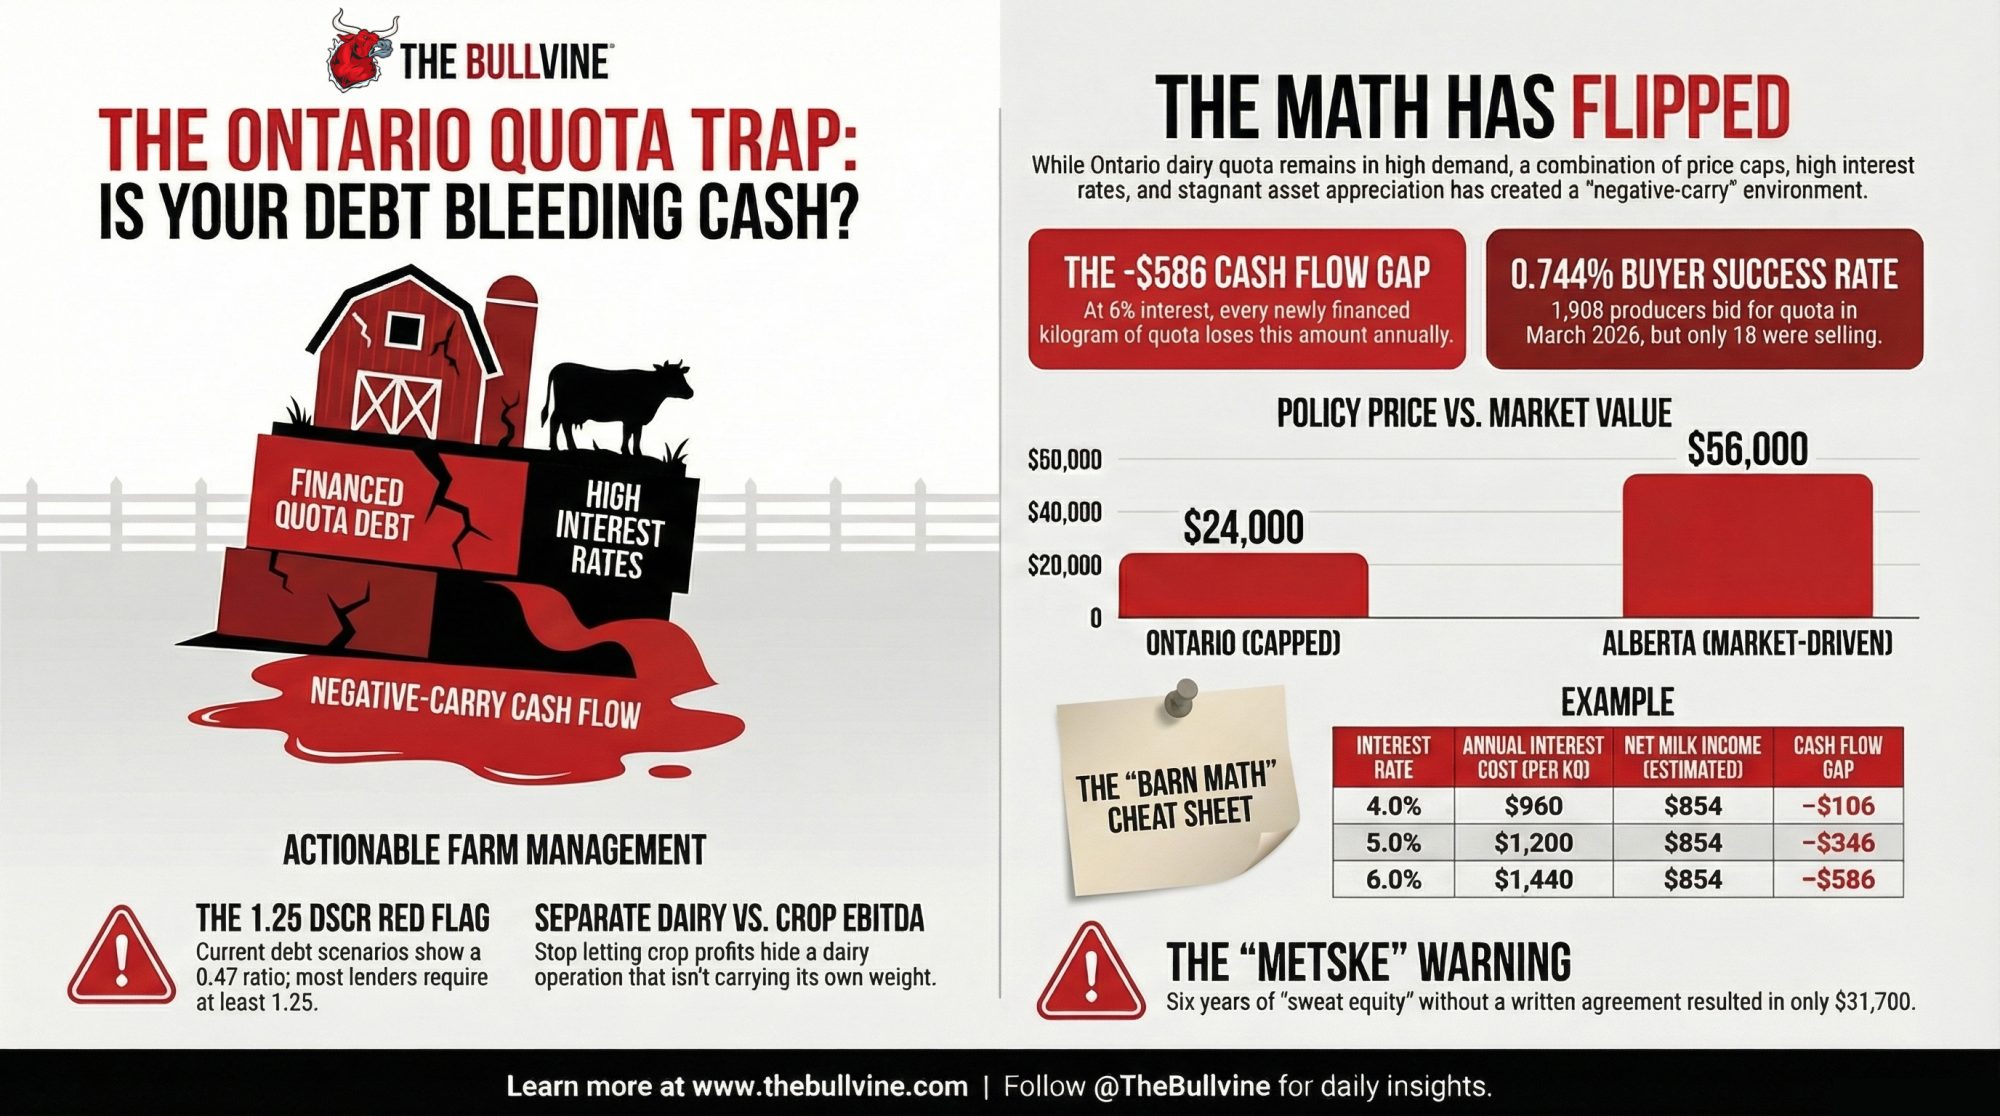
Here’s the squeeze a Quebec producer actually fears: it isn’t the farmgate price drifting down a few percent — it’s what an NMPF-style export cap does to that C$2.55 million quota line. Force Canada to absorb surplus solids domestically rather than export them, and the economics that justify a C$24,000/kg cap start to wobble. Ontario quota already shows the strain: in March 2026, 1,908 producers bid and only 190.6 kg traded, with every financed kilogram at 6% bleeding C$586 a year. Shave even 5% off a C$2.55 million quota base, and that’s roughly C$127,000 in balance-sheet equitygone — dwarfing any single-year farmgate dip. That’s the number Quebec lenders watch. And it explains why DFC Vice-President Daniel Gobeil has fiercely pushed Ottawa to keep supply management off the table — backed by Bill C-202, the law Canada’s Parliament passed barring negotiators from trading away more dairy access. One border’s opportunity is the other’s collateral risk. Same milk molecule, opposite ledgers.
What Does the July Review Actually Decide for You?
The USMCA joint review isn’t a renegotiation by itself. Article 34.7 establishes a structured review in which any of the three countries can put recommendations on the table. NMPF and USDEC filed their asks back in October 2025, and they boil down to three things: open the quota allocation to retailers and food service instead of just Canadian processors, add use-it-or-lose-it penalties for processors who sit on quota, and cap the total nonfat solids Canada can export so the reclassification end-run stops working.
The first two are tune-ups to an existing system. The third is the structural one, and it’s the heavy lift — because Canada argues those reclassified products fall outside USMCA entirely, and it’s leaning on a panel ruling it already won. Canadian trade experts mostly expect the same outcome: more access and tweaked tariff administration, but no dismantling of supply management. Neither side walks in with a clean hand. What you’ll most likely get out of July is a set of commitments whose real value won’t show up until the first full dairy year of implementation, which runs from August 2026 through July 2027. So how do you read whether it actually worked?
How Do You Know If July Delivered Anything Real?
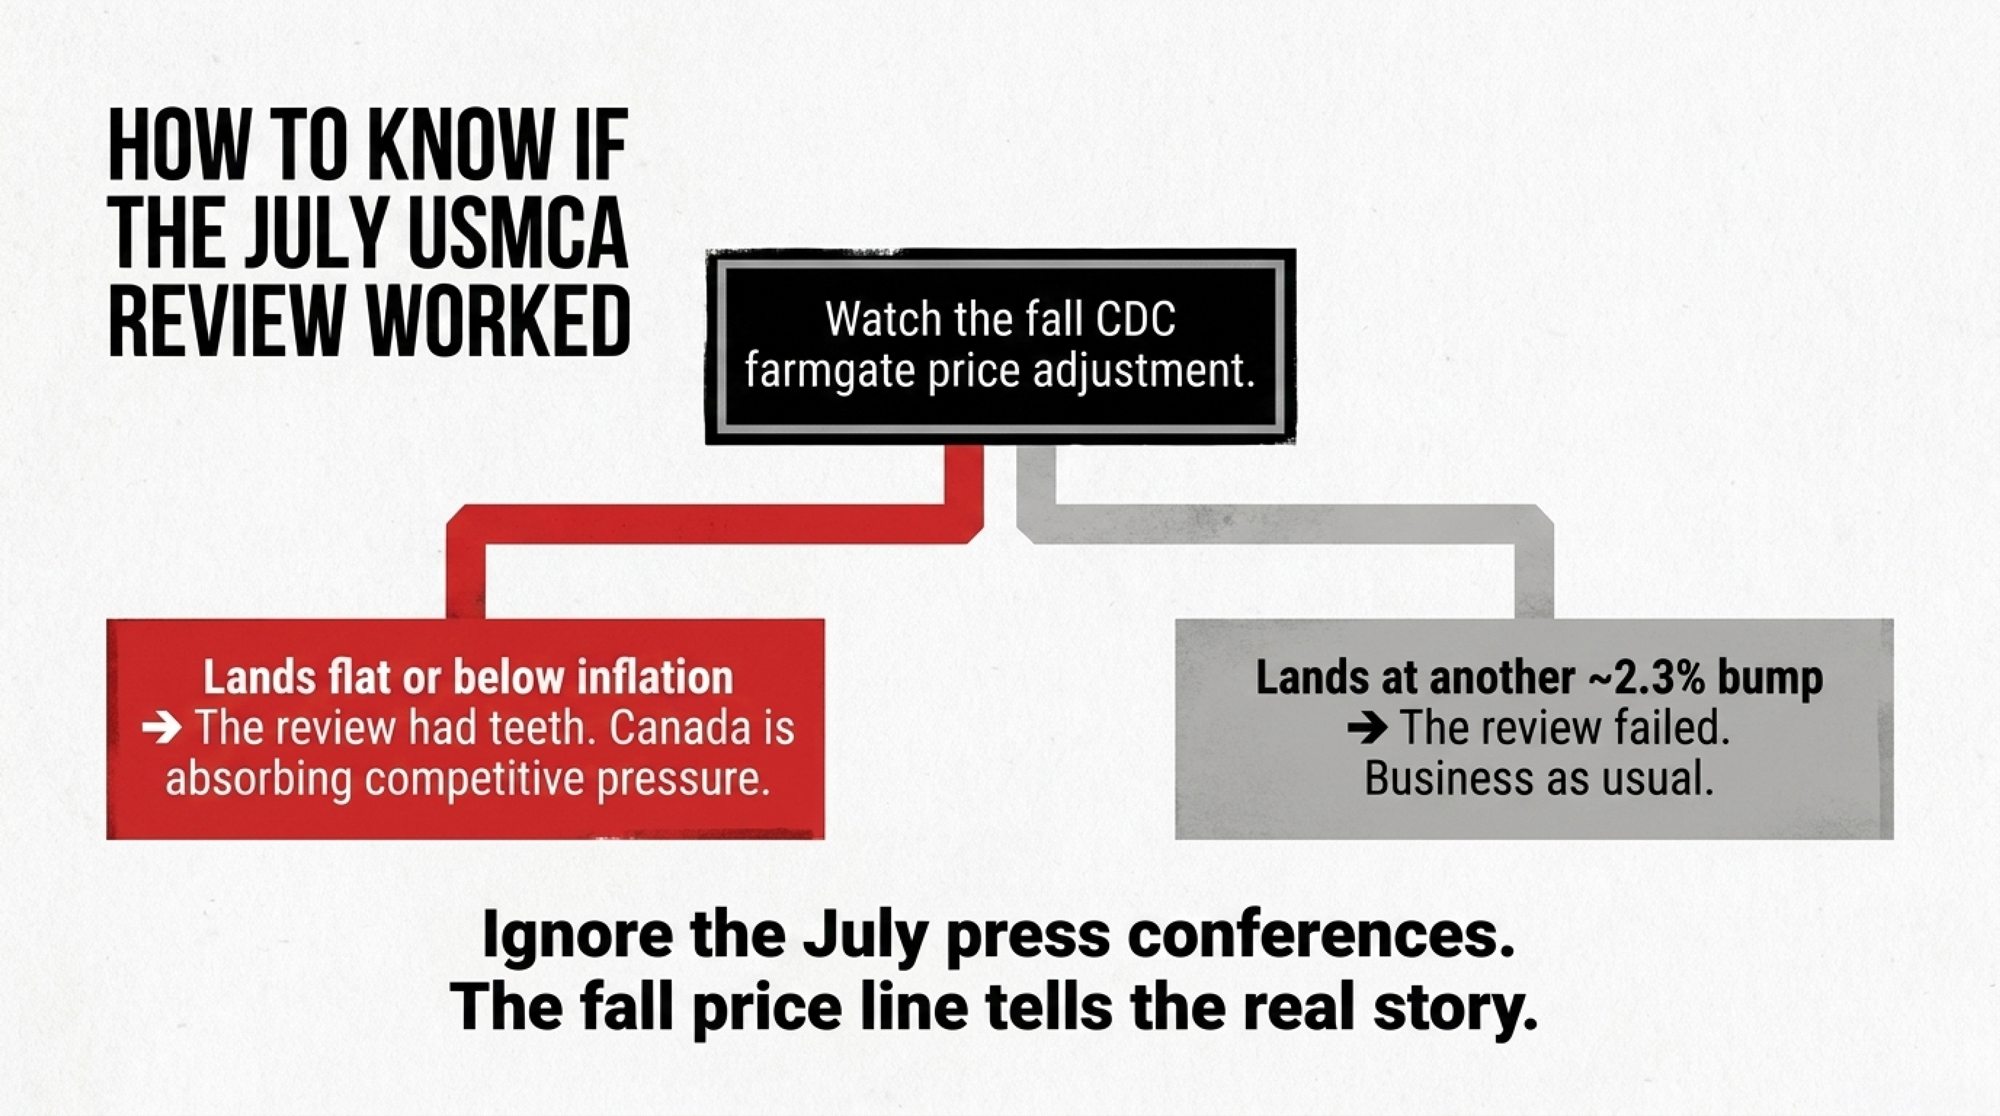
Watch one number, not the whole circus. The Canadian Dairy Commission announces its annual farmgate price adjustment each fall — and the last one, effective February 1, 2026, was a 2.33% increase. For years, it’s tracked inflation, a steady climb. If this fall’s announcement lands flat or below inflation, it means Canada’s pricing system is starting to absorb real competitive pressure. That’s your first hard evidence the review had teeth.
If the CDC posts another comfortable inflation-linked bump, you’ve got your answer too: the fight produced process language and a working group, not market access. The press conferences in July will tell you almost nothing. The fall price line will tell you most of what you need to know.
Signal
What It Means If True
Farm Action
CDC Fall Price Announcement: Flat or below inflation
✅ Review had real teeth — Canada’s pricing system absorbing competitive pressure
Monitor Class IV — structural improvement may follow; revisit 2027 expansion math upward
CDC Fall Price: Another ~2.33% CPI-linked bump
❌ Process language only — no market access change
Keep DRP coverage in place; stress-test 2027 plans at $19.70/cwt; don’t build on a Canadian win
First 2026–27 TRQ fill data (Aug–Oct 2026): Fill rates rise meaningfully
✅ Quota reform commitments have teeth
Expect modest uplift in skim powder and yogurt categories; revisit co-op mix exposure
TRQ fills stay near 42% average
❌ Structural quota allocation unchanged
Access fight gains are cosmetic; reclassification cap is only reform that matters for Class IV
Reclassification cap announced with enforcement mechanism
✅ The big one — Class IV suppression mechanism addressed
Hold existing coverage; assume $20/cwt baseline through 2027
Options and Trade-Offs for Producers
Lock in DRP coverage before July — this is your near-term move. Dairy Revenue Protection exists for exactly this kind of known-event risk, and coverage is available daily for quarters running out through the first quarter of 2027. July 1 is a fixed date with an uncertain outcome; Greer has openly said exit, revision, and renegotiation are all live options. You can’t control the outcome, but you can put a floor under your Class IV exposure at today’s futures before the announcement moves anything. One scheduling note worth knowing: if you’re thinking about switching DRP providers, that’s a once-a-year move with a June 30, 2026, deadline. The trade-off on coverage itself: premium cost against a price that may not move much either way.
Ask your co-op what share of its volume moves through under-filled TRQ categories. A co-op heavy in cheese is sitting in the one category that’s actually working at 83% fill. One leaning on skim powder or yogurt is exposed to the categories where reform matters most. This costs you nothing but a phone call, and the answer tells you how much your milk check is actually riding on the July outcome. If they can’t answer it, that’s worth knowing too.
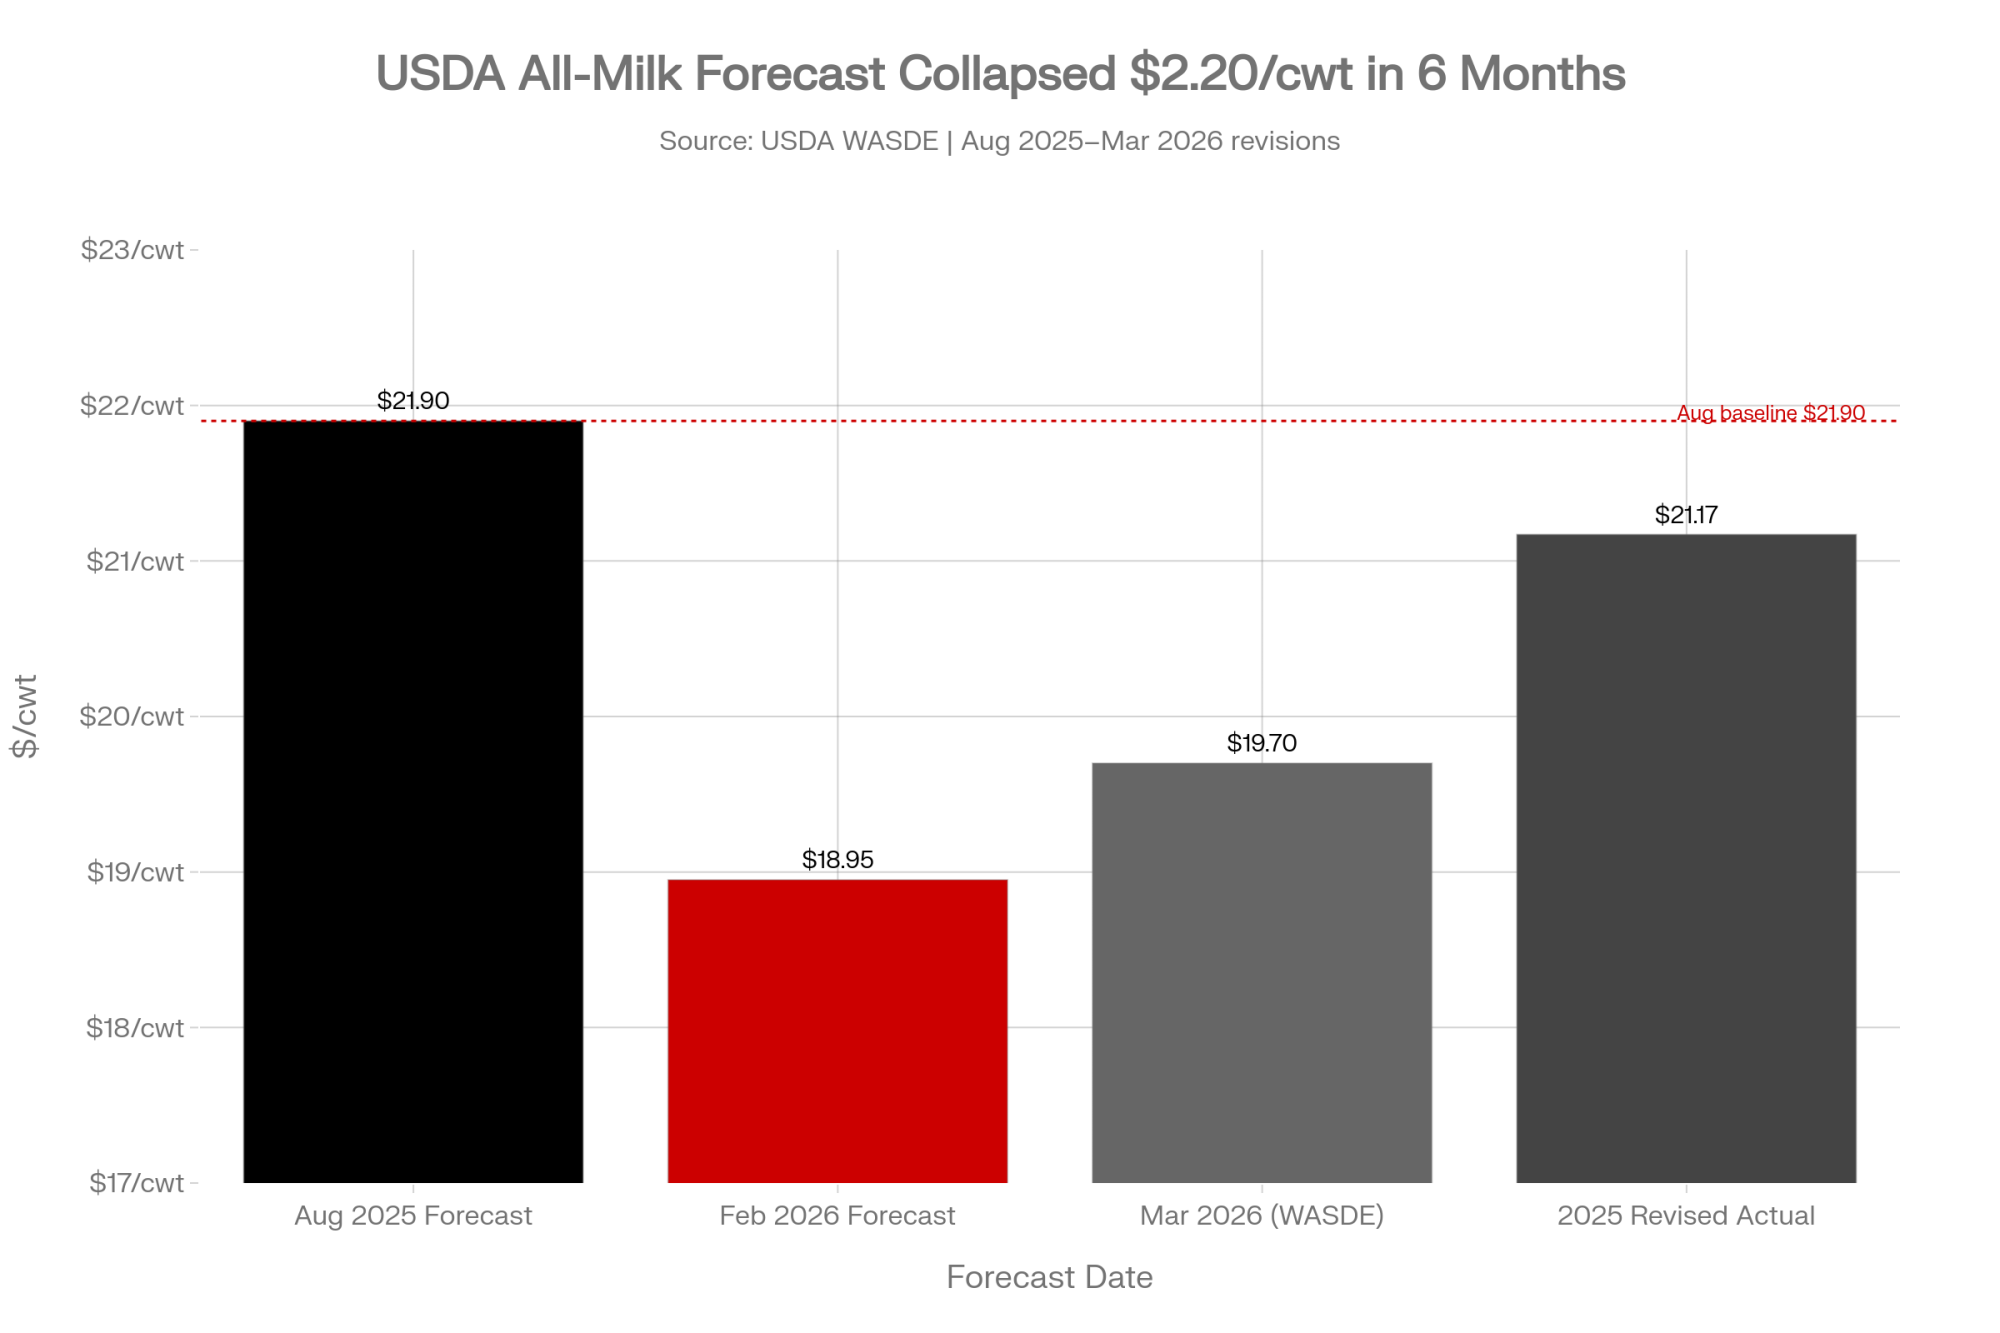
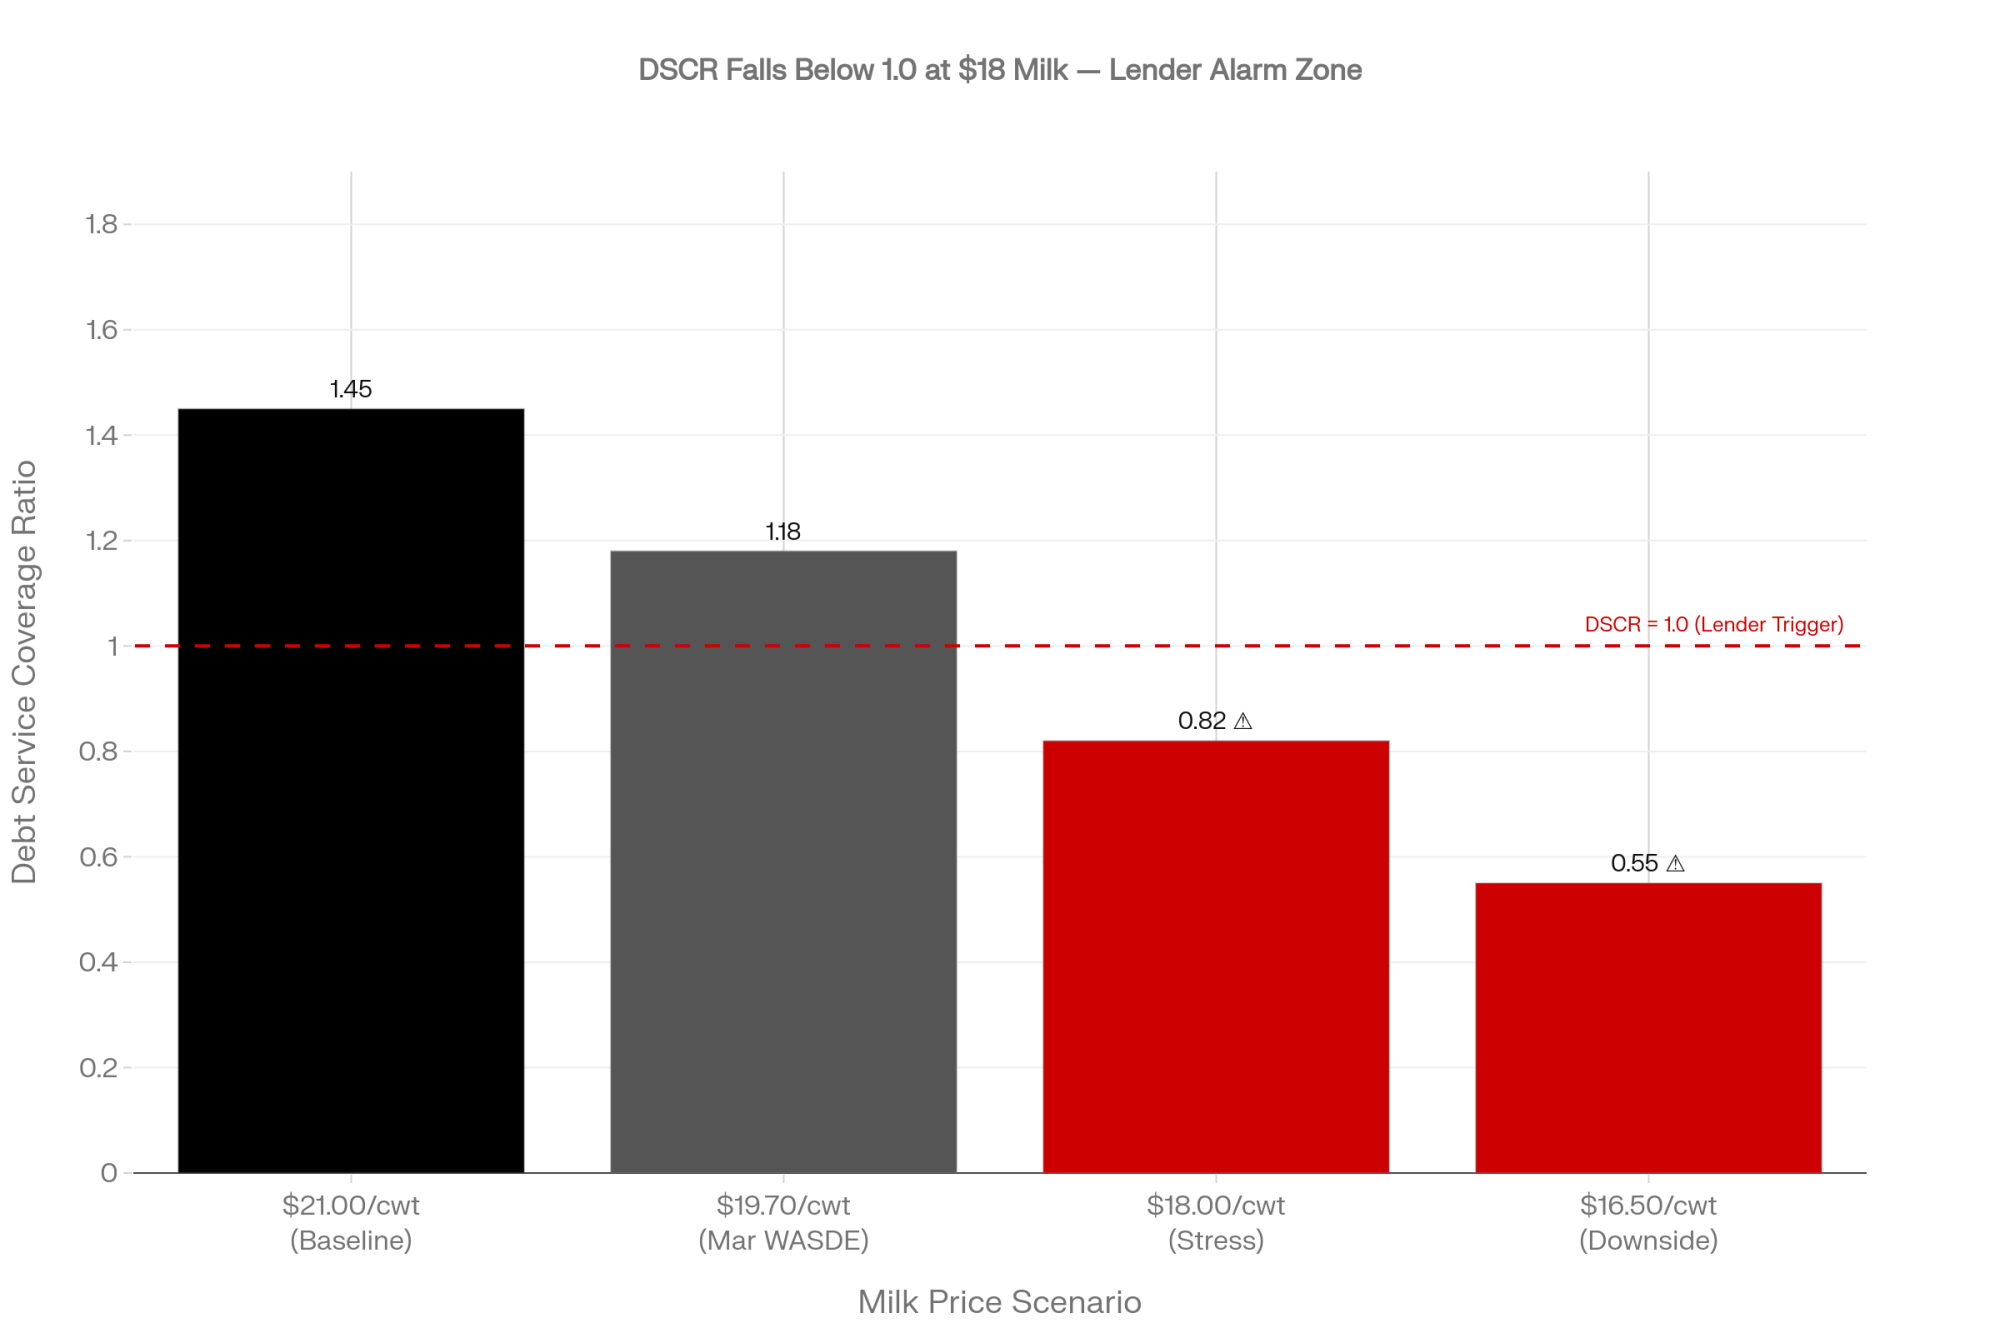
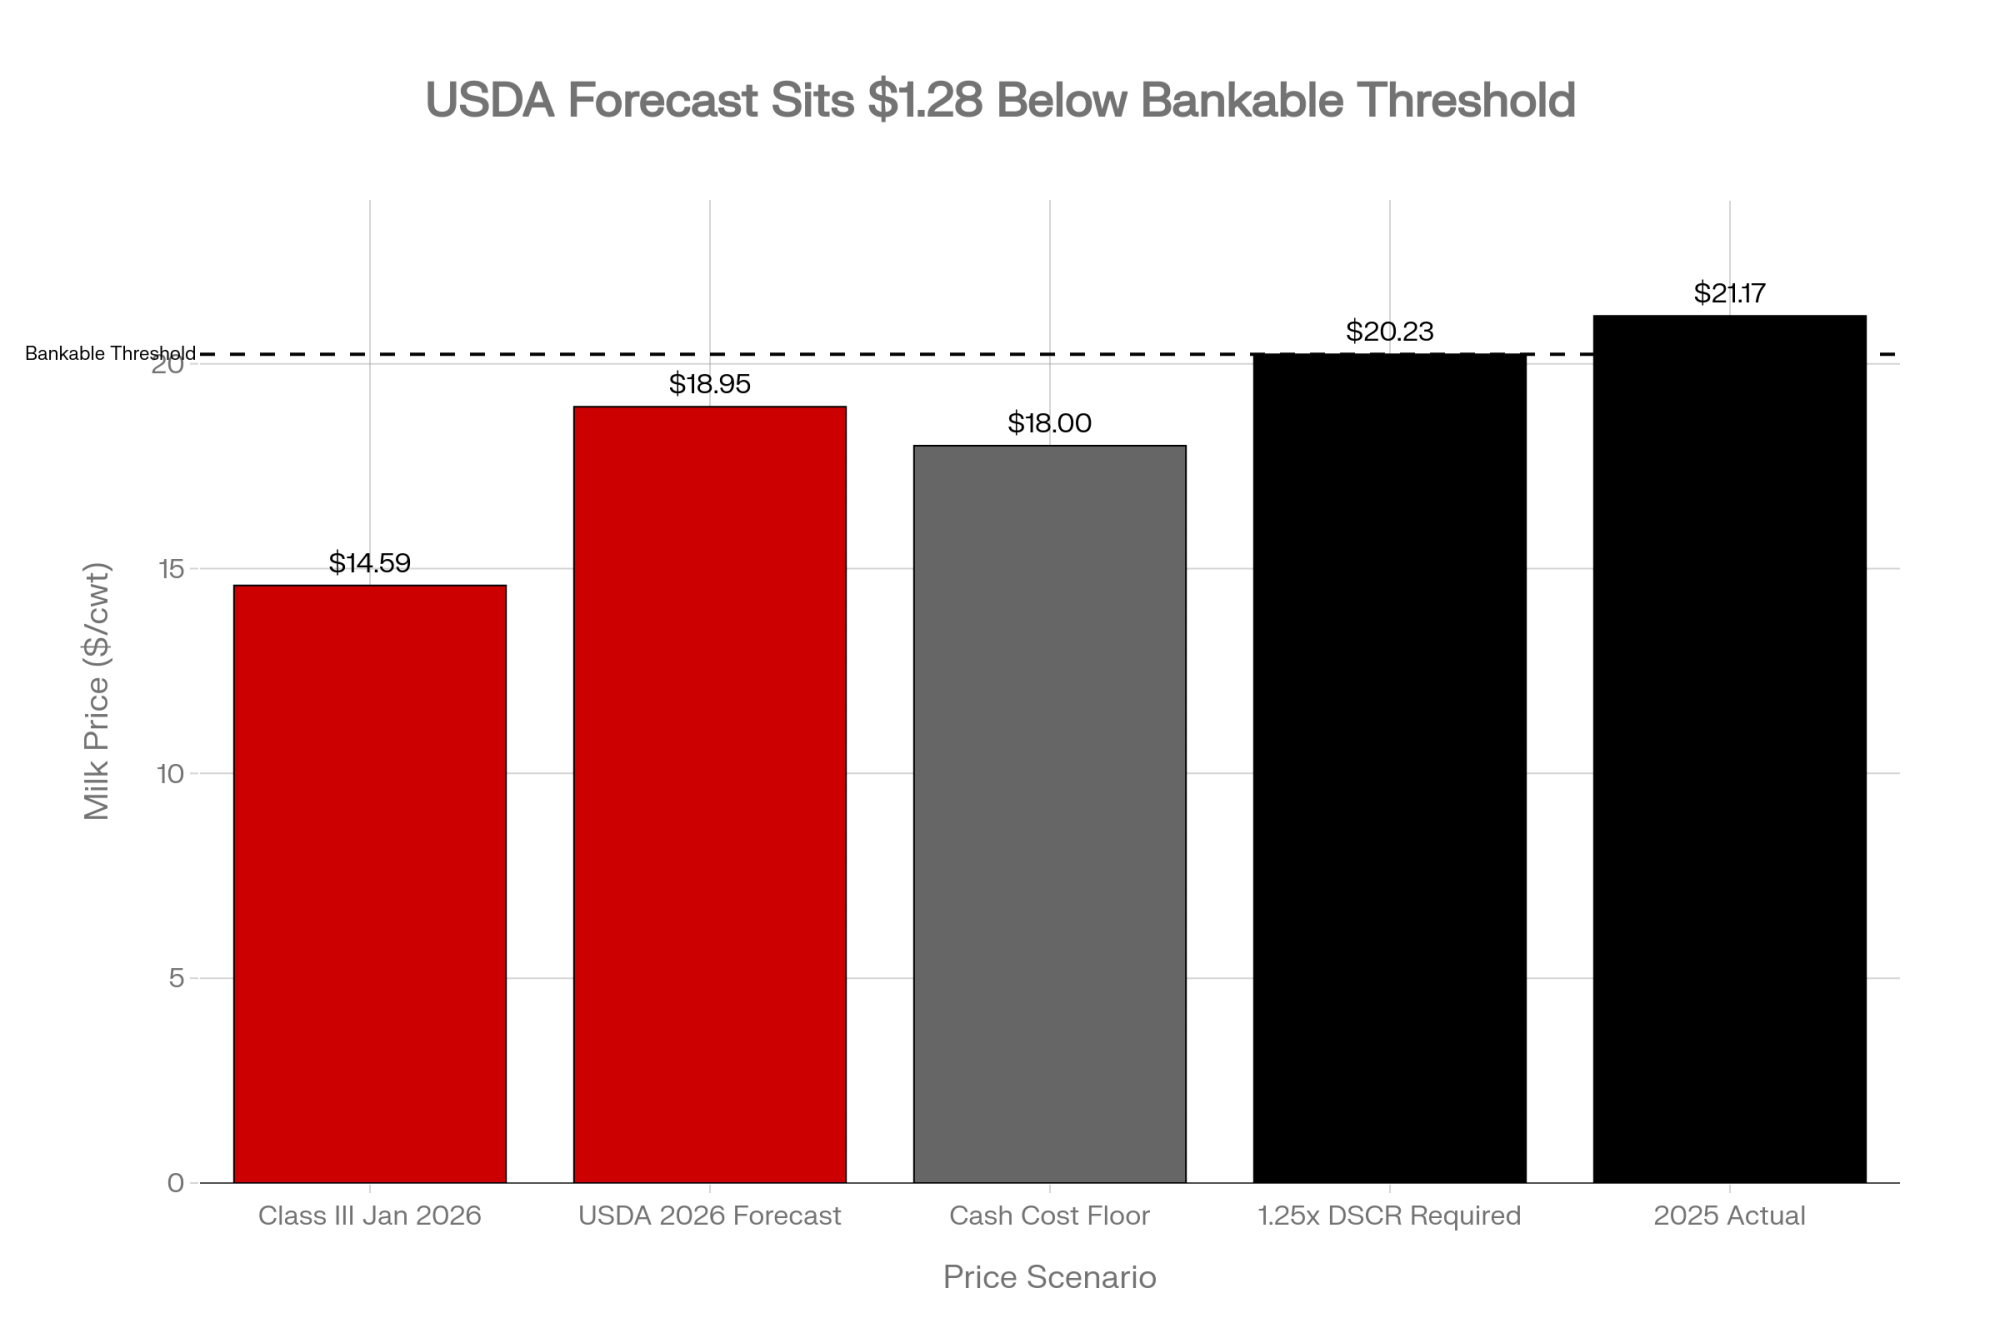
Don’t build your 2027 expansion on a Canadian win. A $0.50-to-$1.00/cwt Class IV lift is plausible if July produces commercial-grade language — but it’s been “almost there” before, and the 2023 panel went Canada’s way. Stress-test any expansion at $19.70/cwt, the figure USDA’s May WASDE landed on after a 75-cent upward revision off February’s $18.95 — still down from the revised 2025 average of $21.17. If the numbers don’t hold there, have the lender conversation before July, not after a disappointment. The trade-off is real: wait too long for clarity, and you miss a window to act; move on a hoped-for recovery, and you’ve bet the operation on a negotiation.
Key Takeaways
When someone sells you the $200 million access gap as a milk-check game-changer, run the nickel. Full TRQ enforcement is about $0.05/cwt nationally — roughly $1,800 on a 150-cow dairy. The reclassification fight is where the real Class IV money sits.
Class IV feeling structurally low, even when butter and powder demand look fine? It might be. Roughly 147,000 metric tons of reclassified Canadian protein hit the U.S. market in 2024, and the USITC says that surplus moves at suppressed prices.
Not covered on Class IV through Q3 2026? Price the DRP decision now — coverage is available daily, and a provider switch carries a June 30 deadline.
Got a co-op leaning on skim powder or yogurt? Your milk check has more riding on July than a cheese plant’s does. Call them and ask.
A 2027 plan that only pencils above $21/cwt is a plan on thin ice. Run it again at $19.70 — USDA’s May WASDE 2026 all-milk figure — and decide before July whether the math survives without a USMCA bump.
Farming under quota in Quebec or Ontario? The line to watch isn’t the farmgate price — it’s whether an export cap shakes confidence in the value of the quota. On an 85-cow herd, a 5% hit to a C$2.55 million quota base is roughly C$127,000 in equity.
Want one signal instead of fifty headlines? Watch this fall’s CDC price announcement. Flat or below inflation means the review bit. Another raise on the order of the 2.33% bump in February 2026 means it didn’t.
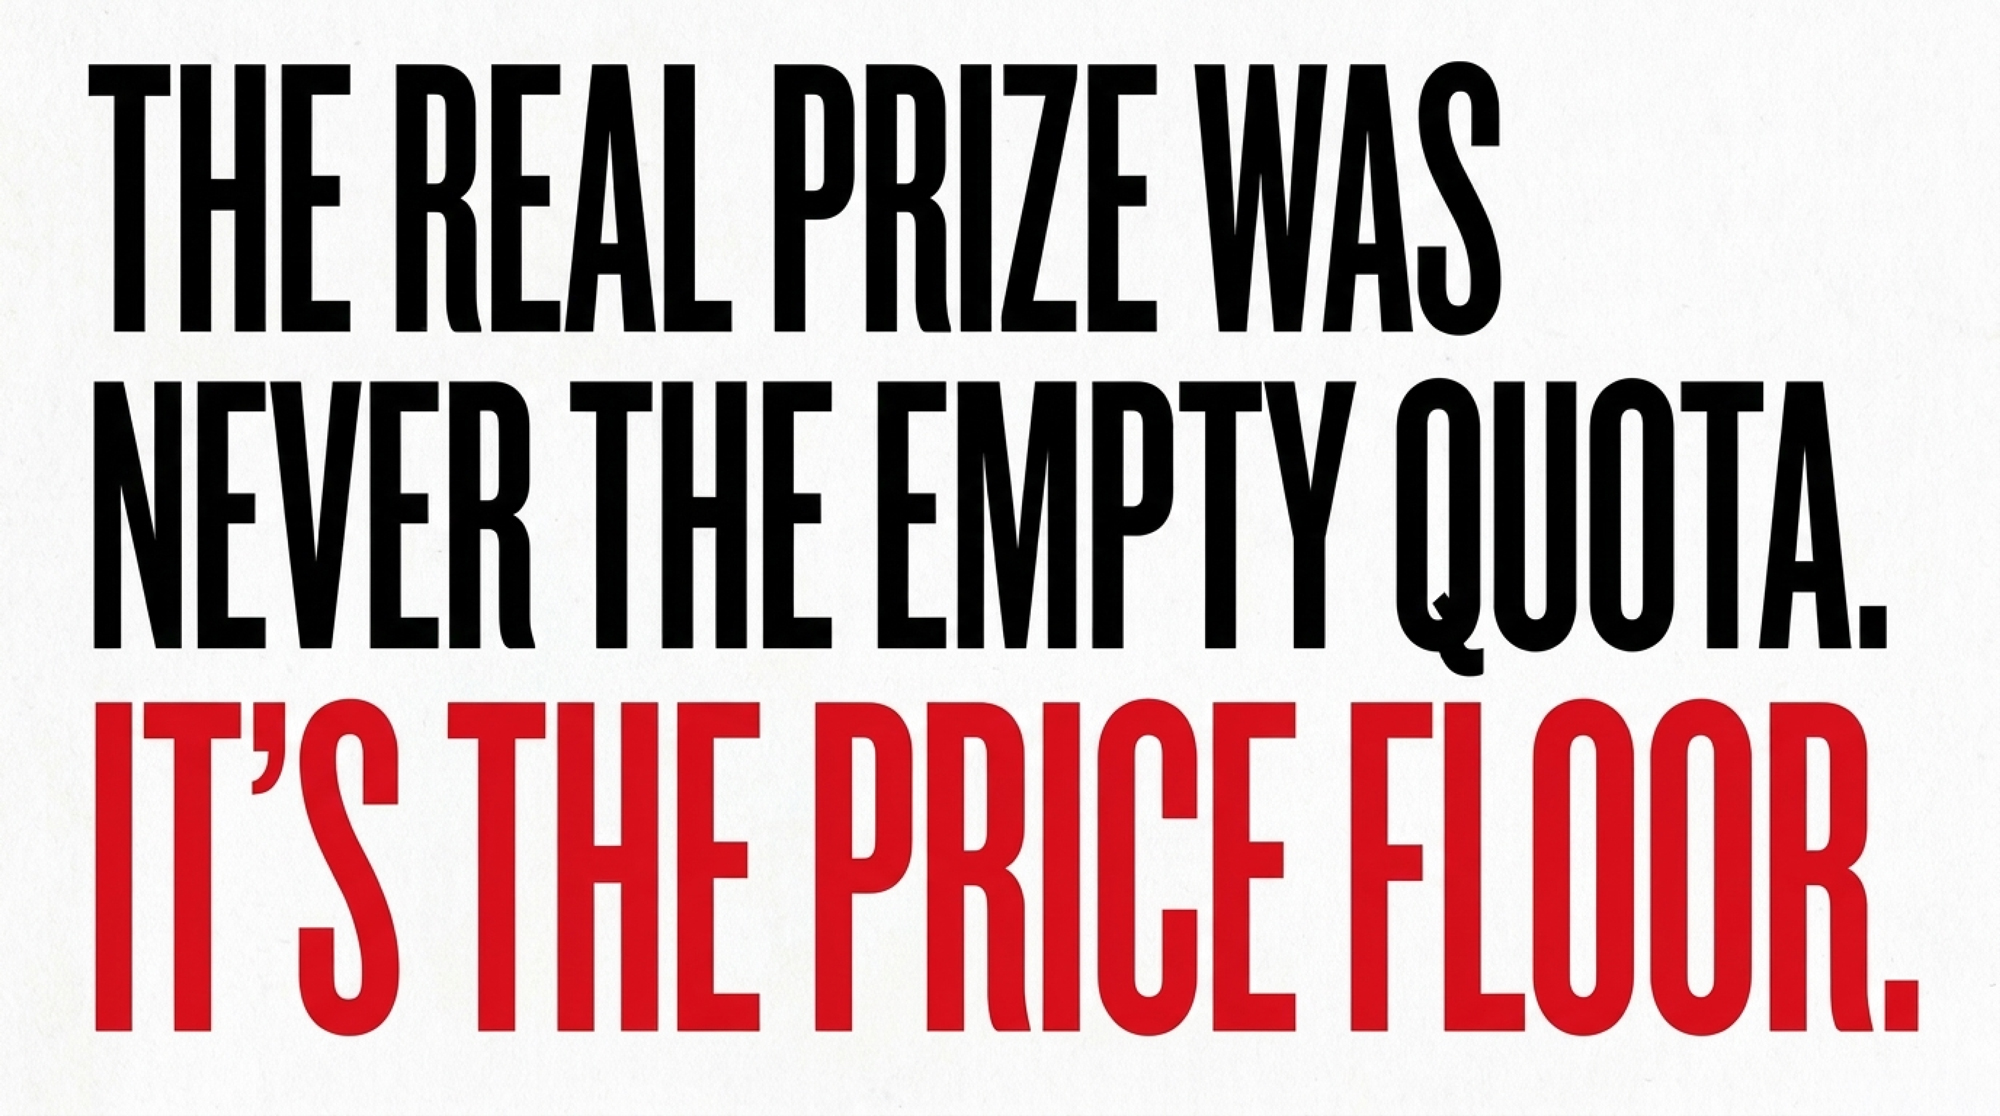
Vander Schaaf went to Washington to make the case that Canada owes U.S. dairy more than it’s delivering. He’s right that the access is short, but the nickel-per-hundredweight access math tells you the real prize was never the empty quota. It’s the price floor. And Gobeil, a province away, is just as right that the same reform that firms up your Class IV price puts real equity at risk on a Quebec balance sheet. The producer reading this before morning milking doesn’t get to vote on the July outcome. You only get to decide how exposed your operation is when it lands. So where does your breakeven actually sit right now, and how much of your 2027 milk check are you quietly counting on a trade win to deliver?
Run Your Numbers
Dairy Profit Projector — Before you bank on a USMCA bump, drop in your herd size and milk price to see where your breakeven and margin per cwt actually land. Stress-test 2027 at $19.70 instead of $21, and find out if your plan survives without a Canadian win.
Complete references and supporting documentation are available upon request by contacting the editorial team at editor@thebullvine.com.
Learn More
The DRP Window Sitting Open on Most Mid-Size Dairies — Arms you with immediate risk-management tactics before the USMCA review, exposing how newly modified, weekend-friendly DRP rules allow mid-size herds to efficiently lock in revenue floors and protect multi-quarter milk-check exposure.
Every week, thousands of producers, breeders, and industry insiders open Bullvine Weekly for genetics insights, market shifts, and profit strategies they won’t find anywhere else. One email. Five minutes. Smarter decisions all week.
Jarratt logged 69 noncompliance records before the listeria hit. Ten funerals, 7 million pounds pulled, 17 months dark — and the margin damage is already moving upstream to 400-cow herds that never shipped a bad load.
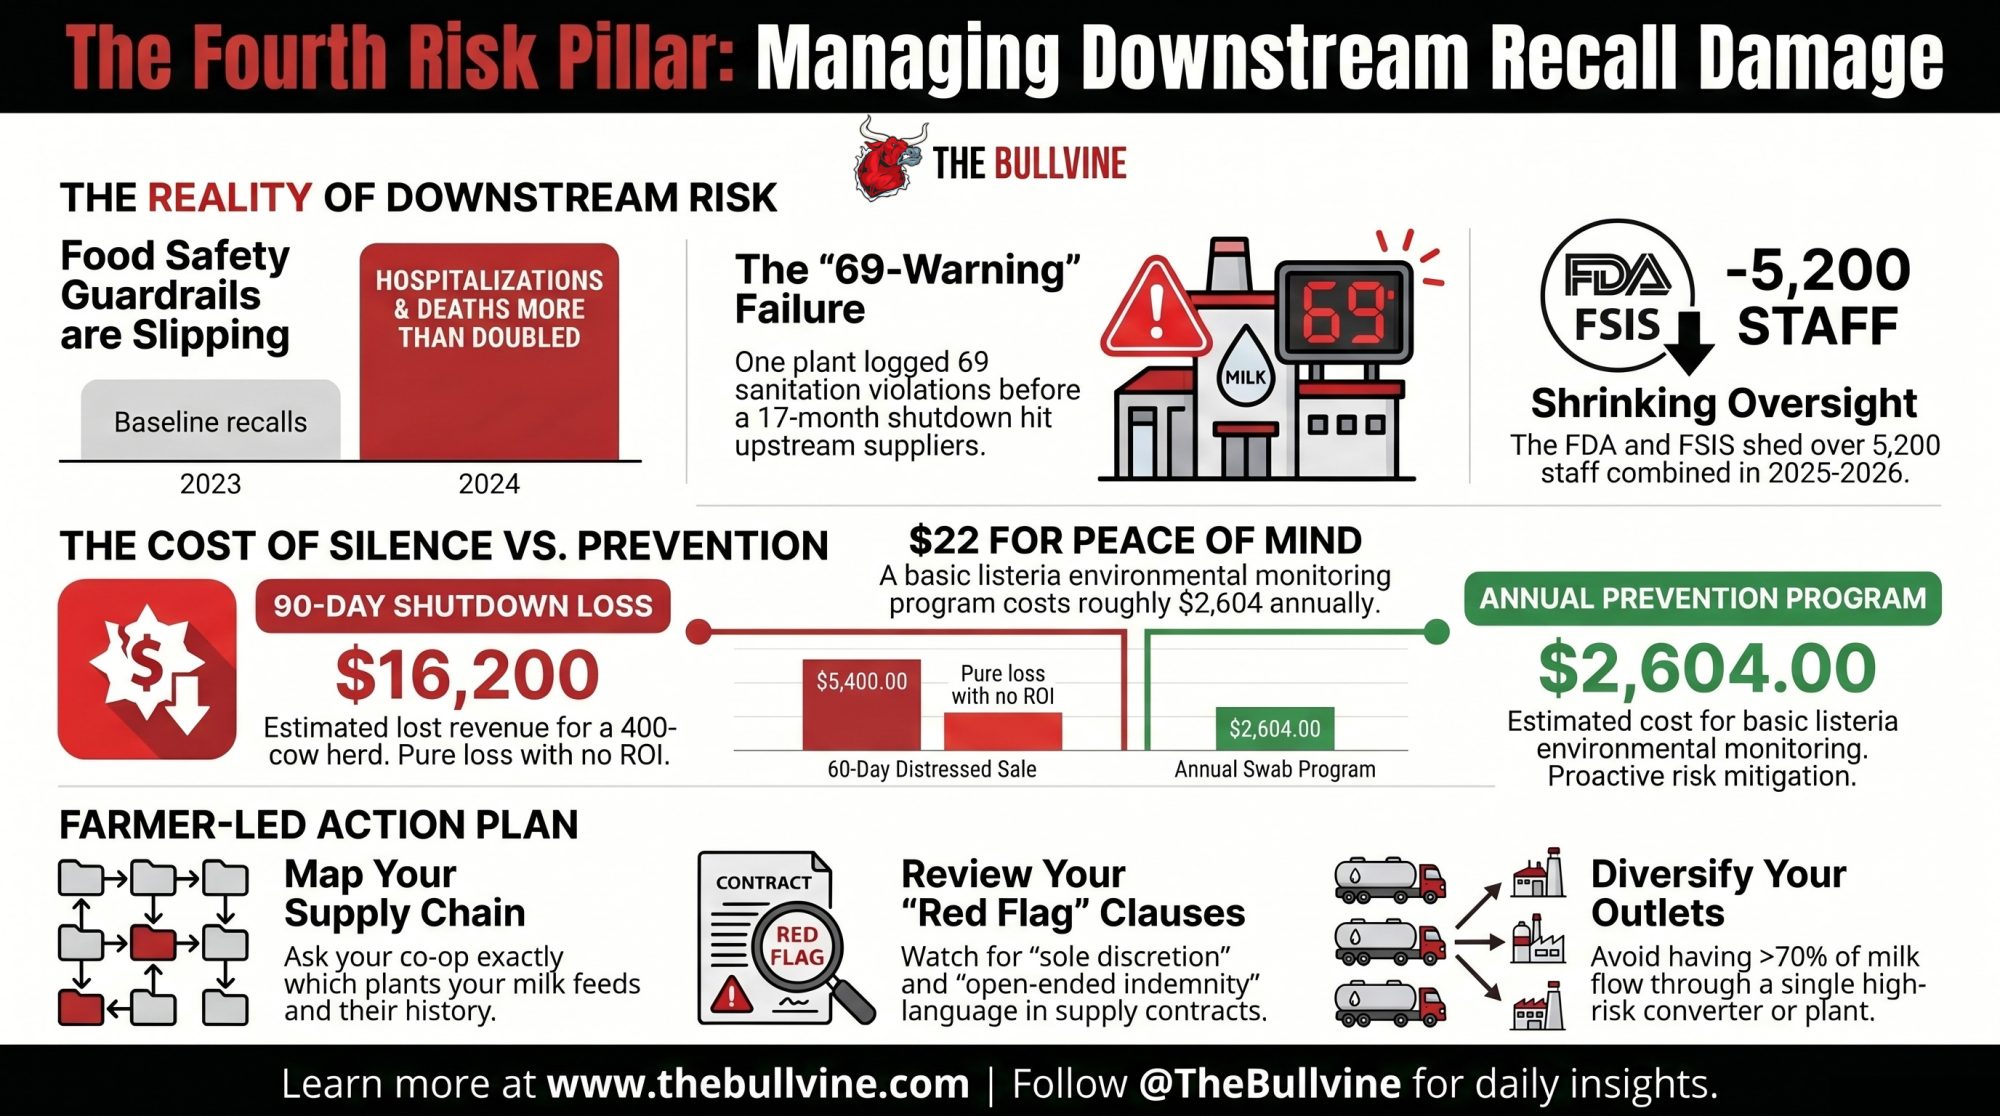
Executive Summary: Boar’s Head’s Jarratt, Virginia plant racked up 69 sanitation noncompliance records before a listeria outbreak killed 10 people, pulled more than 7 million pounds of product, and kept the facility dark for 17 months. That’s one plant in a broader shift: 2024 recall-linked hospitalizations hit 487 and deaths hit 19 — both more than double 2023 — while CDC’s FoodNet quietly de-emphasized listeria as a core target and FDA and FSIS shed over 5,200 staff combined. The dairy side is already in the blast radius — Rizo-López under permanent injunction, Prairie Farms supplemental shakes linked to 14 deaths, and Great Lakes Cheese yanking 1.5 million bags across 31 states on a Class II recall. On a 400-cow herd shipping 300 cwt/day, a 10% downstream intake cut at a $3/cwt discount for 60 days burns about $5,400; a 90-day shutdown scenario runs $16,200 — versus roughly $2,604/year for a basic listeria EMP built on $21.50–$21.86 swabs (Motzer, Trmčić et al., JDS 2025). HACCP self-policing, Talmadge-Aiken enforcement gaps, and co-ops that can’t audit their customers’ drains mean that risk isn’t staying where it was built. If more than 70% of your milk moves through one plant or converter, or your supply contract carries open-ended indemnity and “sole discretion” clauses, you’re carrying downstream plant risk as a fourth pillar next to feed, weather, and price — whether you’ve priced it or not. Read the full piece for the four levers you control, a contract-clause checklist, and the 30-day conversation to have with your co-op before the next recall runs your numbers for you.
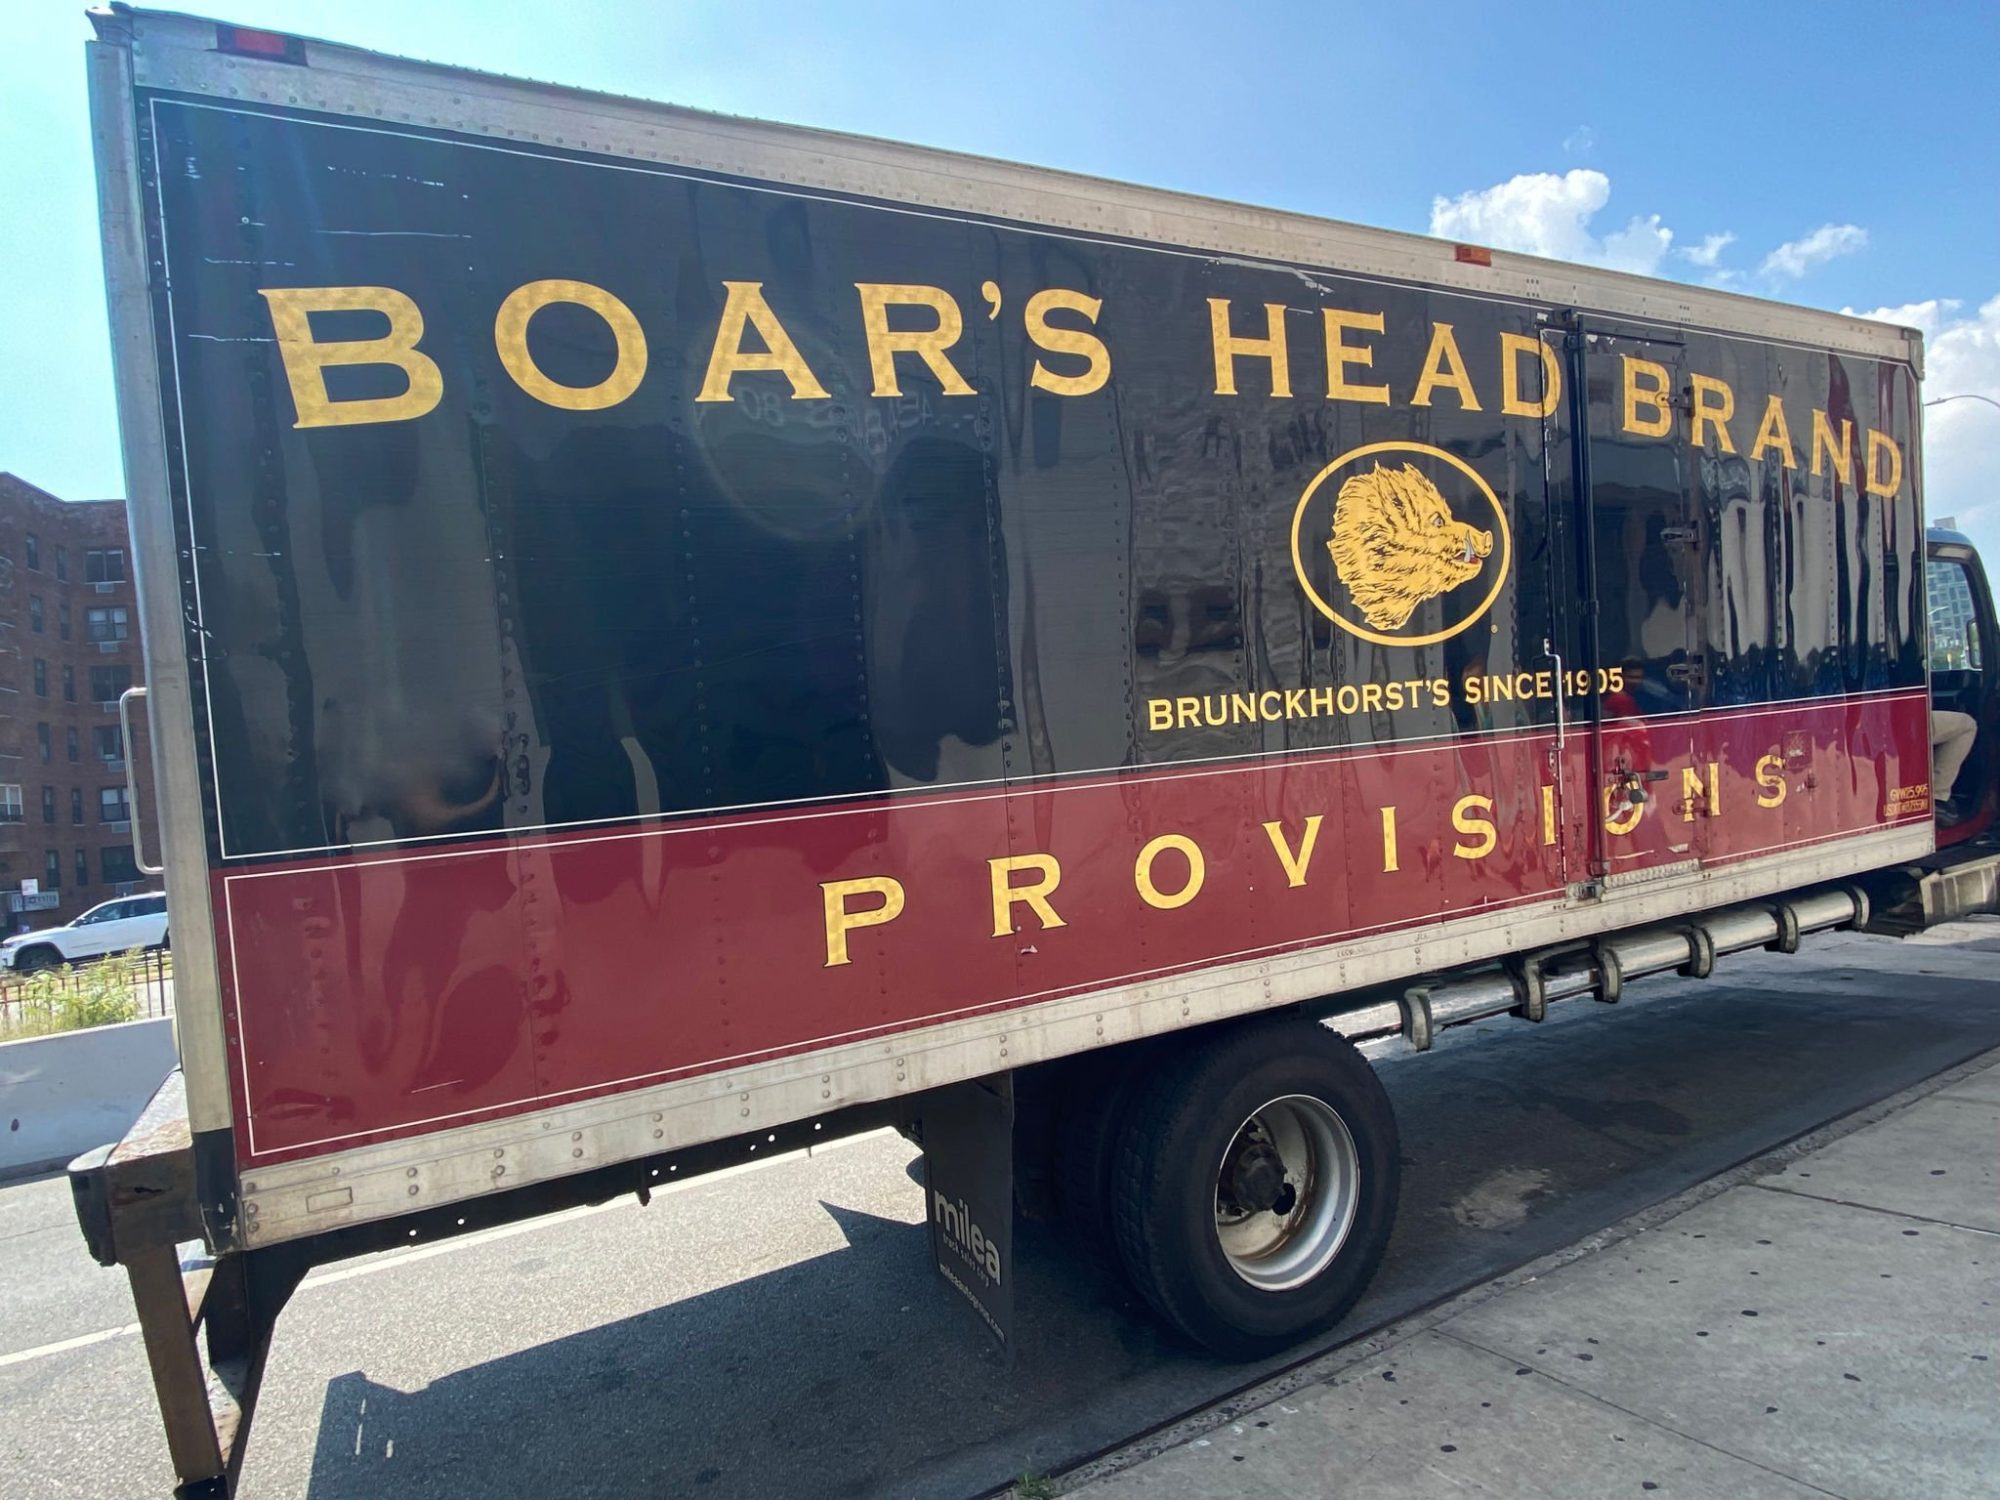
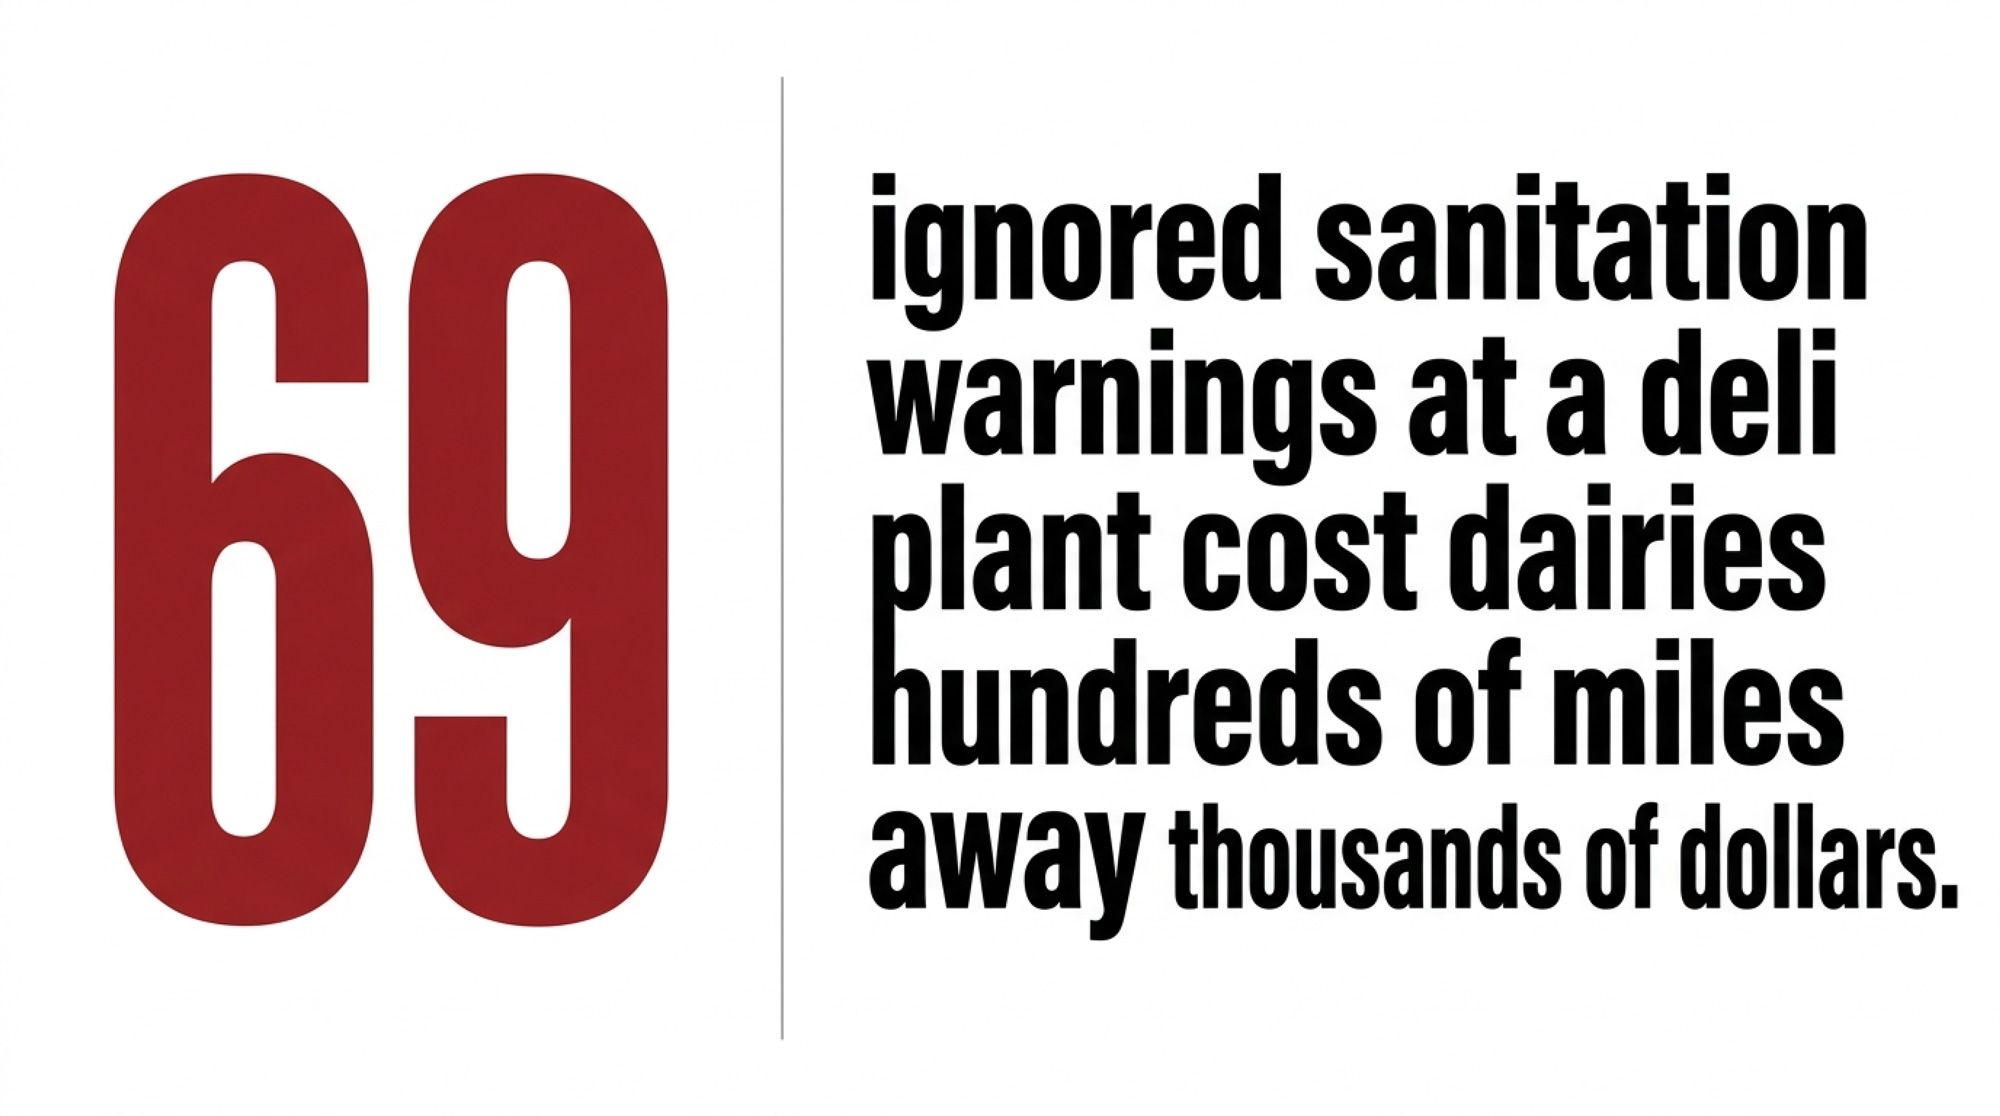
In the twelve months before listeria at Boar’s Head’s Jarratt, Virginia plant killed 10 people across nearly 20 states, inspectors walked that facility and wrote up 69 sanitation noncompliance records. Mold on walls. Insects. Condensation over food‑contact surfaces. Meat residue so caked on equipment the inspectors called it “heavy” and “discolored.” Every finding went in the file. The plant kept running.
By the time the recall dust settled, more than 7 million pounds of deli meat were off shelves. Jarratt shut down September 13, 2024. Boar’s Head didn’t resume operations until early February 2026 — about seventeen months later — after what the company called “comprehensive upgrades,” including adoption of USDA’s Alternative 2 Listeriacontrol program and the hiring of its first Chief Food Safety Officer, Natalie Dyenson, in May 2025.
Families who lost loved ones will never see those sanitation records the way you just did. And the dairies feeding milk into the same national retail chains and distribution networks absorbed a financial hit from a failure they didn’t create and never saw coming. This is the dairy recall risk story nobody put on your balance sheet — but it’s already there.
What’s Changing in Food Safety — and Why It Lands on You
On paper, food safety has never looked more organized: HACCP plans on every wall, third‑party audits, certificates for everything. On the ground, three guardrails are slipping at once.
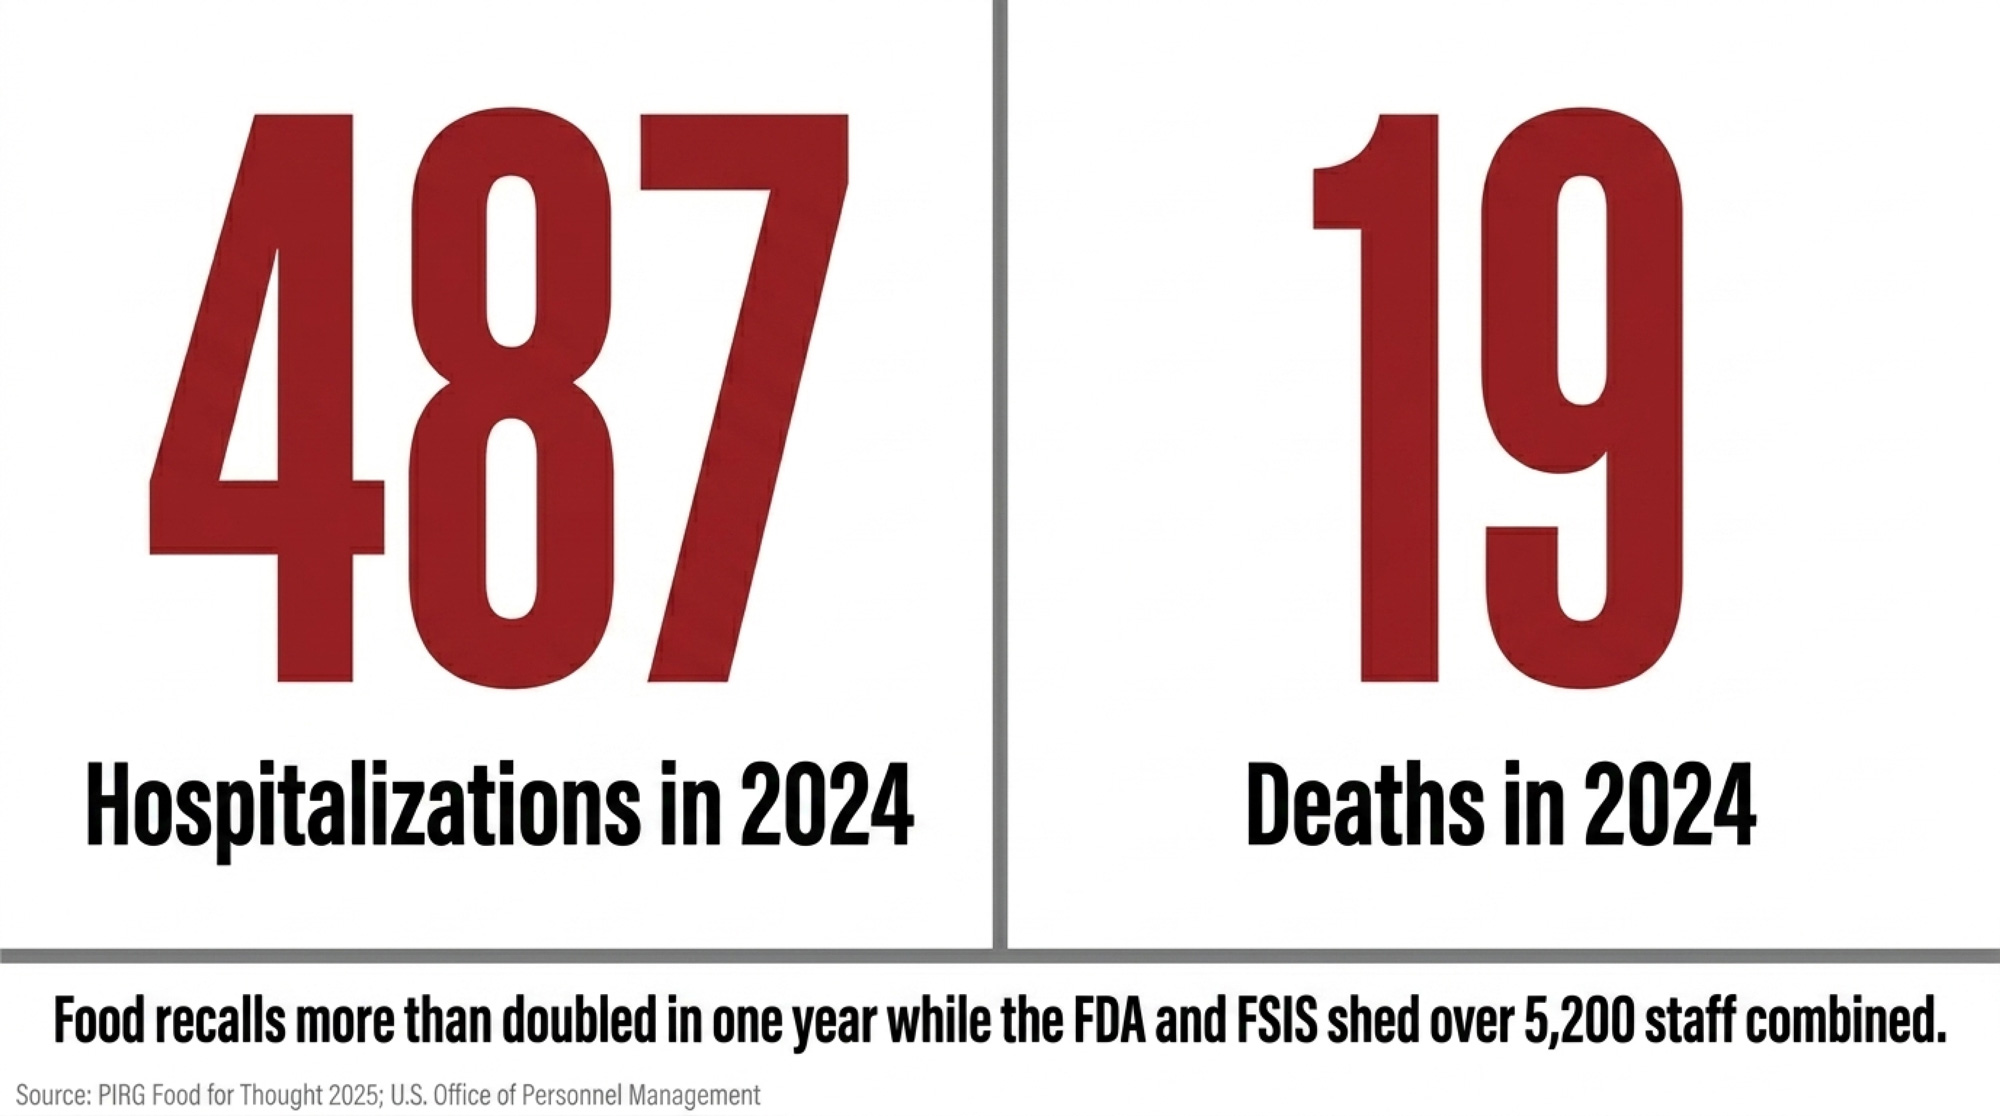
Recalls are getting more severe, not calmer. In 2024, contaminated food in the U.S. led to 487 hospitalizations and 19 deaths — more than double the 230 hospitalizations and 8 deaths tied to recalls the year before, according to PIRG’s Food for Thought 2025 analysis. Bacteria‑related recalls jumped about 41% year‑over‑year, with Listeria monocytogenes alone driving 65 recalls in 2024, up from 47 in 2023.
Before you write this off as a deli‑meat story, remember this: Listeria monocytogenes is the great equalizer. It doesn’t care whether the floor drain is in a ham plant in Virginia or a cheese plant in Wisconsin — it thrives in the same damp, cool environments found in deli processing and dairy bottling halls alike. Dairy‑adjacent products were right in the middle of it. Rizo‑López Foods of Modesto, California — a queso fresco and cotija manufacturer — has been linked to 2 deaths and 26 illnesses across multiple states, and now operates under a permanent injunction barring it from manufacturing until it complies with federal regulations.
A separate outbreak tied to frozen supplemental shakes served in medical and long‑term care facilities sickened 42 people across 21 states and killed 14, with illnesses traced back to products manufactured as far back as 2018. Those shakes were made by Prairie Farms Dairy at its Fort Wayne, Indiana facility under Lyons ReadyCare and Sysco Imperial brands. Read that date again. 2018.
The surveillance net that should catch these problems early is fraying. As of mid‑2025, CDC’s FoodNet narrowed its core annual performance targets to Salmonella and Shiga toxin‑producing E. coli, de‑emphasizing the six other pathogens — including Listeria — that used to sit in the same tier. Listeria is still reportable. But it’s no longer a central FoodNet performance benchmark, and the systematic dragnet that used to pull in listeria cases across 10 sites and flag small clusters is now weaker for exactly the bug driving many of the deadliest recalls.
The people doing the watching are stretched thinner. FDA lost 3,859 employees in 2025 and another 473 in early 2026, while FSIS shed 874 employees — roughly 8% of its workforce — in 2025, according to U.S. Office of Personnel Management data summarized by FoodNavigator‑USA. State and local health departments consistently cite limited staff and delayed lab results as major barriers to investigating suspected outbreaks. Fewer people chasing more signals means the subtle ones — low‑level clusters scattered across counties or months — are the first to get missed.
That’s where dairy recall risk management stops being an FDA problem and starts being yours. More recalls, more severe outcomes, less capacity to catch problems before they blow up. Not just a public‑health story. A milk‑cheque story.
How It Shows Up on a 400‑Cow Dairy
If you’re milking 400 cows, shipping clean milk, and passing every antibiotic and PI test, it’s tempting to look at Boar’s Head or Prairie Farms and think, “That’s their mess. We’re fine.”
But money doesn’t move that way.
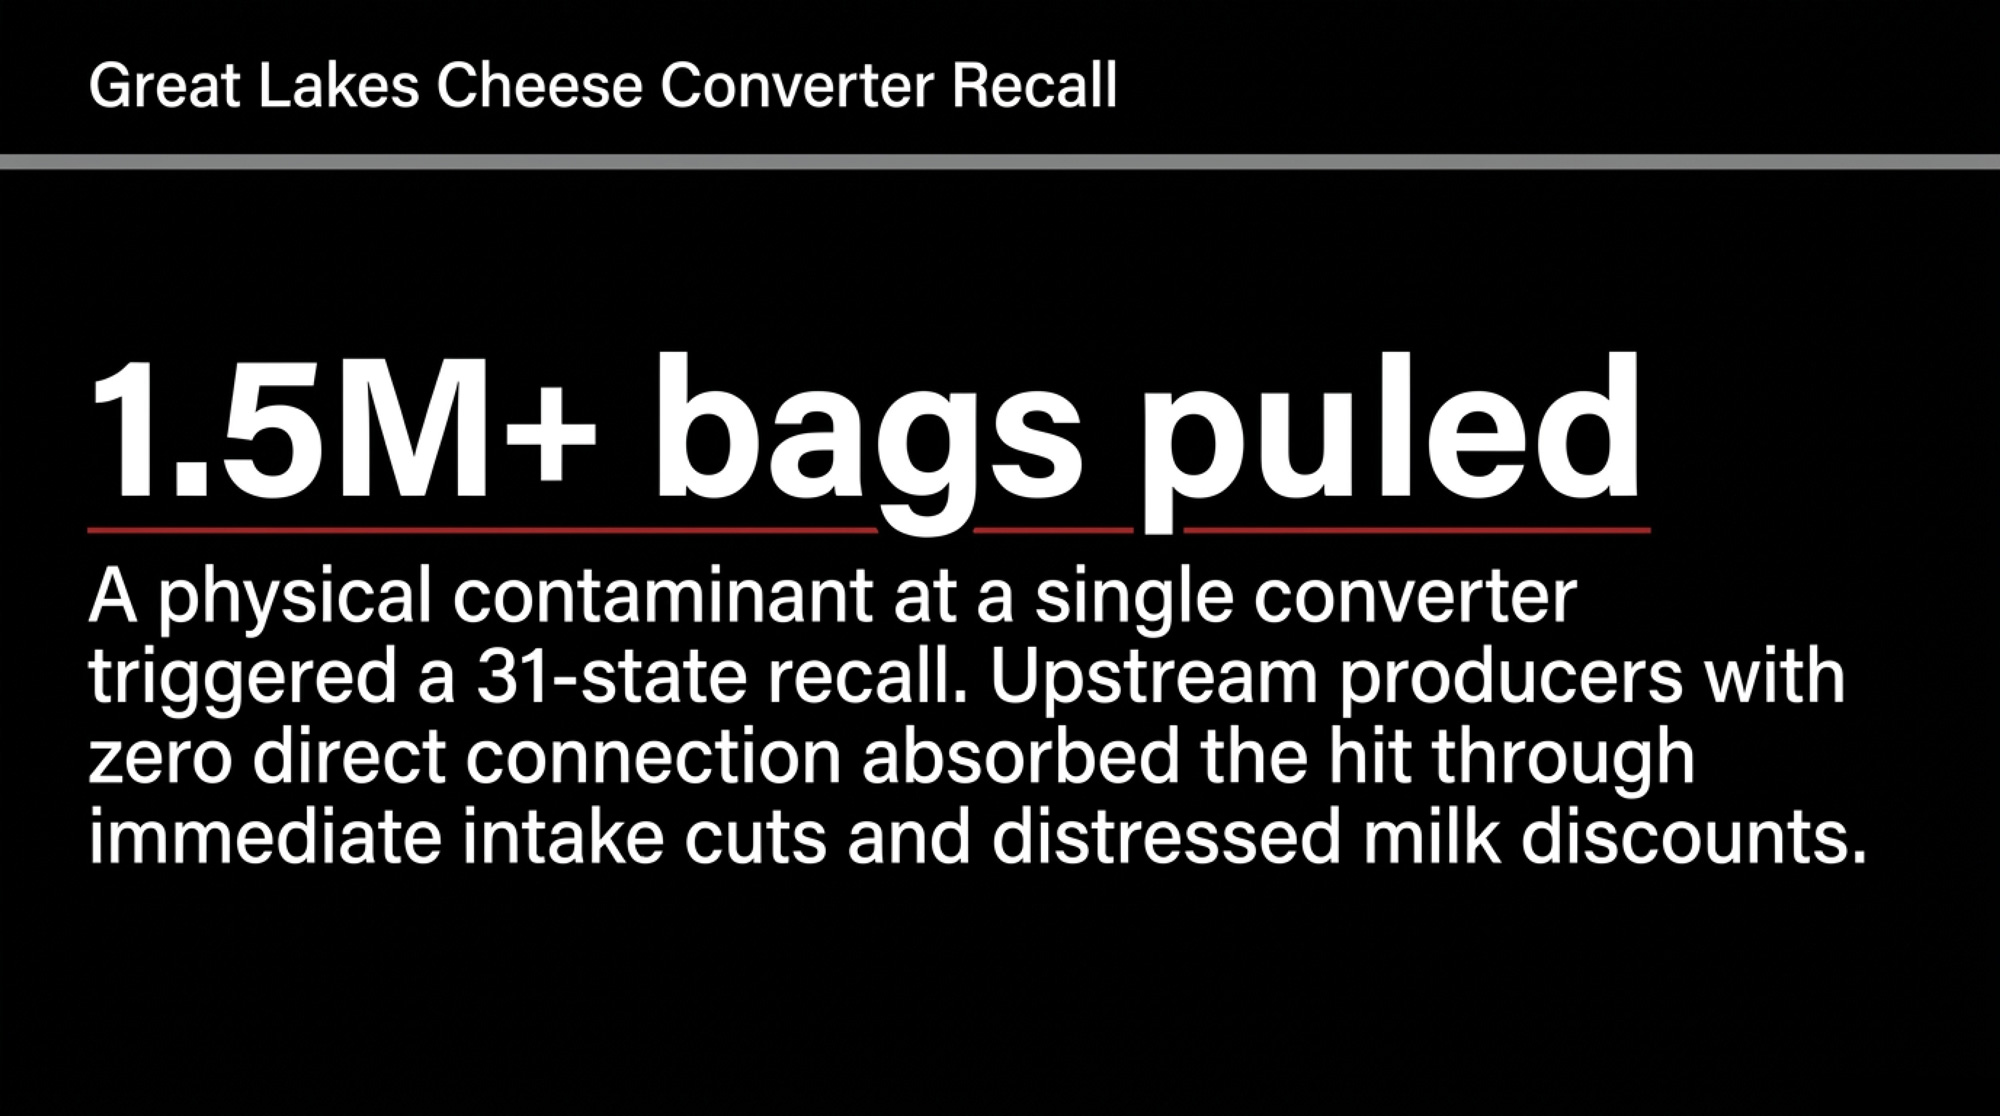
In early October 2025, Great Lakes Cheese initiated a voluntary recall of more than 250,000 cases of shredded and sliced cheese — over 1.5 million bags — sold across 31 states and Puerto Rico under store brands for Walmart, Target, Aldi, Costco, and others after possible metal fragments from a supplier’s raw materials were found in the product. On December 1, 2025, FDA categorized it as a Class II recall, meaning the cheese “may lead to temporary or medically reversible adverse health effects” and the probability of serious consequences is remote. No injuries were reported. Still a massive hit: product write‑offs, recall logistics, lost shelf space, and retailer trust on the line.
Here’s the part that matters for you. Great Lakes operates primarily as what the industry calls a “converter” — they buy 40‑pound commodity cheese blocks from various suppliers, then shred, slice, and package for retail. When a converter that size pulls back, the ripple moves upstream fast. As The Bullvine reported in December 2025, producers across the Upper Midwest who had no direct relationship with Great Lakes Cheese were already feeling effects — milk intake adjustments, price volatility, and the unsettling realization that something happening several steps down the supply chain was showing up on their bottom line.
Here’s what that looks like on paper. On a 400‑cow herd averaging 75 lb/day, you’re shipping roughly 300 cwt/day. That 75 lb/day figure is a planning midpoint — adjust up or down for your own rolling herd average. If a downstream recall forces your co‑op to dial you back 10% for 60 days and that 30 cwt/day has to clear into a distressed market at a $3/cwt discount, you’ve just eaten around $5,400 in lost revenue over two months. Nothing to do with your ration, your SCC, or your parlor routine. Something changed in someone else’s plant — the pain still moved upstream.
The Cost of Prevention vs. the Cost of a Recall
Metric
The “Distressed” Reality (60 Days)
The Prevention Strategy (Annual)
Activity
10% intake cut / distressed sale on a 400‑cow herd
120 environmental swabs + targeted repairs
Daily / Unit Cost
$90.00 / day
$21.70 / swab
Total Financial Hit
$5,400.00
$2,604.00
Business Impact
Pure loss (no ROI)
Risk mitigation / insurance
Illustrative planning numbers — substitute your own cwt/day and discount.
That’s the mild version — a physical contaminant that didn’t kill anyone. When listeria gets into the mix, like at Jarratt or in those supplemental shakes, the recalls are larger, the shutdowns measured in months instead of weeks, and the retailer reaction harsher. The bigger the shock, the more aggressively cost and risk get pushed back through processors, co‑ops, and finally onto you.
Why the System Fails Upstream Producers
So why does someone else’s listeria problem keep showing up in your pay statement instead of staying where it started? A lot of it comes down to how the rules are written — and what they actually reward.
HACCP is built to reward paperwork first, pathogen control second. Processors write their own hazard analyses and critical control points. Inspectors mostly verify those plans exist and the records are filled out. At Jarratt, USDA’s post‑outbreak review found thermometer calibration records in the plant’s HACCP files didn’t match what devices were actually reading on the floor. On paper, the system looked fine. In the coolers, listeria was quietly doing its job.
Many listeria controls live in sanitation SOPs and environmental monitoring programs rather than as “stop‑the‑line” CCPs that automatically shut down production when a threshold is crossed. If a plant treats listeria as a cleaning nuisance instead of a production‑stop issue, management can understaff cleaning, rush changeovers, and still pass audits because the documentation looks tidy. Jarratt’s reopening under the more stringent USDA Alternative 2 Listeriacontrol program — which adds post‑lethality treatments or increased testing — is itself an admission the plant’s earlier controls weren’t enough.
Talmadge‑Aiken agreements can document problems without forcing plants to stop. Jarratt wasn’t inspected by federal FSIS staff day‑to‑day. It fell under a Talmadge‑Aiken agreement where Virginia state inspectors operated under federal authority.
Layman’s definition: Under Talmadge‑Aiken agreements, state inspectors do the footwork, but they’re technically enforcing federal (USDA) standards. It’s a “partnership” that, as Jarratt proved, can sometimes leave accountability gaps — plenty of paperwork generated, not enough production‑stopping force.
Those inspectors wrote up 69 sanitation noncompliance records between August 2023 and August 2024. Each generated a corrective‑action entry. None triggered the kind of sustained production halt and teardown that might have cleared a persistent listeria problem before those deaths and hospitalizations. Only after the outbreak did USDA promise clearer expectations for oversight, tougher enforcement of federal food‑safety laws, and comprehensive federal training for Talmadge‑Aiken inspectors at that plant — exactly the things most producers assumed were already in place.
Your co‑op’s job is to move milk and chase price, not audit every converter’s drains. Most co‑ops don’t own the shredders, blenders, and co‑packers where a lot of recall risk actually sits. Their main levers when a customer has a problem are to redirect loads, renegotiate terms, or adjust member intake. They can’t walk into a customer’s plant, rewrite their HACCP plan, or force them to start paying for a real environmental monitoring program. The Great Lakes situation made that dynamic plain: farmers with zero connection to the recalled product still felt the disruption because their milk traveled through the same supply chain.
That’s how 69 ignored warnings at someone else’s plant, or a multi‑year listeria problem in someone else’s product line, quietly turns into intake cuts, lost premiums, and more volatile contracts for you.
What This Rising Dairy Recall Risk Really Means for Your Operation
In practical terms, the biggest food‑safety risk to your business might not be in your bulk tank or your milking routine. It might be the plant your milk flows into, the converter they sell to, and the brand that ends up on the package.
You already manage the risk inside your fence: mastitis, repro, feed costs, weather. You probably use DMC, DRP, or forward contracts to keep milk price swings from wrecking your cash flow. This is a fourth risk pillar sitting alongside those three: downstream plant and contract risk.
It’s uncomfortable because it lives outside your control. But that doesn’t mean you’re powerless. It means you can’t treat “regulation” as a safety net and assume if something were really dangerous, someone would shut it down. Jarratt ran for a year under 69 documented violations. Rizo‑López stayed in business until a permanent injunction followed multiple illnesses and deaths. The Prairie Farms supplemental shake outbreak ran from 2018 case onsets until the FDA closed its investigation in May 2025 with 42 illnesses and 14 deaths on the books.
The system will sometimes leave bad plants running much longer than you’d expect. So you start with the question most of us avoid: how exposed are you if your main plant goes dark?
How Much Could a 90‑Day Plant Shutdown Really Cost You?
Forget Boar’s Head for a second. Picture your own milk truck.
If your primary processor shut down for 90 days — listeria, metal fragments, equipment failure, enforcement action, whatever — what actually happens to your milk? Do you know which plants are your first and second outlets? Could your co‑op redirect your volume within a week? Would you be on full quota, reduced, or dumping? Have you asked?
Take that same 400‑cow herd shipping about 300 cwt/day. If 20% of your volume — 60 cwt/day — suddenly has to move into lower‑value channels at a $3/cwt discount for three months, the math looks like this:
60 cwt/day × $3/cwt = $180/day
$180/day × 90 days = $16,200
Plug your own cwt/day and discount to see where you land. You can argue about whether $3/cwt is the right number for your market. You might think your co‑op could shift you into something better. That’s exactly the point. For a lot of farms, those are guesses — not numbers.
As The Bullvine reported in December 2025, the herds that rode the Great Lakes disruption best weren’t necessarily the biggest or fanciest. They were the ones who’d already mapped their supply chain. They already knew:
Where their milk actually goes
What backup outlet exists if a plant shuts
How long they can ride a disruption before it forces ugly decisions
Everyone else found out mid‑crisis.
Is a $22 Swab Test Really Worth More Than Your Premium Channel?
If you do any on‑farm processing — fresh cheese, bottled milk, ice cream, even a modest cream line — the math on basic listeria environmental monitoring isn’t that scary.
A 2025 Journal of Dairy Science study by Motzer, Trmčić, and colleagues looked at nine small‑ and medium‑sized dairy processors and found total annual environmental monitoring program (EMP) costs ranged from $1,187 to $55,531per plant, depending on size and intensity. The sponge swab and lab fee together ran about $21.50–$21.86 per sample.
Take 10 targeted swabs a month — drains, floor‑wall junctions, under equipment where it’s always damp — and that’s 120 swabs a year. At roughly $21.70 each, you’re in the ballpark of $2,604 a year. That’s not nothing. But stack it against the $5,400 intake‑cut hit from the earlier two‑month example, and the EMP starts looking less like a line item and more like the cheapest insurance policy you’ll buy all year.
Even if you’re only shipping raw milk, the environmental hygiene logic still applies. Listeria monocytogenes loves cold, wet, nutrient‑rich environments. It forms biofilms on stainless steel and in drains that survive standard sanitizers. Research has shown 10‑day‑old listeria biofilms on stainless steel can resist both quaternary ammonium and chlorine — the same products most parlors and plants rely on every day.
You probably don’t need a full lab in your milk house. But you can:
Fix cracked concrete and low spots where water pools.
Get rid of dead‑leg piping and places where milk or wash water sits.
Keep drains in bulk tank rooms and load‑out areas surgically clean.
Run a few indicator swabs a year through your vet or local lab as a sanity check that your own environment isn’t part of the problem.
Options and Trade‑Offs for Farmers
You don’t get to rewrite HACCP rules or hire back CDC epidemiologists. You do get to decide how much of this downstream risk you carry blind.
Here are four levers you control.
1. Ask where your milk really goes — and do it in the next 30 days.
Within the next month, sit down with your co‑op or buyer and ask three blunt questions:
Which specific plants does my milk typically go to?
What products do those plants make — fluid, commodity powder, shredded cheese, RTE meals, infant formula?
Have those plants or their major customers been involved in recalls or enforcement actions in the last five years?
If the answers are detailed and transparent, that tells you something. If they’re vague or “we don’t really track that,” that tells you something else. As The Bullvine reported in December 2025, the Upper Midwest producers who’d already mapped their supply chain had more room to react than those caught off guard by the Great Lakes ripple.
When it makes sense: Always — this is the lowest‑cost move you can make.
What it requires: A phone call and a willingness to listen.
Risks/limits: You might learn you’re more concentrated than you thought. That’s uncomfortable, but ignorance doesn’t make the risk go away.
2. Don’t put all your volume into one high‑blast‑radius channel.
If 80–100% of your milk is tied to one plant — or flows through a single converter like Great Lakes that feeds dozens of retail brands across 31 states — you’re more exposed than a neighbour whose milk is split across fluid, cheese, and powder.
You might still choose the higher‑risk, higher‑premium outlet. Just treat it like you treat forward contracting: consciously, with eyes open.
When it makes sense: When you have any say in program enrolment or buyer mix.
What it requires: Understanding where your milk ends up and being willing to say “no” to all‑in deals that pay a bit more but concentrate your risk.
Risks/limits: Diversifying outlets can mean giving up some premium today for more resilience tomorrow. Only your balance sheet can answer if that trade works.
3. Read your contracts like they were written for the day after a recall.
If you’re in any kind of direct‑supply or specialty program, pull out your milk supply agreement and look for three phrases:
“Indemnify and hold harmless” — especially if it covers “any contamination‑related loss,” not just issues you directly control.
“Sole discretion to adjust volume or price” — particularly for vague triggers like “market disruption” or “customer quality concerns.”
Fuzzy definitions of “non‑compliance” that could include someone else’s ingredient failure or a downstream recall.
Those phrases don’t automatically make a contract bad. But they do shift more risk onto you when something goes wrong down the line.
When it makes sense: Any time a contract is renewed or a new premium program is pitched.
What it requires: A careful read, maybe a conversation with your lender, accountant, or a lawyer who’s seen these clauses before.
Risks/limits: Pushing back may cost you a premium or a buyer. Accepting them without understanding may cost you much more later.
4. Match your own risk controls to your exposure over the next year.
If you run a farmstead creamery or sell direct, a basic listeria EMP — 5–10 swabs a month in the highest‑risk spots — is reasonable at about $2,604 a year. If you only ship raw milk, focus on environmental fixes: eliminate standing water, repair broken surfaces, and make sure the path from bulk tank to tanker is as close to biofilm‑free as you can make it.
Think of this as sliding a dial. The more your milk ends up in high‑risk, high‑value products, the more it makes sense to spend a little to make sure your own environment isn’t the weak link. Boar’s Head just spent seventeen months and serious capital retrofitting Jarratt with the kind of environmental monitoring they should have had all along. A basic version of that same principle costs you $2,604.
When it makes sense: Over the next 12 months, especially if you’re adding processing or targeting premium RTE channels.
What it requires: Some cash, time, and honesty about “gross spots” you’ve been ignoring.
Risks/limits: You might find something you have to fix. That’s the whole point.
Key Takeaways
If more than about 70% of your milk flows through a single plant or converter, treat that as a red‑line concentration level and run the 90‑day shutdown math on your own numbers before the next recall runs it for you.
If your co‑op or buyer can’t clearly tell you which plants your milk feeds and what their recall history looks like, assume nobody is actively managing that risk on your behalf — and start asking tougher questions this month.
If your supply contract includes open‑ended indemnity language and “sole discretion” volume or price cuts after “market disruptions,” flag it for review before you count on that premium holding.
If a 10–20% intake cut at a $3/cwt discount for 60–90 days would put you in a cash‑flow bind, compare that number to a $2,604 EMP or some concrete and drain repairs — and decide which one is really “too expensive.”
If your milk ends up in RTE products, fresh cheeses, or supplemental shakes, treat environmental testing around the bulk tank room as part of the cost of being in that market, not an optional extra.
The uncomfortable truth is this: you can run a tight herd, ship clean milk every day, and still get sideswiped because a plant you’ve never walked through treated listeria like a paperwork problem instead of a reason to stop the line.
Complete references and supporting documentation are available upon request by contacting the editorial team at editor@thebullvine.com.
Learn More
Heat Kills Bird Flu: Are You Doing Enough to Protect Your Dairy Operation? — Adopt specific heat treatment parameters and biosecurity protocols revealed by Cornell research to neutralize H5N1 risks. Arms your operation with precise temperature/time targets that protect workers, calves, and bulk tank integrity during active outbreaks.
The Digital Dairy Revolution: How IoT and Analytics Are Transforming Farms in 2025 — Secure your bulk tank integrity using in-line sensors that detect quality shifts before they impact your cheque. Demonstrates how new sensor platforms turn passive monitoring into proactive mitigation, shielding your eligibility for high-value premium markets.
The Sunday Read Dairy Professionals Don’t Skip.
Every week, thousands of producers, breeders, and industry insiders open Bullvine Weekly for genetics insights, market shifts, and profit strategies they won’t find anywhere else. One email. Five minutes. Smarter decisions all week.
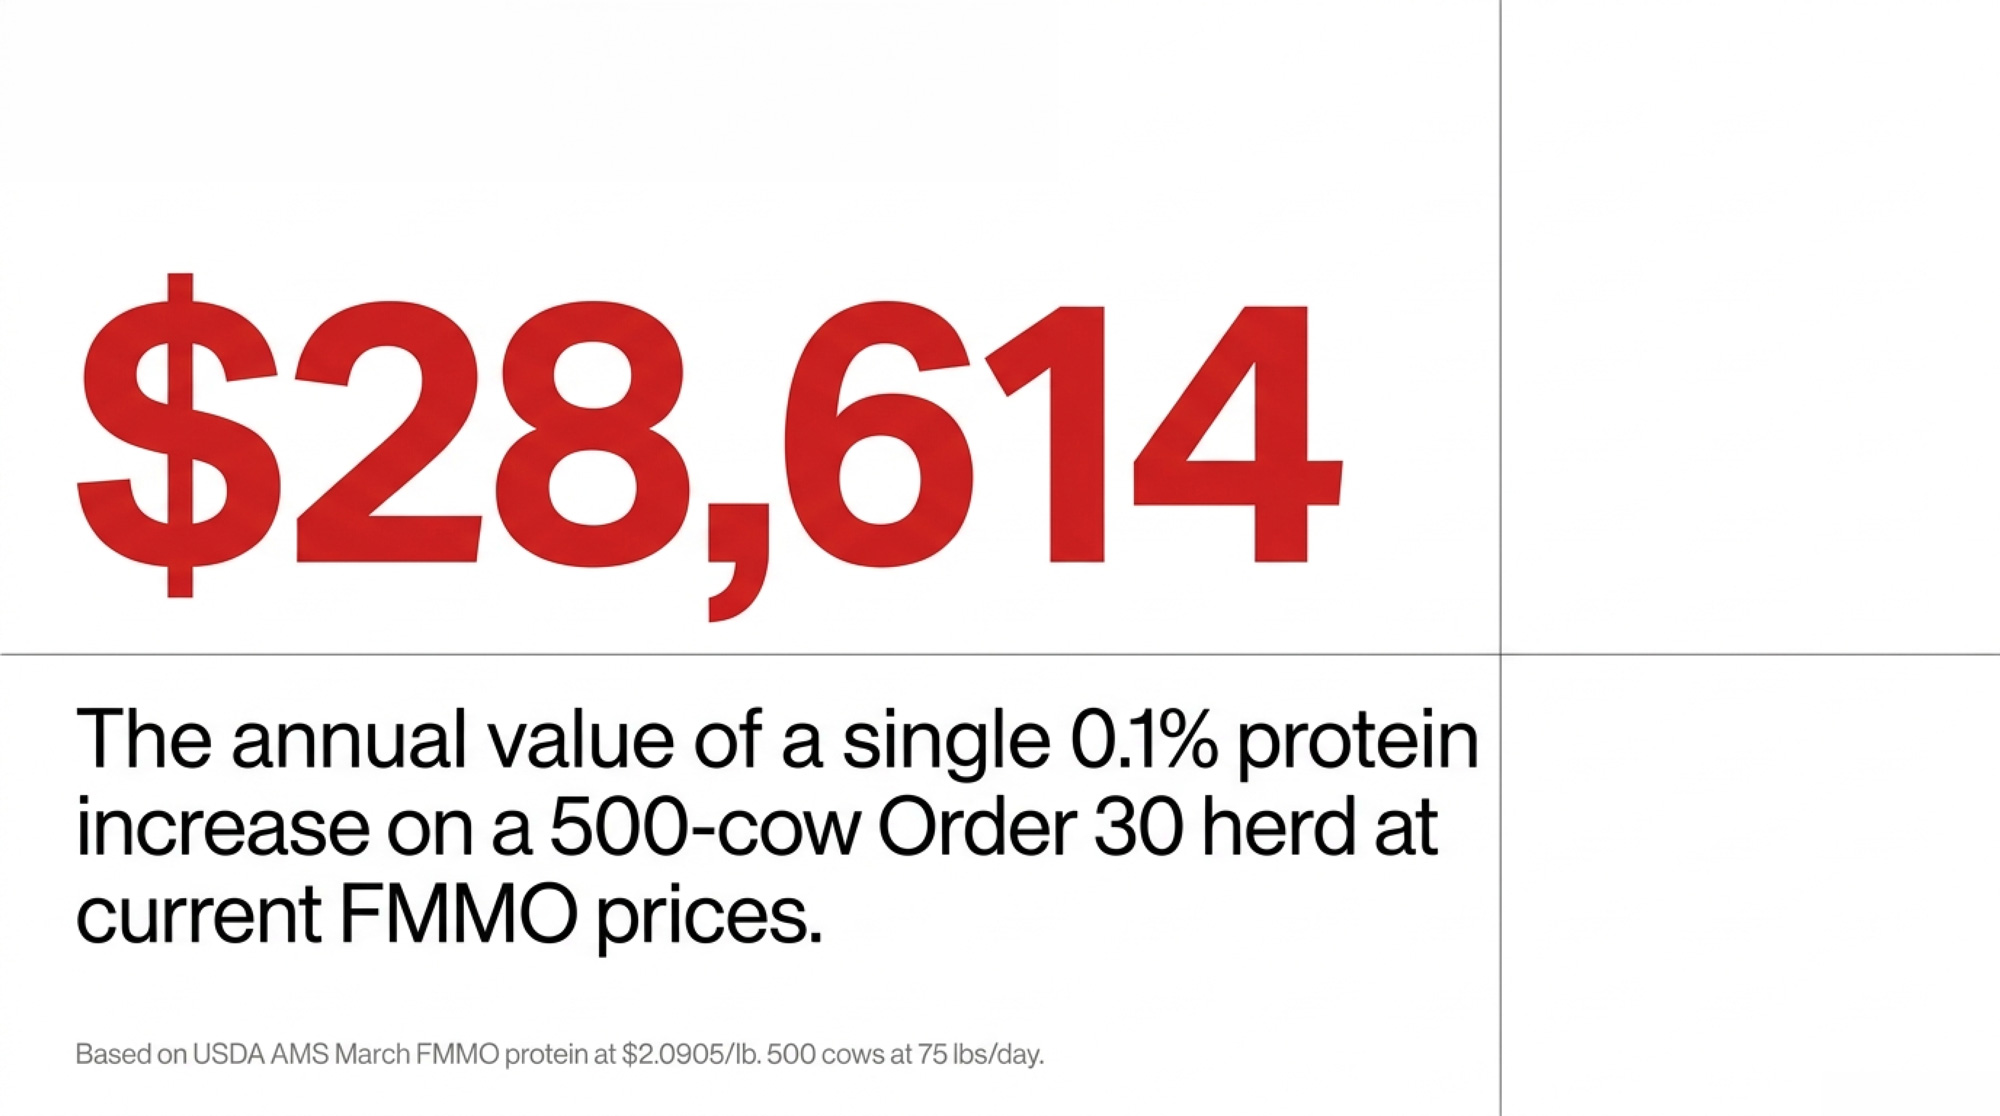
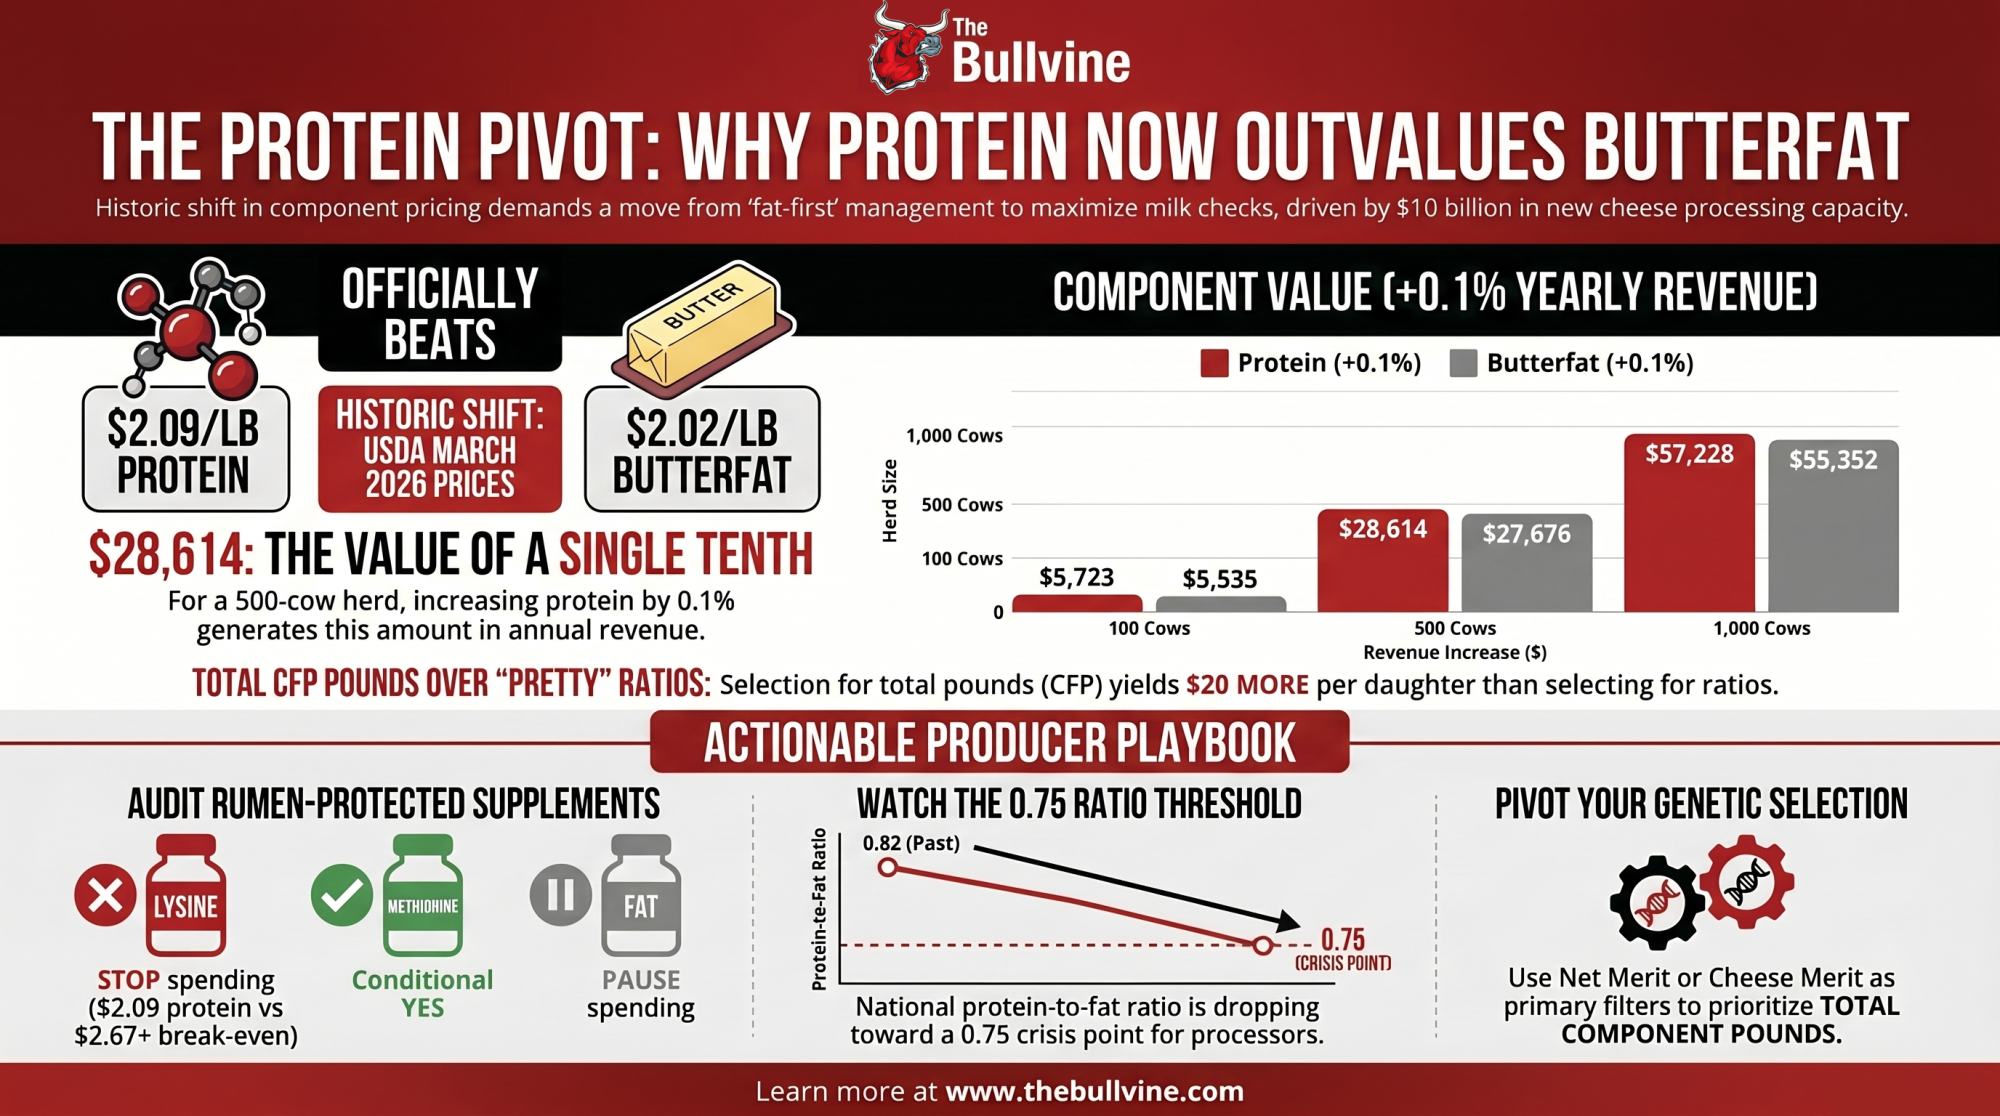
USDA set March protein at $2.0905/lb against butterfat at $2.0220. On a 500-cow Order 30 herd at 75 lbs/day, that tenth is worth $28,614 a year — $938 more than fat. First sustained flip in a decade.
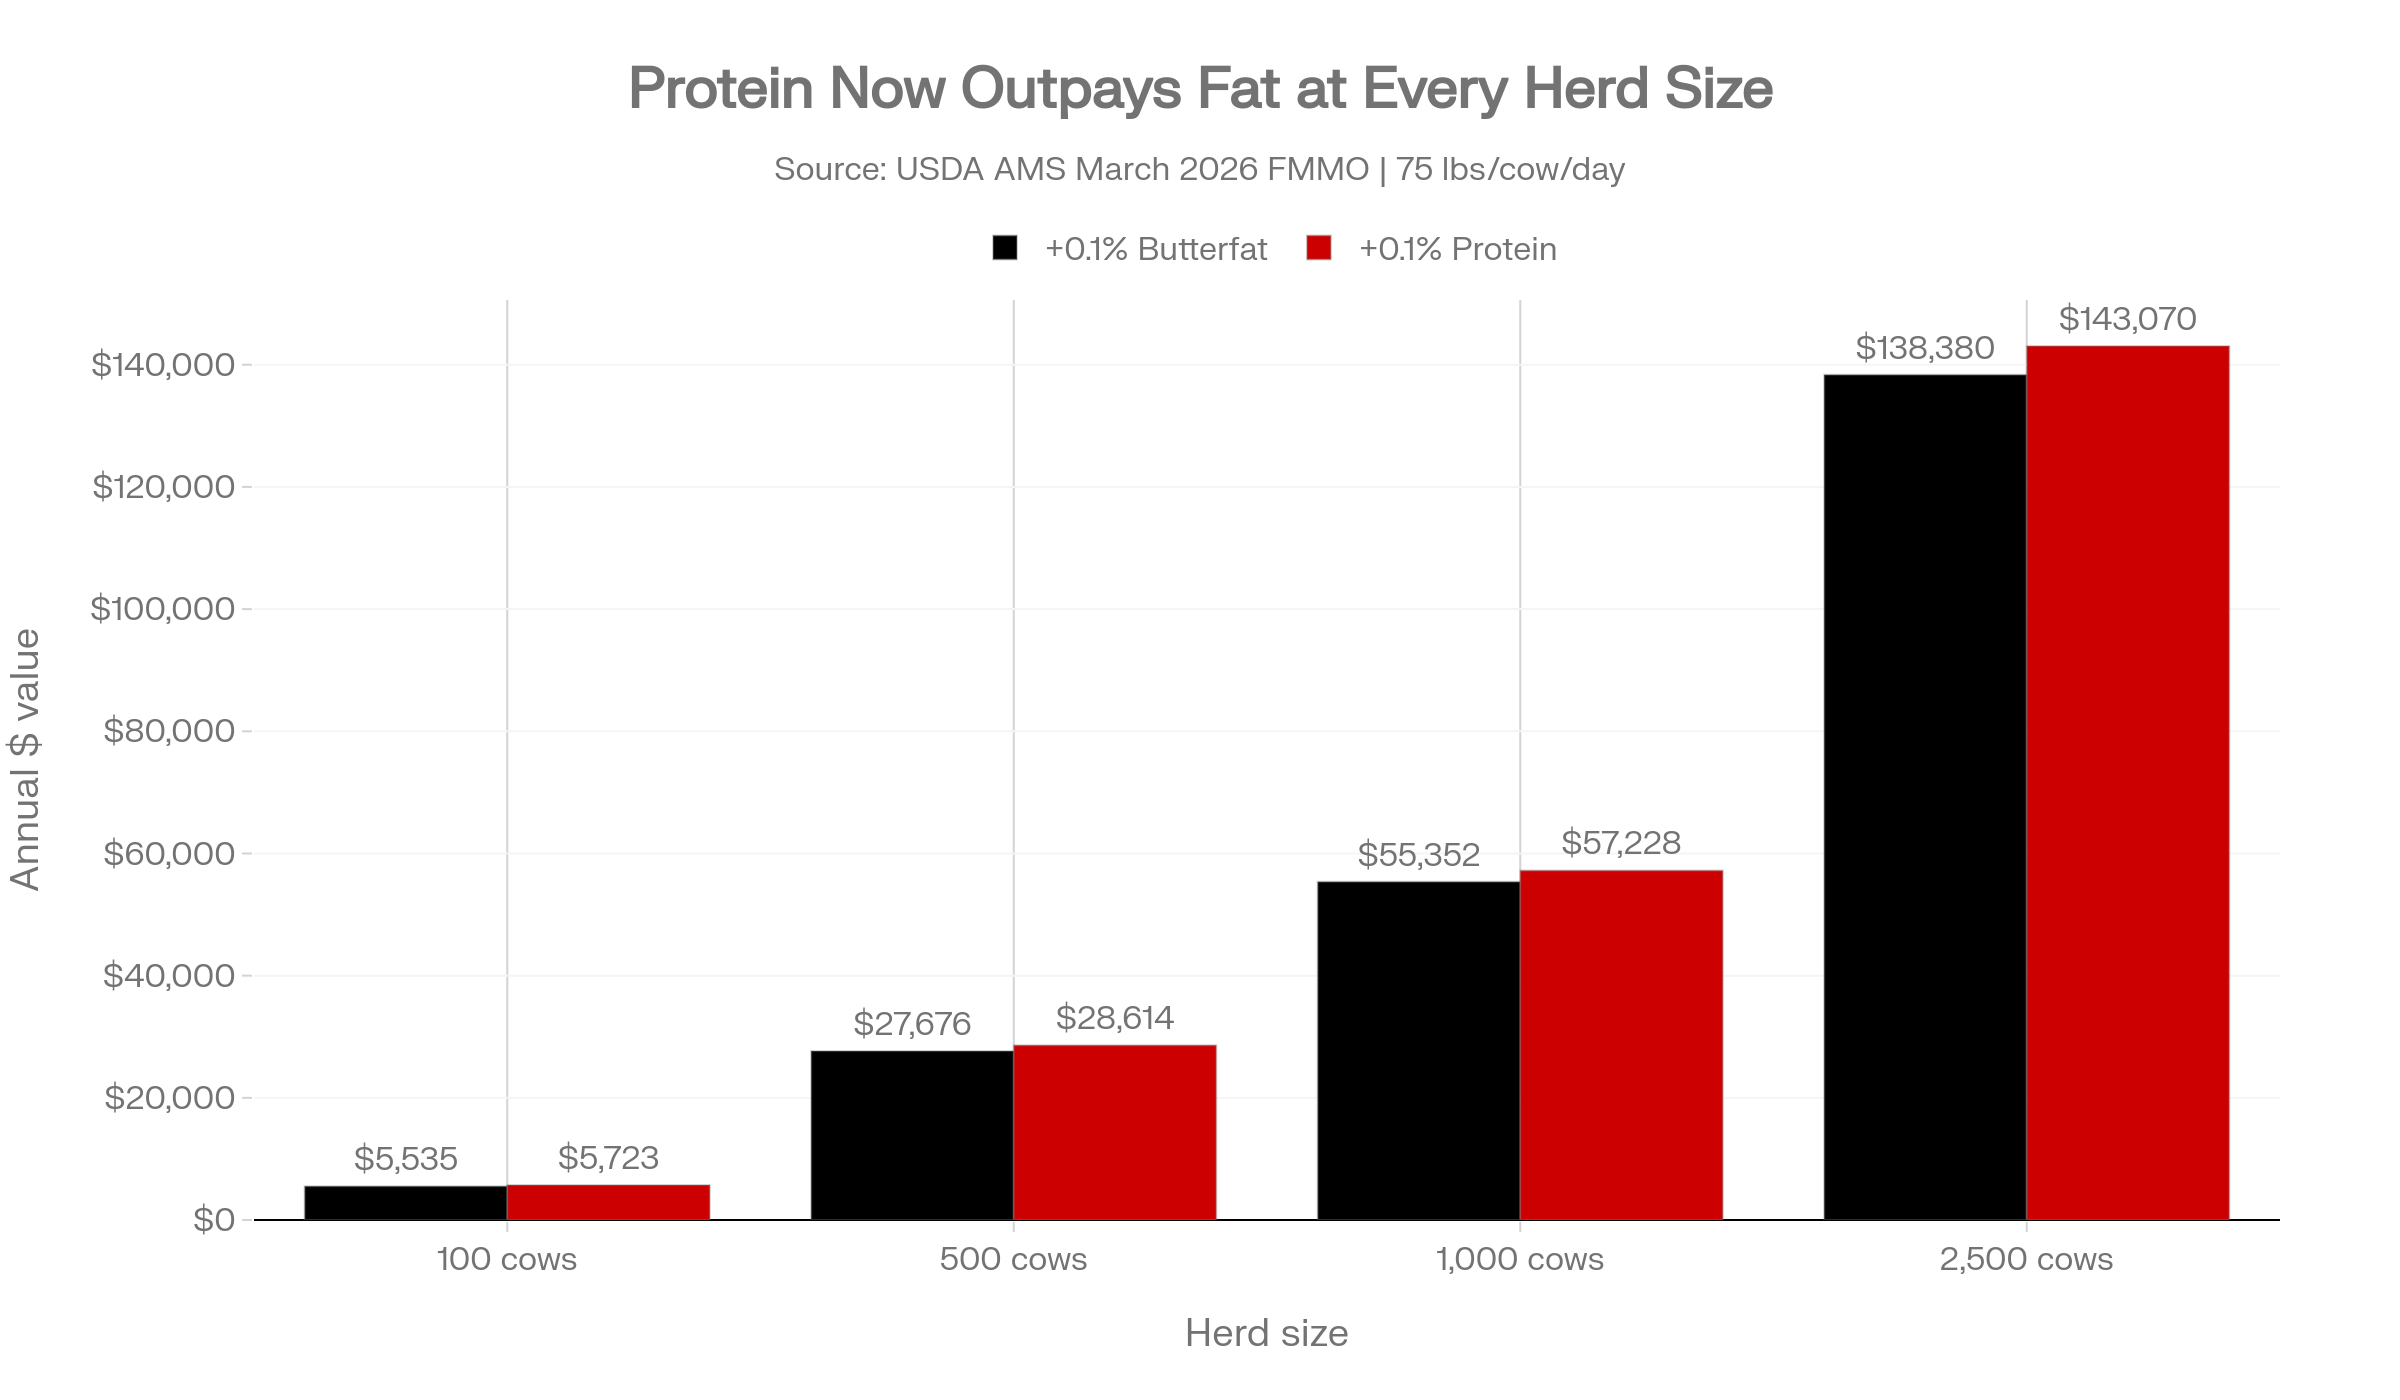
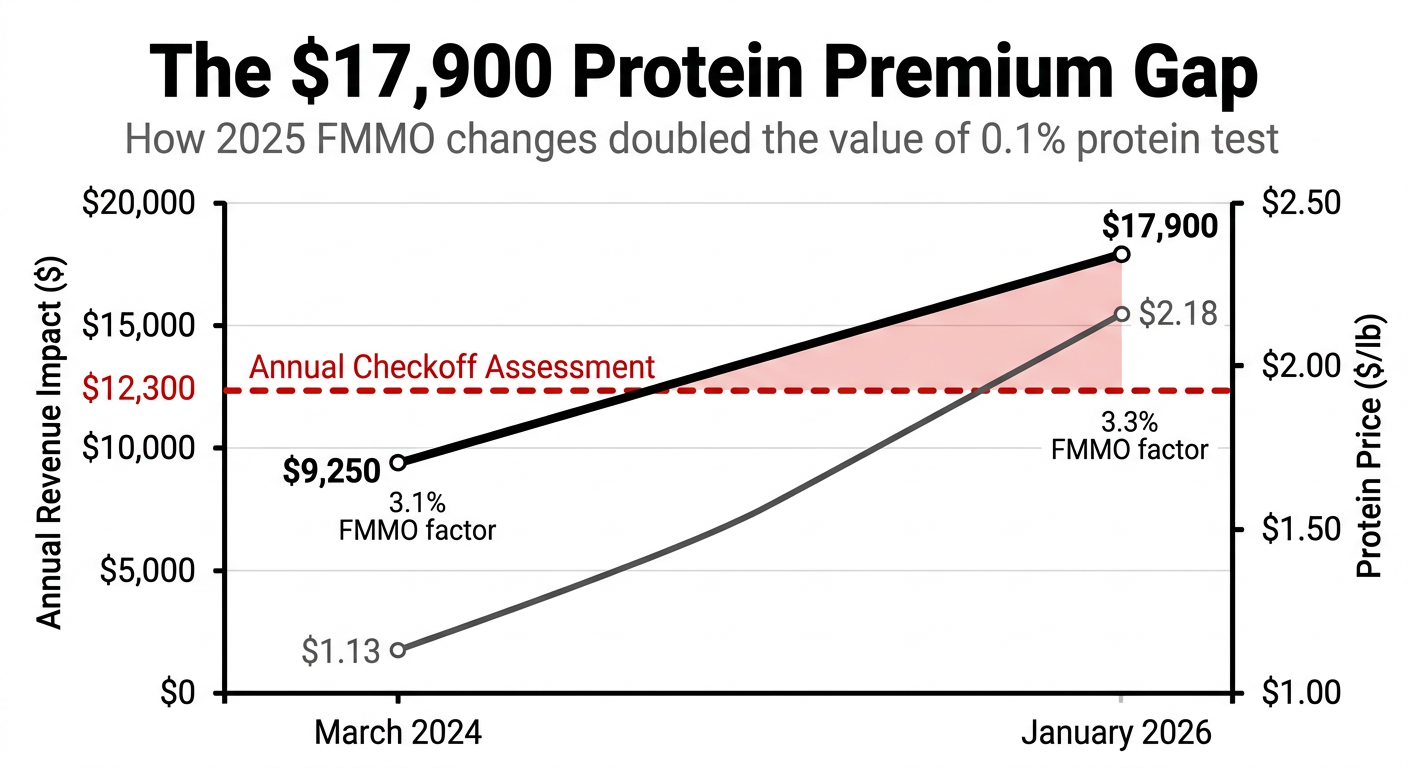
At the March 2026 Federal Milk Marketing Order announcement, USDA AMS set the protein price at $2.0905/lbagainst butterfat at $2.0220/lb — the first sustained stretch in a major cycle where a pound of milk protein outvalues a pound of milk fat. For a 500-cow Wisconsin or Minnesota shipper into Order 30 moving 75 lbs/cow/day, a single tenth-of-a-percent gap in protein now runs $28,614 a year; fat lands close behind at $27,676.
That’s the stake for a mid-size Upper Midwest herd still calibrated to the old fat-premium world. The trap: a decade of fat-first genetics, fat-first rations, and fat-first contracts running headlong into roughly $10 billion in new cheese capacity that needs protein and doesn’t much care about the butter side anymore.
Dairy component economics 2026 isn’t a theme. It’s the math on your next milk check.
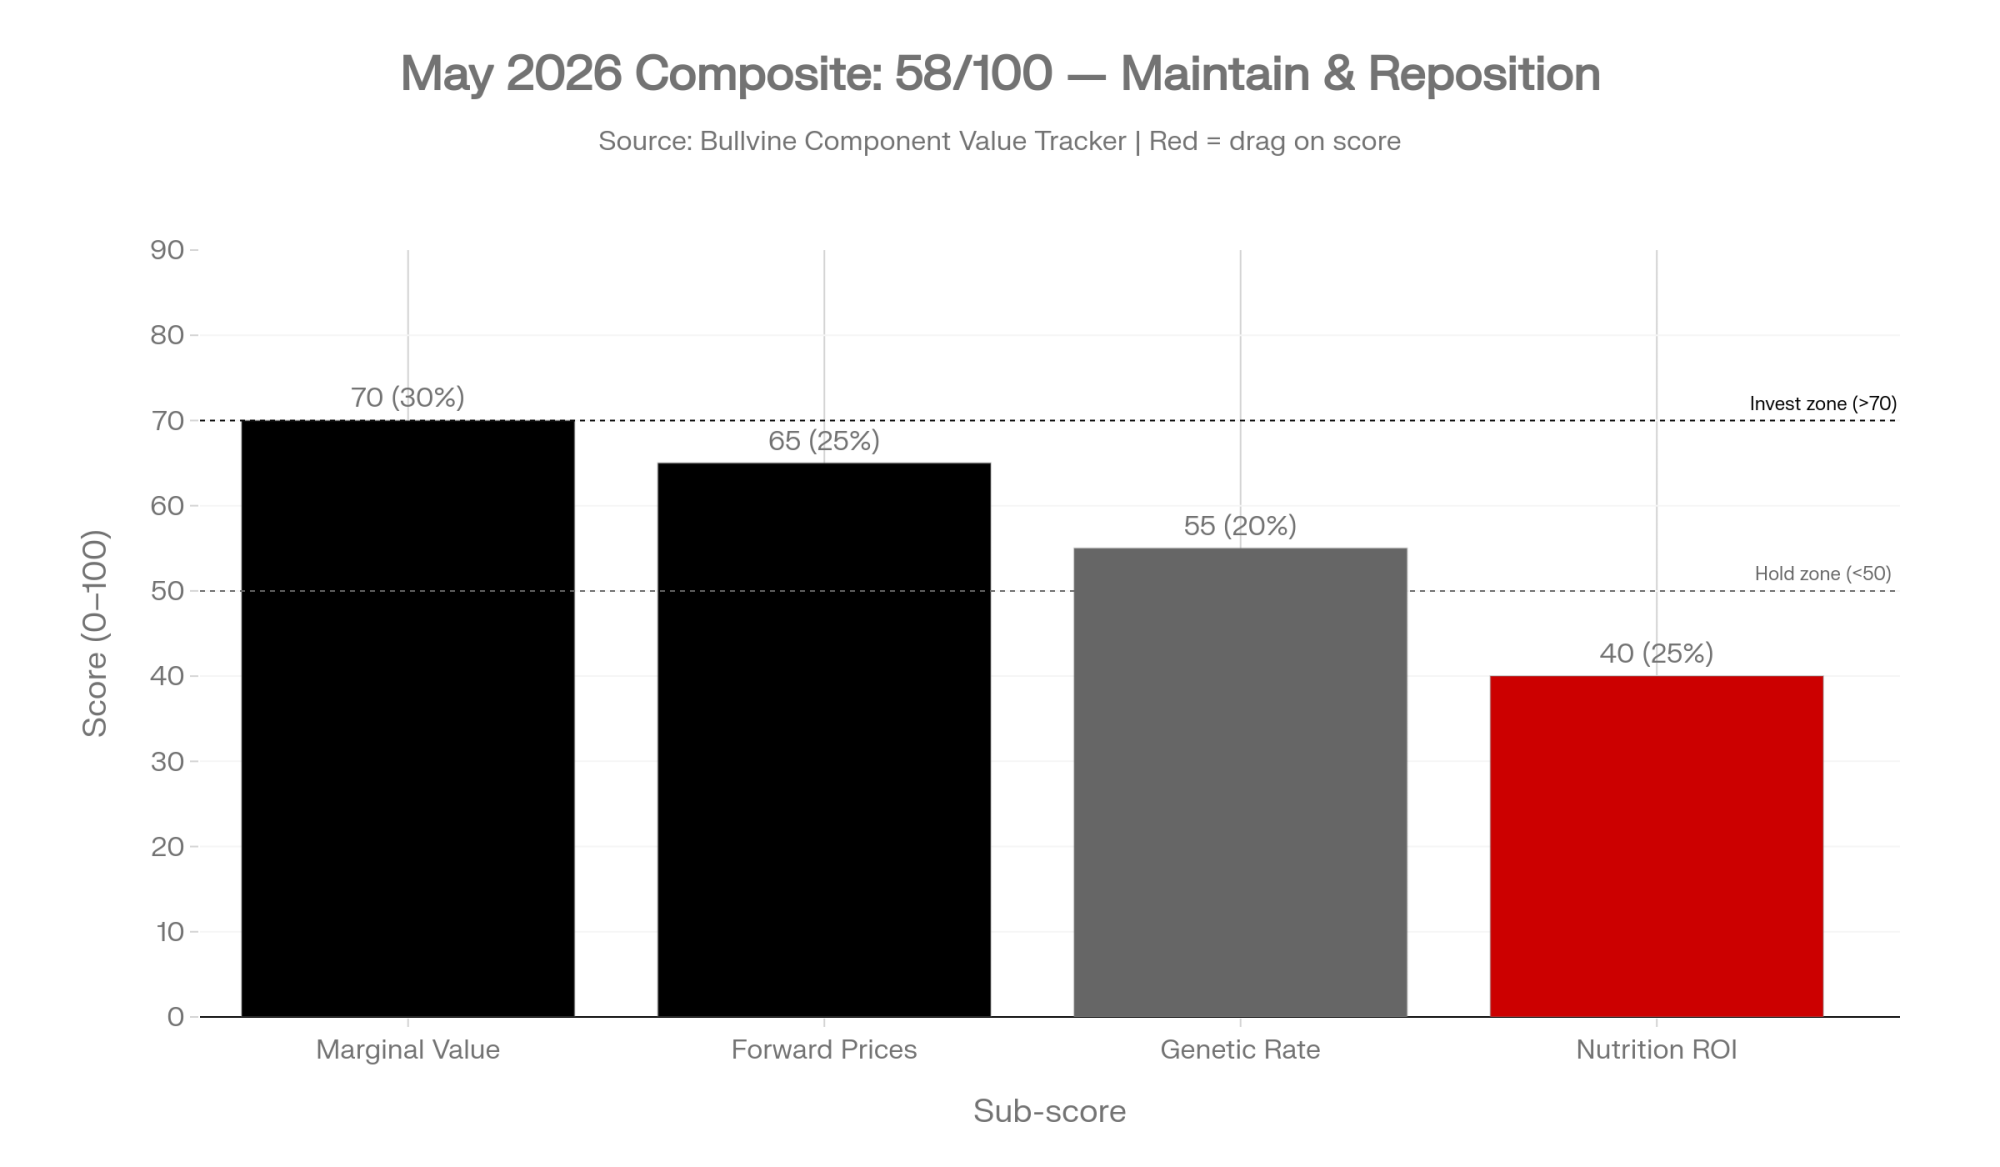
This is Issue #1 of The Bullvine Component Value Tracker — a monthly read translating the FMMO announcement into herd-specific dollar decisions, ranking nutrition break-evens against current prices, and scoring where the month’s highest-return component moves actually sit. May 2026 baseline: 58/100 — Maintain and Reposition Toward Protein.
The Signal the Market Already Sent
For eight of the ten years leading into 2025, butterfat paid more per pound than protein. Producers answered the signal. Genetics companies bred for fat. Nutritionists optimized rations for butterfat response. It worked — arguably too well.
U.S. butterfat climbed 0.58 points between 2015 and 2025, from 3.75% to a record 4.33%, per USDA NASS data compiled by FMMA30 — a 15.5% lift off the 2015 baseline. Over the same window, EU butterfat gained roughly 2.4% and New Zealand roughly 2.5%, per FMMA30’s international comparison. Protein climbed too — 3.11% to 3.29% — but that 5.8% gain only looks healthy until you stack it next to fat running at nearly triple the pace.
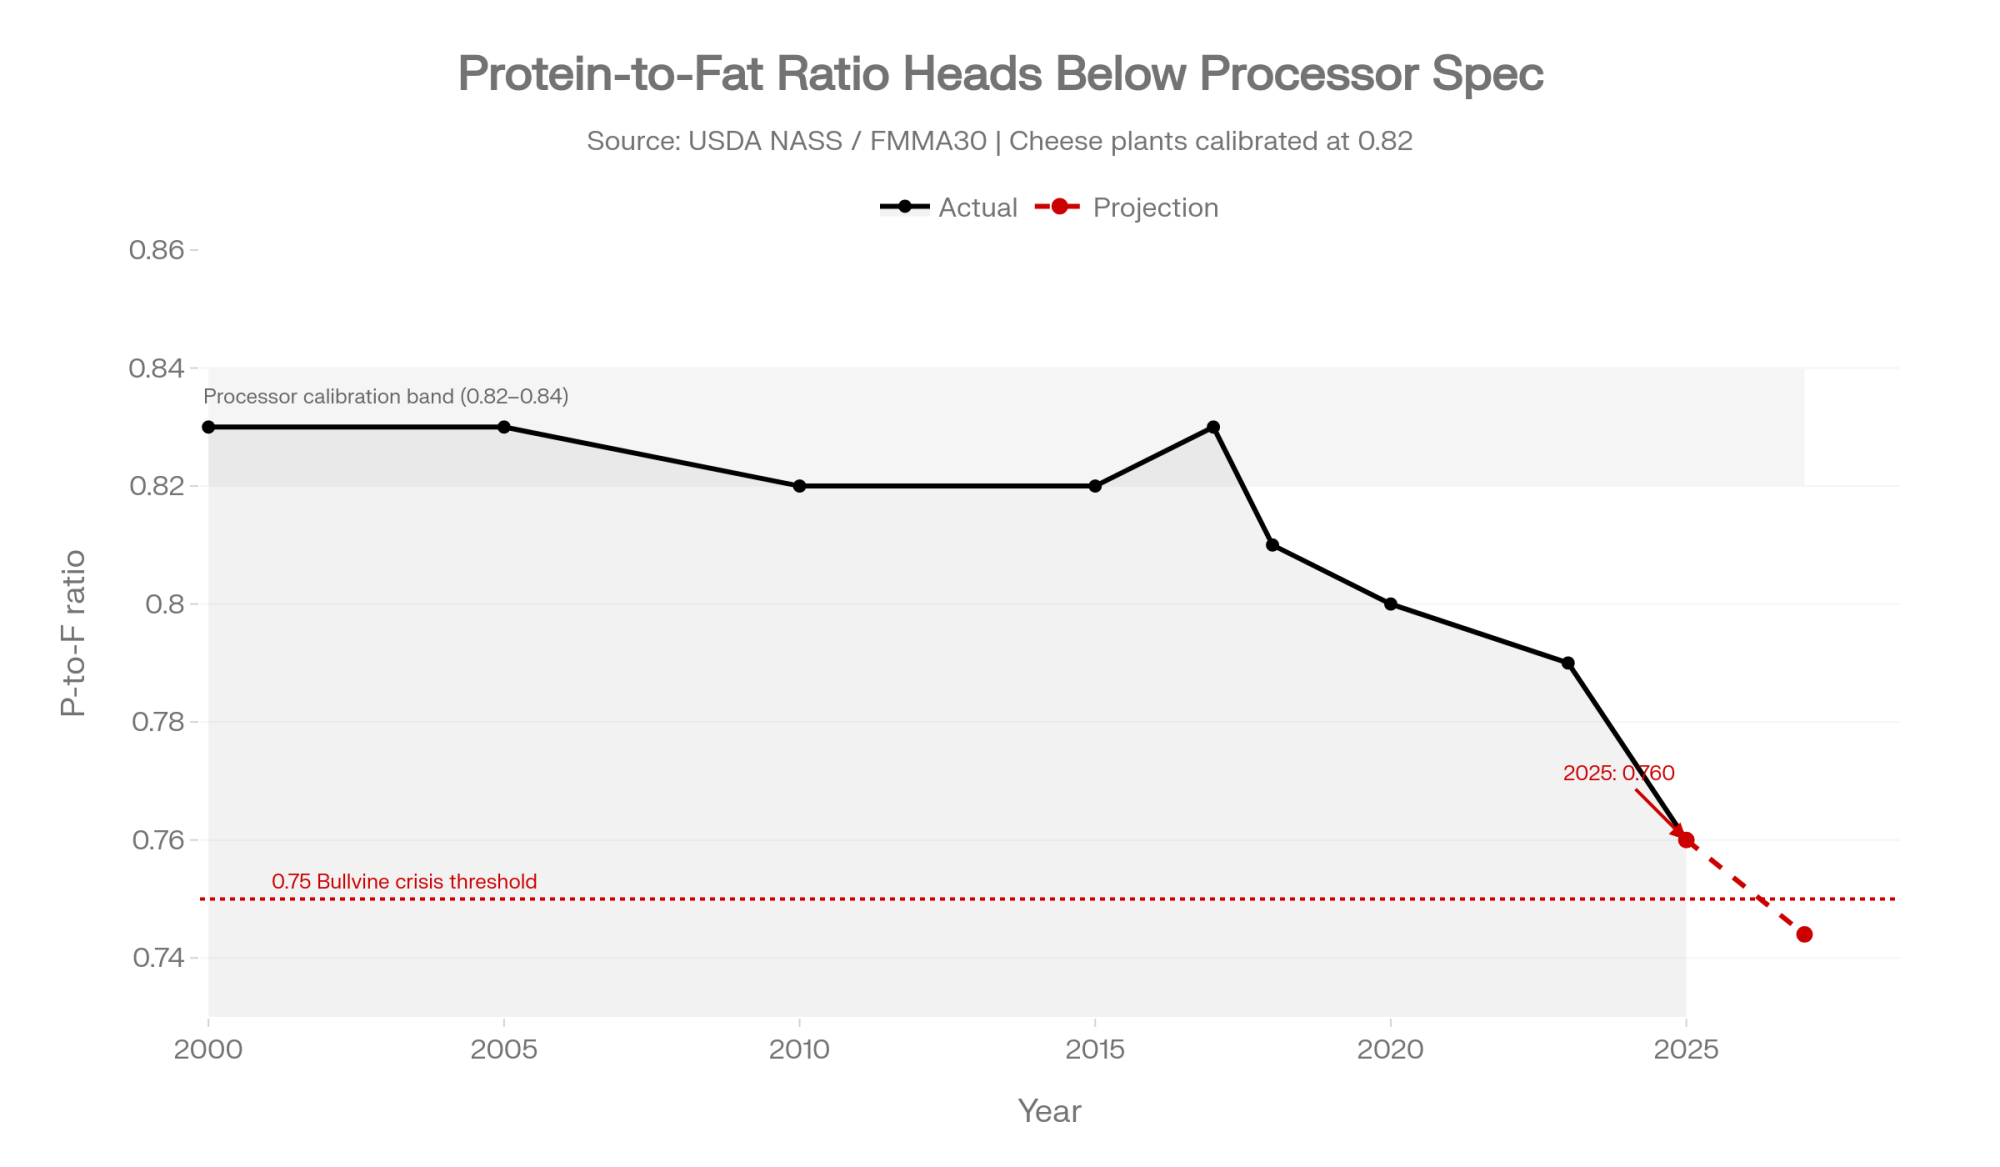
CoBank’s lead dairy economist Corey Geiger flagged the problem in the bank’s September 25, 2025 Knowledge Exchange brief, warning that excessive butterfat can compromise cheese quality and that cheesemakers target a protein-to-fat ratio near 0.80, with ratios significantly below that threshold reducing yield efficiency. At the time, the ratio sat at 0.77. Seven months later, with full-year 2025 butterfat averaging 4.33% against protein stuck at 3.29%, it’s dropped to 0.760 (3.29 ÷ 4.33 = 0.7598).
Over half of U.S. milk now moves into cheese. Those plants were calibrated for 0.82. The milk arriving at the dock doesn’t match the equipment on the other side.
Why Should Upper Midwest Producers Care About the 0.75 Threshold?
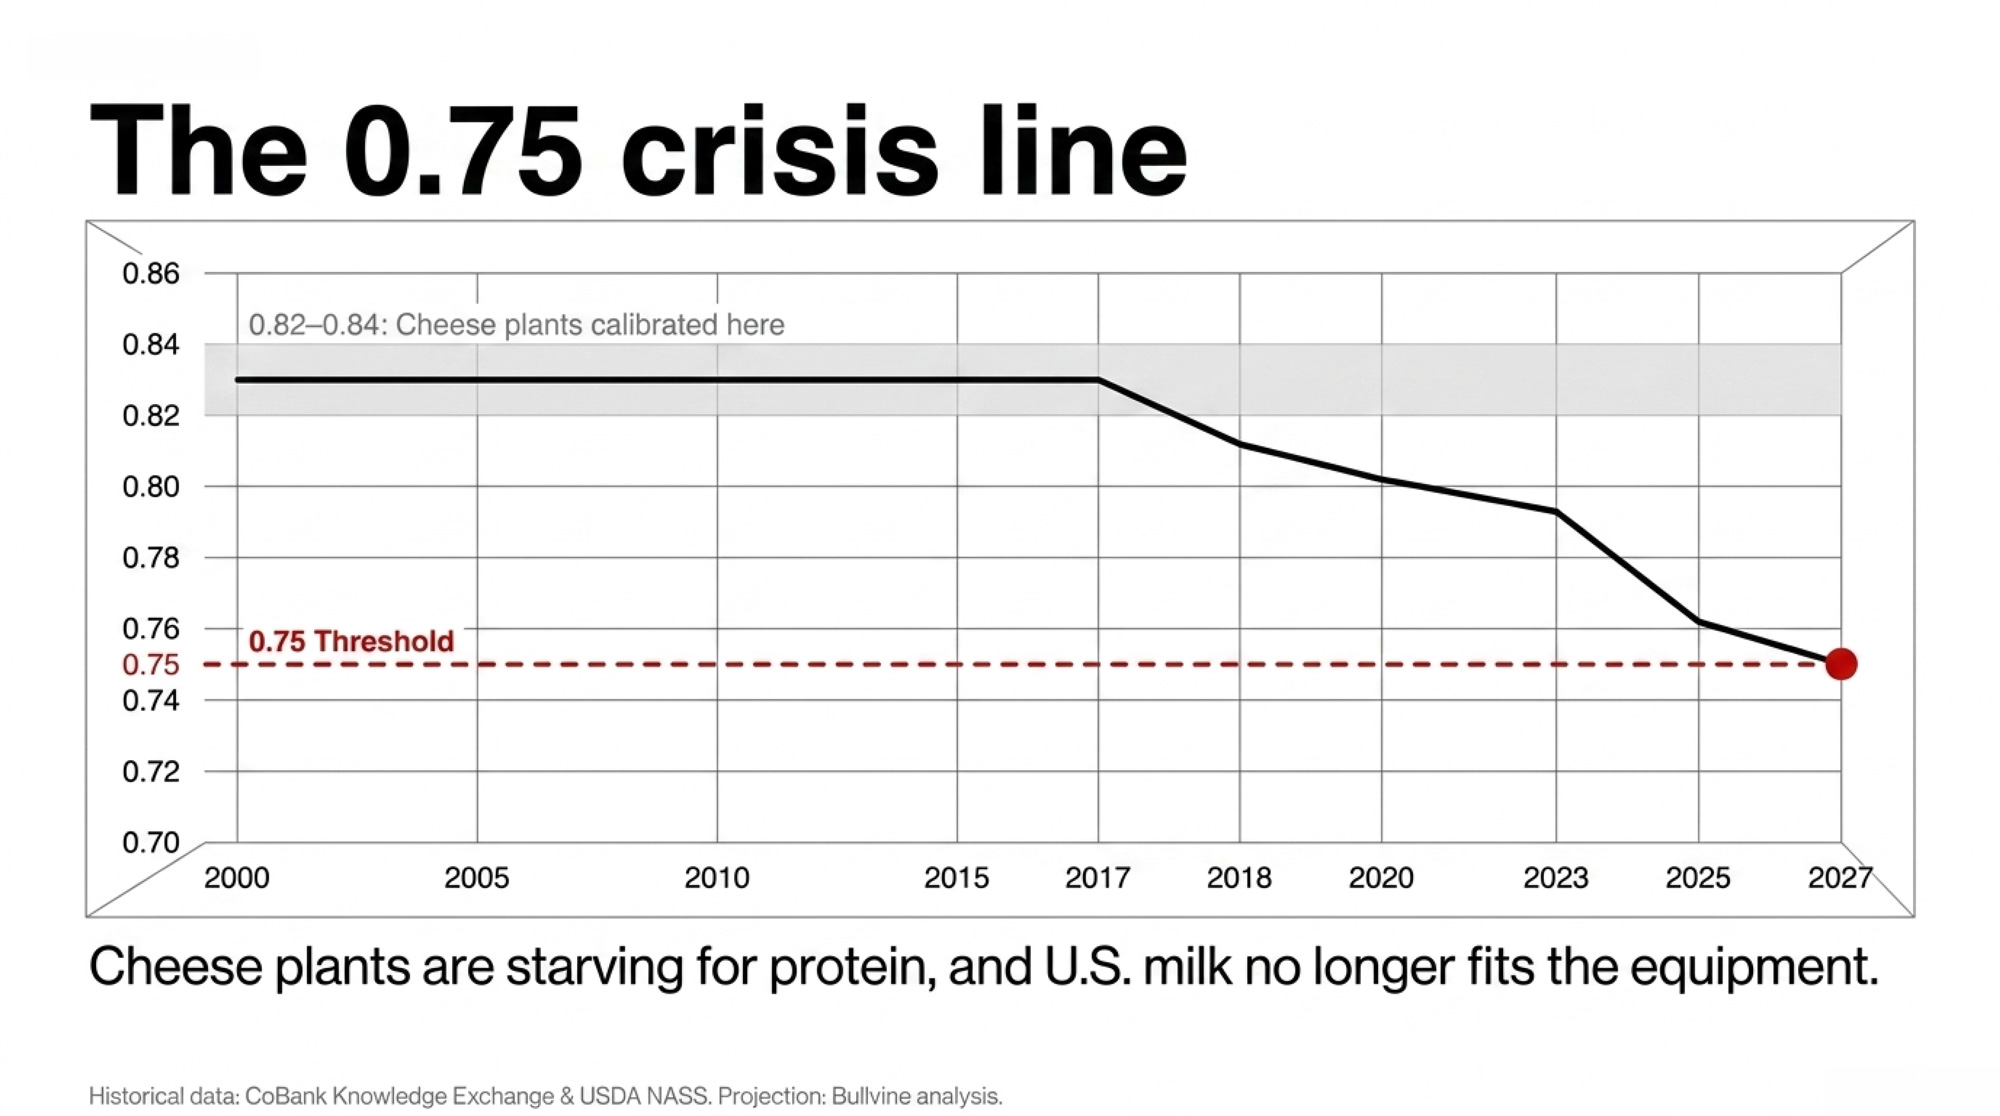
From 2000 to 2017, the U.S. protein-to-fat ratio held flat between 0.82 and 0.84, per CoBank’s Knowledge Exchange. That’s the band processors built their plants around. Starting in 2018, the line bent.
Year
P-to-F Ratio
Context
2000–2017
0.82–0.84
Stable — cheese plants calibrated here
2018
~0.81
Decline begins
2020
~0.80
Geiger’s “near 0.80” cheese-quality target
2023
~0.79
Decline accelerates
2025 full-year
0.760
FMMA30 / USDA NASS annual
Bullvine crisis threshold
0.75
Named in this issue
Projected arrival
Late 2027 (~16 months out)
Bullvine projection, ~0.008/year decline
The Bullvine is putting a stake in the ground: the U.S. protein-to-fat ratio crosses 0.75 within roughly 16 months at current decline rates, and that’s where standardization costs, whey-stream fat losses, and processor basis negotiations visibly reprice Upper Midwest milk checks. If the ratio turns upward before late 2027, the Tracker will say so in writing and retire the call. If it doesn’t, this stops being a chart. It’s the basis for a pricing correction that’s already started.
The structural driver keeping the ratio suppressed is genetics, and the indexes don’t agree on which way out. Holstein USA’s April 2026 TPI revision shifted production weights to 24% protein and 14% fat — a 5-point move in each direction. Top-10% bulls saw an average 34-point TPI decline, with 26.6 of those points attributable to the formula change itself rather than routine evaluation updates. USDA’s Net Merit 2025 moved the opposite direction — 31.8% fat, 13.0% protein. Two major indexes. Two opposite signals. One breeder trying to mate cows this week.
Running the Numbers: What 0.1% Is Worth on a 500-Cow Order 30 Herd
Before you read the rest of this issue, run this math on your own operation.
Scope. 500-cow Wisconsin or Minnesota shipper into FMMO Order 30. 75 lbs/cow/day rolling average. March 2026 FMMO prices.
Formula:
Incremental annual revenue = 0.001 × daily lbs/cow × number of cows × 365 × FMMO component price per lb
Where the $83,000–$140,000 bulk-tank gap comes from. A 500-cow Order 30 shipper at 4.0% fat against a 2025 national average of 4.33% is carrying a 0.33-point fat gap. Three 0.1% increments × $27,676 = roughly $83,000/year in fat alone. Add a 0.2-point protein gap (3.09% vs. 3.29% national), and 2 × $28,614 pulls another ~$57,000/year. The $140,000 upper bound is a composite of two gaps on two components, not one factor. The low end is fat alone.
That’s the money. Not theoretical. Sitting in the bulk tank every month it ships short of county average.
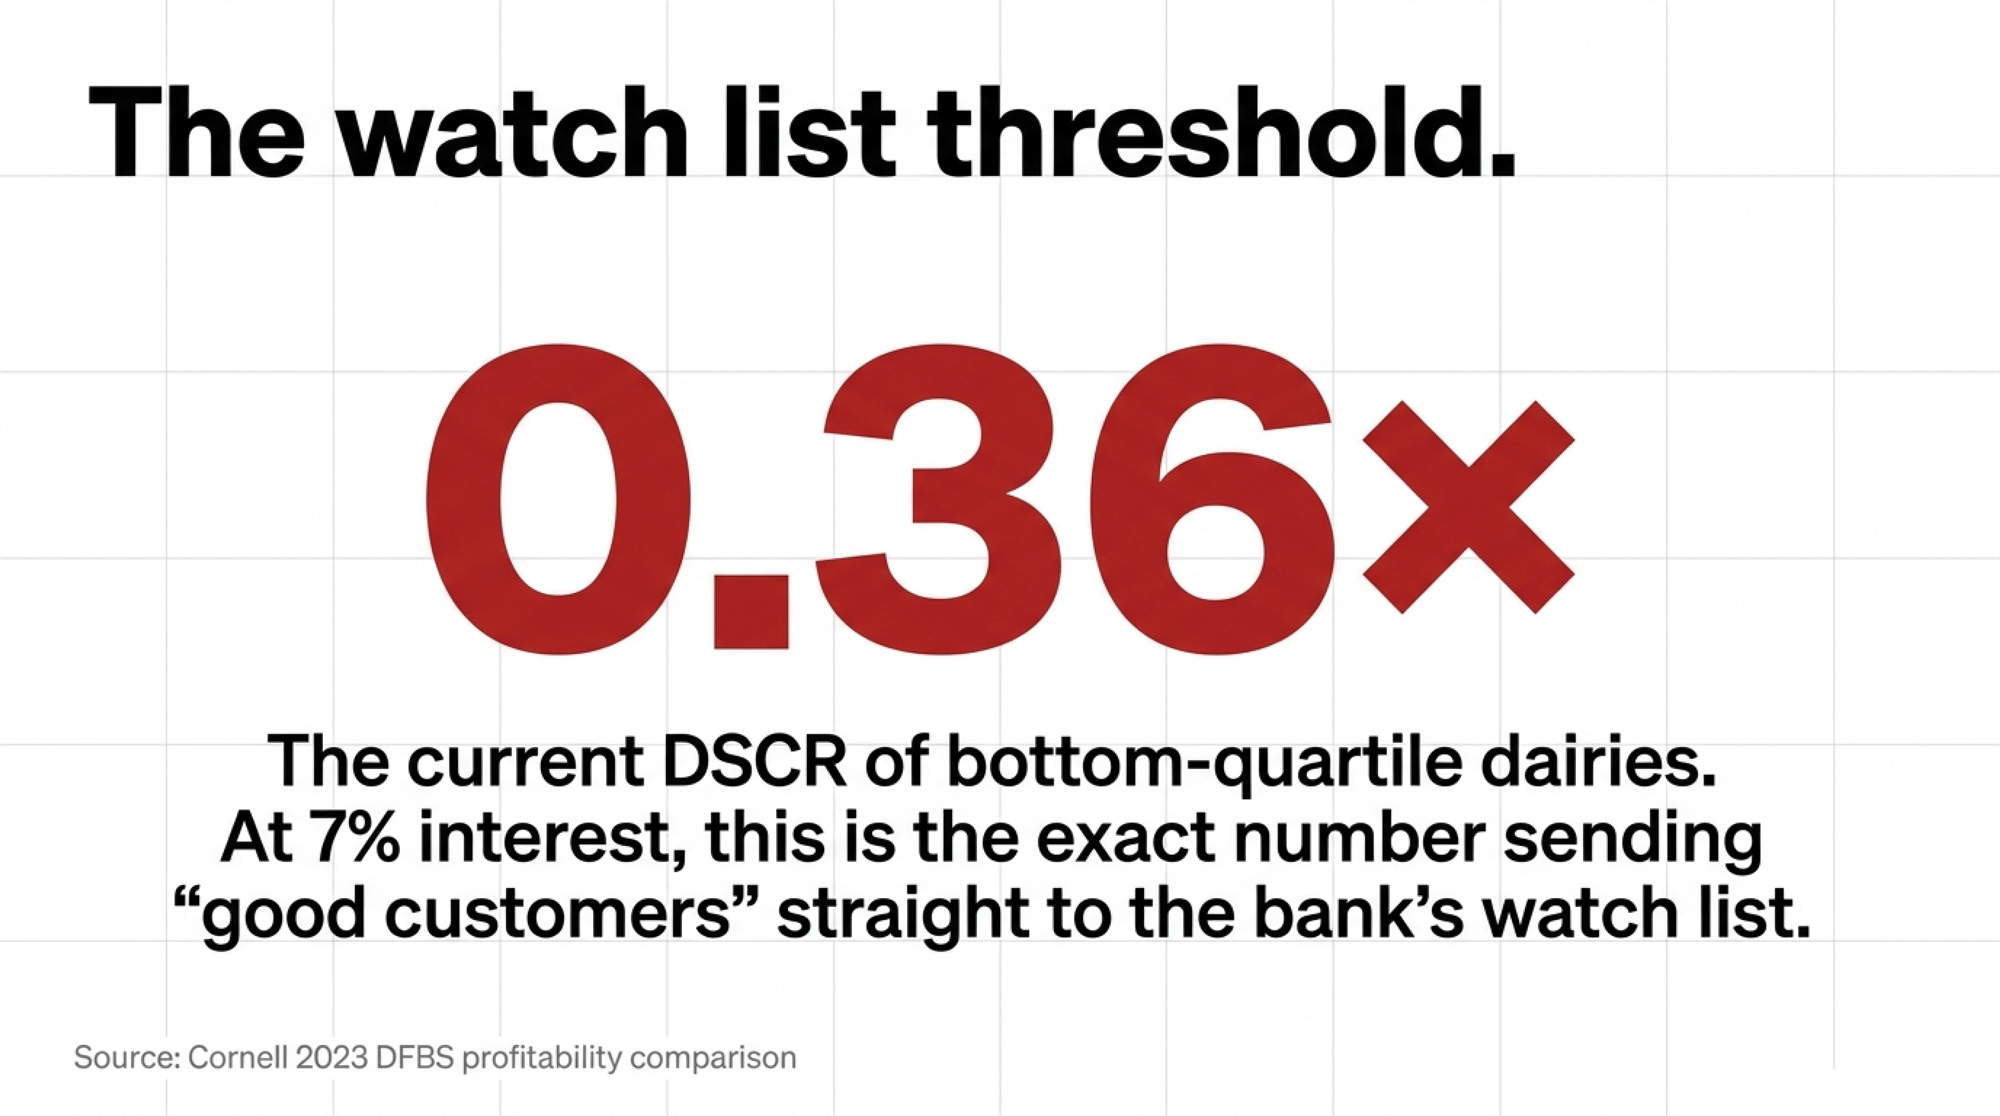
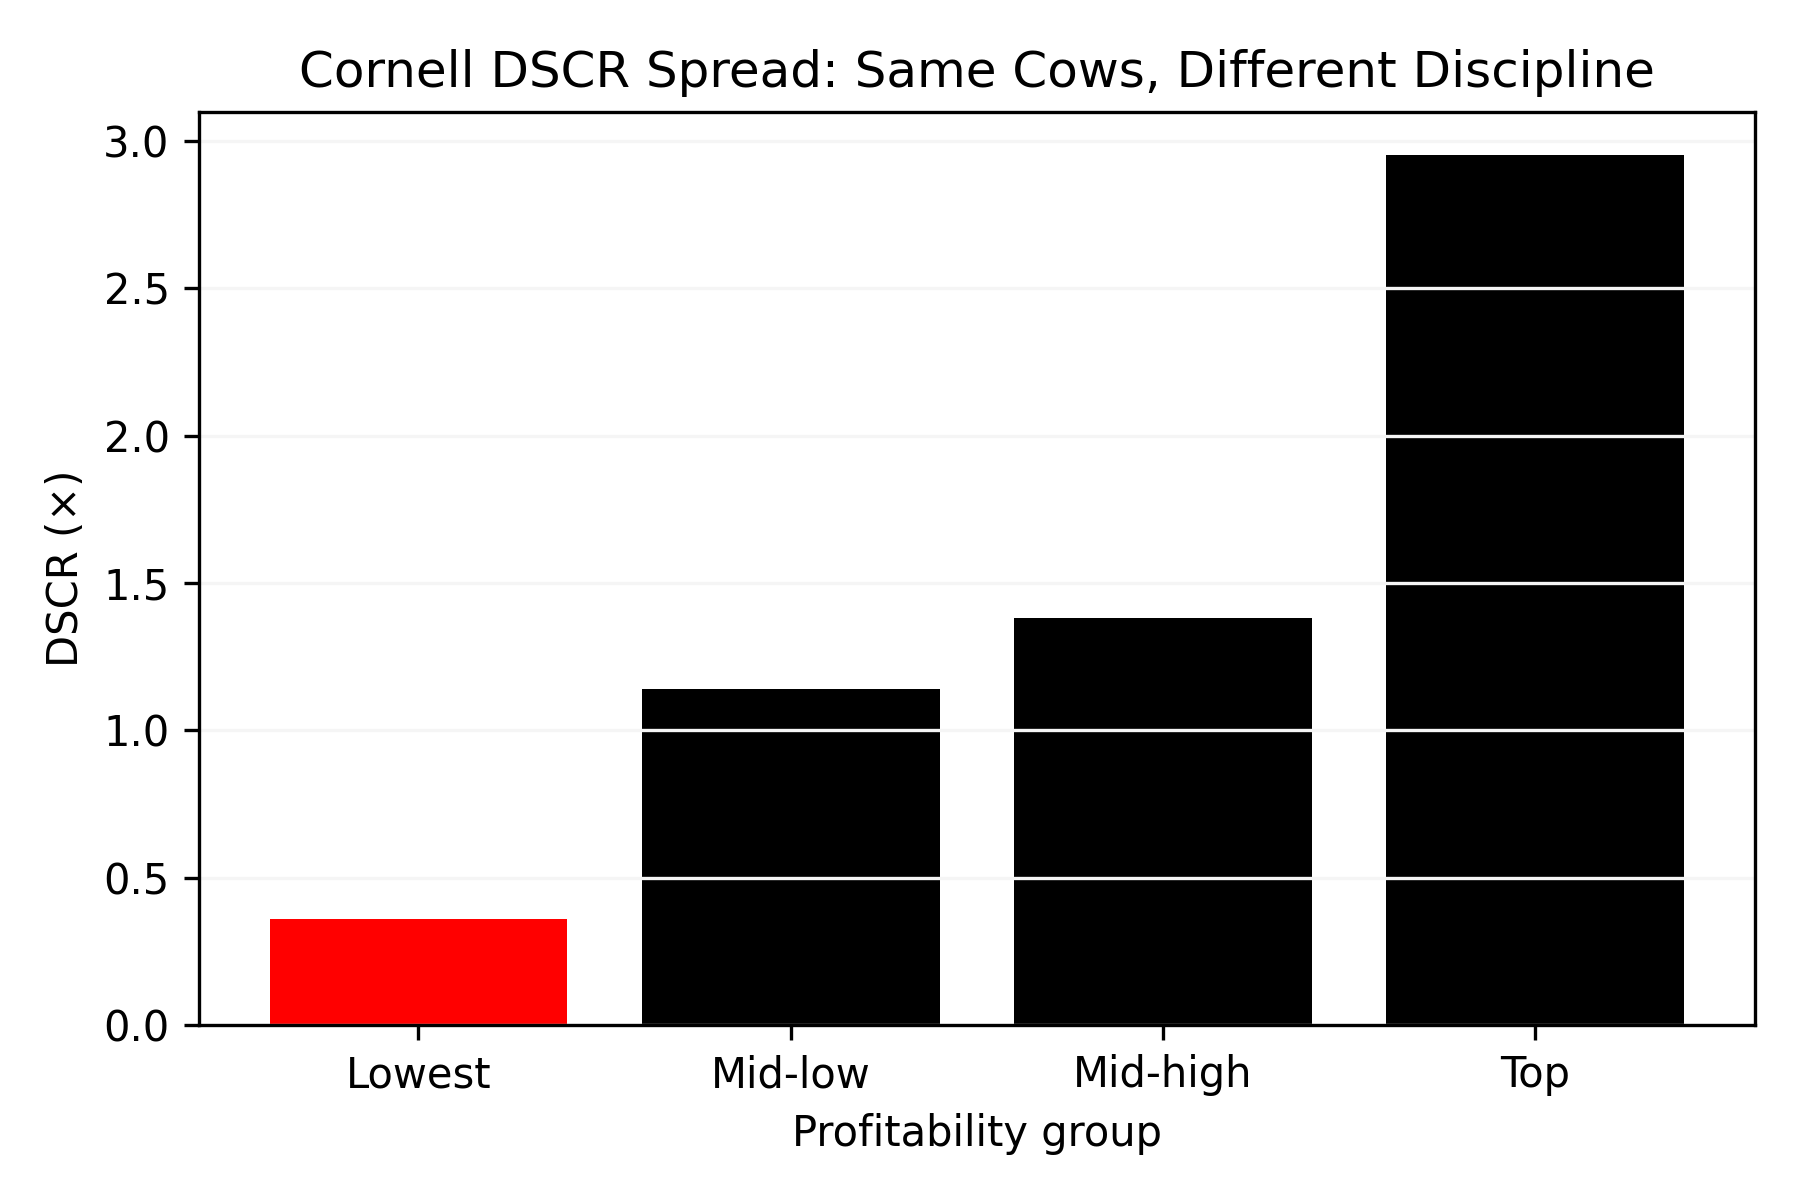
If you’re leveraged. On a 500-cow shop running DSCR closer to 1.1 than 1.3, a captured $56,290 from a combined 0.1%/0.1% component move is the difference between a lender conversation you choose when to have and one your lender chooses for you. Component revenue doesn’t carry the manure tax added volume does — no extra cow, no extra parlor time, no extra lagoon capacity. It’s the highest-leverage margin move currently on the table.
Run the Numbers on Your Herd: The Bullvine Component Value Tracker
Every calculation above is scoped to a 500-cow Wisconsin or Minnesota shipper at 75 lbs/cow/day against March 2026 FMMO prices. Your operation isn’t that one.
The Tracker runs the +0.1% value, the component-gap dollars, and the $17 Class III capital stress-test against your actual numbers — same methodology, your inputs. Plug in your cow count, production level, fat and protein tests, and the dollar numbers move in real time.
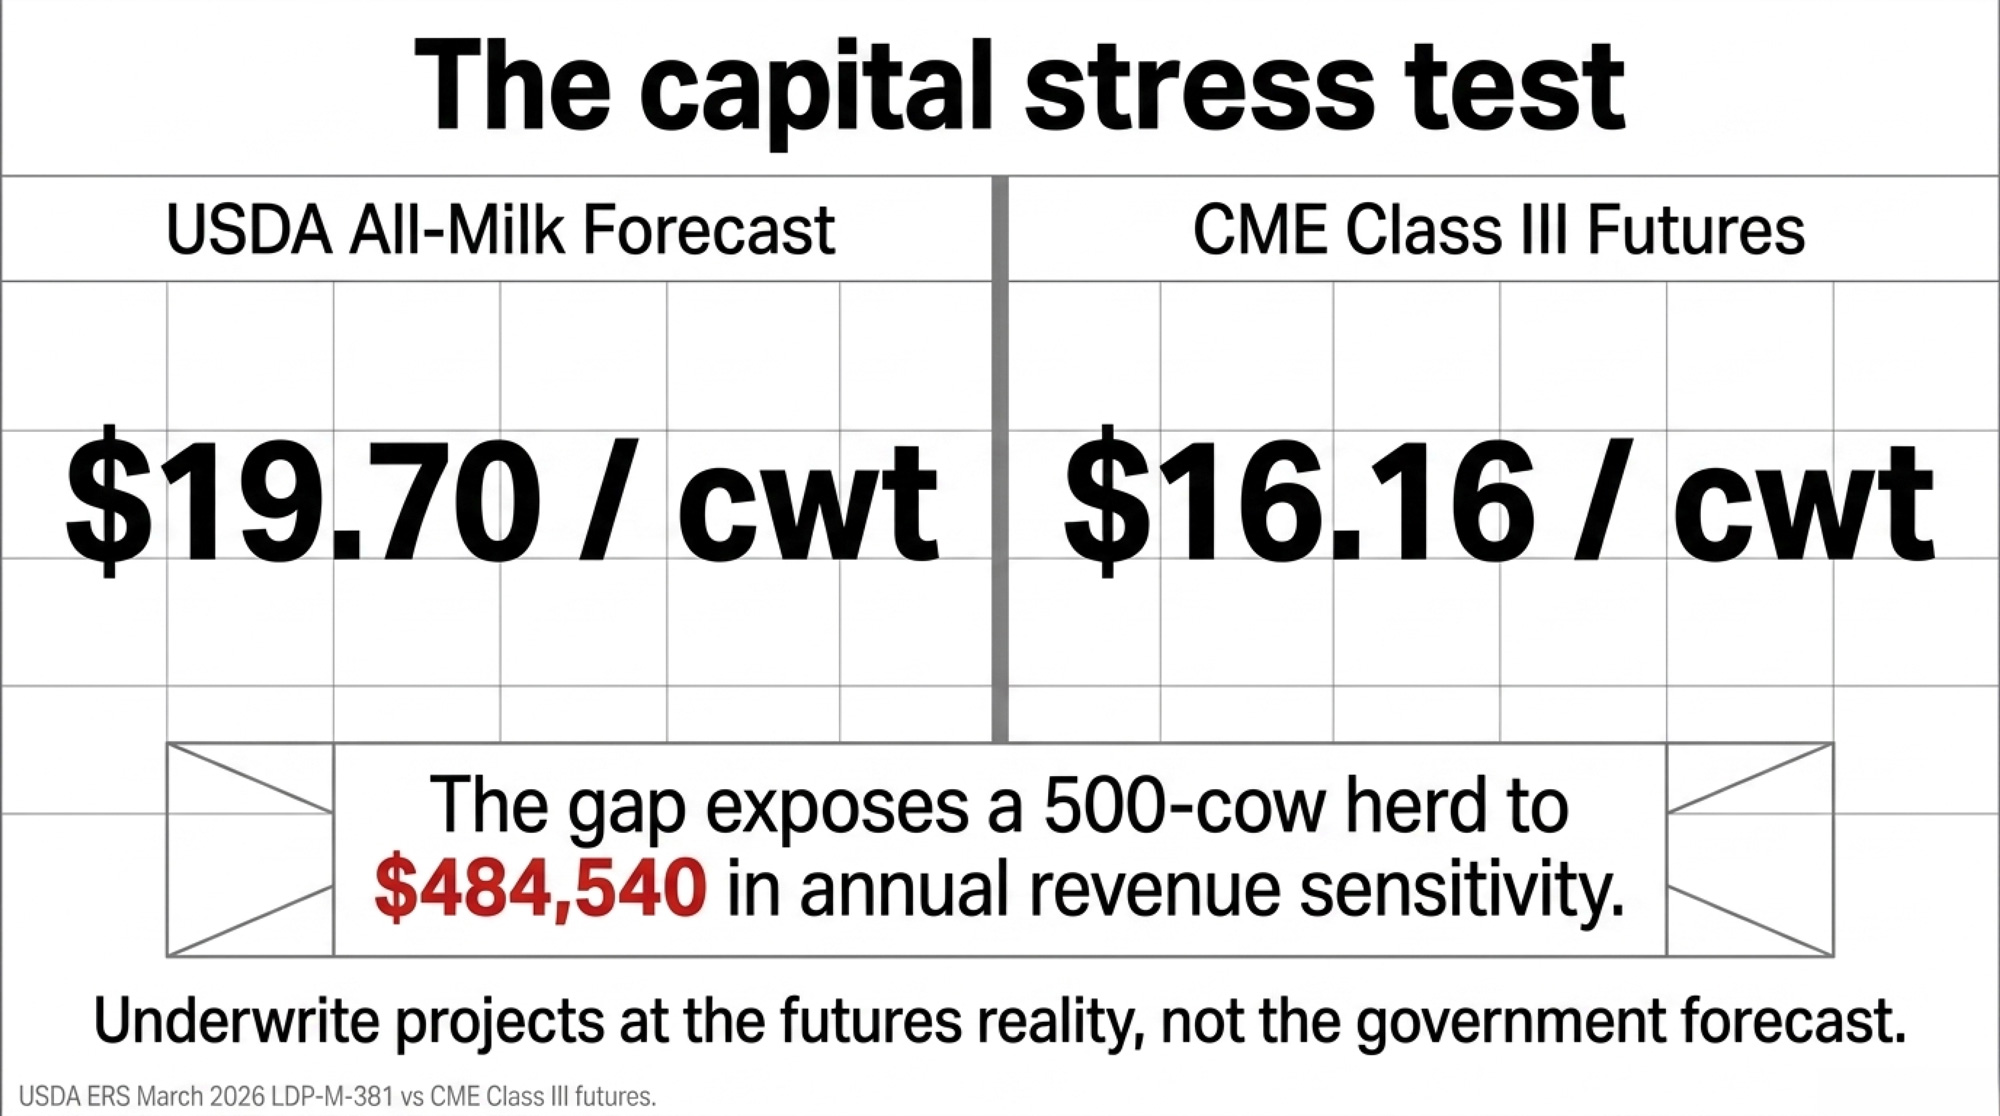
Launch the Tracker pre-loaded with this article’s May 2026 baseline — 500 cows, 75 lbs/day, 4.33% fat, 3.29% protein, $2.0220 fat price, $2.0905 protein price, $19.70 USDA all-milk forecast, $16.16 CME Class III futures:
Bookmark the result once you’ve loaded your own cow count, production, and last month’s component tests — that’s your personal Tracker baseline for the Issue #2 refresh against May FMMO prices.
Why Does Chasing a Better Protein-to-Fat Ratio Cost You Money?
Here’s the assumption the “protein market” headlines set up: the right sire in a protein-premium cycle is the one with the best protein-to-fat ratio. Run the dollars at March 2026 prices, and that logic breaks.
Two sires. Identical on everything else.
Sire
Fat PTA (lbs)
Protein PTA (lbs)
Fat Value
Protein Value
Total per Daughter/Lactation
Winner
Sire A
+45
+35
45 × $2.0220 = $90.99
35 × $2.0905 = $73.17
$164.16
✅ +$19.88
Sire B (prettier ratio)
+30
+40
30 × $2.0220 = $60.66
40 × $2.0905 = $83.62
$144.28
—
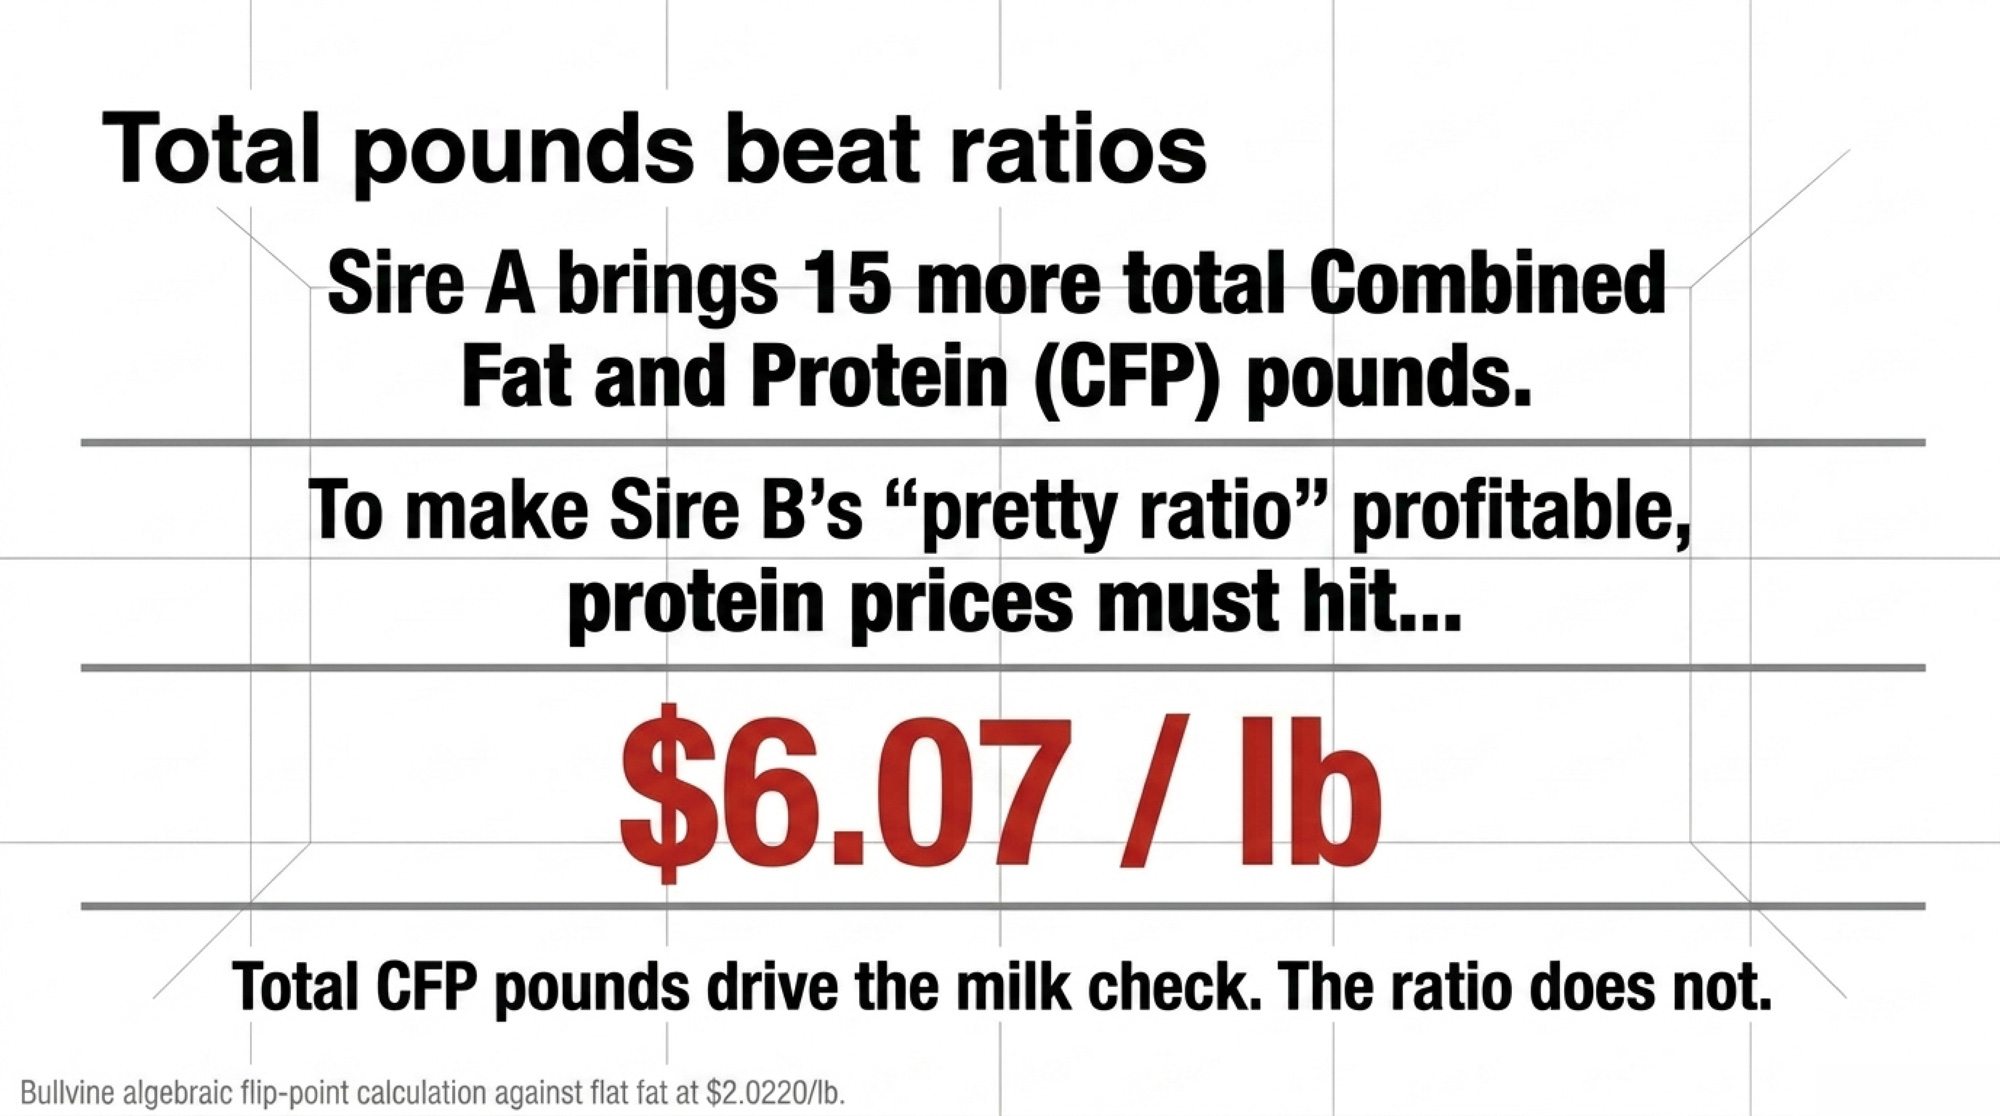
Sire B has the prettier protein-to-fat ratio. Sire A has the heavier check — by $19.88 per daughter per lactation, in a protein-premium market. Total CFP pounds drive the milk check. Ratio doesn’t.
The flip point isn’t where headline logic puts it. Setting Sire A’s value equal to Sire B’s and solving for protein against flat fat at $2.0220/lb:
(45 × $2.0220) + (35 × P) = (30 × $2.0220) + (40 × P) 15 × $2.0220 = 5 × P P = $6.07/lb protein
At flat fat, protein would have to triple from $2.09 to roughly $6/lb before Sire B’s ratio edge overcomes Sire A’s 15-lb CFP advantage. Sire A’s win isn’t marginal. It’s structural — the total-pounds gap is large enough that no realistic protein price flips it.
Picture a Brown County 500-cow operation — a hypothetical herd representative of Order 30 shippers we’ve modeled — that filtered its April sire list on protein-to-fat ratio and surfaced Sire B at the top. Across a typical replacement pipeline of 150 heifers/year and 2.8 lactations per cow in the milking string (Bullvine modeling assumption), that single $19.88/daughter/lactation delta compounds to roughly $8,350/year in steady-state drag once the selection cycles through the lactating herd (150 × 2.8 × $19.88). Filter-the-whole-sire-list style ratio-first selection — not just one sire swap — carries materially more drag; The Bullvine’s April 2026 TPI analysis modeled it at roughly $17,500/year for herds that filtered broadly on ratio across multiple placements.
The ruleset for this mating season:
Primary filter: Net Merit or Cheese Merit — both balance full economics, not just protein percent
Sort by: total CFP pounds
Tie-breaker: protein PTA, when CFP is equivalent
Don’t: select on protein-to-fat ratio at the expense of total CFP
There’s an interpretive tension inside TPI itself worth flagging — this is Bullvine analysis, not a Holstein USA position. Under the April 2026 formula, one pound of PTA protein carries roughly 1.7× the leverage of one pound of PTA fat in the index. TPI’s own Feed Efficiency formula still values fat at $1.86/lb against protein at $1.75/lb. Same index. Two signals. Trust the price on the milk check, not the coefficient on the ranking sheet.
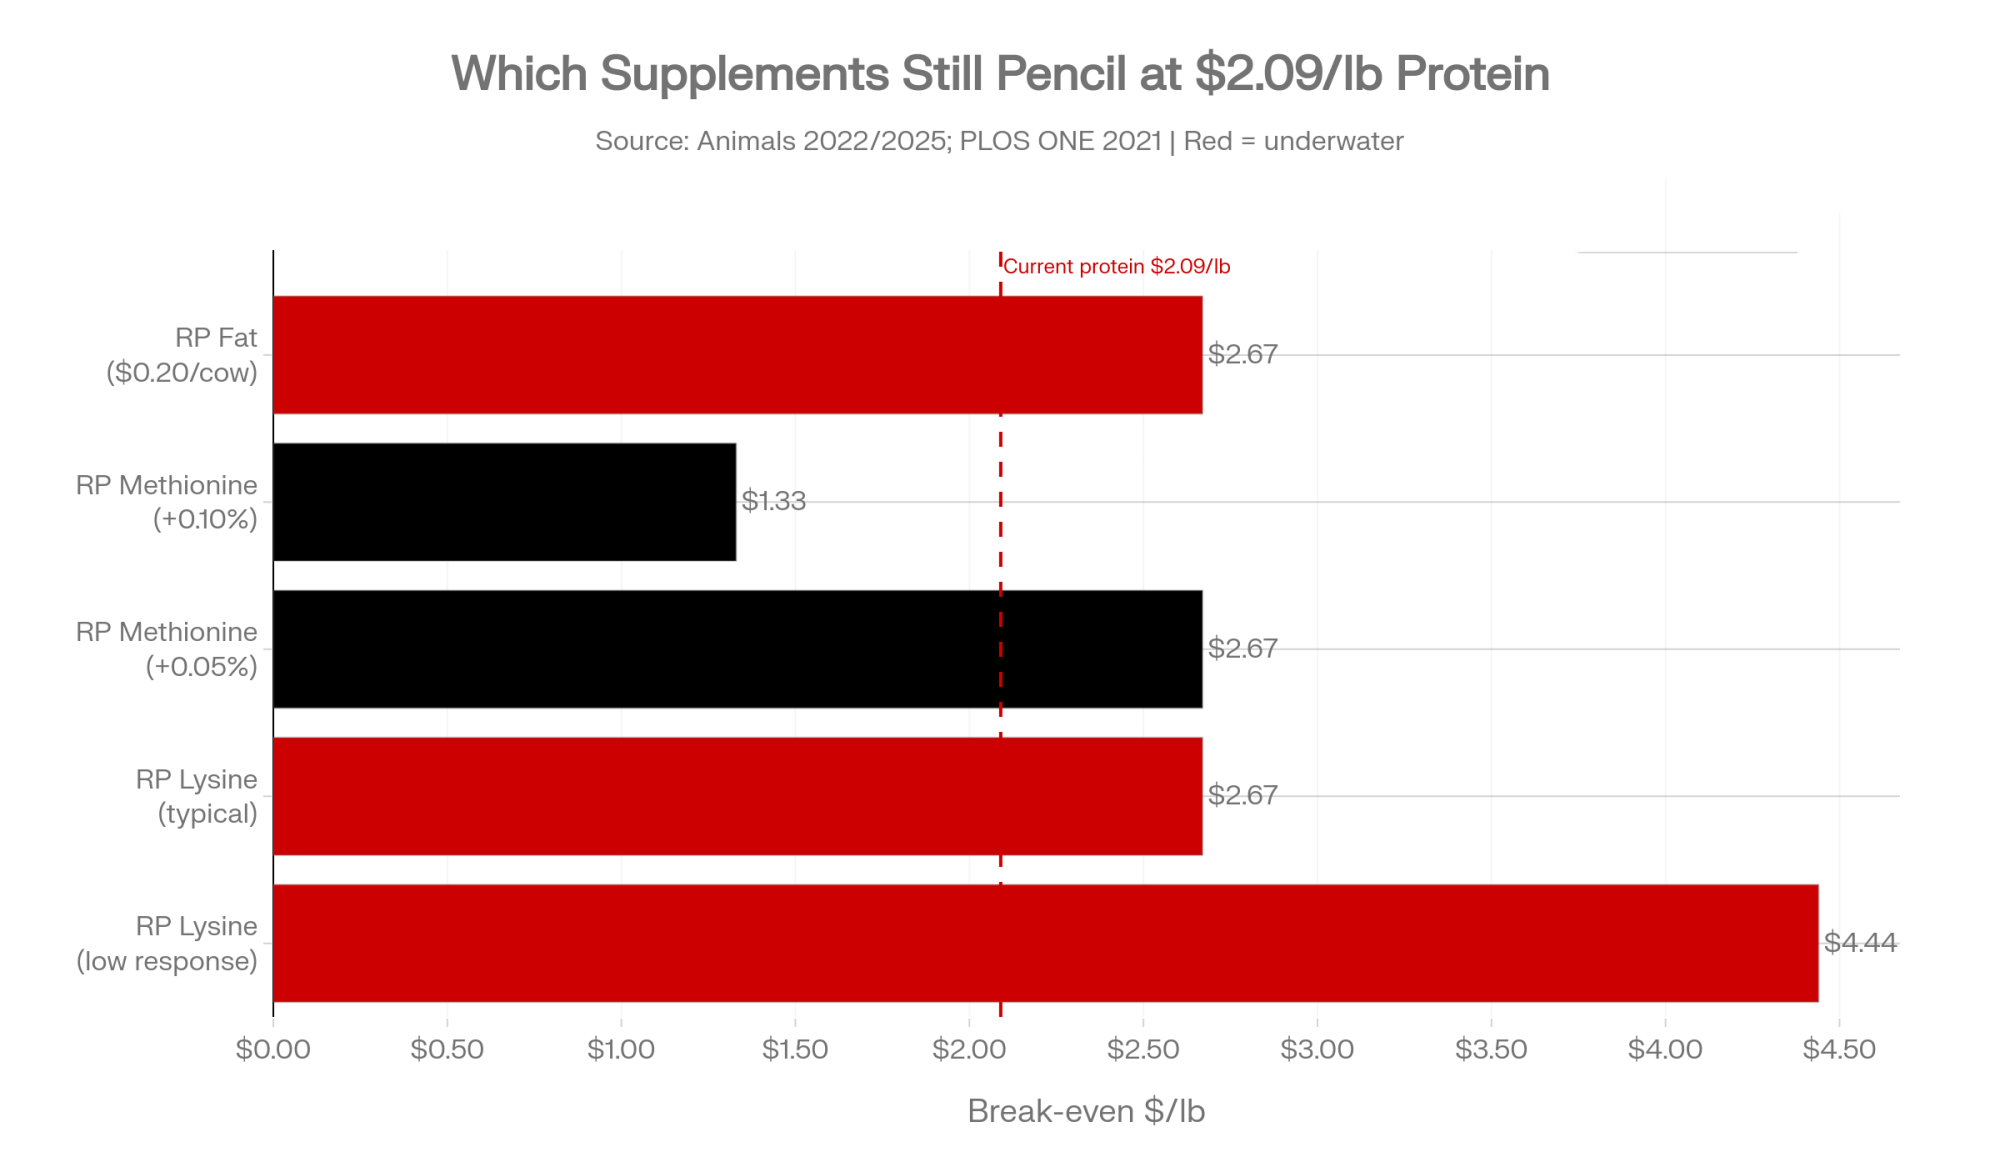
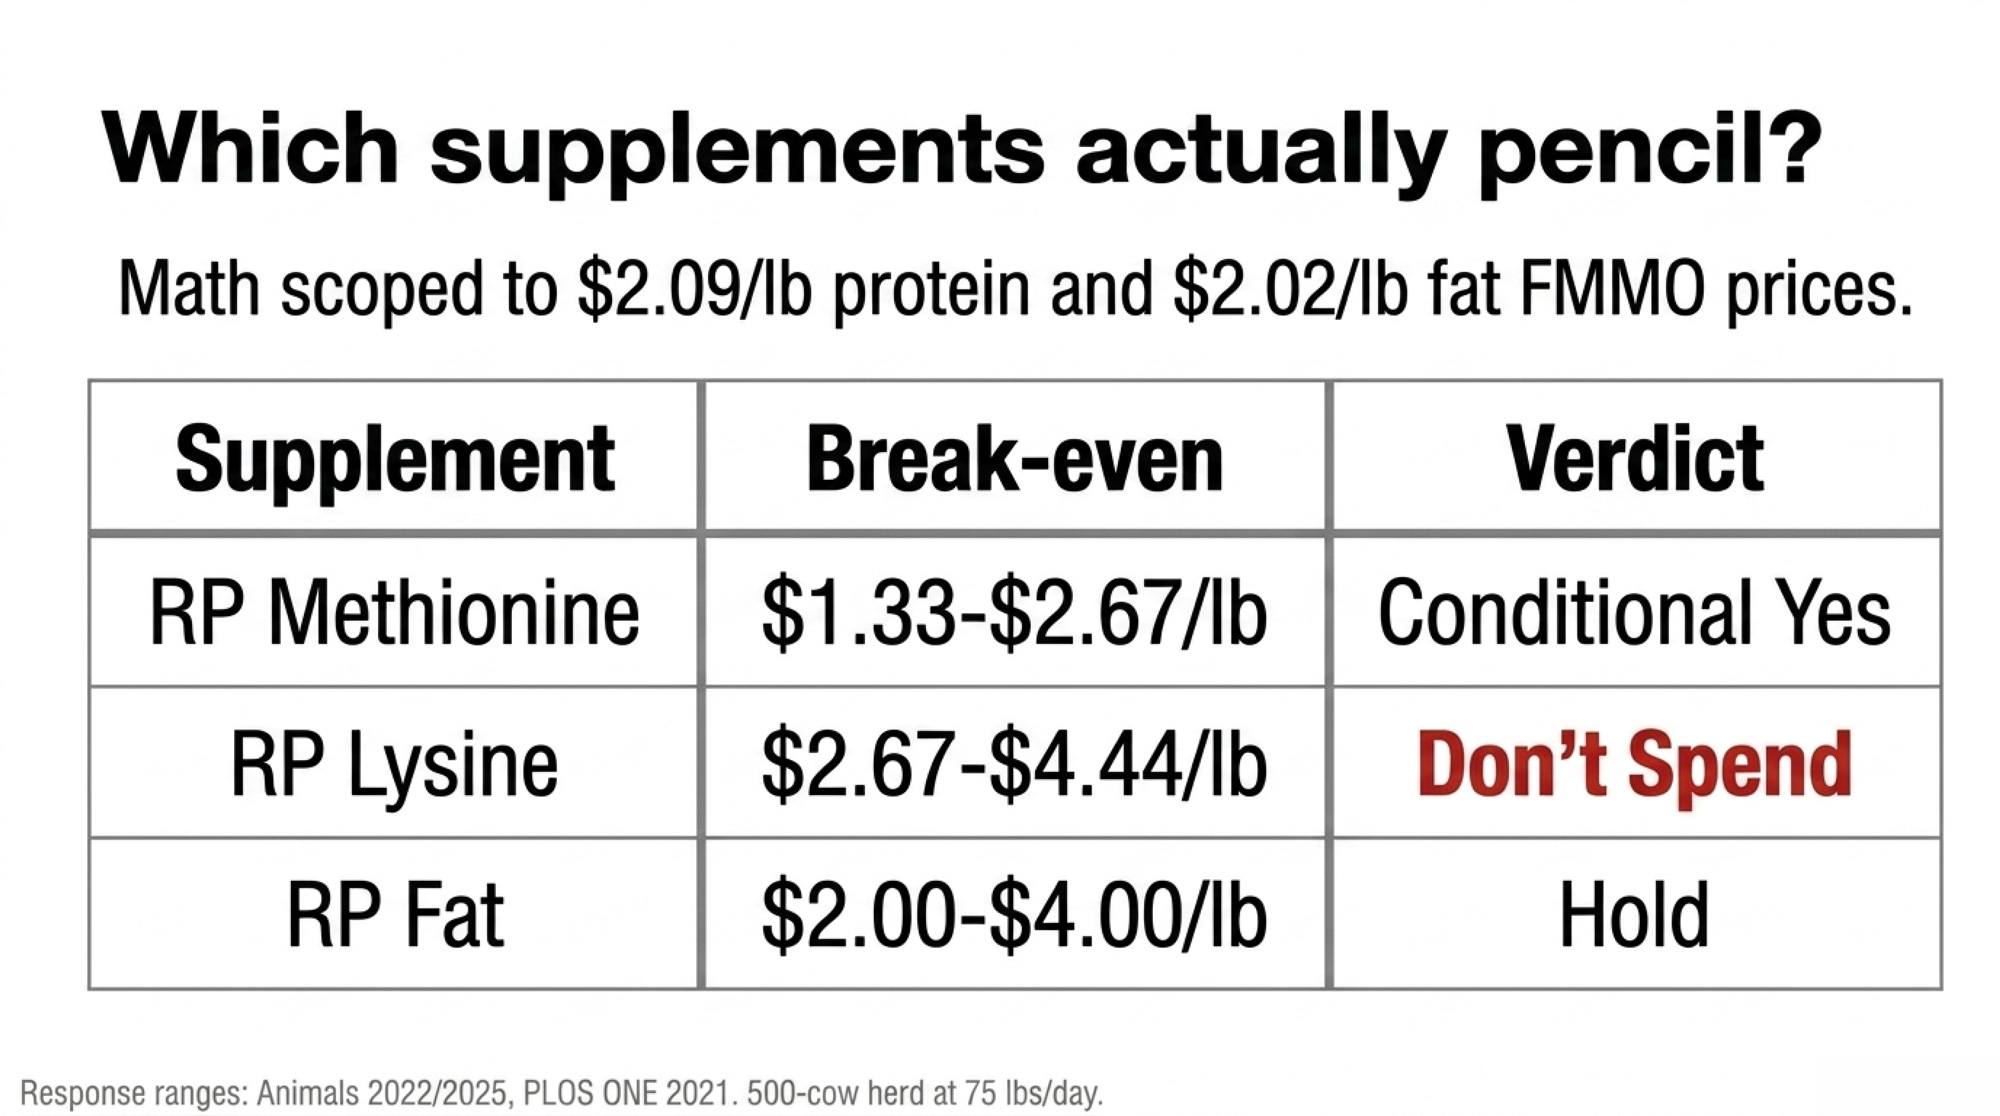
Which Supplements Still Pencil at $2.09/lb Protein?
Component prices shifted. Not every ration has caught up. Break-evens below are scoped to a 500-cow, 75 lbs/cow/day Order 30 operation at March 2026 FMMO prices.
Rumen-Protected Methionine: Conditional Yes
A peer-reviewed meta-analysis in Animals (PMC9219501, 2022) puts RPM’s protein response range at +0.07% to +0.15%, with yield gains of 27–43 g/day. The 2025 combined RPLM paper (Animals, PMC12691028) confirms response is heavily dependent on basal diet and a roughly 3:1 lysine-to-methionine target.
At $0.10/cow/day, +0.05% response:
Extra protein: 0.0005 × 75 = 0.0375 lbs/cow/day
Break-even protein price: $0.10 ÷ 0.0375 = $2.67/lb
Current: $2.09/lb — marginally negative
At $0.10/cow/day, +0.10% response:
Extra protein: 0.075 lbs/cow/day
Break-even: $0.10 ÷ 0.075 = $1.33/lb
Margin vs. current: +$0.76/lb — strongly positive
Methionine pays when the cost is low and the response is real. It doesn’t pay when either assumption slips. That’s a ration-audit conversation, not a standing order.
Rumen-Protected Lysine: Don’t Spend
Commercial RPL response on Holsteins runs +0.03% to +0.08% protein at $0.08–$0.15/cow/day, per trial work summarized in PLOS ONE (pone.0243953, 2021).
At $0.10/cow/day, +0.05% response: break-even $2.67/lb
At $0.10/cow/day, +0.03% response: break-even $4.44/lb
Current protein: $2.09/lb. Unless you’ve got 30+ days of bulk-tank data proving outlier response on your herd, lysine’s a ration tax right now. Not a component strategy.
The flip point. Protein above $2.75/lb sustained before lysine pencils at typical commercial response — $0.66/lb of price movement away.
Rumen-Protected Fat: Hold
At March 2026 butterfat of $2.0220/lb, the break-even for RP fat lands at $2.67/lb (at $0.20/cow/day cost and a +0.10% response: $0.20 ÷ 0.075 = $2.667). Current butterfat sits $0.65 below that threshold. The math works only at lower cost or higher verified response — $0.15/cow/day against the same +0.10% response drops break-even to $2.00/lb, right at the current FMMO.
A year ago, with butterfat peaking at $2.95/lb in January 2025 before collapsing 46% to $1.58/lb by December 2025, the math worked early and not at all by year-end. Any response shortfall flips the decision today.
The flip point. Butterfat sustained above $2.67/lb at typical $0.20/cow/day cost, or contract RP fat below $0.15/cow/day with herd-specific +0.10% response confirmed.
Supplement
Cost/Cow/Day
Response Range
Break-Even (typical)
Current FMMO
Verdict
RP Lysine
$0.08–$0.15
+0.03–0.08% protein
~$2.67–$4.44/lb
$2.09/lb
Don’t spend
RP Methionine
$0.10–$0.14
+0.07–0.15% protein
$1.33–$2.67/lb (response-dependent)
$2.09/lb
Conditional yes — low cost + verified response only
RP Fat
$0.15–$0.30
+0.10–0.20% butterfat
$2.00–$4.00/lb (cost- and response-dependent)
$2.02/lb
Hold — break-even at or above current FMMO
Response ranges: Animals 2022 (PMC9219501); Animals 2025 (PMC12691028); PLOS ONE 2021 (pone.0243953). Herd response varies by basal ration, stage of lactation, and product specification.
How Much Does Your FMMO Order Change the Protein Payoff?
Same genetics move. Same ration tweak. Different milk check — because FMMO class utilization dictates how much the market pays for what you improved.
Order 30 (Upper Midwest) routes 83.9% of producer milk to Class III cheese use, per FMMA30 2025 annual data. Wisconsin contributes 69.6% of Order 30 volume; Minnesota adds 21.0%. In a cheese-heavy order, protein dominates.
FMMO / Region
Class Utilization
P-to-F
Priority
Upper Midwest (30)
83.9% Class III
0.759
Protein first at current FMMO prices — highest protein ROI among major orders
FMMA30 Upper Midwest 2025 annual; ratios derived from regional component averages in FMMO reporting.
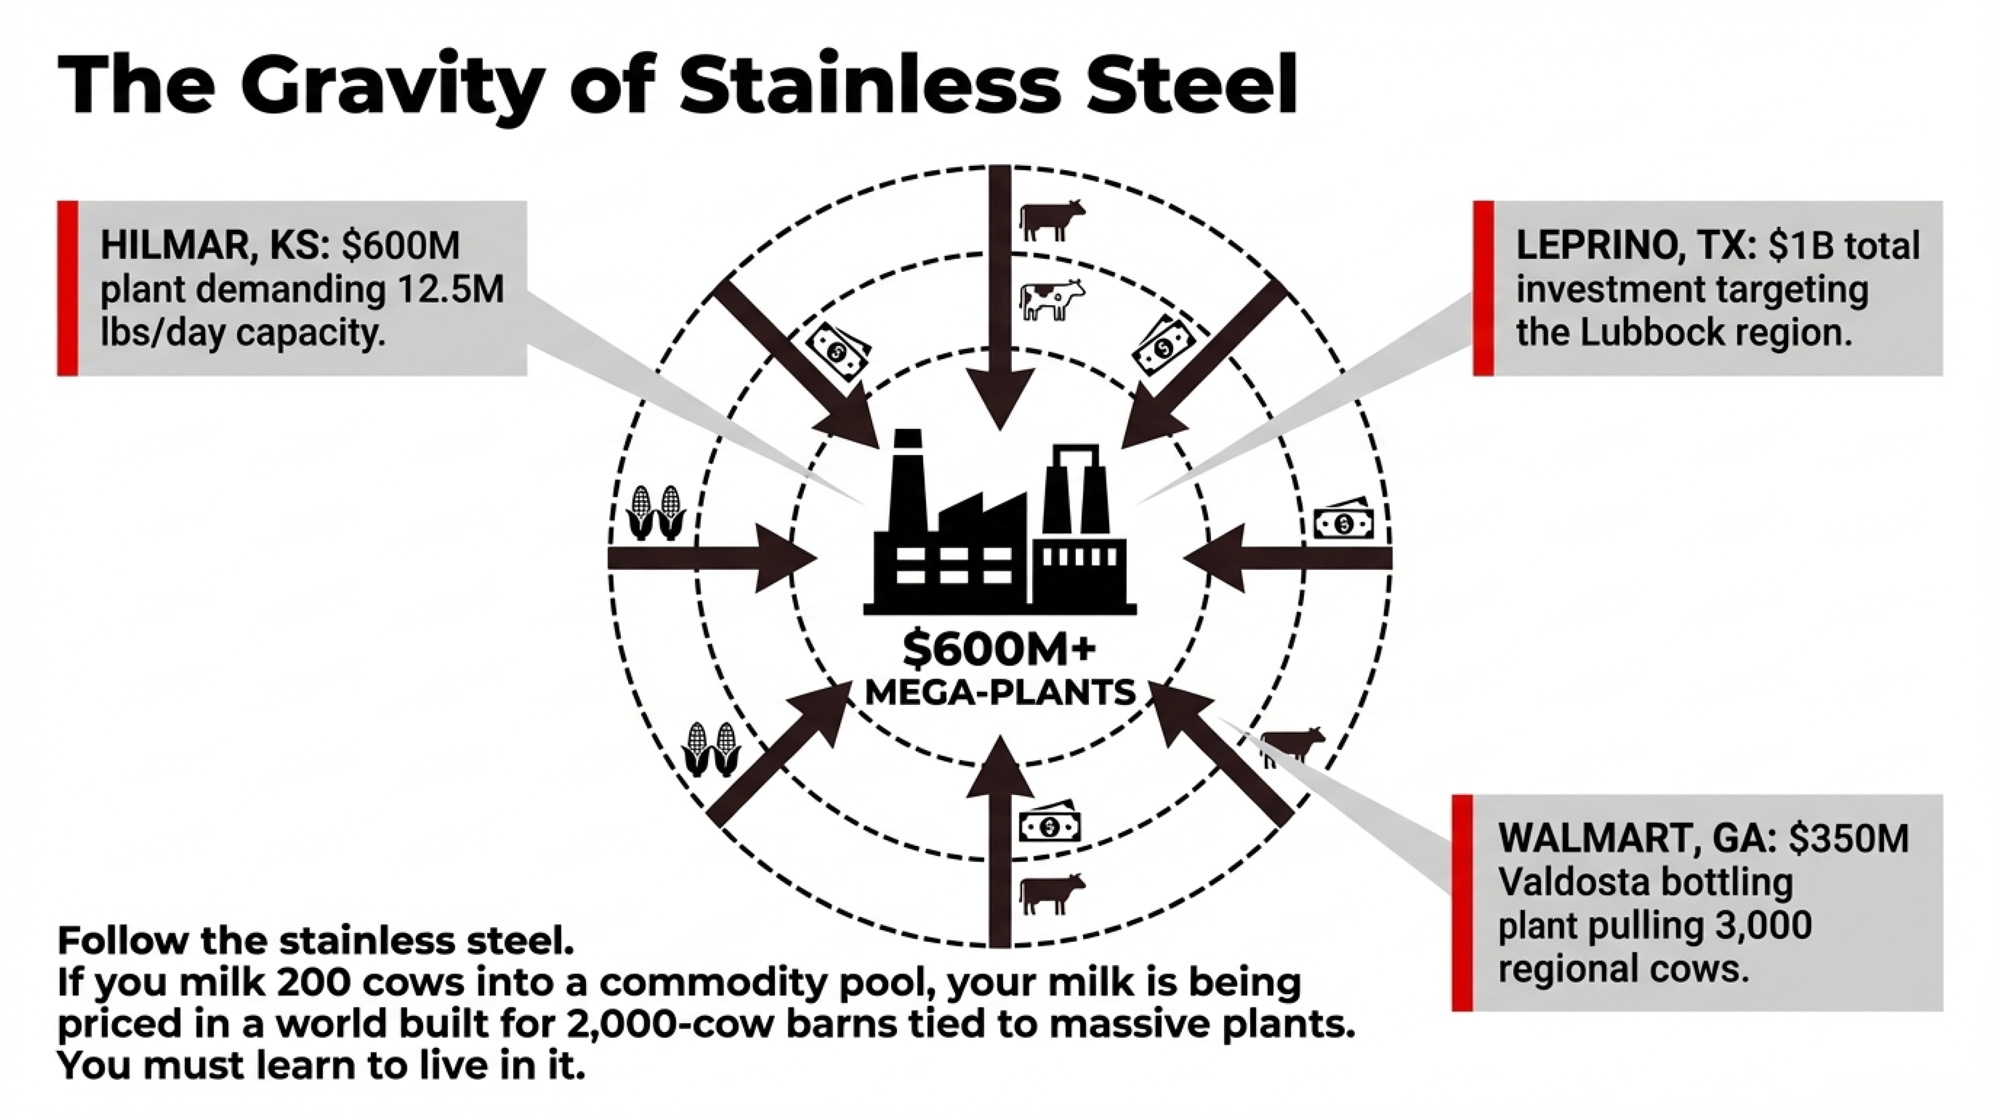
Texas production ran +10.6% in 2025, Kansas +11.4%, per USDA NASS. Idaho regained the nation’s #3 spot at 18.26 billion lbs of milk, edging Texas’s 18.21 billion by roughly one day’s worth of production. The processing gravity wells driving that growth:
Hilmar Cheese, Dodge City, KS — $600M, operational since March 2025
Leprino Foods, Lubbock, TX — approximately $1B complex, ~600 employees, designed for ~1M lbs cheese/day
Valley Queen, Milbank, SD — expansion completed 2025, anchoring the I-29 corridor
Leprino, Lemoore East, CA — closing in 2026, driving California capacity losses
Early-2026 trade coverage of High Plains and I-29 corridor contract offers has flagged structural premium tiers rewarding herds that reach roughly 4.2% fat and 3.3% protein. The specific cwt figure varies heavily by plant, co-op, and volume commitment — verify premium language against your own contract before building the number into a budget. What matters here isn’t the exact number at any one plant. It’s that the premium structure exists where the cheese capacity is landing, and it didn’t exist 18 months ago.
California production ran -5.74% in 2025 (USDA NASS), on water scarcity, regulatory pressure, and lost processing capacity. For the dairies that stay, the shift from fat-heavy checks toward protein-relevant ones is a repositioning window. Not a crisis.
Trade-offs to Watch
Net Merit or Cheese Merit over TPI as your primary screen gives up benchmarking some buyers still reference for genetic marketing. You gain pricing accuracy on the milk check. You give up pedigree shorthand at the auction ring.
Locking 60–75% of feed at $3.90–$4.10 corn needs equal-weight milk-side coverage. One-sided hedging is worse than no hedge — if corn drops and milk drops with it, you’re paying above-market for feed into a weaker check.
Genomic-testing 100% of heifers at ~$40/head runs roughly $6,000/year on a 150-heifer pipeline. Payback only lives in the sorting decision. Testing without changing which heifers breed to elite component sires is a $6,000 data subscription.
What Does a 58/100 Component Opportunity Score Actually Tell You to Do?
Each Tracker issue compresses four market conditions into one score. May 2026 baseline:
Sub-Score
Weight
Reading
Score
Marginal Value ($/0.1% at current FMMO)
30%
$27,676 fat + $28,614 protein on 500-cow Order 30 — off 2025 peaks but meaningful
70
Forward Price Trajectory (CME 6-month)
25%
Butter and cheese in slight contango from depressed levels — stabilizing, not surging
65
Genetic Improvement Rate (CDCB trends)
20%
Fat PTA still outpacing protein PTA; April 2026 TPI starts the correction, pipeline lag is real
55
Nutrition ROI Opportunity
25%
Lysine negative; methionine conditional; RP fat break-even at or above current FMMO
Component premiums justify significant new nutrition + genetics spending
Maintain and Reposition
50–70
Premiums positive but compressed; genetics and market positioning carry highest forward returns
Hold
<50
Premiums don’t justify added investment
A 58 doesn’t mean spend everywhere. It means stay in the component game and be ruthless about which marginal dollar goes where. The 40 on nutrition reflects real margin compression — methionine’s the only consistent winner, and only at the low end of cost. The 55 on genetics reflects the lag between what the market wants and what the CDCB pipeline delivers today.
What pushes the score toward 80+: protein sustaining above $2.50/lb as new cheese plants come online; butterfat stabilizing above $2.25/lb; FMMO reform that increases component weight in pricing.
What drops it below 40: both prices falling below $1.75/lb; a feed-cost spike raising all break-evens; component tests plateauing nationally.
The 30/90/365-Day Playbook for a 500-Cow Order 30 Shipper
30-Day Actions
1. Pull last month’s milk check this week and run the 0.1% formula on your own numbers. Compare your protein test to the Order 30 average near 3.29%. The gap has a dollar sign in front of it — and at current prices, that gap’s worth more per pound than it was 18 months ago. Plug actual fat and protein tests into the embedded Tracker at March 2026 FMMO prices.
Requires: three milk statements, herd size, daily lbs/cow average.
Red-flag trigger: protein test more than 0.15 points below the Order 30 average = over $40,000/year on the table for a 500-cow herd at current prices. Urgent.
Watch for: seasonal variation. Compare trailing 12 months, not just last month.
2. Audit every rumen-protected supplement — and stop RP Lysine this month if response isn’t documented. Pull the invoice cost per cow per day. At $2.09/lb protein and typical commercial lysine response rates, the math is underwater by roughly $0.60 to $2.35/lb depending on your inputs. If you can’t show 30 days of bulk-tank data proving outlier response, it’s a ration tax.
Red-flag trigger: any supplement with implied break-even above $2.09/lb protein or $2.02/lb fat, and no 30-day before-and-after data proving the response — cost to eliminate.
Watch for: products bundled into larger mixes where per-cow-per-day cost is hard to isolate. Ask for it in writing.
3. Put a methionine kill switch in writing with your nutritionist. +0.05% protein minimum, $0.12/cow/day maximum. Review date on the calendar. No exceptions.
Red-flag trigger: either threshold violated for 30 consecutive days — pull the product, reset the ration, re-baseline before adding back.
Watch for: “the response will show up next month.” Put a review date on the calendar and hold it.
4. Before your next breeding decision, ask two questions. “What’s this bull’s total CFP in pounds?” Then: “What’s that worth per lactation at $2.0905 protein and $2.0220 fat?” That conversation surfaces the ratio trap before it ends up in your herd — at current prices, a 15-lb CFP gap between two sires is worth ~$20/daughter/lactation, and no realistic protein price flips that math.
Requires: current sire-list CFP data, March 2026 FMMO prices in the genetic advisor’s conversation.
Red-flag trigger: advisor defaults to protein-to-fat ratio or last year’s prices — stop the meeting and reset the reference numbers.
Watch for: marketing materials built on 2024 component prices. The math has moved.
90-Day Actions
5. Rebuild sire selection criteria around total CFP. Shift from protein-ratio filters to Net Merit or Cheese Merit as the primary screen. Sort by total CFP pounds. Protein PTA as tie-breaker only.
Requires: a conversation with your genetic advisor using March 2026 FMMO prices, not 2024’s. Bring current herd-average component tests.
Threshold: if your current bull lineup’s average CFP sits below the breed top 50% on the current CDCB run, you’re leaving component revenue on the table genetics-to-barn is slow to fix.
Watch for: over-tilting toward protein at the expense of health and fertility. Net Merit and Cheese Merit already hold that balance. Don’t override the index manually for ratio.
6. Stress-test every capital project at $17 Class III, not $19.70 all-milk. USDA’s March 2026 LDP-M-381 outlook projects 2026 all-milk at $19.70/cwt; CME Class III futures at the same moment traded closer to $16.16/cwt. A $3.54/cwt gap between the government forecast and the market’s own price signal is real-money exposure on any capital underwriting. On a 500-cow herd shipping roughly 136,875 cwt/year (500 × 75 × 365 ÷ 100), that’s approximately $484,540/year of revenue sensitivity between the two benchmarks — enough to break a project that only pencils at the USDA forecast. The gap between the government forecast and the futures board is the gap between a project that survives and one that breaks the operation.
Requires: your CPA or lender running sensitivity on barn, robot, and equipment purchases at $17 Class III.
Threshold: if a project’s DSCR drops below 1.2 at $17 milk for three consecutive months, treat as a luxury, not a necessity.
Watch for: contractors and equipment sellers pitching against the USDA forecast. The futures market is the one you hedge.
7. Lock in 60–75% of feed needs when corn projects at $3.90–$4.10/bu. Per the source economic analysis cited in this issue’s methodology, corn in that band yields roughly $11.56/cwt feed cost — manageable against current Class III.
Requires: cash flow for the hedging strategy, or a relationship with your co-op’s risk management service.
Threshold: corn in-band → lock. Corn above $4.25/bu with basis strengthening → wait for pullback or shorten coverage horizon.
Watch for: locking feed without also locking enough milk. You want both sides covered, not just the cost side.
365-Day Moves
8. Map your FMMO basis against the processing gravity wells. If you sit within draw radius of Lubbock, Dodge City, or an I-29 corridor plant, you have pricing leverage producers 200 miles farther out don’t. Structural demand from ~$10B in new cheese processing supports protein prices for the next two to three years. Renegotiate before capacity is fully committed.
Requires: 12 months of basis data against your plant vs. Order 30 statistical uniform price.
Opportunity signal: basis tightened to within $0.30/cwt of the Statistical Uniform Price while your component tests exceed county average — room to ask for contract improvements.
Watch for: short-term premiums written with pull-back triggers tied to volume. Read the basis-when-volumes-fall clause specifically. It’s the clause nobody reads until it triggers.
9. Track the 0.75 milestone quarterly. If the national ratio hits 0.75 on the late-2027 projected timeline, processor standardization costs accelerate and basis pressure increases on fat-heavy, protein-light herds. Herds repositioned 12–18 months ahead feel it least.
Requires: Tracker updates plus your own herd’s component trend line.
Opportunity signal: national ratio stabilizing above 0.76 for three consecutive months = evidence the market is self-correcting. Different strategy.
Watch for: short-term seasonal swings masking a trend reversal. Quarterly, not monthly.
10. Genomic-test for component direction, not just rank. At $30–$40/head, genomic testing identifies the top 20–30% of heifers worth breeding back to elite component sires. Bottom tier goes beef-on-dairy to capture beef-cross value while the pipeline tightens on components.
Requires: ~$40 × testing population + time to integrate results into breeding decisions.
Threshold: if your current replacement pipeline runs less than 25% genomic-tested heifers and you milk 500+, the sorting decision pays back within the replacement cycle at current component prices.
Watch for: testing without changing what you do with the data. ROI lives in the sorting decision, not the test itself.
The market already repriced. Your milk check is catching up. Every month the operation stays calibrated to the old fat-premium world is a month of compounding gap against herds that already moved. You gain cushion on components here. You give up flexibility on ration-by-habit there.
Two questions to take to your next milk meeting. What does your processor contract actually say about basis when Order 30 cheese utilization exceeds 85%? And what’s your real margin over feed per cwt this month versus 90 days ago — at $2.0905 protein, not last year’s number?
Key Takeaways
March 2026 FMMO flipped the component stack: protein at $2.0905/lb now beats butterfat at $2.0220, and on a 500-cow Order 30 herd at 75 lbs/day, every tenth of protein is worth $28,614 a year.
The national protein-to-fat ratio hit 0.760 in 2025 against cheese plants calibrated for 0.82; if you ship into Order 30, you’ve got roughly 16 months before the 0.75 line starts showing up in basis conversations.
At current prices, total CFP pounds drive the milk check — not protein-to-fat ratio. If your sire list is sorted on ratio, you’re leaving roughly $20 per daughter per lactation on the table and you won’t outrun that math until protein triples.
Stress-test every 2026 capital project at $16.16 CME Class III, not USDA’s $19.70 all-milk forecast. The $3.54/cwt gap is about $484,540/year of revenue sensitivity on a 500-cow herd — the difference between a project that survives and one that doesn’t.
Methodology and Sources
Scope. All barn math uses March 2026 USDA AMS FMMO component prices (protein .0905/lb, butterfat .0220/lb) on a 500-cow Wisconsin/Minnesota operation shipping into FMMO Order 30 at 75 lbs/cow/day, unless stated otherwise. Prices refresh with each month’s FMMO announcement. The interactive Component Value Tracker at thebullvine.com/tools lets readers substitute their own herd parameters against the same formulas and price inputs.
Bullvine projections, labeled as such. The 0.75 crisis threshold, the ~16-month timeline, the Component Opportunity Score methodology, the ~$8,350 Brown County single-sire-swap scenario, the $17,500 broad-filter ratio-trap estimate, and the 150-heifer/2.8-lactation replacement-pipeline assumptions are proprietary Bullvine modeling — published here for the first time.
External sources. USDA AMS FMMO March 2026 component prices; FMMA30 Upper Midwest 2025 annual class utilization and international component comparison; USDA NASS Milk Production Reports, February and March 2026; USDA ERS Livestock, Dairy, and Poultry Outlook, March 2026 (LDP-M-381); CoBank Knowledge Exchange, “While U.S. Leads Milk Component Growth, Butterfat May Be Growing Too Fast,” September 25, 2025; Holstein Association USA Geneticist Insights, April 2026; Select Sires / CDCB April 2025 Base Change documentation; Animals meta-analysis of rumen-protected methionine (PMC9219501, 2022); Animals combined RPLM supplementation study (PMC12691028, 2025); PLOS ONE rumen-protected methionine trial (pone.0243953, 2021).
Every week, thousands of producers, breeders, and industry insiders open Bullvine Weekly for genetics insights, market shifts, and profit strategies they won’t find anywhere else. One email. Five minutes. Smarter decisions all week.
Cornell’s bottom‑quartile dairies sit at 0.36× DSCR. At 7% money on $4.5M of repriced debt, that’s about $118,000 more a year — and the reason your loan officer opened the laptop instead of the yellow pad.
Executive Summary: Commercial ag operating rates sat in the mid‑7% range through late 2025 and early 2026, and Cornell’s 2023 DFBS shows the lowest‑profit quartile of New York dairies running a 0.36× DSCR — the exact number sending “good customer” files to the watch list. On $4.5M of repriced debt spread across real estate, equipment, and an operating line, the jump from 3.5–4% money to 7–8% adds roughly $118,000 a year in required payments, or about $1.07/cwt on a 400‑cow herd shipping 110,000 cwt. At USDA’s early‑2026 all‑milk forecast of $18.95/cwt, that same herd barely clears 1.0× DSCR; you need $20+ milk to breathe. Re‑amortizing a $1.8M parlor note from 14 to 25 years at 7.25% frees about $47,000 a year in cash flow — enough to pull a file out of the red, at the cost of more lifetime interest. Lenders aren’t firing bad customers; their models are. The farms getting flexibility walk in with a rolling 12‑month cost per cwt, their own DSCR math, a stress test at $17 milk, and at least one non‑correlated revenue line — beef‑on‑dairy, custom heifers, crop sales — that the dashboard can see. If your DSCR sits below 1.15× today and you can’t list every note and index on one page, your loan officer has more clarity on your risk than you do — and the next 30 days are when that changes.
Picture a gray February morning in central Wisconsin. A third‑generation dairyman walks into his Farm Credit office carrying 30 years of loan statements and the quiet confidence of a guy who’s never missed a payment.
He’s expecting a handshake. A quick renewal. Maybe a short gripe about milk prices over bad coffee.
Instead, the loan officer — younger, laptop already open — pulls up a screen. The numbers don’t work the way they used to. Red on debt service coverage. Yellow on working capital. A projected breakeven that has jumped nearly two bucks a hundredweight after a batch of loans repriced. For a 380‑cow herd, that’s not an abstract “dairy lending 2026” headline. That’s the morning the computer says no — and a family decides whether to catch up to the bank’s math or let the bank decide their future.
A note on these stories: The three dairies described below are illustrative composites, not real operations. They’re built from 2023–2026 industry patterns in Cornell’s Dairy Farm Business Summary, Chicago and Kansas City Fed ag credit surveys, and Bullvine case work. The math and thresholds are real. The names, scenes, and dialogue are not attributed to any specific producer. Real named sources — Nathan Kauffman at the Kansas City Fed and David Oppedahl at the Chicago Fed — are quoted or paraphrased only from their own published commentary and reporting by outlets like Brownfield Ag News. If you’re a producer willing to share your DSCR restructure story on the record, reach out — future “Dairy Lender Files” installments will feature real named operations.
The Day the Screen Replaced the Yellow Pad
For a long time, your dairy loan ran on three things: reputation, collateral, and whether your lender thought you kept a tight ship. You’d sit across from someone who knew your family and your fields. They’d scribble on a yellow pad, ask how the year went, and if you’d always paid your bills, the renewal slid through.
That world hasn’t vanished. It now sits underneath something colder — standardized credit models that score a 200‑cow tie‑stall in Minnesota the same way they score a 1,200‑cow freestall in New York.
Between 2015 and 2021, a lot of dairy debt went on the books at roughly 3.5–4.5% for conventional ag loans. Some FSA‑backed notes sat even lower. Then cheap money disappeared. The Chicago Fed’s 7th District AgLetter has pegged operating‑loan rates in the mid‑7% range and farm real‑estate loans in the high‑6% range through late 2025 and into early 2026 — still about double what many dairies locked in during their last expansion.
Those are effective rates on recently booked loans reported by participating banks — a blend of fixed and variable product. New paper is increasingly written as variable, typically priced as a spread over Prime or a term SOFR benchmark. Ask your lender which index your next renewal tracks. On a $3M loan, a 100‑basis‑point drift is roughly $30,000 a year in added interest; closer to $50,000 on $5M.
As of early 2026, USDA direct FSA operating loans sat in the mid‑4% range and ownership loans in the mid‑5% range — well below the commercial market, but only for borrowers who qualify. Check the current month’s FSA rate notice before you assume you’re priced in.
Kansas City Fed economist Nathan Kauffman told Brownfield Ag News in late 2025 that most producers can still service existing debt, helped by strong land values, but working capital is tight and some have already restructured heading into 2026. Chicago Fed policy advisor David Oppedahl has been more pointed in recent AgLetter commentary: repayment rates on non‑real‑estate loans are slipping, problem loans are creeping up, and roughly half of surveyed ag bankers expect more forced liquidations ahead.
At the system level, it’s “stress, not crisis.” At your kitchen table, sitting at 1.0× DSCR with repriced loans, that distinction feels academic.
What Your Lender’s Dashboard Actually Sees
When your lender opens your file, the model behind the screen scores you on ratios that sound cold but boil down to barn math once you cut the jargon. Every farm should be able to pull this snapshot in under five minutes.
The Dashboard Cheat Sheet
Metric
Target (Strong)
Danger Zone
Where the Numbers Come From
DSCR
> 1.25×
< 1.0×
Cornell DFBS 2023: top group 2.95×, bottom 0.36×
Debt per Cow
< $3,500
> $7,000
Progressive Dairy “Dairy Dozen” benchmarks
Working Capital
> 25% of gross revenue
< 10%
OSU “15 Measures of Dairy Farm Competitiveness”
Debt‑to‑Asset
< 0.25
> 0.40
DFBS 2023 average 0.29; top group 0.21
Now the barn‑math version of each.
Debt service coverage ratio (DSCR). Net cash available for debt service divided by total annual principal and interest. A lot of lenders quietly target at least 1.25× as a comfort line. Cornell’s 2023 DFBS profitability comparison across 129 New York herds makes the spread vivid: the lowest‑profit group averaged just 0.36×, mid‑low hit 1.14×, mid‑high reached 1.38×, and the most profitable group sat at 2.95×. Below 1.0×, you’re not generating enough cash to cover your own debt.
Profitability Group
DSCR (×)
Lowest
0.36
Mid‑low
1.14
Mid‑high
1.38
Top
2.95
Working capital. Current assets minus current liabilities. Ohio State’s “15 Measures of Dairy Farm Competitiveness” calls anything above 25% of gross revenue competitive. In Brownfield’s 2025 coverage, Kauffman flagged working capital as the metric lenders are watching closest heading into 2026.
Debt per cow. Cornell’s lowest‑profit quartile carried about $5,007 of debt per cow versus roughly $3,097 for the top group — a gap of almost $1,900 per cow. Progressive Dairy’s “Dairy Dozen” benchmarks peg $3,000–$5,000 as manageable and flag $7,000 per cow as the point where servicing gets difficult.
Debt‑to‑asset ratio. The Cornell all‑farm DFBS average was 0.29 in 2023. Top‑profit farms ran about 0.21; the lowest‑profit group sat at 0.34. OSU flags anything above 0.30 as moving into higher‑risk territory.
Your grandfather knew these ratios. The difference? He had a year to fix them. You have a quarter.
The model pulls your numbers quarterly — sometimes monthly — and benchmarks them against thousands of farms in the bank’s footprint. Chicago Fed surveys through 2025 showed a rising share of 7th District banks reporting tighter collateral demands. If you’re not running these ratios yourself, your lender still is. You’re just not seeing the same screen.
Three Composite Farms, Three Outcomes
What follows are three composite dairy families — patterns, not people — built from 2023–2026 data in Wisconsin, New York, and Minnesota. Same industry, same rate environment. Very different results, depending on how they showed up at the bank.
A 380‑Cow Wisconsin Dairy: “Good Customer” Meets New Math
Call this composite a 380‑cow Holstein herd in a sand‑bedded freestall in central Wisconsin. Rolling herd average in the high 70s. In 2019, a farm with this profile might have expanded the parlor and housing, taking on roughly $1.8 million in new term debt at around 3.75%. Payments fit fine at the time.
Those loans repriced in late 2025 to just over 7%, right in line with Chicago Fed survey rates. Bullvine’s own rate analysis suggests repricing typical mid‑size dairy debt from the mid‑3s to the mid‑7s can add more than $100,000 a year in debt service on $3–4M of repriced debt. For a 380‑cow herd on this trajectory, breakeven jumps from the high‑$17s into the low‑$19s per cwt.
A herd like this often has never missed a payment. Land still pencils as strong collateral — Oppedahl has noted in the Chicago Fed AgLetter that rising 7th District land values give some stressed farmers the option to sell off a portion of land to support operations. Even so, this kind of file typically shows DSCR sliding from above 1.4× to around 1.1×. That moves it off autopilot and onto the watch list.
At annual review, instead of a quick signature, the conditions now look like this: monthly financials instead of quarterly, a cap on new capital spending, and a clear ask to show a path back to at least 1.25× DSCR inside 18 months.
The common turning point on farms like this: somebody — often a younger family member — pulls 12 months of milk checks and expense reports, sits down with an Extension farm business educator, and builds a cash‑flow projection with three paths. Hold steady and hope for $20+ milk. Trim tail‑enders and push extra cash into principal — exactly the kind of move Kauffman has pointed to as risk reduction. Or lean harder into components and beef‑on‑dairy genetics.
That last path matters more to the bank than many producers realize. Lenders reward revenue that isn’t tied to the Class III/IV roller coaster. Beef‑on‑dairy calves sell into the fed‑cattle market, not the milk market, so they’re effectively non‑correlated revenue — cash that keeps flowing when milk prices tank. On a working balance sheet, a pen of high‑value crossbred calves and short‑bred heifers carries more weight than straight Holstein bull calves, strengthening the working‑capital line the model pulls every quarter. That kind of balance‑sheet signal often translates into more flexibility at renewal.
💡 The $47,000 Payment Gap On a $1.8M parlor note at ~7.25%, re‑amortizing from a 14‑year remaining term to a new 25‑year term drops annual P&I from roughly $203,000 to $156,000 — a gap of ~$47,000 per year. That’s the number in the headline. It’s also what often moves a watch‑list farm back into the “renewed” column. The trade‑off: more total interest over the life of the loan.
When a composite farm like this comes back to its lender with the same cows, same ground, same total debt, but a sharper story, the outcome typically shifts. A $47,000/yr payment drop nudges projected DSCR from about 1.14× into the low‑1.2× range. Not cushy. Out of the danger zone.
The relationship doesn’t carry farms like this. The data does.
Go deeper: “Profitable but Drowning: The Interest Rate Crisis Reshaping Mid‑Size Dairy” walks through the full repricing breakdown on herds in this exact position.
A 620‑Cow New York Dairy: Data Buys Better Terms
The second composite: a 620‑cow western New York dairy built from 200 over a decade by reinvesting profits and timing land buys around local retirements. Total debt near $6.8 million across a Farm Credit real‑estate package, a local bank equipment note, and an FSA‑guaranteed operating line. On paper, that leverage could make any lender twitch in a 7% rate world.
Files like this one earn the opposite reaction.
Operators on this trajectory track cost of production by month. Not just “feed, labor, other” — purchased feed per cow per day, hired labor per cwt, interest expense per cwt, repairs as a percent of gross. A rolling 12‑month cost around $16.80/cwt is plausible for a tightly run herd of this size. A 2023 Northeast Dairy Farm Summary reported a net cost of production of $22.64/cwt across member farms, so this composite would run well below the regional average. Cornell’s DFBS profitability comparison confirms the pattern from another angle: the highest‑profit group carried a debt coverage ratio of 2.95× versus 0.36× at the bottom.
A herd like this seeking $400,000 to upgrade manure storage under state rules would typically show DSCR holding in the high‑1.3× range even under a modeled $17 all‑milk year. Working capital comfortably positive. A simple written succession outline bringing a family member in over the next decade.
Rather than tightening terms, a lender looking for a reason to keep this file often goes the other direction — consolidating higher‑rate equipment debt into a longer real‑estate package. On the $1.2M chunk modeled here, stretching the term and picking up a better rate can cut annual debt service by roughly $40,000 (illustrative; exact savings depend on term and rate selected). That cash goes straight to working capital and strategic repairs.
The farm that walks in with a clear cost‑of‑production story gets the best tools when things get tight.
A 280‑Cow Minnesota Dairy: When “Good Customer” Isn’t Enough
The third composite: a 280‑cow tie‑stall in east‑central Minnesota. The cows do fine. The concrete, not so much.
No parlor, no robots, no big value‑added sideline. Total debt around $1.9 million, mostly land and building mortgages. A family farm like this often works with the same locally owned community bank for decades. The lender knows them by name and quietly rolls the operating line year after year.
Then, in 2024, that bank gets absorbed into a larger regional system — part of the wave of Midwest community‑bank consolidations over the last decade. When the file hits the new centralized risk model, three things flag: DSCR under 1.0× on recent tax returns (well below the Cornell all‑farm average of 1.84×), debt‑to‑asset ratio pushing 0.40 (versus the DFBS average of 0.29), and no documented succession plan. Kids with careers off‑farm.
That’s almost exactly the profile Kauffman has flagged in KC Fed commentary as most at risk — a producer who hasn’t built much land equity and carries heavier leverage on machinery or buildings.
Doors don’t slam on farms like this. The rules change. Operating line renewed for one year instead of three. Rate jumps about 1.25 percentage points, adding roughly $7,500 a year in added interest on a $600,000 line — on top of tighter covenants and a shorter renewal window. The bank asks for a formal transition or exit plan inside 12 months.
The typical next step on these files is a Minnesota Farm Business Management instructor — not to plan expansion, but to map an orderly wind‑down. A realistic three‑year exit: timing cow and equipment sales to avoid fire‑sale discounts, using Dairy Margin Coverage payouts and safety‑net checks to bridge cash flow, and listing land at current comparable values instead of waiting for a sheriff’s notice.
Bullvine’s own case work across several Midwest exits suggests families who planned 7–18 months ahead preserved roughly $400,000–$680,000 more equity than those pushed into forced liquidation. It isn’t the ending anyone dreams of. It beats letting the dashboard pick the date and the price.
▶ Next Step for Farms in This Position:Read “The 45‑Day Survival Guide for Mid‑Sized Dairy Operations” — the most logical playbook for operators whose DSCR is already under 1.0×.
What Happens to Your Milk Check When Your Interest Rate Jumps 1%?
Strip away the banker language and a big part of this shift is brutally simple: the same debt costs you a lot more than when you signed for it.
Take $2.5 million of term debt on a 20‑year amortization. At 6.5%, annual principal and interest runs about $223,700. Ship 100,000 cwt a year, and that’s roughly $2.24/cwt just to service that debt. At 7.5%, the payment climbs to about $241,700 — roughly $2.42/cwt. That’s about $18,000 more per year, or $1,500 less cash per month. (Standard amortization estimates; your exact number depends on payment structure and compounding.)
Interest Rate
Annual P&I (US$)
6.5%
223,700
7.5%
241,700
Now look at how that moves DSCR:
Net cash for debt service at $300,000 and a 6.5% payment: DSCR ≈ 1.34×.
Same cash, 7.5% payment: DSCR drops to about 1.24×.
If milk slides and net cash falls to $200,000 at the higher rate: DSCR ≈ 0.83×.
One percentage point of interest. One dollar of milk price. That’s the gap between “renewed with conditions” and “we need to talk about restructuring.”
How Much Does a Full Repricing Really Move Your Breakeven?
If you’re sitting on around $4.5 million in total debt, here’s what the repricing wave looks like using realistic chunks drawn from Fed survey ranges (standard amortization math, rounded for presentation):
Debt Type
Amount
Old Rate
New Rate
Old Annual P&I
New Annual P&I
Real estate (15‑yr)
$2.7M
3.5%
7.5%
~$232,000
~$300,000
Equipment (7‑yr)
$1.2M
4.0%
7.0%
~$197,000
~$217,000
Operating line (interest‑only)
$600K
3.0%
8.0%
$18,000
$48,000
Total
$4.5M
~$447,000
~$565,000
That’s about $118,000 more per year in required payments.
Spread across different herd sizes shipping milk:
Approximate Herd Size
Cwt Shipped
Added Cost (US$/cwt)
200 cows
55,000
2.15
280 cows
80,000
1.48
400 cows
110,000
1.07
The smaller you are, the bigger the per‑unit hit. And if your margin was only $0.50–$1.00/cwt to start with, that’s the whole ballgame.
Now stress‑test DSCR for that 400‑cow, $4.5M‑debt scenario. Assume 110,000 cwt shipped and non‑debt cash operating costs around .50/cwt — efficient by Cornell’s standards, given that DFBS profitability data shows far higher averages across most farms. USDA’s early‑2026 WASDE pegged the all‑milk forecast at $18.95/cwt, down from a revised $21.17 for 2025.
WASDE updates monthly. If a newer report has landed between filing and publication, refresh both the all‑milk row and the DSCR column below.
All‑Milk Price
Gross Revenue (110k cwt)
Cash Costs (@ $13.50)
Net Cash for Debt
DSCR vs ~$565K P&I
How Your Lender Reads It
$17.00
$1,870,000
$1,485,000
$385,000
~0.68×
“We have a problem.”
$18.00
$1,980,000
$1,485,000
$495,000
~0.88×
Below 1.0× threshold
$18.95
$2,084,500
$1,485,000
$599,500
~1.06×
Barely above water
$20.00
$2,200,000
$1,485,000
$715,000
~1.27×
Comfort zone
$22.00
$2,420,000
$1,485,000
$935,000
~1.66×
Strong
At $18.95 milk, you barely clear 1.0×. You need $20+ to breathe.
And that $13.50/cwt cost assumption is efficient. A 2023 Northeast summary reported a net cost of production of $22.64/cwt across member farms. If your cost base runs closer to $16–$17, the DSCR in this table deteriorates fast.
Go deeper: “$18.95 Milk, $19.14 Costs: USDA’s 2026 Milk Price ‘Upgrade’ Still Leaves Your Dairy in the Red” runs the full margin math band by band.
What DSCR Do Banks Really Want from Dairy Farms?
You can’t control your lender’s internal model. You can understand the target it’s aiming at.
At its simplest: DSCR = net cash available for debt service ÷ total annual principal and interest. If your net cash is $400,000 and total payments are $320,000, your DSCR is 1.25× — the farm generates 25% more cash than it needs to make debt payments.
DSCR Band
Typical Bank View
What It Feels Like on Farm
Lender Response
Below 1.0×
Not covering debt from cash flow
Scrambling to make payments, no buffer
Conditions, collateral pressure, restructure or exit talks
1.0–1.15×
Thin, one bad month from trouble
Every breakdown or milk dip hurts
Short‑term tolerance only with a written plan
1.15–1.30×
“Okay, not great”
Can sleep, but watch weather and milk price
Floor for flexible terms, new money around 1.25×
> 1.30×
Strong performer
Can invest and handle volatility
More freedom on terms, structure, and covenants
Pulling from Cornell’s 2023 DFBS profitability comparison (129 New York herds):
Below 1.0×. Not generating enough cash to cover debt. The lowest‑profit group averaged 0.36×. Expect conditions, collateral calls, or hard conversations.
1.0–1.15×. One bad month of milk, a feed mistake, or a breakdown can push you under. Some lenders will sit here short‑term, but only with a written plan to climb out.
1.15–1.30×. Where a lot of mid‑size herds land when things are “okay, not great.” Many lenders treat 1.25× as the floor for new money or flexible terms. Cornell’s mid‑high profit group averaged 1.38×.
Above 1.3×. Strong. The top‑profit group ran at 2.95×. These farms tend to get more freedom on amortization schedules and covenant structures because the numbers back the story.
Here’s the catch. Your lender isn’t just running DSCR at today’s mailbox price. Chicago Fed data confirm that extensions and renewals on non‑real‑estate lending are increasing — a sign more borrowers are asking for extra time and banks are testing harder before granting it. If you walk in having only looked at your best‑case price, and the dashboard is staring at your worst‑case, you’re not even arguing over the same math.
Are You Giving Your Lender Enough Data to Fight for You?
A lot of good operators will quietly admit they’ve never walked into the bank with a real data packet. The lender knew them. The cows looked fine. Bills got paid.
In a dashboard world, being a good operator still matters — but mostly after the numbers clear the first screen. If you want your lender to push for you with a credit committee that’s never set foot in your parlor, you’ve got to hand them ammunition.
The Minimum Data Packet (200–1,500‑Cow Dairy)
For your next scheduled meeting — not an emergency — walk in with:
Last three years of financials. Tax returns (Schedule F), year‑end balance sheets, depreciation schedules.
Rolling 12‑month cost per cwt. At least broken into feed, labor, and “all other” operating costs.
Your current DSCR. Today’s loan balances, current interest rates, total annual payments.
Working capital snapshot. Current assets minus current liabilities — the metric Kauffman has specifically flagged as the one lenders are watching closest.
Leverage snapshot. Total debt divided by total assets. The DFBS average was 0.29 in 2023; know where you sit.
That alone puts you ahead of more farms than you’d guess.
What Actually Earns Better Terms
Three forward scenarios. Base case, a “$2/cwt lower milk” stress case, and a slightly better‑than‑today case.
A simple succession plan. Even a one‑page outline of who’s likely running the place in 5–10 years. Farm Credit and Extension communications increasingly treat succession as a formal credit factor, not just a family story.
Real‑time production data. Rolling herd average, butterfat/protein trends, voluntary cull rate — anything that shows you manage cows, not just cash.
A non‑correlated revenue story. Beef‑on‑dairy receipts, custom heifer raising, crop sales, on‑farm processing. Anything not priced off the milk check strengthens your current‑asset picture in the bank’s model.
Rate‑index awareness. Know whether your current notes are fixed, variable over Prime, or tied to term SOFR. If you can’t tell the loan officer which index prices your operating line, you’re arguing blind.
FSA awareness. Know whether you qualify for USDA direct loans — well below commercial markets — and whether FSA‑guaranteed lending could improve terms with your current bank.
Red Flags That Trip Wires Fast
Patterns that, from lender and Extension farm‑management conversations, tend to push files straight into the risk bucket:
No updated personal financial statement after the lender asked for one.
No honest cost‑of‑production number.
No forward cash‑flow projection, even a simple one‑pager.
Farm and household expenses so tangled the lender can’t separate them.
A flat refusal to discuss succession.
No idea whether your rate is fixed or floating — or over what index.
When your dashboard numbers are already thin, any one of these pushes a lender toward higher rates, tighter covenants, or a quiet “no.”
Options and Trade‑Offs for Farmers
You don’t control interest rates. You control how you show up in front of the dashboard over the next 12 months.
1. Upgrade Your Data Game (30‑Day Action)
Start here if you plan to keep milking at least 3–5 years, you’re not insolvent, but you honestly don’t know your DSCR or cost per cwt.
This month: Pull 12 months of milk checks and main expense categories. Build a rolling 12‑month cost per cwt using a simple spreadsheet or FINPACK template from Extension. Calculate your DSCR. Then book a meeting with your lender specifically to review your data — not to ask for money.
You walk in knowing where you stand instead of hoping. Your lender sees someone running toward the problem, not hiding.
The risk: You may not like that first DSCR number. But you can’t fix a ratio you won’t look at.
2. Restructure Before You’re Forced To
Move here if your DSCR is hovering near or just below 1.0×, you still have land equity, and your next big renewal is 6–24 months out.
What it takes: Map every loan on one page — balance, rate, index (fixed, Prime‑based, SOFR‑based), remaining term, payment. Model what happens if milk averages $2/cwt less than last year. Be open to extending terms on some debt or selling a non‑core asset. Oppedahl has pointed out in recent AgLetter commentary that some farms will need to sell land to help fund operations — it goes better if you initiate that conversation.
What you gain: Breathing room. A lender looking for a reason to keep you often will stretch a major note from 14 to 25 years, saving about $47,000 a year in payments on $1.8M at roughly 7.25% — enough to move DSCR out of the red.
What you give up: More total interest over the life of the loan. You’re buying flexibility today with future dollars. Move early and you help design the restructure. Wait, and somebody else does it for you.
3. Double Down on Margin, Not Size
This is the right path when you’re not set up to add cows cheaply, but there’s room to improve component premiums, beef‑on‑dairy revenue, or trim operating costs.
What it takes: Honest benchmarking of feed, labor, and machinery cost per cwt against peers. A focused 12‑month plan to raise butterfat/protein, add beef‑cross value, or shave specific costs. Cornell’s DFBS tells the story bluntly: the spread in debt coverage between the lowest‑profit group (0.36×) and highest (2.95×) wasn’t mainly about herd size or premiums — it was about cost discipline that drops straight to the DSCR line.
On a 600‑cow herd shipping 170,000 cwt, a $1.00/cwt cost reduction is worth $170,000 a year. Premiums help. Cost discipline changes your DSCR. A solid beef‑on‑dairy program gives the bank a revenue line that isn’t riding the Class III roller coaster.
The risk: Chasing premiums with extra labor or purchased feed can backfire if costs rise faster than the bonus. Measure tightly.
4. Plan an Exit While You Still Have Leverage
Consider this one when you’re past 60, heirs aren’t coming back, DSCR is under 1.0×, and you’re tired of wondering which letter from the bank is “the one.”
What it takes: A farm transition specialist or attorney. Early, blunt conversations with your lender about what a cooperative exit looks like. The willingness to say, “We might be better off leaving on our own terms.”
Across several Midwest cases, Bullvine’s analysis suggests strategic exits with 7–18 months of planning preserve roughly $400,000–$680,000 more family equity than forced sales — a margin close to the $480,000 equity gap between strategic exit and forced sale we’ve documented in prior case work. The difference between “retire with options” and “start over in town.”
The risk: Emotionally brutal. Some relationships fray. But the math usually gets worse, not better, if you delay.
Go deeper: “Only 12% of Dairy Farms Make It to Generation Three — Here’s What’s Different About the Ones That Do” is the companion read for families wrestling with this path.
Key Takeaways
If your DSCR sits below 1.15× today, treat it as a yellow light. Cornell’s lowest‑profit group averaged 0.36× — they didn’t get there in one quarter. Run your own stress test at $17 milk and talk with your lender before you drift under 1.0×.
If you can’t list your total annual debt payments on one sheet of paper, your lender has more clarity on your risk than you do. Within 30 days: list every note and operating line, add up annual P&I, calculate your DSCR.
If your plan assumes rates “go back to normal,” it’s not a plan. Commercial operating rates sat in the mid‑7% range through late 2025 and early 2026, and new paper is increasingly variable over Prime or term SOFR. Model your next two years at today’s rates and one notch higher.
If more than 90% of your revenue comes off the milk check, your balance sheet is more fragile than your lender’s model likes. Beef‑on‑dairy, custom work, or crop sales aren’t just extra cash — they’re non‑correlated revenue that strengthens how the dashboard reads your farm.
If you want your lender to fight for you in the credit committee room, hand them a story their dashboard can tell. A real cost‑of‑production number, a forward cash‑flow, and at least a rough succession outline.
The next time you sit across from your loan officer, the screen between you will quietly shape how hard they can push on your behalf.
You don’t control that dashboard. You do control whether it shows a fuzzy picture or a sharp one. For the deeper math — DSCR across five milk‑price bands, how Dairy Margin Coverage and FMMO changes interact with lender risk scoring, and the full cost‑of‑production playbook — watch for the next “Dairy Lender Files” installments in The Bullvine Weekly.
If the numbers are weighing on you, don’t carry it alone. Call or text 988 for the Suicide & Crisis Lifeline. For dairy‑specific support, reach out to Farm Aid at 1‑800‑FARM‑AID, your state farm‑mediation service, or your Extension farm management program.
Do you know your DSCR today? If not, the computer does. It’s time to see the same screen.
Complete references and supporting documentation are available upon request by contacting the editorial team at editor@thebullvine.com.
Learn More
The $19 Milk Trap: How 2026 Prices Quietly Drain a 400‑Cow Dairy’s Equity — Exposes the $144,000 annual equity drain facing mid-sized herds and delivers a high-stakes playbook to protect your balance sheet. Breaks down full-cost breakeven targets while providing the “action signals” needed to survive a $19.00 milk market.
Dairy farm economics 2026: pricing and margins — Reveals the structural reset hitting North American producers through FMMO modernization and the Canadian protein pivot. Arms you with the market intelligence to navigate the “higher-of” formula and identify the quiet margin leaks threatening long-term profitability.
Beef-on-Dairy’s $3,000 Trap: 800,000 Missing Heifers and Who Pays the Bill — Dismantles the “cash-flow hero” myth of beef-on-dairy by exposing the looming 800,000-head heifer shortage. Follows the money on $3,000 replacement costs, revealing why high-reproduction herds are the only ones winning the genetic revenue gamble.
The Sunday Read Dairy Professionals Don’t Skip.
Every week, thousands of producers, breeders, and industry insiders open Bullvine Weekly for genetics insights, market shifts, and profit strategies they won’t find anywhere else. One email. Five minutes. Smarter decisions all week.
A 1952 soft-serve window on Boston Street went dark on April 25. Somewhere in the Northeast milk pool, a bulk tank just lost a seasonal account — and that’s a story every New England dairy producer should be reading.
Executive Summary: Salem’s Dairy Witch posted a closing notice on April 25, 2026 after 74 years on Boston Street — and for a 150-cow Essex County herd, a 75¢/cwt squeeze on the over-order premium that follows a seasonal-account loss like this runs about $22,500 a year; at $1.50/cwt, it’s $45,000. The window isn’t the story — the mix plants upstream and the over-order premium coming off your milk check are. Northeast Order 1 Class I utilization sat at just 20.4% of pooled milk in 2024, down from 44% in 2000, and every small seasonal buyer that goes dark thins that stack further. Farm Credit East’s 2024 Northeast Dairy Farm Summary pegged net earnings at 2 per cow last year, with Northeast farm prices typically clearing several dollars/cwt above the .81 Order 1 SUP — that’s the gap that shrinks when handlers lose volume. Stack the 2025 FMMO reforms on top (roughly $0.85–$0.93/cwt off class prices, or $95,000–$115,000 a year on a 500-cow Northeast dairy) and the margin picture gets ugly fast. The 30-day action: run a buyer concentration audit, stress-test your milk check against a $3–$4/cwt downside, and ask your field rep for their 72-hour contingency plan in writing. Read the full piece if any single handler takes more than a third of your volume, or if your over-order premium has slipped two months running.
Bea and Pete Polemenako opened a soft-serve window at 117 Boston Street in Salem in 1952. Seventy-four summers later, on April 25, 2026, Dairy Witch posted a closing notice. Owner Marietta Polemenako announced she was retiring after decades behind the window, and no buyer has been named.
That’s the Boston Globe story. The Bullvine story starts roughly 30 miles away, in a bulk tank whose milk — through a long chain of processors, mix plants, and foodservice trucks — helped feed that soft-serve machine every summer.
Every small dairy plant closure pulls one more thread out of New England’s Class I premium stack. The threads are thinning fast.
The Window Was Never the Story
Dairy Witch was a walk-up soft-serve stand. Seasonal. Open roughly April through early October. Cones, dips, frappes, the occasional hand-packed pint of Moose Tracks on the side.
It wasn’t a bottler. It wasn’t a creamery. No milk truck pulled into 117 Boston Street at 4 a.m. A window that size runs on pre-made soft-serve mix, delivered by a foodservice distributor from a plant somewhere upstream.
In eastern Massachusetts, that chain has gotten short. The FDA’s Interstate Milk Shippers list shows a handful of active licensed fluid operations in the state, and two names dominate the map: HP Hood in Agawam and DFA/Garelick in Franklin. Both remain the state’s largest fluid processors and show no public signs of closure; the pressure point is the smaller, seasonal, and direct-buy end of the market. Regional soft-serve mix moves through distributors like New England Ice Cream Corporation in Norton and Por-Shun in the Boston area.
So no — you won’t find a named Essex County farm that “lost its Dairy Witch contract.” The impact runs one link upstream. When mix plants lose seasonal accounts, over-order premiums typically come under pressure — a pattern Northeast dairy economists have documented for years. And the farms shipping into those plants feel it in the milk check four to six weeks later.
Before the barn math, know what you’re watching for. The checklist below is generic risk-spotting, not a prediction about any named plant.
How do you spot your local fluid buyer going under?
You don’t get a press release. You get signals. Watch for these:
Volume calls that stop mentioning seasonal accounts. Ice cream stands, schools, restaurants — if your field rep stops talking about summer pickups, something shifted.
Over-order premiums slipping two months in a row. One month is weather. Two is a margin problem at the plant.
Route consolidation notices from your distributor, especially if your pickup gets combined with a farm 40 miles farther out.
Owner retirement with no named successor. That’s the Dairy Witch pattern. Marietta is retiring; no buyer announced as of press time.
Lapsed or non-renewed state processor licenses in Massachusetts Department of Agriculture filings. Those are public records. Check them.
What does a dairy farm actually lose when a local buyer closes?
Start with Federal Milk Marketing Order math. Northeast Order 1, with Boston as the base zone, sets a Class I differential of $3.25/cwt on top of the base Class I price. USDA AMS announced the base Class I at $20.15/cwt for May 2026 — up $1.49 from April. That’s the floor.
The real milk check lives above the floor. Analysis of the 2024 Northeast Dairy Farm Summary, released July 2025, reported the average Northeast farm milk price climbed $1.17/cwt in 2024 from 2023 levels, with net earnings of $592 per cow in 2024 versus $292 in 2023. That recovery was driven largely by stronger component prices and a rebound in cheese demand — but it’s still a thin margin for anyone carrying new parlor debt or a recent generational transfer. The weighted-average FMMO Order 1 statistical uniform price was roughly $18.81/cwt for 2023, per USDA AMS’s 2023 Market Summary and Utilization report. Northeast farm prices in 2023 typically cleared several dollars per hundredweight above that floor — over-order premium, quality bonuses, and handler competition all stacked on top.
When a local fluid buyer closes, that stack starts shrinking. Industry commentary and long-standing Pennsylvania Milk Marketing Board testimony puts the over-order premium portion at roughly $0.75–$1.50/cwt in the Northeast, though specific figures vary by handler and year. Either way — it’s real money coming off the check.
Component
Value ($/cwt)
Source
Northeast Order 1 Class I differential, Boston zone
3.25
USDA AMS, FMMO Order 1
Base Class I price, May 2026
20.15
USDA AMS announcement, May 2026
Order 1 statistical uniform price, 2023
18.81
USDA AMS 2023 Market Summary
Northeast over-order premium range
0.75 – 1.50
PA Milk Marketing Board testimony; industry commentary
2024 NE farm price increase vs. 2023
+1.17
2024 Northeast Dairy Farm Summary, July 2025
Quick barn math. Take a 150-cow herd in Essex County. Massachusetts averaged 20,000 pounds of milk per cow in 2024, per USDA NASS — that’s 200 cwt per cow per year, or 30,000 cwt across a 150-cow herd. A 75¢/cwt squeeze on the over-order premium costs about $22,500 a year. At $1.50/cwt, it’s $45,000. Plug in your own herd size; the multiplier is brutal either way.
Stack that on top of the 2025 FMMO reforms, which The Bullvine’s April 2026 analysis estimated at roughly $0.85–$0.93/cwt off class prices for a representative 500-cow Northeast dairy — on the order of $95,000 to $115,000 a year depending on per-cow productivity. The math gets ugly in a hurry.
Thomas Dairy, Rutland, 2020 — A Preview You Already Watched
If Salem feels small, look north. In October 2020, Thomas Dairy in Rutland, Vermont — a fifth-generation fluid milk business founded in 1929 — closed. According to VTDigger and Vermont Public reporting, the closure followed the collapse of the company’s restaurant and school accounts during COVID. Supplier farms had to find new handlers ahead of the shutdown. This is a single historical parallel, not a predictive model — but it’s the closest Northeast case of a mid-century named fluid buyer closing on retirement-plus-market pressure, and the supplier farms did have to reshuffle.
Vermont has lost more than 400 dairies in the past decade. Vermont Dairy Delivers tracks the state at roughly 868 farms in 2015 and a current count in the mid-400s, with steady year-over-year exits. Most of those losses were small and mid-size herds — the same operations most dependent on local handlers paying real over-order premiums.
The national backdrop is rougher. USDA’s 2022 Census of Agriculture recorded a drop from 40,336 farms with milk sales in 2017 to 24,470 in 2022 — a 39% decline in five years. USDA’s February 20, 2026 Milk Production report showed another 1,036 licensed dairy operations exited in 2025, about 4% of the national total, bringing the average licensed count to 23,609. Pennsylvania alone accounted for 41% of all U.S. dairy exits last year, losing 320 farms, per February 2026 analysis.
Fluid drinking milk is the slowest part of the ship to sink with you. In Northeast Order 1, Class I utilization averaged just 20.4% of pooled milk in 2024, per the FMMO Order 1 annual bulletin — up 2.4 percentage points from 2023, but still a long way from the 44% Class I share the Order carried in 2000. Every Dairy Witch-scale account that goes quiet pushes that number further down.
What do you do in the next 30 days?
Don’t wait for a closure announcement. Do this before June.
Run a buyer concentration audit. Add up what percentage of your monthly milk volume goes to your top one, two, and three handlers. Any single buyer taking more than a third of your volume is a concentration risk by most Northeast lender and co-op standards. It’s also the fastest diagnostic you can run on a Sunday afternoon.
Stress-test your milk check. Model what next month’s check looks like if your top buyer exits and you drop to the FMMO blend. Use a conservative –/cwt downside — the rough gap between what Northeast farms have cleared in recent years and the Order 1 statistical uniform price. Multiply by your annual cwt. That’s the number that tells you whether you’re making phone calls this week or next quarter.
Call your cooperative field rep and ask the ugly question directly. “If my handler went dark tomorrow, what’s your 72-hour plan for my milk?” Any answer that isn’t specific is the answer you needed.
Within 90 days, sit down with your cooperative or handler to review your contract language on handler substitution, force-majeure clauses, and route reassignment rights. Those are the paragraphs nobody reads until the plant closes.
Options and Trade-Offs for Farmers
There’s no one right move. Four realistic paths, each with a bill attached.
Path
Best fit
Time to execute
Key constraint
Stay with current co-op, chase quality premiums
<300-cow herds with Agri-Mark/DFA/Hood ties
30–90 days
Caps your over-order upside
Switch to specialty / organic handler (e.g., Stonyfield, Organic Valley)
Pasture-ready farms; pay near mid-$40s/cwt in recent years
3+ years(NOP transition)
2022 Origin of Livestock rule closed one-time conventional loophole
Clusters of 200-cow neighbors on same vulnerable plant
6–18 months
Governance complexity
Stay with your current cooperative and diversify quality premiums. Works if your co-op is Agri-Mark, DFA, or Hood-aligned with multiple Northeast plants. You give up the chase for a higher over-order premium elsewhere, but you gain pooling stability and field rep attention. Good fit for farms under 300 cows without the bandwidth to renegotiate.
Switch to a specialty or organic handler. Stonyfield stepped in for some Horizon Organic farms after Danone’s 2022 Northeast exit. Organic Valley offered placements to dozens of Horizon-dropped operations, per coverage at the time. NODPA’s producer pay price tracking has shown organic figures in the mid-$40s/cwt range in recent years. Trade-off: USDA organic transition requires three full years of organic land management before certified organic milk can ship, plus separate herd-transition requirements under the National Organic Program. The regulatory burden isn’t trivial, and the 2022 Origin of Livestock final rule closed the old one-time conventional-to-organic transition loophole for most operations.
Build a direct-to-consumer line. Shaw Farm in Dracut has been bottling its own milk since 1908, running a home-delivery route, an ice cream stand, and a farm store all from the same property about 30 miles from Salem. Crescent Ridge in Sharon has followed a similar playbook for generations. You capture price — glass-bottle retail milk in eastern Massachusetts clears at a multiple of the FMMO blend. You also take on labor, bottling, delivery, retail, HACCP, and a seven-day-a-week foot-traffic business. Only works if your family has someone who actually wants to run a retail business. This is a 365-day decision, not a 30-day fix.
Consolidate with neighbors on shared processing. Regional co-processing or cheese co-packing arrangements have kept some mid-size Northeast farms alive. Governance gets complicated fast. But if your county has two or three 200-cow herds all shipping to the same vulnerable plant, a shared exit strategy beats three separate collapses.
None of these survive if you can’t see the buyer going under. That’s why the 30-day audit matters first.
Key Takeaways
If a single buyer takes more than a third of your monthly volume, start the alternative-handler conversation this month, not next quarter.
If your over-order premium drops two months in a row without a market-wide explanation, assume your plant has a margin problem and act accordingly.
If your handler’s owner announces retirement with no named successor, treat it like a 90-day exit notice whether or not one has been issued.
If your FMMO’s Class I utilization keeps drifting — Order 1 sat at just 20.4% in 2024 — your over-order-premium ceiling is drifting with it. Build your barn math around the floor, not the five-year average.
If you’re in a co-op, your 72-hour contingency plan isn’t theoretical. Ask for it in writing.
The Bottom Line
Every direct-buy relationship that dies forces a choice: accept the FMMO floor or build a buyer you can’t easily lose. Neither option is free, and neither one waits.
So here’s the question worth chewing on before your next field rep call: what’s the last small fluid buyer in your county, and how many summers do they have left? Salem lost a soft-serve window this spring. Rutland lost a fifth-generation bottler five summers ago. Somewhere in Aroostook County, or Bennington, or outside Springfield, another retirement conversation is happening at another kitchen table right now — and the question is whether your milk check is ready when that window closes too.
The Bullvine Weekly has the full FMMO reform breakdown and the 500-cow dairy barn math behind the six-figure impact flagged above. If you want the deeper economic model — the one to hand your lender before your next operating note — that’s where it lives.
Methodology note: This article is based on public closure coverage and USDA AMS, USDA NASS, VTDigger, Vermont Public, NODPA, and FMMO Order 1 data available as of April 30, 2026. Named processors and distributors are referenced for industry-structure context only; none are alleged to face closure risk.
Learn More
What Lactalis’s 270-Farm Cut Really Means for Every Producer — Clarity on your farm’s structural limits is your best defense against equity loss. This breakdown reveals why 89% of dairies over 1,000 cows profit, arming you with the $0.60/cwt professional service math needed to responsibly scale, transition, or sell.
Surviving the $0.94/cwt Dairy Make Allowance Hit — Exposing the structural federal pricing shifts erasing $105,000 annually from a 400-cow dairy gives you a critical planning advantage. You will master a specific formula to calculate your true All-Milk to mailbox gap and immediately recalibrate break-even metrics.
Every week, thousands of producers, breeders, and industry insiders open Bullvine Weekly for genetics insights, market shifts, and profit strategies they won’t find anywhere else. One email. Five minutes. Smarter decisions all week.
Class III moved $2.26/cwt in 88 days. The entire USMCA enforcement case Morris is running models to $0.31/cwt over 12 months. Guess which one clears your September check.
Executive Summary: Class III moved $2.26/cwt between January’s $14.59 announced price and the April 28, 2026, CME settle near $16.85 — roughly $187,580 of revenue swing on an 800-cow Northeast cheese herd’s Q3–Q4 book, no diplomats required. The entire NMPF/USDEC enforcement case Shawna Morris is running into the July 1 USMCA Joint Review models to a $0.31/cwt total scenario spread over 12 months: +$0.08 best case, -$0.23 worst case, author-modeled off published transmission coefficients and 2024 FAS GATS volumes. HighGround Dairy’s April 22 print shows Q1 2026 DRP netted $0.83/cwt — one quarter of coverage delivered more protection than the maximum USMCA “win” scenario delivers in a year. The real tail risk nobody’s pricing sits in Other Solids: a 35% China whey-price drop runs -$1.38/cwt on Class III, and it stacks on top of Scenario C, not instead of it. Producers with Q3–Q4 2026 contract renewals and unhedged milk are carrying the highest exposure — the 30/90/365 playbook inside starts with an FSA call today and a Contract Audit checklist for the September repricing clause you may not have read. The diplomats control the headline. Your hedge book controls the revenue.
Class III moved $2.26/cwt between the $14.59/cwt January 2026 USDA AMS announced price and the April 28, 2026, CME April-contract settle near $16.85/cwt. On an 800-cow Northeast cheese-oriented operation shipping roughly 83,000 cwt across Q3 and Q4, that’s 7,580 of revenue swing on half a year’s production — a volatility reference point, not a forecast. The market doing what markets do, no diplomats required.
In the 63 days between today and the July 1, 2026, USMCA Joint Review required under Article 34.7, the NMPF and USDEC enforcement push Shawna Morris has led is worth, on the barn math below, about $0.31/cwt of total scenario spread over 12 months.
Ted Vander Schaaf, an Idaho producer and Northwest Dairy Association member-owner, made the institutional case on February 12, 2026, before the Senate Finance Committee on behalf of USDEC, asking Congress to treat July 1 as the window to fix what USMCA promised American producers. The case is real. The September milk check is a separate timeline.
What Shawna Morris’s USMCA Enforcement Case Is Actually Asking For
Morris, EVP of Trade Policy and Global Affairs at NMPF, has pressed the enforcement case publicly for three years. The joint comments NMPF and USDEC submitted on October 31, 2025, for the USMCA Review lay out the mechanism: Canada’s TRQ architecture awards most of the quota in each of 14 dairy categories to Canadian producers of the product in question, forcing US exporters to sell largely to their own Canadian competitors. Morris escalated the same case at the USTR USMCA operation hearing on December 3, 2025, backed the same day by a bipartisan letter from 74 US House members to USTR Jamieson Greer.
The NMPF/USDEC filing documents fill rates as low as 3% on skim milk powder (TRQ-CA3), 8% on milk protein concentrates (TRQ-CA12), 12% on yogurt and buttermilk (TRQ-CA7), 21% on whey powder (TRQ-CA8), 51% on cream (TRQ-CA2), and 59% on industrial cheese (TRQ-CA5). A 20-to-30-point fill-rate gain — moving under-utilized TRQs toward a 70–80% band — is the volume recovery the filing targets.
Dairy Farmers of Canada has pushed back hard. In a March 8, 2025, statement, DFC President David Wiens argued the US “secured substantial tariff-free access to the Canadian dairy market” under USMCA and that the US “enjoys a significant dairy trade surplus with Canada, exporting 7.5 million CAD in dairy products while importing 7.9 million CAD in return.” The June 2025 passage of Bill C-202 further limits Canada’s ability to offer supply-managed concessions in future trade negotiations. The access exists. The access isn’t being fully used. Both positions hold.
Neither one pays your September note.
What Does a $0.31/cwt USMCA Dairy 2026 Spread Actually Mean for Your 800-Cow Herd?
The $0.31/cwt figure is load-bearing for every hedge decision downstream, so it has to hold up.
Published dairy price-transmission literature supports a working coefficient in the low-single-digit cents/cwt range for each 1% of incremental US dairy export volume. Apply that to the TRQ-recovery volume and a Class III discount — cheese-and-whey routes transmit tighter than all-milk because butter and powder share less of the Class III formula — and the midpoint on a US enforcement win lands near +$0.08/cwt. That is author modeling, not a published coefficient, and the methodology note at the end of this piece spells out every assumption behind it.
A failed-talks and retaliation scenario lands near -$0.23/cwt on the same framework, modeled on a 15–25% reduction in 2024 US-to-Canada dairy exports (C$877.5M; roughly US$640M in 2024 annual-average exchange rates per Bank of Canada). Canada retained meaningful counter-tariff authority from the C$30 billion March 4, 2025, list of US goods subject to 25% tariffs, with the updated list effective September 1, 2025.
Total scenario spread: $0.31/cwt, best case to worst case, over 12 months. Author modeling. Not a projection.
The Comparison That Actually Matters
Scenario
Per cwt Impact
800-Cow Annual Impact
USMCA Win (Best Case)
+$0.08
+$13,280
USMCA Retaliation (Worst Case)
-$0.23
-$38,180
Total USMCA Scenario Spread
$0.31
$51,460
Q1 2026 DRP Net Return
+$0.83
+$34,445 (one quarter)
Jan–Apr 2026 Class III Movement
$2.26
$187,580 (half year)
Bottom line: one well-placed quarter of DRP delivered more protection than the entire USMCA “win” scenario delivers in a year. HighGround Dairy’s Q1 2026 DRP results, published April 22, 2026, report estimated indemnities averaging $1.12/cwt against premium costs of $0.28/cwt. HighGround’s five-year review (2019–2023) shows DRP averaged $0.30/cwt in premiums and $0.53/cwt in indemnities, a net gain of $0.23/cwt and a $1.78 return on every $1 of premium.
Production inputs (illustrative Northeast anchor — substitute your own cwt/cow):
57 lbs/cow/day working anchor (USDA NASS Milk Production 03/20/2026 reports January 2026 U.S. 24-state average at 2,068 lbs/cow/month, or ~68 lbs/day; PA January 2026 production totaled 817 million lbs with an 11,000-head cow decline year-over-year)
57 × 365 ÷ 100 = 208.05 cwt/cow/year
800 cows × 208 cwt = ~166,000 cwt/year
Q3 + Q4 combined: ~83,000 cwt
Volatility reference (Jan–Apr 2026 actual):
Class III Jan 2026 announced ($14.59/cwt) → April 28, 2026, front-month (~$16.85/cwt): $2.26/cwt over 88 days
Applied to 83,000 cwt: $187,580 revenue swing — reference, not a prediction
DRP reference (Q1 2026 actual per HighGround):
Net return $0.83/cwt × Q1 production (~41,500 cwt) = +$34,445 in one quarter for covered producers
Scaling the 12-month USMCA scenario spread at $0.31/cwt to your herd:
Herd Size
Annual cwt
USMCA Scenario Spread
400 cows
83,200
$25,792
800 cows
166,000
$51,460
1,200 cows
249,600
$77,376
Pull your last three milk checks, calculate your actual cwt shipped per cow, apply the +$0.08 upside and the -$0.23 downside, and compare the result to what your Q1 2026 DRP coverage paid — or would have paid.
Why Vander Schaaf’s Testimony and a Hedge Book Aren’t the Same Argument
The split between institutional timelines and individual hedge timelines isn’t something trade-group messaging usually spells out.
Vander Schaaf’s Senate Finance testimony addressed a 10-year structural question about USMCA’s enforcement architecture. That question is real. A producer in his position still faces the same 63-day hedge window every other US producer is sitting in. Q3 milk that needs to be priced. A Q4 contract that’s either hedged or isn’t. Cheese markets moving week to week.
NMPF’s enforcement case runs on a 10-year structural horizon. A US dairy producer’s Q3 check clears in September. Both things are true at once.
The processor conflict inside the TRQ system sharpens the split further. The TRQ architecture gives any processor with cross-border manufacturing options sourcing flexibility domestic-only competitors don’t have. Saputo — one of the top three US cheese producers, with US plants spanning Wisconsin, New Mexico, and beyond — Agropur (operating 39 North American plants and moving 6.1 billion litres/year), and Lactalis sit among the cross-border manufacturers whose bilateral US–Canada footprints create material Scenario C retaliation exposure. The question for a producer is whether your own processor’s public position on enforcement aligns with where your milk actually earns.
The Second Front: China Tail Risk Nobody Is Pricing
If the USMCA is the “known” variable producers are watching, the China tail risk is the “unknown” that could swallow the USMCA spread three times over.
China was the US dairy sector’s second-largest export destination outside Mexico in 2024, with dry whey products and lactose the dominant lanes, per USDA FAS Beijing’s Dairy and Products Annual (October 22, 2024) and FAS PSD World Markets and Trade circulars. In April 2025, China’s retaliatory tariffs on US dairy reached 84%, explicitly including whey and lactose — covered in The Bullvine’s April 10, 2025, analysis. FAS Beijing’s May 20, 2025, semi-annual reported China’s whey imports would decline in 2025 “due to China’s retaliatory tariffs on U.S. origin product.” “China takes a lot of US whey products — dry whey, whey protein concentrates, permeate, lactose,” Phil Plourd of Ever.ag said in the April 2025 cycle. “Today, we’re up to 84%, making things more challenging.”
Apply a working model — not a prediction — to April 2026 dry whey pricing near $0.649/lb (USDA AMS Dairy Products Sales Report, week ending April 18, 2026). The Federal Order Class III Other Solids formula runs (dry whey price − $0.2668) × 1.03. At $0.649/lb, Other Solids prices at $0.3939/lb; at $0.4219/lb after a 35% whey drop, Other Solids drops to $0.1596/lb. The delta of $0.2343/lb applied to 5.9 lbs of other solids per cwt (Federal Order standardized factor, USDA AMS FMMO) equals roughly -$1.38/cwt Class III. On a 1,000-cow Midwest whey-heavy operation at 208 cwt/cow (~208,000 cwt/year), that’s -$287,040 annualized.
Critical framing: this -$1.38/cwt China whey shock is additive to any USMCA losses, not alternative to them. A producer modeling the worst case stacks Scenario C’s -$0.23/cwt on top of a -$1.38/cwt whey shock for a combined -$1.61/cwt exposure. These risks can and do compound.
Sensitivity the other way: a 20% whey-price drop lands closer to -$0.79/cwt; a 50% drop pushes past -$1.97/cwt. The 35% draw is a midpoint sensitivity, not a ceiling.
Before any hedge decision works, name the advice pattern that can block it. “Wait and see on Q3 coverage because things might improve after the review” is advice worth examining.
Co-ops and their field representatives balance multiple interests — member retention, logistics, plant utilization, and member margins. Independent DRP agents and ag lenders often point out that those interests don’t always line up one-to-one with a single producer’s hedge economics. That doesn’t make co-op advice bad. It makes it one input among several worth weighing.
Cooperative pooling delivers real benefits individual risk management can’t: spread risk, logistics leverage, steadier pay timing. The point isn’t that pooling is bad. The point is that pool-level price optimism isn’t the same as your farm-level risk management.
Run the asymmetry. HighGround’s five-year review shows DRP premiums averaged $0.30/cwt, with Q1 2026 running lighter at $0.28/cwt. The cost of being wrong on an unhedged 83,000 cwt Q3+Q4 book, against a $1.00/cwt market correction, is $83,000. The $2.26/cwt move that already happened between January and late April 2026 would have been $187,580 on half-year production. Producers who carried DRP coverage into Q1 2026 netted $0.83/cwt after premiums, per HighGround. Producers without coverage didn’t capture that return.
The numbers tell you to carry coverage and stop watching the diplomatic calendar for hedge signals.
The 30/90/365-Day Playbook for 800-Cow Herds Heading Into July 1
30-Day Actions (before May 29, 2026)
Call your FSA county office today. Get the exact Q3 2026 DRP enrollment deadline in writing or with an RMA confirmation reference. The window closes before July 1 — the same date as the USMCA Joint Review required under Article 34.7.
Call a DRP-licensed insurance agent from the USDA RMA Agent Locator, not your co-op field rep. Ask for three specific numbers at 95% coverage: net premium per cwt after subsidy, effective price floor, and total cost on your declared Q3 production. Premium benchmarks land near the $0.28–$0.30/cwt HighGround five-year range; use that as a sanity check on the quote.
Pull your Class III utilization percentage from co-op member services. Not your field rep — member services. A 75%+ Class III operation runs different coverage economics than a 55/30/15 blended one.
Red-flag trigger: If CME cheddar blocks break below your risk advisor’s established reassessment threshold, add coverage the same day.
Where it backfires: If your DSCR has been under 1.2 for three consecutive months on your lender’s covenant method, premium dollars compete with operating line headroom. Call your lender before the insurance agent.
90-Day Actions (through late July 2026)
The Contract Audit — pull your supply agreement and check:
[ ] Does it address retaliatory tariffs (US-imposed or Canada-imposed) and is there a pricing-review trigger?
[ ] What is the notice period for non-renewal?
[ ] Is the repricing mechanism spot, formula, or blend?
[ ] Is the over-order premium fixed, variable, or floored?
[ ] Does it guarantee quarterly component utilization reporting on your own milk?
[ ] What is the effective date of the current terms and when does the next window open?
Other 90-day moves:
Draft a trade-outcome review clause for the renewal. Suggested language: “If the United States imposes retaliatory tariffs on Canadian dairy products, or Canada imposes retaliatory tariffs on US dairy products, either party may request a pricing review within 30 days.” It doesn’t guarantee outcomes. It guarantees a seat at the table if Scenario C activates.
Request quarterly component utilization reporting on your own milk. Not plant economics — your own payment breakdown by component. The ask is legitimate under Federal Order component pricing transparency.
What this requires: A copy of your current contract, your co-op member services contact, and — if the conversation gets serious — an ag contract attorney who works on dairy supply agreements.
Where it backfires: Going in without Q3 hedging in place. Processors know renewal deadlines. Negotiating a 2027 extension with uncovered Q3 milk is negotiating from need, not from position.
365-Day Moves (positioning for the next cycle)
Build a Q3–Q4 2027 hedge ladder now, not in May 2027. HighGround’s research finds DRP coverage secured three quarters out delivered the highest average net return in Q1 2026 at $1.53/cwt — four and five quarters out returned $1.37 and $1.28 respectively. Laddered DRP or Class III put coverage through Q4 2027 costs premium dollars but caps tail risk and historically pays for itself.
Evaluate processor optionality. If your operation runs 75%+ Class III and your co-op’s over-order premium structure doesn’t reflect that concentration, a specialty processor relationship may align your milk more cleanly with your hedge strategy. The trade-off: you lose pooling diversification and take on concentration risk against a single processor.
Track China dairy tariff status monthly. USDA FAS Beijing publishes updates. The signal to watch is whether Chinese importers continue the cost-sharing arrangement absorbing partial tariff pass-through. When that breaks down, whey volume drops within 60–90 days.
Opportunity signal: If your co-op’s over-order premium widens by $0.20/cwt or more in the second half of 2026 while your feed-cost basis holds within $0.40/cwt of current levels, you have room to renegotiate contract term length from 12 months to 24 months at better component premiums.
What Does Your Current Contract Say About the 63 Days You Can’t See Yet?
NMPF’s enforcement push continues through July 1. The testimony is on the record. On April 22, 2026, the Globe and Mail reported Prime Minister Mark Carney rejecting the notion the US “dictates the terms” of USMCA talks, with Finance Minister Dominic LeBlanc telling the paper: “We’re not going to reopen supply management and have a discussion around quotas in the supply managed sector.” That same morning, USTR Jamieson Greer told the House Ways and Means Committee that Canada has made no commitments to alter its largely closed dairy market and that the dispute will be resolved through USMCA negotiations or through enforcement actions. Bill C-202, passed in June 2025, further narrowed Canada’s ability to concede on supply-managed goods. All of that is real. None of it changes what your Q3 milk ships at.
The trade fight is worth $0.31/cwt in total scenario spread over 12 months. Your hedge book is managing a revenue stream that moved $2.26/cwt in the first 88 days of 2026 alone. Both deserve your attention. They don’t deserve equal attention.
Pull your contract today. Find the clause that governs how your September repricing actually works. Call FSA this afternoon. Call a DRP-licensed agent tomorrow morning. Call member services by Friday.
What does your current contract say about what happens to your over-order premium if retaliatory dairy tariffs get imposed between now and your September renewal date? If the answer is nothing — or if you don’t know — that’s the line item worth more attention this week than any USTR press release.
Your hedge book controls your revenue. The diplomats control the headline. Know the difference.
Methodology sidebar: Scenario B and Scenario C midpoints are author modeling informed by published dairy price-transmission literature and USDA FAS GATS 2024 trade data. The +$0.08/cwt Scenario B midpoint reflects a Class III discount applied to a working all-milk export-transmission coefficient and a ~1.2% export-volume recovery drawn from TRQ fill-rate gains on cream and industrial cheese. The -$0.23/cwt Scenario C midpoint is drawn on a 15–25% reduction in 2024 US-to-Canada dairy exports. Neither midpoint is a published figure. Outcomes are not predictions. All dollar figures scale linearly with herd-level cwt shipped; substitute your own production inputs for a farm-specific result. A Q2 2026 follow-up in The Bullvine’s “Hedge Book vs the Headline” series will revisit these scenarios against the post-July-1 review record.
Key Takeaways
The entire NMPF/USDEC enforcement push Morris is running into July 1 models to $0.31/cwt of scenario spread over 12 months. Class III has already moved $2.26/cwt this year. Don’t confuse the headline with the hedge.
One quarter of Q1 2026 DRP netted $0.83/cwt per HighGround — more protection than the maximum USMCA “win” scenario delivers in a full year. If you’re unhedged on Q3–Q4, call a DRP-licensed agent before you call anyone else.
The real tail sits in Other Solids. A 35% China whey-price drop runs -$1.38/cwt on Class III, and it stacks on top of Scenario C, not instead of it — whey-heavy Midwest operations carry the compounded exposure.
If your Q3 or Q4 2026 contract is up for renewal, run the Contract Audit before July 1: repricing mechanism, over-order premium structure, and a trade-outcome review clause that gives you a seat at the table if tariffs land.
Complete references and supporting documentation are available upon request by contacting the editorial team at editor@thebullvine.com.
Learn More
84% Chinese Tariffs Slam US Dairy: Why Whey & Lactose Exports Face Crisis — Arms you with a survival strategy for the “Second Front” of the trade war. This analysis reveals how 84% tariffs make U.S. whey uncompetitive overnight, risking $584 million in annual exports and crashing Class III prices.
$146,000: The Trapdoor Under the 2026 U.S. Dairy Rally — Dismantles the “wait and see” approach by modeling a $146,000 avoidable exposure for unhedged 500-cow herds. It follows the money on fuel and fertilizer inflation, proving that outdated input budgets hit harder than trade headlines.
The Sunday Read Dairy Professionals Don’t Skip.
Every week, thousands of producers, breeders, and industry insiders open Bullvine Weekly for genetics insights, market shifts, and profit strategies they won’t find anywhere else. One email. Five minutes. Smarter decisions all week.
USDA printed $20.50 milk. His lender stress‑tested at $15. His basis had narrowed a quarter. The 400‑cow barn died on the kitchen table — and the $4/cwt gap is why.
Executive Summary: USDA ERS is printing $20.50/cwt all‑milk for 2026, but the lender stress case under every expansion conversation right now sits at $15. That $4/cwt gap is where this year’s basis‑risk story lives. When Leprino opened Lubbock, it closed Lemoore East — capacity moved, it didn’t stack — and USDA DMN Central the week of April 16 described spot milk as readily available, running multiple dollars under Class III. The June 1, 2025, FMMO amendments permanently cut class prices by roughly $0.85–$0.93/cwt, so a $19 pro forma is really the new $17.50 before basis or premiums. A composite 1,000‑cow Central‑region Midwest dairy ran the numbers on a 400‑cow barn add and walked: Scenario C pencils at ~$15.00/cwt realized against a $19–$20+/cwt full‑cost range for larger U.S. operations — a $672K–$840K+ annual shortfall before new debt service. Diversifying 40,000 cwt to a second buyer adds ~$182K/year without a shovel in the ground. Before you sign a construction loan, pull the three clauses — how base is defined, how over‑base is priced this period, and what changed post‑June 1, 2025.
A $19/cwt pro forma sat on one side of the kitchen table. A $15/cwt stress case sat on the other. The operator of a 1,000‑cow Central‑region Midwest dairy we’ll call Hoffman Farms — a composite built from documented 2026 USDA, HighGround Dairy, and Ever.Ag data — pulled his last twelve milk checks and ran the math himself.
His realized $/cwt minus Class III had drifted the wrong way through the back half of 2025 and into Q1 2026, exactly while the trade press celebrated roughly $11 billion in new U.S. processing capacity. His basis to Class III had narrowed by more than a quarter over six months — a working threshold some advisors flag as shed‑level pressure. USDA ERS’s April 2026 Livestock, Dairy, and Poultry Outlook was printing $20.50/cwt all‑milk, $16.90 Class III, $18.60 Class IV. His lender’s 400‑cow barn‑add pro forma came in at $19. The stress case came in at $15.
He walked away from the 400 cows.
Hoffman Farms is a composite — a stand‑in for a 1,000‑cow Midwest operation sitting inside USDA Dairy Market News’ Central reporting region. The math, the contract questions, and the decision triggers are real and sourced. The farm is not. A full methodology note sits at the bottom of this piece.
The $4/cwt gap between USDA’s headline and the lender stress case is where the 2026 dairy basis risk story actually lives. This isn’t a piece about where Class III settles. It’s about bargaining power — whether your plant needs your milk badly enough that a $20‑handle actually lands in your mailbox, or whether you’ve quietly become the balancing tank for a shed that already has more milk than it needs.
Bullvine’s “$19 Milk Trap” analysis from April 6, 2026, walked through the covenant‑pressure sequence in detail. This piece picks up where that one ended: what happens when the pro forma and the stress case sit $4 apart, and the 400 cows are your decision.
The $11 Billion Capacity Story vs. What USDA DMN Actually Said in April 2026
Everyone assumed more capacity meant better leverage for growing Midwest herds. The numbers looked right on the surface. Roughly $11 billion in announced U.S. processing capacity across more than 50 projects running through 2028, based on IDFA‑tracked project lists compiled by HART Design as of October 2025. Named plants, real commitments — Leprino’s Lubbock, Texas facility, Hilmar’s Dodge City, Kansas build, Darigold’s Pasco, Washington expansion, Chobani’s Twin Falls project.
Open USDA Dairy Market News for the week of April 16, 2026, and the story changes. Central region commentary describes spot milk as readily available, with Class III spot pricing running multiple dollars under Class across recent weeks. Ever.Ag’s Milk Premiums report from the same date echoes it: Central Valley manufacturers reporting ample milk, buyers declining incoming loads because hauling distances had become uneconomic.
In reporting by the Fresno Bee in December 2025 and KMPH in November 2025, Leprino cited added capacity from its new Lubbock plant among the reasons for the late‑2025 Lemoore East closure. Capacity didn’t stack on top of California demand. It moved. The milk moved with it. Some California producers who had been shipping into Lemoore East found out the hard way that a capacity announcement somewhere else isn’t the same thing as capacity in their shed.
USDA NASS Milk Production for February 2026 sets the backdrop. U.S. milk up 2.9% year‑over‑year nationally, 3.1% in the 24 major states, with roughly 217,000 more cows than a year earlier. More plants opened. More milk is flowing. Whether the second is outrunning the first in your region is the only question that matters for your check.
What Does Your Lender’s Spreadsheet Actually Say for 2026?
Lenders aren’t being pessimistic. They’re being arithmetic.
Recent industry analysis framed the year around volatility and margin pressure. HighGround Dairy’s Q1 2026 Producer Market Update talks in margin percentiles rather than a single price, flagging H2 2026 as screening in an upper percentile band and urging coverage while it’s on the table. Dairy Herd Management’s May 2025 summary of USDA’s forward outlook captured the sentence lenders internalized for 2026: higher milk output, softer prices. The stress case running through most ag‑lending desks dips into the mid‑teens for six to twelve months.
Hoffman’s co‑op field rep’s tone had shifted over the same stretch — from growth‑friendly language toward supply‑discipline framing. Ever.Ag’s 2026 Milk Premiums weekly reports describe that kind of shift as a leading indicator. It lands before premiums tighten and base/excess programs get enforced more strictly.
When the banker’s stress case and your expansion pro forma disagree by $4/cwt, the equity risk doesn’t split evenly. The bank structured covenants around its number. You structured loan repayment around yours.
The Hidden Haircut: Why Your $19 Pro Forma Is Really the New $17.50
Every 2026 number carries a structural reduction that wasn’t there three years ago.
The June 1, 2025, FMMO amendments permanently reset the make‑allowance formulas. USDA AMS’s Timeline for Changes to Price Announcements (January 2025) set the new rates: cheese at $0.2519/lb, butter at $0.2272/lb, NFDM at $0.2393/lb, dry whey at $0.2668/lb. American Farm Bureau Federation’s Market Intel (September 23, 2025) tallied the first three months under the new rules at roughly $337 million in lost producer pool value — class prices reduced by approximately $0.85–$0.93/cwt. That haircut doesn’t move with the market. It’s baked in.
In 2026, a $19.00 pro forma is the new $17.50 once you stack the 2025 make‑allowance hit on top of modest realized basis erosion in a long‑milk shed. That’s illustrative, not a single‑line subtraction. The ~$0.85–$0.93/cwt class‑price reduction lands before basis, before premiums, before a single load of spot milk gets discounted. The haircut is structural. It doesn’t disappear when Class III recovers.
When the lender stresses at , they’re modeling a year in which that structural cut and a demand softening show up at the same time. That scenario is well inside the range current 2026 lender framing uses. Covenant pressure arrives before the market resolves the question.
What Does “Overflow Tank Milk” Actually Cost Per Hundredweight?
Everyone in the capacity conversation assumed a $20‑handle all‑milk forecast plus $11 billion in new plants equaled bargaining power for a growing Midwest herd. April 2026 contract mechanics tell a different story.
Western base/excess programs have historically priced over‑base milk at the monthly spot average minus a hauling assessment. In heavy months, that produces meaningful $/cwt drag. One publicly documented example from 2022 — an Ag Proud webinar recap describing one co‑op’s program structure of that era — placed the assessment around $1/cwt and the total drag against contract on the order of $5/cwt. Current co‑op terms vary materially between contract cycles and regions. Verify your own agreement before applying any of those numbers as a hard reference.
Layer April 16, 2026, Central spot milk running multiple dollars under Class III on top of that kind of program structure, per USDA DMN and Ever.Ag, and a mailbox that looks stable on the Class III headline diverges sharply the moment a meaningful share of your volume is priced like overflow rather than base.
The contract question worth asking in writing — not over coffee with the field rep: if you add 400 cows, does that new volume get recognized as base within a defined timeframe, at what terms, starting when? An answer that leaves new milk pegged to monthly spot in a shed already running multiple dollars under Class III is a no. It just doesn’t look like one until the check arrives.
Running the Numbers: Hoffman Farms in Three Scenarios
Three illustrative scenarios for a composite 1,000‑cow Midwest operation shipping ~120,000 cwt/year (expansion case: 1,400 cows, ~168,000 cwt/year). All inputs shown. Substitute your own cwt shipped per cow, your own base/over‑base split, your own contract terms.
April 2026 price anchors (USDA ERS, April 2026 Livestock, Dairy, and Poultry Outlook):
Class III: $16.90/cwt
All‑milk: $20.50/cwt
AFBF make‑allowance hit range: ~$0.85–$0.93/cwt (midpoint $0.90/cwt used for scaling)
Scenario
Cows
cwt Shipped
Realized $/cwt
Annual Gross
The Decision
A: Single Buyer, Long Shed
1,000
120,000
$15.45
$1,854,000
Basis eroding
B: Diversified — Two Buyers
1,000
120,000
$16.97
$2,036,000
+$182K vs. A
C: Expand Into a Long Shed
1,400
168,000
$15.00
$2,520,000
$672K–$840K+ below full cost
Scenario A — Single buyer, long shed:
70% of volume (84,000 cwt) at base: Class III $16.90 + $0.50 illustrative basis = $17.40/cwt
30% of volume (36,000 cwt) at over‑base: Class III $16.90 − $5.00 program drag − $1.00 hauling = $10.90/cwt
Annual gross: $2,036,000. Gain vs. Scenario A: $1.52/cwt × 120,000 cwt = $182,400/year
Scenario C — Expand into a long market:
168,000 cwt × $15.00 realized = $2,520,000 gross
Full‑cost range for larger U.S. dairy operations: $19–$20+/cwt, drawn from Bullvine’s February 2026 cost analysis referencing USDA ERS data for larger U.S. dairy cohorts. Verify the applicable range against your own confirmed cost of production before applying.
Total cost: $19.00 × 168,000 = $3,192,000 to $20.00+ × 168,000 = $3,360,000+
Shortfall before new expansion debt service: $672,000–$840,000+
Scenario
Cows
cwt shipped/year
Realized price ($/cwt)
Annual gross revenue ($)
Position vs full cost ($19–$20/cwt)
A – Single buyer, long shed
1,000
120,000
15.45
1,854,000
≈$420k–$540k short
B – Diversified, two buyers
1,000
120,000
16.97
2,036,400
≈$304k–$484k short
C – Expand into long shed (1,400 cows)
1,400
168,000
15.00
2,520,000
≈$672k–$840k short
USDA ERS 2026 all‑milk headline
–
–
20.50
–
Looks solvent on paper only
Bullvine’s April 13, 2026, analysis on a ~$3M dairy expansion showed fixed debt service adding meaningful $/cwt drag at a 500‑cow scale. A Hoffman‑scale expansion produces a different absolute number. The direction doesn’t change.
FMMO make‑allowance hit scaled to smaller herds (AFBF range midpoint of ~$0.90/cwt; substitute your realized per‑cwt impact from recent settlements):
Plug in your own cwt shipped per cow from your last 12 months of checks to size it to your barn.
Why Protein Wins and Your Commodity Plant Might Not
Merrick Capital (June 2025) and Dairy News Today (December 2025) describe the same sector pattern: processors closing older commodity facilities while investing in higher‑margin specialty product lines. McKinsey’s April 19, 2026, dairy industry analysis framed the 2026 processor playbook as protecting margins while pursuing growth. Farm Credit Canada’s February 2026 outlook identified protein as the forward pay driver. Dairy Reporter’s March 2026 coverage of the 2026 global supply situation made the split explicit: protein and specialty hold value; generic commodity milk in an oversupplied shed loses negotiating position.
In the composite Hoffman scenario, the plant sits on the commodity side of that split — a profile that fits a meaningful share of Central‑region facilities, though not all. Adding 400 cows into a long shed tied to a plant with no visible premium‑product trajectory isn’t growth. It’s volunteering to be the region’s balancing supply at the worst moment in the cycle to be the marginal hundredweight.
The equity risk doesn’t split evenly. When your pro forma and your lender’s stress case disagree by $4/cwt, that gap lands entirely in your equity column. Readers who want the lived version of this math — a multi‑generation family dairy that chose consolidation over expansion — can follow Bullvine’s legacy‑family features for the human side of the decision.
The 30/90/365‑Day Playbook for Herds Like Hoffman’s
30 Days — Do These Before Any Other Expansion Conversation
Audit your last 12 milk checks. Calculate realized $/cwt minus Class III, month by month. Requires: 12 months of settlement statements and an hour. Threshold: basis to Class III narrowing $0.25/cwt or more over six months while national capacity headlines grew is a yellow flag on your shed position. Backfire watch: a single month’s component swing distorts a short window — use the full 12.
Pull USDA Dairy Market News for your region. Read the actual language, not the headline price. If commentary describes spot loads available with buyers selective on hauling distance, that’s your plant’s real signal — not USDA ERS’s national all‑milk number. Threshold: language indicating buyers declining loads on distance grounds is a yellow flag on your over‑base exposure.
Ask your co‑op or processor in writing: how is base defined this contract period, how is over‑base priced, and what changed in programs or premiums after the June 1, 2025, FMMO amendments? Requires: a written request. Verbal answers from field reps aren’t binding. Backfire watch: assuming last cycle’s terms still apply.
Red‑flag trigger: if your DSCR has been under 1.2 for three consecutive months using your lender’s or CPA’s method, stop expansion conversations and move this list to the front of the stack.
90 Days — Structural Moves That Require Planning
Stress‑test your DSCR at $15 milk against your current debt load and cost structure. Share results with your lender and ask directly: which scenario are your covenants built on? Requires: 12 months of checks, a verified cost of production that includes family living and deferred maintenance, a meeting with your lender or CPA. Backfire watch: a cost estimate that excludes those lines produces a number that looks better than your bank’s.
Price a realistic second‑buyer option for 20–40% of your volume. Get written hauling quotes from two carriers and a written term sheet from a second buyer before comparing. If incremental hauling comes back in the low‑cents‑per‑cwt range and your current over‑base penalty is $1/cwt or more, diversification pencils before sentiment enters the math. Bullvine’s prior processor bidding‑war and milk‑routing analysis carries the negotiation framework. Backfire watch: hauling quotes that don’t hold through winter, or a second buyer equally long on milk.
Lock a written risk‑management policy — what percentage of milk you’ll cover via Dairy Revenue Protection or options, and at what margin triggers. HighGround Dairy’s Q1 2026 framing of H2 2026 margins in an upper percentile band is a timing reference, not a ceiling. Backfire watch: coverage structured without reference to your verified cost of production.
365 Days — Positioning for the Next Cycle
Decide whether your operation competes on cost, components, or both. Farm Credit Canada’s February 2026 outlook and other recent analysis point to protein as the forward pay driver. Bullvine’s component‑focused sire selection and herd management coverage is the right companion for this decision. Backfire watch: investing in component genetics without a plant that pays a meaningful protein premium in writing.
Evaluate beef‑on‑dairy as a line item in your margin math, not a bonus. Recent commentary flagged beef‑on‑dairy adding $5/cwt or more in some Northeast operations. Midwest and Western calf markets price differently and seasonally. Use your own local auction data, not a regional average from a different geography. Backfire watch: beef‑on‑dairy income masking a structurally weak milk contract underneath.
Opportunity signal: if your basis to Class III re‑widens to a 12‑month high while your mailbox stays above your verified full cost for two consecutive quarters, your plant is telling you it needs your milk. That’s the window to renegotiate base volume, premiums, and hauling terms — not when everyone else in the shed is asking the same question. Backfire watch: confusing a seasonal demand flush with a structural capacity shift; check USDA DMN language for your region before moving.
When Does the 400‑Cow Add Still Pencil in 2026?
Not every expansion is the wrong call this year. Three conditions have to line up at once.
First: a capacity‑short shed where USDA DMN language reads as processors actively seeking loads, not spot loads available — the opposite of what Central region commentary showed the week of April 16, 2026. Second: a plant tied to a premium‑product line — growth cheese, high‑protein ingredients, specialty formats — with a track record of paying for it, consistent with McKinsey’s April 2026 and Farm Credit Canada’s February 2026 framing of where processor margins are actually coming from. Third: a co‑op willing to move new volume into base at full contract terms inside a defined timeframe, in writing, not verbally.
Fail any one of those three tests and your expansion math isn’t wrong because of your operation. It’s wrong because you’re borrowing leverage from a shed that hasn’t given it to you yet. You gain scale economics by building. You give up the bargaining position you currently hold if the shed doesn’t need the milk.
The Contract Check That Should End Every 2026 Expansion Meeting
In the composite Hoffman scenario, the 400 cows didn’t die forever. They died at this price, in this shed, with this contract.
The operator’s agreement would have treated new milk as over‑base, priced off monthly spot. April 2026 Central spot ran multiple dollars under Class III on bad weeks, per USDA DMN and Ever.Ag. The lender’s stress case was $15. USDA’s headline was $20.50. Those four numbers don’t reconcile on paper. So the barn doesn’t get built.
Before your next contract renewal or expansion meeting, pull the document and find three specific clauses: how base is defined, how over‑base is priced in the current contract period, and what programs or assessments changed after June 1, 2025. If you can’t answer all three from the written document before you sign a construction loan, you don’t actually know your own 2026 milk price. You know someone else’s projection.
Clause to pull in writing
Low‑risk answer (build‑worthy)
High‑risk answer (treat as red flag)
How base volume is defined
Current volume plus planned 400 cows added as base within 6–12 months under written terms
New 400 cows treated as over‑base indefinitely with no written path to base
How over‑base milk is priced
Over‑base tied close to Class III with modest hauling adjustment (≤$1/cwt drag)
Over‑base pegged to monthly spot minus program drag and hauling in a long shed
Changes after June 1, 2025
Make‑allowance impact acknowledged and premiums adjusted to partially offset haircut
Programs tightened, premiums trimmed, make‑allowance cut passed straight through
Lender’s stress‑test assumption
Covenants modeled at or below your own verified stress number (≈$15/cwt)
Bank underwriting at $15 while your pro forma assumes $19–$20 with no basis adjustment
The bottom line: In 2026, the most profitable move isn’t building a bigger tank. It’s making sure your plant actually needs the milk already in it.
Scale economics favor building. Bargaining power doesn’t — not in a shed that’s already long.
What does your current processor contract actually say about how your next 400 cows get paid when your plant is already long on milk — and whose stress‑test number is your equity riding on, yours or your lender’s?
Key Takeaways
A $20.50 USDA headline and a $15 lender stress case don’t reconcile. If your expansion pro forma lives in the middle, the $4/cwt gap lands entirely in your equity, not the bank’s.
Capacity moved, it didn’t stack. Read USDA DMN language for your shed before you read the national price — if buyers are declining loads on hauling distance, your incremental milk is overflow, not growth.
The June 1, 2025, FMMO amendments cut class prices by roughly $0.85–$0.93/cwt, and that haircut is permanent. A $19 pro forma is really the new $17.50 before basis or premiums.
Before you sign a construction loan, pull three clauses in writing: how base is defined, how over‑base is priced this period, and what changed post‑June 1, 2025. If you can’t answer all three, you don’t know your own 2026 milk price.
Methodology note: Hoffman Farms, his plant, his co‑op field rep, and his lender are composites constructed from documented 2026 sources: USDA ERS, USDA NASS, USDA AMS, USDA DMN, AFBF Market Intel, HighGround Dairy, Ever.Ag, McKinsey, Farm Credit Canada, Dairy Herd Management, Merrick Capital, Fresno Bee, KMPH, IDFA/HART Design, and Bullvine analysis. The math, contract questions, and decision triggers apply to real operations of this profile; the specific farm does not exist. Scenario inputs use USDA ERS April 2026 Livestock, Dairy, and Poultry Outlook prices ($20.50 all‑milk, $16.90 Class III, $18.60 Class IV), USDA AMS January 2025 make‑allowance figures (cheese $0.2519/lb, butter $0.2272/lb, NFDM $0.2393/lb, dry whey $0.2668/lb), USDA DMN and Ever.Ag April 16, 2026 Central and Central Valley spot milk commentary, and program‑structure context from an Ag Proud April 2022 webinar recap describing one co‑op’s program structure of that era. The $19–$20+/cwt full‑cost range used in Scenario C is drawn from Bullvine’s February 2026 cost analysis referencing USDA ERS data for larger U.S. dairy cohorts; verify the applicable range against your own operation’s confirmed cost of production before use. Co‑op program terms evolve — verify current contract language against your own agreement before applying scenario numbers to your operation.
Learn More
Surviving Dairy Farm Overtime Laws: Robots vs. People — Arms you with the ROI math to choose between $2.4 million in robot debt or skyrocketing overtime bills. Breaks down the $3.50/cwt labor threshold and identifies the exact moment a milker walking away kills your margin.
The $19 Milk Trap: How 2026 Prices Quietly Drain a 400‑Cow Dairy’s Equity — Exposes the dangerous “no man’s land” for mid-sized herds stuck between consumer scale and mega-dairy leverage. Delivers a 90-day playbook to stress-test your balance sheet before equity bleed turns a voluntary pivot into a forced exit.
211,000 More Dairy Cows. Bleeding Margins. The 2026 Math That Won’t Wait. — Reveals how $1,400 beef-on-dairy calf premiums are short-circuiting the culling math and flooding the market. Dismantles the “wait and see” strategy by proving why keeping genetically weak cows in the barn is destroying the replacement pipeline.
The Sunday Read Dairy Professionals Don’t Skip.
Every week, thousands of producers, breeders, and industry insiders open Bullvine Weekly for genetics insights, market shifts, and profit strategies they won’t find anywhere else. One email. Five minutes. Smarter decisions all week.
One of North Dakota’s last 18 Grade A dairies just got directed to a new milk market twice in 30 months. The nearest plant that’ll take the load sits five hours one way.
By early 2026, one of North Dakota’s last 18 Grade A dairies — the regulatory tier that can ship fluid milk, out of roughly 18–25 licensed dairies statewide — had been directed to a new milk market twice in 30 months. Not because production slipped. Not because a lender called a note. Because the state lost nearly every in-state processing option, and the nearest plant willing to take the load sat roughly five hours one way in Perham, Minnesota.
The Bullvine reported in February 2026 that the operators — the Holle family’s 1,000-cow Holstein herd 12 miles south of Mandan — described the freight reality as “really, really hard” and said they didn’t know what they were going to do. That’s not a 60-cow retirement story. It’s a professionally run operation telling the industry, in plain language, that the corridor under its feet doesn’t pencil anymore. And the 2025 FMMO make-allowance update — effective June 1, 2025, per the final rule published in the Federal Register on January 17, 2025 — trimmed another 85–93¢/cwt off the class prices that underwrite their milk check.
Why This Matters
The 2025 FMMO make-allowance change alone can pull an estimated $97,750–$106,950 a year off a 500-cow herd at 230 cwt/cow/year — before a dollar of freight gets layered in.
Upper Midwest hauling charges averaged $0.6137/cwt in May 2023 and $0.7969/cwt in May 2024 — roughly 30% — on a per-farm basis in Federal Order 30 staff data. (Volume-weighted, the order-wide average is lower — $0.50/cwt in 2024 — because large-volume producers negotiate cheaper freight. The per-farm average better captures what small and mid-size herds actually pay.)
North Dakota holds roughly 18 Grade A dairies — and about 25 regular-milk dairies milking 10,000 cows statewide, per Dairy Star’s June 2025 reporting — with at least one 1,000-cow herd now on a five-hour haul to Minnesota. That’s the map today, not a projection.
How Two Plant Closures in 30 Months Cornered a Professional Dairy
North Dakota’s processing contraction is among the most documented in modern U.S. dairy. In September 2023, Prairie Farms’ Bismarck plant — the primary Class I destination for central and western North Dakota — ceased processing and converted to distribution-only operations.
North Dakota Agriculture Commissioner Doug Goehring didn’t mince words:
“This will directly affect the dairies who currently have their milk trucked to Prairie Farms. With no other processors nearby, those dairies will likely pay for shipping longer distances that will be deducted from their milk checks. This will have a dramatic impact on their bottom line.”
On August 30, 2024, DFA’s dairy ingredient facility in Pollock, South Dakota, shut down, eliminating 33 full-time and 4 part-time positions and removing the regional backup. That left one processing facility inside North Dakota state lines: Cass-Clay in Fargo, pressed against the Minnesota border.
Another North Dakota producer, roughly 50 miles northwest of Bismarck, got rerouted 151 miles to Pollock after the Bismarck conversion — at a freight surcharge of about $0.55/cwt — and invested in a second bulk tank to handle every-other-day pickups. Then Pollock closed too. That’s a bulk tank on the balance sheet against a plant that didn’t outlast the depreciation schedule.
Federal Order 30 staff data shows hauling charges on a per-farm basis climbing from $0.6137/cwt in May 2023 to $0.7969/cwt in May 2024 — roughly 30%, with North Dakota posting the order’s highest hauling cost. Stack that freight on a January 2026 Class III price of $14.59/cwt — down $1.27 from December, and the lowest Class III print since July 2023 — and the haul alone eats whatever margin the board hands back.
What the Dairy Farm Extinction Clock Is — and Why We Built It
The Bullvine’s Dairy Farm Extinction Clock is a tracking tool we built using USDA NASS-licensed dairy herd counts going back to 2013. For each state, we calculated the 5-year and 10-year average annual attrition rates, then applied a compound decay model — the same math behind radioactive half-life — to estimate how many years remain before the herd count falls below the USDA NASS disclosure threshold at its current rate.
The classification is simple. Red Zone: extinction projected before 2045. Yellow Zone: 2045–2060. Green Zone:longer runway. Extinct: states already below the USDA disclosure threshold with suppressed data. As of the February 2026 Milk Production Report, the scoreboard reads 11 Red, 1 Yellow, 36 Green, and 2 Extinct — with 26 states showing accelerating attrition.
We built the Clock because national production totals hide the map underneath. The U.S. shipped 226.4 billion pounds of milk in 2022. That number looks fine. What it doesn’t show is that 19,925 licensed herds disappeared in a decade, the Southeast lost 80%+ of its dairy farms since 1992, and states like North Dakota and Arkansas are two to three years from the disclosure threshold on current attrition math.
The Clock doesn’t predict the future. It describes the present, precisely — and it tells you which direction the math is running.
Where the Major Dairy States Stand Right Now
Top 15 U.S. dairy states by 2025 herd count, plus North Dakota for reference. Data from the USDA NASS Milk Production Report, February 2026. Attrition rates are annualized averages. “Accelerating” means the 5-year rate exceeds the 10-year rate — the decline is getting worse, not better. “Clock” = year at which the state is projected to fall below the USDA NASS disclosure threshold (typically ~5 herds), at which point reporting is suppressed. Projections assume current 5-year attrition rates hold.
State
Herds (2025)
5-Yr Attrition
10-Yr Attrition
Accelerating?
Clock
Zone
North Dakota
20
19.3%
13.5%
Yes
2028
RED
Wisconsin
5,375
5.4%
5.9%
No
2179
GREEN
Pennsylvania
4,360
4.3%
4.3%
No
2217
GREEN
New York
2,760
5.4%
5.4%
No
2167
GREEN
Minnesota
1,605
7.3%
7.4%
No
2122
GREEN
Ohio
1,365
4.8%
6.7%
No
2172
GREEN
California
960
4.6%
4.1%
Yes
2171
GREEN
Michigan
825
7.0%
7.8%
No
2117
GREEN
Iowa
675
6.9%
6.7%
Yes
2116
GREEN
Indiana
675
3.5%
5.6%
No
2210
GREEN
Vermont
470
5.9%
5.7%
Yes
2125
GREEN
Illinois
405
5.0%
5.0%
Yes
2141
GREEN
Idaho
350
4.4%
3.8%
Yes
2155
GREEN
Missouri
345
13.6%
11.6%
Yes
2065
GREEN
Texas
280
4.9%
4.2%
Yes
2137
GREEN
Washington
280
3.7%
5.2%
No
2173
GREEN
Every state on this list except North Dakota is Green. Every state is still losing farms. The spread is the signal: Indiana at 3.5% annual attrition has a runway past 2200. Missouri at 13.6% — accelerating — hits the disclosure threshold by 2065 despite starting with 345 herds. Green doesn’t mean safe. It means you have time to act. How much time depends on which row you’re sitting in.
Safe State, Dangerous Corridor: Is Your Route Actually a Green Zone?
The Clock classifies Wisconsin as a Green Zone and North Dakota as a Red Zone. Clean on paper. Messier on the road.
Structural Metric
Wisconsin (Green Zone)
North Dakota (Red Zone)
What It Means for You
Licensed herds, Feb 2026
~5,375
~18–25
ND has <0.5% of WI’s farm base
5-yr annual attrition
5.4%
19.3%
ND is losing ~1 in 5 herds a year
Processing redundancy
Dense, multi-plant network
One effective in-state option
Single point of failure = hostage equity
Projected disclosure-threshold year
2179
2028
ND: 2-year runway, not a generational one
Typical one-way haul to backup plant
<2 hours
~5 hours (Perham, MN)
Freight alone can eat Class III margin
You can live in a Green Zone state and still be sitting on a wasting asset if your hauling corridor is thinning faster than the statewide average. The Clock tells you when a state runs out of farms. It doesn’t tell you when your road runs out of trucks.
Terry Sears of DM&D Milk Haulers in Erie, Kansas, profiled by John Deere’s The Furrow in March 2023, shows what route erosion looks like in practice. The company’s tanker now runs 60 miles back to Erie, then another 205 miles one-way to a DFA plant in Cabool, Missouri, per The Furrow’s reporting. Same line of work Sears started in 1975, covering two counties. A very different map.
That’s the feedback loop most producers don’t see on paper. One farm exits. The route gets longer. Hauling costs rise. Another farm loses margin. Another route thins. Consolidation doesn’t just remove farms — it taxes the survivors.
How the Make-Allowance Update Lands on a 500-Cow Milk Check
Bigger deductions, smaller milk checks. The math is that direct.
FMMO make allowances — the processing-cost deductions pulled out of class prices before your check is calculated — hadn’t been updated since 2008. The final rule published by USDA AMS on January 17, 2025, with make-allowance changes effective June 1, 2025, set the updated deductions in the Class III and IV formulas at $0.2519/lb for cheese, $0.2272/lb for butter, $0.2393/lb for nonfat dry milk, and $0.2668/lb for dry whey. And while North Dakota was losing plants, producers nationally were losing 85–93¢/cwt on the milk they could still ship.
The producer northwest of Bismarck is carrying both hits at once. He’s paying added freight to reach a plant, and taking the FMMO haircut on every cwt once he gets there. That’s the compound problem Red Zone operators are now running inside.
AFBF economist Daniel Munch estimated the first-quarter impact on the producer pool value under the new rule at more than $337 million. “Higher make allowances have imposed the most significant cost to dairy farmers, cutting $337 million from pool revenues and lowering class prices across the board,” Munch wrote in his Market Intel analysis, as reported by Michigan Farm News. That figure covers all 11 federal orders — the 85–93¢/cwt reduction applied against first-quarter pooled volume nationally. Commodity-heavy regions — especially the Upper Midwest — absorbed the deepest cuts.
Barn Math: Walk It on Your Own Herd
Here’s the formula. Take your herd size. Multiply by 230 cwt/cow/year — a conservative national proxy, since USDA NASS reported 2024 production per cow in the U.S. averaged 24,178 pounds. If your herd ships 250 or 270 cwt, scale accordingly. Multiply total cwt by the 85–93¢/cwt reduction. That’s the revenue that moved from your milk check to processor cost recovery under the new make allowances.
Herd size
Production assumption
FMMO hit
Annual milk-check loss
300 cows
230 cwt/cow/year
$0.85–$0.93/cwt
$58,650–$64,170
500 cows
230 cwt/cow/year
$0.85–$0.93/cwt
$97,750–$106,950
700 cows
230 cwt/cow/year
$0.85–$0.93/cwt
$136,850–$149,730
Walk the 500-cow row. At 230 cwt/cow/year, you move 115,000 cwt. Multiply by 85 cents, and you get $97,750. Multiply by 93 cents, and you get $106,950. That range — $97,750 to $106,950 gone from the milk check over 12 months — doesn’t include freight. At USDA NASS national livestock-worker wages of $17.51/hr in October 2024, that’s roughly two full-time dairy employee salaries once you factor payroll taxes and benefits — erased by a single rule change.
Class I differentials and advanced-pricing factors were reworked in the same final rule, but the benefit skewed toward fluid-heavy orders. Add the 30% jump in per-farm hauling on Federal Order 30 between 2023 and 2024, and the net effect on the milk check looks less like modernization and more like a reallocation from producers to processors.
Whatever you call it, it’s a withdrawal.
Cost Driver
Rate
Applied to 500-Cow Herd (115,000 cwt/yr)
Annual Impact
FMMO make-allowance update (low case)
$0.85/cwt
115,000 cwt × $0.85
$97,750
FMMO make-allowance update (high case)
$0.93/cwt
115,000 cwt × $0.93
$106,950
FO30 per-farm hauling, May 2024
$0.7969/cwt
115,000 cwt × $0.7969
$91,644
FO30 hauling increase vs. May 2023
+$0.1832/cwt
115,000 cwt × $0.1832
+$21,068 YoY
Stacked drag (high FMMO + May 2024 hauling)
—
—
~$198,594/yr
The Route Math Most Producers Never See
Cooperatives track route economics internally. Every hauler, every loop, every stop — there’s a model somewhere that says where the margin is and where the routes are becoming uneconomic. That kind of planning information isn’t typically shared at the producer level, and producers rarely get advance notice when a route is at risk of restructuring.
The Holles were directed to a new market twice in 30 months. The producer northwest of Bismarck invested in a second bulk tank — and lost his plant eight months later. Whether that’s a communication gap, a competitive information issue, or a structural feature of how co-ops plan, the practical result for members is the same: you won’t see the route map until a decision has already been made. So if you’re a 500-cow operator in a Green Zone state, it’s worth asking your field rep directly about route density in your corridor. The willingness to engage the question tells you something. So does the reluctance.
The Turn: You Can’t Buy Your Way Back Out
Here’s the turn nobody priced in. Recovery isn’t just a margin problem anymore. It’s a biology problem.
Dairy replacement heifer inventories fell to 3.914 million head as of January 2025 — the lowest level since 1978, per USDA’s January 2025 Cattle report. The number of heifers expected to calve fell to 2.5 million head — the lowest figure in decades, per the same Cattle report. In its February 2025 WASDE report, USDA cut its 2025 milk production forecast by 400 million pounds, citing a tighter heifer supply revealed in the Cattle Inventory and Milk Production reports.
That changes what “fix this” even looks like. If you can’t buy your way out of a thinning corridor with replacements, you have to manage your way out — lower breakevens, tighter loan discipline, stronger reproduction, and decisions that match your corridor rather than your hopes. Even if milk prices rally, the cows aren’t there to repopulate fragile regions quickly.
Dawson Holle — sixth-generation dairy farmer, Northern Lights Dairy co-operator, and North Dakota state representative — told Dairy Star in June 2025 that the market access problem isn’t about herd size: “As markets move, laws must move too. Whether you are large scale with 10,000 cows or small scale with just 10 cows, you should have a place in the market.” He added, “If we can keep milk in-state and add more processing options in the center, that would be a big step forward.”
Dairies in thin corridors are carrying more system risk than the ones sitting in dense corridors, not less.
As The Bullvine reported in our analysis of America’s 800,000-heifer crisis, the industry-wide shift toward beef-on-dairy breeding has driven roughly 800,000 fewer replacement heifers into the national pipeline — with replacement values averaging $3,010 nationally and premium springers in California and Minnesota pushing $3,500–$4,000. And every heifer you do raise is a $2,300–$2,700 capital asset before she ever hits the parlor, per Iowa State’s 2024 budgets — which means how you feed her in week one directly shapes whether that investment pays back or washes out.
What 2,013 Farms Holding 66% of U.S. Milk Means for Your Risk
The 2,013 U.S. farms with 1,000 or more cows accounted for 66% of all U.S. milk sales in the 2022 Census of Agriculture, up from 57% in 2017, per analysis from the University of Illinois’ farmdoc project using USDA NASS data. Total U.S. milk production rose from 215.5 billion pounds in 2017 to 226.4 billion pounds in 2022. That’s the headline the industry points to when it says consolidation is working.
Production stability is masking infrastructure thinning. Rabobank analysis found that dairy operations with fewer than 500 head represented 86% of total farms but produced just 22% of the milk, roughly 20,631 operations at the time of that analysis. So if you’re one of the tens of thousands of herds under 1,000 cows, the 66% figure isn’t about you. The attrition figure is.
North Dakota is betting on size to solve the processing gap from the other direction. Minnesota-based Riverview LLP has obtained environmental permits for a 12,500-cow dairy near Wahpeton and a 25,000-cow herd near Hillsboro, both along the I-29 corridor on the Minnesota border. An environmental group filed a legal challenge to the Hillsboro permit in October 2025. If both go in, North Dakota’s cow count jumps roughly fourfold overnight — but it jumps into the state’s single existing processing corridor, not the western void where the Holles sit.
The Playbook: Scale, Pivot, or Exit Before Your Next Loan Review
If your milk has only one realistic destination within two to three hours, you’re not in a market. You’re in a dependency. Use the next 12 months to figure out which of the three paths your numbers actually support.
Scale into a backbone corridor. Where it helps: dense processing regions with recent plant investment, sound debt-to-asset, and equity rising. You gain leverage and route redundancy. You give up some flexibility and take on more fixed costs concentrated in one place.
Pivot your revenue mix. Where it helps: mid-size herds in thinning corridors with strong genetics or component-rich milk. Robotics, precision systems, component-focused genetics, and beef-on-dairy income can trim your effective breakeven even when the corridor is unfriendly. Trade-off: more management complexity and, in some cases, added biosecurity exposure.
Structure a planned exit. Where it helps: operators past 55 with debt-to-asset above 60%, no committed successor, and a corridor where hauling plus FMMO drag is already eating 2%+ of gross revenue. You keep optionality around cows, equipment, and genetics while the market still rewards them.
Do This in the Next 30 Days
☐ Call your co-op field rep and your hauler. Ask how many herds remain on your route versus five years ago, whether the loop’s geographic footprint has grown, and whether there’s any talk of route optimization or minimum volumes. If they won’t answer, that’s an answer too.
☐ Pull the last 12 months of milk checks. Isolate hauling and stop/fuel surcharges. Compare the total to the same period three years ago. If hauling is rising faster than your mailbox price, your corridor is already taxing your margin.
☐ Name your backup plant. If you can’t identify a second processor within two to three hours that would take your volume tomorrow, you have a single point of failure. Write the plant’s name on paper — or admit you don’t have one.
☐ Sit down with your lender. Ask directly: “What corridor assumption are you using when you underwrite my long-payback projects?” Their answer tells you how they’re stress-testing the same risk you’re living.
Do This in the Next 90 Days
☐ Run a real breakeven. Include family labor at realistic hourly rates and depreciation at replacement cost. If the gap between your breakeven and your mailbox has widened for three years running, that’s a trajectory, not a cycle.
☐ Recalculate debt-to-asset. Under ~50% with equity rising keeps your options open. Over ~60% with equity declining three years running turns the exit conversation from optional to overdue.
☐ Pressure-test your replacement plan. With heifer inventories at a 47-year low and replacements averaging $3,010 nationally, any expansion that depends on buying animals needs a much tighter business case than it did five years ago.
Do This in the Next 365 Days
☐ Commit, or document why you’re still evaluating. By this time next year, you should have a committed corridor decision — scale, pivot, or exit — or a written reason you’re still evaluating. Drift is itself a decision, and it’s rarely the one you’d pick deliberately.
☐ Watch one structural signal. If hauling plus FMMO drag eats more than 2% of gross revenue for two consecutive years — a working threshold The Bullvine uses to separate cyclical stress from structural stress — treat that as a signal to reopen the corridor conversation with your lender.
What This Means for Your Operation
Single-destination risk is structural risk. If your milk has only one realistic buyer within three hours, your equity is a hostage. You aren’t managing a business — you’re managing a countdown. Write the name of a real second buyer on paper, or admit you don’t have one.
Run the FMMO math on your own herd. Take your cwt shipped last year, multiply by 85–93 cents, and that’s your estimated annual make-allowance hit. A 500-cow herd at 230 cwt/cow lands at roughly $97,750–$106,950 a year before freight. If your debt-service coverage ratio (the ratio of your net farm income to annual debt payments) sits below 1.2 — the floor most ag lenders watch — that hit alone can move you into the danger band.
Find your row on the Clock. Look up your state in the 16-state table above. If your 5-year attrition rate is higher than your 10-year rate, you’re in an accelerating state — the decline is getting worse, not better. That’s a decision input for every long-payback project on your desk.
Match your loan horizon to your corridor, not your stainless. If your corridor has lost more than a third of its dairies in the last decade, the route functionally behaves like a wasting asset. Long-payback projects deserve extra scrutiny.
Don’t count on buying your way out. With replacement inventories at a 47-year low and an 800,000-heifer deficit driven by beef-on-dairy breeding, growth plans that assume available heifers at reasonable prices are already out of date. The heifers you do raise are $2,300–$2,700 capital assets — treat them accordingly from day one.
Talk to your lender before your lender talks to you. Ask what corridor risk, hauling inflation, and make-allowance drag are doing to their underwriting model on dairy paper this year. If they haven’t run those numbers, now you both have a problem to solve.
If you’re in a dense corridor, protect the advantage. A Green Zone state with fresh stainless going into nearby plants is the closest thing to a structural tailwind in this market. Don’t squander it by running someone else’s numbers on your own barn.
Six Checks Before Your Next Loan Review
If your FMMO drag plus hauling eats 2%+ of gross revenue for two years running, treat that as a structural trigger — not a bad cycle — and put a corridor conversation on your lender’s calendar.
If your debt-service coverage ratio is already below 1.2, the FMMO rule change alone can push you into covenant territory before any other input moves. Run the 85–93¢/cwt number on your own cwt shipped before your next review.
If your state’s 5-year attrition rate exceeds its 10-year rate on the Clock table, you’re in an accelerating corridor. That’s a signal, not noise.
If you can’t name a second buyer inside a two-to-three-hour radius, your equity is riding on one plant’s business case, not yours.
If your 10-year expansion plan assumes available, affordable replacements, rebuild it. The January 2025 heifer inventory is the lowest since 1978, and the pipeline tightened before the rule did.
If you’re in a dense processing corridor, that’s not luck — it’s a structural tailwind. Don’t let someone else’s growth playbook talk you out of it.
Federal Order 30 staff, USDA NASS, farmdoc, AFBF’s Daniel Munch, and North Dakota’s own agriculture commissioner are all saying the same thing from different angles: route access and policy drag are structural inputs in the dairy financial model now, not cyclical ones. Operators like the Holle family at Northern Lights Dairy got caught on the wrong side of that timing. The window to decide which side of the math you want to be on isn’t closing today, but on current attrition trends in Red Zone states, it’s narrowing year over year. Put your own map on paper, set your breakeven beside it, and answer the only question that actually matters:
Are you financing a dairy, or a route that’s already disappearing?
Complete references and supporting documentation are available upon request by contacting the editorial team at editor@thebullvine.com.
Every week, thousands of producers, breeders, and industry insiders open Bullvine Weekly for genetics insights, market shifts, and profit strategies they won’t find anywhere else. One email. Five minutes. Smarter decisions all week.
Your lender’s pro forma works at today’s margins. Your gut remembers 2023. One of them is right — and a $323,600 annual payment doesn’t care which.
Executive Summary: A million dairy expansion at 7% over 15 years costs you .85 million — adding .39/cwt in fixed debt service on a 500‑cow herd before you pay yourself. The Q1 2026 rally, making those numbers look comfortable, rests on two temporary forces: a global restocking wave that pulled demand forward, and a Hormuz closure that stranded six percent of traded dairy behind a war zone. The supply picture behind the rally hasn’t changed — U.S. herds added 49,000 cows in January–February 2026 alone, EU SMP stocks are running 50% above last year, and butter inventories have doubled. Feed costs feel manageable now because you’re still burning through inputs bought before the conflict repriced fertilizer and energy; late 2026 into 2027 is when the real cost of rationing hits. If your expansion math doesn’t survive 18 months at /cwt milk with post‑Hormuz input costs and full debt service loaded, the project’s timing doesn’t match the risk. The 30/90/365‑day playbook here starts with one check: run your true breakeven with family labor, realistic depreciation, and 7% money — then stress‑test it at a price you know you might see.
Six percent of global dairy trade sitting behind a chokepoint should’ve pushed prices down, not up. Instead, early 2026 has skim milk powder, cheese, and butter all stronger than most models projected — and a lot of 300‑ to 800‑cow U.S. dairies staring at expansion plans that suddenly “pencil.” You’re looking at a rally and wondering if it’s a window or a setup. On a $3 million project at 7% over 15 years, that choice carries an annual payment of roughly $323,600 and nearly $1.85 million in total interest.
Nate Donnay, a Minneapolis‑based dairy market insight director who’s been modeling international and U.S. dairy markets since 2005, told clients in late 2025 to expect a heavy market: big production gains across every major exporter, growing stocks, and prices under pressure. Instead, the first quarter turned into a demand‑driven rally stacked on top of already strong milk flow. For a 500‑cow family operation, that rally now looks like a green light — call the lender, add stalls or robots, lock in what feels like a new floor.
The Rally That Shouldn’t Have Happened
From a pure supply standpoint, this rally shouldn’t be here.
By late 2025, milk production across the big exporting regions — the U.S., EU, New Zealand, Australia, and Argentina — was running hot. On a component‑adjusted basis, U.S. supply alone was growing at more than three percent year‑over‑year into early 2026. New Zealand was on track for roughly four percent milk‑solids growth for the 2025/26 season after Fonterra revised its midpoint milk price forecast upward to NZ.70, up from NZ.50, with decent weather backing it up. EU collections in the second half of 2025 and early 2026 were described as “phenomenal.”
In Donnay’s models, every scenario pointed in the same direction: more milk, more product, lower prices. That’s not what happened.
The restocking wave outside China
The first twist came from buyers, not cows.
One of Donnay’s key charts tracks milk‑equivalent imports by all countries other than China. As prices fell hard across exporters in mid‑2025, those non‑China imports started climbing in August–September. Buyers in Southeast Asia, the Middle East, and parts of Africa had been running inventories tight, waiting for the bottom to fall out. When prices finally felt “cheap enough,” they moved. Hard.
That restocking didn’t magically remove product. It pulled demand forward into a market that was already well supplied. Then a geopolitical choke point poured fuel on the fire.
Six percent of trade is stuck behind Hormuz.
When conflict in Iran effectively closed the Strait of Hormuz in late February, roughly six percent of the world’s traded dairy — on a milk‑equivalent basis, in Donnay’s modeling — suddenly sat behind a chokepoint.
The exposure wasn’t equal:
Around 10% of the global trade in whole-milk powder moved through Hormuz.
Roughly two percent of global whey trade relied on the same route.
Europe was the dominant dairy supplier to the Gulf, followed by New Zealand; U.S. volumes into that corridor were smaller.
The product didn’t vanish, but it didn’t flow smoothly. Exporters rerouted vessels outside the Gulf and trucked loads inland at higher cost. Faced with longer transit times and shipping uncertainty, importers did what risk‑averse buyers always do when they’re afraid of being short: they doubled up.
An Asian buyer with a European powder vessel now going the long way around the Cape might place an additional order from the U.S. West Coast or New Zealand “just to be safe.” Multiply that across enough buyers, on top of the restocking wave already running, and demand suddenly pulled harder than anyone’s supply model expected.
That’s how you get a rally in a market still swimming in product.
Signal
Direction
Detail
Duration Estimate
Non-China restocking wave
🟢 Bullish
SE Asia, Middle East buyers pulling demand forward into a well-supplied market
Short-term; demand already pulled forward
Hormuz closure (6% of trade)
🟢 Bullish near-term
~10% of global WMP, ~2% of whey stranded; importers double-ordering
Temporary; risk-premium only
EU SMP stocks +50% YOY
🔴 Bearish
Modelled January 2026 SMP production up ~20% YOY; stocks well above last year
Ongoing; caps rallies through mid-2026+
EU butter inventories ~2× 2025
🔴 Bearish
Butter prices already backing off highs in early 2026
Ongoing
U.S. herd +49k head (Jan–Feb 2026)
🔴 Bearish
+63% vs. same period in 2025; component-adjusted growth still ~3% YOY
Multi-year structural supply build
NZ milk solids growth ~4%
🔴 Bearish
Fonterra midpoint raised to NZ$9.70; good weather backing it
Season-long (2025/26)
Hormuz demand destruction (medium-term)
🔴 Bearish
Gulf importing nations face higher costs, shipping disruption reduces orders
Develops over 6–12 months
China domestic SMP/MPC exports
🔴 Bearish
Chinese processors now exporting SMP and MPC70 to SE Asia — competing with NZ and EU
Structural shift, not a blip
Europe’s Calving Echo and the Powder Wall Behind This Rally
So why should a delayed calving wave in Germany or France matter to your 500‑cow barn? Because it helped build the powder wall sitting behind every price you’re looking at today.
John Lancaster, who leads EMEA dairy and food consulting from Dublin, sees two main EU drivers: how the milk got here, and how much of it is now sitting in bags and boxes.
Delayed calving, prolonged lactation
Lancaster traces the current EU milk profile back to 2024, when Bluetongue hammered fertility in France, Germany, Belgium, and the Netherlands. Cows that should’ve calved in April through June didn’t freshen until July through September. That shoved a wave of peak‑lactation production into late 2024 and well into 2025.
At the same time, with margins decent and feed grains toward the low end of their five‑year range, plenty of EU producers chose to keep marginal cows milking rather than drying them off.
The result in early 2026: a big cohort of late‑calving cows still in relatively strong lactation stages, older cows kept in milk longer than they would be in a tighter year, and a smaller overall herd producing more milk per cow. Growth built on timing and persistence — not a permanent structural jump.
In Lancaster’s modeling, EU production growth slows sharply as 2026 progresses, especially from Q3 onward. Once 2026 starts to be compared against inflated Q3/Q4 2025 numbers rather than weaker 2024 figures, the growth bars shrink quickly. Donnay agrees with the math but admits he’s “nervous” that the slowdown hasn’t yet shown up in weekly collection numbers from Germany, France, and the UK, which remain very strong.
The SMP and butter overhang nobody’s worked off yet
Based on Donnay and Lancaster’s modeling:
EU SMP production was up about 20 percent year‑over‑year in January 2026, with estimated SMP stocks more than 50 percent above year‑ago levels.
Butter inventories were estimated at more than double last year’s — one reason EU butter prices have already backed away from their highs.
Those are modeled estimates, not official Eurostat figures, but they line up with reports from processors and traders and with AHDB analysis showing a build‑up in available SMP and butter supplies into late 2025.
Lancaster’s test is simple. If SMP stocks peak by late Q2 and start a steady decline — and butter stocks narrow their gap versus 2025 as milk growth slows — the overhang is easing. But if we reach mid‑2026 with SMP still very heavy and butter inventories near twice 2025 levels, that overhang is intact. And it’s going to cap rallies.
Right now, the 2026 rally is underway, with that powder-and-butter wall still sitting behind it.
What Does This Rally Really Mean for a 500‑Cow U.S. Dairy’s Cashflow?
Donnay shows a U.S. gross‑margin chart that explains why so many producers are talking expansion again. After dipping below the long‑term average in January 2026, milk‑minus‑feed margins bounced back above average in February and March. Add in strong slaughter cow and calf cheques, and the total margin line jumps “well above average.”
For a 500‑cow herd, that feels like breathing room. For your lender, it looks like the year you finally pull the trigger.
The problem: that gross‑margin line is not your full cash flow. It usually doesn’t load principal and interest on newlong‑term loans, a fair wage for unpaid family labor, depreciation at replacement cost, or fertilizer and fuel that haven’t repriced because you’re still on pre‑conflict contracts.
The barn‑math reality: $3 million at 7% over 15 years
Here’s where compound interest on a farm loan really matters — and why this isn’t just “principal plus a little interest.”
At 7%, each monthly payment on a $3 million, 15‑year loan runs approximately $26,965. That’s roughly $323,600 per year in combined principal and interest. Over the full 15 years, you pay back approximately $4.85 million — meaning roughly $1.85 million goes to interest alone. That’s about 62 cents in interest for every dollar you borrowed.
The 7% rate isn’t hypothetical. The Chicago Fed’s AgLetter reported farm real‑estate loan rates in the Seventh District around the 7.19% range at the start of 2025, with rates hovering in the high‑6 to low‑7 percent band through much of the year. So 7% sits right in the middle of what lenders were actually charging through 2025.
Now translate that annual payment into the number that actually matters — cost per hundredweight shipped:
Herd Size (Cows)
Annual Milk (cwt)
Added Cost ($/cwt)
$1/cwt Revenue Hit
400
48,000
$6.74
$48,000
500
60,000
$5.39
$60,000
600
72,000
$4.49
$72,000
Note: Based on 120 cwt/cow/year and a $3M project at 7% over 15 years (~$323,600/year).
That “$1/cwt Revenue Hit” column is the one that should keep you up at night. Drop milk by just a dollar, and a 500‑cow herd loses $60,000 in gross revenue — nearly a fifth of that annual loan payment.
Many farm financial advisors and extension economists note that once they fully load family labor, realistic depreciation, and current interest costs, breakevens often land several dollars per cwt higher than what producers carry in their heads. That’s the gap you don’t want to discover two years after concrete is poured.
When Do Fertilizer and Fuel Really Hit Your Ration?
Margins feel better today than they did in 2023. Some of that is the milk price. Some of it is just timing.
On the feed side, global grain markets look calmer than in 2022 — prices for corn, wheat, and soymeal are closer to the low end of their five‑year range, helped by expectations for decent yields. That’s one big reason rations feel manageable. But fertilizer and energy are on a different trajectory:
Benchmark fertilizer prices FOB Middle East/Egypt have “risen substantially,” with delivered costs pushed higher by freight and war‑risk surcharges.
Gasoline prices have risen enough that, in many European countries, diesel now costs more than petrol after taxes are added — the reverse of normal.
Dutch TTF natural gas prices roughly doubled after the conflict flared, and the spread between European and U.S. gas widened sharply.
That doesn’t hit your TMR overnight. Through mid‑2026, you’re still feeding off forage and grain grown or bought when fertilizer and fuel were cheaper. Late 2026 into 2027 is when new‑crop contracts fully reflect the higher input environment — and that’s when the true variable‑cost increase lands in your ration.
If you price an expansion project off 2025/early‑2026 input costs and assume they hold, you’re building your 15‑year breakeven on yesterday’s input reality.
What If the 2026 Rally Sticks Around?
This all sounds cautious. So what’s the scenario where the rally holds, and you’d wish you’d built?
In Donnay and Lancaster’s modeling, there is a path where 2026 doesn’t roll over quickly. You’d need some combination of:
Europe is slowing harder than the models assume. If weather, disease, or policy push EU collections into outright decline sooner than Lancaster’s base case, that tightens export supply faster.
U.S. herd growth is breaking sooner. Since mid‑2024, U.S. dairy farmers have added 293,000 cows, including 49,000 head in January–February 2026 versus 30,000 in the same period a year earlier. Donnay expects this expansion to slow, with component‑adjusted growth easing toward roughly two percent by late 2026. If it plateaus faster, that’s supportive.
China is tilting back toward imports. Over the last 12 months, Chinese processors exported about 12,000 tonnes of SMP and began shipping MPC70 into Southeast Asia, as Yifan Li notes. If domestic demand or policy nudges them to rely more on imports again, that removes a growing competitor at the margin.
Hormuz is keeping a fear premium without crushing Gulf demand or blowing input costs through the roof. Donnay’s view: the conflict could be “mildly supportive” short term, then turns bearish for demand in the medium term, and potentially bullish longer term if fertilizer and energy costs eventually tighten supply.
Is that combination impossible? No. Is it guaranteed? Not even close.
Donnay and Lancaster’s base case still points to strong production across major exporters, heavy EU SMP and butter stocks relative to 2025, a U.S. herd that keeps expanding even if the pace eases, and China with one foot in the export game. That’s why the contrarian play isn’t “never expand.” It’s “don’t build as if this rally is a floor.”
The Turn: One Stress Test Before You Sign Anything
Here’s where this shifts from “what the market’s doing” to “what you do about it.”
Picture the kitchen table. On one side, your lender has a pro forma that works at current margins. On the other hand, someone in the family remembers 2023 and isn’t sure those margins will be there when your kid takes over payments. The numbers on the screen say “go.” The knot in your stomach isn’t so sure.
The market picture Donnay lays out — strong supply, heavy stocks, a rally built on logistics panic — points to one stress test every expansion plan should pass before pen hits paper:
Run an 18‑month cashflow at a realistic down‑cycle milk price and softer beef cheques, using your full post‑expansion cost structure.
Not the price you hope for. The price you know you might see.
A conservative version of that test:
Use a price around the 2023 national U.S. all‑milk average — roughly $20/cwt — as your down‑cycle starting point, then adjust for your own market and component program.
Cut your beef and calf revenue assumptions back from today’s highs.
Load in full principal + interest on all existing and new loans.
Pay yourself and your family at replacement wages.
Price fertilizer, fuel, and purchased feed at post‑Hormuz levels once current contracts expire.
If that 18‑month projection shows operating debt climbing with no credible path back down, that’s not just “tight.” It means the scale or timing of the project doesn’t match the risk you’re actually comfortable carrying.
Scenario
Milk Price ($/cwt)
Feed+Var ($/cwt)
Debt Svc ($/cwt)
Net Cash/Cow/yr
500-Cow Annual Net
Current Rally (Q1 2026)
$23
$14.50
$5.39
$373
$186,600
Base / Mid-Cycle
$21
$14.50
$5.39
$133
$66,500
2023 Down-Cycle Avg
$20
$14.50
$5.39
$13
$6,600
Post-Hormuz Input Costs
$20
$16.00
$5.39
-$$173**
-$86,400
Severe Stress (teens)
$18
$16.00
$5.39
-$413
-$206,400
How Should a 500‑Cow Dairy Use the 2026 Rally Without Getting Trapped?
In the Next 30 Days: Build Your Real Numbers
CALCULATE your true breakeven. Pull 12–24 months of actual data — milk checks, feed bills, fert, fuel, repairs, debt statements. Build a breakeven that includes family labor at replacement wages, realistic depreciation, and current interest rates. Farm real‑estate rates in the Chicago Fed district sat in the high‑6 to low‑7 percent range through 2025, with farm real‑estate loans around 7.19% at the start of 2025 — use that as your benchmark.
RUN the 18‑month cashflow at a down‑cycle price. Use a conservative milk price for your region (around 2023 levels or below), trim beef revenue, and include full payments on any expansion you’re considering. If operating debt climbs for most of that window, revisit project scale or timing.
AUDIT when “cheap” inputs roll off. List expiration dates for your fertilizer, fuel, and feed contracts. Where you’re still living on pre‑conflict pricing, assume the replacement cost is higher and model it.
In the Next 90 Days: Lock In Strength
SECURE downside protection. Talk with your risk‑management advisor about Dairy Revenue Protection or similar tools in your region. The right share to cover depends on your debt load and risk tolerance, so work it through with someone who knows your balance sheet.
ELIMINATE expensive debt. Prioritize paying down high‑interest operating lines and short‑term notes. Every dollar of principal you retire now is room you get back if you spend time in the teens again.
DEFER non‑critical capital spending. Anything that doesn’t clearly improve labor efficiency or feed conversion goes on hold until you’ve seen how this rally resolves.
WRITE a one‑page margin policy. Decide now what forward margin level triggers you to layer in price protection, and what share of production you’ll cover at each trigger. Don’t negotiate with yourself when screens are moving.
Over the Next 365 Days: Watch the Structural Signals
TRACK EU stocks and production. If SMP stocks peak by late Q2 and trend lower as milk growth slows and butter inventories narrow relative to 2025, the overhang is easing. If stocks stay heavy into autumn, assume there’s still a cap on rallies.
MONITOR U.S. herd growth. Donnay’s base case has the U.S. component‑adjusted supply still growing by around 2% by late 2026, even as expansion slows. If cow numbers keep climbing at the Jan–Feb pace, that’s more milk looking for a home.
WATCH China’s role. Li points out that Chinese processors are already shipping SMP and MPC70 to Southeast Asia, and that China’s dairy sector has shifted from pure import dependence to a mixed import‑plus‑export model. If those exports keep growing and imports stay muted, China is a competitor. If exports flatten and imports recover, it’s back as a source of demand.
What This Means for Your Operation
Don’t treat a fear‑driven rally as a permanent rise. Q1 2026 rests on restocking and logistics panic with a heavy EU powder and butter overhang behind it. That’s not a safe foundation for 15‑year debt.
Your “mental breakeven” is probably lower than your actual breakeven. Once you include family labor, realistic depreciation, and post‑Hormuz input costs, the margin cushion you see today may be several dollars per cwt thinner than you think.
Expansion isn’t wrong. Bad timing is. If your 18‑month stress test only works at top‑third milk prices and current beef cheques, the project scale or timing doesn’t match the risk you’re taking on.
The safest contrarian move is to de‑risk into strength. Use this rally to knock down high‑cost debt, lock in partial downside protection for late‑2026/early‑2027, and build flexibility rather than stretch fixed costs.
In the next 30 days, pull one number that forces an honest conversation. Take your current feed cost per cwt and compare it to 90 days ago. Then lay your expansion loan’s $/cwt debt service on top of that. If you wouldn’t sleep with $2–$3/cwt less margin, that tells you whether this project belongs in 2026 or 2027.
Key Takeaways
If your expansion doesn’t pencil at $20 milk, it doesn’t pencil. Use the 2023 all‑milk average as your down‑cycle starting point and build your 18‑month stress test from there, with full principal and interest, family labor, and post‑Hormuz input costs loaded.
A $3M project at 7% is a $4.85M commitment. For a 500‑cow herd shipping 60,000 cwt a year, that adds about $5.39/cwt in fixed cost before you pay yourself, and the first $1/cwt drop in milk erases $60,000 of that cushion.
Use the 2026 rally to buy flexibility, not just concrete. If you come out of this year with less high‑interest debt, some downside protection layered in, and a clear margin policy, you’ve gained options whether milk trades at $18 or $24.
Watch the overhang and the herd, not just the headline price. EU SMP and butter stocks, U.S. cow numbers, and China’s export posture will tell you more about how long this rally can last than any single futures quote.
When you sit back down at the kitchen table tonight, don’t start with “How much will the bank lend us?” Start with this: at a realistic milk price and higher input costs 18 months from now, does your operation’s cash flow still let you sleep?
Complete references and supporting documentation are available upon request by contacting the editorial team at editor@thebullvine.com.
Learn More
The 3.5-Hour Bottleneck: Why Smart Farms Track Parlor Time, Not Cow Count – Breaks down the ‘3.5-hour rule’ that determines whether your next 100 cows generate profit or bleed cash. This operational audit arms you with the specific benchmarks needed to stress-test your existing infrastructure before expanding.
Ditching Robot Pellets: How Smart Farms Save $36000 and Improve Milk Components – Reveals a maverick strategy for robotic milking that saves $36,000 annually by defying 25 years of industry logic. This field-tested approach breaks down the management shifts required to boost butterfat while slashing your automation costs.
The Sunday Read Dairy Professionals Don’t Skip.
Every week, thousands of producers, breeders, and industry insiders open Bullvine Weekly for genetics insights, market shifts, and profit strategies they won’t find anywhere else. One email. Five minutes. Smarter decisions all week.
USDA’s make allowance update structurally cut Class III minimum prices by $0.94/cwt — and the mandatory survey that’s supposed to bring transparency could lock those numbers in for a decade.
Executive Summary: USDA’s June 2025 make allowance increases baked a $0.94/cwt structural cut into every Class III milk check — not a market swing, a formula constant that hits at any commodity price. On a 400-cow herd, that’s $105,280 a year gone before your component values are even calculated. The cheese allowance alone jumped 25.8% — the first reset since 2008 — despite a 12% improvement in plant yield efficiency over that same stretch. Now add the All-Milk/mailbox gap, which has widened to roughly .00/cwt: DMC is measuring a margin your bank account doesn’t actually see. The real fight is the OBBBA’s mandatory processing cost survey, now in rulemaking, where USDA’s approach to cost categories will either audit these allowances down or lock them in for years. If your DSCR drops below 1.2 after you model this $0.94 deduction, the lender conversation needs to happen before the survey results — not after.
We ran the math ourselves — on the June 2025 FMMO change, month by month, through March 2026. Using USDA’s published pricing formulas and commodity prices from AMS Dairy Product Mandatory Reporting, The Bullvine calculated the make allowance impact independently.
The result: $0.94 per cwt stripped from every Class III milk check, and $0.87 per cwt from every Class IV check. Every single month. It doesn’t fluctuate with cheese or butter markets — it’s baked into the formula constants. For a 400‑cow Holstein herd shipping about 112,000 cwt a year, the Class III hit alone works out to $105,280 per year at standard component tests, and closer to $112,000 at actual pool test levels.
“Dairy farmers remain the only participants in the supply chain without the ability to set prices or recover costs through a built‑in mechanism,” says Laurie Fischer, CEO of the American Dairy Coalition. “In practical terms, that’s a multi-dollar deduction built into the pricing system on the front end.”
The comfortable story in 2025 was that FMMO modernization gave everyone something. The formula math says processors got a margin reset. Family herds got deeper into a hole.
Where the Money Goes Before It Reaches Your Check
The allowance doesn’t appear on your pay stub. USDA starts with wholesale commodity prices — block cheddar, butter, nonfat dry milk, dry whey — then subtracts the make allowance before calculating component prices. Every penny the allowance rises, your component value falls. Dollar for dollar.
The June 2025 increases, finalized in rule 90 FR 6600 and effective across all 11 federal orders, were not pennies:
Product
Pre‑2025
Post‑2025
Increase
Cheese
$0.2003/lb
$0.2519/lb
+25.8%
Butter
$0.1715/lb
$0.2272/lb
+32.5%
Nonfat Dry Milk
$0.1678/lb
$0.2393/lb
+42.6%
Dry Whey
$0.1991/lb
$0.2668/lb
+34.0%
Source: USDA AMS Final Rule 90 FR 6600, January 17, 2025. Previous rates had been in effect since October 2008.
Run those rates through the published Class III and IV pricing formulas, and the total allowances embedded in Class III come to $4.22/cwt at standard test (3.5% BF, 3.3% protein), $3.09/cwt in Class IV. At actual pool component levels — butterfat running north of 4.0% nationally — those totals climb higher. ADC’s calculation, using published USDA NASS and AMS data at the pool-average test, puts the range at $3.22 to $5.04/cwt, directionally consistent with our independent figures.
What you feel on the farm: a protein price weaker than expected, a butterfat value that doesn’t track the CME board, and a blend that keeps missing your mental target. Almost none of it is labeled “make allowance.” All of it is influenced by it.
Who Held the Pencil — and Why It Matters Now
USDA set these allowances after a record‑long national hearing in Carmel, Indiana, from August 2023 into early 2024. The agency acknowledged it didn’t have mandatory, audited manufacturing cost surveys when it issued the final rule. It set allowances using voluntary and commissioned data, with full intent to backfill with better surveys later.
Processor groups have been clear about their side. IDFA and others warned that allowances set below actual manufacturing costs risk financial strain and potential plant closures, especially at aging facilities in high‑cost orders. Some pointed to episodes where co‑ops imposed production limits because plant capacity couldn’t keep pace — arguing that realistic make allowances were part of keeping plants open, modern, and able to accept all members’ milk. For producers in those orders, that’s not just a processor problem. A closed plant or a capped intake is a market‑access problem that lands right back on the farm.
The trade‑off is real: you gain plant stability and market access when allowances cover true manufacturing costs, but you give up milk price when those allowances overreach into specialty overhead. The formula math tells you which side of that line we’re on. Using the 2025 average Class III price of $18.01/cwt (from USDA AMS monthly class price announcements, CLS series), the $0.94/cwt structural increase represents a 5.2% reduction in the minimum regulated value of Class III milk. Under the old allowances, every one of those months would have paid producers $0.94 more per hundredweight — no commodity rally required.
How Can Plants Be More Efficient and More Expensive at the Same Time?
Calvin Covington — retired CEO of Southeast Milk and longtime pricing expert formerly with National All‑Jersey — compiled yield data that creates the sharpest contradiction in this fight.
In 2000, it took 99.47 pounds of milk to produce 10 pounds of 38% moisture cheddar. By 2025, that dropped to 87.2 pounds — a 12.3% improvement driven by genetics pushing components higher and decades of plant‑level technology. Independent analysis by CoBank’s lead dairy economist Corey Geiger, using USDA and FMMO data, corroborates this trend: cheese yield per hundredweight grew from 10.14 to 11.24 pounds between 2000 and 2022, a 10.8% gain. Extrapolating that trajectory through 2025’s record component levels — national butterfat averaged 4.15%, a new high — Covington’s endpoint falls well within the expected range. Fewer tanker loads. Less volume through receiving and storage. More finished products to spread fixed overhead across.
If per‑unit costs should be falling with those efficiency gains, why did the cheese make allowance jump 25.8%? NFDM, 42.6%?
Nobody’s arguing that plants haven’t seen real inflation in labor, energy, and compliance. The question is whether the mandatory survey will separate those costs from overhead tied to high‑margin specialty products — WPI, MPC, ultrafiltered milks — that don’t determine your milk price.
When a co‑op installs a new ultrafiltration line, that capital expenditure doesn’t appear on your check as “WPI overhead.” It shows up in the total plant cost. If overhead is allocated broadly across all product streams, some of it lands in the cheese and dry whey buckets that feed the FMMO formulas — even though WPI sells into a completely different, higher‑margin market.
ADC calls this “cost shifting.” Processors say their allocation methods follow current USDA guidance. That’s exactly why the survey definitions and allocation rules matter: what USDA writes now will determine which costs land in your make allowance for years.
⚠️ Lender Alert: The DSCR Threshold You Can’t Ignore
Before the playbook — one number that should stop you cold.
If your debt‑service coverage ratio stays above 1.5 after you model a $0.94/cwt hit from structural make allowance deductions, you’ve got room to absorb survey surprises. Below 1.2 — a level extension and lender materials commonly flag as a minimum comfort zone for leveraged dairies — you’re in a risk band that justifies a hard conversation with your lender before the next survey results lock in.
The 2025 allowances already shifted $0.94/cwt from every Class III check and $0.87/cwt from every Class IV check — permanently, at any commodity price level. Fischer sees a real possibility that if the new survey rules don’t narrow cost‑allocation practices, a future update could push allowances higher again.
That’s an outlook, not a guarantee. But your capital plan shouldn’t pretend it’s impossible.
Why DMC Is Measuring a Margin You Don’t Actually Receive
Dairy Margin Coverage calculates your margin by subtracting a formula feed cost from the NASS All‑Milk price — a gross number that ignores make allowance deductions, hauling, co‑op retains, and basis. Your actual realized price, the mailbox price, runs lower.
ADC compared published USDA NASS All‑Milk and AMS mailbox price series and found the gap has quietly widened: about $0.11/cwt in 2008–2016, $0.63/cwt in 2017–2025, and roughly $1.00/cwt from June 2025 to January 2026 — a 67% jump in one year. The most recent trend is corroborated by Farmshine’s January 2026 report, which confirmed that the USDA mailbox price had plummeted by $5.23 from a year earlier. For additional context, Covington’s own 2019 analysis of the same USDA mailbox data in Progressive Dairy showed the 2018 weighted national average mailbox price at $15.72/cwt — with NASS All‑Milk for that year averaging approximately $16.26/cwt, a gap of roughly $0.54/cwt that falls within ADC’s reported $0.63 average for the 2017–2025 window.
AFBF economist Daniel Munch notes that DMC has distributed roughly $2.7 billion in net support since 2019, but total production costs reached about $23.65/cwt in 2024 — meaning many producers were underwater even when DMC margins sat above trigger levels. OBBBA raised Tier I coverage from 5 million to 6 million pounds and created a 25% premium discount for multiyear enrollment (2026–2031), but it didn’t change the All‑Milk margin calculation itself.
Your safety net is being measured off a headline price that’s drifting farther from what actually hits your bank account. And the 2025 allowance changes are a big reason why.
What Does a $0.94/cwt Make Allowance Hit Mean for a 400‑Cow Herd?
Scenario: All‑Milk at $20.50/cwt, formula feed at $10.50/cwt
DMC sees a $10.00/cwt margin — no payment at $9.50 coverage.
But with a $1.00/cwt All‑Milk/mailbox gap:
Mailbox: ~$19.50/cwt → Real margin: $9.00/cwt — already $0.50 below your coverage
Annual unprotected gap: 112,000 × $1.00 = ~$112,000 the program assumes you have, but your bank account doesn’t
Tighten it. All‑Milk drops to $19.75, feed stays at $10.50:
DMC margin: $9.25/cwt → 25¢ indemnity at $9.50 coverage
Mailbox: ~$18.75 → Real margin: $8.25/cwt — a full $1.25 below the margin you insured
Same herd. Same feed. Same coverage. The only variable: the spread between a national headline price and what actually hits your account.
Will the OBBBA Survey Fix the Make Allowance Problem — or Freeze It In?
The One Big Beautiful Bill Act authorized mandatory surveys of dairy processing costs and yields under Section 10314. According to AFBF’s Munch, those surveys are supposed to be biennial to prevent another 17‑year gap between major resets.
In February 2026, AMS published an Advance Notice of Proposed Rulemaking in the Federal Register to outline the survey design. ADC requested a 60‑day extension; AMS didn’t grant it. Fischer’s team filed formal comments by the March deadline.
Producer groups want a narrow scope: physical conversion costs for four formula products, clear product‑line cost separation, and standardized allocation rules. Processors argue they need flexibility to reflect varied plant types and product mixes. “There is a real expectation that this survey will provide transparency,” Fischer says. “USDA needs to ensure that the expectation is met.”
If the categories and allocation rules come out too loose, the survey could ratify those high allowances and give them fresh, “audited” cover. That’s the real battleground of 2026.
Three Questions to Put in Front of Your Co‑Op Board
Many of the cost‑allocation choices that matter most occur within organizations that still call themselves farmer‑owned. For a 400‑cow member already $105,000 lighter from the formula change, your co‑op’s processing margin and your milk check draw from the same pool.
Ask — in writing:
“Do your cost‑of‑processing reports to USDA include costs from products that don’t set my milk price?”
“How do you allocate overhead between commodity and specialty products, and can members see that schedule?”
“What position did this cooperative take in its ANPR comments?”
If leadership won’t answer clearly, that’s your first real data point.
What Should Your Dairy Do in the Next 30, 90, and 365 Days?
Next 30 Days
Draft a one‑page member resolution calling for a narrow survey scope — physical manufacturing costs for four formula products only, clear product‑line separation, and standardized allocation methods. Get three to five neighbors to co‑sign and push your board to adopt it.
Ask for your co‑op’s ANPR position in writing. If management won’t share it, that tells you something.
Next 90 Days
Run your own All‑Milk/mailbox reconciliation. Pull six checks and compare your mailbox to the published All‑Milk for your state. If the gap averages more than $0.80/cwt, treat DMC as partial relief, not a margin backstop — and walk your lender through the math. If they’ve never heard the term “make allowance,” that conversation itself is the point.
Use strong components as leverage. If your butterfat and protein run well above pool, the make allowance bite is proportionally bigger — but so is your ability to negotiate component premiums. Bring those numbers to your next field‑rep meeting.
Next 365 Days
Stress‑test with your banker. What happens to your DSCR if your effective milk price drops another $0.94/cwt from structural deductions, even with decent futures? Below 1.2, start restructuring conversations now.
Be careful what you build on. If you’re penciling big projects on today’s over‑order premiums, stress‑test against a world where premiums get trimmed but structural deductions stay. Premiums are discretionary. Make allowance deductions held from 2008 to 2025.
What This Means for Your Operation
Make allowances are a structural risk line, not background noise. They reset your pricing base for years. You can’t hedge them with futures or negotiate them with your field rep.
The DMC printout doesn’t match your bank account. If your All‑Milk/mailbox gap is near $1.00/cwt, that gap needs to show up in every capital, coverage, and hiring decision you make.
Your co‑op voice matters right now. Once the OBBBA survey categories lock in, you live with those numbers in your milk check for the next cycle.
Get your lender on the same page early. A banker who understands the make allowance drag is more likely to work with you than one who only sees DMC margins on paper.
Key Takeaways
If your DSCR falls below 1.2 when you model a $0.94/cwt structural hit, you’re in the danger band — and lender conversations shouldn’t wait for the next survey round.
If your All‑Milk/mailbox gap has averaged $0.80/cwt or more over the last six months, your DMC coverage is quietly under‑insuring the margin you actually live with.
If your co‑op runs commodity and specialty lines, you have a direct financial stake in how it allocates overhead in survey responses — and a right to see that logic in writing.
Pull your last six milk checks. Find your mailbox price. Compare it to the All‑Milk number USDA published for those same months. That gap — not the futures board, not the co‑op newsletter, not the DMC margin printout — is the number that tells you how much of your income sits on the other side of formulas you didn’t write and still can’t fully audit.
Complete references and supporting documentation are available upon request by contacting the editorial team at editor@thebullvine.com.
Every week, thousands of producers, breeders, and industry insiders open Bullvine Weekly for genetics insights, market shifts, and profit strategies they won’t find anywhere else. One email. Five minutes. Smarter decisions all week.
Processor consolidation has cut U.S. milk handlers by 28% in two decades. The gap between competitive and captive markets now runs $3–4/cwt — and your address determines which side of that line you’re milking on.
Krista Stauffer’s family has shipped milk to Darigold for years, building equity in the cooperative, as generations of Pacific Northwest dairy families have. She shared that they now have “quite a bit of equity sitting there” — with a real chance that only her kids ever see it come back. Her situation isn’t a one-off grievance. It’s what happens when processor consolidation narrows your options to one real buyer. And the financial distance between farming where processors compete for your milk and farming where a single handler calls the shots is wider than most people think.
When you stack documented premium differences, structural hauling costs, and the 2025 make-allowance hit together, the gap between the best and worst regions runs roughly $3.00–$4.25/cwt on your milk check. On a 500-cow herd, that’s $390,000–$552,500 a year, driven by your zip code, not your TMR.
From 306 Buyers to 220
Twenty years ago, the USDA counted 306 handlers pooling milk across the federal orders. By 2024, that number had dropped to 220 — a 28% decline (USDA AMS, 2024). Pooled producers fell from 52,853 to 20,168 over the same stretch. Fewer farms are shipping to fewer buyers. That’s the whole structural picture in one sentence.
But it doesn’t look the same everywhere. In Wisconsin’s Upper Midwest order, multiple cooperatives and proprietary processors still overlap routes and counties, so they’re forced to bid for milk. In the Pacific Northwest, Darigold operates 11 production facilities and handles the vast majority of pooled milk in the order — processing up to 8 million pounds per day at its new Pasco plant alone (Northwest Dairy Association annual report; FMMO-124 data). In the Southeast, DFA and its affiliates manage supply for essentially every regulated fluid plant in the Florida order. All three regions are “orderly markets” on paper. On your milk check, they’re completely different worlds.
The $11 Billion Build-Out — and Who It Actually Helps
Processors are in the middle of an $11 billion processing build-out — more than 50 new or expanded plants announced between 2025 and 2028 (Dairy Foods, 2025). Texas, Idaho, New York, and South Dakota are picking up the lion’s share. Pennsylvania, parts of the Northeast, and Washington are losing plants as older facilities shutter or consolidate.
That looks like capital investment on a press release. On the farm, it means some regions are getting more bidders for your milk — and others are getting fewer. The question isn’t whether new capacity is coming. It’s whether any of it lands within your hauling radius.
Same Time Zone, Different Reality: Idaho vs. Washington
The sharpest contrast in American dairying right now sits inside the Pacific time zone. Same climate band. Very different leverage.
Idaho just reclaimed the No. 3 spot in U.S. milk production. According to USDA data released in February 2026, the state’s roughly 350 dairy operations produced 18.26 billion pounds of milk in 2025 — narrowly edging Texas at 18.21 billion (USDA NASS, Feb. 2026). In the Magic Valley, at least four independent processors are actively adding capacity. Chobani broke ground on a $500 million expansion in Twin Falls — its largest capital investment ever — bumping milk usage from about 4 million pounds per day to over 10 million (Chobani, 2025; Twin Falls Times-News). Idaho Milk Products is building in Jerome. High Desert Milk has invested tens of millions in its own operation. Newer players like Suntado have come online. Every one of those plants needs milk. Everyone competes for it. Idaho Dairymen’s Association CEO Rick Naerebout told Dairy Herd Management: “Idaho dairymen, for the most part, are fairly well situated financially right now.”
Drive west, and the story flips. Darigold’s Pasco, Washington, plant — originally budgeted at around $600 million — exceeded $900 million by the time it opened in June 2025 (Capital Press; Reuters, 2025). The cooperative approved the project back in 2021. CEO Stan Ryan pointed to labor shortages and equipment procurement as the main cost drivers. To cover the gap, the cooperative pulled a $4/cwt deduction from member checks (eDairyNews, May 2025). Yakima County producer Dan DeRuyter, milking about 4,800 cows, told reporters the hit amounted to nearly $5 million taken from his operation over two years. He didn’t sign the construction contract. He didn’t pick the procurement strategy. He had no practical alternative buyer for his milk. He just absorbed the deduction.
That’s the governance structure on paper. Here’s how it played out on the milk check: one buyer, one deduction, limited alternatives.
The Leverage Gap at a Glance
“Captive” Market (WA / PNW)
“Competitive” Market (ID / Magic Valley)
Dominant Player
Darigold (~85–90% of pooled milk)
Diverse: Chobani, Idaho Milk Products, High Desert Milk, Suntado, Glanbia
Farmer Leverage
Low — limited exit options, retained equity as anchor
High — multiple independent bidders for milk
Recent Trend
$4/cwt capital deduction from member checks
$500M+ in private processor expansions
Risk Profile
High “address risk” — geography controls your basis
Dynamic growth — processors competing for supply
2025 Milk Production
~10 billion lbs (NDA members, WA/OR/ID/MT)
18.26 billion lbs (Idaho alone, USDA NASS)
Here’s the barn math that connects those two columns. Take a 300-cow herd shipping about 78,000 cwt a year. In a region with multiple handlers fighting for milk — over-order premiums, quality bonuses, and hauling competition all working in your favor — it’s reasonable to see at least 50-100¢/cwt more in total value than the same herd in a single-buyer region. That’s $58,500 a year. Or roughly $195/cow — pushed or pulled entirely by how many processors are in range, not how well you bed stalls.
How Many Buyers Can Actually Bid on Your Milk Right Now?
This is the question that invisibly sets your basis.
Pull up a map. Draw a circle with your maximum economic hauling distance — for most outfits, that’s 100–150 miles, depending on roads and fuel. Count the plants inside that circle. Then ask the harder follow-up: how many of those plants are controlled by different companies?
Two DFA plants don’t equal two buyers. A DFA plant and a Leprino plant do.
If you count four or more independent buyers, you’re in rare air. Much of Wisconsin, eastern Minnesota, and chunks of Idaho’s Magic Valley still look like this — multiple co-ops, proprietary cheese plants, and specialty processors overlapping territories. Charles Krause, chair of Midwest Dairy’s board and a sixth-generation dairy producer running a 350-cow operation in Buffalo, Minnesota, told Progressive Dairy: “In the central states, we are finally seeing processors out procuring more milk. It has been several years since farmers had options.”
If the count is one, you’re in a captive market. CME settlements or national mailbox averages don’t drive your real price. It’s set by whatever your lone buyer decides is sustainable — for them.
Where Does the Money Go Before It Reaches Your Statement?
Two pieces of plumbing turn consolidation into smaller milk checks. Neither one shows up as a tidy line item.
Make allowances move money upstream before your check is even printed.
When USDA raised the cheese make allowance to 25.19¢/lb in June 2025 — up from 20.03¢ where it had sat since 2008 — nobody added a “make allowance” deduction to your statement (USDA AMS, Final Decision on FMMO Amendments, 2025). The money vanishes earlier than that. USDA subtracts the allowance from the wholesale commodity price before calculating protein and butterfat values for Class III. The processor keeps the allowance as an operating margin. What’s left becomes your component price.
Danny Munch at AFBF did the math. The new make allowances stripped $337 million from producer pools in just 90 days — June through August 2025 (AFBF Market Intel, 2025). That included about $64 million from the Upper Midwest and $62 million from the Northeast. Class price reductions ranged from 85 to 93 cents per hundredweight. Terrain Ag’s analysis was blunt: “Increased make allowances will have the most clear-cut negative effect on component values and milk prices.”
Run that through the barn. A 300-cow herd shipping 78,000 cwt a year sees about $70,000 in annual gross revenue shift from farm accounts to processor margins because of a single rule change. You can’t negotiate it back in a premium. It’s baked into the formula — based on a voluntary cost survey that, according to the hearing record, only about 17% of eligible plants bothered to respond to.
Co-op governance wasn’t built for nine-figure construction risks.
On paper, farmer-directors run cooperatives. Members often report that management holds significantly more information than individual directors — and in a complex construction project, that asymmetry can matter enormously. When Darigold says “farmer-owners approved the Pasco project,” that’s technically true. The board voted in 2021. But members did not vote on which contractors to use, whether the job was fixed-price or cost-plus, or who would absorb cost overruns. Those three decisions are exactly what turned a $600M project into a $900M one — and a $4/cwt deduction.
Co-op law gives you formal authority. Consolidation takes away your exit threat. When retained equity builds up over decades, notice periods stretch out, and there’s no other buyer within economic hauling distance, “you can always leave” becomes an expensive theory. That’s how Krista Stauffer ends up with equity sitting in a co-op she may never meaningfully cash out of.
The transparency metric worth demanding: Before your co-op board approves any capital project over $100 million, it’s worth asking in writing whether the construction contract is fixed-price or cost-plus — and what the member-approved cost cap is. If there’s no cap, your future milk checks are the cap. A simple resolution — “No cost-plus contracts above a set threshold without a member-wide vote on overrun allocation” — would have changed the math for DeRuyter and Stauffer.
And the pattern isn’t limited to the Pacific Northwest. DFA has settled antitrust lawsuits in three separate regions: $50 million in the Northeast, $140 million in the Southeast, and $34.4 million in the Southwest — a combined $186+ million since 2013 (court records; Cheese Reporter, multiple years). Settling litigation is standard practice and doesn’t constitute an admission of wrongdoing — DFA has made that point explicitly in each case, stating it “steadfastly denied liability and mounted a vigorous defense.” But somebody still wrote a check.
Should You Lock Your Supply Agreement Before or After Your Construction Loan?
Before. Always before.
A 300-cow dairy looking at 1,000 cows has something processors need: roughly 18 million pounds of additional annual supply. Right now, that’s the story around places like Leprino’s new Lubbock cheese plant in Texas, Hilmar’s Dodge City facility in Kansas, and Chobani’s Twin Falls expansion — which alone will need an additional 6 million pounds of milk per day once it’s fully running.
But two clocks are running against you.
Plant utilization. Once those new plants reach roughly 85% capacity, the tone changes. CoBank has warned that as new cheese capacity in the Southern Plains fills by around 2027, competition for milk will cool and product prices will come under pressure. The first herd to sign has more leverage than the last.
Your loan closing. The day your construction loan funds, your lender expects a signed supply agreement. At that point, your processor knows you must have a buyer. Your negotiating position shifts from “we’re one of several attractive options” to “we can’t close this loan without you.”
The contract you’ll live under for five years — base period, over-base penalties, premiums, termination rules — should be negotiated while both clocks are still in your favor. Not as a rushed afterthought once the concrete trucks have come and gone.
What You Can Actually Do About This
Here’s where the data stops and your decisions start. Not every move fits every operation, but each one has a clear trigger, a trade-off, and a timeline.
Next 30 Days: Map your processor options and take the map to your lender.
Set aside an afternoon. Pull a map and mark every plant within your realistic hauling radius: who owns it, what it makes, whether it’s expanding or shrinking. Count independent buyers, not just plant dots. If it’s one, that’s your biggest business risk — bigger than any single feed line. Lenders are starting to stress-test processor dependency alongside debt coverage, especially after 2025’s make-allowance shock and the Darigold overrun.
Walking into a loan review with a processor map signals that you understand your exposure. Suppose you’ve got two or three real options, which gives you room to negotiate. If you don’t, it justifies tighter risk management and more conservative debt.
The Lender Stress-Test Cheat Sheet
Bring these four questions to your next lender meeting:
“How much of our debt coverage depends on over-order premiums that could vanish if our buyer consolidates or restructures?”
“What is our Plan B if our primary plant issues a 12-month termination notice?”
“Based on the 2025 make-allowance shifts, what is our new break-even cost per hundredweight?”
“If our co-op levies a $2–4/cwt capital assessment — like Darigold did — for how many months can we service debt at that reduced pay price?”
Next 90 Days: If you’re expanding, lock your supply agreement before your construction loan closes.
Your leverage window is the 60–120-day period when new plants are still filling capacity, and you haven’t yet signed the building loan. Use it. Ask for a base period that moves with herd size, a clear over-base penalty cap, a symmetric termination notice, and a quality premium schedule fixed for at least 24–36 months. Farms that treat this like a formality end up signing whatever’s in front of them. Farms that treat it like a one-time leverage point can carve out terms that matter the next time prices roll over.
This Year: In single-buyer regions, treat DRP as a core defense.
If you can’t change your processor, you can still change your exposure. HighGround Dairy’s quarterly analysis shows DRP (Dairy Revenue Protection) covered about 32–33% of the U.S. milk supply in Q3–Q4 2024 (HighGround Dairy, 2024). In a competitive market, DRP is one more tool. In a captive market, it might be the only way to put a price floor under part of your check that doesn’t depend on your buyer’s goodwill. The key is to run DRP against your actual butterfat and protein, not a generic blend. A 20-minute meeting with a good agent can show you what 10–20% of protected revenue looks like compared to rolling the dice entirely on your local basis.
You gain a price floor, but you give up premium dollars and take on basis risk between the futures price and the DRP you cover. In a one-buyer region, that trade-off usually pencils. In a region with three competitive buyers already bidding up your premiums, it’s less clear-cut.
Ongoing: Push components that keep paying even when formulas shift.
Make allowances hit everyone, but high-component herds still come out ahead. Herds consistently above about 4.2% butterfat and 3.3% protein are seeing 50¢–$1.50/cwt in premiums that help offset structural hits they can’t control. That doesn’t fix consolidation. But your breeding and feeding decisions can either leave money on the table or claw some of it back.
Key Takeaways
If your processor map shows only one independent buyer within 100–150 miles, treat that as your top business risk. Everything else in your plan should assume that the buyer controls your basis.
If new deductions — hauling surcharges, co-op assessments, base-excess penalties — add up to more than $1/cwt compared to your 2023 statements, that’s a structural change, not a bad month. Revisit expansion plans and debt levels accordingly.
If you’re expanding and your supply agreement is being negotiated after your construction loan closes, you’ve already given up your best leverage. Flip the order.
If you’re in a single-buyer region and not using DRP on at least part of your volume, you’re carrying all the downside your buyer doesn’t want. Run the numbers on one or two coverage levels before your next quarterly enrollment.
If your co-op can approve nine-figure plant projects without a member vote on cost-control terms, assume your future milk checks are potential collateral. Ask for fixed-price contract disclosure and a written cost cap before the next build — not after the overrun.
If your 3-to-5-year plan only works at $22–23/cwt with healthy premiums, it’s not a plan. Model your numbers at $18–21/cwt with no over-order premiums and see if the pencils still sharpen.
Where does your farm sit on this leverage map — competitive, moderate, or captive? That’s not an abstract policy question. It’s whether your next expansion, your next loan renewal, and your next contract negotiation assume you have options or admit you don’t.
The make-allowance drag, the co-op capital calls, and the processor build-out aren’t going away. The real question is whether your numbers, contracts, and risk tools align with the reality of who can actually bid on your milk.
Complete references and supporting documentation are available upon request by contacting the editorial team at editor@thebullvine.com.
More Milk, Fewer Farms, $250K at Risk: The 2026 Numbers Every Dairy Needs to Run – Secure a long-term competitive advantage by mastering the “more milk, fewer farms” era. This strategic breakdown delivers essential margin-protection tactics, helping you choose a profitable path before market consolidation decides your future for you.
The Robot Revolution: Transforming Organic Dairy Farms with Smart Tech in 2025 – Gain a disruptive edge by integrating robotic milking and AI-driven feeding systems into your operation. This analysis exposes how smart technology can reduce waste by 30%, driving efficiency gains that offset narrowing processor margins.
The Sunday Read Dairy Professionals Don’t Skip.
Every week, thousands of producers, breeders, and industry insiders open Bullvine Weekly for genetics insights, market shifts, and profit strategies they won’t find anywhere else. One email. Five minutes. Smarter decisions all week.
January exports hit a record 12% jump. Your milk check rose 4%. That $0.40/cwt gap isn’t abstract — on 500 cows, it’s $54,750 a year walking out the door.
Executive Summary: U.S. dairy exports shattered records in early 2026 — January volume up 12%, February cheese at an all-time 58,406 MT — but the gap between what the world pays and what hits your mailbox keeps widening. ADC estimates the all-milk-to-mailbox spread has grown roughly $0.40/cwt since the FMMO make-allowance changes took effect; on a 500-cow herd, that’s about $54,750 a year not reaching the bulk tank. NFDM hit $2.06/lb on April 9 — highest since January 2014 — as protein gets pulled into yogurt, UF milk, and high-margin whey instead of dryers. Mexico and Canada account for 44% of U.S. dairy export value ($3.6 billion), and the USMCA formal review is set for July, with Canada’s quota system still unresolved. The full article walks through the barn math on both sides of that gap, lays out 30- and 90-day checks you can run against your own numbers, and flags the corridor and contract risks that could move your check before year-end.
Becky Nyman, fourth-generation dairy farmer and USDEC chair, at Nyman Dairy Farm’s 1,200-cow operation in Hilmar, California. Nearly 1 in 5 pounds of U.S. milk now leaves the country — and Nyman’s fighting to make sure the value reaches the farms that produce it.
In January 2026, U.S. dairy export volume jumped 12% year‑over‑year on a milk solids equivalent basis — the biggest January ever recorded, according to USDEC data released March 12. February was even stronger: cheese exports hit an all‑time monthly high of 58,406 metric tons, 30% above last year and 6% above the previous record set in November 2025.
That’s nine straight months of year‑over‑year volume growth — with the most recent four all in double digits. By any measure, the world wants more American dairy than at any point in history. Yet while January volume climbed 12%, export value rose just 4% — to $740 million — and February’s value, at an estimated $804 million, was “only” up 11%.
At the same time, the gap between your all‑milk price and what actually shows up in the mailbox has widened. According to the American Dairy Coalition (ADC) — a producer advocacy group tracking FMMO pricing impacts — that spread has averaged roughly $1.00/cwt since the 2025 make‑allowance changes, up from what ADC calculates as a ~$0.60 baseline. The export boom is real. Whether it’s reaching your bulk tank is a different equation entirely.
The spread isn’t static, though. USDA data showed it at $0.85/cwt in September 2025, and Progressive Dairy reported ~$0.96/cwt in January 2024 — before the FMMO amendments took effect. The gap varies by month, marketing order, and class utilization. ADC’s $0.60 baseline represents their chosen reference period, not a fixed historical average. The direction is real. The exact magnitude depends on where you sit.
What Did 30 Years of USDEC Actually Buy Your Herd?
In 1995, U.S. dairy was playing defense — worried about cheap Oceania imports, leaning on domestic price supports, skeptical that Americans could compete globally. Then, a handful of stakeholders created the U.S. Dairy Export Council with checkoff funding. That bet paid off beyond anyone’s projections.
Here’s how the scoreboard reads:
1995 export value: $656 million (per USDEC)
2024 export value: $8.32 billion — a 1,168% increase from the 1995 baseline (per USDEC’s 30th‑anniversary accounting; USDA FAS reports $8.2 billion for the same period — the gap likely reflects product‑scope differences)
2025 export value: $9.63 billion — a 15% jump over 2024 (per USDEC press release, February 24, 2026)
1995 share of U.S. milk production exported: a small fraction of total production, per USDA/ERS
2025 share of U.S. milk production exported: nearly 20% (per USDEC)
2025 MSE volume: 2.32 million metric tons — second‑highest on record, behind 2022’s 2.41 million MT
“We’ve gone from a minor player to a leading global supplier,” says USDEC president and CEO Krysta Harden, per the organization’s 30th‑anniversary blog. “We’re now positioned to become the No. 1 global exporter of dairy products.”
Nearly 1 in 5 pounds of U.S. milk now leaves the country. For a 500‑cow herd shipping 75 lb/cow/day, roughly 100 cows’ worth of your production depends on buyers in Mexico City, Jakarta, or Riyadh.
If you don’t think of yourself as an exporter, the math says otherwise.
The Export Boom vs. Your Milk Check
The headline numbers tell a story of historic growth. But the question that matters to your operation is simpler: Is any of this actually reaching your mailbox?
<span style=”color:red”>Cash leaving the tank</span>
NFDM Spot Price
~$1.20–$1.42/lb (late 2025)
$2.06/lb (April 9, 2026)
↑ 12-year high
Feb 2026 Cheese Exports
44,928 MT (Feb 2025)
58,406 MT (all-time record)
↑ +30% YoY
New Processing Capacity
—
$11B into 53 facilities (2025–2028)
↑ IDFA pipeline
*The 1,368% figure measures 1995→2025. USDEC’s 30th‑anniversary figure of 1,168% uses the 2024 endpoint of $8.32B.
USDA AMS began consistently tracking mailbox prices in the mid‑1990s, but pre‑amendment spread data is volatile by month and order. ADC’s ~$0.60 baseline is their reference; USDA data shows the spread was already around $0.85–$0.96 at various points before the amendments. The growth in exports is staggering. But the growth in the gap between your gross price and your net check deserves equal attention.
Make Allowance — In Plain English The make allowance is the credit built into FMMO pricing formulas that covers processors’ costs of turning raw milk into cheese, butter, powder, or whey. When USDA raises the make allowance, your minimum regulated price drops — even if the retail or export price of cheese doesn’t change. Think of it as the toll between your bulk tank and the marketplace. In 2025, that toll got significantly more expensive.
The $0.40/cwt Question: Who’s Capturing the Export Gains?
Record volumes should mean a better check. So why doesn’t it feel that way?
The volume–value gap in January isn’t a mystery — it’s a trailing indicator. Falling U.S. cheese and butter prices in Q4 2025 dragged down the value of shipments contracted months earlier. February’s 11% value jump shows the market correcting. But the real disconnect is domestic, not global.
Following the 2025 FMMO amendments — which took effect June 1 and December 31, 2025 — make allowances climbed across products in line with USDA’s final decision. Analysts estimate the aggregate impact on the milk check at about $5.04/cwt when you sum the per‑pound changes across butter, cheese, NFDM, and dry whey. ADC’s analysis of the first eight months under the new rules estimates that processor gross margins increased 26% to 39% and minimum milk values paid to farmers dropped approximately 5% — figures ADC derived from USDA pricing data, though the methodology hasn’t been independently audited. IDFA has not publicly disputed or confirmed ADC’s calculations.
IDFA supported the increase, noting the rates hadn’t been adjusted since the last FMMO hearing process in 2007–2008. And there’s a reason processors pushed hard for it: IDFA president and CEO Michael Dykes told Dairy Herd and other outlets that more than $11 billion is flowing into 53 new or expanded dairy manufacturing facilities across 19 states, slated to come online between 2025 and 2028. These are the plants physically creating the export products, driving the boom. Without that investment, the boom doesn’t exist.
ADC’s counterargument: farmers shouldn’t be subsidizing those plants through formula deductions that widen the gap between the all‑milk price and the mailbox — a gap that, ADC argues, many producers don’t fully see when they look at their checks. Both sides have a point. The question is where the line sits — and right now, it’s moving in one direction.
What Does a $0.40/cwt Increase Look Like on a 500‑Cow Herd?
Becky Nyman — a fourth‑generation dairy farmer from Hilmar, California, and chair of the USDEC board — doesn’t sugarcoat the stakes. “Trade creates opportunities for farmers to stay on the farm,” she said at the 2026 USDEC Annual Membership Meeting. “With 96% of the global population living outside our borders, the opportunity to grow is immense.”
But Nyman is equally clear that exports aren’t charity. They’re the foundation of the modern milk check. And that foundation only works if the pricing system actually delivers those gains to the parlor — not just to the plants.
For any producer who runs their own barn math against ADC’s numbers, there’s a legitimate question: how much of the export boom is actually reaching the milk check that funds next month’s feed bill?
ADC calculates that the all‑milk‑to‑mailbox gap has widened by about $0.40/cwt since the FMMO changes took effect. Again, the baseline varies by source and timeframe, but the direction of widening is consistent across the data.
THE $54,750 QUESTION — Barn Math for a 500‑Cow Herd
Herd size: 500 cows
Shipped per cow per day: 75 lb (adjusted for dry cows, culls)
The $0.40/cwt increase (post‑FMMO amendment, per ADC): 375 cwt × $0.40 = $150/day → $54,750/year
The full $1.00/cwt gap (total all‑milk to mailbox spread, ADC post‑amendment avg): 375 cwt × $1.00 = $375/day → $136,875/year
The $0.40 figure represents ADC’s estimated increase since the FMMO amendments were enacted. The $1.00 figure is ADC’s total gap estimate, including deductions that were in place before. Which number fits your operation depends on your marketing order, class utilization, and co‑op pool distribution. Plug in your own herd size and shipped volume.
Picture a 500‑cow Central Valley operation sitting down with its lender this spring. That $54,750 isn’t theoretical — it’s the difference between a line‑of‑credit buffer and a conversation nobody wants to have in July. And the lender’s looking at the same export headlines you are, wondering why the check doesn’t match the story.
For a 1,500‑cow Western operation shipping 85 lb/cow/day, scale accordingly: the $0.40 increase alone runs roughly $186,000 per year. Under ADC’s numbers, that’s money that’s no longer showing up in the mailbox.
How the Fat Boom and Protein Craze Change What Your Processor Wants
Two structural trends are reshaping what the world buys from U.S. dairy — and both land differently depending on your components and your processor’s export mix.
The fat boom. U.S. herds hit record butterfat levels in 2025, with total butter production up and inventories initially swelling. That surge helped push butter prices below $1.50/lb in late 2025, but aggressive exports helped clear the surplus. By late February 2026, butter inventories stood at 253.8 million pounds — down 17% from a year earlier, per the USDA Cold Storage report released March 24.
The tighter supply triggered a brief spot‑price spike above $2.10/lb on March 2, driven partly by “new crop” trade rules limiting eligible inventory. But butter has since settled back into the $1.73–$1.82 range as of early April.
For Central Valley operations — where butterfat tests typically run above the national average and processors export heavily to Mexico and Asia — more fat is a double‑edged dynamic. Nyman’s Hilmar operation sits in the middle of that corridor. Higher demand for what those herds produce, but tighter competition for the processing capacity to turn it into exportable products.
The protein craze. High‑quality whey proteins and milk protein isolates are getting pulled out of traditional spray dryers and into high‑margin products: Greek yogurt, cottage cheese, ultrafiltered milk, and protein‑enriched drinks. USDEC data indicate that high‑protein whey exports set a record in 2025 and remained strong into the new year.
The protein pull has a flip side. Nonfat dry milk production has dropped, and the squeeze is showing in prices.
The $2.06 signal: CME spot NFDM hit $2.06/lb on April 9 — the highest level since January 2014, when it traded at $2.075. NFDM briefly topped $2.00 in mid‑2022 but never reached the current level. U.S. powder has been trading at a significant premium to both Oceania and European SMP, with many Asian bids running below domestic CME NFDM prices — often by a single‑digit cents‑per‑pound discount, as trade analysts note.
That premium reflects a successful value‑chain pivot. It also prices U.S. suppliers out of cost‑sensitive markets in Southeast Asia and Africa — the exact regions where the long‑term volume growth lives.
If your co‑op’s protein premium has moved meaningfully since 2023, it’s worth revisiting how you’re feeding for protein — not just fat. The market’s telling you which component it’ll pay up for.
Where Does 27% of Your Export Revenue Go — and What Could Disrupt It?
Mexico remains the No. 1 destination for American dairy, accounting for roughly a quarter of total export value in recent years and about $2.5–$2.6 billion in 2025, based on USDEC country‑level tracking and USDA trade data. Fresh cheese volumes to Mexico nearly tripled in February 2026, and total cheese shipments were up 38%. Proximity, rail logistics, and decades of partnership between USDEC, NMPF, and Mexican dairy organizations make this corridor remarkably durable.
The Middle East is surging, too. According to USDEC trade data, butter shipments to MENA jumped dramatically in February, and total MSE volume to the region climbed sharply in the first two months of 2026. Southeast Asia continues to grow — NFDM/SMP shipments to the region rose significantly in January, and the U.S. Center for Dairy Excellence in Singapore, launched in 2019, has become a critical bridge connecting American suppliers with Asian customers through its sensory labs and demo kitchens.
In Indonesia, the government’s Free and Nutritious School Meals initiative is being rolled out to tens of millions of students and other vulnerable groups, with Rabobank estimating it could eventually serve around 83 million recipientsand require more than 2 billion liters of milk annually at full implementation. Indonesia currently relies on imports for more than 80% of its dairy supply, according to USDEC and Agri‑Pulse reporting.
USDEC, NMPF, and the Consortium for Common Food Names are leaning into that gap. In April 2025, U.S. and Indonesian officials signed a landmark dairy agreement that set a framework to boost dairy trade and support public nutrition, complementing joint work on the school meals program. In February 2026, the U.S. and Indonesia signed a new agreement that eliminates tariffs on all U.S. dairy exports, recognizes U.S. regulatory oversight, and commits to protecting common cheese names — explicitly building on the U.S.–Indonesia Dairy Partnership launched in 2024 and joint work on the Free and Nutritious School Meals initiative.
Nyman knows what it takes to build that access. As she shared, a high‑level trip to China brought her into a Ministry of Commerce meeting where trade barriers dominated the conversation. She chose to speak as a producer first — about community, about how dairy farmers worldwide share more in common than divides them. The minister, she recalled, used her words to find common ground.
That kind of moment doesn’t show up in USDEC’s export spreadsheets. But it’s part of why those spreadsheets keep growing.
The July risk: U.S. dairy exports to Mexico and Canada exceeded $3.6 billion last year, accounting for 44% of total export value, according to USDEC and NMPF. The USMCA formal review is set for July 2026, with Canada’s quota system and tariff dynamics still unresolved. If Mexico’s corridor were disrupted by even 10–15%, the impact on pool prices would ripple well beyond the co‑ops that ship directly south of the border. For operations that depend heavily on Class III and IV utilization, even a modest shock in the Mexico corridor can show up as a meaningful hit to pool values and basis — especially stacked on top of already‑wider make allowances.
If more than a third of your plant’s volume goes to Mexico or Canada, that July review is a contract‑risk date, not just a policy headline.
What This Means for Your Operation
In the next 30 days:
Pull your last 12 milk checks. Calculate the effective gap between your all‑milk price and your mailbox price, month by month. Compare Q1 2026 to Q1 2025. Don’t guess — run the numbers.
If the gap has widened more than $0.50/cwt since mid‑2025, bring that number — not a complaint, the actual calculation — to your next co‑op meeting or processor conversation. If it hasn’t widened, your marketing order and class utilization may be buffering you, but know that the next FMMO hearing cycle could change that.
Ask your processor or co‑op what share of their sales moves to export markets and which regions. If more than 30% of their volume is export‑dependent, you’re more exposed to trade disruption than the average FMMO pool assumes. That’s not a reason to panic — it’s a reason to know your DMC enrollment status and your processor’s contract notice period.
Stress‑test at an all‑milk price of $18/cwt. Model your operation’s breakeven at $18/cwt for six months. If you flinch at that number, your banker probably does too — and it’s better to have that conversation on your terms than theirs.
In the next 90 days:
Revisit your component goals with your nutritionist. Align butterfat, protein, and SCC targets against where your processor’s export mix is actually heading — not where it was three years ago. If your processor is shipping more cheese and whey protein than they were in 2023, your feeding and genetics program should reflect that.
If your rolling 12‑month butterfat sits below 4.0% and protein below 3.2%, you’re probably leaving money on the table in a market that rewards components over volume. Review genetics, nutrition, and grouping strategies with your advisor.
Mark July 2026 on your calendar. The USMCA review is the single most consequential trade‑policy event of the year for your milk check. Mexico and Canada represent 44% of the U.S. dairy export value. You should know what’s at stake before the headlines tell you.
Key Takeaways
The export boom is real — and so is the pricing gap. Record Q1 2026 volumes confirm accelerating global demand, but the widening spread between all‑milk and mailbox means the gains aren’t landing dollar‑for‑dollar. On a 500‑cow herd, ADC’s estimated $0.40/cwt widening works out to roughly $54,750/year in additional deductions under the new FMMO math. Run it for your herd.
Components are the strategy, not a bonus. Fat and protein drive the highest‑margin export categories — cheese, butter, and high‑protein ingredients. NFDM just hit $2.06/lb, the highest since 2014, because protein is being pulled into higher‑value products. If your herd is still optimized for volume, you’re misaligned with where the money is going.
Mexico is the linchpin, and July is the deadline. Indonesia, MENA, and Southeast Asia are growing fast, but Mexico and Canada together account for 44% of U.S. dairy export value. Any USMCA disruption hits harder than most producers expect — and the formal review is three months away. If your processor ships heavily into that corridor, it’s your risk too.
The Bottom Line
Nyman likes to point out that per‑capita dairy consumption in parts of Asia runs 50–60 pounds per person, compared to roughly 600 in the U.S. The growth potential is abroad. It’s real. But potential doesn’t pay bills — pricing formulas do.
“The world needs what we produce,” Nyman said. “And together, we’re making sure they can access it.”
That access is the result of 30 years of work. What matters now — for the next 30 and for the next milk check — is whether your contracts, components, and cost structure are set up to capture the value when it arrives. Or whether someone else captures it first. Where does your breakeven sit if Mexico stumbles or make allowances widen again?
Complete references and supporting documentation are available upon request by contacting the editorial team at editor@thebullvine.com.
The Triple Cushion Trap: Why 2025’s Strong Margins Won’t Save You in 2026 – This strategic forecast reveals why relying on beef-on-dairy premiums and cheap feed is a dangerous game. It delivers a roadmap for repositioning your herd’s genetics and cost structure before 2026’s projected margin compression erases current equity gains.
Gold Medal Margins: Italy Turns Less Milk into €22.8B. You’re Stuck at $18.95. – This case study breaks down unconventional value-multiplier strategies that successfully decouple farm revenue from commodity volume. It reveals how shifting your focus from “pounds of milk” to “finished product value” can secure significant per-unit premiums.
The Sunday Read Dairy Professionals Don’t Skip.
Every week, thousands of producers, breeders, and industry insiders open Bullvine Weekly for genetics insights, market shifts, and profit strategies they won’t find anywhere else. One email. Five minutes. Smarter decisions all week.
A 50% tariff on Brazil lasted a few months. The White House rolled it back within a week, the Supreme Court struck down the law behind it, and then the administration opened 80,000 more metric tons of quota for Argentina. Your calf plan didn’t get a vote any of those times.
Executive Summary: A 50% tariff on Brazilian beef lasted from July to November 2025 — then both layers vanished in a single week, the Supreme Court ruled the legal basis unconstitutional, and the White House responded by opening 80,000 metric tons of new duty-free Argentine beef quota. For a 400-cow dairy running 35% beef-on-dairy breedings, that whiplash opened a $35,000 hole in annual calf revenue — $87.50 per cow in working capital your lender won’t ignore. Brazil filled its entire 2026 U.S. quota in six days. The domestic herd sits at 94.2 million head, the lowest mid-year count since 1973, and Chapter 12 farm bankruptcies hit 315 last year — up 46%. JBS co-owner Joesley Batista got a private White House meeting weeks before the exemptions; your banker got a stress test that no longer assumes any tariff protection will return. If your five-year plan only works at last year’s calf prices, you don’t have a plan — you have a bet that Washington will keep a promise it’s already broken three times in eight months.
On a humid July night in 2025, a 400‑cow dairy in central Wisconsin sat at the kitchen table with the banker and finally saw a little daylight.
Trump had just stacked a 40% emergency tariff on top of an existing 10% reciprocal duty on Brazilian imports — beef included — bringing the total tariff on Brazilian beef to 50%. Calf buyers were talking about tight supplies. Four‑figure beef‑on‑dairy cheques didn’t feel like lottery tickets anymore. They felt like something you could cautiously build a plan around.
So the yellow pad on the table assumed about 140 beef‑cross calves at roughly 1,300 dollars a head — somewhere around 182,000 dollars a year in gross calf revenue. That kind of number is plausible in a market where 600‑ to 650‑pound beef‑on‑dairy steers were bringing 269–272 dollars per hundredweight in 2024 video auction data, and 2025 feeder calf prices were running about 15% higher than the year before.
The new barn note looked tight, but doable, as long as those calf numbers held.
By November, both tariff layers were gone. By February 2026, the Supreme Court made sure they couldn’t come back the same way — and the White House responded by opening even more duty‑free quotas for imported beef. That same producer is back at the kitchen table, explaining why the math no longer works.
The Year the Rules Changed Four Times
Here’s how fast the ground beneath your calf cheque moved.
April 2, 2025: Executive Order 14257 slaps a 10% reciprocal tariff on most imports into the U.S., including beef, while exempting Canada and Mexico under USMCA.
May 11, 2025: USDA halts all cattle imports from Mexico after detecting New World screwworm — a parasitic fly that kills livestock by feeding on living tissue. The ban further squeezes domestic feedlot supply.
June 12, 2025: JBS — the Brazilian meat giant that already processes a big share of U.S. beef — completes a dual listing on the NYSE and Brazil’s B3.
July 1, 2025 context: USDA reports the U.S. cattle inventory at 94.2 million head — the lowest mid‑year count on record in data going back to 1973, down 8 million head from 2020. The 2025 calf crop comes in at 32.9 million head, a record low for the second straight year.
July 30, 2025: Executive Order 14323 uses national‑emergency powers to add a 40% tariff on Brazilian goods, including beef. Total duty on Brazilian beef: 50%. The move is sold as a way to protect American agriculture.
August 2025: R‑CALF USA urges Washington to suspend Brazilian beef imports entirely, pointing to Brazil filling its entire 65,000‑ton “other countries” quota in just 17 days at the start of the year.
Late September 2025: Reuters reports that JBS co‑owner Joesley Batista — whose company admitted in Brazilian plea deals to bribing roughly 1,800 politicians — gets a private meeting with President Trump. Sources familiar with the meeting say Batista warned the tariffs were making beef “too expensive” for consumers.
~November 14, 2025: An executive action removes reciprocal tariffs on 200‑plus agricultural products not deemed sufficiently produced in the U.S., including beef.
November 20, 2025: A second order removes the remaining 40% Brazil‑specific duty on beef and other ag goods, retroactive to November 13, with refunds available on duties collected in between. In less than a week, Brazilian beef goes from a 50% combined tariff to zero additional duty beyond the normal quota structure.
February 6, 2026: Trump signs a proclamation titled “Ensuring Affordable Beef for the American Consumer,” temporarily increasing the U.S. beef tariff‑rate quota by 80,000 metric tons for calendar year 2026 — allocated entirely to Argentina, in four quarterly tranches of 20,000 MT each starting February 13. The proclamation cites ground beef hitting $6.69 per pound in December 2025, the highest since the BLS started tracking beef prices in the 1980s.
February 20, 2026: The U.S. Supreme Court rules in Learning Resources, Inc. v. Trump that the International Emergency Economic Powers Act (IEEPA) does not authorize the president to impose tariffs, invalidating the legal basis for both the 10% reciprocal and 40% Brazil‑specific tariffs entirely. The same day, Trump issued an executive order ending the collection of all IEEPA duties.
February 24, 2026: A new 10% global surcharge under Section 122 of the Trade Act of 1974 takes effect as a stopgap — but beef is explicitly exempted via the Annex II exceptions list, along with other agricultural products. Section 122 is capped at 150 days and expires July 24, 2026, unless Congress extends it.
R‑CALF CEO Bill Bullard didn’t hide his frustration. In a November 2025 statement, he called U.S. cattle producers “beleaguered” and said decades of failed trade policy had “driven hundreds of thousands” of ranchers out of business. He argued that the 10% reciprocal tariff plus the 40% Brazil‑specific duty were “important first steps” toward fixing that imbalance.
Both steps got wiped out in a week. A few months later, the court took the whole tool off the table — and the White House added 80,000 metric tons of Argentine beef quota on top of it.
What Happened After the Exemptions Tells You Everything
The ink on the November exemptions was barely dry before Brazilian exporters moved. Authorized Brazilian meatpackers quickly resumed full shipments. According to Valor International, November exports hit about 12,600 tonnes despite only around ten tariff‑free days on the calendar. Volumes were projected at 35,000 tonnes for December and 50,000 tonnes for January as the duty‑free quota reset. Brazil exported 244,500 tonnes to the U.S. from January through November 2025, already surpassing full‑year 2024 totals.
Brazil then filled its 2026 U.S. beef quota within six days of the start of the new trading year. By the USDA weekly report ending January 12, Brazil had already used 73% of its 2026 allocation. For comparison: in 2025, the quota lasted 17 days. In 2024, March. In 2023, May. Each year faster.
On the calf side, the market told a loud story too. Feedlot Magazine reported that from January 2025 to January 2026, the beef‑cross‑dairy calf market increased by 176 dollars per hundredweight — about 1,056 dollars per head on a 600‑pound feeder. Beef‑cross calves out of Holstein dams averaged 26.83 dollars per hundredweight higher than those from non‑Holstein dairy females. Strong, yes. But that strength was built during a period when tariffs theoretically constrained supply and screwworm shut down the Mexican cattle border. With the tariffs gone, the legal basis ruled unconstitutional, and 80,000 MT of new Argentine quota on the books, the floor under those calf prices is thinner than it looked when you and your banker sharpened your pencils in July.
It’s not just the U.S. border that’s opening wider. Mexico announced a new tariff‑free quota for 2026 — up to 70,000 tonnes of beef and 51,000 tonnes of pork from Brazil and other exporters. China set its first formal beef import quota for Brazil at 1.106 million tons for 2026, with an additional 55% tariff on volumes exceeding the cap — a measure that could redirect excess to the U.S. and other markets if Chinese demand softens or the quota binds.
Meanwhile, total U.S. beef imports jumped 17% through November 2025 compared to the same period in 2024, hitting 1.76 million metric tons. The U.S. imported a record 4.64 billion pounds of beef in 2024 alone — a 24% leap from 2023.
You didn’t get a phone call before any of that. You just got the prices on the other side.
How Does a Policy Flip Turn Into a $35,000 Problem at Your Place?
Now put some barn math to what that whiplash does to a 400‑cow dairy that’s leaned into beef‑on‑dairy.
Iowa State Extension livestock economist Lee Schulz documented beef‑on‑dairy steers averaging roughly 269–272 dollars per hundredweight at 650 pounds in Superior and video auction data, meaning a 650‑pound beef‑on‑dairy feeder was worth around 1,750 dollars in that 2024 market. Iowa Beef Center forecasts show 2024–2025 feeder calf prices at historically high levels, keeping four‑figure values common for 550‑ to 650‑pound steers.
On the front end, Midwest Farm Report highlighted baby beef and beef‑cross calves “selling to 1,000 dollars a head” at Wisconsin auctions to start 2025. Wisconsin DATCP summaries showed beef‑on‑dairy cross calves bringing roughly 480 dollars per head against about 110 dollars for straight Holstein bull calves — a 370‑dollar premium in spring 2025.
35% of breedings to beef = roughly 140 beef‑cross calves per year
At 1,300 dollars each — realistic for a solid 600‑ to 650‑pound beef‑on‑dairy feeder in this price environment — that’s about 182,000 dollars in gross calf revenue.
If markets soften by about 20% after the tariff and court whiplash, and those calves fall to roughly 1,050 dollars, you’re at 147,000 dollars.
Gap: $35,000, or $87.50 per cow in working capital
That $87.50 per cow is the kind of number your lender zeros in on. It’s not “extra.” It’s a robot payment. Or a nutrition upgrade. Or the difference between paying principal versus just servicing interest.
What Does Your Lender Actually See When Policy Is Part of Your Repayment Story?
From your side of the table, “tariff whiplash” sounds like a fair explanation for why the numbers don’t pencil anymore.
From your lender’s side, it’s a reminder they can’t afford to build your future on Washington’s promises — especially when the Supreme Court just ruled the legal tool unconstitutional, and the White House responded by opening moreimport access, not less.
After the MFP cycle, regulators pushed banks and Farm Credit to stress‑test loans without assuming ad‑hoc government aid will show up again. A loan that only works if DC sends a cheque isn’t good.
So today, most ag lenders will:
Run your plan without counting any future tariff relief, MFP‑style programs, or emergency cheques
Model what happens if your milk check drops 1–2 dollars per hundredweight, feed jumps 10%, and beef‑on‑dairy calf values fall 15–20%
Watch working capital and total debt per cow closely, especially with many new operating loans at 7–9%.
A Kansas City Fed review found average non‑real‑estate farm loan sizes roughly 30% higher in late 2024 and early 2025 than a year earlier as producers borrowed more to cover higher input costs. In 2025, nearly 40% more new farm operating loans were opened than in the prior year.
At the same time, Chapter 12 farm bankruptcy filings hit 315 in calendar year 2025 — up 46% from 216 in 2024 and the highest count since 2020. Arkansas led the nation with 33 filings (more than double its prior-year total), followed by Georgia at 27, Iowa at 18, Nebraska at 17, and Wisconsin and Missouri at 16 each. The Midwest and Southeast together accounted for 226 of the 315 cases.
When you tell your lender, “The tariff change took 35,000 dollars out of our calf plan,” they don’t argue. They ask:
If calves never reach 1,300 dollars, can this farm still make full payments?
How close are we to breaking covenants if we have one more bad year?
Is it smarter to restructure now, while equity is still there?
If you don’t have your own answers ready before they ask, you’re already behind.
Can You Build a Five‑Year Plan When the Rules Keep Changing Under Your Feet?
You’re making choices right now that will shape the next decade of your operation:
A new barn sized for 550 head when you’re milking 400
A robot system that only pencils if labor stays tight and cull prices hold
A breeding lineup that leans harder into beef‑on‑dairy on the bottom half of the herd
Genomic bets you won’t fully cash for four or five years
Meanwhile, the tools Washington used — reciprocal tariffs, national emergency orders, retroactive exemptions — just had their legal foundation pulled out from under them by the Supreme Court. The 10% Section 122 stopgap expires July 24, 2026, and beef is already exempt from it anyway. The administration’s next move is Section 301 investigations that USTR says will “cover most major trading partners” — but those take months to conclude and years to implement.
And there’s another pressure point already on the books. The formal USMCA joint review is scheduled for July 2026, and NMPF and USDEC testified before USTR on December 3, 2025, urging the administration to fix Canada’s dairy quota implementation. A bipartisan group of 74 House members — led by Representatives DelBene, Tenney, Wied, and Costa — sent a letter to USTR Jamieson Greer the same day, calling out Canada’s unfair TRQ allocation and global dairy protein dumping practices.
That push matters because the numbers are damning. TRQ fill rates averaged just 42% across all 14 dairy categories in 2022/23, with 9 of 14 quotas below 50%. Some categories were barely touched: 3% for skim milk powder, 8% for milk protein concentrates, 12% for yogurt. That’s not weak demand — it’s Canada’s allocation system channeling most quota to domestic processors who don’t use it, exactly as two dispute panels have already confirmed.
USMCA promised roughly $200 million in new annual access to Canada’s dairy market. If U.S. exporters could actually ship the full 100% of what was promised instead of getting stuck at 42%, as NMPF and USDEC have argued in their 2025 testimony, that’s the kind of money that would more than plug a $35,000 calf hole on a 400‑cow dairy.
The U.S. Dairy Export Council estimates Mexico and Canada at about $3.6 billion, or roughly 44% of total U.S. dairy export value. If those markets see new tariffs, quotas, or retaliation because dairy becomes a bargaining chip again, your check feels it — even if you never sell a pound of cheese directly across a border.
So the only way to build a five‑year plan you can sleep on is to assume tariffs and trade deals won’t sit still, policy help is a bonus rather than a baseline, and your numbers have to survive ugly scenarios — not just the best‑case breakout.
What Does a Real Stress Test Look Like Before You Sign?
Before you sign for a barn, a robot, or a major breeding push, you need more than “should work” and a rosy spreadsheet. You need to see what happens when things get ugly.
Your Three‑Case Stress Test at a Glance
Drop in your own numbers. But they should look at least as nasty as this.
Scenario
Milk price assumption*
Feed cost assumption
Beef‑on‑dairy calf values
Interest rate assumption
Most‑likely
Around current Class III/IV strip (e.g., high‑18 to low‑19 dollars/cwt)
3–5% higher than today
Close to recent cheques
Current rates on operating + term debt
Downside
1–2 dollars/cwt below that range
At least 10% higher
15–20% below last year’s cheques
+1 percentage point on variable‑rate debt
Worst‑case
Mid‑16s for roughly half the year
15–20% higher
25–30% below last year’s cheques
+2–3 percentage points on vulnerable loans
*Use the actual futures curve and your co‑op’s basis, not a guess.
Then ask the same questions your lender is already asking:
In the downside case, does this project still cover the full debt service?
Do you have enough working capital and operating line to survive the worst‑case year without missing payments or blowing covenants?
If you can’t answer “yes” to both, you’re not stretching — you’re betting that policy and markets will behave. Given that the legal basis for the original tariffs got struck down by the Supreme Court and the administration added 80,000 more metric tons of imported beef quota on top of that, that bet looks worse today than it did a year ago.
How Do You Keep Beef‑on‑Dairy From Owning Your Future?
Beef‑on‑dairy has been a lifeline for a lot of barns. It’s also a quiet way trade policy can reach right into your calf pen.
When beef semen is going on half your cows because the cheques looked great last year, you’re not just chasing a premium. You’re tying both your heifer pipeline and your loan plan to decisions made in Washington, Brasilia, Ottawa, Mexico City, and Beijing. And now add Buenos Aires, thanks to the February 6 proclamation.
Build calf revenue in your plan at prices 20–30% below the best cheques you’ve seen, and treat anything better as upside.
Suppose that sounds conservative, good. Your banker already thinks this way.
Options and Trade‑Offs for Farmers
You can’t control who gets a White House meeting. You can control how exposed your farm is when tariffs swing — or when courts wipe them out entirely.
Build for Margin, Not for Milk Price
When it makes sense: You’re planning to keep milking 300–600 cows in the commodity stream, and you know “waiting for 20‑dollar milk and a good government” isn’t a strategy.
What it requires:
A current breakeven that includes today’s interest, realistic replacement heifer costs in the 3,000–4,100‑dollarrange, and full family living, not 2022 numbers
A path to pull 1–2 dollars per hundredweight out of your cost via better repro, tighter heifer programs, fewer transition wrecks, and real labor efficiency
The guts to cut non‑essentials that don’t move cost per hundredweight
Where it can bite you: If you’re already carrying high fixed costs — big facility notes, heavy land debt — you may not be able to get cheap enough to play this game.
30‑day action: Before your next lender visit, rerun your breakeven with current loan rates, replacement heifers at 3,000–4,100 dollars, and a calf price 20% below last year’s cheques. If the result makes your stomach flip, that’s the first thing to attack. That 2026 cost‑per‑cwt math is worth running beside these numbers.
Treat Beef‑on‑Dairy as a Tool, Not a Lifeline
When it makes sense: You’re in that 300–1,000‑cow window where beef‑cross calves are real money, but you don’t want a trade decision in Brasilia or Buenos Aires to decide whether you keep the farm.
What it requires:
Capping beef semen at about 25–35% of breedings, not 50–60%, and keeping sexed dairy semen on the top of your genetic stack so your heifer pipeline doesn’t disappear
Monthly heifer inventory checks that look two years ahead
Calf revenue assumptions built 20–30% under the best prices you’ve seen, with upside treated as a bonus
Where it can bite you: If you have already sold too many dairy heifers and dug a big hole, unwinding takes time and discipline. It means saying “no” to the next round of crazy beef prices.
Premium or Differentiated
When it makes sense: You’ve got a genuine premium channel — organic, A2, grass‑fed, on‑farm processing — in a market that can pay for it, and a story people will actually pay extra for.
What it requires:
Knowing the full math of the premium: pay price, cert and testing costs, labor, shrink, rejected loads risk
A plan to protect the margin if premiums shrink or competition crowds in
A clearer brand than “we’re local and we work hard.”
Where it can bite you: Premiums erode. Specs tighten. Consumer fads move. You swap commodity risk for brand and channel risk. This isn’t a soft landing for a weak commodity business — it’s a different business. What Clark Farms learned about on‑farm creamery ROI is a useful reality check before you go down this road.
Policy‑Proofing Your Plan
When it makes sense: Always, this is the base layer under every other layer.
What it requires:
Treating any policy‑driven cheque — MFP, ad‑hoc disaster, tariff‑driven payments — as deleveraging money, not recurring cash flow
Building risk management around tools that are in statute and contracts — DMC, DRP, forward contracts — not around what was said at the last rally
Running the “no help for five years” scenario once a year and asking if the farm still survives
The Supreme Court just made this advice more concrete than ever. The legal basis for the tariffs that were supposedly protecting you was ruled unconstitutional. The 10% Section 122 stopgap expires July 24, 2026; beef is exempt from it anyway, and the Section 301 investigations that follow will take months to conclude. Meanwhile, the July 2026 USMCA review is less than three months away, with 74 House members already pushing USTR Jamieson Greer to fix the 42% dairy fill rate in Canada. If that USMCA $200 million dairy access problem gets fixed, treat the upside as a chance to pay down debt — not add more.
If your five‑year plan only works at last year’s calf prices, you don’t have a plan — you have a bet. Run your numbers at 20–30% lower beef‑on‑dairy calf values and see if the debt still pencils.
If beef semen is going on more than a third of your breedings, your heifer pipeline is tied to trade decisions you’ll never be in the room for. Cap beef matings and protect the top of your herd for replacements.
If a barn, robot, or big upgrade only looks “smart” at 19‑dollar milk and interest rates from two years ago, walk away. The right projects still pay in a 17‑dollar milk, +10% feed, −20% calf world.
If you catch yourself saying, “It’ll be fine once they fix trade,” stop and grab a pencil. The Supreme Court just struck down the legal basis for the tariffs. The White House added 80,000 MT to the Argentine beef quota in the same month. Rebuild the plan assuming nobody fixes anything — and treat any policy win, including a fixed USMCA TRQ, as a chance to deleverage.
If your lender seems more nervous than you are, listen. They’re already stress‑testing your numbers without counting on tariffs, bailouts, or emergency cheques. You should be, too.
The Bottom Line
The picture that sticks from this whole episode isn’t a chart or a tariff code. It’s two people affected by the same decision sitting in very different rooms.
One is Joesley Batista, walking into a private White House meeting and, weeks later, watching both the 10% reciprocal and the 40% emergency tariffs on beef disappear fully inside a single week. Then, watching the Supreme Court make sure the tool behind them can’t be used the same way again. Then, the administration opened 80,000 more metric tons of duty‑free beef quota for good measure.
The other is a 400‑cow producer at a kitchen table, explaining to a lender why a $35,000 calf‑revenue hole — $87.50 per cow in working capital — just opened in a plan built around a “national emergency” tariff that lasted a few months.
The system will keep getting sold as “protecting American agriculture. The question is whether your own numbers treat that as a promise, or as whether you’ve got to farm through.
Complete references and supporting documentation are available upon request by contacting the editorial team at editor@thebullvine.com.
Learn More
The 90-Day Dairy Pivot: Converting Beef Windfalls into Next Year’s Survival – Reveals the high-speed math needed to turn fleeting beef premiums into a 2026 resilience plan. Breaks down the \$26,600 revenue opportunity for 100-cow herds, arming you with the breakeven benchmarks to survive flat milk checks.
Every week, thousands of producers, breeders, and industry insiders open Bullvine Weekly for genetics insights, market shifts, and profit strategies they won’t find anywhere else. One email. Five minutes. Smarter decisions all week.
A 400-cow freestall has roughly $327,600 in annual revenue tied to products governments are now targeting. Here’s the barn math — and the phone call that splits two futures.
Executive Summary: Roughly a third of a 400‑cow Wisconsin herd’s annual milk revenue — about 16,800 cwt worth ~$327,600 at $19.50/cwt — is likely tied to ultra‑processed products that California has already started pushing out of schools, and Canada now tags with front‑of‑pack warning labels. This article shows how AB 1264, a federal warning‑label bill, and Health Canada’s new symbols quietly put pressure on flavoured milks, processed cheese, and dairy ingredients that many processors rely on for 25–40% of their throughput. Using a 400‑cow freestall as the example, it walks the barn math: if that exposed volume takes a $1.50–$2.50/cwt hit over the next decade, you’re looking at $25,000–$42,000/year off the milk check with the same cows and the same parlor. It contrasts how that risk lands in a deregulated U.S. FMMO system versus Ontario’s supply‑managed pool, and why geography changes your levers but not the direction of travel. You’ll get a concrete 30/90/365‑day playbook: the three questions to ask your processor now, how to map your own “UPF exposure” line item, and where breeding (A2/A2, κ‑casein BB, mastitis resistance, components) fits if you want more of your milk flowing into cheese, yogurt, and clean‑label programs instead of the policy blast radius. If you don’t know what percentage of your volume ends up in the ultra‑processed ladder — and what a $2/cwt squeeze on that slice does to your debt‑service coverage — this is the one market piece you actually can’t afford to skip.
California just defined “ultra‑processed food” in statute. A federal warning‑label bill is in the House. And your processor probably can’t tell you how much of your milk ends up in the products they’re targeting.
Take a 400‑cow freestall in southwest Wisconsin shipping about 120 cwt per cow per year. That’s 48,000 cwt annually. Wisconsin’s October 2025 all‑milk price sat at $19.50/cwt — not great, not catastrophic, just the kind of number that makes every line on your milk check matter. Now ask a question nobody’s putting on co‑op agendas: how much of that volume flows through your plant into flavored school milk, processed cheese slices, shelf‑stable puddings, and frozen‑meal ingredients?
If roughly a third of your processor’s output lands in those ultra‑processed or UPF‑adjacent categories — and for many plants, 25–40% is a reasonable working range — then about 16,800 cwt of your annual production is tied to the part of the dairy case that legislators, public‑health researchers, and front‑of‑pack labeling agencies are now actively trying to shrink. At $19.50/cwt, that’s roughly $327,600 riding on product categories that just got a bullseye painted on them.
When Ultra‑Processed Moved From Diet Talk to Dairy Law
Three things happened in quick succession in late 2025, and together they changed what “ultra‑processed” means for your milk check.
In November 2025, The Lancet published a three‑paper series arguing that the ultra‑processed food business model — long ingredient lists, industrial additives, products you can’t reproduce in a home kitchen — is structurally tied to higher risks of obesity, type 2 diabetes, and cardiovascular disease across multiple large cohort studies. The authors didn’t stop at dietary advice. They called for tobacco‑style policy: excise taxes, front‑of‑pack warning labels, marketing restrictions on children, and a shift in agricultural subsidies away from ultra‑processed supply chains.
California moved first. On October 8, 2025, Governor Newsom signed AB 1264, the Real Food, Healthy Kids Act — the first law anywhere to write a statutory definition of “ultra‑processed food” and begin phasing it out of school meals. The California Department of Public Health must finalize detailed definitions of “ultraprocessed foods of concern” by June 1, 2028. From there, the timeline tightens: vendor reporting starts February 1, 2028; schools begin removing targeted products by July 1, 2029; vendors can no longer offer them to schools after July 1, 2032; and schools can no longer serve or sell them by July 1, 2035. Plain pasteurized milk is explicitly exempt. Sweetened, flavored, and additive‑heavy dairy products are not.
Two months later, Representatives Don Beyer (D‑VA), Mike Lawler (R‑NY), and Scott Peters (D‑CA) introduced the Childhood Diabetes Reduction Act — a bipartisan House bill that would slap health warning labels on ultra‑processed foods nationally and restrict their marketing to children. The bill may or may not pass. But the definitional framework from AB 1264 is already being used as a template.
And north of the border, Canada didn’t wait. Health Canada’s mandatory front‑of‑pack nutrition symbols — warning icons on products exceeding thresholds for sugars, saturated fat, or sodium — took effect January 1, 2026. They don’t use the phrase “ultra‑processed,” but they tag many of the same dairy products: high‑sugar flavored milks, sweetened yogurts, processed cheese with elevated sodium.
Same direction. Three different tools. Your milk is part of this story, whether your plant is in Fond du Lac or Fresno.
The Four‑Tier Ladder: Where Does Your Milk End Up?
Forget the academic food‑classification debates. Here’s a practical way to think about where your milk lands after it leaves the bulk tank — and how much regulatory heat each destination carries.
Tier
Product Examples (Dairy)
Processing Distance
Regulatory Pressure
Tier 1 – Minimally processed
Fluid milk, block cheddar, butter, plain yogurt
Short ingredient lists; limited processing
Lowest — exempt from AB 1264; generally outside FOP warnings
High — many fit AB 1264’s “ultraprocessed foods of concern” and Health Canada FOP warning profiles
Tier 4 – Core ultra‑processed
Frozen pizzas, frozen entrées, snack foods where dairy is one of many ingredients
Dairy as a small part of complex products
Highest — direct target of school‑meal bans, proposed warning‑label bills, and potential future taxes
Policy pressure starts at Tier 4 and walks down the ladder. Your exposure isn’t how many cows you milk or what your components look like. It’s how much of your flow ends up in Tier 3 and 4 after it leaves the farm.
For many cheese‑and‑powder‑focused Midwest plants, a working estimate of 25–40% of total intake going into Tier 3–4 products is reasonable, though it varies significantly by plant and market. That’s not a hard statistic — it’s a range based on typical product mixes in mature dairy markets. The exact number at your processor is a question you should be asking, not a figure you should be guessing.
What Does UPF Risk Actually Cost a Wisconsin 400‑Cow Dairy?
Here’s the math. Plug in your own numbers where yours differ.
Step 2 — Exposed volume. If roughly 35% of your plant’s output routes through Tier 3–4 categories: 48,000 cwt × 35% = 16,800 cwt in the blast radius
Step 3 — Price context Wisconsin’s October 2025 all‑milk price: $19.50/cwt. U.S. Class III for October 2025: $16.91/cwt. By March 2026, Class III had slid to $16.16/cwt.
For the 400‑cow Wisconsin herd at $19.50/cwt:
Total annual milk revenue: 48,000 × $19.50 = $936,000
Step 4 — The squeeze scenario. If UPF pressure — school‑meal rules, warning labels, reformulation, buyer shifts — quietly shaves .50/cwt off the value of that exposed volume over the next several years: 16,800 × .50 = ,200/year off your milk check.
If the squeeze lands closer to $2.50/cwt: 16,800 × $2.50 = $42,000/year
That’s $42,000 disappearing into “we had to reformulate,” “school‑milk bids are down,” and “our Class III utilization shifted” — with the same cows, same parlor, same debt service.
For Canadian readers: The math structure is identical. Swap in your October 2025 Ontario gross blend of roughly $42 CAD/cwt (95.46 $/hL per DFO’s October 2025 report ) and the exposed‑volume dollar amounts change, but the exposure percentage and the logic don’t. At the CAD blend, your 400‑cow total is closer to $2,016,000 CAD — and the $2.50/cwt squeeze still costs $42,000 CAD on 16,800 exposed cwt.
Meanwhile, North of the Border: What Supply Management Does — and Doesn’t — Protect
Ontario producers inside the P5 pooling system live in a different structural reality. You can’t easily pick up your quota and ship it to another plant next week. The P5 agreement spreads production and revenues across Ontario, Quebec, and the Atlantic provinces. That structure can spread pain and slow adjustment when specific product categories get squeezed. But it doesn’t erase the underlying economics. If the pool has to absorb lower returns on Tier 3–4 products, that drag still shows up in the blend.
Canada’s front‑of‑pack labels are already live — not proposed, not in committee, live since January 1, 2026. That makes the Canadian market a leading indicator for U.S. producers. Watch what happens to flavored-milk volumes and processed‑cheese positioning in Canadian retail over the next 12–18 months. If those categories soften measurably under FOP labeling, the same dynamic will play out stateside once AB 1264’s school rules and any federal labeling take hold.
The key difference: a Wisconsin producer has more flexibility to shift processors, chase premiums, or pivot volume toward a cheese plant that’s building clean‑label capacity. An Ontario producer’s leverage comes through co‑op governance, producer meetings, and making their milk attractive enough on paper that the processor inside the system channels it toward the more resilient product lines. Different levers. Same direction.
Wisconsin (U.S. FMMO)
Ontario (P5 Supply Mgmt)
Pricing System
Deregulated; classified pricing via FMMO image.jpg
Supply-managed P5 pool across 5 provinces
Oct 2025 Blend
$19.50 USD/cwt image.jpg
~$42 CAD/cwt ($95.46/hL) image.jpg
400-Cow Revenue
~$936,000 USD/yr
~$2,016,000 CAD/yr
UPF Squeeze at $2.50/cwt
–$42,000 USD/yr
–$42,000 CAD/yr
UPF Labels Status
Proposed (federal bill in House)
Live since Jan 1, 2026 image.jpg
Producer Flexibility
Can switch processors, chase premiums
Locked to P5 pool; leverage via governance
Best Lever
Move volume to clean-label plants
Push co-op strategy through producer meetings
Why It Matters
You have options — but only if you’ve mapped them
Pool absorbs pain slowly, but drag still shows in blend
The Phone Call That Splits Two Futures
One Wisconsin producer with 400 Holsteins finally made the call in early 2026. Not to chat about the weather. They called with a script:
“What percentage of our plant’s output currently goes into products that would be classified as ultra‑processed under AB 1264 — flavored school milks, processed cheese, cheese powders, frozen‑meal dairy ingredients? And what’s the plan if those categories take a 10–20% volume or margin hit over the next decade?”
The answer was polite but vague: “We’re monitoring the situation.”
That’s a perfectly normal answer from a mid‑size Midwest processor in spring 2026. But “monitoring” isn’t a strategy. And the producer who asked the question is now ahead of every neighbor who didn’t — because they’ve started mapping their own exposure instead of assuming someone else has it covered.
A second scenario: a 380‑cow Jersey operation reached out to a cheese‑focused processor about their growing artisan and clean‑label lines. The question was simpler — what specs would it take to be part of that program? The processor had concrete targets: butterfat above 4.8%, protein above 3.6%, bulk tank SCC consistently under 150,000, willingness to participate in farm‑story marketing, and on‑farm audits. These specs reflect the kind of quality thresholds several premium cheese and yogurt programs use today, though they aren’t universal or guaranteed.
In this composite example, the early transition incurred roughly $3,000 in quality penalties and additional vetting and consulting work over the first four months. By around month eight, the herd was consistently hitting specs and earning approximately a $1.80/cwt component‑plus‑quality premium across their volume. Not a promise. A realistic sketch of how early costs and later payback can look when a herd leans into a program like this.
Same policy environment. Two different calls. Two different trajectories.
Breeding for the Post‑UPF Era
If a quarter to a third of your milk check feeds the ultra‑processed ladder, genetics is one of the few levers you can pull now that actually changes your risk profile five years out.
Clean‑label and minimally processed dairy brands tend to look for three things at the cow level:
Components and cheese yield. Strong butterfat and protein, plus favorable κ‑casein variants — especially κ‑casein BB — improve true cheese yield and reduce a processor’s reliance on stabilizers and emulsifiers.
Protein type. A growing number of fluid milk and yogurt brands are built around A2/A2 β‑casein, which supports clean‑label positioning and gives processors a marketing hook that avoids the UPF label.
Udder health and milk quality. Genetics for mastitis resistance, lower somatic cell score, and sound udder conformation make it easier to hold under 150,000 SCC without a constant battle.
For the 400‑cow herd watching UPF categories take heat, that means weighting A2/A2, κ‑casein BB, and health traits harder in your young‑stock plan so that by the early 2030s, more of your parlor is suited for cheese, yogurt, and “real food” brands. You’re not breeding for today’s product mix. You’re breeding for whichever part of your plant’s portfolio still looks safe and profitable a decade from now.
The Playbook: How to Move Before the Window Closes
You don’t need to build a creamery or upend your breeding program overnight. But you do need to treat UPF exposure like a real line item in your risk management.
In the Next 30 Days
Call your processor or co‑op field rep and ask three questions:
“Roughly what share of our plant’s output goes into products that would qualify as ultra‑processed under AB 1264 or trigger Canada’s front‑of‑pack warnings?”
“What’s the plan if those categories lose 10–20% of volume or margin over the next decade?”
“Which product lines are clearly outside that blast radius — artisan cheeses, plain yogurts, fluid brands — and what specs would we need to hit to be part of those pools?”
Build a one‑page risk map. What percentage of your annual volume likely ends up in Tier 3–4? At your current blend, what does a $1.50 or $2.50/cwt squeeze on that volume actually cost you per year? Write it down. The number is either small enough to stop worrying or big enough to start planning.
In the Next 90 Days
Audit your quality and components. Is your 12‑month average SCC consistently below 150,000, or bouncing above 200,000? How do your butterfat and protein stack up against what clean‑label cheese or yogurt specs typically call for?
Talk to your genetics advisor. How many of your current and planned service sires are A2/A2 with κ‑casein BB and strong mastitis resistance? What would it take to have 60–70% of your young stock from that profile within 3–5 years?
In the Next 12 Months
Bring UPF exposure into your lender conversation. If your effective blend on exposed volume drops by $1.50–$2.50/cwt over the next 3–5 years, what does that do to your debt‑service coverage ratio and your capital plans?
Stress‑test your processor relationship. If your co‑op or plant is heavily weighted toward Tier 3–4 products and doesn’t have a clear diversification plan, that’s a business risk on top of a policy risk. In a deregulated market, you have the option to move. Know what that option looks like before you need it.
What This Means for Your Operation
Your biggest risk isn’t the milk price. It’s where your milk goes after it leaves the farm. If 30–40% of your processor’s output sits in categories that legislators, labeling agencies, and researchers are actively targeting, your milk check carries exposure you’re not pricing in.
$42,000/year isn’t a scary number — it’s arithmetic. 400 cows, 35% exposure, $2.50/cwt squeeze. Run the same formula with your herd size, your blend, and your best guess at your plant’s UPF share. The formula is the point, not the specific result.
“We’re monitoring the situation” is not a plan. If your processor can’t tell you their UPF exposure and their strategy for it, assume nobody is managing this risk on your behalf.
Genetics is risk management now, not just breeding‑proof bragging. A2/A2, κ‑casein BB, mastitis resistance, and component levels aren’t premiums you chase — they’re the traits that keep your milk relevant to the product lines most likely to survive UPF pressure.
Canada is the canary. Front‑of‑pack warnings are already mandatory there. Watch flavored-milk and processed‑cheese volumes in Canadian retail over the next 12 months. That’s your preview.
Key Takeaways
If your estimated UPF‑exposed share is above 30–35%, you’re in a genuine risk band that warrants deeper planning. Not doomsday. A signal to stop assuming someone else is on top of it.
In a deregulated U.S. market, you can switch plants — but only if you’ve already mapped your options.Inside Canadian supply management, you can’t switch easily, but you can shape your co‑op’s strategy through governance. Either way, the window for proactive positioning is now, not after the squeeze shows up on your check.
The 30‑day action is the phone call. Ask your processor the three questions in this article. If the answer is vague, that’s your answer.
A simple formula — cows × cwt/cow × exposed % × $/cwt squeeze — tells you more about your next five years than any argument over the NOVA classification system. You don’t have to love the policy to count its impact.
The Bottom Line
Pull your last three milk checks. Look at every deduction and utilization line. Ask yourself: how much of this revenue depends on products that California just banned from schools and Ottawa just tagged with a warning label? If the answer makes you uncomfortable, good. That discomfort is worth about $42,000 a year in planning you haven’t started yet.
Complete references and supporting documentation are available upon request by contacting the editorial team at editor@thebullvine.com.
Protein Power Play: How Dairy Can Dominate The GLP-1 Revolution – Reveals the seismic shift from “fat-first” to “protein-driven” breeding as consumer habits change overnight. Strategy to pivot your genetics now, ensuring your herd meets the 40% growth spike in high-protein, clean-label categories.
The Sunday Read Dairy Professionals Don’t Skip.
Every week, thousands of producers, breeders, and industry insiders open Bullvine Weekly for genetics insights, market shifts, and profit strategies they won’t find anywhere else. One email. Five minutes. Smarter decisions all week.
At $19 milk, a 400‑cow herd can watch $240,000 in equity vanish in 12 months. The kicker? Retail prices barely blink—and your co‑op’s plants keep humming.
Executive Summary: USDA’s February WASDE pegs 2026 all‑milk at .95/cwt while full costs for many 300–500 cow herds sit in the low‑ to mid‑s, creating a structural gap you can’t efficiency‑your‑way out of. For a 400‑cow herd shipping 120 cwt/cow, a $5/cwt shortfall is roughly $240,000 a year coming straight out of family equity, not your feed mill or co‑op. At the same time, farm‑value share of the total dairy basket has slid into the mid‑20s while processors and retailers capture the growth from cheese, yogurt, and value‑added products. A handful of big co‑ops now market most U.S. fluid milk, which means many mid‑size herds effectively have one practical buyer and an announced price, not a negotiated one. The article walks through the barn math, the processing and policy mechanics behind “cheap milk,” and why 400‑cow commodity herds are stuck in a no man’s land between direct‑to‑consumer scale and mega‑dairy leverage. It then lays out a 30/90/12‑month playbook to calculate your real breakeven, stress‑test $19 milk with your lender, and decide whether you’re staying, pivoting to a premium path, or planning a strategic exit while you still have equity.
Blake Gendebien milks cows and runs for Congress in northern New York. Earlier this year, he told voters that milk prices “currently are no higher than they were in the 1980s.” PolitiFact dug into Bureau of Labor Statistics data and rated the claim Mostly True: since January 1980, the retail price of whole milk has roughly doubled — from about .03 to .03 per gallon — while overall consumer prices have more than quadrupled over the same period (U.S. national averages through early 2026).
Adjusted for inflation, milk is cheaper now than when many of your freestall barns were first poured.
If you’re a 400‑cow operator shipping into a commodity market, that “cheaper milk” story isn’t a win — it’s your pricing trap.
The Food Dollar: Where Did Your Share Go?
In the early 1980s, USDA Economic Research Service data and historical price‑spread estimates suggest U.S. dairy farmers captured on the order of half of the retail value of the average dairy product basket — milk, cheese, butter, yogurt, the whole cart. That’s based on food‑dollar farm‑share levels in the early 1980s plus reconstructed dairy price‑spreads, not a single official dairy‑basket point, so treat it as an informed estimate rather than a precise cent value.
By 2025, that farm‑value share across the dairy basket had dropped to about 25–26%, according to USDA ERS farm‑to‑retail price‑spread data summarized by Cheese Reporter in April 2026. In the same report, ERS data showed the farm share of a gallon of whole milk at 47%.
Two clarifications that matter for this conversation:
For fluid whole milk alone, USDA ERS data show the farmer still receives roughly half the retail price — the farm share for whole milk declined from 49% to 47% between 2024 and 2025.
For the total dairy product basket, where consumer spending has shifted heavily toward cheese, yogurt, ice cream, and other processed products, the farm‑value share has fallen into the mid‑20s — because the additional processing, marketing, and retail value in those products accrues downstream.
A long run of academic work on dairy price transmission in Canada, parts of Europe, and other markets often finds the same pattern: retail prices tend to move up more quickly when farm‑gate prices rise than they move down when farm‑gate prices fall.
Some studies document several‑month lags before retail prices fully reflect lower farm prices, especially in markets where processing and retail are more concentrated. When your milk cheque drops fast, and the shelf price barely budges, that’s what you’re living.
That “up fast, down slow” pattern is the fingerprint of pricing power — and it’s on the processor/retail side, not in your parlor.
What Does $19 Milk Really Mean for a 400‑Cow Dairy?
Here’s the math that matters when you sit down with your lender.
USDA’s February 2026 World Agricultural Supply and Demand Estimates (WASDE‑668) put the 2026 all‑milk price forecast at $18.95/cwt, up from earlier projections but still below many farms’ full cost of production. For simplicity, we’re rounding that to $19/cwt as a working number for barn math.
On the cost side, USDA ERS cost‑of‑production data and The Bullvine’s February 2026 analysis found full costs — including unpaid family labor valued at $18–22/hour and depreciation at replacement cost — near $19.14/cwt for 2,000‑plus cow herds, with smaller herds substantially higher. For 300–500 cow herds, that realistically puts full costs somewhere in the low‑ to mid‑$20s.
Split the difference. Use $24/cwt as a mid‑range full‑cost breakeven for a 400‑cow commodity herd.
Running the Numbers: Annual Gap at 400 Cows
Full‑cost breakeven (mid‑range): $24.00/cwt (300–500 cow herd, including unpaid labor and depreciation)
If your actual full‑cost breakeven is $22/cwt — leaner operation, lower debt — the gap shrinks but doesn’t vanish:
400 cows × $3.00/cwt × 120 cwt = −$144,000/year
This is the kind of barn math Gendebien is pointing at when he tells voters milk is “no higher than the 1980s.” He’s right about the price. He’s also describing why the farms behind that price are disappearing.
If your full cost sits above $19, you’re not “breaking even with belt‑tightening” — you’re bleeding equity, one cwt at a time.
Now layer this on top: while you absorb that gap, Leprino Foods committed about $1 billion to its Lubbock, Texas, mozzarella complex, Hilmar Cheese announced a roughly $600 million facility in Dodge City, Kansas, and IDFA’s Michael Dykes has highlighted more than $11 billion in new or expanded U.S. dairy manufacturing investments across multiple states.
You’re told to “manage through the cycle” while processors invest billions into plants designed around abundant, relatively cheap milk. That isn’t a coincidence — it’s how their business model works when the supply side carries most of the price risk.
The Pricing Trap: Management Problem or Market Design?
Every time margins get thin, the message is the same: cut costs, tweak rations, adopt new tech, manage risk better. And if none of that works, the implication is clear — you just aren’t competitive enough.
International research on dairy supply‑chain bargaining tells a different story. Several studies across the EU, Iran, and other markets find that processors hold significantly more leverage than farmers when prices are set — and that this asymmetry can be more pronounced for smaller operations than for mega‑dairies. The structural tilt isn’t about your skills. It’s about how many buyers there are for your milk.
A 2023 Farm Aid analysis, citing Food & Water Watch’s The Dirty Dairy Racket report, noted that Dairy Farmers of America is the largest U.S. dairy cooperative, marketing about 39% of all fluid milk sales, and that in 2022 just three cooperatives — DFA, Land O’Lakes, and California Dairies — together marketed around 83% of all U.S. fluid milk. In a lot of U.S. milk sheds, producers say that once they factor in co‑op territories and hauling realities, they effectively have only one practical buyer if they want to stay in Grade A markets in their region.
When there’s effectively only one practical buyer in your area, and that buyer also owns processing plants, your leverage over price is limited. Under most Federal Order structures, producers are essentially working off an announced price plus premiums, not a fully negotiated one.
In July 2022, a federal class‑action lawsuit filed in Vermont alleged that DFA used its dominant Northeast position in ways that limited farmers’ marketing alternatives and kept farm‑gate prices lower to benefit its processing interests. DFA responded in a public statement that the allegations were “baseless and completely without merit,” and as of early 2026, the case remains pending before the court.
Separately, Dairy Farmers of America and Select Milk Producers have agreed to settle a Southwest price‑fixing case for a combined total of about $34 million. Reuters and other outlets report that DFA agreed to pay roughly $24.5 million and Select about $9.9 million, and coverage notes that the settlement allows the co‑ops to resolve the case without continuing litigation and without any findings of liability against them.
The more concentrated your buyers are, the more your “management problem” starts to look like their pricing strategy.
The Processing Paradox: $11 Billion in Plants Is a Warning Sign
On paper, billions in new dairy processing capacity sounds like a success story. New jobs, new export volume, and more demand for milk. That’s how it’s sold at ribbon cuttings.
For a 400‑cow commodity herd, it’s more complicated.
Those plants are engineered to run flat‑out. They’re built on the assumption that raw milk will stay plentiful and relatively cheap. Their investors win when:
Milk supply is reliable and abundant.
The spread between farm‑gate prices and wholesale/retail prices stays wide enough to cover costs and returns.
Price transmission lets them hold margin longer when your milk cheque drops.
When you see a new plant announced in your region, the right question isn’t “Will this save my dairy?” — it’s “How much of that investment depends on my milk staying cheap?”
The Canadian Contrast: Stability at a Price
North of the border, Canada runs dairy on different rules. The Canadian Dairy Commission uses a national formula — built roughly on 50% indexed cost of production and 50% Consumer Price Index — to set annual farm‑gate adjustments for industrial milk. For 2026, that formula produced about a 2.33% increase in the support price effective February 1, based on a 2.7% increase in the cost of production and a 1.9% CPI rise. When input costs rise, part of that pain is explicitly built into what farmers receive.
Between the mid‑2010s and early 2020s, Canadian census and USDA data show dairy farm numbers dropping by roughly a tenth in Canada and by around a third in the U.S. Both countries are consolidating. The pace looks very different on the ground.
Stability has a bill. Multiple Canadian policy and think‑tank analyses estimate that supply management raises the average household’s annual cost for dairy, eggs, and poultry by roughly CAD $300–$450, compared to an open market. High quota values also create a steep barrier for young or new entrants — a different kind of problem than what U.S. operators face, but a real one.
During COVID, when U.S. producers dumped milk and scrambled for emergency payments, a 2020 Canadian policy paper found that supply‑managed sectors were “more resilient” because “producers are generally more financially stable, losses are pooled, and production and marketing efforts are coordinated.”
Canadian supply management isn’t a fantasy — it’s proof that tying farm‑gate prices to the cost of production is a policy choice, not an economic impossibility.
Factor
🇨🇦 Canada (Supply Managed)
🇺🇸 United States (Open Market)
Farm-gate price setting
Formula: 50% cost of production + 50% CPI
FMMO announced price + premiums; no cost-of-production link
2026 price adjustment
+2.33% effective Feb. 1 (cost + CPI formula)
USDA WASDE forecast: $18.95/cwt — below many farms’ full cost
Farm number decline (2015–2023)
~10% reduction
~33% reduction
COVID resilience
Supply-managed sectors “more resilient”; losses pooled
U.S. producers dumped milk; emergency payments required
Consumer cost premium
~CAD $300–$450/household/yr for dairy, eggs, poultry
Lower shelf price; cost burden shifted to farm balance sheets
New entrant barrier
High quota values ($30,000–$40,000+/cow equivalent)
Low entry barrier; market access not guaranteed
Processor relationship
Coordinated; farm price moves with input costs
Processors capture spread asymmetry; “up fast, down slow”
Verdict
Stable farms, high consumer cost, closed to growth
A 100‑cow pasture dairy with low debt and a strong local brand might have a shot at direct‑to‑consumer or niche premiums. A 4,000‑cow desert unit has the volume, scale, and lender relationships to negotiate harder and spread fixed costs.
A 400‑cow commodity dairy? That’s the tough middle.
You’re often:
Too big for most local, direct‑to‑consumer plays to move the needle on total volume.
Too small to have the volume leverage, economies of scale, or bargaining power of the mega‑dairies.
Deep enough into capital investment that “just quitting” isn’t a simple decision, but not big enough to dictate terms.
The 400‑cow herd sits in dairy’s no man’s land: big enough to carry real debt and overhead, not big enough to bend the market.
The Playbook: What to Do Before Summer 2026
The system won’t be fixed in the next 12 months. Your job is to make decisions that assume it won’t — while keeping enough equity to benefit if it ever does.
Herd Size
Full Cost/cwt
2026 All-Milk
Gap/cwt
Annual Equity Drain
24-Mo Stress Risk
Action Signal
300 cows
$24.00
$19.00
–$5.00
$180,000
HIGH
Exit planning warranted
300 cows
$22.00
$19.00
–$3.00
$108,000
MODERATE
Stress-test with lender
400 cows
$24.00
$19.00
–$5.00
$240,000
HIGH
Exit planning warranted
400 cows
$22.00
$19.00
–$3.00
$144,000
MODERATE
Stress-test with lender
500 cows
$24.00
$19.00
–$5.00
$300,000
CRITICAL
Restructure conversation now
500 cows
$22.00
$19.00
–$3.00
$180,000
HIGH
Exit planning warranted
600 cows
$24.00
$19.00
–$5.00
$360,000
CRITICAL
Restructure conversation now
600 cows
$22.00
$19.00
–$3.00
$216,000
HIGH
Exit planning warranted
In the Next 30 Days
Calculate your real breakeven — not cash breakeven, full breakeven. Include unpaid family labor at $18–22/hour, depreciation at replacement cost, and a management return. If your full breakeven sits above the latest USDA all‑milk outlook (~$19/cwt), you’re running at a loss on a full‑cost basis. If your full‑cost breakeven is above $19, your first problem isn’t efficiency — it’s that you’re selling below cost.
Pull your co‑op’s latest annual report or financials. Look at their processing margins alongside the farm‑gate price they announced. Then ask yourself one question: Did that spread widen when milk prices fell? If it did, you’re looking at the asymmetry this article describes — happening in your own supply chain. Ask your co‑op board member directly: “How did processing margins change between 2022 and 2024 while my milk price moved?”
Red flag threshold: Your rolling 18‑month cash‑flow projection shows cumulative losses exceeding 15% of equity. Once 15% of your equity is gone to cover losses, you’re not “weathering a storm” — you’re changing the shape of your future.
In the Next 90 Days
Run a $19 milk stress test with your lender. Model your balance sheet at 24 consecutive months of $19 all‑milk with your current cost structure. If your debt‑to‑asset ratio crosses 60% under that scenario, you need a restructuring conversation, not just a prayer for better prices.
Check your FMMO class and utilization mix. If you haven’t re‑read your order’s pricing rules and your co‑op’s pooling/premium structure since the 2025 adjustments, do it now. Component and class dynamics can move your net check more than you think.
If you’re under 300 cows with low debt and meaningful pasture, and a processor has expressed interest in organic, grass‑fed, or A2A2 supply at premium terms — get it in writing this quarter. Specialty contracts won’t magically fix your economics, but a signed agreement changes the math on whether a 3‑year transition is worth the pain.
If you’re 600+ cows with high leverage, your path is different: every dollar of overhead efficiency matters more, the margin for error on feed procurement is thinner, and your lender conversation is about debt‑service coverage, not expansion. Know your number.
Over the Next 12 Months
Make the binary decision. Can you realistically get your full‑cost breakeven into the low $20s within a year or two — without betting the operation on debt and miracles? If yes, execute ruthlessly on every controllable cost lever and fight for every cent of component premium. If no, plan a strategic exit while you still have equity, strong cull cow prices, and beef‑on‑dairy premiums to work with.
Audit your loyalty. Co‑op success — new plants, strong balance sheets, even healthy patronage checks at the organizational level — does not automatically translate into a higher milk check for you. Read your co‑op’s financials like you would a processor’s: how much value stays in the plant, and how much actually flows back to members?
The critical threshold: If your full cost of production stays above the projected all‑milk price for two consecutive years, the gap is effectively coming out of your family’s equity, while the processing side continues to benefit from relatively cheap raw milk. At that point, you’re no longer just “hanging on” — you’re actively funding someone else’s business plan.
What This Means for Your Operation
You’re not imagining the squeeze. Decades of farm‑share data, price‑transmission research, and bargaining‑power studies confirm that the dairy supply chain is structured so that most of the risk and price adjustment lands on your side.
Your efficiency gains work both ways. When you push more milk through the parlor, you help keep processors’ unit costs low and plant capacity full. Unless your contract structure captures some of that value, the benefit flows downstream.
Your co‑op is a partner and counterparty at the same time. A co‑op that runs plants and export programs has a real structural tension between paying you more and protecting its processing margin. That doesn’t make them villains — it means you should read their balance sheet with the same skepticism you’d apply to a private processor.
Canadian‑style supply management isn’t on the table this decade. But it proves that tying farm‑gate prices to the cost of production is a policy choice, not an economic impossibility.
Waiting for prices to recover is a bet, and recent USDA outlooks suggest it’s a risky one. Treat the $18.95/cwt forecast as a base case, not a worst case. If your full‑cost breakeven doesn’t work at that level, your job this year is to close that gap or decide when and how you’ll exit.
The most important number isn’t on the CME screen. It’s the ratio between what you’re paid per cwt and what a gallon of your milk sells for at retail in your nearest town.
Key Takeaways
If your full‑cost breakeven sits more than $3/cwt above the latest USDA all‑milk outlook and you don’t have a clear, executable plan to close that gap, strategic exit planning should be on the table — not taboo.
If your co‑op’s processing margins grew while your farm‑gate price lagged, that’s the bargaining‑power asymmetry at work — not bad management on your part. Stop treating a structural problem as a personal failure.
If you haven’t run a $19 milk stress test with your lender for a full 24‑month horizon, do it in the next 90 days. The outcome of that meeting should drive whether you’re doubling down, pivoting to a premium path, or quietly lining up your best exit window.
The Bullvine Bottom Line
If you’re effectively subsidizing a processor’s growth with your own family’s equity, you’re not “weathering a storm” — you’re funding someone else’s expansion. It’s time to decide, with your own numbers in front of you, whether you’re truly a partner in that system — or just a donor.
What does your latest milk cheque say about which one you are?
Complete references and supporting documentation are available upon request by contacting the editorial team at editor@thebullvine.com.
The $900/Cow Hit You Can’t Outbreed by April: Western Canada’s 70/25/5 Reckoning – Breaks down how a sudden shift in component payment ratios can vaporize $100,000 in annual revenue. This report delivers a disruptive nutrition and genomic blueprint to pivot your herd’s protein profile before the new pricing rules take hold.
The Sunday Read Dairy Professionals Don’t Skip.
Every week, thousands of producers, breeders, and industry insiders open Bullvine Weekly for genetics insights, market shifts, and profit strategies they won’t find anywhere else. One email. Five minutes. Smarter decisions all week.
Your lender is already running the Q3 margin math. Here’s how to beat them to it.
Executive Summary: Forward dairy margins from March 2026 onward sit above the 83rd percentile of the past decade — and most herds haven’t locked a pound of H2 milk. The Q1 rally that pushed CME NFDM from $1.1750 to $1.93 in under three months wasn’t a fundamental demand reset — it was a short squeeze layered on Hormuz-related double-ordering, and both forces are already fading. On a 500-cow herd, leaving H2 unhedged while running 2025 input numbers creates roughly $146,000 in avoidable exposure: $116,250 in unprotected milk revenue plus $20,000-plus in fertilizer and fuel inflation most budgets haven’t absorbed yet. Central Illinois nitrogen alone is up 20–42% since last summer, depending on source. EU butter and SMP stocks remain heavy, and the late-March GDT Pulse auction already softened. Inside: the full barn math on that $146K, a three-sentence lender script for your Q2 review, and a 30/90/365-day playbook for buying floors while the window’s still open. If your stress-case H2 DSCR sits below 1.2x, read this before your next lender meeting — not after.
Most dairy farmers treat a market rally like a lottery win — they stop checking the numbers and start checking the equipment brochures. Ken McCarty isn’t most farmers. While the rest of the industry basks in the glow of the Q1 2026 bounce, the smart money is already bracing for the $146,000 trap waiting in the H2 tall grass. If you aren’t mathing your margin right now, your lender is about to do it for you — and you won’t like their answer.
McCarty’s family had key energy costs locked years in advance as part of a long‑term risk strategy with their processor and partners. Boring. Disciplined. And worth serious money on a multi‑site family dairy of their size. His philosophy boils down to one line: get on base. Lock in a price you can live with before the market hands you something you can’t.
HighGround Dairy’s Q1 2026 Producer Market Update pegs forward producer margins from March 2026 onward above the 83rd percentile of the past decade — top‑20% territory. At the same time, nitrogen costs have climbed 20–40%from late‑summer 2025 levels, European butter and SMP stocks are heavy, and most 2026 fertilizer invoices haven’t fully landed in cash‑flow plans yet. For a 500‑cow operation that rides the rally, changes nothing, and walks into Q3 unhedged, the math points to roughly $146,000 in avoidable exposure over the next twelve months.
That’s the number your lender is going to circle in red.
Why the Q1 Bounce Feels Safe — and Isn’t
Through late 2025, the consensus called for a “tsunami of milk” in 2026. EU production ran well above year‑earlier levels in Q3 and Q4, with Germany and France driving much of the growth. USDA kept nudging U.S. production forecasts higher. Simple story: too much milk, weaker Mailbox Prices ahead.
Then Q1 didn’t follow the script.
At the first 2026 Global Dairy Trade auction (Event 395), the GDT Price Index jumped 6.3%— snapping a string of declines stretching back to August 2025. A February auction posted another strong gain, driven by whole and skim milk powder. On the Board, CME spot nonfat dry milk opened the year at exactly $1.1750/lb on January 2, according to Brownfield Ag News. By January 20, Federal Order 30 data had it at $1.26/lb. ADPI’s January Dairy Economist Ingredient Outlook confirmed CME NFDM rallied to the mid‑$1.40s by month’s end. By early February, HighGround pegged it at $1.60/lb — a gain of nearly 40% in a matter of weeks. And by March 29, Brownfield had it at $1.93/lb, the highest level since mid‑2022. That kind of move makes you forget what’s sitting on the other side of summer.
On the farm, it finally felt like a break. USDA’s Dairy Margin Coverage program paid out for December 2025 at the $9.50 coverage level — the first and only DMC payment for all of 2025. Cheques improved. Beef calf revenue stayed solid. After a rough 2023–24 stretch, you could almost breathe.
And that’s exactly when the trap tends to spring. The same Q1 that boosted your mailbox also:
Encouraged some operations to treat 2026 DMC coverage as optional because “things were turning around.”
Tempted herds to leave Q3 and Q4 completely unhedged, betting the Board would keep climbing.
Buried the fertilizer bomb — nitrogen climbing 20–40% on the back of the Iran–Hormuz conflict.
Masked the reality that EU butter and SMP inventories were still elevated, and European weekly milk intakes remained strong.
The market handed you a chance to lock in margins in the top fifth of the last decade, whether you treat that like McCarty did with energy — or like a feel‑good moment that looks great on a Q1 statement and ugly by October — is the question this piece is built around.
The Quick Math: Where $146,000 Disappears on a 500‑Cow Herd
Here’s the summary for the barn‑aisle scroll. This is a 500‑cow herd, 85 lb/cow/day, roughly 155,000 cwt per year.
Risk Category
Inputs
Exposure
H2 milk revenue left unhedged
77,500 cwt × $1.50/cwt downside
≈ $116,250
Fertilizer + fuel inflation (2025 → 2026)
N up 20–40%; fuel up ~15–20%
≈ $20,000 (illustrative, based on central IL prices)
Missed DMC safety net
Skipped or under‑enrolled at $9.50
≈ $10,000 (illustrative)
Total avoidable 12‑month exposure
≈ $146,000
That’s the gap between “we bought a floor when the math was there” and “we rode it and hoped.” Now let’s walk through the arithmetic.
How Much H2 2026 Milk Should You Lock?
Take that 500‑cow herd. At 85 lb/cow/day, you ship roughly 155,000 cwt per year. The second half alone:
155,000 cwt ÷ 2 ≈ 77,500 cwt in H2.
HighGround’s Q1 update shows forward margins from March onward sitting above the 83rd percentile of the last ten years. That’s the window your risk advisor is waving their arms about. You don’t have to lock every pound — but leaving them all uncovered is a choice with a price tag.
Stay conservative. Assume you could lock an H2 Class III/all‑milk equivalent $1.50/cwt higher than a plausible Q3 downside if EU inventories weigh in and the squeeze unwinds:
77,500 cwt × $1.50/cwt = $116,250
That’s $116,250 of Mailbox Price you could have “on base,” as McCarty would say, if you’d bought a floor while margins were rich. And $1.50/cwt isn’t an edge case. The Board has moved more than that inside a single year, more than once.
[Pro‑Tip] Don’t wait for your DRP agent to call. Pull your own H2 cwt number this week. Multiply by $1.50. Write it down. That’s what you’re wagering by doing nothing.
The Fertilizer Bomb After Hormuz
Now stack that revenue risk against your 2026 input reality.
The Iran–Hormuz conflict bottlenecked nitrogen exports from a major urea and ammonia‑producing region. Sulfur shipments — a key feedstock for phosphate fertilizers — snarled, too. University of Illinois’ farmdoc daily analysis (March 31, 2026) tracked how fast that hammered central Illinois prices:
Anhydrous ammonia: roughly $0.48/lb N in Aug–Sep 2025 → $0.51 in February → $0.61/lb N by March 20, 2026.
Urea: around $0.65/lb N in late summer 2025 → $0.89/lb N by March 20 — about a 42% jump, the steepest of any major N source.
UAN solutions: up roughly 16–20% over the same stretch.
2025 N budget: 500 ac × 120 lb N × $0.50/lb N ≈ $30,000 Spring 2026 reality: 500 ac × 120 lb N × $0.70–$0.90/lb N ≈ $42,000–$54,000
An extra $12,000–$15,000 on nitrogen alone. Layer on phosphate, potash, and a 15–20% fuel bump on a dairy burning 6,000+ gallons per month, and you’re conservatively in the $20,000 neighbourhood of additional 2026 cash cost. Those N numbers are central Illinois; your local market may differ, but the direction has looked similar across most U.S. regions.
[Lender’s View] Your lender sees that ,000 fertilizer gap as a direct hit to operating cash flow — and if your revenue line isn’t hedged, they’re stacking it on top of the unprotected milk. That’s how a “good year” turns into a covenant conversation.
The Safety Net You May Have Skipped
Brownfield reported on February 23 that 2026 DMC enrollment would close on February 26. Dairy Herd’s “11th‑Hour Trigger” coverage confirmed that December 2025’s margin triggered a payment at the .50 level — the lone DMC cheque for all of 2025. Producers who’d locked coverage when things looked worst saw real money early in 2026.
Those who watched the Q1 rally and figured “maybe we don’t need this” risked missing the only meaningful safety‑net payment of the year. On a 500‑cow herd, even a modest DMC payout reaches into five figures once you multiply per‑cwt across shipped volume. We’ll use roughly $10,000 as an illustrative figure — your actual number depends on your coverage tier and pounds.
What Actually Drove the Board — and Why It Probably Won’t Drive Q3
The Q1 surge wasn’t “strong demand” in the way a rising Mailbox Price implies. There were too many shorts and too many late buyers crammed into the wrong side of the trade at the same time.
Coming into 2026, processors and traders were heavily short, counting on the wall‑of‑milk story to keep the Board pinned. End users had taken minimal forward coverage. Non‑China importers had already stepped up powder purchases in late 2025 when prices were weak. When tight U.S. NFDM production — after two years of milk shifting toward cheese and high‑protein ingredients — left less powder available than anyone had modeled, shorts scrambled. Buyers scrambled. Short‑covering stacked on top of real demand pushed prices higher.
Then Hormuz blew up. Gulf buyers scrambled for rerouted supply. Analysts report that some Asian buyers waiting on delayed European products turned to the U.S. and New Zealand to avoid running short, effectively layering extra orders on top of existing commitments. That double‑booking created a temporary demand bulge on top of the short squeeze — the kind of pattern that lifts a GDT index 6–7% in one event and then fades once the pipeline refills.
By late March, the GDT Pulse auction had already softened. EU butter prices eased. Reports across Europe described butter and SMP stocks as significantly higher year‑over‑year. Rabobank’s Q1 2026 Global Dairy Quarterly, summarized by AHDB, suggested EU milk production may contract about 0.9% in the second half — but emphasized the lag between lower farmgate prices and actual volume response.
The Q3 correction is lining up like a freight train, and a lot of herds are standing on the tracks with a Q1 smile. The wall of milk didn’t crash into Q1 the way early bears predicted. But it didn’t vanish, either. It’s sitting in European supply numbers that haven’t adjusted yet. If panic buying fades, Gulf shipping normalizes, and EU intake stays firmer than models expect, the mechanical rally that saved your Q1 Mailbox Price sets you up for an H2 where Class III and IV give back part of the gains.
The only part of your revenue that holds up is the part you already took off the table. That’s the setup McCarty’s risk plan was built for. Not market timing. Just getting on base before the pitch changes.
McCarty’s Singles and Doubles vs. the “Do Nothing” Herd
McCarty’s approach isn’t clever. It’s a risk philosophy that survives cycles. His family took a long‑term view with their processor to stabilize key costs — energy, feed, equipment — years in advance. Not flashy. Deliberate. When diesel blew up in 2022, they weren’t scrambling. They were executing a plan they’d already paid for.
Right now, a lot of 500‑cow operations are in the opposite position:
Q1 felt good, so 2026 DMC got treated as a “maybe.”
DRP and forward contracts are sitting on the “we really should call our agent” list.
Fertilizer and fuel are budgeted off 2025 numbers, not current March 2026 quotes.
One operation walks into their lender meeting with DRP confirmations, and a fertilizer pre‑buy that proves H2 floor revenue covers term debt even in a stress case. Another walks in with a smile from Q1, a budget using last year’s N prices, and 77,500 cwt of H2 production exposed to whatever EU butter stocks and Hormuz do next.
Same rally. Very different December.
Metric
Hedged Operation (McCarty Model)
Unhedged Operation (“Do Nothing”)
H2 2026 Milk Floor ($/cwt)
Locked ~$19.50–$20.00 via DRP floors at 83rd-pct margins
Riding spot — exposure to $1.50+/cwt downside if Board corrects
Q3/Q4 Volume Protected
40–60% of 77,500 cwt (~31,000–46,500 cwt)
0 cwt — fully exposed to market move
2026 Nitrogen Budget ($/lb N)
Current quotes: $0.70–$0.89/lb (anhydrous/urea blend)
2025 budget: ~$0.50/lb — understated by 40%+
Fertilizer Cash-Flow Gap
~$0 — pre-bought or properly budgeted
~$12,000–$15,000 underfunded on N alone
DMC Enrollment Status
$9.50 coverage confirmed before Feb 26 deadline
Skipped — “things were turning around”
H2 DSCR (Stress Case)
Holds at 1.2x+ even if Board gives back $1.50/cwt
May fall below 1.2x — covenant conversation risk
Lender Meeting Posture
Walks in with DRP confirmations + updated budget
Walks in with Q1 smile and 2025 numbers
December 2026 Outcome
Stable margins; singles and doubles locked in
Six-figure exposure if Q3 correction materializes
Three Sentences to Bring to Your Lender
The headline promises lender math. Here’s how to deliver it in your Q2 review. Walk in with your numbers already run and say:
Sentence 1: “We’ve locked DRP floors on [X]% of our Q3 and Q4 volume at margins that sit above the 83rd percentile of the last ten years, based on HighGround’s Q1 producer update.”
Sentence 2: “Our 2026 cash‑flow plan uses current nitrogen at $0.70–$0.90 per lb of N and March diesel quotes — not 2025 numbers — and we’ve offset part of that with documented manure N credits per acre.”
Sentence 3: “Even in our stress case — the Board gives back $1.50/cwt in H2 and inputs run another 10–15% above current — our debt‑service coverage ratio holds at [X.X]x.”
[Lender’s View] Your lender isn’t asking whether you’re optimistic. They’re asking whether you’ve stress‑tested. These three sentences — backed by actual confirmations and an updated budget — tell them you have. That’s the difference between “extending your line” and “let’s talk about your collateral.”
If you can’t fill in those blanks today, that’s the problem this article is about.
The 30/90/365‑Day Playbook
Action Item
Deadline/Window
Risk if Skipped
Priority
Buy DRP floors on 40–50% of H2 volume
Next 30 days (while margins at 83rd pct)
$116,250 unprotected milk revenue (500-cow herd)
🔴 Critical
Rebuild 2026 input budget with current quotes
Next 30 days
$12–15k+ fertilizer gap; lender sees 2025 numbers
🔴 Critical
Run manure N credits with agronomist
Next 30 days
Miss $30–45/acre savings (up to $13,500 on 300 ac)
🟠 High
Build base + stress H2 margin sheet (DSCR)
Next 90 days
Don’t know if stress DSCR < 1.2x until lender flags it
🟠 High
Ask processor 3 blunt questions (milk end-use)
Next 90 days
Shipping into a plan you don’t understand
🟠 High
Drop bottom-protein bulls; tighten sire stack
Next 90 days
Calving volume-heavy heifers into 2028 component market
🟠 High
Cull by protein yield; deploy beef semen on tail
Next 365 days
Herd drifts away from cheese-yield premium
🟡 Medium
Align risk calendar to DRP sales/DMC deadlines
Ongoing
Buy protection when desperate, not when optimal
🟡 Medium
Basis + alternatives review before contract renewal
Next 365 days
Miss co-op leverage window or consolidation shift
🟡 Medium
You won’t fix all of this in one phone call. But you can move from “hoping” to “protecting” over the next year.
Next 30 Days
1. Buy a floor under a meaningful chunk of your H2 milk. Call your DRP agent or co‑op risk advisor and get Q3/Q4 quotes. Target at least 40–50% of expected H2 volume at today’s margins. If your cheque is heavily component‑based, look at the component blend option so your hedge matches your actual milk. DRP isn’t free — you’re paying a premium or giving up upside. But the decision right now is between a known cost and a six‑figure unknown.
2. Rebuild your 2026 cost line with current quotes. Get written nitrogen quotes for anhydrous, urea, and UAN at current $/lb N. Pull current diesel offers. Replace every 2025 input number in your cash‑flow plan. Circle the gap. If your 2026 budget still shows N at $0.50/lb, you’re already off by 20–40%.
3. Use manure N to claw back some of that increase. Have your agronomist run a proper manure nutrient credit for each field getting manure. University and extension work show farms with real nutrient management plans can cut commercial N by 50+ lb/acre on some fields without losing yield, which at current N prices saves $30–$45/acre. Across 300–500 acres, that’s enough to fund a chunk of your DRP premium.
[Pro‑Tip] Run all three before your Q2 lender review. Walking in with DRP confirmations, updated N quotes, and a manure credit plan is the difference between asking for patience and proving a plan.
Next 90 Days
4. Build a base vs. stress H2 margin sheet. July–December, two columns: base case (hedged floor + updated 2026 inputs) and stress case (same floors + another 10–15% on feed/fertilizer/fuel). Calculate a rough debt‑service coverage ratio in both. If your stress‑case DSCR sits under about 1.2x, have that conversation with your lender before numbers tighten — not after.
5. Ask your processor three blunt questions. What percentage of your milk ends up in cheese and protein ingredients versus butter and powder? What cheese and high‑protein capacity investments are they making over the next three years? If you bring them milk that’s +0.10% protein and +0.15% fat, what does that do to your cheque? If the answers show they’re structurally tied to Class IV butter/powder with weak component incentives, you’ve learned your long‑term plans, and theirs may not be aligned — and that’s a conversation you can’t keep deferring.
6. Build the cheese‑yield engine — starting with your sire stack. If your herd isn’t building the cheese‑yield engine of 2028, you’re breeding further out of line with a market that’s paying for protein and cheese yield, not liters. Every volume‑only heifer you calve this spring pushes you in the wrong direction in a Q3 2026 market that rewards components. Drop the bottom protein bulls. Standardize on 4–6 sires that rank strong on PTA Protein, decent fat, and good fertility. Recent TPI and Canadian LPI index changes increased the protein’s weight because processors and pricing structures are doing the same.
[Lender’s View] Your lender may not care which bull you use. But they absolutely care whether your revenue per cwt is trending toward or away from what your processor actually pays premiums for. A genetic plan that builds cheese yield is a revenue plan — frame it that way.
Next 365 Days
7. Cull with composition in mind. Use 12‑month test‑day data to flag cows in the bottom 10–15% for true protein yield. Let low protein be the tiebreaker when you’re on the fence. Use beef semen aggressively on genetic bottom‑end cows. You’re ratcheting the herd toward the milk your best buyers pay best for — one breeding decision at a time.
8. Align your risk calendar to your cash‑flow pinch points. Mark DRP quarterly sales closing dates, co‑op forward pricing windows, and DMC enrollment deadlines on a wall calendar — with your own “two weeks before” internal target for each. Buy protection when you can afford it, not when you desperately need it and can’t.
9. Run a basis and alternatives review before your next contract renewal. Have an advisor compare what you’ve actually received — net of hauling and premiums — versus what you’d get from a more component‑friendly buyer within realistic hauling distance. Part of that review: understand where the consolidation window is heading for your region and your processor. The leverage you have today isn’t guaranteed tomorrow.
What This Means for Your Operation
If you’re running 400–600 cows and haven’t locked any Q3/Q4 milk, roughly half your H2 volume is exposed to the kind of $1.50/cwt downside this article walked through. Pull your own H2 cwt, multiply by $1.50, and decide if you can absorb that hit without changing plans.
If your 2026 budget still uses 2025 nitrogen and fuel prices, you’re planning with the wrong year. Update those line items this month. If the gap exceeds one good month of milk cheques, your cash‑flow plan needs surgery — not a Band‑Aid.
If your co‑op can’t clearly explain how your milk fits their cheese and high‑protein strategy, you’re shipping into a plan you don’t fully understand. You don’t have to jump ship — but you need to know how much of your 2028 Mailbox Price depends on their capacity bets, not yours.
If your stress‑case H2 DSCR comes in under ~1.2x, your lender sees you as tight. Walk in with proof you’ve acted — DRP floors, updated budgets, manure credits — not just a good attitude.
If you’re still breeding volume‑first and protein‑second, every volume‑heavy heifer you calve this spring is a 2028 risk. Changing bulls and tightening culling is the cheapest way to start building the cheese‑yield engine. Low‑debt operations with strong cost structures may have more room to stay partially uncovered — but even they should be running the stress case, not just assuming the Q1 rally is the new normal.
Your 30‑day check: Pull your projected H2 2026 milk volume (cwt). Multiply by $1.50/cwt. Write that number next to your updated 2026 fertilizer + fuel increase. That spread is what you’re betting on if you do nothing. Now try filling in the three blanks from the lender script above.
Key Takeaways
Unhedged H2 milk plus outdated input budgets is a six‑figure bet that the Q1 rally was more than a mechanical squeeze. Very few 500‑cow herds can afford to be wrong on that bet twice.
DRP and DMC are the difference between having a floor under your Mailbox Price when Q3 softens and hoping the Board doesn’t move too fast. Skipping them in 2026 is a cash‑flow decision, not a paperwork decision.
Aligning genetics toward protein isn’t optional anymore. The herds that start building for cheese yield now see it in 2027–2028 cheques. The herds that don’t stay aligned with a slower‑growing, lower‑value part of the market.
Your lender’s question six months from now won’t be “Did you enjoy the rally?” It’ll be: “What floors did you buy, how does your DSCR hold in a stress case, and what’s your plan if the Board gives back $1.50 by October?”
The Q1 2026 rally gave you something real — not just better cheques, but a window to lock H2 margins at top‑20% levels while everyone else was still smiling at the Board.
Before that window closes, pull two numbers: your protected H2 milk price per cwt and your actual 2026 feed + fertilizer + fuel cost per cwt based on this month’s quotes — not last year’s. Put them side by side. That gap is your forecast. Not the Board. Not the headlines. Not the feeling you got when that Q1 cheque hit.
Be the McCarty of your region: lock the singles and doubles now so you aren’t swinging for a home run when the bases are empty in October.
What does that spread look like on your farm this week?
Email this to your lender and your nutritionist. If you aren’t all on the same page by Friday, you’re already behind.
Complete references and supporting documentation are available upon request by contacting the editorial team at editor@thebullvine.com.
Every week, thousands of producers, breeders, and industry insiders open Bullvine Weekly for genetics insights, market shifts, and profit strategies they won’t find anywhere else. One email. Five minutes. Smarter decisions all week.
Inside the import-substitution playbook, processors run across every dairy market — and the barn math that shows whether your contract is next.
Executive Summary: Galician farmers proved their processor took €14 million in public subsidies, then filled a “local” plant with 12 Portuguese milk tankers a day and still tried to cut contracts 7–9 cents per litre. At Inleit’s proposed 40¢/L base, a 100‑cow herd shipping 800,000 L a year is roughly €40,000 under water against a 45¢/L cost of production, and other big processors in the region landed on almost identical cut ranges. Spain’s Food Chain Law technically bans below‑cost contracts, but AICA’s fines have been tiny, and courts have thrown out sanctions against buyers like Mercadona and Lactalis on procedural grounds, even as a Barcelona court ordered Capsa, Puleva, and Danone to compensate farmers 2% for a proven 2000–2013 milk cartel. The same playbook shows up in North America when subsidized plant expansions, FMMO make‑allowance changes, and TRQ usage quietly move hundreds of millions from the milk pool to processors without an obvious “price cut” on your statement. The article walks through simple checks you can run in 30 days — pulling your processor’s grant files, watching tanker traffic, stress‑testing your breakeven against current offers, and figuring out how exposed you are to a single buyer. If you’re wondering whether your own “local” plant is using foreign milk and regulatory tweaks to set up the next contract squeeze, this is worth a full read.
Roberto García made it official on Monday, March 30, 2026. The General Secretary of Unións Agrarias — Galicia’s largest agricultural union — met with FENIL, the national dairy processor federation, in Madrid. By the end of the session, he’d declared relations “broken with the industry until this situation changes”.
Three days earlier, his members had intercepted a Portuguese tanker truck in the industrial park at Teixeiro, in the municipality of Curtis, A Coruña. They dumped 15,000 liters of milk onto the pavement. Not because they’d lost their minds. Because they’d done the math.
The tanker was headed to Inleit Ingredients — a high-tech protein fractionation plant that received €14 million in Galician public subsidies to process local milk. That’s not a union estimate. Xunta President Alfonso Rueda himself cited that figure during a March 2023 visit to the factory, describing the funds as aid “for the expansion and improvement of Inleit’s facilities since it began its operations”. Óscar Pose, the dairy sector head of Unións Agrarias, told Campo Galego his team had been counting: an average of 12 Portuguese tankers per day — more than 300,000 litres daily — rolling into that same facility in the weeks before the protest. And on the negotiating table? A proposed 15% base price cut — from 47 cents to 40 cents per litre — for the Galician farms that were supposed to be Inleit’s reason for existing.
That’s the story the headlines gave you. But if you think it’s just a Spanish problem, look at your own processor’s recent expansion grants. The playbook is the same. Here’s how it works.
The Subsidy Paradox
The Inleit plant in Teixeiro isn’t a traditional bottling operation. It produces micellar casein, milk permeate powders, and specialized protein isolates — high-margin functional ingredients for sports nutrition, cheese manufacturing, and clinical products. It holds FDA registration and GFSI audit certifications. Exactly the kind of value-added facility that regional governments love to fund.
And the Xunta de Galicia funded it heavily. Rueda’s own March 2023 announcement put the total at €14 million — public money intended to modernize the sector and add value to local production. That language matters. It’s the justification for every euro of taxpayer money. Pose, for his part, told Campo Galego: “It’s not exactly normal for the Galician government to give more than 10 million euros to this company for them to do this”.
But here’s what those subsidy terms apparently didn’t lock down: sourcing requirements. If Inleit can withachieve the same protein density from Portuguese milk at a lower landed cost, the industrial logic points toward importing. How much lower? Unións Agrarias told the Consellería do Medio Rural that imported milk was arriving at processing plants for as little as 20 cents per kilogram — while Portuguese farmgate prices sat at 40 cents and French at 44. As García put it to Campo Galego: “Buying milk in Portugal at 40 cents or in France at 44 and selling it here at 20 cents is unfair competition”.
By December 2025, Unións Agrarias estimated that imported milk flowing into Galician plants exceeded 600,000 kg per day — roughly 7% of the region’s entire output. Pose was blunt about the strategy: “The industry is sorting out its bottom line for the whole of 2026,” he said. “This isn’t just about the next four months of contracts”. In the union’s view, a plant built with Galician public money now functions as a hub for processing cheaper Iberian imports. Inleit has not publicly addressed its intake sourcing relative to subsidy terms.
You’ve seen this movie before. The names change. The pattern doesn’t.
What Every Processor Offers — and What It Actually Means
The Teixeiro dump wasn’t about one plant. All six major Galician processors proposed base-price cuts for April 2026 contracts. The uniformity is what caught the union’s attention.
Processor
Previous Base (cents/L)
New Base (cents/L)
Cut
Max w/ Premiums
Context
Inleit
47.0
40.0
−7.0
40.0
Aggressive base cut, no premium above base
Lactalis
~42.5
38.0
−4.5
45.0
Targeted drops for high-volume suppliers
Larsa (Capsa)
46.0–48.0
39.0
−7.0 to −9.0
46.0
Welfare and volume premiums layered on top
Grupo Lence
47.0–49.0
40.0
−7.0 to −9.0
45.0
Volume and hygiene quality tiers
Naturleite
48.5–50.5
41.5
−7.0 to −9.0
45.0
Environmental and welfare premium integration
Reny Picot
47.0–49.0
40.0
−7.0 to −9.0
45.0
Aligned to Grupo Lence tier structure
Source: Unións Agrarias contract analysis, confirmed by Campo Galego (March 18, 2026).
Look at the Inleit line. A 7-cent base cut — and the maximum potential price, even with every premium, is the same 40 cents as the base. No quality tier, no welfare bonus, no volume incentive. Just a flat number that sits well below what it costs to produce the milk.
Unións Agrarias called the pattern across all six processors an “orchestrated maneuver” to reset the entire market at a lower equilibrium. Six processors are landing on the same 7-to-9-cent cut range during the same contract window. And this comes on the heels of an existing legal finding: Spain’s CNMC (competition authority) already established that major dairy companies colluded on milk pricing between 2000 and 2013. On February 2, 2026, the Audiencia Provincial de Barcelona ordered Capsa — owner of Larsa, one of the six processors in the table above — along with Puleva Food (a Lactalis subsidiary) and Danone, to pay 2% compensation on milk purchased from producers during those cartel years. The court reversed a lower ruling that had dismissed the farmers’ claims as time-barred. Coordination isn’t hypothetical in Spanish dairy. It has a court record.
Can a 100-Cow Galician Dairy Survive These Numbers?
Now put those contract offers into barn language.
Take a family operation in Lugo or Pontevedra province: 100 cows producing roughly 800,000 litres per year. That’s well above the regional average — FEGA data showed the typical Galician herd averaging about 44.9 cows in recent years, though the number climbs every year as smaller farms fold. And they’re folding fast. FEGA’s January 2025 report counted 5,212 active dairy farms in Galicia, already down from approximately 5,571 at the start of 2024 — a loss of 359 operations in a single year. Another 92 disappeared between January and April 2025 alone. At that rate, Galicia has almost certainly dropped 5,000 active dairy farms by now.
At Inleit’s proposed base of €0.40/litre, that 100-cow farm generates €320,000 in annual milk revenue.
Noelia Rodríguez, president of Agromuralla — a separate Galician farm union — told Cadena SER’s Radio Lugo on March 24, 2026 that current production costs for a farm without excessive debt sit at around 45 cents per litre. On 800,000 litres, that’s €360,000.
The gap: €40,000 per year in the red. Not a tight margin. A loss.
Whether that 45-cent figure fully captures the 7-cent cost spike Unións Agrarias documented for early 2026 is unclear. The spike is driven by diesel, fertilizer, and energy costs tied to Middle East instability and disruptions in the Strait of Hormuz. Rodríguez said “right now,” which suggests current conditions — but if the full spike isn’t baked in, the real gap is wider. And for most Galician farms, the March-to-June window represents 60–80% of annual operational spending as they prepare fodder and manage peak biological cycles. A price cut during this specific period is the worst possible timing.
Three separate sources — Rodríguez (Agromuralla), Pose (Unións Agrarias), and the union’s formal input-cost analysis — all point at the same threshold. This isn’t one organization’s negotiating posture. It’s the math.
Even farms hitting the maximum premium tier at Grupo Lence or Naturleite — 45 cents — are just scraping breakeven. Those premiums require hitting quality, welfare, and volume benchmarks that add their own costs.
Why Doesn’t Spain’s Food Chain Law Stop This?
Spain has a law for exactly this situation. The Ley de la Cadena Alimentaria (Law 12/2013, amended by Law 16/2021) explicitly prohibits purchasing agricultural products at prices below the effective cost of production. Unións Agrarias asserts that by proposing prices as low as 38 or 39 cents per litre while costs exceed 45 cents, the industry is in systematic breach.
The enforcement agency, AICA, has been busy — over €703,000 in sanctions in the first three months of 2026 alone for food chain infractions, including non-compliance with payment terms, missing written contracts, and unilateral contract modifications. But the fines are small relative to processor margins, and the courts keep gutting them.
Here’s what that looks like: Mercadona was fined just €66,000 for allegedly buying cow’s milk below cost from Covap — a major dairy cooperative that supplies the Hacendado brand through Naturleite in Galicia. Lactalis faced similar AICA sanctions. Both companies convinced Spain’s National Court to annul the fines — not on the merits, but on procedural defects that left the companies in “a position of legal defenselessness,” according to the court. The law exists. The enforcement exists. And the outcomes still favour the processors.
Agricultural organizations publicly warned processors as recently as March 12, 2026, that reducing milk prices without accounting for new costs from the Middle East conflict could breach the Chain Law. Nothing changed. The proposals went out anyway.
FENIL’s defence? Spanish farmgate prices — averaging €0.495/liter nationally in January 2025, according to FEGA data — have remained above the EU average. FENIL argues this creates a competitiveness gap, making Spain a target for cheaper imports. But that comparison ignores higher Spanish energy and logistics costs — and it ignores that Galicia consistently trails the national average. FEGA’s own January 2025 data puts Galicia at €0.473/liter, a 2.2-cent-per-liter gap below the national figure, making it the cheapest milk-producing region in Spain despite producing the most.
Does This Pattern Show Up in North American Contracts?
Yes. And you don’t have to squint to see it.
In the United States, federal and state subsidies for processing plant construction have accelerated since 2020. New capacity goes online, processors gain intake flexibility across wider geographies, and contract leverage shifts. The USDA’s Federal Milk Marketing Order reform that took effect January 1, 2026, was supposed to help, but an American Farm Bureau Market Intel analysis found the make-allowance increases transferred an estimated $337 million in annual pool revenue from producers to processors in just the first three months. For a 300-cow herd producing roughly 23,000 lbs per cow annually, that kind of systemic revenue shift means thousands of dollars disappearing from each monthly check — money that moved from the barn to the plant through regulatory mechanics, not market forces.
Canada’s supply management system provides more structural protection than anything in the EU or the US. But it’s not immune. Tariff-rate quotas under CUSMA allow a growing volume of US and international dairy to enter the Canadian market at reduced duties. The Canadian Dairy Commission’s pricing formula adjusts with a lag — sometimes a significant one — which means cost spikes on-farm can outrun the administered price for months. And provincial allocation rules determine which processors get quota access, creating their own version of the leverage asymmetry Galician farmers face.
The mechanism is the same everywhere: subsidized capacity expansion → intake geography diversification → contract leverage → price compression. The rulebooks change from country to country. The outcome for your milk cheque doesn’t.
How Would You Know If Your Processor Is Running This Playbook?
You probably wouldn’t — not from the information most producers have access to. That’s the point. The whole setup depends on you not having the numbers.
But there are signals worth watching:
Capital investment without new local supply contracts. When your processor announces a plant expansion funded partly by public grants, and your contract terms don’t improve or lock in volume, that capacity isn’t being built for you. Rueda announced Inleit’s €14 million in March 2023. Three years later, Galician farmers got a 7-cent price cut. Connect the dots.
Subtle shifts in intake policy. New quality tiers, changed testing protocols, or volume-flexibility clauses that weren’t in the last contract can signal that your processor is blending your milk with cheaper imported inputs. Pose’s team documented 12 Portuguese tankers a day arriving at a plant that markets itself as processing Galician milk.
Contract language that eliminates collective bargaining. García described the current proposals as “adhesion contracts where the farmer’s only option is to sign or dump the milk”. The EU’s March 2026 CMO reform specifically targets this tactic by preventing buyers from contacting individual PO members to undercut collective negotiations.
Regional pricing that diverges from national trends. Galicia’s FEGA-reported farmgate price was €0.473/litre in January 2025 — the lowest of any Spanish region, despite producing more milk than any other. When your region’s price falls further behind while your processor’s margins hold, that’s not the market. That’s leverage.
Options and Trade-Offs for Farmers
Play 1: Audit the money — this month. Did your processor receive public funding? Those grant terms are often public record. Pull them. Look for local-sourcing requirements, employment commitments, or production targets. The Galician case is a blueprint: Rueda publicly announced €14 million in Inleit subsidies in March 2023. Three years later, producers caught a dozen Portuguese tankers a day rolling through the gates. If the subsidy terms include sourcing obligations that aren’t being met, that’s leverage — for your PO, your elected representative, or the media. Cost is time, not cash. Risk is low.
Play 2: Count the tankers — this quarter. The Galician farmers who monitored tanker arrivals at Inleit did basic supply-chain surveillance that changed the public conversation. Your PO doesn’t track your processor’s total intake sources? You’re negotiating blind. Under the new EU CMO rules, processors can’t bypass your PO to deal with individual members — but that only works if your PO has data to bargain with. In North America, equivalent information is harder to get but not impossible through FOIA requests and provincial regulatory filings. Trade-off: time and organization now versus better leverage in the next contract round.
Play 3: Break the single-buyer trap. The most vulnerable farms in Galicia ship 100% to one buyer with no alternative outlet. Sound familiar? Start exploring whether a second relationship — even for a small percentage of your volume — changes your risk profile. Splitting volume may cost a tier premium short-term. But single-buyer dependency is exactly what gives processors the confidence to present take-it-or-leave-it contracts. On January 29, 2026, roughly 25,000 Spanish farmers brought 15,000 tractors into city streets for the “Super Thursday” protest against the EU-Mercosur deal. García has called for a dairy-specific mobilization later in April — and that kind of turnout happens when producers feel they’ve run out of options at the negotiating table.
Play 4: Demand indexed contracts — next negotiation cycle. Unións Agrarias has called for contracts that automatically adjust based on official production-cost indices. If your market doesn’t have such indices, advocate for their creation through your national dairy association. The risk: indexation cuts both ways if input costs fall. But the Galician experience shows what happens when there’s no floor at all.
Key Takeaways
If your processor received public subsidies for plant construction but your contract doesn’t include sourcing guarantees, pull the grant terms this month — those obligations may already exist and go unenforced. Xunta President Rueda publicly confirmed Inleit’s €14 million. Three years later, there’s no visible sourcing accountability.
If all processors in your region propose similar price cuts within the same contract window, your producer organization should ask the competition authorities whether the uniformity warrants an investigation. Six Galician processors landing on the same 7-to-9-cent cut isn’t a coincidence in the union’s view — and Spain’s Audiencia Provincial de Barcelona has already ordered Capsa, Puleva, and Danone to compensate farmers at 2% of milk purchased during a proven 2000–2013 cartel.
If your production cost exceeds your contracted base price, you’re operating below the threshold where food chain laws are supposed to protect you. Document your costs in writing, formally, every quarter. Enforcement agencies need paper trails they’re not getting — and when they do act, courts are throwing sanctions out on procedural technicalities.
García told FENIL on March 30 that the industry is “acting unilaterally, trampling the most basic rules of collective negotiation” and imposing “adhesion contracts where the farmer’s only option is to sign or dump the milk”. The contract deadline for the April terms was March 31. Pose summed it up plainly to Campo Galego: “The industry is sorting out its bottom line for the whole of 2026”. If the January “Super Thursday” protest, which drew 25,000 farmers across Spain, is any guide, the processors should pay attention to what comes next.
The Portuguese tankers keep rolling. The question isn’t whether your processor could run this playbook — it’s whether you’ve looked at the numbers closely enough to know if it’s already happening. If you want the full economic model behind processor import-substitution mechanics, we’re building it out for a deeper piece later this month.
Complete references and supporting documentation are available upon request by contacting the editorial team at editor@thebullvine.com.
Learn More
The Hidden Contract Clause That Could Cost Your Dairy $55,000 in 2026 – Arms you with a 30-day action plan to dodge massive liability shifts in new milk contracts. This guide exposes the hidden costs of regulatory compliance and delivers the specific negotiation leverage you need to protect your 2026 net profit.
More Milk, Fewer Farms, $250K at Risk: The 2026 Numbers Every Dairy Needs to Run – Reveals the brutal $250,000 margin gap currently threatening mid-sized operations and breaks down the “more milk, fewer farms” era. It provides the long-term economic benchmarks required to position your herd’s equity before the market decides for you.
Butterfat vs. Powder: What the Great Dairy Divide Really Means for Your Bottom Line – Discovers how to pivot your genetic strategy toward the high-margin components that processors actually value. This analysis exposes why volume is a losing game and shows how precision breeding adds $2.00/cwt to your check without adding a single cow.
The Sunday Read Dairy Professionals Don’t Skip.
Every week, thousands of producers, breeders, and industry insiders open Bullvine Weekly for genetics insights, market shifts, and profit strategies they won’t find anywhere else. One email. Five minutes. Smarter decisions all week.
$11/lb whey. 69¢ on your milk check. We ran the FMMO barn math on a 300‑cow herd to see where the other $1,500 per cow actually went.
Executive Summary: Your component check dropped about $1,520 per cow from February 2025 to February 2026 while premium whey climbed to $11/lb and plants poured $11 billion into new cheese and whey capacity. FMMO’s new make‑allowance formula now prices other solids off 69‑cent dry whey and higher processor costs, cutting roughly 24¢/cwt from your other‑solids line even as whey markets rally. Butterfat and protein did the rest of the damage, taking total Class III components down about $6.09/cwt — a $450K‑plus swing on a 300‑cow herd. At the same time, beef‑on‑dairy calves are throwing off $500–$800/head, helping cash flow but leaving the U.S. roughly 800,000 heifers short heading into a capacity build‑out. The article walks through barn‑level scenarios if whey and cheese both correct, including how negative PPDs could stack another $1–$2/cwt on top of what you’ve already lost. Then it lays out a 30/90/365‑day playbook: audit your component line against AMS values, stress‑test your DMC and DRP coverage, and rebuild any expansion math around ~$15.50/cwt components instead of 2025 peaks. If you’ve got 200–500 cows on a component order and you’re not sure how much of that $11/lb whey is in your milk check, this is the 10‑minute read to run before your next contract or barn decision.
Eleven dollars a pound. That’s where high‑grade whey protein isolate has traded since late 2025, according to Ever.Ag Insight — roughly triple the price three years ago. Cheese plants are sometimes pulling more revenue from the whey stream than the cheese block itself.
But pull your early‑2026 milk check, and a different number stares back. USDA’s February 2026 Class III component values, at standard test of 3.8% fat, 3.2% protein, and 5.7% other solids, work out to about $15.46/cwt — down from $21.55/cwt in February 2025. That’s a drop of $6.09/cwt, or roughly $1,520 per cow on 25,000 lb shipped.
At the National Farmers Union’s 124th annual convention this March, Wisconsin Farmers Union president Darin Von Ruden dropped a number that landed hard: about $50,000. That’s how much less a 300‑cow dairy operator in southwest Wisconsin received on his January 2026 milk check compared with January 2025. Same cows. Same plant. Same truck. The formulas changed. As Von Ruden told Brownfield Ag News, this wasn’t a model herd or a spreadsheet example — it was a neighbor he’d spoken with the week before.
And the $11 billion pouring into 53 new and expanded U.S. dairy processing projects across at least 19 states, according to IDFA, hasn’t changed that producer’s other‑solids line by a dime.
How Much Whey Value Actually Reaches Your Milk Check?
Almost none. And the formula explains why.
Your “other solids” component — the FMMO line where whey economics should show up — is calculated from commodity dry whey, not the premium WPI or WPC‑80 driving the headlines. Under USDA’s January 2025 Final Rule, effective June 1, 2025:
USDA’s February 2026 “Announcement of Class and Component Prices” puts NDPSR dry whey at $0.6931/lb. Run the math:
$0.6931 − $0.2668 = $0.4263
$0.4263 × 1.03 = $0.4391/lb of other solids.
That matches the published number exactly. Meanwhile, premium WPI trades near $11/lb, and WPC‑80 has approached €20,000/ton in Europe. Those are totally different products from the commodity dry whey that feeds the FMMO formula.
Your other‑solids line is tethered to 69‑cent dry whey and pays 44¢/lb. Your processor’s ingredient desk is selling $5–$11/lb whey proteins into sports nutrition and GLP‑1 diets. That’s the first piece of the disconnect — and it’s the piece Rabobank’s Lucas Fuess has been warning about in interview after interview since late 2025.
The Make‑Allowance Hit You Voted For
There’s a second piece, and this one was literally on the referendum ballot.
Dry whey did move up year‑over‑year. February 2025’s NDPSR average: $0.6650/lb. February 2026: $0.6931/lb — an increase of 2.8¢/lb. But your other‑solids value didn’t climb. It slid.
February 2025 other‑solids price: $0.4799/lb (old formula).
February 2026 other‑solids price: $0.4391/lb (new formula).
Dry whey up 2.8¢. Other solids down 4.1¢/lb.
The reason: the FMMO reform raised the dry whey make allowance from $0.1991 to $0.2668/lb — a 34% jump,shifting value from producer to processor. Producers approved it in the December 2024–January 2025 referendum. AFBF economist Danny Munch calculated that in the first three months alone, higher make allowances stripped more than $337 million in combined pool value nationally — class price reductions of 85 to 93 cents per hundredweightdepending on the order (AFBF Market Intel, September 2025). As Munch told Brownfield Ag News, the higher allowances “more than wipe out” the gains from other reforms.
Here’s the barn math at your test level (5.7 lbs OS/cwt):
2025 OS component: $0.4799 × 5.7 = $2.74/cwt.
2026 OS component: $0.4391 × 5.7 = $2.50/cwt.
That’s 24¢/cwt gone from other solids alone. Over 25,000 lb per cow, roughly $60/cow, and about $18,000 on a 300‑cow herd. Even though dry whey itself went up.
The component hit isn’t just whey. It’s the combination of weaker butterfat, softer cheese, and those other solids squeezed all at once.
Using USDA AMS component values for February 2025 vs. February 2026 at standard test:
Component
Feb 2025
Feb 2026
Change/lb
Per‑cwt impact
Butterfat (3.8%)
$2.8186/lb
$1.7794/lb
−$1.0392
−$3.95
Protein (3.2%)
$2.5337/lb
$1.9373/lb
−$0.5964
−$1.91
Other solids (5.7%)
$0.4799/lb
$0.4391/lb
−$0.0408
−$0.23
Total
−$6.09/cwt
Butterfat did about two‑thirds of the damage. Softer cheese pulled protein lower and took another third. Other solids were the smallest slice — but in a whey boom, you’d expect them to be climbing, not sliding.
Per 25,000‑lb cow:
Feb 2025: $21.55/cwt × 250 cwt = $5,387/cow.
Feb 2026: $15.46/cwt × 250 cwt = $3,865/cow.
That’s about $1,520/cow gone — roughly $456,000 on Von Ruden’s 300‑cow neighbor. And through all of that, processors with whey-fractionation capacity booked elevated whey-ingredient margins.
One quirk worth flagging: the FMMO protein formula includes a butterfat deduction. The butterfat drop in early 2026 actually cushioned the protein decline. If butterfat recovers while cheese stays soft, the protein line can fall further, even without another move in cheese.
Who’s Building the Stainless — and Who’s Sharing?
StoneX dairy consultant John Lancaster told DairyReporter that “almost weekly you hear about a small or medium‑sized investment increasing capacity”. Put some names on that $11 billion:
Glanbia/Southwest Cheese — adding significant WPI capacity in Clovis, New Mexico, through a JV with DFA.
Idaho Milk Products — investing roughly $200 million in a new protein and powder blending facility.
Wisconsin Whey Protein — finishing a plant targeting up to 13 million lbs of WPI annually.
Arla Foods Ingredients contracted with Valley Queen in South Dakota for WPC manufacturing.
Globally: Fonterra ($50M Studholme expansion, NZ), Tirlán (€126M new facility, Ireland), Amul (doubling a whey plant plus two new builds, India).
Every pound of WPI starts as your cow’s milk going through a cheese vat. The FMMO formula turns that into $0.4391/lb of other solids. The plant’s ingredient desk sells that same stream at several dollars per pound.
Whey Product
Market Price (Feb 2026)
FMMO Formula Pay
Gap per Pound
Who Captures It
Whey Protein Isolate (WPI)
$11.00/lb
$0.4391/lb
$10.56
Processor ingredient desk
WPC-80
~$9.00/lb (€20k/t equiv.)
$0.4391/lb
$8.56
Processor ingredient desk
NDPSR Dry Whey
$0.6931/lb
$0.4391/lb
$0.254
Partially shared via FMMO
Commodity Dried Whey Permeate
~$0.38/lb
Not in formula
N/A
Processor
Some co‑ops return a slice through patronage dividends or over‑order premiums tied to ingredient economics. In the Upper Midwest, industry sources report some operations have negotiated premiums of $0.20–$0.30/cwt above pool pricing, structured as multi‑year agreements. In a lot of plants, though, any whey value is buried inside the overall component or patronage numbers — not broken out on your statement.
McCully Consulting’s Mike McCully predicts processors will soon be “forced into fights for milk by paying more, meaning some will not get all the milk they need”. That’s your leverage. But only if you know what your milk is worth to the plant buying it — and whether a competing plant within hauling range is offering a clearer premium.
What Happens When $11 Billion in U.S. Dairy Capacity Comes Online?
Every extra pound of premium whey requires another cheese vat running. All that new stainless means more cheese — whether the market is ready or not.
Rabobank’s Fuess warned in March 2026 that these expansions “could temporarily lead to an oversupplied market and reduce cheese prices in the near term as the market works to absorb the additional output”. Cheese has already pulled back from around $1.90/lb a year ago to the mid‑$1.40s in early 2026.
Exports are doing their best to bail the boat. USDEC data show U.S. dairy exports started 2026 with 12% year‑over‑year volume growth in January — the biggest January on record — with cheese up 11%, butter up 187%, and NFDM/SMP up 19%.
But here’s the stress test. Using the USDA’s component formulas and historical price ranges, two downside scenarios:
Scenario A — Whey retreats, cheese softens:
Dry whey slides to $0.55/lb (mid‑2025 levels). Cheese eases ~10% into the high‑$1.20s.
Other solids drop to roughly $0.29/lb. Protein falls to mid‑$1.40s/lb.
Net: about −$2.33/cwt from February 2026 levels → −$582/cow → −$175,000/year on 300 cows.
Scenario B — Deeper correction:
Dry whey returns to $0.45/lb (closer to 2023 levels). Cheese drops ~20% into the low‑$1.10s.
Other solids fall to roughly $0.19/lb. Protein slides toward $1.00/lb.
Net: about −$4.40/cwt → −$1,100/cow → −$330,000/year on 300 cows.
Scenario A isn’t far‑fetched. NDPSR dry whey sat in the 50–60¢ band for stretches of 2024 and 2025.
Now add the hidden multiplier: PPDs. If cheese drops while Class IV holds firm — CME nonfat dry milk has been trading at some of its strongest levels in more than a decade, near $1.94/lb in March 2026 — the spread blows out, and negative Producer Price Differentials come back. In 2020, some orders saw PPDs past −$4 to −$8/cwt. Even a moderate −$1.50/cwt PPD adds another ~$375/cow in exposure.
If you lived through 2020–2021 negative PPDs, you know this isn’t theoretical. And it’s exactly the kind of peak‑price trap that backfired for Kiwi producers when Fonterra built budgets around NZ$9.70 milk.
The Calf Check: One of the Few Hedges Hitting Cash Today
While the FMMO formula fails to capture the $11/lb whey premium, beef‑on‑dairy is one place producers are actually winning back margin in cash.
In strong Wisconsin markets, beef‑cross calves have brought up to $1,750 a head, with Premier’s January 2026 report listing beef‑dairy crosses at $1,000–$1,750. Holstein bull calves, by comparison, sit in the $700–$1,150 range.
That extra $500–$800 per calf functions as a de facto hedge. On 300 cows breeding 40% to beef semen, that’s 120 calves generating roughly $60,000–$96,000/year that never touches a federal order.
The trade‑off is real, though. USDA’s January 1, 2026, cattle report puts U.S. dairy replacement heifers at 3.905 million head — the lowest since the late 1970s and about 16% below January 2020. CoBank dairy economist Corey Geigerprojects the gap at roughly 800,000 fewer replacements across 2025–2026 before inventories begin to rebound sometime in 2027. As Geiger put it: “We don’t see a rebound until 2027, and that will be up 285 thousand, but you’ve got to remember, that’s going to be after 800 thousand fewer heifers”.
Fewer replacements mean fewer cows when all that new stainless steel starts hunting for milk. That takes you straight back to McCully’s question: “Who won’t get the milk?”
Beef‑on‑dairy props up your cash and tightens the supply that new capacity needs. But it comes with a shelf life — and if more than half your AI program is going to beef without a three‑year heifer plan, you’re trading tomorrow’s cow supply for today’s calf check. We walked through exactly how that math can break on a 400‑cow herd last week.
What This Means for Your Operation
Your component check has already absorbed roughly $1,520/cow from February 2025 to February 2026 — about $456,000 on 300 cows. If your expansion budget or debt‑service math is built on early‑2025 component values, you’re building on a number that isn’t there anymore.
The FMMO reform alone shaved about $60/cow off your other‑solids line via the higher make allowance — roughly $18,000/year on 300 cows — even as processors booked stronger whey ingredient margins.
You need to know what your plant does with whey and how they share it. If your co‑op’s annual report shows whey ingredient revenue growing faster than patronage per cwt, that gap is worth understanding — and worth raising at your next member meeting.
Beef‑on‑dairy calves at $1,400–$1,750 are real margin, but they’re also tightening heifer supply in ways that make the coming milk bidding wars more brutal. Your beef‑to‑dairy AI ratio needs to line up with your three‑year heifer plan, not just this month’s calf check.
Negative PPDs are the hidden multiplier. With Class IV buoyed by strong powder and cheese under pressure, the setup looks uncomfortably similar to 2020 and late 2024. Model another $1–$2/cwt of exposure.
Don’t build a barn on a commodity spike. Stress‑test every expansion pro forma at about $15.50/cwt component value, not $21. If it doesn’t cash‑flow there, you’re not investing — you’re betting.
Price the haul to a competing plant. If whey capacity is being added within hauling range, ask directly what the over‑order premium is and how ingredient economics show up in their payment structure. McCully’s “who won’t get the milk?” question is where your leverage comes from.
Within 30 days: Audit your check against USDA component values.
Pull your last three milk statements. Compare your protein, other solids, and butterfat rates to USDA’s February 2026 published component prices: protein at $1.9373/lb, other solids at $0.4391/lb, butterfat at $1.7794/lb.
If your combined protein‑plus‑other‑solids payment runs more than $0.15/cwt below the FMMO values after hauling and marketing deductions, call your co‑op and ask one direct question: “How are whey ingredient economics reflected in my component check?”
If you get a non‑answer, request the co‑op’s annual financial report and equity statement. Compare ingredient revenue to patronage distributions. That gap — if it’s growing — is the conversation to bring to the next member meeting. It’s the kind of thing that costs real money when you put off the hard financial questions.
Within 90 days: Stress‑test your DMC coverage and talk to your lender.
USDA’s January 2026 DMC margin landed at $7.81/cwt, triggering a $1.69/cwt indemnity for herds enrolled at the $9.50 Tier 1 level. February’s margin was projected to be around $8.07/cwt by the Center for Dairy Excellence.
Walk your own numbers through Scenario A:
Knock $2.33/cwt off your current component value.
Layer in a −$1.50/cwt PPD if you’re in an order that’s likely to go negative.
See where your income‑over‑feed margin lands relative to $9.50/cwt.
If the margin drops below $9.50 in that scenario, the expanded Tier 1 coverage — now up to 6 million pounds under the One Big Beautiful Bill Act — is likely your cheapest shock absorber.
Then bring both scenarios to your lender. Ask specifically: what debt‑service coverage ratio would they need to see — 1.2×? 1.3×? — to stay comfortable if those margins showed up for 12 months. Better to push that conversation now than have your banker push it when the PPD turns red.
Within 12 months: Rebuild your expansion math around post‑reform prices.
Run every major capital decision at three component levels:
$15.50/cwt — roughly where early‑2026 Class III components sit.
$19.20/cwt — a 2025‑style “good year” average.
Scenario A with a −$1.50 PPD — your personal worst‑case stress.
You don’t control whether WPI stays at $11 or glides down to $6. You do control whether your business can survive both.
Key Takeaways
If your expansion or refinance pencils out only at a $20+ component value, you’re exposed. Re‑run at $15.50/cwt and see if it still holds water.
If you can’t see whey in your milk check, assume it’s not there. Plan your cash flow on FMMO components alone until your statement or co‑op report shows a clear whey‑linked premium.
If more than half your AI is going to beef without a three‑year heifer plan, you’re trading future cow supply for today’s calf check. Make sure that’s intentional.
If you’re not enrolled at $9.50 DMC Tier 1 and you’re running 200–500 cows, you’re choosing to self‑insure against a whey/cheese/PPD shock. Do the math with your lender, not in your head.
The Bottom Line
What’s your protein premium per cwt this month versus 90 days ago? Does your processor break out whey solids or ingredient premiums anywhere on your statement? And if you’re in a co‑op, how did last year’s patronage per cwt move compared to the co‑op’s reported whey ingredient revenue?
If you don’t know any of those answers, that’s your 30‑day assignment.
Next in “Component Check”: we run the math on how the April DMC margin and the whey premium interact on a 500‑cow milk check. If you want us to use your real numbers, send them.
This analysis uses publicly available USDA data, published analyst commentary, and FMMO pricing formulas. It’s intended as economic education and decision support for dairy producers, not as investment advice or a recommendation regarding any specific co‑op, processor, or financial product.
Complete references and supporting documentation are available upon request by contacting the editorial team at editor@thebullvine.com.
USDA Says $18, Futures Say $16: The $150K Gap That’s Rewriting 2026 Dairy Budgets – Exposes the dangerous disconnect between government forecasts and real-world futures markets. This strategic analysis delivers the $17/cwt “capital test” you must run to ensure your long-term expansion plans don’t collide with the $11 billion processing capacity surge.
Beef-on-Dairy’s $3,000 Trap: 800,000 Missing Heifers and Who Pays the Bill – Breaks down the disruptive math of the national replacement shortage. This report delivers the “guard rails” for reproduction and genetic planning, ensuring you capture immediate beef-cross premiums without accidentally triggering a $60,000-a-year heifer bill by 2027.
The Sunday Read Dairy Professionals Don’t Skip.
Every week, thousands of producers, breeders, and industry insiders open Bullvine Weekly for genetics insights, market shifts, and profit strategies they won’t find anywhere else. One email. Five minutes. Smarter decisions all week.
USDA cut $3/cwt off their 2026 forecast in six months. We ran the stress test on a 500-cow herd — price, freight, and labor hitting at once. The compound number is $550,000.
Executive Summary: USDA’s 2026 all-milk forecast has dropped .20/cwt since last August — on a 500-cow herd, that’s 6,000 in gross revenue gone before costs move. Costs are moving. The Holle family near Mandan, North Dakota, lost two processors in three years and now hauls milk five hours to a Minnesota plant; across FO30, hauling charges jumped 29.8% in one year. Stack that freight squeeze and the new AEWR labor reclassification on top of softer prices, and the compound hit on a 500-cow herd reaches $533,000–$550,000/year — with debt service, you’re modeling a $633,000–$710,000 shortfall before anyone draws a paycheck. We break down the barn math for each layer, walk through three paths (restructure, scale, or planned exit), and lay out a 90-day triage starting with your AEWR audit and two lender scenarios at $18 and $16.50/cwt. If your DSCR drops below 1.0 at either price, you’re not in a dip — you’re in a conversation your lender is already having on your file.
Last August, USDA projected 2026 all‑milk at $21.90/cwt. By February, they’d cut it to $18.95. The March WASDE bumped it back to $19.70 — still $1.47/cwt below the revised 2025 average of $21.17. On a 500‑cow herd shipping 120,000 cwt a year, that gap alone erases roughly $176,000 in gross milk revenue.
And that’s the optimistic number. January’s actual Class III settled at $14.59/cwt. CME futures for February pointed to roughly $15.16. The March WASDE left the 2026 Class III forecast unchanged at .65/cwt — higher cheese prices exactly offset lower whey. The back half of 2026 is doing all the heavy lifting on USDA’s spreadsheet. The question isn’t whether 2026 is a down year. It’s whether you’ve stress‑tested what happens when three cost shocks land on top of that softer price at the same time.
For the Holle family at Northern Lights Dairy near Mandan, North Dakota — about 1,000 Holsteins, now hauling five hours one way to a Bongards plant in Perham, Minnesota — the forecast revisions are background noise. Their real squeeze started the day their closest processor closed. It hasn’t let up since.
When Your Backup Plant Disappears — Twice
The Holles didn’t get a warning shot. In September 2023, Prairie Farms closed its Bismarck processing facility and converted it to distribution only. North Dakota Agriculture Commissioner Doug Goehring was blunt: “With no other processors nearby, those dairies will likely pay for shipping longer distances that will be deducted from their milk checks. This will have a dramatic impact on their bottom line.”
He wasn’t speculating. A producer about 50 miles northwest of Bismarck — identified in Dairy Star’s September 2023 reporting as Henke — saw his milk rerouted 151 miles to a DFA facility in Pollock, South Dakota, at an immediate freight surcharge of $0.55/cwt. He also had to buy an additional bulk tank for every‑other‑day pickup. Then, in July 2024, DFA announced it would close Pollock, too — a plant employing 33 full‑time and four part‑time workers — effective August 30. Suddenly, Henke’s backup was gone. The Holles’ backup was gone. Milk that used to travel dozens of miles was now traveling hundreds of miles into Minnesota plants, with no particular reason to pay a premium for distant, hard‑to‑route volume.
USDA’s Upper Midwest (FO30) data shows what that kind of map‑stretching does at scale. Weighted‑average hauling charges climbed from $0.6137/cwt in 2023 to $0.7969/cwt in 2024 — a 29.8% jump in a single year. Today, the only milk plant operating in North Dakota is Cass‑Clay’s facility in Fargo, pressed against the Minnesota border. For herds west of the Missouri, every extra mile comes straight off the check.
What Does a $3/cwt Drop Actually Do to a 500‑Cow Herd?
USDA’s March outlook at $19.70/cwt sounds like a sigh of relief after February’s $18.95. It isn’t. That forecast still has to be delivered through a first quarter where Class III opened at $14.59 and February futures pointed to $15.16. The March WASDE held the 2026 Class III forecast at $16.65/cwt. Where does your breakeven actually sit if the back half doesn’t deliver?
UW‑Madison’s July 2025 Dairy Enterprise Budget puts the cost of production — after co‑product revenue — at $18.68/cwt for its example operation. That lines up with Minnesota extension benchmarks in the same range. Call it $18.50–$19.00/cwt at cash operating level for a reasonably efficient 500‑cow herd shipping roughly 120,000 cwt — dropping unpaid family labor and some depreciation. That leaves a cash margin of $2.00–$2.50/cwt, or about $240,000–$300,000/year at a $21.00 mailbox.
Now stress‑test at $18.00/cwt — our realistic downside scenario if the back half underperforms USDA’s $19.70 forecast. That’s not the consensus. It’s where we think you should be testing.
Risk 1: Oversupply and Price Erosion
USDA’s March WASDE pegs 2026 production at 234.7 billion pounds, roughly 1.3% above 2025. If your effective mailbox averages $18.00/cwt instead of $21.00, that’s $3.00/cwt off your top line. On 120,000 cwt: –$360,000.
Risk 2: Processor Network and Hauling
FO30’s hauling jump is the baseline. Lose a plant or get rerouted — the way Henke and the Holles did — and it doesn’t take a disaster to lose another $0.75/cwt between basis and freight compared to recent history, on 120,000 cwt: –$90,000.
Risk 3: Labor and the New AEWR Rule
In October 2025, DOL split the Adverse Effect Wage Rate into Skill Level I and Skill Level II, tied to job duties. Cornell’s Ag Workforce team lays out how this hits dairy: a few words in a job description can move you from Level I to Level II. Nationally, CRS puts the Level I range at $7.35–$14.83/hour and Level II at $8.54–$21.16/hour — gaps of $1–$7+/hour depending on your state. In the upper Midwest dairy belt, that spread typically runs $4–$5/hour.
On a 500‑cow herd with roughly 20,800 paid hours/year (10 FTEs at 2,080 hours), a blended increase of $4.00–$4.80/hour — accounting for overtime, payroll burden, and housing — means $83,000–$100,000/year in extra labor cost.
Deep dive:The new AEWR labor math for dairy crews
The 500‑Cow Stress Test: Where $550,000 Vanishes
Here’s the math your lender may already be running on your file. We’re showing every input so you can plug in your own.
*AEWR hit converted to milk terms: $83,000–$100,000 ÷ 120,000 cwt = $0.69–$0.83/cwt.
Stack that against the baseline margin: best case, $300,000 minus $533,000 = –$233,000. Worst case: $240,000 minus $550,000 =– $310,000. Modeled cash margin: –$233,000 to –$310,000.
Now add debt service. A 500‑cow herd that expanded in the 2020–2023 cycle can easily carry $3–$5 million in term debt between facilities, equipment, and replacement stock alone — USDA AMS pegged the national average replacement dairy cow at $3,110/head as recently as October 2025, meaning the animal inventory on a 500‑cow herd represents north of $1.5 million before you count a single piece of concrete. At current rates and 15–20‑year amortizations, $3–$5M in term debt often pencils to $350,000–$450,000/year in principal and interest. Stack a working figure of $400,000 P&I on top of that negative cash margin, and you’re modeling a shortfall between –$633,000 and –$710,000/year before you pay yourselves a dollar.
That’s not a tight year. That’s a year where your lender is choosing which playbook you’re on.
Are You Overpricing H5N1 and Underpricing Labor?
H5N1 grabs the headlines. The math says plan for it — but don’t let it crowd out the risk that’s already in your pay stubs.
Risk Metric
H5N1 (HPAI)
AEWR Labor Reclassification
Best-case annual cost (500-cow herd)
~$0 (no outbreak)
$33,000–$41,000 (4 mis-slotted FTEs)
Expected value (probability-weighted)
$50,000–$55,000 over 12–18 months
$83,000–$100,000/year (certainty if mis-classified)
Worst-case hit
$142,500–$166,250 (30–35% clinical rate)
$100,000+/year (10 FTEs, Level II gap)
Fixable this month?
No — biosecurity reduces, doesn’t eliminate
Yes — job-duty audit + Cornell AEWR checklist
Currently in your breakeven?
Rarely modeled
Almost never modeled
2026 trajectory
Stabilizing (0 new dairy cases, Jan 2026)
Escalating — new DOL rule effective Oct 2025
Per-cow annual exposure
$100–$333/clinically affected cow
$165–$200/FTE/year in wage gap
A Cornell‑led team published results in Nature Communications from an Ohio dairy herd of 3,876 cows hit by HPAI in spring 2024. They counted 777 clinically affected cows — about 20% of the herd — with severe mastitis and steep production drops. Over 60 days, total losses: $737,500, or roughly $950 per clinically affected cow. As of early 2026, USDA APHIS data and AVMA tracking put cumulative confirmed H5N1 dairy infections at more than 1,000 herds across at least 17 states — California alone accounts for more than 750.
But here’s a detail that hasn’t made most farm papers: USDA reported zero new dairy herd detections in January 2026. The outbreak appears to have peaked during California’s fall 2024 wave. The National Milk Testing Strategy is now active in 45 states.
Scale the Cornell numbers to 500 cows if 20% are clinically hit at $950 each: $95,000. Push the clinical rate to 30–35%, and you’re in the $142,500–$166,250 range. Weight those outcomes by rough probability — heavy event at ~10%, moderate at ~40%, minimal at ~50% — and the expected value for a 500‑cow herd lands around $50,000–$55,000 over the next 12–18 months. Those probability weights are our assessment based on current surveillance trends, not the USDA’s.
Now put that beside labor. Under the 2025 AEWR rule, four FTEs misclassified from Level I to Level II cost about $33,000–$41,000/year in wages alone — that’s 4 workers × 2,080 hours × $4–$5/hour. Add one FTE’s churn cost — mistakes, training, yield drag — and lenders will quietly pencil labor risk at $40,000–$50,000/year. You’ve matched your H5N1 expected value with exposure that’s already hitting every pay period.
The Holles spent 2025 worrying more about where their milk was going and whether they could hold a crew than whether a virus would cross their fence line. Line up the math, and that instinct looks smart.
Deep dive:What the H5N1 data actually says about herd‑level cost
The Lender Meeting Your Milk Check Is Writing
When a herd staring at a modeled –$633,000 to –$710,000 gap sits across the desk from a lender, nobody’s leading with forage quality. The real question: Is there a believable path back to positive cash flow in 12–24 months?
Path 1 — Restructure at today’s scale. Stretch terms to 20–25 years, negotiate interest‑only for 12–24 months, and sell non‑essential assets. It only works if a 2027 budget at $17.00–$18.00/cwt still reaches breakeven on realistic costs. For herds in the Holles’ geography — one in‑state plant at Fargo, longer hauls, fewer competing buyers — that’s a tough line to draw.
Path 2 — Scale up to dilute fixed cost. Jumping from 500 to 900 cows means ~400 additional head. USDA AMS data from October 2025 put the national average replacement dairy cow at $3,110/head, with premium genetics running $4,000+ at auction in California, Minnesota, and Pennsylvania. By the February 2026 National Dairy Comprehensive Report, average fresh‑cow prices had eased to around $2,700/head — but that’s still north of $1 million in animal cost alone for 400 head, before facilities. If 2026 milk ends up closer to $17–$18/cwt, those extra cows don’t magically fix two‑year cash flow. You gain scale. You put more equity on the table.
And if you’re thinking Path 2, the cows you add can’t just be black‑and‑white lawn ornaments. In a $17–$18/cwt world, you need animals that turn feed into components, hit pregnancy targets, and stay out of the sick pen. Scaling with mediocre genetics amplifies the problem — you push more volume through a system that still doesn’t pay its bills.
Path 3 — Plan an exit while you still have a say. At $600,000–$700,000/year in modeled losses, equity burn is fast. That’s maybe two or three bad years before the balance sheet no longer lets you choose how the story ends. A deliberate exit — cows first, then iron, then land — preserves more capital than a forced sale.
If you’re leaning toward Path 3, your genetic equity is your last paycheck. The top end of your herd — high‑component, trouble‑free, exportable cow families — often pays better through targeted private‑treaty sales than by sending everything on the same trailer on the same day. Sorting that value ahead of time is how you turn 20 years of breeding decisions into actual exit dollars instead of scrap value.
The point of this math isn’t to push anyone into Path 3. It’s to drag the conversation into Q2, while you still have options, rather than into Q4, when your lender writes the plan.
The 90‑Day Triage: Levers You Actually Control
Clean Up AEWR Exposure — This Month
Download Cornell’s October 2025 AEWR overview and match every H‑2A position to DOL’s Level I vs. Level II duty definitions — not the labels you’ve always used. In the upper Midwest dairy belt, that spread typically runs $4–$5/hour. Four mis‑slotted FTEs cost roughly $33,000–$41,000/year in wages. That’s the same order of magnitude as the modeled H5N1 expected value we just walked through — and it’s a lever you control with a pen and a clear job list.
Run Two Breakevens With Your Lender Before June 30
Build one 2026 budget at $18.00/cwt and a second at $16.50/cwt, using your actual cost structure. If your pro‑forma DSCR comes in below 1.0 in either scenario, you’re in path territory, not ride‑it‑out territory. Above 1.3, you’ve got breathing room. Between 1.0 and 1.2, small misses matter. Two quarters under 1.0, and someone else starts drawing the map.
Go After Turnover and Inputs
Plug one FTE of churn. The real cost of a churned dairy FTE — training, mistakes, production drag — runs $10,000–$15,000/year.
Pick a nitrogen trigger. DTN’s late‑January survey had urea at $583/ton, roughly 13–14% above the $514/tona year earlier. StoneX’s Josh Linville flagged Persian Gulf risk as a fertilizer wildcard. If local urea drops within ~5% of last year’s level, lock in at least a third of your 2026 N.
Pick one micro‑automation project with a sub‑18‑month payback. At a loaded labor cost of nearly $19.50/hour, saving 1,000 hours/year frees up about $19,500. Against ~$25,000 installed, that’s a 15‑month payback.
For herds in the Holles’ position — one plant option, five‑hour hauls, limited buyer competition — the processor‑mapping bullet below isn’t theoretical. It’s their Tuesday.
Three Signals That Could Rewrite This Math
Not all of this has to land. Here’s what changes the picture — in either direction.
USDA’s production line. March’s projection of 234.7 billion pounds is already above 2025. If actual output runs meaningfully lower — tighter base penalties, faster culling, a shorter heifer pipeline — oversupply risk eases and the price outlook improves. If USDA revises upward again, the $16.50 scenario gets more likely, not less.
H5N1 trajectory. Cumulative detections sit above 1,000 herds, but zero new dairy cases in January 2026 and an active testing program in 45 states suggest the outbreak has stabilized. If herd prevalence rebounds or movement restrictions tighten at the marketing‑area level, H5N1 moves back up the risk radar. If the current trend holds, it’s a biosecurity discipline issue, not a budget emergency.
The USMCA review. Article 34.7 mandates the first joint review by July 1, 2026. If it triggers tariff changes, quota shifts, or retaliation that trims U.S. dairy exports, those extra domestic pounds need a home. That leans your budget toward $16.50, not $18. A clean review, on the other hand, removes a significant overhang.
And the upside case? If actual 2026 all‑milk lands at $20.50 — plausible if production underruns the forecast and export demand holds — the same 500‑cow herd picks up roughly $96,000 in gross revenue vs. the $19.70 base case. That’s not transformative on its own. But it’s the difference between Path 1 working and Path 1 failing.
What This Means for Your Operation
Build two 2026 budgets with your lender before June 30 — one at $18.00/cwt, one at $16.50/cwt. If DSCR is under 1.0 in either, you’re choosing between restructure, scale, or exit, whether you say it aloud or not.
Quantify your own triple‑hit. Multiply your shipped cwt by $3.00 for price, then by $0.75 for basis/hauling, then add your state’s AEWR gap times your labor hours. If that combined number exceeds last year’s operating margin, you’re in a structural squeeze — not a cyclical one.
Audit every H‑2A job level in writing this month. Four mis‑slotted FTEs cost $33,000–$41,000/year,depending on your state’s gap, for zero extra production.
Map your processor risk on paper. List your primary plant, realistic backups, miles to each, and expected basis in each scenario. If your “backup” relies on full plants hundreds of miles away, that risk isn’t in your breakeven yet.
If you’re considering Path 2 (scale), sort your genetics first. Every cow you add at $17–$18 milk needs to earn her way on components and fertility, not just fill a stall. At $2,700–$3,100/head for replacement stock, that’s real capital riding on whether she pays her own way.
If you’re considering Path 3 (exit), sort your genetics first, too. Targeted sales of high‑component, high‑index cow families before a dispersal can capture breeding value that a single‑day auction won’t.
Set a 365‑day marker. By March 2027, you should know whether you’re on a three‑year rebuild, an expansion track, or an orderly exit — and have that documented in writing with your lender.
Key Takeaways:
If your 2026 budget only works above $19–$20/cwt, you’re already in the risk band where a 500‑cow herd can model a $633,000–$710,000/year shortfall once price, freight, labor, and debt stack.
A realistic “downside but not disaster” scenario is $18.00/cwt milk, –$3.00/cwt price erosion, –$0.75/cwthauling/basis, and $0.69–$0.83/cwt AEWR labor — together stripping $533,000–$550,000 from a 500‑cow herd’s annual margin.
Four mis‑slotted H‑2A positions can quietly cost $33,000–$41,000/year in wages; that’s roughly the same order of magnitude as your expected H5N1 hit, and it’s fixable this month with a clean job‑duty audit.
If your pro‑forma DSCR drops below 1.0 at $18.00 or $16.50/cwt, you’re not “riding out a rough year” — you’re choosing between restructure, scale with real equity, or planning an exit while you still control the timing.
Your best 90‑day moves are boring, not heroic: run two lender scenarios at $18.00 and $16.50/cwt, quantify your own triple‑hit per cwt, map real backup plants and miles, and write down a 365‑day plan you’d be willing to put in front of your banker.
The Bottom Line
If your 500‑cow budget only works above $19–$20/cwt with today’s cost and debt structure, you’re already in the risk band this stress test describes — whether or not USDA’s March revision to $19.70 felt like good news.
If your modeled DSCR at $17–$18/cwt sits below 1.2, you’re not trimming fat. You’re in a structural conversation, your lender is already having internally.
The Holles are five hours from their plant, down two processors in three years, and still milking. That’s grit. But grit doesn’t fix a –$633,000 gap. Math does. And the math starts with knowing your own number before someone else runs it for you.
The Sunday Read Dairy Professionals Don’t Skip.
Every week, thousands of producers, breeders, and industry insiders open Bullvine Weekly for genetics insights, market shifts, and profit strategies they won’t find anywhere else. One email. Five minutes. Smarter decisions all week.
In March, 1,908 Ontario producers bid on quota. Only 190.60 kg traded. Every financed kilogram lost $586 at 6%. The math has flipped — and most farms haven’t noticed yet.
When it fell apart, the Ontario Court of Appeal — in Metske v. Metske, 2025 ONCA 418 — awarded $33,700 for tangible improvements, then subtracted a $2,000 counterclaim. Net recovery: $31,700. Six years on a 152‑acre operation carrying millions in Ontario dairy quota, and the court valued the tangible result at less than one kilogram of Alberta quota is worth today.
That number matters well beyond one family. It shows how fast sweat equity evaporates on a farm where the P5 quota cap fixes the single largest asset at ,000 per kilogram of butterfat per day — a policy number, not a market number. And right now, the math on buying that asset has quietly turned against anyone carrying debt on it.
1,908 Buyers. 18 Sellers. Zero Upside.
On March 19, 2026, Dairy Farmers of Ontario released the monthly quota exchange results. The numbers are stark: 1,908 producers placed bids to buy. Just 18 offered quota for sale. All kilograms cleared at the $24,000 cap. Of the 25,628 kg bid by buyers, only 190.60 kg actually traded — what DFO’s own summary calls a “0.744% average buyer success rate.”
A month earlier, it was worse. On the February exchange, 1,915 producers tried to buy. DFO needed 191.40 kg to run even the first allotment round, but only 129.27 kg was offered. The exchange was cancelled outright. Not a single kilogram changed hands.
At roughly 106‑to‑1 by producer count, Ontario farmers are bidding into a market where each newly financed kilogram loses about $586 a year at current rates. That’s not building equity. It’s transferring cash flow from the farm to the lender.
Why Ontario Quota Stopped Growing Your Wealth
Before the P5 provinces imposed quota price ceilings, values rose steadily. Ontario prices ranged from roughly $17,000 to $22,000/kg around the 1999/2000 dairy year, according to University of Guelph research, and climbed past $40,000/kg in the 2000s before the caps took hold. That capital gain, layered on top of milk income, made quota one of the best‑performing agricultural assets in the country.
The cap shut off that tailwind. At $24,000/kg, Ontario quota is frozen. It doesn’t climb in a good year, track inflation, or compound. With CPI at 1.8% in February 2026, the real value of each kilogram drops by roughly $432 per year in purchasing power — money you won’t recover as long as the cap holds.
Metric
Ontario
Alberta
Current Quota Price (Jan–Feb 2025)
$24,000/kg(policy cap)
$56,648/kg(market price)
Gap vs. Ontario
—
+$32,648/kg
Appreciation Potential
None(hard cap)
Uncapped; market-driven*
Real Value Loss at 1.8% CPI/yr
–$432/kg/yr
Partially offset by price appreciation
Supply Management System
P5 / National
P5 / National
Annual Cash Flow at 6% Financing
–$586/kg
Negative at same rate; higher income potential
Exit Price for Seller Today
$24,000/kg (capped)
~$56,648/kg (market)
Asset Class Behaviour
Fixed liability
Appreciating asset
Look west for proof that $24,000 is a policy number, not a market number. According to AAFC’s monthly quota trade data, Alberta’s exchange averaged $56,495/kg in January 2025 and $56,800/kg in February. British Columbia — which caps at $35,500/kg — traded at that ceiling in January and at $36,500/kg in February. Saskatchewan and Manitoba traded in the $40,000–$44,000/kg range over the same two months. Ontario sits more than $32,000/kg below Alberta. Same supply management system. Same national milk pool. Radically different asset values.
Is Every Financed Kilogram of Ontario Quota Now Underwater?
Here’s the barn math. Stick it on a sticky note beside your desk.
Take one kilogram of Ontario quota at the $24,000 cap. The Canadian Dairy Commission calculated the 2024 cost of production — indexed to the three months ending August 2025 — at $92.82 per standard hectolitre, up 2.72% from $90.36 the previous year. That iCOP result is what feeds the 2.3255% farmgate price increase effective February 1, 2026.
Using current P5 farmgate pricing with that increase baked in, and subtracting cost of production for feed, labour, overhead, and cow depreciation, you land in the ballpark of 4 in net annual milk income per kilogram of quotaon many Ontario herds. That’s The Bullvine’s modeled estimate using current farmgate pricing and recent P5 cost‑of‑production benchmarks — not a DFO or CDC published constant. Your own number will shift with components, feed costs, and overhead. But it’s a defensible mid‑range figure for this math.
The Bank of Canada cut its overnight rate to 2.25% on October 29, 2025, and has held it there through four consecutive decisions — December, January, March — with the next call on April 29. But commercial lenders price quota loans 200–350 basis points above that floor. A rate of 5.5–6% on a quota loan is realistic right now. Nesto’s March 2026 forecast projects no further easing, with bond markets assigning a slight probability of a 0.25% rate hike by October.
Loan Rate
Annual Interest Cost/kg
Est. Net Milk Income/kg
Cash Flow Gap/kg/yr
Rate Needed to Break Even
4.0%
$960
$854
–$106
~3.56%
5.0%
$1,200
$854
–$346
~3.56%
5.5%
$1,320
$854
–$466
~3.56%
6.0%
$1,440
$854
–$586 🔴
~3.56%
If $1,000/kg net
$1,200 (5%)
$1,000
–$200
~4.17%
At $854/kg net income, there isn’t any commercial dairy loan rate on offer today that makes newly financed Ontario quota cash‑flow positive. Even if you’re running tighter than most and clearing $1,000/kg net, your breakeven is only 4.17%. Where’s your rate sitting right now?
Scale it up. Say you’ve picked up 35 kilograms on the exchange in the past few years, all financed at 6%:
35 × $586 = $20,510 of cash leaving your operation every year
That’s interest only. No principal repayment. No new calf barn. Just debt service.
What Did Kyle Horst Find When He Ran His Own Numbers?
Kyle Horst dairy farms with his wife, Jen, and his brother Craig, a school teacher, near Formosa, Ontario. The farm has about 88 kg of butterfat quota, purchased as part of an ongoing operation in 2019.
When Horst enrolled in Chris Church’s Central Dairy Solutions course, he came in carrying the assumption most dairy farmers hold: more milk means more money. Church’s data challenged that head‑on.
“When I started the course, I always thought another litre of milk is obviously more profitable, but he brought that into question with good data,” Horst told Farmtario in August 2025. “I still think high performance through better management is a winner at the end of the day. But simply doing it through added cost is not necessarily financially sustainable.”
Church — DVM, MBA, University of Guelph, and founder of Central Dairy Solutions — spent years as a dairy vet before shifting his focus to farm finance. “I always just figured, as long as we could make more milk, we could make the farm more money,” he told Farmtario. “And that’s about as deep as we’d usually go. And unfortunately, that’s as deep as most of the producers go.” His courses walk Ontario dairies through their quota ranges, from 40 kg to 1,200 kg, using metrics such as operating expense ratio, EBITDA per kilogram of quota, and debt‑service coverage.
Are You Running a Dairy, a Crop Farm — or Both Without Knowing It?
The Terpstra family milks about 420 cows near Brussels, Ontario. Joe farms with his wife Barb, daughter Emily, and son Cole. Joe and Emily both took Church’s course as part of their succession planning. According to Farmtario, the family has moved to monthly financial reviews, with Emily now managing the books.
“Maybe you’re a really excellent cash cropper and not a great dairy farmer.” — Chris Church, Central Dairy Solutions, Farmtario, August 2025
A lot of farms have never actually separated the financial performance of their dairy from that of their cropping operation. Milk and corn live in the same line on the spreadsheet. As long as the overall farm makes the payment, nobody digs deeper.
But when grain prices drop or weather punches your yields, that cross‑subsidy disappears. The dairy suddenly has to stand on its own. If it can’t, that’s when the bank meeting gets tense. And if your dairy numbers and your crop numbers live in the same line — while you’ve also got leveraged quota in the mix — you might be using crop profits to service a dairy business that, on its own, is financing a negative‑carry asset.
The Succession Collision
This is where the Metske ruling, the quota cap, and the interest rate environment crash into each other.
Most Ontario successions assume the next generation will take over quota — structured as a sale, a gradual buy‑in, or a gift with a vendor take‑back. However you paper it, the incoming operator still has to cash‑flow the debt tied to that quota on their own balance sheet.
Run a DSCR on a mid‑size scenario:
Quota position: 140 kg of butterfat per day
Quota value at $24,000/kg: $3.36 million
Financing: 75% at 6%, amortized over 15 years
Loan amount: $2.52 million
Annual debt service (P+I): ~$255,000
Net milk income: 140 kg × $854 = $119,560
DSCR: $119,560 ÷ $255,000 = 0.47
Most lenders want at least 1.25. In this scenario, quota income covers less than half the payment. The rest has to come from crops, off‑farm income, parents deferring payments, or more borrowing.
In Metske, the Court of Appeal found the family’s discussions were an “agreement to agree” — too vague to create ownership rights. The parents’ decision to sell their dairy quota separately was held to be a legitimate exercise of autonomy. That’s how six years of contributed labour ended up valued at $31,700.
The P5 boards agreed to increase the saleable quota by 1% as of December 1, 2025, which will slightly dilute your share of the national milk pool. The February 2026 farmgate price bump helps offset that erosion, but doesn’t fix the structural problem: you’re trying to service 5.5–6% money with an asset that isn’t allowed to appreciate.
The Trade Risk Nobody’s Priced In
The CUSMA joint review is underway, and it’s not happening in a vacuum. In March 2026, the Trump administration launched Section 301 trade investigations covering Canada and 59 other economies — focused on forced labour and manufacturing overcapacity — after the Supreme Court struck down IEEPA‑based tariffs, according to CBC. USTR fact sheets and the 2026 Trade Policy Agenda make it clear these investigations will feed into the broader USMCA review.
CBC’s coverage notes that U.S. officials have repeatedly flagged Canadian dairy policies as part of a “non‑exhaustive” list of trade irritants. Dairy isn’t the only target, but it’s very much on the table.
Wiens has repeatedly warned that Canada has already conceded roughly 18% of its dairy market access in past trade deals, and that further access would cut directly into domestic production.
Carney has repeatedly said in public that supply management isn’t up for negotiation.
But a Section 301 investigation is different from a negotiation. It’s a unilateral tool the U.S. can use to justify tariffs without Canadian consent. And here’s the link between trade and succession that deserves attention: if a wider TRQ, retaliatory tariffs, or a forced restructuring devalues the exit ramp, the next generation isn’t just fighting to make the numbers work. They’re fighting over a shrinking pie — sale prices might fall at the same time debt loads stay fixed.
Here’s the stress test you can run on your own numbers: assume a modest 3–5% drop in farmgate price if TRQ access expands or tariffs bite. On a farm already running a negative‑carry quota, that price hit drops directly onto your already‑thin DSCR. If a 3–5% decline pushes you below 1.0, you’re into negative cash flow unless something else gives. The quota can’t bail you out by appreciating. The cap keeps that door shut.
Options and Trade‑Offs for Farmers
Path 1: Pay Down Debt First — Your 30‑Day Action
When it makes sense: You’re carrying quota debt at 5% or higher, and your DSCR is hovering near or below 1.25.
What it requires: One meeting with your lender in the next month. Bring your current loan schedule and ask for a simple ranking: highest to lowest effective interest rate. Then commit your next 12 months of surplus cash to retiring the highest‑cost debt instead of bidding on new quota.
Risk/limits: You won’t grow your quota position while your neighbours might. But right now, negative‑carry quota growth is eating equity. You give up bragging rights to keep your balance sheet intact.
Signals to watch: The BoC has held at 2.25% since October 29. Bond markets currently price a small probability of a rate hike by fall. Even if they cut, commercial quota loan rates would need to drop below roughly 3.6% before newly financed quota stops bleeding cash at $854/kg net income, and below 4.17% even at $1,000/kg. Plug your own numbers into the cheat sheet above.
Path 2: Hold and Optimize What You’ve Got
When it makes sense: Your quota is mostly or entirely paid off, and your net yield per kilogram sits comfortably above your personal opportunity cost.
What it requires: Doing the Church‑style split — separate dairy EBITDA from crop EBITDA and calculate net profit per kilogram of quota. Then tighten the screws on the cost of production: feed efficiency, labour per cow, components, and cull strategy. If you’re earning around $854/kg but could push to $950 through better management, that’s the cheapest “quota purchase” you’ll ever make.
Risk/limits: Inflation quietly erodes your real equity every year the cap holds. At 1.8% CPI, that’s $432/year in real purchasing power per kilogram. You’re not building asset value. You’re milking income from a flat line.
Path 3: Restructure the Succession Before the Bank Does
When it makes sense: You’re within 5–10 years of wanting to step back, and a straight transfer at today’s values and rates produces a DSCR under 1.25 for the next generation.
What it requires: Getting uncomfortable now, not desperate later. Sit down with an ag‑focused accountant and your lender to model alternatives: longer amortizations, revenue‑share structures, vendor take‑backs with interest‑only periods, or partial transfers that let the next generation build equity gradually instead of swallowing a $3‑million loan on day one.
Risk/limits: These structures take time and trust. If you wait until a health scare, a marital split, or a CUSMA/301 shock, you’ll be negotiating with fewer options and less leverage. And here’s the trade risk tied back to your succession: if a 301 finding or wider TRQ devalues quota even 10–15%, the exit ramp the parents are counting on to fund retirement gets shorter — while the next generation faces the same debt load on a less valuable asset.
Path 4: Sell and Redeploy
When it makes sense: Your dairy only cash‑flows when crop income props it up, your debt‑to‑asset ratio keeps climbing, and your kids are lukewarm about taking over.
What it requires: Facing the hardest question in farming: is your equity better deployed in quota, cows, and concrete — or somewhere else? Selling quota into a market where 1,908 buyers are chasing 18 sellers at $24,000/kg turns paper into cash fast. That cash can fund debt elimination, retirement, or a pivot into a different enterprise entirely.
Risk/limits: The risk here is almost entirely emotional. You lose the barn, the routine, the identity. Financially, a controlled exit at the cap is far better than a slow slide into forced liquidation if rates stay stubborn and margins tighten. Right now, 1,900+ buyers are competing for scraps. Last month, the exchange was cancelled because not enough quota even made it to the table. That level of demand won’t last forever.
Key Takeaways
If your blended borrowing rate on quota is above ~3.6%, every new kilogram is cash‑flow negative. At 6%, the gap is –$586/kg/year. Even at a net income of $1,000/kg, breakeven is only 4.17%. Plug your own numbers into the cheat sheet before your next exchange bid.
If the next generation’s DSCR on quota debt alone falls under 1.25, the succession structure needs to change — not your kid’s work ethic. The Metske ruling shows where “we’ll figure it out later” ends: $31,700 for six years of contributed labour.
If you haven’t separated dairy EBITDA from crop EBITDA, you don’t actually know which side of your business is profitable. Church’s Central Dairy Solutions courses are working with Ontario farms from 40 to 1,200 kg — and the answers aren’t always what people expect.
If trade pressure devalues the quota even modestly, the exit and entry ramps both get steeper at the same time. Get the succession on paper now, while the exchange is still massively in the sellers’ favour.
What This Means for Your Farm Right Now
Before the next DFO exchange deadline, ask yourself two questions. When was the last time you ran a real DSCR on your quota loans at today’s rates? And what happens to that ratio if the farmgate price slips 3–5% for a year?
Complete references and supporting documentation are available upon request by contacting the editorial team at editor@thebullvine.com.
Learn More
The Metskes’ $31,700 Wake‑Up Call: What ‘Not Yet’ Costs a $4 Million Dairy – Exposes the brutal financial consequences of delaying your transition plan. It arms you with a 365-day succession playbook to protect millions in equity from the “agreement to agree” legal trap that sank the Metske family.
Beyond Efficiency: Three Dairy Models Built to Survive $14 Milk in 2026 – Reveals strategic positioning for the next five years by moving past simple volume. It delivers a blueprint for mid-tier stability through enterprise diversification, ensuring your operation remains cash-flow positive even during the harshest market downturns.
Every week, thousands of producers, breeders, and industry insiders open Bullvine Weekly for genetics insights, market shifts, and profit strategies they won’t find anywhere else. One email. Five minutes. Smarter decisions all week.
At NZ$9.70, a 400‑cow herd clears NZ$163,200. At NZ$9.20 with post‑March fert costs, it’s NZ$72,162. Same cows. Same platform. Different budget.
Executive Summary: Fonterra’s NZ$9.70/kgMS midpoint looks like a win, but ANZ already pegs 2026/27 closer to NZ$8.70, and Ballance just added NZ$90/t to urea. A 400‑cow herd that appears to clear NZ$163,200 at NZ$9.70 and DairyNZ’s NZ$8.68 breakeven can see that surplus collapse to about NZ$72,000 if milk slips to NZ$9.20 and nitrogen climbs another 30%. The co‑op has hedged itself with a 10‑year raw milk deal, a 3‑year ingredients agreement, and roughly NZ$3.9B in returns, but none of that changes your breakeven, leverage, or debt‑service coverage. This piece walks through the barn math step‑by‑step so you can plug in your own kgMS, fert tonnes, and debt schedule. It shows why herds in the 60–65% debt‑to‑asset band are in a “use this payout to de‑risk or double down” 12‑month window. And it lays out a practical playbook: how to stress‑test at NZ$9.20 plus higher fert, what to take to your next bank review, and how to decide whether to lock in nitrogen or ride the market.
For a 400‑cow North Island dairy sitting at about 65% debt‑to‑asset, Fonterra’s NZ$9.70 per kgMS midpoint, NZ$2.00 per share capital return, and 40 cents in dividends feel like a long‑overdue rescue package. On paper, it’s the first season in two years where the milk cheque looks big enough to fix fences, upgrade gear, and finally get the bank manager off your back.
The catch is simple and uncomfortable: those record numbers are boosted by short‑term conflict and shipping friction, while the real damage to demand and fertiliser costs won’t show up in the farmgate milk price for another 12–18 months. If you treat this payout as the new normal, you may be spending what should’ve been your last clean shot at moving out of the danger band — not because the numbers are wrong, but because the conditions behind them may not last.
A 400‑Cow “Win” That’s Not as Fat as It Looks.
Let’s stay with that 400‑cow example, because that’s exactly where a lot of New Zealand herds sit. Call him Mark — 400 cows on about 150 hectares of milking platform in the North Island, running an intensive pasture system and carrying roughly 65% debt‑to‑asset after the last few tough seasons.
Scenario
400 cows (160k kgMS)
800 cows (336k kgMS)
1,500 cows (660k kgMS)
NZ$9.70 FMP, pre-hike costs
NZ$163,200
NZ$342,720
NZ$673,200
NZ$9.70 + Ballance March hike
NZ$160,225
NZ$339,672
NZ$670,105
NZ$9.70 + 30% urea stress
NZ$152,162
NZ$319,544
NZ$628,843
NZ$9.20 + 30% urea stress
🔴 NZ$72,162
🔴 NZ$152,644
🔴 NZ$301,991
On March 22, 2026, Fonterra reported half‑year FY26 numbers: NZ$13.9 billion in revenue and NZ$750 million net profit after tax for the six months to January 31, 2026. On the back of that, the co‑op lifted its forecast Farmgate Milk Price range to NZ$9.40–NZ$10.00 per kgMS, with a midpoint of NZ$9.70 — up from a previous midpoint of NZ$9.50. It also confirmed an interim dividend of 24 cents per share and a special 16‑cent Mainland dividend, and signalled a planned NZ$2.00 per share capital return tied to completion of its Lactalis transactions.
DairyNZ’s Econ Tracker, updated June 26, 2025, put the national average breakeven milk price at NZ$8.68 per kgMS for the 2025/26 season, up from NZ$8.41 the year before. Head of economics Mark Storey linked that increase to higher tax obligations and rising farm working expenses, especially feed, fertiliser, and energy.
If Mark’s breakeven matched that national average, his margin at NZ$9.70 looks like this:
9.70 − 8.68 = NZ$1.02/kgMS margin.
At 160,000 kgMS from 400 cows, that’s NZ$163,200 in operating surplus for the season.
That’s before the capital return and dividends even hit his account. It’s the kind of number that makes you think about new iron, extra land, maybe finally getting ahead of the bank.
But DairyNZ’s NZ$8.68 breakeven was calculated before March 18, 2026.
The Fertiliser Hit You Didn’t Budget For
Four days before Fonterra released those HY26 numbers, Ballance Agri‑Nutrients told farmers it was raising fertiliser prices again. In a March 18 update, Ballance said sulphur‑based and Yara‑branded products would increase immediately, with other products following on March 26, citing “rapidly changing circumstances” in global markets and conflict in the Middle East.
The new Ballance schedule landed like this for New Zealand farmers:
Urea: up NZ$90/tonne, to about NZ$1,075/t.
SustaiN: up NZ$90/t, to around NZ$1,124/t.
DAP: up NZ$75/t, to roughly NZ$1,603/t.
Superphosphate: up NZ$35/t, to about NZ$549/t.
On Mark’s 150‑hectare platform, let’s assume a fairly intensive fertility program — around 25 tonnes of urea, 5 tonnes of DAP, and 10 tonnes of super in a season. Plug your own rates in here, but watch what happens with these numbers:
Urea: 25 t × NZ$90/t = NZ$2,250.
DAP: 5 t × NZ$75/t = NZ$375.
Super: 10 t × NZ$35/t = NZ$350.
That’s an extra NZ$2,975 in fertiliser costs purely from the March increase. Spread over 160,000 kgMS, it’s about 1.9 cents/kgMS off his margin.
So Mark’s “paper” margin drops from NZ$1.02/kgMS to roughly NZ$1.00/kgMS after just one pricing email. Doesn’t sound like much. Not yet. But it’s already trimming a margin most operators are still mentally pencilling at NZ$1.02/kgMS.
The 30% Urea Stress Test: How Fast the Cushion Shrinks
Ballance’s head of procurement, Shane Crean, has been warning since early 2026 that volatility is now the norm rather than the exception: India’s tender timing, China’s DAP export settings, and instability around the Strait of Hormuz are all pushing nitrogen prices higher and making supply less predictable.
The Hormuz corridor carries an outsized share of the global fertiliser trade. Gulf producers supply a significant share of the global trade in nitrogen and phosphate, and New Zealand is directly exposed through imports of urea and other products.
There’s a recent precedent. When Russia invaded Ukraine in early 2022, putting a noticeable share of global urea exports at risk, NZ‑dollar nitrogen prices jumped sharply over a short period. Early commentary around the 2026 Hormuz disruption already highlights quick, double‑digit percentage gains in urea benchmarks as cargos are rerouted and insurers reprice risk.
So take a conservative stress case on top of what’s already happened: another 30% rise in urea from today’s NZ$1,075/t level.
In our example, 25 tonnes of urea, 30% of NZ$1,075 is about NZ$322.50/t.
Extra cost from that move: 25 t × NZ$322.50/t ≈ NZ$8,063.
Add the NZ$2,975 he’s already absorbed from the March hike.
Total incremental fertiliser cost versus pre‑March pricing: roughly NZ$11,038 for the season.
Mark’s apparent NZ$163,200 surplus becomes about NZ$152,162 before any other cost shifts. It’s still money. It’s just less room for error than the milk cheque suggests.
Here’s how that scales for three herd sizes, assuming similar kgMS per cow and the same per‑kg margin changes:
Scenario
400 cows (160k kgMS)
800 cows (336k kgMS)
1,500 cows (660k kgMS)
NZ$9.70 FMP, pre‑hike costs
NZ$163,200
NZ$342,720
NZ$673,200
NZ$9.70 + Ballance hike
NZ$160,225
NZ$339,672
NZ$670,105
NZ$9.70 + 30% urea stress
NZ$152,162
NZ$319,544
NZ$628,843
NZ$9.20 + 30% urea stress
NZ$72,162
NZ$152,644
NZ$301,991
That last row is the uncomfortable one. It combines a NZ$9.20/kgMS milk price — the lower half of Fonterra’s own NZ$9.40–NZ$10.00 forecast range for 2025/26 — with the kind of fertiliser stress we’ve just walked through.
And NZ$9.20 isn’t even the bear case. ANZ’s February 10, 2026, forecast update for the 2026/27 season opened at NZ.70/kgMS, on the assumption that the current price surge would lose momentum and global supply pressures would reassert themselves. That was before the March Hormuz escalation pushed freight costs higher and spooked more Gulf buyers.
This isn’t about proving you’re doomed. It’s about making sure your budget matches the risk, not the press release.
The Global Ripple: Why North American Producers Should Care
It’s easy to look at NZ$9.70 and think, “That’s their problem. Different market.” It isn’t.
When New Zealand buyers and their customers start testing alternatives — shifting some skim and whole milk powder demand toward EU or U.S. suppliers — it doesn’t just reshuffle who wins a tender. It creates a temporary floorunder global dairy prices that’s built more on logistics friction and risk premiums than on a genuine jump in consumption.
Right now, that floor is propped up by longer shipping routes around the Cape of Good Hope, higher war‑risk insurance, and a premium for any supplier who can deliver reliably into the Middle East and North Africa. If shipping normalises or Gulf buyers complete their pivot toward alternative origins, that floor can drop fast — leaving anyone who budgeted off today’s “war premium” exposed.
The same goes for fertiliser. Analysts point out that a meaningful share of globally traded nitrogen‑rich urea and phosphates depends on Gulf producers and shipping lanes. U.S. agriculture has some buffer because it produces most of its ammonia domestically, but imported urea and phosphates still leave crop and dairy margins exposed to disruptions in the Strait of Hormuz corridor.
That’s the real “Hormuz Factor.” It’s not just an NZ shipping problem — it’s a global nitrogen and energy problem that puts pressure on Midwestern and Canadian fertiliser and feed costs in a different but still serious way. If fertiliser prices grind higher while crop prices don’t move in step — a risk several analysts are flagging under a prolonged Hormuz disruption — margins get squeezed in Wisconsin and Ontario just as surely as they do in Waikato, even if the exact numbers differ.
If you’re thinking ahead on dairy farm debt management 2026, this isn’t background noise. It’s one of the main reasons your 12‑month plan needs a stress test baked in.
Is GDT’s 2026 Rally Real Demand or Just a War Premium?
The whole NZ$9.70 story depends on what’s really driving commodity prices right now.
At the March 4, 2026 Global Dairy Trade event, the overall price index rose 5.7% — the fifth consecutive increase since January. Whole milk powder traded around US$3,863/t, skim milk powder rose by roughly 9%, and butter rose by just over 6%. Commentators called it evidence of “resilient demand,” pointing to buyers in the Middle East and Asia still bidding aggressively despite freight headaches.
That’s accurate at the surface level. Buyers are there. But a meaningful chunk of that price strength is better described as a friction premium than a demand boom.
With vessels being rerouted around the Cape of Good Hope and insurance costs rising, it’s simply harder and more expensive to move product from New Zealand to key buyers, including those in the Gulf. The buyers who still want NZ products are paying up to secure them. That’s scarcity in logistics, not a structural jump in how much dairy the world wants to consume.
ANZ’s February 2026 forecast update made a similar point. Agri economist Susan Dilly noted that while the GDT bounce was “great news for dairy farmers,” prices remained “a lot closer to the bottom than the top,” and that buyers “perhaps spooked by geopolitical tensions in the Middle East and elsewhere” were helping to drive the rebound after the late‑2025 sell‑off overshot on the downside.
At the same time, some large importers in the Middle East and North Africa are testing alternatives. EU skim milk powder has become increasingly price‑competitive in MENA markets, and commentary around a larger‑than‑expected ONIL milk powder tender in early 2024 highlighted EU suppliers covering most SMP volumes, even as New Zealand, Europe, and South America shared the WMP business. The pattern isn’t universal, but it’s a clear signal: when NZ gets more expensive or harder to ship, EU offers get a closer look.
Put those pieces together, and you get a two‑stage story:
Short‑term: GDT prices are being pulled up by higher shipping friction and supply risk. That’s what supports NZ$9.70 today.
Medium‑term: As Gulf and MENA buyers adjust their tendering and contract patterns, some volumes that historically defaulted to NZ may shift more permanently toward competing origins. That risk doesn’t show up in this season’s milk price. It shows up in next season’s starting point.
As Dilly told Rural News Group in December 2025, “nearly half of the current season’s production has already been contracted, so GDT results over the rest of the season will have a bigger impact on next year’s starting point than this year’s endpoint.”
That’s the transmission lag that matters here. Mark doesn’t feel it yet. His cheque says NZ$9.70. The tender rooms and freight lanes are determining what his 2026/27 milk price will look like — and they’re doing so long before Fonterra updates its range on the website.
Fonterra Hedged the Co‑op. It Didn’t Automatically Hedge the Farm.
One thing is clear: Fonterra’s board and management haven’t been blind to any of this.
In its HY26 commentary, the co‑op explicitly noted that rising geopolitical risk in the Middle East, especially around the Strait of Hormuz, could disrupt shipping routes, force rerouting, increase inventory levels, and add volatility to global commodity prices. It also warned that some exports could face delivery delays or require re-routing, potentially increasing inventory and costs.
New Zealand’s official trade data underscores how important these markets are. USDA’s 2025 semi‑annual report shows Algeria taking about 10% of New Zealand’s whole milk powder exports in 2024, with the United Arab Emirates taking roughly 6.6%. For butter and AMF, key destinations included Saudi Arabia at about 7% of volume, alongside China, Australia, and the U.S. Add in other Gulf states, and you’re talking about a meaningful slice of NZ’s WMP and butter trade tied to a region now sitting behind a higher‑risk shipping corridor.
At the same time, Fonterra is in the middle of a major strategic pivot. The sale of its Mainland and other consumer brands to Lactalis is designed to turn the co‑op into a more focused B2B dairy nutrition processor, a shift Fonterra has described as “completing its strategic reset.” Regulatory approvals were progressing through early 2026, with completion expected to enable planned capital returns. The deal includes two key supply agreements that will keep the relationship between the co‑op and its former brands alive:
A Raw Milk Supply Agreement with an initial term of ten years, automatically renewing unless either party terminates with 36 months’ notice.
A Global Ingredients Supply Agreement with an initial term of three years, also auto‑renewing with 36 months’ notice to terminate.
From Fonterra’s vantage point, the logic is coherent. The co‑op:
De‑risks its own balance sheet by exiting volatile consumer brands.
Simplifies its business model to focus on B2B ingredients and dairy nutrition.
Locks in demand for its milk pool through the RMSA and GSA.
Delivers a significant cash distribution to farmer‑shareholders — external coverage pegs total cash returns around NZ$3.9 billion once dividends and capital returns are combined.
Reports a return on capital for continuing operations that sits within its 10–12% target band.
If you think in terms of genetics rather than just cheques, this pivot matters. Fonterra’s growth talk now leans heavily into “higher‑value ingredients and nutrition solutions,” with strong earnings contributions from its protein portfolio and Foodservice channels. That naturally pushes the ideal New Zealand cow further toward high solids and efficiency per kgMS, not just raw volume — which is how many genetics‑focused suppliers are reading the signal as they rank sires for the Fonterra milk pool.
From Mark’s vantage point, it looks different.
The short‑term upside — NZ$9.70, dividends, capital return — is very real. It hits his bank account this season. The medium‑term downside — structural Gulf diversification, GDT prices normalising once the war premium fades, and sticky higher fertiliser costs — will land primarily on individual farm P&Ls.
Fonterra’s strategic moves have effectively hedged the co‑op’s position. They haven’t automatically hedged individual farms. The RMSA keeps NZ plants running. The three‑year GSA keeps ingredients flowing. Neither one changes Mark’s breakeven per kgMS, his debt‑to‑asset ratio, or how his lender reads the risk.
The co‑op has used a strong earnings run and a timely asset sale to lock in its own risk position and reward shareholders. The question is whether farms like Mark’s use this same window to de‑risk themselves — or to lean harder into a milk price whose supporting conditions may not hold into 2026/27.
What to Do Before Your Next Bank Review
If you’re sitting somewhere around 60–65% debt‑to‑asset like Mark, you’re not unique. You’re also in the band, many lenders quietly file under “we’ll work with you, but we’re watching.”
The single most important move in the next 30 days isn’t a new tractor, more cows, or a tidy new shed. It’s what you do with this season’s Fonterra cash before your relationship manager walks through the door.
1. Use the payout to move your leverage, not your lifestyle. (Next 30 days)
Decide now what slice of the capital return, dividends, and early NZ$9.70 cash flow you’re going to use to pay down principal on term debt. Then actually do it before the bank review.
On most farms, that won’t magically transform your debt‑to‑asset ratio. But even a visible, documented principal reduction can change how your banker frames you. The story becomes: “We know this payout may be temporary. We used it to de‑risk, not to blow out spending.”
That’s a different conversation than “We’re taking the cash and hoping the good times last.”
2. Stress‑test at NZ$9.20 and current‑plus‑30% urea. (Next 30 days)
Grab three numbers from your own books:
Your actual breakeven per kgMS, not the NZ$8.68 national average.
Your real fertiliser spend at today’s prices and tonnages.
Your current term debt and interest schedule.
Then run the ugly scenario:
Assume a Farmgate Milk Price of NZ$9.20/kgMS instead of NZ$9.70. That’s not doom‑and‑gloom — it’s the lower half of Fonterra’s published range, and still above ANZ’s NZ$8.70 opening forecast for 2026/27.
Add roughly 30% to your urea line on top of the March Ballance increase, using your own tonnes.
Now ask:
Does your debt‑service coverage ratio stay comfortably above about 1.2x? Many lenders start to get uneasy as you drop into that territory.
Do you still have surplus left for drawings and basic reinvestment after servicing the bank?
If the answer is no to either, it’s better to discover that from your own spreadsheet than from a bank credit memo.
3. Decide your fertiliser strategy for 2026/27 and write it down. (Next 90 days)
You can’t get last year’s nitrogen prices back. The decision now is whether to:
Lock in some of next season’s urea at today’s elevated levels to cap your worst‑case risk, or
Wait and hope that conflict risk and export restrictions ease, bringing prices back down.
There’s no universal right answer. But there’s a big difference between walking into a bank meeting saying “we’ll see what happens” and walking in with a one‑page note that says:
“We’ve locked in X% of our expected urea needs at today’s price to cap risk.”
“We’ve left Y% open in case markets soften.”
That tells the lender you’re managing risk, not being managed by it.
4. Treat this payout as a window, not a trend. (Next 365 days)
Make yourself a habit: once a year, before major spending decisions, run a “NZ$9.20 plus fertiliser stress test” on your numbers.
Use your own breakeven, not DairyNZ’s average. Plug in a milk price somewhere in the lower half of Fonterra’s realistic range. Add in the fertiliser costs you’re actually seeing, plus a stress margin if you’re on spot.
If your business only works at NZ$9.70 with last year’s costs, that’s not a stable business. It’s a good year.
Over the next 12–18 months, the farms that use this payout window to get structurally safer will look very different from those that use it to lean harder into a price supported by conflict and shipping friction.
What This Means for Your Operation
Debt-to-Asset
Risk Level
Priority Action
Stress-Test Signal to Watch
>65%
🔴 High
Pay down term principal NOW — before spending review
DSCR drops below 1.2x at NZ$9.20
60–65%
🔴 High
Allocate capital return to leverage reduction, not capex
Breakeven creep above NZ$8.68 national avg
50–60%
🟡 Moderate
Lock in portion of urea; document fert strategy for bank
Any urea +30% scenario that erodes DSCR
<50%
🟢 Low
Position opportunistically — watch for distressed land/shares
Monitor 2026/27 opening price vs ANZ $8.70
If your debt‑to‑asset ratio is north of 60–65%, use this season’s Fonterra cash to move that number, not your machinery lineup. Even a small, documented shift in leverage gives you more breathing room if the 2026/27 milk price opens closer to ANZ’s NZ$8.70 forecast than NZ$9.70.
If your breakeven per kgMS is already above DairyNZ’s NZ$8.68 benchmark, you’re operating with less cushion than the national average. Run your own numbers at NZ$9.20 with today’s fertiliser costs. That gap, not the current midpoint, tells you how fragile things really are.
If your stress‑case debt‑service coverage ratio drops much below about 1.2x, treat that as an urgent signal. That’s the zone where many lenders start tightening terms or asking for a plan, especially if they see structural risk building in your market.
If you’re under 50% debt‑to‑asset and have some fertiliser already forward‑contracted, you’re in a position to be opportunistic. This payout can be used to quietly build capacity so you can move when land, shares, or cows come loose from more leveraged neighbours over the next couple of years.
In the next 30 days, before your bank review, do one thing: put your actual breakeven per kgMS and your fertiliser‑adjusted budget next to a NZ$9.20 milk price on a single sheet of paper. That’s the forecast the bank will stress‑test you against, whether they say it aloud or not.
Key Takeaways
Fonterra’s NZ$9.70 midpoint and NZ$2.00 capital return are real wins — but they’re partly supported by a war premium and freight friction that may not be there when the 2026/27 milk price is set. ANZ’s opening forecast for next season is already NZ$8.70/kgMS.
DairyNZ’s NZ$8.68 breakeven for 2025/26 was published before Ballance’s March 18 hike. For many farms, the “NZ$1.02/kgMS margin” story is thinner than it looks once current fertiliser costs and potential further nitrogen stress are properly baked in.
The Lactalis deal gives Fonterra long‑term supply security — a 10‑year RMSA and a 3‑year GSA, both auto‑renewing with 36‑month notice. That hedges the co‑op’s risk. It does not hedge your farm’s breakeven or leverage.
For genetics‑minded herds, a B2B ingredients focus pushes the “ideal cow” even harder toward high‑solids efficiency over sheer volume. That should show up in how you rank sires and build your next round of matings in the NZ context.
The farms most exposed to a downside scenario are those in the 60–65% debt band that treat this payout as a permanent raise rather than a one‑off window to fix the balance sheet.
The Bottom Line
The real question isn’t whether NZ$9.70 will hold this season. It’s this: what does your breakeven per kgMS look like if you plug in NZ$9.20 and your latest fertiliser invoice — and how far is that from the story your milk cheque is telling you right now?
Complete references and supporting documentation are available upon request by contacting the editorial team at editor@thebullvine.com.
Learn More
The Hidden Contract Clause That Could Cost Your Dairy $55,000 in 2026 – This 30-day action plan arms you with the negotiation leverage needed to dodge massive liability shifts in new contracts. It exposes hidden allergen compliance costs and delivers immediate methods to protect your net profit from processor-driven fee hikes.
The One-Dollar Margin: A Global Wake-Up Call from New Zealand’s Dairy Squeeze – This strategic deep dive reveals why the world’s lowest-cost producers are hitting a structural reset. It breaks down global margin gaps and positions your operation to navigate the 2026/27 price floor before the “war premium” evaporates.
Every week, thousands of producers, breeders, and industry insiders open Bullvine Weekly for genetics insights, market shifts, and profit strategies they won’t find anywhere else. One email. Five minutes. Smarter decisions all week.
$144,000–$240,000. That’s what a 20,000‑cwt herd can lose in a year from the new FMMO make‑allowance math. Before you shrug, run it through three hard questions.
You really see it when you look at how two neighbours handle the same noise. Let’s look at Mark. He’s a composite — built from the kinds of situations central Wisconsin producers are describing this year — but his numbers are real. Mark doesn’t read Federal Register notices. He runs a commercial dairy and measures time in milkings, not hearings. When the new FMMO rules kicked in around June 1, 2025, his co‑op’s economist didn’t send him a white paper. She sent him a number: AFBF economist Daniel Munch’s September 2025 Market Intel showed roughly 85–93¢/cwt in class‑price reductions from higher make allowances — and more than $337 million pulled from producer pool value in the first three months alone.
For his order and plant mix, she translated that into a working range: expect somewhere around $0.60–$1.00/cwt less on each cheque over the next year. Mark ships about 20,000 cwt a month. At the low end, that’s $12,000 gone every month — roughly $144,000 over 12 months. At the high end, closer to $240,000. That’s not “interesting policy.” That’s whether you keep the loan officer relaxed and the feed mill paid on time.
Now picture the producer down the road — call her Sarah. She’s a composite, too, built from the ESG experiences multiple farms have described to us. Sarah tossed a new “Supplier Code of Conduct” email from her processor into the pile on the kitchen table. It linked to a glossy brochure about sustainability, asked her to complete an online questionnaire about manure, energy, and welfare, and used words like “partnership” and “journey.” Fresh cows in the pen and a scraper that wouldn’t start. The survey could wait.
A year later, the tone from procurement on these programs was different at some plants. Supplier codes and ESG surveys were feeding internal risk‑sorting tools that grouped farms by perceived risk level, tied to “time‑bound corrective action” language and, on paper, potential termination if issues weren’t addressed. ESG and procurement teams were using that data to show management which suppliers looked lower‑ or higher‑risk.
Mark and Sarah faced the same wall of noise: FMMO modernization, Dairy Margin Coverage 2026 changes, USMCA review chatter, ESG pressure from retailers and banks. The difference wasn’t that Mark cared more about policy. He just ran every headline through three questions before he gave it his time. Sarah didn’t have a filter at all.
Here’s how you steal those three questions for your own operation — and stop letting policy eat hours of your week without giving anything back to your margin.
Policy Headline
Changes 12-Mo Math?
Decision Deadline
3–5 Year Ground Shift
Bucket
FMMO make-allowance changes (Jun 2025)
YES — $0.60–$1.00/cwt
Already in effect
Class I formula, pool dilution
🔴 Act Now
DMC 2026 Tier 1 expansion to 6M lbs
YES — up to $0.15/cwt savings
Feb 26, 2026
6-year lock-in at 25% discount
🔴 Act Now
USMCA 2026 joint review
Indirect — TRQ fill rates avg 42%
2026 review milestones
Market access, import competition
🟡 Watch
ESG supplier survey (processor)
Not directly — risk tier risk
Varies by contract
Audit/termination clause risk
🟡 Watch
Canada NPF 2028 consultations
No — 2028+
Jan 2026 input window
Safety net depth (AgriStability)
⚫ Ignore for Now
Carbon tax adjustments
Marginal — varies by province/state
Ongoing
Input cost creep
⚫ Ignore for Now
What’s Actually Changed — FMMO Reform 2026 and the Rest of the Noise
On the U.S. side, USDA’s final FMMO decision raised make allowances, butter, nonfat dry milk, and whey, updated product composition factors, adjusted some Class I differentials, and returned the Class I mover to the higher of Class III or IV starting June 1, 2025. In that first look‑back, Munch’s AFBF Market Intel analysis calculated that higher make allowances alone trimmed 85–93¢/cwt off class prices and removed more than $337 million from combined producer pool value in the first three months. Composition factor updates add back around $110 million over the first half‑year — real money, but it doesn’t erase the hit.
Dairy Margin Coverage shifted under your feet, too. For 2026, USDA’s Farm Service Agency reset each farm’s production history to the highest annual marketings from 2021, 2022, or 2023 and expanded Tier 1 coverage from 5 million to 6 million pounds. The 2026 sign‑up window is also your one shot to lock in a coverage level and percentage for 2026–2031 in exchange for a 25% discount on Tier 1 premiums. Enrollment opened mid‑January and closes February 26, 2026, according to FSA national and state office reminders. Miss that, and you’re self‑insuring Tier 1 for the year.
Zoom out further, and trade is humming in the background. The 2026 joint review of the USMCA will reopen questions about dairy access among the U.S., Canada, and Mexico. USMCA promised U.S. dairy roughly $200 million in new annual access to the Canadian market — about 3.6% of Canada’s dairy consumption — but tariff‑rate quota data show average fill rates of only about 42%, with 9 of 14 quotas below 50% in 2022/23. That under‑use has already fuelled formal USMCA disputes and plenty of frustration among U.S. dairy groups and negotiators.
Then there’s “policy by contract.” Supplier codes from global processors say it plainly: they only partner with suppliers who comply with environmental, welfare, and labour requirements, they reserve audit rights, and they can terminate relationships if high‑risk issues aren’t corrected. ESG supply‑chain planning guidance tells those processors to score suppliers on risk, audit the flagged ones, and prioritise low‑risk milk when retailers and banks squeeze.
Meanwhile, North of the Border
If you’re shipping under quota, your stress looks different — but you’re not off the hook.
In Canada, the Sustainable Canadian Agricultural Partnership (Sustainable CAP) runs from 2023 through March 31, 2028, as the main framework behind AgriStability, AgriInvest, AgriInsurance, AgriRecovery, and cost‑shared sustainability and innovation programs. Ottawa launched consultations in January 2026 on the Next Policy Framework (NPF) that will replace it for 2028–2033. Federal and provincial governments are now gathering input on priorities like competitiveness, climate resilience, and risk management as they shape the next five‑year agreement.
For Canadian producers, that framework plays a role similar to that of DMC and other federal tools in the U.S. It doesn’t set your mailbox price, but it shapes how AgriStability, AgriInvest, and other supports respond when margins squeeze. You may not see “NPF 2028” printed on your milk cheque — but it quietly decides how deep the safety net is when weather and markets turn.
Every one of those pieces lands in your feed as “news.” The reality: only a few change your numbers, your deadlines, or your ground in a way that deserves more than a skim.
The Barn Math — DMC 2026 Lock‑In Versus the FMMO Headwind
Back to Mark and that FMMO reality check.
Using that 85–93¢/cwt class‑price impact range and a realistic view of his order’s utilization and plant mix, his co‑op’s economist told him to plan for something in the neighbourhood of $0.60–$1.00/cwt less on his cheque over the next year. Not a perfect model. A band you can work with.
Instead of burying that in prose, here’s how it looks on paper — with a DMC year that lines up with what you’ve already seen when margins got ugly.
Scenario
Impact per cwt
Monthly (20,000 cwt)
Annual Impact
FMMO (Low End)
−$0.60
−$12,000
−$144,000
FMMO (High End)
−$1.00
−$20,000
−$240,000
DMC 2026 Payout*
+$1.50
+$30,000
≈+$82,650 (5.51M lbs covered)
*Example uses a 5.8M‑lb production history at 95% coverage (55,100 cwt) and a hypothetical .50/cwt average annual DMC payment — similar to some of the worst 2019–2020 margin months when modelled over a full year; used here as a stress‑test scenario, not a forecast.
For that 5.8M‑pound herd:
Covered pounds = 5.8M × 0.95 = 5.51M lbs.
Covered cwt = 5.51M ÷ 100 = 55,100 cwt.
Tier 1 premium at $0.15/cwt for $9.50 coverage — the 2026 Tier 1 rate listed by Penn State Extension with the 25% lock‑in discount baked in — comes to 55,100 × 0.15 ≈ = $8,265.
Margin history from 2019–2025 includes several years where DMC payments at higher coverage levels more than covered annual premiums for many herds. It doesn’t take many bad months with average payments around $1.50/cwt to repay an $8,265 premium on that volume.
The ESG Side of the Cheque
Now look again at Sarah’s composite.
Her processor’s supplier code spelled out that they partner only with suppliers who comply with environmental, labour, and animal‑welfare requirements — and that they can audit farms, request documentation on emissions, energy, manure, and welfare, and require action plans if they find problems or data gaps. High‑risk suppliers get corrective action plans with deadlines. Failure to address issues can end the relationship.
That first survey email sounded optional. But in 2026, a no‑response on an ESG survey usually isn’t neutral — in many supplier‑risk systems, it’s treated as a data gap that pushes your farm toward the “higher‑risk” bucket, right alongside weak paperwork or unresolved issues. ESG and procurement teams are already using that data to rank suppliers for audits and, when things get tight, decide whose milk is simplest to keep.
ESG Response Status
How Processor Software Reads You
Typical Consequence
Timeline Risk
Survey completed, no flags
Low-risk supplier
Priority in milk volume allocation
Stable
Survey completed, gaps noted
Medium-risk
Corrective action plan requested
30–90 day window
Survey ignored / no response
High-risk (data gap = red flag)
Audit triggered; at bottom of volume-cut list
Immediate
Repeated non-response
Unacceptable supplier risk
Potential relationship termination
Contract cycle
Survey completed + audit passed
Verified low-risk
Retailer/bank ESG credit for processor
Positive long-term
Good or bad, that’s how their software reads you.
You can’t outrun make allowances by scrolling your phone. The lesson is simpler: you need a fast way to decide whether a headline belongs in your barn math, your calendar, or your trash folder.
The Three‑Question Filter That Keeps Policy in Its Place
You don’t need to enjoy politics to protect your milk cheque. You need three questions you can ask about any policy headline, email, or rumour in under two minutes.
“Does this change my math within 12 months?”
“Does this create a decision window I can actually miss?”
“If this keeps marching for 3–5 years, does it change the ground my operation stands on?”
Here’s what each one is really asking.
How Much Does This Change Your 12‑Month Math?
This is your first cut. Any change that touches your milk price formula (FMMO changes, premiums, hauling adjustments), your safety‑net math (DMC rules, AgriStability margins), or known costs (carbon taxes, labour rules, feed subsidies) deserves a quick “can I put a believable per‑cwt or per‑cow number on this for the next year?”
For FMMO, you’ve already got a starting point: AFBF’s 85–93¢/cwt class‑price hit from higher make allowances. Once you run that through your order’s utilization and your plant’s product mix, it becomes a $0.60–$1.00/cwt working range for your cheque. For DMC, FSA and Extension have already laid out how the new 6M Tier 1 cap and production‑history reset change which part of your volume gets covered cheaply.
If you can’t get to a range for your own operation with help from one or two trusted sources, you either need better sources — or that headline probably doesn’t belong in your “urgent” pile.
How Much Does Waiting 30 Days on FMMO or Dairy Margin Coverage 2026 Actually Cost?
“Wait and see” feels reasonable when you’re tired, and the numbers are fuzzy. Sometimes it is. The trick is stopping it from becoming your default answer to everything that makes your head hurt.
Take that 5.8M‑pound DMC farm. If you shrug and let February 26 slide, you’ve decided to self‑insure Tier 1 for the year — even though margin history from 2019–2025 shows several years where DMC payments at high coverage more than covered premiums for many herds. That decision might be fine if your cost of production is low and you’re comfortable riding the margin. It’s not fine if you just never sat down with a pencil because somebody forwarded a scary link about something else that failed all three questions.
FMMO is the same story. If AFBF’s analysis and your plant’s product mix suggest a realistic $0.60–$1.00/cwt headwind on average mailbox prices once everything bakes in, “wait 30 days” doesn’t improve the forecast. It just pushes back when you revisit risk coverage, tighten cost targets, or re‑evaluate expansion projects that only work at pre‑reform prices.
The real question isn’t “Could this analysis be off?” It’s this: if that range is right and you do nothing, can your operation carry it for a year at current feed, interest, and labour? If your gut says no, waiting isn’t neutral anymore.
Is Your Contract Language Already Writing Policy for You?
On the operational side, a lot of the policy that will matter most to your farm over the next five years isn’t hiding in Parliament or Congress. It’s in contracts.
Supplier codes from global dairy companies are clear on three points. They expect compliance with specific environmental, animal‑welfare, and labour standards — often referencing local law and sometimes going beyond it. They reserve the right to audit your operation, request documentation, and require action plans if they identify problems or data gaps. And they give themselves the option to end relationships with suppliers who don’t correct high‑risk issues within set timelines.
ESG planning guidance tells these companies to categorise suppliers as low, medium, or high risk, then prioritise lower‑risk suppliers when squeezed by retailers, banks, or emission‑reduction commitments. Data you send — or don’t send — in that first “voluntary” survey directly feeds those scores.
If you haven’t read the ESG, audit, and termination sections of your own supplier code or milk contract in the last year, you’re letting someone else decide what risk tier your farm occupies without even knowing the tiers exist. You might be perfectly comfortable where you are. Or you might find out you’re at the bottom of the list only when volume cuts land on your desk.
Options and Trade‑Offs for Farmers
You can’t turn the policy tap off. You can decide how much gets past your gate. Here’s how producers are using the three‑question filter — and what each path demands.
Barn Math First, Politics Later
When it makes sense: You’re already using at least one risk tool (DMC, DRP, crop insurance) and you’re comfortable with a pencil and a calculator.
What it requires: Any time a big headline shows up — FMMO tweaks, DMC changes, USMCA review drama, ESG survey — ask yourself: “Can I get a credible per‑cwt range for this on my farm in the next 12 months?” If yes, what does that look like on your monthly cwt? Lean on one or two trusted sources for the heavy lifting — your co‑op economist, Extension, or a piece that translates policy into cheque math.
Risks/limits: If you don’t have those sources, you risk either underplaying real hits (like making allowances) or overreacting to noise. And barn math is only as honest as your breakeven — if the base numbers are fiction, the filter won’t save you.
The Calendar and Contract Gate
When it makes sense: You’re not spending evenings reading market intel, but you’ll respect hard dates and signatures.
What it requires: Put a single sheet or whiteboard in the office with three columns: “Act Before,” “Ask Before,” and “Ignore For Now.” “Act Before” gets DMC sign‑ups, crop insurance deadlines, DRP windows, and any AgriStability/AgriInvest enrollment dates on your side of the border. “Ask Before” applies to the USMCA 2026 review, co‑op meetings, and any session where your buyer explains their plan. “Ignore For Now” gets headlines that don’t pass any question and carry no date.
Risks/limits: If nobody owns updating that sheet weekly, it becomes wallpaper. Someone — you, a partner, the family member who actually reads this stuff — has to be the designated filter and move items between columns as things develop.
Treat ESG as Contract Risk, Not PR
When it makes sense: Your milk goes to a processor selling into big retail or export markets, and their website is full of “net‑zero,” “scope‑3,” and “responsible sourcing” language.
What it requires: Read every supplier code, sustainability annex, and contract update your buyer sends. Highlight anything about ESG data, audits, “continuous improvement,” or termination. Ask blunt questions: “If I don’t fill out this survey, what happens to my status?” and “Are you scoring suppliers? If so, how?” You don’t have to like the answers. But you’re making decisions with eyes open instead of assuming good farming speaks for itself.
Risks/limits: This won’t stop ESG from coming. It keeps you from being blindsided when procurement starts treating ESG like quality or SCC. If you strongly disagree with the direction, the bigger decision is whether to stay in that buyer’s system at all.
Install a Designated Filter in 30 Days
When it makes sense: You’re running 200–500 cows, you don’t have a “policy person,” and every week someone different is forwarding “urgent” links into the family group chat.
What it requires (within 30 days): Choose one person — the owner, a partner, or a family member who actually reads — and make it their explicit job to filter the policy. Give them 20–30 minutes once a week to run every headline, email, or rumour through the three questions and sort them: “Act Now,” “Watch,” or “Noise.” Only “Act Now” items go on the weekly meeting agenda. “Watch” items get a look at the end of the month. “Noise” dies on their notepad.
Risks/limits: Only works if everyone agrees to respect the filter. If you still treat every Facebook thread like an emergency, you’re back to chaos. But if you back the filter, you trade random panic for a predictable, small time cost that protects a very large cheque.
Key Takeaways
If you can’t get to a realistic 12‑month per‑cwt impact for your own volume, a policy headline doesn’t outrank chores. Ask your co‑op, Extension, or a trusted source to turn it into barn math first.
If there’s a date on it — DMC signup, a USMCA review milestone, a supplier‑code acknowledgment, a contract auto‑renewal — treat it as a decision window, not background noise. Saying nothing before the deadline is still a decision; it might not be the one you’d pick on purpose.
If your main buyer talks about ESG, net‑zero, or “responsible sourcing,” treat supplier codes and sustainability surveys like policy notices, not marketing fluff. Read the audit, data, and termination clauses and decide whether you’re willing to live in the tier they assign you.
If your production history sits between 5 and 6 million pounds, the 2026 DMC upgrade to a 6M Tier 1 cap and six‑year lock‑in changed your numbers enough that “same as last year” isn’t a safe default. Run the new math or call your FSA office now.
If your order’s best estimates point to a $0.60–$1.00/cwt headwind from FMMO changes once make allowances and utilization settle, ignoring it isn’t neutral. Either your balance sheet carries that for a year, or you adjust risk coverage, costs, or capital plans now.
The Bottom Line
The three questions didn’t make the noise go away for producers like Mark. They made it obvious which pieces belonged in barn math, which belonged on a calendar, and which belonged in the trash icon. Farms like Sarah’s didn’t have that filter. By the time they realised their “voluntary” ESG survey had been feeding into a risk-tiering system, their buyer already had a list of farms flagged as harder to keep when things got tight.
So, does your operation look more like Mark’s — pencil to cheque, questions before panic — or more like Sarah’s, finding out about the tiers a year late?
The question isn’t whether policy is getting louder. It’s whether, if FMMO tweaks, a missed DMC cycle, or an ESG‑driven contract change knocks $0.75/cwt off your cheque next year, you’d catch it early enough to move — or hear about it from a neighbour in the parlour after the fact.
Complete references and supporting documentation are available upon request by contacting the editorial team at editor@thebullvine.com.
The Hidden Contract Clause That Could Cost Your Dairy $55,000 in 2026 – This report uncovers high-stakes liability shifts in 2026 milk contracts that could erase 44% of your net profit. It delivers an immediate 30-day survival checklist to dodge these disruptive costs and protect your family equity.
The Sunday Read Dairy Professionals Don’t Skip.
Every week, thousands of producers, breeders, and industry insiders open Bullvine Weekly for genetics insights, market shifts, and profit strategies they won’t find anywhere else. One email. Five minutes. Smarter decisions all week.
New NAAB data says the heifer gap is 200,000 head smaller than CoBank projected. Good news? Not at $4.46 per cwt of your milk check.
Executive Summary: CoBank’s 800,000-heifer shortage projection got the industry’s attention last August. Updated NAAB semen data, released March 10, says the real gap is closer to 600,000 — but your replacement bill doesn’t care about the difference. At ,100/head, a 500-cow herd with a 36% cull rate spends .46/cwt on replacements alone. That’s 25.5% of gross milk revenue at January’s $17.50 all-milk price, and the spread between scenarios is $108,000 a year. Sexed semen’s pipeline correction is running ahead of CoBank’s model; beef-on-dairy’s 8.1 million units aren’t budging. The national gap is probably shrinking. What it costs you to replace cows this spring isn’t.
CoBank projected an 800,000-head decline in the number of replacement heifers. NAAB’s 2025 year-end semen report, released March 10, suggests the real gap is closer to 500,000–700,000. That sounds like relief — until you run the numbers on your own herd. On a 500-cow operation at today’s replacement prices, the spread between the worst and best scenarios is $0.86/cwt, or $108,000 a year. Against January’s $17.50/cwt all-milk price, that’s the gap between margin and none.
But McCarty runs 20,000 cows with locked-in feedlot relationships and a genetics program that ensures his top half keeps producing replacements. Most operations don’t have that math. And the question facing a 400-to-800-cow herd right now isn’t whether CoBank’s 800,000 number is right. It’s whether the actual gap — probably 600,000 to 700,000 — changes what you should do this spring.
What Does a $3,100 Springer Cost You Per Hundredweight?
Before the variables, the barn math. This is the number that should drive your next move.
Assumptions for a 500-cow herd (adjust to your own):
Annual cull rate: 36% → 180 replacements per year
Milk shipped: 25,000 lbs/cow/year → 125,000 cwt total
January 2026 all-milk price: $17.50/cwt (USDA)
At the USDA’s October 2025 national average of $3,100/head:
180 × $3,100 = $558,000 annual replacement cost
$558,000 ÷ 125,000 cwt = $4.46/cwt
That’s 25.5% of your gross milk revenue going to replacement procurement alone
At $2,850/head via contract grower (reported pricing, late 2025):
180 × $2,850 = $513,000
$4.10/cwt — still 23.4% of the check
At $2,500/head (best-case, surplus regions, late 2027):
180 × $2,500 = $450,000
$3.60/cwt — 20.6% of revenue
The threshold that matters: $4.00/cwt. If your replacement cost sits above that line, the heifer shortage is already compressing your margin — regardless of whether the national gap is 500,000 or 800,000 head. For context, USDA-ERS pegs full-cost production for even the most efficient 2,000+ cow herds at $19.14/cwt. The 2026 all-milk forecast is $18.95. Nobody has room to absorb $4.46/cwt in replacement costs without something else giving.
The Two Forces You’re Watching
Two macro variables determine whether the final gap lands at 600,000 or 800,000. You don’t control either one. But you need to track both.
Sexed semen is running ahead of CoBank’s model. NAAB’s year-end data shows sexed dairy semen hit 10.6 million units in 2025 — up 644,000 from 2024 — now 64% of all domestic dairy semen sales (dairy semen only, excluding beef-to-dairy). CoBank’s model captured the 2024 spike but didn’t fully price in a second sustained wave. At industry-average conception rates (29–35% in cows, 46–59% in heifers), each additional million units of sexed semen adds roughly 85,000–120,000 heifers to the pipeline after rearing attrition. That 2025 semen produces heifers entering milking strings in 2028 — the correction is real, but the lag is 27–30 months.
Impact on the gap: shaves an estimated 100,000–130,000 head off CoBank’s projection.
Beef-on-dairy isn’t budging. The 2025 NAAB number: 8.1 million beef semen units sold to dairy. Flat year-over-year. DFA estimates 70% of dairy farmers are now engaged in beef-on-dairy, adding $2.50–$3.00/cwt to their bottom line. According to Laurence Williams at Purina, day-old beef-on-dairy calf prices averaged about 0 three years ago compared to roughly ,400 today. The U.S. cattle inventory sits at a 75-year low of 86.2 million head (USDA, January 2026). McCarty’s read — that beef values hold through early 2027 — looks well-supported by fundamentals.
Year
Sexed Dairy Semen (M units)
Beef-on-Dairy (M units)
2020
7.2
4.1
2021
7.9
5.5
2022
8.6
6.8
2023
9.3
7.8
2024
9.956
8.1
2025
10.6
8.1
Phil Plourd, president of Ever.Ag Insights offered the most honest framing: “It’s certainly possible that beef and cattle prices will retreat at some point over the next couple of years,” but “even a major retreat would still leave dairy producers with much more beef income than they enjoyed seven or 10 years ago.”
Translation: don’t plan on beef-on-dairy fading fast. If it holds at 8.1M units through 2026, the pipeline drag continues at the pace CoBank modeled. The gap stays wide — 700,000 to 800,000 range.
The Two Levers You’re Actually Pulling
Here’s where it gets personal. Two variables sit inside your operation, and they swing the gap by 90,000–140,000 head nationally — and by thousands of dollars on your own P&L.
Your sexed semen conception rate is either building your pipeline or burning your money. CoBank applied an industry-average rate of 29–30% to lactating cows. Reality ranges from 18% to 40%, depending on synchronization protocols, technician quality, and body condition management. Across 9.57 million cows, a 5-point swing on 15% of matings (the share using sexed semen in cows) translates to 40,000–60,000 heifers nationally. On your herd, the question is blunter: if your conception rate on sexed semen in cows is below 28%, you’re producing fewer replacements than your semen invoice suggests. You’ve got a repro problem dressed up as a genetics program.
Your breeding ratio decision is a bet — make sure you know both sides. UW–Madison’s beef-on-dairy economics model, published early this year, found that the wrong breeding plan incurs ,000–9,000 in replacement costs per 300-cow pen at today’s heifer prices of ,000–,100+. Scale that proportionally to 500 cows, and you’re looking at roughly $143,000–$198,000 in added annual replacement expense. (That’s rough math, not a spreadsheet — the point is order of magnitude.)
Two approaches are splitting the industry right now:
McCarty’s group holds course. Large Western herds and processing-aligned mega-dairies with locked-in beef calf contracts and feedlot relationships. Beef-on-dairy income is a non-negotiable revenue line. They won’t adjust ratios until calf prices move against them. This group keeps the national gap wide.
Glenn Kline’s group hedges differently. Kline runs Y Run Farms LLC in Pennsylvania and told a CDCB panel last fall that his team uses a layered approach: “We’ve been using beef on dairy to keep our lower production cows using beef, and we use IVF to try to make better heifers of the good ones.” That’s a third path — keeping beef-on-dairy revenue flowing while using IVF and genomic testing to intensify replacement production from the top genetics. It costs more per heifer to produce, but it insures the pipeline without giving up calf income. Operations recalibrating their ratios — from 65% beef back toward 50–55% — or investing in IVF to protect their replacement pipeline are tightening the national gap toward the 500,000–600,000 range.
Metric
McCarty Model (Large Western)
Kline IVF-Layered
Mid-Herd Pivot (50–55% Beef)
Beef-on-dairy ratio
50% (bottom genomic half)
40–50% selective
50–55% (down from 65%+)
Sexed semen use
Top 50% genomic females
Top IVF donors + genomic selection
Broadly applied to top cows
IVF/embryo use
No (genomic only)
Yes — pipeline insurance
No (cost barrier)
Day-old calf revenue
~$1,400/head
$1,200–$1,400/head
$900–$1,200/head
Heifer pipeline ratio
Secured via feedlot contracts
Self-sufficient + potential surplus
Below 1.0 — at risk by 2027
Springer procurement
Internal supply
Internal supply
Spot market dependent
Risk if beef price drops below $1,100
Low (scale absorbs)
Low (IVF covers gap)
HIGH — dual bet exposed
Annual replacement cost/cow
Lowest (scale efficiency)
Highest (IVF premium)
Middle
Best suited for
5,000+ cow ops with feedlot ties
200–800 cow ops, strong repro mgmt
Operations actively recalibrating now
Every month you continue running 60%+ beef matings without a secured heifer supply source, you’re making two bets at once: that the beef premium holds and that heifers stay available at a price you can afford. That’s two bets, not one.
Which Scenario Are You In? Here’s How to Tell
The range — 500,000 to 800,000 — maps to three distinct price trajectories. Where you land depends on the region and timing.
Scenario
Heifer inventory, end of 2026
What happens to springer prices
CoBank base (~800k gap)
~3.1–3.3M head
Above $3,000 nationally; $4,000+ in deficit regions (TX, KS, CA, ID) into 2028
Mid-range (~600–700k)
~3.3–3.5M head
Modest softening H2 2027 in surplus regions; deficit regions still tight
Best case (~500k)
~3.5M head
Easing visible mid-2027 in Midwest/Northeast; PA and WI markets loosen
State-level data sharpens the picture. In the most recent USDA quarterly survey with state breakdowns (January 2025), Vermont ran highest at $2,930/head, Wisconsin at $2,860/head, and Kansas lowest nationally at $2,350/head — even as new dairy processing capacity comes online in southwest Kansas, Idaho, and Michigan. By October 2025, the national average hit a record $3,110. At auction in early 2026, bred heifers are clearing $3,500–$5,000+, depending on stage and genetics.
Region
Jan 2025
Oct 2025
Kansas
$2,350
$2,700
Wisconsin
$2,860
$3,100
Vermont
$2,930
$3,200
National Avg
$2,850
$3,110
Watch two signals:
NAAB Q1 2026 semen data (expected mid-year): If sexed dairy semen holds above 10.5M annualized and beef-on-dairy drops below 7.5M, you’re in the softer 500k–600k range. If both hold flat, plan for the full 700k–800k gap.
Day-old beef-on-dairy calf prices at auction: When these fall below $1,100 consistently — not a one-week dip, a trend — the economic case for beef-on-dairy weakens and breeding ratios shift. We’re not there. January 2026 reports still show strong premiums.
Your Playbook: 30, 90, and 365 Days
In the next 30 days:
Pull your actual sexed semen conception rate — cows and heifers, separately — for the last 12 months. Not the semen rep’s number. Your pregnancies per AI on sexed straws. Below 28% in cows? Fix the repro management or switch those matings to conventional dairy semen. At least you’ll get heifers in the pipeline.
Calculate your replacement cost per cwt using the formula above. Plug in your cull rate, your milk shipped, and your actual replacement price. If you’re above $4.00/cwt, you need to act on one of three levers: cut your cull rate, lock in contract grower pricing, or build internal heifer capacity. There’s no fourth option.
Count your bred heifers and springers on hand. Divide by your annual replacement need. Below 1.0? You’re already short. Below 0.8? You’re in trouble by 2027 regardless of the scenario.
Pipeline Ratio
Status
What It Means
Action Required
Above 1.2
✅ Surplus
More replacements than you need
Contract bred heifer surplus forward at $3,100+ while pricing holds
1.0–1.2
⚠️ On Track
Adequate 2026–2027 coverage
Monitor NAAB Q1 data; lock in contract growers if you’re in a deficit region
Secure supply immediately — you’re buying on a seller’s market regardless of the national gap
By 90 days (June 2026):
When NAAB releases Q1 2026 data, check sexed dairy semen against the 10.5M annualized threshold and beef-on-dairy against 7.5M. Those two numbers tell you which scenario is materializing. Price your heifer contracts accordingly.
If you’re in a deficit region (TX, KS, CA, ID), lock in contract grower arrangements now. DFA’s Dennis Gillins noted processing capacity is growing in “Idaho, southwest Kansas, Michigan, and New York” — exactly the areas where replacement demand will be fiercest. Don’t plan around the optimistic scenario.
If you’re in a surplus region (PA, WI, parts of the Midwest), contract your bred heifer surplus forward at today’s pricing. Wisconsin’s heifer inventory for milk cow replacement was already down 2% year-over-year as of January 2026 (DATCP/NASS).
By 365 days (March 2027):
Reassess your replacement cost per cwt against your milk price. If the gap has narrowed below $3.50/cwt, the pipeline correction is landing. If it hasn’t, lock in 2028 supply before the rest of the market figures it out.
Review your beef-on-dairy ratio against the updated calf price environment. If day-old calves have dropped below $1,100, the math has shifted — recalculate and adjust.
Key Takeaways
Calculate your replacement cost per cwt. At $3,100/head and a 36% cull rate, a 500-cow herd hits $4.46/cwt. Above $4.00, the shortage is already in your margin — the national gap number won’t change that.
Pull your sexed semen conception rate — cows and heifers, separately. Below 28% in cows, you’re producing fewer replacements than your semen invoice suggests. That’s a repro problem, not a genetics strategy.
If you’re running 60%+ beef matings without a secured heifer source, you’re carrying two bets at once. Beef-on-dairy held flat at 8.1M units — that bet looks solid. Affordable heifers when you need them? That one doesn’t.
Check your pipeline ratio — bred heifers and springers on hand divided by annual replacement need. Below 0.8, you’re short by 2027 in every scenario, including the optimistic one.
Deficit region? Lock in contract growers now at $2,800–$3,200/head. Surplus region with a ratio above 1.0? You have runway — but contract your bred heifer surplus forward while $3,100+ pricing holds.
The Bottom Line
Two paths. Neither is risk-free.
Lock in supply certainty now via contract growers at $2,800–$3,200/head delivered. You pay a $200–$400/head premium over your best-case spot price. But you eliminate the risk of paying $3,500+ if the 800k scenario materializes. Insurance isn’t free — but neither is scrambling for heifers when every other operation in your region is doing the same thing.
Hold and bet on softening by late 2027. You save the contract premium if the pipeline correction delivers cheaper heifers in surplus regions. But if beef-on-dairy holds at 8.1M units and the gap stays wide, you’re buying on the spot market at whatever price deficit-region demand sets. McCarty’s group can absorb that volatility. Kline’s approach — IVF on top of genetics plus targeted beef matings — offers a middle path, but it requires the herd genetics and reproductive infrastructure to execute. Can your operation run it?
The honest answer depends on your pipeline ratio, your region, and your balance sheet. Run the numbers. Then decide.
What’s your replacement cost per cwt right now — and when’s the last time you actually calculated it?
Complete references and supporting documentation are available upon request by contacting the editorial team at editor@thebullvine.com.
Learn More
$3,010 Per Heifer. 800,000 Short. Your Beef-on-Dairy Bill Is Due. – Gain a concrete roadmap to survive the replacement crunch by auditing your breeding balance and processor contracts. This breakdown delivers four specific paths—from strategic culling to internal rebalancing—to protect your operation’s capital before the 800,000-heifer hole deepens.
211,000 More Dairy Cows. Bleeding Margins. The 2026 Math That Won’t Wait. – Position your herd for the long-term structural reset by identifying why traditional culling math no longer works. This analysis exposes how new processing capacity and beef-on-dairy premiums are permanently altering the industry landscape, arming you with a 2026 survival playbook.
Your Top Heifers All Trace to Three Cow Families. That’s a $93,300-A-Year Trap. – Reclaim your genetic diversity and avoid the costly trap of over-concentrated maternal lines. This innovation-focused guide reveals how adding cow family filters to your genomic sorting can stop a $93,000 annual capital drain and insulate your herd against inbreeding-driven frailty.
The Sunday Read Dairy Professionals Don’t Skip.
Every week, thousands of producers, breeders, and industry insiders open Bullvine Weekly for genetics insights, market shifts, and profit strategies they won’t find anywhere else. One email. Five minutes. Smarter decisions all week.
West River’s expansion near Morris could quietly cost every 500‑cow herd in the Upper Midwest shed $57,000–$86,000 a year — and the warning signs aren’t where you’d expect.
Executive Summary: Riverview’s proposed West River expansion near Morris, Minnesota, would take the site to 18,855 cows and add roughly 5.5 million cwt of milk a year into an already tight Upper Midwest processing shed. For a 500‑cow herd shipping 12,000 cwt a month, the article walks through how that single permit can realistically translate into a $0.40–$0.60/cwt hit on net mailbox price — about $57,600–$86,400 per year gone even if you don’t change a thing on your own farm. It shows how that pressure actually lands first in higher hauling charges, thinner component premiums, and quiet “market adjustment” lines, not in an obvious crash on the front of your milk check. Using current FO30 hauling data and Minnesota FBM debt‑service coverage ratios, it gives you a simple margin and DSCR stress test you can run on your last 12 months of milk checks. From there, it lays out a 30/90/365‑day playbook and three realistic lanes — scale, pivot to premium/efficiency, or plan a clean exit — with clear trade‑offs for each. The core takeaway: you can’t control Riverview’s 18,855‑cow bet, but you can decide now whether you’re treated as “core, flex, or fringe” before a $0.60/cwt drain quietly closes off your best options.
Riverview LLP wants to take West River Dairy near Morris, Minnesota, from 7,855 to 18,855 cows — 26,397 animal units on a single site in Synnes Township, Stevens County. The Minnesota Pollution Control Agency is taking public comments on the environmental assessment worksheet through April 9, 2026, after an administrative error forced the agency to re‑notice the EAW and extend the deadline.
If you’re milking 400–600 cows in that same marketing shed, the real question isn’t whether the permit gets approved. It’s what happens to your net mailbox price once roughly 5.5 million cwt of annual milk starts flowing from one driveway. Based on how hauling, premiums, and base programs have behaved in past long‑milk episodes across the Upper Midwest, a realistic band is −$0.40 to −$0.60/cwt. On a 12,000‑cwt monthly milk check, that’s $4,800–$7,200 per month gone without you changing a thing on your own farm.
When 26,397 Animal Units Land in a 280‑Cow State
If you’re running a 500‑cow herd in west‑central Minnesota, you don’t read that MPCA notice as abstract policy. You read it like a weather warning for your balance sheet. You’re already watching your debt‑service coverage ratio (DSCR), scanning every line on the milk check, and wondering if your kids will have a business to come home to.
West River’s expansion plan adds an 11,000‑cow dairy (15,400 AU) to the existing 7,855‑cow (10,997 AU) facility. The build includes a cross‑ventilated, total‑confinement freestall barn, covered clay‑lined liquid manure basins expanding storage from roughly 102 million to 250 million gallons, and about 13,200 acres of cropland in the manure application plan. Riverview is also seeking a water appropriation permit to pump up to 226 million gallons per yearfrom an off‑site well.
Environmental groups — Land Stewardship Project (LSP), Food & Water Watch, and others — are hammering away at water usage and watershed impact. That’s the whole point of the EAW process. Riverview, for its part, says its dairies are “designed and managed to meet or exceed strict environmental standards” and that this expansion “must comply with the state’s stringent permitting requirements.” The environmental fight will play out on its own track. For you, the more immediate issue is simpler and nastier: what does an 18,855‑cow barn do to hauling, base, and mailbox for a 500‑cow herd in a tight processing shed?
Minnesota’s average dairy herd has fewer than 280 cows, according to federal structure data cited by the Star Tribune in March 2026. West River comes in at more than 67 times that average. This isn’t about good vs bad, big vs small. It’s a capital signal. When regulators, lenders, and processors are being asked to sign off on a facility shipping more milk than dozens of family herds combined, the question shifts from “Am I efficient?” to “Where do I sit when plants and banks start ranking who matters most?”
Metric
Minnesota Average Dairy
Riverview West River (Proposed)
Gap
Herd Size (cows)
280
18,855
×67 larger
Animal Units
~392
26,397
×67 larger
Daily Milk (lb)
22,400
1,508,400
×67 larger
Annual Milk (cwt)
81,760
5,500,000
×67 larger
Manure Storage (gal)
~500,000
250,000,000
×500 larger
Water Use (gal/year)
~8,000,000
226,000,000
×28 larger
How Does an 18,855‑Cow Mega‑Dairy Hit 500‑Cow Mailbox Prices?
In public meetings and local coverage, Riverview partner Brady Janzen has argued that West River’s growth is a rational response to rising U.S. cheese demand. He points to USDA data showing per‑capita cheese consumption climbing from roughly 15 pounds in the mid‑1970s to around 40 pounds today. The logic is straightforward: if Americans keep eating more cheese, plants need consistent, high‑volume milk to stay efficient.
Riverview isn’t just adding cows. It’s also building the Stevens Milk Plant in Morris — an approximately 148,000‑square‑foot facility designed to process about 4 million pounds of milk per day into nonfat dry milk, skim milk powder, cream, and evaporated condensed skim milk, with roughly 65 jobs tied to it. The plant broke ground in mid‑2025 and is scheduled to start processing in November 2027, roughly the same timeline that LSP and local coverage expect for West River’s expansion to be fully online, if approved.
That timing matters. Riverview is building processing capacity alongside the new cows — not just dumping milk into a fixed system. But 4 million pounds of daily plant capacity absorbs only about 38% of West River’s expanded daily output at a conservative 80 lb/cow/day. The rest of the shed’s existing production still needs homes, and Riverview’s more than 125,000 cows in Minnesota already produce well over 10 million pounds each day.
Progressive Dairy’s 2024 “State of Dairy” series summed up the broader context: Upper Midwest processing capacity was “very tight”, milk was being hauled “crazy distances,” and switching processors often wasn’t an option. In that kind of shed, a new 18,855‑cow site doesn’t just “add supply.” It can help fill a new plant, yes — but it also reshapes every conversation about base, hauling, and which farms get treated as core vs expendable.
Renville County dairy farmer James Kanne sees the expansion through a very different lens. In LSP’s March 8, 2026, release, he argues that mega‑operations like Riverview’s have “glutted the market and tightened the stranglehold milk giants have on the industry,” pushing small and medium‑sized farms off the land. Whether you agree with that or not, his point matches what’s been happening when the Upper Midwest goes long: base programs kick in, over‑base milk gets discounted hard, and hauling plus “market adjustment” lines quietly bleed margin.
Family Dairies USA’s base program, rolled out in 2017, is one of the most transparent examples. The co‑op set a three‑month rolling production base plus a 1% cushion. Anything over that base wasn’t blocked, but general manager David Cooper shared that spot and over‑base milk often moved with $3–$4/cwt discounts, plus extra hauling and marketing costs, whenever the region was long.
At 80 lb/cow/day, an 18,855‑cow barn throws 1,508,400 lb of milk into the system daily — about 551 million pounds per year, or 5.5 million cwt, from a single site. That doesn’t guarantee your 500‑cow herd gets hammered. But it absolutely raises the odds that your shed crosses from “tight but manageable” into “structurally long,” where co‑ops lean harder on base, discounts, and balancing charges.
The $7,000 Monthly Leak Nobody Warns You About
Here’s the math you can actually run at your kitchen table.
Baseline 500‑cow scenario:
Herd: 500 cows.
Ship weight: 80 lb/cow/day.
Daily cwt shipped: 500 × 80 ÷ 100 = 400 cwt/day.
Monthly cwt (30 days): 12,000 cwt/month.
Plug your own herd and cwt into the same structure.
Step 1: Hauling — the small punch that still hurts
Once a mega‑site becomes a route anchor, haulers redraw for density. Long lanes get built around big barns. Smaller, out‑of‑the‑way farms pick up more deadhead miles.
A 2025 FO30 staff paper on Upper Midwest hauling charges found the weighted average hauling deduction jumped from $0.4202/cwt (May 2023) to $0.5033/cwt (May 2024) — a 19.8% increase in a single year, before West River’s expansion even comes online. Stevens County itself sits below that average because Morris is a processing magnet. But if you’re 30–40 miles out and not on the optimized path to a giant barn, you’re on the wrong side of those averages.
Period / Scenario
Hauling Charge ($/cwt)
Monthly Cost (12,000 cwt)
Annual Cost
Change
May 2023 (FO30 Weighted Avg)
$0.4202
$5,042
$60,508
—
May 2024 (FO30 Weighted Avg)
$0.5033
$6,040
$72,475
+19.8%
Stevens County (Current Est.)
$0.45
$5,400
$64,800
—
Your 500-Cow Scenario (Post-Expansion)
$0.55
$6,600
$79,200
+$1,200/mo
Use a conservative scenario: your hauling inching up by $0.10/cwt over a couple of route changes.
$0.10/cwt × 12,000 cwt = $1,200/month extra hauling.
That’s $14,400/year to get the same milk to a plant.
On its own, you can probably eat that. The real trouble is what shows up on the same check.
Step 2: Basis and premiums — where the real damage happens
When a shed goes long, and plants are full, the pain doesn’t show up in one big blood‑red line. It shows up in a bunch of small ones. Based on prior Upper Midwest long‑milk runs:
Quality/component premiums get trimmed, or their formulas reset, so the same butterfat and protein net $0.25–$0.75/cwt less.
Balancing and “market adjustment” charges take another $0.10–$0.25/cwt when milk has to move farther or into weaker outlets.
You don’t assume the full $3–$4/cwt spot‑load pain from Family Dairies USA across every pound. You assume you keep your core base, but your shed is now structurally long, and the weaker parts of the check start bleeding.
A realistic combined band: −$0.40 to −$0.60/cwt.
On 12,000 cwt per month:
$0.40 × 12,000 = $4,800/month → $57,600/year.
$0.60 × 12,000 = $7,200/month → $86,400/year.
That’s the $7,000‑ish leak. It doesn’t come all at once. It trickles out through hauling, weaker premiums, and quietly rising “market adjustments.”
How fast does your cushion disappear?
Minnesota dairy herds in the FBM program had a DSCR of 1.94:1 in 2024 — solid on paper. The year before, the dairy‑specific DSCR was 0.86:1. That means the average Minnesota dairy in that dataset couldn’t fully cover its debt service from operating income in 2023.
One year took DSCR from healthy to “eating equity.” Another year clawed it back. That’s how volatile the floor really is.
Now overlay the $0.40–$0.60/cwt shed hit:
If you’re sitting at 1.4–1.5 DSCR today and lose $0.50/cwt for 12–18 months, you’re skating very close to that 0.86 world again.
Once you drop below 1.0, every payment comes partly from your balance sheet, not just your milk.
That’s the part your lender will see before your family does.
Quick Margin Check: Your Shed, Your Numbers
Don’t guess. Pull your actual numbers and run this:
Grab your last 12 months of milk checks.
Calculate your average net mailbox price — that’s after hauling and all adjustments.
Subtract $0.40/cwt, then $0.60/cwt.
Multiply each by your average monthly cwt shipped.
Call your lender and ask: “If my net price dropped by that much for 12–18 months, what would my DSCR look like compared to 2023 dairy portfolios?”
If that math puts you under 1.0 — or even under 1.2 — you now know how much clock you actually have if your shed goes long.
The Turn: When the Check Still Looks Fine, But Your Options Don’t
For a while, your milk check still looks “okay.” Components haven’t crashed. Basis hasn’t blown out. There’s no single ugly line that screams “You’re in trouble.”
The early warnings show up in how people talk to you:
Your field rep shifts from “We need all the milk we can get” to “We really need everyone to hold production flat this year.”
A neighbor gets told the co‑op won’t take an extra Sunday load without a deep discount.
Someone else mentions getting a quiet warning: “If you add those heifers, you might land in a new over‑base bucket.”
On the check, you start seeing:
A new “market adjustment” line shaving $0.10–$0.20/cwt.
Component formulas tweaked so the same butterfat and protein pull in a bit less.
It’s death by a dozen small cuts.
The “Core vs Fringe” Reality Nobody Likes to Say Out Loud
Here’s the part you never see in a newsletter. When a shed goes long, who keeps base and who gets squeezed is only partly about SCC and components. It’s also about politics.
A Family Dairies USA federal order brief years ago described local producers as “intent on protecting their markets” and pushing for regulatory fences around who got pool access. That fight was about interstate pooling, but the same instincts show up inside a shed when base‑allocation gets tight. When managers sit down to decide who’s “core,” three things matter:
Volume. Bigger, consistent loads are easier to build routes and plant schedules around.
History. How long you’ve shipped, how you behaved in the last crunch.
Relationships. Whether your field rep goes to bat for you in that meeting.
SCC and components matter. But they’re not the whole story.
Instead of waiting for a base letter to officially label you, you can force that conversation early.
Sit down with your field rep with a one‑pager: 12‑month CWT, SCC, components, and a couple of years of history.
Ask three blunt questions:
“Today, are we core, flex, or fringe?”
“If you had to protect 60–70% of volume in a crunch, where would we land?”
“What two things in the next 12 months would move us closer to core?”
Then take that same one‑pager, plus your −$0.40 and −$0.60/cwt margin scenarios, to your lender.
Ask: “At these three margins — current, −$0.40, −$0.60 — where does my DSCR land? How many months could we tolerate each before my file starts to look like 2023 again?”
Most bankers will tell you straight:
About a year at a lower margin if it’s planned.
Two years start chewing equity.
Three years make expansion or refinancing a hard sell in the credit committee.
The myth you’ve got to drop is: “I’ll know I’m in trouble when my milk check tanks.” By the time that happens, your best options — core base protection, decent refinance terms, or a clean exit — are already narrowing.
The 30/90/365‑Day Playbook After a Mega‑Dairy Permit
You don’t control West River’s permit. You do control how your operation is positioned when 10,000‑plus cows show up in your shed.
30 Days: Own Your Numbers
Run your “minus $0.60/cwt” stress test. Use the quick margin check above. If your DSCR drops under 1.0, you’ve identified a structural risk, not a nuisance.
Get ahead of your lender. Bring three numbers: your actual margin and the two stress‑test margins. Ask for your last two years of DSCR trends. If 2023 already shows a dip, you know how thin the ice is.
Audit your contracts. Highlight:
Termination clauses and notice periods.
Base vs over‑base rules.
Who’s on the hook for hauling if a route changes?
Any “discretionary” premium language. If your contract says “market conditions” can trigger changes on 30–60 days’ notice, and premiums are at the buyer’s discretion, that’s a big red flag in a long‑milk shed.
90 Days: Clarify Your Status
Get your label from your buyer. Core, flex, or fringe. Don’t let it be a secret. Ask what specific changes would move you up a rung — better components, steadier volume, less drama on pickups.
Shop alternatives with real data, not promises. FO30’s 2024 weighted average mailbox price was $21.22/cwt, versus $21.80/cwt for all federal order areas. You’re starting $0.58 behind. A new buyer only makes sense if you can document at least +$0.25–$0.50/cwt net after hauling and with equal or better base security — and only if they can show you 12 months of real checks.
Tighten your quality profile. Cull chronic high‑SCC, low‑production cows that drag your herd average. Get yourself into your buyer’s top quality tier now, before they reset how premiums are paid when the shed goes long.
Scale Up, Pivot, or Get Out: Choosing Your Survival Lane
As MPCA works through the EAW and Rep. Kristi Pursell pushes for mandatory Environmental Impact Statements on 10,000‑AU feedlots, mega‑builds are formally on the table in Minnesota. You’ve got roughly a year to decide which game you’re playing.
Lane 1 — Scale:
You work with your lender on a 3–5-year plan to add cows, showing how you can reduce the fixed cost per cwt enough to offset a $0.40–$0.60 regional hit. Then you ask your buyer straight:
“If we grow to X cows by [year], does that move us into your core base or just make us a bigger flex farm?”
If the lender is nervous and the buyer can’t give you a clear path to core, scale probably isn’t your answer.
Lane 2 — Pivot to Premium/Efficiency:
You’re not going to out‑Riverview Riverview. But you can reduce how much any mega‑permit dictates your fate by:
Locking in premiums that depend on quality/components, not just volume.
Tightening your crop‑livestock loop to drop purchased feed cost per cwt.
Exploring specialty channels that sit outside FO30’s pure commodity stream.
If you can realistically push butterfat up 0.10–0.15% and protein up 0.05–0.10% at the same or lower feed cost, and your co‑op or plant pays decent component premiums, you can claw back a meaningful chunk of that $0.40–$0.60/cwt loss through your own cows instead of someone else’s permit.
Lane 3 — Planned Exit:
If your honest margin stress test shows your DSCR sliding back toward 2023’s 0.86 with no believable fix in sight, a 12–24 month exit while your balance sheet is still strong might be the smartest move on the table.
On a 500‑cow herd:
A $0.40/cwt hit costs about $57,600/year.
A $0.60/cwt hit costs about $86,400/year.
Stay in that position for three to five years, and you’re looking at $173,000–$432,000 in cumulative lost equity. That’s the difference between walking away with fuel for the next chapter — or walking away with just enough to pay off the last one.
What This Means for Your Operation
Don’t wait for the base letter. Treat any new 10,000‑plus permit in your shed as your starting gun for the 30/90/365‑day plan, not as something to file mentally under “policy news.”
Use $0.40–$0.60/cwt as your personal stress‑test band. If dropping your net price into that range for 12–18 months pushes your DSCR below 1.0 — or even under 1.2 — that’s a sign you need a structural answer, not small cost cuts.
Remember, your region starts behind. The FO30 Upper Midwest mailbox price is already $0.58/cwt below the all‑order average. You’ve got less margin to play with than your peers in richer orders.
Watch behavior, not memos. Field reps talking about “holding production,” routes being “optimized” around new big barns, and extra loads being refused are your real‑time indicators that your shed is tipping long.
Don’t move processors without proof. Don’t uproot a 500‑cow herd on a recruiter’s pitch alone. Ask for real mailbox data versus FO30’s weighted average and base terms in writing.
In the next 30 days, pick up the phone twice. Once to your field rep with that one‑pager and three blunt questions. Once to your lender, with your −$0.40/−$0.60 margins pencilled in, asking how many months your DSCR can live there.
Key Takeaways
If a mega‑dairy helps knock $0.40–$0.60/cwt off your net price, you’ve got roughly 12–24 months to either offset it or plan an exit before your balance sheet starts making decisions for you.
The real hit isn’t one big line on your milk check; it’s the combination of higher hauling, thinner premiums, and new “market adjustments” that add up to $60,000–$80,000 a year on a 500‑cow herd.
Your shed already sits $0.58/cwt below the national mailbox average, so the same shock that a Texas or Idaho herd can absorb might push a Minnesota herd back into 2023‑style DSCR territory.
“Core vs fringe” is political as well as technical. Volume, history, and relationships matter as much as your SCC when plants decide who they hold onto in a long‑milk year.
The Bottom Line
Riverview isn’t the villain here. They’re playing the game as it’s written — vertically integrated from cow to powder plant, scaling across six states, lining up processing for their expansion. The real question is whether you’re still playing the game you signed up for — or just waiting quietly for the clock to run out.
Complete references and supporting documentation are available upon request by contacting the editorial team at editor@thebullvine.com.
Every week, thousands of producers, breeders, and industry insiders open Bullvine Weekly for genetics insights, market shifts, and profit strategies they won’t find anywhere else. One email. Five minutes. Smarter decisions all week.
Harrisburg dark Oct 6. 11 farms stranded, unpaid milk piling up. 19.70 $/cwt? $188k yearly bleed for 200‑cow herds. State scorecard + 30‑day paths inside.
When Harrisburg Dairies shut down for good on October 6, 2025, the trucks just stopped coming. At least 11 or 12 family farms and their haulers were suddenly sitting on weeks of shipped milk with no check and no clear backup buyer. That was one regional bottler, one weekend — and a preview of what 19–20 $/cwt milk looks like when the math and the processor power both turn against you.
When the National Numbers Say “We’re Fine” — But Your Milk Check Doesn’t
In Canadian research led by the University of Guelph’s Dr. Andria Jones‑Bitton, roughly one in four farmers said they’d had thoughts of suicide in the previous 12 months, often during winter when stress, debt, and dark days all pile up. Now look at the U.S. scoreboard. USDA NASS says total farm numbers fell from 1,880,000 in 2024 to 1,865,000 in 2025 — that’s 15,000 farms gone in a single year across all sectors. At the same time, January 2026 milk production in the 24 major dairy states hit about 19.1 billion lb, up 3.4 % from a year earlier.
USDA ERS estimates 2025 U.S. milk production at around 231.5 billion lb, roughly 2.5% higher than 2024. WASDE‑669 then calls for a 2026 all‑milk price of 19.70 $/cwt, down from 21.17 $/cwt in 2025. On a 300‑cow herd shipping about 69,000 cwt/year, that 1.47 $/cwt drop alone carves roughly 101,000 $ out of your annual milk check before you do anything wrong. You feel that in every feed‑mill statement, every delayed repair, every time you tell yourself you’ll talk to the bank “after planting.”
Meanwhile, the cows keep coming. In January 2026, the 24 major milk states reported about 9.15 million cows, roughly 200,000 head more than a year earlier. Average output hit 2,082 lb/cow for the month, 24 lb higher than January 2025. NASS licensed‑herd time series show dairy operations have fallen by well over half in two decades, yet national milk production is still climbing. The cows aren’t disappearing — they’re moving into big barns that can afford to live on 19‑dollar milk by spreading fixed costs and risk over thousands of stalls.
Add to the balance sheet. USDA ERS projects farm sector debt of around $ 624.7 billion for 2026, with interest expenses of $33 billion . Every tiny rate bump siphons a few more cents per cwt off your milk check and hands it to the bank before you pay feed, fuel, or yourself. That’s the backdrop to Harrisburg Dairies going dark — and the bigger question hanging over your yard: are you already in the kill zone at 19.70 $/cwt?
The Q1 2026 Dairy Consolidation Scorecard
The USDA’s 2025 “Farms and Land in Farms” summary provides total farm numbers by state. NASS Milk Production supplies state cow inventories and volumes. Put those together, and you can see where consolidation is running hot versus just simmering. Color codes here are based on annual dairy farm loss: RED = >4 %/year, YELLOW= 2–4 %/year, GREEN = <2 %/year. Farm counts are estimated from total farms and dairy cow numbers — directionally right, but not the same as the USDA’s licensed‑herd census.
Color
State
Est. Farms (2025)
YoY Farm Change
Milk Prod (B lb)
YoY Prod Change
Avg Herd Size
Consolidation Velocity
🟢
California
1,175
-1.8%
41.8
+0.4%
1,850
STABLE
🔴
Wisconsin
5,580
-4.3%
31.8
+1.1%
245
ACCELERATING
🟢
Idaho
345
-1.4%
18.2
+5.5%
1,680
STABLE
🔴
Texas
310
-4.6%
18.2
+6.9%
4,000
ACCELERATING
🟡
New York
2,390
-3.9%
15.8
+1.2%
260
STABLE
🔴
Michigan
970
-4.5%
12.4
+3.4%
550
ACCELERATING
🔴
Minnesota
1,810
-5.2%
11.2
+1.0%
240
ACCELERATING
🔴
Pennsylvania
~3,700
-11.7%(41% of U.S. exits)
10.1
-0.8%
~115
ACCELERATING
🟢
New Mexico
110
-2.2%
7.7
-1.0%
2,100
DECELERATING
🟡
Washington
275
-2.6%
6.8
+1.1%
920
STABLE
🟡
Ohio
1,320
-3.4%
5.8
+2.1%
195
STABLE
🟡
Iowa
790
-2.5%
5.7
+0.7%
275
STABLE
🟡
Kansas
180
-3.8%
4.8
+17.2%
1,250
ACCELERATING
🟡
South Dakota
140
-2.9%
4.5
+9.5%
1,300
ACCELERATING
🟢
Colorado
105
-1.9%
5.4
+3.9%
1,550
STABLE
Analysis of USDA’s licensed herd counts says the quiet part out loud: using USDA’s original 2024 baseline, the U.S. lost about 1,202 dairies in 2025, and 490 of them were in Pennsylvania — an 11.7 % drop that accounts for 41 % of all U.S. dairy exits. When four out of every ten closures are in one state and state milk still sits at near 10.1 billion lb, you’re not watching a gentle reshuffle. You’re watching cows stay while barns and families disappear.
Where Is the Processing Money Going — And What Does It Do to Your Milk Check?
If you want to know where your future mailbox price is set, follow the stainless steel, not just the blend price.
Kansas is the clearest example right now. NASS and ERS report Kansas milk output jumped roughly 17.2% in a single year, driven largely by Hilmar Cheese’s new plant in Dodge City. Hilmar has about $600 millionsunk into that site, with a capacity of around 12.5 million lb/day when fully ramped, a level it essentially reached in early 2025. A plant like that doesn’t just “add capacity.” It creates gravity. Cows, corn silage, employees, and bankers all start orbiting Dodge City.
Texas and Idaho are locked in a fight for third place nationally. In 2025, Idaho’s roughly 350 dairies shipped about 18.26 billion lb, just ahead of Texas at 18.21 billion lb. But Texas has the bigger forward pipeline: Leprino’s Lubbock cheese complex — targeting roughly 1 billion $ in total investment — is phasing in through 2026, and Walmart’s fluid plant in Robinson, TX, is sourcing directly from regional farms for Great Value and Member’s Mark bottling. Those facilities want big, steady loads. That shapes what your co‑op can pay, even if your milk never hits their silos.
Up the I‑29 corridor, South Dakota shows how a single expansion can remake a region. State milk production is up around 9.5 %, tied heavily to Valley Queen’s expansion at Milbank, which doubled capacity to roughly 8 million lb/day and is expected to pull in another 25,000–30,000 cows over 2025–2026. Across the High Plains and mountain states, average herd sizes run from roughly 1,700 to more than 2,000 cows, with plenty of outfits milking 4,000 head in the Texas Panhandle.
If you’re milking 150–400 cows into a commodity pool, your milk is being priced in a world built for 2,000‑cow barns tied to 600‑million‑dollar plants. You may hate that. You still have to decide how you’re going to live in it.
Where Are Farms Bleeding Out Fastest — And Can Sub‑500‑Cow Herds Survive This Math?
While stainless steel moves west and south, the traditional milksheds are losing barns first and fastest.
NASS data for the Northeast/Mid‑Atlantic corridor (Maine through Maryland) show hundreds of dairy exits in 2025, and Farmshine’s breakdown of USDA-licensed herd numbers says that, using the original 2024 baseline, 41 % of all U.S. dairy exits were in Pennsylvania alone. That’s 490 dairies gone and an 11.7 % hit to the state’s dairy farm count in one year. State milk output only slipped about 0.8 % to roughly 10.1 billion lb, which tells you exactly what’s happening: cows are staying, they’re just changing barns and addresses.
ERS’s February 2026 cost‑of‑production work (ERR‑334) explains why this is hitting smaller herds first. For herds under 50 cows, full economic cost — cash expenses plus depreciation, unpaid labor, and opportunity cost — sits above 42.70 $/cwt. In the 100–499‑cow bracket, total economic costs cluster roughly between 19 and 21 $/cwt once you count everything, not just the checks you write. At a 19.70 $/cwt all‑milk forecast, any mid‑size herd with a true breakeven near 21.00 is losing about 1.30 $/cwt, even if there’s still something left after paying feed and fuel.
That pressure is showing up in the courts. According to U.S. Courts data summarized by the American Farm Bureau Federation and university analysts, 315 Chapter 12 farm bankruptcies were filed in 2025, up 46 % from 216 in 2024. The Midwest region logged 121 cases, while the Southeast recorded 105, and filings in both regions rose roughly 70 %year‑over‑year. When you hear neighbors say, “We just need one good year,” this is the backdrop — a lot of farms tried to wait that year out and met their lender and their lawyer instead.
Region
2024 Filings
2025 Filings
Midwest
71
121
Southeast
62
105
Other Regions
83
89
Total
216
315
The Hidden Story: Georgia’s Rise and New Mexico’s Floor
Not every growth story comes with sand and center‑pivots.
Georgia quietly led the Southeast in 2025. NASS numbers and extension analysis show the state adding around 3,000 cows and boosting milk output by about 7.8% to roughly 2.09 billion lb, while losing only five dairies. The anchor is Walmart’s 350‑million‑dollar bottling plant in Valdosta, which opened in December 2025 and now supplies more than 650 Walmart and Sam’s Club stores across the Southeast with private‑label milk sourced from regional farms. If you’re milking in Alabama or the Florida panhandle and telling yourself, “This region’s done for dairy,” Georgia is the counter‑example — the plant showed up, and the cows followed.
On the other side, New Mexico looks “stable” in the scorecard — small further farm loss, flat‑to‑slightly‑negative milk — but only because the hard part already happened. Years of contraction stripped out almost every sub‑1,000‑cow operation and left a landscape dominated by 2,000‑plus‑cow barns shipping into a handful of plants. If you’re a 200‑cow operator in Wisconsin or Pennsylvania, New Mexico isn’t an oddity. It’s a possible future — after your region has already done a lot of painful shrinking.
What Does 19.70 Milk Actually Look Like on Your Farm?
Let’s get out of the abstract and into numbers you can map onto your own herd.
Say you’re milking 200 cows in Wisconsin or Pennsylvania. USDA’s 2025 numbers say the average U.S. cow shipped about 24,390 lb — that’s 243.9 cwt per cow per year.
Barn Math: 200 Cows at 19.70 Milk
Revenue side (all‑milk forecast 19.70 $/cwt):
Milk per cow: 243.9 cwt
Gross revenue per cow: 243.9 × 19.70 = 4,804.83 $/cow
Total herd revenue (200 cows): 960,966 $
Cost side (full economic cost, ERS/Illinois FBFM example):
Total economic cost per cwt: 23.56 $/cwt
Total cost per cow: 23.56 × 243.9 = 5,746.28 $/cow
Total herd cost (200 cows): 1,149,257 $
Bottom line:
Net return per cow: 4,804.83 − 5,746.28 = –941.45 $/cow
Annual net loss: –188,290 $
Monthly equity bleed: about –15,700 $/month
That’s at 19.70 $/cwt. You’re probably covering cash bills for feed, fuel, and vet — ERS benchmarks often put cash operating costs in the mid‑to‑high teens per cwt. The grain mill gets paid. The TMR still runs. Maybe you chip away at some old payables.
Year
All-Milk Price ($/cwt)
Full Economic Cost ($/cwt)
2019
18.53
19.85
2020
18.18
20.12
2021
18.64
21.35
2022
25.16
24.89
2023
20.66
22.47
2024
20.82
22.94
2025
21.17
23.12
2026
19.70
23.56
But you’re not paying yourself a fair wage. You’re not truly replacing equipment. You’re not paying for the capital already sunk into cows and concrete. And you’re quietly moving about 3.86 $/cwt of value — the gap between full economic cost (23.56) and forecast price (19.70) — out of your equity column every time you ship a hundredweight.
Line Item
Per Cow ($/cow/year)
200-Cow Herd ($/year)
REVENUE
Milk production (cwt/cow/year)
243.9 cwt
48,780 cwt
All-milk price ($/cwt)
$19.70
$19.70
Gross milk revenue
$4,804.83
$960,966
Cull cow & calf revenue
$285
$57,000
Total Revenue
$5,089.83
$1,017,966
COSTS (Full Economic)
Feed (purchased + homegrown)
$2,850
$570,000
Labor (paid + unpaid family)
$1,125
$225,000
Replacement heifers
$620
$124,000
Fuel, utilities, repairs
$485
$97,000
Vet, breeding, supplies
$310
$62,000
Interest & debt service
$245
$49,000
Depreciation (facilities, equipment)
$385
$77,000
Opportunity cost (equity, land)
$526
$105,200
Total Economic Cost
$6,546.28
$1,309,257
NET RETURN
-$1,456.45
-$291,290
Monthly equity bleed
-$121/cow/month
-$24,274/month
If your basis is weak or your SCC premiums are off by 0.25–0.50 $/cwt, the hole gets deeper. That “one good heifer every 23 days” image isn’t an exaggeration — this example is roughly burning that value, whether you see it on a statement or not.
Where Does Your Real Breakeven Sit — and How Long Can You Live Below It?
This is the question everything else hangs on. You can’t decide whether to scale, specialize, or exit until you know what a hundredweight actually costs you.
Pull the last 12 months of real numbers: feed (including home‑grown at market value), fuel, repairs, vet, breeding, interest, insurance, taxes, family living, and a realistic wage for your time. Divide by shipped cwt, not “produced” milk. If that all‑in number is:
Under 19.70 $/cwt — you have margin and choices.
Around 19–21 $/cwt — you’re in the gray zone where small changes in milk price or feed cost swing you from black to red.
Above 21 $/cwt — you’re already in kill‑zone territory. The longer you run like this, the more equity quietly disappears.
Then stress‑test at 18.00 $/cwt for six months. That’s not a fantasy — January 2026 Class III printed at 14.59 $/cwt, February only improved to 14.94, before basis, hauling, and deductions. At an 18‑dollar average for half a year, can your operation stay under about 60 % debt‑to‑asset and avoid burning more than 15 % of your equity? If the honest answer is “no,” you’ve got a timeline problem, not just a margin problem.
What Can You Realistically Change in the Next 30 Days?
You don’t rebuild a cost structure overnight. You can absolutely change its trajectory in a month.
In the next 30 days, you can:
Sit down at the kitchen table for two hours with last year’s numbers and build your real cost per cwt on paper or with your advisor. That one session changes how you look at every other decision.
Re‑draw your breeding plan so beef semen only hits cows you don’t want daughters out of, and your highest‑merit cows only see high‑profit dairy sires.
Mark cull candidates using both production and genetics — cows sitting in the bottom slice of NM$ who are also lagging in components or fertility.
Call your co‑op or plant rep and ask bluntly what basis, premiums, or volume commitments are likely to look like over the next 12–24 months in your exact area.
You don’t have to decide in 30 days whether to build a 500‑stall barn. You do have to decide whether you’re going to keep feeding cows that don’t pencil at 19‑dollar milk.
How Do You Use Beef‑on‑Dairy as a Tool, Not a Trap?
Beef‑on‑Dairy has been the hottest “extra margin” lever in a lot of parlors and robot rows. Trade and extension reports still talk about beef‑cross calves bringing up to around 1,400 $ a head in some programs when the genetics and weights are right. Spread across your total shipped cwt, that can effectively add 2–3 $/cwt worth of value if you’re consistent and disciplined.
But there’s a hidden tax: replacements. USDA’s price series and industry coverage show dairy replacement heifers averaging around 3,010 $/head by mid‑2025, up from roughly 1,140 $ in 2019 — about a 160 % jump in six years. So every time you chase a high‑priced beef‑cross calf instead of a heifer, you’re betting that Future‑You can afford to buy back the genetics you’re not making today.
The smart way to play Beef‑on‑Dairy in a 19‑dollar world is as a lever, not a life raft:
Aim beef semen at your low‑merit cows first, not your best.
Keep beef to roughly a quarter to a third of your breedings so you don’t starve your replacement pipeline.
Pair it with a genetics plan, not just a cash‑flow band‑aid.
The calf checks feel great. The real test is whether your replacement math still works 18–24 months from now when those heifers should be freshening.
Can Genetics Keep You Off the Auction Block?
Feed, bedding, and power hit every cow the same. Genetics is where you decide which cows deserve a spot on your TMR.
USDA‑ARS is blunt about Net Merit: NM$ is a measure of lifetime profit. It’s built to rank animals by net dollars they’re expected to return, not just yield. When you genomic test and line your cows and heifers up by NM$ or your co‑op’s profit index, you’re looking at who’s likely to pay their way — and who’s just eating.
At 19–20 $/cwt milk, you can’t afford to carry a long tail of passengers. Practical steps:
Sort your cows and heifers by NM$ or your chosen index and print the list.
Circle the bottom slice — whatever percentage your gut can handle — and ask, cow by cow, “Does she justify another lactation, another breeding, or another year’s feed?”
Get especially honest about the heifers stuck in the bottom half of your genomic ranking. In this environment, raising a low‑merit heifer to calving is often worse than selling her and keeping the cash.
You don’t have to chase sky‑high GTPI or build a show string. You do have to stop feeding genetics that have no realistic shot at paying their way under the margins USDA is telling you to expect.
How Do You Use DMC and Risk Tools Without Fooling Yourself?
The 2026 Dairy Margin Coverage enrollment window ran from January 12 to February 26, 2026, so by now, you either locked it in or you didn’t. Under the updated rules, Tier I coverage now extends up to 6 million lb of production history per year — plenty to blanket a 200–500‑cow herd at realistic production levels.
ERS’s LDP‑M‑380 shows how quickly the DMC margin can move when feed and milk don’t play nice together. In late 2025, margins slid close to trigger levels as milk softened while feed costs remained stubbornly high. If you enrolled, those Tier I checks won’t magically turn a structurally unprofitable herd into a winner, but they can plug real holes when margins squeeze hard.
If you didn’t enroll, now’s the time to sit down with your lender and risk‑management advisor and talk about Dairy‑RP, forward contracts, or co‑op tools — not when your Class III mailbox price is already starting with a “1,” and your equity chart is pointed straight down.
What DMC and risk tools cannot do is change the basic fact that if your full cost sits above the price line, you’re selling equity every time the tank empties.
Options and Trade-Offs for Farmers
Here’s where the rubber meets the lane. There are only a few real paths. The math above is what each path is working against.
Path
When It Makes Sense
Key Actions (Next 30–90 Days)
What You Gain
What You Give Up / Risk
1. Fix Cost Structure
Full cost within 1–2 $/cwt of forecast price; solid facility; debt manageable; willing to cut ruthlessly
– Run true cost/cwt with advisor- List specific cuts (rent, machinery, low-merit cows)- Hunt SCC/component premiums- Stress-test at $18/cwt for 6 months
Survival without major capital; preserve equity; keep optionality for next move
Can cut into burnout if you don’t know when to stop; only works if gap is ≤2 $/cwt
2. Scale or Align
In growth corridor (TX, KS, SD, ID, Southeast); processor adding capacity; willing to leverage up or commit volume long-term
– Contact plant/co-op for volume contracts- Model expansion to 500–1,000+ cows- Secure basis guarantees or premiums- Line up financing with lender
Lose flexibility; high leverage = faster pain if Class III tanks; stuck in contract even if milk crashes
3. Specialize & Strip Overhead
Region won’t support mega-scale; real niche demand (A2A2, grazing, on-farm bottling, local brand); you like marketing
– Match genetics/cow type to niche- Cut anything not serving the premium- Build direct customer pipeline- Get comfortable with people, not just cows
Swap FMMO risk for niche margin; can feel like 22–23 $/cwt effective price; differentiation protects you
Customer risk replaces market risk; lose a key buyer = scramble; requires marketing skills most don’t have
4. Plan Strategic Exit
Full cost clearly >21 $/cwt; worn out; no clear successor; equity preservation matters more than legacy
– Price cows & heifers NOW (3,010 $ heifers, 1,800–2,000 $ cows vs. 1,400 $ distressed)- Model liquidation value vs. forced sale- Talk to family, lender, lawyer- Set timeline before bank sets it for you
Preserve 30–40% more equity than distressed sale; protect family balance sheet; exit with dignity
Emotional cost is brutal; end of generational identity; no second chance if you wait too long and values crash
Path 1: Fix the Cost Structure (Start in the Next 30 Days)
When it makes sense You’ve got a solid facility, decent cow flow, and debt that isn’t already crushing you. You’re willing to cut pet expenses and sacred cows — literal and figurative — if the numbers say they should go.
What it takes You do a full, honest cost‑of‑production run — no “back of the napkin,” no ignoring family living. You list specific cuts or changes: maybe it’s dropping one rented parcel that never pays, changing TMR ingredients, or burning down non‑productive machinery. You hunt for easy nickels: better components, SCC premiums, co‑op quality bonuses.
The limits You can cut your way into survival. You can also cut your way into burnout if you don’t know where to stop. This path works best when your full cost is within 1–2 $/cwt of the forecast price and the barn math says you can close that gap.
Path 2: Scale or Align — If Your Region Wants More Milk
When it makes sense You’re in a growth corridor — Texas Panhandle, I‑29, Idaho, parts of the Southeast — where processors are actively adding capacity and courting new milk.
The play You either add cows significantly or tie your existing string into a long‑term supply relationship. That might be a direct contract with a cheese plant, a guaranteed‑volume arrangement through your co‑op, or a barn expansion that moves your average cost per cwt down as you fill stalls.
The catch You gain a better basis and potentially more stable premiums. You give up flexibility and take on more fixed costs. If Class III spends another year flirting with the mid‑teens, highly leveraged big herds feel that pain faster and harder than smaller, lightly leveraged ones.
Path 3: Specialize and Strip Overhead
When it makes sense You’re in a region where you’ll never out‑scale the 4,000‑cow outfits, but there’s real demand for something different — higher components, grazing‑based milk, A2A2, on‑farm processing, or a branded local product.
What it requires You match your genetics, cow type, and farm layout to that niche. You cut anything in your cost stack that doesn’t feed the niche premium. You get comfortable with marketing and people, not just cows.
The trade‑off You swap FMMO risk for customer risk. Lose a key buyer, and you’re scrambling. But if the niche is real — and if you execute — you can turn a 19‑dollar commodity environment into something that feels more like 22–23 $/cwt on your milk check.
Path 4: Plan an Exit While Cows and Heifers Are Still Worth Real Money
When it makes sense Your full‑cost number is clearly above 20 $/cwt, you’re worn out, and the successor plan is blurry or non‑existent.
What it looks like You look straight at the current replacement and cull values. In 2025, replacement heifers averaged around 3,010 $, and many good cows would bring 1,800–2,000 $; in a forced or distressed liquidation, those numbers can slide toward 1,400 $ for cows. That’s a 450 $/head swing. Across 300 cows, that’s roughly 135,000 $ that either lands in your bank account or disappears if you wait too long.
The hard part Emotionally, this is the toughest path. Practically, it can be the one that protects the most family equity and gives the next generation the best footing — whether they farm or not.
Key Takeaways
If your full‑cost breakeven is above 21 $/cwt, 19.70 milk isn’t a rough patch — it’s a slow equity bleed. Either fix the cost, add a margin, or set a clear exit timeline before the bank or your health sets it for you.
If you’re in a processing growth zone and your true cost per cwt is competitive, scaling or aligning with a plant can turn 19‑dollar milk into a workable long‑term play — but only if you respect the leverage and build a genetics pipeline that keeps replacements affordable.
If your proof sheets show a long tail of low‑NM$ or low‑index cows and heifers, feeding them is a choice — culling the bottom slice and only raising replacements from the top half of your ranking is one of the cleanest ways to lift dollars per cwt without adding a single stall.
If you can’t run your own barn math in the next 30 days, you’re flying blind — the biggest risk to your operation isn’t the market, it’s not knowing exactly where your kill zone starts in dollars per cwt.
The Bottom Line
The farm is what you do; it isn’t who you are. The numbers in this scorecard are brutal, but they’re about a system — debt, policy, processors, and markets — not your worth as a producer, a parent, or a neighbor. If walking through this math makes your chest tight or your stomach knot up, that’s not weakness. That’s your body saying the load is heavy. Talk with someone you trust — spouse, vet, lender, neighbor. And if it feels like too much, you can call or text 988 in the U.S., or reach out to farm‑focused supports like Farm Aid or Do More Ag, and talk to someone who understands what you’re carrying.
Then, with your own cost per cwt and best‑guess 12‑month milk price written down in front of you, decide: are you going to fix, scale, specialize, or exit? And before six more milk checks hit the mailbox, what single move — cull list, genetics plan, risk‑management conversation, or succession step — are you willing to make so your herd doesn’t quietly slide deeper into the kill zone?
Complete references and supporting documentation are available upon request by contacting the editorial team at editor@thebullvine.com.
Learn More
Maximizing Your Milk Check: The 2025 Guide to Component Pricing – Stop leaving money in the parlor. This guide exposes the specific component thresholds required to outrun rising input costs and delivers a tactical roadmap for adjusting rations to capture every possible premium on your next check.
The Year of the Great Divide: Navigating Dairy Consolidation – Secure your operation’s future against aggressive structural shifts. This analysis breaks down the economic forces hollowing out the middle market, arming you with the long-term positioning strategies needed to survive the next five years.
Precision Breeding: Using NM$ to Outrun the Commodity Trap – Outrun the commodity trap with data-driven selection. This deep dive reveals how leveraging Net Merit (NM$) and genomic testing creates a high-efficiency herd, giving you a decisive competitive advantage in a low-margin environment.
The Sunday Read Dairy Professionals Don’t Skip.
Every week, thousands of producers, breeders, and industry insiders open Bullvine Weekly for genetics insights, market shifts, and profit strategies they won’t find anywhere else. One email. Five minutes. Smarter decisions all week.
Jakob Stevens just sued Nutrien, Mosaic, CF Industries, Koch, and Yara. His math: 85% of the 2022 fertilizer spike wasn’t gas prices. It was them.
Executive Summary: Jakob Stevens sued the fertilizer giants: Nutrien, Mosaic, CF Industries, Koch, Yara, and Canpotex. Fire Creek Farms leads the class action alleging price collusion for 2021–2023. DOJ’s on it too. Texas A&M says natural gas drove 15% of the spike. The other 85% hit your 500‑cow dairy for $43,500 extra in 2022. That’s $0.35/cwt sneaking into your milk check. Test your manure this month. Recalibrate to MRTN. Time those buys right. The court might take years. Your pit’s got nitrogen now.
On March 7, 2026, New York farmer Jakob Stevens filed what may be the first class‑action lawsuit to put a number on what fertilizer price collusion costs U.S. farms. His family operation, Fire Creek Farms, is the lead plaintiff in Stevens et al v. Nutrien AG Solutions et al (No. 1:2026cv02585, U.S. District Court, Northern District of Illinois). The defendants: Nutrien AG Solutions, Mosaic Company, CF Industries, Koch Agronomic Services, Yara International, and the Canpotex export consortium. The complaint alleges their conduct pushed fertilizer prices above competitive levels during 2021–2023. All of the defendants deny wrongdoing or are expected to contest the allegations; none of these claims has been proven in court.
You don’t have to wait for a verdict to see what that window did to your own invoices.
University of Illinois farmdoc economists Gary Schnitkey, Nick Paulson, and Carl Zulauf tracked what happened in real time. In September 2021, total fertilizer cost on Illinois corn ground averaged $175 per acre. Twelve months later, it was $247 per acre. That $72‑per‑acre jump, applied to a 500‑cow Midwest dairy running 500 acres of corn silage and 300 acres of alfalfa, works out to roughly $43,500 in extra fertilizer in a single crop year — before you talk about fuel, interest, or labor.
What the Companies Made — and What You Paid
Start with the scoreboard the fertilizer giants filed themselves.
Nutrien reported $7.7 billion in net earnings in 2022. By 2024, full‑year net earnings had dropped to $700 million — still big, but less than a tenth of that peak. Mosaic booked $3.6 billion in 2022 net income, according to its year‑end SEC filing. CF Industries reported $3.35 billion in 2022 net earnings attributable to common stockholders, up from $917 million in 2021 on the same metric. Those are audited numbers, not allegations.
Company
2021
2022
2024
Nutrien
$2.1
$7.7
$0.7
Mosaic
$1.3
$3.6
$1.1
CF Industries
$0.9
$3.4
$1.2
Now look at your side of the ledger. In Illinois — a good stand‑in for Corn Belt pricing — anhydrous ammonia averaged $788 per ton on September 23, 2021. By September 22, 2022, it was $1,318 per ton. Earlier that year, prices blew past $1,600 per ton through April before easing. The previous record, set during the 2008 commodity spike, was $1,161 per ton. That record was already history by October 2021.
Benton County, Iowa, farmer Lance Lillibridge put his own numbers on it in a Brownfield Ag News interview. “In January, I was buying anhydrous ammonia for $490 a ton,” he said, talking about 2021. “In February of this year, ammonia was $850 a ton. The price difference in corn is about 20 cents less right now than it was in 2021.” Same product. Same acres. A very different risk.
Lillibridge raises corn and Red Angus cattle near Vinton, not dairy cows, but his math is your math if you grow your own feed. “When we’re jacking up prices of fertilizer 77% on a product that’s actually in the states right now and in warehouses because of something that’s happened half a world away, that’s not right,” he told Brownfield. He’s saying out loud what a lot of people only muttered at the counter.
How Much of Your 2022 Fertilizer Bill Was “Market” — and How Much Was Margin?
You heard the explanation at the time: Russia, Ukraine, natural gas, logistics. All real. All ugly. But not the whole story.
Texas A&M’s Agricultural and Food Policy Center (AFPC) took that story apart in a study commissioned by 21 state corn organizations. They tracked what portion of the anhydrous ammonia price spike from late 2020 through October 2021 could be pinned on its main input, natural gas. Their conclusion: natural gas accounted for only about 15% of the price increase.
Month
Anhydrous Ammonia ($/ton)
Henry Hub Natural Gas ($/MMBtu)
Sep 2020
$380
$2.10
Mar 2021
$490
$2.65
Sep 2021
$788
$5.15
Feb 2022
$1,425
$4.85
Apr 2022
$1,635
$6.80
Oct 2022
$1,318
$5.45
The total increase in anhydrous ammonia over that window was roughly $680–$688 per ton, depending on the exact date. Of that, only about $102 per ton traced back to higher natural gas costs. The remaining $580‑ish per ton — around 85% — reflected other factors: supply/demand shifts, capacity decisions, trade policies, and market power. “The suggestion that recent increases in the price of natural gas are the primary reason for increases in the prices of nitrogen products is highly suspect,” the AFPC report stated.
AFPC’s model farms saw nitrogen costs increase by $52.07 per acre. That’s not a Twitter hot take; it’s a land‑grant economist with a spreadsheet. And AFPC never said that 85% of the increase was collusion. They said natural gas explains only a small slice. In a market where a handful of firms dominate production, that disconnect is part of why farmers like the owners of Fire Creek Farms are now asking a federal judge to look harder at pricing behavior.
The Barn Math: Follow Your Own Invoice
Let’s walk through the numbers so you can run them on your own acres.
Assumptions (from farmdoc daily, September 2022):
500 acres of corn silage at 220 bu/acre yield potential
170 lbs of N per acre from anhydrous ammonia (MRTN rate)
DAP and potash are applied at maintenance rates
300 acres of alfalfa receiving P‑K applications
Illinois AMS fertilizer prices:
Input
Sept 2021 Price
Sept 2022 Price
Change
Anhydrous ammonia
$788/ton
$1,318/ton
+$530/ton
DAP
$633/ton
$947/ton
+$314/ton
Potash
$475/ton
$857/ton
+$382/ton
Corn fert/acre
$175/acre
$247/acre
+$72/acre
On your 500‑acre corn base, that $72/acre increase is $36,000. On 300 acres of alfalfa, a reasonable maintenance P‑K program under those price swings adds roughly $4,000–$7,500, depending on soil tests and removal.
Component
Sept 2021 ($/acre)
Sept 2022 ($/acre)
Nitrogen (anhydrous)
$95
$155
Phosphate (DAP)
$52
$78
Potash
$28
$14
Total
$175
$247
Total: $40,000–$43,500 in extra fertilizer spend.
Break it down per cow and per cwt for a 500‑cow herd:
500 cows shipping roughly 68 lbs/day each will ship about 12.5 million lbs per year — that’s 125,000 cwt.
At $0.35/cwt in additional costs, a cow producing 25,000 lbs/year is costing you $87.50 more just in fertilizer overhead — before she even hits the parlor.
Swap in your own acres, rates, and invoices, and you’ll get your number. A thirty‑five‑cent hit doesn’t sound like much until you lay it over a year where your margin is already thin. When your milk check is at $14.59, and your cost of production is over $20.50, an invisible $40,000 leak isn’t background noise. It’s a trap.
Who Really Controls Your Fertility Budget?
You’ve heard pieces of this before. When you see it all in one place, it hits different.
Between 1984 and 2008, the number of nitrogen‑producing firms in the U.S. fell from 46 to 13 — a 72% reduction. Over the same period, the count of active ammonia plants dropped from 59 to 22. By 2018, the four largest producers controlled about 75% of total U.S. ammonia output.
Metric
1984
2024
Number of nitrogen-producing firms
46
13
Active ammonia plants
59
22
CF Industries alone held 38.8% of domestic anhydrous ammonia capacity and 50.2% of UAN capacity in 2021, according to comments the American Soybean Association filed to USDA’s “Access to Fertilizer” docket. AFPC’s 2024 update put CF, Nutrien, Koch, and Yara‑USA at roughly three‑quarters of U.S. nitrogen production between them.
In potash, North American capacity is dominated by a couple of players, with Canada’s Canpotex consortium coordinating offshore sales by agreement. Mosaic petitioned for anti‑dumping duties on phosphate imports in 2020. CF filed petitions that led to preliminary anti‑dumping margins of up to 127.19% on Russian UAN and 63.08% on Trinidadian UAN in early 2022. Those cases were brought under U.S. law and upheld by trade authorities at the time.
Every one of those moves was legal. Taken together, USDA and AFPC analysts say they’ve contributed to a more concentrated market and less competitive pressure on the domestic prices farmers face. So when someone tells you your 2022 fertilizer bill was “just the market,” it’s fair to ask which market they mean — the global gas market, or a domestic nitrogen market where a small number of firms have outsized influence over how much ammonia gets produced and the price range it trades in.
If DOJ Wins, Do You Ever See a Check?
Short version: probably not in time to help your 2027 plan, and maybe not at all.
The best precedent is the potash price‑fixing litigation that’s been grinding through the same federal court in Chicago since 2008. Mosaic and Potash Corporation of Saskatchewan each paid $43.75 million, with Agrium adding $10 million, for a total of roughly $97.5 million. Russian and Belarusian producers contributed another $12.5 million. Between 3,000 and 5,000 potash buyers made up the class, mostly wholesalers and direct buyers.
Farmers who bought potash through co‑ops or retailers were “indirect purchasers.” Some recovered through separate state‑level settlements, but not much, and it took years.
And there’s another catch. Criminal antitrust fines go to the U.S. Treasury, not to you. Any direct farmer payout would come through the civil case. Antitrust damage claims typically carry a four‑year statute of limitations under Section 4B of the Clayton Act. The clock usually starts when the overcharge happens, though courts can extend it under the discovery rule or the “continuing violation” doctrine.
A lot of your biggest fertilizer checks for 2022 were written in the spring of that year. Four years from spring 2022 is spring 2026. That’s right now.
If you think your operation took an unusually large hit, talk to a U.S. lawyer who understands antitrust and class actions instead of assuming someone else’s case automatically covers you. The Stevens lawsuit and any DOJ or USDA actions are about alleged past behavior. They don’t fix your next fertilizer bill.
Here’s the turn nobody in the DOJ coverage is giving you: regardless of what any court decides, you’ve still got levers to pull on your own operation. The collusion question is interesting. But the nitrogen sitting in your manure pit right now is actionable.
Are You Getting Paid for the Nitrogen Already in Your Pit?
A 500‑cow dairy throwing off 2.5 to 3 million gallons of liquid manure a year is already sitting on a big chunk of its own nitrogen. Typical dairy slurry runs 25–35 lbs of total N per 1,000 gallons, with 40–60% of that plant‑available in year one. Spread across your corn ground, that’s roughly 50–100 lbs of plant‑available N per acre, with most herds falling in the 60–90 range.
If you’re only crediting 40 lbs of N per acre for manure in your plan — off a book value from an old extension table — and your manure is actually delivering 80, you’re buying about 40 lbs of nitrogen per acre that you don’t need. At 82% N in anhydrous, that’s about 49 lbs of product per acre, or 0.024 tons. At $850/ton — roughly where Lillibridge saw prices in early 2026 — that’s $20–$21 per acre, or $10,000–$10,500 across 500 corn acres.
That’s just from bad crediting. No collusion required.
Extension work from Virginia Tech and Ontario shows that injection can more than double plant‑available nitrogen recovery compared to splash‑plate or surface broadcast on the same gallons. At the 2022 peak nitrogen prices, that extra recovery pencils out to roughly $50–$62 per acre in fertilizer value on every field where you switch from broadcasting to injection.
The key is that your Nutrient Management Plan has to catch up. If you’re injecting but your plan still assumes broadcast losses, you’re leaving money on the table twice — overbuying fertilizer and under‑documenting your stewardship.
30‑day action: Before you plant another acre, pull a current manure sample and send it to a lab. Bring the results and your last two years of fertilizer invoices to your agronomist. Ask one question: “If we assume injection on my closest corn fields and use these lab numbers, how many pounds of purchased N can we cut — and on which fields?”
What Can You Actually Change in Your Nutrient Plan Before the 2027 Crop Year?
The Corn Nitrogen Rate Calculator that Schnitkey and his team helped build gives you a Maximum Return to Nitrogen (MRTN) rate for your soil region, at today’s corn and N prices. At a $5.50 corn price and $1,318 per ton anhydrous, the September 2022 Illinois conditions — MRTN rates ran from 157 lbs of N/acre in northern Illinois to 185 lbs in the south.
Farmdoc’s Precision Conservation Management data shows profit peaks right at those MRTN rates — not at the higher “just in case” rates a lot of us grew up with. Profits actually improve when you cut back to the university recommendation at current prices. On 500 acres at $850/ton ammonia, a 20‑lb/acre reduction saves roughly $5,200 in N without touching yield.
Nitrogen Rate (lbs/acre)
Yield (bu/acre)
Gross Revenue ($/acre)
Fertilizer Cost ($/acre)
Net Return ($/acre)
“Typical” Rate (180 lbs)
218
$1,199
$93
$1,106
MRTN Rate (160 lbs)
217
$1,194
$83
$1,111
But here’s the trade‑off: if you’ve got fields where yield is limited by drainage, soil type, or compaction, nitrogen isn’t the bottleneck. Cutting rates there won’t help. It’s a field‑by‑field question, not a blanket one.
90‑day action: Run the MRTN calculator for your state and soil region at current prices. Then ask your agronomist, “Why are we above this number?” If they can’t show you a clear, field‑specific reason, that’s a red flag.
And timing matters as much as rate. Farmdoc’s price series shows farmers who locked in anhydrous in late summer or early fall 2021 paid $700–$800 per ton. Many who waited until spring 2022 wrote checks for $ 1,400+. That’s a $600/ton spread. On a 500‑cow outfit using 50 tons of product, that’s a $30,000 timing mistake.
Track three numbers once a month: NOLA barge urea, Henry Hub natural gas, and your co‑op’s current quote vs where you locked last year. When urea and gas fall back toward long‑term averages, and your local quote follows, that’s your buy window.
365‑day action: Before fall 2026, decide what percentage of your 2027 N you’re comfortable locking at a threshold tied to gas and urea. Write that threshold down. Share it with your lender and supplier so emotion isn’t driving the call.
Key Takeaways
If your 2022 fertilizer cost per acre on corn was north of $247, you were above the Illinois state average at the peak. If you’re well above it, you owe yourself an “invoice autopsy” by field.
If your manure analysis is older than two years — or you’ve never done one — assume you’re either under‑crediting nutrients or over‑applying somewhere. A $40–$60 test can unlock $10,000+ in annual N savings at today’s prices.
If your agronomist can’t show you MRTN rates for your soils at current prices, you’re not having an economics conversation. You’re having a tradition conversation.
If you haven’t looked at when you buy — only what you buy — you’re leaving timing money on the table. In 2021–2022, that timing penalty was $600 per ton for some farmers on anhydrous.
If your 2021–2023 fertilizer documentation lives in a shoebox, you’re not ready if this class action or similar cases move forward. Courts and lenders both run on paper.
The Bottom Line
Whatever DOJ proves, and whatever happens to Nutrien, Mosaic, CF, Koch, Yara, and Canpotex in court, none of that writes the check that covers your 2027 crop. A U.S. judge might sign off on a settlement in 2030. Your lender wants to know what your fertilizer plan looks like at renewal this fall.
Before you make another purchase, ask yourself one hard question: If nitrogen jumps again — whether it’s war, weather, or something else — have you actually pulled every lever you control, or are you still just signing whatever shows up on the counter?
If you want the deeper margin modeling behind this, our breakdown of feed costs and hidden economics is the next stop. And keep an eye on The Dairy Trap Files: Input Costs — fuel and custom harvest are up next. Same pattern.
This article is based on publicly available information as of March 14, 2026, and is for general informational purposes only. It is not legal advice.
Complete references and supporting documentation are available upon request by contacting the editorial team at editor@thebullvine.com.
Learn More
MANURE TO MONEY: How Smart Dairy Farmers Are Turning Waste into Serious Profits – Slash thousands from your input bill by viewing your pit as a high-margin asset. This guide reveals how to transform manure from a liability into liquid gold, delivering the specific ROI benchmarks needed to reclaim your margins today.
$14.59 Milk, $20.54 Costs: The $182,850 Margin Trap Squeezing 500‑Cow Herds – Gain a clear-eyed framework for surviving the structural “deadly middle” that’s currently squeezing mid-sized herds. This report exposes the hidden market forces at play, arming you with the strategic clarity needed to protect your equity through 2027.
Why In-Season Manure Application Will Transform Your Dairy’s Bottom Line – Capture a 10-15% yield bump by disrupting your traditional nutrient cycles with emerging application tech. This analysis delivers the methodology for precision in-season delivery, allowing you to bypass price-gouging volatility and capture maximum nitrogen efficiency.
The Sunday Read Dairy Professionals Don’t Skip.
Every week, thousands of producers, breeders, and industry insiders open Bullvine Weekly for genetics insights, market shifts, and profit strategies they won’t find anywhere else. One email. Five minutes. Smarter decisions all week.
Processor math reveals the brutal truth: If you aren’t in the direct-supply lane, you’re likely financing someone else’s expansion.
Executive Summary: $333M processor rush: Schreiber ($133M yogurt) and Bel ($200M Babybel) double capacity in PA/SD. Rod Hissong’s $5M Schreiber contract gains $165K–$330K/year. 200‑cow pool farms get $1K–$7K. 30‑to‑1 premium gap. PA’s 490 farm exits flip leverage to herds like Mercer Vu. FO30 down $5.42/cwt. Run your numbers: co‑op routing % + SCC <150K? +$0.50/cwt floor to switch lanes. Processor Math asks: where’s your share?”
Rod Hissong ships 33 million pounds of milk a year to Schreiber Foods’ Shippensburg, Pennsylvania, plant — at least .06 million in annual revenue from that one relationship, using the Federal Order Class II minimum of .34/cwt(USDA, February 2026) as a floor. When Schreiber’s new yogurt line hits full stride, that same expansion could add $165,000–$330,000/year to his milk check, while a 200‑cow co‑op farm in the same sourcing zone might only see $1,150–$6,900 from the same announcement — depending on how premiums wash through the pool.
Two days after that Schreiber news, Bel Group broke ground on a 0 million expansion in Brookings, South Dakota, to double Babybel production from 10,000 to 20,000 tons per year and double its milk intake from American farms, primarily in South Dakota and neighboring states. Together, those two projects add 3 million in dairy processing capacity to regions where milk is already concentrating into fewer, larger herds — and where contract structure quietly decides who actually gets paid.
Mercer Vu Farms — Hissong’s operation in Mercersburg, PA — milks about 3,600 mature cows, farms 5,500 acres, and produces roughly 100 million pounds annually. Glenn and Mae Hissong started that herd with 7 cows in 1949; today, about one‑third of Mercer Vu’s production, around 33 million lbs/year, goes straight to Schreiber. The rest moves through Land O’Lakes.
The “average” Schreiber‑zone producer looks very different. The Center for Dairy Excellence’s 2025 survey pegs average responding herd size at 152 cows, while the USDA puts the statewide Pennsylvania average closer to 106 cows. Even using 152, that’s roughly 3.5 million lbs/year per farm — about a tenth of Mercer Vu’s Schreiber volume.
Schreiber’s 109,000 lbs/day: Same Expansion, Very Different Milk Checks
Governor Shapiro’s office says Schreiber’s Shippensburg project will add 109,000 lbs of raw milk processing per day, or about 39.8 million lbs/year, across 165 farms in 11 counties. Under realistic premium scenarios, that looks like this:
Farm Profile
Annual Schreiber Volume
Premium Scenario
Annual Impact (barn math)
Mercer Vu (~3,600 cows, direct)
~33M lbs
+$0.50/cwt
+$165,000 (33,000 cwt × $0.50)
+$1.00/cwt
+$330,000 (33,000 cwt × $1.00)
200‑cow farm (direct, 50% to Schreiber)
~2.3M lbs
+$0.50/cwt
+$11,500 (23,000 cwt × $0.50)
+$1.00/cwt
+$23,000 (23,000 cwt × $1.00)
200‑cow farm (co‑op pool, indirect)
Pooled
+$0.05–$0.15/cwt (diluted)
+$1,150–$3,450 (23,000 cwt × $0.05–$0.15)
+$0.10–$0.30/cwt (diluted)
+$2,300–$6,900 (23,000 cwt × $0.10–$0.30)
Those premium bands line up with historical $0.25–$1.00/cwt over‑order and contract premiums discussed by agricultural economist John Janzen in Progressive Dairy, and with the pooling math laid out by Mark Stephenson and Andrew Novakovic for the Center for Dairy Excellence. Their work shows that when only 20–30% of a co‑op’s milk goes to premium‑paying buyers, those premiums are “seriously diluted” across all member pounds.
Same expansion. Same counties. A difference that can approach 30‑to‑1 between the top and bottom rows.
Farm Profile
Conservative Premium (+$0.50 or +$0.10 pooled)
Higher Premium (+$1.00 or +$0.30 pooled)
Mercer Vu (3,600 cows, direct)
$165,000
$330,000
200-cow farm (direct, 50% to Schreiber)
$11,500
$23,000
200-cow farm (co-op pool)
$2,300
$6,900
If your milk only reaches an expanding plant through a pool, you’re living in that bottom row — even if the press release name‑checks your state.
Concentration Gravity: From Shippensburg to Brookings
What’s happening in south‑central Pennsylvania is part of a broader concentration gravity: processor capital chasing large, “right‑priced” milk blocks.
On the PA side, Schreiber can pick up its extra 39.8 million lbs/year largely by deepening commitments with a handful of big direct shippers like Mercer Vu and adding a smaller number of mid‑size farms that can meet yogurt‑grade quality. Janzen’s line — “it’s much easier to sign up 10 2,000‑cow farms than 100 200‑cow farms” — is the procurement cheat code.
On the SD side, that same gravity is even stronger:
Valley Queen’s 2025 profile highlights 39 farms milking around 95,000 cows — about 2,400 cows per farm, all within reasonable hauling distance.
South Dakota has been one of the fastest‑growing milk states in the U.S., while national herd numbers slowly shrink.
Agropur (Lake Norden), Valley Queen (Milbank), and Bel (Brookings) now form a cheese/snack corridor that can staff expansions with local 2,000‑ to 5,000‑cow herds instead of courting hundreds of smaller shippers.
Bel’s press release says Brookings currently produces 10,000 tons/year of Babybel and will double to 20,000 tons, “doubling milk sourcing from American dairy farms, primarily in South Dakota and neighboring states.” Earlier coverage around the original Brookings plant pegged its draw at about 15,000 cows; doubling production implies a similar additional draw.
The more easily Bel, Agropur, and Valley Queen can fill new vats with I‑29 corridor milk, the fewer basis‑premium “relief valves” remain for smaller herds shipping in from border states. That shows up later as weaker premiums and fewer calls when plants are short.
What Does Bel’s Expansion Really Mean for a 500‑Cow SD Herd?
South Dakota’s starting price floor is very different from Pennsylvania’s.
Federal Order 30 data show an Upper Midwest Statistical Uniform Price of $15.05/cwt in January 2026, down $5.42 from $20.47/cwt in January 2025, and among the lowest uniform prices across the FMMOs at that point. American Farm Bureau’s analysis of the June 2025 FMMO changes estimates that, in the first three months, higher allowances alone will result in about $64 million in lost revenue to the Upper Midwest pool.
A 500‑cow SD herd producing roughly 11.7 million lbs/year sits at about $1.76 million of gross milk revenue at $15.05/cwt.
Bel’s expansion doubles Babybeladd’s output to 20,000 tons and puts another $200 million into the Brookings site. Translate that into barn‑math scenarios for a 500‑cow herd:
Factor
Direct Contract
Co-op Pool
Premium Potential (500-cow herd, SD example)
+$58,500–$117,000/year ($0.50–$1.00/cwt over FMMO)
+$5,850–$17,550/year (diluted +$0.05–$0.15/cwt across all pool lbs)
More flexibility on month-to-month quality variance; still need to meet minimum FMMO standards
Volume Commitment
3–5 year agreement typical; specified daily/monthly minimums; limited flexibility to expand/shrink without renegotiation
Ship what you produce; flexibility to grow/contract herd size without contract amendments
Payment Protection
Termination risk if plant closes, finds cheaper supply, or cites quality “for cause”
Federal Order payment security; pool guarantees you get paid even if processor fails
Upside Capture
You get full premium when processor wins (e.g., +$0.50–$1.00/cwt for specialty cheese/yogurt)
Premium dilution: your milk subsidizes pool members farther from premium plants
Exact over‑order numbers are contract‑specific and not public, but these ranges reflect real SD “right‑price” conversations and are consistent with historical premium levels along the corridor.
Scenario
Volume & Price
Annual Impact (barn math)
Base case (pool only)
11.7M lbs at $15.05/cwt
$1.76M (117,000 cwt × $15.05)
Direct lane, +$0.50/cwt
11.7M lbs at $15.55/cwt
+$58,500 (117,000 cwt × $0.50)
Direct lane, +$1.00/cwt
11.7M lbs at $16.05/cwt
+$117,000 (117,000 cwt × $1.00)
Pool farm, diluted +$0.05–$0.15/cwt corridor lift
11.7M lbs at $15.10–$15.20/cwt
+$5,850–$17,550 (117,000 cwt × $0.05–$0.15)
Lynn Boadwine — who milks more than 2,000 cows near Baltic and has been a visible voice for SD dairy recruitment — summed up the processor logic bluntly: “You don’t want to have the highest price raw material for those folks, so they’re not going to move here. We’ve got to be right-priced to attract a processor.”
When a region can keep landing plants and keep farm‑gate prices “right‑priced” for processors, it’s not just growing local capacity. It’s slowly shifting where processors feel comfortable cutting bigger checks.
490 Pennsylvania Farms Gone — and Why That Flips the Leverage
Now flip back to Pennsylvania, because Hissong’s leverage sits on top of a changing supply base.
Looking at the USDA’s Milk Production report, notes that Pennsylvania lost 490 licensed dairy farms in 2025, dropping from 4,940 to 4,360 dairies — an 11.7% decline and about 41% of all U.S. dairy farm exits that year. Cow numbers fell by around 4,000 head to roughly 465,000, and state milk volume slipped 0.5% while national production rose3.4%.
Schreiber has operated its Shippensburg plant since 2002. By locking in a $132.9 million expansion and 47 new jobs there, the company is effectively tethering more of its future yogurt strategy to south‑central PA.
Put that together:
Fewer herds.
Slightly fewer cows.
More processing demand backed by fresh capital.
For a large, proven direct‑ship supplier like Mercer Vu, that’s the moment the math flips. He’s no longer just one more shipper in a crowded market; he’s one of the relatively few large herds Schreiber can’t easily replace.
For a 200‑cow farm shipping into a co‑op pool, it raises the stakes on whether your co‑op is at the Schreiber table or repositioning milk into lower‑value outlets.
When Hissong said it’s “exciting and commendable for Schreiber Foods to continue investing in this plant” rather than chasing expansion “in West Texas, New York and other areas,” he was also naming the alternative: that $133 million could’ve gone somewhere else. pa
Trevor Farrell, Schreiber’s president, underlined that intent: “This expansion reinforces our long-term commitment to this area.”
Big capital decisions like this lock in procurement patterns and premium maps for years. If your region isn’t seeing those announcements — or if you’re not inside the sourcing radius — you’re playing a different premium game than your peers in PA or SD.
The 90‑Day Playbook Before the Premium Window Closes
Processors usually build their supply base 12–18 months before an expansion line hits full utilization. After that, they mostly manage what they’ve signed.
If you’re anywhere near Brookings or Shippensburg, the next 90 days matter.
If You’re a 500‑Cow SD Herd in the Pool
In the next 30 days:
Pull your last 12 months of DHIA records. Write down the average SCC, bacteria count, fat %, and protein %.
If SCC is over 200,000 or SPC/bacteria over 20,000 cfu/mL, fix that first. That kind of quality noise kills a procurement conversation before it starts.
Call your co‑op field rep and ask three precise questions:
“Do we currently supply Bel Brookings, Agropur Lake Norden, or Valley Queen Milbank?”
“Roughly what share of my milk routes to each?”
“Are there any volume commitments tied to those plants I should know about?”
By 90 days out:
Ask SDSU Extension or SD dairy groups for named contacts in Bel, Agropur, and Valley Queen procurement. Don’t sit back and hope they find you.
Fix any bulk tank cooling problems — recorded temps above 40°F at two hours are a red flag for most audits.
Decide your minimum acceptable premium before you sit down. If Bel or a handler can’t clear your current blend by at least +$0.50/cwt on all lbs, your default assumption should be that staying in the pool is the safer play.
If You’re a 200‑Cow PA Farm in Schreiber’s Zone
This month:
Pull DHIA and tighten your own bar: for Class II yogurt, aim for SCC below 150,000, with <100,000 as the “best shot at premiums” goal.
If you’re at 180,000, that’s a 60–90 day barn‑level fix (dry‑cow program, milking routine, towels, prep).
Ask your co‑op explicitly: “Do we have a direct supply agreement with Schreiber Shippensburg? If yes, how much of that volume comes from farms my size?”
Then set your walk‑away number:
If your current blend is $15.05–$15.34/cwt, you probably need at least +$0.35–$0.50/cwt to justify a direct contract with tighter QA and termination clauses.
On 2.3M lbs, that’s about $8,050–$11,500/year. A +$0.25/cwt offer (~$5,750) may not be worth the extra risk when you can often find similar gains by tightening components and SCC inside the pool.
If You’re a 400–600‑Cow Herd Stuck in “We Should Talk.”
This week:
Call your actual processor contact — not the plant’s main line. If you don’t have a name and a number, that’s job one.
Prepare a one‑page supply proposal:
Average daily lbs.
12‑month quality stats.
Hauling logistics.
A specific offer like: “We can deliver 8 million lbs/year on a 3‑year agreement with 6‑month mutual termination.”
Then get a contract review. Janzen’s work on milk contracts points to “market conditions,” “quality failures,” and “termination for cause” clauses that quietly shift risk to the producer. A $500 legal review on a $2M/year contract is inexpensive risk insurance.
If you don’t have at least a term sheet by fall 2026, assume this specific Bel/Schreiber expansion wave is largely spoken for. You’ll still move milk. You may not be in the first row of premium seats.
What This Means for Your Operation
Your contract lane matters more than your ZIP code. A 500‑cow herd inside Bel’s or Schreiber’s direct‑supply lane can see $58,500–$117,000/year from a $0.50–$1.00/cwt premium. A similar herd shipping through a pool might see $5,850–$17,550 — or nothing direct.
Quality is the ticket, not the bonus. For higher‑value Class II and branded cheese, <150,000 SCC is the starting line, and <100,000 is the target for serious premium conversations. If you’re above that, your first processor‑math project is fixing cows and routines, not chasing contracts.
The co‑op pool is a conscious trade, not a default. You give up some upside — maybe $29,000–$58,500/yearon a 500‑cow SD herd — in exchange for flexibility and regulatory payment protections. For small and mid‑size herds, that can be the smart play if you’re choosing it with eyes open.
Expansion somewhere shifts leverage everywhere. When corridor states like SD keep landing plants and keeping milk “right‑priced” for processors, it slowly nudges leverage away from regions that aren’t seeing those investments. That shows up later as weaker over‑order premiums and tighter contract terms.
30‑day homework: Print your last 12 milk checks and DHIA summary. On one page, answer:
What % of your milk currently routes to a plant with announced expansion?
How many $/cwt above FMMO minimum are you actually getting?
How much of that spread is due to components/quality vs. processor premiums?
If you can’t answer those three without making a call, that’s your signal that the real story isn’t in Bel’s or Schreiber’s press release — it’s in the fine print of your own milk check.
Key Takeaways
If more than half your milk already ships to an expanding plant, you’re in the leverage band this article describes. Your decisions over the next 12–18 months are about terms and floors, not just having a home for your milk.
If all of your milk is pooled and none of it routes to an expanding plant, you’re probably subsidizing someone else’s premium. Your paths are: get into a sourcing radius, get into a different pool, or squeeze more out of components and costs where you are.
If you’re in that 300–500‑cow middle, you’re big enough that a good contract moves the needle, but small enough that you’re not the first call. Your edge is quality plus relationships — not waiting by the phone.
The Bottom Line
Whether you’re sitting in Franklin County or three states away, the practical question is simple: are you close enough — on paper and on quality — to be inside a processor’s premium lane, or are you quietly financing someone else’s expansion?
Complete references and supporting documentation are available upon request by contacting the editorial team at editor@thebullvine.com.
Learn More
The $212,000 Bulk Tank Lie Hitting Upper Midwest Dairies – Gain immediate margin by escaping the “test percentage” trap. This breakdown delivers a four-point playbook to rebuild culling and nutrition around the component pounds that actually drive your 2026 milk check, potentially recovering six figures in lost revenue.
The $100 Springer Gap: Dairy Farm Relocation Is Moving America’s Milk Map to I-29 – Exposes the structural “gravity wells” reshaping the American milk map. You’ll gain a strategic framework to evaluate relocation versus adaptation, arming your operation with the long-term positioning required to survive as processing capacity concentrates into specific growth corridors.
The $1750 Calf: Is Your 2026 Breeding Plan Leaving $800 a Head on the Table? – Reveals how to transform your breeding program into a high-margin revenue engine. This guide breaks down the precise genetic math needed to solve the heifer shortage while capturing massive calf premiums that finally offset unpredictable milk price volatility.
The Sunday Read Dairy Professionals Don’t Skip.
Every week, thousands of producers, breeders, and industry insiders open Bullvine Weekly for genetics insights, market shifts, and profit strategies they won’t find anywhere else. One email. Five minutes. Smarter decisions all week.
EU butter and SMP added €5.56/100 kg while the Dutch advance slid to €42.15. Until you chart that gap, you’re guessing what your contract is worth.
Executive Summary: In early 2026, EU butter and SMP prices added about €5.56/100 kg of product value while ZuivelNL’s average advance dropped to €42.15/100 kg — a gap worth around €200,000/year on a 400‑cow Dutch‑style herd. This article walks through the barn math that exposes the gap, using AHDB and EEX prices, standard butter/SMP yields, and ZuivelNL data, so you can plot the benchmark value against your own milk cheque. It then shows how FrieslandCampina’s 2023–2025 swing from loss to recovery, and the drop in early‑2026 advances, reveal the smoothing valve between markets and farm‑gate prices. From there, you get a four‑step playbook: chart the gap and put it in front of your buyer, run a “Scenario C” DSCR stress test on extra litres, audit notice and revision clauses in your contract, and decide whether you want any tools beyond the cheque as Euronext dairy futures roll out. The payoff is a set of 30‑ and 90‑day checks and longer‑term triggers so you can stop guessing what your contract is worth and start making expansion, debt, and contract decisions with your own two‑line chart in front of you.
ZuivelNL’s January 2026 advance milk price averaged €42.15 per 100 kg of standard milk, down €1.41 from December and well below January 2025’s level. Over the same window, EU butter and skim milk powder benchmarks rallied enough to add about €5.56 per 100 kg of milk to the value of a standard butter/SMP stream. If you’re running a 400‑cow Dutch‑style herd shipping around 3.6 million litres a year, that uplift is worth roughly €200,000/year on paper — if it actually landed in your cheque.
Month
ZuivelNL Advance Price (€/100kg)
Calculated Butter/SMP Product Value (€/100kg)
Jan 2025
44.20
45.80
Apr 2025
43.85
46.10
Jul 2025
43.50
45.50
Oct 2025
43.10
44.90
Dec 2025
43.56
44.20
Jan 2026
42.15
46.30
Mar 11, 2026
42.15
47.71
It didn’t. And that’s not a rounding error. It’s how your processor, your contract, and tight EU capacity decide who captures geopolitical premiums — and who pays the higher freight, fertiliser, and energy bills when a choke point like the Strait of Hormuz gets messy.
The Hormuz Shock vs Your Cheque
By January 2026, EU wholesale prices had quietly clawed back from the 2025 floor. AHDB put EU butter at about €4,252/tonne and skim milk powder at €2,097/tonne that month. Nobody was celebrating, but at least the slide had stopped.
Then the Strait of Hormuz blew up the script.
Late in February, US and Israeli forces hit targets in Iran, and Iran’s Revolutionary Guard threatened to block ships from entering or leaving the strait. Within days, tanker traffic through Hormuz had fallen to almost zero, and major carriers were rerouting ships around Africa. Analytics firm project44 tracked global shipping diversions jumping by more than 360% — from 218 per day on February 20 to 1,010 per day by March 1.
That corridor is a main artery for oil and key fertiliser inputs, such as sulfur. For you, that usually shows up as:
Higher freight on imported feed and inputs.
Higher fertiliser costs heading into planting.
Higher energy bills — right when you least need them.
Dairy markets reacted fast. At the March 3 Global Dairy Trade auction, SMP climbed 9.1%, mozzarella 7.9%, and butter 6.1%. By March 11, Daily Dairy Report data showed EEX March‑26 SMP at €2,603/tonne and butter at €4,580/tonne, both well above January levels.
Category
Butter Contribution (€/100kg milk)
SMP Contribution (€/100kg milk)
Total Commodity Uplift
ZuivelNL Advance Change
Jan–Mar 11, 2026
+1.41
+4.15
+5.56
-1.41
Your fuel and fertiliser suppliers probably moved prices within days. Your milk cheque? That’s a different story.
The Barn Math Behind the €5.56/100 kg Uplift
Most EU product‑value models use the same basic yields: 100 kg of standardised milk routed into a butter + SMP stream yields about 4.3 kg of butter and 8.2 kg of skim milk powder.
Take January to March 11, 2026.
Butter:
January EU wholesale: €4,252/tonne.
March 11 EEX March‑26: €4,580/tonne.
Change: +€328/tonne, or €0.328/kg.
SMP:
January EU wholesale: €2,097/tonne.
March 11 EEX March‑26: €2,603/tonne.
Change: +€506/tonne, or €0.506/kg.
Run that through the yields:
Butter: 4.3 kg × €0.328 ≈ €1.41 per 100 kg milk.
SMP: 8.2 kg × €0.506 ≈ €4.15 per 100 kg milk.
Total: ~€5.56 per 100 kg milk of extra product value between January and March 11.
Now scale it to a realistic Dutch‑style herd:
400 cows × 9,000 litres/cow/year = 3.6 million litres/year.
Treat 100 kg as roughly 100 litres for this exercise → about 36,000 “hundred‑kg” units.
36,000 × €5.56 ≈ €200,000 in extra annualised product value if 100% of that uplift flowed into your milk price.
But it’s not flowing through.
ZuivelNL’s international comparison shows the average European standard milk price trending downward through late 2025, with December around €43.56/100 kg. Their January 2026 advance was €42.15/100 kg, down €1.41 from December and well below the January 2025 level. That’s the opposite direction of the butter and SMP benchmarks.
So you’ve got a clear split:
Product value on a butter/SMP basis is up about €5.56/100 kg in a few weeks.
The average farm‑gate advance is moving down into the low‑€40s.
The size of the gap on your own farm will depend on your processor, your contract, and your product mix — but we’re not talking pennies.
The Processor Valve: Three Years of FrieslandCampina
To see how smoothing works in the real world, look at FrieslandCampina’s last three years.
In 2023, FrieslandCampina reported a net result of –€149 million, hit by weak commodity markets and €136 million in restructuring costs under its “Expedition 2030” plan. The average member milk price dropped to €48.08/100 kg, more than 16% below 2022, and there was no supplementary cash payment.
In 2024, the co‑op’s fortunes flipped. Operating profit climbed to about €527 million, with management crediting €315 million in cost savings from the restructuring. The average member milk price climbed to €52.95/100 kg, and FrieslandCampina reinstated a €1.21/100 kg supplementary cash payment.
In 2025, the recovery continued. FrieslandCampina’s full‑year member milk price reached €56.93/100 kg, with a €1.31/100 kg supplementary cash payment. The co‑op reported revenue of about US$15.85 billion and highlighted improved milk prices as a key driver. Its Half‑year Report 2025 showed operating profit up about 20% year‑on‑year and a strong pro forma milk price, driven mainly by the higher guaranteed price.
Across 2023–2025, the smoothing valve clearly worked both ways: co‑op members saw downside absorbed in 2023 and upside shared in 2024–25.
Year
Net Result (€M)
Member Milk Price (€/100 kg)
Supplementary Cash (€/100 kg)
2023
-149
48.08
0.00
2024
+527 (approx.)
52.95
1.21
2025
+450 (implied)
56.93
1.31
Now zoom back in on early 2026. ZuivelNL’s January 2026 advance price of €42.15/100 kg is well below the 2025 FrieslandCampina average. Your co‑op has just come off a strong year. Benchmarks for butter and SMP are bouncing. And your advance has dropped.
The tension here isn’t “Is my co‑op good or bad?” It’s: when benchmarks move and your input costs spike, how does your contract decide who carries the timing risk?
Not a Milk Shortage Story — It’s Capacity and Allocation
If you only watched futures, you’d assume Europe is short of milk. The physical data and pricing pressure say otherwise.
USDA’s 2026 EU Dairy and Products Annual expects EU‑27 cheese production to edge up by about 0.2% between 2025 and 2026 “at the expense of butter, nonfat dry milk, and whole milk powder.” Processors are nudging more milk into cheese and fresh products, and a bit less into commodity powders and butter.
ZuivelNL’s commentary on the January 2026 advance price is blunt: “The persistently strong growth in milk production remains a key contributing factor.” In other words, there’s plenty of milk. It’s the processor capacity and allocation, not a supply shortage, that drives the pricing pressure you feel.
At the same time, a February 2026 question in the European Parliament flagged regions where farm‑gate prices were 10–15 cents per litre below production costs, pushing producers toward exit. Rabobank’s early‑2026 outlook expects EU milk collections to be roughly 0.9% lower in 2026 as environmental limits and investment fatigue start to bite. That’s a small decline overall, but it’s not going to magically tighten your local market if your catchment is still heavy on milk and short on high‑value processing slots.
So no, Europe isn’t running out of milk. But it’s also not short enough, in the right places, to force processors to chase every litre with top‑end prices. They’re choosing where your litres go — and your contract decides how you get paid for them.
The Contract Lens: Who Can Move Faster — You or Your Buyer?
Most Dutch and Northwest European producers sit on some mix of:
Base (A‑volume) litres priced on a long‑term formula tied to branded, retail, and industrial business.
Flex (B‑volume) litres that bear more direct exposure to commodity swings and surplus outlets.
On paper, that mix gives you stability plus some market connection. In practice, three levers in your contract determine how much of a rally you actually feel.
1. The averaging window
If your price is based on a quarterly (or longer) average of reference prices, January and February’s weaker months get blended with March’s spike. That’s fine for smoothing an ugly year. It’s rough when your fertiliser, freight, and power costs reset in a matter of weeks, and your income catches up months later.
2. Where extra litres go when plants are full
When dryers or cheese plants are running flat out, extra litres don’t automatically land in butter, SMP, or premium cheese — no matter what futures say. ZuivelNL’s slide into the low‑€40s across late 2025 and early 2026 suggests a lot of milk was being pushed into lower‑value streams even as commodity benchmarks improved. If your expansion litres are first in line for those outlets, the extra cows you add during “good” times are actually tied to the risk of lower‑priced surplus in a stress year.
3. Who has the right to change what, and how fast
A Scottish Government‑commissioned study of UK dairy contracts turned up some eye‑opening asymmetries: in certain agreements, the buyer could change pricing methods with 30 days’ notice while the farmer needed 12 months’ noticeto leave the contract. That’s the kind of imbalance EU politicians have been trying to address.
National price indicators that can be used as benchmarks.
Options for revision clauses that allow contracts to be revisited when conditions change.
Rapporteur Céline Imart called it “a major victory for our farmers,” arguing that better contract rules and clear indicators will give producers a fairer place in the value chain. Even so, implementation across member states is expected to take 12–18 months. Until those rules hit your actual paperwork, the notice periods, volume tolerances, and revision rights you already signed are what really matter.
The Turn: Stop Only Reading the Cheque — Start Reading the Gap
Most producers can quote their average milk price off the top of their heads. Fewer can tell you how their price responds when benchmarks move sharply.
The real turn in this story is when you stop treating that disconnect as “just how it is” and start putting numbers to it.
The simplest way to start:
Pull your last 6–9 months of cheques — net price per 100 kg, month by month.
Pull the same months of butter and SMP prices from AHDB, your co‑op’s market reports, or EEX settlements.
Convert those into implied butter/SMP product value per 100 kg using the 4.3/8.2 yields.
Put both lines on the same chart: product value vs. your farm‑gate price.
If you see the top line jump by around €5.56/100 kg while your line drifts downward toward the low‑€40s — which is what ZuivelNL’s averages suggest for early 2026 — you’ve just drawn your contract’s timing and smoothing function. It’s no longer an abstract complaint. It’s a picture you can take to your buyer and your bank.
From there, the decisions get more interesting.
Four Moves to Understand and Narrow Your Contract Gap
1. Chart the Gap and Put It in Front of Your Buyer (Next 30 Days)
Build that two‑line chart for your own farm: monthly farm‑gate price per 100 kg vs. implied butter/SMP value per 100 kg over the last 6–9 months.
Action Step
What to Do
Deadline
Why It Matters
1. Chart the Gap
Build 2-line chart: your farm-gate price vs. butter/SMP product value. Send to buyer.
Next 30 days
Turns complaint into data. Forces buyer to explain who carries timing risk.
2. Stress-Test Expansion
Run Scenario C (extra litres at stress pricing) through DSCR calculation.
Next 90 days
If DSCR falls below 1.2, your expansion is a contract bet, not a cow bet.
3. Audit Contract Terms
Write down your notice periods, volume flex, and revision triggers. Compare to buyer’s.
Next 90 days
Asymmetry (12× worst case, 2–3× typical) decides whether you can pivot when markets turn.
4. Decide on Hedging Tools
Define trigger (e.g., if gap > €4 for 4 weeks, talk to advisor about hedging 10–20% volume).
Next 365 days
Your buyer and lender have tools to manage risk. You need to decide if you want any.
Then send it to your processor or co‑op contact with a short, professional note that:
Acknowledges 2023’s pain on both sides (co‑op loss, price cuts).
Acknowledges 2024–25’s recovery and the higher 2025 milk price.
Points to the early‑2026 pattern: benchmarks higher, advances lower.
The question isn’t “pay me more.” It’s: “When product value moves this fast while input costs spike, what can we do in our contract structure so farms see enough of that move in time to keep paying bills?”
You probably won’t walk away with a new clause tomorrow. But you’ll stop being just another supplier and start being the member who clearly understands how the value flows.
2. Run a Stress Scenario on Your Expansion Plan (Next 90 Days)
If you’re adding cows, robots, or a barn, you’re not just betting on “milk price goes up.” You’re betting on how your incremental litres are priced when plants are full, and exports are messy.
Build three scenarios for the extra litres only:
Scenario A – Smooth: Extra litres always get your current blended price.
Scenario B – Bumpy: Extra litres average a discount to your blended price in “normal” years.
Scenario C – Stress: In tight periods, extra litres earn significantly less than your current average, reflecting how surplus‑type volumes can be priced when advance prices are falling, as in late 2025–early 2026.
Run each scenario through your cash‑flow and debt‑service coverage ratio (DSCR) calculations. If your DSCR is, say, 1.35 at today’s blended price and falls to around 1.15 when you plug in a stress price for extra litres, you’re right at the point where many lenders start to get twitchy.
Scenario
Incremental Litre Pricing Assumption
Extra Annual Income (€)
Annual Debt Service (€)
DSCR
A – Smooth
Extra litres priced at current blended average (€52/100 kg)
+€520,000
€385,000
1.35
B – Bumpy
Extra litres average 5% discount to blended (€49.40/100 kg)
+€494,000
€385,000
1.28
C – Stress
Extra litres priced at stress-period rate (€42/100 kg, like Jan 2026)
+€420,000
€385,000
1.09
The exact thresholds will vary by bank, but once you fall below 1.2, most lenders view you as operating with very little margin for error. That’s not a reason to never expand. It’s a reason to make sure your expansion math reflects how your contract actually treats marginal litres when capacity is tight.
3. Audit Your Contract Terms — Especially Notice and Revision (Next 90 Days)
Most producers sign a contract once and then let it gather dust. In a year like this, that’s dangerous.
Get your contract out and write down:
How much notice do you need to give to change or leave?
How much notice does your buyer need to give to change pricing methods or key terms?
How much can you increase or decrease volume without penalty?
Whether there are explicit revision triggers tied to benchmarks or cost changes.
Use the Scottish study as a mental “worst‑case” benchmark: buyers with 30‑day flexibility vs. farmers needing 12 months to get out. Even if your contract isn’t that lopsided, knowing who can move faster is crucial when you’re deciding on debt and expansion.
Contract Type
Buyer Notice to Change Terms
Farmer Notice to Exit
Asymmetry Factor
Scottish “worst case”
30 days
12 months
12×
Typical NW Europe A-volume
90 days
6 months
2×
Flexible B-volume
30 days
3 months
3×
New EU-mandated (proposed)
90 days
90 days
1× (balanced)
The new EU deal around mandatory written contracts and revision options should improve this over time. But it doesn’t rewrite the document that governs your 2026 cash flow. Only you, your buyer, and — if it comes to it — your lawyer can do that.
4. Decide If You Want Any Tools Beyond the Cheque (Next 365 Days)
Big traders and commercial houses are clearly active in dairy derivatives. Research on dairy volatility since the late 2000s has documented more use of futures and options as markets opened up. Up to now, EEX has been the main European platform for butter and SMP futures.
From 2026, Euronext is set to launch European dairy futures — cash‑settled butter and SMP contracts based on the Vesper Price Index, initially covering the Netherlands, Germany, France, Belgium, Denmark, and Ireland. That’s not something you have to jump on. But it does mean your processor, your buyer, and your lender will have even more tools to manage their risk.
You don’t need to become a trader. You do need to be clear with yourself:
Are you comfortable having zero tools if your lender and buyer are both using them?
Would it make sense to define a small slice of volume you’d ever consider hedging — say 10–20% — if your own numbers scream “this is risky”?
A simple trigger might look like:
“If my implied butter/SMP value per 100 kg sits more than €4 above my contract price for four straight weeks, I’ll talk to my advisor about hedging a portion of volume for the following quarter.”
“If I lock in feed for six months, I’ll at least explore locking in a matching slice of income.”
You’re not trying to outsmart the market. You’re trying not to be the only player in the chain with no tools and all the exposure.
Signals to Watch: Is Your Gap Closing or Widening?
A few external signals will tell you whether this Dutch contract gap is likely to narrow or persist:
How your processor responds to the EU contract deal. Do you see draft written contracts, clear benchmark references, or discussion of revision clauses — or radio silence?
The relationship between ZuivelNL’s advance price and EEX benchmarks. If ZuivelNL advance prices stay around the low‑€40s while EEX butter and SMP hold near recent levels, there’s still margin sitting upstream.
Changes in local capacity and product mix. USDA’s 0.2% cheese uptick “at the expense of butter and powders” shows where processors want to send litres. Any new dryers or cheese lines in your catchment area change your odds of landing in the higher‑paying streams.
The tempo of logistics shocks. Whether it’s Hormuz, the Red Sea, or something nobody’s named yet, global shipping isn’t getting calmer. If you’re seeing a major logistics hit every 18–24 months, treating each one as a one‑off is wishful thinking.
What This Means for Your Operation
If your own two‑line chart shows benchmark product value per 100 kg rising by about €5.56 while your farm‑gate price drifts toward €42/100 kg, your contract is doing heavy smoothing — and you’re carrying most of the timing risk when markets jump.
If your expansion plan pencils out only at today’s blended price, you need a Scenario C in which extra litres earn significantly less during stress periods. If your DSCR falls below roughly 1.2 in that scenario, you’re not just betting on cows and feed — you’re betting on how your buyer treats your marginal litres when plants are full.
If your buyer can change pricing terms faster than you can leave, that asymmetry belongs in every major decision you make in 2026. The EU deal should help over time, but not in time to change the contract already in your drawer.
In the next 30 days, build the two‑line chart and show it to someone who writes cheques to you or for you.Start with data, not just “the price is terrible again.”
In the next 90 days, walk your lender through a stress‑priced expansion scenario. Make sure they see where the weak spots are — contracts and allocation — before you lock in new debt.
Over the next year, watch how your co‑op or buyer talks about Euronext and EEX. Any tools they use to manage their risk are tools you should at least understand, even if you never hedge a litre yourself.
Key Takeaways
If benchmark butter and SMP moves added about €5.56/100 kg of product value while ZuivelNL’s average advance fell into the low‑€40s, you’re effectively absorbing timing risk so processors and buyers don’t have to. The barn math is simple enough to present to them.
FrieslandCampina’s swing from a €149 million loss and a €48.08/100 kg milk price in 2023 to €56.93/100 kg in 2025 — followed by a sharp drop in advance prices in early 2026 — shows just how quickly the valve between farm and market opens and closes. Understanding that the cycle matters more than fixating on any single month’s number.
The new EU contract rules and Euronext’s upcoming dairy futures don’t magically fix your 2026 cash flow — they change the tools on the table. Your current contract and how you use it are still the main levers you control.
The Bottom Line
Before the next alert about shipping lanes, futures rallies, or co‑op results, put two lines on paper: what the market says your litres are worth in butter and powder, and what you actually get per 100 kg. Then ask yourself — and your lender — a simple question: if that gap looks the same a year from now, are you happy with the bets you’re making on cows, concrete, and contracts, or is it time to change how your litres are treated when the world throws another punch?
Complete references and supporting documentation are available upon request by contacting the editorial team at editor@thebullvine.com.
The Triple Cushion Trap: Why 2025’s Strong Margins Won’t Save You in 2026 – Reveals why high cull values and cheap feed are temporary safety nets. Andrew delivers a strategic frame for the next 3-5 years, showing how to reposition your herd’s genetics and contracts before these cushions inevitably deflate.
From Shutdown to Showdown: How Dairy’s 2026 Wake-Up Call Is Redefining Survival – Breaks down the $11 billion processing wave and the high-component quality barriers coming for every milk check. It reveals how shifting to butterfat-focused genetics and precision data delivers a massive $4.40/cwt competitive advantage.
The Sunday Read Dairy Professionals Don’t Skip.
Every week, thousands of producers, breeders, and industry insiders open Bullvine Weekly for genetics insights, market shifts, and profit strategies they won’t find anywhere else. One email. Five minutes. Smarter decisions all week.
50K vanished from WI 300-cow dairy’s Jan check. Von Ruden blames FMMO make allowances. Yours?
Executive Summary: In January 2026, a 300-cow Wisconsin dairy watched $50,000 vanish despite shipping the same milk to the same plant under the same management. This massive revenue hemorrhage is the direct result of the FMMO’s new “make-allowance” deductions—a structural 90¢/cwt tax that processors now skim off the top before you see a dime. While the industry touts federal “safety nets,” the cold math reveals a brutal 23-to-1 gap where DMC pennies cannot stop formula-driven dollar losses. This is not a market anomaly; it is a fundamental wealth transfer from the barn to the plant that your own co-op likely bloc-voted into existence. To survive, producers must audit their statements, isolate their specific “hidden drag,” and demand immediate accountability from leadership before their equity evaporates. Your January check wasn’t just a disappointment—it was a warning shot for an 18-month fight for survival.
At the National Farmers Union’s 124th annual convention this March, Wisconsin Farmers Union president Darin Van Ruden stood up in a delegate session and dropped a number that stuck: about $50,000. That’s how much less a 300‑cow dairy operator in southwest Wisconsin received on his January 2026 milk check compared with January 2025, according to Van Ruden.
He told Brownfield Ag News this wasn’t a model herd or a spreadsheet example. It was a neighbor he’d spoken with the week before — 300 cows, southwest Wisconsin, same plant, same truck, roughly $50,000 gone in one month. The cows didn’t change. The formulas did.
From $20.47 to $15.05: What Changed in a Year
Before you argue about anyone’s $50,000, look at the numbers every FO30 producer faced.
The Upper Midwest FMMO (Order 30) statistical uniform price for January 2025 was $20.47/cwt. In January 2026, it was $15.05/cwt — a year‑over‑year drop of $5.42/cwt. That’s the base reality under every milk check in the order.
Commodity prices did plenty of damage. CME butter’s monthly average price slid from $2.6042/lb in January 2025 to $1.4266/lb in January 2026, down about $1.18/lb — roughly a 45% crash. Cheddar blocks dropped from $1.8954/lb to $1.4003/lb, a 26% hit. FO30’s January Class III price followed that slide, falling from $20.34/cwt in 2025 to $14.59/cwt in 2026 — off $5.75.
Product
Jan 2025 Price
Jan 2026 Price
Change
CME Butter
$2.6042/lb
$1.4266/lb
–$1.18/lb (–45%)
Cheddar Blocks
$1.8954/lb
$1.4003/lb
–$0.50/lb (–26%)
FO30 Class III
$20.34/cwt
$14.59/cwt
–$5.75/cwt (–28%)
FO30 Class I Util
7.7%
7.7%
No blend cushion
And FO30 is built to feel that pain harder than most. Class I made up just 7.7% of pooled producer milk in the order in 2025 — the lowest share of any federal order. Almost everything else is Class III and IV. When cheese and butter break, there isn’t much Class I volume to pull the blend up.
Handlers behaved exactly how you’d expect in that setup. In January 2026, FO30’s producer price differential was $0.46/cwt, and an estimated 2.6 billion pounds of eligible milk weren’t pooled — more than the 1.4 billion that stayed in the pool. When more milk sits outside the pool than inside it, you don’t have a healthy pricing system. You have a blender that’s barely plugged in.
Where the Missing 90¢/cwt Really Went
That $5.42/cwt drop in FO30’s uniform price is not all structure. A big chunk is just a miserable butter and cheese month. But there’s a permanent piece baked into your check now, and that’s the make‑allowance jump.
Make allowances are the manufacturing‑cost numbers USDA subtracts from surveyed cheese, butter, powder, and whey prices in the FMMO formulas. When those numbers go up, class prices go down by the same amount. USDA’s modernization package raised the allowances effective June 1, 2025:
Product
Old make allowance
New make allowance
Change
Cheese
$0.2003/lb
$0.2519/lb
+5.16¢ (25.8%)
Butter
$0.1715/lb
$0.2272/lb
+5.57¢ (32.5%)
NFDM
$0.1678/lb
$0.2393/lb
+7.15¢ (42.6%)
Dry whey
$0.1991/lb
$0.2668/lb
+6.77¢ (34.0%)
American Farm Bureau Federation economist Danny Munch ran those new allowances through 2020–2023 markets. His Market Intel analysis found that higher make allowances alone would have lowered average FMMO class prices by about $0.92/cwt for Class III, $0.85/cwt for Class IV, $0.89/cwt for Class I, and $0.85/cwt for Class II. That’s not worst‑case. That’s the average.
AFBF then looked at what that would have done to pool values. Over just three months — June through August — higher make allowances stripped about $337 million out of producer pools nationally, including roughly $64 millionfrom the Upper Midwest, $62 million from the Northeast, and $55 million from California. That’s money that would’ve been in milk checks under the old formulas.
Yes, USDA did throw some offsets into the same package. The final rule restores the “higher‑of” Class I mover, revises Class I differentials, and updates composition factors so higher‑solid milk gets recognized at 3.3% protein and 9.3 lb SNF instead of the old 3.1/8.7. But timing matters. Make allowances went up on June 1, 2025. The composition factor change didn’t kick in until December 1, 2025. For six months, producers received the full cost increase with no solid‑adjustment relief.
If you want the deeper class‑by‑class walk‑through, The Bullvine’s own FMMO Reset analysis uses AFBF’s numbers to show how that roughly 90¢/cwt drag plays out across orders and herd sizes. The short version: there’s now a structural discount sitting in your class prices that won’t disappear just because butter has a good month.
How Much Did the FMMO Rewrite Actually Cost Your January Milk Check?
Now let’s get close to home.
Take the herd Van Ruden talked about: 300 cows in southwest Wisconsin. If that operation is shipping about 85 lb/cow/day in January, that’s roughly 7,905 cwt in 31 days.
FO30’s statistical uniform price dropped $5.42/cwt from January 2025 to January 2026. The straight arithmetic on that herd looks like this:
7,905 cwt × $5.42/cwt = $42,845 less on the check, just from the change in the uniform price at test.
But FO30’s “at test” milk isn’t 3.5% butterfat. In January 2026, pooled butterfat averaged 4.52%, with protein at 3.42%. At the same time, the butterfat component price fell from $2.9487/lb in January 2025 to $1.4525/lb in January 2026 — a collapse of $1.4962/lb. That hits all the butterfat you’ve bred and fed for above 3.5%.
Layer in premium changes. Plants facing lower class prices and higher make allowances have every reason to trim or restructure volume incentives, quality bonuses, and over‑order payments. You don’t see those cuts in a USDA bulletin. You see them when your “other credits” line shrinks.
When you add the FO30 uniform‑price drop, the butterfat collapse on high‑component milk, and likely premium erosion, you’re suddenly right in the neighborhood of Van Ruden’s $50,000 example for a 300‑cow herd. The exact number belongs to that family. The order‑level math says the story is believable.
Now pull out the structural part. AFBF’s modeling suggests that higher make allowances alone cut FMMO class prices by roughly 90¢/cwt. Here’s what that looks like across herd sizes at 23,000 lb/cow annual production:
Herd size
Annual cwt
90¢/cwt drag/year
Monthly drag
150 cows
34,500
$31,050
$2,588
300 cows
69,000
$62,100
$5,175
500 cows
115,000
$103,500
$8,625
1,000 cows
230,000
$207,000
$17,250
That’s what “structural” means. Those dollars disappear off the table every year until formulas, cost surveys, or utilization change. Markets might add to or subtract from that. The drag itself stays.
And when you park that drag next to the Farm Bill safety net? The Bullvine’s GT Thompson 2026 Farm Bill pieceshows a 200‑cow herd gaining roughly $1,800/year in improved DMC payouts while losing about $42,240/year from higher make allowances. That’s a 23‑to‑1 gap. For every dollar DMC gives back, the formula takes twenty‑three.
How Much Did the Formula Change Actually Cost Your January Check?
Now it’s your turn.
Step 1: Put a real number on your January‑over‑January price.
Grab your January 2025 milk statement. Take net pay (after hauling, dues, and fees) and divide by total cwt shipped. Write that number down.
Do the same for January 2026.
Subtract 2025’s $/cwt from 2026’s $/cwt. That difference is your real‑world January drag.
Step 2: Separate what the market did from what the formula did.
Look at the same FO30 numbers Van Ruden’s neighbor faced:
Class III price: $20.34/cwt → $14.59/cwt (down $5.75).
Butter: about $2.60/lb → $1.43/lb (down roughly $1.18/lb).
If your $/cwt drop is roughly in line with those moves, most of your pain is “just” the butter and cheese crash. Whatever you can’t explain with those class‑price and butter moves is where the structural make‑allowance hit and co‑op decisions are hiding.
Step 3: Put a number on the “hidden” part.
If your unexplained gap sits under 30–40¢/cwt, your buyer might already be buffering some of the structural drag with premiums or patronage.
If it’s over about 50¢/cwt, especially in Class III‑heavy orders like the Upper Midwest and Central, you’re almost certainly feeling that ~90¢/cwt structural penalty from higher make allowances plus whatever your plant adjusted in premiums.
You don’t need an economist to tell you if Van Ruden’s neighbor is alone. That three‑step math will answer the question for your own barn.
Step
Calculation
Your Number
1
Jan 2026 net $/cwt – Jan 2025 net $/cwt
$ ______
2
FO30 uniform price drop (baseline: –$5.42/cwt)
–$5.42/cwt
3
Butterfat price collapse (–$1.50/lb on 4.52% avg)
~$ ______ /cwt
4
Unexplained gap (Step 1 minus Steps 2 + 3)
$ ______
5
If unexplained gap > 50¢/cwt: Structural drag + premium cuts likely
Can You Recapture 90¢/cwt Through Components, or Is This a Permanent Loss?
A lot of advisors will tell you the path is simple: “Just make it up on components.”
There’s truth in that — up to a point. FO30 herds have pushed components hard. Pooled butterfat averaged 4.52% and protein 3.42% in January 2026. The December 2025 composition factor change in the final rule now prices “standard” milk at 3.3% protein and 9.3 lb SNF, up from 3.1/8.7, so you finally get some formula credit for the progress you’ve already bred and fed.
If you’re behind that bar, there’s money on the table. Picking up 0.1–0.2% protein through sire selection, grouping, and ration tuning in a decent Class III month can add 20–25¢/cwt. That’s real.
But look at what happened to the underlying prices you’re stacking that on. In January 2026, the protein price in FO30 was $2.1768/lb, down from $2.9307/lb a year earlier. Butterfat went from $2.9487/lb to $1.4525/lb. You’re trying to outrun a 90¢/cwt structural haircut with component premiums that are themselves sitting on a lower base.
And the system still doesn’t pay you full world value for the fat you ship. In The Bullvine’s butterfat deep‑dive, we showed FMMO formulas paying around $1.71/lb for butterfat at a time when Global Dairy Trade butterfat equivalents were closer to $2.95/lb — a gap north of $1.20/lb. You can crank out more fat, but the pricing system captures barely half its export value for you.
What about DMC? The 2026 Farm Bill draft raises Tier I coverage to 6 million pounds — roughly 260 cows at 23,000 lb —, but anything you ship beyond that is in Tier II or uncapped. USDA and Progressive Dairy coverage show the program helping when margins collapse, but even in “tight” years, the realistic annual benefit is low thousands of dollars on a 200‑cow herd — against roughly $42,240/year lost to higher make allowances in the GT Thompson example. DMCs aren’t designed to track structural formula changes dollar-for-dollar. It’s a margin band‑aid.
So yes, push components. Yes, use DMC intelligently. Just don’t fool yourself into thinking you can component your way out of a 90¢ structural discount that hits every cwt you ship.
Options and Trade-Offs for Farmers
You can’t undo June 1, 2025, on your own. You can decide how you’re going to respond to what it did to your check.
Path 1: Stay Put and Force the Conversation (Your 30‑Day Move)
This path fits if your co‑op or buyer has generally been fair on hauling, basis, and access, and you’ve got some runway.
Here’s the 30‑day checklist:
Print your January 2025 and January 2026 milk statements.
Calculate your net $/cwt for each and the gap between them.
Highlight the part you can’t explain with Class III, Class IV, and butter moves.
Bring those pages to your next district or annual meeting and ask three straight questions:
How did we vote in the FMMO modernization referendum — yes, no, or bloc‑voted by the co‑op?
How much did higher make allowances cost our pool in 2025 and 2026, in dollars and cents per cwt?
What are we doing — via premiums, over‑order pricing, or patronage — to push some of that value back toward member checks?
The risk with this path is time. The FMMO hearing process that produced this package took years. Nobody should be promising a quick redo.
Path 2: Shop Quietly for a Better Milk Check
This path makes sense if you’re consistently 50–60¢/cwt behind neighbors shipping similar milk to another buyer, and you have leverage left — equity, cow quality, location.
You’d need to:
Compare net pay — after hauling, dues, and fees — with producers on other trucks.
Price out hauling, quality penalties, balancing charges, and contract fine print before you even hint at switching.
Equity factor that might get stranded if you leave a co‑op for a proprietary processor.
There’s real upside if another buyer structurally pays closer to class value. But you give up governance and some safety if milk markets get ugly. And in some regions, the “different” hauler still leads back to the same corporate plant.
If you want a sober look at how chasing a higher pay price can still leave you in a margin trap, pair this piece with The Bullvine’s coverage on $14.59 milk against $20‑plus/cwt cost of production — the DSCR math isn’t pretty.
Path 3: Model a Managed Exit While You Still Have Leverage
Nobody wants to be the one to say this, but here it is: some operations already know $15–16/cwt milk with a 90¢ structural drag, and current debt loads won’t pencil long term.
This path fits if:
Your DSCR is stuck under roughly 1.20× at $15–16 uniform prices, and you’ve been there more than a quarter.
You’re putting bills in a stack instead of paying them as they arrive.
Your lender has already started asking for more “updated” projections.
You’d need to:
Build an 18‑month cash flow projection at today’s price levels and at one or two “what if” scenarios.
Sit down with your lender now, not when covenants are already broken.
Price what a step‑back or exit looks like while cull cow and beef‑cross prices are still decent.
Selling cows into strength on your terms almost always preserves more equity than waiting until the bank’s credit committee decides you’re done. It’s ugly. It still beats pretending the structural drag doesn’t exist.
Path 4: Fight the Structural Battle Beyond Your Farm Gate
If the problem is structural, part of the solution has to live in D.C. hearing rooms and comment dockets.
This path fits if:
You can keep the wheels on long enough to care what FMMO 2030 looks like.
You’re angry enough to turn your drag number into testimony, not just coffee‑shop talk.
It looks like:
Submit written comments to USDA the next time pricing hearings or make‑allowance surveys open up, with your herd size, order, and real $/cwt drag front and center.
Pushing your state associations and co‑ops to take specific positions: mandatory processor cost surveys, automatic adjustments tied to verified costs, and a path for make allowances to come down if costs do.
Using Farm Bill touchpoints — like the GT Thompson draft — to argue that a $1,800/year DMC fix against a $42,240/year make‑allowance hit isn’t “modernization.”
You won’t see these efforts reflected in your next milk check. But if producers don’t show up with barn‑floor math, the only numbers on the table will come from people whose margins just got protected.
Key Takeaways
If your unexplained January‑over‑January gap is more than about 50¢/cwt after you factor in Class III, Class IV, and butter moves, treat that as structural drag — not just a bad month. That’s the make‑allowance change and premium structure, and it will hit every cwt you ship until something changes in the formulas or your contracts.
If your DSCR can’t stay above roughly 1.20× at $15–16/cwt uniform prices, you need a written 18‑month plan — not just hope for “better milk.” That’s the line where most lenders start looking harder at restructuring or collateral.
If your co‑op or buyer can’t explain how they voted on FMMO reform and what they’re doing to offset the drag in one clear conversation, treat that as a data point. You have every right to know how your volume was cast and where the money went.
If you missed the 2026 DMC sign‑up, don’t miss the 2027. Run the USDA or AFBF decision tools against your own margins at $15.05 blend and $14.59 Class III, then decide ahead of enrollment how much coverage is worth paying for.
Print the Statements Before Your Next Meeting
Somewhere in southwest Wisconsin, a 300‑cow operation walked into 2026 shipping milk to the same plant in an order where average butterfat hit 4.52% — and opened a January check roughly $50,000 lighter than the year before, if Van Ruden’s account is right. About 90¢/cwt of that hit came from the pricing formula changing underneath them. The rest came from a butter-and-cheese crash that FO30 is structurally exposed to. Only one of those problems is guaranteed to cycle back on its own. fb
Before your next co‑op or lender meeting, do the thing most people keep putting off. Print your January 2025 and January 2026 statements. Run your own $/cwt math. Circle the part you can’t explain with commodity moves. Then lay those pages on the table and ask:
“If this is what the new rules did to my milk check, what’s our plan to change that math?”
If you want to go past envelope math into full spreadsheets — region‑by‑region drag, component strategy, DSCR stress tests — The Bullvine’s FMMO Reality Check analysis and Farm Bill/DMC coverage are built for that deeper dive. Next month, we’ll run this same barn math on a 1,000‑cow Upper Midwest herd and see whether scale fixes the equation — or makes the hole bigger.
Complete references and supporting documentation are available upon request by contacting the editorial team at editor@thebullvine.com.
Learn More
More Milk, Fewer Farms, $250K at Risk: The 2026 Numbers Every Dairy Needs to Run – Stop guessing and start calculating with this essential 2026 playbook. It reveals how mid-size herds can close a $250,000 margin gap by sharpening culling and heifer programs, giving you the immediate tactical advantage to outrun negative cash flow.
Every week, thousands of producers, breeders, and industry insiders open Bullvine Weekly for genetics insights, market shifts, and profit strategies they won’t find anywhere else. One email. Five minutes. Smarter decisions all week.
Mexico just proved it can park 38,000 trucks and almost run out of milk. Has your co‑op ever shown you that risk map?
Farmers and truckers block a commercial highway in Chihuahua during Mexico’s November 2025 “megablockade.” At the Ciudad Juárez–El Paso crossing, roughly 38,000 trucks stalled — and dairy was the first product to nearly run out.
December Class III settled at $15.86/cwt. January dropped to $14.59 — the lowest since July 2023, according to Dairy Star. Those are price moves your hedge is built to handle. But if your co‑op sells heavily into Mexico, your mailbox came in shorter than even those numbers explain. And nothing on the futures screen told you why.
The answer was 1,500 miles south, stuck in traffic at Ciudad Juárez.
In late November 2025, farmer and trucker groups across Mexico launched what they called a “megablockade” — shutting highways and occupying customs facilities in at least 17 states. The National Front for the Rescue of Mexican Farmland (FNRCM), the National Association of Carriers (ANTAC), and the Movimiento Agrícola Campesino (MAC) targeted corridors in Chihuahua, Sinaloa, and Zacatecas, as well as routes radiating from Mexico City. At the Ciudad Juárez–El Paso crossing — Mexico’s busiest commercial border zone — FreightWaves reported roughly 38,000 trucks stranded, delaying about US.45 billion in exports and causing industry losses of around US.8 million per hour.
Dairy was the first product to run short. Iván Pérez Ruiz, president of the Juárez Chamber of Commerce, told news reporters that previous blockades “nearly resulted in a complete shortage of dairy products, with milk and cheese being the most impacted.” María Teresa Delgado Zárate of Index Juárez estimated daily export losses at $250 million. Manuel Sotelo Suárez of CANACAR warned the city was “very close to running out of supplies.”
That’s the heart of this story. You hedge prices like an adult. But the Mexico border isn’t a permanent green light — it’s a high‑beta pipeline that can slam shut with one national protest call. The risk hiding in your milk check isn’t about what Class III settles at. It’s about what happens between that settlement and your mailbox when the road closes.
CoBank Called Mexico “Reliable.” Three Weeks Later, Juárez Froze.
In December 2024, CoBank published a report called “Mexico Has Become America’s Most Reliable Dairy Customer.” Lead dairy economist Corey Geiger laid out the numbers: Mexico accounts for more than one‑fourth of total U.S. dairy export value and buys roughly 4.5% of U.S. milk production. In 2023, U.S. dairy exports to Mexico hit 1.38 billion pounds on a milk‑solids basis — a 42% increase over the prior decade. Mexico’s per-capita dairy consumption has grown about 50 pounds since 2011, and U.S. exports now cover more than 80% of Mexico’s dairy deficit. CoBank estimates one in six tanker loads of U.S. milk ends up overseas, and processors have committed around US$8 billion in new capacity coming online soon.
From a demand standpoint, Mexico really has behaved like an anchor customer. The pipes getting product there are another story.
On November 23–24, 2025, ANTAC, FNRCM, and MAC rolled out coordinated blockades before dawn. Mexico News Daily reported on November 27 that “mega-blockades” were in their fourth day, choking truck access to U.S. ports of entry. Maquiladora plants went into technical stoppages. Around 30,000 workers sat on downtime. Shippers were told to expect 10 or more days of delays even after protesters cleared the roads. News outlets reported the dairy sector faced “operational paralysis,” and by the time a third blockade was announced in December, the backlog from earlier rounds still hadn’t cleared.
Interior Minister Rosa Icela Rodríguez announced a deal on November 27 — working groups in exchange for suspending the blockades. FNRCM and ANTAC called it a truce, not a surrender. They’ve already circled the next date.
On March 3, 2026, UnoTV reported that FNRCM and ANTAC called a national mobilization for March 20 — two weeks from today — including highway blockades and actions in Mexico City. The CNTE teachers’ union announced a national strike for March 18–20, which will overlap with other strikes. MexicoBusiness.news confirmed the call on February 27. Mexico Solidarity described it as a mobilization for “food sovereignty and agricultural transformation,” with farmers demanding that basic grains be removed from the USMCA.
That’s a planned action, not a historical event. But it tells you blockades are a deliberate political tool now — not a one‑off tantrum. And the people who really control your milk check aren’t all sitting at your co‑op’s head office.
How Does This Actually Hit Your Milk Check?
The broader numbers were already ugly before the blockades started. October 2025’s U.S. average mailbox dropped 85¢ in a single month to $18.70/cwt — $5.58 below the same month a year earlier, according to USDA NASS data. Upper Midwest producers on FMMO 30 held up better, averaging $19.74 in September and roughly $19.25 in October. But reports already documented a $1.30/cwt gap nationally between the statistical all‑milk price and what farmers actually received, driven by depooling, component math, and co‑op deductions.
For co‑ops whose Mexico-bound product was stuck at Juárez, that gap had one more driver the data didn’t itemize.
Here’s the sequence: bridges close or crawl for days. Even after protesters leave, backlogs add another 10 days of friction. Plants scramble — rerouting loads through Nogales or Nuevo Laredo, shoving product into lower‑value domestic channels, piling inventory, and hoping buyers wait. Class III still settles where it settles. Your hedge does what it’s supposed to on that screen. But the gap opens in the co‑op’s margin. And when that margin gets squeezed, the co‑op pulls the levers it controls: export premiums, quality incentives, over‑base pricing, intake policies.
The basis risk lands on you.
Here’s the barn math. A 1,200‑cow herd at 80 lb/day ships 960 cwt/day. If the co‑op’s effective pay price runs 40¢/cwtbelow your hedge‑implied price for 30 days, that’s 960 × $0.40 × 30 = US$11,520. A 700‑cow herd shipping 560 cwt/day at the same gap: US$6,720. At 2,400 cows, closer to US$23,000. Plug in your own daily cwt and see where you land.
Those aren’t predictions. They’re scenarios built off the scale you just watched at Juárez — where Delgado Zárate estimated $250 million a day in export losses and Pérez Ruiz said dairy nearly ran out. The kind of surprises that show up in the mailbox, not on the futures app. With dairy economist Bill Brooks of Stoneheart Consulting estimating 2026 income over feed costs at $10.14/cwt — down $2.30 from 2025, per Dairy Star — there’s not much cushion between a rough month and the 2026 margin math that makes every basis surprise harder to absorb.
Why Can’t Your Price Hedge See a Blockade Coming?
Hedging tools handle price risk. There’s no ticker for “pipe” risk — no DRP endorsement that covers Juárez running at half capacity or 8,000 cargo robberies a year on Mexican highways.
Three forces are driving the border risk your hedge account can’t touch.
Cargo theft and highway violence. El País reported in December 2025 that cargo trucks in Mexico suffer at least 8,000 robberies per year — 21 a day — and more than 80% involve violence against the driver. ANTAC says the real figure is 54 to 70 thefts daily because most go unreported. Concamin estimates cargo theft costs around 15 million pesos per day.
Water, grain, and food sovereignty politics. In October 2025, FNRCM paralyzed highways and rail lines in 17 states, demanding higher grain prices and opposing changes to Mexico’s General Water Law. FNRCM leader Marco Antonio Ortiz Salas publicly alleged that the CME and transnational grain companies were “manipulating markets.” No evidence supported that specific claim — but the grievances are real enough to park tractors on bridges, and they’re at the core of the March 20 call.
The 2026 USMCA review. Under Article 34.7, the USMCA must undergo a joint review by July 1, 2026. On January 5, the National Milk Producers Federation said it and the U.S. Dairy Export Council are “advancing a coordinated strategy to ensure the agreement delivers on its promises to U.S. dairy producers.” More than 120 U.S. agricultural groups want an extension with minimal changes. Mexican farm movements want the opposite — basic grains removed from the agreement entirely.
Your hedge locks in a price. The fact that Mexico is both your co‑op’s most “reliable” customer and one of its riskiest corridors — that’s what you have to decide what to do with.
What Should You Ask Your Co‑op Before March 20?
You can’t control FNRCM or ANTAC. You can control how blindly you’re exposed to them.
Start with the exposure question. Ask for a simple 12‑month breakdown: what percent of total solids are exported, what percent goes to Mexico, and how much of that moves through Pharr, Laredo, Ciudad Juárez, or Nogales. CoBank’s data show that Mexico buys more than a quarter of the U.S. dairy export value. If your co‑op can’t ballpark which bridges carry your milk, that’s worth raising at the next member meeting.
Then make them walk through a scenario. Say Juárez runs at half capacity for 30 days, including backlog time. Which plants pull back intake first? Which products get priority for limited export slots? In what order do they adjust premiums, quality incentives, and over‑base pricing? You’re not asking them to predict the future. You’re asking whether they’ve done the same “what if?” work you do before locking in feed.
The USMCA review adds a harder edge. NMPF confirmed in January that it’s pushing for stronger enforcement of market‑access commitments. Mexican farm movements are treating July 1 as a pressure point. Ask your board what assumptions they’re making about Mexico volumes through 2027 — and how those interact with the $8 billion in new processing capacity CoBank flagged.
If the only chart they show you is “exports up and to the right,” ask what happens when the road under that chart closes for a few weeks. For the families who’ve already decided the farm is worth fighting for, the answer matters.
How Does This Change What You Do on the Farm?
Macro risk is interesting. The bank and the feed mill still want their money on time.
Cash flow isn’t just about price anymore. With 2026 income over feed at $10.14/cwt, a surprise basis hit is the difference between a month you ride out, and a month you’re juggling which bill to delay. Within the next 30 days, pull your last 12 months of milk checks, calculate your average daily cwt shipped, and model what happens if your mailbox comes in 30¢/cwt worse than your hedge implied for 30 days. Then do the same at 50¢/cwt. Turn each into a dollar number and ask: could we ride this without breaking covenants?
If the answer makes your stomach tighten, sit down with your lender before March 20. Say: “Here’s what these scenarios look like for us. If something like this happens because of a border event, what would you want to see from us?” That’s not panic. That’s the conversation a lender expects to have before trouble arrives, not after.
Your hedge strategy may need one more trigger. You probably adjust coverage when futures move sharply, or big USDA reports drop. Consider adding one more: the gap between your hedge‑implied price and the actual mailbox. If that gap widens beyond 30–50¢/cwt for two consecutive checks, it doesn’t automatically mean “Mexico.” But it’s a red flag to ask your co‑op whether pipeline issues are in the mix and to re‑check your cash‑flow plan for the next 60–90 days.
Expansion decisions carry new questions. If you’re adding cows or signing a longer‑term supply deal, ask how those decisions tie into Mexico exposure. “How dependent is this plant on exports through Juárez?” and “What exactly did you do on premiums during the November 2025 blockades?” won’t make every marketer smile. But they’re the questions a lender would ask if they were sitting where you are.
Options and Trade‑Offs for Farmers
You don’t get to vote on Mexico’s water law or who parks a tractor on a bridge. You do get to choose how much of that volatility you carry.
Path 1: Treat Mexico as a high‑beta outlet — and price it in. This makes sense if your co‑op is genuinely good at export business and you have enough financial cushion for occasional rough patches. It requires knowing how much of your co‑op’s volume goes to Mexico and building a realistic risk haircut into long‑range margin expectations. You still get stung in bad years. If blockades become seasonal, the “occasional rough patch” becomes a pattern.
Path 2: Run a 30‑day border stress test — this month, before March 20. This is the move if you’re mid-size, have real debt, and have limited shock absorbers. Use your actual daily cwt and run two scenarios — basis 30¢/cwt and 50¢/cwt worse for 30 days. Put those dollar numbers next to your cash‑flow plan and covenants. Book a conversation with your lender this week.
Path 3: Push for a written co‑op border playbook. If you’re committed to your co‑op and want fewer surprises, ask the exposure questions in member meetings, where they’re recorded. Push for a border‑risk section in the annual business update: exposure by crossing, disruption scenarios, and the order in which premiums change. If Pérez Ruiz can tell the media that dairy nearly ran out at his city’s crossing, your co‑op can tell you how much of your milk was heading there. The USMCA review deadline — July 1, 2026 — makes this more urgent, not less.
Path 4: Align your risk advisors around pipes, not just prices. In your next risk call, say: “Let’s talk specifically about basis moves when pipelines jam — blockades, plant outages — and what that looks like in our numbers.” In your next lender meeting: “Are you factoring Mexico corridor risk into how you look at our credit?”
Key Takeaways
If your co‑op sells a meaningful share of solids into Mexico through one or two crossings, treat border risk as its own line on your 2027 plan — not just “export.”
If your mailbox comes in 30–50¢/cwt below what your hedge implied for two consecutive checks, call your co‑op and ask whether pipeline issues are in the mix.
If your co‑op can’t tell you what share of its Mexico volume flows through Pharr, Laredo, Juárez, or Nogales, push for that exposure map before you sign a major expansion or supply contract.
If a 30‑day stress test at 40¢/cwt basis hit would strain your cash flow or covenants, talk to your lender now — not after March 20.
The Bottom Line
Your hedge account sees the price side of your risk. The Mexico border has quietly become one of the most important pipe risks in North American dairy, concentrated in a handful of crossings where organized groups have already proved they can park 38,000 trucks and push dairy to the brink of shortage in days.
The question isn’t whether somebody will line up on those crossings again. They’ve already circled March 20. Whether you find out how exposed you are from a slide at a co‑op meeting, a conversation with your lender, or the next milk check that doesn’t match what you modeled — that part is up to you.
Complete references and supporting documentation are available upon request by contacting the editorial team at editor@thebullvine.com.
Learn More
The $4/cwt Your Milk Check Is Missing – And What’s Actually Working to Get It Back – Stop the bleeding in your mailbox price by identifying the structural make-allowance hits and regional deductions currently scalping your margin. It delivers a hard-nosed checklist to recover value through component gold-rushes and smarter beef-sire selection.
The Texas ESL Boom: How Smart Producers Are Turning Consistency into Contract Power – Reveals how the ESL boom is weaponizing milk quality data into contract leverage, shifting the profit center from bulk volume to 90-day shelf-life predictability. It identifies the high-tech supply chains that will dominate the landscape through 2030.
The Sunday Read Dairy Professionals Don’t Skip.
Every week, thousands of producers, breeders, and industry insiders open Bullvine Weekly for genetics insights, market shifts, and profit strategies they won’t find anywhere else. One email. Five minutes. Smarter decisions all week.
Is your dairy in the 10–15% Nathan Kauffman says are in ‘significant’ stress at $18.95 milk and 8% money, and would your bank tell you if it was?
Executive Summary: USDA’s February 2026 WASDE pegs all‑milk at $18.95/cwt, $2.22 below 2025, while USDA‑ERS full‑economic costs for large herds still sit around $19.14/cwt — meaning many dairies are already underwater on paper before interest and principal. Kansas City Fed data shows operating loan rates near 8% and a surge in operating loan volume, with economist Nathan Kauffman warning that 10–15% of producers are in “significant” financial stress even as 80% remain stable. Using three composite herds — 300, 800, and 1,500 cows — the article shows how $18.95 milk, repriced debt, and higher labour costs hit debt‑service coverage ratios and equity, and where fighting, scaling, or exiting pencils actually work. For a 300‑cow herd carrying about $9,300/cow in debt, realistic culling, beef‑on‑dairy premiums, and ration tweaks can close roughly half to three‑quarters of a $195K–$210K cash‑flow gap, while an orderly exit can still retire $2.8M in debt, keep $300K+ in equity, and avoid roughly $200K in herd‑value erosion over 18 months. At 800 and 1,500 cows, the piece walks through concrete “Path A vs Path B” options — components and longer notes vs. destocking and organic premiums, filling empty stalls vs. robots — and shows how each changes DSCR and risk, rather than pretending scale alone is a safety net. It closes with a step‑by‑step DSCR stress‑test at $18.95, $17, and $16 milk, a checklist of lender “red flag” signals, and a 30‑/90‑day playbook so owners can see whether they’re in Kauffman’s 10–15% band and decide how to use the 18‑month clock before their banker uses it for them.
Your lender ran the numbers before you did. While you’re watching Class III futures and tweaking rations, the credit analyst across the hall already stress‑tested your file at $18.95 all‑milk — USDA’s February 2026 WASDE forecast — and flagged the debt service coverage ratio that slipped below covenant. The operating line crept up. Working capital burned faster than revenue replaced it. Nobody said “watch list” out loud. But the file moved.
That information gap is one of the most expensive blind spots in farm finance. WASDE has all‑milk down $2.22/cwtfrom a revised 2025 average of $21.17. On a 300‑cow herd shipping 69,000 cwt a year, that’s about $153,000 in gross revenue gone before you touch feed, labour, or interest.
Kauffman’s K‑Shaped Warning
Nathan Kauffman — Senior Vice President and Omaha Branch Executive at the Kansas City Fed, and Executive Director of the Center for Agriculture and the Economy — told a University of Nebraska‑Lincoln webinar on February 12 that the headline credit picture still looks relatively stable. But not for everyone.
“There’s a small increase in delinquencies, but it doesn’t compare with the situation before the pandemic,” he said. Bank debt portfolios show “significant” financial stress for around 10% to 15% of producers — “But that means 80% are still stable.” He described the ag economy as increasingly “K‑shaped”: some operations doing very well, others clearly in distress.
Who’s on the wrong leg of that K? Kauffman pointed at younger producers who haven’t had years to build equity during the 2020–2023 “good years,” and renters without land as collateral. If that’s you, the aggregate averages won’t save your file.
Why the Clock Is 18 Months, Not 12 or 24
Lenders re‑underwrite operating and term debt once a year based on your year‑end numbers. In practice, they’re watching you every month: milk check assignments, feed bills, how your operating line cycles — or doesn’t.
Once internal monitors start blinking — DSCR drifting under 1.25×, working capital down quarter over quarter, an operating line parked at 85%+ with no seasonal dip — your file can move from “performing” to “watch” without anyone saying the words.
Here’s how the 18‑month window plays out:
Year 1 review: Lender flags concerns, tweaks covenants, maybe orders an appraisal.
Year 2 review: Lender looks at whether you actually moved the ratios.
In between: One full production year to bend your numbers back toward safety.
Miss that window, and the conversation hardens. Accelerated repayment. Forced asset sales. Transfer to special assets.
The macro data matches the gut feeling. Kansas City Fed surveys show new farm operating loan volume jumped nearly 40% year‑over‑year in Q4 2025, with strong growth through the year. Farm production loan delinquencies at commercial banks sat around 1.02% in Q4 2025: still low, but trending up.
USDA‑ERS puts the full economic cost for herds of 2,000+ cows at $19.14/cwt, based on the 2021 ARMS dairy survey — the most recent available. That includes family labour, owned land, and return on equity; operating costs run lower, but lenders look at the full economic row.
And interest isn’t helping. KC Fed’s Survey of Terms of Lending shows operating loans averaging 8.12% in Q2 2025, down from 8.83% in Q2 2024. Kauffman called the decline “slight” and described interest costs as “a somewhat persistent headwind,” noting some long‑term rates “haven’t moved much, or at all.”
What Cornell’s DFBS Tells You About the Bottom 25%
Before you look at your own books, it helps to know where you sit in the stack.
Cornell PRO‑DAIRY’s 2024 Dairy Farm Business Summary, covering 129 New York farms, shows a wide performance spread. Even in 2023 — a solid milk year feeding into that summary — the lowest‑earning farms struggled to cover debt service. Their debt coverage ratios ran close to or below 1.0× at net milk prices around $22–$23/cwt.
For the long‑term panel group, EB 2024‑5 reports overall DCRs under 1.0× in the repayment analysis, with planned debt payments per cow in the mid‑$500s and farm debt per cow in the mid‑$4,000s. The composite herds below carry heavier debt — $9,000–$9,667/cow — on purpose. They represent the profile Kauffman warned about: expanded when money was cheap, now repricing with less land equity as a cushion.
These composites aren’t real farms. They’re built off real cost structures, current prices, and actual loan‑rate trends. Your job is to plug your own numbers into the same math.
The 300‑Cow Herd: When the Window Is an Exit Question
The setup. Three hundred Holsteins at 23,000 lbs — 69,000 cwt shipped a year. Total debt: $2.8M ($1.6M real estate, $800K equipment, $400K operating line). That’s $9,333/cow — well above Cornell’s quartile averages.
The real estate note repriced last fall from roughly 4.5% to around 7.5%, pushing annual debt service up an estimated $40,000–$55,000 before milk moved a penny.
The squeeze. The $2.22/cwt drop across 69,000 cwt strips out about $153,000 in gross revenue. Layer in the extra debt service, and you’re staring at $195,000–$210,000 in added annual pressure. DSCR can easily slide under 1.0×. That’s covenant‑breach territory.
There’s also money that doesn’t show up in milk price charts. Beef‑on‑dairy calf premiums, cull checks, and government payments have been quietly cushioning margins. In strong Wisconsin markets, crossbred beef‑on‑dairy calves have cleared $1,000–$1,750/head versus $700–$1,000 for Holstein bulls — a $300–$750 per‑calf premium. Real cash. But not guaranteed.
The fight math. Cull the bottom 10%: 30 cows at roughly $137/cwt blended (USDA‑AMS), 1,300 lbs live = $1,781/head → about $53,400 applied straight to the operating line. Breed beef‑on‑dairy on your bottom genetics: ~87 saleable calves → $26,000–$65,000 in premium revenue above Holstein bull calf values. Tighten the ration for $0.30–$0.50/cwt on 62,100 cwt → another $19,000–$31,000 in margin.
On a spreadsheet, that exit looks clean. In the kitchen, it doesn’t. For a lot of 300‑cow families, the 18‑month window isn’t just about DSCR — it’s about whether one more generation gets a shot at the home place, or whether you take the equity that’s left and protect your kids from carrying your debt into their forties.
What Does $18.95 Milk Mean for an 800‑Cow Expansion Herd?
If 300 cows is an exit question, the 800‑cow herd is a margin‑compression test — and it’s the profile Kauffman flagged most directly. hpj
The setup. Eight hundred cows at 24,500 lbs = 196,000 cwt a year. Expanded in 2019 with a new freestall and double‑18 parlour. Debt: $7.2M. Blended interest after repricing: ~7.1%. Debt service: roughly $820,000, up an estimated $150,000–$180,000 since rates moved. Full economic COP near $18.40/cwt.
The squeeze. Revenue loss: 196,000 cwt × $2.22 ≈ $435,000. Labour creep — USDA NASS pegged livestock worker wages around $18.15/hour nationally in April 2025, with average farm wages up roughly 3–4% year‑over‑year — adds another $35,000–$65,000 at this scale. Stack it all: $620,000–$680,000 in extra annual cash pressure. DSCR slides from the low 1.30s toward 1.0–1.05×.
Meanwhile, that 2019 freestall, which cost $2.8M to build, might appraise at only $2.0–$2.2M today. Debt‑to‑asset ratio creeps past the 60% covenant. Technically offside without missing a payment.
800‑Cow Playbook
Path
Core move
Annual impact
Trade‑off
A: Components + labour + longer note
Push BF from 3.85% to 4.05% (+$115K); trim 3× milking on bottom cows (+$80K); stretch barn mortgage to 25‑yr amortization (+$92K)
≈ $287K vs. $620K–$680Khit
Keeps 800‑cow scale; demands tight execution on nutrition, labour, and lender cooperation
On Path A, the butterfat math is straightforward: 19.6M lbs × 0.20 percentage points = 39,200 lbs more BF × $2.94/lb ≈ $115,000. That’s real money. But the breeding decisions behind that 0.20‑point shift matter as much as the ration, and as Dr. Kent Weigel has pointed out, nobody can reliably predict component prices five to seven years out.
On Path B, organic pay in the Northeast has held well above conventional. Bullvine’s 2025 coverage of NODPA data showed Upstate Niagara’s 2025 program at $29.50/cwt base plus a $2.75/cwt organic market adjustment and $2/cwtseasonal incentive, and Horizon targeting up to $45/cwt for some larger herds. NODPA’s January 2026 “Pay and Feed Prices” update confirms that Upstate Niagara will move to a $32.50/cwt base, plus a $2.75/cwt regional adjustment and a $2/cwt seasonal incentive in 2026, and notes that other processors raised base pay by roughly $3/cwt going into 2026. Terms vary — contact processors directly for current details.
Certification takes 36 months. You’re not patching this year’s DSCR with organic premiums. What you are doing is giving your lender a different story than “we’re stuck.”
When Scale Stops Being a Safety Net: 1,500 Cows
Two sites, 1,500 cows total, 26,000 lbs/cow — 390,000 cwt a year. Debt: $14.5M. COP sits in the top quartile at about $17.80/cwt, better than ERS’s $19.14 average for ≥2,000‑cow herds. Sounds comfortable.
Then a regional processor adjusts its Class III allocation, and your blend drops $0.85/cwt — that’s $331,500. In the same quarter, your H‑2A contractor raises fees 12%, adding $180,000 to labour costs. You’ve eaten $511,500 in cash pressure while still technically “efficient.”
Pre‑shock DSCR: 1.42×. Post‑shock: 1.12×. Scale gave you room. It didn’t make you bulletproof.
Convert one barn to 20 units ($4.4M); labour savings $390K–$520K/yr; extra milk $185K–$296K
Net year‑one: –$41K to +$200K; improves as wages rise
Swaps labour volatility for $4.4M in new capital; may need asset sales or guarantees if DSCR is already thin
ISU extension specialist Larry Tranel pegs the installed robot cost at $185,000–$230,000/unit, with some projects reaching $250,000. At $220,000 midpoint, 20 units = $4.4M — about $616,000/year in debt service over 10 years at current rates. The bet is that wages keep climbing while the robot payment stays fixed.
Herd Size
Path Options
Financial Impact
Key Trade-Off
300 cows
Fight: Cull 10%, beef-on-dairy, ration tweak
Close $98K–$157K of $195K–$210K gap
Buys 6–12 months; may still breach covenants
300 cows
Exit: Orderly liquidation
Retire $2.8M debt, keep $300K+ equity
Out of dairy; avoid $200K herd-value erosion over 18 months
800 cows
Path A: Push components 0.20%, trim labor, stretch note
Path B: Destock 150 cows, begin organic transition
$350K–$430K debt paydown now; premium upside at month 36
Gives up volume immediately; 3-year wait for premiums
1,500 cows
Path A: Fill 300 empty stalls to 1,800-head capacity
Add $347K contribution margin
Deepens processor and H-2A labor dependency
1,500 cows
Path B: Install 20 robotic units
$390K–$520K labor savings + $185K–$296K milk = net +$200K year 1
Swaps labor volatility for $4.4M new capital; DSCR impact if already thin
Ten Signals Your Lender Already Started the Clock
You’re likely on an 18‑month clock if:
Your lender asks for quarterly financials instead of annual.
There’s someone you’ve never met at your review — a regional credit analyst or special‑assets contact.
They order a fresh appraisal outside the normal cycle.
Covenant language gets “adjusted”—temporary waivers and revised DSCR targets.
The conversation shifts from “What are your plans?” to “Walk me through your cost of production.”
They start asking for milk per cow, SCC, and cull rates that weren’t part of prior reviews.
Your operating line renewal comes back with a lower limit or shorter term.
Someone mentions stress‑testing at $17/cwt.
They request personal financials from all guarantors, not just the main operator.
Capital‑expense conversations get met with “Let’s revisit after the next review.”
Three or more? You’re on a clock, whether anyone has said those words or not.
How to Stress‑Test Your Dairy at $18.95 Milk
In the next 30 days:
Pull your full economic COP. Not the rough number in your head. Family labour at $18–$22/hour, depreciation at replacement cost, return on equity included. ERS and Cornell DFBS data show total cost ranging from roughly $20/cwt into the high $20s/cwt depending on herd size and performance. Put that number next to $18.95 and see what you’re really asking your lender to finance.
Run your DSCR at three price points. Use the formula: (Total cwt × milk price – operating expenses) ÷ annual debt service = DSCR. Plug in $18.95, $17.00, and $16.00. Under 1.10× at $17? Red flag. Under 1.20× at $18.95? You’re in the band Kauffman’s data identifies as “significant” stress.
Model your exit equity — today and at month 18. Herd, equipment, land. Subtract every dollar of debt. Then re‑run those values 18 months out with lower prices and more forced timing. On a 300‑cow herd, the cattle‑value spread alone can run around $200,000.
Herd Size
DSCR @ $18.95/cwt
DSCR @ $17.00/cwt
DSCR @ $16.00/cwt
300 cows (23K lbs, $280K debt service)
1.08×
0.82×
0.68×
800 cows (24.5K lbs, $820K debt service)
1.28×
1.05×
0.92×
1,500 cows (26K lbs, $1.45M debt service)
1.42×
1.22×
1.09×
Your herd: ___________
_________
_________
_________
In the next 90 days:
Pick your path and take it to your lender — with a number, not a hope. “We’ll reduce the herd by 12%, apply $X to the operating line, and target a DSCR of 1.22× by Q3. Here’s the math.” That’s a different meeting than “We’re hoping milk comes back.”
Build a three‑person advisory bench that doesn’t sell you anything. Your accountant. An ag attorney. One peer who’s been through financial stress and came out the other side. Not your feed rep. Not your equipment dealer.
By this time next year:
Hit the DSCR target you committed to — or have a planned, orderly exit underway before someone else decides for you.
If you’re in Canada, supply management, quota values, and provincial financing change the per‑cwt math. But lenders still watch DSCR and working capital. The 18‑month pressure window exists under quota, too — it just plays out against land and quota values, not Class III futures.
Key Takeaways
If your DSCR sits below 1.20× at $18.95, you’re in the 10–15% band Kauffman’s data flags as “significant” financial stress. KC Fed work suggests 10–15% of producers are in that zone, even as 80% remain stable, and Cornell’s DFBS shows some farms couldn’t cover debt even in stronger milk years.
At 300 cows with $9,000+/cow in debt, a disciplined exit may preserve more equity than fighting for 18 months. The herd‑value spread alone can run around $200,000 before equipment and real estate discounts.
At 800 cows with 2019 expansion debt repricing from mid‑4s into the 7–8% range, you gave up $150,000+ in cash flow before milk moved a penny. Path A or Path B both beat drifting into the next review with no plan.
At 1,500 cows, scale buys more ways to respond — not immunity. One processor adjustment and one H‑2A contract change can add roughly $500,000 in annual pressure, even in a top‑quartile COP herd.
The Bottom Line
The producers who still have options 18 months from now won’t be the ones who hoped for $21 milk. They’ll be the ones who ran the DSCR math at $18.95, $17, and $16 before their lender did — and walked into that meeting with a decision, not just a problem.
Where does your DSCR actually sit today?
Complete references and supporting documentation are available upon request by contacting the editorial team at editor@thebullvine.com.
Learn More
Feed Smart: Cutting Costs Without Compromising Cows in 2025 – Arms you with a precision-feeding roadmap to slash up to $470 per cow in annual costs. It reveals how to leverage co-products and forage digestibility to protect production while margins tighten, providing immediate relief for your Monday morning ration decisions.
Decide or Decline: 2025 and the Future of Mid-Size Dairies – Exposes the three survival paths for mid-sized dairies facing structural industry shifts. You’ll gain a clear-eyed framework for regional positioning, financial clarity, and succession planning to ensure your operation remains a viable legacy through 2027 and beyond.
Every week, thousands of producers, breeders, and industry insiders open Bullvine Weekly for genetics insights, market shifts, and profit strategies they won’t find anywhere else. One email. Five minutes. Smarter decisions all week.
A 550-cow Wisconsin dairy had 11 weeks of cash left at $18–$19 costs and didn’t know it. When you run a real COP, how much runway do you actually have?
Executive Summary: USDA’s 2026 all‑milk forecast of $18.95/cwt can knock a 400‑cow herd’s DSCR from 1.78x to 0.53x on paper — same cows, same debt, very different conversation with your lender. This piece walks you through that math, then shows how a 550‑cow Wisconsin dairy discovered an $18.75/cwt true cost of production and just 11 weeks of cash runway after a real COP review. It explains how bankers are already repositioning — from 30% tightening standards in the Chicago Fed’s district to Farm Credit more than doubling its loan‑loss provisions — and why that hits some regions harder than others. You see why Wisconsin and New York can add cows while Pennsylvania loses farms and processors, and what that geography shift means for your renewal odds. Most importantly, you get DSCR and breakeven thresholds you can plug into your own numbers, a three‑tier action plan by herd size, and a 30‑day checklist to run before you sit down with your lender. If you want one article to double-check whether you’re still comfortably bankable at $18.95 milk, this is it.
Earlier this year, a 550-cow Wisconsin dairy sat down with a farm financial counselor and pulled a full cost-of-production analysis. The details come from the farm financial counselor who conducted the engagement, as first reported in The Bullvine’s Calf-Check Paradox analysis (February 20, 2026), with the operation’s identity withheld at the counselor’s request. The producer had been budgeting around $17.25/cwt as his all-in cost. When the spreadsheet included market-rate family labor, real depreciation, repriced debt at current interest rates, and health insurance, the number came back to $18.75/cwt — right in line with UW Extension’s $18–$19/cwt benchmarks for mid-size Midwest herds.
That $1.50 gap represented roughly $200,000 in annual losses that the operation hadn’t been accounting for. Total liquidity: $227,000. Net weekly cash drain: about $21,000. Eleven weeks of runway — not the five or six months he’d been carrying in his head.
How Many Weeks of Runway Do You Actually Have?
Multiply that math by every dairy operation in the country and drop the milk price from $21.17 to $18.95. That’s USDA’s February 2026 WASDE forecast for all-milk — a $2.22/cwt decline from the revised 2025 average. For a 400-cow herd shipping 96,000 cwt, that’s $213,120 in lost gross milk revenue. It turns a comfortable debt service coverage ratio into something your lender won’t ignore.
The Curve Accelerated — and the Geography Split Wide Open
The Wisconsin producer wasn’t the only one watching the numbers tighten. The structural consolidation trend that his counselor had flagged during their session was playing out nationally. The U.S. lost roughly half its dairy farms between the 2012 and 2022 USDA Censuses, while total production kept climbing. But the speed in 2025 — and where it concentrated — caught attention.
USDA reported 23,609 licensed dairies at year-end 2025, down 1,036. The top 10 states now produce about 74% of U.S. milk, per the NASS 2025 annual summary. Wisconsin added 4,000 cows and pushed output up 0.8% to 32.59 billion pounds — absorbing farm exits into fewer, larger operations. New York added 12,000 cows and boosted production 2.8% to 16.57 billion pounds, growth aligned with major new processing capacity in the state.
Pennsylvania went the other direction. Based on the originally published 2024 baseline, the state lost 490 farms—an 11.7% exit rate that accounts for nearly half of the 1,036 total U.S. dairy losses. This figure stems from a data discrepancy: the USDA revised Pennsylvania’s 2024 baseline downward by 166 farms without flagging the state-level change. Using the revised figure, PA’s 2025 loss was 320 farms. Both numbers tell the same story directionally. January 2026 deepened the gap: Pennsylvania milked 454,000 cows, down 11,000 from a year earlier, and produced 817 million pounds — 3.0% below January 2025, according to the NASS February 20, 2026 Milk Production report.
That divergence isn’t cyclical. It’s structural—and it’s reshaping how lenders view dairy portfolios.
30% of Bankers Tightened: The Lending Turn
In Q4 2025, 30% of bankers in the Chicago Fed’s Seventh District reported tightening lending standards for farm loans. Renewals and extensions kept climbing — the trend now spans multiple consecutive quarters. Fund availability kept falling, extending what the AgLetter has tracked as a multi-year decline.
The share of the District’s farm loan portfolio with major or severe repayment problems hit 5.6% — the highest since mid-2020, per the AgLetter’s February 2026 issue. And 3.8% of borrowers with operating credit were deemed unlikely to qualify for new operating loans in 2026.
The Farm Credit System is feeling it too. Nonaccrual loans rose from 0.74% at year-end 2024 to 0.91% at Q3 2025. Provisions for credit losses more than doubled, from $569 million to $1.23 billion, per the Farm Credit Investor Presentation dated February 20, 2026. Farm Credit’s own commodities outlook projected 2026 milk at $18.30/cwt — below even the USDA’s $18.95.
As one Illinois banker told the Chicago Fed’s Q4 survey: “2026 is going to be a challenge for many producers with higher input prices.” That’s the lending environment the Wisconsin dairy’s counselor was reading when he ran the real numbers.
What Does $18.95 Milk Do to Your DSCR?
Take a 400-cow dairy producing 24,000 lbs/cow/year — 96,000 cwt annually — carrying $1.2 million in term debt on a 10-year note. The Chicago Fed reported Seventh District operating loans at 7.11% and real estate loans at 6.63% in Q4 2025, so a 7.5% blended rate brackets most dairy debt. At standard monthly amortization, annual debt service on $1.2M at that rate runs $170,931.
Debt Service Coverage Ratio — net cash income divided by annual debt service. Below 1.25x, lenders pay closer attention. Below 1.0x, the phone rings.
At $21.17/cwt (revised 2025 average, per USDA WASDE): Revenue: $2,032,320. Cash costs at $18/cwt: $1,728,000. Net cash: $304,320. DSCR: 1.78x — comfortable.
(That $18/cwt cost is illustrative — consistent with UW Extension benchmarks and close to the Wisconsin dairy’s actual $18.75. Plug in your real number.)
At $18.95/cwt (USDA’s 2026 forecast): Revenue: $1,819,200. Same costs: $1,728,000. Net cash: $91,200. DSCR: 0.53x.
From 1.78x to 0.53x. One price move. Same cows, same debt, same parlor.
And $18.95 might be optimistic. January 2026’s Class III posted at $14.59/cwt. December was $15.86. The back half needs to do heavy lifting to deliver USDA’s annual average — and your budget can’t wait for the second half to show up.
The math works in reverse, too. If milk recovers above $21 in the second half — driven by export demand, tighter supply, or both — these DSCRs snap back fast. But your lender isn’t budgeting on a recovery that hasn’t started.
Breakeven milk price for a 1.25x DSCR at these cost and debt levels: $20.23/cwt. USDA’s forecast is $1.28 below that floor.
For context, USDA ERS puts the full economic cost of production at $19.14/cwt for herds with 2,000+ cows and $42.70/cwt for herds under 50 (2021 ARMS, updated August 2024). At $18.95, even the most efficient operations are near breakeven on a full-cost basis.
What the Wisconsin Dairy Did in 48 Hours
That 550-cow operation didn’t wait. According to the counselor’s account in The Bullvine’s Calf-Check Paradox reporting, within 48 hours of seeing the real numbers:
The producer culled his 10 worst feed-to-milk converters, generating roughly $22,000 in cash and cutting daily feed cost by about $85.
He walked into his lender’s office with a 12-month projection at $18/cwt milk and a real cost-of-production sheet — the one with market-rate labor and repriced debt.
He negotiated a reamortization of equipment debt (from seven to twelve years) and four months of interest-only on real estate.
The reamortization buys monthly breathing room, but it isn’t free — extending the note means more total interest paid and collateral tied up longer. The restructuring was approved. Weekly burn dropped from $21,000 to roughly $13,500. Same cows. Same parlor. New math.
That’s the template. Not new genetics. Not a magic ration. Just running the real numbers and moving before the runway disappears. Most producers who lose operations in a down cycle don’t lose them because the math was impossible — they ran the math three months too late.
The Geography of Risk
Your farm’s zip code now affects its creditworthiness as much as its per-cow production.
Picture two 500-cow operations. The Wisconsin one milks into a state where the average herd was 237 cows as of NASS’s 2024 count — and likely higher now — with multiple processors competing and Farm Credit deep in dairy expertise. That renewal is about rate and terms, not about whether.
The Pennsylvania operation milks into a state with a 106-cow average and is shrinking fast. Harrisburg Dairies ceased operations in October 2025 and filed for Chapter 11 bankruptcy on February 20, 2026. According to the PA Milk Board’s November 2025 consent order, the company admitted to failing to pay producers promptly, with $900,070 documented as owed to 16 producers for August and September advance payments. The Bullvine’s own reporting put total unpaid obligations at $985,012 across 15 farms as additional October amounts were added.
Community banks in the region have seen a significant share of their dairy borrowers exit in recent years. For those that remain, the renewal conversation increasingly includes questions about succession, off-farm income, and the value of dairy infrastructure without cows.
Same 500 cows. One banker is talking in expansion terms. The other is weighing whether the regional dairy portfolio still justifies the exposure. This isn’t about Wisconsin being “good” and Pennsylvania being “bad.” It’s about the lending infrastructure around your operation — processor competition, lender expertise, peer density, and regional trajectory. If you’re in a state where the ecosystem is thinning, you need to know it before your renewal.
Warning Sign
What It Looks Like
What It Really Means
Term Shortened
5-year note renewed as 3-year
Lender buying more frequent exit ramps—your risk rating changed
New Covenants Added
DSCR thresholds, working capital floors, monthly reporting required
Portfolio committee wants tighter visibility into your cash position
Monthly Financials Requested
Previously annual, now monthly submission
Someone upstream flagged dairy sector exposure; you’re in enhanced monitoring
Relationship Banker Left
Dairy specialist replaced with generalist or role eliminated
Bank may be shifting resources away from dairy lending—your renewal leverage just dropped
Collateral Requirements Increased
Same loan amount, more collateral pledged
Your internal risk rating deteriorated; bank pricing for higher default probability
Is Your Lender Already Repositioning?
The Wisconsin dairy’s playbook worked because the producer got ahead of the conversation. Here’s what to watch for if the conversation has started without you:
Renewal term shortened. Five years became three? Your lender is buying more frequent exit ramps.
New covenants appeared. DSCR thresholds, working capital floors, or monthly reporting that wasn’t in the prior agreement.
Monthly financials requested. Someone upstream wants tighter visibility into your cash position.
The relationship banker left and wasn’t replaced with a dairy specialist. That could be normal turnover — or it could signal your bank is shifting resources away from dairy lending. Either way, it changes your renewal dynamic.
Collateral requirements increased for the same loan amount. Your internal risk rating changed.
Two or three stacked up means the conversation has shifted. The Wisconsin producer walked in before any materialized. That’s the difference between asking for restructuring and being told the terms.
What This Means for Your Operation
Herd Size
Critical Actions (Next 30 Days)
DSCR Threshold Trigger
Survival Strategy
Under 300 Cows
Run DSCR at $18.95 milk; if below 1.25x, bring real COP sheet to lender within 30 days (not tax return); open exploratory talks with Farm Credit/FSA if community bank shows warning signs
Succession clarity is your strongest lending signal—formalize timeline or lender assumes shorter horizon
300–1,500 Cows
Calculate breakeven to penny; compare to $20.23/cwt floor; if renewal within 90 days, bring competing term sheets—leverage comes from options; stress-test feed bill volatility
Document succession plan with timelines; hedge 30-50% of milk at $19+ if available; diversify lender relationships
1,500+ Cows
Stress-test at both $18.95 and $14.59 (January Class III); on 360k cwt, hedge 50% volume = $360k protected revenue annually; diversify beyond single lender—counterparty risk is real at $5M+ debt
Forward-contract feed and milk simultaneously; maintain 2+ lender relationships; formalize export market strategy if processing for specialty buyers
Under 300 cows: Run your DSCR at $18.95 this week. Below 1.25x, your lender is watching. Below 1.0x, be in your lender’s office within 30 days with a real COP sheet, not last year’s tax return. Open exploratory conversations with Farm Credit or FSA if your community bank shows warning signs. Get honest about succession — a lender who sees no plan on a sub-300 dairy is pricing for a shorter horizon, and the data on generational transfer is sobering.
300–1,500 cows: Know your breakeven to the penny. Compare it to the $20.23/cwt threshold calculated in this article. If renewal is within 90 days, bring competing term sheets — leverage comes from options, not hoping. Formalize succession if you’re transitioning; a documented plan with timelines is one of the strongest lending signals you can send.
1,500+ cows: Stress-test at $18.95 — and at $14.59. Diversify lending relationships — counterparty risk is real at $5M+. On 1,500 cows producing 360,000 cwt, a $2/cwt hedge on half your volume protects $360,000 in annual revenue and directly improves your risk rating.
Your 30-Day Checklist
Run your actual DSCR at $18.95 milk using this year’s feed bill and current debt service. Below 1.25x = the zone this article describes.
Pull your loan covenants. Check for DSCR thresholds, working capital floors, or reporting requirements you may have overlooked.
Request your processor agreement. Confirm component premiums, volume commitments, and termination terms. Your lender will ask.
If your DSCR is below 1.0x at $18.95, schedule a lender meeting this month — before renewal, not during it. Bring a 12-month projection at $18/cwt. The Wisconsin dairy showed what happens when you lead that conversation.
Key Takeaways
If your debt-service coverage ratio drops below 1.25x at $18.95 milk, you’re in the danger band this article describes — that’s your cue to sit down with your numbers and your lender before renewal, not after.
If your breakeven sits more than $1/cwt above USDA’s $18.95 forecast, you’re burning equity every week you don’t adjust — culling, cost cuts, or refinancing are on the table, but each comes with trade-offs in flexibility and total interest cost.
If you’re milking in a thinning dairy region like Pennsylvania, your lender’s view of regional risk now matters as much as your cow performance — processor stability and peer density are part of your credit story, whether you like it or not.
If your current hedging or risk management plan doesn’t even model a $14–$16 Class III stretch, you’re effectively betting the farm on a second-half recovery your lender isn’t banking on.
The Bottom Line
The real question isn’t whether $18.95 milk is fair — it’s where your breakeven actually sits against that number, and how many weeks of runway you really have if Class III spends more time in the $14s than USDA’s annual average implies. The Wisconsin dairy that ran the real numbers bought itself time. Those who wait won’t get the same terms.
Complete references and supporting documentation are available upon request by contacting the editorial team at editor@thebullvine.com.
Learn More
The 90-Day Reckoning: What Your Milk Check Is Really Saying About 2026 – Reveals a brutal 90-day window to preserve equity and arms you with the exact “Liquidity Runway” formula needed to survive mid-teens Class III prices. It bridges the gap between headline forecasts and the survival math required for your Monday morning.
Every week, thousands of producers, breeders, and industry insiders open Bullvine Weekly for genetics insights, market shifts, and profit strategies they won’t find anywhere else. One email. Five minutes. Smarter decisions all week.
TikTok butter boards, protein lattes, a $500M cottage cheese brand — all funded by your 15¢/cwt. But does any of it hit your milk check?
Executive Summary: Every month, your milk check skims off 15¢/cwt into a $121.4 million Dairy Management Inc. budget that helped bankroll TikTok butter boards, protein lattes at Starbucks and Dunkin’, and a $500 million cottage cheese brand. This feature puts three real farmers at the center of the fight over that money: DMI chair and 800‑cow producer Marilyn Hershey, former Dairy Board member Sarah Lloyd, and Supreme Court challenger Brenda Cochran. DMI points to 18.5 billion extra pounds of dairy sold through McDonald’s, Taco Bell, and Domino’s, and research claiming a $3.50 return for every checkoff dollar, while Lloyd and Cochran argue the gains pool in processors and mega-herds as four U.S. farms a day still disappear. The article connects those big marketing wins straight to your breeding and milk check math, showing how a 0.1% protein test bump on a 300‑cow herd is worth roughly $17,900 a year — more than the same herd pays into checkoff. From there, it hands you a simple playbook: audit your last three milk checks for component payments, re-run your sire choices for protein-heavy markets, and press your checkoff reps to explain exactly how influencer and QSR spending shows up in your own numbers. It’s a story about who controls demand, who captures the margin, and whether your 15¢/cwt is a smart bet or just another line on the deduction list.
Marilyn Hershey milks about 800 cows on 550 acres in Cochranville, Pennsylvania — about an hour west of Philadelphia. She’s also the chair of Dairy Management Inc., the organization that decides how to spend more than $200 million in annual checkoff collections from dairy farmers and milk processors nationwide. In a 2022 blog post, Hershey flagged what she saw as a massive untapped opportunity: 80% of the 2 billion chicken sandwiches sold in America each year lack a slice of cheese.
The checkoff, she wrote, was working with Chick-fil-A, Raising Cane’s, and McDonald’s to change that.
That’s the scale of ambition behind your 15¢/cwt. Mandated by Congress under the Dairy Production Stabilization Act, the assessment doesn’t just fund “Got Milk?” reruns. It bankrolls paid influencer networks, food scientists embedded inside fast-food headquarters, and QSR partnerships designed to bake more dairy into every menu in America. DMI’s 2025 program budget alone sits at $121.4 million (compared with $165.7 million in total organizational expenses in 2024, per the Ernst & Young audit filed May 8, 2025), with the largest shares going to export promotion ($31.8 million), reputation-building campaigns ($30.5 million), and innovation partnerships ($28.3 million). We broke down those audited financials — and what they reveal about where every cent goes — earlier this year.
On a 300-cow herd shipping about 75 lbs per cow per day — roughly 82,000 cwt of marketable milk annually — you’re sending approximately $12,300 per year into checkoff programs at 15¢/cwt. That’s real money. And it pools into a war chest that’s reshaping how the world eats dairy — often through channels you’d never expect.
The $24.11 Gamble: Did TikTok Really Sell Your Butter?
The butter board didn’t happen by accident.
In September 2022, influencer chef Justine Doiron posted a TikTok video of herself slathering two sticks of butter directly onto a wooden cheese board — seasoning the thick layer with flaky sea salt and lemon zest, arranging torn herbs and red onion across the surface, finishing with flower petals and a drizzle of honey. The video hit escape velocity. The New York Times, CNN, and the Today Show all covered it. High-end restaurants rolled out $38 tableside “butter service.”
DMI claimed credit in industry press almost immediately — and here’s why they could. Doiron was a member of DMI’s paid “Dairy Dream Team,” a network that, according to DMI, commands a combined 25 million social media followers, plus another 100-plus influencers working with state and regional checkoff teams. In 2026, that’s a larger promotional footprint than most cable networks deliver.
Doiron had posted a clearly labeled DMI advertisement just two days before the viral butter board video. DMI told Grist that the butter board itself wasn’t technically part of the paid partnership — and Doiron’s contract has since expired, according to DMI. That timeline raises a question the checkoff hasn’t fully answered: when an influencer on your roster goes viral with dairy content between paid posts, where exactly does the sponsorship end and the organic moment begin?
For producers, there’s a number worth knowing from USDA’s 2020 Report to Congress on the Dairy Promotion and Research Program: for every dollar spent on demand-enhancing activities for butter, the estimated return was $24.11. But here’s the asterisk. In 2019, less than 2% of total checkoff funds were spent on butter promotion — meaning the high return may reflect a fast-growing category that would have surged regardless of the spending. A prior evaluation using data through 2019 had calculated the fluid milk return at $3.26 per dollar — nearly double the $1.91 figure that emerged when pandemic-year data from 2020 were included. Whether those aggregate returns translate to your individual milk check is a different question. One we’ll come back to.
From Diet Food to a $500 Million Brand: The Cottage Cheese Comeback
If butter was the checkoff’s viral showpiece, cottage cheese is where the market data really moved.
Good Culture — co-founded by Jesse Merrill and Anders Eisner in 2015, headquartered in Austin, Texas — bet on clean labels, modern branding, and higher-welfare sourcing through its partnership with Dairy Farmers of America’s Path to Pasture program. The brand hit $100 million in revenue in 2023 and nearly doubled that in 2024, according to Forbes. In January 2026, private equity firm L Catterton acquired a controlling stake for more than $500 million, with Good Culture raising an additional $55 million from SEMCAP Food & Nutrition the following month. The broader cottage cheese category grew nearly 60% over that same period.
The engine behind that growth? TikTok recipes that repositioned cottage cheese from frumpy 1970s diet food into a high-protein base ingredient — cottage cheese “ice cream,” high-protein pancakes, flatbreads. “It was about a $1.1 billion category when I entered the space… the category growth was kind of flat or in decline for decades,” Merrill told Fast Company. “I just saw that as a huge opportunity.” Each viral recipe effectively increased the serving size per use — exactly what drives volume growth for processors.
If your processor pays on components, that cottage cheese boom translates directly into demand pressure on the protein fraction of your milk check. We dug into why that protein shift matters for your breeding program in “The $97,500 Protein Shift.”
The Genetic Signal in the Checkoff Data
Here’s the part that connects DMI’s viral success to your breeding barn.
Every one of these demand wins — protein lattes, cottage cheese, ultra-filtered milk — rewards milk for what’s in it, not how much of it there is. If DMI is genuinely succeeding at repositioning dairy as a protein ingredient rather than a commodity fluid, that’s not just a marketing shift. It’s a direct economic challenge to the volume-first Holstein model that still dominates most North American breeding programs.
The math is blunt. Under the updated FMMO formula (effective with the FMMO reform final rule published in early 2025), the Class III skim milk price now uses a 3.3% protein factor — up from 3.1%. That change amplifies every tenth of a point in your protein test. And when you pair the factor change with where protein prices have actually been, the gap between volume-bred and component-bred herds widens fast:
Protein Revenue Impact: What 0.1% Protein Test Is Worth(300 cows, 75 lbs/day, component pricing)
Metric
March 2024
January 2026
FMMO Protein Factor
3.1%
3.3%
Protein Price ($/lb)
$1.13
$2.18
Annual value per 0.1% test (300 cows, 75 lb/day)
$9,250
$17,900
Annual checkoff assessment (300 cows)
$12,300
$12,300
Excess value above checkoff
−$3,050
+$5,600
Sources: USDA AMS Announcement of Class and Component Prices, FCPO-0324 (April 2024) and CLS-0126 (February 2026). Protein prices are volatile — the 2024 FMMO protein price ranged from $1.13/lb to a peak of $3.32/lb, and the 2025 average was $2.45/lb. The near-doubling in value shown here is driven primarily by the increase in protein prices; the change in the factor (3.1% → 3.3%) separately affects how protein value flows through Class III blend prices.
That’s not a rounding error. At January 2026 prices, $17,900 per year from a 0.1% protein test improvement exceeds your $12,300 annual checkoff assessment, from one-tenth of a percentage point. If you’re still selecting bulls primarily on milk volume and ignoring protein test, you’re breeding for yesterday’s market while DMI spends your checkoff dollars building tomorrow’s.
This doesn’t mean volume is irrelevant. A 300-cow herd that gains 2,000 lbs per cow on the next generation but drops 0.15% protein may still come out ahead — depending entirely on your federal order, your processor’s product mix, and your contract structure. The point is that you need to run both sides of that equation now, not five years from now.
Is Your Checkoff Actually Delivering?
Not every producer is convinced the math works out. And some of the sharpest critics have seen the program from the inside.
Sarah Lloyd farms in Columbia County, Wisconsin. She served on the national Dairy Board from 2013 to 2016, milking 350 to 400 cows on the Nelson family operation near Wisconsin Dells. She’s since begun transitioning that farm toward conservation and new agricultural enterprises — but her critique of the checkoff hasn’t softened.
“It’s set up to be entirely demand-side,” Lloyd told Grist. “You’re not allowed to talk about price, you’re not allowed to talk about supply. It’s a wasted effort.”
Lloyd told Grist she’d watched a neighboring dairy operation quadruple in size to supply mozzarella to a nearby frozen pizza factory — and that local water quality had suffered as a result. “It’s a real crisis right now on all the legs of sustainability: ecologically, socially, economically.” In a separate interview with the Milwaukee Journal Sentinel, she was more pointed about the structural problem: “I can’t do the wheeling and dealing to directly line up milk to the supply chain that is benefiting from the marketing dollars. I need to rely on the trickledown.”
Lloyd isn’t alone. Brenda Cochran milked in Tioga County, Pennsylvania, and took the checkoff fight all the way to the Supreme Court — arguing the mandatory assessment was compelled speech that violated her First Amendment rights. “For years, the forced deductions from our milk checks being used to finance the generic dairy checkoff program have exceeded $4,500 annually,” Cochran wrote for the Organization for Competitive Markets in 2017, “which is a huge financial loss from our already insufficient milk income.” We told Cochran’s full story — and the $352 million question it raises — last month.
Hershey sees it differently. Those chicken sandwiches without cheese, the Starbucks protein lattes — these are macro demand plays that individual farms can’t execute alone. At DMI’s November 2025 annual meeting, she emphasized that “national programs rely on local engagement, and local programs depend on unified national priorities that make every farmer dollar work harder.”
The tension among Lloyd, Cochran, and Hershey reflects something checkoff defenders rarely address head-on: growing total demand doesn’t necessarily protect the individual farm, especially when that demand is captured primarily by large-scale operations with processor relationships that smaller herds can’t access. That’s the rub: a mandatory, farmer‑funded checkoff grows its budget with milk volume, not milk price. So how, exactly, is it supposed to prove farm‑level return?
What Did $875 Million in QSR Partnerships Actually Build?
DMI’s answer to the skeptics lives inside fast-food headquarters — literally.
Since 2009, DMI has placed dairy food scientists directly inside McDonald’s corporate offices. By 2015, McDonald’s was using 14% more dairy (in milk-equivalent pounds) than at the start, according to DMI. Porter Myrick, one of those on-site scientists, described the arrangement in a 2018 Dairy Foods Magazine announcement: “We work here every day alongside the McDonald’s culinary staff, and we very much feel like one team.”
Their work has been specific and measurable: white cheddar cheese slices more than 30% larger rolled out across 14,000 restaurants, reformulated chocolate milk with 25% less sugar for Happy Meals, and the dairy-heavy menu infrastructure that was already in place when the Grimace Shake went viral in 2023. DMI CEO Barb O’Brien put it directly on a December 2023 podcast: “My hope is that farmers, when they see a new milkshake or a new McFlurry at McDonald’s, that they know that it’s their new product.”
The most recent numbers back up the scale. According to DMI’s November 2025 economic impact report, the foodservice strategy across McDonald’s, Taco Bell, and Domino’s contributed 18.5 billion additional pounds of dairysold at retail between 2009 and 2024 — generating $875.9 million in incremental farmer revenue and a return of $3.49 for every dollar invested.
Why Are Starbucks and Dunkin’ Betting on Your Milk?
Protein has moved from the gym to the coffee counter. And dairy is winning.
QSR Chain
Product Launch
Protein Content
Why It Matters to Your Breeding Strategy
Starbucks
Protein Lattes & Cold Foam (Sept 2025)
19–36 grams per grande
Ultra-filtered/protein-boosted formulations require high-protein milk — processors will pay premiums for 3.3%+ test herds
Dunkin’
“Protein Milk” Line (Jan 2026)
15 grams per medium
Partnered with Megan Thee Stallion for launch; protein-forward menu expansion signals sustained QSR demand
In late September 2025, Starbucks launched protein lattes and protein cold foam nationally, with some drinks delivering up to 36 grams of protein per grande using a “Protein-Boosted Milk” blend of 2% milk and unflavored dairy protein. CNBC reported that protein options would span both hot and iced beverages, with protein cold foam add-ons delivering 19 to 26 grams of protein per grande across the menu. On January 7, 2026, Dunkin’ followed with its own “Protein Milk” — adding 15 grams of protein per medium drink — alongside new Protein Refreshers and Protein Lattes, partnering with Megan Thee Stallion for the launch campaign.
Those protein lattes don’t make themselves. Ultra-filtered and protein-boosted formulations need milk that tests high on true protein — and processors are starting to pay accordingly. As more QSR volume shifts to protein-forward formulations, expect your processor to pay closer attention to your protein test. If you’re selecting genetics primarily for volume and fat right now, this demand shift is worth factoring into your breeding decisions over the next proof cycle.
That’s the case for the money working — 18.5 billion additional pounds through restaurant partnerships, a $500 million cottage cheese brand, influencers with 25 million followers turning butter into lifestyle content. But all those aggregate billions didn’t stop four farms from going under every day. Consider the raw milk market as a kind of control group: according to NielsenIQ data reported by PBS NewsHour, weekly raw cow’s milk sales surged 21% to 65% above the prior year during key weeks in 2024, even as the FDA ramped up H5N1 warnings, with zero checkoff dollars behind it. How much of the butter board boom and the cottage cheese comeback would have happened without DMI? Nobody has a clean answer. But it’s worth asking before you decide whether your $12,300 is money well spent.
DMI’s counter-argument, supported by USDA-commissioned research led by Dr. Oral Capps Jr. at Texas A&M University, is that the return on investment is measurable: $1.91 per dollar on fluid milk promotion, $3.27 for cheese, and $24.11 for butter, according to the 2020 Report to Congress. The evaluation methodology was reviewed by the Government Accountability Office (GAO-17-188). A more recent DMI-commissioned analysis pegged the overall return at $3.50 per checkoff dollar invested, suggesting milk prices would be roughly $1 per hundredweight lower without the program. Both sides have data. What neither side has is a clean answer to the question that matters most to the 300-cow operator: does that $12,300 you send every year come back to your milk check, or does it come back to the industry’s aggregate numbers while your margins stay flat?
Metric
DMI’s Aggregate Claim
300-Cow Farm Reality
The Gap
ROI per dollar invested
$3.50
Unknown — not broken out by farm size or processor type
Is your processor even breaking out components? (30 days) Pull your last three milk checks and look at what you’re actually being paid for butterfat and protein separately. If those lines aren’t there — or if the breakdown isn’t clear — call your co-op or processor this week and ask. At January 2026’s FMMO protein price of $2.18/lb, a 0.1% improvement in your herd’s protein test on 300 cows shipping 75 lbs/day works out to roughly $17,900 per year in additional component value. That’s more than your annual checkoff assessment, from one-tenth of a percentage point.
$17,900 says your genetic strategy deserves a second look. (90 days) If your breeding program is optimized purely for volume, run the numbers on component-weighted selection before your next sire order. You might sacrifice some total pounds per cow, but the revenue per hundredweight could more than compensate — especially now that USDA’s updated FMMO formula uses a 3.3% protein factor (up from 3.1%), amplifying the revenue impact of every tenth of a point. We walked through that math in “Component Gold Rush.”
Good Culture didn’t need the checkoff to build a $500 million brand — but they needed a story. (6–12 months)The cottage cheese, artisan butter, and raw milk booms all show consumer willingness to pay premiums for products with narrative. If you’re within a reasonable distance of a metro market, co-packing partnerships or farm-branded products are worth penciling out. The risk is real: startup capital, regulatory compliance (which varies dramatically by state), and the reality that marketing requires a completely different skill set than dairy farming.
Can’t opt out? Then show up. (Ongoing) Whether you think DMI’s $121.4 million is well spent or not, it’s your money. Review their annual budget at dairycheckoff.com and attend a farmer relations meeting. Ask specifically how influencer and QSR partnership spending translates into demand that reaches your milk check — not just national consumption statistics. “I want farmers to know that I know who I work for,” O’Brien told Dairy Herd Management. Take her up on it.
Key Takeaways
If your processor pays component pricing, the butter/protein/cottage cheese demand surge matters directly to your revenue — check whether your fat and protein tests are trending in line with the market’s reward. At January 2026’s FMMO protein price of $2.18/lb, each 0.1% protein test improvement is worth roughly $60/cow/year.
If you’re selecting genetics primarily for volume, the protein-forward product boom is a signal to re-evaluate — run your component-weighted revenue per cow against your current selection index before your next breeding cycle.
If you’re considering raw milk or value-added as a revenue play, the consumer demand is real, but so is the liability — price your regulatory and insurance costs before you price your product.
If you can’t articulate what your $12,300/year bought this year, attend your next checkoff farmer relations meeting and ask. DMI publishes its full budget at dairycheckoff.com — the data is there. Whether the return reaches your operation is a question only your own numbers can answer.
The 30-Day Checkoff ROI Audit: 5 Questions to Ask Your Milk Check (and Your Co-op) This Month
Audit Question
Why It Matters
Where to Find the Answer
Red Flag / Green Flag
1. Does my processor pay component pricing?
At $2.18/lb protein (Jan 2026), 0.1% test improvement = $17,900/year on 300 cows
Last 3 milk checks: look for separate butterfat & protein lines
Red: No component breakdown → you’re subsidizing QSR protein demand without capturing premium
2. What’s my herd’s protein test trend (last 12 months)?
DMI positioned dairy as protein ingredient; if your test is flat/declining, breeding strategy isn’t aligned
Herd management software or DHI reports
Red: <3.2% protein average → leaving $17,900+ on table vs. 3.3% herds
3. How much did I pay into checkoff last year?
15¢/cwt × annual marketable milk = your investment; need baseline to evaluate return
Milk check deduction line (usually labeled “Promotion & Research”)
Red: Can’t find deduction amount → demand transparency from processor
4. Can my checkoff rep explain how QSR/influencer spending reaches my milk check?
DMI claims $3.50 ROI, but aggregate ≠ individual; force explanation of trickledown mechanism
Red: Answer is “industry-wide demand lifts all boats” → press for farm-size, processor-type ROI breakout
5. What’s my processor’s product mix (fluid vs. cheese vs. exports)?
76% of checkoff goes to cheese & exports; if your processor is fluid-heavy, you’re funding demand for someone else’s product
Call co-op/processor field rep directly or check annual reports
Green: Cheese/export processor → your checkoff aligns with spending; Red:Fluid-heavy → structural mismatch
The Bottom Line
Your 15¢/cwt built the butter board moment, put scientists inside McDonald’s, and helped engineer protein into every Starbucks in America. Pull up your last milk check. Look at the checkoff line. Then look at your component premiums. Can you see the return?
Complete references and supporting documentation are available upon request by contacting the editorial team at editor@thebullvine.com.
Four Farms Exit Daily: The $100K Decision Reshaping Dairy Survival – Expose the “processor risk” fault line that is claiming four dairies a day. This analysis delivers a four-question audit of your cash runway and milk-check concentration, arming you with the strategic advantage of a 72-hour survival plan.
Beef-on-Dairy’s $6,215 Secret: Why 72% of Herds Are Playing It Wrong – Break down the genomic multipliers that turn surplus pregnancies into a high-margin second revenue stream. This deep dive weaponizes your data to capture massive premiums, revealing why most herds are leaking profit and how to dominate the new beef-on-dairy landscape.
The Sunday Read Dairy Professionals Don’t Skip.
Every week, thousands of producers, breeders, and industry insiders open Bullvine Weekly for genetics insights, market shifts, and profit strategies they won’t find anywhere else. One email. Five minutes. Smarter decisions all week.
Fluid milk finally rose in 2024, then slipped again in 2025. This isn’t a comeback—it’s a math test for any herd that lives on Class I.
Executive Summary: U.S. dairy producers pay 15¢/cwt into the national checkoff. Texas A&M’s independent model says it adds about $1/cwt to the all‑milk price — but 76% of the $6 billion in cumulative value is tied to cheese exports and foodservice. In comparison, fluid milk innovation gets just $121.5 million and a $1.68 return per dollar. For a 275‑cow herd like Mike Yager’s in Wisconsin, that modelled uplift looks good on paper, yet the June 2025 FMMO reform yanked 1.9 million from producer pools in three months, with his Upper Midwest order losing million to higher make allowances and gaining only million back in differentials. The brief 2024 uptick in fluid sales was driven by higher‑priced whole, organic, and value‑added products, but it flipped negative again in 2025, so this is not a structural demand comeback for conventional Class I milk. At the same time, Coca‑Cola’s fairlife has grown into a billion ultra‑filtered milk brand, showing how checkoff‑supported category growth can create huge value that mostly lands on corporate balance sheets rather than your milk statement. This analysis uses barn‑math walk‑throughs and four practical levers — boosting components, using beef‑on‑dairy strategically, reassessing your processor’s product mix, and tracking school milk and FMMO policy shifts — so you can see how much checkoff ROI actually hits your own fluid milk check and where you still have room to move.
When Mike Yager spoke to Brownfield Ag News last November, he was milking 275 Holsteins at Road View Dairy near Mineral Point, Wisconsin. First-generation operation — he and his wife, Sherri, started it in 1992. He put a question on the air that every dairy checkoff contributor deserves an answer to: “I want to see the difference… the 13.3 billion less we received for the milk in income between those two years… but I’m pretty sure dairy prices were higher for the consumer, so where did all of that money go?”
He’s asking where the money went. USDA NASS data show a $11.4 billion nominal decline in U.S. milk cash receipts — from $57.3 billion in 2022 to $45.9 billion in 2023 (USDA NASS, April 2024 and April 2023). That’s a 19.8% haircut in one year. Meanwhile, Yager and every other U.S. producer continued to pay 15 cents per hundredweight into the national dairy checkoff. For his 275-cow herd at the time, that’s roughly $7,500 a year. Dairy Management Inc. says those collective dollars generated $6 billion in cumulative farmer value since 2009.
Six billion sounds like it’s working. Pull the number apart, and the story changes.
Where Your 15 Cents Actually Lands
Dr. Oral Capps Jr. at Texas A&M has conducted the federally mandated independent checkoff evaluation since 2011. His breakdown of that $6 billion, presented at DMI’s joint annual meeting with MilkPEP in Arlington, Texas, last November, tells you everything about who benefits most:
Exports — overwhelmingly cheese, whey, and powder — account for 76% of total value. Foodservice is the checkoff’s most defensible win: DMI embeds dairy food scientists inside partner test kitchens with contractual volume commitments. Producers invested $195.3 million since 2009. That generated $875.9 million in incremental revenue.
Here’s the structural catch that matters for your milk check: nearly all of this is cheese demand, which lifts Class III pricing. If you’re a fluid shipper, that value reaches you only through FMMO pool blending — diluted across every pound in the system.
The fluid milk innovation bucket? Smallest segment. $121.5 million over six years, returning $1.68 per dollar invested. Not nothing. But it’s 2% of the total cumulative value.
What Does the Dairy Checkoff Actually Return to a 275-Cow Operation?
Capps’ simulations estimate the all-milk price would sit about $1/cwt lower without the checkoff. That’s a national econometric model — peer-reviewed, independently mandated, and the best available estimate we have. Here’s what it means in formal terms for a herd like Yager’s 275 cows:
Annual checkoff assessment: (Cows × lbs per cow) ÷ 100 × $0.15“
Modeled revenue support: (Cows × lbs per cow) ÷ 100 × $1.00Theoretical net benefit: [(Cows × lbs per cow) ÷ 100 × $1.00] − [(Cows × lbs per cow) ÷ 100 × $0.15]
That’s a 6.7-to-1 return at the national level. For a 200-cow herd at the same per-cow production, $50,000 in modeled support versus $7,500 in assessments. Same 6.7-to-1 ratio. Plug in your own numbers — the formula scales linearly.
The critical qualifier: this is a national model, not an individual farm measurement. It assumes the full all-milk price effect reaches every producer equally. It doesn’t. A Southeast fluid shipper and a Wisconsin cheese-country operation live in different economic universes — and the June 2025 FMMO reform made that gap wider.
How the FMMO Reform Changed the Checkoff Math
The reform that took effect June 1, 2025, raised allowances, restored the higher-of Class I mover, increased Class I differentials, removed 500-lb barrel cheese from pricing surveys, and — six months later — updated milk composition factors.
AFBF economist Daniel Munch scored the first three months in September 2025. Here’s the headline math:
Make allowances, cut $337 million from pool revenues — class prices dropped 85 to 93 cents per hundredweight.
Higher Class I differentials clawed back $137 million — but the skew was sharply regional.
Higher-of mover costs $31.1 million versus the old formula in calm markets
Net result: $231.9 million less in producer pool revenues across all 11 orders
The regional breakdown is where this gets personal: The Upper Midwest lost $64 million in make allowance costs and recovered just $7 million in differentials — the widest gap of any order with complete data. California: $55 million out, $7 million back. The Northeast fared comparatively better — $62 million in losses but $34 million in differential recovery — because it carries the highest Class I utilization among the large orders. Cooperatives in the Northeast, where Class I utilization is highest, have pointed to the differential recovery as partial validation. The Mideast recovered $30 million in differentials, but AFBF didn’t break out its individual make allowance hit.
Federal Order
Make Allowance Cost
Differential Recovery
Net Impact
Per-Cwt Effect
Upper Midwest
-$64M
+$7M
-$57M
-$0.86
California
-$55M
+$7M
-$48M
-$0.73
Northeast
-$62M
+$34M
-$28M
-$0.42
Mideast
Not disclosed
+$30M
Unknown
—
All Orders
-$337M
+$137M
-$231.9M
-$0.35 avg
Yager’s herd sits in that Upper Midwest order — where producers absorbed the largest make allowance hit of any region. Sixty-four million out, roughly a dime on the dollar back. The reform was designed to help processors invest in capacity. It wasn’t designed for a 275-cow Mineral Point operation.
Dairy economist Calvin Covington confirmed the Southeast will see the “majority of benefit” from updated differentials, with composition factors adding about 35 cents per cwt to Class I prices in the southeastern orders still using fat/skim pricing.
University of Minnesota dairy economist Marin Bozic offered a contrarian read to Brownfield Ag News in January 2025: he expects more milk to be pooled under the new formulas, not less, because “the processors have stronger incentives to bring that milk to the pool to try to get a piece of the producer price differential and forward that to their patrons”. Over-order premiums, in his view, “will come back.” Worth watching — but not here yet.
The 2024 Recovery That Wasn’t
Total U.S. fluid milk sales rose in 2024 — the first year-over-year gain since 2009. USDA AMS in-area route sales showed roughly 0.5%; ERS total estimates ran closer to 0.6–0.8%.
Dig into the segments, and the optimism fades. Whole milk topped 15 billion pounds, up 1.6% — first time since 2007 outside the COVID-era spike. Organic rose 7.2% to approximately 3 billion pounds. Value-added products like fairlife kept climbing. But reduced-fat (2%) fell 4.4%. Skim sits at less than a quarter of its late-1990s peak.
None of those growth segments is cheap milk. Conventional whole averaged a record $4.39 per gallon in 2024 — up 5 cents from 2023, based on federal order market administrator surveys across 30 cities (Hoard’s Dairyman, January 22, 2025). Organic whole averaged $4.81 per half gallon. More than double conventional on a per-gallon basis.
Karen Gefvert of Edge Dairy Farmer Cooperative called it: the increase “was not significant, and is likely just sort of a pause in the inevitable continuous decline in fluid milk sales”.
She was right. By February 2025, USDA AMS monthly data showed total sales down 2.2%, year-to-date down 1.3%. First-half 2025: down 0.5% on a leap-day-adjusted basis, totaling 21.1 billion pounds. November 2025: total fluid down 1.8%, conventional down 1.5%, organic down 6.0% (USDA AMS, January 2026).
Per-capita sales dropped 20% over 35 years from 1975 to 2010. Then fell another 28% in just the next 12 (from USDA data). The acceleration matters more than any single-year recovery.
The $7 Billion Brand Your Checkoff Built — for Coca-Cola
No brand illustrates the value-capture gap more clearly than fairlife. Mike and Sue McCloskey — dairy farmers who built Fair Oaks Farms in Indiana — co-developed ultrafiltration technology with Select Milk Producers in a joint venture with Coca-Cola. Launched nationally in 2014. Coca-Cola acquired full ownership in 2020. By early 2025, the total cost, including performance-based earnouts, reached approximately $7 billion. Fairlife surpassed $1 billion in annual retail sales by 2022.
The new $650 million fairlife plant in Webster, New York creates real volume demand for area producers. But the brand premium that makes fairlife a multi-billion-dollar asset flows to Coca-Cola shareholders—not back to the producers whose assessments helped build the fluid milk innovation category.
That’s by design. Commodity promotion builds the category. The market decides who captures margin. Understanding the difference isn’t cynicism — it’s information you need to make better decisions about where your own operation captures value.
Do Consumer Campaigns Actually Move Gallons?
The foodservice partnerships bypass consumer persuasion entirely — dairy gets engineered into products people already order. That mechanism has tight evidence behind it.
Consumer-facing campaigns are a different story. DMI’s Dairy Diaries Roku series reported 52% of viewers left with a “very favorable” opinion of dairy. No purchase behavior data published. Got Milk? achieved massive awareness over three decades, while per capita consumption declined each year. Views aren’t gallons.
DMI CEO Barbara O’Brien cited a 2025 back-to-school activation that “generated 1.5% sales growth in participating markets” (DMI, November 2025). If that comes with a published methodology and proves replicable, it’s genuinely meaningful. As of February 2026, DMI hasn’t released methodology, market definitions, or measurement periods for that claim.
Four Moves for Fluid-Dependent Operations
The checkoff ROI conversation matters. But you can’t wait for Washington or Rosemont to fix your milk check. Here are four things within your control.
1. Push your components higher. The federal order butterfat price averaged $2.44/lb across 2025, though it dropped sharply from $2.95/lb in January to $1.58/lb by December (USDA AMS). Even at January 2026’s $1.4525/lb, the math on a 0.2-point test improvement is significant. Here’s the walkthrough for a 200-cow herd:
Added butterfat (lbs): Cows × lbs per cow × Butterfat test increase
At current prices:
200 cows × 24,000 lbs × 0.002 × $1.45Annual value at 2025 average: Added butterfat lbs × $2.44
Plug in your own test numbers. National test climbed from 3.8% to 4.33% between 2015 and March 2025 across FMMO-pooled milk. The genetics are already moving — but the dollar value swings hard with the commodity market. Butterfat dropped 46% in 12 months.
2. Run the beef-on-dairy math. Beef cow inventory has been down for six consecutive years since the 2019 peak (Hoard’s Dairyman, March 30, 2025). Dairy-beef crosses keep commanding wider premiums. New Holland in late January 2025: crosses at $675/head versus $414 for straight Holstein bulls — a $261 premium. By September average prices of $1,400. February 2026 auctions: crossbred bull calves at $7.75–$18.50/lb, meaning a 75-lb calf can clear $580–$1,387 (Edgewood Livestock, February 3, 2026).
Trade-off: Dairy heifer inventories have fallen for six consecutive years to their lowest in 20 years. The crossbreeding trend “suggests that the heifer shortage will continue for years”. Only makes sense if you’re not expanding.
3. Know your processor’s product mix. New cheese and ultra-filtration capacity is expanding — Coca-Cola’s fairlife plant in Webster, plus investments by California Dairies Inc. and Darigold. The new make allowance structure “suggests that cheese production should pick up”. If your current processor is a fluid bottler with declining volumes, your milk market is shrinking regardless of what DMI does. Ask yourself: has your processor’s fluid volume declined for three consecutive years? Regardless of the percentage, that’s a trend, not a blip. Worth a conversation with your cooperative board.
Trade-off: Switching cooperatives means potentially losing patronage dividends, equity credits, or hauling arrangements. Compare the full package — not just the base price on your stub.
4. Track the Whole Milk for Healthy Kids Act. Schools account for about 8% of U.S. fluid milk, amounting to roughly $1 billion per year (Dairy Reporter, April 2025). Real volume. But student consumption has been declining for years, and access alone doesn’t change habits. Watch the data as implementation rolls out.
What This Means for Your Operation
If you ship more than 60% Class I and your cooperative’s utilization is declining, you’re on the wrong side of where checkoff value concentrates. The AFBF data shows the reform’s benefits are heavily skewed by region — California and the Upper Midwest gained just $6–$8 million in differentials, while $55–$64 million in make allowance losses were incurred. Run the net math for your order before assuming you came out ahead.
If your herd butterfat averages below 3.9%, genomic selection for fat percentage likely offers the highest near-term ROI on this list. The walkthrough above shows a 200-cow herd gaining $14,525–$24,400 annually on just 0.2 points of test — but verify your cooperative pays component premiums. Four southeastern orders still don’t. And butterfat dropped from $2.95 to $1.45 in 12 months.
If you’re evaluating organic, organic’s momentum stalled hard in 2025: after growing 7.2% in 2024, it edged up just 0.7% in the first half and, by November, was down 6.0% year-over-year. Run your three-year transition math against a stressed premium scenario, not just the current one.
If you pay $7,500+ per year in checkoff, run Capps’ framework on your own herd: multiply your total hundredweights by $1.00 and compare to your annual assessment. That’s the best-case national model. Then ask what it looks like when Class I utilization drops another five points — because it’s heading that direction.
If your cooperative votes on your behalf in FMMO proceedings, ask about the upcoming mandatory biennial processor cost survey required by the One Big Beautiful Bill Act. That survey could ground future make allowance decisions in verifiable data — the first structural fix to what AFBF called reliance on a self-selected sample of self-reported manufacturers’ cost data.
📊 Your Accountability Dashboard
Metric
Source
Frequency
Something’s Working
Red Flag
Per-capita fluid decline rate
USDA ERS
Annually
Slows below 2%
Holds above 2.5%
Conventional fluid sales
USDA AMS
Monthly
Stabilizes within -0.5%
Keeps falling 1–3%+
DMI campaign sales lift
DMI annual reports
Annually
1.5%+ lift replicated with methodology
One-time claim, never verified
Class I utilization
FMMO market administrator
Monthly
Holds above 25% nationally
Drops below 22%
FMMO reform net impact
AFBF Market Intel
Quarterly
Composition + differentials exceed make allowance losses
Net pool decline continues into 2026
Processor cost survey
USDA (per OBBBA mandate)
Biennial
Published with transparent methodology
Delayed or limited scope
If four or more flash red two years from now, the collaboration built awareness and trust — both valuable — but didn’t bend the structural curve.
Key Takeaways
An independent Texas A&M analysis verifies the checkoff’s $6 billion. But 76% is exports and foodservice — overwhelmingly cheese demand that lifts Class III. Fluid milk innovation returned .68 per dollar over six years. If your revenue depends on Class I, you’re funding a system that works better for someone else’s milk. The data exists for you to measure that gap.
The 2024 fluid recovery was in the premium segments, pulling the total above zero. Conventional kept eroding. By November 2025, total fluid was down 1.8%, organic down 6.0%. Don’t plan around a trend that lasted 12 months.
Your checkoff dollars helped build the landscape fairlife rides — a brand Coca-Cola values at $7 billion. Understanding that the value-capture gap isn’t a frustration. It’s the starting point for figuring out where your own operation captures margin.
The June 2025 FMMO reform hit producers with a net $231.9 million decline in pool revenue over three months. Benefits skewed heavily by region — the Upper Midwest order, where Yager milks lost $64 million and recovered $7 million. Know your order’s net math. Don’t assume the national story is your story.
Component optimization can add $14,525–$24,400/year for a 200-cow herd that moves 0.2 points of test. Beef-on-dairy crosses are clearing $580–$1,387 per calf at February 2026 auctions. Neither requires waiting on Washington or your checkoff board. You’ve got levers. Use them.
The Bottom Line
Pull up your 2024 and 2025 year-end milk statements side by side. What changed? Where did your 15 cents go? When Yager asked that question on Brownfield last November, he was milking 275 cows and looking for answers. So are you. And here’s the thing — you’ve got the framework now. The math, the dashboard, the four strategies. The question isn’t whether the checkoff works in aggregate. It does. The question is whether it works for you, in your order, at your scale, with your product mix if the answer isn’t specific enough — from DMI, from your cooperative, from your own milk statement — that tells you exactly where to push next.
Complete references and supporting documentation are available upon request by contacting the editorial team at editor@thebullvine.com.
Every week, thousands of producers, breeders, and industry insiders open Bullvine Weekly for genetics insights, market shifts, and profit strategies they won’t find anywhere else. One email. Five minutes. Smarter decisions all week.
The Supreme Court struck down one set of tariffs and set a 150‑day clock. For a 500‑cow herd, the spread is $147,000. Where does your breakeven sit?
Executive Summary: The Supreme Court’s 6–3 ruling in Learning Resources, Inc. v. Trump killed all IEEPA-based tariffs and replaced them, for now, with a 15% Section 122 surcharge on a 150‑day clock that ends July 24. For a 500‑cow dairy shipping 117,500 cwt a year, Cornell economist Charles Nicholson’s model says the difference between tariffs gone, a 15% replacement that sticks, or continued uncertainty is about $147,000 in annual margin — enough to hire a person or cover six months of feed. At the same time, a new U.S.–Taiwan deal locks in zero dairy tariffs, while Canada’s ongoing obstruction of USMCA dairy TRQs now faces less U.S. leverage after the ruling, even as exporters still fight to use roughly 42% of the access they were promised. CBP has collected $133.5 billion in IEEPA tariffs through late 2025, and Penn Wharton estimates up to $175 billion could be refunded with interest, raising a blunt question: will processors keep that money, or pass any of it back down the chain? In the next 30 days, producers need to lock in or adjust 2026 Dairy Margin Coverage before the February 26 deadline; over the next 90–365 days, they should stress‑test breakevens against $18‑class futures, press co‑ops on export plans to Canada, Mexico, and Taiwan, and treat July 24 as a hard decision line for contracts and capital plans. Put simply, the Court didn’t eliminate tariff risk — it turned your milk check into a 150‑day countdown in which standing still is the most expensive option.
$147,000. That’s the gap between the best and worst scenarios facing a 500-cow dairy between now and July 24 — the day the replacement tariffs expire, or don’t. The Supreme Court’s 6-3 ruling on February 20 in Learning Resources, Inc. v. Trump didn’t end the tariff fight. It moved it to a different legal lane with a ticking clock.
Ted Vander Schaaf milks 1,250 Holsteins near Kuna, Idaho. He told the Senate last week that U.S. trade leverage was slipping — that countries were already gaming the system before the Court weighed in. Four days later, Chief Justice Roberts wrote the majority opinion, confirming what Vander Schaaf had seen in his bulk tank: the legal foundation of the tariff regime had never been solid.
Now every dairy producer in the country faces the same question Vander Schaaf does. Not whether the tariffs are gone—they’re not. Whether the replacement tariffs hold, and what your milk check looks like if they don’t.
What the Court Killed — and What It Didn’t
The ruling was definitive on one point: IEEPA does not authorize tariffs. Period. Roberts, joined by Gorsuch, Barrett, Sotomayor, Kagan, and Jackson, wrote that the power to “regulate importation” as granted to the president in IEEPA does not embrace the power to impose tariffs. The statute contains no reference to tariffs or duties, and no president in IEEPA’s 49-year history had ever used it this way.
What’s gone: every IEEPA-based tariff. The country-by-country reciprocal rates — up to 34% on China, 25% on certain Canadian and Mexican goods, and the 10% baseline on everybody else. All invalidated. The administration issued an executive order the same day stating these tariffs “shall no longer be in effect and, as soon as practicable, shall no longer be collected.”
What’s still standing: Section 232 tariffs (national security — steel, aluminum), Section 301 tariffs (unfair trade practices — existing China tariffs on specific goods), and antidumping/countervailing duties. These operate under separate statutory authority and weren’t touched by the ruling.
[INTERNAL LINK: “The American Dairy Heist: Who Really Owns Your Milk Check” → Suggested anchor text: “the margin chain between your bulk tank and the shelf”]
And then there’s the replacement.
The 150-Day Clock: Why Section 122 Probably Won’t Survive
Within hours of the ruling, Trump announced a 10% tariff on imports from around the world under Section 122 of the Trade Act of 1974. A day later, he bumped it to 15% — the statutory maximum. Section 122 allows temporary import surcharges for up to 150 days to address “fundamental international payments problems.”
Here’s the problem: the U.S. doesn’t have one.
Peter Berezin, chief global strategist at BCA Research, put it bluntly on February 20: “A balance of payments deficit is not the same thing as a trade deficit. You cannot have a balance of payments deficit if you have a flexible exchange rate.” Bryan Riley, director of the National Taxpayers Union’s Free Trade Initiative, made the same argument: Section 122 was written for a fixed exchange-rate world that hasn’t existed since 1973. The statute has never been invoked. Not once in 52 years.
The Peterson Institute for International Economics laid out the technical case in a February 22 analysis. Under a floating exchange rate, potentially insufficient private financial inflows are remedied by currency depreciation, which puts domestic assets and exports “on sale” and precludes a balance-of-payments deficit before it starts. The U.S. has a large supply of attractive financial assets and faces no difficulty financing its current account deficits.
Even the administration’s own lawyers argued during the IEEPA case that Section 122 was no substitute for IEEPA because balance-of-payments deficits are “conceptually distinct” from trade deficits.
So the replacement tariff’s legal foundation is arguably weaker than the one the Court just demolished. And it expires on July 24, 2026 — 150 days from the February 24 effective date — unless Congress votes to extend it. Both the House and Senate have already passed bills disapproving of the IEEPA tariffs. Extension looks dead on arrival.
Rep. Mike Flood (R-NE) underscored the point: “The ruling underscores Congress’s responsibility and obligation to set tariff policy.”
What happens after July 24? The administration has signaled it will initiate Section 301 investigations against multiple trading partners and may accelerate pending Section 232 investigations. Those routes require investigations and findings of fact—a process that can take months, even on an expedited timeline. There will be a gap.
$147,000 Three Ways: What Your 500-Cow Dairy Looks Like Under Each Scenario
Cornell’s Charles Nicholson projected at the January 2025 Dyson Agricultural and Food Business Outlook conference that the combination of tariffs, deportations, and potential nutrition spending cuts could produce a billion loss in U.S. dairy profits over four years. That’s a combined-policy number, not tariffs alone — but tariff-driven retaliation from Mexico, Canada, and China was the biggest single driver.
“If you pick a trade fight with our major export destinations — Mexico, Canada, and China — and they decide to retaliate, that has some substantive negative implications for dairy farms and processors,” Nicholson said.
The SCOTUS ruling scrambled the assumptions underneath that projection. Here’s how the math lands on a 500-cow operation producing 235 cwt/cow/year — 117,500 cwt of annual production. Plug your own herd size, and you can scale these directly.
For context: Class III milk settled at $15.07/cwt on February 19 — the last trading day before the ruling. That’s up from a $14.53 low on February 3, but still well below the $17–18 range where Q2 and Q3 2026 futures are currently trading on the CME.
Retaliatory tariffs from Mexico, Canada, and China unwind. Export demand recovers. Class III and Class IV futures adjust upward as export-driven cheese and powder demand returns to the pre-tariff trajectory. Nicholson’s model suggests milk prices recover by 2027, with the 2025–26 damage partially absorbed.
Estimated price impact: +$0.75 to +$1.25/cwt above current baseline Your 500-cow math: 117,500 cwt × $1.00/cwt midpoint = +$117,500/year
This is the best case—and it’s not guaranteed. It depends on trading partners actually unwinding retaliatory measures, which Ian Sheldon at Ohio State warns is far from certain.
The 15% across-the-board tariff stays through July 24. Retaliatory tariffs remain partially in place. Some trading partners renegotiate, others slow-walk. Class III price stays compressed. Input costs (equipment, parts, and some feed additives) remain elevated due to the 15% surcharge.
Estimated price impact: -$0.50 to -$1.00/cwt below pre-tariff baseline. Your 500-cow math: 117,500 cwt × -$0.75/cwt midpoint = -$88,125/year
Section 122 is challenged in court. Trading partners pause compliance with existing deals. Processors can’t price forward contracts. Futures volatility spikes. Co-ops hold back on premiums.
Estimated price impact: -$0.25 to -$0.50/cwt from uncertainty discount alone. Your 500-cow math: 117,500 cwt × -$0.25/cwt (conservative) = -$29,375/year in margin compression — before any tariff-driven price move lands
Scenario
Legal Status
Milk Price Impact (per cwt)
Annual Margin Impact (500 cows, 117,500 cwt)
What That Buys
1. Tariffs Gone
IEEPA dead, Section 122 expires, no replacement
+$1.00
+$117,500
Hired employee + equipment down payment
2. 15% Replacement Holds
Section 122 survives or transitions to 301/232
-$0.75
-$88,125
6 months of feed costs vanish
3. Uncertainty Limbo
Legal challenges, policy chaos, no clear signal
-$0.25
-$29,375
Used mixer wagon—gone
Spread (Best vs. Worst)
—
$1.75/cwt
$147,000
The gap between survival and exit
The spread between Scenario 1 and Scenario 2: roughly $147,000 per year on a 500-cow dairy. That’s not a rounding error. That’s a hired employee. A used mixer wagon. Six months of feed.
For Vander Schaaf’s 1,250-cow operation, multiply accordingly. The stakes scale linearly.
Is the Taiwan Deal Safe from the Ruling?
The U.S.–Taiwan trade agreement, signed on February 13, eliminates tariffs on all U.S. dairy products and preempts nontariff barriers. Taiwan is the third-largest destination for U.S. fluid milk exports. USDEC president and CEO Krysta Harden called it a deal that “improves our competitiveness compared to other suppliers.”
Good news: this deal is structurally safe from the SCOTUS ruling. It’s a bilateral trade agreement negotiated under standard trade authority, not an IEEPA executive order. The legal basis is entirely separate.
But context matters. The deal was negotiated while IEEPA tariffs of 20%+ gave the U.S. significant leverage. With the baseline tariff now at 15% under Section 122 — and likely headed to zero after July 24 — Taiwan’s incentive to maintain generous terms may shift. For now, the agreement stands, and it’s a genuine win for U.S. dairy exporters in Asia.
The bigger question is what Ohio State’s Sheldon flagged on February 22: “A lot of countries are now questioning the validity of the deals that they signed.” The EU was already backing away. Countries that negotiated under the threat of 34% tariffs may no longer feel bound by the same terms now that the threat has been invalidated.
For dairy specifically, Taiwan is the bright spot. But it’s a $300 million market, not a $3 billion one. Mexico and Canada are where the volume lives — and both of those relationships just got more complicated.
Canada’s TRQ Gambit Gets New Cover
This is where the ruling connects directly to what Vander Schaaf told the Senate. Canada has been obstructing USMCA dairy tariff-rate quotas since the agreement took effect. Only about 42% of the dairy access the U.S. negotiated under USMCA is actually being utilized — not because American producers aren’t trying, but because Canada’s allocation system effectively locks out retailers, food service operators, and other importers who would actually bring in American product.
The U.S. won the first USMCA dispute panel in January 2022. Canada made “insufficient changes.” The U.S. filed a second dispute. The panel ruled Canada hadn’t acted unreasonably — a devastating outcome for American dairy exporters.
Now the SCOTUS ruling removes the 25% fentanyl-based IEEPA tariff that was the biggest stick the U.S. had against Canada outside of USMCA’s own dispute mechanism. The 15% Section 122 tariff explicitly exempts USMCA-compliant goods, so it provides no additional leverage.
Sheldon’s warning lands hardest here. If countries are questioning the validity of deals signed under IEEPA pressure, Canada has even less reason to move on dairy TRQ compliance. The legal mechanism still exists — but the political leverage that made enforcement credible just evaporated.
For producers whose co-ops or processors export to Canada, this is a 365-day watch item. Canada’s dairy TRQ year runs August 1 through July 31, with allocation announcements typically published in the months prior. If fill rates stay where they are, the $200 million in theoretical access remains exactly that — theoretical.
The Refund Question: $133.5 Billion and Counting
One angle that hasn’t gotten enough attention in dairy media: the Court didn’t just stop future IEEPA tariffs. It invalidated all of them retroactively. Every importer who paid IEEPA duties is entitled to refunds plus interest.
U.S. Customs and Border Protection reported $133.5 billion in IEEPA tariff collections through December 14, 2025. The Penn Wharton Budget Model estimates the total refund liability — including collections through February 2026 and accrued interest — at up to $175 billion. That makes this potentially the largest single government refund event in U.S. history, affecting roughly 301,000 importers across 34 million import entries.
For dairy specifically, processors who imported ingredients, packaging materials, or equipment subject to IEEPA tariffs can file Post Summary Corrections on unliquidated entries or administrative protests on liquidated entries within 180 days. The legal authority for refunds is clear. The timeline for actually getting money back is not — CBP generally liquidates entries within 314 days, and the volume of claims will be enormous. Interest accrues at approximately 3–4% annually from the deposit date, but small businesses are already warning they can’t wait months for bureaucratic processing.
If your processor has been passing through tariff surcharges on imported inputs, ask them directly: when do those surcharges come off, and will any refund savings flow back to the farm gate? The answer will tell you a lot about where you stand in the value chain.
Refund Category
Who’s Eligible
Estimated Exposure
Timeline to Receive
What to Ask Your Processor
Imported Ingredients
Processors who paid IEEPA duties on whey, lactose, specialty proteins
$8–12B (dairy-specific est.)
180–365 days (CBP backlog)
“When do tariff surcharges come off our milk check?”
Packaging & Equipment
Processors, suppliers
$2–4B (across food/ag sectors)
180–365 days
“Will refund savings flow back to farm gate pricing?”
Total IEEPA Refund Pool
301,000 importers across all sectors
$175B
Unclear—largest government refund in U.S. history
“Are you sharing refunds, or keeping them above my milk check?”
Direct Farm Impact
Dairy producers
Zero automatic pass-through
Depends on processor transparency
Call your co-op today
What This Means for Your Operation
Timeline Window
Key Decision
Action Item
Risk If You Wait
Data Point to Watch
Next 30 Days (Now – Mar 24)
DMC 2026 enrollment
Lock in Tier 1 coverage (6M lbs) at 25% discount for 2026–2031
Miss expanded coverage; pay higher premiums in 2027
Class III Feb 3 low: $14.53/cwt
Next 90 Days (Now – May 24)
Forward contract evaluation
Model margin against Scenario 2 (15% tariff holds); consider locking Q3 production
July volatility spike when Section 122 expires—contracts tighten
CME Q3 2026 futures: $18.26–$18.35/cwt
90–150 Days (May 24 – July 24)
Export contract renegotiation
Press co-op on Mexico/Canada export commitments; ask about Taiwan volume
Don’t wait for clarity. The 150-day window is the decision window. Here’s what to do with it:
In the next 30 days:
Re-run your DMC enrollment math. The 2026 signup deadline is February 26 — two days from now. This year’s enrollment includes expanded Tier 1 coverage at 6 million pounds (up from 5 million) and a new option to lock in coverage levels for 2026–2031 at a 25% premium discount. With Class III sitting at $15.07/cwt and the $14.53 low from early February still fresh, this isn’t optional. Contact your local FSA office today.
Call your co-op or processor. Ask two questions: (1) Are they passing through any tariff-related surcharges on imported inputs, and when do those come off now that IEEPA duties are being refunded? (2) What does the 15% Section 122 tariff mean for their export commitments to Mexico or Canada?
If you’re carrying equipment or parts debt tied to tariff-inflated prices, check whether you’re eligible for a refund. Your dealer or equipment supplier should know.
In the next 90 days:
Model your margin against Scenario 2 (15% replacement holds). Class III Q3 2026 futures are currently trading in the $18.26–$18.35/cwt range on the CME. If those hold, consider locking in a portion of production before the Section 122 expiration creates another volatility spike around July 20. If they soften toward $17, the risk-reward on forward contracts shifts.
Watch Section 301 investigation announcements. If the administration fast-tracks dairy-related investigations (such as China dairy ingredients), new tariffs could land before old ones fully unwind.
In the next 365 days:
Track Canada’s next dairy TRQ allocation cycle. The TRQ year runs August 1 through July 31, with allocations announced in the months prior. If fill rates stay below 50%, your co-op’s Canadian export margin is getting squeezed, whether you see it on your milk check or not.
Monitor whether the Taiwan bilateral actually moves dairy volume. USDEC’s initial framing was optimistic. Check against actual trade data by Q4 2026.
If your processor ships to Mexico, ask them what happens to their purchase commitments if the Section 122 tariff goes to zero with no replacement. Mexico’s retaliatory posture could shift in either direction.
Key Takeaways
The Supreme Court killed IEEPA tariffs and dropped dairy into a 150‑day, 15% Section 122 experiment that likely can’t stand past July 24.
On a 500‑cow, 117,500‑cwt herd, the gap between tariffs gone, a 15% replacement, or ongoing limbo is roughly $147,000 in annual margin.
Taiwan is now a zero‑tariff bright spot, but Canada’s USMCA TRQ games just got new cover, leaving as much as 58% of U.S. dairy access to Canada stranded on paper.
Importers have paid $133.5 billion in IEEPA tariffs, with refund exposure up to $175 billion — if your processor doesn’t drop tariff surcharges or share savings, that’s real margin left above your milk check.
The only safe “wait and see” is on Twitter; on the farm, the next 30–365 days are for re‑running DMC, stress‑testing breakevens against $18‑class futures, and renegotiating contracts with July 24 circled in red.
The Bottom Line
Pull your last three milk checks. Calculate your per-cwt margin at current input costs. Class III hit $14.53 on February 3 — a 52-week low. If that’s not the bottom but the new floor, what exactly are you changing before July 24?
Vander Schaaf told the Senate the leverage was slipping. The Court agreed. What you do with the 150-day window between now and July 24 is the only part of this you control.
Complete references and supporting documentation are available upon request by contacting the editorial team at editor@thebullvine.com.
More Milk, Fewer Farms, $250K at Risk: The 2026 Numbers Every Dairy Needs to Run – Reveals the $250,000 margin gap currently threatening 500-cow operations and delivers a survival checklist for $17-milk scenarios. It prepares your balance sheet for the 2026 “biological trap” by benchmarking full economic costs against tightening futures.
Every week, thousands of producers, breeders, and industry insiders open Bullvine Weekly for genetics insights, market shifts, and profit strategies they won’t find anywhere else. One email. Five minutes. Smarter decisions all week.
One month of DMC at $9.50 could pay several years of premiums. The deadline is Wednesday. Have you actually run the math?
Executive Summary: January’s Class III price fell to $14.59/cwt while March Class IV futures climbed to $19.50, creating a $2.99/cwt spread that works out to about $382,000/year on a 500‑cow herd shipping 70 lbs/cow/day. That gap sits atop June 2025 make‑allowance changes that already skimmed roughly 90¢/cwt from producer checks and is being widened by a global butterfat shortage, a tight U.S. powder market, and a new $75 million USDA butter buy. At the same time, the U.S. dairy herd has grown to 9.58 million cows, the largest in more than 30 years, setting up a spring flush that could pressure prices unless Section 32 purchases and exports keep absorbing product. The one clear positive is Dairy Margin Coverage: with a projected January margin of $7.52/cwt, $9.50 coverage throws off about $1.98/cwt on Tier 1 milk, so a single month’s payment can cover several years of premiums. For a 500‑cow dairy, each combined 0.1% gain in butterfat and protein now adds roughly $46,400/year, making components one of the few levers that improve cash flow without new capital. This article doesn’t just recap those numbers; it walks through barn‑level math and a 30/90/365‑day playbook for lining up DMC enrollment, DRP weighting, component strategy, and Section 179 planning with $16–$17 Class III, not a rosy futures average. It ends with a hard question every producer has to answer: where does your breakeven sit relative to $16.51 Class III, and what are you going to do about it before the DMC window closes?
January’s FMMO Class III price landed at $14.59/cwt — down $1.27 from December and the lowest since July 2023’s $13.77. Part of that’s structural: USDA’s June 2025 make-allowance increases shifted roughly 90¢/cwt from producer checks to processor cost recovery. But the bigger story is what happened on the other side of the class divide.
March Class IV futures settled at $19.50/cwt on February 20 — the same day March Class III settled at just $16.51. That’s a $2.99/cwt same-month spread. Nearly three dollars separating what your milk is worth as butter and powder versus cheese, on the same contract month.
That kind of gap doesn’t just show up on a chart. It shows up on your milk check, your DRP election, and your cash-flow projections for the next 90 days.
Consider a 500-cow freestall shipping 70 lbs/cow/day — the kind of Upper Midwest operation that entered 2026 staring at roughly $90,000 less operating margin than it had the year before. That was before the Class IV spread blew open. Now the question isn’t just “are margins tight?” It’s “which side of the Class III/IV line is your milk landing on?”
$263 Million in Section 32 Purchases — and the Spread Just Got Wider
For that 500-cow operation already staring at a $2.99 class gap, USDA just added fuel to the fire.
On February 19, Secretary of Agriculture Brooke Rollins announced a $263 million Section 32 purchase of dairy and agricultural products. Of that, $148 million goes to dairy — matching the number NMPF requested in late 2025.
The dairy breakdown:
$75 million in butter — the first major USDA butter purchase in five years
$32.5 million in Cheddar cheese and cheese products
$10 million in Swiss cheese
$20.5 million in fresh fluid milk
$10 million in UHT milk
Traders pushed several CME butter contracts to their daily upper limits on Thursday and Friday. The irony isn’t subtle: a program designed to improve food affordability could temporarily tighten commercial butter supplies and push prices higher. Rush the purchases, and you squeeze an already tight market. Spread them out, and the impact fades. Either way, it lit a fire under Class IV futures that isn’t going out this week.
What Does a $2.99/cwt Class Spread Mean for a 500-Cow Dairy?
The headline number means nothing without per-cow math. So let’s walk it.
A 500-cow herd averaging 70 lbs/cow/day ships roughly 255.5 cwt/cow/year, or about 127,750 cwt annually for the operation.
At March Class IV of $19.50/cwt, that’s approximately $2,491,000 in gross milk revenue annualized at that price. At March Class III of $16.51, it’s roughly $2,109,000.
The same-month gap: $382,000/year. About $31,800/month. $63.66/cow/month.
April’s spread narrows. April Class III settled at $17.30 on February 20, while April Class IV held at $19.50 — a $2.20/cwt spread, or about $281,000 annualized. The futures curve expects some Class III recovery. But March is what’s hitting checks right now.
And no herd receives a pure single-class check. Your milk check is a blend, weighted by your handler’s utilization decisions and the pool. When Class IV runs this far above Class III, depooling accelerates — handlers pull Class IV milk out of the pool because it’s more profitable outside. In Federal Order 30 (Upper Midwest), pooled Class IV producer milk totaled just 1.4 billion pounds in 2025, even as butter and powder production ran strong. Handlers kept that high-value milk outside the pool, and the blend price for everyone who stayed pooled took the hit.
Metric
March Class III ($16.51/cwt)
March Class IV ($19.50/cwt)
Annual Production (500-cow herd, 70 lbs/day)
127,750 cwt
127,750 cwt
Gross Milk Revenue (annualized at this price)
$2,109,000
$2,491,000
Annual Revenue Gap
—
+$382,000 🔴
Monthly Revenue Impact
$175,750
$207,583
Monthly Gap
—
+$31,833 🔴
Per-Cow Monthly Revenue
$292.92
$345.14
Per-Cow Monthly Gap
—
+$52.22 🔴
Run your own numbers. If the gap between your handler’s blend and what you’d get at pure Class IV pricing is more than $1.50/cwt, the rest of this article matters more to your operation than most.
Three Forces That Won’t Let the Spread Self-Correct
For that 500-cow operation watching the spread widen, three structural drivers suggest it isn’t cooling off by April.
Global fat shortage. GDT Event TE398 — the fourth consecutive price increase — saw butter jump 10.7% to $6,347/MT. Anhydrous milk fat climbed 3.8% to $6,751/MT. Butterfat is tight worldwide, not just in the U.S.
U.S. powder premium over world price. CME spot NDM surged to $1.685/lb during the week ending February 20 — the highest since mid-2022. That sits well above the GDT SMP equivalent of roughly $1.44/lb protein-adjusted. The U.S. powder market is especially tight, and it’s dragging Class IV higher.
Government demand is stacked on top. The Section 32 butter buy adds $75 million in new purchasing power to a market already rationed by price. That’s demand creation at the worst possible moment for anyone hoping Class IV cools off.
CME spot butter jumped 16.5¢ to $1.87/lb for the week, a five-month high. Spot cheddar blocks rose 11¢ to $1.4975/lb — competitive, but nowhere near the butterfat rally. Whey fell 4¢ to $0.68/lb, bucking the trend entirely.
The Spring Flush Math Just Got Worse
That same 500-cow herd’s spring production ramp is about to collide with the largest national herd in over 30 years.
USDA’s January Milk Production report, released February 20, showed total U.S. production at 19.8 billion pounds, up 3.2% year-over-year. The herd itself reached 9.58 million head — up 189,000 cows from January 2025, up 14,000 from December, and the highest total since 1993.
Growth concentrated in the Great Lakes, Texas, and the Northern Plains. Kansas alone added 45,000 cows year-over-year. Wisconsin added 20,000, Idaho 22,000, and Michigan 15,000. On the other side: Washington lost 17,000, Pennsylvania shed 11,000, and New Mexico dropped 8,000. California’s per-cow yields surged 4.6% — from 1,960 to 2,050 lbs/cow in January — with avian influenza fully cleared.
More milk hitting the market should, in theory, ease commodity prices. But the butterfat complex isn’t responding to supply signals the way cheese is. If Section 32 purchases and export demand don’t absorb the extra volume, the futures curve’s $19+ Class IV projection gets tested hard by May, and the spread could narrow from the wrong direction.
But One Thing Already Broke in Their Favor: DMC
Here’s the turn for that 500-cow operation. The safety net they may have treated as an afterthought in 2025 just became the most important enrollment of the decade.
December 2025’s Dairy Margin Coverage margin came in at $9.42/cwt, triggering the first and only payment of 2025 — a thin $0.08/cwt. January doesn’t look thin.
The Center for Dairy Excellence projects the January margin at $7.52/cwt. At $9.50 coverage, that’s a $1.98/cwt indemnity. On 5,000 cwt of monthly Tier 1 production (a 6-million-pound annual allocation), that’s roughly $9,900 in a single month — enough to cover the full year’s premium several times over.
NMPF’s William Loux confirmed the direction: he expects DMC payments through the first quarter and probably through the first half of the year.” USDA projects margins below $9.50/cwt through July.
Enrollment closes February 26. Under the One Big Beautiful Bill Act:
Tier 1 expanded from 5 million to 6 million pounds — covering herds up to roughly 250–350 cows at the $0.15/cwt premium for $9.50 coverage.
Highest production year from 2021–2023 becomes your new baseline.
The trade-off is real. You’re committed through 2031 regardless of where margins go. If margins recover to $12+ by 2027, you’re paying premiums on coverage you won’t trigger. But at $7.52 projected margins in January, the payback math is aggressive. If you haven’t enrolled, the decision framework is here.
Components: Where the Real Money Hides at $14.59 Milk
January FMMO component prices tell the story: butterfat at $1.4525/lb and protein at $2.1768/lb. In a $14.59 Class III environment — made worse by the June 2025 make-allowance hike that shifted roughly 90¢/cwt to processor cost recovery — components are the difference between breaking even and bleeding cash.
Component Improvement
Additional Production (lbs/year)
FMMO Price ($/lb)
Annual Revenue Gain
0.1% Butterfat
12,775 lbs
$1.4525/lb
+$18,556 🔴
0.1% Protein
12,775 lbs
$2.1768/lb
+$27,809 🔴
Combined 0.1% BF + Protein
25,550 lbs
—
+$46,365 🔴
Per-Cow Monthly Impact (500-cow)
—
—
+$7.73/cow 🔴
Here’s the math on a 500-cow herd shipping 12.775 million lbs/year:
Each 0.1% protein improvement: 12,775 lbs additional protein × $2.1768/lb = $27,809/year
Combined 0.1% gain in both: roughly $46,400/year — or $7.73/cow/month
If you’re below 4.0% fat and 3.1% protein, talk to your nutritionist this week. The herds making component gains aren’t spending more per cow — they’re tightening transition protocols, adjusting TMR formulations, and managing bunk time. Those are $46,000 improvements at the cost of management attention, not capital.
What This Means for Your Operation
This week — before February 26:
DMC enrollment. At the projected January margin of $7.52/cwt, one month’s indemnity at $9.50 coverage equals $1.98/cwt across your Tier 1 production. USDA projects margins below $9.50 through July. The deadline is Wednesday.
DRP weighting review. With a $2.99/cwt same-month Class III–IV spread, your election weighting is the single highest-dollar decision you’ll make this quarter. Call your risk management advisor this week.
Next 90 days — through the spring flush:
Model cash flow at $16–$17 Class III, not the $18.95 annual WASDE average. Your March and April checks reflect January and February commodity prices, which were ugly. If your all-in cost of production sits above $18/cwt, model your cash reserve at $16 Class III for Q1 and count the months of runway.
Pull your handler’s utilization report. In Federal Order 30, Class IV depooling thinned the pool all through 2025. If you don’t know where your milk is classified, you can’t evaluate whether this spread is working for or against you.
Push components hard. At January’s $1.4525/lb butterfat and $2.1768/lb protein, each tenth of a percent in BF and protein combined is worth $46,400/year on a 500-cow herd. Talk to your nutritionist about transition cow protocols and bunk management — that’s where the cheapest gains live.
By year-end:
Section 179 planning. The OBBBA raised Section 179 expensing to $2.5 million with 100% bonus depreciation through 2030. But borrowing to buy equipment to save on taxes only works if you can service the debt at $16 milk. Run those numbers with your accountant before your lender does.
Watch the July USMCA review. The mandatory six-year joint review hits July 1, 2026. Canada and Mexico bought $3.6 billion in U.S. dairy in 2024 — roughly 44% of the $8.2 billion total export value that year. In 2025, U.S. dairy exports surged to a confirmed $9.51 billion, nearly matching the $9.54 billion record set in 2022. But Canada’s TRQ fill rates still average just 42%. NMPF’s Shawna Morris argues that Canada remains “technically compliant with USMCA’s text, commercially limiting in practice.” If you’re in a co-op with significant North American export exposure, the July outcome shapes your 2027 milk price more than anything on the CME right now.
Key Takeaways
If your handler’s blend is more than $1.50/cwt below a pure Class IV value, this spread is actively costing your herd real money.
At $7.52/cwt projected January margin, one DMC indemnity month at $9.50 can pay several years of premiums on your Tier 1 volume — but only if you’re enrolled before February 26.
Each combined 0.1% gain in butterfat and protein is worth about $46,400/year on a 500-cow herd at today’s component prices.
The Bottom Line
The futures curve says relief is coming. Your January check says it hasn’t arrived yet. That 600-cow Wisconsin freestall operation profiled in The Bullvine’s January analysis — the one facing a $250,000 margin gap between full cost of production and what 2026 futures actually deliver? They stress-tested at $16 milk, trimmed 50–75¢/cwt from their breakeven through tighter heifer programs and lease renegotiations, and showed their lender a plan built off conservative numbers. The lender, seeing they were budgeting off realistic prices and actively adjusting, worked with them on amortization flexibility.
The producers who come out of this spring in good shape won’t be the ones who waited for $19. They’ll be the ones who ran their numbers at $16 and made decisions accordingly.
Where does your breakeven sit relative to $16.51 Class III? That’s the only number that matters this week.
Complete references and supporting documentation are available upon request by contacting the editorial team at editor@thebullvine.com.
Dairy Tech ROI: The Questions That Separate $50K Wins from $200K Mistakes – Cut through the trade-show hype and discover which innovations actually move the needle. This guide exposes the $200,000 mistakes in automation, arming you with the scale-specific ROI benchmarks that separate profitable disruptors from the struggling.
The Sunday Read Dairy Professionals Don’t Skip.
Every week, thousands of producers, breeders, and industry insiders open Bullvine Weekly for genetics insights, market shifts, and profit strategies they won’t find anywhere else. One email. Five minutes. Smarter decisions all week.
9.57M milk cows. 3.9M replacements. $3,000 heifers. Beef-on-dairy and genetics built this paradox — and 2027 is when it breaks.
Executive Summary: The U.S. milking herd just climbed back to 9.57 million cows — a 30‑year high — while replacement heifers fell to 3.905 million, a 48‑year low, with only 2.498 million actually expected to calve. That gap isn’t a fluke; it’s what happens when beef‑on‑dairy premiums pull calves to the feedlot, genomic selection lets good cows work longer, and $3,000–$4,000 heifers convince producers to stop culling anything that still stands in a stall. CoBank and AFBF both say this “shrinking herd pipeline” hits the wall in 2027, right as more than $10–11 billion in new U.S. processing plants come online, looking for milk that the heifer pipeline may not be able to supply. At the farm level, that shows up as a replacement bill jumping from about $567,000 to $903,000 a year on a 1,000‑cow dairy, while a genetically driven extra lactation can be worth $8,000–$9,000 per cow when you combine one less replacement and one more year of mature‑cow milk. Research from Albert De Vries and Mike Overton draws a bright line between real longevity and desperation: keeping healthy, high‑PL cows longer pays, but hanging onto chronic, low‑producing cows because you can’t afford replacements can cost three times more than culling too early and easily $500–$600 per cow in lost opportunity. For 2026–2027, the winning herds will be the ones that tighten up PL and health in their sire stack, genomic‑test and sort the milking herd, pull some breedings back from beef to dairy on their best cows, and model their 2027 heifer needs now — while there’s still time to grow the replacements they’ll need.
At the CDCB Industry Meeting at World Dairy Expo last October, Eric Grotegut told a room of 200 people — and another 375 watching the livestream — that he runs a 25% replacement rate on 3,500 cows.
A decade ago, that number would’ve raised eyebrows. The national average was pushing 39%. But Grotegut Dairy in Newton, Wisconsin, isn’t running short-lived cows out the door. The 2025 IDFA/Dairy Herd Management Innovative Dairy Farmer of the Year is keeping them — and paying less for replacements because of it.
“Fifteen to 25 years ago, it seemed like I was selling cows every day; lameness, mastitis, and pneumonia… there was something all the time,” Grotegut told the panel, titled Cows Can Live Longer — Are We Letting Them? “Now, most cull cows are one day a week. They don’t have to go as early.”
He and nearly 600 attendees were there because of two numbers that shouldn’t coexist in the same industry. 9.57 million milking cows as of November 2025 — the most since 1993. And 3.905 million replacement heifers as of January 1, 2026 — the lowest since 1978. Both numbers are verified. Neither survives 2027 without something giving way.
Year
Milking Cows (M)
Heifers Expected to Calve (M)
2001
9.10
4.10
2005
9.03
4.35
2010
9.09
4.20
2015
9.31
4.65
2020
9.40
3.10
2024
9.36
2.70
2025
9.50
2.55
2026
9.57
2.50
Three Forces, One Collision
Danny Munch has watched these lines diverge for months. The American Farm Bureau Federation economist isn’t subtle about what’s driving it.
“All of these statistics are accumulating into sort of a system that’s more responsive to the beef sector than it is to dairy,” Munch said.
He pointed to record U.S. and global milk production — production that “has weighed heavily on dairy prices” — while beef-cross calves pull $1,000 within two or three days of birth.
That’s the first force: beef-on-dairy economics. High Ground Dairy’s income model projects an average revenue boost from beef-cross calves of $4.37/cwt in 2025, with seven of the next 12 months projected above $5.00/cwt as of their October analysis. On most operations, that’s not a bonus. That’s the margin.
Mike North of Ever.ag framed it bluntly last July: “We’re creating a lot of revenue, upwards of two and a half dollars per hundredweight in revenue back to the farm just in beef breeding, and even higher than that in some cases.” By January 2025, he noted some replacement heifers “moving in the northwest were north of $4,000 an animal. That’s a pretty tall price.” He was talking about the heifers that beef-on-dairy has made scarce.
The second force: rock-bottom culling. Cumulative dairy cow slaughter through the first 50 weeks of 2025 totaled just 2.53 million head — the lowest in more than a decade, well below the roughly 3 million slaughtered annually in most prior years. Cull rates fell below 30% in 2024, per High Ground Dairy — historically unusual. And USDA’s October 2025 Agricultural Prices report showed the price received for milk cows hit a record $3,110 per head. Nobody’s shipping cows. Because the heifer to fill that stall doesn’t exist.
The third force is the one you won’t read about in most outlets: genetics. Cows are living longer because we bred them to live longer. That’s both the solution and the ticking clock.
Why Are Replacement Heifer Numbers at a 48-Year Low?
Start with this: across two consecutive January Cattle reports, USDA revised its dairy replacement heifer estimates downward by a combined 371,600 head. The original January 2023 figure of 4.337 million was later corrected to 4.073 million — a 263,600-head haircut. Then, in January 2024’s original 4.059 million dropped to 3.951 million. Nearly 372,000 heifers USDA thought existed… didn’t.
USDA’s latest Cattle report pushes the number even lower — 3.905 million as of January 1, 2026, down 16% from January 2020 and nearly 20% below the 4.81 million record set in 2016. The heifer-to-cow ratio dropped to 40.8%, down from 41.7% a year earlier and the lowest since 1990.
Here’s the number that should keep you up at night. Heifers expected to calve — the animals actually approaching the milking string — fell to 2.498 million head as of January 2026. That’s the lowest since USDA began reporting the series in 2001. Each of the last four years has posted a new record low.
Corey Geiger, the CoBank economist tracking this, put it simply: “The U.S. dairy herd is like an ocean liner, and it takes three years from conception to reach the milk barn. That would be the time necessary to make more heifers.”
The Semen Data Seals It
CoBank’s model — built on NAAB semen sales data — predicts 357,490 fewer heifers in 2025 and another 438,844 fewer in 2026 before any recovery begins. NAAB’s 2024 year-end report shows U.S. dairy farmers used an estimated 7.9 million units of beef semen on dairy cows, out of 9.7 million total domestic beef units sold. Domestic dairy semen sales totaled 16.2 million units, with gender-selected dairy semen reaching 9.9 million units, up 1.5 million from 2023.
Sexed semen is helping maximize the dairy heifers that do get bred. But the sheer volume of beef breeding means the pipeline was sealed off years ago and won’t reopen meaningfully until 2027 at the earliest.
And even those dairy heifer calves aren’t all making it. Mike Overton, DVM — Global Dairy Platform Lead at Zoetis — analyzed heifer completion rates across 65 herds in 2025. The median: just 76% of dairy heifer calves born alive actually reach first calving. Most producers assume closer to 90%. That 14-point gap means roughly one in four dairy heifer calves born today won’t produce a gallon of milk. Layer that attrition on top of 7.9 million units of beef semen, and the pipeline math gets even uglier.
Glenn Kline started genomic testing his herd back in 2011, when Y Run Farms LLC in Troy, Pennsylvania, milked about 500 cows with 15 employees. “We wanted a source of truth,” he told Dairy Herd Management.
Fourteen years later, Y Run milks 1,200 cows across 2,700 acres with a crew of 20 full-time employees. The herd more than doubled — through 830 cows by mid-2023 and 1,200 by late 2024. But it didn’t get there on organic growth alone.
“We did expand here three years ago, and we had to buy some animals in,” Kline told the CDCB panel at World Dairy Expo. “There was really a significant difference with our original animals lasting longer.”
That one sentence is the genetics story in miniature. Thirteen-plus years of genomic selection showed up in the barn: his homegrown cows outlasted the purchased replacements by a margin he could see.
His strategy now: beef on the bottom end, IVF from the top. “We’ve been using beef on dairy to keep our lower production cows using beef, and we use IVF to try to make better heifers of the good ones,” Kline said.
Kristen Metcalf takes a different approach at Glacier Edge Dairy in Milton, Wisconsin, where her family milks about 300 registered Jerseys. They breed their best cows to Jersey bulls and the rest to Charolais, Angus, and Limousin. Metcalf told the WDE panel she’d ideally keep Jerseys in the herd for five or six lactations.
“If we’re using management tools correctly and really looking at some different traits when we’re breeding, I don’t think you should be burning cows out,” Metcalf said. “They should be able to live productive and healthy lives until they naturally reach that dip in milk production.”
Both approaches — Kline’s concentrate-and-IVF model on 1,200 cows and Metcalf’s longevity-from-the-best-Jerseys strategy on 300 — are exactly the kind of rational, individual decisions that, multiplied across thousands of herds, have thinned the national replacement pipeline to its breaking point.
The Genetics Nobody Else Is Connecting to This Crisis
Every outlet covers the heifer shortage as a supply story. Beef-on-dairy pulled heifers out of the pipeline. True enough. But there’s a second, quieter force — and it’s the one that makes breeders and genetics-focused producers the central players: genomic selection is keeping cows productive longer, and that changes the math on whether you even need replacements at the old rates.
A 2016 study in the Journal of Dairy Science found that following the implementation of genomic selection, “dramatic response… was observed for the lowly heritable traits DPR, PL, and SCS. Genetic trends changed from close to zero to large and favorable, resulting in rapid genetic improvement in fertility, lifespan, and health.” Rates of genetic gain per year for Productive Life increased three- to fourfold compared to pre-genomic baselines.
Those gains are compounding. The April 2025 NM$ revision set the combined longevity emphasis at 18.0% — PL at 8.0%, Cow Livability at 8.0%, and Heifer Livability at 2.0%. It’s the index equivalent of saying, “Keep them alive, and we’ll figure out the rest.” And the sire lineup reflects it.
These aren’t niche longevity specialists. SHEEPSTER graduated to the daughter-proven ranks in December 2025 as #1 TPI across all bulls — proven and genomic — at 3572G. The next closest bull, SDG CAP GARZA, sits at 3464G. That’s a 108-point gap. His daughters in the UK posted a lifespan of +110 days, and multiple SHEEPSTER sons now rank in the genomic top 10.
One caution worth flagging: when an entire industry chases the same longevity sires, inbreeding concentrations accelerate. If SHEEPSTER and his sons dominate your sire stack, that’s a different kind of risk—the genetic narrowing kind.
Milking Speed launched as an official genetic evaluation in August 2025 — PTAs expressed as pounds of milk per minute, with a Holstein breed average of 7.0 lbs/min. CDCB geneticist Kristen Gaddis, Ph.D., reported the heritability at 42%, an unusually high figure for a management-linked trait. That matters: slow milkers are a primary reason cows get culled in robotic herds. Remove that as a cull trigger, and productive life extends.
John B. Cole, Ph.D., told the WDE audience that genomic evaluations for calf respiratory disease and scours are the next tools that could help more calves survive long enough to enter the milking string. Ashley Ling, Ph.D., is developing camera-based mobility scoring for hoof health evaluations to address another major involuntary cull trigger.
Here’s the part of this story that doesn’t fit the hero narrative.
University of Florida dairy scientist Albert De Vries dug into the productive lifespan as an economic question. He noted cows used to live 5 to 10 years after calving in the 1930s; by 2018, the average was down to 35.3 months — fewer than 3 lactations. Using a simple economic model, De Vries arrived at an “ideal” productive lifespan of about 5 years total. “Longer productive lifespans for healthy dairy cows are not necessarily profitable,” he concluded. “Optimal replacement decisions and optimal annual cow replacement rates are dynamic and change over time.”
The critical word is healthy. A 2025 study in Frontiers in Veterinary Science found that the economic loss from retaining unprofitable cows was approximately three times greater than from culling too early. Cows held past their productive window produce less milk, carry higher somatic cell counts, face more lameness and mastitis, and have lower fertility — costs that cascade past the replacement price they were supposed to avoid.
What Forced Retention Actually Costs
Overton put numbers to this at the 2025 Western Dairy Management Conference in Reno. He compared Holstein herds that had adequate replacements in 2020–2022 against herds running short on heifers in 2023–2024. The short herds retained cows 25 days longer in milk. Those cows averaged 7 pounds less milk per day over their last 30 days before culling — and chronic mastitis cases climbed.
In a separate analysis, Overton modeled the impact of a 4% drop in replacement rate from 39% to 35%: cows stay roughly 100 days longer than optimal, costing $500–$600 per cow in lost opportunity. That’s not longevity. That’s treading water.
Strategy
Days Kept Beyond Optimal
Milk Loss (last 30 days)
Cost per Cow
Genetic longevity (planned)
0
0 lbs/day
$0
Forced retention (no heifers)
+25 days
-7 lbs/day
-$525
Extended retention (4% rate drop)
+100 days
-10 lbs/day est.
-$600
Culling chronic cows 3x too late
+150 days
-12 lbs/day est.
-$1,800
Penn State Extension’s Michael Lunak puts the breakeven at three-plus lactations — that’s what it takes to recoup the cost of raising a replacement. But the average productive life of a U.S. dairy cow is just 2.7 lactations, and 70% of cows are culled before completing their third.
That difference matters more right now than it ever has, because the heifers to replace those cows just aren’t there. Extend productive life through genetics and management — better feet, better fertility, better disease resistance — and you win. Extend it through forced retention — keeping cows because you can’t afford to replace them — and you’re borrowing against your herd’s future health.
$11 Billion in Processing Steel Meets 2.498 Million Heifers
This paradox might survive 2026. It won’t survive the construction cranes.
America’s dairy processors have committed more than $11 billion in new and expanded manufacturing capacity across 19 states, with over 50 building projects planned between 2025 and early 2028, according to IDFA data released in October 2025. Gregg Doud, NMPF president, put it this way: “It really is $10 billion — 2023, 2024, 2025, 2026 — in new dairy processing investment in the U.S. There’s nothing like it in the history of U.S. agriculture, of any commodity, anywhere in the world.”
The named projects tell the story. Fairlife broke ground on a $650 million, 745,000-square-foot facility in Webster, New York, scheduled to take in five to six million pounds of milk per day from local dairy farmers and projected to create 250 jobs. Walmart is building its third milk processing plant, this time in Robinson, Texas. HP Hood committed $120 million to expand its Batavia, New York, plant by 20 million gallons per year. Valley Queen Cheese in Milbank, South Dakota, invested $195 million in a three-year expansion completed in January 2025, and projected needing approximately 25,000 additional cows in 2025 and 2026 to supply the added capacity.
Every one of those plants needs milk. And IDFA president Michael Dykes acknowledged the tension: “I can’t tell you how many meetings I went to where people said, ‘We’re scared to death there won’t be enough milk.'”
CoBank’s Geiger connected the dots directly: “Given these tight inventories and the $10 billion of new dairy plants set to come online through 2027, dairy replacement values will likely climb even higher.”
When $11 billion in processing steel meets 2.498 million heifers expected to calve — the lowest pipeline ever recorded — the collision isn’t theoretical. It’s on the construction timeline.
The Barn Math: What This Costs You Right Now
Plug in your own herd size.
Replacement Cost Shock
A 1,000-cow dairy replacing 30% of its herd annually needs 300 replacements. At USDA’s July 2025 price of $3,010/head, that’s $903,000. The same 300 head in January 2024 cost $1,890 each — $567,000 total.
The annual replacement bill rose $336,000. On a 300-cow dairy, it’s still $100,800.
And auction-quality springers keep climbing. At Premier Livestock & Auctions in Pennsylvania, top-quality springing heifers hit $3,000–$3,750 at the January 27, 2026, special heifer sale — 765 head through the ring. By mid-February, top Holstein springers there were fetching $2,800–$4,400. Open heifers in the 700–850-lb range moved at $1,550–$3,000.
The Longevity Dividend
Every lactation you extend through genetics saves one replacement purchase and adds a year of mature-cow milk revenue. First-lactation animals produce 80–85% of the milk that a third-plus-lactation cow can.
Component
Value ($)
Saved replacement cost
$3,010
Mature-cow milk premium (1 year)
$5,500
Total longevity dividend
$8,510
At current prices: one fewer replacement saves $3,010. One more year of mature-cow production adds roughly $5,000–6,000 in milk revenue above feed costs. Net value of a longevity-driven extra lactation: approximately $8,000–$9,000 per cow. That’s PL, expressed in real dollars.
The Beef-on-Dairy Trade-Off Is Flipping
On a 1,000-cow dairy breeding 60% to beef: 600 beef-cross calves at $1,500 each = $900,000 in calf revenue. At Premier Livestock’s February 2026 sale, beef-cross calves were moving at $1,200–$1,910/head — so per-calf revenue is holding up, for now.
Metric
Jan 2024
Feb 2026
Beef-cross calf price
$1,500
$1,500
Purchased replacement cost
$1,890
$3,010
Revenue gap (per head)
-$390 (in your favor)
+$1,510 (against you)
Net margin shift (300 replacements)
-$117,000 saved
+$453,000 cost
But those 600 cows didn’t produce dairy heifer calves. If you need to buy replacements for even a fraction of them at $3,010+, the math reverses. Two hundred purchased replacements cost $602,000 — eating two-thirds of that beef calf revenue in a single line item.
Two years ago, the beef premium overwhelmed replacement costs. That gap is closing. By 2027, it may flip entirely for herds that didn’t plan their dairy-heifer pipeline.
What 3.9 Million Heifers and $3,010 Replacements Mean for Your Breeding Plan
This isn’t a crisis you can wait out. The heifers that calve in spring 2028 need to be conceived by spring 2026. The clock is running.
This month: Pull your herd’s current replacement rate and weighted-average PL breeding value. If your cows average fewer than 2.7 lactations — the current national average — you’re replacing faster than the industry and paying $3,010+ per head to do it. If PL in your sire stack averages below +3.0, you’re not making the longevity bet.
Within 90 days: Model your 2027 heifer needs. Count the cows in your milking string who’ll likely leave within 18 months — age, health status, reproductive failure. Count the heifers you have coming. If there’s a gap, it takes two years to grow a replacement. Decisions that matter start now.
Before summer: Run the updated barn math on your beef-vs-dairy breeding split with your actual calf prices and youractual replacement costs. At Premier Livestock’s late-January sale, open Holstein heifers in the 700–850-lb range moved at $1,550–$3,000. For many herds, the breakeven has already shifted.
Within 12 months: If you haven’t genomic-tested your milking herd, that’s the single highest-ROI decision available right now. You can’t breed your best cows to dairy sires and your worst to beef if you don’t know which is which. Grotegut, Kline, and Metcalf all started with testing. The strategy flows from there.
If your cows average fewer than 2.7 lactations, you’re replacing faster than the industry — and the cost per replacement has risen $1,120+ in two years. The longevity dividend runs $8,000–$9,000 per cow per extra lactation. Genetics that extend productive life aren’t optional anymore; they’re your cheapest source of replacements.
If you’re breeding more than 50% of your herd to beef, model what happens when you need to buy back 200 replacements at $3,010+. Two years ago, beef-on-dairy economics were a no-brainer. Today, the breakeven is moving. Know where yours sits.
If you haven’t modeled your 2027 heifer pipeline, do it this quarter. CoBank’s data says the shortage gets worse before it gets better — 438,844 fewer heifers in 2026 before any recovery in 2027. The processors coming online need your milk. The question is whether you’ll have the cows to produce it.
Forced retention is not longevity. Overton’s data shows herds running short on heifers retain cows 25 days longer and lose 7 lbs/day in the process — plus $500–$600/cow in opportunity cost. Keeping cows alive through genetics and management pays. Keeping them alive because you can’t afford to replace them costs three times more than culling too early.
The Bottom Line
Pull your herd’s average productive life. If your cows average fewer than 2.7 lactations — the current national average — you’re replacing faster than the industry, and paying $3,010+ per head for the privilege. If your PL breeding values don’t reflect the kind of genetic progress driving the national culling decline, you’re watching this story unfold from the wrong side.
Glenn Kline figured this out in 2011, when he started genomic testing 500 cows in Troy, Pennsylvania. Fourteen years and 700 additional cows later, he can see the difference between the animals he built and the ones he had to buy. Eric Grotegut built a 25% replacement rate on 3,500 cows by letting genetics do the culling for him. Kristen Metcalf’s 300 Jerseys are bred to stay five or six lactations. Different scales. Different breeds. Same bet.
The ocean liner isn’t turning. But what you breed this spring determines which side of the deck you’re standing on when it does.
Complete references and supporting documentation are available upon request by contacting the editorial team at editor@thebullvine.com.
$3,010 Per Heifer. 800,000 Short. Your Beef-on-Dairy Bill Is Due. – Position your operation for the 800,000-head replacement gap already locked into the 2026 market. This deep dive reveals why beef premiums are no longer a no-brainer, delivering the intelligence needed to survive dairy’s looming structural reset.
Every week, thousands of producers, breeders, and industry insiders open Bullvine Weekly for genetics insights, market shifts, and profit strategies they won’t find anywhere else. One email. Five minutes. Smarter decisions all week.
The USMCA review hits July 1. Two dairy farmers — one in Idaho, one in Québec — are watching the same deadline with completely different balance sheets at stake. Here’s the barn math for both sides of the border.
The U.S. dairy industry told the Senate this week that Canada is blocking roughly $200 million per year in dairy market access it promised under the USMCA — called CUSMA in Canada. Spread that number across American production, and the farm-level impact lands around five cents per hundredweight. Before Congress approved this deal, the U.S. International Trade Commission projected it would boost dairy exports to Canada by 43.8% — about $227 million once fully implemented (USITC Publication 4889, April 2019). Both countries are spending enormous political capital on a fight where the per-farm stakes are far smaller than either side’s press releases suggest.
On February 12, Ted Vander Schaaf delivered that case to the Senate Finance Committee. Vander Schaaf milks approximately 1,250 Holsteins near Kuna, Idaho, on 1,400 acres of forage, is a third-generation member-owner of the Northwest Dairy Association (the co-op behind Darigold), and board member of the Idaho Dairymen’s Association. “Market access that exists only on paper does not support farm families, pay employees, or justify new investment,” he told the Committee. And then the line that landed: “A firm base depends on Canada upholding their end of the bargain”.
About 1,500 kilometres northeast, Daniel Gobeil runs Ferme du Fjord in La Baie, Québec — deep in Saguenay-Lac-Saint-Jean — with about 125 lactating cows across more than 1,000 acres of barley, oats, and soybeans (DFC). Gobeil is Vice-President of Dairy Farmers of Canada and President of Les Producteurs de lait du Québec. When Vander Schaaf told the Senate that Canada isn’t upholding its end of the bargain, the implications land directly on operations like his.”
What’s Actually on the Table This July
The USMCA hits its first mandatory joint review by July 1, 2026, as required by Article 34.7. All three countries decide: extend the agreement for 16 years (to 2042), continue with annual reviews until the 2036 expiration, or walk away. U.S. Trade Representative Jamieson Greer left no ambiguity in December 2025: “Could it be exited? Yes, it could be exited. Could it be revised? Yes. Could it be renegotiated? Yes. That is the purpose of that clause, and all of those things are on the table”.
Dairy is the loudest file in the room—and the most organized. On February 4, NMPF and USDEC co-launched the Agricultural Coalition for USMCA, an industry-wide push to strengthen and renew the agreement. When the deal was signed, it opened about 3.6% of Canada’s dairy market as tariff-rate quota access — roughly US$200 million per year across 14 product categories. But those quotas aren’t filling. The overall average fill rate was just 42% in 2022/23, with 9 of 14 TRQs below half the negotiated value. More current data tells a split story:
Product
Fill Rate
Period
Cheese (all types)
83%
2024 calendar year
Butter & cream powder
81%
2023/24 dairy year
Industrial cheese
59%
2024
Milk powders
57%
2024
Fluid milk
34%
Cumulative
Skim milk powder
7%
Cumulative
Note: Globe & Mail figures reflect CUSMA-specific TRQs. USDA FAS data may include quotas across all trade agreements (WTO, CETA, CPTPP), which explains the variance in cheese fill rates between sources. Both are accurate within their reported scope.
Cheese and butter fill reasonably well. It’s the fluid milk and powder categories dragging the average, and those are the categories where the allocation system faces the strongest U.S. criticism. Canada argues some TRQs go unfilled because American exporters haven’t generated sufficient demand — a demand problem, not an allocation barrier. The U.S. counters that the allocation system suppresses demand by restricting who can import. A Texas Tech University causal impact study found the actual USMCA boost came in at 34% ($519 million cumulatively) — real growth, but below the USITC’s 43.8% projection, partly because “Canada’s allocation of these quotas mostly favors its own processors over U.S. exporters”.
By our math, 0 million in annual TRQ access times the 42% fill rate — roughly 6 million per year in negotiated access goes unused. That’s a lot of money from the lobby’s podium. It’s a different number from the barn.
Metric
Lobby Number
Barn Number
Total annual unused TRQ access
$200M (promised) / $116M (unused at 42% fill)
—
Spread across 227B lbs U.S. production
—
$0.05/cwt
Impact on 150-cow farm (36,000 cwt/yr)
—
$1,800/year
Impact on 500-cow farm (120,000 cwt/yr)
—
$6,000/year
Impact if export lift adds $0.10–0.15/cwt
“Game-changer” (NMPF)
$3,600–$5,400/year (150-cow)
Average U.S. dairy cost of production
—
$19–23/cwt (USDA)
February 2026 all-milk forecast
—
$18.95/cwt (WASDE)
Who’s Pushing — and Who’s Pushing Back
The U.S. says Canada designed its allocation system to block imports by reserving 80–85% of many TRQs for domestic processors who had little incentive to use them. A USMCA dispute panel ruled in the U.S.’s favour in January 2022 and ordered changes. Canada rewrote the rules. A second panel, reporting on November 24, 2023, found, by a two-to-one decision, that Canada’s revised system didn’t technically breach USMCA. The dissenting panelist argued Canada’s narrow eligibility rules “significantly limit a large number of other Canadian importers who would be eager to bring U.S. dairy products to Canada”.
On December 2, 2025, 74 bipartisan House members from dairy states, including New York, Washington, Wisconsin, and California, wrote to Greer urging him to use the 2026 review for enforcement. “NMPF and USDEC — led by President and CEO Gregg Doud, the former Chief Agricultural Negotiator at USTR — have described Canada’s TRQ policies as ‘manipulative’ and accused Ottawa of ‘circumvention’ of USMCA’s dairy export disciplines.” Vander Schaaf told senators the U.S. exported approximately $9 billion in dairy products in 2025, including a record 559,000 metric tons of cheese through November. The trajectory is up. The frustration is that Canada isn’t absorbing its share.
On the Canadian side, Prime Minister Mark Carney responded directly in December 2025. Supply management is “not on the table,” — and he answered the English-language question in French. That’s a message aimed squarely at Québec.
DFC President David Wiens — who milks about 240 cows with his brother Charles near Grunthal, Manitoba — told MPs the combined impact of CUSMA, CETA, and CPTPP means roughly 18% of Canada’s domestic dairy demand is now met by imports. When CUSMA was signed, DFC projected that cumulative concessions would displace one in five Canadian dairy products — amounting to $1.3 billion in annual farm-gate losses once fully phased in. Both sides believe they’re defending survival — $1.14 billion in U.S. dairy exports to Canada in 2024, a record, and part of a $3.6 billion flow to Mexico and Canada that accounts for 44 percent of total U.S. dairy export value. On the other side: CA$4.8 billion in federal compensation flowing to supply-managed sectors.
Why the Same Commodity Pays Two Different Mortgages
The single biggest difference between Vander Schaaf’s milk check and Gobeil’s: how the price gets set.
In the U.S., the base price flows from Class III/IV futures and commodity markets. USDA’s February 2026 WASDE projects the all-milk annual average at US$18.95/cwt — but January’s Class III came in at just $14.59/cwt. The back half of the year has to do heavy lifting to hit that average. The safety net is Dairy Margin Coverage: insurance, not a guaranteed price. Over the last five years, U.S. all-milk prices swung from roughly $16.20 in 2020 to $27.10 in 2022 — an $11/cwt range.
Year
U.S. All-Milk Price (US$/cwt)
Canadian Equivalent (US$/cwt)
2020
$16.20
$28.00
2021
$18.10
$28.50
2022
$27.10
$30.00
2023
$20.60
$29.20
2024
$22.40
$29.60
2025
$21.50 (est.)
$29.40
2026
$18.95 (forecast)
$30.10 (forecast w/ 2.3% increase)
In Québec, the Canadian Dairy Commission surveys actual production costs each year and adjusts the farmgate price to cover them. The formula: 50% of the change in the indexed cost of production, 50% of the change in the consumer price index. That produced the 2.3255% farmgate increase effective February 1, 2026 — tied to input costs and inflation, not commodity markets in Chicago. Canadian farmgate prices move in a narrow band, roughly US$28–30/cwt equivalent at the 2025 average exchange rate, against that $11 U.S. swing.
But that stability comes stapled to a different kind of risk. In the P5 provinces — Ontario, Québec, New Brunswick, Nova Scotia, and PEI — quota trades at a cap of CA$24,000 per kilogram of butterfat per day. A cow producing 1.2–1.3 kg BF/day means a per-cow quota value around CA$28,800–$31,200. In western Canada, it’s higher — Alberta’s quota traded at CA$56,495/kg BF/day in January 2025, and Manitoba’s at CA$44,000. On Gobeil’s 125-cow Québec farm, that’s roughly CA$3.6–3.9 million in quota value — an asset that exists only as long as Ottawa keeps defending it.
One system charges you in income volatility. The other charges you in political risk locked inside your balance sheet.
What Does the USMCA Review Mean for a 150-Cow Wisconsin Dairy?
Here’s where the barn math gets humbling. Spread across 227 billion pounds of annual U.S. production, the raw math on $116 million in unused TRQ access works out to about $0.05/cwt nationally. Five cents.
Take a 150-cow Wisconsin dairy producing 24,000 lbs per cow. That’s 36,000 cwt per year. At $0.05/cwt, full TRQ enforcement is worth roughly $1,800 annually. Scale to a 500-cow operation producing 120,000 cwt, and it’s $6,000 — still not survival money.
But trade access lifts demand signals across the domestic market. Cornell dairy economist Charles Nicholson, working with Wisconsin’s Mark Stephenson, estimated that each additional 1% of U.S. dairy components exported lifts the all-milk price by about $0.12/cwt (95% CI: half a cent to $0.24/cwt). Their own conclusion: “it would be appropriate to be cautious in estimating the magnitude of price impacts from US dairy exports.” As exports grow, supply grows roughly in step.
Herd Size
Annual Production (cwt)
Direct TRQ Impact ($0.05/cwt)
Optimistic Export Lift ($0.10–0.15/cwt)
Total Potential Gain
Cost of Production ($/cwt)
2026 Forecast ($/cwt)
Margin Gap
150 cows
36,000 cwt
$1,800/yr
$3,600–$5,400/yr
$5,400–$7,200/yr
$19–23
$18.95
−$0.05 to −$4.05
500 cows
120,000 cwt
$6,000/yr
$12,000–$18,000/yr
$18,000–$24,000/yr
$19–21 (scale advantage)
$18.95
−$0.05 to −$2.05
1,250 cows(Vander Schaaf)
150,000 cwt
$7,500/yr
$15,000–$22,500/yr
$22,500–$30,000/yr
~$19 (scale advantage)
$18.95
−$0.05
Apply that framework. Filling the remaining $116 million wouldn’t move the export needle by a full percentage point. Even at the generous end of Nicholson’s range, you’re looking at $0.10–$0.15/cwt in total price lift. On 36,000 cwt, that’s $3,600 to $5,400 per year for our 150-cow Wisconsin dairy.
Set that against cost reality. USDA ERS data (2021 ARMS survey, published July 2024) shows farms with 2,000+ cows averaging $19.14/cwt in full economic cost, while herds under 50 cows hit $42.70/cwt. Analysts pegged mid-size net cost of production at $22.64/cwt. A 150-cow operation in that $19–23/cwt range — receiving a forecast of $18.95 — is treading water or running red before trade even enters the picture. An extra $1,800 to $5,400 helps. It won’t flip a negative-margin farm into a positive one.
What a Nickel Means for a 125-Cow Québec Quota Farm
Now flip the border. If those TRQs fill completely, cheese is already at 81–83%, so the real incremental pressure comes from powder and fluid categories. On 125 cows producing roughly 27,500 cwt per year, a nickel-per-hundredweight hit works out to about $1,375 annually. Ottawa cushions that — CA$1.2 billion over six years through the Dairy Direct Payment Program alone for CUSMA. Minister Bibeau confirmed in November 2022 that the combined package across three trade deals reaches CA$4.8 billion.
But every round of “access goes up, Ottawa writes a bigger cheque” adds weight to a political question. That CA$4.8 billion comes from general federal revenue — Canadian taxpayers. FCC’s 2026 dairy outlook advises producers to “continue focusing on what they can control on the farm” until the details of the CUSMA review are known. Sensible. It’s also what you say when you don’t know how the politics will break.
The bigger exposure isn’t the milk cheque. It’s the balance sheet. A 20% decline in quota value on Gobeil’s 125-cow operation at the P5 cap means roughly CA$720,000–$780,000 in equity gone. If you’re running 500+ cows in Alberta at CA$56,495/kg BF/day, your exposure is roughly double the P5 math. Your stress test looks different.
Are These Farmers Actually on Opposite Sides?
The easy version — American dairy vs. Canadian dairy, free market vs. supply management — misses what’s happening to both of them.
Vander Schaaf’s 1,250-cow Idaho operation and Gobeil’s 125-cow Québec farm are both getting squeezed by the same forces — processors, retailers, global commodity traders — and dealing with it through completely different systems. The American system absorbs that pressure through farmer income. The Canadian system absorbs it through government spending and quota valuation. Neither pushes the pressure back up the chain to the players who actually control pricing power.
If both sides “win” their version of the 2026 review — full TRQ enforcement for the U.S., intact supply management plus compensation for Canada — it doesn’t fix either farmer’s structural problem. It determines who bleeds a little slower.
The Border Math, Side by Side
Metric
150-Cow Wisconsin Dairy
125-Cow Québec Dairy
Price mechanism
Class III/IV futures + commodity markets
CDC formula (50% COP + 50% CPI)
Farmgate price (5-year range)
~US$16.20–$27.10/cwt (2020–2022)
~US$28–30/cwt equivalent
2026 price signal
$18.95/cwt forecast (WASDE Feb 2026)
2.3255% increase eff. Feb 1, 2026
Annual production
~36,000 cwt
~27,500 cwt
USMCA impact (full TRQ enforcement)
+$1,800–$5,400/yr
−$1,375/yr (before compensation)
5-year price volatility
~$11/cwt swing
~$2–4/cwt swing
Safety net
DMC + crop insurance
Supply management + CA$4.8B federal compensation
Balance-sheet risk
Land + cows + equipment
Land + cows + equipment + ~CA$3.6–3.9M quota
The math doesn’t pick a winner. It shows two different bills for the same thing: stability.
What You Can Do Before July
If you’re milking in the U.S.:
Enroll in DMC before February 28. Tier 1 coverage expanded from 5 million to 6 million pounds under the One Big Beautiful Bill Act (signed July 4, 2025). At $9.50 coverage, you’re paying $0.15/cwt in premium. Lock in for six years (2026–2031) at a 25% premium discount — but that means you can’t adjust if your herd grows or margins recover. If you’re above 6 million lbs (roughly 275+ cows at the national average production), Tier 1 covers only a fraction. Talk to your risk management advisor about Dairy Revenue Protection or Livestock Gross Margin for the rest.
By spring: Run a survival scenario at US$17–18/cwt with your lender. If your breakeven sits above $18, work the restructuring math before margins compress — not after.
Before July: Ask your co-op: “What percentage of our milk ends up in Canada or Mexico, and what’s our contingency if USMCA stalls?” Mexico and Canada purchased $3.6 billion in U.S. dairy products in 2024, accounting for 44 percent of total U.S. dairy exports.
If you’re milking in Canada:
Pull your own cost-of-production numbers and compare them against the CDC’s national average. If you’re not participating in COP surveys, you’re relying on your neighbours’ data while your livelihood depends on the results.
Watch the protein shift. FCC’s 2026 dairy outlook flags that both P5 and WMP are restructuring producer pay to incentivize more protein and less butterfat. If your herd tests 4.5% BF and 3.4% protein, you’re roughly neutral. Push butterfat higher without matching protein, and your gross revenue could drop by 1.2% under the new WMP structure. Factor that into breeding and ration planning alongside trade uncertainty.
By spring, model a 20% decline in the quota value with your lender. Not because that’s likely — but because you should know the answer before you need it. If you’re carrying debt against quota collateral, ask what their haircut assumptions are. FCC’s 2026 dairy outlook is worth reading alongside your balance sheet.
Before July: Watch two signals. First, CDC pricing bulletins — are they still citing cost of production and CPI as drivers, or are words like “affordability” or “competitiveness” creeping in? That language shift is your early-warning system. Second, provincial quota exchange reports. In January 2025, Ontario moved 405.98 kg BF/day at the CA$24,000 cap. Firm volume at the cap means the market believes the system holds. Watch for softening.
Both sides: Don’t let the trade conversation be somebody else’s problem. Your milk check is already a trade document.
Key Takeaways:
The USMCA dairy fight is huge in headlines ($200M–$1.14B), but the farm‑level effect is small: roughly 5¢/cwt or $1,800–$5,400/year for a 150‑cow U.S. herd.
Canadian supply management trades income stability for political and balance‑sheet risk: US$28–30/cwtstability on the milk cheque, but CA$3.6–3.9M in quota equity exposed to Ottawa’s trade decisions.
Full TRQ enforcement and a “win” for U.S. dairy won’t rescue a negative‑margin farm; survival still comes down to cost control, risk management (DMC/DRP/LGM), and co‑op strategy.
For Canadian producers, the real USMCA/CUSMA risk isn’t this year’s milk price; it’s possible quota repricing, so you need to stress‑test a 20% equity hit with your lender.
If you don’t know your co‑op’s export exposure, your breakeven, or your quota‑value stress line, you’re flying blind into the 2026 review — your milk cheque is already a trade document.
The Bottom Line
Vander Schaaf delivered his testimony and returned to his Idaho operation. Gobeil, 1,500 kilometres north, leads the organization representing every Québec dairy farmer who’ll feel whatever the July review decides. Both face the same July deadline. Both will judge the outcome by the deposit on their next milk cheque. The question for you isn’t which system is better — it’s whether you know your own numbers well enough to plan around whatever comes out of that review.
When the USMCA review panel reports this summer, we’ll re-run the barn math for both sides of the border in our Border Math series. What does your co-op’s export breakdown look like? What’s your breakeven?
Updated Feb 23, 2026: Headline revised for clarity. Daniel Gobeil was not interviewed for this article. Farm-level analysis is based on publicly available DFC data applied to representative Québec dairy operations.
Updated Feb 23, 2026: Headline revised for clarity. Daniel Gobeil was not interviewed for this article. Farm-level analysis is based on publicly available DFC data applied to representative Québec dairy operations.
Complete references and supporting documentation are available upon request by contacting the editorial team at editor@thebullvine.com.
Every week, thousands of producers, breeders, and industry insiders open Bullvine Weekly for genetics insights, market shifts, and profit strategies they won’t find anywhere else. One email. Five minutes. Smarter decisions all week.
You paid 15¢/cwt into the dairy checkoff. A $500M cottage cheese deal didn’t need it. Are you funding TikTok trends or your own milk check?
Executive Summary: Dairy farmers are still paying 15¢/cwt into a national checkoff that now bets big on TikTok creators, fast‑food shakes, and retail algorithms, even as the hottest growth story in dairy — a $500 million-plus Good Culture cottage cheese deal — unfolded with no clear checkoff role at all. The article opens with Brenda Cochran’s two‑decade fight against mandatory assessments and Sarah Lloyd’s insider critique from the DMI board table to show how the same 15¢/cwt feels on very different farms. It then tracks the money through USDA’s 2022 Report to Congress and economist Oral Capps’ analysis, which claim an all‑dairy benefit‑cost ratio above 5:1 and suggest milk prices would sit about $1/cwt lower without the program. That glossy ROI is set against awkward facts: historically thin butter promotion despite booming butter demand, fluid milk’s modest 0.8% uptick, and a cottage cheese market that nearly doubled on its own. A simple barn‑math example walks a 300‑cow herd through what it actually takes for that 15¢/cwt to pencil out — and why it often doesn’t if your co‑op’s plant is still mostly pushing commodity powder instead of value‑added products. Finally, the piece gives producers a 30‑day checklist: pull their own checkoff and component numbers, press co‑op leadership on product mix and premiums, and decide whether reforms like the bipartisan OFF Act are worth backing before the next Farm Bill window closes.
Joe and Brenda Cochran sit in their Tioga County barn, the 160‑cow dairy they’ve fought to keep afloat while battling the mandatory checkoff that still pulls 15¢ from every cwt they ship.
In April 2002, Brenda and Joe Cochran — dairy farmers in Westfield, Pennsylvania — sued the USDA over the mandatory dairy checkoff. “This is about our First Amendment rights, plain and simple,” Brenda told Farm and Dairy. Their 160-cow herd on 213 acres of Tioga County hillside shipped roughly 7,000 pounds a day, and the checkoff cost them nearly $4,000 a year. That money, the Cochrans argued in their filed complaint, represented “a significant portion of the gross profit margin” and kept them from “implementing essential farm management practices.”
The Cochrans weren’t co-op members. They marketed their own milk, negotiated their own contracts, and milked mostly Holsteins alongside Jersey and Normandy crosses—a pasture-based operation producing what they considered a differentiated product. Being forced to fund generic advertising that, as their complaint stated, amounted to “speech that denies there is any difference in milk” struck them as fundamentally wrong. So they hired the Institute for Justice and went to federal court.
They won.
A Federal Victory — and a Supreme Court Reversal
In February 2004, three judges on the Third Circuit declared the dairy checkoff unconstitutional, ruling it was compelled private speech that violated the Cochrans’ First Amendment rights. Brenda was “ecstatic” with the ruling, Farm and Dairy reported at the time.
That victory lasted about a year. In 2005, the Supreme Court ruled in a separate beef checkoff case — Johanns v. Livestock Marketing Association — that commodity checkoff programs constitute government speech, not private speech. The reasoning effectively gutted the Cochrans’ win. The dairy checkoff kept collecting.
By 2017, Cochran was writing publicly about what that meant for her family’s operation. “For years, the forced deductions from our milk checks being used to finance the generic dairy checkoff program have exceeded $4,500 annually,” she wrote in an essay for the Organization for Competitive Markets, “which is a huge financial loss from our already insufficient milk income.”
She was even more direct with the Daily Caller News Foundation in 2018: “It is a total scam… They have forced us to finance research on products that benefit fast food joints and pizza parlors. And they want me to develop cheese and yogurt? I’m very upset about it. Even just talking about it makes my blood pressure go up.”
The Cochrans raised 14 children on that Tioga County farm. The checkoff didn’t care about their herd size, their marketing approach, or their bottom line. It just took the 15 cents.
She Isn’t the Only One Asking
Eight hundred miles west, Sarah Lloyd farms with her husband, Nels Nelson, on the Nelson family operation outside Wisconsin Dells. Her herd runs about 350 cows. Lloyd holds a PhD in rural sociology from UW-Madison, and she’s served on both the National Dairy Promotion Board and the Wisconsin Milk Marketing Board — the bodies that oversee where your checkoff dollars go.
Her public assessment of the system is blunt.
Lloyd has spoken publicly about how checkoff-driven consolidation plays out at the local level. She told Grist that a neighboring dairy quadrupled in size to supply mozzarella to a nearby frozen pizza factory — while local infrastructure struggled to handle the waste. “We have massive water quality issues,” she said. “It’s a real crisis right now on all the legs of sustainability: ecologically, socially, economically.”
Producer
Location & Herd
Marketing Approach
Checkoff Cost (Annual)
Core Critique
Brenda Cochran
Tioga County, PA 160 cows (Holstein, Jersey, Normandy) ~7,000 lbs/day shipped
Independent marketer Negotiates own contracts No co-op membership
~$4,000/year
“Forced to finance research on products that benefit fast food joints and pizza parlors. It’s a total scam.”(red)
Sarah Lloyd
Wisconsin Dells, WI 350 cows Nelson family operation
Co-op member Served on National Dairy Promotion Board & Wisconsin Milk Marketing Board
~$9,500/year
“I paid for the development of Fairlife, then Select Milk just pocketed my money and took the profit when they sold to Coca-Cola.”(red)
System Impact
—
—
$352.1M (2022) all U.S. producers
Both producers pay 15¢/cwt regardless of herd size, product differentiation, or measurable return at the farm level.
The checkoff helped create demand for that mozzarella. Whether it helps a family operation competing with the factory next door is a different question entirely.
Where Does $431.8 Million a Year Actually Go?
Cochran and Lloyd are asking the same question from different states, with different herd sizes, and from different angles. And in 2026, that question involves $431.8 million of producer and processor money.
Every U.S. dairy producer pays $0.15 per hundredweight of milk sold. In 2022 — the most recent audited year — that added up to $352.1 million in mandatory producer assessments, plus another $79.7 million from fluid milk processors through MilkPEP, according to USDA’s 2022 Report to Congress published in September 2024.
The money is split roughly 26% to Dairy Management Inc. (DMI), 23% to MilkPEP, and 51% to state- and regional-qualified programs. DMI is the entity that turns those dollars into demand campaigns — and some of those campaigns ended up going spectacularly viral.
From Courtrooms to TikTok: Where Cochran’s 15¢ Ended Up
While Cochran was filing legal briefs in Tioga County and Lloyd was raising transparency concerns from inside the boardroom, DMI was building something neither of them voted for — a social media marketing machine powered by producer assessments.
In September 2022, influencer chef Justine Doiron posted a TikTok of herself slathering butter onto a wooden board — sea salt, lemon zest, flower petals. The New York Times picked it up. CNN ran it. New York Magazine declared that “butter has become the main character.” What the audience didn’t know: Doiron was on a paid contract with DMI as part of their “Dairy Dream Team” of sponsored influencers. Her butter board video carried no advertising disclosure — and she’d posted a DMI-sponsored ad just two days before the viral hit. DMI told Grist that the specific video “was not itself technically part of the partnership,” but the organization claimed credit for the butter board trend in industry press.
The strategy runs deeper than social media. Since 2009, DMI has placed two dairy scientists directly inside McDonald’s headquarters to increase dairy across the menu. Less than a decade later, four in five McDonald’s menu items contained dairy, according to a DMI board member. When the Grimace Shake went viral in Q2 2023 — the hashtag hit 3 billion TikTok views, per McDonald’s CFO Ian Borden on the company’s Q2 2023 earnings call — it helped drive McDonald’s U.S. same-store sales up 10.3% for the quarter.
DMI also partnered with YouTube star MrBeast, staging a custom Minecraft gaming competition on National Farmer’s Day in October 2022 that featured dairy sustainability messaging. And MilkPEP has paid more than 200 influencers — including Emily Ratajkowski and Kelly Ripa — to promote milk on social media.
DMI CEO Barb O’Brien put the McDonald’s partnership plainly on a podcast in December 2023: “My hope is that farmers, when they see a new milkshake or a new McFlurry at McDonald’s, that they know that it’s their new product.”
Lloyd saw it differently. She told The American Prospect in April 2023 that she’d sat on the state checkoff board when they voted to fund product development at Fairlife. After the rollout, Select Milk Producers helped sell Fairlife to Coca-Cola. “I paid for the development of that product, and then Select Milk just pocketed my money and took the profit from that,” Lloyd said.
Does the Checkoff Actually Move Your Milk Price?
Here’s where the argument gets genuinely messy — for both sides.
USDA’s 2022 Report to Congress, authored by Texas A&M’s Oral Capps Jr., puts the aggregate all-dairy benefit-cost ratio at $5.23 per dollar spent — meaning the model estimates that for every dollar the checkoff collected, it generated $5.23 in economic value for the dairy sector. That’s the highest across four consecutive evaluations. In a separate analysis presented at the 2025 Joint Annual Meeting in Arlington, Texas, Dr. Capps and colleagues at the University of Missouri estimated that without the checkoff, the all-milk price would be “about $1 per 100 weight” lower. For a 300-cow herd producing 87,600 cwt per year, that’s $87,600 in theoretical price support. On paper, the system works.
But zoom in on individual categories, and the picture fractures.
Year
All-Dairy BCR
Cheese BCR
Butter BCR
2012
4.8
6.2
7.1
2013
5.1
5.8
6.4
2014
5.4
5.3
5.9
2015
5.6
4.9
5.2
2016
5.5
4.6
4.8
The aggregate looks strong. But the two highest-value component categories — butter and cheese — are both showing falling returns on checkoff spending. Fluid milk collapsed before partially recovering. When you dig into the 2016 numbers, the disconnect jumps out. It sure looks like the ‘return’ had very little to do with where your dollars actually went.. Despite this minimal spend, butter was already the fastest-rising demand category in the industry. It suggests a scenario where the reported ‘return’ may have had very little to do with the actual ‘investment’ of producer dollars.
Category
% of Total Checkoff Spending (2016)
Market Performance
DMI’s Role
Butter
0.5%
Fastest-rising demand category in dairy; consumer-driven surge
Minimal—growth happened independently
Fluid Milk
33.5%
Modest 0.8% uptick after decades of collapse
Heavy investment, limited return
Cheese
~35%
41% of U.S. milk supply; BCR falling (6.2→4.6)
Pizza R&D, McDonald’s partnerships
Cottage Cheese
0%
Market doubled; $1.75B in sales (+18% YoY, 2025)
None—$500M Good Culture deal with zero checkoff
The 2022 report doesn’t provide the same level of detail to check whether that pattern holds.
The Cottage Cheese Paradox
In January 2026, private equity firm L Catterton agreed to acquire a majority stake in Good Culture in a deal valued at more than $500 million, Reuters reported. Co-founder Jesse Merrill launched the cottage cheese brand in 2015 after being diagnosed with ulcerative colitis. “I had to rethink how I fueled my body completely,” Merrill wrote on LinkedIn. He built a clean-label, high-protein line in a category that hadn’t seen real innovation in decades.
Good Culture hit $187 million in dollar sales for the 52 weeks ending February 23, 2025 — up 75% year-over-year, per Circana data reported by Dairy Foods. The broader U.S. cottage cheese market reached $1.75 billion in total dollar sales over that same period, an 18% year-over-year jump.
There’s no public record of DMI involvement in the cottage cheese revival. No “Dream Team” contract. No branded editorial deal. The cottage cheese boom looks like a genuine consumer pull — the “protein hack” trend on TikTok collided with clean-label preferences and the category exploded without anyone from DMI touching it.
That’s the paradox: the biggest dairy demand story in a decade grew without the checkoff. Cochran has been funding the program with her checkoff dollars for more than two decades, and the half-billion-dollar success story happened in a category the program never touched.
The aggregate BCR says the system works. On paper, the system works. In cottage cheese, it clearly worked just fine without your 15¢/cwt.
What Does This Math Look Like at Your Tank?
Let’s get concrete.
On a 300-cow herd shipping 80 lbs/day at 4.2% butterfat, your mandatory checkoff costs $13,140 a year — that’s $43.80 per cow. When the Cochrans were shipping 7,000 lbs/day from Tioga County, they paid nearly $4,000 — and they shipped independently, without a cooperative to negotiate on their behalf. None of that money is optional.
Nobody’s arguing DMI doesn’t create demand. Butter boards, Grimace Shakes, cheese-stuffed everything — the campaigns are real. The real question is whether that demand reaches your tank.
Context matters: the FMMO butterfat component price in 2025 swung from $2.9460/lb in January to $1.5831/lb by December — a $1.36/lb range and a 46.3% drop across 12 months, per USDA AMS class and component price announcements.
Metric
Checkoff Cost
Price Lift Needed to Break Even
Per-Cow Annual
$43.80
$61
Herd-Level (300 cows)
$13,140
$18,396
That same 300-cow herd produces roughly 367,920 lbs of butterfat per year. If checkoff-driven demand pushes the butterfat component price up just $0.05/lb above where it would otherwise land, that’s $18,396 — about $61 per cow. Your checkoff costs $43.80/cow. The math can work.
But — and this is Cochran’s point and Lloyd’s point — it only works if your co-op’s plant is positioned to capture premium demand. If your milk goes into commodity powder or Class IV, TikTok doesn’t show up on your check. One threshold worth asking about at your next board meeting: what percentage of your co-op’s plant volume goes to specialty or value-added products? Our rough benchmark: if the answer sits below 20%, the demand creation DMI is funding is likely not reaching your milk check in any meaningful way.
What Can You Actually Do About This?
There isn’t one right answer. But there are different ways to respond depending on where you sit.
Push for transparency from the system. Sixty-eight farm and food organizations now back the OFF Act (Opportunities for Fairness in Farming), a bipartisan bill introduced in May 2025 by Senators Mike Lee (R-UT) and Cory Booker (D-NJ), with cosponsors Rand Paul (R-KY) and Elizabeth Warren (D-MA). The legislation would ban checkoff organizations from lobbying or contracting with lobbying groups, require program audits, and create an ombudsman for producer complaints. It hasn’t passed, and the dairy lobby has fought previous versions hard. But the bipartisan sponsor list — from Lee to Warren — tells you something about where the political pressure is building. If the OFF Act matters to you, contact your representatives this month while the Farm Bill is still in play; your voice carries the most weight then.
Run the math on your own operation. Pull your component test data — butterfat and protein pounds shipped per month — and calculate your annual checkoff cost at $0.15/cwt. Then compare that to your co-op’s announced component premiums and the FMMO component prices on your settlement statement. You’re looking for the gap between where DMI says demand is growing and where your milk check says the money actually lands. If there’s a disconnect, that’s a conversation to bring to your co-op’s member meeting.
Ask your co-op three specific questions. (1) What percentage of our plant volume goes to specialty or value-added products versus commodity products? (2) Has checkoff-funded demand creation measurably increased the component premiums we receive at the farm level? (3) What specific DMI or state checkoff programs directly benefit our marketing region? If your co-op can’t answer these, that tells you something, too.
Phase
Timeline
Action Step
What You’re Looking For
1. Pull Your Own Numbers
Days 1–7
Request 12 months of milk settlement statements from your co-op. Calculate: (a) total cwt shipped, (b) total checkoff deducted ($0.15/cwt), (c) total lbs butterfat & protein shipped.
Your checkoff cost per cow (annual total ÷ herd size).Benchmark: $43.80/cow for 300-cow herd shipping 80 lbs/day at 4.2% BF.
2. Press Co-op Leadership
Days 8–21
Attend next member meeting or email board with three specific questions: (1) What % of our plant volume goes to specialty/value-added vs. commodity products?(2) Has checkoff-driven demand measurably increased our component premiums?(3) Which DMI programs directly benefit our marketing region?
Red flag if: <20% specialty volume, vague answers on premiums, or no regional program specifics.Green flag if: Board provides documented component price lift data and product mix breakdown.
3. Run the Breakeven Math
Days 22–28
Calculate what component price lift would be needed to justify your checkoff cost. Formula: (checkoff cost ÷ lbs butterfat shipped) = $/lb price increase required.Example: $13,140 checkoff ÷ 367,920 lbs BF = $0.0357/lb price lift needed.
Compare to FMMO butterfat price volatility (2025: $1.36/lb range).Question: Is your co-op capturing enough of that volatility through premium positioning to deliver the $0.04–$0.05/lb lift needed?
4. Decide on OFF Act Support
Days 29–30
Review OFF Act provisions: bans checkoff lobbying, requires program audits, creates producer ombudsman.68 farm/food orgs backing it (bipartisan: Lee, Booker, Paul, Warren).Contact your U.S. Representative and Senators.
Critical window: Farm Bill negotiations active now—your voice matters most before the bill is finalized, not after.Decide: Is transparency reform worth backing?
Look at what’s working without checkoff support. The cottage cheese category surged 18% in dollar sales, without a DMI campaign. Consumer protein demand and clean-label preferences drove that growth on their own. If you’re considering value-added — farmstead cheese, bottled milk, direct-to-consumer — the market signal from cottage cheese is that real consumer demand doesn’t always need a $352 million marketing program behind it. Sometimes it just needs a product people want.
A Note for Canadian Producers
If you’re milking north of the border, your version of this debate plays out through Dairy Farmers of Canada’s promotion levy — currently CA$1.50 per hectolitre, confirmed by Western Producer. The structure differs from the U.S. system: supply management means DFC doesn’t need to stimulate demand the same way DMI does, and the levy funds are smaller. But the transparency questions are similar — where does your levy go, what measurable return does it deliver, and who decides? If quota holders are paying into a promotion system, they deserve the same level of allocation transparency that U.S. producers are fighting for through the OFF Act.
Key Takeaways
If your co-op can’t tell you what percentage of its plant volume goes to specialty products, that’s your first question at the next member meeting. Below 20%, and the checkoff’s demand creation likely isn’t reaching your check.
Pull your component test data this month and calculate your exact annual checkoff cost against what DMI’s demand programs would need to move your price by $0.05/lb butterfat to break even. On a 300-cow herd, that’s $43.80/cow in versus $61/cow out — but only if the demand hits your pool.
Track the OFF Act. Sixty-eight organizations across the political spectrum are backing it. If Farm Bill negotiations are still active in your state, a call to your representative this month matters more than a call next year.
Watch the cottage cheese signal. The biggest dairy demand story of the decade happened without checkoff funding. If consumer pull can drive $1.75 billion in cottage cheese sales without a marketing program, it raises a real question about what your $352 million is buying that the market wouldn’t deliver on its own.
The Bottom Line
Cochran has been paying into this system since before she sued the USDA in 2002. Lloyd’s been poking at it from inside the boardroom. Twenty‑four years later, the system’s still collecting, and the questions are bigger, not smaller. Your checkoff costs you $43.80/cow this year, whether you ask those questions or not. So ask them — and pay attention to who’s willing to answer.
Complete references and supporting documentation are available upon request by contacting the editorial team at editor@thebullvine.com.
Dairy Tech ROI: The Questions That Separate $50K Wins from $200K Mistakes – Expose the truth behind trade-show promises and save your dairy from a six-figure automation blunder. This hard-hitting analysis reveals the actual $27/hour labor threshold for robotic breakeven and arms you with data to match technology to your specific scale.
The Sunday Read Dairy Professionals Don’t Skip.
Every week, thousands of producers, breeders, and industry insiders open Bullvine Weekly for genetics insights, market shifts, and profit strategies they won’t find anywhere else. One email. Five minutes. Smarter decisions all week.
To provide the best experiences, we use technologies like cookies to store and/or access device information. Consenting to these technologies will allow us to process data such as browsing behavior or unique IDs on this site. Not consenting or withdrawing consent, may adversely affect certain features and functions.
Functional
Always active
The technical storage or access is strictly necessary for the legitimate purpose of enabling the use of a specific service explicitly requested by the subscriber or user, or for the sole purpose of carrying out the transmission of a communication over an electronic communications network.
Preferences
The technical storage or access is necessary for the legitimate purpose of storing preferences that are not requested by the subscriber or user.
Statistics
The technical storage or access that is used exclusively for statistical purposes.The technical storage or access that is used exclusively for anonymous statistical purposes. Without a subpoena, voluntary compliance on the part of your Internet Service Provider, or additional records from a third party, information stored or retrieved for this purpose alone cannot usually be used to identify you.
Marketing
The technical storage or access is required to create user profiles to send advertising, or to track the user on a website or across several websites for similar marketing purposes.
To provide the best experiences, we and our partners use technologies like cookies to store and/or access device information. Consenting to these technologies will allow us and our partners to process personal data such as browsing behavior or unique IDs on this site and show (non-) personalized ads. Not consenting or withdrawing consent, may adversely affect certain features and functions.
Click below to consent to the above or make granular choices. Your choices will be applied to this site only. You can change your settings at any time, including withdrawing your consent, by using the toggles on the Cookie Policy, or by clicking on the manage consent button at the bottom of the screen.
Functional
Always active
The technical storage or access is strictly necessary for the legitimate purpose of enabling the use of a specific service explicitly requested by the subscriber or user, or for the sole purpose of carrying out the transmission of a communication over an electronic communications network.
Preferences
The technical storage or access is necessary for the legitimate purpose of storing preferences that are not requested by the subscriber or user.
Statistics
The technical storage or access that is used exclusively for statistical purposes.The technical storage or access that is used exclusively for anonymous statistical purposes. Without a subpoena, voluntary compliance on the part of your Internet Service Provider, or additional records from a third party, information stored or retrieved for this purpose alone cannot usually be used to identify you.
Marketing
The technical storage or access is required to create user profiles to send advertising, or to track the user on a website or across several websites for similar marketing purposes.