Archive for milk check deductions

Darigold’s $4/cwt Deduction. Idaho’s Five-Processor Bidding War. The Map That Shows Which Side You’re On.

Processor consolidation has cut U.S. milk handlers by 28% in two decades. The gap between competitive and captive markets now runs $3–4/cwt — and your address determines which side of that line you’re milking on.

Krista Stauffer’s family has shipped milk to Darigold for years, building equity in the cooperative, as generations of Pacific Northwest dairy families have. She shared that they now have “quite a bit of equity sitting there” — with a real chance that only her kids ever see it come back. Her situation isn’t a one-off grievance. It’s what happens when processor consolidation narrows your options to one real buyer. And the financial distance between farming where processors compete for your milk and farming where a single handler calls the shots is wider than most people think.

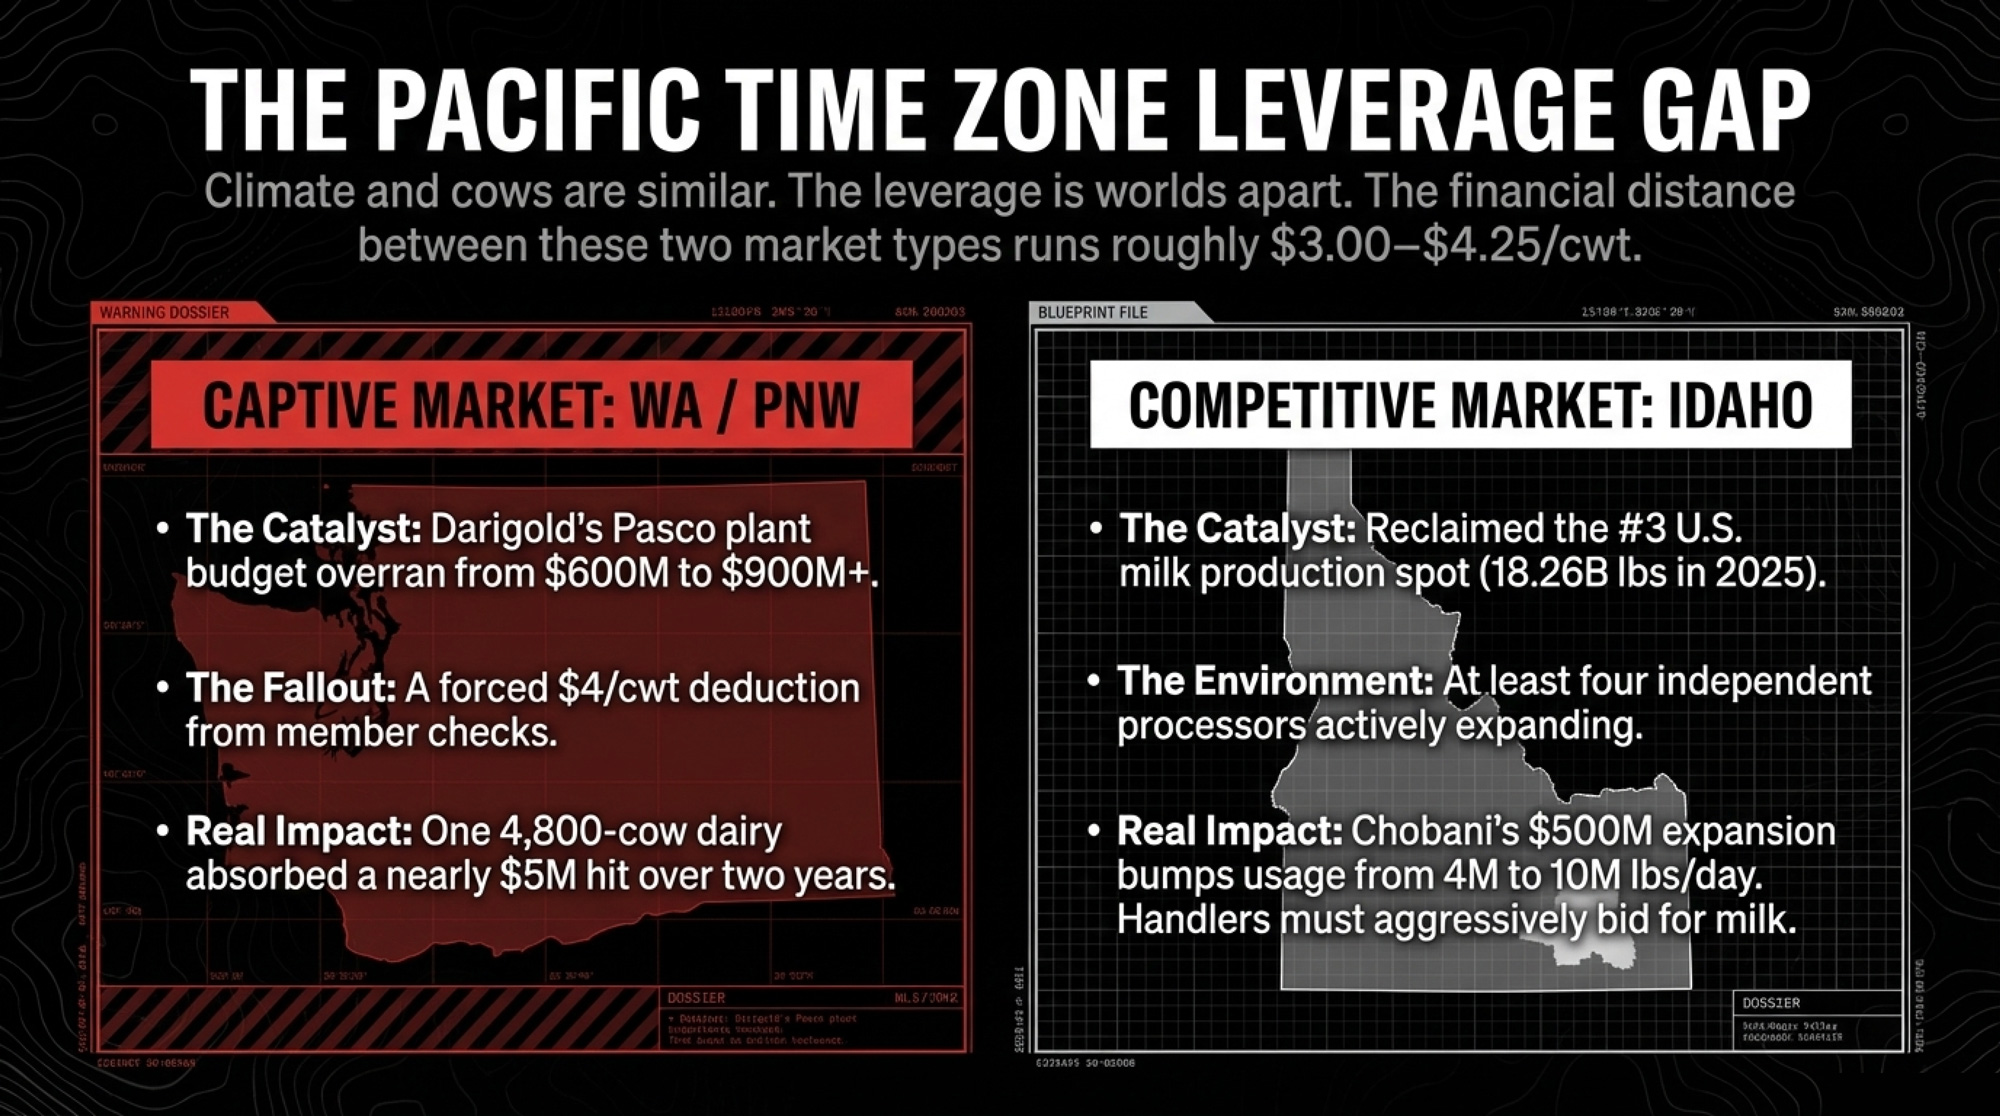
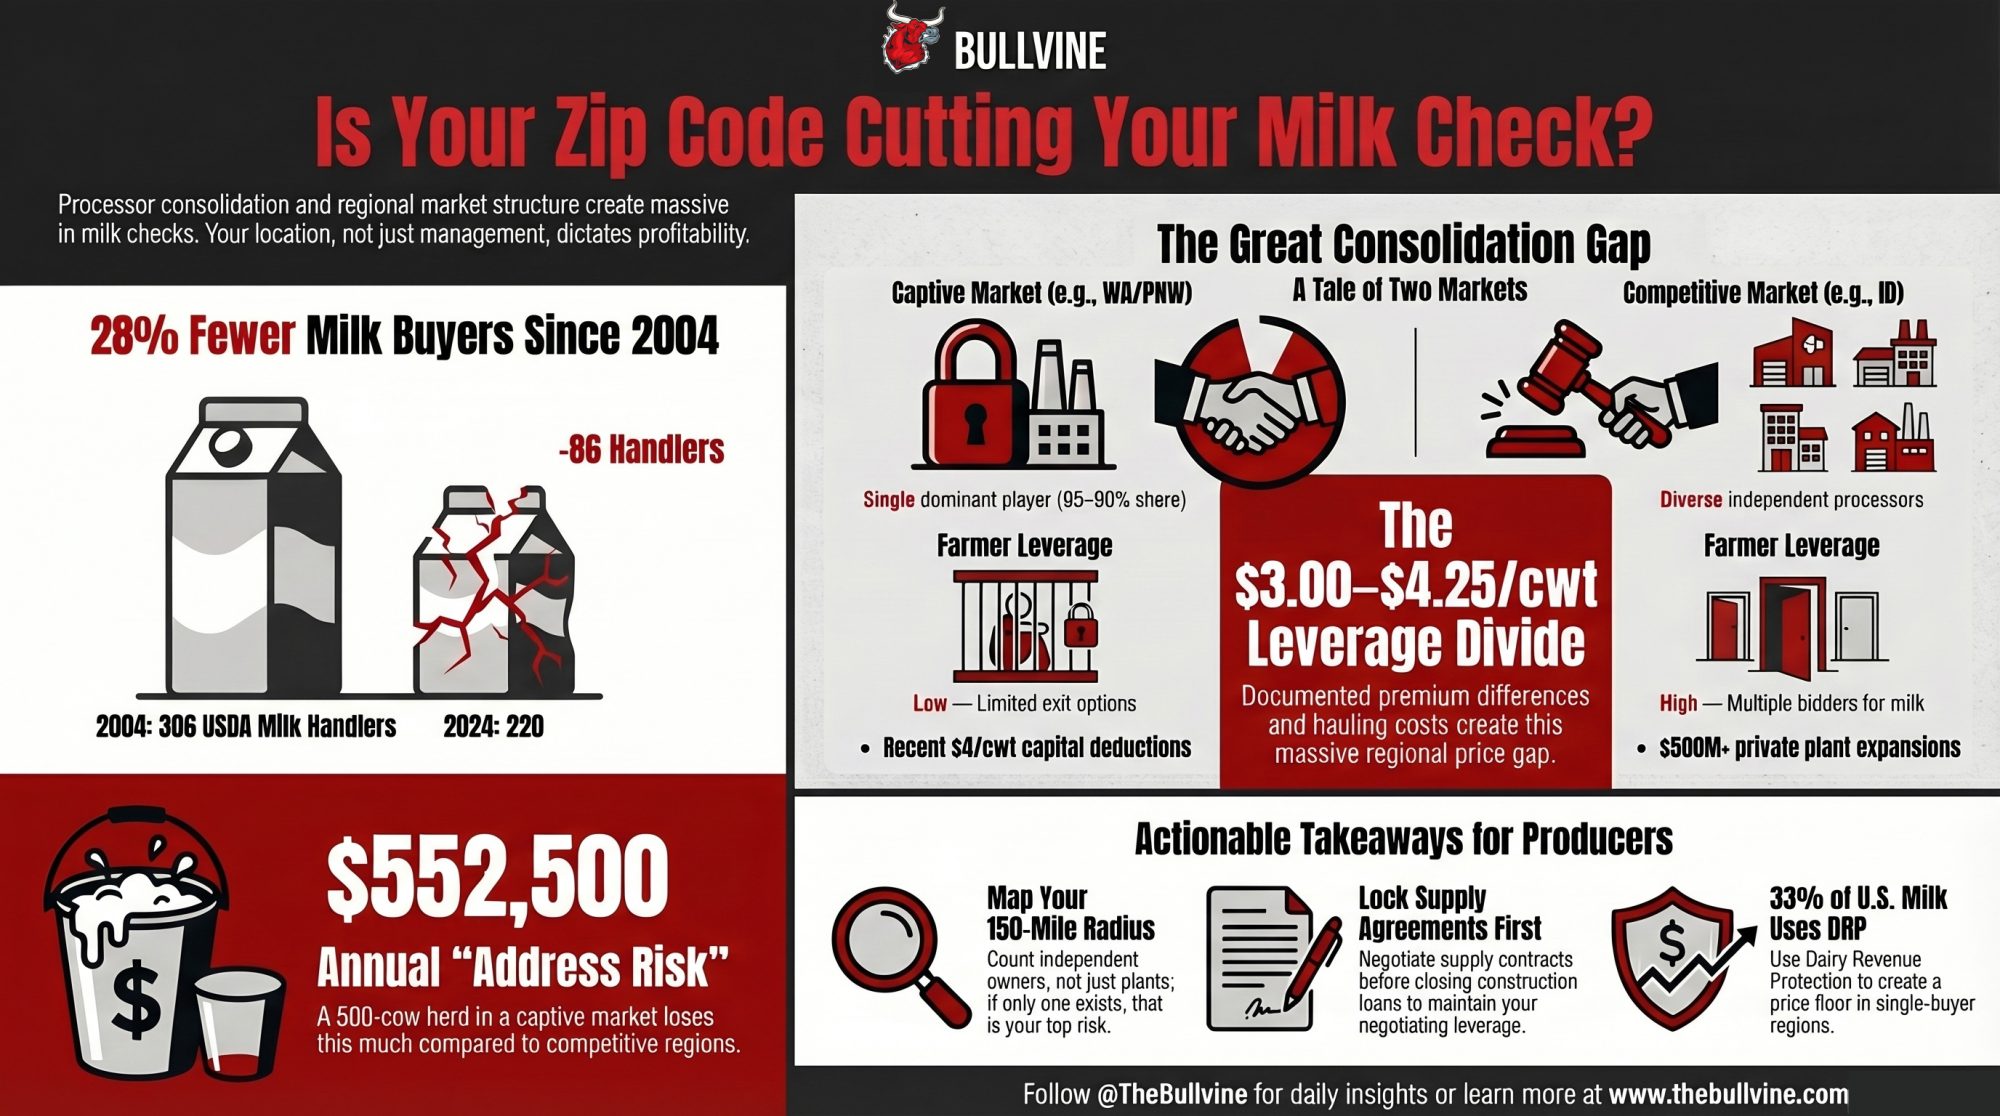
When you stack documented premium differences, structural hauling costs, and the 2025 make-allowance hit together, the gap between the best and worst regions runs roughly $3.00–$4.25/cwt on your milk check. On a 500-cow herd, that’s $390,000–$552,500 a year, driven by your zip code, not your TMR.

From 306 Buyers to 220

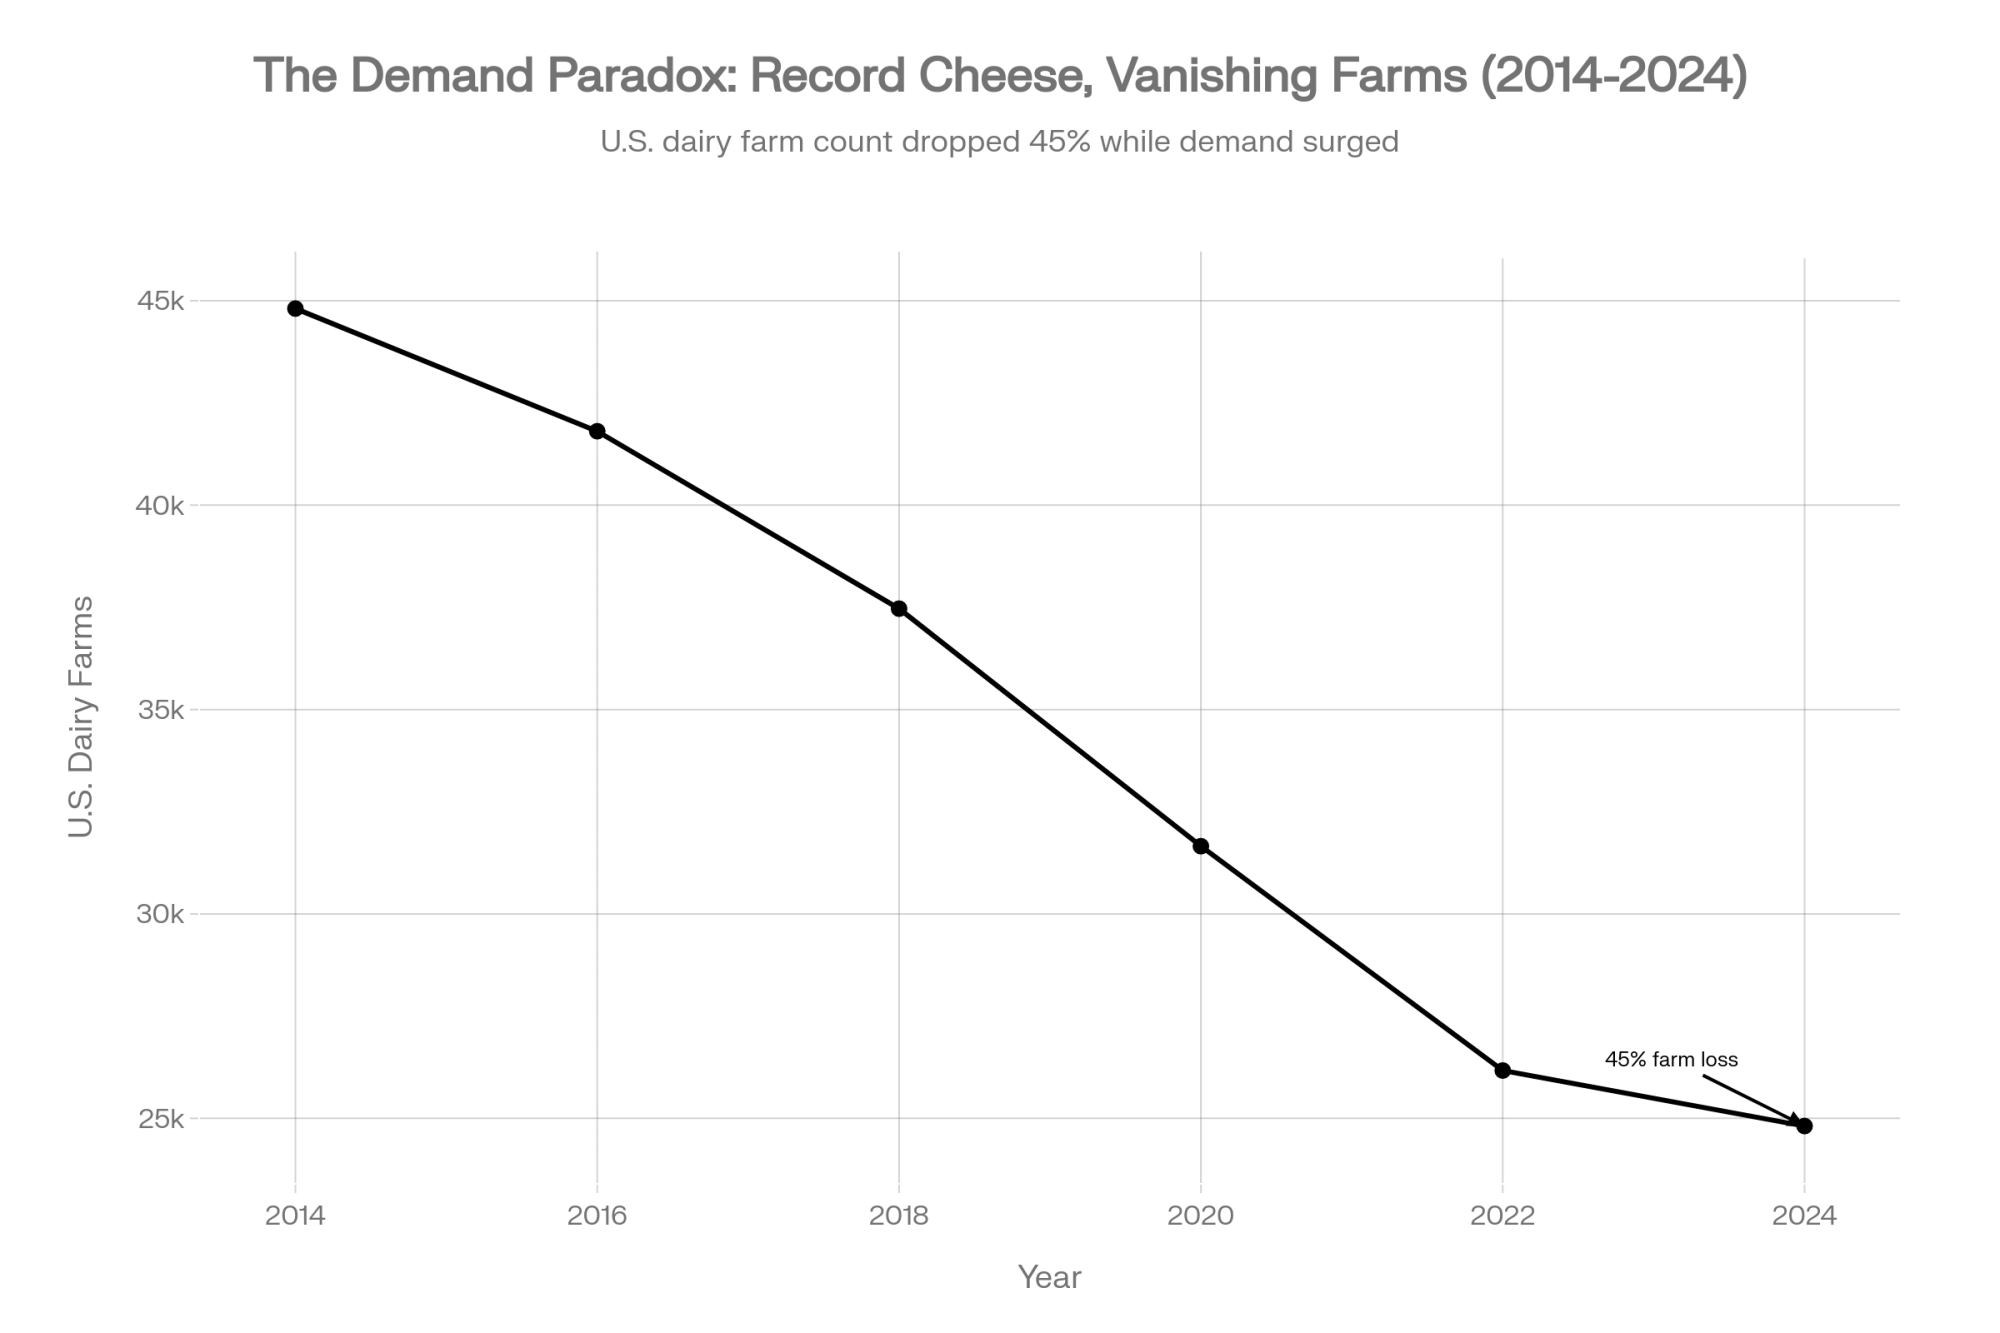
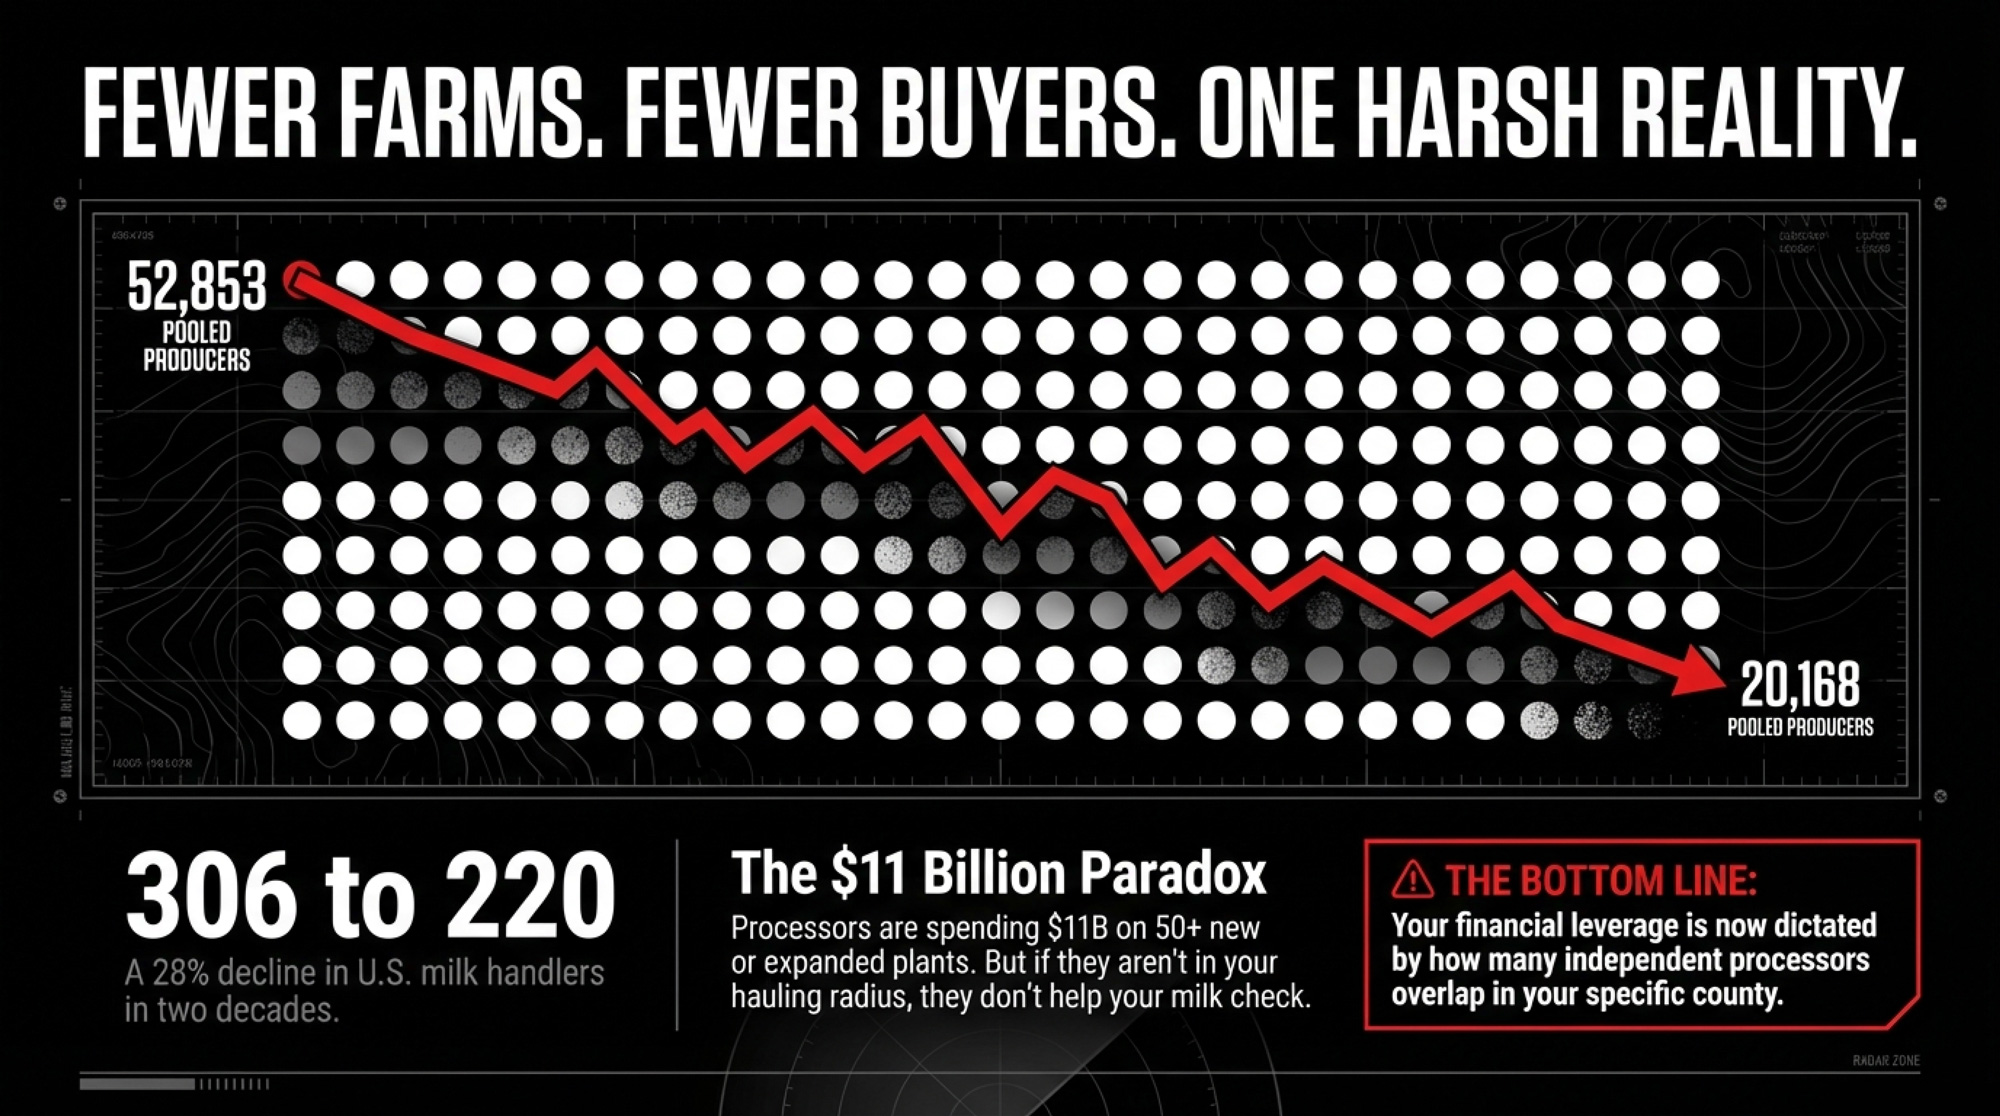
Twenty years ago, the USDA counted 306 handlers pooling milk across the federal orders. By 2024, that number had dropped to 220 — a 28% decline (USDA AMS, 2024). Pooled producers fell from 52,853 to 20,168 over the same stretch. Fewer farms are shipping to fewer buyers. That’s the whole structural picture in one sentence.

But it doesn’t look the same everywhere. In Wisconsin’s Upper Midwest order, multiple cooperatives and proprietary processors still overlap routes and counties, so they’re forced to bid for milk. In the Pacific Northwest, Darigold operates 11 production facilities and handles the vast majority of pooled milk in the order — processing up to 8 million pounds per day at its new Pasco plant alone (Northwest Dairy Association annual report; FMMO-124 data). In the Southeast, DFA and its affiliates manage supply for essentially every regulated fluid plant in the Florida order. All three regions are “orderly markets” on paper. On your milk check, they’re completely different worlds.

The $11 Billion Build-Out — and Who It Actually Helps

Processors are in the middle of an $11 billion processing build-out — more than 50 new or expanded plants announced between 2025 and 2028 (Dairy Foods, 2025). Texas, Idaho, New York, and South Dakota are picking up the lion’s share. Pennsylvania, parts of the Northeast, and Washington are losing plants as older facilities shutter or consolidate.

That looks like capital investment on a press release. On the farm, it means some regions are getting more bidders for your milk — and others are getting fewer. The question isn’t whether new capacity is coming. It’s whether any of it lands within your hauling radius.

Same Time Zone, Different Reality: Idaho vs. Washington

The sharpest contrast in American dairying right now sits inside the Pacific time zone. Same climate band. Very different leverage.

Idaho just reclaimed the No. 3 spot in U.S. milk production. According to USDA data released in February 2026, the state’s roughly 350 dairy operations produced 18.26 billion pounds of milk in 2025 — narrowly edging Texas at 18.21 billion (USDA NASS, Feb. 2026). In the Magic Valley, at least four independent processors are actively adding capacity. Chobani broke ground on a $500 million expansion in Twin Falls — its largest capital investment ever — bumping milk usage from about 4 million pounds per day to over 10 million (Chobani, 2025; Twin Falls Times-News). Idaho Milk Products is building in Jerome. High Desert Milk has invested tens of millions in its own operation. Newer players like Suntado have come online. Every one of those plants needs milk. Everyone competes for it. Idaho Dairymen’s Association CEO Rick Naerebout told Dairy Herd Management: “Idaho dairymen, for the most part, are fairly well situated financially right now.”

Drive west, and the story flips. Darigold’s Pasco, Washington, plant — originally budgeted at around $600 million — exceeded $900 million by the time it opened in June 2025 (Capital Press; Reuters, 2025). The cooperative approved the project back in 2021. CEO Stan Ryan pointed to labor shortages and equipment procurement as the main cost drivers. To cover the gap, the cooperative pulled a $4/cwt deduction from member checks (eDairyNews, May 2025). Yakima County producer Dan DeRuyter, milking about 4,800 cows, told reporters the hit amounted to nearly $5 million taken from his operation over two years. He didn’t sign the construction contract. He didn’t pick the procurement strategy. He had no practical alternative buyer for his milk. He just absorbed the deduction.

That’s the governance structure on paper. Here’s how it played out on the milk check: one buyer, one deduction, limited alternatives.

The Leverage Gap at a Glance

 “Captive” Market (WA / PNW)“Competitive” Market (ID / Magic Valley)
Dominant PlayerDarigold (~85–90% of pooled milk)Diverse: Chobani, Idaho Milk Products, High Desert Milk, Suntado, Glanbia
Farmer LeverageLow — limited exit options, retained equity as anchorHigh — multiple independent bidders for milk
Recent Trend$4/cwt capital deduction from member checks$500M+ in private processor expansions
Risk ProfileHigh “address risk” — geography controls your basisDynamic growth — processors competing for supply
2025 Milk Production~10 billion lbs (NDA members, WA/OR/ID/MT)18.26 billion lbs (Idaho alone, USDA NASS)

Here’s the barn math that connects those two columns. Take a 300-cow herd shipping about 78,000 cwt a year. In a region with multiple handlers fighting for milk — over-order premiums, quality bonuses, and hauling competition all working in your favor — it’s reasonable to see at least 50-100¢/cwt more in total value than the same herd in a single-buyer region. That’s $58,500 a year. Or roughly $195/cow — pushed or pulled entirely by how many processors are in range, not how well you bed stalls.

How Many Buyers Can Actually Bid on Your Milk Right Now?

This is the question that invisibly sets your basis.

Pull up a map. Draw a circle with your maximum economic hauling distance — for most outfits, that’s 100–150 miles, depending on roads and fuel. Count the plants inside that circle. Then ask the harder follow-up: how many of those plants are controlled by different companies?

Two DFA plants don’t equal two buyers. A DFA plant and a Leprino plant do.

If you count four or more independent buyers, you’re in rare air. Much of Wisconsin, eastern Minnesota, and chunks of Idaho’s Magic Valley still look like this — multiple co-ops, proprietary cheese plants, and specialty processors overlapping territories. Charles Krause, chair of Midwest Dairy’s board and a sixth-generation dairy producer running a 350-cow operation in Buffalo, Minnesota, told Progressive Dairy: “In the central states, we are finally seeing processors out procuring more milk. It has been several years since farmers had options.”

If the count is one, you’re in a captive market. CME settlements or national mailbox averages don’t drive your real price. It’s set by whatever your lone buyer decides is sustainable — for them.

Where Does the Money Go Before It Reaches Your Statement?

Two pieces of plumbing turn consolidation into smaller milk checks. Neither one shows up as a tidy line item.

Make allowances move money upstream before your check is even printed.

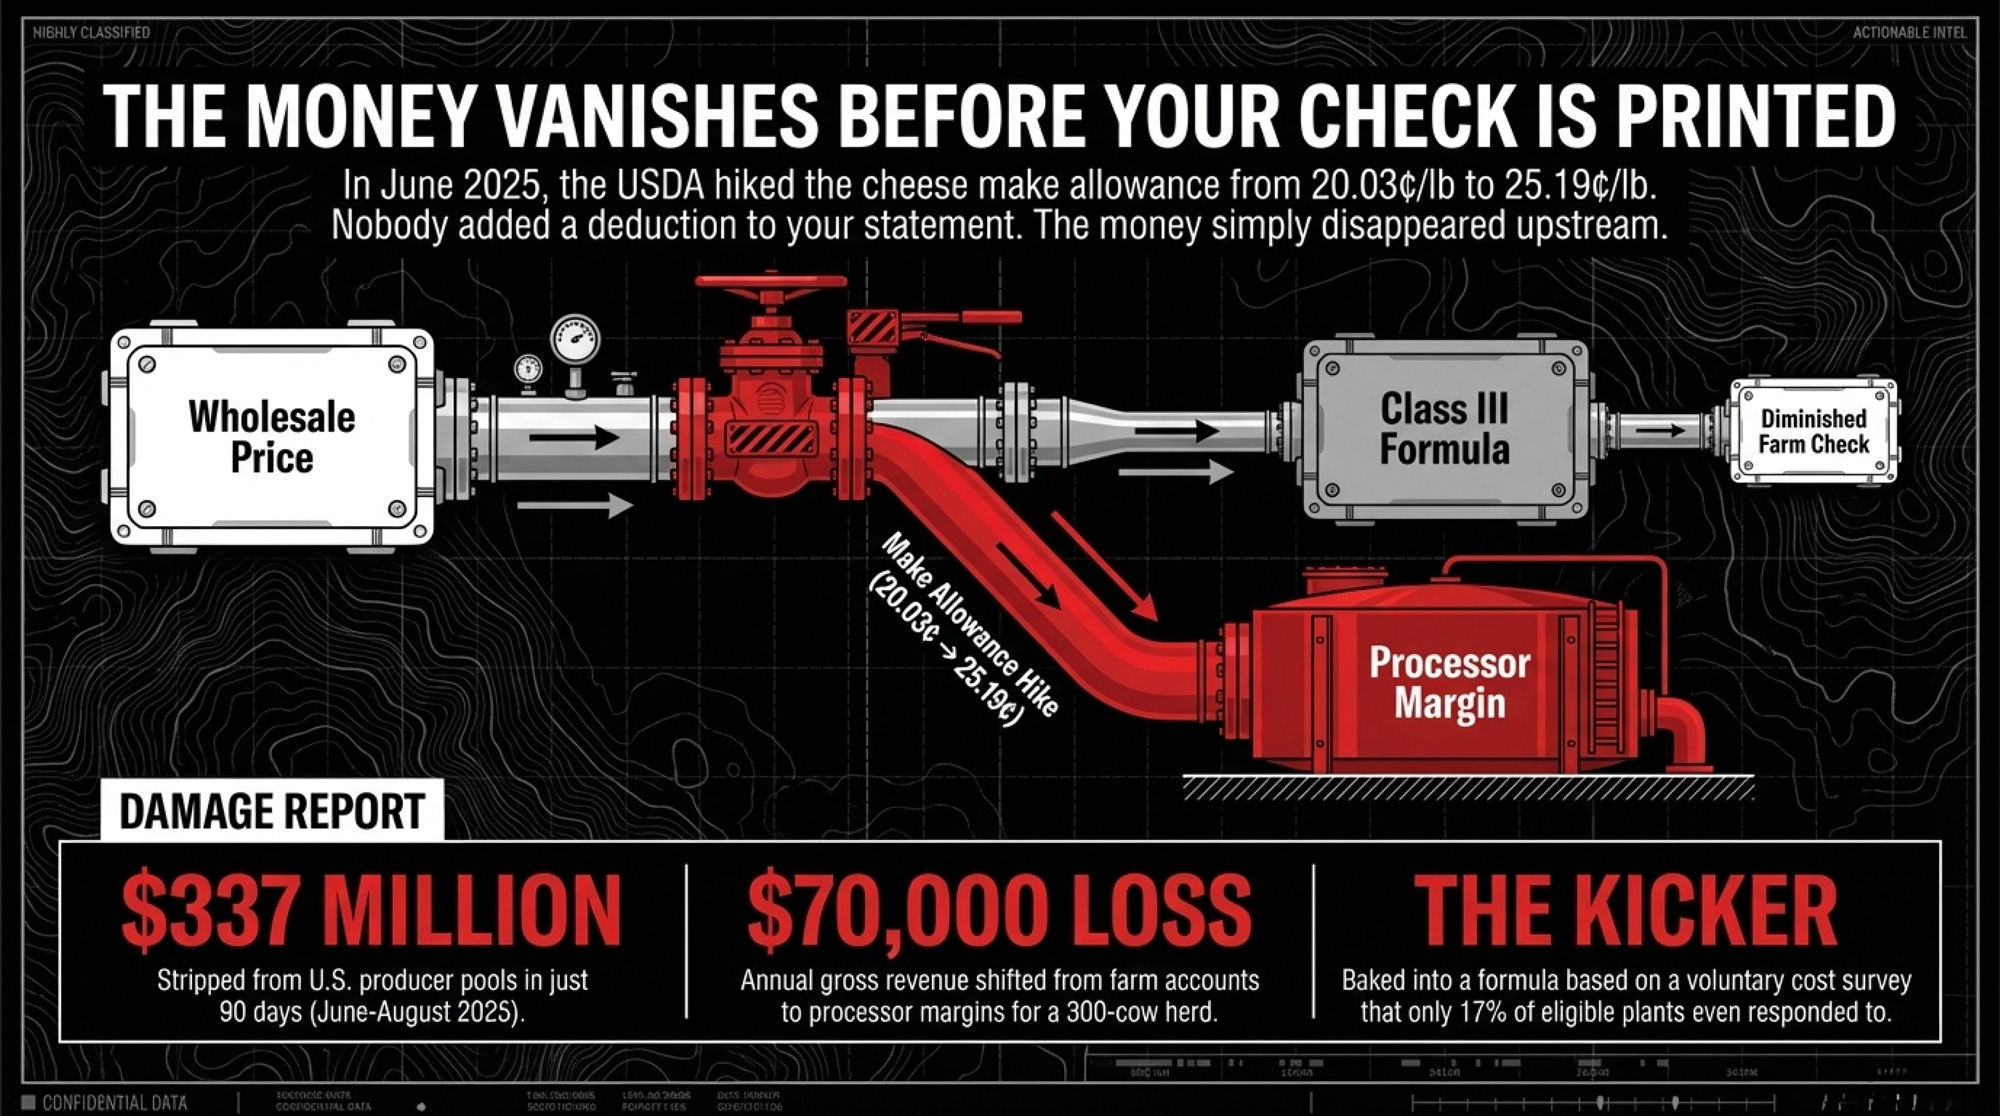
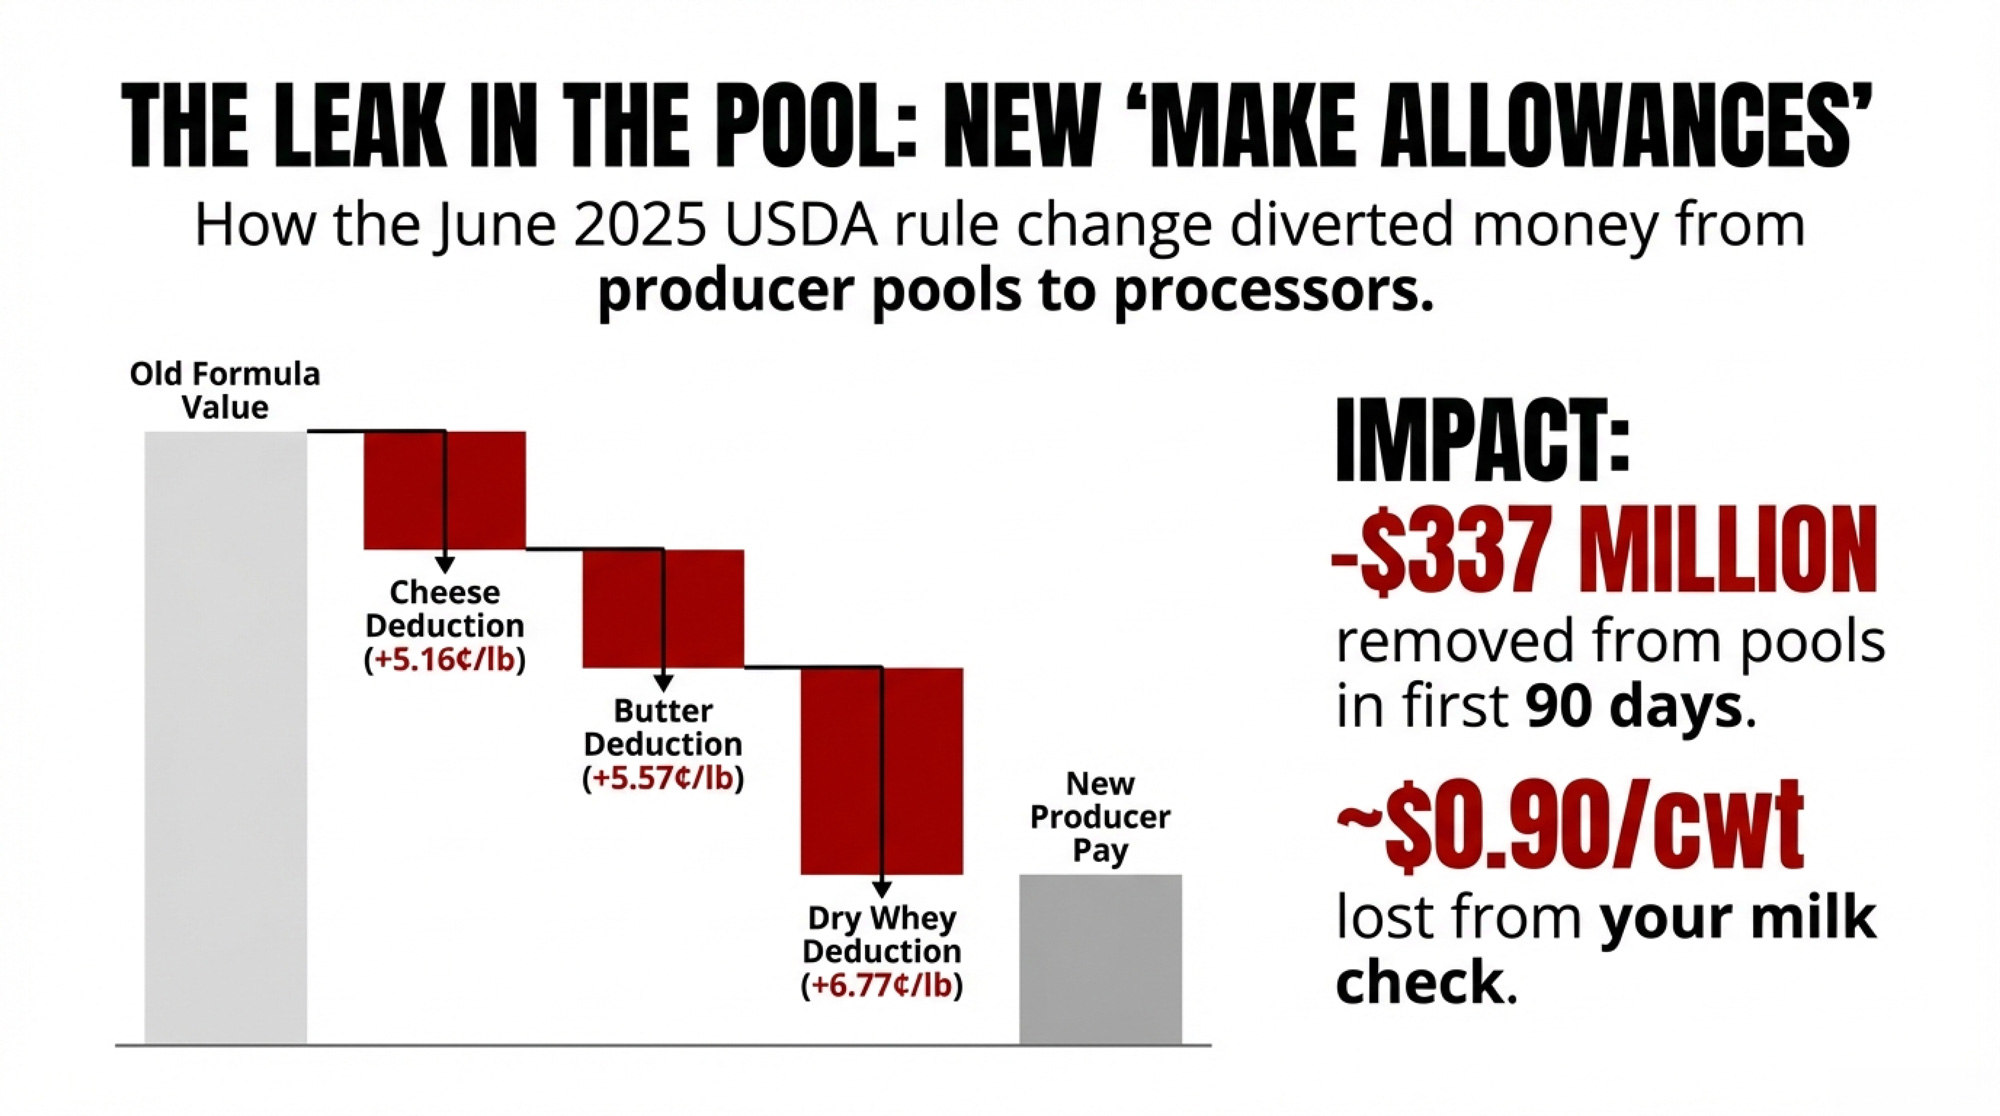
When USDA raised the cheese make allowance to 25.19¢/lb in June 2025 — up from 20.03¢ where it had sat since 2008 — nobody added a “make allowance” deduction to your statement (USDA AMS, Final Decision on FMMO Amendments, 2025). The money vanishes earlier than that. USDA subtracts the allowance from the wholesale commodity price before calculating protein and butterfat values for Class III. The processor keeps the allowance as an operating margin. What’s left becomes your component price.

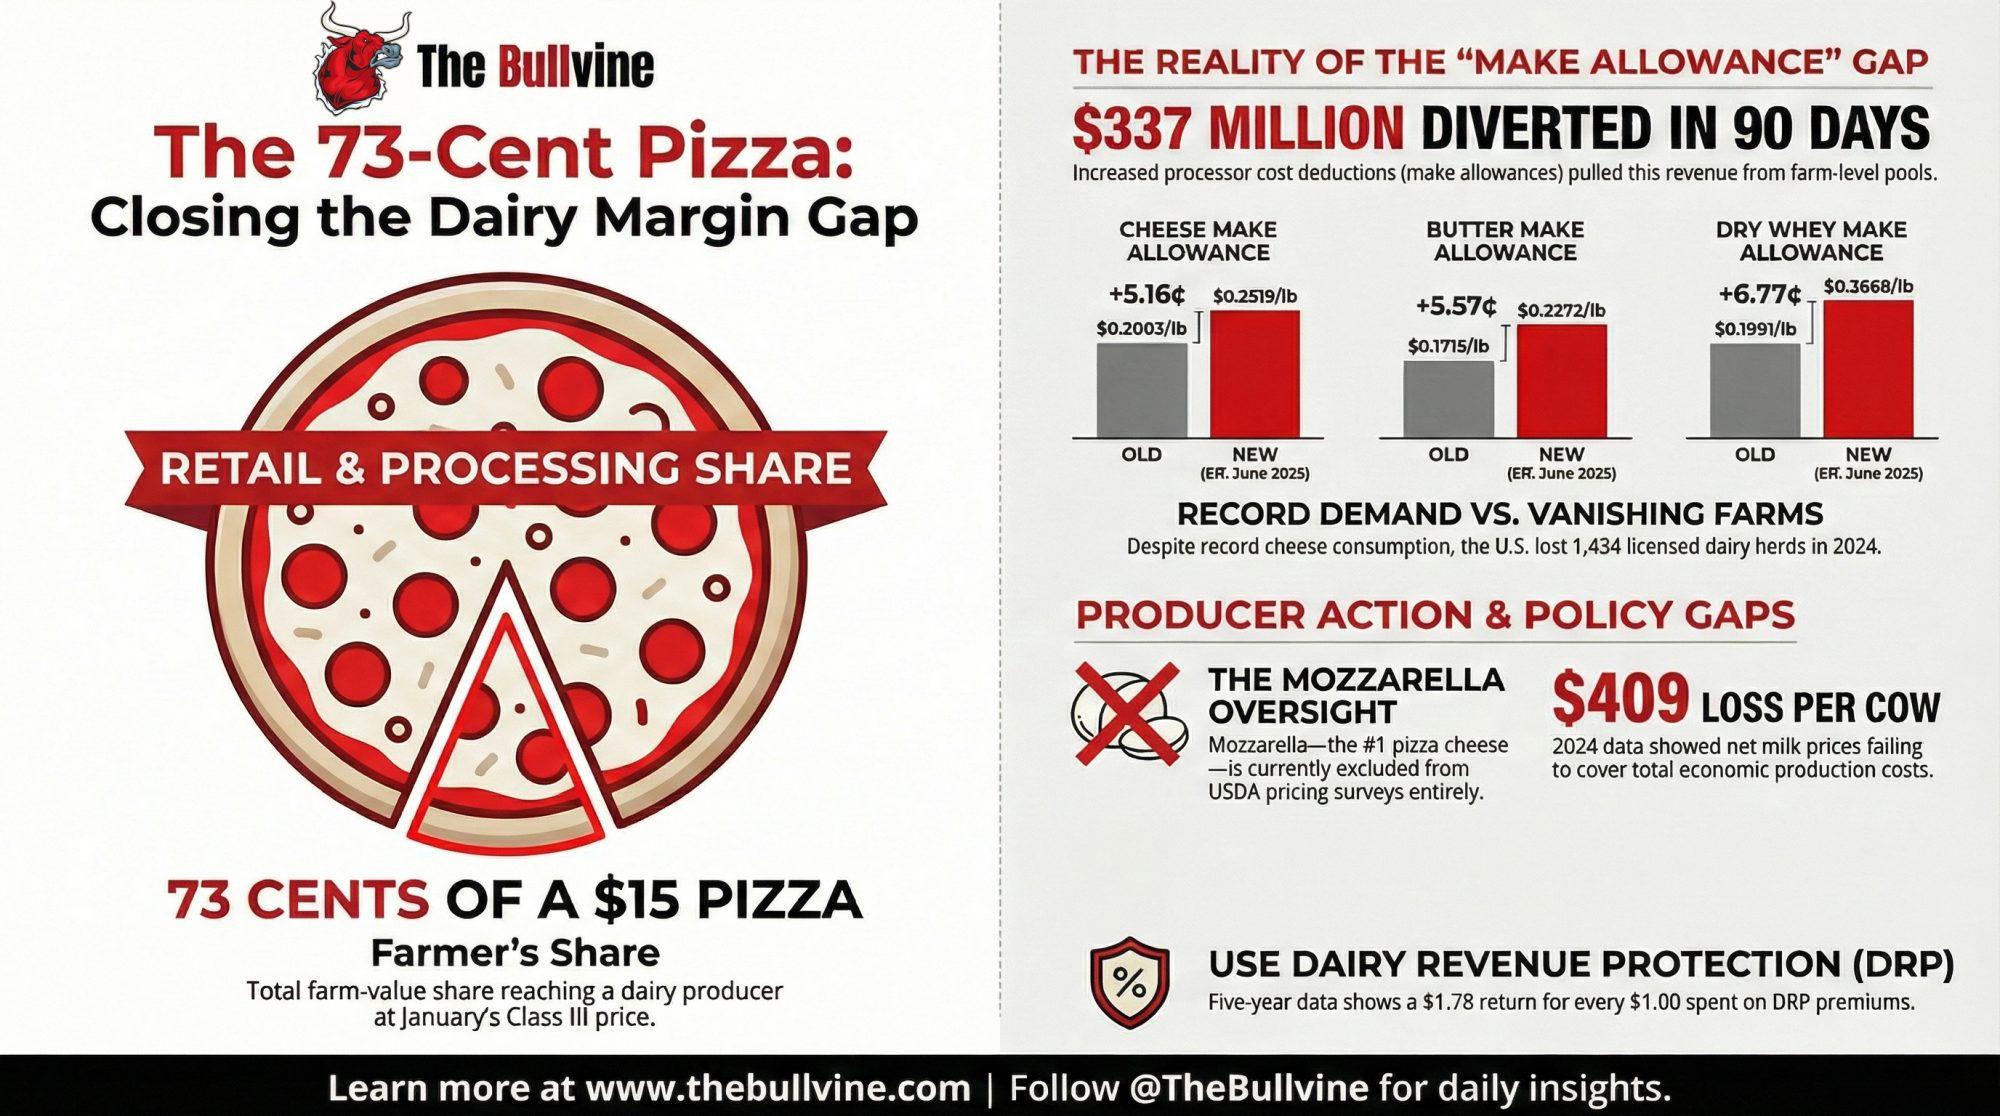
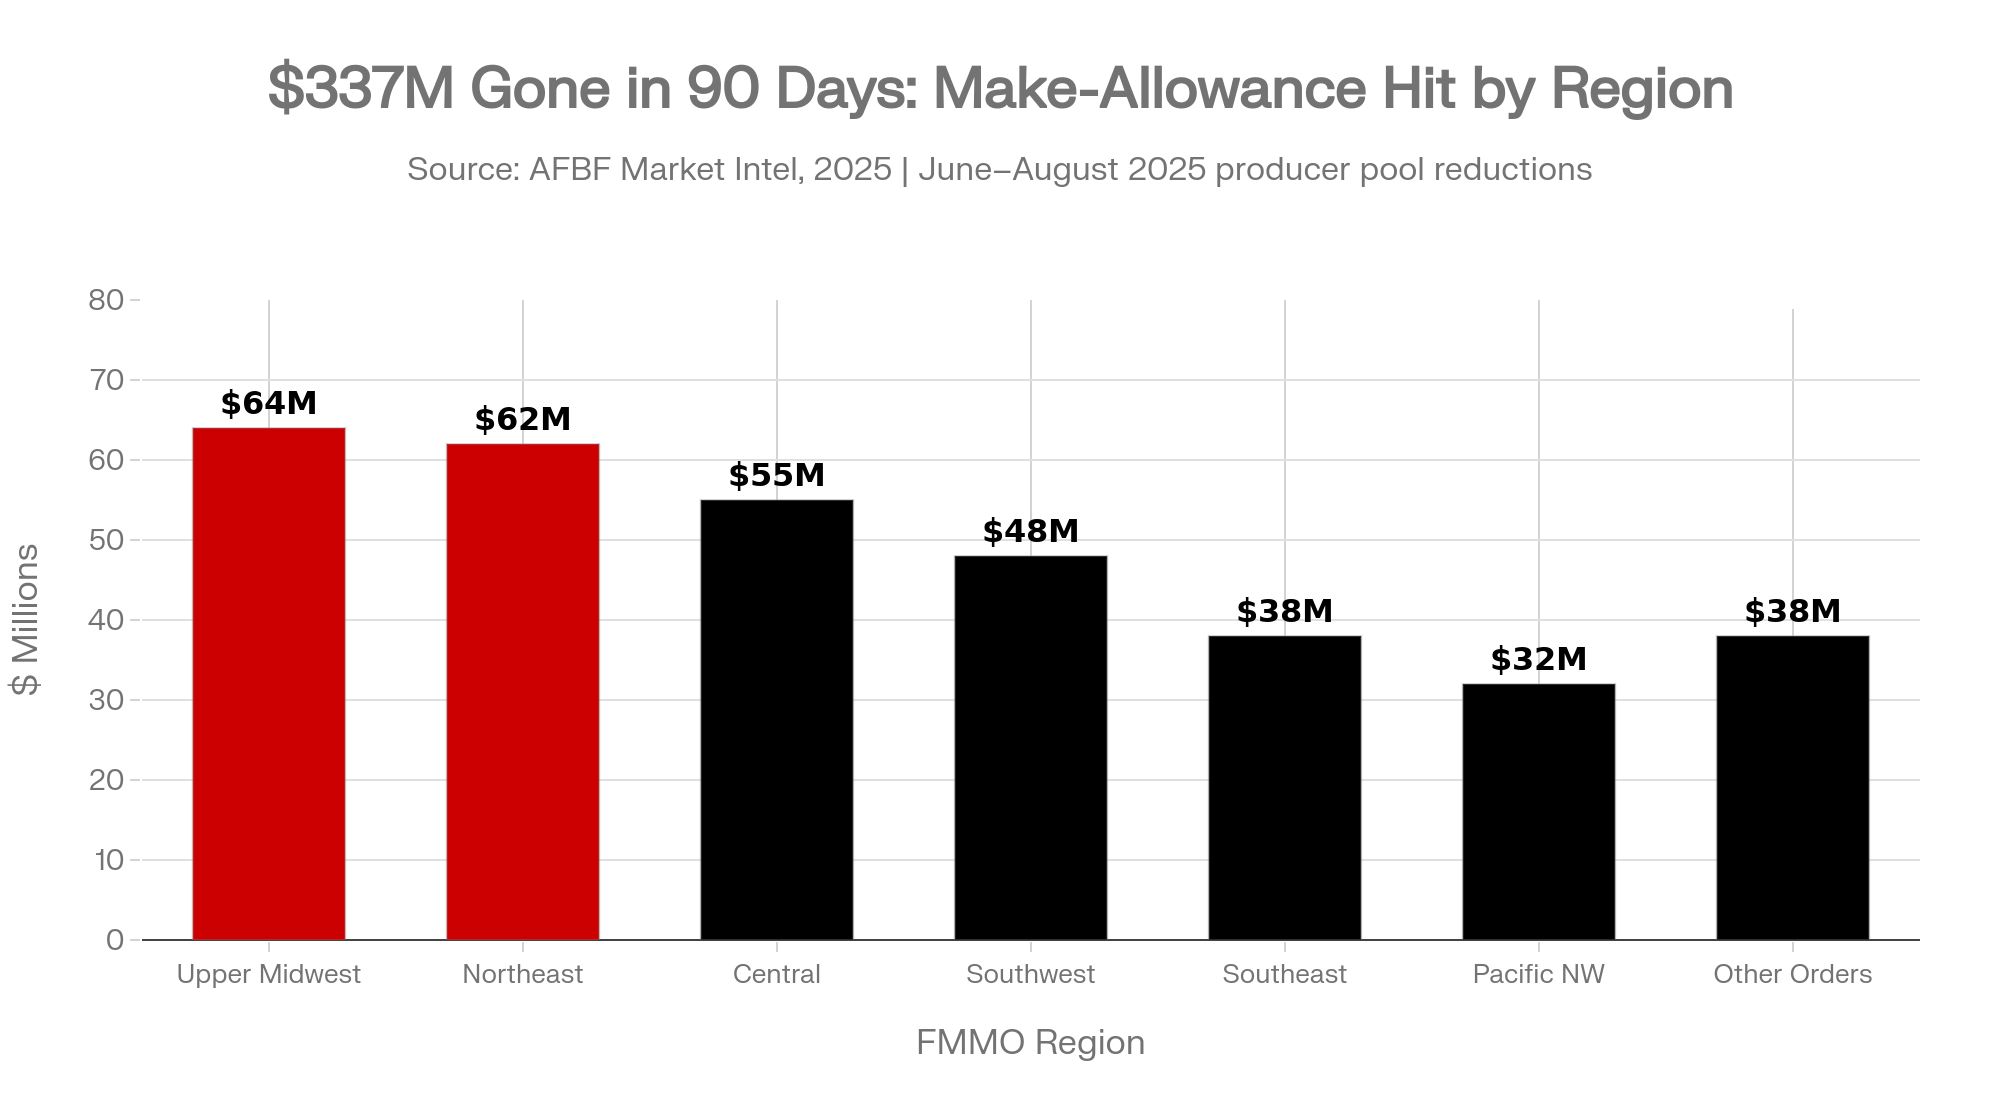
Danny Munch at AFBF did the math. The new make allowances stripped $337 million from producer pools in just 90 days — June through August 2025 (AFBF Market Intel, 2025). That included about $64 million from the Upper Midwest and $62 million from the Northeast. Class price reductions ranged from 85 to 93 cents per hundredweight. Terrain Ag’s analysis was blunt: “Increased make allowances will have the most clear-cut negative effect on component values and milk prices.”

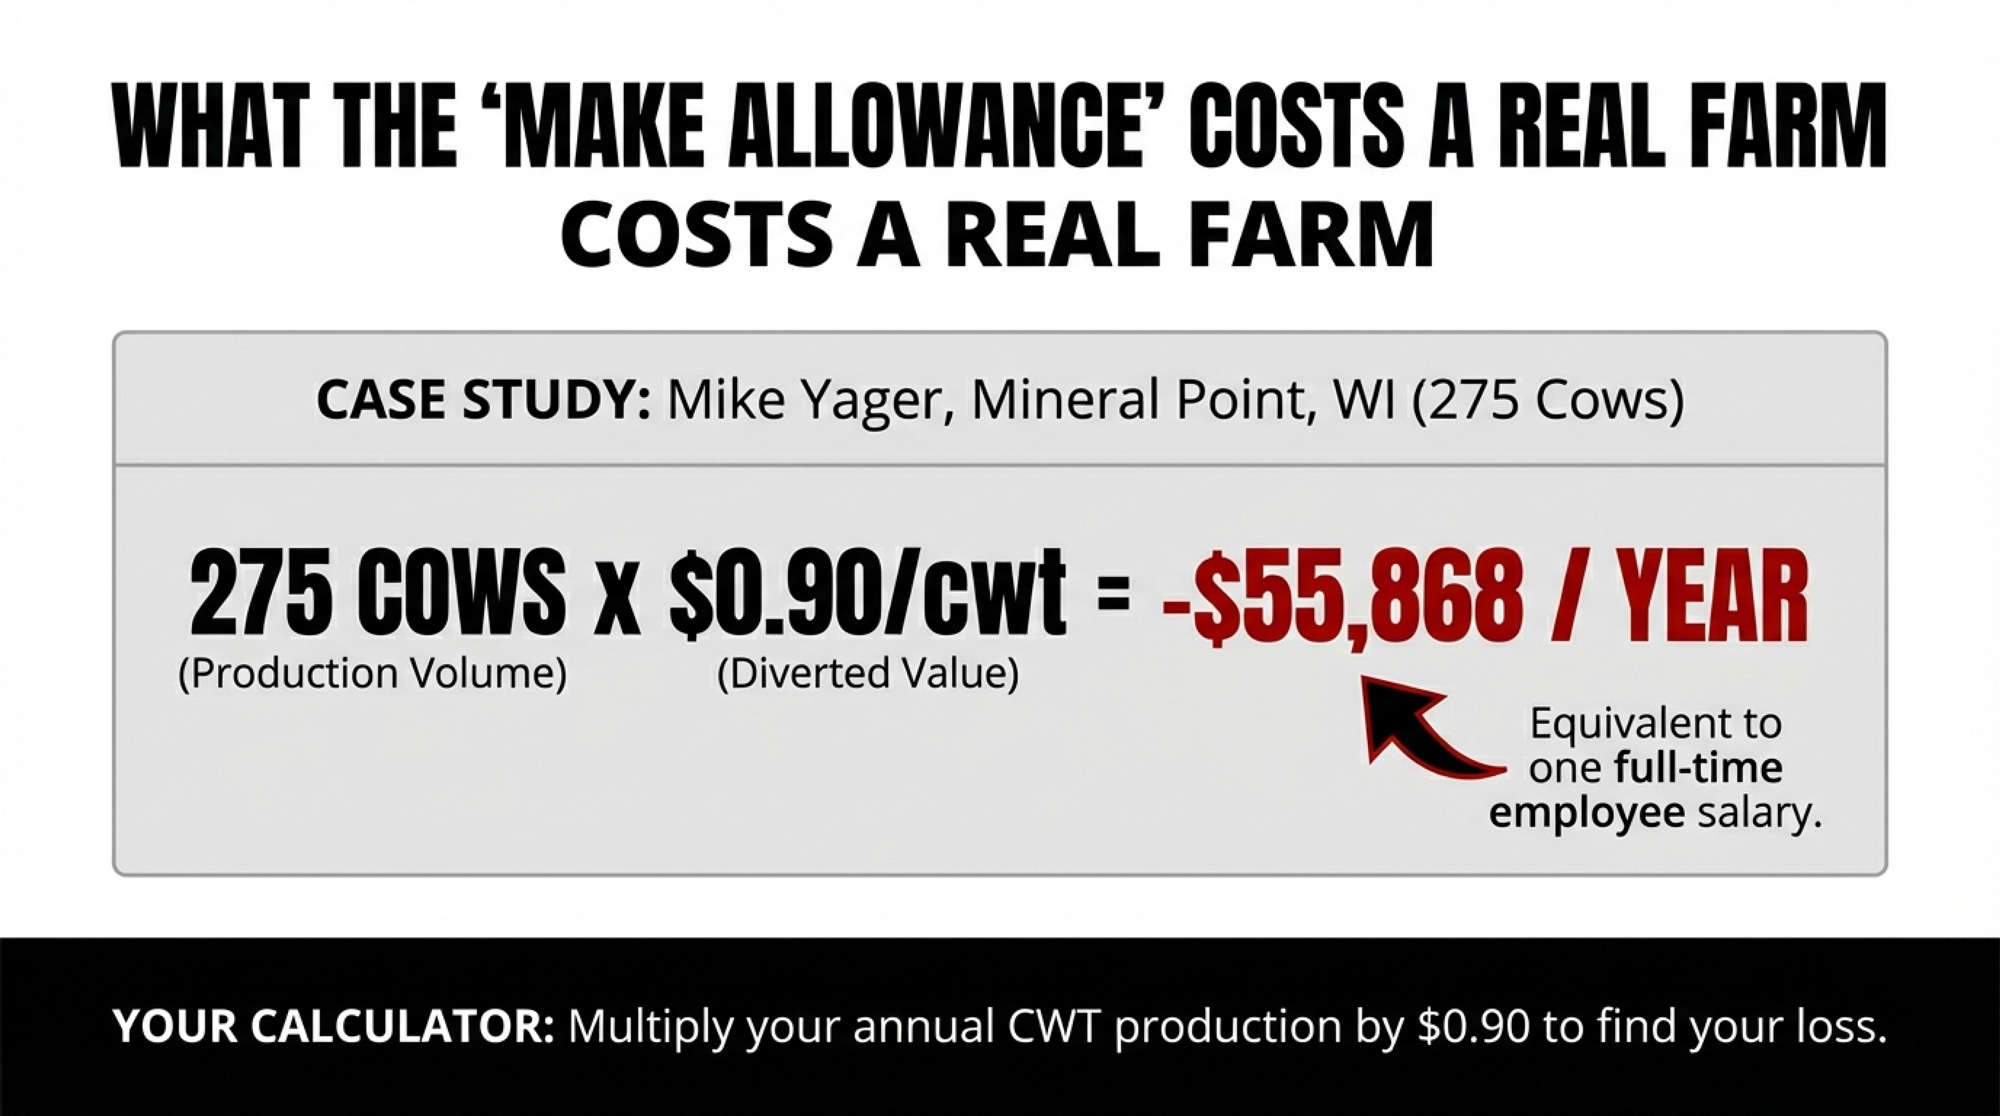
Run that through the barn. A 300-cow herd shipping 78,000 cwt a year sees about $70,000 in annual gross revenue shift from farm accounts to processor margins because of a single rule change. You can’t negotiate it back in a premium. It’s baked into the formula — based on a voluntary cost survey that, according to the hearing record, only about 17% of eligible plants bothered to respond to.

Co-op governance wasn’t built for nine-figure construction risks.

On paper, farmer-directors run cooperatives. Members often report that management holds significantly more information than individual directors — and in a complex construction project, that asymmetry can matter enormously. When Darigold says “farmer-owners approved the Pasco project,” that’s technically true. The board voted in 2021. But members did not vote on which contractors to use, whether the job was fixed-price or cost-plus, or who would absorb cost overruns. Those three decisions are exactly what turned a $600M project into a $900M one — and a $4/cwt deduction.

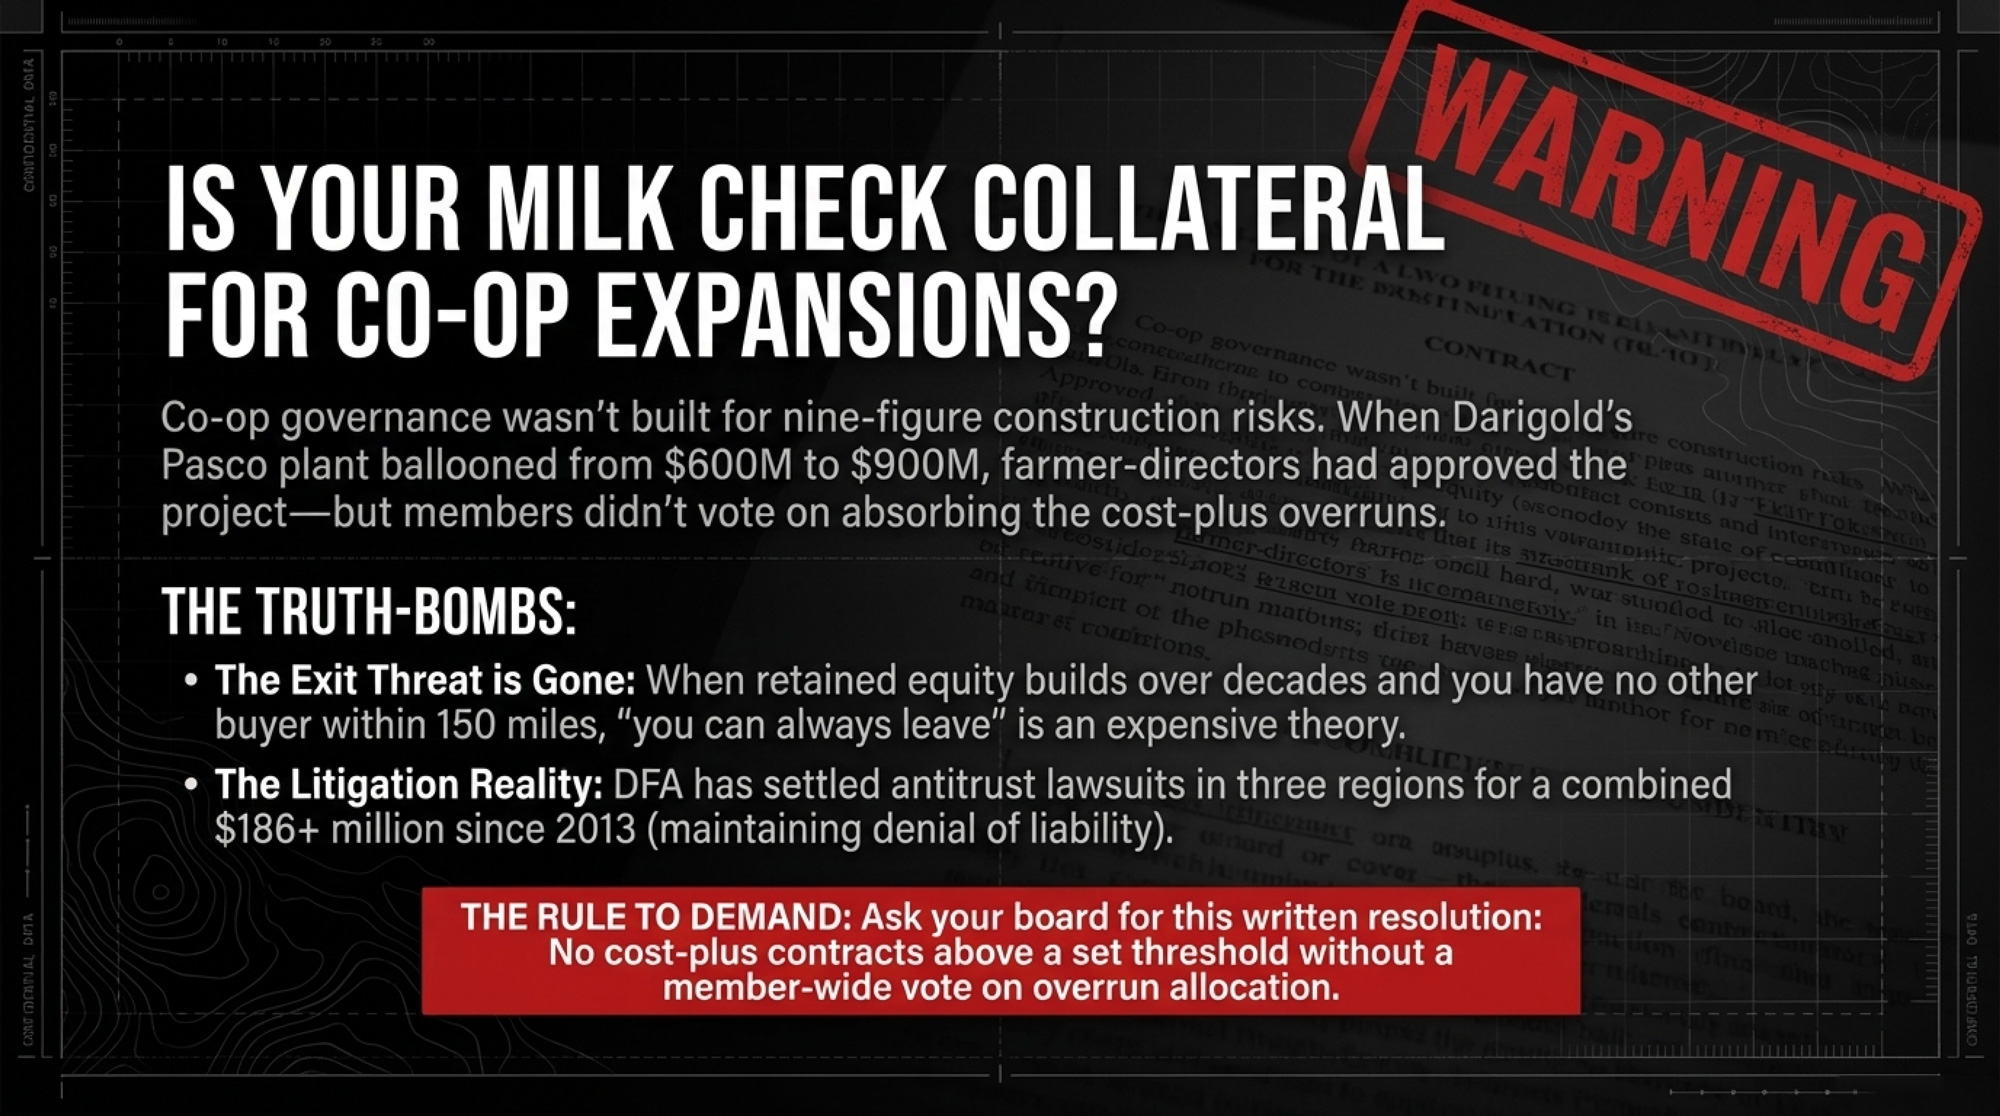
Co-op law gives you formal authority. Consolidation takes away your exit threat. When retained equity builds up over decades, notice periods stretch out, and there’s no other buyer within economic hauling distance, “you can always leave” becomes an expensive theory. That’s how Krista Stauffer ends up with equity sitting in a co-op she may never meaningfully cash out of.

The transparency metric worth demanding: Before your co-op board approves any capital project over $100 million, it’s worth asking in writing whether the construction contract is fixed-price or cost-plus — and what the member-approved cost cap is. If there’s no cap, your future milk checks are the cap. A simple resolution — “No cost-plus contracts above a set threshold without a member-wide vote on overrun allocation” — would have changed the math for DeRuyter and Stauffer.

And the pattern isn’t limited to the Pacific Northwest. DFA has settled antitrust lawsuits in three separate regions: $50 million in the Northeast, $140 million in the Southeast, and $34.4 million in the Southwest — a combined $186+ million since 2013 (court records; Cheese Reporter, multiple years). Settling litigation is standard practice and doesn’t constitute an admission of wrongdoing — DFA has made that point explicitly in each case, stating it “steadfastly denied liability and mounted a vigorous defense.” But somebody still wrote a check.

Should You Lock Your Supply Agreement Before or After Your Construction Loan?

Before. Always before.

A 300-cow dairy looking at 1,000 cows has something processors need: roughly 18 million pounds of additional annual supply. Right now, that’s the story around places like Leprino’s new Lubbock cheese plant in Texas, Hilmar’s Dodge City facility in Kansas, and Chobani’s Twin Falls expansion — which alone will need an additional 6 million pounds of milk per day once it’s fully running.

But two clocks are running against you.

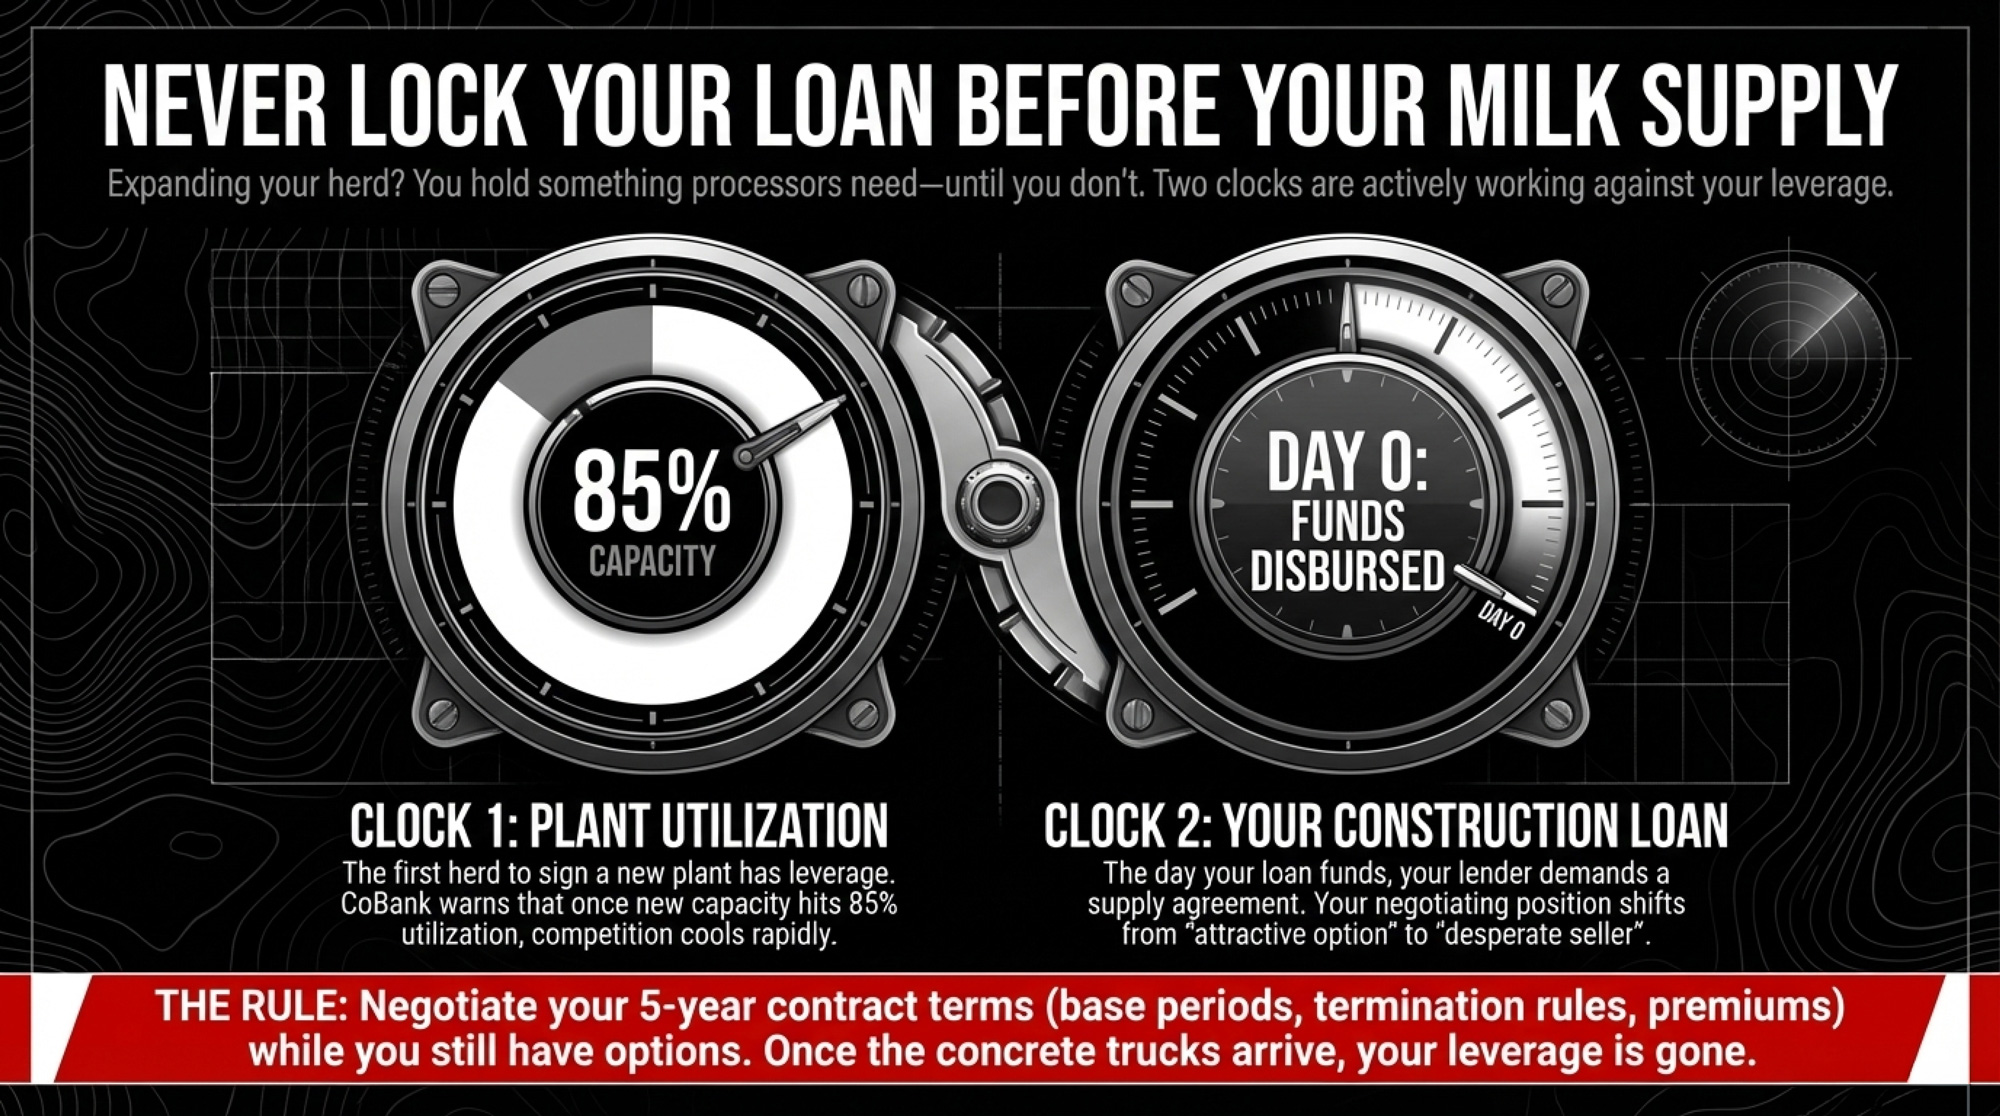
Plant utilization. Once those new plants reach roughly 85% capacity, the tone changes. CoBank has warned that as new cheese capacity in the Southern Plains fills by around 2027, competition for milk will cool and product prices will come under pressure. The first herd to sign has more leverage than the last.

Your loan closing. The day your construction loan funds, your lender expects a signed supply agreement. At that point, your processor knows you must have a buyer. Your negotiating position shifts from “we’re one of several attractive options” to “we can’t close this loan without you.”

The contract you’ll live under for five years — base period, over-base penalties, premiums, termination rules — should be negotiated while both clocks are still in your favor. Not as a rushed afterthought once the concrete trucks have come and gone.

What You Can Actually Do About This

Here’s where the data stops and your decisions start. Not every move fits every operation, but each one has a clear trigger, a trade-off, and a timeline.

Next 30 Days: Map your processor options and take the map to your lender.

Set aside an afternoon. Pull a map and mark every plant within your realistic hauling radius: who owns it, what it makes, whether it’s expanding or shrinking. Count independent buyers, not just plant dots. If it’s one, that’s your biggest business risk — bigger than any single feed line. Lenders are starting to stress-test processor dependency alongside debt coverage, especially after 2025’s make-allowance shock and the Darigold overrun.

Walking into a loan review with a processor map signals that you understand your exposure. Suppose you’ve got two or three real options, which gives you room to negotiate. If you don’t, it justifies tighter risk management and more conservative debt.

The Lender Stress-Test Cheat Sheet

Bring these four questions to your next lender meeting:

  1. “How much of our debt coverage depends on over-order premiums that could vanish if our buyer consolidates or restructures?”
  2. “What is our Plan B if our primary plant issues a 12-month termination notice?”
  3. “Based on the 2025 make-allowance shifts, what is our new break-even cost per hundredweight?”
  4. “If our co-op levies a $2–4/cwt capital assessment — like Darigold did — for how many months can we service debt at that reduced pay price?”

Next 90 Days: If you’re expanding, lock your supply agreement before your construction loan closes.

Your leverage window is the 60–120-day period when new plants are still filling capacity, and you haven’t yet signed the building loan. Use it. Ask for a base period that moves with herd size, a clear over-base penalty cap, a symmetric termination notice, and a quality premium schedule fixed for at least 24–36 months. Farms that treat this like a formality end up signing whatever’s in front of them. Farms that treat it like a one-time leverage point can carve out terms that matter the next time prices roll over.

This Year: In single-buyer regions, treat DRP as a core defense.

If you can’t change your processor, you can still change your exposure. HighGround Dairy’s quarterly analysis shows DRP (Dairy Revenue Protection) covered about 32–33% of the U.S. milk supply in Q3–Q4 2024 (HighGround Dairy, 2024). In a competitive market, DRP is one more tool. In a captive market, it might be the only way to put a price floor under part of your check that doesn’t depend on your buyer’s goodwill. The key is to run DRP against your actual butterfat and protein, not a generic blend. A 20-minute meeting with a good agent can show you what 10–20% of protected revenue looks like compared to rolling the dice entirely on your local basis.

You gain a price floor, but you give up premium dollars and take on basis risk between the futures price and the DRP you cover. In a one-buyer region, that trade-off usually pencils. In a region with three competitive buyers already bidding up your premiums, it’s less clear-cut.

Ongoing: Push components that keep paying even when formulas shift.

Make allowances hit everyone, but high-component herds still come out ahead. Herds consistently above about 4.2% butterfat and 3.3% protein are seeing 50¢–$1.50/cwt in premiums that help offset structural hits they can’t control. That doesn’t fix consolidation. But your breeding and feeding decisions can either leave money on the table or claw some of it back.

Key Takeaways

  • If your processor map shows only one independent buyer within 100–150 miles, treat that as your top business risk. Everything else in your plan should assume that the buyer controls your basis.
  • If new deductions — hauling surcharges, co-op assessments, base-excess penalties — add up to more than $1/cwt compared to your 2023 statements, that’s a structural change, not a bad month. Revisit expansion plans and debt levels accordingly.
  • If you’re expanding and your supply agreement is being negotiated after your construction loan closes, you’ve already given up your best leverage. Flip the order.
  • If you’re in a single-buyer region and not using DRP on at least part of your volume, you’re carrying all the downside your buyer doesn’t want. Run the numbers on one or two coverage levels before your next quarterly enrollment.
  • If your co-op can approve nine-figure plant projects without a member vote on cost-control terms, assume your future milk checks are potential collateral. Ask for fixed-price contract disclosure and a written cost cap before the next build — not after the overrun.
  • If your 3-to-5-year plan only works at $22–23/cwt with healthy premiums, it’s not a plan. Model your numbers at $18–21/cwt with no over-order premiums and see if the pencils still sharpen.

Where does your farm sit on this leverage map — competitive, moderate, or captive? That’s not an abstract policy question. It’s whether your next expansion, your next loan renewal, and your next contract negotiation assume you have options or admit you don’t.

The make-allowance drag, the co-op capital calls, and the processor build-out aren’t going away. The real question is whether your numbers, contracts, and risk tools align with the reality of who can actually bid on your milk. 

Complete references and supporting documentation are available upon request by contacting the editorial team at editor@thebullvine.com.

Learn More

The Sunday Read Dairy Professionals Don’t Skip.

Every week, thousands of producers, breeders, and industry insiders open Bullvine Weekly for genetics insights, market shifts, and profit strategies they won’t find anywhere else. One email. Five minutes. Smarter decisions all week.

NewsSubscribe
First
Last
Consent

$15 Pizza. 73-Cent Milk Check. The Real Super Bowl Score for Dairy Farmers.

America eats 29 million pounds of cheese today — and the FMMO make allowance ensures your share keeps shrinking.

EXECUTIVE SUMMARY: Americans are tearing into an estimated 29 million pounds of cheese today — six times normal daily volume — and the dairy farmer’s cut of a $15 Super Bowl pizza is 73 cents at January’s Class III price of $14.59/cwt. USDA’s June 2025 make allowance increases widened that gap, diverting an additional 85–93 cents per hundredweight from producer pools to processors and pulling $337 million from farm-level revenue in the first 90 days alone, per the American Farm Bureau Federation’s analysis. The demand story is real; the margin story isn’t. Illinois FBFM data shows dairy operations lost $409 per cow in 2024 on a total economic cost basis — even with per capita cheese consumption hovering near all-time highs. Wisconsin producer Mike Yager calculated the make allowance hit on his 275-cow Mineral Point operation at roughly $55,868 per year in value that now stays with the processor, and says no new premiums have materialized to offset it. If your cash costs are above $17.50/cwt and your order’s blend is anywhere near Class III, your working capital is eroding monthly — and tonight’s pizza binge won’t change that.  The lever that matters now: ensuring USDA’s mandatory biennial processor cost surveys — authorized under the One Big Beautiful Bill Act signed July 4, 2025 — launch on a concrete timeline and include mozzarella, the dominant Super Bowl cheese, which is currently excluded entirely from USDA pricing surveys.”

Right about now, Americans are tearing into an estimated 29 million pounds of cheese. That’s the number Dairy Farmers of Wisconsin — the checkoff-funded marketing organization funded by farmers themselves — projects for Super Bowl Sunday, roughly six times what the country consumes on a normal day. Enough mozzarella, cheddar, pepper jack, and queso to top 12.5 million pizzas, fill millions of nacho platters, and anchor every cheese board from Seattle to Miami. Instacart’s 2026 Super Bowl data shows just how dairy-heavy the day has become: queso orders surged 196% and buffalo sauce — the stuff that goes on wings destined for ranch and blue cheese dip — jumped 201% during game week. 

Here’s the kicker: the same farmers who pay into that checkoff fund to promote cheese are getting about $0.73 of farm value on a $15 pizza when January’s Class III sits at $14.59 per hundredweight. If February futures hold near $15.92, that climbs to about 80 cents. Either way, the delivery driver’s tip is almost certainly larger. The FMMO formula is supposed to connect consumer demand with farm-gate value. Super Bowl Sunday is Exhibit A for why it doesn’t. 

The Demand Is Real — the Margin Isn’t

That volume translates to real dollars at retail — just not at the farm gate. Wells Fargo’s Agri-Food Institute pegs the average 10-person Super Bowl party spread at about $140 in 2026, up just 1.6% from last year — below the 2.4% food-at-home CPI. Frozen pizza prices actually fell 0.6% year over year. For consumers, dairy-heavy game-day food is a bargain. 

Those party-spread prices reflect a deeper pattern. Per capita total cheese consumption hit a record 40.54 pounds in 2023 — the third straight record year, according to USDA ERS data published in late 2024. Then, in 2024, it slipped to the lowest level since 2021, per the ERS’s January 2026 update — the first year-over-year decline since at least 2013. Even at record or near-record consumption, the economics at the farm gate keep tightening. 

A note on the 29-million-pound figure: this is a promotional estimate from a checkoff-funded organization, not an independently audited figure. It’s been used for at least the 2024 and 2025 Super Bowls; no 2026-specific update had been published at the time of writing. Treat it as a credible industry estimate, not a USDA-verified statistic.

Following 73 Cents from the Pizza Box to the Bulk Tank

A standard large pizza uses roughly half a pound of mozzarella. Industry yield runs about 10 pounds of milk per pound of cheese. One pizza, therefore, requires approximately 5 pounds of milk — or 0.05 hundredweight.

0.05 cwt × $14.59/cwt (January 2026 Class III, USDA AMS) = $0.73

At 2024’s all-milk price of $22.55 per hundredweight (USDA ERS annual data), that same pizza returned about $1.13 to the farm — still under 8% of the retail price. As of January 2026, Class III levels are barely 5%. 

USDA ERS published its 2024 farm-to-retail price spread data in June 2025. Nationally, the farm-value share of the dairy product basket was 25 percent, up from 23 percent in 2023. For cheddar specifically, the farm value was $1.80 per pound against a retail price of $5.66 — a 32 percent farm share. Butter fared better at 57 percent. But cheese — which is what’s disappearing tonight — sits squarely in that one-quarter-to-one-third zone. 

The farmer’s share of a $15 Super Bowl pizza: 73 cents. The delivery driver’s tip is almost certainly larger.

PeriodFarm Value ($)Processor/Retail ($)Class III ($/cwt)
Jan 20260.7314.2714.59
Feb 2026 Futures0.8014.2015.92
2024 Average1.1313.8722.55

That’s what happens when the formula pays everyone else first and hands you what’s left

How the FMMO Make Allowance Sets Your Price Before Game Day

On June 1, 2025, USDA raised the make allowances embedded in all 11 Federal Milk Marketing Orders—the first update since the FMMO system was consolidated in January 2000. These are the processing cost deductions that come off wholesale commodity prices before any value reaches producers. 

The American Farm Bureau Federation’s Danny Munch calculated the early damage: class price reductions ranging from 85 to 93 cents per hundredweight, pulling roughly $337 million out of combined producer pool values in just the first 90 days (AFBF Market Intel, September 21, 2025). As Munch told RFD-TV: “Dairy farmers were most concerned about the impact of increased make allowances because they reduce the price farmers receive, and were based on incomplete data during the hearing process”. 

ProductOld Make Allowance ($/lb)New Make Allowance ($/lb)Increase (¢/lb)Impact
Cheese$0.2003$0.25195.16¢Directly hits Super Bowl cheese
Butter$0.1715$0.22725.57¢Record high costs
Nonfat Dry Milk$0.1678$0.23937.15¢Highest increase
Dry Whey$0.1991$0.26686.77¢Wings & dip tax

Source: USDA Final Rule on FMMO Amendments, effective June 1, 2025

Take cheese at $1.60 per pound on the CME. Under the old formula, $1.3997 per pound flowed into Class III component values ($1.60 minus $0.2003). Under the new formula, only $1.3481 does ($1.60 minus $0.2519). That extra 5.16 cents per pound never hits the pool—it stays with the processor as cost recovery.

Here’s a detail that should land hard on Super Bowl Sunday: mozzarella — the single most consumed cheese in America, the cheese on every one of those 12.5 million pizzas tonight — is currently excluded from USDA’s pricing surveys and formula pricing entirely. The cheese-making allowance was set using cheddar processing cost data. Processors testified during the FMMO hearing that mozzarella processing costs differ from cheddar, yet the USDA doesn’t track them separately. The dominant game-day cheese is priced off a formula that doesn’t account for how it’s actually made. 

Processor costs are genuinely higher than they were in 2000 — energy, labor, and packaging all climbed. But AFBF argues the adjustments “must be grounded in comprehensive, mandatory and independently audited surveys” and warns there is “some likelihood that USDA’s changes will unfairly penalize dairy farmers by overstating processing costs”. The data the USDA used were self-selected and self-reported by processors and were not independently verified. 

So when 29 million pounds of cheese disappear tonight, every pound carries that larger deduction. And every hundredweight behind it pays the farmer less than it did a year ago — even if the block price on the CME hasn’t moved.

How Pizza Chains Lock In Their Price While You Ride the Cycle

Domino’s, Pizza Hut, and the major frozen pizza brands don’t buy mozzarella on the spot market in February. They negotiate supply contracts months in advance — typically locking prices or establishing cost-plus formulas that insulate them from short-term CME volatility. 

Tonight’s Super Bowl surge was priced into processor order books weeks or months ago. The demand spike is real, but it doesn’t create upward spot-market pressure that would flow back through Class III into your milk check. By the time 29 million pounds of cheese hits the coffee table, the price was already set. And by the time Americans order those 12.5 million pizzas tonight, Yager’s January milk check was already settled.

You’re selling milk into a Class III formula that resets monthly based on USDA commodity surveys. If CME blocks rally in February, you might see a modest lift in your March check. If they don’t, you won’t — regardless of how many pizzas Americans ordered tonight.

Record Cheese, Vanishing Farms: The Demand Paradox

Americans have never eaten more cheese over a sustained period than they did from 2021 through 2023 — three consecutive record years, peaking at 40.54 pounds per capita in 2023. And yet U.S. dairy farms keep closing at an accelerating rate.

The numbers are stark. USDA NASS data shows the U.S. lost 1,434 licensed dairy herds in 2024 alone — a 5.5% decline in a single year, bringing the national total to 24,811 farms. That’s down from 44,809 just a decade earlier — a 45% loss since 2014. And 86% of the 2024 decline was concentrated in the Midwest and Eastern states: Wisconsin lost 400 herds, Minnesota and New York shed a combined 315, and Pennsylvania dropped another 90. 

RegionFarms Lost (2024)% of National LossImpact
Wisconsin40027.9%Worst hit
Minnesota18012.5%Severe
New York1359.4%Severe
Pennsylvania906.3%Major
Other Midwest/East42929.9%Critical belt
Western States20014.0%Growing regions
Total U.S.1,434100.0%5.5% decline

The Bullvine reported in October 2025 that 1,420 American dairy farms had exited in the prior year. If that pace continued or accelerated, The Bullvine estimated the 2025 total could approach 2,800 closures — though the actual figure depends on how many operations secured financing versus being forced out. Cornell’s Dr. Andrew Novakovic put it bluntly: “What took ten years then is happening in two or three now” (The Bullvine, November 2025). 

Processing capacity, meanwhile, is expanding in the opposite direction. Hilmar Cheese opened a $600 million facility in Dodge City, Kansas, in March 2025, specializing in American-style cheese in 40-pound commercial blocks and employing nearly 250 people. Great Lakes Cheese announced a $185 million expansion in Abilene, Texas, in 2024. These plants are designed to run for decades. And every one of them operates under the wider make allowances that took effect last June. 

The View from Two Federal Orders

Mike Yager milks 275 Holsteins and grows feed crops near Mineral Point, Wisconsin — squarely in Federal Order 30, the Upper Midwest. When the make allowance increases hit last June, he did his own calculation: that additional 90 cents per hundredweight amounts to roughly $55,868 per year for an average-sized Wisconsin dairy in value that now stays with the processor instead of reaching the bulk tank. To estimate your own hit: multiply your total hundredweight shipped per year by $0.90. A 500-cow herd shipping around 110,000 cwt annually loses roughly $99,000 in pool value. 

Herd SizeAnnual Shipment (cwt)Annual Loss from Make AllowanceMonthly Impact
Mike Yager (275 cows)62,076$55,868$4,656
Average WI (500 cows)110,000$99,000$8,250
Large (1,000 cows)220,000$198,000$16,500
Mega (5,000 cows)1,100,000$990,000$82,500

“We as dairy farmers don’t see it on our milk checks. But via the new make allowances, we are losing out on 90 cents per hundredweight additional money that the processors are now receiving.” — Mike Yager, Brownfield Ag News, November 2025 

For his operation, that deficit is roughly equivalent to an employee’s salary. And so far, he says, no added premiums have materialized to offset the loss. 

The regional numbers vary, but no federal order escaped the hit. In the Northeast, the Milk Dealers and Distributors Industry Association warned during FMMO hearings that reduced minimum prices would be “particularly problematic” amid “widespread and accelerating exit of Northeast dairy farmers” — and could push the milkshed past a point of no return. Calvin Covington estimated Southeast orders will see the largest net benefit from updated Class I differentials — an average $1.42/cwt increase, but only on Class I volume. For Upper Midwest producers like Yager, where the blend skews heavily toward Class III, the make allowance hit lands harder, and the Class I differential cushion is thinner. 

Illinois Farm Business Farm Management data tells the broader story. The 2024 numbers showed an average net milk price of $21.63 per hundredweight against total economic costs of $23.56 — a loss of $1.93/cwt, or negative $409 per cow for the year. Feed costs averaged $11.64/cwt, and nonfeed costs hit a record $11.92/cwt. SDA ERS’s January 2026 Livestock, Dairy, and Poultry Outlook forecasts the 2026 all-milk price at $18.25 per hundredweight, down from $21.15 in 2025 — a decline of nearly $3.00/cwt, or roughly 14% ​. That’s a wider drop than feed cost savings can absorb.” This is the single most important factual correction in this draft.

If you’re on a component order running 4.0% butterfat and 3.3% protein, there is a premium above the Class III floor — but it’s thinner than you might assume. At January 2026 component prices (butterfat at $1.4525/lb, protein at $2.1768/lb, other solids at $0.4448/lb — per USDA AMS), a hundredweight at those test levels returns roughly $15.53in component value (assuming 5.7% other solids, standard for Holstein herds), about $0.94 above the $14.59 Class III. That’s real money. But the make allowance still comes off the top of every component calculation before those prices are set. High components help. They don’t fix the formula. 

What This Means for Your Operation

This isn’t a guilt trip. It’s a math problem — and the math has specific levers you can pull.

  • Pull your last 12 months of milk checks and calculate your true net effective price — not the blend, not the gross, but what actually hit your account after deductions, hauling, and co-op assessments. USDA ERS data shows the national dairy farm-value share was 25% of the retail dollar in 2024. If your net is more than $1.50 below the FMMO blend minimum published by your order, you need to understand why. 
  • Know your breakeven in Class III terms. Illinois FBFM data pegged total economic costs at $23.56/cwt for 2024, with feed and cash operating costs at $17.43/cwt. Your costs vary by region, herd size, and feed situation — but if your cash costs are above $17.50/cwt and January’s $14.59 Class III is anywhere near your order’s blend, your working capital is eroding monthly. That’s the conversation to have with your lender this month, not in May. 
  • Talk to your crop insurance agent about Dairy Revenue Protection for Q2 and Q3 2026. HighGround Dairy’s five-year analysis found that for every $1.00 spent on DRP premiums, producers received $1.78 in return on average — a net benefit of $0.23/cwt after premiums. Coverage booked three quarters out returned the highest average net benefit at $0.30/cwt, despite higher premiums. With February 2026 advanced cheese prices at $1.4078/lb and butter at $1.4201/lb (USDA AMS, February 4, 2026), markets are signaling continued softness — exactly the environment where DRP has historically paid off. The trade-off is real: DRP premiums are a cash cost that hits quarterly, whether you need the coverage or not, and if milk rallies above coverage levels, you’ve paid for protection you didn’t use. But at current futures, the odds favor the buyer. If you haven’t locked Q3 2026 yet, that window is still open. 
  • Push USDA to launch mandatory processor cost surveys—and include mozzarella. Congress has already acted: the One Big Beautiful Bill Act, signed July 4, 2025, mandates biennial cost-of-production surveys covering cheese, butter, and nonfat dry milk processors, with $9 million appropriated for the program. But AFBF’s Danny Munch warns the timeline remains unclear. “They’re going to have to set up a methodology. They’re going to have to have staff and researchers set aside for this,” Munch told Brownfield Ag News at World Dairy Expo. “I don’t expect it to happen anytime soon”. And even when data comes in, there’s no automatic adjustment — a full FMMO hearing would still be required to change make allowances. The gap to push on: the survey covers cheese, butter, and NFDM, but does not explicitly name mozzarella — the single largest-volume cheese in America and the backbone of tonight’s pizza consumption. Push your co-op and trade organization to demand that mozzarella be included in the USDA’s survey methodology before it’s finalized. USDA’s FMMO modernization referendum was approved across all 11 orders in January 2025, with pricing amendments effective June 1, 2025.
  • Request one competitive price comparison from an alternative buyer. If you ship to a large co-op, call an independent or a smaller cooperative and ask what they’d pay for your components. Yager’s experience is telling: the fear of being dropped keeps many farmers from asking tough questions about premiums. You don’t have to switch — switching carries real risk, including loss of hauling routes, potential basis penalties during transition, and relationship capital that’s hard to rebuild. But knowing you have options strengthens every negotiation you stay in. And if you’re exploring farmstead cheese or on-farm retail, start with no more than 10–20% of your production; the capital and compliance costs catch more operations than the margins do. 

The Three Numbers That Matter Monday Morning

  • 73 cents — the farm share of a $15 Super Bowl pizza at January’s Class III. Your actual loss from the make allowance increase scales with production: multiply your annual hundredweight shipped by $0.90. Nationally, the farm-value share of all dairy products at retail was 25% in 2024. 
  • 29 million pounds of cheese was priced into processor contracts weeks ago. Game-day demand doesn’t create spot-market pressure that flows back to your bulk tank. The consumption is real; the price signal to producers is at best muted.
  • Mozzarella — tonight’s dominant cheese — isn’t even in the USDA pricing survey. The make allowance was set on cheddar data. Until the survey includes the cheeses that actually drive demand, the formula will keep underpricing your contribution to the products consumers want most. 

Beyond the Final Whistle

Seventy-three cents on a fifteen-dollar pizza. That’s the current system’s answer to record demand. It matters that dairy farmers built what’s on every table in America tonight — and it matters more that the pricing formula doesn’t reflect it.

Yager’s math is blunt: the make allowance increase alone costs an average-sized Wisconsin dairy enough to fund a full-time employee — and so far, no premiums have shown up to replace it. In the Northeast, state industry groups have warned that continued milkshed contraction threatens the infrastructure supporting all small-scale agriculture in rural New England. Novakovic says the consolidation cycle is compressing a decade into two or three years. Whether the system changes fast enough to slow that compression is the open question — and 2,800 farms may not get to wait for the answer. 

Pull your numbers this week. If your net effective price is more than $1.50 below the published FMMO blend, call your field rep before March—and then call the people who claim to speak for you and ask one specific question: what are they doing to ensure USDA’s mandatory processor cost surveys include mozzarella and launch before the next make-allowance fight. The gap between what consumers pay and what you receive won’t close on its own.

Complete references and supporting documentation are available upon request by contacting the editorial team at editor@thebullvine.com.

Learn More

The Sunday Read Dairy Professionals Don’t Skip.

Every week, thousands of producers, breeders, and industry insiders open Bullvine Weekly for genetics insights, market shifts, and profit strategies they won’t find anywhere else. One email. Five minutes. Smarter decisions all week.

NewsSubscribe
First
Last
Consent
Send this to a friend