Archive for 2026 milk price forecast

$262,000 a Year, Gone: The USDA Formula Change No Milk Check Explains

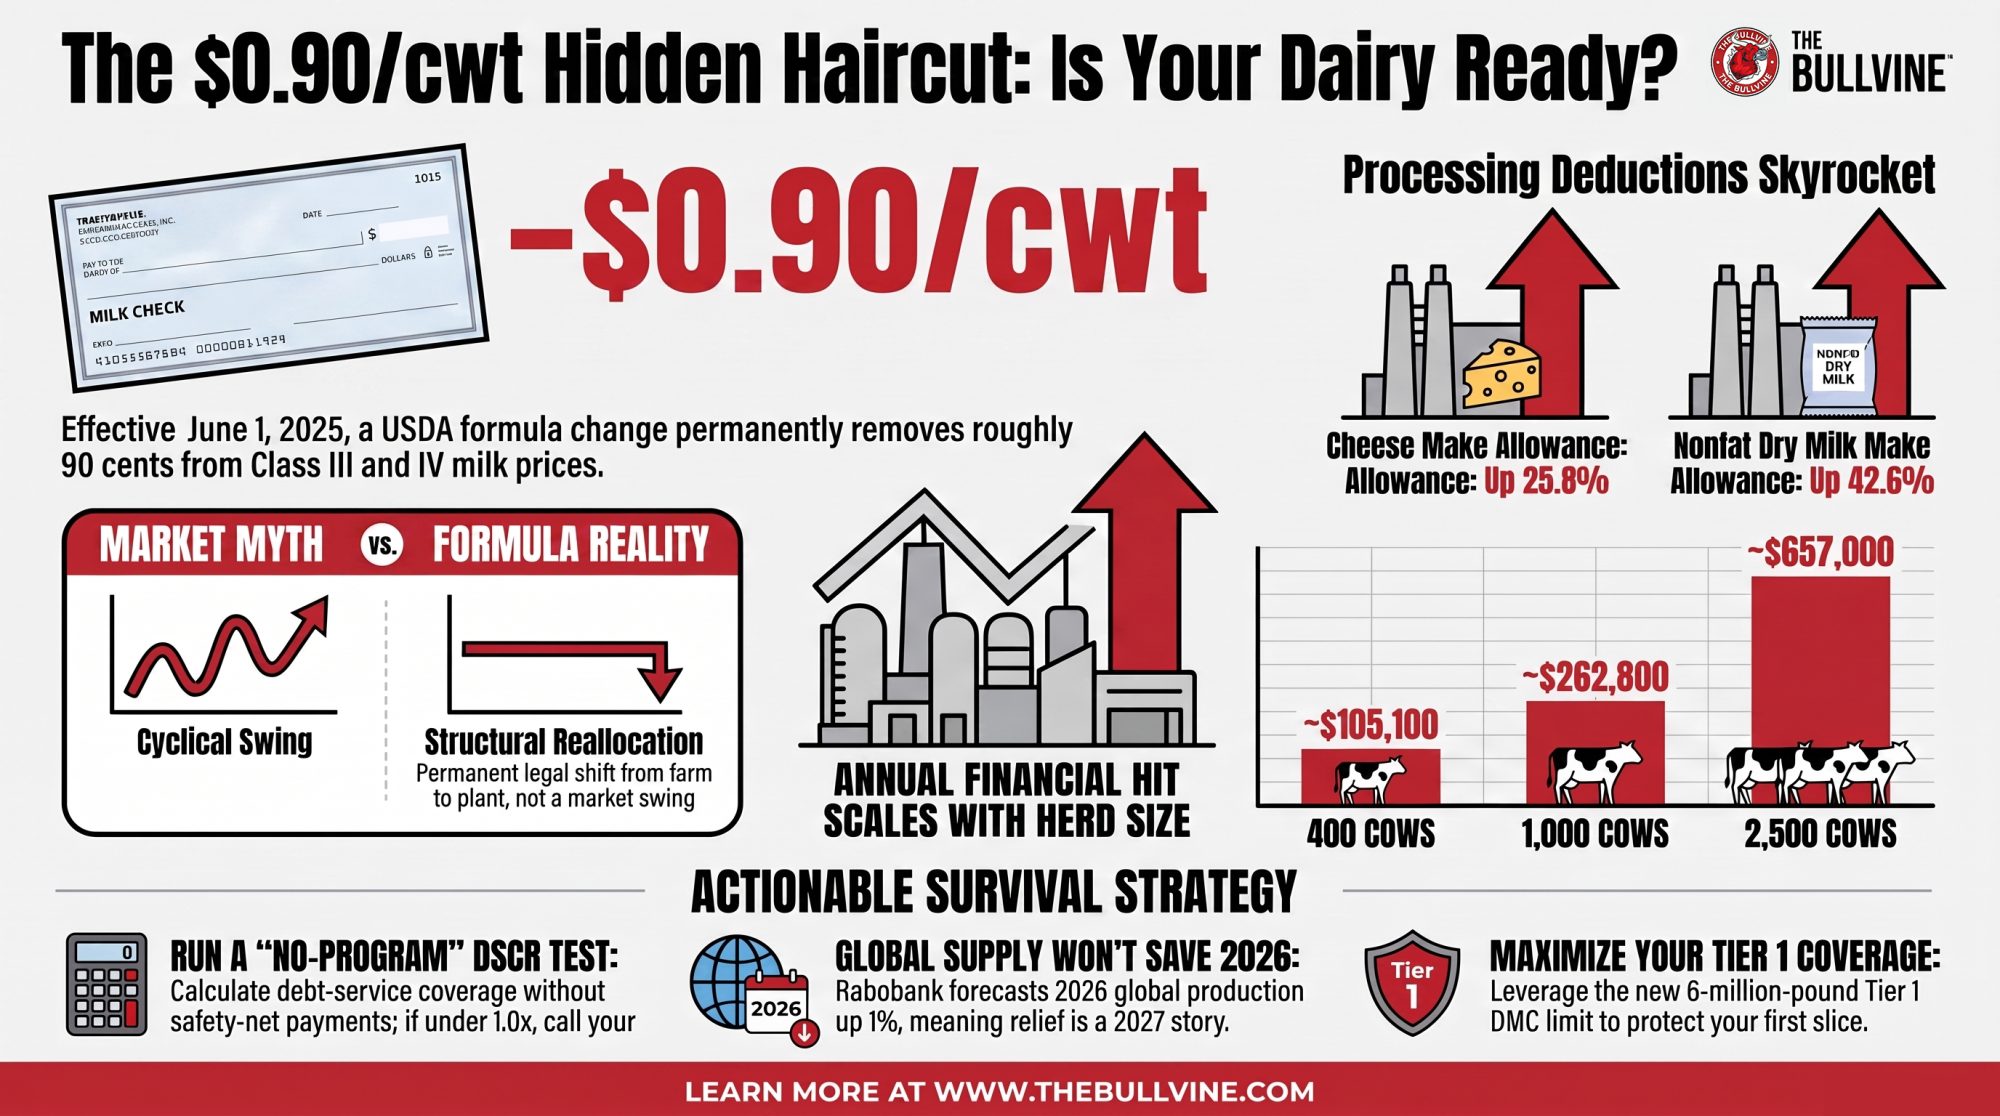
USDA reset make allowances June 1, 2025, and quietly pulled ~90¢/cwt from Class III/IV. On 1,000 cows, that’s about $262,000 a year — and no line on your check says so.

Executive Summary: On June 1, 2025, USDA reset FMMO make allowances for the first time since 2008, and that single formula change pulled roughly 90¢/cwt out of regulated Class III and IV prices — before global oversupply took a nickel. If your milk flows into cheese, butter, or powder across the Upper Midwest, Plains, or West, this hit you hardest, and nothing on your check spells it out. On a 1,000-cow herd shipping 80 lbs/day, that’s about $262,000 a year, gone; run your own pounds times 90¢, and the number scales straight up. AFBF’s Danny Munch clocked Class III down 86¢ and Class IV down 89¢ in the first three months, and here’s the part that stings: it’s structural, not cyclical, so it won’t bounce back when futures rally. Don’t count on shrinking global supply to bail you out either — Rabobank still has 2026 production up about 1%, and USDA has EU deliveries edging up 0.1%, not down. With 2026 all-milk forecast at $20.70, the real question is whether your operation can run 12 months at that number with 90¢ permanently baked into the floor. The move this month: run your DSCR without any DMC or Dairy-RP payments, and if it lands under 1.0x, that’s a lender conversation now — not at renewal.
make allowance milk price

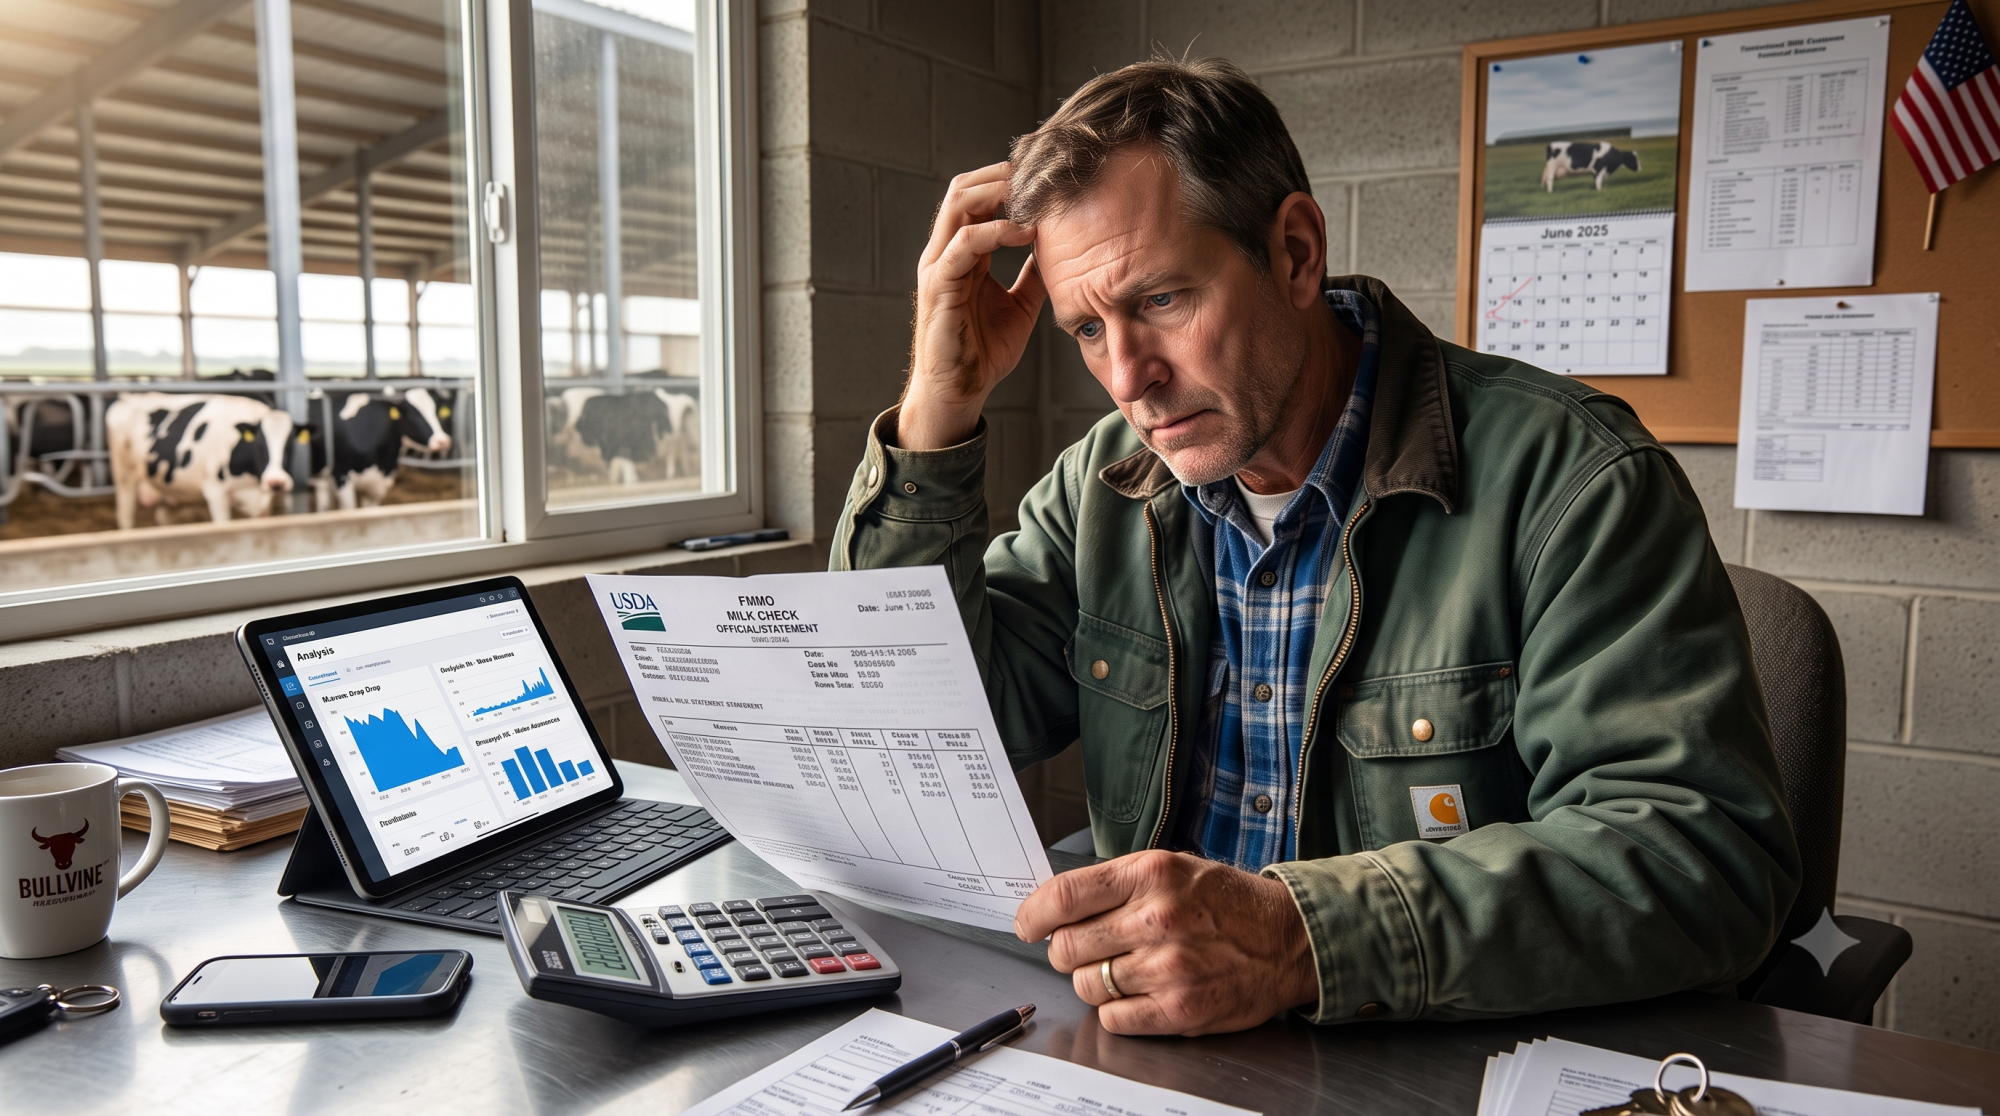
Picture an Upper Midwest dairy milking 1,000 cows. Same parlor, same cows, same routine that penciled out fine in 2024.

Then the June 2025 milk check came back lighter. And it kept coming back lighter, month after month, with nothing new in the deductions column to point at. Nobody dried off the wrong cows. Nobody blew a ration. The math changed underneath them.
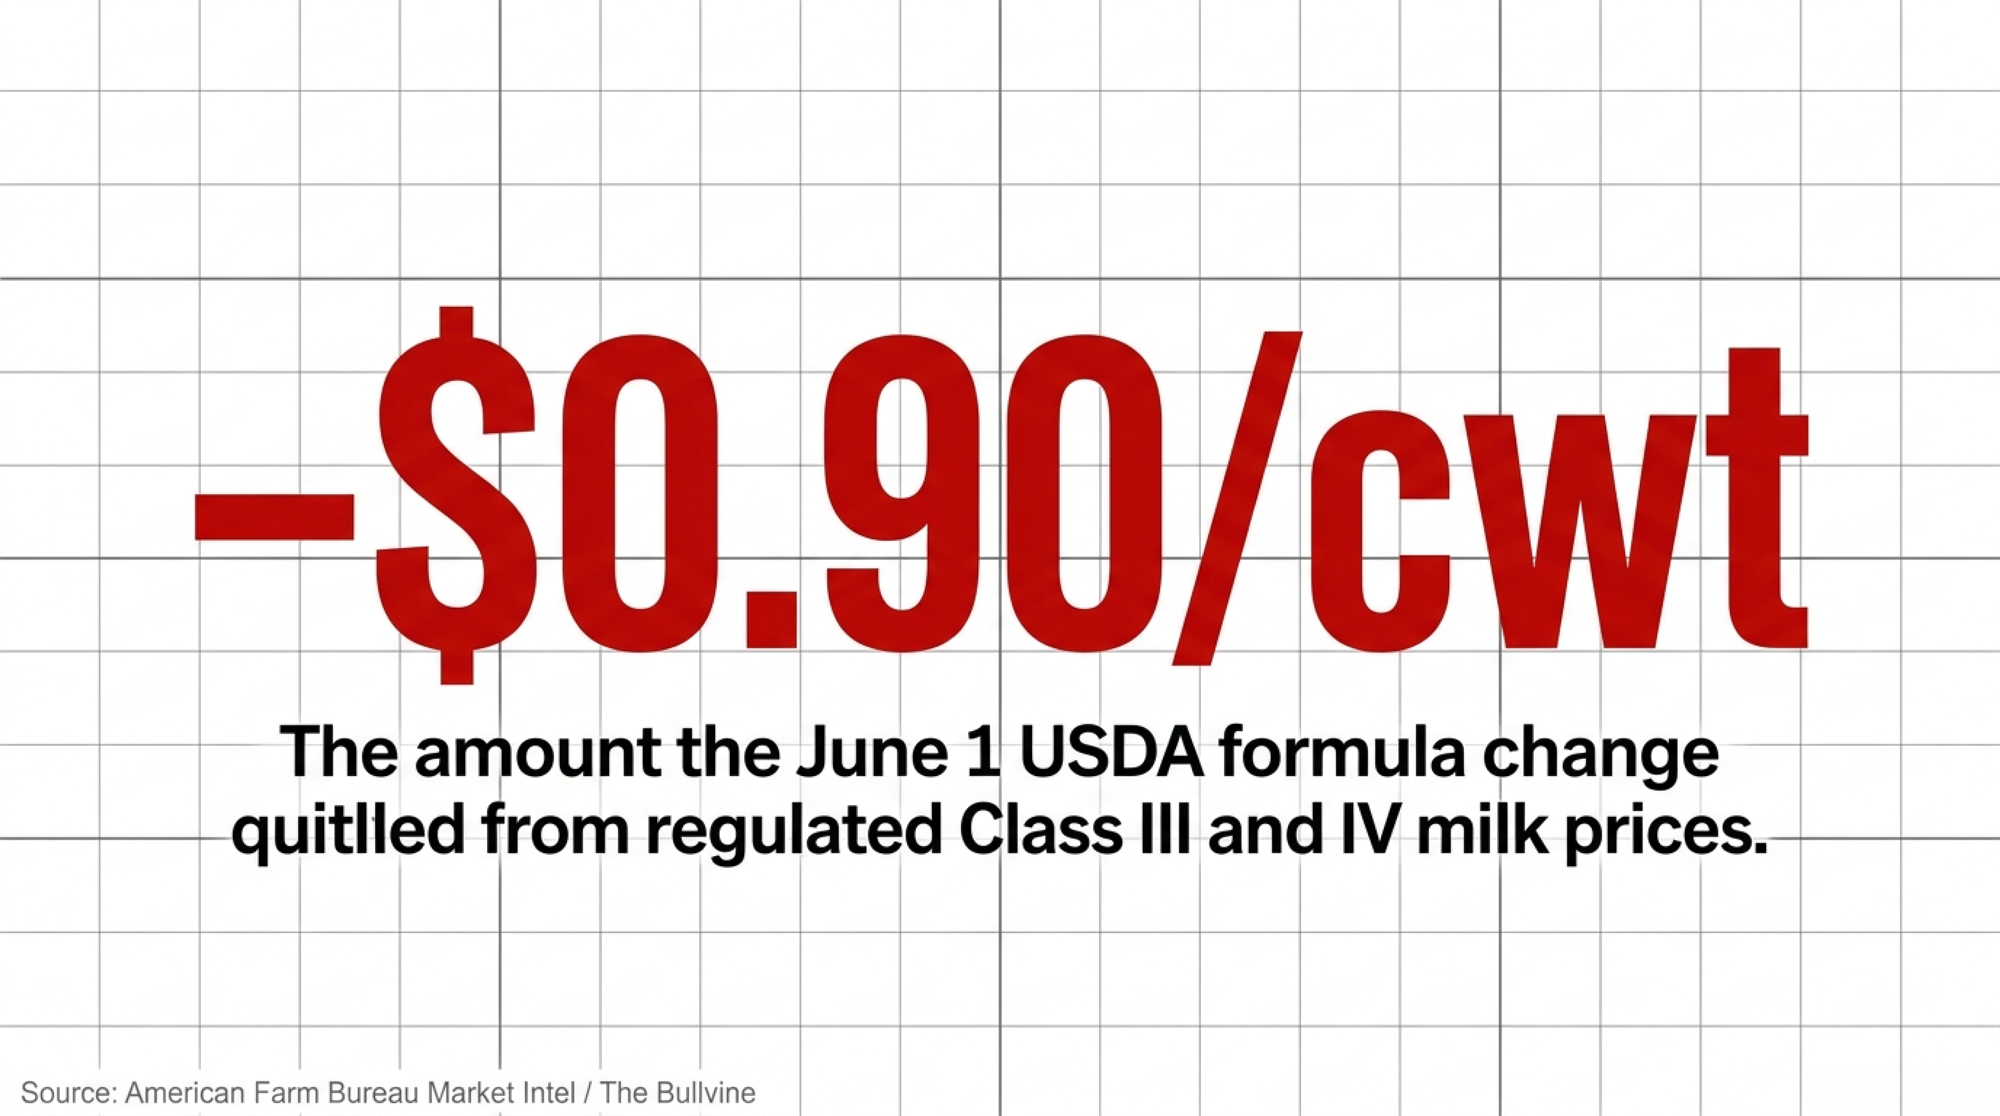
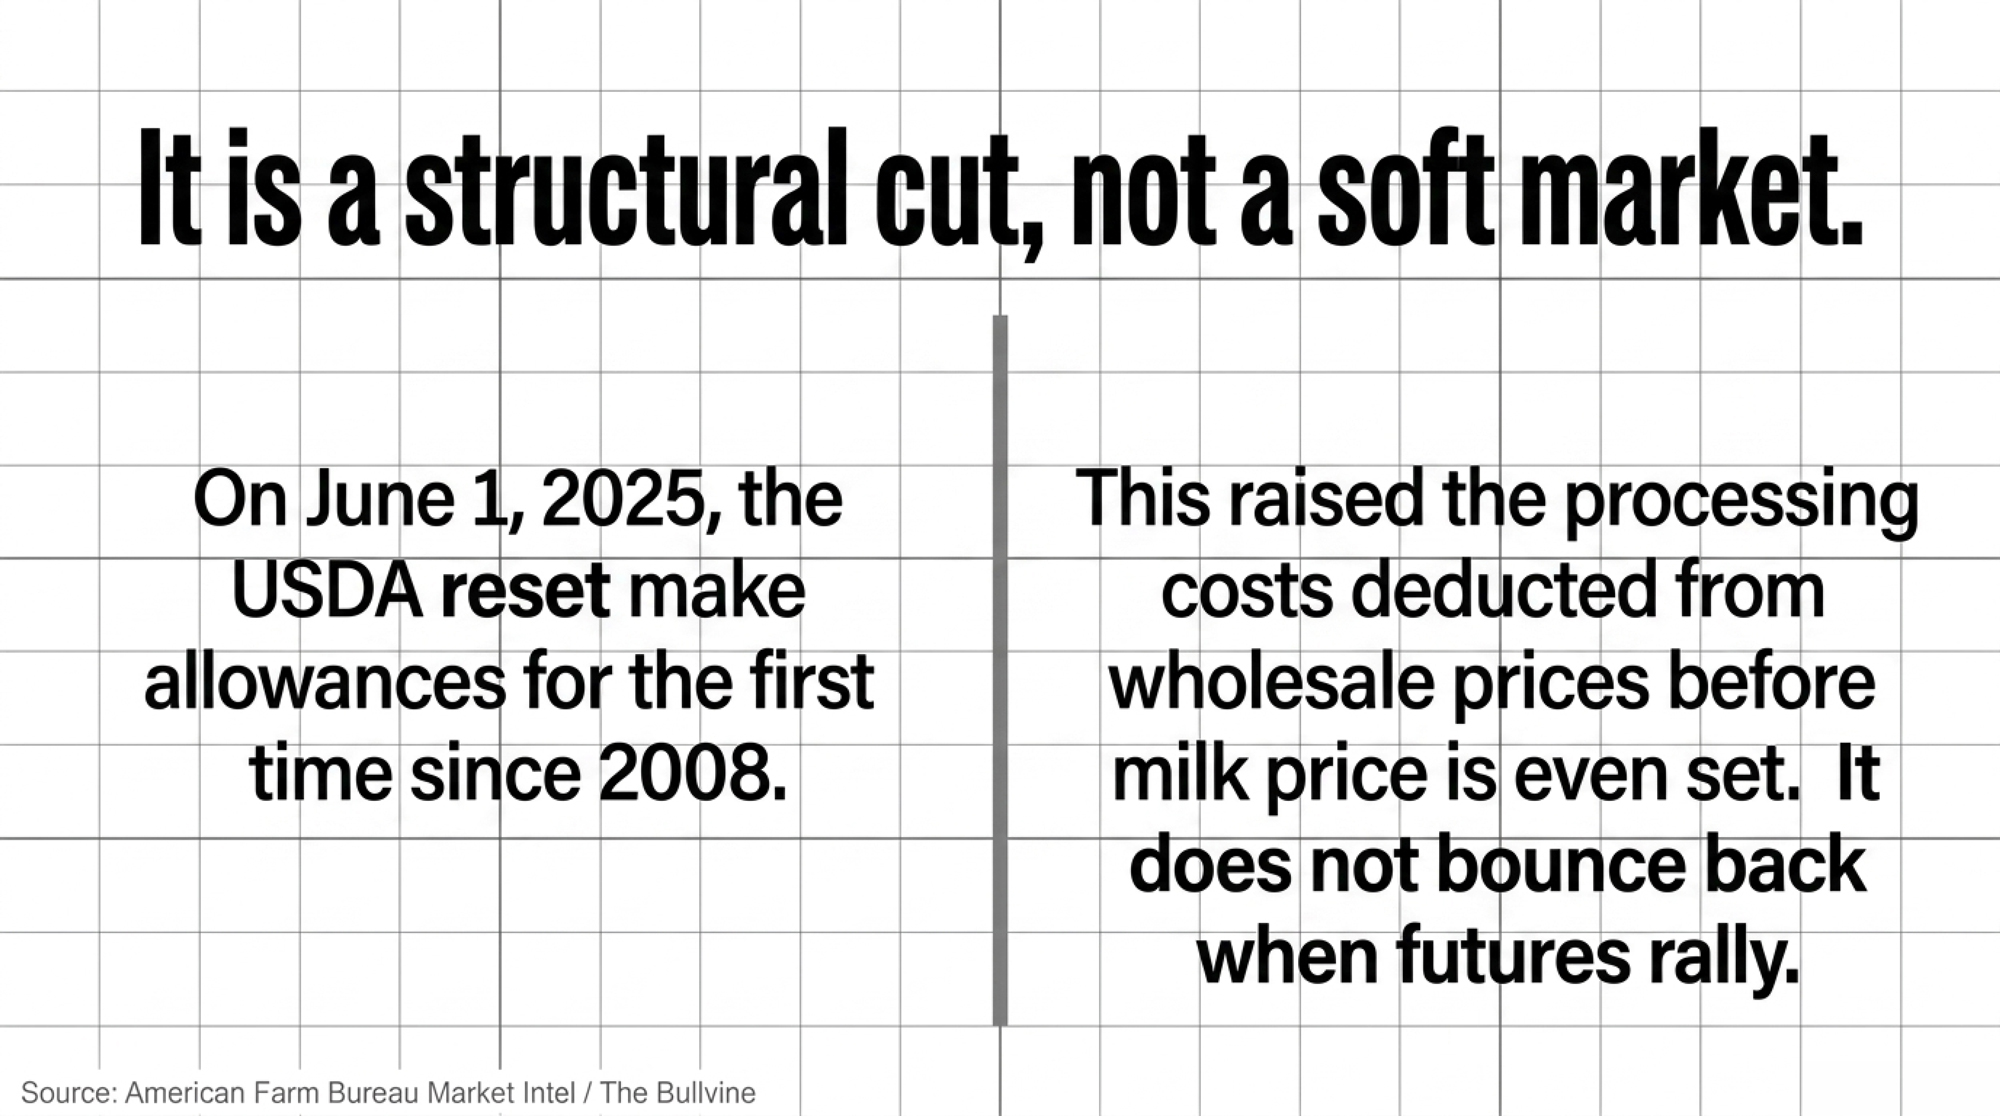
On June 1, 2025, a federal pricing formula quietly shifted. That one change pulled roughly $0.90/cwt out of regulated Class III and IV milk prices — before global supply moved a nickel.

That’s the make-allowance change. And it’s the part of the 2026 squeeze most producers felt in their gut but couldn’t name on paper.

What Actually Changed on June 1, 2025

A make allowance is the processing cost USDA subtracts from surveyed wholesale prices for cheese, butter, nonfat dry milk, and dry whey when it builds your Class III and IV milk prices. Raise that deduction, and the regulated milk price drops by the same amount — dollar for dollar, per pound of product.

It’s not a market force. It’s a formula input.
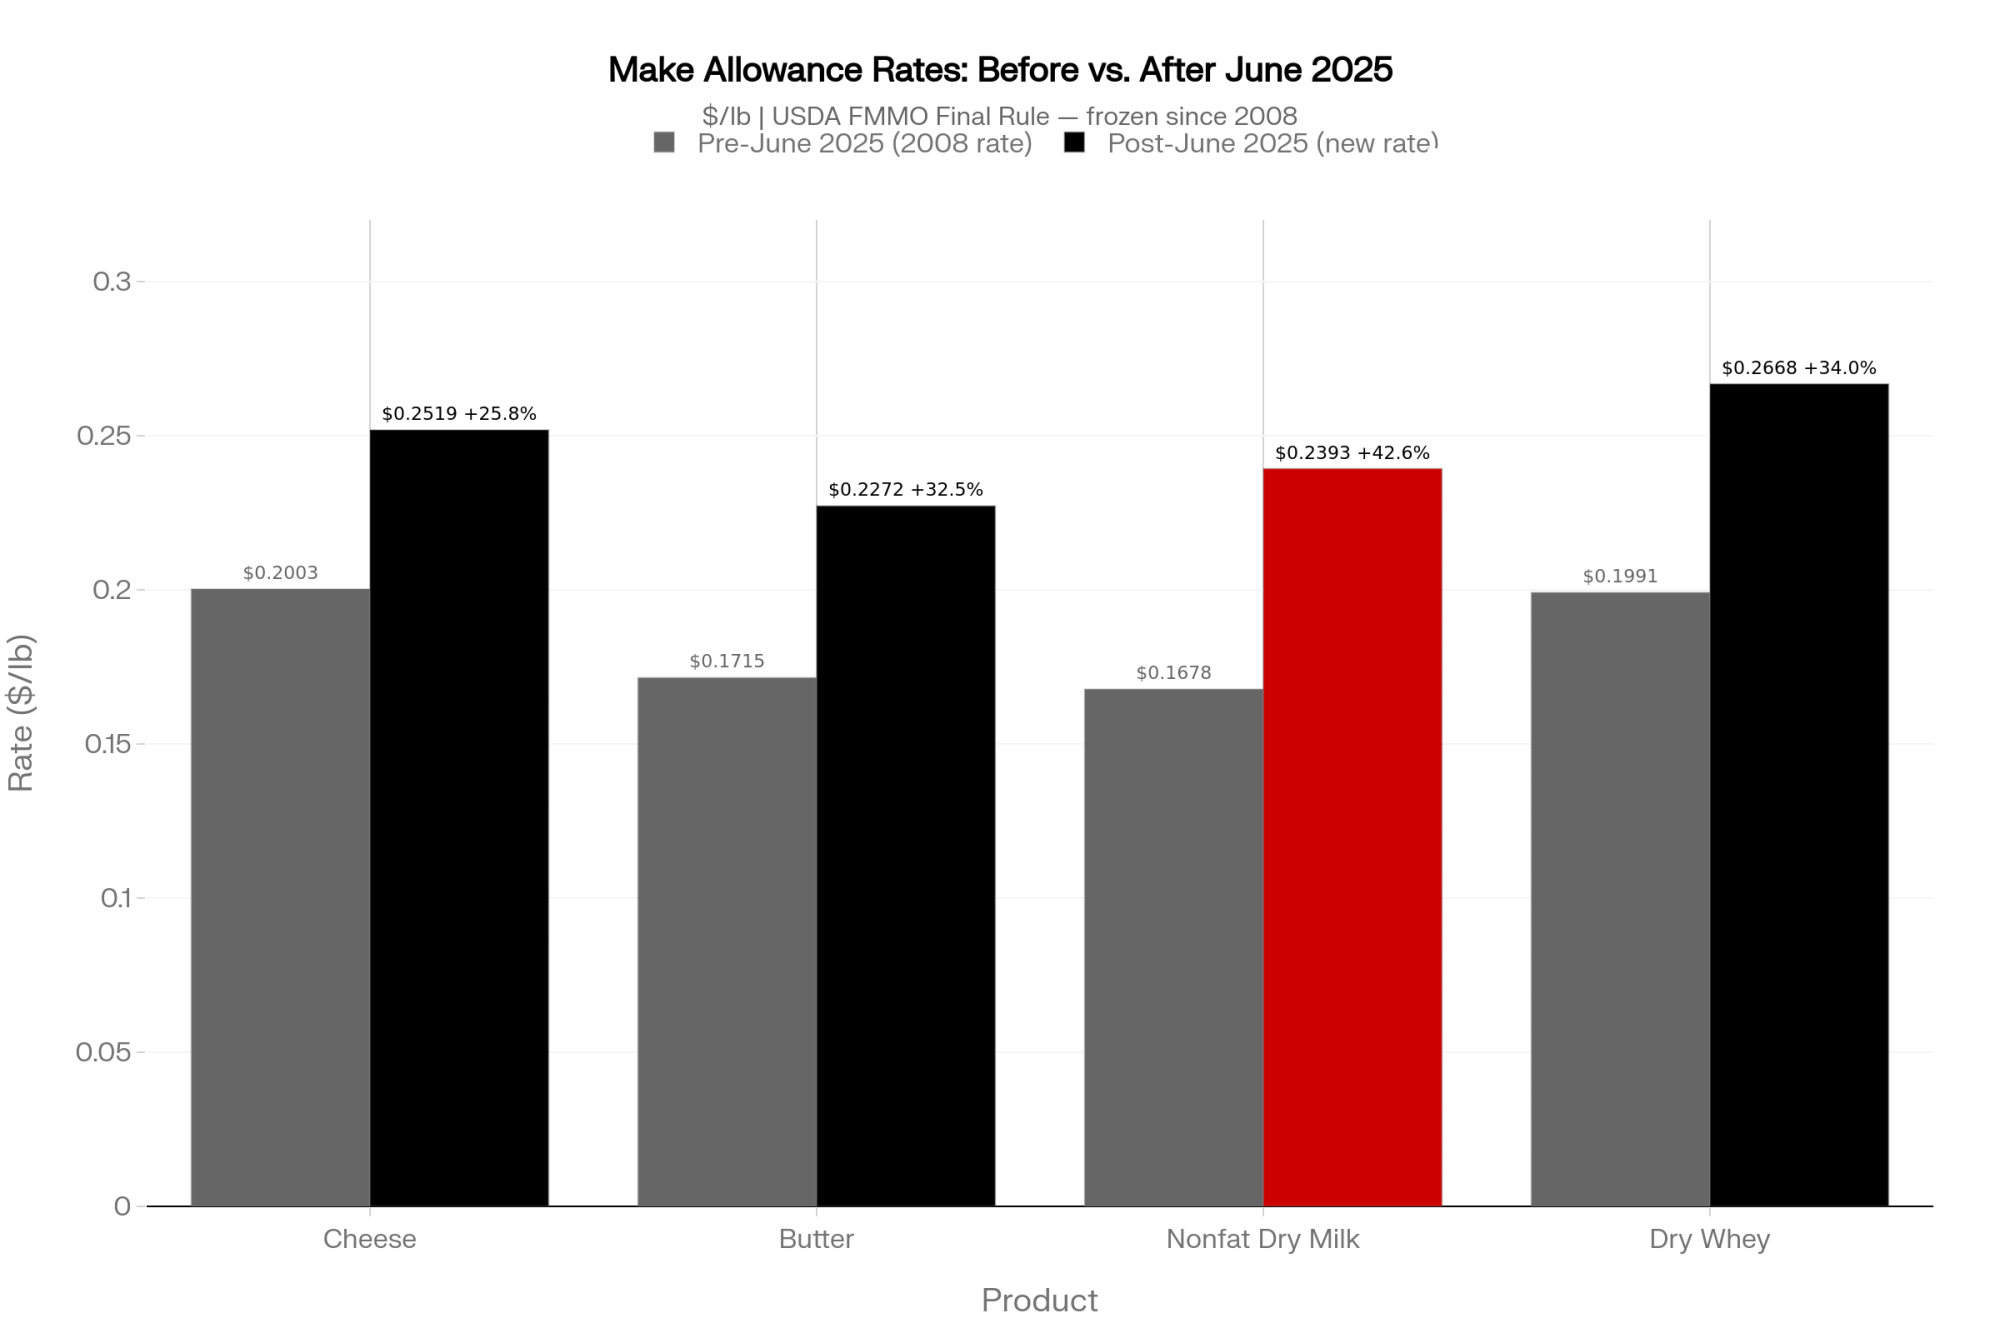
USDA’s final rule reset those allowances effective June 1, 2025: $0.2519/lb for cheese, $0.2272/lb for butter, $0.2393/lb for nonfat dry milk, and $0.2668/lb for dry whey. The old rates — frozen since October 2008 — were $0.2003 for cheese, $0.1715 for butter, $0.1678 for nonfat dry milk, and $0.1991 for dry whey, according to USDA Agricultural Marketing Service rulemaking.

Run the percentages and the jumps are steep: 25.8% on cheese, 32.5% on butter, 42.6% on nonfat dry milk, and 34.0% on dry whey. Those aren’t tweaks. The cheese number alone — a nickel a pound more carved out before the milk price is even set — is what does most of the damage to a III-heavy check, because cheese yield drives the Class III formula harder than anything else. The Bullvine has shown how thin the link already is between what your components are actually worth and what the formula pays you — and this rule widened that gap.

American Farm Bureau economist Danny Munch, tracking the first three months under the new rule, found average Class III prices fell about 86¢/cwt and Class IV about 89¢/cwt, with the make-allowance bump doing most of the damage, per American Farm Bureau Market Intel. The Bullvine’s own breakdown landed close by, at $0.94/cwt on Class III and $0.87 on Class IV.

The spread between those estimates comes down to method and which orders you weight — which is exactly why “roughly 90 cents” is the honest midpoint to plan around.

And who gets hit hardest? If your milk flows into cheese, butter, and powder — the Upper Midwest, the Plains, the West — your mailbox price leans on Class III and IV, so the haircut lands with full force. Fluid-heavy regions feel it less, because more of their value rides on Class I, which the same rule actually nudged higher in spots.

How This Plays Out in the Barn

Here’s what makes it so slippery: nothing on the check screams “USDA just took a dollar.” Class prices simply print lower.

So you blame exports, or China, or “the market” — and the formula change rides along invisible.

Run the math on that 1,000-cow herd. At about 80 lbs/cow/day — swap in your own average — you’re shipping roughly 292,000 cwt a year. A $0.90/cwt haircut works out to about $262,000 gone — every year — before a single cull cow leaves the yard or a futures contract moves.

The number scales cleanly with herd size, because it’s just pounds times 90 cents. Here’s the same math run across four herd sizes, all at 80 lbs/cow/day:
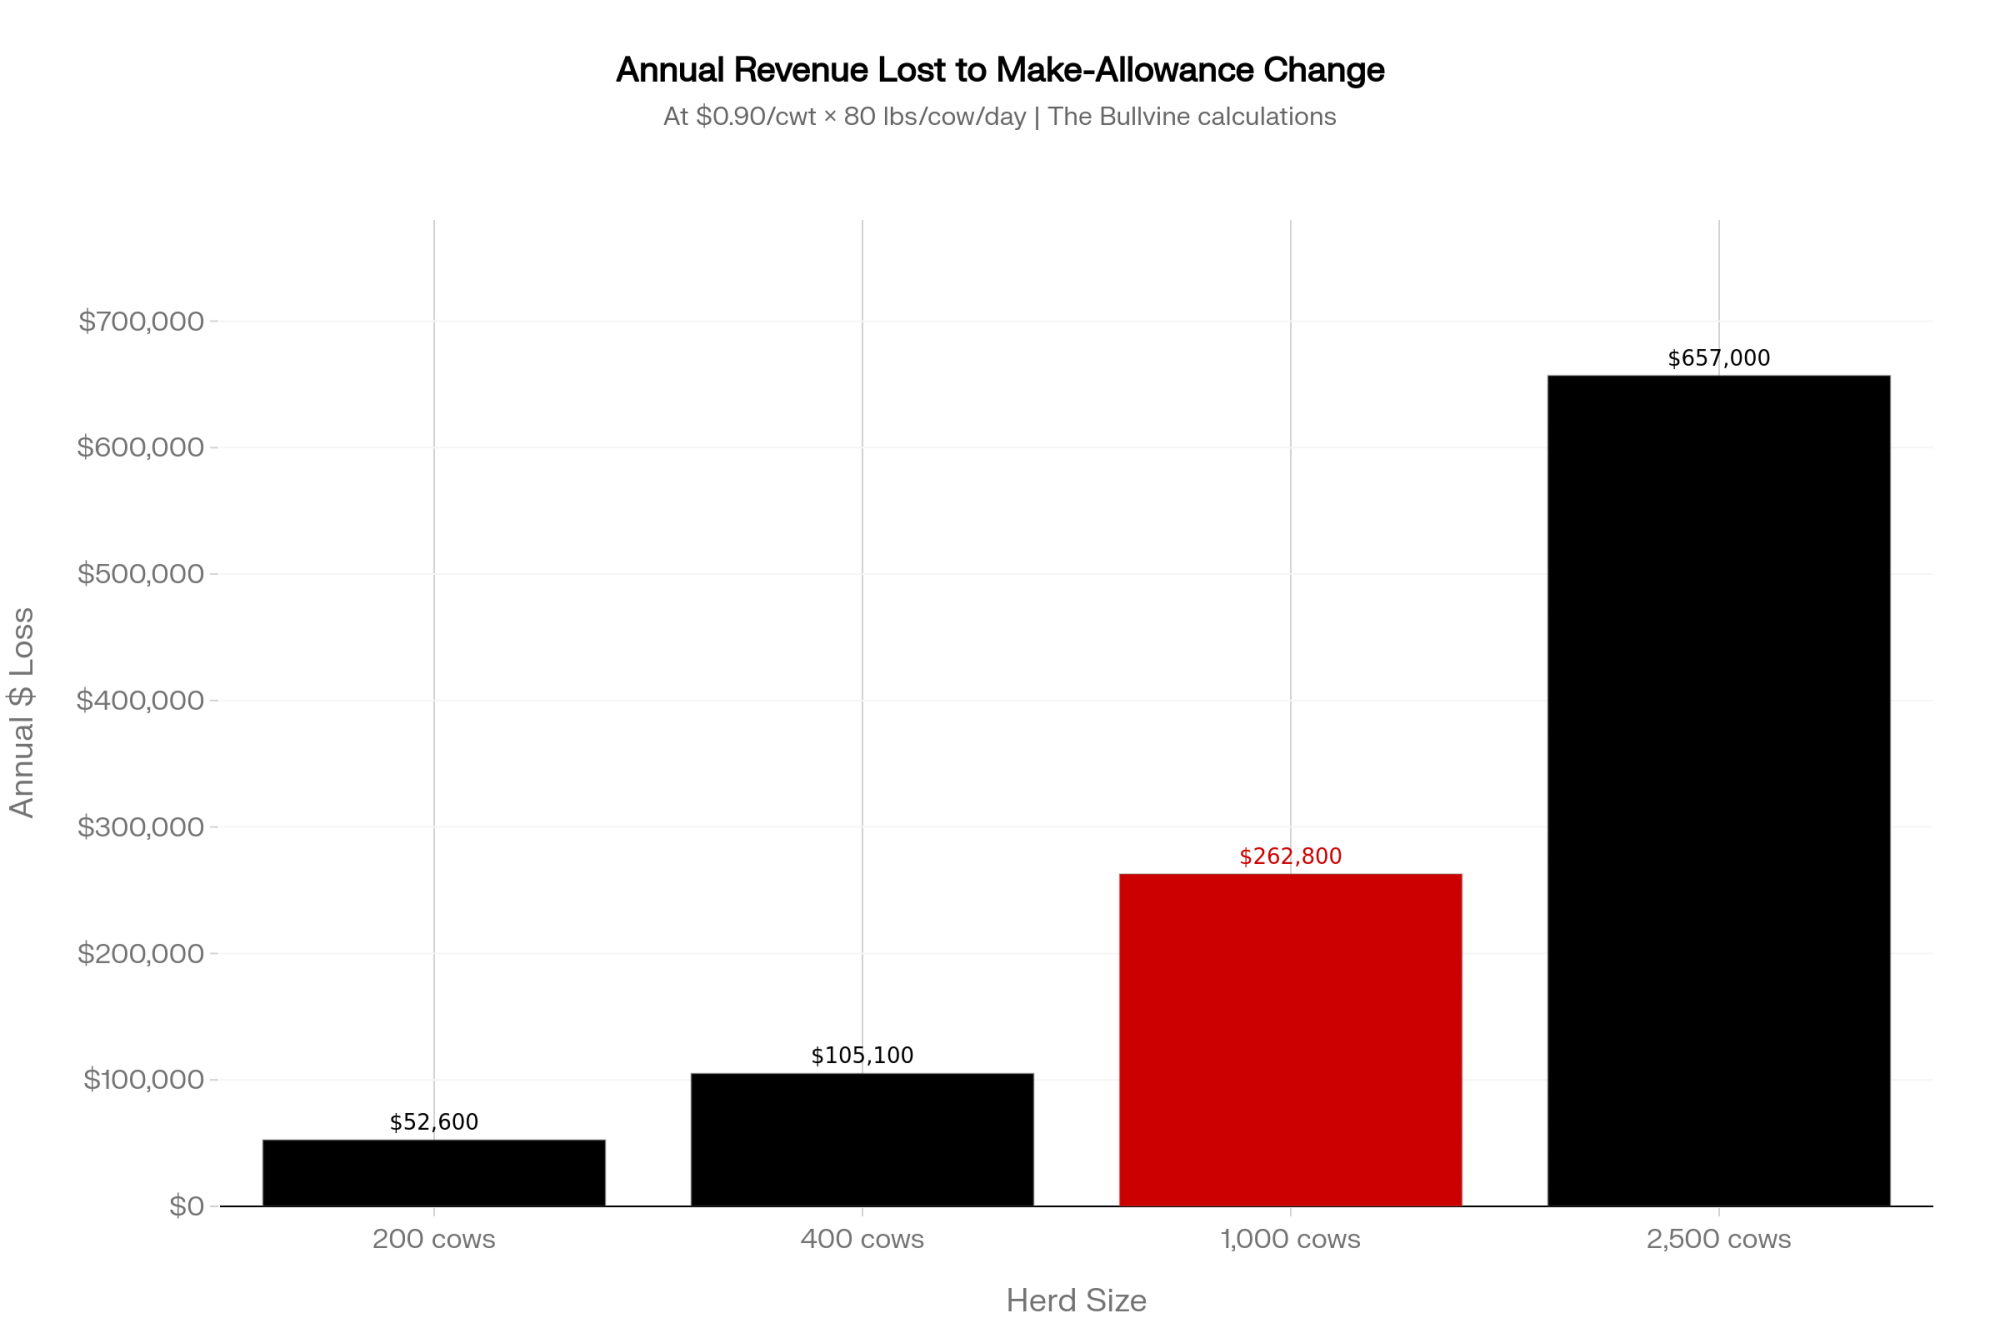
Herd sizeApprox. annual cwtAnnual hit at $0.90/cwt
200 cows58,400~$52,600
400 cows116,800~$105,100
1,000 cows292,000~$262,800
2,500 cows730,000~$657,000

The Bullvine ran a version of this on a 400-cow herd and got close to $105,000 a year vanishing into the formula. Plug in your own per-cow production — a 90-lb herd ships more pounds, so the bite is bigger.
And it didn’t land in a vacuum. The rule took effect just as global milk surged through mid-2025, so the cut and the oversupply hit the same checks at the same time — but only the oversupply made headlines. USDA’s June 2026 WASDE lowered the 2026 all-milk forecast by 55¢ to $20.70/cwt — below 2025 and below full economic cost for a lot of mid-size herds.
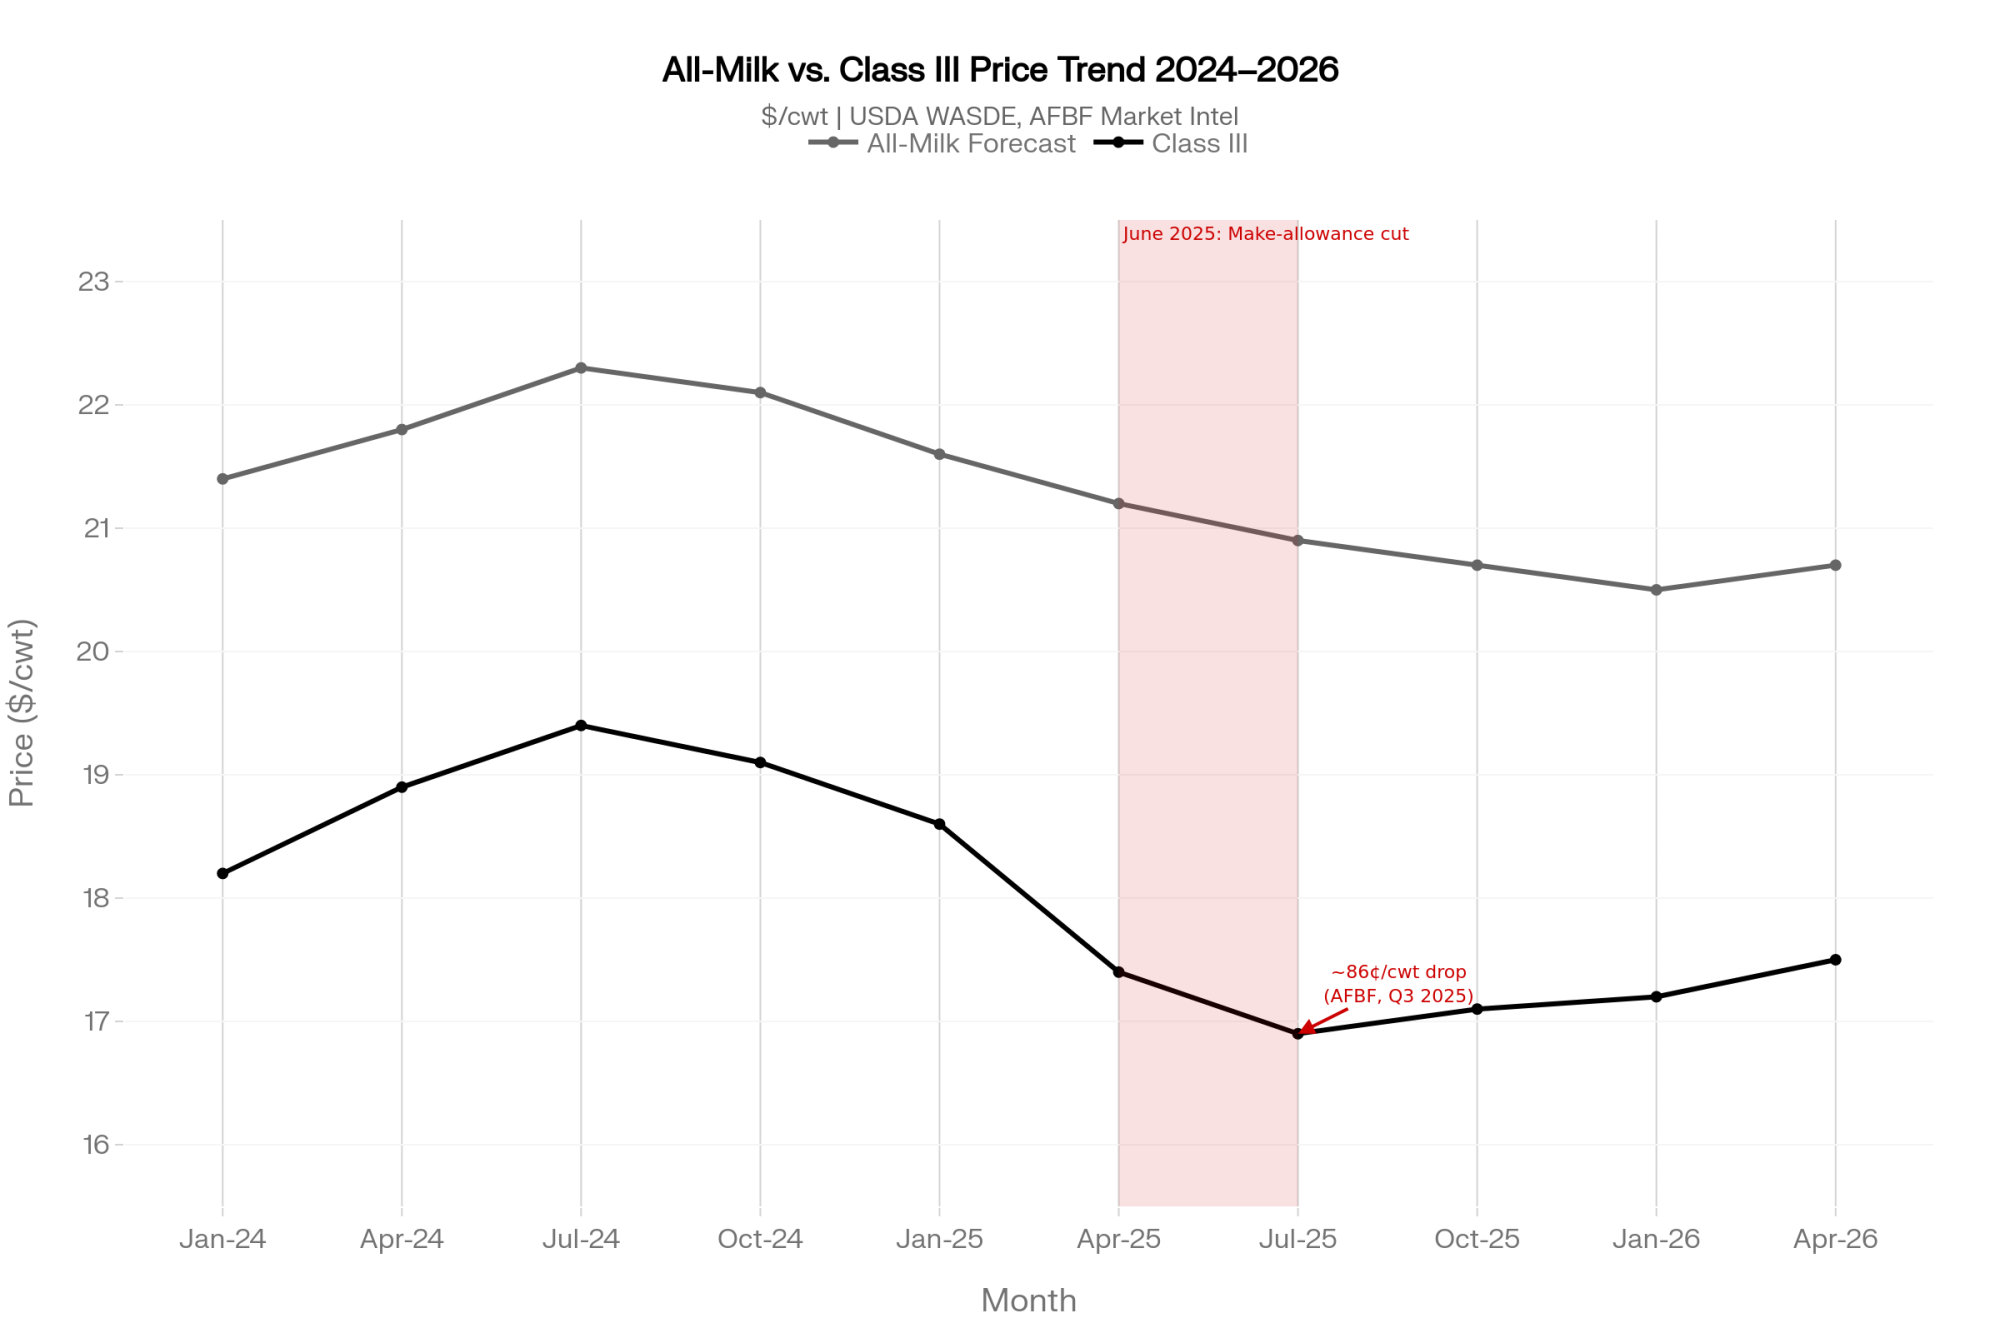
Stack the structural cut on top of a soft market, and that “$1.25/cwt even when you do everything right” feeling stops being a complaint. It’s arithmetic.

The Mechanics Nobody Walked You Through

Why didn’t this register clearly? Because USDA bundled the bad news with some good.

The same rule package returned Class I to the “higher of” mover and raised Class I differentials in parts of the East — both lift fluid skim values. And there was a genuine offset for high-component herds: updated skim milk composition factors — protein assumptions raised from 3.1% to 3.3%, other solids from 5.9% to 6.0%, nonfat solids from 9.0% to 9.3% — that lift the calculated value of skim milk.

But that piece didn’t take effect until December 1, 2025, a full six months after the make-allowance cut had already been pulling cash out of checks.

Rule ElementEffective DateWho It HelpsWho It Hurts$/cwt Impact
Make-allowance rate reset (cheese +25.8%, butter +32.5%, NDM +42.6%, whey +34.0%)June 1, 2025ProcessorsClass III/IV producers (Upper Midwest, Plains, West)−$0.86–0.94/cwt
Class I “higher of” mover restoredJune 1, 2025Fluid milk regions (East/Southeast)No direct impact on Class III/IV+Variable
Class I differentials increased (select Eastern orders)June 1, 2025Eastern fluid producers+Variable
Skim milk composition factors updated (protein 3.1%→3.3%; other solids 5.9%→6.0%; nonfat solids 9.0%→9.3%)December 1, 2025High-component herdsLow-component herds+Partial offset
DMC Tier 1 coverage raised to 6M lbs at $9.50 margin2026 Farm BillSmaller herds (≤6M lbs production)Large herds shipping 20M+ lbs — Tier 1 covers <25% of volumePartial floor only
Net structural impact on Class III/IV mailbox priceOngoingAll manufacturing-region producers~−$0.90/cwt permanent

That staggered timing is what muddied the water. The big-picture message could stay neutral-to-positive even while the specific message for cheese-and-powder country was brutal: your core class prices just dropped almost a dollar.
Farm groups didn’t speak with one voice, either. Processors had pushed for higher make allowances for years, arguing real costs — energy, labor, packaging — had outrun rates frozen since 2008. That argument isn’t crazy on its face; nobody’s processing milk in 2026 at 2008 cost. But “the rate was stale” and “the producer should eat the entire catch-up in one step” are two very different conclusions, and the rule landed on the second one. Some producer groups swallowed the higher allowances as the price of getting “higher of” back. So the clean “you’re losing 90 cents” line got lost in the trade.

The distinction that matters: this isn’t cyclical. It doesn’t reverse when futures rally. The Bullvine put it bluntly — “that money is now legally reallocated from the farm to the plant.” It’s welded into the floor now.

Won’t Slowing Global Milk Bail Out Prices?

Every few weeks a hopeful headline lands: the global wall of milk is finally cresting. And there’s truth to it — Rabobank’s Q2 2026 Global Dairy Quarterly, released in June, has Big-7 output growth peaking and milk supply turning negative by the fourth quarter, down an estimated 1.6% year-on-year.

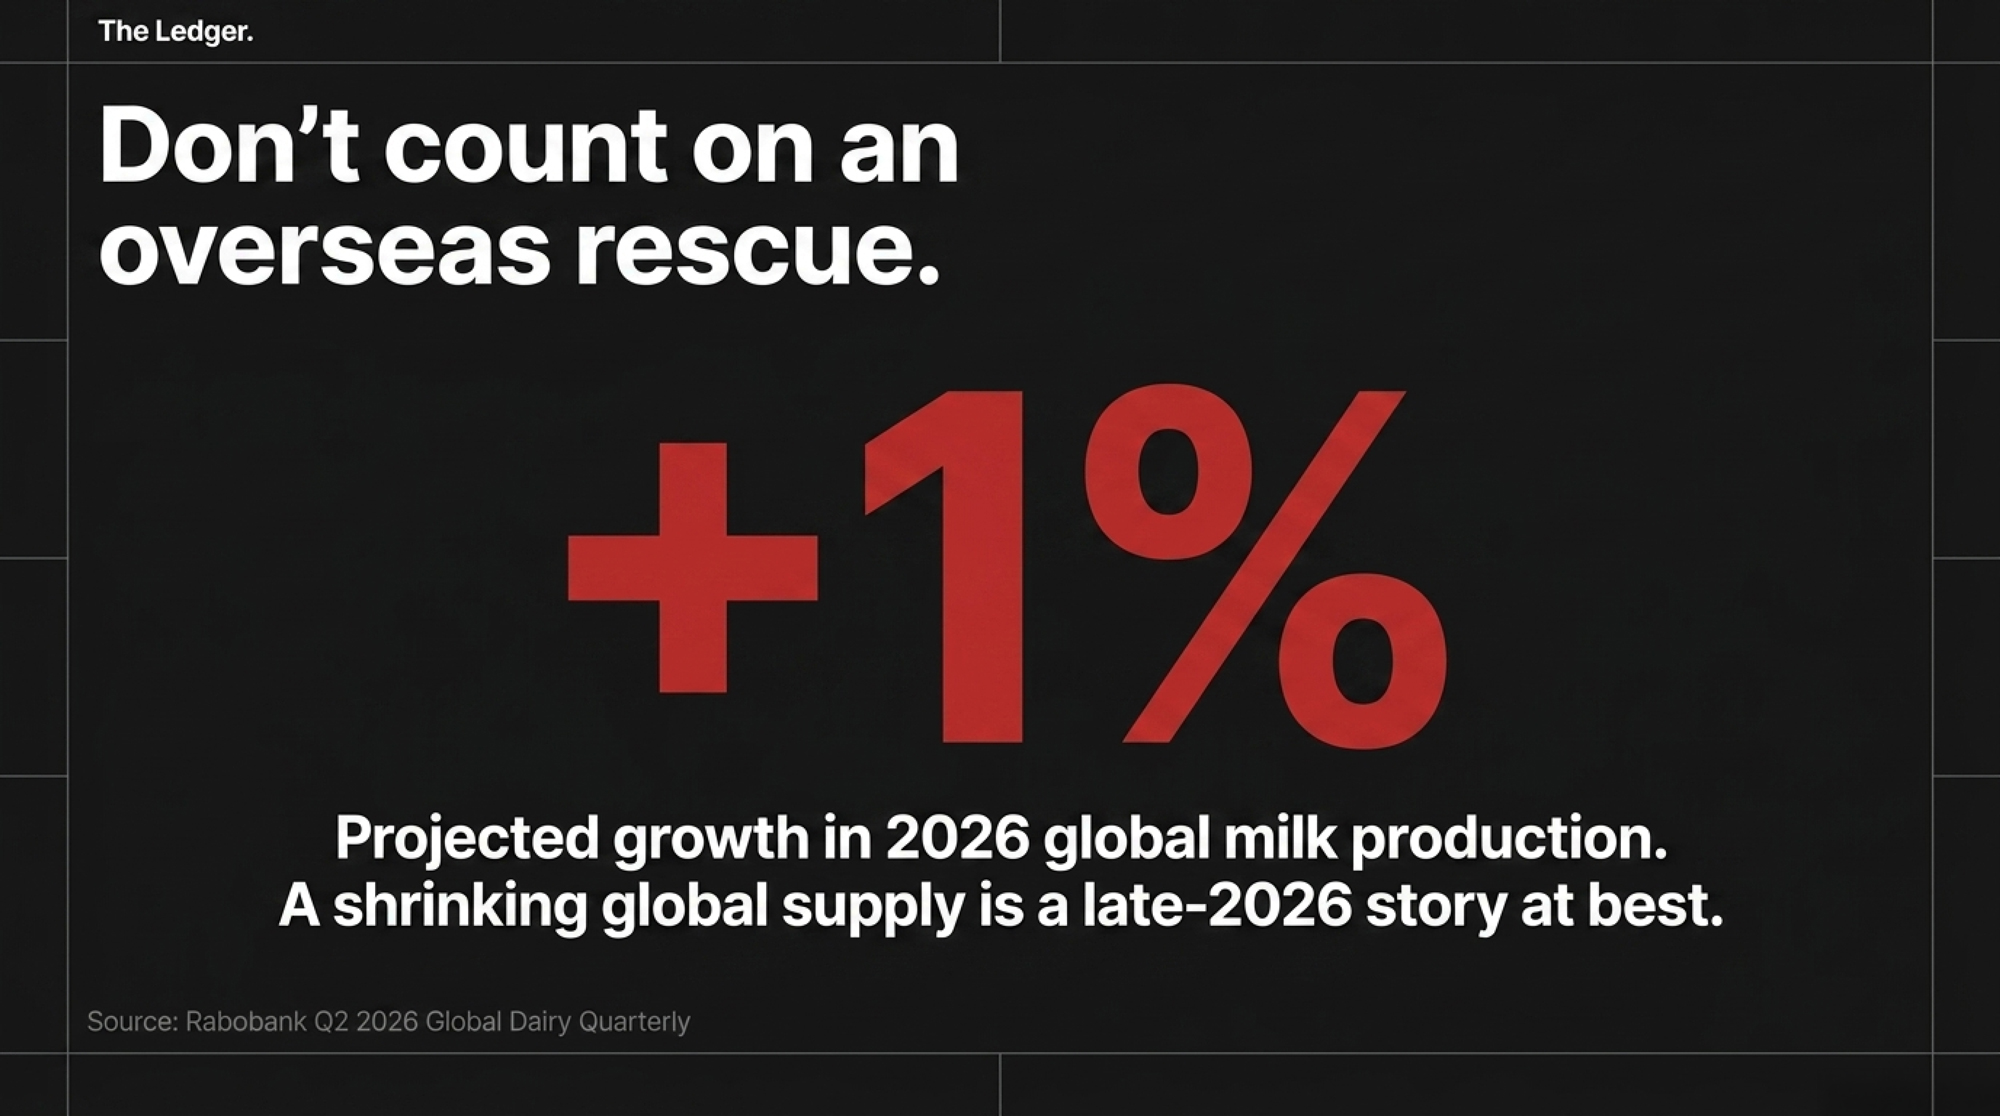
But here’s the catch most of those headlines skip. Rabobank still pegs full-year 2026 global production up about 1%, following a 3.1% surge in 2025. The slowdown is a Q4 story, not a 2026 story. A herd budgeting on a calendar-year basis won’t feel a fourth-quarter dip until the back end of the year — long after the spring and summer checks are already spent.

So why doesn’t your check recover? Because the milk’s still coming. The U.S. is forecast to keep growing for the full year, and even Europe isn’t pulling back the way the “shrinking EU herd” story suggests — USDA’s Foreign Agricultural Service, in its June 2026 update, actually has EU cows’ milk deliveries edging up 0.1% in 2026 to about 148.6 million metric tons. That’s not a contraction. That’s flat-to-higher from the one region everyone keeps expecting to ride to the rescue.

The wall doesn’t come down until production actually contracts and stays there — and Rabobank doesn’t see that holding until late 2026 into 2027.

The Bullvine has laid out who actually blinks first in the global milk picture — worth a read if you’re tempted to bank on an overseas rescue.

How Much Does Doing Nothing Actually Cost You?

This is the question worth sitting with at the kitchen table. On a 1,000-cow herd shipping about 24,000–25,000 cwt a month, a $1.00/cwt shortfall against what you budgeted is roughly $25,000 a month — just under $300,000 a year.

The Bullvine’s risk math frames the smaller version cleanly: on 9,000 cwt, every $1.00/cwt gap is $9,000 a month.

Dairy Margin Coverage helps — but know exactly where it stops. Tier 1 coverage rose from 5 to 6 million lbs for 2026, with subsidized protection up to a $9.50 margin. That’s a genuine lifeline on your first 6 million pounds.

But a 1,000-cow herd ships around 29 million pounds, which leaves roughly 23 million pounds with no Tier 1 net under it. DMC puts a floor under part of your milk. It doesn’t fix a model that’s underwater before debt service.

If you want the coverage tables and lane-by-lane strategy, the full 2026 risk playbook breaks it down.

What This Means for Your Operation

Strip away the policy talk and it comes down to three things you can do something about. First, the make-allowance cut is now part of your structural cost of doing business, the same way a higher haul rate or a tighter component schedule would be — so it belongs in your budget as a permanent line, not a bad-luck footnote you expect to bounce back.

Second, the size of the hit scales directly with how many pounds you ship, which means your highest-production strings are also where the formula takes the most. That’s not a reason to pull production. It is a reason to make sure every one of those pounds is either hedged, contracted, or priced into a margin you can actually live with.

Third, the relief everyone’s waiting on — shrinking global supply — is a late-2026-into-2027 event at best, and Europe isn’t even cooperating with the story yet. Budget for the world you’re milking in now, not the one the optimistic headlines keep promising. If your 2026 cash-flow plan assumes a second-half price rally, stress-test it against milk staying near $20.70 and see whether the year still closes in the black.

Is Your Breakeven Number Written Down — or Just a Feeling?

Here’s the one risk-management question most operators aren’t asking out loud: What’s the lowest mailbox price and margin over full cost you can ride for 12 straight months before you’re forced to cut cows, change the model, or get out — and what protection actually kicks in at that line?
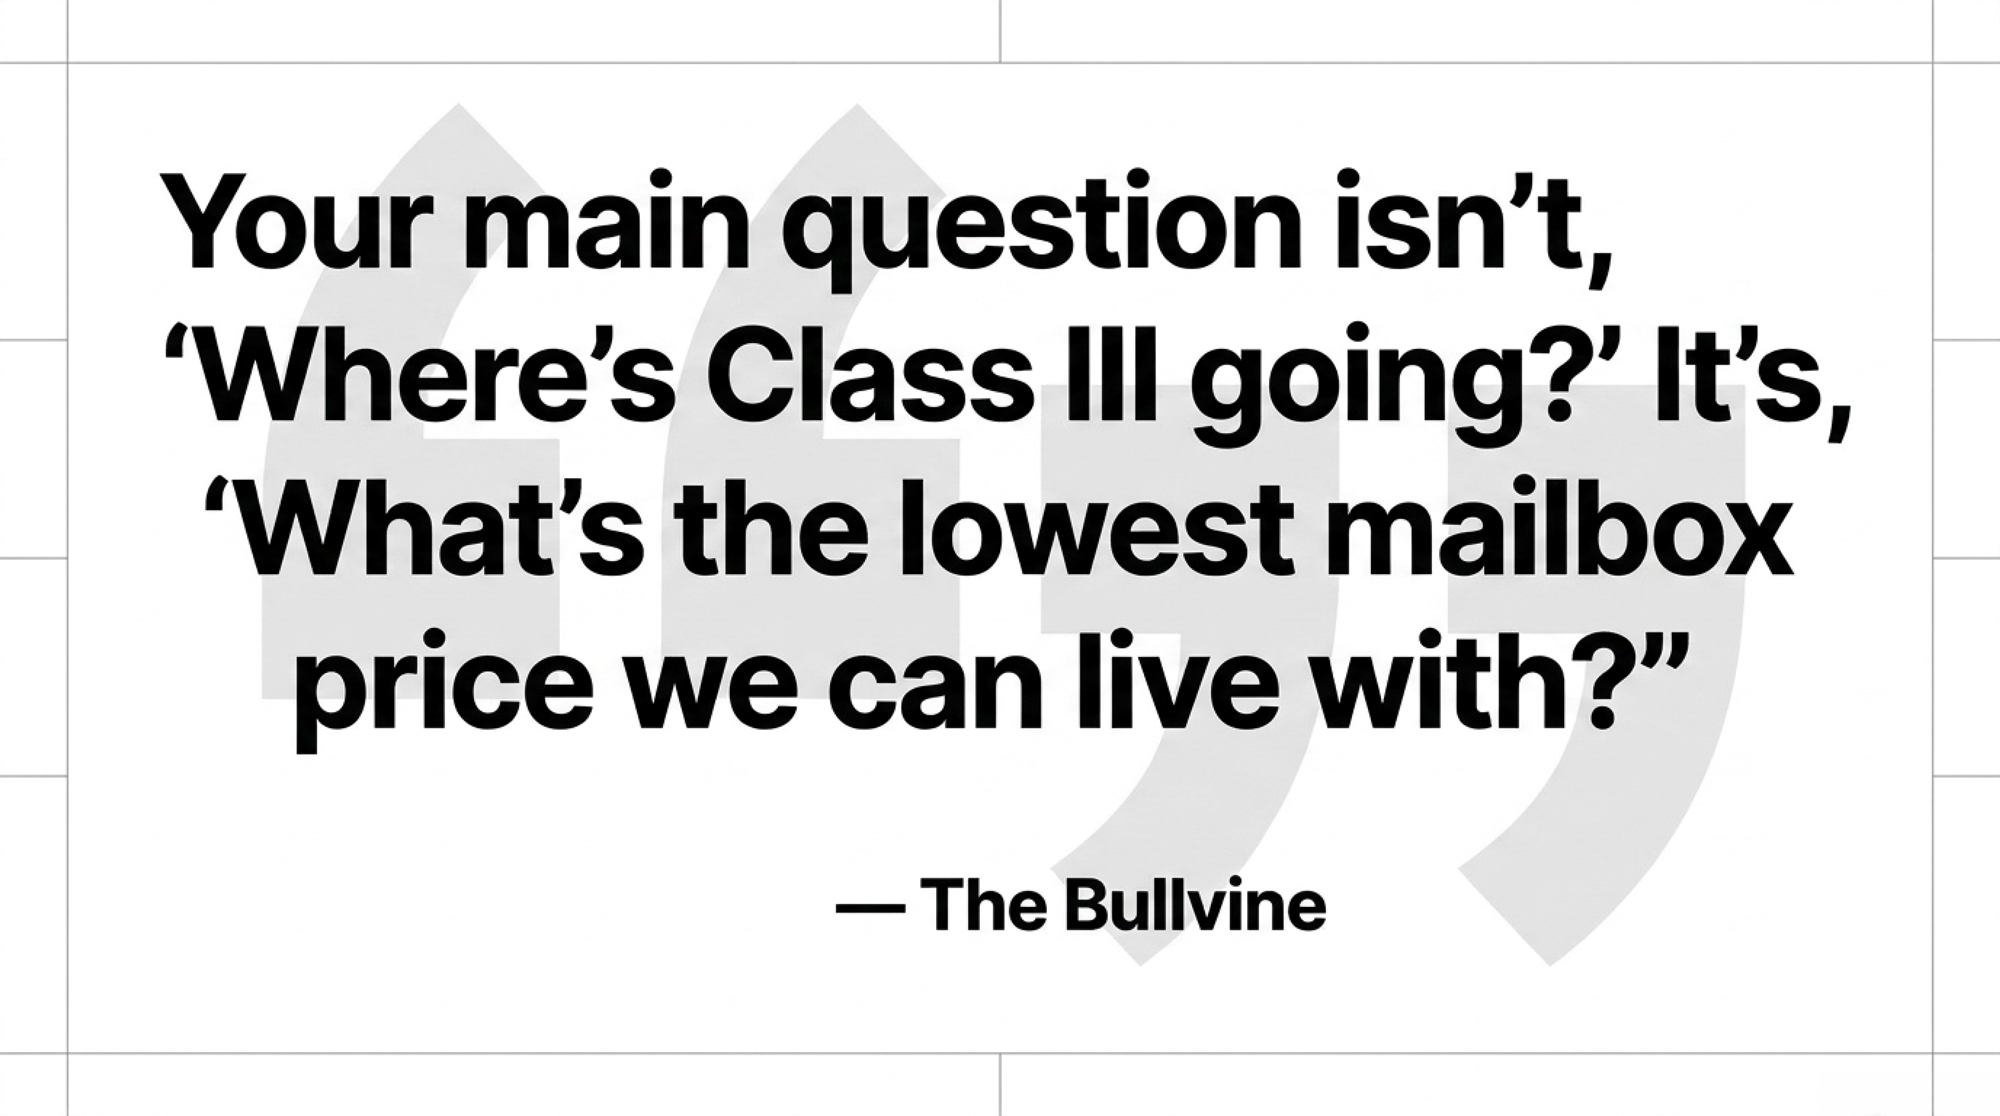
Most producers can rattle off their rolling herd average from memory but can’t name that floor. The Bullvine said it plainly: “Your main question isn’t, ‘Where’s Class III going?’ It’s, ‘What’s the lowest mailbox price we can live with and still pay the bills and keep the lender comfortable?'”

Write the number down. Then tie specific hedges, DMC coverage, and cull triggers to it.

If you can’t name it, you’re not managing risk — you’re hoping the wall of milk spares your yard.

Options and Trade-Offs

Producers are handling this squeeze a few different ways. None is a silver bullet, and each one costs you something. Here’s how they stack up — scan the bold, then dig into the one that fits your operation:

  • Layer DMC and Dairy-RP together: This remains a no-brainer for 2026, especially with the 6-million-pound Tier 1 bump. Just remember: DMC only protects your first slice; Dairy-RP has to handle the rest without capping your upside too heavily if the market rallies.
Protection ToolCoverage TriggerMax Covered VolumeApprox. Annual PremiumAddresses Structural Cut?Lender Comfort?
DMC Tier 1 (2026)Margin < $9.50/cwt6M lbs (~75 cows)~$800–$1,200 subsidizedNo — formula loss not a DMC triggerPartial — floor on first slice only
DMC Tier 2Margin < $9.50/cwtUnlimited (unsubsidized)Rises steeply above 6M lbsNoPartial
Dairy-RP (Class III/IV floor)Declared price < insured levelUp to ~100% of production$0.05–$0.15/cwt depending on coverage %Yes — if floor set below current pricesYes — quantifiable hedge
DMC + Dairy-RP layeredCombined triggersFull production volume$0.08–$0.20/cwt combinedBest availableStrongest lender case
No program$0NoDSCR risk: <1.0x on many 1,000-cow herds
Futures hedge onlyCBOT Class IIIVariableBasis risk + margin callsPartial — doesn’t recover formula lossDepends on structure
  • Run a “No-Program” DSCR Test within 30 days: Calculate your debt-service coverage ratio without any safety-net payments. If your herd sits below the 1.15x–1.25x benchmark your bank demands — The Bullvine’s 400-cow analysis found one at just 0.9x even after a $16,600 DMC “win” — you need a proactive conversation with your lender today, not at loan renewal.
  • Audit your basis and your buyer: This matters most in manufacturing regions, where plant closures or consolidation can widen basis $2–3/cwt. The risk you can’t hedge is the one to name out loud: a buyer that simply stops taking your extra milk.
  • Tighten breeding and replacement decisions before the cushions thin: Beef-on-dairy premiums and strong cull prices have been quietly masking the milk-margin problem — and both could face pressure by late 2026. The trade-off is real: more dairy replacements means giving up some beef-cross cash flow today.
Key Takeaways

  • If you ship to a Class III/IV-heavy order, treat roughly $0.90/cwt of your 2025–26 price drop as structural, not market — and build your cash flow as if it’s permanent.
  • Multiply your annual cwt by $0.90. If that number rattles you (a 1,000-cow herd: about $262,000; a 2,500-cow herd: north of $650,000), it belongs in your 2026 budget, not your blind spot.
  • Run your DSCR without program payments this month. If it’s under 1.0x, that’s a lender conversation now — not at renewal.
  • Don’t budget around a global supply rescue. Rabobank still has 2026 production up about 1%, and even the EU is edging up, not down — so the relief is a late-2026-into-2027 story at best.
  • Watch your cushions. If beef-on-dairy premiums or cull prices soften while milk stays flat, the margin you thought you had disappears fast.
  • Write down your 12-month floor — the lowest mailbox price you can survive — and attach a specific action to it before futures test that line.

So — Where Does Your Floor Actually Sit?

If milk holds near $20.70 and that make-allowance cut stays baked in, can your operation run 12 months at that number without leaning on the cushions? It’s not rhetorical. It’s the question your lender will ask at renewal, and the one your milk buyer is already modeling.

Pull last June’s milk check and this one, lay them side by side, and see how much of the gap you can actually explain. The part you can’t? Some of that is the formula.

Calculate Your Structural Make-Allowance Hit

Enter your herd size or annual milk volume to see the real impact of the USDA formula shift on your operation.

cows
lbs/day

Calculated Annual Shipped Vol. 292,000 cwt
Estimated Annual Margin Loss $262,800
Monthly Cash Flow Hit: $21,900 / mo

*Based on a baseline structural loss midpoint of $0.90/cwt across Class III and Class IV pricing formulas following the June 1, 2025 FMMO modifications.

Editor’s Note: The 1,000-cow operation described below is a composite scenario, modeled from typical Upper Midwest herds shipping to Class III and IV markets. It does not represent any single real farm. The dollar figures are drawn from USDA, the American Farm Bureau, and published Bullvine calculations, as cited throughout.

Learn More

The Sunday Read Dairy Professionals Don’t Skip.

Every week, thousands of producers, breeders, and industry insiders open Bullvine Weekly for genetics insights, market shifts, and profit strategies they won’t find anywhere else. One email. Five minutes. Smarter decisions all week.
NewsSubscribe
First
Last
Consent

The One-Dollar Margin: A Global Wake-Up Call from New Zealand’s Dairy Squeeze

A $9.50 milk price sounds great—until you see the $8.50 break-even. NZ’s one-dollar margin is a wake-up call for dairy farmers everywhere.

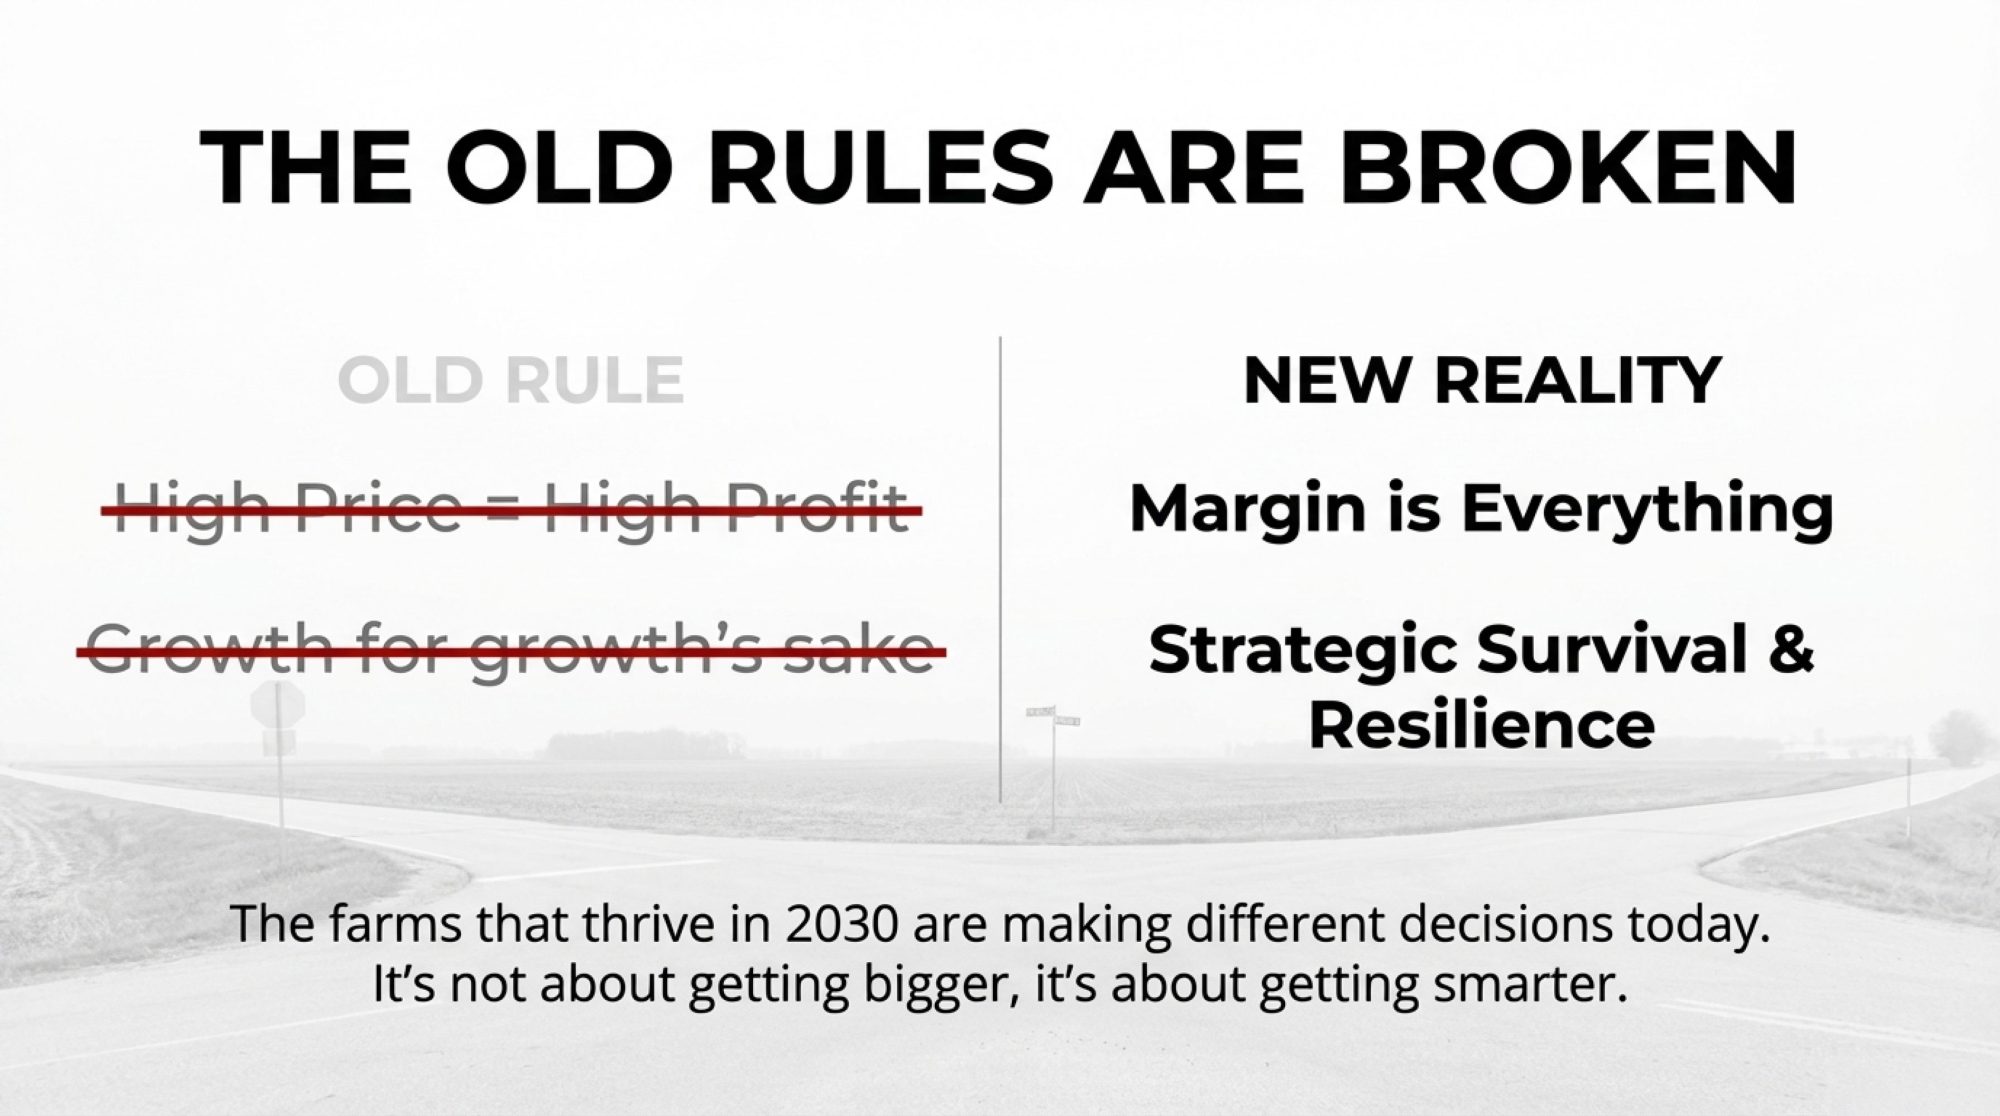
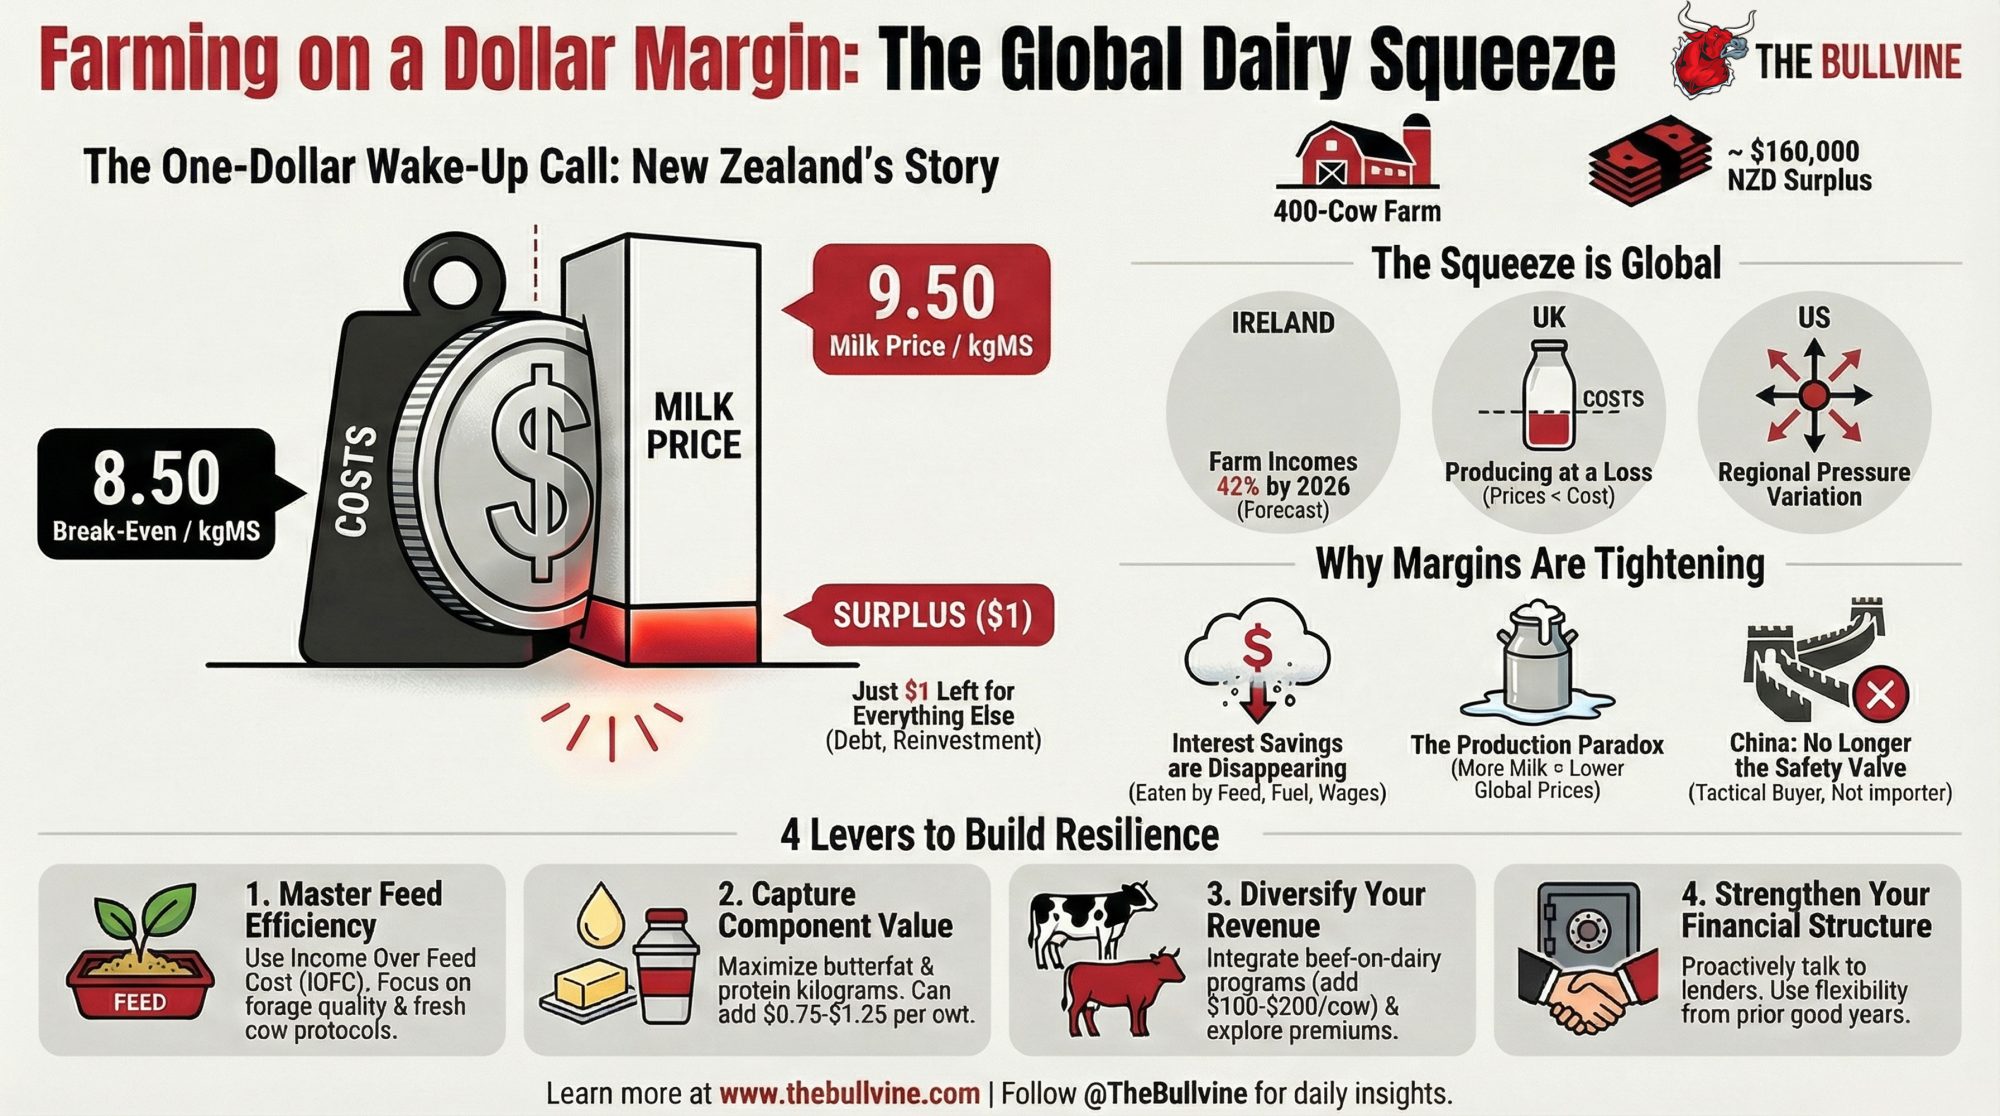
Executive Summary: When the world’s lowest-cost milk producers are farming on a dollar of margin, that’s a wake-up call for dairy everywhere. New Zealand’s December 2025 numbers: $9.50/kgMS milk price, $8.50 break-even, one dollar left for debt, drawings, and reinvestment. They’re not alone. Teagasc projects Irish dairy incomes dropping 42% in 2026. UK farmgate prices have fallen below production costs. Rabobank calls global output growth ‘stunning’—the very oversupply compressing margins worldwide. And China’s shift from aggressive importer to tactical buyer has removed the demand safety valve the industry once counted on. The old formula—high prices equal comfortable margins—no longer holds. The farms that make it through will be those building resilience now: feed efficiency, component focus, diversified revenue, right-sized debt. Not growth for growth’s sake. Strategic survival.

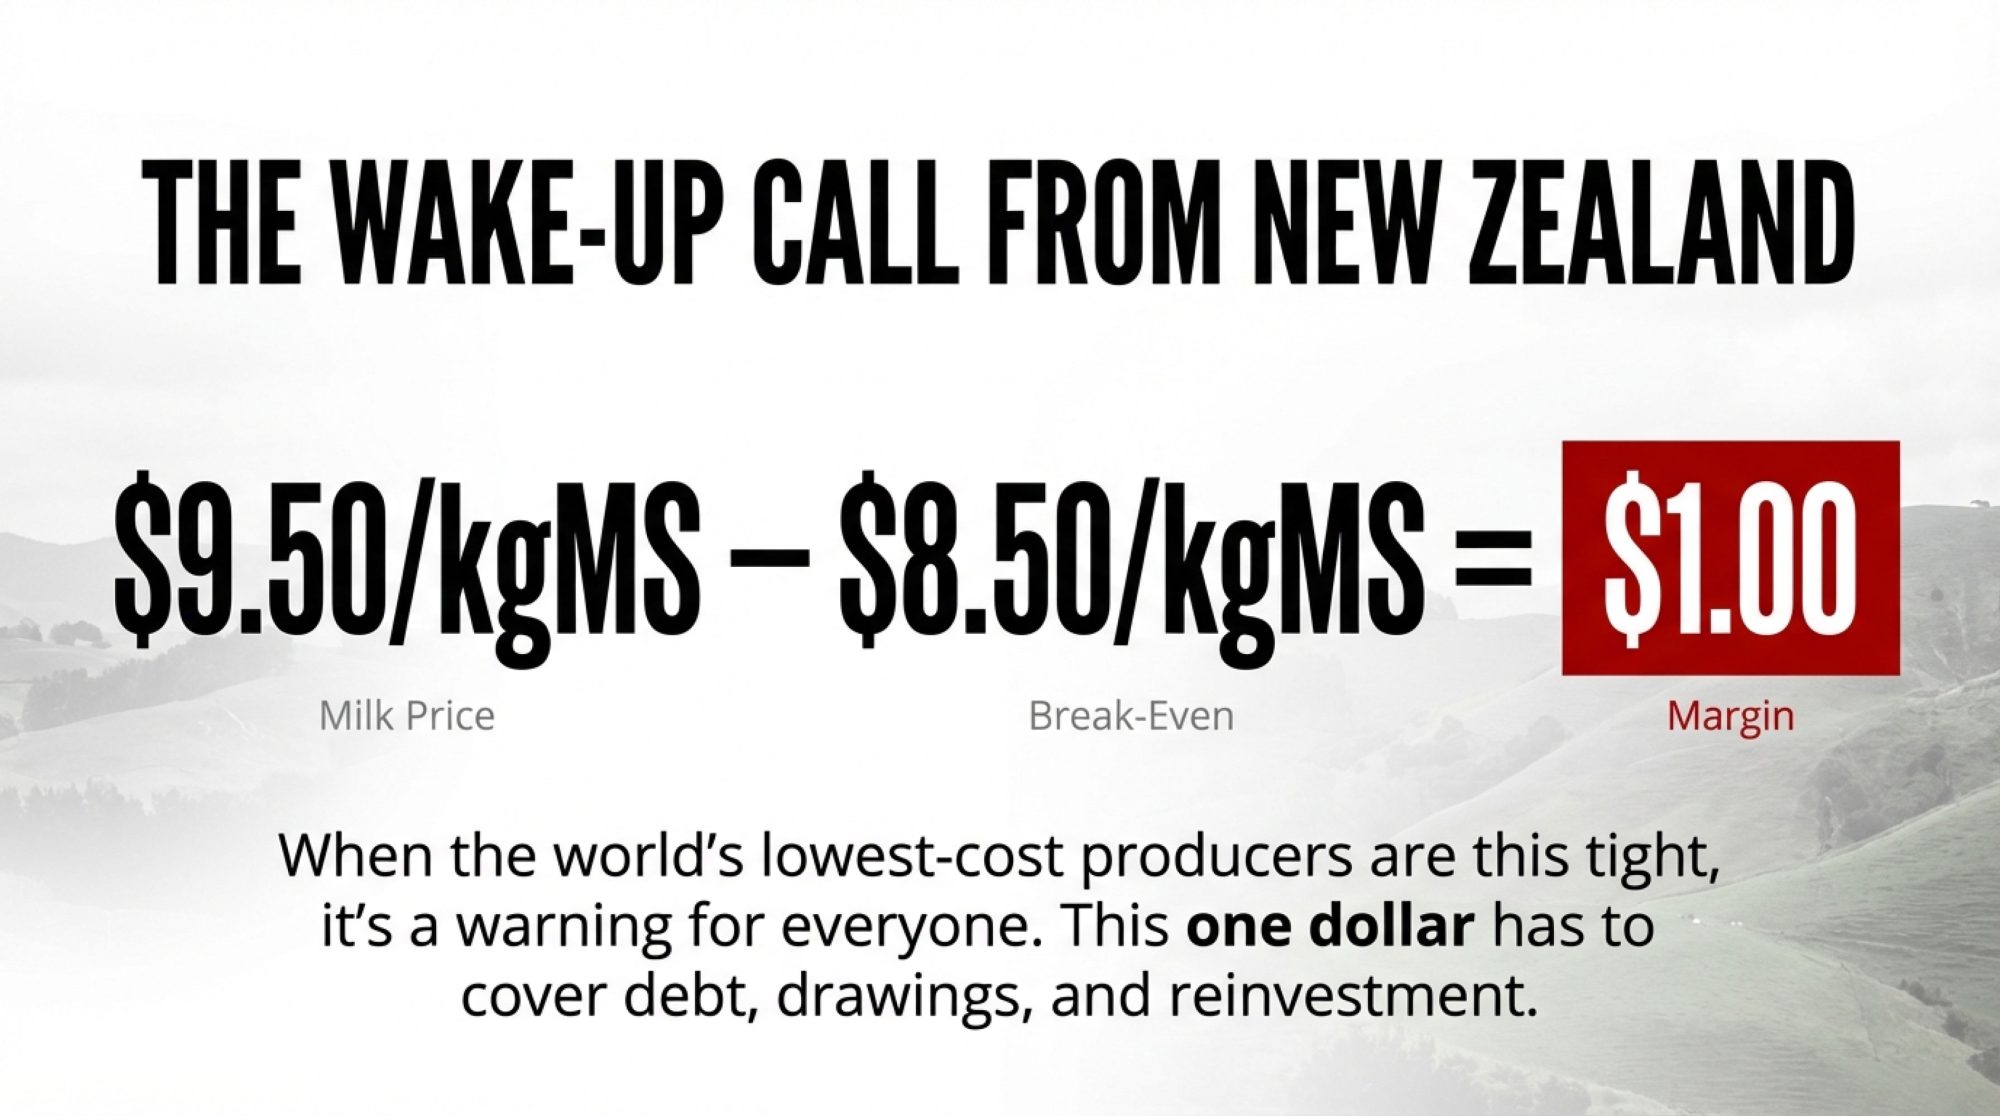
When the world’s lowest-cost milk producers are working on about one dollar of operating margin per kilogram of milk solids, that’s worth every dairy farmer’s attention.

That’s exactly where New Zealand finds itself heading into 2026.

Here’s what makes this relevant beyond the Pacific: it’s essentially a real-time stress-test of the global dairy model. From Wisconsin freestalls to Irish grass paddocks to Canterbury’s irrigated pastures, the underlying question is the same.

If New Zealand’s efficient pasture systems can’t maintain comfortable margins at these milk prices, what does that mean for the rest of us?

The narrative has shifted. It’s less about waiting for the next price spike and more about adapting to a new reality—one defined by persistent cost pressure, cautious global buyers, and markets that recover more slowly than they used to.

Understanding the One-Dollar Margin

DairyNZ’s December 2025 Economic Update paints a clear picture.

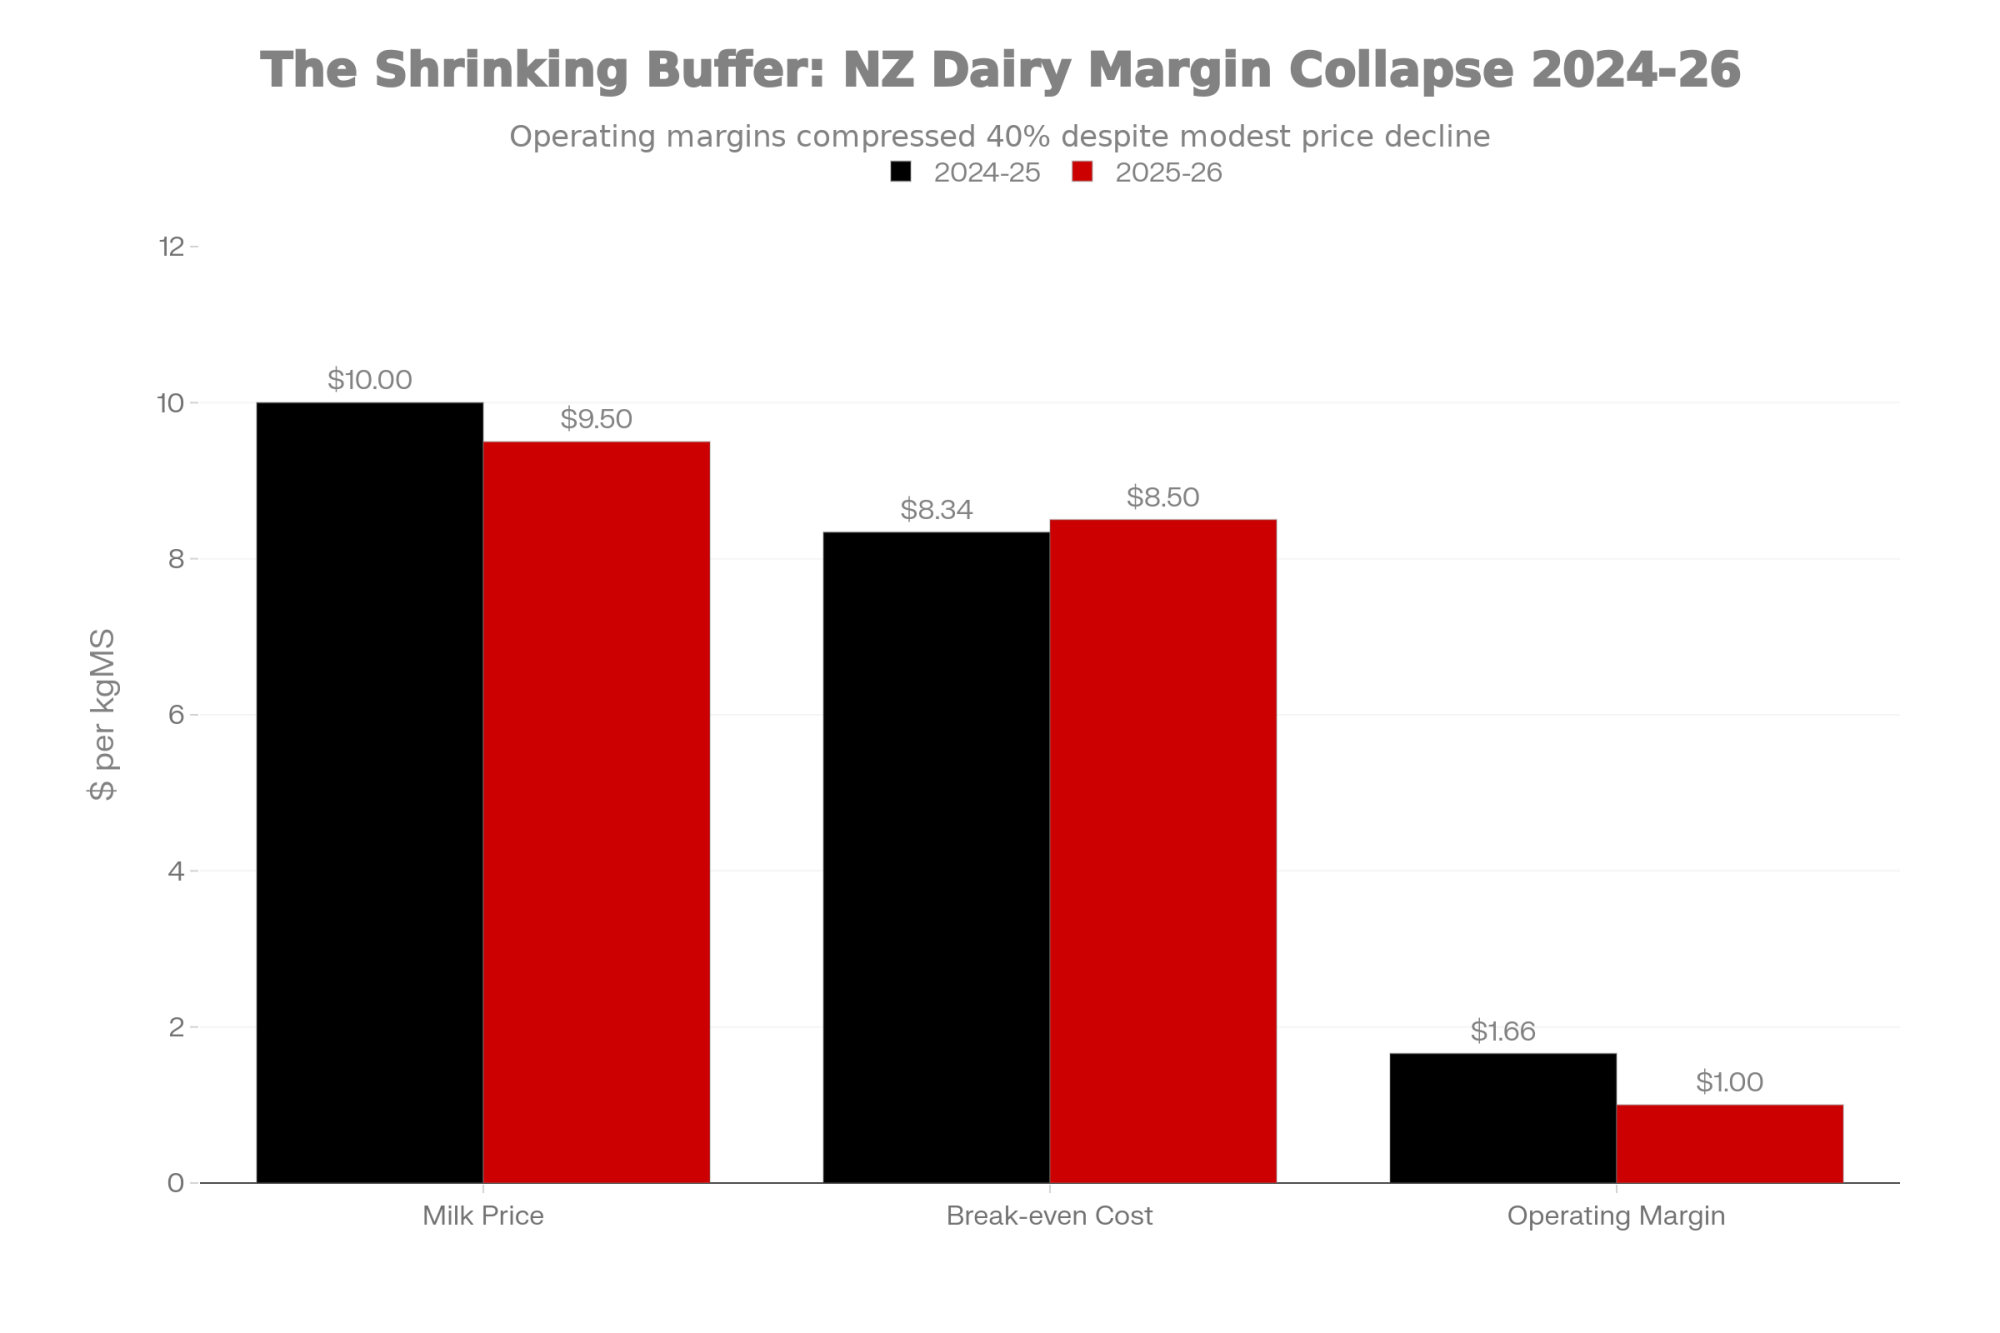
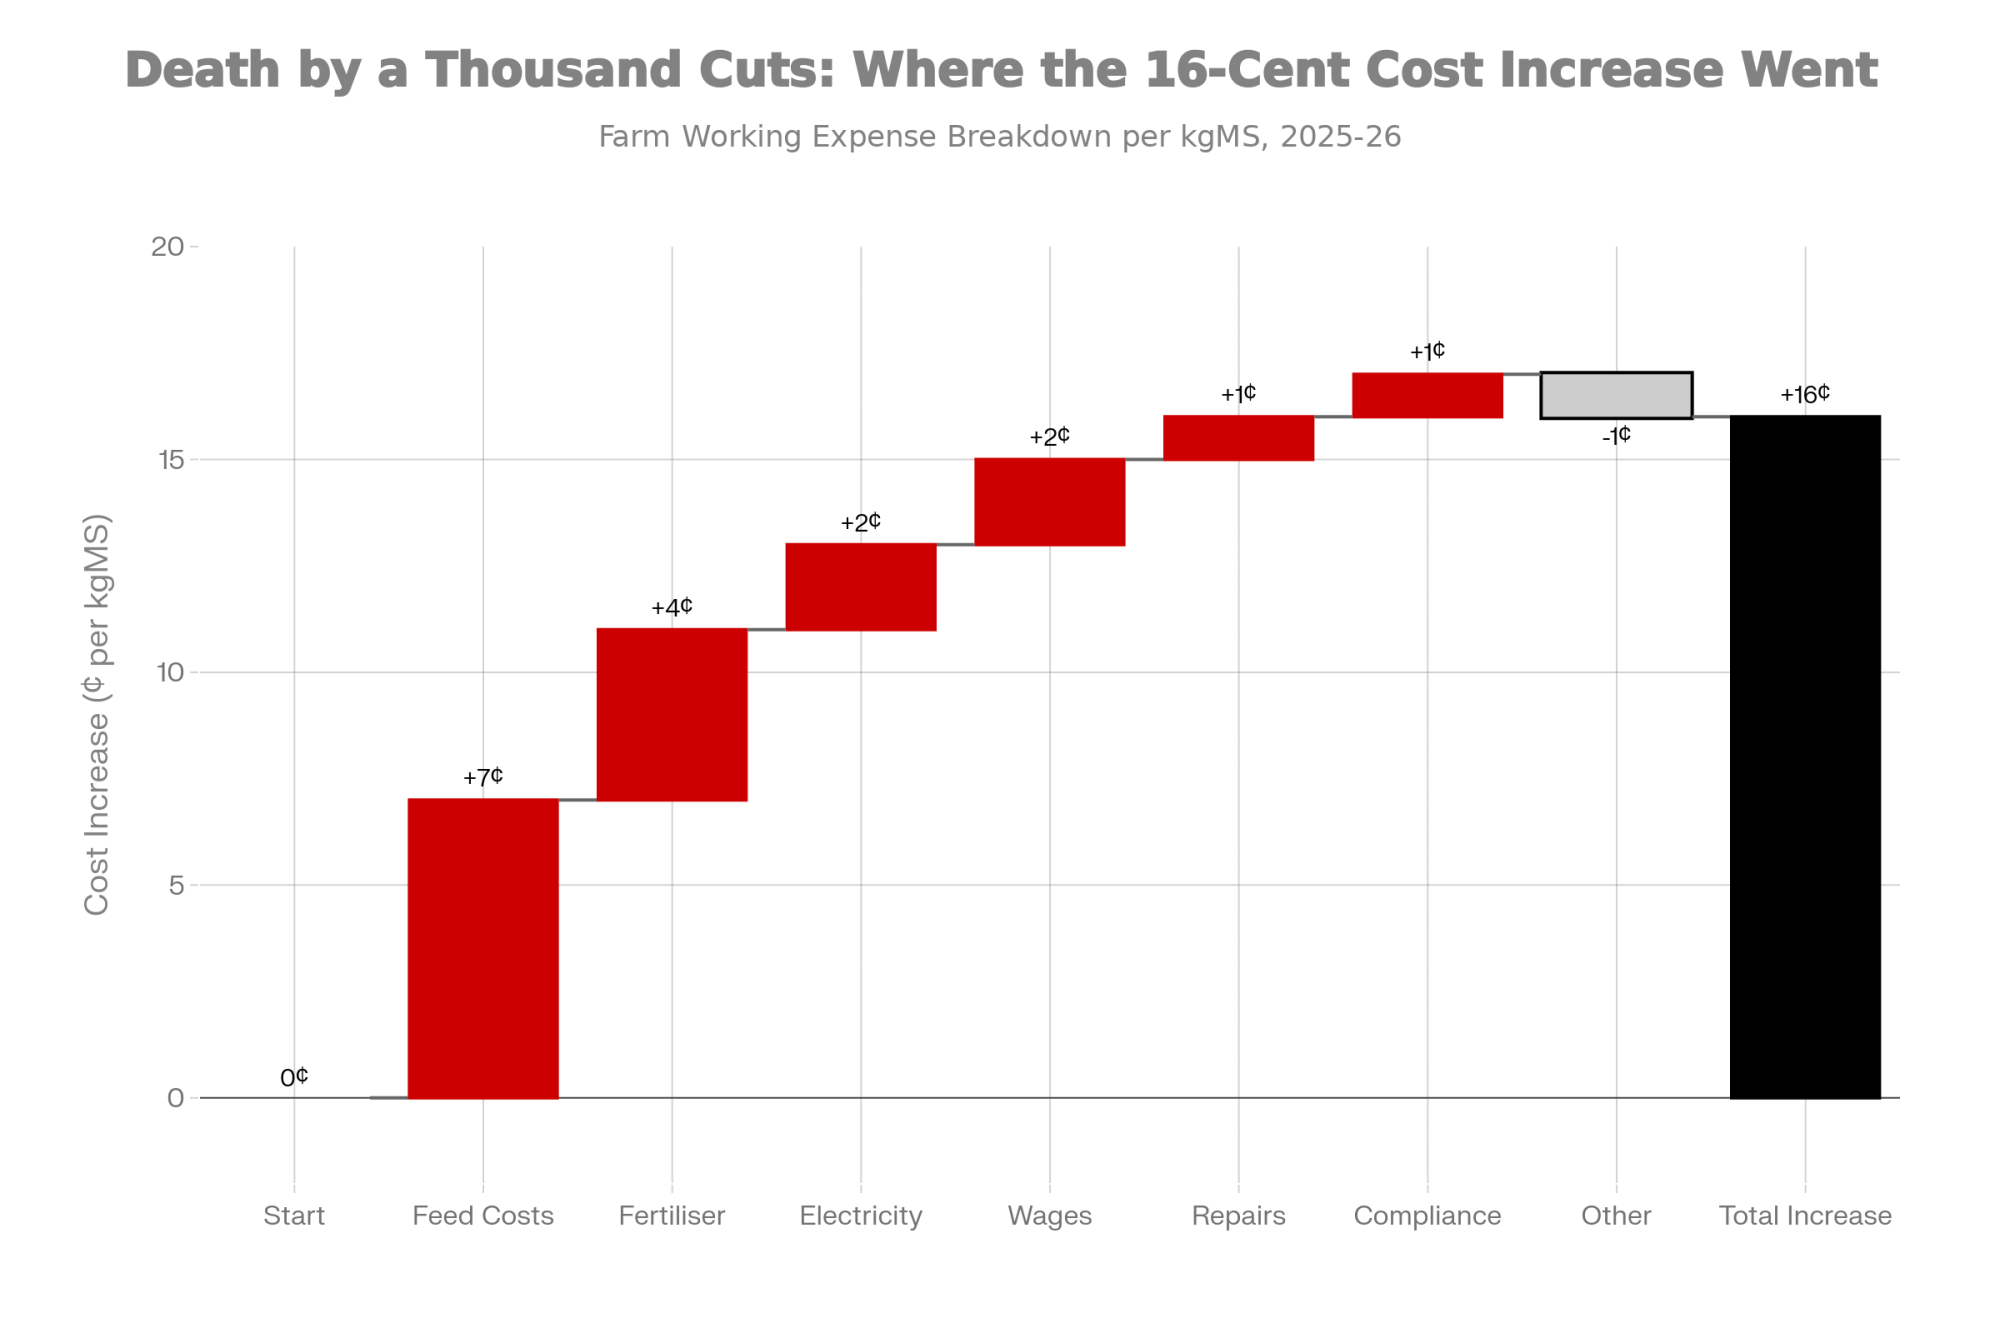
Farm working expenses have climbed 16 cents to $5.83 per kgMS. Meanwhile, Fonterra revised its 2025-26 farmgate milk price forecast down to a midpoint of $9.50 per kgMS—a notable drop from the earlier $10.00 projection.

DairyNZ puts the break-even milk price for an average reference farm at around $8.50 per kgMS.

That leaves roughly a dollar per kgMS as operating surplus. And that’s before capital repayments, family drawings, or any reinvestment.

Metric2024-25 Season2025-26 SeasonChange
Milk Price ($/kgMS)$10.00$9.50-$0.50
Break-even Cost ($/kgMS)$8.34$8.50+$0.16
Operating Margin ($/kgMS)$1.66$1.00-$0.66
Farm Working Expenses ($/kgMS)$5.67$5.83+$0.16
Interest Costs ($/kgMS)$1.46$1.11-$0.35

Tracy Brown, DairyNZ’s chair and herself a Waikato dairy farmer, offered some measured perspective in their December update: “Profit is still on the table, but the margin gap has clearly tightened, and that means every spending decision on farm needs a harder look.”

That’s a statement worth sitting with.

What This Looks Like on a Real Farm

Think about a fairly typical New Zealand herd—400 cows producing 400 kgMS each. That gives you 160,000 kgMS for the season.

At $9.50 per kgMS, gross milk revenue comes to about $1.52 million NZD. With a break-even point of around $8.50, core operating costs consume roughly $1.36 million.

That leaves approximately $160,000 NZD of operating surplus.

On paper, that’s profit. But reality includes broken gates, aging tractors, and family obligations. The buffer is much thinner than the headline suggests.

I recently spoke with a consultant who works across both New Zealand and Australian operations. His observation: for a 200-cow farm, that surplus might only be $80,000 NZD before tax and drawings. For a 2,000-cow operation, you’re looking at roughly $800,000—but spread across substantially higher fixed costs and larger teams.

Farm SizeProduction (kgMS)Gross RevenueOperating CostsOperating SurplusMargin Per Cow
200 cows80,000$760,000$680,000$80,000$400
400 cows160,000$1,520,000$1,360,000$160,000$400
2,000 cows800,000$7,600,000$6,800,000$800,000$400

The ratio matters more than the headline number. Whether you’re milking 200 or 2,000, everyone’s working with a narrower buffer.

The Takeaway: A $9.50 milk price sounds strong. But with $8.50 break-evens, you’re farming on a dollar of margin—and that dollar has to cover everything else.

Tracing the Cost Increases

Where exactly did those 16 cents go? Understanding the drivers makes them easier to address.

DairyNZ’s Econ Tracker identifies three primary contributors.

Cost CategoryIncrease (¢/kgMS)400-Cow Farm ImpactControllability
Feed Costs+7¢+$11,200Medium – Nutrition strategy
Fertiliser+4¢+$6,400Low – Global commodity
Electricity/Irrigation+2¢+$3,200Low – Fixed infrastructure
Wages+2¢+$3,200Low – Labour market
Repairs/Maintenance+1¢+$1,600Medium – Defer vs invest
Compliance+1¢+$1,600None – Regulatory
Other Operating-1¢-$1,600Variable
TOTAL+16¢+$25,600

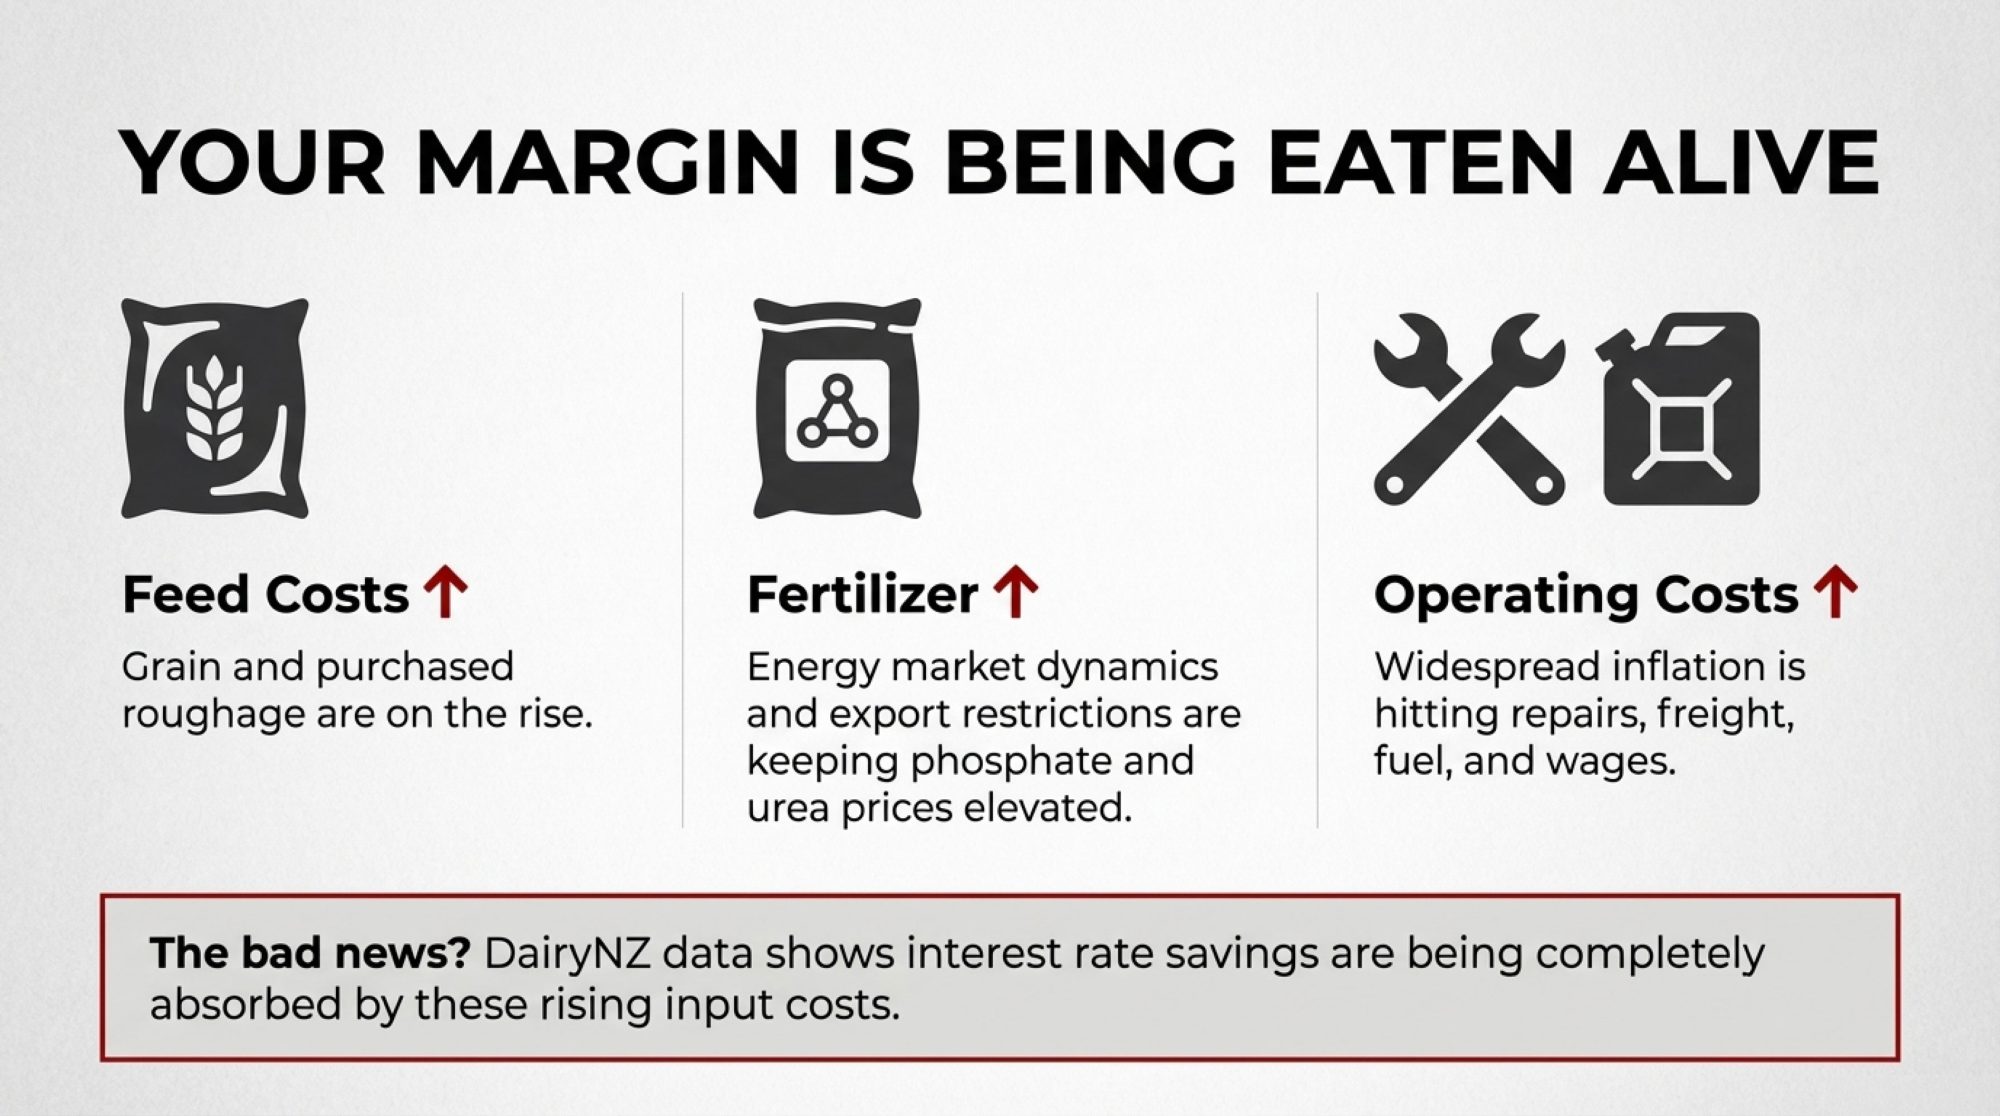
Feed costs have risen meaningfully year-on-year across most categories. Palm kernel has been somewhat more stable, but grain and purchased roughage have risen noticeably.

Fertiliser continues to pressure budgets. Phosphate and urea prices remain elevated, driven by energy market dynamics and export restrictions from major suppliers. Teagasc’s Outlook 2026 suggests costs will climb further as the EU Carbon Border Adjustment Mechanism takes effect.

Other operating costs—repairs, freight, wages, fuel, compliance—have all experienced inflation.

The encouraging news? DairyNZ reports that interest costs are easing. Payments are forecast to drop about 35 cents to $1.11 per kgMS for 2025-26.

The catch? Those interest savings are largely offset by increases elsewhere. The budget might show relief on one line, but feed, fertiliser, and operating costs are absorbing it.

For a 200-cow farm, this might mean choosing between replacing an ageing parlour component or making do with repairs. On a 2,000-cow dry-lot operation, it could be the difference between upgrading a feed mixer or deferring that decision another year.

The Takeaway: Feed and fertiliser are eating your interest rate savings before you ever see them.

The Production Paradox

This is where the situation becomes counterintuitive.

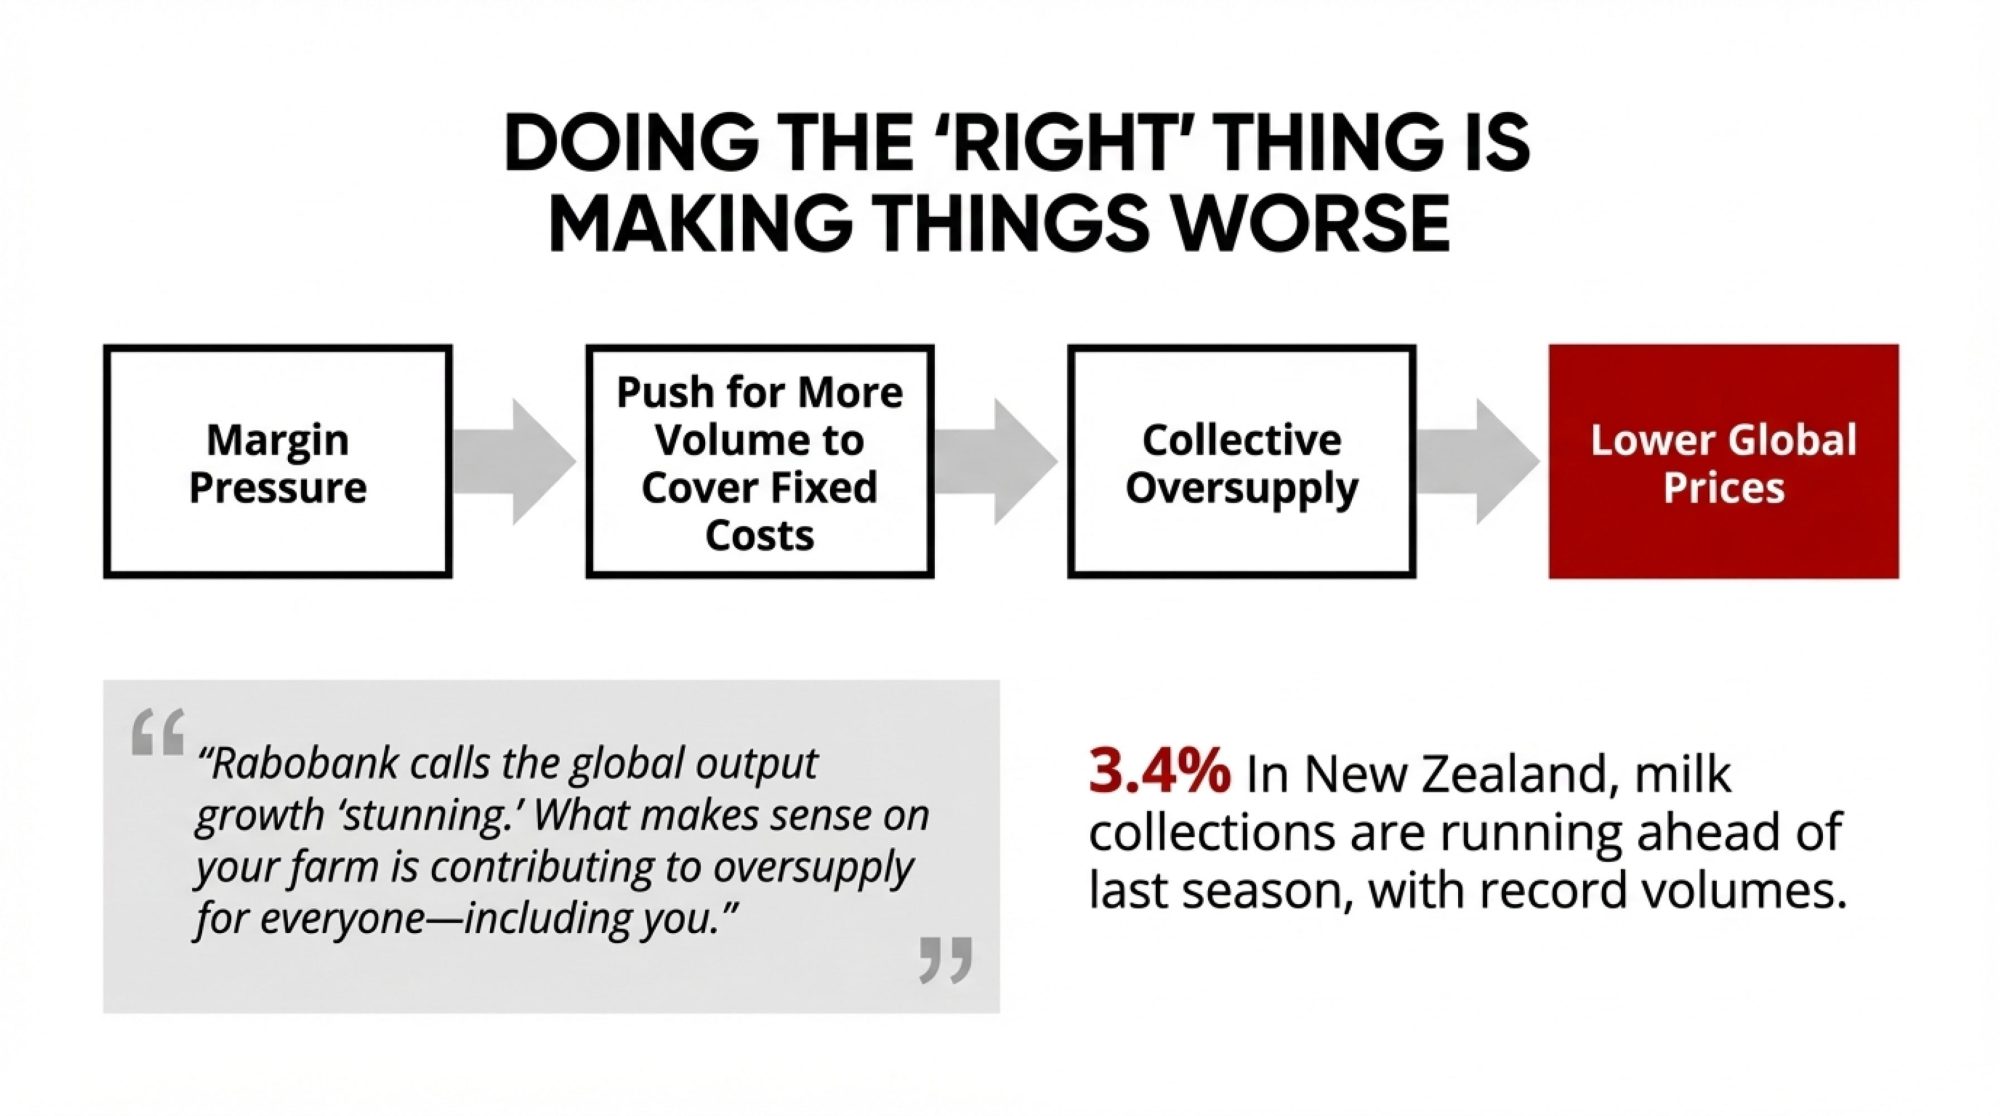
New Zealand is currently in its spring flush. DairyNZ reports national milk collections running about 3.4% ahead of last season, with August and October 2025 volumes among the highest on record.

South Island production in October was up 5.7% year-on-year. Customs data shows palm kernel imports are up significantly—a clear indicator that farmers leaned into purchased feed to boost production.

Why does this matter? Because the same pattern is playing out across multiple dairy regions simultaneously.

I’ve been following similar trends in US and European coverage. Where corn or by-products are relatively affordable, there’s considerable temptation to push cows harder to maintain cashflow. Especially when fixed obligations don’t adjust downward just because your milk price does.

At the individual farm level, this appears entirely rational. If you’ve already invested in the parlour, the effluent system, and the bank financing, pushing a few more kilograms through spreads those fixed costs.

But collectively? When New Zealand, the US, Ireland, and parts of Europe all make that same calculation simultaneously, you end up with what Rabobank’s December 2025 commentary described as “stunning” global output growth.

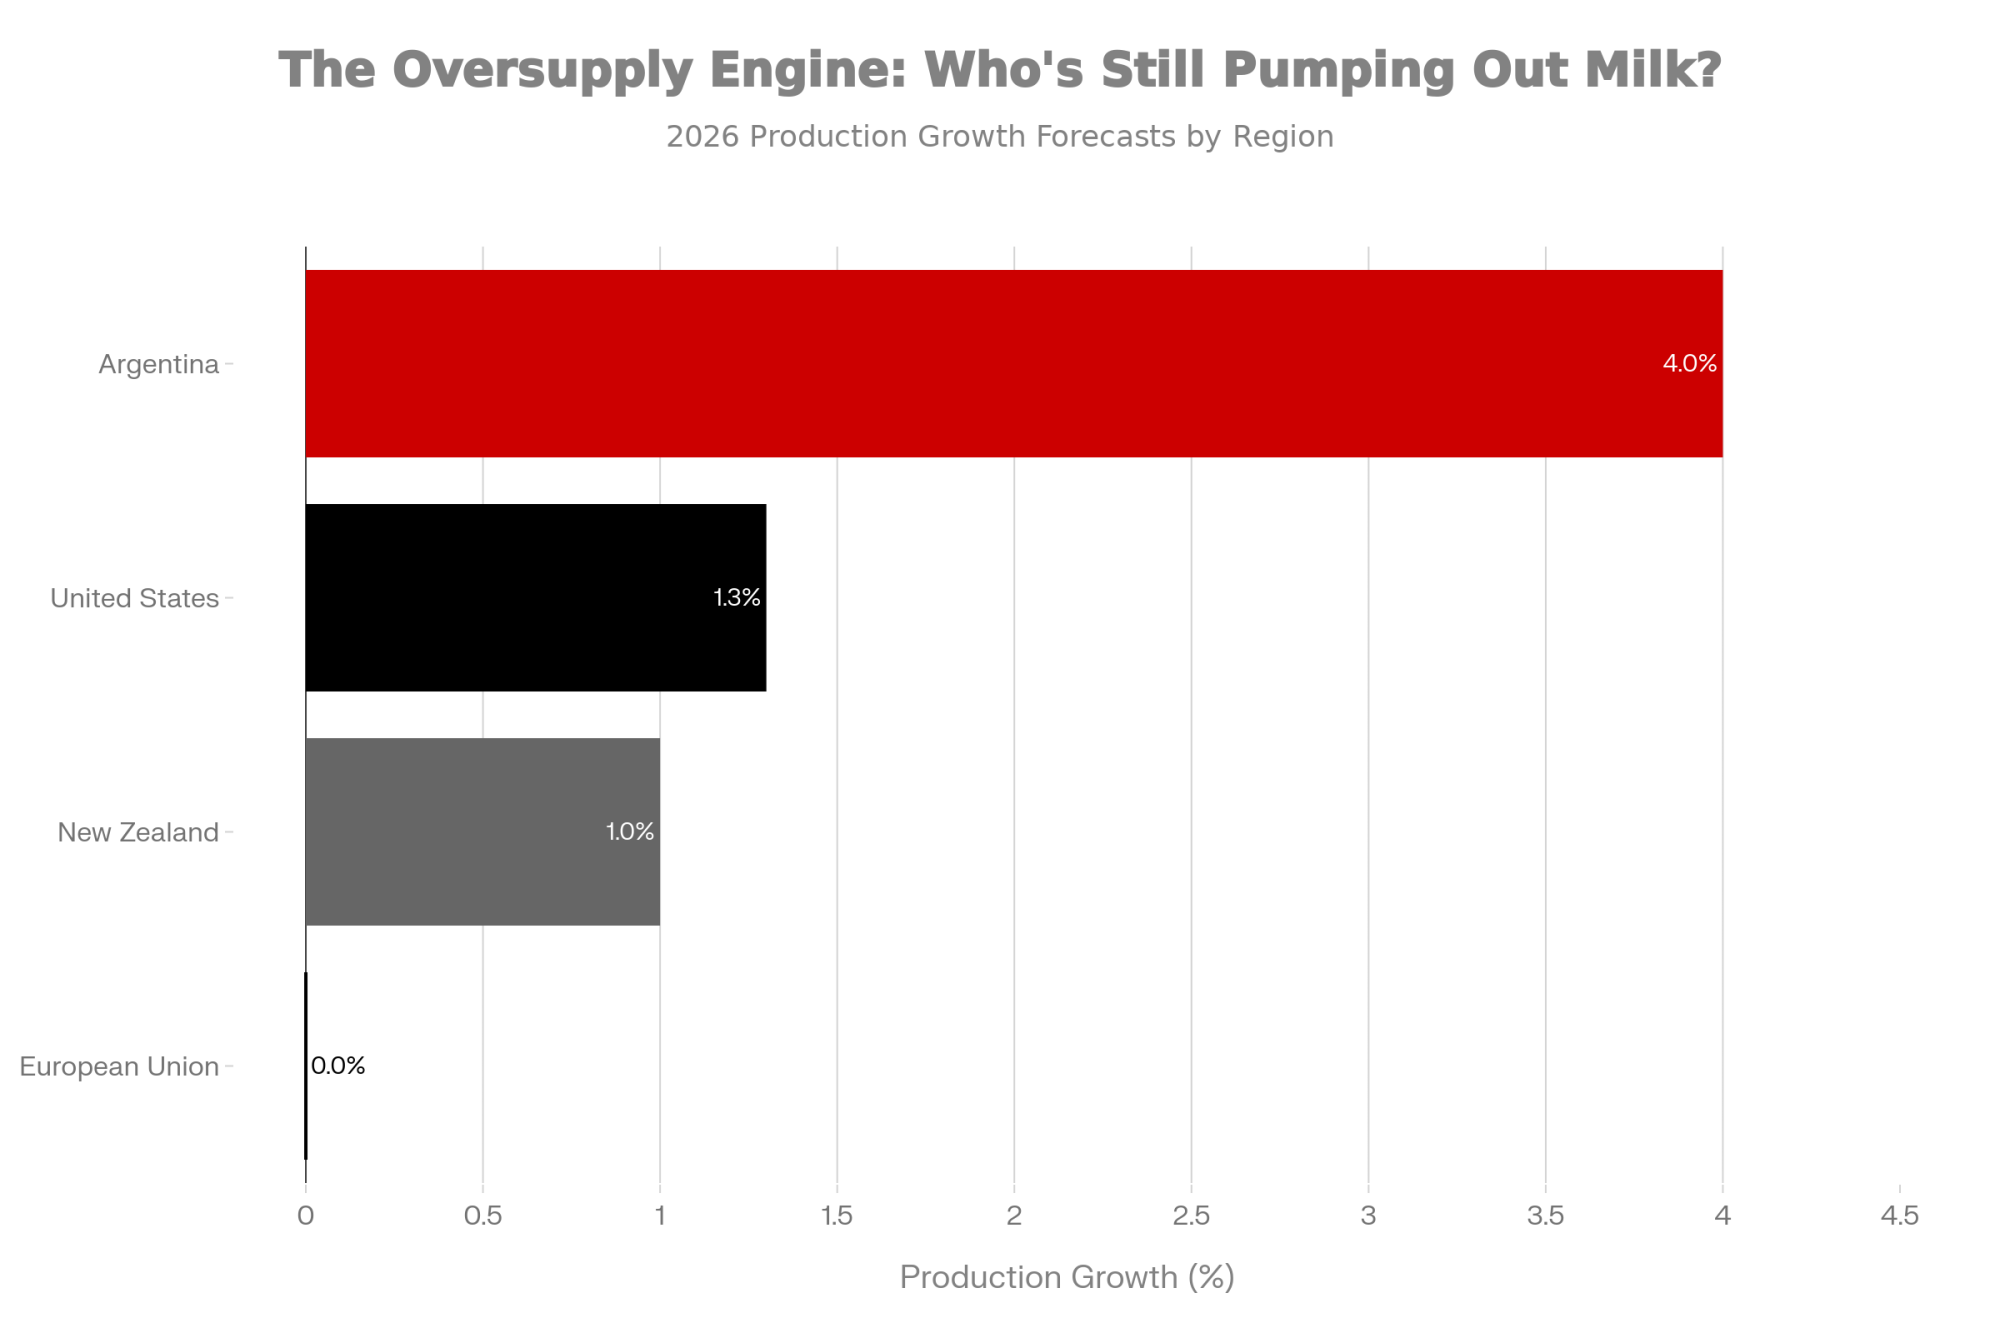
Region2026 Growth ForecastImpact on Global Supply
Argentina+4.0%Aggressive expansion continues
United States+1.3%Steady growth despite tight margins
New Zealand+1.0%Spring flush pushing volumes
European Union0.0%Only major exporter hitting brakes

That additional milk is precisely why price forecasts have moderated.

A Midwest producer I spoke with recently put it simply: “We’re not trying to grow anymore—we’re trying to survive long enough to see the other side.”

The Takeaway: What makes sense on your farm might be making things worse for everyone—including you.

Regional Perspectives

New Zealand’s experience offers the clearest current signal. But similar pressures are emerging across other major dairy regions.

RegionCurrent Margin (2025)2026 ForecastKey Pressure PointCompetitiveness
New Zealand+$1.00/kgMSTight ($0.80-1.00)Feed & fert eating savingsHigh — Pasture based
Ireland€0.115/LSevere (-45%)Butter price collapseMedium — Scale challenges
United KingdomBelow cost (38.5p/L)Further pressureCommodity liquid pricingLow — High costs
United States (DMC)Above $9.50/cwtStable (low feed)Production growthVariable — Regional
European UnionSqueezed — variedContraction likelyChina probe uncertaintyMedium — Policy support

Ireland: Preparing for a Correction

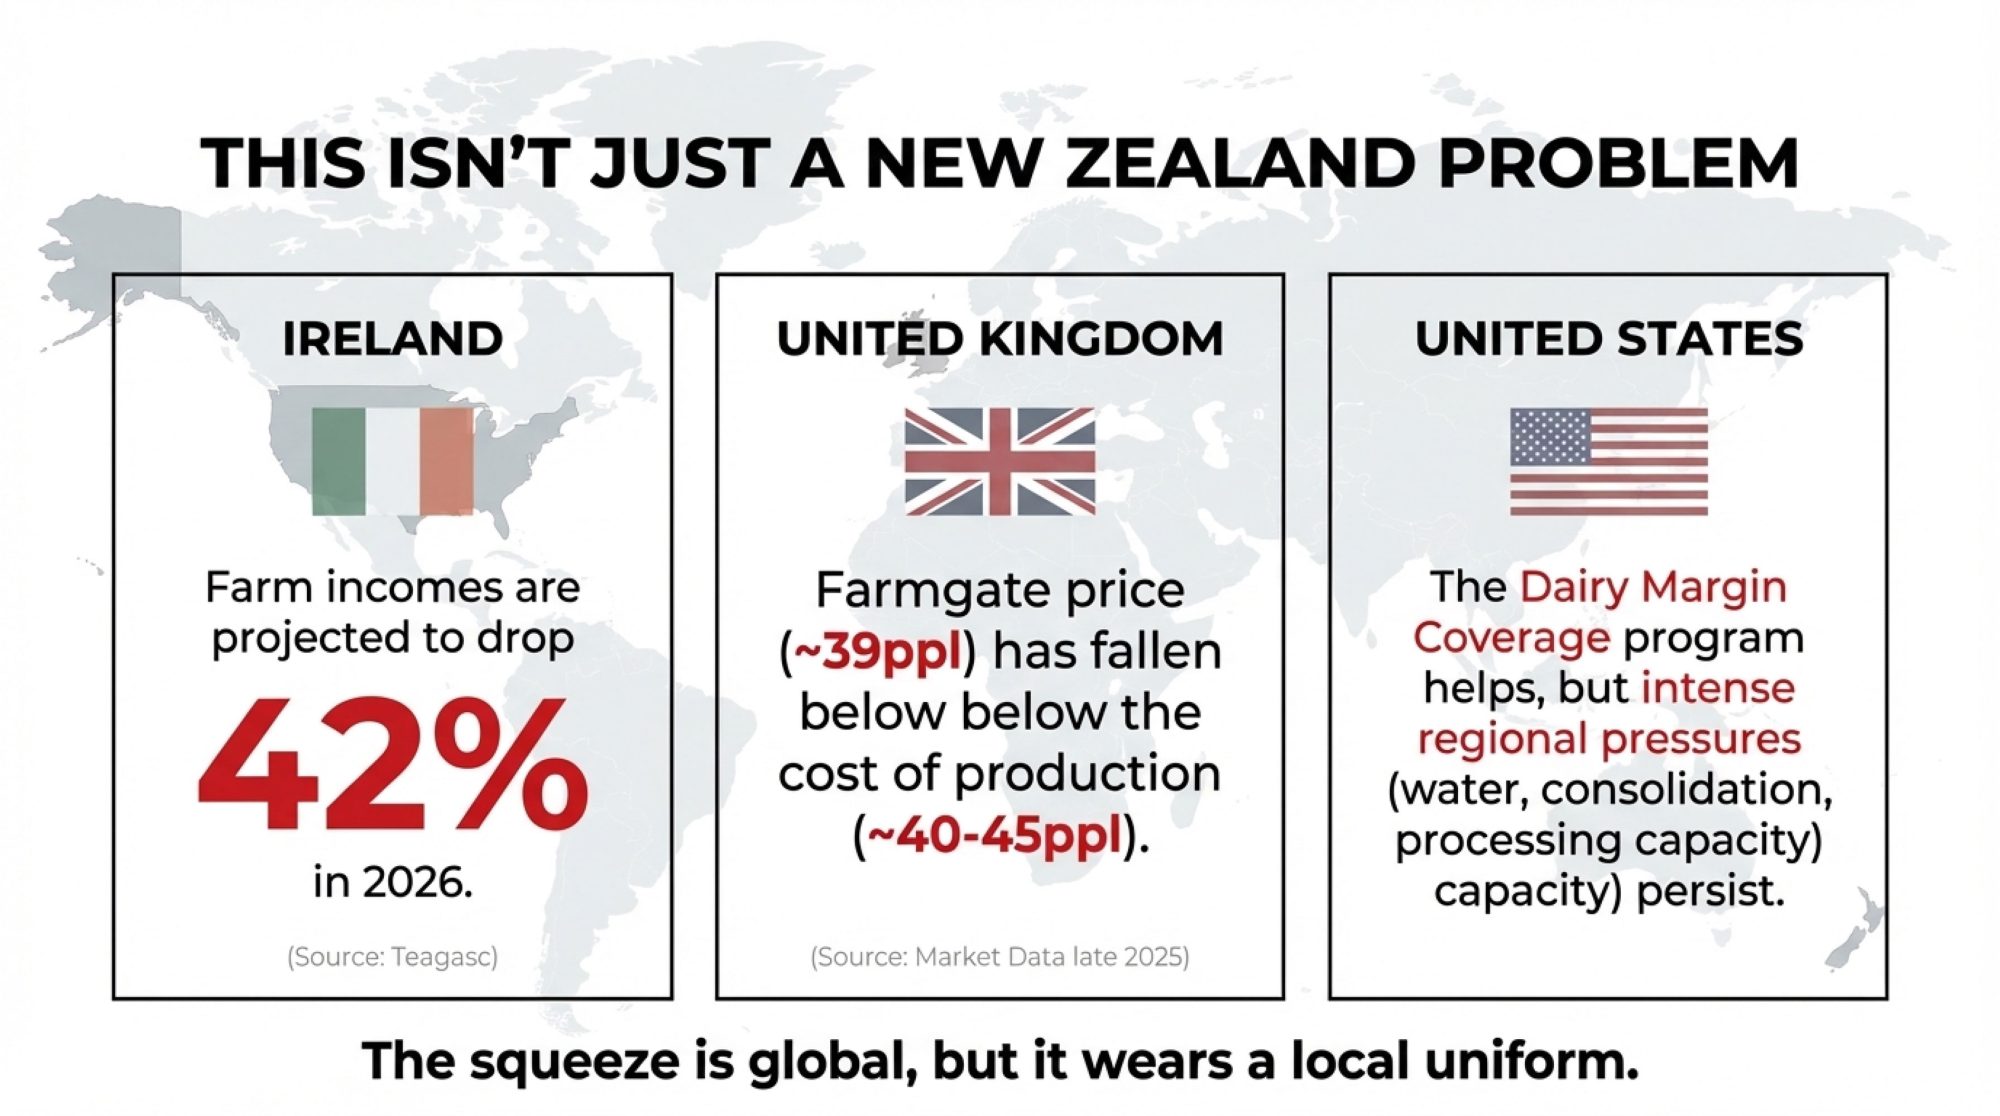
Teagasc’s Outlook 2026 projects that average Irish dairy farm incomes could decline by approximately 42% in 2026. That would take the average income from an estimated €137,000 this year to around €80,000.

Their baseline anticipates milk prices moderating from the high-40s cent per litre range back toward approximately 42 cents.

At 11.5 cents per litre, the average dairy net margin in 2026 is forecast to be down 45% from 2025 levels.

For a 70-hectare, 100-cow family farm, cash surplus after drawings and loan repayments could drop from around €80,000 to closer to €45,000.

That’s manageable if the debt is moderate. For operations that expanded aggressively, the adjustment will be sharper.

The UK: Below-Cost Production

Recent market data shows that farmgate milk prices have fallen below full production costs for many operations.

As of late 2025, Arla’s conventional price sits around 39.21 pence per litre. Müller’s Advantage price drops to 38.5ppl from January 2026.

Industry estimates place all-in production costs closer to the 40-45ppl range.

The picture varies by contract type. Producers on cheese or retailer-aligned arrangements often fare better. But in the commodity liquid segment, some operations are producing milk at a level below full economic cost.

Processors have responded by shifting toward component-based and fixed-volume contracts. Retailers continue to prioritise competitive shelf prices, putting pressure on producers’ margins.

The US: Regional Variations

The American experience differs due to policy structure—and substantial regional variation.

The Dairy Margin Coverage programme has provided meaningful support. The University of Wisconsin Extension reports that through the first ten months of 2023, DMC distributed over $1.27 billion in indemnity payments. That averaged approximately $74,453 per enrolled operation, with around 17,059 dairy operations participating.

But the experience varies dramatically by region.

In California, water costs and environmental compliance add layers of expense that Midwest operations don’t face. Wisconsin operations are navigating processor consolidation and volatility in the cheese market. Northeast producers face declining fluid milk demand and processing capacity constraints.

Larger US herds—1,000 cows and above—are increasingly relying on scale economies and diversified revenue streams. Beef-on-dairy programmes, heifer development, and energy projects are becoming standard.

The Takeaway: The squeeze is global, but every region has its own version. Know your local dynamics.

The China Factor

For two decades, much of dairy’s long-term optimism rested on a straightforward assumption: China would continue buying more.

That assumption deserves recalibration.

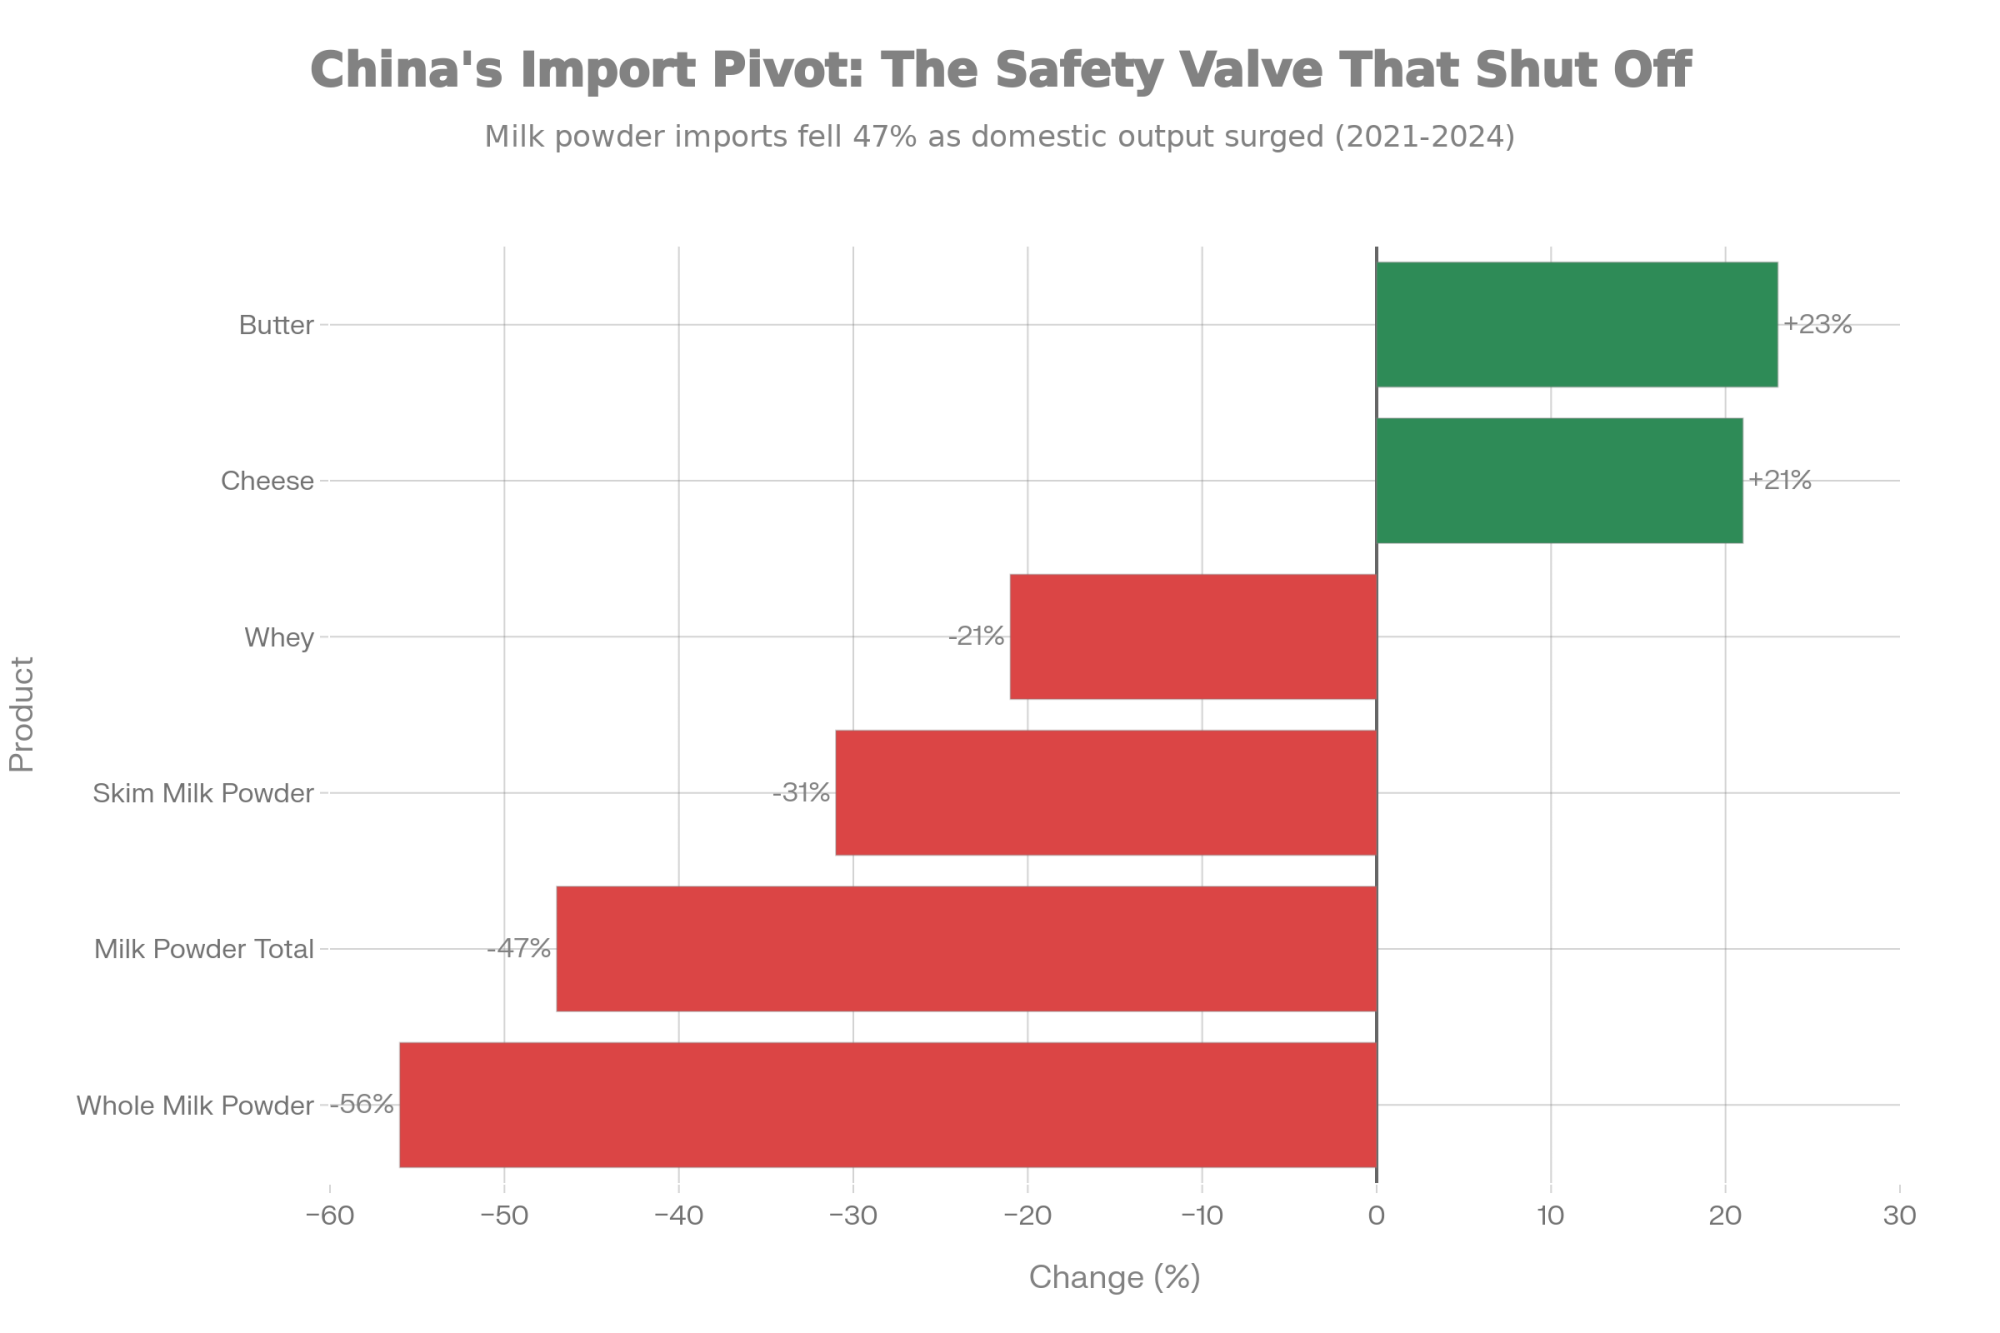
New Zealand Treasury’s 2024 dairy exports analysis, Rabobank’s global outlooks, and trade reports identify three meaningful shifts.

Product Category2021 Imports (MT)2024 Imports (MT)ChangeTrend
Whole Milk Powder1,680,000740,000-56%Domestic production surge
Milk Powder (Total)2,580,0001,360,000-47%Structural decline
Skim Milk Powder900,000620,000-31%Domestic substitution
Whey480,000380,000-21%US tariff impact
Cheese140,000170,000+21%Foodservice growth
Butter110,000135,000+23%Bakery sector expansion

Domestic production has expanded substantially. China has invested heavily in large-scale dairy operations. This is structural import substitution, not a temporary measure.

Per-capita consumption growth has moderated. Dairy consumption continues trending upward, but at slower rates than during the expansion years. The steepest part of the adoption curve appears behind us.

Purchasing behaviour has become tactical. Chinese buyers now step back when prices strengthen and increase purchases when value emerges—rather than consistently supporting auctions.

China remains a vital market. But it’s no longer the automatic release valve that absorbs surplus production.

The Takeaway: Don’t count on China to bail out oversupply anymore. That era is over.

What Farmers Are Actually Doing

When margin discussions move from conferences to kitchen tables, what are producers actually changing?

Managing Through Feed

In New Zealand, palm kernel imports are up significantly. Many farmers chose to push production while payout expectations remained near $10/kg MS.

Similar decisions are playing out in US operations where corn and by-products remain relatively affordable.

The logic is straightforward: when principal payments and family expenses don’t flex with milk price, spreading fixed costs across more production can appear to be the only short-term lever.

Strengthening Balance Sheets

New Zealand’s Ministry for Primary Industries notes that some farmers used the strong 2021-2023 payouts to reduce debt rather than adding infrastructure.

That decision is looking increasingly prudent.

On a 200-cow farm, this might translate to directing an extra $20,000 annually toward debt reduction rather than equipment upgrades. On a 2,000-cow operation, it could mean restructuring short-term facilities into longer-term arrangements.

Diversifying Revenue

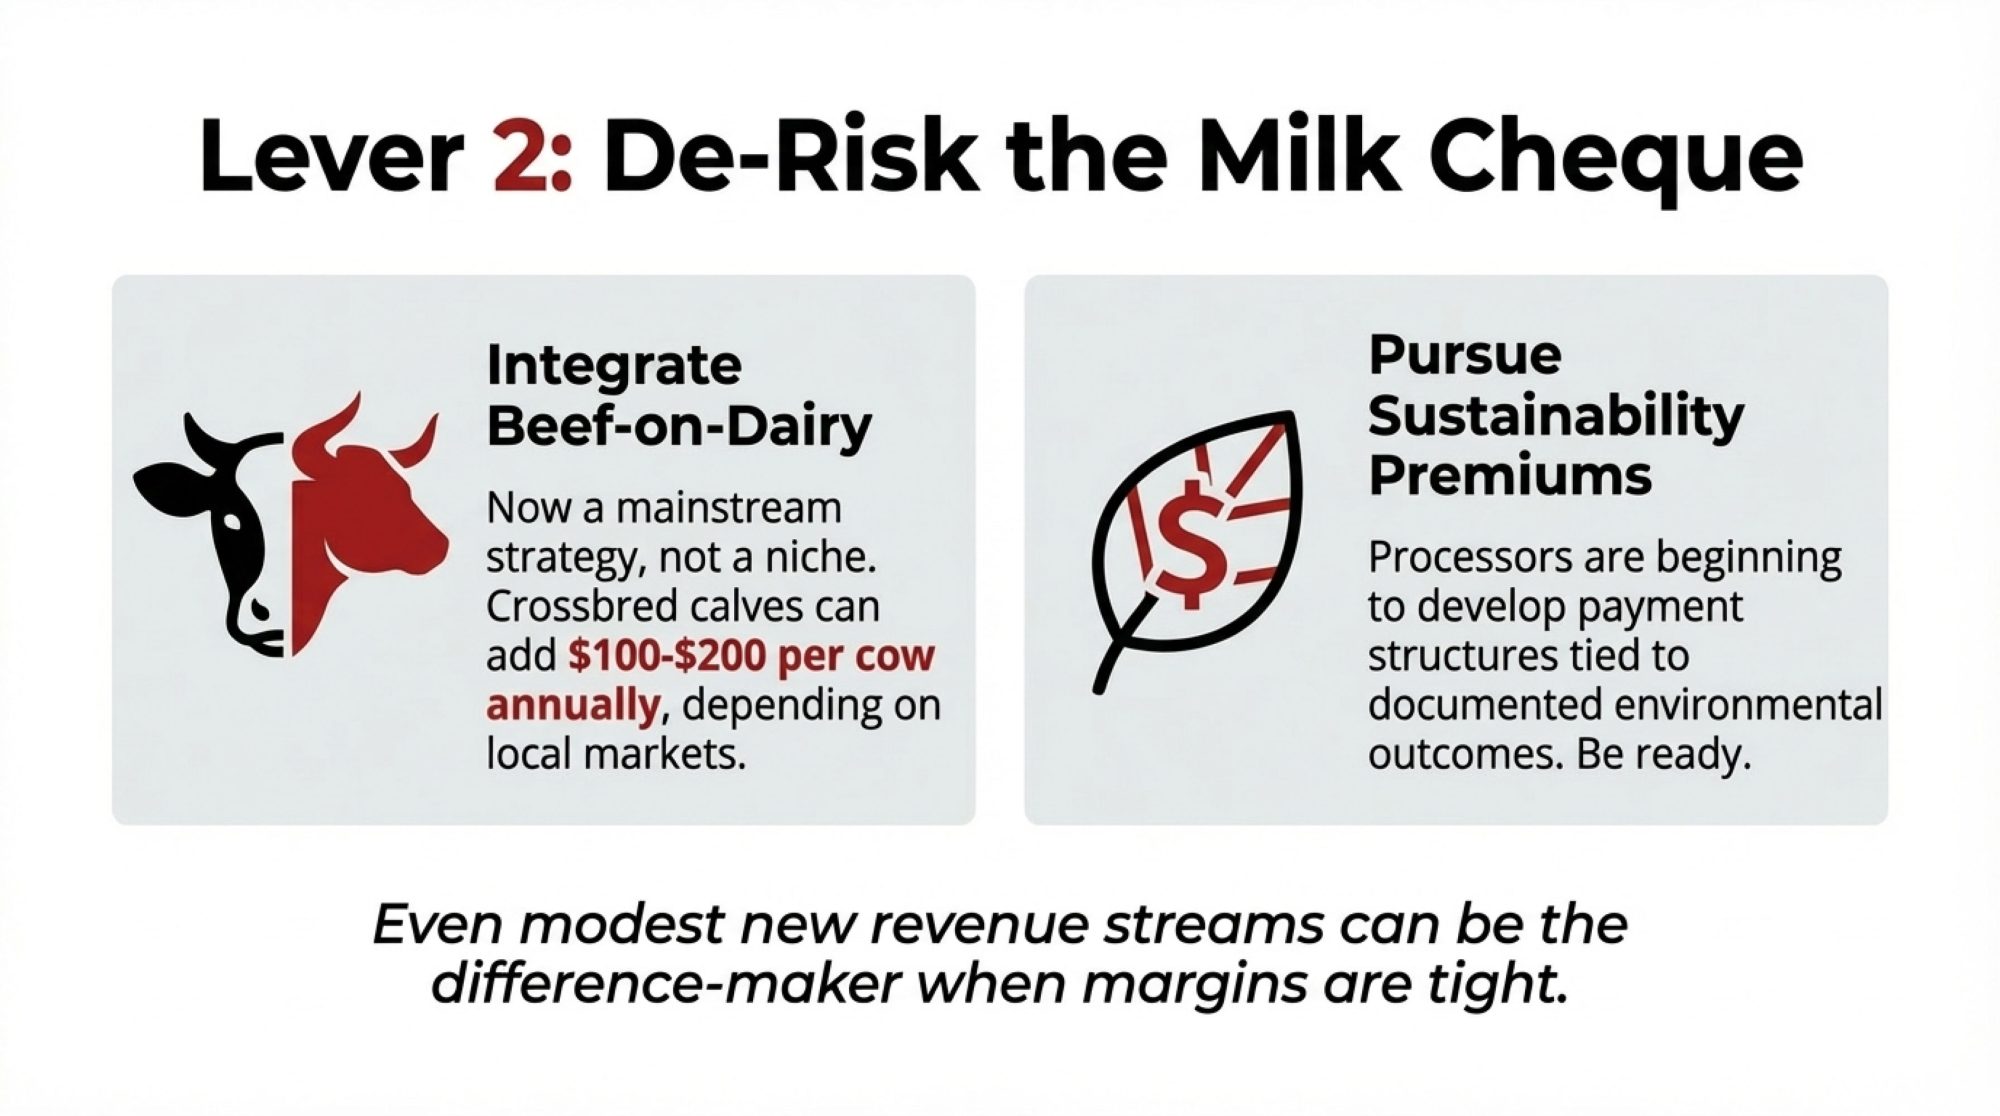
Beef-on-dairy has become mainstream. Industry analyses suggest crossbred calves can add $100-200 per cow annually, depending on local markets.

Sustainability-linked premiums are emerging as processors develop payment structures tied to documented environmental outcomes.

Even modest additional revenue streams—$50,000-$100,000 annually on a mid-sized operation—can make a meaningful difference when the milk cheque alone isn’t covering the spread.

The Takeaway: Smart operators aren’t just cutting costs. They’re restructuring debt and finding new revenue.

StrategyShort-Term CashflowMargin ImpactRisk LevelBest For
Push Production (Palm Kernel)Improved$0.85/kgMSHigh — Adds to oversupplyHigh debt, large scale
Cut Costs AggressivelyPreserved$1.15/kgMSMedium — Quality risksMedium farms, low debt
Maintain Status QuoSqueezed$1.00/kgMSHigh — Thin bufferNo flexibility
Reduce Debt FirstReduced$1.00/kgMSLow — Future flexibilityStrong balance sheet

Strategic Levers by Scale

Even in challenging margin environments, individual operations retain meaningful levers. They won’t shift global prices, but they determine which side of the margin line you occupy.

Feed Efficiency and IOFC

Research consistently documents substantial variation in feed efficiency—both between herds and within individual herds.

Progress typically comes from:

  • Forage quality management—harvest timing, processing, storage, feedout
  • Fresh cow protocols that establish strong intake patterns during those critical first 30-60 days
  • Active use of income over feed cost metrics as management tools, not retrospective reports

Getting started: On smaller operations, work with a nutritionist to develop simple IOFC reporting by production group. On larger TMR operations, establish monthly review rhythms to identify underperforming groups.

Component Value Capture

As payment systems emphasise solids over volume, butterfat and protein percentages deserve strategic attention.

The value ranges from 75 cents to $1.25 per hundredweight in many component-based systems, even at equivalent volume.

Getting started: Talk with your AI representative about reorienting sire selection toward fat and protein kilograms. Pair that with a nutritionist input on optimising rumen health, not just energy delivery.

Beef-on-Dairy Integration

This has evolved from a niche strategy to standard practice.

Getting started: Begin with market research. Talk with calf buyers about which terminal breeds and calving ease profiles actually command premiums in your area.

Financial Structure

What research keeps showing—across EU and Latin American farms alike—is that how you structure debt often matters as much as how efficiently you produce.

Getting started: Have proactive lender conversations before cash flow challenges emerge. Walk through three-year projections under multiple price scenarios.

The Takeaway: You can’t control global milk prices. But you can control feed efficiency, component focus, revenue diversity, and debt structure.

StrategyImmediate Impact1-Year Margin GainResilienceCapital Required
Feed Efficiency FocusModerate — Slow gains+$0.10-0.20/kgMSHigh — PermanentLow — Nutrition/management
Component OptimizationModerate — Genetic lag+$0.15-0.25/kgMSHigh — PermanentLow — Semen/consulting
Beef-on-Dairy IntegrationHigh — Instant revenue+$0.08-0.15/kgMSMedium — Market dependentLow — Contract only
Aggressive Debt ReductionLow — Reduces cashflow$0/kgMSVery High — Future flexibilityHigh — Requires surplus
Volume Push (Status Quo)High — Spreads fixed costs-$0.05 to +$0.05/kgMSLow — Worsens oversupplyModerate — Feed purchases

What Could Actually Change Things?

If current margin pressure is structural, what developments might shift the trajectory?

Genuine supply contraction would require sustained exits that actually reduce production capacity. We’re seeing accelerating consolidation in parts of Europe, the UK, and Australia. It’s unclear whether the pace is sufficient.

Emerging market demand growth offers longer-term potential in Southeast Asia, Africa, and Latin America. But developing those markets takes time.

Policy and structural changes—such as transition support, improved risk-sharing between processors and producers, and trade agreements—could shift the environment. But political processes move slowly.

None of these are quick fixes. But understanding the possibilities helps inform longer-term positioning decisions.

Key Takeaways

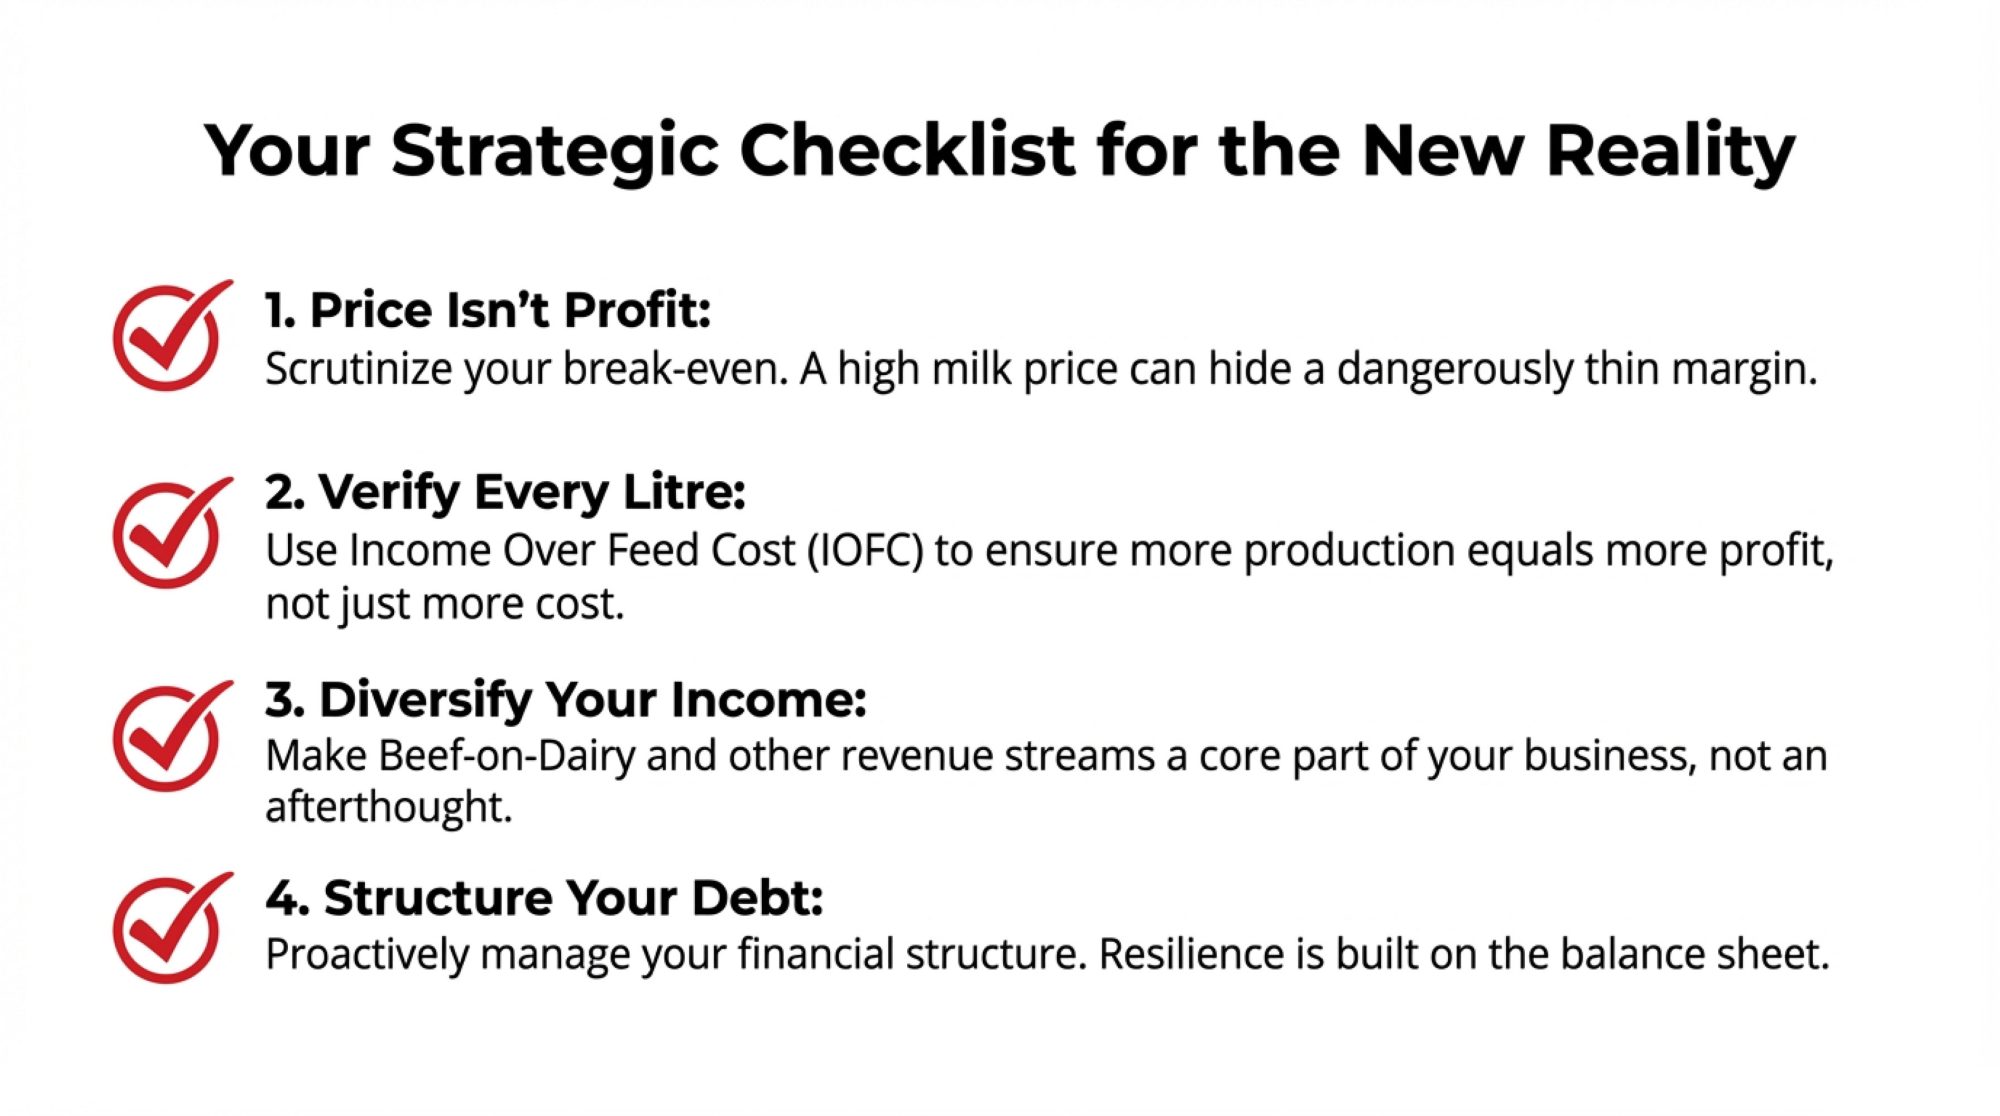
Price levels don’t ensure margin. A $9.50 per kgMS payout with $8.50 break-evens means strong prices can coexist with tight margins.

Volume gains require margin verification. More production can support cashflow while contributing to oversupply. Check IOFC, not just output.

Input decisions carry strategic weight. Feed and fertiliser now warrant careful analysis, not routine repetition.

Revenue diversification has moved mainstream. Beef-on-dairy and sustainability premiums are standard elements, not experiments.

Financial structure shapes survival. Operations that reduced debt during good years enter this period with more flexibility.

Opportunity persists, but looks different. More competition, more selective buying, more scrutiny. Adapt or get squeezed.

The Bottom Line

No individual farm can resolve global oversupply. No policy will quickly restore previous comfort levels.

But careful attention to what New Zealand’s numbers reveal—and thoughtful application regardless of region or scale—can improve the odds of staying on the right side of that one-dollar margin line.

The farms that thrive in 2030 are making decisions right now. Not necessarily to get bigger. But to get more resilient, more diversified, more intentional about where margin actually comes from.

Complete references and supporting documentation are available upon request by contacting the editorial team at editor@thebullvine.com.

Learn More:

The Sunday Read Dairy Professionals Don’t Skip.

Every week, thousands of producers, breeders, and industry insiders open Bullvine Weekly for genetics insights, market shifts, and profit strategies they won’t find anywhere else. One email. Five minutes. Smarter decisions all week.
NewsSubscribe
First
Last
Consent

The $200K Dairy Margin Trap: What Cheap Feed Won’t Tell You About 2026

Feed dropped 75¢. Milk dropped $2. That’s not savings—that’s a $200K trap.

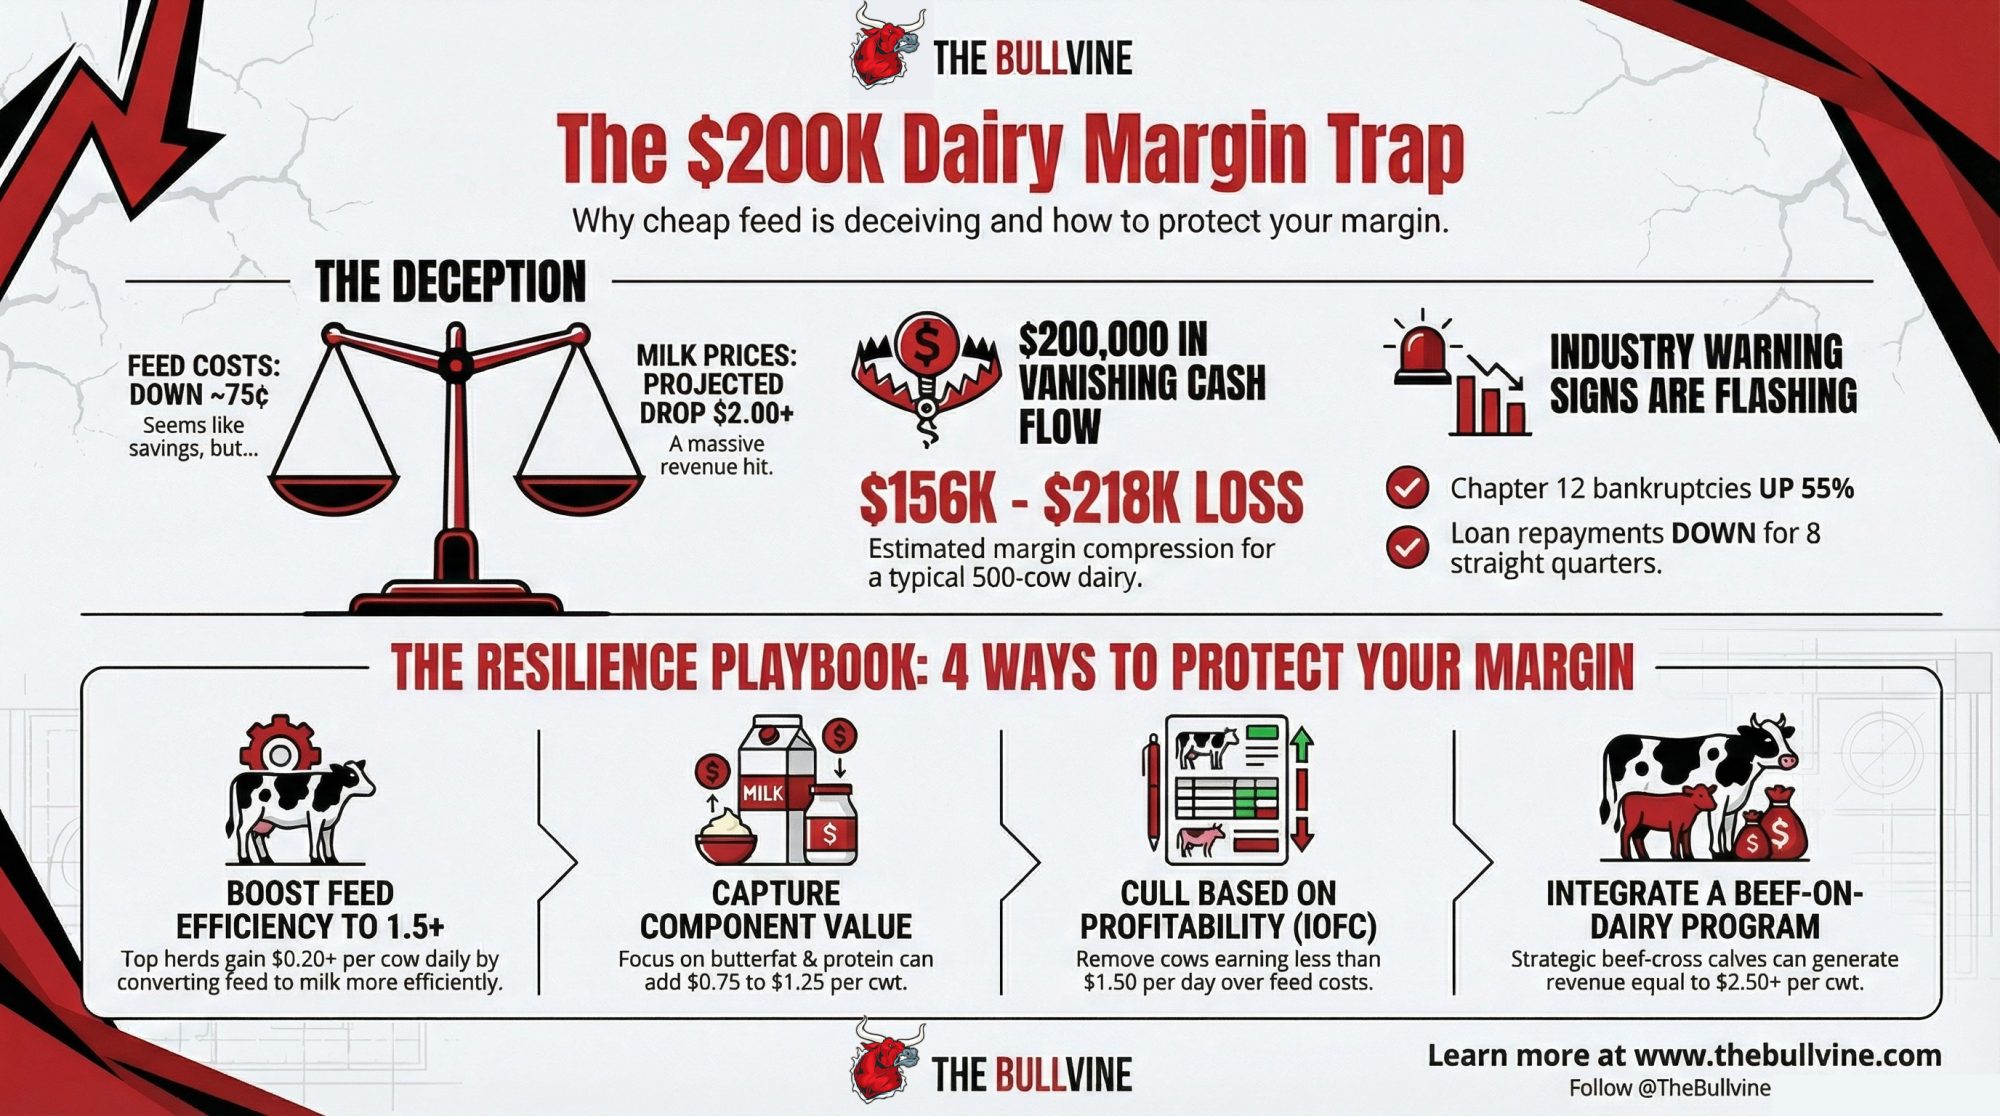
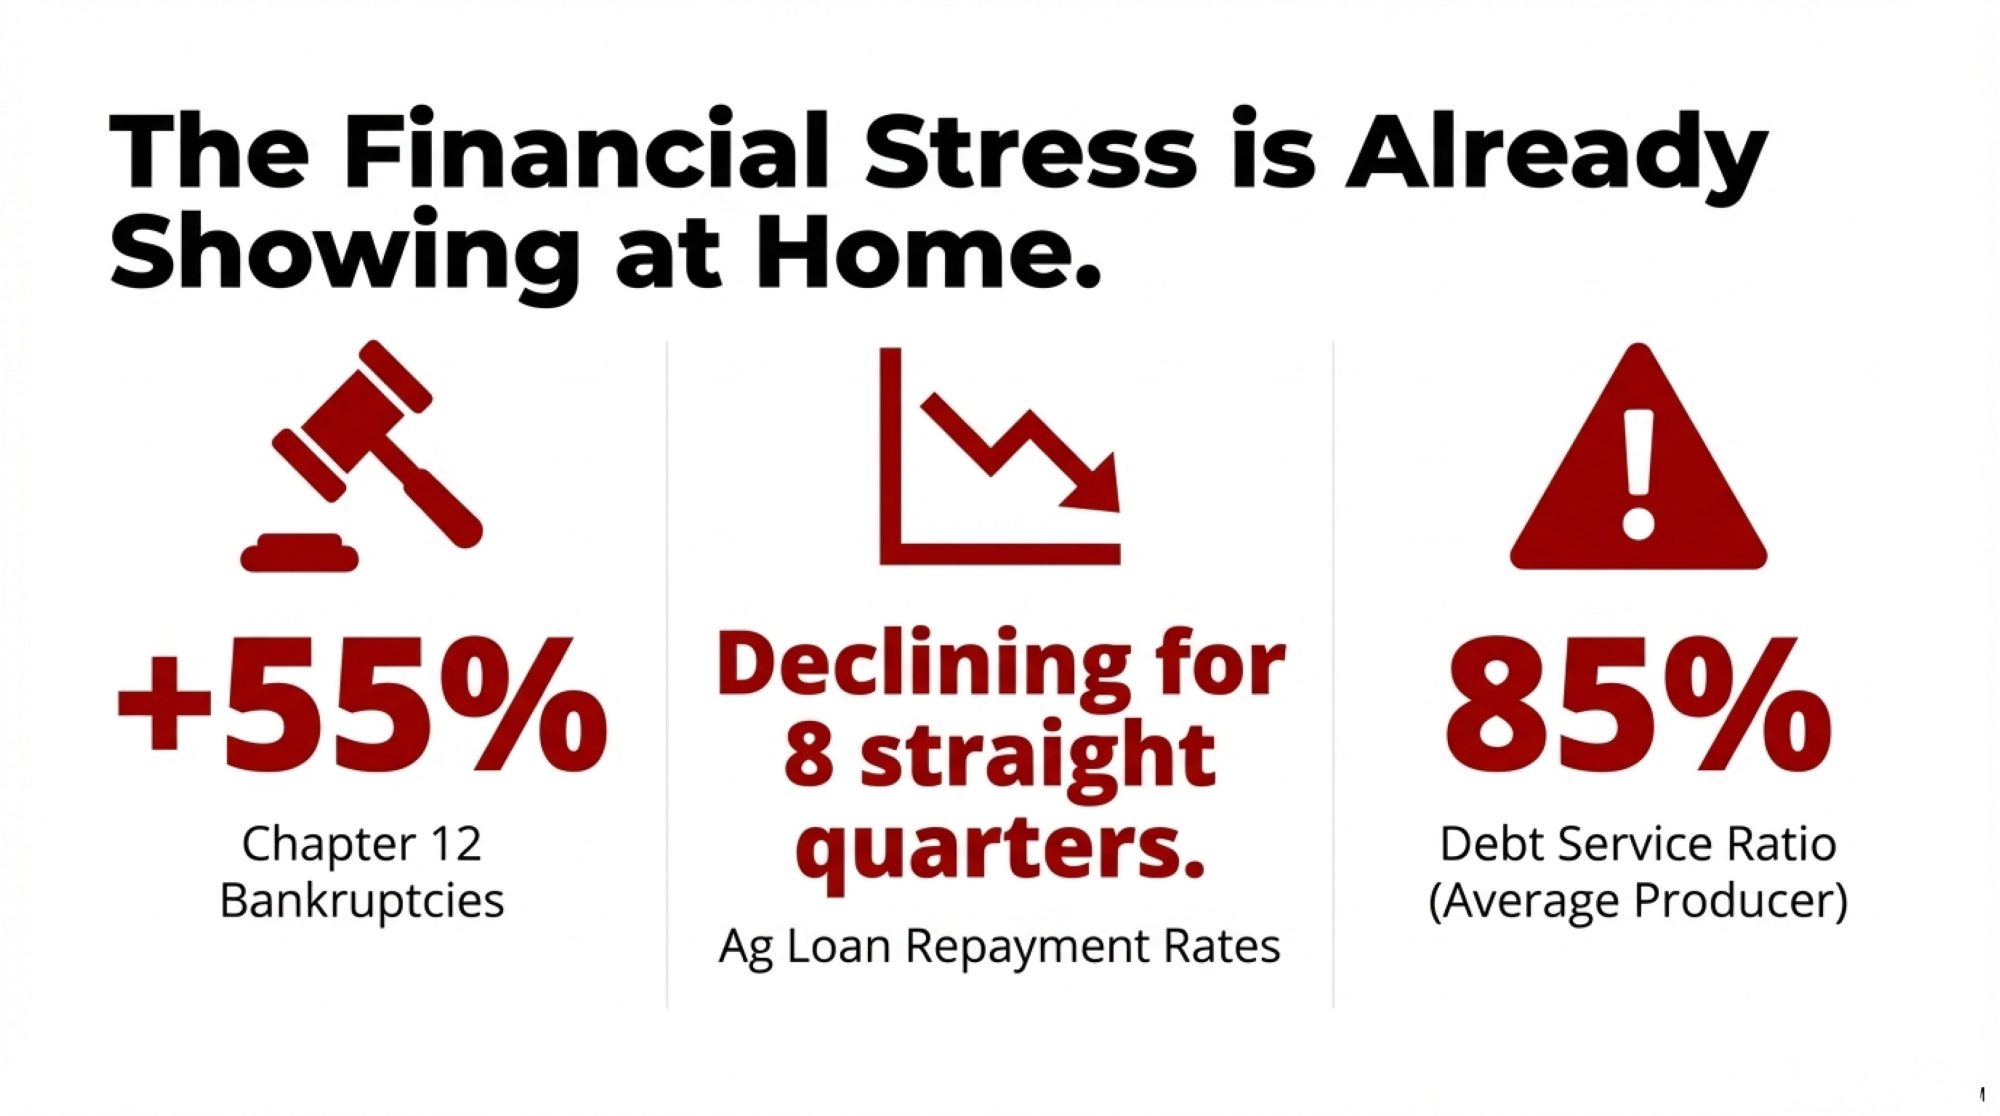
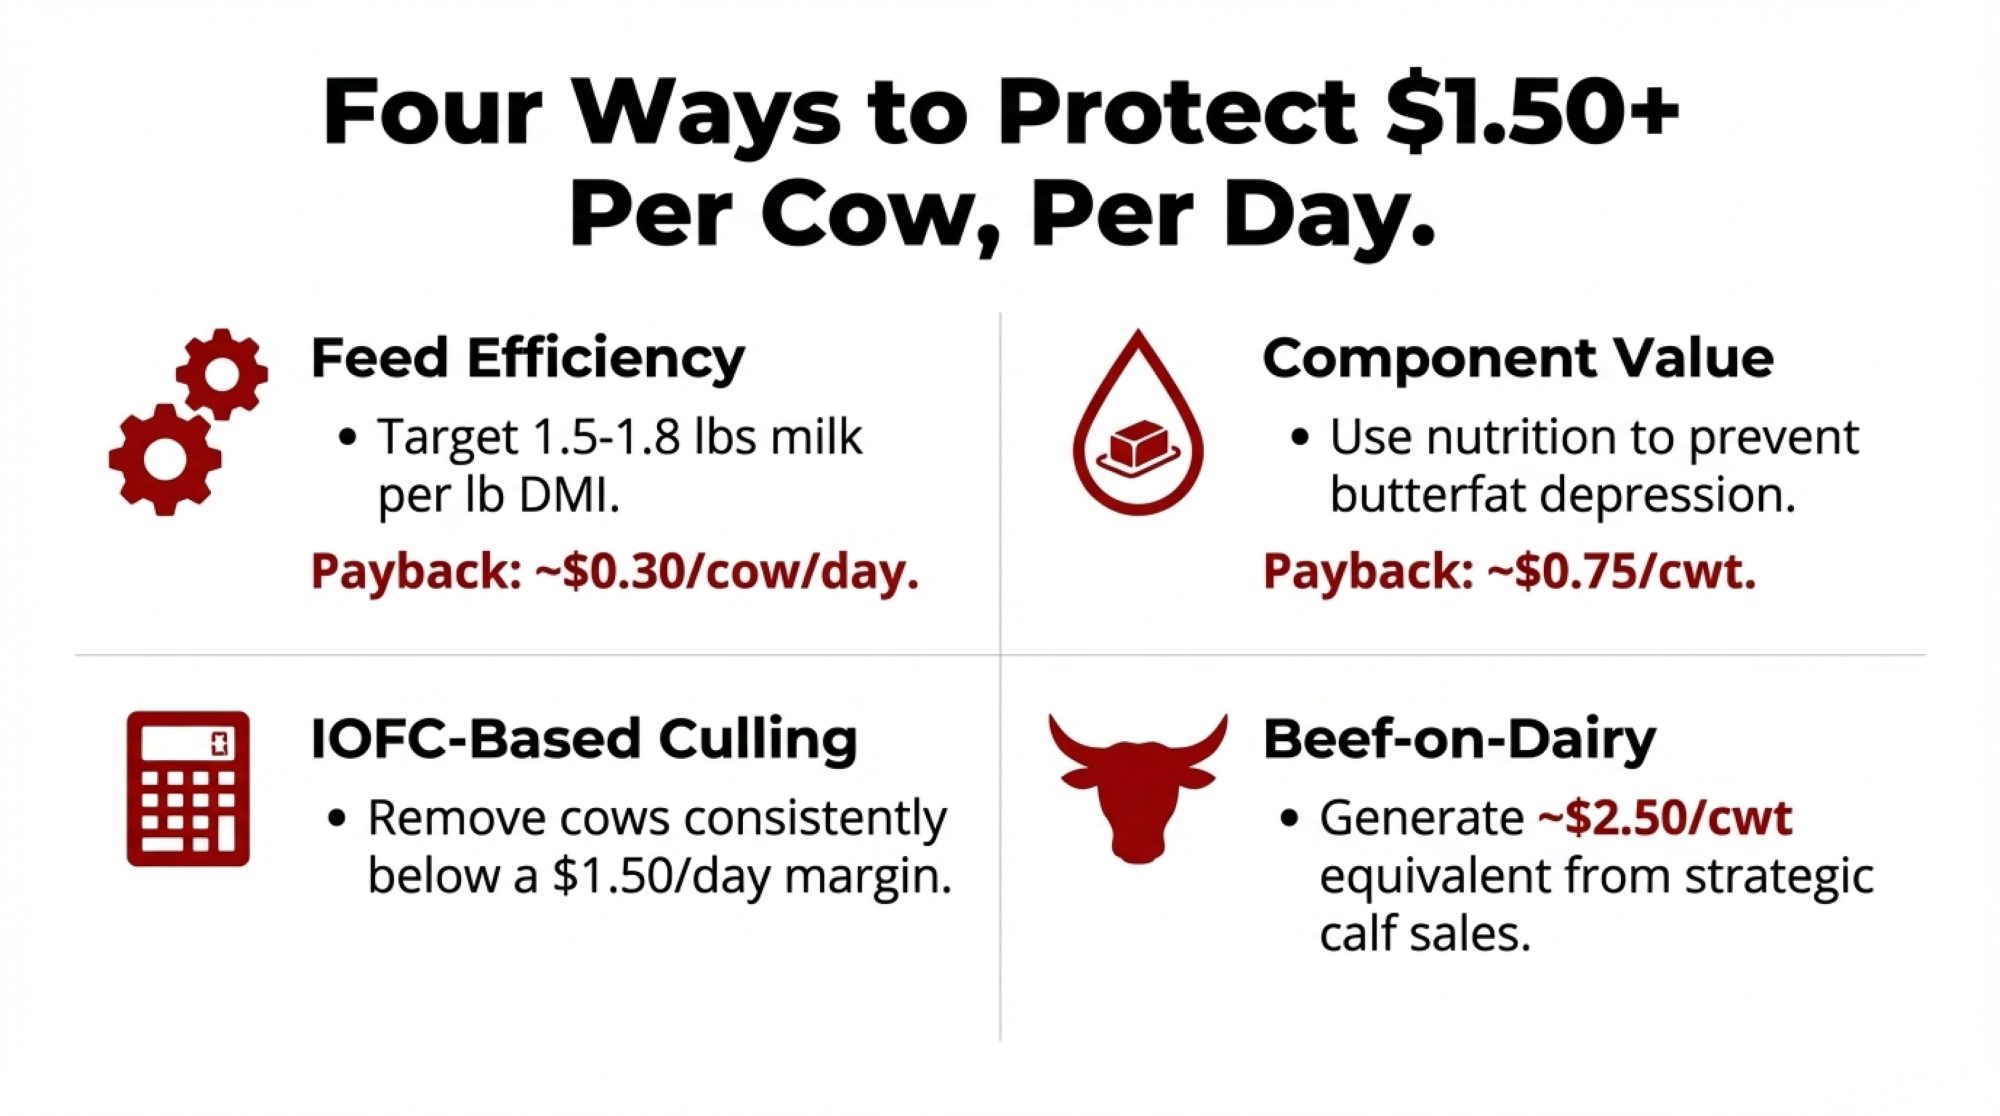
EXECUTIVE SUMMARY: Everyone’s celebrating cheap corn—but the math tells a different story. USDA projects 2026 milk at $19.25/cwt while feed costs have dropped only modestly, creating net margin compression of $1.25-1.75/cwt—that’s $156,000 to $218,000 in lost cash flow for a 500-cow dairy. New Zealand’s lowest-cost producers see what’s coming: they paid down $1.7 billion in debt this year rather than expand. Top U.S. operators are responding with feed efficiency gains, component optimization, IOFC-based culling, and beef-on-dairy programs that can protect $1.50+ per cow daily. With Chapter 12 bankruptcies up 55% and ag lenders reporting eight straight quarters of declining repayment rates, the window for strategic positioning is narrowing. The question isn’t whether margins compress in 2026—it’s whether you’ll position your operation before they do.

You know that feeling when everything looks fine on paper, but something in your gut says otherwise?

It’s the kind of conversation happening at kitchen tables across dairy country right now. The milk check looks okay—maybe even decent by recent standards. Feed costs have come down. The cows are milking well.

And yet something feels off.

That instinct isn’t wrong.

The FAO has been tracking global food prices for decades, and its November numbers tell an interesting story. The overall Food Price Index has dropped for three consecutive months, and the dairy sub-index has declined for five straight months.

New Zealand just posted a 17.8% production surge in their early season, according to their Dairy Companies Association data. U.S. milk output keeps climbing, too.

What’s worth understanding—and this is something many of us tend to underestimate—is the timeline between when these global signals show up and when they hit our milk checks.

Generally speaking, we’re looking at about six to eight months.

So the softening that started this fall? It’s likely showing up in Q2 and Q3 2026 checks.

Mark Stephenson, who spent years as Director of Dairy Policy Analysis at the University of Wisconsin-Madison before his recent retirement, studied these price transmission patterns extensively throughout his career. His research documented this lag across multiple market cycles.

The movement in international powder and butter prices isn’t really a question of whether it affects domestic markets—it’s more about when and how much.

USDA’s November World Agricultural Supply and Demand Estimates projects the all-milk price at $19.25 per hundredweight for 2026. That’s a meaningful change from the $22-24 range that many operations built their budgets around during stronger periods.

So what are the producers who’ve navigated these cycles before actually doing about it?

The Feed Cost Conversation That’s Missing Something

Walk into any farm supply store or dairy meeting right now, and you’ll hear some version of the same reassurance: “At least feed costs are down.”

And that’s true.

Corn is trading around $4.37 per bushel on the Chicago Board of Trade as of early December. Soybean meal is running around $310-$315 per ton. The DMC feed cost calculation is in a favorable territory compared to recent years—no question about that.

But here’s what that conversation often leaves out.

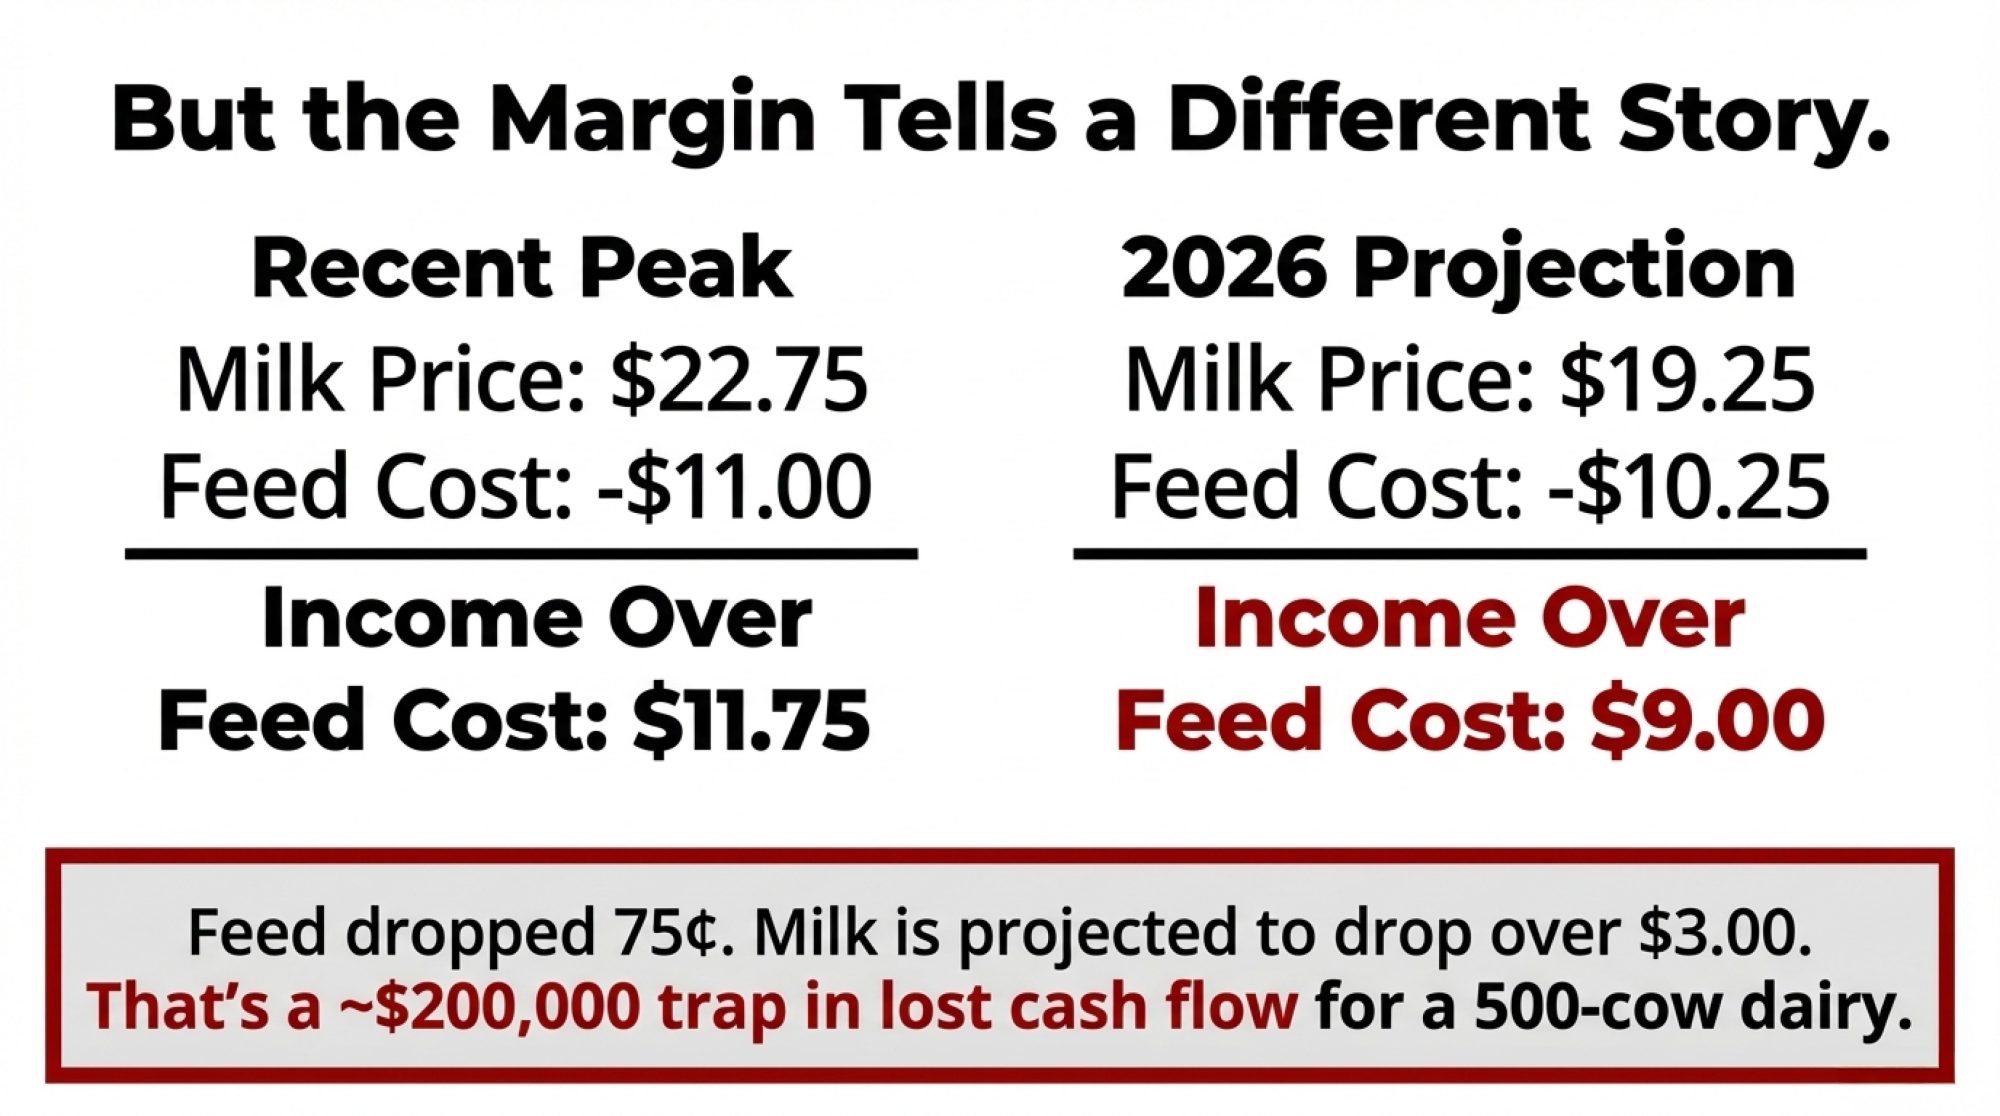
When milk prices were $22.75, and feed costs were about $11.00 per hundredweight, producers captured roughly $11.75 in income over feed costs.

Run the same math with 2026 projections—$19.25 milk and lower feed costs—and that margin still compresses to around $9.00.

Feed improved by maybe seventy-five cents. Milk dropped by more than two dollars.

The net effect is still a $1.25 to $1.75 per hundredweight margin compression for most operations.

On a 500-cow dairy producing 125,000 hundredweight annually, that’s $156,000 to $218,000 in reduced cash flow. Real money that has to come from somewhere—whether that’s reduced family living, deferred maintenance, or tighter input decisions.

Michael Dykes, who leads the International Dairy Foods Association as their President and CEO, put it well in a recent industry briefing. Lower feed costs are helpful, no question, but they’re best understood as breathing room to make strategic moves—not as a solution to margin pressure.

I recently spoke with an Upper Midwest nutritionist who put it more directly:

“I’ve got producers telling me they’re holding off on decisions because corn is cheap. That’s exactly backwards. Cheap corn is the opportunity to lock in favorable feed contracts and build some cushion—not permission to wait and see what happens.”

The timing matters here.

Producers who lock in Q1 and Q2 2026 feed contracts now, while basis levels remain favorable, capture that advantage regardless of what happens to spot markets later. Those who wait may find the window has closed.

It’s worth running the numbers with your feed supplier at a minimum.

What’s Actually Happening in Export Markets

The China situation deserves more attention than it typically gets in domestic dairy discussions, even for producers who don’t think of themselves as export-dependent.

Why does this matter to all of us? The economics tell the story.

The current reality is pretty stark.

U.S. dairy products face total tariffs of 84 to 125 percent in China following the trade escalation that peaked in April 2025—China’s Ministry of Finance and Reuters covered this extensively at the time.

New Zealand, by contrast, completed their Free Trade Agreement phase-in on January 1, 2024, and now ships dairy to China at zero percent tariff.

The market share shift has been significant.

While exact percentages shift quarter to quarter, the direction is clear: New Zealand has captured the lion’s share of China’s powder imports while U.S. product faces what amounts to a prohibitive tariff wall.

That displaced volume didn’t disappear—it backed up into domestic markets.

Even producers selling exclusively to domestic processors feel this effect, as Mary Ledman at Rabobank has pointed out in her global dairy market analysis. She’s been tracking these patterns as their Global Dairy Strategist for years now.

When export channels close, that milk has to go somewhere. It adds supply pressure that affects everyone, even if indirectly.

The regional effects aren’t uniform, though.

California and Idaho operations—traditionally more export-oriented through Pacific Rim trade—feel this more acutely than Upper Midwest producers whose milk flows primarily into domestic cheese markets.

I spoke with a Wisconsin cheesemaker recently who said his plant’s order book looks fine through mid-2026, but he’s watching West Coast capacity closely because displaced milk eventually tends to find its way east.

What’s particularly noteworthy is how New Zealand producers are responding to their advantageous position.

Despite favorable prices and strong production conditions, Kiwi farmers repaid NZ$1.7 billion in debt in the six months through March 2025 rather than expanding. ANZ Bank and New Zealand’s rural news outlets have been tracking this closely.

When the world’s lowest-cost producers choose balance sheet repair over growth during historically good times… well, it suggests they’re preparing for extended market softness.

That’s a signal worth paying attention to.

Reading the Financial Signals

Several data points help distinguish what’s happening now from typical cyclical patterns.

Chapter 12 farm bankruptcy filings—the specialized bankruptcy provision for family farmers—hit 216 cases in 2024, up 55 percent from the prior year. The American Farm Bureau Federation has been tracking federal court records on this, and the first half of 2025 saw additional filings running well ahead of 2024’s pace.

Context matters here. Bankruptcy filings alone don’t tell the whole story—they can reflect access to legal resources, regional legal practices, and individual circumstances as much as broad economic conditions.

But the trend is notable.

Geographic patterns show particular stress in California, Iowa, Michigan, Kansas, and Wisconsin—a mix of traditional dairy regions and areas affected by specific challenges, such as avian influenza and water constraints.

Debt service coverage ratios tell a related story.

Farm Progress recently reported on data from the Minnesota FINBIN farm financial database showing that the average producer had a concerning coverage ratio of around 85 percent in 2024—meaning operations were generating only 85 cents for every dollar of debt service obligation.

The remaining gap has to come from equity drawdown, off-farm income, or loan restructuring.

What concerns many lenders is the compounding effect.

Interest costs have roughly doubled over the past three years as rates have reset. An operation that was comfortable at 3.5 percent interest faces a completely different equation at 7.5 percent—as many of us have experienced firsthand.

The Federal Reserve Bank of Chicago’s Q3 2025 agricultural credit survey found 38 percent of banks reporting lower repayment rates—the eighth consecutive quarter of deterioration. More than two-thirds of lenders expect farmland values to flatten or decline in 2026.

None of this predicts any individual operation’s future—every farm has its own circumstances, strengths, and challenges.

But it does suggest the industry overall is experiencing stress levels that reward careful financial planning over optimistic assumptions.

The Expansion Paradox

One of the more counterintuitive aspects of current markets—and something I find genuinely interesting to think through—is why production keeps growing despite weakening price signals.

The biological reality is that dairy expansion decisions made two to three years ago are just now showing up in production numbers.

Heifers conceived in early 2023 are entering milking strings in late 2025. Facilities that broke ground during strong margins in 2023 and 2024 are now completing and being populated.

Once those commitments are made—once the cows are bred, raised, and the facilities built—the production is essentially locked in.

Debt service creates similar momentum.

Operations carrying expansion loans need to maintain production to meet their obligations. Reducing herd size often costs more than continuing to milk at marginal profitability, especially when the alternative is triggering loan covenant violations.

Christopher Wolf, the E.V. Baker Professor of Agricultural Economics at Cornell, has written thoughtfully about this dynamic. The economics of stopping are often worse than the economics of continuing.

That’s not irrational behavior—it’s responding logically to the debt structure and fixed-cost reality that exist in most operations.

Processing capacity investment adds another layer.

More than $11 billion in new U.S. dairy processing capacity is under construction or recently completed—IDFA released a detailed report in October covering 50-plus projects across 19 states.

That processing investment creates a regional demand pull that can support local expansion even when broader markets are oversupplied. A producer within hauling distance of a new plant in Dodge City or along the I-29 corridor faces different economics than one in a region without recent processing investment.

I’ve been hearing about this regional divide increasingly this season.

In Texas and New Mexico, where several major cheese and powder facilities have opened or expanded, local producers report being actively recruited with multi-year contracts.

Meanwhile, some Northeast producers describe tighter relationships with their cooperatives—fewer premium opportunities and more pressure on base pricing.

Same industry, very different regional realities.

What Successful Producers Are Doing Differently

Conversations with producers navigating current conditions successfully reveal consistent patterns. These aren’t revolutionary changes requiring massive capital—they’re an intensified focus on fundamentals.

1. Feed Efficiency Optimization

Top-performing herds are achieving feed efficiency ratios of 1.5 to 1.8 pounds of milk per pound of dry matter intake. The industry average sits around 1.4.

The Impact: Each tenth of a point improvement translates to roughly $0.20 to $0.30 per cow/day in margin enhancement.

The Tactic: Weekly NIR analysis on forages (~$15/sample) allows for immediate ration adjustments, rather than guessing between monthly tests.

I recently spoke with a Wisconsin producer who started as a custom heifer raiser before transitioning to his own milking herd. He described implementing weekly NIR testing on every forage load.

“The payback is maybe ten to one in ration accuracy,” he said. “We were basically guessing before.”

Most producers I’ve talked with see measurable results within 45 to 60 days—though individual results vary based on starting point and forage variability.

2. Component Value Capture

Producers focusing on butterfat performance and protein levels report capturing an additional $0.75 to $1.25 per hundredweight compared to volume-focused approaches.

The Tactic: Using rumen-protected choline during transition periods and summer heat stress (~$0.08/cow/day) to prevent butterfat depression.

The genetic piece is a longer-term play—daughters of high-component sires won’t hit the milking string for two-plus years—but the nutritional interventions can show results within a milk test cycle or two.

Worth having a conversation with your nutritionist about current ration fatty acid profiles and where component optimization opportunities might exist for your herd.

3. Strategic Culling Based on IOFC

Rather than culling primarily based on age, reproduction metrics, or production levels, progressive operations calculate income over feed cost for each cow and move out animals that are consistently below $1.50 per cow daily.

The Shift: “A seven-year-old cow giving 60 pounds might look fine on paper,” one herd manager at a 1,200-cow Minnesota dairy told me. “But when you run her actual IOFC with her feed intake and health costs, she’s sometimes underwater. We’re making decisions on math now, not sentiment.”

For operations without individual cow feed intake data (which is most of us), pen-level IOFC calculations still identify which groups are carrying the herd versus dragging it down.

Most herd management software can generate these reports with minimal setup.

4. Beef-on-Dairy Integration

Producers systematically breeding bottom-tier genetics to beef sires report equivalent revenue of $2.50+ per hundredweight from crossbred calf sales.

The Math: A straight Holstein bull calf might bring $150. A beef-cross brings $1,000 or more based on current USDA feeder cattle reports.

The Genetics Play: Use genomic testing or breeding values to identify the bottom 20-30% of your herd’s genetic merit. Breed those animals to proven beef sires with good calving ease scores, and establish buyer relationships before calves hit the ground.

This is where your genomic data becomes a direct revenue driver—not just a breeding tool.

Operations that treat beef-on-dairy as an afterthought leave money on the table compared to those who plan the program strategically.

The Emerging Structure: Two Viable Paths

Looking at where the industry appears headed over the next three to five years, a structural pattern is emerging that’s worth understanding—even if it raises uncomfortable questions.

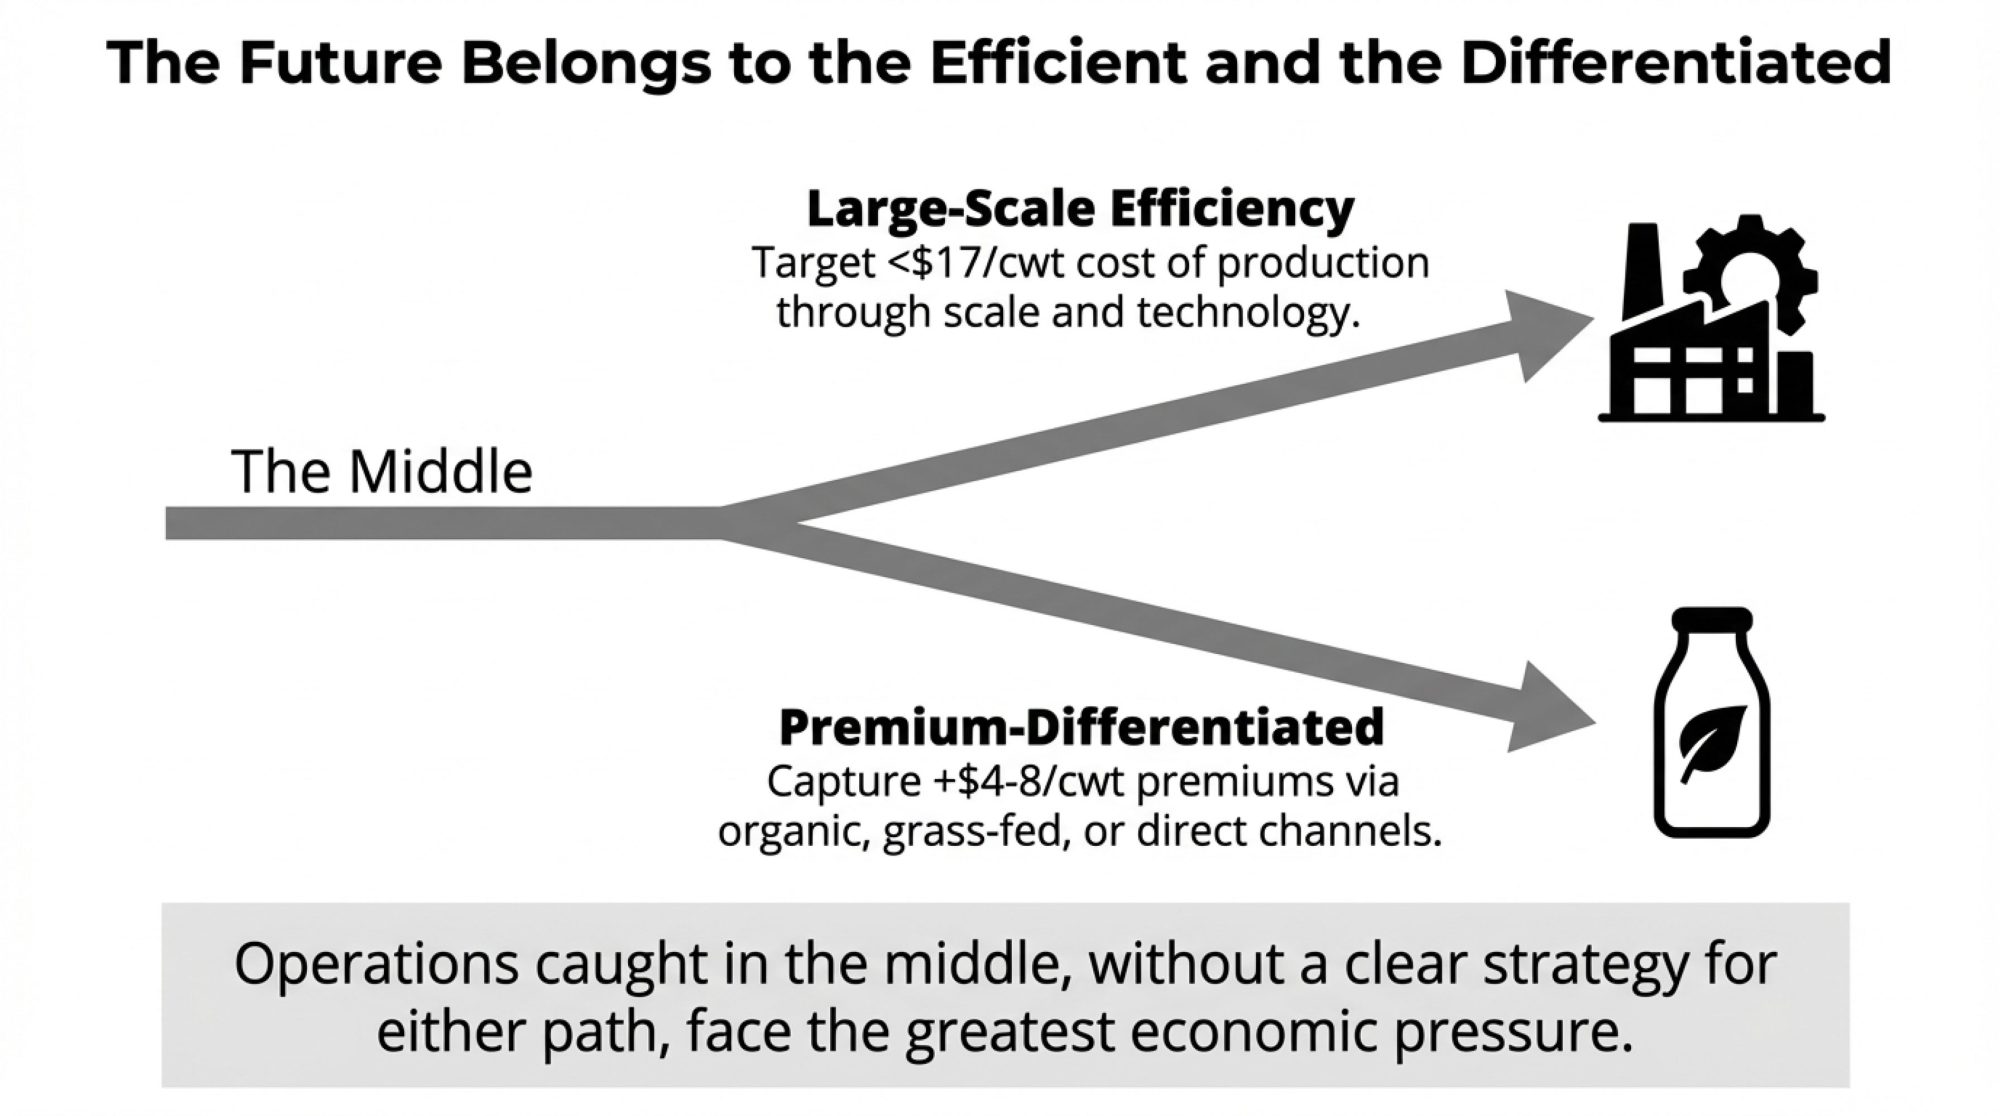
The data increasingly suggests two economically viable models:

Large-scale efficiency operations—generally 1,500 cows and above—achieving production costs in the $14 to $17 per hundredweight range through scale economics, technology adoption, and processing relationships.

USDA’s Economic Research Service cost-of-production data confirms that this scale advantage has widened over the past decade. Many of these operations use dry-lot systems or hybrid facilities to maximize throughput efficiency.

Premium-differentiated operations—typically 50 to 500 cows—capturing $4 to $8 per hundredweight premiums through organic certification, grass-fed positioning, or direct-to-consumer channels.

These require proximity to metro markets and significant transition investment, but create a margin cushion independent of commodity prices.

Operations in the middle face the most challenging economics under the current market structure.

This isn’t a judgment about the value of family-scale dairy farming or the communities these farms anchor. It’s an observation about where the current market structure creates clearer paths forward.

Regional variation matters significantly.

A 300-cow dairy in Vermont with Boston market access faces different options than a similar-sized operation in central Wisconsin without nearby premium channels.

A Framework for Evaluation

For producers working through these questions—and most of us are—several considerations help clarify the path forward.

For operations considering expansion:

  • Is there processing capacity within 200-300 miles actively seeking suppliers?
  • Is replacement heifer availability realistic? National inventory sits at roughly 3.9 million dairy replacement heifers 500 pounds and over—the lowest absolute level since 1978, according to USDA’s January 2025 Cattle report. The heifer-to-cow ratio of 41.9% is the lowest since 1991.
  • Can production costs realistically reach sub-$17 per hundredweight at expanded scale?
  • What do debt service requirements look like at current interest rates, not 2021 rates?

For operations considering premium positioning:

  • Is there a metro market within a reasonable distance with demonstrated premium demand?
  • What’s the realistic timeline? Organic certification alone typically takes three years under USDA National Organic Program rules.
  • Does the land base and climate support pasture-based systems?
  • Is there family interest in direct marketing relationships?

For operations evaluating the current position:

  • What’s the actual debt service coverage ratio at projected 2026 milk prices?
  • When do loans mature, and at what interest rate reset?
  • Has the processor offered multi-year supply contracts?
  • What’s the true breakeven with full cost accounting—including family labor and reasonable return on equity?

These aren’t comfortable questions.

But they’re better asked now than answered by circumstances later.

The Timing Reality

One thread runs through conversations with producers, lenders, and analysts who’ve navigated previous downturns: timing matters more than most people acknowledge.

Producers who assess their position and make strategic decisions during 2025 and early 2026—while milk prices are still serviceable, while cull cow prices remain historically strong—retain meaningfully more options than those who wait.

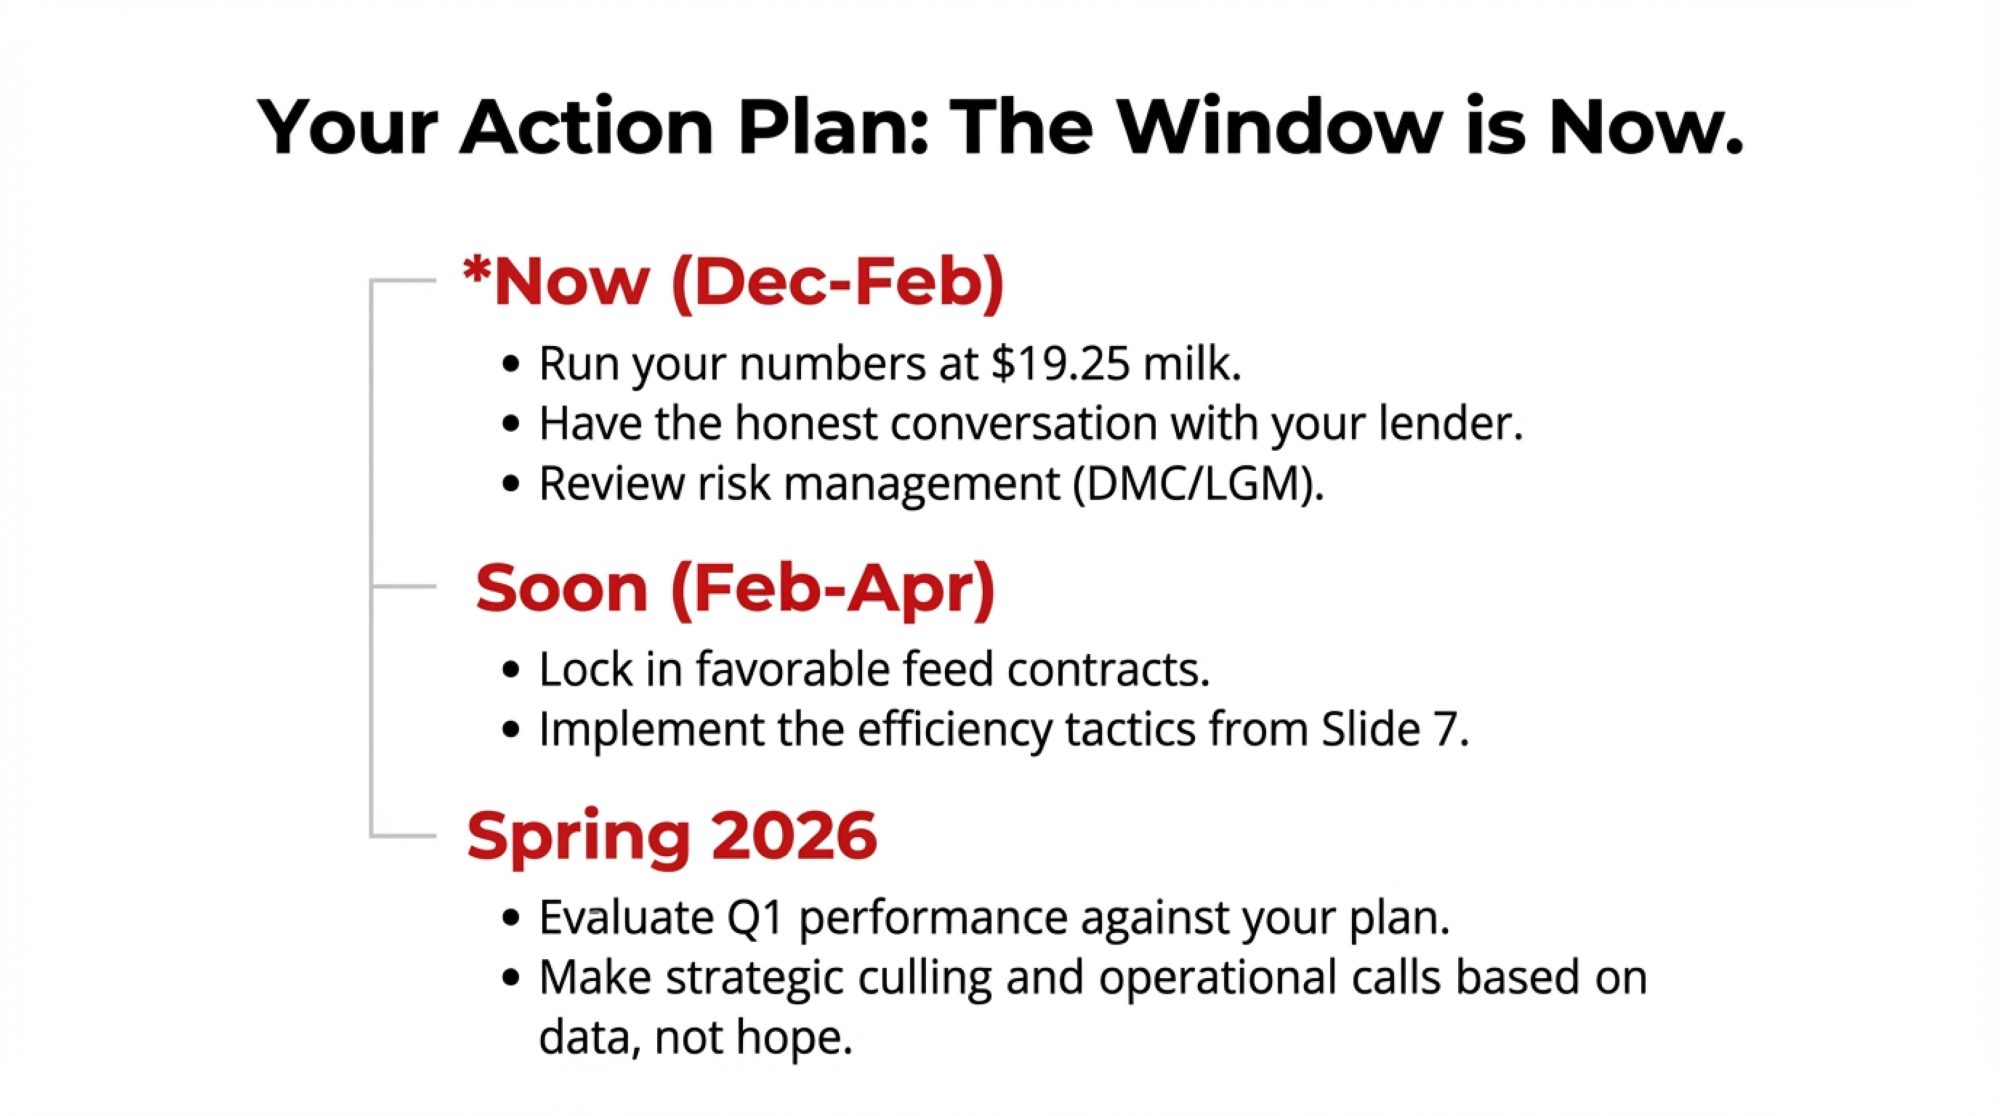
December through February: Run your real numbers. Calculate the actual DSCR at $19.25 milk. Have the honest conversation with your lender—most good lenders appreciate proactive communication.

This is also the window for DMC enrollment decisions. If you haven’t reviewed your coverage levels against projected margins, now’s the time. LGM-Dairy is worth a conversation with your insurance agent, too, especially for operations wanting more flexible coverage options.

February through April: Make feed decisions. Lock contracts if the math works. Implement efficiency improvements that deliver results by summer.

Spring 2026: Evaluate first-quarter performance against projections. Adjust culling strategy based on actual margins. Make the bigger strategic calls with real data rather than hope.

The Bottom Line

The dairy industry has navigated challenging transitions before, and it will again.

The producers who came through previous cycles strongest were generally those who saw conditions clearly, made decisions based on their specific circumstances, and acted while they still had choices.

That window is open now.

The question is what each of us does with it.

The Bullvine provides market analysis and industry perspective for dairy producers worldwide. This article reflects conditions and data available as of early December 2025. Individuals should consult their own financial advisors, lenders, and Extension specialists when making significant business decisions. Every farm’s situation is unique, and the right path forward depends on factors only you and your advisors can fully evaluate.

KEY TAKEAWAYS

  • The Trap: Feed dropped 75¢. Milk dropped $2. That’s not savings—that’s $200K in vanishing cash flow for a 500-cow dairy.
  • The Global Signal: NZ farmers paid down $1.7 billion in debt instead of expanding. The world’s lowest-cost producers expect extended softness.
  • The Warning Signs: Chapter 12 bankruptcies up 55%. Ag loan repayments have been declining for 8 quarters straight. Financial stress is accelerating.
  • What Top Producers Are Doing: Capturing $1.50+/cow/day through feed efficiency, component optimization, IOFC-based culling, and beef-on-dairy integration.
  • The Window Is Now: Cull values are strong. Milk checks are still serviceable. Lenders are still flexible. Make strategic decisions while you still have options.

Complete references and supporting documentation are available upon request by contacting the editorial team at editor@thebullvine.com.

Learn More:

  • The $700 Truth: Your Best Milkers Are Your Worst Investment – Reveals why high-volume cows often lose $3/day in actual margin and demonstrates how to use Residual Feed Intake (RFI) data to identify the true profit-drivers in your herd.
  • The $228,000 Exit Strategy Reshaping Dairy – Uncovers the “Section 1232” tax provision behind the recent surge in Chapter 12 filings, explaining how strategic bankruptcy is helping retiring producers preserve equity rather than losing it in traditional sales.
  • Robot Revolution: Why Smart Dairy Farmers Are Winning – Analyzes the 2025 ROI of automated milking systems beyond simple labor savings, providing a blueprint for the “efficiency-at-scale” model that allows family operations to compete with larger consolidators.

The Sunday Read Dairy Professionals Don’t Skip.

Every week, thousands of producers, breeders, and industry insiders open Bullvine Weekly for genetics insights, market shifts, and profit strategies they won’t find anywhere else. One email. Five minutes. Smarter decisions all week.
NewsSubscribe
First
Last
Consent
Send this to a friend