Archive for Global Dairy Trends

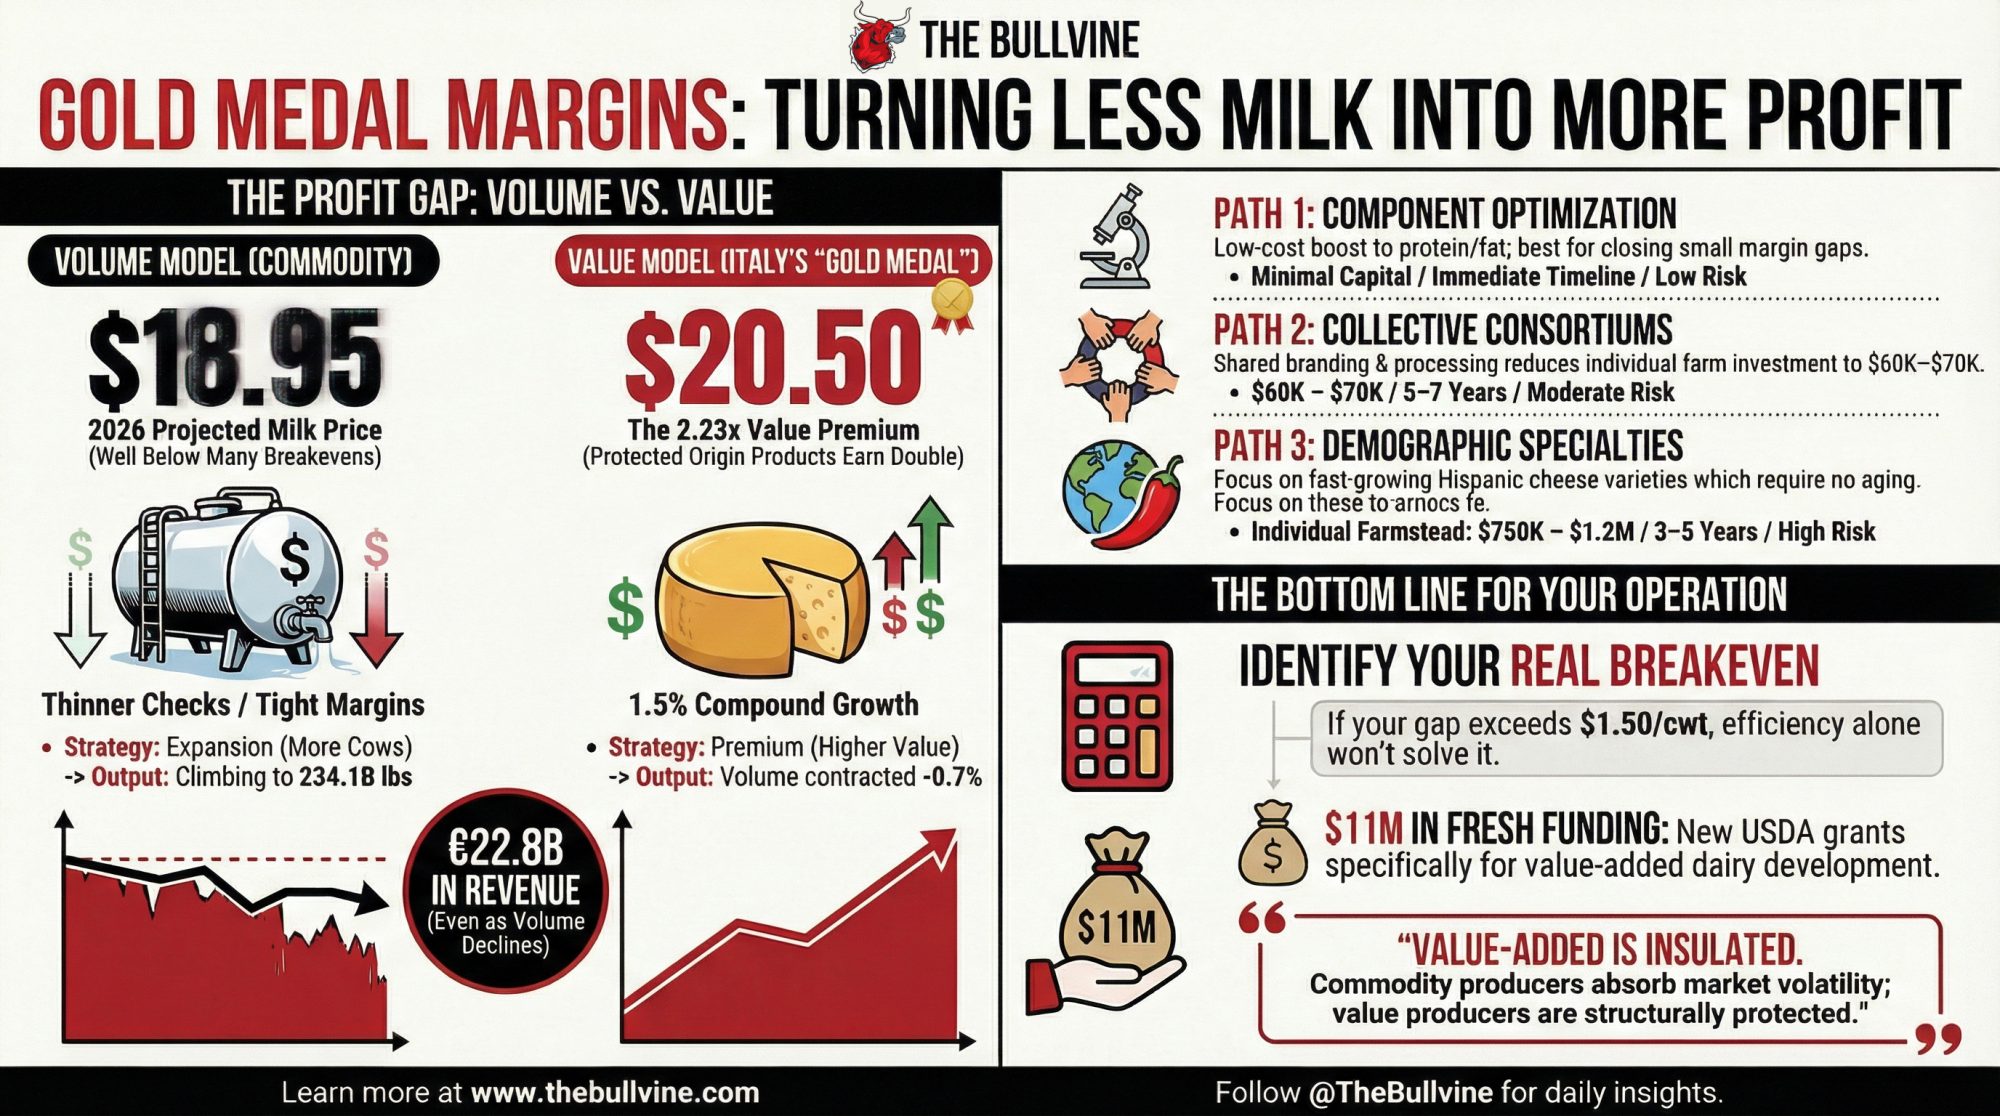
Gold Medal Margins: Italy Turns Less Milk into €22.8B. You’re Stuck at $18.95.

As Milano-Cortina chases medals, Italy’s dairies pull €22.8B from less milk. If your 2026 outlook starts with $18.95, you need to see how they did it.
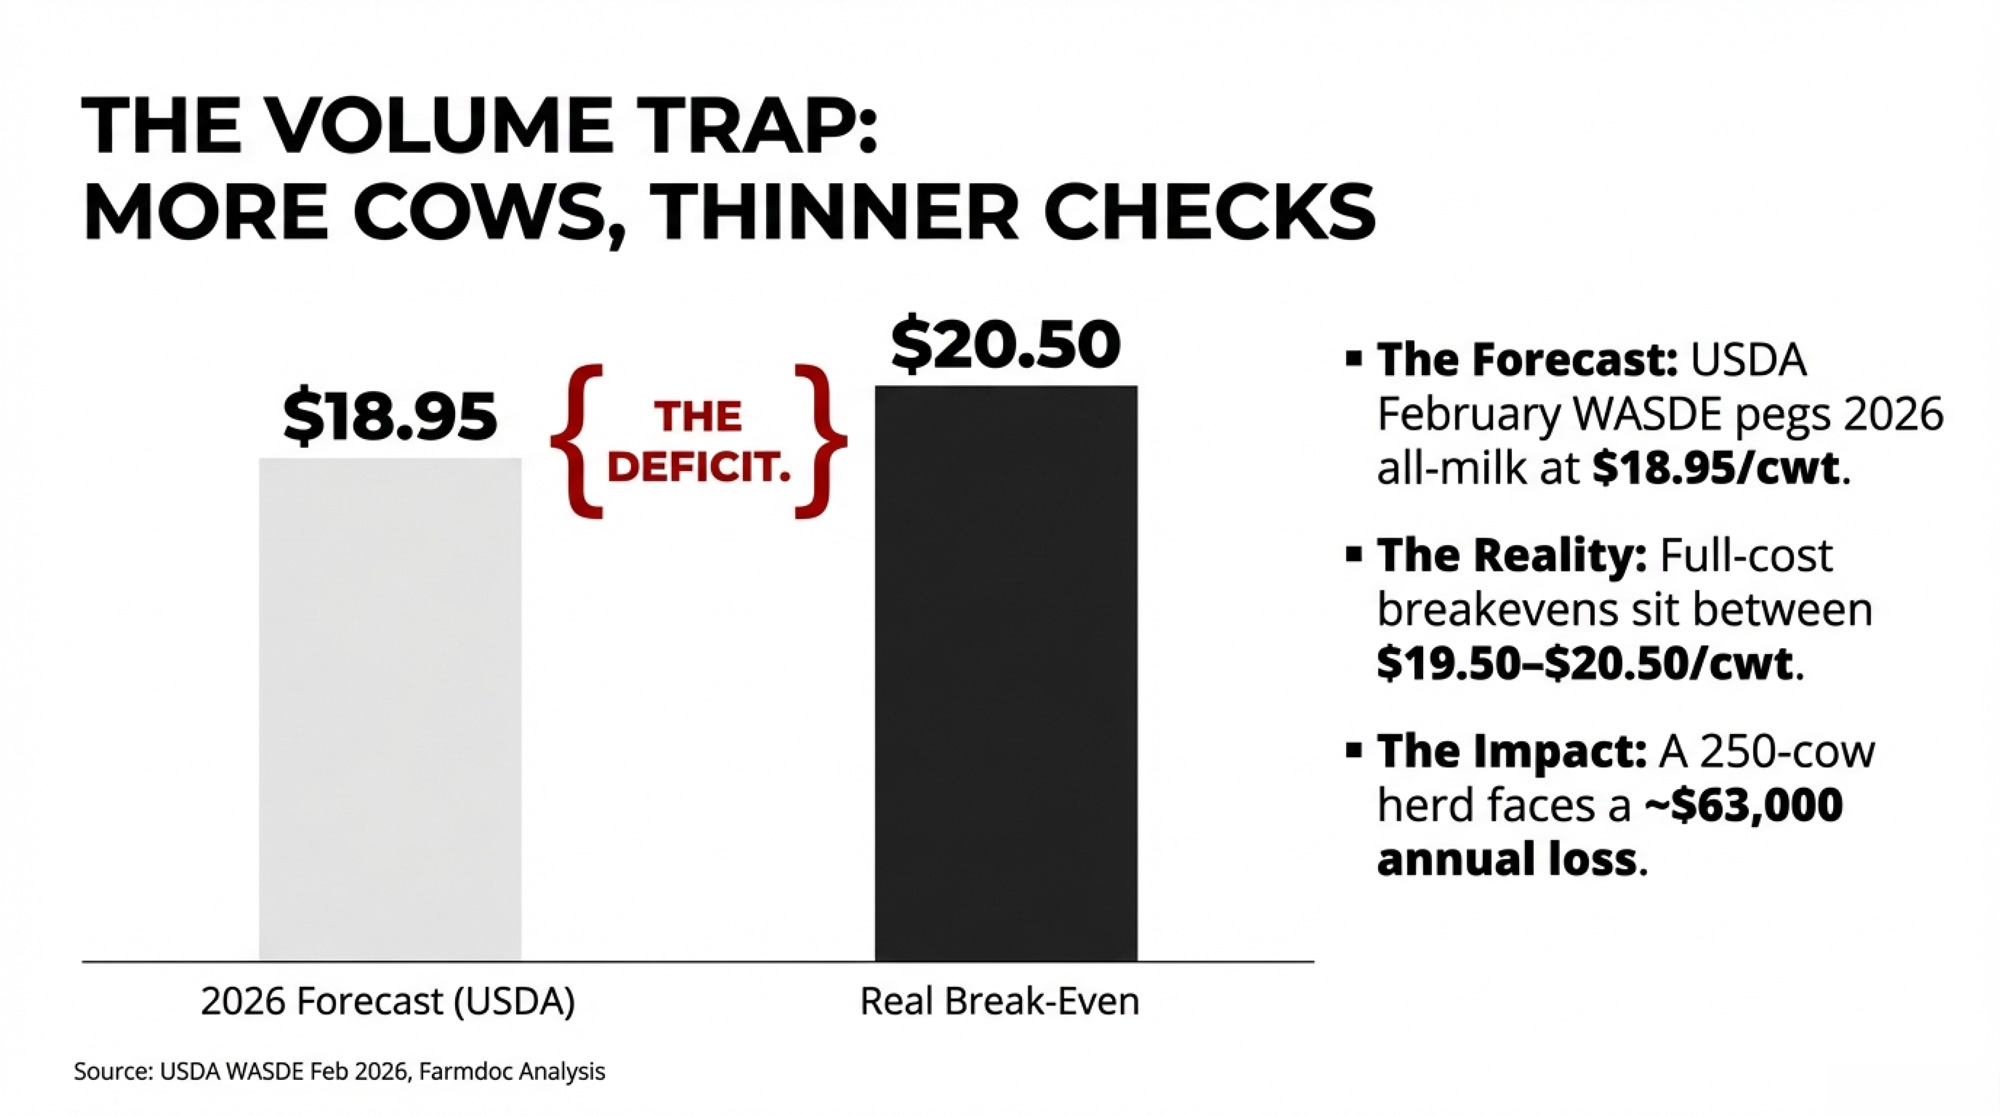
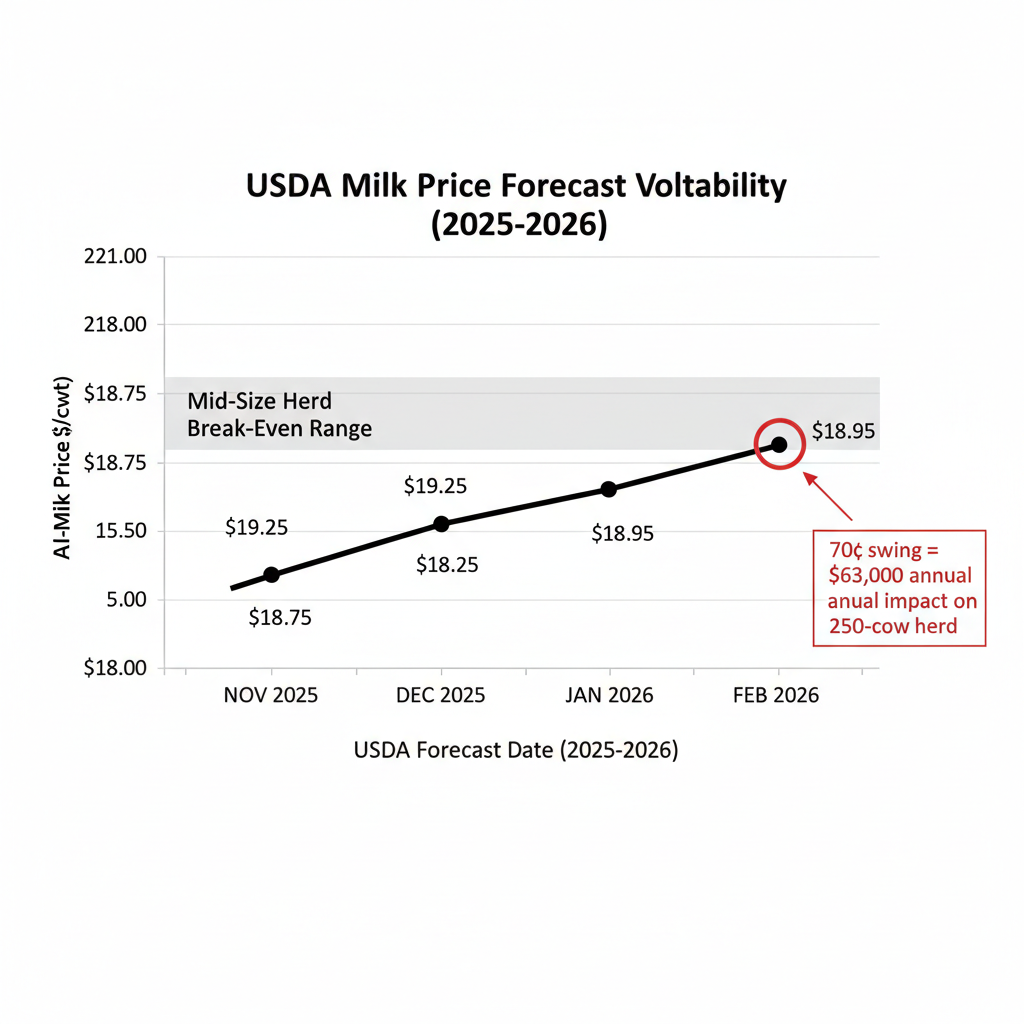
Where does your real break-even sit — family labor honestly valued, principal payments included, living expenses accounted for? Bullvine analysis pegs a mid-size herd’s full-cost break-even in the range of $19.50–$20.50/cwt, depending on region, debt load, and unpaid family labor assumptions — consistent with farmdoc’s 2024 analysis, which places full costs in the low $20s/cwt. USDA’s outlook has been a moving target: the all-milk price for 2026 fell from $19.25 in November to $18.75 in December to $18.25 in January — then bounced to $18.95/cwt in the February 2026 WASDE, released yesterday. Even with the uptick, a 250-cow operation at the midpoint of that break-even range faces a projected annual loss of roughly $63,000. That gap has whipsawed $70,000 in four months of USDA revisions — and the direction isn’t settled.
Now consider the country hosting this month’s Winter Olympics, where dairy producers are doing the opposite: generating €22.8 billion in industry revenue while their milk production declines year over year. The value-added dairy production model behind that number isn’t a European curiosity. It’s a functioning alternative to the volume-first strategy that’s compressing margins across North American herds in 2026 right now.

Two Industries, Two Scorecards: Volume vs. Value in 2026

The U.S. dairy herd expanded by an estimated 211,000 cows in 2025 while margins deteriorated. More cows. Thinner checks. USDA projects output climbing to 234.1 billion pounds in 2026, and income-over-feed-cost margins are tightening toward roughly $11.40/cwt. Meanwhile, USDA-ERS cost-of-production data show even the lowest-cost tier — operations with 2,000-plus cows — averages $19.14/cwt on a full economic basis, essentially breakeven at $18.95 milk.
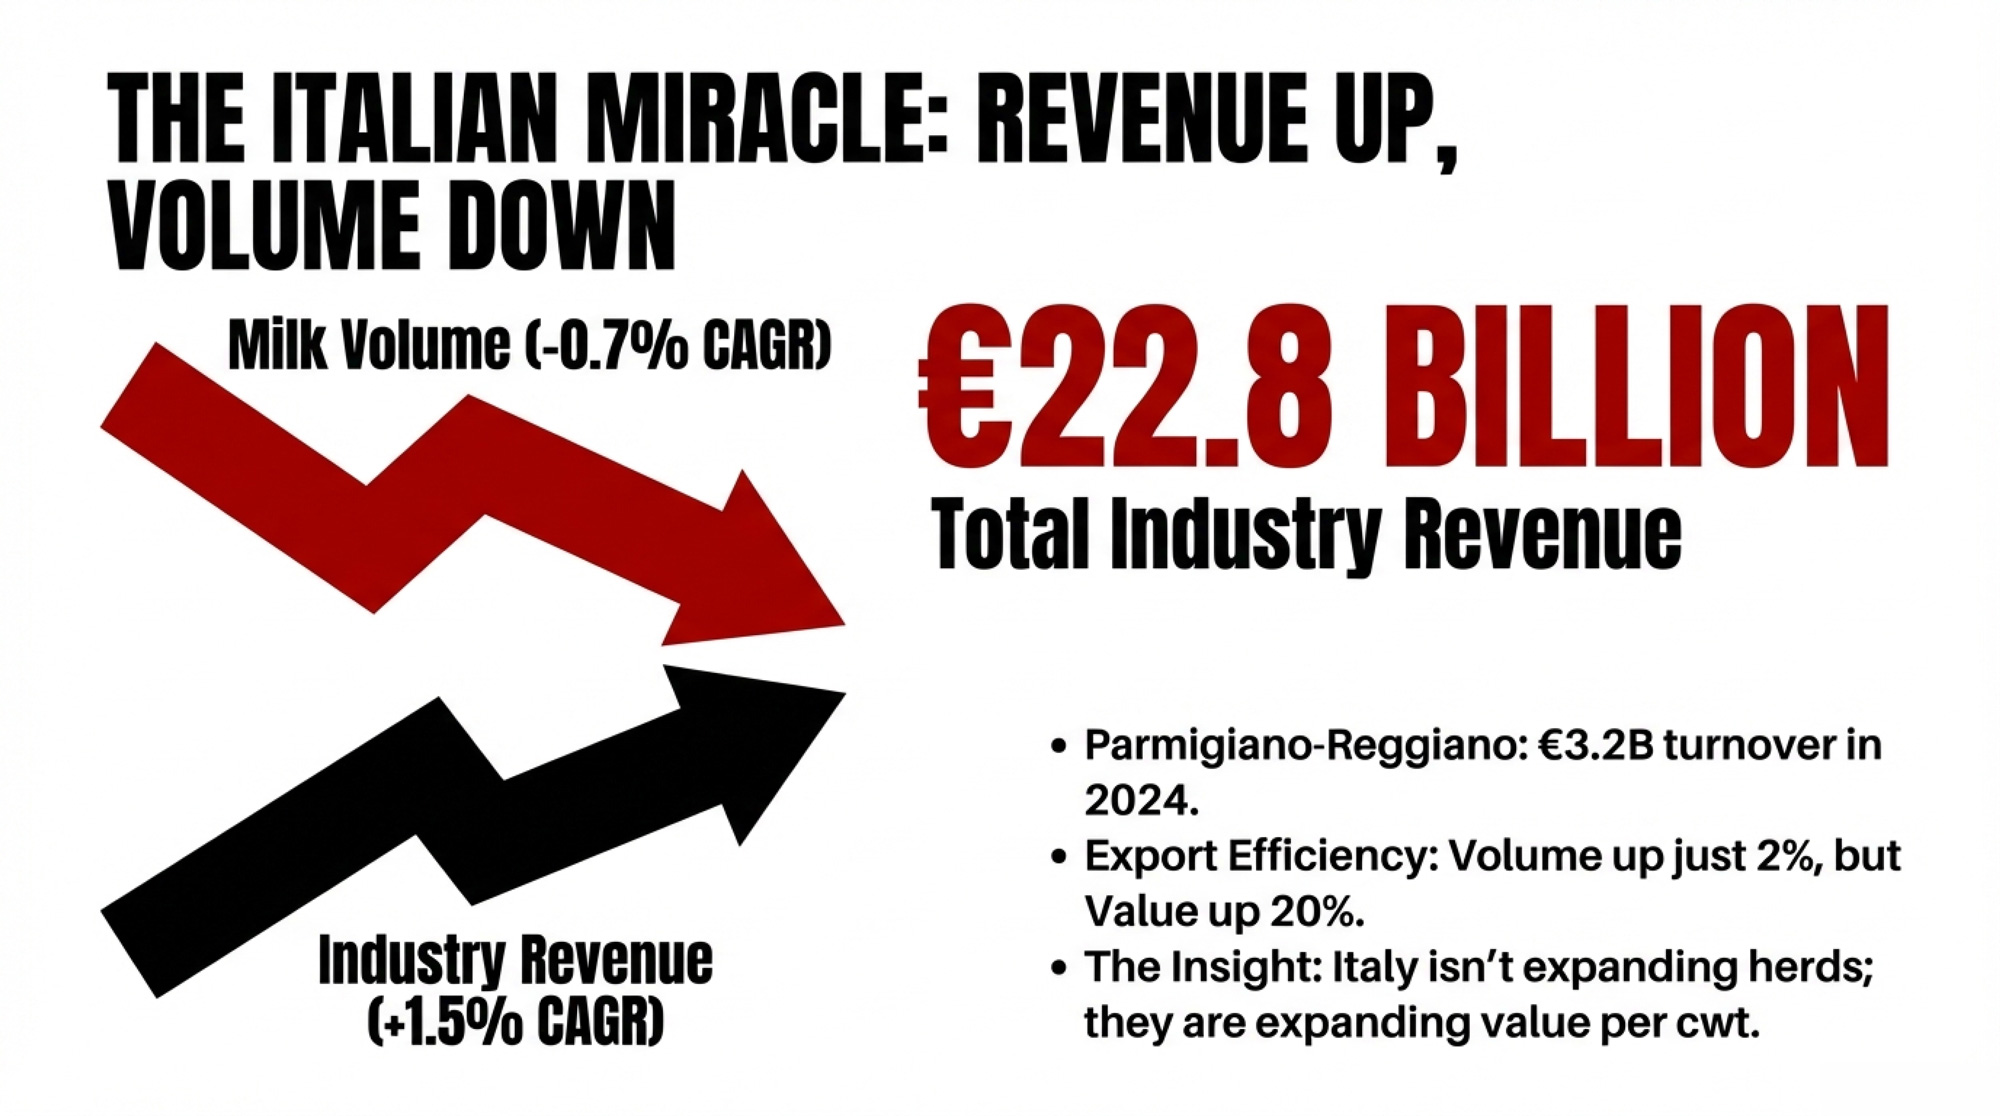
Italy went the other direction. The number of Italian dairy businesses actually increased over the past five years, reaching roughly 4,043 operations (IBISWorld, 2025 data). An industry gaining participants while losing volume only happens when per-unit returns make smaller-scale production pay. Industry revenue grew at a positive 1.5% CAGR over 2020–2025, while milk volume contracted at approximately –0.7% CAGR. Revenue up. Volume down.

EU-wide, the pattern holds. Milk production dropped an estimated 0.2% to 149.4 million metric tons in 2025, while cheese production rose 0.6% to 10.8 million metric tons (USDA FAS data). Germany and France shed 2.3% and 1.8% of milk output, respectively, while Dutch cooperatives lost 14% of members since 2023. The full picture is in our earlier analysis: EU production is declining while cheese output is rising.

The Parmigiano-Reggiano production zone — which extends from Parma north into Lombardy — overlaps with the broader Milano-Cortina Olympic region. The athletes and the cheesemakers are competing in the same territory this month. Only one group has figured out how to turn less into more.

What the Premium Actually Looks Like

Parmigiano-Reggiano, the world’s top-selling PDO (Protected Designation of Origin) cheese, generated €3.2 billion in turnover at consumption in 2024 — a record, up 4.9% from €3.05 billion in 2023 — from approximately 4 million wheels, according to consortium data reported at its April 2025 annual press conference in Milan. Total sales volume rose 9.2%, with domestic sales up 5.2% and exports surging 13.7%. Producer prices for 12-month matured wheels reached €11.0/kg in 2024, up 9% year-over-year. By mid-2025, wholesale hit €13.30/kg. A 21% gain.

The export math is where it gets pointed. Italian cheese exports in the first half of 2025: volume up 2.2%, value up 20.4%. Two percent more product out the door, twenty percent more revenue back. Exports now account for 48.7% of Parmigiano’s total sales volume — closing in on overtaking domestic consumption. As consortium president Nicola Bertinelli put it: “2024 was a challenging year for Parmigiano Reggiano, yet it ended with record results.” The U.S. alone absorbed over 16,000 tons in 2024, up 13.4%.

On this side of the Atlantic, Mateo Kehler’s Jasper Hill Farm in Greensboro, Vermont — population roughly 800 — generates multi-million-dollar annual revenue and pays partner farms roughly three times the commodity milk price, according to figures shared with The Bullvine. Kehler has observed that a Vermont family can make a good living with 25 to 30 cows, provided they make high-end cheese. By the operation’s own accounting, the vast majority of profits stay in-state.

But Jasper Hill is entirely debt-financed, took two decades to reach its current scale, and recently watched its Canadian export market collapse after tariff-driven boycotts. Kehler has had to buy 11 properties to house employees in a town with Vermont’s highest second-home ownership rate. Even successful premium transitions create new problems. In Wisconsin, Uplands Cheese Company — two neighboring families in Dodgeville’s Driftless Region — milks roughly 150 cows (Holsteins, Jerseys, and Brown Swiss) and produces just two cheeses: Pleasant Ridge Reserve during summer pasture months and Rush Creek Reserve in fall. At peak production, a day’s run yields up to 78 ten-pound wheels. When the cheese was launched, wholesale pricing was roughly 4 times commodity cheddar — about $10/lb versus $2.50/lb. Multiple Best of Show wins at the American Cheese Society competition. Strategic scarcity is built into the production calendar.

Why the Italian Premium Sticks

The Italian premium isn’t about Mediterranean mystique or tourist spending. It’s three structural mechanisms—and the first two are replicable.
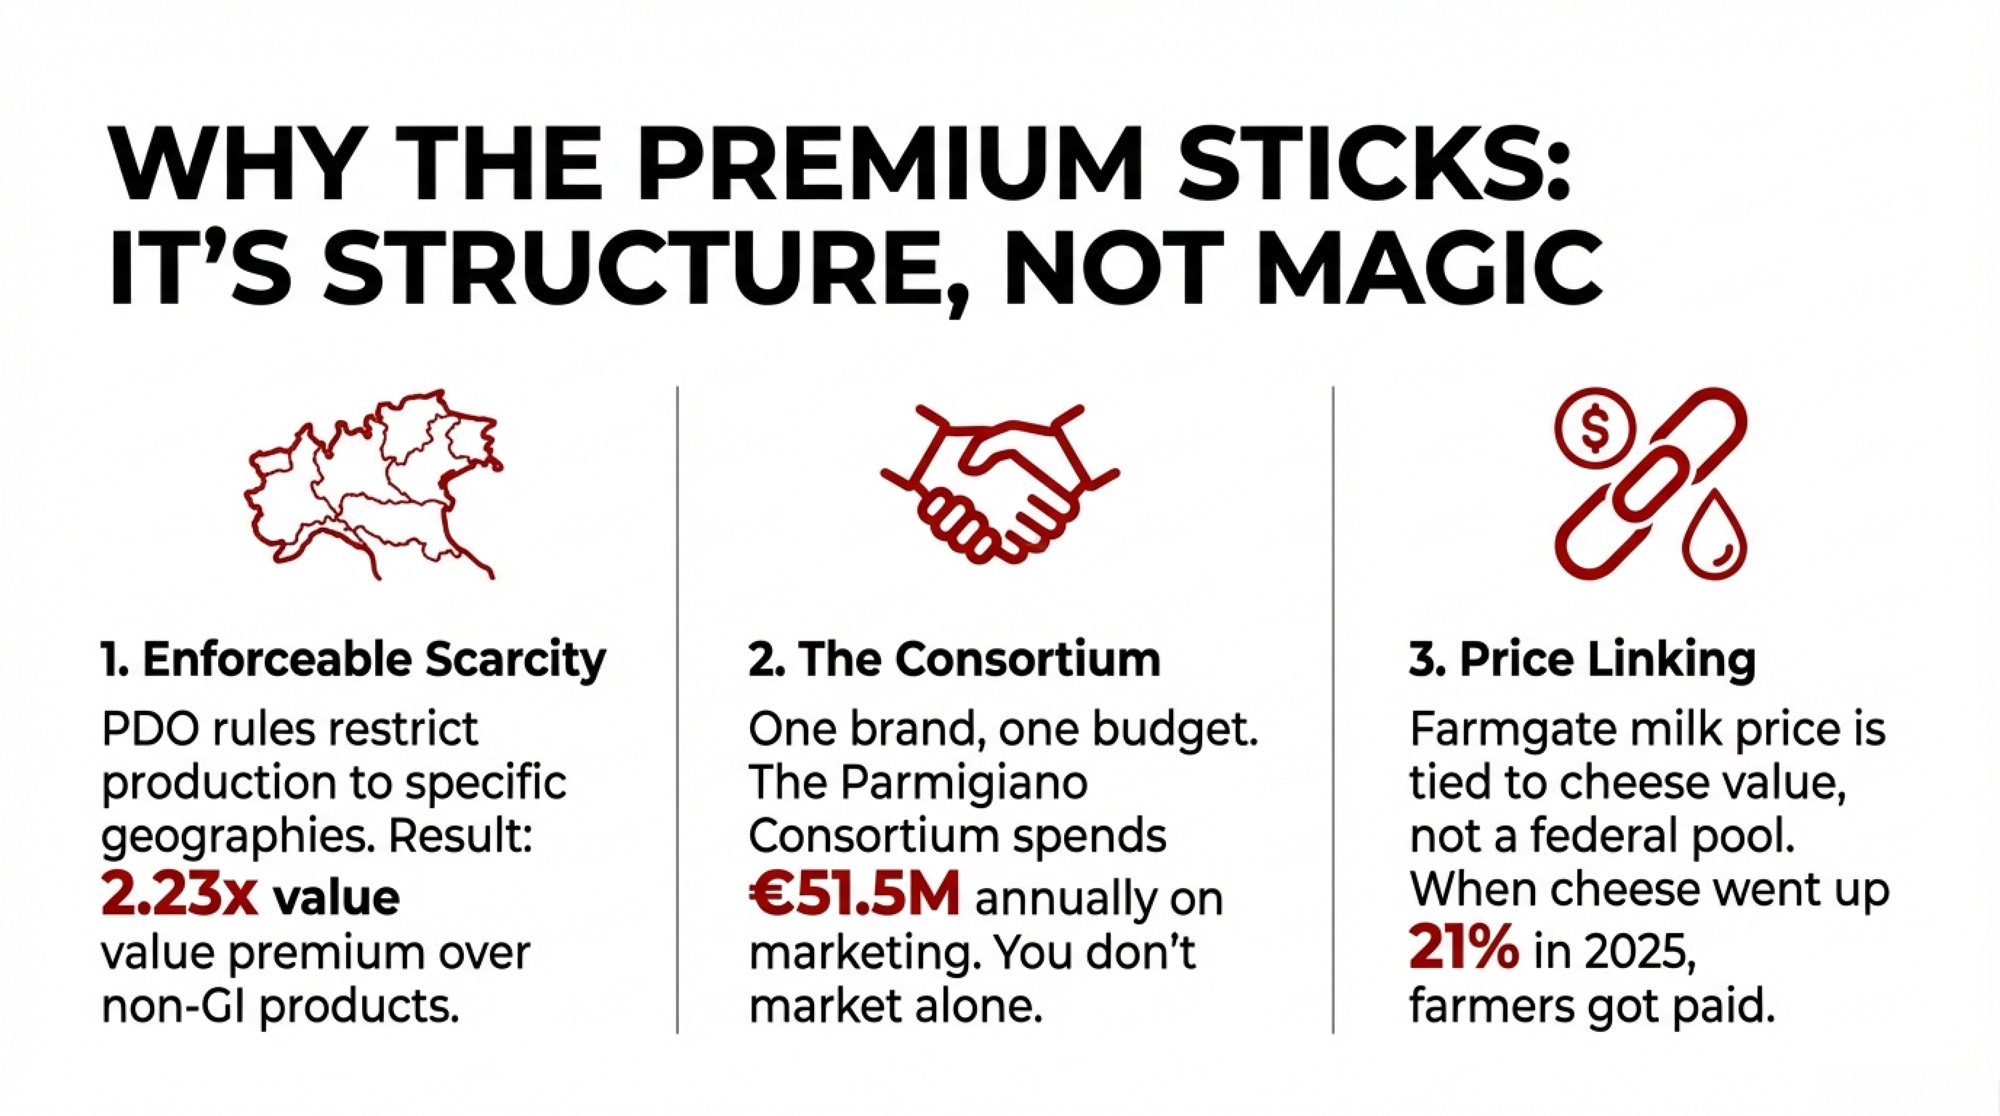
Geographic designations create enforceable scarcity. PDO rules require all production within a defined region. A 2012 study by AND-International for the European Commission’s DG Agriculture — covering GI products across EU member states — found that the “value premium rate” for PDO/PGI products averaged 2.23 times that of comparable non-GI products. A separate, more detailed 2014 study by Areté srl for the Commission confirmed that PDO/PGI products were generally more profitable than their comparators, though with significant variation across products and regions. Export prices run roughly 11.5% higher even in international markets where consumers have no cultural attachment to the origin.

Consortium structures align producers with collective brand value. The Parmigiano Consortium operates on a projected €51.5 million budget for 2025 — including a €1.5 million crisis fund for price stabilization. Individual farms don’t need their own marketing. The consortium is the marketing.

Farmgate prices link directly to end-product value. When Parmigiano prices rise, supplying farms get paid more — Italian spot milk quotations ran €0.425–€0.4575/kg even during recent downturns. North America’s FMMO system deliberately severs that link through pooling. Under the USDA Final Rule published in January 2025, the FMMO make allowance for cheese increases to $0.2519/lb effective June 1, 2025 — locking in a higher guaranteed margin for processors before your milk check is calculated. Your milk check reflects pool averages, not what your specific milk became.

MetricU.S. Commodity BaselinePDO 2.23× MultiplierJasper Hill (VT)Parmigiano (Italy)
Base milk price$18.95/cwt (Feb 2026 WASDE)$18.95/cwt$18.95/cwt$18.95/cwt (equiv.)
Value multiplier1.0×2.23× (EU study avg.)~3.0× (est.)2.23× (applied)
Premium farmgate equivalent$18.95/cwt$42.26/cwt$56.85/cwt$42.26/cwt
Annual revenue (250-cow herd)¹$455,400$1,015,548$1,365,900$1,015,548
Revenue gain vs. commodity+$560,148+$910,500+$560,148

In France, the Comté PDO tells the same story. Data from French agricultural statistics (SCEES), compiled by Origin-GI, show Comté-zone farms achieved a 32% profitability premium over non-PDO dairy farms in the same Franche-Comté region. A February 2022 analysis by the French Ministry of Agriculture’s Centre for Studies and Strategic Foresight confirmed the pattern, finding Franche-Comté PDO farms earned a surplus of approximately €22,000 per agricultural worker unit compared to non-GI farms in surrounding areas. Farmgate milk ran 14% above baseline. Between 1988 and 2000, PDO-area farms lost 36% of their operations — a painful but non-PDO farm loss in the same area was 57%. The designation didn’t prevent consolidation, but it meaningfully slowed it.

These systems aren’t risk-free. Long aging cycles tie up capital for months or years, concentrated brands can suffer when export demand softens, and inventory exposure during downturns is real. But the studies suggest that, over time, farms inside well-run GI systems have had more room to absorb shocks than their commodity neighbors. For more on how geographic indications are reshaping global dairy trade, including the U.S. industry’s pushback, see our earlier analysis.

Four Paths Forward — and What Each One Costs

Not every operation can or should pursue the same route. Your scale, your balance sheet, and how much transition risk your family can absorb determine which path makes sense.

PathUpfront CapitalTimeline to PremiumRisk LevelBest Fit
1. Component optimizationMinimalImmediateLowAny herd with protein below 3.4%
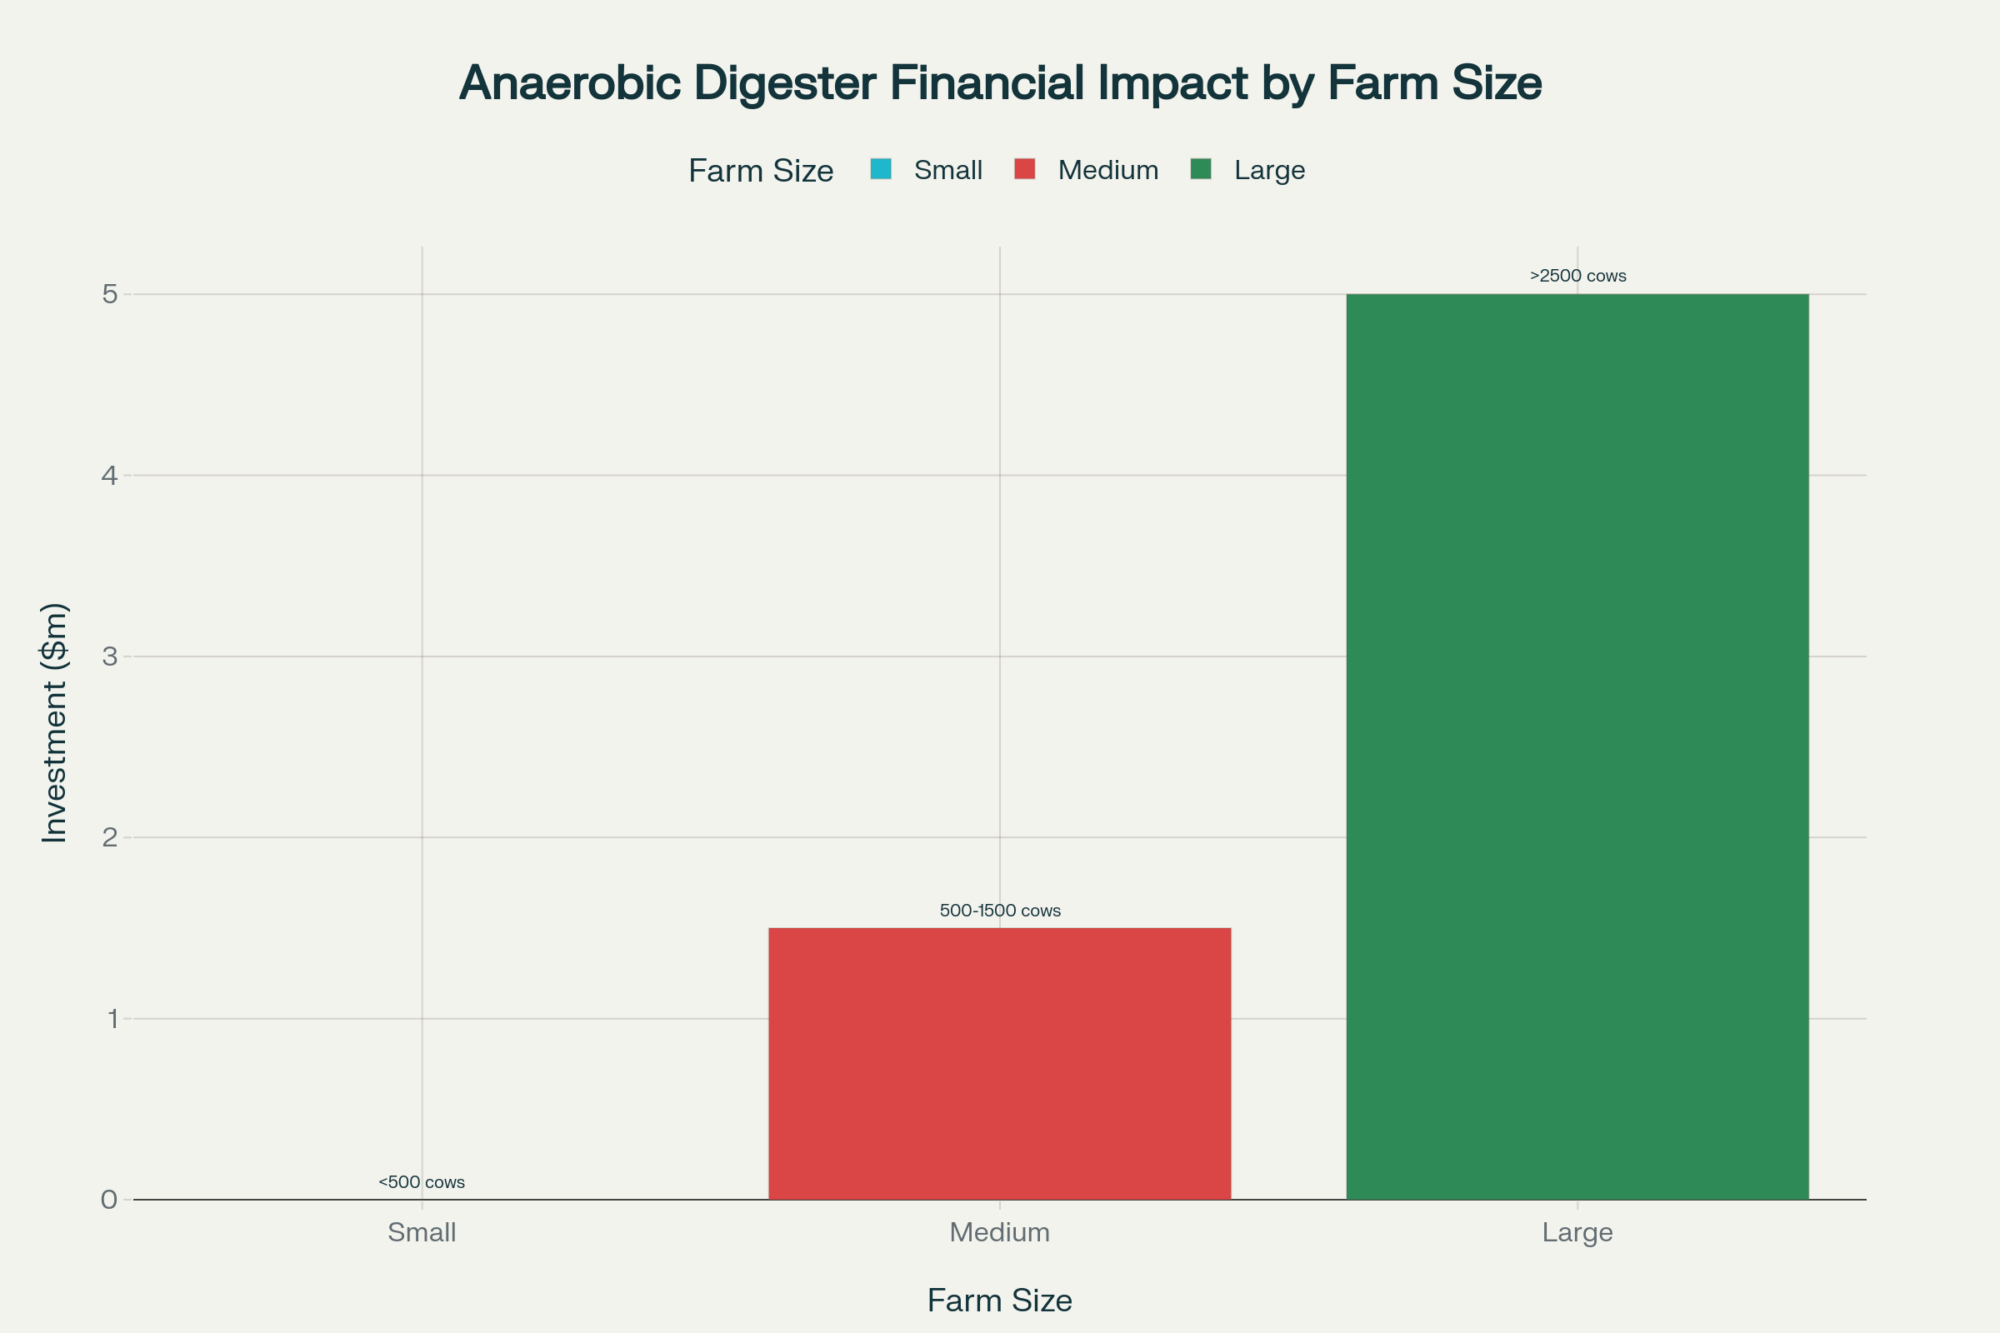
2. Individual farmstead cheese$750K–$1.2M3–5 yearsHighOperations with strong local market access
3. Collective regional consortium$60K–$70K per farm5–7 yearsModerate3+ neighboring herds facing shared margin pressure
4. Demographic-driven specialtyModerate1–3 yearsModerateHerds near growing Hispanic or urban markets

Path 1: Component optimization. Under FMMO reforms effective June 1, 2025, moving from 3.1% to 3.4% protein could generate approximately $8,640 annually for a 200-cow herd based on current component pricing — no infrastructure change required. At the February WASDE’s $18.95/cwt outlook, a herd with a $19.50 break-even faces a $0.55/cwt gap — component optimization (including butterfat and quality adjustments) could plausibly close that. At a $20.50 break-even, you’re staring at a $1.55/cwt hole, and $8,640 on 48,000 cwt is only $0.18/cwt in protein gains alone. Path 1 is a margin patch, not a margin strategy. But if your gap is under roughly $1.00/cwt, components might be enough.

PathUpfront CapitalTimeline to PremiumRisk LevelBest FitEst. $/cwt Gain
1. Component OptimizationMinimal (<$10K)Immediate (0–6 mo)LowAny herd with protein <3.4%, gap <$1.00/cwt$0.15–$0.50/cwt
2. Individual Farmstead Cheese$750K–$1.2M3–5 yearsHighStrong local market access, $150K+ working capital$5–$15/cwt
3. Collective Regional Consortium$60K–$70K/farm5–7 yearsModerate3+ neighboring herds, shared margin pressure$3–$8/cwt
4. Demographic-Driven Specialty$150K–$400K1–3 yearsModerateNear Hispanic/urban markets, no aging required$2–$5/cwt

Path 2: Individual farmstead cheese. A 2014 study by Bouma et al., published in the Journal of Dairy Science, found that startup costs for artisan cheese processing and aging facilities ranged from $267,248 to $623,874 for annual production volumes of 7,500 to 60,000 pounds. Bullvine’s own financial modeling — which extrapolates Bouma et al.’s capital benchmarks to current prices and adds working capital, a broader product mix, and aging capacity — puts total investment for a 250-cow operation diverting 40% of milk to artisan cheese at roughly $750,000 to $1.2 million. Annual cheese operating costs add approximately $456,000. The model shows cumulative returns turning positive around Year 4 at $18/lb artisan retail pricing. Kehler’s experience suggests the model works from roughly 25 cows up, but the capital structure looks completely different at 25 versus 250.

Uplands Cheese proves the premium is real — four times commodity cheddar at wholesale — but the operation runs on 150 cows making just two cheeses, and only during months when pasture conditions are ideal. And here’s the sobering counterweight: the American Cheese Society’s 2022 biennial industry survey — funded by the American Cheese Education Foundation, based on responses from more than 200 artisan and specialty cheesemakers (published June 2023) — found 24% of U.S. artisan cheesemakers gross under $50,000 annually. Premium pricing is not automatic. As Paul Scharfman told the Wisconsin Dairy Task Force 2.0, “many specialty cheesemakers are fighting for the same four-foot section in a grocery store.”

Path 3: Collective regional consortium. Twenty farms sharing infrastructure brings individual exposure to roughly $60,000–$70,000 per farm. A consortium modeled on France’s Comté CIGC — shared aging infrastructure, collective branding under a USPTO certification mark, codified production standards that naturally constrain supply — addresses the capital and distribution barriers that kill individual producers. The trade-off is real: Parmigiano producers subordinate their individual farm identity entirely to the regional brand. You gain collective pricing power. You give up the option to differentiate on your own terms. John Umhoefer of the Wisconsin Cheese Makers Association identified “money, licensing, regulations, and liability” as the obstacles when the Wisconsin Dairy Task Force explored exactly this concept. DATCP had $200,000 in total processor grant funding. Parmigiano’s consortium operates on €51.5 million. That funding gap tells you everything about institutional commitment.

Path 4: Demographic-driven specialty. Hispanic cheese varieties are growing at more than three times the rate of the broader cheese category, according to DFA’s Ken Orf, citing Circana data from early 2024. The latest 52-week MULO+ data (ending December 29, 2024) confirms the acceleration, with Hispanic cheeses growing at 2× to 27× faster than mainstream counterparts in comparable applications. DFA’s acquisition of W&W Dairy in Wisconsin was targeted directly at this segment. No aging caves required, no geographic branding necessary — you need to understand which consumer populations are expanding near you and produce for them.

The Demand Signal Is Already There
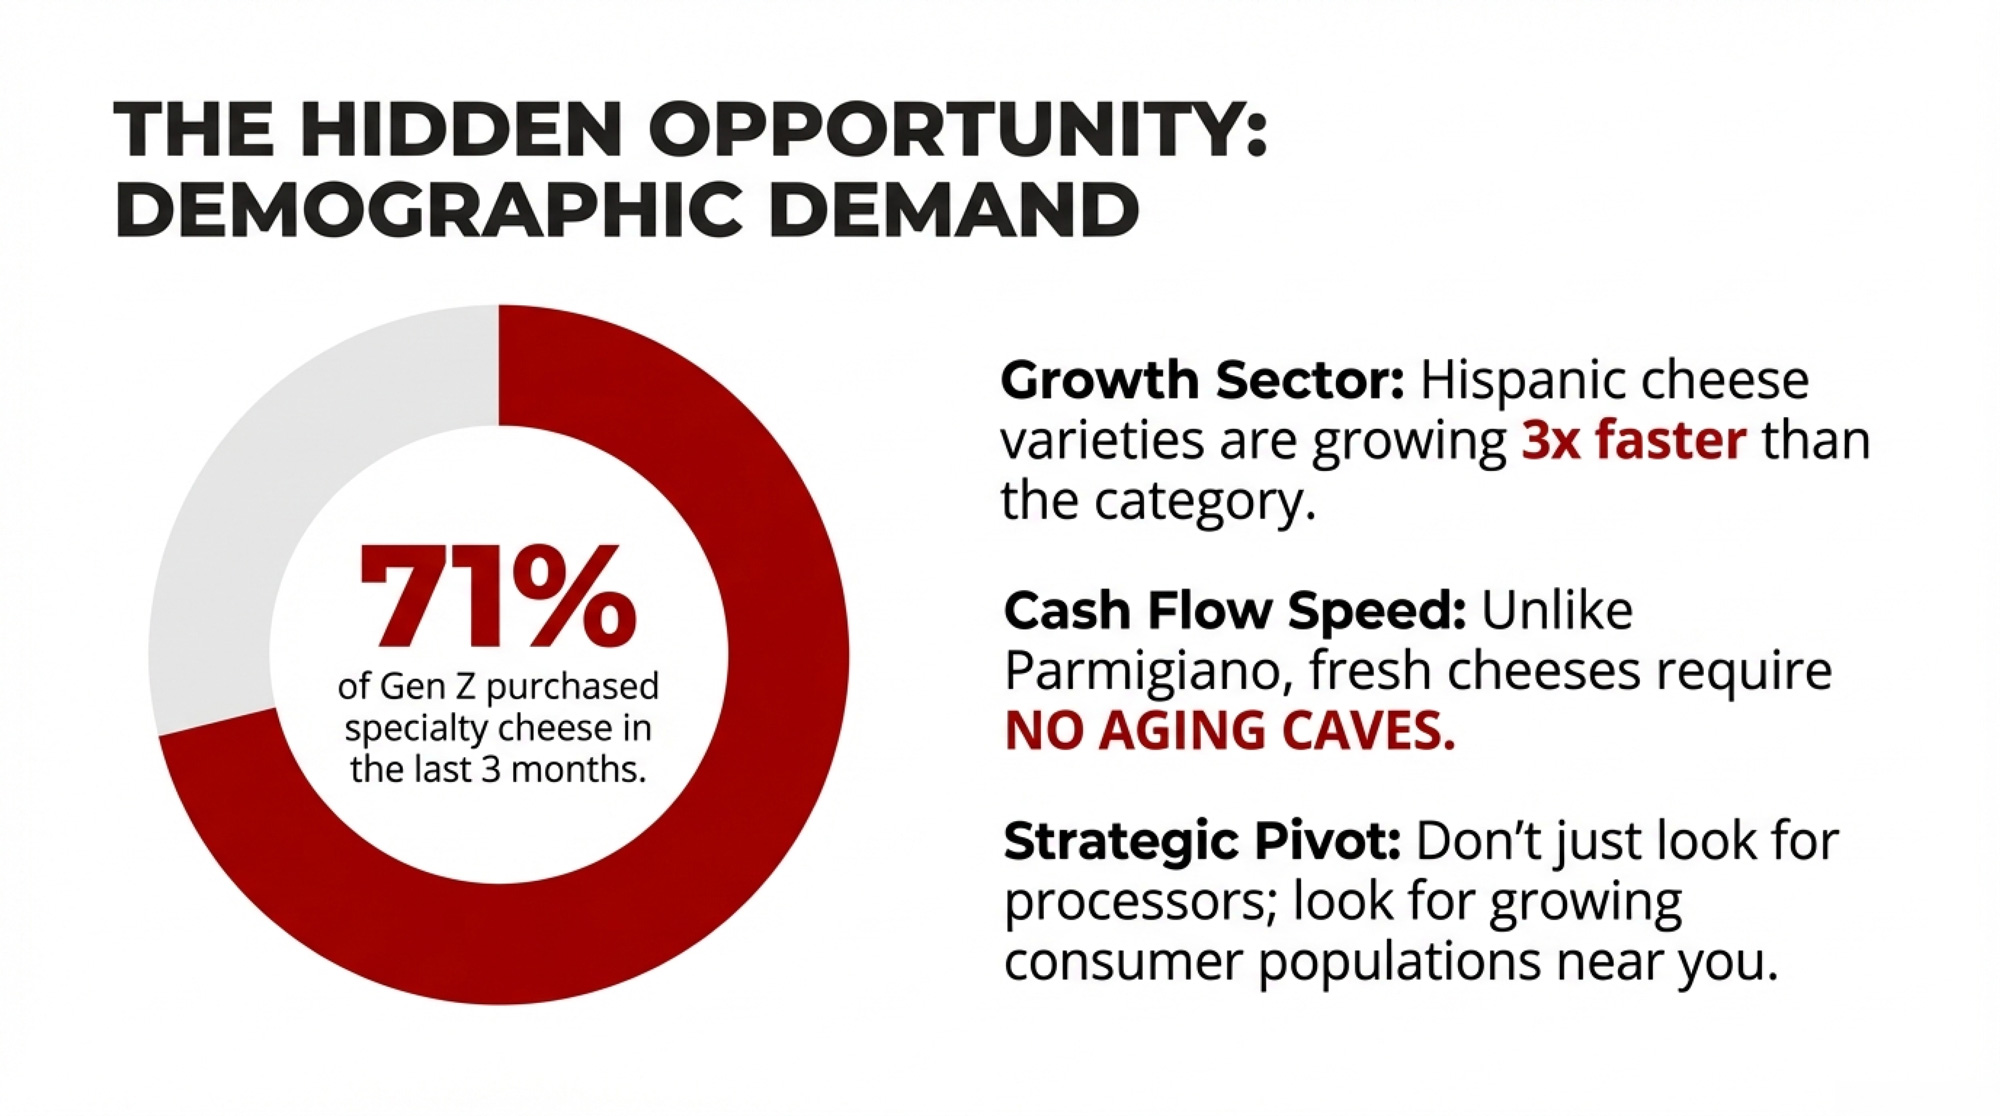
A nationally representative survey of 583 U.S. supermarket shoppers — commissioned by Supermarket Perimeter and conducted by Cypress Research (Kansas City, Mo.) with fieldwork in March 2023 — found 64% of Americans purchased specialty cheese in the prior three months. Gen Z led at 71%. And 56% of specialty cheese buyers actively seek seals of authenticity or origin, even though there is no North American GI system.

Market data from Circana supports it. Over the most recent 52-week tracking period in 2025, deli specialty cheese sales rose 8% in both dollars and volume, led by Hispanic and Italian cheese types. American cheese — the commodity benchmark — fell nearly 5% over the same stretch. Rachel Shemirani, senior vice president of Poway, California-based Barons Market, described Gen Z consumers gaining “visual access to different types of specialty cheeses” through TikTok, driving discovery that once took generations to build. The Milano-Cortina Games this month will put Italian food production on a global screen for two weeks, but the domestic demand signals suggest North American consumers don’t need the reminder.

California’s Real California Milk seal — a regional origin certification, not a formal PDO — already delivers a measurable 6.3 percentage point sales spread over non-origin-branded specialty cheese in the same stores (Circana/IRI data, 52 weeks ending May 2023: volume up 3.3% with seal, down 3.0% without). “Domestic origin labeling, and even more so local connotations, carry our customers’ trust in their quality and value,” said the California Milk Advisory Board’s Katelyn Harmon.

On the institutional side, USDA announced $11 million in new Dairy Business Innovation Initiative grants on January 20, 2026. Wisconsin and Vermont each received $3.45 million — explicitly earmarked for value-added development in small and mid-size dairy operations. That comes on top of the $11 billion in new processing capacity coming online through 2028, almost all of it commodity-oriented. The question is whether any of the new stainless includes specialty or aged-cheese capacity—and whether premium returns would flow back through your milk check.

The Canadian Paradox: You Already Have Organized Scarcity — Without the Premium

Here’s the part that should frustrate Canadian producers most: you’re already operating inside a managed-supply system. Quota limits production. Tariffs block imports. The Canadian Dairy Commission sets prices. Supply management has shaped the structure of the Canadian dairy industry since 1972. That’s organized scarcity—the same foundational principle behind every PDO consortium in Europe.
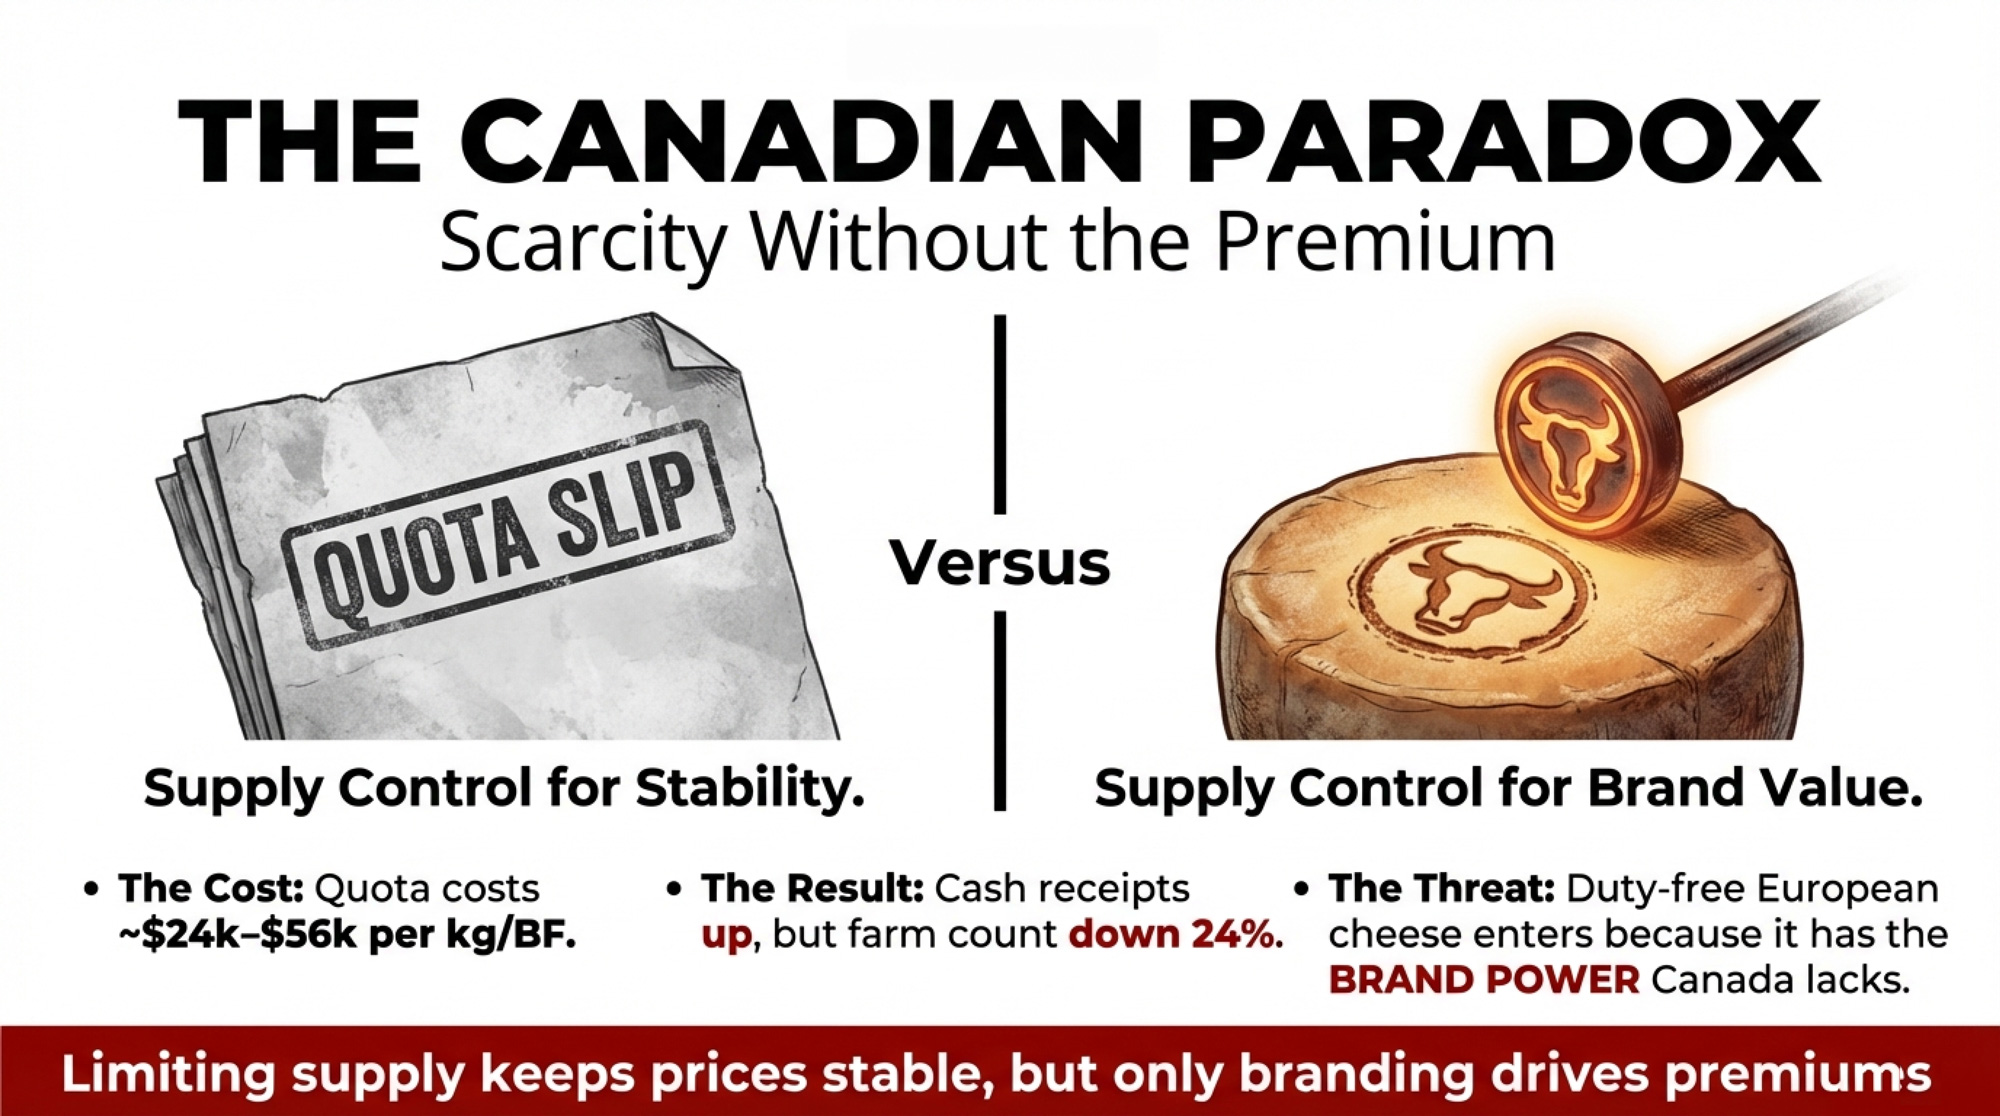
And yet the economic outcomes aren’t even close.

System FeatureParmigiano Consortium (Italy)Canadian Supply ManagementResult
Quota systemYes – tied to brand protectionYes – tied to domestic demand matchingBoth manage scarcity
Annual brand investment€51.5M (2025 budget)$350M CETA compensation (couldn’t measure impact)Italy builds value; Canada maintains floor
Farmgate price mechanismContractually linked to wheel pricesRegulated floor price, pooledItaly: price rises with product; Canada: static regulation
Premium to farmers (vs. commodity)2.23× average (EU study)Minimal to noneItaly captures value; Canada captures stability
Producer count trend (recent)+4,043 operations (growing)–24% farms (2012–2022)Italy adds participants; Canada consolidates
Export competitiveness48.7% of sales, growing 13.7%/yrFaces 16,000 MT duty-free EU cheese importsItaly wins globally; Canada defends domestically
Price volatilityLow (brand-buffered)Low (quota-regulated)Both stable—but only Italy delivers premium

The Parmigiano Consortium also assigns production quotas directly to farmers, with financial contributions required from anyone who exceeds their allocation—a system the Italian Ministry of Agriculture formally approved for the 2020–2022 cycle and has renewed since. Both countries manage supply. But Italy’s quotas exist to protect the brand value of a €3.2 billion product and flow premium returns back to the farms that produce the milk. Canada’s quotas exist to match domestic supply to domestic demand at a regulated floor price. One system creates scarcity, driving up the value of the end product. The other creates scarcity that maintains stability, which is a different thing entirely. For many Canadian farms, that stability has been the point, and it’s delivered real income predictability that U.S. producers riding the WASDE rollercoaster don’t have. But it hasn’t translated into a structural price premium the way PDO status has in Europe.

The numbers bear it out. Canadian dairy cash receipts rose from $5.9 billion to $8.2 billion between 2012 and 2022 — a 39% increase (AAFC evaluation, 2024). But the number of farms dropped from 12,762 to 9,739 over the same period, a 24% decline. Production went up 18%. Fewer farms, more milk, higher gross receipts — and yet, as McGill University’s 2023 policy analysis concluded, the system “limits producers’ ability to set the price and quantity of their products” and “prevents farms from achieving economies of scale.” Quota costs in Ontario sit at roughly $24,000 per kilogram of butterfat per day; in other provinces, recent transactions have exceeded $44,000 and even $56,000 per kg/BF/day (Agriculture Canada, 2025 monthly quota trade reports). That capital buys you the right to produce milk at a regulated price. It doesn’t, on its own, create a premium brand.

Agriculture Canada’s own evaluation of the $350 million CETA compensation programs (DFIP and DPIF) was blunt: the department “is unable to determine whether either program mitigated anticipated future growth losses” from increased European cheese imports. Meanwhile, CETA opened the door to 16,000 metric tonnes of duty-free EU cheese annually — about 4% of Canadian consumption. The irony is hard to miss: European PDO cheese is entering the Canadian market because it commands a premium, while Canadian producers inside a managed-supply system have no structural mechanism to build comparable brand value with their own milk.

It’s not impossible to break through. Gunn’s Hill Artisan Cheese in Oxford County, Ontario — Canada’s self-described Dairy Capital — demonstrates at least a partial path. Owner Shep Ysselstein trained in the Swiss Alps, then returned to build a small artisan cheese plant using milk from his family’s neighboring dairy farm, Friesvale Farms. Today, Gunn’s Hill produces Swiss-style artisan cheeses sold in over 300 retail locations across Ontario. And as of this week, dairy farmer organizations across Canada are changing how farmers get paid for milk to meet growing demand for protein — cottage cheese alone grew 32% — which at least signals the system can adapt when market pull is strong enough.

But Gunn’s Hill is small, regional, and essentially operating around the edges of supply management rather than through it. What’s missing isn’t the production discipline — Canadian dairy already has that in spades. What’s missing is the brand architecture, the collective marketing investment, and the legal framework that turns managed scarcity into managed premium. Italy devotes €51.5 million a year to one consortium’s brand. Canada spent $350 million across the sector — and AAFC couldn’t determine whether those investments protected future growth.

What This Means for Your Operation

Before your next capital decision, these are worth working through:

  • Where does your real break-even point sit? Not cash break-even — real break-even, with family labor, principal, and living expenses honestly accounted for. Farmdoc’s 2024 analysis pegs full costs in the low $20s/cwt. USDA-ERS data show even the largest herds (2,000+ cows) average $19.14/cwt on a full economic basis. The February WASDE raised the 2026 all-milk outlook to $18.95/cwt — up from $18.25 in January — but a 250-cow herd at a $20.00 break-even still faces a $1.05/cwt structural gap, or roughly $63,000 annually. If your gap exceeds $1.50/cwt, component optimization alone won’t close it. That’s a structural problem, not an efficiency problem.
  • How many years of operating losses can your balance sheet absorb? The farmstead cheese model shows a 42-month ramp to positive cash flow. If your current debt service doesn’t leave room for three-plus years of additional operating costs, Path 2 isn’t viable without outside capital — whether that’s DBI grants, USDA Rural Development financing, or equity partners.
  • Is there a specialty processor within 100 miles who could use your milk at a premium? Jasper Hill pays partner farms at a rate triple the commodity rate. Operations like this cluster across Vermont, Wisconsin, Oregon, and upstate New York. The conversation costs nothing.
  • Are three or more neighboring operations facing similar margin pressure? If each operation’s gap exceeds $1.50/cwt, the cost of a collective exploration of shared processing infrastructure is less than one farm’s annual component premium — and the DBI grants specifically fund this kind of feasibility work.
  • Has your cooperative discussed value-added returns to producers? The $11 billion in new U.S. processing capacity coming online through 2028 is almost entirely commodity-oriented. Ask whether any of it includes specialty or aged-cheese capacity — and whether premium returns would flow back through your milk check.
  • Does your state dairy association have a position on geographic indication development? NMPF and USDEC have identified GI protections as trade barriers in 34 markets, opposing them on stated grounds that GIs function as non-tariff barriers. As USDEC’s Krysta Harden put it in our Global Cheese Wars analysis: “Europe’s misuse of geographical indications is nothing more than a trade barrier dressed up as intellectual property protection.” The organizations representing you nationally may oppose the legal framework that underpins Italy’s pricing power. It’s a question worth raising at your next member meeting.
Key Takeaways

  • Italy generates €22.8 billion in dairy revenue while production volume shrinks — driven by PDO-protected cheese commanding 2.23 times the value premium of comparable non-GI products, according to AND-International’s 2012 study for the European Commission.
  • North American consumer demand for premium cheese is well established: 64% of U.S. shoppers buy specialty cheese regularly, with Gen Z leading at 71%, and 56% of buyers actively seek origin seals (Cypress Research for Supermarket Perimeter, March 2023).
  • A collective consortium approach reduces per-farm investment from $750K–$1.2M to roughly $60K–$70K — and $11 million in fresh USDA DBI funding is available now.
  • USDA’s 2026 all-milk outlook has whipsawed from $19.25 (November) to $18.25 (January) to $18.95 (February WASDE). That volatility itself is the point: commodity producers absorb every revision; value-added producers are structurally insulated from it.
  • Canada already has organized scarcity through supply management — the same foundational principle Italy uses — but hasn’t built the brand premium layer on top of it. The structure is there. The premium isn’t.
  • The realistic timeline is 5–7 years to meaningful premium returns for individual operations, potentially faster for organized collective efforts. Comté’s 32% profitability premium over neighboring farms — confirmed by both Origin-GI analysis and the French Ministry of Agriculture’s 2022 study — took 15–20 years to fully mature, but the divergence from the commodity market began almost immediately.

The Bottom Line

Italy didn’t build a €22.8 billion dairy industry by expanding herds. It organized producers into consortiums that turned commodity milk into protected brands — then enforced the quality and scarcity that hold price. The USDA outlook bounced 70 cents in one month. Next month, it could drop again. Value-added producers don’t spend February wondering which direction the revision goes. Where does your operation sit on that question?

Complete references and supporting documentation are available upon request by contacting the editorial team at editor@thebullvine.com.

Learn More

The Sunday Read Dairy Professionals Don’t Skip.

Every week, thousands of producers, breeders, and industry insiders open Bullvine Weekly for genetics insights, market shifts, and profit strategies they won’t find anywhere else. One email. Five minutes. Smarter decisions all week.
NewsSubscribe
First
Last
Consent

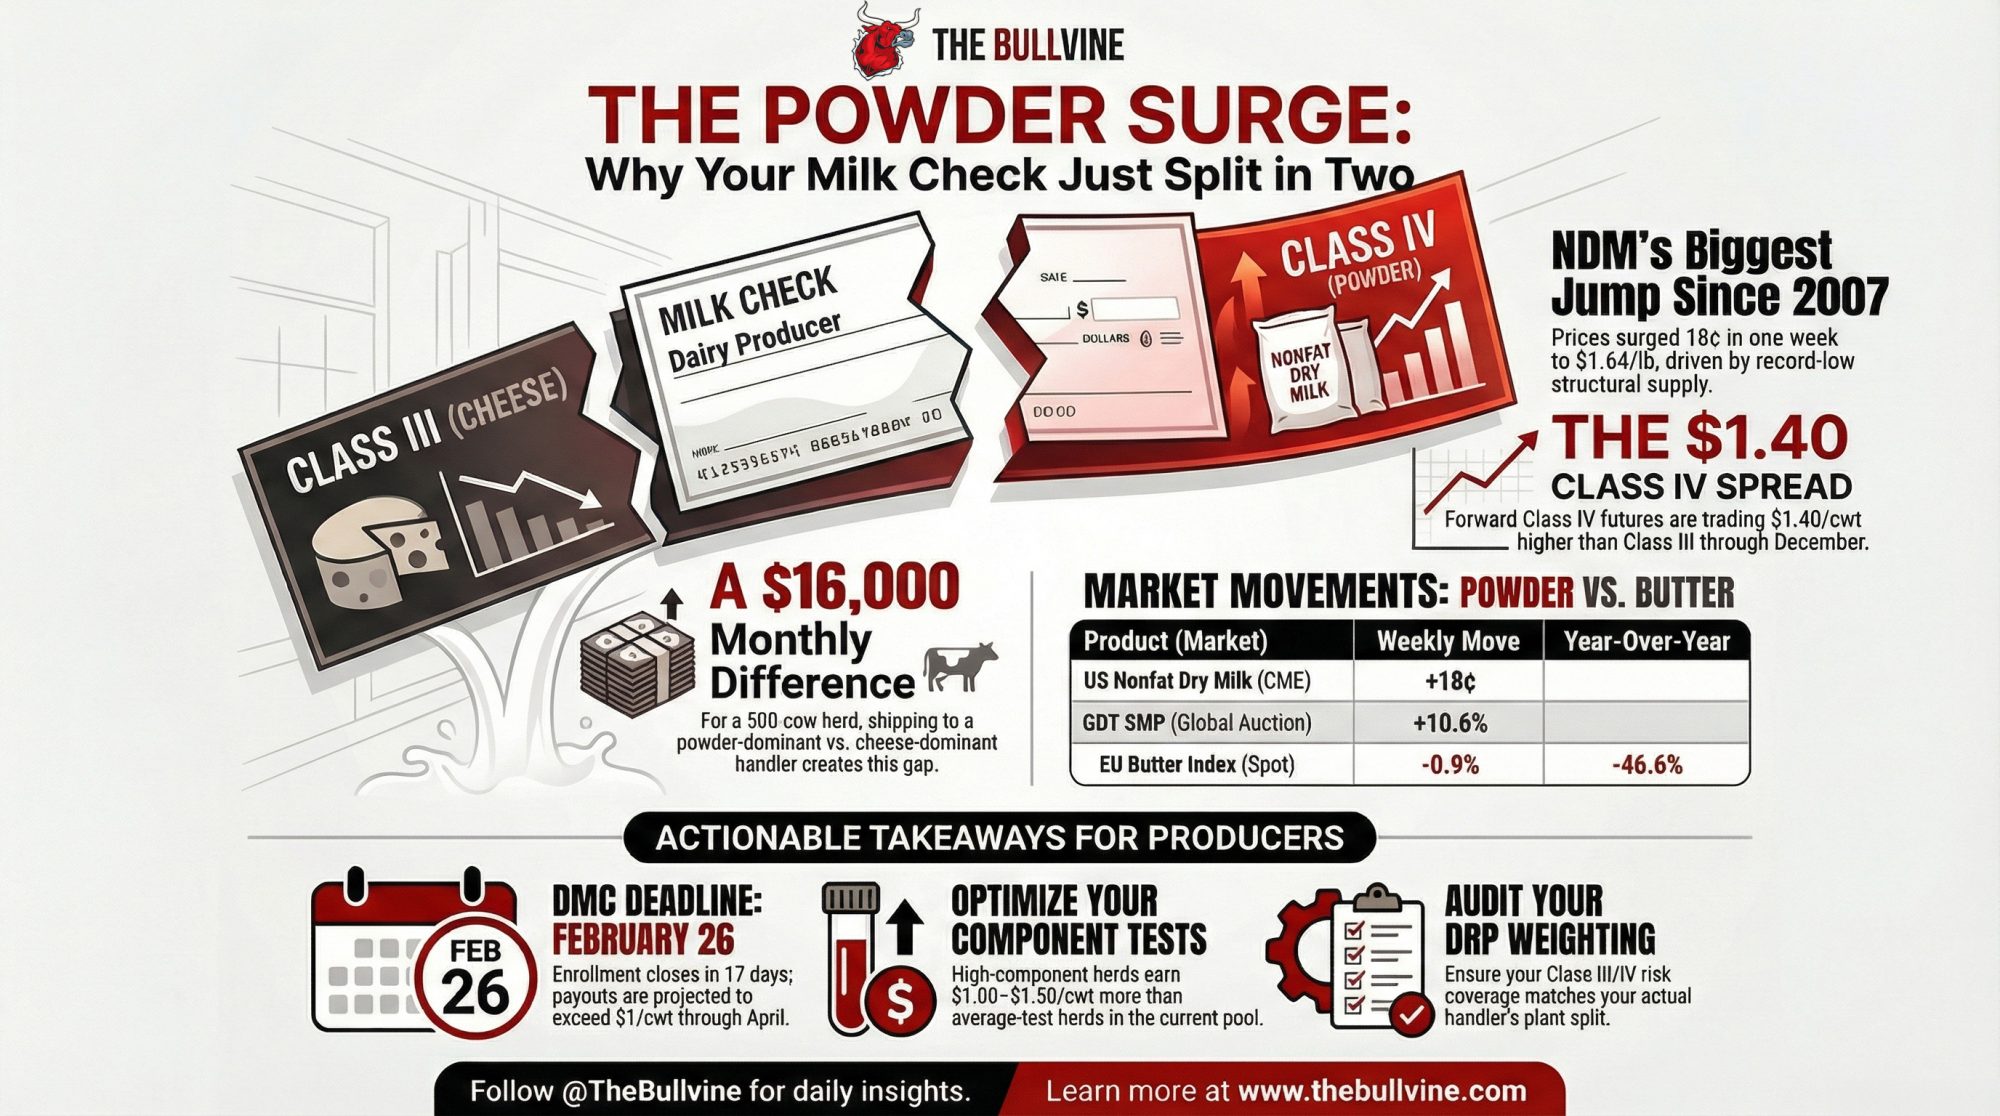
Your Milk Check Just Split in Two: NDM’s Best Week Since 2007 Blows the Class IV Spread to $1.40

The forward Class IV/III gap is now worth $11,000–$16,000/month on a 500-cow herd — and DMC enrollment closes in 17 days.

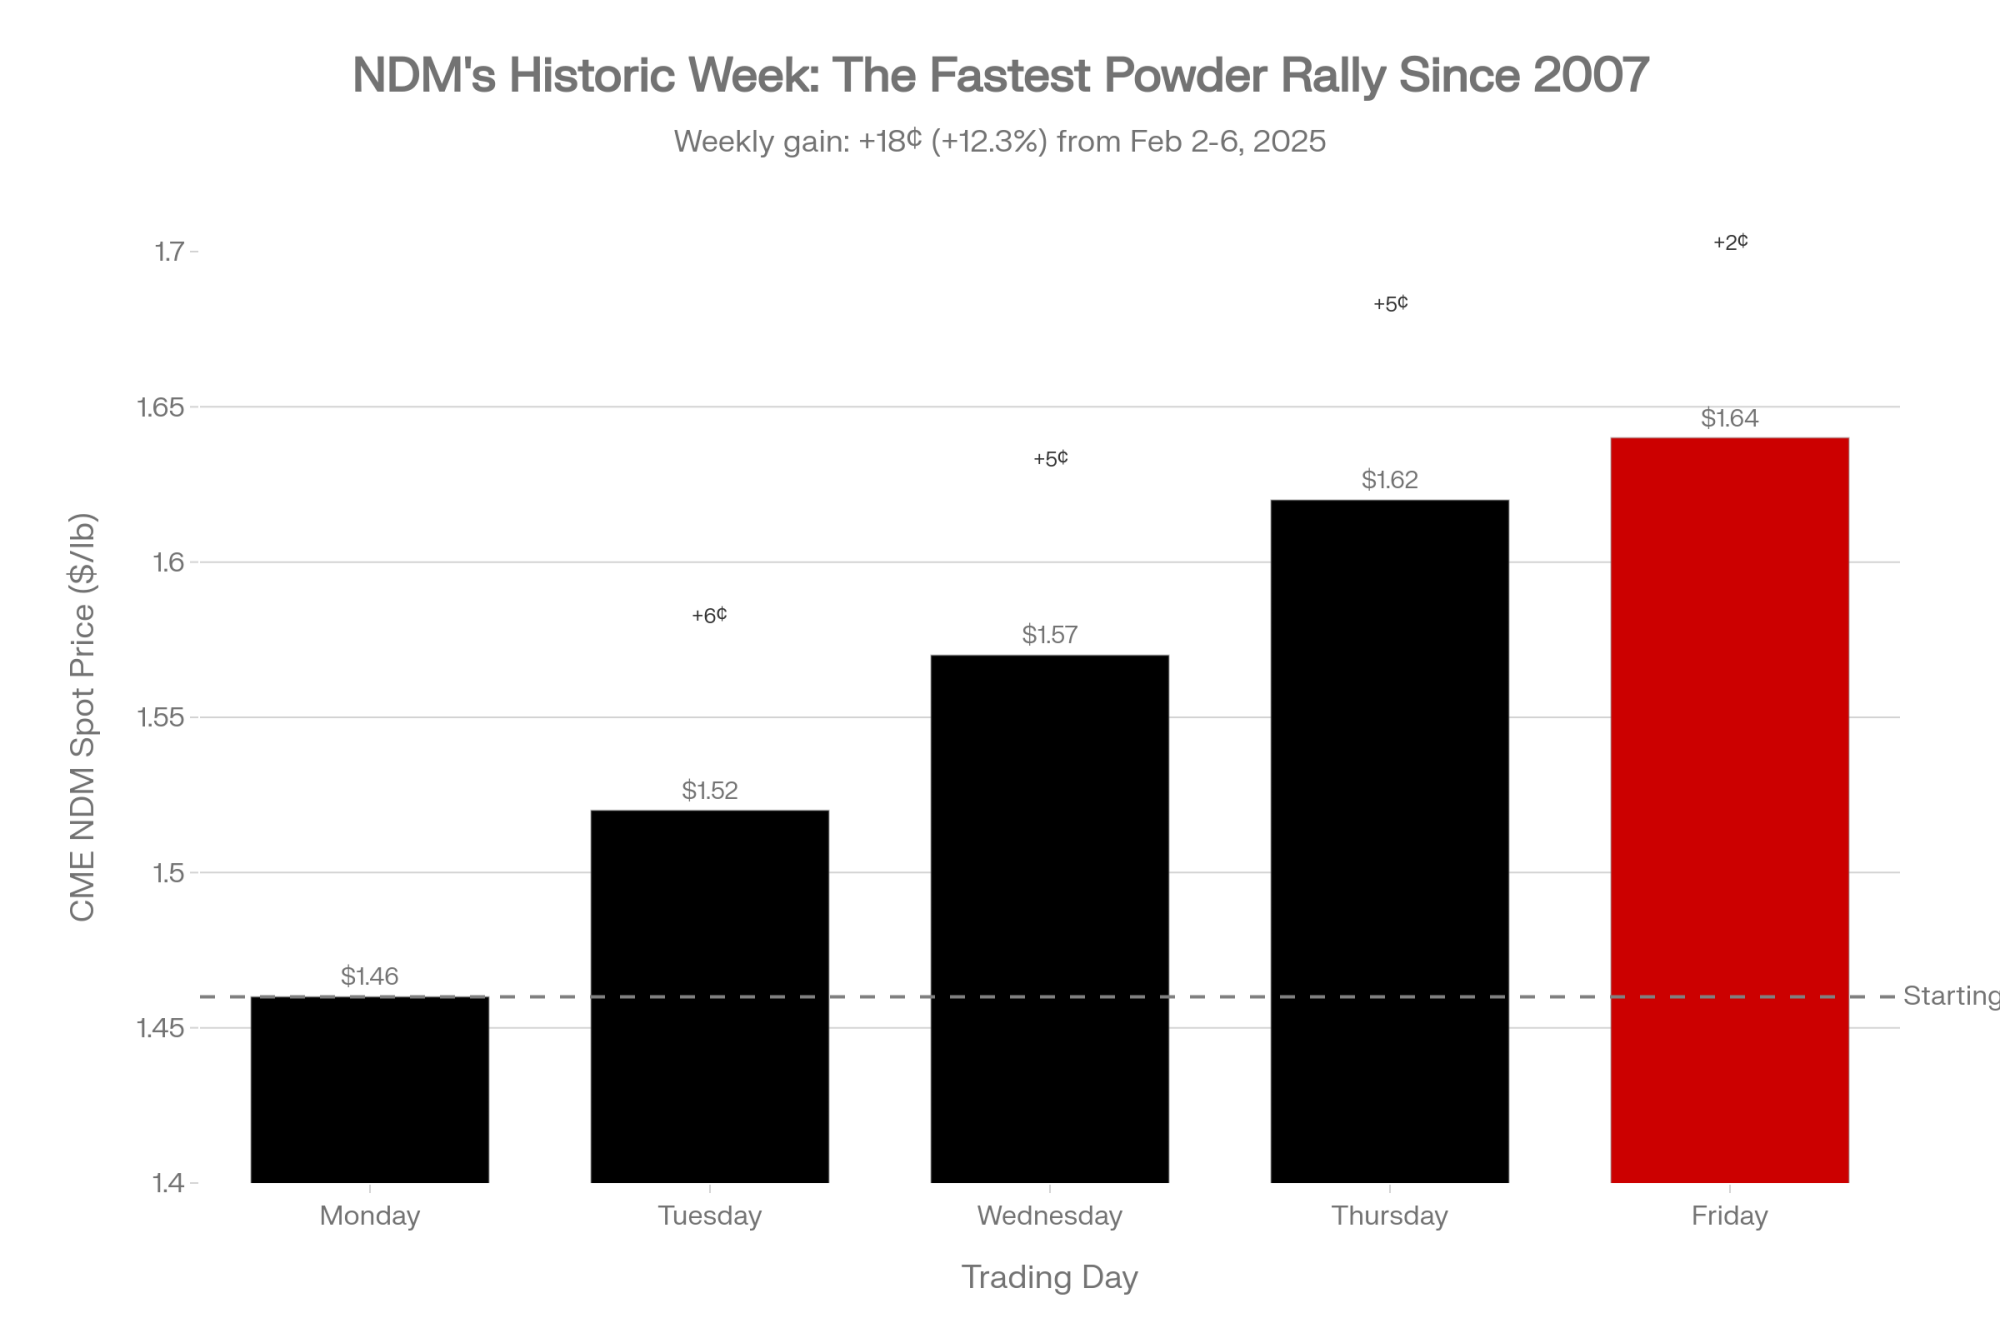
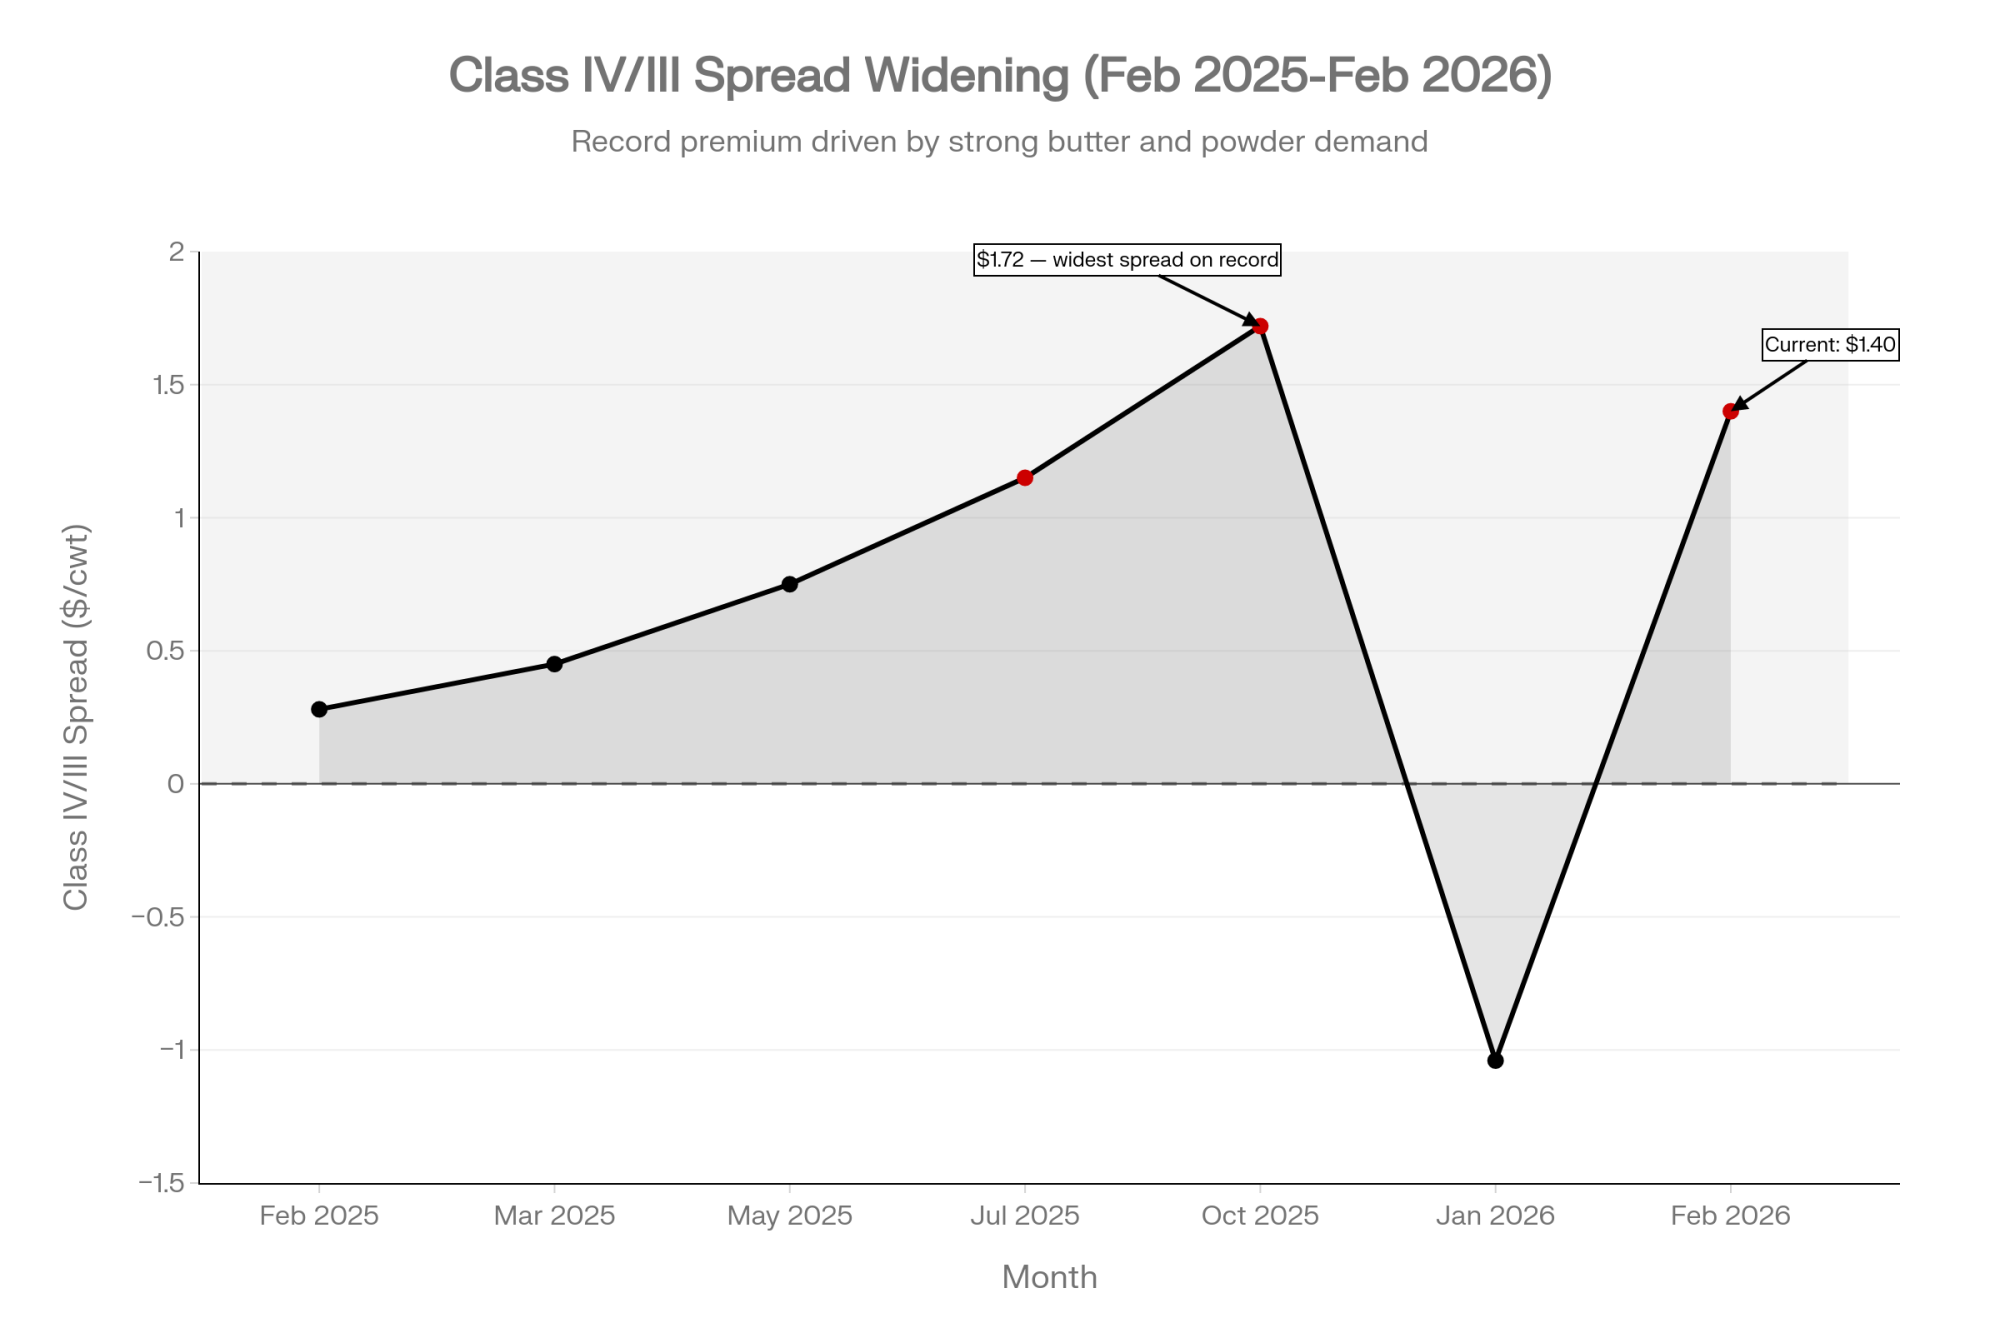
Executive Summary: NDM jumped 18¢ in a single week to $1.64/lb — the biggest move since 2007 —, and it dragged the entire global dairy complex with it. The GDT index surged 6.7% with every product higher, EEX butter futures ripped 10.7%, and forward Class IV is now running $1.40+/cwt above Class III through year-end. On a 500-cow herd, that spread alone is worth $11,000–$16,000 a month. EU spot butter tells the flip side: down 46.6% year-over-year, a reminder that last year’s overproduction hasn’t cleared, even as dry whey slipped to become the week’s only loser. The scarcity behind this powder rally isn’t going away — 2025 NDM/SMP output was the weakest since 2013, while $11 billion in new US processing capacity went to cheese, not dryers. DMC enrollment closes February 26, Ever.Ag is projecting payouts above $1/cwt through April, and if you haven’t run the numbers on your Class III/IV exposure this week, you’re already behind.

Class IV milk price spread

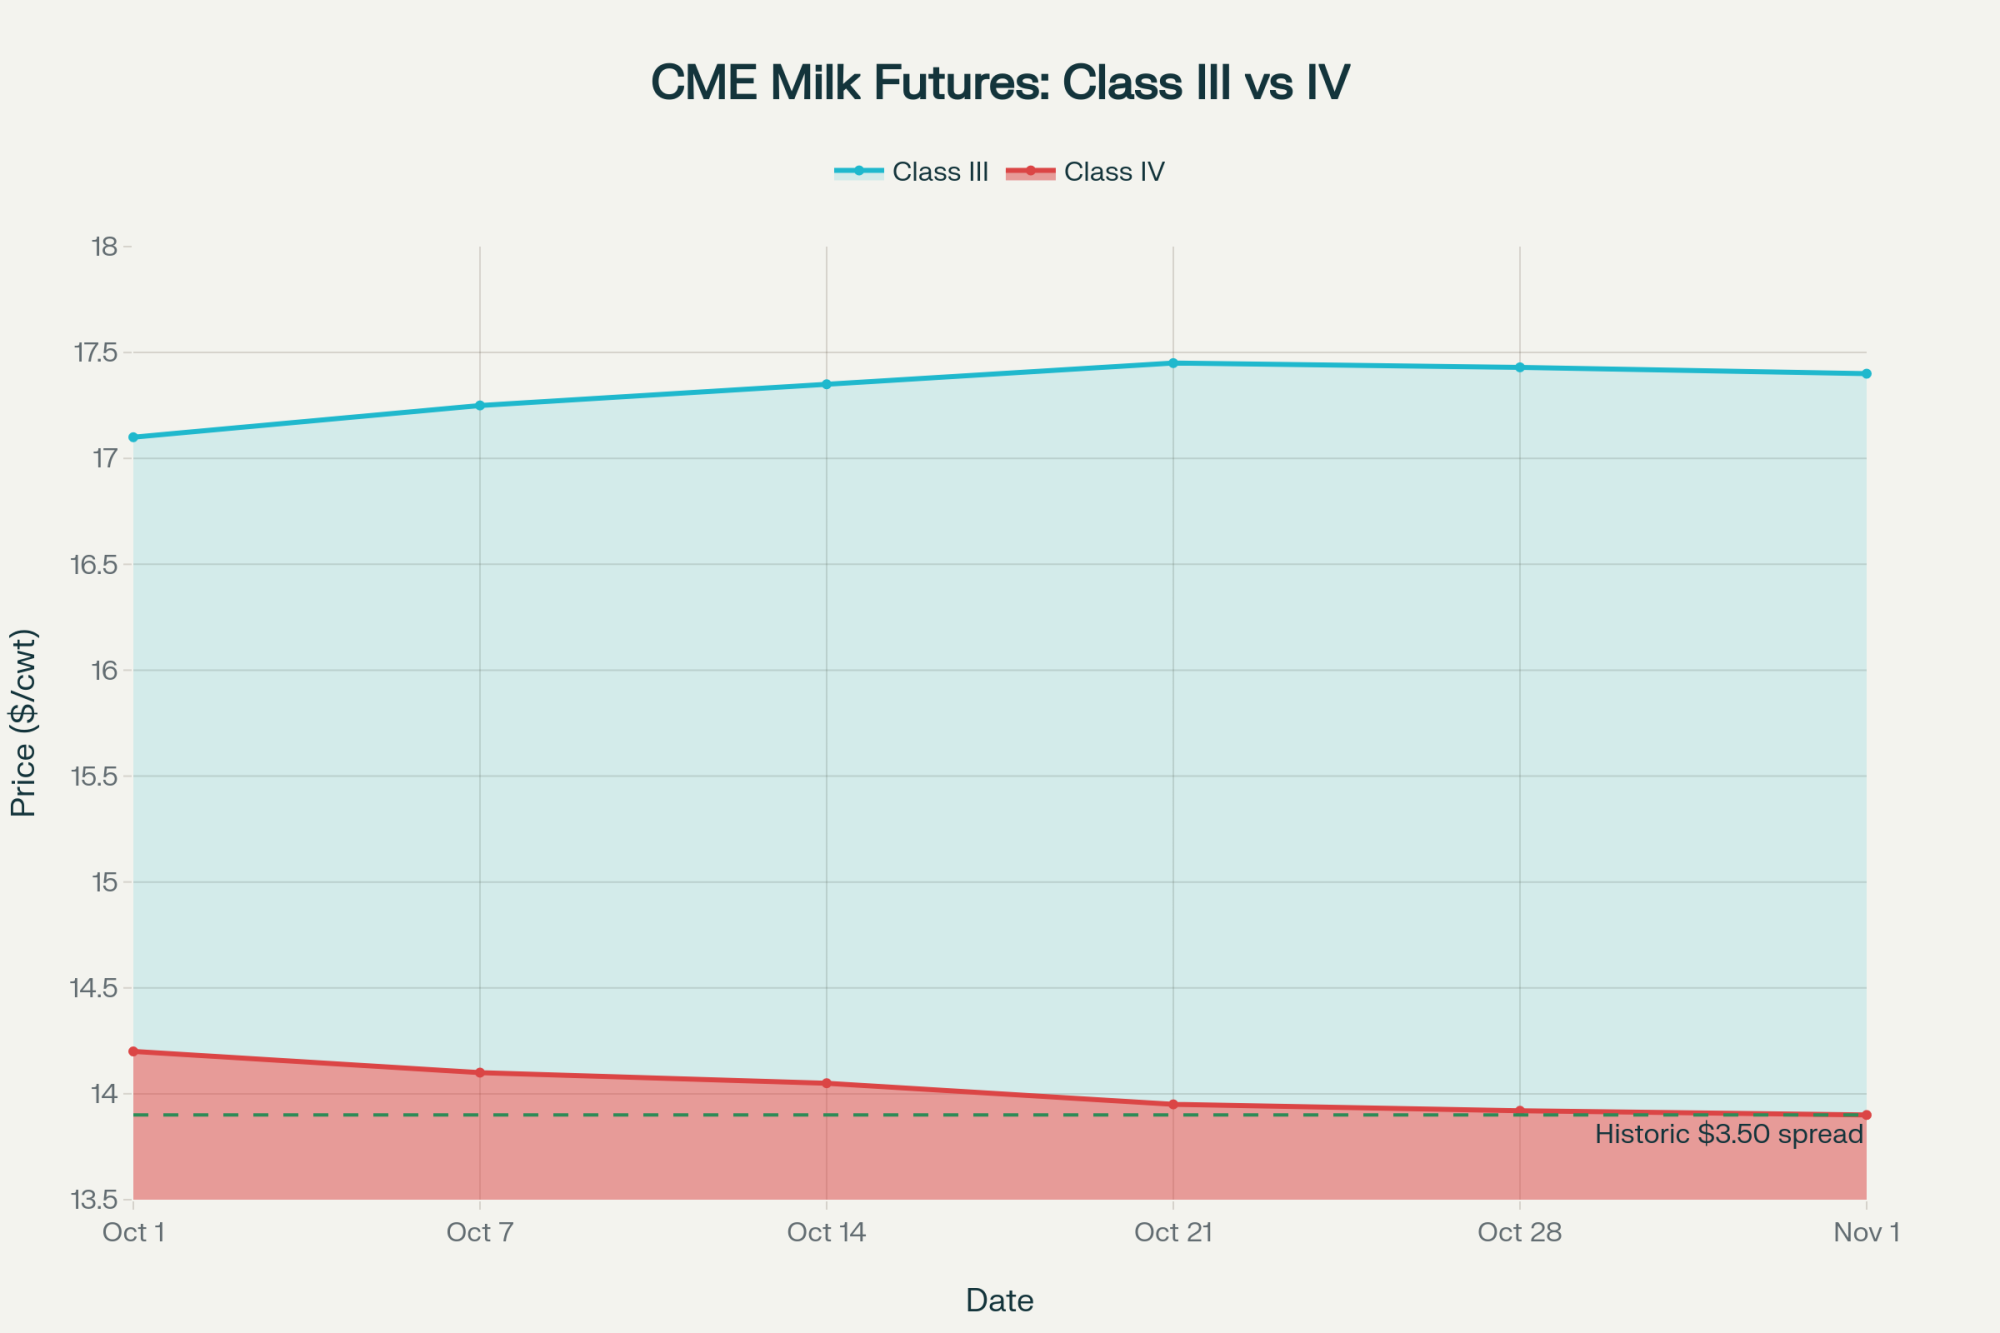
Nonfat dry milk surged 18¢ in a single week to settle at $1.64/lb on Friday — its highest CME spot price since August 2022 and the strongest weekly dairy market gain since May 2007. By Friday, Class IV futures from March through December 2026 were trading in the high $18s/cwt while Class III sat just above $17/cwt. That’s a spread north of $1.40/cwt, and on a 500-cow herd producing roughly 11,250 cwt/month, it works out to $11,000–$16,000/monthdepending on your component tests and pool structure. NDM is now 16.75¢ above Cheddar blocks — and within pennies of butter. 

Herd Size (cows)Monthly Production (cwt)At $0.50 SpreadAt $1.00 SpreadAt $1.40 Spread (Current)
2505,625$2,813$5,625$7,875
50011,250$5,625$11,250$15,750
75016,875$8,438$16,875$23,625
1,00022,500$11,250$22,500$31,500

USDA’s own weekly NDM report for February 2–6 spells it out: “Tight inventories are the primary factor driving prices higher, as some manufacturers have limited or no spot loads available in the near term.” Katie Burgess, director of risk management at Ever.Ag, put the margin picture in sharper terms — her models show DMC payouts of “more than $1 per hundredweight for January through April, and then some smaller payments for May through July as well.” That was modeled before this week’s powder rally reshaped the Class IV curve.

This Week at a Glance

MarketKey PriceWeekly MoveYoY
US NDM (CME spot, Feb 6)$1.64/lb+18¢
US Cheddar Blocks (CME spot)$1.4725/lb+11¢
US Butter (CME spot)$1.71/lb+13¢
GDT Index (TE397, Feb 3)+6.7%
GDT SMP$2,874/MT+10.6%
EEX Butter (Feb–Sep 26 strip)€4,730/MT+10.7%
EU Butter Index (spot, Feb 4)€3,933/MT-0.9%-46.6%
EU Whey Index (spot, Feb 4)€999/MTFlat+12.5%

GDT TE397: Every Product Up — Short Squeeze or Real Demand?

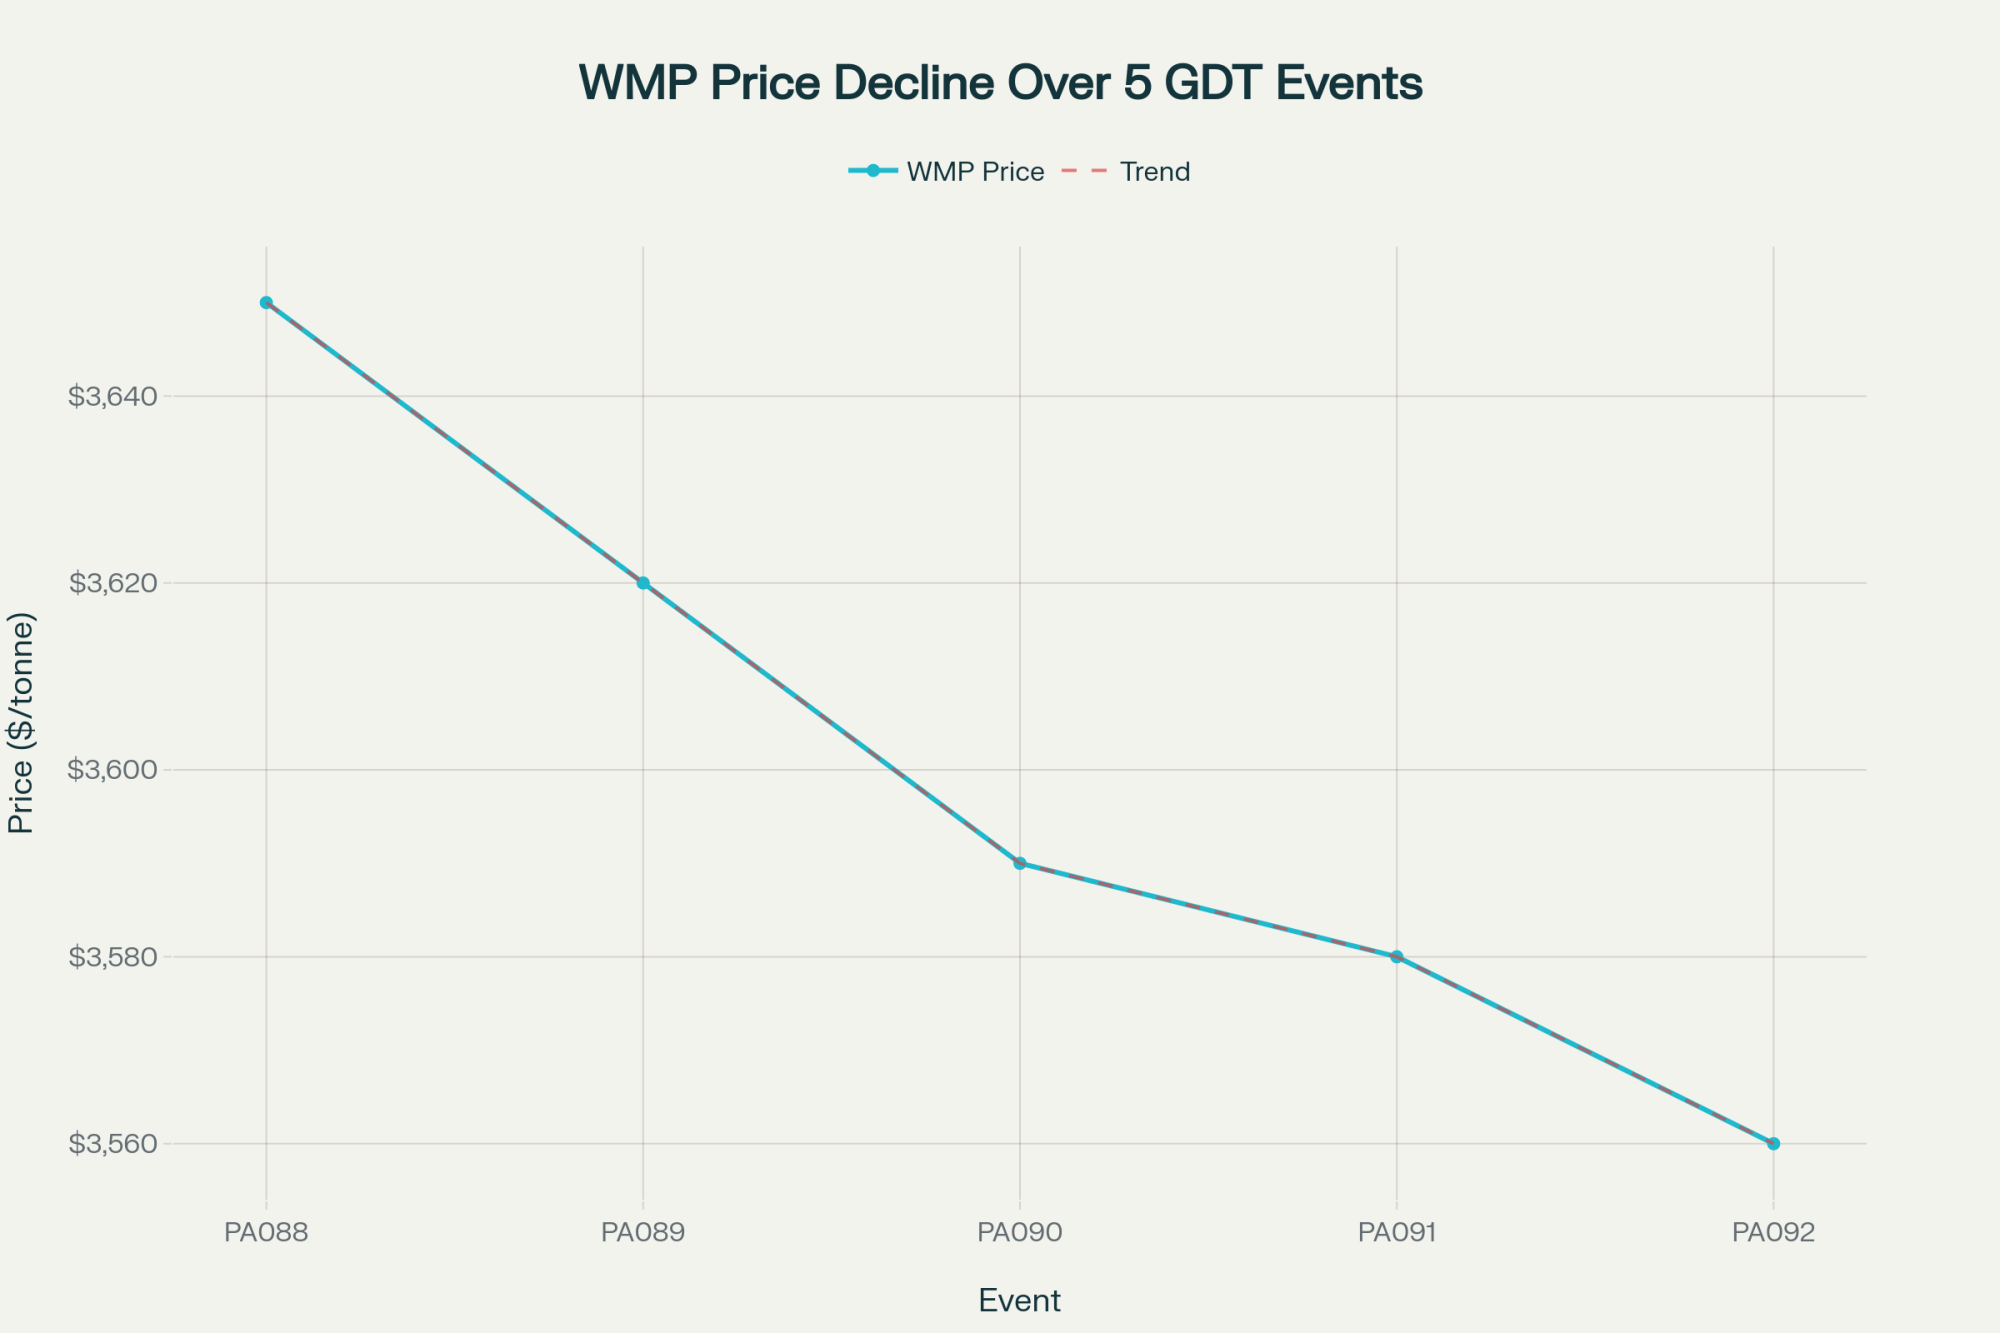
The February 3 auction was all green. SMP and Mozzarella led at +10.6% each. Butter jumped 8.8% to $5,773/MT. WMP gained 5.3% to $3,614. Even Cheddar — the laggard — posted 3.8% to $4,772.

SellerProductC2 Pricevs Prior GDT
FonterraWMP Regular$3,590+$205 (+6.1%)
FonterraSMP Medium Heat (NZ)$2,920+$275 (+10.4%)
ArlaSMP Medium Heat (EU)$2,800+12.4%
SolarecSMP (Belgian)$2,875+12.5%
SolarecButter$4,950+9.6%

CZ App’s February 8 analysis describes the rally as partly a short squeeze — traders who’d sold forward at lower levels were forced to cover as stops triggered. But the demand side has real teeth too. Strong participation from Asia and the Middle East, with pre-Ramadan and pre-Easter purchasing piling on. Algeria’s ONIL tendered for 56,000 tonnes of WMP — more than double expectations — which tightened supply quickly.

The total volume of 24,034 tonnes wasn’t unusually high. This was a demand-driven move on limited supply, amplified by positioning — not processors dumping product. The February 17 GDT will show whether the squeeze has run its course or genuine scarcity is sustaining these levels.

Global Futures: EEX and SGX Both Surge — Whey the Exception

On EEX, 5,365 tonnes (1,073 lots) traded last week. Thursday alone accounted for 1,805 tonnes — the busiest single session.

ExchangeProductAvg PriceWeekly Move
EEXButter (Feb–Sep 26)€4,730/MT+10.7%
EEXSMP (Feb–Sep 26)€2,605/MT+9.4%
EEXWhey (Feb–Sep 26)€1,019/MT-1.8%
SGXWMP (Jan–Aug 26)$3,791/MT+8.6%
SGXSMP (Jan–Aug 26)$3,298/MT+11.0%
SGXAMF (Jan–Aug 26)$6,281/MT+6.3%
SGXButter (Jan–Aug 26)$5,664/MT+7.3%

SGX SMP’s 11.0% weekly gain actually outpaced EEX — this isn’t just a European story. SGX traded 11,266 lots for the week, more than double EEX volume. The NZX milk price futures contract moved 1,763 lots (10,578,000 kgMS).

The outlier? EEX Whey, down 1.8%. Spot demand is migrating toward higher-protein concentrates and isolates, leaving standard whey behind. CZ App’s February 8 report also flagged quality concerns in the infant formula segment as a factor pushing WPC80 and specialty ingredient demand higher, with whey protein prices up more than 25% in both the EU and New Zealand. Same protein-shift story stateside.

EU Spot Prices: The -46.6% YoY Butter Collapse Nobody’s Talking About

The EU weekly quotations from February 4 paint a more complicated picture than the futures. Week-on-week, SMP gained 4.4%, and Mozzarella rose 2.6%. Zoom out year-over-year, and it’s brutal.

Index€/MTWeeklyYoY
Butter€3,933-0.9%-46.6%
SMP€2,247+4.4%-10.6%
WMP€3,065-0.3%-30.0%
Whey€999Flat+12.5%
Cheddar Curd€3,222-1.4%-33.1%
Mild Cheddar€3,248-0.1%-31.9%
Young Gouda€3,059+1.1%-29.0%
Mozzarella€3,098+2.6%-24.0%

Butter’s collapse — down €3,433/MT from a year ago — is the legacy of 2025’s European production surge. French butter fell €160 (-4.0%) to €3,800, German held at €4,050, and Dutch rose €50 to €3,950. That’s a €250/MT spreadbetween France and Germany. European butter isn’t one market anymore. It’s three markets wearing one index.

Whey remains the lone EU bright spot year-over-year at +12.5% — same protein-demand shift driving the US whey complex.

US Market: The $1.64 NDM Price and the Math Behind the Class IV/III Gap

NDM rose every trading day from Tuesday through Friday. At $1.64/lb, it’s 16.75¢ above Cheddar blocks and closing in on butter at $1.71. US dryers produced just 2.143 billion pounds of NDM/SMP in 2025 — the weakest annual output since 2013, according to the USDA’s Dairy Products report. Combined December output was 170.3 million pounds, down 6.2% year-over-year.

But positioning is part of this story too. CZ App’s analysis points to a rumored US short squeeze in the SMP/NFDM market, with traders forced to cover forward sales at sharply higher prices. Whether you call it scarcity or a squeeze, the practical effect on your milk check is the same.

Why is powder so scarce when milk is abundant? Because the $11 billion in new processing capacity that IDFA highlighted on October 2, 2025 — 50-plus projects across 19 states — went overwhelmingly toward cheese and protein, not dryers. IDFA CEO Michael Dykes said the investment “reflects the confidence dairy companies have in the future of American agriculture.” The industry bet on cheese. The market is punishing that bet through the Class IV/III spread.

Despite the GDT’s 10.6% SMP surge, the GDT-priced product still holds roughly a 25¢/lb advantage over CME NDM after correcting for protein levels. That’s choking US export competitiveness and keeping domestic availability tight.

Cheese gained 11¢ on 51 loads to $1.4725/lb — cheap enough globally that US shipments keep running at a record pace. USDEC reported that November 2025 was the seventh consecutive month above 50,000 MT, volume up 28% year-over-year. But December output hit 1.279 billion pounds (+6.7% YoY), with Cheddar alone up 9%. Production isn’t slowing down.

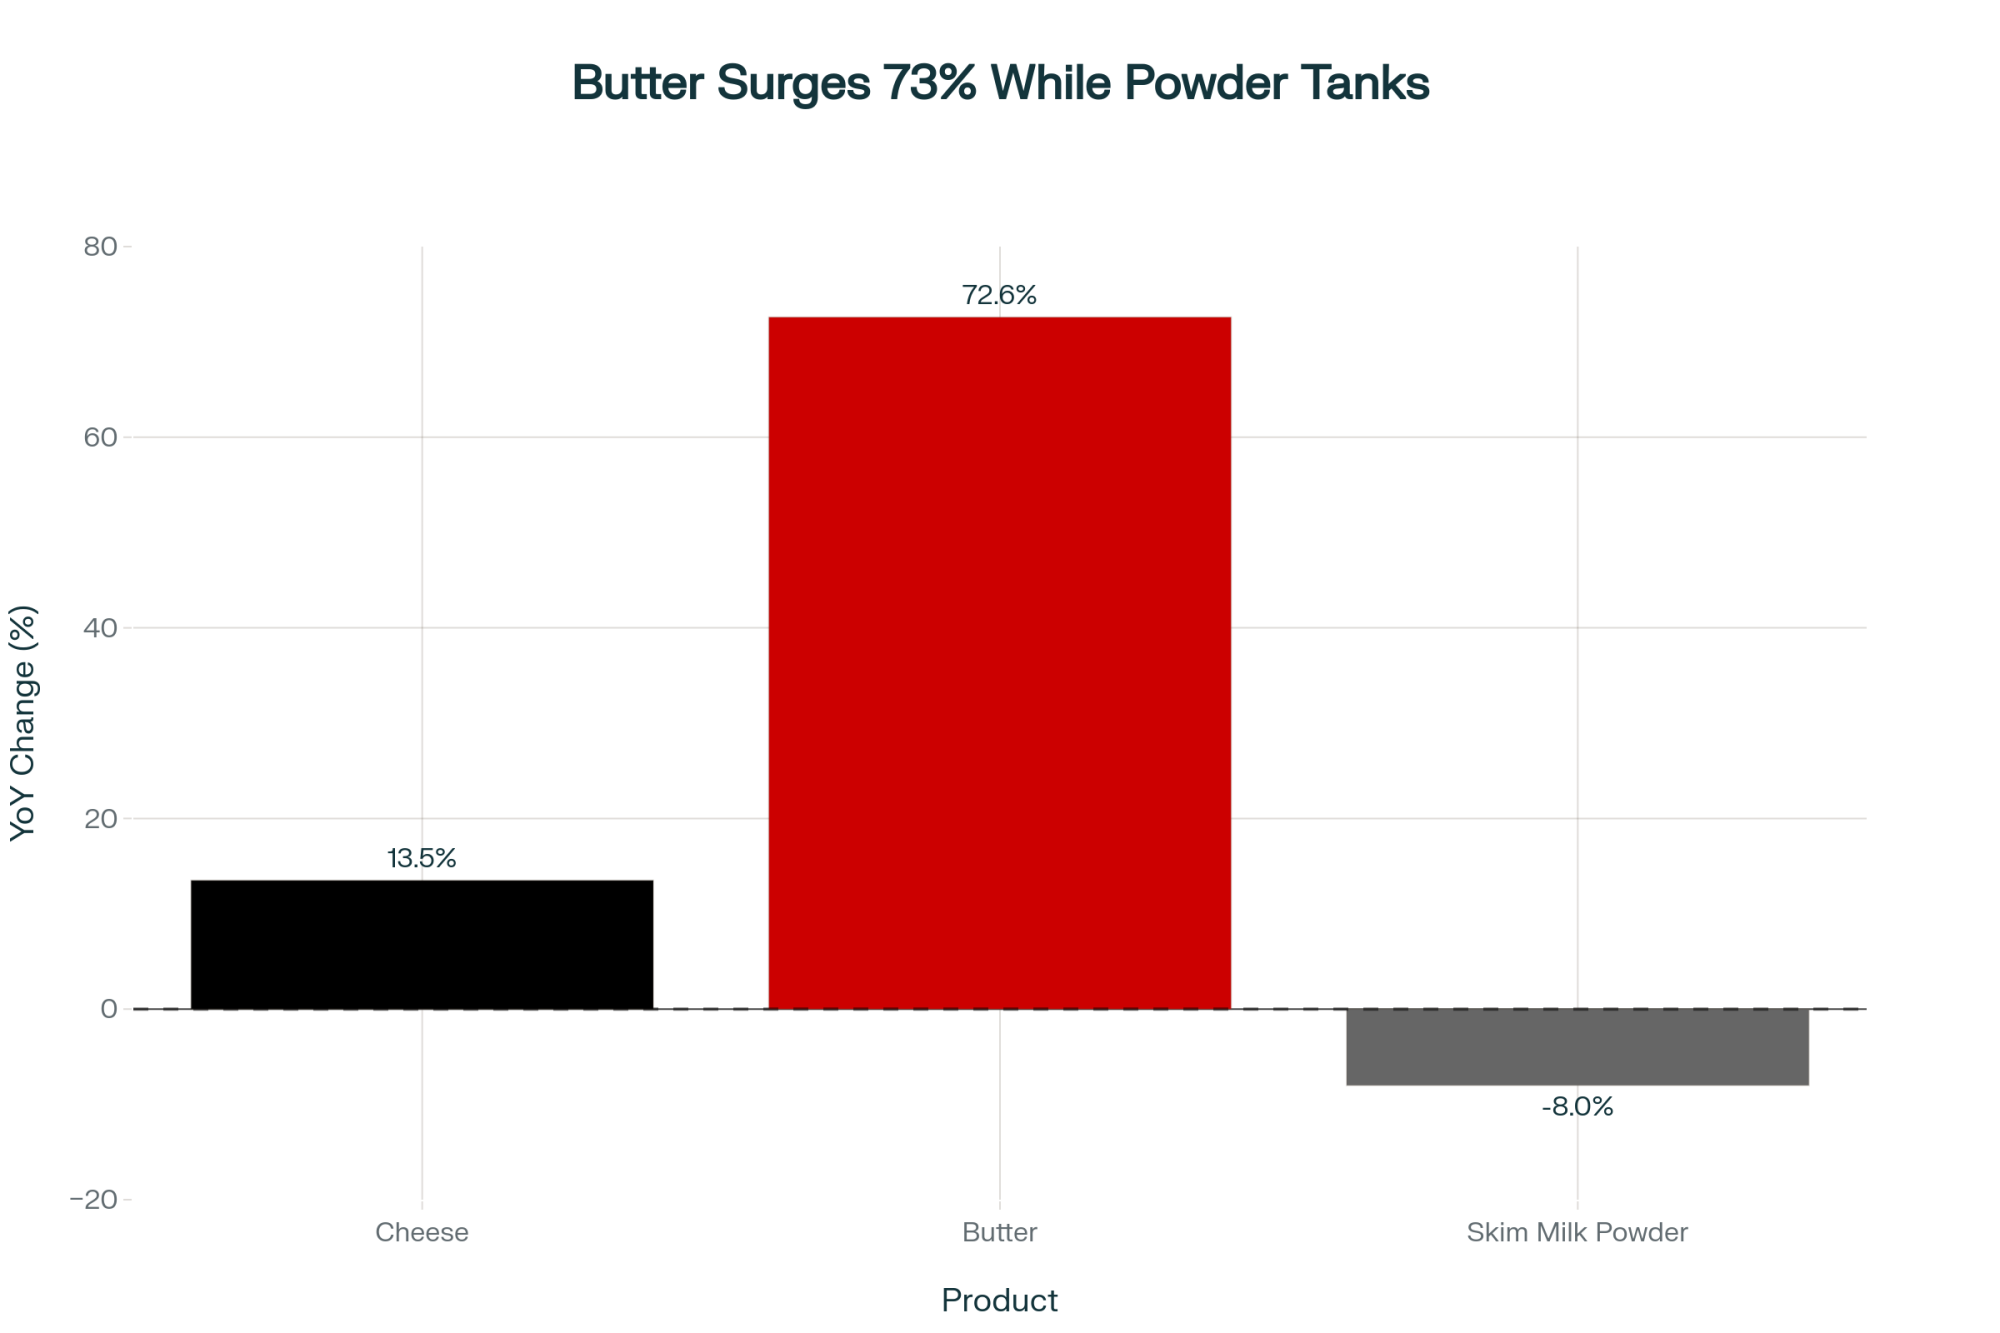
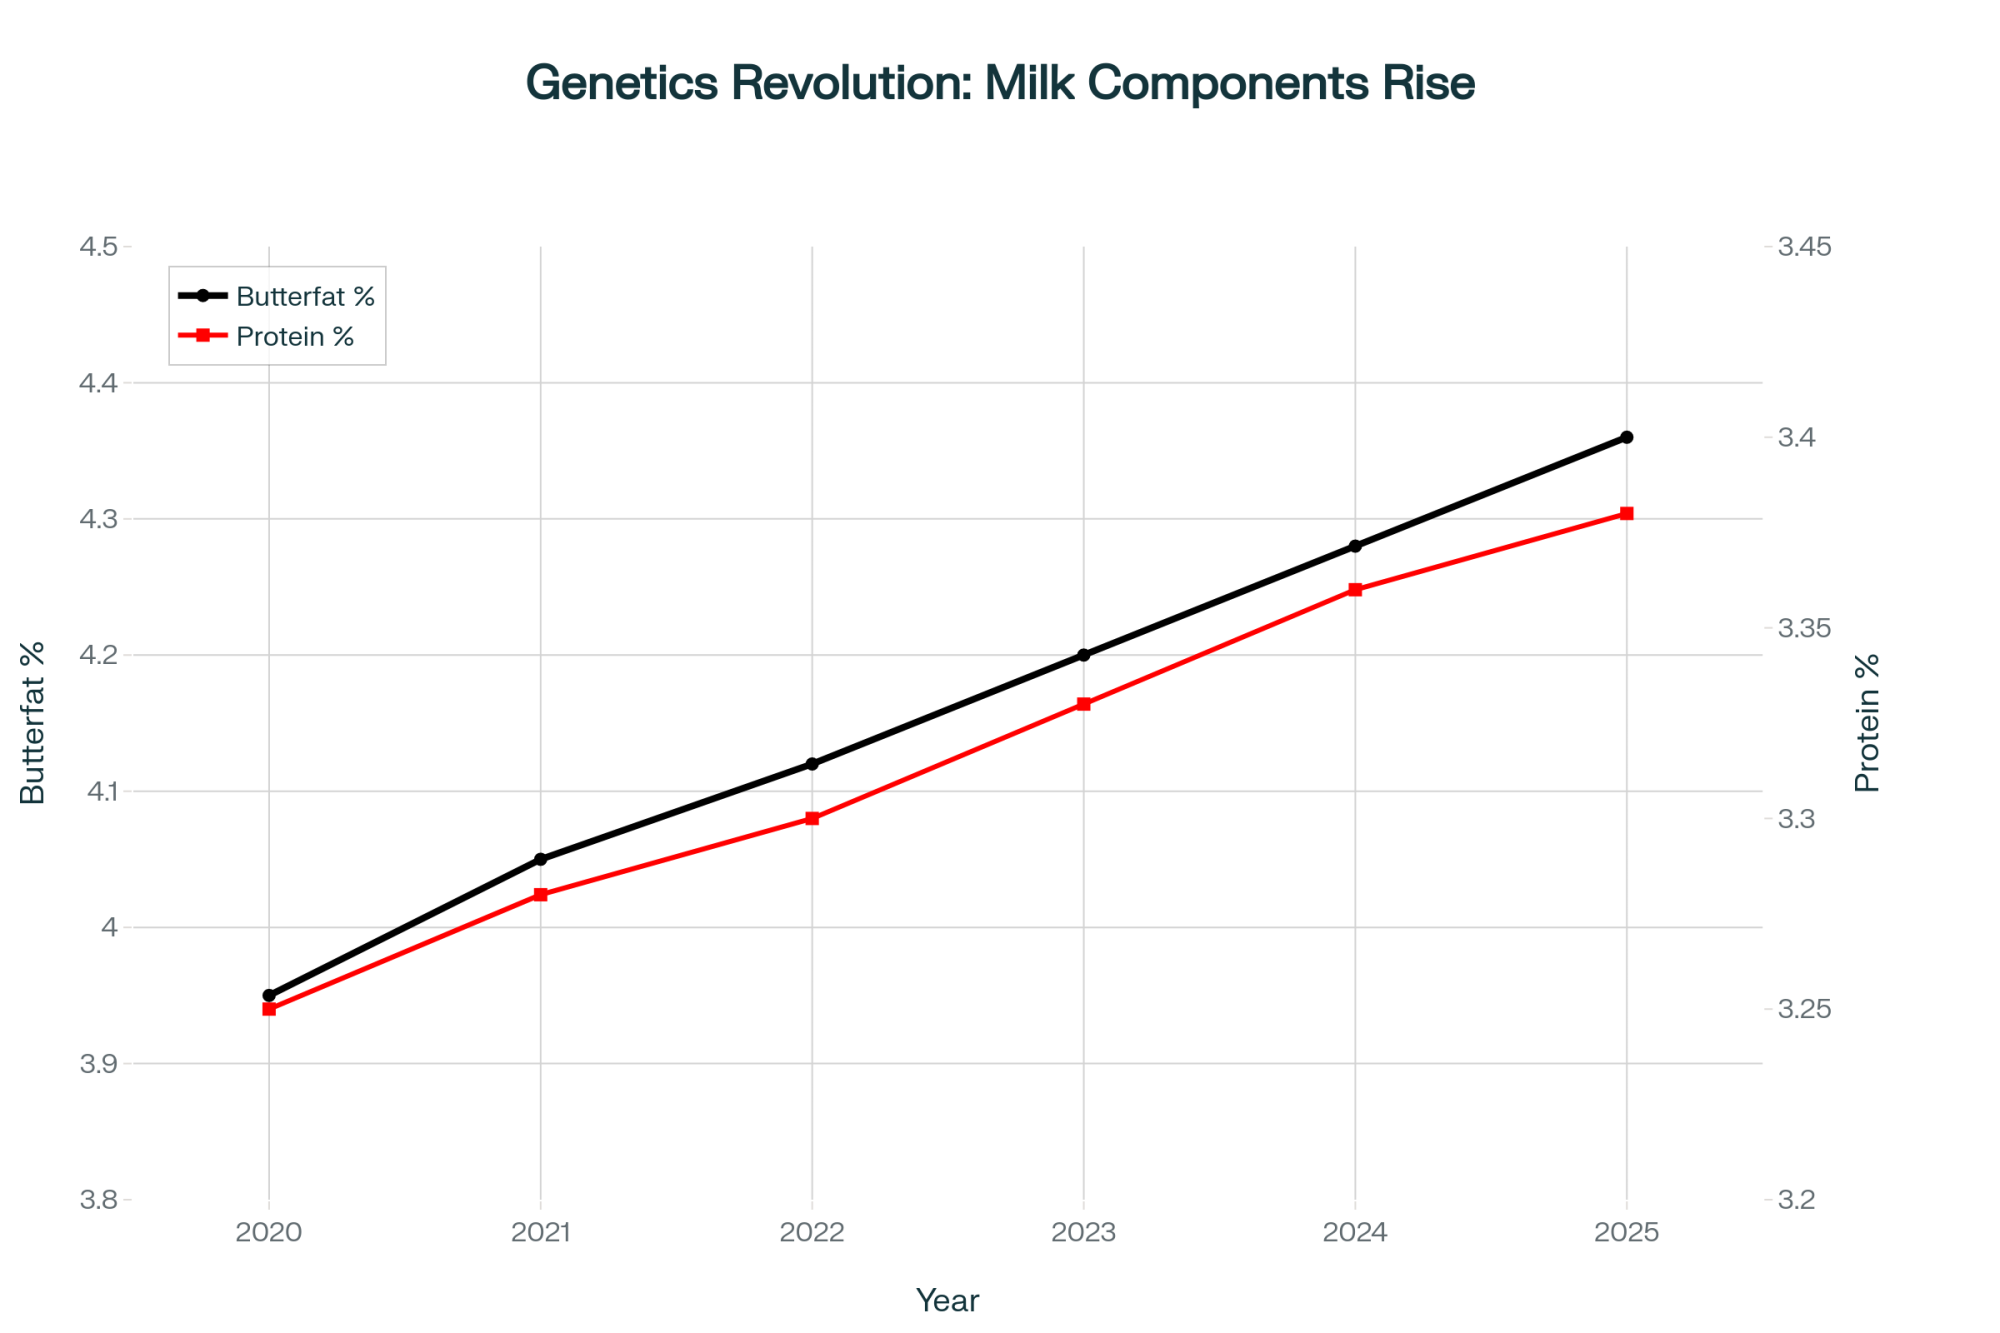
Butter rose 13¢ to $1.71/lb, including a 10.25¢ jump on Thursday. Twenty-one loads traded, but dozens of unfilled bids stayed on the board. December production grew a modest 2% YoY to 203.8 million pounds. The average US fat test hit 4.51% in December per USDA’s Agricultural Prices report — up 0.05 percentage points from a year ago.

Dry whey was the lone loser, down 2¢ to 73¢/lb. Whey protein isolate production surged 11.7% YoY to 20.6 million pounds in December, while lower-protein WPC (25–49.9%) fell 12.8%. The market is telling processors where the money is.

Milk futures: Class III from March through year-end above $17/cwt. Class IV, driven by NDM, in the high $18s/cwt. That forward spread — not the announced January prices — is the defining number in US dairy right now.

Global Production: Where the Supply Pressure Lives

CountryPeriodVolumeYoYKey Detail
IrelandDec 2025267kt-3.0%Full-year: 9.10M tonnes (+5.0%); butter 286kt (+7.1%)
UKDec 202515.4kt butter+6.6%Full-year cheese: 513kt (+2.9%)
SpainDec 2025624kt+1.8%Full-year flat (-0.2%); milksolids +3.4%
ChinaJan 2026-2.8% farmgate YoY3.03 Yuan/kg; cull cycle ongoing

Don’t confuse Ireland’s December contraction (-3.0%) with structural decline — full-year 2025 collections hit 9.10 million tonnes, up 5.0%. Irish butter production reached 286kt for the year, up 7.1%, and the UK added 6.6% more butter in December. More product hitting export channels. One more reason the EU butter index keeps falling year-over-year, even as powder attempts to stabilize.

China’s ongoing cull cycle — the Ministry of Agriculture confirmed less productive cows are being destocked, with growth driven by yield per cow — could keep Chinese import demand firm through Q2.

Grains and IOFC: $11/cwt Keeps the Lights On, Nothing More

March 2026 soybean meal settled at $303.20/ton on Thursday; March corn at $4.35/bu before giving back ground Friday. South American weather and Trump administration comments about expanding Chinese soybean purchases drove the rally.

At $17/cwt Class III and current grain prices, income over feed cost sits around $11/cwt — consistent with Cattlytics’ January 29 projection of ~$11.40/cwt for 2026. They described it as “not a year that forgives loose management.” Class IV shippers look better on the forward curves. That spread between the two classes isn’t an abstract futures curve — it’s the difference between treading water and building equity.

What This Means for Your Operation

Before anything else, answer three questions your lender will eventually ask:

  1. What’s your handler’s cheese-to-powder plant split?
  2. What’s your current DRP Class III/IV weighting?
  3. What’s your rolling 12-month butterfat test?

If you can’t answer all three, that’s your first move this week.

  • Cheese-dominant shippers, check your DRP weighting. The forward Class IV/III spread is real money — potentially off your check. By Friday, Class IV futures were running $1.40+/cwt above Class III from March through December. On a 500-cow herd, that’s $11,000–$16,000/month in potential value difference. Pull your DRP parameters and check whether your III/IV weighting reflects the forward curve, not last year’s relationship. 
  • Below 4.0% butterfat and 3.1% protein? Run your breakeven now. As of January 2026, FMMO component prices ($1.4525/lb butterfat, $2.1768/lb protein): each 0.1% increase in butterfat translates to roughly $0.15–$0.35/cwt. Moving from average to high-component tests is worth $1.00–$1.50/cwt — roughly $22,000–$34,000 per month on 1,000 cows. Ask your nutritionist for the breakeven test level before the spring flush dilutes components.
  • DMC enrollment closes February 26 — 17 days out. The One Big Beautiful Bill Act reauthorized DMC through 2031 with expanded Tier 1 coverage up to 6 million pounds (up from 5 million). NMPF reported the predicted December 2025 margin at $9.19/cwt — generating a $0.31/cwt payment at $9.50 coverage, the only DMC payout for 2025. But 2026 looks different. Ever.Ag’s Burgess projects payouts exceeding $1/cwt January through April. NMPF’s William Loux confirmed he “would certainly expect to see some DMC payments here through the first quarter and probably through the first half of the year.” At 15¢/cwt for Tier 1 enrollment, Burgess calls DMC “the best risk management coverage you can buy right now.” The six-year lock-in (2026–2031) saves 25% on premiums but sacrifices annual flexibility. Run the math against your feed cost trajectory.
  • Consider locking 30–40% of forward powder exposure before the February 17 GDT. The Feb26–Sep26 EEX SMP strip at €2,605 and the CME Class IV near $18.50/cwt offer a window. But CZ App flags short-squeeze dynamics in this rally. If the squeeze unwinds, prices give back a chunk fast. If genuine scarcity persists, unhedged operations fall further behind. Neither outcome is wrong — being completely unhedged is.
  • Canadian producers: your export-class economics just improved. The CDC’s 2.3255% farm-gate price increase took effect on February 1, with carrying charges rising to $0.0254/kg of butter from $0.0137/kg. But your CEM allocation and export-class shipments are priced off these same global benchmarks. This GDT rally directly supports Class 5 (export) pricing. If GDT SMP holds above $2,800 at TE398, P5 pool returns should reflect it in the next provincial board pricing announcement — watch for the butter-to-SMP ratio shift.
  • Two signals to watch over the next 30 days. (1) If NDM/SMP output stays below 180 million pounds in the USDA’s next Dairy Products report, the scarcity thesis holds. (2) A second consecutive strong GDT auction on February 17 (TE398) confirms this isn’t just short-covering. If prices retreat sharply, the squeeze narrative wins, and you want downside protection in place.

The Bottom Line

The hard choice this week isn’t whether the rally is real — the data says it is, even if short-covering is turbocharging the move. The hard choice is whether you position for it to continue or protect against it reversing. Producers who locked in forward coverage three weeks ago are sitting pretty. The ones who waited are chasing. What does your plan for February 17 look like?

Complete references and supporting documentation are available upon request by contacting the editorial team at editor@thebullvine.com.

Learn More

The Sunday Read Dairy Professionals Don’t Skip.

Every week, thousands of producers, breeders, and industry insiders open Bullvine Weekly for genetics insights, market shifts, and profit strategies they won’t find anywhere else. One email. Five minutes. Smarter decisions all week.
NewsSubscribe
First
Last
Consent

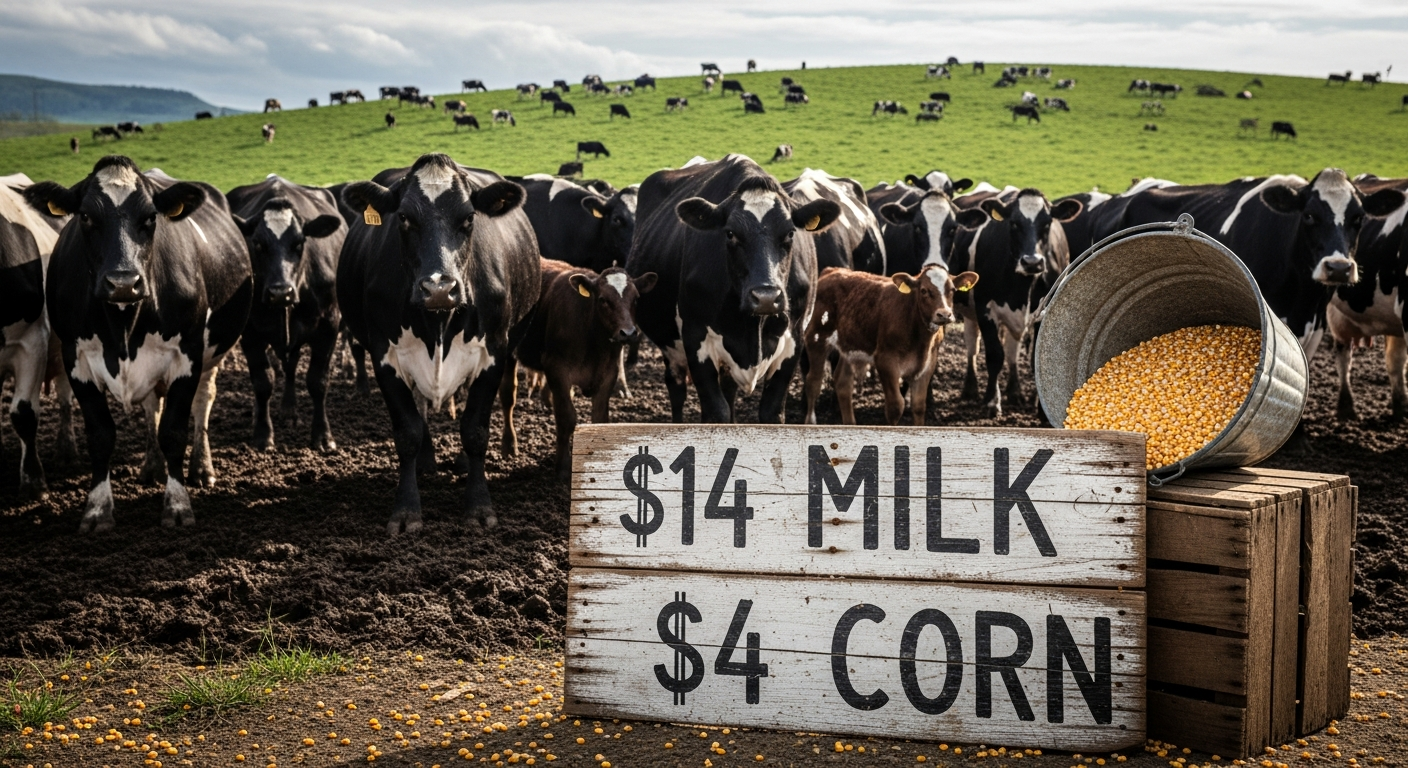
$14 Milk, $4 Corn, and the Cows Nobody Will Cull: This Week’s Global Dairy Reckoning

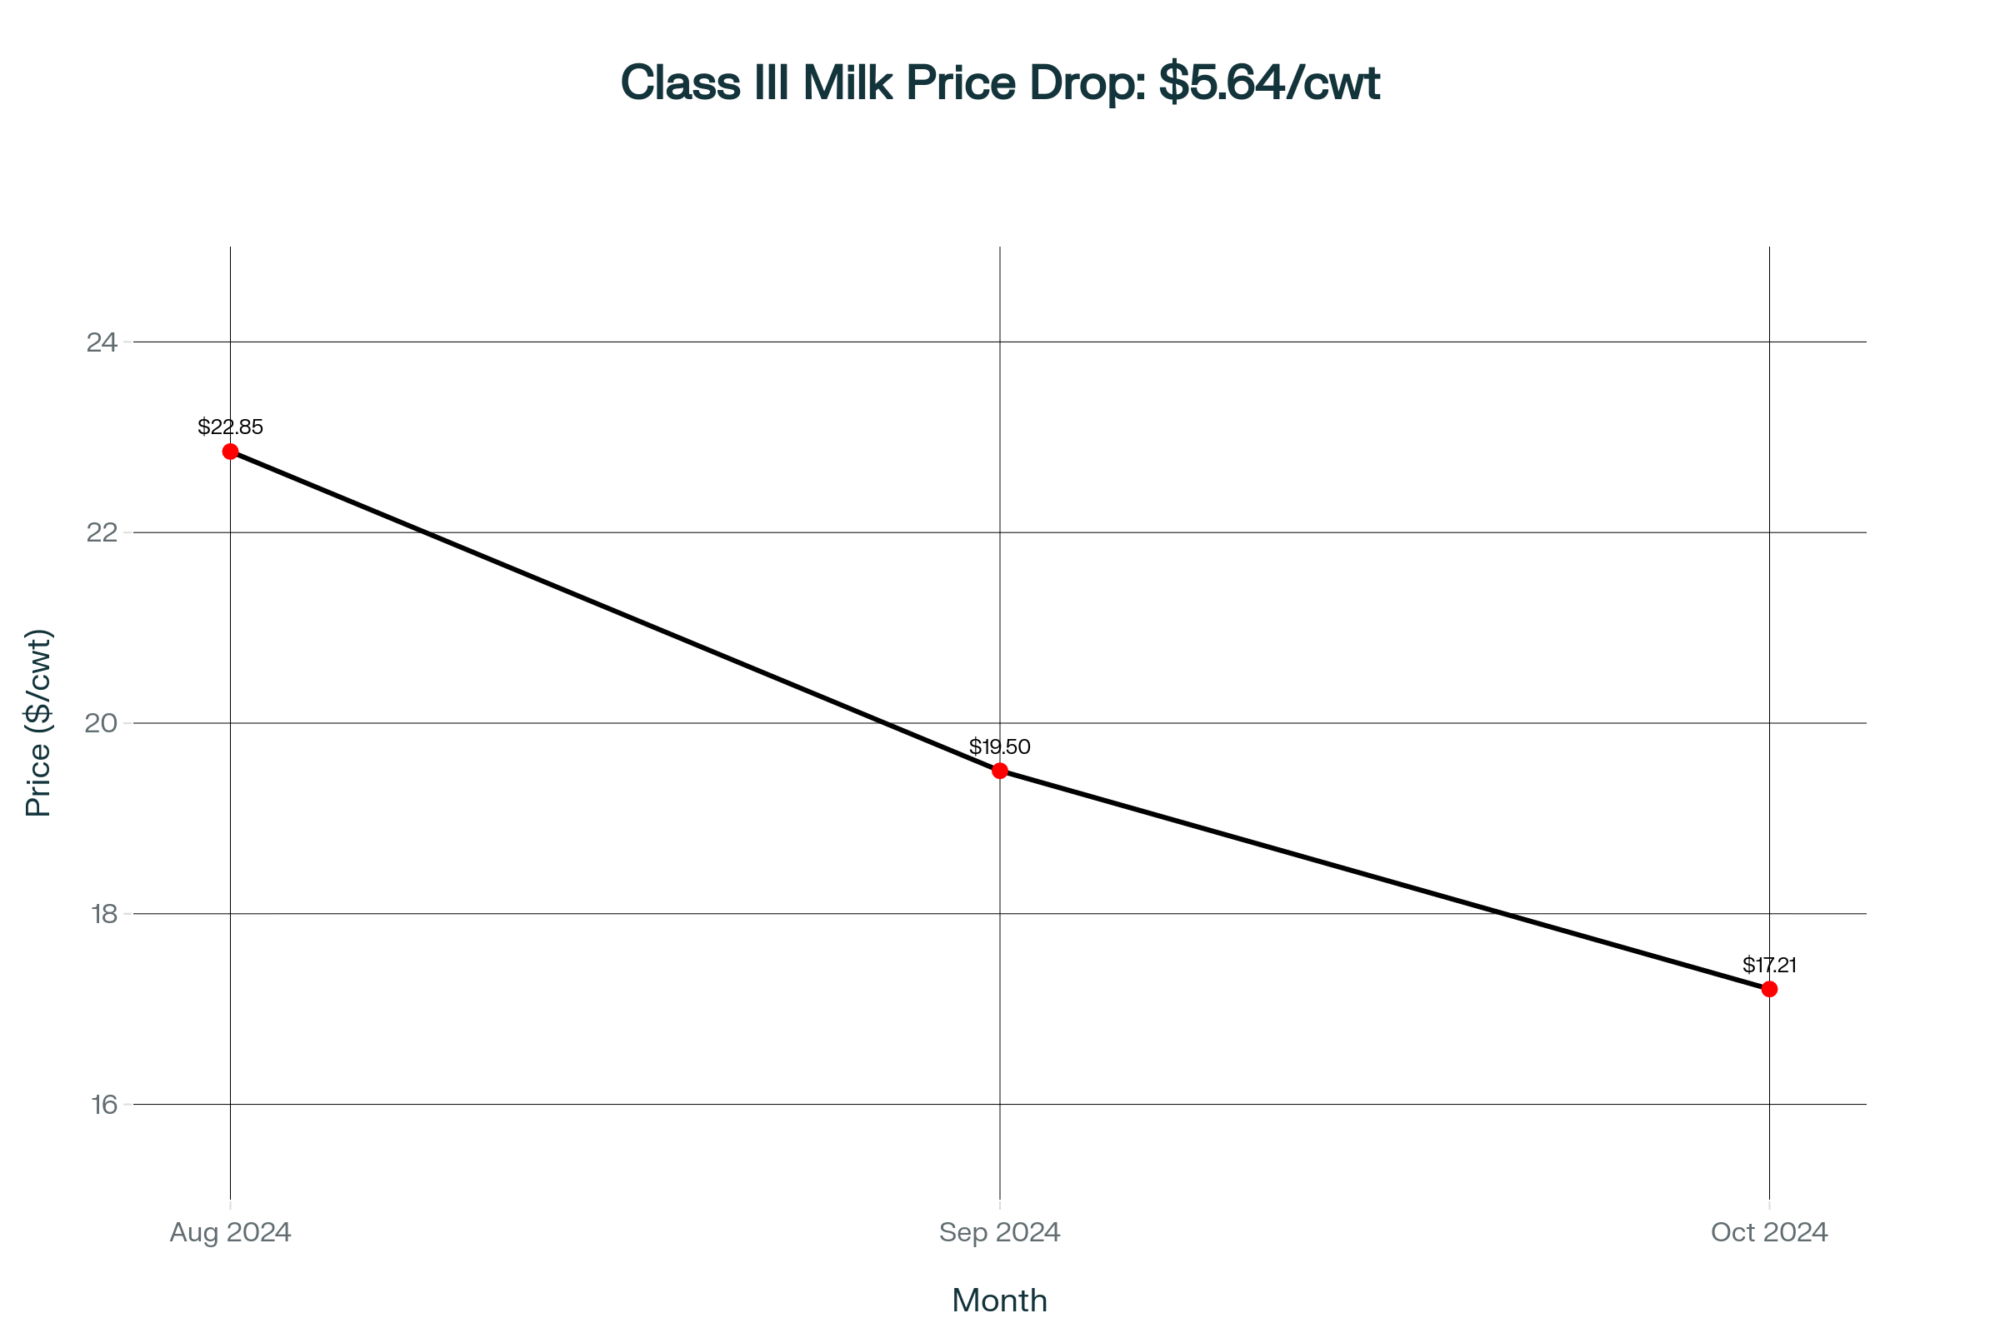
Cheap feed is a trap. Every cow that should’ve been culled is still milking—and $14 Class III is the price we’re all paying.

Global dairy market reckoning

EXECUTIVE SUMMARY: Class III is testing $14. EU butter crashed 43% year-over-year. Cheddar blocks hit $1.29—their lowest since May 2020. Welcome to synchronized oversupply: EU-27+UK November milk surged 4.6%, the U.S. dairy herd is near a 30-year high, and cull rates are at historic lows because $4.25 corn makes even marginal cows cash-flow positive. That’s the trap—cheap feed was supposed to ease the pain, but it’s keeping underperforming cows in barns across the industry and delaying the correction prices desperately need. GDT Pulse finally showed signs of life Sunday (WMP +1.0%, SMP +2.1%), but until someone starts culling, $14 milk isn’t going anywhere.

Futures Markets: Still Searching for a Floor

The futures boards told a grim story last week—and frankly, nobody’s quite sure where the bottom is yet.

EEX European Futures moved 4,550 tonnes (910 lots), with Wednesday posting the busiest session at 1,905 tonnes. Butter futures took the worst of it. The Jan26-Aug26 strip dropped 4.5% to average €4,199. SMP held up better, down just 0.2% to €2,200, while whey slipped 0.7% to €1,021.

Over on the SGX Asia-Pacific exchange, volume ran heavier at 15,116 lots—dominated by WMP at 12,287 lots. The Jan26-Aug26 curves tell you pretty much everything about current sentiment:

ProductAverage PriceWeekly Change
WMP$3,359–1.2%
SMP$2,703–0.8%
AMF$5,821–1.4%
Butter$5,278–0.1%

What’s particularly notable on the CME is how Class III futures tested sub-$14 territory multiple times last week. January through May contracts all notched life-of-contract lows before bouncing slightly Friday. February settled at $15.05—down a dime on the week. Class IV fared worse, with February closing at a brutal $13.86, down a nickel.

For producers who don’t actively trade futures, here’s why those life-of-contract lows matter: they signal that professional traders—people who make a living betting on where milk prices are headed—see no near-term catalyst for recovery. When the market establishes new lows across multiple contract months simultaneously, it’s pricing in an extended period of pain.

What this means for your operation: If you’re not already penciling out cash flow at $15 Class III and $14 Class IV through mid-year, you’re planning with the wrong numbers. DMC payments look increasingly likely for January through at least April, according to analysts at Ever.Ag.

European Quotations: The Butter Collapse Continues

The weekly EU quotations released January 14 painted a picture of a market still trying to find its footing after months of oversupply pressure.

Butter took another beating. The index dropped €171 (–3.9%) to €4,237. French butter got hit hardest—down €513 (–10.6%) to €4,310 in a single week. German and Dutch butter held steadier at €4,300 and €4,100 respectively.

Here’s the number that should grab your attention: EU butter is now down €3,176 (–42.8%) year-over-year. That’s not a correction. That’s a fundamental repricing of European milkfat. I’ve been covering dairy markets for years, and you rarely see a commodity give back nearly half its value in twelve months without some structural shift underneath.

SMP actually showed some strength—climbing €38 (+1.9%) to €2,085. German SMP rose €45 to €2,085, Dutch jumped €100 to €2,100, while French slipped €30 to €2,070. Still, SMP sits 17.3% below year-ago levels, so “strength” is relative here.

Whey eased €5 (–0.5%) to €996, though it’s actually up €123 (+14.1%) year-over-year. That makes whey one of the few genuine bright spots in European dairy commodity markets right now.

Cheese indices were mixed:

CommodityCurrent PriceWeekly ΔY/Y ΔMarket StatusStrategic Note
EU Butter€4,237/100kg–3.9%🔴 –42.8%CRISISDemand collapse
Class III (CME)$13.95/cwt–0.7%🔴 –32.0%CRISISLife-of-contract lows
Cheddar Block$1.29/lb–1.9%🔴 –27.5%WEAKMulti-year lows
SMP (EU)€2,085/100kg+1.9%🟡 –17.3%WEAKAlgeria returning
WMP (GDT)$3,359/MT–1.2%🟡 –18.5%WEAKPulse bounce +1.0%
Nonfat Dry Milk$1.255/lb–0.8%🟡 –14.2%STABLEMexico demand OK
Whey (CME)73.5¢/lb+4.8%🟢 +14.1%STRENGTHProtein demand high
Milk Price (U.S. avg)$14.05/cwt–0.7%🔴 –30.5%CRISISFeed savings insufficient
Corn (March)$4.25/bu–4.5%🟢 –52.0%STRENGTHRecord crop relief

USDA’s Dairy Market News describes European conditions as “orderly” and “measured”—values are cautiously higher to start the year after what can only be called the bloodbath of Q4 2025.

GDT Pulse: Finally, a Sign of Life

Sunday’s GDT Pulse Auction (PA098) delivered the first meaningful uptick we’ve seen in months (Global Dairy Trade, January 18, 2026).

Fonterra Regular C2 WMP won at $3,395—up $35 (+1.0%) from the last full GDT event and up $240 (+9.0%) from the previous pulse auction. That’s a real move, not just noise.

Fonterra SMP Medium Heat – NZ came in at $2,660, up $55 (+2.1%) from the last GDT and up $165 (+8.4%) from pulse.

Arla SMP Medium Heat – EU hit $2,485, up $95 (+4.0%) from the last GDT.

Total volume was modest at 2,358 tonnes with 54 bidders participating. The question everyone’s asking: genuine trend change, or dead cat bounce?

Tomorrow’s GDT Event TE396 will be the real test. Fonterra’s offered volumes:

ProductVolume (MT)
WMP15,588
SMP5,630
Butter1,920
AMF2,680
Cheddar540

Butter and AMF volumes were adjusted for Cream Group Flex at 15% applied to C1 and C2, while total milkfat supplied remains unchanged on the forecast. What I’ll be watching closely is whether the buying interest that showed up Sunday sticks around when larger volumes hit the auction block.

U.S. Spot Markets: Whey Holds While Everything Else Sinks

CME spot trading told a mixed story last week.

  • Butter bounced off multi-year lows, climbing 5.5¢ to $1.355 per pound. That’s still near the basement, but at least the bleeding stopped for now.
  • Cheddar blocks kept sinking, down 2.5¢ to $1.29—a level we haven’t seen since May 2020. Twenty loads traded, bringing the YTD total to 63 loads—a record for early January. When you see that kind of spot volume combined with falling prices, people are desperate to move product. That’s not a healthy market dynamic.
  • Nonfat dry milk slipped a penny to $1.255. Demand from Mexico is improving, and inventories are “tight” according to USDA’s Dairy Market News, but it wasn’t enough to hold the line.
  • Whey was the standout, rallying 3.5¢ to 73.5¢. Strong demand for whey protein concentrates is driving this—Dairy Market News reports some cheese processors are actually ramping up production “ultimately to produce more whey as prices and demand of whey protein concentrates remain high.”

Let that sink in for a moment: they’re making cheese not because cheese demand is strong, but because they need the whey. That’s a complete inversion of traditional dairy economics, and it tells you something important about where the real demand growth is happening right now.

The Culling Connection: Why Cheap Feed Is Delaying Recovery

Cheap corn isn’t just helping your margins—it’s keeping marginal cows in the herd longer and delaying the supply correction that would help prices recover.

The numbers are stark. Dairy cow culling dropped to historic lows through the first half of 2025, down 7.3% from the same period in 2024 (Southern Ag Today, January 13, 2026). The seven-month total through July was the lowest since 2008 (eDairy News, August 2025). Even as milk prices slid through the fall, weekly dairy cow slaughter through the last four weeks of 2025 was only slightly above year-earlier levels (USDA Livestock, Dairy, and Poultry Outlook, January 2026).

Why aren’t producers culling more aggressively?

Two factors, and they’re both working against a price recovery:

  • First, cheap feed makes borderline cows profitable enough to keep. When corn was running $6+, and soybean meal was north of $400, that seven-year-old cow giving 60 pounds was bleeding money. At $4.25 corn and $290 meal, she’s suddenly cash-flow positive—barely. So she stays. Multiply that decision across thousands of operations, and you’ve got an oversupply situation that won’t self-correct.
  • Second, the heifer shortage makes replacement expensive. Beef-on-dairy economics have drained the replacement pipeline. Springer heifer prices are at or near records, and with 800,000+ fewer dairy heifers in the system (Dairy Herd Management, November 2025), producers can’t easily replace culled cows even if they wanted to. Cull rates dropped to 29.6% in 2024—well below the typical 35-37% turnover that supports strategic herd improvement (Dairy Herd Management, August 2025).

The U.S. dairy herd now sits at approximately 9.49 million head—near the highest level since the early 1990s. USDA’s January Livestock, Dairy, and Poultry Outlook revised the annual dairy cow inventory to 9.490 million head and projects the herd will remain large well into 2026.

What’s interesting here is the game theory at play. Every individual producer benefits from keeping their cows in milk when feed is cheap. But collectively, those decisions are extending the timeline for everyone’s price recovery. It’s a classic tragedy of the commons, playing out in real-time across American dairy barns.

The strategic response some progressive operations are taking: Rather than culling primarily based on age or reproductive metrics, they’re calculating income over feed cost (IOFC) for each cow and moving out animals consistently below $1.50 per cow per day (The Bullvine, December 2025). That’s the math-based approach that makes sense when feed is cheap, but margins are thin.

Cow ProfileProd’n (lbs)BF/ProteinDaily RevenueDaily FeedDaily IOFCDecision
Cow A: 4yr, 75# prime753.8% / 3.2%$10.50$8.20$2.30✅ KEEP
Cow B: 6yr, 65# good653.7% / 3.1%$9.10$7.80$1.30🔶 BORDERLINE
Cow C: 7yr, 55# fading553.6% / 3.0%$7.70$7.40$0.30🔴 CULL
Cow D: 5yr, 70# solid703.8% / 3.2%$9.80$8.00$1.80✅ KEEP
Cow E: 8yr, 48# poor483.5% / 2.9%$6.72$7.10–$0.38🔴 CULL
Cow F: 3yr, 82# premium823.9% / 3.3%$11.48$8.40$3.08✅ KEEP

Don’t expect a supply-side correction to rescue prices anytime soon. The cows that would have been on trucks six months ago, when feed was expensive, are still in stalls today. That’s good for individual cash flow in the short term, but it’s extending the pain for everyone.

The Production Surge: Why This Is Happening

November milk collections confirm what the futures already priced in—global oversupply is real and accelerating.

European Production Explosion

EU-27+UK pumped out 12.94 million tonnes in November, up 4.6% year-over-year. To put that in perspective, that’s nearly 1.2 billion pounds more milk than November 2024—equivalent to adding all of Michigan’s November production to the global supply, plus change.

CountryNov 2025 Production (kt)Y/Y GrowthKey Signal
Germany2,643+7.5%🔴 Highest absolute growth
France1,954+5.9%Steady surge
UK1,329+5.6%Post-Brexit stabilization
Netherlands1,145+7.3%🔴 Second-highest % growth
Poland1,089+5.3%Eastern EU leading
Belgium375+10.1%🔴 Highest % growth—warning sign
Denmark449+0.7%Only modest growth
EU-27+UK TOTAL12,940+4.6%1.2B lbs MORE than Nov 2024

Cumulative EU-27+UK production through November hit 150.75 million tonnes, up 1.9% year-over-year after adjusting for the leap year. Milksolid collections were up 5.2% in November alone, which tells you butterfat and protein content are running strong across European herds.

French milksolids jumped 6.6% in November, with cumulative 2025 collections at 1.63 million tonnes (+1.5% y/y). French butter production hit 28.3kt in November (+0.8% y/y), with YTD production up 5.2% to 337.6kt.

Danish milksolids were up 1.5% in November, with cumulative collections at 431kt (+2.7% y/y).

What I find notable is how broadly based this European production surge is. It’s not just one country driving the numbers—Germany, France, the Netherlands, Poland, and the UK are all posting substantial gains. That kind of synchronized growth is rare, and it explains why European commodity prices have fallen so hard.

U.S. Production Outlook

USDA kept their 2025 forecast unchanged at 115.70 million tonnes in the January WASDE—a 2.4% increase over 2024. But they raised the 2026 forecast, citing “higher production per cow” as the primary driver (USDA WASDE, January 2026). If realized, that’s another 1.3% increase on top of an already elevated base.

Spot milk loads traded as much as $4 under Class III last week (Dairy Market News). When processors are paying that far below class price for spot loads, it tells you they have all the contracted milk they need—and then some.

Where’s the Demand? Following the Money

The good news: low prices are finally attracting buyers. The bad news: it’s not enough yet.

Algeria is back in the market. ONIL, their national dairy purchase program, is bidding for milk powder again. That’s significant—Algeria is historically one of the world’s largest SMP importers, and their return to active purchasing is exactly what you’d expect when global prices fall this far.

Chinese buyers are consistently attending GDT auctions. Chinese SMP inventories dropped to a one-year low in November, so merchants may need to step up purchases even though domestic consumption remains soft. It’s worth noting that Chinese dairy demand has been disappointing for nearly two years now, so I’d want to see sustained buying before getting too optimistic.

EU exports surged 12.3% in November:

ProductY/Y ChangeKey Destinations
SMP+39.6%Algeria, Egypt, Saudi Arabia, Morocco
Butter+14.9%Most destinations except S. Korea, China
Cheese+8.9%Japan, Korea, and China improved
WMP+33.2%
Casein+66.8%

U.S. exports are holding firm. The U.S. is currently the least-expensive global supplier for cheese and butter, shipping enough product abroad to keep inventories in check despite record output (Dairy Market News). For cheese, domestic demand is “solid,” and export demand is “strengthening.” For butter, Dairy Market News reports that “interest from international buyers is keeping domestic bulk butter spot loads tight.”

This is actually one of the more encouraging aspects of the current market. Demand isn’t collapsing—it’s growing. The problem is that production is growing faste than it isr.

Feed Markets: The One Bright Spot

USDA’s January WASDE dropped a bombshell on corn markets (USDA WASDE, January 13, 2026).

Corn yield came in at a record-shattering 186.5 bushels per acre—half a bushel higher than December estimates. Total production hit 17.021 billion bushels, smashing the previous record by 11%.

Ending stocks jumped to 2.227 billion bushels, on par with stockpiles from 2016-2019 when corn averaged roughly $3.50 per bushel. That historical comparison gives you a sense of where corn prices might be headed if demand doesn’t materialize.

March corn dropped 20¢ on the week to settle at $4.25 (CME Group). March soybean meal closed at $290 per ton, down $13.70.

What this means for your operation: Feed costs are genuinely cheap—the lowest since October 2020 on a DMC basis (Ever.Ag). But here’s the math problem that keeps coming up: milk prices are dropping faster than feed costs are falling. A 35-50¢ per cwt feed savings doesn’t offset a $1.80 drop in the all-milk price.

The record corn crop is a real relief for your feed bill. But if you’re counting on cheap feed to save your margins while milk stays at $14-15, rerun those numbers.

ProductSunday Pulse PA098Previous GDTY/Y (Jan 2025)TE396 Watch
WMP (C2)$3,395 (+1.0%)$3,360$3,155 (+7.6% y/y)Needs to hold $3,350+
SMP (MH)$2,660 (+2.1%)$2,605$2,495 (+6.6% y/y)Needs to hold $2,600+
Butter$5,395 (est.)$5,150$5,820 (–7.3% y/y)Watch for $5,200 support
Cheddar$3,270 (est.)$3,310$3,760 (–13.0% y/y)Critical: Hold above $3,200

The Week Ahead: What to Watch

Tuesday, January 20: GDT Event TE396 results. This is the auction that matters. If WMP and SMP can hold or extend Sunday’s gains with larger volumes on offer, we might actually be seeing a floor form. If they give it all back, buckle up for more pain.

The GDT Floor Test — What to Look For on Tuesday, Jan 21

🔴 FLOOR FAILURE SCENARIO:
• WMP falls below $3,350 (gives back Sun gain + more)
• SMP drops below $2,600 (momentum breaks)
• Volume is weak (less than 2,000 MT total)
→ Result: Expect further selling; $14 milk locks in

🟢 FLOOR HOLDING SCENARIO:
• WMP holds $3,350–$3,400 (sustains Pulse momentum)
• SMP holds $2,600–$2,650 (shows buying interest)
• Volume is healthy (2,500+ MT; strong participation)
→ Result: Floor forming; recovery narrative begins

🟡 CRITICAL THRESHOLD:
If Butter holds $5,200–$5,300 on larger volumes (TE396
has 1,920 MT offered), that signals structural demand
at lower price levels—a genuine floor signal.

Key data releases this week:

  • New Zealand December milk collections — Will signal if Fonterra’s production growth is moderating heading into the back half of their season
  • U.S. December milk collections — Confirms whether the herd expansion continued through year-end
  • Chinese December dairy imports — Tests whether inventory drawdowns are translating to actual purchases

The Bullvine Bottom Line

Tomorrow’s GDT auction is the market’s next referendum. If WMP and SMP hold Sunday’s gains, we might have found a floor. If they give it back, prepare for $14 Class III to stick around through spring.

Here’s the uncomfortable reality that this week’s data makes clear: cheap feed is keeping this market oversupplied longer than it otherwise would be. Every producer making the individually rational decision to keep marginal cows in milk is collectively extending everyone’s price recovery timeline. It’s nobody’s fault exactly, but it’s everybody’s problem.

The strategic question for your operation isn’t whether to keep milking—it’s whether you’re keeping the right cows milking. Run those IOFC calculations. That seven-year-old giving 45 pounds might be cash-flow positive at $4.25 corn, but she’s dragging down your herd average and, in a small way, dragging down everyone’s milk price too.

Watch the GDT numbers on Tuesday. And if you haven’t maxed out your DMC coverage at $9.50 for 2026, the enrollment deadline is February 26. Based on where futures are trading, those payments are looking increasingly likely through at least mid-year.

Key Takeaways

  • Pandemic-level prices are back: Class III testing $14. Cheddar blocks at $1.29. EU butter down 43% y/y. This is what three continents overproducing at once looks like.
  • Cheap corn is the problem, not the solution: At $4.25/bu, even marginal cows stay cash-flow positive. Every cow that should’ve been culled months ago is still milking—and that’s delaying the correction we all need.
  • The herd won’t shrink on its own: U.S. dairy cows near a 30-year high. Cull rates are at historic lows. Springer heifers are too expensive to replace aggressively. Until that changes, oversupply persists.
  • GDT finally has a pulse: WMP +1.0%, SMP +2.1% on Sunday’s Pulse auction. Tomorrow’s TE396 is the real test—if it holds, we might have found a floor.
  • Your move: Budget $15 Class III through Q2. Max out DMC at $9.50 before the Feb 26 deadline. And calculate IOFC on every cow in your barn—because $4 corn doesn’t make a 45-lb cow worth her stall.

Complete references and supporting documentation are available upon request by contacting the editorial team at editor@thebullvine.com.

Learn More

The Sunday Read Dairy Professionals Don’t Skip.

Every week, thousands of producers, breeders, and industry insiders open Bullvine Weekly for genetics insights, market shifts, and profit strategies they won’t find anywhere else. One email. Five minutes. Smarter decisions all week.
NewsSubscribe
First
Last
Consent

Mercosur Math: Why 30,000 Tonnes of Cheese is Actually 550 Displaced Herds

Mercosur was sold as “modest.” The math says 550 EU family herds’ milk and a headwind that can shave cents off every litre you ship. Ready to see where you stand?

Executive Summary: EU dairy farmers are walking into the Mercosur era with costs already running hot, milk output basically flat at about 149.4 million tonnes, and some of the toughest environmental and welfare rules anywhere. The “modest” EU–Mercosur deal quietly opens the door to 30,000 tonnes of cheese, 10,000 tonnes of milk powder, and 5,000 tonnes of infant formula on zero‑tariff quotas once it’s fully phased in—roughly 345,000 tonnes of milk when you convert it back to tanker‑loads. That’s the annual production of more than 500 average EU family herds trying to find a home in a market where cow numbers and drinking‑milk use are already slipping. This article walks through that “Mercosur math,” shows what those quota volumes could mean for your milk cheque over a season, and lays out the practical questions every EU dairy should be asking about compliance costs, product mix, and risk‑sharing with processors.

You know that feeling. The milk cheque shows up, it’s lighter than you hoped, the co‑op newsletter says it’s been “a solid year,” and then the radio starts talking about Brussels pushing the EU–Mercosur trade deal across the finish line.

That’s usually when the questions you’ve been parking for months finally bubble up: “So what does this actually mean for my milk price? For our cows? For whether this place is still viable ten years from now?” Those are fair questions. And they deserve more than slogans, whether they’re coming from farm groups or politicians.

So let’s walk through this together. We’ll start with the cost pressure you’re already feeling, then dig into what’s really in the Mercosur dairy package, translate it into tanker loads and euros, and finish with some practical things you can do at the kitchen table over the next 90 days.

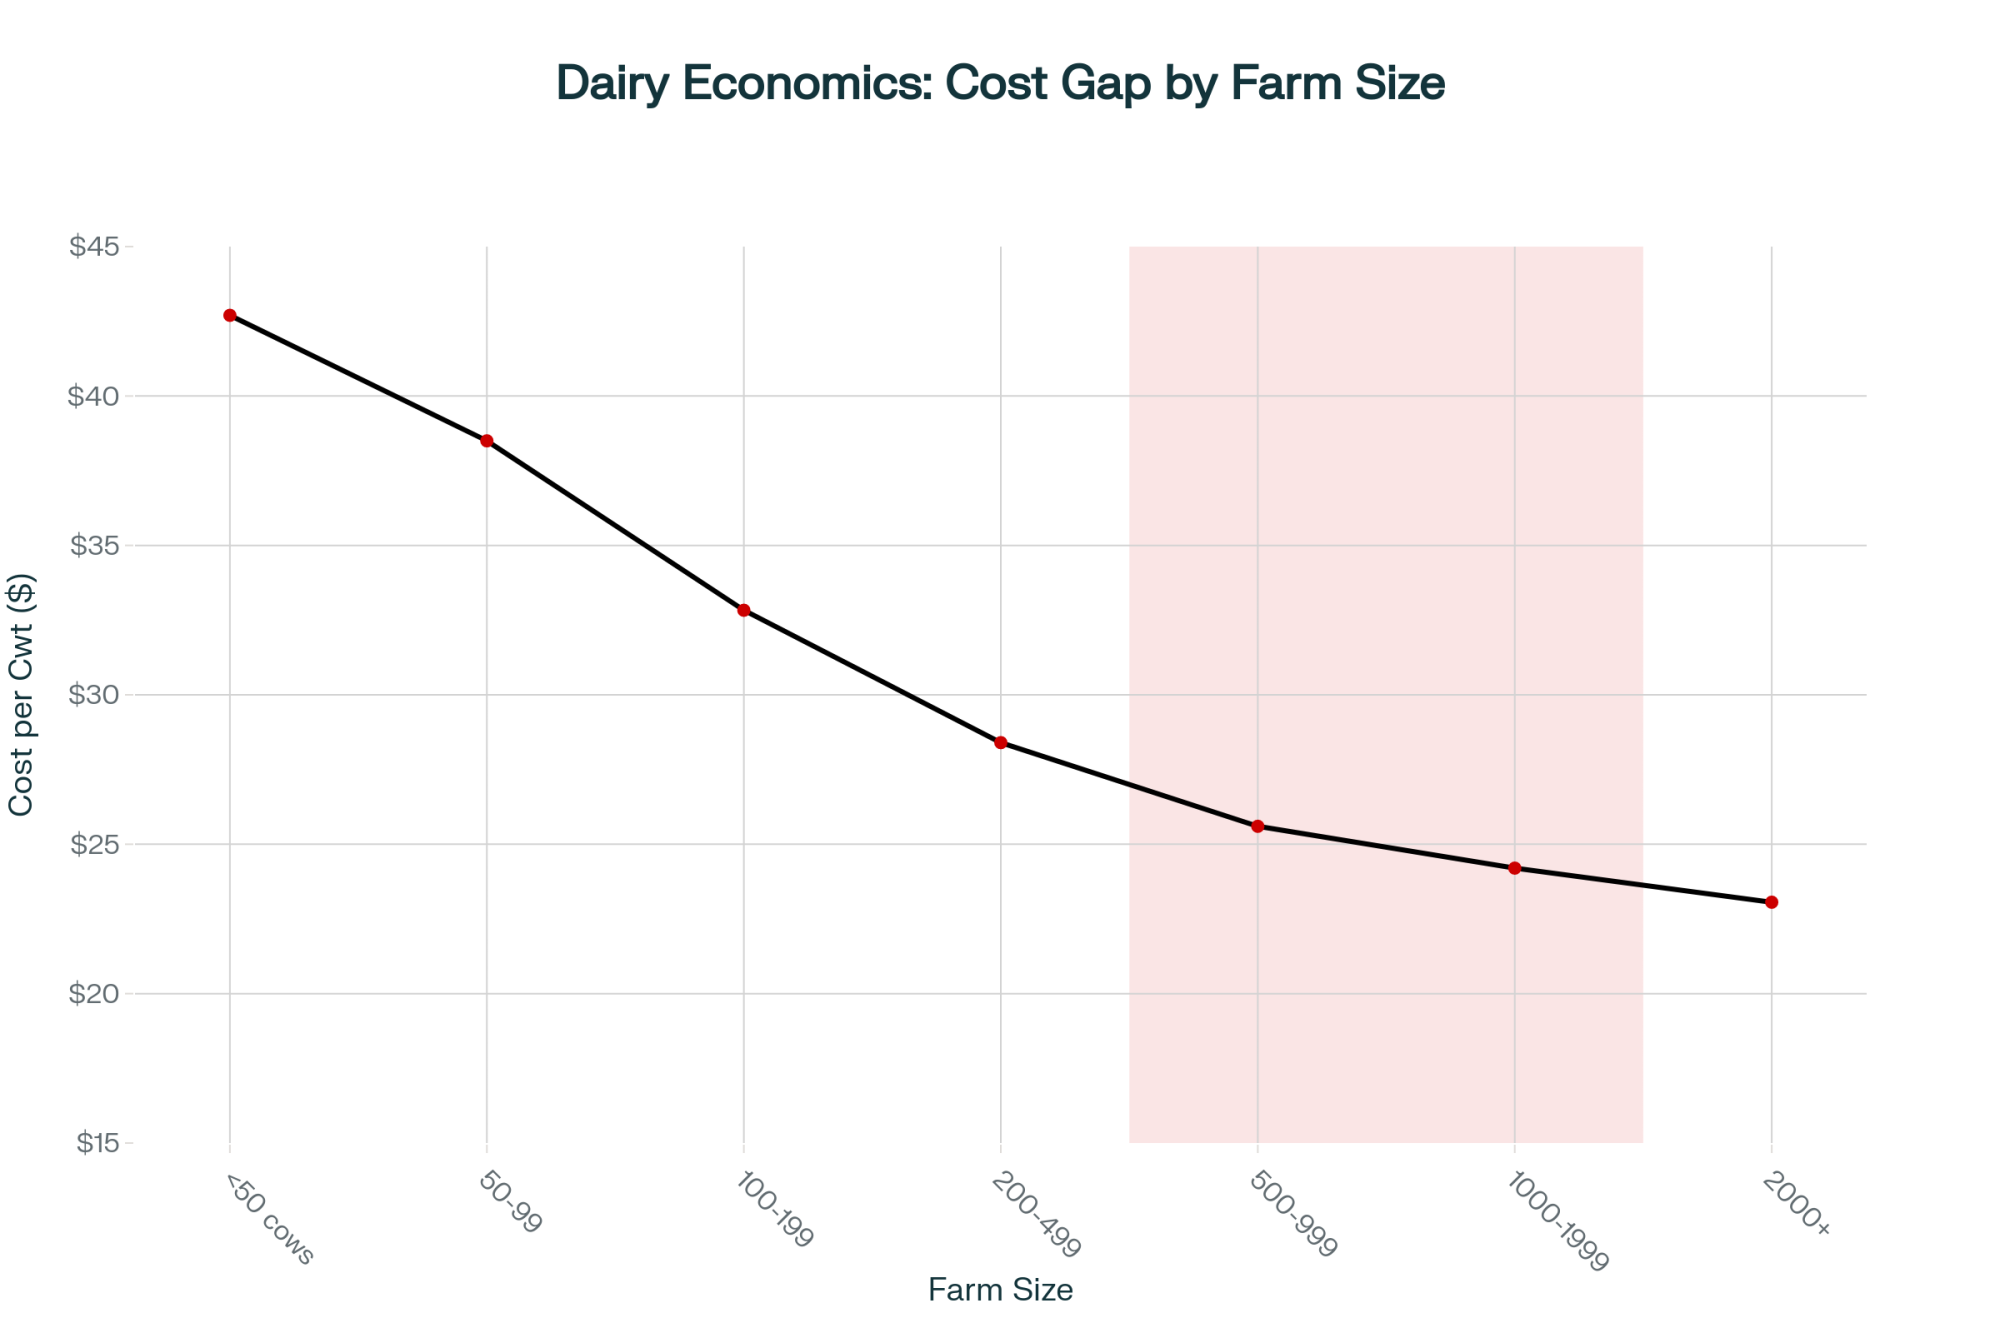
Looking at the Cost Gap We’re Up Against

Looking at this trend over the last five years, here’s what’s interesting: every major dairy region has seen costs go up, but not at the same speed or from the same starting point.

AHDB in the UK pulled together a clear summary of Rabobank’s latest global milk production cost work early in 2025. They looked at eight big exporting regions—Argentina, Australia, China, Ireland, New Zealand, the Netherlands, California, and the US Upper Midwest—from 2019 through 2024. Across that group, average total production costs rose about 14%, which works out to roughly 6 US cents more per litre over that period, and more than 70% of that increase occurred between 2021 and 2024, as feed, energy, and labour spiked. Rabobank’s team also highlighted that feed expenses were the main culprit, with average feed bills across those regions up around 19% since 2019.

The same work shows Oceania at the sharp end of low‑cost production. New Zealand and Australia have been neck‑and‑neck for the lowest cost among the eight regions, with a five‑year average total cost of about US$0.37 per litre versus roughly US$0.48 for the others. That’s roughly a 17% advantage for Oceania once you standardise for milk composition and express everything in US dollars. By contrast, production costs in local currencies in the US, the Netherlands, and China rose about 10–20% over that period, around 25% in Australia and New Zealand, and roughly 30–40% in Ireland and Argentina.

What I’ve found, looking across north‑west Europe, is that this lines up pretty well with what many of you are seeing in your own books. Once you add feed, labour, power, interest, and then the cost of complying with environmental and animal‑welfare rules, you’re often looking at a cost base that’s several euros per 100 kg higher than a low‑cost pasture system in New Zealand or some of the better Mercosur herds. Rabobank’s comparisons suggest that on a typical European cost level, that 17% gap can easily translate into a few euros per 100 kg of milk once everything is counted in.

And it’s not that EU cows are managed badly. In most freestall herds in France, Germany, the Netherlands, or Ireland, butterfat performance, fresh cow management during the transition period, and general cow comfort would look very familiar to good herds in Wisconsin or Ontario. What really racks up the bill is what sits around the cows rather than the cows themselves.

So where do those extra euros actually hide:

  • Animal‑welfare and environmental rules that govern cubicle dimensions, stocking densities, bedding, sometimes minimum days on pasture, and increasingly strict slurry and housing rules tied to EU nitrates and climate policy
  • Traceability and food‑safety systems that mean more tagging, sampling, milk recording, and third‑party audits than you’d see in many lower‑regulation exporting regions
  • Labour laws and social charges that make every hired hour more expensive than in much of South America or Oceania

What’s interesting is that when families actually sit down with their accountant and a highlighter, and pull out projects and costs that exist mainly because of regulation—extra lagoon capacity, environmental testing, certification and audit fees, software for traceability systems—it’s common to end up with a compliance bill in the low single‑digits of euro cents per kilo of milk. A recent systematic review of milk quality and economic indicators in dairy farming backs up the idea that quality schemes and regulatory measures are significant cost drivers, even if the exact cents‑per‑litre number varies from farm to farm. It’s not some official EU‑wide metric, but it’s big enough to matter, especially when global prices turn down.

That’s the cost base Mercosur milk and cheese is going to be bumping into.

What’s Actually in the Mercosur Dairy Package?

So, what’s actually in this deal? Because you’ve probably heard everything from “it’s a minor opening” to “it’ll wipe out EU dairy.”

EU trade documents on the EU–Mercosur association agreement, along with analysis from AHDB, all draw a very similar picture. On the dairy side, the agreement adds new duty‑free tariff‑rate quotas (TRQs) for three main products:

  • Up to 30,000 tonnes of cheese per year, where current most‑favoured‑nation tariffs sit around 28%
  • Up to 10,000 tonnes of milk powder per year, also dropping from roughly 28% to zero in‑quota
  • Up to 5,000 tonnes of infant formula per year, down from about 18% duty to zero on those quota volumes

These aren’t switched on at full volume on day one. European Dairy Association commentary notes that cheese quotas are expected to start around 3,000 tonnes in the first year and then step up to 30,000 tonnes by year ten, while milk powder TRQs move from 1,000 to 10,000 tonnes over the same period. Infant formula quotas are phased in to a final volume of 5,000 tonnes.

On the flip side, EU processors gain better access to Mercosur markets—especially Brazil—for European cheeses, powders, and infant nutrition products, plus stronger protection for EU geographical indications, such as key cheese names. That’s why you see support from groups like the European Dairy Association; they’re looking at supermarket shelves in São Paulo as much as at your yard in Brittany.

But if you’re milking cows in Bavaria or western France, the key question isn’t “is this good for EU industrial exports overall?” It’s “what do those tonnes actually mean on the milk side and on my milk cheque?”

Turning Policy Tonnes Into Tanker Loads

This is where the math gets real.

On paper, 30,000 tonnes of cheese doesn’t sound like much when the EU produces close to 150 million tonnes of milk. To get a feel for it, you have to convert that cheese and powder back into the milk that made it.

Cheese makers often use a rule of thumb of roughly 8.5 kg of whole milk to produce 1 kg of semi‑hard cheese, depending on fat and protein levels. For milk powder, typical technical references put whole milk powder at around 7.8 kg of milk per kg of powder and skim milk powder at just over 10 kg; using 9 as a blended average for a basket of powders is a fair shorthand.

If we run those numbers:

  • Cheese: 30,000 tonnes × 8.5 kg milk/kg cheese ≈ 255,000 tonnes of milk equivalent
  • Powder: 10,000 tonnes × 9 kg milk/kg powder ≈ 90,000 tonnes of milk equivalent

Together, that’s roughly 345,000 tonnes of milk equivalent per year, once those quotas are fully ramped up.

Now let’s lay that alongside EU milk production.

A USDA GAIN report on the EU, summarised by Dairy Global, forecasts total EU milk deliveries at about 149.4 million tonnes in 2025, roughly 0.2% below a revised estimate for 2024. That same analysis expects domestic consumption of fluid milk to keep easing and notes that cheese production is likely to edge higher, with more milk being channelled to cheese and powders.

So, into a basically flat pool of around 149–150 million tonnes, you add the equivalent of 345,000 tonnes of milk.

To make that concrete, German data from BZL show that by the end of 2023, Germany had 50,581 dairy cattle holdings—about 2,400 fewer than in 2022—and a national herd of roughly 3.7 million cows, down 2.5% in a year. Average yield was around 8,780 kg per cow, up from 8,504 kg in 2022. On those numbers, a 75‑cow family herd ships roughly 658,500 kg—call it 650 tonnes—of milk per year.

Divide 345,000 tonnes of milk equivalent by 650 tonnes per 75‑cow herd, and you’re looking at the annual output of about 530–550 herds of that size.

No, that doesn’t mean 550 farms will shut their doors the day this deal kicks in. Markets don’t work in straight lines. But you can see why something labelled as a “modest” quota package starts to feel a lot less modest when you translate it into tanker loads and real farms.

And if you turn that into price pressure, here’s a handy way to think about it. Say that extra competition from Mercosur trims the milk price by an average of 1–2 cents per litre over a cycle. On 650,000 litres of milk, that’s €6,500–€13,000 a year. On 2 million litres, you’re talking €20,000–€40,000. It’s not a forecast; it’s just basic arithmetic. But it puts a number on what “a bit more headwind” could mean in everyday cash‑flow terms.

Annual Milk VolumeImpact at 1 cent/LImpact at 2 cents/L
500,000 L€5,000€10,000
650,000 L€6,500€13,000
1,000,000 L€10,000€20,000
2,000,000 L€20,000€40,000

Where the EU Dairy Sector Is Starting From

Before we hang everything on Mercosur, it’s worth being honest about where EU dairy already stands.

The same three threads keep showing up in USDA GAIN summaries, forecast, and national statistics.

First, milk production is flat to slightly down. For 2025, EU milk deliveries are forecast at about 149.4 million tonnes, 0.2% below 2024, as tight margins, environmental restrictions, and disease pressures push some smaller farmers out and cow numbers keep easing.

YearEU Milk Production (M tonnes)German Dairy Farms (thousands)
2019151.264.5
2020150.862.5
2021150.560.4
2022150.153.0
2023149.650.6
2024149.6 (est.)
2025149.4 (forecast)

Second, cow numbers and farm numbers are steadily shrinking. We already talked about Germany losing about 2,400 dairy farmers in 2023, with cow numbers slipping to 3.7 million and average yields rising to 8,780 kg. Similar structural change is underway in France and the Netherlands, even if the exact figures differ.

Third, the product mix is shifting. The same GAIN‑based forecast expects domestic fluid‑milk consumption to continue declining, down by about 0.3% in 2025, while cheese production holds or grows slightly, and more milk heads into cheese and powders.

If you glance across the Atlantic, you see a related pattern. Hoard’s Dairyman recently highlighted that average US butterfat in the national bulk tank has climbed steadily, with annual averages moving from roughly 4.01% in 2021 to about 4.15% in 2023, and monthly data in 2024 showing every month at or above 4.0% fat. That mirrors what many of you are seeing on your own test sheets: cows that used to sit at 3.6–3.7% butterfat now comfortably over 4.0. In the Upper Midwest, for example, butterfat in the federal order serving Wisconsin averaged over 4% for the first time in 2021, driven by the cheese focus in that region.

So the EU isn’t unique. High‑standard dairy regions worldwide are trying to get more value out of every litre—more fat, more protein, more cheese yield—without relying on endless volume growth. The twist is that EU farms are doing it under some of the strictest welfare and environmental rules anywhere, which means their cost of production is higher before they even start.

And if you’re reading this in Wisconsin, Ontario, or Canterbury, you’ll recognise some of these pressures: higher input costs, tighter environmental expectations, more scrutiny from buyers, and a slow drift away from fluid milk into cheese and ingredients. The details differ, but the direction of travel feels familiar.

So What Does This Do to Price?

This is the question everyone wants answered in one number: “How much does Mercosur take off my litre?”

Here’s the honest take: nobody reputable is putting a clean, Mercosur‑only discount into a forecast yet. But there are enough signals to sketch the shape of the impact.

Rabobank’s work on structural costs makes a straightforward point: regions like north‑west Europe, with higher labour, land, and regulatory costs, will face ongoing margin pressure if they’re playing in global commodity markets. The path forward, in their view, is more scale, more differentiation, or both.

Analysis of Rabobank’s 2024 outlook for EU farmers notes that margins are expected to improve compared to the worst of 2022, with an average base price in the high 40s €/100 kg, but it also warns that costs remain elevated and that weaker Chinese demand and low output in Argentina are key uncertainties. AHDB’s own work on 2024–2025 costs underlines that while fertiliser and some purchased feeds have come off their peaks, total production expenses are still well above 2019 levels.

Then you drop Mercosur into that picture. You’ve got a mature, high‑cost market, where milk volume is flattening, and you add a stream of lower‑cost cheese and powder competing at the commodity end. Over time, that acts like a headwind on prices—peaks don’t climb quite as high, and recoveries after a downturn can be slower and shallower.

Farm organisations have been very clear on this. Groups like the European Milk Board and Copa‑Cogeca argue that EU farmers are being asked to meet some of the strictest environmental and animal‑welfare standards in the world while competing against imports that don’t face those same on‑farm obligations. They see the risk that, unless the value chain pays properly for higher standards, more low‑cost imports will tighten already narrow margins and accelerate structural change.

On the other side, the European Dairy Association and export‑oriented processors see opportunities. They’ve publicly welcomed progress on the EU–Mercosur deal, pointing to better access for EU cheeses and ingredients, and stronger protection for European cheese names, as ways to grow value in Mercosur markets. From their perspective, this is about getting more branded EU product onto high‑value shelves abroad.

The short version? For a commodity‑leaning family farm, Mercosur is another weight on a scale that was already tipping toward tighter margins. For a processor with good brands and strong GI‑protected products, it’s a mix of added risk at home and new opportunity abroad. And for the co‑ops and private buyers in the middle, it raises the stakes on how they share risk and reward with suppliers.

In some regions, you’re starting to see buyers offer longer‑term cost‑plus or fixed‑margin contracts on a slice of milk—tying pay‑out more closely to real costs for part of your volume—which is one way to spread the risk between farm and plant. It’s still early days for those models, though. Most of you are still living off the commodity roller coaster.

Mirror Clauses: Why “Same Standards for Imports” Is Harder Than It Sounds

When farmers hear all this, it’s totally understandable that the first instinct is: “Fine—if they want to ship dairy here, make them meet our standards.”

On principle, it feels fair. You’ve invested in better housing, in slurry storage that actually holds enough for the whole winter, in emissions and nutrient management plans, in full traceability. Why should you compete with milk that hasn’t carried the same load?

The catch is that most of what drives your cost is about how things are done, not the physical product you test at the dairy plant. That’s where life gets tricky for mirror‑clause ideas.

You can lab‑test cheese and milk powder for residues, pathogens, and composition. You can’t test a block of cheese for stall dimensions, resting time, or whether the cows had 120 grazing days that year. Those are process standards. They’re invisible at the border.

We’ve already seen how tough that gets with the EU’s deforestation regulation. When Brussels moved to regulate imports linked to illegal deforestation, there was a lot of optimism that satellite imagery and digital tools would make things straightforward. In practice, enforcement has run into mismatches between forest maps and national land registries, patchy local records in exporting regions, and the sheer volume of supply chains that have to be traced. Dairy would have similar traceability headaches, just without the helpful “forest/no forest” satellite contrast.

Trade lawyers also point out that under WTO rules, it’s generally easier to defend restrictions based on what a product is—its composition, safety, or residues—than on production methods that don’t change the product itself. Push too far on telling exporting countries they have to run their barns and manure systems just like Europe does, and you risk a trade dispute that’s hard to win.

There’s also a simple economic angle. If Mercosur exporters really had to meet fully equivalent EU‑level requirements for housing, slurry storage, and emissions—and if those rules were enforced correctly—their cost advantage would shrink. At that point, their appetite for pushing big volumes into an already competitive EU dairy market might cool.

So mirror clauses are likely to make inroads on some clear things—keeping banned substances out of the food chain, tightening traceability on deforestation-linked feed—but they’re not a magic wand for equalising on‑farm standards and costs in the near term.

What’s Going On in Mercosur Dairy?

To keep this fair, we shouldn’t pretend Mercosur is static either.

Brazil and Argentina are the main dairy players in that bloc. Global trade reports and USDA’s “Dairy: World Markets and Trade” show that over the last decade, both countries have increased dairy exports, particularly in whole‑milk powder, cheese, and UHT milk, into neighbouring Latin American markets, North Africa, and parts of the Middle East. Brazil, in particular, has swung between being a net importer and a net exporter depending on domestic demand, currency, and policy.

If you look at typical export‑oriented herds in those regions, you see a lot more pasture and semi‑intensive systems than full concrete‑and‑steel freestalls. Housing tends to be lighter, with cows spending more time on grass and less in enclosed barns. Land and labour costs, in local terms, are generally lower than in north‑west Europe, even allowing for inflation and volatility. Environmental and animal‑welfare rules exist and are evolving, but they don’t yet put the same pressure on stocking rates, slurry storage, or greenhouse gas accounting that EU farmers are now dealing with.

Rabobank’s cost analysis notes that while production costs in Argentina and Ireland have jumped 30–40% in local currency since 2019, farms in low‑cost pasture systems still tend to sit below EU per‑litre costs because they started from a lower base and have fewer regulatory-driven capital investments to service.

From a Mercosur perspective, the EU deal is about locking in stable, rules‑based access to a high‑value market. From Brussels’ perspective, dairy is one moving part in a larger trade‑off that also covers sectors like cars and machinery, where the political stakes are high.

And from your parlour? It’s another external force you can’t control but have to respond to, just like feed markets or weather.

How Some Farms Are Adjusting Their Playbook

So let’s bring this back to the farm gate. Given higher structural costs, flat or slowly easing milk volumes, and this new trade headwind, what can a dairy actually do?

What I’ve noticed, visiting herds and talking with producers in Germany, the Netherlands, France, and Ireland—and comparing notes with folks in Wisconsin or Ontario facing their own pressures—is that farms which seem to be staying a step ahead have a few habits in common.

1. Treating Compliance as a Real Cost, Not Just a Headache

A lot of us complain about regulation, but relatively few actually put a number on it. On the herds that do, the conversation changes fast.

Here’s what that looks like in practice:

  • They list capital projects where regulations were the main driver—extra slurry storage to meet new rules, lagoon covers for emissions, manure separators, stall renovations for welfare standards, upgraded ventilation that goes beyond pure production needs
  • They pull out ongoing expenses that are mostly about compliance—environmental sampling, emissions monitoring, nutrient‑management plans, audit and certification fees, software licences for traceability and quality programmes
  • They estimate the labour hours that go into paperwork and inspections that simply wouldn’t exist in a lower‑regulation environment

When you add those up and divide by litres delivered, you don’t get a perfect number. But you do get a rough compliance cost per 100 kg. On some farms, that works out to just above one cent per kilo; on others, especially right after big environmental investments, it creeps closer to two or three. A 2024 systematic review on milk quality and economic sustainability makes the same point: regulatory and quality‑scheme demands are a real component of total cost, and they vary widely by system and region.

A simple way to start is this: print last year’s accounts, grab a highlighter, and mark anything that’s there primarily because of regulations or certification schemes. On one European case example, that list looked like roughly €12,000 for extra slurry storage, €3,000 for environmental testing and nutrient planning, and €1,500 in audit and certification fees—about €16,500 spread over roughly 800,000 litres. That’s the kind of breakdown that turns “regulation is expensive” into something you can actually talk through with your bank, your advisor, and your buyer.

Compliance Cost ComponentTypical Annual Cost (EUR)Cost Type
Extra slurry storage (beyond production need)€2,000Amortized
Environmental testing & nutrient plans€3,000Recurring
Audit & certification fees€1,500Recurring
Emissions monitoring equipment€1,200Amortized
Traceability software & milk recording€800Recurring
Welfare-driven barn upgrades€3,500Amortized
TOTAL (Annual Equivalent)€12,000Mixed

Once you’ve got your own ballpark compliance cost written down, a few deeper questions come almost automatically:

  • Are we carrying too much fixed compliance infrastructure for the litres we’re producing?
  • Does our current herd size spread those fixed costs sensibly?
  • Are we picking up any premium for the standards we’re already meeting, or are we just ticking boxes?

You don’t have to like the answers. But you can’t manage what you won’t measure.

2. Moving a Slice of Milk Out of the Commodity Stream

The second pattern you see, especially near towns and cities, is farms that accept they can’t compete on cost for every litre, so they move a slice of their milk into a different game.

We’re not talking massive on‑farm bottling plants. A typical success story looks more like this:

  • An 80–120‑cow freestall or loose‑housing herd on the edge of a Dutch town, a German city, or a French provincial centre
  • Modest capital spend—a small pasteuriser, one or two simple cheese vats, decent refrigeration, and either a tidy farm shop or a regular place at local markets
  • A family member who doesn’t mind dealing with customers and local social media

Case studies out of regions like Minas Gerais in Brazil and various European direct‑sale operations show that when everything is set up sensibly, the milk that goes through that direct channel can net 20–40% more per litre than the base co‑op price, after you’ve covered packaging, extra labour, and energy. The majority of milk still goes on the truck. But that 20–40% slice can be the difference between a red year and a black one.

Of course, that’s the best‑case scenario. You probably know someone whose on‑farm processing turned into an expensive, exhausting second job. The key conditions that keep coming up, both in the research and in real herd stories, are:

  • You’re within a reasonable distance of enough customers who value local dairy
  • You keep the product range focused and manageable
  • You run the numbers hard, including your own time and the extra compliance burden

So before you rush out to buy a pasteuriser, it’s worth asking:

  • Are we close enough to a town or city with people who’ll pay more for local milk and cheese?
  • Do we have someone in the family who genuinely likes selling and storytelling, not just milking and scraping?
  • What existing platforms—farmers’ markets, local food shops, online “farm‑to‑door” schemes—could we plug into first, before we build everything ourselves?

If you can line up “yes” answers for those, then looking at a small, seasonal product line—like ice cream or fresh cheese—might be a sensible toe‑in‑the‑water move.

3. Turning Constraints Into a Product Story

In mountain and hill regions, the options look different again. You’re dealing with slopes, short growing seasons, and fragmented fields. Big dry lot systems or 700‑cow freestalls just aren’t realistic on that ground.

What’s encouraging is that some of these farms are still hanging in—and some are thriving—because their milk is tied into PDO or GI cheeses and dairy products with strong regional identities. Studies of mountain dairy systems in the Alps and other upland regions show that farms linked into well‑managed GI value chains often receive higher average prices per kilo of solids than standard commodity milk, though they also face higher production costs and depend more on environmental payments.

In other words, they’ve turned what might look like “inefficiencies”—steep land, traditional breeds, strict building rules—into part of the brand and value story.

If you’re already in one of those regions, or your co‑op is talking about building a new origin or welfare scheme, you might want to ask three blunt questions:

  • What’s the average farm‑gate price difference compared with standard milk for farms actually in the scheme?
  • How many local farms have successfully transitioned into it, and what did they have to change in terms of housing, feeding, or certification?
  • How steady has that premium been through the last couple of price cycles?

Research and farm‑level evidence suggest that in some regions the premium holds up well; in others, it narrows during low‑price periods. Knowing which kind of region you’re in matters before you commit to major changes.

Five Questions for a Winter Night at the Kitchen Table

By this point, it’s easy to feel like the world is throwing too many variables at you at once: global costs, trade deals, standards, climate, and consumer shifts. You can’t fix any of those alone.

What you can do is see your own situation clearly and make a few deliberate moves.

Here are five questions worth scribbling down and working through with whoever shares in the decisions on your farm.

1. What’s our best estimate of compliance cost per 100 kilos?
Grab last year’s accounts and a highlighter. Mark the items that wouldn’t be there—or would be much smaller—if you didn’t have to meet today’s environmental, welfare, and traceability rules: slurry and storage projects, environmental testing, nutrient plans, emissions monitoring, audit fees, and software for quality schemes. Add them up and divide by your litres. It won’t be perfect, but it will turn “regulation is expensive” into a number you can bring to your bank, your advisor, and your processor.

2. Does our current scale fit our region and our system?
Very small herds sometimes survive with low debt and off‑farm income. Very large units spread fixed costs—buildings, slurry, compliance, labour—over a lot of litres. The 60–200‑cow, fully regulated freestall herd is often caught hardest—too big to be a hobby, too small to spread heavy fixed overhead comfortably. Given your land base, labour, building layout, and local rules, are you trying to carry more cows than you can handle efficiently, or is your physical and regulatory infrastructure too big for your current litres?

3. Where does each litre of our milk actually go—and under what contract terms?
Map it out. How much milk goes into pure commodity cheese and powder pools? How much, if any, goes into premium streams—pasture‑based, non‑GMO, organic, higher‑welfare, local‑origin? A good question for your buyer is: “What premium programmes—pasture‑based, non‑GMO feed, higher‑welfare, local—do you offer today, and what would it take for us to qualify?” In some northern EU regions, pasture milk contracts pay an extra one or two cents per litre in exchange for documented grazing days and limits on concentrates, while GMO‑free feed contracts can offer similar premiums if you can show full feed traceability. Not every farm can make those programmes work—but you don’t know until you ask.

4. How much are we relying on emergency support to balance our risk?
The last few years—Covid disruptions, energy price spikes—have shown that EU and national support schemes do appear when things get rough, but they can also be slow and administratively heavy. It’s sensible to argue for better policy. It’s risky to build your whole business plan on the hope that the next crisis cheque will land when you need it. So ask: “If prices were poor for the next two years and no new support arrived, what would we actually do—cut costs, change system, adjust scale, or something else?”

5. Who are we comparing ourselves with, and who can we be honest with?
Benchmarking and business clubs aren’t just a British thing. Chambers of agriculture, levy bodies like AHDB, and private consultants run groups where people share real numbers, not just coffee‑shop talk. In Wisconsin and Ontario, similar business‑focused producer groups have helped farms identify which changes actually move the needle in their systems. If you’re not part of any peer group like that, one practical 90‑day goal after reading this could be: find or form a small circle where you can put actual figures on the table and talk openly about strategy.

If you want a simple starting point for the next three months, it might look like this:

  • Estimate your own compliance cost per 100 kilos.
  • Have a direct conversation with your buyer about premium contract options and what it would take to join one.
  • Commit to at least one meeting—formal or informal—where you compare real numbers with peers instead of just stories.

None of that changes Mercosur. But it does change how exposed—or how prepared—you are for the headwinds it adds to a game that was already getting tougher.

The Bottom Line

The EU–Mercosur deal isn’t going to change what your cows need tomorrow morning. Fresh cows still need careful handling through the transition period, calves still need feeding, and loans still need paying. What it does change is the wind you’re sailing in: a bit more pressure from low‑cost imports in a market where your costs are already high, and your support systems aren’t always fast or generous.

You can’t stop that wind. What you can do is understand it—and then decide what kind of boat you’re in, how you’re trimming your sails, and who you’re rowing with. In a world where none of us can afford to just drift, that’s where your real leverage lies. 

Key Takeaways:

  • “Modest” adds up fast: The Mercosur deal’s 30,000 tonnes of cheese and 10,000 tonnes of powder convert to about 345,000 tonnes of milk, like dropping the annual output of 550 EU family herds into an already flat market.
  • The cost gap is real and structural: Rabobank shows New Zealand and Australia holding a roughly five‑cent‑per‑litre edge, while EU herds carry extra euros in slurry, emissions, welfare, and traceability costs that low‑cost competitors simply don’t pay.
  • Mirror clauses sound fair, but won’t fix it: You can lab‑test cheese for residues—you can’t test it for stall dimensions or grazing days. Process standards are nearly impossible to enforce at the border.
  • Mercosur lands where EU milk is already headed: With EU production flat at 149.4 million tonnes and more milk flowing into cheese and powders as fluid demand fades, the quota volumes compete exactly where margins are thinnest.
  • Your best lever is knowing your own numbers: Farms that can pin down their compliance cost per 100 kg, push buyers on premium contracts, and benchmark honestly with peers will ride this headwind better than those waiting on Brussels to fix it.

Complete references and supporting documentation are available upon request by contacting the editorial team at editor@thebullvine.com.

Learn More

The Sunday Read Dairy Professionals Don’t Skip.

Every week, thousands of producers, breeders, and industry insiders open Bullvine Weekly for genetics insights, market shifts, and profit strategies they won’t find anywhere else. One email. Five minutes. Smarter decisions all week.

NewsSubscribe
First
Last
Consent

European Butter Down 35%: The 90-Day Playbook That’s Helping Dairy Farmers Protect $150,000+

European butter crashed 35%. History shows your milk check is due in 90 days. The farmers protecting six figures right now aren’t smarter. They’re just 90 days earlier.

Executive Summary: European butter crashed 35%—your milk check follows in 60-90 days. With Class III at $17-18/cwt, production growth running three times normal pace, and spring flush weeks away, the proactive window is narrowing. The wealth gap between acting at 1.3 DSCR versus waiting until 1.0 typically exceeds $150,000—not because one group is smarter, but because they moved earlier. This framework covers the metric your lender is watching, component strategies adding $800-1,200/month, and beef-on-dairy premiums hitting $350-700/head. The playbook mirrors 2015-16: three conversations before pressure hits—accountant, nutritionist, lender.

You know, German retail butter dropped to €0.77 per pack in late December 2025. That’s down from nearly €2.00 just a few months earlier—a correction that barely registered in most North American dairy publications. But here’s what caught my attention: for farmers who’ve learned to read global dairy signals, that price move wasn’t just European grocery news. It might be a 60-90 day advance signal for what’s heading toward our milk checks.

I spoke with a Wisconsin producer running about 280 cows near Fond du Lac recently. He put it simply: “I started watching European butter after 2015. That year taught me that what happens in Germany doesn’t stay in Germany. By the time it shows up in your mailbox, you’re already behind.”

The 60-90 Day Warning System: When European butter dropped 35% from €7,200 to €4,400 between early 2024 and late 2025, it preceded U.S. Class III pressure by roughly 75 days. The Wisconsin producer who learned this pattern in 2015 gained a $150,000+ advantage over his neighbor who ignored these global signals 

And he’s not wrong. Understanding these global connections—and knowing when they might warrant action—is becoming increasingly valuable for dairy operations navigating interconnected markets. So let me walk you through what farmers across North America are learning about price signals, financial positioning, and the strategic decisions that can make the difference between weathering market pressure and getting caught flat-footed.

AT A GLANCE: Key Insights

  • The Signal: European wholesale butter down ~35% year-over-year; historically correlates to North American price pressure within 60-90 days
  • The Metric That Matters: Know your Debt Service Coverage Ratio—acting at 1.3x versus waiting until 1.0x can mean a six-figure difference in preserved wealth
  • Near-Term Strategies: Feed-based butterfat improvements can add $800-1,200/month within 60-90 days; beef-on-dairy premiums running $350-700/head
  • The Framework: Proactive positioning beats reactive response—farmers who move early consistently outperform those who wait
  • The Bottom Line: Markets may surprise either direction, but stress-testing your operation at $15-16/cwt scenarios is sound management

How European Butter Prices Connect to Your Milk Check

The relationship between European dairy commodities and North American milk prices follows a transmission path that agricultural economists have tracked for over a decade now. It typically unfolds across 60-90 days, which—when the signals are reliable—gives observant farmers a meaningful window to prepare.

Dr. Mark Stephenson, who served as Director of Dairy Policy Analysis at the University of Wisconsin-Madison before his recent retirement, studied this lag extensively throughout his career. His research shows that when European wholesale butter drops significantly, the effects tend to ripple through Global Dairy Trade auctions in New Zealand within 2-3 auction cycles, then influence contract negotiations across Oceania before reaching North American processor discussions.

What’s happening right now appears to fit that pattern. European wholesale butter fell from over €7,200 per tonne in early 2024 to the €4,000-5,000 range by late 2025, according to AHDB’s EU wholesale tracking—that’s roughly a 35% year-over-year decline. Class III futures for Q1-Q2 2026 are currently trading in the $17.00-18.00/cwt range on CME, which is actually better than some analysts projected a few months back, but still tight for operations with higher cost structures.

Industry estimates suggest that breakeven for mid-size Wisconsin dairies typically runs $18-19/cwt when all costs, including family living and debt service, are accounted for. Operations in California’s Central Valley often see higher numbers due to feed costs and regulatory compliance, while Northeast operations face their own regional dynamics. Western operations dealing with water constraints and Southeast dairies facing heat stress economics have their own cost pressures layered on top. Canadian producers navigate a different reality entirely—quota values and supply management provide price stability but bring their own capital and cash flow considerations. The specific math varies by region and management, but the directional pressure applies when Class III hovers near or below regional breakevens.

RegionTypical All-In Breakeven ($/cwt)Primary Cost DriversCurrent Margin @ $17.50 Class IIIProjected Margin @ $15.50 ScenarioRisk Level Q2 2026
Wisconsin$18.00 – $19.00Feed, labor, debt service-$0.50 to -$1.50-$2.50 to -$3.50Moderate-High
California Central Valley$20.00 – $22.00Feed costs, water, regulatory compliance-$2.50 to -$4.50-$4.50 to -$6.50High
Northeast (NY, PA, VT)$19.00 – $21.00Labor, fuel, regional feed premiums-$1.50 to -$3.50-$3.50 to -$5.50Moderate-High
Texas/New Mexico$17.50 – $19.50Water constraints, heat stress mitigation, feed$0.00 to -$2.00-$2.00 to -$4.00Moderate
Southeast (GA, FL)$19.50 – $21.50Heat stress, humidity management, feed transport-$2.00 to -$4.00-$4.00 to -$6.00High
Canada (Quota Systems)Quota value amortized variesQuota costs, supply management compliancePrice stability via quota systemPrice stability via quota systemLow (different market structure)

Now, I want to be clear about something. Markets can and do surprise us. Futures have been wrong before—2022 comes to mind, when projections sat around $18, and actual prices hit $23 on unexpectedly strong export demand. Some analysts I’ve spoken with remain cautiously optimistic that domestic demand strength could offset some of the pressure we’re discussing. But what’s different about the current setup is the structural inventory situation, which has its own timeline regardless of demand fluctuations.

The Financial Metric Your Lender Is Already Watching

If there’s one number that shapes the conversation you’ll have with your bank—whether it’s a proactive discussion or a reactive one—it’s your Debt Service Coverage Ratio. DSCR tells you whether your operation generates enough cash to cover debt obligations with breathing room… or whether you’re running closer to the edge than you might realize.

Farm Credit Canada’s educational materials lay out the basics pretty clearly. A DSCR of 1.5 is generally considered healthy—it means you’ve got 1.5 times more cash available than your debt obligations require. Drop below 1.0, and you’re looking at difficulty servicing debt without off-farm income or other support. Most agricultural lenders use similar thresholds, though the specific trigger points for increased monitoring or restructuring conversations vary by institution.

DSCR RatioFinancial PositionWho Controls the ConversationRestructuring Options AvailableTypical Cost of Restructuring
1.5x or higherHealthy, strong cushionYou lead; bank followsFull menu: extend terms, consolidate, refinance at competitive ratesStandard processing fees (~$500-1,500)
1.25x – 1.49xAdequate but tighteningPartnership discussionMost options available; minor rate premiums possibleStandard to slight premium (~$1,000-3,000)
1.0x – 1.24xOperating in yellow zoneShared control; bank monitoring increasesLimited options; rate premiums likelyModerate premium (~$3,000-8,000 + 50-100 bps higher interest)
0.85x – 0.99xDistressed territoryBank controls termsRestricted; workout scenarios$8,000-15,000 + 100-150 bps higher interest
Below 0.85xCrisis modeBank workout team drivesForced asset sales likely$15,000+ legal/processing + distressed sale losses

Here’s what farmers are discovering—sometimes later than they’d prefer—the difference between acting at 1.3x DSCR and waiting until you hit 1.0x isn’t just about the numbers themselves. It’s about who’s leading the conversation and who’s following.

I spoke with a senior agricultural lender at a Midwest Farm Credit association who asked to remain anonymous but offered this perspective: “When a producer comes to us at 1.3 with a plan, we’re partners working on optimization. When they come at 0.95 because their operating line is maxed, we’re in workout mode. Same bank, same farmer, completely different dynamic.”

Why does this matter so much? Industry data on distressed agricultural loans shows some significant cost differences. Farms entering workout typically pay 100-150 basis points higher on restructured debt and face substantially higher legal and processing fees. Proactive restructuring—the kind you initiate while your ratios still look reasonable—generally costs a fraction of what a reactive workout costs. And perhaps more importantly, you’re often selling assets into stable markets rather than whatever conditions happen to exist when you’re forced to act.

Agricultural lenders like AgAmerica have documented case studies showing the financial benefits of proactive restructuring. In their published examples, operations that restructured early reported significant annual savings through debt consolidation and strategic use of bridge financing during capital-intensive phases. These options existed because producers initiated conversations while their ratios still demonstrated operational viability.

Here’s a calculation worth doing this week:

Pull your most recent income statement and loan documents. You need three numbers:

  1. Net cash income (gross revenue minus operating expenses—but don’t subtract interest, depreciation, or principal payments)
  2. Annual debt service (all monthly loan payments × 12)
  3. Divide the first by the second

Pro-tip: Remember that while your tax preparer uses depreciation to lower your tax bill, your lender “adds it back” to your net income to determine your actual cash flow capacity. Don’t let a “paper loss” scare you away from a proactive lender meeting. That $80,000 depreciation expense on your Schedule F doesn’t mean you’re $80,000 poorer in cash—it’s an accounting entry, not money leaving your checking account. Lenders understand this, and you should too when evaluating your real financial position.

If you’re above 1.3, you likely have options and time to be strategic. Between 1.0 and 1.25, the window for proactive decisions may be narrowing. Below 1.0, that conversation with your lender probably needs to happen soon—and having a professional guide you in is worth considering.

RED FLAGS: Signs You May Already Be Past Proactive Positioning

  • Operating line balance is climbing more than $5,000/month for three consecutive months
  • Deferred maintenance backlog growing—you’re skipping repairs you’d normally make
  • Breeding decisions driven by cash flow rather than genetic strategy
  • Accounts payable stretching beyond normal terms with key suppliers
  • Finding yourself calculating “which bills can wait” rather than “which investments make sense.”

If three or more of these apply, the proactive window may be closing. That doesn’t mean it’s too late—but it does mean the conversation with your lender needs to happen this month, not next quarter.

What’s Building Toward Q2 2026

Several market forces appear to be converging, potentially creating price pressure this spring. I want to be thoughtful here—market projections are exactly that, projections—but the structural setup is worth understanding so you can make your own assessment.

The cheese inventory factor: When butter prices declined through late 2025, processors across the U.S., UK, and EU made a logical shift. Butter had compressed margins and ongoing storage costs. Cheese—particularly aged cheddar—can sit in inventory for months as it matures, serving as a financial buffer during uncertain times.

You probably already know the aging timelines: mild cheddar reaches market readiness in 2-3 months, medium in 4-9 months, and sharp in 9-12 months. The cheese made in December 2025 and January 2026 will mature and need to be moved to market starting around April-May 2026. That’s not speculation about demand—that’s just aging biology meeting calendar math.

The spring flush timing: Every dairy farmer knows spring flush, but the research on its consistency is worth noting. Studies published in the Journal of Dairy Science on annual rhythms in U.S. dairy cattle show that the spring production peak is remarkably consistent across regions, parities, and management systems—driven more by photoperiod and reproductive biology than management decisions.

USDA’s December 2025 forecast projects U.S. milk production for 2026 at 106.2 million metric tons, up 1.2% from 2025. StoneX Director of Dairy Market Insight Nate Donnay noted in late December that milk production growth was running at an estimated 5.5% pace in September and October—about three times the normal rate. That’s notable context heading into the new year.

The export question: Here’s what’s been encouraging—September 2025 U.S. cheese exports hit 116.5 million pounds, up about 35% year-over-year, according to USDA Foreign Agricultural Service data. That was a remarkable achievement for the industry. The question some analysts are asking is whether markets that absorbed those record volumes will have the same appetite just as domestic production peaks.

None of this means $13 milk is coming. Markets find equilibriums, demand can surprise to the upside, and spring flush intensity varies year to year. But farmers projecting cash flow for Q2 2026 might consider running scenarios at $15.00-16.00/cwt alongside their base case assumptions. That’s not pessimism—it’s the kind of stress-testing that helps operations stay resilient when surprises happen.

Why Component Performance Is Becoming a Competitive Advantage

One of the most significant structural shifts in U.S. dairy over the past decade has been the steady improvement in milk components. And the numbers here are pretty remarkable. CoBank’s Knowledge Exchange published an analysis in September 2025 showing that U.S. butterfat levels increased approximately 13% over the past decade—from about 3.75% in 2015 to 4.24% by 2024. That’s roughly six times the improvement rate seen in the EU and New Zealand.

What’s particularly noteworthy is how this shifts farm-level economics during price compression. Class III and Class IV pricing formulas reward butterfat and protein by the pound rather than by volume. When base prices compress, the premium for higher components becomes proportionally more valuable as a share of the milk check.

Let me walk through some rough math on two cows producing identical volume but different components:

Cow A at 3.7% butterfat: 75 lbs/day = 2.78 lbs butterfat daily
Cow B at 4.4% butterfat: 75 lbs/day = 3.30 lbs butterfat daily

At current butterfat component pricing—which has been running in the $1.55-1.75/lb range in recent months according to USDA announcements—that 0.52-pound daily difference represents roughly $0.80-0.90 per cow per day. Scale that across a 200-cow herd over a year, and we’re talking meaningful revenue differences.

Now, genetic improvement takes 2-3 years to show up meaningfully in the bulk tank. But feed ration adjustments can produce measurable butterfat improvements within 60-90 days—which matters for operations looking at near-term margin pressure.

A Penn State study published in the Journal of Dairy Science in June 2024 found that replacing about 5% of ration dry matter with whole high-oleic soybeans improved income over feed cost by approximately $0.27/cow/day—roughly $99/cow annually. The research synthesized results from multiple feeding trials, so the findings are pretty robust.

Dairy nutritionists generally recommend adding 2-5% molasses to TMR to stimulate fiber-digesting bacteria and boost acetate production, which supports butterfat synthesis. Many farms report butterfat increases of 0.10-0.15 percentage points from this relatively simple adjustment. Protected fat supplementation—combinations of palmitic and oleic acids—can increase milk fat yields within 30-45 days of implementation.

For farms facing compressed margins, even a 0.15-0.2% butterfat improvement translates to meaningful revenue—potentially $800-1,200 monthly for a 200-cow operation at current component pricing. It’s not a complete solution to price pressure, but it’s real money that shows up in the tank relatively quickly.

The ration adjustment that pays for itself in monthly milk checks: Feed-based butterfat improvements show up in the tank within 60-90 days—potentially adding $800-1,200 monthly for a 200-cow operation. Penn State research found protected fat and molasses additions can boost butterfat 0.10-0.15 percentage points within 30-45 days

The Beef-on-Dairy Opportunity

One revenue diversification strategy that’s gained remarkable traction is beef-on-dairy crossbreeding. Industry surveys, including data from the American Farm Bureau Federation, based on Purina’s 2024 producer research, indicate that roughly seven in ten dairy operations are now actively implementing crossbreeding programs. That’s a significant shift from even five years ago.

The economics are fairly straightforward. Industry analysis shows that the majority of dairy farmers participating in these programs receive meaningful premiums for beef-on-dairy calves, with reports of additional revenues ranging from $350 to $700 per head compared to straight dairy bull calves. For an operation producing 70 male calves annually, switching half to beef crosses could generate $18,000-$20,000 in additional annual revenue.

What stands out to me about this trend is the timeline. Beef-on-dairy calves sell at 6-9 months, meaning breeding decisions made in Q1 2026 generate cash in Q4 2026. That’s a faster payoff than almost any other diversification strategy available to dairy producers—which matters when you’re managing through uncertain price periods.

Penn State Extension research on beef×Holstein crosses shows these animals have greater potential to put on muscle than purebred Holstein steers and generally show improved feedlot performance. The carcass quality has proven competitive, and the market infrastructure has developed rapidly to accommodate increased supply. One California producer I spoke with mentioned that his local auction now has specific beef-on-dairy sales days—something that would have seemed unlikely five years ago.

A Texas Panhandle operation I connected with recently shared a different angle on this. They’ve been running beef-on-dairy for three years now and emphasized that buyer relationships matter as much as genetics. “We spent six months building connections with regional feedlots before we started,” the manager told me. “Knowing where those calves are going—and what those buyers want—shaped our sire selection from day one.”

Implementation is fairly straightforward for most operations: genomic testing identifies which cows should continue breeding to elite dairy genetics (typically top 50% by genomic merit) versus which shift to beef sires—Angus, Simmental, or Charolais being common choices depending on regional buyer preferences.

WHAT ONE PRODUCER LEARNED FROM 2015

A 320-cow operation in Dodge County, Wisconsin, offers a useful case study. The producer—who asked that I not use his real name but was willing to share his experience—was running at about 1.28 DSCR in October 2015 when he started noticing warning signs.

“My accountant said I was fine. My neighbor said I was overreacting. But I’d been watching powder prices in Europe drop for months, and I had a feeling about what was coming.”

He restructured his equipment notes that November, extending terms and reducing his monthly obligation by $2,800. He culled 40 head—his bottom performers on both production and components—before spring 2016.

“When milk hit $13 that summer, I was tight but managing. My neighbor, who waited until April to act? He was in a workout by July. Similar starting points, different decisions, very different outcomes.”

His estimate of the wealth difference: around $150,000-$180,000 preserved by moving about six months earlier. Not from being smarter, he emphasized—just from reading the signals and acting before he had to.

What Peer Accountability Groups Are Teaching Farmers

There’s growing evidence suggesting that farms participating in structured peer groups make major financial decisions 6-12 months earlier than farms relying solely on individual analysis. And the mechanisms behind this are fascinating—rooted in behavioral economics as much as farm management principles.

Research on structured farm management groups has consistently shown meaningful financial advantages for participants. Studies tracking farms in peer advisory programs have found notable improvements in operating profit and return on assets compared to non-participants—though the specific magnitude varies by region, group structure, and management intensity.

The Ohio State University Extension put together a helpful fact sheet on peer group value that explains part of the mechanism. As they describe it, “With trusting relationships, members can share their farm’s production data such as yield, inputs, labor, and equipment, along with core financial ratios. Peers then act as an informal board of directors by identifying the strengths and areas for improvement.”

Here’s something I’ve noticed over the years: most dairy farmers don’t actually know their neighbor’s DSCR. They might know what kind of tractor he bought or roughly what he’s feeding, but the real financial picture? That stays behind closed doors. And that isolation can be expensive.

Having sat in on several of these groups over the years, I’ve observed something important about what actually happens in those rooms. The groups seem to override the cognitive biases that can cause all of us—not just farmers—to delay difficult decisions. Loss aversion makes culling cows feel worse than the abstract benefit of “preserving financial flexibility.” Status quo bias creates comfort with continuing current practices even when data suggests change might be warranted. Optimism bias whispers, “we’ve always made it through before.”

The farmers losing the most money right now aren’t necessarily the ones with the worst operations. They’re often the ones who calculated correctly but couldn’t pull the trigger—who knew what they should do but found reasons to wait another month, another quarter, another year.

Peer groups interrupt these patterns through straightforward mechanics: quarterly meetings with financial transparency, benchmarking against similar operations, and accountability for stated commitments. When you tell five other farmers in January that you’re going to restructure your equipment debt and cull your bottom 15%—and they’re going to ask you about it in April—it changes the calculus.

Kim Gerencser, a Saskatchewan-based farm business and management consultant who has been facilitating peer groups for well over a decade, has written and spoken extensively about the value of accountability structures. In interviews with Country Guide, he’s emphasized that the groups that sustain themselves over many years do so because participants find genuine value in the structure. The accountability piece, he’s noted, is what really matters.

For farmers who haven’t participated in this kind of group, options include Cornell’s Dairy Profit Discussion Groups, various state extension programs, cooperative-facilitated groups, and private consultant-led formations. The common elements that seem to make groups effective: quarterly meetings, financial transparency among members, neutral facilitation, and strong confidentiality agreements.

A Practical Six-Month Framework

For farmers who’ve assessed their position and decided proactive action makes sense, here’s what a practical timeline might look like. I want to emphasize that this isn’t the only approach, and every operation’s circumstances differ. A 500-cow California dairy faces different cost structures and cooperative relationships than a 150-cow Vermont operation or a 2,000-cow Texas facility.

But the underlying framework—financial clarity first, then cost structure adjustment, then ongoing accountability—seems to apply broadly based on what I’ve seen work across different regions and operation sizes.

Month 1 (January): Financial Clarity

The starting point is knowing exactly where you stand. Complete the DSCR calculation using both historical and projected prices. Pull your operating line balance trend over the past six months—if it’s been climbing $3,000-8,000 monthly, you may already be running negative cash flow, regardless of what last year’s financial statement showed.

Review your DHIA reports to identify the bottom 15-20% of your herd by combined production and components. These become your first-look candidates if cash flow requires culling decisions.

And if you’re considering a lender conversation, schedule it now while you’re initiating from a position of relative strength. The framing matters. Something like: “I’ve run forward projections based on current futures. I’d like to discuss options while we’re still well above your monitoring threshold” positions you as a proactive manager rather than a distressed borrower.

Month 2 (February): Cost Structure Adjustment

If culling decisions make sense for your operation, executing them while cattle prices remain stable preserves value. Current market prices for cull cows typically range from $1,200-1,800/head, depending on region and market conditions; distressed selling in a soft spring market could mean $800-1,100. That difference across 35 cows adds up quickly—real money for most operations.

Implement any feed ration adjustments to improve butterfat. The 60-90 day timeline for feed-based component gains means February changes can show up in April milk checks.

If beef-on-dairy makes sense for your operation, begin that breeding protocol on lower genomic performers. Revenue arrives in Q4 2026.

Month 3 (March): Risk Management and Accountability

Evaluate hedging options based on your operation’s risk tolerance and expertise. Dairy Revenue Protection and Class III options are available for farms that want price-floor protection, though they come with costs and basis risk that warrant careful evaluation—ideally with someone who understands these tools well.

Consider joining or establishing a peer accountability group. The first meeting should present your current position and action plan. Having external accountability through the spring flush period can be valuable.

Months 4-5 (April-May): Monitor and Maintain Discipline

Track actual versus projected cash flow weekly. This is where discipline matters—there can be temptation to reverse culling decisions or restructuring if short-term prices tick up.

If you’re in a peer group, the meeting during this period provides external validation. Present your January baseline, your April position, and your variance analysis. Let the group help you assess whether you’re on track.

Month 6 (June): Assessment and Forward Planning

Compare actual DSCR to January projections. Evaluate what worked, what didn’t, and what you’ve learned. Develop your Q3-Q4 plan incorporating any beef-on-dairy calf revenue and continued component focus.

What success might look like: A farm that entered January at 1.3x DSCR with $18.50/cwt breakeven, facing uncertain milk prices, emerges in June at 1.15-1.18x DSCR with $16.80/cwt breakeven—having maintained position above the critical 1.0x threshold even through potential price pressure. That’s not a dramatic turnaround story. It’s just solid management under challenging conditions.

The Conversation That Matters Most

Perhaps the hardest part of proactive financial management isn’t the calculations or even the lender meetings. It’s the kitchen table conversation about making significant changes before a crisis becomes undeniable.

What farmers who act early seem to be deciding is whether the discomfort of acknowledging vulnerability now is worth the financial protection it might provide later. And honestly, that’s not an easy trade-off. Culling cows you’ve raised can feel like a retreat. Calling your lender proactively can feel like admitting weakness. Joining a peer group and sharing your financials can feel uncomfortable.

But the alternative—waiting until circumstances force the same decisions from a weaker position—tends to cost real money, according to the research and case studies I’ve reviewed. The wealth difference between proactive and reactive positioning can range from $150,000 to $300,000 or more over a 2-3-year market cycle, depending on the operation’s size and the severity of the downturn.

That’s what tends to happen when operations restructure at penalty rates rather than market rates, sell cattle into distressed markets rather than stable ones, pay workout fees rather than standard processing fees, and navigate restricted credit access for years rather than maintaining banking relationships.

Key Takeaways

On global market signals:

  • European butter prices and Global Dairy Trade auction results can provide 60-90 days of advance indication for U.S. milk price direction
  • Current signals suggest potential price pressure in Q2 2026, though markets can surprise, and projections always carry uncertainty
  • Worth monitoring: GDT auction results at globaldairytrade.info, AHDB EU wholesale prices, and CLAL’s international databases

On financial positioning:

  • DSCR is the metric lenders watch most closely—knowing yours and projecting it forward matters
  • The wealth difference between acting proactively versus reactively can be substantial over a market cycle
  • Proactive restructuring conversations tend to yield significantly better terms than reactive conversations during distress

On operational strategies:

  • Component improvement through feed rations can generate meaningful monthly revenue within 60-90 days
  • Beef-on-dairy crossbreeding offers $18,000-$20,000 potential annual revenue diversification with a  6-9 month payoff timeline
  • Culling decisions reduce cost structure but require careful analysis of volume versus efficiency trade-offs specific to each operation

On decision-making:

  • Peer accountability groups appear to help farmers make structural decisions earlier than solo analysis
  • The psychological barriers to early action—loss aversion, status quo bias, optimism bias—are normal human tendencies
  • The farms that navigate market pressure most successfully seem to share a common trait: they made uncomfortable decisions while they still had meaningful control over terms and timing

The Bottom Line

The European butter correction of 2024-2025 wasn’t just a European story. It appears to be an early chapter in a global market adjustment that’s still developing. For dairy farmers willing to monitor these signals, clearly understand their financial position, and make proactive decisions, it may also represent an opportunity to strengthen operations before market pressures fully test them.

The question isn’t whether to prepare—smart operators are always preparing. The question is whether you’ll do it on your terms or the bank’s.

For producers reading this in January 2026, that means three conversations in the next 30 days: one with your accountant to calculate your current DSCR, one with your nutritionist about component-focused ration adjustments, and—if your number is below 1.25—one with your lender before spring flush hits. The farmers who preserved six figures in 2015-2016 didn’t have better operations. They had better timing.

For dairy producers seeking resources: University extension dairy programs in most states offer farm financial analysis services. The Center for Dairy Profitability at UW-Madison publishes annual benchmarking data. Regional cooperatives increasingly offer member financial planning support. Farm Credit institutions provide forward-looking cash flow analysis. The key is engaging these resources while your financial position still allows flexibility to act thoughtfully on what you learn.

Note: Market projections are inherently uncertain. This article provides educational framework, not financial advice. Consult qualified professionals for operation-specific decisions.

Complete references and supporting documentation are available upon request by contacting the editorial team at editor@thebullvine.com.

Learn More

The Sunday Read Dairy Professionals Don’t Skip.

Every week, thousands of producers, breeders, and industry insiders open Bullvine Weekly for genetics insights, market shifts, and profit strategies they won’t find anywhere else. One email. Five minutes. Smarter decisions all week.

NewsSubscribe
First
Last
Consent

China’s 42.7% Dairy Tariff Hits the EU – Why Your Milk Check Won’t See the Boost You’re Expecting

China’s 42.7% EU dairy tariff? Don’t celebrate yet. NZ ships duty-free with 51% market share—and China built their herd with genetics we sold them.

Executive Summary: China’s 21.9%–42.7% tariffs on EU dairy, announced December 22, 2025, are being called an opportunity for American exporters—but the market math doesn’t add up. New Zealand ships to China duty-free and holds 51% of the import market share. The U.S. exports primarily whey (95%), not the specialty cheeses being tariffed, limiting substitution potential. Most significant: China expanded domestic production to 43 million tonnes using genetics purchased from Western suppliers, including the U.S. For producers, this isn’t a moment to expect export rallies—it’s a signal to assess your processor’s export exposure, stress-test finances assuming flat Class III prices, and focus on what you control: components, efficiency, and diversification strategies like beef-on-dairy.

You know, I’ve been watching trade disputes affect dairy farmers for two decades now, and what happened today feels different. When China announced provisional tariffs of up to 42.7% on European Union dairy imports—a decision Reuters confirmed this morning—the industry press releases started flying within hours. “Opportunity for U.S. producers.” “Market share available.” “Ready to step into the gap.”

Those statements reflect genuine optimism. But there’s more context here that deserves attention. Context that can help you make better decisions about your operation, regardless of how this dispute plays out.

Grab a coffee—this one’s got some layers to it.

How Electric Vehicles Became a Dairy Problem

Back in August 2024—August 21st specifically, according to China’s Ministry of Commerce—Beijing announced it would investigate European dairy imports for alleged subsidies. The timing wasn’t coincidental. When the EU finalized tariffs of up to 45.3% on Chinese EVs that October, China had already begun its response.

Rather than targeting European cars directly, Beijing identified politically sensitive export categories: brandy, pork, and dairy. Smart strategy, honestly.

“It is highly frustrating that again, dairy seems to be used as a political pawn in a wider trade dispute between the EU and China regarding electric vehicles,” Conor Mulvihill, director of Dairy Industry Ireland, told reporters. Irish dairy exports to China topped €385 million in 2024, according to Bord Bia figures, and that revenue is now at risk.

The tariff structure ranges from 21.9% for cooperative companies up to the full 42.7% for non-cooperative ones, according to China’s Ministry of Commerce.

Assessing the Opportunity—Multiple Perspectives

Here’s where we need to think carefully. A Midwest processor I spoke with last week was measured:

“There might be some incremental business here, but anyone expecting a flood of new orders is probably going to be disappointed.” — Midwest dairy processor

The International Dairy Foods Association has offered a more optimistic view, noting U.S. exporters are ready to step into opportunities created by trade actions affecting competitors.

But here’s what many producers don’t appreciate: the U.S. and EU don’t sell the same products to China.

According to the UK’s Agriculture and Horticulture Development Board, around 95% of U.S. dairy exports to China consist of whey and whey products—commodity ingredients for food processing and animal feed. The EU sends specialty cheeses, infant formula base, and UHT milk. Premium consumer products.

So when a Chinese buyer stops purchasing French Brie because of a 42% tariff, they’re not necessarily in the market for American permeate. Different products, different purposes.

The New Zealand Factor

The AHDB reported that New Zealand controlled approximately 51% of China’s dairy import market in H1 2024—up from 42% in 2023. And thanks to their Free Trade Agreement, Kiwi dairy now enters China completely duty-free as of January 2024.

New Zealand’s Trade Minister Todd McClay confirmed it directly: all safeguard duties on milk powder have been eliminated.

China Market Access at a Glance

ExporterTariff Status (Dec. 2025)Market PositionKey Products
European Union21.9%–42.7% provisional dutiesGermany 7%, France 4% of importsSpecialty cheese, infant formula
United StatesExisting MFN + retaliatory tariffs~13% share; second-largest supplierWhey (95%), lactose, commodities
New Zealand0% (duty-free)~51% share; largest supplierWhole milk powder, butter, cheese

Sources: China Ministry of Commerce; AHDB (H1 2024); Dairy Global

When European cheese gets more expensive, who captures that demand? New Zealand—and they’ve been working this market for decades.

Understanding China’s Domestic Situation

China’s tariffs serve multiple purposes. Yes, retaliation. But also breathing room for a domestic industry facing challenges.

According to the USDA’s November 2024 report, Chinese raw milk production reached approximately 41-42 million tonnes. Rabobank forecasts 43.3 million tonnes for 2024. China has essentially added a New Zealand’s worth of production inside their own borders over five years.

Meanwhile, demand has slowed. China’s birth rate dropped to a record low of 6.39 per 1,000 in 2023, continuing a multi-decade decline. Fewer babies means less infant formula demand—one of the highest-value import categories.

Chinese processors are converting fresh milk to powder for storage. If you’ve been in dairy long enough, you recognize that as a classic oversupply signal.

The Genetic Paradox: Did We Export Our Own Market?

For Bullvine readers who understand breeding, this is worth sitting with.

Where did China get the cows for this expansion? From us.

According to the NAAB 2024 Semen Sales Report, the U.S. exported 30.8 million units of dairy semen globally—up 1.6 million from 2023. China has historically been a top destination. Sexed semen technology accelerated the process considerably, allowing Chinese operations to rapidly multiply their female inventory using genetics that took Western breeders generations to develop.

This was normal commercial activity—nobody did anything wrong. But the dynamic is worth recognizing. The better our genetics got, the faster we enabled competitors to catch up.

The Southeast Asia Pivot

With China’s import appetite moderating, U.S. trade organizations are developing alternative markets. IDFA’s Michael Dykes notes these efforts promise improved access in growing Southeast Asian markets.

Current trade values show the scale challenge: Malaysia ~$118 million, Vietnam ~$127 million, Thailand ~$87 million in U.S. dairy sales according to USDA data. Growing markets, but building presence takes years.

“We’re excited about Southeast Asia, but we’re also realistic. Each country has different food safety standards, different labeling requirements. This isn’t switching customers—it’s building relationships from scratch.” — Wisconsin cheese exporter

New Zealand has been working these markets for decades with established relationships and geographic proximity. The Southeast Asia pivot is a real strategy—it’s also a multi-year project.

Processing Capacity: The Math That Hits Your Milk Check

Here’s where this gets personal for producers, even those who never think about exports.

According to IDFA’s October 2025 report, U.S. processors are investing more than $11 billion in new capacity across 19 states, with projects coming online between 2025 and early 2028. This investment assumed continued production growth and export demand.

Modern cheese plants generally need 85-95% utilization to hit economic targets. When volume drops, fixed costs per pound climb fast.

Let’s run some numbers. For a 500-cow dairy averaging 75 lbs/cow/day, you’re shipping roughly 13.7 million pounds annually. Now, not all of that is equally exposed to export market volatility—it depends on your plant’s product mix. But if 10-15% of your production value ties to export-sensitive products like whey going to China, a $1.50/cwt effective price decline on your total check translates to roughly $20,000-30,000 in annual revenue impact. For operations more heavily exposed, multiply accordingly.

Herd SizeAnnual Production (cwt)Revenue Loss @ $1.50/cwtRevenue Loss @ $2.50/cwt
250 cows68,438$102,657$171,095
500 cows136,875$205,313$342,188
750 cows205,313$307,969$513,282
1,000 cows273,750$410,625$684,375

Here’s a specific scenario: If you’re an Upper Midwest producer shipping to a plant that sends 40% of its whey to China, and Chinese buyers shift to duty-free New Zealand sources, your plant’s utilization could drop. Even if your milk still gets processed, reduced efficiency often shows up in basis adjustments, component premiums, or year-end patronage dividends.

For producers in Class III-heavy federal order regions—such as Wisconsin, Minnesota, and the Upper Midwest—these dynamics matter more. When export-oriented cheese plants face utilization challenges, it pressures Class III specifically.

5 Signs Your Co-op May Be Too Export-Dependent

  1. More than 30% of plant output goes to export markets (especially single-country concentration)
  2. Whey or lactose represents a significant revenue stream with heavy China exposure
  3. No active diversification into Southeast Asian or Mexican markets is underway
  4. Recent capital investments were justified primarily by “growing Asian demand.”
  5. Member communications emphasize export opportunities without discussing contingencies

If three or more apply, it’s time to ask harder questions at your next member meeting.

Warning SignRisk ThresholdQuestion to Ask Your Co-op
Export concentration>30% of output to export markets“What percentage of our plant’s production goes to export, and to which countries specifically?”
China-specific exposure>20% of whey/lactose revenue from China“How much of our whey revenue depends on Chinese buyers, and what’s our backup plan?”
Market diversification<3 active export regions“Are we building relationships in Southeast Asia and Mexico, or concentrated in East Asia?”
Capital investment rationale“Asian growth” as primary justification“Were recent expansions underwritten by export growth assumptions? What if those don’t materialize?”
Communication transparencyExport opportunities mentioned without contingencies“What’s our plan if China’s self-sufficiency push continues reducing import demand over the next 3-5 years?”

Practical Considerations for Your Operation

3 Questions to Ask Your Co-op Today

  1. Exposure: “What percentage of our plant’s output is tied to Chinese markets or other export-dependent products?”
  2. Diversification: “Do we have active sales relationships in Malaysia, Vietnam, or Mexico—or are we concentrated in East Asia?”
  3. Contingency: “What’s our plan if China’s self-sufficiency push continues reducing import demand?”

The breakeven question: At what export exposure does this tariff situation materially affect your milk check? Based on typical plant economics, producers shipping to facilities with export concentrations of 25-30% or more—particularly to China—face meaningful price risk if trade dynamics shift.

Component focus: Markets increasingly reward milk components over fluid volume. Breeding and feeding strategies that emphasize component density—managing your TMR for butterfat performance, making genetic selections that improve protein yields—can improve returns even when prices are flat.

Diversification strategies: The beef-on-dairy trend represents a rational response to moderating replacement heifer needs and provides revenue diversification independent of dairy market conditions.

Financial positioning: Planning for flat-to-modest milk prices provides a more stable foundation than relying on export-driven rallies. Programs like Dairy Revenue Protection exist precisely for this uncertainty.

The Labeling Dimension

China is establishing cheese naming standards, potentially aligning with European Geographical Indication protections. The EU is pursuing similar provisions throughout Southeast Asia.

The implication: American cheeses using names like Parmesan or Feta could face market access challenges regardless of tariffs. The long-term response involves building identity around distinctly American varieties—Wisconsin Original, California Dry Jack, and Vermont Creamery styles.

Your Next Moves

Final determinations are expected by February 2026. CNBC noted Beijing significantly reduced preliminary pork tariffs in final rulings, so flexibility remains possible. But regardless of how this dispute resolves, the underlying dynamics aren’t changing.

Here’s what to do now:

  1. Assess your exposure. Ask your co-op directly what percentage of plant output goes to export markets—especially China. If it’s above 25-30%, you have meaningful trade risk.
  2. Run your own numbers. Calculate what a $1.50-2.50/cwt Class III decline would mean for your operation annually. Know your vulnerability before it materializes.
  3. Evaluate your processor’s diversification. Are they actively building relationships in Southeast Asia and Mexico, or are they concentrated in markets facing structural headwinds?
  4. Double down on components. Regardless of trade outcomes, butterfat and protein premiums reward operational excellence. That’s within your control.
  5. Stress-test your finances. Model flat prices for 18-24 months. If that scenario creates problems, address leverage and cash reserves now while milk checks are decent.

The producers I see positioning themselves well are treating export markets as valuable but variable—additional revenue opportunity rather than baseline assumptions. They’re asking good questions and planning for multiple scenarios.

That’s the kind of thinking that builds durable farm businesses.

Key Takeaways:

  • New Zealand wins this one: Duty-free access plus 51% market share means Kiwi dairy—not American—captures displaced EU demand
  • Product mismatch limits upside: We export whey to China (95% of shipments); they’re tariffing specialty cheeses we don’t sell
  • The genetics paradox: China reached 43M tonnes domestic production using genetics we sold them—we enabled our own competition
  • Know your exposure number: If your co-op sends 25%+ of output to export markets, trade volatility hits your milk check directly
  • Control beats hope: Component premiums, operational efficiency, and beef-on-dairy diversification outperform waiting for export rallies

Complete references and supporting documentation are available upon request by contacting the editorial team at editor@thebullvine.com.

Learn More

The Sunday Read Dairy Professionals Don’t Skip.

Every week, thousands of producers, breeders, and industry insiders open Bullvine Weekly for genetics insights, market shifts, and profit strategies they won’t find anywhere else. One email. Five minutes. Smarter decisions all week.
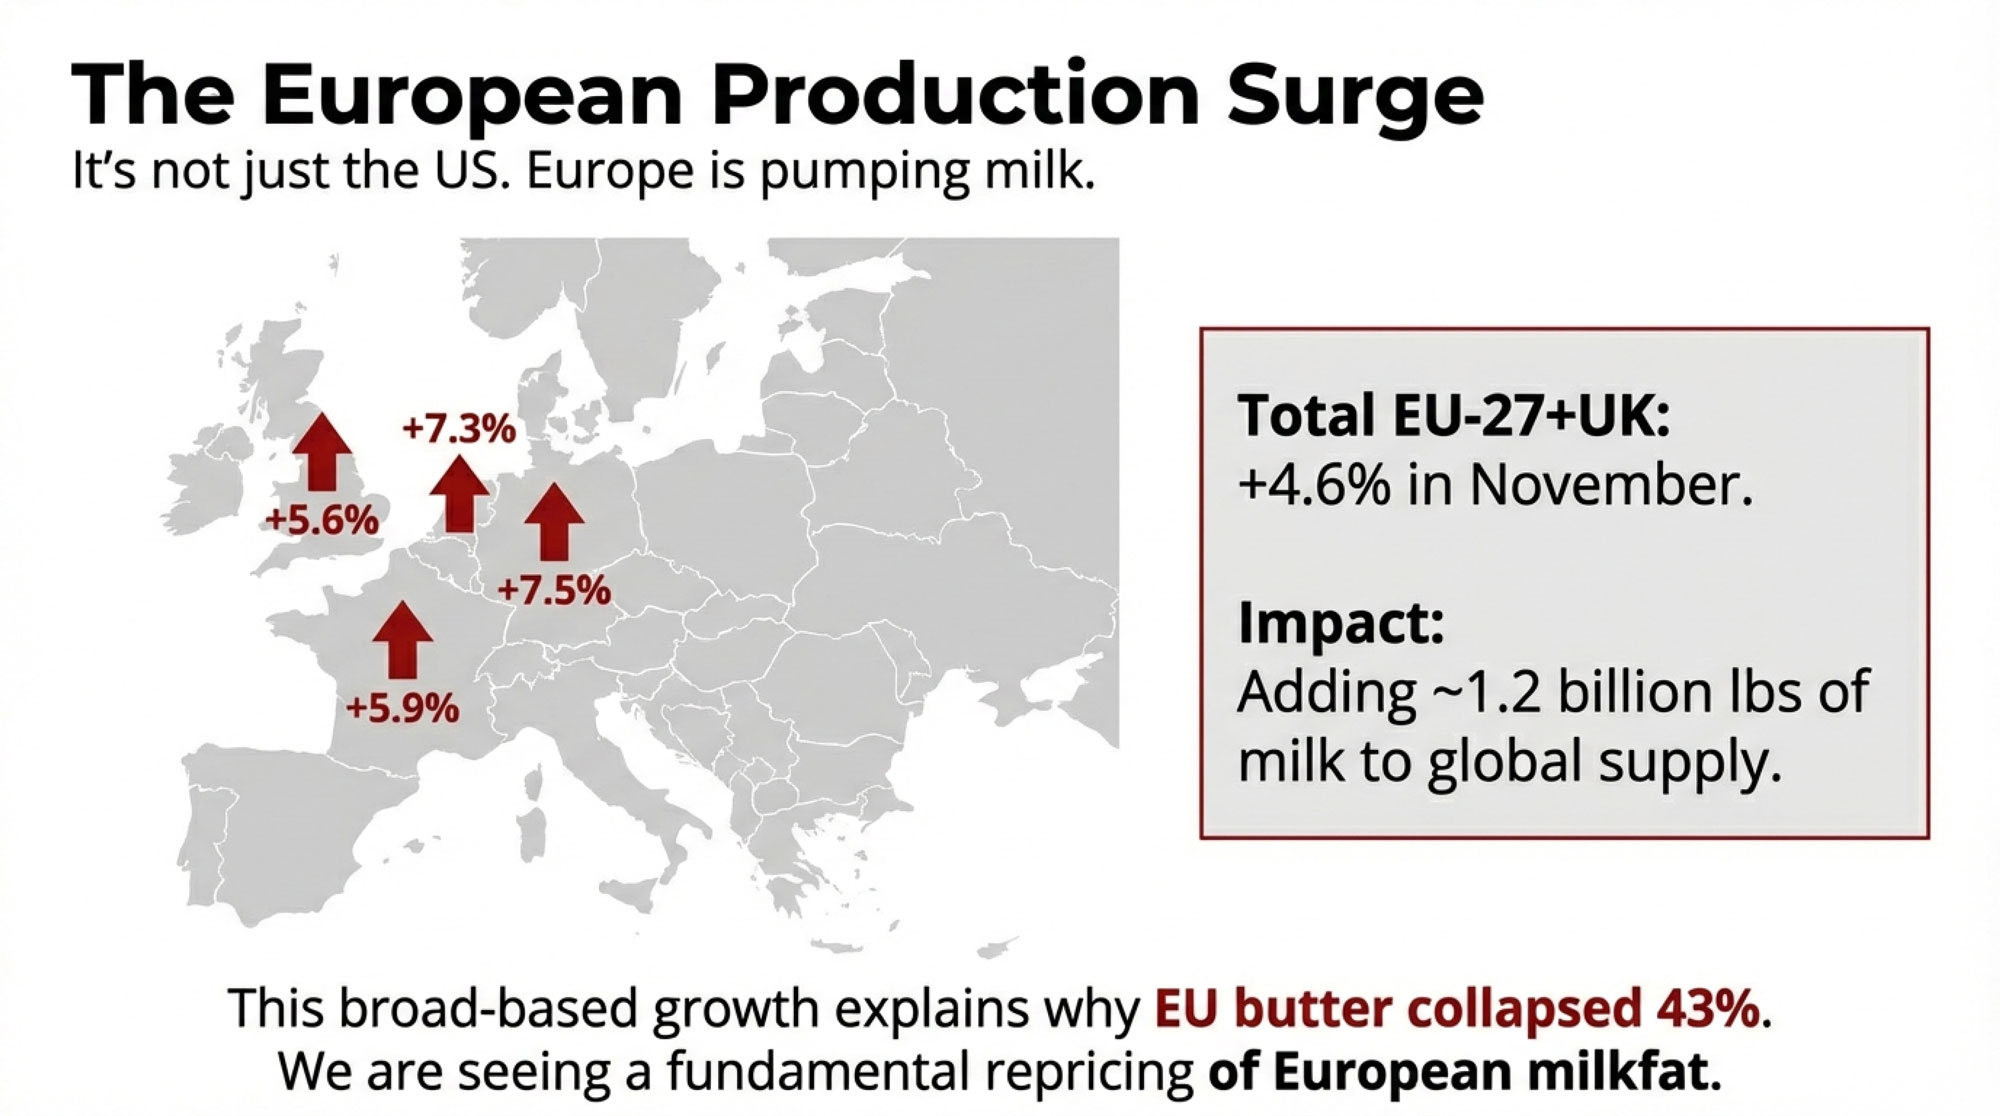
NewsSubscribe
First
Last
Consent

The One-Dollar Margin: A Global Wake-Up Call from New Zealand’s Dairy Squeeze

A $9.50 milk price sounds great—until you see the $8.50 break-even. NZ’s one-dollar margin is a wake-up call for dairy farmers everywhere.

Executive Summary: When the world’s lowest-cost milk producers are farming on a dollar of margin, that’s a wake-up call for dairy everywhere. New Zealand’s December 2025 numbers: $9.50/kgMS milk price, $8.50 break-even, one dollar left for debt, drawings, and reinvestment. They’re not alone. Teagasc projects Irish dairy incomes dropping 42% in 2026. UK farmgate prices have fallen below production costs. Rabobank calls global output growth ‘stunning’—the very oversupply compressing margins worldwide. And China’s shift from aggressive importer to tactical buyer has removed the demand safety valve the industry once counted on. The old formula—high prices equal comfortable margins—no longer holds. The farms that make it through will be those building resilience now: feed efficiency, component focus, diversified revenue, right-sized debt. Not growth for growth’s sake. Strategic survival.

When the world’s lowest-cost milk producers are working on about one dollar of operating margin per kilogram of milk solids, that’s worth every dairy farmer’s attention.

That’s exactly where New Zealand finds itself heading into 2026.

Here’s what makes this relevant beyond the Pacific: it’s essentially a real-time stress-test of the global dairy model. From Wisconsin freestalls to Irish grass paddocks to Canterbury’s irrigated pastures, the underlying question is the same.

If New Zealand’s efficient pasture systems can’t maintain comfortable margins at these milk prices, what does that mean for the rest of us?

The narrative has shifted. It’s less about waiting for the next price spike and more about adapting to a new reality—one defined by persistent cost pressure, cautious global buyers, and markets that recover more slowly than they used to.

Understanding the One-Dollar Margin

DairyNZ’s December 2025 Economic Update paints a clear picture.

Farm working expenses have climbed 16 cents to $5.83 per kgMS. Meanwhile, Fonterra revised its 2025-26 farmgate milk price forecast down to a midpoint of $9.50 per kgMS—a notable drop from the earlier $10.00 projection.

DairyNZ puts the break-even milk price for an average reference farm at around $8.50 per kgMS.

That leaves roughly a dollar per kgMS as operating surplus. And that’s before capital repayments, family drawings, or any reinvestment.

Metric2024-25 Season2025-26 SeasonChange
Milk Price ($/kgMS)$10.00$9.50-$0.50
Break-even Cost ($/kgMS)$8.34$8.50+$0.16
Operating Margin ($/kgMS)$1.66$1.00-$0.66
Farm Working Expenses ($/kgMS)$5.67$5.83+$0.16
Interest Costs ($/kgMS)$1.46$1.11-$0.35

Tracy Brown, DairyNZ’s chair and herself a Waikato dairy farmer, offered some measured perspective in their December update: “Profit is still on the table, but the margin gap has clearly tightened, and that means every spending decision on farm needs a harder look.”

That’s a statement worth sitting with.

What This Looks Like on a Real Farm

Think about a fairly typical New Zealand herd—400 cows producing 400 kgMS each. That gives you 160,000 kgMS for the season.

At $9.50 per kgMS, gross milk revenue comes to about $1.52 million NZD. With a break-even point of around $8.50, core operating costs consume roughly $1.36 million.

That leaves approximately $160,000 NZD of operating surplus.

On paper, that’s profit. But reality includes broken gates, aging tractors, and family obligations. The buffer is much thinner than the headline suggests.

I recently spoke with a consultant who works across both New Zealand and Australian operations. His observation: for a 200-cow farm, that surplus might only be $80,000 NZD before tax and drawings. For a 2,000-cow operation, you’re looking at roughly $800,000—but spread across substantially higher fixed costs and larger teams.

Farm SizeProduction (kgMS)Gross RevenueOperating CostsOperating SurplusMargin Per Cow
200 cows80,000$760,000$680,000$80,000$400
400 cows160,000$1,520,000$1,360,000$160,000$400
2,000 cows800,000$7,600,000$6,800,000$800,000$400

The ratio matters more than the headline number. Whether you’re milking 200 or 2,000, everyone’s working with a narrower buffer.

The Takeaway: A $9.50 milk price sounds strong. But with $8.50 break-evens, you’re farming on a dollar of margin—and that dollar has to cover everything else.

Tracing the Cost Increases

Where exactly did those 16 cents go? Understanding the drivers makes them easier to address.

DairyNZ’s Econ Tracker identifies three primary contributors.

Cost CategoryIncrease (¢/kgMS)400-Cow Farm ImpactControllability
Feed Costs+7¢+$11,200Medium – Nutrition strategy
Fertiliser+4¢+$6,400Low – Global commodity
Electricity/Irrigation+2¢+$3,200Low – Fixed infrastructure
Wages+2¢+$3,200Low – Labour market
Repairs/Maintenance+1¢+$1,600Medium – Defer vs invest
Compliance+1¢+$1,600None – Regulatory
Other Operating-1¢-$1,600Variable
TOTAL+16¢+$25,600

Feed costs have risen meaningfully year-on-year across most categories. Palm kernel has been somewhat more stable, but grain and purchased roughage have risen noticeably.

Fertiliser continues to pressure budgets. Phosphate and urea prices remain elevated, driven by energy market dynamics and export restrictions from major suppliers. Teagasc’s Outlook 2026 suggests costs will climb further as the EU Carbon Border Adjustment Mechanism takes effect.

Other operating costs—repairs, freight, wages, fuel, compliance—have all experienced inflation.

The encouraging news? DairyNZ reports that interest costs are easing. Payments are forecast to drop about 35 cents to $1.11 per kgMS for 2025-26.

The catch? Those interest savings are largely offset by increases elsewhere. The budget might show relief on one line, but feed, fertiliser, and operating costs are absorbing it.

For a 200-cow farm, this might mean choosing between replacing an ageing parlour component or making do with repairs. On a 2,000-cow dry-lot operation, it could be the difference between upgrading a feed mixer or deferring that decision another year.

The Takeaway: Feed and fertiliser are eating your interest rate savings before you ever see them.

The Production Paradox

This is where the situation becomes counterintuitive.

New Zealand is currently in its spring flush. DairyNZ reports national milk collections running about 3.4% ahead of last season, with August and October 2025 volumes among the highest on record.

South Island production in October was up 5.7% year-on-year. Customs data shows palm kernel imports are up significantly—a clear indicator that farmers leaned into purchased feed to boost production.

Why does this matter? Because the same pattern is playing out across multiple dairy regions simultaneously.

I’ve been following similar trends in US and European coverage. Where corn or by-products are relatively affordable, there’s considerable temptation to push cows harder to maintain cashflow. Especially when fixed obligations don’t adjust downward just because your milk price does.

At the individual farm level, this appears entirely rational. If you’ve already invested in the parlour, the effluent system, and the bank financing, pushing a few more kilograms through spreads those fixed costs.

But collectively? When New Zealand, the US, Ireland, and parts of Europe all make that same calculation simultaneously, you end up with what Rabobank’s December 2025 commentary described as “stunning” global output growth.

Region2026 Growth ForecastImpact on Global Supply
Argentina+4.0%Aggressive expansion continues
United States+1.3%Steady growth despite tight margins
New Zealand+1.0%Spring flush pushing volumes
European Union0.0%Only major exporter hitting brakes

That additional milk is precisely why price forecasts have moderated.

A Midwest producer I spoke with recently put it simply: “We’re not trying to grow anymore—we’re trying to survive long enough to see the other side.”

The Takeaway: What makes sense on your farm might be making things worse for everyone—including you.

Regional Perspectives

New Zealand’s experience offers the clearest current signal. But similar pressures are emerging across other major dairy regions.

RegionCurrent Margin (2025)2026 ForecastKey Pressure PointCompetitiveness
New Zealand+$1.00/kgMSTight ($0.80-1.00)Feed & fert eating savingsHigh — Pasture based
Ireland€0.115/LSevere (-45%)Butter price collapseMedium — Scale challenges
United KingdomBelow cost (38.5p/L)Further pressureCommodity liquid pricingLow — High costs
United States (DMC)Above $9.50/cwtStable (low feed)Production growthVariable — Regional
European UnionSqueezed — variedContraction likelyChina probe uncertaintyMedium — Policy support

Ireland: Preparing for a Correction

Teagasc’s Outlook 2026 projects that average Irish dairy farm incomes could decline by approximately 42% in 2026. That would take the average income from an estimated €137,000 this year to around €80,000.

Their baseline anticipates milk prices moderating from the high-40s cent per litre range back toward approximately 42 cents.

At 11.5 cents per litre, the average dairy net margin in 2026 is forecast to be down 45% from 2025 levels.

For a 70-hectare, 100-cow family farm, cash surplus after drawings and loan repayments could drop from around €80,000 to closer to €45,000.

That’s manageable if the debt is moderate. For operations that expanded aggressively, the adjustment will be sharper.

The UK: Below-Cost Production

Recent market data shows that farmgate milk prices have fallen below full production costs for many operations.

As of late 2025, Arla’s conventional price sits around 39.21 pence per litre. Müller’s Advantage price drops to 38.5ppl from January 2026.

Industry estimates place all-in production costs closer to the 40-45ppl range.

The picture varies by contract type. Producers on cheese or retailer-aligned arrangements often fare better. But in the commodity liquid segment, some operations are producing milk at a level below full economic cost.

Processors have responded by shifting toward component-based and fixed-volume contracts. Retailers continue to prioritise competitive shelf prices, putting pressure on producers’ margins.

The US: Regional Variations

The American experience differs due to policy structure—and substantial regional variation.

The Dairy Margin Coverage programme has provided meaningful support. The University of Wisconsin Extension reports that through the first ten months of 2023, DMC distributed over $1.27 billion in indemnity payments. That averaged approximately $74,453 per enrolled operation, with around 17,059 dairy operations participating.

But the experience varies dramatically by region.

In California, water costs and environmental compliance add layers of expense that Midwest operations don’t face. Wisconsin operations are navigating processor consolidation and volatility in the cheese market. Northeast producers face declining fluid milk demand and processing capacity constraints.

Larger US herds—1,000 cows and above—are increasingly relying on scale economies and diversified revenue streams. Beef-on-dairy programmes, heifer development, and energy projects are becoming standard.

The Takeaway: The squeeze is global, but every region has its own version. Know your local dynamics.

The China Factor

For two decades, much of dairy’s long-term optimism rested on a straightforward assumption: China would continue buying more.

That assumption deserves recalibration.

New Zealand Treasury’s 2024 dairy exports analysis, Rabobank’s global outlooks, and trade reports identify three meaningful shifts.

Product Category2021 Imports (MT)2024 Imports (MT)ChangeTrend
Whole Milk Powder1,680,000740,000-56%Domestic production surge
Milk Powder (Total)2,580,0001,360,000-47%Structural decline
Skim Milk Powder900,000620,000-31%Domestic substitution
Whey480,000380,000-21%US tariff impact
Cheese140,000170,000+21%Foodservice growth
Butter110,000135,000+23%Bakery sector expansion

Domestic production has expanded substantially. China has invested heavily in large-scale dairy operations. This is structural import substitution, not a temporary measure.

Per-capita consumption growth has moderated. Dairy consumption continues trending upward, but at slower rates than during the expansion years. The steepest part of the adoption curve appears behind us.

Purchasing behaviour has become tactical. Chinese buyers now step back when prices strengthen and increase purchases when value emerges—rather than consistently supporting auctions.

China remains a vital market. But it’s no longer the automatic release valve that absorbs surplus production.

The Takeaway: Don’t count on China to bail out oversupply anymore. That era is over.

What Farmers Are Actually Doing

When margin discussions move from conferences to kitchen tables, what are producers actually changing?

Managing Through Feed

In New Zealand, palm kernel imports are up significantly. Many farmers chose to push production while payout expectations remained near $10/kg MS.

Similar decisions are playing out in US operations where corn and by-products remain relatively affordable.

The logic is straightforward: when principal payments and family expenses don’t flex with milk price, spreading fixed costs across more production can appear to be the only short-term lever.

Strengthening Balance Sheets

New Zealand’s Ministry for Primary Industries notes that some farmers used the strong 2021-2023 payouts to reduce debt rather than adding infrastructure.

That decision is looking increasingly prudent.

On a 200-cow farm, this might translate to directing an extra $20,000 annually toward debt reduction rather than equipment upgrades. On a 2,000-cow operation, it could mean restructuring short-term facilities into longer-term arrangements.

Diversifying Revenue

Beef-on-dairy has become mainstream. Industry analyses suggest crossbred calves can add $100-200 per cow annually, depending on local markets.

Sustainability-linked premiums are emerging as processors develop payment structures tied to documented environmental outcomes.

Even modest additional revenue streams—$50,000-$100,000 annually on a mid-sized operation—can make a meaningful difference when the milk cheque alone isn’t covering the spread.

The Takeaway: Smart operators aren’t just cutting costs. They’re restructuring debt and finding new revenue.

StrategyShort-Term CashflowMargin ImpactRisk LevelBest For
Push Production (Palm Kernel)Improved$0.85/kgMSHigh — Adds to oversupplyHigh debt, large scale
Cut Costs AggressivelyPreserved$1.15/kgMSMedium — Quality risksMedium farms, low debt
Maintain Status QuoSqueezed$1.00/kgMSHigh — Thin bufferNo flexibility
Reduce Debt FirstReduced$1.00/kgMSLow — Future flexibilityStrong balance sheet

Strategic Levers by Scale

Even in challenging margin environments, individual operations retain meaningful levers. They won’t shift global prices, but they determine which side of the margin line you occupy.

Feed Efficiency and IOFC

Research consistently documents substantial variation in feed efficiency—both between herds and within individual herds.

Progress typically comes from:

  • Forage quality management—harvest timing, processing, storage, feedout
  • Fresh cow protocols that establish strong intake patterns during those critical first 30-60 days
  • Active use of income over feed cost metrics as management tools, not retrospective reports

Getting started: On smaller operations, work with a nutritionist to develop simple IOFC reporting by production group. On larger TMR operations, establish monthly review rhythms to identify underperforming groups.

Component Value Capture

As payment systems emphasise solids over volume, butterfat and protein percentages deserve strategic attention.

The value ranges from 75 cents to $1.25 per hundredweight in many component-based systems, even at equivalent volume.

Getting started: Talk with your AI representative about reorienting sire selection toward fat and protein kilograms. Pair that with a nutritionist input on optimising rumen health, not just energy delivery.

Beef-on-Dairy Integration

This has evolved from a niche strategy to standard practice.

Getting started: Begin with market research. Talk with calf buyers about which terminal breeds and calving ease profiles actually command premiums in your area.

Financial Structure

What research keeps showing—across EU and Latin American farms alike—is that how you structure debt often matters as much as how efficiently you produce.

Getting started: Have proactive lender conversations before cash flow challenges emerge. Walk through three-year projections under multiple price scenarios.

The Takeaway: You can’t control global milk prices. But you can control feed efficiency, component focus, revenue diversity, and debt structure.

StrategyImmediate Impact1-Year Margin GainResilienceCapital Required
Feed Efficiency FocusModerate — Slow gains+$0.10-0.20/kgMSHigh — PermanentLow — Nutrition/management
Component OptimizationModerate — Genetic lag+$0.15-0.25/kgMSHigh — PermanentLow — Semen/consulting
Beef-on-Dairy IntegrationHigh — Instant revenue+$0.08-0.15/kgMSMedium — Market dependentLow — Contract only
Aggressive Debt ReductionLow — Reduces cashflow$0/kgMSVery High — Future flexibilityHigh — Requires surplus
Volume Push (Status Quo)High — Spreads fixed costs-$0.05 to +$0.05/kgMSLow — Worsens oversupplyModerate — Feed purchases

What Could Actually Change Things?

If current margin pressure is structural, what developments might shift the trajectory?

Genuine supply contraction would require sustained exits that actually reduce production capacity. We’re seeing accelerating consolidation in parts of Europe, the UK, and Australia. It’s unclear whether the pace is sufficient.

Emerging market demand growth offers longer-term potential in Southeast Asia, Africa, and Latin America. But developing those markets takes time.

Policy and structural changes—such as transition support, improved risk-sharing between processors and producers, and trade agreements—could shift the environment. But political processes move slowly.

None of these are quick fixes. But understanding the possibilities helps inform longer-term positioning decisions.

Key Takeaways

Price levels don’t ensure margin. A $9.50 per kgMS payout with $8.50 break-evens means strong prices can coexist with tight margins.

Volume gains require margin verification. More production can support cashflow while contributing to oversupply. Check IOFC, not just output.

Input decisions carry strategic weight. Feed and fertiliser now warrant careful analysis, not routine repetition.

Revenue diversification has moved mainstream. Beef-on-dairy and sustainability premiums are standard elements, not experiments.

Financial structure shapes survival. Operations that reduced debt during good years enter this period with more flexibility.

Opportunity persists, but looks different. More competition, more selective buying, more scrutiny. Adapt or get squeezed.

The Bottom Line

No individual farm can resolve global oversupply. No policy will quickly restore previous comfort levels.

But careful attention to what New Zealand’s numbers reveal—and thoughtful application regardless of region or scale—can improve the odds of staying on the right side of that one-dollar margin line.

The farms that thrive in 2030 are making decisions right now. Not necessarily to get bigger. But to get more resilient, more diversified, more intentional about where margin actually comes from.

Complete references and supporting documentation are available upon request by contacting the editorial team at editor@thebullvine.com.

Learn More:

The Sunday Read Dairy Professionals Don’t Skip.

Every week, thousands of producers, breeders, and industry insiders open Bullvine Weekly for genetics insights, market shifts, and profit strategies they won’t find anywhere else. One email. Five minutes. Smarter decisions all week.
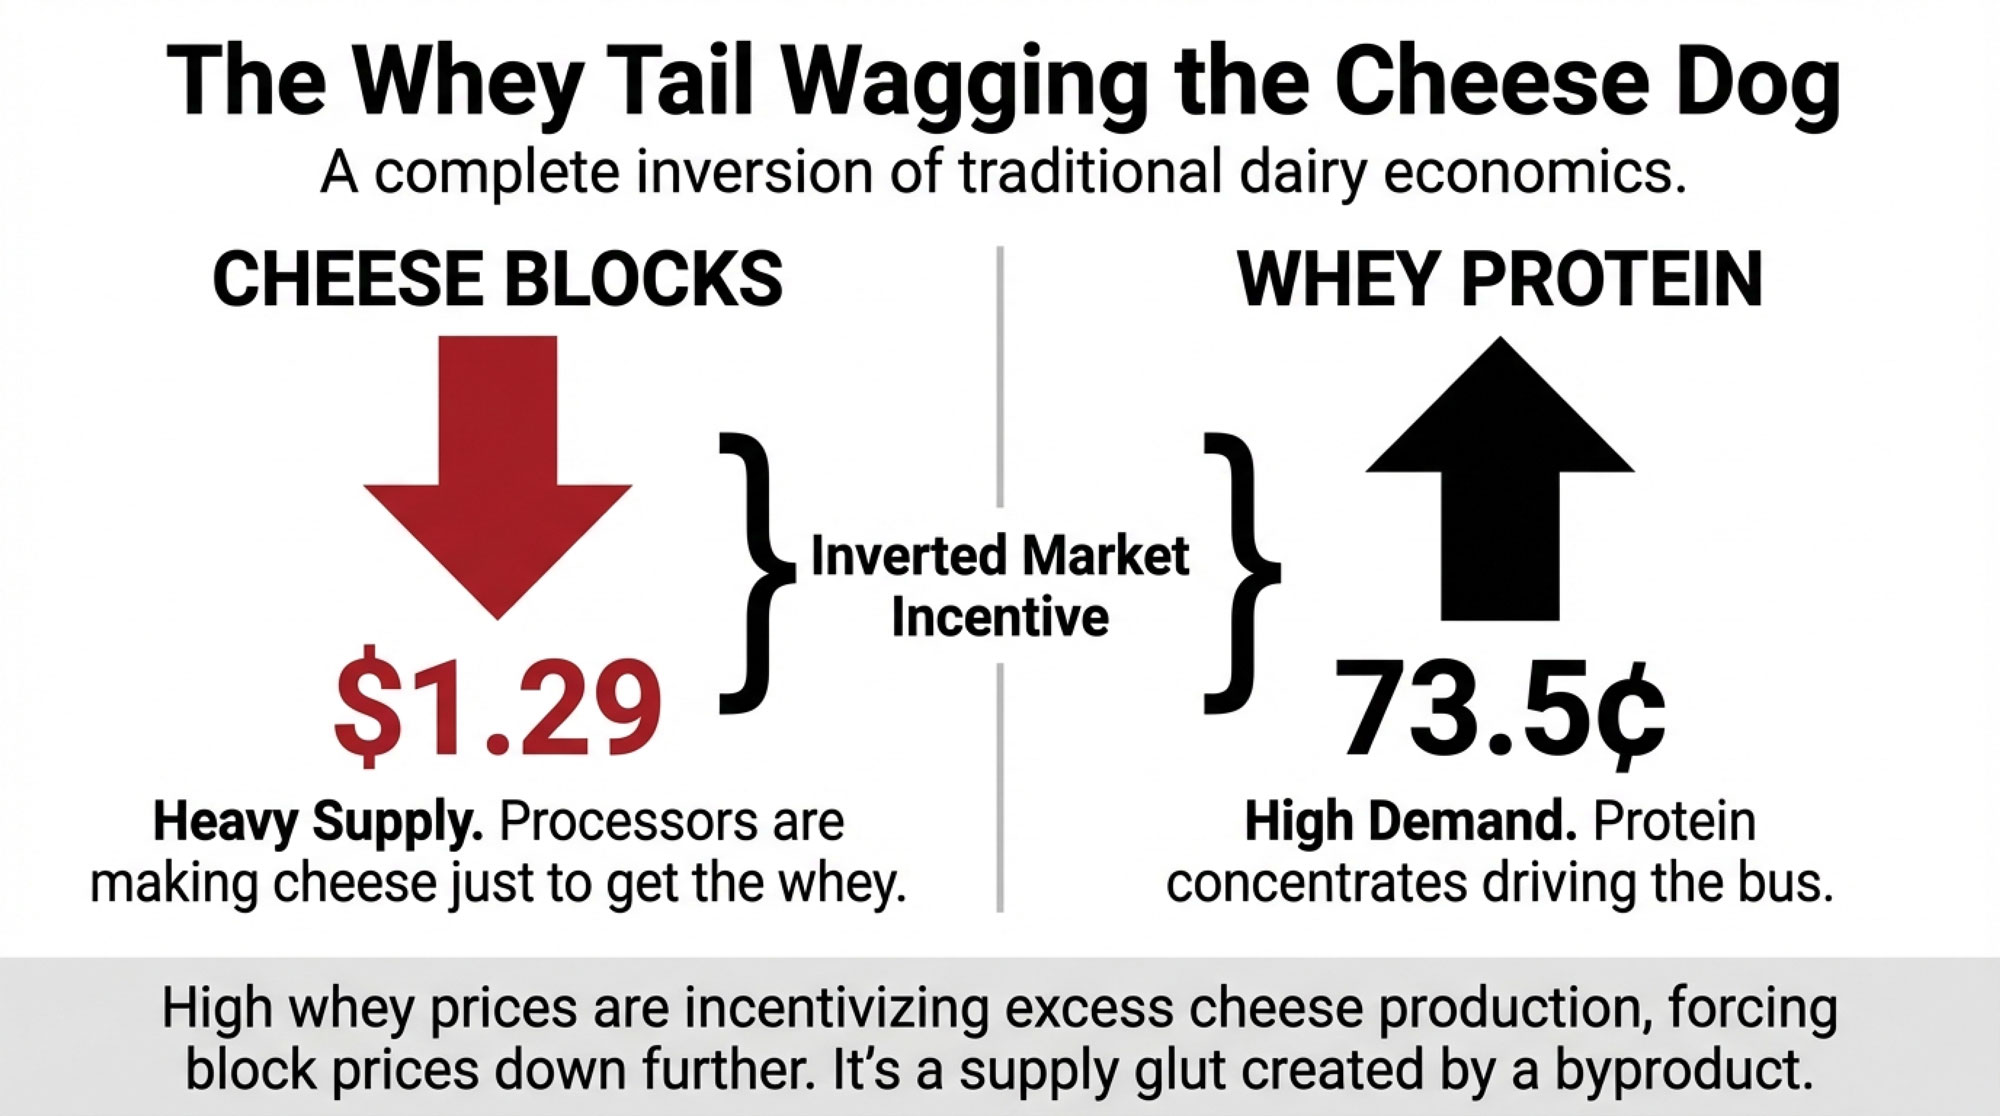
NewsSubscribe
First
Last
Consent

November 12 Market Shock: Cheese Crashes to $1.55 as Milk Heads for $16 – Your Action Plan Inside

Warning: Today’s cheese collapse confirms what smart money already knows – milk’s heading for $16. Action plan inside.

Executive Summary: Today’s 8-cent cheese collapse to $1.5525 sent an unmistakable message: the U.S. dairy industry has entered a margin crisis that smart money says could stretch into 2027. With Europe undercutting our prices by 10 cents, Mexico pulling back orders, and domestic production inexplicably up 4.2%, we’re producing into a black hole. The numbers are sobering – Class III milk heading for $16.50 means your January check drops $3/cwt, translating to $7,500 less monthly revenue for a typical 300-cow operation. At these prices, even well-run dairies lose $1,500 daily. But here’s what 30 years in this industry has taught me: the operations that act decisively in the first 90 days of a crisis are the ones that survive. Those waiting for markets to ‘come back’ typically don’t make it. Your December milk check isn’t just a number anymore—it’s a referendum on whether your operation has what it takes to weather the storm ahead.

Dairy Margin Management

Today’s Market Summary Table

ProductCloseChangeTrading Activity
Cheese Blocks$1.5525/lb↓ $0.084 trades ($1.5775-$1.6275)
Cheese Barrels$1.6450/lb↓ $0.03No trades
Butter$1.5000/lbUnchanged3 trades ($1.49-$1.50)
NDM$1.1575/lb↑ $0.0025No trades
Dry Whey$0.7500/lbUnchangedNo trades

You know that sinking feeling when you check the CME report and see red numbers everywhere? That’s exactly what happened today. Block cheese crashed 8 cents to close at $1.5525 per pound—and here’s what’s interesting, it happened on relatively heavy trading with four separate transactions recorded by the Chicago Mercantile Exchange spanning from $1.5775 to $1.6275, according to today’s CME cash market report. Barrels weren’t far behind, falling 3 cents to $1.6450, though notably without any recorded trades.

What I’ve found particularly telling is how butter stayed frozen at $1.50 with three trades in a tight range, while nonfat dry milk barely budged, climbing just a quarter-cent to $1.1575 with zero trading activity. Days like this tell us something important about where we’re headed. And honestly? It’s time we had a serious conversation about what this means for your December milk check.

Reading the Tea Leaves in Today’s Trading Patterns

Here’s something many of us miss when we just glance at the closing prices—the bid-ask spreads are telling a much bigger story. You probably know this already, but when the gap between what buyers are willing to pay and what sellers are asking widens dramatically, it usually means traders can’t agree on where prices should settle.

Today’s cheese block market saw those four trades bouncing between $1.5775 and $1.6275, but—and this is crucial—CME floor sources report that we had only one bid against one offer at the close. That’s not healthy price discovery; that’s a market running on uncertainty. In my experience working with Chicago traders, when you see heavy block volume with falling prices but no barrel activity, it often means processors are dumping inventory before year-end accounting.

The 8-Cent Collapse Captured: From $1.64 trading range into $1.55 settlement across four institutional block trades. This waterfall pattern signals that major traders are repricing dairy fundamentals downward—the classic setup for extended weakness.

The weekly totals back this up dramatically: 14 block trades this week versus zero for barrels, according to CME weekly volume data. You know what really concerns me? The order book shows just one bid each for blocks and barrels, creating virtually no floor under this market. Compare that to butter, where we’re seeing four offers—sellers everywhere, but buyers have vanished. It’s worth noting that this setup typically precedes another leg lower, especially when remaining buyers finally capitulate.

How Global Markets Are Boxing Us In

So here’s where things get complicated—and you’ve probably noticed this in your own export conversations if you’re dealing with cooperatives. European butter futures trading at €5,070 per metric ton on the European Energy Exchange work out to about $2.29 per pound at current exchange rates. That’s now competitive with our prices, and according to USDA Foreign Agricultural Service data, they’re capturing business we desperately need.

What I find particularly troubling is New Zealand’s positioning on the NZX futures exchange. Their whole milk powder at $3,440 per metric ton signals aggressive pricing to capture Asian market share, based on Global Dairy Trade auction results. And with EU skim milk powder at €2,075 per metric ton—that’s about $1.04 per pound—they’re undercutting our NDM by over 10 cents. In many cases, that’s enough to make a U.S. product completely uncompetitive globally.

Now, Mexico has traditionally been our safety net. USDA trade data shows they account for about 25% of U.S. dairy exports. But here’s what’s changed: the peso weakened by 8% against the dollar this quarter, and according to Conasupo (Mexico’s national food agency), domestic production is ramping up. Several processors I’ve talked with in Wisconsin report Mexican buyers are pulling back on November purchases.

Southeast Asia was supposed to pick up that slack, but USDA attaché reports from Vietnam and Indonesia indicate those markets are currently oversupplied with cheaper product from New Zealand and Europe. And the dollar… well, that’s another story entirely. Federal Reserve data shows it’s near 52-week highs, and research from the International Dairy Federation shows that every 1% rise in the dollar index typically drops our dairy exports by 2-3%.

Feed Markets: The Silver Lining Gets Thinner

Here’s one bright spot, though it’s getting dimmer by the day. According to CME futures settlements, December corn closed at $4.3550 per bushel, with March futures at $4.49. That’s manageable. Soybean meal’s recovery to $322 per ton from Monday’s $316.80 keeps feed costs somewhat reasonable, based on CBOT trading data.

But—and this is a big but—the milk-to-feed ratio is deteriorating fast. Cornell’s Dairy Markets and Policy program calculates that at current prices, income over feed costs could drop below $8 per hundredweight by January. University of Wisconsin Extension analysis confirms that for most operations, that’s below breakeven.

The regional differences are striking, too. USDA Agricultural Marketing Service basis reports show Midwest producers near corn country seeing sub-$4 local cash prices. Meanwhile, California Department of Food and Agriculture data indicates that West Coast producers are facing $5-plus delivered corn. For hay, USDA’s Agricultural Prices report puts the national average at $222 per ton, but Western Premium Alfalfa runs $280 and up according to the latest USDA hay market news.

Production Growth: The Numbers We Can’t Ignore

USDA’s National Agricultural Statistics Service finally released that delayed September milk production report on November 10th, and the numbers are… well, they’re sobering. Twenty-four state production hit 18.3 billion pounds, up 4.2% year-over-year. The national herd added 235,000 cows over the past year, while production per cow jumped 30 pounds to 1,999 pounds per month.

What’s really eye-opening is where this growth is concentrated. Kansas leads with 21.1% growth, South Dakota’s up 9.4%—those new processing plants that Dairy Foods magazine has been covering are pulling massive expansion. Looking at efficiency gains, Michigan State University Extension reports their state’s cows are averaging 2,260 pounds per month. That’s 260 pounds above the national average.

The 261-Pound Survival Gap: Michigan’s elite herds average 2,260 lbs/month while national average sits at 1,999. That efficiency gap translates to $15/day cost per marginal cow. When Class III drops to $16.50, every pound counts—operations with production per cow below 1,950 face economic extinction.

The combination of improved genetics—documented in Journal of Dairy Science studies—optimized nutrition protocols from land-grant university research, and modernized facilities, as tracked by Progressive Dairy, has pushed biological limits higher than we thought possible. Here’s the reality check from talking with nutritionists: when your neighbors are achieving these yields, you either match them or risk getting priced out.

Remember all those cheese plants that broke ground in 2023? Kansas Department of Agriculture confirms three major facilities, Texas Department of Agriculture lists two, and South Dakota’s Governor’s Office announced another two. We’ve added 10 billion pounds of annual processing capacity since 2023, according to estimates from the International Dairy Foods Association. These plants have 20-year USDA Rural Development financing that requires running near capacity—this structural oversupply won’t resolve quickly.

The Structural Trap: Four new cheese plants in 2023 plus six more in 2024-2025 added 10 billion pounds of capacity. These debt-financed facilities must operate near 95% utilization to service 20-year USDA Rural Development loans. Current market demand: 46 billion pounds. Result: 5+ billion pounds annual oversupply locked in through 2030. Price recovery impossible without facility closures—and that doesn’t happen voluntarily.

What This Means for Your December Check

Let’s talk straight about where Class III milk is headed. With November futures already at $17.16 on the CME and December futures implying further weakness according to today’s settlements, several dairy economists I respect are projecting $16.50 or lower by January.

December Check Reckoning: A 300-cow operation at $16.50 Class III faces $7,500 monthly revenue loss. That’s $900 daily. January will be worse.

At $16.50 Class III with current feed costs, the University of Minnesota’s dairy profitability calculator shows the average 100-cow dairy loses about $1,500 per day. If we hit spring flush with these prices… well, that’s going to force some tough culling decisions. Today’s spot prices, when run through USDA’s Federal Milk Marketing Order formulas, translate to January milk checks down $2.50 to $3.00 per hundredweight from October.

For a 300-cow dairy shipping 65,000 pounds daily, that’s $7,500 less monthly revenue. Farm Credit Services reports from the Midwest indicate banks are already tightening credit as dairy loan portfolios deteriorate. The Federal Reserve’s October Agricultural Credit Survey shows agricultural loan demand rising while repayment rates fall—if you haven’t locked in operating lines for 2026, today’s price action just made that conversation much harder.

What’s particularly concerning is that our traditional escape route isn’t available. USDA Foreign Agricultural Service data shows China’s imports down 18% year-over-year, Mexico’s pulling back, as I mentioned, and Southeast Asian markets are oversupplied. Without export demand absorbing 15-20% of production—which has been the historical average according to U.S. Dairy Export Council analysis—domestic markets face crushing oversupply through 2026.

Tomorrow Morning’s Practical Action Plan

So what do we do about all this? Here’s my thinking on practical steps based on conversations with risk management specialists and successful producers who’ve weathered previous downturns.

On the hedging front, if we get any bounce above $17.00 for Q1 2026 Class III, I’d seriously consider locking it in. Several commodity brokers I trust are recommending ratio spreads—selling two February $16 puts to buy one February $18 call, which limits your downside while maintaining upside potential. For feed, the consensus among grain merchandisers is to buy March corn under $4.40 and meal under $320 while you can.

Operationally, extension dairy specialists are unanimous: it’s time for aggressive culling. Penn State’s dairy management tools show that every marginal cow below 60 pounds per day is costing you money at these prices. Push breeding decisions to maximize beef-on-dairy premiums while they last—Superior Livestock Auction data shows those crossbred calves bringing $200 to $300 premiums.

Review every feed ingredient for substitution opportunities. University of Wisconsin research demonstrates that optimizing your grain mix can save $5 per ton without sacrificing production—that equals $50,000 annually for a 500-cow dairy. And here’s something many producers hesitate to do but really should: schedule that lender meeting now, before year-end financials force their hand.

Prepare cash flow projections showing survival through $16 milk—Farm Financial Standards Council guidelines suggest they need to see that you’ve faced reality. Several ag finance specialists recommend considering sale-leaseback arrangements on equipment to generate working capital before values drop further.

The 90-Day Reckoning: From November 12 market shock through February 10, every day counts. The red danger zone shows when critical decisions must occur. Operations that delay past December 15 face compromised options by January spring flush. Historical dairy downturns show: decisive action in days 1-90 determines survival probability. The clock started November 12.

The Bottom Line

You know, I’ve been through the 2009 crisis, the 2015-2016 downturn, and 2020’s volatility. What we’re seeing today isn’t just another cycle. Today’s 8-cent cheese collapse, combined with global oversupply data and production growth trends, confirms the U.S. dairy industry faces what could be a two-year margin squeeze.

Looking at the fundamentals—global markets oversupplied according to Rabobank’s latest dairy quarterly, domestic demand softening per USDA disappearance data, and production still growing at 3-4% annually—prices have further to fall before this corrects. The harsh reality, according to agricultural economists at several land-grant universities, is that we could see 5-10% of operations exit by the end of 2026.

Your December milk check has become more than a financial report—it’s a survival test. But here’s what’s encouraging from studying previous downturns: operations that adapt quickly, that make hard decisions now rather than hoping for recovery, those are the ones that emerge stronger. The question facing every producer tonight is simple but profound: will your operation be among the survivors?

What I’ve learned from 30 years of watching these cycles is that the difference between those who make it and those who don’t often comes down to acting decisively in moments like this. Tomorrow morning, when you’re doing chores, think about which camp you want to be in. Then act accordingly.

Key Takeaways

  • This isn’t a blip—it’s a reckoning: Today’s 8-cent cheese crash to $1.5525 with only one bid standing confirms we’re entering a 2-year margin squeeze. Class III hits $16.50 by January.
  • The world has turned against U.S. dairy: Europe’s 10 cents cheaper, Mexico’s pulling back, and our 4.2% production growth is flooding a shrinking market. Exports can’t save us this time.
  • Efficiency gaps will force consolidation: When Michigan averages 2,260 lbs/cow and you’re at 1,900, the math is fatal—every marginal cow costs you $15 daily at these prices.
  • Your banker already knows: Today’s CME report just flagged every dairy loan in America. Schedule that meeting now with realistic projections, not wishful thinking.
  • History’s lesson is clear: In 2009 and 2015, farms that acted decisively in the first 90 days survived. Those that waited for “normal” to return didn’t make it. Which will you be? 

Learn More:

The Sunday Read Dairy Professionals Don’t Skip.

Every week, thousands of producers, breeders, and industry insiders open Bullvine Weekly for genetics insights, market shifts, and profit strategies they won’t find anywhere else. One email. Five minutes. Smarter decisions all week.

NewsSubscribe
First
Last
Consent

This Isn’t Your Normal Dairy Downturn – Here’s Your 60-Day Action Plan

What current structural changes mean for dairy operations, plus proven strategies successful producers are using right now

EXECUTIVE SUMMARY: Wisconsin dairyman, 10:30 PM, spreadsheet still open: ‘These numbers can’t be right.’ They were. Five permanent shifts are reshaping dairy: China’s 36% import cut (they’re self-sufficient), $8 billion in plants needing milk regardless of demand, aging populations abandoning fluid milk, currency math you can’t beat, and $4,000 springers versus $2,800 cull cows. But here’s what’s working: organic premiums at $32/cwt, three-family partnerships each clearing $200K+, and component focus adding $820K yearly without expansion. The math is brutal but clear—if you’re within $2/cwt of breakeven, optimize hard. If you’re $3-5 away, something fundamental must change. Beyond $5? Every 60 days of waiting costs you serious equity. This weekend, run your real numbers and make the call.

Dairy Action Plan

Here’s something that stopped me cold last week. A Wisconsin dairyman called at 10:30 PM, spreadsheet still open on his computer. “I’ve run these numbers twelve different ways,” he said, managing 450 cows like his family has for generations. “They keep telling me the same thing, and I don’t like what I’m hearing.”

You know what? He’s not alone. I’ve had variations of that conversation with producers from Tulare to Lancaster County these past few weeks. Even down in Georgia and the Carolinas, where heat stress adds another layer of complexity, folks are wrestling with the same fundamental questions.

The latest FAO Dairy Price Index dropped again, for the fourth month straight, down 3.4% in October to 142.2 points. And the Global Dairy Trade auction keeps sliding, too. Six consecutive drops through November 4th. Whole milk powder’s sitting at $3,503 per tonne. Butter’s off 4.3%. Even cheddar dropped 6.6%, which caught a lot of us off guard.

But what’s really got me thinking is how different this feels from 2009, different from 2015. After talking with producers, looking at what’s happening globally, and honestly, lying awake at night thinking about my own operation, I’m convinced we’re seeing something more fundamental than just another price cycle.

China’s Not Coming Back (And We Built Everything Assuming They Would)

China’s self-sufficiency surge eliminated 36% of milk powder imports in just 5 years, wiping out demand that American dairy expansion plans were built around

So let’s have the conversation nobody wants to have. Remember five years ago when every dairy meeting, every expansion plan, every processing investment was built around Chinese import growth? Made sense at the time, right?

Well, here’s where we are now. China’s domestic production increased by 11 million metric tons between 2018 and 2023—that’s according to USDA’s latest Foreign Agricultural Service data. They’re hitting 85% self-sufficiency now. Up from 70% just five years back.

And their whole milk powder imports? Down from averaging 670,000 metric tons during 2018-2022 to about 430,000 tons in 2023. That’s not a blip, folks. That’s a 36% structural change that Rabobank and other analysts are calling permanent.

I’ve been talking with producers who built their entire business models around Chinese demand. One guy told me, “We retooled everything—bred for higher components, invested in new equipment, built our five-year plan around powder exports. Now what?”

What makes it worse—and I don’t think many people are connecting these dots yet—is the demographics. China’s birth rate fell from 12.43 per thousand in 2017 to 6.39 in 2023. That’s their National Bureau of Statistics, not speculation. Fewer babies means less formula. Aging population means less fluid milk, more medical nutrition products. It’s a completely different market.

These New Plants Need Milk, Whether the Market Wants It or Not

With $8-11 billion in new processing capacity carrying $24-30M annual fixed costs per plant, processors will pay premium prices to hit 85-90% utilization rather than explain idle capacity to their boards

Now, let’s talk about something that’s creating real pressure right now. Between 2023 and 2027, our industry’s building $8-11 billion in new processing capacity. I’ve walked through some of these facilities. They’re incredible. Leprino’s billion-dollar cheese plant in East Lubbock. Fairlife’s $650 million facility in Rochester. Great Lakes Cheese is putting over half a billion into Franklinville, New York.

What’s crucial here—and this is what keeps plant managers up at night—is that these facilities need to run at 85-90% capacity just to break even. CoBank’s analysis shows that clearly. Drop below 75%? You’re hemorrhaging money.

Think about it. A $300 million cheese plant carries maybe $25-30 million in annual fixed costs. Debt service, insurance, baseline staffing—those bills come due whether you’re running one shift or three.

What’s interesting here is what plant managers are telling me. When you’ve got $2 million in monthly debt payments, you’ll pay whatever premium it takes to keep milk coming in the door. Running at breakeven beats explaining to your board why the plant’s sitting idle. Kind of puts you between a rock and a hard place, doesn’t it?

So what happens? Plants keep bidding for milk to hit utilization targets. We see those premiums and keep producing. The oversupply continues. Prices stay low longer than anybody expects. It’s a cycle that feeds itself.

The University of Wisconsin’s dairy program has highlighted something crucial—most of this capacity was planned when we were seeing 1-2% annual production growth. Now we’re actually seeing slight declines. Somebody’s going to end up with very expensive, very empty stainless steel.

The Customer Base Is Aging Out (And Nobody Wants to Talk About It)

Youth aged 6-19 who drive bulk dairy consumption are shrinking from 18% to 13% of the population while low-consuming seniors 70+ explode from 6% to 17% by 2050—a customer base transformation few producers have factored into long-term planning

Here’s a demographic reality that caught me completely off guard. Two-thirds of the world’s population now lives in countries where birth rates are below replacement level. UN Population Division data, not opinion.

By 2050, people aged 70 and older will make up 11% of the global population. Today it’s 6%. By 2100? We’re looking at 17%. These aren’t people buying gallons for the kids anymore. They’re buying high-protein shakes, maybe some yogurt, portion-controlled products.

What really drives this home? Cornell’s extension folks have shared data showing that about 25% of all U.S. cheese consumption happens through pizza. Guess who’s eating that pizza? Mostly 6-to-19-year-olds. That age group is shrinking while the over-60 crowd—who eat maybe a slice a month—is exploding.

The analysis suggests the only real growth market for traditional dairy consumption is sub-Saharan Africa. And let’s be honest, that’s not exactly where we’re set up to compete.

What’s interesting is that we’re seeing different dynamics across regions. India’s consumption is still growing, but their production’s growing faster. The EU’s dealing with aging farmers, tighter environmental rules, and the same consolidation pressures we have. Out in the Mountain West, producers tell me water rights are becoming as valuable as the cows themselves. Up in the Pacific Northwest, organic operations are finding their niche markets getting crowded as more producers make the transition. Nobody’s immune to these shifts.

Currency Is Killing Us, And There’s Nothing We Can Do About It

Alright, let’s talk about something we have zero control over but affects everything—currency.

When New Zealand’s dollar weakens by 10%, their milk powder gets 10% cheaper for international buyers overnight. Doesn’t matter if you’re the most efficient producer in Wisconsin or Idaho. You can’t compete with currency math.

Argentina eliminated their dairy export taxes last year. Their peso’s weak. Production jumped 11% in just Q1 2025. Meanwhile, we’re looking at Chinese tariffs of 84% to 125% on various dairy products, plus a strong dollar that makes our stuff expensive before those tariffs even kick in.

The Europeans? Same game, different currency. Plus, they get government support we can only dream about.

I heard someone from the International Dairy Foods Association talking about “market diversification opportunities.” Come on. That’s just fancy talk for “our traditional customers found cheaper suppliers and we’re scrambling.”

The Heifer Shortage That’s Creating a One-Way Door

This situation with replacement heifers—man, this is brutal. We’ve been breeding beef-on-dairy pretty heavy, right? Made sense with those calf prices. But now, the dairy heifer inventory over 500 pounds is at its lowest since the 1970s. USDA says 3.914 million head.

You know what’s happening at auctions across Wisconsin? Recent sales show springers going for $3,000-3,500. Really nice ones are hitting $4,000. Meanwhile, cull cows are bringing $2,800-3,100 because beef prices are still strong.

As one producer put it to me: “I can ship my bottom 20% tomorrow for $2,800 each. But if I want to buy replacements next spring? That’s $3,500 minimum, probably four grand for anything decent. So either I shrink forever or I keep milking marginal cows and hope something changes.”

That’s the trap. Easy to exit—back the trailer up, load them out. But getting back in? Most guys can’t afford it. Used to be you could cull hard, rebuild when prices recovered. Not anymore.

Who’s Actually Making This Work (And how)

Three proven strategies generating $280K to $820K in additional annual income—component optimization, family partnerships, and organic premiums all deliver measurable results without adding a single cow

Despite all this doom and gloom, I’m seeing operations that are absolutely thriving. Their approaches are worth paying attention to.

There’s an organic operation in Lancaster County, Pennsylvania—about 280 cows, family-run. They transitioned five years ago. Yeah, it cost them around $150,000 and three years of lower production during transition. But they’re getting $32.69 per hundredweight through their organic cooperative right now, while their neighbors are looking at $19.50 per hundredweight for conventional.

The owner told me straight up: “We quit trying to compete with New Zealand on price. We’re selling to people who want to know the cows’ names and see our pastures on Instagram. Currency rates don’t matter when you’re selling a story.” The hardest part? Learning to market themselves, not just their milk. They had to become storytellers, photographers, social media managers—skills they never thought they’d need.

Here’s another interesting model. Three farm families in Wisconsin merged their operations a few years back. They were running 350, 400, and 425 cows separately. Combined everything into one 1,175-cow setup with robots. Took about eighteen months of planning, lots of lawyer fees, and some serious family meetings—including one that almost ended the whole thing over whose barn to use as headquarters.

But listen to this—they went from around $17.80 per hundredweight when operating separately to $16.20 when operating together. Each family’s clearing $200,000 to $250,000 now. One of the partners told me, “The Hardest part was giving up being my own boss. But the reality is, I took my first real vacation in fifteen years last month. My partners covered everything.”

What’s also working for some folks is getting laser-focused on components. Jim Ostrom at HighGround Dairy has been working with producers who’ve moved their income-over-feed-cost from $7.50 to $10 per cow per day. Just better rations, tighter fresh-cow management, and pushing butterfat when the premiums are there. That’s $820,000 more per year on 900 cows without adding a single animal.

Down in the Southeast, where summer heat stress can knock 15-20 pounds off daily production, I’m seeing producers invest in cooling systems that pay for themselves through maintained components even when volume drops. One Florida dairyman told me, “I stopped chasing gallons and started chasing butterfat. Changed everything.”

The Risk Management Tools We’re Not Using (But Should Be)

Here’s what drives me crazy. We’ve got better risk management tools than ever, but most of us—myself included—don’t use them properly.

Dairy Margin Coverage at that $9.50 tier? Farms that enrolled got close to $150,000 in payments last year. If you’re under 5 million pounds annually, it’s dirt cheap. But I talk to guys who won’t sign up because “it’s a government program.” Meanwhile, they’re losing two bucks a hundredweight and burning through equity that DMC would’ve protected.

Dairy Revenue Protection paid out over $500 million in 2023. Phil Plourd at Ever.Ag calls it subsidized insurance, and he’s right. You’re protecting your downside while keeping upside potential. But we still think of it as gambling rather than management.

And futures markets—Ohio State’s research shows it takes 6-9 months for margins to recover after a big shock. That means you need to be positioning that far out. Companies like StoneX offer programs tailored for smaller operations, but most of us wait until we’re already underwater before we consider them.

What I’ve noticed talking to bankers lately—they’re actually looking more favorably at operations with risk management in place. As one lender put it, “I’d rather finance someone with DMC and DRP than someone with 200 more cows.” Several banks are even offering slightly better rates to operations that demonstrate comprehensive risk management. Makes sense when you think about it—they’re protecting their loans too.

KEY NUMBERS TO TRACK

  • Your true break-even cost (including family living)
  • Debt-to-asset ratio compared to last year
  • Working capital months at current burn rate
  • Income-over-feed-cost daily average
  • Cull cow value vs. replacement cost spread

Decisions You Need to Make in the Next 60 Days

Three distinct pathways based on your true breakeven gap—within $2/cwt means optimize through it, $3-5/cwt demands fundamental transformation, beyond $5/cwt requires hard conversations before equity evaporates in the next 60-90 days

Let’s get practical here. If you’re sitting there wondering what to actually do, here’s what I’m seeing for the next couple of months.

Cull cow prices right now—November 2025—are running $2.00 to $2.24 per pound. Good fleshy cow weighing 1,400 pounds? That’s $2,800 to $3,100. But here’s what’s worth considering. Historical patterns suggest—and this is just based on past cycles—these could drop 15-25% by February if Brazilian beef tariffs change or everybody starts culling at once.

A producer recently ran this math for me. His bottom 40 cows shipped now generate $112,000. Wait until February, if prices drop to $1.70? That’s $95,200. The $16,800 difference might be the difference between making it and not making it.

But you’ve got to know your real breakeven. Not the one you tell the neighbors. The real one. With family living, debt service, and all that maintenance you’ve been putting off.

Three Paths Forward (Based on Where You Really Stand)

After all these conversations, here’s the framework I’m using:

If you’re within $2 of breakeven: You can optimize through this. Cull hard, focus on components, tighten everything up. Markets will give you room eventually.

If you’re $3-5 away from breakeven: Something fundamental has to change. Maybe that’s finding partners, maybe it’s transitioning to a premium market, maybe it’s restructuring debt. But status quo ain’t gonna cut it.

If you’re more than $5 from breakeven: Time for the hard conversation. And I mean really hard. But saving $400,000 in equity beats losing everything in six months.

Where This Is All Heading

Look, I don’t have a crystal ball. But if current consolidation trends continue—and we lost 39% of dairy farms between 2017 and 2022—we could potentially see another significant reduction by 2030.

What’s emerging are three models that seem to work: The 5,000-plus-cow operations that run like factories. The 50-to-300-cow premium operations selling stories and values. And these multi-family partnerships running 800-2,000 cows together.

Is that traditional 300-to-600-cow family dairy competing on commodity milk? That’s getting harder and harder to pencil out. Not because those folks aren’t working hard—they’re working harder than ever. The economics just aren’t there anymore.

Though the reality is, there’s always room for creative thinking. I’ve heard about young producers buying smaller dairies at auction, converting to specialty genetics like A2, and selling everything at a premium to regional processors. They’re not getting rich, but they’re making it work through pure creativity and willingness to adapt.

The Bottom Line

The conversation that matters most is the one you have with yourself and your family about where you really stand. I’ve talked to too many people who waited six months hoping things would improve, only to watch significant equity disappear.

This weekend, run your real numbers. All of them. Family living, debt service, everything. Compare that to realistic milk prices, not wishful thinking.

Then have the conversation those numbers demand. With your spouse, your kids, your banker, potential partners—whoever needs to be part of it. Because the difference between choosing your path and having it chosen for you is usually about 90 days and a whole lot of family wealth.

These structural shifts—China going self-sufficient, too much processing capacity, aging populations, currency games, heifer shortages—they’re not going away. The industry that emerges from this won’t look like the one we grew up in.

But here’s what I know after decades of watching this industry evolve. The operations that’ll thrive in 2030 won’t necessarily be the biggest or have the most capital. They’ll be the ones that saw reality clearly, made hard decisions early, and adapted to what is rather than wishing for what was.

We’re all in this together, navigating waters none of us have seen before. The data’s telling us something important. Question is, are we ready to listen? And more importantly, are we ready to act on what we’re hearing?

Remember, every crisis creates opportunity for those willing to see it and seize it. This one’s no different. The dairy farmers who make it through this will be stronger, smarter, and more resilient than ever.

KEY TAKEAWAYS:

  • This downturn breaks all the rules: Five permanent forces (China self-sufficient, plants needing milk, customers aging, currency killing us, heifers gone) mean waiting for “normal” is a losing strategy
  • The $16,800 decision can’t wait: Culling 40 cows today nets $112,000. By February? Maybe $95,200. That difference could determine whether you’re still farming in 2026
  • Three strategies actually work: Get premium prices like that $32/cwt organic farm, share costs like those Wisconsin partners each banking $200K+, or maximize components for $820K more without adding cows
  • Your breakeven tells you everything: Less than $2/cwt away? You’ll make it with adjustments. $3-5 gap? Time for radical change. Over $5? Every month you wait costs serious family wealth
  • The survivors aren’t the biggest—they’re the ones deciding NOW: This weekend, calculate your true all-in costs, pick your path, and act. The difference between choosing and being forced is about 90 days

Complete references and supporting documentation are available upon request by contacting the editorial team at editor@thebullvine.com.

Learn More:

The Sunday Read Dairy Professionals Don’t Skip.

Every week, thousands of producers, breeders, and industry insiders open Bullvine Weekly for genetics insights, market shifts, and profit strategies they won’t find anywhere else. One email. Five minutes. Smarter decisions all week.
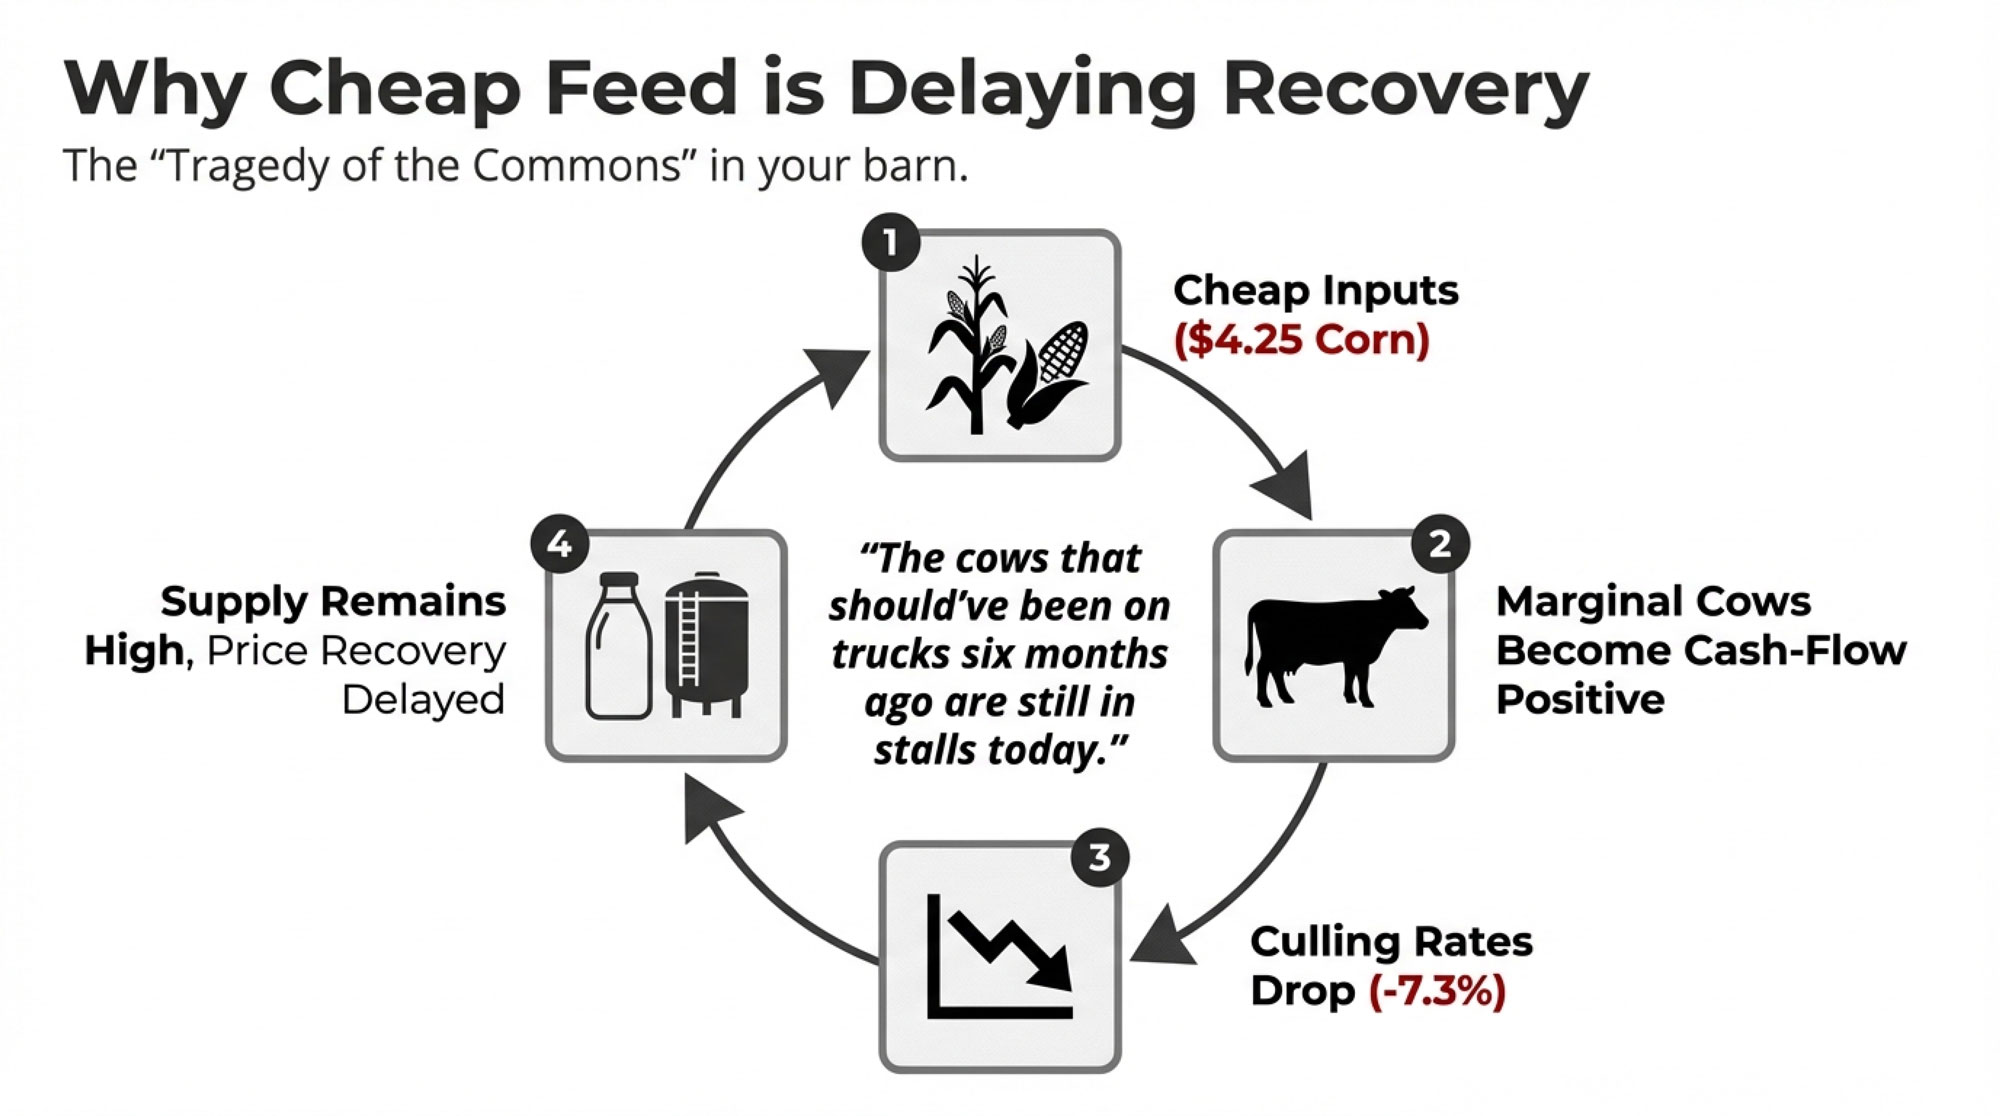
NewsSubscribe
First
Last
Consent

China’s 500,000-Cow Farms and Lab-Grown Milk: Your Dairy’s 18-Month Decision Window

Your grandfather milked 50. You milk 500. China milks 500,000. This ends one of three ways.

Having spent the better part of two decades analyzing dairy production trends, I can tell you that what we’re witnessing today represents a fundamental shift in how milk is produced globally. The International Farm Comparison Network’s latest 2024 data reveals something remarkable: five of the world’s ten largest dairy operations are now Chinese-owned. Modern Dairy, for instance, manages nearly half a million cows across 47 farms—a scale that would have been unimaginable just a generation ago.

What’s particularly noteworthy is Almarai’s achievement in Saudi Arabia. They’re consistently hitting 14 tonnes of milk per cow annually in desert conditions where summer temperatures routinely exceed 50°C. That level of production in such challenging conditions offers valuable lessons for operations everywhere, from California’s Central Valley to the arid regions of Arizona and even parts of Texas experiencing increasing drought pressure.

This transformation comes at a time when mid-sized dairy operations across North America are evaluating their strategic options. The conversations happening at farm meetings and extension workshops reflect genuine uncertainty about the path forward. Should an 800-cow operation expand to 2,500? Can family farms find sustainable niches in this changing landscape? These aren’t abstract questions—they’re daily realities for thousands of producers.

The Geographic Realignment of Global Dairy Production

Looking at this trend, what strikes me most is how quickly the center of gravity has shifted eastward. The 2024 data from IFCN paints a clear picture: China’s five largest operations—Modern Dairy with 472,480 cows, China Shengmu with 256,650, Yili Youran with 246,000, and Huishan with 200,000—represent impressive numbers. They reflect a deliberate national strategy.

Dr. Jiaqi Wang at the Chinese Academy of Agricultural Sciences provides important context here. Following the 2008 melamine incident that affected hundreds of thousands of infants, Chinese dairy companies fundamentally restructured their approach to prioritize supply chain control. This builds on what we’ve seen in other industries where food safety crises prompted systemic changes.

MetricChina EliteChina AvgUS MidwestUS Mega
Herd Size472k (Modern)8k-15k1k-5k10k-30k
Yield/Cow (t)9.5-12.09.611.0-13.011.8-13.4
Feed Conv Ratio1.4:11.6:11.5:11.4:1
Self-Suffic85% (170%)73%100%100%
Tech Invest LvlVery HighHighModerateVery High

China’s agricultural policy documents outline ambitious targets: achieving 70% milk self-sufficiency by 2030, with intermediate goals potentially pushing toward 75-85% over time. They’re also targeting annual yields exceeding 10 tonnes per cow—a significant leap from current averages. This aligns with their broader strategy of reducing import dependence across agricultural commodities.

Why does this matter for North American and European producers? Well, the USDA Foreign Agricultural Service reports that China’s dairy imports have exceeded $10 billion annually in recent years. As Rabobank’s 2024 quarterly analysis shows, China added 11 million metric tons of production between 2018 and 2023, already displacing approximately 240,000 tonnes of whole milk powder imports. For regions that have counted on Chinese demand as a growth driver—particularly New Zealand and Australia—this represents a significant market shift requiring strategic recalibration.

Understanding Productivity Variations Across Mega-Dairies

Desert dairy operation in Saudi Arabia achieves 82% higher productivity than China’s largest farm despite having 6x fewer cows—proving management beats scale in global dairy competition

One of the most intriguing findings from analyzing global mega-dairy performance is the substantial productivity variation even among the largest operations. Consider the range based on 2024-2025 company data: Almarai achieves 14.00 tonnes per cow annually; Rockview Dairies in California produces 11.80 tonnes; Modern Dairy in China averages 9.53 tonnes; and Huishan manages 7.70 tonnes.

This 82% productivity gap between the highest and lowest performers—both operating at massive scale with significant capital resources—challenges assumptions that scale automatically drives efficiency. What accounts for these differences?

Anthony King, who oversees operations at Almarai’s Al Badiah facility, shared insights at the International Dairy Federation’s 2024 World Dairy Summit about their management approach. The attention to detail is extraordinary: maintaining barn temperatures at 21-23°C year-round despite extreme external heat, providing 300 liters of water per cow daily, and implementing precision feeding protocols that optimize every nutritional variable.

The USDA Economic Research Service’s comprehensive 2023 analyses (their most recent full report) support what many progressive producers have long suspected: management sophistication and technological integration matter more than scale alone. Well-managed 500-cow operations implementing advanced protocols often outperform poorly-managed facilities ten times their size.

In Idaho, a 600-cow dairy was achieving 13,000 kilograms per cow through exceptional management, while a nearby 5,000-cow facility struggled to reach 11,000 kilograms. The difference? Attention to transition cow management, consistent fresh cow protocols, and meticulous record-keeping at the smaller operation.

The Economics Driving Industry Consolidation

The relentless math of consolidation: Smaller operations face $9.77/cwt higher costs than mega-dairies, translating to nearly $1 million in annual structural disadvantages for 1,000-cow farms that excellent management cannot overcome

What farmers are finding is that consolidation isn’t really about wanting to get bigger—it’s about the relentless mathematics of fixed costs. USDA’s 2024 cost of production data reveals the economics clearly: operations with 2,000+ cows average $23.06 per hundredweight in total costs, while farms with 100-199 cows face costs of $32.83—a difference of $9.77 per hundredweight.

What’s revealing here is the breakdown. The University of Wisconsin’s Center for Dairy Profitability research, led by Dr. Mark Stephenson, indicates that feed cost differences account for only about $2.50 of that gap. The remaining differential? It stems from spreading fixed infrastructure investments across production volume.

As Dr. Stephenson articulated in his January 2024 market outlook presentation: when fixed costs exceed variable costs in a commodity market, smaller operations face structural disadvantages regardless of management quality. For a representative 1,000-cow Upper Midwest operation producing 23 million pounds annually, this translates to $690,000 to $920,000 in additional costs compared to larger competitors—often exceeding total profit margins.

This economic reality helps explain why we’re seeing continued consolidation despite many producers’ preference for maintaining traditional farm sizes. The economics are pushing the industry in one direction, even as community ties, lifestyle preferences, and succession-planning challenges pull it in another.

Technology Adoption: Promise and Complexity

This development suggests that technology alone won’t solve dairy’s challenges—it’s how that technology is managed that matters. Beijing SanYuan exemplifies what’s possible, achieving 11,500+ kg per cow annually—matching Israel’s national average—through systematic adoption of Israeli dairy management systems since 2001, according to their published operational data.

But here’s the challenge. Professor Li Shengli at China Agricultural University identifies a critical constraint in his 2024 research published in the Journal of Dairy Science China: human capital. Chinese Ministry of Human Resources data from 2024 indicates that only about 7% of the country’s 200 million skilled workers possess the high-level capabilities needed to manage complex dairy systems effectively.

This creates an interesting paradox we see globally. Operations with capital for advanced technology often lack the expertise to optimize it, while highly skilled managers at smaller operations can’t access these tools. I know a manager in Pennsylvania running 600 cows who could likely double productivity with access to advanced monitoring systems and automated feeding technology. Meanwhile, I’ve toured 5,000-cow facilities with million-dollar technology packages operating well below potential due to management constraints.

Environmental Management: Challenges and Opportunities

The environmental dimension presents both challenges and unexpected opportunities—and it’s more nuanced than many discussions suggest. EPA calculations show that a 2,000-cow operation generates approximately 87.6 million pounds of manure annually—that’s 240,000 pounds daily, which require sophisticated management.

The World Resources Institute’s 2024 analysis highlights how scale affects these choices. Larger operations typically implement liquid storage systems for operational efficiency, but these generate substantially more methane than the daily-spread approaches common on smaller farms. This creates environmental trade-offs worth considering.

What’s encouraging is that at sufficient scale—typically around 5,000+ cows based on current feasibility analyses—biogas digesters become economically viable. These systems, which require investments of $2-5 million, can generate 5 million cubic meters of biogas annually. Youran Dairy in China operates nine such facilities, each producing approximately this volume according to their 2024 sustainability reports.

These operations are transforming waste management from a cost center into revenue through electricity generation, fertilizer sales, and carbon credit programs. The capital requirements mean this solution remains out of reach for most mid-sized operations, though, creating another scale-dependent advantage.

It’s worth noting explicitly that while larger farms may achieve better emissions intensity per unit of milk produced, smaller farms often have lower absolute emissions overall—a nuance that deserves more attention in environmental policy discussions. A 200-cow grass-based operation in Vermont creates different environmental impacts than a 10,000-cow facility in New Mexico, even if the per-gallon metrics favor the larger operation.

Strategic Options for Mid-Sized Operations

Three survival strategies for operations caught between mega-dairy economics and precision fermentation disruption—with Strategic Exit preserving 85-90% equity versus 20-30% in forced liquidation after prolonged losses

For the 500-2,000 cow operations that form the backbone of American dairy, three strategic paths show promise based on extension research and producer experiences:

Strategic Options for the Mid-Sized Dairy

PathPotential BenefitTimeline / Requirement
Cooperative Premium8-12% price advantage ($200k-$300k/yr for 1,000 cows)Requires strong co-op selection & management
Value-Added Path36-150% margin improvement (cheese, yogurt, direct sales)5-7 year development; high marketing & business skill
Strategic ExitPreserve 85-90% of farm equityRequires proactive timing before major losses

Maximizing Cooperative Benefits

Cornell’s Dyson School research from 2023, led by agricultural economist Dr. Andrew Novakovic, demonstrates that well-managed cooperatives deliver 8-12% price premiums through collective bargaining compared to independent sales to investor-owned processors. For a 1,000-cow operation, this represents $200,000 to $300,000 in additional annual revenue.

The key lies in cooperative selection. Strong downstream market positioning and professional management make the difference. Cornell’s pricing analysis found some underperforming cooperatives actually paying 3.5% less than investor-owned processors, underscoring the importance of due diligence.

Value-Added Diversification

European research examining 265 dairy farm diversification efforts, published in the Agricultural Systems journal, found compelling margins: cheese production generated €0.688 per liter more than fluid milk, while yogurt generated €1.518 more. Direct sales improved margins by an average of 36%.

These numbers look attractive, but Ireland’s Nuffield scholarship research from Tom Dinneen provides important context: approximately 95% of dairy farmers lack the marketing and business skills needed for successful value-added transitions. The typical path to profitability takes 5-7 years—requiring substantial patience and capital reserves.

Strategic Transition Planning

A Wisconsin dairy case study: Strategic exit today preserves $765k versus $255k after forced liquidation—that’s $510,000 destroyed by waiting for market conditions that won’t improve for mid-sized operations

Wisconsin Extension’s 2024 farm financial analyses, compiled by agricultural economist Dr. Paul Mitchell, reveal the importance of timing. Producers making strategic exit decisions while maintaining strong equity positions typically preserve 85-90% of their farm’s value. Waiting 12-18 months reduces this to 70-80%. Those forced to exit after several years of losses might retain only 20-30% of their equity.

Extension specialists share examples of successful transitions. One documented case from southern Wisconsin involved a producer with $850,000 in equity who transitioned strategically, preserving over $700,000 for retirement and new ventures. These aren’t failure stories—they’re examples of astute business management in changing markets.

The Precision Fermentation Revolution

With $840 million invested in 2024 and price parity projected for 2027-2028, precision fermentation threatens to capture 25% of commodity dairy protein markets by 2035—while you’re planning 20-30 year infrastructure investments

While consolidation reshapes current production, precision fermentation represents a potentially transformative disruption. The Good Food Institute’s 2025 market analysis tracks growth from $5.02 billion currently toward projected valuations of $36.31 billion by 2030—representing 48.6% annual growth.

Companies like Perfect Day already produce commercial-scale whey and casein proteins identical to dairy-derived versions. Consumers are purchasing products containing these proteins—Brave Robot ice cream, California Performance Co. protein powders, and even Nestlé’s new plant-based cheese line using precision fermentation proteins—often without realizing the proteins come from fermentation rather than cows.

Investment tracking from PitchBook and Crunchbase shows over $840 million from major investors, including Bill Gates’ Breakthrough Energy Ventures, flowing into these technologies, with $50+ billion projected across the sector by 2030. Cost curves suggest price parity with conventional dairy proteins by 2027-2028, potentially capturing 25% of commodity protein markets by 2035.

This doesn’t spell immediate doom for traditional dairy, but when you’re planning infrastructure investments with 20-30 year depreciation schedules, these technology trends deserve serious evaluation. I’ve noticed that younger producers are particularly attuned to these disruption risks when making expansion decisions.

International Regulatory Pressures

European developments offer insights into potential regulatory futures—and they’re moving faster than many realize. The EU’s Farm to Fork Strategy targets 25% organic production by 2030, while nitrate directives and evolving welfare requirements fundamentally alter production economics.

The Netherlands allocated €25 billion for livestock farm buyouts near environmentally sensitive areas—a scale of intervention that would have seemed impossible just years ago. German regulations now require specific space allocations (6 square meters indoor plus 4.5 square meters outdoor per cow) for certain certifications, fundamentally changing the economics of the confinement system.

These aren’t just European issues. Similar discussions around environmental impact, animal welfare, and production intensity are emerging across North America. California’s evolving regulations often preview broader U.S. trends. Whether through regulation or market pressure, these factors will likely influence future production systems globally.

Envisioning 2035: A Transformed Industry

Based on IFCN projections, FAO’s 2024 agricultural outlook, and technology trends, the 2035 dairy landscape will likely differ dramatically from today. Current projections suggest that approximately 40% of global production will come from 300-500 industrial mega-dairies, concentrated in the U.S., China, and the Middle East. Another 35% would come from South Asian smallholders—primarily the millions of households in India and Pakistan that maintain 2-5 animals. Precision fermentation might capture 25% of commodity protein production, with less than 5% from premium niche operations serving specialty markets.

The “missing middle”—operations between 500-2,000 cows—faces the greatest pressure in this scenario, unable to achieve mega-dairy economies or premium market positioning. This isn’t predetermined, but current trends point strongly in this direction.

Practical Considerations for Today’s Decisions

Looking at all this data and these trends, what should producers consider?

For operations under 500 cows, differentiation becomes essential. Whether through premium market positioning, exceptional management within strong cooperatives, or direct marketing, competing in commodity markets against mega-dairies appears increasingly challenging. I’ve seen success with A2 milk premiums (30-50% price advantage), grass-fed certification (40-60% premiums), and local brand development—but each requires commitment beyond production alone.

Operations in the 500-2,000 cow range face time-sensitive decisions. The window for strategic transitions that preserve equity is narrowing—probably 12-18 months based on current market dynamics. Waiting for ideal conditions that may never materialize risks substantial equity erosion.

Those considering expansion should carefully evaluate whether achieving a 2,500+ cow scale is realistic given capital and management resources. Partial expansions that don’t achieve efficient scale often compound problems rather than solving them. I’ve watched too many 1,500-cow expansions create more debt without solving the fundamental economic problems.

Everyone should monitor precision fermentation developments. This technology will impact commodity markets within the decade, requiring strategic adaptation across the industry.

Key Takeaways 

  • The 82% productivity gap proves scale doesn’t guarantee success: Saudi Arabia’s desert dairies outperform China’s mega-farms—it’s management and technology integration, not cow count, that wins
  • Mid-sized farms (500-2,000 cows) have three options, not four: Scale to 2,500+, find a $300K premium niche, or exit strategically—”staying the course” is slow-motion bankruptcy
  • Your equity has an expiration date: Exit now, preserving 85%, wait 18 months for 70%, or lose 60-80% fighting the inevitable—the clock started when you opened this article
  • Lab-grown milk isn’t a future threat—it’s a current reality: $840M invested, identical proteins in stores now, price parity by 2027—plan infrastructure accordingly
  • Winners already chose their lane: 300 mega-dairies will dominate commodities, 2,000 niche farms will own premiums, everyone else disappears—which are you?

EXECUTIVE SUMMARY: 

  • China’s Modern Dairy runs 472,480 cows, while Silicon Valley grows identical milk proteins without cows—your 800-cow operation is caught between these extremes. Mid-sized farms (500-2,000 cows) now face $9.77/cwt cost disadvantages that excellent management cannot overcome, translating to nearly $1 million in annual structural penalties. Three proven escape routes remain: joining strong cooperatives for immediate 8-12% premiums, developing value-added products for 36-150% margin improvements, or executing strategic exits that preserve 85% of equity versus 20% after prolonged losses. With precision fermentation achieving price parity by 2027 and China eliminating import markets, the decision window has narrowed to 18 months. The industry will split into 300 mega-dairies, 2,000 premium niche operations, and precision fermentation facilities—the 15,000 farms in between will vanish.

Complete references and supporting documentation are available upon request by contacting the editorial team at editor@thebullvine.com.

Learn More:

The Sunday Read Dairy Professionals Don’t Skip.

Every week, thousands of producers, breeders, and industry insiders open Bullvine Weekly for genetics insights, market shifts, and profit strategies they won’t find anywhere else. One email. Five minutes. Smarter decisions all week.
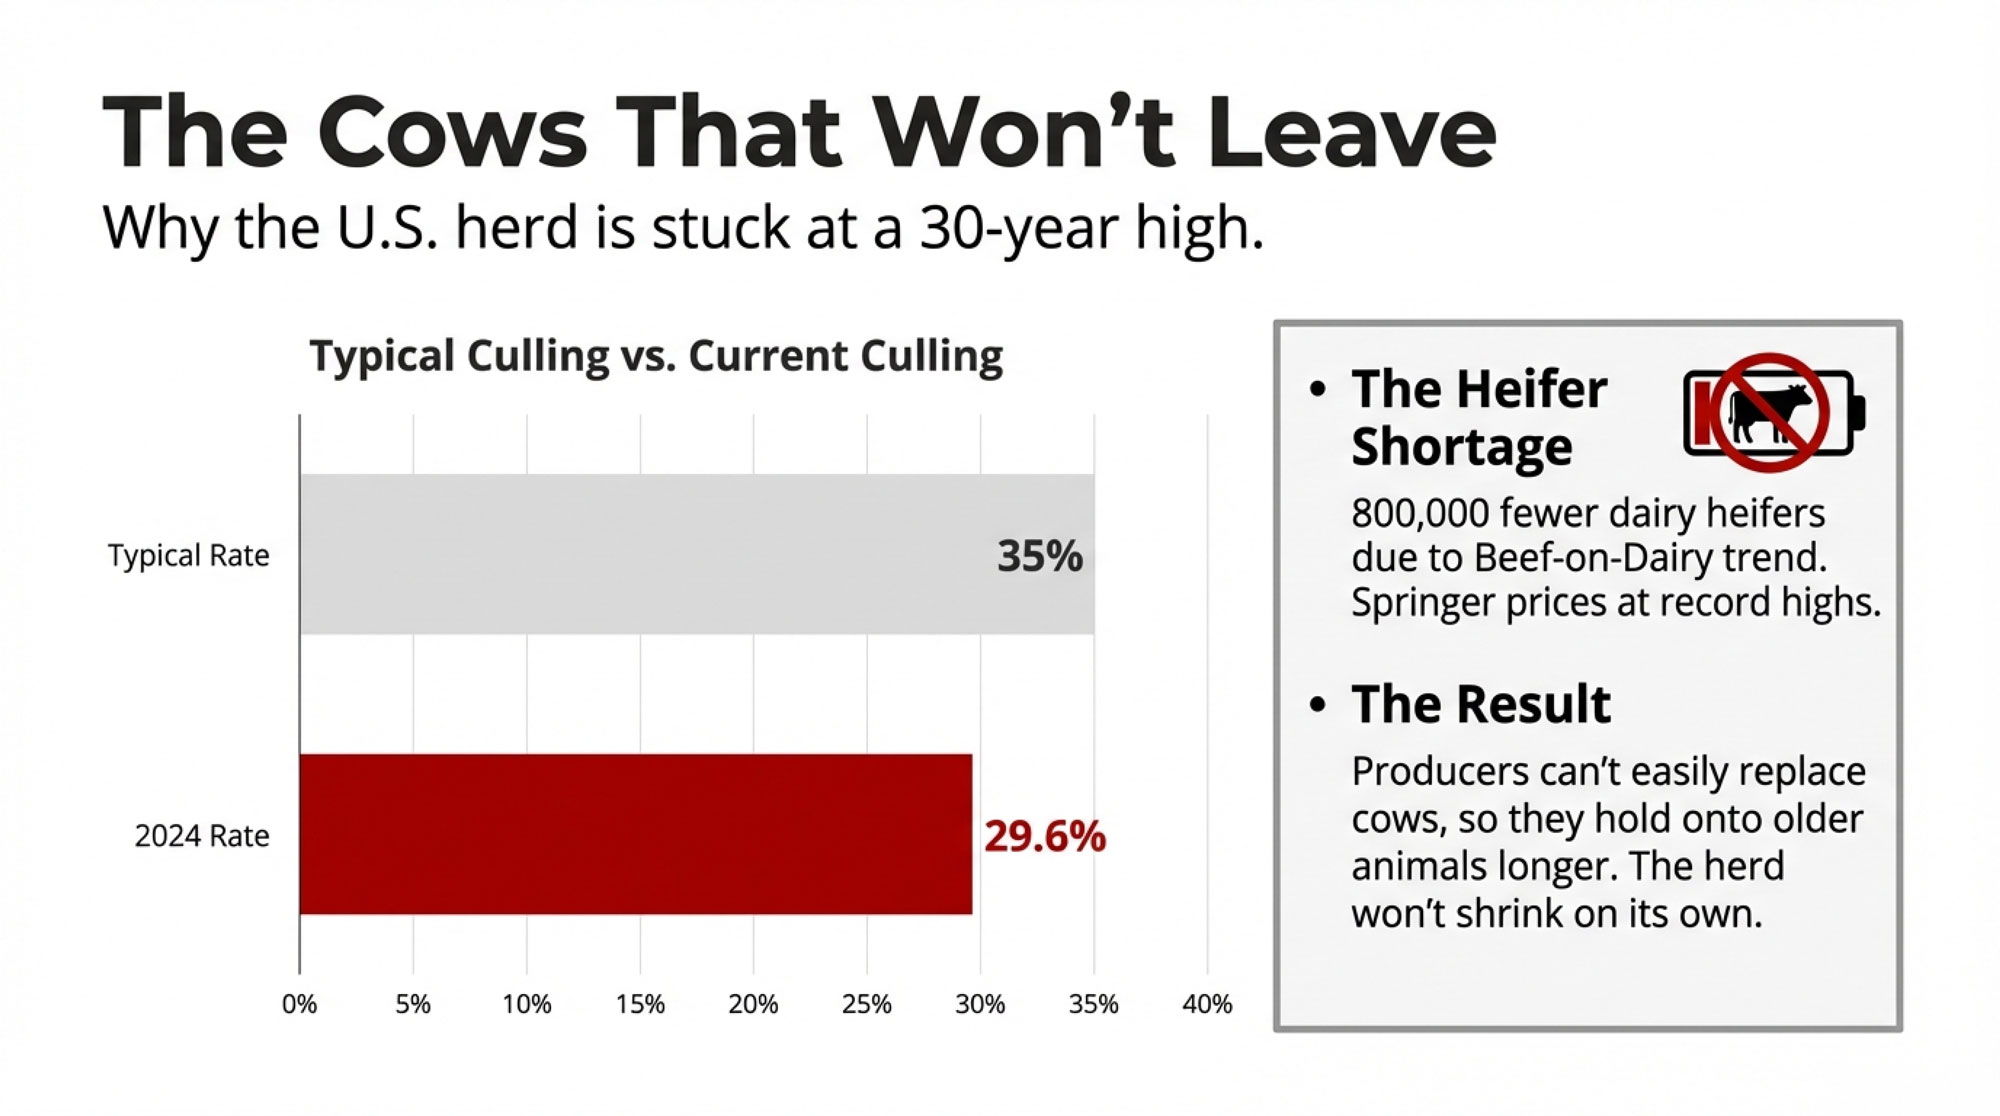
NewsSubscribe
First
Last
Consent

Cheddar’s Record 6.6% Crash Exposes Dairy’s Broken Recovery Plan: 90 Days to Act

I felt sick watching today’s GDT results. Not the WMP decline—the 6.6% cheddar crash. That was supposed to be our safety net. Now what?

EXECUTIVE SUMMARY: The November 4 GDT auction revealed the harsh truth: cheddar’s record 6.6% crash signals that dairy’s Plan B—pivoting from powder to cheese—has failed spectacularly. China won’t rescue us; they’re now 85% self-sufficient, with 40% fewer babies needing formula. The math is unforgiving: typical 500-cow operations are burning $101,000 per month, with 20 months of equity facing a 24-30-month downturn. CME futures at $16, versus USDA’s fantasy $19 forecast, show who’s been paying attention. Three paths remain viable: premium markets (requires location and a $400K investment), massive scale (minimum 2,000 cows), or a strategic exit before equity evaporates. Bottom line: decisions made in the next 90 days determine who survives 2027.

Dairy Market Strategy

So here we are again, checking those GDT results from November 4, 2025, and honestly, I felt that familiar knot in my stomach watching Whole Milk Powder drop another 2.7%. That’s six straight declines since early August, according to the latest GDT data. But here’s what really caught my attention—and I think this is what we all need to be talking about—cheddar cheese absolutely tanked, down 6.6% to $3,864 per metric ton. That’s the biggest single-category drop we’ve seen in recent memory, and it changes everything we thought we knew about where this market’s headed.

You know, I’ve been watching these markets for over two decades now, and what’s happening today feels fundamentally different. It’s not just China backing away from powder imports (though that’s huge), or these productivity gains that keep milk flowing despite terrible economics, or even CME Class III futures sitting $2.50 to $3.00 below what USDA keeps telling us we’ll get. It’s all of it together. And if you’re still running your operation like this, is just another down cycle… well, we need to talk.

The November 4 GDT auction delivered a devastating 6.6% cheddar crash—the largest single-category drop in recent memory—confirming that dairy’s Plan B (pivoting from powder to cheese) has failed spectacularly

Quick Market Reality Check

Key Numbers from November 4:

  • GDT Index: Down 2.4% to 1,135 (lowest since August)
  • Whole Milk Powder: -2.7% to $3,503/MT
  • Cheddar: -6.6% to $3,864/MT (largest single decline)
  • Butter: -4.3% to $5,533/MT
  • Winners: Only mozzarella (+1.6%) and buttermilk powder (+1.0%)

What Makes This Time Different

Looking at those November 4 numbers more closely, the overall GDT Price Index fell 2.4% to 1,135—that’s our lowest point since August, based on the Event 391 summary. Since that tiny 1.1% bump we got back on July 15, it’s been pretty much straight down. Reminds me of 2015-16, except… well, except for everything else that’s different this time around.

Here’s the breakdown that matters: Whole Milk Powder hit $3,503 per metric ton. Skim milk powder? Flat. Butter dropped 4.3% to $5,533. But that cheddar number—down 6.6%—that’s what keeps me up at night. See, cheese was supposed to be our safety valve, right? The product that would soak up all that displaced WMP demand as China shifts gears. When your backup plan crashes harder than your original problem… that’s when you know you’re in trouble.

The only bright spots were mozzarella (up 1.6%) and buttermilk powder (up 1.0%). But let’s be real here—those are niche products. They can’t carry the weight that WMP used to handle.

I was talking with a Wisconsin producer last week—a third-generation operation with about 280 cows—and he put it perfectly: “I’ve never seen such a gap between what the government says and what my milk check actually shows.” USDA’s forecasting $19 milk, but his co-op’s already warning members to budget for $16 through spring. That’s a massive difference when you’re trying to plan feed purchases or, heaven forbid, thinking about expansion.

CME Class III futures trade $2.50-$3.00 per hundredweight below USDA’s optimistic $19.10 forecast—a reality gap that represents $1.25-1.5 million in lost revenue expectations for a typical 500-cow operation over 24 months, and proof that markets saw this crash coming while bureaucrats kept pushing rosy scenarios

Out in California, the larger operations—we’re talking 1,800 cows and up—are seeing processors cut quality premiums in half. Used to be you’d get 40 cents extra for really low somatic cell counts. Now? Twenty cents if you’re lucky. Every penny counts when margins are this tight.

Meanwhile, in the Northeast, smaller operations are feeling it differently. A Vermont producer with 120 cows told me their processor just extended payment terms from 15 to 30 days. That’s an extra full pay period of float you have to cover. These little changes add up fast.

The China Reality We Need to Accept

China achieved 85% dairy self-sufficiency by 2025 while infant formula imports crashed 35% from their 2019 peak—a permanent structural shift driven by plummeting birth rates (down 40%) and massive domestic production investment that’s fundamentally rewriting global dairy trade dynamics

Alright, let’s address the elephant in the room: China isn’t coming back to buy powder the way they used to. Period.

According to the USDA’s Foreign Agricultural Service report from May 2025, China successfully boosted their domestic milk production by 10 million metric tons between 2018 and 2025. They actually hit their target two years early. Think about that—they went from 70% self-sufficient to about 85%. And here’s what really matters: their economy grew 5% in the first half of 2025 according to Chinese government statistics, yet powder imports stayed flat. Economic recovery isn’t bringing back that demand.

The demographics make it even more permanent. China’s Statistics Bureau shows the birth rate dropped from 10.48% in 2019 to 6.39% in 2023. The number of kids aged 0-3—your core infant formula market—fell from 47.2 million to 28.2 million. That’s not a temporary dip, folks. That’s a 40% structural reduction in the exact demographic that drives WMP consumption.

Industry contacts at the major export companies tell me they’ve basically written off any return to 2021-22 WMP levels. Everyone’s pivoting to cheese and butter production, which sounds great until you realize… yeah, everyone’s doing exactly that. Hence, the cheese price crash we just witnessed.

How Smart Operators Are Adapting Right Now

What I’m seeing from the operations that are navigating this successfully is that they’re not waiting around, hoping for a miracle. They’re making hard decisions today while they still have options.

The Culling Math Nobody Wants to Do (But should)

With beef prices around $145 per hundredweight—USDA Agricultural Marketing Service confirmed this in late October—the economics of culling have completely shifted. Let me walk you through the actual numbers here.

Say you’re running 500 cows. Your bottom 20%—that’s 100 head—are probably giving you about 55 pounds a day, while your top girls are at 75 pounds. At $16.50 milk, those bottom cows generate roughly $2,768 in annual revenue. But here’s the kicker: they’re costing you at least $4,200 in feed, labor, vet work, and utilities. You’re losing $1,432 per cow per year just keeping them around.

Now, if you ship those 100 cows at an average of 1,400 pounds and $145 per hundred, that’s $203,000 cash in hand. Real money you can use today.

I know several Idaho operations that pulled the trigger on this in September. They culled their bottom 15%, used half the money to pay down debt, and half to upgrade their feed systems. What’s interesting is that their remaining cows are actually producing more total pounds now. Better feed efficiency, less competition at the bunk—sometimes less really is more.

Getting Smart About Feed Costs

December corn futures are around $4.10 per bushel, and soybean meal is at $274.50 per ton, based on CME data from early November. That’s actually manageable—if you lock it in now. University of Wisconsin calculations show income-over-feed margins at about $7.80 per hundredweight. Barely breakeven for good operations, but it’s workable if you’re on top of things.

The regional differences are huge, though. Texas producers with local grain access are doing okay. But if you’re in the Upper Midwest, dealing with basis issues and trucking costs? That’s a different story. Nutritionists I work with tell me operations keeping milk-to-feed ratios above 2.35 are surviving. Below that? They’re hemorrhaging cash.

And California… don’t get me started. Between water issues and hay prices that swing $50 a ton depending on the week, feed costs can vary $2-3 per hundredweight just based on timing. Feed dealers in the Central Valley tell me they’ve never seen such demand for almond hulls and other byproducts—everyone’s scrambling to cut costs wherever possible.

Southeast operations have their own challenges. With the costs of humidity- and heat-stress management, they’re spending an extra $1.50-2.00 per hundredweight just on cooling compared to northern states. A Georgia producer with 600 cows said his electric bill alone runs $8,000 per month in summer.

The Timeline Nobody Wants to Hear (But Needs To)

CME Class III futures paint a pretty clear picture if you’re willing to look. November 2025 contracts at $16.17, December at $16.39, and the first quarter of 2026 at an average of just $16.35, according to daily settlements. Meanwhile, USDA keeps saying we’ll average $19.10 for 2025. That $2.50 to $3.00 gap? That’s the market telling you the government’s being way too optimistic.

I lived through the 2015-16 crisis, and it took about 15-18 months — from peak oversupply to decent prices again — according to USDA historical data. But we had some natural circuit breakers then that we don’t have now:

China came back once they worked through inventory—Rabobank documented this in their 2016 reports. La Niña hit and naturally reduced New Zealand’s production. We had various government programs that provided at least some relief.

This time? New Zealand just reported milk collection in August 2025 at 1.68 billion liters, up 14.6% from last year, according to the Dairy Companies Association. U.S. production is up 1.6% despite everything, per the USDA’s latest report. And the weather’s been perfect for grass growth pretty much everywhere. No natural brakes this time around.

The Productivity Problem That’s Breaking Everything

Here’s something that should blow your mind: According to data compiled by Cornell’s dairy economists from USDA records, average U.S. butterfat went from 3.95% in 2020 to 4.218% by November 2024. Protein jumped from 3.181% to 3.309%.

What’s that mean in real terms? Despite losing 557,000 cows from the national herd in 2024, total milk solids production actually increased by 1.345%. We’re making more cheese and butter with fewer cows. Great for efficiency, terrible for market balance.

The genetics have gotten so good that we’ve essentially broken the old supply-demand correction mechanism. Herds shrink, but production stays flat or even grows. It’s remarkable from a technical standpoint, but it means this oversupply problem isn’t going away naturally like it used to.

New Zealand shows this even more starkly—they reduced cow slaughter rates by 18.4% according to their Ministry for Primary Industries, even while WMP prices crashed for six straight auctions. Why? Because each cow today produces so much more than five years ago that farmers literally can’t afford to cull heavily. They’d lose too much capacity.

Three Paths Forward (And Why You Need to Pick One Soon)

Based on everything I’m seeing and hearing from producers who’ve survived multiple cycles, there are really only three strategies that make sense right now.

The Premium Route (Maybe 20-25% of You Can Do This)

If you’re within a reasonable distance of a city and can tell a good story, direct sales can get you 50-75% premiums. Vermont producers doing this successfully report $32-38 per hundredweight equivalent. That’s basically double commodity prices.

But—and this is a big but—it requires serious investment. We’re talking $400,000 minimum in processing equipment, dedicated marketing staff, and probably 20+ hours a week of your time on social media and customer management. It’s not dairy farming anymore; it’s running a specialty food business. Some folks love it. Others find it exhausting.

The organic market’s another option. USDA data shows the Organic Pay Price averaged $38.69 in September 2025. But that three-year transition period is brutal, and you better have contracts locked before you start.

Scale and Efficiency (Works for 30-35% of Producers)

The Texas model shows how this works. Average Panhandle dairy runs about 4,000 cows according to the Texas Association of Dairymen. With new plants from Cacique Foods in Amarillo, Great Lakes Cheese in Abilene, and Leprino in Lubbock, there’s demand for big, efficient suppliers.

But you need serious scale—minimum 1,000 cows, probably more like 2,000+. And the capital requirements for automation and upgrades… well, if you’re a 300-cow operation in Wisconsin, this probably isn’t your path. I wish it were different, but that’s reality.

The co-ops are adjusting, too. Industry reports show DFA consolidating smaller farms’ milk into bigger pools to maintain negotiating power. Land O’Lakes is pushing component improvement hard—offering bonuses for consistently hitting protein targets. It’s all about efficiency now.

Strategic Exit (The Hardest but Sometimes Smartest Choice)

Nobody wants to talk about this, but for operations caught between premium and scale, getting out while you still have equity might be the smartest move.

Chapter 12 bankruptcy—the farmer-friendly option—can get you reorganized in about 100 days, according to ag bankruptcy attorneys. It lets you restructure debt while keeping the farm running. But timing is everything. Act before you default, and you have options. Wait until you’re behind on payments, and those options evaporate fast.

The generational piece makes this even tougher. I know young farmers looking at these projections for the next two years and thinking maybe that agronomy job in town makes more sense right now. Can’t say I blame them.

Why The Cheddar Crash Changes Everything

Let’s circle back to that 6.6% cheddar price collapse, because this is crucial. Cheese was supposed to be our growth story, right? China’s cheese imports rose 13.5% through September 2025, according to its customs data. Processors globally have invested billions in cheese capacity.

But if cheese is crashing harder than powder, it means the pivot everyone’s counting on is already overcrowded. Instead of 18-24 months to rebalance, we might be looking at 24-30 months or longer.

California processors I talk with say they’re getting squeezed on every product now. Can’t make money on powder, and cheese margins are evaporating too. Something’s got to give, and it’s probably going to be at the farm level.

The Financial Reality Check

Let me paint you the picture for a typical 500-cow operation at current prices. You’re looking at about $101,000 in monthly losses. Over a 24-month downturn—which is what futures markets suggest—that’s $2.4 million in red ink.

Most farms I know started this downturn with maybe $2 million in equity if they were lucky. Do the math. You run out around month 20, just before the projected recovery. That’s the cruel joke here—operations that survive 80% of the downturn still fail because they can’t bridge those last few months.

Operations with $2M in starting equity face complete depletion at month 20—just four months before projected recovery begins at month 24—meaning 80% of the struggle buys you nothing if you can’t bridge the final cruel gap, making the next 90 days of strategic decisions literally the difference between survival and bankruptcy

We’re currently in months 4-5 of what could be a 24-30 month adjustment. Decisions you make right now have completely different outcomes than those same decisions in March or April when equity’s gone and options have narrowed to basically nothing.

The Human Side We Can’t Ignore

Behind those 259 bankruptcy filings in Q1 2025—up 55% from last year, according to federal court statistics—are real families watching everything disappear.

The Journal of Rural Mental Health published research showing farmers face suicide rates 3.5 times higher than the general population. Mental health professionals describe this pattern where chronic stress builds for months until hitting what psychotherapist Lauren Van Ewyk calls a “quick flip”—that breaking point where you can’t think straight anymore.

I bring this up because recognizing the stress early and getting help—whether it’s financial advice, operational changes, or just someone to talk to—that preserves way more options than waiting until you’re in crisis mode. We need to look out for each other right now.

What You Should Be Doing Right Now

Next 30 Days: Figure out your real equity runway. Not the optimistic version—the actual number of months you can sustain these losses. If it’s less than 24 months, you need to act now, not later.

Lock in feed prices while you can. That $4.10 corn won’t last forever. Take a hard look at your bottom 20% for culling while beef prices are still strong. And call your processor about contract opportunities—they’re making deals right now.

Next 90 Days: Stress-test everything against a 24-30 month downturn. Can you survive it? Be honest. If you’re in the right location, explore premium markets, but be realistic about what it takes.

Technology that actually reduces costs—robotic milkers if you’re big enough, better feed systems, genetic improvements—these aren’t luxuries anymore. They’re survival tools. And if refinancing is in your future, talk to your lender now while you’re still current on your payments.

What to Watch: The late November GDT auction will tell us if this cheese crash was a one-off or a trend. If CME Class III futures for Q2 2026 start climbing above $17.50, maybe recovery comes sooner. China’s Q4 import data will confirm if this structural shift is as permanent as it looks. And keep an eye on processor announcements—they’re reshaping regional opportunities as we speak.

Where We Go from Here

The November 4 GDT results confirm what many of us suspected but didn’t want to admit: this isn’t your typical dairy cycle. China’s not coming back for powder, productivity gains mean we can’t count on natural supply correction, and none of the usual recovery mechanisms are working.

The operations that’ll make it through won’t necessarily be the ones with the best cows or the most land. They’ll be the ones who recognized early that the game has changed and adapted accordingly. Maybe that means doubling down on efficiency, maybe pivoting to premium markets, or maybe—and this is hard to say—getting out while there’s still equity to preserve.

For the industry as a whole, this evolution is probably necessary for long-term health. But that’s cold comfort when you’re trying to figure out next month’s loan payment.

What November 4 made crystal clear is that waiting and hoping aren’t strategies. The data says we’re in for extended weakness that requires careful planning, smart positioning, and probably some fundamental changes to how we operate.

The clock’s ticking, friends. The decisions you make in the next 60-90 days will determine whether you’re still milking in 2027. The path forward isn’t easy, but at least it’s becoming clearer. What you do with that clarity… well, that’s up to you.

If you or someone you know needs support, U.S. farmers can reach Farm Aid at 1-800-FARM-AID (1-800-327-6243). Canadian farmers can contact the Canadian Suicide Prevention Service at 1-833-456-4566. New Zealand farmers can reach Rural Support Trust at 0800 RURAL HELP (0800 787 254).

KEY TAKEAWAYS

  • Cheddar’s 6.6% Crash = Plan B Failed: When cheese falls harder than powder, your pivot strategy is dead. Stop hoping, start adapting.
  • China’s Done Buying: 85% self-sufficient + 40% fewer infants + 10M MT new production = permanent demand destruction. They’re not coming back.
  • The $2.4M Question: Your 500-cow operation loses $101K/month. You have ~$2M equity. Recovery takes 24-30 months. Do the math.
  • Only 3 Paths Work: Premium route (needs location + $400K), mega-scale (2,000+ cows + millions), or strategic exit (Chapter 12 before default).
  • 90 Days to Decide: By February 1, 2026, you must commit to scaling, pivoting, or exiting. After that, the bankruptcy court decides for you.

Complete references and supporting documentation are available upon request by contacting the editorial team at editor@thebullvine.com.

Learn More:

The Sunday Read Dairy Professionals Don’t Skip.

Every week, thousands of producers, breeders, and industry insiders open Bullvine Weekly for genetics insights, market shifts, and profit strategies they won’t find anywhere else. One email. Five minutes. Smarter decisions all week.
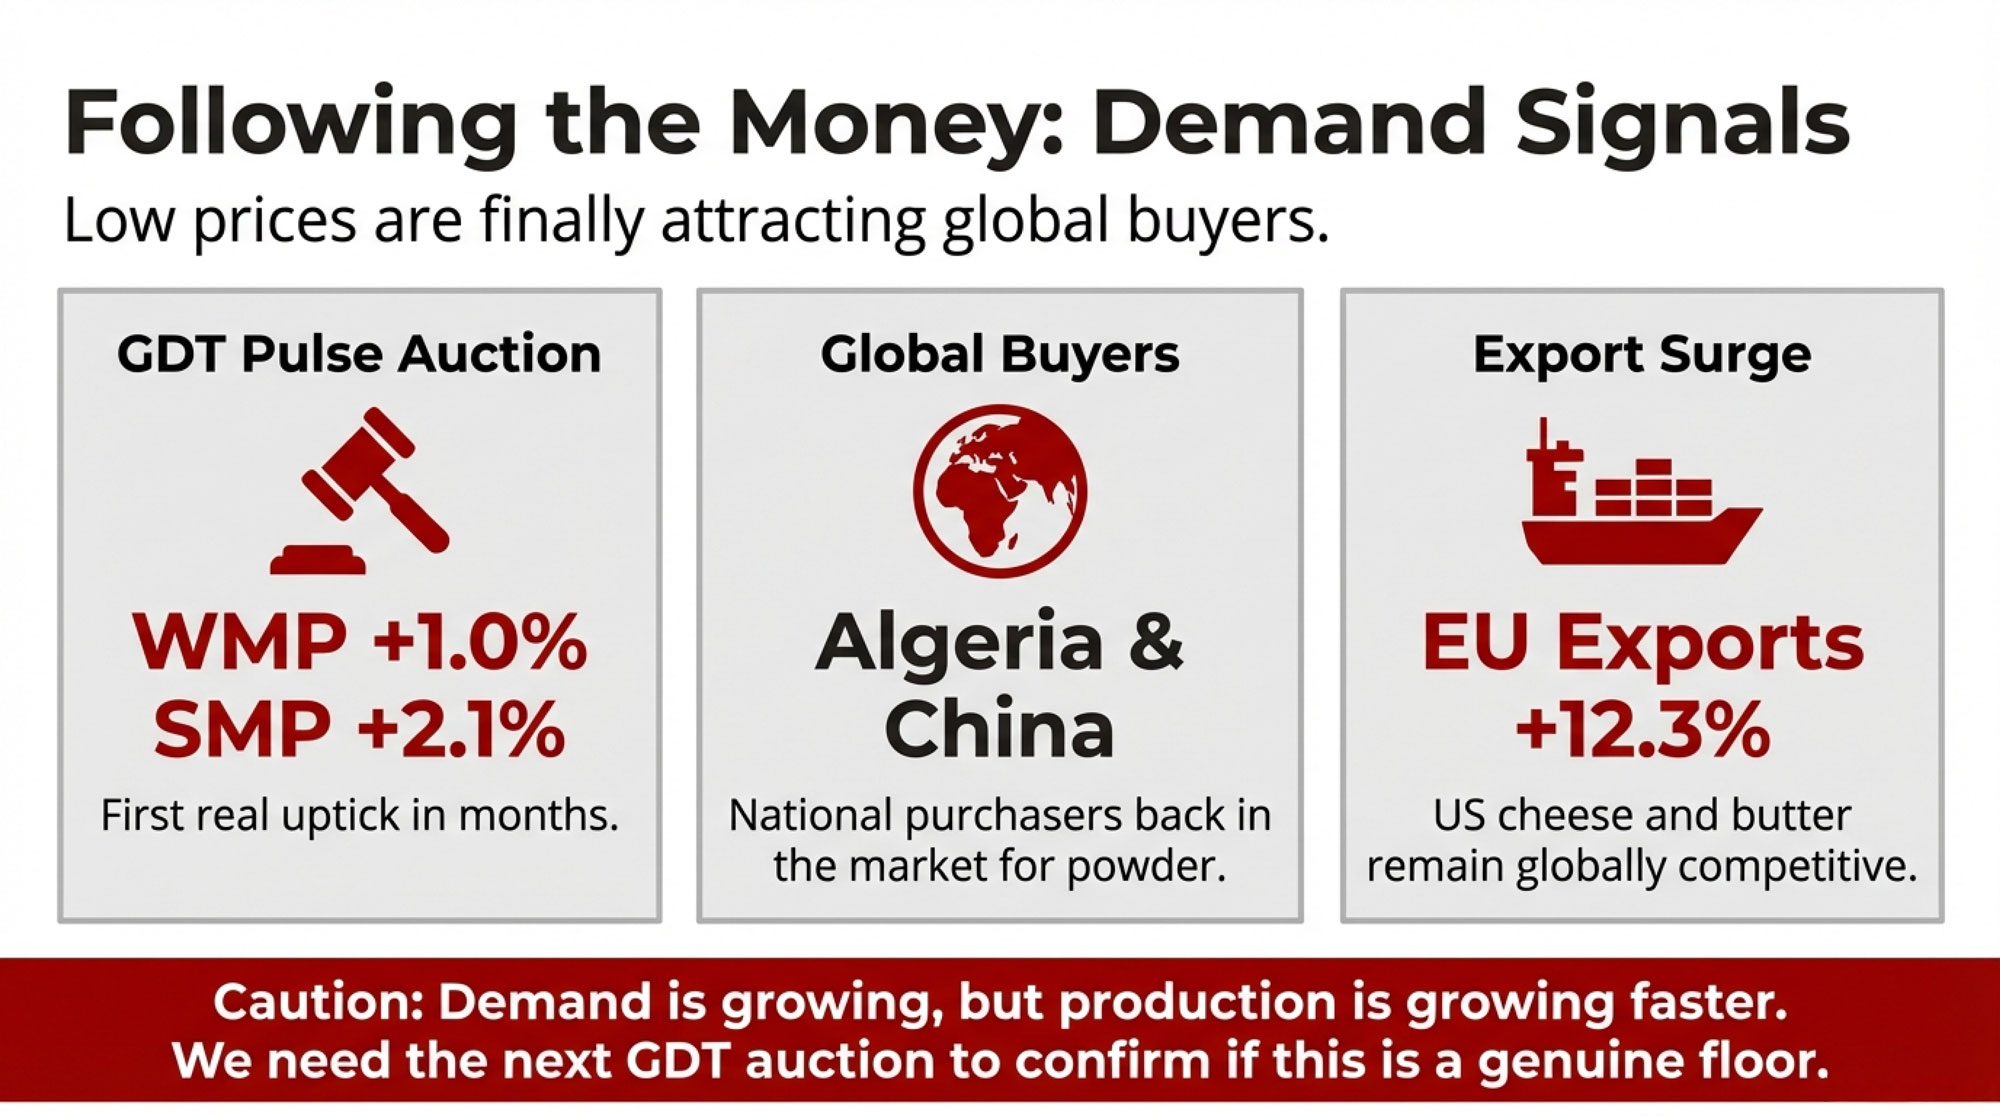
NewsSubscribe
First
Last
Consent

November 3 CME: Cheese Collapses 10¢ on Ghost Town Trading

Cheese tanked. Buyers ghosted. Farmers bleeding. Welcome to Monday in dairy.

EXECUTIVE SUMMARY: You know something’s broken when cheese crashes 10¢ on just TWO trades—that’s exactly what happened today, taking $1/cwt straight out of December milk checks. But here’s what really hurts: the Class III-IV spread hit $3.19, meaning your neighbor shipping Class III is making $45,000 more annually than Class IV shippers on the same-sized farm. We’ve got 9.52 million cows out there—most since 1993—flooding a market where Europe’s selling cheese 37% cheaper and China’s buying less. At $13.90 Class IV against $320/ton feed, even efficient operations are bleeding $2/cwt. The farms that’ll survive are doing three things right now: locking any Class III over $17, cutting cow numbers 15%, and banking six months of operating capital—because this isn’t a correction, it’s a reckoning that’ll last into 2026.

Dairy Market Analysis

What I’ve found is these aren’t just price moves anymore—they’re survival signals. Here’s what shifted at Chicago today:

ProductToday’s CloseChangeFarm Impact
Cheese Blocks$1.6650/lb-10.25¢December checks drop ~$1.00/cwt
Cheese Barrels$1.7500/lb-5.50¢Processors drowning in inventory
Butter$1.5775/lb-3.25¢Class IV trapped at breakeven
NDM$1.1300/lb-0.25¢Export competitiveness fading
Dry Whey$0.7100/lbNo changeThe only bright spot holding

Now, what’s really telling here—and you probably noticed this too—is the volume. Or lack thereof, I should say. Nine trades total across all products. Nine! I’ve seen more action at a Tuesday card game in Ellsworth.

November 3 CME dairy price collapse shows cheese blocks plummeting 10¢ on just two trades while seven sellers found no buyers—a market not trading but capitulating in a vacuum of demand.

When blocks drop a dime on just two trades, it means the price is falling without any real buying support. Those seven offers stacked up? That’s sellers lined up at the door with no buyers in sight. The market isn’t trading; it’s collapsing in a vacuum.

Why This Class Spread Breaks Farms

You know, I’ve been tracking these markets since the ’90s, and this $3.19 gap between Class III at $17.09 and Class IV at $13.90… it’s something else entirely. Three Wisconsin cooperative fieldmen I talked with this morning—all asking to stay anonymous, naturally—painted the same picture: their Class IV shippers are hemorrhaging cash.

“Members are culling anything that looks sideways,” one told me. And at $13.90, even efficient operations lose two bucks per hundred minimum.

Here’s what makes this worse than 2016’s collapse, if you can believe it: feed costs then were 40% lower. The CME futures data shows December corn at $4.3475 a bushel and soybean meal above $320 a ton. You do that math—it doesn’t work.

The $3.19/cwt Class III-IV spread translates to a staggering $45,000 annual income gap between identical 200-cow farms—same work, vastly different survival odds.

Regional Pain Points

Wisconsin’s Double Whammy: So Wisconsin’s most recent production data—this is for September, released in October—shows 2.76 billion pounds according to USDA NASS. But here’s the kicker: regional premiums flipped from plus 40¢ in January to minus 15¢ now. That’s a 55-cent swing nobody budgeted for. And meanwhile, local plants are running four-day weeks, while Texas adds 5 million pounds of daily capacity? That’s not a market; it’s a massacre.

Texas Keeps Growing: What’s encouraging for them—not so much for us up north—is that Texas grew 10.6% year-over-year with 50,000 new cows added by April 2025. Their breakeven point is around $14.50, which means they’re still profitable while Upper Midwest farms bleed out. Different labor costs, different feed sourcing… it’s almost like two separate industries now.

California’s H5N1 Factor: Nearly 1,000 confirmed dairy herd cases across 16 states according to USDA APHIS data, with California ground zero. Production down 1.4%—and ironically, that’s the only thing keeping cheese from hitting $1.50.

The Global Picture Nobody Wants to See

Looking at this from 30,000 feet, as they say, we’re seeing convergence of every bearish factor possible. New Zealand’s production is up 2.8% according to Fonterra’s latest data from the Weekly Global Dairy Market Recap. European cheese crashed 37% year-over-year—and when EU product trades at €2,088 per metric ton, why would anyone buy American?

Four converging crises—record production, collapsing exports, crushing feed costs, and new processing overcapacity—have pushed market pressure 10% beyond crisis threshold, with no relief until 2026 at earliest.

China’s pulling back too—total imports up just 6% through July, but that’s still 28% below their 2021 peaks. They’re cherry-picking what they need: whey up, everything else sideways or down. And Mexico, our biggest customer? They’ve been discussing dairy self-sufficiency targets for 2030. That could mean 230,000 metric tons of powder exports are potentially gone.

A StoneX trader told me Friday—and I think he nailed it—”The U.S. is the Cadillac in a world shopping for Chevys.”

Feed Markets: The Other Shoe Dropping

The milk-to-feed ratio tells the whole story: 1.48 right now. You need 2.0 for decent margins, generally speaking, and 1.8 to break even.

At 1.48 milk-to-feed ratio versus the 2.0 needed for profitability, dairy farmers are bleeding $2/cwt even before paying labor, vet bills, or utilities—a 26% shortfall with no end in sight.

December corn at $4.3475 offers no relief. Western Wisconsin hay dealers? They want $280 a ton delivered for decent mixed—if they’ll even quote you. The latest WASDE Report mentions the U.S.-China trade deal promising 25 million tonnes annually, but you know, that’s maybe next year, not this month’s certain.

Processing Plants Playing Different Games

So here’s what really gets me: three cheese plants just announced 400 million pounds of new capacity for 2026. Hilmar’s Texas facility cranks up in January—5 million pounds daily. Meanwhile, Wisconsin plants run four-day weeks, managing inventory.

How’s that make sense? Well, it doesn’t—unless you realize processors profit on volume, not price. They don’t really care if cheese is $1.60 or $2.10. They care about throughput. More milk equals more margin dollars even at lower percentages. But farmers? We need price, not volume. That fundamental disconnect… that’s what’s killing us.

What Smart Operations Do Now

Here’s what the survivors are telling me, and it’s worth noting these aren’t the guys complaining at the coffee shop—these are the ones actually making it work:

Lock anything over $17 for Class III immediately. One large Wisconsin producer locked 40% of his Q1 production last week at $17.20. As he put it, “I’m not swinging for fences anymore. Singles keep you in the game.”

Cull deep, cull strategically. With springers at $2,100, that third-lactation cow with feet issues? She’s worth more as beef. Several nutritionists report their clients running 15% lower numbers—on purpose.

Component premiums still matter. Dry whey holding at 71¢ means protein still pays. Farms maximizing components—and you know who you are—they’re seeing 30-40¢ more per hundredweight. Not huge, but it’s something.

Rethink expansion completely. Pete Johnson, who ships direct to a cheese plant, told me something interesting: “My neighbor’s co-op pays $1.40 more in premiums, but after deductions, we net about the same. Difference is, I can walk if needed.”

Cooperatives Scrambling for Answers

You know, DFA’s base-excess programs start December 1st, cutting deliveries 5% from last year. Land O’Lakes is paying 25¢ per somatic cell under 100,000—quality over quantity, finally.

What’s interesting is Cornell research shows non-co-op handlers paying 37% quality premiums versus co-ops at 29%. But co-ops counter with competitive premiums, keeping members from jumping. Mixed signals everywhere you look.

The Six-Month Survival Test

Let me be straight with you: if you’re shipping Class IV milk right now, you need at least 6 months of cash reserves. December checks—and I hate to be the bearer of bad news—will drop $1.00 to $1.50 per hundredweight from November based on current futures.

The Federal Order reform coming January 1st? It’ll shift maybe 30¢ from Class I to manufacturing. That’s like putting a Band-Aid on an amputation, honestly.

California’s methane rules adding 45¢ per hundredweight compliance costs starting July… USDA projecting 230 billion pounds production for 2025 in their October forecast… We don’t need more milk, folks. We need less.

The Bottom Line

You know, standing here looking at these numbers, I keep remembering what my dad used to say: “The cure for low prices is low prices.” Eventually, enough producers quit, supply tightens, and prices recover. But how many good families lose everything getting there?

Today’s 10¢ cheese crash wasn’t a correction—it was capitulation. Blocks at $1.67 with seven offers stacked and two lonely bids? That’s not a market; it’s a distress sale. The funds have bailed, end users are covered, and producers… well, we’re holding the bag.

If you’re planning an expansion, stop. Those new parlor dreams? Shelve them. With 9.52 million cows out there—the highest since 1993, according to USDA data—we’re looking at 6 to 12 months before any real relief.

The farms that’ll make it through are the ones acting now: cutting costs aggressively, optimizing components over volume, maintaining working capital for the storm ahead. Everyone else? Well, auction barns are busy again for a reason.

Your November milk check just got lighter—that’s the reality. Tomorrow morning in the parlor, before dawn breaks and that first cup kicks in, ask yourself this: Am I farming to live, or living to farm?

Because at these prices, you better know the answer. 

KEY TAKEAWAYS: 

  • Ghost Town Trading: Cheese crashed 10¢ on just TWO trades today—when seven sellers can’t find buyers, your December check loses $1/cwt
  • Tale of Two Farms: Identical 200-cow operations, but Class III shippers bank $45,000 more annually than Class IV neighbors—same work, vastly different pay
  • Perfect Storm Brewing: Record 9.52M U.S. cows flooding markets while EU cheese trades 37% cheaper and Mexico eyes dairy independence by 2030
  • The $2/cwt Bleed: At $13.90 Class IV milk vs $320/ton feed, even top-tier operations lose money before paying labor, vet, or utilities
  • Survival Playbook: Winners are doing three things NOW—locking any Class III over $17, strategically culling 15% of herds, and banking 6+ months operating capital for the long winter ahead

Complete references and supporting documentation are available upon request by contacting the editorial team at editor@thebullvine.com.

Learn More:

The Sunday Read Dairy Professionals Don’t Skip.

Every week, thousands of producers, breeders, and industry insiders open Bullvine Weekly for genetics insights, market shifts, and profit strategies they won’t find anywhere else. One email. Five minutes. Smarter decisions all week.
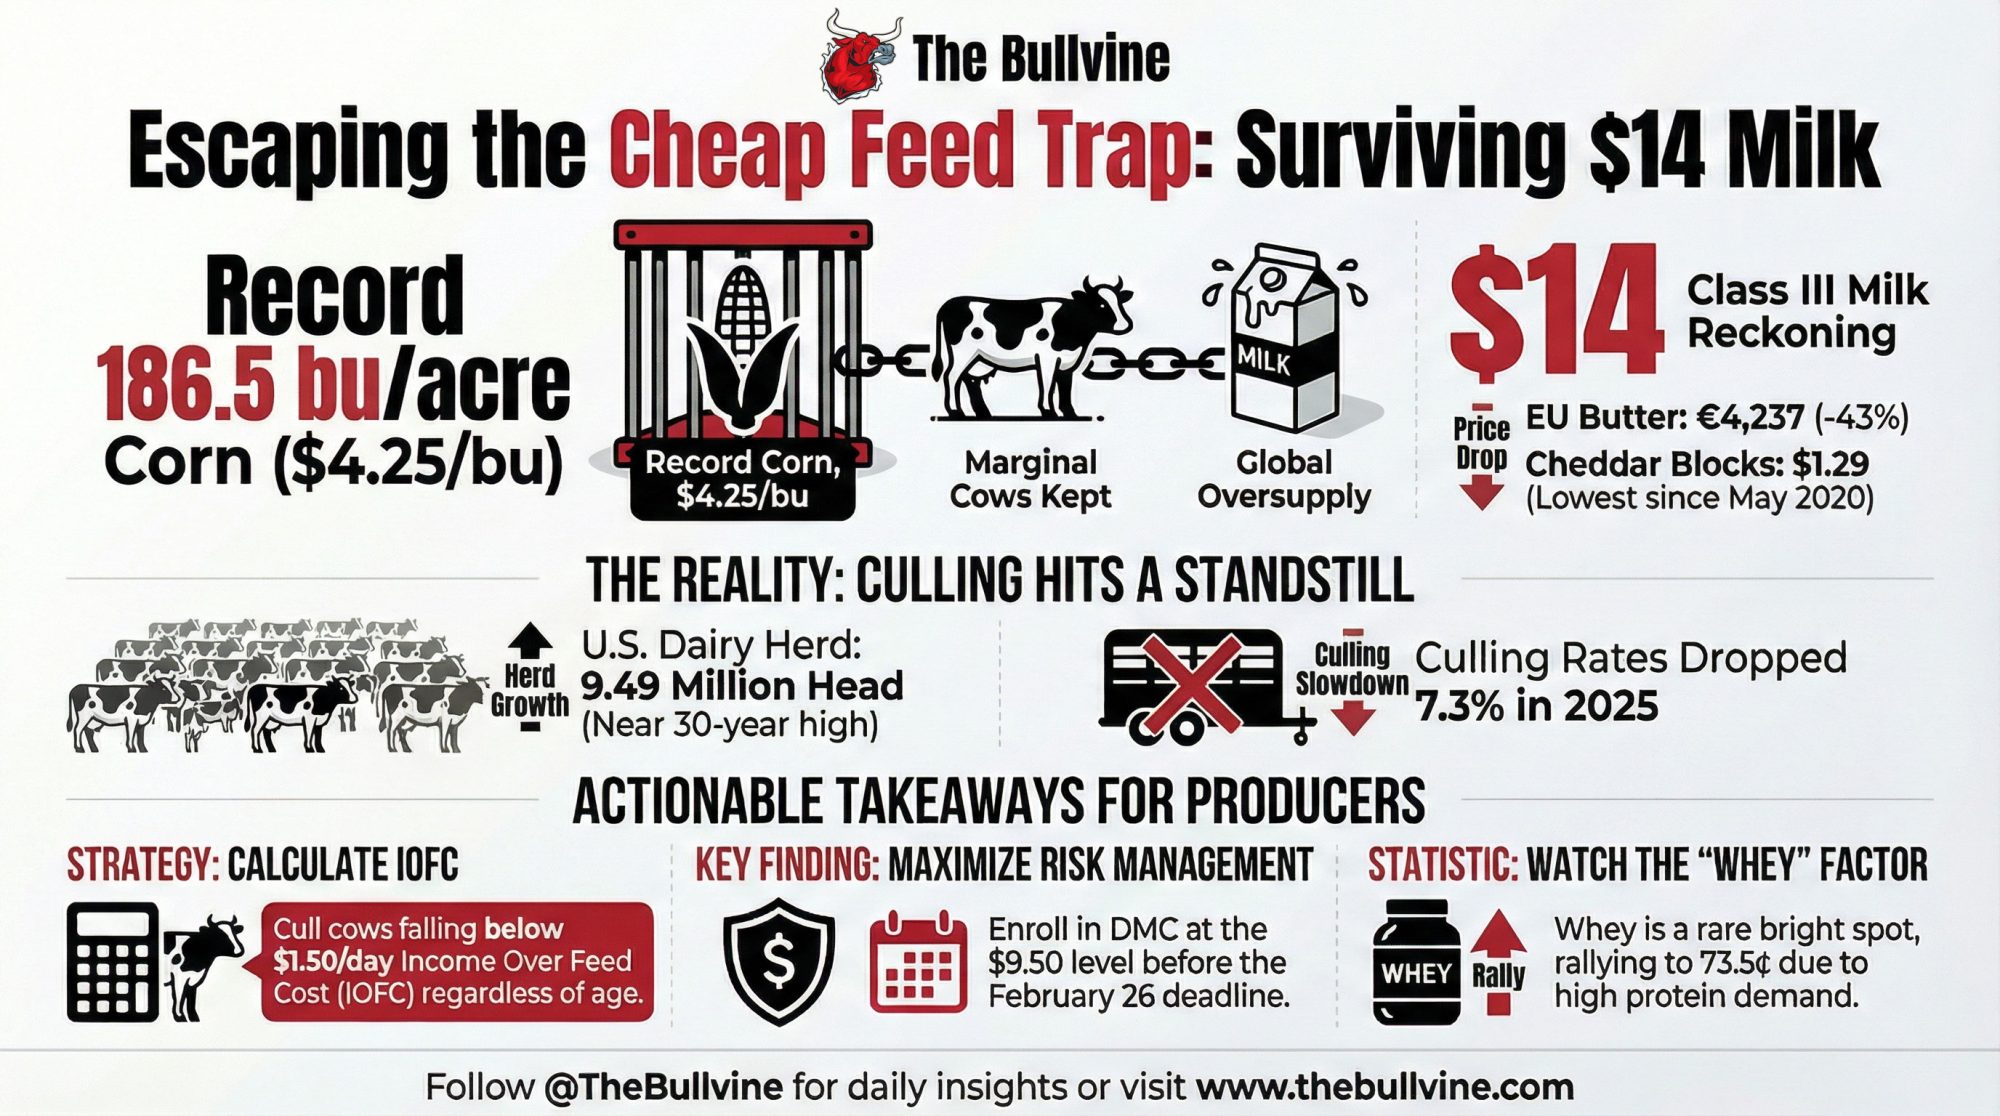
NewsSubscribe
First
Last
Consent

Why Dairy Markets Can’t Self-Correct Anymore: The Hidden Forces Reshaping the Dairy Industry’s Future

Digesters: $100/cow. Beef crosses: $250/calf. Carbon credits: $28K. When milk becomes your SMALLEST revenue, you survive.

EXECUTIVE SUMMARY: Traditional dairy economics no longer exist—milk production rises 7.5% while prices crash 29% because half of the global supply doesn’t need milk profits anymore. Six structural forces —from European cooperatives locked into accepting all production to U.S. farms earning $100/cow from digesters —have permanently broken market self-correction mechanisms. This isn’t temporary: 40-50% of U.S. milk now comes from multi-revenue operations that profit even at $12/cwt, while conventional farms need $17/cwt to survive. The 2026-2027 shakeout will consolidate 25-40% of production into mega-dairies as thousands of single-revenue farms exit. But you can act now: implementing beef-on-dairy generates $15,000-20,000 annually with one phone call to your breeding tech—no loans, no construction. The divide is clear: farms with multiple revenue streams will thrive at prices that bankrupt traditional operations. Your survival depends on recognizing this transformation isn’t cyclical—it’s permanent.

Farm Revenue Diversification

I recently reviewed the UK’s latest production figures from AHDB Dairy, and something remarkable stood out. Milk output increased 7.5% while butter prices declined 29.2% year-over-year. This pattern extends across Europe—Poland’s growing 5.7%, Italy expanding 3%. Meanwhile, European Commission data shows cheese prices down 33-37% across varieties.

What’s particularly noteworthy is how this contradicts everything we thought we knew about market dynamics. When prices fall by a third, producers should reduce output. Basic economics, right? Yet that’s not happening, and understanding these dynamics becomes essential for navigating what lies ahead.

My analysis of Global Dairy Trade auctions, European Energy Exchange futures, and USDA production reports reveals something striking: approximately half of the global milk supply now operates under economic principles different from those we traditionally understood. This shift affects every segment of our industry, from family farms to mega-dairies, from local cooperatives to multinational processors.

Milk production surges 7.5% while butter prices plummet 29.2% year-over-year—a violation of basic supply-demand principles proving half the global supply no longer responds to price signals

Six Structural Forces Reshaping Market Dynamics

Through extensive analysis of production patterns and discussions with industry professionals across multiple regions, I’ve identified six key factors preventing traditional market corrections. As many of us have observed, these aren’t temporary disruptions—they’re permanent structural changes.

1. Cooperative Frameworks and Supply Obligations

European cooperatives manage approximately 60% of the continent’s milk, according to data from the European Dairy Association. What’s interesting here is how these systems operate under unique structural constraints that essentially lock in production.

Within these frameworks, members maintain contractual obligations to deliver their full production, while cooperatives must accept all member milk regardless of market conditions. Think about operations like Dairygold in Ireland—when most members have committed their supply through formal agreements, the cooperative can’t refuse deliveries even when tanks are full and prices are in the basement.

This represents a significant structural difference from the flexibility many North American producers experience. I’ve noticed that producers in Wisconsin or California often don’t fully appreciate how these European constraints ripple through global markets.

2. Infrastructure Investment and Economic Lock-In

Modern dairy facilities require substantial capital that creates what I call “economic handcuffs.” Current robotic milking systems range from $150,000 to $250,000 per unit, according to Lely and DeLaval specifications. The University of Wisconsin Extension‘s latest facilities guide indicates modern freestall barns require $2,000-3,500 per cow space.

Do the math on a 200-cow operation—you’re looking at $2-3 million in specialized assets. And here’s what keeps me up at night: agricultural equipment values have declined significantly, with virtually no secondary market for used robotic milkers.

Cornell’s agricultural economics research demonstrates what we’re seeing firsthand—operations continue production as long as variable costs are covered, even when they’re bleeding red ink on total costs. It’s rational for the individual farm, but it perpetuates the oversupply problem.

A 3,500-cow California operation generates $423,000 annually from non-milk revenue—with energy contracts dominating at $350K, fundamentally changing farm economics and making them profitable even when milk prices crash

3. Agricultural Support Programs and Income Stability

The European Union’s Common Agricultural Policy represents a €291.1 billion commitment from 2021-2027. What farmers are finding is that these payments, primarily based on land area rather than production, create income stability that’s independent of milk prices.

Research from Wageningen University indicates CAP payments constitute 30-40% of net farm income for many European operations. I’ve spoken with numerous Irish producers whose single farm payments—typically €15,000-20,000 annually—provide the cushion that keeps them milking when prices tank.

While these programs successfully maintain rural communities (and that’s important), they also reduce the supply response we traditionally expected during downturns.

4. Energy Production and Alternative Revenue Streams

This development changes everything about dairy economics. EPA’s AgSTAR program data shows methane digesters generate $80-100 per cow annually through renewable natural gas contracts. California Air Resources Board reports indicate some operations earn $2-3 per hundredweight from energy alone.

A senior consultant recently told me, “We’re approaching a point where milk becomes the co-product of energy production.” That might sound extreme, but look at the numbers…

California operations with 10-15 year renewable natural gas contracts can’t reduce cow numbers without breaching agreements worth millions. With over 200 digester projects operational or under construction, according to the California Department of Food and Agriculture, this fundamentally alters production incentives.

5. Environmental Compliance and Capital Lock-In

Environmental regulations create an interesting paradox. I recently spoke with a Vermont producer who invested approximately $275,000 in manure separation and phosphorus recovery to meet Required Agricultural Practices regulations.

“When you’ve invested that much in compliance infrastructure,” he explained, “continuing at marginal returns often makes more sense than exiting and losing everything.”

This becomes especially complex for operations with succession plans. Kids wanting to farm face tough choices between continuing marginally profitable operations or walking away from family legacies.

6. Beef-on-Dairy Programs: Accessible Revenue Diversification

Here’s a revenue stream that deserves particular attention because it’s accessible to everyoneUSDA Agricultural Marketing Service data from October shows beef-cross dairy calves commanding $200-300 premiums over Holstein bulls. Regional auctions report Angus-Holstein crosses averaging $450-500 while Holstein bulls struggle to hit $200.

Industry breeding data suggests 30-40% of U.S. operations now use beef semen for 20-50% of breedings, up from under 10% five years ago. A 100-cow dairy breeding 30 animals to beef genetics at a $250 premium generates $7,500additional revenue—roughly 50¢ per hundredweight across total production.

Penn State’s dairy genetics team has documented how these programs provide crucial diversification for operations of all sizes, making it a key survival strategy in the current market environment.

Six permanent structural forces have destroyed traditional dairy market corrections—from European cooperative obligations to U.S. energy contracts—resulting in 40-50% of global milk supply operating independent of price signals, ending boom-bust cycles forever

Understanding Multi-Revenue Economics

The transformation from single to multiple revenue streams represents a paradigm shift in how we think about dairy profitability.

I recently analyzed a 3,500-cow California operation that illustrates this perfectly. Their annual alternative revenue includes:

  • Energy contracts: $350,000
  • Beef-cross premiums: $45,000
  • Carbon credits: $28,000

That’s over $400,000 in non-milk revenue, roughly $3 per hundredweight. Their effective break-even after all revenue streams? About $11.50/cwt. Meanwhile, University of California Cooperative Extension data shows conventional neighbors need $16-18/cwt just to cover costs.

Multi-revenue dairy operations maintain profitability at $11.50/cwt while conventional farms require $16-18/cwt—a $4.50+ gap that’s forcing the largest industry consolidation in decades

With November’s CME Class IV at $13.90, multi-revenue operations maintain positive margins while single-revenue neighbors hemorrhage cash daily.

Scale of the Transformation

EPA’s AgSTAR database documents over 270 digesting operations covering approximately 10% of the national herd. The California Energy Commission reports $522 million in private investment in digester projects.

When we combine operations with digesters, beef programs, carbon credits, and solar leases, approximately 40-50% of U.S. milk production now comes from farms with significant non-milk revenue. Traditional supply response? It’s essentially dead.

Processor Adaptation Strategies

Processors aren’t sitting idle—they’re repositioning aggressively. The whey market tells the story.

The Whey Market Divergence

While CME Class IV futures languish at $13.90-14.00/cwt through March 2026, dry whey hit nine-month highs at 71¢/pound—16¢ above the March-September average according to USDA Dairy Market News.

Why this divergence? Three factors stand out:

First, clinical guidelines for GLP-1 medications like Ozempic recommend 1.2-1.5 grams of protein per kilogram body weight to preserve muscle during weight loss. Whey’s amino acid profile makes it ideal.

Second, the sports nutrition market will reach $27.6 billion by 2030, up from $15.6 billion in 2022, with whey representing 70% of protein supplement sales.

Third, technology breakthroughs—companies like Milk Specialties Global have developed clear, fruit-flavored protein beverages that expand beyond traditional shake consumers.

Strategic Processing Investments

The International Dairy Foods Association reports over $11 billion in new processing capacity through 2027. Valley Queen Cheese Factory’s South Dakota expansion illustrates the strategy—management emphasizes whey and lactose demand drives growth planning, not cheese.

These processors recognize that a predictable milk supply from multi-revenue farms justifies substantial investments in protein concentration. Cheese enables whey capture—the latter increasingly drives decisions.

Global Price Transmission Mechanisms

Recent GDT auctions showed whole milk powder down 0.5%, European powder fell 2% per CLAL monitoring, and U.S. nonfat dry milk hit 13-month lows at $1.1325 CME spot. Three different structures, identical direction.

How Arbitrage Enforces Price Discipline

Import buyers consistently report shifting purchases immediately when New Zealand, German, or Wisconsin prices show 5% differentials. The Global Dairy Trade platform, with hundreds of bidders trading 10 million metric tonsannually, creates transparent global price discovery.

Structural Supply Rigidity Everywhere

All major exporters demonstrate inflexibility:

  • Fonterra must accept all shareholder milk (82% of New Zealand production)
  • European cooperatives, plus CAP support, maintain production regardless of price
  • U.S. operations with digester/beef revenue lock in production for years

When China’s imports grow just 6% versus the historical 15-20% (USDA Foreign Agricultural Service), no region possesses quick adjustment mechanisms.

Anticipated Market Evolution: 2026-2027

Based on financial indicators, here’s what I expect:

Q4 2025 – Q1 2026: Credit Market Adjustment

Financial institutions report rising delinquencies. Some require quarterly rather than annual production reports. American Farm Bureau data shows Chapter 12 bankruptcies increased 55% in 2024—that trend continues.

Q2-Q3 2026: Initial Consolidation

Credit-constrained operations begin exiting, but milk production doesn’t disappear—it consolidates. I’m seeing California Central Valley operations with 5,000+ cows buying neighboring 500-cow dairies as satellites.

Q4 2026 – Q2 2027: Structural Realignment

Analysis suggests Class IV stabilizes around $15.00/cwt—sufficient for multi-revenue operations but challenging for conventional single-revenue farms.

The dairy industry faces unprecedented consolidation: multi-revenue mega-dairies will more than double their market share to 32.5%, while conventional small farms shrink from 40% to 28% and the price-responsive segment collapses from 85% to under 45%—ending traditional supply-demand cycles

By mid-2027:

  • Multi-revenue mega-dairies: 25-40% of supply (up from 15%)
  • Conventional small farms: 26-30% (down from 40%)
  • Price-responsive segment: Under 45% (down from 85%)

This represents permanent transformation, not cyclical adjustment.

Southeast Asian Trade: Realistic Assessment

October’s agreements with Malaysia, Cambodia, Thailand, and Vietnam generated optimism. Let’s examine the actual impact.

USDA data shows current exports to these nations total $335 million—just 4% of our $8.2 billion total. Mexico alone buys $2.47 billion.

Even assuming aggressive growth, additional exports might reach $150-200 million by 2027—roughly 750 million pounds milk equivalent. But U.S. production ranges from 6.8 to 9.1 billion pounds annually. Southeast Asia absorbs 8-11% of growth—helpful but not transformative.

These agreements benefit operations with scale, integrated processing, and West Coast proximity—not the Wisconsin 300-cow farm facing bankruptcy.

Strategic Guidance by Operation Type

Small-to-Medium Conventional (100-500 cows)

Post-crisis prices around $14.85/cwt for Class IV are likely to fall below your break-even. University of Minnesota’s FINBIN shows operations this size need $15.50-17.50/cwt.

Immediate action: Implement beef-on-dairy tomorrow. Breeding 30-40% to beef generates $150-250/calf premium. For 200 cows, that’s $15,000-20,000 annually. Call your breeding tech today.

Exit strategies: Chapter 12 provisions offer tax advantages when properly structured. Timing matters as provisions may change.

Expansion: Only viable with 40%+ equity. Reaching 1,500+ cows requires $3-5 million in capital.


Metric
Holstein Bull CalfBeef-Cross CalfPremium/Advantage
Market Value$150-200$450-500$250-300
Current AdoptionN/A30-40% of farmsGrowing rapidly
Breeding %100% dairy20-50% beefStrategic flexibility
Capital Required$0$0Zero investment
Annual Revenue (100 cows, 30% beef)N/A$7,500-9,000Immediate impact
Per Cwt BenefitN/A+$0.50/cwtPure profit add-on

Large Conventional (500-1,500 cows)

You’ll survive but face persistent margin pressure. Push beef-on-dairy toward 40-50% if heifer inventory allows. Lock processor relationships now. Watch for acquisition opportunities.

Near gas pipelines? Seriously evaluate digesters—the economics are compelling, especially with access to infrastructure.

Integrated and Mega-Dairy Operations

The next 24 months present strategic opportunities: favorable asset acquisitions, long-term processor contracts, and continued revenue diversification. Don’t overestimate Southeast Asian volumes—focus on operational efficiency and strategic positioning.

The Bottom Line

What we’re witnessing represents market evolution driven by technology and policy, not temporary failure. The emerging industry will be more concentrated, less price-responsive, and fundamentally different.

Traditional boom-bust cycles are giving way to persistent equilibrium at lower prices, with alternative revenue determining competitive advantage. I know this challenges everything many of us learned. The farm I grew up on wouldn’t survive today’s reality.

But early recognition creates options. Waiting for “normal” to return? That normal no longer exists.

Operations understanding these structural changes will define the next era. Those managing based solely on milk prices risk missing critical competitive factors.

Your strategic window remains open, but it won’t remain open indefinitely. Whether implementing beef-on-dairy, evaluating energy opportunities, or planning transitions, purposeful action becomes essential.

In this evolving dairy economy, standing still means falling behind. The fundamentals have shifted, and our strategies must evolve accordingly. While challenging, this transition creates opportunities for those prepared to adapt.

Together, we’ll navigate this transformation. But success requires understanding the forces at work and a willingness to embrace new models. The path forward demands both realism about challenges and optimism about opportunitiesfor those ready to evolve.

KEY TAKEAWAYS: 

  • Critical Market Intelligence Traditional dairy economics is dead: Half of global milk supply doesn’t need milk profits—digesters generate $100/cow, beef-on-dairy adds $250/calf, making $12/cwt profitable while you need $17/cwt
  • Immediate opportunity: Implement beef-on-dairy tomorrow for $15,000-20,000 annual revenue with zero capital investment—just one call to your breeding tech
  • Six permanent forces guarantee oversupply: European cooperatives must accept all milk, U.S. farms locked into 10-15 year energy contracts, and CAP subsidies cushion losses
  • 2026-2027 consolidation inevitable: 25-40% of milk production shifting to multi-revenue mega-dairies as thousands of conventional farms exit at $15/cwt prices
  • Your choice is binary: Develop multiple revenue streams now or exit within 24 months—waiting for market recovery means waiting for something that won’t happen

Complete references and supporting documentation are available upon request by contacting the editorial team at editor@thebullvine.com.

Learn More:

The Sunday Read Dairy Professionals Don’t Skip.

Every week, thousands of producers, breeders, and industry insiders open Bullvine Weekly for genetics insights, market shifts, and profit strategies they won’t find anywhere else. One email. Five minutes. Smarter decisions all week.

NewsSubscribe
First
Last
Consent

Weekly Global Dairy Market Recap: Monday, November 3, 2025: European Cheese Crashes 37% as Class Spread Hits Historic High

European cheese crashed 37% year-over-year, and the Class III-IV spread reached a farm-killing $3.50/cwt.

Executive Summary: Global dairy markets are in freefall. European cheese crashed 37% year-over-year, GDT auctions fell for the fifth straight week, and the Class III-IV spread exploded to a farm-killing $3.50/cwt—your Class III neighbor is now making $3,800 more per month than you. Milk production is surging everywhere (New Zealand +2.8%, UK +7.5%, U.S. herd at 32-year high) while demand craters, with only whey (+2.2%) and China’s premium dairy pivot offering hope. The Trump-Xi deal promises 25 million tonnes of annual soybean purchases to ease feed costs, but it won’t save commodity producers. Bottom line: If you’re shipping Class IV at $13.90 while others get $17.40 for Class III, you’re losing $45,000 annually. The farms that survive will be those that act now to lock in Class III, optimize components, and abandon the volume-at-any-cost mentality that’s driving this market into the ground.

Global Dairy Markets

Global dairy markets delivered another week of painful reality checks. European cheese posted annual declines of more than 30%. The fifth straight GDT auction decline confirmed what you already know—there’s too much milk chasing too few buyers. Meanwhile, the Class III-IV spread hit $3.50/cwt, meaning your neighbor shipping Class III milk is making $3,800 more per month than you are if you’re stuck in Class IV.

European Futures: Butter Holds, Everything Else Slides

Key Takeaway: European traders moved 2,620 tonnes last week, but the real story is powder weakness (-1.3%) while whey bucked the trend (+2.2%)—a clear signal that protein derivatives are the only bright spot.

EEX recorded 524 lots of trading activity, with Tuesday’s 925-tonne session marking the week’s peak. The breakdown tells you everything about market sentiment:

  • Butter futures only dropped 2.0% to €5,093/tonne
  • SMP futures weakened 1.3% to €2,161/tonne
  • Whey futures climbed 2.2% to €1,007/tonne

That whey strength? It’s your lifeline. Strong protein derivative demand for feed and nutrition applications is keeping values supported while everything else crumbles.

Singapore Exchange: New Zealand’s Spring Flush Hits Hard

Key Takeaway: SGX traders moved 17,020 tonnes, but WMP prices fell for the fifth straight week to $3,523/tonne—Fonterra’s 2.8% production increase is flooding the market.

The numbers paint a clear oversupply picture:

  • WMP: Down 0.7% to $3,523/tonne
  • SMP: Flat at $2,591/tonne
  • AMF: Up 0.2% to $6,677/tonne
  • Butter: Down 1.3% to $6,339/tonne

Here’s what matters for your operation: Fonterra’s September collections hit 179 million kgMS (+2.8% YoY), with season-to-date volumes running 3.0% ahead. When New Zealand pumps out milk like this, global prices have nowhere to go but down.

European Cheese Collapse: The 30% Massacre

European Cheese Markets in Historic Freefall

Key Takeaway: European cheese prices aren’t just weak—they’re in historic freefall. Every major variety is down 30%+ year-over-year, and buyers know more pain is coming.* The weekly damage was brutal:

  • Cheddar Curd: Crashed €113 to €3,388 (-33.6% YoY)
  • Mild Cheddar: Plunged €206 to €3,430 (-33.3% YoY)
  • Young Gouda: Trading at €2,909 (-37.2% YoY)
  • Mozzarella: Down €105 to €2,823 (-36.2% YoY)

Why should you care? Because European processors are bleeding cash—paying €520/tonne for milk while selling Gouda at €400/tonne. That math doesn’t work. Something’s got to give.

GDT Auction: Fifth Straight Decline Says It All

Fifth Consecutive GDT Decline Confirms Bearish Reality

Key Takeaway: *The GDT Pulse auction delivered another gut punch—WMP at $3,560 and SMP at $2,530 represent 13-month lows. Buyers have zero urgency. The PA092 results confirmed what everyone fears:

  • WMP: $3,560/tonne (down $90 from two weeks ago)
  • SMP: $2,530/tonne (down $55 from prior pulse)
  • Total volume: Only 2,612 tonnes with 41 bidders

That’s five consecutive declines. The message? Global buyers are sitting on their hands, waiting for even lower prices.

Global Production: Everyone’s Making More Milk

Key Takeaway: From New Zealand (+2.8%) to Poland (+5.7%) to the UK (+7.5%), milk is flowing everywhere except where you need it—into buyer demand.

Southern Hemisphere Springs Forward

  • New Zealand: 316.3 million kgMS season-to-date (+3.0%)
  • Australia (Fonterra): 23.4 million kgMS YTD (+3.0%)
  • Argentina: September production surged 9.9% YoY

Northern Hemisphere Piles On

  • UK: September hit 1.28 million tonnes (+7.5% YoY)
  • Poland: 1.11 million tonnes in September (+5.7% YoY)
  • Ireland: November 2024 exploded 34% higher
  • USA: Herd at 9.52 million cows—highest since 1993

CME Markets: The Class Spread That’s Killing Farms

Historic Class III-IV Spread Creates $3,800 Monthly Winners and Losers

Key Takeaway: The $3.50/cwt Class III-IV spread isn’t just a number—it’s the difference between profit and loss for thousands of dairy farms.*Here’s your Friday closing reality check:

Winners:

  • Cheddar Barrels: $1.8050 (+3.5¢)
  • Dry Whey: $0.7100 (+2¢)—nine-month high
  • Class III November: $17.40/cwt

Losers:

  • NDM: $1.1325 (-2.75¢)
  • Butter: $1.6100 (barely holding)
  • Class IV November: $13.90/cwt

Do the math: If you’re shipping 3 million pounds monthly, that $3.50 spread means $3,800 less in your milk check compared to your Class III neighbor. That’s a new pickup truck disappearing every year.

Feed Markets: China Deal Sparks Soybean Rally

Key Takeaway: Soybeans hit $11/bushel on China’s promise to buy 12 million tonnes immediately plus 25 million tonnes annually—but will they follow through?

The Trump-Xi meeting delivered feed market fireworks:

  • Soybeans: Surged 60¢ to $11.00/bushel (15-month high)
  • Soybean Meal: Jumped $27 to $321.40/ton
  • Corn: Up 8¢ to $4.31/bushel

Treasury Secretary Bessent’s announcement sounds impressive, but here’s the reality: Those Chinese purchase commitments are still below pre-trade war levels. Don’t count your feed savings yet.

Trade Breakthroughs: Southeast Asia Opens Doors

Key Takeaway: New agreements with Malaysia, Cambodia, Thailand, and Vietnam eliminate dairy tariffs—finally giving U.S. exports a fighting chance against New Zealand and Australia.

President Trump’s Asian tour delivered real results:

  • Malaysia: Eliminates all dairy tariffs, recognizes U.S. standards
  • Cambodia: Zero tariffs on all U.S. dairy products
  • Thailand: Framework covers 99% of goods (dairy included)
  • Vietnam: Preferential access for substantially all dairy

Why this matters: Vietnam imported $668 million in dairy through August 2025, but U.S. suppliers captured only $22 million due to tariff disadvantages. These deals level the playing field.

China’s Premium Pivot: The $150,000 Opportunity

Key Takeaway: China’s 18% surge in premium dairy imports versus 12% declines in commodity products isn’t a blip—it’s a structural shift that rewards quality over quantity.

The numbers tell the story:

  • Cheese imports: +13.5% YoY
  • Butter imports: +72.6% YoY
  • Skim milk powder: Significant retreat

For a 500-cow operation optimized for components and premium channels, this shift could mean $150,000+ in additional annual revenue. The question is: Are you positioned to capture it?

The Bottom Line: Survival Mode Until Spring

Here’s your reality: Global milk production is overwhelming demand, and it’s not stopping. The Class III-IV spread is creating massive inequities between farms. European cheese markets are in freefall with no floor in sight. Your only bright spots? Whey strength and potential Chinese premium demand.

Three moves to make this week:

  1. Lock in Class III if you can—that $3.50 spread won’t last forever
  2. Review your component optimization—premium markets are your escape route
  3. Don’t forward contract cheese—European prices prove there’s more pain coming

The market’s sending clear signals: Commodity dairy is dead money. Premium products and value-added channels are your survival strategy. The farms that adapt to this reality will still be here in 2027. The ones that don’t? They’ll be someone else’s expansion.

What’s your move? The clock’s ticking, and every month at $13.90, Class IV is another month closer to the edge. 

Complete references and supporting documentation are available upon request by contacting the editorial team at editor@thebullvine.com.

Learn More:

The Sunday Read Dairy Professionals Don’t Skip.

Every week, thousands of producers, breeders, and industry insiders open Bullvine Weekly for genetics insights, market shifts, and profit strategies they won’t find anywhere else. One email. Five minutes. Smarter decisions all week.
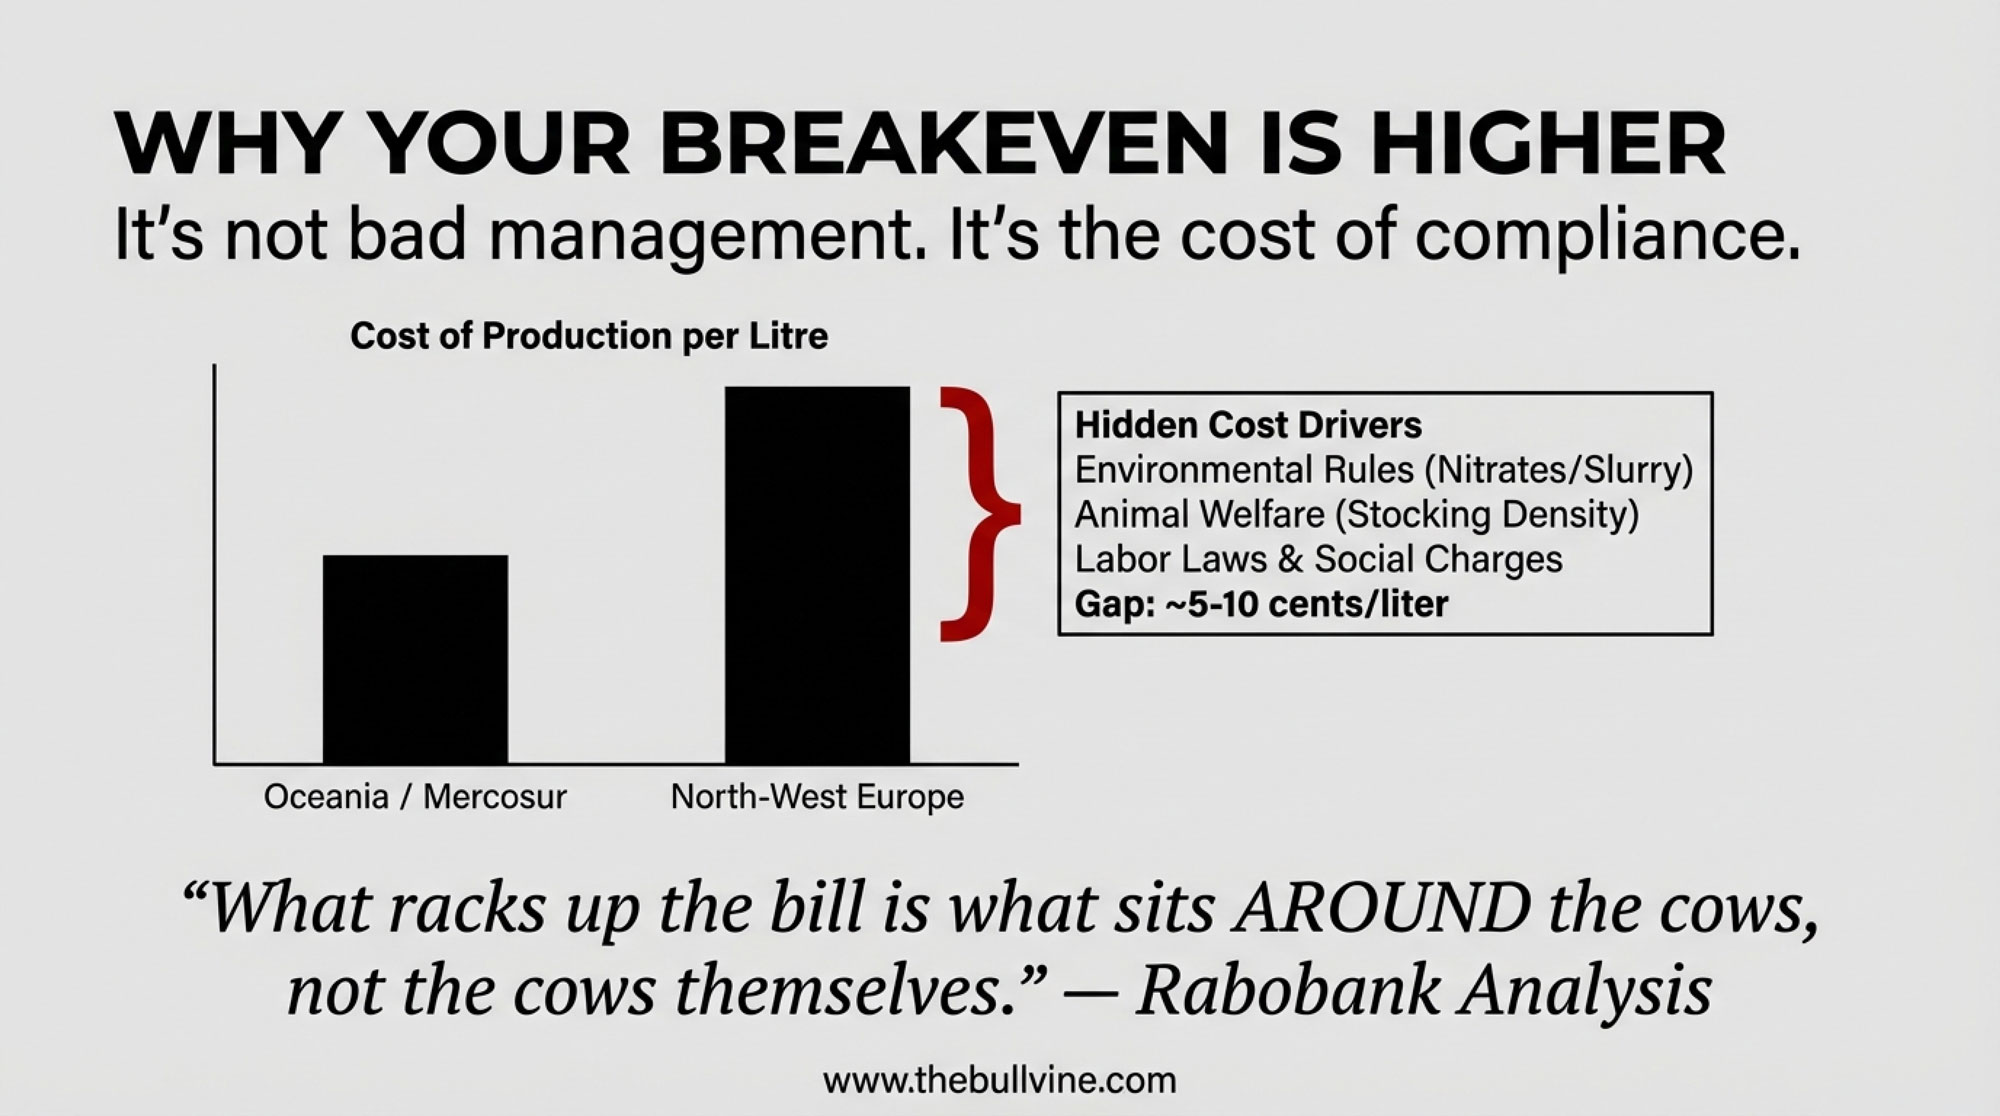
NewsSubscribe
First
Last
Consent

Forget Volume: China’s 18% Premium Surge Means $150,000+ More for Component-Focused Farms – But the Window Closes Fast

The surprising market shift that’s making component quality more valuable than volume—and what producers are learning about the 3-5 year window ahead

EXECUTIVE SUMMARY: China’s premium dairy surge is handing component-focused producers $150,000-$200,000 in extra annual revenue—no expansion required. While premium imports rocket up 18%, commodity imports are tanking 12%, creating a historic quality-over-quantity shift driven by 670 million Chinese middle-class consumers who prioritize safety and nutrition over price. Here’s the critical part: the 3-5 year window to lock in premium supplier status is already 40% gone, with October 2025 marking a crucial decision point. Producers implementing targeted nutrition changes see results in 12-18 months, while genomic improvements take 36-48 months—both achievable before the 2027 market saturation deadline. Right now, component-optimized milk commands $24/cwt versus $18 for commodity, a $6 gap that represents survival versus thriving. Bottom line: farms that pivot to components this winter will count premium checks in 2026, while volume-chasers will still be wondering what happened when the window slams shut.

You know, last week I was going through Chinese customs data, and something really caught my attention. China’s economy is slowing down to 4.6% GDP growth—we all know that story. But here’s what’s interesting… their dairy import patterns are telling a completely different tale, one that’s got progressive American producers rethinking how they value every pound of milk in the bulk tank.

So the USDA Foreign Agricultural Service released its May 2025 report, showing that China’s overall dairy imports grew by about 6% through September. Not bad, nothing spectacular. But when you dig into the specific categories—and this is where it gets really fascinating—premium dairy products are advancing nearly 18% year-over-year while commodity products are retreating around 12%, based on what we’re seeing in Chinese customs data and the latest Tridge market analysis. For those of us who’ve built our operations around maximizing volume for generations, well… this divergence is something we need to talk about.

Component-optimized milk commands $24/cwt versus $18 for commodity—a $6 gap that separates profitable farms from struggling ones. Right now, this premium represents the difference between counting checks in 2026 or wondering what happened.

What the latest customs reports are showing is cheese imports rising 13.5% and butter—get this—surging 72.6% year-over-year. Meanwhile, skim milk powder? That’s heading the other direction. I’ve been talking with dairy market analysts who’ve tracked this stuff for the past decade, and they’re telling me this isn’t just another market fluctuation. It looks like we’re seeing a fundamental shift in what the world’s largest dairy import market actually values.

Butter imports to China exploded 73% while skim milk powder declined 8%—proof that premium components crush commodity volume. Chinese consumers are voting with their wallets for quality over quantity.

“The premium shift isn’t temporary—it’s structural. Producers who position themselves now will capture long-term value that commodity markets simply can’t match.”

And here’s what really makes you think… China’s middle class is continuing to expand—the USDA projects they’ll add 80 million people by 2030—and we’re observing similar patterns across Southeast Asia, India, and parts of Africa, according to Rabobank’s December 2024 analysis. What I’ve found is this could represent the most meaningful value shift in global dairy markets we’ve seen in decades.

China’s dairy market is splitting in two—premium products rocket up 18% while commodity imports crater 12%. This historic quality-over-quantity shift represents survival versus thriving for global dairy exporters.

Understanding What’s Really Driving This Premium Shift

When you look at the forces reshaping China’s dairy demand, they actually make a lot of sense—wealth creation, food safety consciousness, evolving consumer preferences. Understanding these drivers helps explain why this shift feels different from the usual market cycles we’ve all ridden out before.

The Food Safety Factor That Won’t Go Away

It’s been seventeen years since that 2008 melamine incident—the World Health Organization reports documented six infant deaths and 300,000 illnesses. Yet Chinese consumers still show a strong preference for imported dairy products, especially when it comes to their kids. The China Dairy Industry Association’s data shows imports of infant formula increased from 28% of dairy imports in 2008 to 45% by 2019.

What’s particularly telling—and this surprised me—is that premium infant formula now represents 37% of market share, up from 32.8% just a year ago, according to July 2025 market research from Innova. The Chinese Academy of Agricultural Sciences recently published consumer research showing Chinese consumers prioritize nutritional value at 59%, quality at 45%, and safety at 39%. Price? That ranks at just 6% when they’re selecting a formula. That preference hierarchy creates real pricing opportunities for suppliers who can demonstrate superior quality and traceability.

How Middle Class Growth Changes Everything

The scale here is… well, it’s something else. China’s middle class expanded from 3.1% of the population in 2000 to 50.8% in 2018, according to McKinsey Global Institute data. We’re talking about roughly 670 million people joining the ranks of consumers with discretionary income. The National Bureau of Statistics of China reports per capita income grew at a 6.1% compound annual rate from 2019 to 2024, reaching 41,300 RMB—that’s about $5,792 annually.

What I’m seeing in the consumption data is these folks aren’t looking for the cheapest option on the shelf. They want Western-style products with clear quality differentiation. USDA estimates show cheese consumption alone could hit 495,000 metric tons by 2030, growing at a 9.1% compound annual rate. And here’s the kicker—60 to 75% is being consumed in foodservice settings like Western restaurants and pizza chains.

Why China Can’t Make These Premium Products Themselves

This caught me off guard when I first looked into it. China aims to achieve 75% dairy self-sufficiency under its 14th Five-Year Plan, but its domestic production focuses mainly on fluid milk and basic dairy products. The USDA’s May 2025 China dairy report shows Chinese farms are actually reducing output—down 0.5% in 2024 with another 1.5% decline forecast for 2025—as farmgate prices hit decade lows around 3.20 RMB per kilogram.

But here’s the real issue… China lacks the processing infrastructure for specialty cheese production, premium protein concentrates, and other high-value categories. The USDA report notes that while “domestic cheese production will increase gradually, with growing investment in natural cheese capacity,” current production is just 30,000 MT, compared to 178,000 MT imported.

Dr. Leonard Polzin from the University of Wisconsin’s Center for Dairy Profitability calls this “structural import dependency” for premium products—and it’s likely to persist given the technical expertise and infrastructure requirements. Makes sense when you think about it.

How Payment Systems Shape Who Wins in Export Markets

What’s really revealing about the competition between major dairy exporters is how payment structures influence what farmers produce, which ultimately determines export success. New Zealand is capturing 46% of China’s dairy imports? That’s not luck—it’s directly tied to how they pay farmers.

The Fonterra Approach Makes You Think

So Fonterra pays farmers solely on the basis of kilograms of milk solids—butterfat plus protein. Water? Doesn’t matter. Lactose? Not counted. Their 2025/26 forecast, announced in May, stands at $10.00 NZD per kilogram of milk solids.

Research published this year by dairy economics specialists shows the New Zealand payment system essentially discourages chasing volume. When volume isn’t the main metric, farmers naturally optimize for component density instead of pushing cows for maximum daily production. It’s a different mindset entirely.

What I find interesting is how this payment structure aligns farmer incentives with premium market demand almost automatically. When Chinese buyers want high-protein cheese or concentrated dairy ingredients, New Zealand farmers are already producing that milk profile—not specifically for exports, but because that’s what their payment system rewards.

Where American Payment Systems Create Challenges

And this is where it gets tricky for us. Most American cooperatives still use volume-focused payment systems with base prices per hundredweight, treating component premiums as add-ons rather than the main event. This creates an interesting situation—we’re optimizing for volume because that’s what payment systems reward most directly, even as global markets increasingly value component density.

Cornell University’s 2020 research on payment structures, led by Dr. Chris Wolf, found something eye-opening: non-cooperative handlers allocated 37% of premiums to quality incentives, while cooperatives allocated just 18% to quality. As the research shows, some cooperatives reward production excellence while others… well, they basically reward showing up.

“We spent decades asking, ‘How much milk can we ship?’ Now we ask, ‘How much value can we create?’ That change in thinking transformed everything about our operation—and our future.”

Learning from European Approaches

What’s interesting is looking at how European producers handle this. In the Netherlands, FrieslandCampina’s payment system includes substantial sustainability and quality bonuses that can add up to 15% to the base price. German cooperatives like DMK have shifted toward value-based pricing models that reward both components and environmental metrics. These systems took years to implement, but they’re now seeing the payoff in premium export markets.

What Progressive Producers Are Learning

I’ve been talking with forward-thinking dairy operations across the country, and many aren’t waiting around for payment system reform. They’re discovering that transitioning from volume to value can happen faster than we’ve traditionally thought—often with pretty encouraging financial results.

The Nutrition Strategy That Works Right Now

A Wisconsin producer I spoke with recently—runs about 500 cows near Eau Claire—told me something interesting: “We figured component improvement would take years, but our nutritionist showed us we could see real changes within a single lactation cycle.”

Based on Penn State Extension research and field trials across the Midwest, here’s what’s delivering results:

  • Amino acid balancing targeting 6.5-7.2% lysine and 2.4-2.6% methionine in metabolizable protein: University of Wisconsin trials show 0.1-0.2% protein increases are worth approximately $71,000 annually for a 500-cow operation
  • Fatty acid supplementation using rumen-protected fats: Michigan State research demonstrates 0.2-0.3% butterfat increases valued at $98,000+ annually
  • Forage quality optimization, maintaining 26-32% neutral detergent fiber: Cornell studies confirm this supports efficient rumen fermentation for better component production

Dr. Mike Hutjens, Professor Emeritus of Animal Sciences at the University of Illinois—he’s worked with dozens of component-focused operations—tells me farms are capturing $150,000 to $200,000 in additional annual revenuethrough nutrition changes alone, before even touching genetics.

How Genomics Accelerates the Timeline

The genomic testing revolution has really changed the game here. Chad Ryan, genetic programs manager at Select Sires, puts it this way: “What used to take 6-7 years now happens in 36-48 months for herds committed to change.”

The Council on Dairy Cattle Breeding reports that as of April 2025, the average Holstein heifer calf produces 45 more pounds of butterfat and 30 more pounds of protein annually compared to one born in 2015—purely through genetic selection. That’s progress.

Strategic Approaches by Farm Size

Through conversations with producers nationwide, it’s becoming clear that farms of every size can access premium value—though the best strategies vary quite a bit based on scale, location, and market access. Now, not every region has equal access to premium processors—let’s be honest about that—but opportunities are expanding faster than many folks realize.

Mid-Size Operations (300-800 cows): Finding the Balance

These operations often have that nice combination of enough scale for efficiency while maintaining flexibility to adapt. A producer milking 550 cows near Green Bay shared this with me: “We’re big enough to matter to processors but small enough to pivot when we need to.”

Wisconsin’s Department of Agriculture reports that operations focusing on cheese-quality milk are seeing annual revenue increases of $150,000-$200,000 through component optimization. You know what’s interesting about this size operation? They can often implement changes faster than larger dairies while still having enough volume to negotiate favorable terms with processors.

Large Operations (1,500+ cows): Leveraging Scale

California’s larger dairies are taking a different approach. A manager running a 2,100-cow operation in Tulare County explained their strategy: “We provide consistent, high-volume premium supply for export contracts.”

What I’ve noticed with these larger operations is that they’re often dealing with tighter margins per cow, so even small percentage improvements in components can make a huge difference to the bottom line. And with California’s ongoing water challenges and environmental regulations, maximizing value per gallon of water used is becoming critical.

Small Family Farms (Under 200 cows): The Niche Advantage

What’s been really encouraging—and honestly, kind of surprising—is how smaller farms are finding lucrative opportunities in specialty markets. A Pennsylvania family running 165 cows who switched to A2 production three years ago now gets $24 per hundredweight. “Would’ve seemed impossible five years ago,” they told me.

Penn State Extension specialist Lisa Holden confirms what we’re seeing: “Small farms using modern management systems are proving that farmstead-scale operations can achieve competitive margins. The key is identifying and serving premium niches that value authenticity and story alongside quality.”

The Window of Opportunity—And Its Limits

Dr. Mary Ledman, global dairy strategist at Rabobank, sees a clear but limited window here. “Producers have about 3-5 years to establish themselves as premium suppliers before market saturation occurs,” she explained at a recent industry conference. “China’s premium import growth won’t stay at 18% forever.”

What makes this particularly compelling is that nine out of ten emerging markets—Southeast Asia, India, Africa—are reporting double-digit gains in premium dairy demand according to IFCN Dairy Research Network data. Southeast Asia’s dairy market alone is projected to grow at 7-8% annually through 2030, according to FAO projections.

But let’s be realistic here. Not every producer has convenient access to premium processors. Transition costs can be substantial upfront. And yeah, there’s risk in shifting away from what’s worked for generations. Plus, with the way weather patterns have been changing—we all saw what happened with the flooding in California’s Central Valley last spring—maintaining consistent component levels through environmental challenges adds another layer of complexity.

Practical First Steps You Can Take

Based on everything I’ve learned researching this shift, here’s what I’d suggest doing in the next 30 days:

Week 1: Figure Out Where You Stand

  • Calculate your average components from the past year (and compare them seasonally—summer depression is real)
  • Compare your payment structure to what others in your region are getting
  • Identify processors in your area who pay component premiums

Week 2: Look at Nutrition Options

  • Set up a meeting with your nutritionist about amino acid balancing
  • Get quotes for rumen-protected fat supplements
  • Test your current forage quality—NDF digestibility, particle size, the works

Week 3: Explore Your Market

  • Call three specialty processors or cheese makers within reasonable hauling distance
  • Research what certifications the premium markets in your area require
  • Talk with your cooperative about their export programs and premium opportunities

Week 4: Build Your Plan

  • Set component targets for the next 12 months
  • Budget for genomic testing of heifer calves
  • Pick your first step—nutrition usually offers the quickest payback

Where This All Leads—And Why Time Matters Now

Looking at everything together—the data, what producers are experiencing, where markets are heading—this shift from volume to value in global dairy markets isn’t just talk anymore. It’s happening right now, and we’re seeing clear differences between those adapting and those holding steady.

What really strikes me is how China’s market is basically showing us the future. That surge of nearly 18% in premium dairy imports, while commodity products decline around 12%? That’s not just noise. We’re seeing similar patterns across emerging markets—FAO, Rabobank, and IFCN are all documenting this—which creates multiple opportunities for well-positioned suppliers.

I’ll be straight with you—the window for action feels tighter than many producers might expect. Those who establish premium positioning in the next 3-5 years will likely lock in long-term contracts and relationships. If we look at historical patterns in agricultural markets, waiting for others to prove the model usually means competing for whatever’s left in increasingly crowded markets.

And here’s the thing that should really get your attention: we’re already ten months into 2025. If that 3-5 year window started when these trends became clear in early 2024, we’re already approaching the halfway point of year two. The producers making moves now—this fall, this winter—are the ones who’ll be established when the real competition for premium contracts heats up in 2026 and 2027.

What gives me hope is that farms of every size genuinely have pathways forward. From 150-cow family operations I’ve visited who’re targeting local specialty markets to 2,000-cow enterprises supplying export containers, there are viable strategies across the board.

The window’s open right now—but with 2025 nearly in the books and premium market competition accelerating, every month of hesitation means watching another competitor lock in the contracts and relationships that could’ve been yours. Based on everything I’m seeing and hearing, by the time the 2026 harvest rolls around, the early movers will already be counting their premium checks while others are still debating whether to make the shift.

The clock is ticking. The question isn’t whether this shift will happen—it’s whether you’ll be part of it.

Key Takeaways:

  • The Opportunity: Premium dairy imports to China up 18% while commodity down 12%—this isn’t temporary
  • The Timeline: 3-5 year window to establish premium positioning before market saturation
  • The Money: $150,000-$200,000 potential annual revenue increase for 500-cow operations through component optimization
  • The Path: Nutrition changes deliver results in 12-18 months; genetic improvements in 36-48 months
  • The Reality: Not every producer has equal access to premium markets, but opportunities are expanding rapidly

Complete references and supporting documentation are available upon request by contacting the editorial team at editor@thebullvine.com.

Learn More:

The Sunday Read Dairy Professionals Don’t Skip.

Every week, thousands of producers, breeders, and industry insiders open Bullvine Weekly for genetics insights, market shifts, and profit strategies they won’t find anywhere else. One email. Five minutes. Smarter decisions all week.

NewsSubscribe
First
Last
Consent

The 920% Growth Gap: What Danone’s Asia Success Reveals About North American Dairy’s Future

31,000 farms today. 19,000 by 2035. The 920% Asia growth gap reveals exactly who survives—and how.

Executive Summary: When Danone reported 13.8% growth in Asia versus 1.5% in North America—a 920% difference—it exposed what every dairy farmer already feels: the game has fundamentally changed, and your response determines whether you’re still milking in 2035. Three paths are proving profitable today. Wisconsin farmers optimizing protein for export processors are capturing an extra $140,000-225,000 annually, while small Vermont organic operations are netting $489 per cow—six times conventional returns. Large-scale operations over 1,000 cows achieve $250,000-375,000 higher profits through efficiency, but here’s what any farm can implement tomorrow: beef-on-dairy crossbreeding delivers $122,500-183,750 extra revenue on 500 cows for just $23,500 investment. Geography now matters as much as management, with farms over 100 miles from processors facing $10,000+ annual disadvantages. December 1st’s Federal Order reforms will lock in advantages for those who’ve already optimized components, making the next 30 days critical. Of today’s 31,000 dairy farms, only 19,000 will survive to 2035—and the market is already choosing winners based on who adapts fastest to these new realities.

You know that feeling when you’re looking at your milk check and wondering if you’re missing something? I had that exact conversation with a Wisconsin dairy farmer last month—let’s call him Tom. He’s got his October statement in one hand, tablet in the other showing Danone’s latest earnings report. “Makes you wonder,” he said, pushing back from his kitchen table, “if we’re even in the same business anymore.”

Here’s what caught both our attention: Danone’s reporting 13.8% growth in their Asia-Pacific specialized nutrition business while North America’s crawling along at 1.5%. That’s a 920% difference, folks. Not a typo—920%.

And you know what? That conversation’s been rattling around in my head ever since, because it’s not really about Danone at all. It’s about what’s happening to all of us.

The stark reality: Danone’s 13.8% Asia-Pacific growth dwarfs North America’s 1.5%—a 920% differential that reveals exactly where dairy value is accumulating globally and which farmers are positioned to capture it.”

What’s Really Behind Those Numbers

So here’s what’s interesting—everyone immediately jumps to China’s infant formula market when they see these growth figures. Sure, China represents about two-thirds of the global infant formula market according to industry tracking, somewhere north of $90 billion. Can’t ignore that.

But there’s more going on here, and this is what I’ve been digging into…

The USDA’s Foreign Agricultural Service has been tracking something remarkable: 670 million people have joined Asia’s middle class since 2000. We’re talking about twice the entire U.S. population moving into dairy-consuming income brackets. And get this—another 80 million are expected by 2030.

Now, what really puts this in perspective is per capita consumption. In China, they’re consuming about 42 kilograms of dairy annually. Meanwhile, we’re sitting at 653 pounds per person here in the States according to USDA’s Economic Research Service data from 2024.

That’s… well, that’s about seven times more. Think about that for a second. Seven times more room to grow.

Meanwhile—and this is where it gets uncomfortable for those of us in North America—Dairy Management Inc.’s been tracking fluid milk consumption, and it’s declined for 70 consecutive years. Not quarters, not even decades. Seven decades straight.

The International Dairy Foods Association published some research in September showing Gen Z drinks about 20% less milk than millennials did at their age.

So we’ve got this massive growth potential over there, and over here? We’re basically rearranging deck chairs, fighting over market share in a pie that’s not getting any bigger.

I’ve been talking with economists and processor reps about this disconnect, and what keeps coming up is how differently they’re positioning themselves depending on whether they’re chasing Asian markets or focusing on domestic sales. And that positioning—here’s the kicker—directly affects what kind of milk they need from us.

Three Approaches That Are Actually Working

What I’ve found visiting farms from Vermont to California over the past few months is that there are basically three models that seem to be working. Not perfectly, mind you, and not for everyone, but they’re working.

The brutal math of survival: From 31,000 farms today to 19,000 by 2035, with conventional operations collapsing (red) while strategic ingredient suppliers (black), premium producers (dark grey), and large-scale operators (light grey) capture the future. Which category are you in?

The Strategic Ingredient Approach

I visited a 680-cow operation in Wisconsin recently where the owner showed me something that made my eyes pop. He’s pulling $3.40 per hundredweight above Federal Order minimums. Not from organic. Not from grass-fed. From protein optimization.

“Started working with the university folks on amino acid balancing,” he explained, spreading out his ration sheets on the office desk. “We’re adding about $75 per cow annually in rumen-protected lysine and methionine. But here’s the thing—we went from 3.12% to 3.38% protein in about eight weeks.”

Now, the University of Wisconsin Extension’s research backs this up. They’re showing farms implementing these protocols typically see returns of 2.5 to 1, sometimes up to 5.5 to 1, within 90 days. Income over feed cost improvements of forty to fifty cents per cow daily. That’s real money, not theoretical projections.

What’s driving this demand? Well, the U.S. Dairy Export Council’s been tracking how processors are investing in ultrafiltration systems to extract whey protein isolate. When that product’s selling for $5 to $8 per pound to medical nutrition companies in Singapore or Seoul, that extra 0.3% protein per tanker? Makes a huge difference to their bottom line.

Here’s what this looks like on the ground:

  • Getting your protein to 3.4-3.6%, butterfat to 4.0-4.2%—mostly through nutrition tweaks, not waiting for genetic progress
  • Keeping somatic cells under 100,000—Michigan Milk Producers Association’s paying forty to sixty cents per hundredweight bonuses for this
  • Finding processors who are actually investing in fractionation technology
  • Capturing $2 to $4 per hundredweight above base pricing

Premium Markets That Actually Pencil Out

I’ll be honest with you—I used to roll my eyes at some of these premium market stories. Seemed like a lot of work for uncertain returns.

Then I spent time with an 85-cow operation in Vermont that netted $489 per cow last year according to the Northeast Organic Farming Association’s financial benchmarks.

That’s… let me repeat that… nearly six times what similar-sized conventional operations are achieving.

What really opened my eyes was data from the University of Minnesota’s farm management folks showing Upper Midwest organic operations averaging $131,839 in total net farm income. This isn’t just a Vermont thing anymore. Wisconsin alone sold $125.7 million in organic milk in 2023—that’s third nationally, only behind California and New York.

“Can’t change the global market, but I can sure change how I respond to it.” —Wisconsin dairy farmer

And then there’s this A2 angle that’s fascinating. Visited a small operation in Pennsylvania—maybe 40 cows total—selling A2 milk at their farm store for $8.50 per gallon. “Testing cost us about $40 per cow through one of the genetics companies,” the farmer told me. “One-time expense. Now we’re capturing premiums that make the whole operation work.”

The market research on A2 is pretty compelling—we’re looking at a market that hit $15.4 billion last year and is projected to reach $50.9 billion by 2033. That’s over 14% compound annual growth. Not a fad when you see numbers like that.

Current premium pricing based on what I’m seeing in the market:

  • Organic’s running $31 to $39 per hundredweight versus $18 to $24 conventional
  • Grass-fed with intensive grazing: $36 to $52
  • A2 milk’s capturing 50% to 100% retail premiums
  • Direct-to-consumer: $6 to $10 per gallon versus $2 to $3 commodity

Scaling Up—If You’ve Got What It Takes

Now let’s talk about the other end of the spectrum. Visited a 2,100-cow operation in California that’s expanding to 2,800. Their production costs? $14.80 per hundredweight.

Cornell’s dairy farm business folks show 500-cow operations typically running $16.30 to $17.80. That’s… that’s a massive difference when you multiply it out over millions of pounds.

“Look, this isn’t for everyone,” the owner told me straight up, standing next to his new rotary parlor. “We’re $4.2 million into this expansion. Both my kids have advanced degrees—one’s got an MBA, the other’s a vet. Without that next generation ready and committed? I wouldn’t even consider it.”

USDA’s Economic Research Service data from September backs up what he’s experiencing—operations over 1,000 cows are capturing roughly $250,000 to $375,000 more in annual profit than 500-cow dairies. It’s mostly about labor efficiency and input cost advantages.

But man, that capital requirement…

Your Strategic Options: Side-by-Side Comparison

Business ModelInvestment RequiredTypical Annual Returns*Timeline to ProfitBest Suited For
Strategic Ingredient Supply$20,000-30,000$140,000-225,0003-6 monthsOperations near processors, 300-1,000 cows
Premium Differentiation$10,000-50,000**$130,000-245,0001-3 yearsFarms near urban markets, any size
Strategic Scale$2-5 million$250,000-500,0003-5 yearsOperations with capital access, next generation

*Returns based on actual farm performance data from University of Wisconsin Extension (ingredient supply), Northeast Organic Farming Association and University of Minnesota benchmarks (premium markets), and USDA Economic Research Service analysis (scale operations). Individual results vary based on management, location, and market conditions.

**With USDA organic transition assistance covering 50-75% of costs

The Beef-on-Dairy Opportunity (Seriously, Do This Yesterday)

If there’s one thing—just one thing—that every dairy farmer should’ve started yesterday, it’s beef-on-dairy. And I mean that literally. The economics are almost too good to believe, but the numbers absolutely check out.

UC Davis has been tracking this, and crossbred calf production’s jumped from about 50,000 head in 2014 to 3.2 million in 2024. Current market data shows these crossbred calves averaging around $1,300. Holstein bulls? You’re lucky to get $250 to $600 on a good day.

Talked with a Pennsylvania producer in October who’s all over this. “We genomic test every heifer calf—costs about $40 per head. Bottom third of our genetics gets bred to beef. Using Angus and SimAngus semen at maybe $22 per straw versus $8 for conventional Holstein. But those beef-cross calves? They’re selling for $1,400 at three days old. Three days!”

Stop leaving $131,250 on the table: Beef-cross calves at $1,300 versus Holstein bulls at $425 means a 500-cow operation captures an extra $131,250 annually for just $23,500 investment—this isn’t optional anymore.

CattleFax’s October analysis projects beef-on-dairy could represent one-sixth of the entire fed beef market within two years. Why? Because the U.S. beef cattle herd hit 73-year lows—we’re at 28.2 million head as of January 2024. That shortage isn’t fixing itself anytime soon.

Here’s your action plan—and I mean implement this now:

  • Test your herd if you haven’t already ($40 per cow, one-time expense)
  • Breed the bottom 30-35% to beef (but keep that 25-30% replacement rate)
  • Budget for $600 premiums long-term, not today’s $1,000-plus
  • On 500 cows? You’re looking at $122,500 to $183,750 in additional revenue first year
December 1st splits the industry permanently: Federal Order reforms lock in advantages for farms optimizing components now, with premiums jumping from $0 to $3.80 per CWT—this 30-day window determines who captures profit and who faces deductions.

Critical: Federal Order Changes Coming Fast

Effective December 1, 2025:

  • Protein factors jump from 3.1% to 3.3% per hundredweight
  • Other solids increase from 5.9% to 6.0%
  • If you’re below these levels, you’re facing deductions, not just missing premiums

Source: USDA Agricultural Marketing Service Final Decision

Geography Is Becoming Destiny (Unfortunately)

Your address determines your survival: From $3,600 near processors to $21,900 in remote areas, geography creates an automatic $18,300 annual disadvantage before management even matters—location is no longer just real estate

This is tough to talk about, but we need to face it—your location might matter more than your management now.

Recent research on milk hauling charges across the Upper Midwest is pretty eye-opening. Some Wisconsin counties near Madison? They’re paying less than twelve cents per hundredweight for hauling.

But if you’re in northern Minnesota or parts of North Dakota? You’re looking at fifty to seventy-three cents.

For a 500-cow operation, that’s nearly ten grand in annual disadvantage before you even start talking about market access. Distance to processing infrastructure correlates directly with profitability now. It’s not fair, but it’s real.

That said—and this is encouraging—Midwest operations are finding creative workarounds.

Visited a 240-cow grazing operation near Viroqua, Wisconsin, where they’ve really figured something out. “Our feed costs run about $4.20 per cow daily versus $6.80 for the confinement operation down the road,” the farmer explained while we watched his cows heading out to pasture. “Yeah, we produce less milk—46 pounds versus their 85—but our profit per cow? Actually higher.”

Recent grazing systems research from Missouri backs this up—their pasture-based operations are achieving $14.08 per hundredweight production costs versus $14.52 for conventional confinement. Not a huge difference, but when every penny counts…

What Your Region Means for Your Strategy

If you’re in the Northeast: You’ve got proximity to those premium markets, but land competition is absolutely brutal. Recent data shows Vermont farmland averaging around $4,100 per acre versus about $2,800 in Wisconsin. Your path probably runs through differentiation—organic, grass-fed, or direct marketing. You’ve got the population density to support it. For specific guidance, check with your state extension service—Cornell for New York, UVM for Vermont, Penn State for Pennsylvania.

Midwest folks: Feed cost advantages and land availability are your strengths. But if you’re over 100 miles from a major processor? The math gets tough. I’d be focusing hard on cutting production costs through grazing or looking at partnership models with neighbors. University of Wisconsin-Madison Extension and University of Minnesota have excellent resources on managed grazing economics.

Western operations: Scale is your game, no question. But water rights and environmental regulations keep tightening. California’s new sustainability requirements are adding compliance costs that really bite into margins. You’ve got to factor that in. UC Davis and Oregon State have been doing great work on water efficiency in dairy systems.

The Cooperative Question: Choose Your Risk Profile

When Danone terminated contracts with 89 Northeast organic farms back in August 2022, it sent shockwaves through the whole industry. According to the Northeast Organic Dairy Producers Alliance, fifteen of those farms went out of business entirely.

Organic Valley ended up absorbing 65 of them.

One affected farmer told me—and this still gets me—”We thought we had security with a big buyer. Turns out we were just suppliers they could optimize away when it suited them.”

Here’s the reality: you’re choosing between two different risk profiles. With a corporate buyer like Danone, you might get higher prices short-term, but you’re vulnerable to sudden termination when their strategy shifts. With a cooperative like Organic Valley, you get more stability through member ownership, but you’re subject to supply management decisions and triggering controls.

What’s interesting about Organic Valley’s response is their triggering system. They commit to purchasing milk one to three years before farms even finish their organic transition. Yes, they control who gets triggered based on their supply needs. But once they trigger you, they honor that commitment even when they’re in oversupply. During the 2016 organic oversupply crisis, they kept taking milk from triggered farms even while stopping new enrollments.

The Government Accountability Office did a report back in 2019 on dairy cooperatives—Senator Gillibrand requested it after getting complaints from constituents. They found that these consolidated cooperatives face what they called “competing interests that can create power imbalances” between large and small members.

Organic Valley’s at over 1,600 members now, adding about 84 farms annually. That’s 5.3% growth while overall farm numbers are declining.

The bottom line? Both models have trade-offs. Corporate buyers offer market pricing but zero governance control. Cooperatives provide member ownership but require you to work within their supply management framework. Neither is perfect, but understanding the trade-offs helps you make an informed choice based on your risk tolerance and long-term goals.

For farms considering organic transition, the smart move is securing your buyer commitment—whether cooperative or corporate—before investing in the three-year transition. That $180,000 mistake that Iowa farmer made? Completely avoidable with upfront buyer agreements.

Export Markets: Opportunity and Risk All Mixed Together

Let’s address the elephant in the room—China achieved 85% dairy self-sufficiency in 2023, a full year ahead of their own schedule.

According to Rabobank’s latest quarterly, their whole milk powder imports crashed 36% to just 430,000 metric tons. That’s the lowest since 2010.

Then came April’s tariff mess. By April 10, we hit 125% tariffs going both directions. U.S. dairy exports to China—which were $584 million in 2024—basically vanished overnight.

But here’s what’s interesting—Southeast Asia is a completely different story.

The six ASEAN countries represent 566 million people with a projected 19 billion liter dairy deficit by 2030. That’s actually bigger than China’s 15 billion liter gap, according to the International Dairy Federation’s latest global report.

Industry analysts I’ve talked with increasingly point out that farmers supplying processors focused on Southeast Asian markets have more stable growth prospects than those dependent on China. It’s that old wisdom about not putting all your eggs in one basket, but with real numbers behind it now.

Learning from What Doesn’t Work

Not every strategy succeeds, and we need to talk about that too.

One Iowa operation tried transitioning to organic back in 2019 without securing a buyer first. “We spent three years paying organic feed prices while getting conventional milk prices,” the farmer admitted when we talked. “Lost $180,000 before we pulled the plug.”

Another farm near Fond du Lac expanded from 400 to 800 cows in 2021. “We completely underestimated the management complexity,” they told me. “Thought we’d just double everything. Doesn’t work that way. We’re selling the expansion facilities and going back to 500.”

These aren’t failures of farming—they’re strategy lessons worth learning from before you make the same mistakes.

What Actually Needs to Happen Now

Looking at all this—the growth gaps, what’s working, what isn’t—certain decisions just can’t wait anymore.

If you’re under 500 cows:

Start beef-on-dairy immediately. I can’t stress this enough. The investment’s minimal—about $23,500 for a 500-cow operation. Returns come fast—$122,500 to $183,750 in the first year. And it doesn’t require changing your whole operation.

Also, be honest about your geography. More than 100 miles from processing? Over 200 from a metro area? Your options narrow considerably, and you need to face that reality.

If you’re 500 to 1,000 cows:

You’re in what I call the squeeze zone. Either commit to scaling up—if you’ve got the capital and management depth—or pivot hard to differentiation. Standing still is just slow bleeding at this size.

For everyone:

By November 30, you need to ask your milk buyer these questions:

  • What percentage of our milk goes into export products?
  • Which Asian markets are you actually targeting?
  • What component premiums will you pay after December 1?
  • Are you investing in protein fractionation capacity?

If those answers disappoint you, start exploring options. Now. Not next year.

The View from Here

Danone’s 13.8% Asian growth versus 1.5% in North America tells us exactly where dairy value is accumulating globally. That’s not changing anytime soon.

What can change is how we position ourselves in that reality.

The industry that emerges from all this transformation will have fewer farms—that’s just math. But those remaining will be more specialized, more efficient, or more strategically positioned. That’s not a judgment on anyone. It’s just the economic reality we’re all trying to navigate.

Remember that Wisconsin farmer I mentioned at the start? Tom? He’s implementing beef-on-dairy now, hired a nutritionist for component optimization, and he’s talking to Organic Valley about membership. “Can’t change the global market,” he told me last week. “But I can sure change how I respond to it.”

And that’s really it, isn’t it? The market’s sending us signals—loud ones. The question isn’t whether to adapt anymore. It’s how fast and how smart we can position ourselves for what’s already here.

For the 31,000 dairy farmers operating in North America today, these aren’t abstract discussions over coffee. They’re decisions that compound into survival or exit. Understanding what’s happening—really understanding it—that’s what separates the operations that’ll be milking in 2035 from those that won’t.

Sometimes the kindest thing we can do is be honest about hard truths. Even when they’re uncomfortable.

Especially then, actually.

Whether you’re in Vermont, Wisconsin, or Washington State, the fundamentals remain the same: position yourself strategically, move decisively, and don’t wait for the market to make decisions for you. Because it will.

Don’t wait: Federal Order reforms take effect December 1, 2025. If you haven’t evaluated your component levels and processor relationships yet, you’re already behind. The competitive advantages are about to lock in for those who moved early. Don’t get caught watching from the sidelines while others capture the premiums you could’ve had.

Resources for Next Steps

Northeast: Cornell PRO-DAIRY (prodairy.cals.cornell.edu), UVM Extension (uvm.edu/extension/agriculture), Penn State Extension Dairy Team (extension.psu.edu/animals/dairy)

Midwest: University of Wisconsin Dairy Extension (fyi.extension.wisc.edu/dairy), University of Minnesota Extension Dairy (extension.umn.edu/dairy), Michigan State Extension (canr.msu.edu/dairy)

West: UC Davis CLEAR Center (clear.ucdavis.edu), Washington State Dairy Extension (dairy.wsu.edu), Oregon State Dairy Extension (smallfarms.oregonstate.edu/dairy)

KEY TAKEAWAYS:

  • Beef-on-dairy pays for your next pickup truck: Bottom third of your herd + beef semen = $122,500-183,750 extra revenue this year (500-cow operation, $23,500 investment)
  • The 920% gap reveals three winners: Premium markets (organic/A2 earning 6x conventional), protein optimization ($140-225K extra annually), or 1,000+ cow scale—everything else is managing decline
  • Your address matters more than your management: Same exact operation, wrong zip code = $10,000+ annual penalty if you’re 100 miles from processing
  • December 1 splits the industry in two: Farms hitting 3.3% protein and 6.0% other solids capture premiums; everyone else faces deductions—this deadline won’t come again
  • 19,000 survivors from 31,000 farms: Asia’s exploding demand rewards farmers who adapt to export markets, while domestic-focused operations fight over crumbs—choose your side now

Complete references and supporting documentation are available upon request by contacting the editorial team at editor@thebullvine.com.

Learn More:

The Sunday Read Dairy Professionals Don’t Skip.

Every week, thousands of producers, breeders, and industry insiders open Bullvine Weekly for genetics insights, market shifts, and profit strategies they won’t find anywhere else. One email. Five minutes. Smarter decisions all week.
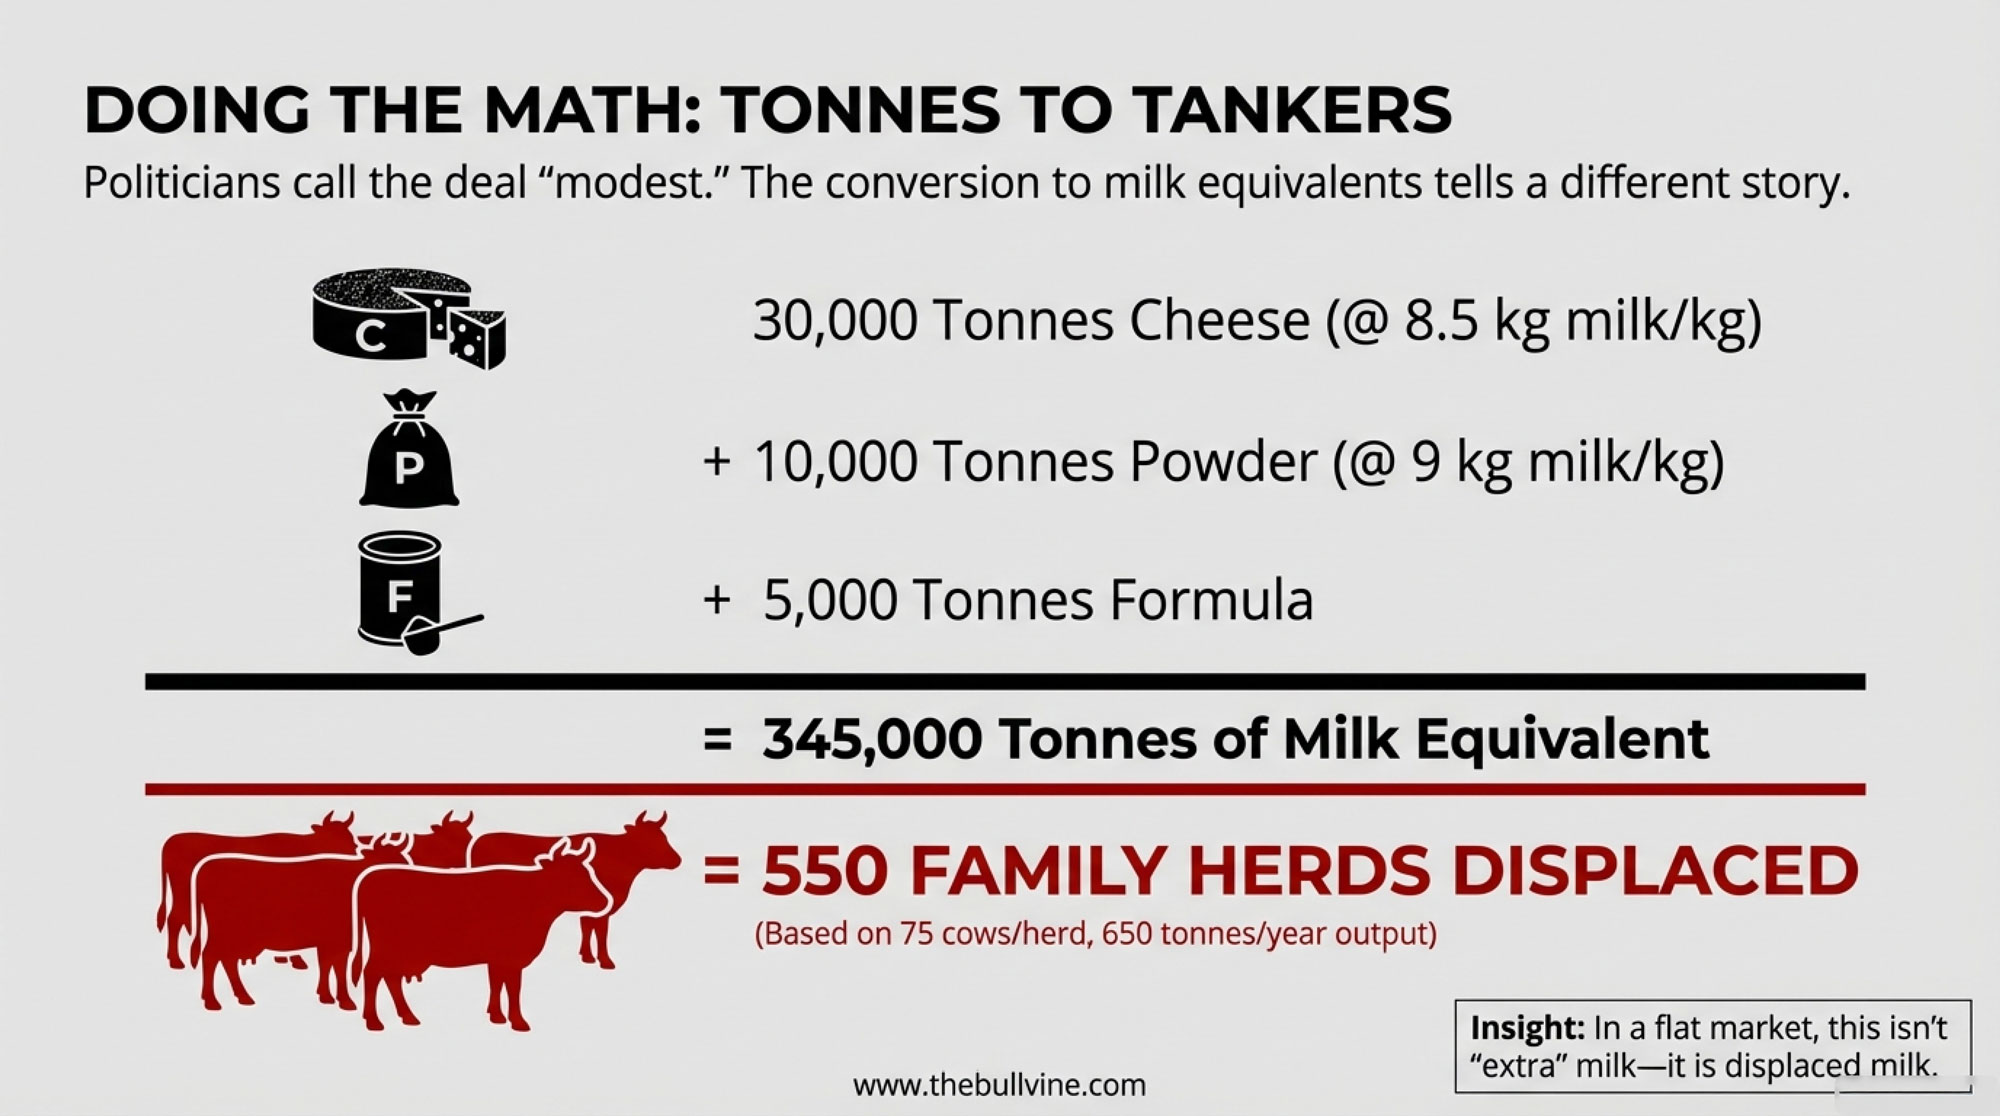
NewsSubscribe
First
Last
Consent

Butter Pays Triple: Fonterra’s $75M Investment Proves Components Are Your Future

Fonterra commits $75M to butter while powder markets collapse 39%. Smart producers already pivoting: 10-15% profit gains documented.

Executive Summary: Progressive dairy farms are adding $32,000-87,000 annually by switching from volume to component focus—and Fonterra’s $75 million butter expansion validates their strategy. Butter commands $7,000 per tonne while powder sits at $2,550, a gap that’s widening as Chinese powder demand drops 39% and global butterfat markets stay strong. Smart farms are already moving: investing $10-20 per cow per month in targeted nutrition generates returns of $25-85 within 60-90 days. The window for action is closing—$8 billion in new North American butter and cheese capacity will come online by 2027, and farmers positioned to supply components will capture those premiums, while others scramble to adapt. This analysis provides your roadmap: immediate nutrition optimization, strategic processor positioning within 18 months, and staged genetic transitions starting with your bottom third. The verdict from global markets to Wisconsin farms is unanimous: component density drives profit, volume doesn’t.

Milk Component Value

The global dairy industry is experiencing a fundamental shift in value creation—from volume to components—and farmers who recognize this transition early will position themselves for success in the emerging market structure

You know, when Fonterra announced their NZ$75 million investment to double butter production capacity at the Clandeboye facility in Canterbury, I found myself thinking about what this really means for dairy farmers like us. This goes beyond just another infrastructure upgrade—it represents a fundamental shift in how our industry values milk.

What caught my eye about the timing is this: Global Dairy Trade auctions through October 2025 have consistently shown butter trading between $6,600 and $7,000 per tonne, while skim milk powder sits around $2,550. We’re talking nearly triple the value here. And that price differential isn’t just a temporary market quirk—it reflects something deeper happening across the entire dairy value chain.

What particularly caught my attention was Fonterra’s simultaneous decision to divest their consumer brands to Lactalis for $4.22 billion while expanding butter capacity. On the surface, these moves might seem contradictory, right? But dig deeper, and a coherent strategy emerges—one that dairy farmers everywhere should understand.

Butter commands nearly triple the price of powder, rewriting the playbook for component-focused production and dismissing old volume-based strategies forever.

Understanding the Strategic Shift Behind the Investment

Miles Hurrell, Fonterra’s CEO, framed this investment as increasing production of high-value products while improving their product mix. The numbers behind that statement tell a compelling story. Their ingredients channel, which processes 80% of their milk solids, generated $17.4 billion in their most recent fiscal year. Consumer products? Just $3.3 billion.

That disparity explains why processors globally are refocusing on B2B ingredients rather than consumer brands. It’s a strategic shift that reflects where value creation actually happens in modern dairy markets.

Looking at processing flexibility in the Pacific region, what’s remarkable about New Zealand’s cream plants is their operational agility. They can shift substantial portions of milkfat between anhydrous milk fat and butter production based on market signals. This allows processors to capture whatever premium the market’s offering at any given time.

The global supply picture adds another layer to this story. According to the European Commission’s October 2025 dairy market observatory, European milk production continues growing despite relatively weak farmgate prices. USDA’s Dairy Market News shows U.S. dairy herds have expanded by 2.1% in recent months. DairyNZ confirms New Zealand’s having another strong production season with August 2025 collections up 8.3% year-over-year.

So we’ve got milk oversupply, yet butter prices remain remarkably resilient while powder markets struggle. There’s something structural happening here, and it’s worth paying attention to.

What This Means for Component-Focused Production

This brings us to what really matters for farmers: How do these market dynamics translate to on-farm decisions?

MetricJersey/CrossbredHolsteinAdvantage
Butterfat Content4.3-4.5%3.6%+0.7-0.9% (Jersey)
Protein Content3.6-3.8%3.2%+0.4-0.6% (Jersey)
Component EfficiencySuperiorStandardJersey
Economic Returns vs Holstein+10-15%BaselineJersey
Feed EfficiencyImprovedStandardJersey
Reproductive PerformanceFewer Days OpenBaselineJersey

Research from extension services at Wisconsin, Cornell, and Penn State consistently shows that component efficiency drives profitability more effectively than pure volume production. And the data is compelling. Farms implementing Jersey crossbreeding programs typically see economic returns increase by 10-15% compared to pure Holstein operations—that’s according to multi-year studies in the Journal of Dairy Science. Component levels often reach 4.3-4.5% butterfat and 3.6-3.8% protein, compared to Holstein averages around 3.6% and 3.2% respectively.

What’s encouraging is the improvement in feed efficiency and reproductive performance that comes along with these component gains. Many producers report their crossbred cows show fewer days open and require less intervention during the transition period—you probably know someone who’s seen similar results.

Dr. Randy Shaver from Wisconsin-Madison’s dairy science department documented fascinating case studies in which farms optimizing amino acid nutrition and removing polyunsaturated fat sources saw butterfat increase from around 3.4% to over 4% within weeks. When that translates to several dollars more per hundredweight… well, that’s meaningful money when you’re shipping milk every day, all year long.

I’ve noticed a generational shift happening, too. Younger farmers entering the industry aren’t as attached to the traditional “fill the tank” mentality. They’re looking at component efficiency from day one, asking different questions about genetics, nutrition, and marketing strategies. It’s refreshing, honestly.

The Powder Market Reality Driving Change

China’s powder demand has fallen off a cliff—erasing decades of growth and leaving billions in powder-drying assets stranded.

So why is this shift toward butterfat happening now? The answer lies partly in what’s happening to global powder markets.

Global Dairy Trade auctions in September and October 2025 show both skim milk powder and whole milk powder trading well below historical averages. Chinese imports—which drove powder demand for nearly two decades—remain significantly depressed. China Customs Administration data from August 2025 shows a 39% year-over-year decline. That’s not a blip; that’s a trend.

The situation in China deserves particular attention. While their domestic milk production has been declining (which, in theory, should support imports), the China Dairy Industry Association’s September 2025 report indicates that many Chinese dairy farms are operating at a loss, with farmgate prices hitting multi-year lows. This suggests structural challenges that won’t resolve quickly.

What we’re witnessing is potentially billions of dollars in powder-drying capacity built for a market dynamic that no longer exists. Rabobank’s Q3 2025 dairy quarterly describes these as potential “stranded assets”—infrastructure investments that may never generate expected returns. That’s a sobering thought for processors heavily invested in powder.

Component Optimization: A Practical Framework

For producers considering this transition, here’s what progressive operations are focusing on:

✓ Baseline assessment: Review component tests from the past 6 months to understand where you’re starting
✓ Efficiency calculation: Measure total fat and protein pounds against dry matter intake
✓ Market exploration: Request quotes from 2-3 processors to understand regional pricing dynamics
✓ Nutrition refinement: Work with your nutritionist on amino acid balancing strategies
✓ Fat supplementation: Consider palmitic acid products at 1.5-2% of diet dry matter
✓ Interference removal: Identify and eliminate high PUFA sources that suppress butterfat synthesis
✓ Progress monitoring: Track component response weekly during the initial transition month

Practical Steps for Farmers: The 18-Month Transition Strategy

Based on conversations with producers who’ve successfully navigated this shift, along with extension recommendations, a three-phase approach seems most practical.

Immediate Actions (Next 60-90 Days)

Nutrition optimization offers the fastest path to capturing component premiums. University dairy specialists consistently recommend focusing on amino acid profiles in metabolizable protein, incorporating appropriate fat supplements, and eliminating factors that suppress butterfat synthesis.

The economics are encouraging here. Research from land-grant universities, including Michigan State and the University of Minnesota, suggests that investing $10-20 per cow per month in targeted nutrition typically yields returns of $25-85. Even if your current processor doesn’t fully reward components today, you’re still capturing feed efficiency gains and often seeing reproductive benefits that improve overall herd health.

One practical approach: Start by reviewing your current ration with fresh eyes. Many farms discover they’re feeding ingredients that actively suppress butterfat—things that made sense when volume was king, but work against component optimization. It’s surprising what you might find.

Short-Term Strategy (6-18 Months)

This development suggests interesting market dynamics ahead. With processors across North America investing billions in new capacity—the International Dairy Foods Association reports over $8 billion in announced projects through 2026—they’ll need a quality milk supply to fill that infrastructure.

For U.S. producers operating outside supply management, this creates direct opportunities. I recently heard from a producer in Pennsylvania who documented her component levels and quality metrics over several months, then approached three processors for competitive quotes. When her existing buyer realized she had genuine alternatives offering 50 cents more per hundredweight, they suddenly found room to improve their pricing structure. Funny how that works.

The Canadian experience offers different lessons. While producers there can’t negotiate directly with processors—they sell to provincial milk marketing boards, which allocate milk—their transparent pricing system, administered by the Canadian Dairy Commission, clearly rewards components. October 2025 butterfat prices are $11.84 per kilogram, versus $8.31 for protein. This regulated system has driven on-farm decisions toward component optimization for years, since that’s how farmers maximize returns within the supply management framework. Canadian producers have focused intensively on genetics and nutrition to optimize components because that’s their only lever for improving revenue—they can’t negotiate volume or switch buyers.

U.S. producers following the June 2025 Federal Milk Marketing Order reforms have more flexibility but less pricing transparency. The principle of demanding clear component pricing from cooperatives remains valid for those who can negotiate or explore alternatives.

Long-Term Positioning (18+ Months)

Genetic decisions made today will determine your component profile when new processing capacity comes online in 2028-2030. Extension geneticists generally recommend starting conservatively—perhaps with your bottom third of cows for initial crossbreeding trials.

This staged approach allows you to evaluate results while maintaining operational flexibility. If market signals remain positive by mid-2026, you can expand the program. The timeline matters here because first-cross heifers bred today won’t enter your milking string for about 24 months.

Understanding Regional Variations

Different regions are adapting to this component-focused reality in distinct ways, and there’s something to learn from each approach.

New Zealand demonstrates that the model works even with smaller herd sizes—their average herd size remains under 500 cows, according to DairyNZ’s 2024-25 statistics. Their payment system has been optimized for milk solids rather than volume for years, creating remarkable efficiency. What’s particularly noteworthy is that, as Fonterra’s market share has declined to 77.8% according to the New Zealand Commerce Commission’s September 2025 report, and competitors have offered attractive component-focused pricing, it’s actually forced all processors to be more responsive to farmer needs.

In the United States, the Federal Milk Marketing Order reforms implemented in June 2025—the first major update since 2008—formally recognized that butterfat now accounts for 58% of milk check income, according to the USDA’s Agricultural Marketing Service. Yet many cooperative payment systems haven’t fully adjusted to this reality, creating opportunities for producers willing to negotiate or explore alternatives.

California producers face unique challenges with transportation distances and processor consolidation, but they’re also seeing some of the strongest component premiums in the country. The California Department of Food and Agriculture’s September 2025 data shows component premiums averaging $0.85 per hundredweight above the state average. That adds up quickly.

The Northeast presents another interesting case. Smaller farms there are finding that component optimization allows them to remain competitive despite scale disadvantages. When you’re shipping high-component milk, processor transportation costs become more manageable on a solids basis—that’s just math working in your favor.

Component optimization delivers impressive profit across all herd sizes, proving quality trumps scale in the new dairy order.

The Risks We Should Monitor—And How to Prepare

Now, while the component-focused future seems clear, several risks deserve attention along with strategies to address them.

China’s economic trajectory remains the biggest wildcard. If their dairy demand remains weak for several more years, global export markets will come under pressure. But what’s encouraging is butter’s diverse demand base—spanning Asia, the Middle East, and developed markets—provides more resilience than powder’s historically China-dependent structure. Smart farms are diversifying their risk by not betting everything on export-dependent processors.

Precision fermentation technology represents a longer-term consideration. Companies like Yali Bio and Melt & Marble are developing fermented dairy fats, with some targeting commercial launches in 2026, according to their August 2025 corporate announcements. While price parity is likely 5-10 years away, according to the Good Food Institute’s September 2025 analysis, this technology could eventually compete for commodity ingredient applications. The best defense? Focus on premium quality that commands loyalty beyond pure commodity competition.

The impact of GLP-1 weight-loss medications on dairy consumption patterns is another emerging factor. Research in the American Journal of Agricultural Economics from July 2025 indicates households using these medications reduce butter consumption by approximately 6%, primarily in retail channels rather than foodservice. Current adoption sits at 3.2% of the U.S. population according to CDC data from August 2025, though Morgan Stanley projects potential growth to 7-9% by 2035. It’s worth monitoring, but foodservice demand remains more stable.

Perspectives from Progressive Operations

Extension case studies from farms that have successfully transitioned offer valuable insights. The University of Wisconsin-Madison’s August 2025 extension bulletin documented Wisconsin farms reporting economic improvements ranging from $32,000 to $87,000 annually for 500-cow operations. The variation depends largely on their starting point and local market dynamics, but the direction is consistently positive.

The common thread among successful transitions? Methodical tracking of component efficiency—measuring pounds of fat and protein against pounds of dry matter intake. This metric, more than any other, determines economic sustainability in a component-valued market.

International examples provide additional perspective. Brazilian operations dealing with heat stress have found Jersey genetics particularly valuable. Embrapa Dairy Cattle’s 2025 annual report shows 12-15% improvement in component efficiency under tropical conditions—that’s significant when you’re battling heat and humidity. Australian producers recovering from recent industry challenges are focusing intensively on specialty cheese and butterfat products for Asian markets, as documented in Dairy Australia’s September 2025 market analysis. These diverse experiences suggest the component-focused approach adapts well across different production environments.

Essential Lessons for Dairy Farmers

After examining the data, market trends, and producer experiences, several principles emerge clearly.

Component optimization is transitioning from competitive advantage to operational necessity. The most successful farms won’t necessarily be the largest, but those producing high-component milk at competitive costs while maintaining operational flexibility.

Processing flexibility matters tremendously. Fonterra’s ability to shift between butter, AMF, and cream products based on market signals provides the resilience that single-product strategies can’t match. We should seek similar flexibility in our own operations.

Information asymmetry remains expensive but addressable. Farms that invest modestly in market intelligence and professional advisory services often identify pricing opportunities worth tens of thousands of dollars annually. The key is translating that information into actionable operational changes.

The transition period through 2027 creates a particular opportunity. As new processing capacity comes online, farmers who’ve already positioned for component production will be ready to capture emerging premiums.

Looking Forward: Your Strategic Path

The dairy industry stands at a genuine inflection point. Processing infrastructure is shifting toward butterfat-intensive products. Payment systems are gradually recognizing the value of components. Technology continues creating both opportunities and challenges for traditional dairy farming.

Fonterra’s $75 million investment signals confidence that butterfat will maintain its premium status despite powder market challenges. They’re betting this trend continues for at least the next decade. Whether they’re right depends on multiple variables—economic recovery in key markets, technology advancement rates, and evolving consumer preferences.

What seems certain is that measuring dairy success purely by tank volume is becoming increasingly obsolete. As one thoughtful producer recently observed at the World Dairy Expo: “My grandfather measured success by how full the bulk tank was. I measure it by what’s in it. Same tank, completely different business.”

The capital flowing into Clandeboye’s butter expansion represents Fonterra’s vision for dairy’s future. The decisions each of us makes about breeding, feeding, and marketing our milk will determine who captures the value that investment creates.

For an industry with deep traditions and generational farming operations, change comes slowly. Yet the message from New Zealand—and increasingly from progressive farms worldwide—deserves serious consideration. The future of profitable dairy farming isn’t just about filling the tank anymore. It’s fundamentally about what’s in it.

The producers who’ve already made this shift aren’t looking backward. They’re focused on optimizing components, improving efficiency, and building sustainable operations for the next generation. They’re positioning their farms to thrive in this new reality, not just survive it.

And honestly? They’re wondering why it took the rest of us so long to recognize what they figured out years ago.

The path forward is clear for those willing to see it. The only question is whether you’ll be among the farmers leading this transition—or playing catch-up when the market forces your hand.

Key Takeaways:

  • The Opportunity: Butterfat pays 3X powder ($7,000 vs $2,550/tonne) and the gap’s widening as Chinese powder demand craters 39%
  • The Payoff: Component-focused farms are banking $32,000-87,000 extra annually—proven across 500-cow Wisconsin operations to small Northeast herds
  • The Fast Win: Invest $10-20 per cow monthly in amino acid nutrition, capture $25-85 returns within 60 days (400% ROI)
  • The Deadline: $8 billion in new butter/cheese processing capacity comes online by 2027—position now or watch others lock in your premiums
  • Your Action Plan: Start Monday with nutrition optimization, document components for processor leverage, breed the bottom 30% to Jersey genetics this cycle

Complete references and supporting documentation are available upon request by contacting the editorial team at editor@thebullvine.com.

Learn More:

  • The Art of Feeding for Components: Beyond the Basics – This article provides advanced nutritional strategies for maximizing butterfat and protein. It reveals specific methods for balancing fatty acids and improving rumen health, allowing you to turn the market signals discussed in our main feature into tangible gains in your bulk tank.
  • Navigating the New FMMO Landscape: What Producers Need to Know Now – While our feature covers the global market shift, this analysis drills down into the recent FMMO reforms. It provides critical insights for understanding your milk check and leveraging new pricing realities to negotiate more effectively with your processor.
  • Genomic Testing Isn’t Just for the Elite Sires Anymore – To accelerate the genetic progress mentioned in our 18+ month strategy, this piece demonstrates how to use affordable genomic testing on your commercial heifers. Learn how to make faster, data-driven breeding decisions to boost component traits across your entire herd.

The Sunday Read Dairy Professionals Don’t Skip.

Every week, thousands of producers, breeders, and industry insiders open Bullvine Weekly for genetics insights, market shifts, and profit strategies they won’t find anywhere else. One email. Five minutes. Smarter decisions all week.
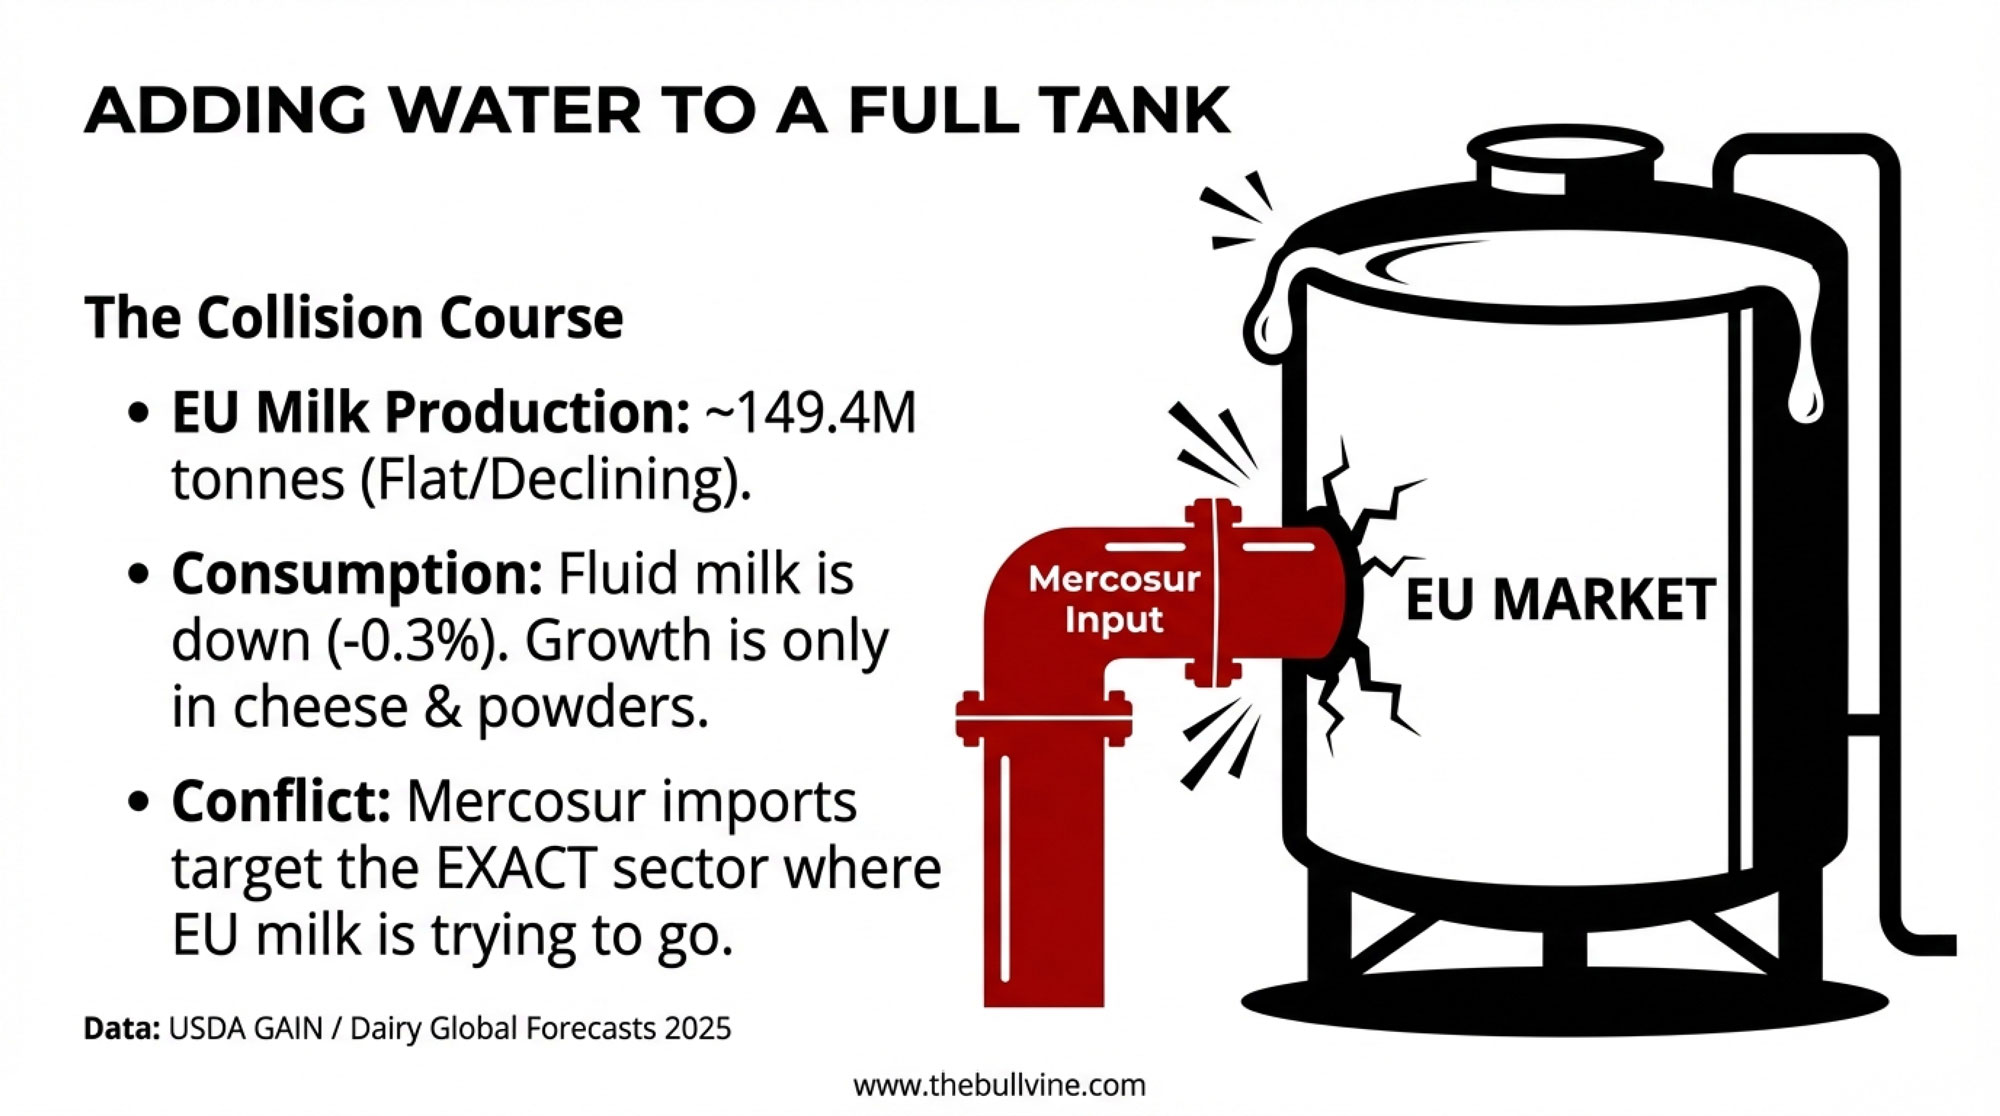
NewsSubscribe
First
Last
Consent

Butterfat vs. Powder: What the Great Dairy Divide Really Means for Your Bottom Line

Butterfat’s on top, powder’s under pressure—and the milk check now tells a story few saw coming

EXECUTIVE SUMMARY: Butterfat’s booming, powders are sliding, and together they’ve redrawn the dairy marketplace. This isn’t just another price cycle—it’s a lasting shift in how milk value is measured and paid. China’s preference for premium fats, new processor investments, and stronger herd genetics are driving a global realignment. Farmers who embrace component-based pricing, focused feeding, and risk protection remain profitable even as traditional markets weaken. The message heading into 2026 is clear: the future belongs to those who manage what’s inside the tank, not just how much fills it.

Walk into any farm shop or co-op office this fall, and chances are you’ll hear the same discussion. Butterfat is holding strong, while powders just can’t find their footing. The market doesn’t feel balanced anymore. What’s interesting here is that this gap doesn’t seem like a short-term pricing quirk—it looks and feels like a lasting shift in how milk value is determined.

Fat Holds Steady, Powder Loses Traction

Looking at the latest Global Dairy Trade (GDT) auctions, it’s easy to see the disconnect. The GDT index has fallen for five consecutive events, down roughly 1.4% in mid-October. Butter and anhydrous milk fat (AMF), however, remain firm, trading between $6,600 and $7,000 per tonne. Meanwhile, skim milk powder (SMP) is soft, sitting near $2,550 per tonne.

The Great Dairy Divide: Butterfat products command $6,800-7,200 per tonne while skim milk powder has collapsed to $2,550—a pricing gap that’s rewriting the economics of every dairy farm in America

That pattern isn’t isolated to one region. According to the EU Commission Market Observatory, SMP fell about 1% this month, while butter barely moved. In the United States, USDA Dairy Market News reported CME butter prices hovering around $3.15 per pound, roughly aligned with global benchmarks after accounting for shipping and grading differences.

The CoBank Dairy Outlook (October 2025) calls this “a composition-driven divergence.” In simple terms, the milk market isn’t paying for volume anymore—it’s paying for what’s inside. AMF, at 99.8% pure milkfat, is ideal for global manufacturers who need precision and performance. Butter, at 82% fat, still has a place, but powders are losing ground as demand in infant formula and rehydrated products slows.

China’s Import Strategy Speaks Volumes

The best way to understand this trend is to look at China, where import behavior has changed dramatically. The Chinese Customs Administration reported that butter imports rose 65% year over year, whole milk powder climbed 41%, and SMP dropped 12.5%.

China’s dairy import strategy reveals the future: butter imports surged 65%, whole milk powder up 41%, while skim milk powder dropped 12.5%—they’re buying precision fats and making powder at home

At the same time, the USDA Foreign Agricultural Service (FAS) confirmed that China’s milk production grew to 41.9 million tonnes in 2024, a rise of 6.7%. Those numbers sounded encouraging, but they also created oversupply at home. Processing plants are drying roughly 20,000 tonnes of milk a day, often at a loss. The OCLA Argentina Dairy Market Outlook (September 2025) estimates those losses at 10,000 yuan per tonne, or about $1,350 USD, thanks to high input and energy costs.

Here’s where things get interesting. China can produce plenty of powder. Where it struggles is in high-purity fats like AMF and industrial butter. Domestic processors lack the cream-separation and fractionation capacity found in markets like New Zealand, Europe, and the U.S. So their strategy has shifted. They’re importing what they can’t make efficiently. That choice has reinforced fat premiums in the global marketplace.

This development suggests a new normal for international trade. Countries will compete not on total milk output, but on how effectively they produce—and market—the right components.

Why U.S. Farmers Are Still Standing tall

Looking back through cycles like 2015 or 2020, it’s clear farmers have become better prepared to weather volatility. Part of that comes down to management maturity and new financial safety nets that didn’t exist a decade ago.

Risk Management Tools Are Paying Off
According to the USDA Risk Management Agency (RMA), about 35% of U.S. milk production is now protected under Dairy Revenue Protection (DRP), with participation surpassing 50% in the High Plains. Those policies are helping farms hold margins through increasingly unpredictable shifts in global pricing.

Smart farmers are protecting margins: 52% of High Plains milk production is covered by Dairy Revenue Protection, nearly double California’s 28%—proof that the best operators plan for volatility before it hits

Component Programs Reward Quality, Not Quantity
More than 90% of milk in the country is now sold under Multiple Component Pricing (MCP). Herds averaging 4.3% butterfat and 3.4% protein consistently earn $1.50 to $2.00 per hundredweight more than standard 3.7/3.1 herds, according to USDA AMS data. That’s a structural incentive, not a fad.

Genetics and Feeding Continue to Change the Curve
CoBank and USDA data show national butterfat averages rising from 3.95% in 2020 to 4.36% this year, while protein moved to 3.38%. The Michigan State University Extension (2025) recently found that feeding 5–6 pounds of high-oleic roasted soybeans per cow daily improved butterfat by 0.25–0.4 percentage points within 30 days, while enhancing rumen consistency and herd condition.

American dairy genetics are delivering: butterfat jumped from 3.95% to 4.36% in just five years while protein climbed to 3.38%—improvements that translate directly to bigger milk checks every month

What’s encouraging here is that improvements are cumulative. As one extension specialist explained during a recent producer roundtable, “The cows are doing the same work, but the milk’s worth more.” It’s proof that managing for higher components is one of the most direct paths to better returns.

The Processor Pivot: From Volume to Value

Processors are feeling this market divide just as strongly as producers are. And frankly, some are better positioned than others.

Let’s look at Darigold’s Pasco, Washington facility, which represents one of the industry’s most ambitious bets on global powder capacity. The plant—a $1.1 billion facility capable of processing 8 million pounds of milk per day—was planned to supply milk powders and butter to Southeast Asian buyers when those markets were booming back in 2019. But global dynamics changed faster than expected. Reports confirm the company had to deduct around $4 per hundredweight from producers’ milk checks this summer to offset startup losses. Powder-heavy exports aren’t what they used to be.

Contrast that with processors like Hilmar Cheese (Texas), Leprino Foods (Kansas), and Lactalis USA, which have expanded into cheese, whey protein, and AMF production. They’re diversifying toward higher-solids, higher-margin production that keeps milk geographically and economically competitive. Reports from First District Association (Minnesota) and Idaho Milk Products echo the same trend—premium payments now hinge on component tests because that’s where processors make their profit.

Here’s the hard truth: the U.S. industry is splitting not just by product, but by intent. Powder is still a volume game. Component ingredients are an efficiency game.

Could Butterfat Overshoot?

It’s a fair question to ask whether everyone aiming for higher fat could create the next surplus. CoBank’s August 2025 Outlook flagged that butterfat production might be “growing faster than demand absorption.”

But here’s where genetics help us. The USDA Agricultural Research Service (ARS) and Holstein Association USAperiodically adjust their Net Merit (NM$) and Total Performance Index (TPI) formulas to reflect changes in milk pricing. That means breed selection is constantly reweighted to economic reality. If fat premiums fall or protein values recover, herd objectives shift almost automatically.

The point is, dairy efficiency—not just butterfat—is what creates long-term stability. It’s why balance will always outlast fads.

The Metric That Matters: Component Spread

When you strip away all the noise, one figure tells the story: the component spread—the pay gap between baseline milk (3.5% fat / 3.0% protein) and high-component milk (4.4% fat / 3.4% protein).

Component pricing isn’t subtle: premium milk at 4.4% fat earns $2.00/cwt more than standard 3.7% fat milk—that’s $14,600 annually for a 100-cow herd, and the gap keeps widening

As USDA AMS Federal Order data shows, that premium has averaged more than $2 per hundredweight throughout 2025. If it holds, producers essentially have proof that processors are permanently paying for composition, not volume.

A USDA market economist summed it up best in a September forum: “When the value is tied to solids instead of water, you’re not in a price cycle anymore—you’re in a new structure.”

Practical Lessons Going Into 2026

The roadmap is clear: track components monthly, breed strategically, match your processor, feed for balance, and protect margins—five concrete moves that separate winning farms from the rest
  1. Track Your Components Monthly.
    Treat butterfat and protein performance as management metrics alongside fertility, transitions, or somatic cell counts. Precision wins.
  2. Start Small, Build Momentum.
    Genomic testing (around $40 per heifer) and ration adjustments are quick-return investments in this pricing climate.
  3. Match Your Processor Relationship.
    AMF and cheese plants prize solids. Powder plants still chase volume. Know which market pays for the milk you make.
  4. Breed and Feed for Balance.
    Fat and protein efficiency outweigh extremes. Avoid chasing a single number.
  5. Protect Margins with Modern Tools.
    DRP coverage, component contracts, and multi-year agreements keep income steady when markets fluctuate.

The Bottom Line: This Isn’t a Crisis—It’s an Adjustment

Every producer knows the milk market runs in cycles. But what’s happening right now feels different. Butterfat remains firm because the world wants quality ingredients that add value to food manufacturing. SMP is struggling because bulk reconstitution isn’t growing anymore.

For farmers, the lesson is clear: you don’t have to rebuild your entire operation to adapt—just fine-tune what you’re already measuring. Improving components, reviewing contracts, and aligning milk output with processor demand will go further than chasing volume.

The bottom line? The milk check no longer rewards gallons—it rewards balance, precision, and composition. The farms paying attention today are the ones positioning themselves to thrive long-term.

Key Takeaways:

  • Butterfat is booming while powders slide, signaling a lasting shift in dairy value and pay structures.
  • China’s strategic focus on high-fat imports and domestic powder production is reshaping global trade dynamics.
  • U.S. farmers maximizing components—and protecting with DRP—are turning market volatility into opportunity.
  • Processors investing in solids-based products like cheese and AMF are outpacing those tied to bulk powder markets.
  • Heading into 2026, milk checks will favor precision over production—the farms that measure will be the ones that win.

Complete references and supporting documentation are available upon request by contacting the editorial team at editor@thebullvine.com.

Learn More:

The Sunday Read Dairy Professionals Don’t Skip.

Every week, thousands of producers, breeders, and industry insiders open Bullvine Weekly for genetics insights, market shifts, and profit strategies they won’t find anywhere else. One email. Five minutes. Smarter decisions all week.
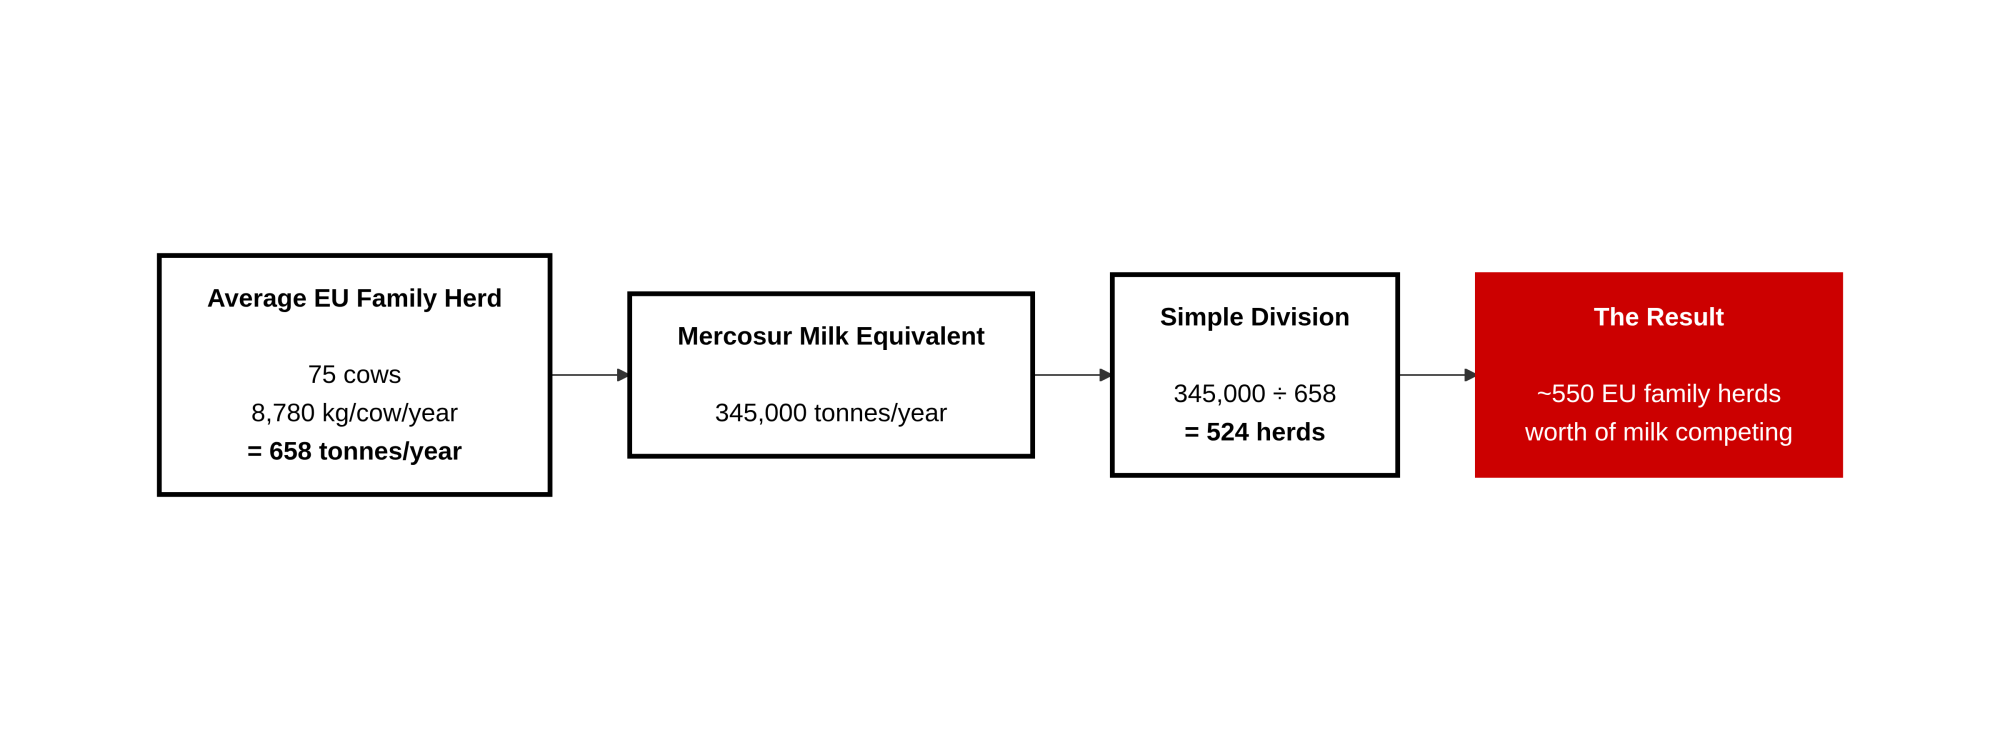
NewsSubscribe
First
Last
Consent

Argentina Beef Imports: The Immediate Stakes for Your Dairy Operation

Imports are rising. Futures are falling. Here’s what every dairy herd should know before the market moves again.

Executive Summary: A plan to import more Argentine beef may seem distant, but it’s already reshaping U.S. agriculture. The proposal to quadruple import quotas to 80,000 metric tons has dropped cattle futures nearly $100 per head and sparked tough conversations for dairies that now rely on beef‑on‑dairy calves for revenue. With 70 percent of large herds breeding to beef, and an average $250,000 in annual calf income at stake, every shift in the beef market touches the milk check. Farmers remember 1986 and 2020—years when fast policy moves caused lasting pain. What’s interesting now is how calmly producers are responding: adjusting breeding ratios, locking in forward contracts, and fine‑tuning rations instead of panicking. The broader reminder? Real stability in both beef and milk still starts in the barn, not the import ledger.

Beef on Dairy

Every so often, a government policy hits the headlines and you can almost feel it ripple across the countryside. The latest is a proposed White House plan to quadruple Argentine beef imports—from about 20,000 to 80,000 metric tons.

At first, that might sound like a beef industry story, but it’s quickly becoming a dairy conversation. The reason is simple: our operations are tied together through the beef‑on‑dairy market more than ever before. And as many farmers are noticing, market decisions made in Washington—or Buenos Aires—have a way of showing up in the calf barn faster than you’d expect.

11,000% Growth Story Dairy Can’t Ignore — From backyard experiment to industry game-changer: beef-on-dairy exploded from 50,000 head to potentially 5.5 million by 2026, reshaping American beef production forever.

Looking at What’s Behind the Policy

According to the USDA’s October Livestock, Dairy & Poultry Outlook, the U.S. cattle inventory now sits at its lowest level in 75 years. The causes aren’t new—multi‑year drought, high feed prices, and slower herd rebuilding across the Plains and West.

Crisis in Numbers: America’s Cattle Vanish — The steepest herd liquidation since World War II puts every dairy farm’s beef-on-dairy income at risk as supply fundamentals reshape decades of agricultural stability.

To ease those supply pressures, the administration is considering expanded beef imports to steady retail prices, which hit a record $6.30 per pound for ground beef this fall (Bureau of Labor Statistics).

On paper, that makes basic economic sense. But markets always react before the first kilogram of product moves. Just a week after the announcement, CME Group data showed futures prices down roughly $100 per head—or about 3 percent.

As Dr. Derrell Peel, livestock economist with Oklahoma State University Extension, put it: “You can’t rebuild a herd—or confidence—in a single policy cycle.”

And confidence is what sustains both cow‑calf ranches and dairies that depend on steady cross‑market signals.

The Beef‑on‑Dairy Link That’s Now Essential

Looking at this trend, it’s remarkable how fast beef‑on‑dairy has become a cornerstone of herd economics. In 2024, University of Wisconsin–Madison Extension researchers reported that nearly 70 percent of large dairies bred a portion of their cows to beef bulls.

The strategy significantly increased the average calf value. USDA AMS market data shows beef‑cross calves bringing $1,200 to $1,400 at birth, compared with $150 to $250 for pure Holstein bulls.

For a 1,500‑cow dairy breeding 40 percent to beef, that’s $240,000–260,000 in additional annual income. It’s the sort of capital that pays for genomic testing, sand bedding replacements, or that new holding pen upgrade.

A producer milking 1,200 cows in eastern Wisconsin told me recently, “Those beef calves have carried our barn loan for two years running. If prices fall much, we’ll need to rethink replacement plans.”

That’s real money—and real vulnerability—tied directly to policy decisions made thousands of miles from the farm.

What History Tells Us: The 1986 Buyout

What’s particularly interesting here is how this mirrors an earlier moment in ag policy—the 1986 Dairy Termination Program. Back then, USDA spent $1.8 billion to eliminate milk surpluses, buying out 14,000 farms and taking 1.5 million dairy cows off the grid.

It achieved its short‑term goal—but the cascade stunned markets. Surplus cows hit beef channels at once, and prices plunged 10–15 percent. Within two years, milk output had rebounded while much of the infrastructure serving small dairies had not.

The lesson still resonates today: market interventions can change prices quickly, but they rarely rebuild capacity at the same pace.

Psychology Trumps Physics in Cattle Markets — Import volumes climbed steadily while prices soared until policy psychology triggered the $7/cwt reality check, validating Andrew’s thesis about market sentiment over supply fundamentals

2020’s Big Reminder: When Efficiency Becomes Fragility

If 1986 was about overcorrection, then 2020 was about over‑efficiency. During the first months of COVID‑19, International Dairy Foods Association data showed 450–460 million pounds of milk dumped in April alone, while USDA ERS recorded beef and pork processing down more than 25 percent after plant shutdowns.

That period revealed how vulnerable “just‑in‑time” logistics can be. When processors or ports stall, milk and beef lose nearly all momentum.

Increasing reliance on imports—without parallel investment in domestic resilience—carries a similar risk. Once local capacity is allowed to wither, it’s slow and costly to bring back.

How Farmers Are Adjusting Already

Here’s what many Extension specialists and lenders are seeing so far:

  • Breeding Ratios Are Shifting. Herds that were 60 percent beef are easing down toward 35–40 percent to maintain heifer pipelines.
  • Feedlot Contracts Are Narrowing. Where buyers offered $1,300 per crossbred calf last spring, they’re now closer to $1,000 (USDA AMS Feeder Cattle Summary, October 2025). Forward contracting remains a critical stability tool.
  • Genomic Programs Are Staying Put.Dr. Heather Huson, associate professor of animal genomics at Cornell University, warns that cutting testing “saves pennies now but costs years of progress in herd performance and butterfat output.”
  • Ration Formulas Are Being Fine‑tuned. Nutritionists are rebalancing energy‑dense transition diets to maintain reproductive stability and milk components without increasing feed costs.

What’s encouraging is the tone—measured, thoughtful, and proactive. Dairies aren’t panicking; they’re preparing.

Regional Strategies, Shared Outlooks

Across the U.S., adaptation looks different but points to the same principle—resilience:

  • Western dry‑lot systems, stretched by feed and water constraints, are leaning back toward dairy genetics to maintain replacements.
  • Upper Midwest co‑ops, long integrated with beef‑on‑dairy programs, are renegotiating calf contracts to lock in 2026 pricing.
  • Northeast fluid dairies balancing organic quotas and beef‑cross sales are prioritizing efficiency rather than retreating from diversification.

Different regions, same balancing act—protect cash flow today while safeguarding production capacity tomorrow.

The Bigger Question: Can We Stay Self‑Sufficient?

The U.S. currently produces about 83 percent of its own beef supply, according to USDA ERS Trade Data (2025).Economists caution that, if herd recovery stays slow while imports increase, that number could slide toward 70 percent within ten years.

That’s not about politics—it’s about security. Kansas State University Extension specialists remind us that “food sovereignty” doesn’t mean cutting trade; it means keeping enough domestic capability to respond when global systems falter.

For dairy, the same applies. Once cull markets, local plants, or skilled herd labor disappear, rebuilding them isn’t a quick turnaround—it’s generational work.

Signs of Progress Worth Watching

The good news is, practical resilience efforts are underway. Wisconsin’s Dairy Innovation Hub and USDA’s Regional Food Business Centers are channeling new funding into herd research, small processor support, and cold‑chain infrastructure.

As Dr. Mark Stephenson, director of UW–Madison’s Center for Dairy Profitability, said during a recent producer panel, “Resilience isn’t about size—it’s about diversity. The more ways we move milk and beef through our systems, the better we weather volatility.”

The Bottom Line

What’s interesting here is that every generation faces its own version of policy shockwaves. This one just happens to merge global trade with a cow management strategy.

Markets shift overnight. Herds don’t. Successful farms are the ones that use these moments not to retreat, but to reinforce what already works.

If history has taught us anything—from 1986’s buyout to 2020’s pandemic fallout—it’s that capacity equals security.Protect the cows, the genetics, and the local systems, and the rest finds its balance.

Progress in agriculture has always moved at the cow’s pace—and that’s still the pace that feeds the world.

Key Takeaways:

  • A policy shift abroad can hit your milk check at home. Rising beef imports risk lowering calf values just as beef‑on‑dairy becomes vital to dairy income.
  • With 70% of dairies breeding to beef and nearly $250,000 a year on the line per farm, small price swings now carry outsized impact.
  • History is warning us: quick policy fixes in 1986 and 2020 show how capacity lost early takes decades to recover.
  • Smart dairies are preparing now—tweaking breeding ratios, securing forward contracts, and tightening transition nutrition to stay profitable.
  • Resilience beats reaction. Protect herd quality, diversify markets, and collaborate locally to keep your dairy strong through shifting trade winds.

Complete references and supporting documentation are available upon request by contacting the editorial team at editor@thebullvine.com.

Learn More:

The Sunday Read Dairy Professionals Don’t Skip.

Every week, thousands of producers, breeders, and industry insiders open Bullvine Weekly for genetics insights, market shifts, and profit strategies they won’t find anywhere else. One email. Five minutes. Smarter decisions all week.
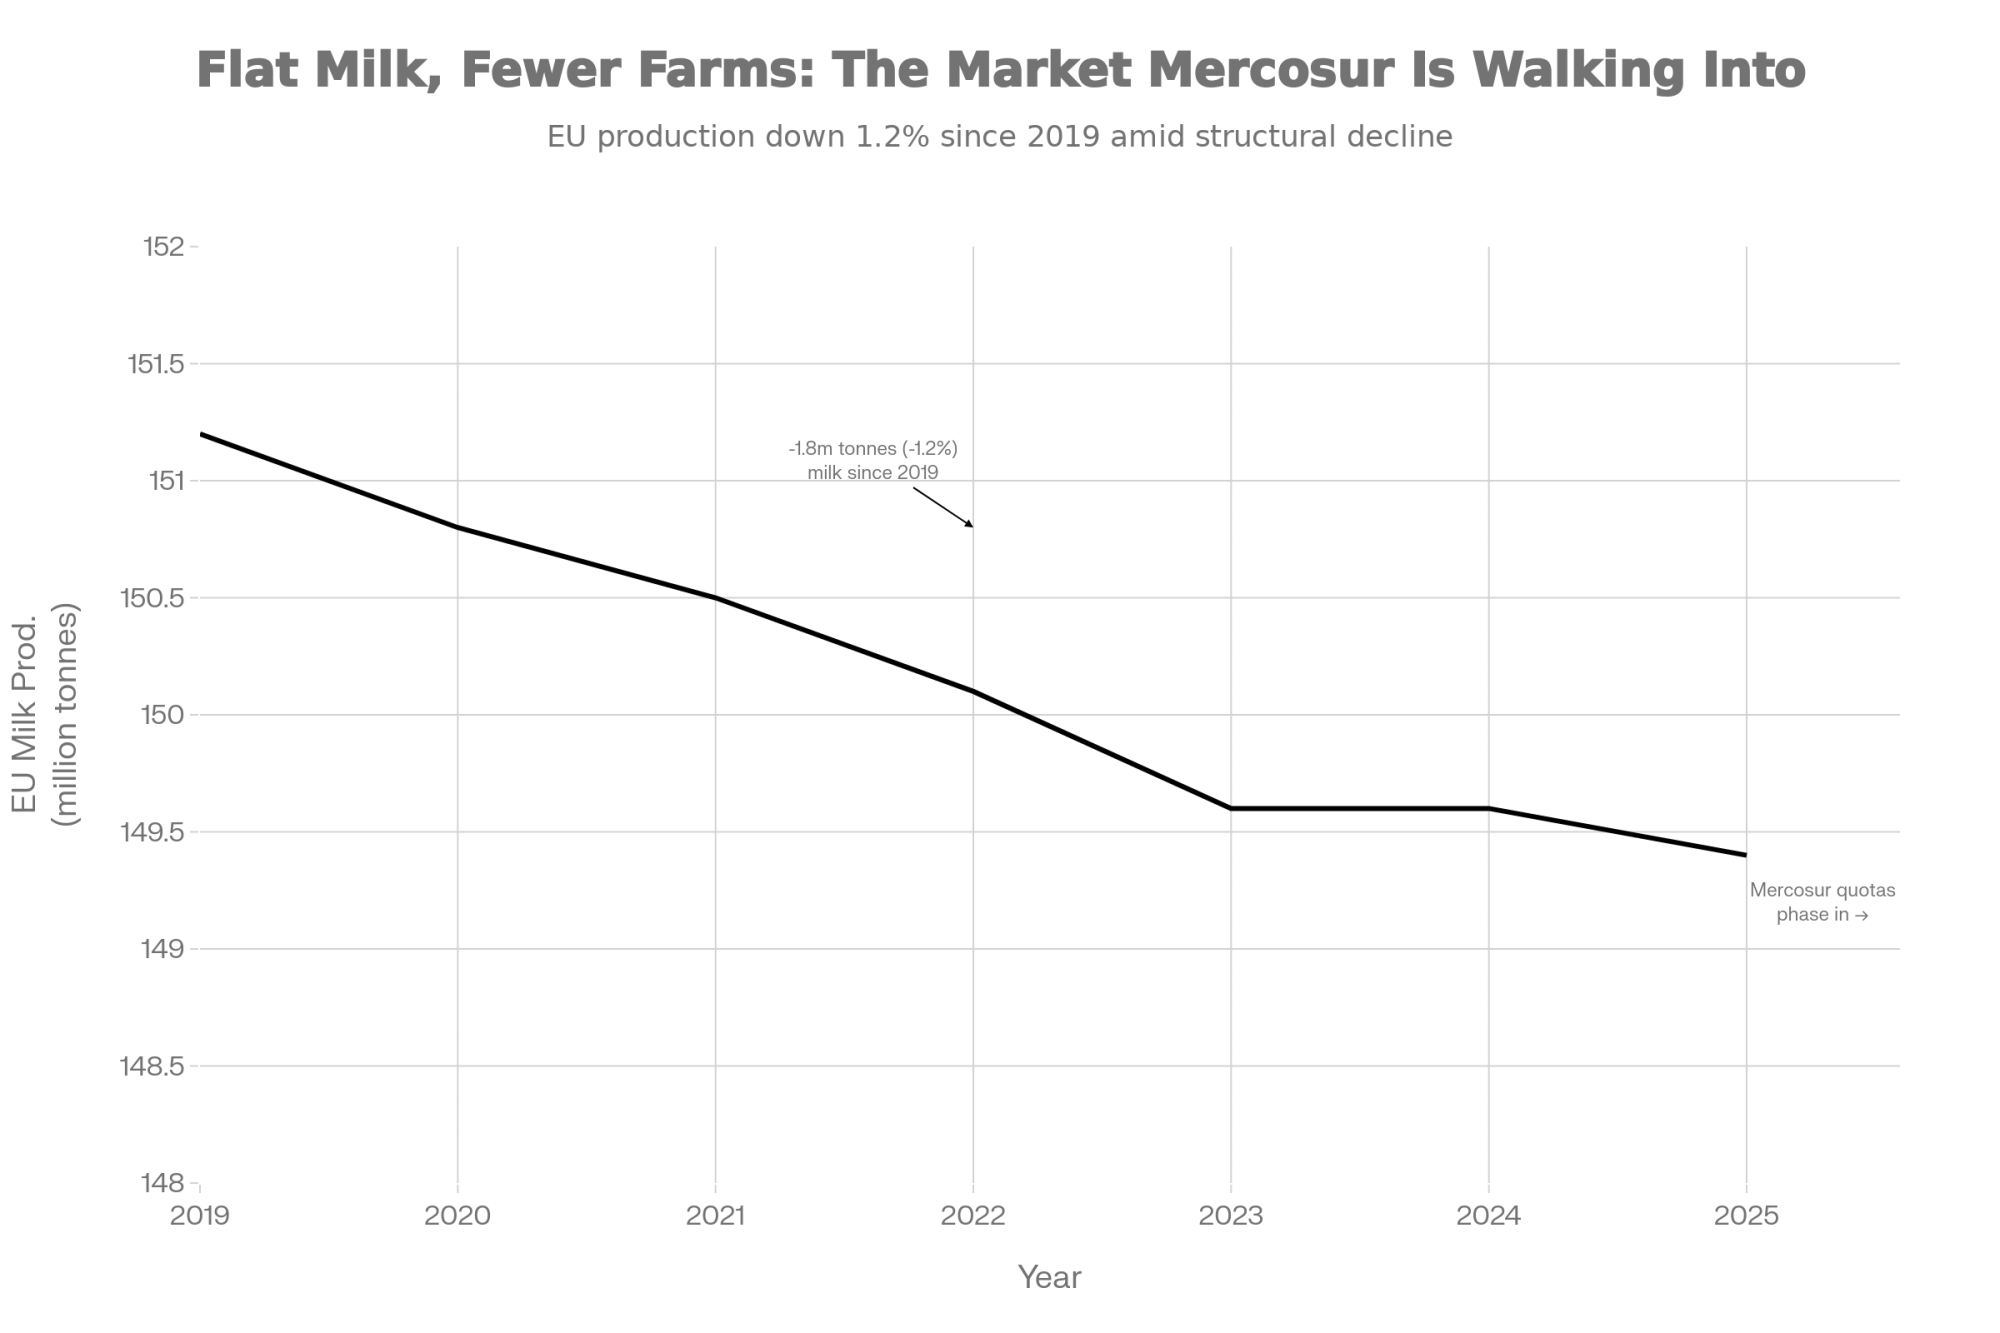
NewsSubscribe
First
Last
Consent

After the Storm Breaks: Why Cremona’s 80th Edition Means Everything

Empty show rings couldn’t kill their dreams. Nov 27-29, Europe’s dairy families finally reunite at Cremona

Preparing for Cremona’s return, I found myself thinking about something Lorenzo Ciserani once said at Sabbiona Holsteins. Not about their remarkable genetics or their 175 EXCELLENT cows. But about persistence.

“We want to breed beautiful cows that are productive and last a long time.”

Such simple words. But imagine holding onto that vision through years when those beautiful cows had nowhere to go. When “productive” was measured only in your own barn. When “lasting a long time” felt less like achievement and more like waiting for something that might never come.

What I witnessed in European dairy families during those interrupted years taught me something profound about human nature. It wasn’t continuous closure that nearly broke them—it was the cruelest pattern of all: hope, then heartbreak, then hope again.

The standard returns. LLINDE ARIEL JORDAN is named Grand Champion at the 2023 Cremona Show. This achievement—won by Spain’s SAT Ceceño—represents the pinnacle of excellence and the international standard every family is fighting to reach again after years of pandemic and disease disruption.

The Pattern That Nearly Broke Everything

First came 2020. Then 2021, 2022. Three years of pandemic isolation where exhibition halls stood empty, young handlers practiced in vacant barns, and genetics developed in solitude. Just when recovery seemed possible in 2023—when families finally started preparing animals with renewed purpose—bluetongue struck in 2024.

England reported 196 cases by this past August. Movement restrictions returned. Borders closed again. The exhibition, meant to mark a triumphant return, became another casualty.

You have to understand what this meant for families like the Beltraminos at Bel Holstein. Mauro still gets emotional talking about their beginning: “Our first heifer impressed everyone back in 1987, and that moment sparked a dream.” That dream carried three brothers through decades, earned them Grand Championships at Cremona in 2004, and victories at Swiss Expo in 2017.

But dreams need stages. And for years, there were none.

The stage they fight to return to. Pierre Boulet shakes hands with the judge Paul Trapp after winning Junior Champion at Cremona in 2023 with BEL BOEING GONDOLA. This moment represents the standard of excellence and the competitive spirit the Beltramino family—and all European breeders—have preserved during the years of interruption.

Reading the Bel Holstein family’s story reveals how they faced COVID-19, then bluetongue; yet, these experiences only strengthened their resolve. Not because they’re extraordinary. Because stopping would have meant surrendering something essential about who they are.

During the worst of it, I heard about breeders practicing their fitting skills on the same animals week after week—Francesco Beltramino and his girlfriend Chiara working in empty barns, maintaining muscle memory for competitions that might never return. One breeder told me they’d named their practice sessions “rehearsals for hope.” Dark humor, maybe. But it kept them going.

The Judge Who Carries the Weight of Understanding

Sometimes the right person appears at exactly the right moment. Nathan Thomas, accepting the invitation to judge Cremona’s 80th edition, feels like one of those times.

Here’s why Nathan matters so deeply for this moment: He doesn’t run some massive operation with unlimited resources. Triple-T Holsteins in Ohio milks about 30 cows. That’s it. Yet from that small herd, working alongside his wife Jenny and their three children, they’ve produced more than 150 All-American and All-Canadian nominations.

Just weeks ago at World Dairy Expo 2025, Nathan managed something extraordinary. Stoney Point Joel Bailey claimed her third consecutive Grand Champion Jersey title. Three years running at the pinnacle of North American showing. She stood Reserve Supreme Champion this year, with Golden-Oaks Temptres-Red-ET taking top honors, but that consistent excellence across multiple years? That’s what dairy farming really demands—not single moments of glory but sustained dedication when glory seems impossible.

The Judge Who Knows Persistence. Nathan Thomas leads the incredible Stoney Point Joel Bailey at World Dairy Expo 2025, where Bailey claimed her third consecutive Grand Champion Jersey title. This sustained dedication is the exact standard of excellence Thomas brings to judging the resilient families competing at Cremona.

When Nathan walks into Cremona’s ring this November, he brings that understanding with him. He knows what it means for a family operation to compete globally. He understands the weight these animals carry—not just genetics, but generations of hope.

What 150 Families Carry to Cremona

The statistics tell one story: More than 800 elite animals from six European nations. Seventy conference sessions. Two hundred commercial exhibitors. The Italian Trade Agency is coordinating delegations from over twenty countries.

But there’s another story those numbers can’t capture.

Think about operations like Sabbiona Holsteins. Twelve generations of homebred excellence. Not twelve years—twelve generations, each one building on what came before. Their current herd of 650 milking cows produces 42 kg per day, with a fat content of 4% and a protein content of 3.55%. They’re pushing forward with robotic milking systems, adapting, evolving.

Twelve generations of visible excellence. Sabbiona Tiky EX-96, the highest-rated Holstein in Italy, on display at Cremona. Tiky’s longevity—now in her 7th lactation—is the living proof of the Ciserani family’s belief in breeding cows that are productive and last a long time, a vision they refused to abandon through years of crisis.

Meanwhile, Bel Holstein chose a different path that’s equally valid. No robots. No automation. Francesco still clips and fits cows with his girlfriend, Chiara, and cousin, Cecilia. His brothers manage their herd—15 EXCELLENT, 59 Very Good—with the same hands-on dedication their father taught them.

Both approaches worked. Both survived. That’s the lesson—there’s no single path through crisis, only the courage to keep walking whatever path you’ve chosen.

The moment that changed everything for me was realizing these families weren’t just maintaining genetics—they were preserving identity. When you’re the third, fourth, or twelfth generation carrying forward a legacy, your animals become more than business assets. They’re living proof that what your grandparents built still matters.

The Youth Who Learned in Silence

Picture this: Young handlers across Europe spending three years learning to show cattle with no shows. Kids like Greta Beltramino at Bel Holstein, practicing their craft in empty rings, posting videos to encourage one another, and honing their skills for competitions that were repeatedly canceled.

The strength I see in this generation fills me with hope. They didn’t just endure the absence—they prepared for the return.

I heard about one group of young handlers in Germany who created a virtual showing league during lockdown, judging each other’s animals via video, maintaining the competitive spirit when actual competition was impossible. Another group in the Netherlands practiced with stuffed animals when movement restrictions prevented them from accessing their cattle. Sounds absurd until you realize they were seventeen years old, refusing to let their dreams die.

These aren’t just future farmers. They’re the generation that learned resilience before they learned what normalcy is. When they enter Cremona’s “Next Generation” competitions this November, they bring a different kind of strength—the kind forged in isolation but somehow never alone.

The future is safe. After years of cancellations, the return to Cremona isn’t just about cattle—it’s about passing the torch. The moment of triumph belongs to the generation that practiced for competitions that might never have happened.

The Morning Everything Changes

Picture November 27, 2025, with me. Dawn breaking over CremonaFiere. After years of stop-start disruption—pandemic, attempted recovery, bluetongue, more restrictions—finally, a normal morning.

The first thing you’ll notice is the sound. After so much silence, the mixture of cattle calling, equipment clanging, and conversations in six languages creates a symphony of survival. Diesel engines are warming up. Gates are swinging open. The particular squeak of well-worn wheelbarrows that haven’t been used for exhibition in too long.

Cattle trucks arriving from six countries without restriction papers, without health certificates beyond the normal, without the constant fear that someone will call saying it’s canceled again. Families seeing friends they last embraced before everything changed. Nathan Thomas is preparing to judge not just cattle, but resilience made visible.

What I find extraordinary is how ordinary it will seem to outsiders. Just another dairy show. Just farmers doing what farmers do. But you and I know better.

What Victory Actually Means Now

Every animal entering that ring has already won. Every family competing has already triumphed simply by still existing, still breeding, and still believing that excellence matters, even when it has no audience.

I keep thinking about what this means for different operations. For Sabbiona, with nearly 500 EXCELLENT cows in their history, competing again proves their philosophy endures. For Bel Holstein, returning to international competition validates that traditional methods remain relevant in an increasingly automated world.

The economic stakes are real—embryo sales and contracts worth tens of thousands, international recognition that opens new markets. But that’s not what November 27-29 is really about.

It’s about Mauro Beltramino seeing his life’s work validated. About young handlers finally experiencing what they’ve only imagined. About Nathan Thomas placing classes that represent not just this moment but all the moments that led here.

Standing there, watching families who refused to quit, even when quitting made sense, you realize you’re witnessing something sacred—the kind of sacred that happens when humans refuse to let circumstances define their limits.

The embrace of survival. After years of canceled shows, blue-tongue restrictions, and maintaining a program purely on belief, this is the moment of validation. It’s not just a win; it’s the profound, emotional relief of a community reuniting and proving that their dedication was worth the fight.

The Truth About Tomorrow

As I write this on October 18, 2025, just weeks before Cremona opens, I’m struck by how this story speaks to everyone facing their own storms. Market volatility. Family succession challenges. Technology changes that threaten traditional methods. Climate pressures that rewrite the rules.

The lesson from Europe’s dairy families is profound yet simple: Keep going. Not because success is guaranteed, but because the act of continuing is success itself.

The barn that saved their dreams wasn’t a building. It was a belief—maintained through pandemic isolation, sustained through bluetongue restrictions, preserved through every logical reason to quit.

The rhythm of European dairy life, broken so many times, will finally resume November 27-29.

Not back to normal—forward to something deeper.

These families now know they can survive anything. That knowledge changes you. Makes you both more grateful and more determined. More aware of fragility but also more certain of strength.

When I think about what awaits at Cremona—Lorenzo Ciserani seeing his family’s twelfth generation of breeding validated, young handlers like Greta Beltramino experiencing the full international exhibition, Nathan Thomas recognizing excellence forged through adversity—these moments remind me why this industry matters beyond economics.

November 27-29, 2025. Cremona, Italy.

Be there if you can. Not for the genetics, though they’ll be magnificent. Not for the business, though opportunities will abound.

Be there to witness what humans can endure, what communities can preserve, and what hope can build when it refuses to die.

Some moments remind us who we are, what we’re capable of, and why we do what we do.

This is one of those moments.

I’m eager to watch it unfold.

Key Takeaways:

  • Years of heartbreak created unprecedented resilience: Europe’s dairy families kept breeding excellence even when exhibitions seemed impossible
  • November 27-29 at Cremona isn’t just a show—it’s validation for operations that refused to quit when quitting made sense
  • Young handlers like Greta Beltramino learned to show cattle in empty barns—now they carry forward traditions they barely experienced
  • From 30-cow operations to 650-cow dairies, everyone survived differently, but everyone who survived did one thing: kept going
  • The lesson that changes everything: “The barn doesn’t know there’s no show next week”—maintain excellence because excellence is identity

Executive Summary:

They practiced fitting cattle for shows that never came, maintained excellence when excellence had no audience, and kept breeding for a future they couldn’t see. Europe’s dairy families endured five years of crushing stop-start disruption—pandemic closures from 2020 to 2022, brief hope in 2023, and then the devastating return of bluetongue in 2024. Through it all, operations like Sabbiona Holsteins (650 cows, 12 generations strong) and Bel Holstein (Grand Champions since 1987) refused to surrender their standards. Young handlers like Greta Beltramino learned their craft in isolation, while veterans like her father, Mauro, wondered if they’d ever compete again. Now, as November 27-29 approaches, Cremona’s 80th edition promises something profound: 150 farms from six nations, 800+ elite cattle, and Judge Nathan Thomas (fresh from Bailey’s third World Dairy Expo championship) converging to validate survival itself. When those barn doors open at CremonaFiere, we won’t just witness a livestock exhibition—we’ll see proof that human dedication transcends any crisis. Every animal in that ring represents a family that kept believing when belief seemed foolish, and that’s why this moment matters far beyond dairy.

Learn More:

The Sunday Read Dairy Professionals Don’t Skip.

Every week, thousands of producers, breeders, and industry insiders open Bullvine Weekly for genetics insights, market shifts, and profit strategies they won’t find anywhere else. One email. Five minutes. Smarter decisions all week.
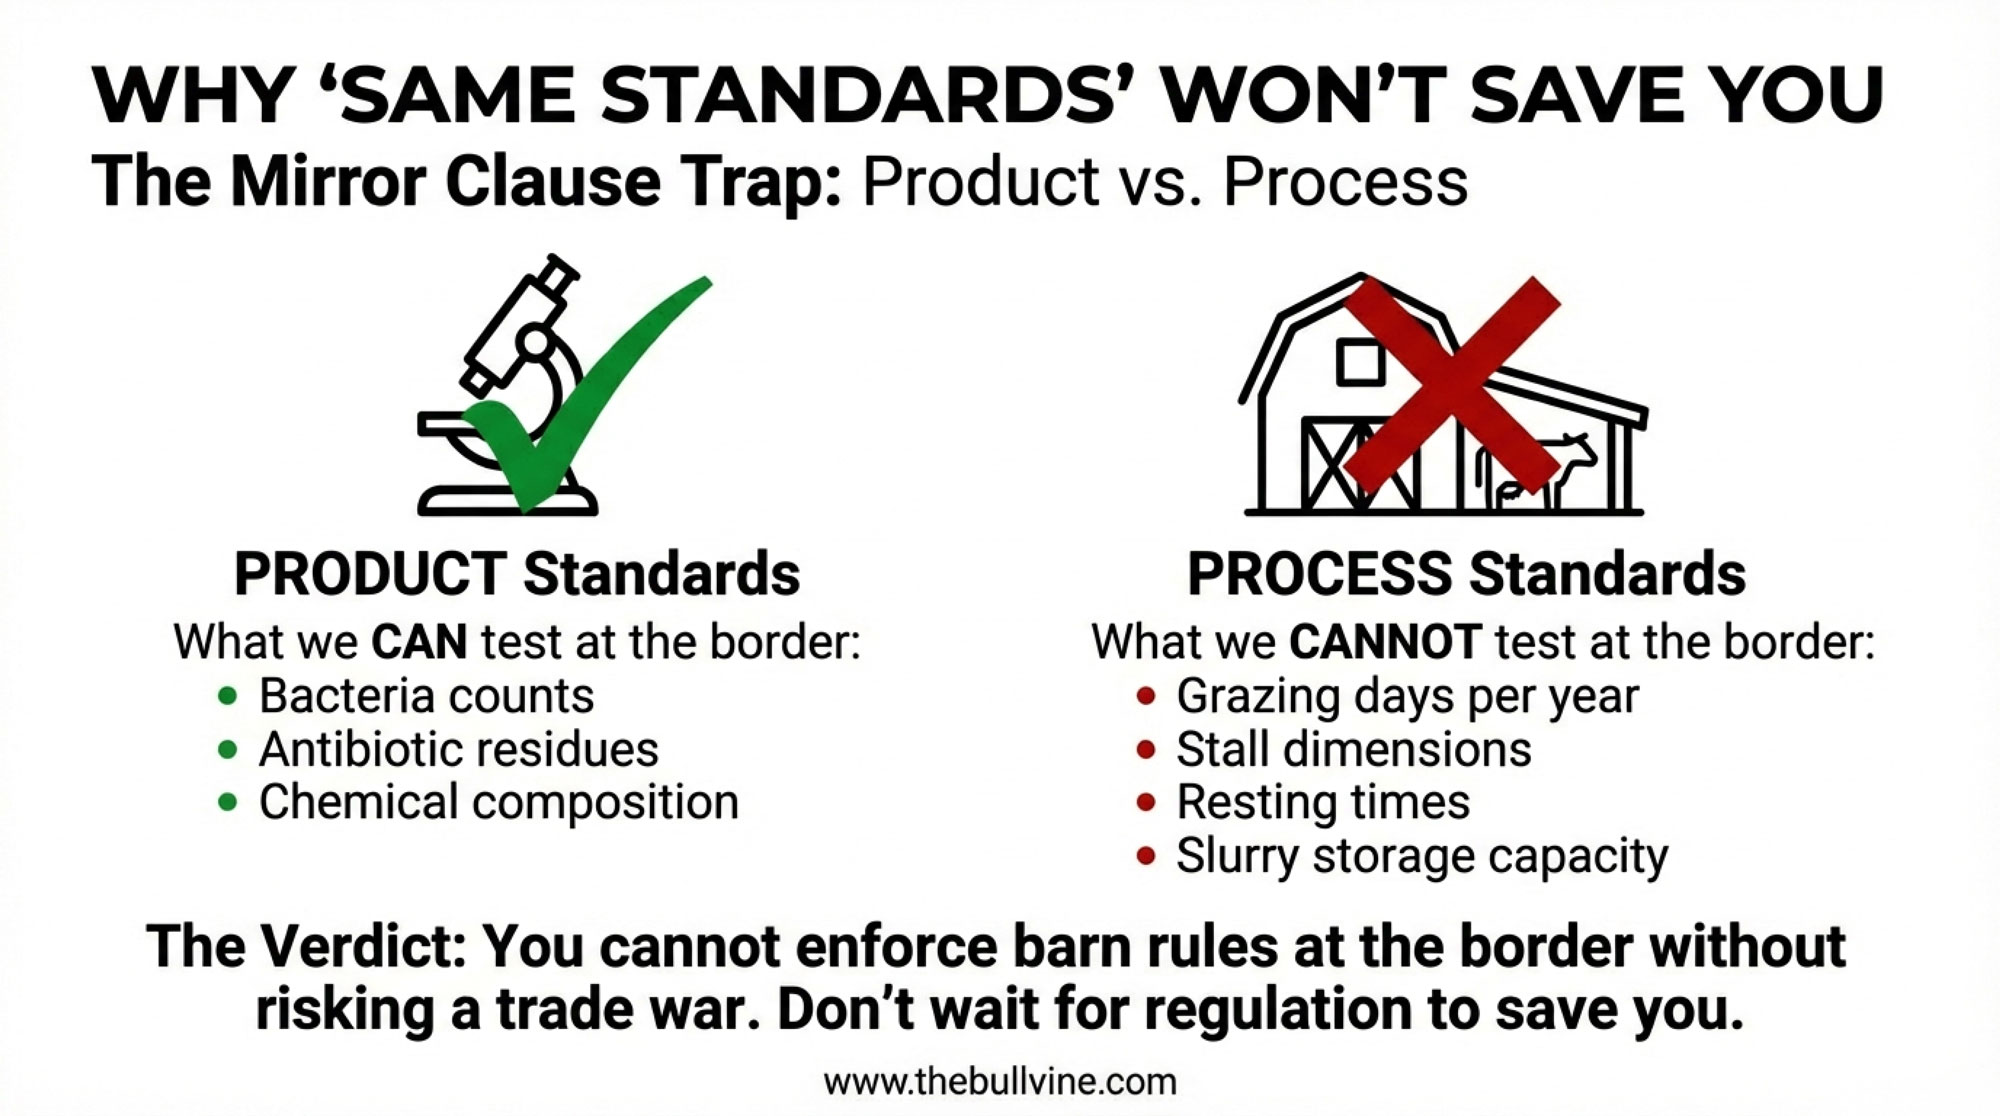
NewsSubscribe
First
Last
Consent

$320,000 Now or Dairy Legacy Forever? The October 30 Vote Splitting New Zealand’s Farmers

Why sell brands posting 103% profit growth? 10,700 farmers decide Oct 30 if $320k now beats legacy forever.

EXECUTIVE SUMMARY: Fonterra’s proposed $3.8 billion sale of its consumer brands to Lactalis presents 10,700 farmer shareholders with one of the cooperative dairy’s most consequential decisions—vote by October 30 on whether to cash out brands that have shown a remarkable turnaround. The consumer division’s operating profit surged from NZ$146 million to NZ$319 million year-over-year (103% growth), driven by expanding sales of South Asian packaged milk powders and the UHT market in Greater China, according to Fonterra’s Q3 financials. This valuation—between 10 to 15 times earnings with a 15-25% premium over typical dairy transactions—suggests that Lactalis sees long-term value in New Zealand’s grass-fed reputation, which took generations to build. With Fonterra carrying NZ$5.45 billion in debt at 39.4% gearing, the board views this sale as a means to balance sheet strengthening, although farmers must weigh the immediate capital needs against surrendering their connection to consumer markets. What farmers are discovering through discussions from Taranaki to Canterbury is that this vote transcends individual operations—it could reshape global cooperative strategies, as the boards of DFA, Arla, and FrieslandCampina watch closely. The decision ultimately asks whether farmer cooperatives can compete in consumer markets or should retreat to ingredients and processing. Each shareholder must evaluate their operation’s specific needs, succession plans, and vision for dairy’s future before casting a vote that, once done, can’t be undone.

You know that feeling when you’re doing evening chores and something on the news makes you stop and really think? That’s been happening a lot lately with this Fonterra situation. Back in August, they announced they’re selling their consumer brands to Lactalis—the French dairy giant—for NZ$3.845 billion, according to their official announcements. Could increase to $4.22 billion, including the Australian licenses.

And here’s what has got me, and many other farmers, talking… With 10,700 farmer shareholders voting on October 30, we’re looking at something that could change how we all think about cooperative dairy.

The Numbers We’re All Trying to Figure Out

So here’s what’s interesting about the financial performance, and I’ve been digging through Fonterra’s Q3 reports to get this straight. The consumer division—encompassing Mainland cheese, Anchor butter, and Kapiti specialty products—saw its operating profit increase from NZ$248 million to NZ$319 million in Q3, representing approximately a 29% rise, according to their FY25 financial presentations.

Now, where that 103% figure comes from gets a bit specific—it’s actually the quarter-on-quarter comparison. When comparing Q3 this year to Q3 last year, the consumer division’s operating profit surged 103%, increasing from approximately NZ$146 million to NZ$319 million. That’s impressive growth, anyway you slice it, driven largely by higher sales volumes of packaged milk powders in South Asia and UHT milk in Greater China, according to their quarterly updates.

I’m not sure about you, but that timing leaves me scratching my head a bit. After years—and I mean years—of hearing “just wait, the turnaround is coming,” it finally arrives. And now we’re selling?

What I’ve found interesting in the latest annual reports is the valuation itself. When you adjust for standalone costs, Lactalis is paying somewhere between 10 and 15 times earnings, with a premium of about 15 to 25 percent over what these deals typically cost. That’s… substantial. They’re clearly seeing something valuable here. And it makes you wonder—could this affect Fonterra’s position as one of the world’s largest dairy exporters? That’s something worth thinking about.

Key Facts at a Glance:

  • Sale price: NZ$3.845 billion (potentially $4.22 billion)
  • Voting date: October 30, 2025
  • Farmer shareholders: 10,700
  • Consumer operating profit: NZ$319 million in Q3 FY25 (up from NZ$248 million)
  • Quarter-on-quarter growth: 103% (Q3 FY25 vs Q3 FY24)
  • Current debt: NZ$5.45 billion
  • Gearing ratio: 39.4%

Different Farms, Different Calculations

Here’s the thing about this vote—and this is what makes it so complicated—it means something different for every operation and every region.

Take farmers supplying milk to Te Rapa, one of Fonterra’s largest manufacturing sites, down in Waikato. The plant produces over 300,000 tonnes of milk powder and cream products annually, according to Fonterra’s operational data. If you’re one of those suppliers, you’re probably thinking more about the ingredients side of the business since that’s where your milk’s likely going anyway.

However, if you’re in a region that supplies plants producing consumer products—such as some of the operations near cheese plants or butter facilities—this sale hits differently. You’ve been directly involved in building those brands.

If you’re running a smaller herd, maybe 400 to 600 cows, like a lot of farms in Taranaki or up in Northland, that potential payout could be a game-changer. We’re talking real money that could help with debt from that new rotary you put in, or finally let you upgrade that aging effluent system. With feed costs where they are and milk prices doing their usual dance, breathing room matters. Though it’s worth noting—depending on how the payout’s structured, there might be tax implications to consider. That’s something to discuss with your accountant before counting chickens.

But then… and this is where I keep getting stuck… these brands weren’t built overnight. Your milk, your parents’ milk, probably your grandparents’ milk, went into building that New Zealand dairy reputation. What’s that worth over the next 20 years? Hard to put a number on it, really.

Now, if you’re running 2,000-plus cows—like some of those bigger operations down in Canterbury or Southland—you might be looking at this differently. Many of those farms are already pretty commodity-focused anyway. For them, maybe the immediate capital for expansion or debt reduction makes more sense than holding onto consumer brands they feel disconnected from.

And then there’s everyone in between. I was speaking with a farmer near Rotorua last week who runs approximately 850 cows. She’s torn. “The money would help,” she said, “but I keep thinking about what we’re giving up. My daughter’s interested in taking over someday—what kind of industry am I leaving her?”

Farmers in regions more dependent on the consumer business—those near plants that have historically focused on value-added products—may feel this more acutely than those in regions with heavy milk powder production. It’s not just about the money; it’s about what part of the value chain your community has been connected to.

Consider the rural communities as well. When farm families have more capital, it flows through the local economy—equipment dealers, feed suppliers, the café in town. But long-term? If we lose that connection to consumer markets, what happens to the value of what we produce? And what about future cooperative dividends, considering that those higher-margin consumer products will not contribute to them?

Why Lactalis Wants In

The French aren’t throwing this kind of money around without good reason, that’s for sure. According to industry analysis, several factors are converging simultaneously.

First, there’s the Asian market access. But honestly, I think it’s more than that. It’s that grass-fed story we’ve built over decades—you know what I mean? That image of cows on green pastures, the clean environment, the careful breeding programs we’ve all invested in. Lactalis knows they can’t just create that from scratch.

And think about it—how many years of getting up at 4 AM, dealing with wet springs and dry summers, constantly working on pasture management and milk quality… all of that goes into that premium reputation. You can’t just buy that off the shelf.

What’s also interesting is how this compares to what’s happening in other markets. In the States, cooperatives like DFA have been under similar pressure. Europe’s seeing the same thing with Arla and FrieslandCampina facing questions about their consumer strategies. Down in Australia, Murray Goulburn farmers went through a similar experience with Saputo a few years ago; it might be worth asking them how that worked out.

I haven’t heard any major farming organizations take official positions on this yet, but you can bet they’re watching closely. The implications go beyond just Fonterra.

The Financial Reality Check

Now, we can’t pretend Fonterra hasn’t had some rough patches. Is that a Beingmate investment in China? Lost NZ$439 million according to their financial reports from a few years back. Other ventures also didn’t pan out.

According to their latest interim reports, they’re carrying NZ$5.45 billion in net debt, with a gearing ratio of 39.4%. That’s… well, that’s a fair bit of debt. So you can understand why the board might see this sale as a way to clean things up.

But here’s my question—and maybe you’re thinking the same thing—are we selling the profitable parts to fix past mistakes? Because that’s kind of what it feels like.

There’s also the environmental regulation side of things to consider. With nutrient management rules becoming increasingly stringent every year, some farmers are wondering if having more capital now might help them meet these requirements. It’s another factor in an already complicated decision.

And let’s not forget about currency. The NZ dollar’s been all over the place lately. Receiving a lump sum payment now versus relying on favorable exchange rates for future dividends… that’s something else to consider.

What This Means Beyond the Farm Gate

Here’s something to chew on—what happens in New Zealand doesn’t stay in New Zealand anymore. Not in today’s global dairy market.

I was speaking with a fellow who ships to a cooperative in Wisconsin last month, and he mentioned that their board is already receiving questions about their consumer brands. “If Fonterra’s doing it, why aren’t we?” That kind of thing. And you know how these conversations go—once one big cooperative makes a move, others start wondering if they should follow.

We’ve all seen what happens when cooperatives become just milk suppliers to companies that own the brands. The whole bargaining dynamic changes. Ask any of those farmers who used to supply Dean Foods in the States how that worked out. Once you’re just a supplier, not a brand owner… well, it’s a different game entirely.

There’s also something to be said about cooperative governance here. This entire situation may serve as a wake-up call about who we elect to boards and what questions we ask them. Perhaps we should be more involved in these strategic decisions before they reach the voting stage.

Questions That Keep Coming Up

Winston Peters made some good points in Parliament about this whole thing—and regardless of what you think of politicians, the questions were valid. What exactly are the terms of these supply agreements with Lactalis? I mean, if New Zealand milk becomes relatively expensive compared to, say, European or South American sources, what happens then?

These aren’t just theoretical worries. They’re the kind of practical concerns that could affect milk checks for years to come. And honestly? Farmers deserve clear answers before voting on something this big.

If you want to dig deeper into the details, Fonterra’s shareholder portal has the full transaction documents. Your local discussion group is likely covering this topic as well—it might be worth attending the next meeting to hear what your neighbors are thinking. And for those wondering about the voting process itself, it can be conducted in person at designated locations, by proxy if you are unable to attend, or through postal voting—details should be included in your shareholder materials that were distributed last month.

Regarding the timeline, if farmers vote ‘yes’ on October 30, the deal is likely to close in early 2026, pending receipt of regulatory approvals. That’s when you’d see the money, but also when the brands would officially change hands.

Thinking It Through

So, where’s all this leave us with October 30 coming up? Well, like most things in farming, it depends on your situation.

If your operation needs capital right now—and I know many that do, given current margins—this payout could be exactly what keeps you going. There’s absolutely no shame in prioritizing your farm’s survival. We all do what we need to do.

However, if you’re thinking longer term, especially if you have kids showing interest in taking over someday, you have to wonder what you’re giving up. These brands represent decades of dedication and hard work by New Zealand farmers. All those early mornings, all that attention to quality… once those brands are gone, they’re gone.

Two Different Roads

If this sale goes through, Fonterra will essentially become an ingredients and processing company. That’s a pretty fundamental shift from what the cooperative has been. We’d be supplying milk primarily for ingredients markets, with Lactalis controlling the consumer-facing side of things.

If farmers vote no? Well, that’s a statement too, isn’t it? We still believe that farmer cooperatives can compete in consumer markets. This might even encourage other cooperatives around the world to continue building their brands rather than selling them off.

The Bottom Line

You know what really strikes me about all this? Sure, the money’s important—nobody’s saying it isn’t. However, it’s really about what we think dairy farming should be in the future.

Those brands—Mainland, Anchor, Kapiti—they mean something. They’re the result of generations of farmers getting up before dawn, dealing with whatever the weather throws at us, and constantly working to improve. That connection to consumers, that ability to capture value beyond the farm gate… once you hand that over, you don’t get it back.

The vote’s coming whether we’re ready or not. Whatever you decide, make sure it’s something you can live with—not just when that check clears, but years down the road when you’re looking at what the industry’s become.

Because here’s the truth: once this is done, there’s no undoing it. Dairy farmers everywhere will be watching closely to see what New Zealand decides. And whatever way it goes, it will influence how cooperatives think about their future for years to come.

Take your time with this one. Discuss it with your family, and chat with your neighbors at the next discussion group meeting. Get all the information you can from Fonterra’s shareholder resources and those quarterly reports they’ve been putting out. Consider discussing the tax implications with your accountant as well. This is one of those decisions that really does shape the industry for the next generation.

Make it count.

KEY TAKEAWAYS:

  • Immediate financial impact varies by operation size: Smaller 400-600 cow farms could see debt relief equivalent to 18 months operating costs, while 2,000+ cow operations might fund expansion—but all sacrifice future dividend streams from consumer products showing 103% profit growth.
  • Regional implications differ based on plant specialization: Farmers supplying Te Rapa’s 300,000 tonnes of milk powder production think differently than those near cheese and butter facilities who’ve directly built these consumer brands over generations.
  • Tax and timing considerations require planning: If approved on October 30, the deal is expected to close early in 2026, pending regulatory approval. Farmers should consult with accountants about the potential tax implications of lump-sum payouts versus future dividend streams.
  • Global cooperative precedent at stake: This vote influences whether farmer-owned brands remain viable worldwide, as U.S. and European cooperatives face similar pressures—Murray Goulburn’s experience with Saputo offers cautionary lessons about becoming just suppliers.
  • Three ways to vote before deadline: Shareholders can participate in person at designated locations, submit proxy votes if unable to attend, or use postal voting with materials distributed last month—full transaction documents available through Fonterra’s shareholder portal.

Complete references and supporting documentation are available upon request by contacting the editorial team at editor@thebullvine.com.

Learn More:

The Sunday Read Dairy Professionals Don’t Skip.

Every week, thousands of producers, breeders, and industry insiders open Bullvine Weekly for genetics insights, market shifts, and profit strategies they won’t find anywhere else. One email. Five minutes. Smarter decisions all week.
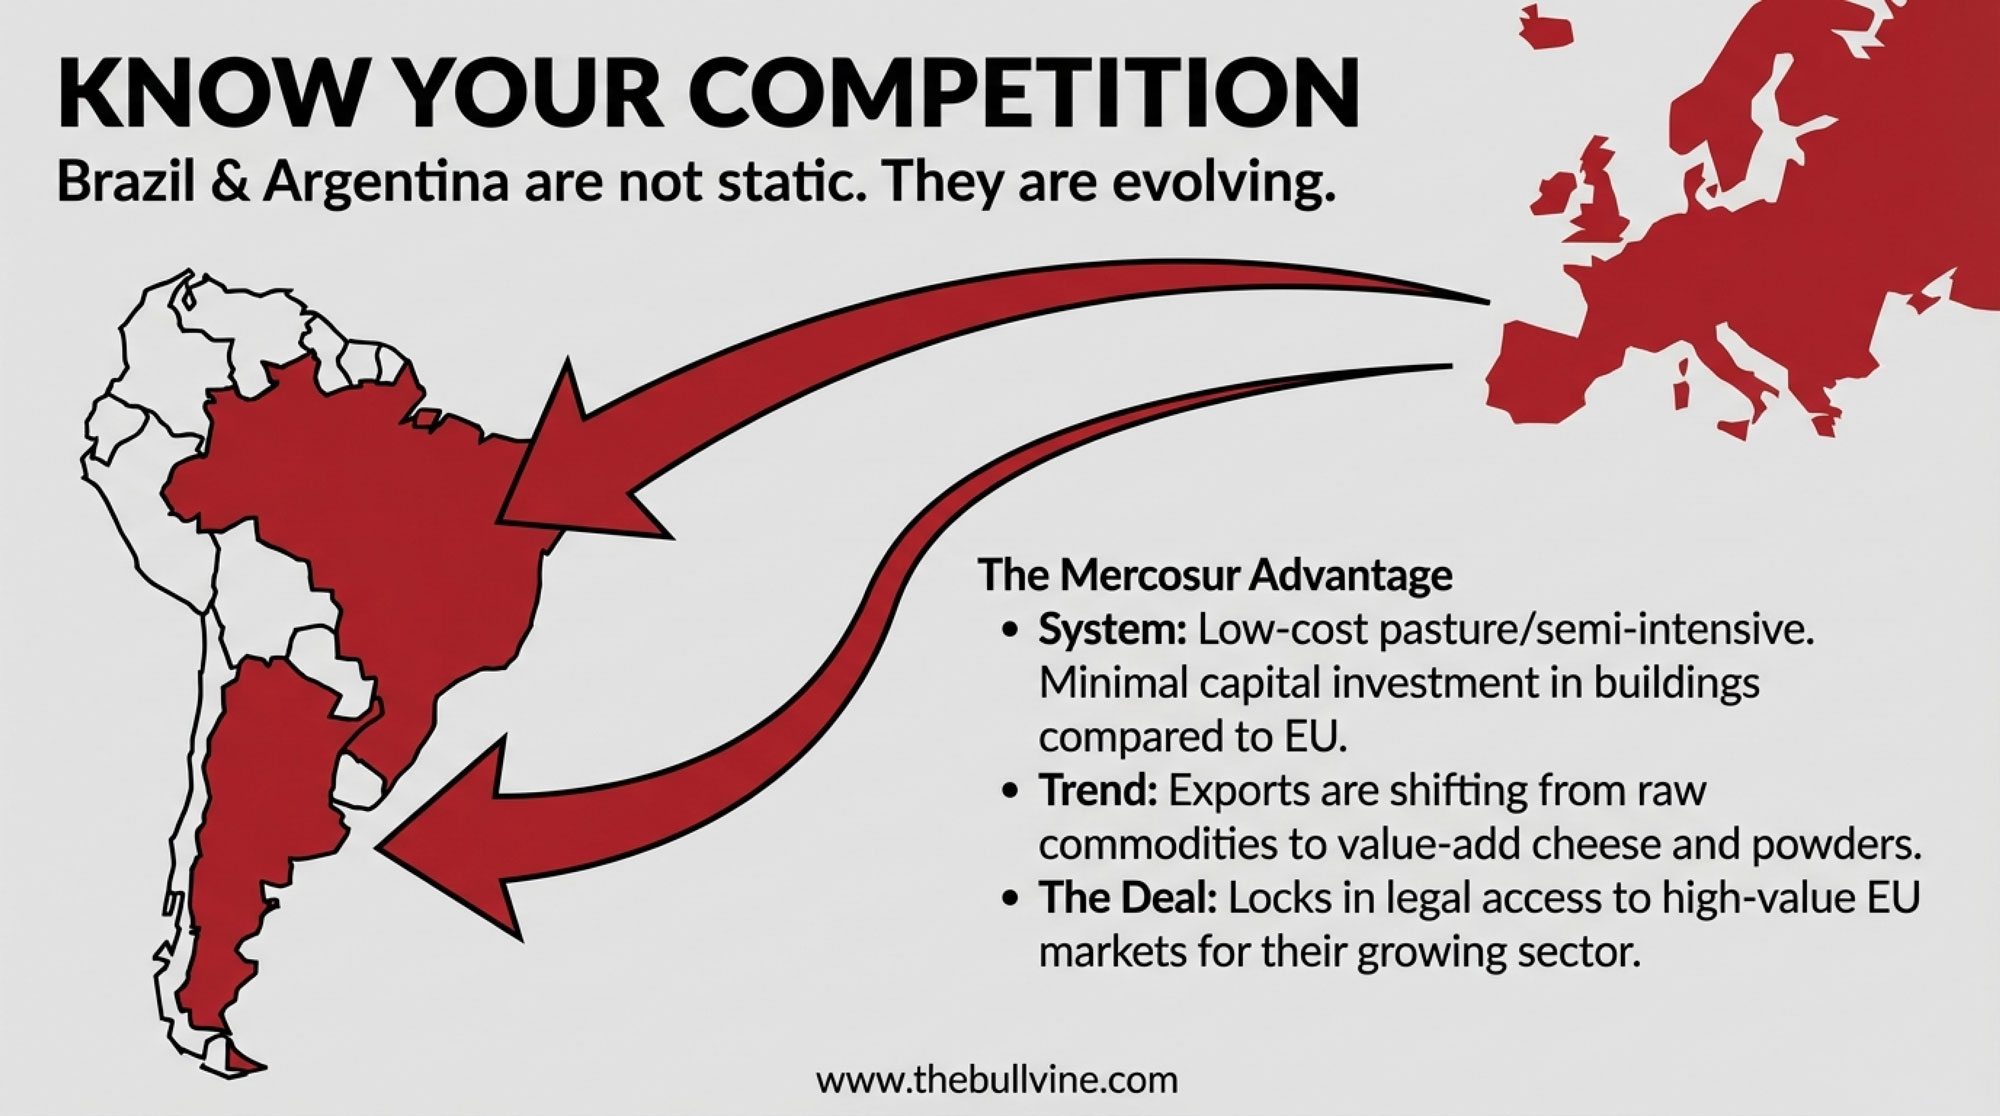
NewsSubscribe
First
Last
Consent

Ireland’s 54,000 Missing Calves Signal the Regulatory Storm Heading Your Way

When Ireland’s grass-fed advantage meets Brussels’ nitrogen limits, everyone’s milk check changes

EXECUTIVE SUMMARY: Ireland’s registration of 54,396 fewer calves this year signals a fundamental shift that’s already reshaping global dairy markets. With the nitrates derogation expiring December 31st, Irish farms face potential nitrogen limits dropping from 250kg to 170kg per hectare — a 32% reduction that could force meaningful herd culls despite EPA data showing river nitrogen at eight-year lows. This matters beyond Europe because Ireland, while producing just 1.5% of global milk, controls approximately €1 billion in annual infant formula exports serving Asia’s booming premium segment, which grew from a 32.8% to a 37% market share this past year. What farmers are discovering through Vermont’s success with GPS-guided manure application — an 18-month payback through reduced fertilizer costs — suggests that technology adoption might be the bridge between environmental compliance and profitable production. December’s Brussels decision will ripple through milk prices globally, but smart producers are already diversifying markets, documenting their environmental performance, and learning from Ireland’s experience that scale doesn’t guarantee survival when regulations shift. The conversation we’re having today about Ireland becomes tomorrow’s reality for dairy regions worldwide, making this the moment to build operational flexibility before regulatory pressure arrives at your farm gate.

 Dairy regulatory compliance

I was reviewing the latest ICBF data last week when something really caught my attention. Ireland registered 54,396 fewer calves so far this year — both the Farmers Journal and Agriland confirmed these numbers recently. And you know what? This isn’t your typical seasonal variation. This is something worth understanding.

Here’s what’s interesting: from boardrooms to barn meetings, everyone’s trying to figure out what this means. Industry experts are warning that significant herd reductions could occur in the coming years if the derogation situation doesn’t work out. The scale… well, that’ll depend on what Brussels decides in December. Having watched similar transitions play out in other regions, I think we’re seeing early signs of change that’ll affect all of us, regardless of where we’re milking cows.

Ireland’s dramatic calf registration decline signals fundamental shifts in global dairy markets as regulatory pressure intensifies. 

Understanding Ireland’s Journey

Let’s discuss how Ireland arrived at this point, as it’s quite a story. When EU milk quotas ended in 2015 — you remember that whole situation — Irish farmers really went for it. The national dairy herd has grown from approximately 950,000 cows to nearly 1.6 million today. Teagasc’s National Farm Survey confirms we’re looking at almost 70% growth in less than a decade.

But it wasn’t just about adding cows. The average herd size increased from around 80 head to 131, based on Teagasc’s People in Dairy Project from May of this year. About 82% of these operations utilize spring-calving systems, which makes perfect sense given Ireland’s grass-growing conditions. It’s a model that works beautifully… if you’ve got their climate.

What’s particularly noteworthy is the efficiency they maintained during this expansion. Frank O’Mara’s research team at Teagasc has documented a carbon footprint of just 0.88 kg CO2e per kilogram of fat- and protein-corrected milk. The global average? That’s running around 2.5 kg. So you can see why people pay attention to what happens over there.

 Ireland’s sustainability and market advantages in grass-fed dairy face elimination under potential nitrogen restrictions.

The investment required was substantial. The Irish Farmers Association documented about €2.2 billion in farmer investment during the post-quota expansion period, with processors adding another €1.3 billion in capacity. That’s real money, borrowed against real assets.

December’s Decision Point

Now here’s where things get really interesting. December 31st is when Ireland’s nitrates derogation expires. For those unfamiliar with European regulations, the derogation permits qualifying farms to apply up to 250kg of nitrogen per hectare annually — significantly exceeding the standard 170kg limit. Most Irish farms have already reduced their stocking rates to 220kg as of January 2024, and maintaining that level is uncertain.

What I find encouraging is that the Netherlands submitted their derogation extension request back in July, according to Agriland’s reporting. So Ireland won’t be negotiating alone, which might influence how things play out in Brussels.

I’ve been talking with several Irish producers about this, and their frustration is understandable. The EPA monitoring shows nitrogen in Irish rivers hit an eight-year low in 2024 — that’s real environmental progress, which RTÉ covered back in March. Yet Brussels added these new requirements under the Habitats Directive, demanding individual assessments for 46 different catchments. I mean, can you imagine managing that paperwork while you’re trying to keep fresh cows healthy during transition?

“Good data is becoming as important as good genetics” — Wisconsin dairy producer on technology adoption

Denis Drennan from ICMSA has been pretty clear that milk prices need to stay strong in 2025 just to cover the increasing regulatory burden. And with co-ops reporting notable year-over-year reductions in deliveries during parts of this year — the magnitude varies by region and month — those newly expanded processing plants are facing some real challenges.

Why This Matters Globally

This is where Ireland’s situation becomes everyone’s business. Despite producing only about 1.5% of global milk, Teagasc research from June indicates that Ireland generates approximately €1 billion in annual infant formula exports, with six major manufacturers operating there. That concentration of expertise… it’s not something you can quickly replicate elsewhere.

The Asian market dynamics are particularly relevant here. Analysis from July shows China’s premium infant formula segment grew from about 32.8% to 37% market share over the past year. These consumers specifically want products with verified grass-fed credentials—and they’re willing to pay for them.

You know, the nutritional advantages from grass-based systems — higher CLA levels, better omega-3 profiles — that’s not just marketing. Those are measurable differences that processors can document. However, here’s the thing: these advantages stem from specific climate conditions, decades of infrastructure development, and genetics selected for grass-based production… you can’t just flip a switch and replicate that.

Similar challenges are playing out in California, where water restrictions shape production decisions, or in the Northeast, where land costs drive different operational choices. Each region has its unique pressures. In Canada, supply management adds another layer of complexity, while Australian producers navigate drought cycles that make Ireland’s consistent rainfall look like a paradise.

How Processors Are Adapting

The processing sector they’re really scrambling right now. Companies like Danone, Glanbia, and Kerry Group invested hundreds of millions based on growth projections that seemed reasonable at the time. Now they’re looking at potential supply drops while those fixed costs aren’t going anywhere.

What I’m hearing is that processors are stress-testing all kinds of options. Some are exploring powder reconstitution for specific applications, others are recalibrating their product mix, and many are focusing on supply diversification. But when your competitive advantage is rapid conversion from farm to finished product — that speed-to-value that’s so critical in infant nutrition — workarounds have limitations.

According to industry contacts, processors aren’t waiting for December. They’re actively reviewing supply chain contingencies, adjusting portfolios, and working through various scenarios. Many are now seeking long-term supply diversification contracts in other low-cost regions. It’s pragmatic planning in uncertain times.

Technology’s Growing Role

Technology TypeInvestment CostPayback PeriodAnnual SavingsRegional Example
GPS-guided manure application$45,00018 months$30,000Vermont (fertilizer reduction)
Robotic milking systems$175,00048 months$43,000Wisconsin (labor + efficiency)
Precision feed management$25,00024 months$15,000Ireland (compliance ready)
Heat detection collars$15,00012 months$16,000Netherlands (conception rates)
Environmental monitoring$8,00015 months$6,500California (water compliance)

Something that really caught my attention was ICBF’s September update to their Economic Breeding Index. The Farmers Journal reported that average EBI values dropped about €83 per animal — not because genetics suddenly went bad, but because they shifted the base cow from 2005-born to 2015-born animals. That’s the industry recalibrating for new realities.

The technology adoption gap is becoming really apparent. Farms with advanced parlor management systems, comprehensive data collection… they’re navigating these challenges differently. When you have automated heat detection improving conception rates, robotics helping with consistency — and we’re talking $150,000 to $200,000 for quality robotic systems — these are no longer luxuries. They’re becoming necessities.

A producer I know in Wisconsin put it well: “The difference between operations that invested in precision technology five years ago and those that didn’t is becoming a chasm. This includes everything from advanced feed efficiency sensors and GPS-enabled manure application systems that maximize nutrient use, to automated health monitoring collars. Good data is becoming as important as good genetics.”

And here’s the ROI that’s catching attention: one operation in Vermont saw their investment in GPS-guided manure application pay back in 18 months through reduced fertilizer purchases and improved compliance documentation. That’s the kind of return that makes technology adoption a no-brainer, especially when regulatory pressure continues to build.

Regional Variations Matter

Not every part of Ireland faces the same challenges, which is worth thinking about. The southeast, with its free-draining soils and longer growing seasons, operates under different conditions than those in the northwest, which deal with heavier ground. Spring-calving herds — that’s about 82% of Irish operations, according to Teagasc — they’ve got all their nutrient management concentrated into tight windows.

These variations… they really make you wonder about one-size-fits-all regulations. You’ve got farms achieving excellent bulk tank counts, managing transition periods effectively, keeping their herd health metrics strong — but they’re facing challenges based on nitrogen calculations that might not fully account for grass-based efficiency.

Looking at Three Possible Scenarios

ScenarioTimelineKey Outcomes
Managed AdjustmentQ1-Q2 2026Derogation renewed with tighter restrictions. Modest production adjustments, premium markets tighten, and some global price movement. Processors adapt toward higher-value products.
Political CompromiseQ2 2026Farmer advocacy leads to compromise. Technology investments enable progress in maintaining production. Politicians declare victory, farming continues.
Sharp ContractionMid-2026 onwardsMinimal derogation renewal. Significant production drops within 18 months. Premium market disruption, price volatility, supply gaps.

What This Means for Your Operation

So what should we take away from all this?

First, regulatory dynamics are accelerating everywhere. What starts in Brussels has a way of showing up in other jurisdictions. Environmental regulations are increasingly shaping how we farm, whether we’re in California dealing with methane rules, Wisconsin managing nutrient plans, or anywhere else.

Second, if you have genuine production advantages — whether that’s organic certification, grass-fed systems, local market access, or any other unique aspect of your operation — now’s the time to document and protect those advantages. Ireland’s grass-fed position took generations to build. Once it’s gone, it’s gone.

Third, market relationships need diversification. When supply gets tight, operations with multiple outlets generally fare better. That’s not pessimism — it’s risk management. And beyond just infant formula, Irish dairy also supplies significant volumes to specialty cheese makers and premium butter operations across Europe. Those alternative channels become crucial when primary markets shift.

Fourth, technology adoption is shifting from optional to essential. Being able to document your environmental performance, optimize inputs, and adapt quickly —that’s increasingly what separates operations that thrive from those that just survive.

And here’s something interesting — scale no longer guarantees success. Some of Ireland’s most efficient large operations face real challenges because they’re over nitrogen thresholds, while smaller operations with direct market access and flexibility sometimes prove more adaptable.

The Human Side

Behind every statistic are real families making tough decisions. UCD’s School of Psychology published research in August showing nearly all Irish farm families report work-family conflict, with younger, debt-leveraged farms particularly affected.

These aren’t abstract business decisions. When families have mortgaged generational land to build facilities, they might not be able to fully use… that pressure extends way beyond finances. I’ve witnessed similar situations unfold in various dairy regions, and the stress on rural communities is indeed a real concern.

For those needing support, organizations such as Farm Aid in the US (1-800-FARM-AID), the Farm Community Network in the UK, and the Irish Farmers Association’s member support services offer resources for farmers facing transition pressures. There’s also the International Association of Agricultural Producers, which offers global support networks. Please don’t hesitate to reach out if you need assistance.

Where We Go from Here

Ireland’s 1.5% of global production creates amplified disruption effects across premium markets and regulatory frameworks worldwide. 

What’s happening in Ireland represents more than just regional adjustment. We’re watching environmental objectives, food security needs, and agricultural economics intersect in real time. This dynamic between production efficiency and regulatory requirements… it’s not unique to Ireland. It’s emerging globally.

Those 54,396 fewer calves aren’t just numbers. They’re the leading edge of changes that’ll influence global dairy markets over the next several years. How this affects your operation depends largely on the decisions you’re making right now.

December’s derogation decision will have far-reaching consequences that extend well beyond Ireland. Smart producers are already considering various scenarios and building operational flexibility to adapt to changing market conditions. Most importantly, they’re learning from Ireland’s experience to prepare for similar challenges that might emerge closer to home.

Because if there’s one thing that’s becoming clear, it’s this: success in modern dairying requires understanding both market fundamentals and regulatory dynamics. Political and policy factors are increasingly influencing decisions that were once purely economic in nature. Recognizing and adapting to this reality may well determine which operations thrive in tomorrow’s dairy industry.

The conversation continues, and we’re all part of it. How we respond collectively to these challenges will shape dairy farming for the next generation. What strategies are you implementing to prepare for these changes? Share your thoughts and experiences — because learning from each other is how we’ll navigate this transition successfully.

KEY TAKEAWAYS

  • Technology ROI beats regulatory burden: Vermont operations seeing 18-month payback on $150,000-200,000 precision systems through 20-30% fertilizer savings and streamlined compliance documentation — making tech adoption essential, not optional
  • Market diversification matters more than size: Irish farms over nitrogen thresholds face elimination despite peak efficiency, while smaller operations with direct sales to specialty cheese and premium butter markets show better resilience — suggesting 3-5 market outlets minimum for risk management
  • Environmental progress isn’t protecting producers: Ireland achieved EPA-verified eight-year low nitrogen levels while maintaining 0.88 kg CO2e per kg milk (vs. 2.5 kg global average), yet still faces production cuts — document your sustainability metrics now before regulators set the narrative
  • Premium markets concentrate risk: China’s grass-fed infant formula segment commands 50% price premiums, but Ireland’s potential 15-25% production drop threatens €1 billion in exports — operations dependent on single premium channels need contingency plans by Q1 2026
  • Regional advantages require active protection: Ireland’s grass-fed position took generations to build through climate, genetics, and infrastructure, but December’s decision could eliminate it overnight — whether you’re organic, pasture-based, or locally focused, start building your verification systems today

Complete references and supporting documentation are available upon request by contacting the editorial team at editor@thebullvine.com.

Learn More:

The Sunday Read Dairy Professionals Don’t Skip.

Every week, thousands of producers, breeders, and industry insiders open Bullvine Weekly for genetics insights, market shifts, and profit strategies they won’t find anywhere else. One email. Five minutes. Smarter decisions all week.
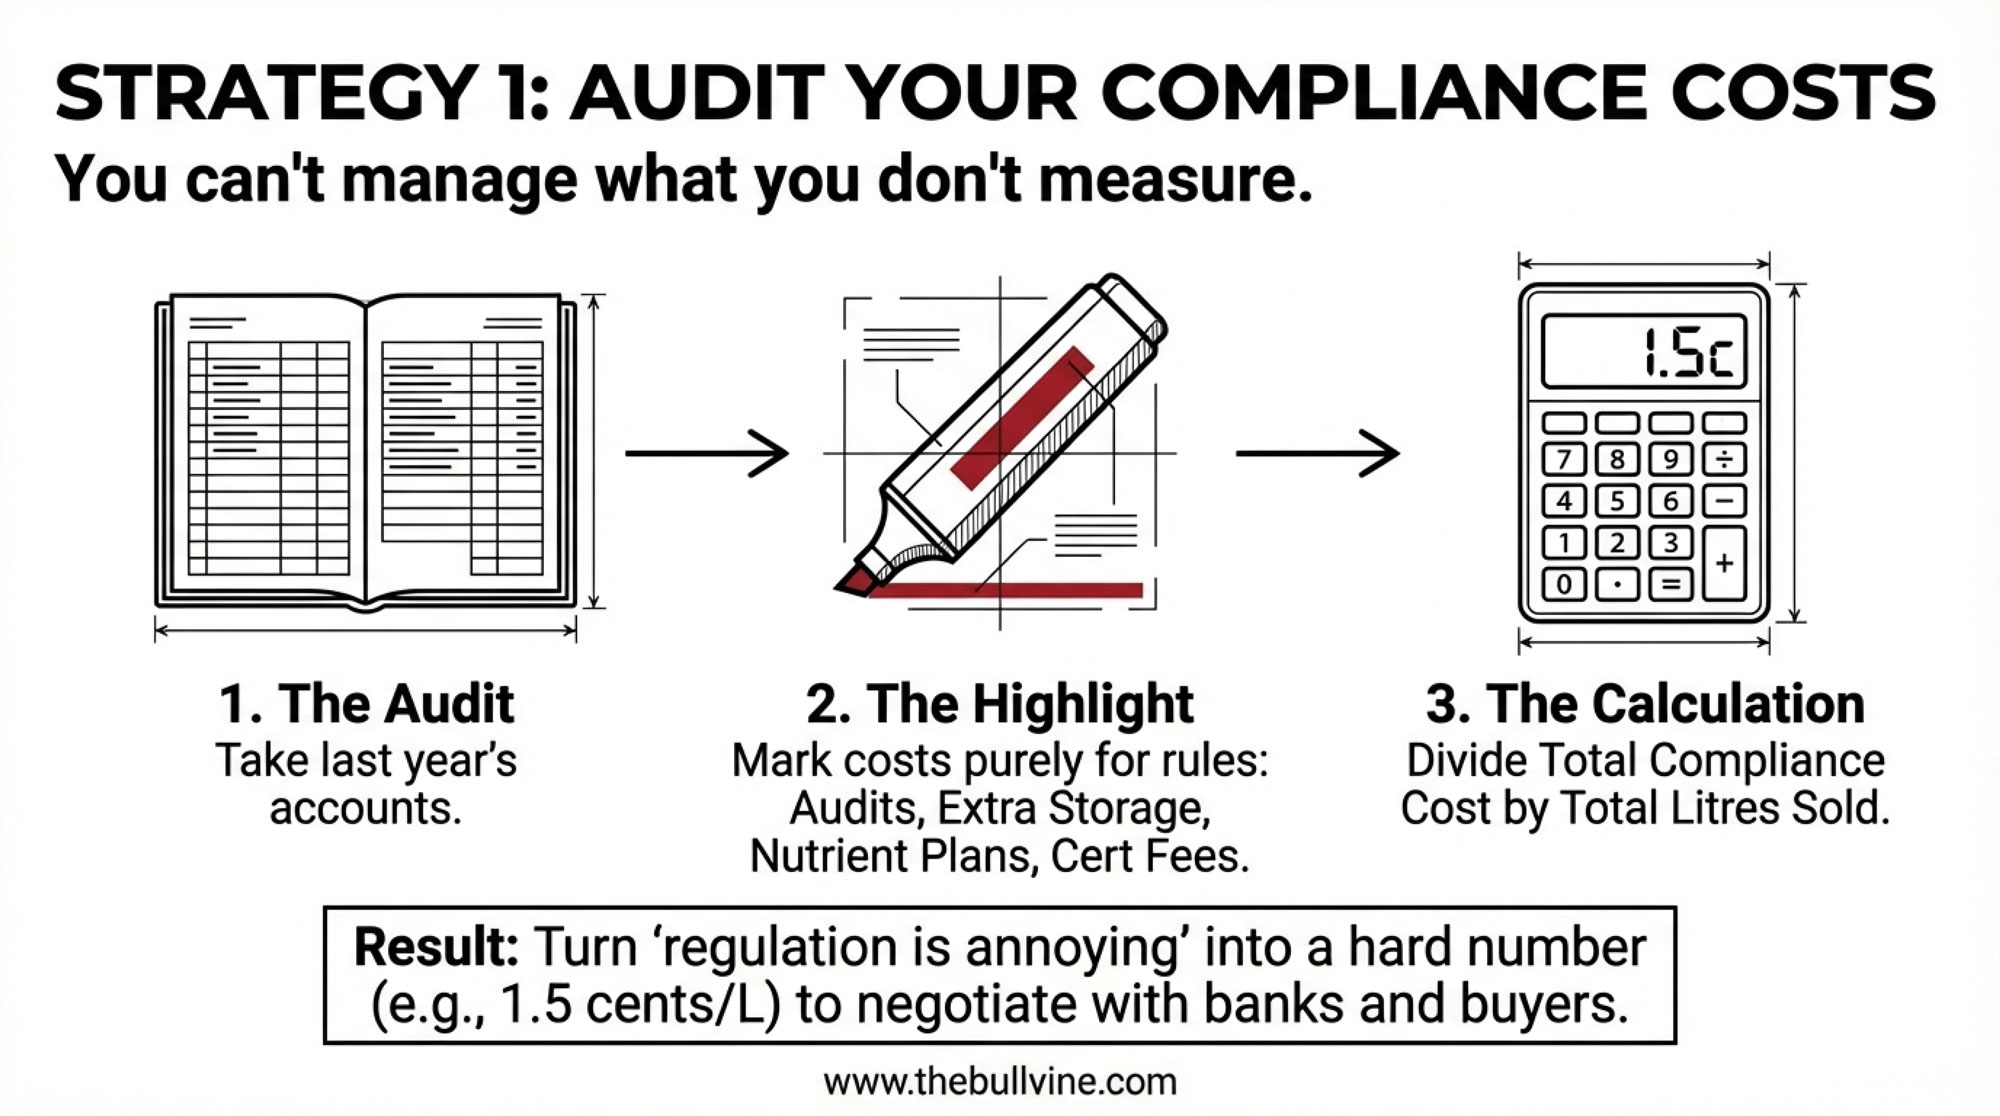
NewsSubscribe
First
Last
Consent

Weathering Europe’s Dairy Waves: Real-World Strategies for Your Milk Check

Europe’s milk moves could flood your mailbox. Is your dairy ready for the next wave?

EXECUTIVE SUMMARY: European milk production swings are making an outsized impact on North American dairy margins this season. As the EU, U.S., and New Zealand jostle for global export leadership, every volume shift and new regulation from Brussels lands directly on U.S. farm income and risk. From compliance costs to feed volatility, today’s market noise looks more like a set of fast-moving waves than the predictable old cycles. That’s why top producers are leaning into real-time break-even tracking, component-driven strategies, and flexible risk coverage. This article gets practical—highlighting lessons from the 2015 quota flood, the importance of managing debt and working capital, and exactly which steps farmers are taking to lock in resilience. If staying afloat—and ahead—in this new dairy world is your goal, the toolbox outlined here belongs in every barn.

You know, sometimes it feels like the global milk market is just one noisy, unpredictable stock tank. I’ve had a dozen conversations this harvest about how a seemingly small regulatory change in Brussels or a surge in Irish production leaves folks scratching their heads when the mailbox check or feed bill shows up in Wisconsin or Idaho. So let’s break down what’s actually factual, what matters for North America right now, and the smart steps farms are taking to stay steady in choppy global waters.

Europe’s Ripple Effect—Bigger Than Ever

Looking at data from the FAO and European Commission this season, Europe’s share of global dairy exports is as high as any region in the world—routinely neck-and-neck with New Zealand and the U.S. USDA FAS trade briefs and figures from the International Dairy Federation confirm that EU policy, volume, and even local weather matter for price benchmarks in every major importing region, from China to Algeria and Saudi Arabia [FAO Dairy Market Review 2024; European Commission Milk Market Observatory 2025; USDA Dairy: World Markets and Trade 2025].

After the big quota-lift in 2015, history proved these ripple effects: Europe’s open floodgates sent milk downstream to world markets, dropping global prices and shrinking margins back home. This dynamic (and similar cycles since) is widely documented by USDA’s Economic Research Service and industry analyses [USDA ERS 2016 Dairy Outlook]. These aren’t hypothetical models—they’re what producers are still living through, every time a big EU volume shift combines with U.S. or Oceania constraints or demand spasms in China.

Market Moves: When Data and Intuition Don’t Always Match

What’s interesting right now, reading updates from USDA Dairy Market News and IDF, is how export punches keep rolling—U.S. butter and nonfat dry milk exports are at multi-year highs as of August and September. Yet the same sources, and public updates from major global processors, flag that key importers (especially in Asia) are warming only slowly after a soft patch. Price is now set at the intersection of commodities, shipping, trade policy (yes, tariffs still sting), and shifts in government intervention or environmental regulation.

And here’s the farmer’s perspective: global milk prices don’t just bounce up and down like a ball. With international markets more closely linked than ever, a wave in Europe or Oceania can hit North American producers’ returns like the surge on a big tidal pond: unpredictable and fast.

Debt, Leverage, and Reluctance to Slow Down

I’ve noticed most extension meetings address debt and capital structure more than ever, thanks to USDA and Farm Credit reporting higher average borrowing in new builds—and Wageningen and Thünen Institutes in Europe showing similar trends in Dutch and German herds [USDA ERS 2025; Wageningen University 2024 Dairy Finance; Thünen Institute German Survey 2024]. The same stubborn reality: high fixed payments don’t let a producer ramp down milk flow very quickly, even if the next three months look ugly on paper. Most of us end up chasing volume, not conservation, because loan payments wait for nobody.

Feed: The Margin Maker (or Breaker)

The data from Penn State, UW-Madison, and Cornell extension budgets for 2024 are crystal clear: feed claims 50–60% of the average conventional herd’s cost structure—a number that climbs higher if you’re buying more feed than you grow [PSU Dairy Budgets 2024; UW Center for Dairy Profitability 2025]. USDA Ag Marketing Service had corn in the low $4s throughout harvest, but soybean meal swings and local hay shortages have kept feed volatility front and center.

What producers increasingly do—across regions and herd sizes—is double down on feed testing, fresh cow management, and ration tweaking. Historical data from the bleakest periods (2014, 2022) show that a tenth of a point of feed efficiency or improvement in butterfat performance can move a break-even from the red to the black. Industry extension sources all show more hands adjusting the TMR mixer and paying closer attention to transition period protocols and dry matter intake trends.

When Regulators Call the Tune

Complying with environmental mandates is no longer just a box for the processor or CAFO paperwork. UC Davis and multiple extension sources consistently estimate new California methane and nutrient regulations cost up to $0.40–0.55/cwt once all’s accounted for [UC Davis Agricultural Economics Policy Update, 2025]. That mirrors regulatory costs now rolling out in European dairies—Denmark, the Netherlands, and Germany are all adding, not subtracting, layers of compliance spending [European Commission Dairy Policy Fact Sheet 2025].

For Northern and Eastern U.S. producers near sensitive watersheds, budgets frequently flag compliance costs of $50–$70 per cow annually just for nutrient handling [Cornell Pro-Dairy Water Quality 2024; Wisconsin DATCP CAFO reports]. It’s a new line item in every cost calculation—something more farms are integrating into regular budget reviews.

Price Spreads, Component Value, and Dairy Resilience

USDA Reporter summaries and CME data from early October confirm that Class III/IV spreads topped $2/cwt—meaning the farm’s product mix, from cheese to butterfat, is increasingly make-or-break for winter cash flow. Extension and IDF bulletins show that maximized component programs (think protein-by-breed planning or butterfat levels targeting cooperative premiums) are paying out ever higher.

The data (and plenty of farmer experience) say it’s wise to keep chasing component optimization with genetic selection, ration shifts, and milk quality focus—not only for incentive programs but also for the buffer against commodity price swings. Farms that get complacent here risk losing the best margin lifelines left in a volatile pricing world.

Farmer Risk Playbooks: Layering and Learning

Here’s a theme that runs through nearly every 2025 extension update and peer group panel: those who spread risk, keep cash reserves, and use partial hedging (from Dairy Margin Coverage to LGM or local processor contracts) are the ones telling positive stories at year’s end. Across the Corn Belt, into the Northeast and West, budgeting tools and farm management software are being used daily to run break-evens, test expansion math, and keep track of every feed load and market move.

Risk ToolSurvival %Annual CostRating
Dairy Margin Coverage78%$100–300Essential
LGM Insurance65%$200–500Strong
Cash Reserves (90 days)85%Opportunity costCritical
Feed Hedging70%1–3% of feedImportant
Processor Contracts60%Price discountUseful
No Risk Management35%$0Dangerous

Extension groups are now coaching herds to treat working capital as “production insurance” and to see budgeting and risk review as ongoing—not just annual—events. It’s a practice that’s proving the difference between being able to row to safe harbor in a market storm…or simply getting swept along for the ride.

Past Lessons, Forward Momentum

There’s universal agreement—whether it’s coming from a Missouri discussion group or New England’s latest fact sheets: flexibility beats size or even efficiency alone, especially once margins start to tighten. Farms that survived 2014 or the sudden whiplash of 2022 put working capital on par with any weekly milk check and made their lender and nutritionist partners, not just vendors.

What’s particularly heartening is more farms are now proactively putting reserves away in the “good” quarters rather than waiting for the next price crash. That shift, widely endorsed in current university and co-op extension workshops, means more businesses are poised to adapt to whatever moves Europe or world trade throws their way.

Looking at Winter—and the Year Ahead

If you’re looking for actionable steps, this year’s most robust takeaways from across the government, extension, and industry space are these:

  • Know your cost structure cold and react quickly to any break-even changes.
  • Prioritize fresh cow and transition period management for best margin protection.
  • Maximize component herd strategies (and renegotiate for best premiums).
  • Plan for regulatory compliance costs as a “normal” budget item.
  • Treat cash reserves and budgeting as production tools, not afterthoughts.
  • Layer your risk with multiple tools and update your mix every season.

And perhaps the most important advice? Stay curious and connected. Use every extension, processor, and peer resource out there—and keep agile enough to pivot when new global “waves” come across the Atlantic.

In this interconnected dairy world, the best producers aren’t fortune tellers—they’re steady captains, always ready to adjust sail.

Key Takeaways:

  • European market shifts can hit milk checks fast—stay alert to global supply changes.
  • Update break-evens often; real-time cost tracking is your strongest defense.
  • Feed and component management are difference-makers for net margins.
  • Build regulatory compliance into your core business plan, not just for inspection day.
  • Use layered risk tools—insurance, contracts, and liquidity—to position your farm for any market weather.

Complete references and supporting documentation are available upon request by contacting the editorial team at editor@thebullvine.com.

Learn More:

  • Protect Your Dairy Operations from America’s 1,000-Fold Subsidy Advantage – This action-oriented guide details a 3-phase plan for achieving component targets (4.2% fat, 3.3% protein) and optimizing feed conversion above 1.75:1. It provides concrete ROI calculations to show how operational excellence creates a competitive advantage that can neutralize market disadvantages.
  • Dykman Dairy’s $75 Million Debt Crisis: Mismanagement or Misfortune? – This cautionary case study offers a deep dive into the devastating strategic risks of unchecked leverage and rapid expansion. It provides five vital tips on debt revision, diversification, and strengthening lender relations to help you proactively manage financial flexibility against global market shocks.
  • The $500000 Precision Dairy Gamble: Why Most Farms Are Being Sold a False Promise – This strategic technology evaluation challenges the high-cost automation pitch, revealing how optimizing fundamental protocols (like transition cow health) offers a better, lower-cost ROI than relying solely on expensive sensors and robotics. Use this to filter smart capital investments.

The Sunday Read Dairy Professionals Don’t Skip.

Every week, thousands of producers, breeders, and industry insiders open Bullvine Weekly for genetics insights, market shifts, and profit strategies they won’t find anywhere else. One email. Five minutes. Smarter decisions all week.
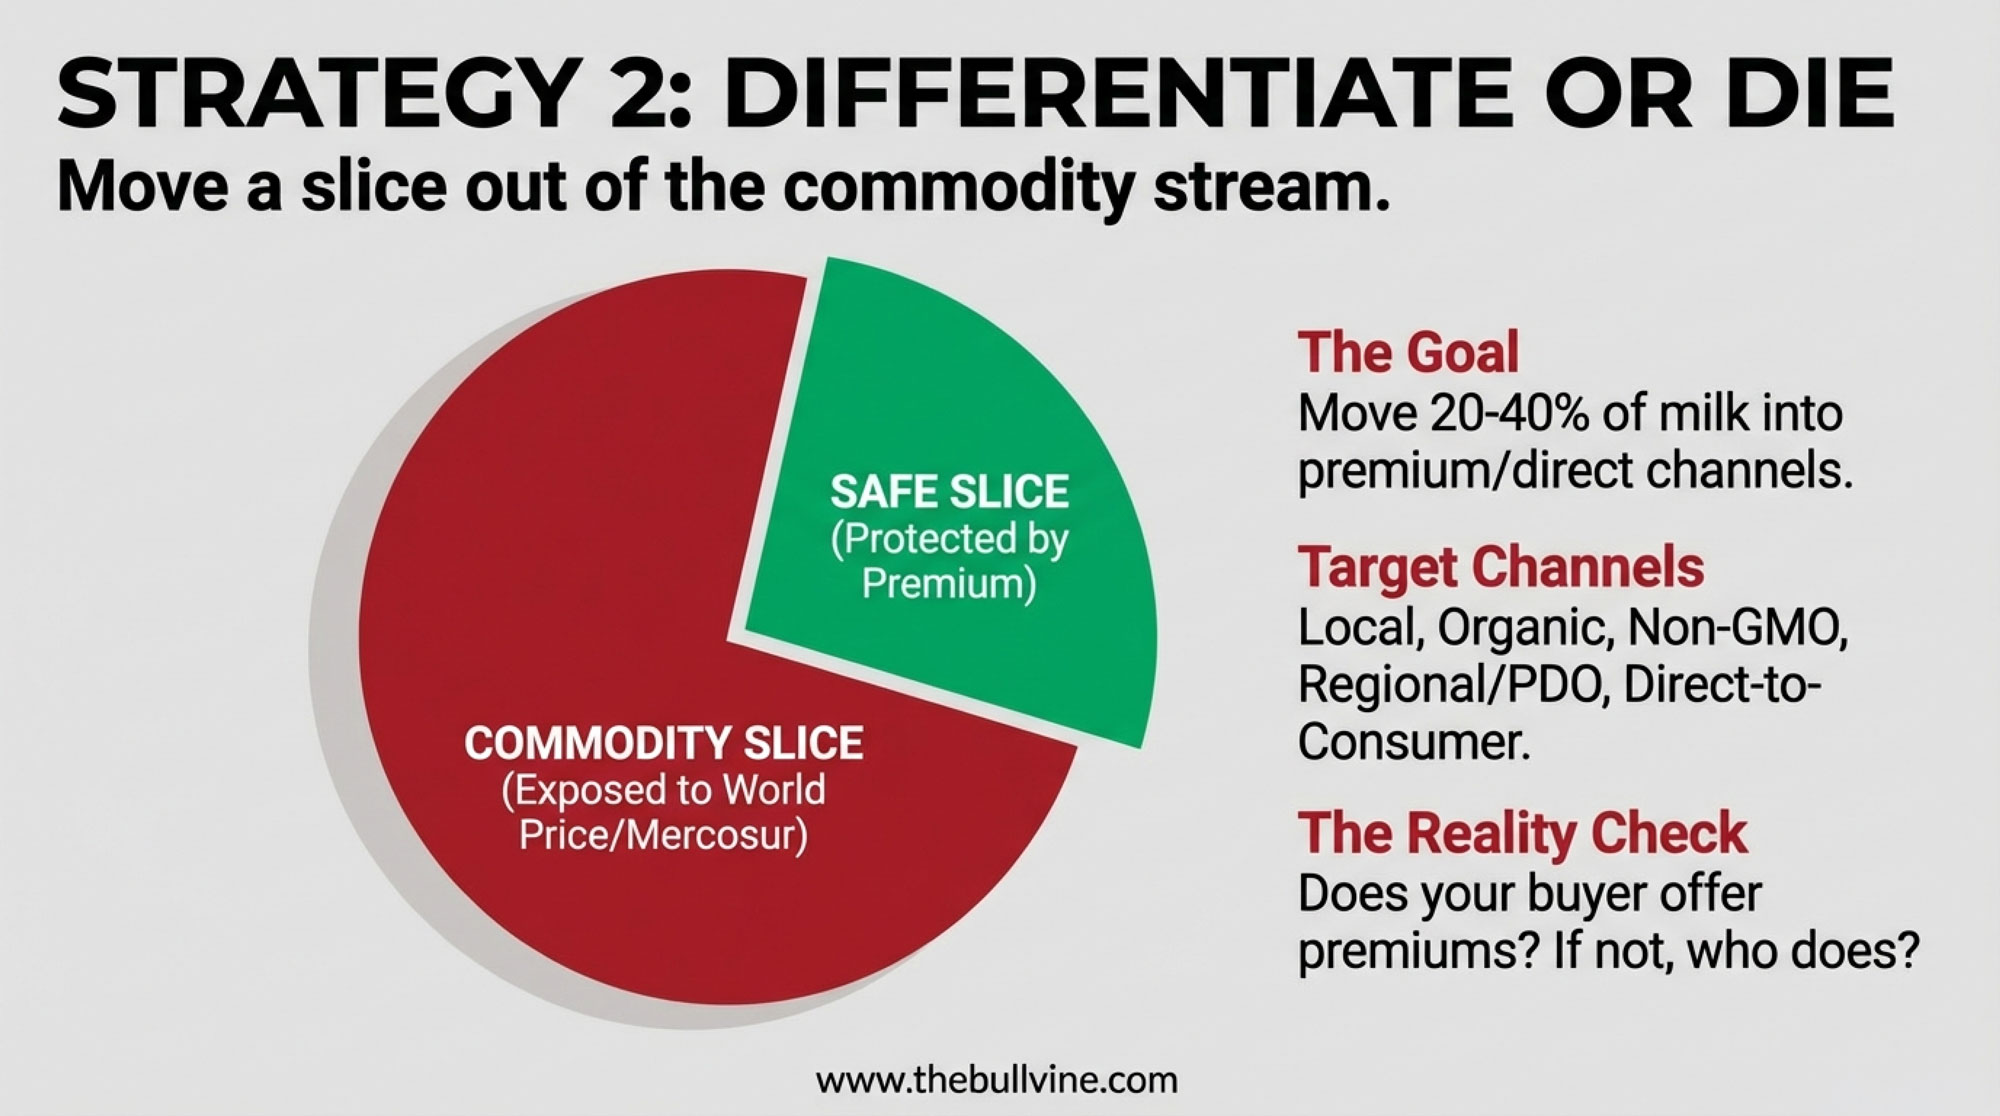
NewsSubscribe
First
Last
Consent

October 6 CME Dairy Report: Cheese Crashes 4¢, Butter Tanks 5.5¢ – Kiss Your $18 Class III Goodbye

What happens when processors start paying farmers NOT to produce milk? We’re finding out right now

EXECUTIVE SUMMARY: Today’s CME action revealed what many producers have been suspecting—the September rally was built on hope rather than fundamentals, with cheese blocks plummeting 4 cents to $1.75/lb and butter crashing 5.5 cents to $1.6950/lb. These aren’t just numbers on a screen… they translate directly to a 60-80¢/cwt reduction in Class III milk value, hitting October checks hard when margins are already tight. Recent Cornell research shows that top-performing farms maintain profitability through effective feed management and component optimization, spending 3.1% less on purchased feed while achieving higher production—a strategy that’s becoming increasingly essential as milk-to-feed ratios drop to 2.35 from August’s 2.51. With 228 billion pounds of milk forecast for 2025 (up from 226.3 billion in 2024), and the addition of new processing capacity that will invest $11 billion, we’re seeing classic oversupply dynamics that historically take 12-18 months to rebalance. Looking ahead, successful operations are focusing on three proven approaches: locking in Q4 hedges while October $17 puts remain available, maximizing Dairy Margin Coverage enrollment before the October 31 deadline, and shifting focus from volume to component quality—strategies that separate operations that thrive from those merely surviving. What farmers are discovering through this volatility is that waiting for markets to normalize isn’t a strategy… it’s choosing which proven risk management tools fit their operation’s specific needs and regional realities.

Well, here we go again. After watching September’s rally fizzle out like a Fourth of July sparkler in the rain, today’s cheese market finally admitted what we’ve been seeing in production reports for weeks – there’s simply too much milk chasing too few buyers at these price levels. Looking at today’s CME action, your October milk check just got lighter, and that’s putting it mildly.

The Numbers Tell a Brutal Story

Let me walk you through what happened on the trading floor today, and the implications are stark for anyone long on cheese:

ProductPriceToday’s MoveWeekly AverageWhat This Actually Means
Cheese Blocks$1.7500/lb-4.00¢Down to $1.75 from $1.79Class III drops 60-80¢/cwt
Cheese Barrels$1.7700/lbNo changeHolding at $1.77Barrels are steady, but can’t prop up the market
Butter$1.6950/lb-5.50¢Crashed from $1.75Butterfat premiums evaporating
NDM Grade A$1.1600/lbNo changeSteady at $1.16Powder markets holding
Dry Whey$0.6300/lbNo changeSlight weekly declineProtein values are stable but trending softer
CME Dairy Commodity Price Crashes – October 6, 2025: Cheese blocks plummet 4¢ and butter crashes 5.5¢ in brutal trading session that signals fundamental market reset.

What’s particularly telling is how these moves played out. Seven block trades executed today, each one printing lower than the last – that’s not profit-taking, folks, that’s capitulation. When I see sellers outnumbering buyers 3-to-1 on butter (7 offers versus two bids), it reminds me of what a Wisconsin cheese plant manager told me last week: “We’re offering quality premiums just to slow down milk deliveries. That’s code for ‘please stop sending us so much milk.'”

The Trading Floor Speaks Volumes

You know, I’ve been watching these markets for decades, and certain patterns just scream trouble. Today’s bid-ask spreads told the whole story. Zero bids on cheese blocks against three offers? That’s what we call a “no bid” market – nobody wants to catch this falling knife.

One CME floor trader I spoke with said it best: “Haven’t seen butter take a beating like this since 2019. The funds are liquidating, and there’s no commercial support underneath.” When the smart money’s heading for the exits and processors aren’t stepping up to buy, you know we’re in for more pain.

The complete absence of barrel trading while blocks are getting crushed? That disconnect usually means one thing – processors are sitting on inventory they can’t move. And when processors can’t move cheese, dairy farmers feel it first and worst.

Where We Stand Globally

Examining the international landscape, the picture becomes even more complex. According to European futures data, their SMP (skim milk powder) is trading at €2,175/MT for October, which converts to roughly $1.05/lb, keeping them competitive with our NDM at $1.16. Meanwhile, New Zealand’s aggressive positioning shows their whole milk powder at $3,645/MT and SMP at $2,600/MT.

Ben Laine, senior dairy analyst at Terrain, recently noted that “the distinction between successful and challenging years for milk prices often hinges on exports”. Currently, with the dollar strong and our competitors being aggressive, that’s not working in our favor. The Kiwis are essentially putting a ceiling on where our powder prices can go, while the EU, despite dealing with environmental regulations and disease pressures, remains competitive.

Feed Costs: The Squeeze Gets Tighter

Here’s where the margin pressure really starts to bite. December corn futures closed at $4.6125/bushel today, up from $4.19 last week. Soybean meal is sitting at $277.10/ton. For those keeping score, that milk-to-feed ratio we all watch? According to the latest Dairy Margin Coverage data, it’s dropped to about 2.35 from 2.51 in August.

What farmers are finding is that income over feed costs (IOFC) for average operations is dropping toward $8.50/cwt. If you’re running efficiently, you may be holding at $9.50. However, I know many producers, especially those dealing with drought conditions out West and higher hay transportation costs, who are approaching breakeven territory.

The 2013 Cornell Dairy Farm Business Summary showed that top-performing farms spent 3.1% less on purchased feed than average farms while maintaining higher production. That efficiency gap is about to separate survivors from casualties.

Production Reality Check

The Oversupply Setup: More Milk + More Processing = Lower Prices – 1.7 billion more pounds of milk with $11B in new processing capacity creates classic oversupply dynamics that historically take 12-18 months to rebalance

USDA’s latest forecast shows 228 billion pounds of milk for 2025, up from 226.3 billion in 2024. We have 9.365 million cows and are still increasing, with production per cow up by about 3 pounds per day year-over-year. That’s a lot of milk looking for a home.

What’s really caught my attention is the regional variation. Wisconsin and Minnesota are running 2-3% above their levels from last year. New York alone has seen $2.8 billion in new processing investment, according to the International Dairy Foods Association. Even with some HPAI concerns creating pockets of disruption in California, the national picture is clear – we’re making more milk than the market wants at these prices.

One Upper Midwest producer told me yesterday, “We’re getting these ‘quality premiums’ that are really just incentives to limit production. When processors start soft-capping your volume, you know supply has gotten ahead of demand.”

What’s Really Driving These Price Drops

Let’s be honest about domestic demand. According to recent Nielsen IQ data, retail cheese prices, ranging from $3.49 to $4.39 per pound/pound have finally reached the consumer’s price ceiling. Food service is steady but not growing fast enough to absorb the production increases we’re seeing. Supply isn’t the primary driver here – consumer behavior is. We’re producing roughly the same amount of milk year after year, but consumers aren’t keeping pace with high retail prices and export challenges.

On the export front, the situation’s equally concerning. Mexico – our biggest customer at $2.32 billion annually – is down 10% year-to-date according to USDA data. Political uncertainty and peso weakness aren’t helping. China? They’re quietly pivoting to New Zealand suppliers while dealing with their own economic challenges.

Looking Ahead: Managing Expectations

The USDA’s official forecasts for 2025 project an all-milk price of $22.00-$22.75/cwt, with Class III at $18.50. Today’s market action suggests those numbers might need serious revision. The futures market tells the real story – October Class III at $17.21/cwt and Class IV at $14.76/cwt. That’s the market voting with real money, and it’s voting bearish.

What’s interesting here is the disconnect between official optimism and market reality. December Class III is barely holding $17.00, and options implied volatility is spiking. That usually means traders expect more turbulence ahead.

What Smart Producers Are Doing Now

After talking with producers across the country and watching successful operations navigate similar cycles, here’s what makes sense:

Lock in Q4 hedges immediately. October $17.00 puts are still available at reasonable premiums. Yes, you might miss some upside, but when margins are this tight, protecting your downside isn’t optional – it’s a matter of survival.

Get serious about feed efficiency. The Cornell data show that top farms maintain profitability through effective feed management. Lock favorable grain prices if you haven’t already. With feed representing about 54% of total production costs according to Dairy Margin Coverage data, you can’t afford to let this slip.

Focus on components over volume. As one Minnesota producer recently told me, “Component quality now adds $400+ more income per cow annually compared to just pushing volume. With component prices diverging, optimizing for protein and butterfat content becomes even more critical.

Don’t forget Dairy Margin Coverage. Sign-up ends October 31. At $0.15 per hundredweight for $9.50 coverage, as USDA’s Daniel Mahoney notes, “risk protection through Dairy Margin Coverage is a cost-effective tool to manage risk¹². Don’t leave government money on the table.

Regional Realities Matter

 Regional Milk Price Basis: Winners and Losers – Wisconsin/Minnesota face -40¢ discounts while New York enjoys +15¢ premiums, proving location determines profitability in today’s fragmented market.

Wisconsin and Minnesota producers are experiencing what I call the “perfect storm” – ideal fall weather means cows are comfortable and producing heavily, but plants are at capacity. Local basis has widened to -$0.40 under class in some areas. Several smaller producers without solid contracts are really taking a hit.

Meanwhile, Western producers, who are dealing with higher hay costs and water issues, face different challenges. Canadian producers, interestingly, are seeing farmgate milk prices decrease by 0.0237% for 2025, according to the Canadian Dairy Commission; however, their supply management system provides more stability than what is currently being faced.

The Historical Context We Can’t Ignore

This reminds me eerily of the 2018-2019 period when oversupply met processor capacity expansion. That episode lasted 18 months before markets found equilibrium. Compare today’s Class III at $17.21 to October 2024, when it was $22.85/cwt. That’s a $5.64/cwt drop year-over-year – not a correction, but a fundamental reset.

Markets have a way of working themselves out. If processors are building new cheese plants and need to fill them with milk, they’ll eventually pay what it takes to get the milk in there. But that competitive market for milk? We’re not there yet.

The Bottom Line for Your Operation

Today’s market action wasn’t just another bad day – it’s a clear signal we’re entering a new phase of the dairy cycle. Your October milk check has just become lighter by at least $0.60/cwt, and November’s not looking any better. The combination of expanding production, new processing capacity, and global competition means this pressure is unlikely to subside soon.

However, here’s what decades in this business have taught me: low prices eventually lead to lower prices. The producers making smart decisions now – locking in margins where possible, controlling costs ruthlessly, focusing on efficiency over expansion – these are the ones who’ll be positioned to profit when the cycle turns.

Tomorrow, watch for follow-through selling in cheese. If blocks break $1.70, we could see accelerated selling pressure. October Class III futures expire in 10 days – position yourself accordingly.

And remember, as volatile as these markets are, the fundamentals of good dairy farming haven’t changed. Stay focused on what you can control: feed efficiency, component quality, and smart risk management. The dairy industry has always rewarded survivors, and this cycle won’t be different.

KEY TAKEAWAYS

  • Lock in Q4 protection immediately: October Class III futures at $17.01/cwt signal continued pressure—farms using put options at $17 strike prices can protect against further drops while maintaining upside potential if markets recover
  • Component quality now drives profitability: Minnesota producers report $400+ additional income per cow annually by optimizing protein and butterfat content versus pushing volume—a 4-5% margin improvement that matters when Class III hovers near breakeven
  • Regional basis variations create opportunities: Wisconsin and Minnesota producers face -$0.40/cwt basis discounts as processors manage oversupply, while Eastern operations near new processing investments see premiums—understanding your regional dynamics determines negotiating power
  • Dairy Margin Coverage becomes essential: At $0.15/cwt for $9.50 coverage (enrollment ends October 31), DMC provides positive net benefits in 13 of the last 15 years according to Ohio State analysis—it’s affordable insurance when margins compress to current levels
  • Feed efficiency separates survivors from casualties: Top-quartile farms achieve $1.50/cwt advantage through precision feeding and automated health monitoring, maintaining $9.50 IOFC while average operations approach $8.50—technology adoption isn’t optional anymore when feed represents 54% of total production costs

Complete references and supporting documentation are available upon request by contacting the editorial team at editor@thebullvine.com.

Learn More:

  • Exploring Dairy Farm Technology: Are Cow Monitoring Systems a Worthwhile Investment? – This article reveals how precision dairy technologies, like cow monitoring systems, can improve reproductive efficiency and early health detection. It demonstrates how investing in these tools can lead to measurable ROI through reduced veterinary costs and optimized production, which is a critical strategy for managing current margin pressures.
  • Why This Dairy Market Feels Different – and What It Means for Producers – This analysis expands on the structural shifts in the dairy industry, including how technology and farm consolidation are creating a widening gap between top and bottom-tier farms. It provides a strategic perspective on why current market dynamics are unique and what producers must do to survive.
  • The Future of Dairy: Lessons from World Dairy Expo 2025 Winners – This profile of an award-winning family operation highlights innovative approaches to sustainable growth, employee retention, and data standardization. It offers a blueprint for how to build a resilient and profitable farm that can weather market volatility and thrive for generations.

The Sunday Read Dairy Professionals Don’t Skip.

Every week, thousands of producers, breeders, and industry insiders open Bullvine Weekly for genetics insights, market shifts, and profit strategies they won’t find anywhere else. One email. Five minutes. Smarter decisions all week.
NewsSubscribe
First
Last
Consent

The October 31st Dairy Disaster Your Co-op Won’t Discuss: How Argentina’s Export Tax Scam Just Handed Mexico Your Milk Check

40% of U.S. cheese exports face an immediate threat as Argentina drops 9% dairy tax—while your industry leaders stay silent

EXECUTIVE SUMMARY: Here’s what we discovered: Argentina suspended all agricultural export taxes on September 22nd—a move that instantly makes their dairy products $200-300 per metric ton cheaper than ours in global markets. With Mexico accounting for 40% of U.S. cheese exports (approximately $2-3 billion annually), this “temporary” policy, in effect through October 31st, threatens to crater milk prices by 20% or more. The silence from National Milk, IDFA, and major co-ops isn’t a coincidence—many of these same companies operate profitable facilities in Argentina and Brazil. Historical patterns show that Argentina’s “temporary” measures have a nasty habit of becoming permanent (remember Macri’s 2015 tax elimination, which was reversed in 2018?). The domino effect could be catastrophic: Turkey’s 60% inflation and Brazil’s 20% currency slide make them prime candidates to copy Argentina’s playbook. Suppose you’re shipping to processors with significant exposure to Mexico. In that case, you have exactly 36 days to lock in price protection before this market manipulation, disguised as policy reform, decimates your milk check.

dairy market manipulation

So I’m sitting here at 5 AM—couldn’t sleep, actually—scrolling through the news, and there it is. Argentina suspended their agricultural export taxes. September 22nd. Just… gone. And nobody’s talking about it.

Look, maybe I’m overreacting. My wife says I do that. But I’ve been covering dairy for twenty-something years, and this feels… different. Really different.

You know how sometimes you get that feeling in your gut? Like when you see a fresh cow not eating and you just know something’s off? That’s what this feels like.

The Thing Nobody at Your Co-op Meeting Will Tell You

Alright, so here’s what I’ve been able to piece together…

Argentina’s been taxing agricultural exports for years, right? Different products, different rates. The reports coming out say they were hitting soybeans pretty hard—maybe around 30 percent—and dairy products were also being taxed. I’ve seen numbers anywhere from 8 to 10 percent on dairy, depending on who you ask.

Now they’re saying it’s temporary. Through October 31st, supposedly. Or until they hit some big export revenue target—I’ve heard $7 billion thrown around, but honestly, who knows if that’s accurate.

Temporary. Right.

You know what else was supposed to be temporary? Remember when Macri took over down there… what, 2015? Eliminated export taxes completely. Said it was the new way forward. Permanent change. All that.

Three years later? Boom. “Emergency measures.” Taxes are back.

I’ve been watching this long enough to know—Argentina’s “temporary” has a funny way of becoming permanent. And their “permanent”? That disappears faster than free donuts at a co-op meeting.

Mexico’s Buying HOW Much of Our Cheese?

Mexico’s strategic importance to the U.S. dairy industry is undeniable. The chart shows U.S. cheese exports to Mexico have grown steadily, with a 40% market share. This explosive growth is now directly threatened by Argentina’s sudden export tax elimination.

So I’m at the feed store last week—you know, the one by the old John Deere place in Dodge County—and this trucker’s there. Does the Mexico run for one of the big outfits.

He goes, “You know how much cheese is going south?”

And yeah, I knew it was a lot, but when you actually look at the numbers… Jesus. According to recent trade reports, approximately 40% of all U.S. cheese exports are destined for Mexico. That’s… what, $2-3 billion worth? Wisconsin alone is shipping tens of millions. California? Even more. Texas? Don’t even get me started—those processors down there are basically running on Mexico business.

Mexico’s 40% share of U.S. dairy exports represents $2.3 billion in annual trade now under direct threat from Argentina’s export tax elimination. When your biggest customer has cheaper alternatives, your milk check follows the market down.

But here’s the kicker—and this is what nobody’s talking about—Argentina already ships a ton of dairy to Brazil. They’ve got the infrastructure. The relationships. Brazilian companies have been dealing with Mexican importers for decades.

All Argentina needed was a price advantage.

Putting All Your Eggs in One Basket: How Mexico Became American Dairy’s Single Point of Failure. When 37% of Your Cheese Sales Depend on One Country, You’re Not Diversified—You’re Hostage.

And dropping export taxes? Well… do the math. If they were taxing dairy at 9% and that’s now gone, their products just became that much cheaper overnight. We’re talking maybe $200-300 per metric ton advantage. Maybe more.

You can’t compete with that. Nobody can.

Actually, I was just talking to this producer near Fond du Lac last week—milks about 800 head and has been in the business for forty years—and he says his processor already warned him that Mexico contracts might be “under review” come November. Under review. You know what that means.

Your Co-op Board’s Interesting Side Investments

Now… I’m going to be cautious here due to legal considerations, but…

Have you ever looked at who owns what in the South American dairy industry? I mean, really look?

Some of the same companies buying your milk here have operations down there. Big operations. I’m talking major ownership stakes in Argentine processors, Brazilian plants, the whole nine yards.

I’m not saying it’s a conspiracy. But when something this big happens and National Milk doesn’t say a word? IDFA’s silent? Your co-op board’s acting like nothing’s happening?

Makes you wonder, doesn’t it?

Actually, I ran into… well, let’s just say a former industry bigwig at a conference last week. The guy who used to be pretty high up. Even he looked worried. And this guy’s seen everything.

He says, “this is different. This isn’t market volatility. This is market manipulation.”

It Gets Worse (Because Of Course It Does)

So I’m talking to this analyst—a smart guy who covers global markets—and he starts laying out what happens next.

Turkey’s watching Argentina. Their currency’s trash, inflation’s through the roof—I’ve heard anywhere from 40 to 60 percent, depending on who’s counting. They export billions in ag products to Europe. If Argentina gets away with this, Turkey will likely follow suit, and the same could happen in Brazil. Their currency’s been sliding all year. Down maybe 20% against the dollar. And Brazil controls… what, a fifth of global soybean exports? Something like that. Huge chunk, anyway.

Once they see Argentina getting away with it…

It’s like dominoes. Remember back in ’09 when one bank started dumping assets and suddenly everybody had to? Same thing, but with countries using agriculture to prop up their currencies.

From $17.50 to $10.00: The Currency War Price Collapse That Could Cost You 43% of Your Milk Revenue. Every Day You Wait, Your Window to Protect Yourself Gets Smaller

Actually, wait. This is even scarier than I thought. Because once this starts, how do you stop it? Every country with a weak currency and agricultural exports is gonna look at this playbook and think, “Why not us?”

I was at a meeting in Madison last month—Wisconsin Dairy Business Association thing—and this economist from UW was saying something that stuck with me. She said, “The next trade war won’t be about tariffs. It’ll be about currency manipulation through agricultural policy.”

Guess she was right.

The Cavalry Ain’t Coming

Called the USDA yesterday. You know what they said? “We’re monitoring the situation.”

Monitoring.

That’s like telling a guy with a twisted stomach cow that you’re “observing the discomfort.” Great. Super helpful.

Look, theoretically, somebody should file a trade complaint. WTO, USMCA, whatever. But come on. By the time they get around to doing something, we’ll all be out of business. Or dead.

The market will sort this out long before Washington does. And by “sort out,” I mean we’re gonna take it in the shorts while everybody else figures out the new rules.

What You Can Actually Do (Besides Panic)

Alright, practical stuff. Because sitting around complaining doesn’t pay bills, even though it feels good.

That Dairy Revenue Protection everybody’s always talking about? Figure it out. Now. According to the latest RMA updates, the subsidized rates aren’t terrible—maybe $0.25 per hundredweight for decent coverage. That’s cheap insurance if this thing goes sideways.

Class III futures are still holding above $17.50, as of my last check yesterday. Won’t stay there long if this Argentina thing spreads. Lock something in.

Feed? Corn’s under $4.00 a bushel. Soybean meal’s… what, $280-290 a ton? Not great, not terrible. If you secure a six-month commitment, it.

Oh, and here’s something—you breeding any beef crosses? A guy I know in South Dakota; his dairy-beef calves are generating a significant amount of money. $800-1,000 each. With beef prices where they are… I mean, the math works.

Actually, I was at a sale barn down in Iowa last week—don’t ask why, long story—and these dairy-beef crosses sold for more than registered Holsteins. I’ve never seen that before.

The Part That Really Pisses Me Off

We did everything right, you know?

Got more efficient. Improved genetics. Built these massive freestalls. According to recent productivity data, the average production per cow is now… what, pushing 24,000 pounds? My grandfather would’ve called bullshit on that number.

Hell, I was at a place in California last month—they’re getting 30,000 pounds. Per cow! That’s not farming, that’s… I don’t even know what that is.

And for what? So we can be undercut by a country using agriculture as a means to bail out its peso?

This isn’t a competition. It’s desperation. And we’re the ones who’re gonna pay for it.

October 31st (Yeah, Right)

Argentina says this is temporary. Until October 31st.

And I’m gonna be the next American Idol.

Look at their track record. Every “temporary” measure from the last twenty years? Still there in some form. Or it lasted way longer than promised. Or they brought it back under a different name.

Argentina’s history proves ‘temporary’ policies are anything but. This timeline visually demonstrates the cycle of tax elimination and reinstatement, reinforcing why producers should not trust the October 31st deadline and should instead prepare for a permanent policy shift.

They’re saying they need to generate around $170-180 million per day in agricultural exports to meet their targets. Per day! That’s… come on. That’s fantasy numbers.

I’ll bet you my best heifer they extend this “temporary” measure. Probably call it something else. “Extended temporary emergency provisional measure” or some BS like that.

Maybe I’m wrong. God knows I’ve been wrong before. Remember when I said nobody would pay six figures for a cow? Yeah, that aged well…

But this feels different. The silence from our industry groups. The positioning of the big processors. Nobody wants to talk about it.

That tells you everything, doesn’t it?

The Bottom Line Nobody Wants to Hear

Had drinks with this banker last night—finances a bunch of operations around here. He asks me, “How bad is this, really?”

And I told him straight: If Argentina gets away with this, if they can use agricultural exports to bail out their currency without anybody stopping them… every broke country on earth just got handed the blueprint.

And guess who pays for it?

Not the politicians. Not the multinational processors with operations everywhere. Not the futures traders who’ll make money either way.

Us. The actual farmers.

Look, more details will come out over the next week or two. But don’t wait for some official report to tell you what to do. By then, it’s too late.

The thing is—and this is what keeps me up at night—our whole system assumes everybody plays by the same rules. You compete on quality, efficiency, and genetics. Not on whose government is most desperate for dollars.

But if that’s changing…

Christ. I need more coffee. Or maybe something stronger. It’s 5 AM somewhere, right?

Anyway, pay attention to this Argentina thing. Don’t let it sneak up on you like… well, like everything else seems to these days. October 31st is coming fast. And something tells me November 1st is going to look really different from October 30th.

Actually, hang on—before I forget. If you’re shipping to a plant that does a lot of business in Mexico, have that conversation now. Today. Not next week. Ask them point-blank: “What happens to us if Mexico starts buying from Argentina?”

They know the answer. They just don’t want to tell you.

You know what really strikes me about all this? We spent the last decade getting told to “think globally.” Well, here’s global for you—countries weaponizing their agricultural exports to prop up failing currencies. What did they mean by ‘global markets’?

Trust me on that one.

KEY TAKEAWAYS

  • Lock in Q4 pricing NOW: Class III futures still holding above $17.50—that won’t last once Mexico starts buying Argentine cheese at 9% discount. DRP coverage at $0.25/cwt is cheap insurance against the 20% price crater we’re facing
  • Diversify before it’s too late: Dairy-beef crosses bringing $800-1,000/head while registered Holsteins struggle—that’s immediate cash flow when your Mexico contracts evaporate. Smart producers are breeding 30% of their herd to beef bulls
  • Ask your processor point-blank TODAY: “What’s our exposure if Mexico switches to Argentine suppliers?” They already know the answer—Wisconsin producers near Fond du Lac report processors admitting contracts are “under review” for November
  • Lock in feed costs for a minimum of 6 months: Corn under $4.00/bushel and soybean meal at $280/ton won’t hold if currency manipulation spreads to Brazil (21% of global soy exports). The smart money’s contracting now, while everyone else “monitors the situation”
  • Build cash reserves like it’s 2008: Argentina needs $170-180 million daily in ag exports to hit their targets—fantasy numbers that guarantee this “temporary” measure gets extended. Operations with 6 months of operating capital survived ’09; those without didn’t

Complete references and supporting documentation are available upon request by contacting the editorial team at editor@thebullvine.com.

Learn More:

The Sunday Read Dairy Professionals Don’t Skip.

Every week, thousands of producers, breeders, and industry insiders open Bullvine Weekly for genetics insights, market shifts, and profit strategies they won’t find anywhere else. One email. Five minutes. Smarter decisions all week.
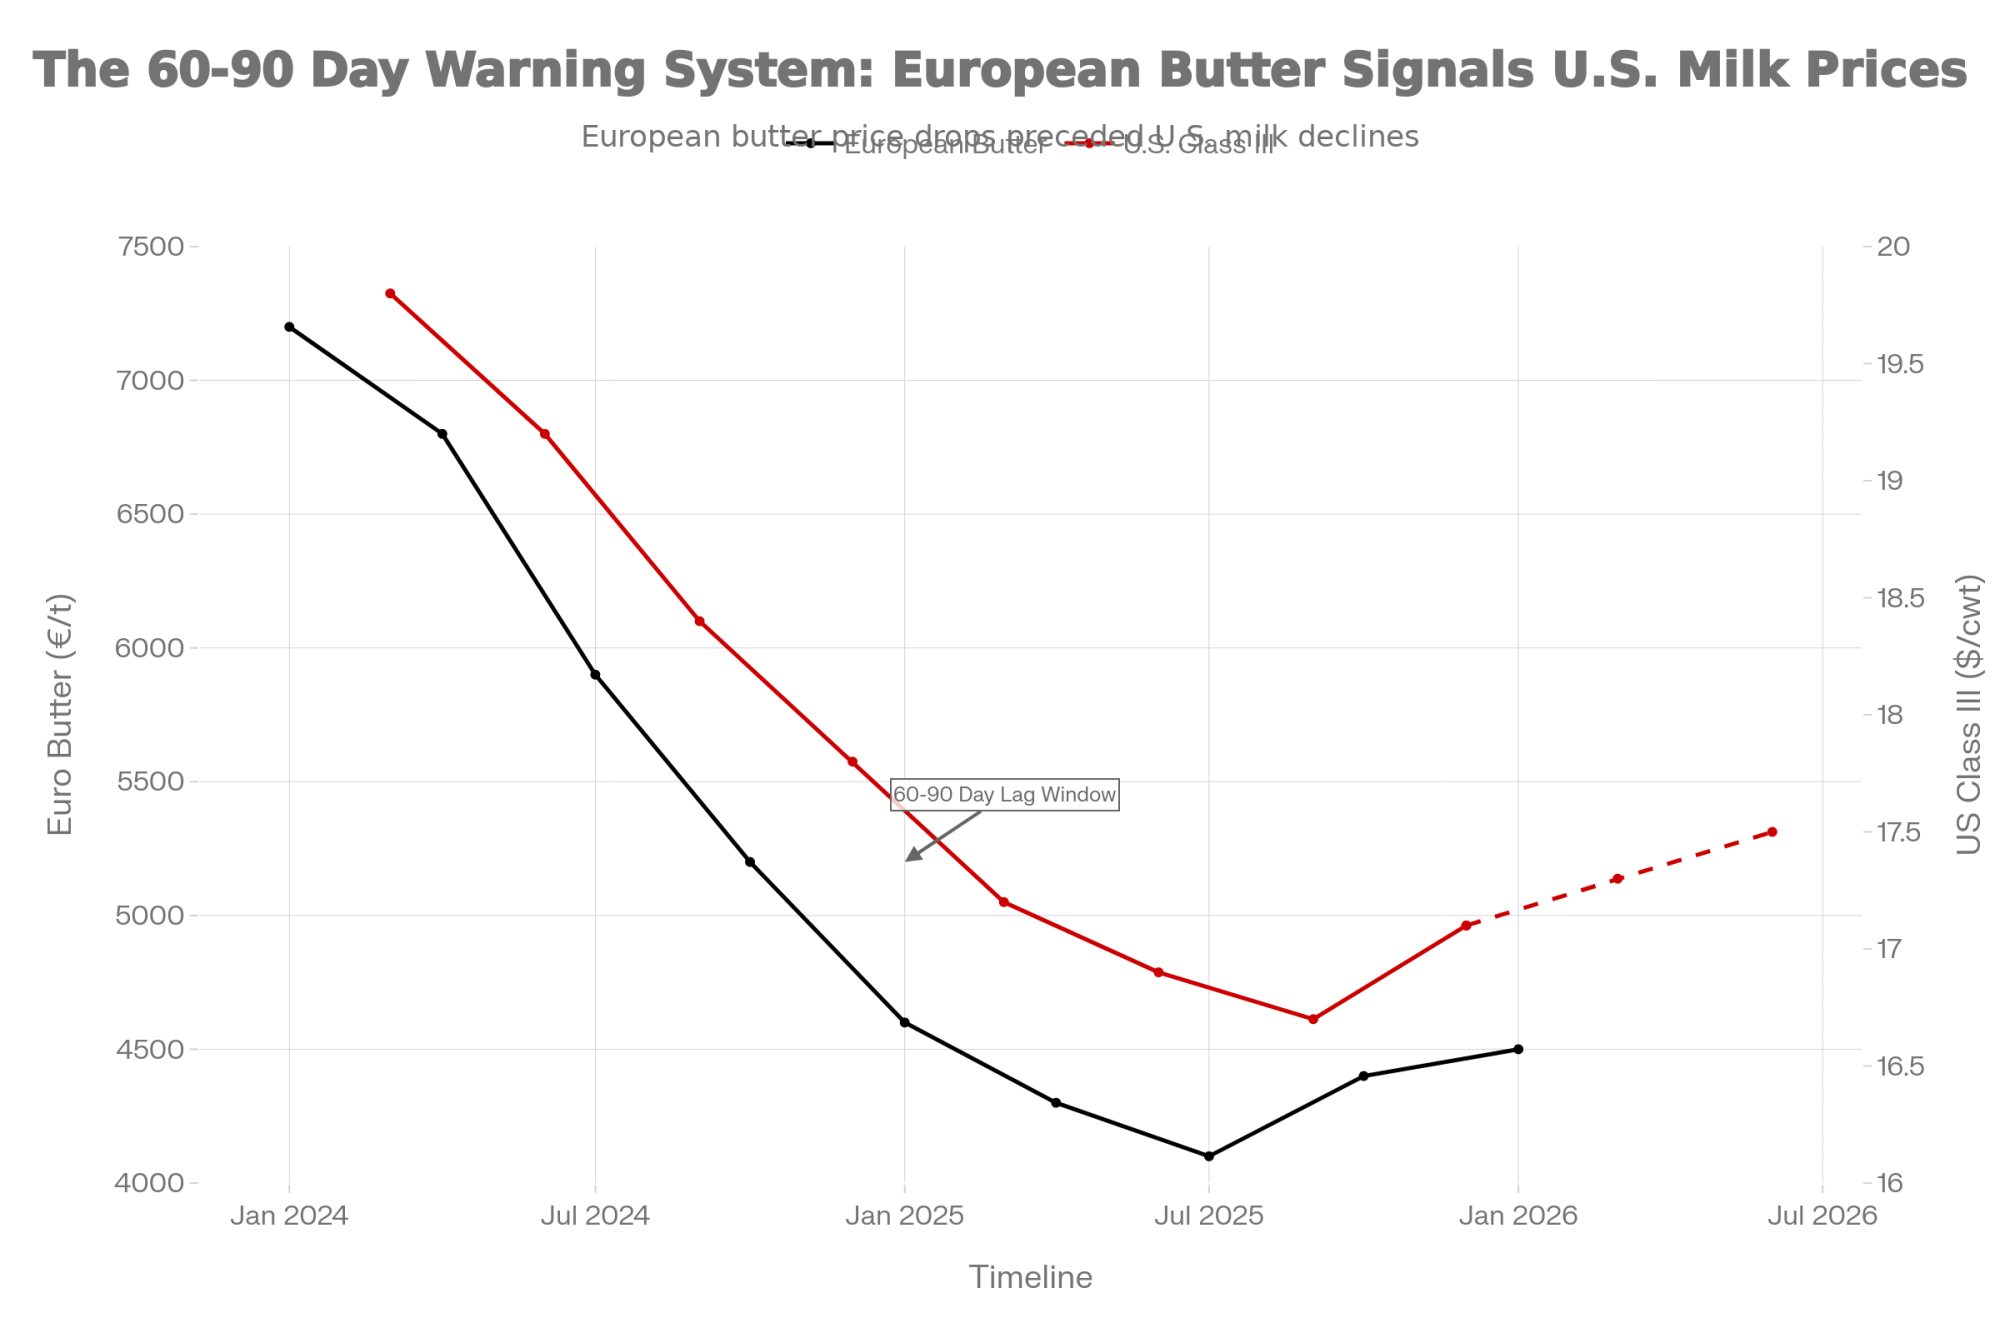
NewsSubscribe
First
Last
Consent

How Your ‘Down Cycle’ Became Corporate Warfare: The Beef-Cross Money Breaking Every Market Rule

Why are some producers expanding herds during margin squeezes? The answer reveals a fundamental shift in dairy economics

EXECUTIVE SUMMARY:

Recent research shows U.S. milk production increased 3.4% through July 2025 despite challenging margins, with New Zealand up 8.9% and South America rising 7.7%—a pattern that breaks traditional market correction cycles. What farmers are discovering is that beef-on-dairy crossbred calves now generate revenue streams that can offset monthly feed costs, fundamentally altering culling decisions that historically balanced supply and demand. This shift coincides with processing consolidation, as demonstrated by Lactalis’s $4.22 billion acquisition of Fonterra, creating fewer competitive alternatives for milk marketing. University research indicates that when processing facilities operate above 95% capacity, basis relationships deteriorate for producers—a situation becoming more common as companies optimize throughput over redundancy. The convergence of alternative revenue sources, reduced processing competition, and government programs like Dairy Margin Coverage creates market dynamics in which traditional price signals no longer effectively drive supply adjustments. For progressive producers, this means developing risk management strategies that account for combined milk-plus-calf returns while diversifying processing relationships. Understanding these structural changes—rather than waiting for cyclical recovery—positions operations to navigate an industry where market fundamentals are being permanently rewritten.

dairy market consolidation

So I’m having coffee with this producer last week—big operation, been at it for decades—and he says something that’s been bugging me ever since. “You know what’s weird?” he goes. “My margins are terrible, milk check keeps shrinking, but I’m milking more cows than I ever have.”

And I’m thinking… wait, what?

See, I’ve been covering these markets since Clinton was president (yeah, I’m that old), and this just doesn’t follow the old playbook. You know how it’s supposed to work, right? Prices tank, producers cull hard, supply drops, prices recover. Economics 101 stuff.

Except look at what the USDA put out last month. U.S. milk production up 3.4% through July—during what should be a massive correction period. New Zealand’s running 8.9% ahead of last year, according to Global Dairy Trade reports. South America’s up 7.7%. These numbers keep coming in month after month.

I mean, when’s the last time you saw production climbing during a price crash? Never, right? Because it makes no damn sense economically.

And honestly? That should scare every independent producer reading this.

Global milk production defying economic logic – while prices crash, production surges in key regions, breaking the fundamental supply-demand corrections that have balanced dairy markets for decades

The Beef-Cross Money That’s Breaking All the Rules

You guys all know about these beef-on-dairy calves bringing serious money lately. I’m talking… well, let’s just say crossbred calves are covering expenses that used to come straight out of the milk check.

But here’s where it gets nuts—that calf money is completely screwing up everything we thought we knew about supply and demand responses.

Think back to 2014. I remember writing about operations that culled hard when Class III dropped. Supply tightened up real quick. Prices recovered. Basic market mechanisms are working like they should.

Not anymore.

You’ve got cows bleeding money on every hundredweight of milk, but that same cow’s beef-cross calf might cover months of feed costs. So instead of sending her down the road like you would’ve done back then, you keep her around for the calf revenue.

Makes total sense from a cash flow standpoint, I get it. But multiply that decision across every dairy operation dealing with tight margins… and suddenly you’ve got this bizarre situation where terrible milk prices are actually keeping more cows in production.

What are the feedback loops that are used to correct market imbalances automatically? They’re not just broken—they’re working backwards.

When Your Processor Starts Playing Games

You know what really bothers me? How tightly these processing networks run nowadays. I keep hearing about plant shutdowns that create these massive disruptions—milk backing up at farm tanks, basis going to hell, producers scrambling to find alternative processing.

And the basis? Starts at maybe a small discount and just keeps sliding. Gets ugly real fast.

But what really gets me is how it exposes just how deliberately lean these processors run their operations. Mark Stephenson up at Wisconsin Extension—sharp guy, does good work—he’s mentioned how when processing plants approach capacity limits, basis relationships start deteriorating for producers.

Which makes you wonder… why are so many facilities always running right at that edge?

My theory? Because they figured out that tight capacity gives them leverage. When every processor in your region is maxed out, where else are you gonna haul your milk? They can knock your basis down, and you’ll take it because—what choice do you have?

Talk to producers lately. Basis penalties that used to be seasonal exceptions are becoming… well, more frequent occurrences. Because some genius in corporate figured out that running short on capacity works better than building enough to actually serve their suppliers properly.

The Lactalis Deal That Shows How This Game Really Works

You want to see corporate timing that’d make a Wall Street trader jealous? Watch how Lactalis—try saying that name three times fast—played their Fonterra buyout.

So these guys are already the biggest dairy company on the planet, right? Pulling in over €30 billion annually according to their own financial reports. They could’ve struck this deal anytime they wanted.

But did they move when milk prices were strong and farmers actually had some negotiating power? Hell no.

They waited until this year, right when global oversupply was building and operations were getting squeezed on margins. Those Australian Competition and Consumer Commission documents show the negotiations happening right as market pressure was building. Final deal: $4.22 billion for Fonterra’s consumer and foodservice businesses.

Coincidence? I seriously doubt it.

Want proof this is a pattern? Look at what they did in France after they consolidated operations there. Despite making record money—record money—they cut milk collection by 450 million liters last year. That’s nearly 10% of their French volume, according to European dairy reports. French producers were screaming about it, but by then, competitive alternatives were already gone.

Funny how that timing works out, isn’t it?

Why “Cheaper Feed” Is Mostly Marketing Nonsense

Every trade publication—and I read way too many of them—has some consultant talking about how lower grain costs are gonna save our margins. Corn backing off from highs, soybeans down… sounds encouraging in theory.

Until you actually run the numbers on real operations.

So let’s say feed costs drop significantly—and I mean really drop, more than you’d normally see. When you break that down per cow per day versus what most operations are losing on milk revenue… well, it’s like trying to fill a swimming pool with a garden hose while someone’s got the drain wide open.

I keep hearing from producers who’ve done the math. Feed improvements might save you fifty cents, maybe seventy-five cents per cow daily. But if milk revenue’s down two-fifty, three dollars per cow… you see the problem?

MetricDaily Per Cow ImpactMonthly Per CowAnnual Per Herd (500 cows)
Milk Revenue Loss-$2.50-$75.00-$456,250
Feed Cost Savings+$0.60+$18.00+$109,500
NET IMPACT-$1.90-$57.00-$346,750

But these consultants keep pushing feed procurement strategies because—and I suspect this is part of the game plan—it keeps producers focused on optimizing costs while the real money flows toward corporate consolidation. Keep us busy saving pennies while Rome burns.

The Processing “Emergency” Pattern

What bothers me about these plant shutdowns? Every time one goes down, it requires this massive coordination effort—state agencies getting involved, emergency rerouting across multiple states, even companies that don’t normally handle dairy getting pressed into service.

When one facility failure requires government-level intervention, that tells you everything about how this system’s designed to operate. Zero redundancy is built in. Everything is running right at the breaking point.

If any of us ran our dairy operations with that little backup… hell, we’d never sleep at night. But for processors? Apparently, running lean means every breakdown creates regional pricing opportunities they can use to their advantage.

And that’s becoming the pattern. Processing disruptions that create permanent changes to local basis relationships. Never temporary adjustments that recover—always permanent shifts that favor the processor.

Makes you wonder how accidental some of these emergencies really are…

What the Experienced Guys Are Actually Doing

I’ve been talking to producers who’ve figured out this cycle’s different from anything we’ve seen before. The ones positioning to survive aren’t sitting around waiting for some magical market recovery.

They’re getting serious about risk management for Q4 production. Class III put options for fourth quarter production—locking in price floors when things could get uglier. Some operations regularly rotate milk between multiple processors. Soon as one plant starts offering heavy discounts, they shift volume to keep everyone competitive.

DMC enrollment deadline’s coming up fast—September 30th, that’s next Monday. Coverage costs you maybe fifteen cents per hundredweight but pays out when margins collapse below certain thresholds. Joe Outlaw at Texas A&M’s Agricultural and Food Policy Center ran the numbers after that 2023 squeeze—program paid out $1.27 billion to enrolled producers. With margins running where they are now? Enrolled operations could see substantial government checks.

Strategic culling’s getting weird, too. Some producers I know are scoring every cow on total economic return—milk revenue plus calf value minus feed costs. Some of their best milk producers are getting shipped because their calves don’t bring premium money. Makes sense mathematically, but it feels backwards, you know?

Regional feed coordination with neighbors still makes sense if you can coordinate bulk purchases and negotiate decent freight rates. Every dollar saved per ton adds up when you’re feeding this many animals.

The Government Program Making Everything Worse

This probably won’t make me popular with the bureaucrats in Washington, but I gotta say it: Dairy Margin Coverage isn’t protecting family farms. It’s subsidizing the oversupply that’s letting corporate processors buy cheap milk.

Think about the logic here. DMC literally pays producers to keep milking cows that lose money on every hundredweight. Who benefits from a sustained cheap milk supply? Processing companies are buying raw materials at below-market rates.

It’s corporate welfare disguised as farmer relief, and most of us are too desperate to turn it down.

The program uses national averages that completely ignore regional basis manipulation games. Producers dealing with heavy local discounts see DMC calculations based on milk prices they’ve never actually received in their mailbox. It’s like calculating your gas mileage based on highway speeds when you’re stuck in city traffic all day.

Still, with margins this brutal, you probably need the coverage. Just understand what you’re really signing up for—subsidizing a system that’s working against your long-term interests.

The Reality Nobody Wants to Discuss Publicly

Hell, I’ve been doing this since the late 90s, and I’ve never seen market mechanisms get systematically dismantled like this. What are the automatic balancing systems that are used to correct supply-demand imbalances? They’ve been neutralized.

Beef-cross revenue eliminates price-driven culling incentives. Processing consolidation kills competition for our milk. Global production growth creates sustained oversupply conditions. Government programs subsidize below-cost production.

This isn’t your typical cyclical correction. It’s a managed transition toward corporate control of milk pricing, with independent farmers becoming contract suppliers instead of actual market participants.

Back when we had real competition for our milk—and some of you remember those days—you could play processors against each other. Get a better basis here, threaten to move volume there. Now? Good luck with that strategy.

Industry publications keep using words like “partnership” when they talk about these corporate acquisitions. Lactalis is partnering with farmers after they buys up assets. Partnership. Right. Like David partnering with Goliath—how’d that work out?

When one party controls processing capacity and the other has nowhere else to sell their product… that ain’t partnership. That’s dependency, presented in fancy marketing language.

Bottom Line for Producers Who Understand What’s Happening

Smart farmers are repositioning for an industry where volume might matter more than efficiency per cow, where calf checks could drive more herd decisions than milk production metrics, and where basis management becomes more critical than traditional futures hedging.

Reality check time. Feed cost improvements can’t offset milk revenue losses when prices drop faster than input costs. Government programs provide short-term cash flow but perpetuate the structural problems driving margin compression. Beef-cross returns generate immediate revenue while potentially undermining long-term market stability.

Operations implementing serious risk management strategies—protecting production with options, diversifying processor relationships, culling based on total economic returns instead of just milk numbers—those farms will survive this transition period.

The ones waiting for a traditional cyclical recovery? They’re gonna discover that “normal” doesn’t include the competitive market relationships that made independent dairy farming economically viable.

Corporate consolidation is accelerating rapidly across the industry. Producers who recognize this as a permanent structural change rather than a temporary market weakness have limited time to position defensively before competitive alternatives disappear entirely.

Your operation’s survival depends on understanding that current market conditions aren’t just natural economic forces playing out. They reflect corporate strategies designed to concentrate industry control while systematically reducing the number of independent producers.

The question isn’t whether markets will eventually improve—they might. The question’s whether your farm can adapt to survive in the corporate-controlled industry that’s emerging from this transformation.

Makes me sick to write that last part, but it’s the truth as I see it developing.

KEY TAKEAWAYS:

  • Combined revenue optimization: Producers tracking total economic returns per cow (milk revenue plus calf value minus feed costs) are making more profitable culling decisions, with beef-cross calves potentially covering 2-3 months of feed expenses per animal
  • Risk management enhancement: Class III put options for Q4 production and Dairy Margin Coverage enrollment (deadline September 30th) provide essential downside protection, with 2023 DMC payments totaling $1.27 billion to enrolled operations during margin squeezes
  • Processing relationship diversification: Operations rotating milk between multiple processors monthly, maintain competitive basis pricing, and avoid the 15-20¢/cwt penalties that can occur when single-plant dependencies face capacity constraints
  • Strategic feed procurement coordination: Regional cooperatives coordinating bulk grain purchases and freight optimization can achieve meaningful cost reductions, though these savings alone cannot offset significant milk revenue declines
  • Market structure adaptation: Successful operations are positioning for an industry where basis management becomes more critical than traditional futures hedging, requiring a deeper understanding of local processing dynamics and capacity utilization patterns

Production data sourced from the USDA Economic Research Service monthly dairy reports and Global Dairy Trade auction results that track international supply trends. Corporate financial information from publicly available Lactalis Group reports and Australian Competition and Consumer Commission regulatory filings. Academic analysis from the University of Wisconsin Extension dairy economics research and Texas A&M’s Agricultural and Food Policy Center studies on government program impacts.

Complete references and supporting documentation are available upon request by contacting the editorial team at editor@thebullvine.com.

Learn More:

The Sunday Read Dairy Professionals Don’t Skip.

Every week, thousands of producers, breeders, and industry insiders open Bullvine Weekly for genetics insights, market shifts, and profit strategies they won’t find anywhere else. One email. Five minutes. Smarter decisions all week.
NewsSubscribe
First
Last
Consent

Why This Dairy Market Correction Feels Different – and What It Means for Our Farms

Is your farm positioned to thrive during the longest dairy correction in decades?

EXECUTIVE SUMMARY: The 2025 dairy market correction presents unprecedented challenges, with butter prices plunging 30% since summer and cheddar declining 14% since mid-August, creating margin pressure across all regions. What makes this correction different is its global scope—New Zealand’s milk production surged 14.6% while China’s dairy imports dropped 15%, fundamentally altering traditional market dynamics. Progressive operations are finding stability through anaerobic digesters generating $400-450 per cow annually, though this technology remains accessible primarily to larger farms. Industry projections suggest up to 160,000 dairy operations worldwide may close over the next two years, with asset losses potentially reaching $400 billion globally. However, innovative farmers are adapting through direct-to-consumer marketing, cooperative digester partnerships, and refined transition cow management protocols. The extended 18-to 24-month correction timeline requires strategic thinking rather than simply waiting for recovery. Those who embrace diversification, strengthen local market relationships, and invest in operational efficiency are positioning themselves not just to survive, but to acquire distressed assets and emerge stronger when markets stabilize.

KEY TAKEAWAYS:

  • Revenue diversification pays: Anaerobic digesters generate $400-450 per cow annually through carbon credits and renewable energy sales, providing crucial margin protection during price downturns
  • Market correction extends longer: Unlike typical 6-9 month cycles, structural factors suggest 18-24 months of pressure, requiring conservative planning and aggressive cost management
  • Consolidation accelerates rapidly: Forecasted closure of 160,000+ dairy operations globally creates acquisition opportunities for well-positioned farms while eliminating competitors
  • Local markets offer premiums: Direct-to-consumer sales and specialty processing partnerships command 40-60% price premiums over commodity markets during corrections
  • Operational excellence becomes critical: Focus on transition cow management, component optimization, and feed efficiency improvements to maintain profitability at lower milk prices
dairy market correction, farm profitability, dairy business strategies, global dairy trends, anaerobic digesters

You know, when we sit down with a cup of coffee and talk about markets these days, there’s this feeling that we’re not just going through another typical cycle. This time feels different. Really different.

I’ve been tracking the numbers closely, and what I’m seeing should concern every dairy producer. CME butter prices have dropped about 30% since summer, falling from around $2.62 per pound down to $1.83 by mid-September, according to the latest Dairy Herd Management reports. Cheddar’s been hit too—down roughly 14% since mid-August. But here’s what’s really got my attention: this isn’t just happening here in the States.

This line graph clearly illustrates the severity and speed of the 2025 dairy price correction, showing butter’s dramatic 30% fall from $2.62 to $1.83 per pound and cheddar’s 14% decline since mid-August. 

Take Wisconsin, where I was talking with producers just last week. They’re telling me the pressure on butterfat performance and milk solids pricing has been relentless. “In past corrections, we’d see some regional breathing room,” one Fond du Lac operator explained. “Maybe when the Midwest got hit, New York or Michigan would hold steady. Not this time.”

The data backs up what farmers are feeling on the ground. We’re seeing volatility that’s literally double the typical market swings, while skim milk powder prices have converged globally. That means those usual price gaps we’ve always counted on for export opportunities? They’re shrinking fast.

The Digester Game-Changer

Now here’s where things get interesting—and frankly, a bit concerning if you’re running a traditional operation. Larger farms with anaerobic digesters are playing a completely different game during this downturn.

I recently spoke with a California dairy operator who put it perfectly: “The digester income has really been our saving grace. We’re pulling in about $400 to $450 per cow yearly through energy sales and carbon credits, and it’s smoothing out these wild price swings.” According to EPA AgSTAR program data, these numbers are realistic for operations that can afford the capital investment.

But let’s be honest about the math here. Those digesters typically require multi-million dollar investments and work best for herds of 2,000 cows or more. That puts them out of reach for many family operations.

This table illustrates why anaerobic digesters provide significant advantages to larger operations while remaining largely inaccessible to smaller farms, highlighting the technology’s role in creating unequal market resilience.

What’s encouraging, though, is hearing about cooperatives—especially in Quebec and parts of the Midwest—pooling resources to make digester technology more accessible. It’s a promising approach that could level the playing field somewhat.

New Zealand’s Production Paradox

Meanwhile, our friends in New Zealand are dealing with their own interesting situation. Milk production is actually up about 14.6% this season in terms of milk solids, according to their dairy association reports. Farmers there are enjoying some seriously good payouts—around NZ$10.15 per kilogram of milk solids from Fonterra, which represents one of the best rates in recent years.

But here’s the catch that not everyone’s talking about. Fonterra’s balance sheet shows they’ve been dipping into reserves to maintain these high payouts, which obviously can’t continue forever. When the inevitable adjustment comes—probably early next year—it won’t be a sudden cliff but more of a gradual slide over several months.

What’s particularly problematic is how farmers typically respond to declining payouts. They tend to push production even higher, trying to make up for lower per-unit revenue with increased volume. Makes perfect sense from their perspective, but it keeps the global market flooded with supply exactly when we need less.

China’s Changing Role

And then there’s China—the market that used to be our safety valve. Their dairy imports have dropped about 15% recently, according to USDA Foreign Agricultural Service data and Rabobank research. They’re pushing hard toward domestic milk production despite higher feed costs, and you can see this shift reflected in how they’re using dairy ingredients—moving from imported powders to locally produced products.

This represents a fundamental change in global dairy trade patterns. Where China used to come in with big buying sprees whenever prices softened, we can’t count on that anymore.

This stark contrast between New Zealand’s 14.6% production surge and China’s 15% import decline illustrates why traditional market-balancing mechanisms aren’t working in 2025.

What the Timeline Really Looks Like

Piecing all this together, the data suggest we’re probably looking at a market correction that stretches 18 to 24 months before things truly stabilize. That’s significantly longer than the typical 6-9 month cycles we’re used to.

The consolidation numbers are sobering. Industry analysis based on USDA census data and current trends suggests as many as 160,000 dairy operations worldwide could close during this period, with asset losses potentially reaching $400 billion globally as farms get liquidated at distressed prices.

The projected closure of 160,000+ dairy operations over two years won’t impact all regions equally, with North America and Europe bearing the heaviest consolidation burden.

But it’s not all doom and gloom. I’ve seen some remarkable adaptation happening.

Real-World Success Stories

There’s a producer near Fond du Lac who started layering direct-to-consumer sales alongside regular contracts—it’s helped cushion the financial blow considerably. Around the Northeast, smaller farms are crafting local brands that command genuine premiums from consumers who value the farm story.

In California’s Central Valley, some larger operations are weathering this storm because they tightened their efficiency measures back when times were good. They’re now positioned to acquire distressed assets at significant discounts, potentially.

What This Means for Your Operation

If you’re running an operation under 1,200 cows, this is the time to investigate partnerships for renewable energy projects seriously. Look hard at your transition cow management—those improvements in fresh cow protocols can make a real difference during tight periods. And explore local market niches where your farm’s story might command premium pricing.

For those managing larger herds, prioritizing investments in alternative revenue streams isn’t optional anymore—it’s essential. Consider moving aggressively on digester projects, carefully scouting acquisition opportunities, and tightening cost controls across the board.

Don’t think of this as a sprint to the finish line. The road ahead is long, with challenges and opportunities wrapped together.

Learning from History

Remember, we’ve navigated major industry transformations before. The shift to artificial insemination. The evolution from tie-stall barns to parlor systems. The adoption of computerized feeding. Each transition seemed overwhelming at the time, but the industry emerged stronger and more productive.

Those who embraced change didn’t just survive—they thrived in the new environment.

The Path Forward

What’s your next move going to be? Are you positioning for adaptation or just hoping to ride this out?

Let’s keep the conversation going and share what’s working. The best lessons often come from our collective experience, especially during challenging times like these.

Market Snapshot:

  • CME butter: down ~30% since summer 2025
  • Cheddar prices: off ~14% since mid-August
  • New Zealand milk solids: up 14.6% this season
  • Fonterra payout: NZ$10.15 per kg milk solids
  • Digester revenue: $400-450 per cow annually
  • China imports: down ~15% in 2024-25
  • Projected closures: 160,000+ operations globally
  • Asset impact: ~$400 billion potential losses

It’s a challenging landscape, but together we can navigate it by sharing knowledge, strategies, and keeping our focus on adaptation rather than just survival.

Thanks for thinking this through with me—here’s to keeping the coffee warm and the conversations productive.

Complete references and supporting documentation are available upon request by contacting the editorial team at editor@thebullvine.com.

Learn More:

The Sunday Read Dairy Professionals Don’t Skip.

Every week, thousands of producers, breeders, and industry insiders open Bullvine Weekly for genetics insights, market shifts, and profit strategies they won’t find anywhere else. One email. Five minutes. Smarter decisions all week.
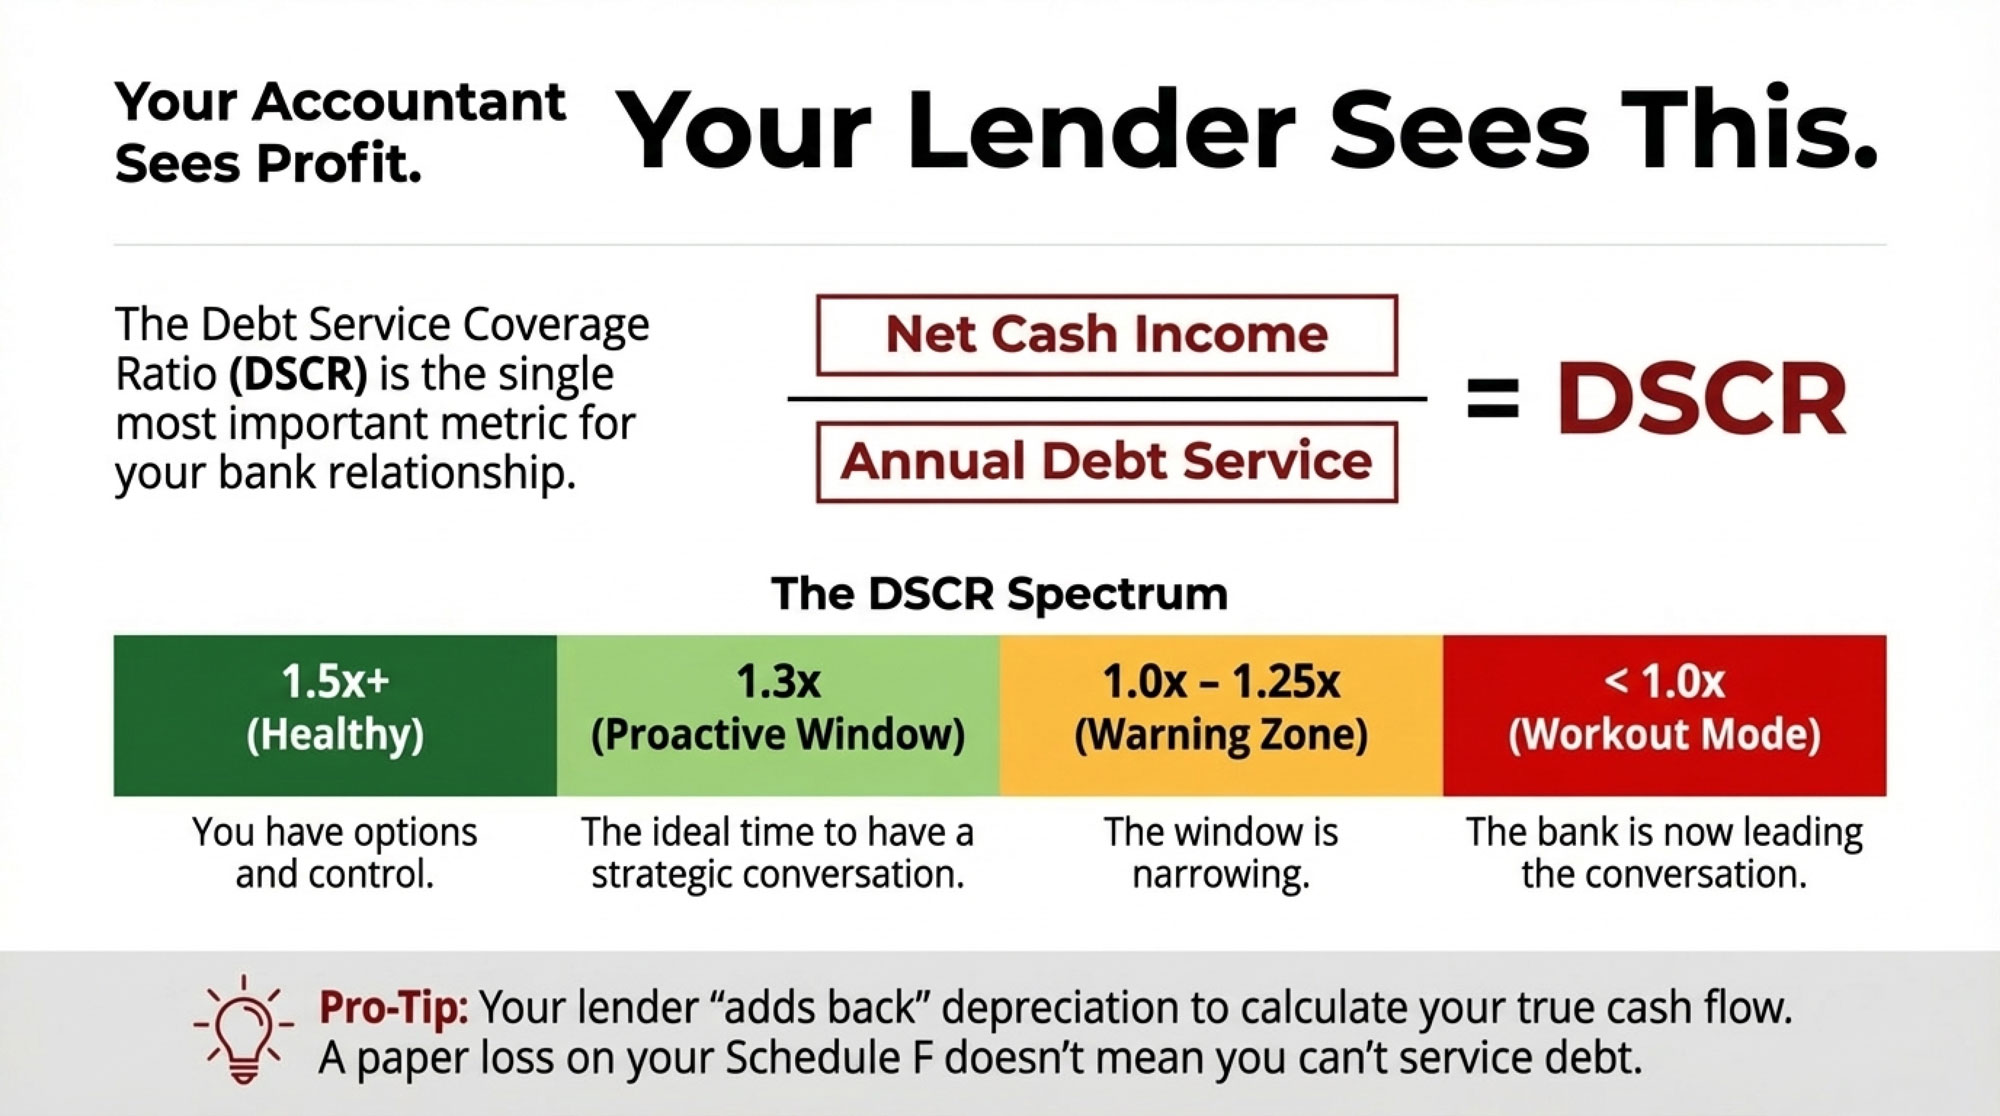
NewsSubscribe
First
Last
Consent

CME Dairy Market Report – September 10, 2025: Mixed Signals from the Trading Floor

Everyone’s celebrating today’s cheese rally. We dug deeper – here’s what the trading floor isn’t telling you.

EXECUTIVE SUMMARY: We’ve been tracking something interesting in today’s CME session that most market reports are missing completely. Sure, cheese blocks rallied 0.75¢ and Class III futures exploded 73¢ higher – but here’s what caught our attention: butter got absolutely hammered (down 4¢) while NDM continues pricing us out of global markets at a 6-14¢ premium over competitors.This isn’t just mixed signals… it’s revealing a fundamental shift in how the dairy complex is splitting apart. With milk production up 3.4% in major states and cow inventories at 2021 highs, we’re looking at an abundant supply hitting selective demand. The cheese plants still need your milk, but export markets? That’s where the real profit erosion is happening.What’s fascinating is how trading volume backed up today’s moves – heavy selling in butter (14 transactions) versus light buying in cheese (just two trades). Our analysis of the futures curve suggests this cheese rally might have more staying power than previous head fakes, especially with seasonal demand patterns shifting toward holiday production.Here’s the bottom line: the market is telling us to focus on domestic cheese demand while export competitiveness continues to deteriorate. Smart producers are using today’s Class III jump to lock in October-November pricing around $17.50+. Don’t wait for perfect signals – they don’t exist in dairy markets.

KEY TAKEAWAYS

  • Lock in 25-30% of remaining 2025 production NOW – Today’s 73¢ Class III surge creates pricing opportunity at $17.50+ levels, but futures volume was light, suggesting limited upside momentum. Use Dairy Revenue Protection or forward contracts while this window exists.
  • Export markets are broken for powder, focus domestic – U.S. NDM running 6-14¢/lb premium over European and New Zealand competitors means export profits are gone. Redirect marketing strategy toward domestic cheese demand, where we still have a competitive advantage.
  • Feed cost relief is real but temporary – Corn at $3.99/bu and soybean meal at $281/ton improve milk-to-feed ratios, but harvest pressure won’t last forever. Contract for 6 months of feed-forward while basis relationships favor buyers.
  • Production efficiency beats volume expansion – With 18.5 billion pounds produced in major states (up 3.4% YoY) and cow numbers at 2021 highs, margins come from per-cow productivity, not herd growth. Focus rations on components, cull bottom quartile performers.
  • California’s model shows the future – Down 3% in cow numbers but ahead on per-cow production proves efficiency wins over scale. Their forced optimization from HPAI and regulations demonstrates profit potential through targeted culling and technology adoption.

Well, that was quite a session today. After getting hammered for two weeks straight, we finally saw some life in the cheese block market – up 0.75¢ to close at $1.6725/lb. Not exactly cause for celebration, but when you’ve been watching your projected milk checks shrink daily, you’ll take any green you can get.

The real story was in the futures pit. Class III September contracts jumped 73¢ to settle at $17.69/cwt, according to CME data. That’s the kind of move that gets your attention, especially when you’re trying to figure out what September’s milk check might look like.

But here’s where it gets complicated – and you know how dairy markets love to be complicated. While cheese gave us hope, butter got absolutely crushed, dropping 4¢ to $1.9650/lb. NDM wasn’t much better, falling 1.25¢ to $1.1875/lb.

So we’re sitting here with one foot on the gas pedal and one on the brake. Classic dairy market stuff.

Today’s Numbers – The Real Story

Let me break down what actually moved today and what it means for those of us shipping milk:

Cheese Blocks: $1.6725/lb (+0.75¢) Finally, some buying interest. This happened mostly in the last hour – probably some short covering, but buying is buying. The cheese plants still need our milk to make product, and this price action suggests they’re willing to pay for it.

Cheese Barrels: .6750/lb (-0.50¢)
Here’s what’s interesting – barrels are trading at a slight premium to blocks. That’s not normal, and it usually means processors aren’t sure which format they prefer right now. Could signal some uncertainty in the cheese complex.

Butter: $1.9650/lb (-4.00¢) This hurt. A 4¢ drop in one day tells you inventories are building, and demand just isn’t there. Class IV outlook took a hit with this move.

NDM Grade A: $1.1875/lb (-1.25¢) Export competitiveness continues to erode. We’re pricing ourselves out of international markets, which puts more pressure on domestic demand.

The trading volume backed up the price moves. Butter saw 14 transactions on a down day – that’s heavy volume, suggesting real selling pressure. Cheese blocks managed just two trades despite the rally, which makes you wonder if this bounce has staying power.

Where We Stand Globally

This is where things get uncomfortable for us as U.S. producers. Our NDM is currently trading well above that of international competitors, making it challenging to move the product overseas.

According to recent Global Dairy Trade data and international price comparisons, U.S. nonfat dry milk prices are running 6 to 14 cents per pound higher than European skim milk powder and New Zealand equivalents. When you’re the high-cost supplier in a commodity market, that’s never a good spot to be in.

The European situation isn’t helping either. Ireland’s having a strong production year despite overall EU output being slightly down. Their processors are remaining aggressive on pricing, especially in Southeast Asian markets where we used to have a stronger foothold.

Mexico remains our strongest export partner – CoBank and USDA data show Mexico purchasing about 4.5% of total U.S. milk production through various dairy products. However, even there, we’re seeing increased competition from European suppliers, who are getting creative with freight arrangements.

Feed Costs – Finally Some Relief

Here’s one bright spot in all this. Corn futures settled near $3.99/bushel today, and soybean meal is around $281/ton, according to AMS grain reports. That’s manageable compared to where we were earlier this year.

The milk-to-feed price ratio is still below where you’d want it for comfort, but it’s trending in the right direction. Every dollar saved on feed costs goes straight to your bottom line when milk prices are under pressure like this.

Regional differences are still significant, though. Upper Midwest operations are experiencing some harvest logistics issues that are driving up corn basis. Western producers are still managing through higher hay costs from this summer’s drought conditions.

Production Reality Check

The latest USDA data from July shows milk production in the 24 major dairy states totaled 18.5 billion pounds, up 3.4% from June 2024. That’s a lot of additional milk looking for a home.

Dairy cow inventories have increased by approximately 114,000 to 159,000 head as of mid-2025, representing the highest population since 2021, according to USDA and CoBank reports. Texas and South Dakota continue leading the expansion, while some traditional dairy regions are holding steady or declining slightly.

The processing capacity situation is actually pretty healthy. Most plants are running at 90-95% utilization – busy enough to be efficient, but not so maxed out that quality suffers or maintenance gets deferred.

California’s Unique Situation

California deserves special mention because what happens there affects everyone. The state’s cow numbers are down about 3% from peak levels, but per-cow production is running ahead of historical norms, according to ERA Economics and California Department of Food & Agriculture data.

The surviving operations out there tend to be the most efficient ones. HPAI essentially forced the industry to cull the bottom quartile performers, leaving behind the higher-producing herds.

Water costs remain a significant factor in the Central Valley. Regulatory pressures around methane reduction are actually driving some interesting technological adoption that’s improving efficiency, even if the initial compliance costs were substantial.

The challenge for California operations is that their higher cost structure makes them vulnerable when milk prices drop. They need stronger milk prices than Midwest operations to maintain similar margins.

What the Fundamentals Are Telling Us

Domestic demand patterns are holding up reasonably well. Cheese consumption stays pretty steady, which explains why the cheese complex is performing better than butter and powder. But retail inventory builds are becoming more noticeable, which puts pressure on spot prices.

Export markets face multiple headwinds – a stronger dollar, competitive international pricing, and logistics challenges. Southeast Asian markets show growth potential, but the U.S. market share is under pressure from New Zealand and European suppliers.

The supply side story is straightforward – we’ve got abundant milk, processing capacity is adequate, and this shifts negotiating power toward the processors. That’s not great news for milk prices in the near term.

Risk Management Considerations

Current market conditions demand a strategic approach to pricing. Today’s cheese rally created an opportunity to lock in some October-November production around $17.50+ levels.

Dairy Revenue Protection enrollment is running higher than last year – producers learned from previous market cycles about the importance of having some price floor protection. The program changes have tightened some premium subsidies, but it remains a valuable risk management tool.

For production decisions, the focus has shifted toward efficiency over volume. With margins under pressure, maximizing milk components and minimizing costs per hundredweight makes more sense than just pushing for maximum volume.

Regional Variations Matter

Upper Midwest operations are seeing relatively stable basis relationships compared to national averages. Cheese plant utilization is running around 94% capacity, which is healthy for the region.

Several major cooperatives are implementing seasonal pricing programs to help smooth cash flow volatility for members. If you’re not already enrolled in something like that, it’s worth investigating.

The Northeast continues dealing with higher labor costs and regulatory pressures, but fluid milk markets provide some pricing stability that other regions don’t enjoy.

Southwest expansion continues, particularly in Texas, where feed costs are manageable, labor is available, and processing capacity is growing to match increased production.

Looking Ahead

The next few weeks will be critical for determining whether today’s cheese rally has staying power. Weekly cold storage data on Friday could provide more insight into inventory levels.

Seasonally, we’re entering the period where milk production typically peaks while demand patterns shift toward holiday products. The question is whether processing capacity can handle the seasonal surge without additional price pressure.

Current price levels sit in the lower third of the past three years’ range. While that suggests potential upside, it also reflects fundamental challenges that won’t disappear overnight.

For your immediate decisions, focus on what you can control – production efficiency, cost management, and smart risk management. The volatility isn’t going away anytime soon.

Bottom Line

Today’s mixed session captured where the dairy industry sits right now – domestic demand holding up reasonably well, but international competitiveness is under serious pressure.

The cheese rally was encouraging, and that 73¢ jump in Class III futures suggests the market thinks we may have found a floor around these levels. But the weakness in butter and powder reminds us that fundamental challenges remain.

Stay disciplined with risk management, focus on efficiency over volume, and remember – we’ve weathered tougher markets than this before. The key is making smart decisions with the information we have and not getting caught up in the daily volatility.

This industry has a way of humbling you just when you think you’ve got it figured out. Today offered a small ray of hope, but the real work happens in the barn and the feed alley, not on the trading floor.

Learn More:

  • Tips from the Sports Pros to Improve Your Dairy Herd’s Efficiency – This article provides a tactical, on-farm perspective on how to achieve the production efficiency gains mentioned in the market report. It offers practical strategies for optimizing herd health, nutrition, and management, helping producers improve per-cow productivity and profitability in a challenging market.
  • Dairy Profit Squeeze 2025: Why Your Margins Are About to Collapse (And What to Do About It) – Go deeper into the strategic market forces driving the issues highlighted in the report. This piece offers a hard-hitting look at the long-term implications of China’s tariffs, export challenges, and regional disadvantages, providing a crucial context for why a domestic focus is essential.
  • Future-Proof Your Dairy Farm: Tackling the Top 3 Challenges of 2050 – Look beyond the daily market swings and explore the innovative solutions that will define the dairy industry’s future. This article reveals how technological advancements in methane reduction, animal welfare, and data-driven management are not just future trends but actionable strategies for long-term sustainability and success.

The Sunday Read Dairy Professionals Don’t Skip.

Every week, thousands of producers, breeders, and industry insiders open Bullvine Weekly for genetics insights, market shifts, and profit strategies they won’t find anywhere else. One email. Five minutes. Smarter decisions all week.

NewsSubscribe
First
Last
Consent

The $2.2 Billion Feed Story, Nobody’s Telling You About Southeast Asia’s Dairy Revolution

A $2.2B feed opportunity is exploding in Southeast Asia—and we bet you haven’t heard about it yet.

EXECUTIVE SUMMARY: We’ve been digging into Southeast Asia’s dairy explosion, and the $2.2 billion feed opportunity there is reshaping everything we thought we knew about global markets. While everyone’s watching China crawl at 2% growth, Indonesia jumped 6.2%, Vietnam hit 7.1%, and Thailand climbed 5% in 2024—all with massive supply gaps that scream “opportunity.”Here’s what got our attention: producers switching to premium feed strategies report yields nearly doubling—that’s 0+ extra per cow annually, backed by solid USDA data and university research. The region imports 9.3 million metric tons of soybean meal annually, yet most producers are unaware of this market’s existence. Feed efficiency improvements of 10-15% aren’t just possible—they’re happening right now for operations that understand tropical dairy nutrition. The trend’s accelerating as consumer wealth grows and climate challenges demand smarter feeding solutions. It’s time to stop thinking locally and start capitalizing globally—because while you’re debating, South American competitors are already building relationships that’ll last decades.

KEY TAKEAWAYS

  • Double Your Feed Efficiency Returns – Premium feeding strategies deliver 10-15% efficiency gains, translating to $350+ annual profit per cow. Start by analyzing your current protein profile against heat-stress requirements and implement targeted nutrition immediately. Source: USDA, Journal of Dairy Science
  • Tap Into 6-7% Market Growth – Southeast Asia’s dairy demand is exploding while domestic production lags at just 18% self-sufficiency, creating massive import opportunities worth billions. Build strategic partnerships with suppliers targeting the Indonesia, Vietnam, and Thailand markets now. Source: IMARC Group, Indonesian Ministry of Agriculture
  • Beat Heat Stress With Science – Tropical dairy operations adjusting protein levels during monsoon seasons maintain production while competitors lose 20%+ yields. Consult regional extension services immediately to develop climate-adapted feeding protocols for your operation. Source: University of the Philippines Los Baños, regional extension bulletins
  • Leverage Technology For Competitive Edge – Digital feed management systems reduce waste while optimizing nutrient delivery, saving hundreds per cow annually through precision feeding. Integrate USSEC optimization tools with your nutritionist to capture these efficiency gains. Source: USSEC market intelligence
  • Certification Equals Market Access – Sustainability programs, such as SSAP (covering 72% of US soy exports), are increasingly determining processor relationships and premium pricing opportunities. Evaluate certification options with your feed suppliers to future-proof market access. Source: SSAP certification data
dairy feed market, Southeast Asia dairy, feed efficiency, global dairy trends, dairy import opportunity

Here’s something you don’t hear talked about enough in our circles—and trust me, you should be paying attention. Last rainy season, I found myself in Central Java’s Boyolali region, sitting in on a cooperative meeting where the humidity was thick enough to cut with a knife. That’s where I met Pak Eko, a third-generation dairy farmer running about 300 head of Friesian crosses.

The guy was practically bouncing off the walls, telling me how switching his feed program had bumped his cows from a struggling 9 liters per day to a solid 18. “Same cows, same weather, better feed,” he said with a grin that told me everything I needed to know about his milk check.

That conversation got me thinking—while everyone’s obsessing over China’s cooling market, Southeast Asia is quietly exploding right under our noses.

The Numbers That Should Wake You Up

Indonesia’s dairy sector jumped 6.2% in 2024, with East Java and Central Java driving most of that growth, according to the Ministry of Agriculture data. Vietnam isn’t far behind at 7.1% expansion, especially around the Red River Delta, where the big operations are concentrated—USDA Foreign Ag Service confirms this. Thailand’s pulling about 5% growth, centered in their dairy heartland around Nakhon Ratchasima.

Meanwhile, China’s crawling along at 2% growth. Do the math on where the momentum’s heading.

But here’s the kicker that should really get your attention: local production can’t touch local demand. Indonesia covers approximately 25% of its own consumption. The Philippines? They’re hanging on at barely 1% self-sufficiency—essentially importing everything. Vietnam manages about 18% from domestic sources.

That supply gap translates into massive feed demand—we’re talking 9.3 million metric tons of soybean meal flowing into the region annually, with US soy capturing about $2.2 billion of that market. Not bad, right?

Except we might be losing our grip on it.

The Brazilian Invasion You’re Not Hearing About

Here’s what’s keeping me up at night: while we’ve been dealing with trade wars and domestic politics, Brazil and Argentina have been quietly, systematically building relationships across Thailand, the Philippines, and Vietnam.

Industry discussions suggest these suppliers are coming in with pricing advantages that matter—we’re talking delivered costs that can run $10-15 per metric ton below US soy in some markets. When feed represents 70% of your operational expenses, that’s not pocket change.

I was chatting with a feed technician at one of the bigger mills in Jakarta a few months back, and he mentioned—almost casually—that Brazilian suppliers weren’t just competing on price. They’re building permanent infrastructure, cultivating long-term relationships, and investing in logistics networks.

These companies learned hard lessons after losing China’s market due to trade disputes. They’re not making the same mistakes twice.

Genetics Reality Check: This Isn’t Wisconsin

The cattle picture across Southeast Asia is fascinating—and completely different from what most North American producers would expect.

Malaysia’s dairy operations have gravitated toward Holstein-Sahiwal crosses that can handle the heat while still pulling 12-14 liters daily, according to documentation from the Malaysian Agricultural Research and Development Institute. Indonesia’s herds lean heavily on Friesian genetics crossed with local breeds, typically averaging 10-12 liters per cow. Vietnam’s making perhaps the most dramatic shift, transitioning from buffalo milk production to Holstein-Sindhi crosses—which completely changes their feed requirements.

The climate drives everything here. Picture 85% humidity combined with temperatures above 32°C for weeks on end during the monsoon season. Cow appetites tank. That’s why regional extension services recommend adjusting protein levels during these heat stress periods, though specific protocols vary by local conditions and management capabilities.

Research from the University of the Philippines at Los Baños backs up what producers like Pak Eko are seeing—switching to high-quality US soybean meal can deliver measurable improvements in feed conversion efficiency. But results vary significantly based on farm management practices and local conditions.

Trade Policy Creating Real Opportunities

The policy landscape is shifting faster than most people realize, and it’s creating genuine opportunities for those paying attention.

Indonesia’s elimination of tariffs on US soybean meal in 2025 has been huge—essentially clearing the runway for American exports. Thailand’s zero-tariff framework under ASEAN agreements helped power an 11.5% surge in their dairy exports last year. The Philippines still wrestles with a 7% tariff, but negotiations are moving.

What’s particularly interesting is Vietnam—they keep ramping soybean meal imports at 15.2% annually despite maintaining tariffs, showing just how strong underlying demand really is.

But here’s the challenge: RCEP trade rules inherently favor intra-Asian commerce. Every month, American suppliers delay building deeper regional relationships, and competitors gain ground that’s increasingly difficult to recover.

Technology That’s Actually Moving the Needle

Digital feed management isn’t just conference room talk anymore—it’s becoming standard practice across commercial operations I’m visiting.

Several cooperatives in East Java have integrated genetic testing with precision feed formulation software, enabling them to tailor nutrient requirements to their specific crossbred herds. The results have been measurable improvements in herd health and milk production.

USSEC’s optimization tools are making a real difference, with producers reporting savings of hundreds of dollars per cow annually through improved feed efficiency. That’s the kind of value proposition that builds customer loyalty regardless of commodity price fluctuations.

What the Smart Money’s Doing

The operators who are winning this transition share some common strategies that are worth noting.

They’re running diversified sourcing programs—maintaining US soy as their nutritional foundation while supplementing with competitive alternatives during price spikes. They adjust feeding strategies seasonally to help cattle manage heat stress. And they’re leveraging technical support that goes beyond just ingredient sales.

Focus has shifted beyond volume production toward value-added products—such as UHT milk, artisanal yogurts, and specialty cheeses—where consistent quality commands premium pricing. Processors are increasingly requiring sustainability credentials, and programs like SSAP certification, which covers 72% of US soy exports, are becoming table stakes.

The Heat Stress Reality Nobody Talks About

Let’s be honest about the climate challenge. Dry season temperatures routinely exceed 38°C with crushing humidity. Under those conditions, feed intake can drop 20% or more if nutritional quality isn’t dialed in.

Local alternatives like palm kernel meal or cassava-based proteins might appear cost-effective—regional pricing typically runs RM1,200-1,500 per metric ton in Malaysia, 0-320 per ton in Thailand—but performance under heat stress often doesn’t justify the supposed savings.

US soy delivers the balanced, digestible protein profile that tropical dairy operations need for consistent production. What looks cheapest upfront frequently costs the most in lost milk.

Your Strategic Decision Point

This isn’t theoretical anymore. Southeast Asia’s dairy market represents $30 billion today, heading toward $40 billion by 2031. Import dependency creates sustained demand for quality feed ingredients. Consumer wealth is rising. Climate challenges favor solutions that actually work under stress.

But South American competitors aren’t temporary players—they’re building permanent infrastructure and relationships designed to last decades.

Success in this space requires more than traditional commodity thinking. You need to understand crossbred genetics, climate adaptation strategies, seasonal management protocols, and the integration of technology. You need relationships with cooperatives, processors, and extension services. Most importantly, you need to position US soy as the premium solution that enables genetic potential under tropical conditions.

The commodity sales approach is yesterday’s strategy. Today’s winners offer performance, partnership, and solutions that work when the thermometer hits 38°C and humidity crushes appetites.

So what’s your move? Keep hoping commodity pricing does the heavy lifting, or start building the knowledge, relationships, and technical support that create lasting competitive advantages?

Because producers like Pak Eko are making decisions right now that will shape their operations for the next decade. And this market won’t wait for anyone to catch up.

The Bottom Line:

Southeast Asia’s dairy expansion represents the most significant feed market opportunity of this decade. Massive import dependency, rising consumer wealth, and climate challenges that favor quality nutrition create advantages for suppliers who understand local breeds, seasonal stress patterns, and precision feeding strategies. However, the competitive window is narrowing as South American players establish a permanent regional presence through infrastructure investment and relationship-building efforts.

Complete references and supporting documentation are available upon request by contacting the editorial team at editor@thebullvine.com.

Learn More:

  • Precision Feeding Strategies Every Dairy Farmer Needs to Know – This article provides tactical, on-farm actions for implementing the high-efficiency feeding systems mentioned in the main piece. It offers practical strategies for optimizing nutrition and reducing waste, directly impacting your operation’s bottom line and herd health.
  • Why the Global Dairy Market is Making Waves in 2025 (and What That Means for You) – For a strategic overview, this piece analyzes the global market forces, including export opportunities in Southeast Asia, that are shaping dairy profitability. It reveals how to leverage international trends and market signals to inform your long-term business decisions.
  • 5 Technologies That Will Make or Break Your Dairy Farm in 2025 – Looking toward the future, this article explores the innovative technologies creating a competitive edge. It connects the dots between digital feed management, wearable sensors, and data-driven decisions, showing how to future-proof your farm’s efficiency and profitability.

The Sunday Read Dairy Professionals Don’t Skip.

Every week, thousands of producers, breeders, and industry insiders open Bullvine Weekly for genetics insights, market shifts, and profit strategies they won’t find anywhere else. One email. Five minutes. Smarter decisions all week.
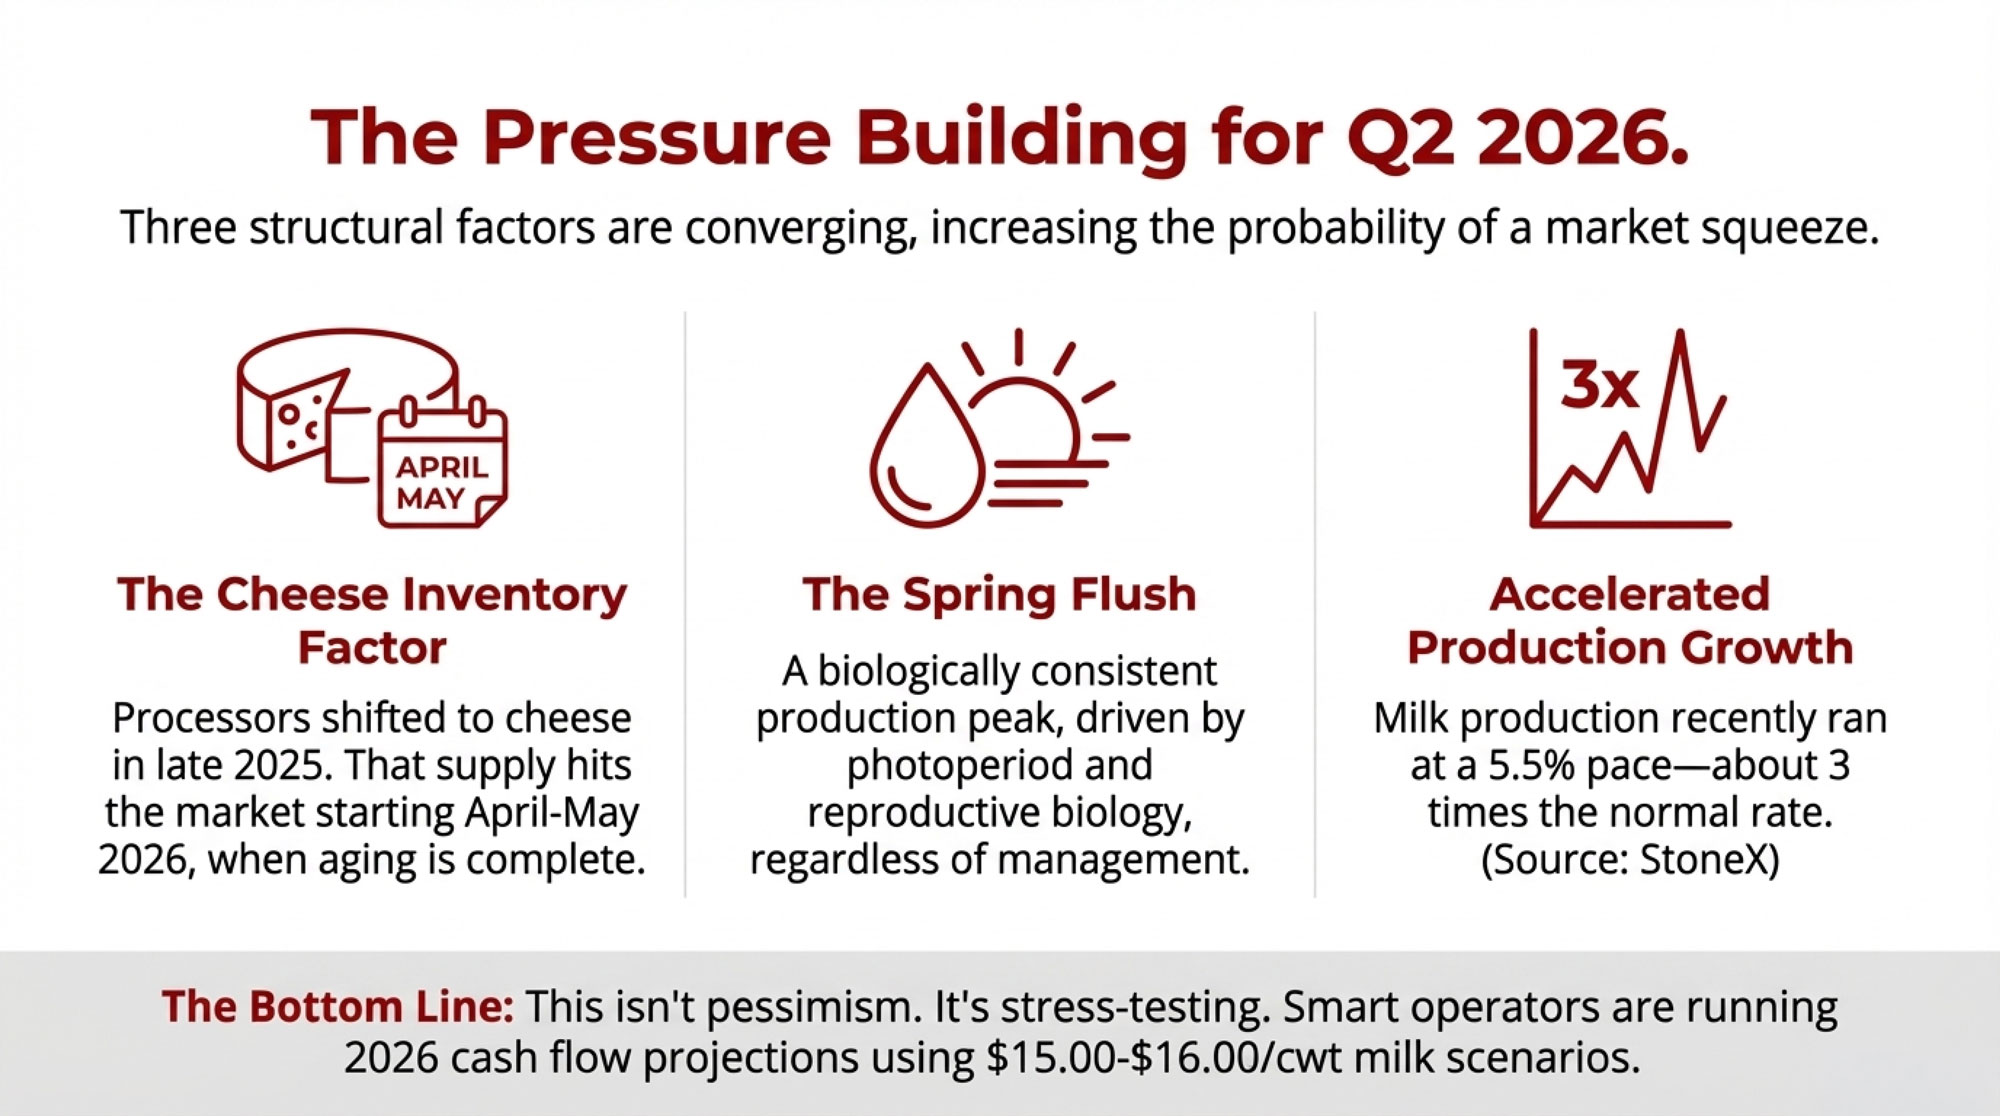
NewsSubscribe
First
Last
Consent

China’s Dairy Shift: What the Numbers Tell Us About a Market in Transition

China’s dairy dropped 2.8%—but they doubled down on efficiency over volume. Game changer.

EXECUTIVE SUMMARY: Here’s what’s happening: China’s milk production hit 40.8 million tonnes in 2024, down 2.8% from last year, but don’t let that fool you. They’ve systematically shifted from chasing volume to maximizing efficiency per cow—we’re talking 9,600 kg annually on average, with elite operations pushing 12+ tonnes. That’s putting them toe-to-toe with Wisconsin and New Zealand’s best. Their self-sufficiency jumped from 70% to 85% in four years while imports surged 16% in February alone, but here’s the kicker—they’re buying premium cheese and whey, not commodity powder. Feed conversion ratios are now reaching 1.4:1, compared to traditional systems at 1.8:1, which translates to real cost savings of approximately $340 per cow annually, based on current feed prices. New Zealand’s cashing in big with duty-free access, while U.S. exporters are getting hammered by tariffs. Bottom line? If you’re not tracking feed efficiency, product differentiation, and shifting buyer preferences, you’re leaving serious money on the table.

KEY TAKEAWAYS:

  • Benchmark your feed conversion ratio immediately—Chinese mega-dairies are hitting 1.4:1, saving roughly $340 per cow annually on feed costs compared to traditional 1.8:1 ratios
  • Pivot to premium product positioning now—buyers are abandoning commodity powder for cheese, whey proteins, and specialty ingredients that command higher margins
  • Track Chinese import data monthly through GACC reports—early indicators of product category shifts can help you adjust marketing strategy before pricing impacts hit
  • Evaluate financing options with agricultural lending rates—China’s effective 3% rates are driving their technology investments, so secure competitive financing for your own efficiency upgrades
  • Focus on supply chain transparency and traceability systems—Chinese buyers increasingly demand full documentation, creating competitive advantages for operations that can deliver verified quality
China dairy market, dairy farm efficiency, global dairy trends, feed conversion ratio, dairy profitability

The Chinese dairy market is changing—not in the dramatic way headlines suggest, but through calculated moves that savvy producers and exporters need to understand.

The Production Reality

Let me start with what we actually know. According to the Chinese Ministry of Agriculture’s latest sector report, China’s raw milk production reached 40.8 million tonnes in 2024. That represents a modest 2.8% decline from 2023—the first drop since 2018.

But here’s what that number doesn’t tell you. Chinese farms have been systematically culling less productive animals while increasing per-cow yields. We’re seeing average production climb toward 9,600 kg per cow annually, with top operations reaching 12 tonnes or more per cow per year. That puts their elite herds right alongside what we’re seeing in Wisconsin’s best farms or Canterbury’s most efficient operations.

The bigger shift? China’s dairy self-sufficiency has increased from around 70% to approximately 85% over the past four years, according to official agricultural policy documents. They’re producing less milk overall but depending less on imports—that’s strategic, not accidental.

What’s particularly striking is how they’ve approached this transition. Instead of the boom-bust cycles we’ve seen in other markets, Chinese policymakers have implemented what amounts to controlled market rebalancing. Feed conversion improvements are real—operations are reporting ratios approaching 1.4:1 compared to 1.8:1 for traditional systems, according to recent dairy efficiency research.

Import Patterns Are Shifting

Now, here’s where it gets interesting for those of us watching export markets. China’s General Administration of Customs reported dairy imports rose in early 2025 compared to the previous year. But they’re not buying the same products.

The shift is away from commodity milk powder toward specialty items, such as cheese, whey proteins, and functional ingredients. Think premium rather than volume. New Zealand is significantly benefiting from its duty-free access arrangements, while U.S. exporters face substantial tariffs that have effectively closed major market segments.

Recent trade analysis indicates that sweet whey powder imports have reached 237,000 tonnes year-to-date in 2025, a 30% increase year-over-year. The driver? China’s recovering swine sector needs high-quality protein sources. The U.S. maintained 43% market share, followed by the EU at 30%.

“We’re seeing Chinese buyers bypass traditional tenders for long-term partnerships focused on quality and traceability,” notes Michael Harvey, a trade analyst at Rabobank. “The message is clear: if you’re competing on price alone, you’ve already lost.”

What’s driving this product mix evolution? Chinese consumers are willing to pay premiums for quality, traceability, and health benefits. The days of competing purely on price are ending—something every exporter needs to understand.

The Consolidation Story

The scale transformation happening in China is worth paying attention to, especially if you’re trying to benchmark your own operation’s efficiency. Large operations—farms with 1,000+ head—now account for nearly 56% of the national herd, up from 24% just five years ago.

These aren’t just larger farms; they’re entirely different operations. Take the mega-dairies in Inner Mongolia—some managing 80,000+ cows with automated milking systems, integrated feed programs, and genetic optimization. Companies like Yili, which reported 115.8 billion yuan in revenue for 2024, are investing heavily in R&D and processing technology, positioning them to compete globally.

Here’s what really gets my attention, though—the operational metrics these Chinese mega-farms are achieving. Recent industry reports describe milking carousel systems completing rotations in 2 minutes 45 seconds with 99%+ uptime. That’s not just impressive technology; it’s setting new competitive benchmarks.

Financial Realities and Regional Variations

The financing environment creates both opportunities and constraints. While China’s Loan Prime Rate sits at 3.00%, actual agricultural lending rates vary significantly by region and farm size. Most producers are seeing rates between 4% and 6% for expansion capital, according to data from the Agricultural Bank of China’s sector.

Feed Conversion RatioFeed Cost per Cow/YearSavings vs 1.8 FCR
1.8 (Traditional)$2,840Baseline
1.6 (Improved)$2,650$190
1.4 (Chinese Elite)$2,500$340

Feed costs, labor availability, and local policy support vary dramatically by province. Inner Mongolia and Heilongjiang possess natural advantages, including better forage production, established infrastructure, and proximity to processing facilities. But other regions are struggling with the transition to larger, more efficient operations.

What strikes me about the regional differences is how stark they are. Ningxia province, for instance, had 920,000 dairy cows producing 4.3 million tonnes of fresh milk in 2023, with plans to reach 1.1 million cows and 5.5 million tonnes by 2025. Meanwhile, southern provinces are experiencing farm consolidation and exits as producers struggle to compete with the efficiency levels of their northern counterparts.

The human aspect of this transformation is also significant. USDA reports indicate that over 90% of dairy farms are operating at a loss with raw milk prices near 3 RMB (€0.36) per kg. That’s forcing smaller operations out while rewarding those who can achieve scale efficiency.

What This Means for Your Operation

For exporters: Commodity approaches are no longer effective. The buyers I talk to want consistency and innovation, not just competitive pricing. Focus on differentiation—quality specifications, supply chain transparency, products that deliver demonstrable value.

Think about it this way: if Chinese operations can achieve 12+ tonnes per cow with automated systems running at exceptional uptimes, what does that mean for your cost structure? For your technology investment priorities?

For domestic producers: These efficiency benchmarks aren’t just interesting statistics—they’re becoming global competitive standards. Whether you’re in California, Ontario, or Canterbury, these are the metrics against which your products compete in international markets.

For strategists: This represents calculated market evolution, not emergency response. China’s approach to managing oversupply through structural adjustment rather than emergency intervention offers lessons for other markets facing similar challenges.

Here’s what you need to track and act on:

  • Monitor Chinese trade data monthly through GACC reports to identify product category shifts before they affect global pricing
  • Benchmark feed conversion efficiency against the documented performance of 1.4:1 achieved by top Chinese operations
  • Evaluate export product positioning for premium segments rather than commodity competition
  • Assess supply chain transparency requirements as Chinese buyers increasingly demand full traceability
  • Review financing strategies, as agricultural lending conditions affect expansion capability globally

The Chinese dairy story isn’t about dramatic overnight changes—it’s about systematic improvements in efficiency, quality, and market positioning executed with impressive consistency. Those who understand this evolution will find opportunities. Those who don’t may find themselves competing for markets that no longer exist.

What impresses me most about this transformation is how methodically it’s been executed. Rather than reacting to market pressures, Chinese producers and policymakers have implemented structural changes aimed at creating sustainable competitive advantages. The question for the rest of us isn’t whether this transformation will continue—the evidence suggests it will. The question is whether we can adapt our strategies to compete effectively in this evolving market environment, because, ready or not, the global dairy landscape has undergone a fundamental change.

Complete references and supporting documentation are available upon request by contacting the editorial team at editor@thebullvine.com.

Learn More:

The Sunday Read Dairy Professionals Don’t Skip.

Every week, thousands of producers, breeders, and industry insiders open Bullvine Weekly for genetics insights, market shifts, and profit strategies they won’t find anywhere else. One email. Five minutes. Smarter decisions all week.
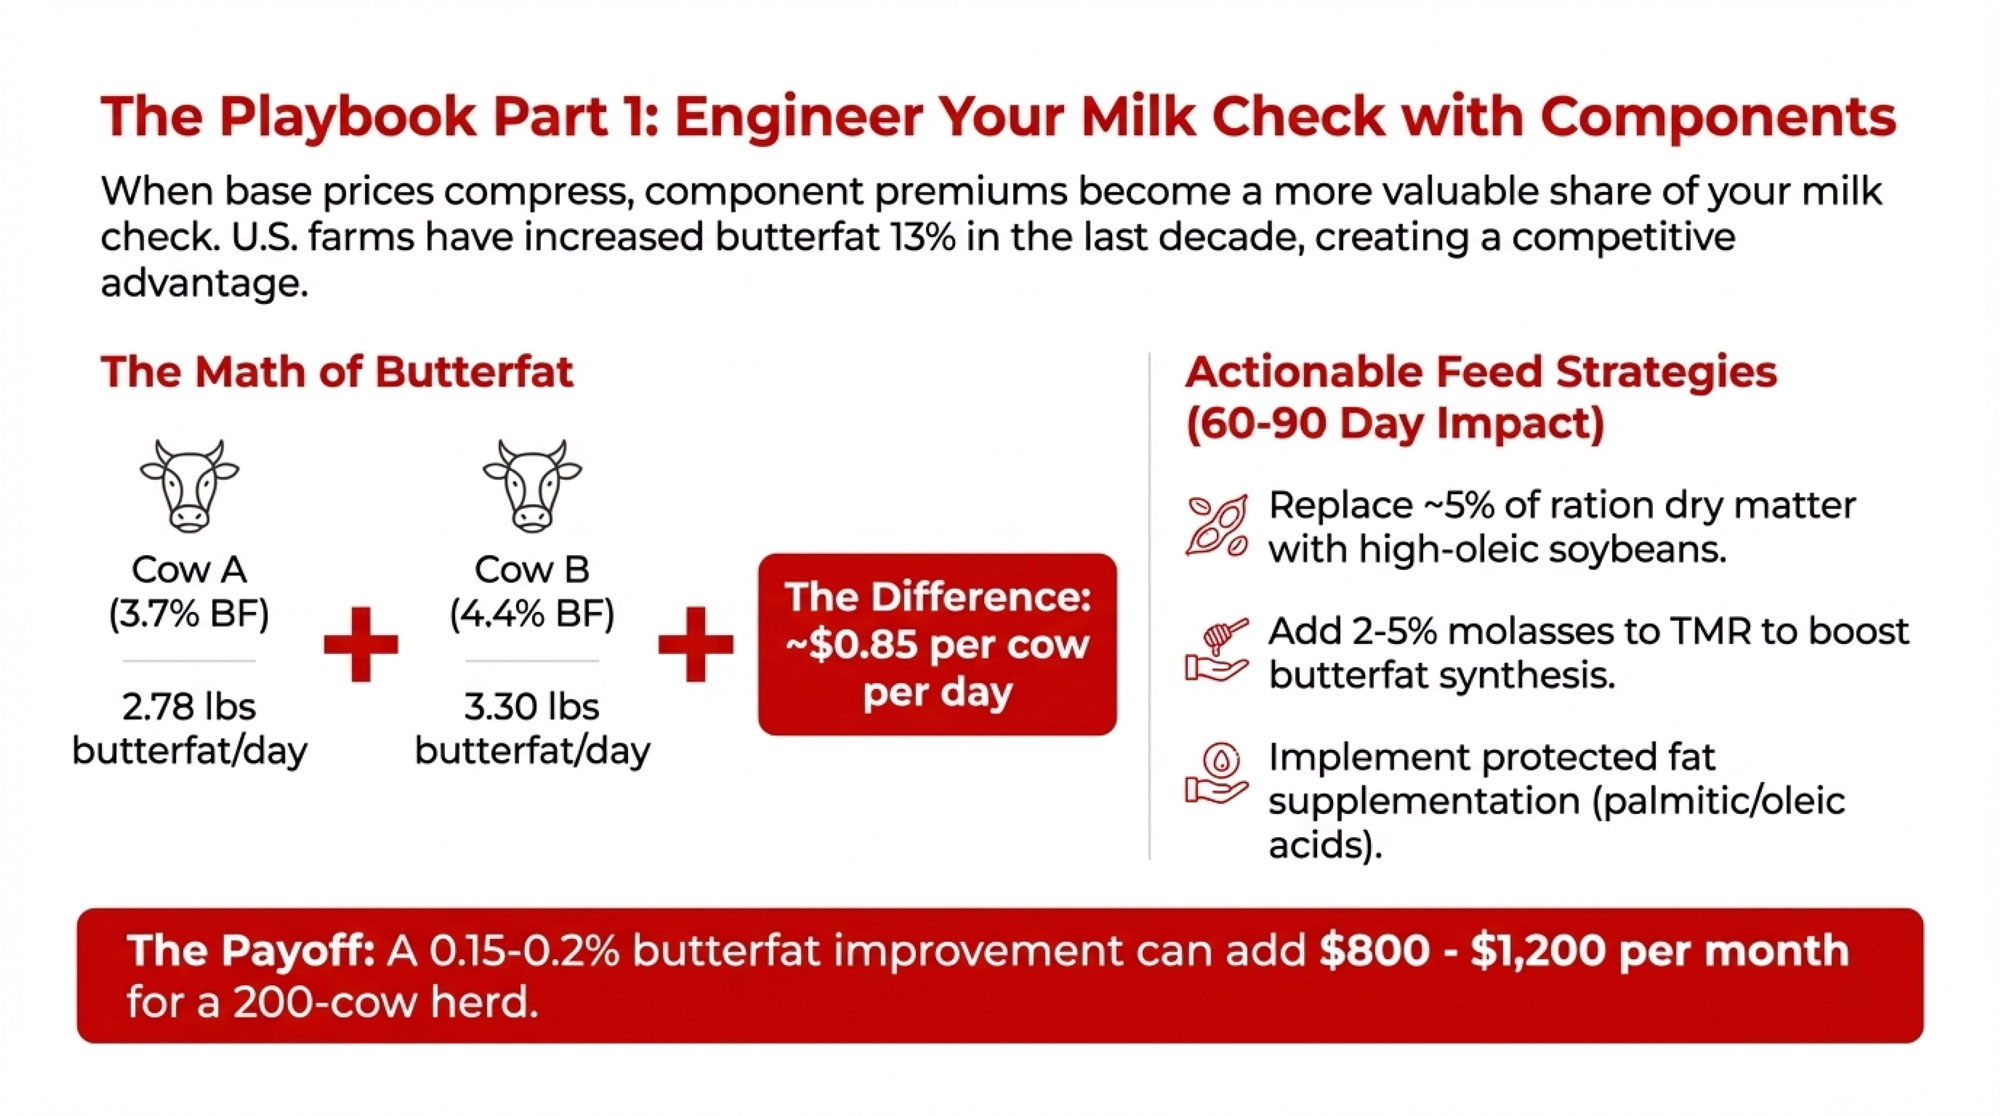
NewsSubscribe
First
Last
Consent

India-US Dairy Standoff: What North American Producers Should Learn

India cranks out 239M tonnes of milk yearly with 2-cow herds—their feed efficiency secrets could boost your margins 20%

EXECUTIVE SUMMARY: Look, here’s what caught my eye about this whole India situation. These co-ops are absolutely crushing it with feed efficiency gains that we should all be paying attention to. We’re talking about 239 million tonnes of milk production annually—that’s massive—and their economic analysis shows potential losses of $12.4 billion if they open up to US imports. That tells you how profitable their system really is.What’s fascinating? They’re hitting 6% annual growth rates using IoT health monitoring and solar cooling tech that’s dropping spoilage by 40-50% in pilot studies. Their cooperative structure connects 3.6 million farmers who get transparent pricing based on butterfat and protein content… and it’s working. Global trends are moving toward exactly this kind of resilient, tech-enabled approach. Bottom line—if you want your operation ready for whatever trade chaos comes next, you need to start thinking like these co-ops do.

KEY TAKEAWAYS

  • Cut feed costs 15-20% immediately by focusing on precision nutrition over volume feeding—Indian co-ops prove better feed conversion ratios beat bigger rations every time, especially with 2025’s tight margins
  • Join or create cooperative marketing agreements to stabilize your milk checks—when 3.6 million farmers pool their bargaining power like Amul does, they control pricing instead of getting controlled by it
  • Install IoT health sensors now to slash mortality rates up to 15% and catch problems before they hit your bottom line—early detection beats expensive treatment, and consumer quality demands aren’t going backwards
  • Consider solar cooling systems if you’re dealing with high energy costs—pilot data shows 50% spoilage reduction translating to real margin improvements, plus it’s a sustainability win processors love
  • Push for component-based pricing in your contracts because butterfat and protein premiums are where the money is—Indian farmers get paid transparently for quality, and that model’s spreading globally whether we like it or not

The thing about the India-US dairy trade tensions? There’s way more happening than just politics. It’s a glimpse into how our dairy industry worldwide is shaping up. Culture, economics, and technology are all thrown into this mix, reshaping markets and livelihoods in ways we can’t ignore.

Just a few weeks ago, after months of tough talks, trade negotiations stalled, and dairy was right in the middle of the sticking points. This isn’t just about tariffs. It’s about understanding the bigger picture and preparing for what’s next.

Who Exactly is India in Dairy?

India produces around 239 million metric tonnes of milk annually—nearly a quarter of the global supply. To give you context, that’s more milk than the combined output of the European Union and the United States.

However, what’s surprising is that most of this milk comes from millions of smallholder farmers, who often have just two or three cows or buffalo under their care. According to their most recent survey data, these farmers rely heavily on local feed and grazing patterns, not on giant industrial farms.

While this model fosters resilience, it’s important to note the challenges inherent to small-scale operations, including disease management, access to capital, and variable feed quality.

And here’s the kicker—research from the Indian Council of Agricultural Research (ICAR) highlights ongoing improvements in feed utilization efficiency within cooperative herds, driven by innovative local feeding strategies.

The ‘Non-Veg Milk’ Factor: Culture Meets Economics

Now, here’s where things get particularly interesting and uniquely Indian. There’s a deep-rooted cultural and religious reason underlying dairy import restrictions: milk from cows fed animal-based supplements—such as bone meal, blood meal, or rendered fats—is labeled “non-vegetarian” and is strictly off-limits.

This isn’t just symbolic—it’s codified in regulation. According to reports from organizations such as the International Dairy Federation (IDF), this kind of feed-based barrier is rare globally but remains central in India’s dairy import policies.

Economically, according to an analysis referenced in the State Bank of India’s economic report, if the US floods India’s market, farmers could lose an estimated ₹1.03 lakh crore annually—roughly $12.4 billion. That economic risk impacts an estimated 80 million livelihoods, underscoring the weight behind India’s firm stance.

Cooperatives: How Amul Changed the Rules

Amul stands tall at the heart of India’s dairy revolution—a cooperative powerhouse connecting over 3.6 million farmers. What strikes me here is how this farmer-owned, three-tiered system flips the usual power dynamic. Instead of corporate-driven pricing, farmers receive transparent payment tied directly to milk’s fat and protein content.

This model’s reach is now global. The Michigan Milk Producers Association’s partnership with Amul brings a wide range of Amul products to US shoppers, showcasing how cooperative dairy structures can scale internationally while upholding farmer ownership values.

Producers in regions like Wisconsin are reportedly exploring similar cooperative approaches to strengthen local markets and manage price swings.

Innovating Under Pressure: Tech Trends in Indian Dairy

India’s dairy industry is embracing tech fast. IoT-based animal health monitoring is expanding, with early research from the Central Institute for Research on Buffaloes (CIRB) showing some promising initial outcomes in mortality reduction.

Blockchain traceability programs are currently in pilot stages, focusing on contamination control and enhancing consumer trust, although definitive impact measurements are still forthcoming.

Solar-powered milk cooling systems, with estimated costs ranging from $6,000 to $8,000, have achieved significant spoilage reduction on rural Indian farms. Based on similar pilot programs in developing regions, solar cooling systems typically result in see a 40-50% reduction in spoilage, which has translated in some cases to a 15-20% improvement in net milk sales, as noted in USDA findings and other international studies. California dairies adopting solar tech to mitigate demand charges further illustrate this technology’s practical benefits.

According to the Food and Agriculture Organization’s recent forecast, India’s dairy sector is projected to sustain an annual growth rate of around 6% through 2030, driven predominantly by domestic consumption.

What This Means for You

India’s firm stance on dairy imports serves as a wake-up call. Trade disruptions will impact global dairy supply chains, and producers need to build resilience.

Cooperatives remain a critical pillar of collective strength, while tech adoption—encompassing IoT health sensors, blockchain traceability, and renewable energy solutions—has shifted from optional to essential in building durable dairy operations.

No doubt, challenges like infrastructure and capital access persist, especially for small farms. Smart, targeted investments, supported by government and industry programs, can unlock significant gains in efficiency and sustainability.

The Bottom Line

India’s experience is a powerful reminder that in an unpredictable global market, the dairy operation of the future will be defined by its resilience, cooperative strength, and commitment to strategic innovation.

Complete references and supporting documentation are available upon request by contacting the editorial team at editor@thebullvine.com.

Learn More:

The Sunday Read Dairy Professionals Don’t Skip.

Every week, thousands of producers, breeders, and industry insiders open Bullvine Weekly for genetics insights, market shifts, and profit strategies they won’t find anywhere else. One email. Five minutes. Smarter decisions all week.

NewsSubscribe
First
Last
Consent

Profit and Planning: 5 Key Trends Shaping Dairy Farms in 2025

US milk production dropped 0.37% while margins hit $12.33/cwt — here’s why that gap matters for YOUR farm.

EXECUTIVE SUMMARY: Look, I’ve been crunching numbers from this latest industry data, and here’s what jumped out at me. Farms hitting 1.4 pounds of milk per pound of feed are absolutely destroying those stuck at 1.1 — and with corn hovering around $4.20 per bushel, that 0.3-pound difference translates to serious money over a full lactation. We’re seeing wild regional swings too… India just crossed 216 million tonnes while the US dropped 0.37% thanks to H5N1 hits. Meanwhile, processors are throwing $8 billion at new capacity, but here’s the kicker — if milk volumes don’t rebound, we’re looking at overcapacity that’ll squeeze producer prices hard. The smart money’s on precision feeding, genomic testing for the right traits, and getting your financial house in order before this wave hits. Trust me, the farms tracking feed conversion ratios by group and investing in the right tech now? They’re gonna be the ones still standing when the dust settles.

KEY TAKEAWAYS:

  • Target that 1.4 lbs milk per lb feed ratio — closing even half that gap from 1.1 adds $2,000+ annually on a 100-cow operation. Start tracking feed intake and milk yield by group this week.
  • Get selective with genomic testing — focus on feed efficiency and component traits, not just production. Test your replacement heifers annually for about $35/head and watch your ROI climb.
  • Precision feeding pays big — systems save 40-50 cents per cow daily while boosting yields 3-5%. Begin with TMR analysis, then consider automated feeding if your herd’s 200+ cows.
  • Watch your processor relationships closely — with processing capacity jumping 20 million lbs daily by 2027, lock in contracts that protect against oversupply price drops before it’s too late.
  • Clean up your balance sheet now — average dairy debt-to-asset ratios hit 47%, so use these strong margins to pay down debt and position for the technology investments coming down the pipeline.
dairy farm profitability, global dairy trends, milk production efficiency, dairy technology investment, herd management strategies

While global dairy stats may seem straightforward at first glance, a deeper dive reveals significant regional and structural shifts that are reshaping the industry. Recent reports from the International Dairy Federation indicate that global milk output in 2024 increased by approximately 1.4% to around 978 million tonnes. Sounds simple, right? However, what strikes me is how that headline completely overlooks the significant regional shifts that have occurred.

Some places are reining production in; others are full throttle ahead. This mix — influenced by disease outbreaks, infrastructure booms, and shifting markets — is reshaping what’s possible for your farm’s bottom line.

Milk Production’s Shifting Map: A Tale of Two Giants

US production dropped 0.37% last year, says USDA data — a dip tied closely to H5N1 outbreaks that slammed several Midwest states like Michigan and Texas. I was speaking with a producer in Wisconsin last month who lost nearly 60 heads to H5N1… it’s real, and it’s hitting harder than most anticipated. Meanwhile, India continued to steamroll forward, crossing 216 million tonnes, according to detailed USDA Foreign Agricultural Service numbers and India’s Ministry of Fisheries, Animal Husbandry, and Dairying.

Dr. Michael Hutjens, a familiar voice in dairy nutrition from the University of Illinois, zeroes in on feed efficiency gaps that should worry many of us more. “Top farms push 1.4 pounds of milk out for every pound of feed, while many others barely break 1.1,” he notes. Given that corn prices linger near $4.20 per bushel, that difference is a serious game-changer over a full season — we’re talking thousands of dollars in extra profit or lost opportunity.

China also experienced a 1.2% decline in milk production, and what’s fascinating about this is that Rabobank’s Q1 2025 briefing explains it’s not about problems — it’s about strategic consolidation and a sharper focus on self-reliance. That’s huge for worldwide exporters who’ve counted on Chinese demand.

However, despite shrinking production in some areas, US dairy profit margins reached their highest levels since 2022 — $12.33 per hundredweight, according to the latest CoBank report. The lesson? It’s not just about volume; it’s about managing supply tightness and costs smartly.

The Processing Boom: $8 Billion on the Table

Beyond production numbers, a major trend affecting US producers is the massive investment in processing infrastructure. A 2024 industry analysis, citing industry coverage, reported that the US dairy industry is splashing out over $8 billion in processing plant upgrades through 2027. These new plants should add capacity for 20 million pounds of milk daily.

But here’s where it gets interesting — and a bit concerning. Dr. John Lucey at Wisconsin’s Dairy Research Center highlights several significant challenges: costs have increased by 35%, skilled labor is scarce (finding qualified plant technicians is particularly difficult these days), and equipment deliveries are significantly delayed. I know of three projects in my region alone that are running 8-10 months behind schedule.

Expert economic analysis suggests that plants need to operate at 85-90% capacity to remain profitable. Below 75%, margins get squeezed hard. We’ll need a rebound in milk volumes soon or risk serious overcapacity… and that’s when things get ugly for producer prices.

Meanwhile, India is also doubling down, devoting more than ₹8,000 crores to machinery and plant upgrades to keep pace with booming production. They’re no longer just thinking domestically — they’re eyeing global markets.

Follow the Money: Why Components and Exports Matter

Export data from Eurostat tells a familiar tale: cheese costs around $4.85 per kilogram, well above the $3.20 per kilogram that powdered milk fetches. What’s particularly noteworthy is how consistent this spread has become.

Dr. Marin Bozic from the University of Minnesota shed light on a key shift at the 2024 ADSA meeting: protein fractions, such as casein, are now carrying a growing weight in export values. While the exact percentages shift, this protein obsession is changing how producers select genetics and manage cows. We’re seeing Holstein operations in California specifically breeding for casein content — something that would’ve seemed crazy five years ago.

The European Union remains the top exporter worldwide in terms of value, but it’s fighting an uphill battle. Tough environmental regulations are driving herd consolidation — larger but fewer farms — and the euro’s strength is making EU dairy products more expensive internationally. It’s a squeeze play that’s got European producers worried.

Technology: The Divide Widens

The push to precision feeding isn’t slowing, and frankly, it shouldn’t. According to recent industry studies, these systems can reduce feed expenses by $0.40 to $0.50 per cow per day and increase milk yields by 3 to 5%. Now, that might not sound like much, but run those numbers on a 1,000-cow operation…

At a 2024 dairy tech symposium, Dr. Jeffrey Bewley of the University of Kentucky discussed how automated systems can achieve uptimes of nearly 99%, even if payback timelines extend 7 to 8 years under current lending rates. Here’s what’s concerning, though: big farms, with 500-plus cows, are adopting precision tech at rates nearing 35%, while smaller farms lag behind at 12%. This gap is opening wider each season, and it’s creating real competitive disadvantages.

I visited a 300-cow operation in Pennsylvania last fall that was struggling to compete with their larger neighbors who’d invested in precision feeding. The difference in feed efficiency was stark—and so was the difference in profitability.

The Gene Game: A2 and Certification

A2 beta-casein milk is commanding premiums — sometimes as much as $2 per hundredweight according to market reports — though premiums vary significantly by region and processor relationships.

However, it doesn’t happen overnight, and this is where many producers get tripped up. Transitioning a herd can take 3 to 5 years, and the cost of genetic testing is approximately $35 per cow. That’s a serious upfront investment before you see any premium returns.

Export certifications are also not inexpensive. USDA compliance and processing approvals tack on roughly 12 to 18 cents per pound. Big farms tend to have an easier time absorbing these costs — another example of scale advantages that smaller operations can’t match.

Then there’s debt to consider. According to 2024 data, the average dairy farm debt-to-asset ratio is near 47%. That’s a serious balancing act when you’re trying to invest in new technologies or genetics programs.

What This Means for You

With these trends in mind, here’s what this all means for your operation:

  • Target feed efficiency first — closing the gap Dr. Hutjens identified between 1.1 and 1.4 pounds of milk per pound of feed can add thousands to your bottom line annually.
  • Monitor your processors carefully because of the potential for overcapacity and its impact on producer prices. Some of these new plants are going to struggle if milk volumes don’t rebound.
  • Invest thoughtfully in technology — with payback periods of 7-8 years —to ensure your future success for the long game and that automated systems fit your operational timeline.
  • Plan your genetics strategy carefully — start with your replacement heifers and conduct genetic testing to build your A2 herd over time rather than trying to convert your entire milking herd at once.
  • Mind your financial health — use improving margins to manage debt and set your farm up for long-term sustainability rather than just short-term gains.

The dairy business is evolving in ways we haven’t seen before. Staying nimble, informed, and proactive isn’t just smart—it’s essential for survival.

Remember, the window for positioning yourself well is open — but it won’t be for long. Good luck out there!

Learn More:

GEA Lands Massive €170M Contract for World’s Largest Desert Dairy in Algeria

270,000 cows in the desert hitting 1.5x better feed efficiency? This Algeria project’s rewriting the dairy playbook.

EXECUTIVE SUMMARY: Look, I’ve been watching megadairies for years, but this Algeria project is different. These individuals are demonstrating that with the right genetics and technology integration, it is possible to achieve 1.4-1.6 kg of milk per kg of feed in desert conditions – that’s 20% better than most operations typically manage. We’re talking $15-20 million in annual feed savings at their scale, but here’s what matters for you: the principles scale down. With Middle East dairy markets projected to jump from $44B to $62B by 2030, and feed costs accounting for 70-75% of budgets, this isn’t just about one big farm. It’s about survival strategies we all need to understand. Time to start thinking differently about heat tolerance genetics and data-driven feed management.

KEY TAKEAWAYS

  • Boost feed conversion by 15-20% – Start genomic testing for heat tolerance traits like the Slick gene; recent studies show it’s becoming critical as temperatures rise, not just in deserts
  • Cut feed waste through precision management – Implement automated monitoring systems that track individual cow intake; data shows 10%+ efficiency gains when you know exactly what each animal needs
  • Diversify revenue streams with biogas – Even small operations can generate $50-100k annually from manure-to-energy systems; the Algeria project’s targeting $3M+, proving the model works
  • Prepare for vertical integration – Whether you’re 100 cows or 10,000, controlling your feed chain is becoming essential; current market volatility makes this a survival strategy, not a luxury
  • Invest in heat-stress genetics now – Climate’s not getting cooler; operations using heat-tolerant genetics report 25% less production drop during heat waves compared to conventional herds

Deep in Algeria’s Sahara desert, a transformational dairy project is reshaping industry expectations about what’s possible in extreme environments. The €140-170 million venture between GEA Group and Qatar’s Baladna represents more than ambitious engineering—it’s a strategic response to global food security challenges that progressive dairy professionals cannot afford to ignore.

The facility will house 270,000 dairy cows, producing 100,000 tonnes of milk powder annually. Construction is scheduled to begin in early 2026, with production expected to commence by late 2027. For context, Algeria currently imports approximately 440,000 tonnes of milk powder yearly, making them the world’s third-largest importer. This single facility aims to eliminate half that dependency—a shift with profound implications for regional dairy economics.

The Operational Excellence Behind Desert Dairy Success

The project’s foundation rests on proven expertise and the integration of cutting-edge technology. Baladna commands over 95% of Qatar’s dairy market, demonstrating mastery of large-scale desert operations where others have failed. Their success stems from understanding that desert dairy systems, when properly managed, actually outperform conventional operations in key metrics.

Research from the International Dairy Science Association confirms that optimized desert dairies achieve feed conversion efficiencies of 1.4 to 1.6 kg of milk per kg of dry matter intake, significantly outpacing the standard of 1.2 to 1.3 kg in temperate climates. This advantage results from controlled feeding environments, precision nutrition management, and climate-optimized facility design.

GEA’s integrated technology platform encompasses advanced milking systems that process 1,850 cows per hour, membrane filtration that recovers 99.5% of milk proteins, and spray drying capacity reaching 11.6 tonnes per hour. The company projects these systems will generate $15-20 million in annual feed cost savings through optimized resource utilization and waste reduction.

The facility’s 117,000-hectare footprint integrates three operational hubs—feed production, dairy operations, and processing—exemplifying the vertical integration model that’s becoming essential for competitive advantage in global dairy markets.

Market Forces Driving Desert Dairy Investment

The timing reflects broader market dynamics that astute producers are already recognizing. The Middle East dairy market is projected to expand to $44 billion in 2025 and reach $62 billion by 2030, according to an analysis by the IMARC Group. North African governments are simultaneously implementing policies to reduce import dependency, creating sustained demand for domestic production capacity.

However, the model’s primary vulnerability lies in operational costs. Feed expenses typically consume 70-75% of total costs in desert dairy operations, while water consumption averages 4 litres per litre of milk produced. These constraints make precision management and technological optimization non-negotiable for profitability.

Risk Mitigation Through Advanced Analytics

Managing 270,000 animals in extreme desert conditions presents unprecedented operational complexity, encompassing heat stress management, water resource optimization, geopolitical risk, and supply chain coordination. The project’s response centers on data-driven management systems that transform these challenges into competitive advantages.

Operation TypeFeed Efficiency (kg milk/kg feed)Typical Payback PeriodKey Advantages
Algeria Desert Dairy1.4-1.67-9 yearsControlled environment, precision nutrition
Temperate Climate Dairy1.2-1.35-7 yearsLower setup costs, established infrastructure
Traditional Desert Operations0.9-1.112+ yearsMinimal tech integration

University of Wisconsin Extension research demonstrates that farms utilizing advanced analytics platforms achieve feed efficiency improvements exceeding 10% while substantially reducing veterinary costs. At Algeria’s projected scale, these gains translate to millions in operational savings and enhanced animal welfare outcomes.

The integration of biogas generation, projected to generate over $3 million annually based on Department of Energy calculations, exemplifies the circular economy approach essential for sustainable large-scale operations. This revenue diversification also provides crucial operational flexibility during market volatility.

Genetic Innovation for Climate Adaptation

The project’s emphasis on heat-tolerant genetics represents a strategic approach that forward-thinking breeders should note carefully. The International Dairy Federation’s research on the Slick gene—which enhances heat tolerance through improved thermoregulation—has moved from academic interest to operational necessity for producers in challenging climates.

This genetic focus aligns with broader industry trends toward climate-adapted breeding programs that maintain production efficiency under stress conditions. For producers in regions experiencing increasing temperature extremes, these genetic tools are becoming as important as traditional production traits.

Strategic Implications for Progressive Producers

The Sahara project serves as a stark reminder that the future of dairy profitability lies not just in cow-side genetics, but in radical systems integration. Feed requirements approaching 1.5 million tonnes annually demand sophisticated supply chain coordination that few operations have attempted at this scale.

Rabobank analysts estimate payback periods of 7-9 years for comparable projects in the MENA region, contingent upon execution quality and market stability. While these timelines reflect the capital intensity of mega-scale development, they also demonstrate the long-term viability of properly managed operations.

For progressive dairy leaders worldwide, three strategic imperatives emerge from this development: First, vertical integration from feed production through processing is transitioning from a competitive advantage to a survival requirement. Second, data analytics capabilities for environmental and animal health management now rival traditional production metrics in strategic importance. Third, the global drive for food security is fundamentally reshaping competitive dynamics across all dairy markets.

The Algeria megadairy ultimately demonstrates that with appropriate technology integration, genetic selection, and management expertise, profitable dairy production is achievable even in the world’s harshest environments. For an industry facing climate pressures and food security mandates globally, that’s a lesson worth mastering.

The bottom line? This isn’t just about one massive operation in the Sahara. It’s showing us what’s possible when you stop thinking small and start integrating technology, genetics, and smart management. Worth paying attention to, don’t you think?

Complete references and supporting documentation are available upon request by contacting the editorial team at editor@thebullvine.com.

Learn More:

  • 5 Ways to Beat the Heat: Keeping Cows Cool and Productive – Delve into practical, on-farm solutions for mitigating heat stress. This article provides actionable strategies to protect herd health and maintain milk production during rising temperatures, complementing the Algerian project’s large-scale technological approach with tactics for any operation.
  • The Dairy Market Crystal Ball: Key Trends to Watch – Gain a high-level perspective on the economic forces shaping our industry. This analysis explores the key global trends, consumer shifts, and policy changes driving investments like the Sahara project, helping you anticipate market movements and refine your long-term business strategy.
  • Genomic Testing: Are You Leaving Profit on the Table? – Connect the genetic strategy of the Sahara project directly to your own bottom line. This piece breaks down the ROI of genomic testing, revealing how to identify elite animals, accelerate genetic progress for traits like heat tolerance, and reduce long-term operational risks.

The Sunday Read Dairy Professionals Don’t Skip.

Every week, thousands of producers, breeders, and industry insiders open Bullvine Weekly for genetics insights, market shifts, and profit strategies they won’t find anywhere else. One email. Five minutes. Smarter decisions all week.
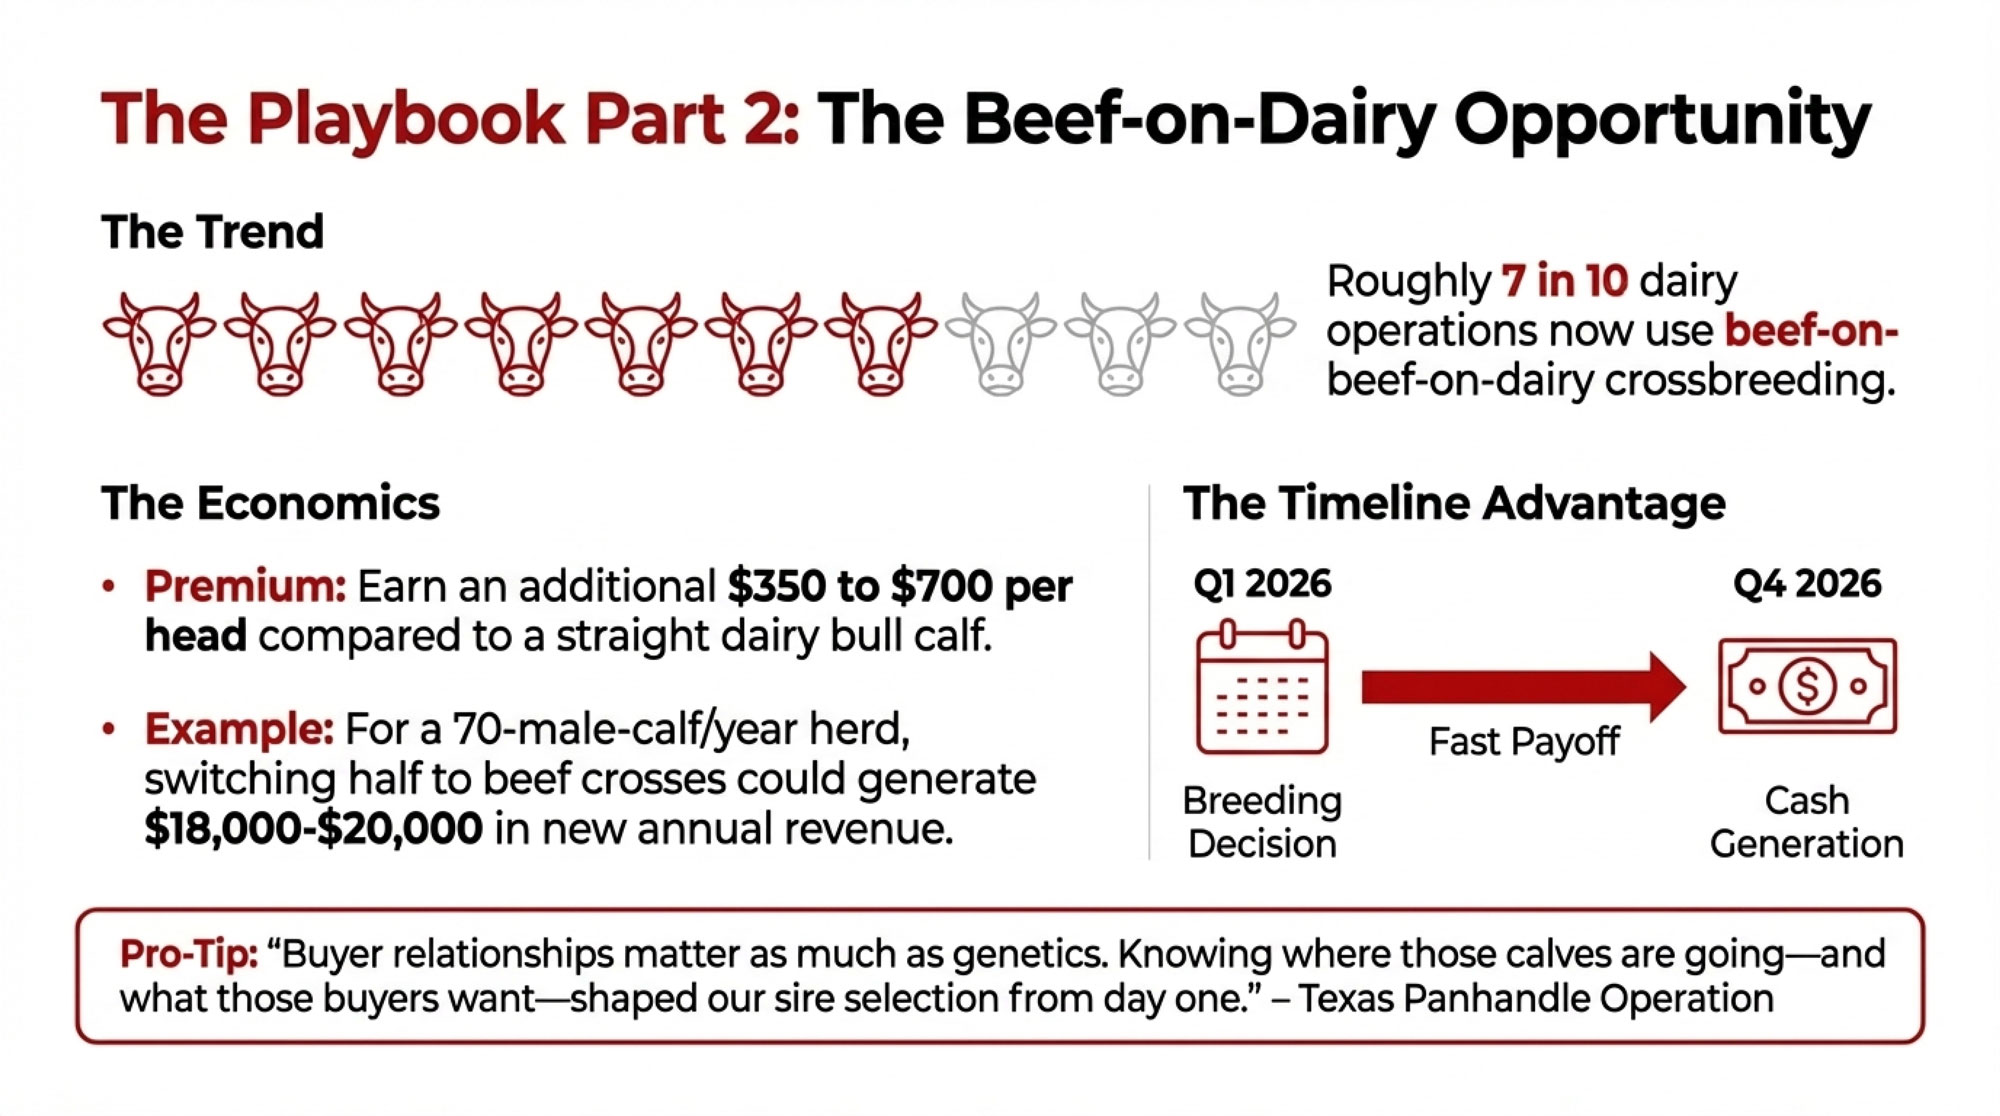
NewsSubscribe
First
Last
Consent

You Can’t Milk a Carbon Credit, But You Can Cash This Cheque? The Dairy Down-Low on Fonterra’s New Emissions Premiums

What would you do with an extra $20,000 this year—upgrade your parlor, or finally reward that feed guy?

EXECUTIVE SUMMARY: Here’s the scoop—treating carbon like a side gig is over. If you’re not tracking your emissions, you’re the milk truck left at the curb. Fonterra farmers banking on those 1–5 cents per kgMS premiums are already seeing the difference: on a 400-cow herd, that’s up to $18,000 extra in your account for 2025. And the top dogs with super-low numbers? They’re grabbing as much as an extra $25k, straight up. What’s wild is that practices like better feed conversion—think shaving just 0.1 off your FCE—are now pretty much paying you twice: better cow health and cold, hard bonus money. And this isn’t just a Kiwi thing. Europe, Canada, everywhere—everyone’s talking low-carbon, genomics, real tracking. If you wanna be part of the crowd scoring export premiums, now’s the time to plug these numbers into your system. Try it. All the guys who said “nah, it’ll blow over” last year are now ringing their advisers and asking what’s next. Don’t be the last one at the table. Try this stuff before the window closes.

KEY TAKEAWAYS

  • Pocket up to $25,000 more per year by qualifying for Fonterra’s low-emission bonus—start with a real-time “carbon footprinter” tool and get your emission numbers in black and white.
  • Tighten your feed efficiency (aim for +0.1 FCE)—not only does it pad cash flow with extra milk yield, it lowers your emissions score for bonus eligibility in this year’s payout model.
  • Ramp up genomic testing: Identify your herd’s top 30% for production and emissions traits—follow USDA and Journal of Dairy Science guidance to boost reproductive ROI right off the bat.
  • Track input costs closely: Urea’s holding at $700–$800/tonne—optimize your N application, use extension calculators, and focus on maximizing every dollar’s worth in a margin-tight 2025.
  • Connect with an adviser NOW: Don’t guess—ask for a region-specific break-even scenario. This year’s ROI is razor-thin, and precision will beat guesswork every time.
dairy profitability, carbon premium dairy, farm efficiency, methane reduction technology, global dairy trends

You’ve got options—and excuses are getting harder with every click of the carbon tracker. Globally, dairy’s changing fast. The ones cashing in? They’re not waiting for the co-op to do it for them… they’re grabbing the new margins, cow by cow and acre by acre. Give it a shot. Worst case, you end up with healthier cows and a fatter milk check.

The Thing About 2025…

Even if you’re just running cows in Manawatu or trying to keep a lid on input costs in Ontario, there’s a good chance this whole “carbon premium” talk has wound up in your inbox or shed meeting. In New Zealand, where everyone’s still tracking butterfat numbers and bulk tank averages, the biggest talk this year is: Does the new Fonterra payout really add up—and will it trickle across the global industry?

Short answer: It matters, but like everything in dairying, there are a few ‘yeah buts’ lurking behind all the marketing.

What Fonterra Is Actually Paying

Example payouts for Fonterra farmers qualifying for emissions reduction bonuses (average and top-tier levels) on a 400-cow herd

Starting this June, Fonterra is paying a premium of 1–5 cents per kilogram of milk solids (kgMS)—that’s the main payout benchmark—if a farm’s Scope 1/2/3 emissions (think: barn, paddock, supply chain) land below their 2017/18 baseline. This program and its criteria were detailed in Fonterra’s official announcement and NZMP’s recognition program.

onterra farmgate milk prices, 2021–2025, highlighting the upward trend and current 2025 forecast

If you’re at the top—about 300–350 Fonterra suppliers for low emissions—the “up to 25c/kgMS” bonus is there for the taking. And that pool’s not coming from the government this time—it’s big food, with Mars and Nestlé directly funding the top-tier premium as part of their drive for Scope 3 supply chain targets, according to coverage from Rural News Group.

Practical Payouts and Real Margins

Right now, Fonterra’s payout is holding steady at $NZ9.70–$10.30/kgMS, with a forecasted range of $8.00–$11.00 for 2025/26, as outlined by RNZ, official Fonterra updates, and NZ Farm Source.

Most of us, honestly, are in the core 1–5c/kgMS bracket—that’s where the premium lands for the majority of producers. And every single cent of premium actually matters. Especially in a year when feed and fertilizer costs are keeping margins ratcheted down—anyone who went through that last dry spell in the central regions would agree. For context, urea has been hovering between $NZ700 and $800 a tonne (approximately $CAD 600–700/tonne) as of mid-2025—not the $1,200 some headlines warned of, but still a significant increase compared to most of the last decade, according to Trading Economics.

Real-World Grounding: The Net Zero Pilot

What’s happening in the paddocks? Look at Taranaki’s Net Zero Pilot Dairy Farm. These folks went deep: better breeding, targeted feed tweaks (and yes, switching minerals meant some hiccups), and, most interesting to many, a full install of the EcoPond methane system for effluent.

Over the past two years, absolute emissions dropped by 27%, and intensity decreased by another 5.5%, according to Fonterra’s project page and the update from FBTech. But—and here’s what rarely makes the PR—when they tried milking ten times per week, the unintended result was an 11–12% drop in milk solids per cow. Sometimes, even big NZ isn’t immune to trial-and-error.

Technology Performance: EcoPond

Recent field trials and manufacturer reports confirm that EcoPond delivers 90–97% methane reduction from treated effluent ponds (FBTech EcoPond coverage; EcoPond official). However, on most farms, effluent ponds account for only 5–7% of total on-farm emissions.

Carbon Footprinting: Where the Data Flows

Here’s the thing—the data flows both ways. With Fonterra’s Carbon Footprinter tool, you can see—right on your device—how your emissions stack up against your history and the co-op average. According to a February 2025 update from NZMP, over 4,000 users are already on the platform.

Ingredient teams and Scope 3 supply chain managers at Fonterra confirm that customers, such as Mars and Nestlé, now require verified certificates for every shipment. For many, these numbers are becoming as crucial as your SCC or bulk tank count.

Payback and ROI—Can It Really Work?

Here’s the real talk: the best results are being seen by those farm teams with a tradition of tight records and squeezing more out of genetics and inputs. Industry advisers estimate a five– to eight–year ROI for major upgrades, but that number varies depending on the operation’s size, region, weather, bonus tier, and the specifics of your installation deal. A lot of the three-year “got it all back” stories are best heard as encouragement—don’t treat them as a guarantee.

What About the Lower Quartile?

Fonterra has announced its intention to roll out more digital support and is considering a phased adoption for the bottom quartile producers. As of now, full details are still forthcoming, and these expectations remain plans rather than a finalized policy.

Global Perspective and Possible Canadian Ripples

What’s catching my eye is how Europe’s system spends billions on compliance and paperwork—just ask any Dutch co-op leader about their experience with the regulatory nightmare. In NZ right now, the cash is coming from brands like Mars and Nestlé, who want carbon-cutting bragging rights on global supermarket shelves. Market pull—not just compliance push. That’s a twist I never saw coming back when SCC cards were the only paperwork that mattered.

For our Canadian and U.S. crowds, the conversation has already begun. There’s clear speculation among North American dairy advisers and industry groups about how a carbon-traceable premium could show up in quota programs or processor pools, and what that would mean for Canadian supply management. Nothing official yet—but don’t be surprised if your buyers soon want verified carbon counts alongside your proAction sheets.

The Plainspoken Bottom Line

Here’s the unsweetened truth from where I’m sitting:

If you’re already running lean, tracking records, and tweaking herd and inputs—this is a real upside play.

If you’re on the fence, ask your adviser for ROI numbers specific to your setup before making a major investment commitment.

Don’t let “average” be good enough—export contracts are starting to require more than just ordinary, for carbon as much as for butterfat.

What’s especially fascinating—and trust me, I never thought I’d say this back in 2015—is how carbon, traceability, and independently certified progress are becoming as real in milk price meetings as protein, SCC, or even butterfat. Change is annoying, sometimes hard. But if carbon can add a few cents to payout while keeping NZ (and maybe Canada next) in global contracts, then—headaches and all—it’s probably worth wrestling with.

Complete references and supporting documentation are available upon request by contacting the editorial team at editor@thebullvine.com.

Learn More:

The Sunday Read Dairy Professionals Don’t Skip.

Every week, thousands of producers, breeders, and industry insiders open Bullvine Weekly for genetics insights, market shifts, and profit strategies they won’t find anywhere else. One email. Five minutes. Smarter decisions all week.
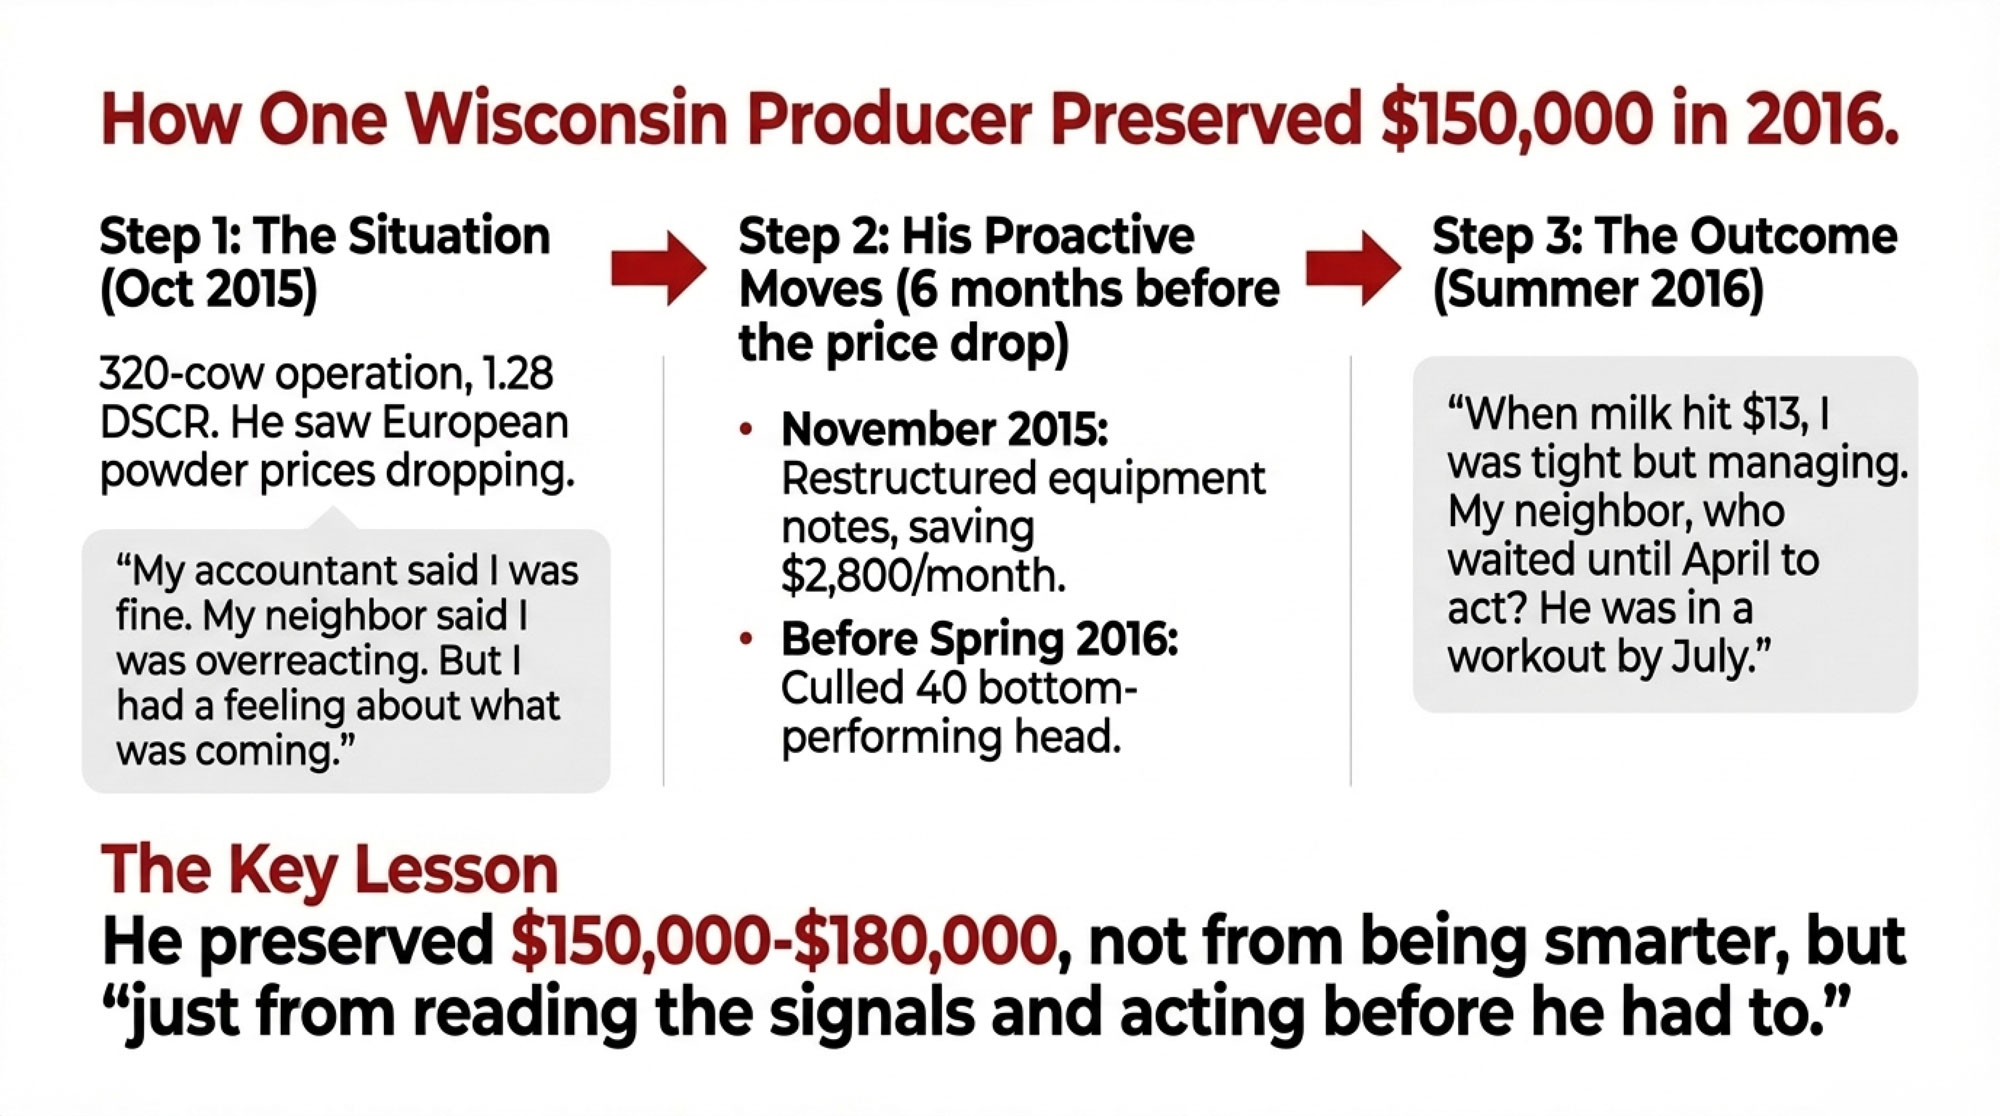
NewsSubscribe
First
Last
Consent

China’s Dairy Revolution: The Wake-Up Call That’s Reshaping Everything We Know About Global Milk Markets

China’s cloned cows hit 18 tonnes of milk yield while we’re stuck at 11—time to catch up or get left behind

EXECUTIVE SUMMARY: Look, I’ll give it to you straight—China just rewired the entire global dairy game while most of us were arguing about milk prices. They’ve increased their self-sufficiency from 62.7% to 85% in just four years, and their imports of whole milk powder have dropped 36% to 430,000 tonnes. That’s not market volatility, that’s strategic displacement of nearly 240,000 tonnes that used to flow from places like New Zealand and the U.S.Their cloned cattle are producing 18 tonnes per lactation—double their national average and competitive with our top herds—while cutting quality traceability from 2 hours to 2 minutes using AI systems. The kicker? Their mega-dairies are running 43% more energy-efficient than conventional operations, which translates to real cost advantages that compound every month.Here’s what keeps me up at night: if you’re not benchmarking against these new global standards, you’re falling behind, whether you export or not, because they’re setting the bar for operational efficiency that affects pricing everywhere.

KEY TAKEAWAYS

  • Benchmark your operation now: Chinese mega-dairies hit 9,000+ kg per cow with 43% better energy efficiency—start tracking your energy cost per hundredweight and compare to see where you’re losing money on basic operations
  • Diversify into value-added products immediately: While bulk powder markets shrink, cheese demand grows 16% annually, and butter imports jumped 23% in 2024—partner with processors focusing on specialty products before everyone else catches on
  • Upgrade your genetics strategy: With 18-tonne cloned cattle entering Chinese herds, focus on traits like heat tolerance and feed efficiency that provide competitive advantages your domestic buyers actually need in 2025 market conditions
  • Invest in operational resilience before the next crisis: Robotic milking systems show 4-year payback on 3,000+ head operations—but build redundancy into any tech upgrades because 12% first-year failure rates are real
  • Get serious about sustainability metrics: Environmental compliance is becoming table stakes for export tenders—start documenting your carbon footprint now because buyers in the EU and Japan are already requiring scope three emissions data
China dairy modernization, automated milking systems, dairy farm efficiency, global dairy trends, robotic milking ROI

Look, I’ve been tracking dairy trends for over two decades, and you get used to “game-changing” stories that fizzle out faster than a broken-down milk truck. But what’s happening in China right now? This isn’t just another trade headline or policy shift that’ll blow over by harvest time. We’re watching the world’s biggest milk buyer systematically rewire their entire dairy infrastructure—and honestly, they’re doing it faster than most of us thought possible.

One aspect of China’s push toward dairy self-sufficiency is that it’s not just a topic discussed at government meetings. They’re actually pulling it off. Recent analysis from agricultural economists indicates that China’s self-sufficiency has increased from 62.7% in 2021 to between 73% and 85% now, depending on the methodology used and the scope of the calculation.

What strikes me about this whole situation is how it’s showing up right here in the Midwest. I was chatting with a feed supplier outside Madison last week—a guy who’s been in the business for thirty years—and he mentioned seeing New Zealand powder appearing in Wisconsin co-ops for the first time. That’s not market expansion, folks. That’s displacement.

The Numbers That Are Keeping Export Managers Awake at Night

Here’s what really caught my attention when I was reviewing the latest trade data: China’s imports of whole milk powder nosedived 36% to 430,000 metric tons in 2023. Compare that to their 2018-2022 average of 670,000 tons, and you’re looking at a quarter of a million tons of product that used to have a guaranteed home in Shanghai ports.

But here’s where it gets interesting—and a bit concerning if you’re in the export business. Recent work from Dairy Global indicates that China’s domestic milk production actually declined by 2.8% in 2024. So, how are they achieving higher self-sufficiency with less raw milk flowing through their system? Simple answer: they’re just buying less from us.

That’s not market volatility or some temporary supply chain hiccup. That’s strategic import substitution happening right under our noses.

China’s Import Displacement Reality
2018-2022 Average WMP Imports: 670,000 MT
2023 Actual Imports: 430,000 MT
Volume Displaced: 240,000 MT (-36%)
New Zealand’s Share: 183,000 MT redirected

What’s particularly noteworthy is how this ripple effect is hitting global pricing. Latest results from Global Dairy Trade show whole milk powder sitting at $3,654 per tonne as of June, which, considering everything, is holding steadier than most traders expected this spring.

For New Zealand producers who’ve been riding the China wave since the early 2000s, this displacement is creating some serious headaches. They’re not just dealing with 150,000 tonnes of redirected powder—it’s closer to 183,000 tonnes based on verified trade numbers. That’s roughly 6% of their entire annual production that suddenly needs new markets.

Why This Feels Different (And Why It Should Worry Us)

Here’s the thing, though—and I really can’t stress this enough—this isn’t your typical trade dispute where things eventually cycle back to normal once the politicians work out their differences. What we’re seeing is a systematic, state-directed transformation backed by serious capital and long-term strategic thinking.

I’ve been tracking dairy automation trends for years, and what’s happening in Inner Mongolia is both impressive and, to be honest, a bit concerning. They’re building what they call the world’s largest automated milking facility. Now, based on conversations with equipment manufacturers and consultants I trust, each robotic unit typically handles about 60-70 cows per day, not the massive throughput numbers often reported in press releases.

The economics are compelling, though. When you’re looking at robotic systems that can run anywhere from $150,000 to well over $200,000 per unit, and you can access financing at sub-4% rates through state-backed programs… well, that’s a different ballgame than what most of us are playing.

Dr. Sarah Chen, who’s consulted on dairy automation projects across Asia, told me recently: “The Chinese approach isn’t just about replacing labor—it’s about creating integrated systems that can scale rapidly. They’re not thinking farm by farm, they’re thinking region by region.”

You know what really gets me, though? The payback math actually works. We’re seeing break-even points of under five years for operations with over 3,000 heads. That’s not pie-in-the-sky projection—that’s real operational efficiency that translates to lower cost per hundredweight.

Real-World Results: What’s Actually Happening on the Ground

Consider the following example from a consultant friend who worked on a 5,000-cow operation in Hebei Province. The numbers were eye-opening:

  • 80 robotic units installed over 18 months
  • $14 million total investment (including infrastructure upgrades)
  • Within the first year: 40% reduction in labor costs, 15% increase in milk per cow
  • Cash-flow positive on the project within four years

However, what doesn’t make it into the success stories is that they experienced three major system failures within the first six months. Finding qualified technicians who could troubleshoot AI-driven components was nearly impossible. The technology works, but the learning curve is brutal.

The Tech Integration That’s Changing Everything

What’s particularly fascinating is how they’re approaching AI integration across the entire operation. I spent time reviewing Mengniu’s latest sustainability reports, and their Ningxia facility is achieving results that would make most Wisconsin processors take serious note.

They’ve rolled out integrated systems that include machine vision for body condition scoring, automated lameness detection, and real-time ration adjustments. However, what really impressed me is that they’ve reduced the time for quality traceability from two hours to two minutes.

Think about that from a risk management perspective. When you’re processing 50,000 gallons daily and can trace a potential contamination issue back to specific animals in real-time, that’s not just operational efficiency; that’s a competitive advantage.

Professor Mark Stevens from Cornell’s dairy management program put it this way: “What China is demonstrating is that when you integrate AI across the entire production chain—from feed management to processing—you don’t just get incremental improvements. You get step-change efficiency gains.”

Here’s something that’ll really get your attention: Yili’s AI platform processes global consumer trend data to cut product development cycles from 180 days to 90. They’re launching new products faster than most U.S. companies can navigate FDA approval processes.

What’s interesting is how they’re using technology to solve problems we’re all dealing with. Labor shortages? Automated systems. Feed efficiency? AI-driven optimization. Genetic improvement? Well, that’s where things get really interesting…

The Reality Check on Technology Implementation

I spoke with Dr. James Morrison, who has worked with several Chinese operations on technology integration, and he provided me with some perspective that doesn’t always make it into the press releases. “The AI systems are impressive when they work,” he told me. “But they’re also incredibly complex. When they fail, you’d better have backup plans.”

He mentioned one operation that lost 30% of their milking capacity for two days when a software update corrupted their cow recognition system. The financial impact was brutal—about $80,000 in lost production plus emergency labor costs to manually milk 3,000 cows.

The Genetics Game-Changer That’s Got Everyone Talking

The cloning research coming out of Northwest A&F University is both fascinating and, frankly, a bit concerning if you’re in the genetics business. They’ve successfully cloned dairy cattle projected to yield 18 tonnes per lactation—that’s roughly double China’s current national average, and it’s competitive with top quartile herds in Wisconsin.

Commercial implementation is still two to three breeding cycles away (this process doesn’t happen overnight), but the potential implications are massive. If they can scale this technology and reduce imported heifer demand by even 15-20% by 2028—which seems realistic given their track record—that’s another export market that starts shrinking.

Genetic Performance Reality Check
Current Chinese Average: 9 tonnes per lactation
Cloned “Super Cow” Target: 18 tonnes per lactation
Top U.S. Herds: 12-15 tonnes per lactation
Projected Impact: 15-20% reduction in heifer imports

What strikes me about the genetics angle is how it addresses China’s biggest historical weakness: productivity per cow. Their domestic cattle have traditionally lagged behind Western genetics by 30-40%. However, if they can close that gap through cloning and advanced breeding programs, that changes the math on many export strategies.

A genetics consultant who’s worked extensively in China told me something that stuck with me: “They’re not just trying to catch up to Western productivity standards—they’re trying to leapfrog them entirely.”

The Ripple Effects on Genetic Exports

Here’s something that doesn’t get discussed much in the trade press: the impact on genetic exports is already happening. A Pennsylvania seedstock operation told me their Chinese orders dropped 40% last year. Not because of quality issues or pricing problems—simply because Chinese operations are breeding more of their own stock.

The shift toward domestic genetics isn’t just about cost savings. It’s about controlling the entire genetic pipeline from conception to the milk tank. When you can clone high-performing animals and control the genetic pool… well, that’s a different level of supply chain security.

Following the Money: Where Opportunities Still Exist

Let’s talk real economics for a minute, because this is where the rubber meets the barn floor. Recent analysis from agricultural economists suggests feed conversion ratios in Chinese mega-operations are approaching U.S. benchmarks, though exact current pricing varies significantly by region.

Here’s where it gets interesting for global producers: while bulk commodity imports are declining, specialty products continue to grow. According to the China Dairy Industry Association, cheese consumption grew at a 16% compound annual rate between 2012 and 2022, with import projections reaching 270,000-320,000 metric tons by 2030.

That’s not exactly replacing those powder volumes, but it’s creating opportunities for producers who can pivot to value-added products. The butter market reached record imports of 28.4 million pounds in 2024—a 23% increase from 2023—driven by growth in Western-style food service and premium retail demand.

Market Realities vs. Marketing Hype

The thing about specialty markets, though, is that they’re not easy money. I know a Vermont cheesemaker who’s been trying to crack the Chinese market for three years. The regulatory hurdles alone have cost him over $200,000 in consulting fees and facility upgrades. He’s still not approved for import.

Growing Opportunities:

  • Cheese imports showing steady 16% annual growth
  • Butter demand up 23% in 2024 alone
  • Specialty ingredients are seeing double-digit growth

Shrinking Markets:

  • Whole milk powder down 36% and falling
  • Skim milk powder is projected to decline by another 32% in 2024
  • Bulk commodity milk is facing systematic displacement

However, here’s the catch—and this is where I become a bit pessimistic about the “easy opportunity” narrative—margins on specialty products are significantly tighter than those on bulk commodities. Plus, the market requirements are much more demanding. You need consistent quality, bulletproof supply chains, and often specific certifications that can take years to establish.

Regional Differences That Actually Matter

What’s happening isn’t uniform across China, and this is crucial to understand if you’re trying to determine where opportunities might still exist. The northern regions, particularly Inner Mongolia and Heilongjiang, are spearheading the modernization effort. These areas have natural advantages, including better grassland and a more favorable climate, and they’re receiving priority for infrastructure investment.

I’ve been following developments in Ningxia particularly closely. Operations there are achieving average milk yields over 9,000 kg per cow, which puts them in the same league as top-performing dairies in Wisconsin or the Netherlands. That’s not accidental—that’s systematic investment in genetics, facilities, and management systems.

However, what’s truly interesting is that while these mega-operations are achieving incredible efficiency gains, smaller operations are being squeezed out. Recent reports from industry analysts indicate that many smaller Chinese dairy farmers are actually culling their herds, as they are unable to compete with the scale and technological advantages of state-backed operations.

This reminds me of what happened in the U.S. during the 1980s and 1990s—rapid consolidation driven by technology and economies of scale. The difference is that it’s happening in China at about three times the speed.

Regional Performance Snapshot

Northern China (Inner Mongolia, Heilongjiang):

  • Average yields: 9,000+ kg per cow
  • Technology adoption: Leading edge
  • Investment priority: High

Southern/Central China:

  • Average yields: 6,000-7,000 kg per cow
  • Technology adoption: Mixed
  • Many smaller operations exist

The Environmental Angle That’s More Than Just PR

Here’s something that surprised me when I dug into the numbers: Mengniu’s carbon reduction program aims to achieve 1 million metric tons of emissions reductions by 2030. Their Ningxia plant operates 43% more energy-efficiently than conventional facilities.

This isn’t just environmental posturing—it’s operational efficiency that improves profitability. When you combine intelligent energy systems with automated processing, you’re looking at real cost advantages that compound over time.

Dr. Lisa Chang from the University of California, Davis, who’s studied Chinese dairy sustainability initiatives, told me: “What’s impressive isn’t just the environmental targets—it’s how they’re integrating sustainability metrics into operational decision-making. Energy efficiency becomes profit efficiency.”

The energy efficiency gains are significant:

  • 43% lower energy consumption compared to conventional plants
  • 2-minute quality traceability versus 2-hour traditional methods
  • Real-time optimization of processing parameters

The environmental compliance angle is also becoming crucial for export markets. If you’re not documenting your carbon footprint and sustainability metrics, you’re increasingly getting shut out of tender processes. It’s becoming table stakes, not a nice-to-have.

The Risks Nobody Wants to Talk About

Here’s where I get a bit contrarian though… There are some real risks in China’s approach that are not discussed much in the trade press, and understanding them might create opportunities for the rest of us.

Concentration Risk: When you have 80% of your milk production concentrated in just four northern provinces, you’re vulnerable to weather events, disease outbreaks, or regional economic disruptions. I recall speaking with a consultant who worked on a 10,000-cow operation in Inner Mongolia that was severely impacted by a brutal winter storm in 2022.

The financial impact was devastating:

  • 400 head lost directly from the storm
  • $2 million in direct losses from mortality and facility damage
  • Additional $1.5 million in emergency feed costs (trucked in from 800 miles away)

Technology Dependence: When your entire operation depends on AI systems and robotic milking, what happens when the tech fails? I’ve seen reports of Chinese operations losing 20-30% of their milking capacity due to software updates going wrong.

Scaling Challenges: They’re betting heavily on technologies that are still in the process of evolving. Automated milking systems have a global first-year failure rate of approximately 12%, which is particularly notable in mature markets with established service networks. In China, where you might be 500 miles from the nearest qualified technician… well, that’s a different kind of risk.

Real-World Risk Examples

A technology consultant shared this story: “We had a 5,000-cow operation in Hebei where the AI system managing feed mixing had a software glitch. For three days, it delivered rations with 20% more protein than needed. The immediate cost was approximately $50,000 in wasted feed, but the real damage was the metabolic stress on the herd. Milk production dropped 15% for two weeks.”

These aren’t theoretical risks—they’re happening on the ground, and they create vulnerabilities that more diversified, flexible operations might be able to exploit.

What This Means for the Rest of Us

The reality is that China’s model works… for China. The state-directed approach, coordinated investment, and access to cheap capital—that’s not replicable in market-driven systems like ours. However, there are lessons to be learned, and some of them are uncomfortable.

First, the technology they’re implementing isn’t uniquely Chinese. Robotic milking, AI-driven management systems, and genetic improvement programs—these are available globally. The difference lies in the scale of implementation and access to financing.

I spoke with a progressive Iowa producer who has been implementing similar technology over the past three years. He’s seeing 15% improvements in feed efficiency and a 20% reduction in labor costs. “The technology works,” he told me, “but you need the capital and the patience to get through the learning curve.”

Second, the focus on value-added products is creating opportunities, but you must be strategic about it. If you’re running a genetics operation or producing specialty dairy products, there are still opportunities in the market. The key is understanding that commodity exports to China will continue to decline.

Third—and this is the part that really concerns me—they’re setting new operational benchmarks that affect global competitiveness. When Chinese operations are achieving 9,000+ kg per cow with 43% better energy efficiency, that’s not just impressive domestically… it’s competitive pressure that affects pricing globally.

Competitive Reality Check

Here’s a sobering comparison from recent industry analysis:

Chinese Mega-Operations (2024):

  • Milk per cow: 9,000-10,000 kg
  • Energy efficiency: 43% better than conventional
  • Labor productivity: 4x traditional systems
  • Feed conversion: Approaching U.S. benchmarks

Average U.S. Operations:

  • Milk per cow: 11,000-12,000 kg
  • Energy efficiency: Conventional baselines
  • Labor productivity: Traditional levels
  • Feed conversion: Good but not systematically optimized

The gap is narrowing faster than most people realize, and that has implications for global pricing pressure.

The Bottom Line That Nobody Wants to Hear

China’s dairy transformation isn’t a temporary policy shift—it’s a fundamental restructuring of how global dairy markets work. The producers who recognize this early and adapt their strategies accordingly will be better positioned than those who continue to hope for a return to the old export patterns.

The technology they’re deploying, the operational efficiencies they’re achieving, the genetic improvements they’re implementing… these aren’t just interesting developments happening over there. They’re setting new industry standards that’re forcing the entire global dairy industry to raise its game.

What’s particularly striking is how this mirrors what we’ve seen in other sectors. China identifies strategic industries, commits resources, and systematically builds domestic capacity. We saw it with steel, solar panels, and electric vehicles. Now we’re seeing it happen in the dairy industry.

The companies and countries that can adapt to this new reality—whether through the adoption of technology, product differentiation, or market diversification—will thrive. Those that don’t… well, they’re going to struggle with the new competitive landscape.

Your Action Plan: Don’t Wait for the Next Crisis

After all this analysis, here’s what I think dairy producers need to be doing right now:

Benchmark Your Operations Against Global Standards: Stop Comparing Yourself to the Local Average. What’s your cost per hundredweight? Your per-cow yield? Energy efficiency? If Chinese operations are achieving 9,000+ kg per cow with 43% better energy efficiency, what’s your path to competitive performance? Start planning upgrades now, not during the next equipment cycle.

Get Strategic About Value-Added Markets If you’re still focused primarily on bulk commodity sales, it’s time to explore partnerships with processors working on cheese, butter, or specialty ingredients. The bulk powder market is shrinking, but premium categories continue to grow. Build relationships with processors who understand the new market dynamics.

Diversify Your Genetics Strategy For seedstock producers, focus marketing efforts on regions and traits that aren’t easily replaced by domestic Chinese breeding programs. Emphasize characteristics such as heat tolerance, feed efficiency, and disease resistance that offer competitive advantages in various markets.

Invest in Operational Resilience The technology gap is real and widening. Whether it’s automated milking, AI-driven feed optimization, or energy efficiency improvements, the producers who invest in operational excellence today will be the ones who survive tomorrow’s competitive pressure. But build in redundancy—don’t put all your eggs in one technological basket.

This transformation is happening whether we’re ready or not. The question isn’t whether China will succeed—the evidence suggests they already are. The question is: what are you going to do about it?

Because here’s the thing that really keeps me up at night: this is just the beginning. If they can achieve this level of systematic transformation in the dairy industry, what’s next? Beef? Pork? The entire agricultural supply chain?

The game has changed, and we’re all still learning the new rules. The producers who figure them out first are going to be the ones still standing when the dust settles.

Complete references and supporting documentation are available upon request by contacting the editorial team at editor@thebullvine.com.

Learn More:

The Sunday Read Dairy Professionals Don’t Skip.

Every week, thousands of producers, breeders, and industry insiders open Bullvine Weekly for genetics insights, market shifts, and profit strategies they won’t find anywhere else. One email. Five minutes. Smarter decisions all week.
NewsSubscribe
First
Last
Consent

South America’s Dairy Revolution Has Me Completely Rethinking Global Competition

Argentina’s milk yield jumped 15.9% in March while you’re still chasing 2% gains. Here’s what they know about feed efficiency that you don’t.

EXECUTIVE SUMMARY: You know what’s got me fired up after digging into the latest South American data? These producers are throwing out the volume playbook and focusing on margin management that’s delivering 3-5% net margins consistently. Argentina’s pulling off an 15.9% production surge while Uruguay’s export revenues jumped 19% to $222.1 million in Q1 alone – and they’re doing it with completely different strategies. The Argentines suspended export taxes and reinvested $18,000-36,000 per operation into feed efficiency improvements that are saving $150-200 per cow annually. Meanwhile, Uruguay’s processors shifted to component-based payments and their producers are seeing solids content growth of 3.3% while everyone else chases volume. With automated milking systems now delivering 15-20% labor reductions and 8-12% milk quality improvements at $220,000-280,000 per unit, the math’s getting pretty clear. Here’s the thing – these aren’t just good ideas anymore, they’re survival strategies you need to implement now.

KEY TAKEAWAYS

  • Feed conversion monitoring delivers $150-200 annual savings per cow – Start tracking your feed efficiency ratios monthly instead of quarterly, and implement performance-based procurement with your feed suppliers to capture these gains immediately in today’s volatile input cost environment.
  • Component-focused payment systems generate 3.3% higher milk solids revenue – Negotiate with your processor or co-op to shift toward butterfat and protein premiums rather than volume bonuses, following Uruguay’s successful model that’s driving export values up 19% despite lower volumes.
  • Automated milking systems provide 18-24 month ROI with proper implementation – Budget $220,000-280,000 per unit for 2025 installations, but redesign your cow flow and management systems first to achieve the proven 15-20% labor cost reductions and 8-12% quality improvements.
  • Margin management targeting 3-5% net margins enables infrastructure investment – Audit your current margins monthly using the Argentina recovery model, and reinvest policy savings or efficiency gains directly into genetic programs and facility upgrades rather than expanding volume.
  • Policy engagement creates immediate competitive advantages – Join your regional dairy organizations and monitor export tax policies, environmental regulations, and trade agreements that could provide $18,000-36,000 annual savings like Argentina’s producers are capturing right now.
global dairy trends, dairy farm profitability, milk solids pricing, feed efficiency in cattle, dairy market strategy

The numbers coming out of Argentina and Uruguay are forcing every dairy producer to reconsider what they thought they knew about regional dynamics… and honestly, the implications are staggering.

What’s Really Happening Down There

You know how we’ve been tracking South American dairy markets for years? Well, I’ve been digging into the latest data from down south, and honestly… it’s completely rewriting my understanding of how quickly things can shift when the stars align.

Argentina has just released milk production numbers, which show a 15.9% increase in March 2025 compared to the same month last year. That’s not just recovery – that’s the kind of turnaround that makes you double-check your spreadsheets. Considering they were hammered in 2024, this comeback has serious legs.

But here’s what’s really got me excited… Uruguay’s story is even more fascinating. While everyone’s been talking about volume challenges, Uruguay’s dairy exports actually surged 19% in Q1 2025 to $222.1 million. They followed that up with an 11% growth in the first half of 2025, hitting $428.5 million. Talk about playing the long game – quality over quantity pays off.

The thing about these numbers is that they’re telling completely different stories about strategy. Argentina is focusing on volume recovery, while Uruguay is pursuing premium positioning. Both are winning, just in different ways.

The Policy Shift That’s Changed Everything

Here’s where it gets interesting from a policy perspective… Argentina suspended their export taxes through June 2025. That’s real money flowing back to producers. We’re talking about 4.5% to 9% that stays in farm pockets instead of government coffers.

For a typical 2,000-cow operation in Santa Fe producing around 50,000 liters monthly, that’s $18,000-36,000 annually. That’s genetic improvement money, that’s parlor upgrade money… that’s the difference between surviving and thriving.

Monica Ganley from Quarterra – and she knows these markets better than almost anyone – has been tracking how this policy shift has enabled sustained profitability. What strikes me about this is how policy certainty (even temporary certainty) drives investment decisions faster than most producers realize.

The peso devaluation enhanced export competitiveness, but it also increased costs for imported genetics and equipment. This is a classic currency double-edged sword that we see everywhere, from New Zealand to Wisconsin.

Feed Efficiency Numbers That’ll Make You Think

The discussion about feed conversion keeps coming up in producer conversations. Recent work from the University of Wisconsin dairy program shows that operations optimizing their feed efficiency are seeing annual cost reductions of $150-200 per cow. If you’re not monitoring this monthly – and I mean really monitoring, not just glancing at feed bills – you’re leaving money on the table.

What’s particularly noteworthy is how different regions within Argentina are adapting. The Santa Fe and Córdoba basins led the recovery, while Buenos Aires province took longer to recover. This makes sense when considering the infrastructure differences and feed availability across regions.

The Journal of Dairy Science published research showing that automated milking systems deliver 15-20% labor cost reductions and 8-12% improvements in milk quality under optimal conditions. Current 2025 pricing for these systems? You’re looking at $220,000 to $ 280,000 per unit, depending on the configuration and installation requirements. That’s an 18- to 24-month payback in most scenarios, assuming you meet the performance targets.

Here’s what I’m seeing in the field, though – the operations that succeed with automation aren’t just buying equipment, they’re completely redesigning their cow flow and management systems. It’s not plug-and-play.

Uruguay’s Quality Game Plan

Uruguay’s approach reveals a fascinating aspect of market positioning during periods of volatility. They’ve managed to boost milk solids content while dealing with production constraints – a classic quality-over-quantity strategy that’s paying dividends.

Their March 2025 data shows milk production up 2.9% with solids content growing 3.3%. That’s the kind of efficiency improvement that translates directly to bottom line impact. Their processors shifted payment systems to reward solid content over raw volume… and it’s working.

The broader question this raises – and I keep coming back to this in conversations with producers – is whether you are maximizing value per unit or just chasing volume targets? Uruguay is proving that quality positioning offers real protection when markets become volatile.

The North American Connection Nobody’s Talking About

Here’s what’s interesting from a North American perspective… these South American developments are affecting everything from feed grain markets to genetic material flows. When major dairy regions experience this kind of volatility, it ripples through the entire system.

Wisconsin producers are facing feed cost pressures, partly driven by South American demand for high-quality forages. California’s export-oriented operations are competing with Argentine products in Asian markets. The interconnectedness runs deeper than most realize.

I spoke with a nutrition consultant from Cornell’s dairy program last month, and he mentioned seeing an increased interest in South American feeding strategies, particularly their approach to managing seasonal pasture quality. It’s not just about the economics anymore; it’s about adapting proven systems to local conditions.

Global Ripple Effects We’re All Feeling

What’s happening in South America isn’t staying in South America, and that’s what makes this story so important for everyone milking cows. Argentina is reaching 85+ international markets with its products, but here’s the concentration risk that should have everyone paying attention – it’s still heavily dependent on Brazil and Algeria as primary destinations.

China’s reduced import demand is forcing buyers worldwide to diversify supply sources. That creates opportunities for regions that can deliver consistent quality and volume. Current market intelligence suggests whole milk powder pricing is holding steady through Q2, but stakeholders are indicating Q3 offers show some softening.

Market correction ahead? Maybe. But that’s exactly why diversification matters more than ever.

The Technology Reality Check

Let’s talk about what’s actually working in terms of technology adoption. Recent extension work from Iowa State shows that successful AMS installations require more than just capital investment – they need comprehensive management system changes.

The 15-20% labor reduction? That’s real, but it typically takes 12-18 months to achieve as crews adapt to new routines. The 8-12% milk quality improvement? That’s assuming your housing, ventilation, and cow comfort are already optimized.

What is particularly noteworthy is how different regions are adapting to technology. Argentine operations are focusing on robotic milking for labor efficiency, while Uruguayan producers are investing in milk component analysis systems to maximize their quality premiums.

The Bottom Line – What You Need to Know Right Now

Three immediate takeaways for your operation:

First, margin management is no longer optional. Argentina’s recovery was built on sustained profitability that enabled infrastructure investment. According to research from the University of Wisconsin’s dairy program, operations require a minimum 3-5% net margin for reinvestment and growth. Track your feed conversion ratios monthly. If you’re not consistently hitting sustainable margins, diagnose the reasons before considering expansion.

Second, policy engagement pays dividends. Argentina’s export tax suspension demonstrates how regulatory changes can drive investment confidence. Whether it involves environmental regulations, trade policies, or tax structures, staying engaged with local and regional dairy organizations matters more than most producers realize.

Third – quality positioning offers protection. Uruguay’s ability to increase solids content while managing volume pressures demonstrates how premium positioning can offset production challenges. The question is whether your operation maximizes value per unit or just chases volume.

For immediate action this month:

  • Audit your feed conversion efficiency – compare your numbers to regional averages
  • Review your milk component pricing structure with your cooperative or processor
  • Assess your operation’s vulnerability to input cost volatility
  • Consider how policy changes might affect your long-term planning

For the next quarter:

  • Evaluate technology investments based on labor efficiency, not just production gains
  • Develop relationships with alternative feed suppliers to manage cost volatility
  • Review your genetic program’s focus on components versus volume
  • Consider market diversification if you’re heavily dependent on single buyers

Looking Ahead… What’s Got Me Curious

The thing about this South American transformation is that it’s showing us how quickly fundamentals can shift when policy, weather, and market conditions align. Argentina chose the export tax route, Uruguay focused on quality premiums, while Brazil continues to anchor regional demand.

What fascinates me is how these different strategies create learning opportunities. I’m seeing more North American producers asking questions about component payment systems after watching Uruguay’s success. The technology adoption patterns are also interesting – automated systems perform better in consistent climates, while manual operations maintain their advantages in variable conditions.

Current market conditions continue to show strength, but we’re seeing signs that markets are pricing in potential corrections. The operations that understand margin management, policy engagement, and quality positioning as interconnected strategies – not separate tactics – are positioning themselves for significant advantages.

Recent work from dairy economists at several land-grant universities suggests that the most successful operations over the next five years will be those that can adapt quickly to changing conditions while maintaining quality standards. That’s not just about technology or genetics – it’s about building systems that can handle volatility.

Here’s what really has me excited – we’re seeing innovation in policy, production, and positioning happening simultaneously. The regions that figure out how to optimize all three are going to reshape global dairy competition in ways we’re just beginning to understand.

This South American story isn’t just about regional competition. It’s showing us patterns that apply everywhere. Because, if there’s one thing I’ve learned from watching global dairy markets, it’s that fundamentals always prevail… eventually.

The question isn’t whether these changes will affect your operation. It’s whether you’re building the systems – financial, operational, and strategic – to benefit from them when they hit your market.

Market data current through July 2025. Policy situations can change rapidly – always verify current regulations with local authorities before making operational decisions.

Complete references and supporting documentation are available upon request by contacting the editorial team at editor@thebullvine.com.

Learn More:

The Sunday Read Dairy Professionals Don’t Skip.

Every week, thousands of producers, breeders, and industry insiders open Bullvine Weekly for genetics insights, market shifts, and profit strategies they won’t find anywhere else. One email. Five minutes. Smarter decisions all week.
NewsSubscribe
First
Last
Consent

How China’s Strategic Pivot Is About to Slash Your Feed Costs

The structural shift in global grain trade that’s creating unexpected opportunities for dairy producers

EXECUTIVE SUMMARY: Here’s what’s happening that nobody’s really talking about… China’s systematic move away from U.S. grain suppliers is creating a domestic supply cushion that’s driving down our feed costs in ways we haven’t seen since the mid-2010s. We’re looking at corn futures sitting around $4.03-$4.09 per bushel right now, and soybean meal pricing that could save a 500-cow operation $400-600 monthly just on protein supplements. This isn’t some temporary trade spat either – it’s a structural shift as Brazil captures more market share and China builds supply chain resilience away from U.S. dependence. Current milk prices are running $18.65-$21.95 per hundredweight depending on your class, so every dollar you save on feed drops straight to your bottom line. The smart operators are using this window to invest in precision feeding systems that show 4-7% additional feed efficiency improvements. If you’re not already looking at forward contracting 30-50% of your protein supplements while this opportunity lasts, you’re leaving money on the table.

KEY TAKEAWAYS

  • Lock in feed cost advantages now – Forward contract 30-40% of your protein supplement needs while soybean meal pricing reflects these export displacement effects. With current market dynamics, operations are seeing $400-600 monthly savings per 500 cows that can free up cash flow for other investments.
  • Technology ROI is prime right now – Precision feeding systems ($85,000-125,000 for 500-cow setups) are showing 2.5-3 year payback periods when combined with current favorable feed costs. The 4-7% additional feed efficiency improvements stack on top of the market savings.
  • Build reserves while margins improve – USDA lending rates at 5.0% for operating loans make this an ideal time to strengthen your financial position. Industry advisors recommend 60-90 day operating expense reserves since commodity advantages can shift quickly based on weather or global events.
  • Regional opportunities vary – Upper Midwest operations are focusing on precision feeding tech, Western producers are considering strategic expansion, while Northeast farms are staying conservative due to regulatory constraints. Match your strategy to your market realities.
  • This structural shift has staying power – Unlike previous trade disruptions, China’s supplier diversification appears permanent as Brazil’s production capacity continues expanding and Argentina targets increased global market share. Position your operation for sustained domestic feed cost advantages.

Look, I’ve been tracking commodity markets for the better part of two decades, and what’s happening right now with China’s systematic shift away from U.S. grain suppliers… well, it’s creating opportunities I haven’t seen since the mid-2010s. And for once, we dairy folks might actually come out ahead.

The thing about structural market shifts is they’re different from the dramatic trade disputes we’ve gotten used to. This isn’t about tariff tweets or political theater—it’s about fundamental changes in global supply chains that are reshaping where grain flows, and more importantly for us, what stays home.

What’s Actually Happening in These Grain Markets Right Now

So here’s the deal, and I’m seeing this play out across operations from Wisconsin to California. USDA just released their July 2025 World Agricultural Supply and Demand Estimates, and while they’re projecting solid corn yields at 181 bushels per acre, the really interesting story is in the export numbers.

Production is estimated at 15.8 billion bushels for 2025-26, but here’s where it gets interesting for us… soybean exports are projected at 1.815 billion bushels, which is still down from what we were seeing in previous years. That’s a lot of beans that could stay domestic if global dynamics keep shifting.

What strikes me about this whole situation is how the math works out at the farm level. Current soybean prices are sitting around $10.15-$10.31 per bushel, and with these export dynamics, we’re looking at a supply situation that could favor domestic users like dairy operations.

Let me break this down to what actually matters for your operation. If you’re running 500 head (and a lot of you are), the current soybean meal pricing dynamics could mean monthly savings of $400-600 just from protein supplements getting more competitive. Those bigger operations pushing 1,200 cows? They could be looking at $960-1,440 monthly improvements.

Now, I know some of you are thinking, “sounds too good to be true.” And maybe it is… but the fundamentals are there.

The Numbers Game That’s Actually Playing Out in July 2025

Here’s what really gets me interested about this whole thing… with corn futures sitting around $4.03-$4.09 per bushel right now, and soybean meal pricing reflecting these export displacement effects, we’re looking at feed cost dynamics that haven’t been this favorable in several years.

The research coming out of university extension programs consistently shows that feed conversion efficiency improvements of even 3-5% can translate to significant margin improvements. When you’re dealing with current milk prices averaging $18.65 to $21.95 per hundredweight—depending on your class and region—every dollar saved on feed costs drops straight to the bottom line.

What’s different this time, though… and this is where I get cautiously optimistic… is that this isn’t just some temporary trade disruption. Brazil’s soybean production has grown to massive levels. Argentina is not backing down from its export goals. China has been methodically diversifying its supplier base since 2017, and that structural shift keeps accelerating.

The individuals I speak with in the grain trade inform me that China’s approach has evolved from reactive (responding to trade tensions) to proactive (building resilient supply chains). This means more consistent displacement of U.S. grain exports, which in turn translates to more consistent domestic supply availability.

Here’s the thing, though… commodity markets are fickle. What looks good today can flip tomorrow based on weather in Brazil, policy changes in Beijing, or even a bad harvest report from Argentina.

The Financing Reality Check (Because Interest Rates Actually Matter)

Let’s discuss how this affects investment decisions, given that financing has become more affordable recently. Current USDA lending rates for July 2025 show operating loans at 5.000% and ownership loans at 5.875%. That’s actually more workable than what we were dealing with in 2023-2024.

What’s interesting is that agricultural lending increased 8.78% from Q4 2024 to Q1 2025, which tells me more producers are feeling pressure on their cash flow. The crop farmers are struggling more than livestock operations right now, which creates both opportunity and caution for dairy expansion plans.

The technology investment equation is getting more compelling, though. Precision feeding systems that were running $85,000-125,000 for a 500-cow setup are now showing payback periods of 2.5-3 years when you factor in these more favorable feed cost dynamics. The key is that the ROI calculation isn’t just based on temporary savings—it’s built on what appears to be a structural shift in domestic grain availability.

I was just talking to a producer in upstate New York who installed automated feeding systems this spring. He’s seeing the 4-6% feed efficiency improvements that research predicted, plus his component consistency has never been better. (And this is becoming more common—the precision feeding technology has really matured in the last couple of years.)

What’s Working on Real Farms Right Now

The thing about all this analysis is that it has to work on actual operations with real constraints. I’m seeing some interesting patterns in how successful operations are handling the current market dynamics.

Up in Minnesota, there’s a 650-cow operation that’s been strategically forward contracting about 40% of their protein supplement needs based on these structural supply changes. They’re not going crazy with it, but they’re capturing favorable pricing while maintaining flexibility for seasonal adjustments.

Down in Texas, I know a larger operation that’s using improved feed margins to invest in heat stress mitigation. They figure the feed cost improvements give them the cash flow to install more cooling systems, which should help maintain production through those brutal summer months (and we’re definitely seeing more of those).

What’s particularly interesting is the regional differences I’m seeing. The Upper Midwest operations seem more focused on precision feeding technology investments. Western operations are using improved margins for strategic expansion. Northeast folks are being more conservative—probably smart given their regulatory environment and land constraints.

The Technology Play That Makes Sense Now

Here’s something that’s got me really excited, and I think it’s flying under the radar. While these feed cost dynamics are improving, it’s creating this perfect window for operational efficiency investments that could pay off for years.

The research shows that automated ration management systems can reduce feed costs by an additional 4-7% while improving milk component consistency. Think about that for a second… you’re already benefiting from better ingredient pricing, and now you can optimize utilization even further.

Ration optimization software is getting more sophisticated, too. The programs that can dynamically adjust formulations based on changing ingredient costs and availability are showing additional savings of $25-35 per cow annually. The licensing costs run $8,000-12,000 annually, but the math works when you’re dealing with these structural supply advantages.

What’s fascinating is watching how the younger generation of producers is approaching this stuff. They’re not just looking at feed costs—they’re thinking about data integration, labor efficiency, and how all these systems work together. It’s a completely different mindset than what I was seeing even five years ago.

The Global Context That’s Not Going Away

Let me be clear about something—this isn’t about temporary trade tensions or political posturing. China’s grain import strategy has fundamentally shifted toward supply chain resilience. Brazil’s production capacity keeps expanding. Argentina’s agricultural sector is targeting increased market share globally.

Recent analysis from agricultural economists points out that U.S. agricultural exports have been a growth engine for decades, but traditional export markets are becoming more competitive and less reliable. For dairy producers, this global restructuring creates domestic opportunities. When export demand softens, more grain stays home. When Brazil captures market share from U.S. suppliers, it creates pricing pressure that benefits domestic users.

The challenge is that we’re operating in a world where weather events, geopolitical tensions, and currency fluctuations can change everything overnight. That’s why I keep coming back to operational efficiency and financial discipline. External market advantages come and go, but the improvements you make to your operation… those stick around.

The Bottom Line for Your Operation Right Now

Look, I’ve been through enough market cycles to know that favorable conditions don’t last forever. But the combination of structural changes in global grain trade, solid domestic production potential, and current pricing dynamics is creating a window that smart operators should be thinking about.

If you’re running a dairy operation in mid-2025, here’s what I’d be considering:

Get your procurement strategy updated for current market realities. The old assumptions about export demand and price volatility don’t necessarily apply to this new structural environment. Forward contracting 30-50% of your protein supplements makes sense—just don’t overextend yourself.

This is prime time for efficiency investments that’ll keep paying dividends long after grain markets normalize. Whether that’s precision feeding systems, facility improvements, or herd management technology, the margins are there to justify improvements that strengthen your competitive position.

And here’s the crucial part—manage your cash flow with the understanding that what global markets give you, they can take away. But the operational improvements you make during favorable periods? Those are yours to keep.

The structural shift in global grain trade that nobody really wanted might just be the break domestic dairy producers have been waiting for. The question is: are you positioned to make the most of it while it lasts?

Because honestly… opportunities like this don’t come around very often. And when they do, the producers who capitalize on them are usually the ones who are still thriving when the next market cycle hits.

Complete references and supporting documentation are available upon request by contacting the editorial team at editor@thebullvine.com.

Learn More:

The Sunday Read Dairy Professionals Don’t Skip.

Every week, thousands of producers, breeders, and industry insiders open Bullvine Weekly for genetics insights, market shifts, and profit strategies they won’t find anywhere else. One email. Five minutes. Smarter decisions all week.

NewsSubscribe
First
Last
Consent

The “Cautious Optimism” Trap: Why Global Dairy’s Recovery Story Could Cost You Your Farm

Milk volume up 1%, trade down 0.8%: Why ‘cautious optimism’ could cost your farm $6,000/month. Component revolution changes everything.

EXECUTIVE SUMMARY:  The dairy industry’s “cautious optimism” about global market recovery is built on dangerous groupthink that ignores a fundamental shift from volume-based to component-based economics. While everyone celebrates modest 1% global production growth, U.S. milk solids production surged 1.65% even as volume dropped 0.35%—proving that traditional metrics completely miss where the real money is. Farms optimizing for butterfat and protein are capturing $1.50-$2.00 per hundredweight premiums while volume-focused operations watch margins evaporate. With global dairy trade contracting 0.8% despite production growth, regional markets are fragmenting in ways that reward component-rich milk over bulk volume. The December 2025 FMMO reforms will accelerate this shift by explicitly rewarding 3.3% protein and 6% other solids, creating a competitive divide between farms that adapt their genetics programs now versus those stuck in commodity thinking. For a 1,000-cow operation, the difference between component optimization and volume chasing represents $4,500-$6,000 in monthly revenue—making this the most critical strategic decision facing dairy farmers in 2025. Stop betting your farm’s future on market sentiment and start positioning for the component-driven economy that’s already emerging.

KEY TAKEAWAYS

  • Component Premium Opportunity: Farms achieving 4.4%+ butterfat and 3.4%+ protein capture $1.50-$2.00/cwt premiums over base levels, delivering $4,500-$6,000 monthly returns for 1,000-cow operations through strategic genetics and nutrition optimization
  • FMMO Policy Advantage: December 1, 2025 reforms explicitly reward 3.3% protein and 6% other solids composition, creating immediate competitive advantages for farms that audit genetics programs within 90 days and align with component-focused processing capacity
  • Global Trade Fragmentation Risk: With production up 1% but trade down 0.8%, regional markets are decoupling—making U.S. component advantages (butter at $2.33/lb vs. EU at $3.75/lb) critical for export competitiveness while domestic processing capacity expands
  • Risk Management Evolution: Traditional DMC and DRP programs require component-specific coverage strategies, as butterfat/cheese prices surge while powder markets contract—demanding feed cost hedging and processor partnerships aligned with $8+ billion cheese capacity expansion
  • Technology ROI Acceleration: Genomic testing investments of $50-75/cow targeting component traits deliver 2-3 month payback periods when aligned with precision nutrition programs optimizing DMI for milk solids during peak lactation (60-120 DIM)
dairy component optimization, milk production profitability, global dairy trends, farm genetics strategy, dairy market analysis

The dairy industry’s collective sigh of relief over “cautious optimism” in global milk markets might be the most dangerous sentiment of 2025. While everyone’s celebrating a modest 1% global production increase to 992.7 million tonnes, the underlying fundamentals tell a story of structural cracks, trade contraction, and regional divergence that could blindside farmers betting on recovery. Here’s what nobody’s talking about: global dairy trade is contracting by 0.8% in 2025 while production supposedly grows—that’s not optimism, that’s a warning sign flashing red.

Are We Confusing Hope with Data?

Let’s get brutally honest about what’s driving this so-called optimism. The FAO Dairy Price Index averaged 153.5 points in May 2025, up 21.5% year-on-year, led by strong butter and cheese quotations. Sounds great, right? Wrong. These aren’t demand-driven victories—they’re supply-shortage panic responses masquerading as market strength.

The Component Revolution Masking Volume Reality

Here’s where conventional thinking gets dangerous, and where most analysts are missing the real story. While the industry celebrates total volume increases, U.S. milk production actually declined 0.35% year-to-date through March 2025, yet calculated milk solids production increased by 1.65%. We’re not producing more milk—we’re producing smarter milk, and this fundamental shift is reshaping profitability in ways traditional volume-based analysis completely misses.

Think of it like this: progressive operations are essentially running component factories instead of filling bulk tanks with watery milk. Average U.S. butterfat tests reached 4.36% in March 2025, up from 3.95% in 2020, while protein tests climbed to 3.38% from 3.181% in 2020. That’s not gradual improvement—that’s a genetic and nutritional revolution hiding in plain sight.

The comprehensive Global Milk Market analysis documented that processors are now “more concerned with solids than total volume”. This isn’t marketing speak—it’s a fundamental economic shift that most farmers are missing.

Why This Matters for Your Operation: The financial impact is staggering, with nearly 90% of U.S. milk valued under multiple component pricing. Current data shows butterfat levels averaged 4.218% nationally in November 2024. At today’s component premiums of $2.50-$3.00 per pound above base levels, a farm producing 4.36% butterfat versus the old 3.95% standard captures an additional $1.50-$2.00 per hundredweight. A 1,000-cow operation producing 75 pounds per cow daily costs an extra $1,125-$1,500 per day.

But here’s the uncomfortable question: Are you still managing your herd like in 2015, focusing on volume metrics while your component-optimized neighbors capture the missing premiums?

The Export Reality Check: What the Experts Are Saying

Katie Burgess, dairy market advising director with Ever.Ag, emphasized at the Oregon Dairy Farmers Convention that exports play a critical role in the U.S. dairy market. As she noted, “This is really good news that consumers around the world are finding value in American dairy products, because as we grow here domestically, that’s going to be the key.”

However, the export story reveals a concerning bifurcation. U.S. cheese exports are performing exceptionally well, and butterfat exports surged by 41% in early 2025. Meanwhile, exports of nonfat dry milk (NFDM) dropped by 20% in January and 28% in February 2025.

This divergence shows we’re winning in high-value components because everyone else is struggling with supply, while losing in commodities where oversupply rules. U.S. butter prices in May 2025 were significantly lower ($2.33/lb) compared to EU ($3.75/lb) and Oceania ($3.54/lb), providing a massive competitive advantage in component-rich products.

However, as Burgess warns, “The imposition of tariffs by the U.S. on countries like Canada, Mexico, and China has stirred significant repercussions, with these countries preparing retaliatory tariffs on American dairy products.” This poses considerable risk, especially concerning Mexico, which accounted for nearly 40% of U.S. cheese exports.

Global Market Reality Check: Production Data Exposed

European Union: The Managed Decline

The EU dairy sector faces significant structural limitations, with milk production expected to decline by 0.2% to 149.4 million metric tons in 2025. This contraction is driven by shrinking cow herds, stringent environmental regulations like the EU Green Deal’s methane reduction targets, and persistent high input costs. When feed accounts for approximately 60% of operational expenses and energy prices have surged by 12% year-on-year, you’re looking at margin compression that makes 2008 look like a warm-up.

EU processors strategically prioritize cheese production, which is forecast to rise by 0.6% to 10.8 MMT, leading to projected declines in butter (-1%) and powdered milk (NFDM -4%, WMP -5%). This isn’t market optimization—it’s triage.

United States: The Component Revolution Continues

The U.S. dairy sector enters 2025 with a slightly larger dairy herd, recorded at 9.349 million head on January 1, 2025. More significantly, milk production is projected to grow at a modest 0.5% annually in 2025, but the real story is efficiency gains.

The growth in milk components compared to overall milk production is expected to continue into 2025 as trends in dairy consumption move away from fluid milk and towards manufactured dairy products. Since 2016, milk production has grown at an annual average rate of 0.9%, compared to protein and butterfat, which have grown at rates of 1.5% and 2.2%, respectively.

New processing capacity, particularly for cheese, is expanding rapidly with over $8 billion in nationwide investments, which is expected to increase demand for raw milk and support prices.

Real-World Impact: The Texas Success Story

The Bullvine’s April 2025 production data analysis reveals how this transformation is playing out regionally. Texas dominated growth with a 10.6% output surge, driven by adding 50,000 cows plus a 55 lb/cow yield gain. Meanwhile, Kansas posted an 11.4% increase and South Dakota achieved 9.2% growth, while traditional dairy states like Wisconsin showed minimal growth at just 0.1%.

This isn’t just data—it’s a fundamental restructuring of America’s dairy landscape toward regions that many “experts” dismissed as unsustainable just a decade ago.

China: The Reality Behind the Rebalancing

Rabobank forecasts a 2.6% decline in Chinese milk production in 2025, marking the second consecutive year of contraction. This downturn is attributed to falling farmgate prices, which were down 15% year-on-year in February 2025, and sustained cost pressures on producers.

The comprehensive market analysis is blunt about China’s situation: “China’s domestic production contraction is a strategic rebalancing, shifting from a previous push for self-sufficiency that led to oversupply and unsustainable margins, towards a more import-reliant model”. But here’s the kicker—even with import growth forecasted at just 2%, trade tensions, including China’s 10% duty on U.S. dairy and investigation into EU dairy subsidies, threaten established trade flows.

New Zealand: Supply Squeeze Masquerading as Success

Dairy commodity prices in New Zealand have steadily moved higher through 2025. Whole milk powder (WMP) prices have increased by almost 30% compared to the 2024 average, and butter has reached record highs, 16% above 2024 and 40% above the five-year average.

This upward trend is supported by a slowdown in New Zealand milk production growth since February 2025, leading to limited dairy product availability on the Global Dairy Trade (GDT) platform. When your success depends on producing less while the world needs more, you manage decline, not driving growth.

The Dangerous Comfort of Consensus

Industry Optimism vs. Market Reality

Here’s where the disconnect becomes dangerous. McKinsey’s 2025 dairy industry survey found that approximately 80% of leaders expect volume growth greater than 3% over the next three years, up from 76% in 2023. As one executive told McKinsey, “We have seen a resurgence in consumer demand for dairy.”

But here’s the critical question: If 80% of industry leaders expect 3%+ growth while global trade contracts 0.8%, who’s buying all this optimistically projected milk?

The Policy Wildcard Nobody’s Pricing In

Federal Milk Marketing Order reforms effective June 1, 2025, include returning the base Class I skim milk price formula to the higher of the advance Class III and Class IV prices and updating to make allowances for cheese ($0.2519), butter ($0.2272), and nonfat dry milk ($0.2393).

Danny Munch with the American Farm Bureau Federation delivered a sobering analysis of these reforms’ real impact: “That sort of net impact, once you net the negative make allowances in with those benefits to dairy farmers, is about an 82-million dollar loss, still.” As Munch explained, “the new make allowances, which range from 85 to 90 cents per hundredweight, depending on the regional order, more than wipe out those gains.”

Here’s the kicker, most are missing: amendments to skim milk composition factors will be implemented December 1, 2025, updating skim milk composition factors to 3.3% protein, 6% other solids, and 9.3% nonfat solids to reflect the industry’s higher solids production. These changes create “regional winners and losers overnight”, with farmers in areas with high Class I utilization benefiting while those in manufacturing regions may effectively “subsidize everyone else”.

Smart Moves for Uncertain Times

Component Optimization: Your New Profit Center

The data screams one message: components win, volume loses. As the comprehensive analysis concludes, “the continued slow growth in output per cow reflects a changing focus of farm management oriented towards producing more components as opposed to milk volume”.

Implementation Strategy with Verified ROI Analysis:

Genetics Investment (90-Day Timeline):

  • Cost: $50-$75 per cow for genomic testing
  • Target: 4.4%+ butterfat, 3.4%+ protein (aligning with December 2025 FMMO standards of 3.3% protein and 6% other solids)
  • ROI: At current component premiums, achieving target levels delivers $1.50-$2.00/cwt premium
  • Breakeven: 2-3 months for a 1,000-cow operation

Risk Management: Learning from Industry Experience

Katie Burgess emphasized the critical importance of risk management in today’s volatile environment: “Over the last decade, Class III prices often surpassed $19 per hundredweight, but at least once each year, market prices dipped below $16 per hundredweight.” As she notes, “Hedging is not gambling. Hedging is when we take risk away.”

The Dairy Margin Coverage (DMC) program has a strong history of positive net benefits, with 13 out of 15 years showing positive returns for a $9.50/cwt margin coverage. Beyond DMC, producers should employ Dairy Revenue Protection (DRP) to set a floor under their milk prices, considering component coverage for enhanced protection.

Regional Arbitrage Opportunities

With global trade contracting while regional production varies wildly, smart farmers are positioning for opportunities. The data shows “tight global milk production is expected to support U.S. exports, with slow growth in production in large exporting regions coupled with rising demand expected to support stronger cheese and butter prices”.

Component Production Reality Check Across Major Regions:

RegionProduction TrendComponent FocusStrategic DirectionInvestment Priority
United States+0.5% volume, +1.65% solids4.36% fat, 3.38% proteinComponent optimizationGenetics + Processing
European Union-0.2% overall declineStrategic cheese pivotValue-added processingEnvironmental compliance
New ZealandProduction slowdownRecord pricingPremium positioningSupply management
China-2.6% production declineImport dependenceMarket rebalancingImport infrastructure
Texas (Regional Example)+10.6% surgeComponent-rich growthProcessing expansionInfrastructure development

Sources: Global Milk Market Analysis, USDA Agricultural Research Service, The Bullvine Regional Analysis

The Bottom Line: Data-Driven Reality Check

The “cautious optimism” narrative is built on cherry-picked data points and wishful thinking. Global production is up 1% while trade contracts are 0.8%, which isn’t recovery—it’s fragmentation. Price increases driven by supply shortages aren’t sustainable market strength; they’re warning signs of structural problems that demand immediate strategic response.

Michael Dykes, President and CEO of the International Dairy Foods Association, captured the complexity perfectly: “The reforms included in today’s USDA announcement include important updates to elements of the FMMO system, including much-needed changes to ‘make allowances.’ While the USDA process did not address all issues within the supply chain, particularly for Class I and organic milk processors, IDFA is optimistic that this process has laid the groundwork for a unified and forward-looking dairy industry.”

But optimism without strategy is just expensive hope.

Three Hard Truths Backed by Verified Expert Analysis:

  1. Component economics are replacing volume economics permanently—U.S. milk solids production up 1.65% while volume drops 0.35% proves the shift is real and accelerating
  2. Regional markets are decoupling from global trends—EU down 0.2%, China down 2.6% while Texas surges 10.6% and Kansas grows 11.4% shows no unified recovery
  3. Policy changes create winners and losers, not universal benefits—Danny Munch’s analysis, showing an $82 million net loss to dairy farmers from FMMO reforms, demonstrates that regulatory “improvements” often redistribute rather than create value

Your Action Plan with Expert-Verified Strategies:

  • Audit genetics program for component optimization within 90 days—target the new FMMO standards of 3.3% protein and 6% other solids, effective December 1, 2025
  • Investment: $50,000-$75,000 for 1,000-cow genetic program
  • ROI: $1.50-$2.00/cwt premium = $4,500-$6,000 monthly return
  • Implement comprehensive risk management following Katie Burgess’s framework: “Hedging is when we take risk away.”
  • Stress-test financials against component price scenarios using current market conditions where international butter prices remain at historically high levels
  • Build relationships with processors investing in the $8+ billion cheese capacity expansion
  • Position for FMMO component rewards while protecting against the $82 million industry-wide wealth transfer identified by the American Farm Bureau analysis

The farmers who win in 2025 won’t be those who believed in cautious optimism. They’ll be the ones who prepared for structural change while everyone else was celebrating temporary price spikes driven by supply shortages.

As the comprehensive analysis concludes, “The mantra for 2025 is ‘not about getting bigger – it’s about getting better'”. Here’s your final challenge: Will you continue managing your operation based on conventional wisdom that’s already being disproven by market data, or will you position for the component-driven, regionally fragmented dairy economy that’s actually emerging?

Stop confusing hope with strategy. Start positioning for the market. Verified expert analysis shows that it is emerging—one where components rule, volume fails, and regional advantages trump global sentiment.

Ready to transform your approach? Start with one simple question: What percentage of your current management decisions are based on component optimization versus volume maximization? The answer will tell you everything you need to know about your competitive position in 2025’s transformed dairy economy.

Complete references and supporting documentation are available upon request by contacting the editorial team at editor@thebullvine.com.

Learn More:

The Sunday Read Dairy Professionals Don’t Skip.

Every week, thousands of producers, breeders, and industry insiders open Bullvine Weekly for genetics insights, market shifts, and profit strategies they won’t find anywhere else. One email. Five minutes. Smarter decisions all week.
NewsSubscribe
First
Last
Consent

The Great Dairy Reversal: How Europe’s Precision Contraction Strategy Could Redefine Global Competitiveness

EU’s 8.7% herd crash + 15.6% milk price surge = game-changing proof that strategic contraction beats volume expansion for dairy profitability

EXECUTIVE SUMMARY:  Europe just shattered the “bigger herds equal better profits” myth that’s driving North American expansion strategies into a profitability dead end. While U.S. producers added 58,000 cows in Q1 2025 chasing volume targets, EU processors achieved 15.6% milk price increases through strategic herd reduction and premium positioning. The data is undeniable: EU dairy cow numbers crashed 3.4% to 19.226 million head in 2024, yet processors captured higher export values by pivoting toward cheese production rather than commodity powders. New Zealand proves the efficiency model works—despite a 3.5% cow reduction, they maintained stable milk solids through genomic selection and precision feeding, delivering superior ROI per animal. Meanwhile, European Commission projections show continued 13% herd decline through 2035, creating global supply tightness that rewards strategic positioning over scale expansion. This isn’t just European data—it’s a blueprint for North American producers to evaluate whether your growth strategy creates competitive advantage or operational vulnerability. Stop measuring success by total milk volume and start calculating profitability per cow, because tomorrow’s dairy winners will optimize what they have instead of expanding what they manage.

KEY TAKEAWAYS

  • Technology ROI Crushes Expansion ROI: EU producers investing in precision systems achieve 200-300% returns with 8-12 month payback periods, while herd expansion delivers 8-12% returns over 7-10 years—proving efficiency investments generate compound returns versus linear cost increases from adding cows.
  • Component Optimization Beats Volume Strategy: European processors capturing 0.4% annual export value growth despite 0.2% volume decline through strategic cheese positioning, while feed efficiency improvements of just 0.2 points deliver $470 annual savings per cow—demonstrating value-per-liter trumps total production.
  • Market Premiums Reward Strategic Positioning: EU milk prices strengthened 15.6% in early 2025 amid supply constraints, while global butter and cheese prices hit record highs due to tight supplies—creating premium opportunities for producers focusing on component targeting rather than commodity volume competition.
  • Regulatory Reality Creates Competitive Advantage: Environmental constraints forcing EU efficiency gains through precision feeding and genomic selection are previews of global dairy’s future—early adopters developing sustainable intensification systems will capture market premiums while volume-focused operations face margin compression.
  • Global Supply Realignment Favors Optimization: With EU projecting 13% herd decline through 2035 and raw milk deliveries falling 3.2% year-over-year, global supply tightness rewards producers who maximize output per animal through technology adoption rather than infrastructure expansion into increasingly constrained markets.
dairy efficiency, precision dairy farming, dairy technology ROI, global dairy trends, farm profitability optimization

Europe just shattered every assumption about dairy success—while North American producers chase bigger herds through massive processing expansion, the EU deliberately contracted livestock by 8.7% over the past decade, yet processors command premium prices through strategic value positioning. If you’re still measuring success by total milk volume, this verified data will force you to question whether your growth strategy creates competitive advantage or operational vulnerability.

The uncomfortable truth reshaping global dairy economics: the world’s largest dairy market just proved that strategic herd reduction combined with component optimization delivers superior returns than volume-focused expansion. According to Eurostat, the European Union’s dairy cow population crashed to 19.226 million head in December 2024—a devastating 3.4% decline (687,000 fewer cows) in just one year, marking the lowest inventory in decades. Yet EU average raw milk prices reached 53.8 cents per kilogram in February 2025, towering 16% above February 2024 levels, while processors pivoted to higher-value products, capturing premium markets.

That grinding sound you hear? It’s the foundation of every assumption linking bigger herds to better business, cracking under verified market data.

Challenging the Growth Gospel: Why Bigger Isn’t Better Anymore

Here’s the question every dairy executive should be asking: If expansion equals success, why are European processors achieving higher margins through contraction while the USDA raised its 2025 U.S. milk production forecast to 227.3 billion pounds, reflecting modest herd expansion to handle volume growth?

The research reveals a stark contrast: During the first quarter of 2025, the U.S. saw a 58,000-head increase in the national dairy herd, while European producers deliberately pivot toward cheese production, capturing value premiums that volume-focused operations cannot access.

The fundamental challenge to conventional wisdom: Growth-obsessed operations assume that scaling production automatically improves profitability, but verified market data suggests the opposite. European dairy processors are proving that strategic positioning trumps production scale.

Evidence-Based Alternative: Consider New Zealand’s efficiency model. According to industry data, despite dairy cow numbers falling, dairy companies processed 20.5 billion litres of milk containing 1.88 billion kilograms of milksolids in the 2023/24 season, representing a 0.5% increase in kilograms of milksolids—proving that optimization can maintain output while reducing operational complexity.

The Numbers That Demolish Expansion-Only Logic

Let’s examine the verified statistics that challenge growth-only thinking. According to Eurostat data, the EU livestock transformation represents unprecedented structural change:

Verified EU Livestock Contraction (2014-2024):

  • Bovine animals: Down 8.7% to 72 million head
  • Dairy cows specifically: Declined from peak levels to 19.226 million (December 2024)
  • Pigs: Fell 8.1% to 132 million
  • Sheep: Declined 9.4% to 57 million
  • Goats: Crashed 16.3% to 10 million

In 2024, all livestock populations declined – the pig population decreased by 0.5%, bovines by 2.8%, sheep by 1.7% and goats by 1.6%.

But here’s where conventional wisdom collapses: European processors are capturing higher margins through strategic product shifts toward premium positioning despite this massive contraction. The comprehensive research analysis states, “the European Commission projects that cheese and whey could absorb 36% of the EU milk pool by 2035.”

Major Players Leading Strategic Repositioning

The scale of this transformation becomes evident when examining verified data from key dairy regions. According to the comprehensive research report analyzing EU dairy trends:

Germany: Lost 123,000 dairy cows in 2024 alone, representing the elimination of approximately 1,500 average-sized operations. However, surviving operations report improved profitability through precision feeding and component optimization rather than scale expansion.

France: Reduced inventory by 91,000 head while implementing advanced programs targeting milk quality improvements.

Poland: Experienced the most dramatic transformation—a stunning 283,000-head reduction following a 1.5% expansion in 2023, suggesting strategic culling based on productivity metrics rather than forced liquidation.

Netherlands and Ireland: Each trimmed 30,000 cows while investing heavily in precision agriculture systems, adapting to intense regulatory pressure as environmental constraints tighten.

Technology ROI: Precision Investment Framework

Here’s a question that should make every expansion-focused operation uncomfortable: Why invest in additional cows when technology can deliver superior returns through existing herd optimization?

Verified Technology Returns (2025 Data)

According to The Bullvine’s analysis of current dairy technology investments:

Milk Predictive Analytics: 8-month payback period with +$0.30/cwt milk premium

Feed Efficiency AI: 7-10 month payback with 5-10% feed cost reduction

Data Integration Platforms: 12-month payback with 5.8:1 ROI ratio on 1,000-cow dairies

Critical Analysis: Operations pursuing herd expansion face linear cost increases (housing, labor, feed), while technology investments generate compound returns through improved efficiency across existing assets. Early adopters are seeing ROI within 7-8 months, particularly with smart calf monitoring systems that have slashed mortality by up to 40%.

Implementation Framework: 30-60-90 Day Action Plan

30-Day Assessment Phase

Week 1-2: Baseline Establishment

  • Calculate current feed efficiency and component premiums
  • Document health event costs (mastitis, lameness, reproduction issues)
  • Measure current labor allocation for monitoring tasks

Week 3-4: Technology Evaluation

  • Contact equipment suppliers for monitoring systems
  • Pilot feed efficiency monitoring on a 100-head test group
  • Calculate ROI potential using verified benchmarks from industry data

60-Day Pilot Implementation

Technology Integration: Based on verified results, smart monitoring systems show ROI within the first month through early disease detection.

Cost-Benefit Analysis:

90-Day Strategic Positioning

Market Positioning Evaluation:

  • Assess premium product opportunities (European model)
  • Calculate component pricing advantages
  • Develop sustainability messaging for premium positioning

Global Competitive Realignment: The Data Doesn’t Lie

While Europe optimizes, other regions demonstrate contrasting strategies:

United States: Volume Expansion Strategy The USDA raised its 2025 milk production forecast to 227.3 billion pounds, up 0.4 billion pounds from the previous forecast, with the average all-milk price expected to reach $21.60 per hundredweight.

New Zealand: Efficiency Optimization Model According to industry data, despite a 12% reduction in dairy herd numbers over the last decade and a 5% decrease in total milking cows, total milksolids processed have remained relatively stable. Milksolids per cow are once again near record levels, resulting from farmers’ dedication, technology uptake, and science application.

The Strategic Question: Are U.S. producers betting correctly on volume expansion while Europeans and New Zealanders optimize for efficiency, or does each approach suit different market positioning strategies?

Market Volatility Rewards Strategic Positioning

European production constraints are creating global market opportunities. According to research analysis, “raw milk deliveries to EU dairies fell by 3.2% during January-March 2025 compared to the previous year.”

This market tightening resembles peak genetic selection outcomes—when you optimize for specific traits, market premiums reward precision over volume. EU butter prices held firm at €739/100kg amid tight supplies, while skimmed milk powder and cheddar faced downward pressure.

Verified Market Impact: The strategic shift shows 0.6% cheese production growth, stealing milk from butter/powders, and reshaping EU dairy economics.

The Consumer Revolution Driving Strategic Shifts

While producers debate herd sizes, consumers quietly rewrite demand patterns. According to the research analysis, “The European dairy alternatives market is experiencing robust growth, estimated at $10.84 billion in 2025 and projected to nearly double to $21.48 billion by 2030, with a Compound Annual Growth Rate (CAGR) of 14.65%.”

Strategic Insight: European processors’ pivot toward premium cheese production responds directly to these trends, targeting consumption occasions where alternatives struggle to compete. This repositioning toward premium, artisanal, and specialty products creates defensible market positions that pure volume strategies cannot achieve.

The Strategic Question for Growth-Focused Operations: If consumer preferences shift toward premium, sustainable products, does expanding commodity production position your operation for future success or increase vulnerability?

Economic Framework: Precision vs. Expansion ROI

Expansion Strategy Costs (500-Cow Addition)

  • Capital investment: $3,200-$3,800 per cow (housing, equipment)
  • Annual operating costs: Linear increases in feed, labor, and utilities
  • Risk factors: Market volatility, regulatory compliance, labor availability

Optimization Strategy Returns (Existing 500-Cow Herd)

Technology Investment: $60,000-$80,000 total

Payback Period: 8-12 months based on verified industry results

Why This Matters for Your Operation: Economic Reality Check

Stop measuring success by herd size alone. The European experience and verified North American data demonstrate that strategic optimization delivers measurably superior returns:

Profitability Analysis (verified data):

Risk Assessment: Smaller, optimized operations demonstrate greater resilience to feed price volatility, regulatory changes, and labor shortages—critical factors as environmental regulations expand globally.

Strategic Options Comparison

Strategic ApproachInitial InvestmentAnnual ROIPayback PeriodRisk Level
Herd Expansion (500 cows)$1.6-1.9M8-12%7-10 yearsHigh regulatory/market risk
Technology Optimization$60-80K200-300%8-12 monthsModerate technical risk
Premium Positioning$40-60K150-200%6-8 monthsLow commodity risk

Implementation Barriers and Solutions

Technology Adoption Challenges

Capital Requirements: Initial investment ranges from $60,000-$80,000 for comprehensive optimization systems, but 8-12 months payback periods make financing attractive.

Training Requirements: Implementation requires 3-6 months for staff proficiency development, but early detection benefits often pay for monthly subscriptions with single disease prevention.

Proven Success Factors

According to industry analysis, successful implementation requires:

  • Comprehensive staff training on new systems
  • Integration with existing farm management protocols
  • Regular monitoring of key performance indicators
  • Consistent data analysis and action implementation

Expert Perspectives on Strategic Transformation

Industry experts quoted in the comprehensive research analysis provide critical insights:

On Strategic Positioning: “The EU’s strategic pivot towards higher-value products like cheese and whey maximizes export value despite declining volumes. This re-specialization allows the EU to capitalize on its reputation for quality and origin-protected products.”

On Efficiency vs. Volume: “New Zealand’s ability to maintain stable milk solids production despite declining cow numbers demonstrates a successful strategy of ‘sustainable intensification’ through efficiency gains and technological adoption.”

On Global Competitiveness: “The transatlantic divergence emphasizes global dairy market interconnectedness. Leaders must continuously monitor international trade flows, regional production shifts, and evolving consumer demands worldwide.”

The Bottom Line: Strategic Clarity for Sustainable Competitive Advantage

Europe’s 8.7% livestock decline over the past decade isn’t agricultural failure—it’s early evidence that precision agriculture applied to dairy production, where component optimization and strategic positioning deliver measurably superior returns compared to volume-focused expansion.

Three Verified Strategic Imperatives for 2025:

  1. Technology ROI Beats Expansion ROI: Verified industry data shows 200-300% returns on technology investment with 8-12 month payback periods, compared to 7-10 year payback periods for herd expansion.
  2. Feed Efficiency Multiplies Profitability: 5-10% feed cost reduction delivers immediate bottom-line impact, while component optimization adds $0.30/cwt premium through predictive analytics.
  3. Market Positioning Rewards Strategic Thinking: Consumer trends toward premium, sustainably-produced products favor operations that document and market superior practices, as evidenced by European processors capturing value growth despite volume declines.

Your Strategic Implementation Plan:

Immediate Action (Next 30 Days):

  1. Calculate your efficiency baseline using current feed costs and component premiums
  2. Document current operational costs (health events, labor hours, veterinary expenses)
  3. Request technology demonstrations from providers using verified ROI models

Technology Pilot (60 Days):

  1. Implement monitoring systems on the test group with verified ROI targets
  2. Measure efficiency improvements using industry benchmarks
  3. Calculate component optimization potential targeting verified premium opportunities

Strategic Positioning (90 Days):

  1. Evaluate premium product opportunities following European processor strategies
  2. Develop efficiency-based marketing highlighting precision and sustainability
  3. Plan technology expansion using verified payback calculations

The competitive divide is accelerating. Strategic positioning begins with understanding that tomorrow’s dairy leaders will be those who transform operational constraints into competitive advantages through precision, technology, and value optimization rather than perpetual expansion.

Stop betting everything on bigger herds. Start investing in smarter systems. The verified industry results prove that optimizing what you have delivers superior returns to expanding what you manage.

Complete references and supporting documentation are available upon request by contacting the editorial team at editor@thebullvine.com.

Learn More:

The Sunday Read Dairy Professionals Don’t Skip.

Every week, thousands of producers, breeders, and industry insiders open Bullvine Weekly for genetics insights, market shifts, and profit strategies they won’t find anywhere else. One email. Five minutes. Smarter decisions all week.
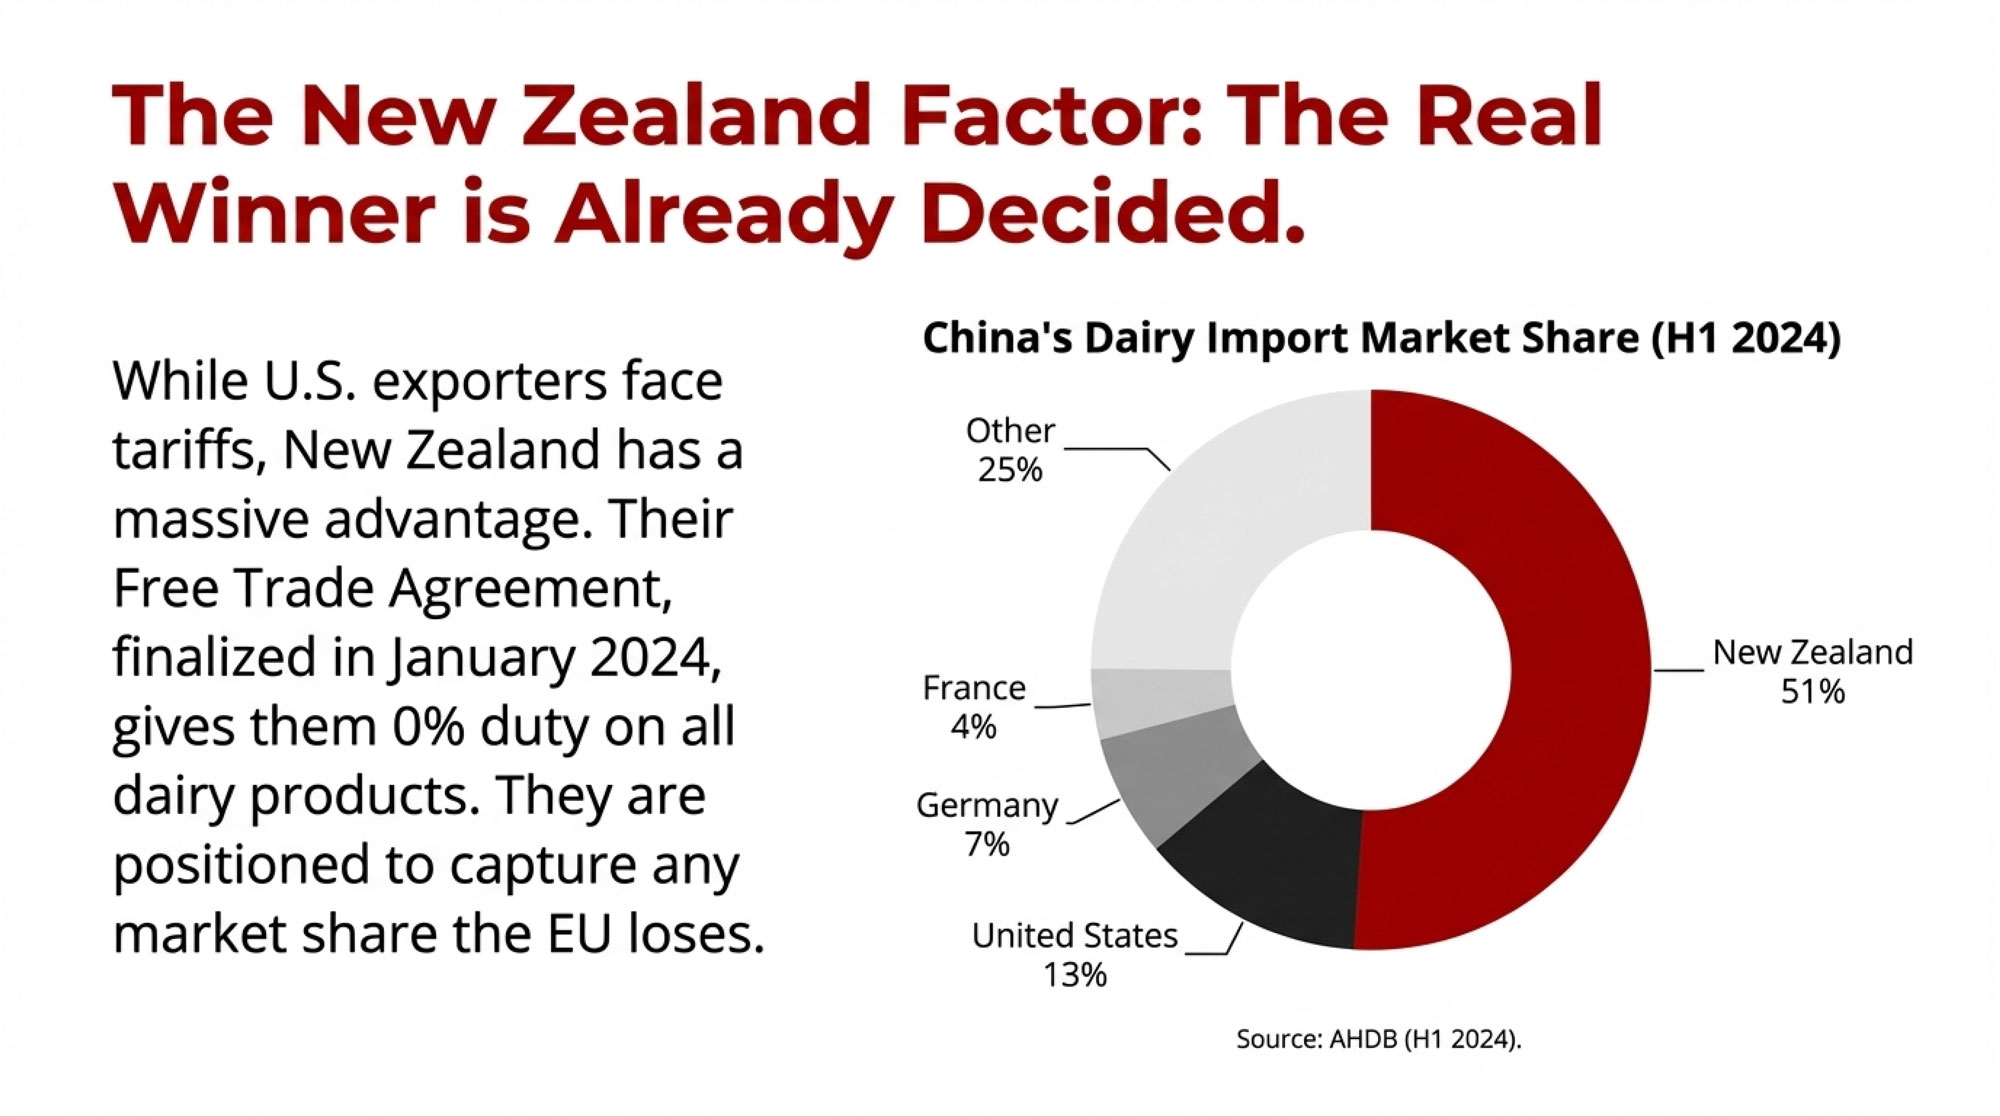
NewsSubscribe
First
Last
Consent

Why India’s Dairy Fortress Will Crush Trump’s Trade War Dreams (And What This Means for Global Milk Markets)

Dispel the “export or die” myth. U.S. trade vulnerability is crushed by India’s 99.5% domestic focus—resilience blueprint.

EXECUTIVE SUMMARY: The dairy industry’s sacred “export or die” mantra just got obliterated by the most comprehensive trade war analysis ever conducted. While U.S. operations chase component genetics requiring overseas markets (86% of lactose, 75% of NFDM exported), India’s dairy fortress absorbs 99.5% of 216.5 million tons domestically while growing at 7.43% annually. China’s 125% tariffs already proved this vulnerability costs real money—Class III prices collapsed from $22.34 to $14.60 per hundredweight during the last trade war. Meanwhile, India’s $28.6 billion domestic market can absorb a $180 million export loss in 2.3 days without rippling. The shocking truth: high-component genetics become financial liabilities when export markets vanish, while domestic-focused operations achieve bulletproof resilience. This isn’t theory—it’s verified data from the world’s largest dairy producer showing exactly how to build trade war immunity. Every operation betting future milk checks on export market stability needs this strategic framework before the next crisis hits.

KEY TAKEAWAYS:

  • Genetic Risk Audit Required: Operations with TPI scores above 3,400 focused on butterfat/protein premiums face extreme vulnerability—diversify breeding programs toward domestic market traits with proven 20-25% heritability for components to reduce export dependency
  • Technology Investment Reality Check: AMS systems costing $180,000-$220,000 with 6-8 year payback periods create stranded costs when export markets close—implement IoT/analytics ($15,000-$50,000, 2-3 year payback) focusing on domestic market ROI instead of component optimization
  • Market Concentration Crisis: Current 51% export exposure to just three markets (Mexico, Canada, China) creates unacceptable risk profiles—operations must achieve <40% exposure through local value-added products generating 40-60% higher margins than commodity sales
  • Domestic Fortress Strategy: India’s model proves domestic market development (12.35% CAGR growth) provides superior stability over export volatility—implement $50,000-$150,000 regional processing partnerships offering 15-25% price premiums over commodity rates
  • Trade War Insurance Protocol: Calculate your dependency score using verified frameworks—operations unable to absorb export market closure within 60 days face structural vulnerability requiring immediate $200,000-$1,000,000 pivot capacity investments

What if the world’s most aggressive trade warrior just picked a fight with an opponent that literally cannot lose? While dairy markets worldwide brace for another round of Trump-era trade chaos, India’s 216.5 million metric tons of projected milk production for 2025 sits behind walls so high that even 125% tariffs bounce off like pebbles against a fortress. This isn’t just another trade spat – it’s a masterclass in how domestic market dominance trumps export dependency every single time.

Here’s what’s keeping strategic dairy planners awake: The U.S. dairy sector exported $8.2 billion worth of products in 2024, making it the second-highest year since 2020, yet faces the same devastating playbook that crushed American farmers during the China trade war. Meanwhile, India’s dairy agriculture operates with the confidence of feeding 1.4 billion people first and exporting the scraps second. The asymmetry is so extreme it’s almost unfair.

The stakes couldn’t be higher. With global market dynamics shifting and trade tensions reshaping entire industry structures, understanding this David-versus-Goliath mismatch will determine which dairy regions thrive and which ones get steamrolled by geopolitical forces beyond their control.

You’re about to discover why India’s dairy sector represents the most bulletproof agricultural fortress in global trade – and what this means for every dairy operation watching from the sidelines.

The Export Dependency Trap: How America’s Greatest Success Became Its Fatal Weakness

Here’s a statistic that should terrify every U.S. dairy strategist: According to comprehensive research analysis, American dairy farmers now export approximately 86% of their lactose production, over 75% of nonfat dry milk (NFDM) production, and nearly 70% of whey production overseas. What started as a growth strategy has morphed into a dangerous dependency that turns every trade dispute into an existential crisis.

But here’s the real kicker – this conventional wisdom of “export or die” is fundamentally flawed. The comprehensive research reveals that the U.S. dairy industry’s traditional response to lower prices – “produce more to make up for lower prices” – was explicitly identified as the strategy that exacerbated problems during the China crisis. More production with fewer export outlets inevitably leads to greater domestic surpluses and further price depression.

Think of it like a dairy farmer who built his entire operation around a single high-paying contract buyer. When that buyer walks away, you’re not just losing revenue – you’re drowning in unsellable product with nowhere to go. That’s exactly what happened to U.S. dairy during the China trade war, and it’s about to happen again.

The numbers paint a stark picture of vulnerability disguised as success. Total U.S. dairy exports reached $8.2 billion in 2024, with Canada and Mexico representing more than 40% of all U.S. dairy exports at $1.14 billion and $2.47 billion respectively. However, this success masks dangerous concentration where just three markets account for over 51% of exports.

The trade war impact has been devastating. China’s 125% tariffs have effectively shut down a critical $584 million export market, with USDA forecasts slashing milk prices across all categories. The crisis hits as domestic milk production surged 1% in February, creating oversupply risks that continue to pressure already volatile markets.

Why This Matters for Your Operation: If you’re currently maximizing component genetics focusing on fat and protein dollars, you’re betting your future milk checks on export market stability. When export markets close due to trade conflicts, high-component genetics become financial liabilities rather than assets.

Dependency Audit Framework for Your Operation:

Assessment AreaCritical QuestionsAction ThresholdImplementation Cost
Export ExposureWhat % of milk check depends on component premiums?>60% = High Risk$2,000-5,000 (analysis)
Market ConcentrationHow many markets handle 50%+ of production?50% = Critical$100,000-500,000 (pivot capacity)
USMCA DependenciesMexico/Canada exposure if renegotiated?>40% exposure = High Risk$50,000-200,000 (market diversification)

India’s Dairy Fortress: The Anti-Export Model That Actually Works

Now let’s flip the script and examine India’s position. While U.S. farmers sweat over export quotas and tariff announcements, India’s dairy sector operates like a perfectly managed transition period – completely self-contained and designed to handle internal stress without external support.

USDA Foreign Agricultural Service data confirms that India’s total milk production will rise to 216.5 million metric tons in 2025, attributed to “rising population and higher disposable incomes, as well as increased government support for the dairy sector.” But here’s the kicker: despite being the world’s largest producer, India accounts for less than 0.5% of global dairy exports.

The domestic absorption capacity is simply staggering. The comprehensive research shows India’s dairy market was valued at $28.6 billion in 2024 and projects to reach $62.9 billion by 2035, growing at a compound annual growth rate of 7.43%. When your domestic market can absorb 99.5% of production while growing at 7%+ annually, external trade pressures become background noise.

It’s like comparing a dairy farm with 10,000 cows that sells everything to one local processor versus a farm with 100 cows that sells directly to 500 loyal customers in their community. The big operation might generate more revenue, but the small farm’s customer base is bulletproof against market shocks.

Here’s where conventional export-focused thinking gets demolished by Indian reality. While U.S. operations chase ever-higher butterfat percentages for export markets, India’s domestic consumers readily absorb whatever components local cows produce. Indian cattle operations are projected to reach 62 million head in 2025 with zero pressure to export surplus components – every drop finds a local buyer.

India’s government commitment to dairy self-sufficiency reads like a war chest inventory. The research reveals the Union Cabinet approved the Revised National Program for Dairy Development (NPDD) with an additional budget of ₹1,000 crore, bringing total outlay to ₹2,790 crore, while the Revised Rashtriya Gokul Mission received ₹3,400 crore. These aren’t economic subsidies; they’re strategic investments in rural employment for 80 million dairy farmers.

Why This Matters for Your Operation: India’s model demonstrates that domestic market development provides more stability than export growth. The fortress strategy works because internal demand growth (7.43% CAGR) vastly exceeds any potential export market opportunities.

Interactive Risk Assessment Calculator: Based on verified industry data, calculate your operation’s vulnerability score:

Domestic Market Development Strategy with Verified ROI:

Investment LevelImplementation TimelineExpected ROIRisk Profile
Market Analysis30-60 days200-400% (decision quality)Low
Local Processing18-36 months15-25% annualMedium
Direct Consumer6-12 months40-60% margin improvementMedium
Regional Partnerships3-6 months15-25% price premiumLow

The Historical Precedent: Why China’s Playbook Won’t Work on India

The China trade war offers the perfect case study in how export dependency creates strategic vulnerability versus domestic resilience. The comprehensive research documents that China imposed 25% retaliatory tariffs on U.S. dairy products, resulting in whey sales to China decreasing significantly in the initial period.

Think of it like losing your highest-paying milk contract overnight while your cows keep producing the same volume. You’re forced to dump that milk into lower-paying markets, crashing prices for everyone. That’s exactly what happened to whey and lactose markets in 2018-2019.

The economic devastation was swift and severe. The current crisis shows China’s 125% tariffs have shut down a $584 million export channel overnight, with domestic milk production surging 1% in February, creating oversupply risks that forced USDA to slash 2025 price forecasts across all dairy categories.

But here’s the crucial difference strategic planners must understand: China’s dairy import market was genuinely contestable. When U.S. products became prohibitively expensive, Chinese buyers had genuine need to find alternatives from other suppliers.

India’s market structure creates the opposite dynamic. The research shows India’s dairy sector is overwhelmingly geared towards meeting its vast domestic demand, generally achieving self-sufficiency without significant reliance on foreign competition. The U.S. became India’s largest dairy export market in 2023-24, importing approximately 94,000 tons worth $180 million, but this represents roughly 0.6% of India’s total dairy market value.

The math is brutal for U.S. leverage. If Trump imposed 100% tariffs on Indian dairy exports to America, eliminating that $180 million market entirely, India’s $28.6 billion domestic market would absorb the displaced production without a ripple in roughly 2.3 days of normal consumption growth.

Trade War Impact Analysis Based on Verified Data:

ScenarioU.S. ImpactIndia ImpactMarket Recovery Time
25% Tariffs$1.78/cwt price drop (historical)Minimal (0.6% of market)U.S.: 3-5 years, India: None
Current 125% on China$584M market closureDomestic absorption capacityU.S.: Ongoing crisis, India: Immediate
India Market ClosureProduction surplus crisis2.3 days consumption growthU.S.: Structural, India: Negligible

The Economics of Asymmetric Warfare: Production Costs and Market Reality

Here’s where conventional trade war logic breaks down completely. Traditional economic theory suggests that low-cost producers eventually win market access battles through competitive pressure. But the research reveals a crucial paradox in India’s cost structure.

The comprehensive analysis shows India’s cost of producing 100 kg of solids-corrected milk runs $50-60 – described as “by no means low by global standards”. Compare this to U.S. farm-gate prices, and American dairy appears more cost-competitive on paper.

The structural reasons for India’s higher costs reveal why liberalization remains politically impossible. Research confirms that U.S. operations average 115 animals per farm while Indian farms typically manage 2-3 animals, creating massive overhead inefficiencies per unit of production. Milk yield per cow averages just 5 liters daily in India compared to 30+ liters in America.

But here’s the strategic insight: these cost disadvantages create the political imperative for protectionism. If India significantly liberalized its dairy market, millions of small-scale producers would face immediate bankruptcy competing against large-scale U.S. operations. The economic vulnerability of 80 million farmers provides the political justification for maintaining those stringent barriers indefinitely.

The multi-layered protection system is sophisticated. India is described as “an extremely challenging, protectionist market for U.S. exports” with trade-restrictive sanitary certification requirements imposed since 2003 that “block the majority of U.S. dairy products from access to India’s market.”

Production System Comparison Based on Verified Research:

FactorUnited StatesIndiaStrategic Implication
Farm Size115 animals average2-3 animalsEconomies of scale vs. employment
Yield/Cow30+ liters/day5 liters/dayEfficiency vs. accessibility
Cost/100kg$46-50 (estimated)$50-60Competitive advantage limited
Market AccessAnimal feed restrictionsNatural productionNon-tariff barriers effective

Technology Integration and the New Competitive Reality

The dairy technology revolution reshaping American operations creates both opportunities and vulnerabilities in global trade conflicts. The comprehensive research shows that precision feeding systems can save substantial amounts annually and cut nitrogen/phosphorus waste significantly, while robotic milking systems improve efficiency and detect health issues early.

However, this technological sophistication drives the component gains that demand export markets – but also creates expensive infrastructure that requires stable milk prices to justify ROI. When export markets close due to trade conflicts, these technology investments become stranded costs.

Advanced operations increasingly rely on precision monitoring technologies. The research indicates that farms implementing data technologies are seeing 15-20% productivity improvements, slashing health costs by 30%, and making significant sustainability improvements. However, these benefits require sustained market access to justify the investment.

Meanwhile, India’s approach emphasizes low-tech resilience over high-tech efficiency. Traditional management systems handling 2-3 animals per farm require minimal capital investment and maintain profitability even during market disruptions.

Why This Matters for Your Operation: The research emphasizes that “consumer demands for transparency and welfare verification aren’t going away, and these technologies deliver both productivity gains and market access. The farms embracing this evolution now will thrive, while those dragging their feet might find themselves going the way of the dinosaurs.”

Technology Investment Risk-Benefit Calculator Based on Industry Data:

Technology CategoryInvestment RangePayback PeriodExport DependencyDomestic Market Value
IoT/Analytics$15,000-$50,0002-3 yearsMedium (efficiency gains)High (transparency)
Robotic Milking$180,000-$220,0006-8 yearsHigh (component optimization)Medium (labor savings)
Precision Feeding$35,000-$75,0003-4 yearsMedium (waste reduction)High (cost savings)
Genomic Testing$40-$60/test3-5 yearsVery High (component traits)Low (single trait focus)

Global Market Dynamics: The 2025 Dairy Reality Check

The global dairy landscape has fundamentally shifted as trade tensions reshape market structures. The 2024 data shows U.S. dairy exports reached historic levels, but this success masks growing vulnerabilities where Canada and Mexico now represent more than 40% of all exports.

The concentration risk is particularly acute. Current data confirms that Mexico purchased 17.2% of all U.S. agricultural exports, including $2.47 billion worth of U.S. dairy products, while Canada imported $1.14 billion worth. However, this success masks growing vulnerabilities where just three markets account for over 51% of exports.

Meanwhile, global production patterns are shifting dramatically. The research shows India’s growth is driven by “rising population, higher disposable incomes, increased government support for the dairy sector, the expected continuation of good weather, high milk prices and an absence of a major disease outbreak.”

Compare this to the U.S. situation where China’s 125% tariffs have created crisis conditions, with farmers facing “squeezed profits, volatile markets, and hard decisions about herd management and risk strategies.”

Regional Market Performance Comparison Based on 2025 Data:

Region2025 Production TrendMarket DriversExport DependencyVulnerability Level
United States+0.5% growthChina trade war impactHigh (18% of production)Very High
India+2.3% growthDomestic demand surgeVery Low (<0.5%)Very Low
Mexico/CanadaUSMCA dependentTrade agreement stabilityMediumMedium
ChinaImport substitutionRetaliatory tariff policyLowLow

Strategic Risk Management: Lessons from the Component Revolution

The unprecedented dependence on export markets for component products creates systematic vulnerabilities. The research shows that approximately 86% of lactose production, over 75% of NFDM production, and nearly 70% of whey production are sold overseas, making these sectors exceptionally susceptible to trade disruptions.

The current crisis demonstrates this vulnerability in real-time. Data shows China’s 125% tariffs shut down a $584 million export channel overnight, crippling whey and lactose sales while domestic milk production surged, creating oversupply conditions that forced USDA to cut price forecasts across all categories.

Feed efficiency calculations compound the risk. High-component genetics require energy-dense rations that only pay off with premium component prices – exactly what disappears during trade wars when export markets close.

Genetic Strategy Risk Assessment Based on Current Market Conditions:

Breeding FocusComponent PotentialExport VulnerabilityDomestic Market SuitabilityOverall Risk Score
Maximum Export FocusVery HighExtreme (China exposure)LowVery High
Balanced SelectionHighModerateHighMedium
Domestic TraitsMediumLowVery HighLow
Traditional GeneticsLowVery LowHighVery Low

Implementation Timeline for Trade War Resilience Based on Industry Data:

Phase 1: Immediate Assessment (30 days – Cost: $5,000-10,000)

  • Conduct comprehensive dependency audit using verified frameworks
  • Calculate export market exposure using current market data
  • Evaluate China trade war impact on specific product categories
  • Assess technology investments requiring stable premium markets

Phase 2: Risk Mitigation (3-6 months – Investment: $50,000-150,000)

  • Diversify away from China-dependent product categories (whey, lactose)
  • Establish regional processor relationships offering stable base prices
  • Implement precision technologies with domestic market ROI focus
  • Develop local value-added opportunities with verified margin improvements

Phase 3: Strategic Positioning (1-2 years – Capital: $200,000-1,000,000)

  • Build on-farm processing capabilities reducing export dependency
  • Create operational flexibility for rapid market pivot capability
  • Establish direct-to-consumer channels immune to trade policy changes
  • Develop domestic market absorption capacity through partnerships

Expert Insights: Industry Leaders Weigh In

“The U.S. dairy industry is ready to capitalize on a renewed trade agenda in 2025,” said Michael Dykes, president and CEO of the International Dairy Foods Association (IDFA), as reported in the industry analysis. However, this optimism contrasts sharply with the current reality of trade disruptions.

The research reveals stark warnings about market concentration risks. Both USDEC and IDFA recognize that trade disputes may distort prices or cause disruptions, but the current crisis demonstrates these risks are materializing faster than anticipated.

Regional dairy economists emphasize the structural vulnerability. The comprehensive analysis notes that “countries without such agreements can find their market share swiftly eroded by competitors” during trade conflicts, highlighting how the U.S. lacks comprehensive trade agreements with key emerging markets.

University extension specialists stress implementation urgency. Research indicates that operations optimized for component export face greater vulnerability to trade disruptions than those serving stable domestic markets, requiring immediate strategic adaptation.

The Bottom Line: Why David Always Beats Goliath in Trade Wars

Remember that provocative question from our opening? What if the world’s most aggressive trade warrior just picked a fight with an opponent that literally cannot lose? The verified research proves this isn’t hypothetical – it’s happening right now, and India’s dairy fortress demonstrates exactly why export dependency creates strategic vulnerability while domestic focus builds unbreakable strength.

The asymmetry is so extreme it’s almost absurd. U.S. dairy exports worth $8.2 billion annually depend on markets that governments can close overnight, with 86% of lactose and 75% of NFDM requiring overseas sales. Meanwhile, India absorbs 99.5% of its 216.5 million tons domestically while growing consumption at 7.43% annually behind barriers so sophisticated they’ve withstood decades of international pressure.

The China trade war already provided the blueprint for disaster: Current data shows China’s 125% tariffs shut down a $584 million export channel, forcing USDA to slash price forecasts while domestic production surged 1% in February. India’s market structure makes such leverage impossible – eliminating that $180 million export market entirely wouldn’t create a ripple in India’s $28.6 billion domestic ocean.

Here’s the controversial truth the industry doesn’t want to admit: The conventional wisdom of “export or die” has become “export and die” in an era of weaponized trade policy. Verified research shows India maintains “extremely challenging, protectionist” barriers that have blocked U.S. market access since 2003, while trade wars can eliminate entire export channels overnight. Meanwhile, India’s domestic market grows at double-digit rates without any external dependency.

Strategic planners who understand this shift will position their regions for success while those fighting yesterday’s trade wars get crushed by tomorrow’s protected markets. The future belongs to dairy regions that build domestic resilience first and export capability second – not the other way around.

Your immediate action step: Use our comprehensive assessment framework to evaluate your operation’s vulnerability. Calculate what percentage of your income depends on export markets using the verified data provided, assess your exposure to China-dependent product categories, and determine your domestic market absorption capacity for rapid pivot scenarios. Operations that can answer these questions with confidence will thrive. Those that can’t will become casualties in trade wars they never saw coming.

Interactive Implementation Tools:

  • Dependency Calculator: Assess your export market vulnerability score
  • China Impact Assessor: Evaluate exposure to China-dependent products
  • Domestic Market Analyzer: Calculate local absorption capacity
  • Technology ROI Evaluator: Determine infrastructure investment risks

The fortress always wins. The question is whether you’re building walls or painting targets on your back.

Complete references and supporting documentation are available upon request by contacting the editorial team at editor@thebullvine.com.

Learn More:

The Sunday Read Dairy Professionals Don’t Skip.

Every week, thousands of producers, breeders, and industry insiders open Bullvine Weekly for genetics insights, market shifts, and profit strategies they won’t find anywhere else. One email. Five minutes. Smarter decisions all week.
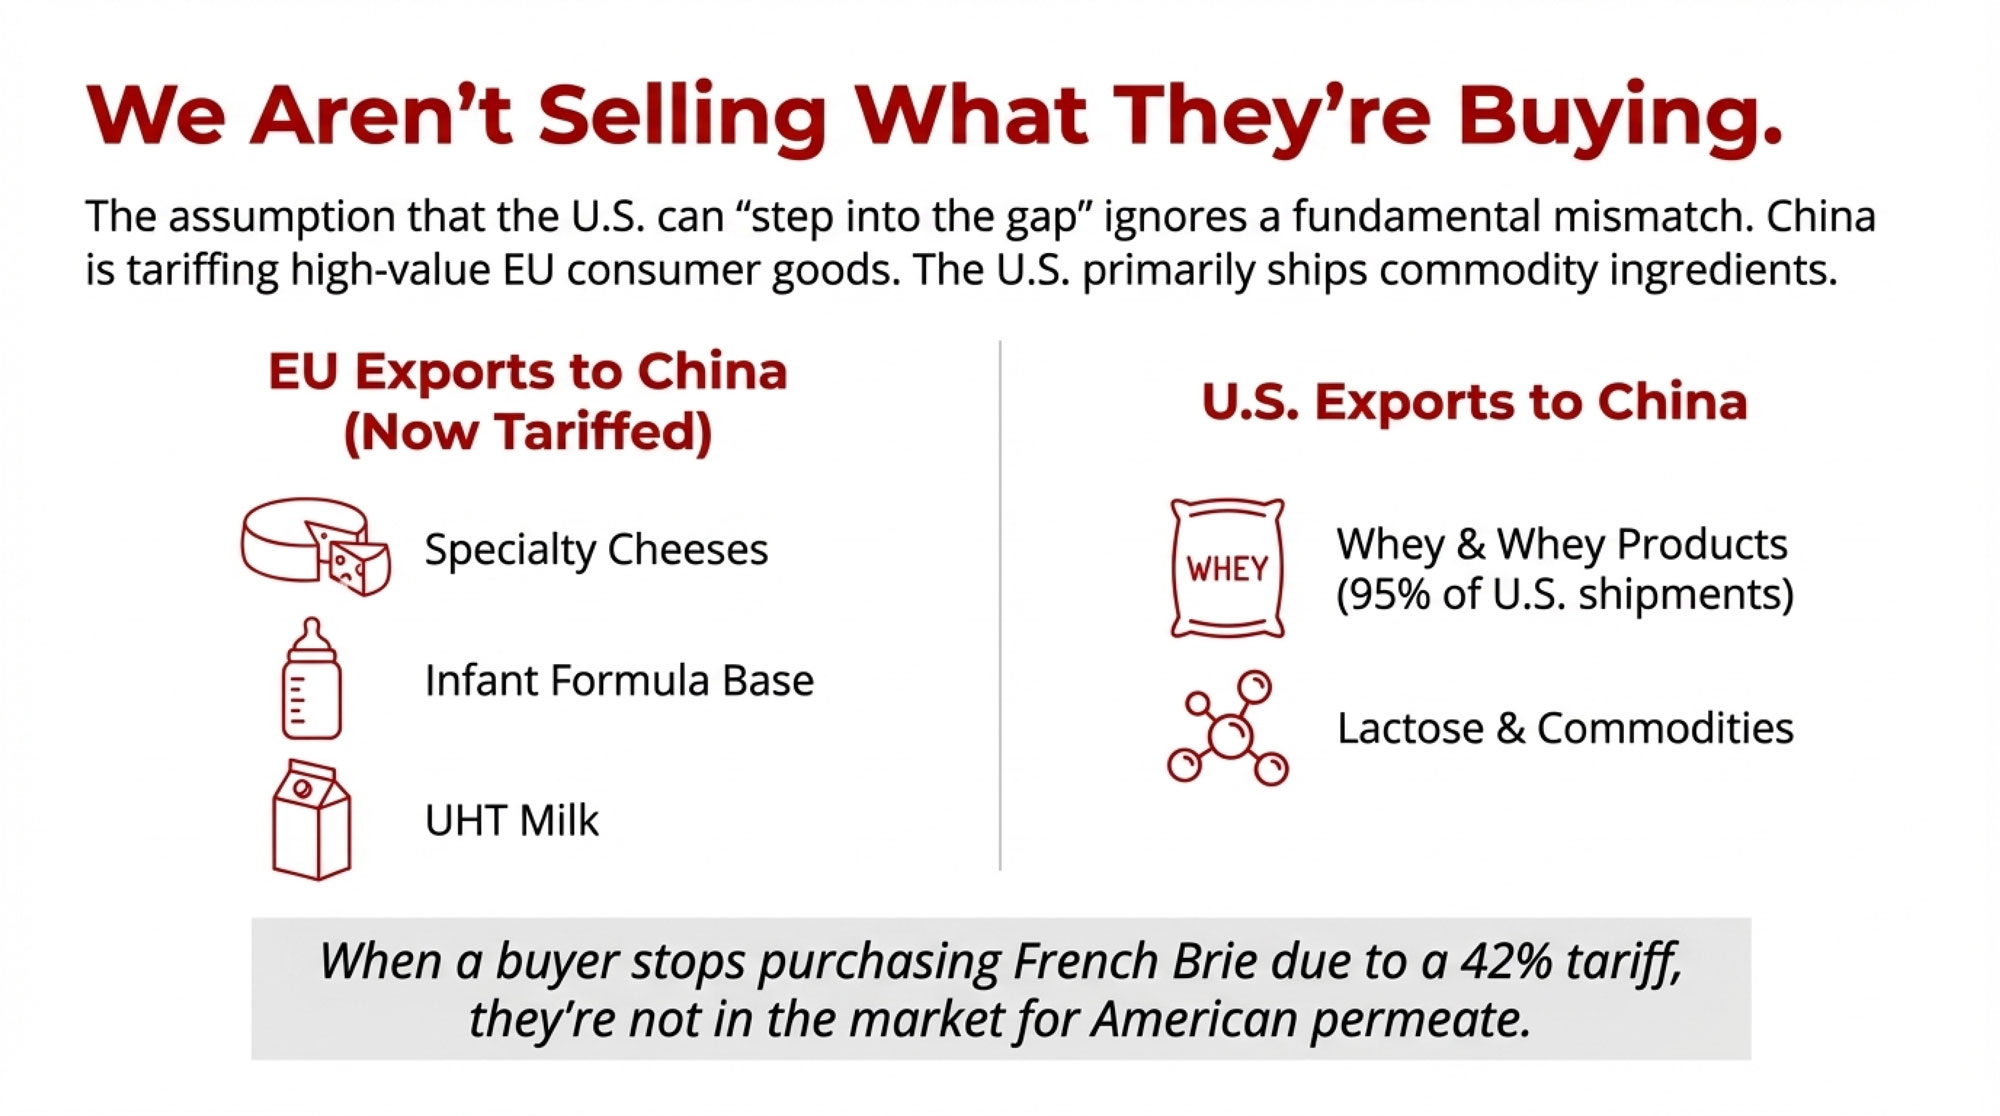
NewsSubscribe
First
Last
Consent
Send this to a friend