Archive for FMMO make allowance

The Bank Stopped Asking If You Paid. Now It Asks How Long You’d Last at $17.

It’s renewal season. Your banker already ran your cows at $17 milk and watched the working capital run dry on a screen you’ve never seen. Have you run that number yet?

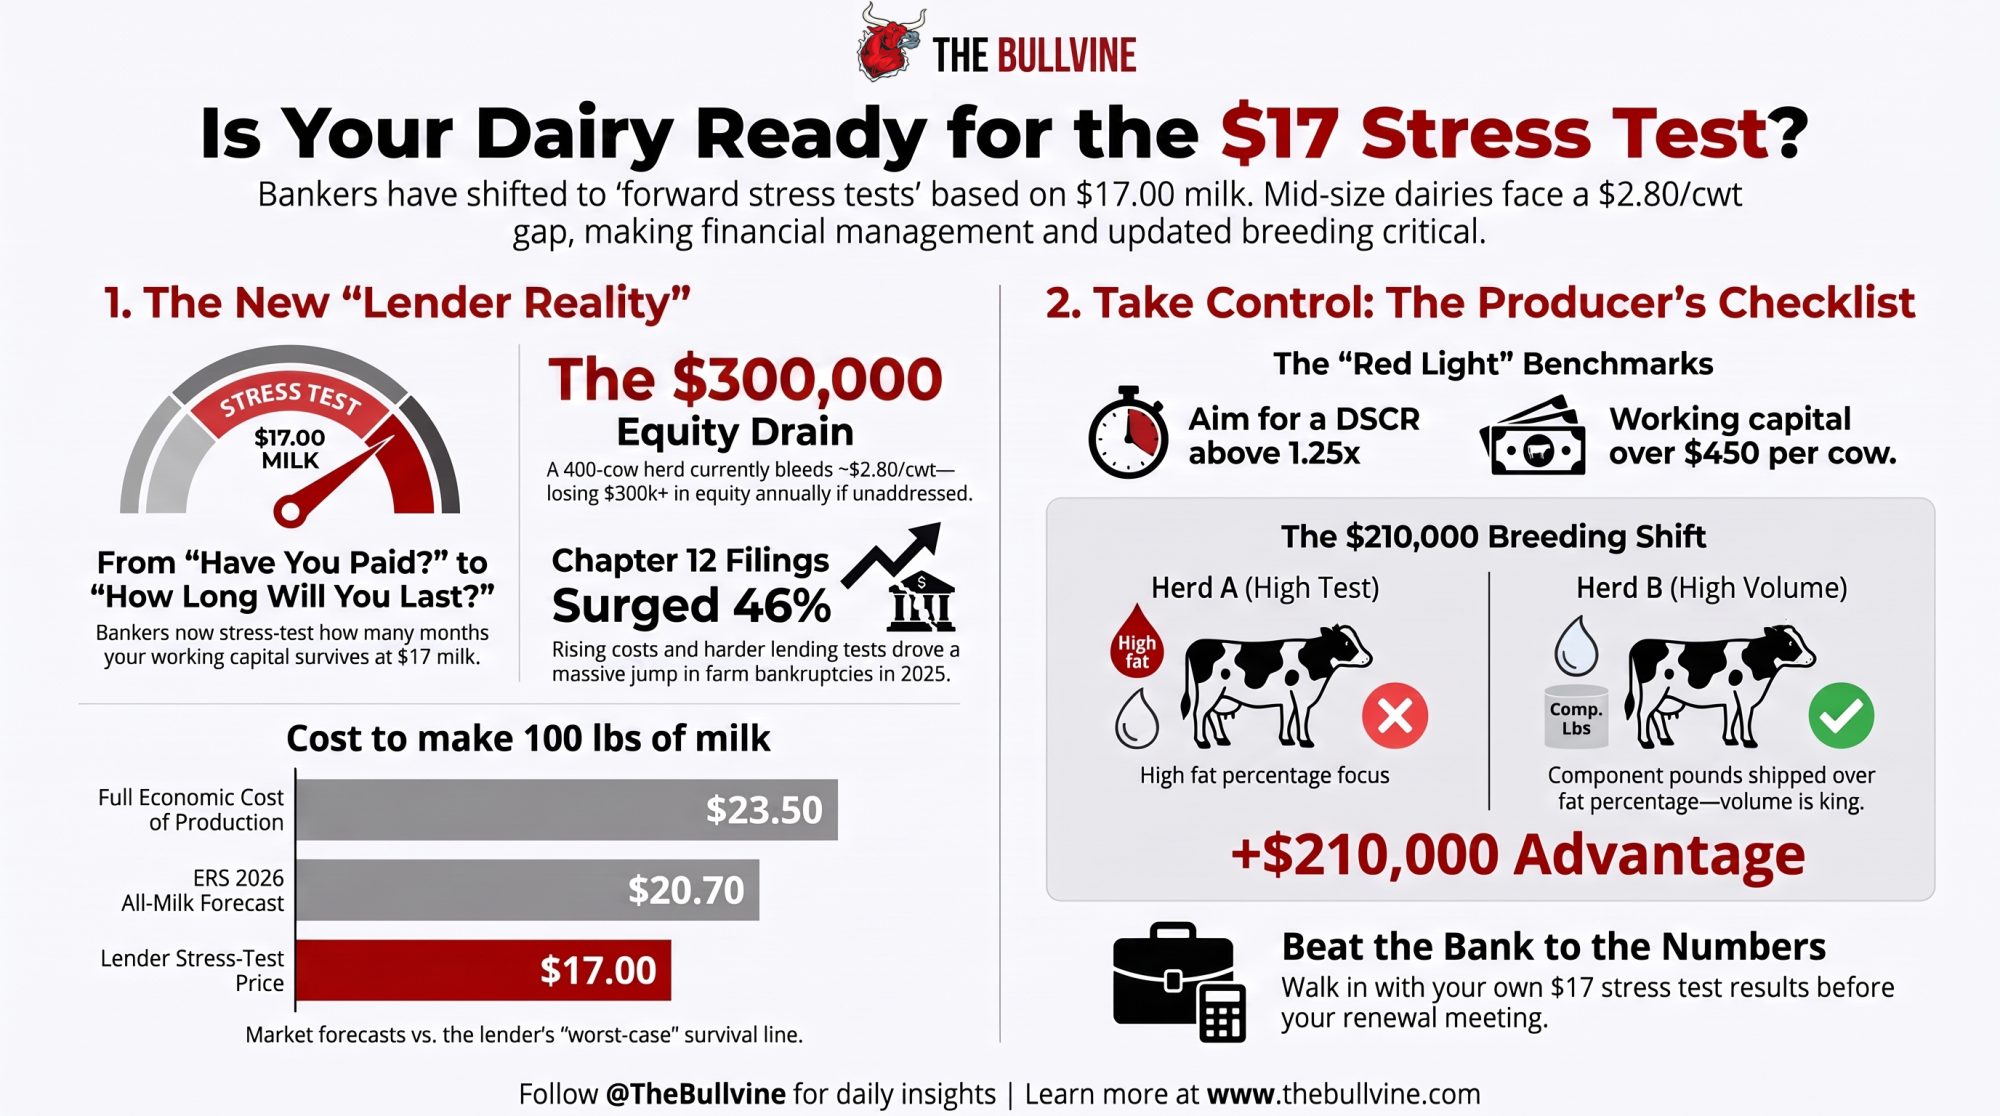
Executive Summary: Your lender has already run your herd at $17 milk for 2026–2028 — the question is whether you’ve run the same number, because the test just quietly switched from “have you always paid?” to “how many months do you last before the working capital’s gone.” That shift hits 200- to 1,000-cow operators hardest: ERS pegs 2026 all-milk near $20.70/cwt against a full economic cost close to $23.50, so a 400-cow herd is bleeding roughly $2.80/cwt — call it $300,000 a year — through equity and borrowing before basis drag even lands. Cornell’s 2023 PRO-DAIRY summary put the average farm’s debt-service coverage near 0.29, meaning a lot of dairies couldn’t fully cover payments in a decent income year, let alone at the $17 your banker is stress-testing. Sit on your hands for 18 months, and that gap runs $300K–$500K in lost margin and equity; Chapter 12 filings already jumped 46% in 2025, and Kooser Farms filed twice in six years. The FMMO make-allowance change stacks on top — 85–93¢/cwt off class prices, $337 million pulled from producer pools in 90 days — and it now pays component pounds shipped, not test percentage, so three cycles bred for high fat and low volume can quietly become a liability. The fix isn’t complicated: run your own DSCR at $17 before renewal season, check working capital per cow against the $450 line, and walk into the bank first with your numbers instead of last with a tax return and a story. If your breakeven at $17 is a number you can’t say out loud right now, that’s the thirty-minute job that changes every decision after it.
Editor’s note: The 400-cow figures below are a composite scenario, modeled from multiple mid-size U.S. dairy financials and Cornell PRO-DAIRY benchmark data — built from real numbers, not one real farm. The named farms and counselor session referenced are real and sourced. Price and cost figures reflect USDA and industry data as of June 2026.

Earlier this year, a 550-cow Wisconsin dairy sat down with a farm financial counselor and ran the same numbers their lender was about to run. Same cows, same parlor, same management that had always made the payment. What changed wasn’t the farm — it was the test the farm was being judged against. That’s the quiet shift reshaping mid-size dairy in 2026: your lender relationship stopped running on payment history and started running on a forward stress test.

Here’s the short version. Your banker isn’t really asking “have they always paid?” anymore. They’re asking how many months this business survives $17 milk before the working capital runs dry. Two very different questions. And the gap between them is exactly where 200- to 1,000-cow operators are getting caught.

What’s Actually Changing
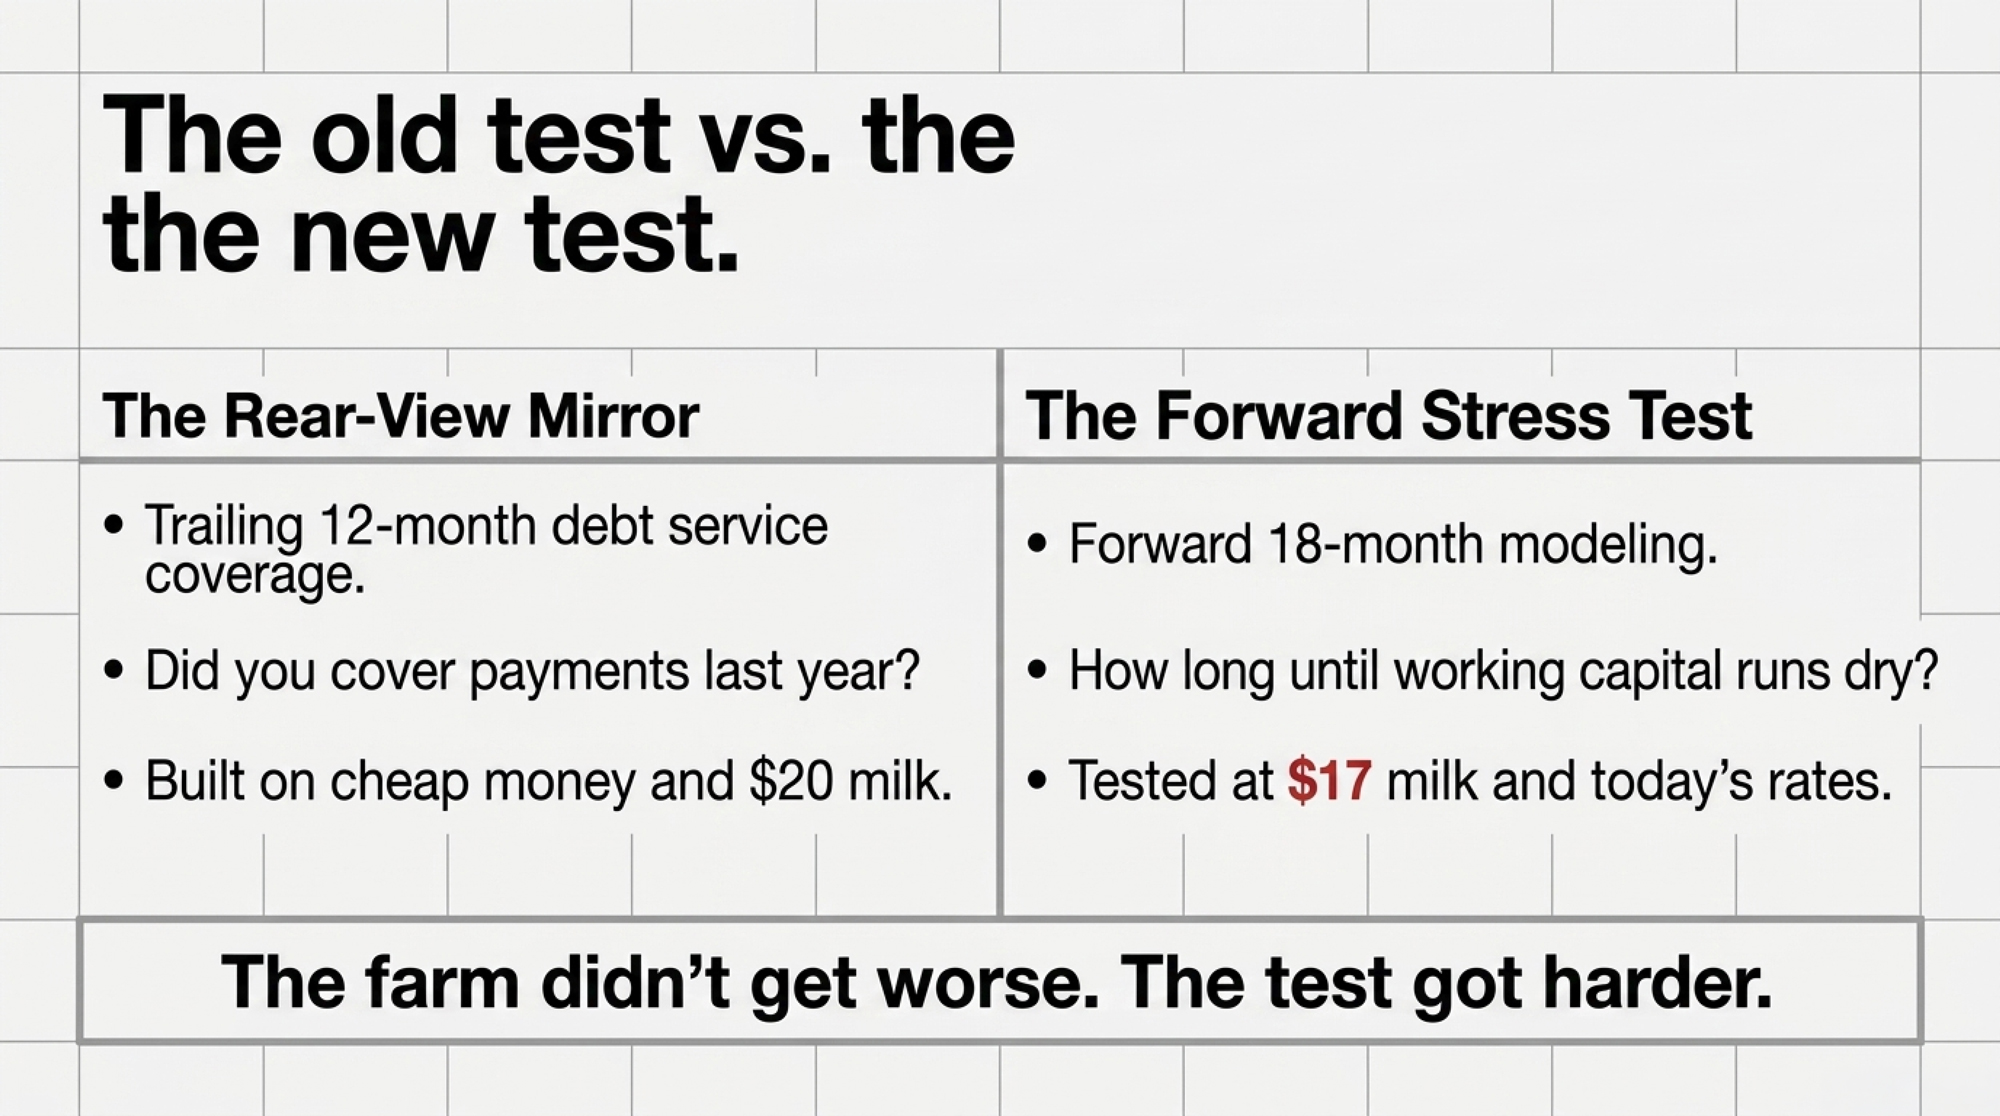
For years, ag lenders ran a trailing 12-month debt service coverage ratio. Did you cover your payments last year — yes or no? That’s not the test anymore. Lenders now model forward DSCR at lower milk prices and higher interest rates, stress-testing your cash flow against that scenario rather than the rear-view mirror. The same three-scenario drill banks run on their own books — most likely, downside, worst-case — they’re now running on your file.

DSCR is just the cash you’ve got to service debt divided by your total debt payments. Farm Credit Canada calls 1.5x healthy, 1.0–1.25x tight but manageable, and anything under 1.0x a flashing red light — the farm can’t cover payments from operations alone. Now the uncomfortable part. Cornell’s PRO-DAIRY Dairy Farm Business Summary for the 2023 business year — 127 New York farms — put the all-farm average DSCR near 0.29, with the lowest-profit group around 0.34. Many dairies couldn’t fully cover debt payments even in a decent income year.

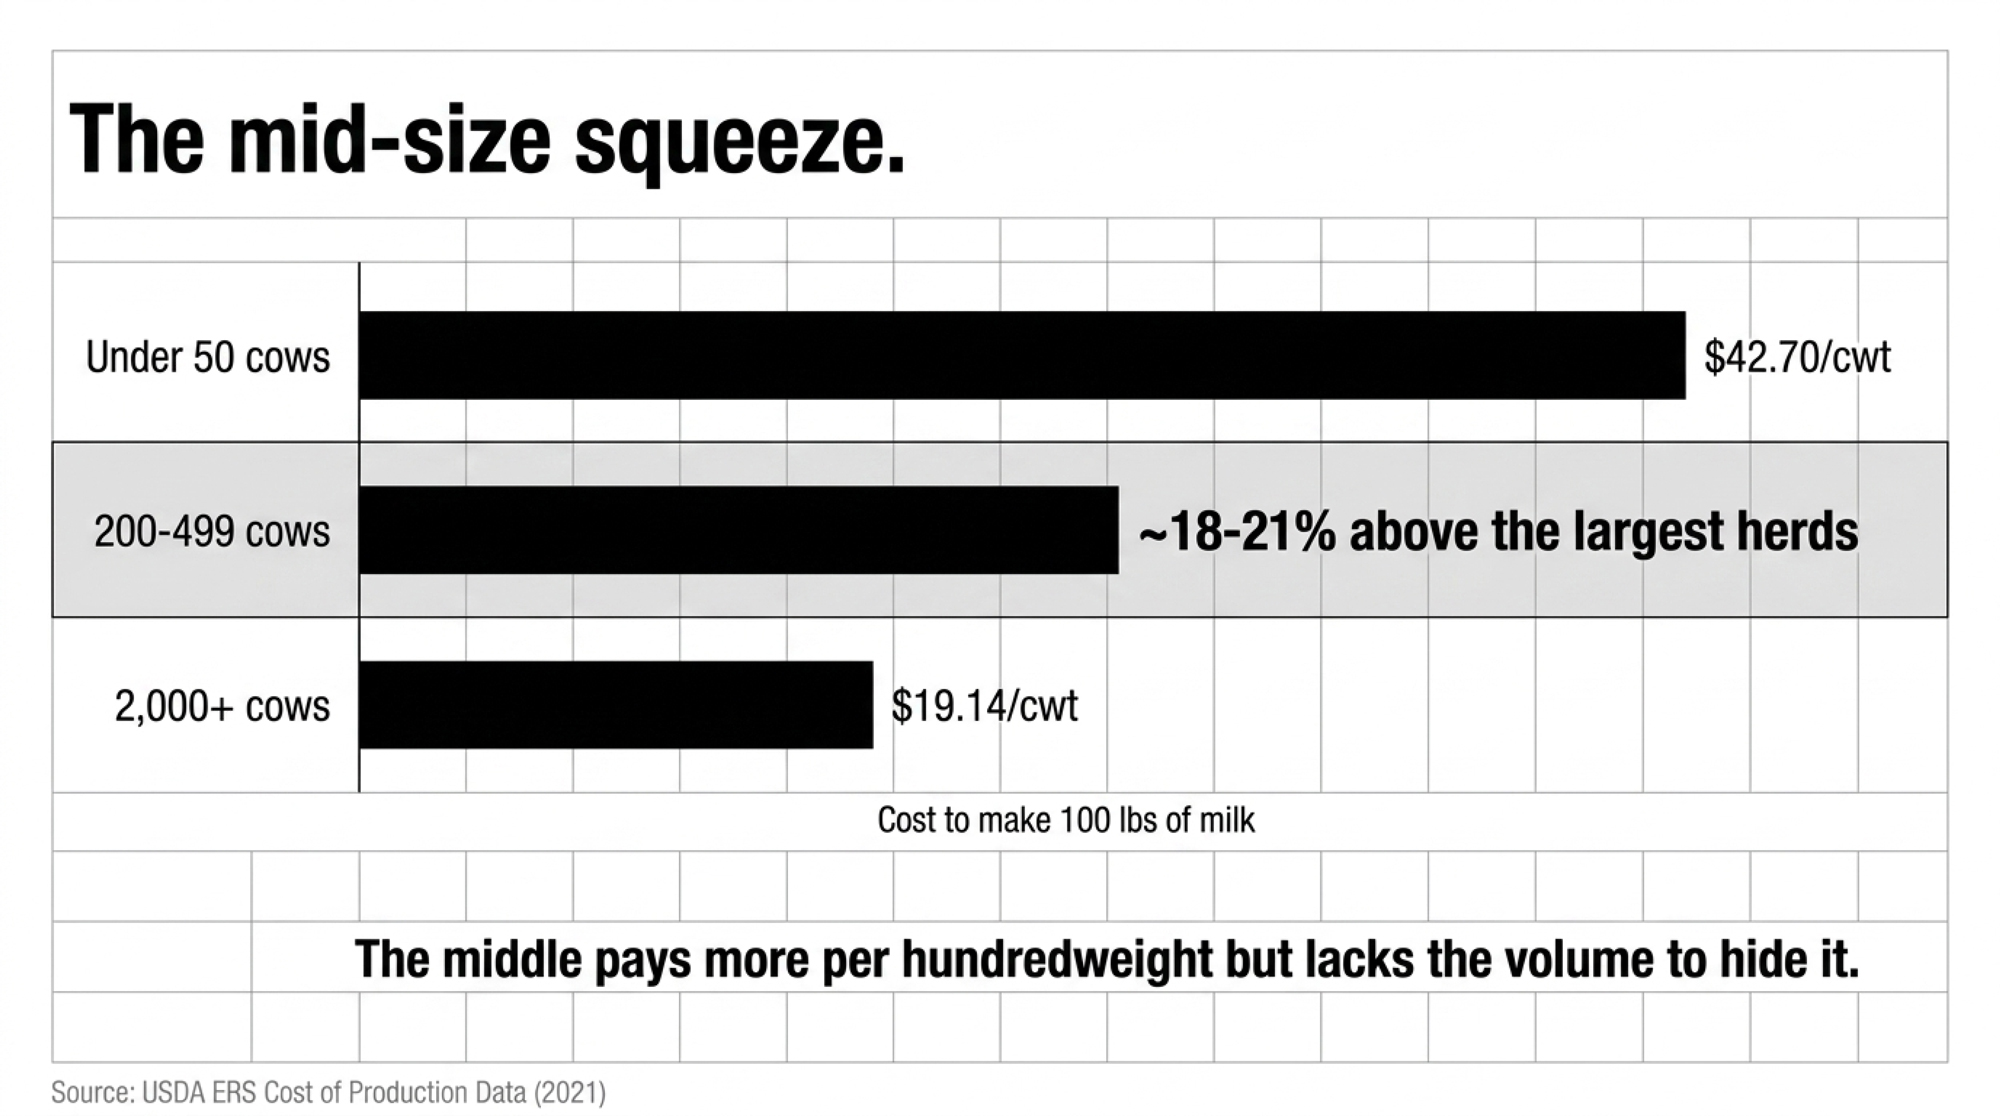
Who’s most exposed? The middle. USDA’s Economic Research Service reports licensed U.S. dairy herds fell 63% — from 66,825 in 2004 to 24,811 in 2024 — while average herd size more than doubled. The 200- to 1,000-cow herd lands in a hard spot on the cost curve: too big to run on sentiment, too small to claim the lowest cost structure. ERS’s cost-of-production data makes the gap concrete:

Cost to make 100 lbs of milk, by herd size
Herd sizeCost per cwt
Under 50 cows$42.70/cwt
200–499 cows~18–21% above the largest herds
2,000+ cows$19.14/cwt

The middle pays more per cwt than the big herds — and ships less volume to spread it over. (2021 ERS; latest full national breakdown available.)

How It Plays Out on Real Farms

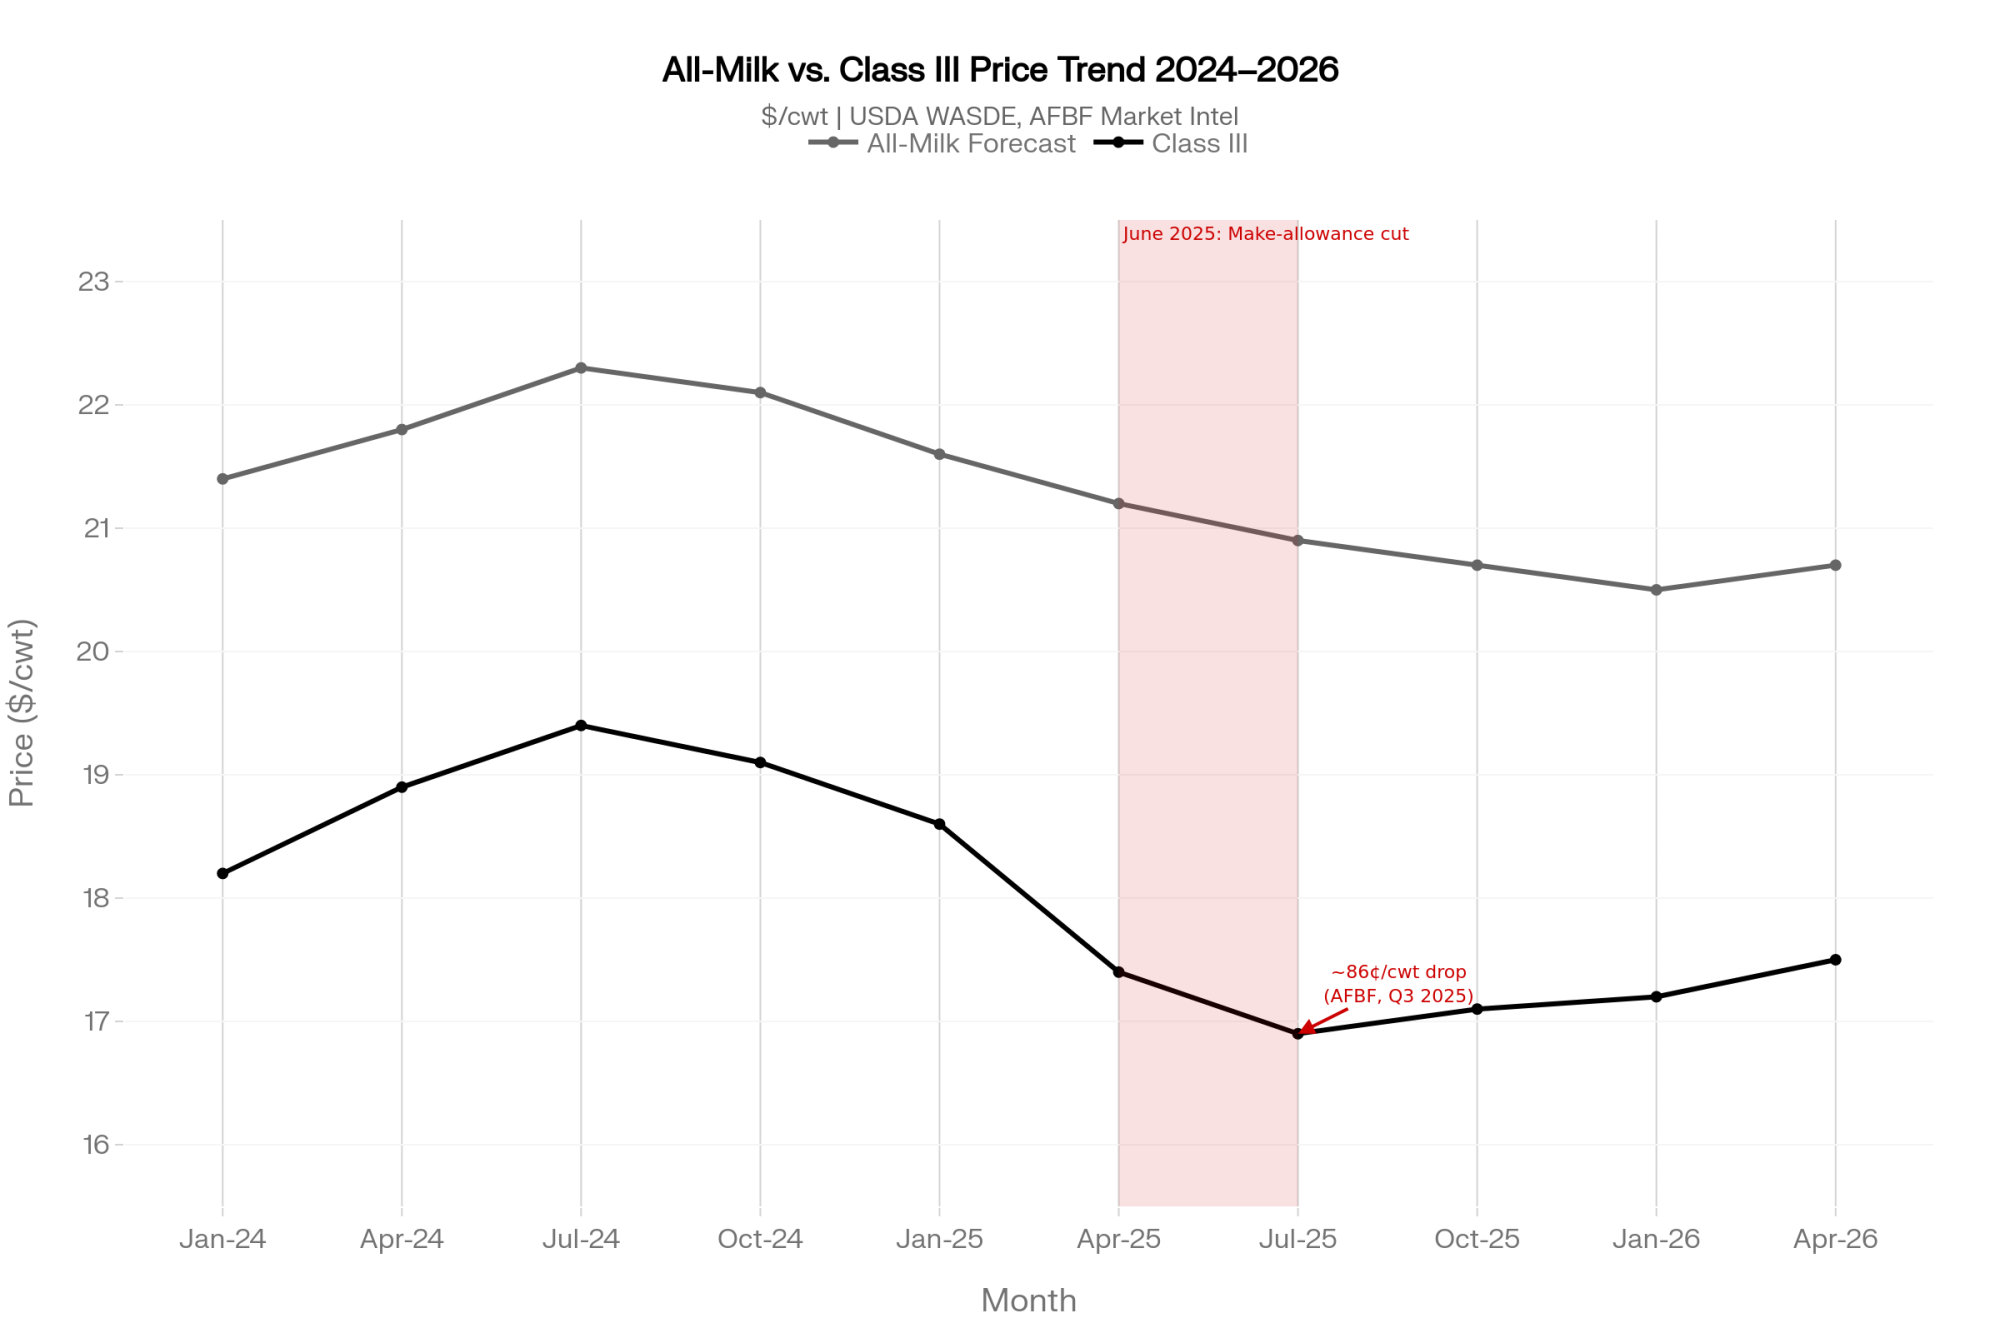
Run that Wisconsin operation forward on one clean baseline. ERS’s June 2026 forecast puts 2026 all-milk at $20.70/cwt — revised down 55 cents from the month before — while full economic cost of production sits close to $23.50/cwt. That’s the number that matters: a gap of roughly $2.80/cwt between what it costs to make the milk and what the milk pays back.
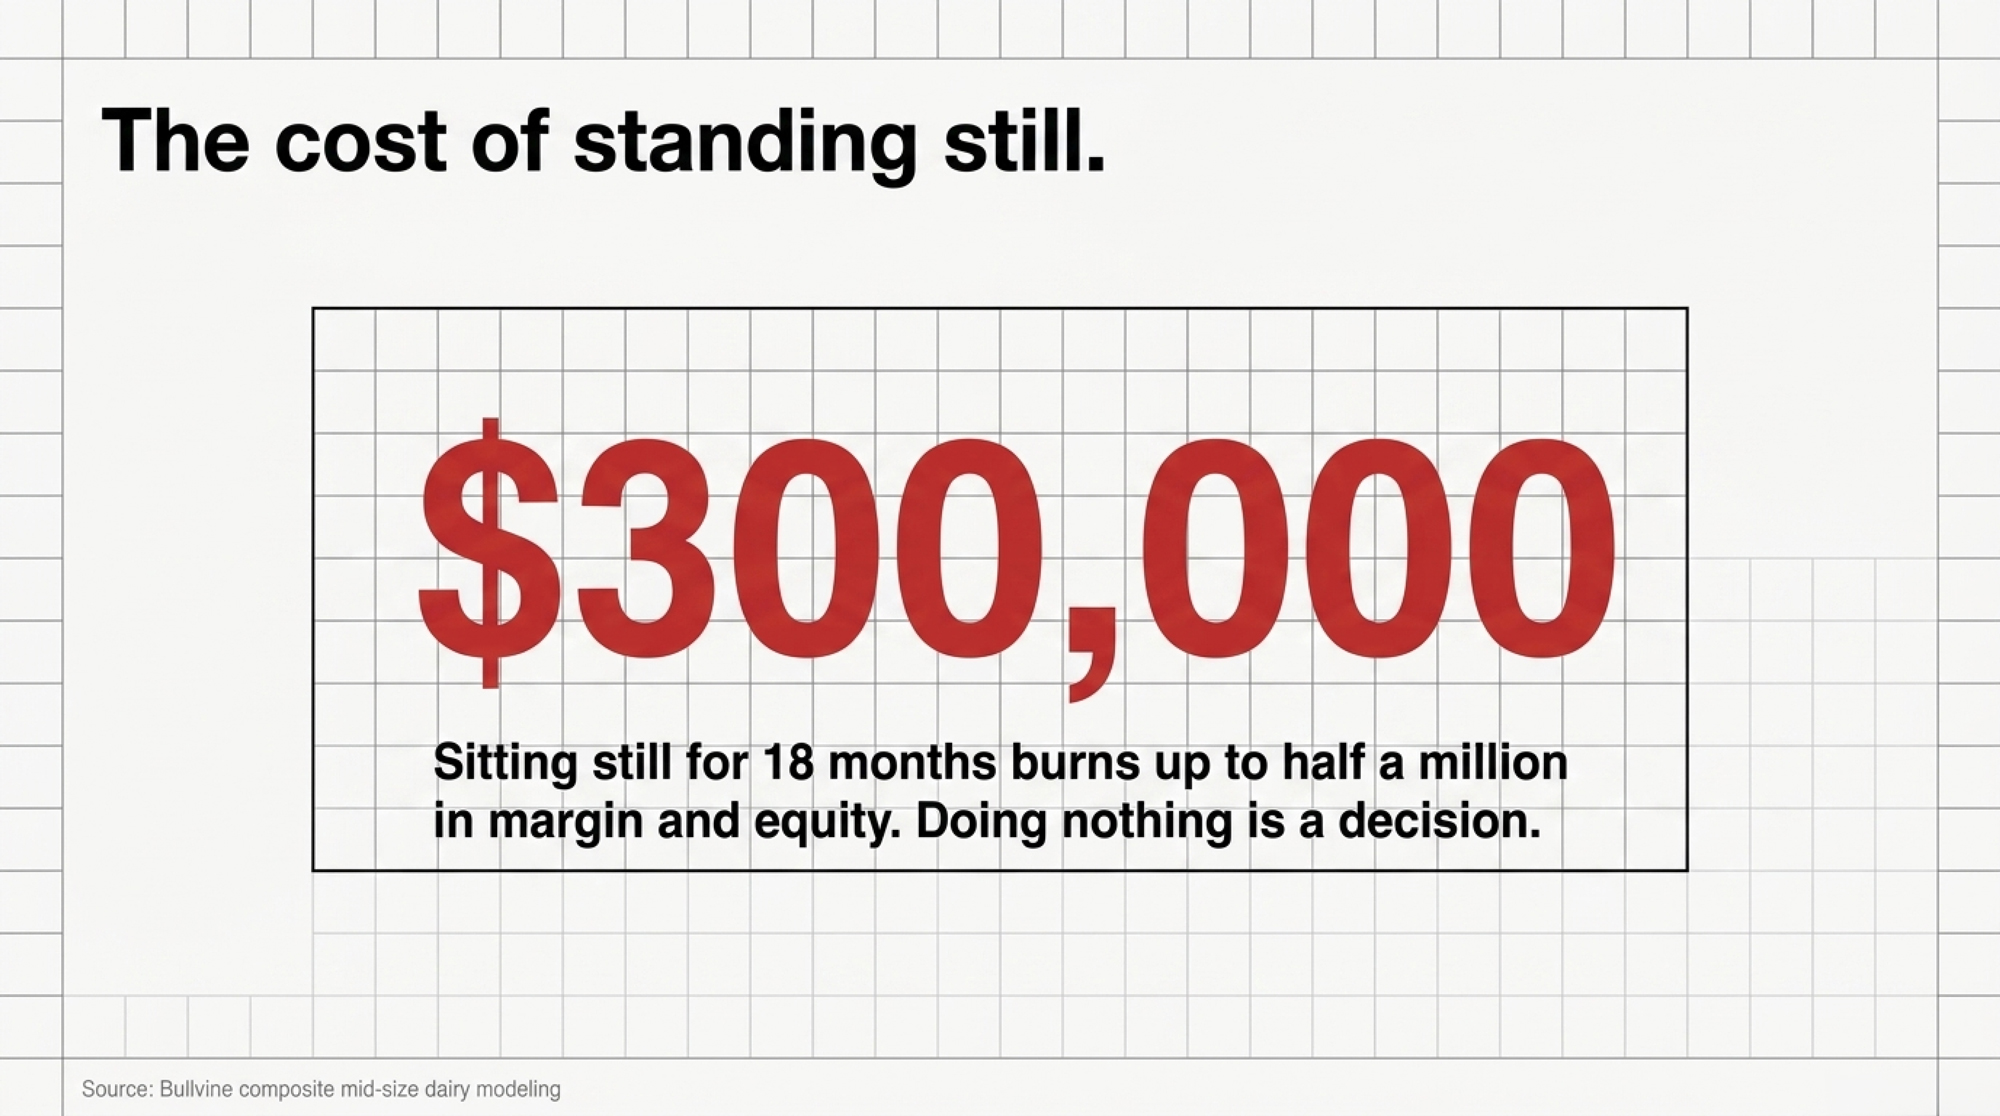
Now the barn math. A 400-cow herd at about 75 lbs/cow/day moves roughly 300 cwt a day — call it 110,000 cwt a year. Multiply that $2.80 gap across the year, and you’re absorbing better than $300,000 through equity and borrowing, unless something changes. Stretch it across 18 months of doing nothing, layer in the basis drag below, and you’re looking at $300,000 to $500,000 in lost margin and equity. Here’s how the rest of the price picture stacks up around that baseline:

The numbers your lender is working with
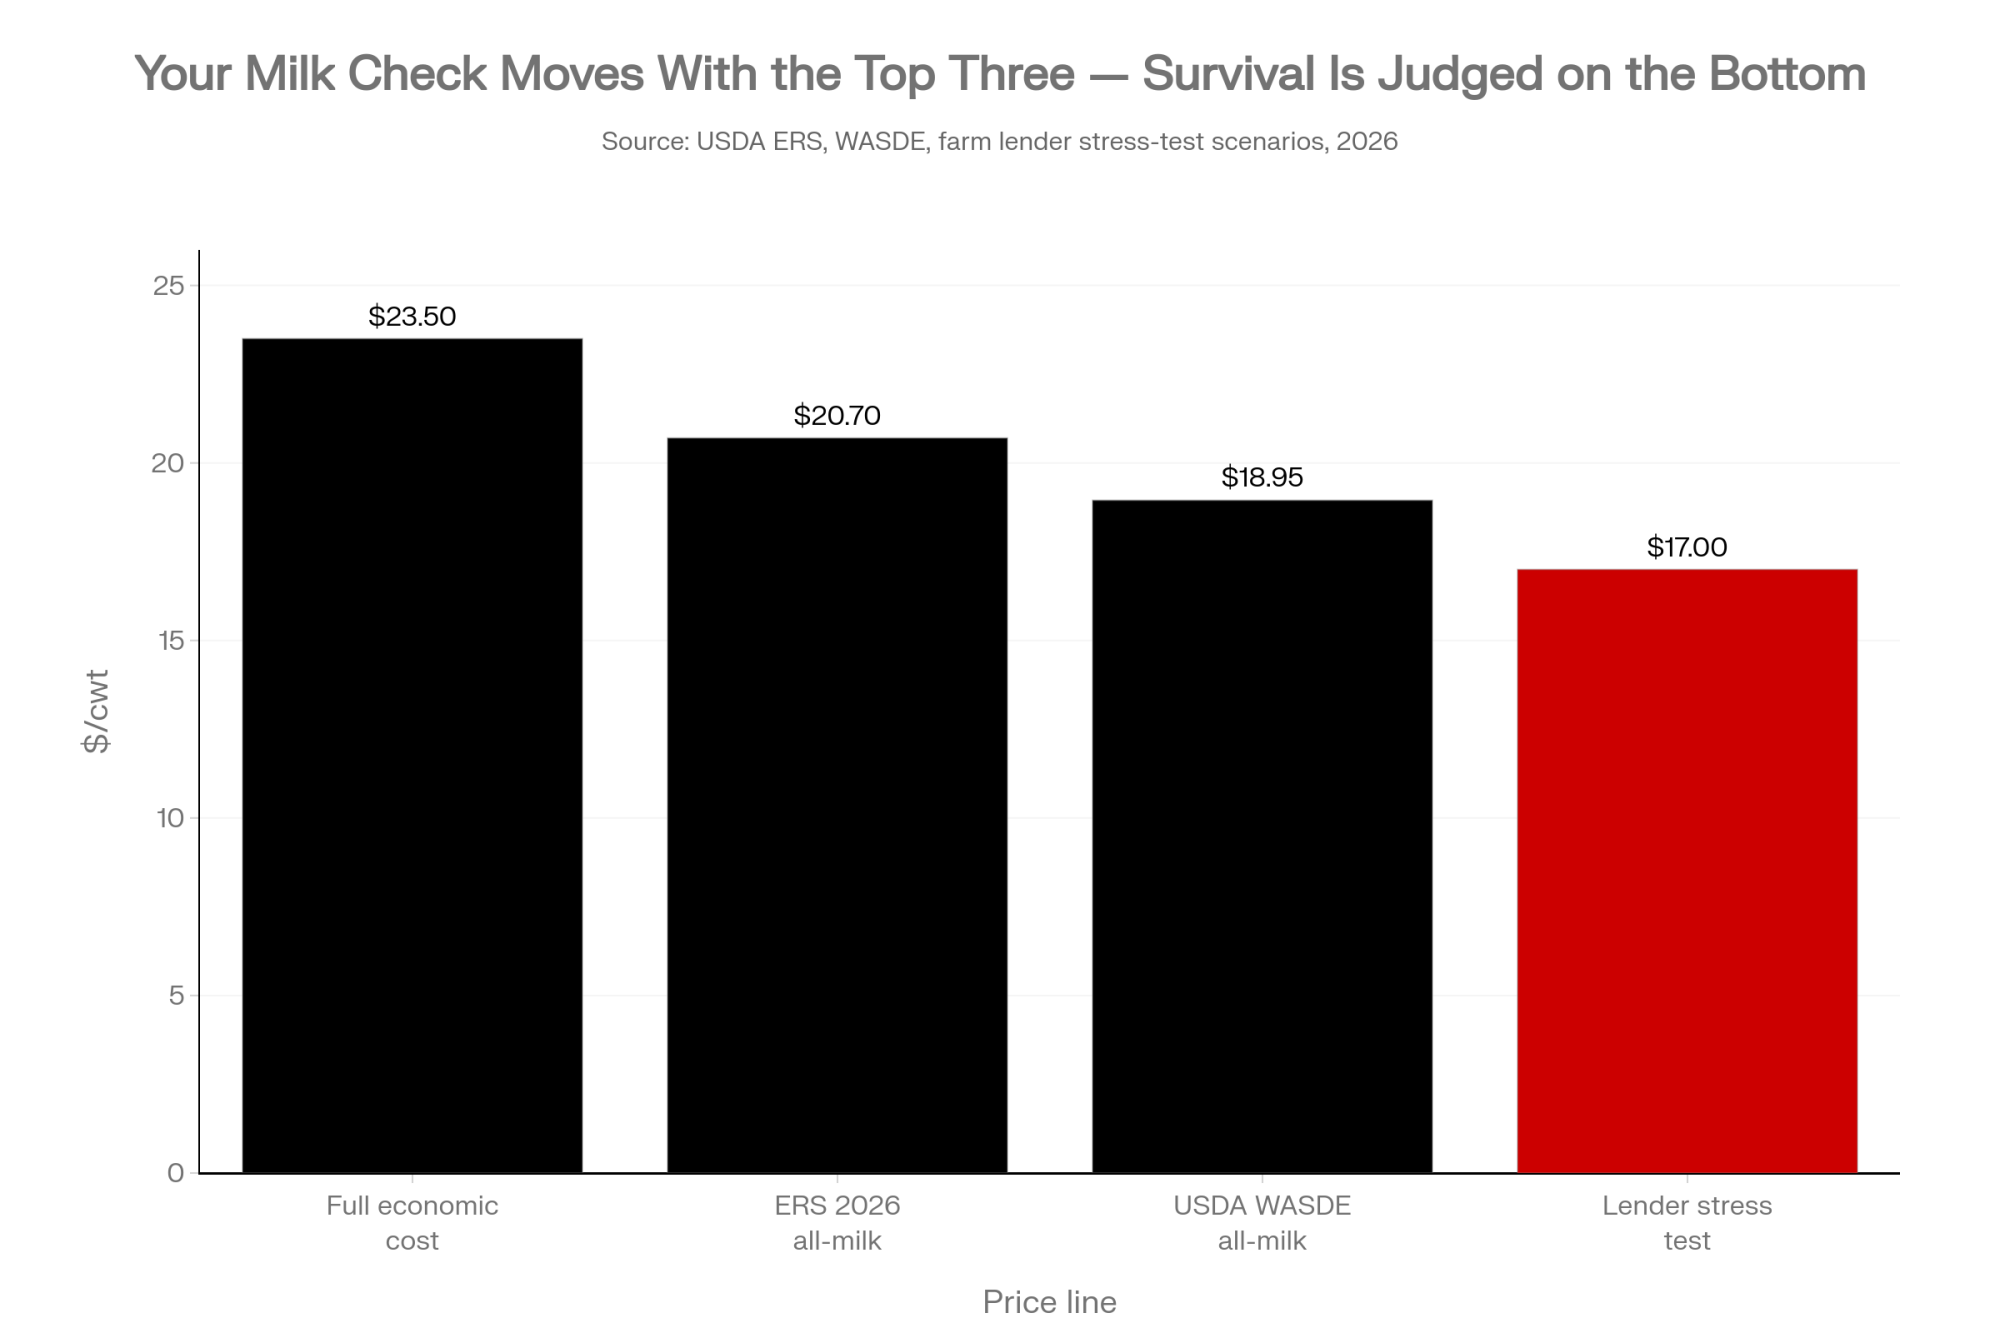
LinePrice
ERS 2026 all-milk forecast$20.70/cwt
Lender stress-test price$17.00/cwt
USDA 2026 all-milk (Feb WASDE)$18.95/cwt
Full economic cost of production$23.50/cwt

Your milk check moves with the top three. Your survival is judged against the $17 line.

Then it stacks. As regional milk volume grows, basis and premiums can tighten — Bullvine’s regional milk-price analysis associates this with net price differences of 40 to 60 cents/cwt in some regions.¹ On a 9,000-cwt monthly check, that’s $3,600 to $5,400 a month, or roughly $43,000 to $65,000 a year, gone before you touch a single thing on your own farm. None of it lands as one dramatic blow. Ninety cents here, fifty thousand there.

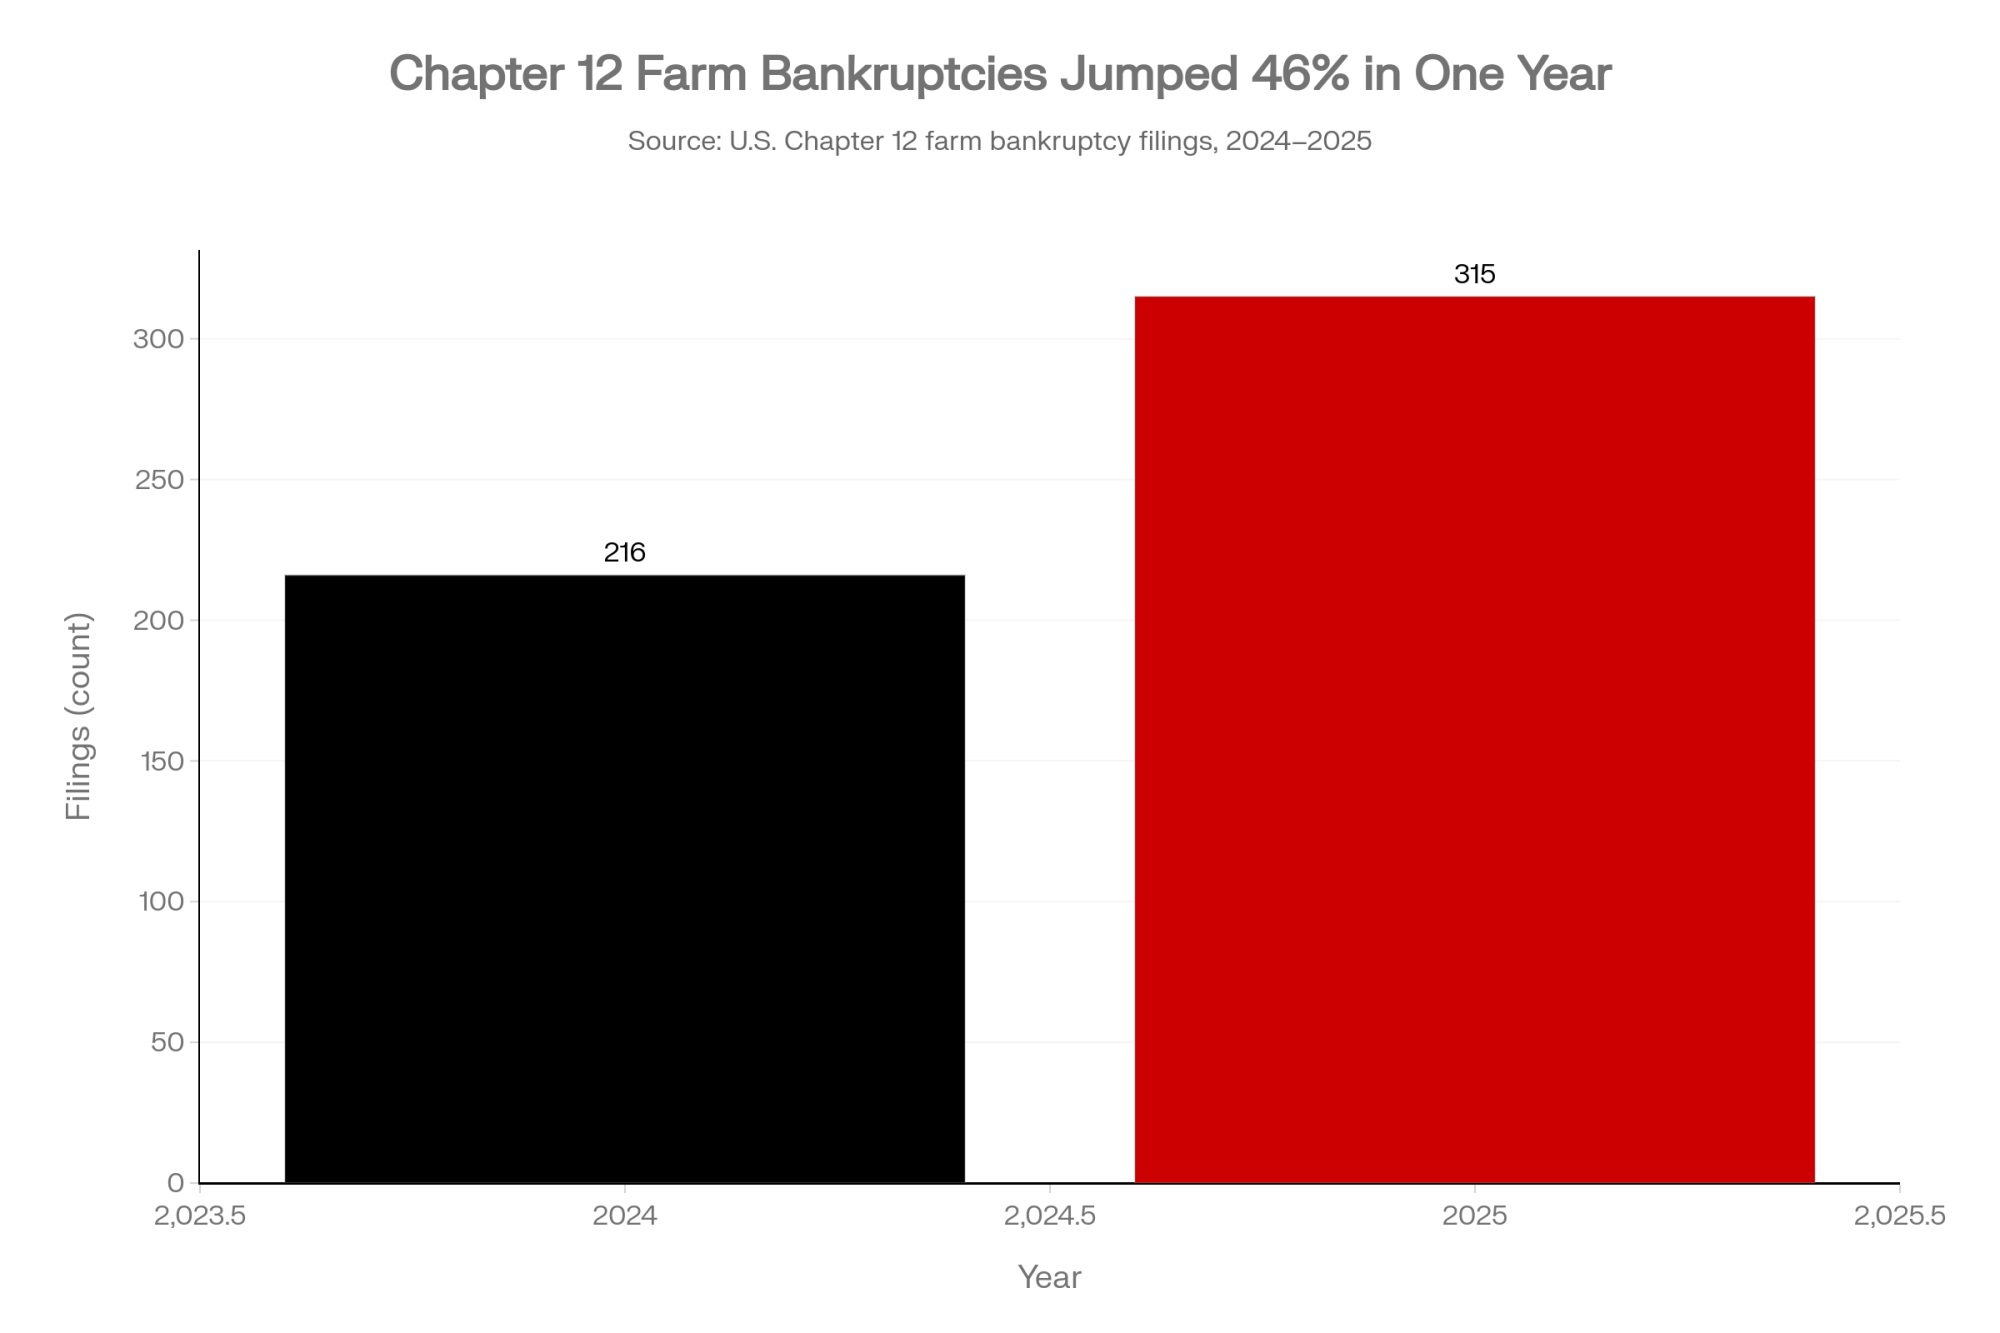
And you usually find out late. Bullvine’s reporting describes the tells — quarterly financial requests where you used to send them once a year, a new credit analyst in the room, an off-cycle appraisal, an operating line that stops expanding. The shift from partner to decision-maker happens inside the committee before anyone says it out loud in your barn. The proof it’s already happening: U.S. Chapter 12 farm bankruptcy filings hit 315 in 2025 — a 46% jump — and some operations are filing twice. Kooser Farms of Pennsylvania filed Chapter 12 in October 2025, six years after its first filing in 2019; a federal judge confirmed its second restructuring plan in February 2026.
What’s on the Committee’s Screen

So what are they actually looking at? More than character and collateral. They run your DSCR at base and stress prices — current cash flow at $18.95 milk, then at $17, sometimes $16 — plus a rate bump on any variable debt, watching for where you cross below 1.25x and 1.0x. They check working capital per cow — Compeer flags a management goal above $450/cow — as well as your operating expense ratio and debt repayment per cwt. And they read the trend lines: is equity eroding? Is liquidity shrinking year over year?

MetricHealthyWarning zoneRed flag
DSCR1.5x+1.0–1.25xBelow 1.0x
Working capital/cow$450+$300–$450Below $300
Debt-to-asset ratioUnder 55%55–70%Above 80%
Operating line drawnUnder 50%50–80%Above 80%

The rate side matters more than it used to. Farm Credit Services of America projects Class III to average around $17.25/cwt in the second half of 2026, stress-tested against operating-loan rates that are well above where they were a few years ago. So a herd that penciled fine at the cheap money and $20 milk of three years back can fail the same committee’s test at today’s rates and $17 milk, with not one cow sold and not one ration changed. That’s the trap. The farm didn’t get worse. The test got harder.

None of these formulas are secret. Compeer publishes them. Farm Credit Canada explains them. Your local extension office hands them out for free. So the gap isn’t access. It’s time, identity, and a little bit of dread. You’re running a multi-million-dollar business and a hands-on farm at once, and most operators were raised to think of themselves as dairy farmers first, never the CFO. Purdue Extension has made the point that producers under financial stress tend to bury themselves in chores and put off the long-term decisions.

There’s a real cost to opening that file, too. Researchers define financial stress as the psychological strain that comes from worrying about money — for farm households it’s a measurable, front-and-center part of the work, not a footnote. The first time you run DSCR at $17 and see a number below 1.0, the story flips from “we’re tight but okay” to “this has to change.” That moment stings. It’s also the only place real decisions start. If the math feels heavier than the spreadsheet, you’re not the only one — in the U.S., the 988 Suicide & Crisis Lifeline and the Farm Aid hotline (1-800-FARM-AID) are there for exactly that pressure; in Canada, Do More Ag connects producers to the same kind of help.

How Much Does Standing Still Actually Cost?

Scenario (400-cow herd)Annual cost gap18-month cumulative cost
Cost-of-production gap ($2.80/cwt × 110,000 cwt)~$300,000~$300,000–$500,000
Regional basis drag (40–60¢/cwt)~$43,000–$65,000Stacks on top of above
Cornell PRO-DAIRY avg. DSCR (2023)0.29Can’t fully cover payments in a good year

Freezing isn’t passive. It’s a decision to accept the status quo — and in 2026 the status quo carries a price tag. For a 400-cow herd carrying that economic-cost gap plus basis drag, doing nothing for 18 months runs comfortably into the $300,000 to $500,000 range in lost margin and equity, before you count the heifer-replacement squeeze coming down the pipe. When a producer says “we’ll ride it out,” the math usually hears “we’ll give up a quarter-million and hope the market bails us out before the lender’s spreadsheet does.”

The outlook doesn’t reward waiting, either. The University of Georgia’s 2026 outlook cited a USDA all-milk projection near $18.75/cwt, with prices expected to stay soft through much of the year. Class III futures have priced milk near $17/cwt through the third quarter of 2026. Riding it out is a bet on a bounce the current data doesn’t promise.

Is Your Breeding Strategy Already Behind the Pay Formula?

Here’s where it gets interesting for herds that chased butterfat for a decade. The FMMO make-allowance changes that took effect June 1, 2025, cut class prices roughly 85 to 93 cents/cwt and, per American Farm Bureau Federation analysis, pulled about $337 million out of producer pool values in the first 90 days. The change was adopted to reflect processors’ rising plant costs, but the skim-composition update that would have partly offset the producer side didn’t take effect until December 31, 2025 — so you absorbed the full hit before any relief showed up. Butterfat’s component value, meanwhile, slid from around $2.95/lb in January 2025 to roughly $1.45/lb a year later.

The deeper shift is in the formula logic: Net Merit $ now rewards component pounds shipped, not just test percentage. Bullvine modeled two 500-cow Upper Midwest herds on NM$ planning prices — same cow count, opposite breeding philosophy — and the spread is the part worth screenshotting:

Two 500-cow herds · same count · opposite strategy (modeled)

HerdButterfatMilk/cowComponent value
A — “High Test”4.25%72 lbsbaseline
B — “High Volume”4.05%82 lbs~$210,000 more per year

Lower test, higher volume — and the pay formula now rewards exactly that. The modeled edge ranges from roughly $55,000 (fluid-heavy order) to $95,000 (manufacturing order) on a comparable component improvement.

Three breeding cycles built for high test, low volume can quietly turn into a structural disadvantage after a single formula change. There’s a fuller breakdown in our look at [what butterfat’s crash reveals about breeding into a moving market][LINK-1] — worth reading before your next sire decision.

Options and Trade-Offs

There’s no single right move. But there are a few clear paths producers are taking, each with real trade-offs.

  • Run your own stress test and get to the lender first — within 30 days. Pull your last 12 months of financials and calculate DSCR and full breakeven at $17–$18 milk, including unpaid family labor and depreciation at replacement cost. Then book the meeting before renewal season books it for you. Bullvine’s reporting and Ag Proud’s stress-test guidance both find that operators who walk in with their own rolling cost-per-cwt and downside scenarios get more flexibility on terms than those who show up with a tax return and a story. The requirement is honesty. The only real risk is emotional — you have to be willing to see the number.
  • Restructure debt, but only if you fix the underlying problem. Re-amortizing carry-over debt or refinancing can ease the monthly squeeze. The catch: restructuring without closing the cost gap delays your position on the curve, as Bullvine’s analysis puts it. Wisconsin Extension makes the same point a blunter way — paying down dead-weight debt and rebuilding working capital often beats the more exciting capital upgrade. It buys time, not a fix.
  • Add non-correlated revenue. Lenders like income that isn’t chained to the Class III/IV roller coaster, and beef-on-dairy calves sell into the fed-cattle market, not the milk market. But lean too hard on it, and you drain a pipeline you’ll need later — replacement heifers hit a record $3,010/head in July 2025, a 164% jump, and have topped $4,000 at some auctions.
  • Plan a controlled exit with equity intact. For some operators, the right call is selling on your own timeline rather than the bank’s — or filing a strategic Chapter 12 while equity remains, which works best when debt-to-asset is in the 55–70% range, and the operation can pencil after restructuring. It’s the hardest path emotionally and the cleanest one financially when DSCR is structurally broken.

What’s Stopping You From Running the Numbers Today?

If the formulas are free and the stakes are six figures, why is the 400-cow operator so often the last person to run them on themselves? Usually it isn’t ignorance. It’s that the day-to-day grind eats the hours, and there’s a quiet fear that the real cost-per-cwt sits three dollars higher than the story you’ve been telling yourself. Heavier to face than a balky parlor.

But here’s the reframe. Once you’ve seen your own math in the same light your lender is using, every other decision — breeding, expansion, exit, even who you ship to — stops being a guess and becomes a choice. That Wisconsin dairy didn’t walk out of the counselor session with better cows. It walked out knowing which months of the year actually broke even and which ones bled — the same numbers the bank was already holding. 

Your 30-Day CFO Checklist

Work these in order. Each step has a trigger — a number that tells you whether to move on or stop and act. Print it, screenshot it, tape it to the office wall.

1. Run the core number. Calculate DSCR at $17 milk using this year’s feed bill and current rates. → Trigger: below 1.20x at $18.95 milk is your warning line — stop here and make it a 30-day priority. Kansas City Fed surveys already show that 60% of district lenders report lower farm income and loan repayment rates at their weakest since 2020, so the squeeze is real even as overall stress is still building.

2. Check your liquidity cushion. Pull working capital per cow and your operating-line draw. → Trigger: line more than 80% drawn, or working capital well under $450/cow? Those are the exact trend lines your committee is watching.

3. Read your leverage. Find your debt-to-asset ratio. → Trigger: past 60%, restructuring talks should already be happening; past 80%, call an ag attorney this week.

4. Re-test against the rate environment. If any debt is on variable rates, re-run the test at today’s money and $17 milk. → Trigger: the same cows fail a test that penciled three years ago? The rates moved, not the herd.

5. Audit your component strategy. Model fat and protein pounds — not test percentage — against the post-June 2025 pay formula. → Trigger: three breeding cycles of high-test, low-volume genetics? Reweigh it before your next sire pick.

6. Pressure-test your side revenue. If beef-on-dairy is propping up margin, check what it’s doing to your replacement pipeline. → Trigger: heifers north of $3,010/head mean you may be selling tomorrow’s herd to fund today’s cash flow.

So here’s the real question — not whether your lender has run these numbers, but whether you’ve seen the same spreadsheet they’re working from. Where does your breakeven actually sit at $17 milk, and how many months of it can your balance sheet absorb before something gives? The 550-cow Wisconsin dairy found out by choosing to look. Most won’t, until the committee looks for them.
Key Takeaways

  • Your lender’s already stress-testing you at $17 milk against a full cost near $23.50/cwt — run your own DSCR at $17 before renewal season, because on 400 cows that gap is roughly $300K a year through equity.
  • If your DSCR comes in under 1.0 or working capital’s below $450/cow, that’s not a wait-and-see number — get to the bank first with your own math instead of last with a tax return and a story.
  • The FMMO change now pays component pounds shipped, not test percentage; if you’ve bred three cycles for high fat and low volume, reweigh that before your next sire pick.
  • Sitting still for 18 months runs $300K–$500K in lost margin and equity, and Chapter 12 filings jumped 46% in 2025 — riding it out is a bet on a bounce the current numbers don’t promise.

Run Your Numbers

Dairy Profit Projector — Before renewal season, run your herd at $17 milk and see your own breakeven price, IOFC per cow per day, and 12-month margin — the same math the committee’s already holding. Walk in with the number, not a tax return and a story.

Complete references and supporting documentation are available upon request by contacting the editorial team at editor@thebullvine.com.

Learn More

The Sunday Read Dairy Professionals Don’t Skip.

Every week, thousands of producers, breeders, and industry insiders open Bullvine Weekly for genetics insights, market shifts, and profit strategies they won’t find anywhere else. One email. Five minutes. Smarter decisions all week.
NewsSubscribe
First
Last
Consent

$262,000 a Year, Gone: The USDA Formula Change No Milk Check Explains

USDA reset make allowances June 1, 2025, and quietly pulled ~90¢/cwt from Class III/IV. On 1,000 cows, that’s about $262,000 a year — and no line on your check says so.

Executive Summary: On June 1, 2025, USDA reset FMMO make allowances for the first time since 2008, and that single formula change pulled roughly 90¢/cwt out of regulated Class III and IV prices — before global oversupply took a nickel. If your milk flows into cheese, butter, or powder across the Upper Midwest, Plains, or West, this hit you hardest, and nothing on your check spells it out. On a 1,000-cow herd shipping 80 lbs/day, that’s about $262,000 a year, gone; run your own pounds times 90¢, and the number scales straight up. AFBF’s Danny Munch clocked Class III down 86¢ and Class IV down 89¢ in the first three months, and here’s the part that stings: it’s structural, not cyclical, so it won’t bounce back when futures rally. Don’t count on shrinking global supply to bail you out either — Rabobank still has 2026 production up about 1%, and USDA has EU deliveries edging up 0.1%, not down. With 2026 all-milk forecast at $20.70, the real question is whether your operation can run 12 months at that number with 90¢ permanently baked into the floor. The move this month: run your DSCR without any DMC or Dairy-RP payments, and if it lands under 1.0x, that’s a lender conversation now — not at renewal.

make allowance milk price

Picture an Upper Midwest dairy milking 1,000 cows. Same parlor, same cows, same routine that penciled out fine in 2024.

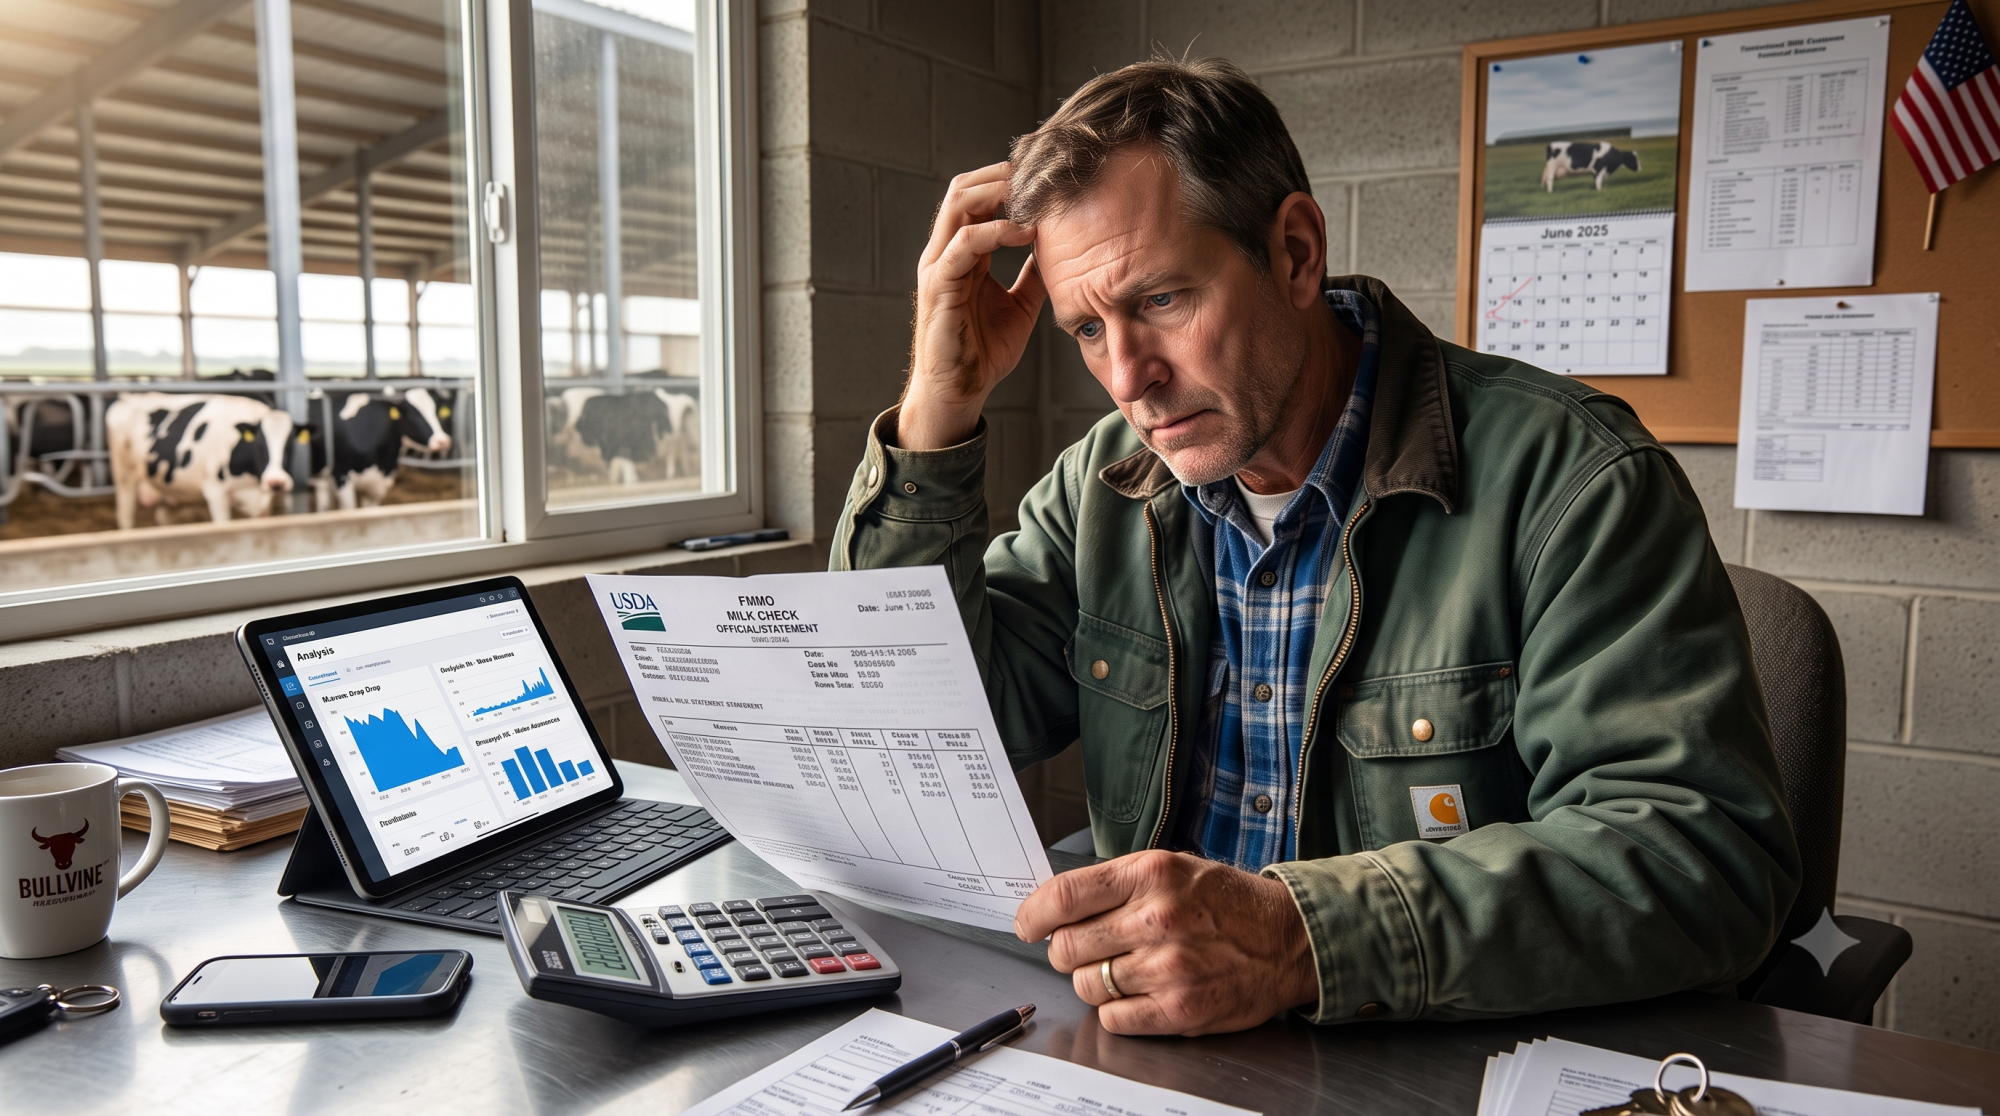
Then the June 2025 milk check came back lighter. And it kept coming back lighter, month after month, with nothing new in the deductions column to point at. Nobody dried off the wrong cows. Nobody blew a ration. The math changed underneath them.

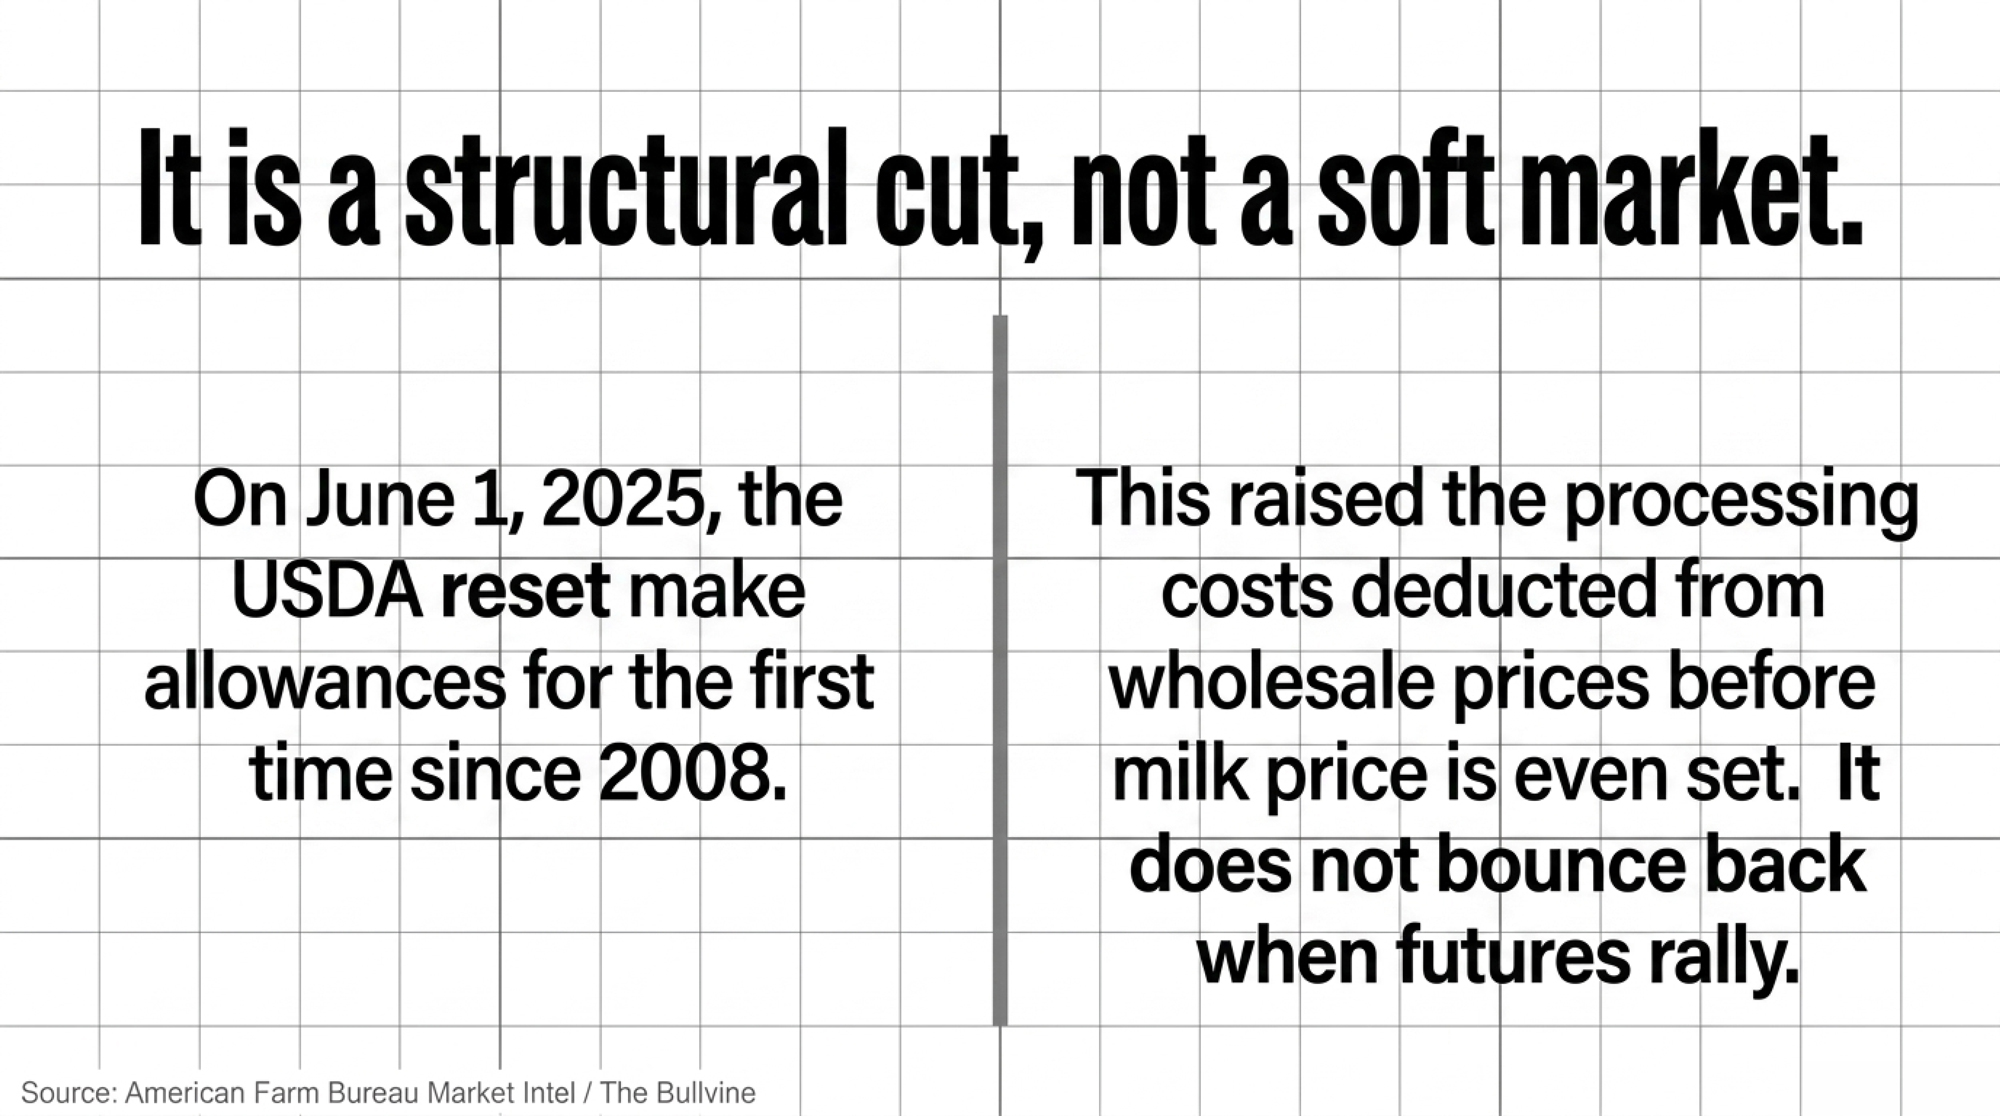
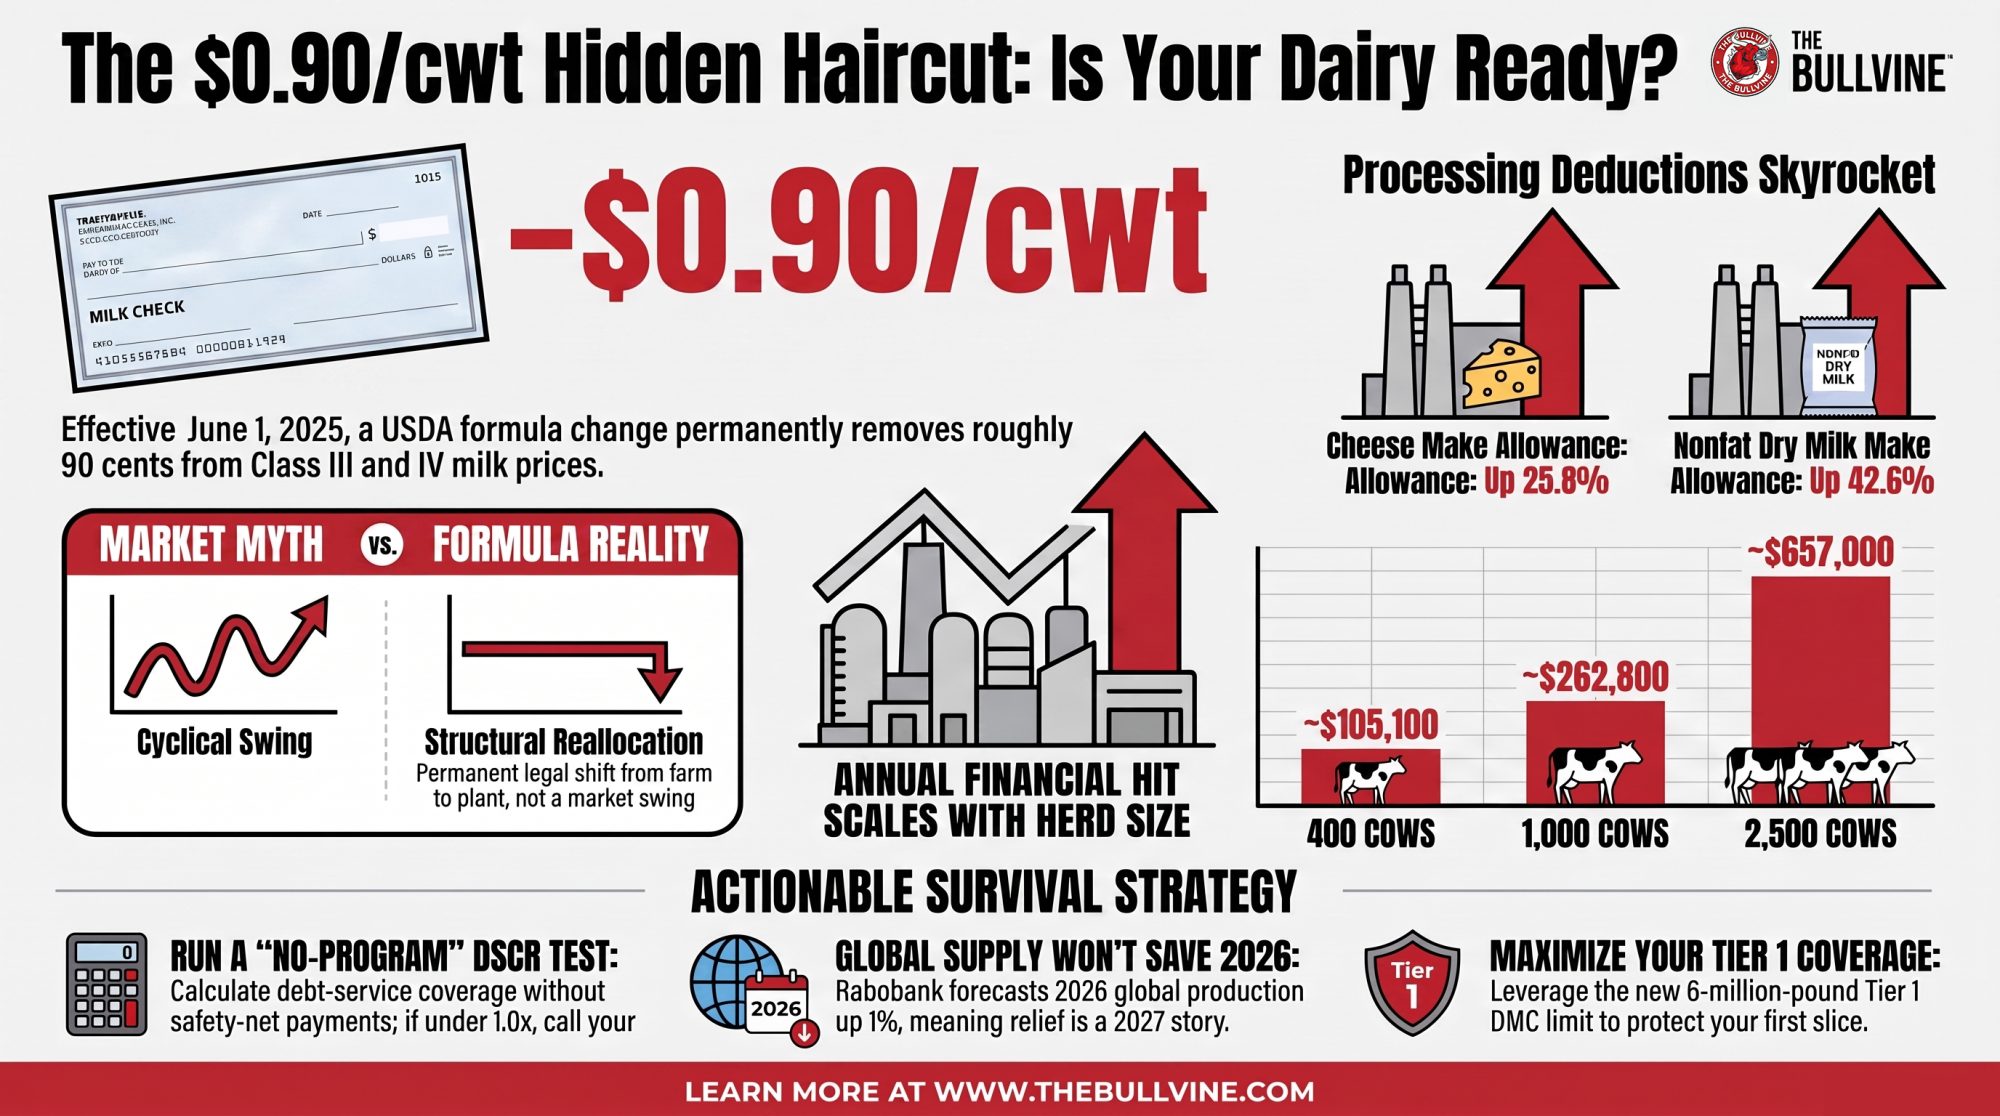
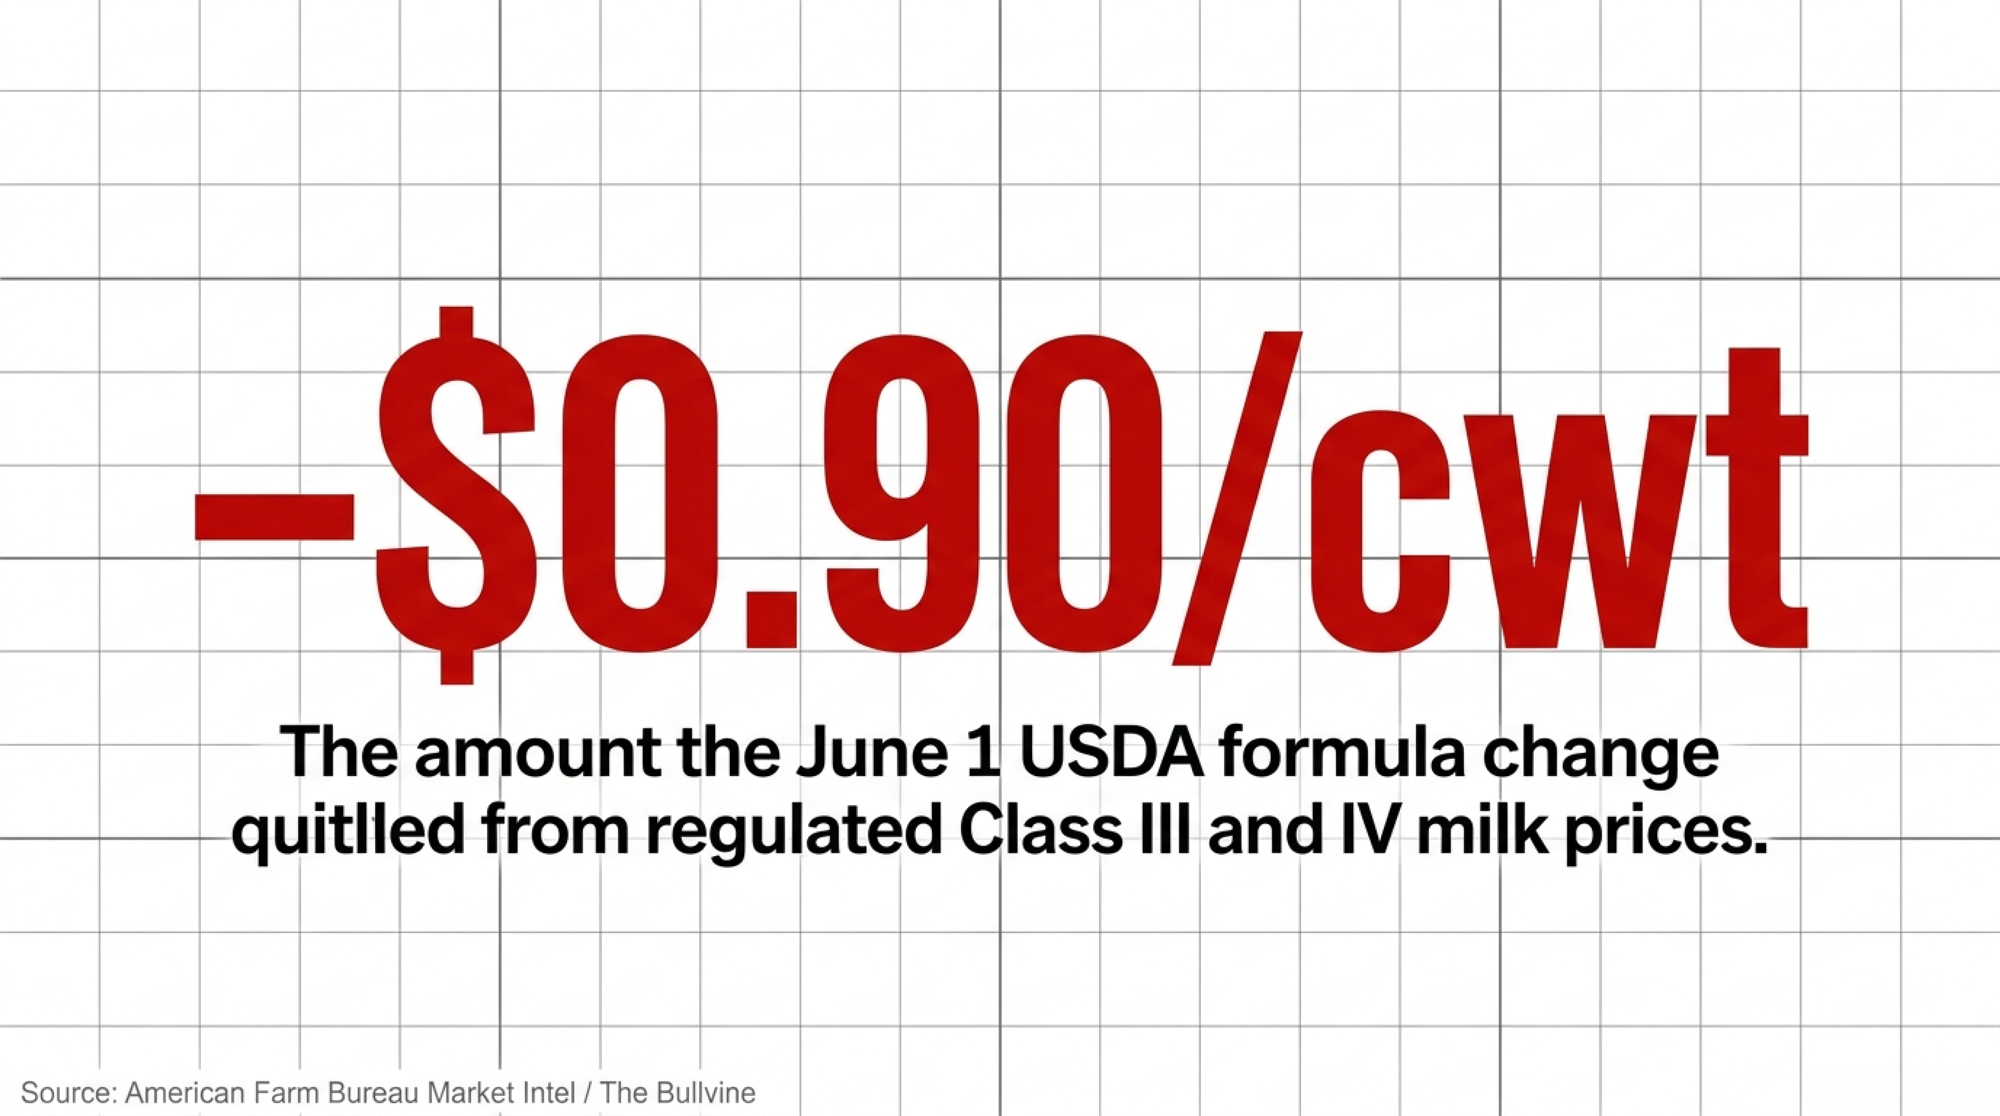
On June 1, 2025, a federal pricing formula quietly shifted. That one change pulled roughly $0.90/cwt out of regulated Class III and IV milk prices — before global supply moved a nickel.

That’s the make-allowance change. And it’s the part of the 2026 squeeze most producers felt in their gut but couldn’t name on paper.

What Actually Changed on June 1, 2025

A make allowance is the processing cost USDA subtracts from surveyed wholesale prices for cheese, butter, nonfat dry milk, and dry whey when it builds your Class III and IV milk prices. Raise that deduction, and the regulated milk price drops by the same amount — dollar for dollar, per pound of product.

It’s not a market force. It’s a formula input.

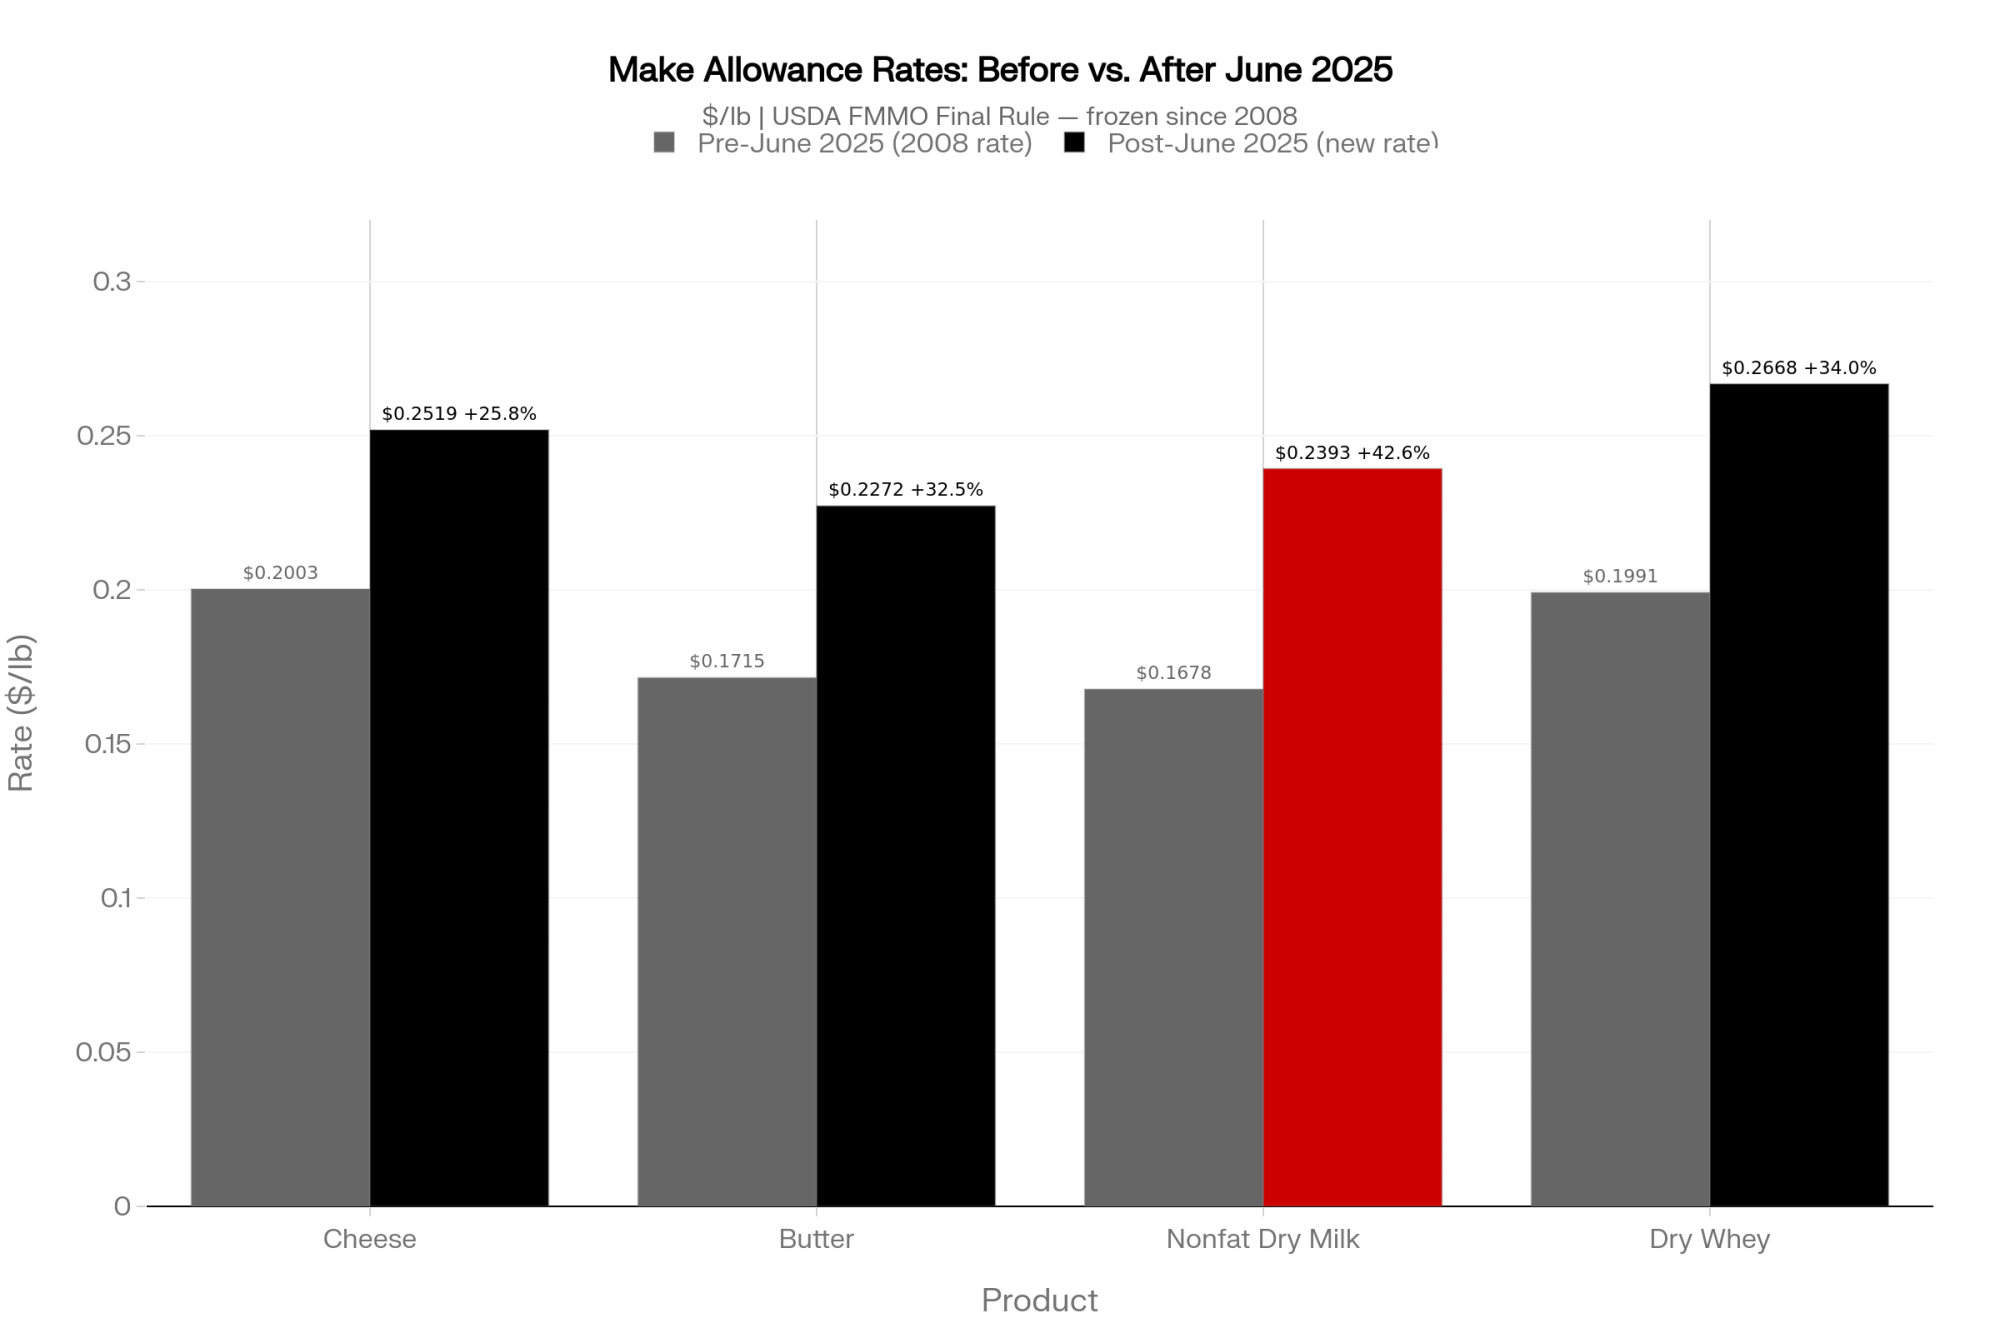
USDA’s final rule reset those allowances effective June 1, 2025: $0.2519/lb for cheese, $0.2272/lb for butter, $0.2393/lb for nonfat dry milk, and $0.2668/lb for dry whey. The old rates — frozen since October 2008 — were $0.2003 for cheese, $0.1715 for butter, $0.1678 for nonfat dry milk, and $0.1991 for dry whey, according to USDA Agricultural Marketing Service rulemaking.

Run the percentages and the jumps are steep: 25.8% on cheese, 32.5% on butter, 42.6% on nonfat dry milk, and 34.0% on dry whey. Those aren’t tweaks. The cheese number alone — a nickel a pound more carved out before the milk price is even set — is what does most of the damage to a III-heavy check, because cheese yield drives the Class III formula harder than anything else. The Bullvine has shown how thin the link already is between what your components are actually worth and what the formula pays you — and this rule widened that gap.

American Farm Bureau economist Danny Munch, tracking the first three months under the new rule, found average Class III prices fell about 86¢/cwt and Class IV about 89¢/cwt, with the make-allowance bump doing most of the damage, per American Farm Bureau Market Intel. The Bullvine’s own breakdown landed close by, at $0.94/cwt on Class III and $0.87 on Class IV.

The spread between those estimates comes down to method and which orders you weight — which is exactly why “roughly 90 cents” is the honest midpoint to plan around.

And who gets hit hardest? If your milk flows into cheese, butter, and powder — the Upper Midwest, the Plains, the West — your mailbox price leans on Class III and IV, so the haircut lands with full force. Fluid-heavy regions feel it less, because more of their value rides on Class I, which the same rule actually nudged higher in spots.

How This Plays Out in the Barn

Here’s what makes it so slippery: nothing on the check screams “USDA just took a dollar.” Class prices simply print lower.

So you blame exports, or China, or “the market” — and the formula change rides along invisible.

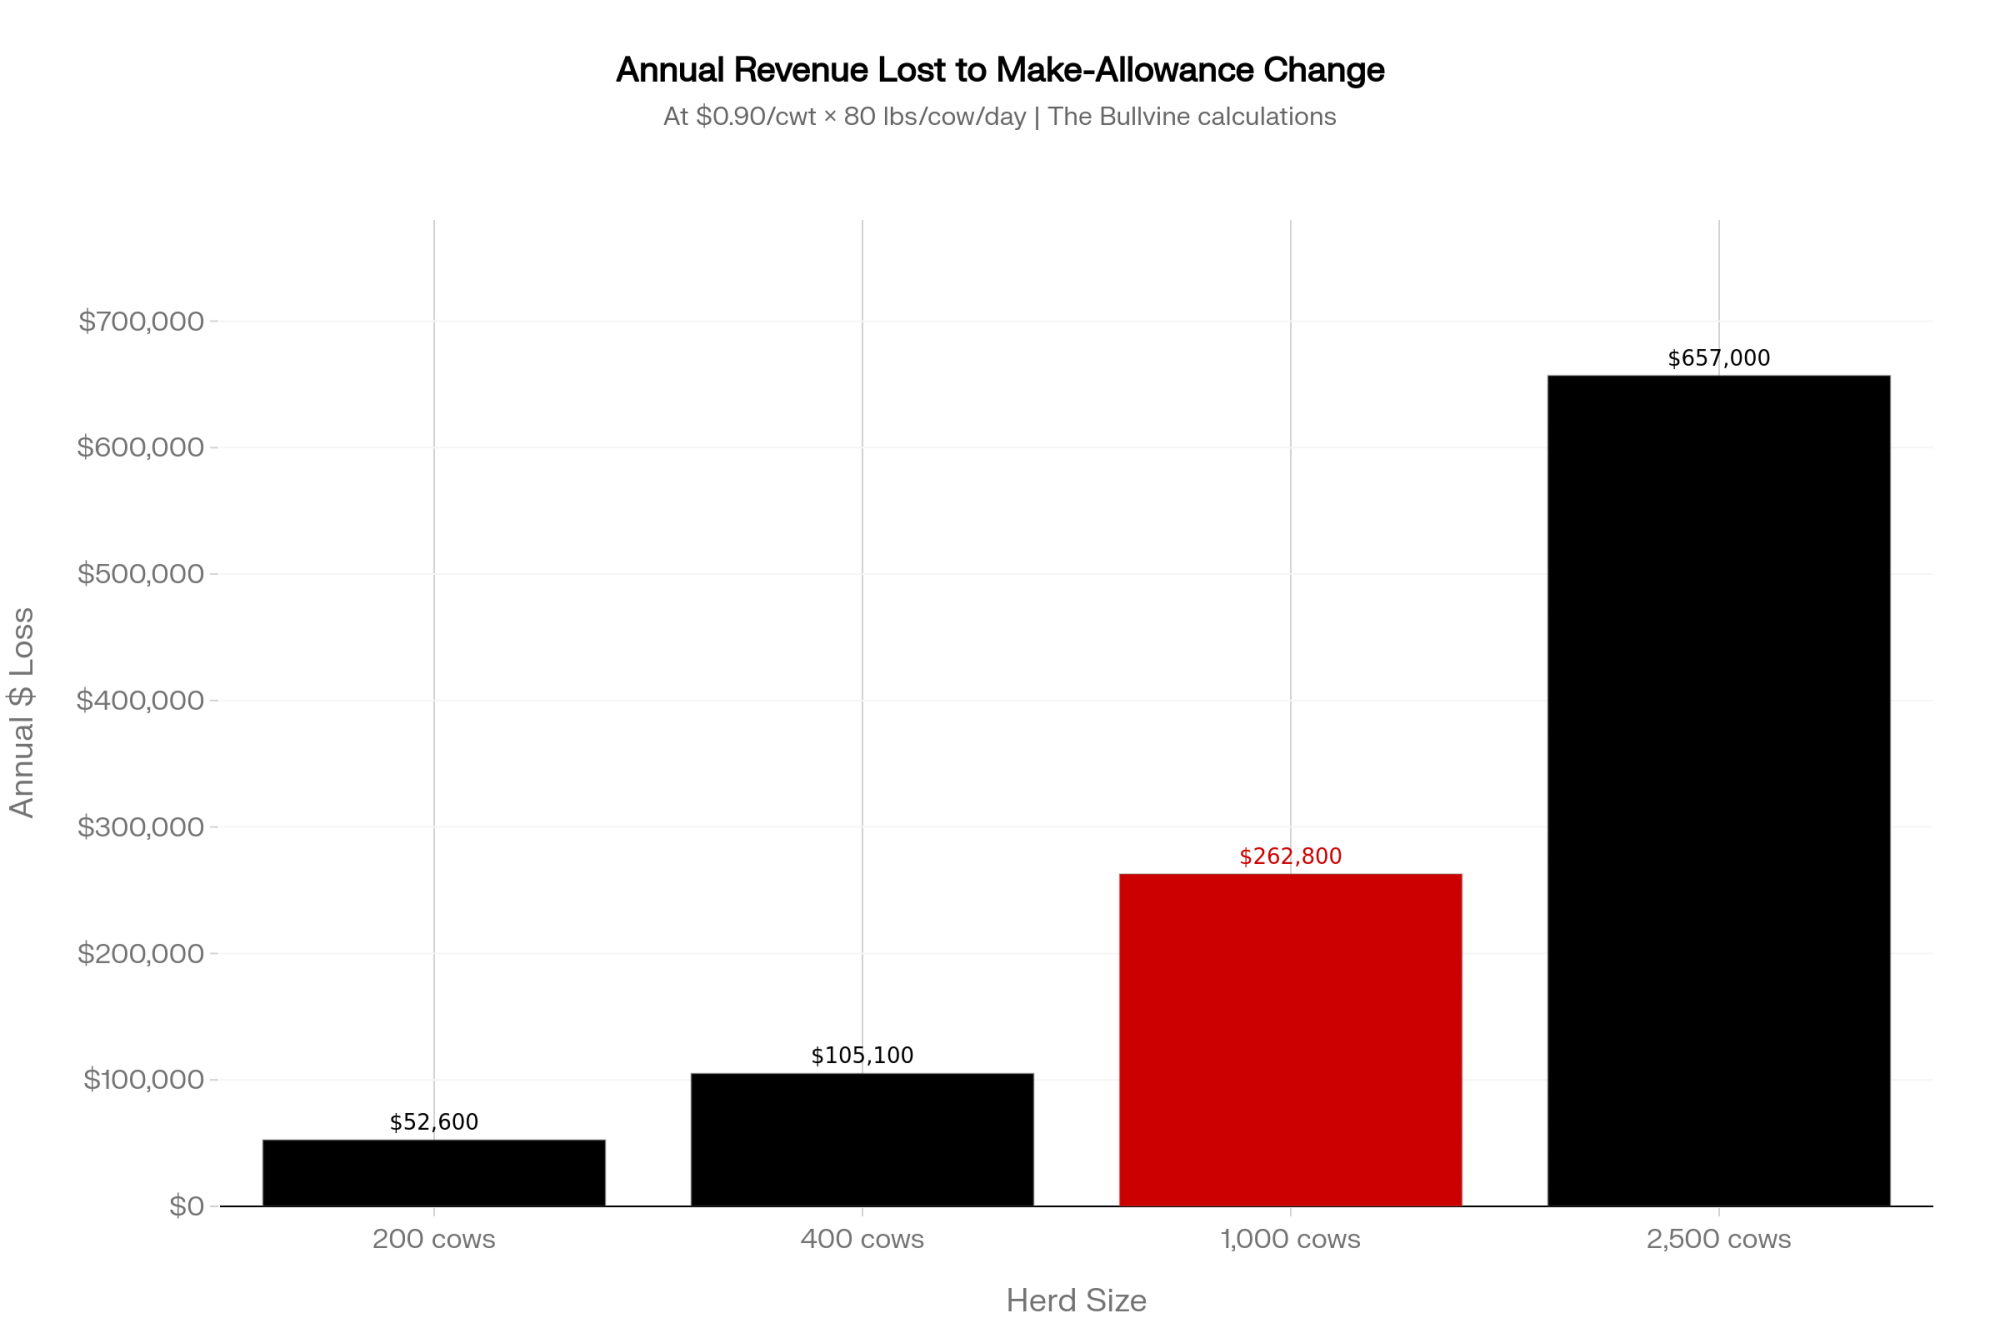
Run the math on that 1,000-cow herd. At about 80 lbs/cow/day — swap in your own average — you’re shipping roughly 292,000 cwt a year. A $0.90/cwt haircut works out to about $262,000 gone — every year — before a single cull cow leaves the yard or a futures contract moves.

The number scales cleanly with herd size, because it’s just pounds times 90 cents. Here’s the same math run across four herd sizes, all at 80 lbs/cow/day:

Herd sizeApprox. annual cwtAnnual hit at $0.90/cwt
200 cows58,400~$52,600
400 cows116,800~$105,100
1,000 cows292,000~$262,800
2,500 cows730,000~$657,000

The Bullvine ran a version of this on a 400-cow herd and got close to $105,000 a year vanishing into the formula. Plug in your own per-cow production — a 90-lb herd ships more pounds, so the bite is bigger.

And it didn’t land in a vacuum. The rule took effect just as global milk surged through mid-2025, so the cut and the oversupply hit the same checks at the same time — but only the oversupply made headlines. USDA’s June 2026 WASDE lowered the 2026 all-milk forecast by 55¢ to $20.70/cwt — below 2025 and below full economic cost for a lot of mid-size herds.

Stack the structural cut on top of a soft market, and that “$1.25/cwt even when you do everything right” feeling stops being a complaint. It’s arithmetic.

The Mechanics Nobody Walked You Through

Why didn’t this register clearly? Because USDA bundled the bad news with some good.

The same rule package returned Class I to the “higher of” mover and raised Class I differentials in parts of the East — both lift fluid skim values. And there was a genuine offset for high-component herds: updated skim milk composition factors — protein assumptions raised from 3.1% to 3.3%, other solids from 5.9% to 6.0%, nonfat solids from 9.0% to 9.3% — that lift the calculated value of skim milk.

But that piece didn’t take effect until December 1, 2025, a full six months after the make-allowance cut had already been pulling cash out of checks.

Rule ElementEffective DateWho It HelpsWho It Hurts$/cwt Impact
Make-allowance rate reset (cheese +25.8%, butter +32.5%, NDM +42.6%, whey +34.0%)June 1, 2025ProcessorsClass III/IV producers (Upper Midwest, Plains, West)−$0.86–0.94/cwt
Class I “higher of” mover restoredJune 1, 2025Fluid milk regions (East/Southeast)No direct impact on Class III/IV+Variable
Class I differentials increased (select Eastern orders)June 1, 2025Eastern fluid producers+Variable
Skim milk composition factors updated (protein 3.1%→3.3%; other solids 5.9%→6.0%; nonfat solids 9.0%→9.3%)December 1, 2025High-component herdsLow-component herds+Partial offset
DMC Tier 1 coverage raised to 6M lbs at $9.50 margin2026 Farm BillSmaller herds (≤6M lbs production)Large herds shipping 20M+ lbs — Tier 1 covers <25% of volumePartial floor only
Net structural impact on Class III/IV mailbox priceOngoingAll manufacturing-region producers~−$0.90/cwt permanent

That staggered timing is what muddied the water. The big-picture message could stay neutral-to-positive even while the specific message for cheese-and-powder country was brutal: your core class prices just dropped almost a dollar.

Farm groups didn’t speak with one voice, either. Processors had pushed for higher make allowances for years, arguing real costs — energy, labor, packaging — had outrun rates frozen since 2008. That argument isn’t crazy on its face; nobody’s processing milk in 2026 at 2008 cost. But “the rate was stale” and “the producer should eat the entire catch-up in one step” are two very different conclusions, and the rule landed on the second one. Some producer groups swallowed the higher allowances as the price of getting “higher of” back. So the clean “you’re losing 90 cents” line got lost in the trade.

The distinction that matters: this isn’t cyclical. It doesn’t reverse when futures rally. The Bullvine put it bluntly — “that money is now legally reallocated from the farm to the plant.” It’s welded into the floor now.

Won’t Slowing Global Milk Bail Out Prices?

Every few weeks a hopeful headline lands: the global wall of milk is finally cresting. And there’s truth to it — Rabobank’s Q2 2026 Global Dairy Quarterly, released in June, has Big-7 output growth peaking and milk supply turning negative by the fourth quarter, down an estimated 1.6% year-on-year.

But here’s the catch most of those headlines skip. Rabobank still pegs full-year 2026 global production up about 1%, following a 3.1% surge in 2025. The slowdown is a Q4 story, not a 2026 story. A herd budgeting on a calendar-year basis won’t feel a fourth-quarter dip until the back end of the year — long after the spring and summer checks are already spent.

So why doesn’t your check recover? Because the milk’s still coming. The U.S. is forecast to keep growing for the full year, and even Europe isn’t pulling back the way the “shrinking EU herd” story suggests — USDA’s Foreign Agricultural Service, in its June 2026 update, actually has EU cows’ milk deliveries edging up 0.1% in 2026 to about 148.6 million metric tons. That’s not a contraction. That’s flat-to-higher from the one region everyone keeps expecting to ride to the rescue.

The wall doesn’t come down until production actually contracts and stays there — and Rabobank doesn’t see that holding until late 2026 into 2027.

The Bullvine has laid out who actually blinks first in the global milk picture — worth a read if you’re tempted to bank on an overseas rescue.

How Much Does Doing Nothing Actually Cost You?

This is the question worth sitting with at the kitchen table. On a 1,000-cow herd shipping about 24,000–25,000 cwt a month, a $1.00/cwt shortfall against what you budgeted is roughly $25,000 a month — just under $300,000 a year.

The Bullvine’s risk math frames the smaller version cleanly: on 9,000 cwt, every $1.00/cwt gap is $9,000 a month.

Dairy Margin Coverage helps — but know exactly where it stops. Tier 1 coverage rose from 5 to 6 million lbs for 2026, with subsidized protection up to a $9.50 margin. That’s a genuine lifeline on your first 6 million pounds.

But a 1,000-cow herd ships around 29 million pounds, which leaves roughly 23 million pounds with no Tier 1 net under it. DMC puts a floor under part of your milk. It doesn’t fix a model that’s underwater before debt service.

If you want the coverage tables and lane-by-lane strategy, the full 2026 risk playbook breaks it down.

What This Means for Your Operation

Strip away the policy talk and it comes down to three things you can do something about. First, the make-allowance cut is now part of your structural cost of doing business, the same way a higher haul rate or a tighter component schedule would be — so it belongs in your budget as a permanent line, not a bad-luck footnote you expect to bounce back.

Second, the size of the hit scales directly with how many pounds you ship, which means your highest-production strings are also where the formula takes the most. That’s not a reason to pull production. It is a reason to make sure every one of those pounds is either hedged, contracted, or priced into a margin you can actually live with.

Third, the relief everyone’s waiting on — shrinking global supply — is a late-2026-into-2027 event at best, and Europe isn’t even cooperating with the story yet. Budget for the world you’re milking in now, not the one the optimistic headlines keep promising. If your 2026 cash-flow plan assumes a second-half price rally, stress-test it against milk staying near $20.70 and see whether the year still closes in the black.

Is Your Breakeven Number Written Down — or Just a Feeling?

Here’s the one risk-management question most operators aren’t asking out loud: What’s the lowest mailbox price and margin over full cost you can ride for 12 straight months before you’re forced to cut cows, change the model, or get out — and what protection actually kicks in at that line?

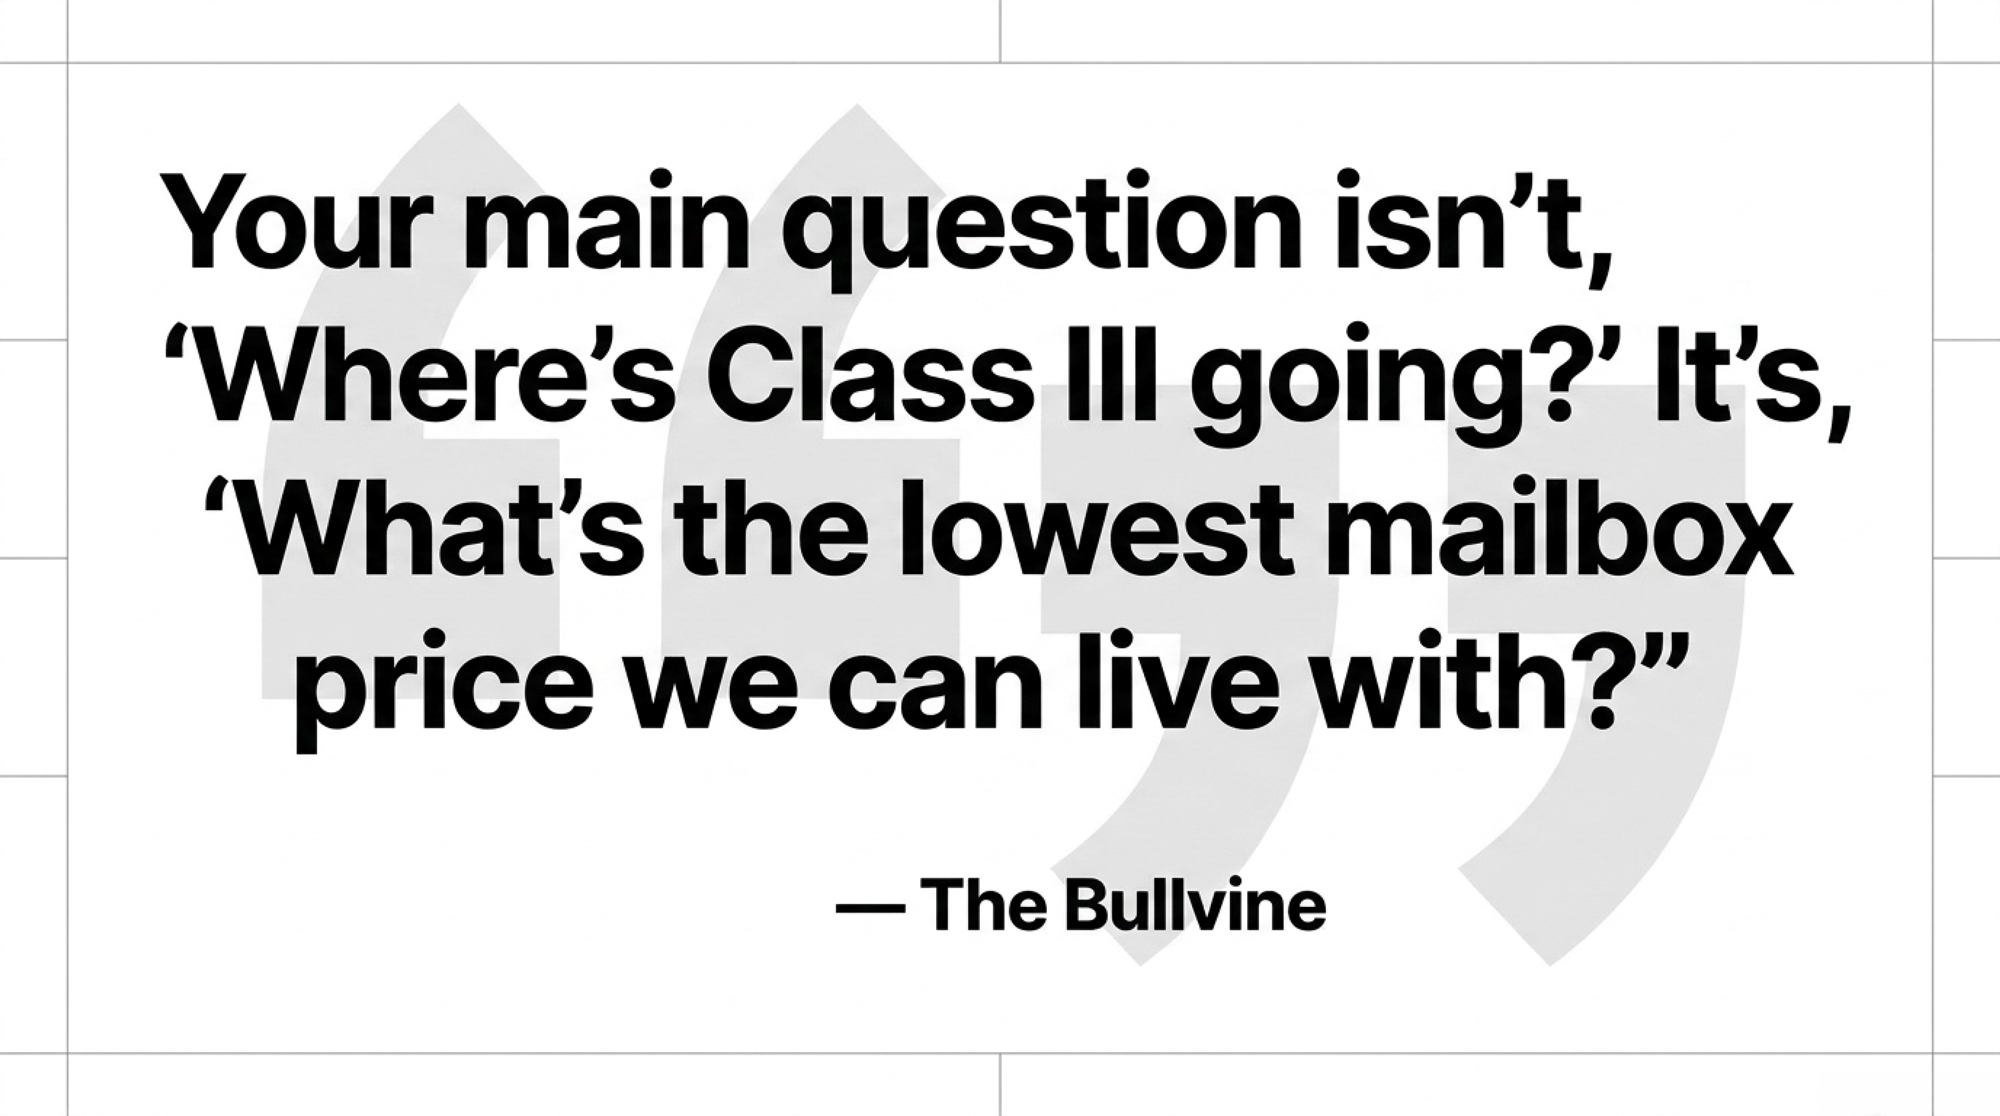
Most producers can rattle off their rolling herd average from memory but can’t name that floor. The Bullvine said it plainly: “Your main question isn’t, ‘Where’s Class III going?’ It’s, ‘What’s the lowest mailbox price we can live with and still pay the bills and keep the lender comfortable?'”

Write the number down. Then tie specific hedges, DMC coverage, and cull triggers to it.

If you can’t name it, you’re not managing risk — you’re hoping the wall of milk spares your yard.

Options and Trade-Offs

Producers are handling this squeeze a few different ways. None is a silver bullet, and each one costs you something. Here’s how they stack up — scan the bold, then dig into the one that fits your operation:

  • Layer DMC and Dairy-RP together: This remains a no-brainer for 2026, especially with the 6-million-pound Tier 1 bump. Just remember: DMC only protects your first slice; Dairy-RP has to handle the rest without capping your upside too heavily if the market rallies.
Protection ToolCoverage TriggerMax Covered VolumeApprox. Annual PremiumAddresses Structural Cut?Lender Comfort?
DMC Tier 1 (2026)Margin < $9.50/cwt6M lbs (~75 cows)~$800–$1,200 subsidizedNo — formula loss not a DMC triggerPartial — floor on first slice only
DMC Tier 2Margin < $9.50/cwtUnlimited (unsubsidized)Rises steeply above 6M lbsNoPartial
Dairy-RP (Class III/IV floor)Declared price < insured levelUp to ~100% of production$0.05–$0.15/cwt depending on coverage %Yes — if floor set below current pricesYes — quantifiable hedge
DMC + Dairy-RP layeredCombined triggersFull production volume$0.08–$0.20/cwt combinedBest availableStrongest lender case
No program$0NoDSCR risk: <1.0x on many 1,000-cow herds
Futures hedge onlyCBOT Class IIIVariableBasis risk + margin callsPartial — doesn’t recover formula lossDepends on structure
  • Run a “No-Program” DSCR Test within 30 days: Calculate your debt-service coverage ratio without any safety-net payments. If your herd sits below the 1.15x–1.25x benchmark your bank demands — The Bullvine’s 400-cow analysis found one at just 0.9x even after a $16,600 DMC “win” — you need a proactive conversation with your lender today, not at loan renewal.
  • Audit your basis and your buyer: This matters most in manufacturing regions, where plant closures or consolidation can widen basis $2–3/cwt. The risk you can’t hedge is the one to name out loud: a buyer that simply stops taking your extra milk.
  • Tighten breeding and replacement decisions before the cushions thin: Beef-on-dairy premiums and strong cull prices have been quietly masking the milk-margin problem — and both could face pressure by late 2026. The trade-off is real: more dairy replacements means giving up some beef-cross cash flow today.

Key Takeaways

  • If you ship to a Class III/IV-heavy order, treat roughly $0.90/cwt of your 2025–26 price drop as structural, not market — and build your cash flow as if it’s permanent.
  • Multiply your annual cwt by $0.90. If that number rattles you (a 1,000-cow herd: about $262,000; a 2,500-cow herd: north of $650,000), it belongs in your 2026 budget, not your blind spot.
  • Run your DSCR without program payments this month. If it’s under 1.0x, that’s a lender conversation now — not at renewal.
  • Don’t budget around a global supply rescue. Rabobank still has 2026 production up about 1%, and even the EU is edging up, not down — so the relief is a late-2026-into-2027 story at best.
  • Watch your cushions. If beef-on-dairy premiums or cull prices soften while milk stays flat, the margin you thought you had disappears fast.
  • Write down your 12-month floor — the lowest mailbox price you can survive — and attach a specific action to it before futures test that line.

So — Where Does Your Floor Actually Sit?

If milk holds near $20.70 and that make-allowance cut stays baked in, can your operation run 12 months at that number without leaning on the cushions? It’s not rhetorical. It’s the question your lender will ask at renewal, and the one your milk buyer is already modeling.

Pull last June’s milk check and this one, lay them side by side, and see how much of the gap you can actually explain. The part you can’t? Some of that is the formula.

Calculate Your Structural Make-Allowance Hit

Enter your herd size or annual milk volume to see the real impact of the USDA formula shift on your operation.

cows
lbs/day

Calculated Annual Shipped Vol. 292,000 cwt
Estimated Annual Margin Loss $262,800
Monthly Cash Flow Hit: $21,900 / mo

*Based on a baseline structural loss midpoint of $0.90/cwt across Class III and Class IV pricing formulas following the June 1, 2025 FMMO modifications.

Editor’s Note: The 1,000-cow operation described below is a composite scenario, modeled from typical Upper Midwest herds shipping to Class III and IV markets. It does not represent any single real farm. The dollar figures are drawn from USDA, the American Farm Bureau, and published Bullvine calculations, as cited throughout.

Learn More

The Sunday Read Dairy Professionals Don’t Skip.

Every week, thousands of producers, breeders, and industry insiders open Bullvine Weekly for genetics insights, market shifts, and profit strategies they won’t find anywhere else. One email. Five minutes. Smarter decisions all week.
NewsSubscribe
First
Last
Consent

The $20 Milk Paradox: Why a 1,000‑Cow Midwest Dairy Canclled Its 400‑Cow Barn Expansion

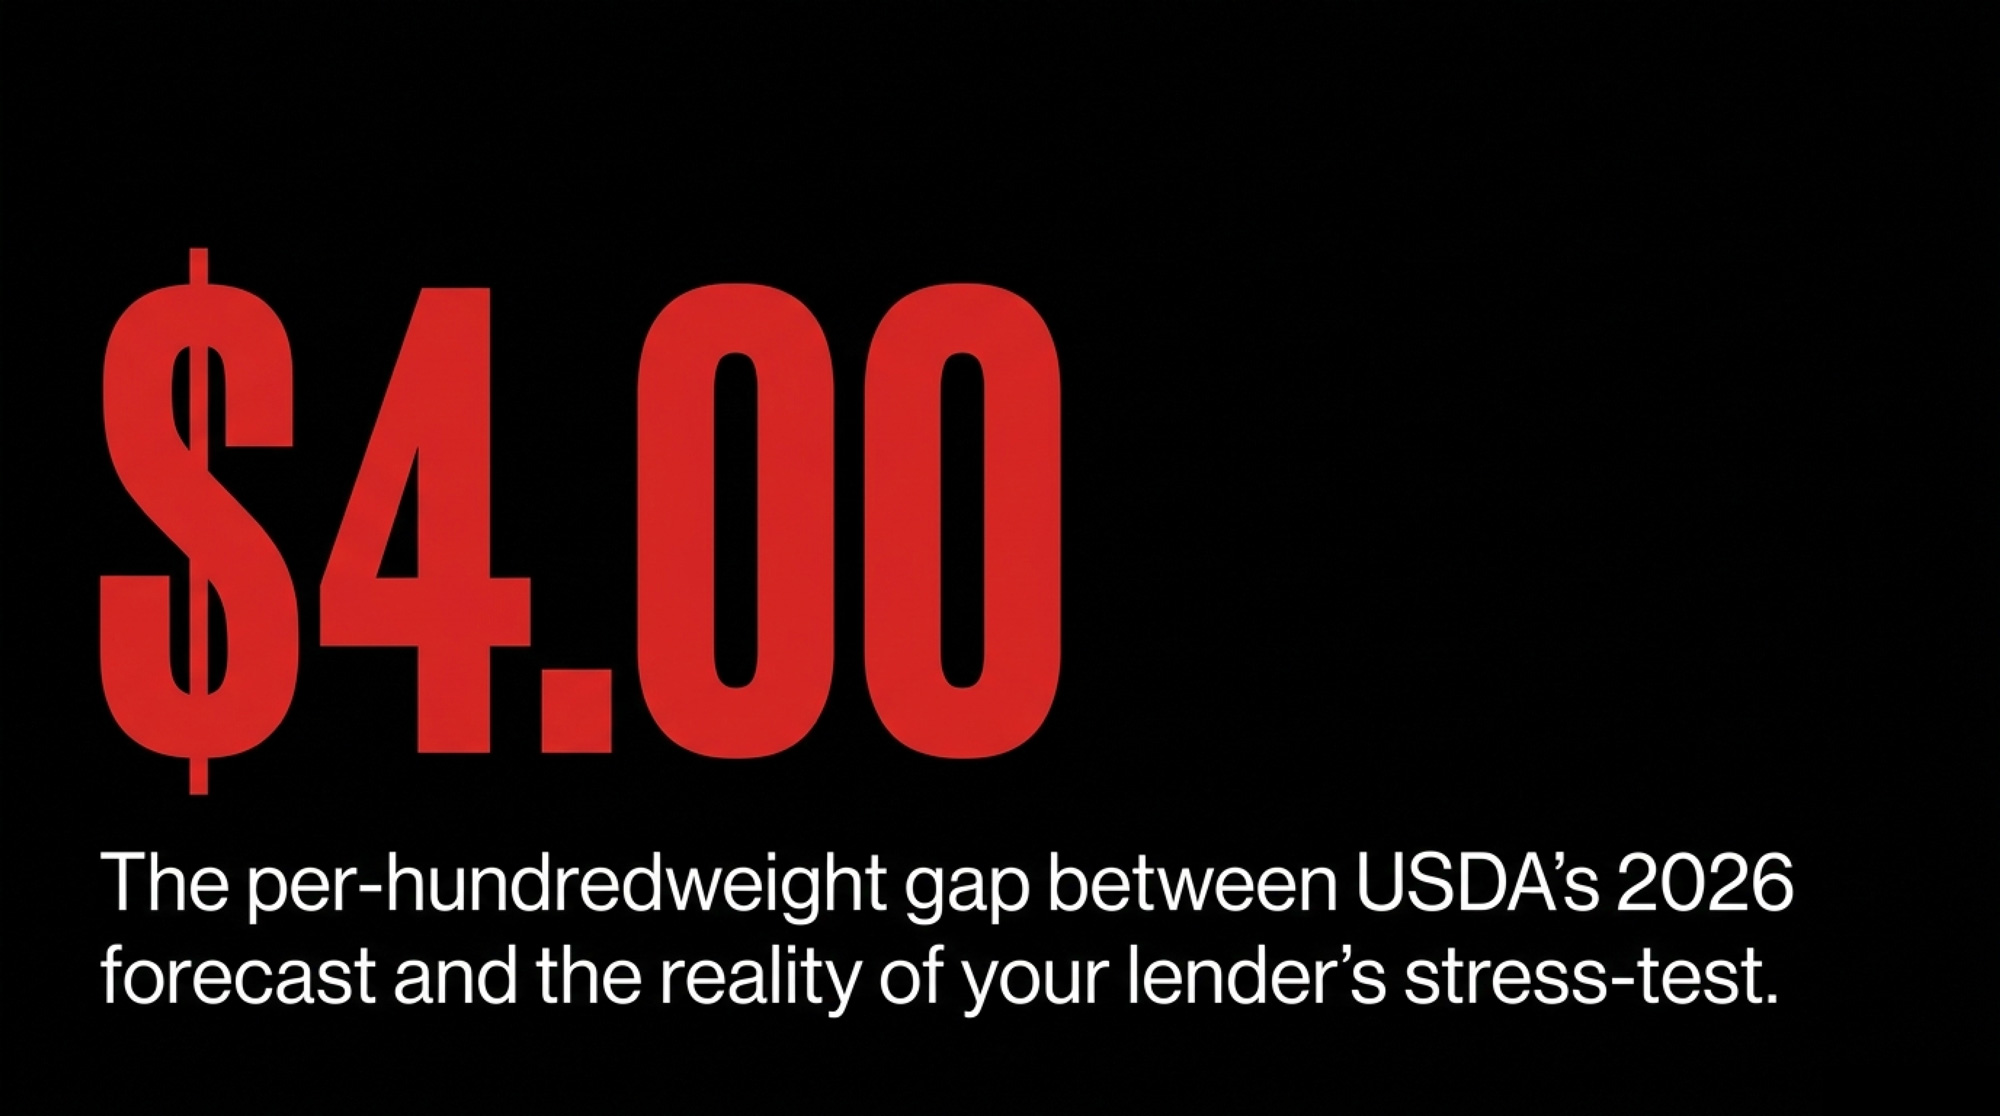
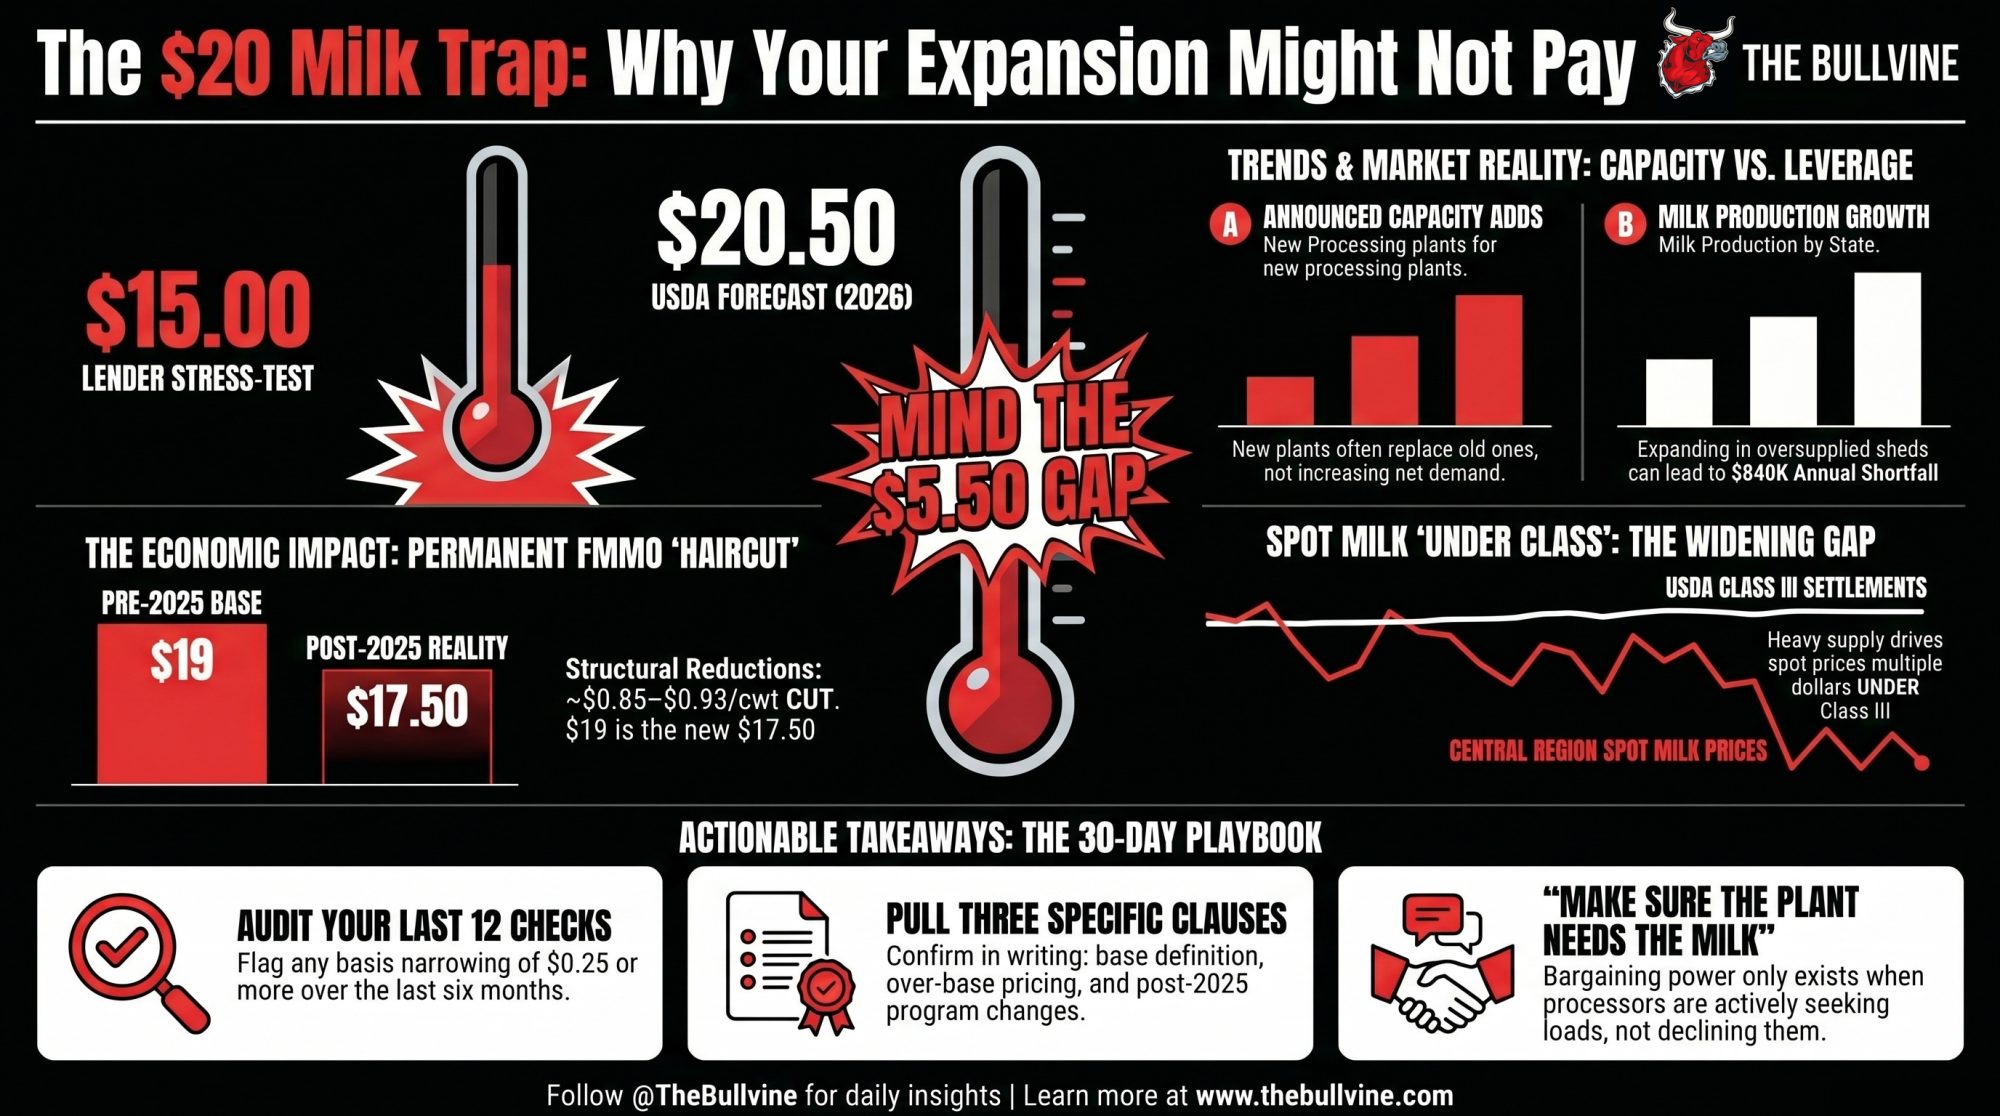
USDA printed $20.50 milk. His lender stress‑tested at $15. His basis had narrowed a quarter. The 400‑cow barn died on the kitchen table — and the $4/cwt gap is why.

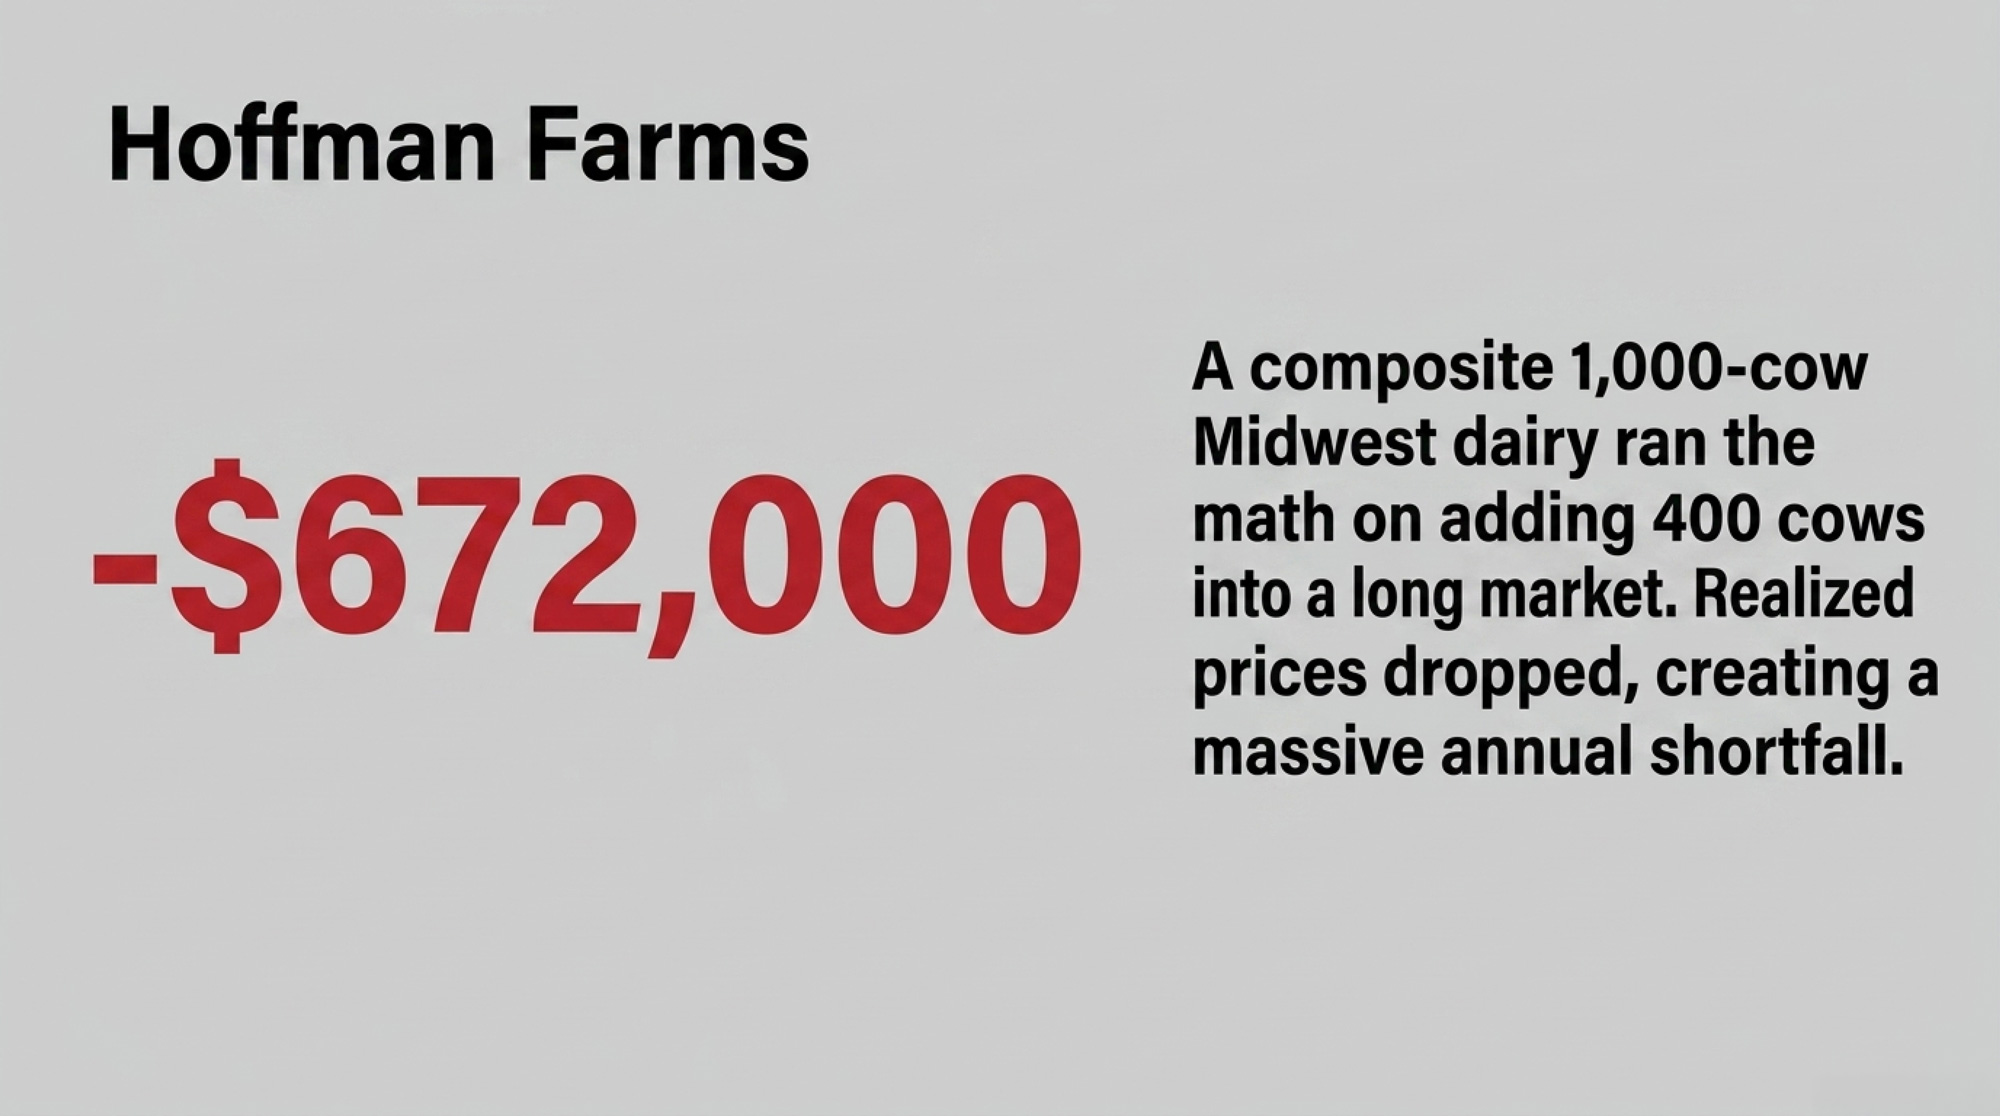
Executive Summary: USDA ERS is printing $20.50/cwt all‑milk for 2026, but the lender stress case under every expansion conversation right now sits at $15. That $4/cwt gap is where this year’s basis‑risk story lives. When Leprino opened Lubbock, it closed Lemoore East — capacity moved, it didn’t stack — and USDA DMN Central the week of April 16 described spot milk as readily available, running multiple dollars under Class III. The June 1, 2025, FMMO amendments permanently cut class prices by roughly $0.85–$0.93/cwt, so a $19 pro forma is really the new $17.50 before basis or premiums. A composite 1,000‑cow Central‑region Midwest dairy ran the numbers on a 400‑cow barn add and walked: Scenario C pencils at ~$15.00/cwt realized against a $19–$20+/cwt full‑cost range for larger U.S. operations — a $672K–$840K+ annual shortfall before new debt service. Diversifying 40,000 cwt to a second buyer adds ~$182K/year without a shovel in the ground. Before you sign a construction loan, pull the three clauses — how base is defined, how over‑base is priced this period, and what changed post‑June 1, 2025.

2026 dairy basis risk

A $19/cwt pro forma sat on one side of the kitchen table. A $15/cwt stress case sat on the other. The operator of a 1,000‑cow Central‑region Midwest dairy we’ll call Hoffman Farms — a composite built from documented 2026 USDA, HighGround Dairy, and Ever.Ag data — pulled his last twelve milk checks and ran the math himself.

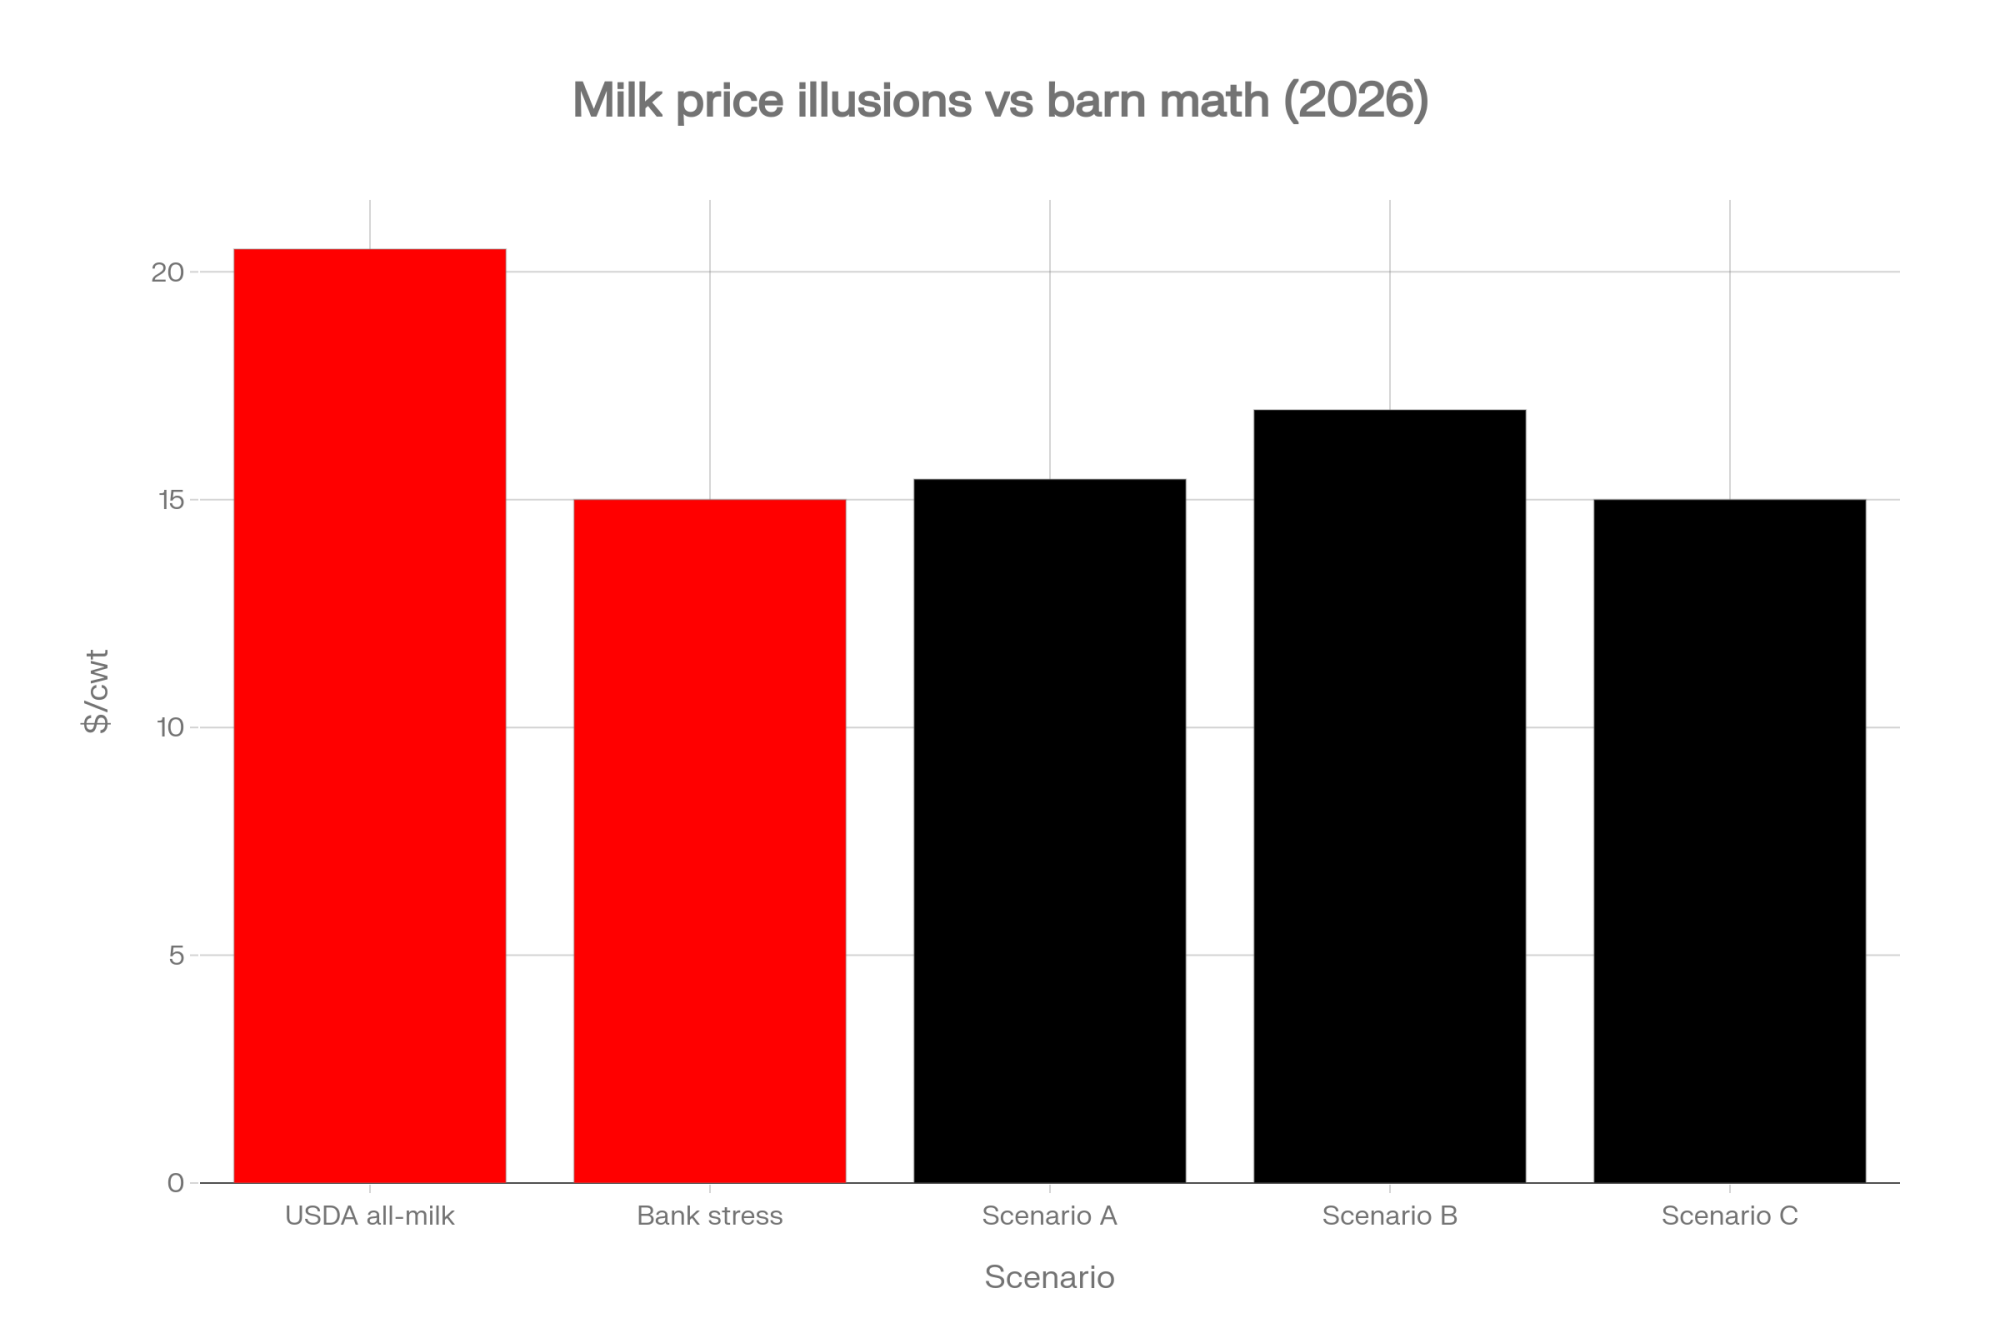
His realized $/cwt minus Class III had drifted the wrong way through the back half of 2025 and into Q1 2026, exactly while the trade press celebrated roughly $11 billion in new U.S. processing capacity. His basis to Class III had narrowed by more than a quarter over six months — a working threshold some advisors flag as shed‑level pressure. USDA ERS’s April 2026 Livestock, Dairy, and Poultry Outlook was printing $20.50/cwt all‑milk, $16.90 Class III, $18.60 Class IV. His lender’s 400‑cow barn‑add pro forma came in at $19. The stress case came in at $15.

He walked away from the 400 cows.

Hoffman Farms is a composite — a stand‑in for a 1,000‑cow Midwest operation sitting inside USDA Dairy Market News’ Central reporting region. The math, the contract questions, and the decision triggers are real and sourced. The farm is not. A full methodology note sits at the bottom of this piece.

The $4/cwt gap between USDA’s headline and the lender stress case is where the 2026 dairy basis risk story actually lives. This isn’t a piece about where Class III settles. It’s about bargaining power — whether your plant needs your milk badly enough that a $20‑handle actually lands in your mailbox, or whether you’ve quietly become the balancing tank for a shed that already has more milk than it needs.

Bullvine’s “$19 Milk Trap” analysis from April 6, 2026, walked through the covenant‑pressure sequence in detail. This piece picks up where that one ended: what happens when the pro forma and the stress case sit $4 apart, and the 400 cows are your decision.

The $11 Billion Capacity Story vs. What USDA DMN Actually Said in April 2026

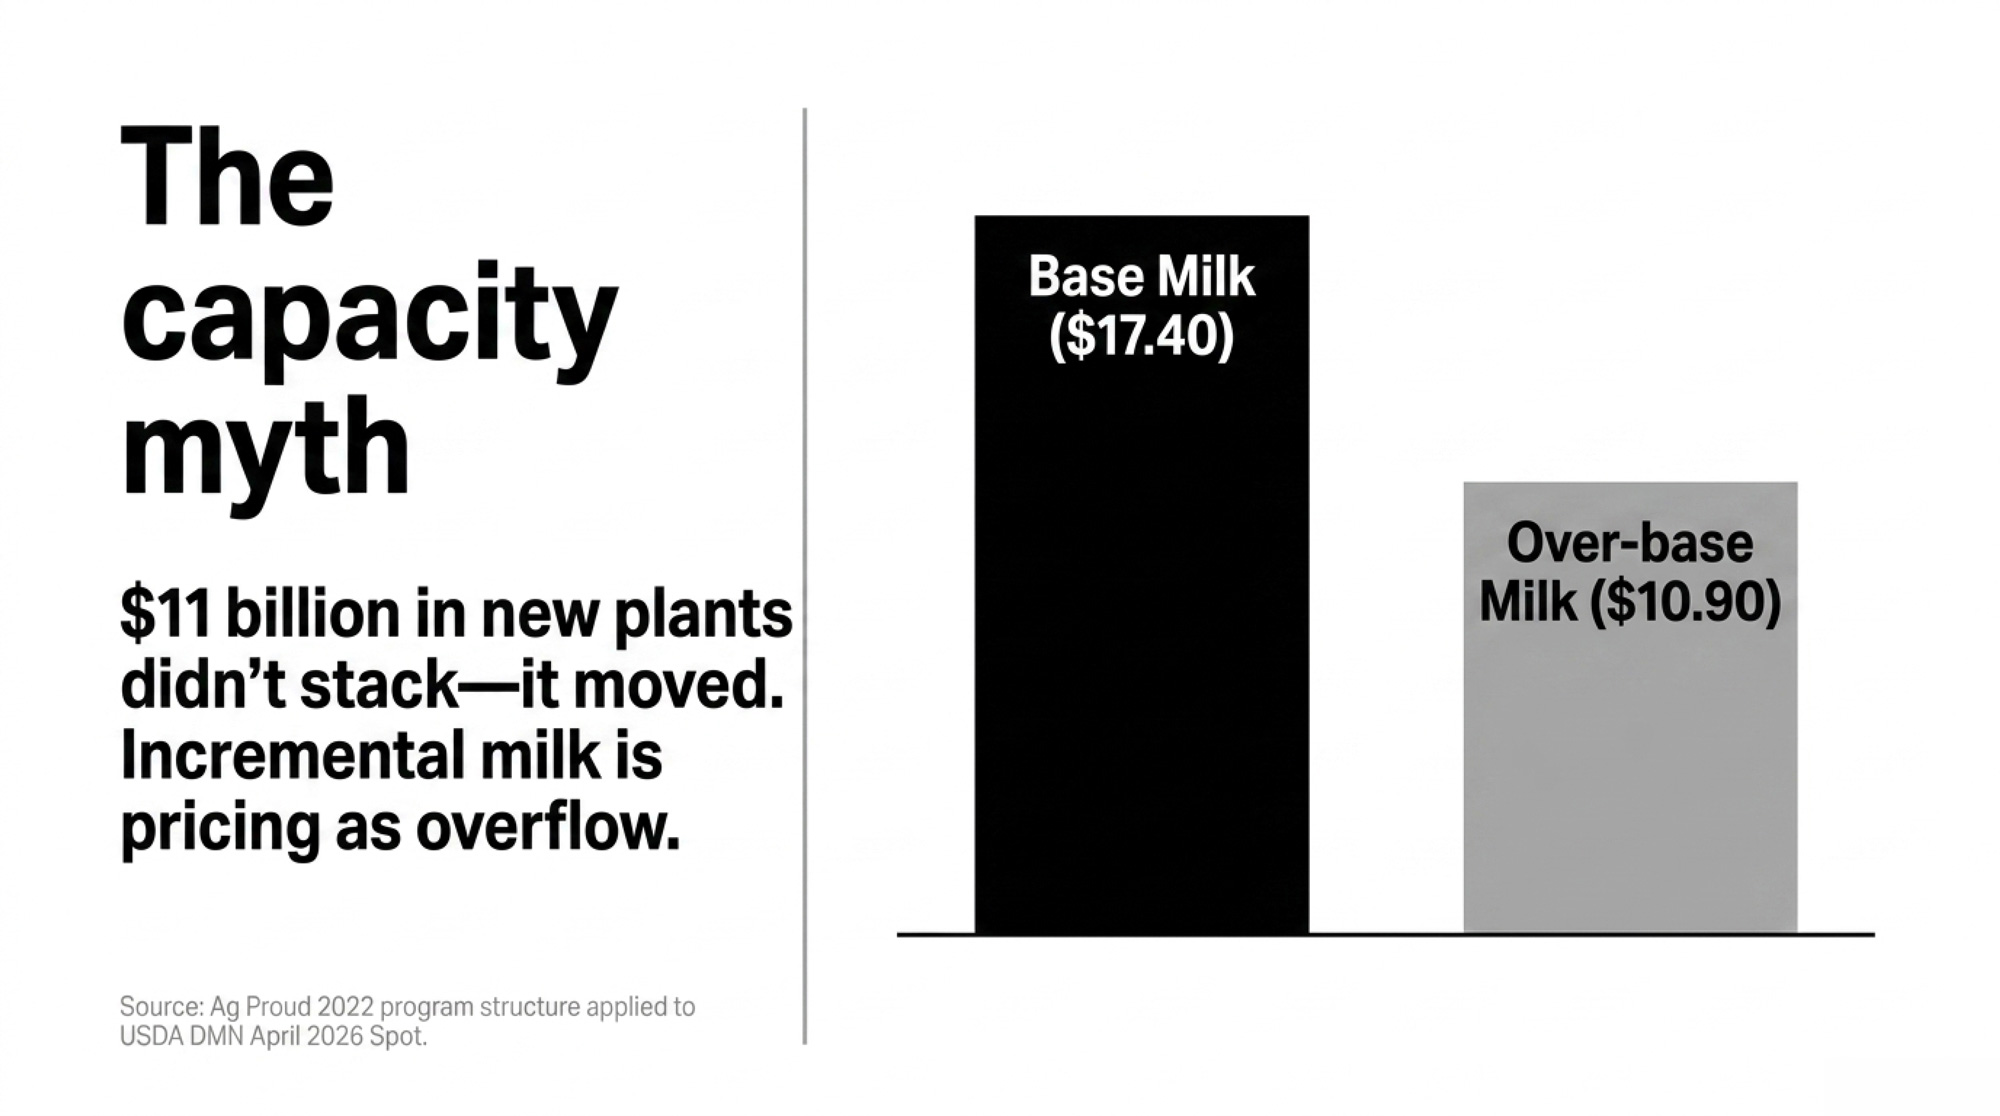
Everyone assumed more capacity meant better leverage for growing Midwest herds. The numbers looked right on the surface. Roughly $11 billion in announced U.S. processing capacity across more than 50 projects running through 2028, based on IDFA‑tracked project lists compiled by HART Design as of October 2025. Named plants, real commitments — Leprino’s Lubbock, Texas facility, Hilmar’s Dodge City, Kansas build, Darigold’s Pasco, Washington expansion, Chobani’s Twin Falls project.

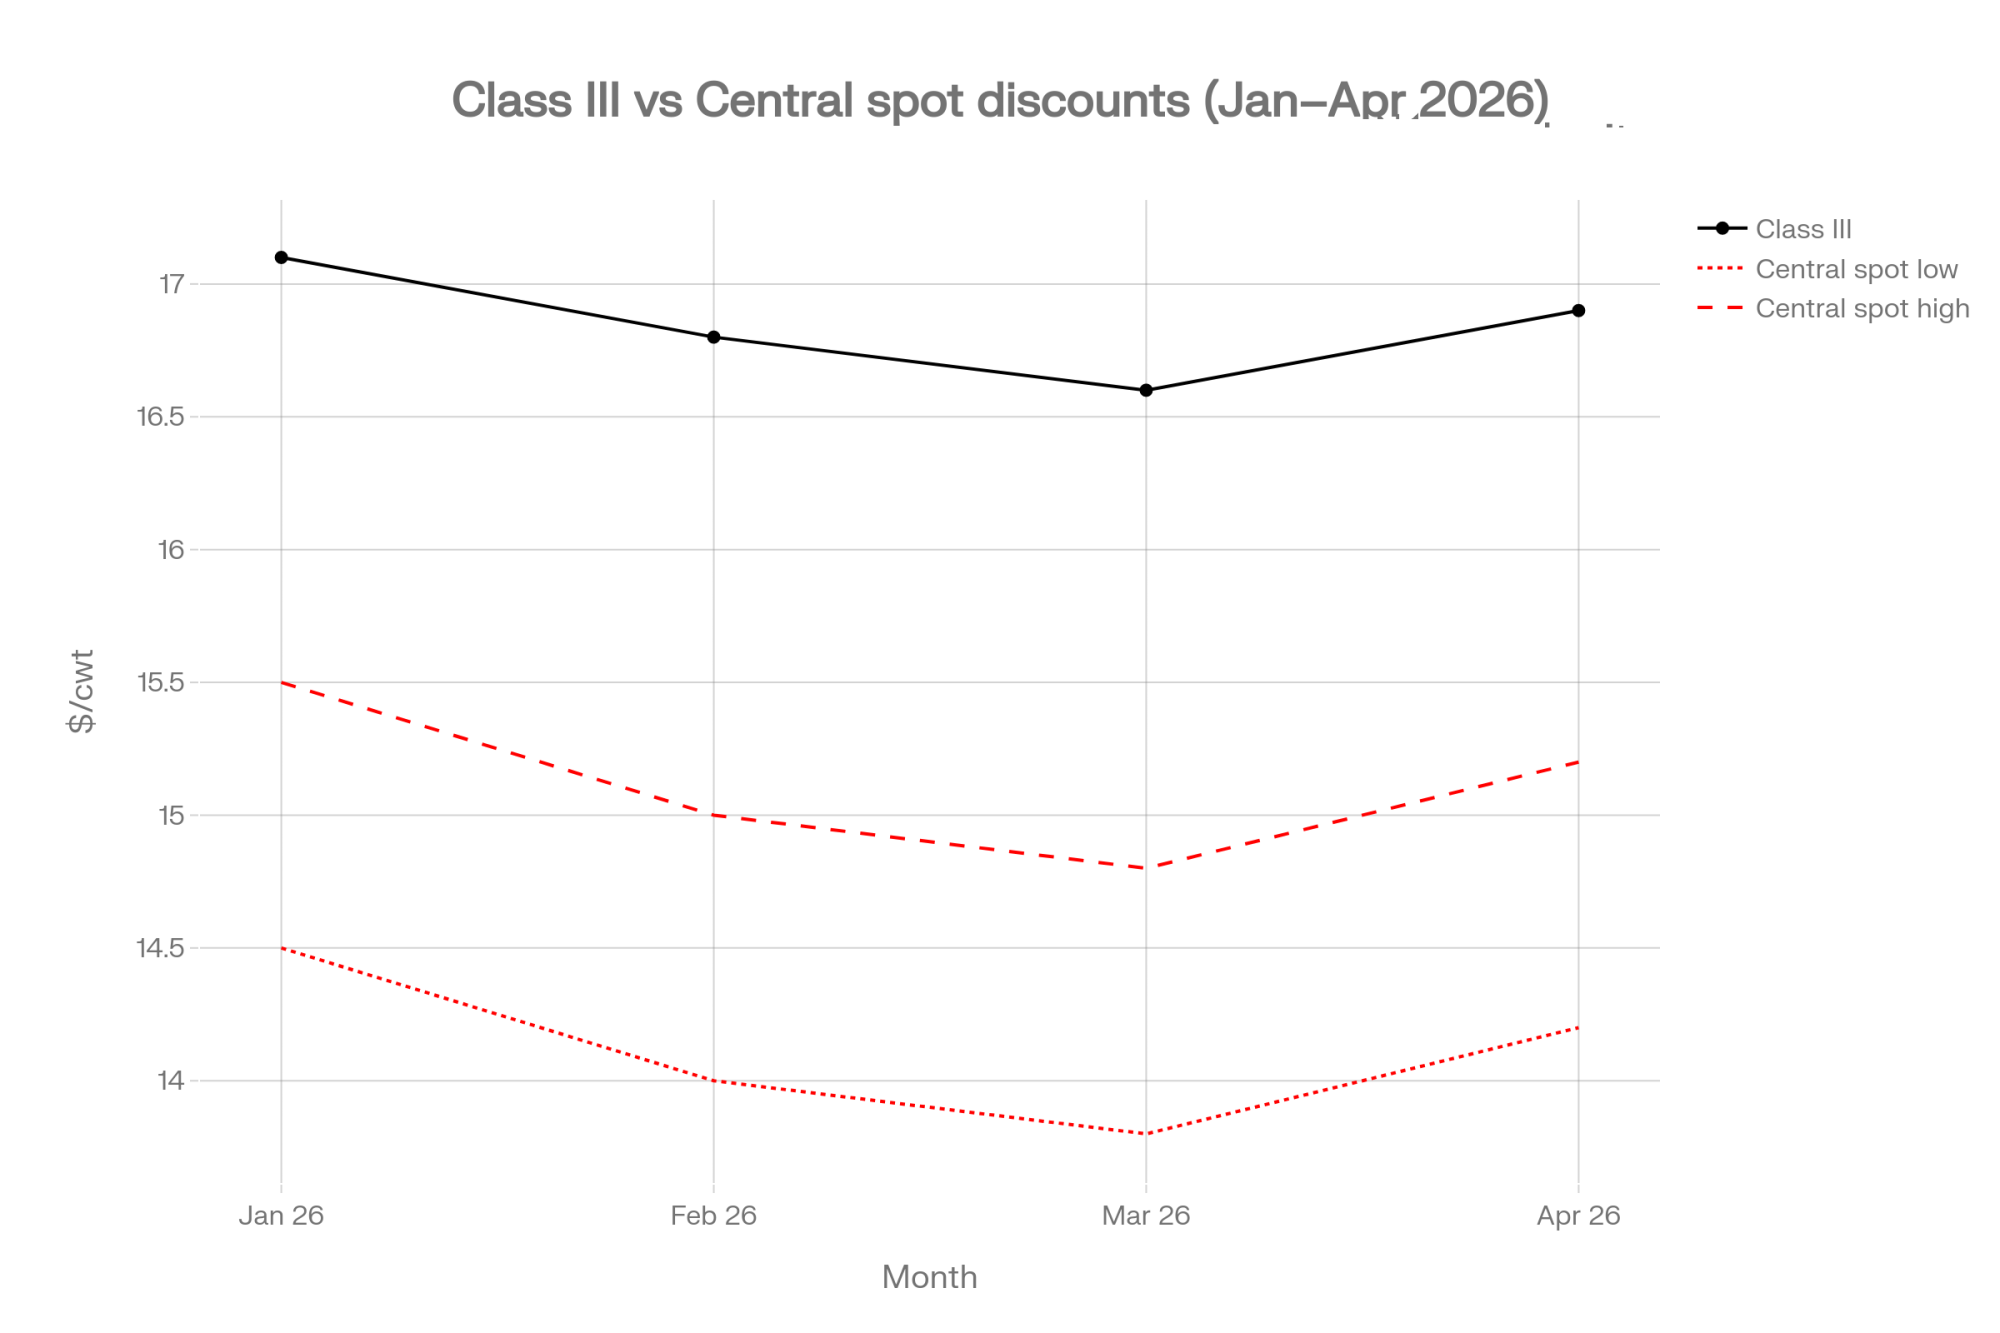
Open USDA Dairy Market News for the week of April 16, 2026, and the story changes. Central region commentary describes spot milk as readily available, with Class III spot pricing running multiple dollars under Class across recent weeks. Ever.Ag’s Milk Premiums report from the same date echoes it: Central Valley manufacturers reporting ample milk, buyers declining incoming loads because hauling distances had become uneconomic.

In reporting by the Fresno Bee in December 2025 and KMPH in November 2025, Leprino cited added capacity from its new Lubbock plant among the reasons for the late‑2025 Lemoore East closure. Capacity didn’t stack on top of California demand. It moved. The milk moved with it. Some California producers who had been shipping into Lemoore East found out the hard way that a capacity announcement somewhere else isn’t the same thing as capacity in their shed.

USDA NASS Milk Production for February 2026 sets the backdrop. U.S. milk up 2.9% year‑over‑year nationally, 3.1% in the 24 major states, with roughly 217,000 more cows than a year earlier. More plants opened. More milk is flowing. Whether the second is outrunning the first in your region is the only question that matters for your check.

What Does Your Lender’s Spreadsheet Actually Say for 2026?

Lenders aren’t being pessimistic. They’re being arithmetic.

Recent industry analysis framed the year around volatility and margin pressure. HighGround Dairy’s Q1 2026 Producer Market Update talks in margin percentiles rather than a single price, flagging H2 2026 as screening in an upper percentile band and urging coverage while it’s on the table. Dairy Herd Management’s May 2025 summary of USDA’s forward outlook captured the sentence lenders internalized for 2026: higher milk output, softer prices. The stress case running through most ag‑lending desks dips into the mid‑teens for six to twelve months.

Hoffman’s co‑op field rep’s tone had shifted over the same stretch — from growth‑friendly language toward supply‑discipline framing. Ever.Ag’s 2026 Milk Premiums weekly reports describe that kind of shift as a leading indicator. It lands before premiums tighten and base/excess programs get enforced more strictly.

When the banker’s stress case and your expansion pro forma disagree by $4/cwt, the equity risk doesn’t split evenly. The bank structured covenants around its number. You structured loan repayment around yours.

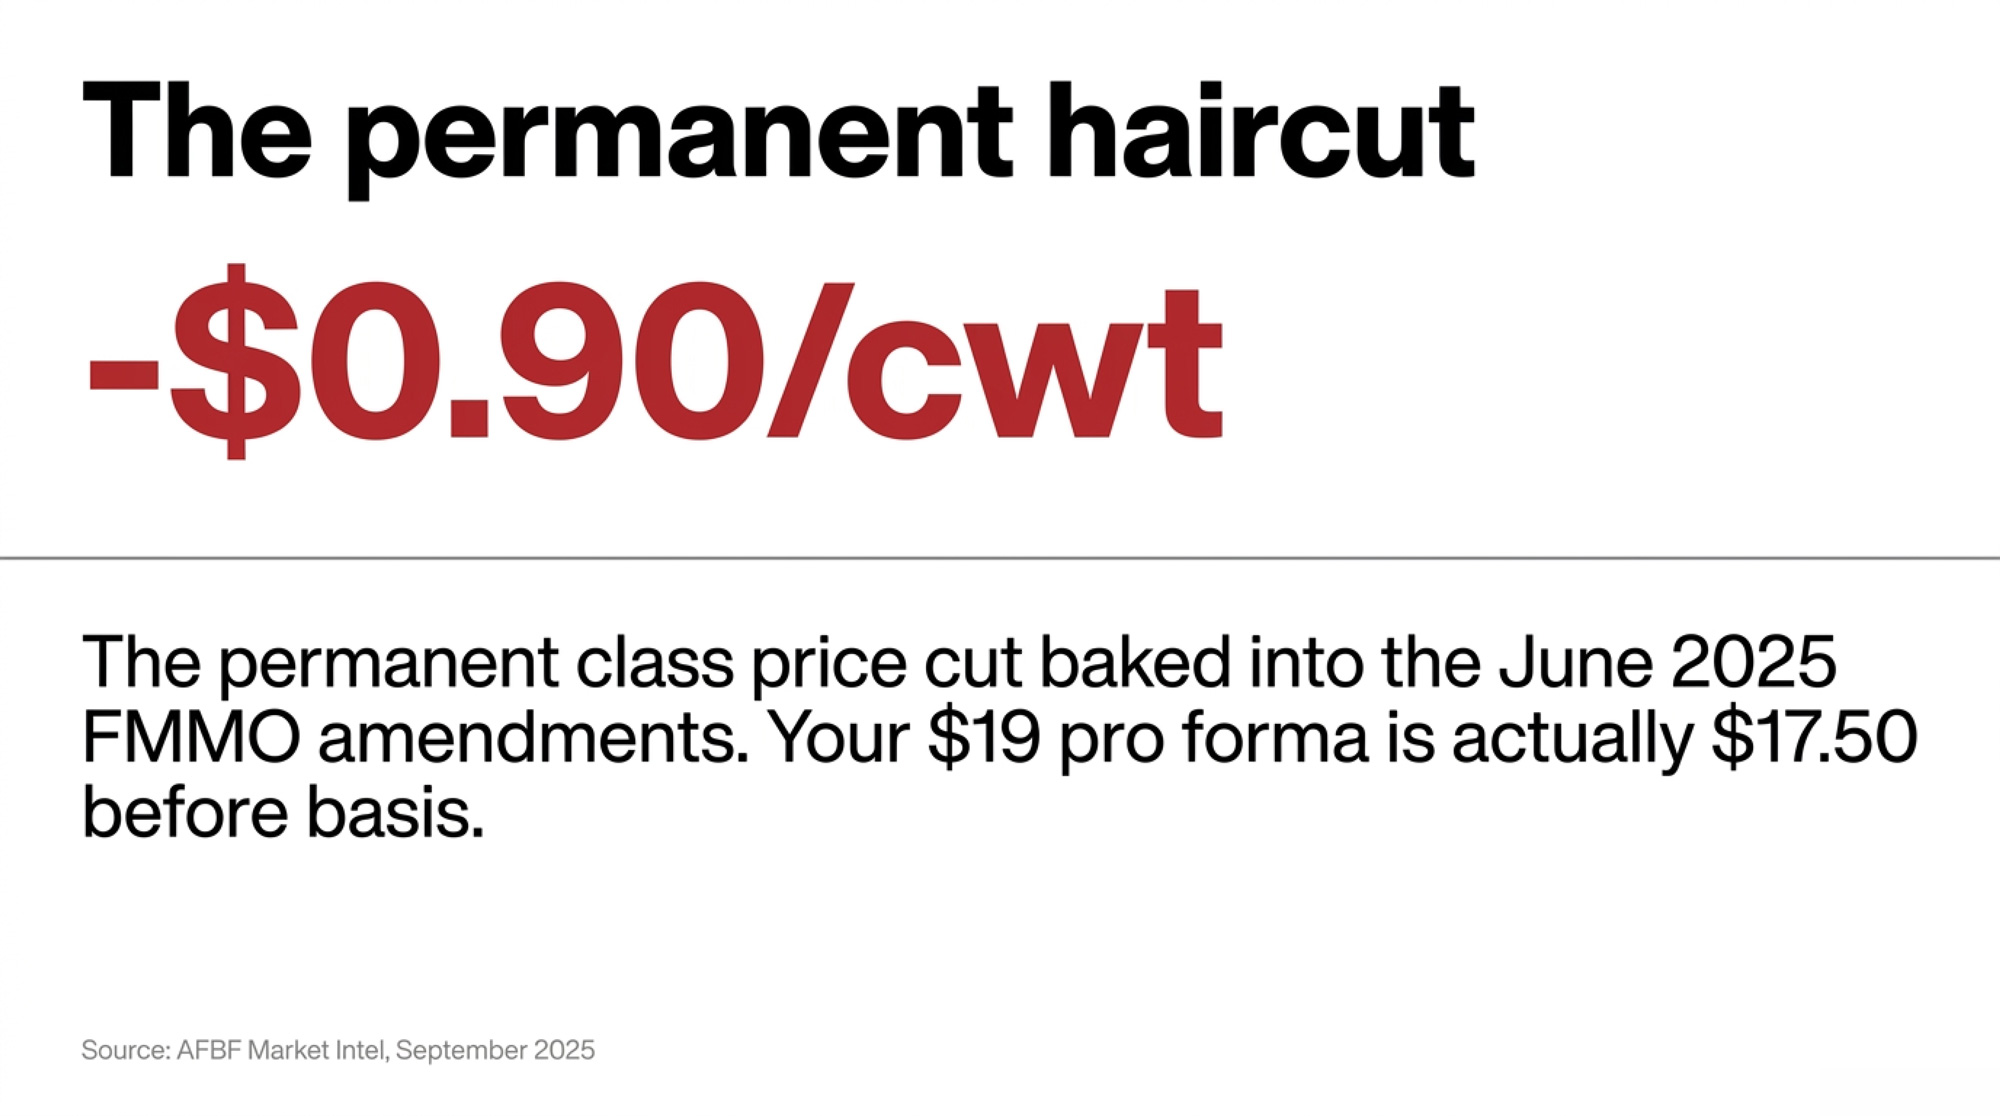
The Hidden Haircut: Why Your $19 Pro Forma Is Really the New $17.50

Every 2026 number carries a structural reduction that wasn’t there three years ago.

The June 1, 2025, FMMO amendments permanently reset the make‑allowance formulas. USDA AMS’s Timeline for Changes to Price Announcements (January 2025) set the new rates: cheese at $0.2519/lb, butter at $0.2272/lb, NFDM at $0.2393/lb, dry whey at $0.2668/lb. American Farm Bureau Federation’s Market Intel (September 23, 2025) tallied the first three months under the new rules at roughly $337 million in lost producer pool value — class prices reduced by approximately $0.85–$0.93/cwt. That haircut doesn’t move with the market. It’s baked in.

In 2026, a $19.00 pro forma is the new $17.50 once you stack the 2025 make‑allowance hit on top of modest realized basis erosion in a long‑milk shed. That’s illustrative, not a single‑line subtraction. The ~$0.85–$0.93/cwt class‑price reduction lands before basis, before premiums, before a single load of spot milk gets discounted. The haircut is structural. It doesn’t disappear when Class III recovers.

When the lender stresses at , they’re modeling a year in which that structural cut and a demand softening show up at the same time. That scenario is well inside the range current 2026 lender framing uses. Covenant pressure arrives before the market resolves the question.

What Does “Overflow Tank Milk” Actually Cost Per Hundredweight?

Everyone in the capacity conversation assumed a $20‑handle all‑milk forecast plus $11 billion in new plants equaled bargaining power for a growing Midwest herd. April 2026 contract mechanics tell a different story.

Western base/excess programs have historically priced over‑base milk at the monthly spot average minus a hauling assessment. In heavy months, that produces meaningful $/cwt drag. One publicly documented example from 2022 — an Ag Proud webinar recap describing one co‑op’s program structure of that era — placed the assessment around $1/cwt and the total drag against contract on the order of $5/cwt. Current co‑op terms vary materially between contract cycles and regions. Verify your own agreement before applying any of those numbers as a hard reference.

Layer April 16, 2026, Central spot milk running multiple dollars under Class III on top of that kind of program structure, per USDA DMN and Ever.Ag, and a mailbox that looks stable on the Class III headline diverges sharply the moment a meaningful share of your volume is priced like overflow rather than base.

The contract question worth asking in writing — not over coffee with the field rep: if you add 400 cows, does that new volume get recognized as base within a defined timeframe, at what terms, starting when? An answer that leaves new milk pegged to monthly spot in a shed already running multiple dollars under Class III is a no. It just doesn’t look like one until the check arrives.

Running the Numbers: Hoffman Farms in Three Scenarios

Three illustrative scenarios for a composite 1,000‑cow Midwest operation shipping ~120,000 cwt/year (expansion case: 1,400 cows, ~168,000 cwt/year). All inputs shown. Substitute your own cwt shipped per cow, your own base/over‑base split, your own contract terms.

April 2026 price anchors (USDA ERS, April 2026 Livestock, Dairy, and Poultry Outlook):

  • Class III: $16.90/cwt
  • All‑milk: $20.50/cwt
  • AFBF make‑allowance hit range: ~$0.85–$0.93/cwt (midpoint $0.90/cwt used for scaling)
ScenarioCowscwt ShippedRealized $/cwtAnnual GrossThe Decision
A: Single Buyer, Long Shed1,000120,000$15.45$1,854,000Basis eroding
B: Diversified — Two Buyers1,000120,000$16.97$2,036,000+$182K vs. A
C: Expand Into a Long Shed1,400168,000$15.00$2,520,000$672K–$840K+ below full cost

Scenario A — Single buyer, long shed:

  • 70% of volume (84,000 cwt) at base: Class III $16.90 + $0.50 illustrative basis = $17.40/cwt
  • 30% of volume (36,000 cwt) at over‑base: Class III $16.90 − $5.00 program drag − $1.00 hauling = $10.90/cwt
  • Weighted average: (84,000 × $17.40 + 36,000 × $10.90) ÷ 120,000 = $15.45/cwt
  • Annual gross: 120,000 × $15.45 = $1,854,000

Scenario B — Two buyers, split volume:

  • 80,000 cwt to Buyer 1 at Class III + $0.25 premium = $17.15/cwt
  • 40,000 cwt to Buyer 2 at Class III − $0.30 extra hauling = $16.60/cwt
  • Weighted average: (80,000 × $17.15 + 40,000 × $16.60) ÷ 120,000 = $16.97/cwt
  • Annual gross: $2,036,000. Gain vs. Scenario A: $1.52/cwt × 120,000 cwt = $182,400/year

Scenario C — Expand into a long market:

  • 168,000 cwt × $15.00 realized = $2,520,000 gross
  • Full‑cost range for larger U.S. dairy operations: $19–$20+/cwt, drawn from Bullvine’s February 2026 cost analysis referencing USDA ERS data for larger U.S. dairy cohorts. Verify the applicable range against your own confirmed cost of production before applying.
  • Total cost: $19.00 × 168,000 = $3,192,000 to $20.00+ × 168,000 = $3,360,000+
  • Shortfall before new expansion debt service: $672,000–$840,000+
ScenarioCowscwt shipped/yearRealized price ($/cwt)Annual gross revenue ($)Position vs full cost ($19–$20/cwt)
A – Single buyer, long shed1,000120,00015.451,854,000≈$420k–$540k short
B – Diversified, two buyers1,000120,00016.972,036,400≈$304k–$484k short
C – Expand into long shed (1,400 cows)1,400168,00015.002,520,000≈$672k–$840k short
USDA ERS 2026 all‑milk headline20.50Looks solvent on paper only

Bullvine’s April 13, 2026, analysis on a ~$3M dairy expansion showed fixed debt service adding meaningful $/cwt drag at a 500‑cow scale. A Hoffman‑scale expansion produces a different absolute number. The direction doesn’t change.

FMMO make‑allowance hit scaled to smaller herds (AFBF range midpoint of ~$0.90/cwt; substitute your realized per‑cwt impact from recent settlements):

  • 300 cows × ~220 cwt/cow/year ≈ 66,000 cwt × $0.90 = $59,400/year
  • 500 cows × ~220 cwt/cow/year ≈ 110,000 cwt × $0.90 = $99,000/year

Plug in your own cwt shipped per cow from your last 12 months of checks to size it to your barn.

Why Protein Wins and Your Commodity Plant Might Not

Merrick Capital (June 2025) and Dairy News Today (December 2025) describe the same sector pattern: processors closing older commodity facilities while investing in higher‑margin specialty product lines. McKinsey’s April 19, 2026, dairy industry analysis framed the 2026 processor playbook as protecting margins while pursuing growth. Farm Credit Canada’s February 2026 outlook identified protein as the forward pay driver. Dairy Reporter’s March 2026 coverage of the 2026 global supply situation made the split explicit: protein and specialty hold value; generic commodity milk in an oversupplied shed loses negotiating position.

In the composite Hoffman scenario, the plant sits on the commodity side of that split — a profile that fits a meaningful share of Central‑region facilities, though not all. Adding 400 cows into a long shed tied to a plant with no visible premium‑product trajectory isn’t growth. It’s volunteering to be the region’s balancing supply at the worst moment in the cycle to be the marginal hundredweight.

The equity risk doesn’t split evenly. When your pro forma and your lender’s stress case disagree by $4/cwt, that gap lands entirely in your equity column. Readers who want the lived version of this math — a multi‑generation family dairy that chose consolidation over expansion — can follow Bullvine’s legacy‑family features for the human side of the decision.

The 30/90/365‑Day Playbook for Herds Like Hoffman’s

30 Days — Do These Before Any Other Expansion Conversation

  • Audit your last 12 milk checks. Calculate realized $/cwt minus Class III, month by month. Requires: 12 months of settlement statements and an hour. Threshold: basis to Class III narrowing $0.25/cwt or more over six months while national capacity headlines grew is a yellow flag on your shed position. Backfire watch: a single month’s component swing distorts a short window — use the full 12.
  • Pull USDA Dairy Market News for your region. Read the actual language, not the headline price. If commentary describes spot loads available with buyers selective on hauling distance, that’s your plant’s real signal — not USDA ERS’s national all‑milk number. Threshold: language indicating buyers declining loads on distance grounds is a yellow flag on your over‑base exposure.
  • Ask your co‑op or processor in writing: how is base defined this contract period, how is over‑base priced, and what changed in programs or premiums after the June 1, 2025, FMMO amendments? Requires: a written request. Verbal answers from field reps aren’t binding. Backfire watch: assuming last cycle’s terms still apply.
  • Red‑flag trigger: if your DSCR has been under 1.2 for three consecutive months using your lender’s or CPA’s method, stop expansion conversations and move this list to the front of the stack.

90 Days — Structural Moves That Require Planning

  • Stress‑test your DSCR at $15 milk against your current debt load and cost structure. Share results with your lender and ask directly: which scenario are your covenants built on? Requires: 12 months of checks, a verified cost of production that includes family living and deferred maintenance, a meeting with your lender or CPA. Backfire watch: a cost estimate that excludes those lines produces a number that looks better than your bank’s.
  • Price a realistic second‑buyer option for 20–40% of your volume. Get written hauling quotes from two carriers and a written term sheet from a second buyer before comparing. If incremental hauling comes back in the low‑cents‑per‑cwt range and your current over‑base penalty is $1/cwt or more, diversification pencils before sentiment enters the math. Bullvine’s prior processor bidding‑war and milk‑routing analysis carries the negotiation framework. Backfire watch: hauling quotes that don’t hold through winter, or a second buyer equally long on milk.
  • Lock a written risk‑management policy — what percentage of milk you’ll cover via Dairy Revenue Protection or options, and at what margin triggers. HighGround Dairy’s Q1 2026 framing of H2 2026 margins in an upper percentile band is a timing reference, not a ceiling. Backfire watch: coverage structured without reference to your verified cost of production.

365 Days — Positioning for the Next Cycle

  • Decide whether your operation competes on cost, components, or both. Farm Credit Canada’s February 2026 outlook and other recent analysis point to protein as the forward pay driver. Bullvine’s component‑focused sire selection and herd management coverage is the right companion for this decision. Backfire watch: investing in component genetics without a plant that pays a meaningful protein premium in writing.
  • Evaluate beef‑on‑dairy as a line item in your margin math, not a bonus. Recent commentary flagged beef‑on‑dairy adding $5/cwt or more in some Northeast operations. Midwest and Western calf markets price differently and seasonally. Use your own local auction data, not a regional average from a different geography. Backfire watch: beef‑on‑dairy income masking a structurally weak milk contract underneath.
  • Opportunity signal: if your basis to Class III re‑widens to a 12‑month high while your mailbox stays above your verified full cost for two consecutive quarters, your plant is telling you it needs your milk. That’s the window to renegotiate base volume, premiums, and hauling terms — not when everyone else in the shed is asking the same question. Backfire watch: confusing a seasonal demand flush with a structural capacity shift; check USDA DMN language for your region before moving.

When Does the 400‑Cow Add Still Pencil in 2026?

Not every expansion is the wrong call this year. Three conditions have to line up at once.

First: a capacity‑short shed where USDA DMN language reads as processors actively seeking loads, not spot loads available — the opposite of what Central region commentary showed the week of April 16, 2026. Second: a plant tied to a premium‑product line — growth cheese, high‑protein ingredients, specialty formats — with a track record of paying for it, consistent with McKinsey’s April 2026 and Farm Credit Canada’s February 2026 framing of where processor margins are actually coming from. Third: a co‑op willing to move new volume into base at full contract terms inside a defined timeframe, in writing, not verbally.

Fail any one of those three tests and your expansion math isn’t wrong because of your operation. It’s wrong because you’re borrowing leverage from a shed that hasn’t given it to you yet. You gain scale economics by building. You give up the bargaining position you currently hold if the shed doesn’t need the milk.

The Contract Check That Should End Every 2026 Expansion Meeting

In the composite Hoffman scenario, the 400 cows didn’t die forever. They died at this price, in this shed, with this contract.

The operator’s agreement would have treated new milk as over‑base, priced off monthly spot. April 2026 Central spot ran multiple dollars under Class III on bad weeks, per USDA DMN and Ever.Ag. The lender’s stress case was $15. USDA’s headline was $20.50. Those four numbers don’t reconcile on paper. So the barn doesn’t get built.

Before your next contract renewal or expansion meeting, pull the document and find three specific clauses: how base is defined, how over‑base is priced in the current contract period, and what programs or assessments changed after June 1, 2025. If you can’t answer all three from the written document before you sign a construction loan, you don’t actually know your own 2026 milk price. You know someone else’s projection.

Clause to pull in writingLow‑risk answer (build‑worthy)High‑risk answer (treat as red flag)
How base volume is definedCurrent volume plus planned 400 cows added as base within 6–12 months under written termsNew 400 cows treated as over‑base indefinitely with no written path to base
How over‑base milk is pricedOver‑base tied close to Class III with modest hauling adjustment (≤$1/cwt drag)Over‑base pegged to monthly spot minus program drag and hauling in a long shed
Changes after June 1, 2025Make‑allowance impact acknowledged and premiums adjusted to partially offset haircutPrograms tightened, premiums trimmed, make‑allowance cut passed straight through
Lender’s stress‑test assumptionCovenants modeled at or below your own verified stress number (≈$15/cwt)Bank underwriting at $15 while your pro forma assumes $19–$20 with no basis adjustment

The bottom line: In 2026, the most profitable move isn’t building a bigger tank. It’s making sure your plant actually needs the milk already in it.

Scale economics favor building. Bargaining power doesn’t — not in a shed that’s already long.

What does your current processor contract actually say about how your next 400 cows get paid when your plant is already long on milk — and whose stress‑test number is your equity riding on, yours or your lender’s?

Key Takeaways

  • A $20.50 USDA headline and a $15 lender stress case don’t reconcile. If your expansion pro forma lives in the middle, the $4/cwt gap lands entirely in your equity, not the bank’s.
  • Capacity moved, it didn’t stack. Read USDA DMN language for your shed before you read the national price — if buyers are declining loads on hauling distance, your incremental milk is overflow, not growth.
  • The June 1, 2025, FMMO amendments cut class prices by roughly $0.85–$0.93/cwt, and that haircut is permanent. A $19 pro forma is really the new $17.50 before basis or premiums.
  • Before you sign a construction loan, pull three clauses in writing: how base is defined, how over‑base is priced this period, and what changed post‑June 1, 2025. If you can’t answer all three, you don’t know your own 2026 milk price.

Methodology note: Hoffman Farms, his plant, his co‑op field rep, and his lender are composites constructed from documented 2026 sources: USDA ERS, USDA NASS, USDA AMS, USDA DMN, AFBF Market Intel, HighGround Dairy, Ever.Ag, McKinsey, Farm Credit Canada, Dairy Herd Management, Merrick Capital, Fresno Bee, KMPH, IDFA/HART Design, and Bullvine analysis. The math, contract questions, and decision triggers apply to real operations of this profile; the specific farm does not exist. Scenario inputs use USDA ERS April 2026 Livestock, Dairy, and Poultry Outlook prices ($20.50 all‑milk, $16.90 Class III, $18.60 Class IV), USDA AMS January 2025 make‑allowance figures (cheese $0.2519/lb, butter $0.2272/lb, NFDM $0.2393/lb, dry whey $0.2668/lb), USDA DMN and Ever.Ag April 16, 2026 Central and Central Valley spot milk commentary, and program‑structure context from an Ag Proud April 2022 webinar recap describing one co‑op’s program structure of that era. The $19–$20+/cwt full‑cost range used in Scenario C is drawn from Bullvine’s February 2026 cost analysis referencing USDA ERS data for larger U.S. dairy cohorts; verify the applicable range against your own operation’s confirmed cost of production before use. Co‑op program terms evolve — verify current contract language against your own agreement before applying scenario numbers to your operation.

Learn More

The Sunday Read Dairy Professionals Don’t Skip.

Every week, thousands of producers, breeders, and industry insiders open Bullvine Weekly for genetics insights, market shifts, and profit strategies they won’t find anywhere else. One email. Five minutes. Smarter decisions all week.
NewsSubscribe
First
Last
Consent

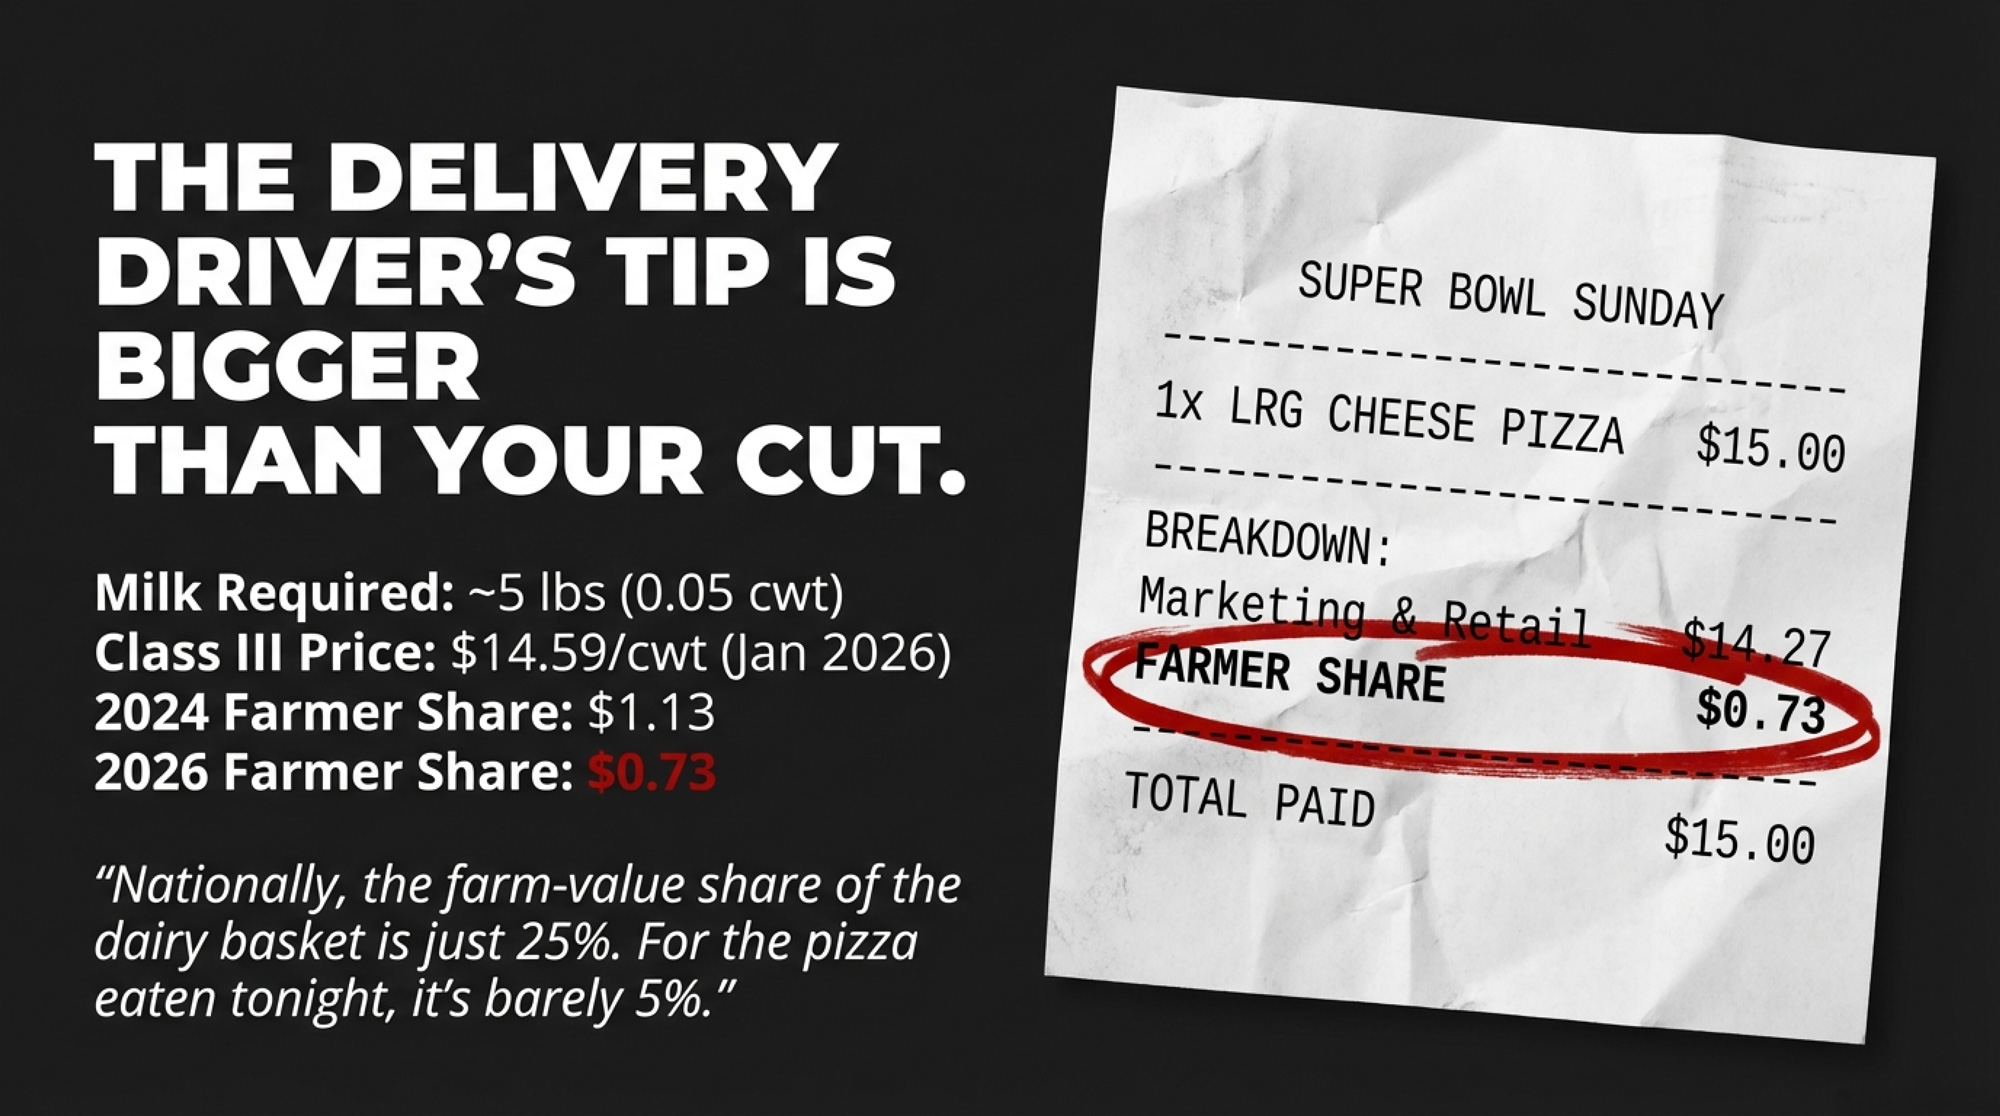
$15 Pizza. 73-Cent Milk Check. The Real Super Bowl Score for Dairy Farmers.

America eats 29 million pounds of cheese today — and the FMMO make allowance ensures your share keeps shrinking.

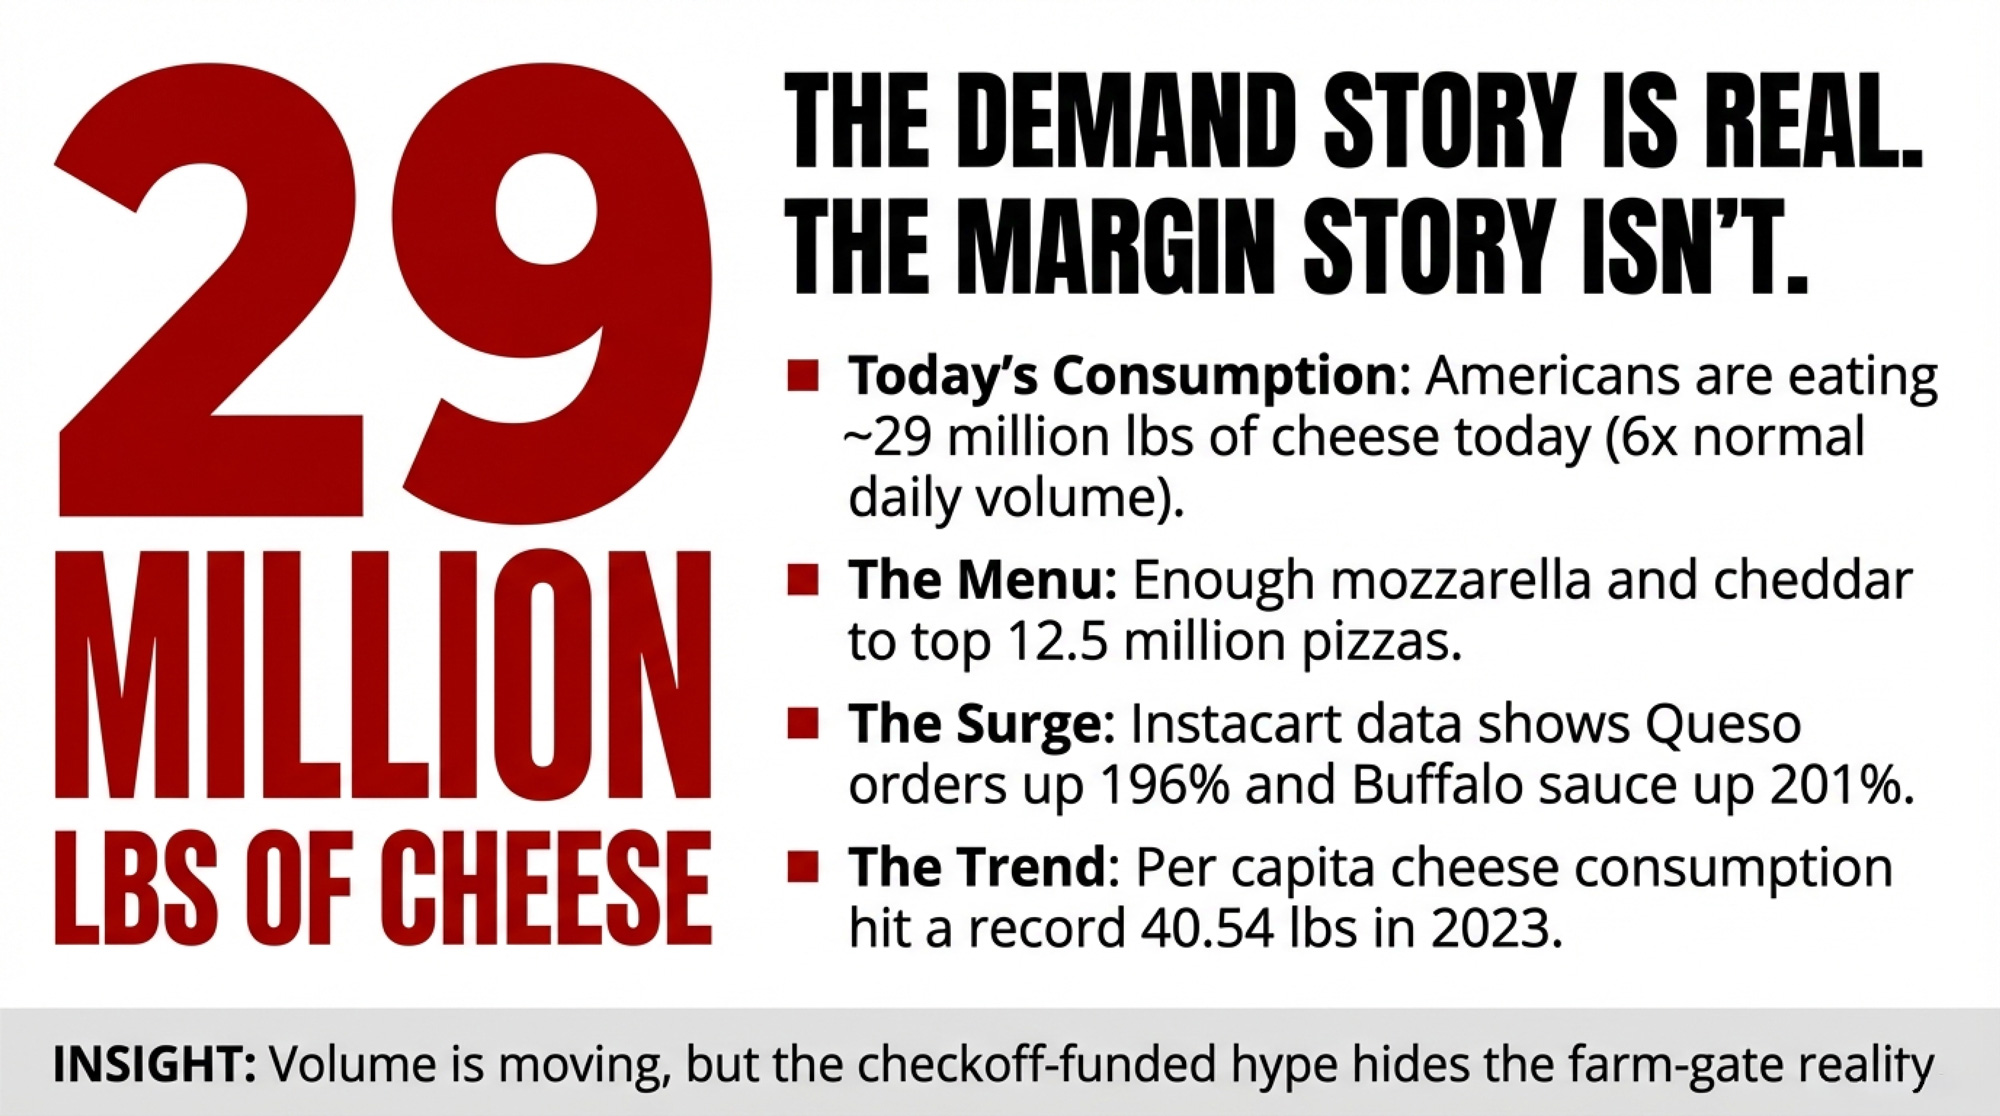
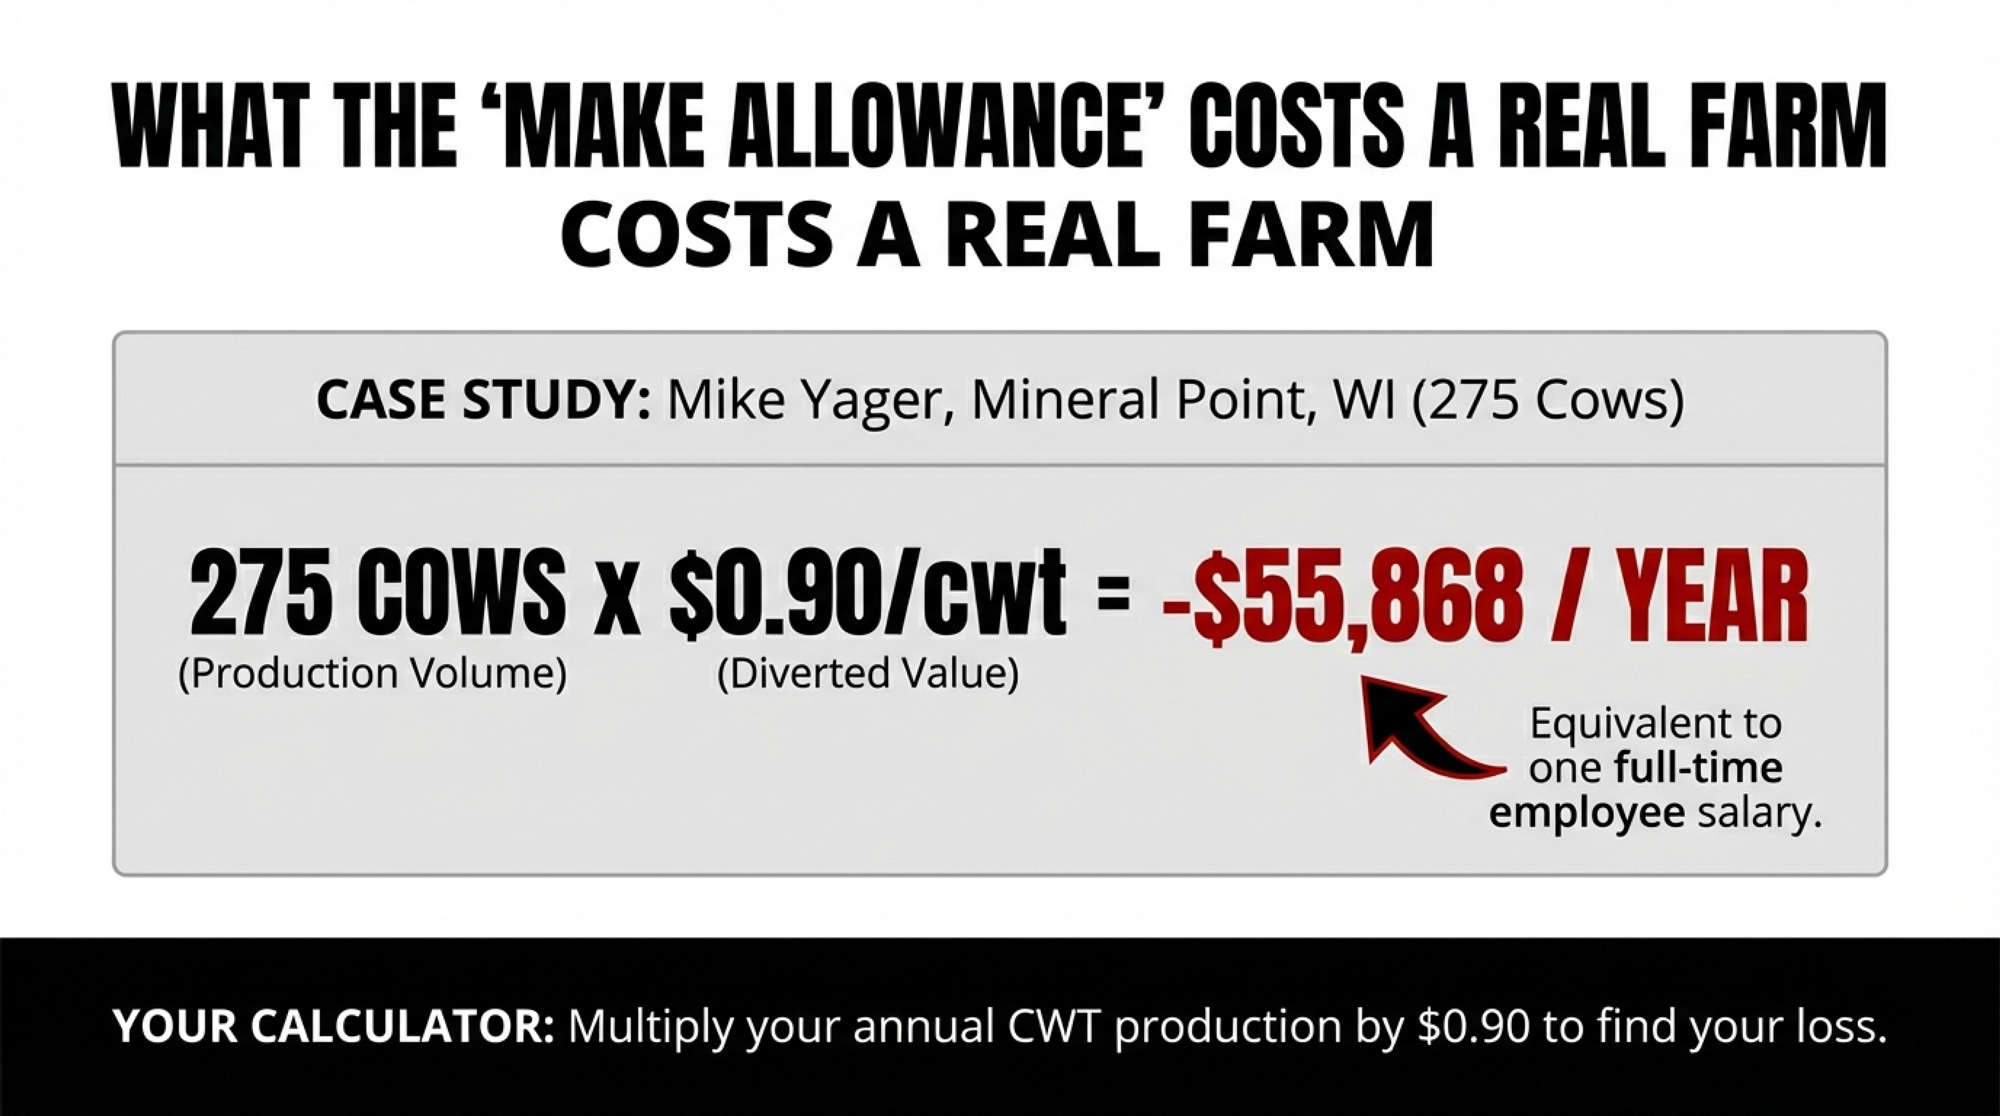
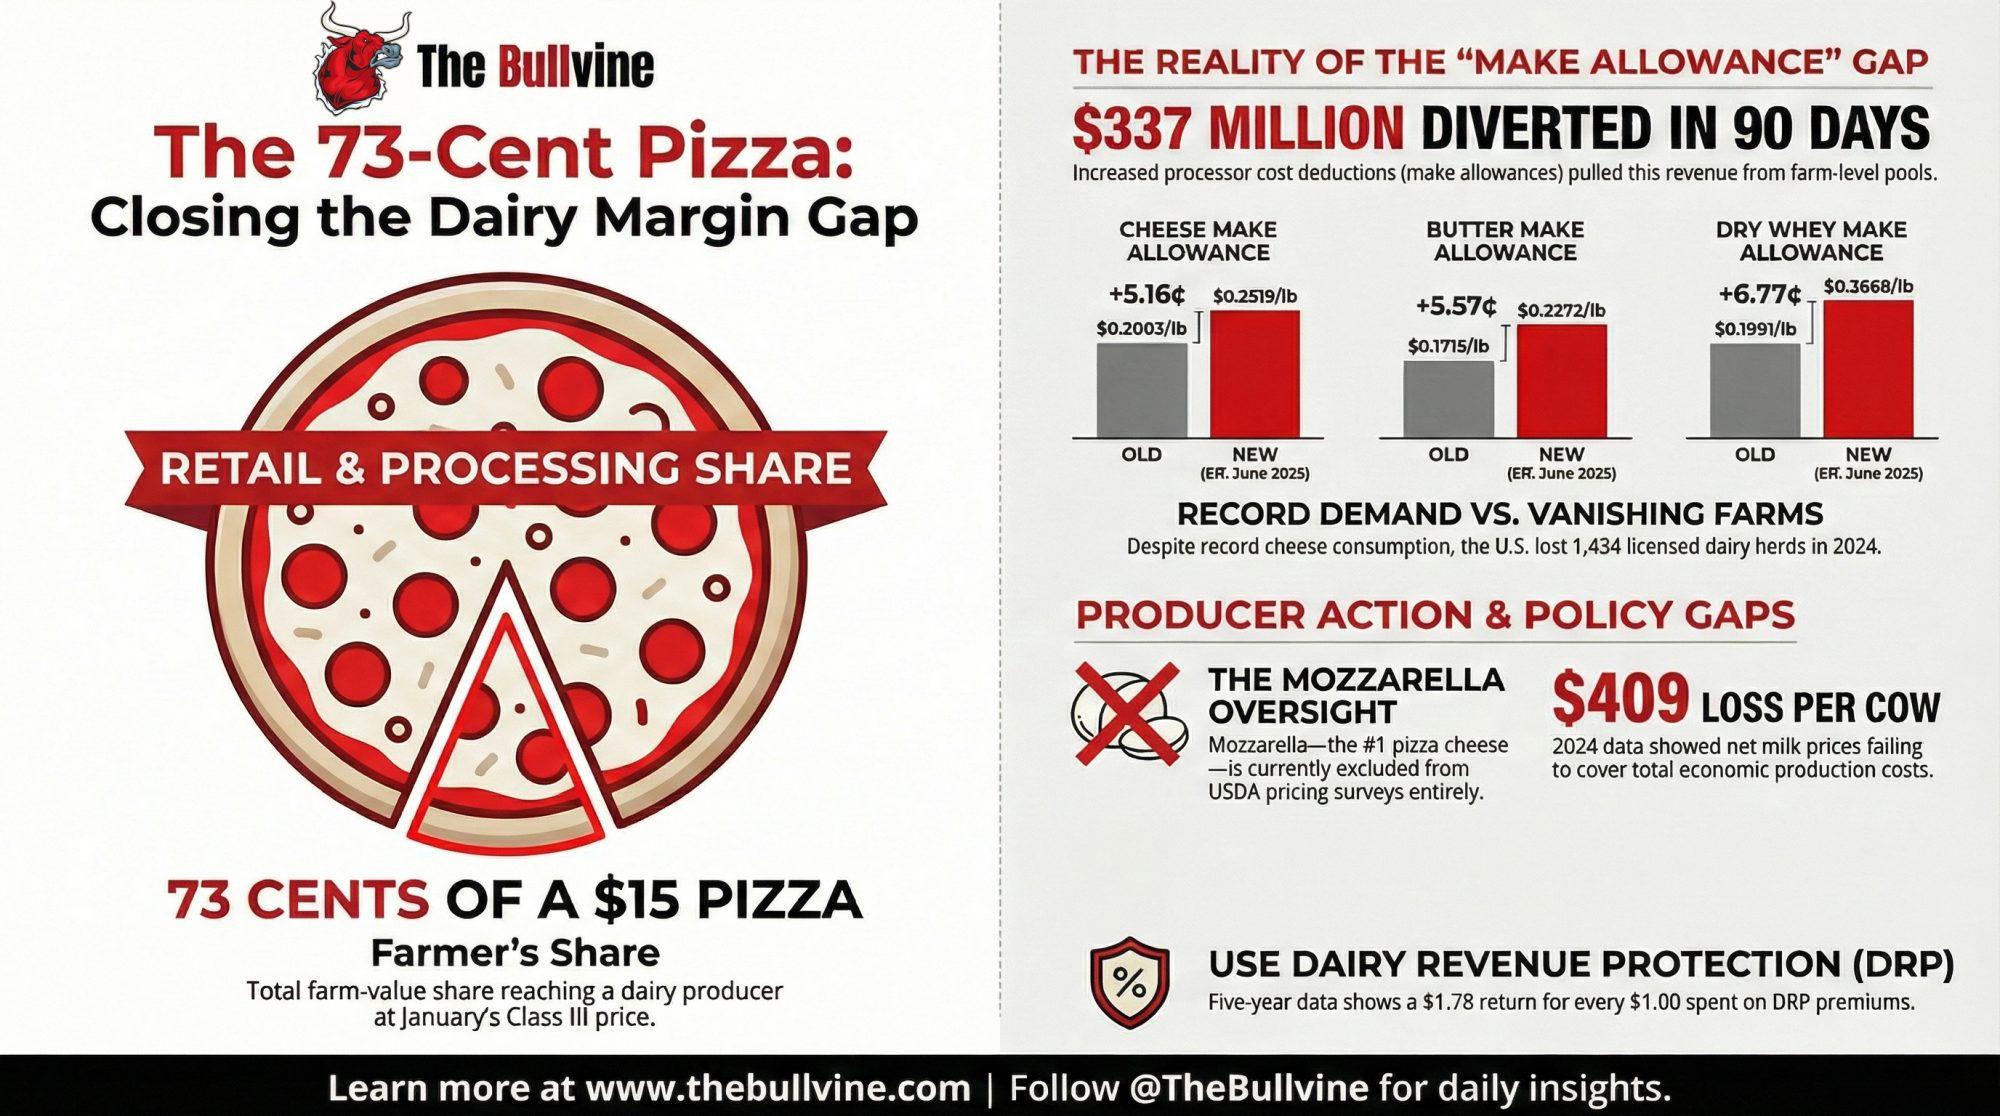
EXECUTIVE SUMMARY: Americans are tearing into an estimated 29 million pounds of cheese today — six times normal daily volume — and the dairy farmer’s cut of a $15 Super Bowl pizza is 73 cents at January’s Class III price of $14.59/cwt. USDA’s June 2025 make allowance increases widened that gap, diverting an additional 85–93 cents per hundredweight from producer pools to processors and pulling $337 million from farm-level revenue in the first 90 days alone, per the American Farm Bureau Federation’s analysis. The demand story is real; the margin story isn’t. Illinois FBFM data shows dairy operations lost $409 per cow in 2024 on a total economic cost basis — even with per capita cheese consumption hovering near all-time highs. Wisconsin producer Mike Yager calculated the make allowance hit on his 275-cow Mineral Point operation at roughly $55,868 per year in value that now stays with the processor, and says no new premiums have materialized to offset it. If your cash costs are above $17.50/cwt and your order’s blend is anywhere near Class III, your working capital is eroding monthly — and tonight’s pizza binge won’t change that.  The lever that matters now: ensuring USDA’s mandatory biennial processor cost surveys — authorized under the One Big Beautiful Bill Act signed July 4, 2025 — launch on a concrete timeline and include mozzarella, the dominant Super Bowl cheese, which is currently excluded entirely from USDA pricing surveys.”

Right about now, Americans are tearing into an estimated 29 million pounds of cheese. That’s the number Dairy Farmers of Wisconsin — the checkoff-funded marketing organization funded by farmers themselves — projects for Super Bowl Sunday, roughly six times what the country consumes on a normal day. Enough mozzarella, cheddar, pepper jack, and queso to top 12.5 million pizzas, fill millions of nacho platters, and anchor every cheese board from Seattle to Miami. Instacart’s 2026 Super Bowl data shows just how dairy-heavy the day has become: queso orders surged 196% and buffalo sauce — the stuff that goes on wings destined for ranch and blue cheese dip — jumped 201% during game week. 

Here’s the kicker: the same farmers who pay into that checkoff fund to promote cheese are getting about $0.73 of farm value on a $15 pizza when January’s Class III sits at $14.59 per hundredweight. If February futures hold near $15.92, that climbs to about 80 cents. Either way, the delivery driver’s tip is almost certainly larger. The FMMO formula is supposed to connect consumer demand with farm-gate value. Super Bowl Sunday is Exhibit A for why it doesn’t. 

The Demand Is Real — the Margin Isn’t

That volume translates to real dollars at retail — just not at the farm gate. Wells Fargo’s Agri-Food Institute pegs the average 10-person Super Bowl party spread at about $140 in 2026, up just 1.6% from last year — below the 2.4% food-at-home CPI. Frozen pizza prices actually fell 0.6% year over year. For consumers, dairy-heavy game-day food is a bargain. 

Those party-spread prices reflect a deeper pattern. Per capita total cheese consumption hit a record 40.54 pounds in 2023 — the third straight record year, according to USDA ERS data published in late 2024. Then, in 2024, it slipped to the lowest level since 2021, per the ERS’s January 2026 update — the first year-over-year decline since at least 2013. Even at record or near-record consumption, the economics at the farm gate keep tightening. 

A note on the 29-million-pound figure: this is a promotional estimate from a checkoff-funded organization, not an independently audited figure. It’s been used for at least the 2024 and 2025 Super Bowls; no 2026-specific update had been published at the time of writing. Treat it as a credible industry estimate, not a USDA-verified statistic.

Following 73 Cents from the Pizza Box to the Bulk Tank

A standard large pizza uses roughly half a pound of mozzarella. Industry yield runs about 10 pounds of milk per pound of cheese. One pizza, therefore, requires approximately 5 pounds of milk — or 0.05 hundredweight.

0.05 cwt × $14.59/cwt (January 2026 Class III, USDA AMS) = $0.73

At 2024’s all-milk price of $22.55 per hundredweight (USDA ERS annual data), that same pizza returned about $1.13 to the farm — still under 8% of the retail price. As of January 2026, Class III levels are barely 5%. 

USDA ERS published its 2024 farm-to-retail price spread data in June 2025. Nationally, the farm-value share of the dairy product basket was 25 percent, up from 23 percent in 2023. For cheddar specifically, the farm value was $1.80 per pound against a retail price of $5.66 — a 32 percent farm share. Butter fared better at 57 percent. But cheese — which is what’s disappearing tonight — sits squarely in that one-quarter-to-one-third zone. 

The farmer’s share of a $15 Super Bowl pizza: 73 cents. The delivery driver’s tip is almost certainly larger.

PeriodFarm Value ($)Processor/Retail ($)Class III ($/cwt)
Jan 20260.7314.2714.59
Feb 2026 Futures0.8014.2015.92
2024 Average1.1313.8722.55

That’s what happens when the formula pays everyone else first and hands you what’s left

How the FMMO Make Allowance Sets Your Price Before Game Day

On June 1, 2025, USDA raised the make allowances embedded in all 11 Federal Milk Marketing Orders—the first update since the FMMO system was consolidated in January 2000. These are the processing cost deductions that come off wholesale commodity prices before any value reaches producers. 

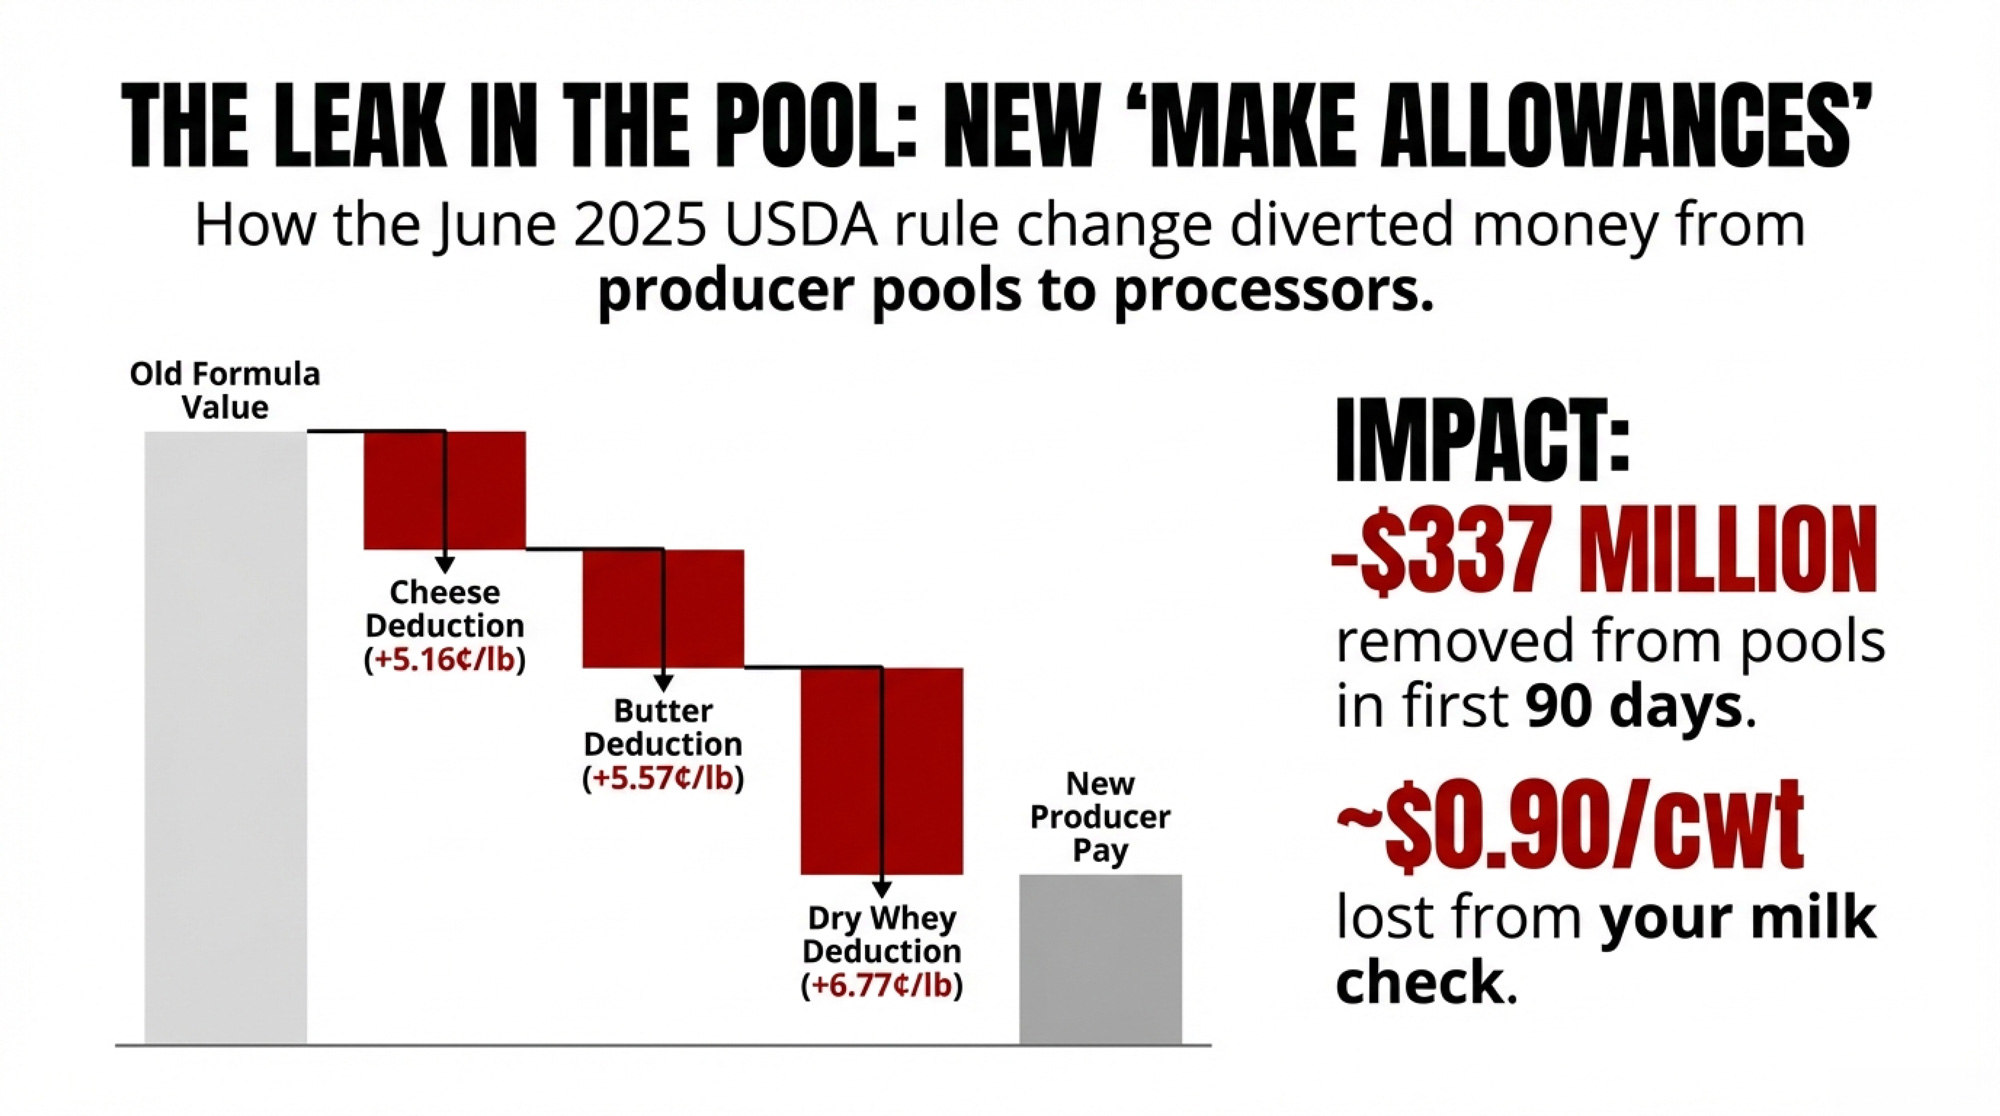
The American Farm Bureau Federation’s Danny Munch calculated the early damage: class price reductions ranging from 85 to 93 cents per hundredweight, pulling roughly $337 million out of combined producer pool values in just the first 90 days (AFBF Market Intel, September 21, 2025). As Munch told RFD-TV: “Dairy farmers were most concerned about the impact of increased make allowances because they reduce the price farmers receive, and were based on incomplete data during the hearing process”. 

ProductOld Make Allowance ($/lb)New Make Allowance ($/lb)Increase (¢/lb)Impact
Cheese$0.2003$0.25195.16¢Directly hits Super Bowl cheese
Butter$0.1715$0.22725.57¢Record high costs
Nonfat Dry Milk$0.1678$0.23937.15¢Highest increase
Dry Whey$0.1991$0.26686.77¢Wings & dip tax

Source: USDA Final Rule on FMMO Amendments, effective June 1, 2025

Take cheese at $1.60 per pound on the CME. Under the old formula, $1.3997 per pound flowed into Class III component values ($1.60 minus $0.2003). Under the new formula, only $1.3481 does ($1.60 minus $0.2519). That extra 5.16 cents per pound never hits the pool—it stays with the processor as cost recovery.

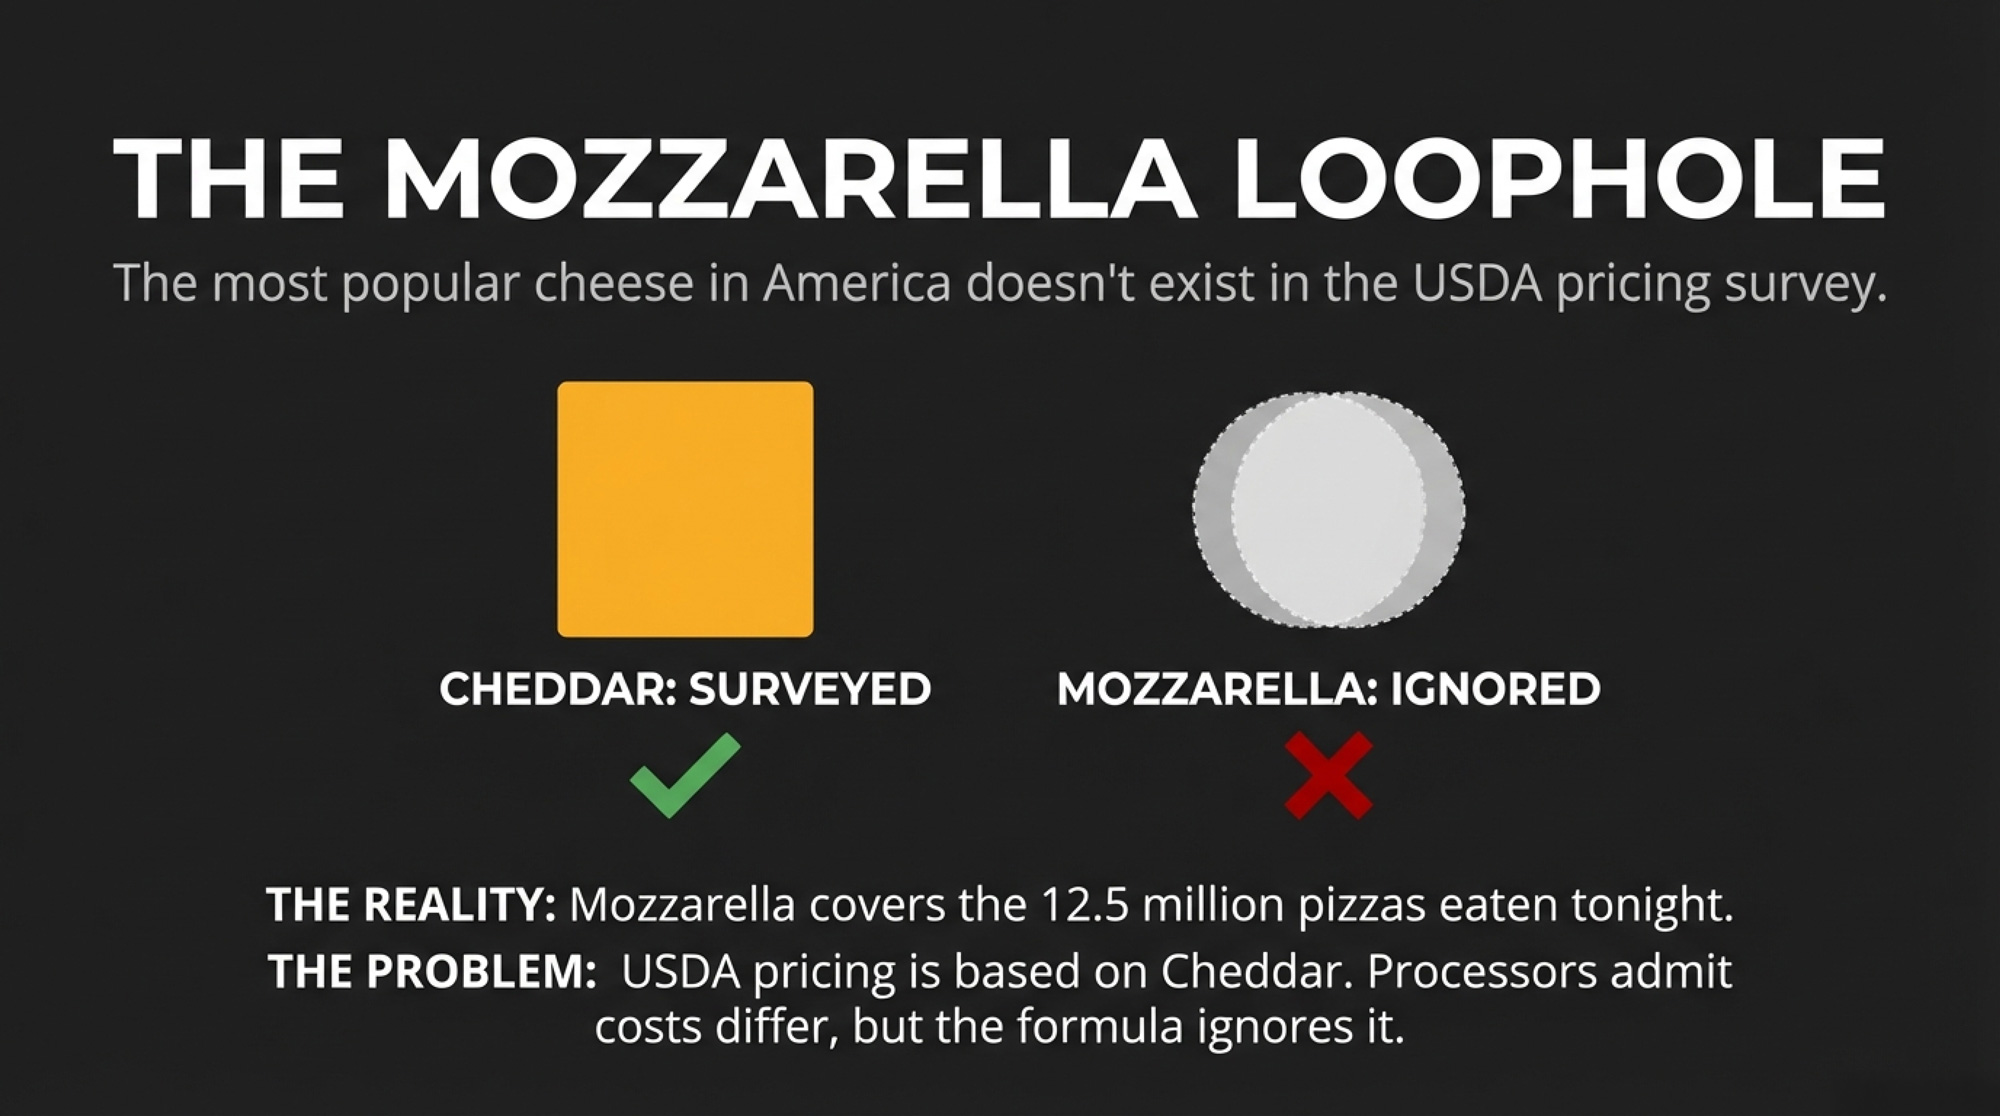
Here’s a detail that should land hard on Super Bowl Sunday: mozzarella — the single most consumed cheese in America, the cheese on every one of those 12.5 million pizzas tonight — is currently excluded from USDA’s pricing surveys and formula pricing entirely. The cheese-making allowance was set using cheddar processing cost data. Processors testified during the FMMO hearing that mozzarella processing costs differ from cheddar, yet the USDA doesn’t track them separately. The dominant game-day cheese is priced off a formula that doesn’t account for how it’s actually made. 

Processor costs are genuinely higher than they were in 2000 — energy, labor, and packaging all climbed. But AFBF argues the adjustments “must be grounded in comprehensive, mandatory and independently audited surveys” and warns there is “some likelihood that USDA’s changes will unfairly penalize dairy farmers by overstating processing costs”. The data the USDA used were self-selected and self-reported by processors and were not independently verified. 

So when 29 million pounds of cheese disappear tonight, every pound carries that larger deduction. And every hundredweight behind it pays the farmer less than it did a year ago — even if the block price on the CME hasn’t moved.

How Pizza Chains Lock In Their Price While You Ride the Cycle

Domino’s, Pizza Hut, and the major frozen pizza brands don’t buy mozzarella on the spot market in February. They negotiate supply contracts months in advance — typically locking prices or establishing cost-plus formulas that insulate them from short-term CME volatility. 

Tonight’s Super Bowl surge was priced into processor order books weeks or months ago. The demand spike is real, but it doesn’t create upward spot-market pressure that would flow back through Class III into your milk check. By the time 29 million pounds of cheese hits the coffee table, the price was already set. And by the time Americans order those 12.5 million pizzas tonight, Yager’s January milk check was already settled.

You’re selling milk into a Class III formula that resets monthly based on USDA commodity surveys. If CME blocks rally in February, you might see a modest lift in your March check. If they don’t, you won’t — regardless of how many pizzas Americans ordered tonight.

Record Cheese, Vanishing Farms: The Demand Paradox

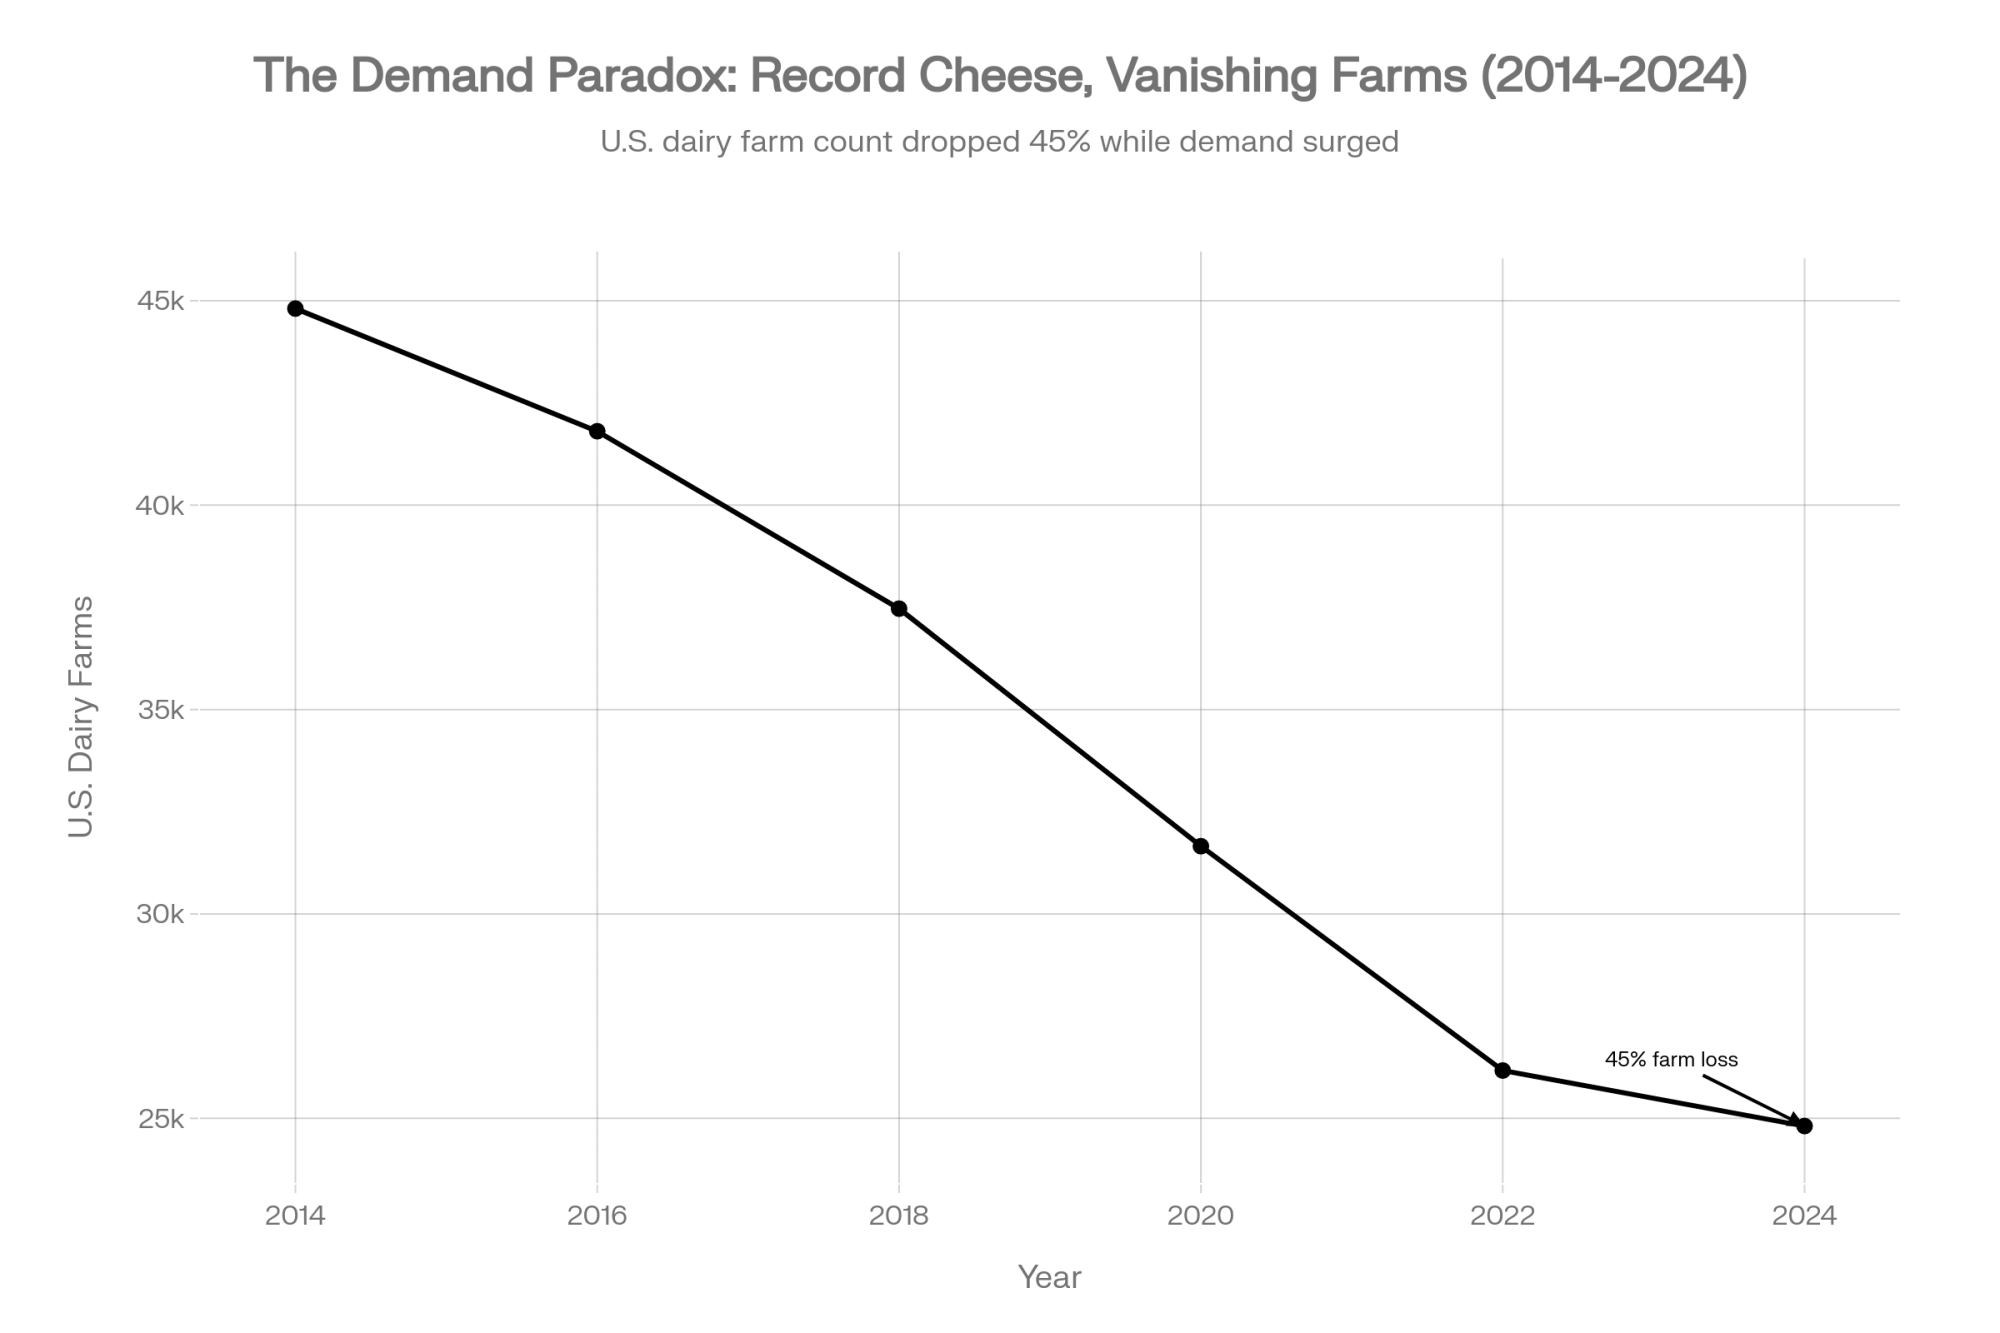
Americans have never eaten more cheese over a sustained period than they did from 2021 through 2023 — three consecutive record years, peaking at 40.54 pounds per capita in 2023. And yet U.S. dairy farms keep closing at an accelerating rate.

The numbers are stark. USDA NASS data shows the U.S. lost 1,434 licensed dairy herds in 2024 alone — a 5.5% decline in a single year, bringing the national total to 24,811 farms. That’s down from 44,809 just a decade earlier — a 45% loss since 2014. And 86% of the 2024 decline was concentrated in the Midwest and Eastern states: Wisconsin lost 400 herds, Minnesota and New York shed a combined 315, and Pennsylvania dropped another 90. 

RegionFarms Lost (2024)% of National LossImpact
Wisconsin40027.9%Worst hit
Minnesota18012.5%Severe
New York1359.4%Severe
Pennsylvania906.3%Major
Other Midwest/East42929.9%Critical belt
Western States20014.0%Growing regions
Total U.S.1,434100.0%5.5% decline

The Bullvine reported in October 2025 that 1,420 American dairy farms had exited in the prior year. If that pace continued or accelerated, The Bullvine estimated the 2025 total could approach 2,800 closures — though the actual figure depends on how many operations secured financing versus being forced out. Cornell’s Dr. Andrew Novakovic put it bluntly: “What took ten years then is happening in two or three now” (The Bullvine, November 2025). 

Processing capacity, meanwhile, is expanding in the opposite direction. Hilmar Cheese opened a $600 million facility in Dodge City, Kansas, in March 2025, specializing in American-style cheese in 40-pound commercial blocks and employing nearly 250 people. Great Lakes Cheese announced a $185 million expansion in Abilene, Texas, in 2024. These plants are designed to run for decades. And every one of them operates under the wider make allowances that took effect last June. 

The View from Two Federal Orders

Mike Yager milks 275 Holsteins and grows feed crops near Mineral Point, Wisconsin — squarely in Federal Order 30, the Upper Midwest. When the make allowance increases hit last June, he did his own calculation: that additional 90 cents per hundredweight amounts to roughly $55,868 per year for an average-sized Wisconsin dairy in value that now stays with the processor instead of reaching the bulk tank. To estimate your own hit: multiply your total hundredweight shipped per year by $0.90. A 500-cow herd shipping around 110,000 cwt annually loses roughly $99,000 in pool value. 

Herd SizeAnnual Shipment (cwt)Annual Loss from Make AllowanceMonthly Impact
Mike Yager (275 cows)62,076$55,868$4,656
Average WI (500 cows)110,000$99,000$8,250
Large (1,000 cows)220,000$198,000$16,500
Mega (5,000 cows)1,100,000$990,000$82,500

“We as dairy farmers don’t see it on our milk checks. But via the new make allowances, we are losing out on 90 cents per hundredweight additional money that the processors are now receiving.” — Mike Yager, Brownfield Ag News, November 2025 

For his operation, that deficit is roughly equivalent to an employee’s salary. And so far, he says, no added premiums have materialized to offset the loss. 

The regional numbers vary, but no federal order escaped the hit. In the Northeast, the Milk Dealers and Distributors Industry Association warned during FMMO hearings that reduced minimum prices would be “particularly problematic” amid “widespread and accelerating exit of Northeast dairy farmers” — and could push the milkshed past a point of no return. Calvin Covington estimated Southeast orders will see the largest net benefit from updated Class I differentials — an average $1.42/cwt increase, but only on Class I volume. For Upper Midwest producers like Yager, where the blend skews heavily toward Class III, the make allowance hit lands harder, and the Class I differential cushion is thinner. 

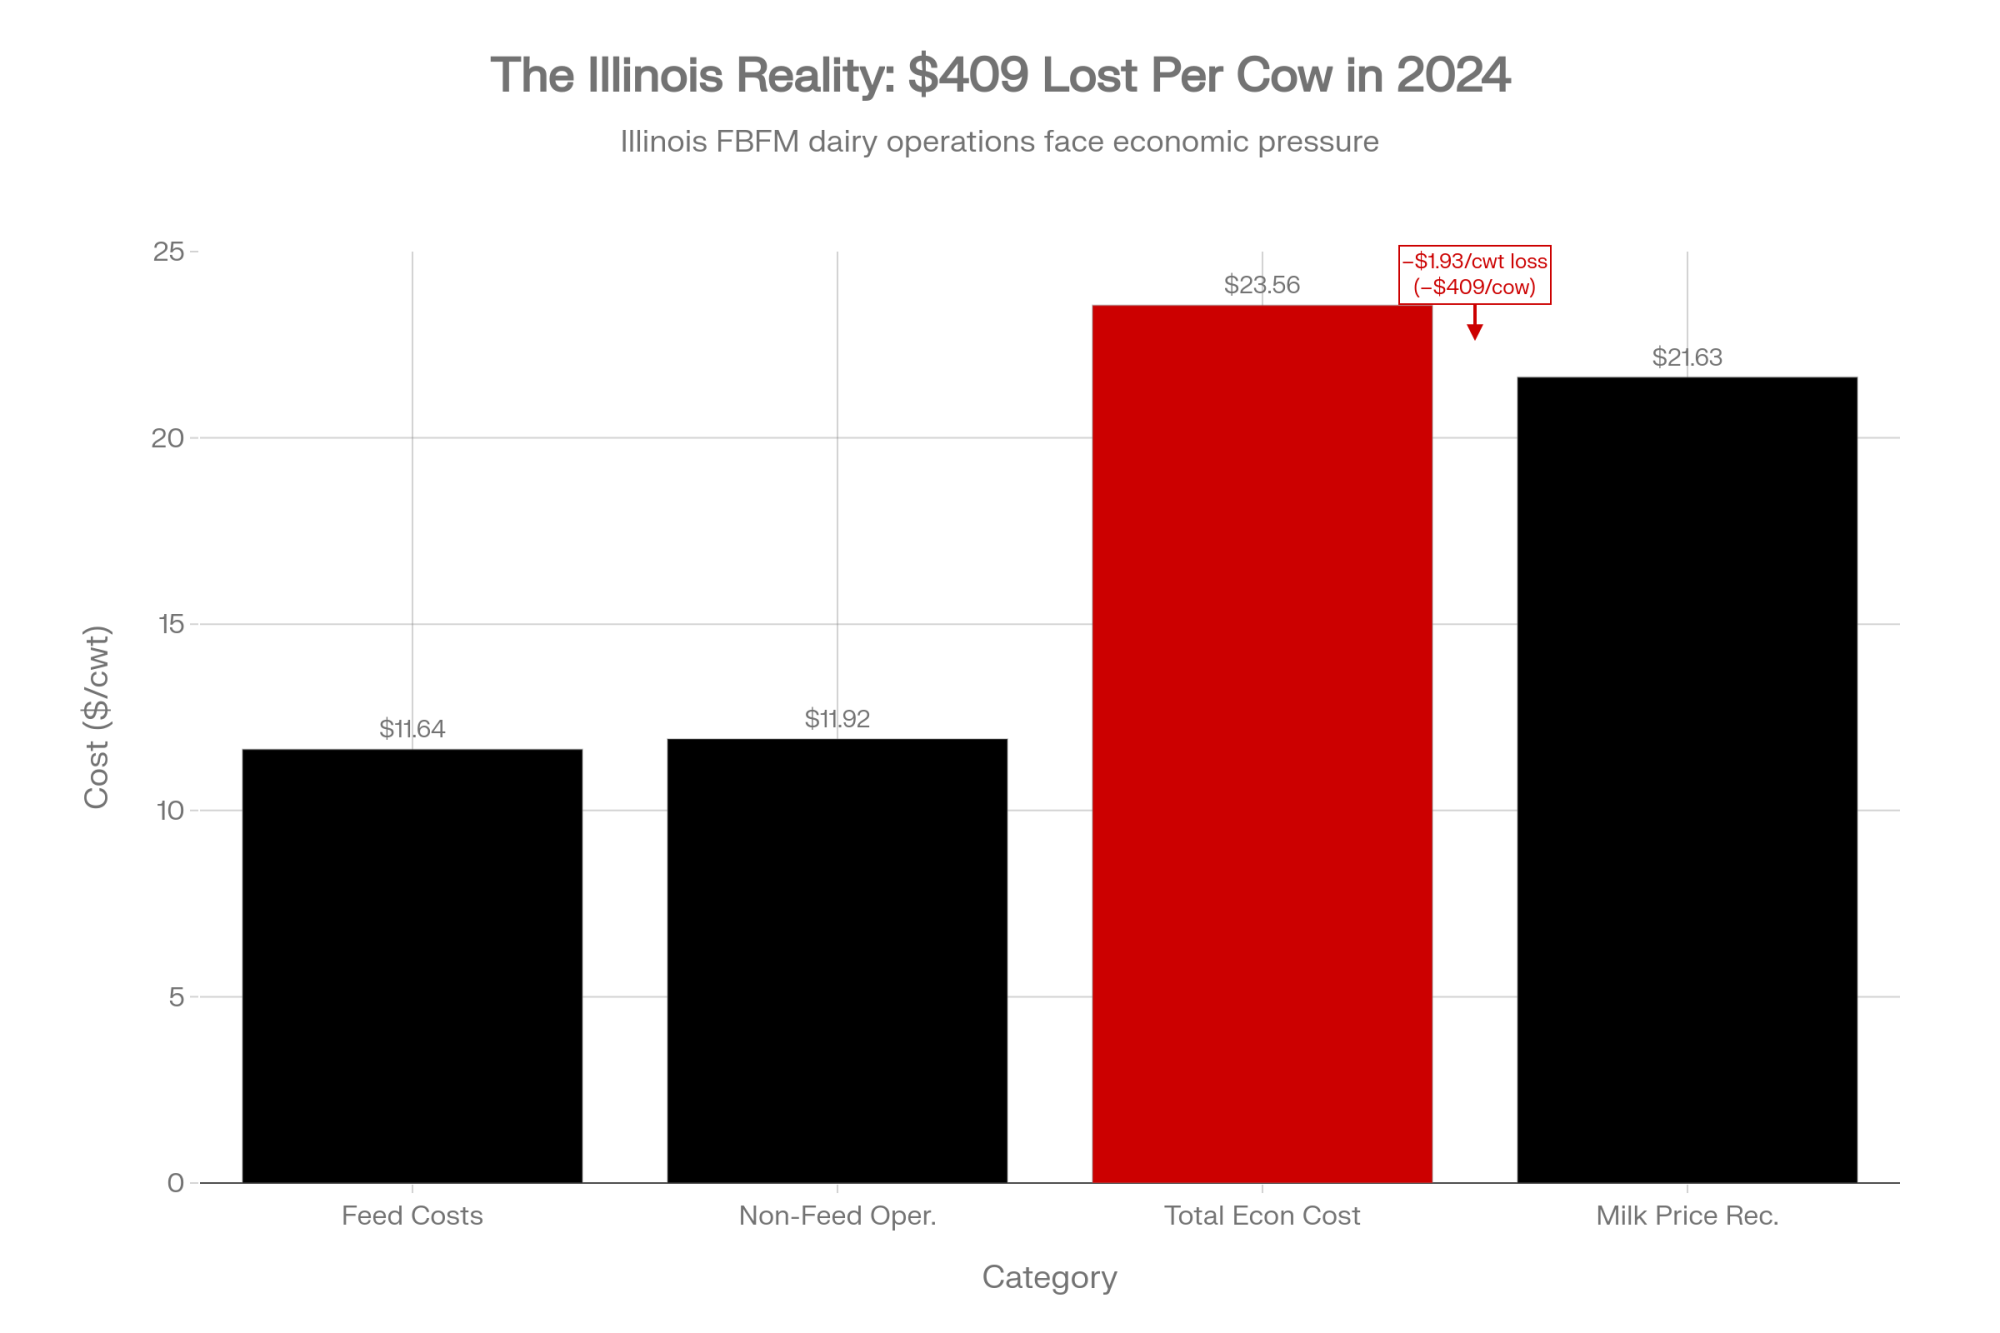
Illinois Farm Business Farm Management data tells the broader story. The 2024 numbers showed an average net milk price of $21.63 per hundredweight against total economic costs of $23.56 — a loss of $1.93/cwt, or negative $409 per cow for the year. Feed costs averaged $11.64/cwt, and nonfeed costs hit a record $11.92/cwt. SDA ERS’s January 2026 Livestock, Dairy, and Poultry Outlook forecasts the 2026 all-milk price at $18.25 per hundredweight, down from $21.15 in 2025 — a decline of nearly $3.00/cwt, or roughly 14% ​. That’s a wider drop than feed cost savings can absorb.” This is the single most important factual correction in this draft.

If you’re on a component order running 4.0% butterfat and 3.3% protein, there is a premium above the Class III floor — but it’s thinner than you might assume. At January 2026 component prices (butterfat at $1.4525/lb, protein at $2.1768/lb, other solids at $0.4448/lb — per USDA AMS), a hundredweight at those test levels returns roughly $15.53in component value (assuming 5.7% other solids, standard for Holstein herds), about $0.94 above the $14.59 Class III. That’s real money. But the make allowance still comes off the top of every component calculation before those prices are set. High components help. They don’t fix the formula. 

What This Means for Your Operation

This isn’t a guilt trip. It’s a math problem — and the math has specific levers you can pull.

  • Pull your last 12 months of milk checks and calculate your true net effective price — not the blend, not the gross, but what actually hit your account after deductions, hauling, and co-op assessments. USDA ERS data shows the national dairy farm-value share was 25% of the retail dollar in 2024. If your net is more than $1.50 below the FMMO blend minimum published by your order, you need to understand why. 
  • Know your breakeven in Class III terms. Illinois FBFM data pegged total economic costs at $23.56/cwt for 2024, with feed and cash operating costs at $17.43/cwt. Your costs vary by region, herd size, and feed situation — but if your cash costs are above $17.50/cwt and January’s $14.59 Class III is anywhere near your order’s blend, your working capital is eroding monthly. That’s the conversation to have with your lender this month, not in May. 
  • Talk to your crop insurance agent about Dairy Revenue Protection for Q2 and Q3 2026. HighGround Dairy’s five-year analysis found that for every $1.00 spent on DRP premiums, producers received $1.78 in return on average — a net benefit of $0.23/cwt after premiums. Coverage booked three quarters out returned the highest average net benefit at $0.30/cwt, despite higher premiums. With February 2026 advanced cheese prices at $1.4078/lb and butter at $1.4201/lb (USDA AMS, February 4, 2026), markets are signaling continued softness — exactly the environment where DRP has historically paid off. The trade-off is real: DRP premiums are a cash cost that hits quarterly, whether you need the coverage or not, and if milk rallies above coverage levels, you’ve paid for protection you didn’t use. But at current futures, the odds favor the buyer. If you haven’t locked Q3 2026 yet, that window is still open. 
  • Push USDA to launch mandatory processor cost surveys—and include mozzarella. Congress has already acted: the One Big Beautiful Bill Act, signed July 4, 2025, mandates biennial cost-of-production surveys covering cheese, butter, and nonfat dry milk processors, with $9 million appropriated for the program. But AFBF’s Danny Munch warns the timeline remains unclear. “They’re going to have to set up a methodology. They’re going to have to have staff and researchers set aside for this,” Munch told Brownfield Ag News at World Dairy Expo. “I don’t expect it to happen anytime soon”. And even when data comes in, there’s no automatic adjustment — a full FMMO hearing would still be required to change make allowances. The gap to push on: the survey covers cheese, butter, and NFDM, but does not explicitly name mozzarella — the single largest-volume cheese in America and the backbone of tonight’s pizza consumption. Push your co-op and trade organization to demand that mozzarella be included in the USDA’s survey methodology before it’s finalized. USDA’s FMMO modernization referendum was approved across all 11 orders in January 2025, with pricing amendments effective June 1, 2025.
  • Request one competitive price comparison from an alternative buyer. If you ship to a large co-op, call an independent or a smaller cooperative and ask what they’d pay for your components. Yager’s experience is telling: the fear of being dropped keeps many farmers from asking tough questions about premiums. You don’t have to switch — switching carries real risk, including loss of hauling routes, potential basis penalties during transition, and relationship capital that’s hard to rebuild. But knowing you have options strengthens every negotiation you stay in. And if you’re exploring farmstead cheese or on-farm retail, start with no more than 10–20% of your production; the capital and compliance costs catch more operations than the margins do. 

The Three Numbers That Matter Monday Morning

  • 73 cents — the farm share of a $15 Super Bowl pizza at January’s Class III. Your actual loss from the make allowance increase scales with production: multiply your annual hundredweight shipped by $0.90. Nationally, the farm-value share of all dairy products at retail was 25% in 2024. 
  • 29 million pounds of cheese was priced into processor contracts weeks ago. Game-day demand doesn’t create spot-market pressure that flows back to your bulk tank. The consumption is real; the price signal to producers is at best muted.
  • Mozzarella — tonight’s dominant cheese — isn’t even in the USDA pricing survey. The make allowance was set on cheddar data. Until the survey includes the cheeses that actually drive demand, the formula will keep underpricing your contribution to the products consumers want most. 

Beyond the Final Whistle

Seventy-three cents on a fifteen-dollar pizza. That’s the current system’s answer to record demand. It matters that dairy farmers built what’s on every table in America tonight — and it matters more that the pricing formula doesn’t reflect it.

Yager’s math is blunt: the make allowance increase alone costs an average-sized Wisconsin dairy enough to fund a full-time employee — and so far, no premiums have shown up to replace it. In the Northeast, state industry groups have warned that continued milkshed contraction threatens the infrastructure supporting all small-scale agriculture in rural New England. Novakovic says the consolidation cycle is compressing a decade into two or three years. Whether the system changes fast enough to slow that compression is the open question — and 2,800 farms may not get to wait for the answer. 

Pull your numbers this week. If your net effective price is more than $1.50 below the published FMMO blend, call your field rep before March—and then call the people who claim to speak for you and ask one specific question: what are they doing to ensure USDA’s mandatory processor cost surveys include mozzarella and launch before the next make-allowance fight. The gap between what consumers pay and what you receive won’t close on its own.

Complete references and supporting documentation are available upon request by contacting the editorial team at editor@thebullvine.com.

Learn More

The Sunday Read Dairy Professionals Don’t Skip.

Every week, thousands of producers, breeders, and industry insiders open Bullvine Weekly for genetics insights, market shifts, and profit strategies they won’t find anywhere else. One email. Five minutes. Smarter decisions all week.
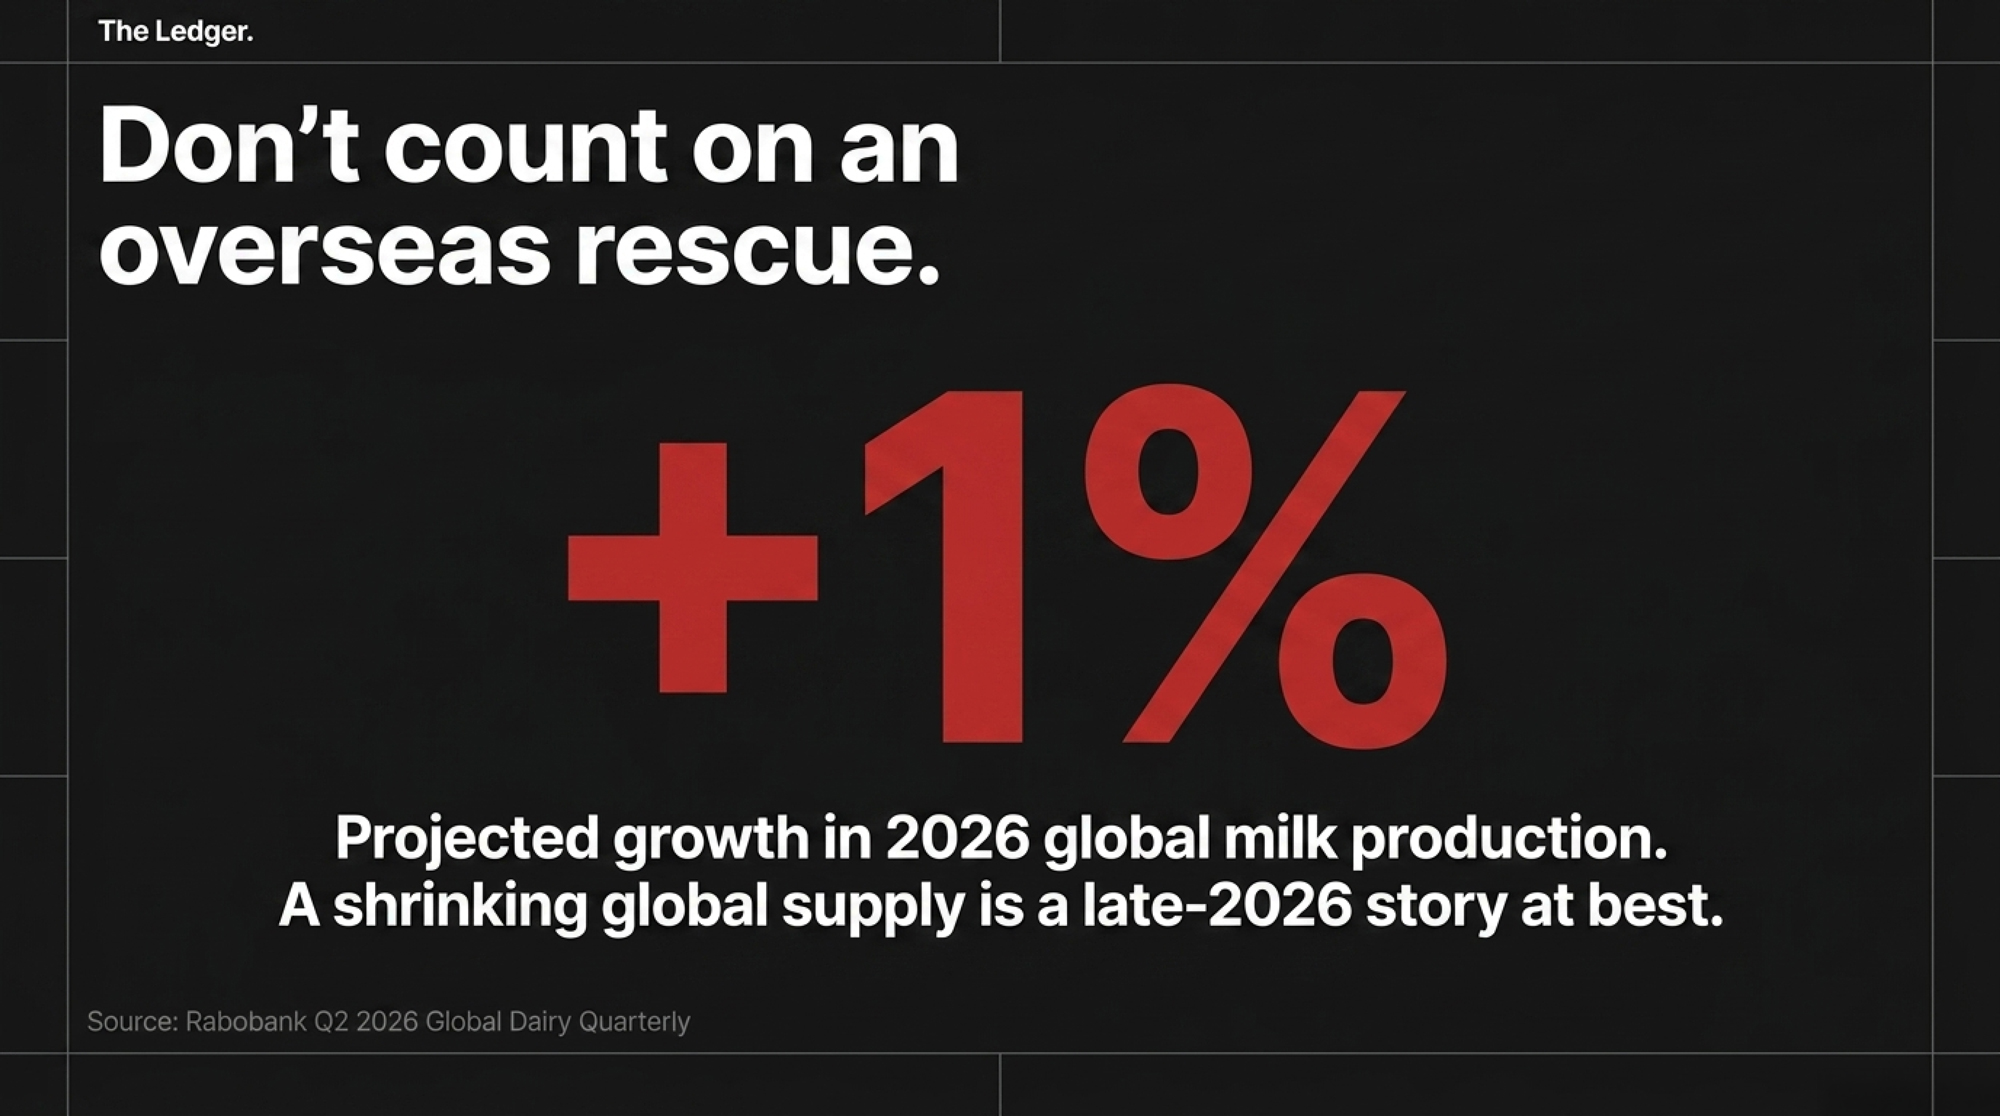
NewsSubscribe
First
Last
Consent
Send this to a friend