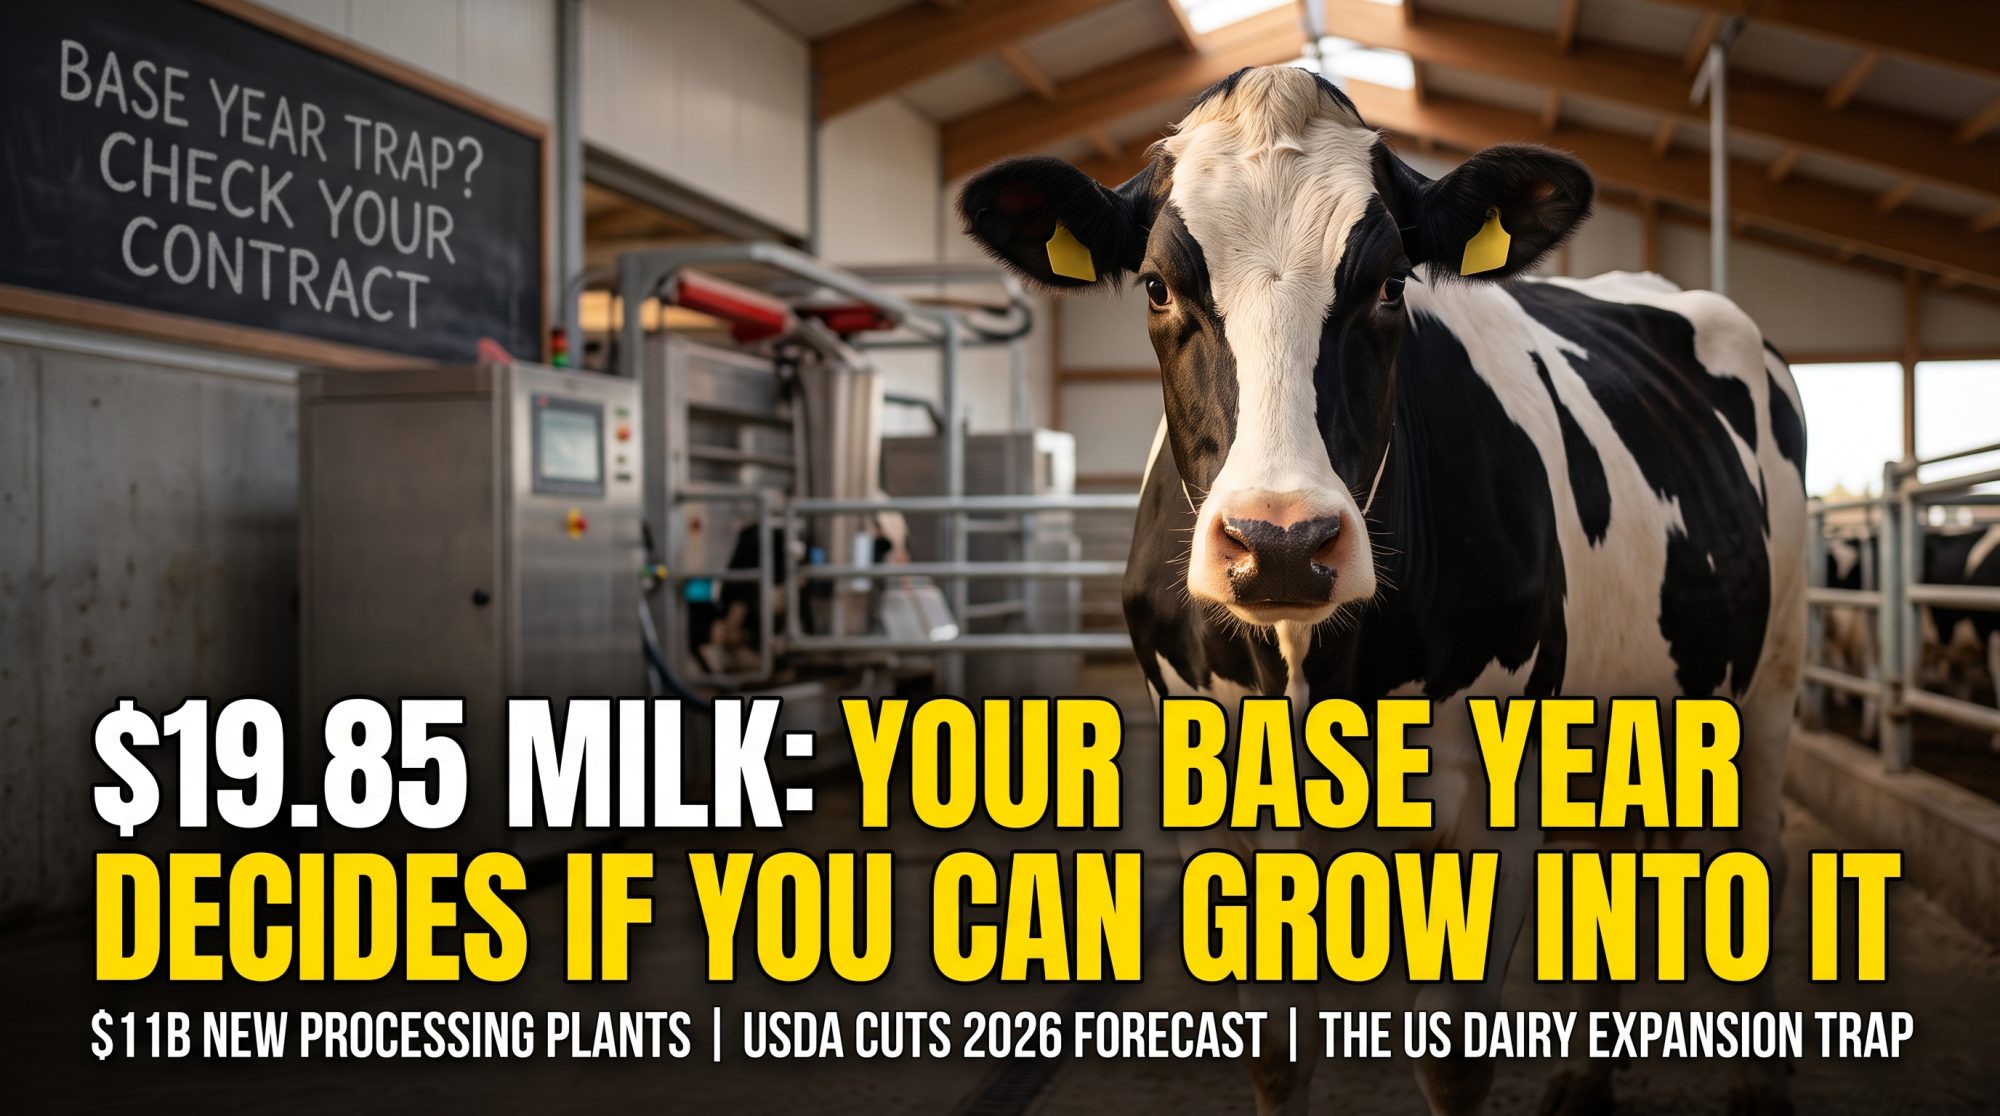
Your co-op’s base year was probably set before you thought about expanding — and that decides whether new milk pays base or excess.
EXECUTIVE SUMMARY: USDA cut its 2026 all-milk forecast to $19.85/cwt on August 19 — the same month the dairy sector points to $11 billion in new plant capacity as a green light for growth. But on a 400-cow herd shipping 109,500 cwt, that price swings farm returns from +$49,275 to −$454,425 depending entirely on your full economic cost.
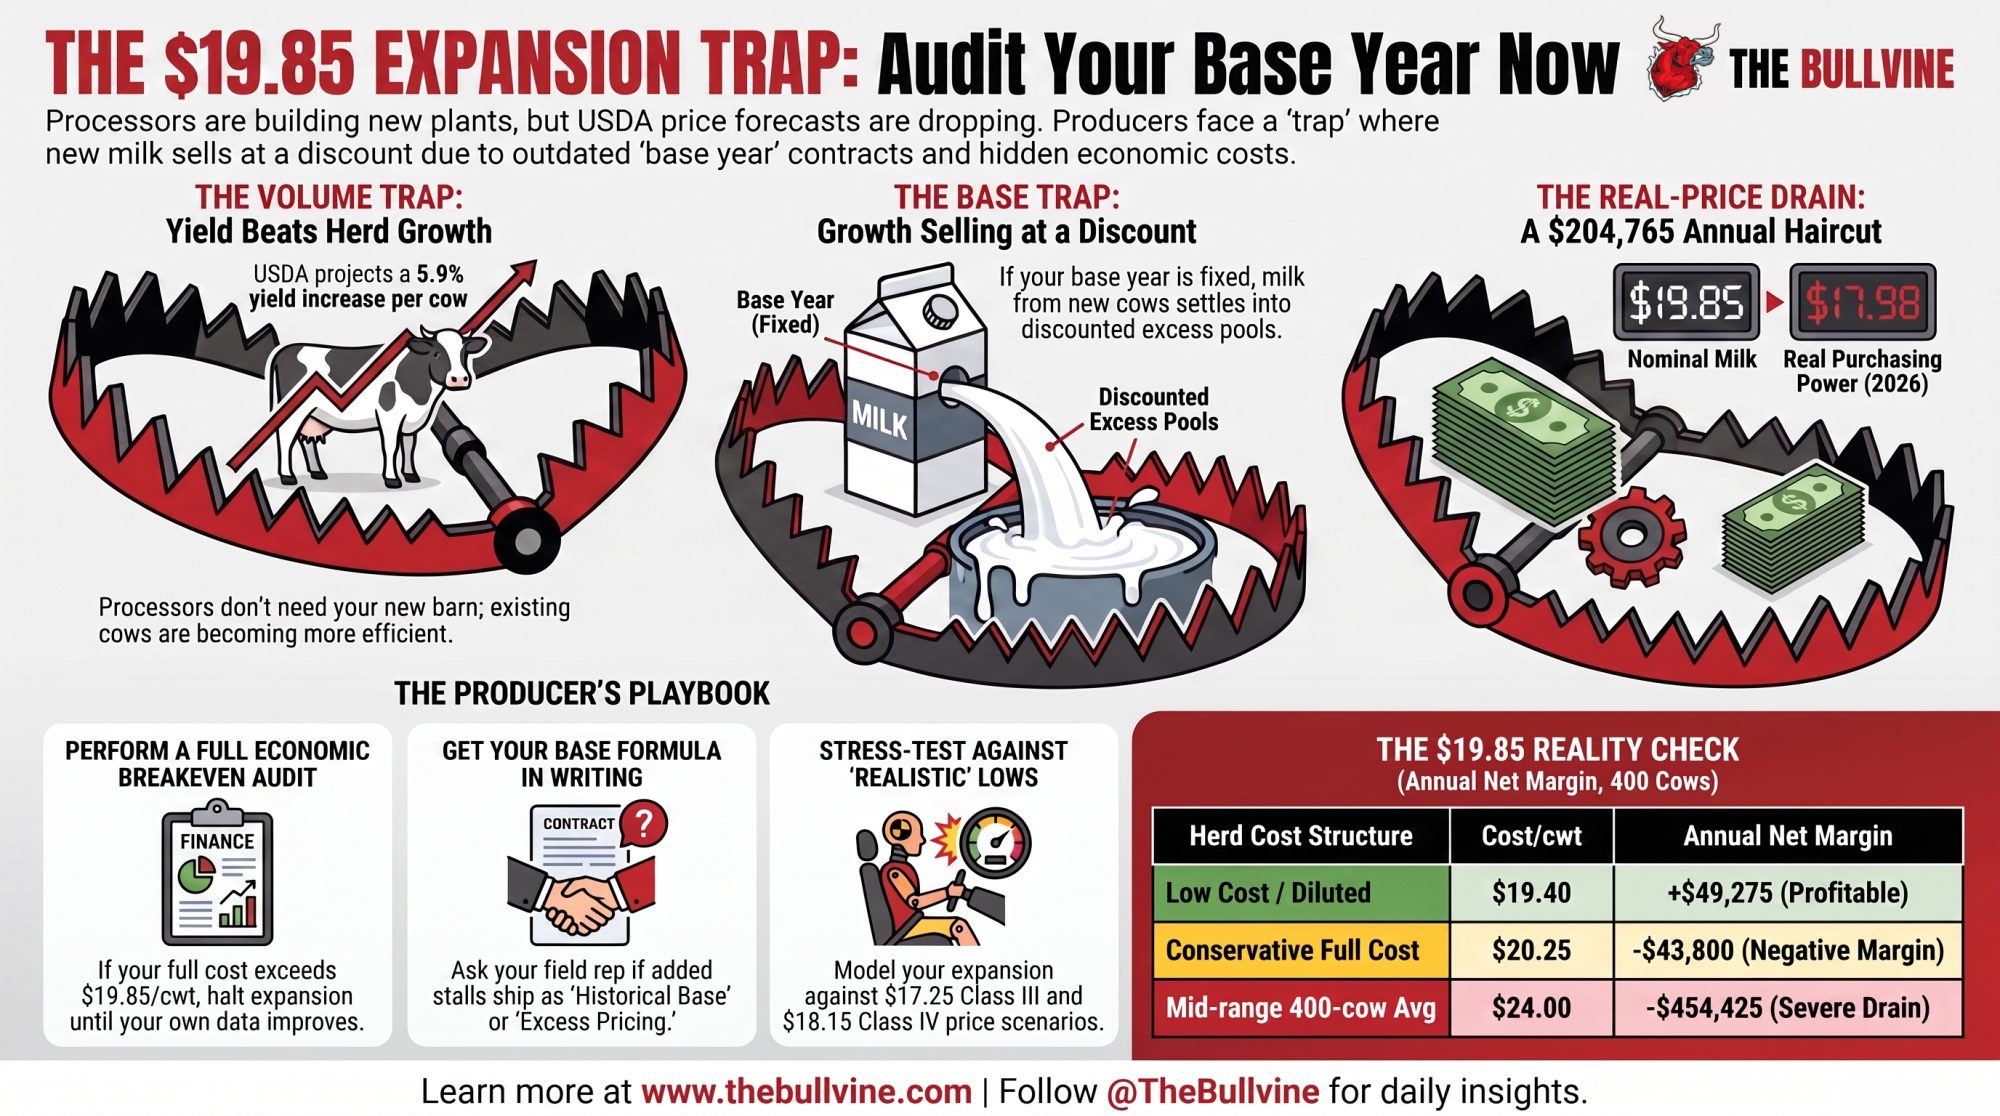
- The Volume Trap: USDA’s 17.8B lb baseline increase arrives on yield per cow (+5.9%), not herd growth (+1.9%). Processors get their milk without your new barn.
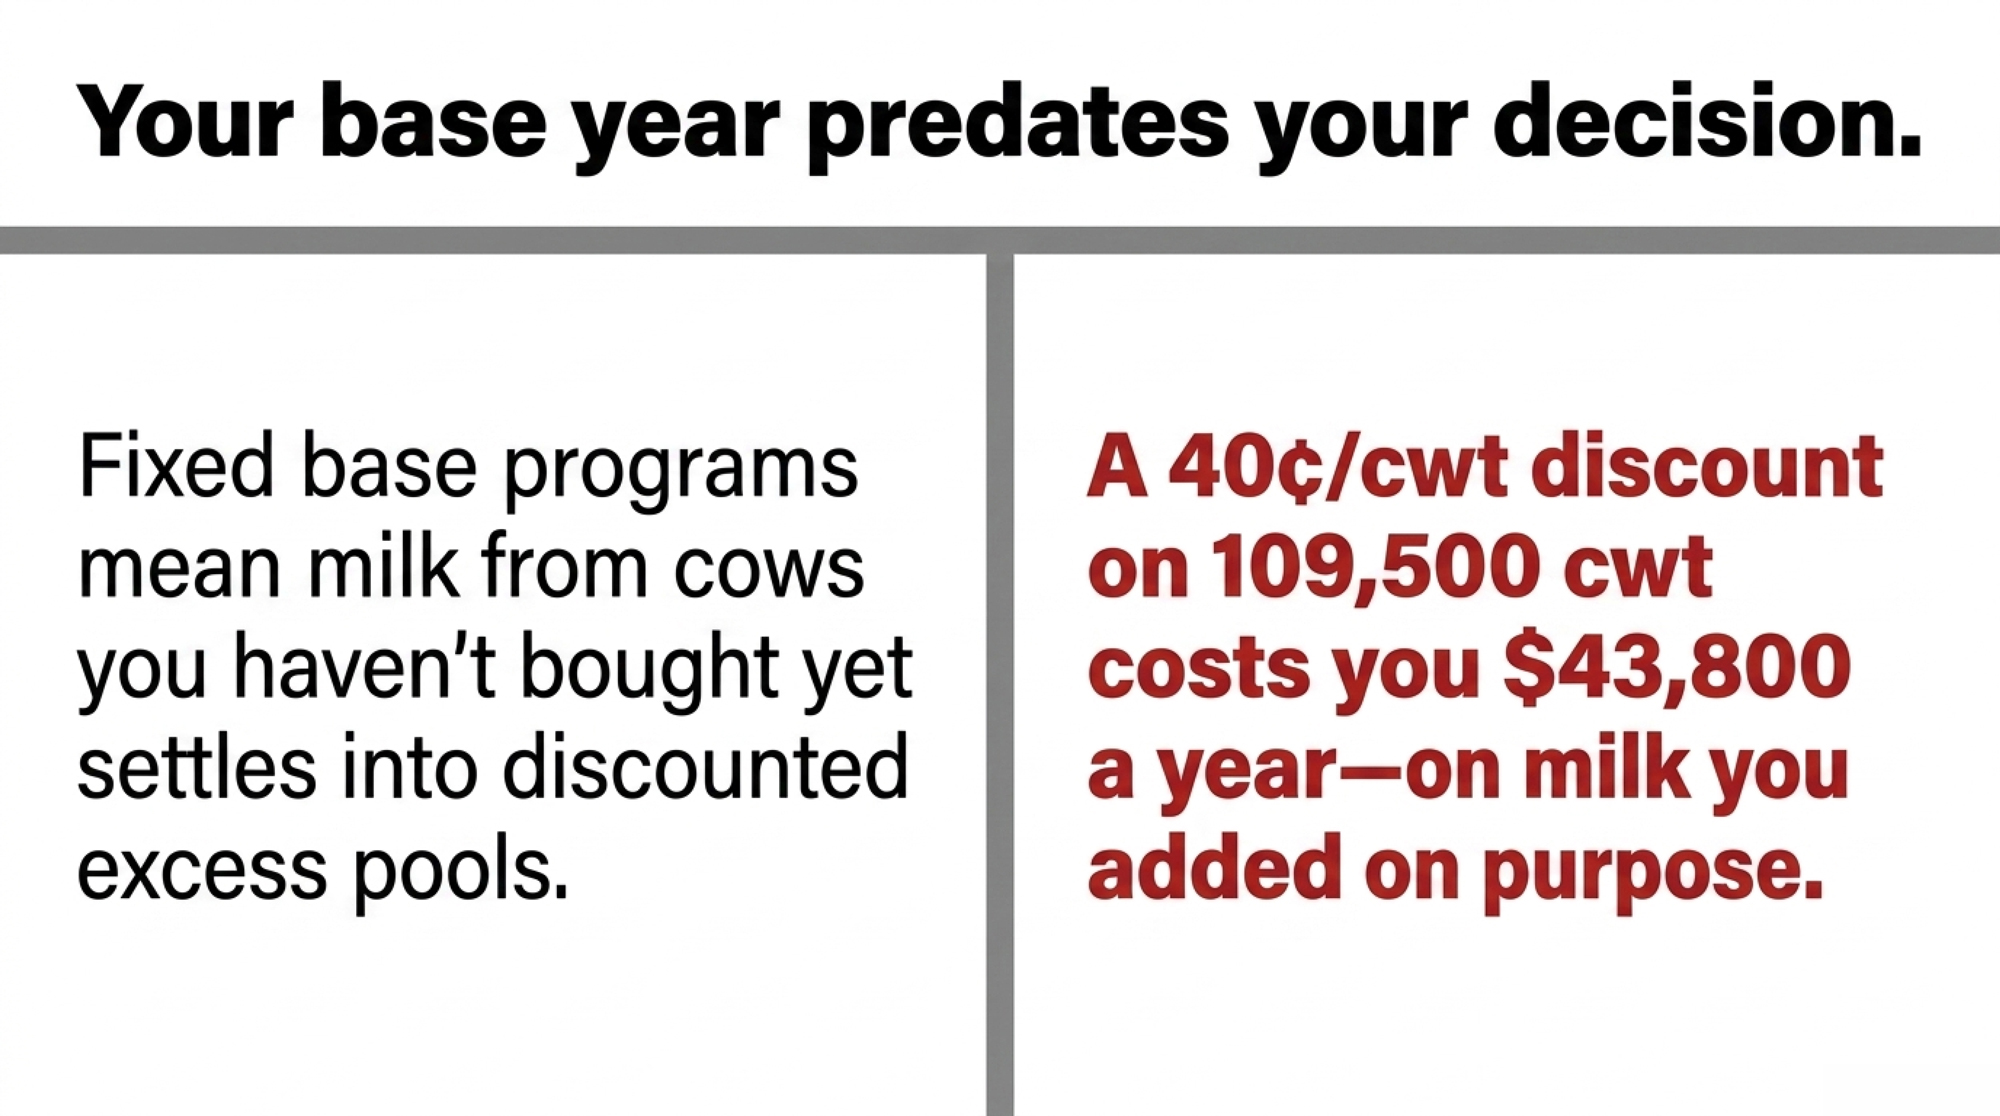
- The Base Trap: Fixed base programs mean milk from cows you haven’t bought yet settles into discounted excess pools.
- The Real-Price Drain: Holding nominal milk at $19.85 through 2030 erodes purchasing power to $17.98/cwt in 2026 dollars — a $204,765 annual haircut on 400 cows.
USDA’s Economic Research Service cut its all-milk forecast to $19.85/cwt for 2026 and $19.80 for 2027 on August 19. Five days ago. That’s the number a 400-cow owner-operator in New York, Idaho, or Wisconsin is being asked to expand into, right as a processor breaks ground nearby and a field rep starts talking about growth room.
Whether that’s a trap depends on two things you can actually check: where your full economic cost sits, and whether your co-op’s base year predates the cows you haven’t bought yet. Get both right, and there’s real room. Get either wrong and a 40¢/cwt gap on 109,500 cwt runs $43,800 a year — on milk you added on purpose.
The plants are real. The International Dairy Foods Association documented more than $11 billion committed across 19 states and more than 50 building projects between 2025 and early 2028 — New York at $2.8 billion, Texas at $1.5 billion, Wisconsin at $1.1 billion, Idaho at $720 million, Iowa at $701 million. IDFA president and CEO Michael Dykes put the reasoning plainly in the association’s October 2, 2025 release: the investment “reflects the confidence dairy companies have in the future of American agriculture and their commitment to meeting growing domestic and global demand for nutritious dairy foods.” That same release states the industry expects U.S. milk production to grow by 15 billion pounds by 2030. Trade coverage in August 2026 has cited the investment total at $13 billion; no primary IDFA statement bridging $11 billion to $13 billion has surfaced, so $11 billion is the figure with a source behind it.
Capacity going up. Price forecast coming down. Same month.
The Trap: Your Base Year Predates Your Decision
Here’s the part that reframes every number above, and it has nothing to do with the price forecast.
Land O’Lakes has run structured base programs since at least 2016, historically offering incremental base to existing members who wanted to grow, and expanded the approach regionally into Eastern states by 2023. Documentation available for this piece runs through 2023 — whether that structure holds unchanged in 2026 is a question for your own field rep, not a settled fact. Not every cooperative works that way. Dairy Farmers of America told The Bullvine in June 2026, in the context of its St. Albans plant closure, that it doesn’t cap how much milk a member can produce and hasn’t announced any base or penalty program tied to those closures.
Two of the largest names in American dairy have publicly described different approaches. That’s the point: there’s no single industry default, which is why the answer for your farm has to come from your own agreement rather than from either co-op’s reputation. Neither cooperative was contacted specifically for this analysis, which relies on published statements and prior reporting.
A structured base program isn’t inherently the bad option. Land O’Lakes documented its base-offer sequencing publicly, which is more transparency than most producers get, and offering incremental base to existing members first cuts in your favor.
The mechanics are well documented even where a specific co-op’s current terms aren’t. American Farm Bureau describes the standard structure: producers establish a base during short-supply months, receive the higher milk price up to that base, and milk above base sells at a discount — the discount exists precisely to remove the incentive to oversupply.
Congressional Research Service documentation of proposed federal versions describes base set either as a three-month rolling average of recent marketings or the same month in the prior year, with excess assessed a penalty redistributed to producers who stayed inside allocation.
Those describe generic structures, not either named co-op’s actual terms. Your own contract is the only document that answers this for your barn.
Read that with a barn addition in mind. Under a fixed-base structure, milk from cows you haven’t bought yet lands in the excess bucket. Even under a rolling base, it sits there until the window catches up. The plant down the road doesn’t change that. Your base formula does.
No public reporting establishes whether any cooperative has tied this specific buildout to written incremental-base offers for existing mid-size members. That’s the most operator-relevant unanswered question in the 2030 story. It’s also the one you can get answered — for your own farm, this week, by asking.
Everyone Assumed New Plants Mean New Room
The logic feels airtight: plants get built, plants need milk, producers ship more of it at a better price. It’s three separate bets wearing one coat, and only one of them is documented.
Bet one is capacity, and it’s solid. Named companies, named states, real concrete.
Bet two is price. USDA’s August 2026 Livestock, Dairy and Poultry Outlook lowered the 2026 Class IV forecast to $18.15/cwt, down a quarter, on weaker butter. AgCountry’s third-quarter 2026 outlook projects second-half Class III averaging $17.25/cwt and Class IV at $18.50 — an analyst forecast, not USDA data, and scoped to half the year rather than the annual average. Two credible reads. Both below where a lot of 2025 expansion math got built.
And the formula has been working against you separately from the market. USDA’s June 2025 Federal Order modernization — per the final rule published January 17, 2025 — raised the butter make allowance from $0.1715/lb to $0.2272/lb, a 32.5% increase, with cheese moving from $0.2003 to $0.2519. Those are subtractions from your component values before any market move. How the make-allowance changes reached your milk check is its own arithmetic, and it compounds everything below.
Bet three is access, and you just read why nobody’s published a number on it.
The Yield Math Says Nobody Needs Your Extra Cows
Run USDA’s baseline and the shape gets uncomfortable. Production climbs from 225.9 billion pounds in 2024 to roughly 243.7 billion by 2030 — a gain of 17.8 billion pounds, which actually overshoots the 15-billion figure the industry has been quoting. Yield per cow does the work: 24,177 pounds to 25,607, up 1,430 pounds. The national herd stays close to flat — about 9.34 million head in 2024, peaking near 9.5 million around 2026, settling near 9.52 million by 2030.
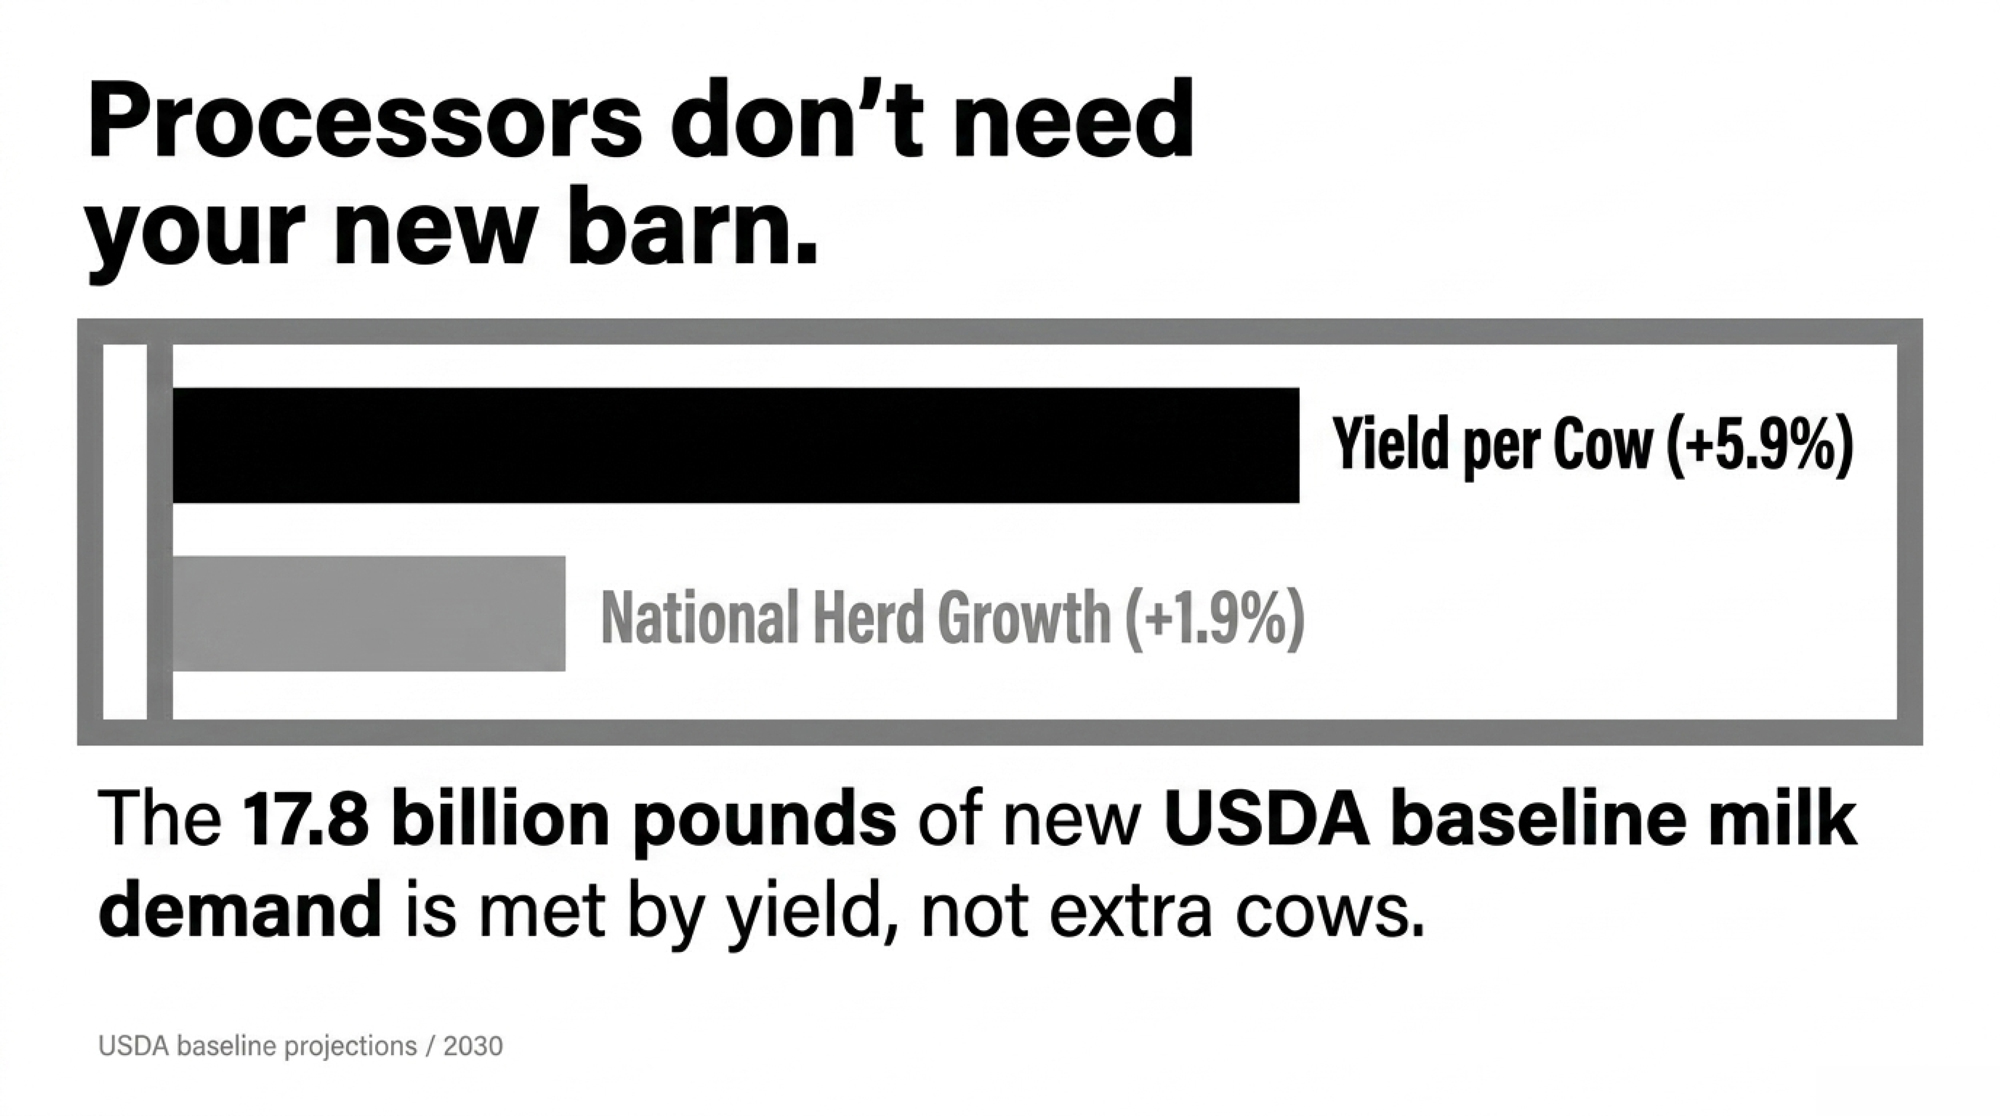
Put the two growth rates side by side and the whole thesis fits in one line: yield up 5.9%, herd up 1.9%.
Multiply the endpoints. 9.52 million × 25,607 = 243.8 billion pounds. The math holds.
So the volume arrives whether or not one new farm exists, and whether or not you buy a single heifer. That’s not a scare line — it’s USDA’s own arithmetic. The buildout is a demand signal for volume, not an invitation to you specifically.
Label this correctly: USDA baseline projections are conditional models built on stated assumptions, not predictions. And a separate USDA-linked summary of the same series published through Ohio State University Extension shows 9.43 million cows at 26,295 pounds for 2030. Different split, same neighborhood on total. Two vintages circulating at once, and coverage rarely names which one it’s quoting.
Where Did “Half the Farms by 2030” Come From?
You’ve seen that phrase attached to this projection. It doesn’t survive the window it’s applied to.
USDA NASS counted 24,600 licensed dairy herds in 2024 and about 23,600 in 2025, with an average herd size of 397 cows. Terrain’s June 2026 analysis projects fewer than 20,000 by decade’s end — a decline of roughly 15 to 19% from today, not 50%.
The halving is real. It’s a two-decade story, and ERS has the exact figure: licensed U.S. dairy herds fell 63%, from 66,825 in 2004 to 24,811 in 2024, per the agency’s February 2026 Amber Waves analysis. Production over that same span rose 32%, from 170.8 billion pounds to 225.9 billion. Pair a twenty-year farm-loss number with a six-year production number in one sentence and the two read as simultaneous. They aren’t. A producer sizing an expansion off that sentence is working from a compressed timeline. Where the farm-count curve actually points — 15,000 to 16,000 herds by 2035, under 10,000 by 2050 — is a slope, not a cliff.
Running the Numbers: What $19.85 Does at Three Cost Structures
Assume 400 cows in milk at 75 lbs/day, 365 days, no dry-period adjustment: 400 × 75 = 30,000 lbs/day, × 365 = 10,950,000 lbs, ÷ 100 = 109,500 cwt/year. If your 400 head includes dry cows at roughly 85% milking, run the table on about 93,000 cwt instead — the per-cwt logic doesn’t change; the dollars do.
Revenue calculated on 400 cows in milk @ 75 lbs/day = 109,500 cwt/year ($2,173,575 total gross).
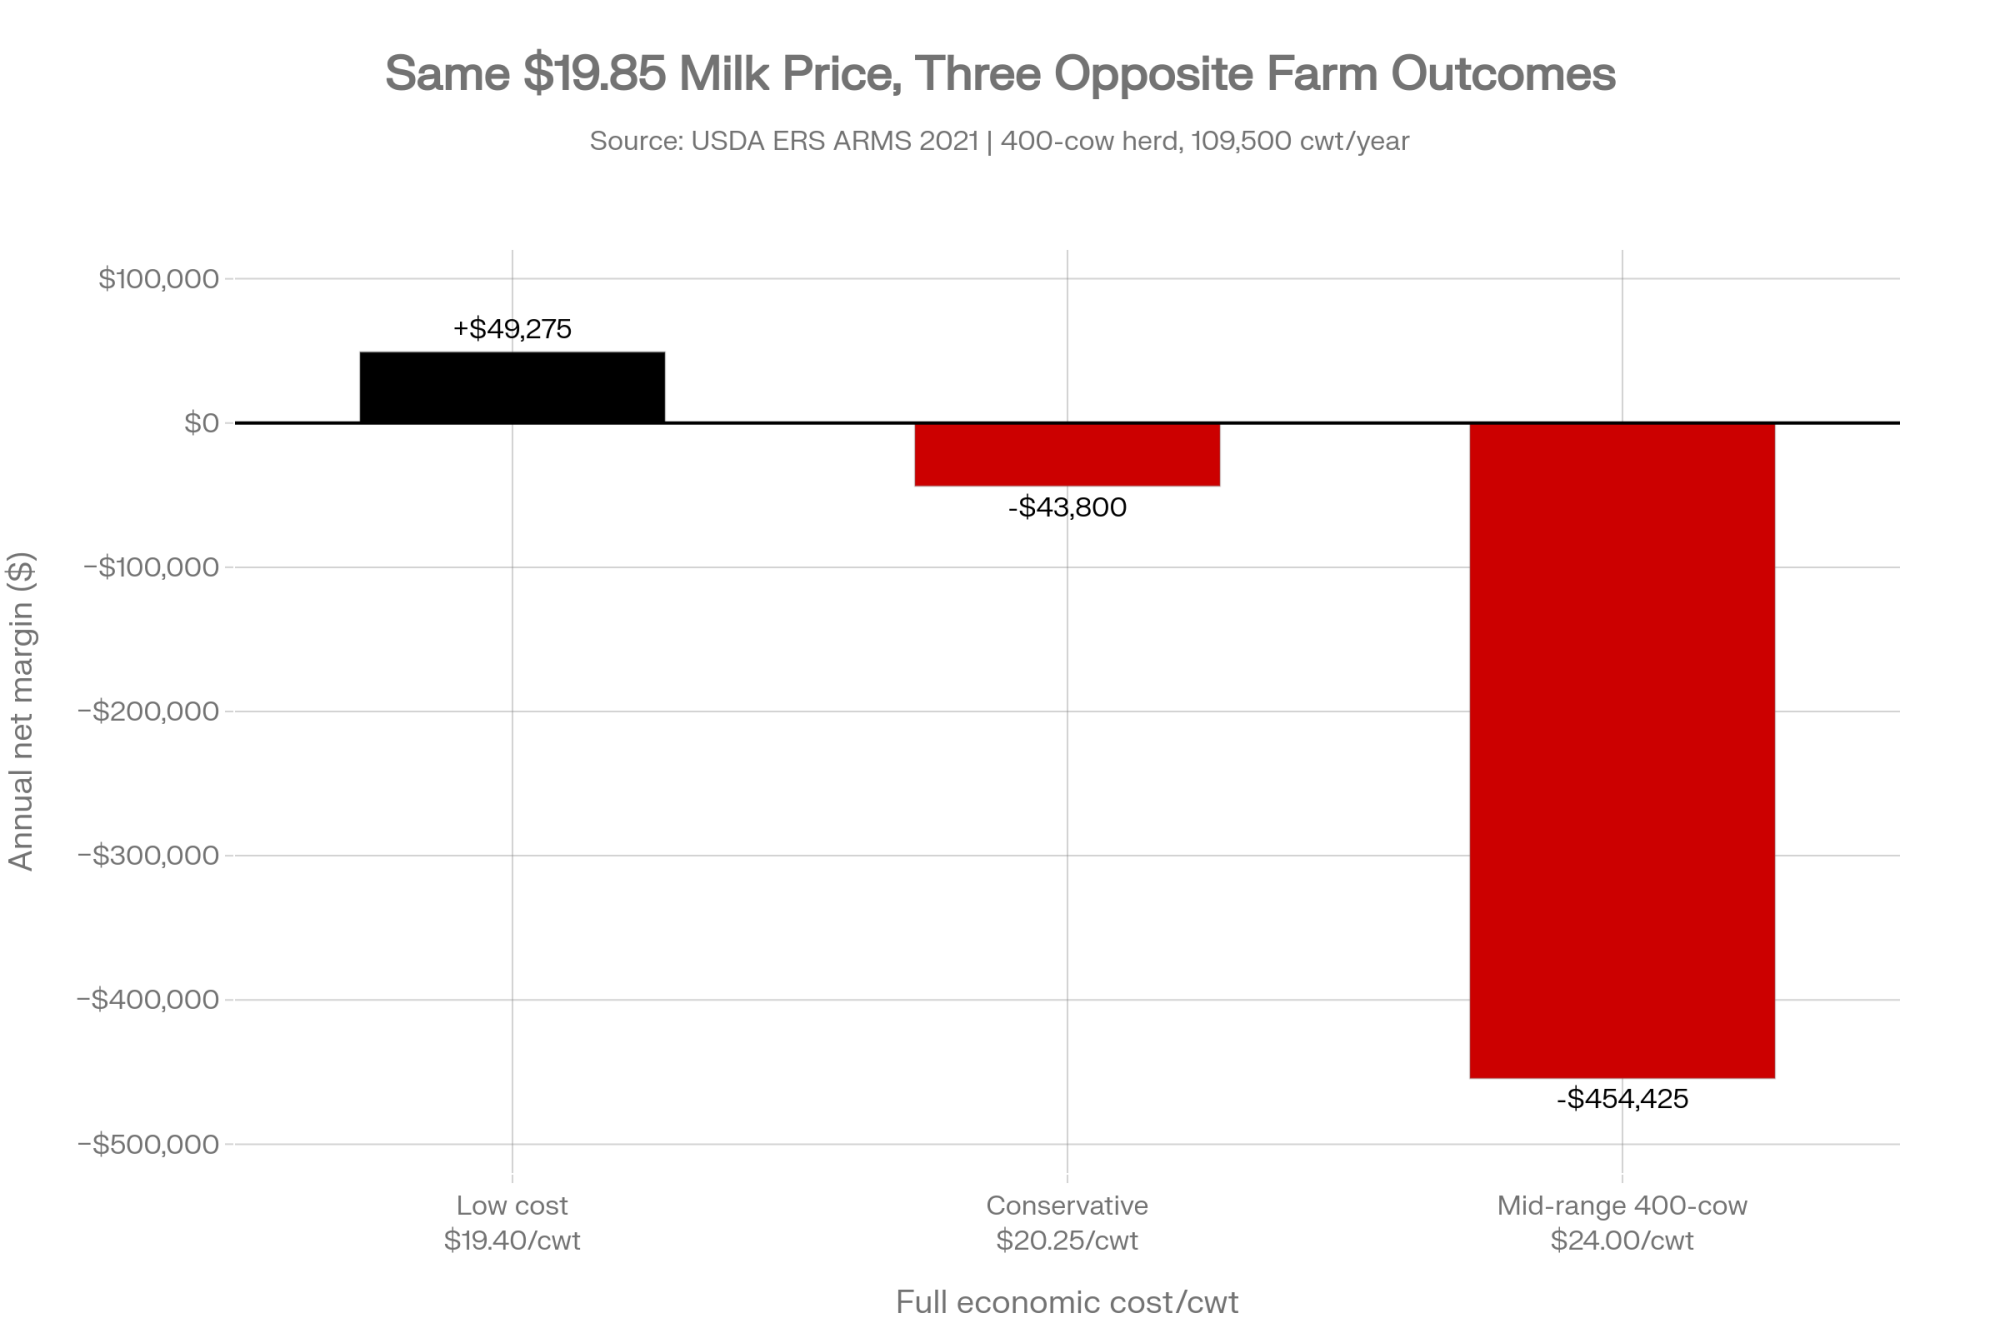
| Scenario / Herd Cost Structure | Cost/cwt | Revenue @ $19.85 | Annual Net Margin | Economic Status |
| Low cost / diluted overhead | $19.40 | $2,173,575 | +$49,275 | Profitable expansion room |
| Conservative full cost | $20.25 | $2,173,575 | −$43,800 | Negative economic margin |
| Mid-range 400-cow average | $24.00 | $2,173,575 | −$454,425 | Severe capital drain |
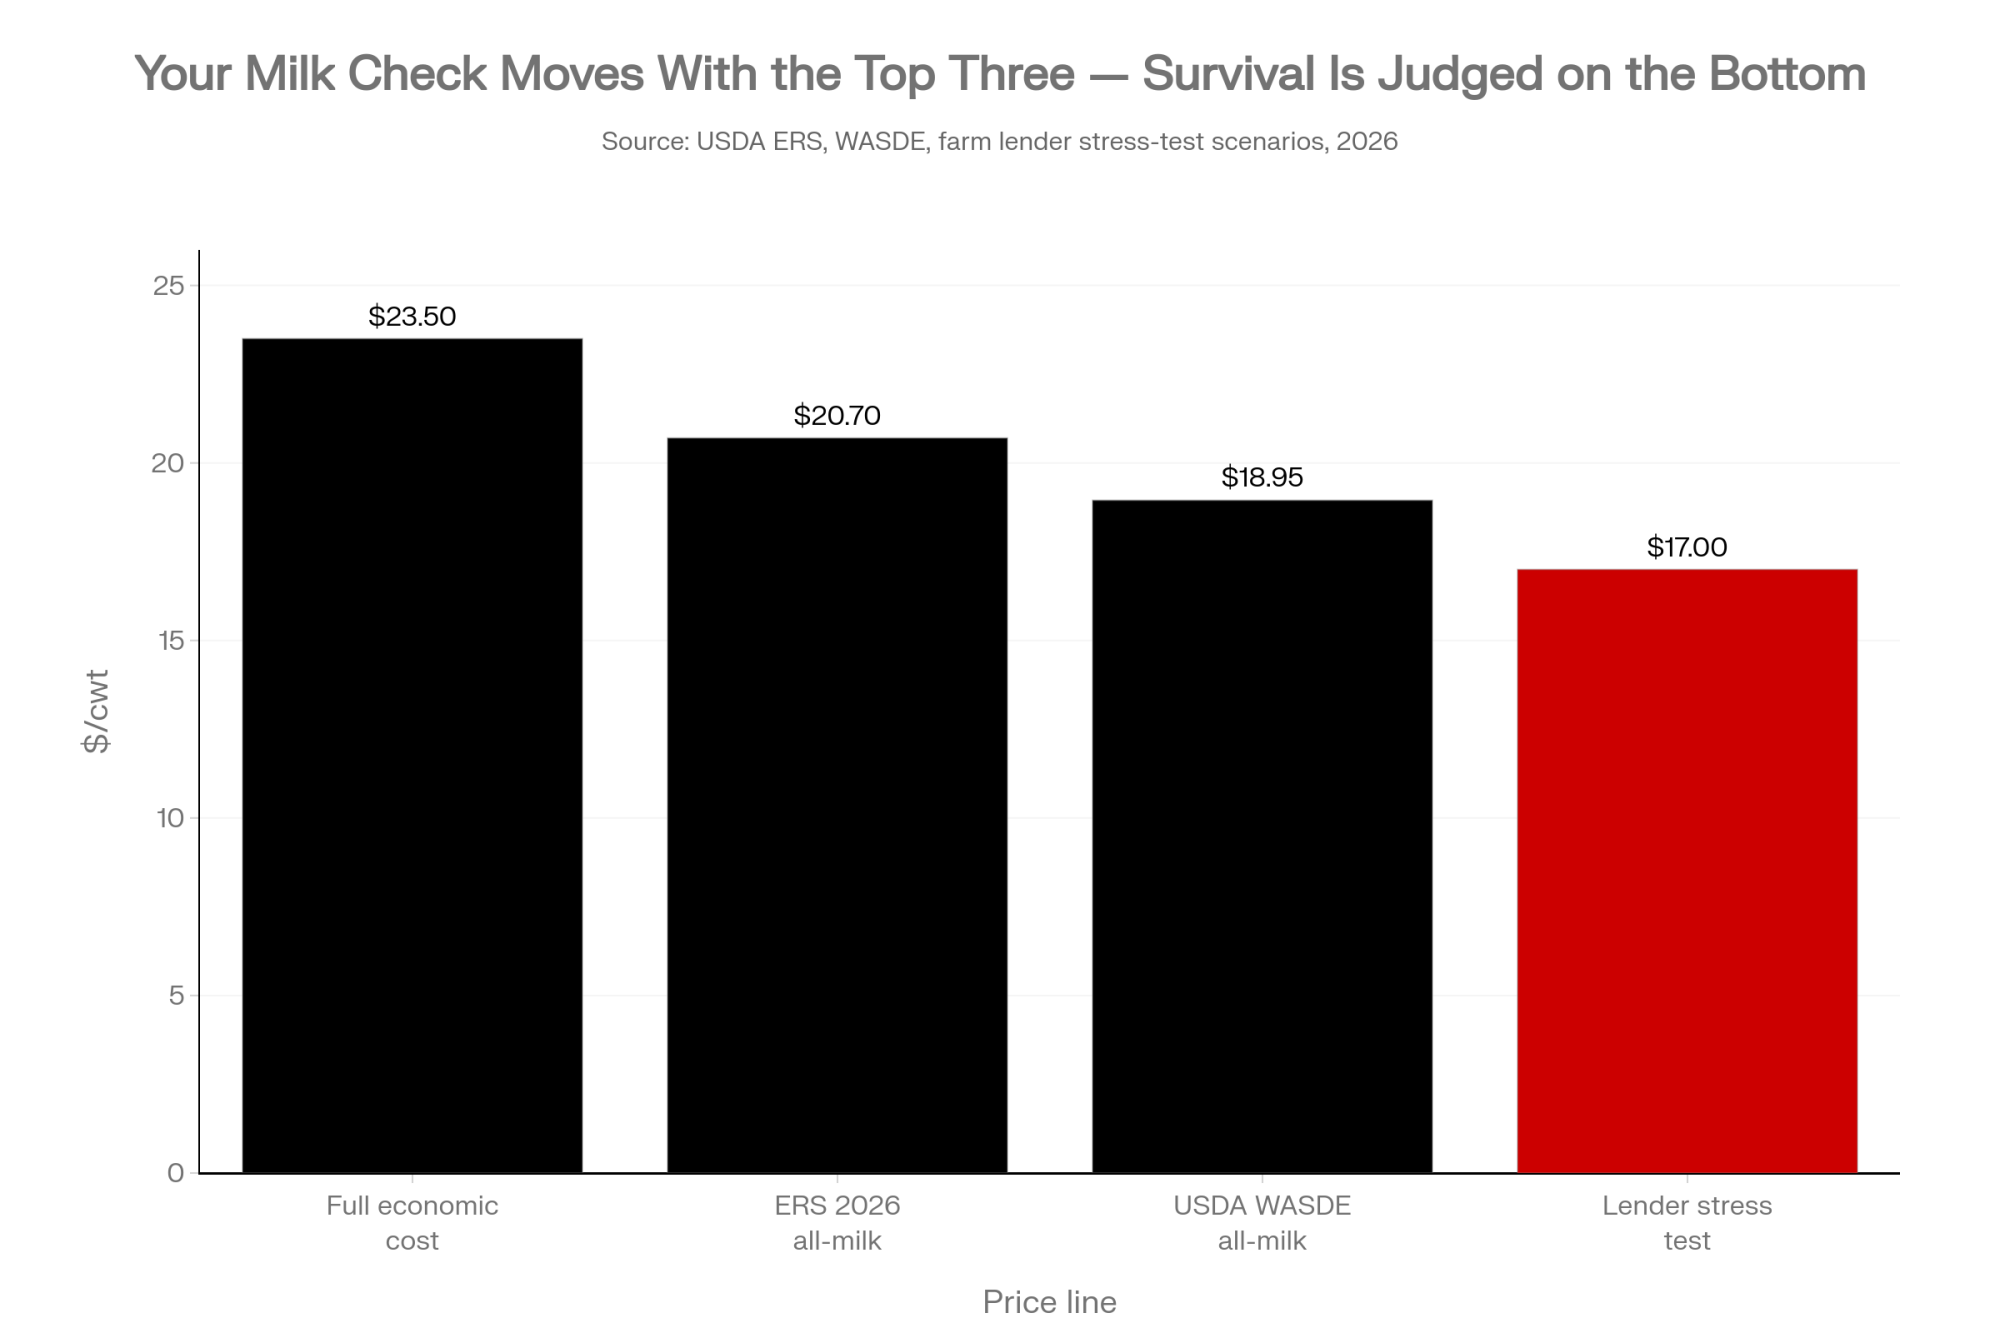
Sourcing on those inputs: ERS 2021 ARMS data — national averages by herd-size class — puts full economic cost near $20.54/cwt for 500–999-cow herds and $19.14/cwt for 1,000-plus. The $24.00 figure is the mid-range 400-cow full cost our April analysis used, including unpaid family labor valued at $18–22/hour and depreciation at replacement cost. The $19.40 and $20.25 rows are illustrative inputs, not reported figures.
Three cost structures, three completely different decisions off one milk price. That spread is the entire argument for running your own number instead of anyone’s average — and it’s why the headline’s trap is conditional. If you’re the top row, there’s room. If you’re the bottom row, no plant announcement fixes that.
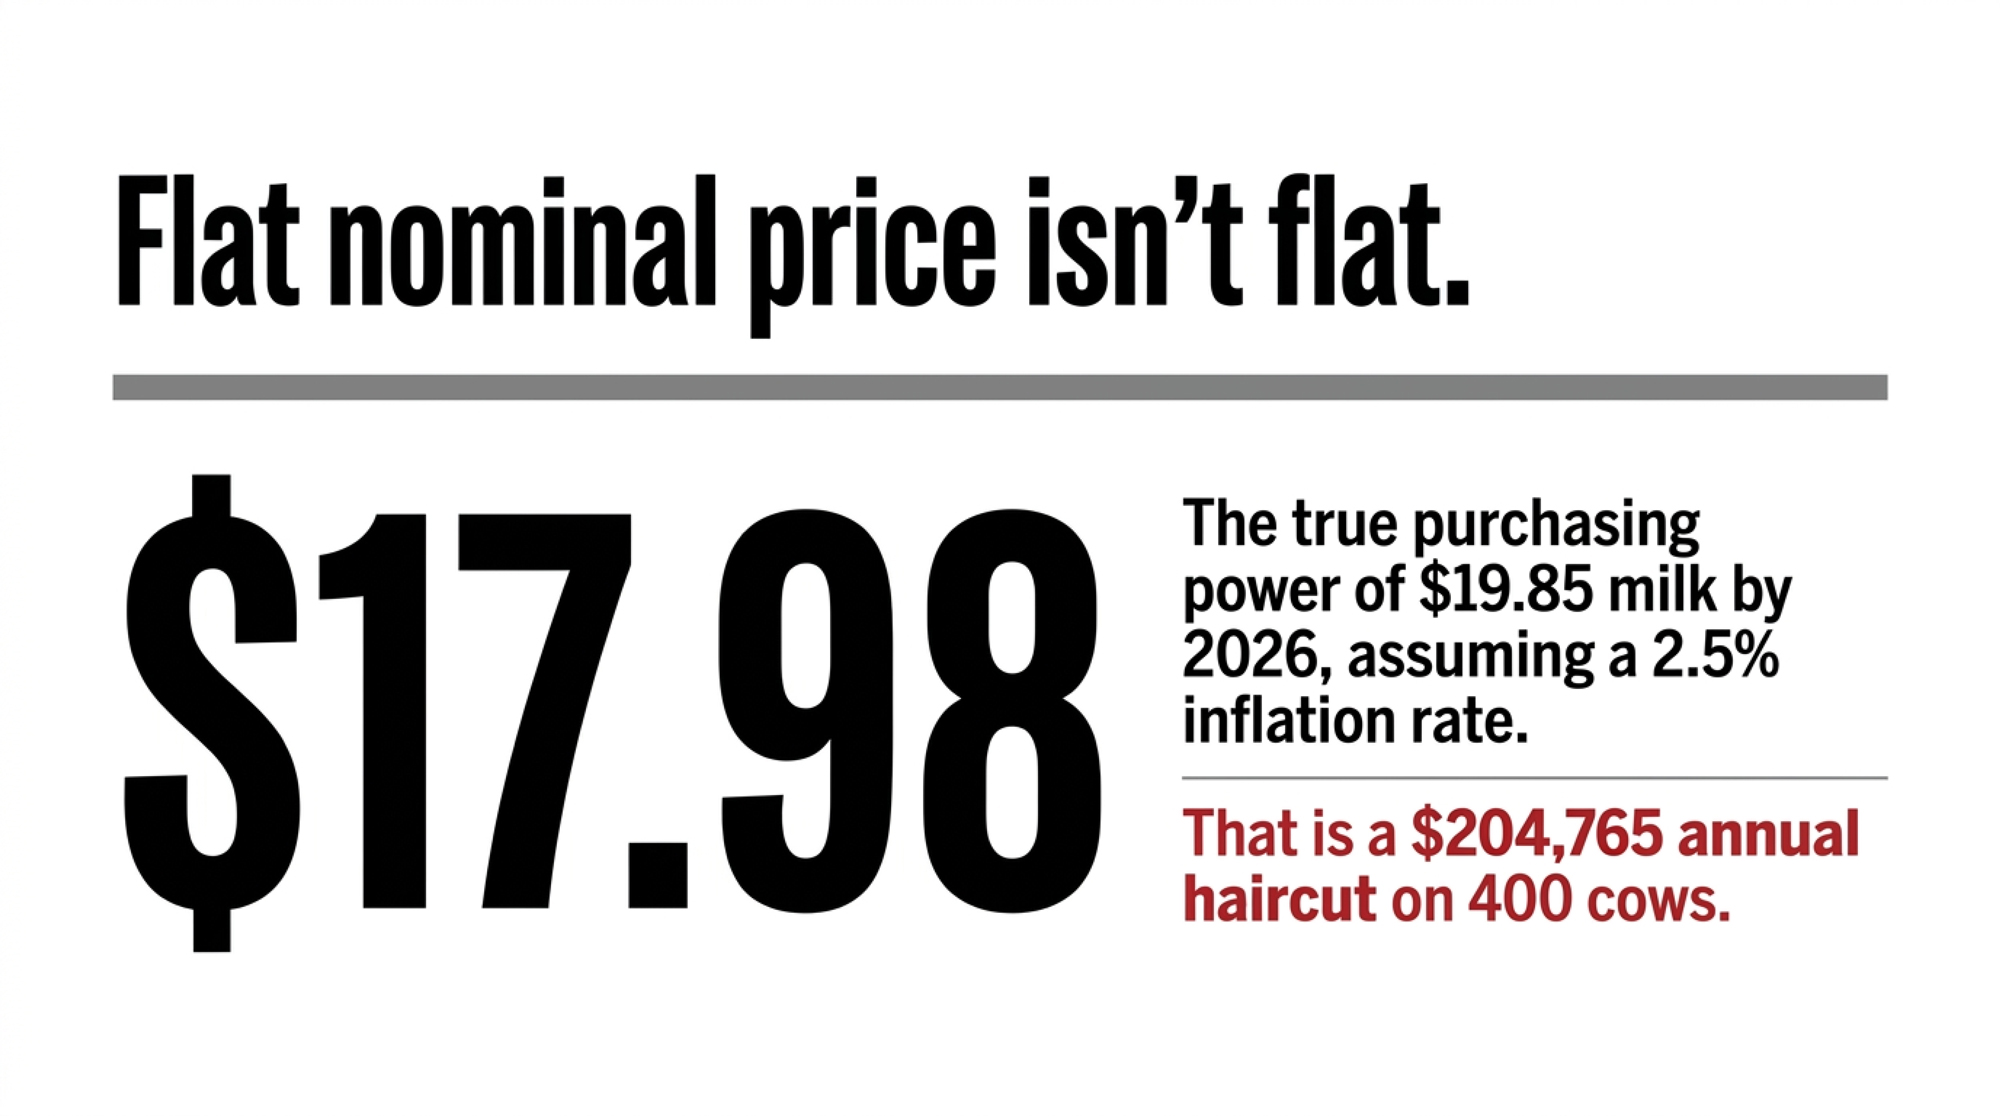
And separately — the real-price erosion. USDA’s $19.85 and $19.80 are nominal. Hold nominal price flat through 2030 and deflate at 2.5% annual general inflation, roughly the Federal Reserve’s long-run target and a stated placeholder rather than a forecast:
- $19.85 ÷ (1.025)⁴ = $17.98 in 2026 dollars
- Real decline: $1.87/cwt
- On 109,500 cwt: $204,765 of annual purchasing power, gone
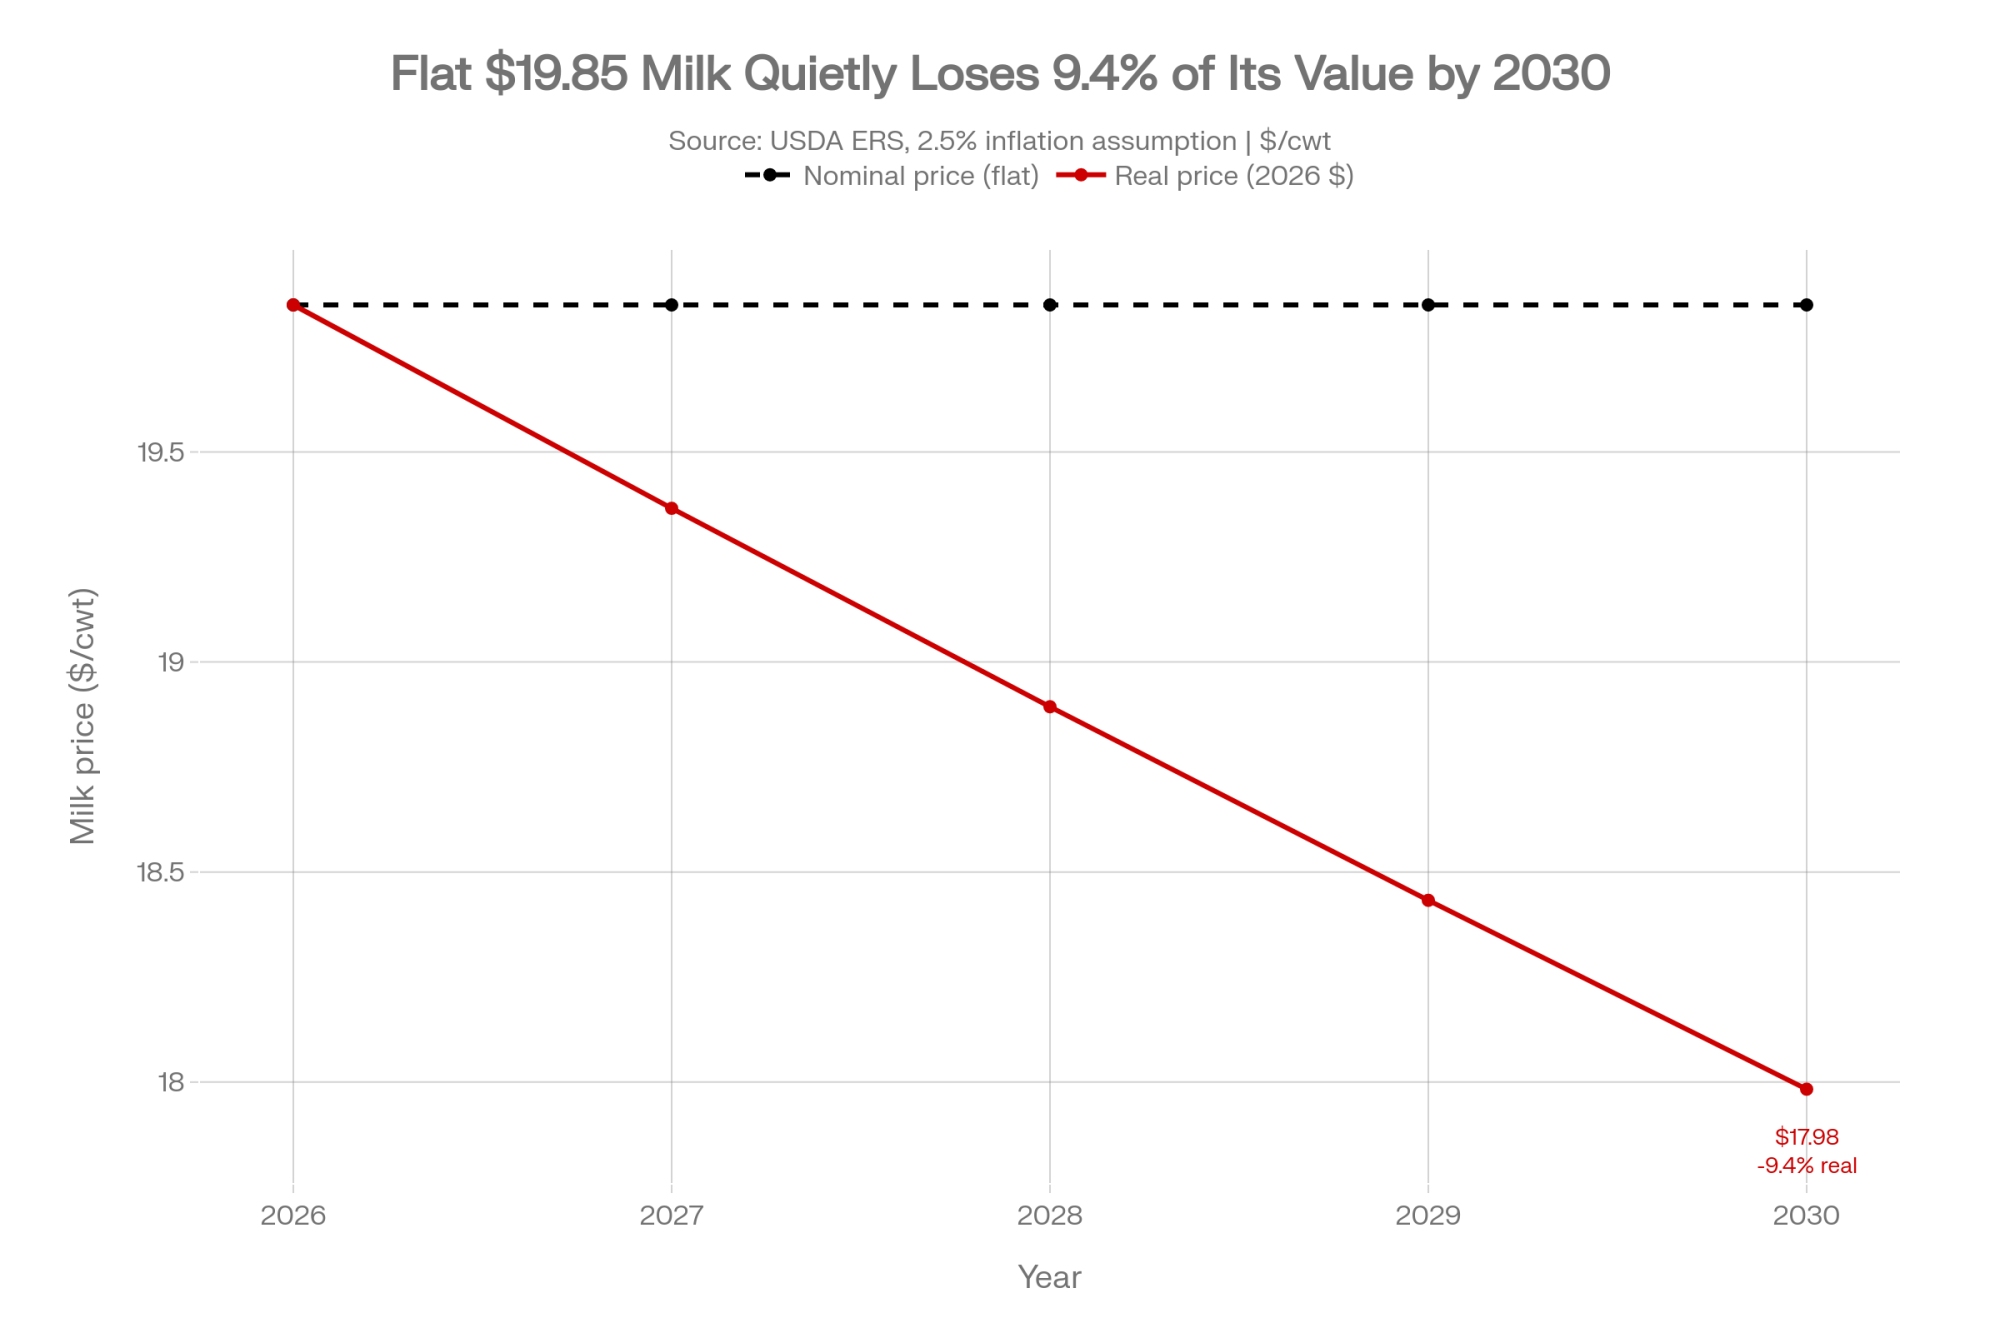
That figure isn’t a margin — it’s erosion of what the same nominal revenue buys. It stacks on top of whichever row above describes your barn. Change the inflation assumption and the number moves; the direction doesn’t.
Can Your Cost Structure Actually Dilute?
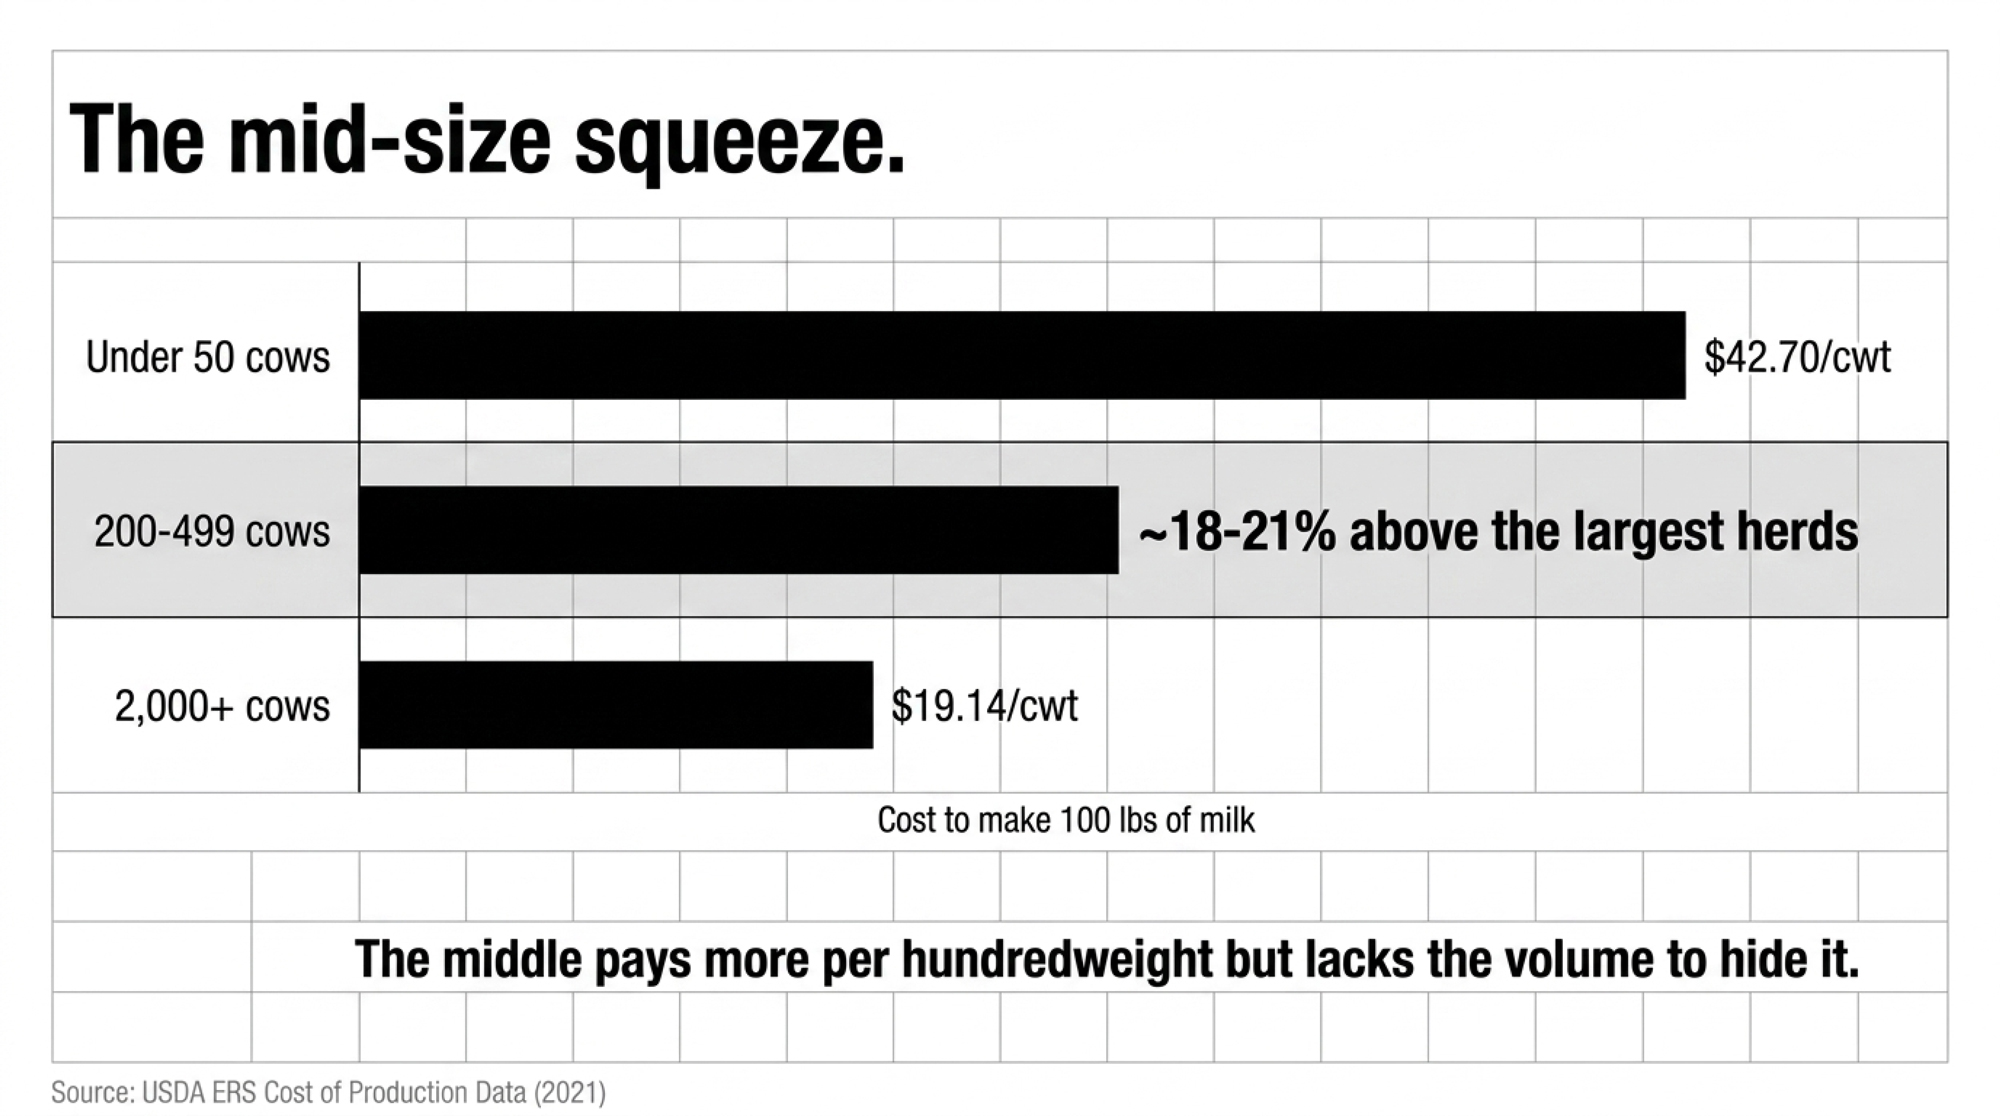
USDA ERS cost-of-production estimates — national averages by herd-size class — put 2,000-plus-cow operations near $19.14/cwt and the smallest herds near $42.70/cwt. Against $19.85 all-milk, the large operation sits roughly at breakeven on full economic cost. The small one isn’t in the conversation.
One caveat that should change how you use those numbers. ERS states its milk cost-of-production estimates from 2021 forward are built on 2021 ARMS survey data, updated only for annual price changes — not re-surveyed. Price-adjusted 2021 cost structures, national scope. Directionally useful. Don’t build a loan application on the decimals.
That spread is the consolidation mechanism in two numbers, alongside labor, succession, and capital access, which the spread doesn’t capture. ERS documents the direction: from 2002 to 2022, farms with fewer than 1,000 cows declined while farms with 1,000 or more grew 60%. It points at the assumption doing all the work in USDA’s 2030 model — cost dilution through scale. If your cost per cwt genuinely falls as you grow, the projection describes you. If it doesn’t, it describes somebody else’s farm.
The 30/90/365-Day Playbook for 400-Cow Herds Facing a Plant Announcement
30-Day Actions
- Full economic breakeven audit. Calculate non-cash costs: unpaid family labor at a real wage, replacement-cost depreciation, current debt interest, and a return to management.
- Trigger: if full cost exceeds $19.85/cwt, halt uncommitted expansion plans until your own data says otherwise.
- Backfire risk: relying on cash-flow breakeven masks long-term equity depletion. You’ll clear a threshold you never cleared.
- Base contract classification. Request written documentation on whether your cooperative operates a fixed or rolling base year, and what the formula is.
- Core question for your field rep: “Does milk from added stalls settle into historical base, or excess pricing tiers?”
- Backfire risk: a verbal “no cap” may be current policy rather than contract. Policy changes. Get the distinction on paper.
90-Day Actions
- Dual-formula scenario modeling. Model herd returns under both primary base pool pricing and discounted over-base settlement. Requires the formula from your 30-day ask; if the co-op won’t commit it to writing, that silence is the answer.
- Legal contract review. Review member agreements for volume penalty clauses, mandatory processing deducts, and exit penalties. Requires an hour with your lawyer, not your field rep.
- Watch for: a clean contract protects you; it doesn’t pay you. Don’t mistake one for a margin.
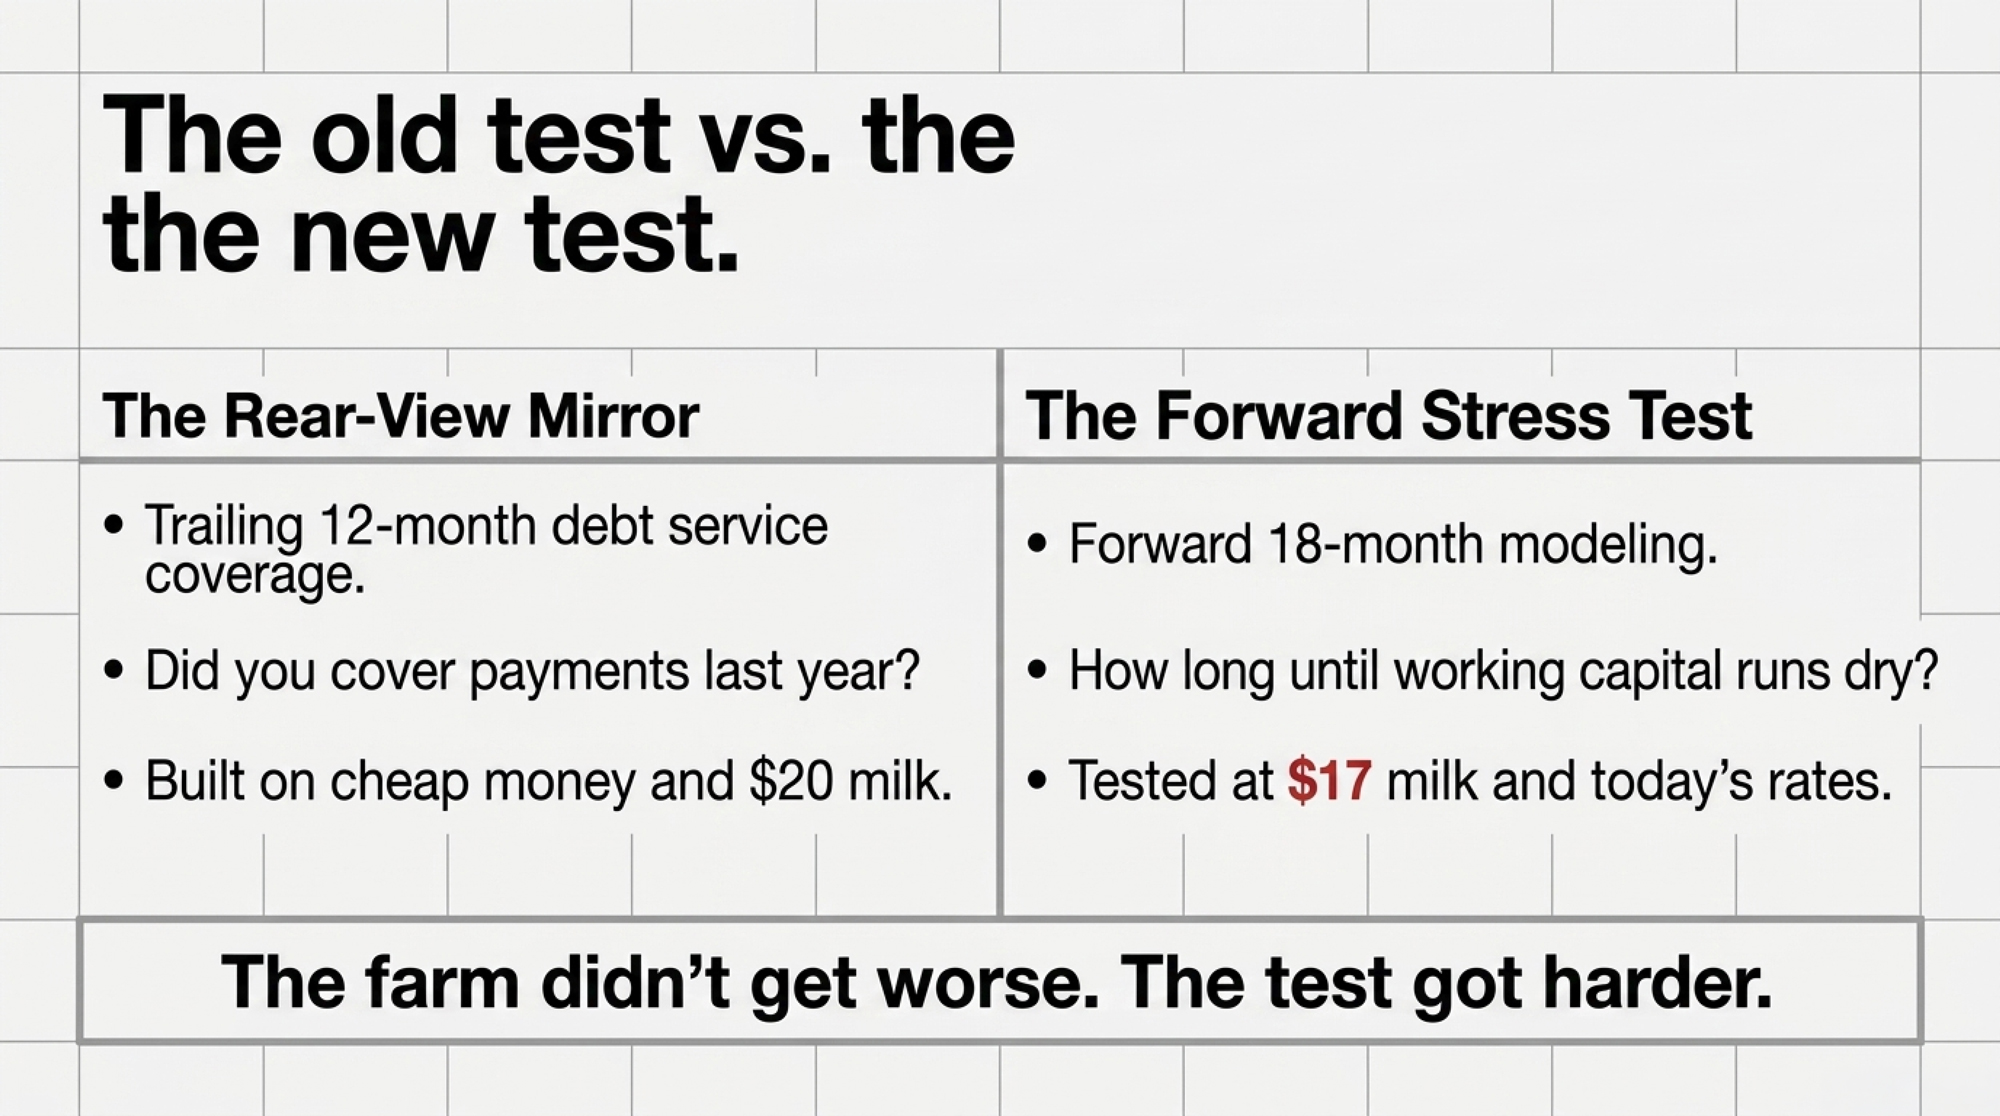
- Downside stress-testing. Model the barn addition against $18.15 Class IV and $17.25 Class III rather than optimistic price peaks.
- Trigger: if the expansion only pencils on the optimistic forecast, it doesn’t pencil.
365-Day Moves
- Scale dilution vs. margin defense. Expand only if marginal cost per hundredweight demonstrably decreases with added volume. Opportunity signal: full-cost breakeven below $19.40 and incremental base confirmed in writing means you have room the projection was actually built for. What per-cow overhead looks like at each size class is where that comparison starts.
- Monitor co-op allocation releases. Track written growth-allowance amendments as regional processing plants complete commissioning through early 2028. A written offer is the signal. A groundbreaking photo isn’t.
- Hold deliberately if the numbers say hold. Real risk, stated honestly: if access tightens and base gets allocated to whoever moved first, waiting carries a cost nobody can quantify right now because the data isn’t public. That’s an unknown, not a reason to move.
What Should a Canadian Producer Take From a US Buildout?
Different system, and the contrast is sharper than most cross-border comparisons.
| Metric / Mechanism | US Market (FMMO / Private Handlers) | Canadian Supply Management (CDC / TPQ) |
| Pricing baseline | Market-derived; $19.85/cwt nominal forecast for 2026 | National Pricing Formula; +2.3255% effective Feb 1, 2026, COP + CPI indexed |
| Inflation protection | No automatic indexing of the producer price. Nominal stagnation produces roughly $1.87/cwt of real decline by 2030 | Built-in formulaic cost-of-production and inflation adjustment |
| Volume allocation | Private co-op base contracts; fixed or rolling, terms vary by cooperative and frequently aren’t public | Statutory quota via provincial boards. Nova Scotia’s TPQ regulations cap cumulative over-production at 10× daily TPQ |
| Expansion risk | Milk from new barns can fall into excess/discounted pricing tiers | Volume capped by quota availability; penalties published in advance |
Those first two rows are the whole real-price problem in one frame. A Canadian producer’s price mechanism is designed to track inflation and cost of production. A US producer’s isn’t — FMMO class prices move off product markets, and while make allowances did get adjusted on plant-cost data in 2025, that adjustment cut against producers. Flat nominal all-milk through 2030 quietly becomes a $1.87/cwt real decline; a CDC-priced hectolitre doesn’t erode the same way.
What travels across the border is the allocation discipline. Same underlying question about who controls your volume — very different transparency about the answer. One system publishes its limits in regulation. The other keeps them in a contract you have to request.
Is Your Growth Room Already Allocated?
Not “is a plant coming.” That’s in every trade outlet this month.
The question is whether your cooperative’s base formula treats milk from future cows as base or as excess, and whether anything in writing commits incremental base to existing members. Land O’Lakes put its sequencing on paper in 2016. That proves such commitments can exist in documented form, which means asking for one isn’t unreasonable.
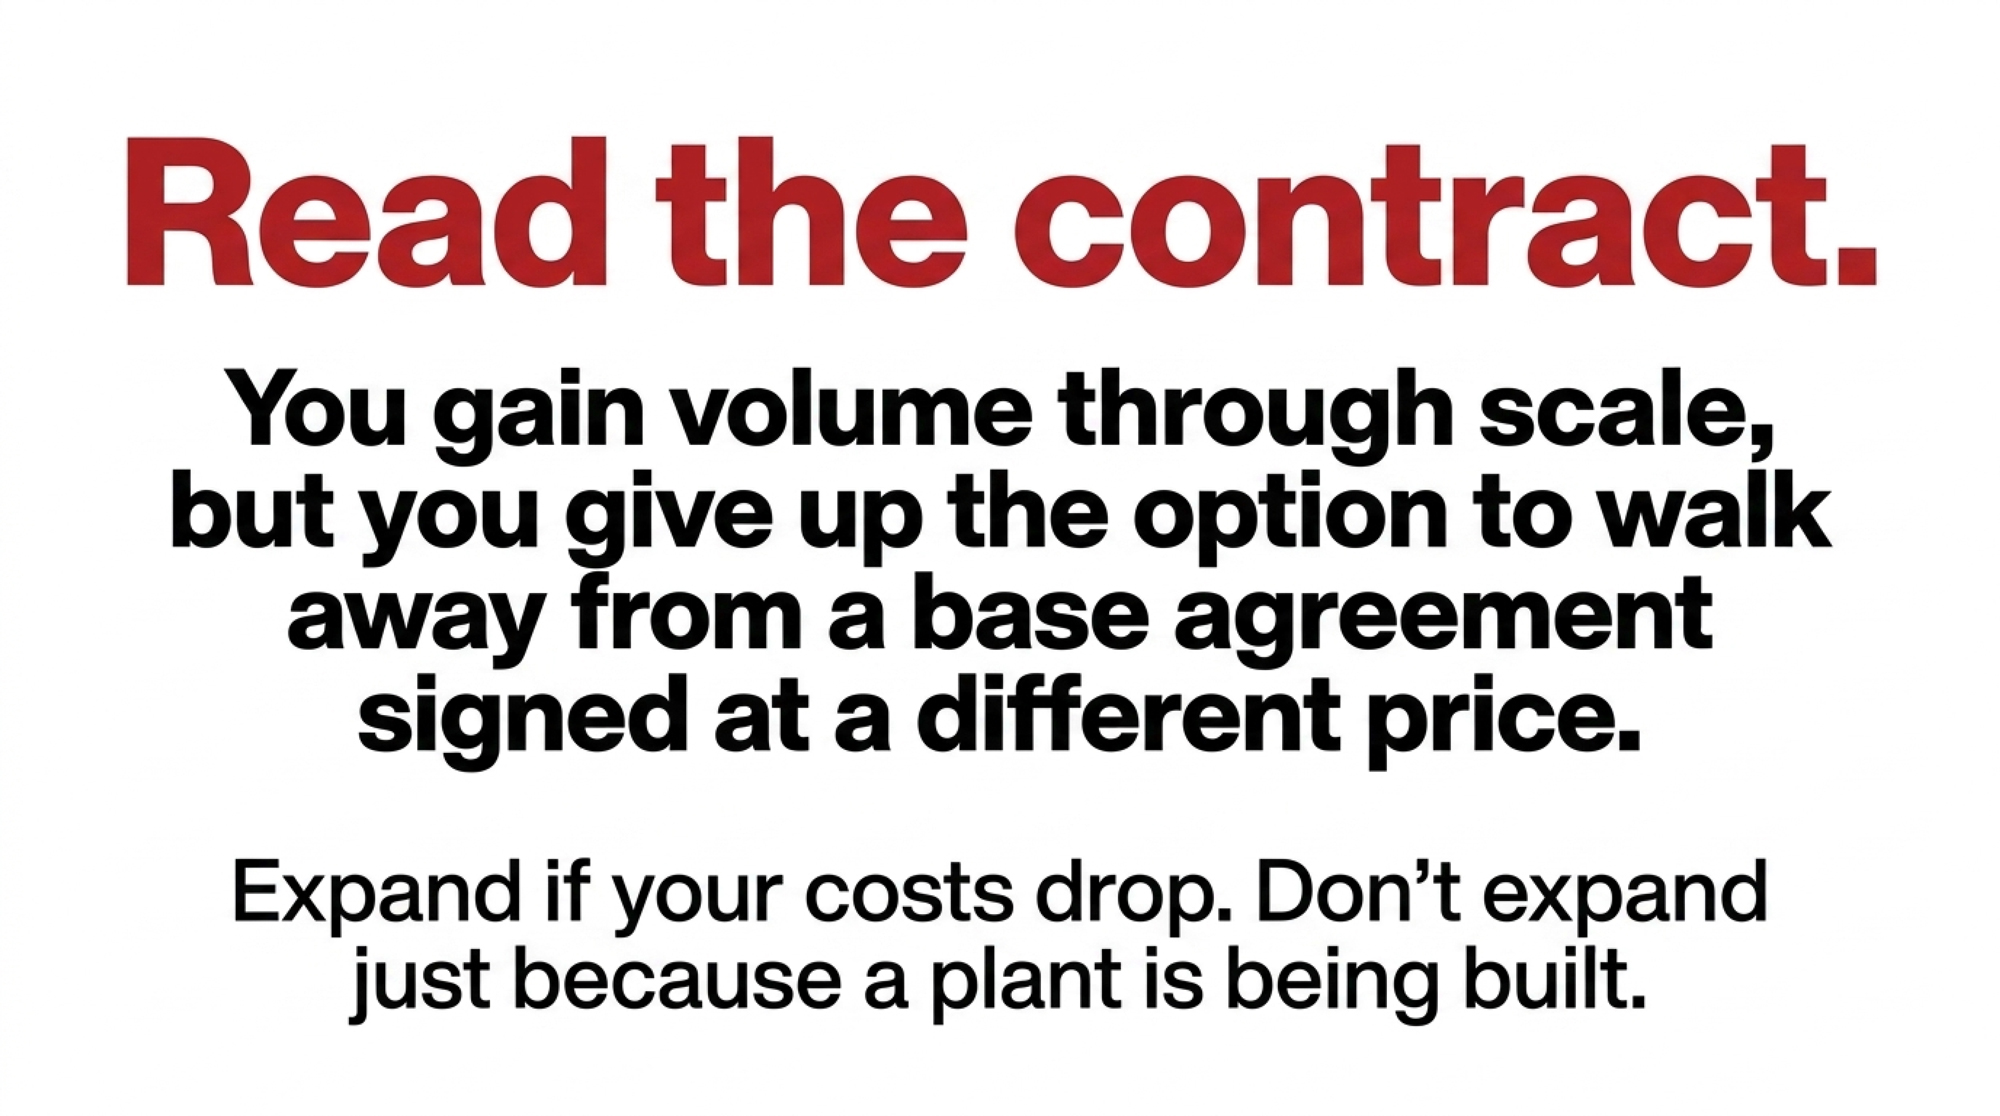
Eleven billion dollars of concrete is going up on Dykes’s stated confidence in long-term demand. USDA’s August revision is a bet that the margin won’t improve. Both can be true at once, and the projection can be internally sound while describing a farm that isn’t yours. You gain volume through scale, but you give up the option to walk away from a base agreement you signed at a different price.
So before the next conversation with your field rep: what does your cooperative’s base formula actually say about milk from cows you haven’t bought yet — and have you read it, or just been told about it?
Key Takeaways
- If your full economic cost — unpaid labor, replacement-cost depreciation, real interest — lands above $19.85/cwt, treat every expansion conversation as negative-margin until your own numbers say otherwise.
- Ask your co-op whether your base year is fixed or rolling, and get it in writing. Under a fixed base, milk from cows you haven’t bought yet ships as excess, at a discount.
- USDA’s own baseline gets to 2030 on yield, not cows — up 5.9% per cow against 1.9% herd growth. The volume shows up whether or not you add a stall.
- Flat nominal price isn’t flat. Hold $19.85 to 2030 and it’s $17.98 in today’s money — a $1.87/cwt haircut before any input outruns inflation.
Run Your Numbers
Dairy Profit Projector — This article says your full-cost breakeven decides everything. The projector calculates it from your own herd size, production, and ration, then shows margin per cwt against $19.85 milk. The sensitivity table stress-tests milk and corn moves before you commit capital.
Complete references and supporting documentation are available upon request by contacting the editorial team at editor@thebullvine.com.
Learn More
- $50K Gone: Von Ruden Reveals FMMO Make Allowance’s 300-Cow Dairy Gut Punch — Arms you with a 30-day milk-check audit protocol to isolate your exact Federal Order make-allowance exposure, showing why formula-driven deductions drain up to $50,000 annually per 300 cows before market prices even move.
- The Bullvine Dairy Curve: 15000 U.S. Farms by 2035 and Under 10000 by 2050 – Who’s Still Milking? — Dismantles the 2030 cliff myth by mapping out long-term 4% annual structural attrition, forcing operations to choose between 1,000-plus cow scale, margin-focused specialization, or an equity-preserving exit before national herd numbers drop to 15,000.
- Pellet-Free Robotic Milking: The $36740 Decision Your Operation Needs to Make Now — Delivers a blueprint to capture $36,740 in annual net savings per 200 cows while boosting butterfat by 0.2–0.4%, proving guided cow-traffic design outperforms expensive, standard automated pellet feeding.
The Sunday Read Dairy Professionals Don’t Skip.

Every week, thousands of producers, breeders, and industry insiders open Bullvine Weekly for genetics insights, market shifts, and profit strategies they won’t find anywhere else. One email. Five minutes. Smarter decisions all week.