Archive for herd economics

Iowa’s Manure Penalty Never Left $5,000. The Restitution Ran 6.7 Times Higher.

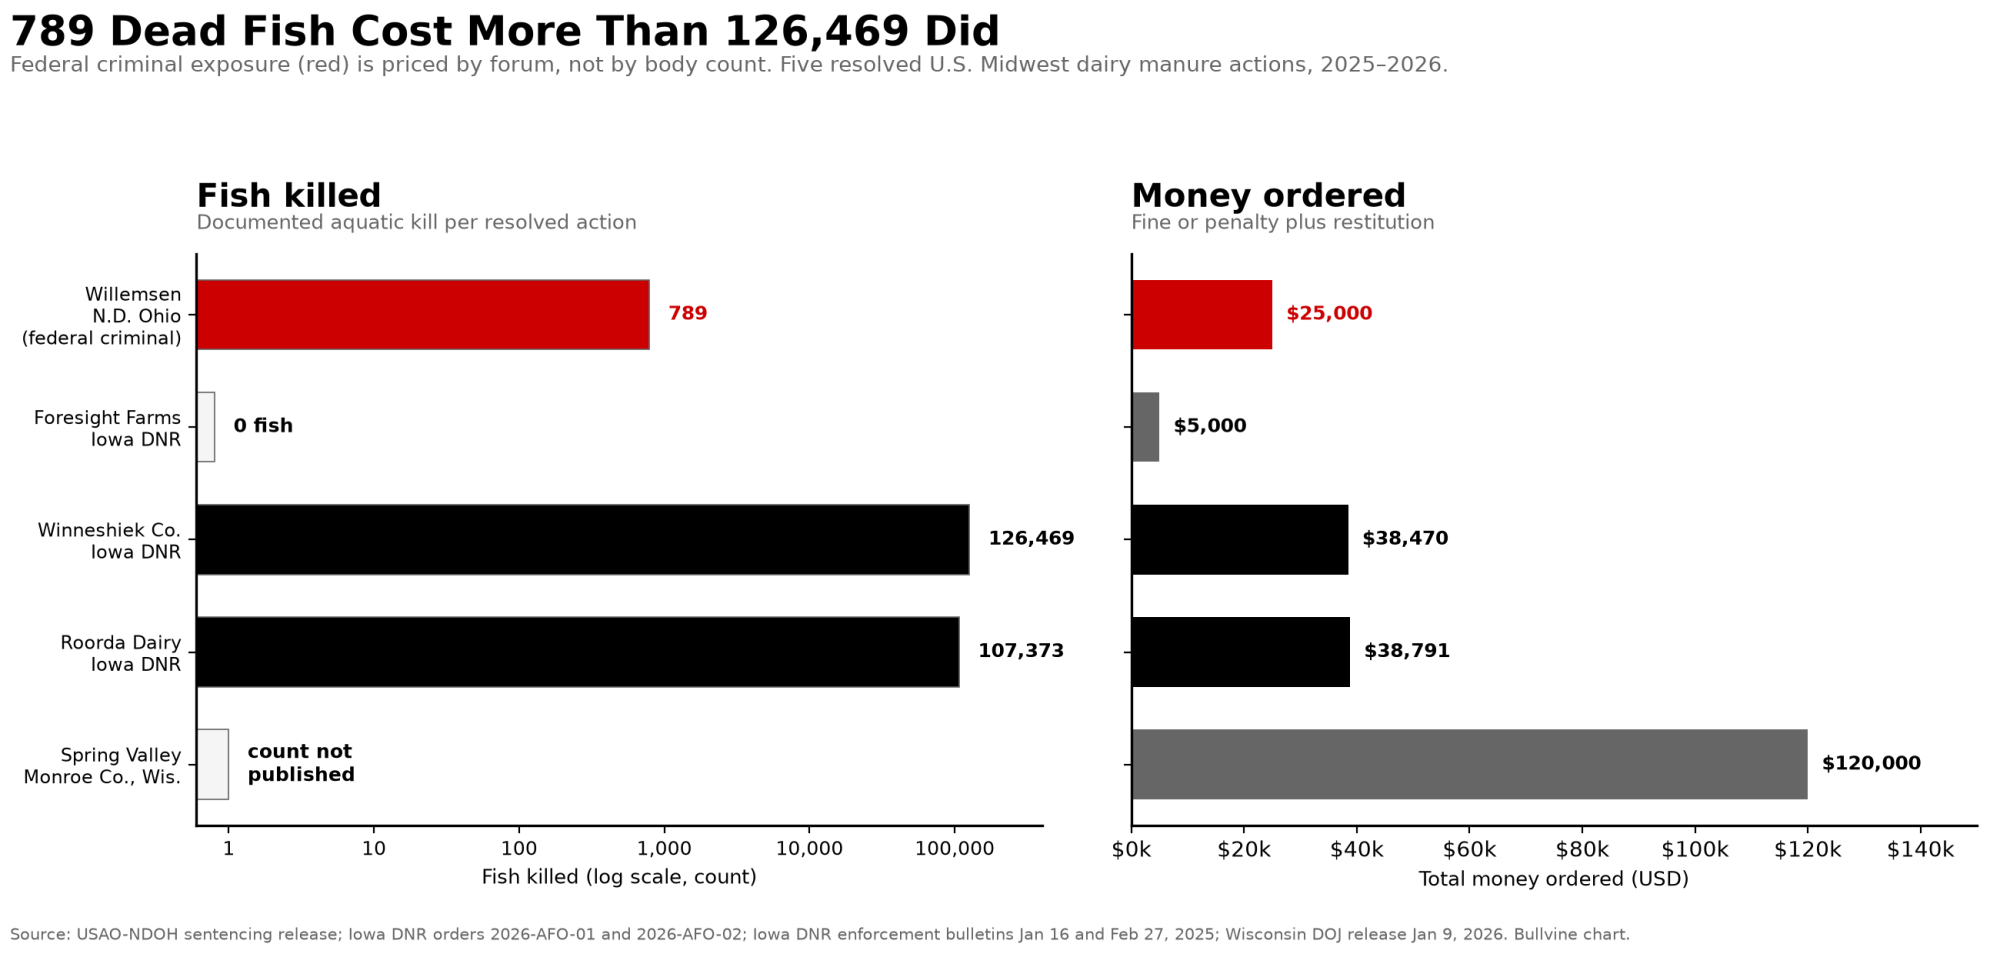
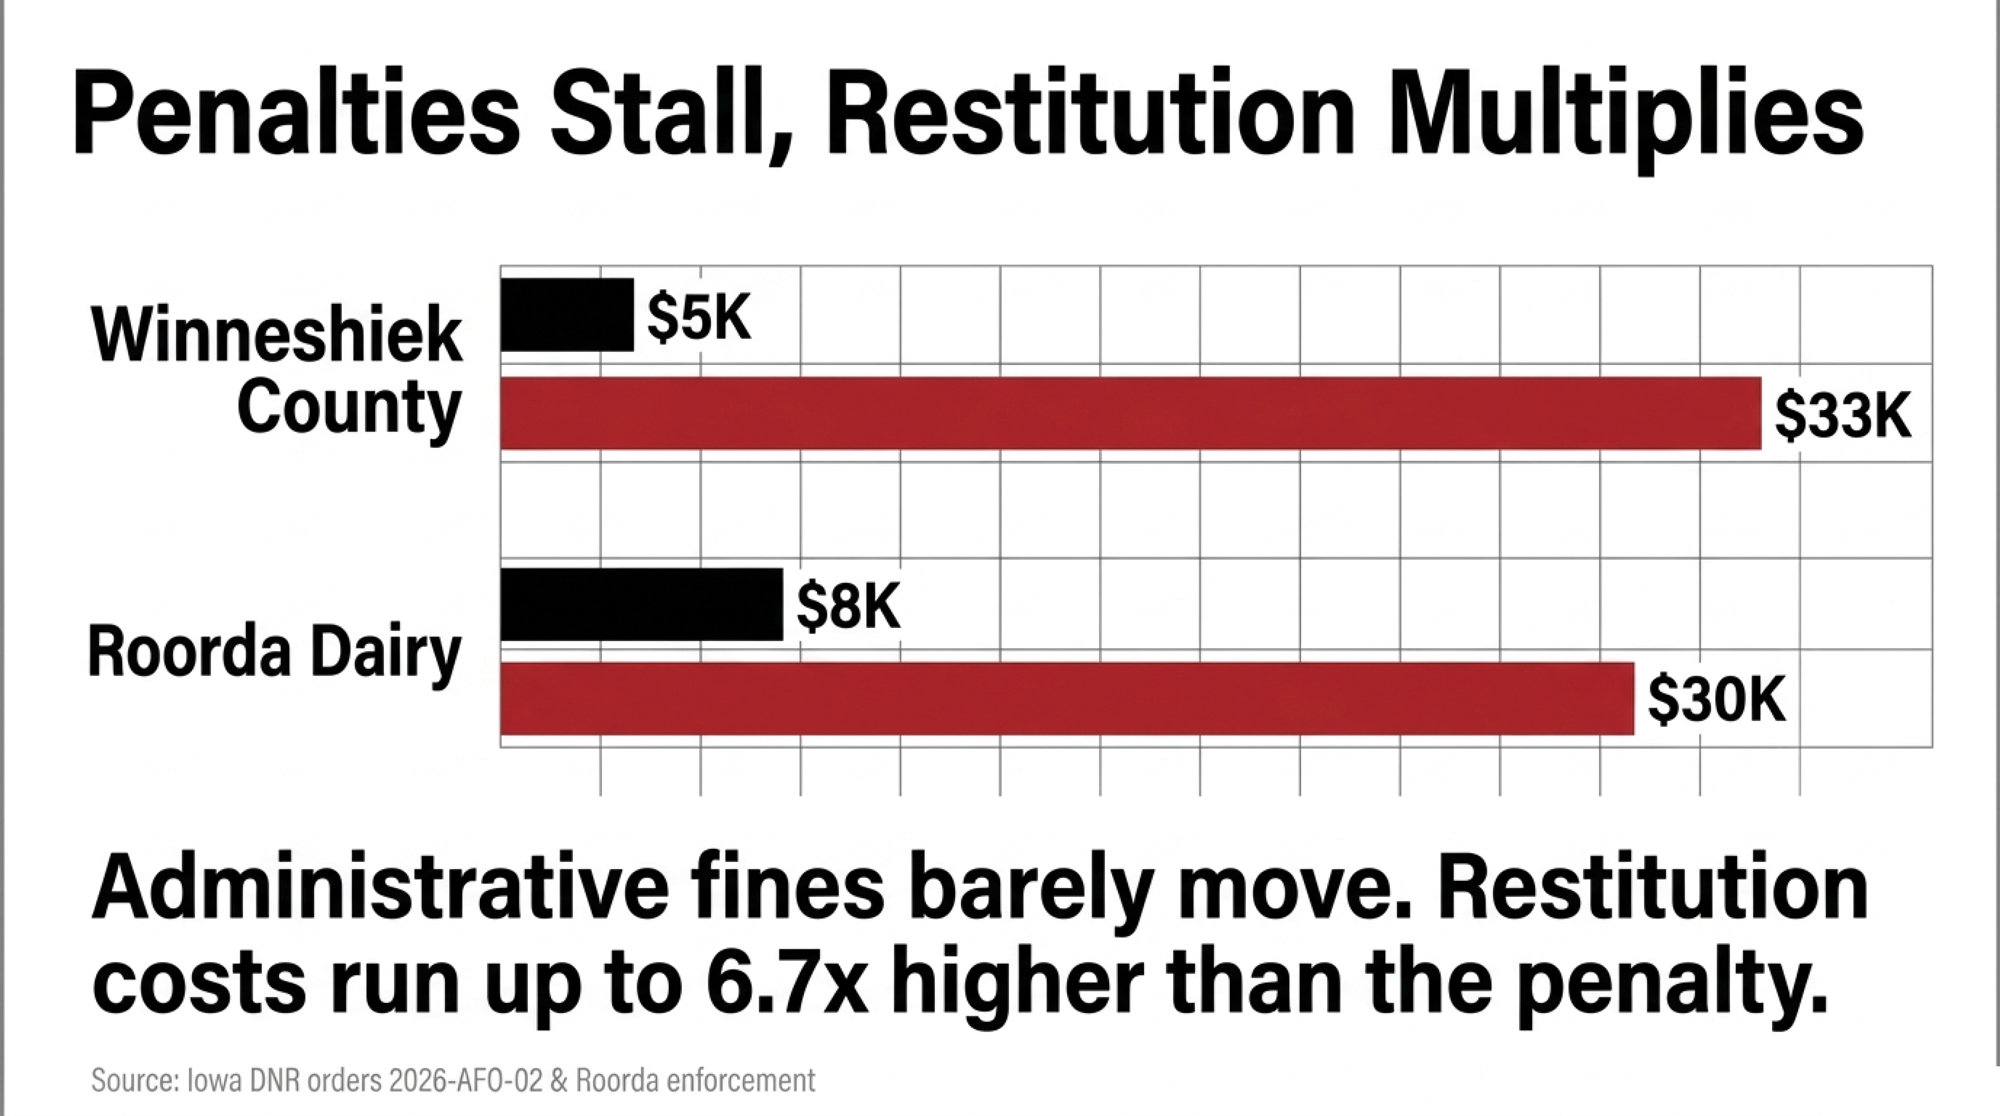
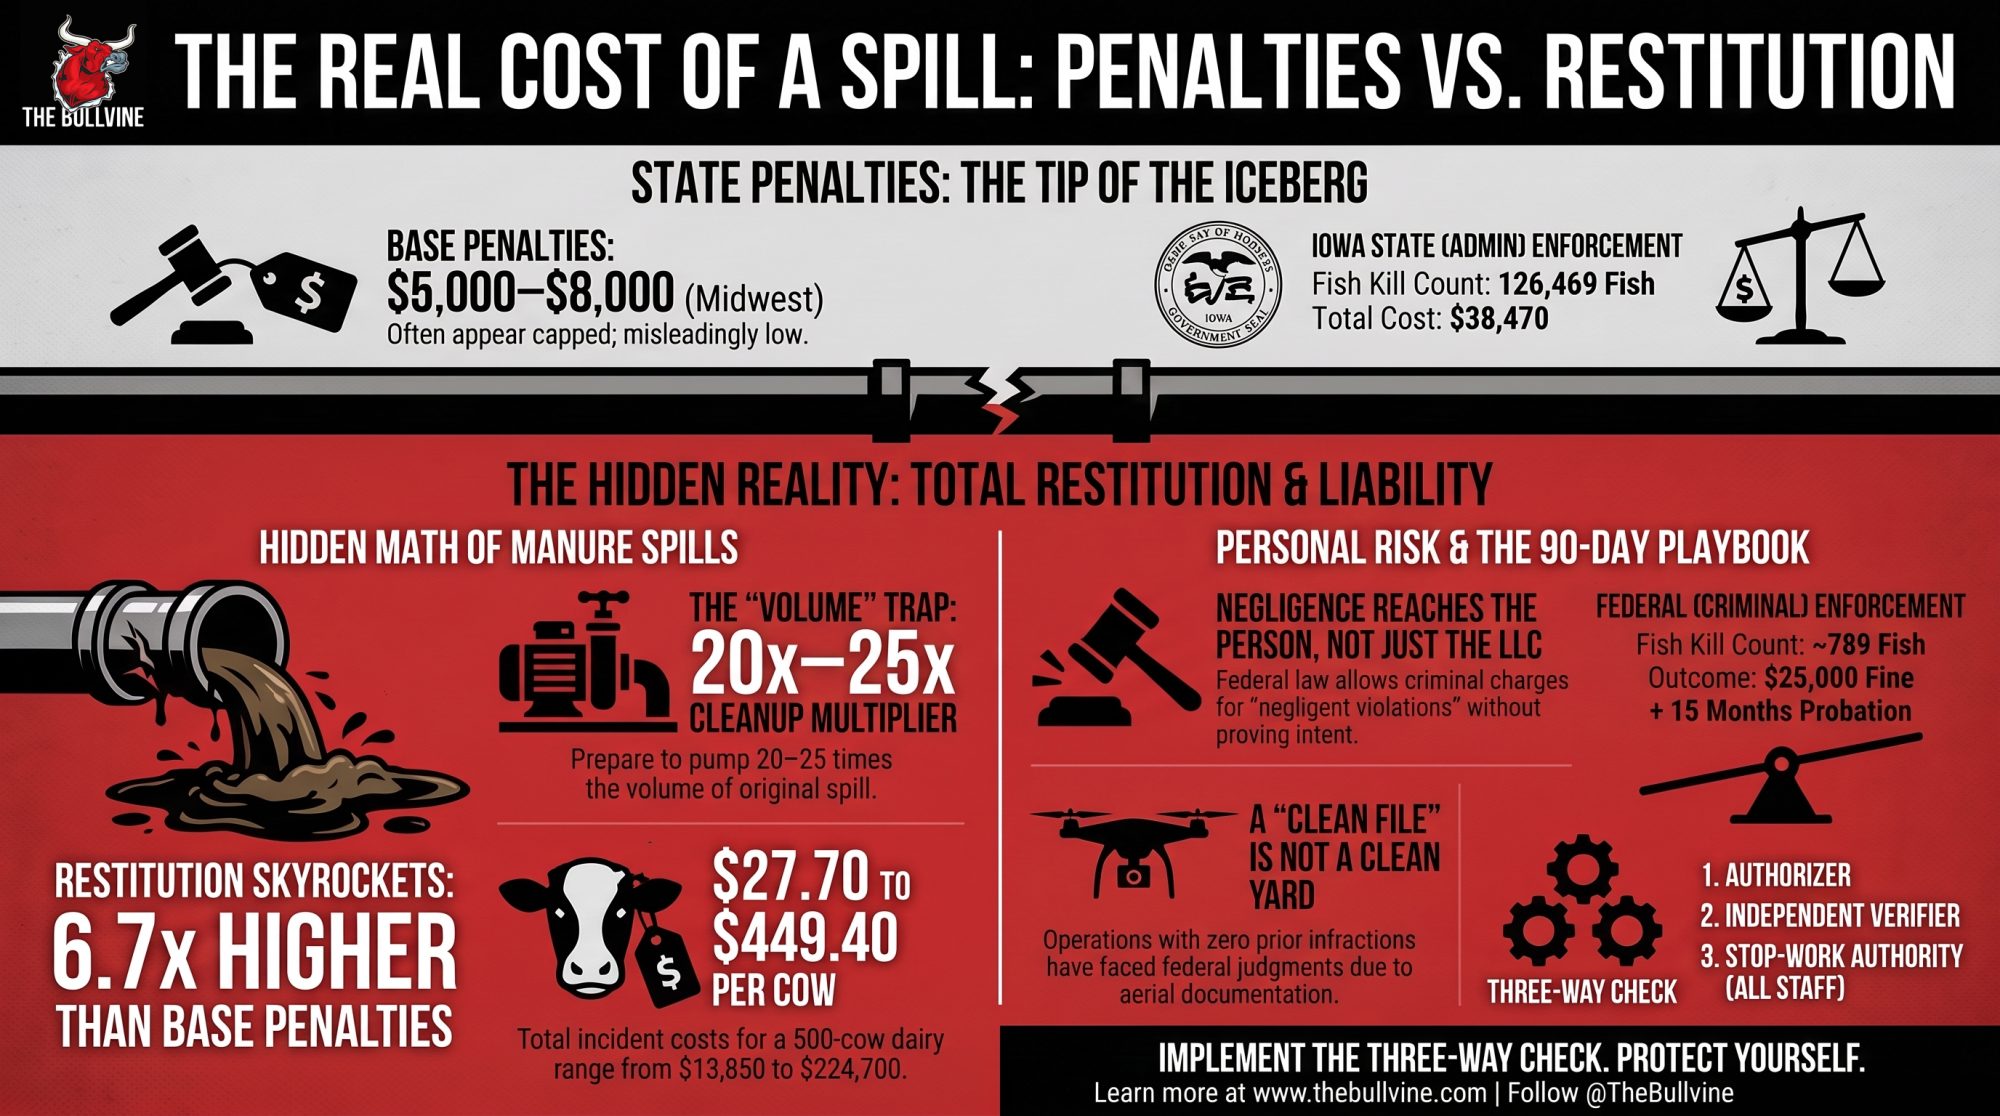
Four Iowa consent orders held the penalty between $5,000 and $8,000, whether the kill was zero fish or 126,469, on herds from 330 cows to about 4,200. Restitution ran 6.7 times higher. In Ohio, roughly 789 dead fish produced a federal conviction, 15 months of probation and a $25,000 fine for one man.
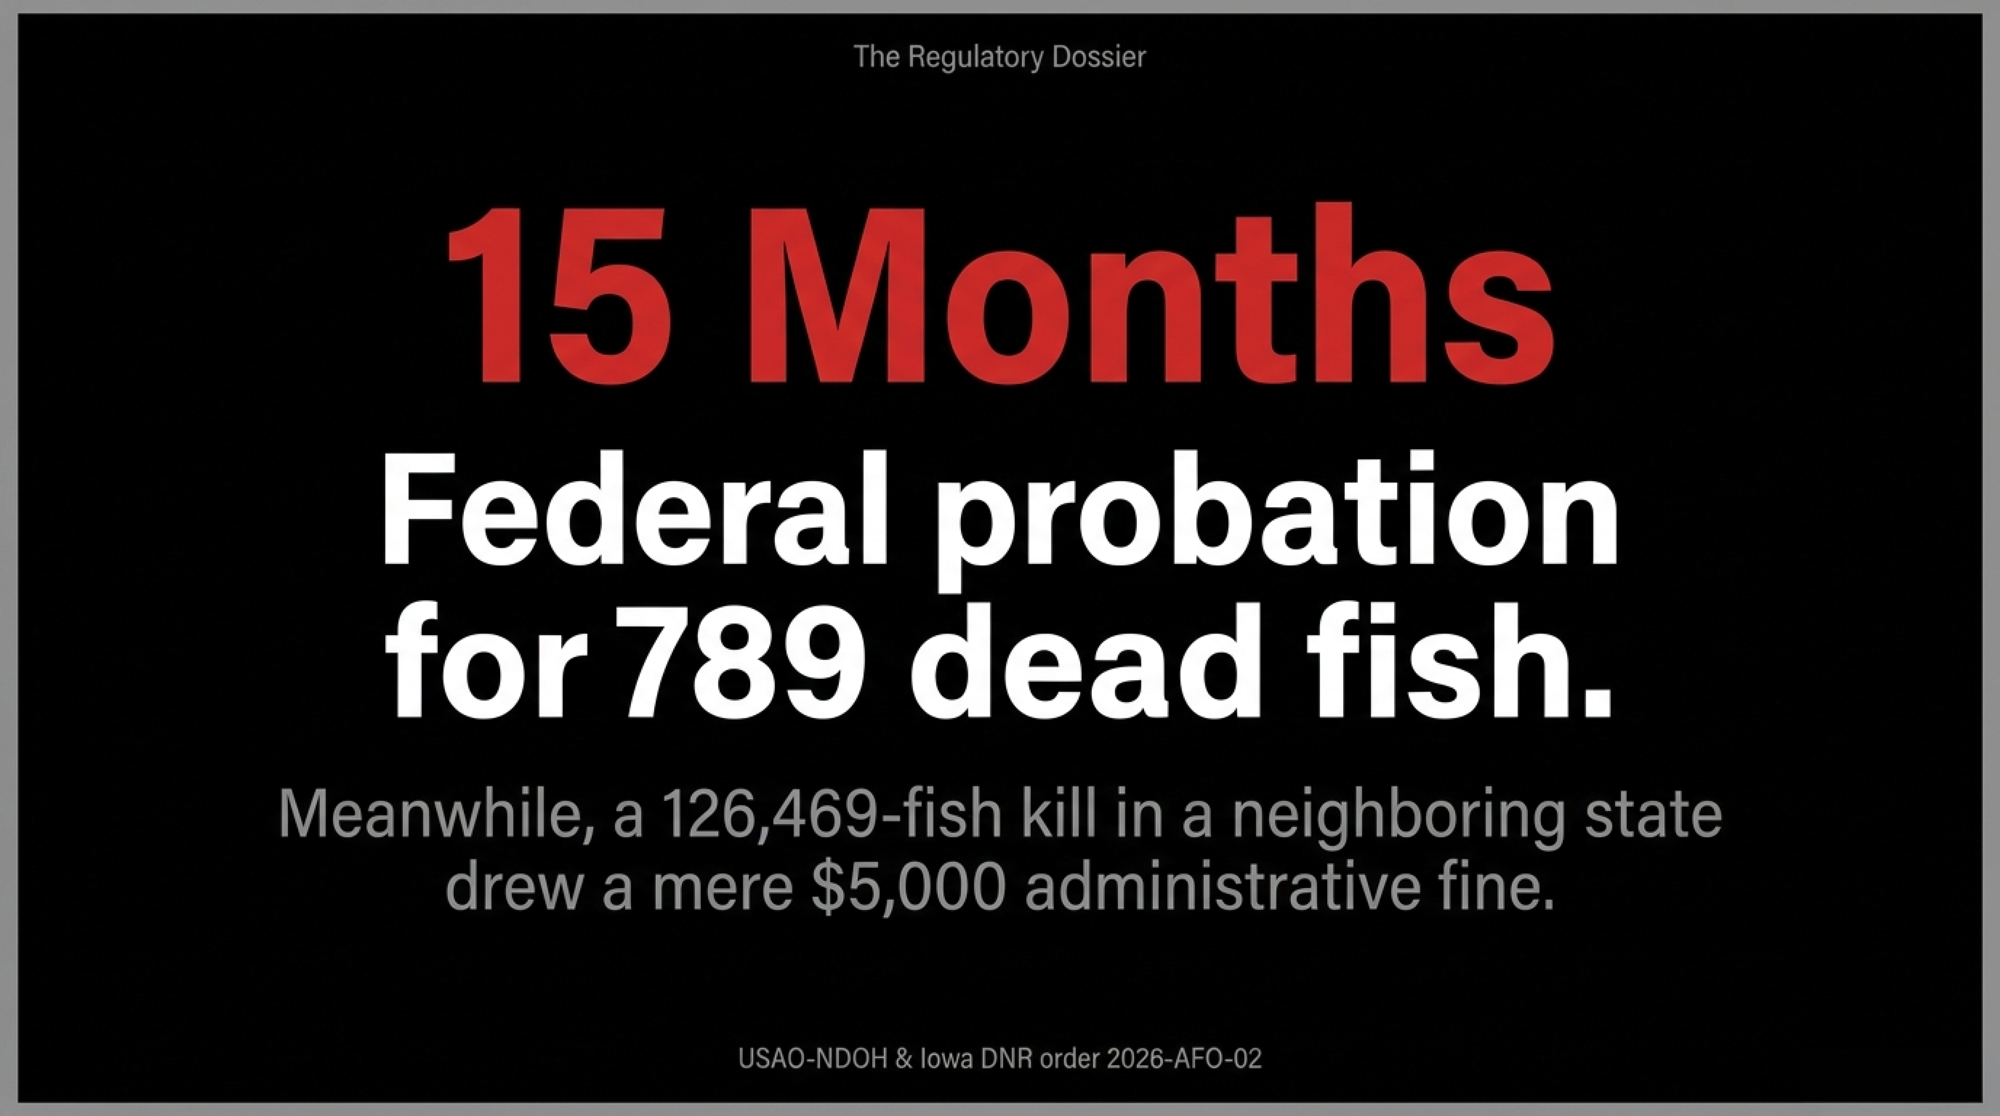
A creek in Mercer County tested between 120 and 150 parts per million of ammonia on December 12, 2022. Thirteen ppm is considered chronic toxicity to aquatic life and 1 ppm is normal, according to Mercer Soil and Water Conservation District officials. Daily Standard Three years and nine months later, in a dairy Clean Water Act sentencing that named one man, U.S. Magistrate Judge Darrell A. Clay handed down 15 months of probation, a $25,000 fine and 100 hours of community service.
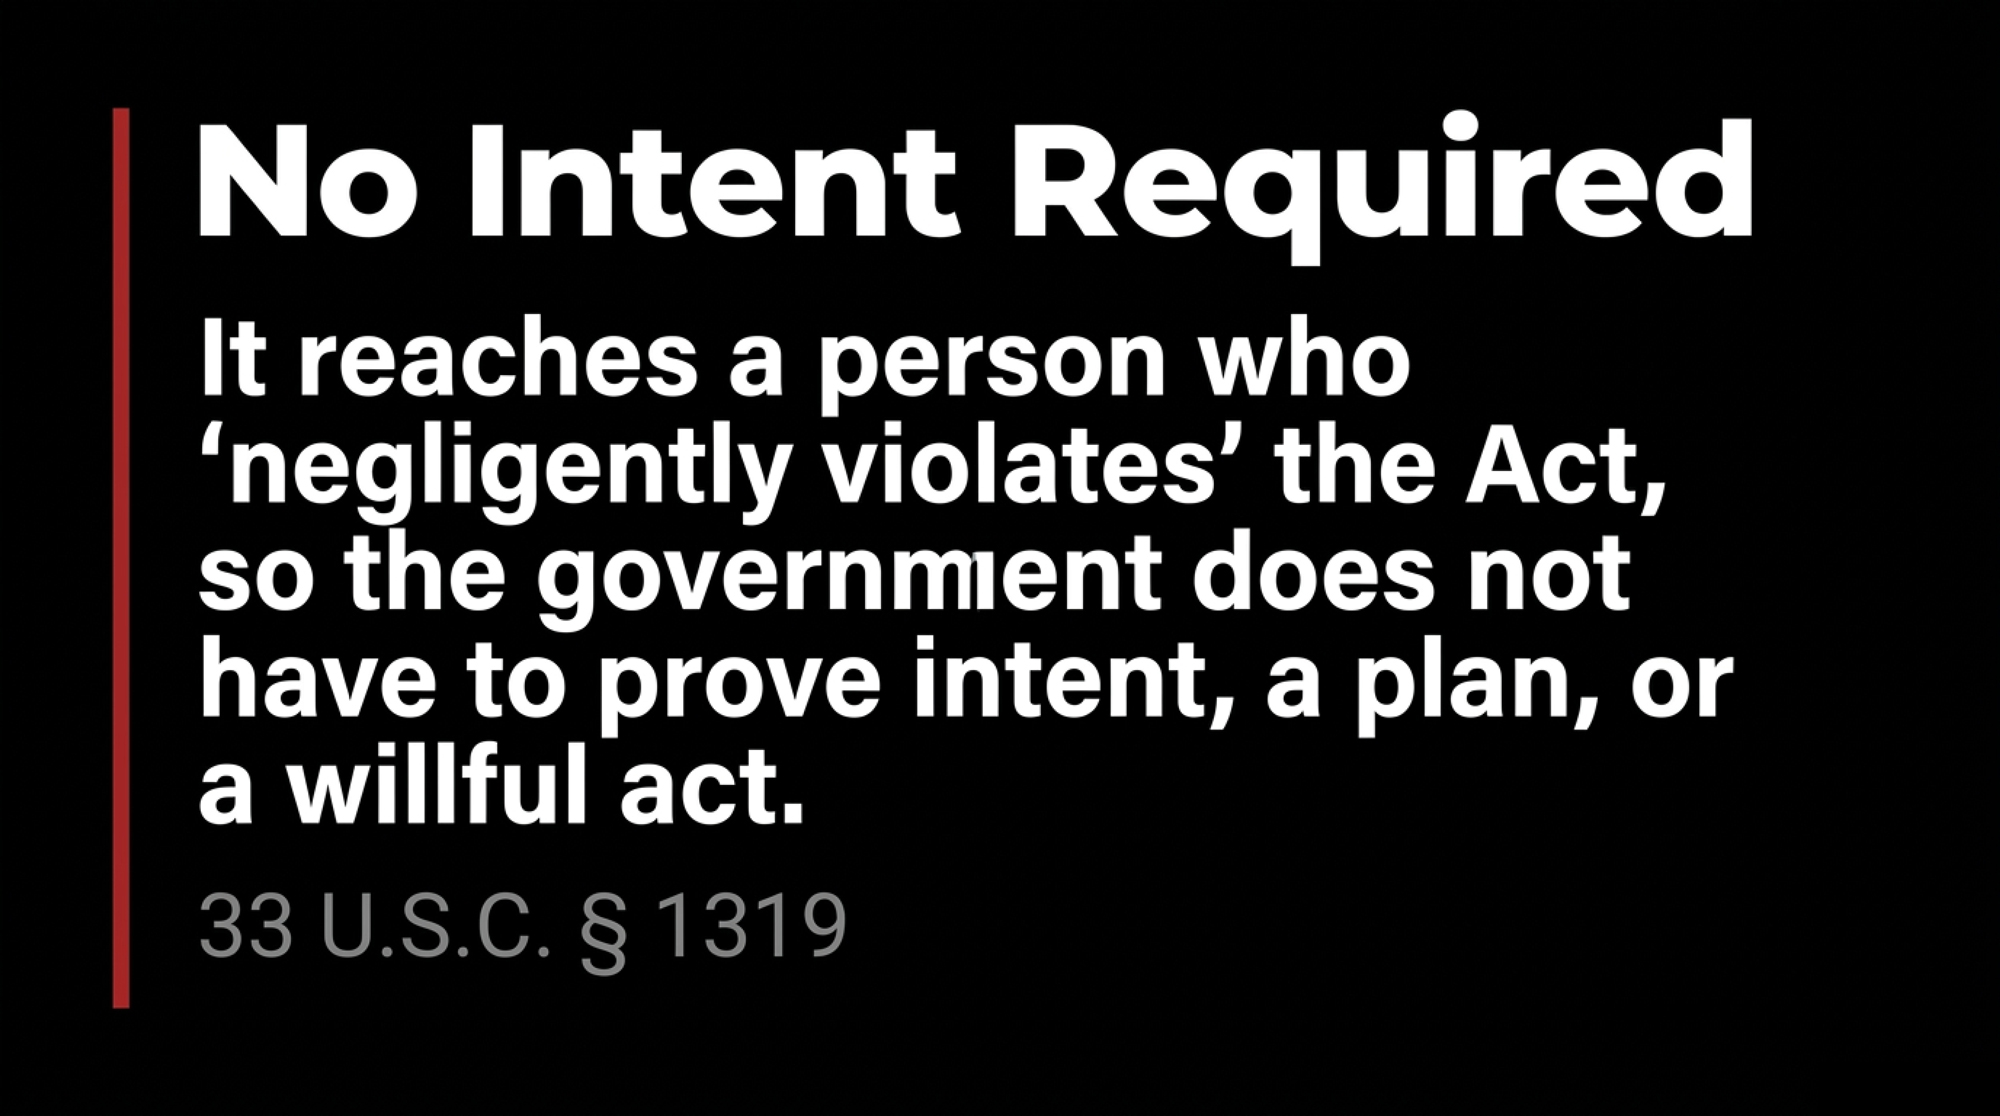
The judgment names Teunis Jan Willemsen, 54, who was serving as manager of Heartland Dairy in December 2022. USAO-NDOH The operation at 3101 Tama Road southwest of Rockford, formed in 2010 and formerly known as Rockford Dairy, is run by Heartland Dairy Holdings, LLC. Daily Standard, 2017 Lima News He pleaded guilty on May 8, 2026, to negligently discharging a pollutant under 33 U.S.C. §§ 1311(a) and 1319(c)(1)(A). DOJ Environmental Crimes Bulletin Read that provision closely, because it is the part most operators get wrong: it reaches a person who “negligently violates” the Act, so the government does not have to prove intent, a plan, or a willful act. It carries $2,500 to $25,000 per day of violation, up to a year in prison, or both.
Now put that beside Iowa. A January 2026 consent order in Winneshiek County carried a $5,000 penalty and $33,470.39 in restitution and investigative costs, $38,470.39 in total, for 126,469 dead fish over 10.2 miles. Iowa DNR order 2026-AFO-02 Ohio’s federal case produced a $25,000 criminal fine and 15 months of probation on a kill of roughly 789 fish. USAO-NDOH The operations most exposed are in delegated-permit states, with a leachate or manure structure within hose reach of a swale, tile inlet, or culvert.

What the records establish, and where they disagree

DOJ’s two publications give the outcome. The mechanism comes from the Mercer district’s own field investigation, presented at its January board meeting and reported January 6, 2023, by Leslie Gartrell in The Daily Standard. Bullvine requested the district’s minutes and complaint file on September 17 and had not received them before publication, so the account that follows is that newspaper’s report of a public meeting.

The account runs on a clock. Then-Ohio DNR Mercer County wildlife officer Brad Buening called then-district technician Matt Heckler at 8:25 a.m. on December 12, 2022, reporting discolored water and dead fish where Little Black Creek crosses Erastus Durbin Road. Heckler notified Dave Schilt, then at Ohio EPA’s Division of Environmental Response and Revitalization, and Frances Springer, then at ODA’s Division of Soil and Water. Crews walking the creek found a 10- to 12-inch tile discharging foaming water above 10 ppm ammonia. At the facility, they found a pump in the silage leachate collection system with a hose running over the collection wall and discharging into the clean water swale on the north side of the operation.
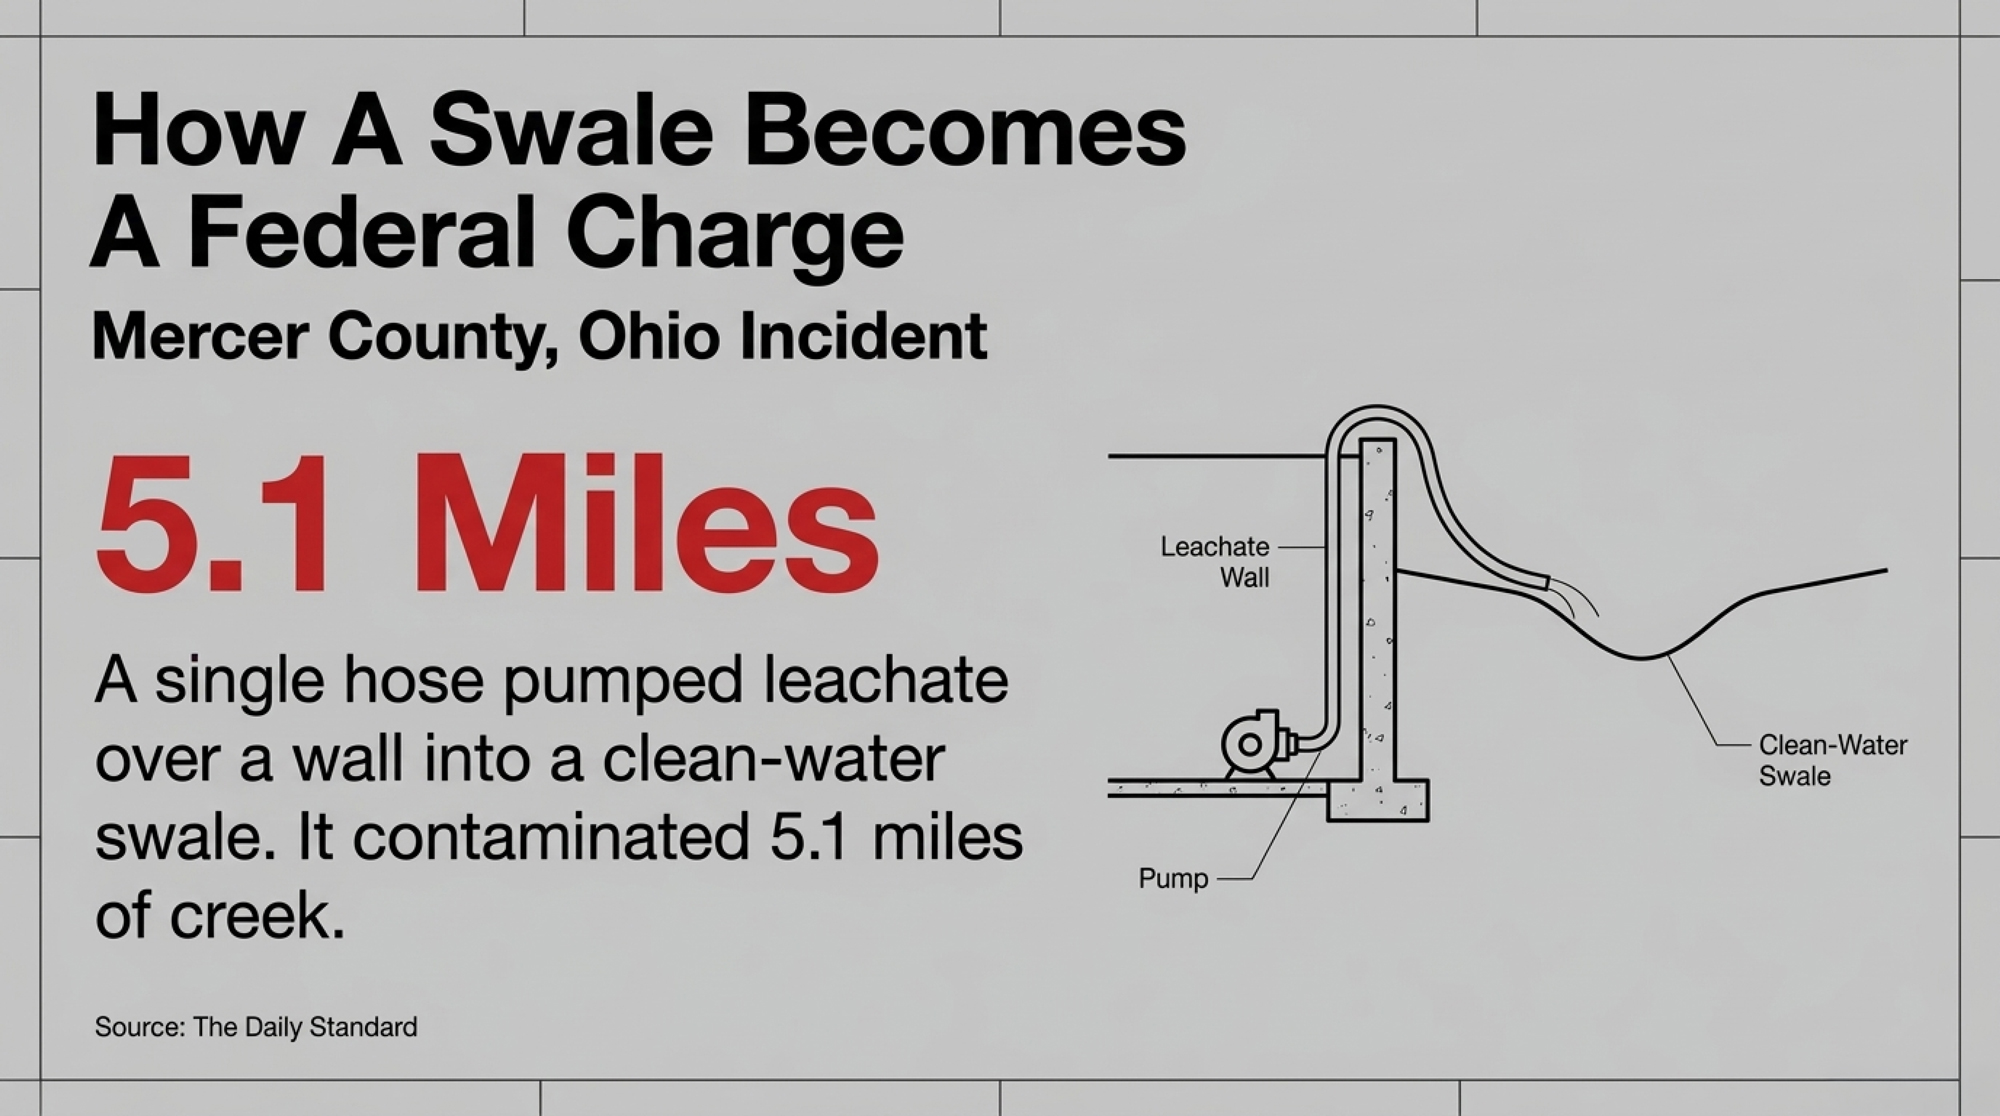
Heckler described silage leachate as a corn byproduct, high in nutrients and land-applicable, and called it one of the worst potential pollutants. By 12:35 p.m., a manure applicator working for the dairy told officials he had plugged the tile in the catch basin and closed the inline water control structure. Total contamination: 5.1 miles of creek. The district found a valid pollution complaint and referred it to ODA-DLEP and Ohio EPA for enforcement. Daily Standard No state enforcement outcome has been verified, and the district had not responded before publication to a September 17 request for comment.

Three places where the records do not line up, stated rather than smoothed. DOJ’s May bulletin locates the dairy in “Rockland, Ohio,” while the county-level record puts it at Rockford in Mercer County. DOJ Daily Standard DOJ describes wastewater pumped from a settling basin into a nearby ditch, consisting of manure and silage leachate, while the district found a pump in the leachate collection system feeding a clean water swale. And the May bulletin puts the non-fish toll at 1,370 animals, attributed to the Ohio Department of Agriculture, while the September release says 1,371. DOJ USAO-NDOH Neither DOJ publication states the discharge volume.

Nor does either explain how they counted the roughly 789 dead fish. Iowa publishes its method: in the Winneshiek County matter, DNR Fisheries staff Theresa Shay, Josh Hefflefinger, Caleb Schnitzler and Steve Pecinovsky surveyed 10.2 miles between March 11 and 14, 2025, using the “Narrow Stream, Incompletely Accessible” method from American Fisheries Society Special Publication 35, and the order names the method on its face. Iowa DNR order 2026-AFO-02 Iowa also runs a public fish-kill database that logs each event’s mechanism and the surveyed distance in yards, with GPS coordinates for the endpoints. Iowa DNR Fish Kill Database Ohio’s count arrives without a method.

The federal record establishes the bridge to the defendant. The bulletin says Willemsen “stated he was responsible for employees pumping the contents from the settling basin into a nearby drainage ditch.” DOJ Special Agent in Charge Allison Landsman of EPA’s criminal enforcement program in Ohio said in the sentencing release: “The defendant oversaw a discharge of ammonia-laden wastewater to Little Black Creek in the Maumee River, Ohio watershed that poisoned the water for miles and killed thousands of fish and other aquatic animals.” “Reckless and careless business practices that threaten Ohio’s environment and wildlife will not be tolerated,” U.S. Attorney David M. Toepfer said.

Employees ran the pump. The manager carried the charge. Assistant U.S. Attorney Matthew D. Simko prosecuted with EPA Regional Criminal Enforcement Counsel Sasha Reyes assisting. USAO-NDOH The reviewed federal materials identify no corporate co-defendant, which is not the same as DOJ clearing the company: Bullvine has not read the judgment, the charging document, the plea agreement, or the full docket in No. 3:26-mj-08002, and no public document explains the charging decision between entity and individual.

How does a clean water swale become a Clean Water Act charge?

Your state permit did not keep federal investigators out of this barn. Ohio EPA has held authority over the base NPDES permit program since March 11, 1974. EPA EPA’s Criminal Investigation Division, the Ohio Attorney General’s Bureau of Criminal Investigation, and Ohio EPA’s Special Investigations Unit still worked this file with support from Ohio DNR.

The pathway had three links and no independent check on any of them. A pump sat in a leachate collection system. A hose crossed a wall into a swale built for clean water. That swale fed an outlet tile connected to Little Black Creek. Daily Standard The statute reaches negligence, and the tile worked exactly as designed.
Two details raise the stakes for anyone whose permit file looks clean. Springer sent Heckler a Mercer County auditor aerial image from March 2021 showing a pump and hose already present in the leachate collection system, and the district said it cannot verify whether contamination had been continuous since then. Daily Standard No document reviewed establishes when that pump was placed, how often it was used, or whether it discharged before December 2022. Worth sitting with: that image came from the county auditor’s aerial photography, so the yard was documented years before anyone walked it. Ohio county auditors publish aerial imagery, and many county assessors elsewhere do the same. Check what your county publishes, then look at what a hose, a pump, or a stained swale would show from above.

Separately, then-ODA-DLEP program administrator Nancy Cunningham said in December, during a five-year permit-to-operate renewal, that the facility had no infractions since its permit was first granted. Daily Standard Heartland Dairy Holdings, LLC was asked on September 17 to respond to each of those findings, including the aerial image and the referral, and to say whether the company was ever charged or resolved any civil or administrative matter. It had not responded before publication. ODA-DLEP was asked the same day for the outcome of the December 2022 referral, the facility’s current permit status, and whether the no-infractions characterization was accurate. It had not responded.

Ohio already requires you to name the people who will execute your plan. Administrative Code 901:10-2-17 requires an emergency response plan identifying those responsible for implementing it, and 901:10-2-14 requires manure management procedures that minimize loss or spillage in transport with prompt cleanup.

What Bullvine got wrong in 2024, and the exact correction

On August 27, 2024, this publication told operators to designate an incident leader and split shutdown, containment, and communication duties. Bullvine, 2024 The instinct was right, and the four-hour gap between Buening’s 8:25 a.m. call and the 12:35 p.m. containment report shows why somebody has to own the response.

The wording was not right. That piece framed the assignment as settling “who is liable for what,” and internal assignments do not decide who a regulator or prosecutor may charge. Section 1319(c)(1)(A) does not read your org chart, and the Alternative Fines Act at 18 U.S.C. § 3571 means the $25,000 daily figure should not be treated as a universal individual ceiling. That page requires correction before this article links to it.

The replacement rule has four roles instead of one: an authorizer, a second trained verifier who is not the pump operator, anyone on the crew with authority to stop the pump, and a named incident leader for the response. Cornell Cooperative Extension recommends that every employee, including those not running waste equipment, know the system and how to shut valves. Cornell CCE Purdue’s response order starts with controlling the source by stopping pumps, closing valves, and breaking the siphon.

Iowa’s orders show what regulators ask for after the fact, and it is close to the same list. Foresight Farms was ordered to develop a standard operating procedure for employee training and equipment inspection. Iowa DNR order 2026-AFO-01 Jochum Agri-Services was ordered to produce five years of manure-application training records and to write mandatory release reporting into its updated procedure. Iowa DNR, Feb 27, 2025 The Winneshiek County operator was ordered to submit a professional engineer’s report on manure storage capacity, rework the grass waterway feeding the tile intake, and write a feedlot maintenance plan.

Does an LLC keep your manager’s name off the caption?

Across one federal case and five resolved state actions read from the orders, consent-order bulletins, and releases themselves, all of them Midwestern, the actor named changes with the conduct and the forum, not with the corporate form.
ActionWho was namedDocumented eventMoneyLegal form
Willemsen, N.D. Ohio, sentenced Sept 8, 2026Individual dairy managerDischarge reached Little Black Creek; roughly 789 fish and 1,371 other aquatic animals$25,000 fine, 15 months probation, 100 hours serviceCriminal conviction on guilty plea
Jochum Agri-Services, Inc., Iowa DNR, penalty due Feb 18, 2025Sioux County respondent, ordered to produce five years of manure-application training recordsManure release$5,000 administrative penaltyConsent order
Foresight Farms, L.C., Iowa DNR order 2026-AFO-01, signed Jan 7, 2026Dairy LLC, 1,098 animal units at signing, GarnavilloUmbilical hose coupler separated Oct 4, 2025; manure reached an unnamed tributary of Buck Creek; four dams and two pumps kept it out of Buck Creek, which showed no ammonia$5,000 administrative penalty, no restitutionConsent order, appeal rights waived
Iowa DNR order 2026-AFO-02, signed Jan 30, 2026An individual dairy operator, Winneshiek County, 330 mature dairy cattle at signingOpen-feedlot runoff entered a tile intake and an unnamed tributary of Dry Run Creek, March 2025; 126,469 fish killed over 10.2 miles; earthen basin below two-foot freeboard$5,000 penalty plus $33,470.39 restitution and investigative costs, $38,470.39 total on a four-payment planConsent order
Roorda Dairy LLC, Iowa DNR, incident July 2024, enforcement Jan 16, 2025Dairy LLC, roughly 4,200 dairy cattle per Iowa Capital Dispatch reporting on DNR records, PaullinaBlown tile during land application sent manure to Mud Creek; 107,373 fish killed, with dead fish logged along 16,900 yards, or 9.6 miles, to the Mill Creek confluence src$8,000 penalty plus $30,791.07 fish restitution, $38,791.07 totalConsent order
Spring Valley Holsteins, Inc. and its operator, Monroe County Circuit Court, approved Dec 23, 2025Norwalk, Wisconsin dairy corporation and its operator at the time of the judgmentComplaint alleged a faulty manure transfer system let manure escape into an unnamed tributary and Moore Creek; dead brown trout, white suckers, and dace reported May 13, 2024$120,000, including $90,000 to Wisconsin DNR to remedy fish-kill effectsStipulated judgment resolving alleged violations

Read the Iowa column down, and the pattern is hard to miss. The administrative penalty sits at $5,000 for a manure release in Sioux County, $5,000 for a contained release with no fish kill at Foresight Farms, $5,000 for a kill of 126,469 fish in Winneshiek County, and $8,000 for a kill of 107,373 at Roorda. Iowa DNR Foresight order Winneshiek order Roorda The penalty barely moves, and it does not track herd size either: $5,000 on a 330-cow operation, $8,000 on one running about 4,200. What moves is restitution, which ran 6.7 times the penalty in Winneshiek County and 3.8 times at Roorda.

Iowa priced that kill at $30,923.54 for 126,469 fish, about 24 cents a fish, and added $1,750.63 in Fisheries costs and $796.22 in field office costs. Winneshiek order Apply that rate to Ohio’s 789 fish, and the natural-resource value is roughly $190. On a kill Iowa’s own rate would value near $190, Ohio’s outcome was a $25,000 criminal fine.

MetricWinneshiek Co., IowaRoorda Dairy, IowaWillemsen, N.D. Ohio
Fish killed126,469 over 10.2 miles107,373 over 9.6 milesroughly 789
Count method publishedYes — AFS Special Pub. 35, “Narrow Stream, Incompletely Accessible,” four named DNR staffYes — DNR fish-kill database, 16,900 yards logged with GPS endpointsNo method stated
Natural-resource value$30,923.54 (~$0.24/fish)$30,791.07 fish restitution~$190 at Iowa’s rate
Money ordered$38,470.39$38,791.07$25,000 fine
Ordered money ÷ Iowa-rate fish value1.2x1.3x~132x

The Winneshiek County operator and Spring Valley Holsteins were both asked on September 17 to comment on the figures reported here, including Bullvine’s calculation that restitution ran 6.7 times the penalty. Neither had responded before publication.

Different statutes, different forums, different standards of conduct. That is the point. A negligent discharge charged criminally under federal law produced a personal judgment on a small kill, while administrative water-quality violations on kills more than 130 times larger produced payment plans against two operations and one operator.

Running the Numbers

Bullvine calculation: one resolved manure discharge on a 500-cow dairy. USD, U.S. Midwest, single incident, before any capital work.

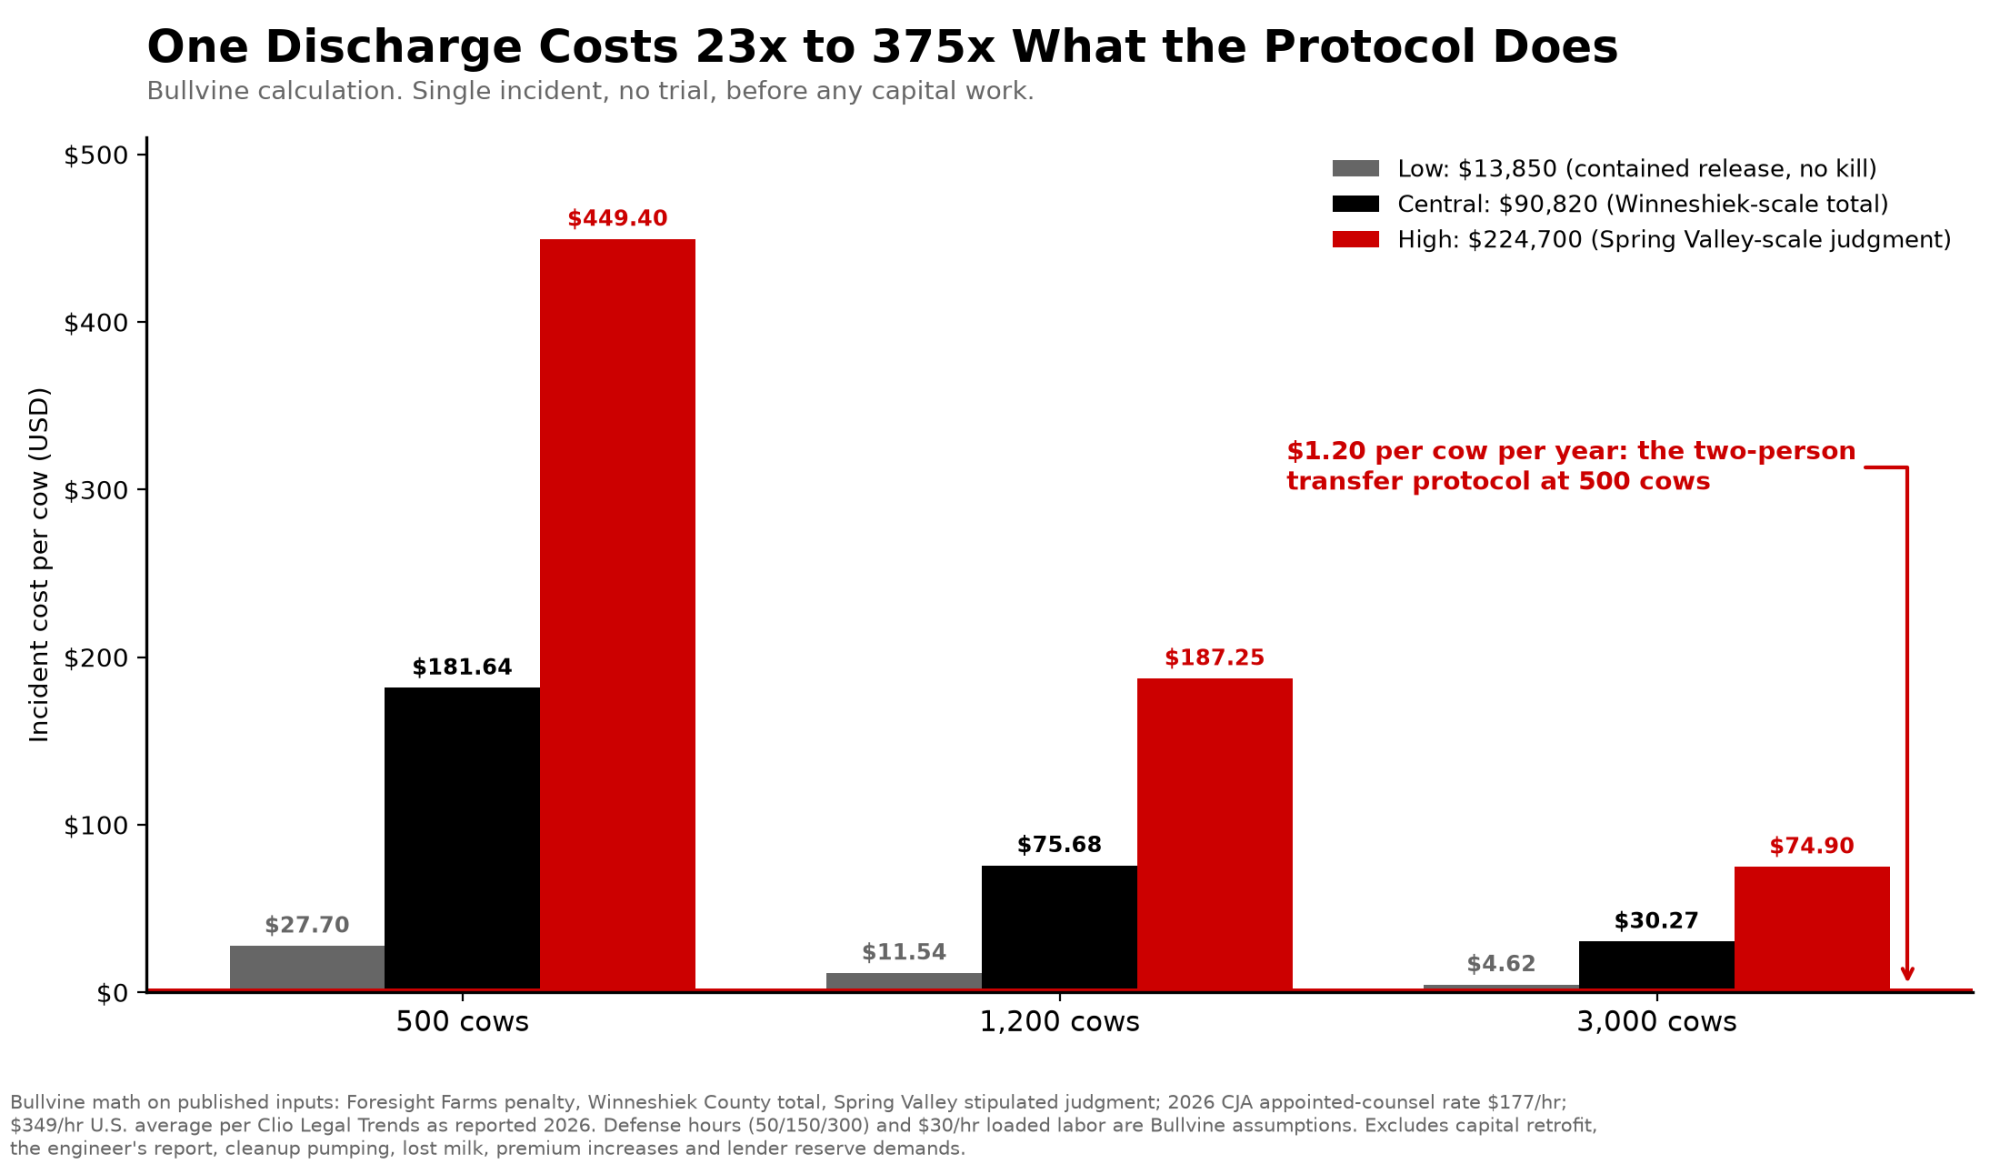
Published evidence, two inputs. Enforcement and environmental payment, from resolved dairy outcomes: $5,000, the Foresight Farms penalty for a release with no fish kill. $38,470.39, the Winneshiek County total. $120,000, the Spring Valley stipulated judgment. Defense rates: the 2026 federal appointed-counsel rate of $177 per hour, and a $349 U.S. average lawyer hourly rate from Clio’s Legal Trends data as reported in 2026.

Stated assumptions, kept separate. Fifty, 150, and 300 defense hours are Bullvine assumptions, not case figures. Every scenario assumes a single incident and no trial.
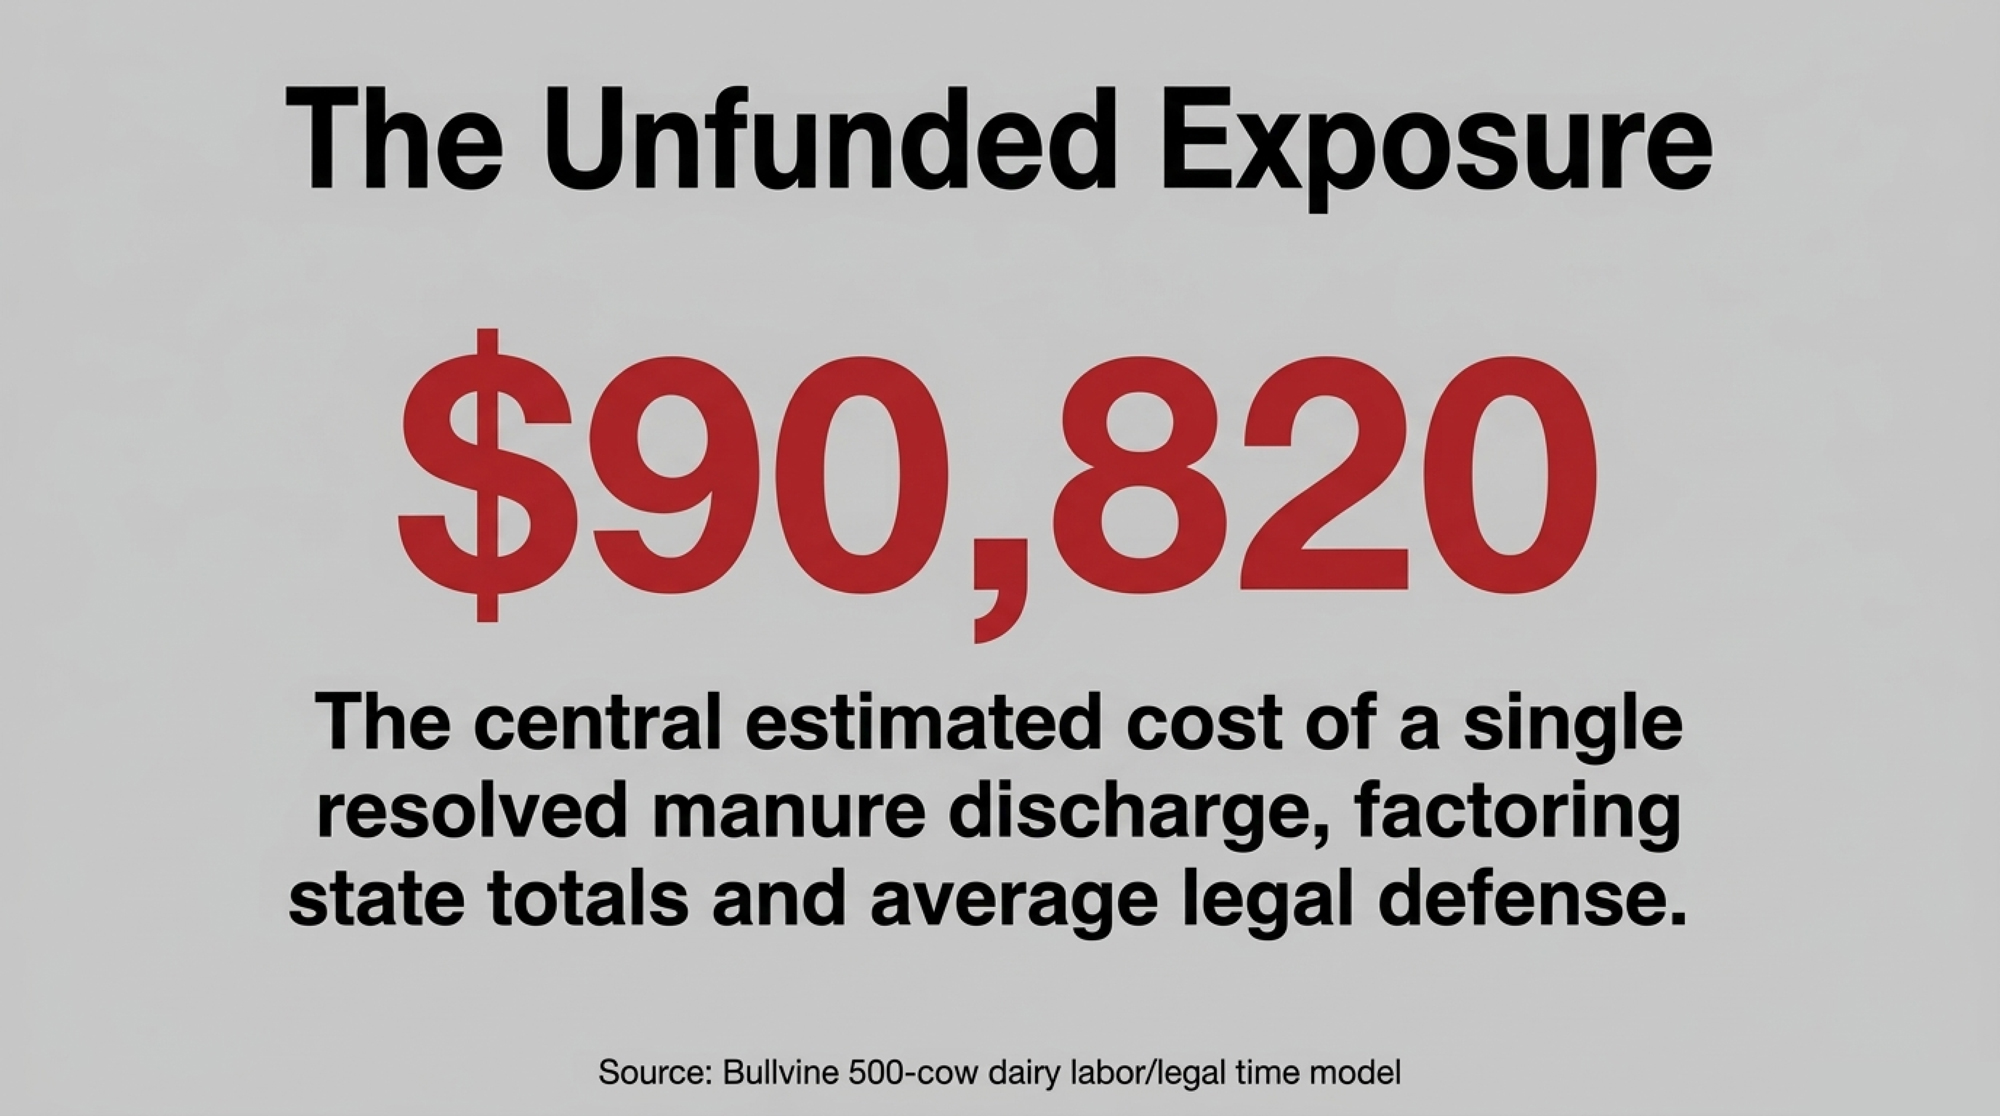
Bullvine math. Low: $5,000 plus 50 × $177, or $8,850, giving $13,850. Central: $38,470 plus 150 × $349, or $52,350, giving $90,820. High: $120,000 plus 300 × $349, or $104,700, giving $224,700.

ScenarioIncident total500 cows1,200 cows3,000 cows
Low$13,850$27.70/cow$11.54/cow$4.62/cow
Central$90,820$181.64/cow$75.68/cow$30.27/cow
High$224,700$449.40/cow$187.25/cow$74.90/cow

Excluded, deliberately. Capital retrofit, the professional engineer’s report Iowa ordered in the Winneshiek County matter, the grass-waterway rework, permit and consulting response, lost milk, business interruption, premium increases, and lender reserve demands.

The cleanup line nobody has priced. Ohio State University Extension advises being prepared to pump 20 to 25 times the volume of manure that entered a stream. OSU Extension Heartland pumped water from Little Black Creek from December 12 until December 30, 18 days elapsed. Daily Standard Neither DOJ publication states the discharge volume, and no agency published the pumping cost, so this one stays an equation rather than a number: recovered volume equals released volume times 20 to 25, and cash cost equals that volume times your contractor’s per-gallon transfer rate. Both inputs are yours to obtain. Call your vacuum or dragline contractor for the per-gallon figure before you need it, because it is the only line in this article you can price today, and nobody has priced it for you.

Carry the conservative figure: $13,850, or $27.70 per cow at 500 cows. That case assumes a contained release, no fish kill, no restitution, and no trial. The moment fish die, Iowa’s own arithmetic says the bill multiplies by four to seven.

Against that, the control. Assume 100 transfers a year and 12 minutes for authorization, independent route verification, and first-flow confirmation. That is 20 labor hours, and at an assumed loaded $30 per hour, it is $600 a year, or $1.20 per cow on 500 cows. The $25,000 Ohio fine alone equals 41.7 years of that figure. To be exact: $600 is a Bullvine labor-time model on the two assumptions just named, not a Heartland cost and not evidence that any protocol would have changed this case.

A $600 protocol is not immunity, and nothing in these records says it would have stopped this discharge. What it buys is the ability to prove who authorized a transfer, who independently checked it, and who could stop it, on a day when a regulator is standing in your swale. Here is how to audit your transfer line over the next quarter.

The 90-Day Playbook for Herds Moving Manure in a Delegated-Permit State

30 days

  • Walk every clean water swale, catch basin, and outlet tile and write down where each discharges. Requires two hours and a map. Threshold: any swale within hose reach of a leachate or manure structure, the configuration documented at Rockford. Backfire: a map filed and forgotten, so post it at the pump.
  • Split the transfer decision. One authorizer, one independent verifier who is not the pump operator, logged with a time. Threshold: any transfer within sight of a tile inlet, ditch, or culvert. Backfire: an unfilled log is worse evidence than none, so audit five entries monthly.
  • Put stop-work authority in writing for every worker on the place, in every language your crew reads. Write the non-retaliation clause so the person holding the valve does not have to weigh his job against a shutdown, and name who guarantees it. Cornell Extension recommends that every employee, including those not running waste equipment, know the system and how to shut valves. Cornell CCE Threshold: new hire, new hose route, night pumping. Backfire: a policy the day shift can read and the night crew cannot is not a policy.
  • Pull five years of manure-application training records and see whether they exist. Iowa ordered exactly that from Jochum Agri-Services. Iowa DNR Red-flag trigger: if you cannot produce three of the last five years, this moves to the top of today’s list.
  • Find your own reporting window in your permit to operate and ODA’s published discharge procedure, and post the number by the pump.

90 days

  • Get two answers from your insurer in writing: whether the pollution exclusion reaches manure and silage leachate, and whether a named manager’s criminal defense is funded. Requires the policy, your broker, and one hour. Threshold: renewal date. Decision rule: if either answer is no, you are self-insuring that exposure, and the figure to reserve is the $90,820 central case rather than the $13,850 low one. Backfire: an oral assurance a claims file will not honor.
  • Ask your lender which environmental events trigger notice, default, a borrowing-base cut, or an added reserve. USDA’s Farm Service Agency treats environmental risk screening as due diligence before taking a security interest in real estate, and FDIC agricultural-lending procedures cover identifying environmental concerns and on-farm inspections. FSA FDIC If your loan documents carry an environmental covenant, the notice clause fires before the penalty is even assessed; if they carry none, the same event lands as a straight liquidity draw. Threshold: if your DSCR has been under 1.25 for three consecutive months on your lender’s calculation, a $90,820 central case is a covenant conversation, not a check.
  • Get a per-gallon transfer quote from your vacuum or dragline contractor and put it in the emergency file next to the storage volumes. Requires one phone call. Threshold: before the wet season. Backfire: a quote with no volume beside it, so record both.

365 days

  • Commission a professional engineer’s report on manure storage capacity before a regulator orders one. Iowa ordered one within 30 days of signature in the Winneshiek County matter. Iowa DNR order 2026-AFO-02 Opportunity signal: an operation that arrives at a permit conversation with drawings and a price negotiates timing; one that arrives empty negotiates nothing.
  • Build a five-record incident standard: structure levels, pump logs, employee assignments, weather, notifications. Threshold: any transfer season where staffing turns over. Backfire: records that contradict each other, so assign one owner per file.

The number check

Pull your permit to operate, your last three transfer records, and your liability policy onto one desk tonight, then walk the swale on the north side of your own facility and find out what its tile is connected to. Heartland Dairy Holdings, LLC held a permit that ODA-DLEP described in December as carrying no infractions since it was first granted, and a hose over a collection wall still put 5.1 miles of Little Black Creek above 100 ppm ammonia and one man’s name on a federal judgment. Daily Standard USAO-NDOH What does your own emergency response plan actually say about who can stop the pump without asking permission?

Two Bullvine files worth pulling alongside this one: whether a permit that promises no discharge survives contact with a watershed, and the same contractor-control question inside a manure-gas enforcement file.

Footnote on scope. This comparison is limited to U.S. Midwestern actions, where federal Clean Water Act authority and delegated state administrative programs operate on the same facility. For a non-U.S. reference point outside that framework: Lacpatrick Dairies (NI) Ltd, a Lakeland-owned processor, was fined £115,000 at Strabane Magistrates’ Court on August 13, 2026, after guilty pleas to 16 offenses affecting the Glenmornan River, £70,000 on seven permit offenses and £45,000 on nine water-pollution offenses.

This article is based on court and agency records available as of September 17, 2026. Comment was sought from every party named critically on September 17, with a stated deadline.
Key Takeaways

  • The Clean Water Act’s negligent-discharge provision reaches any person, not just the permit holder. Intent isn’t an element, which is how Willemsen drew a $25,000 fine and 15 months’ probation on a guilty plea.
  • Across four Iowa consent orders the penalty never left $5,000 to $8,000, whether the kill was zero fish or 126,469, on herds from 330 cows to about 4,200. Restitution is what moved, running 6.7 times the penalty.
  • Roughly 789 dead fish in a federal criminal case cost more in fine than 126,469 did in Iowa state penalty. The forum you land in prices the harm more than the body count does.
  • ODA-DLEP described Heartland’s permit as carrying no infractions since it was first granted, yet a March 2021 county aerial already showed a pump and hose in the leachate system. A clean file isn’t a clean yard.

Run Your Numbers

Farm Benchmark Snap Check — The DVI Risk Check reads your hedge position, debt load, feed share, and working capital, then bands you Strong, Watch, or Risk. Run it before you decide whether a $90,820 incident is a covenant conversation or a cash crunch.

The Sunday Read Dairy Professionals Don’t Skip.

Every week, thousands of producers, breeders, and industry insiders open Bullvine Weekly for genetics insights, market shifts, and profit strategies they won’t find anywhere else. One email. Five minutes. Smarter decisions all week.

NewsSubscribe
First
Last
Consent

USDA Publishes Two Costs for the Same 200-Cow Herd. S.4906 Prices Milk Off One of Them.

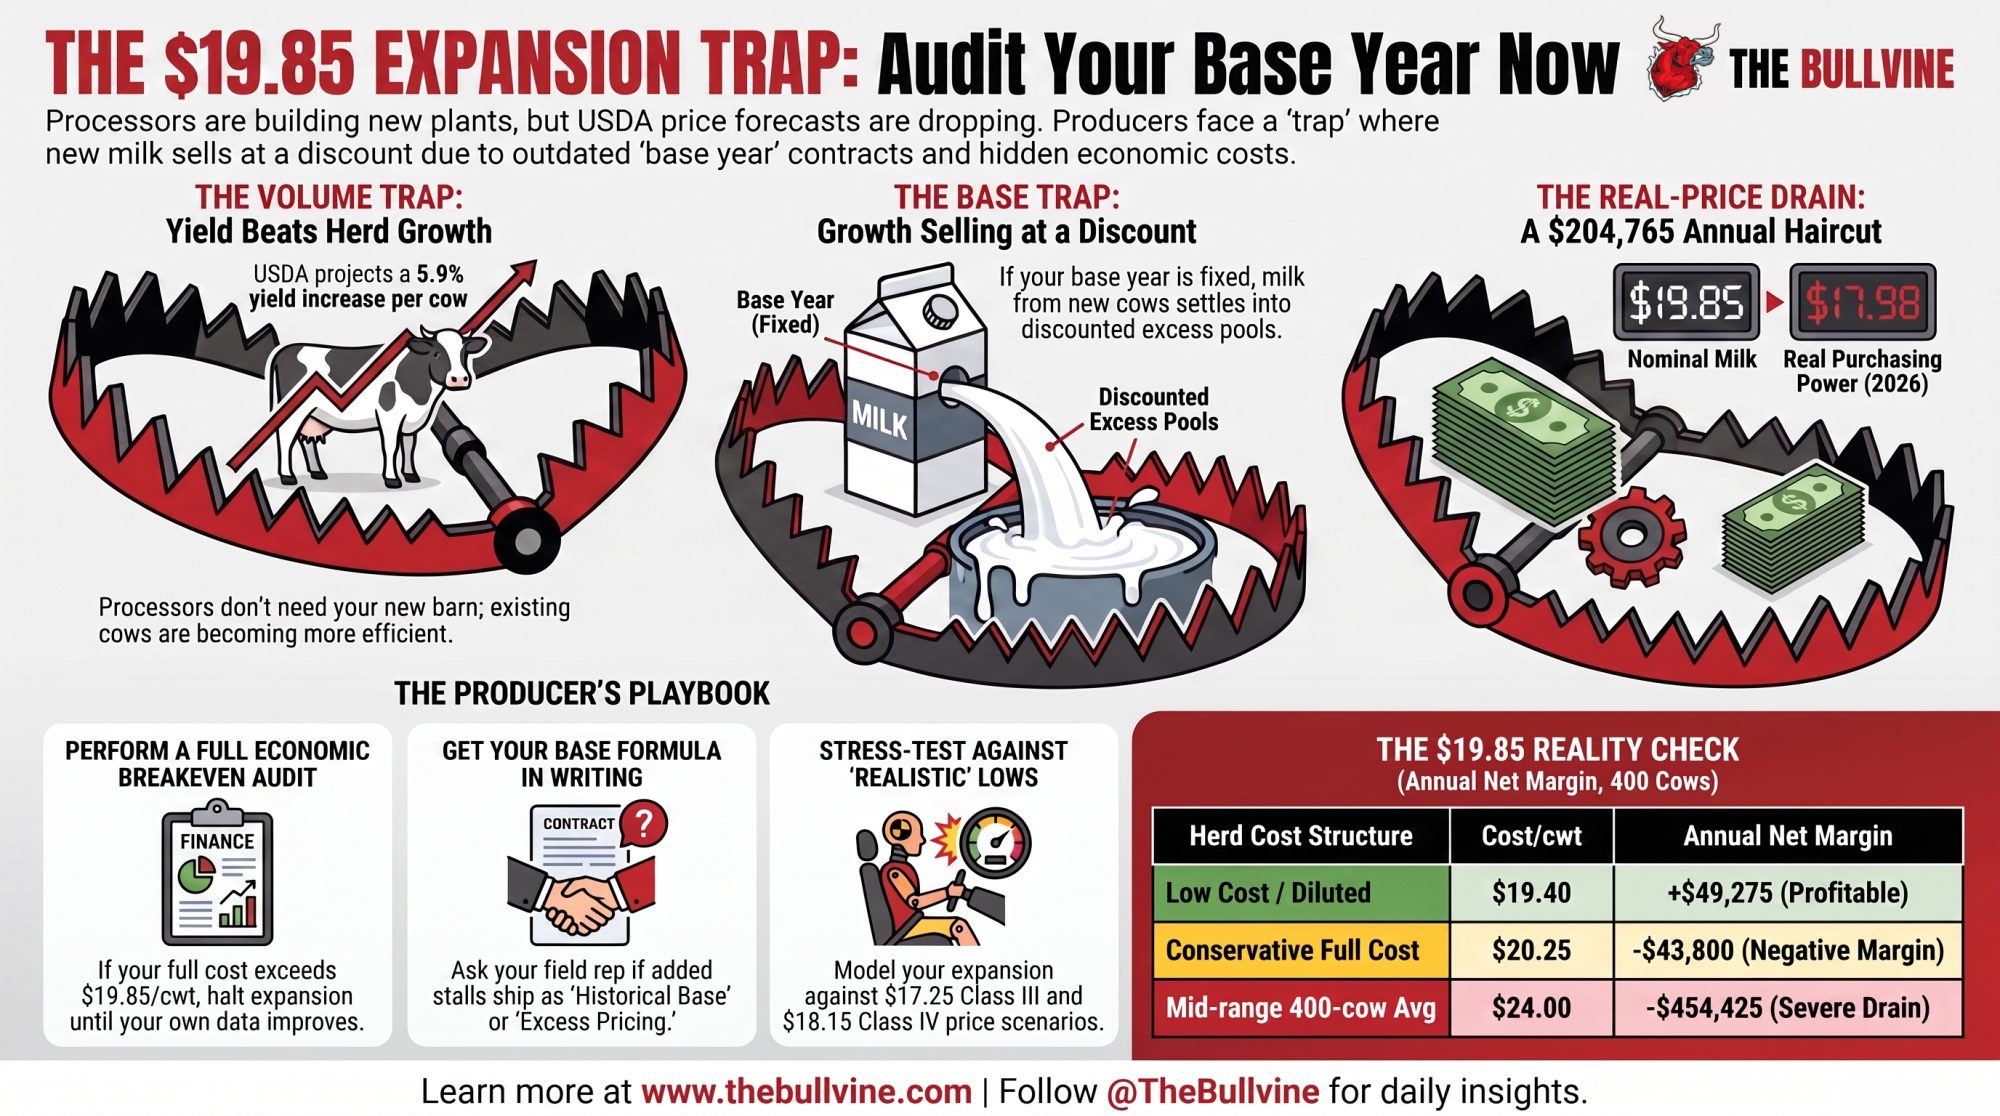
USDA reports two costs for a 200-cow herd: $27.21/cwt on full economic cost, $14.53 on operating costs alone. S.4906 would set price floors from production costs without specifying which — making it either a $402,960 raise or a floor that never binds.

S.4906 milk price floors

USDA publishes two costs of production for a 200-to-499-cow dairy in 2025 — $27.21/cwt on full economic cost, $14.53 on operating cost alone. Sen. Peter Welch’s S.4906, referred to Senate Agriculture on June 24 and unmoved since, would set minimum milk prices partly from that data without saying which measure it means. We ran the ERS size-of-operation workbook against the mechanism: the higher figure sits $7.36 above the current all-milk forecast, worth $402,960 a year on 200 cows. The lower one never binds. ERS also puts mid-size herds $3.59/cwt underwater on full cost while 2,000-plus herds clear $4.25. And the bill would switch off Dairy Margin Coverage while it runs.

USDA publishes a cost of production for your herd size. It publishes two of them, and the gap is $12.68 a hundredweight.

Sen. Peter Welch of Vermont introduced S. 4906 on June 24, 2026, cosponsored by Sen. Bernie Sanders. It was read twice and referred to the Senate Committee on Agriculture, Nutrition, and Forestry the same day, and hasn’t moved since. According to Welch’s own section-by-section summary, Section 3 creates a Dairy Market Stabilization Program by amending the Dairy Production Stabilization Act of 1983.

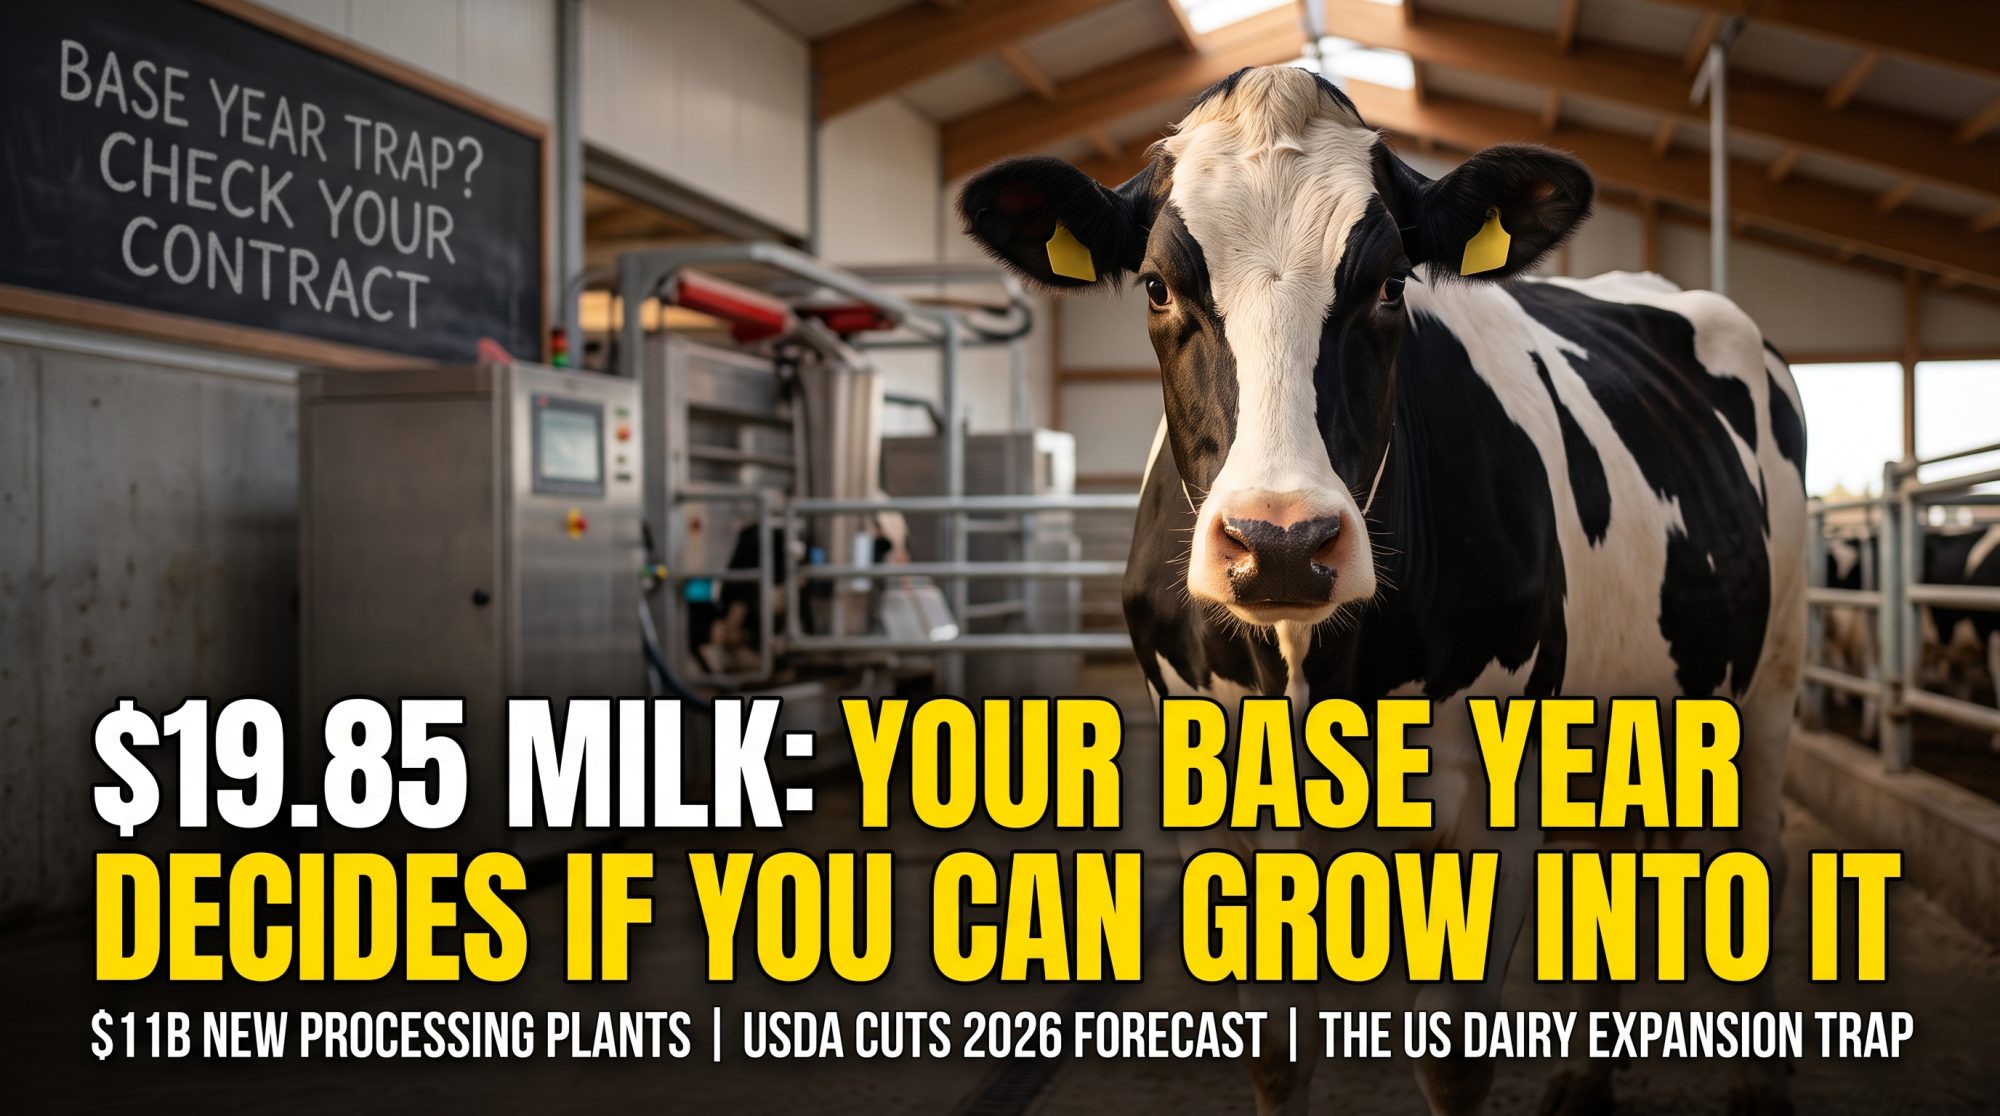
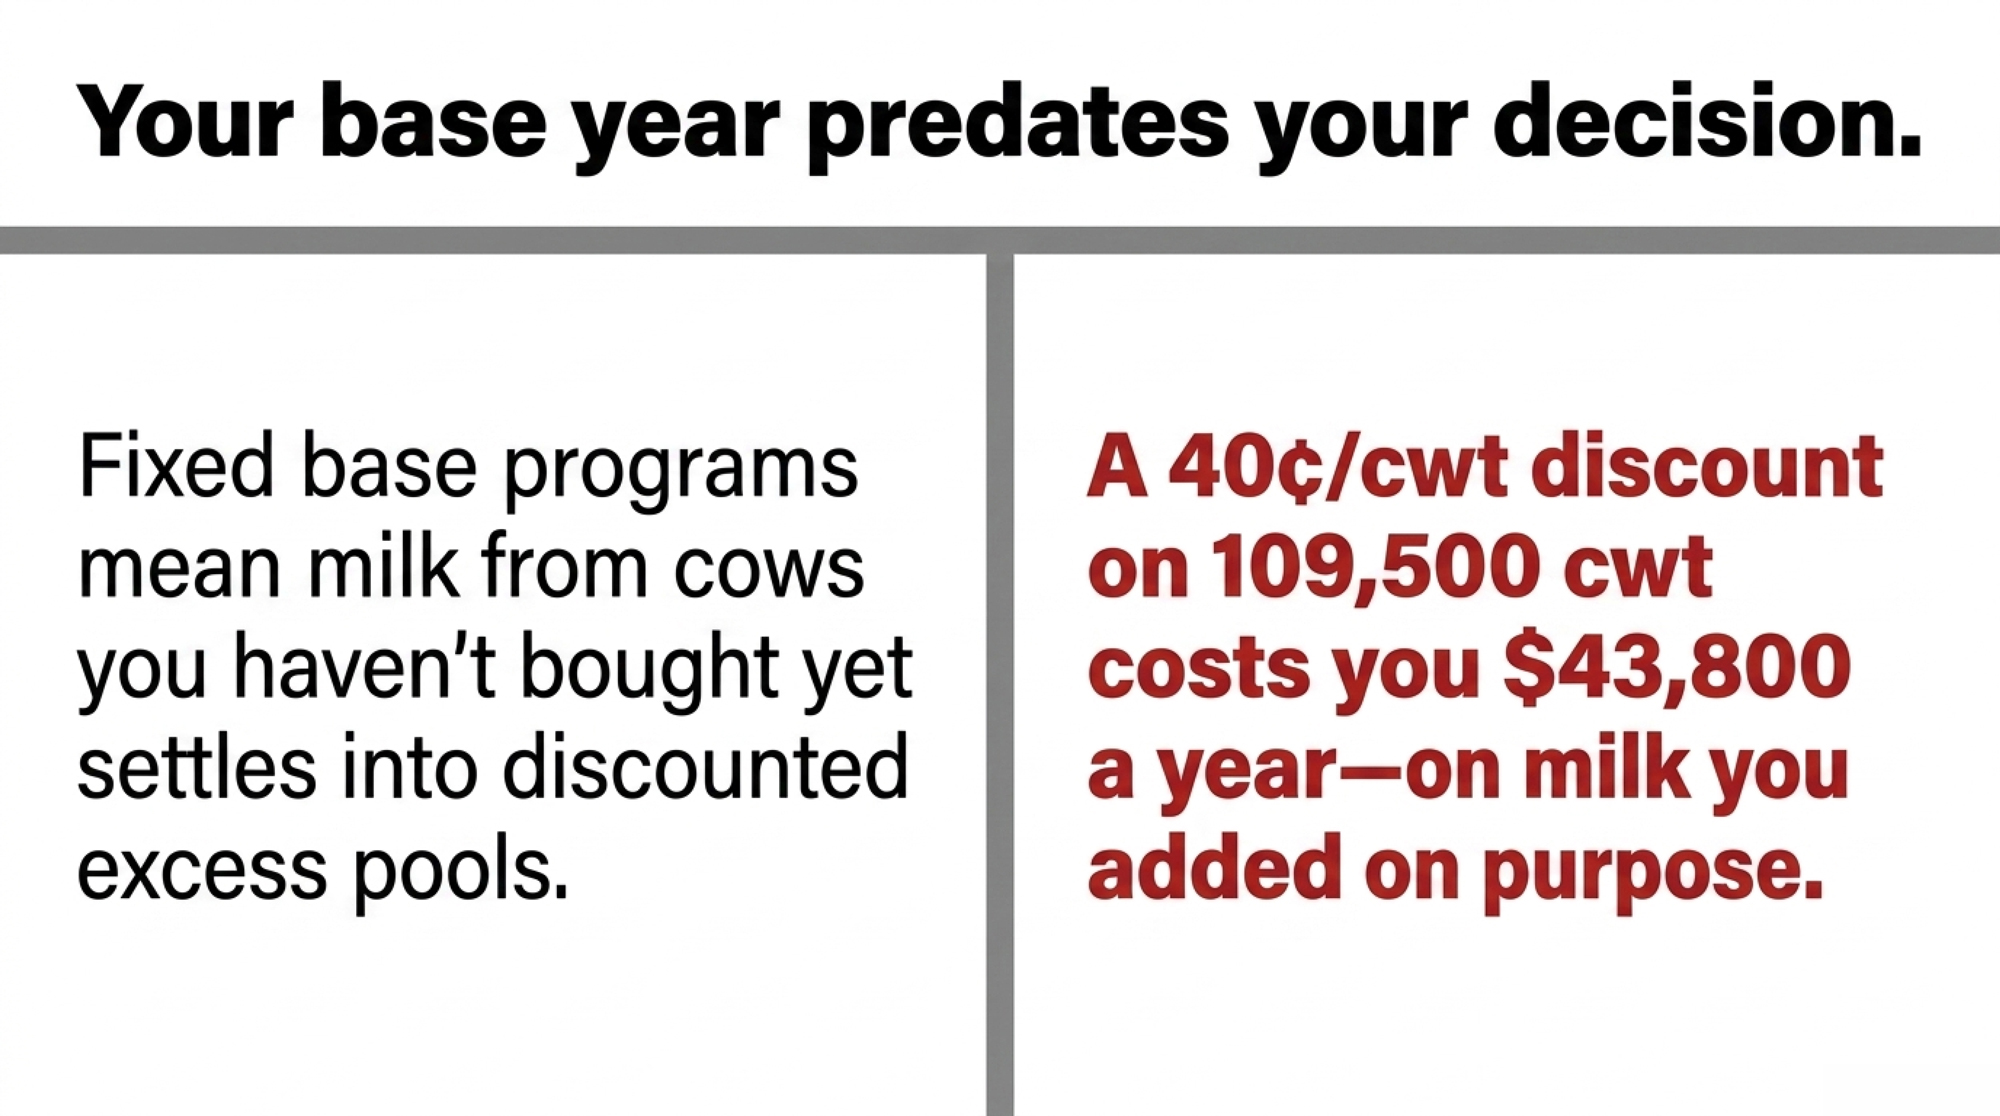
Here’s why the gap matters. If a rulemaking reads cost of production as full economic cost, a 200-cow herd’s floor lands at $27.21/cwt against an all-milk forecast of $19.85 — a raise of $7.36 on every hundredweight. If it reads the phrase as operating cost, the floor lands at $14.53, never binds, and pays nothing. Same herd, same USDA table, same survey year. Everything below turns on which number wins.

CaseCost BasisFloor ($/cwt)Binds at $19.85?Whole-Herd Uplift
A — Full economic costERS total costs, 200-499 tier, 2025$27.21Yes+$402,960
B — Operating cost onlyERS operating costs, 200-499 tier, 2025$14.53No$0

What the Bill Would Do, on the Record

The mechanism, as described by the sponsor’s summary and independent bill analyses: national and regional dairy boards advising the Secretary, production limits set for each producer, minimum milk prices based partly on production costs, fees charged to producers who exceed their allotment, and those fees redistributed to producers who stay within theirs. Producers may appeal their allotment to the Secretary under the National Board’s advisement.

Two features matter for anyone comparing this to Canada. Allotments “could not be sold, leased, traded, or otherwise monetized,” and the bill limits the buying and selling of production quotas. There’s no asset to build equity in.

Then the provision nobody has costed. Section 3(b)(1) provides that while the Dairy Market Stabilization Program is in effect, the Dairy Margin Coverage program “shall have no force or effect.” Section 3(b)(2) would bar the Federal Crop Insurance Corporation from offering Dairy Revenue Protection or any substantially similar policy. Congress reauthorized DMC through calendar 2031 under the One Big Beautiful Bill Act in July 2025 and raised its Tier 1 threshold at the same time. Eleven months later, this bill would switch it off.

Section 6 would fund dairy training, farmworker ownership assistance, and regional processing infrastructure.

Does S.4906 Mean U.S. Dairy Supply Management in 2026?

It borrows Canada’s cost-of-production logic and breaks from it on the point a lender cares about most: the production right isn’t an asset.

Point of comparisonCanadaS.4906 as described
Is the production right tradable?Yes, through monthly provincial exchangesTransferable between producers, but monetizing, leasing, selling or trading is prohibited
What is it worth?Ontario’s cap is $24,000.00 per kg of butterfat, and quota trades at the cap. Saskatchewan, outside the P5 cap, cleared at $44,144.00 per kg of butterfat in April 2026Nothing. There is no price
EnforcementQuota is required to market milkA fee on production above your allotment
Can you retire on it?Yes — quota is a saleable balance-sheet assetNo. Nothing to sell, nothing to borrow against
Who buys the milkProvincial marketing boardThe Secretary, per the descriptions available

Sources and units: Dairy Farmers of Ontario publishes the Ontario figure as a quota price cap in its Quota Exchange Summary, March 2026, and DFO’s Markets Report records the same $24,000 cap in effect across Prince Edward Island, New Brunswick, Ontario, Nova Scotia and Quebec. SaskMilk publishes its figure as a market clearing price per kilogram of butterfat in its April 2026 newsletter. Agriculture and Agri-Food Canada reports provincial averages as dollars per kilogram of butterfat per day. All figures Canadian dollars.

That second row is the whole difference, and the Saskatchewan number shows the scale of it. A Canadian dairy farmer who wants out sells quota — at $24,000 a kilogram in Ontario, or $44,144 where the cap doesn’t apply. A U.S. producer under S.4906 hands an allotment to a neighbor and books nothing.

Ontario also shows what rationing looks like when the asset exists and nobody will part with it: Dairy Farmers of Ontario’s own quota exchange archive records cancellations in February, April, May, July, and August 2026 — five of the first eight months — with the September exchange running. Our breakdown of the May exchange found 1,978 producers bidding against eighteen offering.

The historical parallel is narrower than usually claimed. NMPF published its Foundation for the Future proposal in June 2010, and a version was introduced in the 112th Congress as H.R. 3062, the Dairy Security Act, by House Agriculture Committee Ranking Member Collin Peterson on September 23, 2011. The Agricultural Act of 2014, signed February 7, 2014, included the Margin Protection Program and the Dairy Product Donation Program. The supply-control companion didn’t survive. NMPF’s position at the time, reported by DTN Ag Policy Blog on January 15, 2014, was that House Speaker John Boehner’s opposition “effectively served to kill our proposal within the committee.”

NMPF Answered Through a Trade Outlet, Not a Filing

The National Milk Producers Federation, which represents dairy cooperatives, has one public statement on this bill. Alan Bjerga, NMPF’s executive vice president of communications and industry relations, told Progressive Dairy on September 7, 2026: “Government-mandated supply management has a track record of unintended consequences: It limits farmers’ ability to grow and respond to market signals, it puts producers who have invested in expanding their operations at a disadvantage, and it raises consumer grocery costs.” He added: “Rigid production controls aren’t the right path forward for dairy.”

“Rigid production controls” describes a mechanism the available descriptions don’t support. In the sponsor’s summary and independent analyses, the bill enforces through a fee on over-allotment production, not a prohibition on marketing. That’s a different instrument with a different incentive, and the statement doesn’t engage it — nor does it engage Section 3(b).

The consumer-cost half of the statement is a different matter, and the arithmetic below supports it plainly. A floor set at mid-size full cost of production transfers $7.36 per hundredweight, and somebody pays it.

NMPF issued detailed public praise for Chairman John Boozman’s Senate farm bill draft, naming Dairy Margin Coverage continuation, common cheese name protections, and export promotion funding. The International Dairy Foods Association, which represents dairy processors and manufacturers, endorsed the same draft on June 22. Neither has publicly addressed Section 3(b). We put the question to IDFA the same day we wrote to NMPF.

The bill’s endorsers filed their own record on June 28: the National Family Farm Coalition, Farm Aid, Wisconsin Farmers Union, and the Northeast Organic Dairy Producers Alliance among dozens of farm and food organizations. Wisconsin Farmers Union president Darin Von Ruden, a dairy farmer at Westby, said: “If we want family farms to stay in business, we need a dairy economy that works for the people producing the milk and not one that expects farmers to just work harder.”

NFFC’s own legislative document states the Act “includes a parallel pricing and supply management system for organic farmers.” How that parallel system sets organic floors, and whether organic producers sit inside or outside the main Program, is another question we’ve asked.

What Would Cost-of-Production Pricing Do to a 200-Cow Milk Check?

Running the Numbers — Bullvine calculation

Scope: 200 cows, 12 months, Northeast or Upper Midwest, USD.

The bill would base minimum prices partly on production costs. USDA publishes those costs by herd size, and it publishes two of them.

What Is Cost of Production for a 200-Cow Dairy in 2025?

USDA ERS, Milk Cost of Production Estimates, size-of-operation series, 2025 values, dollars per hundredweight sold:

Herd Size (Cows), 2025Total Full Cost ($/cwt)Operating Cost Only ($/cwt)Milk Sold ($/cwt)Total Gross Value ($/cwt)Net on Full Cost ($/cwt)
Fewer than 50$47.33$16.37$23.45$27.79−$19.54
50–99$37.05$16.77$22.72$26.46−$10.59
100–199$29.56$14.87$21.55$24.61−$4.95
200–499$27.21$14.53$20.94$23.62−$3.59
500–999$23.06$14.33$21.74$24.72+$1.65
1,000–1,999$21.08$13.32$21.04$24.11+$3.03
2,000 or more$18.65$12.69$20.26$22.90+$4.25
All sizes$23.37$13.75$21.00$23.92+$0.55

Read the columns in order, because milk alone doesn’t cover full cost on any tier under 500 cows. Total Gross Value adds cattle sales and other income to the milk check — that’s what ERS nets against total cost, which is why Net isn’t Milk Sold minus Total Full Cost. The All sizes row is ERS’s own aggregate, not our average of the tiers.

The largest single driver on the mid-size row is capital recovery on machinery, housing, and equipment at $7.51/cwt.

Other published inputs:

  • All-milk price, 2026 forecast: $19.85/cwt. USDA ERS, Livestock, Dairy, and Poultry Outlook, August 19, 2026, U.S. national average, revised down 15 cents
  • Class III, August 2026: $16.64/cwt. USDA AMS, U.S. national
  • DMC in 2026: Tier 1 covers the first 6 million lbs of production history, raised from 5 million under the One Big Beautiful Bill Act, which also reauthorized the program through 2031. Coverage $4.00 to $9.50/cwt; $9.50 costs $0.15/cwt plus a $100 annual fee. USDA Farm Service Agency
  • DMC margin below $9.50 in 39 of 84 months, 2019 through 2025, or 46.4%. University of Wisconsin-Madison Division of Extension
  • The margin did not slip below $9.50 until December 2025, per the American Farm Bureau Federation, then triggered again in February 2026 on a margin of $8.46/cwt
  • Output per cow, 200–499 class, 2025: 23,479 lbs. USDA ERS

Stated assumptions, not source figures:

  • 75 lbs/cow/day, 365 days = 27,375 lbs/cow/year = 273.75 cwt. A managed Northeast or Upper Midwest herd, above the ERS class average. Substitute your own DHIA number.
  • The floor operates as a minimum, not a substitute price. A floor below market does nothing.
  • The 200–499 tier is the relevant one for a 200-cow herd if floors are tiered by herd size, as the sponsor’s materials describe.

Bullvine math:

200 cows × 75 lbs × 365 days = 5,475,000 lbs = 54,750 cwt.

The Two Costs, Side by Side

CaseCost basisFloor ($/cwt)Binds at $19.85?Uplift ($/cwt)Whole-HerdPer Cow
A — full economic costERS total costs listed, 200–499, 2025$27.21Yes+$7.36+$402,960+$2,015
B — operating cost onlyERS operating costs, 200–499, 2025$14.53No$0$0$0

Same herd. Same tier. Same dataset. Same year. The only variable is which cost measure a rulemaking adopts. Full economic cost includes imputed returns to owned land and the value of unpaid family labor. Operating cost doesn’t. When a producer says “my cost of production,” they almost always mean the second. When ERS publishes cost of production, it leads with the first.

Read Case A as a per-hundredweight transfer before you read it as a per-cow windfall. A $7.36/cwt uplift is what full-cost pricing actually costs — a 37% lift on the current all-milk forecast, and the strongest available argument against the bill as well as for it. Substitute the ERS class output of 23,479 lbs/cow and the same floor delivers $345,611 whole-herd, or $1,728 a cow.

The Handler Problem, and Why the Bill Reaches for a Single Desk

A tiered floor creates an immediate commercial trap, though not quite the one it first appears to be.

On the 2025 ERS numbers, a full-cost floor prices 200-to-499-cow milk at $27.21/cwt. A 2,000-plus-cow herd’s full cost is $18.65 — below the $19.85 all-milk forecast, so a floor set there never binds and that milk still clears at market. The penalty for sourcing from the smaller herd isn’t the gap between the two floors. It’s $27.21 minus $19.85: $7.36/cwt, the identical figure the mid-size producer gains.

That symmetry is the finding. A transfer has two sides, and both are the same size. No processor buying in a normal market absorbs $7.36 voluntarily, which is why mid-size patrons would be the first contracts under pressure.

The bill appears to see this coming, and its answer is structural rather than financial. On the descriptions available, the Secretary would purchase milk from producers and sell it on to handlers. That removes the choice: a cheese plant can’t drop its small patrons because it wouldn’t have patrons, it would have a supply relationship with a Regional Board.

Which moves the $7.36 rather than erasing it. Somebody still pays the difference between what the Board pays a 200-cow herd and what it charges the plant, and the resale price is the number we can’t find. That’s the question a mid-size operator should want answered before anything else in this bill — not whether the floor is generous, but who sits on the other side of it, and at what price. 

What You’d Be Giving Up

Section 3(b) would settle the other half of the math. DMC would be suspended while the Program runs, and Dairy Revenue Protection couldn’t be offered. Here’s the arithmetic on giving that up.

At $9.50 coverage on 95% of a 200-cow herd’s production history, 52,012.5 cwt at $0.15/cwt is $7,801.88 a year in premium, plus the $100 fee. DMC repays that in any year when indemnities exceed $0.15/cwt of covered production— the premium rate itself. February 2026’s $1.04/cwt shortfall, spread across a twelfth of annual production, is worth $0.0867/cwt on the year, so roughly 1.7 months at February’s depth covers it. Across 2019 through 2025 the margin sat below $9.50 in 46.4% of months, though the record since December 2025 has been sparser.

Methodology Note. Both floor figures are ERS-published 2025 values from the size-of-operation workbook, read directly from the file, not Bullvine constructions; the modeled inputs are yield and DMC election only. “Total Full Cost” is ERS “total costs listed” — operating costs plus allocated overhead, which for the 200–499 row is $14.53 plus $12.68. All uplift figures are calculated against the all-milk forecast as of the August 19, 2026 ERS release; USDA’s release calendar puts the next Livestock, Dairy, and Poultry Outlook on September 16, and it will supersede that figure. Class III appears as market context only; Class III, CME futures, and a legislated floor are three separate things. Per-cwt uplift scales linearly with volume. No double counting: the DMC premium appears once, indemnities once. We do not model any dividend, because its size would depend on how much over-allotment milk the country ships. On how sharply full and cash cost diverge as herds get smaller, see our small herd cost of production breakdown.

One more thing about the data. ERS states that estimates since 2021 “are based on the 2021 USDA, Agricultural Resource Management Survey (ARMS) data from milk producers, with subsequent updates based upon annual price changes.” The 2025 figures above are price-updated from a 2021 structural snapshot. Any floor built on this series inherits that, and the next ARMS re-survey would reset the entire cost ladder.

The 30/90/365 Playbook for Herds Shipping Under 500 Cows

30 days

  • Get two cost numbers from your accountant, not one: cash cost, and full cost with unpaid labor and capital recovery included. Your tier’s 2025 ERS figures are $14.53 and $27.21. Requires one meeting. Threshold: the gap between your two numbers is the range cost-of-production pricing would swing your milk check across. Backfire risk: quoting only cash cost in a comment to USDA argues for the floor that pays you nothing.
  • Pull your 2026 DMC election and divide last year’s indemnities by your covered hundredweight. The Tier 1 threshold moved to 6 million pounds this year, so more of your production may be covered than you think. Threshold: if that number beats $0.15/cwt, DMC has been paying you, and Section 3(b) would take it away. Backfire risk: DMC is a national margin, so yours may have moved differently.
  • Red-flag trigger: if your debt service coverage ratio has been under 1.2 for three consecutive months on your lender’s calculation, losing DMC and Dairy Revenue Protection together is a covenant conversation, not a policy curiosity.

90 days

  • Ask your lender how they underwrite your operating line of credit. DMC indemnities are a documented, program-based cash flow with a published trigger — the kind of line a bank can put in a pro forma and lean on when sizing a winter feed line. Dairy Revenue Protection is the same. If both were suspended, ask specifically: higher cash equity, tighter collateral margins, a lower advance rate, or a covenant change? Requires your loan officer, your last two operating-line renewals, and both cost figures above. Threshold: urgent before your next renewal if either program appears in your credit file. Backfire risk: raising a hypothetical bill can spook a nervous lender — lead with the arithmetic and the fact that nothing is in force.
  • Write down the production figure you’d want as your allotment base and the three years behind it. Requires DHIA or handler records for the past three years. Threshold: if your last twelve months ran more than 5% above your three-year average, how a base gets calculated is worth real money to you.
  • If you’re a co-op delegate, ask your government affairs staff three questions in writing: what happens to your co-op’s base plan if a federal allotment system arrives, what the co-op considers cost of production to mean, and what price handlers would pay a Regional Board. Requires one email. Threshold: immediate if your co-op is preparing a position.

365 days

  • Decide whether your next capital commitment assumes a volume-growth path or a component-and-efficiency path, and run both. Capital recovery is already the largest cost line on your tier at $7.51/cwt. Requires a nutritionist, a breeding plan, and a capital budget. Threshold: any commitment past 2027 with payback built on more hundredweight. Backfire risk: over-rotating to components on a thin premium schedule leaves money on the table if no supply program passes.
  • Opportunity signal: the bill’s described structure redirects allotment toward new entrants and funds farmworker ownership assistance. If a generational transition sits on your five-year horizon, those are the provisions to read when the text is in front of you.

The Committee Vote That Decides Whether Any of This Matters

The Senate Agriculture Committee voted 10-11 against reporting the 2026 Farm Bill out of committee on August 6. Chairman Boozman recessed the committee before the summer break rather than reporting the failed vote, so he could call members back without a lengthy amendment and debate process.

He’s calling them back. Boozman told POLITICO on September 10 that he plans another committee vote next week, without a firm date set: “I really feel like it’s important to continue to have members express where they’re at on this, and so we are going to vote again next week.” He said he’ll call the vote whether or not Sen. Mitch McConnell — hospitalized since June, home for rehab since August, and hoping to attend “if it’s humanly possible” — is well enough to be there. McConnell’s absence, alongside unified Democratic opposition, is what stalled the August markup.

Note what the fight is actually about, because it isn’t dairy. Democrats voted the package down over SNAP spending cuts, and their demand is two extra years for all states before a new requirement that states pay part of SNAP benefits. Boozman’s bill offers a one-year delay, and he told POLITICO that’s his best and final offer. Which means the dairy title’s fate rides on a nutrition-program dispute, and a reopened dairy title is where stabilization language would arrive as an amendment. Advocacy groups backing S.4906 have spent the past week urging exactly that. As of today the bill remains referred, unmarked-up, and unscheduled on its own.

Whether cost-of-production pricing pays you $7.36 a hundredweight or nothing turns on which of USDA’s two cost numbers a rulemaking picks. Get both from your accountant this month — cash and full. Then ask your lender what your operating line looks like if Section 3(b) takes Dairy Margin Coverage off the table.

Key Takeaways

  • USDA publishes two cost figures for a 200-to-499-cow herd in 2025 — $27.21/cwt full economic cost and $14.53 operating cost. S.4906 would price milk off cost of production without saying which. That’s $402,960 a year on 200 cows, or nothing.
  • Section 3(b) would suspend Dairy Margin Coverage and bar Dairy Revenue Protection while the Program runs. DMC at $9.50 costs a 200-cow herd $7,801.88 a year and repays that whenever indemnities clear $0.15/cwt — about 1.7 months at February 2026’s margin.
  • A full-cost floor prices mid-size milk $7.36/cwt above what the market pays for large-herd milk — the same figure the producer gains. The bill’s answer is to make USDA the buyer, which relocates that transfer rather than removing it. Nobody has said what handlers would pay.
  • Senate Agriculture is expected back in markup the week of September 14, on a vote Boozman says he’ll hold regardless of attendance. The blocker is SNAP, not dairy — but a reopened dairy title is the route an amendment would take.
  • Get both cost numbers from your accountant this month, cash and full, before any comment period opens. Then ask your lender what your operating line looks like without DMC.

Run Your Numbers

Dairy Profit Projector — This article gives you USDA’s two cost figures. The Projector gives you yours: drop in your herd size, production, and ration to get your own breakeven milk price and margin per cwt, then move the milk price to see where a floor would actually bind.

Learn More

The Sunday Read Dairy Professionals Don’t Skip.

Every week, thousands of producers, breeders, and industry insiders open Bullvine Weekly for genetics insights, market shifts, and profit strategies they won’t find anywhere else. One email. Five minutes. Smarter decisions all week.

NewsSubscribe
First
Last
Consent

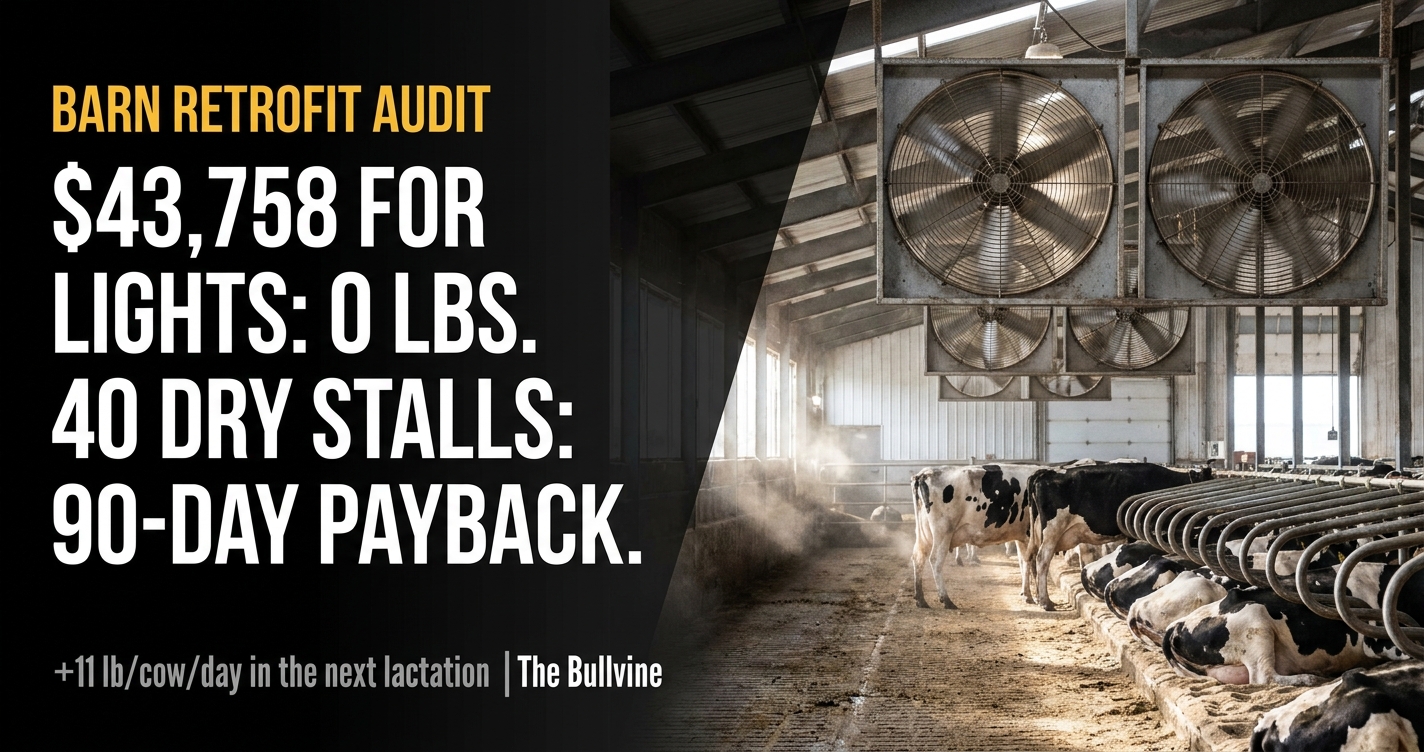
$43,758 for Zero Extra Pounds — and 40 Dry Stalls That Pay Back in Months, Not Years

The lights measured zero. The dry pen didn’t. On a 250-cow herd that’s 41 freshenings a year at $459 each — and one hour in the herd software to find out.

EXECUTIVE SUMMARY

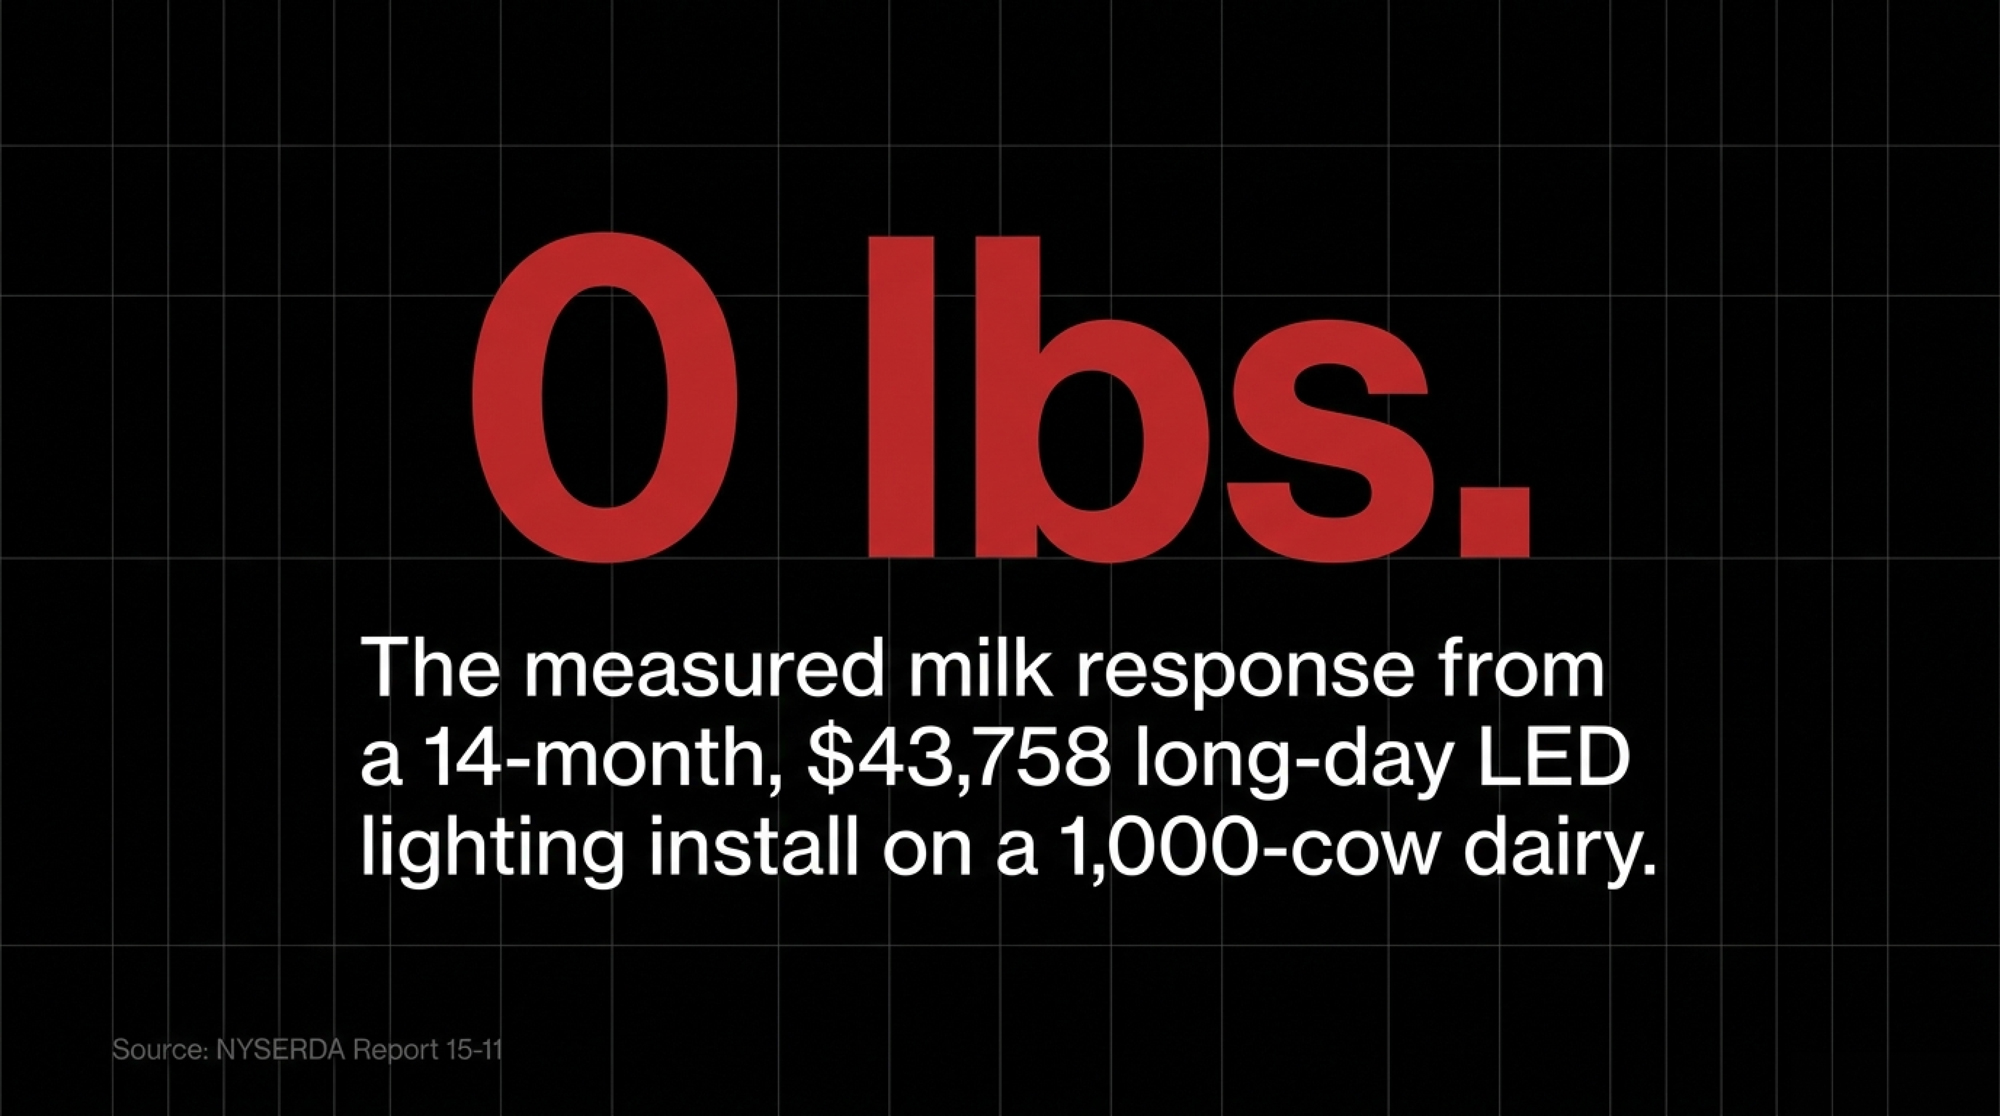
  • The lighting trap. Cornell Cooperative Extension fitted a 1,000-cow western New York dairy with long-day lighting, tracked milk for 14 months against a true control, and measured zero response — turning a $43,758 install into a net loss across all fifteen sensitivity runs.
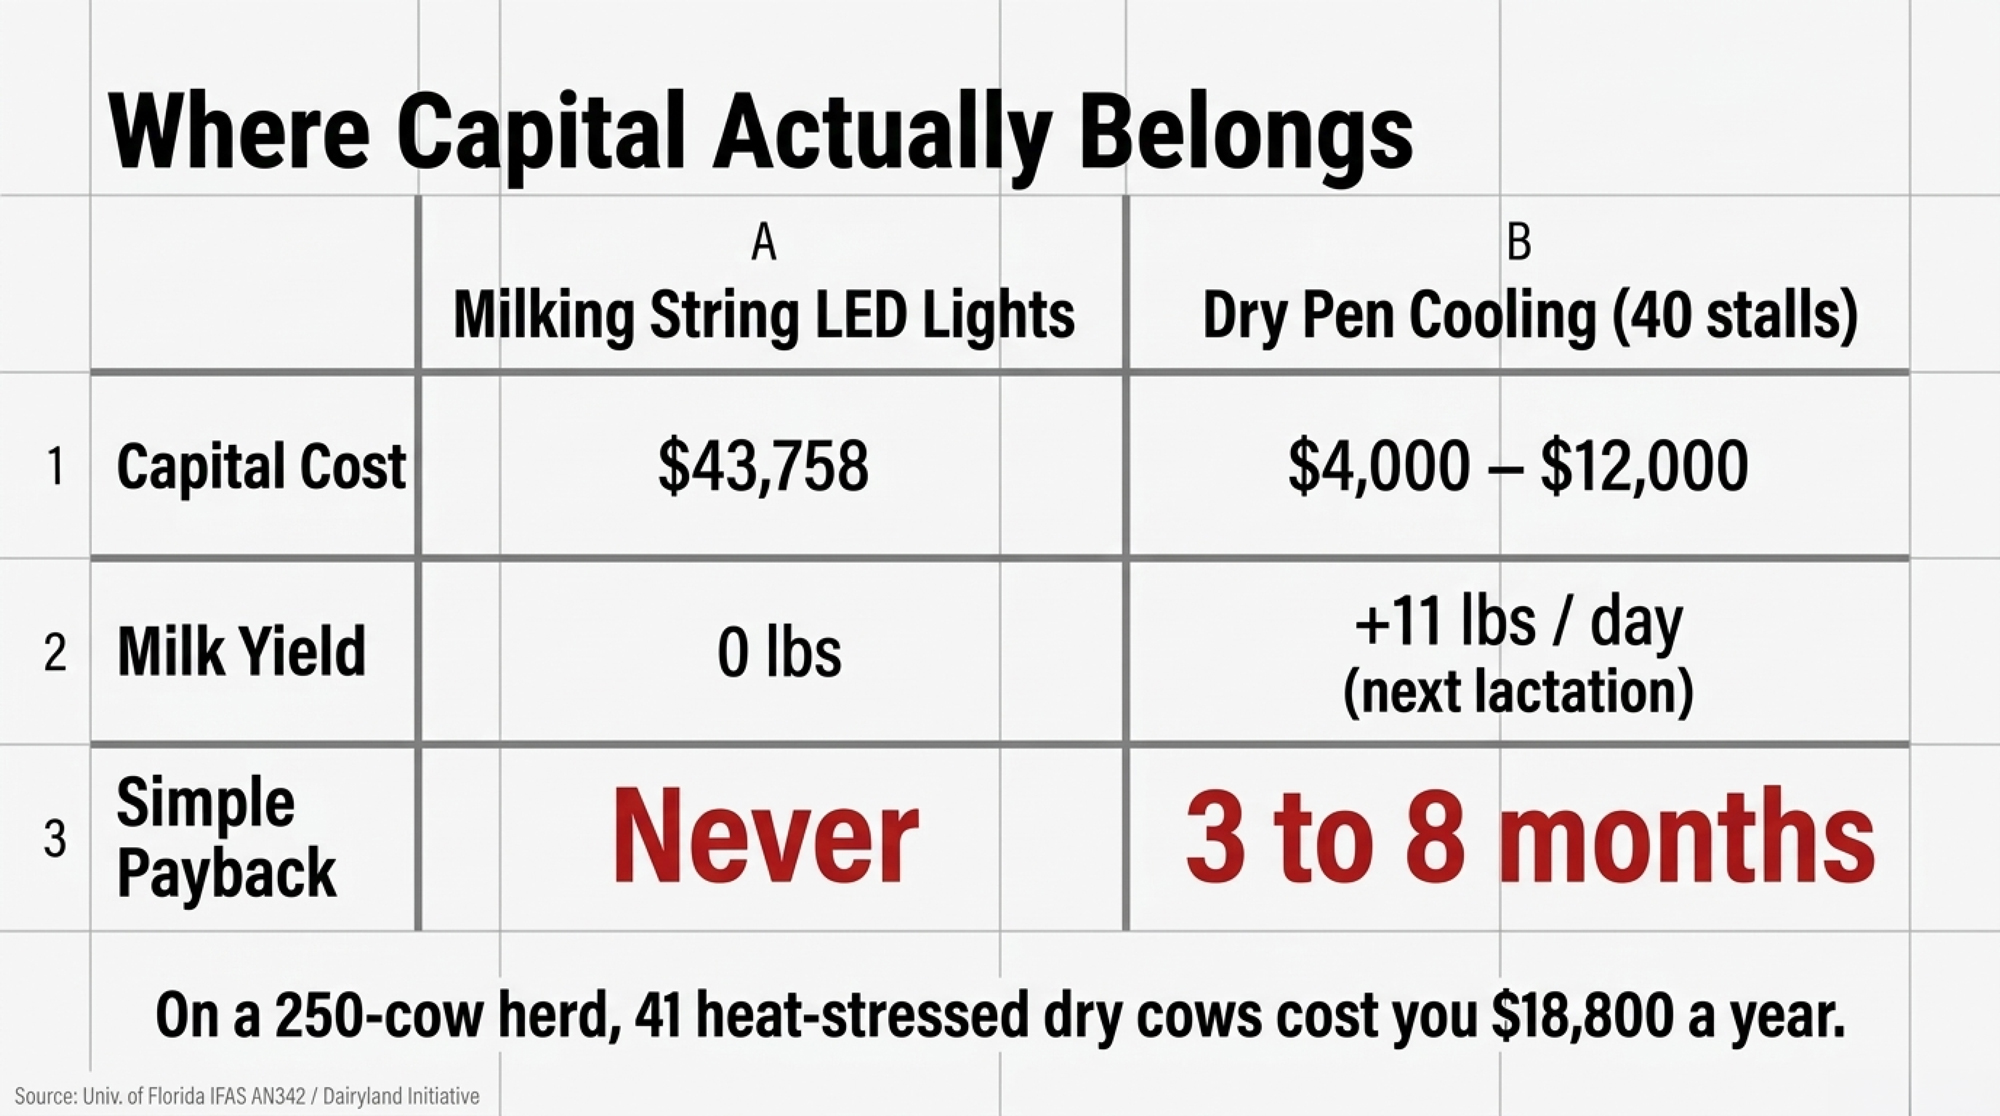
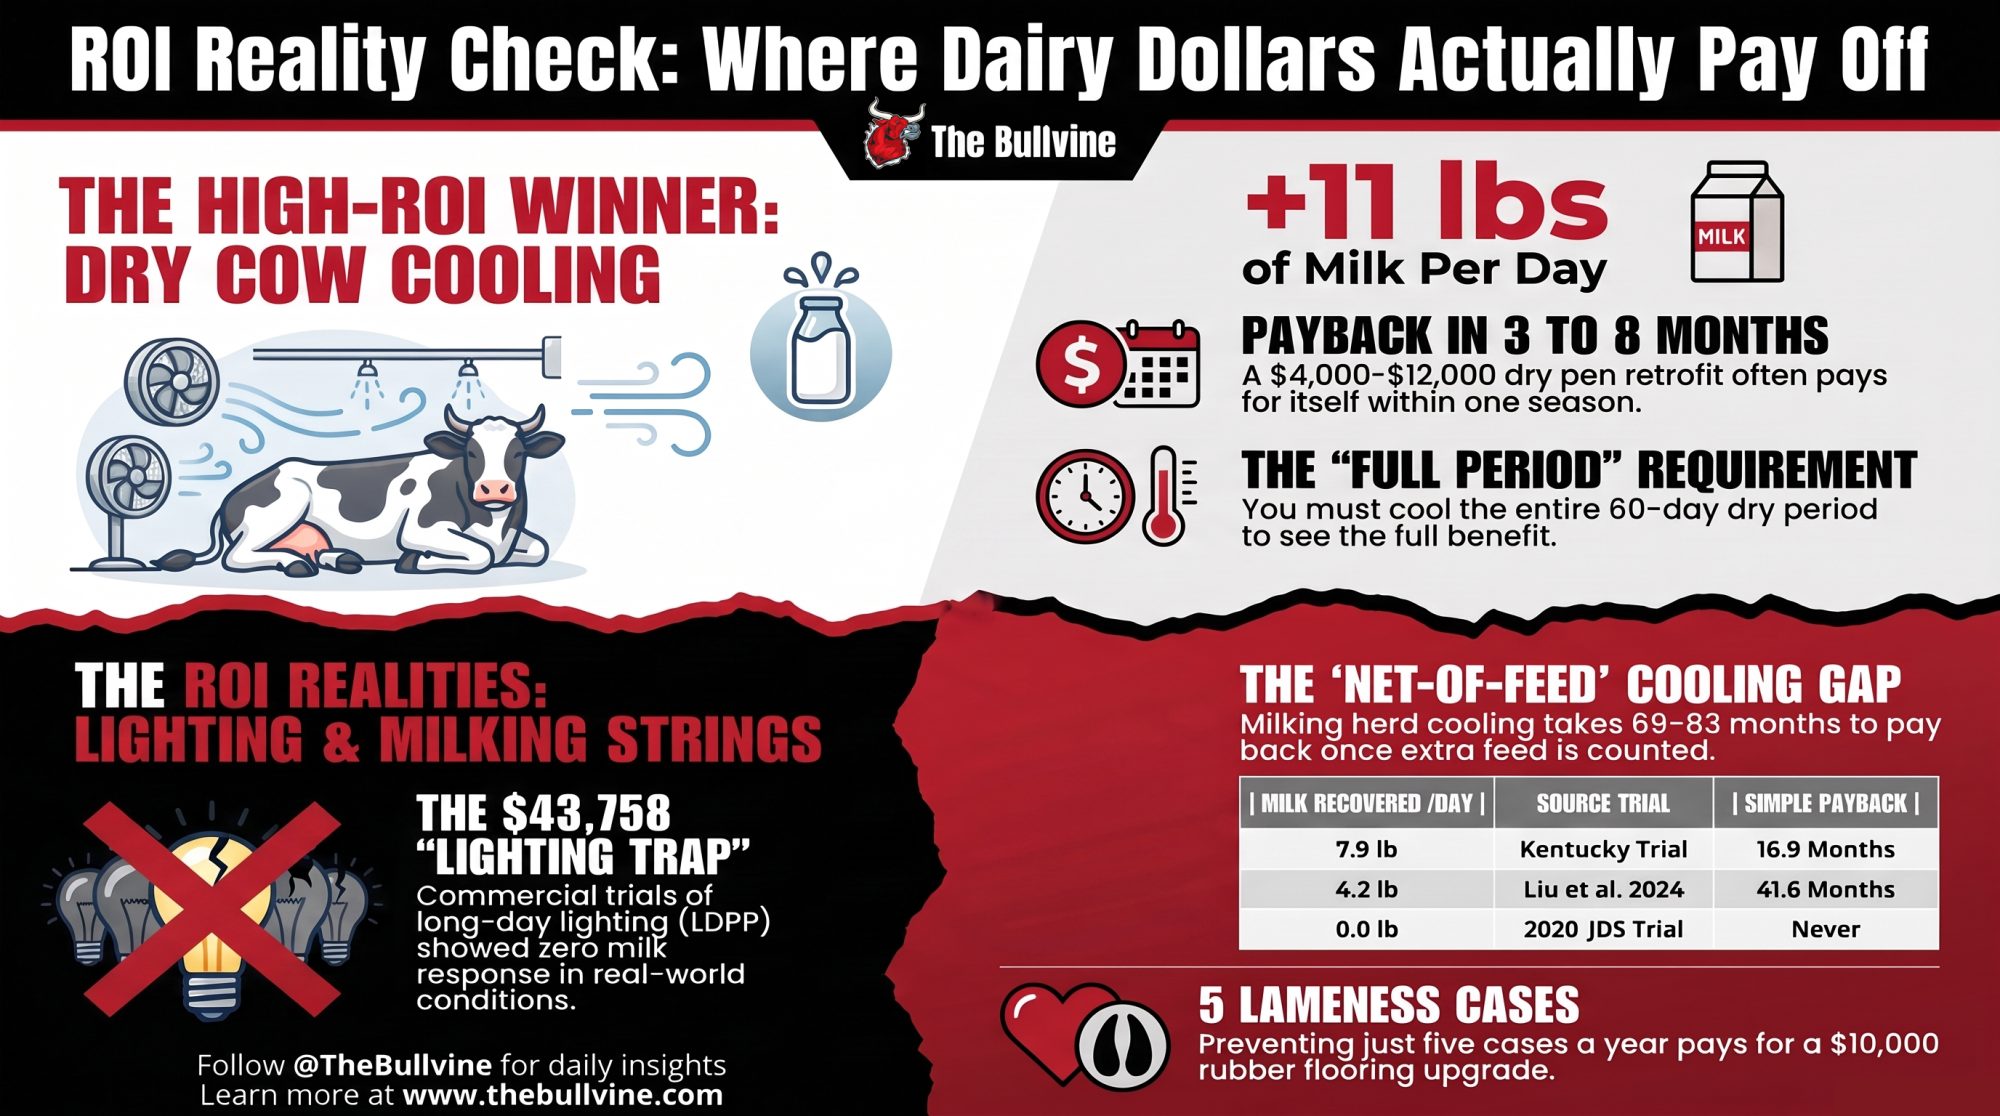
  • The overlooked pen. University of Florida’s IFAS puts dry cows given cooling and shade at 11 lb/day more milk in the next lactation than cows given shade only. On a 250-cow herd with 60 heat-stress days, that’s 41 affected freshenings and $459 a cow — roughly $18,800 a year against a $4,000–$12,000 install, paying back in under three to eight months. The ranking holds at $17 milk as well as $22.
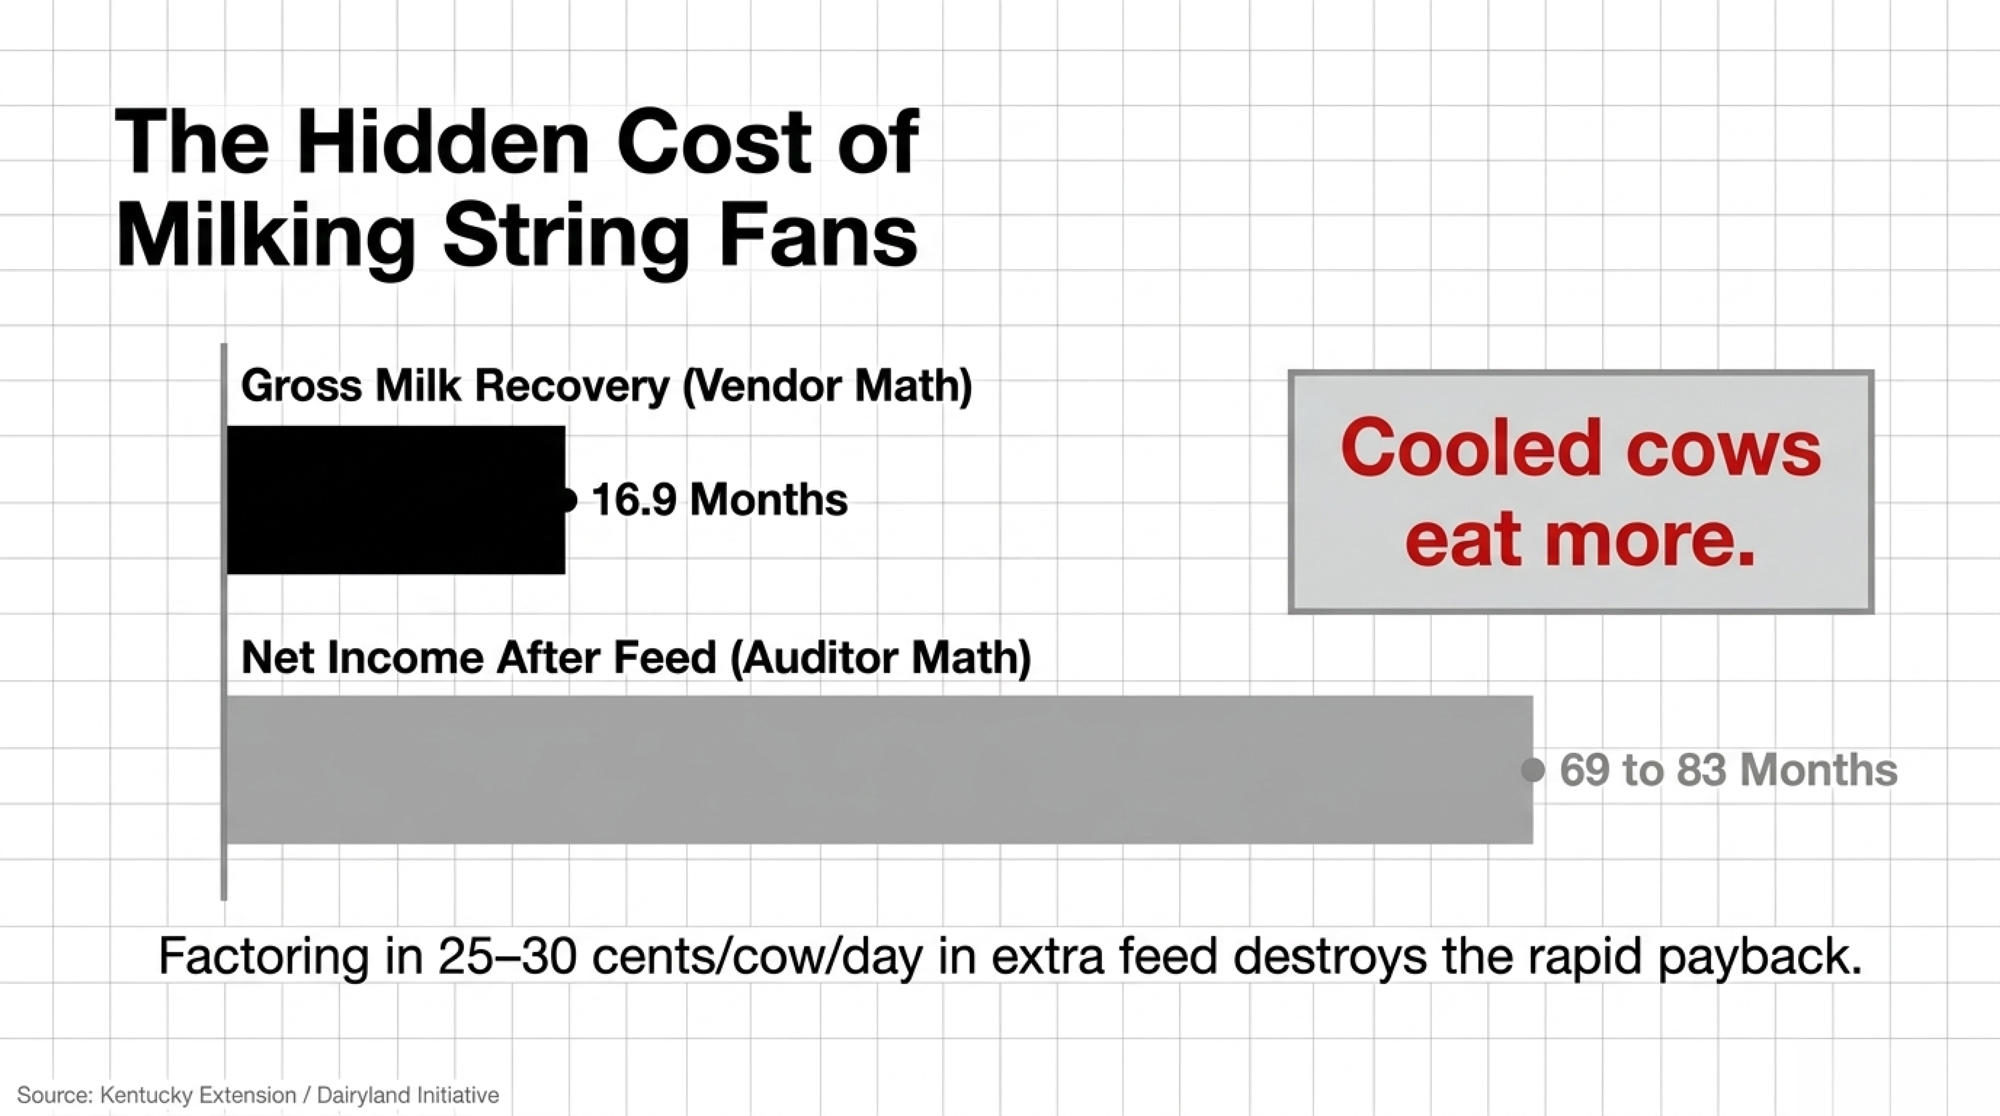
  • The catches. Cool the entire 60-day dry period: partial cooling rescues yield for about three weeks instead of thirty. And count the feed. On the milking string, a $26,000 fan retrofit runs 16.9 months on gross milk recovery but 69 to 83 months once Kentucky’s net-of-feed figure is applied.
 dry cow cooling payback

Equipment costs retrieved August 31, 2026. Milk price: $19.85 USD/cwt (USDA ERS Livestock, Dairy and Poultry Outlook, August 19, 2026 — the most recent all-milk forecast as of publication). Exchange rate: $1 USD = $1.3825 CAD (Bloomberg, September 10, 2026, 10:16 a.m. EDT). All dollar figures are USD unless marked CAD. Retrofit basis, not new construction.

In September 2012, Libby Eiholzer and Michael Capel started rewiring a dairy barn in western New York.

Eiholzer is a bilingual dairy specialist with Cornell Cooperative Extension’s North West New York Dairy, Livestock and Field Crops Team. Capel is a veterinarian at Perry Veterinary Clinic. On a NYSERDA-funded study, they built something the industry had talked about for thirty years and rarely actually measured on a working farm: a controlled test of long-day lighting, with a real control group, on a 1,000-cow commercial dairy, running fourteen months.

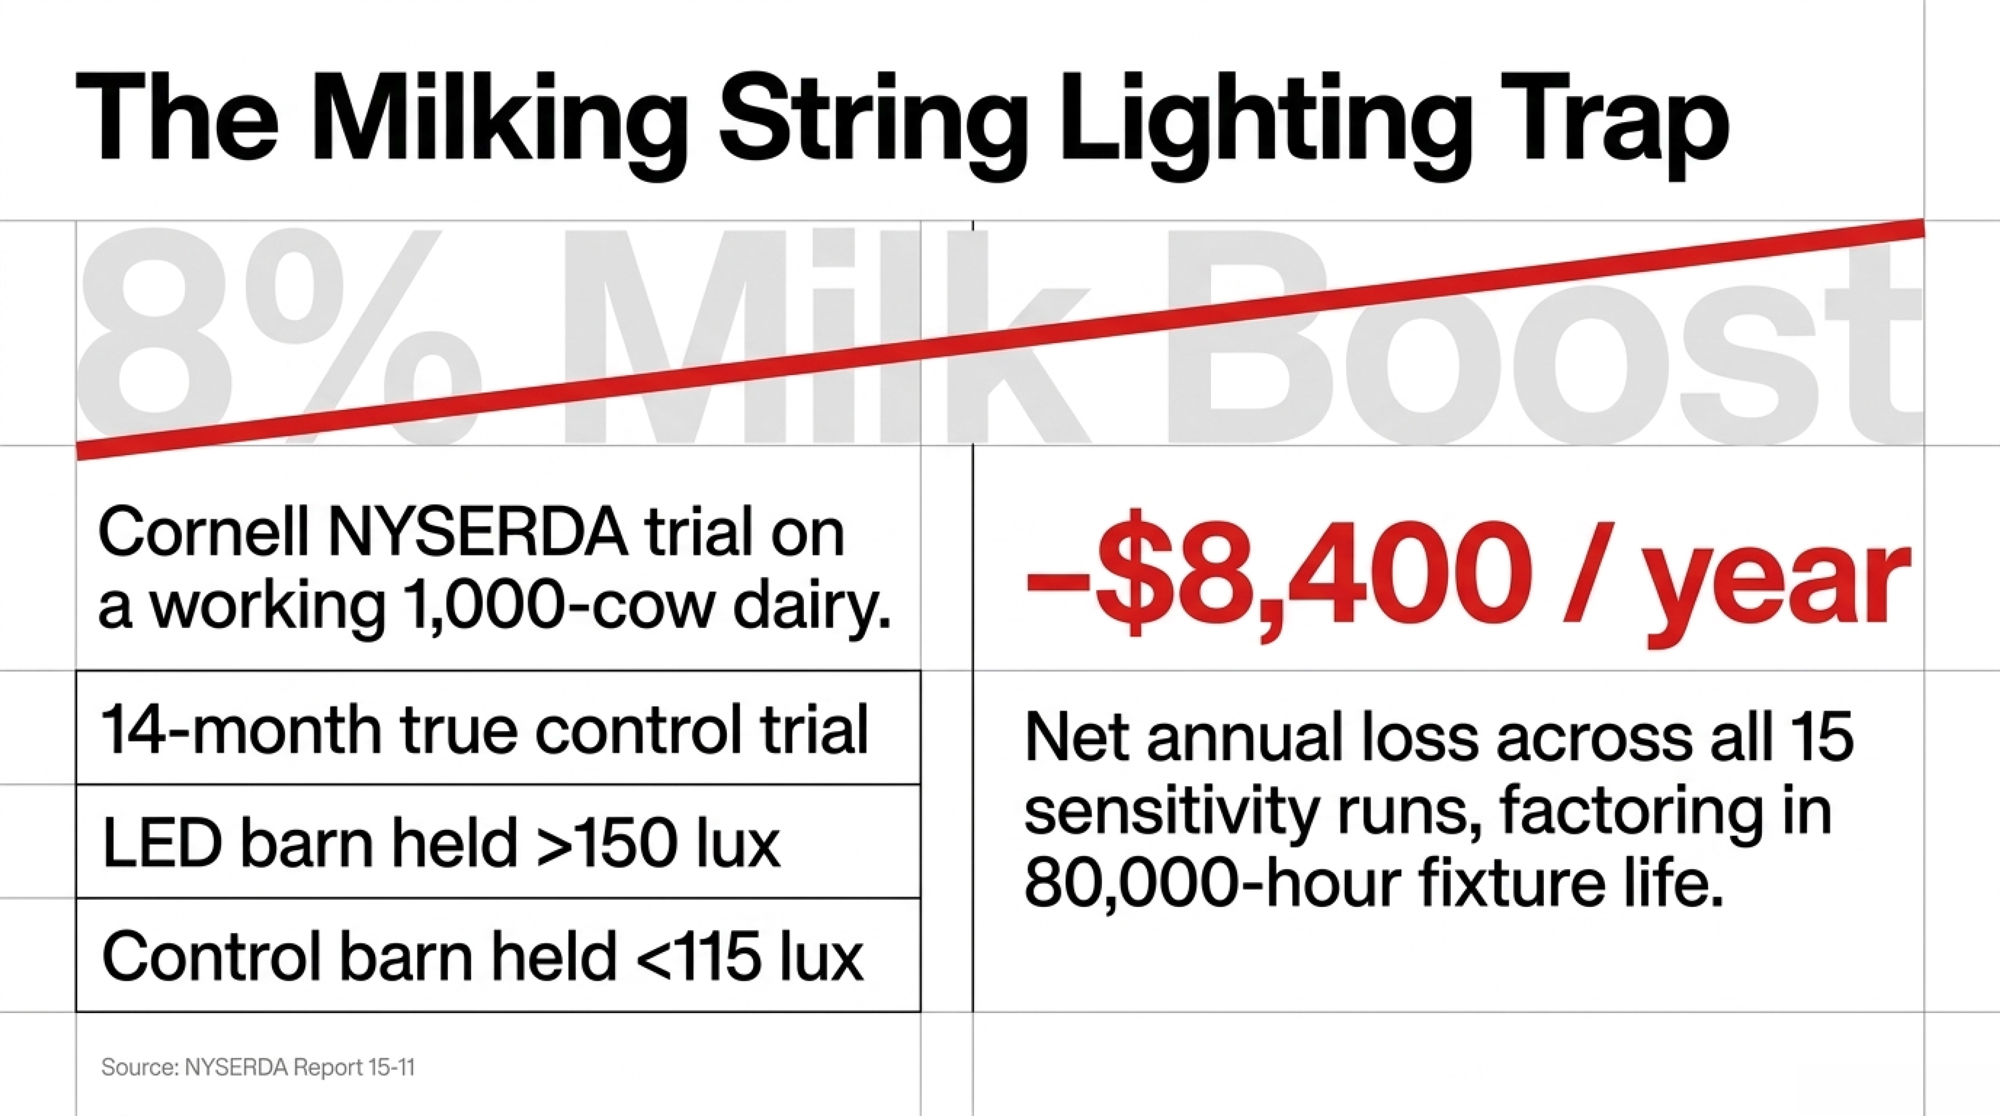
Three barns. LED on a 16-to-18-hour photoperiod. T8 fluorescent on the same photoperiod. And one barn deliberately held below the light threshold as a control. They checked it with a photometer — both treatment barns stayed above 150 lux; the control never cleared 115. Milk came off monthly DHIA tests across roughly 300 days per cow.

Clean design. And to be clear about what they were doing: testing a published hypothesis on a working farm, not going after anybody’s product.

What did the trial actually find?

Nothing. No milk response at all.

From the conclusions of NYSERDA Report 15-11, April 2015: “Despite previous research results, LDPP did not result in an increase in milk yield in this study. There was no statistical difference in milk production detected between the first lactation animals in the LDPP LED and the LDPP T8 treatment groups, nor between the mature cattle in the LDPP LED, the LDPP T8 and the control T8 treatment groups.”

Fitting that LED barn cost $43,758 USD in 2012 dollars. With no milk response and an 80,000-hour fixture life, the partial budget came back at negative $8,400 a year. Then they ran fifteen combinations of fixture lifetime and electricity cost, looking for one that worked. All fifteen came back negative.

The biology isn’t junk. Peters and colleagues reported it in Science in 1978: sixteen hours of light daily at 114 to 207 lux raised milk yield 10 to 15% against cattle on natural photoperiods of 9 to 12 hours at 39 to 93 lux. Dahl, Buchanan and Tucker’s 2000 review in the Journal of Dairy Science confirmed long-day stimulation across numerous studies and pointed to IGF-I as the likely mediator. That’s the foundation under every lighting quote you’ve been handed — including our own coverage of the 8% claim, which this piece corrects.

That same 2000 review flagged something the industry mostly forgot. Relative to long days, short-day treatment during the dry period produced the largest magnitude of milk-yield response in the subsequent lactation. Hold that thought.

But Eiholzer and Capel were straight about why their farm might not have shown the lactating-cow effect. Long-day photoperiod needs six to eight hours of genuinely uninterrupted dark. Milking three times a day, cows kept ending up in the holding pen or the parlor under lights during what was supposed to be their dark window. Two waterers froze in the LED barn over the winter of 2013–14, restricting water for part of the season.

One trial isn’t a verdict. It’s also the only independent commercial trial, and it measured zero.

The pen you drive past on the way to the parlor

Here’s what holds up. And notice where it points — the same place the photoperiod work pointed twenty-six years ago.

The University of Florida program — Geoffrey Dahl, Sha Tao and colleagues — established that cows heat-stressed in late gestation give less milk in their next lactation than herdmates that were cooled. The mechanism is impaired mammary development before she calves, not heat stress while she’s milking. Tao and Dahl published the core work in JDS in 2013, and Fabris and colleagues extended it across the full dry period in 2019.

For the number to plan around, UF’s own extension economics publication is the place to go. IFAS document AN342, updated August 2026, puts it plainly: dry cows given evaporative cooling and shade produced on average 11 lb per day (5 kg) more milk in the next lactation than cows given shade only, citing do Amaral et al. 2009 and Tao et al. 2011 and 2012.

Other sources land higher or lower — University of Maryland Extension cites 9 pounds, and Purina’s summary of the same Florida work says 14 in the first 30 weeks. IFAS’s 11 is the conservative middle, and it comes from the publication written specifically to answer the economics question, so that’s what we use below.

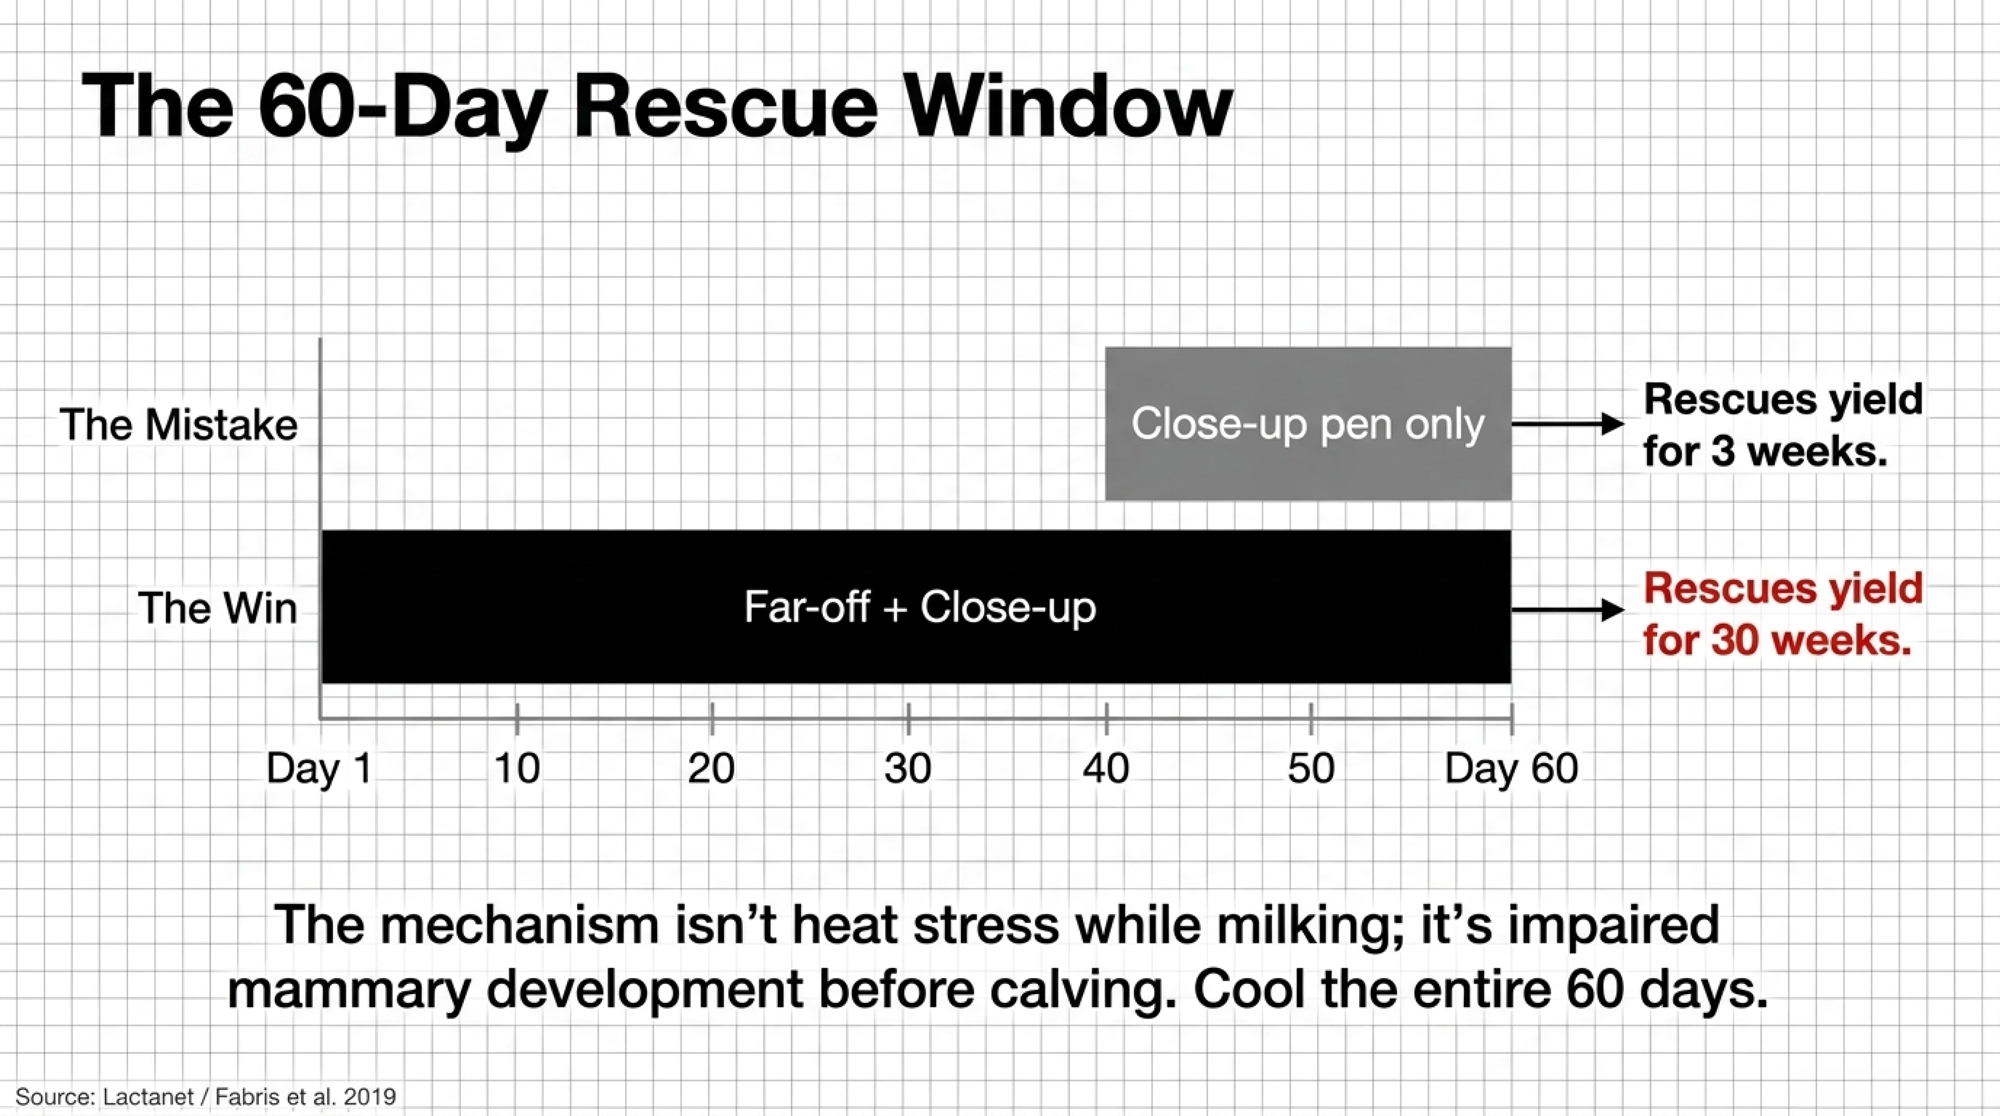
Here’s the condition most people miss. Lactanet’s summary of the Florida work is blunt: cooling for the entire dry period raised milk yield out to 30 weeks into lactation. Cooling only the early or only the late dry period partially rescued yield for just the first three weeks. If you cool the close-up pen and leave the far-off pen in the sun, you’re buying three weeks of benefit, not thirty.

Run the number on your own herd

Say you milk 250 cows, your dry period runs 60 days, and you carry roughly 60 days a year where heat genuinely costs you milk. About 41 of your annual freshenings will have spent their dry period inside that window — 250 × 60 ÷ 365.

Take IFAS’s 11 pounds across the 30-week measurement window:

11 lb × 210 days = 2,310 lb, or 23.1 cwt — about $459 USD a cow.

Multiply by 41 cows, and you’re at roughly $18,800 USD a year. Milking 200? Thirty-three cows fall in that window — about $15,100.

That $459 moves with the milk price, obviously. At $17 — the number your lender is probably modeling — it drops to $393 a cow, or $16,100 across the herd. At $22, it’s $508 and $20,800. The ranking doesn’t change at any of those prices, which is more than you can say for most of what’s below.

One caveat on that 41: it treats partial heat exposure as proportional. Fabris found late-gestation exposure matters most, so a cow stressed for twenty of her sixty dry days may not take exactly a third of the hit. The number could move either way.

Why does it pay so fast? The dry pen is small. Cooling 40 stalls costs a fraction of cooling 250, and the return per cow is bigger and lasts longer. Scaling the University of Wisconsin–Madison Dairyland Initiative’s published figure of $104 USD per cow, fans and soakers over a 40-stall dry pen lands in the $4,000 to $12,000 USD range. Against roughly $600 USD a year to run them, that pays back in under three to eight months — the low end if you’re at the cheap end of that install range, the high end if you’re not.

Two things to know about that cost. It’s scaled from a published per-cow number, not a contractor quote. And the Dairyland figure comes from an 800-cow barn in Green Bay, so scaling down to 40 stalls understates it — electrical service and mobilization don’t shrink proportionally.

Nobody sends a rep out to quote a 40-stall dry pen. That’s most of the story right there.

And this model doesn’t count the upside. Urdaz and colleagues (2006) ran 475 prepartum cows and found adding shade and fans to an existing feed bunk sprinkler system produced a significant lift in 60-day milk production and an economic benefit over the cooling system already in place. Separately, UF extension work reports daughters of heat-stressed dry cows produce 4.9 lb/day less in first lactation and 5.1 lb/day less in second, with effects documented across up to three lactations. Cooling the dry pen buys milk you won’t see for three years.

Does cooling the milking herd actually pay at $19.85 milk?

The Dairyland Initiative publishes two numbers for a natural-ventilation retrofit with fans over the stalls: $104 USD per cow installed, and $20.05 USD per cow per year to run them. Our own first draft only used one of them. On 250 cows that’s $26,000 in and about $5,012 a year in electricity.

Now the part that matters. Fans and soakers mitigate heat stress — they don’t erase it. So the driver isn’t the milk you’re losing. It’s the milk cooling actually gets back, and that’s been measured across several trials.

University of Kentucky extension engineers pulled four sprinkler-and-fan trials into one table. Florida: 39.8 lb up to 44.4, a gain of 4.6 (11.6%). Kentucky: 50.1 to 58.0, a gain of 7.9 (15.8%). Missouri: 51.4 to 55.8, a gain of 4.4 (8.6%). Israel: 72.8 to 78.0, a gain of 5.2 (7.1%). Rectal temperature fell a full degree Fahrenheit in the Kentucky work.

Liu and colleagues, publishing peer-reviewed work in Animals in 2024, ran an automated sprinkler system and found milk yield of 31.3 kg against 29.4 in controls — up 1.9 kg, or 4.2 lb (P = 0.046, nine cows per group). And a 2020 JDSstudy of alternative cooling strategies found no milk difference at all, which the authors attributed to low heat load during the study period.

Milk recovered /cow/daySource trialNet annual gain, 250 cows @ $19.85 USD/cwtSimple payback on $26,000 USD install
0 lb (low heat load year)2020 JDS trial–$5,012 (electricity loss)Never
4.2 lb (1.9 kg)Liu et al. 2024, Animals$7,49441.6 months
4.4 lbMissouri trial$8,08938.6 months
5.2 lbIsrael trial$10,47129.8 months
7.9 lbKentucky trial$18,51016.9 months

Payback reflects gross milk recovery minus $5,012 USD in annual electricity. It doesn’t subtract the additional feed those cows will eat — see below.

Read the column header carefully. It says recovered, not lost.

And here’s the cost that table leaves out, which is exactly the thing we’ve been complaining about. Cooled cows eat more. Rather than estimate the feed line ourselves, look at what Kentucky Extension reports as the bottom line: 25 to 30 cents USD per cow per day in additional net income, after paying for the increased feed, water, and electricity. On 250 cows across 60 days, that’s $3,750 to $4,500 a year — and a payback closer to 69 to 83 months.

That is a different investment than the one in the table. Same equipment, same barn. The gap is feed, and it’s the single largest omission in most cooling proposals — including our own, until we went looking.

BasisMilk recovered/cow/dayAnnual value, 250 cows @ $19.85/cwtPayback on $26,000 install
Gross milk recovery (Kentucky trial)7.9 lb$18,51016.9 months
Net-of-feed, water, electricity (Kentucky Extension)7.9 lb$3,750–$4,50069–83 months
Difference attributable to feed/water/power—$14,010–$14,76052–66 months added

Where you farm changes the answer

Gunn and colleagues (2019) projected abatement economics under mid- and late-century climate scenarios and put mean annual net values at –$30 to $190 a cow for High abatement, and –$20 to $590 for Intense. Note the negative floor on both — and that the biggest returns sit late-century rather than today. Reviewing that same paper in 2025, Hutchins and colleagues summarized it bluntly: heat abatement is only cost-effective in the most intense heat.

USDA’s ERS (Key et al., ERR-175) sorted states into four tiers by long-run THI load. The Pacific Northwest and Northeast carry the lightest exposure. The Desert Southwest, Southern Plains, and Southeast have the heaviest. If you’re farming in the top tier, everything in the table above moves toward the bottom row. If you’re in the lightest, it drifts toward the top — and the top row is a loss.

That doesn’t mean you’ve got nothing to spend on. It means the two break-evens further down — five lameness cases, seventeen minutes a day — are where your capital has to earn its keep instead, because neither one depends on how hot your July gets.

How do you know if your barn has a problem worth spending on?

Pull last July’s daily milk weights. Not the monthly test, and not the bulk tank — the per-cow dailies.

The Dairyland Initiative’s own diagnostic is a drop of more than 5 pounds per cow per day in warm weather. That tells you heat is costing you something. What you recover depends on what you install and how you run it. And it’s exactly why monthly testing misses this: heat comes and goes between tests, so a monthly number can look fine while you bled milk for nine straight days.

The management detail matters more than the equipment brochure. Ohio State extension guidance is specific: about 30 seconds of soaking at 0.9 to 1.4 gal/min to wet a cow’s coat through, then four to five minutes of fan-only time to dry her. Air should reach cow height at 8 to 10 ft/sec. Start the system at THI 65 to 68 — roughly 70 to 75°F with moderate humidity — because preventing a rise in body temperature is far easier than pulling one back down.

Flow rate is its own lever. Tresoldi and colleagues, in JDS in 2019, found milk yield roughly 5 kg/day higher in cows soaked at 1.25 and 2.0 L/min than at 0.5 L/min. Same fans, same barn, different nozzle.

For your own local picture, UW–Madison Extension’s Heat Abatement Investment Scouter turns your coordinates into ten years of hourly temperature and humidity and estimates annual hours above THI 68. In Wisconsin, that’s 1,000 to 2,000 hours a year — call it 42 to 83 full-day equivalents. Lactanet, working from a lower THI-60 threshold, reports the Canadian average at 117 days outside the comfort zone.

What Ontario’s incentive program changes

If you farm in Ontario, check the incentives before you price equipment. Everything in this section is in Canadian dollars.

Save on Energy’s Retrofit program lists recirculation ventilation fans as an eligible agriculture measure, and on the schedule effective June 30, 2026, the incentive runs up to $4,820 CAD per high-volume low-speed fan. High-efficiency ventilation exhaust fans draw up to $500 CAD each. Also on the agribusiness list: dairy plate coolers at $1,800 CAD, milk scroll compressors at $1,620 CAD, low-energy livestock waterers at $580 CAD, and solar hot water collectors for dairy at $2,380 CAD.

Two things to watch. The program’s per-cow natural ventilation measure — $56 CAD a cow — is written for tie-stalls, not freestalls, so a freestall dry pen doesn’t qualify. And every figure above is a maximum: IESO states plainly that actual amounts depend on equipment size and eligible cost caps.

Now convert before you compare. The Dairyland figure of $104 USD per cow is roughly $144 CAD at today’s rate, so a 40-stall dry pen at the middle of our range — $7,000 USD — is about $9,700 CAD installed.

Against that:

  • At the HVLS rate, a $4,820 CAD incentive covers roughly half the project. Net cost lands near $4,900 CAD, or about $3,500 USD — a payback around two and a half months.
  • Under the $500 CAD exhaust measure, net cost is about $9,200 CAD, or $6,700 USD — a payback of around four and a half months.
  • If the project fits no prescriptive measure, the Custom stream pays $1,800 CAD/kW or $0.20 CAD/kWh, whichever is higher, up to 50% of eligible project costs — which on a larger cooling retrofit may beat the prescriptive route outright.
Incentive streamMax incentive (CAD)Net install cost (CAD)Net cost (USD)Approx. payback
HVLS fan rate$4,820~$4,900~$3,500~2.5 months
Exhaust fan rate$500~$9,200~$6,700~4.5 months
Custom stream (if no prescriptive fit)50% of eligible costsVaries by projectVariesCase-by-case

One honest limit on those paybacks: the milk revenue behind them uses the USDA all-milk price, because we don’t have a verified Ontario blend price for this analysis. Substitute your own, and the months will move. The cost side of the comparison is sound regardless — halving your install price halves your payback, whatever you’re getting paid for milk.

Either way, it’s the fastest thing in this article, and the difference between those numbers is one phone call: IESO at 1-844-303-5542 or retrofit@ieso.ca. Program terms change, and prescriptive measures require pre-approval and follow one-for-one replacement rules. Confirm eligibility and current amounts before you build a budget on any figure here.

Two upgrades you can settle with a break-even

For these, the cost side is well documented, and the benefit side isn’t. So here’s the break-even instead of a payback — check it against your own records.

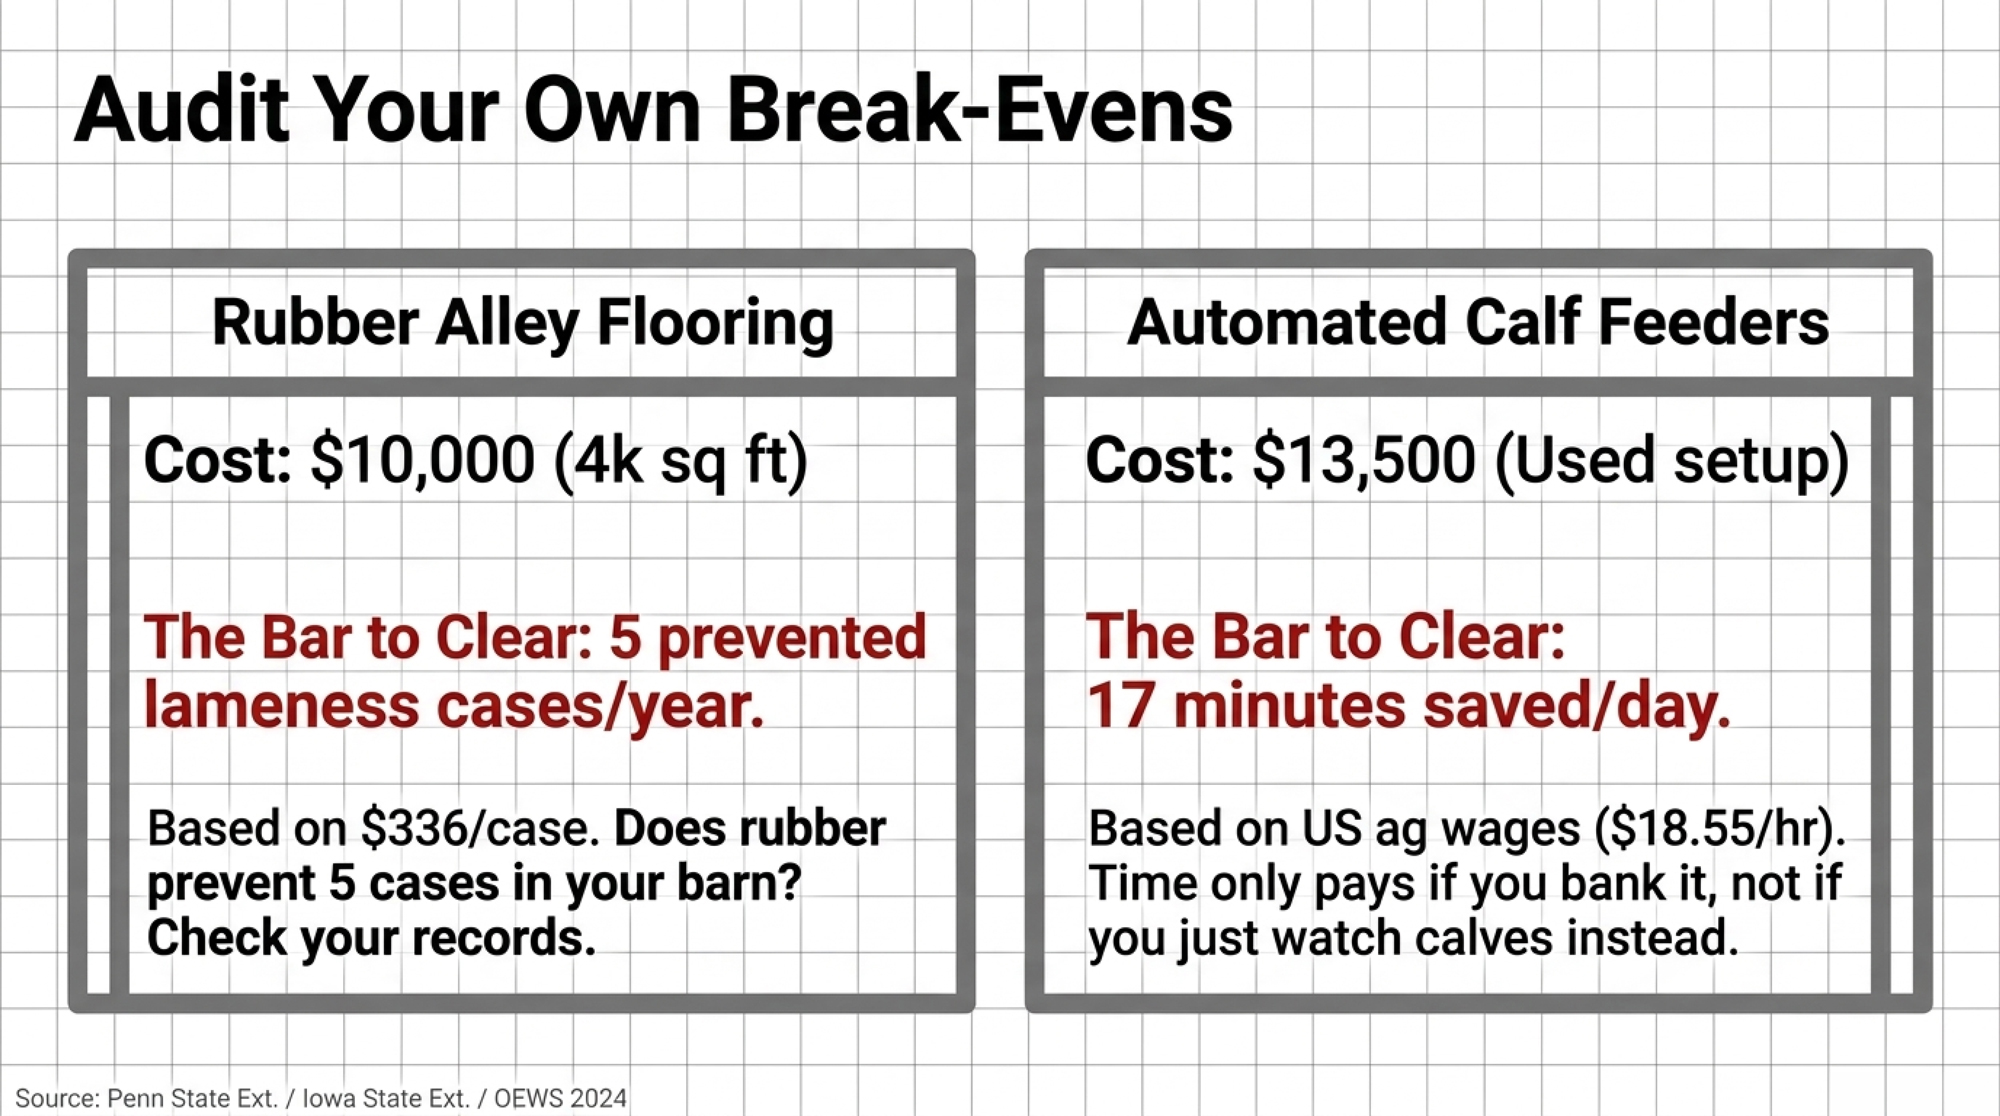
Rubber flooring in alleys. Cornell’s NYSCHAP flooring module puts grooved rubber belting at $2.25 to $2.75 USD per square foot installed. Cover 4,000 square feet of transfer alley and holding area, and you’re near $10,000. Vanegas and colleagues (2006) documented reduced claw growth and wear versus bare concrete — a real, peer-reviewed hoof-health benefit.

Lameness cost is documented too. Penn State Extension, updated January 2026, cites Dolecheck and Bewley’s summary at $76 to $533 USD per case, with one study averaging $336.91. Cha and colleagues (2010) broke it out by lesion: $216 for sole ulcer, $133 for digital dermatitis, $121 for foot rot.

So: $10,000 over eight years at 7% needs about $1,675 a year back. At $336.91 a case, you need to prevent five cases a year. At the low end of the published range, twenty-two. Whether rubber prevents five cases in your barn is the number nobody has published. Count last year’s cases and decide.

Automated calf feeders. Iowa State Extension puts stations at $2,000 to $28,000 USD, using $5,500 as a used-equipment default. CalfStar listed new CalfExpert units from $23,250 USD as of August 2026. Two used stations plus a computer runs about $13,500.

Run the break-even in your own currency, because the wage rates differ. In the US, OEWS 2024 puts livestock farmworkers at $18.55 USD an hour — against a $13,500 setup over ten years at 7%, break-even is 17 minutes a day. On the CalfStar figure, 29 minutes. In Ontario, FARMS Ontario’s October 1, 2025 schedule runs $17.60 CAD lower-skilled and $19.06 CAD higher-skilled, with the provincial minimum moving to $17.95 CAD on October 1, 2026 — and that same used setup converts to roughly $18,700 CAD, putting break-even nearer 25 minutes a day.

That US figure comes from OEWS now because USDA’s NASS canceled the Farm Labor Survey on August 28, 2025, and posted the discontinuance to the Federal Register on September 3. The long-running quarterly benchmark for farm wages no longer exists.

Iowa State’s producer survey found farms averaging 2.2 hours a day feeding calves, with some who switched reporting 1.5 hours a day saved — about a 16-month payback at the US wage. But the same survey recorded others saying flatly that no labor was saved at all; the hours just moved from feeding into monitoring. Seventeen minutes is a low bar. Whether you clear it depends on whether you bank the time or spend it watching calves.

UpgradeInstall costAnnualized cost (8yr @ 7% or 10yr @ 7%)Break-even requirement
Rubber alley flooring (4,000 sq ft)~$10,000~$1,675/yr5 prevented lameness cases/yr @ $336.91 avg
Used automated calf feeder (2 stations)~$13,500 USD / ~$18,700 CAD—17 min/day saved (US wage) or ~25 min/day (Ontario wage)

Three we won’t put a payback on

These fail for three different reasons — a contested effect, a missing cost, and a null result. Worth knowing which is which, because they don’t all mean the same thing.

Cow brushes — the effect size is contested. The 2.2-pound figure everyone cites traces to one 2009 Cornell study by Schukken and Young at Sprucehaven Farm. Their abstract puts it precisely: installing the brushes produced either no difference in daily milk production in lactation 1 and lactation 3-and-higher, or roughly a 3.5% (1 kg) increase— that increase falling in second lactation. Clinical mastitis dropped by more than 30% in second-and-higher lactation animals. We found the field study on a cow-brush manufacturer’s website. Readers can find the funding and disclosure details in the paper itself.

Two later studies don’t line up with it. Li and colleagues, in Veterinary Sciences in 2024, found the milk response in higher-parity animals — fourth and fifth — with no significant difference in second and third. Griffin’s 2025 Mississippi State thesis found brushes lowered cortisol, but milk didn’t differ statistically: 19.9 versus 22.4 kg/day, P = 0.18. The numerical gap ran the wrong way, with the brush group producing less, which usually means a sample too small to settle it either way.

Three studies, three answers. On Schukken’s number, five brushes pay back in about seven months. On Griffin’s, never. Buy brushes for the welfare case and the mastitis finding — both better supported than the yield claim.

Sand bedding — the cost side doesn’t exist. Where brushes have a disputed benefit, sand has a well-established one and no published price. OMAFRA puts sand at $8–10 per tonne against $40–50 for organic bedding, and the comfort case is solid. What nobody publishes is the retrofit manure-handling cost, and on an existing barn that decides everything. Patz names converting existing barns as a distinct cost. McLanahan notes reclaimed sand offsets 90–95% of purchase. Neither publishes a price for the separation system a barn without one has to add. We checked university, extension, and ministry sources across several passes and found no figure, so we’re not handing you one. Treat sand as a new-build decision until somebody prices that equipment.

Automated feed push-up — the one trial measured nothing. And this one has both a cost and a benefit study. The problem is what the study found. Kary Babb, working through a Vita Plus Dairy Technical Extended Internship in partnership with UW–Platteville, tested a Lely Juno against skid-loader push-up at the university’s Pioneer Farm over four months in an ABA design. Her result: “no significant change in milk production and only a slight change in dry matter intake.” That’s one machine, on one farm, over four months — a result about this trial, not a verdict on the technology.

The detail that lands hardest is Babb’s own explanation. “This farm has been well managed prior to implementing the Lely Juno 100. Feed was pushed up at least six times a day using the skidloader.” They tested the machine where it had almost nothing left to improve.

The labor case is better sourced and still tight. Jack Rodenburg of DairyLogix, working a Progressive Dairy Operators survey of 115 herds from 40 to over 1,000 cows, found the average herd pushing feed 4.27 times a day at 6.07 minutes a go — 158 hours a year, $2,256 in labor at $14.31 an hour. Against a then-quoted $24,675 machine at 5% over 15 years, his read: the average farm comes “about $100 per year short on covering the cost of ownership from the labour saved.” The two farms in that survey that already owned one pushed feed 11 and 18 times a day. Well above average.

That’s your rule — the labor case strengthens the more often you do it by hand, and collapses if you’re already at two. Same discipline we applied to sensors, where precision monitoring ran past a six-year payback on health benefits aloneonce Cornell’s real 2.1-day warning window replaced the five days in the marketing.

The Bullvine action checklist

Audit last July’s per-cow dailies. Not the monthly test, not the bulk tank. A drop over 5 lb/cow/day in warm weather tells you heat is costing you something. Under 3 lb and a $26,000 USD fan retrofit won’t clear its own $5,012 annual electricity bill, let alone the feed.

Price the dry pen before the milking string. Forty stalls at $4,000–12,000 USD return about $459 USD a cow, roughly $18,800 a year on a 250-cow herd, and it holds that ranking from $17 milk to $22. Cover the entire 60-day dry period — cooling one pen and not the other buys about three weeks of the effect instead of thirty.

Check the nozzles before you buy more fans. Tresoldi found roughly a 5 kg/day difference between cows soaked at 1.25–2.0 L/min and those at 0.5 L/min. Same equipment, different flow rate.

Strip two lines out of every quote you’re handed. Electricity at $20.05 USD/cow/year, and the feed those cooled cows will eat. Kentucky’s net-of-everything number is 25–30 cents USD per cow per day — compare any vendor’s milk-response math against that before you sign.

Work the break-even on the contested ones. Rubber flooring needs five prevented lameness cases a year. A used calf feeder needs 17 minutes a day at US wages, or about 25 in Ontario. Both are numbers sitting in your own records right now.

In Ontario, phone IESO before you phone a dealer. Whether your fans draw $4,820 CAD or $500 CAD roughly halves or barely touches your install cost — and that changes the ranking, not just the payback.

What’s your dry pen actually costing you?

Most of us can quote a robot to the dollar and a load of sand to the tonne. Fewer of us have ever put a number on forty stalls of dry cows standing in August heat, because nobody has driven out to the farm and asked us to.

Twenty-six years ago, a review in the Journal of Dairy Science said the largest photoperiod response showed up in the dry period. The industry went and sold lights for the milking string instead. That’s worth sitting with.

So run the hour. Count how many cows went dry between June and August, multiply by $459, and set that against whatever you were about to spend somewhere else. If it surprises you, you’re in good company — it surprised us enough that we threw out our first ranking and rebuilt it. Twice.

The full model goes out to Bullvine Weekly subscribers with the spreadsheet attached: every assumption, the NPV and IRR runs, milk-price sensitivity at $17 and $22, and the interaction math on which upgrades genuinely stack against which ones double-count each other through dry matter intake.

And if you’ve cooled a dry pen, send us the invoice. The weakest number in this article is what that retrofit actually costs, because no university publishes it and we won’t invent it. Reply with a real quote, and we’ll run it in next year’s update with your farm’s name on it.

Run Your Numbers

Dairy Profit Projector — Cooling only pays if the extra milk survives the extra feed. Drop in your herd size, production, milk price and ration cost, and the Projector returns your IOFC per cow per day and breakeven milk price — the two numbers that decide whether a cooling quote’s payback is real or gross.

Learn More

The Sunday Read Dairy Professionals Don’t Skip.

Every week, thousands of producers, breeders, and industry insiders open Bullvine Weekly for genetics insights, market shifts, and profit strategies they won’t find anywhere else. One email. Five minutes. Smarter decisions all week.

NewsSubscribe
First
Last
Consent

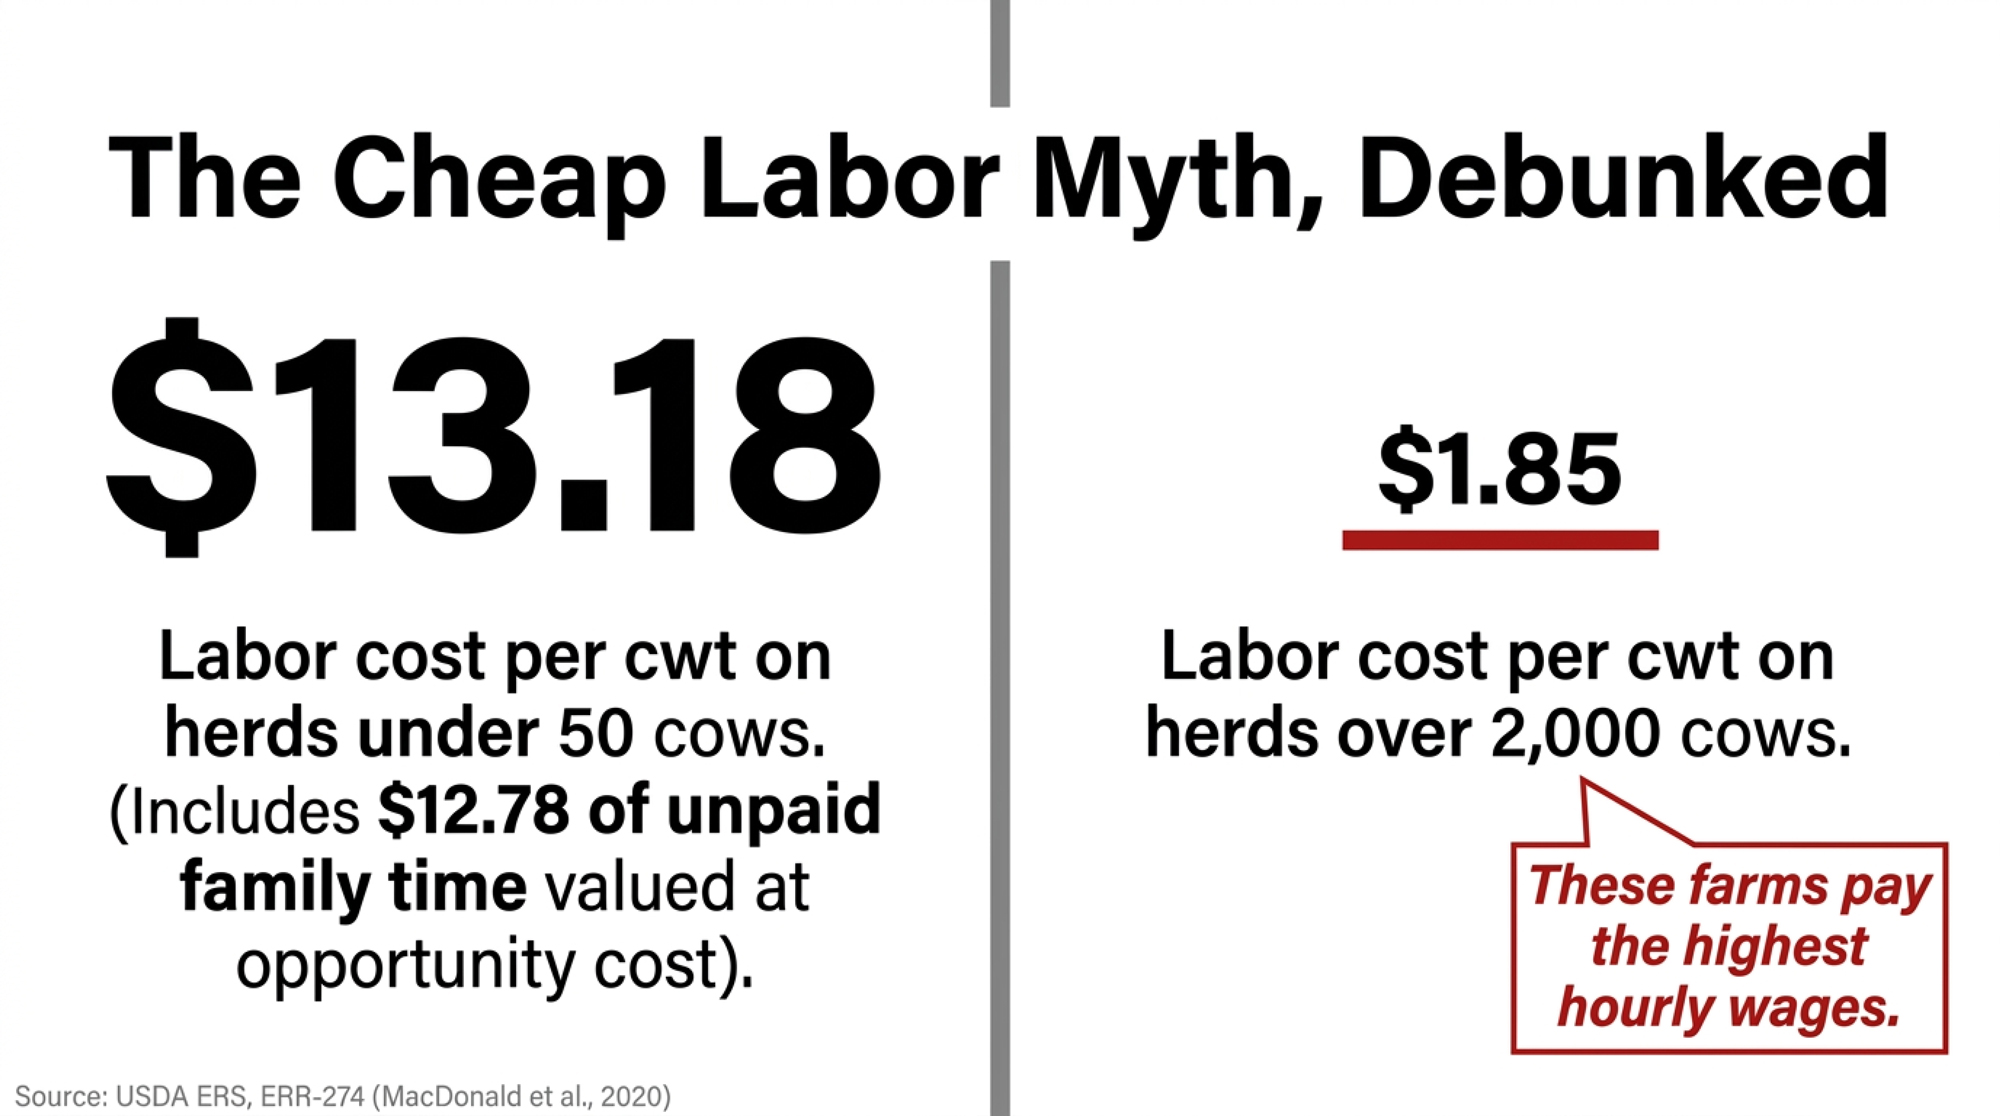
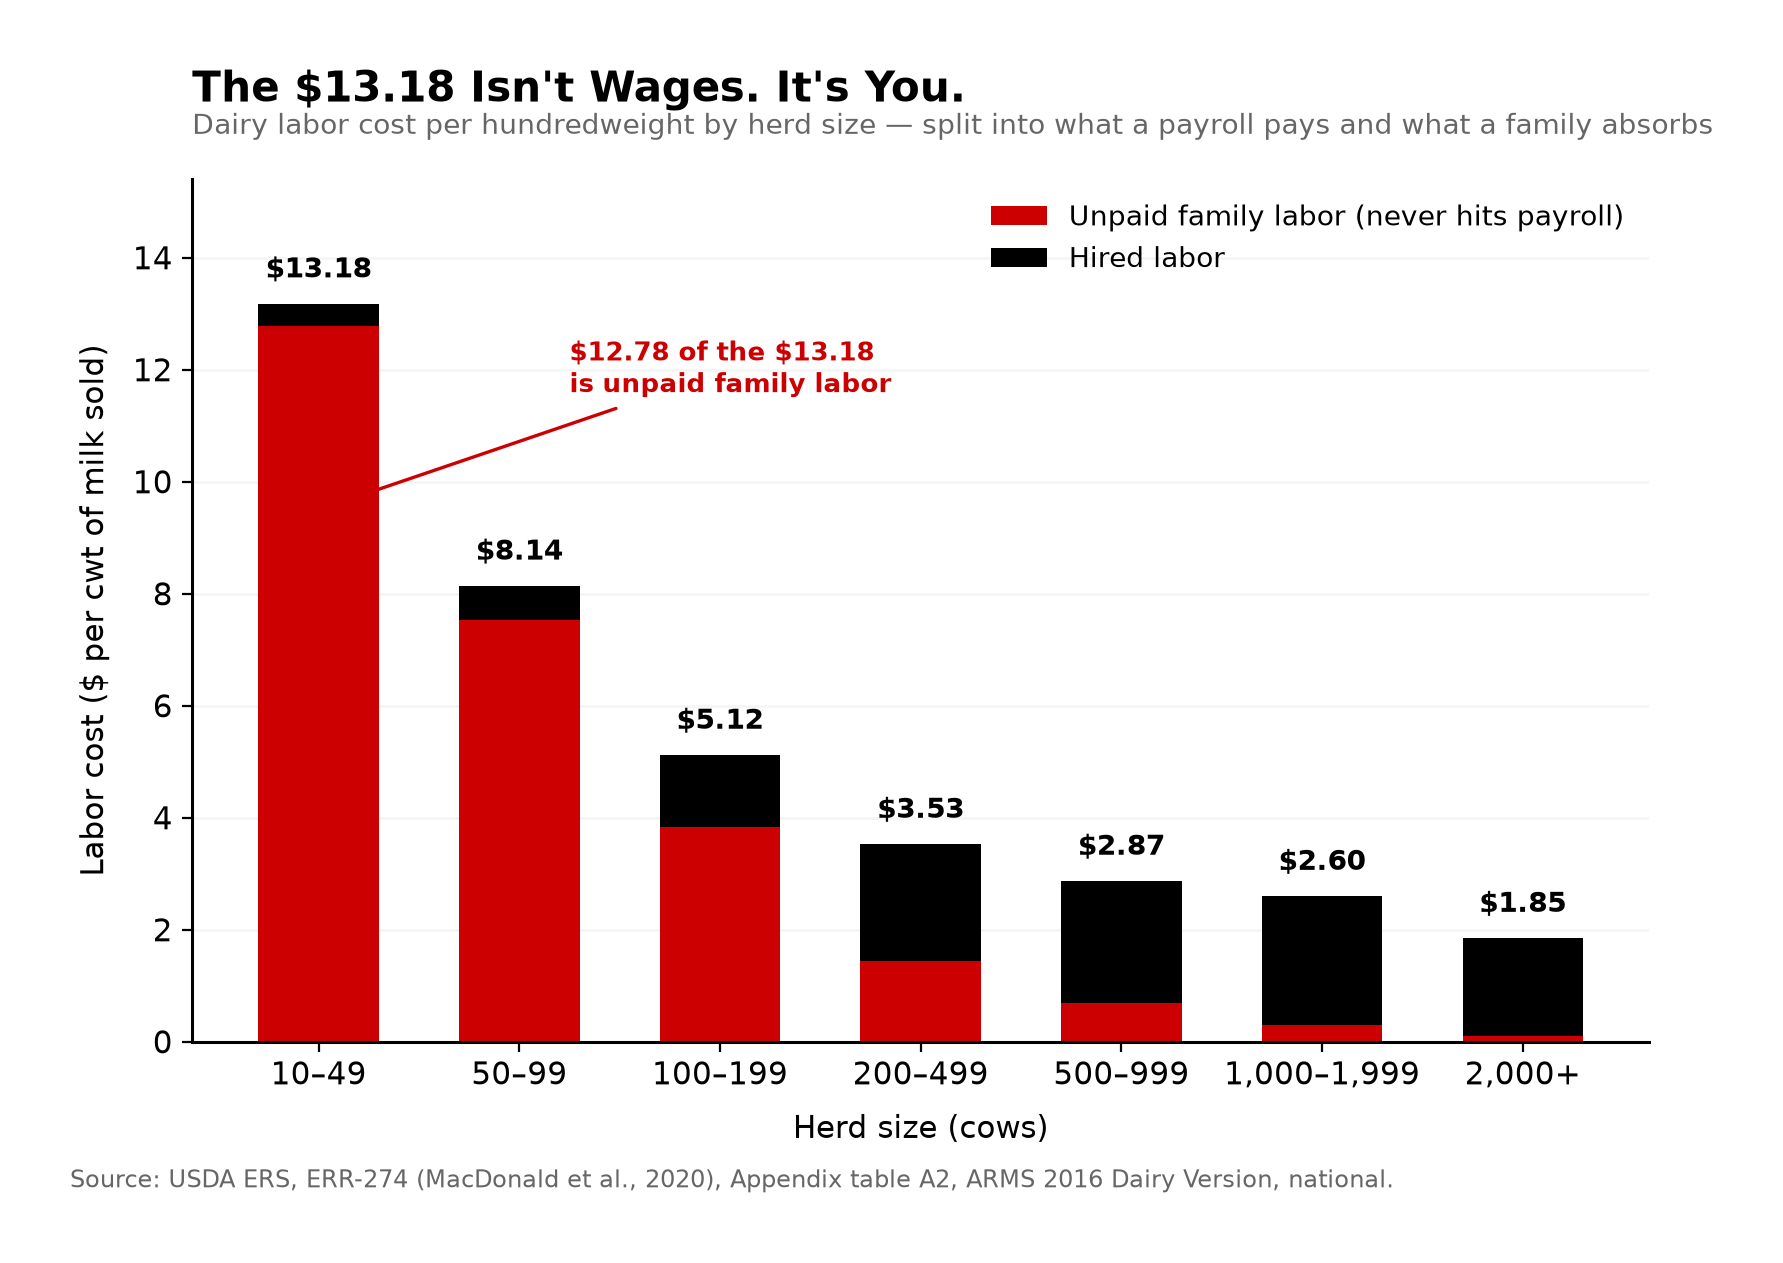
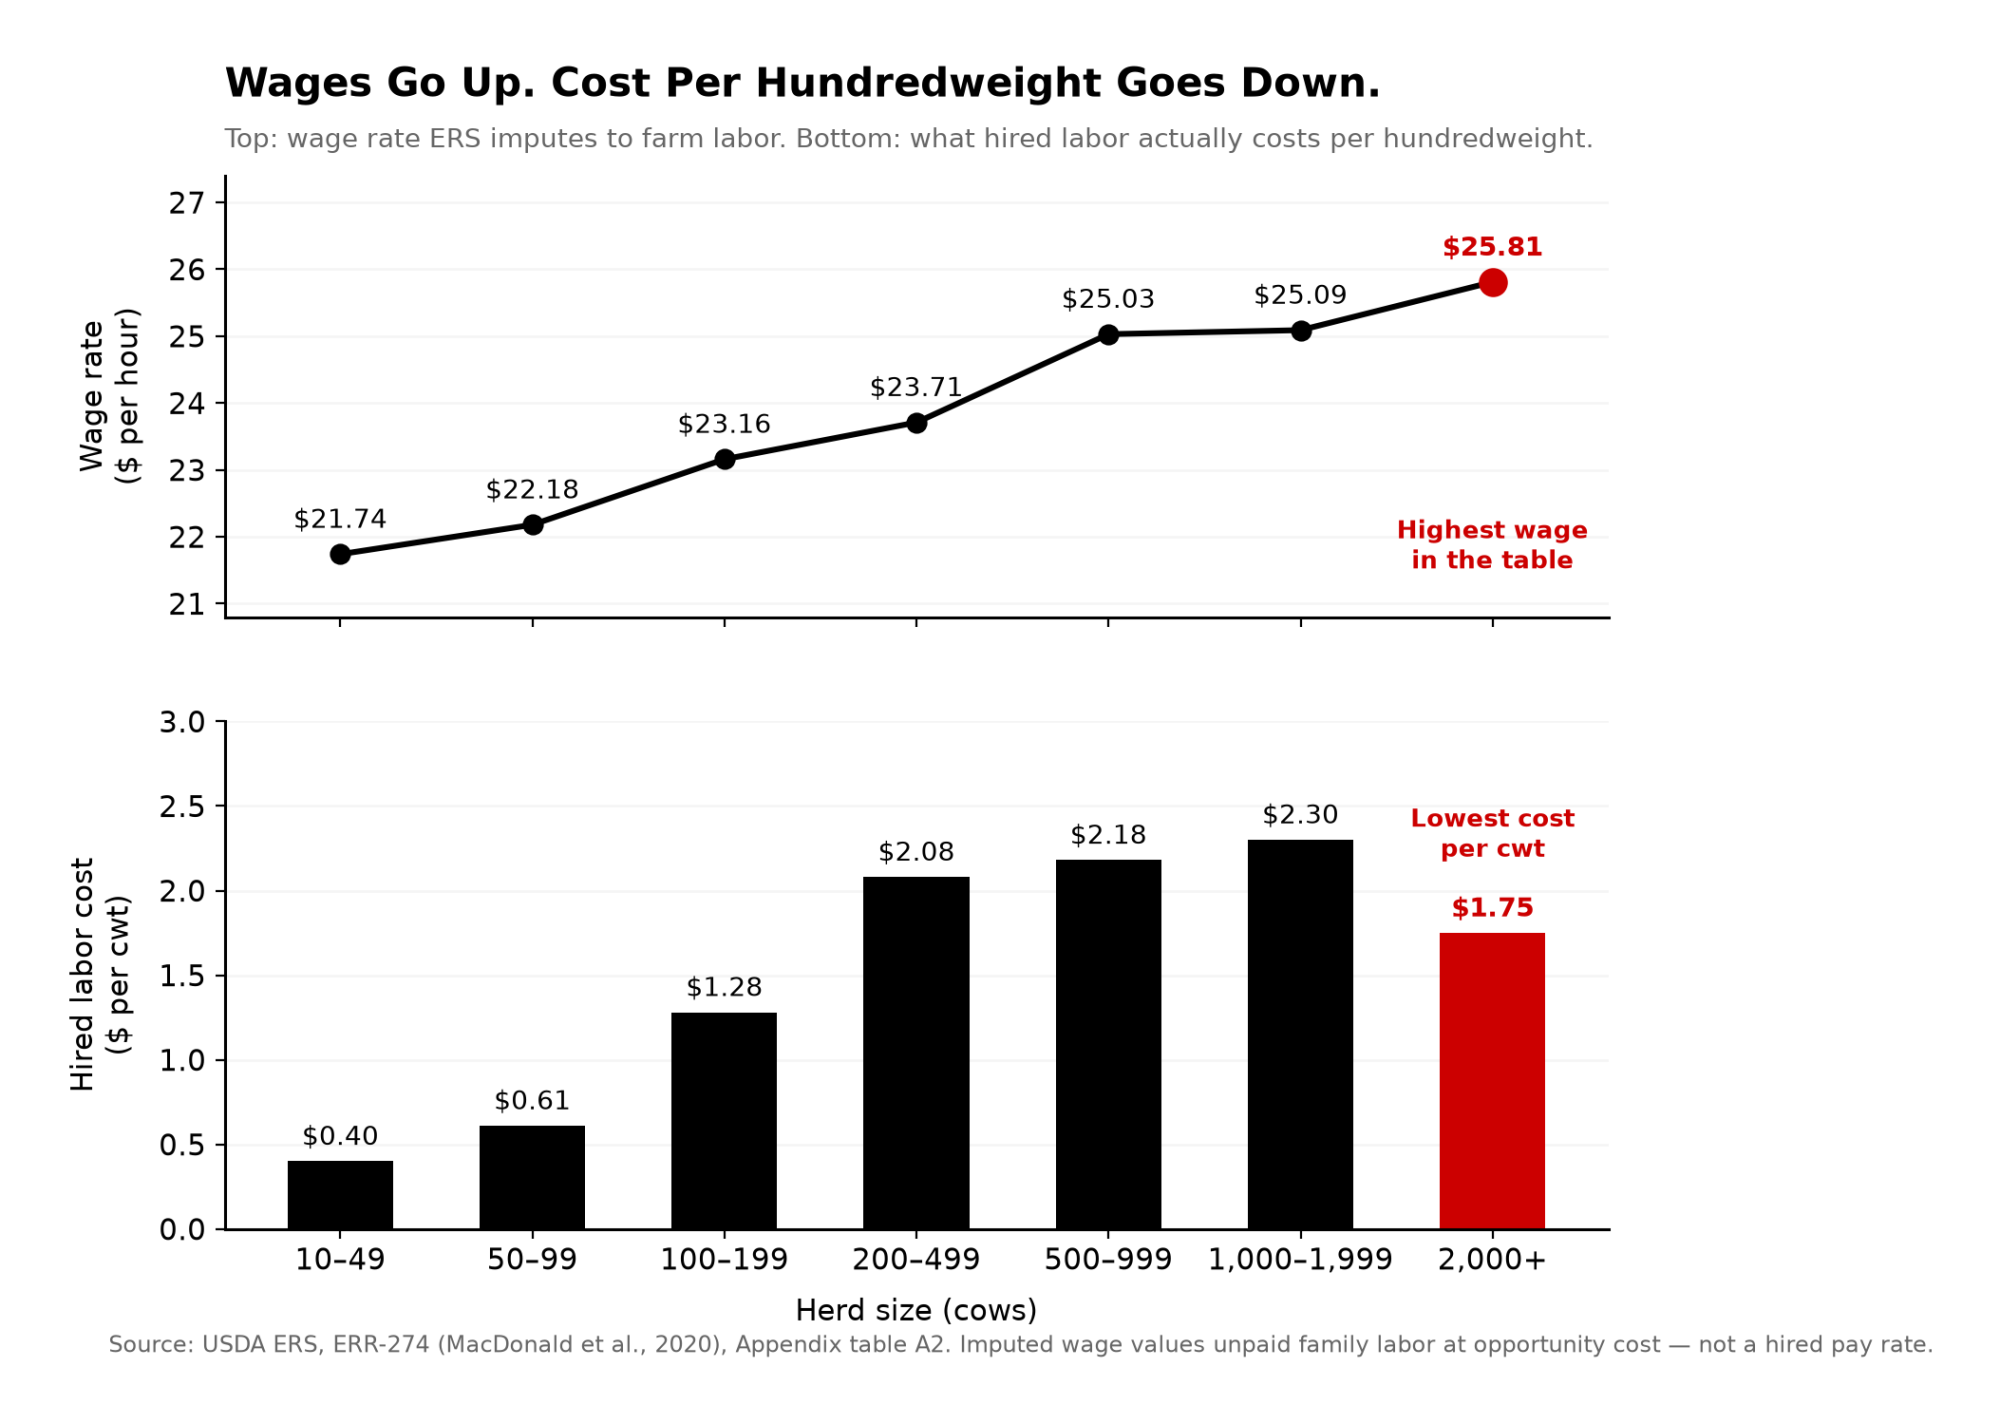
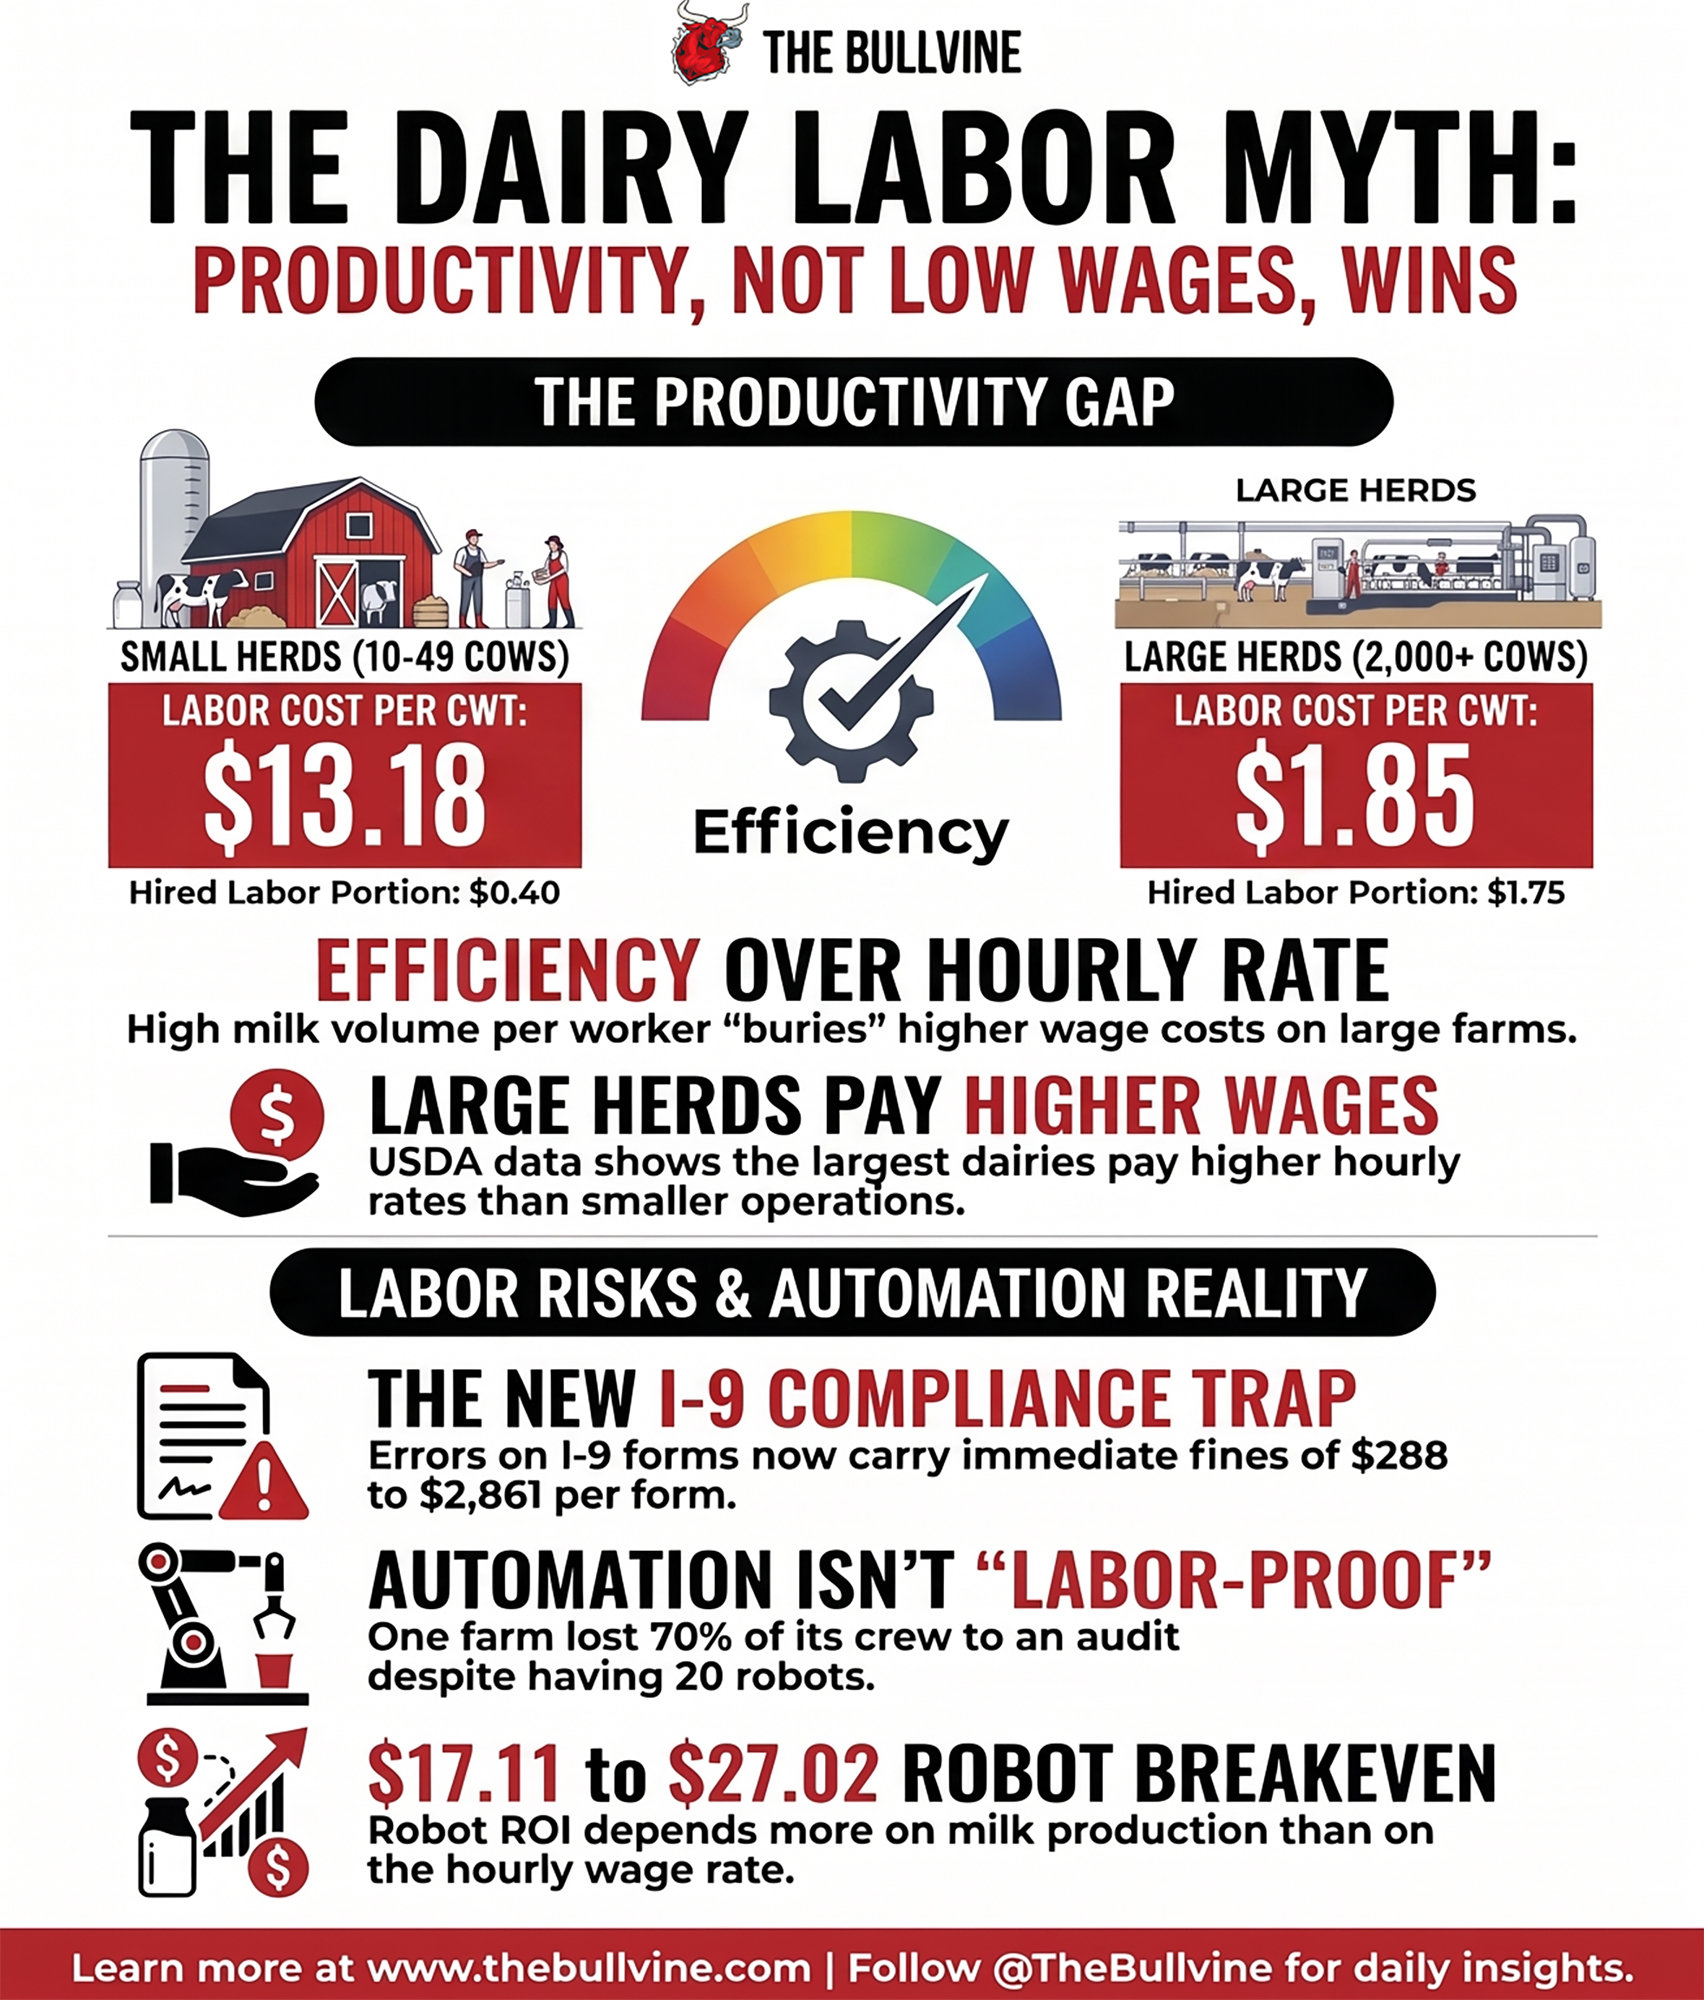
The Biggest Dairies Pay the Highest Wages. Their Labor Costs $1.85/cwt.

ERS puts labor at $1.85/cwt on farms above 2,000 cows and $13.18 on herds under 50 — while the big farms pay the higher wages. Almost none of the gap is pay. And $12.78 of it is you.

Rodney and Dorothy Elliott left a 140-cow farm in Northern Ireland to build Drumgoon Dairy near Lake Norden, South Dakota. Nearly two decades later, they were milking 6,500 cows with 20 robots and more than 50 employees. Some of those people had been with them since the earliest years.

In late May 2025, the Department of Homeland Security audited Drumgoon’s labor records. DHS determined that 38 workers had inaccurate, outdated, or incomplete citizenship or work-authorization documentation, according to South Dakota Searchlight’s October 2025 reporting. Elliott asked them for updated papers. Most couldn’t resolve the issues, and she had to let them go.

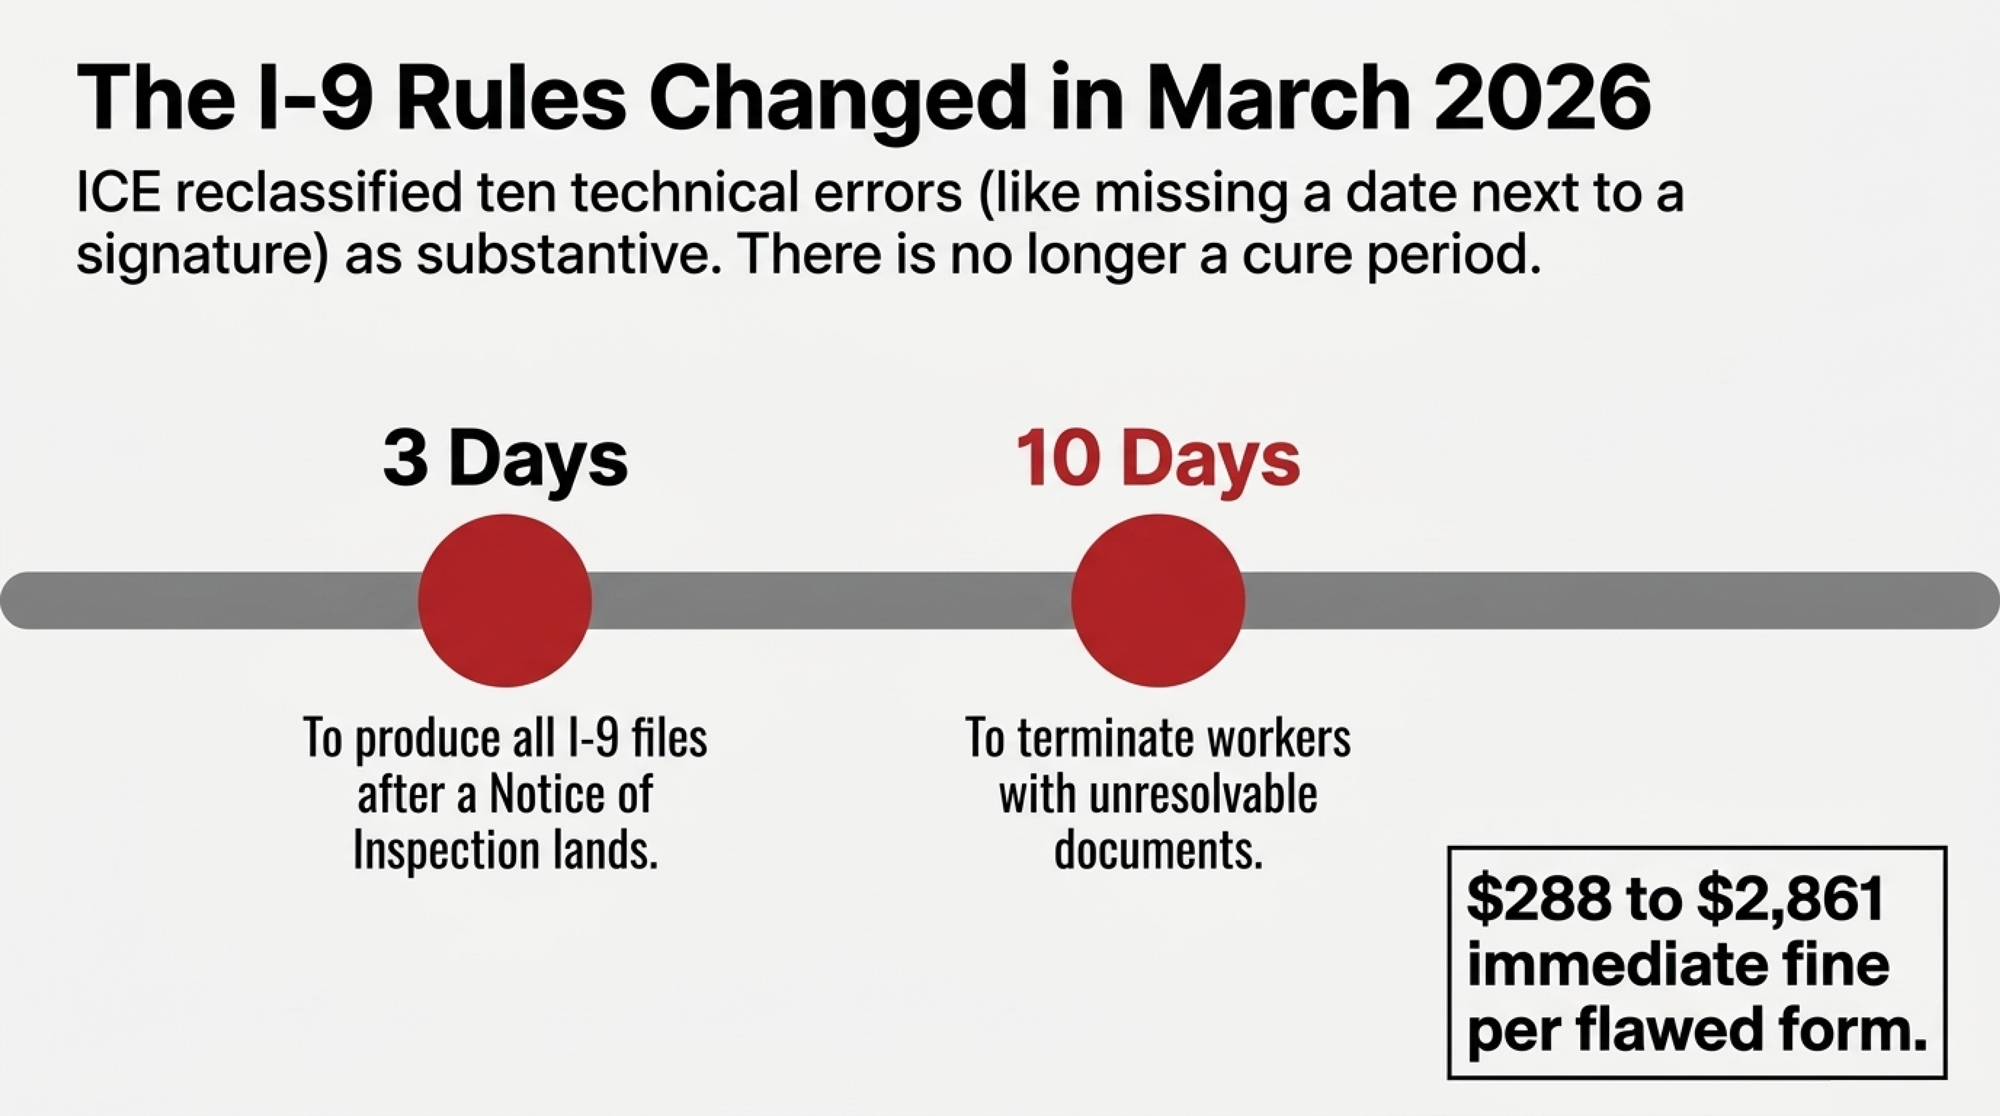
The crew went from more than 50 to 16 (South Dakota Searchlight, October 10, 2025; Northeast Radio SD, October 2025). Most of the 38 had worked at Drumgoon for years, the Searchlight reported, and some for nearly two decades — long enough to have had a hand in building the operation they were leaving. Elliott does not know where they went. Federal rules gave them ten business days from the audit finding to resolve their paperwork or be terminated.

Now the part that matters for anyone with a payroll. She didn’t post higher wages and wait for local applicants. She spent more than $110,000 on recruiters and transportation to bring 22 H-2A visa workers up from Mexico.

The Rebuild Nobody Talks About

This was an audit, not a raid. No agents in the yard, no arrests. Drumgoon had gone twenty years without one. Elliott told the Searchlight she reviewed applicants’ documents herself and had turned candidates away repeatedly over the years when the IDs looked questionable.

MetricBefore audit (May 2025)After rebuild (Oct 2025)What it cost
Crew size50+ employees38 workersStill 10–15 short
Immediate post-audit crew—16 workers6,500 cows on 16 people
Workforce compositionLocal hires, some 20-year tenure22 H-2A visa, 16 local/tempVisa roles legally restricted
Workers terminated—38 (10 business days to cure)Most had years of tenure
Recruitment and transport$0$110,000+Recruiters and travel from Mexico
Wage increase posted—None reportedMoney went to recruiting, not pay
Robot maintenance openingsPostedPostedZero applicants

South Dakota Searchlight, October 10, 2025; Northeast Radio SD, October 2025. Elliott’s account describes recruitment and transportation spending; no wage increase was reported.

Note what the visa route couldn’t do. Those permits restricted which jobs the workers could legally perform, so Drumgoon still had to fill 16 positions locally. And she did all of this in mid-2025 — a full year before USCIS issued the memo that finally wrote down how dairy H-2A petitions get judged. The pathway existed. The clarity didn’t. Even rebuilt to 38, the farm sat short of where it started.

Sixteen people were now covering a 6,500-cow operation. Elliott told the Searchlight her remaining employees were making mistakes from the long hours, or because they were new to farm work — including backing a payloader into the manure pond. Some, she said, were getting only one or two days off in a 15-day period. Nearby farms sent workers over for a couple of days at a time through the summer.

“But what else do you do? Do you just let cows starve or calves die because there’s no one there to take care of them?”

— Dorothy Elliott, co-owner, Drumgoon Dairy, to South Dakota Searchlight, October 2025

Then the detail that should stop you cold. Drumgoon had 20 robots running before any of this happened, and posted maintenance positions aimed at graduates of the Lake Area Technical College program in the same county.

Twenty robots. A technical college down the road. Open skilled positions. And as of the October reporting, nobody had applied.

This wasn’t new either. Back in October 2023, two years before anyone audited anything, Drumgoon told a county zoning process it employed 22 people, 15 of them milkers and stall management operators, and that finding local workers was extremely difficult (Dakota Free Press, October 12, 2023). That’s on the record. The empty applicant pool isn’t a post-audit excuse — it’s a documented pre-existing condition.

Elliott put the question more directly than most operators would:

“We’ve achieved our goals we set out for ourselves: build a dairy, milk cows and grow the dairy industry in South Dakota. Is it a sustainable goal if there’s nobody to work on these dairies?”

Here’s the part that reframes all of it. ERS data says the largest dairies pay the highest wages in dairy — and still carry the lowest labor cost per hundredweight of any herd size class. A sub-50-cow herd shows $13.18/cwt. A 2,000-cow herd shows $1.85. If cheap labor built the big farms, that table should read the other way around.

Your $32 Billion Talking Point Is Older Than Your Replacement Heifers

Three numbers anchor nearly every dairy labor conversation in Washington and at every co-op annual meeting. Immigrant workers make up 51% of hired dairy labor. Farms employing them produce 79% of U.S. milk. Losing that workforce would cost the economy $32.1 billion.

The figureWhere it comes from
51% / 79% / $32.1BAdcock, Anderson & Rosson, Texas A&M AgriLife Center for North American Studies
PublishedSeptember 2015
Data vintageSurvey fielded fall 2014; employment estimates for 2013
FunderCommissioned by the National Milk Producers Federation
Independently replicated?No — and the 2015 report was itself an update to a 2009 study by the same team for the same client

None of it is hidden. NMPF hosts the PDF and discloses the funding. But by 2024 and 2025, those numbers were circulating in trade coverage and House Agriculture Committee documents with no date attached.

Worth being precise about what “51%” actually measures, since this article is about dating your numbers. Researchers estimated 150,418 people worked on U.S. dairy farms in 2013, and that 76,968 of them — 51% — were immigrants. Thirteen-year-old employment data, restated in 2026 as though someone counted last week.

The same 2015 study found immigrant dairy employment rose 35%, nearly 20,000 people, over the six years since the 2009 survey — a number NMPF was still promoting in a December 2018 release. Funded by an industry association with a policy position, so weigh it accordingly. But it points up, not down.

If you cite 51/79 in a memo or at a hearing, attach the year. Costs nothing, and it makes you the most credible person in the room.

Why a Sub-50-Cow Herd Shows $13.18/cwt in Labor and a 2,000-Cow Herd Shows $1.85

USDA’s Economic Research Service breaks out dairy labor costs by herd size. Here’s the full table, including the column almost nobody quotes.

Herd sizeTotal labor/cwtUnpaid familyHiredImputed wage for unpaid labor
10–49 cows$13.18$12.78$0.40$21.74/hr
50–99$8.14$7.53$0.61$22.18/hr
100–199$5.12$3.84$1.28$23.16/hr
200–499$3.53$1.45$2.08$23.71/hr
500–999$2.87$0.69$2.18$25.03/hr
1,000–1,999$2.60$0.30$2.30$25.09/hr
2,000+$1.85$0.10$1.75$25.81/hr

USDA ERS, ERR-274 (MacDonald et al., 2020), Appendix table A2, using ARMS 2016 Dairy Version, national. Hired column derived as total minus unpaid. The imputed-wage column values unpaid family labor at opportunity cost — it is not a hired pay rate.

That last column is the argument. The imputed wage rises steadily with herd size — $21.74 on the smallest farms to $25.81 on the largest. Hired wages do the same. ERR-274 doesn’t publish the hired rate by herd class, but MacDonald reports the same direction of travel: hired wage rates, like imputed ones, run higher on larger farms. That’s the whole point — the biggest dairies pay more per hour and still land at $1.85/cwt.

MacDonald states it flatly: differences in labor costs “do not arise from differences in hourly wage rates,” because wages for both hired and unpaid labor are higher on larger farms.

So the herd that shows $13.18/cwt isn’t paying more per hour. It’s paying $21.74 an hour of opportunity cost for a lot of hours spread across very little milk, and $12.78 of that $13.18 never touches a payroll cheque. It’s your hours and your family’s. Elliott’s 6,500 cows put her in the bottom row of that table. If you’re in the top one, you’re the unpaid labor line.

Look at the hired column too. It climbs to $2.30 at 1,000–1,999 cows and then drops to $1.75 on farms above 2,000 — despite those farms paying the highest wages in the table. That’s not a wage effect. That’s enough milk per worker to bury the cost.

Productivity gap, not wage gap. Which flips the question entirely. The 51/79 framing asks who’s milking the cows. The ERS data asks how many cows one person can milk.

The Expansion Math Was Never About Cheap Wages

We went looking for the counter-argument — that cheap labor was the precondition for building operations like Drumgoon. The expansion literature doesn’t support it.

Hadley, Wolf, and Harsh at Michigan State tracked 20 dairy farms through one-time herd increases of at least 20% between 1988 and 1998, and published their findings in the Journal of Dairy Science in 2002.

MeasurePreexpansionPostexpansion
Herd size296 cows569 cows (+92%)
Milk per full-time equivalent686,656 lb917,980 lb (+34%)
Labor expense$5.14/cwt$3.50/cwt (−32%)
Debt-to-asset ratio31.3%43.4%

Hadley et al., Journal of Dairy Science 85(8), 2002. Debt-to-asset ratio reported for 14 of the 20 farms.

They didn’t get there by paying less. A 34% gain in milk per worker produced a 32% drop in labor cost per hundredweight — the same mechanism the ERS table shows, caught in real time during the buildout decade.

It wasn’t free either. Leverage went from 31.3% to 43.4% across the 14 farms reporting it. Same strategy, different landings.

Bewley, Palmer, and Jackson-Smith surveyed Wisconsin producers who modernized between 1994 and 1998, also in the Journal of Dairy Science, and asked what actually made expansion hard. Labor management ranked high. Wage rates didn’t make the list — and their finding that larger herds relied more on nonfamily labor while finding labor management easier is the whole argument in one sentence.

When the Labor Vanished, Nobody Got a Raise

Drumgoon isn’t the only case. In July 2025, at least nine Texas dairies received Notices of Inspection over a single weekend, Tyne Morgan reported for Dairy Herd Management on July 15. An NOI is a records request, not a finding of wrongdoing.

One farm and a Texas weekend are confirming evidence, not proof. Better to say so than let a handful of cases carry weight they can’t hold.

The stronger evidence sits outside dairy, and it’s causal.

The Bracero termination. The Johnson administration ended the program on December 31, 1964, excluding almost half a million Mexican seasonal farm workers. Clemens, Lewis and Postel studied it in the American Economic Reviewin 2018 and found no meaningful rise in domestic farm wages or employment. Growers mechanized instead — tomato harvesters went from a handful of units to near-universal inside about a year. The finding has a published critic: Kaestner argued in Econ Journal Watch in 2020 that the identification is weaker than claimed. It still stands as the best natural experiment available.

California’s AB 1066. The farmworker overtime phase-in began in January 2019 for employers with 26 or more workers, stepping the weekly threshold down from 55 hours to 40 by 2022. Alexandra Hill at UC Berkeley used National Agricultural Workers Survey data for 2019 and 2020 and found employers cut hours rather than pay premiums. The share working 56–60 hours a week — just under the old threshold — fell by roughly half. The share working 46–50 hours rose by about a third. Workers earned $6 to $9 million less in weekly paychecks across those two years, and the share earning $600–$800 a week dropped by roughly a third, most shifting into the $400–$500 bracket.

Different decades, different crops, different researchers. Both pointing where Drumgoon pointed. When labor gets scarce or expensive, employers reach for visas, machines, or fewer hours before they reach for a raise.

What Would Domestic-Only Labor Actually Cost You Per Hundredweight?

Fair warning on our own math first. The $1.75/cwt hired-labor figure is ARMS 2016, and the production cost is 2021. Two vintages in one equation, against a 2026 price. We just spent a section criticizing undated numbers, so it would be cheap not to date our own.

Here’s the calculation, and you can run the same shape of it on your own payroll in about four minutes. Take hired labor for 2,000-plus cow herds, $1.75/cwt, and apply a wage premium as though you’d replaced that workforce domestically.

Formula: $1.75 × your wage premium = added cost per cwt.

ERS puts 2021 total cost of production at $19.14/cwt for 2,000-plus cow herds. The 2026 all-milk price forecast has been sliding all summer: $20.70 in June, cut 70 cents to $20.00 on July 16, then cut another 15 cents in the August 24 outlook to $19.85/cwt.

Wage premiumAdded cost/cwtTotal costMargin at $19.85
Baseline—$19.14+$0.71
+20%$0.35$19.49+$0.36
+40%$0.70$19.84+$0.01
+60%$1.05$20.19−$0.34

USDA ERS, Livestock, Dairy and Poultry Outlook, August 24, 2026. Every margin cell moves one-for-one with the milk price.

Watch what the August revision did. At a 40% wage premium, a 2,000-cow dairy now lands one cent above breakeven — it was sixteen cents in July. Thirty cents of forecast erosion did more damage to that row than a 20-point swing in the wage assumption.

Which is the actual finding. The worst-case labor shock costs a large herd about a dollar per hundredweight. The milk price moved 85 cents in ten weeks without anyone voting on it.

Now set both beside the herd size actually in trouble. ERS has sub-50-cow herds at $42.70/cwt in 2021 — $22.85 underwater against $19.85 milk, before labor enters the conversation at all. That’s the arithmetic closing barns, and it has nothing to do with immigration.

One more limit. We picked 20/40/60% as a sensitivity bracket because no study establishes what premium would actually pull domestic workers into dairy at scale. The model also assumes farms would pay it. Drumgoon, Bracero, and California all say they’d restructure or buy iron first. Elliott’s $110,000 went to recruiters, not a wage sheet.

Your Robot Breakeven Isn’t One Number. Salfer’s Own Range Runs $17.11 to $27.02

Bullvine has published the $27.05/hour breakeven repeatedly — and dated it to 2018 on at least one page. We went back to the source; what we found changes how you should use it.

That number comes from Jim Salfer and colleagues at the University of Minnesota, published in the Journal of Dairy Science in 2017, modeling a 1,500-cow dairy with 25 robots against a double-24 parlor. And it isn’t a single finding. It’s one cell in a sensitivity analysis.

Salfer’s 1,500-cow model, by assumptionBreakeven labor rate
1% wage inflation, robots give up 0.91 kg/d (about 2 lb)$27.02/hour
3% wage inflation, equal production, 30-year horizon$17.11/hour

Salfer et al., Journal of Dairy Science 100(9):7739–7749, 2017.

Read that again. Same researcher, same herd, same model — and the answer swings ten dollars an hour on two assumptions: whether your robots hold production, and what wages do over three decades.

We’ve been quoting only the top of that range. So has most of the industry.

Now the second land-grant number. UW-Madison Extension released its AMS Transition Budgeter on February 5, 2026, and the worked example runs 120 cows, two robots, a 5% milk bump, labor at $20.00/hour, boxes near $200,000 each. Breakeven wage: $14.77/hour. Since that farm already pays $20.00, the transition pencils. The tool’s rule is simple — if your actual labor cost is higher than the breakeven number, it works.

Here’s what nobody has connected. UW’s example is a 120-cow herd. And Salfer’s paper found robots penciling at 120 and 240 cows, while the 1,500-cow parlor beat the robots. Two land-grants, nine years apart, converging on the same range — and both saying scale cuts against automation, not for it.

So the apparent chasm between $14.77 and $27.02 was never a disagreement about robots. It was a disagreement about herd size, and about whether you assume production holds.

Our own Robot ROI Reality Check runs harder numbers than most quotes do:

AssumptionDealer projectionBullvine model
Installed costDealer quote1.4× dealer quote
Production gain10–12%6%
Maintenance—$11,500/robot/year
Downtime—6.5%

Bullvine modeling assumptions, not published research. Run your own quote through them.

On those inputs, a two-robot install on a 140-cow herd carries roughly an $8,776-a-year cash-flow hole for seven yearsbefore the math turns. Note the herd size — that figure is specific to a 140-cow model, not generic to any two-robot job.

Drumgoon is the sharper lesson anyway, and it isn’t the one in the brochures. Twenty robots didn’t stop that farm from losing 70% of its crew, and the skilled maintenance roles those robots created went unfilled. Automation changes what kind of labor you need — usually toward scarcer, better-paid labor. It doesn’t make you labor-proof.

Where the Evidence Still Runs Thin

Three honest gaps, because you’d spot them anyway.

Hadley’s cohort averaged 569 cows afterward — nowhere near Drumgoon’s 6,500. Whether the same productivity mechanism scales from 600 cows to 6,000 is an extrapolation, not a finding. And the debt-to-asset numbers come from 14 farms, not 20.

Salfer’s robot economics are from 2017, modeled on one 1,500-cow herd. Robot pricing, service contracts, and labor rates have all moved. The sensitivity logic holds; the dollar figures deserve a fresh run.

And nobody has done the direct study. No published work tests whether immigrant labor availability by region predicted where dairies expanded, holding feed cost, land price, and processing capacity constant. That’s the biggest hole in this entire debate, and it’s been sitting open for twenty years.

Options and Trade-Offs for Farmers

Path 1 — Run your own labor cost per hundredweight. Do this within 30 days.

When it makes sense: Any operation, any size; cheapest analysis here, and it tells you whether the rest of this applies to you.

What it requires: Annual payroll and annual hundredweight shipped. Divide one into the other. Work it on your own numbers — a 200-cow herd shipping 26,000 lb per cow moves 52,000 cwt a year, so a payroll of, say, $310,000 lands at $5.96/cwt. That example herd is deliberately labor-heavy. Swap in your two figures and see where you land against the $1.28 ERS reports for 100-to-199-cow herds and the $1.75 for 2,000-plus.

Risks and limits: Decide whether you’re valuing your own hours. ERS imputes $21.74/hour on sub-50-cow herds and $23.16 at 100–199. Skip that step, and you’re understating your real position — to yourself and to your lender.

Path 2 — Audit your I-9 files with counsel, also within 30 days.

The rules changed on March 16, 2026. ICE quietly updated its Form I-9 Inspection fact sheet, moving more than ten error categories from “technical” to “substantive.” Missing date of birth in Section 1. Missing date next to the employee signature. Incomplete List A, B, or C data in Section 2 — even where you kept document copies. Incomplete preparer or translator data. Electronic audit-trail deficiencies. Each now carries an immediate fine of $288 to $2,861 per formwith no cure period.

When it makes sense: Every operation with hired labor. No exceptions, and this is the risk that hasn’t priced in yet.

What it requires: Work with immigration counsel rather than alone. Ballard Spahr’s February 2026 guidance is blunt on the point — internal audits are what demonstrate good-faith compliance if a government audit lands. The statutory good-faith exception has always applied only to technical violations; that hasn’t changed. What changed is which errors count as technical. The ten-business-day cure window still exists for a shorter list: wrong Form I-9 version, missing “other last names used,” missing employee address in Section 1, missing business address in Section 2. Our full breakdown of how a Notice of Inspection unfolds walks through the mechanics step by step.

Risks and limits: You have three business days to produce every I-9 once a Notice of Inspection lands, and you must terminate workers with unresolvable documents within ten business days. Do the arithmetic on your own file count: 40 employees with one substantive error each, at the midpoint of that penalty range, is roughly $63,000 before anyone argues about aggravating factors. Drumgoon had a clean twenty-year record and a co-owner who personally checked IDs, and still lost 38 people. This reduces exposure. It doesn’t eliminate it.

Path 3 — Price your automation breakeven against your own herd size, not the brochure’s.

When it makes sense: Both land-grant models point at the same window. Salfer’s paper found robots penciling at 120 and 240 cows, while the parlor won at 1,500. UW’s worked example is 120 cows with a 5% milk bump and a $14.77 breakeven against $20.00 labor. If you’re between roughly 100 and 500 cows paying above $17/hour loaded, the math is live.

What it requires: A current dealer quote run at 1.4× installed cost, an honest production assumption, and a real budget line for maintenance skill. Drumgoon posted those positions and got nobody.

Risks and limits: The single biggest swing factor is production, not wage rate — that’s what moves Salfer’s breakeven from $17.11 to $27.02. Ask for the production guarantee in writing. And if a scale argument is doing the work in your automation decision, check it against the papers: both models put the economics at 120 to 240 cows, and Salfer’s parlor beat the robots at 1,500.

Path 4 — H-2A got clearer in June. Read what the memo actually says.

When it makes sense: Wider than early coverage suggested. On June 17, 2026, USCIS issued Policy Memorandum PM-602-0200, “Guidance on Temporary or Seasonal Need for H-2A Petitions for Dairying” — nine pages, effective immediately, binding on adjudicators. USDA welcomed it the same day. Per July 6, 2026 analysis, even dairies without a discrete breeding season may qualify by documenting materially different herdsman duties across the year, even though milking itself never stops.

What it requires: Documentation of seasonal duty variation, not of a labor shortage. And more lead time than you’d think — the contract, the certification, and a housing inspection all have to clear before anyone arrives, which puts realistic planning several months out.

Risks and limits: It’s a policy memorandum, not a regulation. It creates no legally enforceable right; any administration can rescind it, and petitions are judged case by case. Your year-round milking crew is still ineligible on its own. Elliott’s experience is the cautionary version: she was working this pathway in 2025, before the standard was written down, with counsel and $110,000 to spend — and it still left her 16 positions short. The Farm Workforce Modernization Act would put a year-round fix in statute, not a memo. It has passed the House twice and stalled in the Senate twice.

Key Takeaways

  • Divide annual payroll by annual hundredweight shipped. Above 500 cows and well north of $1.75/cwt, your gap is labor efficiency, not your wage rate.
  • Under 100 cows, value your own hours at ERS’s $21.74/hour before you call your cost of production finished. Otherwise, you’re the cheapest employee on the place, and nobody’s tracking it.
  • If you audited your I-9 files before March 16, 2026, that audit is stale. Errors that were curable then now carry $288 to $2,861 per form with no correction window.
  • Anyone quoting you one robot breakeven wage is quoting one cell of a sensitivity table. Ask which production assumption it uses. Equal production puts the bar near $17/hour; two pounds a day lost puts it near $27.
  • Above 1,000 cows and weighing robots? Both Salfer and UW put the economics near 120 to 240 cows, and Salfer’s parlor beat the robots at 1,500.
  • Modeling expansion? Track milk per FTE, not wage rate. The Michigan State cohort cut labor cost per cwt by 32% on productivity alone — and carried leverage from 31.3% to 43.4% getting there.
  • Financing this year? Your lender’s labor-shock question has a bounded answer — $0.35 to $1.05/cwt on large herds. The milk price moved 85 cents against you in ten weeks. Know which one you’re actually exposed to.

So where does your labor cost per hundredweight actually sit — and how much of it are you paying versus quietly absorbing? Twenty minutes with your payroll file answers both, and it’s a better twenty minutes spent before an envelope arrives than after.

We’re running the complete scenario model — all seven ERS herd-size tiers, every premium cell, formula, and assumptions on the table — in an upcoming Bullvine deep dive. If you want the full math rather than the headline version, it’ll live there.

This article draws on reporting by South Dakota Searchlight (October 10, 2025), Northeast Radio SD (October 2025), and Dakota Free Press (October 12, 2023); on USDA ERS data and peer-reviewed research as cited; and on federal policy documents current as of September 2026. Drumgoon Dairy was not contacted for this article.

Learn More

  • H-2A Dairy Visa Cost — Arms you with line-by-line guest worker recruitment expense data before signing agency contracts. Reveals true all-in costs averaging $877 per cow, exposing hidden legal overhead, transportation fees, and housing inspection mandates that conventional wage comparisons routinely conceal.
  • Dairy Cost of Production: Small Herds — Dismantles the persistent myth that milk market consolidation is driven purely by feed volatility. Exposes how imputed family labor burdens of $12.78/cwt quietly suffocate sub-50-cow operations long before hired payroll changes impact the balance sheet.
  • Robotic Milking ROI: Cash Flow Valley — Follows the money through a seven-year automated milking conversion to protect working capital. Breaks down why realistic 1.4× capital expenditure multipliers and $11,500 annual maintenance costs create an $8,776 yearly deficit on 140-cow setups despite brochure promises.

The Sunday Read Dairy Professionals Don’t Skip.

Every week, thousands of producers, breeders, and industry insiders open Bullvine Weekly for genetics insights, market shifts, and profit strategies they won’t find anywhere else. One email. Five minutes. Smarter decisions all week.

NewsSubscribe
First
Last
Consent

Your Embryo Rep Negotiates the $50 Line. The $217 Line Has No Rep.

Of the $349.48 it took one Wisconsin herd to make a confirmed pregnancy, the embryo was $50. Cows that got one and didn’t conceive were $217.41. Only one of those has a salesperson attached.

embryo transfer cost

A 2,000-cow Jersey dairy in south-central Wisconsin ran two recipient protocols side by side across six months of 2022 — same barn, same embryos, same $400 calf contract. One cleared $1,465 on 100 recipients. The other lost $1,018. The embryo transfer cost per pregnancy came apart by $135.35, which is more than any discount you’ll negotiate this year, and nobody sold them a different embryo. It came down to which two days of the week the transfer window was open.

Natalia Hincapie went in chasing a narrow question about hCG. Working under Paul Fricke at the University of Wisconsin–Madison, her master’s project asked whether 2,500 IU at transfer would lift pregnancy outcomes in lactating Jerseys. It raised progesterone and luteal volume and did nothing for pregnancy per transfer. The farm — unnamed in the published paper, a condition of its participation — was running terminal Angus IVP embryos into those recipients to sell day-old crossbreds, not to build replacements.

Two protocols ran side by side. Protocol A was Double-Ovsynch, every cow transferred on a fixed schedule after synchronized ovulation, no heat watching. Protocol B was synchronized estrus, transferred only once standing heat was observed. Estrus detection in that second arm ran at 74%, which sounds respectable right up until you check what happened to the cows that cycled on the wrong days.

The myth every embryo conversation starts with

Cost lineAmountShare of totalHas a sales rep?
Nonpregnant recipients$217.4162%No
Embryo$50.0014%Yes
Transfer (ET fee + ultrasound)$40.0011%No
Hormonal treatments (incl. hCG $17.97)$28.778%No
Veterinary exams$9.503%No
Unutilized recipients$3.801%No

Ask a producer what an embryo program costs and you’ll get a per-embryo number. Ask a rep and you’ll get a per-embryo number with a volume discount attached. That’s the frame — cost equals price, and price is negotiable.

The frame survives right up until somebody itemizes a real program. Then the negotiation everybody has turns out to be over the fourth-largest line on the invoice, and the largest line turns out not to be on the invoice at all.

Running the Numbers

On a 400-cow herd, enroll 100 cows as recipients. That’s a quarter of the herd, which is workable. On 200 cows it’d be half, which isn’t — scale the enrollment before you scale the conclusion.

Run each protocol at the performance this herd actually recorded: 93% utilization and 31% pregnancies per transfer at day 61 for Double-Ovsynch, 50% and 24% for synchronized estrus. Substitute your own contract price and volume. The structure holds, the dollars won’t.

Metric / Cost ComponentTimed ET (Double-Ovsynch)Synchronized Estrus (Visual Detection)
Recipient utilization93%50%
Pregnancy rate (day 61)31%24%
Transfers per 100 enrolled9350
Confirmed pregnancies2912
Cost per confirmed pregnancy$349.48$484.83
Total enrollment cost (100 cows)$10,134.92$5,817.96
Gross calf revenue ($400/head)$11,600.00$4,800.00
Net program margin+$1,465.08−$1,017.96

Roughly $2,483 apart on the same 100 cows. Read the estrus-detection column carefully before you draw the wrong conclusion from it: that program spent less in total, because half those cows never received an embryo. Fewer transfers, fewer pregnancies, and every fixed cost landing on a smaller base.

What the table actually measures is a denominator. The estrus-detection arm didn’t overpay for a single input — it just had 12 pregnancies to carry costs the timed arm spread across 29. Cost per pregnancy isn’t a price you get quoted. It’s a quotient your calendar sets.

Now price the alternative you were actually considering. Knock 20% off your embryos and you save about $31 a pregnancy. The protocol difference was worth $135.35 — roughly four times the money, and none of it visible on a purchase order.

Where does the money actually go in a $349 pregnancy?

The full Double-Ovsynch stack behind one confirmed pregnancy:

  • Nonpregnant recipients — $217.41, 62%. Cows that received an embryo and didn’t hold.
  • Embryo — $50.00, 14%. The list-price line, and the only one with a rep attached.
  • Transfer — $40.00, 11%. A $35.25 ET fee plus a $4.75 recipient eligibility ultrasound.
  • Hormonal treatments — $28.77, 8%. Of which $17.97 was hCG, against $10.80 for the protocol hormones alone.
  • Veterinary examinations — $9.50, 3%. Pregnancy diagnosis and confirmation work.
  • Unutilized recipients — $3.80, 1%. Cows synchronized but never transferred into.

(Dollar figures are the study’s. Percentages are Bullvine calculations against the $349.48 total and don’t sum to exactly 100 because of rounding.)

That $217.41 deserves a slow read, because it isn’t pure recipient waste. It bundles hormones, transfer fee, the day-33 pregnancy check and the embryo itself for all 103 cows that got one and didn’t conceive.

Count those embryos and your real embryo spend runs about $155 per pregnancy — roughly 44% of the total, not the $50 sitting on its own line. (Bullvine calculation derived from the study’s stated formula. That figure is ours, not the authors’.)

So the embryo isn’t the trivial cost some cost tables make it look like. It just isn’t the biggest lever either. There’s a difference, and the difference is worth $135.35.

Since the hCG didn’t move pregnancy per transfer, a herd skipping it is working from a lower stack than the published figure — call it $331.51 before you compare against your own contract.

Why couldn’t half those cows get an embryo?

Transfers were scheduled Thursdays and Fridays. That was the binding constraint on the entire program.

Cows expressing estrus four, five, six, or seven days after the final prostaglandin — 24% of that group, 44 head out of 180 — couldn’t be transferred into at all. Synchronized, checked, paid for, and then no window. The paper doesn’t say whether the two-day schedule reflected clinic routing, the farm’s own arrangement, or both. Only that cows cycling outside it were unusable.

The estrus-detection arm ran so poorly the farm’s management team wasn’t willing to continue with it. That’s how the partial budget came to exist in the first place.

Be precise about causation, though, because the short version of this story is too simple. The paper names two drivers: the utilization gap and fewer pregnancies per transfer among the estrus-detection cows, 24% against 31%. The narrow window drove the first. Together they built the $135.35 — and neither one is an embryo problem. Repro fundamentals come first, and they’re cheaper than any genetics purchase. The 6-day protocol getting herds to 60% heifer conceptionis the move most herds should try before they buy an embryo.

The Cost Stack in 2026: What Moves When You Leave Wisconsin

Everything above carries a date and a zip code. The cost analysis covers the preliminary experiment only — June through November 2022 — and every line item was priced by Jefferson Veterinary Clinic in Jefferson, Wisconsin, in June 2022. Four years on, two things have moved: the inputs themselves, and what a clinic somewhere else charges for them.

Start with the inputs. A modified Double-Ovsynch study published in the Journal of Dairy Science in January 2026 lists GnRH at $1.53 a dose and PGF2α at $2.34. Read those against Hincapie’s June 2022 budget as dollar figures from the same journal and that’s GnRH up roughly 16%, prostaglandin up 27%. (Bullvine calculation. Neither paper states a conversion, so treat those percentages as direction, not a benchmark.)

Then look at what market does to the same two molecules:

Source / marketGnRH per dosePGF2α per dose
Hincapie budget, Wisconsin, June 2022$1.32$1.84
Modified Double-Ovsynch, JDS, January 2026$1.53$2.34
2025 economic evaluation of Double-OvsynchUSD 2.60USD 2.60
2025 study, large Romanian commercial dairies4 EUR3 EUR

Geography swings harder than four years of inflation did. The Romanian figures come off operations where veterinary services get contracted at scale for 50-plus animals per visit — volume that should push prices down, not up. For the wider protocol-cost picture, two herds solving the same pregnancy-rate problem in opposite directions runs the European comparisons alongside the US numbers.

The transfer line needs its own sanity check. Published commercial ET price lists put a bovine transfer somewhere between $65 and $80 per recipient depending on whether the embryo is fresh, direct-thaw, or vitrified, with IVF embryo production quoted from $55 to $140 an embryo depending on volume. Those are vendor list prices, not independently verified, and every company publishing them sells the service. They also sit well above the $35.25 the Wisconsin veterinarian charged, which may reflect a research-collaboration rate rather than a quote you’d get. Same story on the embryo: those were Angus IVP units carrying a $50 list price from J.R. Simplot Company, priced for volume rather than genetic merit. Nothing like what a dairy embryo selected on index costs.

Canadian readers get less to work with. No published equivalent to the Hincapie breakdown surfaced in a search for this piece, and CETA/ACTE doesn’t publish member pricing. North of the border the cost structure still holds — utilization still drives it — but you’ll need your own clinic’s numbers plus your own read on health-certificate and import requirements.

None of which makes this a boutique practice. AETA reported that in 2021, U.S. transfers of in vitro-produced embryos — 206,584 fresh and 156,261 frozen — ran well ahead of in vivo-derived transfers at 43,588 fresh and 75,720 frozen. Borrow the structure from Wisconsin. Price it yourself.

What the modeling says about paying more

Albert De Vries and Karun Kaniyamattam at the University of Florida put the break-even price for commercial IVP embryo transfer at $89, against their own 2017 base-case assumption of $165. In that scenario, straight AI beat a full embryo program by $185 per cow per year.

Their follow-up work, summarized in Animal Reproduction in 2020, tested 144 price combinations and found the optimal embryo share ranging anywhere from 3% to 100% of breedings. Only 6 of 24 scenarios favored going all-in, each requiring sub-$100 embryos and a premium paid for genetically superior calves. Their read isn’t that embryos never pay. It’s that some use is profitable across a fairly wide band, and the all-in case is narrow.

Nine-year-old modeling assumptions, so read them as direction rather than a current quote — and check them against what’s happening to genetics pricing right now.

Fresh versus frozen: what ships isn’t what performs

One clarification, because it’s easy to assume otherwise: the Wisconsin work wasn’t a heat-stress study. Nobody was testing summer fertility. The flip side is worth knowing though — that cost analysis ran June through November 2022, which means those pregnancy rates were earned partly through a Wisconsin summer. If anything, 31% may be conservative against a year-round program.

The fresh-versus-frozen question still lands on your invoice. Hansen’s 2020 synthesis in the Journal of Animal Scienceput a number on it: across all studies, pregnancy per transfer for cryopreserved embryos ran 7.4 percentage points below fresh. Frozen is what ships, what stores, and what the Wisconsin herd used. If a supplier leads with fertility performance, ask which product the number came from.

The 30/90/365-Day Playbook for Herds Running Recipients

30 days — audit your recipient utilization rate. Pull last year’s records and divide cows enrolled as recipients by cows that actually received an embryo. An afternoon and your repro software, no capital. Trigger: under 75% and you’re funding synchronization on cows that never get a shot at conceiving. Where it backfires: counting mid-protocol culls as scheduling failures will send you after the wrong fix — separate the health exits from the calendar misses before you conclude anything.

30 days — price your calf contract against the stack. Compare what you’re getting for a day-old crossbred against $349.48. Trigger: under roughly $350 and the Wisconsin 2022 cost structure wouldn’t have covered itself, and with hormone prices up double digits since, that line has drifted upward. Where it backfires: the $349.48 excludes on-farm labor for protocol administration, so treat it as a floor rather than a full accounting.

90 days — rebuild the calendar around the transfer window. Book synchronization to match technician availability instead of hoping heats land on the right days. Requires a conversation with your clinic and a willingness to run timed protocols over heat watching. Where it backfires: switching protocols while keeping a one-day-a-week window buys you the hormone cost and none of the gain. Hormone spend barely differed in Wisconsin — $28.77 against $30.15. The savings came entirely from utilization.

365 days — set your embryo share against your own break-even. Four inputs decide it: negotiated embryo price, surplus calf value, whether anyone pays you a genetic premium, and how wide your genetic gap actually runs against active sires — and remember the base change moved everyone’s numbers before you measure that gap. The published modeling puts the answer anywhere from 3% to 100%, and closer to zero more often than the pitch suggests. Opportunity signal: clear 90% utilization with a contract comfortably above $350 and you’re on the profitable side of the Pereira range — that 2024 JDS work modeled Jersey herds swinging from $52.90 to $232.90 per cow per year on embryo cost and beef calf price alone, so there’s real room above the threshold.

365 days — weigh terminal beef against replacement scarcity. Every recipient carrying a terminal beef embryo is a recipient not carrying a replacement dairy calf, and that trade got more expensive. USDA NASS reported 3.90 million dairy replacement heifers on January 1, 2026, with 2.50 million expected to calve against 9.57 million milk cows — a 26.1% ratio. Our read: run the terminal program on the cows you’d never keep a daughter from, and check what a replacement actually costs you now before you widen the share.

Key Takeaways

  • Recipient utilization is the number that decides this, not embryo price. This herd ran 93% one way and 50% the other, and per 100 cows enrolled that split a $1,465 gain from a $1,018 loss.
  • Price negotiation is the smallest lever on this board. Your calendar is the biggest, and no supplier will bring it up because there’s nothing in it for them.
  • Pull the audit inside 30 days: cows you enrolled as recipients divided by cows that actually got an embryo. Under 75% and you’re paying full freight on synchronization for cows that never get a shot.
  • These were $50 terminal Angus embryos sold as day-old crossbreds, priced June 2022, on a $400 contract. Borrow the cost structure, not the dollars — under roughly $350 a calf it didn’t cover itself.

The trade-off nobody prices

You can buy genetic progress faster with embryos, or you can buy crossbred calf revenue with terminal ones. Either way you hand 62% of your cost per pregnancy to whatever your recipient pen does next, and that pen answers to a calendar, not a catalogue.

The Wisconsin herd didn’t fail at genetics. It ran two protocols and one of them lost $1,017.96 per 100 enrolled cows on a scheduling conflict.

So pull the number that describes your barn instead of somebody else’s. What percentage of the cows you enrolled as recipients last year actually received an embryo — and what does that gap cost you against the calf contract you already signed?

Figures here are drawn from published research and public data as cited. This is journalism, not financial or veterinary advice — check your own numbers with your vet and your accountant.

Complete references and supporting documentation are available upon request by contacting the editorial team at editor@thebullvine.com.

Learn More

The Sunday Read Dairy Professionals Don’t Skip.

Every week, thousands of producers, breeders, and industry insiders open Bullvine Weekly for genetics insights, market shifts, and profit strategies they won’t find anywhere else. One email. Five minutes. Smarter decisions all week.

NewsSubscribe
First
Last
Consent

The High Cost of Cheap Dairy Margin Coverage

Same $8.00 margin. Same milk out of the same tank. One paragraph of federal regulation decides whether you pay ten cents a hundredweight or a dollar eighty-one.

EXECUTIVE SUMMARY: At the same $8.00 margin, DMC charges $0.100/cwt in Tier 1 and $1.813/cwt in Tier 2 — eighteen times the price for identical coverage on milk from the same tank. One paragraph of federal regulation, 7 CFR § 1430.407(d), decides which side you land on: elect Tier 1 at $8.00 or below and your Tier 2 pounds lock to that same level automatically, but elect $8.50 or higher and the rule forces you to set Tier 2 separately, which is the only route to the free $4.00 catastrophic floor. Run a modeled 500-cow Upper Midwest herd through 84 months of published FSA margins, and the decoupled election returns $344,669, while locking both tiers at $8.00 loses $417,748 — a $762,417 swing where the winning choice is the more expensive Tier 1 rate. This hits any operation above 6,000,000 lb of production history, roughly 240 cows at 25,000 lb, and the 2026 window already closed February 26. What’s left is Tier 2 coverage at a workable price: DRP ran $0.28/cwt in Q1 2026 against $111,953 for the Tier 2 half of an $8.00 election, and HighGround’s data shows coverage bought three quarters out returned $1.53/cwt while only 19% of producers booked that far ahead. Before the 2027 signup, pull your FSA production history and ask the county office what coverage is currently attached to your Tier 2 pounds — if your Tier 1 sits at $8.00 or under, those numbers should be identical, and you may be paying rates you never picked.

DMC Tier 2 premium

Two Dairy Margin Coverage elections. Same 500-cow Upper Midwest herd, same 2026 program year, same USDA margins. One returns $344,669 across seven years. The other loses $417,748.

The gap is $762,417 — and the election that wins is the more expensive coverage level.

That’s not a typo. It’s written into federal regulation, in a single paragraph of 7 CFR § 1430.407 that decides what your milk above 6,000,000 lb costs to protect. The rule isn’t secret. It’s just not on the form you sign.

The paragraph that decides everything

The Regulatory Rule Every Producer Misses

A dairy operation “may only select one coverage level threshold and only one percentage of coverage applicable to both Tier 1 and Tier 2.”

But an operation electing $8.50, $9.00, or $9.50 in Tier 1 “must choose a different coverage level threshold” — anywhere from $4.00 to $8.00 — for the production history above the tier line.

— 7 CFR § 1430.407(d)

Read it twice, because the logic runs backward from intuition.

Elect Tier 1 at $8.00 or below, and one number covers everything. Your Tier 2 milk gets locked to the same level, at Tier 2 prices. Elect $8.50 or higher, and the regulation requiresyou to set Tier 2 separately — which is the only way to put it at the free $4.00 catastrophic level.

Buying up in Tier 1 is the mechanism that lets you buy down in Tier 2. Jason Hartschuh, Extension Field Specialist in Dairy Management and Precision Livestock at The Ohio State University, flagged the same $8.50 threshold for producers above 6 million pounds when he wrote up 2026 enrollment in Buckeye Dairy News.

So the producer economizing at $7.50 doesn’t save anything. They get pulled into $7.50 Tier 2 pricing on every pound above the line, and Tier 2 pricing is where this program stops being affordable.

What the regulation actually charges

The short version: $0.100 versus $1.813 at the same coverage level. Here’s why the cheaper election is the expensive one.

Table 1 to § 1430.407(e), reproduced in full. These are the statutory rates from the Agricultural Improvement Act of 2018, and USDA’s January 2026 final rule left them unchanged — only the tier threshold moved, from 5 million pounds to 6,000,000 lb.

Coverage LevelTier 1 ($/cwt)Tier 2 ($/cwt)Price Multiple
$4.00 (Catastrophic)NoneNone—
$5.50$0.030$0.1003.3x
$6.50$0.070$0.6509.3x
$7.50$0.090$1.41315.7x
$8.00$0.100$1.81318.1x
$9.50 (Max, Tier 2 decoupled)$0.150Free at $4.00—

Read the $8.00 row twice. Same margin protection, same milk, same barn — $0.100 in Tier 1 and $1.813 in Tier 2. Eighteen times the price for identical coverage. Compare each tier’s best available option instead, and it’s $0.150 against $1.813, a little over twelve times.

The columns track each other to $5.00. Past that, they fork hard, and by $7.00 Tier 2 costs nearly fourteen times what Tier 1 charges.

Running the Numbers

Model Herd Profile: 500 cows | 25,000 lb/cow | 12.5M lb total | Federal Order 30

Covered history at 95%: 57,000 cwt Tier 1 · 61,750 cwt Tier 2

Monthly exposure: 4,750 cwt Tier 1 · 5,146 cwt Tier 2

Window: July 2025 – June 2026, the most recent twelve months with final FSA margins

Scaling: Every figure below moves with the coverage percentage you elect. At 50% coverage, halve them.

Coverage percentage is set at 95%, the maximum § 1430.407(a)(2) allows, and applied to both tiers as § 1430.407(d) requires. The margin itself is one national calculation, so this premium math holds regardless of your order. What varies by region is the gap between that national margin and your actual mailbox price — which matters later, when we get to DRP.

Worked examples on a modeled herd, not a forecast. Confirm your own election with your county FSA office or a licensed crop insurance agent.

Election A — Tier 1 at $9.50, Tier 2 set separately to $4.00

  • Premium: 57,000 × $0.150 = $8,550, plus the $100 administrative fee
  • Dec 2025, margin $9.42: ($9.50 − $9.42) × 4,750 = $380
  • Jan 2026, margin $7.81: ($9.50 − $7.81) × 4,750 = $8,028
  • Feb 2026, margin $8.46: ($9.50 − $8.46) × 4,750 = $4,940
  • Tier 2 collected nothing. The margin never touched $4.00.
  • Net: +$4,697

Election B — Tier 1 at $8.00, Tier 2 locked to $8.00

  • Premium: (57,000 × $0.100) + (61,750 × $1.813) + $100 = $117,753
  • January was the only month below $8.00, by nineteen cents
  • Both tiers together paid $1,880
  • Net: −$115,873

Election C — Tier 1 at $7.50, Tier 2 locked to $7.50

  • Premium: (57,000 × $0.090) + (61,750 × $1.413) + $100 = $92,483
  • The margin bottomed at $7.81. Neither tier paid a cent.
  • Net: −$92,483

Election A carries the highest Tier 1 rate on the table. It’s the only one that made money.

Scale it to your herd: per 1,000 cwt of production history covered at 95% and $9.50, you paid $142.50 and collected $222 across those three months. Multiply by your own Tier 1 hundredweight.

What if you’re still under 6 million pounds?

Then none of this costs you anything yet, and your election is simple: take $9.50, take the six-year lock-in, and skip the Tier 2 rows entirely.

Watch the line, though. At 25,000 lb per cow, 6,000,000 lb is roughly 240 cows. Every cow past that puts milk into a tier where protection costs eighteen times more — a number most expansion budgets never carry. If you’re within about 500,000 lb of the threshold, run the tier split before you pour the pad.

Does one quiet year prove anything?

Fair challenge, and Hartschuh raised a version of it during the 2026 sign-up.

Writing in Buckeye Dairy News, he pointed out how fast the floor can drop: “In November of 2022, during the DMC program sign-up, the lowest projected milk margin was $8.80, but it fell all the way to $3.52 in July of 2023.” His conclusion — that the collapse demonstrated “the need to use risk management tools even when the risk does not appear to be present.”

He’s right that nobody saw 2023 coming. The margin fell more than five dollars below what the market projected at signup.

So run every year, not just the calm one. Eighty-four months of FSA’s published margin series, same illustrative herd, same three elections.

Election, 2019–2025Premium PaidIndemnitiesNet Position
Tier 1 $9.50 + Tier 2 $4.00$60,550$405,219+$344,669
Tier 1 $7.50, both tiers locked$647,379$313,104−$334,275
Tier 1 $8.00, both tiers locked$824,269$406,521−$417,748

The locked elections collected roughly the same indemnities as the decoupled one. They paid ten to thirteen times more for the privilege.

This comparison is The Bullvine’s own analysis, built from Table 1 to § 1430.407(e), the election rule at § 1430.407(d), and FSA’s published margins. Hartschuh’s guidance in Buckeye Dairy News addresses the general principle for herds above 6 million pounds — that DMC “should be used as a tool to protect your operation from catastrophic losses” — not this specific comparison.

That principle, run through the rate table, points somewhere concrete: elect above $8.00 so the regulation hands you a separate Tier 2 decision.

One cross-check, since the whole argument rests on the margin series. CRS independently reports annual average DMC margins of $9.61 for 2019, $9.45 for 2020, $6.92 for 2021, $10.72 for 2022, and $6.70 for 2023. Averaging FSA’s monthly figures produces 9.61, 9.45, 6.92, 10.72, and 6.70. Two federal sources, same numbers.

Readers who followed the calendar year DMC paid out nothing at all have seen the other side of this. Tier 1 posts losing years too. The seven-year total is what settles it.

What changed for the 2026 program year

The One Big Beautiful Bill Act reauthorized DMC through 2031 and moved the Tier 1 threshold to 6,000,000 lb, a shift we covered when Tier 1 jumped to six million pounds.

Every 2026 enrollee established a new production history. Farms marketing before January 1, 2023 use the highest of their 2021, 2022, or 2023 marketings, documented with milk marketing statements. Later entrants use their first year of monthly marketings.

The lock-in is spelled out at § 1430.404(e)(2): operations making a one-time election during the 2026 period are locked at the same coverage level and percentage from January 1, 2026 through December 31, 2031, at a 25% premium discount — taking the Tier 1 $9.50 rate from $0.150 to about $0.1125/cwt. Locked-in operations still owe the annual administrative fee and still have to file a contract each year certifying they’re producing and marketing milk. Miss that, and you stay liable for the unpaid fees anyway.

One date worth calendaring: premium is due when you submit your election, and no later than September 1 of the coverage year, per § 1430.407(h).

What actually drove the margin swing in the test window was milk, not feed. FSA’s 2026 rate table shows the all-milk price climbing from $17.50/cwt in January to $21.10 in June, while the feed cost component moved only from $9.69 to $10.22. January’s $7.81 margin wasn’t a feed spike. It was a milk price that hadn’t caught up yet.

Enrollment ran January 12 to February 26, 2026. It’s closed. FSA hadn’t posted 2027 dates as of August 31, 2026 — recent cycles opened in mid-January, which is a pattern, not a promise.

Is anyone checking whether producers understand the form?

Not according to the Government Accountability Office, which audited FSA’s outreach in July 2025.

Metric20192024Change
Total DMC-enrolled farms23,48515,686−33%
National participation rate68%63%−5 pts
Small-operation share of participants76%68%−8 pts

Participation is sliding. GAO found 68% of U.S. dairy farms enrolled in 2019 — 23,485 of 34,207. By 2024: 63%, or 15,686 of 24,811. Smaller operations, the ones Tier 1 was designed to serve, fell from 76% of participants to 68%.

Farmer groups told GAO the barriers include “limits on the amount of milk covered, the cost of buy-up coverage… and awareness about the program.” GAO found FSA “has not evaluated its communication efforts.”

FSA’s printed reply: “FSA generally disagrees with the findings in the GAO draft report as it relates to FSA communications and their efficacy.”

Not we’re working on it. Paragraph (d) is a decent example of what that awareness gap looks like in practice — a sentence in the Code of Federal Regulations that swings six figures of premium, sitting nowhere near the paperwork you sign.

The American Farm Bureau Federation reports that in practice, most Tier 2 production is already enrolled at or near the catastrophic $4.00 level. Farm Bureau doesn’t cite the underlying dataset, and FSA doesn’t publish tier-level elections, so read it as an informed industry assessment rather than an audited figure. It lines up with what the arithmetic recommends.

How to protect the Tier 2 milk without paying USDA’s $1.813 rate

Decoupling Tier 2 to $4.00 solves the premium problem and leaves a coverage problem: that milk now carries a catastrophic floor and nothing else. Two federal products fill the gap at a fraction of the Tier 2 rate.

Start with what producers actually paid this year. HighGround Dairy’s review of first-quarter 2026 Dairy Revenue Protection results put average producer-paid premium at $0.28/cwt. On this herd’s 61,750 covered Tier 2 cwt, that’s about $17,290 spread across four quarterly endorsements — against $111,953 for the Tier 2 portion of an $8.00 election. Roughly one-sixth the cost.

Q1 was a strong quarter for anyone holding coverage. HighGround estimated indemnities averaging $1.12/cwt and a net return of +$0.83/cwt after premium, with Class III settling below the 95% coverage level in 93% of the sales days they examined. Read those numbers with three things in mind: RMA hadn’t released Q1 indemnities at publication, so the payout side is estimated from announced class prices and yields; one strong quarter isn’t a run rate; and HighGround Insurance Group is a licensed agency selling this product.

DRP isn’t a fringe tool anymore either. Roughly 16.1 billion pounds of milk carried DRP coverage in Q1 2026 — 27.5% of the U.S. milk supply.

How much does the timing of a DRP purchase actually matter?

More than the premium does, according to HighGround’s Q1 breakdown.

Coverage bought three quarters ahead returned the most: $1.53/cwt net of premium. Four quarters out returned $1.37, five quarters out $1.28. Producers who waited and bought one quarter out saved about $0.20/cwt on premium — and gave up roughly $1.50/cwt in indemnity to do it.

Only 19% of Q1 2026 coverage was booked three to five quarters ahead.

That’s the pattern worth stealing. The cheap premium is usually the expensive decision.

Where DRP can leave you short

DRP settles against an index built from CME futures and state or regional production, not your milk check. Two mechanisms drive the gap.

The first is basis. A herd in Federal Order 30 and one in the Southwest can hold identical coverage and land in different places, because their mailbox-to-index spreads differ. We walked through that in our spring 2026 DRP risk plan.

The second is the Yield Adjustment Factor — your state or pooled region’s actual yield from USDA’s Milk Production report, divided by the expected yield when you bought. Above 1, your indemnity gets cut. Below 1, it gets enhanced. So a quarter where your region milks well and prices fall can pay you less than the price move alone would suggest, regardless of what your own tank did.

Coverage levels run 80% to 95%, with a class pricing option built on Class III and Class IV and a component pricing option using butterfat, protein, and other solids. Subsidies hold at 55% for 80% coverage, 49% at 85%, and 44% at both 90% and 95% — unchanged for the 2027 crop year, per University of Wisconsin–Madison Extension’s August 2026 review. Beginning and veteran farmers receive an additional subsidy.

LGM-Dairy covers the margin between Class III milk and corn and soybean meal futures, with feed quantities set by the producer rather than fixed by formula. Per UW–Madison Extension’s May 2026 summary, deductibles run from $0 to $2.00/cwt in dime increments, with subsidies from 18% to 50%; there’s no minimum hundredweight, and premium comes due at the end of the coverage period.

You gain precision on the feed side. You give up a program your county office can explain in ten minutes.

For readers north of the border

None of this transfers. Canadian farmgate prices are set through the Canadian Dairy Commission’s cost-of-production formula blended with the Consumer Price Index, and production runs on quota rather than open marketing. Because Canadian pricing isn’t benchmarked to CME Class III and Class IV, DMC, DRP, and LGM-Dairy have no Canadian equivalent — there’s no margin index to insure against.

What crosses the border: feed. Corn and soybean meal are globally priced, and input hedging is the one page of this playbook an Ontario or Quebec operation can use directly.

The 30/90/365-Day Playbook for a Herd Sitting on the Tier Line

30 days — urgent checks

  • Pull your FSA production history in pounds. Not your tank average — the number on file, recalculated for 2026 as the highest of your 2021, 2022, or 2023 marketings. Requires one call to the county office. Where it backfires: planning a 2027 election around a split you assumed instead of confirmed.
  • Ask your county office two things: what Tier 1 level you elected for 2026, and what coverage level is currently attached to your Tier 2 history. If your Tier 1 sits at $8.00 or below, those numbers should be identical — and you may be paying Tier 2 rates you never chose. Most expensive item on this list to get wrong.
  • Trigger: if your debt service coverage ratio has sat under 1.2 for three consecutive months on your lender’s calculation, cross CME futures off entirely. Class III trades in 200,000 lb contracts with margin near $1,000 per contract as of the April 2026 specifications, and the exchange resets those periodically. Ten contracts means five figures parked and callable at the worst possible moment.

90 days — structural adjustments

  • Start pricing DRP three to five quarters out, not one. HighGround’s Q1 2026 data puts the net return on three-quarters-out coverage at $1.53/cwt against roughly $0.20/cwt of premium savings for waiting. Requires an agent relationship and a willingness to buy when the quarter still looks fine. Backfires if you commit volume you later sell forward — you’d be insuring milk that’s no longer exposed.
  • Pull twelve months of milk checks and calculate your own mailbox-to-Class III spread. That number tells you whether index-based coverage will actually pay when you’re hurting. If it runs wide or erratic, weight toward LGM-Dairy instead of DRP.
  • Model both DMC elections side by side rather than picking a Tier 1 number in isolation. Run $9.50 with Tier 2 at $4.00 against your preferred lower level with both tiers locked. The gap is usually wider than producers expect, and it usually favors buying up.
  • If you took the six-year lock-in, calendar the annual certification now. The regulation keeps you liable for premiums and fees whether or not you file the paperwork.

365 days — strategic positioning

  • Add one row to your own record every January: what the margin did, what you paid, what you collected. Seven years of that turns an opinion into a table.
  • Opportunity signal: if your realized mailbox-to-Class III spread has held within about a dollar across the last twelve months and your Tier 1 election is above $8.00, index-based DRP is doing roughly what it says on the tin for you, and the Tier 2 substitution is worth pricing seriously. If that spread runs wider, keep the exposure and manage feed instead.
  • Track the 2027 rules, which changed more than most producers noticed. RMA’s package for the 2027 crop year permits concurrent DRP, LRP, and LGM coverage and cancels policies earning no premium for three consecutive years. Earliest practical effect lands around June 2027, when dormant policies cancel ahead of the following year. A lapsed policy you forgot about can disappear quietly.

The trade-off at the center of this

Tier 1 is the cheapest risk management in American dairy, and one paragraph of federal regulation decides whether you get to keep it clean. Elect above $8.00 and § 1430.407(d) hands you a separate Tier 2 decision. Elect $8.00 or less, and it locks your largest block of milk to a rate that hasn’t paid for itself across seven years of USDA data.

Taking the higher Tier 1 number costs nothing real. On the herd modeled above, not knowing why it’s there cost $762,417.

So find your 2026 paperwork. What Tier 1 level did you actually elect — and have you asked your county office what coverage that decision attached to every pound above 6,000,000 lb?

Key Takeaways

  • Elect Tier 1 above $8.00 and the regulation forces you to set Tier 2 separately — that’s the only path to parking it at the free $4.00 level. Elect $8.00 or under and both tiers lock together at Tier 2 prices.
  • At the same $8.00 margin, Tier 1 costs $0.100/cwt and Tier 2 costs $1.813. Eighteen times the price for identical coverage on milk that came out of the same tank.
  • Across 2019–2025, the decoupled election returned $344,669 on this modeled herd. Locking both tiers at $8.00 lost $417,748 — collecting nearly the same indemnities for ten times the premium.
  • Before the 2027 window opens, pull your FSA production history and ask the county office what coverage is currently attached to your Tier 2 pounds. If your Tier 1 sits at $8.00 or below, those numbers should match — and you may be paying rates you never picked.
The Bullvine | Regulatory Investigation

The USDA DMC Tier Trap

Same $8.00 Margin Protection. 18.1x The Premium.

Tier 1 ($9.50 Elect)
$0.150/cwt
Unlocks separate $4.00 catastrophic floor for Tier 2.
7-Yr Net: +$344,669
Tier 2 ($8.00 Lock)
$1.813/cwt
Automatic rate lock on all milk over 6,000,000 lb.
7-Yr Net: -$417,748
The Regulatory Spread on 500 Cows
$762,417
Difference hidden inside 7 CFR § 1430.407(d)
Calculate Your Herd’s Tier Exposure:
Tier 2 Milk (Over 6M lbs): 6,500,000 lbs
Tier 2 Annual Lockout Penalty: $111,953 / yr
Source: 7 CFR § 1430.407 | Analysis by TheBullvine.com

Election rules and premium rates: 7 CFR § 1430.407 (buy-up coverage) and § 1430.404 (registration and annual election), current as retrieved September 1, 2026. Note that the CFR text still references the pre-2026 five-million-pound tier threshold; USDA’s January 2026 final rule raised it to six million pounds under the One Big Beautiful Bill Act, and the rate schedule was unchanged. Margin data and feed cost components: USDA Farm Service Agency, Dairy Margin Coverage Program Updates and Prices, 2019–2026 series. Annual average cross-check: Congressional Research Service. DRP performance data: HighGround Dairy, “DRP Results: Q1 2026” — indemnity figures in that report are estimated, as RMA had not released Q1 settlements at publication; HighGround Insurance Group is a licensed insurance agency. LGM and DRP subsidy terms: University of Wisconsin–Madison Extension, May and August 2026. Canadian pricing context: Canadian Dairy Commission. Net-position figures are The Bullvine’s own calculations applied to the illustrative herd described above — arithmetic, not forecasts. Past margins do not predict future ones. Confirm all program elections with your county FSA office or a licensed crop insurance agent.

Learn More

The Sunday Read Dairy Professionals Don’t Skip.

Every week, thousands of producers, breeders, and industry insiders open Bullvine Weekly for genetics insights, market shifts, and profit strategies they won’t find anywhere else. One email. Five minutes. Smarter decisions all week.

NewsSubscribe
First
Last
Consent

That cull cow brings $2,340. Her replacement costs $3,500.

Thursday morning, the trailer backed up to the door, and she’s sound and bred back. The check is $2,340. Her replacement runs $3,500-plus into a heifer market at a 20-year low.

That $1,160 gap is the whole story of the 2026 dairy cull cow decision — and it runs opposite to twenty years of culling habit. The reflex that used to be free money is now the expensive side of the trade.

More stalls to fill, fewer heifers to fill them with. That’s the arithmetic behind the squeeze: USDA counted 3.90 million dairy replacement heifers on January 1, down slightly year over year and roughly a 20-year low by CoBank’s read, while the milking herd climbed to 9.57 million head.

Third lactation, milking just under herd average. Not a wreck. Not a star. For twenty years she was an obvious load. Now she’s a math problem.

The cull check is real. So is the replacement bill.

Southern Plains cull cow auction prices climbed to almost $180/cwt in late April 2026, up about $15/cwt since January, according to Southern Ag Today. Two caveats before you count that check. Leaner 85–90% cows were running closer to $167/cwt earlier in the year, so check your own grade and basis before assuming the top of the market. And this year’s seasonal increase has been smaller than normal — worth knowing if you’re timing a sale.

On a 1,300-pound cow at the top of that market, the salvage math is simple:

13 cwt x $180/cwt = $2,340

The other side has moved just as hard. USDA reported an average U.S. replacement dairy heifer price of $3,110/head in October 2025 — a record, up $100 (3%) from July 2025 and up $510 (16%) from October 2024. Dairy Star reported replacements running $3,000–$4,000/head through late 2025 as inventories tightened. By mid-2026, USDA’s January report showed the ratio of dairy heifers expected to calve had tightened to a record-low 26.1%, pushing replacement values into territory the industry hasn’t priced before.

CoBank tracked the run-up. Lead dairy economist Corey Geiger put replacement values at $1,140/head in April 2019, $2,660 by January 2025, then a record $3,010 in July 2025 — a 164% climb.¹ The bank’s models show dairy replacement inventories for the milking herd not rebounding until 2027.

So the swap, stated plainly:

  • Salvage check today: $2,340
  • Replacement heifer, current market: $3,500+
  • Purchase-price gap: $1,160

$3,500 – $2,340 =$1,160.00

Call that what it is — a purchase-price gap, not a verdict. It doesn’t yet include the milk she’d have shipped, her feed, her health costs, or her pregnancy status. Those are farm-specific, and they’re where the real answer lives.

What this means for your operation: if the cull candidate is bred, sound, and carrying no chronic health costs, the burden of proof shifts onto the cull decision. You have to show her replacement returns more than the $1,160 gap plus the margin she’d have earned. That’s a higher bar than “she’s below average.”

Why the heifer pipeline got thin

Every cow bred to beef produces a valuable calf and no dairy replacement. During 2023–24 that trade was rational — beef-cross calves paid real money the day they hit the ground, Holstein bull calves didn’t, and milk was weak.

The bill came due three years later. CoBank’s August 2025 analysis, authored by Geiger, put replacement heifer inventories at a 20-year low just as processors were committing to historic plant expansions. As heifer values climbed, the report noted, producers began culling fewer cows to keep milk flowing.

Bullvine’s own reporting on that analysis tracked a structural deficit of 438,844 heifers against the 2026 requirement, locked in by 2023 breeding decisions. Biology’s 30-month timeline means there’s no quick fix — only adaptation. We ran the full pipeline arithmetic when the deficit first showed up, including the forward inventory formula for calculating annual replacement need.

The pain isn’t evenly spread. USDA ERS put 2021 production cost at $42.71/cwt for herds under 50 cows against $19.14/cwt for herds of 2,000-plus. And per USDA ERS Amber Waves (February 2026), the number of licensed U.S. dairy herds fell 63%, from 66,825 in 2004 to 24,811 in 2024. A $3,500 replacement lands differently on a 60-cow dairy than on a 1,500-cow one.

When is a below-average cow still worth keeping?

Penn State Extension puts replacement animals at 15–20% of total milk production cost, ranking them the second- or third-largest production cost on most dairies, behind feed and possibly labor. When that line item roughly doubles, the threshold for shipping a cow moves with it.

Here’s the honest version of the calculation. A cow finishing a 22,000-pound lactation represents real gross milk revenue, but the retained margin depends on your milk price, ration cost, days in milk remaining, health status, and whether she’s settled. There’s no universal number, and anyone who hands you one is guessing. Run it against your own cost of production.

The direction isn’t in question. USDA’s ERS forecast the 2026 all-milk price at $18.25/cwt as of January 2026. Against a $3,500-plus replacement, a settled cow milking modestly below herd average can pencil better than the heifer you’d buy to take her stall — but that depends on your milk price, her remaining days in milk, and her health costs.

This is not a keep-every-cow rule. Chronic mastitis, repeat lameness, long withdrawal periods, genuine reproductive failure, cows eating cash — those still ship, and shipping them into a record cull market is good business. The mistake is treating every below-average cow as a replacement you can buy back cheaply. You can’t right now.

Does the math work the same in Canada?

The biology travels. The market doesn’t.

MetricUnited StatesCanada
Heifer inventory3.90M head — roughly a 20-year lowCattle inventories up year over year, Jan 1 2026
Cost to raise to first calving15–20% of total production cost (Penn State Extension)C$4,822 (Lactanet, 2021) to C$4,870 ± 757 (Canadian Journal of Animal Science)
Milk price exposureOpen market; ERS forecast US$18.25/cwt for 2026Supply-managed; CDC farmgate +2.3255% effective Feb 1 2026
Where to price cowsUSDA AMS regional auction reportsBrussels Livestock (ON); Les Producteurs de bovins du Québec weekly cull report
Current cull tradeSouthern Plains near $180/cwt, late Apr 2026Good Holsteins C$215–$234/cwt; medium C$200–$214/cwt (Brussels, summer 2026)
Heifers expected to calveRecord-low 26.1% ratio (USDA, Jan 2026)Not published on the same basis — verify provincially

Three notes on the Canadian column. The rearing-cost figures come from two separate studies — Lactanet’s 2021 analysis put it at C$4,822 per heifer to first calving, while a Canadian Journal of Animal Science study calculated C$4,870 ± 757 — and both skew toward Quebec herds, so verify against your own province. The February 2026 farmgate increase of 2.3255% came from the National Pricing Formula, which weighs producer cost of production against the consumer price index. And don’t import U.S. auction prices into a supply-managed operation; the quota cushion changes how milk revenue behaves when you hold a cow an extra lactation.

One practical note on Canadian cull values: Ontario’s Brussels Livestock has been reporting good Holstein cows in the $215–$234/cwt range and medium Holsteins at $200–$214/cwt this summer. Springer and fresh-cow pricing moves separately from cull trade, so get a current quote before you budget a replacement purchase.

The transferable part: at roughly C$4,800–C$4,900 to raise a replacement to first calving, a sound settled cow carries more value than her rank in the herd average suggests.

Planning examples: the same decision at two herd sizes

These are planning examples with stated inputs, not case studies from documented farms. Substitute your own numbers.

250-cow herd — five convenience culls this quarter

  • Sound, bred cows shipped mainly for sitting at the bottom of the rolling herd average
  • Replaced at $3,500–$5,000 each
  • Purchase-price gap alone: $5,800 to $13,300
  • Lost production not included
  • The cost surfaces later, when the heifer pen comes up short

60-cow herd — three forced replacement purchases

  • At $3,500 each: $10,500 in gross purchase cash
  • Not a projected loss — a check you write
  • A 1,500-cow dairy absorbs it. A 60-cow dairy feels every dollar

Same decision, same market. The difference is whether your operation has the scale to absorb the cash requirement.

Is your cull list a plan or a habit?

Pull the current list and sort it into two piles: cows that are genuine cash drains, and cows that are merely below average. Those are different animals with different economics, and only one pile belongs on a trailer in this market.

Cow profileCull check @ $180/cwtReplacement costPurchase-price gapVerdict
3rd lactation, confirmed pregnant, 8% below herd average, no health events$2,340 (1,300 lb)$3,500–$1,160KEEP — below average is not a cash drain
5th lactation, open 180+ days, 3 failed breedings, milking herd average$2,610 (1,450 lb)$3,500–$890SHIP — no pregnancy, no next lactation
2nd lactation, third clinical mastitis case, chronic high SCC$2,250 (1,250 lb)$3,500–$1,250SHIP — treatment cost and dumped milk outrun the gap
4th lactation, settled, mild recurring lameness, 12% below herd average$2,520 (1,400 lb)$3,500–$980HOLD & TREAT — decide after hoof work, not at the trailer

Then check whether your pipeline can cover the departures. Divide heifers expected to freshen in the next 12 months by cows expected to leave over the same period. There’s no industry-standard threshold here — the honest test is whether that ratio covers your farm’s projected replacement need, given your cull rate and heifer survival. If it doesn’t, your herd won’t refill itself, and every voluntary cull becomes a purchase decision.

Want the structured version? Lay your heifers out by age band and run them against your cull rate — that walkthrough also pulls in your 12-month 21-day pregnancy rate, which is what determines whether the pipeline holds.

Options and trade-offs

Option 1 — Run the three-gate cull test

Timeline: complete within 30 days

Before any cow goes on the trailer, run her through three gates:

  1. Will she breed back?
  2. Is she a genuine cash drain, or just below herd average?
  3. Can your heifer pipeline absorb losing her stall?

Then reconcile the pipeline:

  • Match cows likely to leave against confirmed heifers due to calving
  • Set the maximum number of voluntary culls your pipeline can actually cover
  • Hold the cull list to that number until the pipeline recovers

Works on: every herd, right now. Requires: honest health and repro records. Fails when: sentiment creeps in and genuine money-losers stay on the list. Open cows and chronic problems still ship.

Option 2 — Cap beef-on-dairy by counting backward

Timeline: before the next breeding cycle

Start from replacement need, not the calf check. Work the steps in order:

  1. Calculate annual replacement need from your cull rate — a 250-cow herd culling at 32% needs roughly 80 replacements a year
  2. Add your own heifer loss rate to get the true springer requirement
  3. Build your calf-to-springer conversion from your own records: sex ratio, calf mortality, heifer mortality, age at first calving, conception losses
  4. Work backward to the number of breedings genuinely free for beef semen
  5. Set the cap — and for herds that ran beef semen well above 40% during the boom, a lower cap is the defensible position until the pipeline recovers

Any single industry conversion factor is a farm-specific assumption, not a constant. Build it from your records.

Works on: herds that pushed hard into beef-cross. Requires: accurate cull and loss rates. Fails when: you surrender calf revenue without a real pipeline deficit to justify it.

Option 3 — Stretch productive cows, not problem cows

Extending herd life on sound, fertile, productive cows avoids replacement purchases at current prices. Bullvine’s estimate of the per-cow annual value of added longevity is a directional calculation built from CoBank replacement-cost figures and University of Wisconsin longevity research — our math, not theirs, and not a guaranteed return.

Works on: short or tight pipelines. Requires: sharper repro and hoof health. Fails when: you hold cows past their useful window and trade a shortage problem for a hospital-pen problem.

Option 4 — Secure heifer supply before you’re forced to buy

Contract growing can price below a spot-market springer when a herd is caught short, particularly in deficit regions like Texas, Kansas, California, and Idaho. Specific contract terms vary by grower, region, and duration — get current quotes in writing rather than working from reported ranges.

Works on: deficit regions with thin local heifer supply. Requires: an honest replacement forecast first. Fails when: you over-contract and end up long on heifers you can’t house.

Key Takeaways

  • If a cow will breed back, isn’t a genuine cash drain, and your pipeline can’t replace her, keep her off the voluntary cull list.
  • If your projected heifer inventory doesn’t cover projected departures, treat every voluntary cull as a purchase decision — because that’s what it is.
  • If beef semen exceeded roughly 40% of your breedings during the boom, rebuild your cap from your own replacement need before the next breeding cycle.
  • If you’re budgeting replacement purchases through 2027, use at least $3,500 per bred heifer and verify against current local auction reports.
  • If you milk under 100 cows, weight the cash requirement harder — three forced purchases is a five-figure check with no scale to absorb it.
  • If you milk in Canada, use Canadian inventory, rearing-cost, and quota economics. The U.S. price column doesn’t transfer.

Replacement availability stays constrained by breeding decisions already locked into the pipeline, and the pace of any rebuild depends on future dairy-semen use, heifer survival, and culling behavior across the industry — not on anyone’s forecast. CoBank’s models don’t show a meaningful recovery before 2027.

So the question isn’t whether heifers stay tight. It’s whether the cows on your list this month are genuinely costing you money, or whether you’re about to sell a productive cow into a record market and buy her replacement into a hotter one. Pull your heifer inventory against projected departures this week and see which pile your cull candidates actually land in. And when you’re ready to put real dollars on a specific cow rather than a market average, the full hold-versus-cull breakeven is where that math lives — replacement cost, longevity value, and the per-cow case for keeping a sound old cow.

Executive Summary: A 1,300-pound cull cow at $180/cwt brings $2,340 right now, and her replacement will run $3,500 or more — a $1,160 purchase-price gap before you count a single day of her lost lactation. USDA’s January 1, 2026 Cattle report put dairy replacement heifers at 3.90 million head, roughly a 20-year low per CoBank, while milk cows climbed 2% to 9.57 million, the largest U.S. herd since 1993. That’s the squeeze: more stalls to fill, fewer heifers to fill them, and USDA’s October 2025 national average already at a record $3,110/head. The pain scales down, not up — a 250-cow herd shipping five convenience culls this quarter is out $5,800 to $13,300 on the swaps alone, and a 60-cow dairy needing three forced buys has to find $10,500 in cash a 1,500-cow operation would barely notice. CoBank’s models don’t show replacements rebounding until 2027, and 2023 breeding decisions locked in the 438,844-head deficit, so there’s no waiting this one out. None of that means keeping every cow — chronic mastitis, repeat lameness, and genuine repro failure still ship, and shipping them into a record cull market is good business. The decision worth 30 minutes this week is sorting your list into cows that actually drain cash versus cows that sit at the bottom of the rolling herd average, then checking whether your heifer pipeline can even cover the departures.

Run Your Numbers

R/C Snapshot — This article tells you to divide heifers freshening by cows leaving. The R/C Snapshot does it in 90 seconds and tells you which band you land in: short, tight, balanced, or long. Under 1.5 and your herd shrinks whether you meant it to or not.

Editor’s note: The barn scenario below is a composite, modeled from multiple Midwest and Northeast operations facing the same cull-versus-replace decision in 2026. The market data is sourced and dated; the producer is a representative planning example, not a documented individual. Dollar figures are in USD unless marked CAD.

¹ On replacement price series: This article uses the USDA/Geiger national-average series — $1,140/head (April 2019) to $3,010/head (July 2025), alongside USDA’s $3,110 October 2025 national average. Some earlier Bullvine coverage cites a $1,720-to-$4,100+ range, which reflects top-end auction clearing prices rather than national averages. Both are defensible; national averages are the conservative basis for budgeting.

Learn More

The Sunday Read Dairy Professionals Don’t Skip.

Every week, thousands of producers, breeders, and industry insiders open Bullvine Weekly for genetics insights, market shifts, and profit strategies they won’t find anywhere else. One email. Five minutes. Smarter decisions all week.

NewsSubscribe
First
Last
Consent

$19.85 Milk: Your Base Year Decides If You Can Grow Into It

Your co-op’s base year was probably set before you thought about expanding — and that decides whether new milk pays base or excess.

EXECUTIVE SUMMARY: USDA cut its 2026 all-milk forecast to $19.85/cwt on August 19 — the same month the dairy sector points to $11 billion in new plant capacity as a green light for growth. But on a 400-cow herd shipping 109,500 cwt, that price swings farm returns from +$49,275 to −$454,425 depending entirely on your full economic cost.

  • The Volume Trap: USDA’s 17.8B lb baseline increase arrives on yield per cow (+5.9%), not herd growth (+1.9%). Processors get their milk without your new barn.
  • The Base Trap: Fixed base programs mean milk from cows you haven’t bought yet settles into discounted excess pools.
  • The Real-Price Drain: Holding nominal milk at $19.85 through 2030 erodes purchasing power to $17.98/cwt in 2026 dollars — a $204,765 annual haircut on 400 cows.
milk price forecast 2026

USDA’s Economic Research Service cut its all-milk forecast to $19.85/cwt for 2026 and $19.80 for 2027 on August 19. Five days ago. That’s the number a 400-cow owner-operator in New York, Idaho, or Wisconsin is being asked to expand into, right as a processor breaks ground nearby and a field rep starts talking about growth room.

Whether that’s a trap depends on two things you can actually check: where your full economic cost sits, and whether your co-op’s base year predates the cows you haven’t bought yet. Get both right, and there’s real room. Get either wrong and a 40¢/cwt gap on 109,500 cwt runs $43,800 a year — on milk you added on purpose.

The plants are real. The International Dairy Foods Association documented more than $11 billion committed across 19 states and more than 50 building projects between 2025 and early 2028 — New York at $2.8 billion, Texas at $1.5 billion, Wisconsin at $1.1 billion, Idaho at $720 million, Iowa at $701 million. IDFA president and CEO Michael Dykes put the reasoning plainly in the association’s October 2, 2025 release: the investment “reflects the confidence dairy companies have in the future of American agriculture and their commitment to meeting growing domestic and global demand for nutritious dairy foods.” That same release states the industry expects U.S. milk production to grow by 15 billion pounds by 2030. Trade coverage in August 2026 has cited the investment total at $13 billion; no primary IDFA statement bridging $11 billion to $13 billion has surfaced, so $11 billion is the figure with a source behind it.

Capacity going up. Price forecast coming down. Same month.

The Trap: Your Base Year Predates Your Decision

Here’s the part that reframes every number above, and it has nothing to do with the price forecast.

Land O’Lakes has run structured base programs since at least 2016, historically offering incremental base to existing members who wanted to grow, and expanded the approach regionally into Eastern states by 2023. Documentation available for this piece runs through 2023 — whether that structure holds unchanged in 2026 is a question for your own field rep, not a settled fact. Not every cooperative works that way. Dairy Farmers of America told The Bullvine in June 2026, in the context of its St. Albans plant closure, that it doesn’t cap how much milk a member can produce and hasn’t announced any base or penalty program tied to those closures.

Two of the largest names in American dairy have publicly described different approaches. That’s the point: there’s no single industry default, which is why the answer for your farm has to come from your own agreement rather than from either co-op’s reputation. Neither cooperative was contacted specifically for this analysis, which relies on published statements and prior reporting.

A structured base program isn’t inherently the bad option. Land O’Lakes documented its base-offer sequencing publicly, which is more transparency than most producers get, and offering incremental base to existing members first cuts in your favor.

The mechanics are well documented even where a specific co-op’s current terms aren’t. American Farm Bureau describes the standard structure: producers establish a base during short-supply months, receive the higher milk price up to that base, and milk above base sells at a discount — the discount exists precisely to remove the incentive to oversupply.

Congressional Research Service documentation of proposed federal versions describes base set either as a three-month rolling average of recent marketings or the same month in the prior year, with excess assessed a penalty redistributed to producers who stayed inside allocation.

Those describe generic structures, not either named co-op’s actual terms. Your own contract is the only document that answers this for your barn.

Read that with a barn addition in mind. Under a fixed-base structure, milk from cows you haven’t bought yet lands in the excess bucket. Even under a rolling base, it sits there until the window catches up. The plant down the road doesn’t change that. Your base formula does.

No public reporting establishes whether any cooperative has tied this specific buildout to written incremental-base offers for existing mid-size members. That’s the most operator-relevant unanswered question in the 2030 story. It’s also the one you can get answered — for your own farm, this week, by asking.

Everyone Assumed New Plants Mean New Room

The logic feels airtight: plants get built, plants need milk, producers ship more of it at a better price. It’s three separate bets wearing one coat, and only one of them is documented.

Bet one is capacity, and it’s solid. Named companies, named states, real concrete.

Bet two is price. USDA’s August 2026 Livestock, Dairy and Poultry Outlook lowered the 2026 Class IV forecast to $18.15/cwt, down a quarter, on weaker butter. AgCountry’s third-quarter 2026 outlook projects second-half Class III averaging $17.25/cwt and Class IV at $18.50 — an analyst forecast, not USDA data, and scoped to half the year rather than the annual average. Two credible reads. Both below where a lot of 2025 expansion math got built.

And the formula has been working against you separately from the market. USDA’s June 2025 Federal Order modernization — per the final rule published January 17, 2025 — raised the butter make allowance from $0.1715/lb to $0.2272/lb, a 32.5% increase, with cheese moving from $0.2003 to $0.2519. Those are subtractions from your component values before any market move. How the make-allowance changes reached your milk check is its own arithmetic, and it compounds everything below.

Bet three is access, and you just read why nobody’s published a number on it.

The Yield Math Says Nobody Needs Your Extra Cows

Run USDA’s baseline and the shape gets uncomfortable. Production climbs from 225.9 billion pounds in 2024 to roughly 243.7 billion by 2030 — a gain of 17.8 billion pounds, which actually overshoots the 15-billion figure the industry has been quoting. Yield per cow does the work: 24,177 pounds to 25,607, up 1,430 pounds. The national herd stays close to flat — about 9.34 million head in 2024, peaking near 9.5 million around 2026, settling near 9.52 million by 2030.

Put the two growth rates side by side and the whole thesis fits in one line: yield up 5.9%, herd up 1.9%.

Multiply the endpoints. 9.52 million × 25,607 = 243.8 billion pounds. The math holds.

So the volume arrives whether or not one new farm exists, and whether or not you buy a single heifer. That’s not a scare line — it’s USDA’s own arithmetic. The buildout is a demand signal for volume, not an invitation to you specifically.

Label this correctly: USDA baseline projections are conditional models built on stated assumptions, not predictions. And a separate USDA-linked summary of the same series published through Ohio State University Extension shows 9.43 million cows at 26,295 pounds for 2030. Different split, same neighborhood on total. Two vintages circulating at once, and coverage rarely names which one it’s quoting.

Where Did “Half the Farms by 2030” Come From?

You’ve seen that phrase attached to this projection. It doesn’t survive the window it’s applied to.

USDA NASS counted 24,600 licensed dairy herds in 2024 and about 23,600 in 2025, with an average herd size of 397 cows. Terrain’s June 2026 analysis projects fewer than 20,000 by decade’s end — a decline of roughly 15 to 19% from today, not 50%.

The halving is real. It’s a two-decade story, and ERS has the exact figure: licensed U.S. dairy herds fell 63%, from 66,825 in 2004 to 24,811 in 2024, per the agency’s February 2026 Amber Waves analysis. Production over that same span rose 32%, from 170.8 billion pounds to 225.9 billion. Pair a twenty-year farm-loss number with a six-year production number in one sentence and the two read as simultaneous. They aren’t. A producer sizing an expansion off that sentence is working from a compressed timeline. Where the farm-count curve actually points — 15,000 to 16,000 herds by 2035, under 10,000 by 2050 — is a slope, not a cliff.

Running the Numbers: What $19.85 Does at Three Cost Structures

Assume 400 cows in milk at 75 lbs/day, 365 days, no dry-period adjustment: 400 × 75 = 30,000 lbs/day, × 365 = 10,950,000 lbs, ÷ 100 = 109,500 cwt/year. If your 400 head includes dry cows at roughly 85% milking, run the table on about 93,000 cwt instead — the per-cwt logic doesn’t change; the dollars do.

Revenue calculated on 400 cows in milk @ 75 lbs/day = 109,500 cwt/year ($2,173,575 total gross).

Scenario / Herd Cost StructureCost/cwtRevenue @ $19.85Annual Net MarginEconomic Status
Low cost / diluted overhead$19.40$2,173,575+$49,275Profitable expansion room
Conservative full cost$20.25$2,173,575−$43,800Negative economic margin
Mid-range 400-cow average$24.00$2,173,575−$454,425Severe capital drain

Sourcing on those inputs: ERS 2021 ARMS data — national averages by herd-size class — puts full economic cost near $20.54/cwt for 500–999-cow herds and $19.14/cwt for 1,000-plus. The $24.00 figure is the mid-range 400-cow full cost our April analysis used, including unpaid family labor valued at $18–22/hour and depreciation at replacement cost. The $19.40 and $20.25 rows are illustrative inputs, not reported figures.

Three cost structures, three completely different decisions off one milk price. That spread is the entire argument for running your own number instead of anyone’s average — and it’s why the headline’s trap is conditional. If you’re the top row, there’s room. If you’re the bottom row, no plant announcement fixes that.

And separately — the real-price erosion. USDA’s $19.85 and $19.80 are nominal. Hold nominal price flat through 2030 and deflate at 2.5% annual general inflation, roughly the Federal Reserve’s long-run target and a stated placeholder rather than a forecast:

  • $19.85 ÷ (1.025)⁴ = $17.98 in 2026 dollars
  • Real decline: $1.87/cwt
  • On 109,500 cwt: $204,765 of annual purchasing power, gone

That figure isn’t a margin — it’s erosion of what the same nominal revenue buys. It stacks on top of whichever row above describes your barn. Change the inflation assumption and the number moves; the direction doesn’t.

Can Your Cost Structure Actually Dilute?

USDA ERS cost-of-production estimates — national averages by herd-size class — put 2,000-plus-cow operations near $19.14/cwt and the smallest herds near $42.70/cwt. Against $19.85 all-milk, the large operation sits roughly at breakeven on full economic cost. The small one isn’t in the conversation.

One caveat that should change how you use those numbers. ERS states its milk cost-of-production estimates from 2021 forward are built on 2021 ARMS survey data, updated only for annual price changes — not re-surveyed. Price-adjusted 2021 cost structures, national scope. Directionally useful. Don’t build a loan application on the decimals.

That spread is the consolidation mechanism in two numbers, alongside labor, succession, and capital access, which the spread doesn’t capture. ERS documents the direction: from 2002 to 2022, farms with fewer than 1,000 cows declined while farms with 1,000 or more grew 60%. It points at the assumption doing all the work in USDA’s 2030 model — cost dilution through scale. If your cost per cwt genuinely falls as you grow, the projection describes you. If it doesn’t, it describes somebody else’s farm.

The 30/90/365-Day Playbook for 400-Cow Herds Facing a Plant Announcement

30-Day Actions

  • Full economic breakeven audit. Calculate non-cash costs: unpaid family labor at a real wage, replacement-cost depreciation, current debt interest, and a return to management.
  • Trigger: if full cost exceeds $19.85/cwt, halt uncommitted expansion plans until your own data says otherwise.
  • Backfire risk: relying on cash-flow breakeven masks long-term equity depletion. You’ll clear a threshold you never cleared.
  • Base contract classification. Request written documentation on whether your cooperative operates a fixed or rolling base year, and what the formula is.
  • Core question for your field rep: “Does milk from added stalls settle into historical base, or excess pricing tiers?”
  • Backfire risk: a verbal “no cap” may be current policy rather than contract. Policy changes. Get the distinction on paper.

90-Day Actions

  • Dual-formula scenario modeling. Model herd returns under both primary base pool pricing and discounted over-base settlement. Requires the formula from your 30-day ask; if the co-op won’t commit it to writing, that silence is the answer.
  • Legal contract review. Review member agreements for volume penalty clauses, mandatory processing deducts, and exit penalties. Requires an hour with your lawyer, not your field rep.
  • Watch for: a clean contract protects you; it doesn’t pay you. Don’t mistake one for a margin.
  • Downside stress-testing. Model the barn addition against $18.15 Class IV and $17.25 Class III rather than optimistic price peaks.
  • Trigger: if the expansion only pencils on the optimistic forecast, it doesn’t pencil.

365-Day Moves

  • Scale dilution vs. margin defense. Expand only if marginal cost per hundredweight demonstrably decreases with added volume. Opportunity signal: full-cost breakeven below $19.40 and incremental base confirmed in writing means you have room the projection was actually built for. What per-cow overhead looks like at each size class is where that comparison starts.
  • Monitor co-op allocation releases. Track written growth-allowance amendments as regional processing plants complete commissioning through early 2028. A written offer is the signal. A groundbreaking photo isn’t.
  • Hold deliberately if the numbers say hold. Real risk, stated honestly: if access tightens and base gets allocated to whoever moved first, waiting carries a cost nobody can quantify right now because the data isn’t public. That’s an unknown, not a reason to move.

What Should a Canadian Producer Take From a US Buildout?

Different system, and the contrast is sharper than most cross-border comparisons.

Metric / MechanismUS Market (FMMO / Private Handlers)Canadian Supply Management (CDC / TPQ)
Pricing baselineMarket-derived; $19.85/cwt nominal forecast for 2026National Pricing Formula; +2.3255% effective Feb 1, 2026, COP + CPI indexed
Inflation protectionNo automatic indexing of the producer price. Nominal stagnation produces roughly $1.87/cwt of real decline by 2030Built-in formulaic cost-of-production and inflation adjustment
Volume allocationPrivate co-op base contracts; fixed or rolling, terms vary by cooperative and frequently aren’t publicStatutory quota via provincial boards. Nova Scotia’s TPQ regulations cap cumulative over-production at 10× daily TPQ
Expansion riskMilk from new barns can fall into excess/discounted pricing tiersVolume capped by quota availability; penalties published in advance

Those first two rows are the whole real-price problem in one frame. A Canadian producer’s price mechanism is designed to track inflation and cost of production. A US producer’s isn’t — FMMO class prices move off product markets, and while make allowances did get adjusted on plant-cost data in 2025, that adjustment cut against producers. Flat nominal all-milk through 2030 quietly becomes a $1.87/cwt real decline; a CDC-priced hectolitre doesn’t erode the same way.

What travels across the border is the allocation discipline. Same underlying question about who controls your volume — very different transparency about the answer. One system publishes its limits in regulation. The other keeps them in a contract you have to request.

Is Your Growth Room Already Allocated?

Not “is a plant coming.” That’s in every trade outlet this month.

The question is whether your cooperative’s base formula treats milk from future cows as base or as excess, and whether anything in writing commits incremental base to existing members. Land O’Lakes put its sequencing on paper in 2016. That proves such commitments can exist in documented form, which means asking for one isn’t unreasonable.

Eleven billion dollars of concrete is going up on Dykes’s stated confidence in long-term demand. USDA’s August revision is a bet that the margin won’t improve. Both can be true at once, and the projection can be internally sound while describing a farm that isn’t yours. You gain volume through scale, but you give up the option to walk away from a base agreement you signed at a different price.

So before the next conversation with your field rep: what does your cooperative’s base formula actually say about milk from cows you haven’t bought yet — and have you read it, or just been told about it?

Key Takeaways

  • If your full economic cost — unpaid labor, replacement-cost depreciation, real interest — lands above $19.85/cwt, treat every expansion conversation as negative-margin until your own numbers say otherwise.
  • Ask your co-op whether your base year is fixed or rolling, and get it in writing. Under a fixed base, milk from cows you haven’t bought yet ships as excess, at a discount.
  • USDA’s own baseline gets to 2030 on yield, not cows — up 5.9% per cow against 1.9% herd growth. The volume shows up whether or not you add a stall.
  • Flat nominal price isn’t flat. Hold $19.85 to 2030 and it’s $17.98 in today’s money — a $1.87/cwt haircut before any input outruns inflation.

Run Your Numbers

Dairy Profit Projector — This article says your full-cost breakeven decides everything. The projector calculates it from your own herd size, production, and ration, then shows margin per cwt against $19.85 milk. The sensitivity table stress-tests milk and corn moves before you commit capital.

Complete references and supporting documentation are available upon request by contacting the editorial team at editor@thebullvine.com.

Learn More

The Sunday Read Dairy Professionals Don’t Skip.

Every week, thousands of producers, breeders, and industry insiders open Bullvine Weekly for genetics insights, market shifts, and profit strategies they won’t find anywhere else. One email. Five minutes. Smarter decisions all week.

NewsSubscribe
First
Last
Consent

At $3,010 a Heifer, Your Worst Cow Just Got a Reprieve

Five cows on the cull list this morning. Run the retention math at $3,010 a springer, and three of them are worth more in the stall than any heifer you could buy.

Executive Summary: At $3,010 a head — USDA’s July 2025 average, with top springers past $4,000 — the cheapest cow on most operations is the one already standing in the stall. Run Overton’s net replacement cost formula, and a heifer moving from $1,500 to $3,500 pushes your cost from about $1.37 a day to $6.85 on the same animal in the same slot, because the denominator never changed; that extra $5.48 a day is what a marginal cow now has to beat before she earns a trip to the plant. CoBank’s June 2026 numbers explain why this isn’t a one-year problem: 796,000 head drained from the pipeline across 2025-2026, against a rebuild of just 360,200 by 2028. Here’s the part that stings — retention pay-off models accurately rank damaged cows, and with 30% of cows hit by clinical disease inside 21 DIM (Carvalho et al., via UW-Madison Extension), a lot of your “obvious culls” were made in the fresh pen, not born that way. Cows with one clinical event drop 750 to 800 pounds over the lactation; dry-period heat stress costs another 5 kg/day through the next one (Tao et al., 2011). Fix the transition inputs before you trust any cull ranking, and the four moves that matter most — fresh-cow ketone checks, RPO-ranked cull lists, a lower replacement-rate target, dry-pen cooling — need labor and attention, not capital. The counterweight: Swiss data across 29 farms shows over-retention costs about three times more than culling early, roughly 161 CHF per farm per month, so this isn’t permission to keep passengers.

replacement heifer cost

Picture a manager standing at the head of the fresh pen with a list of five second-lactation cows he’s ready to sell. Annoying cows. Cows he’s tired of looking at. Then, for the first time, he runs them through a retention pay-off calculator — and three of the five come back worth more in place than any heifer he could realistically buy.

That’s the moment the math changes. Not in a boardroom, not in a journal — at chore time, with a $3,500 replacement price tag turning a gut-feel call into something expensive to get wrong. This is a story about a number that used to be background noise and is now the loudest figure on the balance sheet. And about producers learning, sometimes reluctantly, that on the economics, the most profitable cow in the barn often isn’t the biggest milk check on the board.

What’s Really at Stake

Replacement heifers used to be the cheapest fix on the farm, and now they’re one of the most expensive decisions you’ll make all year. For years, keep-or-replace was easy because it was cheap. A springer ran around $1,200, so culling the bottom of the herd and slotting in a fresh face barely moved the needle. You didn’t need a model. You needed a cull truck and a phone number.

That world is gone. U.S. dairy replacement heifer inventory has fallen to its lowest level since 1978, and CoBank’s June 2026 Knowledge Exchange report projects supplies will keep shrinking — a combined 796,000 head drained from the pipeline across 2025 and 2026 — before a slow rebuild of about 360,200 head begins in 2027 and 2028. That rebuild is real but thin: roughly 3.75% of the herd against what the pipeline just lost. Average replacement prices hit $3,010 per head in USDA’s July 2025 Agricultural Prices data, and top springers in California and Minnesota auction barns have cleared $4,000.

Here’s why that reshuffles the whole decision. When a heifer was cheap, a marginal cow’s flaws were the only thing on the scale. Now there’s a $3,000-plus weight sitting on the other side. If you’re running 500 cows at a 35-38% replacement rate, this is your story whether you like it or not — that’s 175 to 190 head a year you’re either buying or growing, at a cost that’s tripled. The “just buy another heifer” reflex now carries a price that forces a harder question, one the best dairy systems in the world have been asking for years.

Why Dutch Herds Measure Value Per Cow Per Day

The Netherlands ranks its most profitable farms on value generated per cow per day of productive life — not peak milk, not herd average, but what she returns for every day she occupies a stall. It’s a deceptively simple metric, and it changes what “a good cow” means.

Look at what those top Dutch farms actually show. CRV’s milk-recording statistics for the 2022-2023 year put Dutch culled cows at an average of 2,255 days of age — just over six years — and 38,327 kilograms of lifetime milk. CRV has gone further and put a euro figure on it: extending lifespan by two years could mean 1,800 to 3,000 euros in additional lifetime margin per cow, depending on milk margin.

Now compare that to high-producing systems generally, where average productive lifespan still sits at roughly three to four years — a figure that’s barely budged despite decades of longevity research. The gap isn’t mostly genetic, though genetics carries its own quiet bill: rising Holstein inbreeding is already draining real money per cow, and two herds found different ways to stop that leak. The bigger gap is how the question gets asked. Dutch top farms ask, “How many euros does this cow deliver per day she stands in that stall?” Plenty of North American herds are still asking, “What’s my cull rate?”

It’s the difference between managing a percentage and managing a pipeline. One is a habit you inherited. The other is a strategy you choose. And the herds that chose it years ago are the ones least exposed to a $3,500 springer right now.

Inside the RPO Math: What Actually Moves the Needle

Retention pay-off math answers one question: does keeping this cow in this stall for another year beat replacing her? Crack open the calculation and it’s less intimidating than it sounds. It’s one question with receipts — do I make more from her, or from the heifer whose bill I’d be paying?

The concept traces to economic modeling by Dr. Victor Cabrera at the University of Wisconsin-Madison and Dr. Albert De Vries at the University of Florida. De Vries’s replacement-economics work framed the goal plainly: maximize the net return each stall — each “slot” — generates per year, not the milk any single cow gives today. The model’s job is to fill that slot with the cow that returns the most over time, not the one that looks best this Tuesday.

So what moves the needle? A handful of inputs do most of the work. The cow’s parity and where she sits on the lactation curve. Her pregnancy status — an open cow with three failed inseminations scores nothing like a confirmed pregnant one. Her current and expected milk yield. Then the price side: milk price, feed cost, cull cow value, and the big lever, replacement cost.

Most of us have seen this formula and never actually run it. Dr. Mike Overton, in his University of Guelph heifer-inventory work, boils net replacement cost down to one line you can write on a notepad:

Read that denominator again. When a heifer jumps from $1,500 to $3,500, it doesn’t change — she still takes the same number of days to grow up and produce. The numerator climbs hard. That single shift is what flips RPO from “always cull the bottom 30%” to “wait, this annoying second-calver might be the cheaper option.”

What That Looks Like in Dollars

Run Overton’s formula on a marginal cow. Say she’ll give you roughly 305 lactating days plus a 60-day dry period before her next decision point — call it 365 days in the slot. That denominator holds steady no matter what heifers cost.

InputAt $1,500 HeiferAt $3,500 Heifer
Replacement heifer cost$1,500$3,500
Net salvage value (cull cow)$1,000$1,000
Days in slot (denominator)365365
Net replacement cost/day$1.37$6.85
Marginal cow must earn/day to justify cullingLow bar$5.48 more

Now plug in real numbers. Take a net salvage value of around $1,000 for a cull cow.* At a $1,500 replacement, your net replacement cost runs about $1.37 per day. Push the heifer to $3,500 and the same cow in the same stall jumps to roughly $6.85 per day — about a fivefold increase. Nothing about the cow changed. The cost of getting rid of her did. That extra $5.48 a day is what a low-end cow now has to beat before she earns a one-way trip, and plenty of cows you’d have culled on reflex two years ago clear that bar easily.

And here’s the twist record cull prices add: USDA pegged combined cull cow values at $162/cwt in October 2025, so a heavy cull can now salvage $2,000 or more. When the cull check climbs that high, the salvage side of the formula gets large enough that selling a productive older cow later — instead of dumping her early into a soft decision — can pencil out even harder in her favor. The cull check is real money, but it’s a one-time event. Her future margin compounds every day she’s in the stall.

That’s the whole game in one line. A cow’s value to you isn’t fixed — it’s relative to what it costs to replace her. And right now, that cost is the highest it’s been in two generations. If you’ve ever watched what happens when a family actually runs the real math on their own operation, you know the number on the page usually isn’t the number in your head.

*Net of hauling and commission, and conservative against today’s market; run your own cull weight × current $/cwt to re-pencil for your barn.

The Blind Spot That Survives the Spreadsheet

Now the uncomfortable part. RPO is only as honest as the cow you hand it. And on most farms, that cow’s “true potential” got quietly shaved off months earlier — in the transition pen.

The transition period runs 60 days before calving through 30 days after, and University of Minnesota Extension is blunt about it: cows are at their greatest risk of disease and involuntary culling during this window. In a retrospective study of more than 5,000 cows by Carvalho et al., summarized by University of Wisconsin-Madison Extension, nearly 50% of cows experienced at least one clinical disease by 305 days in milk — 40% by 60 days, and 30% by just 21 days. Cows with one clinical disease lost roughly 750 to 800 pounds of milk over the lactation. Cows with multiple diseases lost about 1,550 pounds.

Subclinical ketosis tells the same story in miniature. A Canadian study (Duffield et al., Journal of Dairy Science) pegged the cost of an SCK case at about CAD $289, with prevalence of 15-30% common in many herds and roughly double the risk of early removal. University of Florida research (Tao et al., 2011) measured cows heat-stressed across the entire dry period producing about 5 kilograms per day less milk through the next lactation than cooled cows — milk you can’t claw back once she’s calved.

So here’s the line that stops people: RPO will happily tell you a cow is a bad bet — it just won’t tell you that you made her a bad bet at calving. Feed a damaged performance profile into the model and it calmly recommends replacing a cow who, managed properly, might have been one of your most profitable four-lactation animals. The math is complex. The fix is boring.

The Fix Is Boring. That’s the Point.

If half your fresh pen takes a transition hit, then half your RPO inputs are already corrupted. The model isn’t wrong — it’s ranking damaged cows accurately. It just can’t show you the cows you could have had. Which means the place to start fixing your cull list isn’t the cull list. It’s the feedbunk.

None of the Monday-morning moves require new capital. Check fresh cows for ketones in the first 7-14 days using a hand-held blood meter, treat the positives, and adjust the transition ration around body condition instead of habit. Don’t overstock the close-up and fresh pens — aim to keep cows lying 12 to 14 hours a day and out of the pen no more than three to three-and-a-half hours for milking and handling, because Miner Institute work ties each lost hour of lying time to 2 to 3.5 pounds of lost milk and more lameness. And hang fans and soakers in the dry pen, not just the milking string, because the heat stress you ignore in July shows up as lost milk and open cows next spring.

It doesn’t look like a longevity strategy. It looks like chores. But it’s the difference between an RPO score that reflects a cow’s real potential and one that reflects how badly she got managed in her first three weeks. At today’s heifer prices, that difference is no longer a rounding error — it’s the cost of a $3,500 springer you didn’t actually need to buy.

Four Paths That Don’t Need a Checkbook

None of these needs new capital. All of them need you to reorder what you pay attention to.

FixBest ForRisk If Done Wrong
Clean up transition inputsHerds with fresh-cow disease above 20% in first 21 DIMOne-time audit instead of daily routine
Make RPO the default cull list300+ cow herds with solid recordsData corrupted by untracked transition damage
Lower target replacement rate (39% → 35%)Herds rethinking beef-on-dairy/sexed-semen mixCutting heifer numbers before longevity actually improves
Hard-wire dry-pen heat abatementAny herd in a warm climateBackfires only through inaction — easiest to skip, easiest to regret

1. Clean Up the Transition Inputs

  • Best for: Herds where fresh-cow disease runs above the 20% benchmark in the first 21 days.
  • The action: Pull fresh-cow records this month; run daily fresh-cow checks and ketone testing.
  • The risk: Backfires if you treat it as a one-time audit instead of a hard-wired daily routine.

2. Make RPO the Default Cull List

  • Best for: 300-plus cow herds with decent records.
  • The action: Stop picking “the bottom 32%.” Rank cows by expected future margin and start at the bottom — with a bias to delay replacing low-value cows whose problem you’re actively fixing.
  • The risk: Backfires if the data feeding it is already corrupted by untracked transition damage.

3. Lower the Target Replacement Rate

  • Best for: Operations rethinking their sexed-semen and beef-on-dairy mix.
  • The action: Overton’s work shows dropping replacement rate from 39% to 35% keeps the average market cow about 100 days longer — build a multi-year youngstock plan to match.
  • The risk: Backfires if you cut heifer numbers before your longevity actually improves and you get caught short.

4. Hard-Wire Heat Abatement Into the Dry Pen

  • Best for: Any herd in a warm climate.
  • The action: Put fans and soakers in the close-up and fresh pens, not just the milking string — dry-period cooling protects the next lactation.
  • The risk: Backfires only through inaction; it’s the easiest investment to skip and the easiest to regret.

The forward signal worth watching: CoBank’s own numbers show the rebuild adding back just 360,200 head over 2027-2028 against 796,000 drained. The operations that come through intact won’t be the ones scrambling to source replacements. They’ll be the ones who don’t need as many — and in a decade where the honest question is who’s still milking at all, that distinction matters more than any single year’s cull rate.

Key Takeaways

  • If a heifer now costs $3,500 instead of $1,500, your net replacement cost per day roughly five-folds on the same animal in the same stall — which means cows you’d have culled on reflex two years ago may now pencil out as keepers.
  • If your fresh-cow disease rate is above 20% in the first 21 days, fix the transition pen before you trust any RPO ranking — you’re scoring damaged cows, not their real potential.
  • If you’re still managing to a cull percentage instead of value per cow per day, you’re using the metric many of the world’s most profitable herds have already moved past.
  • If you’re cooling only the milking string, you’re paying for dry-period heat stress next spring in lost milk and open cows — and you won’t see it coming on the spreadsheet.

Here’s the trap waiting for the producers who do everything right. You fix the math. You clean up the fresh pen. You rebuild the policy. And then you overcorrect — you start keeping cows for the wrong reasons, just with better vocabulary. The Swiss research warns about exactly this from the other direction: in a study of replacement decisions across 29 farms, losses from retaining unprofitable cows ran about three times higher than losses from culling too early, averaging 161 Swiss francs per farm per month. Sentiment is expensive. So the question isn’t whether you can keep cows longer — it’s whether you’ll know the difference between a cow that’s earning her stall and a passenger you’re keeping out of habit.

Which one is standing in your fresh pen right now?

Run Your Numbers

Bullvine Pipeline Index Calculator — Six numbers off your herd software scores your replacement pipeline 0-100 and flags whether it’s green, yellow, or already red. It weighs heifer supply, your actual replacement cost, cull rate, and sexed-versus-beef semen mix, then plots you against the national trend and CoBank’s 2027-2028 rebuild.

Complete references and supporting documentation are available upon request by contacting the editorial team at editor@thebullvine.com.

Learn More

The Sunday Read Dairy Professionals Don’t Skip.

Every week, thousands of producers, breeders, and industry insiders open Bullvine Weekly for genetics insights, market shifts, and profit strategies they won’t find anywhere else. One email. Five minutes. Smarter decisions all week.

NewsSubscribe
First
Last
Consent

The Fairlife Hackers Didn’t Need a Password. Anubis Leaked 1TB Anyway.

Coca-Cola refused to pay. Anubis published a terabyte anyway on July 27 — nine days after four US plants went dark. Your DairyComp goes down Monday, and 20 heats are gone by Wednesday.

EXECUTIVE SUMMARY: Anubis leaked a claimed 1TB of Fairlife data on July 27 after Coca-Cola refused to pay — the same day it finished recovering four US plants that had been down since July 16, which tells you backups fix downtime and nothing else. Security reporting points to CVE-2025-5777, “CitrixBleed 2,” a flaw that leaks live session tokens out of a Citrix appliance’s memory, so an attacker walks in as an already-logged-in user with no password to crack and no MFA prompt to answer. Nobody on the payroll had to click a thing, and the patch was free. Your DairyComp or PC-DART database, DelPro Remote, Lely T4C, and your daily co-op upload all live behind that same category of hardware — no vendor has disclosed a comparable flaw, but the connection type is identical. Price it on a 500-cow herd: 72 hours dark runs roughly $918–$982 in missed heats and re-keying using a deliberately low $1.50 per extra day open — below almost every published estimate — and $1,660–$2,590 once you load culling, with tighter repro herds losing more because more cows sit in the window. Dole booked $10.5M in direct costs in 2023 and JBS paid $11M in 2021, so the sector precedent is real even though Coca-Cola’s ransom figure was never disclosed. Two things before your next herd-check: turn on MFA anywhere an off-farm login runs on a password alone, and unplug one backup copy — then actually pull a file off it.

 Fairlife ransomware Anubis

Fairlife’s four US plants stopped running on July 16. Coca-Cola disclosed unauthorized third-party access to a portion of its systems, including production, and confirmed a ransomware event. Fairlife’s Canadian operations weren’t affected. The Anubis ransomware group listed Fairlife on its dark-web leak site on July 20, claiming it had locked servers and taken 1TB of confidential data, and gave the company a week. The deadline passed July 27 without payment. Anubis published the dataset.

One terabyte, now public. That volume is still the gang’s own claim — Coca-Cola hasn’t confirmed the amount or the contents, and Anubis never posted proof it was behind the breach.

Here’s the part worth your attention. Neither entry method researchers associate with this group requires an employee to click anything. The reported way in was a box on a rack. And boxes on racks are how your nutritionist pulls a ration, how your vet reviews a repro list from the truck, and how your herd data reaches your co-op.

The Reported Vector Is a Patching Story

Security reporting attributes the intrusion to CVE-2025-5777 — nicknamed “CitrixBleed 2,” a memory-read flaw in Citrix NetScaler ADC and Gateway appliances — and says Anubis went on to encrypt Fairlife’s Nutanix infrastructure. Coca-Cola hasn’t confirmed the vector publicly. Its own statement said the full scope, nature, and impacts were unknown.

The plain version of the flaw: an attacker sends a deliberately malformed request to a vulnerable box, and the box leaks live session tokens sitting in its memory. Those tokens are a hall pass belonging to somebody who already logged in properly. Replay the token, and you’re inside as a trusted user — no password to crack, no login screen, no second-factor prompt, because you never triggered the login.

Arctic Wolf’s research names two standard entry methods for this group: stolen VPN credentials, or CitrixBleed 2. Both are remote-access stories. Neither requires anybody on the payroll to do a single thing wrong.

And the fix for that particular flaw is free. Patch the appliance. Roger Grimes — the security veteran whose MFA numbers appear later in this piece — estimates better patching stops 20 to 40% of cybercrime, which is more than he credits MFA with. Every dollar figure below buys you something different: a smaller blast radius once somebody’s already inside. 

Why “Just Restore From Backup” May Not Save You

Anubis runs as ransomware-as-a-service. The core crew builds the tooling and rents it to affiliates who carry out the attacks — publicly active since roughly December 2024, rebranded from an earlier strain called Sphinx.

Double extortion is their baseline: encrypt the files, then publish whether or not anyone pays. Fairlife is now the textbook demonstration. The group offered to restore systems “within hours” if Coca-Cola paid — a sales pitch, not evidence. Coca-Cola declined, recovered production through its own procedures, and the data went out anyway.

But the feature that should change how you think about the external drive on your office shelf is an optional switch called /WIPEMODE. It permanently destroys file contents on top of encrypting them. Paying guarantees nothing. And a backup still plugged into your network when the attack runs can be destroyed alongside the original.

KPMG’s threat advisory documents the signature: files renamed with a .anubis extension, Volume Shadow Copies deleted through vssadmin before the ransom note ever appears. Prior confirmed victims span healthcare, construction, engineering, and hospitality across Australia, Canada, Peru, France, and the US. Fairlife is the most prominent victim publicly attributed to the group so far.

What Has a Food-Sector Attack Actually Cost?

While Anubis’s exact ransom figure remains undisclosed by either side, confirmed precedents demonstrate the scale involved when food supply chains freeze:

CompanyYearSectorDisclosed cost
Dole2023Produce/food processing$10.5 million in direct costs, including $4.8 million tied to continuing operations, after roughly half its legacy servers were hit
JBS2021Beef processing$11 million ransom paid in Bitcoin, even though most plants kept running

Neither figure predicts what Fairlife will report. Coca-Cola’s stated position in late July was that it doesn’t expect a material financial impact. The company reports quarterly, so any restated figure surfaces on its normal reporting calendar rather than in a press release. What was actually in that terabyte — customer records, employee files, supplier contracts, production specs — Coca-Cola still hasn’t said.

What Would Three Days Without Your Herd Software Cost You?

Here’s where a processor story becomes a barn story. Run it on a 500-cow herd: your DairyComp or PC-DART database goes unreachable Monday morning and stays down through Wednesday.

Semen is the cheap part. The expensive part is what a missed heat does downstream — those cows sit another 21 days before the next shot at them.

Now, what’s a day open actually worth? The published estimates don’t agree, and anyone who tells you there’s one number hasn’t read the literature. Plaizier’s review spanned −$0.29 to $2.60 per extra day open, with his own estimate landing near $3.36; French and Nebel modeled $0.42 at 100 days open climbing to $4.95 at 175 days open. De Vries’s separate work on pregnancy economics puts the average value of a new pregnancy at $278 and the average cost of a pregnancy loss at $555. 

We’re running $1.50 below. That sits under almost every published estimate on purpose — a conservative number you can’t argue with beats an aggressive one you can.

📊 Financial Breakdown: The 72-Hour Blackout on a 500-Cow Herd

Assumptions: 200 cows past voluntary waiting period (VWP) · 70% baseline detection rate, the floor for well-managed herds per AHDB and NADIS benchmarking · $1.50 per extra day open — our deliberately low anchor, below the published range, culling costs excluded · Assumes detection drops to zero without the due-list, so a crew catching heats visually will do better · 72 hours is under one full cycle, so no cow gets missed twice

  • Cows cycling in the window: 200 cows past VWP ÷ 21-day cycle × 3 days = ~28.6 cows
  • Missed heat loss: 28.6 × 70% detection = 20 heats you’d normally catch. Assume the database going down drops detection to zero on those cows: 20 × 21 extra days open × $1.50/day = $630. If your crew still catches a third of them on paper, it’s closer to $315.
  • Reconstruction labor: two days of somebody’s time (~16 hours, author estimate) @ $18–22/hr Cornell priced farm labor = $288–$352
  • Conservative total outage cost: $918–$982
  • Culling-inclusive model (NZ analysis, $3.19–$5.41/day open): $1,660–$2,590

The NZ figure uses a different currency and production system — directional only. Run $3.36 or $4.95 through the same arithmetic and the number climbs fast. Swap your own inputs through the days-open calculator.

What this model leaves out: delayed treatment calls, missed dry-off dates, and the milk-check reconciliation you can’t run against your own figures. It prices lost heats and re-keying. Nothing else.

Push the day-open cost into that culling-inclusive range and the same outage runs $1,660 to $2,590. Note what the spread tells you: a herd running a tight 21-day pregnancy rate loses more than a herd already carrying a long calving interval. That’s not a rounding difference. That’s the whole point of running it yourself.

Which of Your Systems Sit on That Same Kind of Connection?

Before the table: this is not a list of vulnerable products. No herd-software vendor — not VAS, not Lely, not DeLaval — has disclosed a flaw comparable to CitrixBleed 2, and no herd-management platform has been named as breached in this incident or any other. What follows maps where off-farm connections exist on a typical operation. Appearing on it reflects normal connected-system design, not a known weakness in any product.

SystemWhat it touchesWhere the off-farm connection lives
DairyComp 305 (VAS)Herd database, repro, production recordsRemote access and mobile sync create an external door by design
Lely T4CAstronaut robots, feeders, one shared networkLely publishes its own cybersecurity guidance precisely because the platform is network-connected
DeLaval DelPro / DelPro RemoteMilking data, off-farm accessDeLaval describes DelPro Remote as preconfigured network equipment with a built-in security package — a vendor-managed appliance sitting between your network and the outside world, the general category where the Fairlife flaw was found
PC-DART / BoviSyncDHI records, breeding decisionsSyncs outward to processors and DHIA
Milk-processor uploadsDaily production and component data pushed to your co-opA direct pipeline between farm and processor systems — the connection type that made Fairlife a supply-chain event
Sensor arraysRFID, activity monitors, parlor controlsOften bridged onto the office LAN unless somebody deliberately separated them — worth checking rather than assuming either way

Not a vulnerability list. No vendor named above has disclosed a flaw comparable to CitrixBleed 2.

The honest wrinkle: a vendor-managed remote-access box may well get patched faster than one you maintain yourself. Nobody outside your operation can tell you which situation you’re in. That’s why the last path below is a phone call, not a purchase.

Options and Trade-Offs for Farmers

Path 1: Enforce Multi-Factor Authentication (MFA)

  • Goal: Complete within 30 days.
  • Scope: Email, VPN, DelPro Remote, herd-management accounts, co-op portals.
  • A correction we owe you: In Part 1 we passed along CISA’s claim that MFA makes you 99% less likely to get hacked. That number doesn’t hold up, and we shouldn’t have repeated it without checking. 
  • The reality check: Roger A. Grimes, a 38-year security veteran and CISO advisor at KnowBe4, told Cybersecurity Ventures in February 2023 that MFA stops 30–50% of credential attacks — and that the 99% figure “is not true and never will be”. Grimes has also noted that 90–95% of MFA implementations can be bypassed with a well-built phishing email. Turn it on anyway. A third to a half of credential attacks is still the cheapest risk reduction available to you. 
  • What it won’t do: Stop a CitrixBleed 2 session-token replay. A stolen token skips the login entirely. This eliminates the low-hanging fruit, not the exploit that hit Fairlife.
  • Cost: $0 on systems you already pay for, up to $3–$15 per user per month for a paid tool plus a few hours of setup.
  • The friction: One hour of work, and complaints from whoever now types a code.

Path 2: Air-Gap One Backup (3-2-1 Rule)

  • Goal: Complete this month.
  • Action: 3 copies of your data, 2 different media types, 1 fully unplugged from any network.
  • Why it matters: Direct defense against Anubis’s /WIPEMODE switch, which permanently destroys file contents rather than just encrypting them.
  • Crucial step: Run a test restore onto a secondary laptop. An unverified backup is a hope with a schedule attached.
  • The limit: It protects your data, not your uptime — and nothing about a leak. Coca-Cola recovered production through its own procedures and still had files published.

Path 3: Segment Parlor Networks from Office Computers

  • Goal: Quarantine IT from OT (operational technology).
  • Action: Make sure the office laptop checking email cannot speak to your robotic milkers, feeders, or activity collars on a flat network.
  • What it won’t do: Stop a token-replay exploit. Patching would have, for free — and on Grimes’s own numbers, patching outperforms MFA. Segmentation buys containment, not prevention. 
  • Estimated investment: $2,000–$4,000 for a robotics or automated-feeding setup, from our earlier cybersecurity reporting drawn from composite accounts across multiple operations. Treat it as a benchmark, not a quote.
  • The basics, from the people who publish them: Penn State Extension’s farm cybersecurity guidance covers employee training, password management, timely software updates, phishing awareness, and regular backups. The 72-hour continuity plan and the 30–45 days of cash or credit for feed and payroll come from our own earlier reporting rather than from Extension directly — flagging that so you know which is which.
  • When to skip it: Two computers and a wall-mounted tablet don’t need segmentation.

Path 4: Ask Your Vendor Who Patches the Box

  • Goal: One phone call, no purchase.
  • The question: Who applies security patches to our connected gateway, on what schedule, and how would we find out if it were compromised?
  • Why this is the same fight: Deere spent years insisting owners didn’t hold rights to the software running their machines. It took an FTC settlement in July 2026 — plus 10 years of compliance oversight — to force diagnostic tools out to independent shops. Same argument as the tractor in your yard.
  • The signal to watch: Whether any herd-software vendor issues a security advisory in the wake of Fairlife. None has. If one does, this stopped being a processor story.
DefenseCostTimelineStops CitrixBleed-style token replay?
Enable MFA$0–$15/user/month30 daysNo — token replay skips login entirely
Air-gap one backup (3-2-1 rule)Minimal (existing drive)This monthNo — protects data, not disclosure
Segment parlor/office networks$2,000–$4,000Varies by setupNo — containment only, not prevention
Ask vendor who patches the box$0 (one phone call)ImmediateYes, if patch cadence is confirmed fast

Key Takeaways

  • If any account on your farm can be reached from off-farm with a password alone, turn on MFA before your next herd-check. It’s 30–50%, not 99% — and it still costs nothing on most systems you already pay for. 
  • If your appliance patching is behind, fix that first. Grimes puts patching at 20–40% of cybercrime stopped, ahead of MFA, and the CitrixBleed 2 patch was free. 
  • If you can’t remember your last successful restore test, treat that backup as unverified until you’ve pulled an actual file off it.
  • If you think good backups make you leak-proof, look again at Fairlife. Coca-Cola restored production, and the terabyte went public anyway. Backups fix downtime, not disclosure.
  • If your repro program is tight — service rate above 55%, conception above 32% — your outage cost runs higher than a herd carrying a long interval, because more cows sit in the window to lose.
  • If you want a number you can defend at the kitchen table, don’t use ours. The published cost of a day open runs from under a dollar to nearly $5 depending on days open and milk price. Ours is deliberately low. 
  • If your AMS, milk meters, and office computer share one flat network, get a segmentation quote and judge it against three days of lost records, not against the quote in isolation.
  • If a vendor manages your remote-access hardware, you don’t set the patch schedule. Find out who does and how fast they move.
  • If you’ve never written down what you’d do in the first 72 hours of an outage, that’s the cheapest gap on this list to close — University of Maryland Extension publishes a free farm business continuity template covering prevention, response, and recovery, and there’s a farm-specific cyber continuity guide that does the same. 
  • If somebody tells you paying fixes it, weigh Coca-Cola’s refusal against the $11 million JBS paid in 2021 while most of its plants kept running anyway. Neither is clean, and a /WIPEMODE victim who pays may get nothing back.

Coca-Cola has a security team, a legal department, and an incident-response retainer on standby. It still stopped production at four plants over a flaw in a piece of network hardware — and the patch for that flaw was free. So the question isn’t whether your operation is worth attacking. It’s whether you could name, right now, every device on your farm that something outside your fenceline can reach. Most producers get to three and go quiet. Where do you land?

Still unresolved: the ransom figure, what specifically was in the published dataset, how long production was actually down, and whether the National Milk Producers Federation or Cornell PRO-DAIRY will say anything on the record. Nobody has yet. The full outage model — sensitivity-tested across detection rates, days open, and herd size so you can run your own numbers instead of ours — is what we’re building next for the Bullvine Weekly.

📝 The 10-Minute Security Audit Checklist

  • [ ] Audit user access: Delete retired employees, former herd managers, or equipment reps granted access years ago.
  • [ ] Verify restore ability: Extract a single file from last week’s backup onto an offline machine. Did it work, or did the job just run?
  • [ ] Isolate remote login: Check whether any off-farm login relies solely on a single shared password — especially one also used for email.
  • [ ] Confirm appliance patching: Call your hardware or software vendor and ask: “Who applies security patches to our connected gateway, and how are we notified of vulnerabilities?”

Bullvine Tool: 72-Hour Outage Risk Calculator

Estimate what 3 days without your herd database or parlor network costs your operation.

Estimated 72-Hour Outage Impact

Cows Cycling in 3-Day Window: 28.6 cows
Missed Heat Financial Drag: $630.00
Reconstruction Labor Cost (16 hrs): $320.00

Total Direct Outage Cost: $950.00

*Calculations based on 21-day heat cycles, 16 hours of whiteboard reconstruction labor, and selected day-open economic benchmarks.

This article reflects public reporting and disclosures available as of July 30, 2026. Coca-Cola has not publicly confirmed the attack vector, the volume of data taken, its contents, or the duration of production downtime. Fairlife, Coca-Cola, and DeLaval had not issued public comment beyond the disclosures cited here as of publication. Correction: an earlier version of our July 18 coverage repeated CISA’s claim that MFA makes users 99% less likely to be hacked; that figure is disputed and has been corrected here.

Learn More

The Sunday Read Dairy Professionals Don’t Skip.

Every week, thousands of producers, breeders, and industry insiders open Bullvine Weekly for genetics insights, market shifts, and profit strategies they won’t find anywhere else. One email. Five minutes. Smarter decisions all week.

NewsSubscribe
First
Last
Consent
Send this to a friend