










Five cows on the cull list this morning. Run the retention math at $3,010 a springer, and three of them are worth more in the stall than any heifer you could buy.
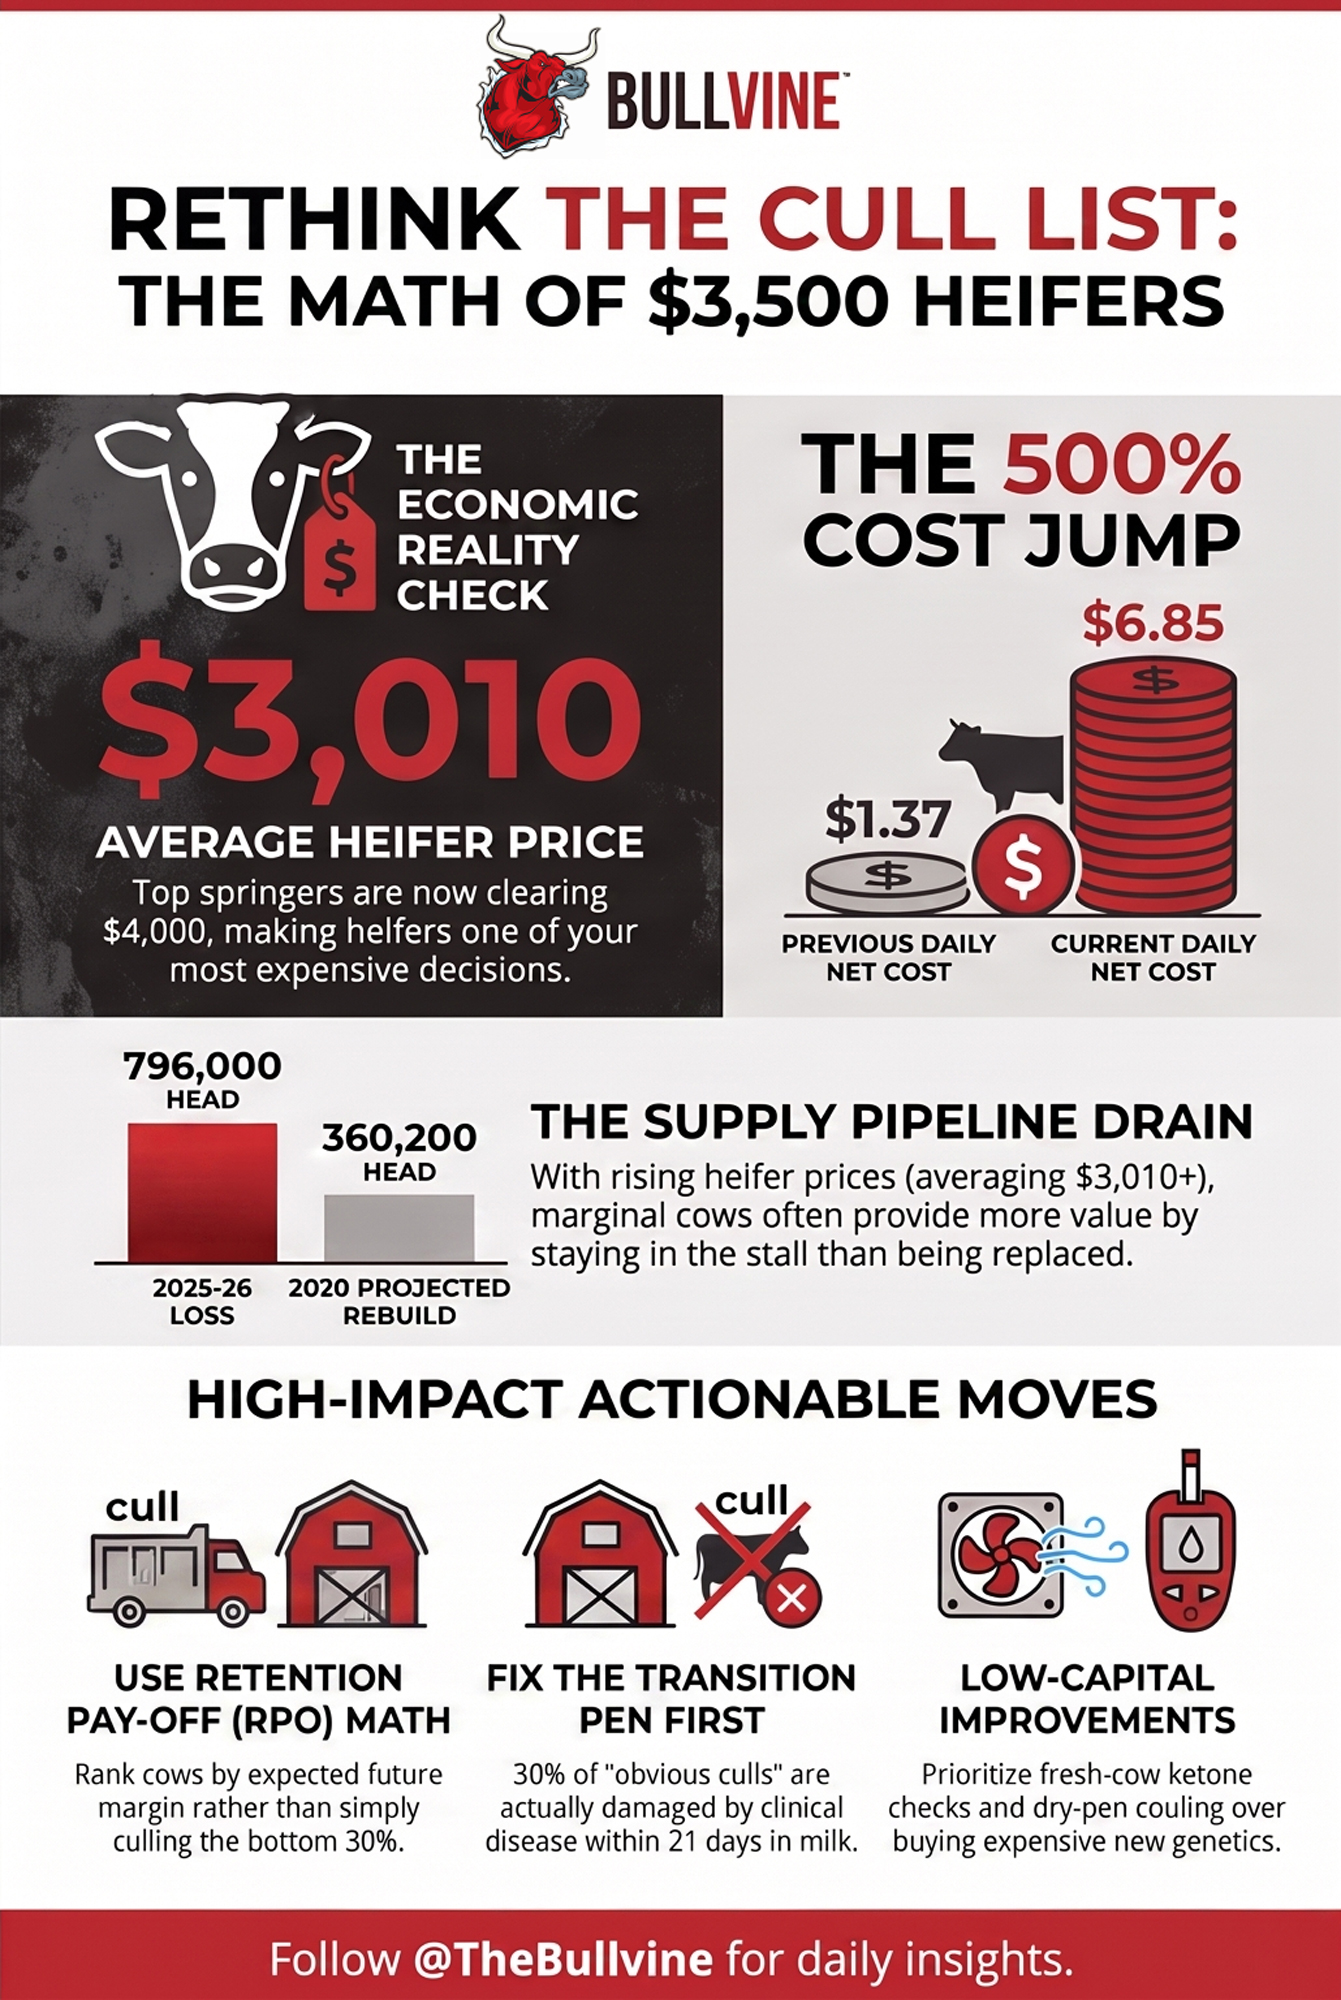
Executive Summary: At $3,010 a head — USDA’s July 2025 average, with top springers past $4,000 — the cheapest cow on most operations is the one already standing in the stall. Run Overton’s net replacement cost formula, and a heifer moving from $1,500 to $3,500 pushes your cost from about $1.37 a day to $6.85 on the same animal in the same slot, because the denominator never changed; that extra $5.48 a day is what a marginal cow now has to beat before she earns a trip to the plant. CoBank’s June 2026 numbers explain why this isn’t a one-year problem: 796,000 head drained from the pipeline across 2025-2026, against a rebuild of just 360,200 by 2028. Here’s the part that stings — retention pay-off models accurately rank damaged cows, and with 30% of cows hit by clinical disease inside 21 DIM (Carvalho et al., via UW-Madison Extension), a lot of your “obvious culls” were made in the fresh pen, not born that way. Cows with one clinical event drop 750 to 800 pounds over the lactation; dry-period heat stress costs another 5 kg/day through the next one (Tao et al., 2011). Fix the transition inputs before you trust any cull ranking, and the four moves that matter most — fresh-cow ketone checks, RPO-ranked cull lists, a lower replacement-rate target, dry-pen cooling — need labor and attention, not capital. The counterweight: Swiss data across 29 farms shows over-retention costs about three times more than culling early, roughly 161 CHF per farm per month, so this isn’t permission to keep passengers.
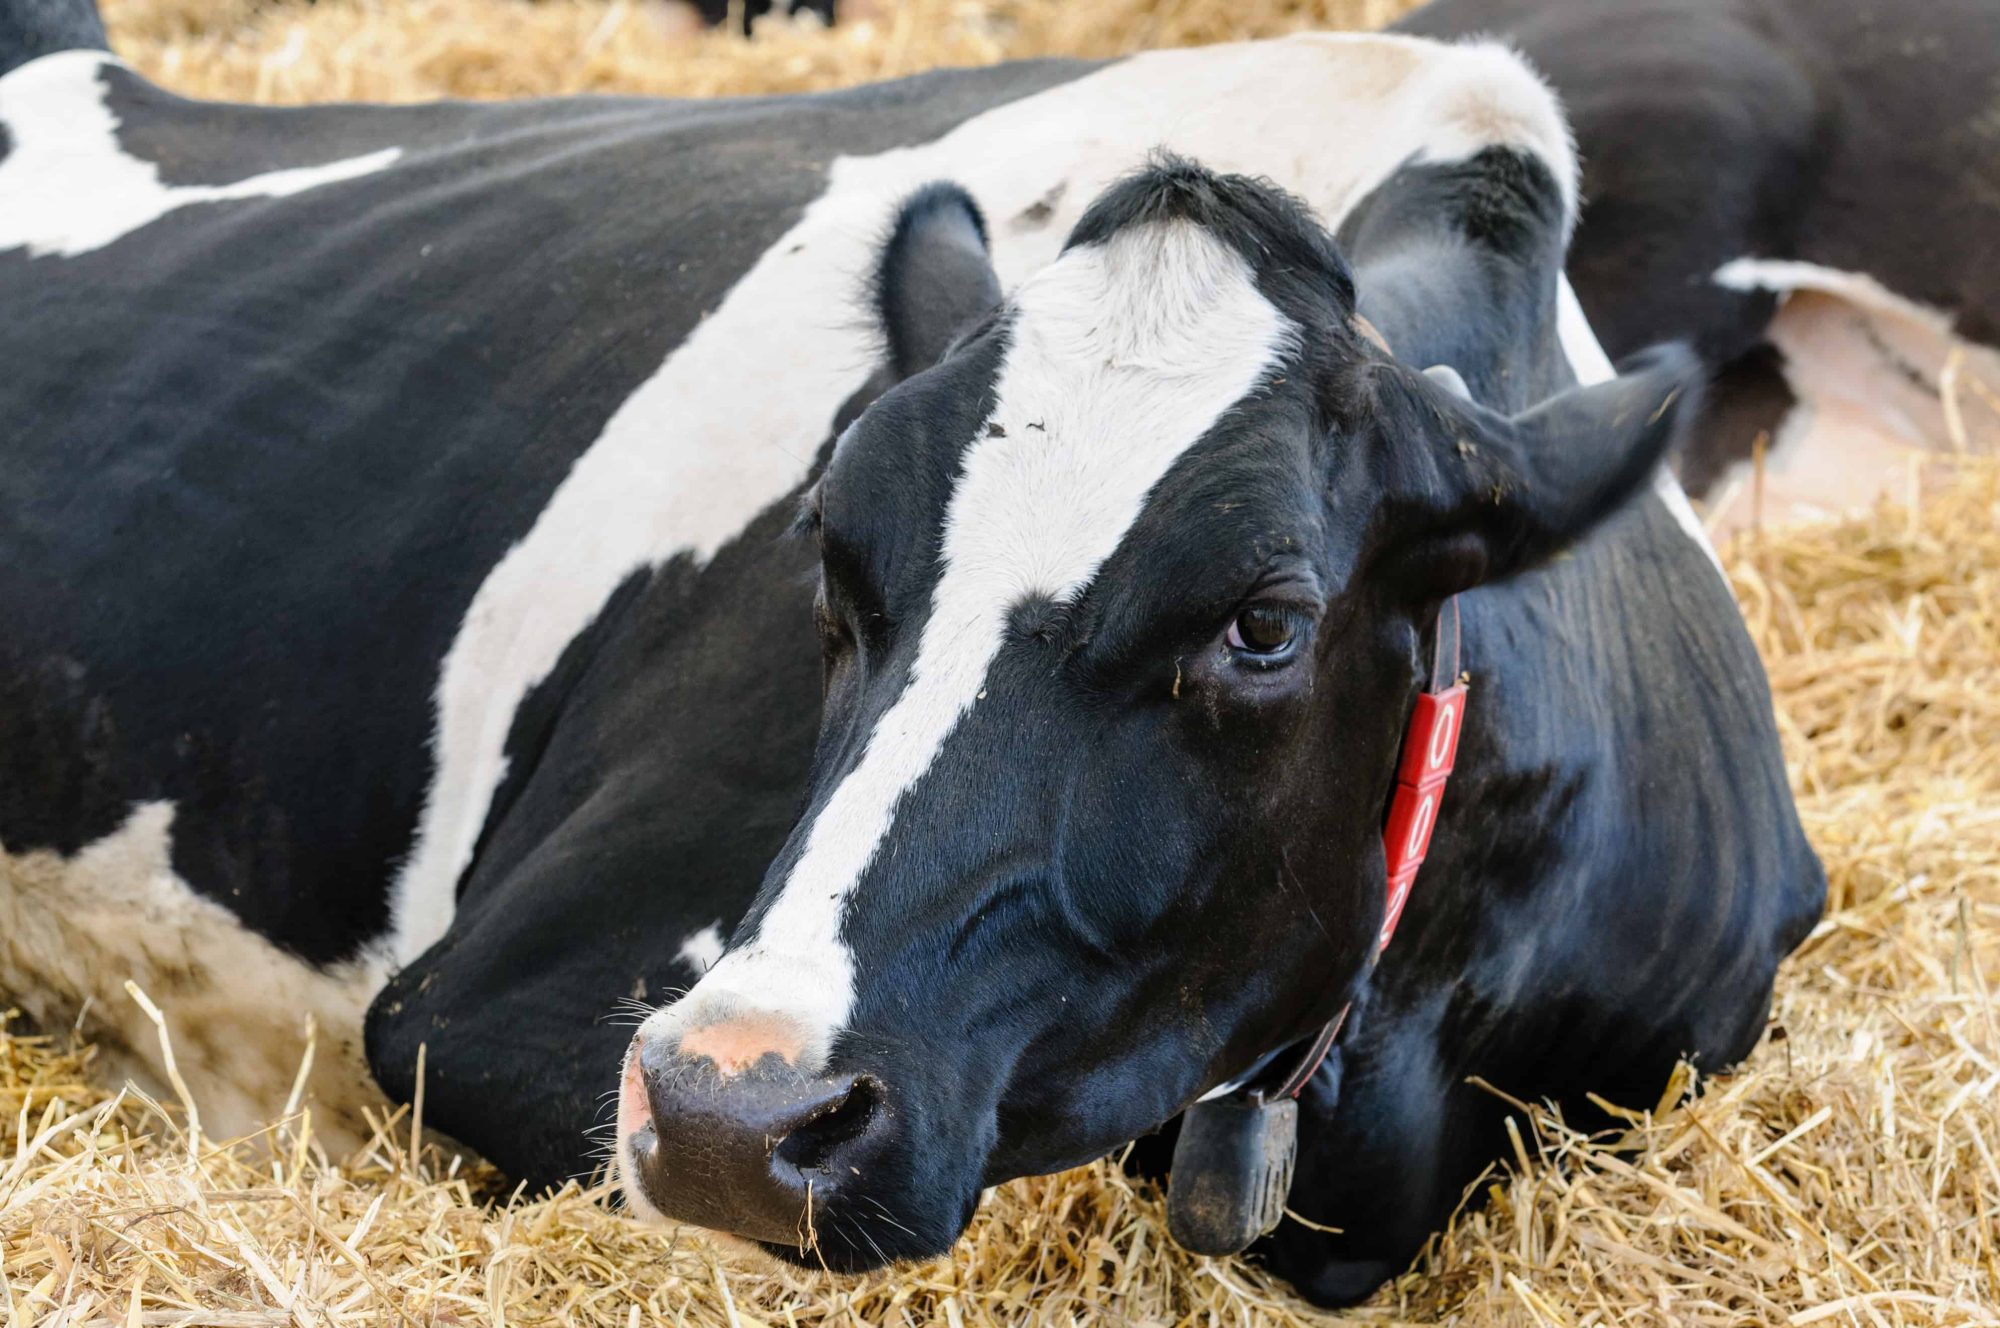
Picture a manager standing at the head of the fresh pen with a list of five second-lactation cows he’s ready to sell. Annoying cows. Cows he’s tired of looking at. Then, for the first time, he runs them through a retention pay-off calculator — and three of the five come back worth more in place than any heifer he could realistically buy.
That’s the moment the math changes. Not in a boardroom, not in a journal — at chore time, with a $3,500 replacement price tag turning a gut-feel call into something expensive to get wrong. This is a story about a number that used to be background noise and is now the loudest figure on the balance sheet. And about producers learning, sometimes reluctantly, that on the economics, the most profitable cow in the barn often isn’t the biggest milk check on the board.
What’s Really at Stake
Replacement heifers used to be the cheapest fix on the farm, and now they’re one of the most expensive decisions you’ll make all year. For years, keep-or-replace was easy because it was cheap. A springer ran around $1,200, so culling the bottom of the herd and slotting in a fresh face barely moved the needle. You didn’t need a model. You needed a cull truck and a phone number.
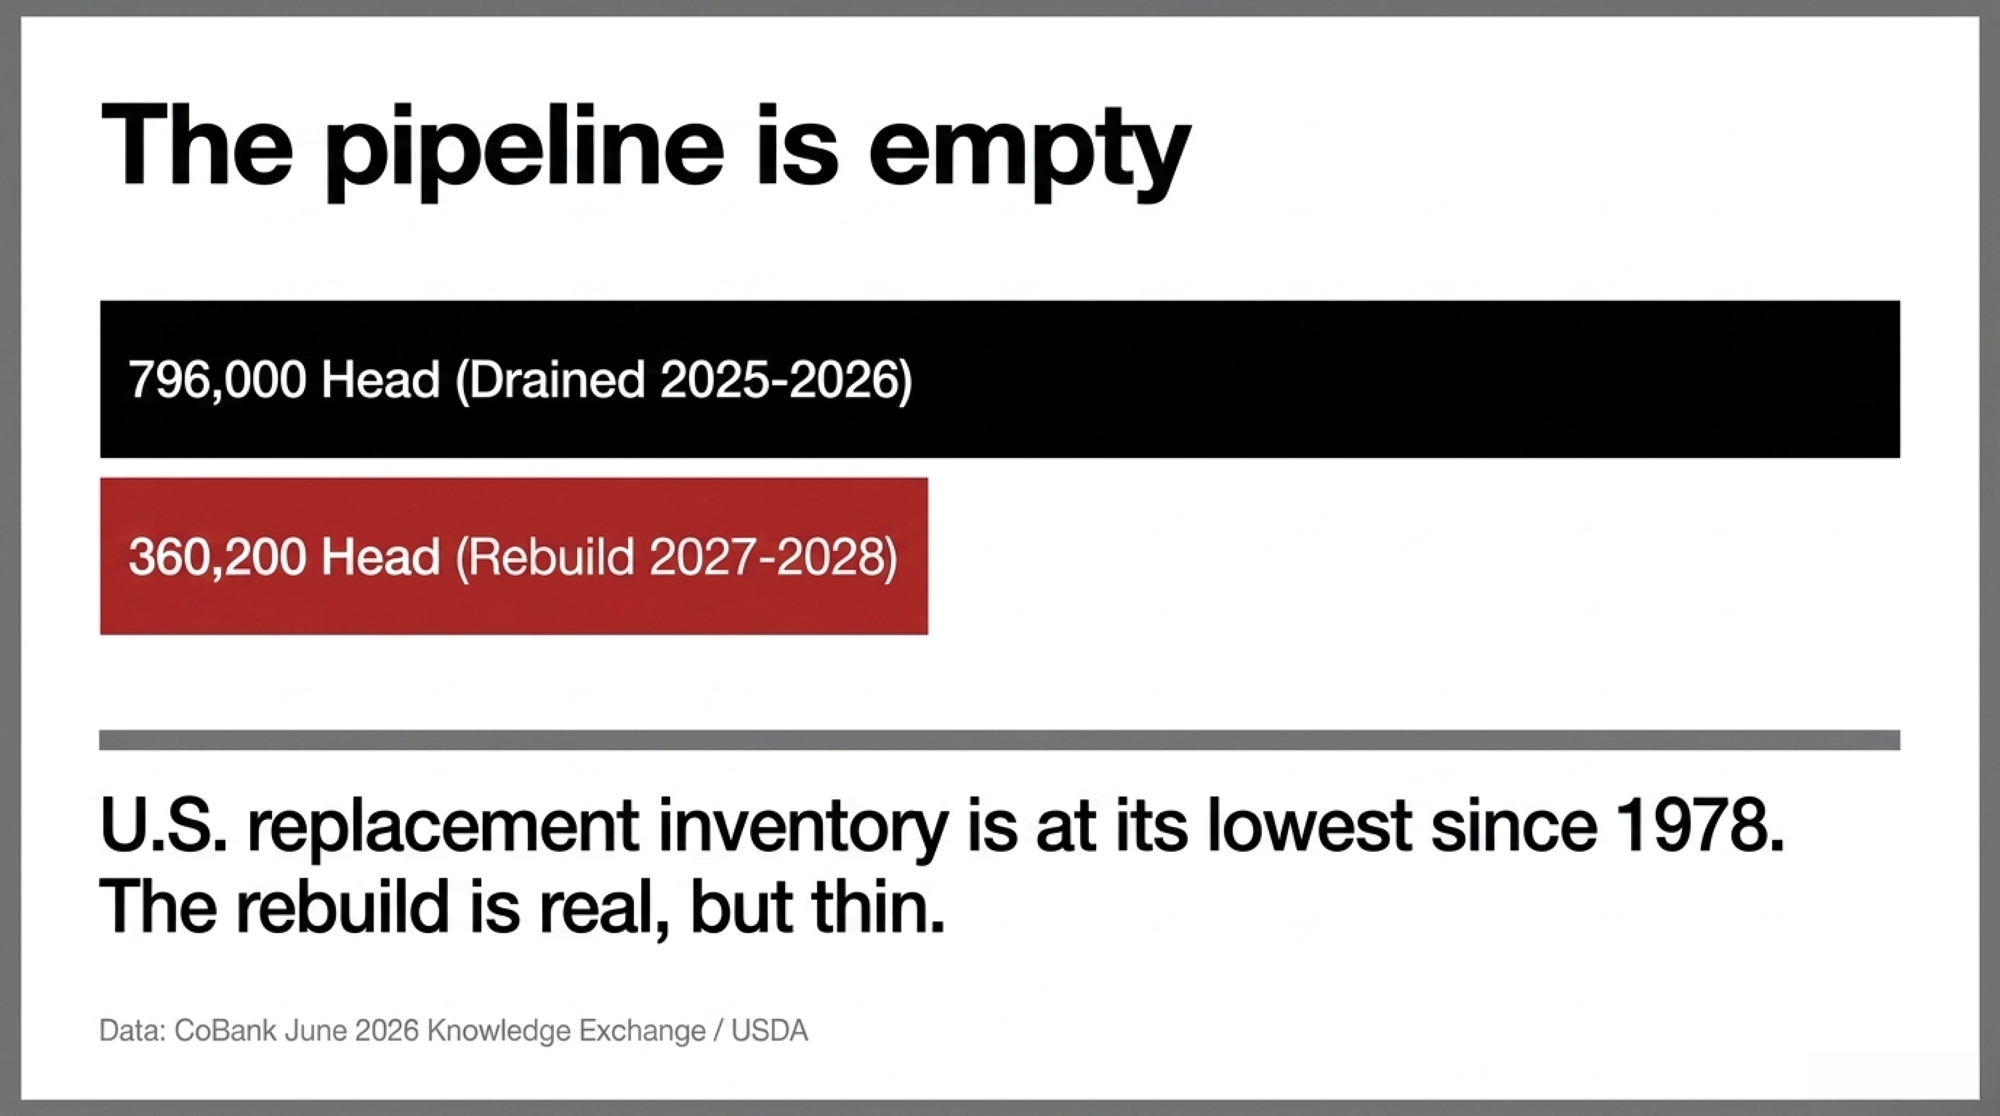
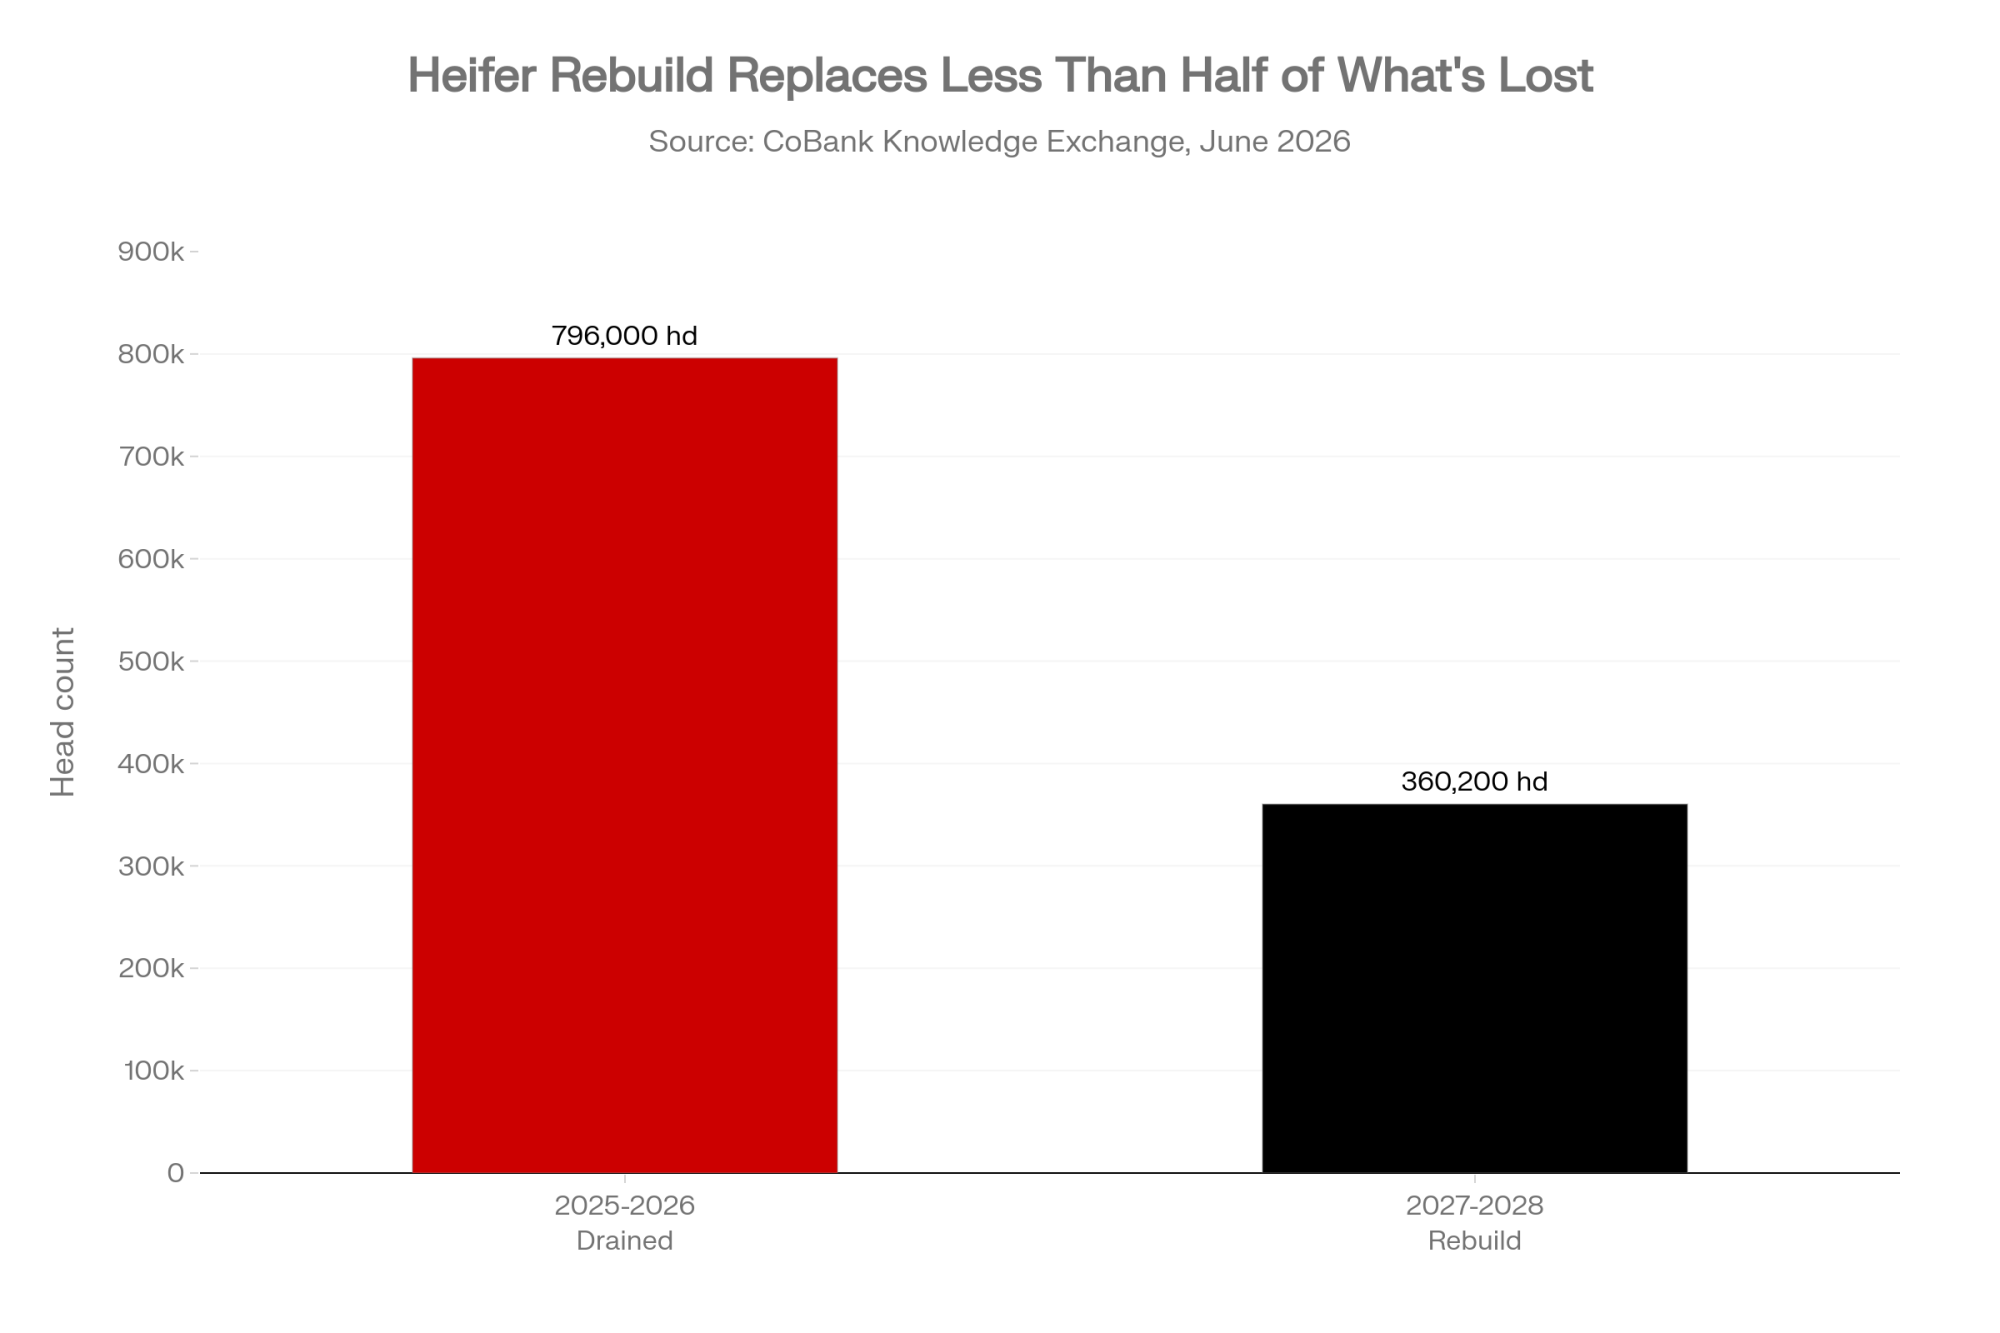
That world is gone. U.S. dairy replacement heifer inventory has fallen to its lowest level since 1978, and CoBank’s June 2026 Knowledge Exchange report projects supplies will keep shrinking — a combined 796,000 head drained from the pipeline across 2025 and 2026 — before a slow rebuild of about 360,200 head begins in 2027 and 2028. That rebuild is real but thin: roughly 3.75% of the herd against what the pipeline just lost. Average replacement prices hit $3,010 per head in USDA’s July 2025 Agricultural Prices data, and top springers in California and Minnesota auction barns have cleared $4,000.
Here’s why that reshuffles the whole decision. When a heifer was cheap, a marginal cow’s flaws were the only thing on the scale. Now there’s a $3,000-plus weight sitting on the other side. If you’re running 500 cows at a 35-38% replacement rate, this is your story whether you like it or not — that’s 175 to 190 head a year you’re either buying or growing, at a cost that’s tripled. The “just buy another heifer” reflex now carries a price that forces a harder question, one the best dairy systems in the world have been asking for years.
Why Dutch Herds Measure Value Per Cow Per Day
The Netherlands ranks its most profitable farms on value generated per cow per day of productive life — not peak milk, not herd average, but what she returns for every day she occupies a stall. It’s a deceptively simple metric, and it changes what “a good cow” means.
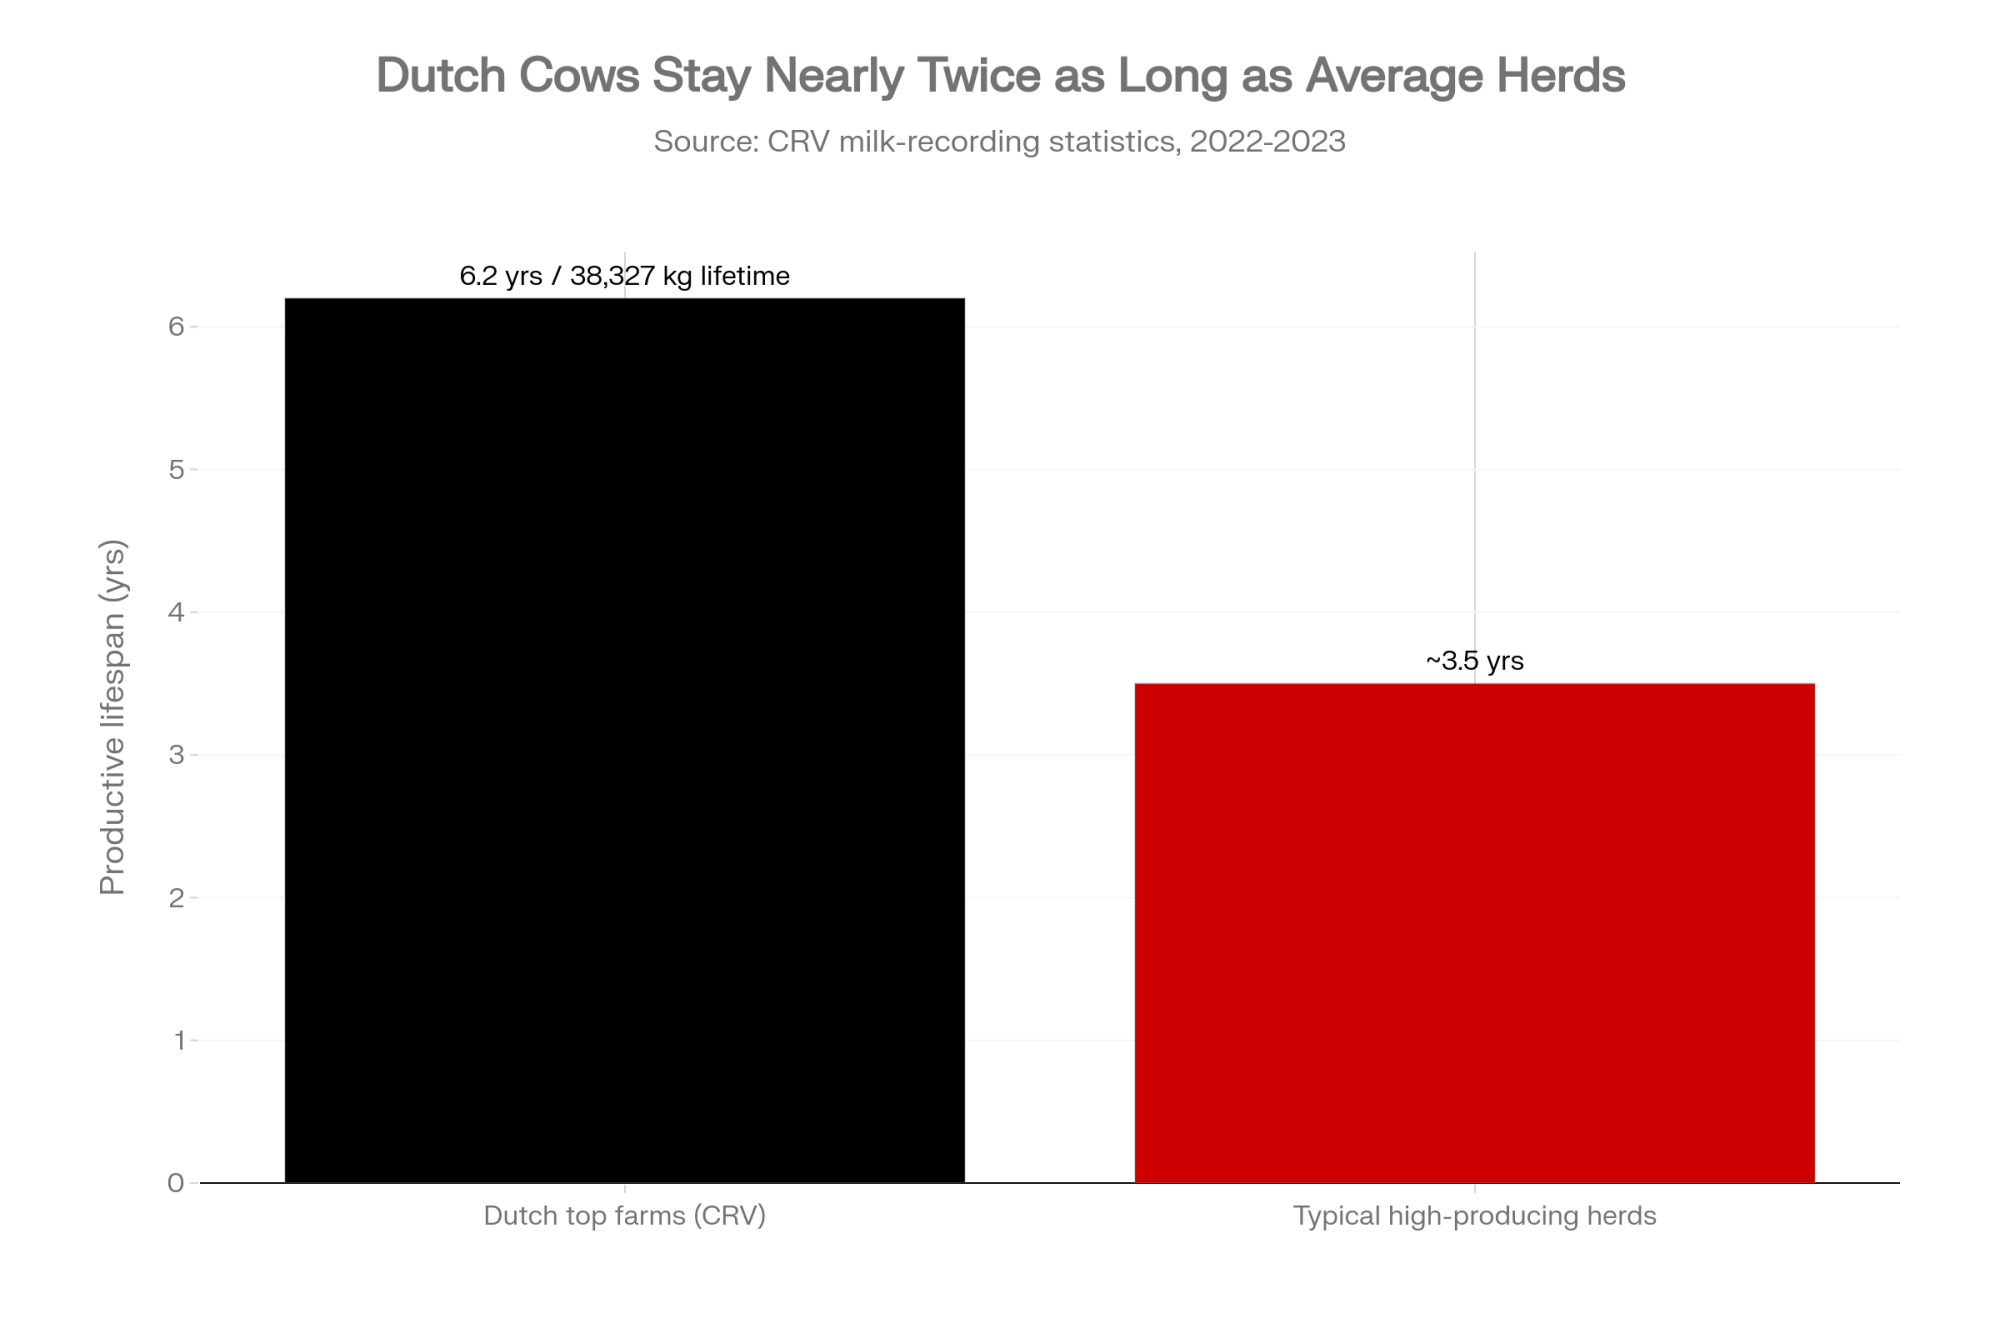
Look at what those top Dutch farms actually show. CRV’s milk-recording statistics for the 2022-2023 year put Dutch culled cows at an average of 2,255 days of age — just over six years — and 38,327 kilograms of lifetime milk. CRV has gone further and put a euro figure on it: extending lifespan by two years could mean 1,800 to 3,000 euros in additional lifetime margin per cow, depending on milk margin.
Now compare that to high-producing systems generally, where average productive lifespan still sits at roughly three to four years — a figure that’s barely budged despite decades of longevity research. The gap isn’t mostly genetic, though genetics carries its own quiet bill: rising Holstein inbreeding is already draining real money per cow, and two herds found different ways to stop that leak. The bigger gap is how the question gets asked. Dutch top farms ask, “How many euros does this cow deliver per day she stands in that stall?” Plenty of North American herds are still asking, “What’s my cull rate?”
It’s the difference between managing a percentage and managing a pipeline. One is a habit you inherited. The other is a strategy you choose. And the herds that chose it years ago are the ones least exposed to a $3,500 springer right now.
Inside the RPO Math: What Actually Moves the Needle
Retention pay-off math answers one question: does keeping this cow in this stall for another year beat replacing her? Crack open the calculation and it’s less intimidating than it sounds. It’s one question with receipts — do I make more from her, or from the heifer whose bill I’d be paying?
The concept traces to economic modeling by Dr. Victor Cabrera at the University of Wisconsin-Madison and Dr. Albert De Vries at the University of Florida. De Vries’s replacement-economics work framed the goal plainly: maximize the net return each stall — each “slot” — generates per year, not the milk any single cow gives today. The model’s job is to fill that slot with the cow that returns the most over time, not the one that looks best this Tuesday.
So what moves the needle? A handful of inputs do most of the work. The cow’s parity and where she sits on the lactation curve. Her pregnancy status — an open cow with three failed inseminations scores nothing like a confirmed pregnant one. Her current and expected milk yield. Then the price side: milk price, feed cost, cull cow value, and the big lever, replacement cost.
Most of us have seen this formula and never actually run it. Dr. Mike Overton, in his University of Guelph heifer-inventory work, boils net replacement cost down to one line you can write on a notepad:

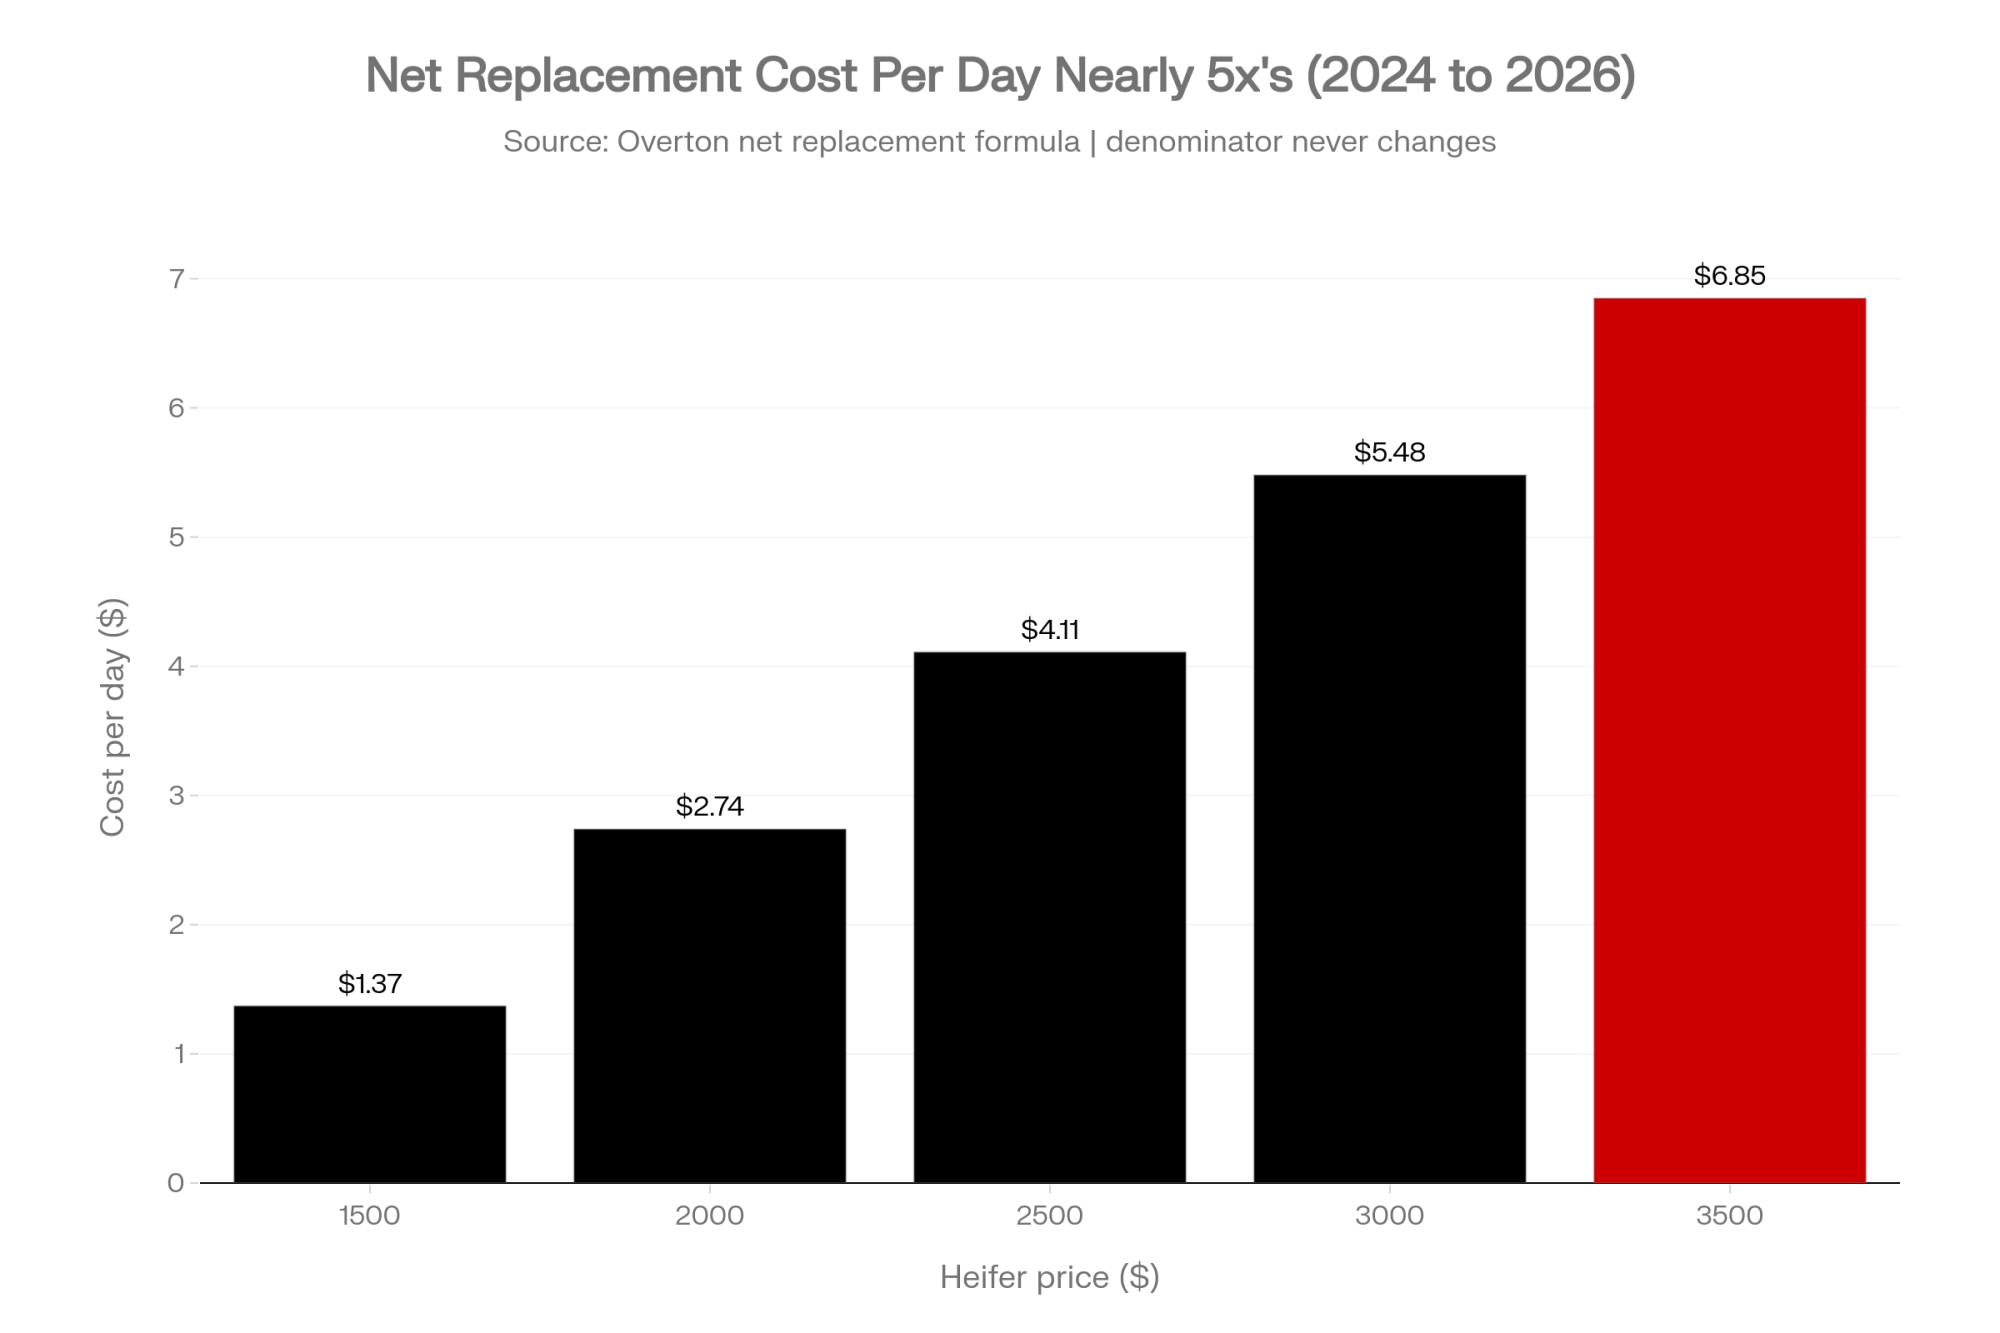
Read that denominator again. When a heifer jumps from $1,500 to $3,500, it doesn’t change — she still takes the same number of days to grow up and produce. The numerator climbs hard. That single shift is what flips RPO from “always cull the bottom 30%” to “wait, this annoying second-calver might be the cheaper option.”
What That Looks Like in Dollars
Run Overton’s formula on a marginal cow. Say she’ll give you roughly 305 lactating days plus a 60-day dry period before her next decision point — call it 365 days in the slot. That denominator holds steady no matter what heifers cost.
| Input | At $1,500 Heifer | At $3,500 Heifer |
|---|---|---|
| Replacement heifer cost | $1,500 | $3,500 |
| Net salvage value (cull cow) | $1,000 | $1,000 |
| Days in slot (denominator) | 365 | 365 |
| Net replacement cost/day | $1.37 | $6.85 |
| Marginal cow must earn/day to justify culling | Low bar | $5.48 more |
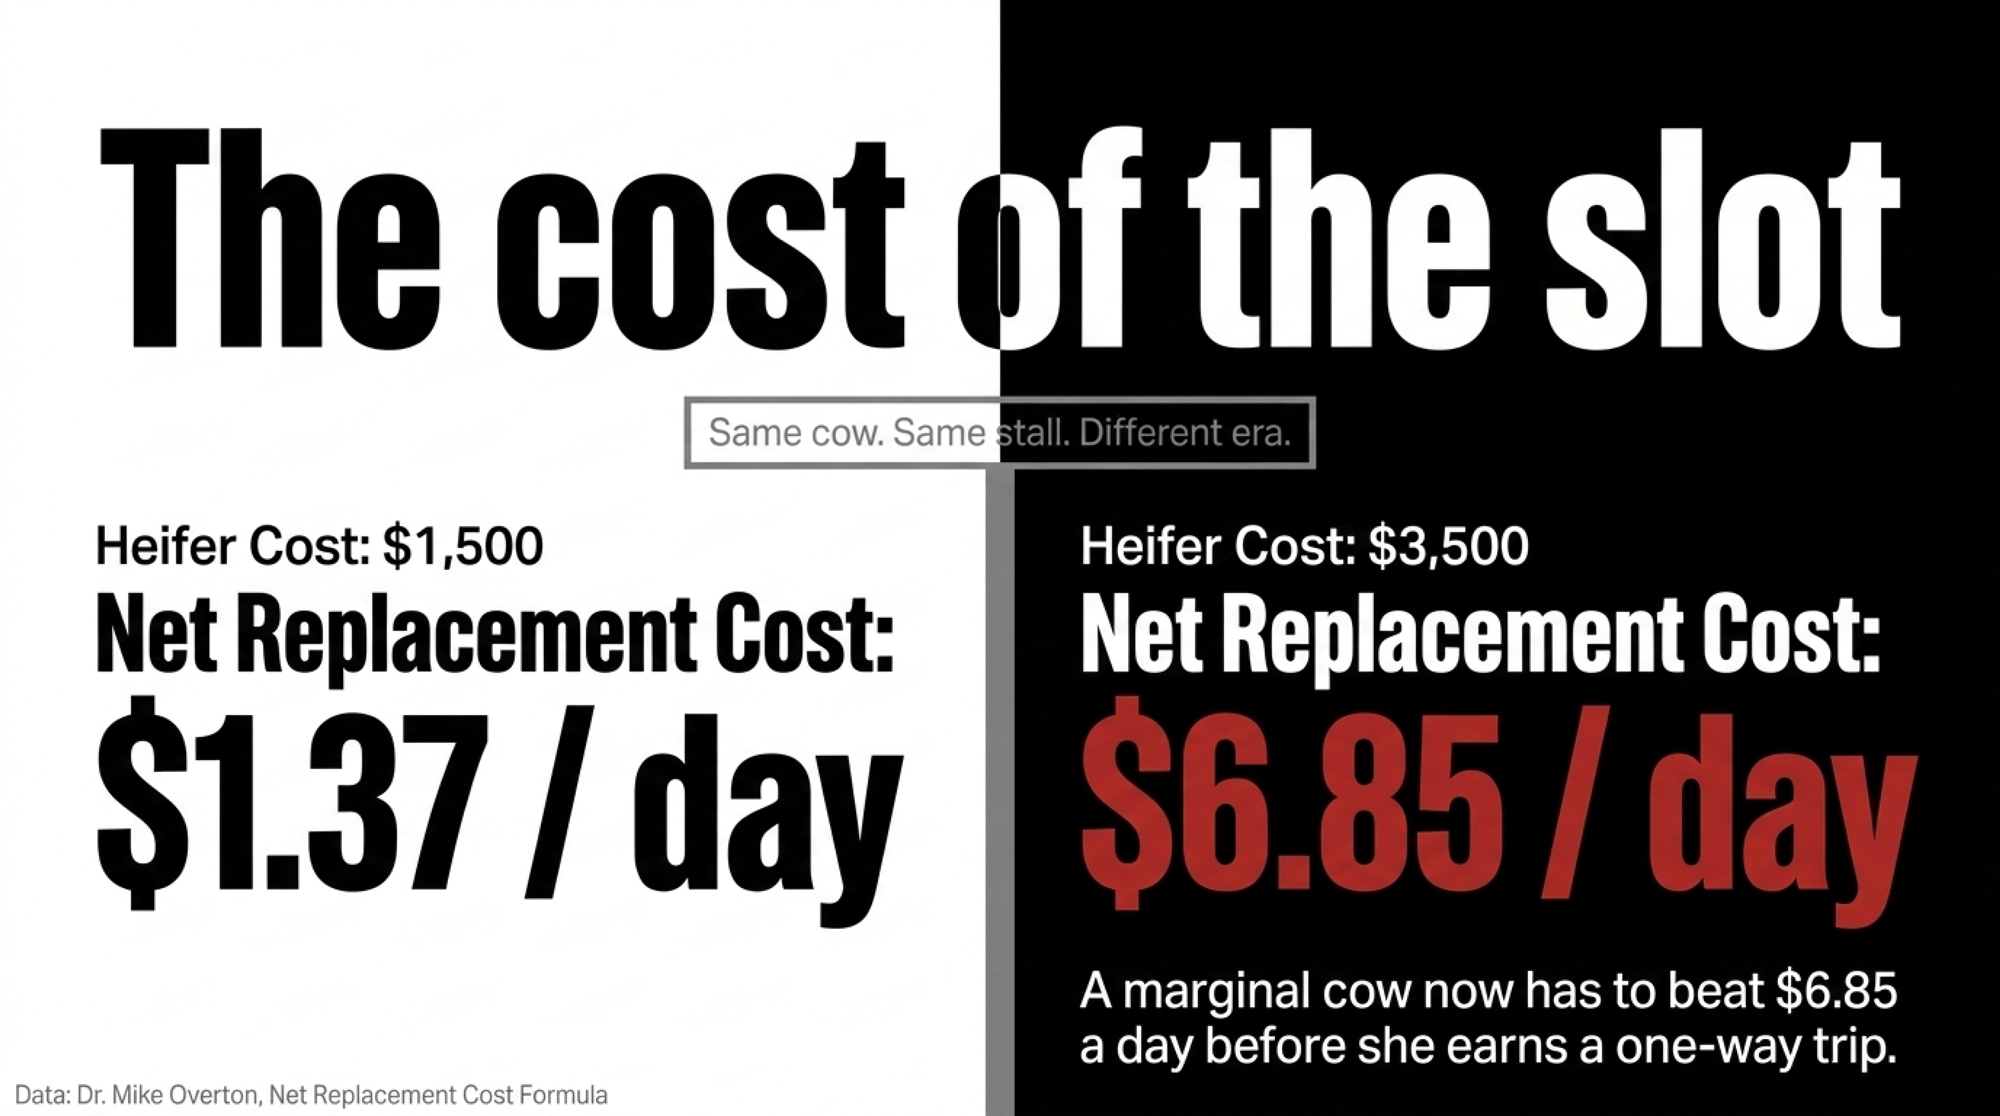
Now plug in real numbers. Take a net salvage value of around $1,000 for a cull cow.* At a $1,500 replacement, your net replacement cost runs about $1.37 per day. Push the heifer to $3,500 and the same cow in the same stall jumps to roughly $6.85 per day — about a fivefold increase. Nothing about the cow changed. The cost of getting rid of her did. That extra $5.48 a day is what a low-end cow now has to beat before she earns a one-way trip, and plenty of cows you’d have culled on reflex two years ago clear that bar easily.
And here’s the twist record cull prices add: USDA pegged combined cull cow values at $162/cwt in October 2025, so a heavy cull can now salvage $2,000 or more. When the cull check climbs that high, the salvage side of the formula gets large enough that selling a productive older cow later — instead of dumping her early into a soft decision — can pencil out even harder in her favor. The cull check is real money, but it’s a one-time event. Her future margin compounds every day she’s in the stall.
That’s the whole game in one line. A cow’s value to you isn’t fixed — it’s relative to what it costs to replace her. And right now, that cost is the highest it’s been in two generations. If you’ve ever watched what happens when a family actually runs the real math on their own operation, you know the number on the page usually isn’t the number in your head.
*Net of hauling and commission, and conservative against today’s market; run your own cull weight × current $/cwt to re-pencil for your barn.
The Blind Spot That Survives the Spreadsheet
Now the uncomfortable part. RPO is only as honest as the cow you hand it. And on most farms, that cow’s “true potential” got quietly shaved off months earlier — in the transition pen.
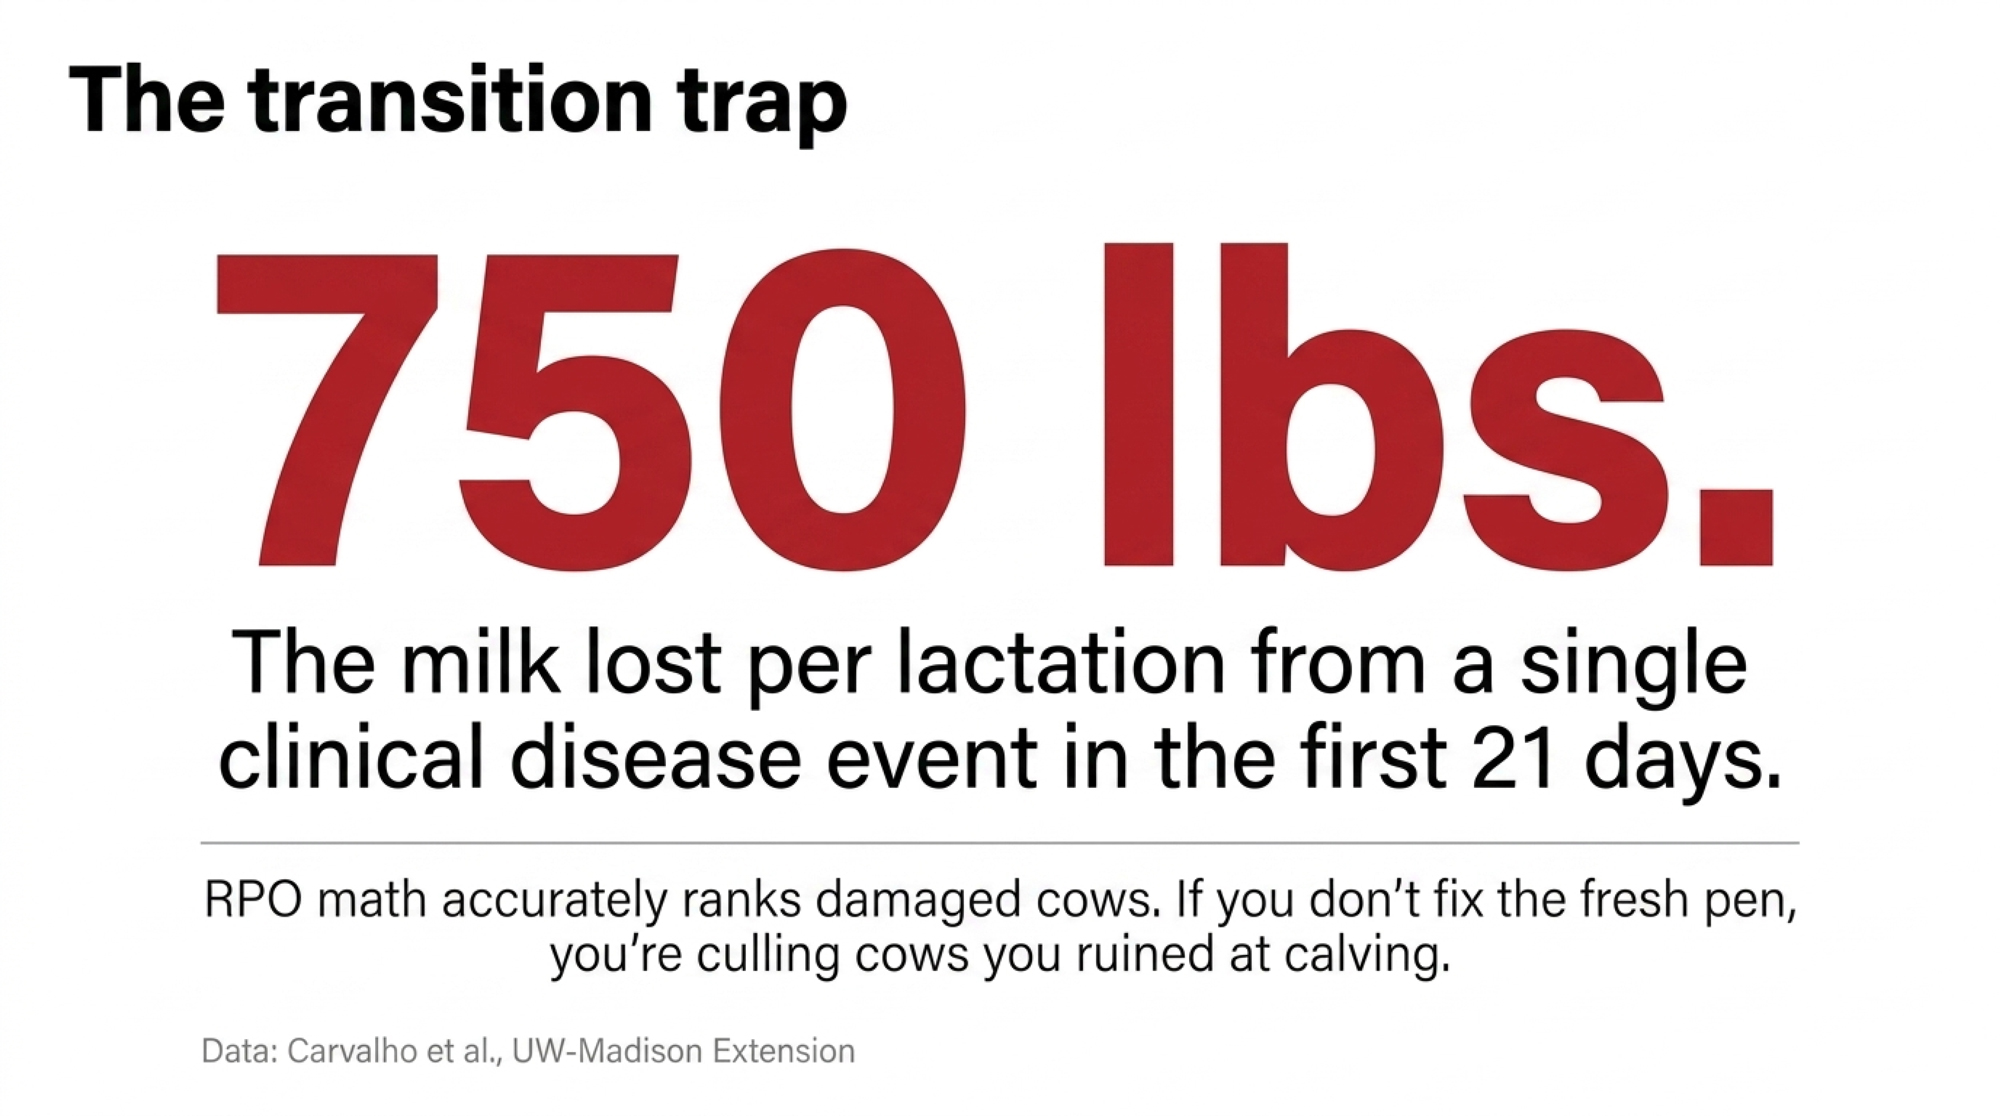
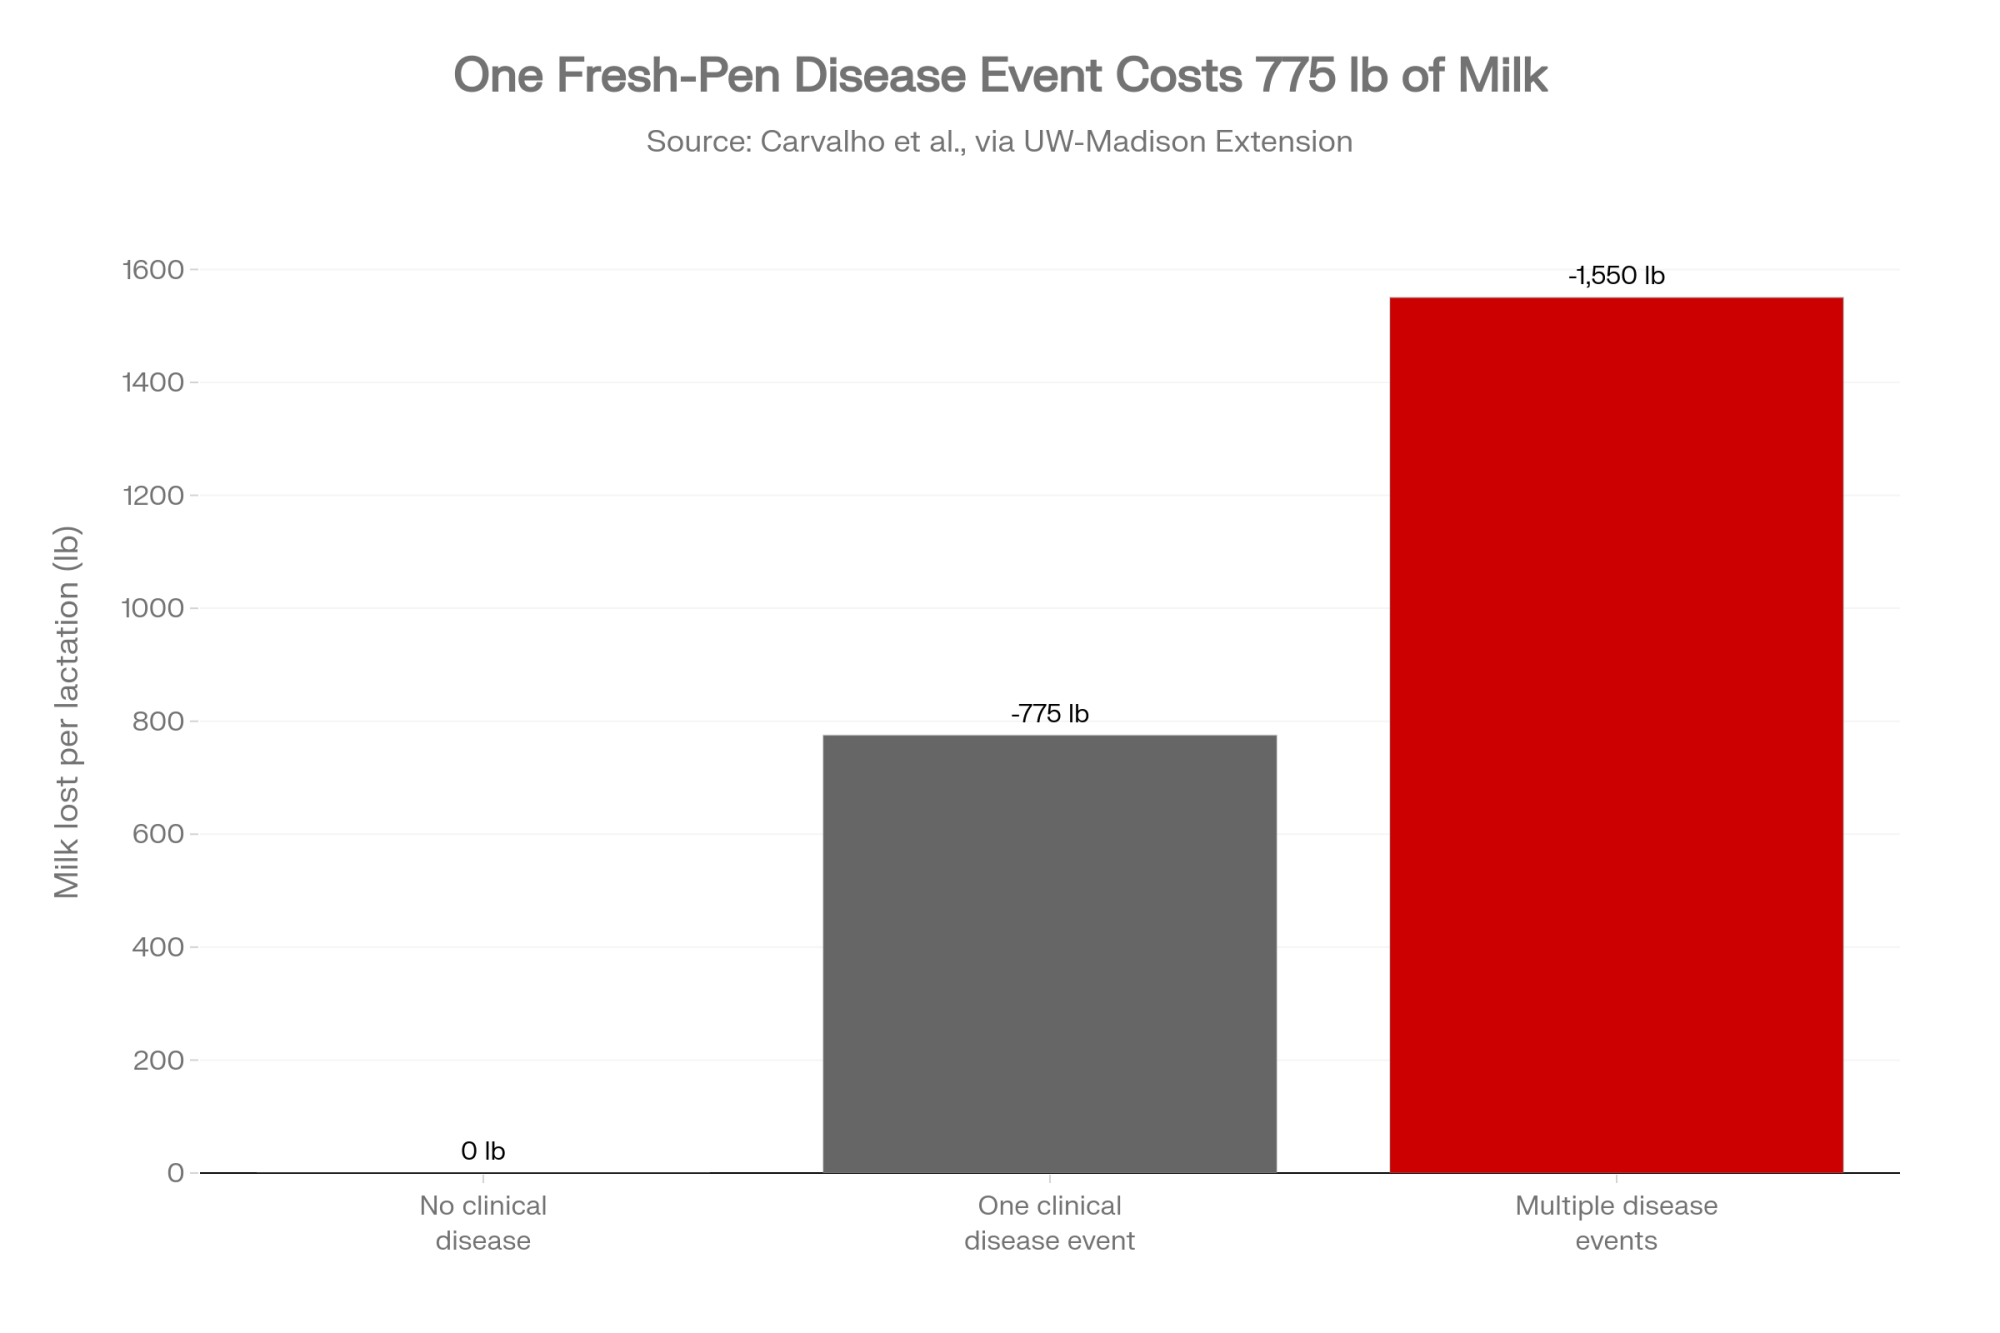
The transition period runs 60 days before calving through 30 days after, and University of Minnesota Extension is blunt about it: cows are at their greatest risk of disease and involuntary culling during this window. In a retrospective study of more than 5,000 cows by Carvalho et al., summarized by University of Wisconsin-Madison Extension, nearly 50% of cows experienced at least one clinical disease by 305 days in milk — 40% by 60 days, and 30% by just 21 days. Cows with one clinical disease lost roughly 750 to 800 pounds of milk over the lactation. Cows with multiple diseases lost about 1,550 pounds.
Subclinical ketosis tells the same story in miniature. A Canadian study (Duffield et al., Journal of Dairy Science) pegged the cost of an SCK case at about CAD $289, with prevalence of 15-30% common in many herds and roughly double the risk of early removal. University of Florida research (Tao et al., 2011) measured cows heat-stressed across the entire dry period producing about 5 kilograms per day less milk through the next lactation than cooled cows — milk you can’t claw back once she’s calved.
So here’s the line that stops people: RPO will happily tell you a cow is a bad bet — it just won’t tell you that you made her a bad bet at calving. Feed a damaged performance profile into the model and it calmly recommends replacing a cow who, managed properly, might have been one of your most profitable four-lactation animals. The math is complex. The fix is boring.
The Fix Is Boring. That’s the Point.
If half your fresh pen takes a transition hit, then half your RPO inputs are already corrupted. The model isn’t wrong — it’s ranking damaged cows accurately. It just can’t show you the cows you could have had. Which means the place to start fixing your cull list isn’t the cull list. It’s the feedbunk.
None of the Monday-morning moves require new capital. Check fresh cows for ketones in the first 7-14 days using a hand-held blood meter, treat the positives, and adjust the transition ration around body condition instead of habit. Don’t overstock the close-up and fresh pens — aim to keep cows lying 12 to 14 hours a day and out of the pen no more than three to three-and-a-half hours for milking and handling, because Miner Institute work ties each lost hour of lying time to 2 to 3.5 pounds of lost milk and more lameness. And hang fans and soakers in the dry pen, not just the milking string, because the heat stress you ignore in July shows up as lost milk and open cows next spring.
It doesn’t look like a longevity strategy. It looks like chores. But it’s the difference between an RPO score that reflects a cow’s real potential and one that reflects how badly she got managed in her first three weeks. At today’s heifer prices, that difference is no longer a rounding error — it’s the cost of a $3,500 springer you didn’t actually need to buy.
Four Paths That Don’t Need a Checkbook
None of these needs new capital. All of them need you to reorder what you pay attention to.
| Fix | Best For | Risk If Done Wrong |
|---|---|---|
| Clean up transition inputs | Herds with fresh-cow disease above 20% in first 21 DIM | One-time audit instead of daily routine |
| Make RPO the default cull list | 300+ cow herds with solid records | Data corrupted by untracked transition damage |
| Lower target replacement rate (39% → 35%) | Herds rethinking beef-on-dairy/sexed-semen mix | Cutting heifer numbers before longevity actually improves |
| Hard-wire dry-pen heat abatement | Any herd in a warm climate | Backfires only through inaction — easiest to skip, easiest to regret |
1. Clean Up the Transition Inputs
- Best for: Herds where fresh-cow disease runs above the 20% benchmark in the first 21 days.
- The action: Pull fresh-cow records this month; run daily fresh-cow checks and ketone testing.
- The risk: Backfires if you treat it as a one-time audit instead of a hard-wired daily routine.
2. Make RPO the Default Cull List
- Best for: 300-plus cow herds with decent records.
- The action: Stop picking “the bottom 32%.” Rank cows by expected future margin and start at the bottom — with a bias to delay replacing low-value cows whose problem you’re actively fixing.
- The risk: Backfires if the data feeding it is already corrupted by untracked transition damage.
3. Lower the Target Replacement Rate
- Best for: Operations rethinking their sexed-semen and beef-on-dairy mix.
- The action: Overton’s work shows dropping replacement rate from 39% to 35% keeps the average market cow about 100 days longer — build a multi-year youngstock plan to match.
- The risk: Backfires if you cut heifer numbers before your longevity actually improves and you get caught short.
4. Hard-Wire Heat Abatement Into the Dry Pen
- Best for: Any herd in a warm climate.
- The action: Put fans and soakers in the close-up and fresh pens, not just the milking string — dry-period cooling protects the next lactation.
- The risk: Backfires only through inaction; it’s the easiest investment to skip and the easiest to regret.
The forward signal worth watching: CoBank’s own numbers show the rebuild adding back just 360,200 head over 2027-2028 against 796,000 drained. The operations that come through intact won’t be the ones scrambling to source replacements. They’ll be the ones who don’t need as many — and in a decade where the honest question is who’s still milking at all, that distinction matters more than any single year’s cull rate.
Key Takeaways
- If a heifer now costs $3,500 instead of $1,500, your net replacement cost per day roughly five-folds on the same animal in the same stall — which means cows you’d have culled on reflex two years ago may now pencil out as keepers.
- If your fresh-cow disease rate is above 20% in the first 21 days, fix the transition pen before you trust any RPO ranking — you’re scoring damaged cows, not their real potential.
- If you’re still managing to a cull percentage instead of value per cow per day, you’re using the metric many of the world’s most profitable herds have already moved past.
- If you’re cooling only the milking string, you’re paying for dry-period heat stress next spring in lost milk and open cows — and you won’t see it coming on the spreadsheet.
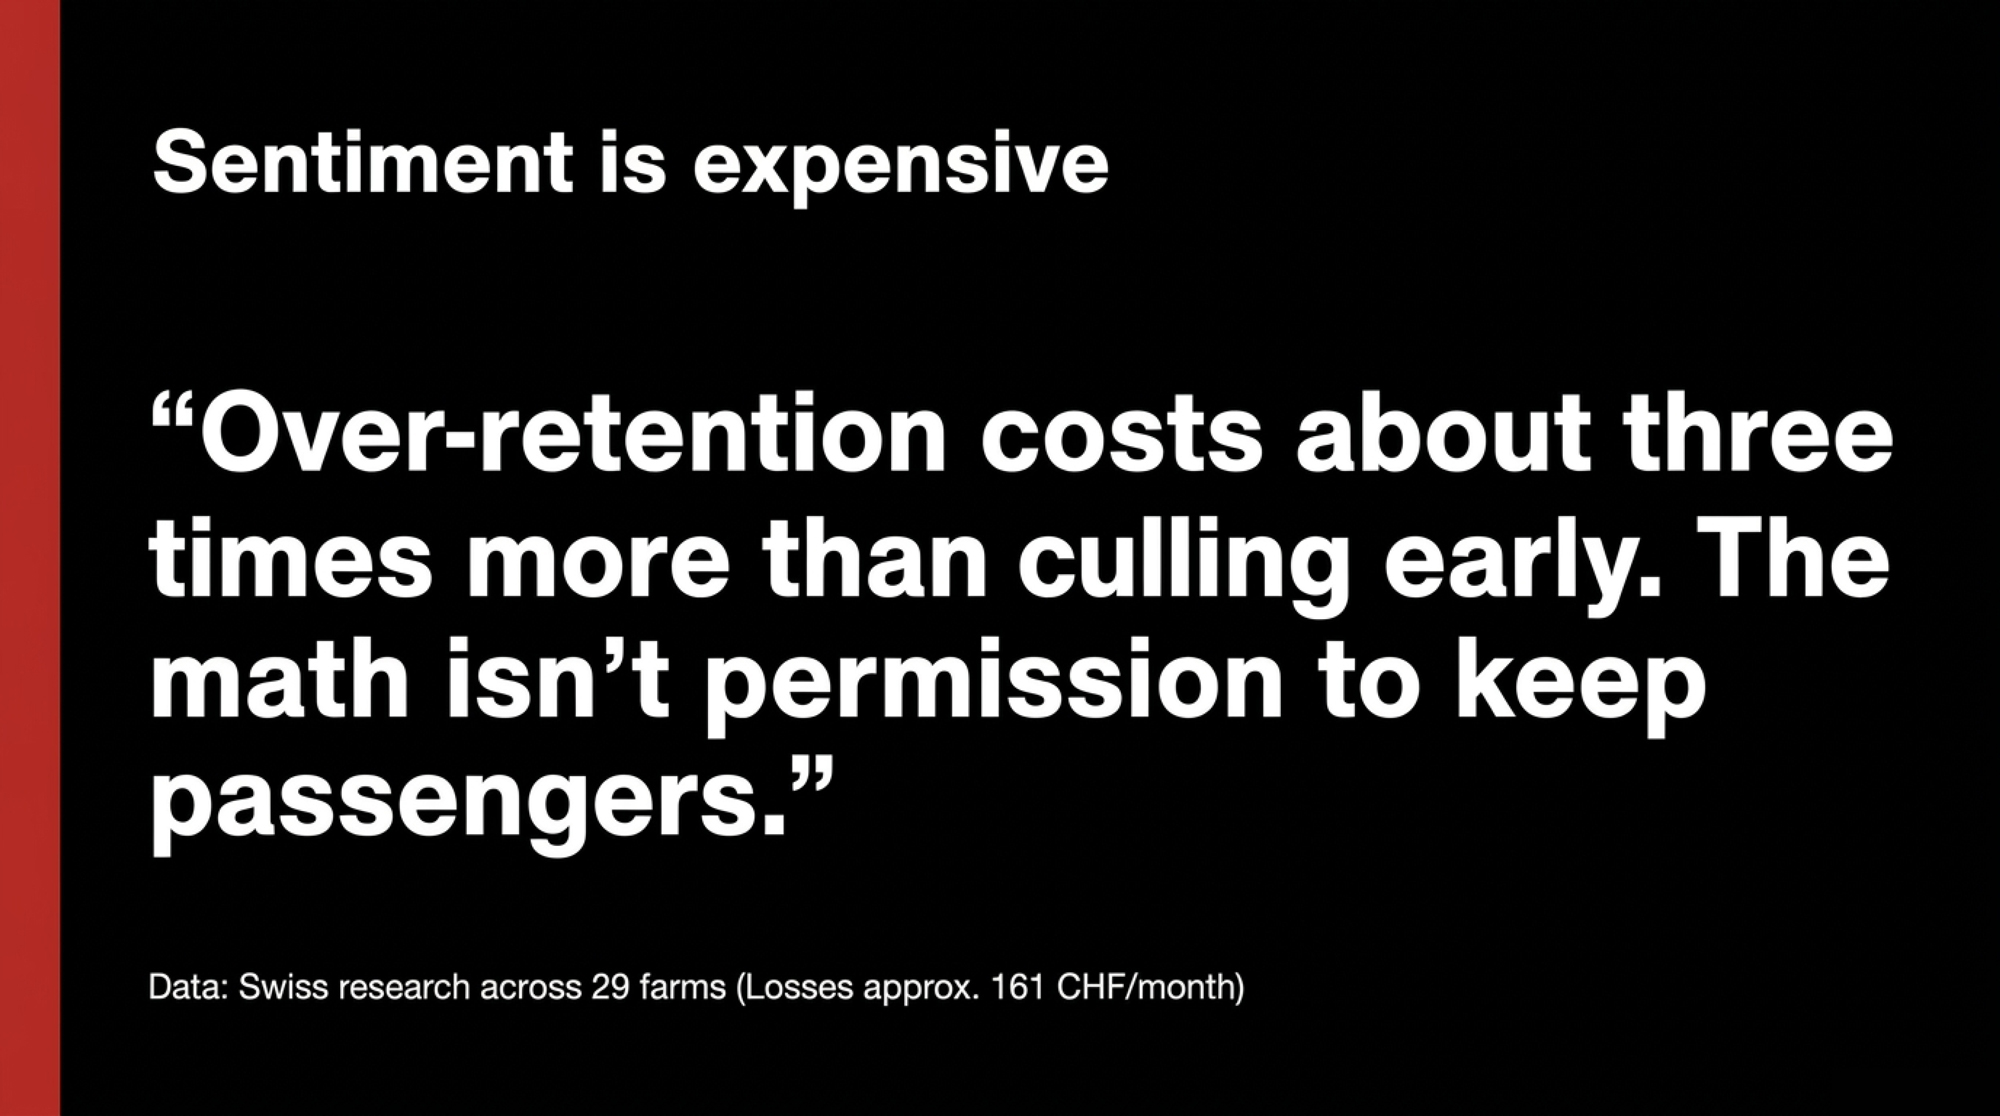
Here’s the trap waiting for the producers who do everything right. You fix the math. You clean up the fresh pen. You rebuild the policy. And then you overcorrect — you start keeping cows for the wrong reasons, just with better vocabulary. The Swiss research warns about exactly this from the other direction: in a study of replacement decisions across 29 farms, losses from retaining unprofitable cows ran about three times higher than losses from culling too early, averaging 161 Swiss francs per farm per month. Sentiment is expensive. So the question isn’t whether you can keep cows longer — it’s whether you’ll know the difference between a cow that’s earning her stall and a passenger you’re keeping out of habit.
Which one is standing in your fresh pen right now?

Run Your Numbers
Bullvine Pipeline Index Calculator — Six numbers off your herd software scores your replacement pipeline 0-100 and flags whether it’s green, yellow, or already red. It weighs heifer supply, your actual replacement cost, cull rate, and sexed-versus-beef semen mix, then plots you against the national trend and CoBank’s 2027-2028 rebuild.
Complete references and supporting documentation are available upon request by contacting the editorial team at editor@thebullvine.com.
Learn More
- Holstein Inbreeding Hit 9.99%: Birkstead and North Florida Found Two Ways to Stop the $100-Per-Cow Leak— Dismantles the silent profit drag hiding in modern breeding decisions by revealing how two commercial herds eliminated genetic depression to reclaim $100 per cow in lost milk, fertility, and herd longevity.
- The Bullvine Dairy Curve: 15,000 U.S. Farms by 2035 and Under 10,000 by 2050 — Who’s Still Milking? — Follows the money on structural herd consolidation across North America, mapping key financial benchmarks and operational moves that dictate which dairies survive the contraction toward sub-10,000 herd landscapes.
- From 1.5 Million to 150,000: The Dairy Genetics Shakeout and Your Next Move — Exposes the seismic shift in sexed-semen strategy and beef-on-dairy breeding ratios, arming producers with actionable youngstock inventory models to optimize heifer raising costs amid shifting market dynamics.
 The Sunday Read Dairy Professionals Don’t Skip.
 The Sunday Read Dairy Professionals Don’t Skip.
Every week, thousands of producers, breeders, and industry insiders open Bullvine Weekly for genetics insights, market shifts, and profit strategies they won’t find anywhere else. One email. Five minutes. Smarter decisions all week.




