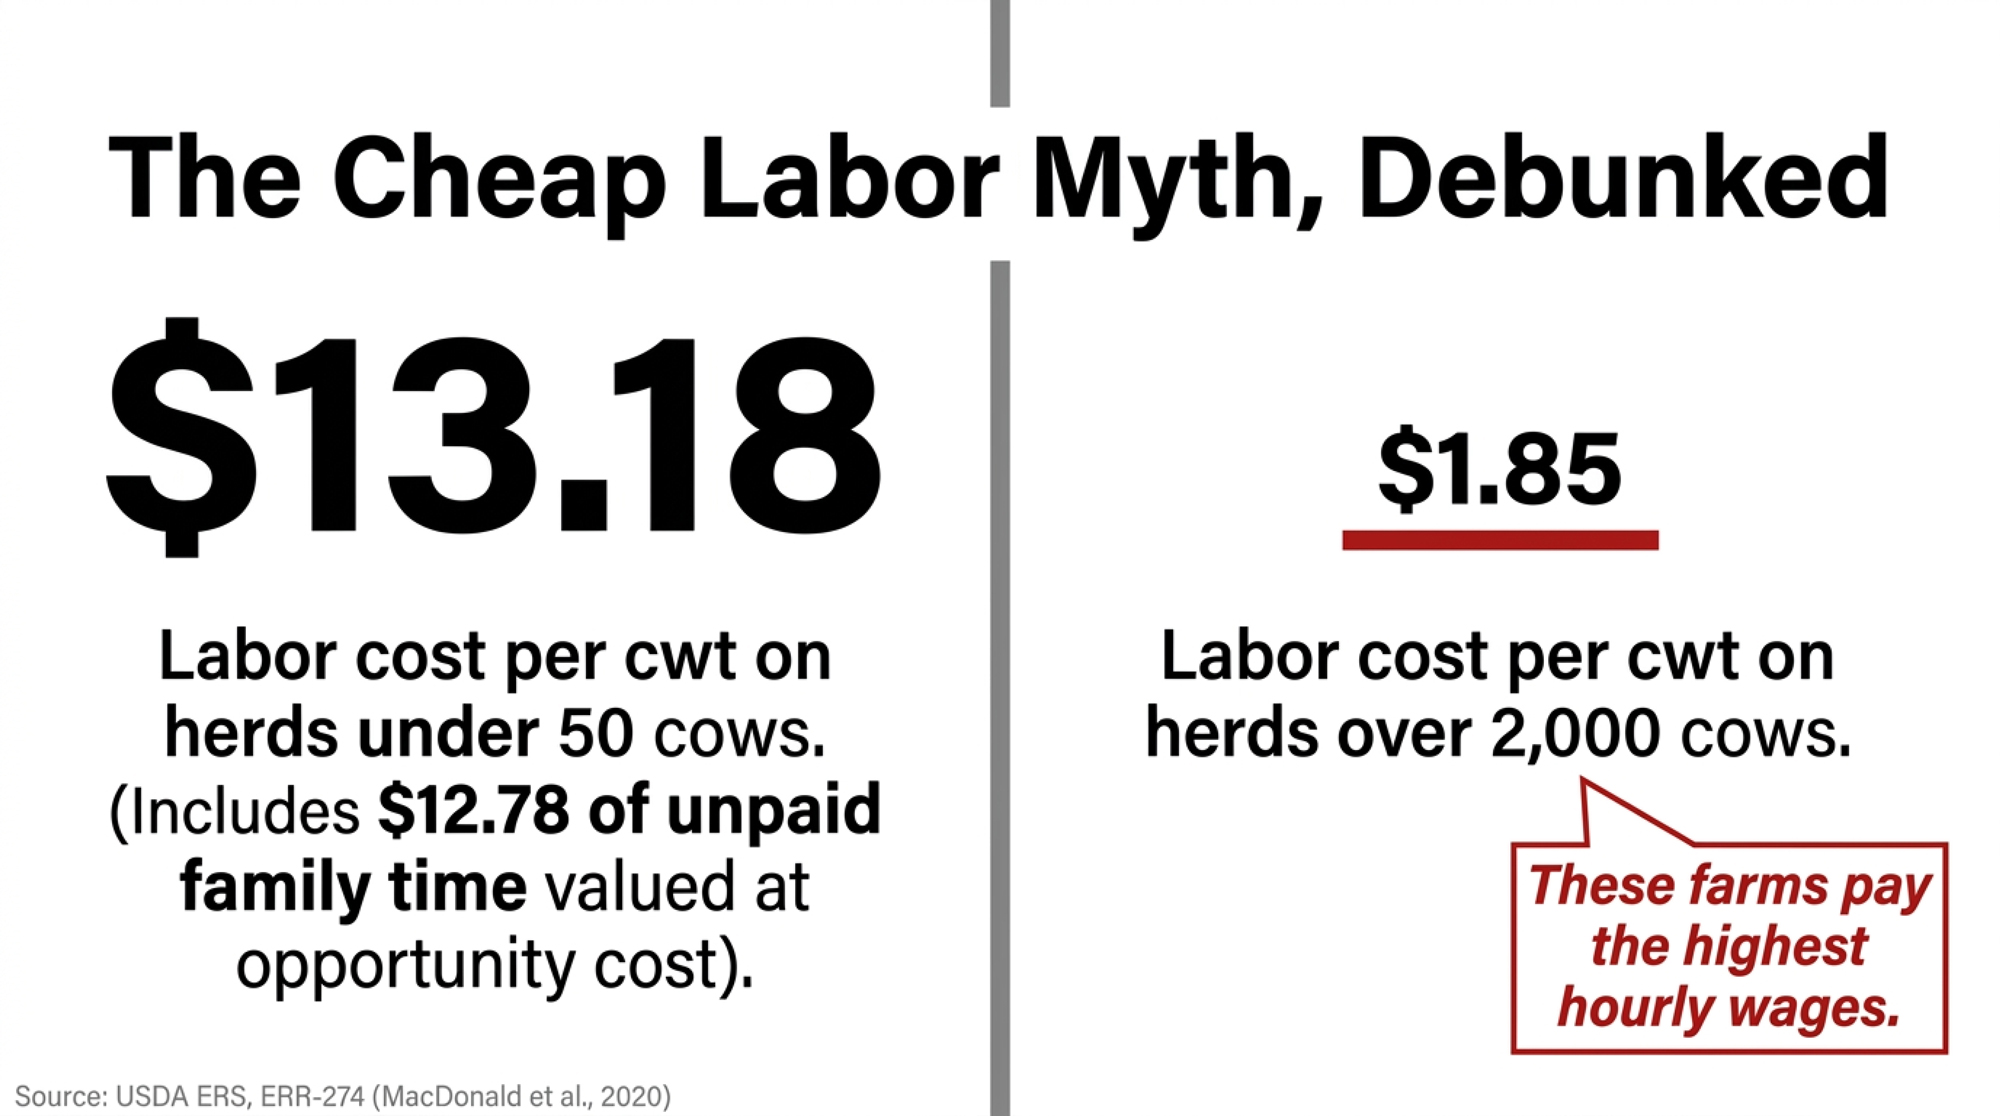
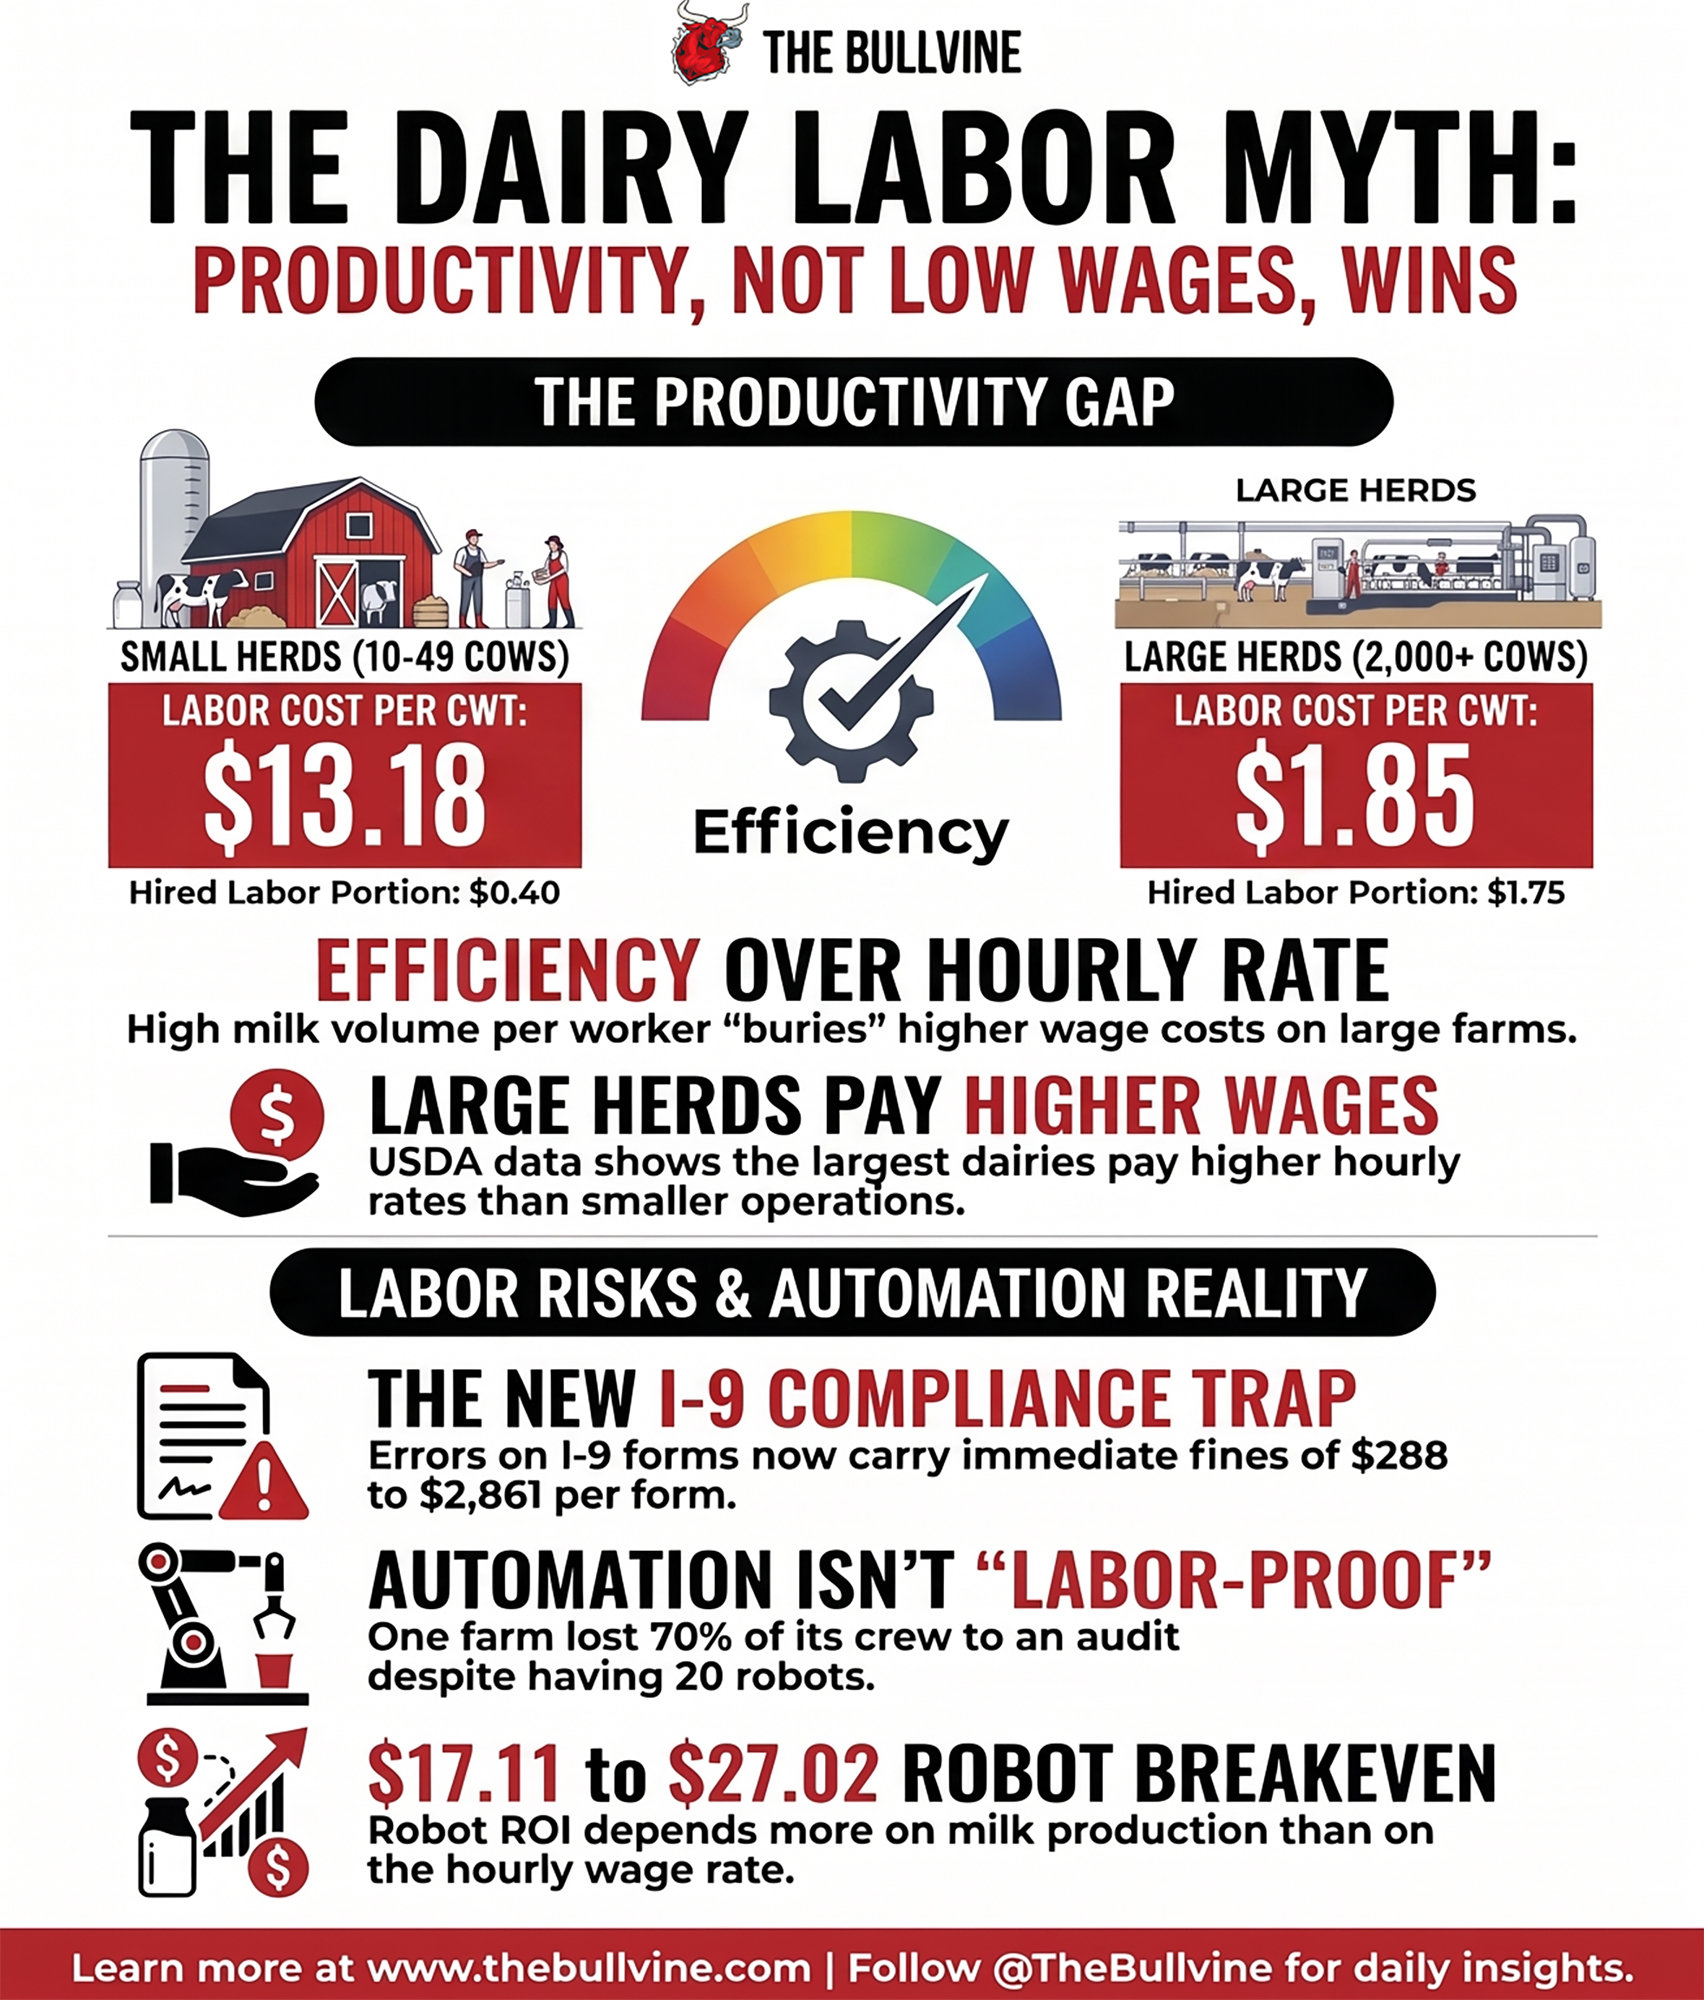
ERS puts labor at $1.85/cwt on farms above 2,000 cows and $13.18 on herds under 50 — while the big farms pay the higher wages. Almost none of the gap is pay. And $12.78 of it is you.
Rodney and Dorothy Elliott left a 140-cow farm in Northern Ireland to build Drumgoon Dairy near Lake Norden, South Dakota. Nearly two decades later, they were milking 6,500 cows with 20 robots and more than 50 employees. Some of those people had been with them since the earliest years.
In late May 2025, the Department of Homeland Security audited Drumgoon’s labor records. DHS determined that 38 workers had inaccurate, outdated, or incomplete citizenship or work-authorization documentation, according to South Dakota Searchlight’s October 2025 reporting. Elliott asked them for updated papers. Most couldn’t resolve the issues, and she had to let them go.
The crew went from more than 50 to 16 (South Dakota Searchlight, October 10, 2025; Northeast Radio SD, October 2025). Most of the 38 had worked at Drumgoon for years, the Searchlight reported, and some for nearly two decades — long enough to have had a hand in building the operation they were leaving. Elliott does not know where they went. Federal rules gave them ten business days from the audit finding to resolve their paperwork or be terminated.
Now the part that matters for anyone with a payroll. She didn’t post higher wages and wait for local applicants. She spent more than $110,000 on recruiters and transportation to bring 22 H-2A visa workers up from Mexico.
The Rebuild Nobody Talks About
This was an audit, not a raid. No agents in the yard, no arrests. Drumgoon had gone twenty years without one. Elliott told the Searchlight she reviewed applicants’ documents herself and had turned candidates away repeatedly over the years when the IDs looked questionable.
Metric
Before audit (May 2025)
After rebuild (Oct 2025)
What it cost
Crew size
50+ employees
38 workers
Still 10–15 short
Immediate post-audit crew
—
16 workers
6,500 cows on 16 people
Workforce composition
Local hires, some 20-year tenure
22 H-2A visa, 16 local/temp
Visa roles legally restricted
Workers terminated
—
38 (10 business days to cure)
Most had years of tenure
Recruitment and transport
$0
$110,000+
Recruiters and travel from Mexico
Wage increase posted
—
None reported
Money went to recruiting, not pay
Robot maintenance openings
Posted
Posted
Zero applicants
South Dakota Searchlight, October 10, 2025; Northeast Radio SD, October 2025. Elliott’s account describes recruitment and transportation spending; no wage increase was reported.
Note what the visa route couldn’t do. Those permits restricted which jobs the workers could legally perform, so Drumgoon still had to fill 16 positions locally. And she did all of this in mid-2025 — a full year before USCIS issued the memo that finally wrote down how dairy H-2A petitions get judged. The pathway existed. The clarity didn’t. Even rebuilt to 38, the farm sat short of where it started.
Sixteen people were now covering a 6,500-cow operation. Elliott told the Searchlight her remaining employees were making mistakes from the long hours, or because they were new to farm work — including backing a payloader into the manure pond. Some, she said, were getting only one or two days off in a 15-day period. Nearby farms sent workers over for a couple of days at a time through the summer.
“But what else do you do? Do you just let cows starve or calves die because there’s no one there to take care of them?”
— Dorothy Elliott, co-owner, Drumgoon Dairy, to South Dakota Searchlight, October 2025
Then the detail that should stop you cold. Drumgoon had 20 robots running before any of this happened, and posted maintenance positions aimed at graduates of the Lake Area Technical College program in the same county.
Twenty robots. A technical college down the road. Open skilled positions. And as of the October reporting, nobody had applied.
This wasn’t new either. Back in October 2023, two years before anyone audited anything, Drumgoon told a county zoning process it employed 22 people, 15 of them milkers and stall management operators, and that finding local workers was extremely difficult (Dakota Free Press, October 12, 2023). That’s on the record. The empty applicant pool isn’t a post-audit excuse — it’s a documented pre-existing condition.
Elliott put the question more directly than most operators would:
“We’ve achieved our goals we set out for ourselves: build a dairy, milk cows and grow the dairy industry in South Dakota. Is it a sustainable goal if there’s nobody to work on these dairies?”
Here’s the part that reframes all of it. ERS data says the largest dairies pay the highest wages in dairy — and still carry the lowest labor cost per hundredweight of any herd size class. A sub-50-cow herd shows $13.18/cwt. A 2,000-cow herd shows $1.85. If cheap labor built the big farms, that table should read the other way around.
Your $32 Billion Talking Point Is Older Than Your Replacement Heifers
Three numbers anchor nearly every dairy labor conversation in Washington and at every co-op annual meeting. Immigrant workers make up 51% of hired dairy labor. Farms employing them produce 79% of U.S. milk. Losing that workforce would cost the economy $32.1 billion.
The figure
Where it comes from
51% / 79% / $32.1B
Adcock, Anderson & Rosson, Texas A&M AgriLife Center for North American Studies
Published
September 2015
Data vintage
Survey fielded fall 2014; employment estimates for 2013
Funder
Commissioned by the National Milk Producers Federation
Independently replicated?
No — and the 2015 report was itself an update to a 2009 study by the same team for the same client
None of it is hidden. NMPF hosts the PDF and discloses the funding. But by 2024 and 2025, those numbers were circulating in trade coverage and House Agriculture Committee documents with no date attached.
Worth being precise about what “51%” actually measures, since this article is about dating your numbers. Researchers estimated 150,418 people worked on U.S. dairy farms in 2013, and that 76,968 of them — 51% — were immigrants. Thirteen-year-old employment data, restated in 2026 as though someone counted last week.
The same 2015 study found immigrant dairy employment rose 35%, nearly 20,000 people, over the six years since the 2009 survey — a number NMPF was still promoting in a December 2018 release. Funded by an industry association with a policy position, so weigh it accordingly. But it points up, not down.
If you cite 51/79 in a memo or at a hearing, attach the year. Costs nothing, and it makes you the most credible person in the room.
Why a Sub-50-Cow Herd Shows $13.18/cwt in Labor and a 2,000-Cow Herd Shows $1.85
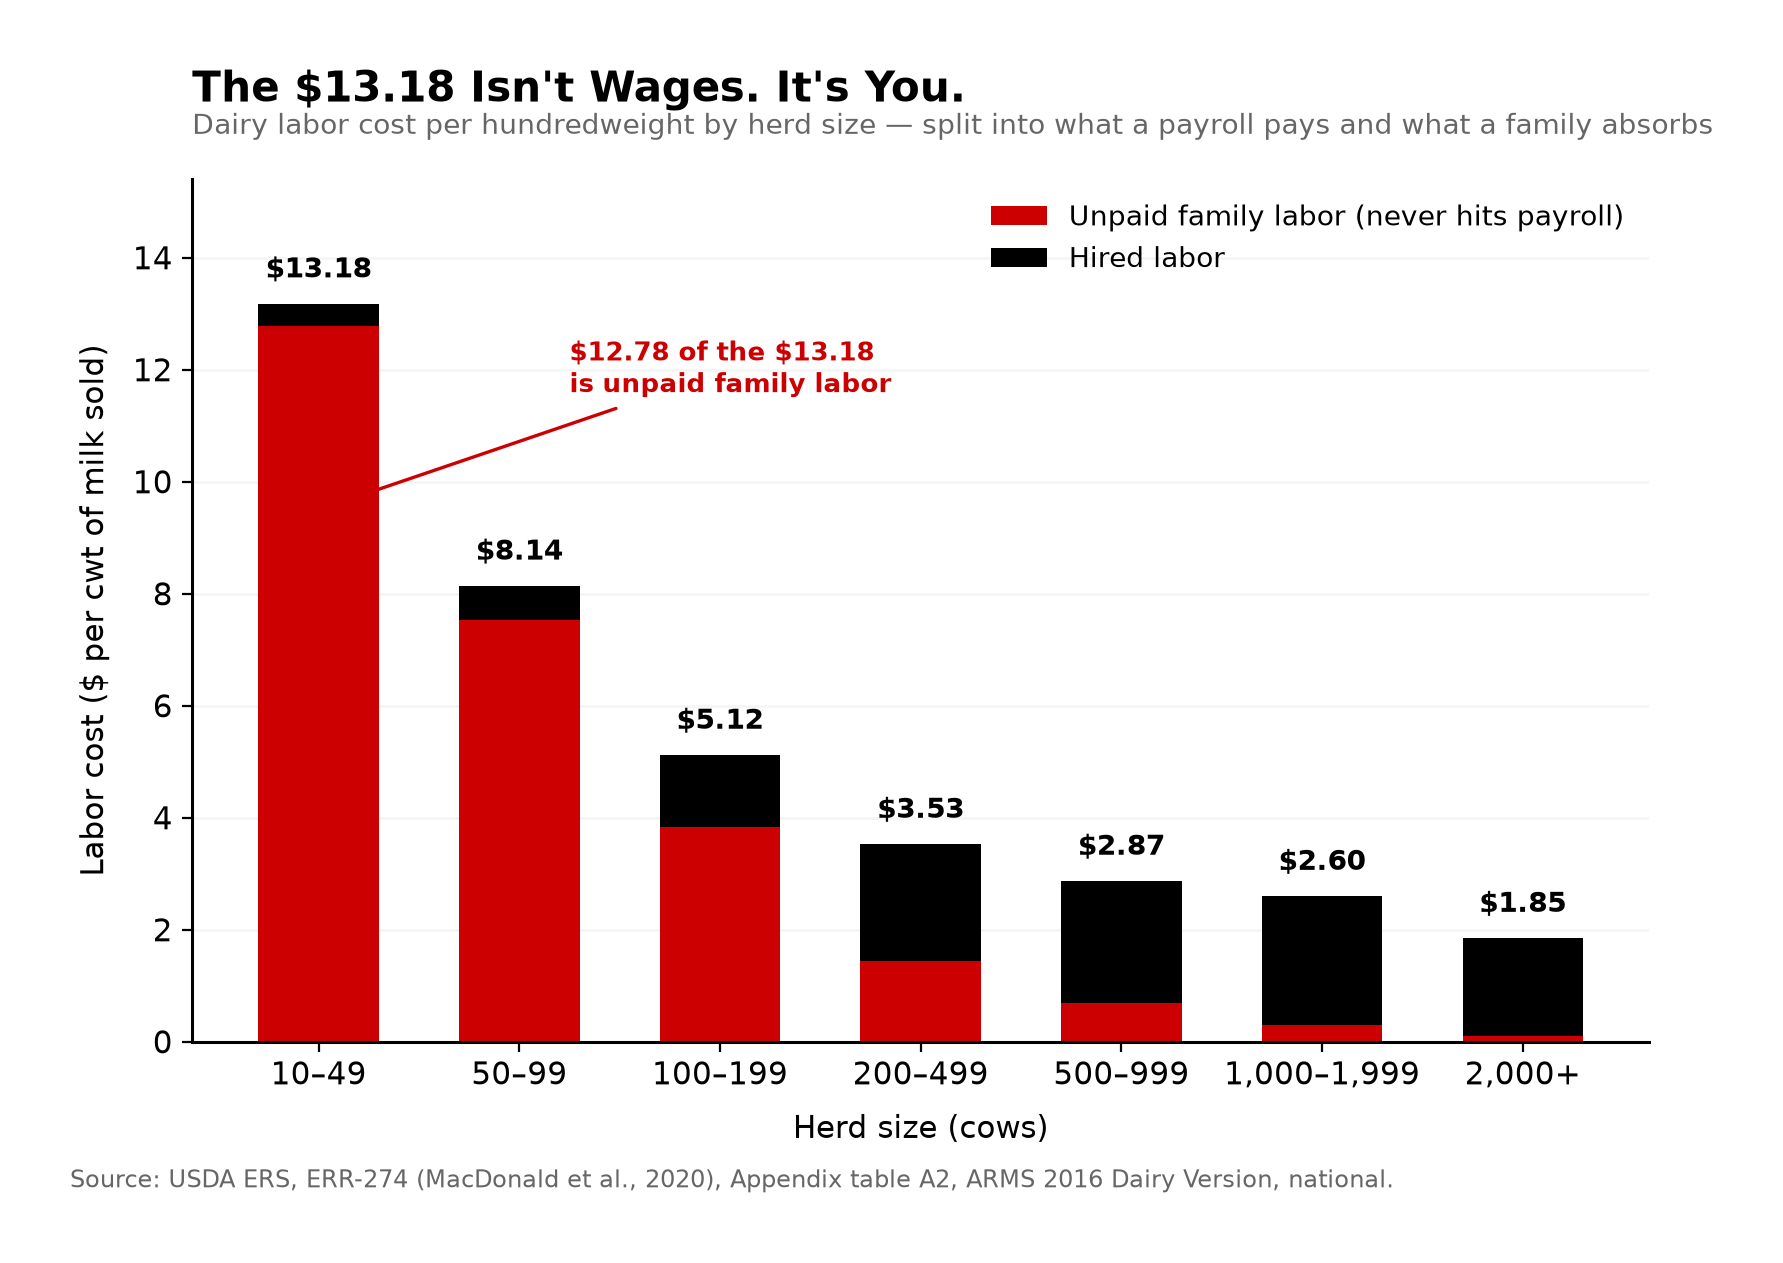
USDA’s Economic Research Service breaks out dairy labor costs by herd size. Here’s the full table, including the column almost nobody quotes.
Herd size
Total labor/cwt
Unpaid family
Hired
Imputed wage for unpaid labor
10–49 cows
$13.18
$12.78
$0.40
$21.74/hr
50–99
$8.14
$7.53
$0.61
$22.18/hr
100–199
$5.12
$3.84
$1.28
$23.16/hr
200–499
$3.53
$1.45
$2.08
$23.71/hr
500–999
$2.87
$0.69
$2.18
$25.03/hr
1,000–1,999
$2.60
$0.30
$2.30
$25.09/hr
2,000+
$1.85
$0.10
$1.75
$25.81/hr
USDA ERS, ERR-274 (MacDonald et al., 2020), Appendix table A2, using ARMS 2016 Dairy Version, national. Hired column derived as total minus unpaid. The imputed-wage column values unpaid family labor at opportunity cost — it is not a hired pay rate.
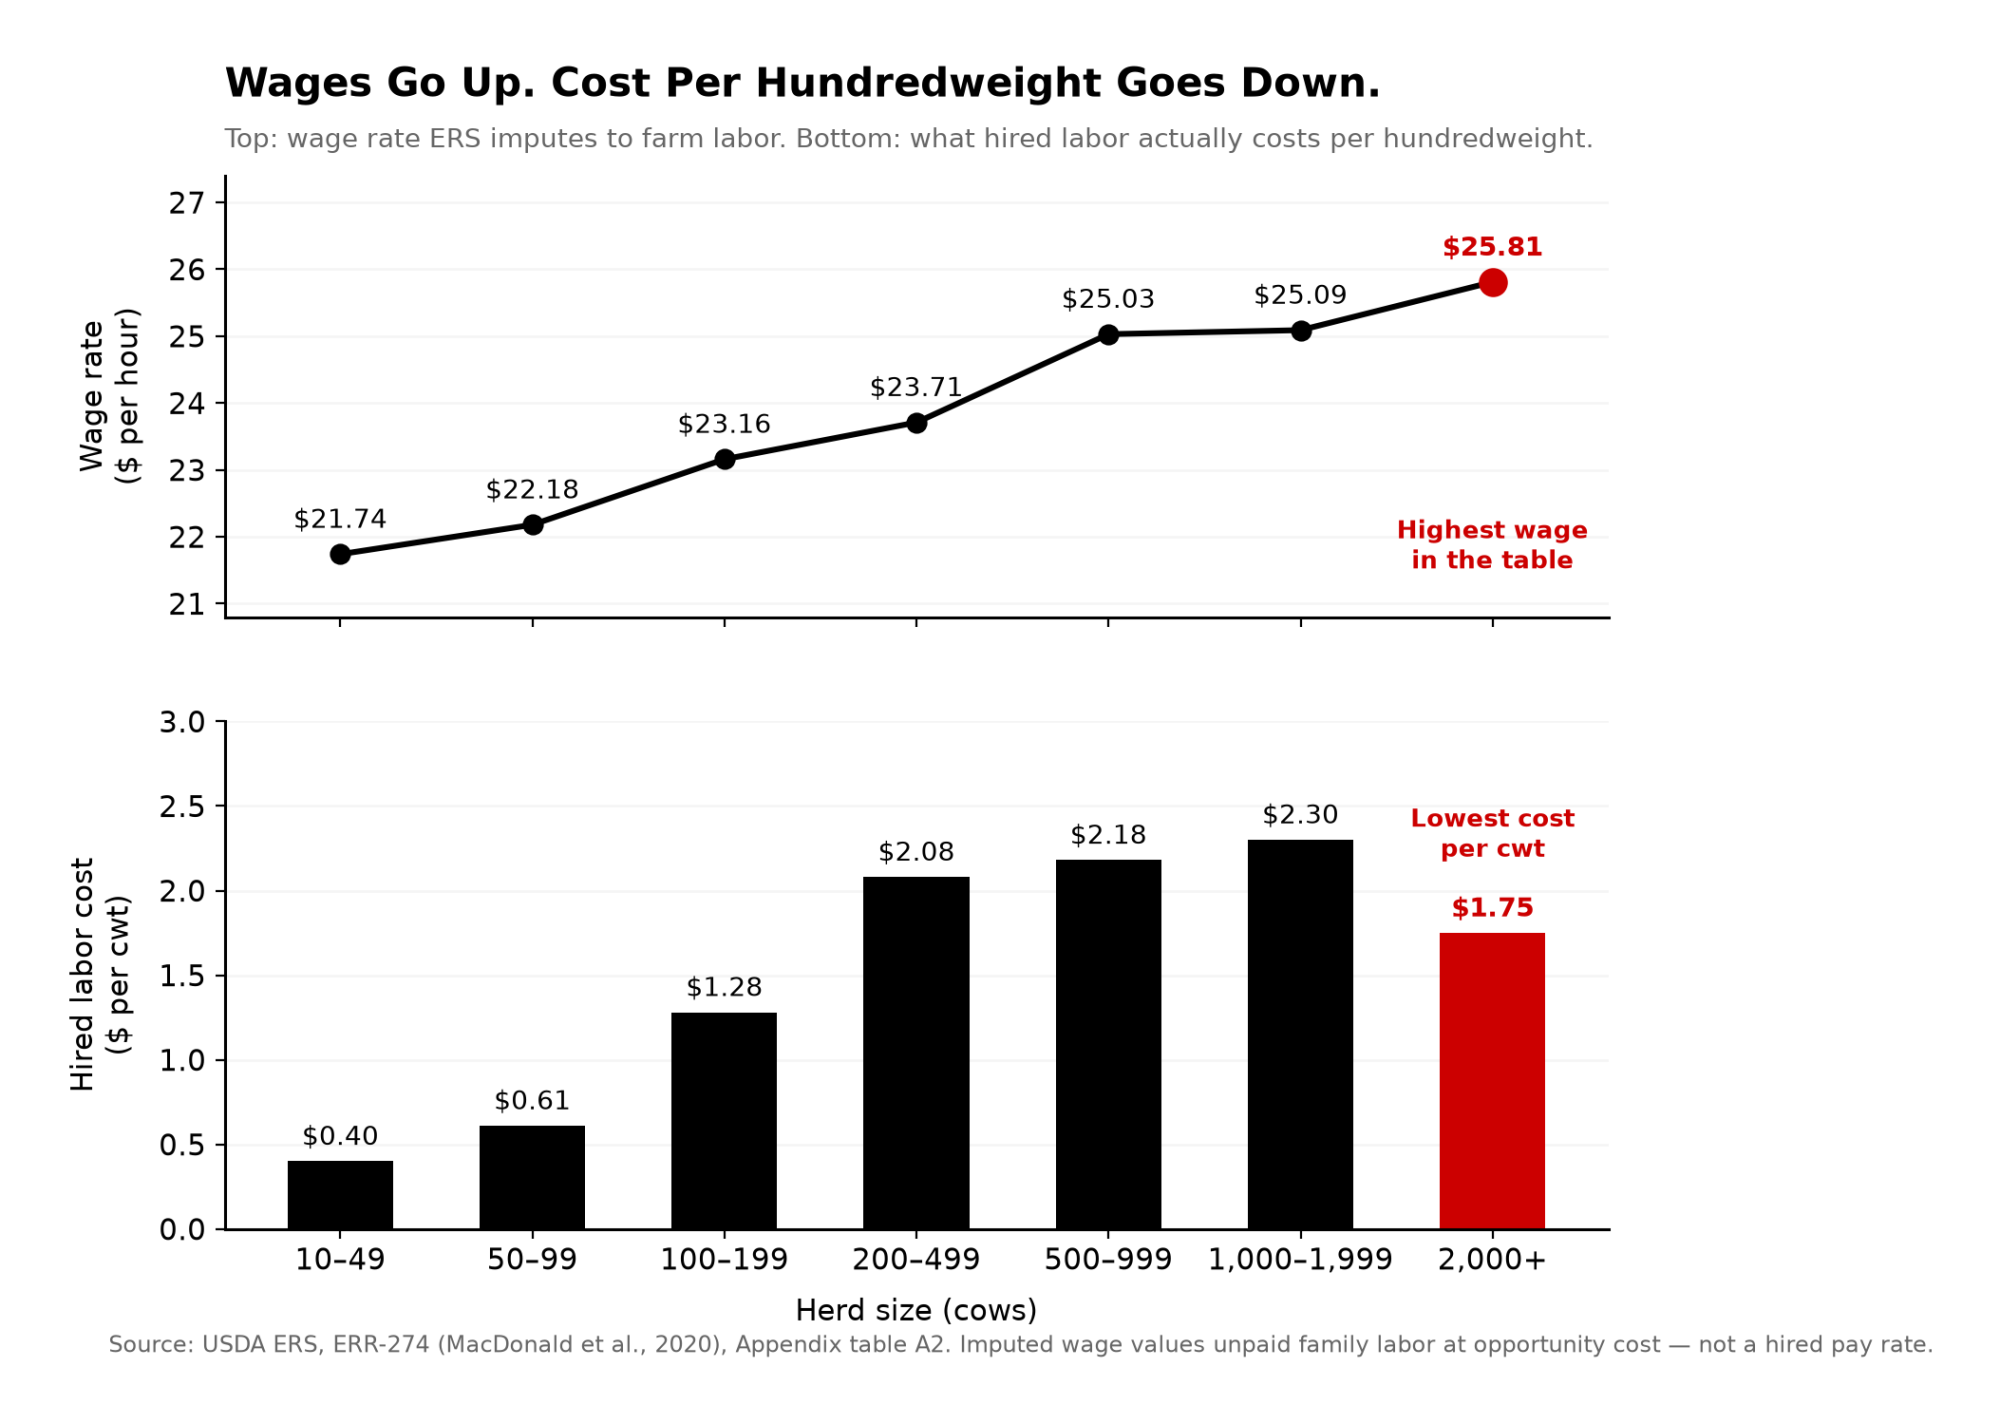
That last column is the argument. The imputed wage rises steadily with herd size — $21.74 on the smallest farms to $25.81 on the largest. Hired wages do the same. ERR-274 doesn’t publish the hired rate by herd class, but MacDonald reports the same direction of travel: hired wage rates, like imputed ones, run higher on larger farms. That’s the whole point — the biggest dairies pay more per hour and still land at $1.85/cwt.
MacDonald states it flatly: differences in labor costs “do not arise from differences in hourly wage rates,” because wages for both hired and unpaid labor are higher on larger farms.
So the herd that shows $13.18/cwt isn’t paying more per hour. It’s paying $21.74 an hour of opportunity cost for a lot of hours spread across very little milk, and $12.78 of that $13.18 never touches a payroll cheque. It’s your hours and your family’s. Elliott’s 6,500 cows put her in the bottom row of that table. If you’re in the top one, you’re the unpaid labor line.
Look at the hired column too. It climbs to $2.30 at 1,000–1,999 cows and then drops to $1.75 on farms above 2,000 — despite those farms paying the highest wages in the table. That’s not a wage effect. That’s enough milk per worker to bury the cost.
Productivity gap, not wage gap. Which flips the question entirely. The 51/79 framing asks who’s milking the cows. The ERS data asks how many cows one person can milk.
The Expansion Math Was Never About Cheap Wages
We went looking for the counter-argument — that cheap labor was the precondition for building operations like Drumgoon. The expansion literature doesn’t support it.
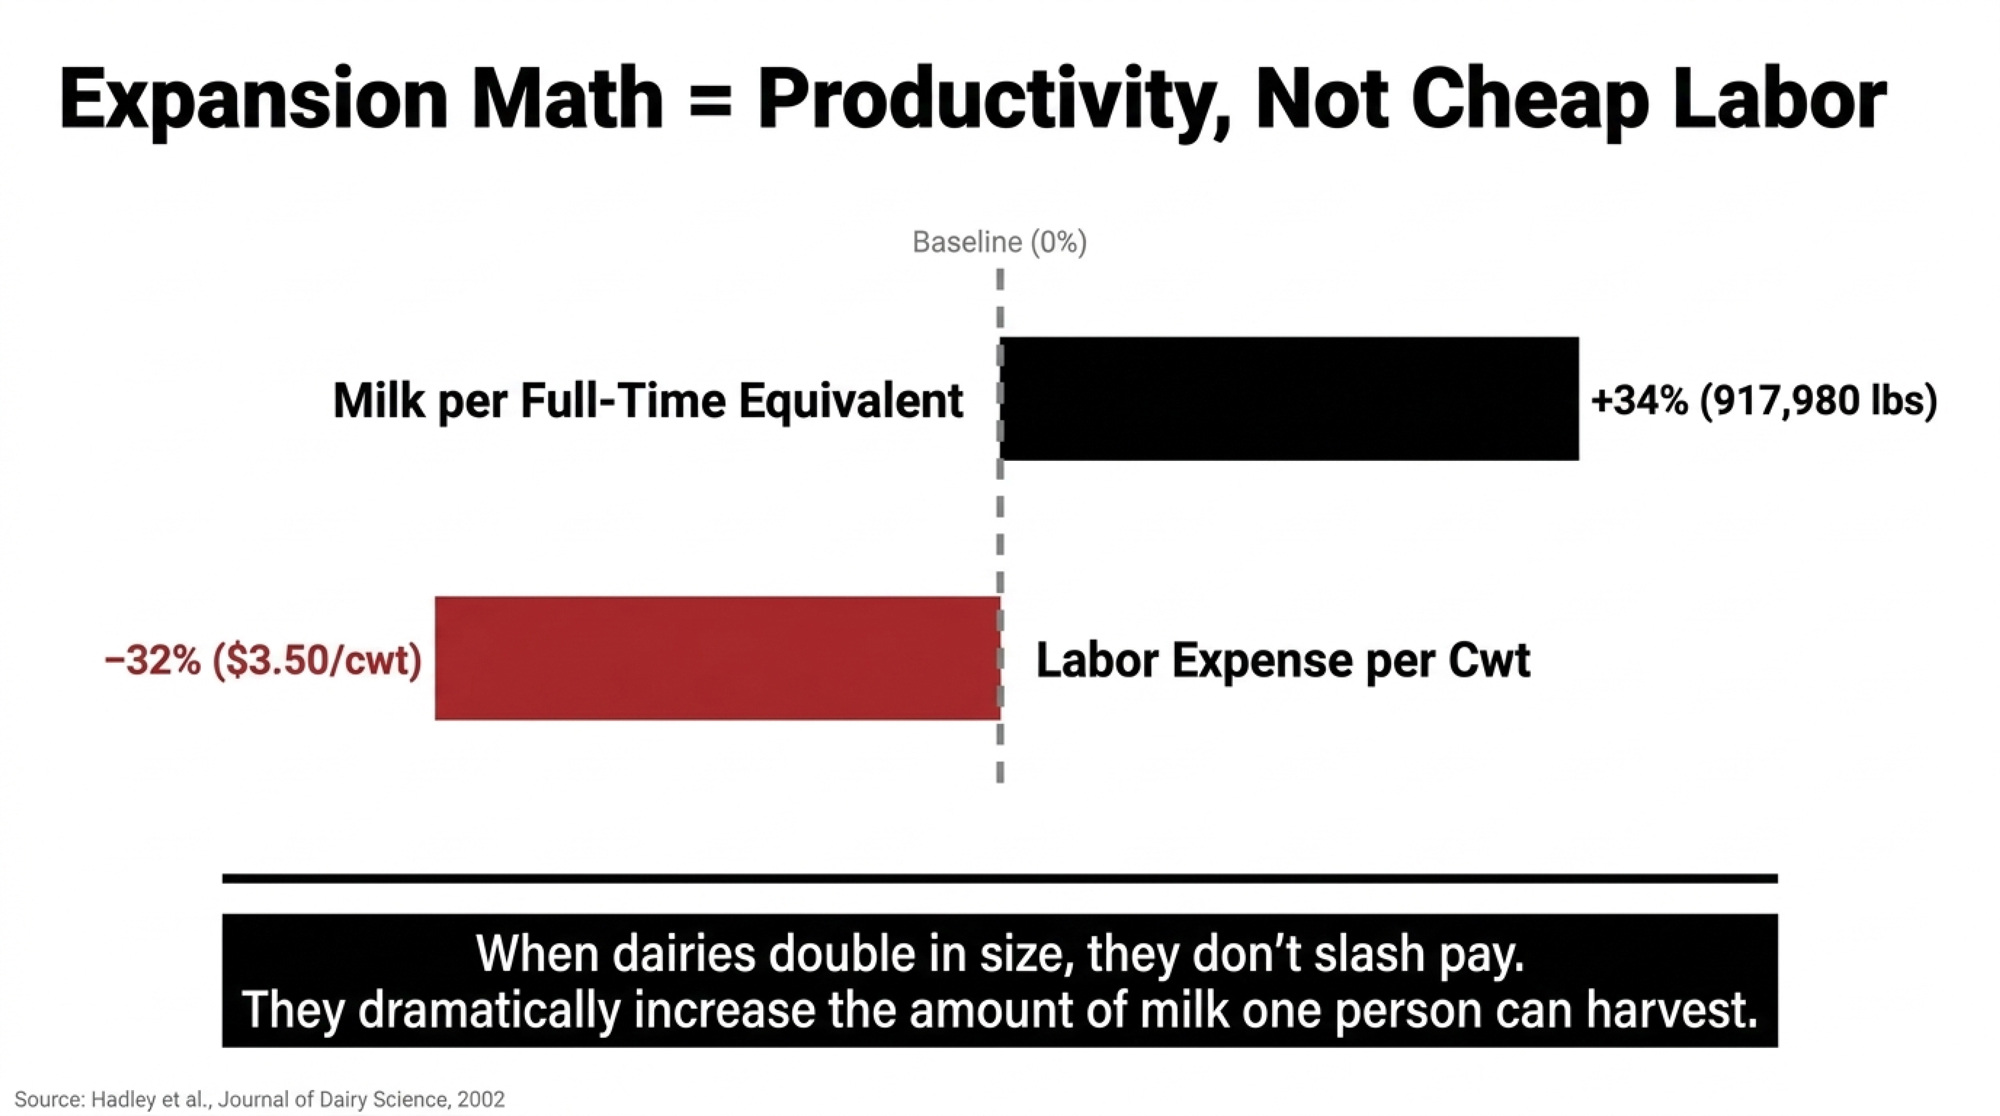
Hadley, Wolf, and Harsh at Michigan State tracked 20 dairy farms through one-time herd increases of at least 20% between 1988 and 1998, and published their findings in the Journal of Dairy Science in 2002.
Measure
Preexpansion
Postexpansion
Herd size
296 cows
569 cows (+92%)
Milk per full-time equivalent
686,656 lb
917,980 lb (+34%)
Labor expense
$5.14/cwt
$3.50/cwt (−32%)
Debt-to-asset ratio
31.3%
43.4%
Hadley et al., Journal of Dairy Science 85(8), 2002. Debt-to-asset ratio reported for 14 of the 20 farms.
They didn’t get there by paying less. A 34% gain in milk per worker produced a 32% drop in labor cost per hundredweight — the same mechanism the ERS table shows, caught in real time during the buildout decade.
It wasn’t free either. Leverage went from 31.3% to 43.4% across the 14 farms reporting it. Same strategy, different landings.
Bewley, Palmer, and Jackson-Smith surveyed Wisconsin producers who modernized between 1994 and 1998, also in the Journal of Dairy Science, and asked what actually made expansion hard. Labor management ranked high. Wage rates didn’t make the list — and their finding that larger herds relied more on nonfamily labor while finding labor management easier is the whole argument in one sentence.
When the Labor Vanished, Nobody Got a Raise
Drumgoon isn’t the only case. In July 2025, at least nine Texas dairies received Notices of Inspection over a single weekend, Tyne Morgan reported for Dairy Herd Management on July 15. An NOI is a records request, not a finding of wrongdoing.
One farm and a Texas weekend are confirming evidence, not proof. Better to say so than let a handful of cases carry weight they can’t hold.
The stronger evidence sits outside dairy, and it’s causal.
The Bracero termination. The Johnson administration ended the program on December 31, 1964, excluding almost half a million Mexican seasonal farm workers. Clemens, Lewis and Postel studied it in the American Economic Reviewin 2018 and found no meaningful rise in domestic farm wages or employment. Growers mechanized instead — tomato harvesters went from a handful of units to near-universal inside about a year. The finding has a published critic: Kaestner argued in Econ Journal Watch in 2020 that the identification is weaker than claimed. It still stands as the best natural experiment available.
California’s AB 1066. The farmworker overtime phase-in began in January 2019 for employers with 26 or more workers, stepping the weekly threshold down from 55 hours to 40 by 2022. Alexandra Hill at UC Berkeley used National Agricultural Workers Survey data for 2019 and 2020 and found employers cut hours rather than pay premiums. The share working 56–60 hours a week — just under the old threshold — fell by roughly half. The share working 46–50 hours rose by about a third. Workers earned $6 to $9 million less in weekly paychecks across those two years, and the share earning $600–$800 a week dropped by roughly a third, most shifting into the $400–$500 bracket.
Different decades, different crops, different researchers. Both pointing where Drumgoon pointed. When labor gets scarce or expensive, employers reach for visas, machines, or fewer hours before they reach for a raise.
What Would Domestic-Only Labor Actually Cost You Per Hundredweight?
Fair warning on our own math first. The $1.75/cwt hired-labor figure is ARMS 2016, and the production cost is 2021. Two vintages in one equation, against a 2026 price. We just spent a section criticizing undated numbers, so it would be cheap not to date our own.
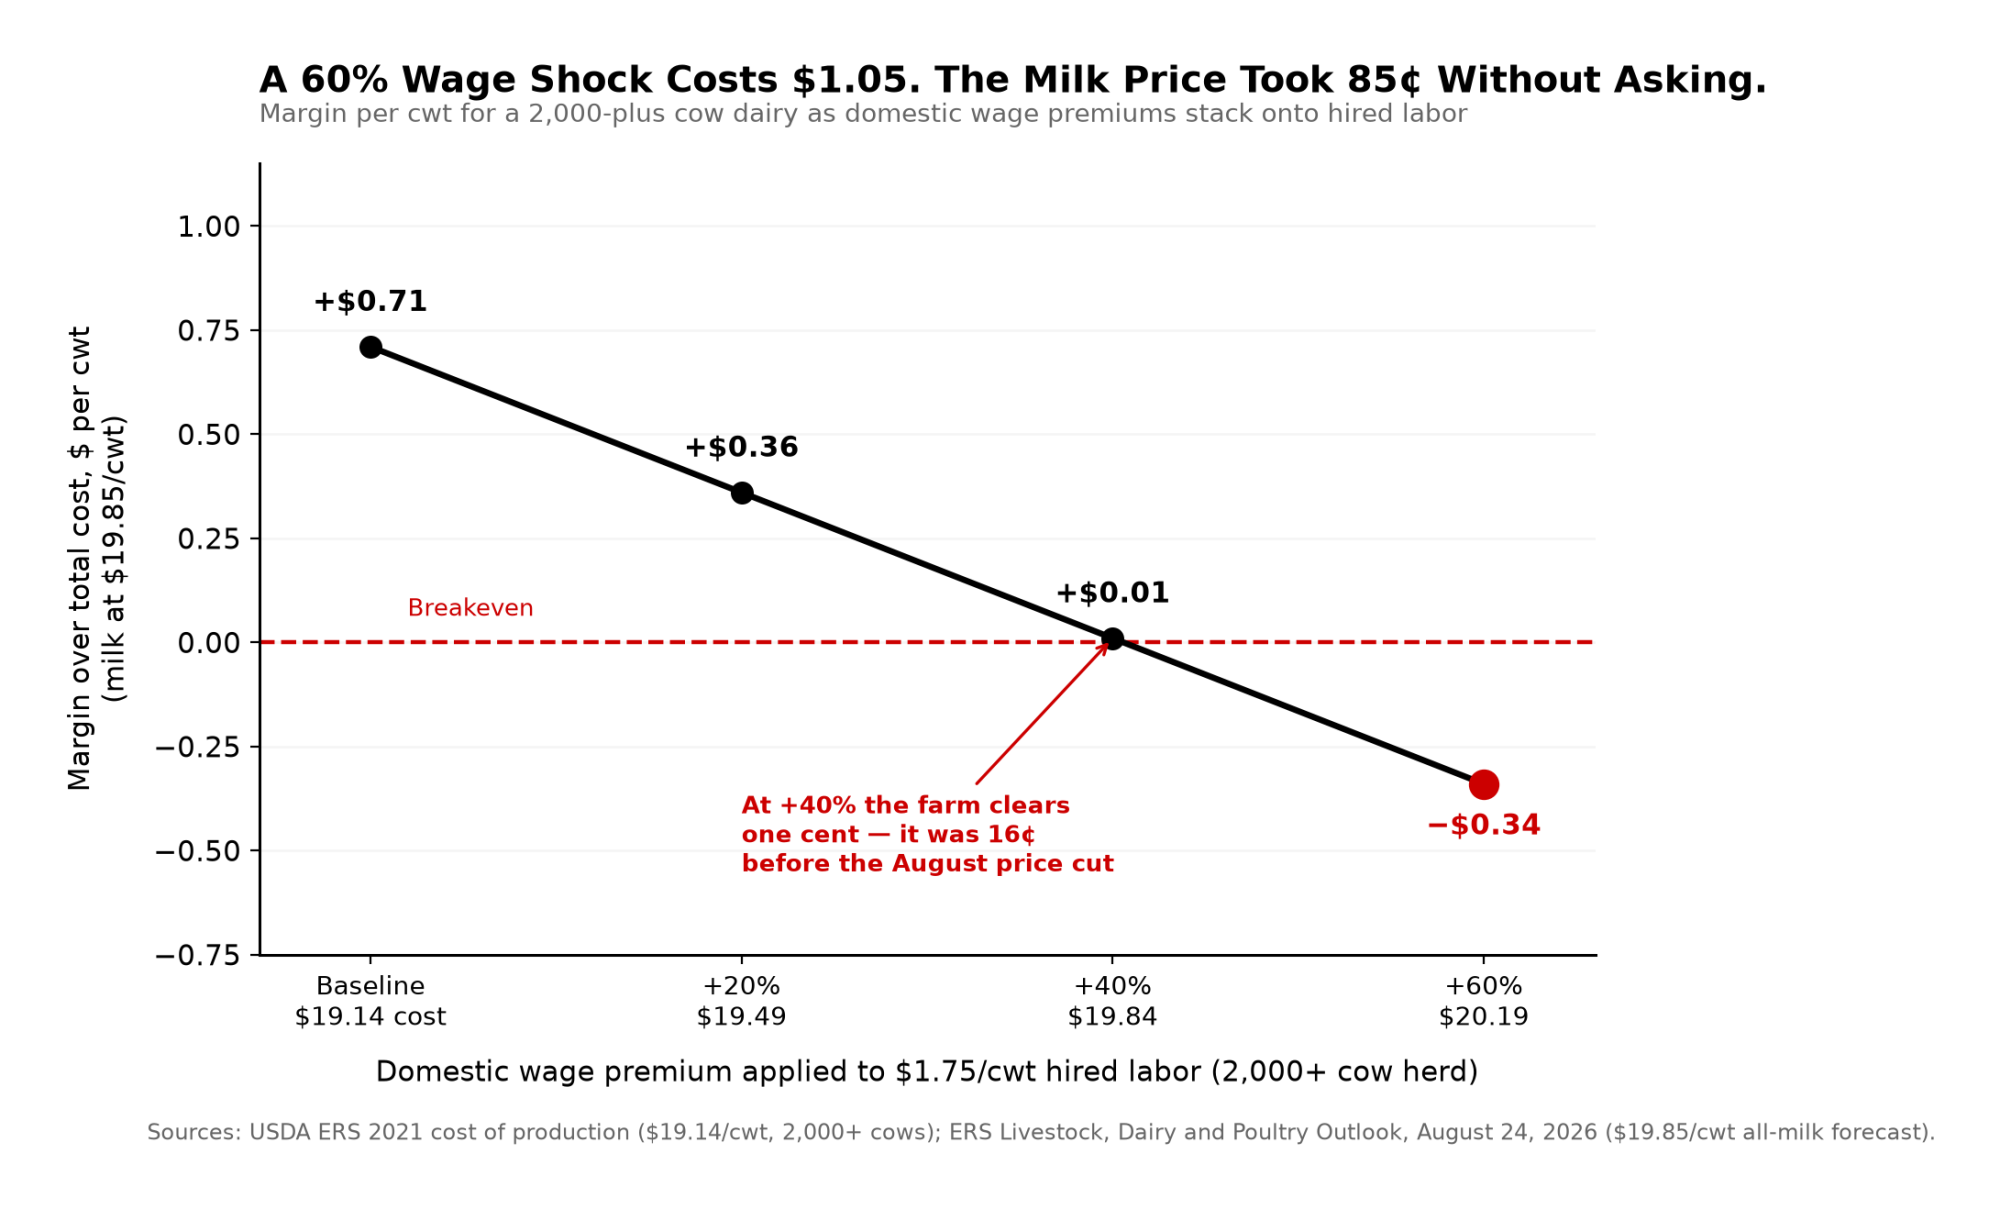
Here’s the calculation, and you can run the same shape of it on your own payroll in about four minutes. Take hired labor for 2,000-plus cow herds, $1.75/cwt, and apply a wage premium as though you’d replaced that workforce domestically.
Formula: $1.75 × your wage premium = added cost per cwt.
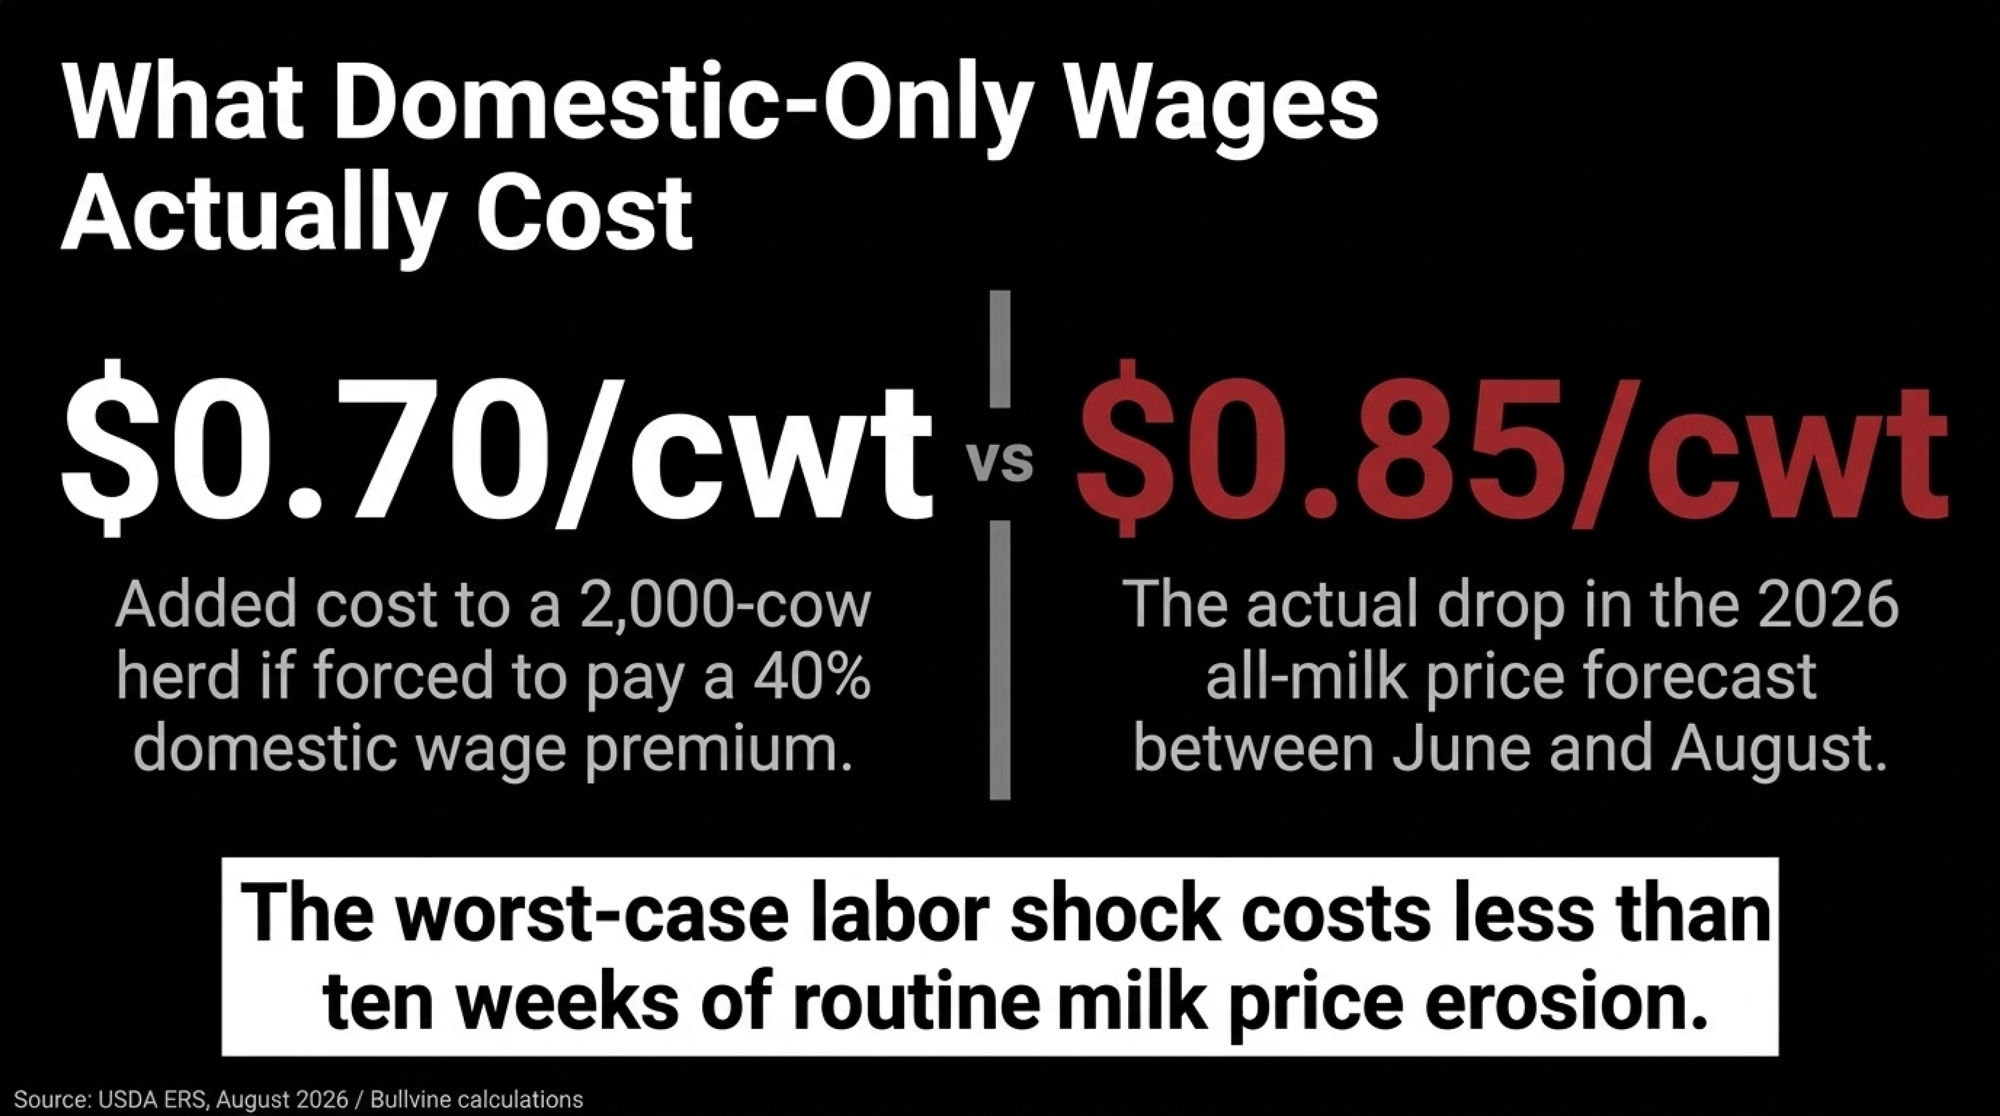
ERS puts 2021 total cost of production at $19.14/cwt for 2,000-plus cow herds. The 2026 all-milk price forecast has been sliding all summer: $20.70 in June, cut 70 cents to $20.00 on July 16, then cut another 15 cents in the August 24 outlook to $19.85/cwt.
Wage premium
Added cost/cwt
Total cost
Margin at $19.85
Baseline
—
$19.14
+$0.71
+20%
$0.35
$19.49
+$0.36
+40%
$0.70
$19.84
+$0.01
+60%
$1.05
$20.19
−$0.34
USDA ERS, Livestock, Dairy and Poultry Outlook, August 24, 2026. Every margin cell moves one-for-one with the milk price.
Watch what the August revision did. At a 40% wage premium, a 2,000-cow dairy now lands one cent above breakeven — it was sixteen cents in July. Thirty cents of forecast erosion did more damage to that row than a 20-point swing in the wage assumption.
Which is the actual finding. The worst-case labor shock costs a large herd about a dollar per hundredweight. The milk price moved 85 cents in ten weeks without anyone voting on it.
One more limit. We picked 20/40/60% as a sensitivity bracket because no study establishes what premium would actually pull domestic workers into dairy at scale. The model also assumes farms would pay it. Drumgoon, Bracero, and California all say they’d restructure or buy iron first. Elliott’s $110,000 went to recruiters, not a wage sheet.
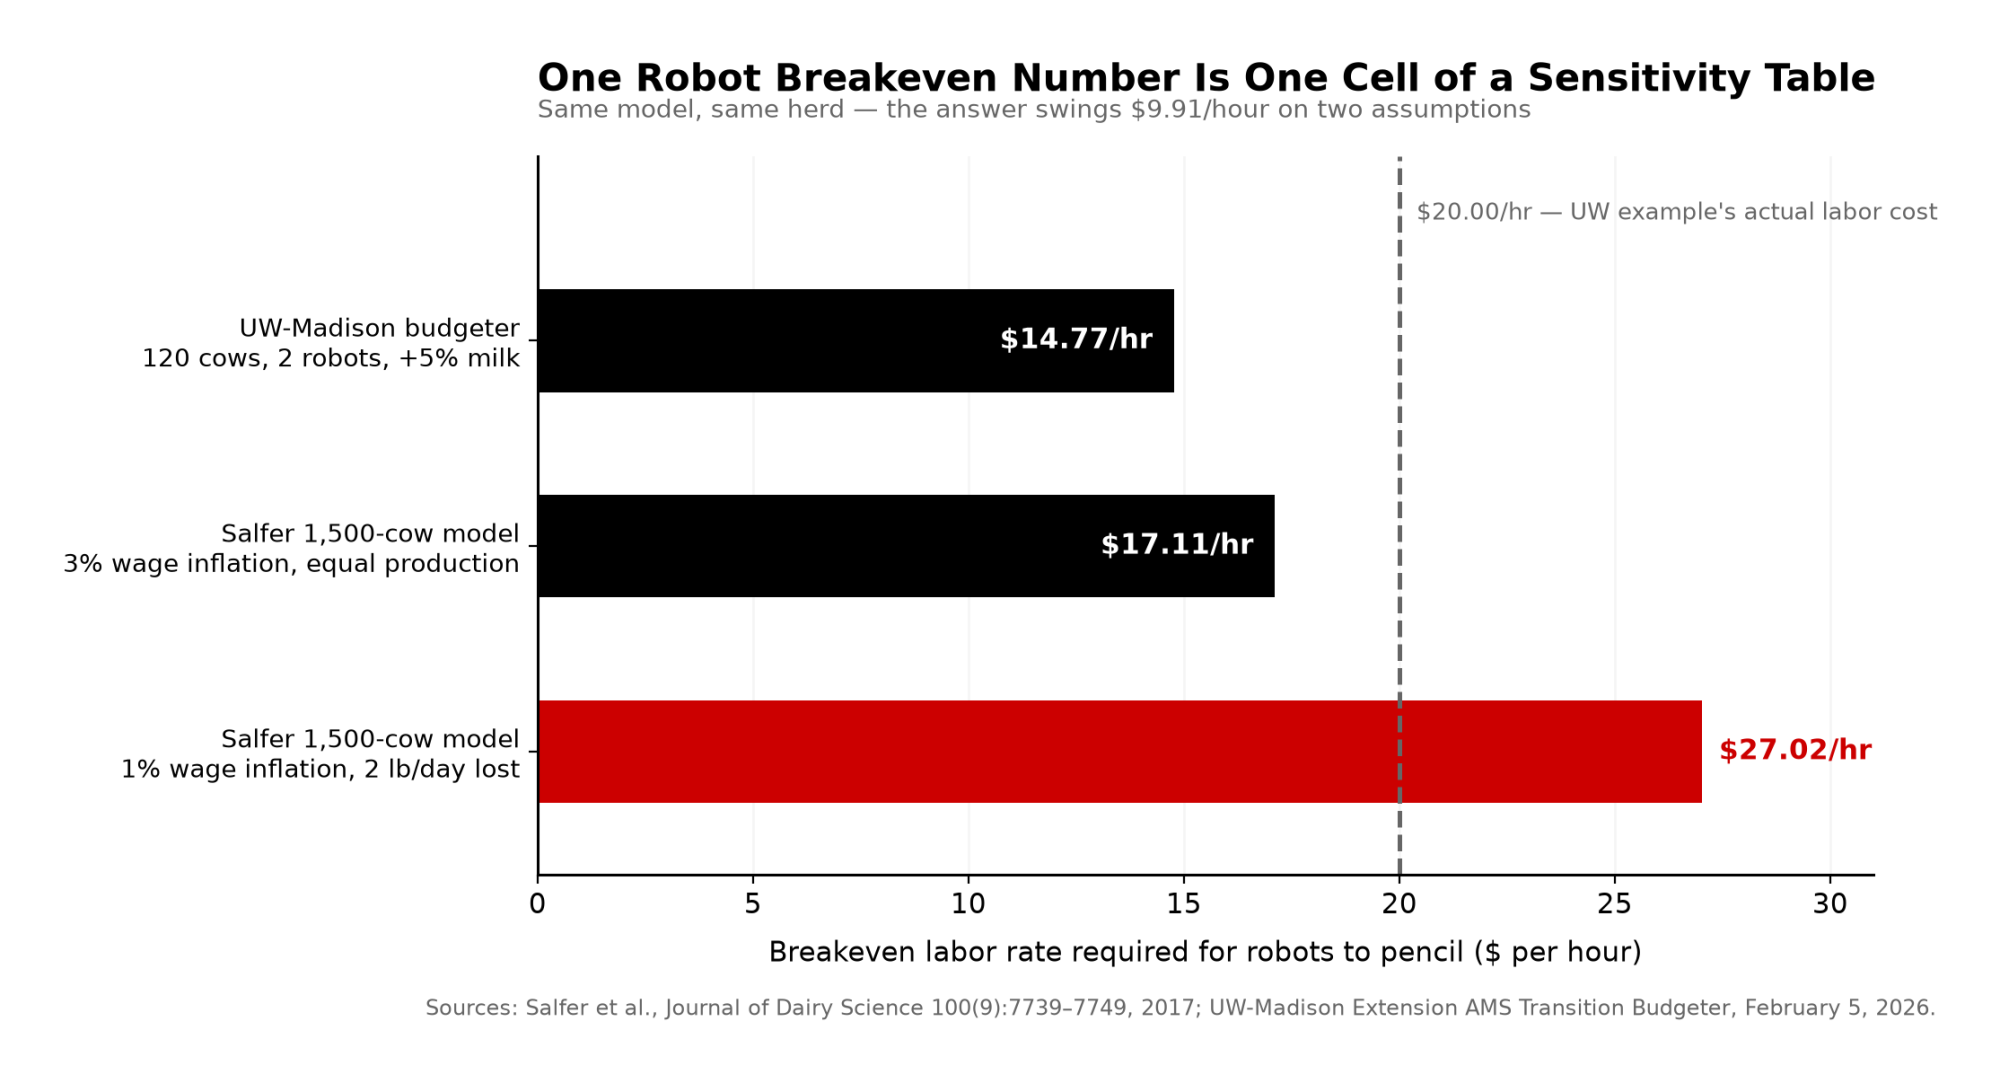
Your Robot Breakeven Isn’t One Number. Salfer’s Own Range Runs $17.11 to $27.02
Bullvine has published the $27.05/hour breakeven repeatedly — and dated it to 2018 on at least one page. We went back to the source; what we found changes how you should use it.
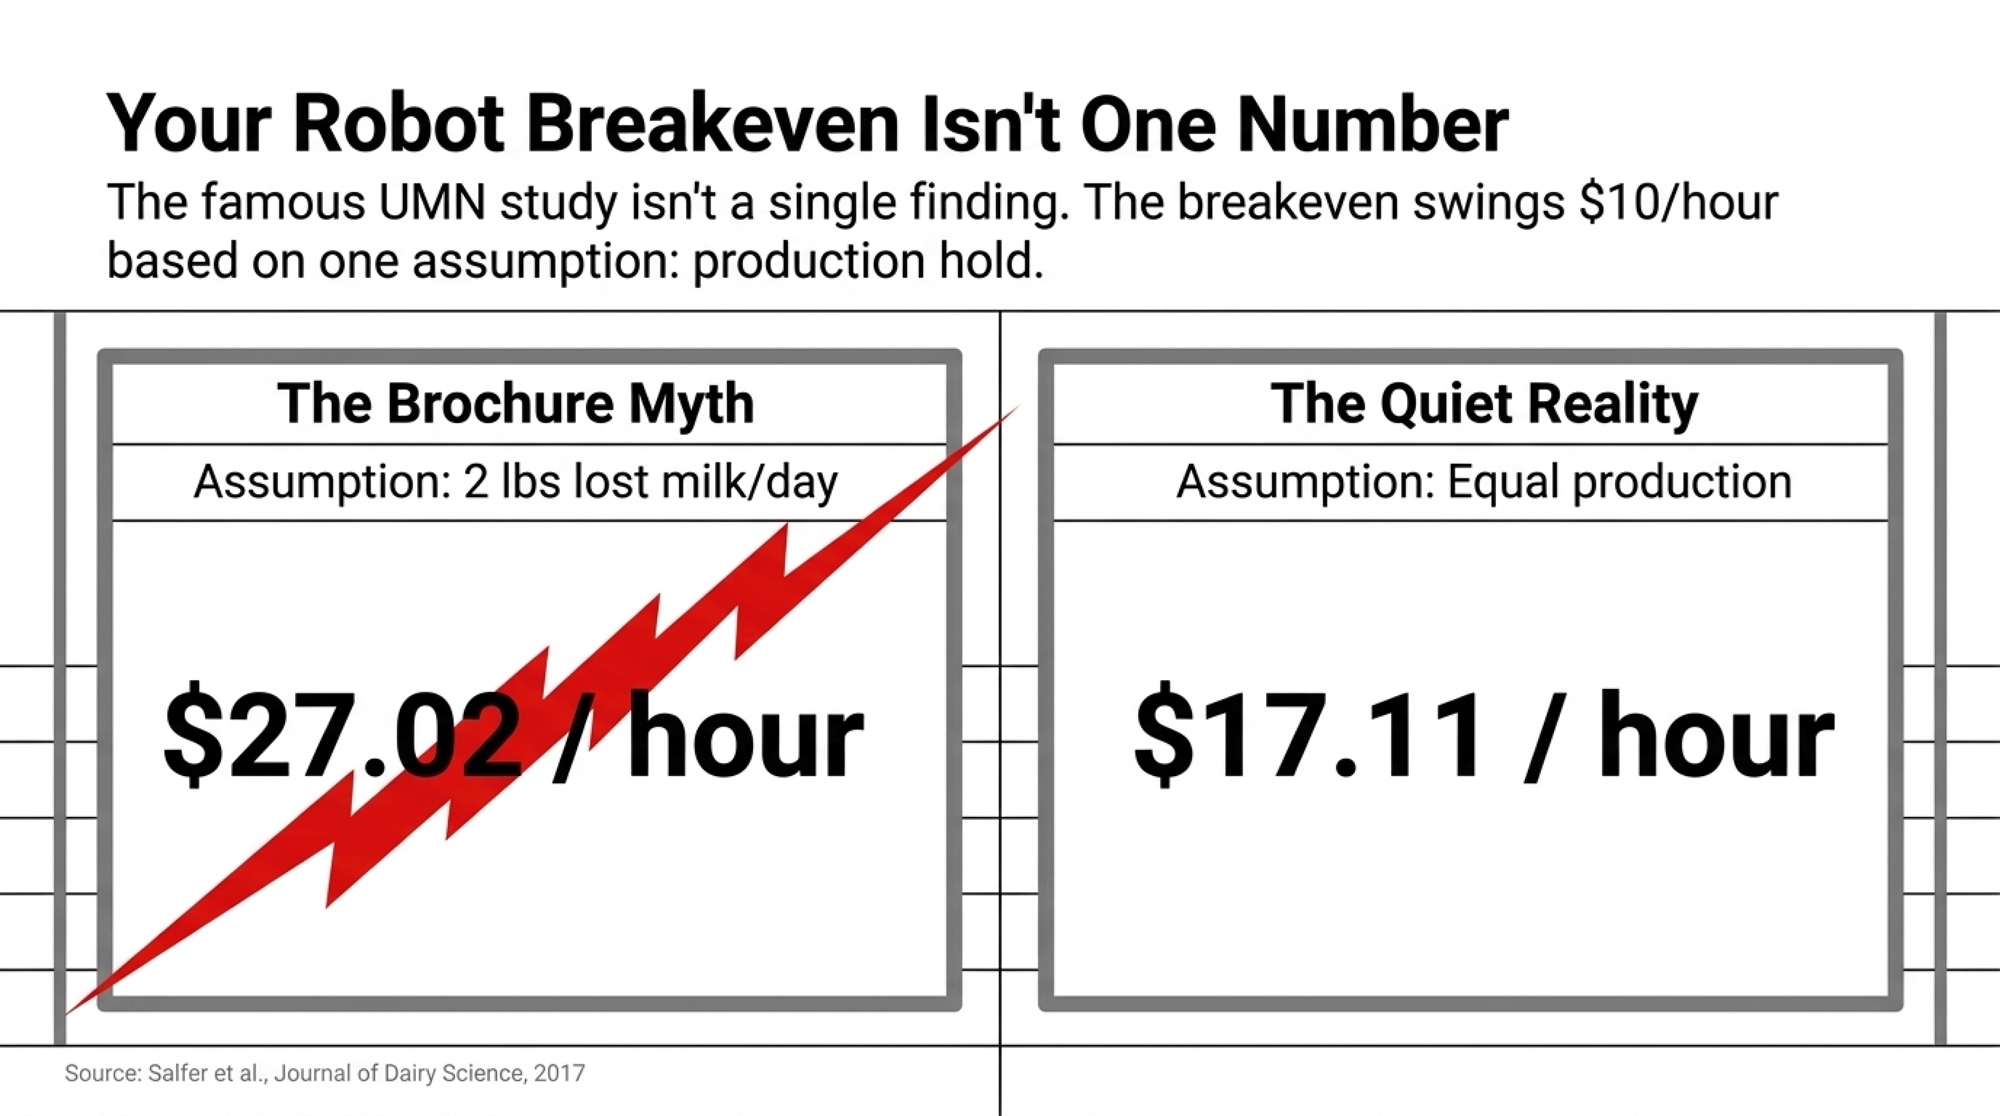
That number comes from Jim Salfer and colleagues at the University of Minnesota, published in the Journal of Dairy Science in 2017, modeling a 1,500-cow dairy with 25 robots against a double-24 parlor. And it isn’t a single finding. It’s one cell in a sensitivity analysis.
Salfer’s 1,500-cow model, by assumption
Breakeven labor rate
1% wage inflation, robots give up 0.91 kg/d (about 2 lb)
Salfer et al., Journal of Dairy Science 100(9):7739–7749, 2017.
Read that again. Same researcher, same herd, same model — and the answer swings ten dollars an hour on two assumptions: whether your robots hold production, and what wages do over three decades.
We’ve been quoting only the top of that range. So has most of the industry.
Now the second land-grant number. UW-Madison Extension released its AMS Transition Budgeter on February 5, 2026, and the worked example runs 120 cows, two robots, a 5% milk bump, labor at $20.00/hour, boxes near $200,000 each. Breakeven wage: $14.77/hour. Since that farm already pays $20.00, the transition pencils. The tool’s rule is simple — if your actual labor cost is higher than the breakeven number, it works.
Here’s what nobody has connected. UW’s example is a 120-cow herd. And Salfer’s paper found robots penciling at 120 and 240 cows, while the 1,500-cow parlor beat the robots. Two land-grants, nine years apart, converging on the same range — and both saying scale cuts against automation, not for it.
So the apparent chasm between $14.77 and $27.02 was never a disagreement about robots. It was a disagreement about herd size, and about whether you assume production holds.
Drumgoon is the sharper lesson anyway, and it isn’t the one in the brochures. Twenty robots didn’t stop that farm from losing 70% of its crew, and the skilled maintenance roles those robots created went unfilled. Automation changes what kind of labor you need — usually toward scarcer, better-paid labor. It doesn’t make you labor-proof.
Where the Evidence Still Runs Thin
Three honest gaps, because you’d spot them anyway.
Hadley’s cohort averaged 569 cows afterward — nowhere near Drumgoon’s 6,500. Whether the same productivity mechanism scales from 600 cows to 6,000 is an extrapolation, not a finding. And the debt-to-asset numbers come from 14 farms, not 20.
Salfer’s robot economics are from 2017, modeled on one 1,500-cow herd. Robot pricing, service contracts, and labor rates have all moved. The sensitivity logic holds; the dollar figures deserve a fresh run.
And nobody has done the direct study. No published work tests whether immigrant labor availability by region predicted where dairies expanded, holding feed cost, land price, and processing capacity constant. That’s the biggest hole in this entire debate, and it’s been sitting open for twenty years.
Options and Trade-Offs for Farmers
Path 1 — Run your own labor cost per hundredweight. Do this within 30 days.
When it makes sense: Any operation, any size; cheapest analysis here, and it tells you whether the rest of this applies to you.
What it requires: Annual payroll and annual hundredweight shipped. Divide one into the other. Work it on your own numbers — a 200-cow herd shipping 26,000 lb per cow moves 52,000 cwt a year, so a payroll of, say, $310,000 lands at $5.96/cwt. That example herd is deliberately labor-heavy. Swap in your two figures and see where you land against the $1.28 ERS reports for 100-to-199-cow herds and the $1.75 for 2,000-plus.
Risks and limits: Decide whether you’re valuing your own hours. ERS imputes $21.74/hour on sub-50-cow herds and $23.16 at 100–199. Skip that step, and you’re understating your real position — to yourself and to your lender.
Path 2 — Audit your I-9 files with counsel, also within 30 days.
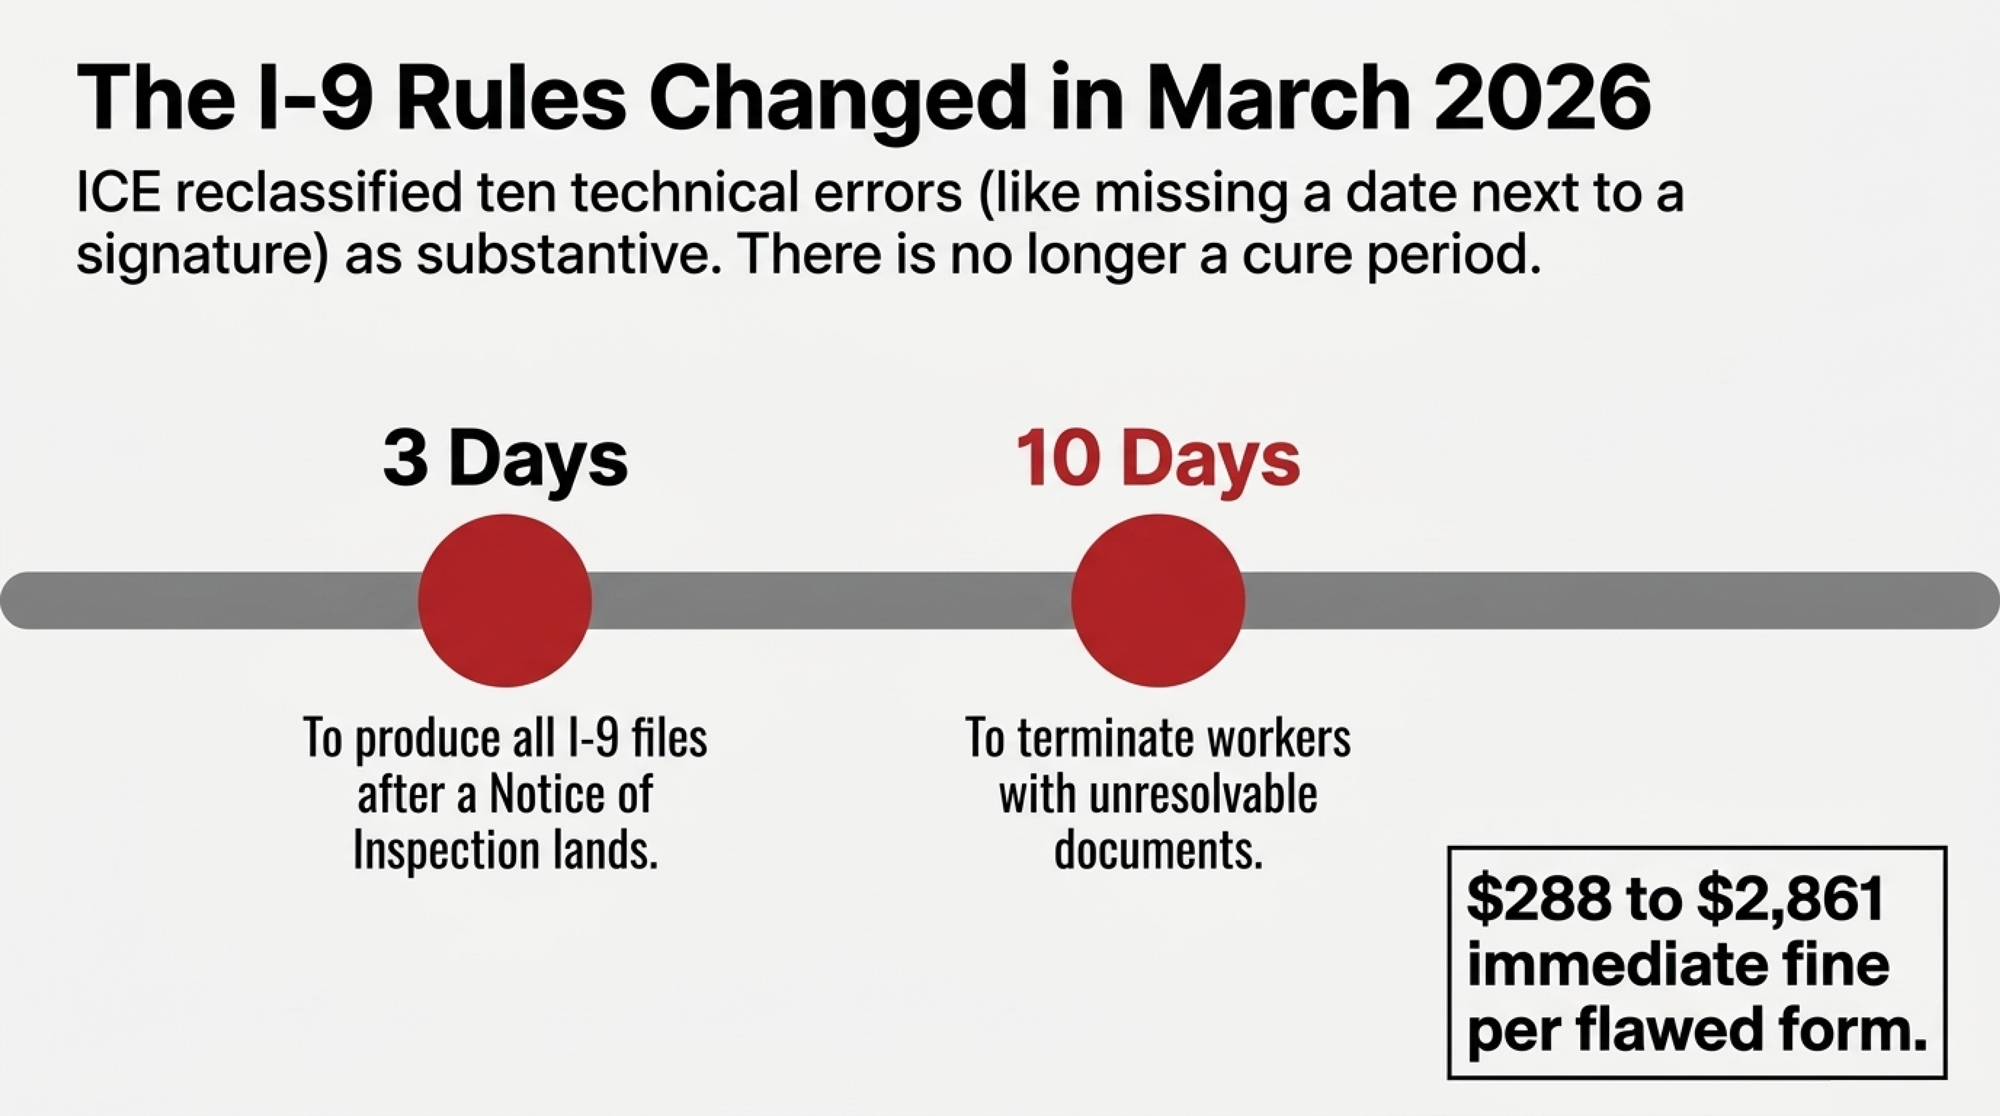
The rules changed on March 16, 2026. ICE quietly updated its Form I-9 Inspection fact sheet, moving more than ten error categories from “technical” to “substantive.” Missing date of birth in Section 1. Missing date next to the employee signature. Incomplete List A, B, or C data in Section 2 — even where you kept document copies. Incomplete preparer or translator data. Electronic audit-trail deficiencies. Each now carries an immediate fine of $288 to $2,861 per formwith no cure period.
When it makes sense: Every operation with hired labor. No exceptions, and this is the risk that hasn’t priced in yet.
What it requires: Work with immigration counsel rather than alone. Ballard Spahr’s February 2026 guidance is blunt on the point — internal audits are what demonstrate good-faith compliance if a government audit lands. The statutory good-faith exception has always applied only to technical violations; that hasn’t changed. What changed is which errors count as technical. The ten-business-day cure window still exists for a shorter list: wrong Form I-9 version, missing “other last names used,” missing employee address in Section 1, missing business address in Section 2. Our full breakdown of how a Notice of Inspection unfolds walks through the mechanics step by step.
Risks and limits: You have three business days to produce every I-9 once a Notice of Inspection lands, and you must terminate workers with unresolvable documents within ten business days. Do the arithmetic on your own file count: 40 employees with one substantive error each, at the midpoint of that penalty range, is roughly $63,000 before anyone argues about aggravating factors. Drumgoon had a clean twenty-year record and a co-owner who personally checked IDs, and still lost 38 people. This reduces exposure. It doesn’t eliminate it.
Path 3 — Price your automation breakeven against your own herd size, not the brochure’s.
When it makes sense: Both land-grant models point at the same window. Salfer’s paper found robots penciling at 120 and 240 cows, while the parlor won at 1,500. UW’s worked example is 120 cows with a 5% milk bump and a $14.77 breakeven against $20.00 labor. If you’re between roughly 100 and 500 cows paying above $17/hour loaded, the math is live.
What it requires: A current dealer quote run at 1.4× installed cost, an honest production assumption, and a real budget line for maintenance skill. Drumgoon posted those positions and got nobody.
Risks and limits: The single biggest swing factor is production, not wage rate — that’s what moves Salfer’s breakeven from $17.11 to $27.02. Ask for the production guarantee in writing. And if a scale argument is doing the work in your automation decision, check it against the papers: both models put the economics at 120 to 240 cows, and Salfer’s parlor beat the robots at 1,500.
Path 4 — H-2A got clearer in June. Read what the memo actually says.
When it makes sense: Wider than early coverage suggested. On June 17, 2026, USCIS issued Policy Memorandum PM-602-0200, “Guidance on Temporary or Seasonal Need for H-2A Petitions for Dairying” — nine pages, effective immediately, binding on adjudicators. USDA welcomed it the same day. Per July 6, 2026 analysis, even dairies without a discrete breeding season may qualify by documenting materially different herdsman duties across the year, even though milking itself never stops.
What it requires: Documentation of seasonal duty variation, not of a labor shortage. And more lead time than you’d think — the contract, the certification, and a housing inspection all have to clear before anyone arrives, which puts realistic planning several months out.
Risks and limits: It’s a policy memorandum, not a regulation. It creates no legally enforceable right; any administration can rescind it, and petitions are judged case by case. Your year-round milking crew is still ineligible on its own. Elliott’s experience is the cautionary version: she was working this pathway in 2025, before the standard was written down, with counsel and $110,000 to spend — and it still left her 16 positions short. The Farm Workforce Modernization Act would put a year-round fix in statute, not a memo. It has passed the House twice and stalled in the Senate twice.
Key Takeaways
Divide annual payroll by annual hundredweight shipped. Above 500 cows and well north of $1.75/cwt, your gap is labor efficiency, not your wage rate.
Under 100 cows, value your own hours at ERS’s $21.74/hour before you call your cost of production finished. Otherwise, you’re the cheapest employee on the place, and nobody’s tracking it.
If you audited your I-9 files before March 16, 2026, that audit is stale. Errors that were curable then now carry $288 to $2,861 per form with no correction window.
Anyone quoting you one robot breakeven wage is quoting one cell of a sensitivity table. Ask which production assumption it uses. Equal production puts the bar near $17/hour; two pounds a day lost puts it near $27.
Above 1,000 cows and weighing robots? Both Salfer and UW put the economics near 120 to 240 cows, and Salfer’s parlor beat the robots at 1,500.
Modeling expansion? Track milk per FTE, not wage rate. The Michigan State cohort cut labor cost per cwt by 32% on productivity alone — and carried leverage from 31.3% to 43.4% getting there.
Financing this year? Your lender’s labor-shock question has a bounded answer — $0.35 to $1.05/cwt on large herds. The milk price moved 85 cents against you in ten weeks. Know which one you’re actually exposed to.
So where does your labor cost per hundredweight actually sit — and how much of it are you paying versus quietly absorbing? Twenty minutes with your payroll file answers both, and it’s a better twenty minutes spent before an envelope arrives than after.
We’re running the complete scenario model — all seven ERS herd-size tiers, every premium cell, formula, and assumptions on the table — in an upcoming Bullvine deep dive. If you want the full math rather than the headline version, it’ll live there.
This article draws on reporting by South Dakota Searchlight (October 10, 2025), Northeast Radio SD (October 2025), and Dakota Free Press (October 12, 2023); on USDA ERS data and peer-reviewed research as cited; and on federal policy documents current as of September 2026. Drumgoon Dairy was not contacted for this article.
Learn More
H-2A Dairy Visa Cost — Arms you with line-by-line guest worker recruitment expense data before signing agency contracts. Reveals true all-in costs averaging $877 per cow, exposing hidden legal overhead, transportation fees, and housing inspection mandates that conventional wage comparisons routinely conceal.
Dairy Cost of Production: Small Herds — Dismantles the persistent myth that milk market consolidation is driven purely by feed volatility. Exposes how imputed family labor burdens of $12.78/cwt quietly suffocate sub-50-cow operations long before hired payroll changes impact the balance sheet.
Robotic Milking ROI: Cash Flow Valley — Follows the money through a seven-year automated milking conversion to protect working capital. Breaks down why realistic 1.4× capital expenditure multipliers and $11,500 annual maintenance costs create an $8,776 yearly deficit on 140-cow setups despite brochure promises.
The Sunday Read Dairy Professionals Don’t Skip.
Every week, thousands of producers, breeders, and industry insiders open Bullvine Weekly for genetics insights, market shifts, and profit strategies they won’t find anywhere else. One email. Five minutes. Smarter decisions all week.
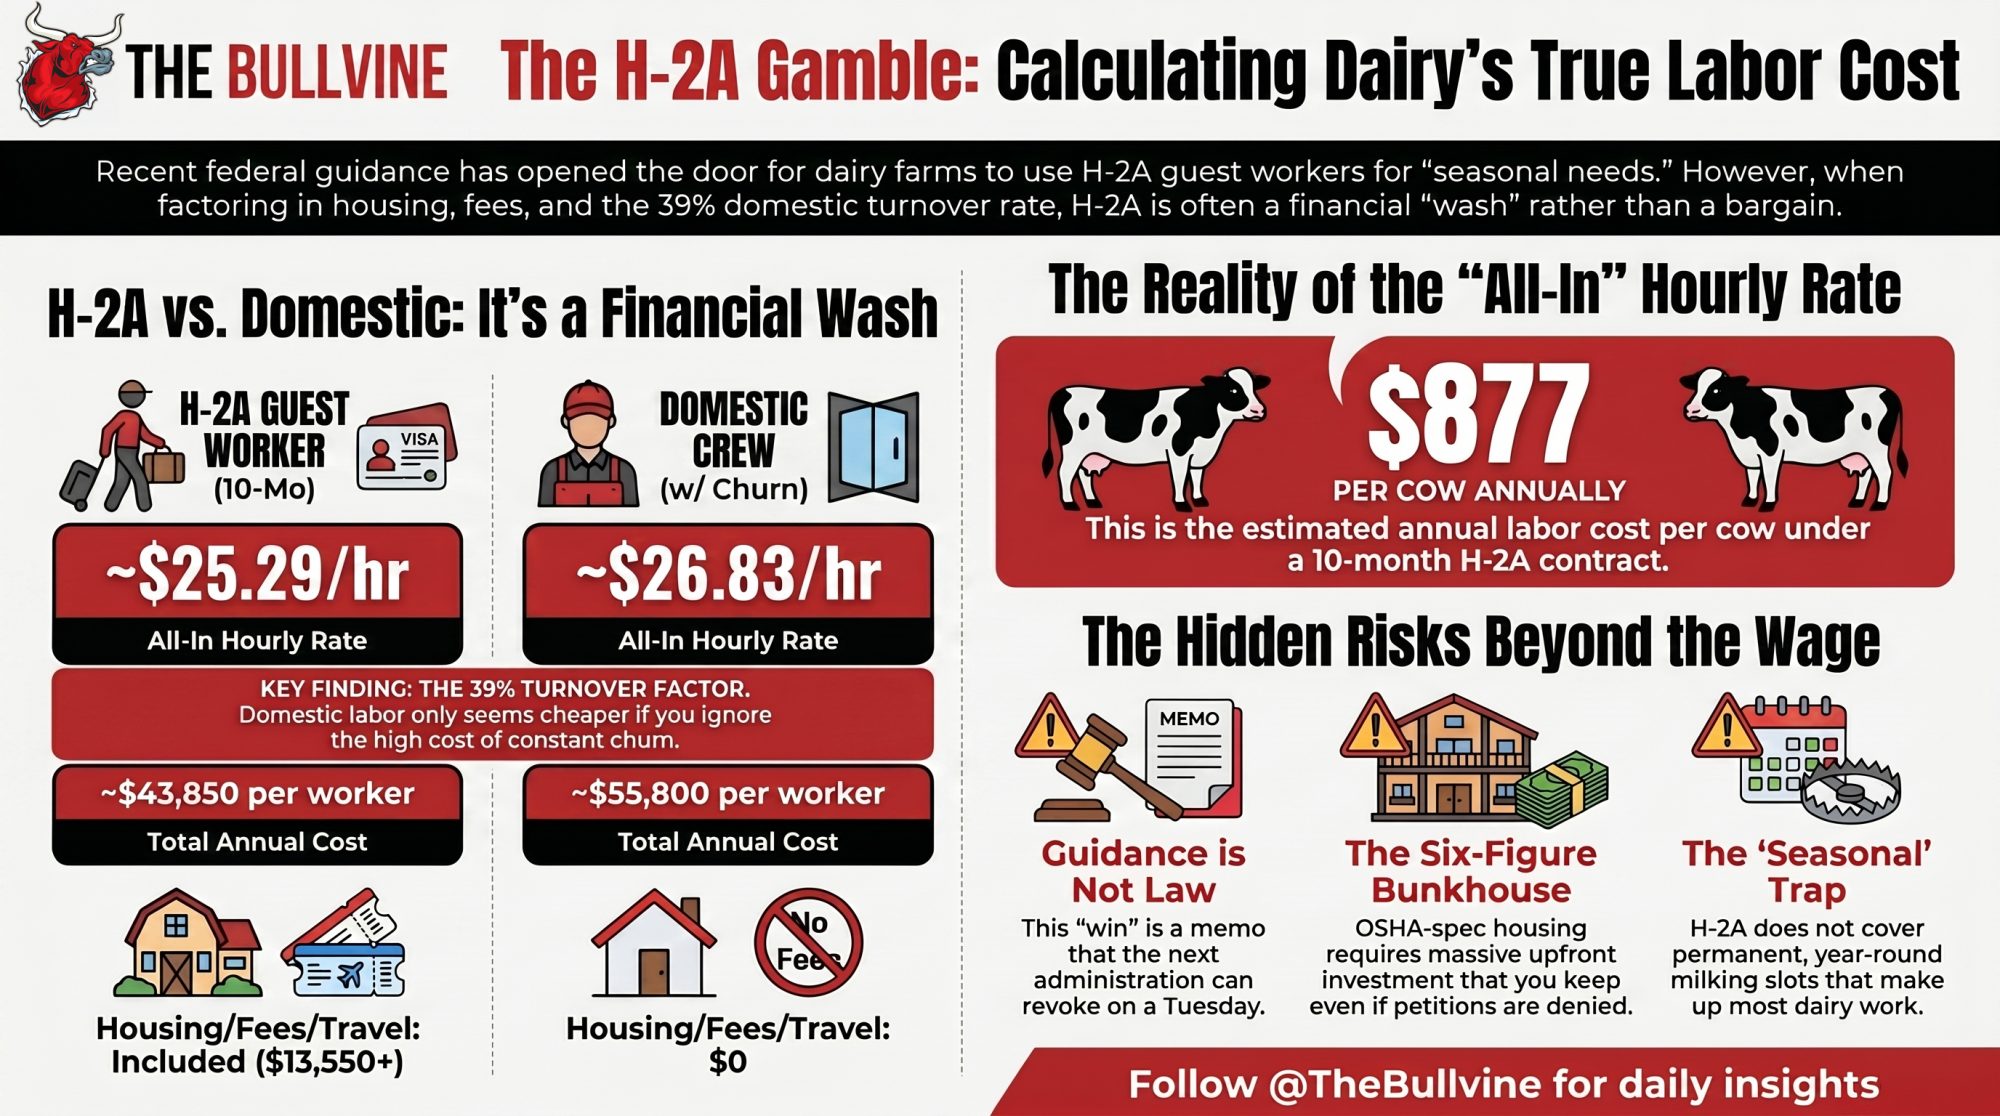
Trade media called the H-2A reinterpretation a win. Nobody ran the barn math: ~$877 a cow a year, about $25/hr all-in — right on top of the crew you’ve already got. Run your number first.
Executive Summary: After 40 years shut out, dairy can finally tap H-2A guest workers as of mid-June 2026 — but in Wisconsin the all-in cost lands near $25 an hour, about $877 per cow a year, right on top of what your current crew runs. This isn’t a new law; it’s a USCIS guidance memo reinterpreting “seasonal need,” which means the next administration can pull it as fast as it appeared, and it still won’t cover the year-round milking slots that make up most of the 51% immigrant share of the dairy workforce. Price your domestic crew honestly — wages plus the turnover hit at the 39% industry churn rate — and it runs about $26.83/hr, so H-2A isn’t a bargain or a blunder. It’s a wash. Which means the real decision was never cost; it’s stability versus compliance risk and a possible six-figure OSHA-spec bunkhouse you’ll still own if USCIS denies your petition. It pencils for higher-wage states with documentable seasonal spikes and existing housing — and stays a co-op conversation for the 240-cow herd milking the same five people all year. Pull your last 12 months of labor records before you call a recruiter, because the question isn’t whether the door’s open. It’s whether walking through pays for your herd.
For four decades, the federal answer to dairy on H-2A was a near-automatic no. The program was built for harvest crews that come and go with the apples or the lettuce. Milking isn’t seasonal — cows don’t stop in December — so dairy never fit the box. That changed in mid-June 2026, when the government quietly reinterpreted the rules. The trade press ran it as a win. Nobody put a pencil to what walking through that door actually costs a working herd. So before you call a recruiter, here’s the math the headlines skipped.
What Actually Changed in June
U.S. Citizenship and Immigration Services issued new guidance directing its officers to stop reflexively rejecting dairy petitions and instead judge each one on whether the farm has a genuine temporary or seasonal need. Read that carefully. It’s a change in how existing rules get applied — not a new law, and not an expansion passed by Congress.
The distinction matters more than the headlines let on. A law takes an act of Congress to pass and another to repeal. Guidance is a memo. It tells the agency’s adjudicators how to read existing rules, and the next administration can issue a different memo on a Tuesday. So when you hear “dairy got H-2A,” what dairy actually got is a more favorable reading of the same statute that’s been on the books for years — not a new, durable right.
The industry welcomed it, carefully. The National Milk Producers Federation framed it as a step toward opening the door. Edge Dairy Farmer Cooperative called it an early, positive step for year-round producers. Both groups are membership organizations whose job is to advance producer interests, so a positive read is expected, which makes the hedging in their own words (“toward,” “first step”) worth noting. Even the people cheering aren’t calling it the fix.
Here’s the catch that didn’t lead the coverage. The guidance does not open H-2A to permanent, year-round milking. Cornell’s Ag Workforce Development team read it as covering temporary or seasonal jobs only — not permanent or back-to-back consecutive roles. File repeat petitions for the same milking slot with no real break, and USCIS will generally read that as proof of a permanent need — and deny you.
Who This Helps — and Who It Doesn’t
This change helps a specific kind of operation. Larger herds with a documentable seasonal spike — a tight calving window, a defined expansion phase, and seasonal feed work. Farms in higher-wage states, where the gap between the H-2A wage floor and your current payroll is already thin. And operations that either own compliant worker housing or can afford to build it.
It does a lot less for everyone else. Milk 240 cows in a low-wage state with the same five people all year, and there’s no seasonal spike to point to — and the all-in cost can run higher than what you pay now once housing and fees land. For those herds, this was something to talk about at the co-op, not a new labor source.
The biggest number in the room goes untouched. An NMPF-commissioned study put immigrant labor at roughly 51% of the dairy workforce, producing close to 79% of America’s milk — figures now about a decade old but still the standard reference. Most of those workers hold the year-round jobs this guidance doesn’t cover. So whatever H-2A becomes for dairy, it’s not a swap for the crew already in your parlor.
Farm Profile Factor
H-2A Likely Pencils ✓
H-2A Likely Doesn’t Pencil ✗
Herd size
500+ cows, multiple labor slots
240 cows or fewer, same 5 people year-round
Seasonal need
Defined calving window, expansion phase
Year-round milking with no documented spike
State wage floor
Higher-wage states (WA, OR, NY, CA)
Low-wage states where AEWR adds little vs. local labor
Housing status
Own compliant OSHA-spec bunkhouse now
Aging trailer, shared bath, no locks — renovation = six figures
Turnover rate
39%+ churn — you’re already paying the H-2A rate
Low churn, stable crew — domestic wins on simplicity
Risk tolerance
Can absorb a denial after fees are sunk
Cannot carry sunk housing cost if petition is denied
Visa fee trajectory
Locked into a short-cycle contract
Multi-year plan built on today’s $1,350 — fees keep climbing
Does H-2A Actually Pencil Out for a 500-Cow Dairy?
Everyone assumed “access to H-2A” meant cheaper labor. The barn math says otherwise. Here’s how the numbers stack up for a 500-cow Wisconsin dairy running 10 full-time equivalents on a 10-month contract, against a traditional domestic crew. That one-worker-per-50-cows ratio swings with parlor type and automation — some herds run 8, some run 12 — so set yours before you trust the rest.
Running the Numbers: H-2A vs. Domestic Labor (Per Worker, Bullvine Model)
Cost Category
H-2A Guest Worker (10-Mo. Contract)
Domestic Crew (Honest Costing w/ Churn)
Base cash wages
$30,300 (~1,733 hrs @ ~$17.50 effective)
$40,560 (2,080 hrs @ $19.50, Midwest working assumption)
Taxes & benefits
Included in fees/overhead
$7,440 (payroll taxes, modest perks)
Housing operating cost
$11,000 (USDA seasonal average)
$0 (assumes no farm-provided housing)
Visa & application fees
$1,350 (up ~$600 in two years)
$0
Inbound/outbound travel & subsistence
$1,200
$0
Annualized turnover hit
$0 (contract-guaranteed term)
$7,800 (39% avg @ $20k replacement)
Total cost per worker
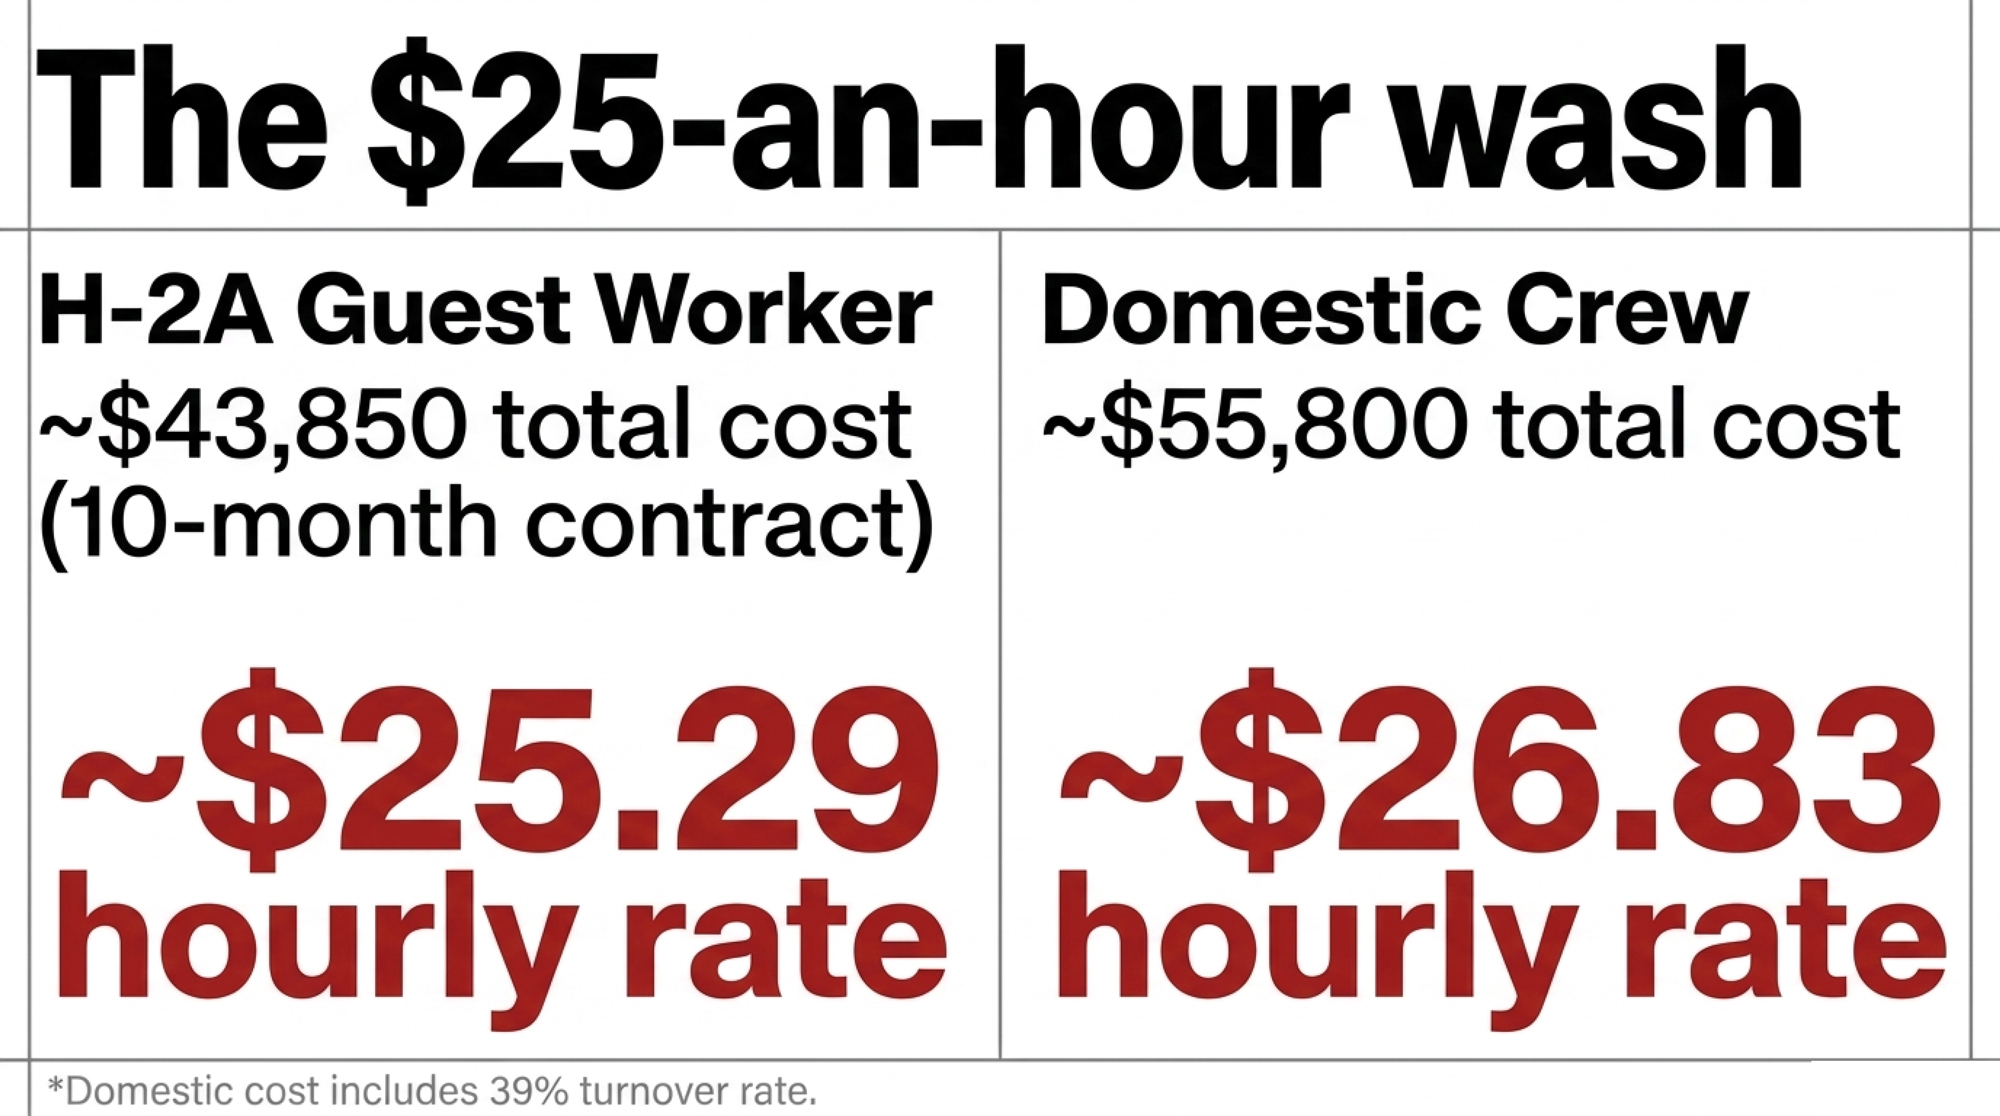
~$43,850
~$55,800
All-in hourly rate
~$25.29/hr (over ~1,733 contract hrs)
~$26.83/hr (over 2,080 hrs)
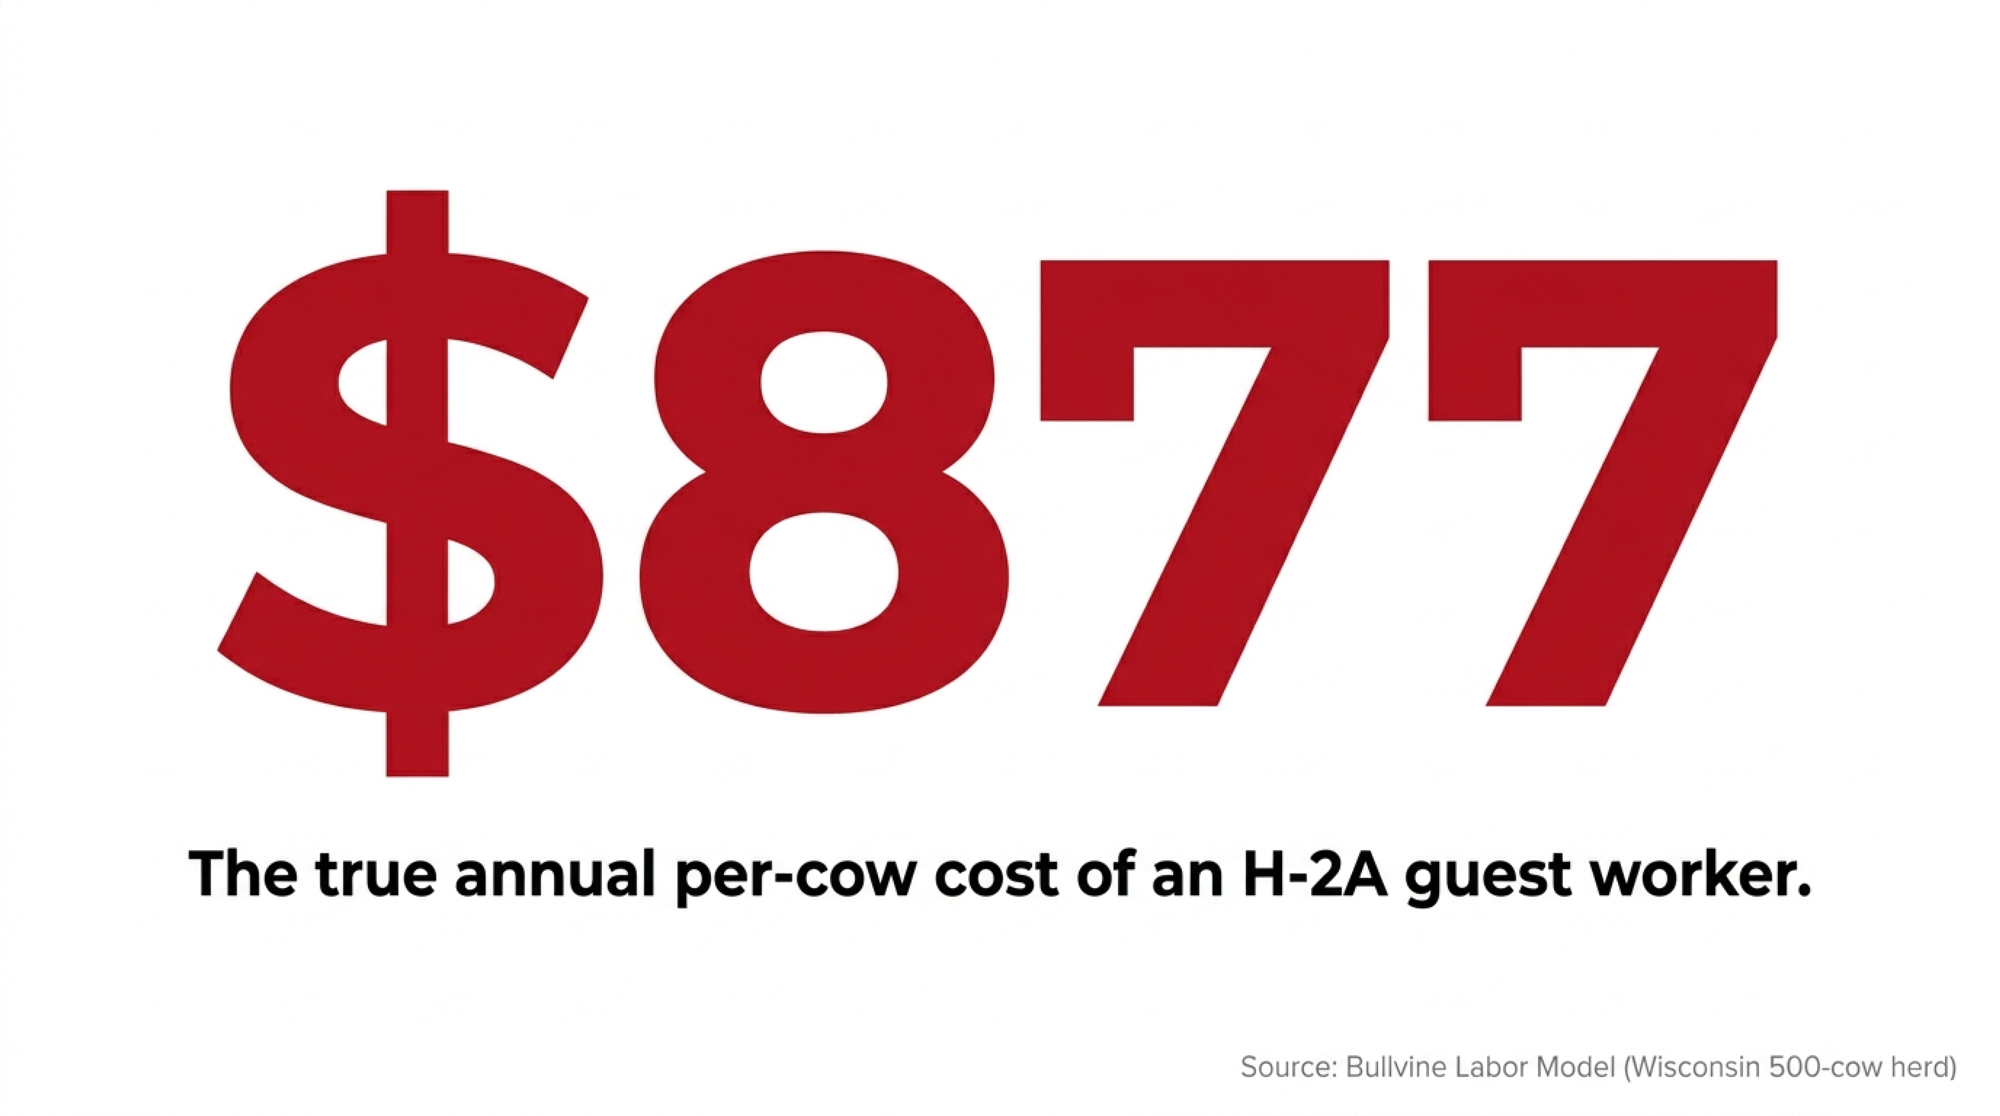
Run that per-worker H-2A number against the cows it covers, and you get the figure the headlines never quote: one worker per 50 cows at ~$43,850 a year is about $877 per cow annually — your single biggest controllable cost after feed, and a number you can plug your own ratio straight into.
Two notes on reading that table honestly. The H-2A wage assumes a 40-hour week across the contract — real barn hours often run longer, so scale it to your own schedule. And the two hourly figures sit on different denominators (1,733 contract hours versus 2,080 full-time hours), so treat them as all-in cost-of-labor rates, not identical-hour comparisons.
The $43,850 isn’t a single-sourced figure — it’s a stack of USDA’s housing range, AFBF’s fee data, and published academic transport costs. Housing costs and fees vary by state and farm size, so confirm your state’s current AEWR off the DOL table and price your own housing before you lock in a decision.
One more thing the table can’t show: the fees move. AFBF flagged the per-worker application and visa costs climbing by roughly $600 over two years. Build a five-year labor plan on today’s $1,350, and you’re already behind, because the one input that’s pure paperwork is the one that keeps rising.
The Turnover Line That Flips the Whole Comparison
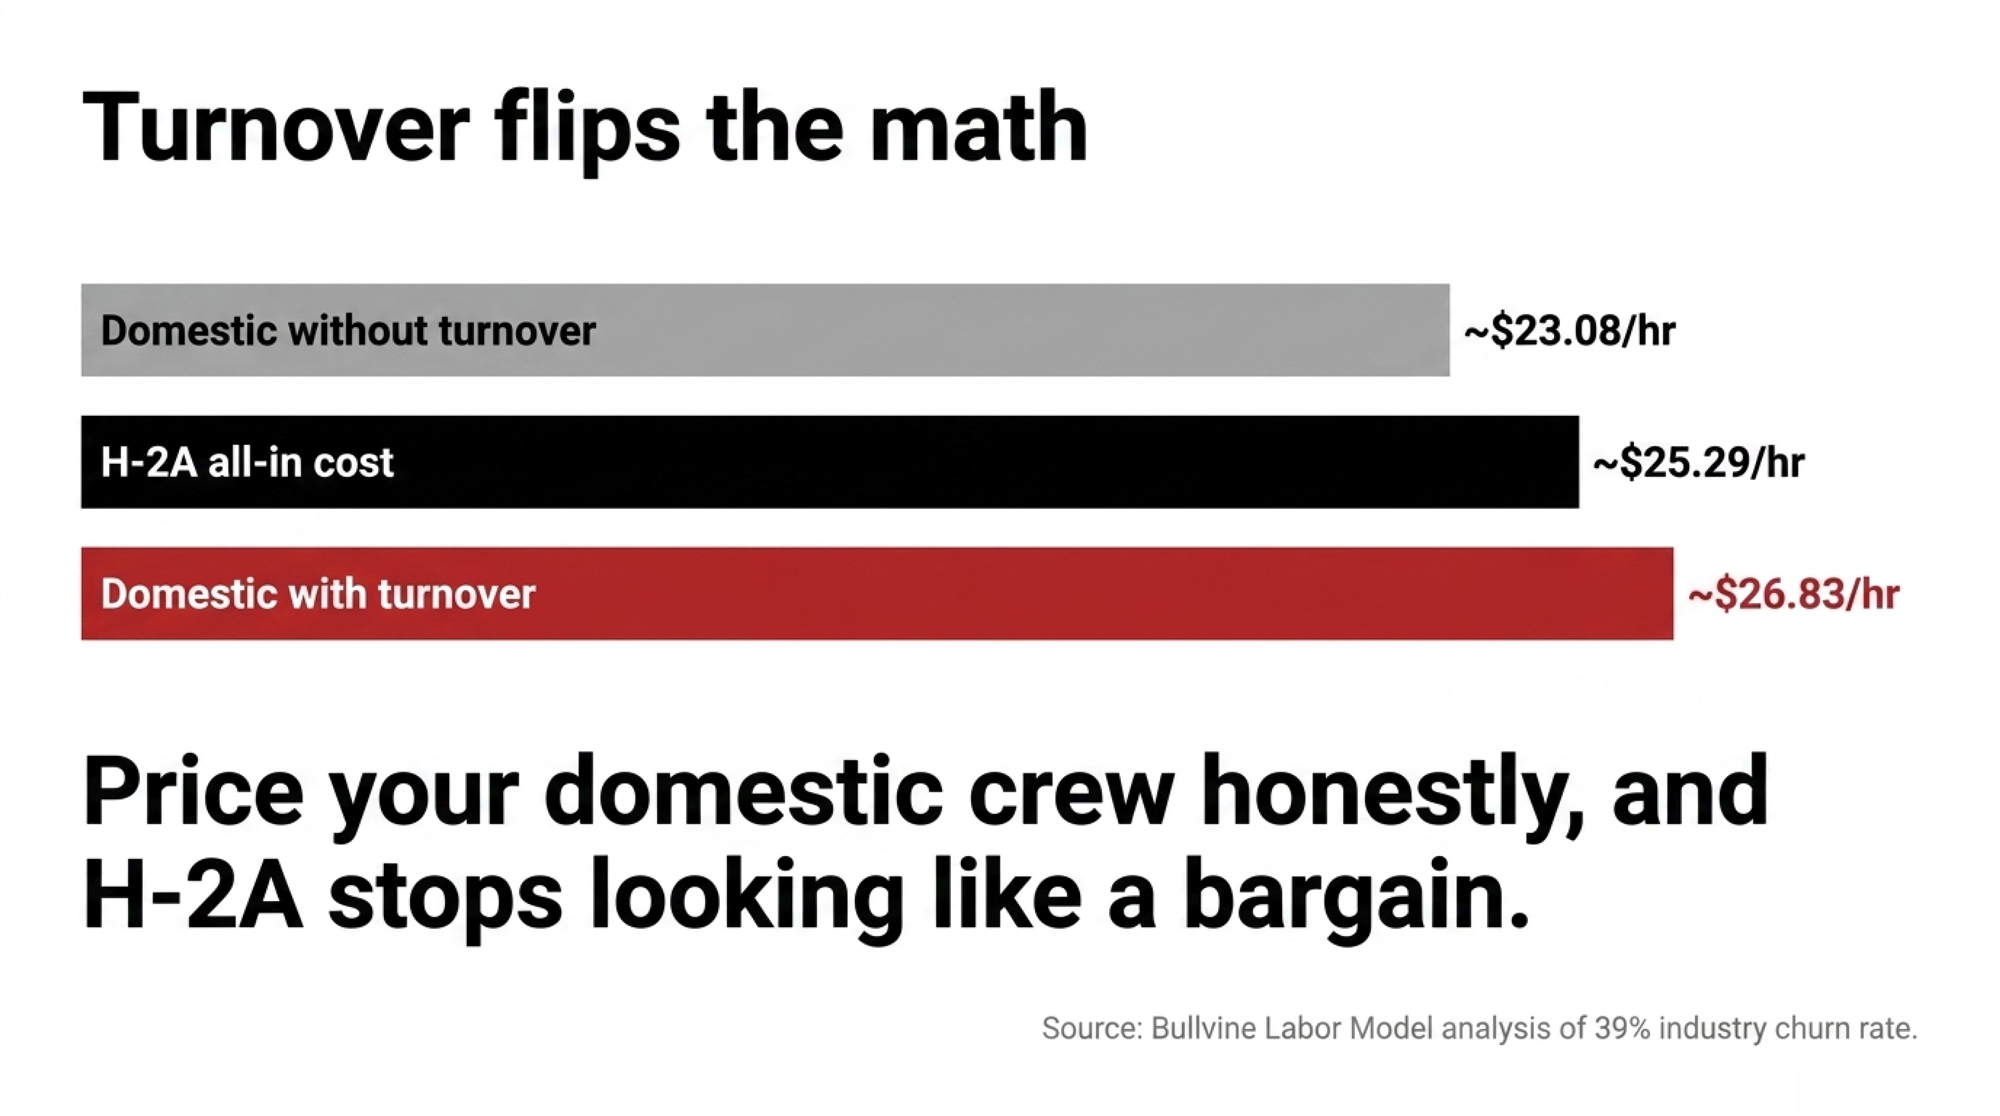
Look at the table without the turnover row and domestic labor wins clean — about $48,000 against H-2A’s $43,850. Add the churn back, and the gap closes to almost nothing. That’s the entire argument in one line item:
H-2A, all-in: ~$25.29/hr — fixed by contract
Domestic, turnover excluded: ~$23.08/hr — what most herds think they pay
Domestic, turnover included: ~$26.83/hr — what they actually pay at the 39% industry average
The number herds skip is the one that decides this. Price your crew honestly, and H-2A stops looking like a bargain or a mistake. It looks like a wash. And a wash on cost means the decision was never really about cost at all, which is where most of these conversations go wrong from the first phone call.
Why It Was Never a Wage Question
Once those two numbers sit side by side, the real question flips. It’s not “Is H-2A cheaper?” It’s “which system gives me more stability for roughly the same dollars — and can I survive a denial letter after I’ve poured concrete for a bunkhouse?”
That’s the trade the table doesn’t price. H-2A buys you a contract-locked crew that shows up for the season and can’t quit for the dairy down the road offering fifty cents more. You give up flexibility, and you take on compliance risk. A domestic crew gives you flexibility and no petition to lose — but you carry the turnover, the recruiting, and the 2 a.m. text that someone isn’t coming in. Same money, different risk. Pick the risk you can actually manage. That’s the revolving door at the parlor most operators are quietly trying to close.
For a 500-cow herd, converting four genuinely seasonal positions to H-2A while keeping six domestic year-round might trim your labor line by a few cents to roughly $0.40/cwt — but only if you already own compliant housing and your petitions are approved. This is a marginal-savings figure from a partial conversion, not the same animal as the $877-per-cow all-in cost above — keep them separate. Here’s the arithmetic, with the production assumption stated: four H-2A at ~$43,850 plus six domestic at ~$55,800 runs about $510,000, against roughly $558,000 for an all-domestic crew priced for turnover. Spread the ~$48,000 gap across 120,000 cwt of annual production — that’s 500 cows at about 24,000 lb each — and you land near $0.40/cwt. Build housing from scratch, though, and you add maybe $1,500–$2,600 per worker per year in amortized cost — enough to erase that savings.
Why Is “Free Housing” a Six-Figure Decision?
The reason H-2A isn’t cheap comes down to what the program legally demands. Pay the highest applicable wage. Provide free housing that meets federal safety standards. Cover travel in and out. And guarantee at least 75% of the contracted hours, whether or not the work shows up. That three-quarters guarantee is the clause nobody mentions — if your calving peak runs late, you still owe the hours.
Compliant H-2A housing isn’t a spare farmhouse with a couple of mattresses and a space heater. Under OSHA’s temporary labor camp standard, you need at least 50 square feet of sleeping space per person, one toilet for every 15 workers, one shower for every 10, a stove per 10, a refrigerator for every 6, screened windows that open, working smoke detectors, and roughly 35 gallons of water per person per day. Build a bunkhouse for 10 to that spec, and you’re well into six figures.
Housing Requirement
OSHA H-2A Standard
NY Dairy Survey Finding
Gap
Sleeping space
Min. 50 sq ft per person
Not measured directly
Unknown — likely underbuilt
Toilets
1 per 15 workers
48% of workers: no door locks on any bathroom
Non-compliant baseline likely common
Showers
1 per 10 workers
Not separately measured
Likely insufficient in older housing
Windows
Screened, must open
58% reported insect infestations
Indicates screened windows non-functional or absent
Structural integrity
No holes in walls/floors
32% had holes in walls or floors
Direct structural non-compliance
Water supply
~35 gal/person/day
Not measured
Unknown compliance rate
Security
Implied by safety standards
48% had no door locks
Direct safety non-compliance
Estimated retrofit cost
—
—
$80,000–$150,000+ for a 10-worker bunkhouse
A lot of existing dairy housing is nowhere close. A New York survey of dairy farmworker housing — general dairy housing, not H-2A-inspected units — found 58% of workers reported insect infestations, 48% had no door locks, and 32% had holes in their walls or floors. The point isn’t that H-2A housing is bad. It’s the gap. If your setup is an aging trailer with soft floors and one bathroom for eight guys, you’re not a coat of paint from compliance. You’re a renovation away.
Here’s where the housing math turns on you. Spend six figures retrofitting a bunkhouse to OSHA spec, then file a petition that USCIS denies because your “seasonal” need looks year-round, and the concrete doesn’t disappear. You own the building and none of the workers. That’s the asymmetry: the housing cost is certain and up-front, the approval is not.
Is the Real Fix Even Coming From Washington?
Be careful betting your operation on it. This is policy guidance, not a law — a future administration could rewrite it without a single vote in Congress. It’s a door that can be closed the same way it opened.
A real fix would need two hard things at once: legal status for the people already milking your cows, and a true year-round visa that admits cows don’t take winters off. The Farm Workforce Modernization Act proposed exactly that. It passed the House twice — in 2019 and 2021 — and died in the Senate both times. That’s the honest track record. Push for reform, by all means. But plan your next five to ten years as if it never arrives, and treat any progress as upside, not a rescue plan.
This is the same squeeze behind the fact that 51% of the dairy workforce is immigrant labor — a structural dependence no temporary-visa memo was built to solve.
The 30/90/365-Day Playbook for Herds Weighing H-2A
Timeframe
Action
Estimated Cost
Reversible?
Red Flag Trigger
30 Days
Pull turnover rate + true replacement cost
Staff time only — $0 out of pocket
Yes
Churn near 39%? Your crew already costs ~$26.83/hr
30 Days
Contractor housing walkthrough vs. OSHA checklist
$500–$1,500 inspection fee
Yes
One bathroom for 8 workers = six-figure reno, not a paint job
90 Days
Document seasonal need with legal help
$2,000–$5,000 attorney fees
Partial
Can’t define a clear start-and-stop? Treat petition as a coin flip
90 Days
File H-2A petition (DOL + USCIS)
$1,350 visa & app fees per worker + legal
No — fees go to zero on denial
File late = approval lands after the work it was meant to cover
90 Days
Invest same money in housing as retention tool
Varies — same housing, zero visa exposure
Yes
Pays back whether or not you ever file
365 Days
Build/retrofit compliant bunkhouse
$80,000–$150,000+ for 10 workers
No — concrete doesn’t disappear on denial
Amortized cost erases $0.40/cwt savings if built from scratch
365 Days
Model labor assuming no Washington reform
Internal planning cost only
Yes
If reform comes, treat it as upside — not a rescue plan
30-Day Actions (run the checks before you call anyone):
Pull your actual turnover rate and your true cost per worker, churn included. This is the one number that reframes every decision here. What to do: count departures over the last 12 months, multiply by the $15,000–$25,000 replacement range. Trigger: if your turnover is near the 39% average, your domestic crew may already cost what an H-2A worker would. Where it backfires: lowball your replacement cost, and you’ll talk yourself into a program you don’t need.
Get a contractor’s housing quote before you get a wage quote. What it requires: a walkthrough against the OSHA checklist. Watch for: a “small renovation” that becomes a six-figure build once the inspector counts toilets and square footage.
90-Day Actions (structural moves that need planning):
If you decide to pursue H-2A, document a genuinely seasonal need that survives USCIS scrutiny — a defined calving or expansion window, not a year-round milking slot. What it requires: legal help and clean records. Trigger: if you can’t draw a clear start-and-stop on the work, treat the petition as a coin flip. Backfire risk: a denial after you’ve sunk housing and fees.
Or skip the visa and treat housing as a retention investment instead. Bullvine’s earlier reporting on Midwest dairies that invested in quality worker housing found turnover dropped as a result. The same housing pays back whether or not you ever file a petition.
Time the petition to your start date. H-2A filings move through DOL and USCIS on a calendar, not on demand, so a crew you need for a spring calving push has to be filed months ahead. What it requires: a target start date locked now and a lead time confirmed with your ag-labor attorney. Backfire risk: file late, and the approval lands after the work it was meant to cover.
365-Day Moves (position for the next cycle):
Build your labor model assuming Washington delivers nothing. If reform comes, it’s upside. Opportunity signal: if you’re in a higher-wage state, already own compliant housing, and your turnover is punishing, that’s the narrow case where H-2A genuinely pencils — move deliberately, not on the recruiter’s timeline.
Watch the guidance’s legal footing. Because it’s policy guidance, not statute, build any multi-year housing investment so it pays off through retention even if H-2A access gets pulled.
Stress-test your crew against a labor shock that empties your parlor. The herds that survive a sudden loss of workers are the ones that already know which jobs are seasonal, which are essential, and what each one really costs.
Key Takeaways
If your annual turnover is near the 39% industry average, run your real replacement cost before you call a recruiter — your domestic crew may already cost what H-2A would.
If you don’t already have compliant housing, get a contractor quote before a wage quote. You’re not comparing labor costs — you’re comparing labor plus a possible six-figure build.
If you can’t document a genuinely seasonal need that survives USCIS scrutiny, treat the petition as a coin flip — the fees and housing go to zero the day a denial arrives.
If you farm in a state with a wage floor under $16, check whether H-2A’s all-in cost actually beats your current payroll. It often won’t.
So, Where Does Your Operation Actually Land?
H-2A is a narrow tool that pays for specific herds in specific states, and guidance that can be rewritten as fast as it was written. The trade-off at the heart of this isn’t cost versus savings. It’s stability versus paperwork-and-risk, for roughly the same dollars.
So pull your last 12 months of labor records this week. What’s your real cost per worker once you factor in turnover — and would an H-2A worker at about $25 an hour, roughly $877 per cow per year, actually beat it, or would you just be paying for more paperwork and a bunkhouse you’ll owe whether the guidance survives or not? The full cost-per-cwt model run line by line, for both a 500-cow and a 1,500-cow herd, is in the next Bullvine Weekly.
Is H-2A a Wash or a Win for Your Herd?
The math shifts the second you cross a state line or change your housing footprint. Use this interactive calculator to plug in your regional wage floor (AEWR), current domestic payroll, and real worker housing situation to see the true cost per hour side-by-side.
Dairy Labor Cost Calculator
Compare H-2A Guest Workers vs. Real Domestic Costs
1. H-2A Setup & Regional Rules
2. Your Current Domestic Crew
*Industry average is 39%. Replacing one worker safely costs $15,000–$25,000 in lost efficiency & recruitment.
3. True Side-By-Side Rate Analysis
All-In H-2A Cost
$25.29
per worker-hour across contract
Real Domestic Cost
$26.83
per hour once turnover is paid
Loading financial comparison scenario…
Complete references and supporting documentation are available upon request by contacting the editorial team at editor@thebullvine.com.
Dairy Technology 2026: Robotics, Sensors, AI and Real-World ROI — Exposes the hidden maintenance fees and specific hourly wage thresholds required to make multi-million dollar automated milking box investments actually beat a highly efficient parlor setup.
The Sunday Read Dairy Professionals Don’t Skip.
Every week, thousands of producers, breeders, and industry insiders open Bullvine Weekly for genetics insights, market shifts, and profit strategies they won’t find anywhere else. One email. Five minutes. Smarter decisions all week.
To provide the best experiences, we use technologies like cookies to store and/or access device information. Consenting to these technologies will allow us to process data such as browsing behavior or unique IDs on this site. Not consenting or withdrawing consent, may adversely affect certain features and functions.
Functional
Always active
The technical storage or access is strictly necessary for the legitimate purpose of enabling the use of a specific service explicitly requested by the subscriber or user, or for the sole purpose of carrying out the transmission of a communication over an electronic communications network.
Preferences
The technical storage or access is necessary for the legitimate purpose of storing preferences that are not requested by the subscriber or user.
Statistics
The technical storage or access that is used exclusively for statistical purposes.The technical storage or access that is used exclusively for anonymous statistical purposes. Without a subpoena, voluntary compliance on the part of your Internet Service Provider, or additional records from a third party, information stored or retrieved for this purpose alone cannot usually be used to identify you.
Marketing
The technical storage or access is required to create user profiles to send advertising, or to track the user on a website or across several websites for similar marketing purposes.
To provide the best experiences, we and our partners use technologies like cookies to store and/or access device information. Consenting to these technologies will allow us and our partners to process personal data such as browsing behavior or unique IDs on this site and show (non-) personalized ads. Not consenting or withdrawing consent, may adversely affect certain features and functions.
Click below to consent to the above or make granular choices. Your choices will be applied to this site only. You can change your settings at any time, including withdrawing your consent, by using the toggles on the Cookie Policy, or by clicking on the manage consent button at the bottom of the screen.
Functional
Always active
The technical storage or access is strictly necessary for the legitimate purpose of enabling the use of a specific service explicitly requested by the subscriber or user, or for the sole purpose of carrying out the transmission of a communication over an electronic communications network.
Preferences
The technical storage or access is necessary for the legitimate purpose of storing preferences that are not requested by the subscriber or user.
Statistics
The technical storage or access that is used exclusively for statistical purposes.The technical storage or access that is used exclusively for anonymous statistical purposes. Without a subpoena, voluntary compliance on the part of your Internet Service Provider, or additional records from a third party, information stored or retrieved for this purpose alone cannot usually be used to identify you.
Marketing
The technical storage or access is required to create user profiles to send advertising, or to track the user on a website or across several websites for similar marketing purposes.








 The Sunday Read Dairy Professionals Don’t Skip.
 The Sunday Read Dairy Professionals Don’t Skip.