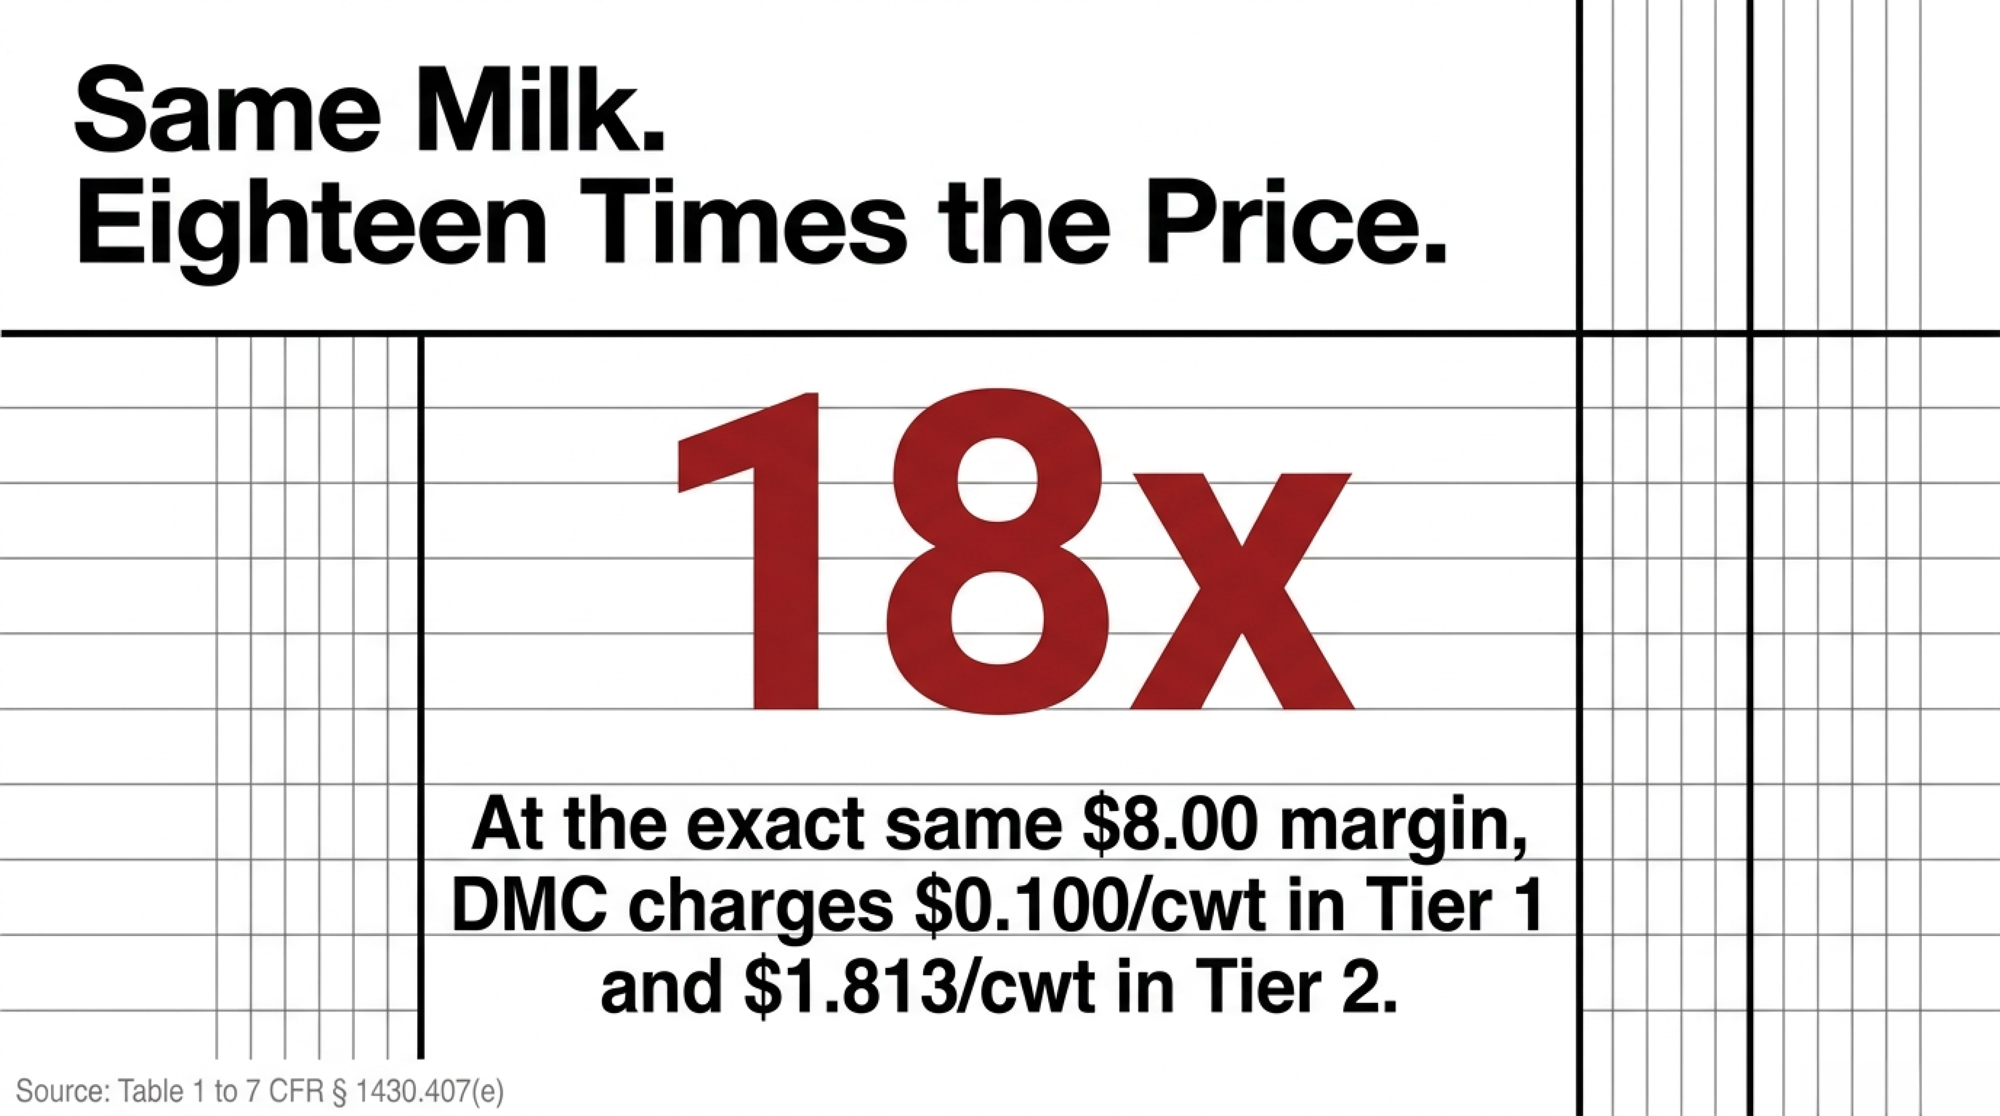
Same $8.00 margin. Same milk out of the same tank. One paragraph of federal regulation decides whether you pay ten cents a hundredweight or a dollar eighty-one.
EXECUTIVE SUMMARY: At the same $8.00 margin, DMC charges $0.100/cwt in Tier 1 and $1.813/cwt in Tier 2 — eighteen times the price for identical coverage on milk from the same tank. One paragraph of federal regulation, 7 CFR § 1430.407(d), decides which side you land on: elect Tier 1 at $8.00 or below and your Tier 2 pounds lock to that same level automatically, but elect $8.50 or higher and the rule forces you to set Tier 2 separately, which is the only route to the free $4.00 catastrophic floor. Run a modeled 500-cow Upper Midwest herd through 84 months of published FSA margins, and the decoupled election returns $344,669, while locking both tiers at $8.00 loses $417,748 — a $762,417 swing where the winning choice is the more expensive Tier 1 rate. This hits any operation above 6,000,000 lb of production history, roughly 240 cows at 25,000 lb, and the 2026 window already closed February 26. What’s left is Tier 2 coverage at a workable price: DRP ran $0.28/cwt in Q1 2026 against $111,953 for the Tier 2 half of an $8.00 election, and HighGround’s data shows coverage bought three quarters out returned $1.53/cwt while only 19% of producers booked that far ahead. Before the 2027 signup, pull your FSA production history and ask the county office what coverage is currently attached to your Tier 2 pounds — if your Tier 1 sits at $8.00 or under, those numbers should be identical, and you may be paying rates you never picked.

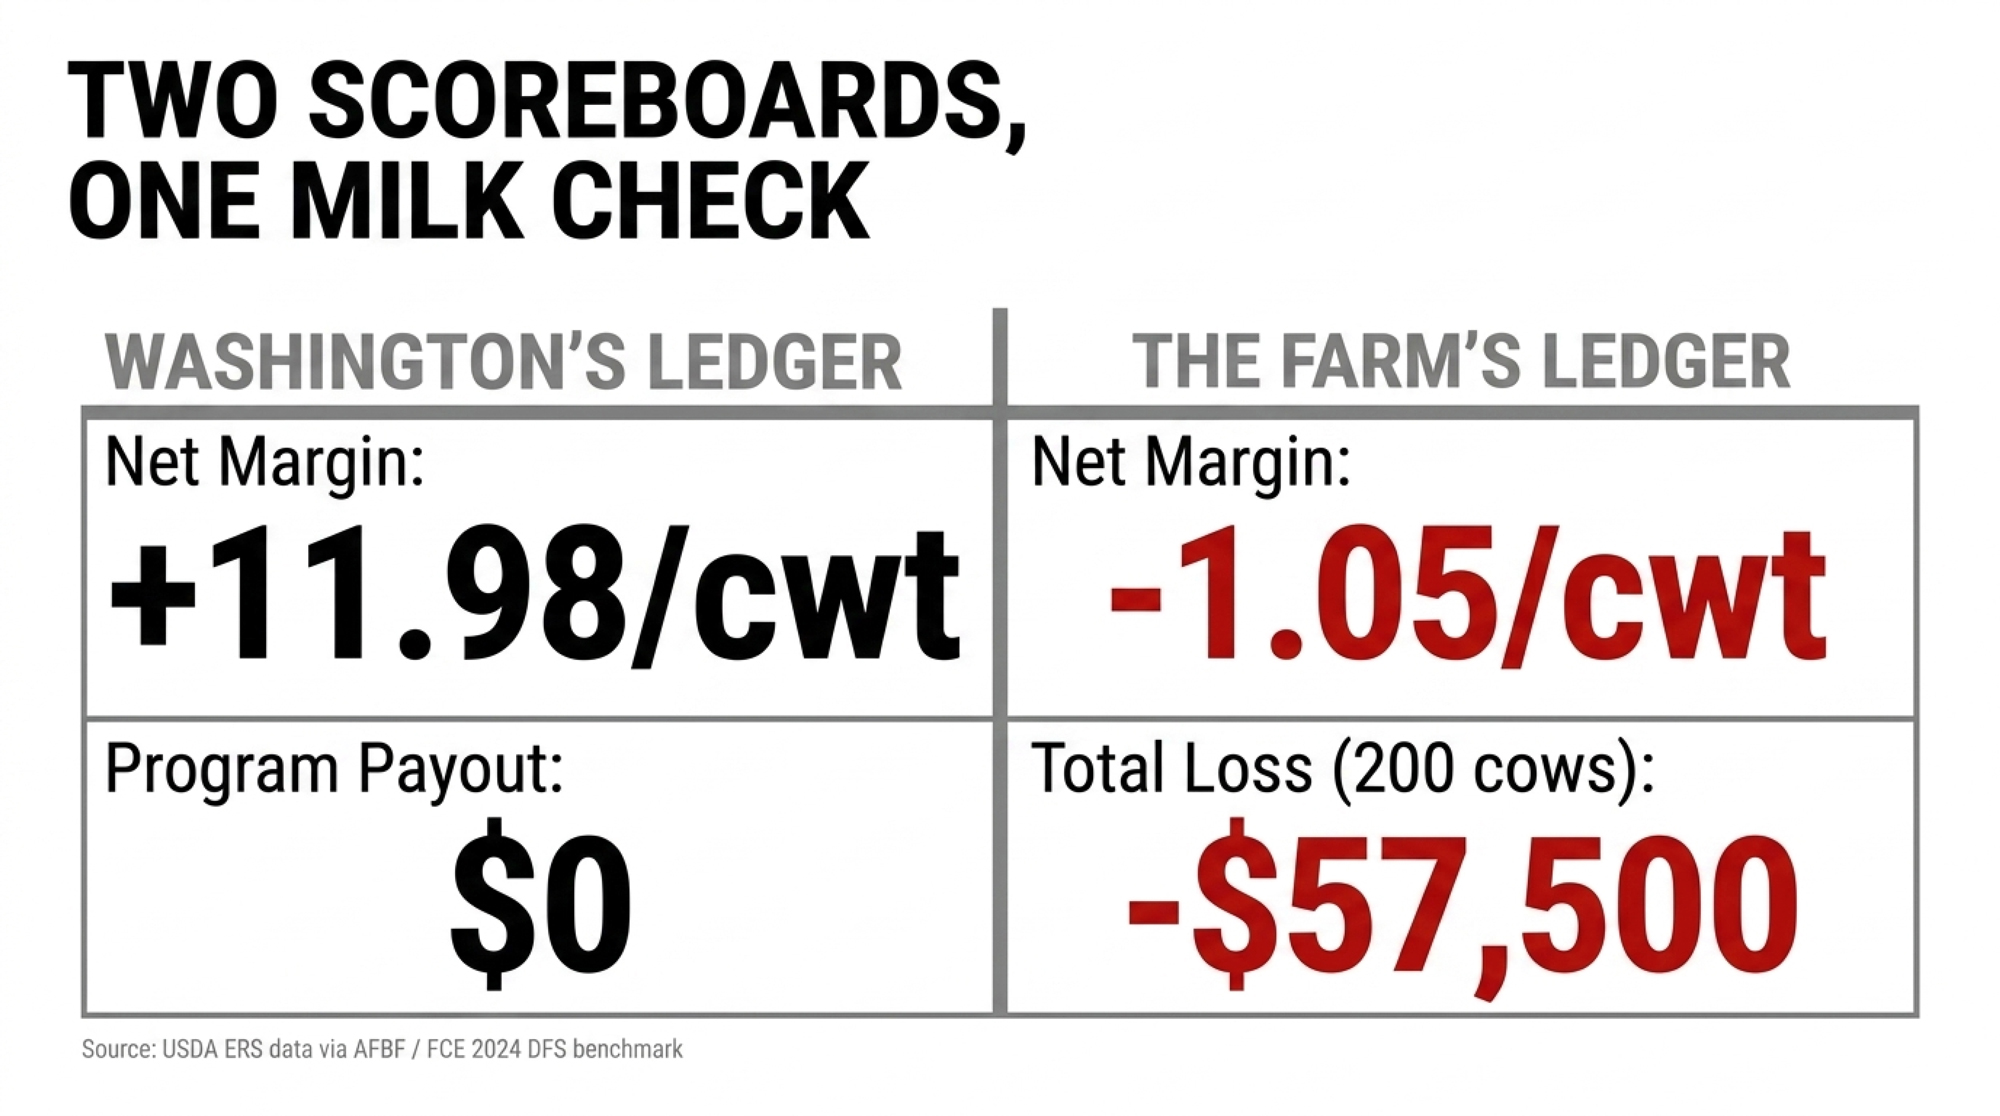
Two Dairy Margin Coverage elections. Same 500-cow Upper Midwest herd, same 2026 program year, same USDA margins. One returns $344,669 across seven years. The other loses $417,748.
The gap is $762,417 — and the election that wins is the more expensive coverage level.
That’s not a typo. It’s written into federal regulation, in a single paragraph of 7 CFR § 1430.407 that decides what your milk above 6,000,000 lb costs to protect. The rule isn’t secret. It’s just not on the form you sign.
The paragraph that decides everything
The Regulatory Rule Every Producer Misses
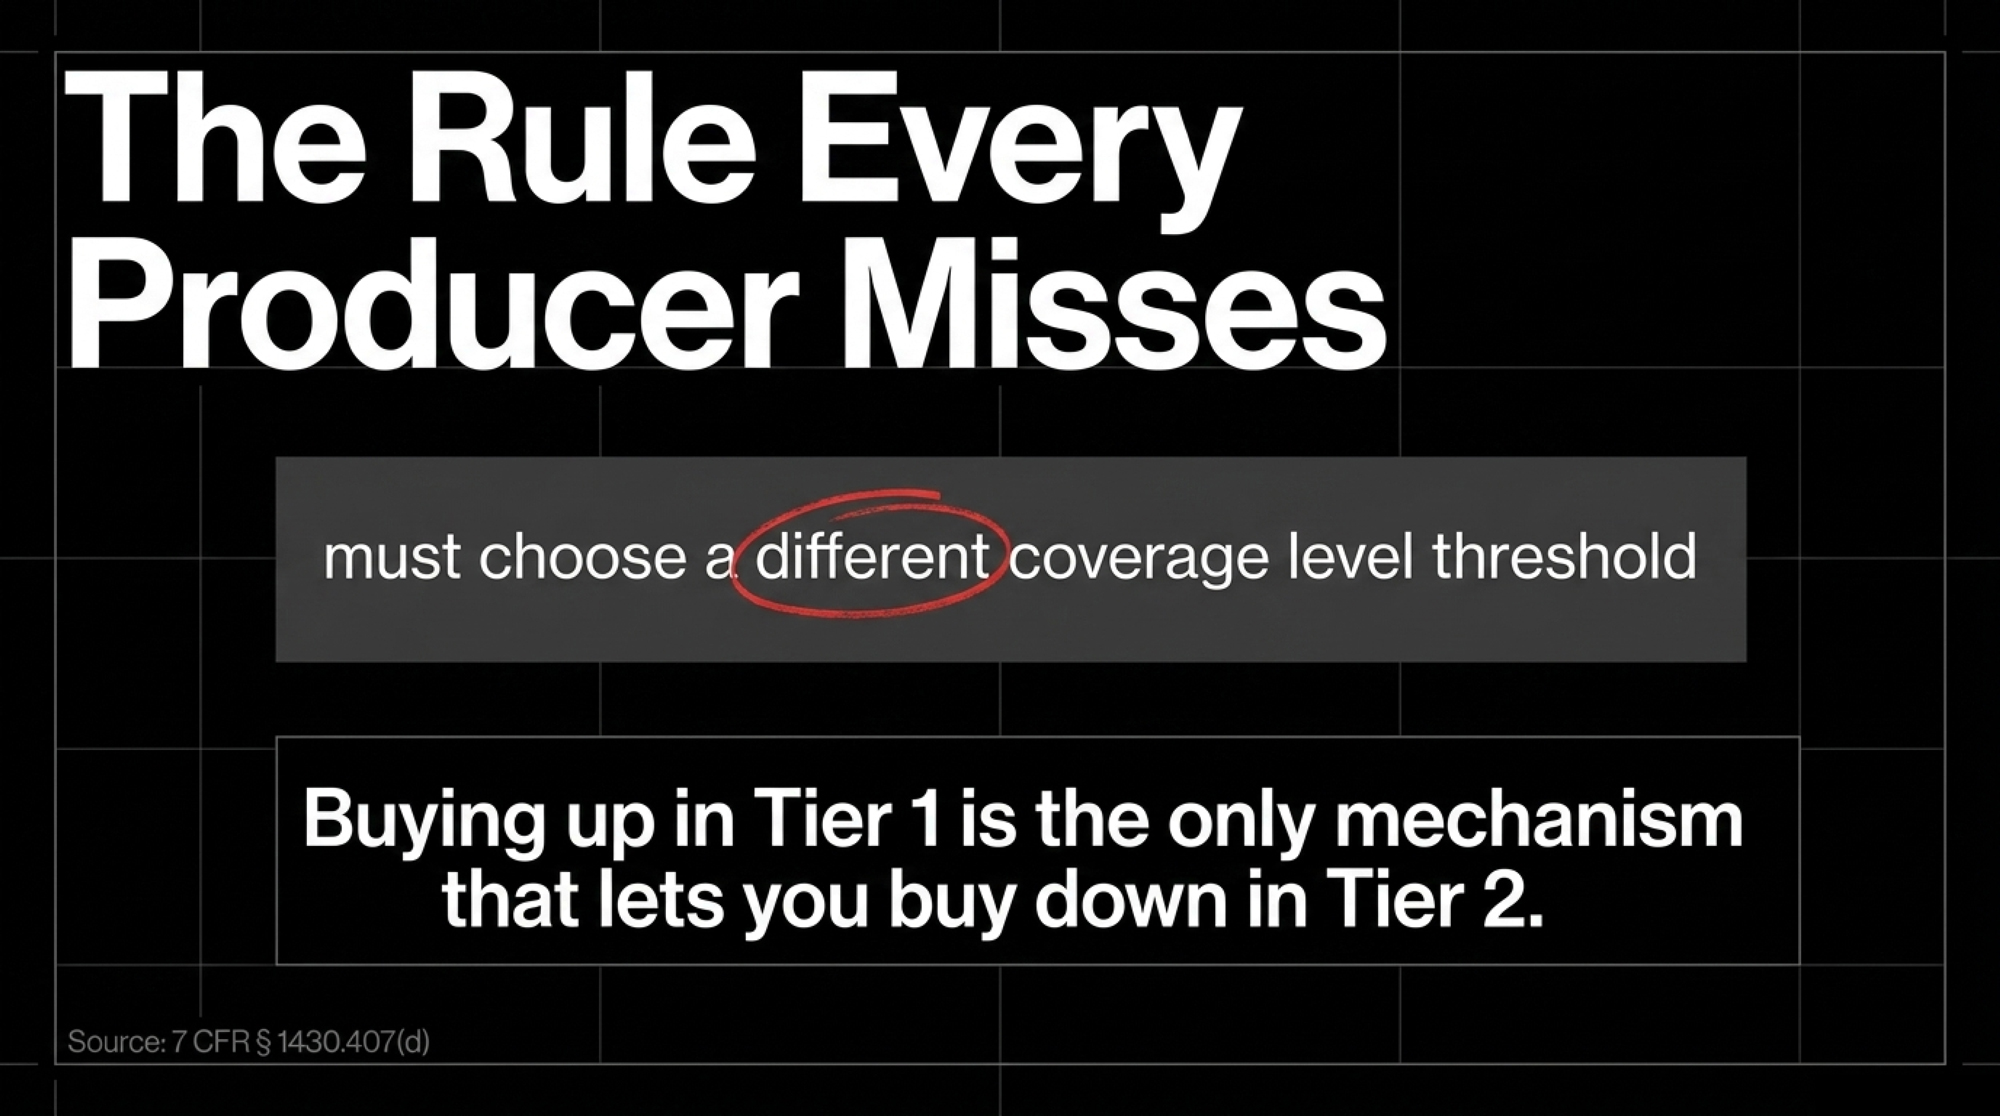
A dairy operation “may only select one coverage level threshold and only one percentage of coverage applicable to both Tier 1 and Tier 2.”
But an operation electing $8.50, $9.00, or $9.50 in Tier 1 “must choose a different coverage level threshold” — anywhere from $4.00 to $8.00 — for the production history above the tier line.
— 7 CFR § 1430.407(d)
Read it twice, because the logic runs backward from intuition.
Elect Tier 1 at $8.00 or below, and one number covers everything. Your Tier 2 milk gets locked to the same level, at Tier 2 prices. Elect $8.50 or higher, and the regulation requiresyou to set Tier 2 separately — which is the only way to put it at the free $4.00 catastrophic level.
Buying up in Tier 1 is the mechanism that lets you buy down in Tier 2. Jason Hartschuh, Extension Field Specialist in Dairy Management and Precision Livestock at The Ohio State University, flagged the same $8.50 threshold for producers above 6 million pounds when he wrote up 2026 enrollment in Buckeye Dairy News.
So the producer economizing at $7.50 doesn’t save anything. They get pulled into $7.50 Tier 2 pricing on every pound above the line, and Tier 2 pricing is where this program stops being affordable.
What the regulation actually charges
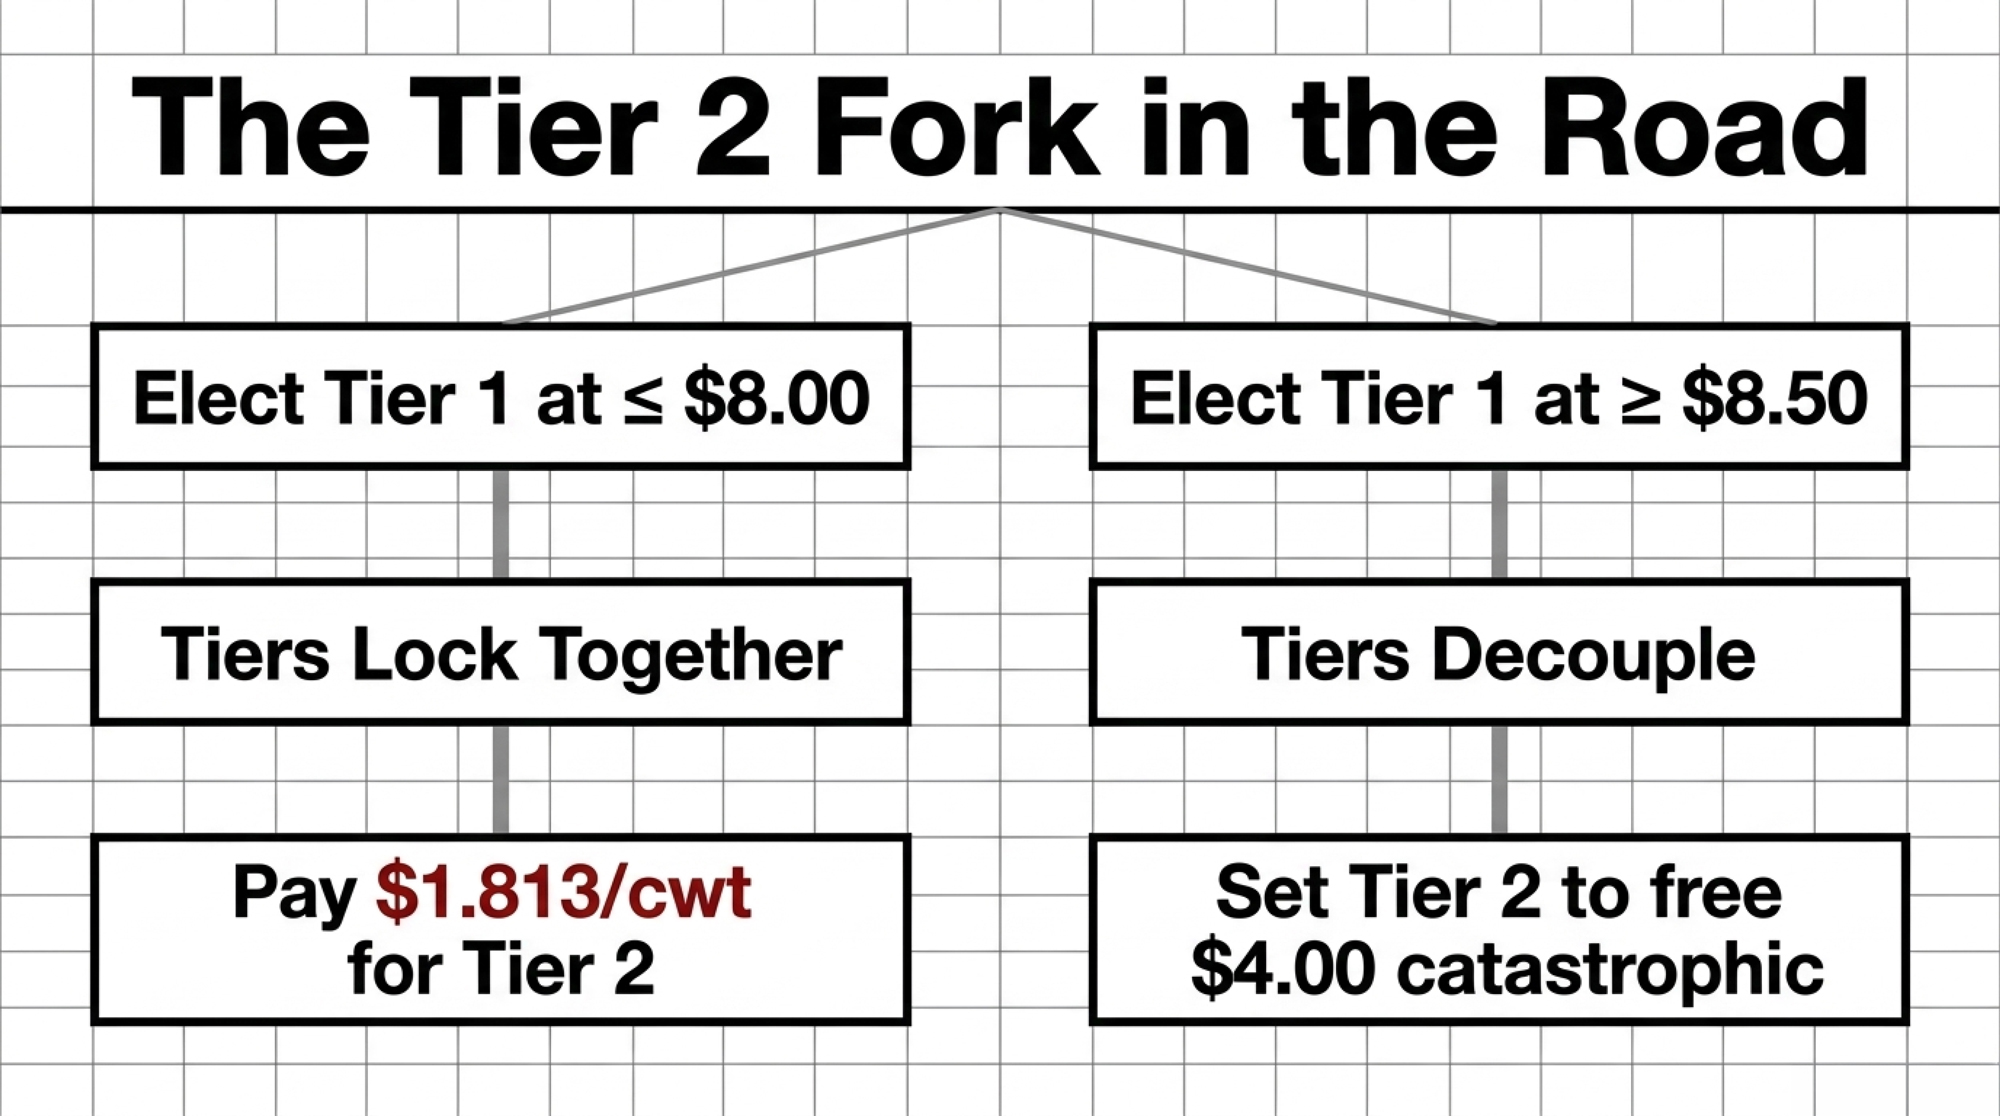
The short version: $0.100 versus $1.813 at the same coverage level. Here’s why the cheaper election is the expensive one.
Table 1 to § 1430.407(e), reproduced in full. These are the statutory rates from the Agricultural Improvement Act of 2018, and USDA’s January 2026 final rule left them unchanged — only the tier threshold moved, from 5 million pounds to 6,000,000 lb.
| Coverage Level | Tier 1 ($/cwt) | Tier 2 ($/cwt) | Price Multiple |
|---|---|---|---|
| $4.00 (Catastrophic) | None | None | — |
| $5.50 | $0.030 | $0.100 | 3.3x |
| $6.50 | $0.070 | $0.650 | 9.3x |
| $7.50 | $0.090 | $1.413 | 15.7x |
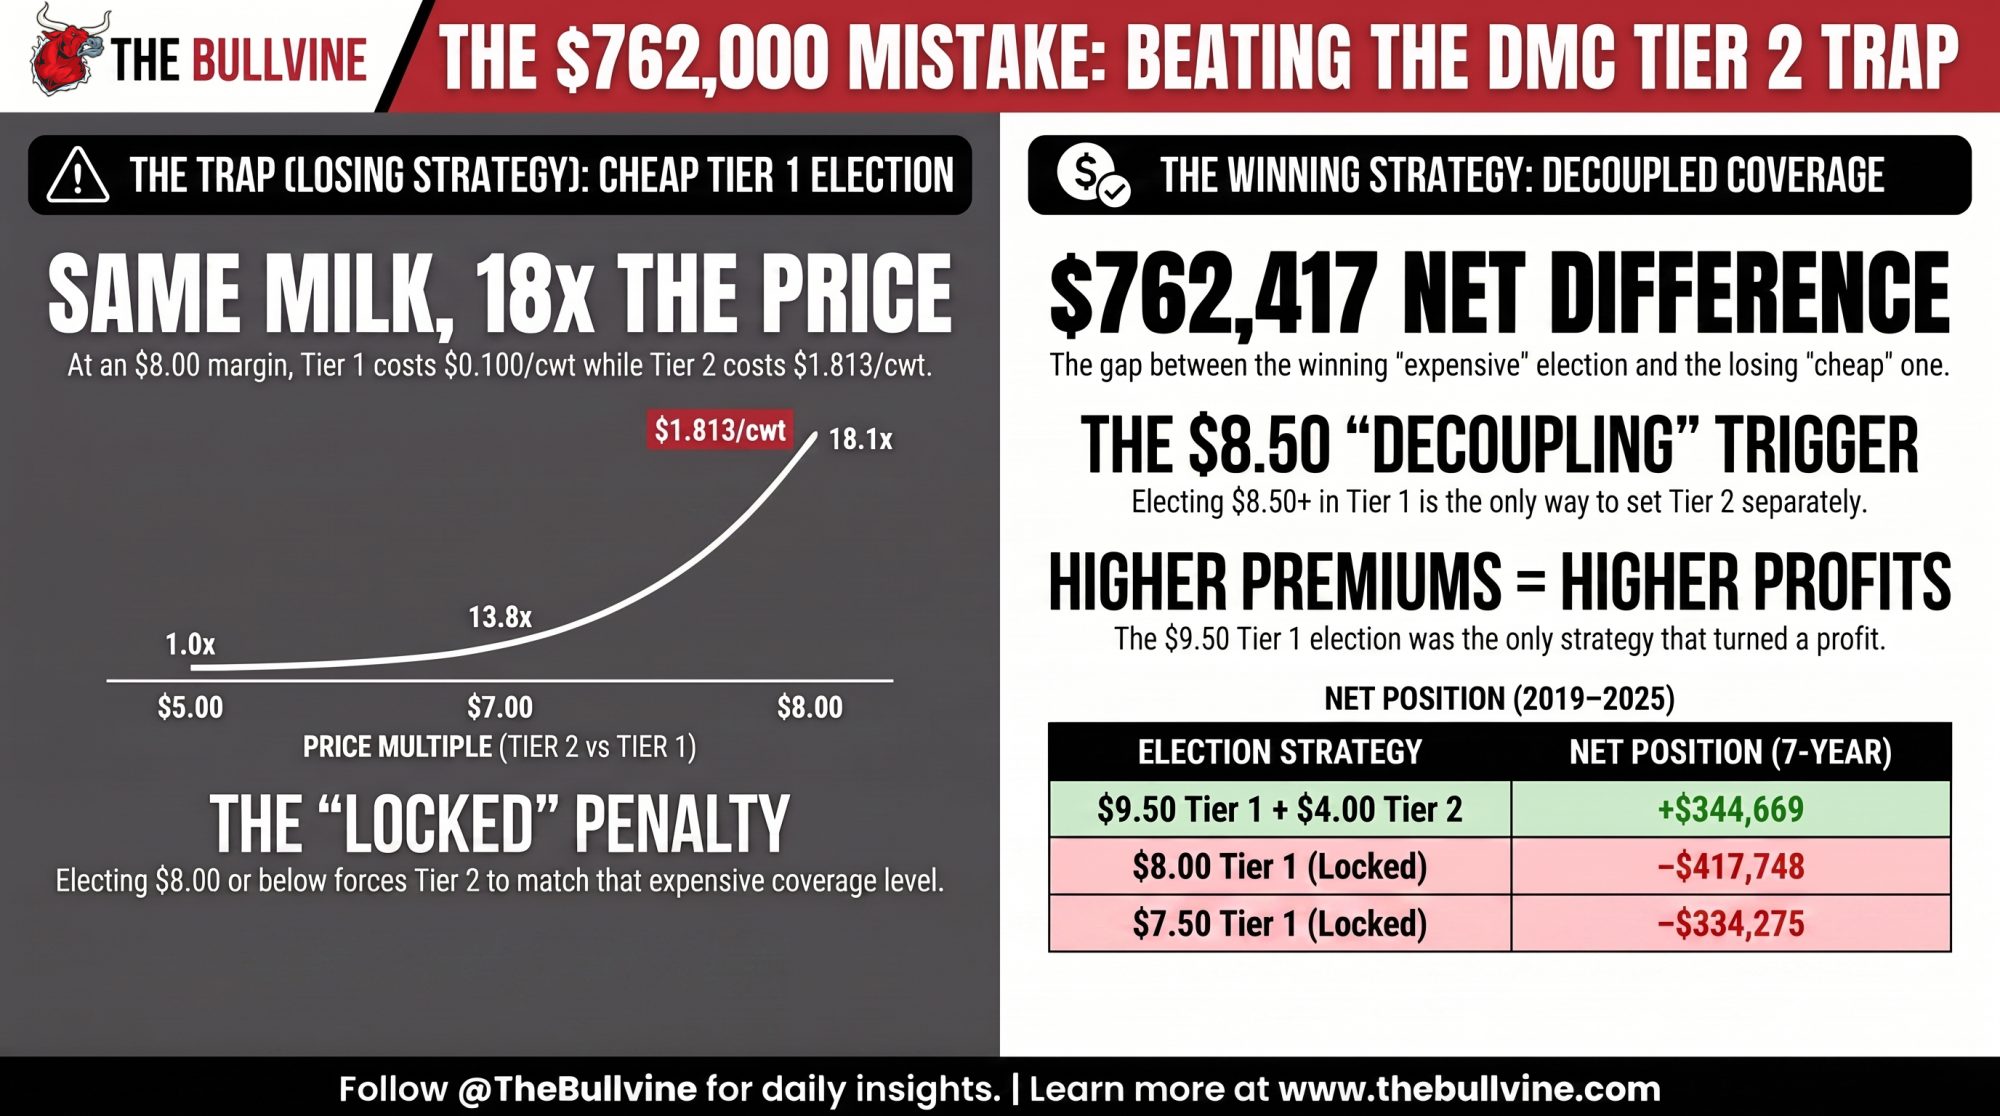
| $8.00 | $0.100 | $1.813 | 18.1x |
| $9.50 (Max, Tier 2 decoupled) | $0.150 | Free at $4.00 | — |
Read the $8.00 row twice. Same margin protection, same milk, same barn — $0.100 in Tier 1 and $1.813 in Tier 2. Eighteen times the price for identical coverage. Compare each tier’s best available option instead, and it’s $0.150 against $1.813, a little over twelve times.
The columns track each other to $5.00. Past that, they fork hard, and by $7.00 Tier 2 costs nearly fourteen times what Tier 1 charges.
Running the Numbers
Model Herd Profile: 500 cows | 25,000 lb/cow | 12.5M lb total | Federal Order 30
Covered history at 95%: 57,000 cwt Tier 1 · 61,750 cwt Tier 2
Monthly exposure: 4,750 cwt Tier 1 · 5,146 cwt Tier 2
Window: July 2025 – June 2026, the most recent twelve months with final FSA margins
Scaling: Every figure below moves with the coverage percentage you elect. At 50% coverage, halve them.
Coverage percentage is set at 95%, the maximum § 1430.407(a)(2) allows, and applied to both tiers as § 1430.407(d) requires. The margin itself is one national calculation, so this premium math holds regardless of your order. What varies by region is the gap between that national margin and your actual mailbox price — which matters later, when we get to DRP.
Worked examples on a modeled herd, not a forecast. Confirm your own election with your county FSA office or a licensed crop insurance agent.
Election A — Tier 1 at $9.50, Tier 2 set separately to $4.00
- Premium: 57,000 × $0.150 = $8,550, plus the $100 administrative fee
- Dec 2025, margin $9.42: ($9.50 − $9.42) × 4,750 = $380
- Jan 2026, margin $7.81: ($9.50 − $7.81) × 4,750 = $8,028
- Feb 2026, margin $8.46: ($9.50 − $8.46) × 4,750 = $4,940
- Tier 2 collected nothing. The margin never touched $4.00.
- Net: +$4,697
Election B — Tier 1 at $8.00, Tier 2 locked to $8.00
- Premium: (57,000 × $0.100) + (61,750 × $1.813) + $100 = $117,753
- January was the only month below $8.00, by nineteen cents
- Both tiers together paid $1,880
- Net: −$115,873
Election C — Tier 1 at $7.50, Tier 2 locked to $7.50
- Premium: (57,000 × $0.090) + (61,750 × $1.413) + $100 = $92,483
- The margin bottomed at $7.81. Neither tier paid a cent.
- Net: −$92,483
Election A carries the highest Tier 1 rate on the table. It’s the only one that made money.
Scale it to your herd: per 1,000 cwt of production history covered at 95% and $9.50, you paid $142.50 and collected $222 across those three months. Multiply by your own Tier 1 hundredweight.
What if you’re still under 6 million pounds?
Then none of this costs you anything yet, and your election is simple: take $9.50, take the six-year lock-in, and skip the Tier 2 rows entirely.
Watch the line, though. At 25,000 lb per cow, 6,000,000 lb is roughly 240 cows. Every cow past that puts milk into a tier where protection costs eighteen times more — a number most expansion budgets never carry. If you’re within about 500,000 lb of the threshold, run the tier split before you pour the pad.
Does one quiet year prove anything?
Fair challenge, and Hartschuh raised a version of it during the 2026 sign-up.
Writing in Buckeye Dairy News, he pointed out how fast the floor can drop: “In November of 2022, during the DMC program sign-up, the lowest projected milk margin was $8.80, but it fell all the way to $3.52 in July of 2023.” His conclusion — that the collapse demonstrated “the need to use risk management tools even when the risk does not appear to be present.”
He’s right that nobody saw 2023 coming. The margin fell more than five dollars below what the market projected at signup.
So run every year, not just the calm one. Eighty-four months of FSA’s published margin series, same illustrative herd, same three elections.
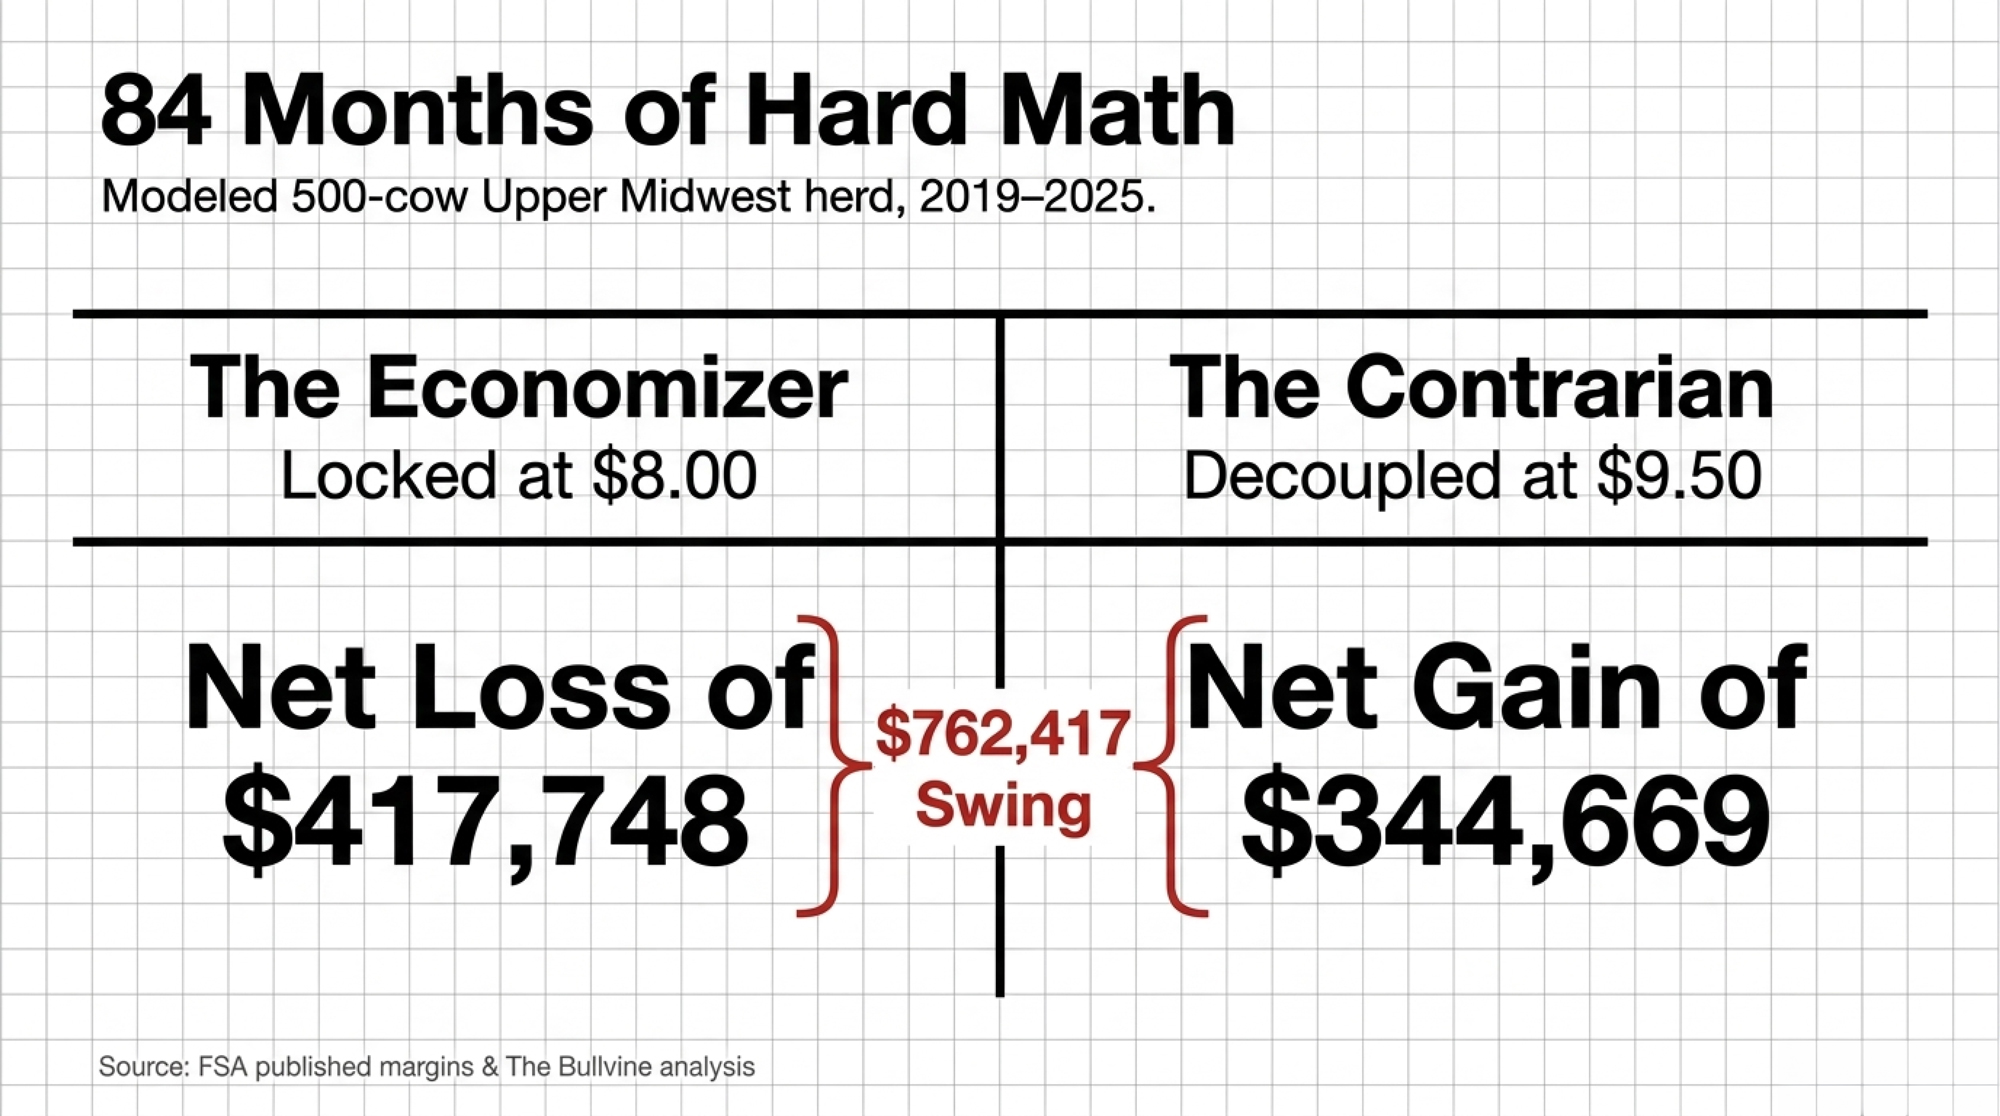
| Election, 2019–2025 | Premium Paid | Indemnities | Net Position |
| Tier 1 $9.50 + Tier 2 $4.00 | $60,550 | $405,219 | +$344,669 |
| Tier 1 $7.50, both tiers locked | $647,379 | $313,104 | −$334,275 |
| Tier 1 $8.00, both tiers locked | $824,269 | $406,521 | −$417,748 |
The locked elections collected roughly the same indemnities as the decoupled one. They paid ten to thirteen times more for the privilege.
This comparison is The Bullvine’s own analysis, built from Table 1 to § 1430.407(e), the election rule at § 1430.407(d), and FSA’s published margins. Hartschuh’s guidance in Buckeye Dairy News addresses the general principle for herds above 6 million pounds — that DMC “should be used as a tool to protect your operation from catastrophic losses” — not this specific comparison.
That principle, run through the rate table, points somewhere concrete: elect above $8.00 so the regulation hands you a separate Tier 2 decision.
One cross-check, since the whole argument rests on the margin series. CRS independently reports annual average DMC margins of $9.61 for 2019, $9.45 for 2020, $6.92 for 2021, $10.72 for 2022, and $6.70 for 2023. Averaging FSA’s monthly figures produces 9.61, 9.45, 6.92, 10.72, and 6.70. Two federal sources, same numbers.
Readers who followed the calendar year DMC paid out nothing at all have seen the other side of this. Tier 1 posts losing years too. The seven-year total is what settles it.
What changed for the 2026 program year
The One Big Beautiful Bill Act reauthorized DMC through 2031 and moved the Tier 1 threshold to 6,000,000 lb, a shift we covered when Tier 1 jumped to six million pounds.
Every 2026 enrollee established a new production history. Farms marketing before January 1, 2023 use the highest of their 2021, 2022, or 2023 marketings, documented with milk marketing statements. Later entrants use their first year of monthly marketings.
The lock-in is spelled out at § 1430.404(e)(2): operations making a one-time election during the 2026 period are locked at the same coverage level and percentage from January 1, 2026 through December 31, 2031, at a 25% premium discount — taking the Tier 1 $9.50 rate from $0.150 to about $0.1125/cwt. Locked-in operations still owe the annual administrative fee and still have to file a contract each year certifying they’re producing and marketing milk. Miss that, and you stay liable for the unpaid fees anyway.
One date worth calendaring: premium is due when you submit your election, and no later than September 1 of the coverage year, per § 1430.407(h).
What actually drove the margin swing in the test window was milk, not feed. FSA’s 2026 rate table shows the all-milk price climbing from $17.50/cwt in January to $21.10 in June, while the feed cost component moved only from $9.69 to $10.22. January’s $7.81 margin wasn’t a feed spike. It was a milk price that hadn’t caught up yet.
Enrollment ran January 12 to February 26, 2026. It’s closed. FSA hadn’t posted 2027 dates as of August 31, 2026 — recent cycles opened in mid-January, which is a pattern, not a promise.
Is anyone checking whether producers understand the form?
Not according to the Government Accountability Office, which audited FSA’s outreach in July 2025.
| Metric | 2019 | 2024 | Change |
|---|---|---|---|
| Total DMC-enrolled farms | 23,485 | 15,686 | −33% |
| National participation rate | 68% | 63% | −5 pts |
| Small-operation share of participants | 76% | 68% | −8 pts |
Participation is sliding. GAO found 68% of U.S. dairy farms enrolled in 2019 — 23,485 of 34,207. By 2024: 63%, or 15,686 of 24,811. Smaller operations, the ones Tier 1 was designed to serve, fell from 76% of participants to 68%.
Farmer groups told GAO the barriers include “limits on the amount of milk covered, the cost of buy-up coverage… and awareness about the program.” GAO found FSA “has not evaluated its communication efforts.”
FSA’s printed reply: “FSA generally disagrees with the findings in the GAO draft report as it relates to FSA communications and their efficacy.”
Not we’re working on it. Paragraph (d) is a decent example of what that awareness gap looks like in practice — a sentence in the Code of Federal Regulations that swings six figures of premium, sitting nowhere near the paperwork you sign.
The American Farm Bureau Federation reports that in practice, most Tier 2 production is already enrolled at or near the catastrophic $4.00 level. Farm Bureau doesn’t cite the underlying dataset, and FSA doesn’t publish tier-level elections, so read it as an informed industry assessment rather than an audited figure. It lines up with what the arithmetic recommends.
How to protect the Tier 2 milk without paying USDA’s $1.813 rate
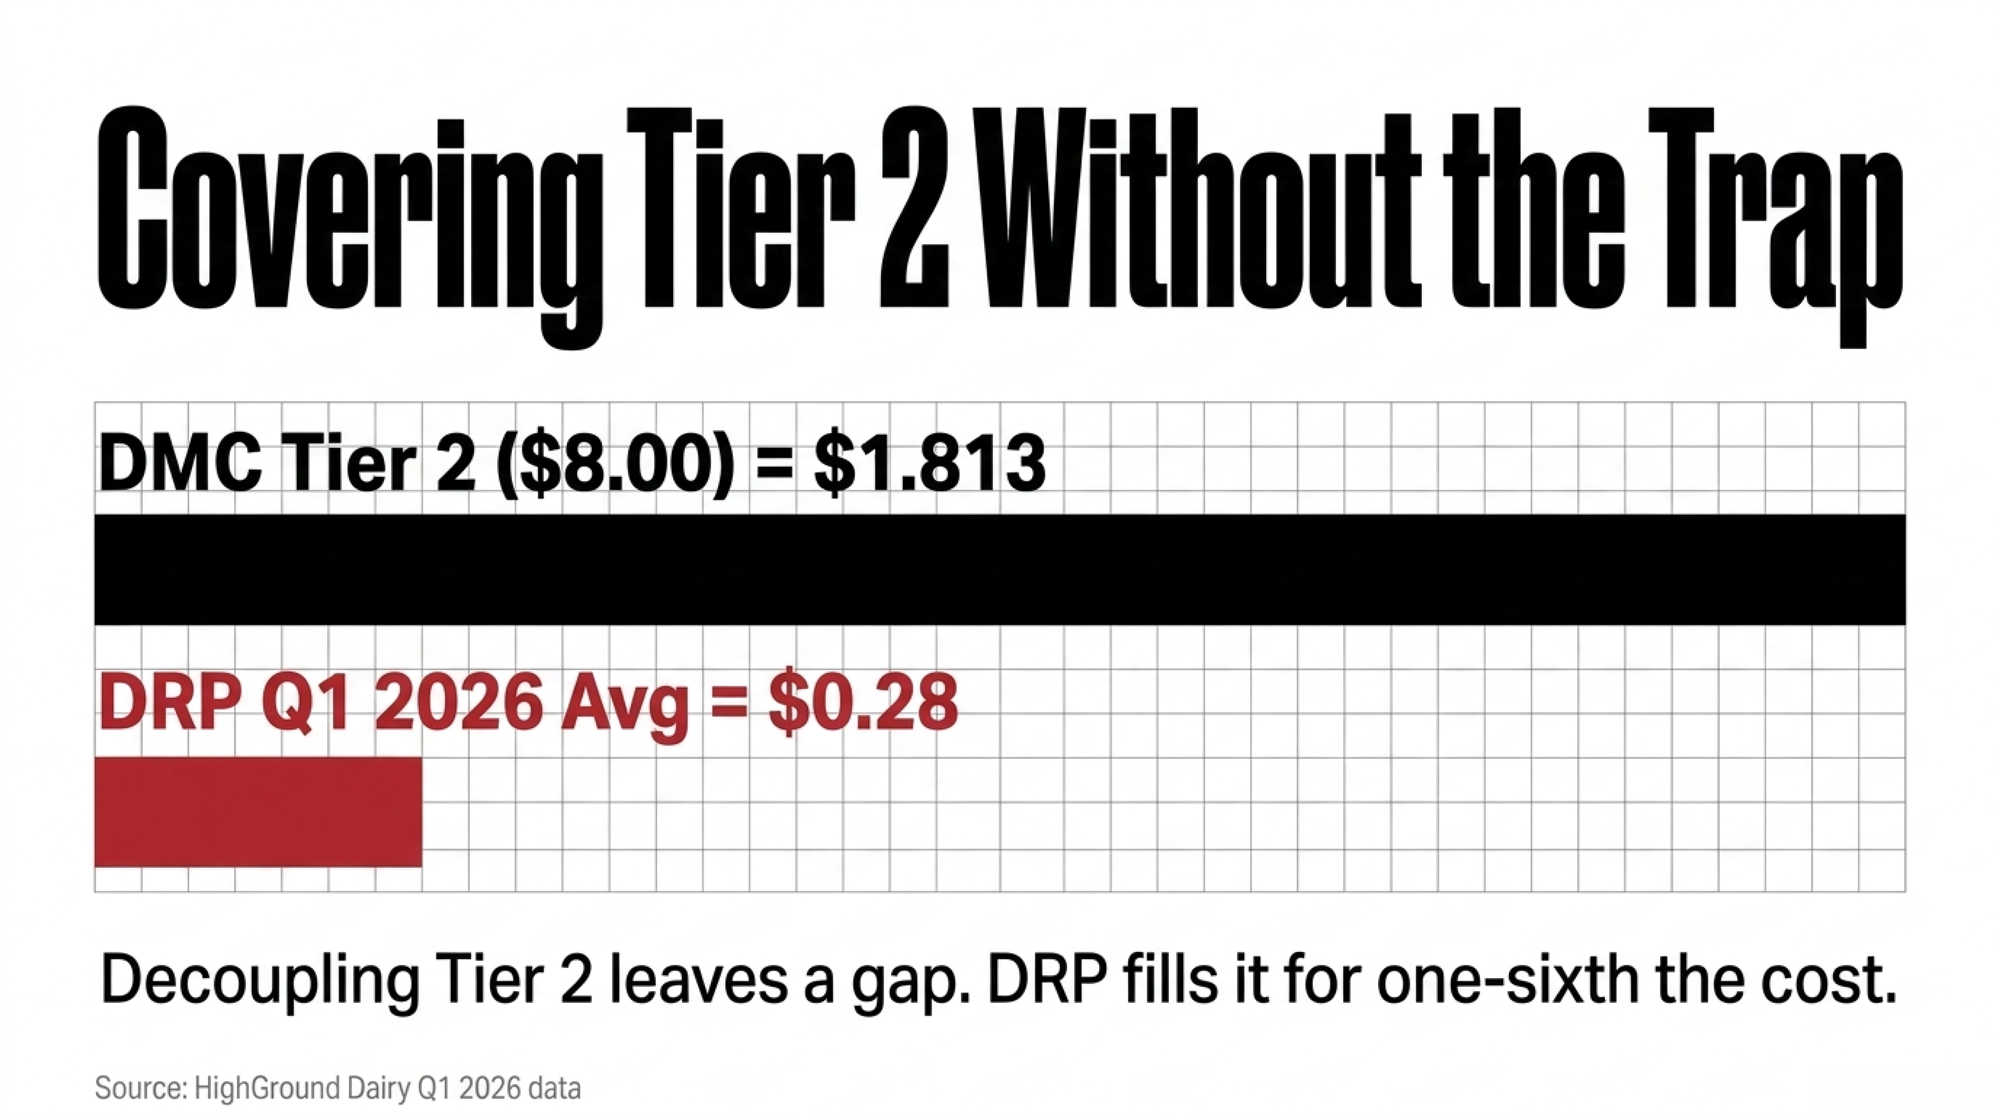
Decoupling Tier 2 to $4.00 solves the premium problem and leaves a coverage problem: that milk now carries a catastrophic floor and nothing else. Two federal products fill the gap at a fraction of the Tier 2 rate.
Start with what producers actually paid this year. HighGround Dairy’s review of first-quarter 2026 Dairy Revenue Protection results put average producer-paid premium at $0.28/cwt. On this herd’s 61,750 covered Tier 2 cwt, that’s about $17,290 spread across four quarterly endorsements — against $111,953 for the Tier 2 portion of an $8.00 election. Roughly one-sixth the cost.
Q1 was a strong quarter for anyone holding coverage. HighGround estimated indemnities averaging $1.12/cwt and a net return of +$0.83/cwt after premium, with Class III settling below the 95% coverage level in 93% of the sales days they examined. Read those numbers with three things in mind: RMA hadn’t released Q1 indemnities at publication, so the payout side is estimated from announced class prices and yields; one strong quarter isn’t a run rate; and HighGround Insurance Group is a licensed agency selling this product.
DRP isn’t a fringe tool anymore either. Roughly 16.1 billion pounds of milk carried DRP coverage in Q1 2026 — 27.5% of the U.S. milk supply.
How much does the timing of a DRP purchase actually matter?
More than the premium does, according to HighGround’s Q1 breakdown.
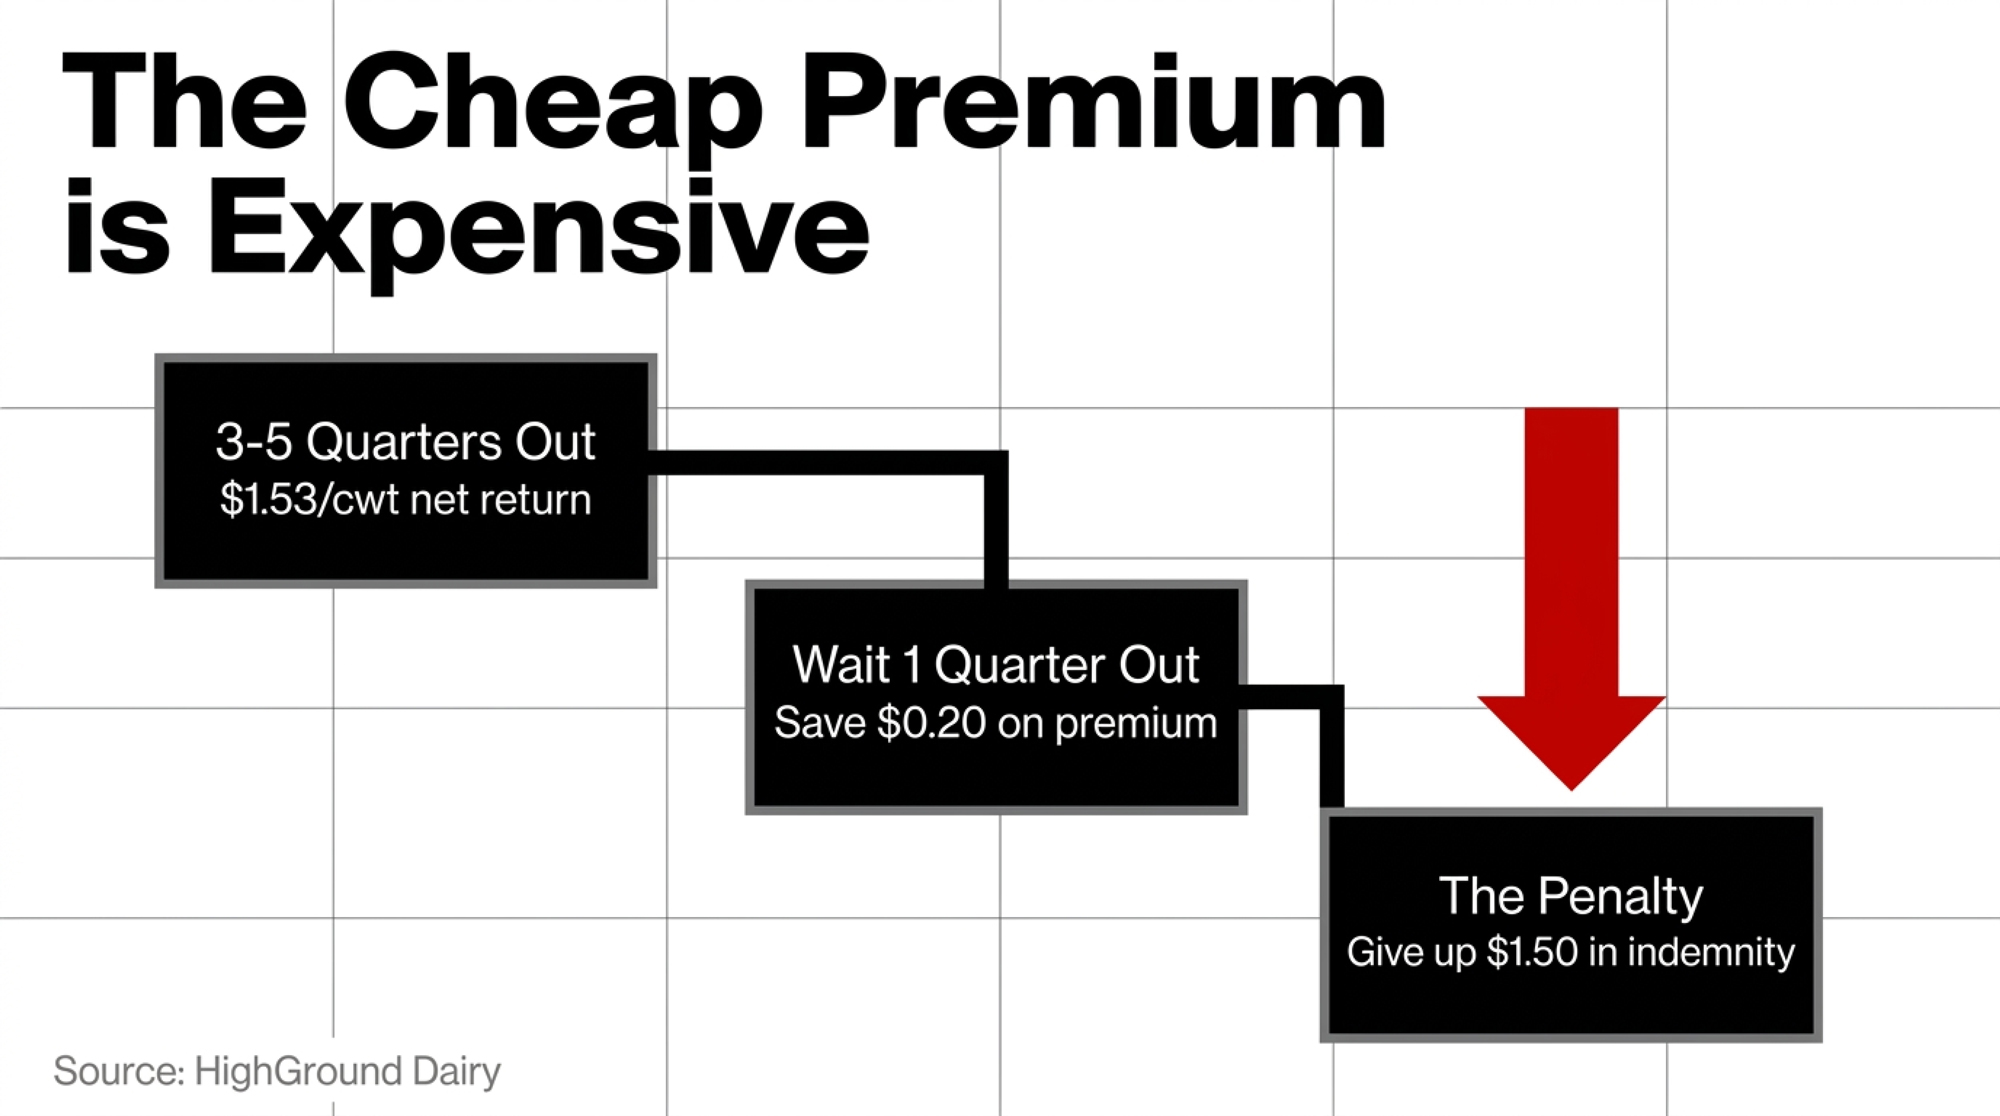
Coverage bought three quarters ahead returned the most: $1.53/cwt net of premium. Four quarters out returned $1.37, five quarters out $1.28. Producers who waited and bought one quarter out saved about $0.20/cwt on premium — and gave up roughly $1.50/cwt in indemnity to do it.
Only 19% of Q1 2026 coverage was booked three to five quarters ahead.
That’s the pattern worth stealing. The cheap premium is usually the expensive decision.
Where DRP can leave you short
DRP settles against an index built from CME futures and state or regional production, not your milk check. Two mechanisms drive the gap.
The first is basis. A herd in Federal Order 30 and one in the Southwest can hold identical coverage and land in different places, because their mailbox-to-index spreads differ. We walked through that in our spring 2026 DRP risk plan.
The second is the Yield Adjustment Factor — your state or pooled region’s actual yield from USDA’s Milk Production report, divided by the expected yield when you bought. Above 1, your indemnity gets cut. Below 1, it gets enhanced. So a quarter where your region milks well and prices fall can pay you less than the price move alone would suggest, regardless of what your own tank did.
Coverage levels run 80% to 95%, with a class pricing option built on Class III and Class IV and a component pricing option using butterfat, protein, and other solids. Subsidies hold at 55% for 80% coverage, 49% at 85%, and 44% at both 90% and 95% — unchanged for the 2027 crop year, per University of Wisconsin–Madison Extension’s August 2026 review. Beginning and veteran farmers receive an additional subsidy.
LGM-Dairy covers the margin between Class III milk and corn and soybean meal futures, with feed quantities set by the producer rather than fixed by formula. Per UW–Madison Extension’s May 2026 summary, deductibles run from $0 to $2.00/cwt in dime increments, with subsidies from 18% to 50%; there’s no minimum hundredweight, and premium comes due at the end of the coverage period.
You gain precision on the feed side. You give up a program your county office can explain in ten minutes.
For readers north of the border
None of this transfers. Canadian farmgate prices are set through the Canadian Dairy Commission’s cost-of-production formula blended with the Consumer Price Index, and production runs on quota rather than open marketing. Because Canadian pricing isn’t benchmarked to CME Class III and Class IV, DMC, DRP, and LGM-Dairy have no Canadian equivalent — there’s no margin index to insure against.
What crosses the border: feed. Corn and soybean meal are globally priced, and input hedging is the one page of this playbook an Ontario or Quebec operation can use directly.
The 30/90/365-Day Playbook for a Herd Sitting on the Tier Line
30 days — urgent checks
- Pull your FSA production history in pounds. Not your tank average — the number on file, recalculated for 2026 as the highest of your 2021, 2022, or 2023 marketings. Requires one call to the county office. Where it backfires: planning a 2027 election around a split you assumed instead of confirmed.
- Ask your county office two things: what Tier 1 level you elected for 2026, and what coverage level is currently attached to your Tier 2 history. If your Tier 1 sits at $8.00 or below, those numbers should be identical — and you may be paying Tier 2 rates you never chose. Most expensive item on this list to get wrong.
- Trigger: if your debt service coverage ratio has sat under 1.2 for three consecutive months on your lender’s calculation, cross CME futures off entirely. Class III trades in 200,000 lb contracts with margin near $1,000 per contract as of the April 2026 specifications, and the exchange resets those periodically. Ten contracts means five figures parked and callable at the worst possible moment.
90 days — structural adjustments
- Start pricing DRP three to five quarters out, not one. HighGround’s Q1 2026 data puts the net return on three-quarters-out coverage at $1.53/cwt against roughly $0.20/cwt of premium savings for waiting. Requires an agent relationship and a willingness to buy when the quarter still looks fine. Backfires if you commit volume you later sell forward — you’d be insuring milk that’s no longer exposed.
- Pull twelve months of milk checks and calculate your own mailbox-to-Class III spread. That number tells you whether index-based coverage will actually pay when you’re hurting. If it runs wide or erratic, weight toward LGM-Dairy instead of DRP.
- Model both DMC elections side by side rather than picking a Tier 1 number in isolation. Run $9.50 with Tier 2 at $4.00 against your preferred lower level with both tiers locked. The gap is usually wider than producers expect, and it usually favors buying up.
- If you took the six-year lock-in, calendar the annual certification now. The regulation keeps you liable for premiums and fees whether or not you file the paperwork.
365 days — strategic positioning
- Add one row to your own record every January: what the margin did, what you paid, what you collected. Seven years of that turns an opinion into a table.
- Opportunity signal: if your realized mailbox-to-Class III spread has held within about a dollar across the last twelve months and your Tier 1 election is above $8.00, index-based DRP is doing roughly what it says on the tin for you, and the Tier 2 substitution is worth pricing seriously. If that spread runs wider, keep the exposure and manage feed instead.
- Track the 2027 rules, which changed more than most producers noticed. RMA’s package for the 2027 crop year permits concurrent DRP, LRP, and LGM coverage and cancels policies earning no premium for three consecutive years. Earliest practical effect lands around June 2027, when dormant policies cancel ahead of the following year. A lapsed policy you forgot about can disappear quietly.
The trade-off at the center of this
Tier 1 is the cheapest risk management in American dairy, and one paragraph of federal regulation decides whether you get to keep it clean. Elect above $8.00 and § 1430.407(d) hands you a separate Tier 2 decision. Elect $8.00 or less, and it locks your largest block of milk to a rate that hasn’t paid for itself across seven years of USDA data.
Taking the higher Tier 1 number costs nothing real. On the herd modeled above, not knowing why it’s there cost $762,417.
So find your 2026 paperwork. What Tier 1 level did you actually elect — and have you asked your county office what coverage that decision attached to every pound above 6,000,000 lb?

Key Takeaways
- Elect Tier 1 above $8.00 and the regulation forces you to set Tier 2 separately — that’s the only path to parking it at the free $4.00 level. Elect $8.00 or under and both tiers lock together at Tier 2 prices.
- At the same $8.00 margin, Tier 1 costs $0.100/cwt and Tier 2 costs $1.813. Eighteen times the price for identical coverage on milk that came out of the same tank.
- Across 2019–2025, the decoupled election returned $344,669 on this modeled herd. Locking both tiers at $8.00 lost $417,748 — collecting nearly the same indemnities for ten times the premium.
- Before the 2027 window opens, pull your FSA production history and ask the county office what coverage is currently attached to your Tier 2 pounds. If your Tier 1 sits at $8.00 or below, those numbers should match — and you may be paying rates you never picked.
The USDA DMC Tier Trap
Same $8.00 Margin Protection. 18.1x The Premium.
Election rules and premium rates: 7 CFR § 1430.407 (buy-up coverage) and § 1430.404 (registration and annual election), current as retrieved September 1, 2026. Note that the CFR text still references the pre-2026 five-million-pound tier threshold; USDA’s January 2026 final rule raised it to six million pounds under the One Big Beautiful Bill Act, and the rate schedule was unchanged. Margin data and feed cost components: USDA Farm Service Agency, Dairy Margin Coverage Program Updates and Prices, 2019–2026 series. Annual average cross-check: Congressional Research Service. DRP performance data: HighGround Dairy, “DRP Results: Q1 2026” — indemnity figures in that report are estimated, as RMA had not released Q1 settlements at publication; HighGround Insurance Group is a licensed insurance agency. LGM and DRP subsidy terms: University of Wisconsin–Madison Extension, May and August 2026. Canadian pricing context: Canadian Dairy Commission. Net-position figures are The Bullvine’s own calculations applied to the illustrative herd described above — arithmetic, not forecasts. Past margins do not predict future ones. Confirm all program elections with your county FSA office or a licensed crop insurance agent.
Learn More
- Ishler vs. Ferreira: The Feed‑Cost Trap Hiding $547500 in Your IOFC — Arms you with barn-level income-over-feed-cost calculations to expose how a $0.75/cwt feed move swings annual cash flow by $98,550 on 400 cows.
- The $17500 Dairy Margin Coverage Gamble: The 6‑Year Lock‑In — Breaks down the multi-year risk of taking USDA’s 25% premium discount, revealing what happens when herd expansion outpaces fixed base production history.
- $19.85 milk price forecast 2026: your base year decides — Dismantles top-line price optimism by modeling structural margin compression against $18.15 Class IV and $17.25 Class III baselines for upcoming capital investments.
 The Sunday Read Dairy Professionals Don’t Skip.
 The Sunday Read Dairy Professionals Don’t Skip.
Every week, thousands of producers, breeders, and industry insiders open Bullvine Weekly for genetics insights, market shifts, and profit strategies they won’t find anywhere else. One email. Five minutes. Smarter decisions all week.