A$39,600 in fines on the other side of the world. The same clause language sits unredlined in North American milk contracts — and on an 800-cow robot barn, the 90-day math runs $386,000.

The Australian Competition and Consumer Commission’s May 21, 2026 announcement confirmed it had accepted infringement notices from the supermarket Coles and the processor Brownes Foods Operations for alleged breaches of the Australian Dairy Code of Conduct — A$39,600 each. ACCC alleged Coles published two milk-supply agreements requiring exclusive supply to the retailer while capping the maximum volume of milk farmers could produce. ACCC alleged Brownes published two agreements that didn’t clearly set out the minimum prices applying across the full supply period, or justify the reasons for those prices. Under Australian law, infringement notices aren’t admissions of liability, and neither company had publicly responded to the May 2026 action by publication time.
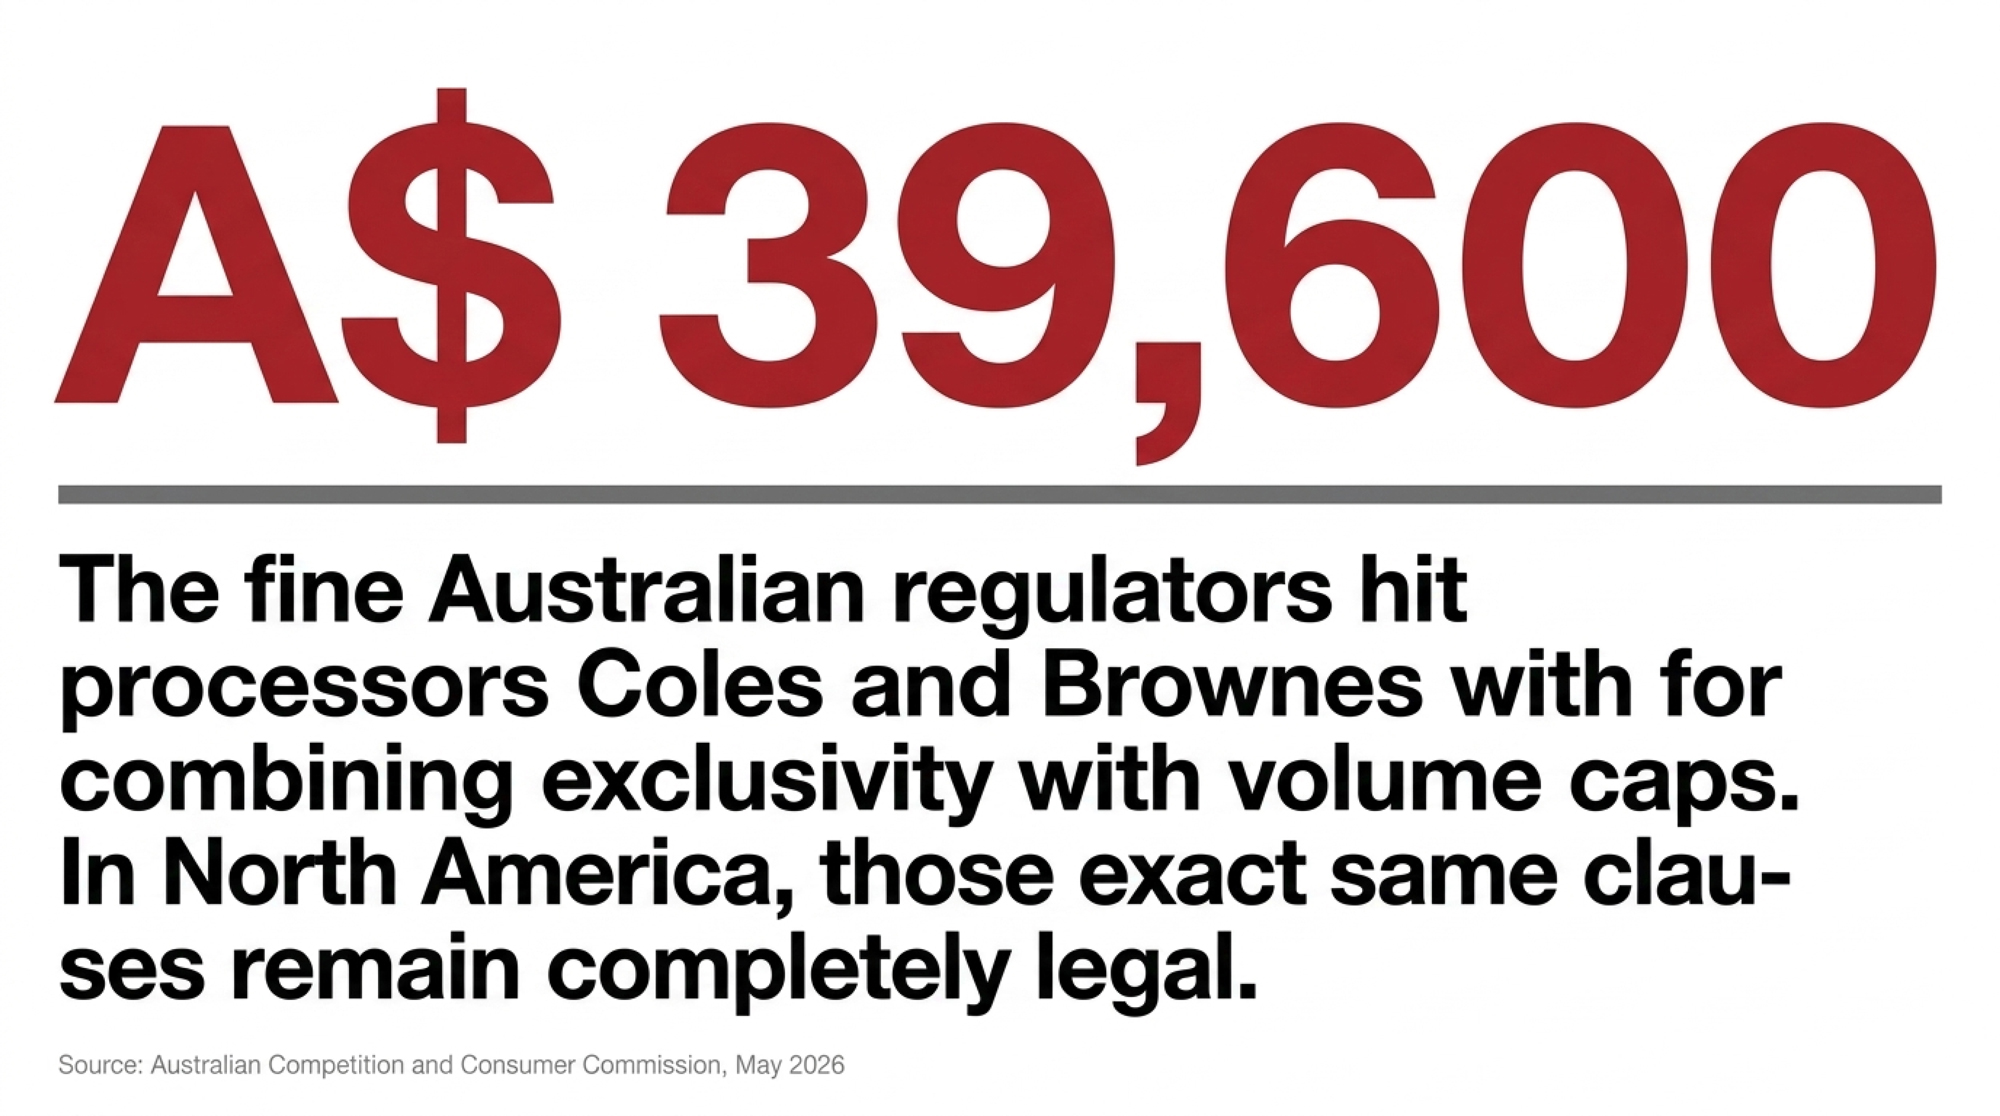
The fine is rounding-error money. The clause language ACCC went after lives freely in North American milk contracts and co-op bylaws right now — with no equivalent code to back you up.
Picture the contract on your desk. Five-year term. Exclusive supply. A 16,000 cwt monthly minimum. “Competitive pricing tied to Class III.” Your banker won’t release the robot loan until it’s signed. Now picture an 800-cow operation that just signed off on a robotic parlor. Fourteen robots at roughly $195,000 per unit — within the published 2026 range commonly cited by Compeer Financial and university extension robotics economic models — puts the equipment alone at $2.73 million, with retrofit and infrastructure pushing the total package past $3.5 million. Compeer Financial’s 2026 published guidance flags principal-and-interest payments above $2.50/cwt of milk production as the threshold at which dairy debt service gets uncomfortable. On 230,400 cwt a year, that ceiling pencils to roughly $48,000 a month in total debt service. The deal works — barely — at $22/cwt and 19,200 cwt a month, against USDA’s $18.95 milk forecast and $19.14 cost forecast for the year. Then the renewal lands.
What’s Changing And Why
ACCC didn’t go after Coles and Brownes over the prices they paid. ACCC went after the structure. Under the Australian Dairy Code, processors must publish contracts that include defined minimum prices and volumes. Clauses blocking farmers from supplying anyone else while letting the buyer cap intake aren’t allowed in exclusive deals.
Brownes has been here before. In 2021, the processor paid A$22,200 in infringement-notice penalties over alleged Code breaches that ACCC said involved open-ended supply periods and unilateral price step-down rights. ACCC has flagged increased Code enforcement since 2021. The 2026 action is part of a pattern, not a one-off.
| Clause | Standalone Risk | Combined Risk | Australian Dairy Code | North American Status |
|---|---|---|---|---|
| Exclusivity— all milk to one buyer | Low if price/volume are solid | HIGH — traps milk if cap invoked | ❌ Must offer non-exclusive alternative | ✅ Standard; no equivalent rule |
| Volume cap / “subject to capacity” | Moderate — buyer manages plant load | HIGH — combined with exclusivity, you can’t redirect | ❌ Not permitted in exclusive deals | ✅ Freely used; labeled “capacity-subject intake” |
| Vague pricing (“tied to Class III”) | Moderate — price drifts inside term | HIGH — no floor means deductions compound | ❌ Minimum price must be defined across full supply period | ✅ Common; no defined-spread requirement |
| Tiered pricing (Tier A/Tier B) | Low — standard revenue management | HIGH — erases expansion economics at cap volume | ❌ Requires non-exclusive alternative if combined with exclusivity | ✅ Unregulated; UK FDOM now requires fairness test |
North America has no equivalent rule. In the US, supply terms vary by federal order, co-op, and private milk processor contract — there’s no national code that says “if you cap volume, you must release exclusivity.” In Canada, supply management sets prices and quotas at the provincial level, but the underlying co-op membership rules and processor agreements still carry exclusivity, notice, and discipline language buried in bylaws most members never re-read. The same clause families show up under different names — “base-excess pricing,” “market adjustment factors,” “capacity-subject” intake language — depending on who drafted your agreement.
The UK went the other direction in 2025. Under the Fair Dealing Obligations (Milk) regulations phased in across 2024 and 2025, contracts combining exclusivity with tiered pricing must satisfy a fairness test that effectively forces processors to offer a non-exclusive alternative — closing the same gap North American producers carry without protection. The producers most exposed are the ones financing expansion — robots, parlors, freestall barns, sexed semen, genomics programs — on the assumption their milk has a guaranteed home. That assumption is contractual, not natural.
How This Plays Out On Real Farms
Run the stress test on the 800-cow scenario. Two years into the renewal, the processor loses a major retail account and invokes a volume cap clause — the kind that lets them reduce intake by 10–15% on 60 days’ notice. Accepted volume drops from 19,200 to 16,320 cwt. The other 2,880 cwt a month is still being produced. Still being fed. And under typical exclusivity language, you can’t ship that milk to anyone else without the buyer’s written consent.
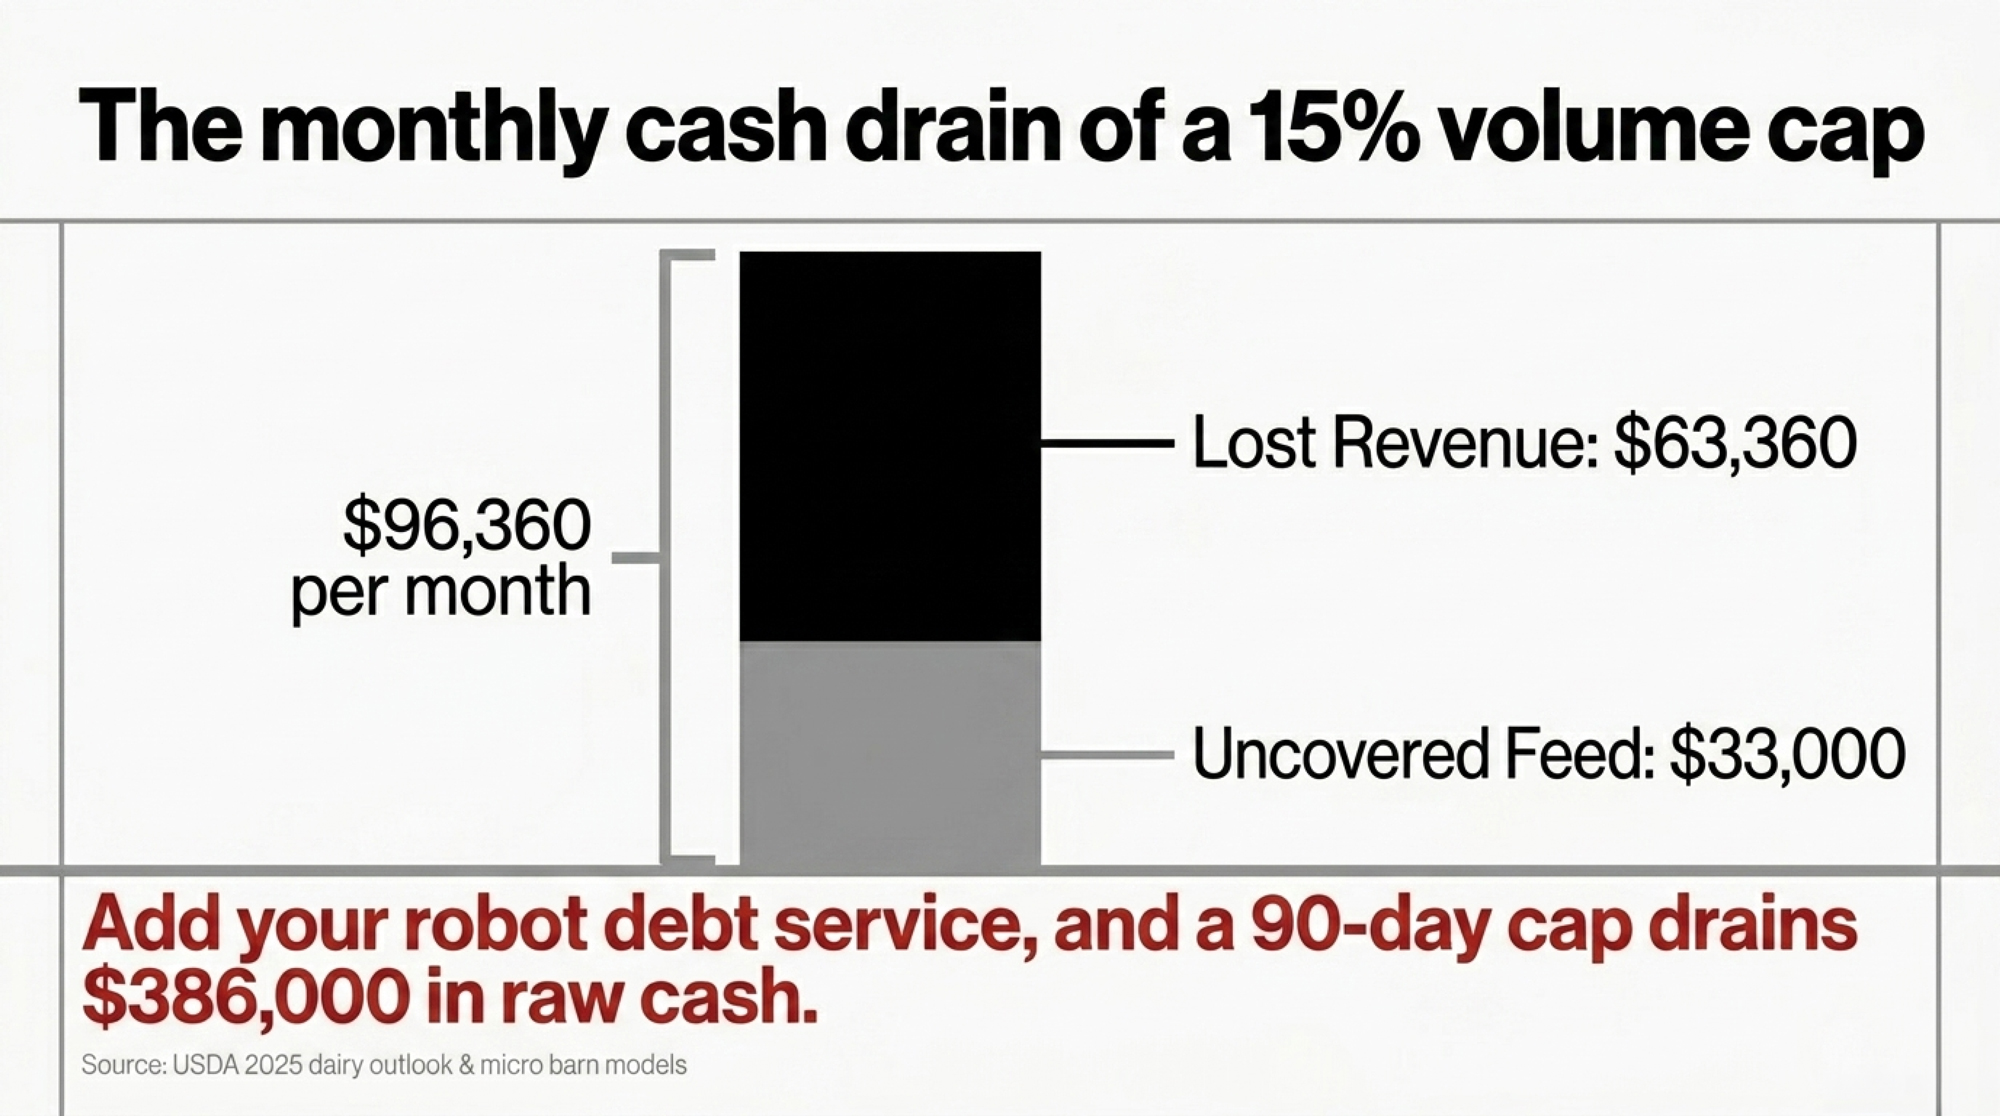
Here’s the micro barn math any producer can map to their own herd. Lost monthly revenue: 2,880 cwt × $22/cwt = $63,360. USDA’s 2025 dairy outlook projected feed costs around $11.56/cwt at corn near $4.35 a bushel. At that input, the uncovered feed exposure on 2,880 cwt of trapped milk runs roughly $33,000 a month — sunk into milk that won’t sell. The robot debt service still drafts on schedule, even when the math says it shouldn’t have to.
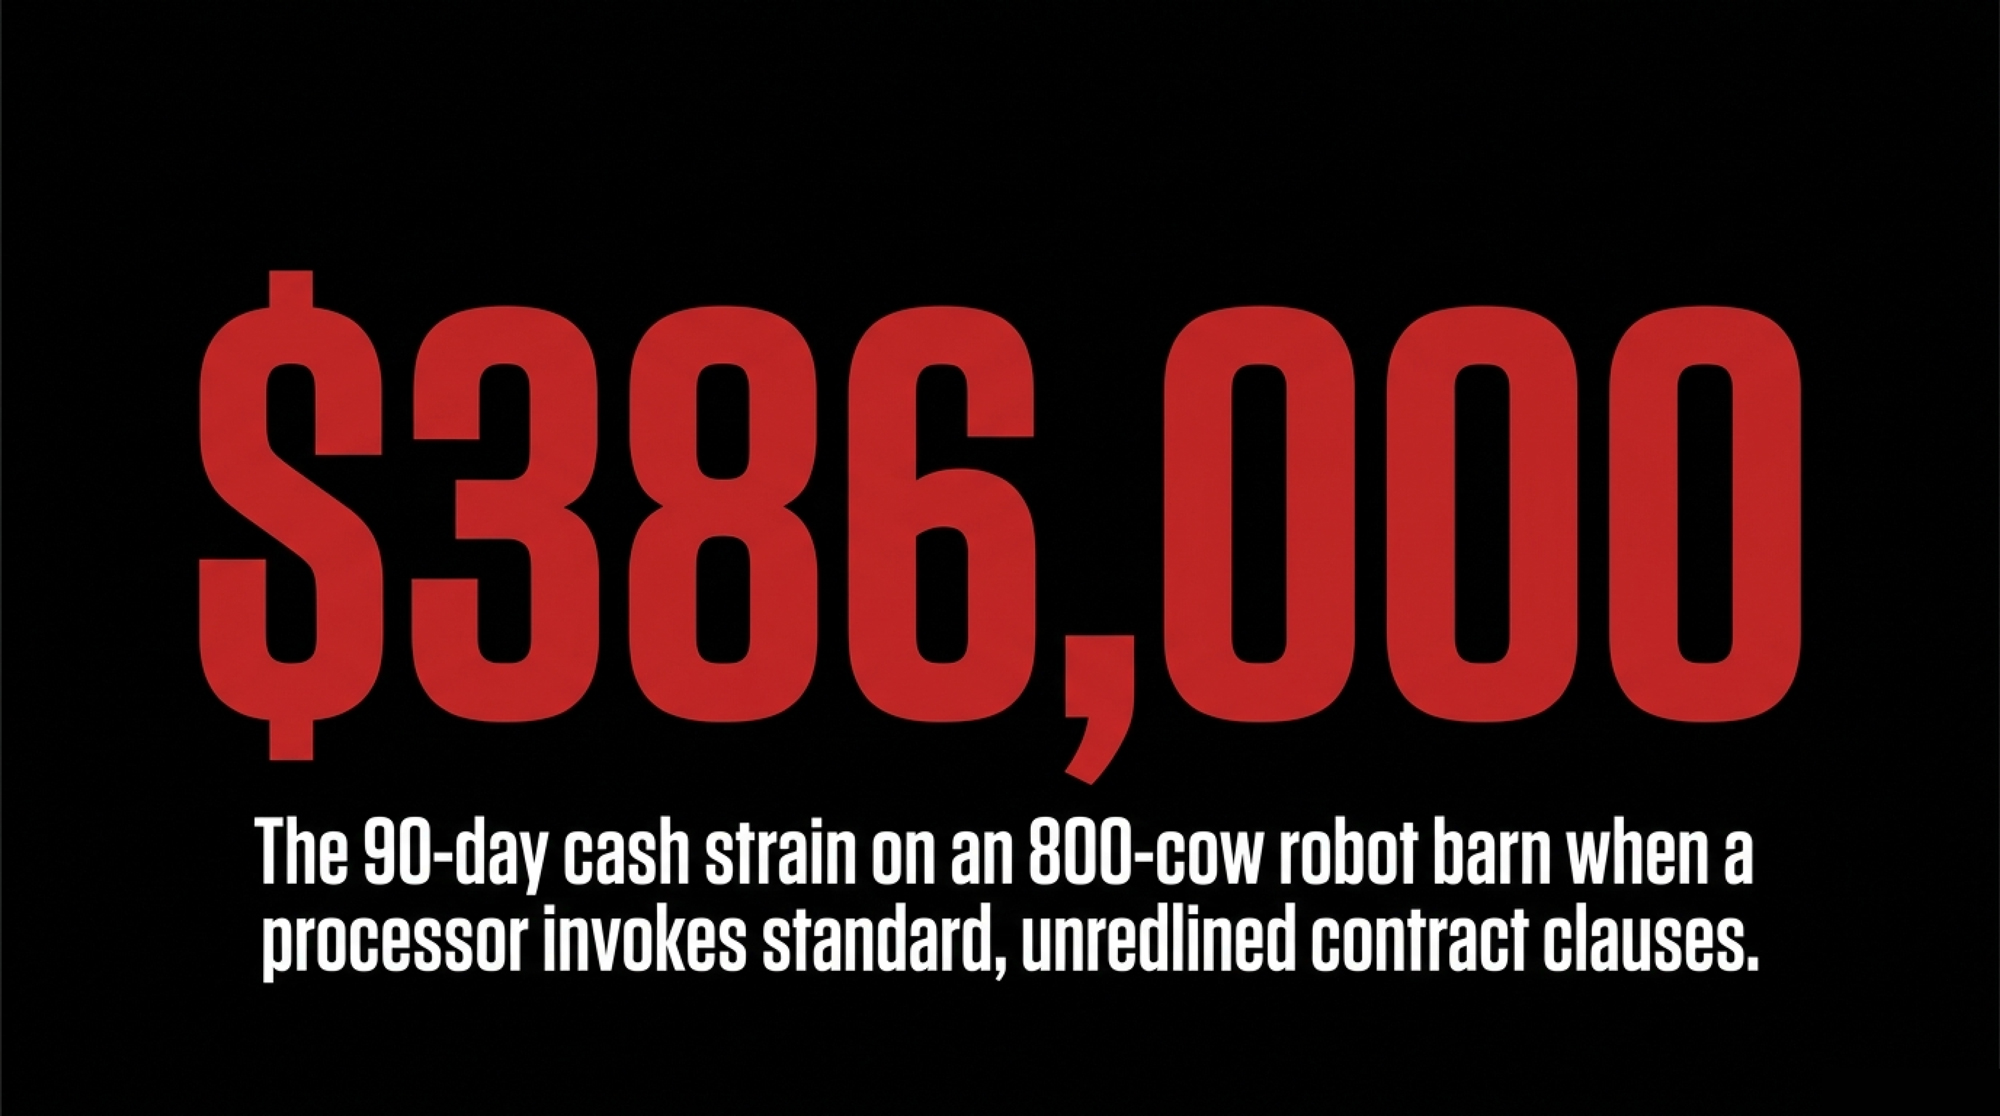
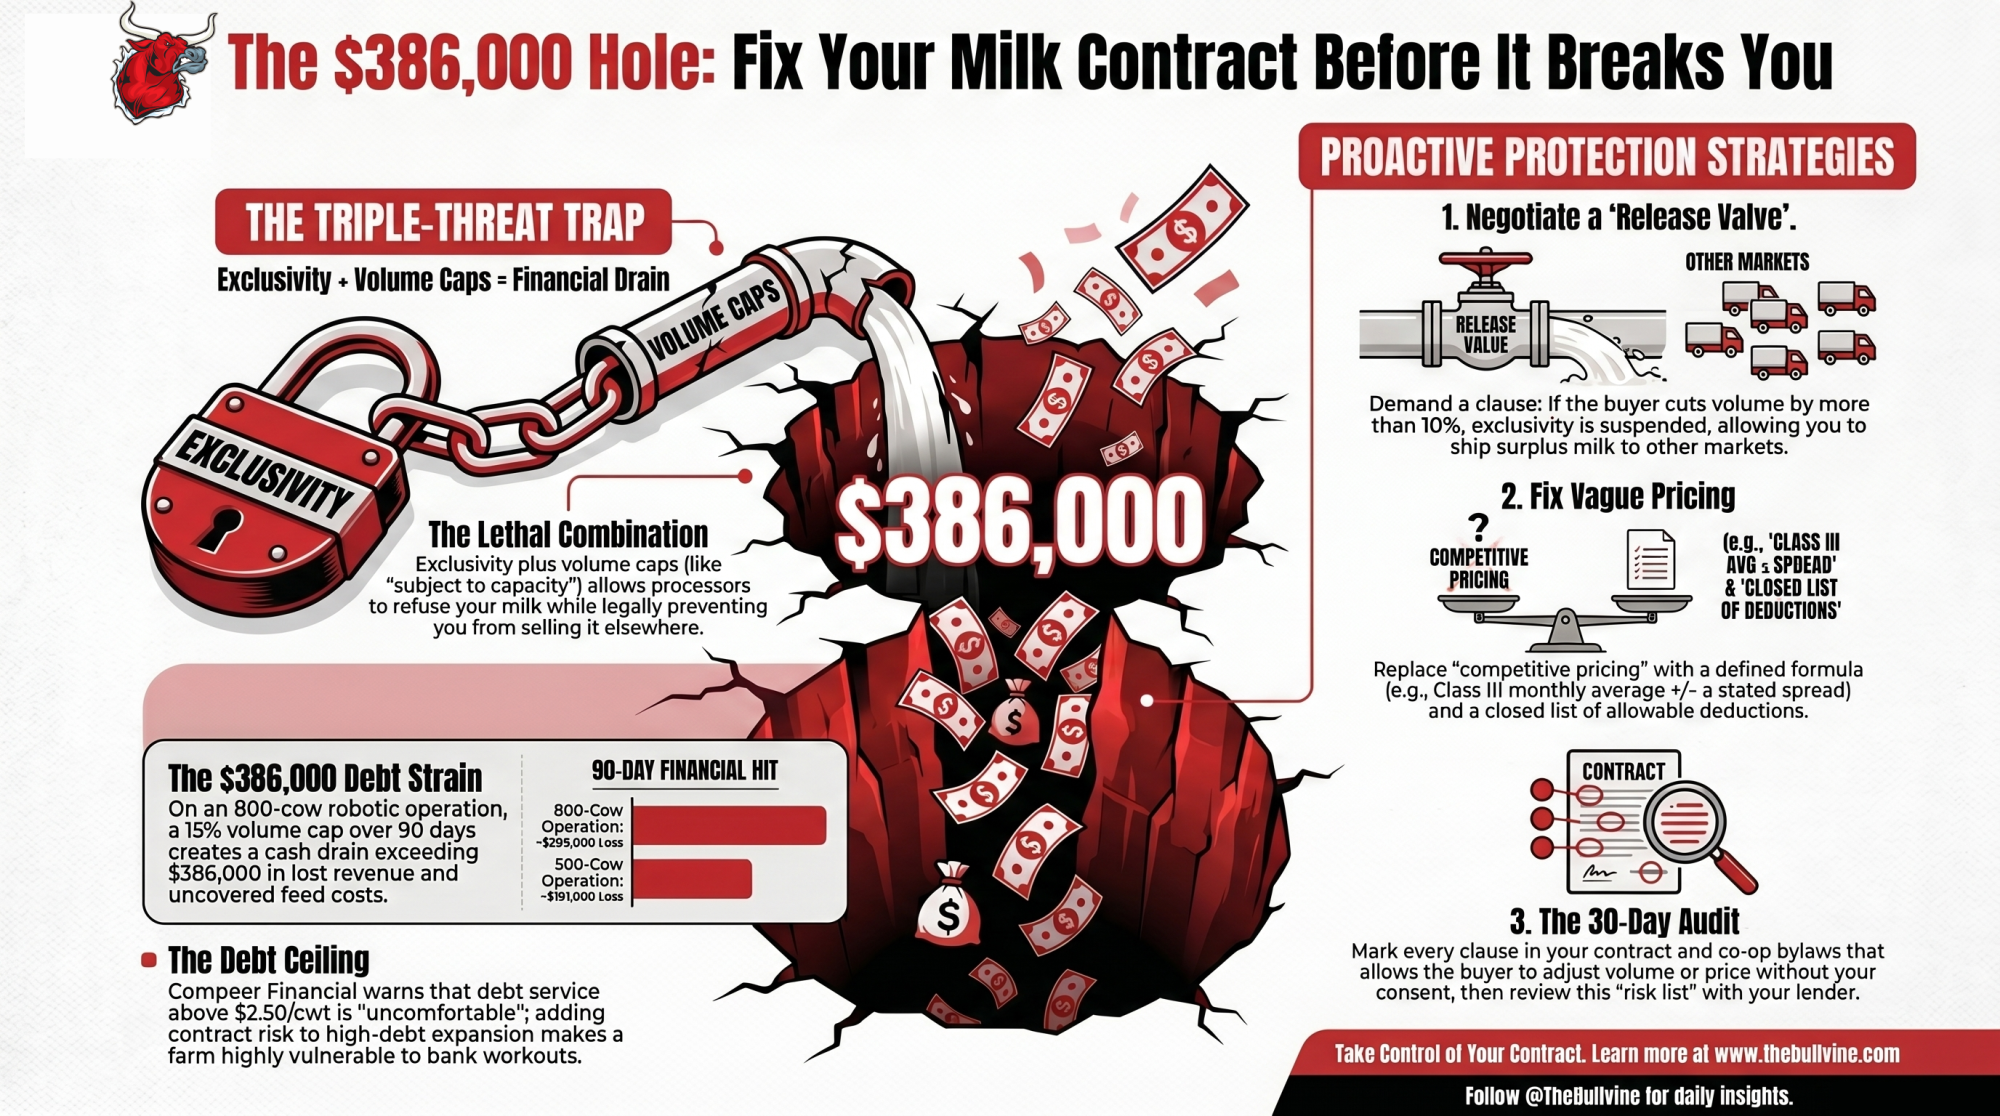
Stack three months together and the curve gets ugly fast. Incremental losses from lost revenue and uncovered feed run between $274,000 and $289,000 over 90 days, depending on where the variable feed cost actually lands. Layer in robot debt service still drafting against milk that won’t ship — roughly two months of P&I at $48,000 — and the cumulative cash strain on the 800-cow scenario pushes past $386,000. The 500-cow version trims the absolute number but not the shape of the problem.
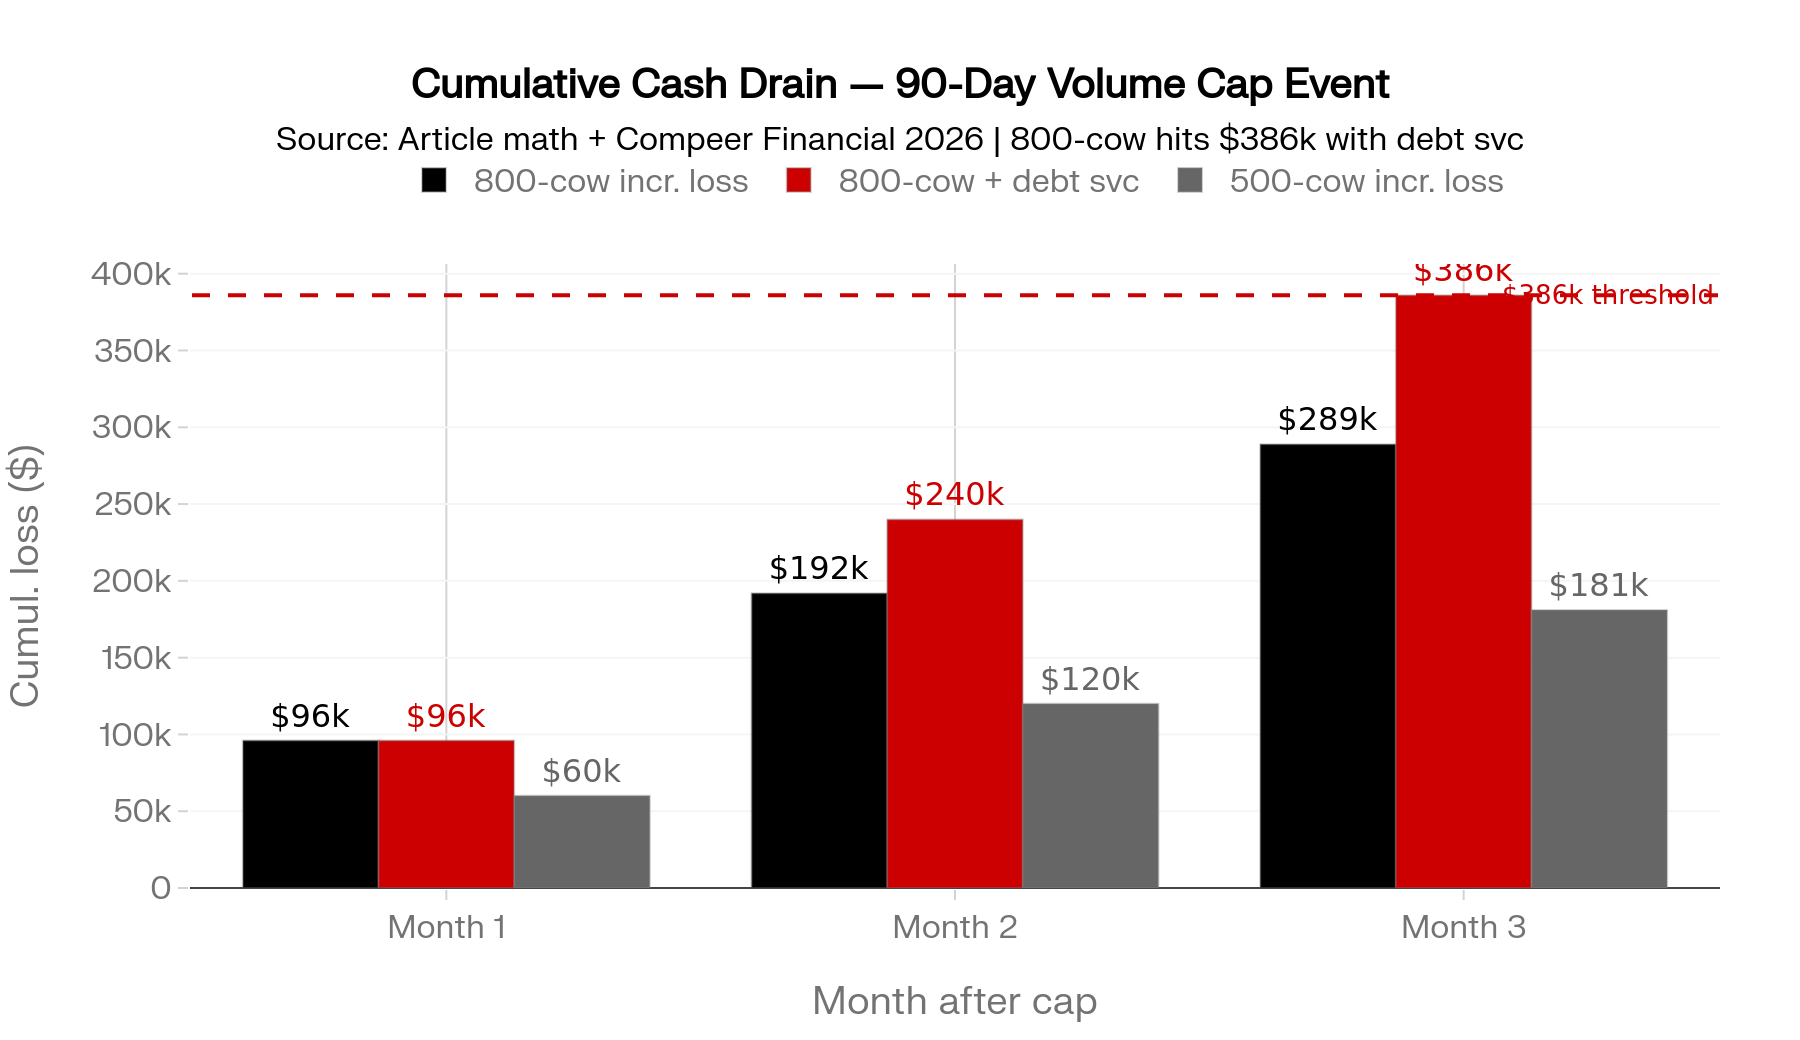
| Exposure on a 90-day volume cap | 800-cow operation | 500-cow operation |
| Capped milk per month | 2,880 cwt | 1,800 cwt |
| Lost monthly revenue at $22/cwt | $63,360 | $39,600 |
| Uncovered feed exposure at $11.56/cwt | ~$33,000 | ~$21,000 |
| Total monthly hit | ~$96,000 | ~$60,000 |
| 90-day incremental loss | ~$289,000 | ~$181,000 |
| Robot/expansion debt service | Continues drafting all 90 days | Continues drafting all 90 days |
The shock absorber gets smaller. The pressure on the bank conversation does not.
The Mechanics Behind The Outcomes
Three clauses do the damage when they show up together. None is automatically bad on its own. Combined, they let a processor turn your expansion volume into a free buffer for their plant or retail-account risk.
- Exclusivity. All milk produced goes to one buyer; selling to anyone else requires written consent.
- Volume cap or “subject to capacity” language. The buyer’s obligation to take milk is limited to a stated maximum — or whatever their plant decides it can handle. ACCC’s 2026 enforcement action against Coles alleged exactly this combination.
- Vague pricing. “Competitive pricing tied to Class III” with no defined spread or deduction list lets the buyer adjust the effective price downward inside the term — the same gap ACCC alleged against Brownes, where ACCC said the minimum price wasn’t clearly set out across the supply period.
None of those would survive the Australian Dairy Code in an exclusive contract. All three live freely in North American agreements.
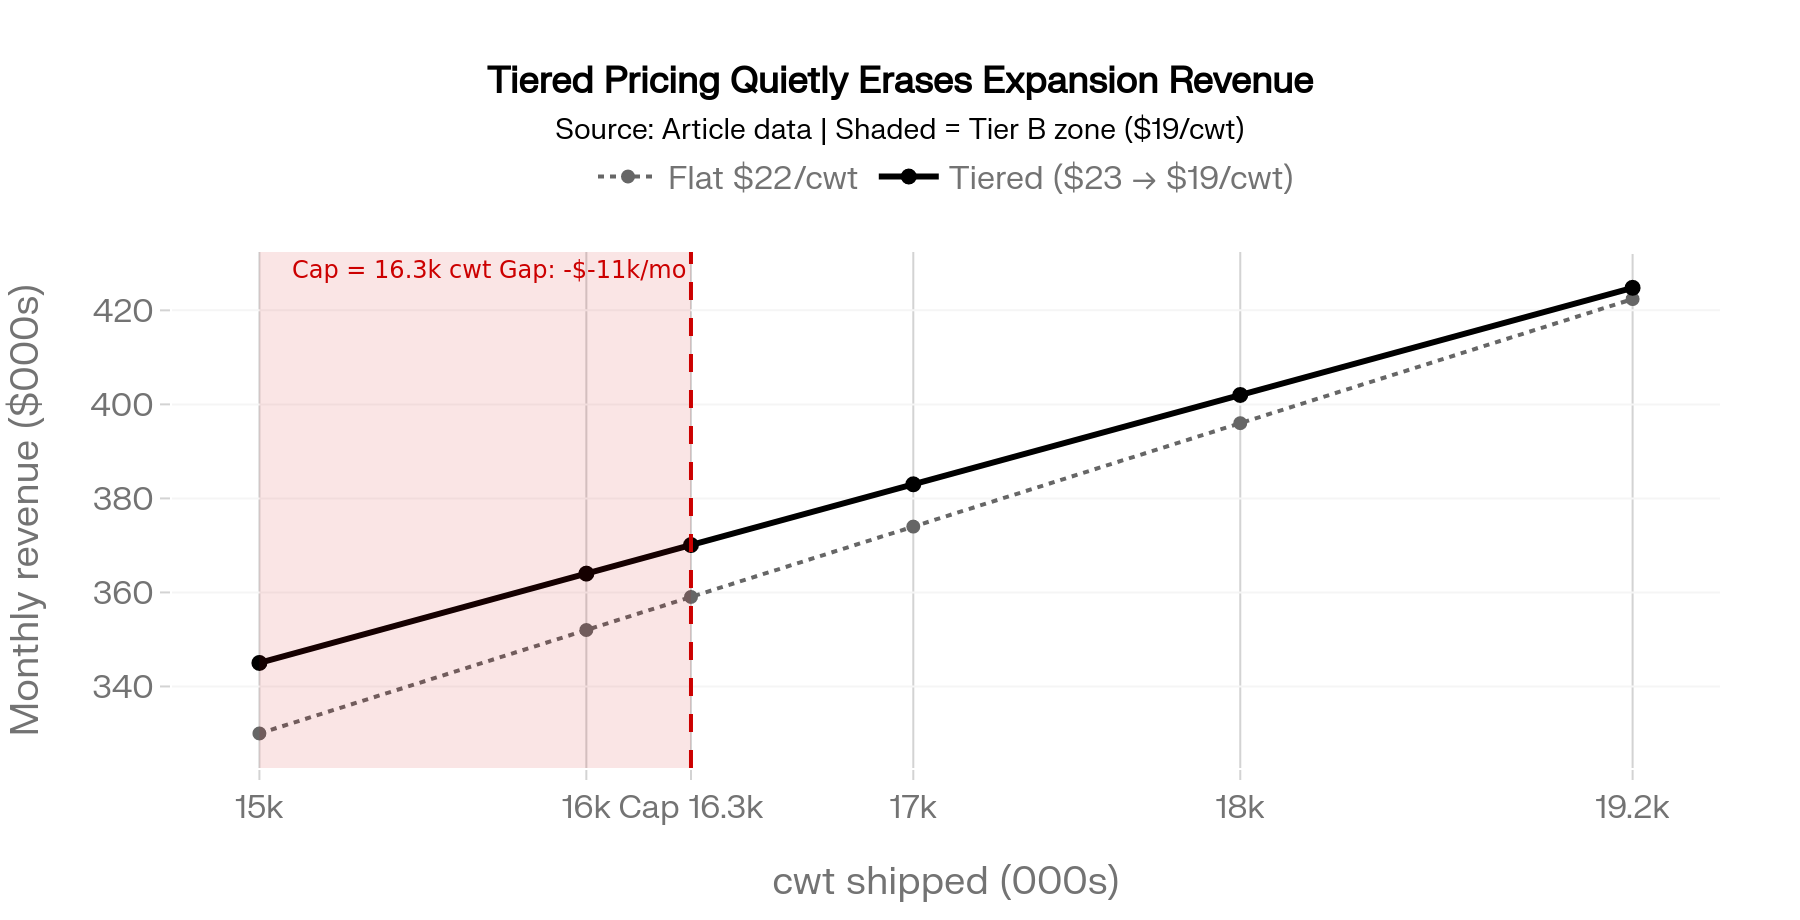
Layer in tiered pricing — say $23/cwt on the first 15,000 cwt, $19/cwt above that — and the expansion case quietly collapses. With a 16,320 cwt cap, you earn $345,000 on Tier A and $25,080 on Tier B, total $370,080 a month. Without the cap, full 19,200 cwt would have generated $424,800. That’s $54,720 a month of revenue erased on milk the contract said the buyer could simply refuse to take. Under UK FDOM rules, that combination of exclusivity plus tiered pricing requires a non-exclusive alternative. North American milk processor contracts don’t.
How Much Does An Exclusive Milk Processor Contract Without A Release Actually Cost?
Honest answer: it depends on whether the buyer ever pulls the trigger. If they don’t, the cost is zero and you feel smart for signing. If they do, the cost compounds in three layers.
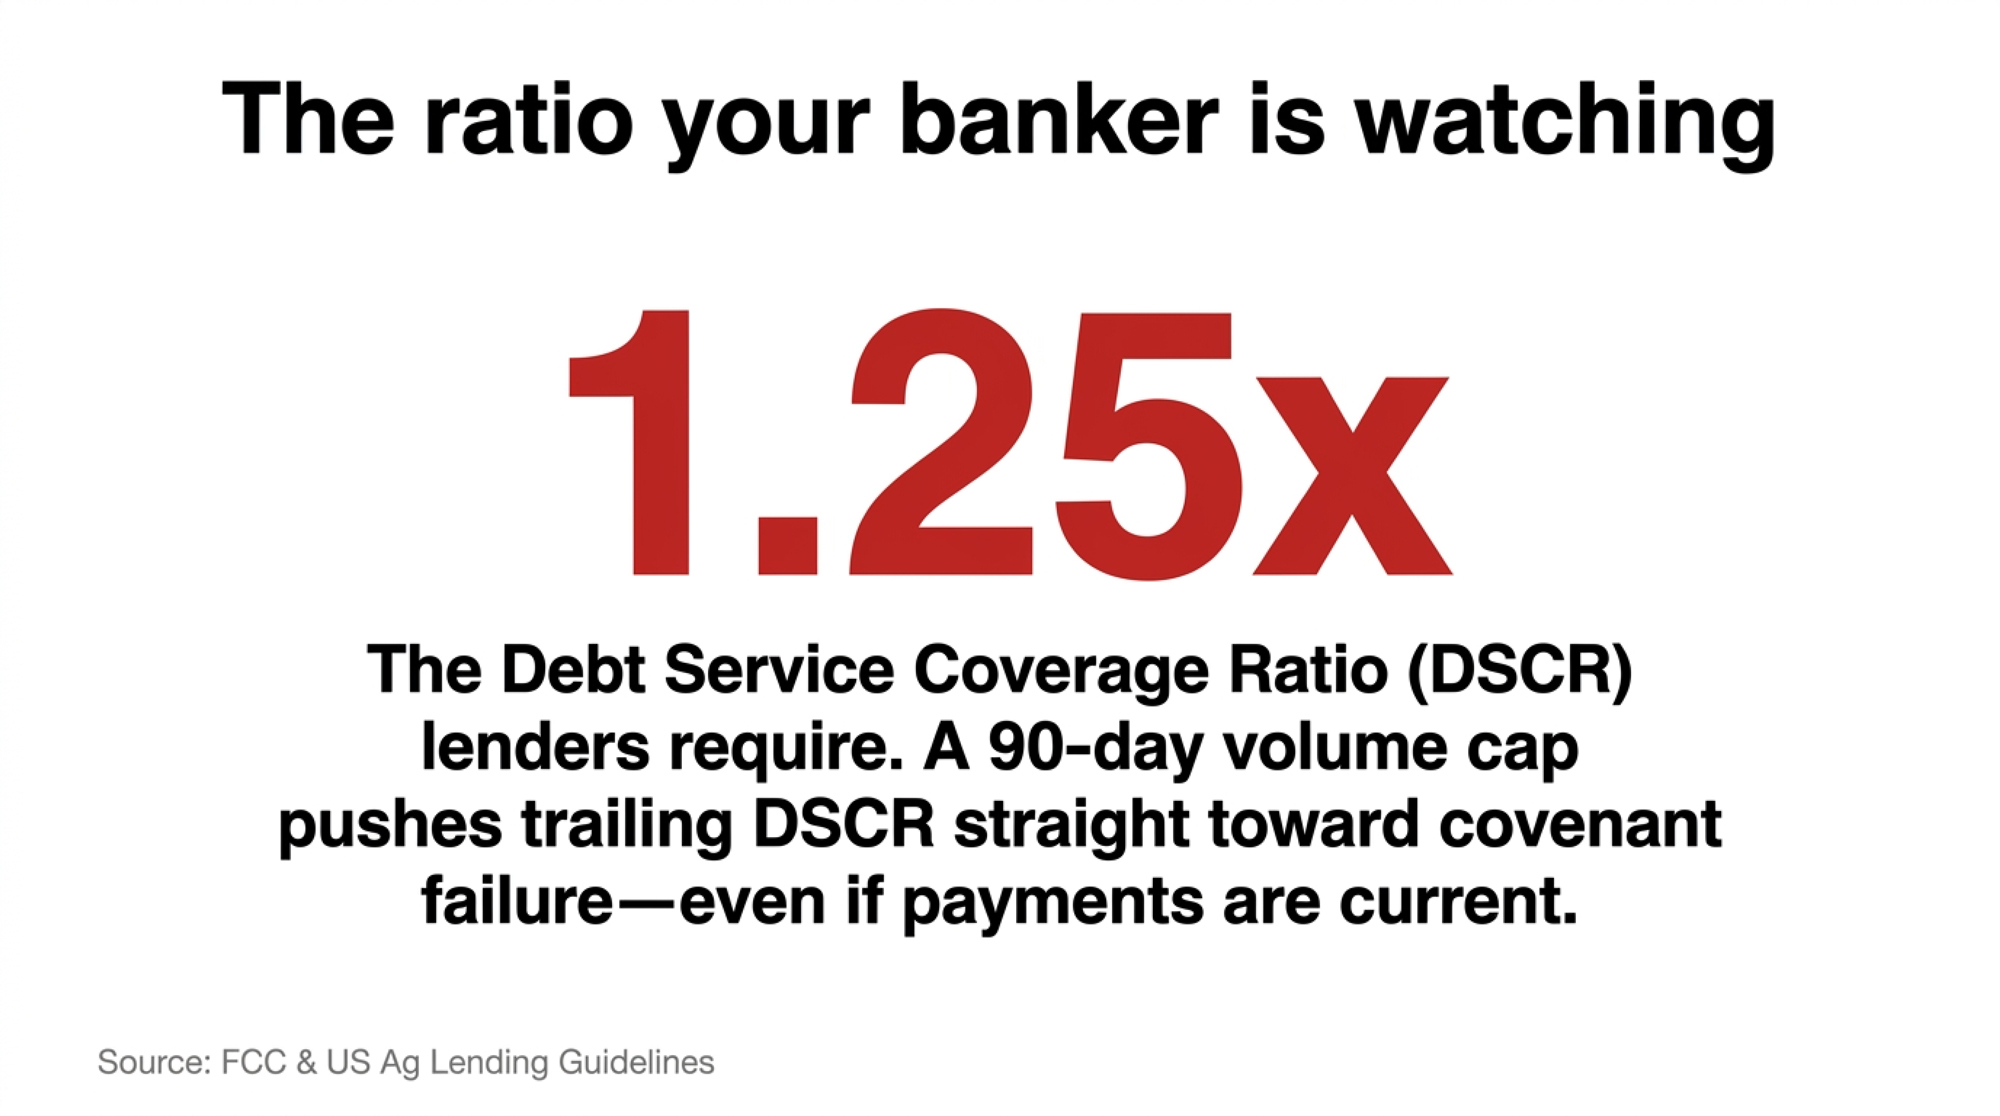
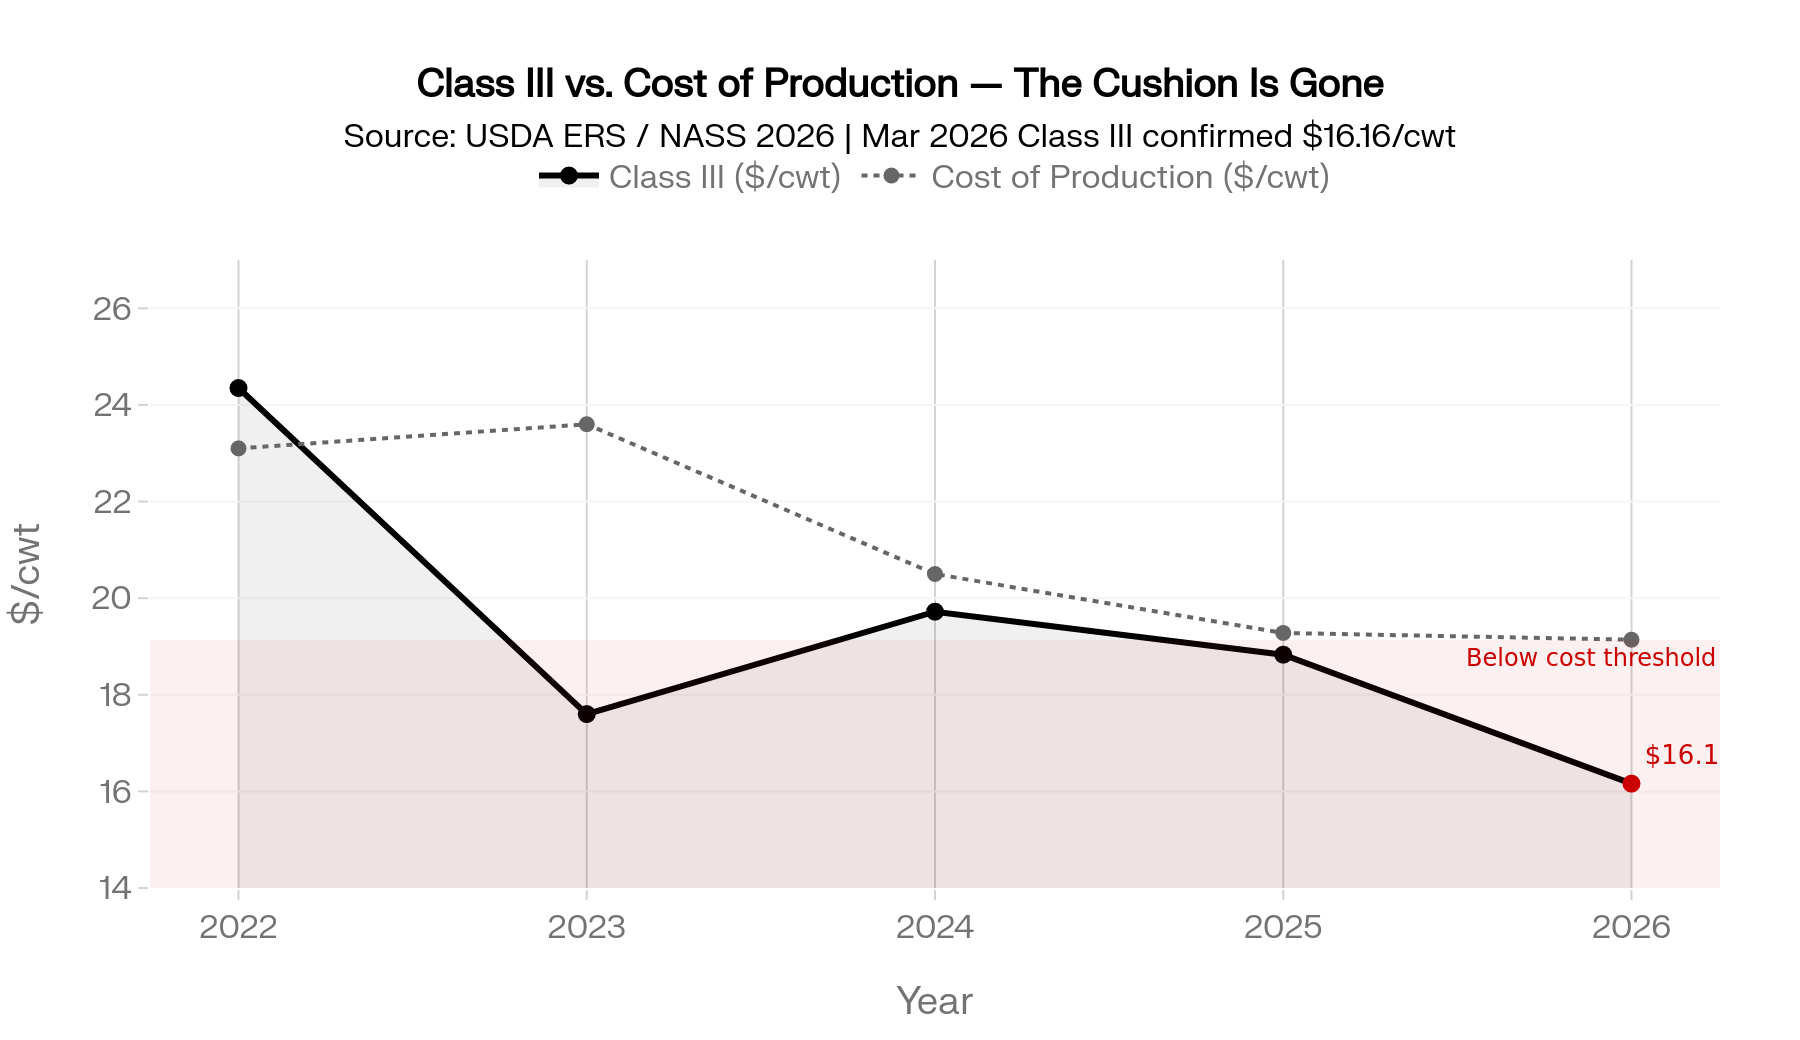
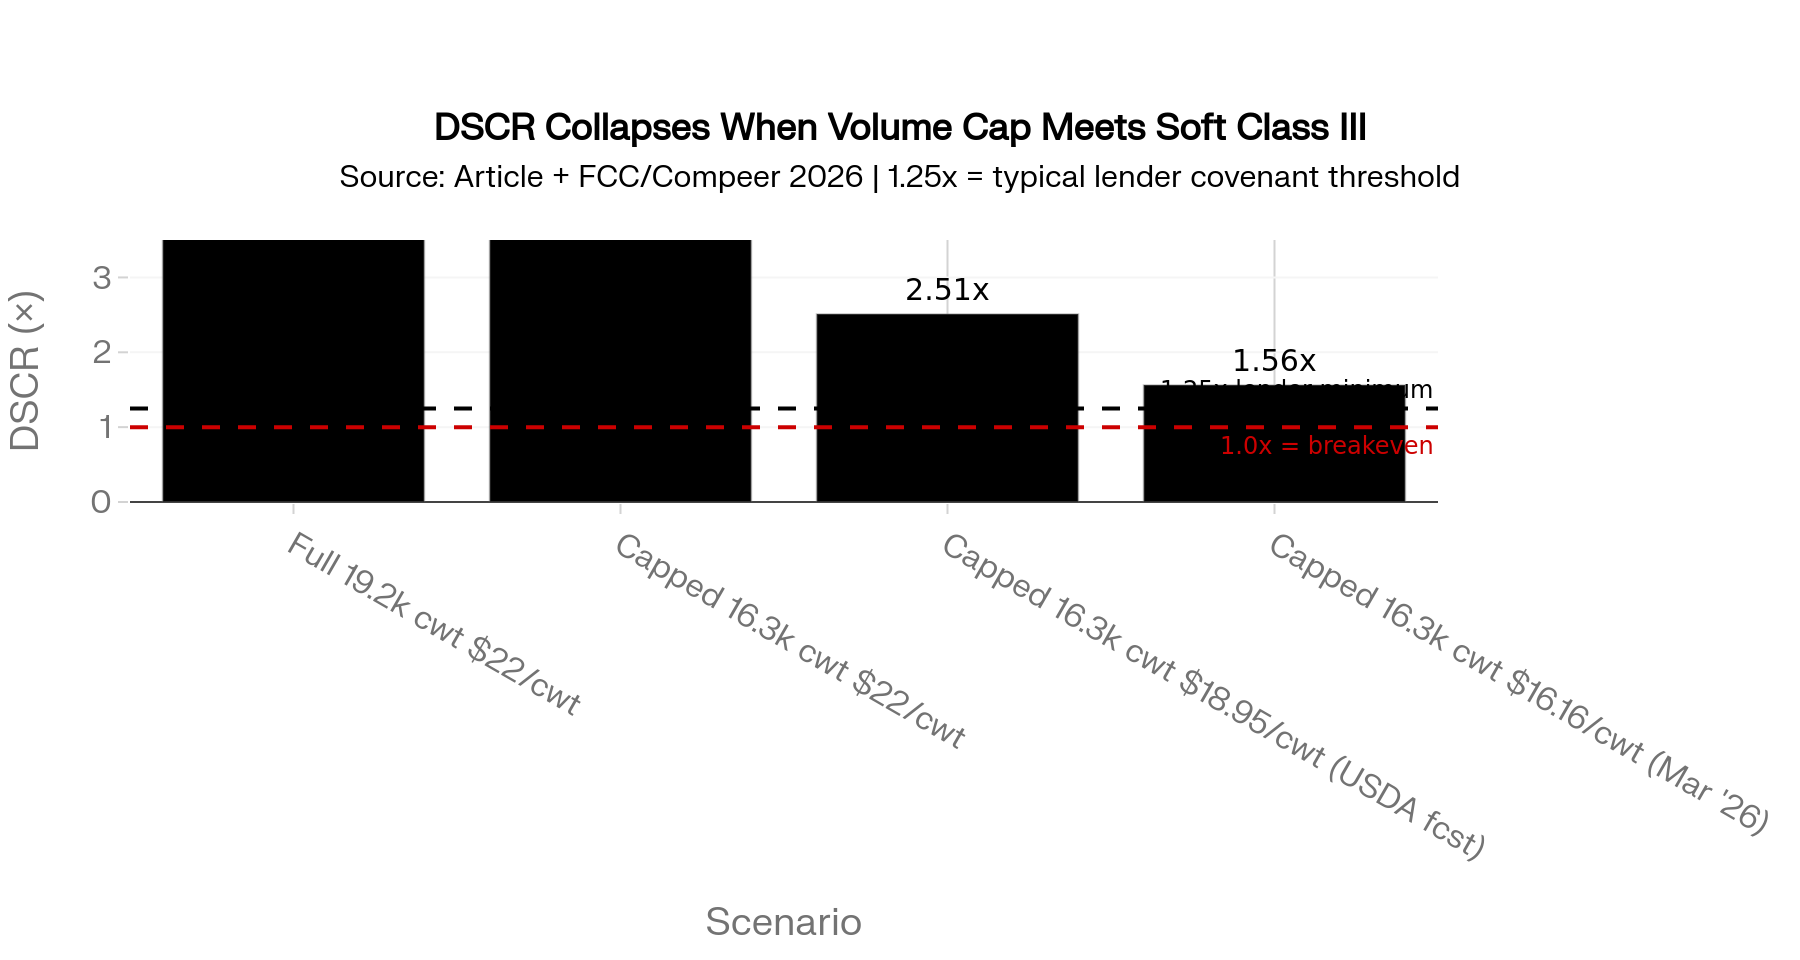
Layer one is direct revenue loss on capped milk — in the 800-cow case, roughly $63,000 a month at $22/cwt. Layer two is uncovered fixed costs: feed on milk with no buyer, robot debt that doesn’t pause, labor already scheduled. Layer three is the one your banker cares about — debt service coverage ratio. FCC flags 1.25x DSCR as a common ag lending threshold for expansion loans, and most US lenders sit in the same range. Once a 90-day cap event lands on top of that, the math turns fast.
Run this through the kind of DSCR worksheet most ag lenders use, and a 90-day cap during a Class III soft patch compresses trailing DSCR straight toward covenant thresholds — even when every payment is current. With Class III at $16.16/cwt confirmed for March 2026 and Class IV at $18.94/cwt the same month, the cushion between forecast and covenant is already thin. That’s the moment the conversation with the bank shifts from planning to workout.
Is Your Co-Op Bylaw Doing The Same Thing As An Exclusive Contract?
For a lot of North American producers, the answer is yes. Most haven’t read the document closely enough to see it. Co-op membership agreements often include exclusive supply requirements, disciplinary powers for “bringing the co-op into disrepute,” and rules about how losses from recalls or lost retail accounts get spread across the pool.
The mechanics look different from a private supply agreement. The leverage is similar. Members can’t easily ship elsewhere, and the board controls how downstream pain gets allocated. Watch for “termination for cause” clauses tied to vague conduct standards, capital-retain rules that lock equity in the co-op for years after you stop shipping, and notification language that lets the co-op invoke recall-loss allocation without member consent.
The ByHeart organic infant formula recall in late 2025 is a recent reminder of how downstream brand-owner events can hit upstream producers without warning. Producers inside contamination footprints often discover only after a recall what their notification rights actually were — or weren’t. Contract risk lives in bylaws too, not just in the supply agreement on top of them.
Options and Trade-Offs for Farmers
There’s no single fix here. Four paths are showing up in producer–processor conversations right now. Each carries a real trade-off.
| Protection | Australia (Dairy Code 2020) | UK (FDOM 2024–25) | Canada (Supply Mgmt) | USA (Federal Order) |
|---|---|---|---|---|
| Defined minimum price across full term | ✅ Required | ✅ Required | ✅ Quota price set provincially | ❌ No requirement |
| Volume cap with exclusivity release | ✅ Prohibited without release | ✅ Must offer non-exclusive alternative | N/A — quota governs volume | ❌ No requirement |
| Closed deduction list | ✅ Required | ✅ Fairness test | Partial — provincial variation | ❌ Processor discretion |
| Minimum notice on volume reduction | ✅ Defined in Code | ✅ 3-month minimum | ✅ Quota adjustment via board | ❌ Varies by contract; often 30–60 days |
| Co-op bylaw conduct/discipline rules | Code overrides bylaw | Regulated | Provincial oversight | ❌ Member agreement only; no federal floor |
| Producer redress mechanism | ✅ ACCC enforcement | ✅ AHDB / Groceries Code | ✅ Provincial marketing boards | ❌ Litigation only |
1. Negotiate an exclusivity release tied to volume reductions. This is the highest-leverage clause to push for. Plain language: if the buyer cuts accepted volume below the monthly minimum by more than 10%, exclusivity is suspended on the surplus and you can ship it elsewhere. Best fit on any 5-year-plus contract tied to new debt. Bring your banker into the conversation as a second voice — a lender’s signature on the loan gives you cover to ask. The risk: many North American processors and co-ops will say no, possibly flat. Your fallback is shorter notice periods, defined minimums, and a closed list of allowable deductions instead of a true release.
2. Define the minimum price. Replace “competitive pricing tied to Class III” with a real formula — Class III monthly average minus a stated spread, plus a closed list of premiums and deductions, with any change requiring a written amendment. This is the exact gap ACCC alleged against Brownes. Worth pushing whenever the contract runs more than two years. You’ll need a clean set of recent milk cheques to negotiate the spread. The buyer may push back on locking in a five-year formula — an annual review window is a reasonable compromise.
3. Buy the price floor in the market, not the contract. If the contract won’t define a minimum price, hedging tools — DMC, Dairy Revenue Protection, private margin contracts — can synthesize one. Best fit when the contract is otherwise acceptable but the pricing language is vague. You’ll need an adviser who actually understands DRP basis risk. Hedging costs eat margin in normal years, and they don’t fix the volume-cap problem at all.
4. Right-size the operation to the contract, not the barn. If you can’t get a release clause, the next-best move is to scale to guaranteed volume, not theoretical max. If the buyer commits to 16,000 cwt, build the herd, ration, and labor plan around 16,500–17,000 cwt — not 19,200. Makes sense in one-buyer regions where there’s no realistic alternate market. Requires discipline on heifer inventory and culling.
The trade-off on Path 4: lost upside if the buyer never invokes the cap. With Class III sitting at $16.16/cwt for March 2026 and Compeer’s May 2026 published outlook flagging tighter dairy margins ahead, the cost of being right-sized is smaller than the cost of being over-built into a soft market.
30-Day Action — Do This Now. Pull every supply contract, membership agreement, and co-op bylaw out of the file cabinet and read the exclusivity, volume, notice, and termination language line by line. Mark every clause that lets the buyer adjust volume or price without your written consent. Bring that marked-up copy to your banker before your next renewal meeting. That’s the audit list for negotiation, and the document your loan officer needs to actually price the risk you’re being asked to carry.
Key Takeaways
- If your contract has exclusivity AND a volume cap AND no written release, treat any expansion debt tied to it as carrying unpriced counterparty risk. Tell your banker before they tell you.
- If “competitive pricing tied to Class III” is the only price language in your contract, that’s not a price — it’s the same gap ACCC alleged against Brownes. Push for a defined formula and a closed list of deductions before signing.
- If a “minus 15% volume” scenario drops your DSCR below 1.0x, that’s the number you take to your lender — not a hypothetical worth ignoring.
- If your principal-and-interest payments run above $2.50/cwt of production, your robot loan is already carrying more weight than Compeer’s own published guidance recommends. Adding contract risk on top of that is two compounding strikes.
- If your buyer won’t add an exclusivity release, ask for two fallbacks instead: 90- to 120-day minimum notice on volume reductions, and a hard floor below which exclusivity automatically suspends.
- If you ship through a co-op, read the bylaws on discipline, recall loss allocation, and notification rights this month. That’s where most of the real risk lives.
- If your contract renewal is on the desk in the next 90 days, the audit conversation with your banker happens before the negotiation, not after.
If your processor or co-op invokes every option the contract gives them tomorrow, what does your DSCR look like 90 days later? And does anyone at your bank actually know that number?
Run Your Numbers
Farm Benchmark Snap Check — Pressure-test your own contract exposure against the $386,000 scenario. Plug in your herd size, milk price, feed cost, and debt service to see what a 90-day volume cap actually does to your DSCR before the renewal lands on your desk.
Complete references and supporting documentation are available upon request by contacting the editorial team at editor@thebullvine.com.
Learn More
- The $20 Milk Paradox: Solving 2026 Dairy Basis Risk — Arms you with the exact contract assessment formulas and localized base/over-base calculation tools needed to cross-examine processor plant intake capabilities before signing expansion debt covenants.
- The $19 Milk Trap: How 2026 Prices Quietly Drain a 400‑Cow Dairy’s Equity — Exposes the asymmetry between processor margins and farm-gate checks, delivering an 18-month financial checklist to shield operational equity from downstream buyer losses.
- Robotic Milking Pays 13% More – After 7 Years of Red Ink — Breaks down the true $2.13/cwt automation ownership threshold, deploying actual partial budget data to expose the hidden cash flow traps that standard dealership financing models leave out.
 The Sunday Read Dairy Professionals Don’t Skip.
 The Sunday Read Dairy Professionals Don’t Skip.
Every week, thousands of producers, breeders, and industry insiders open Bullvine Weekly for genetics insights, market shifts, and profit strategies they won’t find anywhere else. One email. Five minutes. Smarter decisions all week.