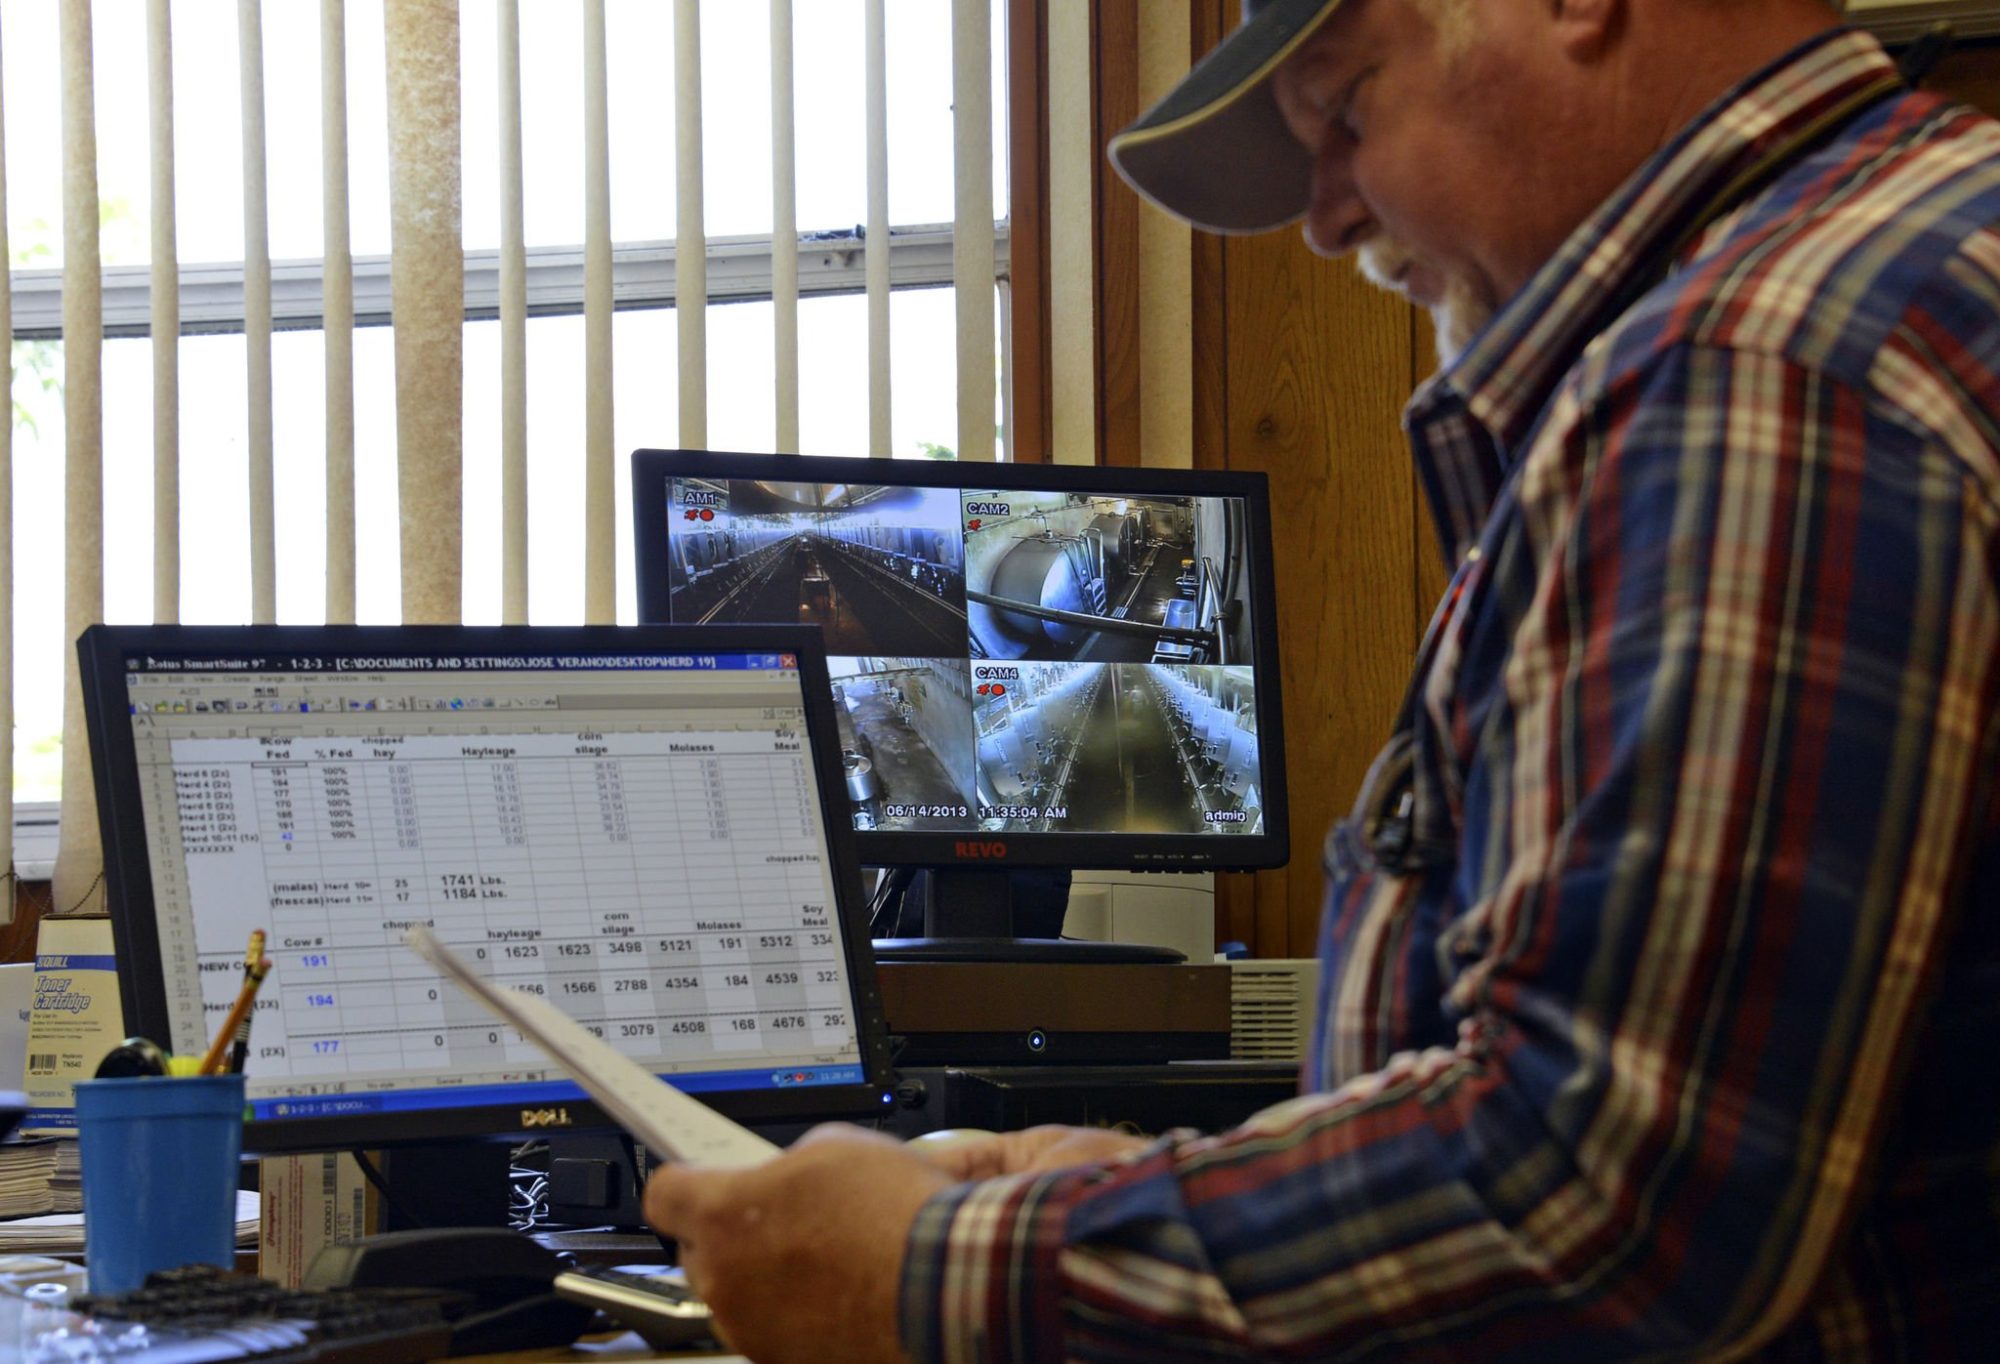
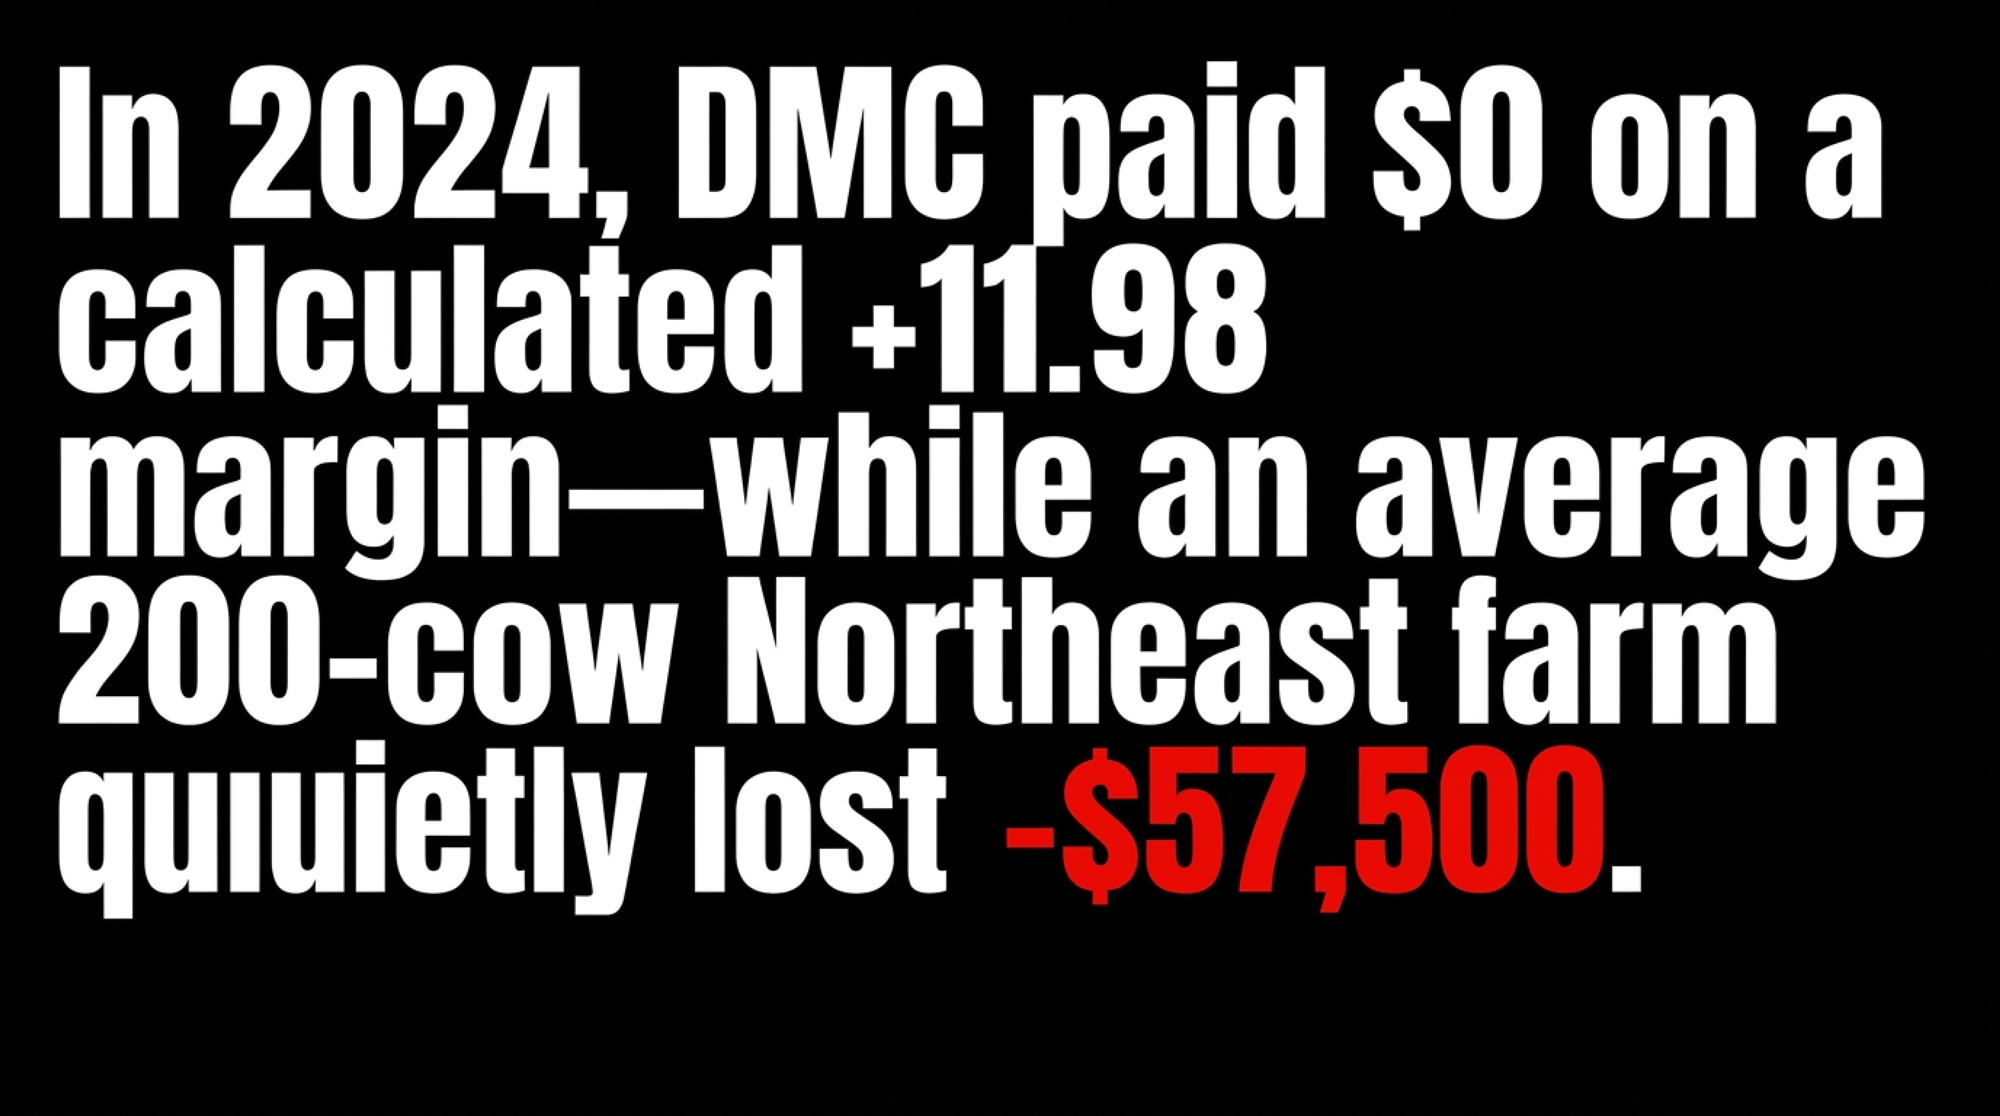
USDA’s 2024 DMC margin printed 11.98/cwt and triggered nothing. Run the same year’s actual costs through a 200‑cow Northeast barn, and you’re at –1.05/cwt. Your banker already knows.
Executive Summary: USDA’s 2024 Dairy Margin Coverage program calculated an 11.98/cwt national margin, never tripped its 9.50 trigger, and paid almost nothing, while AFBF’s March 2026 analysis of USDA ERS data shows the average U.S. dairy ran a real margin near –1.05/cwt on $23.65/cwt of total cost. Run those national 2024 averages through a 200‑cow Northeast barn shipping ~54,750 cwt, and you compute to roughly –$57,500/year on a full‑cost basis. A 2024 Northeast Dairy Farm Summary (122‑farm benchmark) puts the regional gap wider: 23.93/cwt milk against 26.54/cwt total expenses, or about –$143,000/year on the same herd. OBBBA raised the Tier 1 cap to 6 million pounds and discounted premiums 25% through 2031, but it didn’t touch the formula — which still ignores labor, fuel, repairs, vet, interest, and a New York forage basis the formula doesn’t see. The producers feeling it most are mid‑size, labor‑heavy Northeast dairies whose DSCRs are sliding under 1.10x while DMC tells Washington everything’s fine. Inside: a side‑by‑side scoreboard, the lender language at 0.94 DSCR, and a 30/90/365 playbook for a 200‑cow Northeast herd — including whether the 6‑year DMC lock‑in saves enough ($12,375 on a 5.5M‑lb shipper) to be worth it.
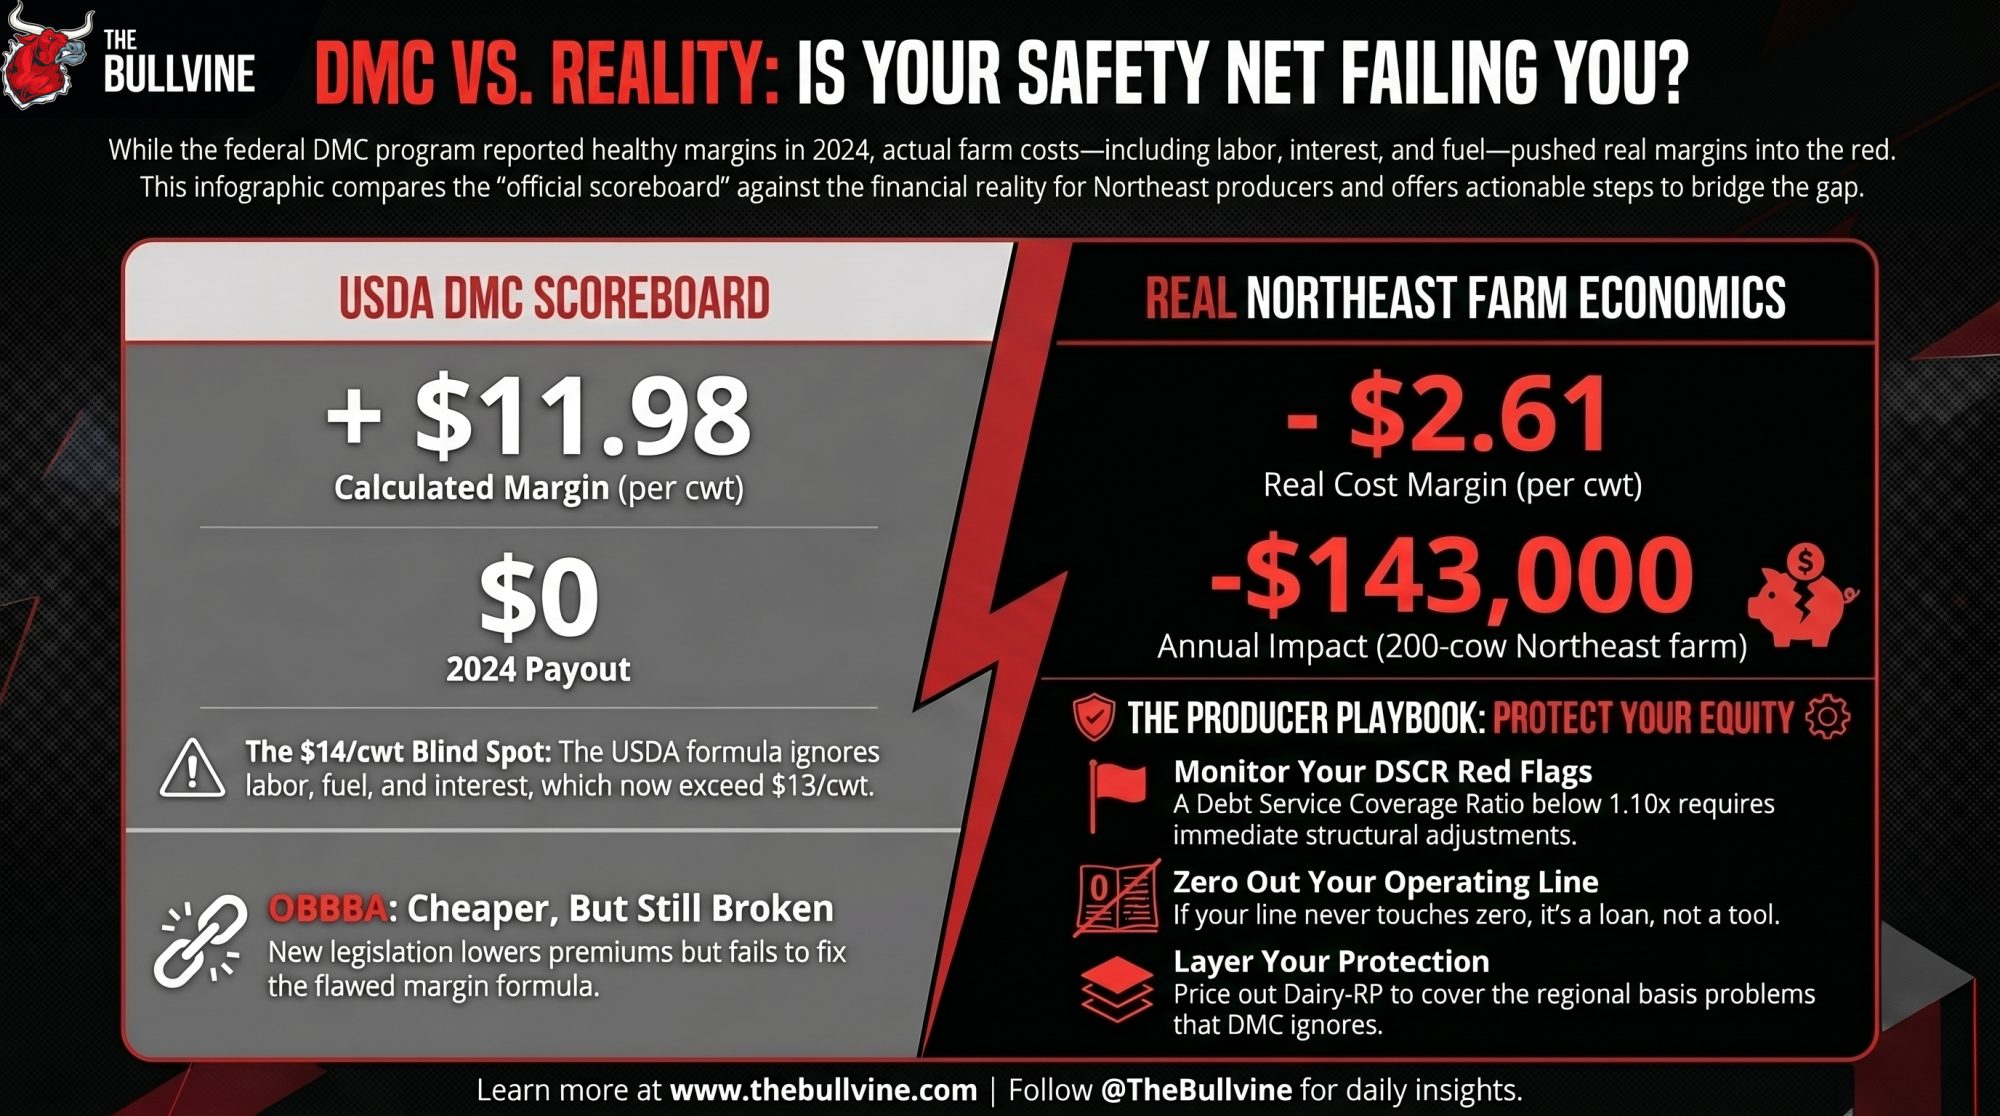
In 2024, the average U.S. dairy carried roughly 23.65/cwt in total production costs against a 22.60/cwt all‑milk price— a real margin near –1.05/cwt, per AFBF’s March 2026 analysis of USDA ERS milk cost‑of‑production data. The federal Dairy Margin Coverage program calculated a national margin of 11.98/cwt that same year, well above its 9.50 trigger, and paid almost nothing for most of 2024 and 2025, per AFBF March 2026 and USDA FSA monthly margin tables.
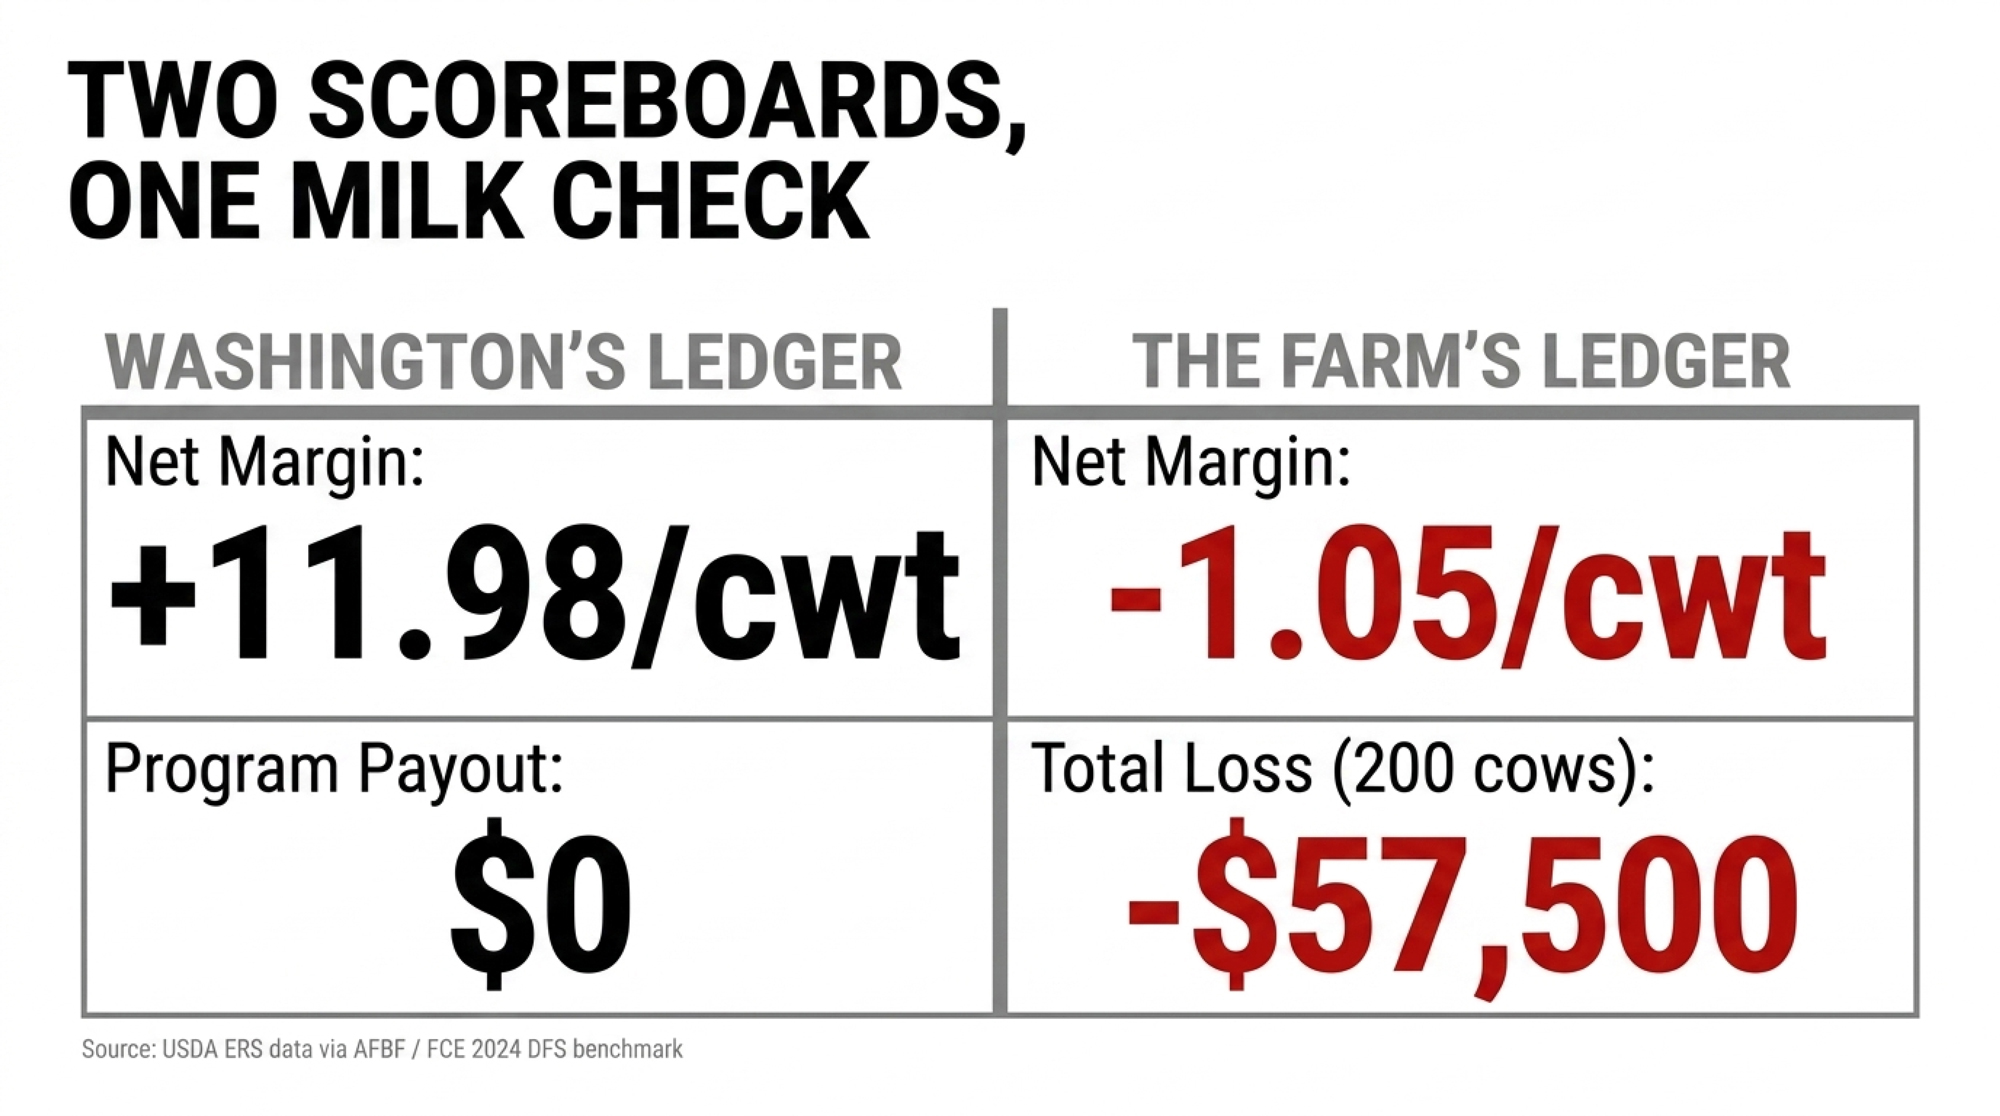
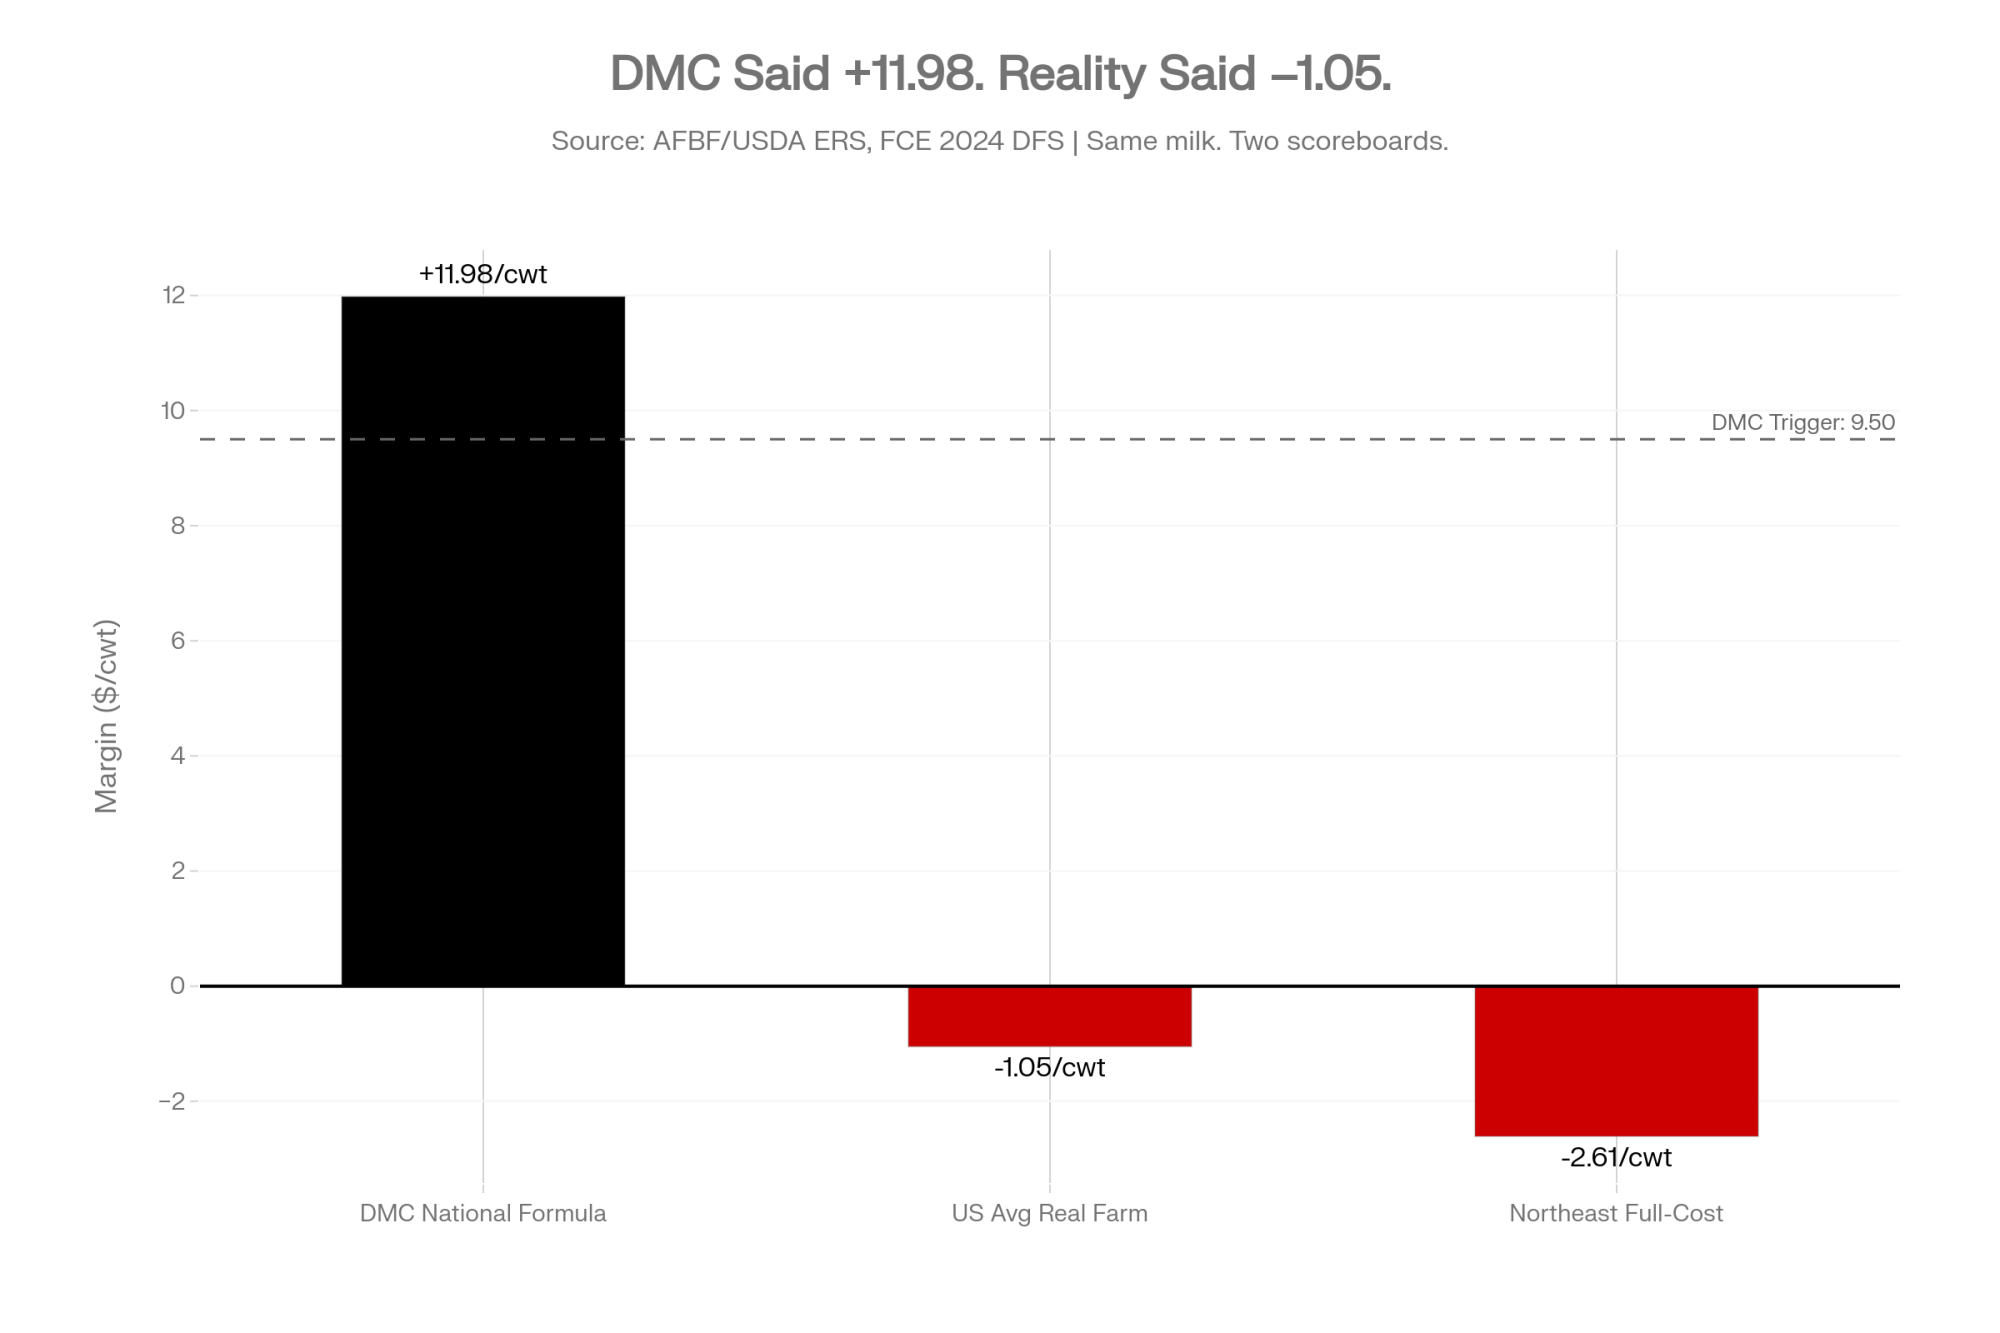
Same milk. Same year. Two scoreboards.
| Metric | DMC Formula | US Avg Real Farm | Northeast FCE Benchmark |
| All-milk price | $22.60/cwt | $22.60/cwt | $23.93/cwt |
| Feed cost / allowance | $10.62/cwt | $10.31/cwt | Included in total below |
| Non-feed overhead | Not calculated | $13.34/cwt | Included in total below |
| Total cost of production | — | $23.65/cwt | $26.54/cwt |
| Net margin | +$11.98/cwt | –$1.05/cwt | –$2.61/cwt |
| Tier 1 payout (2024) | $0 | — | — |
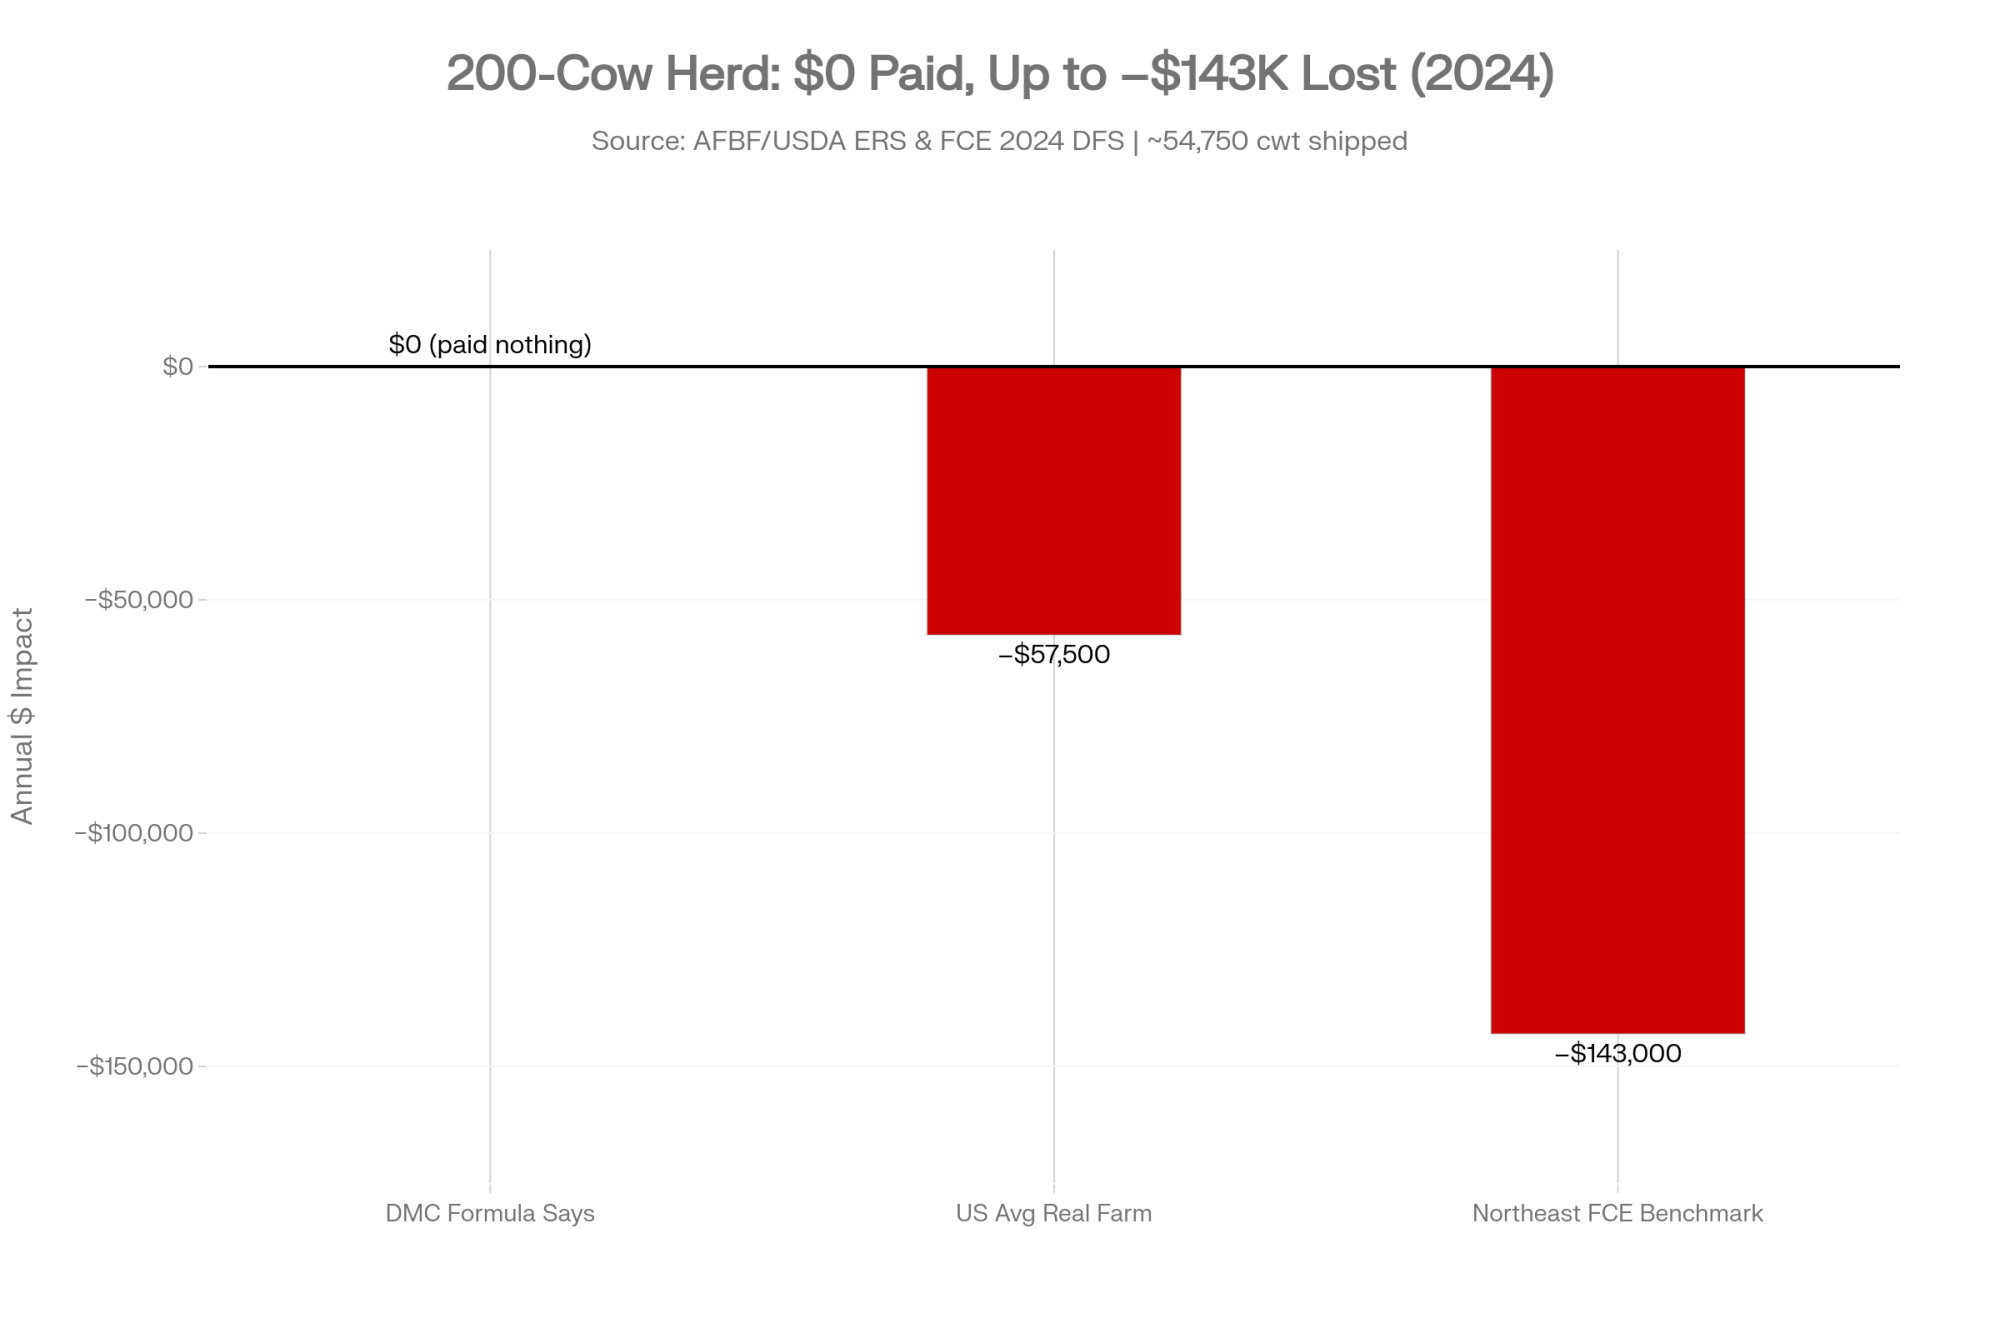
| Annual impact, 200-cow herd | $0 | ≈ –$57,500 | ≈ –$143,000 |
Sources: USDA ERS via AFBF March 2026; 2024 Northeast Dairy Farm Summary (122-farm benchmark, July 2025)
Mid‑size, labor‑heavy Northeast dairies — operations like Center Creek Farm in South Wales, New York — are feeling that gap most. New York Farm Bureau president David Fisher has consistently raised regional cost variation as a structural concern in DMC’s design, in NYFB public statements on federal dairy policy. The producers feeling it most are exactly the ones DMC was sold to protect.
What DMC 2026 Actually Covers After OBBBA
DMC is built on a deliberately simple equation. Take the U.S. all‑milk price, subtract a national feed cost based on corn, soybean meal, and premium alfalfa hay, and that’s your “margin.” If the monthly figure drops below your elected coverage level — up to 9.50/cwt in Tier 1 — the program pays, per USDA FSA program rules.
What it never sees is the rest of the P&L: hired labor, electricity, fuel, repairs, vet, breeding, insurance, property taxes, manure handling, and interest. None of it lives inside the formula. The cost of growing your own forage doesn’t either.
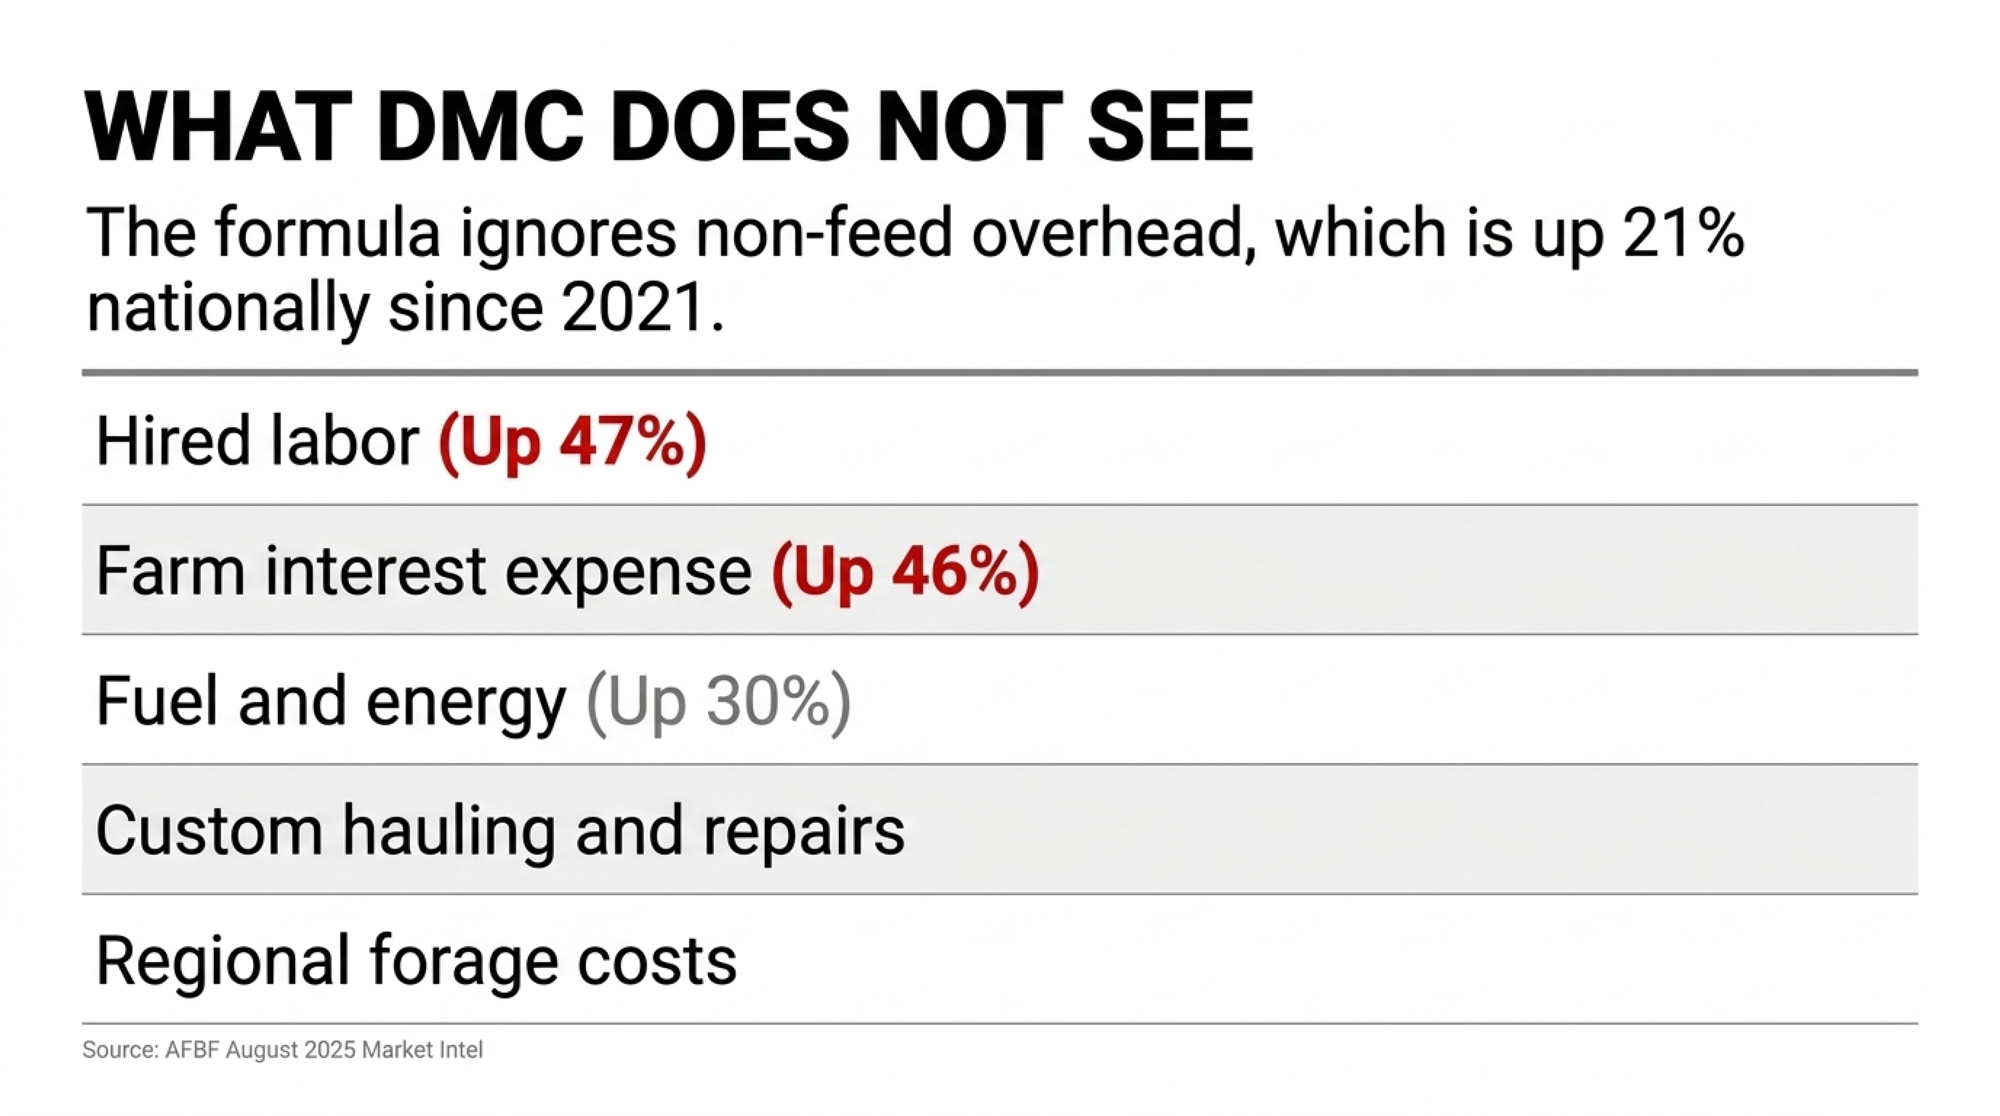
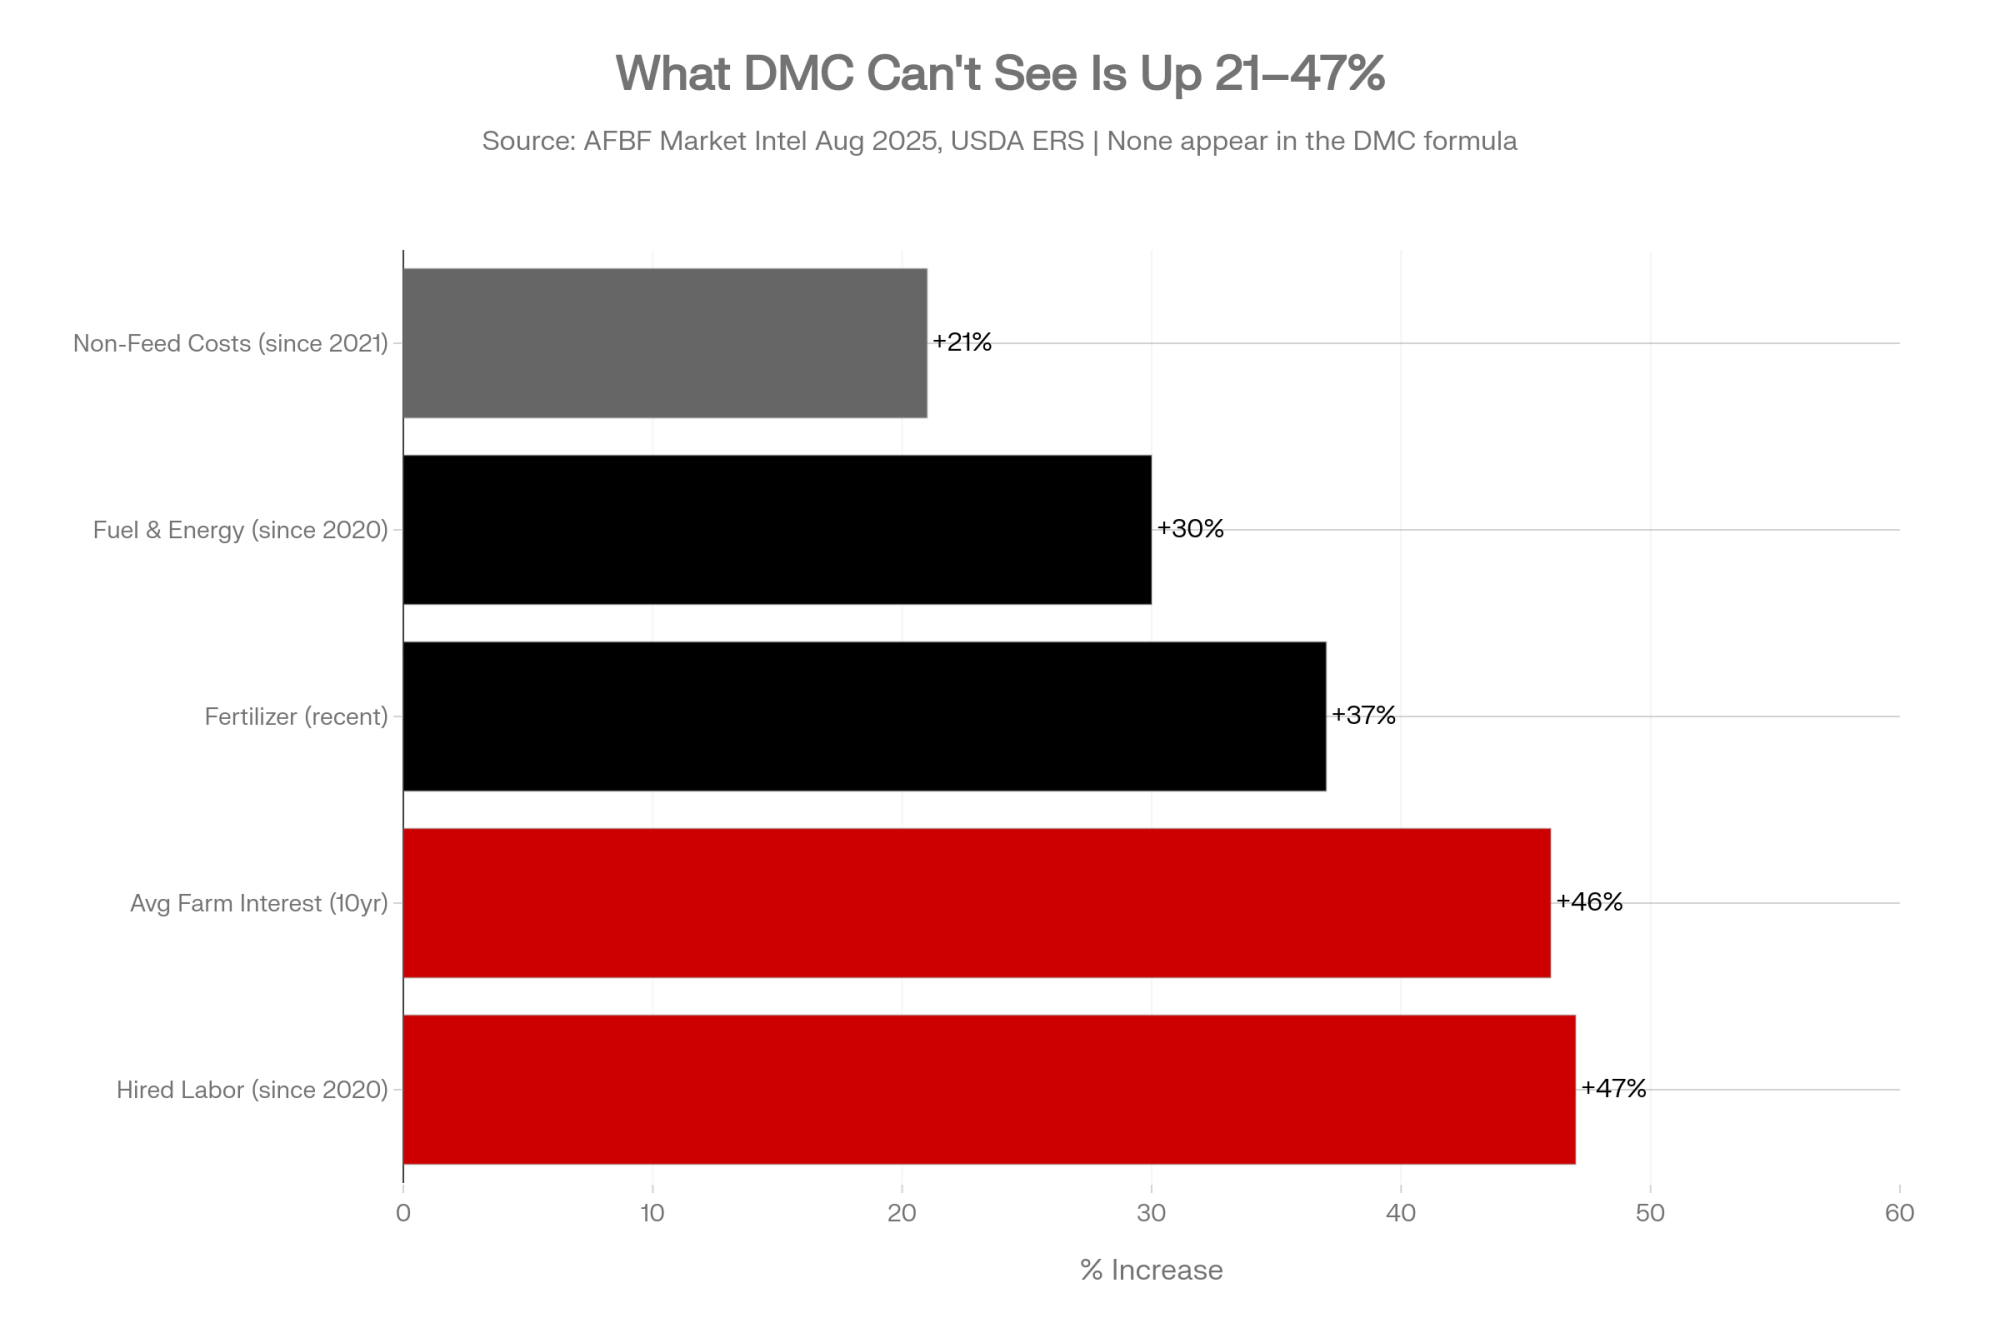
That’s exactly what set up the trap. AFBF estimates non‑feed costs are up roughly 21% since 2021 nationally and aren’t coming back down, per its August 2025 Market Intel using USDA ERS components. Hired labor is up around 47% since 2020. Fuel and energy are up more than 30% over the same window. Fertilizer is up about 37%. Average farm interest expense has climbed roughly 46% over the last decade, with most of the increase concentrated in the last few years. None of those line items show up in the formula USDA uses to decide whether the safety net trips.
The One Big Beautiful Bill Act, signed July 4, 2025, made DMC slightly cheaper and broader. Tier 1 expanded from 5 million to 6 million pounds of production history. Producers who lock in coverage from 2026 through 2031 receive a 25% premium discount, taking the Tier 1 9.50 premium from 0.15/cwt to about 0.1125/cwt. Base history was reset to the highest of 2021, 2022, or 2023, per AFBF March 2026 and USDA FSA’s 2026 enrollment notice. What OBBBA didn’t change is the formula itself. You can buy more of the same scoreboard. The scoreboard still doesn’t see your overhead.
The Northeast Basis Problem Inside the National Average
DMC’s second blind spot is geographic. One national margin is meant to describe California, Idaho, Wisconsin, and New York at the same time, and the numbers don’t cooperate.
A 2024 Northeast Dairy Farm Summary, drawn from a benchmark sample of 122 dairies across its territory, pegs net cost of production at 21.49/cwt. Once family living and total expenses load in, the figure climbs to roughly 26.54/cwt, per FCE’s July 2025 release. Northeast milk price averaged 23.93/cwt that year. Even on the average — not the bottom quartile — Northeast farms came up about 2.61/cwt short of total expenses while DMC was telling Washington everything was fine.
Inside New York, the spread by management and scale is wider still. Cornell PRO‑DAIRY’s 2023 NY Dairy Farm Business Summary shows a meaningful gap between the lowest‑earning and highest‑earning quartiles on the total cost of producing milk. A “comfortable” 9‑12 DMC margin on paper means very different things to those two operations.
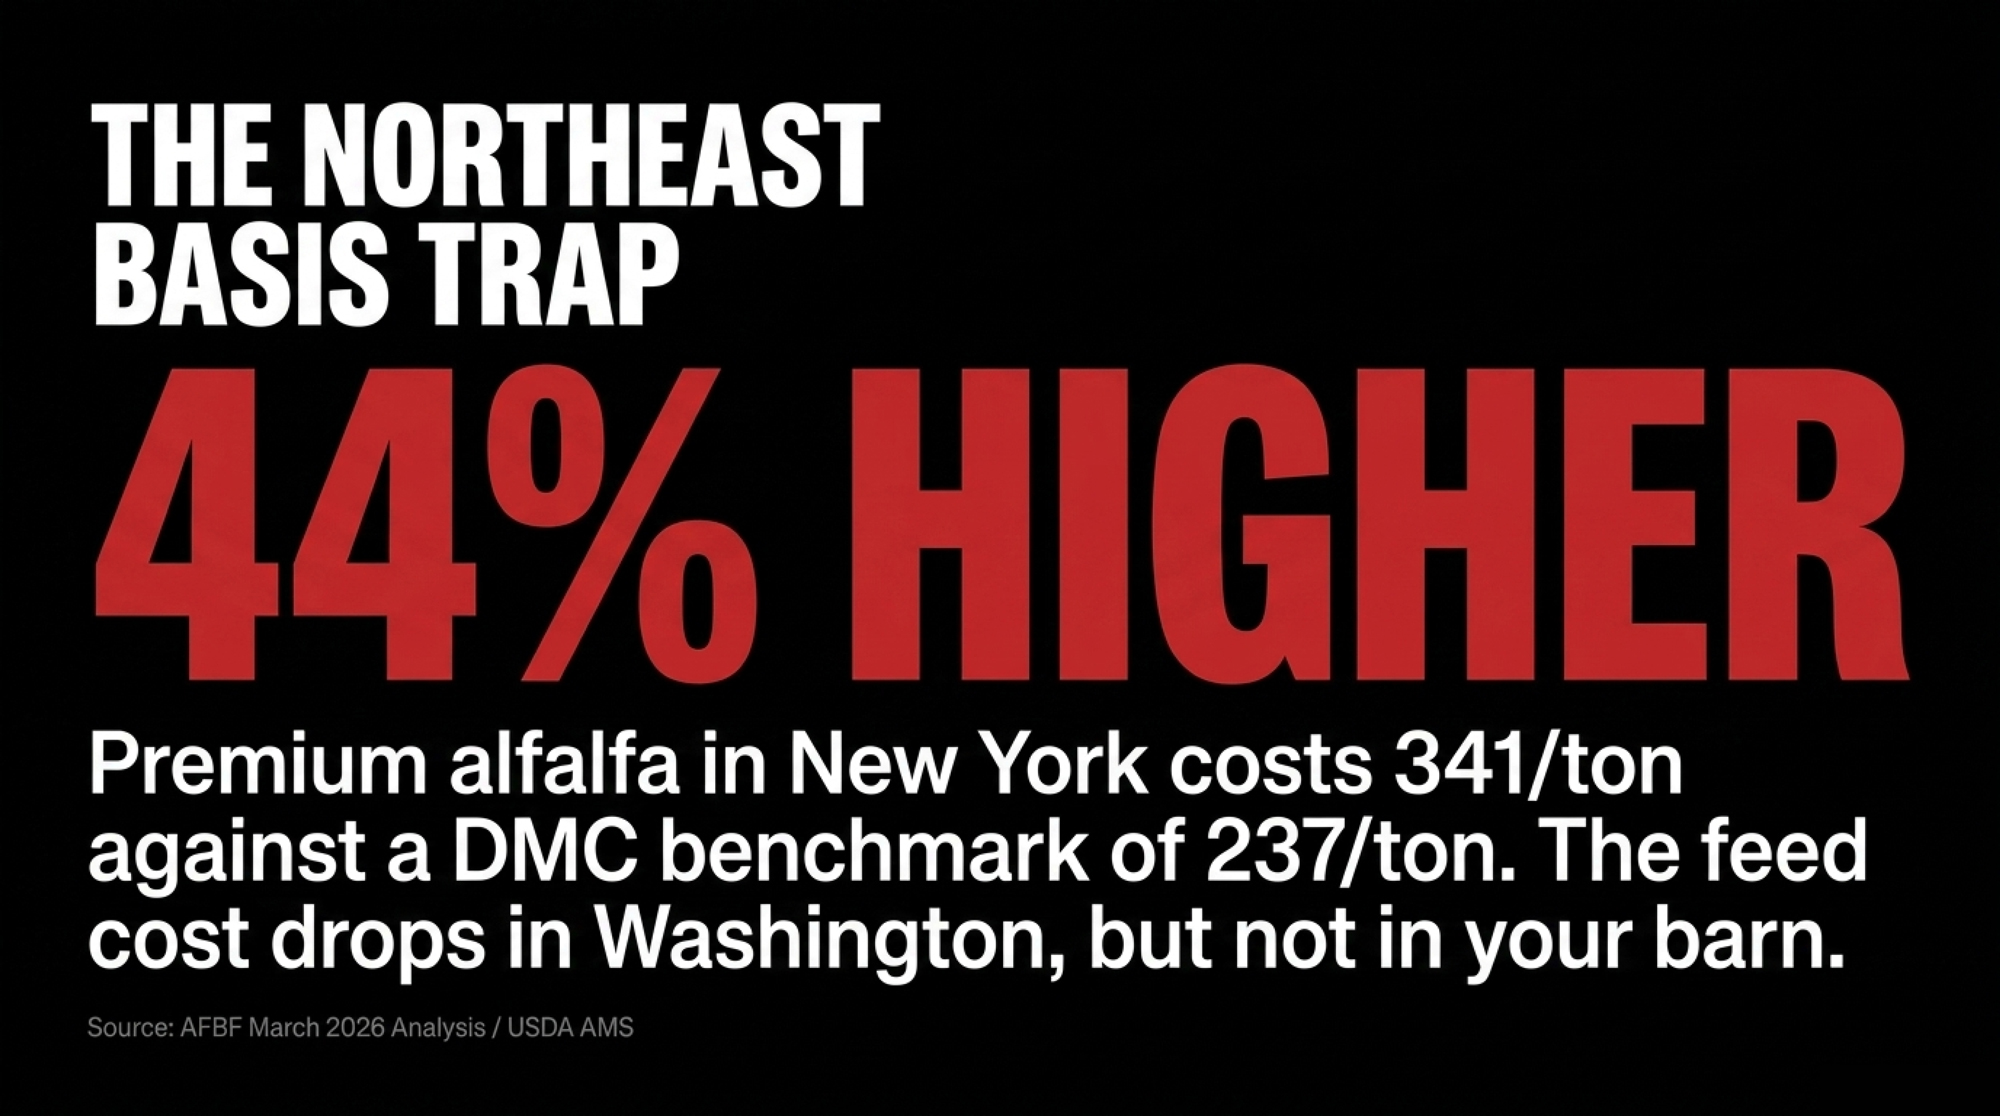
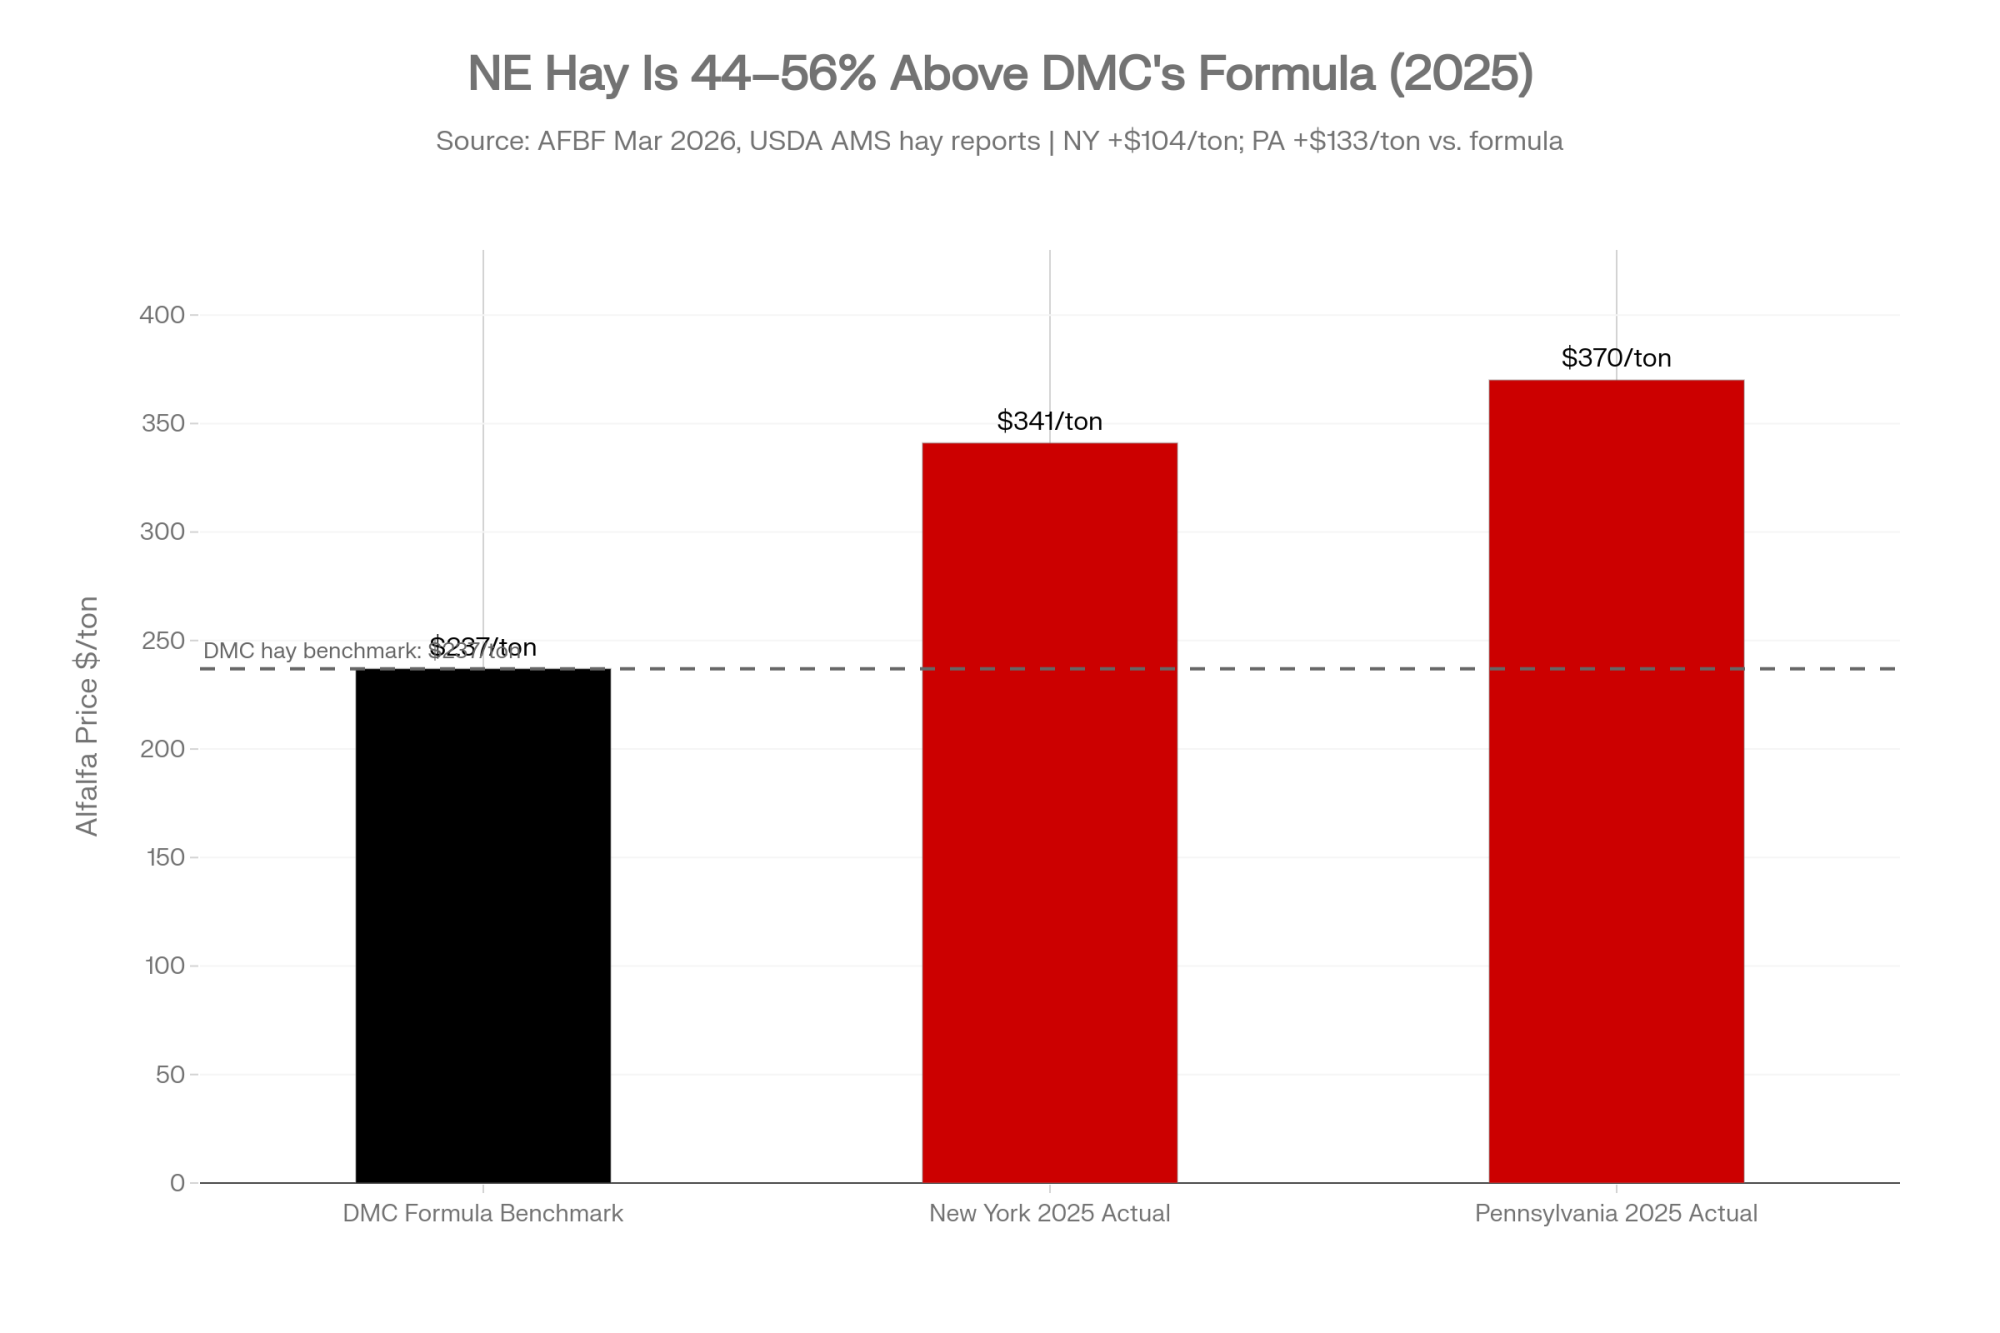
The forage piece tightens it further. AFBF’s March 2026 analysis flags premium alfalfa landing near 341/ton in New York in 2025 against a DMC benchmark closer to 237/ton — about 44% above the formula assumption — while Pennsylvania ran near 370/ton, drawing on USDA AMS hay reports. Northeast operations grow a meaningful share of their own forage. CME corn softens. The DMC feed cost falls. Your barn doesn’t.
Running the Numbers: 2024 Margin Scoreboard, Policy vs. Reality
Sources: National figures from USDA ERS milk cost‑of‑production data via AFBF March 2026; Northeast figures from a 2024 Northeast Dairy Farm Summary (July 2025), 122‑farm benchmark sample. The Northeast column shows total expense, including family living, per FCE’s 2024 DFS, not the same DMC‑style feed/non‑feed split as the national column. 200‑cow herd assumption: 75 lb/cow/day × 365 days ≈ 54,750 cwt shipped. Premium math elsewhere uses 5.5M lb / ≈ 55,000 cwt as a round shipping figure for the same 200‑cow herd; the 250‑cwt difference is rounding.
| Metric / Line Item | DMC National Formula | Real Farm Economics (US Avg, 2024) | Northeast Full‑Cost (FCE Benchmark, 2024) |
| All‑milk price | 22.60/cwt | 22.60/cwt | 23.93/cwt |
| Feed cost / allowance | 10.62/cwt | 10.31/cwt | included in total expense below |
| Non‑feed overhead | not calculated | 13.34/cwt | included in total expense below |
| Total cost of production | — | 23.65/cwt | 26.54/cwt (incl. family living) |
| Net calculated margin | +11.98/cwt | −1.05/cwt | −2.61/cwt |
| Tier 1 program payout | $0 | — | — |
| Annual impact, 200‑cow herd (~54,750 cwt) | $0 | ≈ −$57,500 | ≈ −$143,000 |
| Illustrative gap at 13/cwt (not a predicted loss) | — | $650,000 on 5M lb shipped; $1,300,000 on 10M lb shipped | — |
Two takeaways from one table. The federal scoreboard says +11.98 and pays nothing. Your real scoreboard, especially in the Northeast, says you came up short of total expenses — and your lender already has the second number.
What Does It Look Like When DMC Pays But Your Banker Still Says No?
Picture a Northeast operator walking into Farm Credit at the end of February for renewal. The scene below is composite — built from FCE’s DFS patterns and the DSCR thresholds widely used across Northeast ag lending — not a single named meeting. Every line is something operators are hearing right now.
The lender doesn’t open with policy. They open with the ratio.
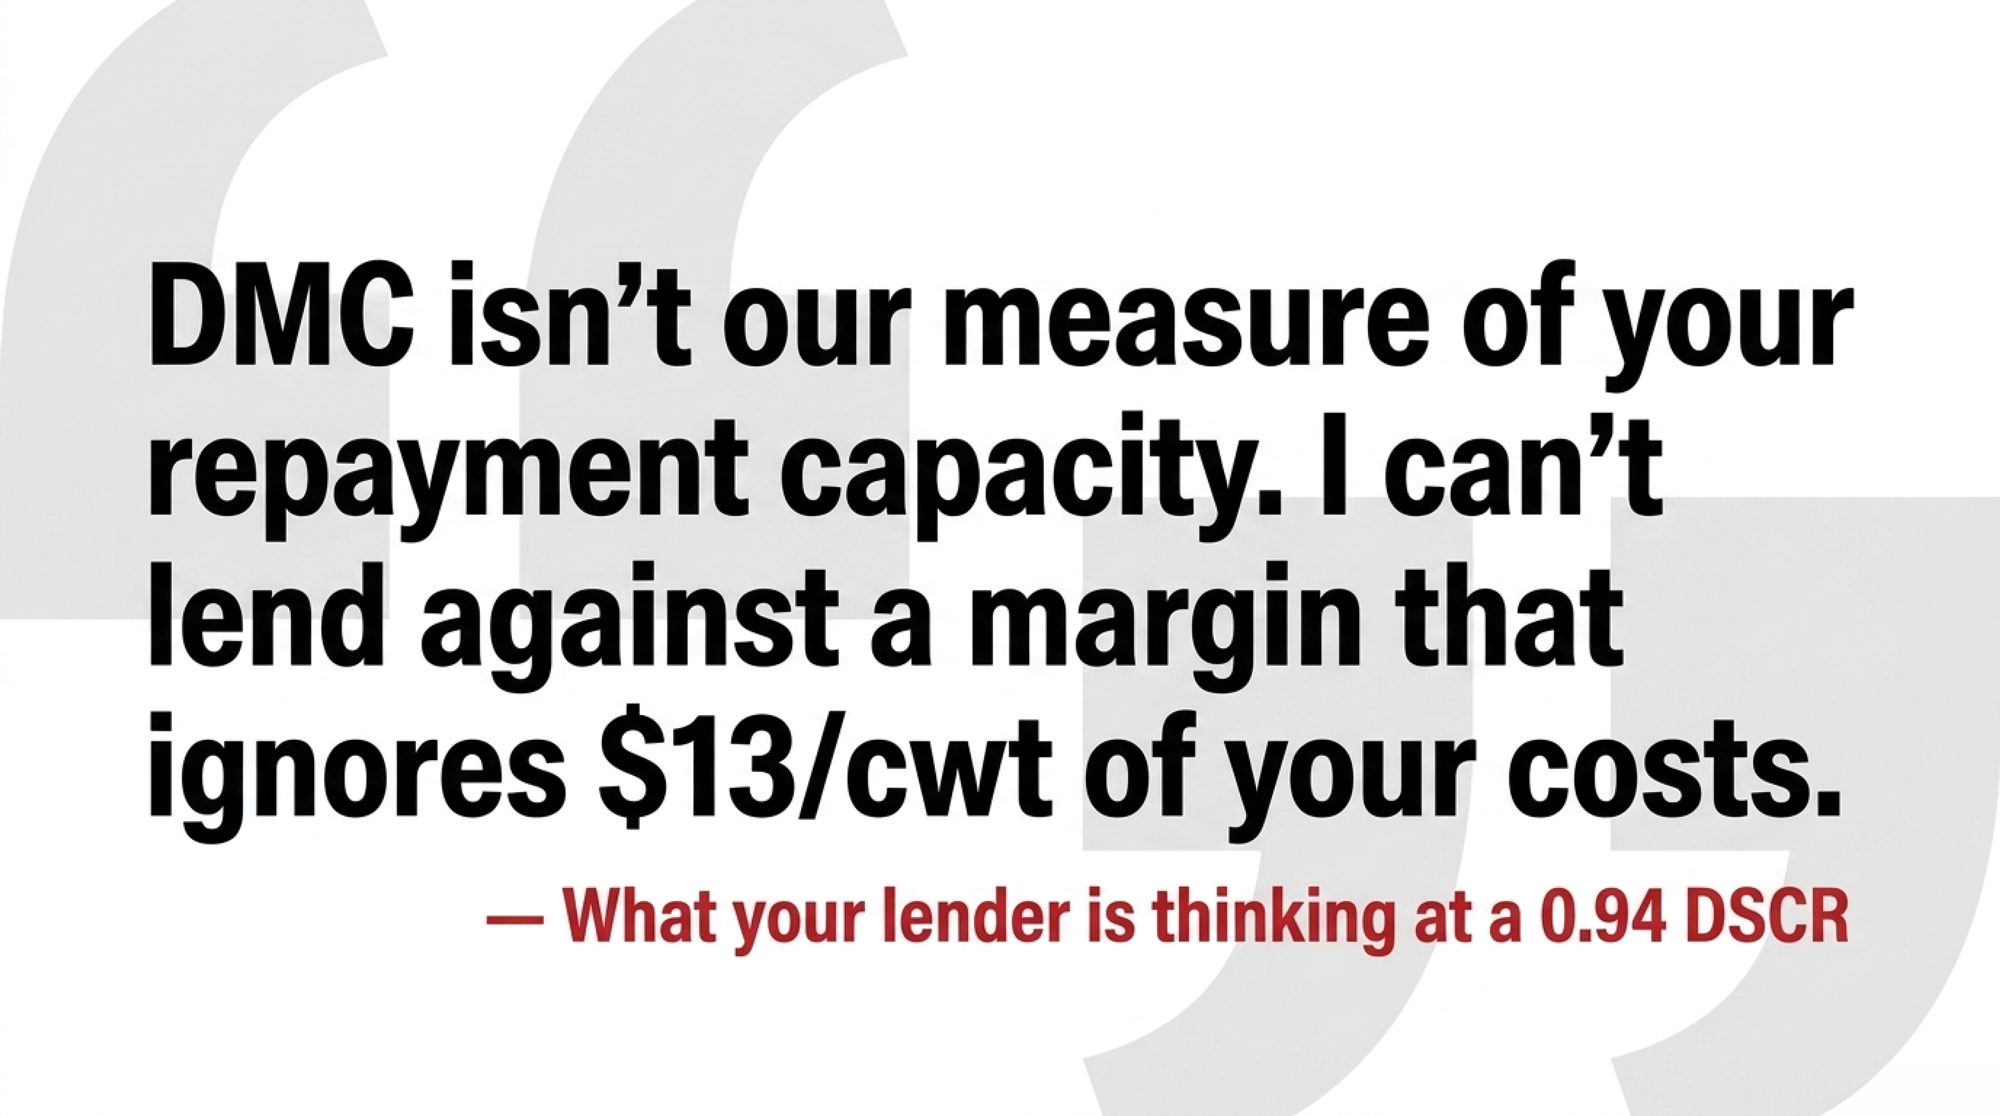
“Your debt service coverage ratio came in at 0.94 last year, under 1.0. Your earnings didn’t fully cover principal and interest from operations. I want to help you get out in front of this.”
The producer pushes back. USDA’s own numbers say margins were strong. The banker nods, then pivots — direct, but without flinching from the work ahead together:
“DMC isn’t our measure of your repayment capacity. We underwrite to your actual cost of production. We’ll take any DMC checks that come — they help. But I can’t lend against a margin that ignores 13/cwt of your costs. So let’s build a plan you and I can both defend to committee.”
Specific cutoffs vary by institution, but the internal language is consistent across the region. Above 1.10x DSCR is comfort. Between 1.00 and 1.10 is a watch list. A run of 0.85–1.00 starts producing the words “restructuring” and “right‑size.” Below roughly 0.75–0.80, with sliding equity, “orderly” and “exit plan” enter the conversation. Thresholds vary by institution.
Layer that on top of the formula problem, and you get an unforgiving feedback loop. DMC margins look healthy. Real margins go negative. Operating lines stop cycling down. Repair invoices climb while capital purchases stall. Equity erodes a little each year. None of it shows up in DMC. All of it shows up in the credit memo.
| DSCR Range | Lender Status | Typical Language | Action Signal |
|---|---|---|---|
| Above 1.20x | Comfortable | “Strong position; room to grow” | Refinancing & expansion optionality open |
| 1.10x – 1.20x | Watch list entry | “We’re watching trends here” | Bring real CoP to renewal proactively |
| 1.00x – 1.10x | Active watch list | “Coverage is thin; covenant tightening” | 60-day pre-renewal meeting now |
| 0.85x – 1.00x | Restructuring zone | “Right-size operations; explore options” | Operating line review; capital plan required |
| Below 0.75x – 0.80x | Exit territory | “Orderly exit plan” | Equity erosion check; legal/financial counsel |
Note: DSCR thresholds vary by institution. Ranges drawn from FCE DFS patterns and Northeast ag lending conventions cited in the article.
Is Your Farm Quietly Drifting Into the “Controlled Crash” Zone?
Most lenders won’t use the phrase out loud. The pattern is consistent anyway. Watch your own books for:
- An operating line that doesn’t cycle down to zero anymore — an operating line behaving like a term loan is the number one red flag for credit committees.
- Repair invoices climbing while capital purchases stall.
- DMC margins that look fine while your real cost‑of‑production margin drifts negative.
- Equity slipping a couple of points a year, even in “okay” milk‑price years.
If two or three of those are happening at once, you’re not in a rough year. You’re in a pattern. Patterns are what lenders price.
Why Producers Still Mail That Premium Check Anyway
Plenty of operators have stopped believing the DMC margin describes their business — and they still enroll every year. That isn’t habit.
At Tier 1 9.50 with the OBBBA lock‑in discount, you’re paying about 0.1125/cwt for catastrophic feed‑shock coverage on the first 6 million pounds. On a 200‑cow herd shipping 5.5 million pounds, that pencils to roughly $6,200/year for an option that paid out enough to matter in 2021 and 2023. AFBF estimates DMC has delivered more than $2.7 billion in net support since 2019, with payouts above $1 billion in both 2021 and 2023.
There’s a political layer too. Enrollment numbers are the first data point staffers reach for when the next Farm Bill cycle opens. Walking away from a subsidized backstop in your region weakens the case your senators and Farm Bureau make on your behalf — and risks leaving you outside the eligibility line if a future ad‑hoc fix is bolted onto “enrolled producers.” Most operators read that risk clearly and stay in.
The honest framing: DMC is a cheap option on a feed‑shock year and a participation chip in the next reform fight. It isn’t a margin tool, and it never will be, until the formula itself changes.
The 30/90/365‑Day Playbook for a 200‑Cow Northeast Herd
You can’t fix the formula from the kitchen table. You can change which scoreboard governs your decisions.
30‑Day Actions (urgent checks)
- Rebuild your 2024 and 2025 cost of production line by line, with non‑feed broken out: labor, power, repairs, vet, fertilizer/seed for homegrown forage, insurance, interest. Lay it next to your DMC margin for the same months. The number you’re looking for is your own gap between USDA’s margin and your real margin. Requires:clean GL data, a CPA or an analyst hour, an honest non‑feed split. Where it backfires: it surfaces hard truths you might prefer to leave unsaid.
- Pull your last twelve months of operating‑line statements and mark every month the line touched zero. If it never zeroed out, your operating line is behaving like a term loan — which is the number one red flag for credit committees. Treat it as a structural pressure, not a seasonal one.
- Red‑flag trigger: if your DSCR has been under 1.10x for three or more consecutive quarters by your lender’s or CPA’s calculation, treat that as urgent. That’s the level where covenant language and stress tests start tightening, even if no one says so out loud.
90‑Day Actions (structural adjustments)
- Schedule a pre‑renewal meeting 60–90 days before your line expires, not the week of. Bring a one‑page capital plan, your real cost‑of‑production worksheet, and a written summary of any Dairy‑RP, LGM, or LRP coverage you carry. Requires: about 60 days of prep, a written narrative on equity and capital plans. Where it backfires: you can’t un‑show the numbers; bring them anyway.
- Price out a Dairy‑RP layer on top of DMC for your state. Dairy‑RP indexes covered milk to your region and protects up to 95% of expected revenue against quarterly declines — directly addressing the basis problem DMC ignores, per USDA RMA’s Dairy Revenue Protection product description. Pull a current sample premium for your state and coverage band from your crop insurance agent so you can compare it line‑by‑line against your DMC premium for the same production. Requires: an insurance agent who actually knows dairy products, premium capacity, bandwidth to manage quarterly endorsements. Where it backfires: premiums can be heavy in volatile markets, and lapses in coverage can affect lender posture if they’ve quietly built it into underwriting.
- Build a deferred‑capital schedule for parlor, milking, manure, and forage equipment. Two or more unplanned major repair events in 18 months is a deferred‑maintenance signal, not bad luck.
365‑Day Moves (strategic positioning)
- Decide whether the 6‑year DMC lock‑in fits your structure. The 25% premium discount saves about (0.15 − 0.1125) × 55,000 × 6 = $12,375 on a 200‑cow / 5.5M‑lb herd — real money on a cheap option, but it ties you to an unreformed formula through 2031.
- If you’re Northeast and growing a meaningful share of your own forage, run a homegrown‑feed cost breakdown against the national DMC ration. If your real feed cost stays well above the formula even when CME corn is soft, you have a quantified basis case to bring to your delegation and your co‑op.
- Opportunity signal: if your DSCR rebuilds above 1.20x for two consecutive years and your equity trend turns positive, you regain real optionality — refinancing, measured expansion, or selective herd upgrades — that operations stuck under 1.0x don’t have.
What This Means For Your Operation
The DMC formula won’t start seeing your labor, your power bill, or your custom hauling invoice in time to save your next renewal cycle. The fix that would matter most — a regional non‑feed allowance baked into the margin calculation — isn’t in OBBBA, and as of May 2026 isn’t in any public House Ag, Senate Ag, or NMPF reform draft currently circulating.
You can still control which scoreboard governs your decisions. Keep DMC as a cheap option for the one scenario it actually covers. Stop running the business as if its margin number is your margin number. Walk into your next lender meeting with the same numbers your banker is already looking at — before they’re the ones explaining them to you.
The trade‑off is uncomfortable but clean. You can manage to two scoreboards for a while. Only one of them decides whether the farm survives the next down‑cycle, and it isn’t the one in Washington.
Pull your last three milk checks and your last operating‑line statement. What does that gap actually show — and how far is it from the DMC margin you’ve been quoted for the same period?
Run Your Numbers
Farm Benchmark Snap Check — Stack your real cost of production, milk price, and DSCR against Northeast benchmarks so you walk into renewal with the same numbers your lender’s already looking at — not the DMC margin USDA prints. Stress-test whether the 6-year lock-in actually pencils on your shipping volume.
Key Takeaways
- DMC’s 2024 scoreboard read +11.98/cwt and paid almost nothing, but a 200‑cow Northeast barn ran a real margin near –1.05/cwt nationally and –2.61/cwt on the FCE benchmark — that’s roughly –$57,500 to –$143,000/year the formula can’t see.
- OBBBA made DMC cheaper (Tier 1 to 6M lb, 25% premium discount through 2031), but it didn’t touch the formula. Treat DMC as a cheap option on a feed‑shock year, not a margin tool.
- If your DSCR has been under 1.10x for three or more consecutive quarters, or your operating line is behaving like a term loan, walk into renewal early with your real cost of production — not USDA’s margin number.
- Before you sign the 6‑year lock‑in, price out a Dairy‑RP layer for your state. The lock‑in saves about $12,375 on a 5.5M‑lb shipper, but Dairy‑RP is the product that actually covers the basis problem DMC ignores.
Complete references and supporting documentation are available upon request by contacting the editorial team at editor@thebullvine.com.
Learn More
- The $17,500 Dairy Margin Coverage Gamble: The 6‑Year Lock‑In Decision Most Farms Haven’t Run the Numbers On Yet — Arms you with the exact historical data needed to evaluate the FSA signup deadline. Breaks down whether locking in premium discounts through 2031 outpaces your market flexibility or traps your equity under a stagnant national benchmark.
- The $19 Milk Trap: How 2026 Prices Quietly Drain a 400‑Cow Dairy’s Equity — Delivers a clear survival roadmap for mid-tier herds facing structural price compression. Exposes how sub-$19 milk values create a $5.00/cwt loss gap, forcing critical restructuring conversations before your family balance sheet is permanently eroded.
- Robotic Milking Pays 13% More – After 7 Years of Red Ink — Dismantles standard automation vendor pitches by detailing a seven-year cash-flow valley before automated milking systems turn profitable. Reveals how a hidden $1.00/cwt operational cost gap vs conventional parlors shifts your tech focus to strict scale-dependent ROI.
 The Sunday Read Dairy Professionals Don’t Skip.
 The Sunday Read Dairy Professionals Don’t Skip.
Every week, thousands of producers, breeders, and industry insiders open Bullvine Weekly for genetics insights, market shifts, and profit strategies they won’t find anywhere else. One email. Five minutes. Smarter decisions all week.