Archive for Class III pricing

Coles and Brownes Just Exposed The $386,000 Hole In Your Milk Contract

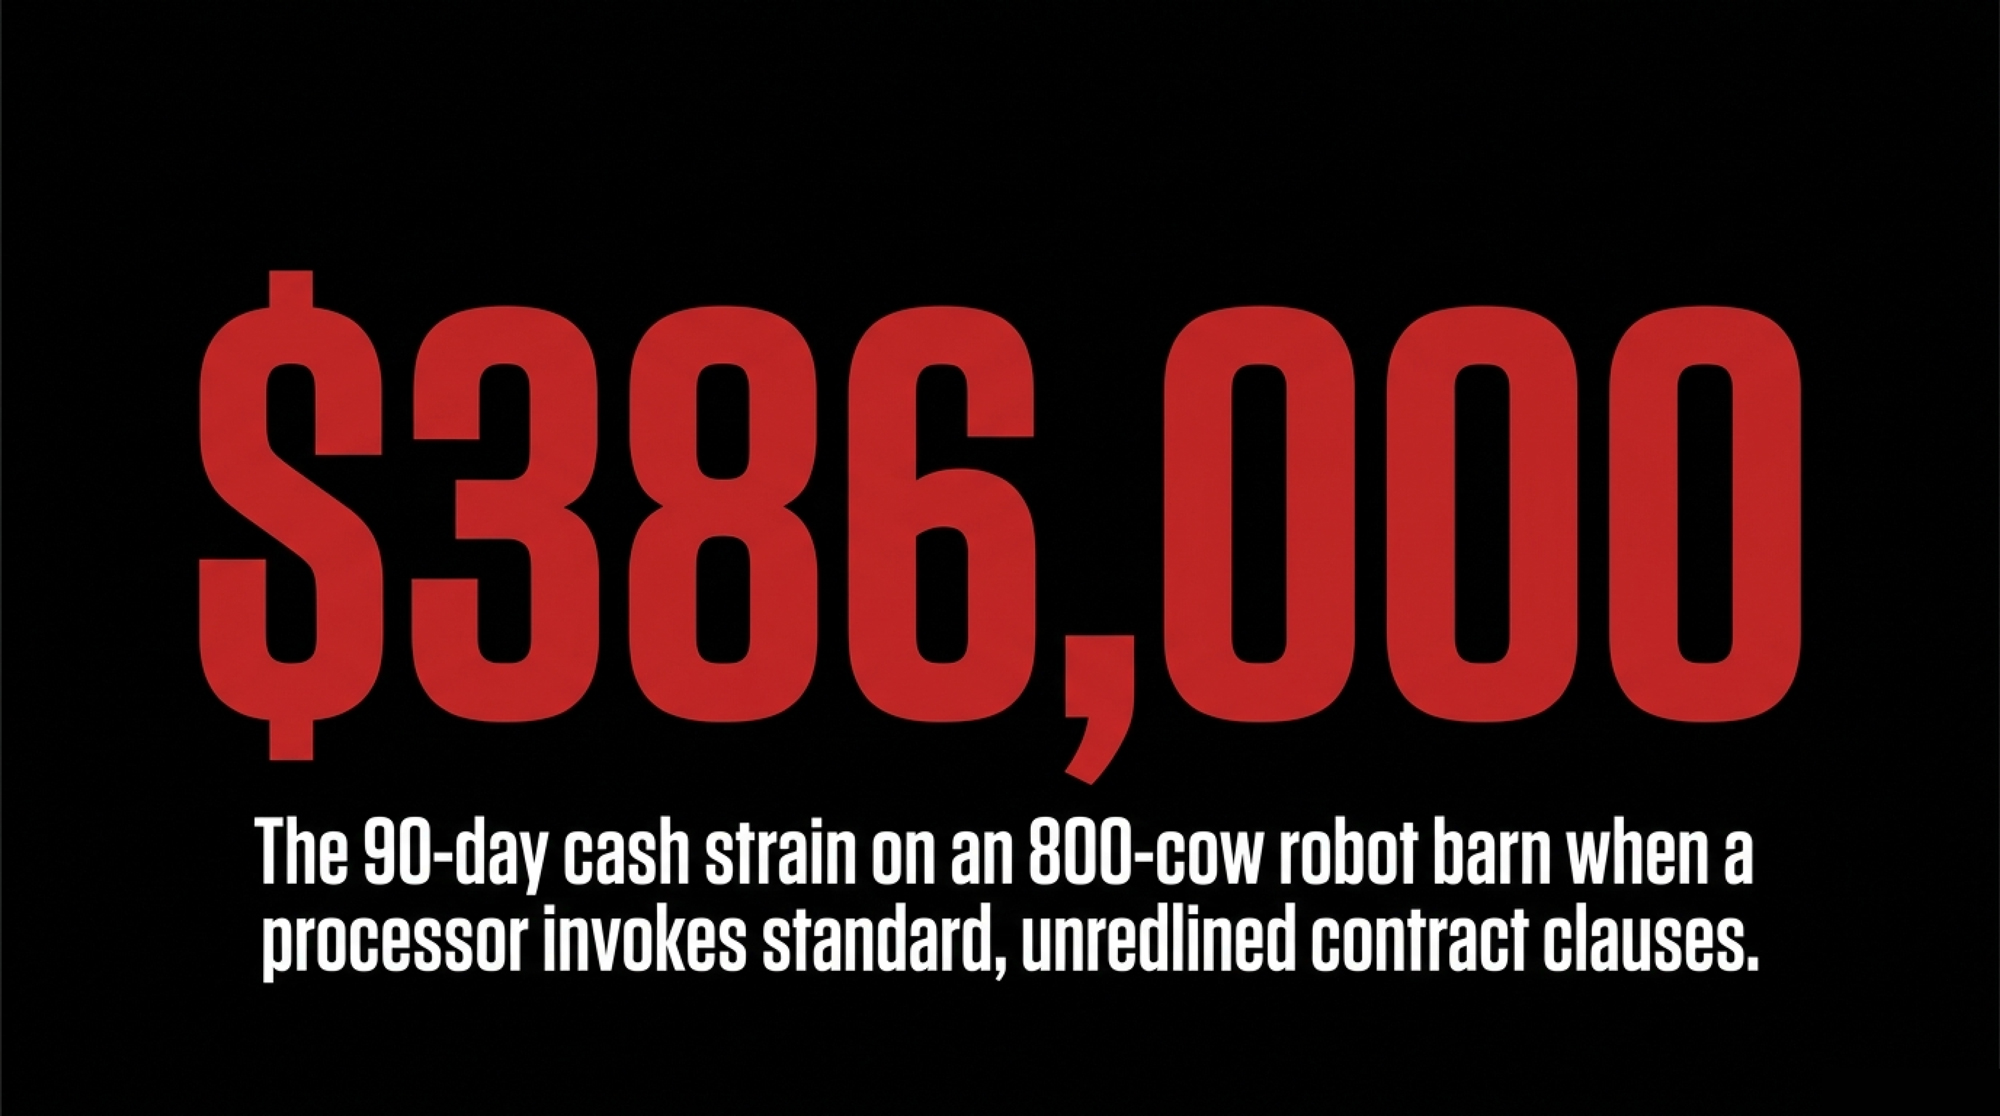
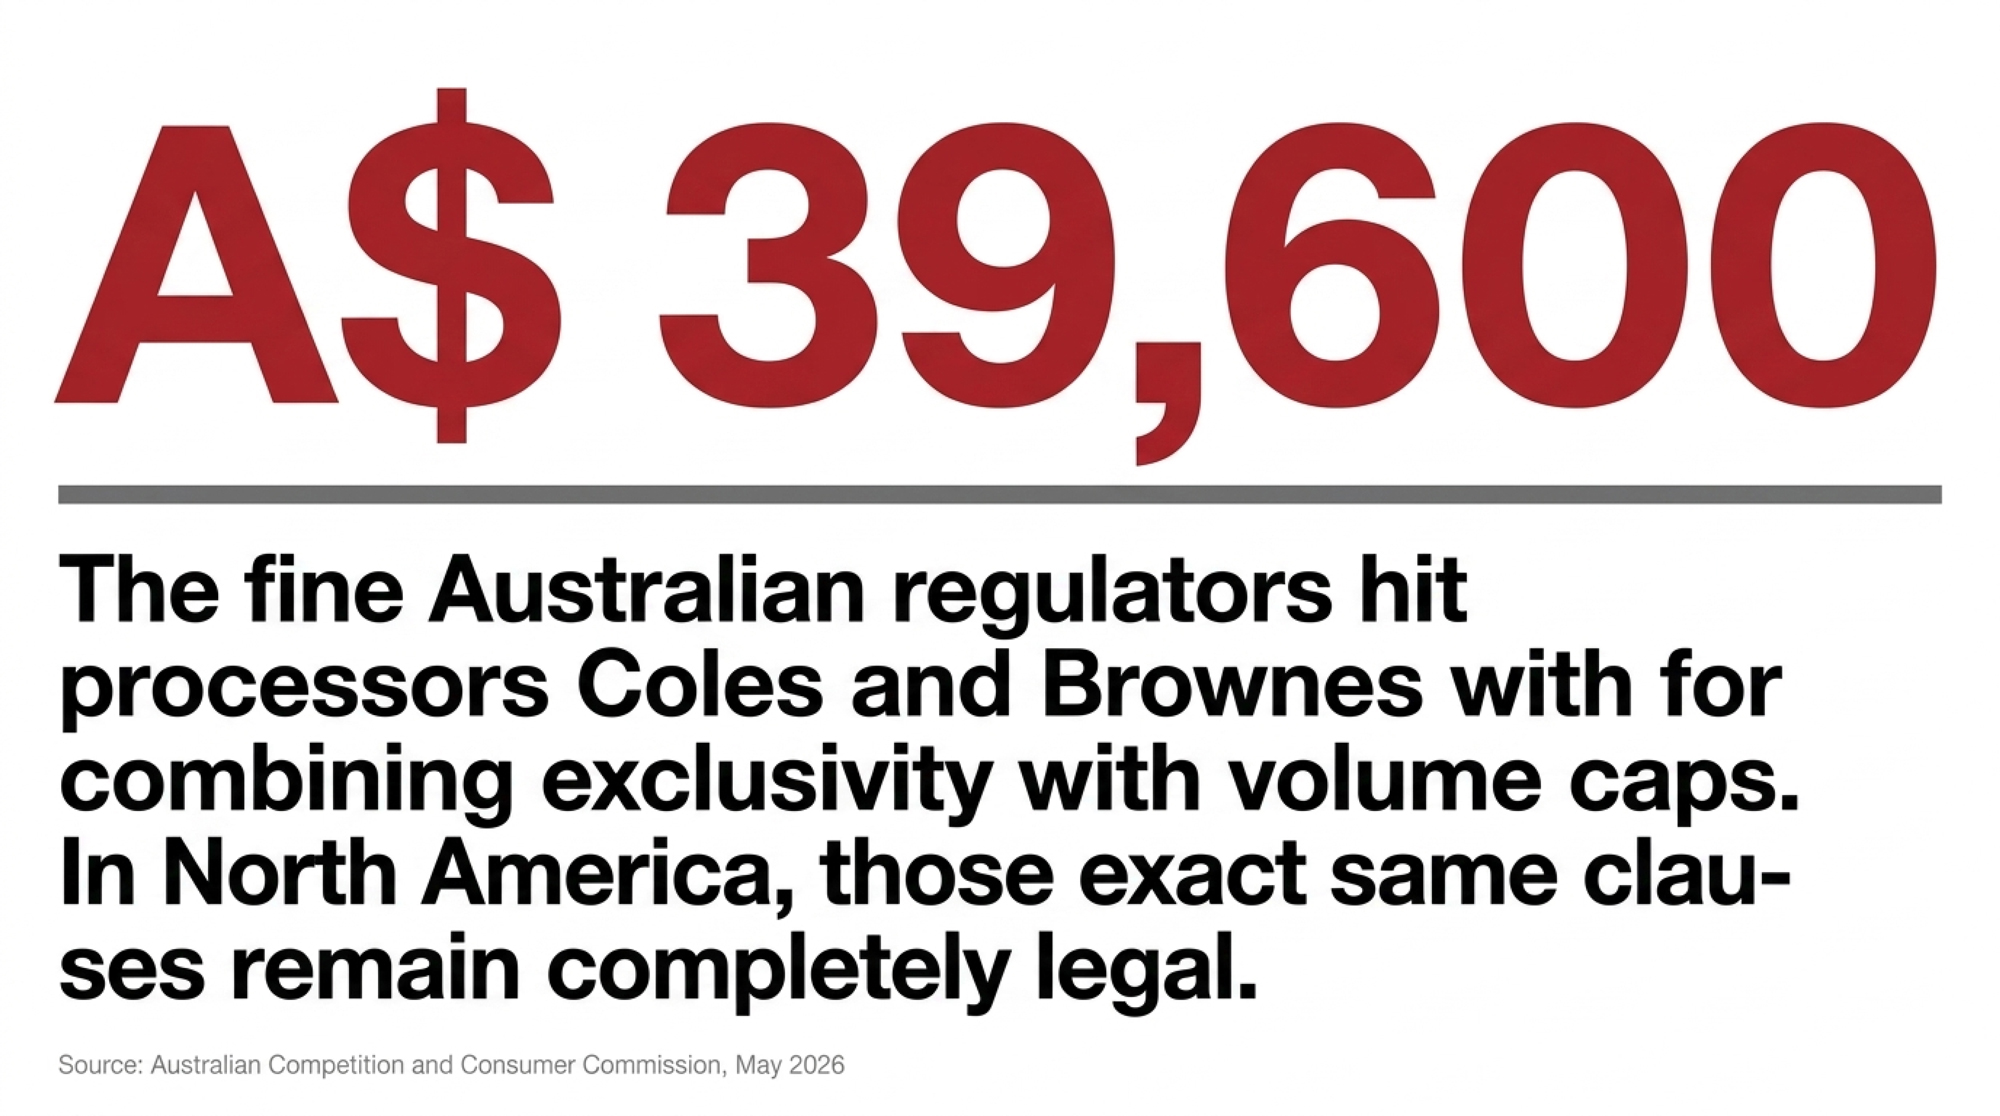
A$39,600 in fines on the other side of the world. The same clause language sits unredlined in North American milk contracts — and on an 800-cow robot barn, the 90-day math runs $386,000.

exclusive milk supply contract, ACCC Coles Brownes, Class III pricing, robotic milking debt, DSCR dairy lending, co-op bylaws, milk contract volume cap

The Australian Competition and Consumer Commission’s May 21, 2026 announcement confirmed it had accepted infringement notices from the supermarket Coles and the processor Brownes Foods Operations for alleged breaches of the Australian Dairy Code of Conduct — A$39,600 each. ACCC alleged Coles published two milk-supply agreements requiring exclusive supply to the retailer while capping the maximum volume of milk farmers could produce. ACCC alleged Brownes published two agreements that didn’t clearly set out the minimum prices applying across the full supply period, or justify the reasons for those prices. Under Australian law, infringement notices aren’t admissions of liability, and neither company had publicly responded to the May 2026 action by publication time. 

The fine is rounding-error money. The clause language ACCC went after lives freely in North American milk contracts and co-op bylaws right now — with no equivalent code to back you up. 

Picture the contract on your desk. Five-year term. Exclusive supply. A 16,000 cwt monthly minimum. “Competitive pricing tied to Class III.” Your banker won’t release the robot loan until it’s signed. Now picture an 800-cow operation that just signed off on a robotic parlor. Fourteen robots at roughly $195,000 per unit — within the published 2026 range commonly cited by Compeer Financial and university extension robotics economic models — puts the equipment alone at $2.73 million, with retrofit and infrastructure pushing the total package past $3.5 million. Compeer Financial’s 2026 published guidance flags principal-and-interest payments above $2.50/cwt of milk production as the threshold at which dairy debt service gets uncomfortable. On 230,400 cwt a year, that ceiling pencils to roughly $48,000 a month in total debt service. The deal works — barely — at $22/cwt and 19,200 cwt a month, against USDA’s $18.95 milk forecast and $19.14 cost forecast for the year. Then the renewal lands. 

What’s Changing And Why

ACCC didn’t go after Coles and Brownes over the prices they paid. ACCC went after the structure. Under the Australian Dairy Code, processors must publish contracts that include defined minimum prices and volumes. Clauses blocking farmers from supplying anyone else while letting the buyer cap intake aren’t allowed in exclusive deals. 

Brownes has been here before. In 2021, the processor paid A$22,200 in infringement-notice penalties over alleged Code breaches that ACCC said involved open-ended supply periods and unilateral price step-down rights. ACCC has flagged increased Code enforcement since 2021. The 2026 action is part of a pattern, not a one-off. 

ClauseStandalone RiskCombined RiskAustralian Dairy CodeNorth American Status
Exclusivity— all milk to one buyerLow if price/volume are solidHIGH — traps milk if cap invoked❌ Must offer non-exclusive alternative✅ Standard; no equivalent rule
Volume cap / “subject to capacity”Moderate — buyer manages plant loadHIGH — combined with exclusivity, you can’t redirect❌ Not permitted in exclusive deals✅ Freely used; labeled “capacity-subject intake”
Vague pricing (“tied to Class III”)Moderate — price drifts inside termHIGH — no floor means deductions compound❌ Minimum price must be defined across full supply period✅ Common; no defined-spread requirement
Tiered pricing (Tier A/Tier B)Low — standard revenue managementHIGH — erases expansion economics at cap volume❌ Requires non-exclusive alternative if combined with exclusivity✅ Unregulated; UK FDOM now requires fairness test

North America has no equivalent rule. In the US, supply terms vary by federal order, co-op, and private milk processor contract — there’s no national code that says “if you cap volume, you must release exclusivity.” In Canada, supply management sets prices and quotas at the provincial level, but the underlying co-op membership rules and processor agreements still carry exclusivity, notice, and discipline language buried in bylaws most members never re-read. The same clause families show up under different names — “base-excess pricing,” “market adjustment factors,” “capacity-subject” intake language — depending on who drafted your agreement. 

The UK went the other direction in 2025. Under the Fair Dealing Obligations (Milk) regulations phased in across 2024 and 2025, contracts combining exclusivity with tiered pricing must satisfy a fairness test that effectively forces processors to offer a non-exclusive alternative — closing the same gap North American producers carry without protection. The producers most exposed are the ones financing expansion — robots, parlors, freestall barns, sexed semen, genomics programs — on the assumption their milk has a guaranteed home. That assumption is contractual, not natural. 

How This Plays Out On Real Farms

Run the stress test on the 800-cow scenario. Two years into the renewal, the processor loses a major retail account and invokes a volume cap clause — the kind that lets them reduce intake by 10–15% on 60 days’ notice. Accepted volume drops from 19,200 to 16,320 cwt. The other 2,880 cwt a month is still being produced. Still being fed. And under typical exclusivity language, you can’t ship that milk to anyone else without the buyer’s written consent. 

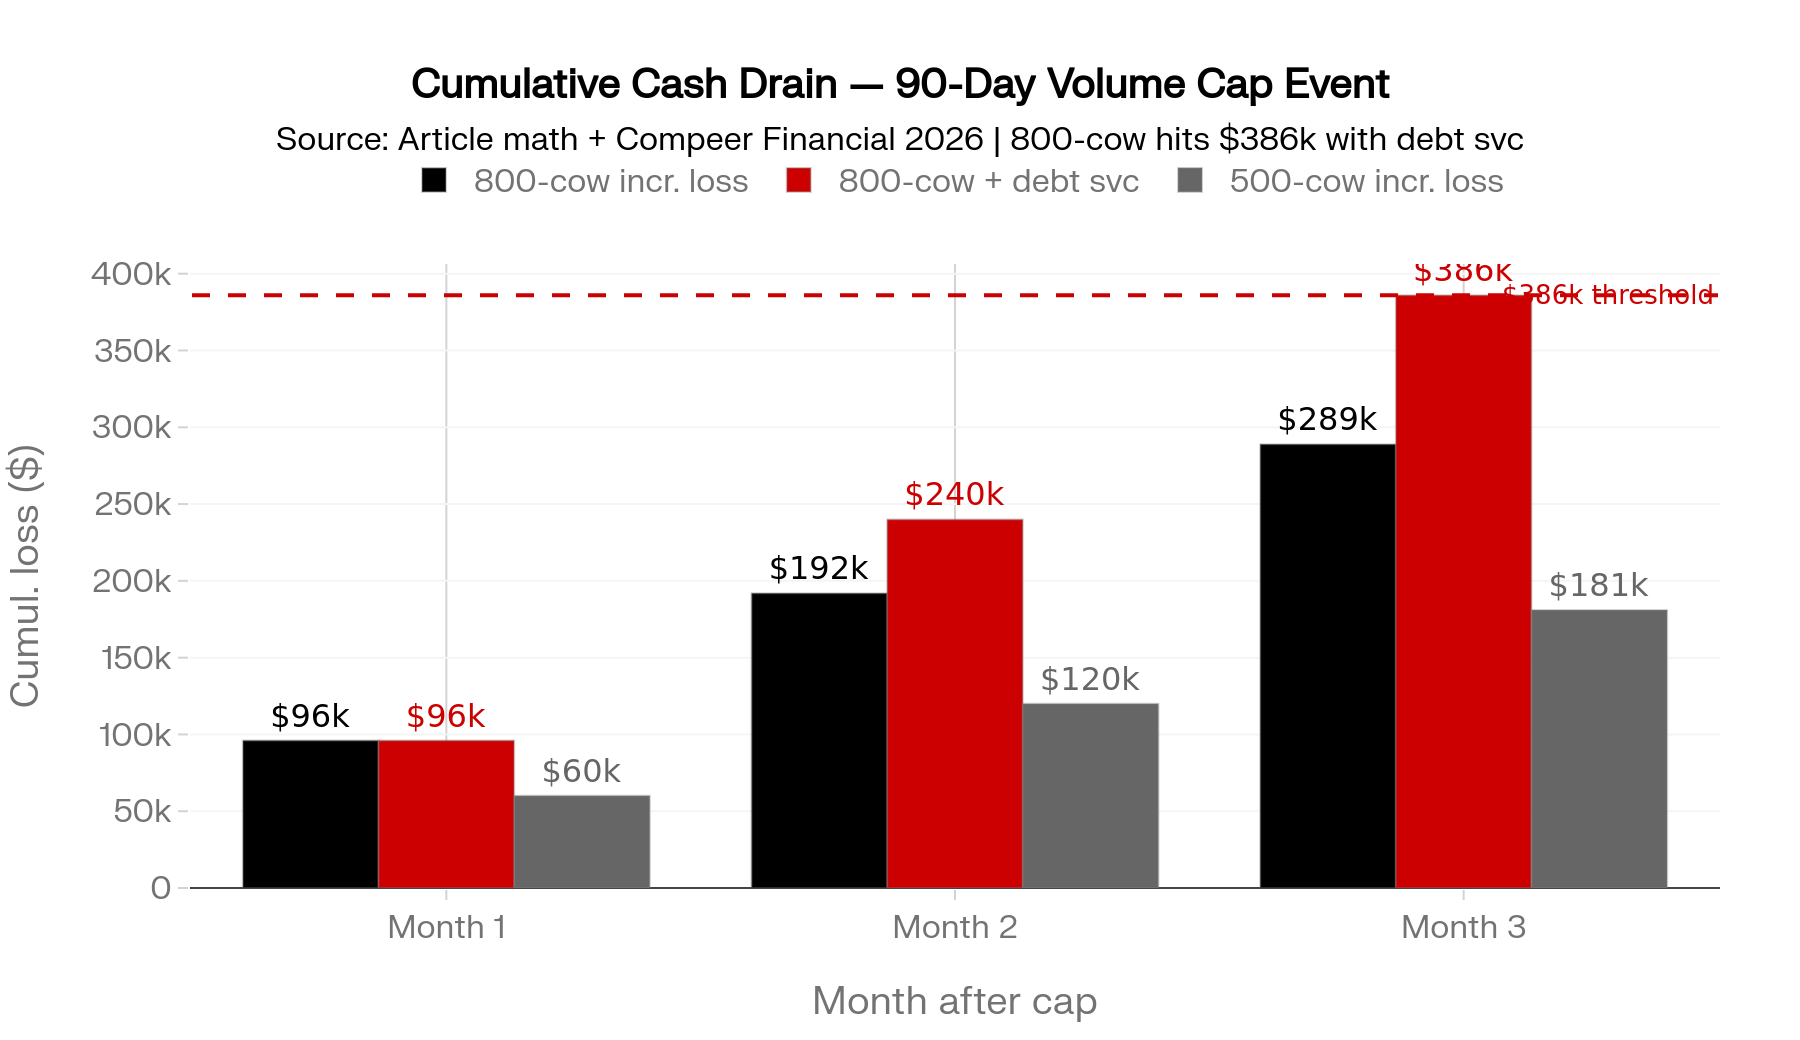
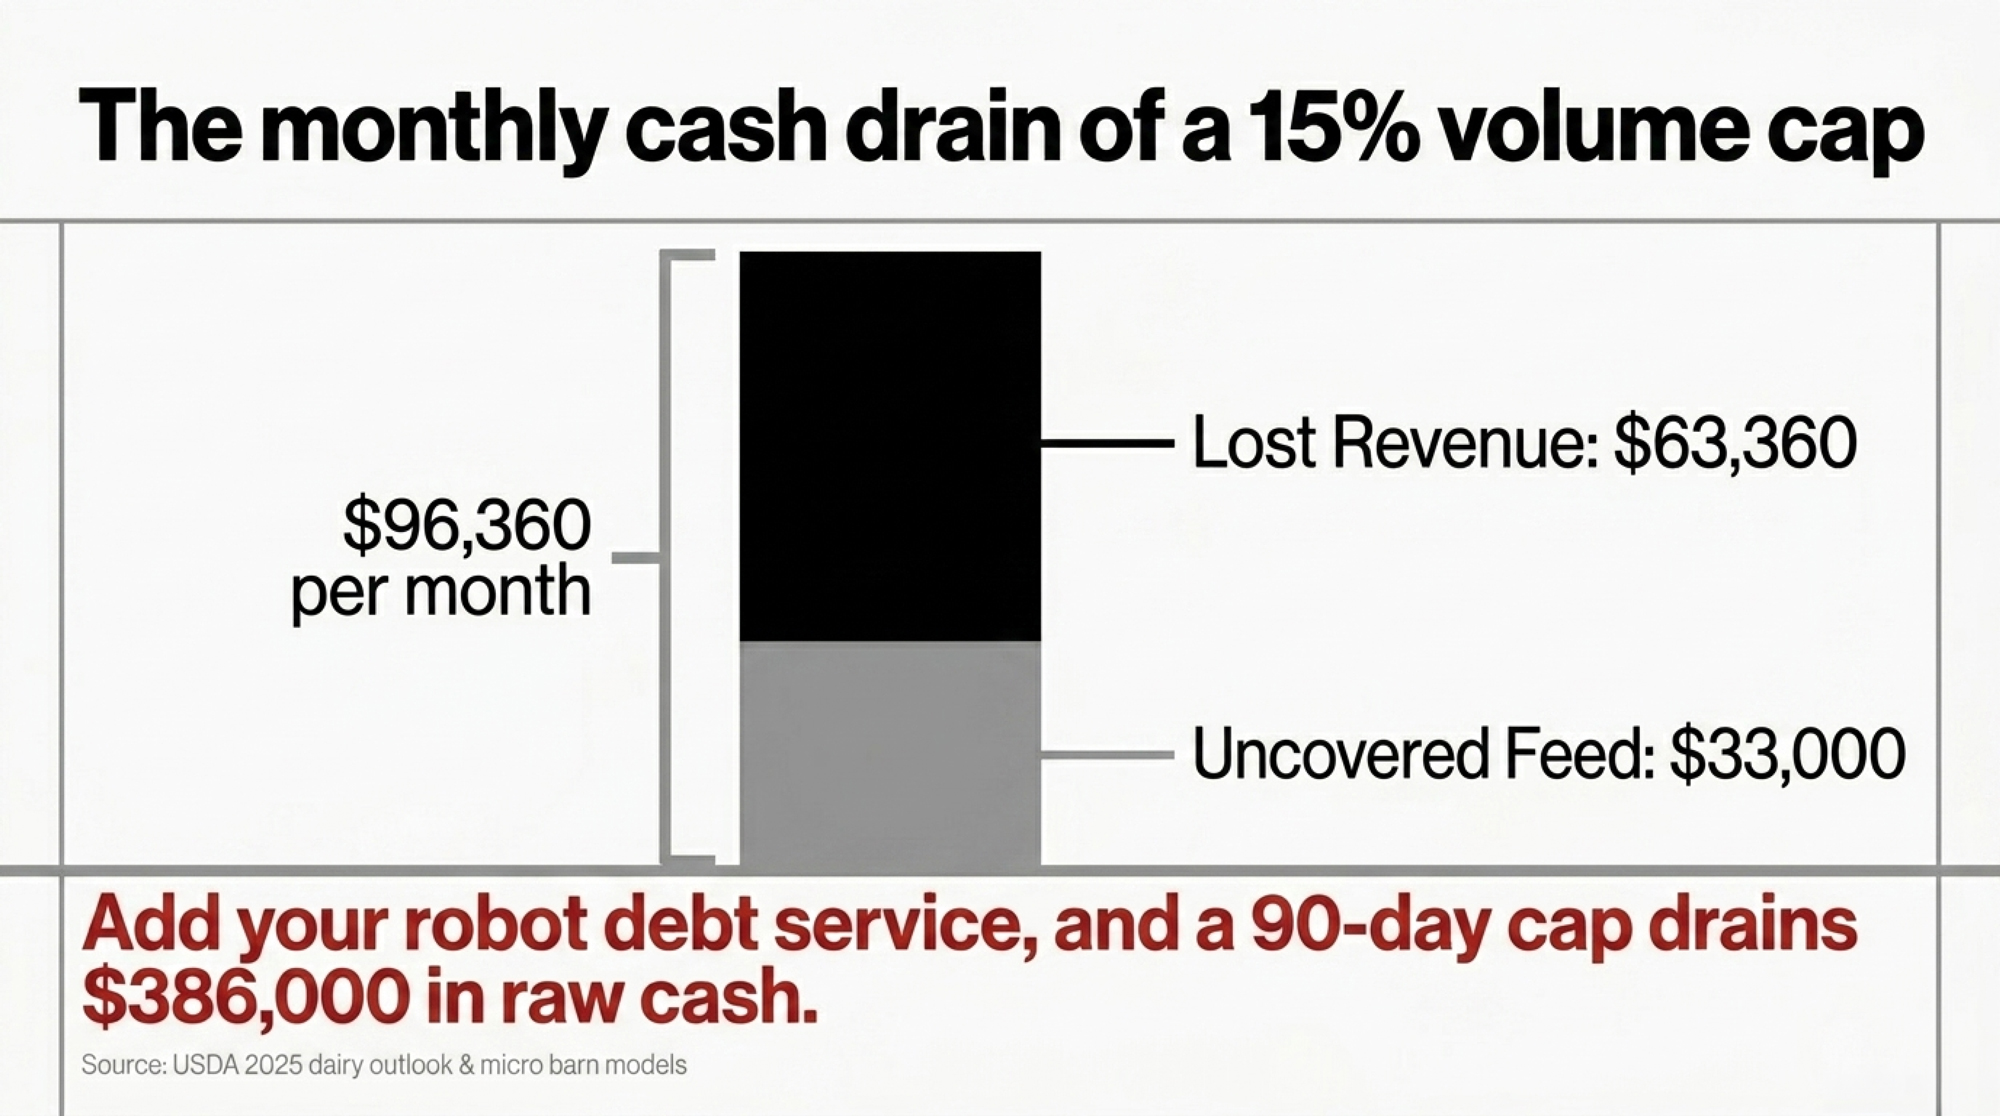
Here’s the micro barn math any producer can map to their own herd. Lost monthly revenue: 2,880 cwt × $22/cwt = $63,360. USDA’s 2025 dairy outlook projected feed costs around $11.56/cwt at corn near $4.35 a bushel. At that input, the uncovered feed exposure on 2,880 cwt of trapped milk runs roughly $33,000 a month — sunk into milk that won’t sell. The robot debt service still drafts on schedule, even when the math says it shouldn’t have to. 

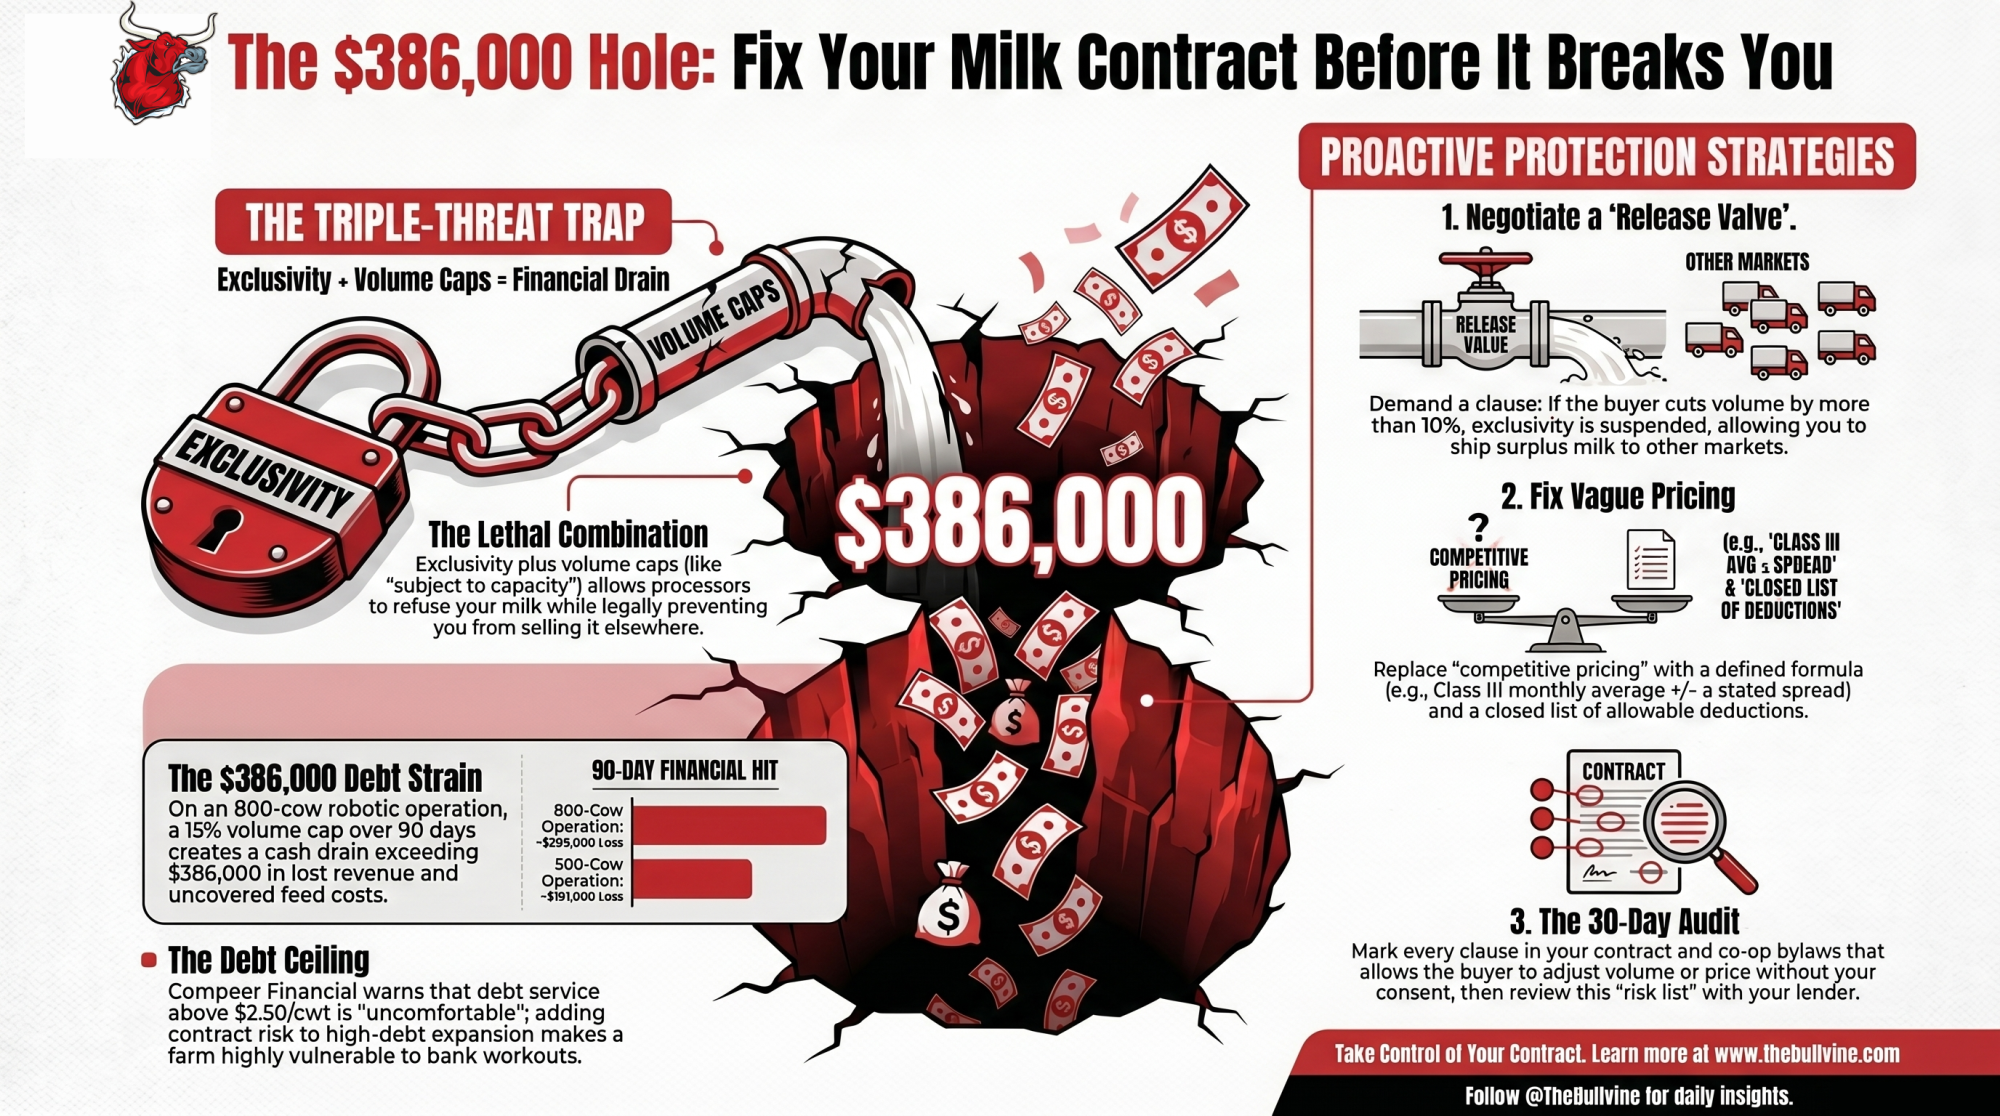
Stack three months together and the curve gets ugly fast. Incremental losses from lost revenue and uncovered feed run between $274,000 and $289,000 over 90 days, depending on where the variable feed cost actually lands. Layer in robot debt service still drafting against milk that won’t ship — roughly two months of P&I at $48,000 — and the cumulative cash strain on the 800-cow scenario pushes past $386,000. The 500-cow version trims the absolute number but not the shape of the problem. 

Exposure on a 90-day volume cap800-cow operation500-cow operation
Capped milk per month2,880 cwt1,800 cwt
Lost monthly revenue at $22/cwt$63,360$39,600
Uncovered feed exposure at $11.56/cwt~$33,000~$21,000
Total monthly hit~$96,000~$60,000
90-day incremental loss~$289,000~$181,000
Robot/expansion debt serviceContinues drafting all 90 daysContinues drafting all 90 days

The shock absorber gets smaller. The pressure on the bank conversation does not. 

The Mechanics Behind The Outcomes

Three clauses do the damage when they show up together. None is automatically bad on its own. Combined, they let a processor turn your expansion volume into a free buffer for their plant or retail-account risk. 

  • Exclusivity. All milk produced goes to one buyer; selling to anyone else requires written consent.
  • Volume cap or “subject to capacity” language. The buyer’s obligation to take milk is limited to a stated maximum — or whatever their plant decides it can handle. ACCC’s 2026 enforcement action against Coles alleged exactly this combination. 
  • Vague pricing. “Competitive pricing tied to Class III” with no defined spread or deduction list lets the buyer adjust the effective price downward inside the term — the same gap ACCC alleged against Brownes, where ACCC said the minimum price wasn’t clearly set out across the supply period. 

None of those would survive the Australian Dairy Code in an exclusive contract. All three live freely in North American agreements. 

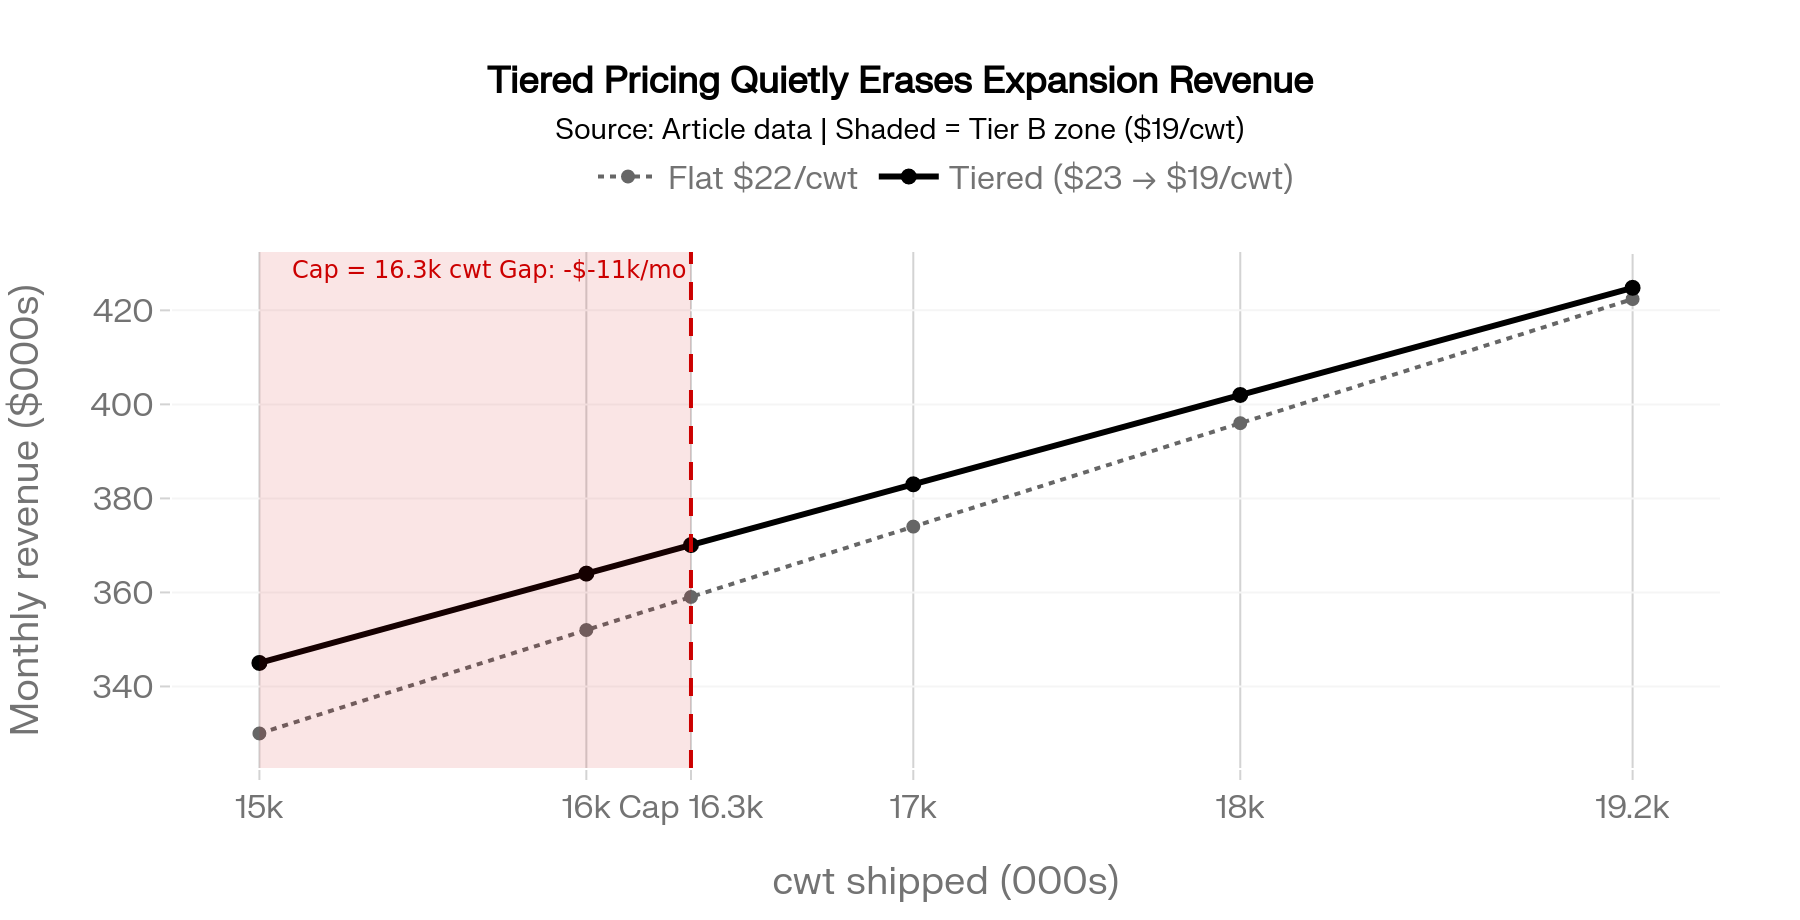
Layer in tiered pricing — say $23/cwt on the first 15,000 cwt, $19/cwt above that — and the expansion case quietly collapses. With a 16,320 cwt cap, you earn $345,000 on Tier A and $25,080 on Tier B, total $370,080 a month. Without the cap, full 19,200 cwt would have generated $424,800. That’s $54,720 a month of revenue erased on milk the contract said the buyer could simply refuse to take. Under UK FDOM rules, that combination of exclusivity plus tiered pricing requires a non-exclusive alternative. North American milk processor contracts don’t. 

How Much Does An Exclusive Milk Processor Contract Without A Release Actually Cost?

Honest answer: it depends on whether the buyer ever pulls the trigger. If they don’t, the cost is zero and you feel smart for signing. If they do, the cost compounds in three layers. 

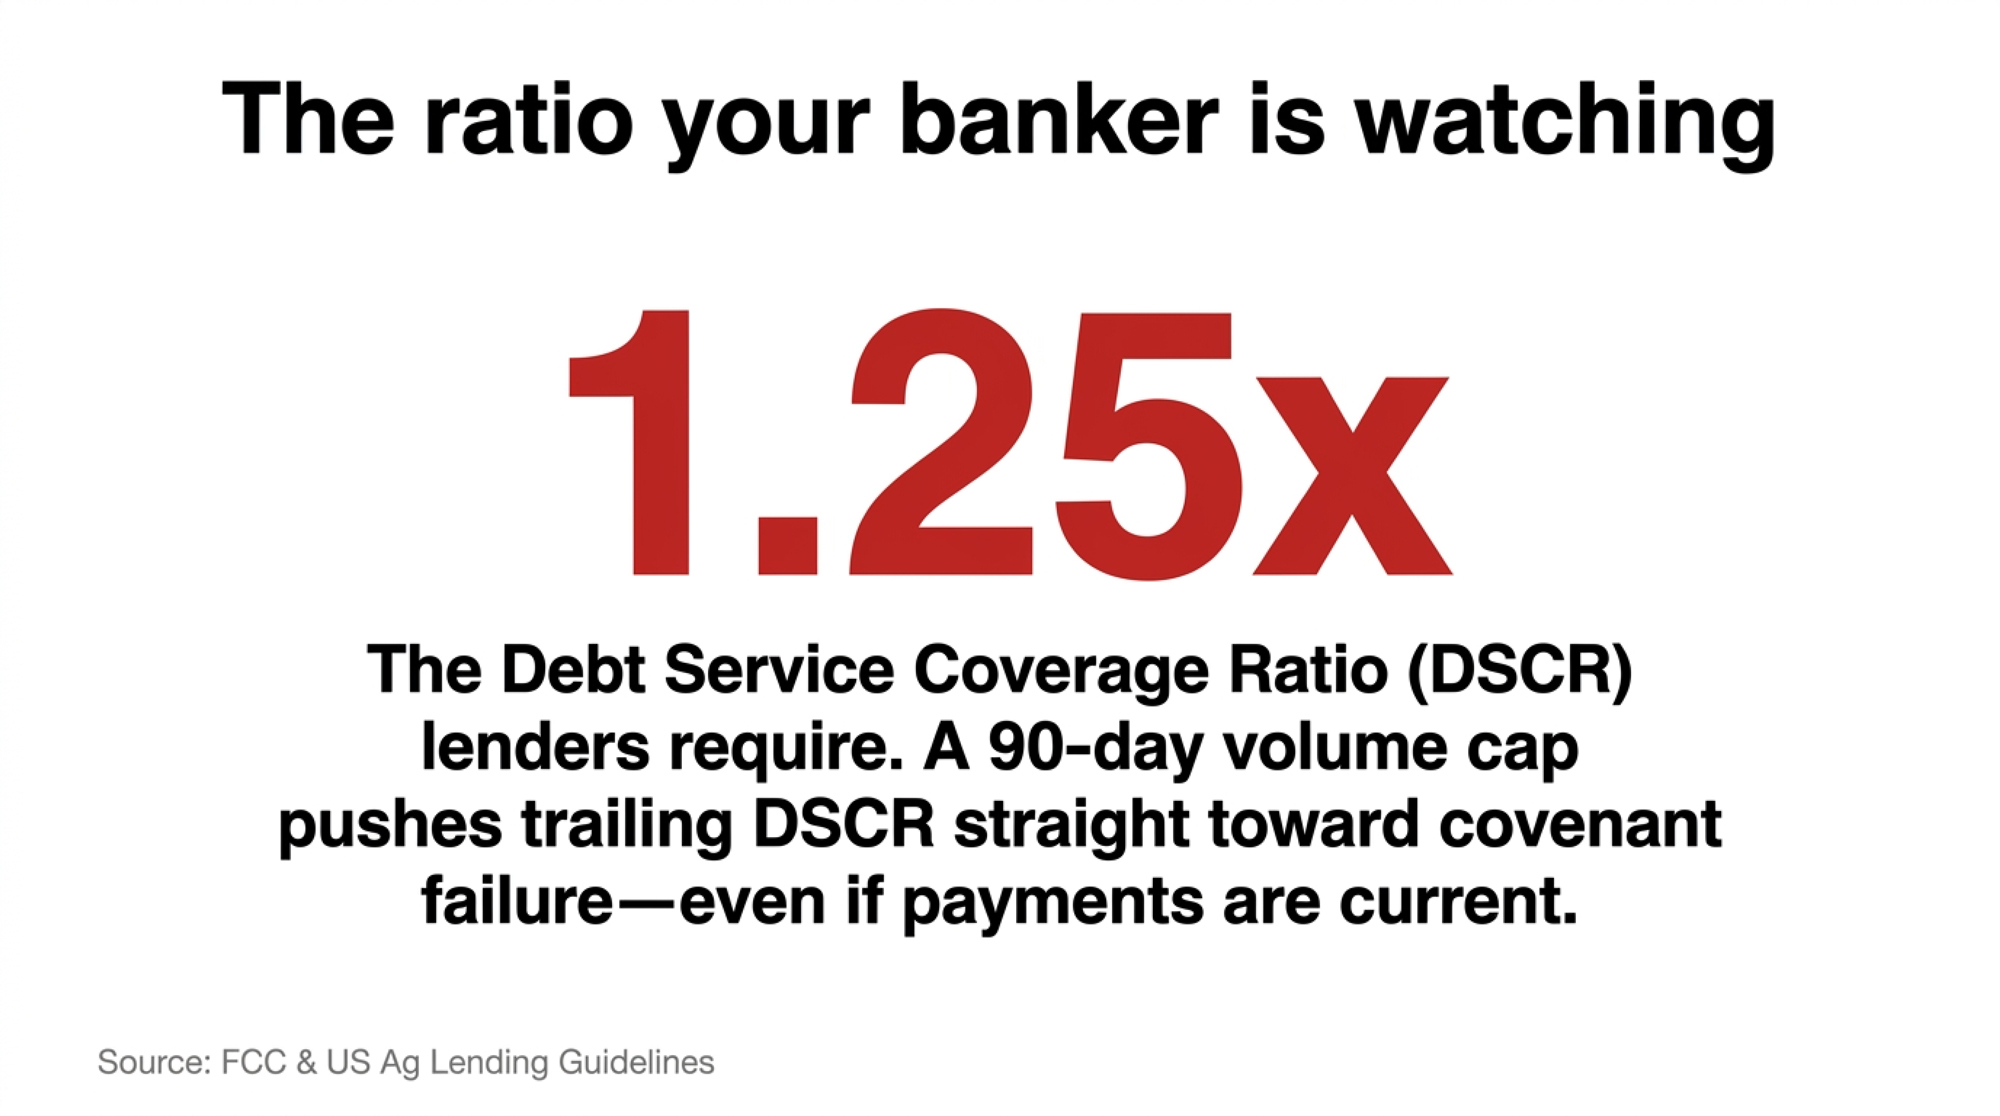
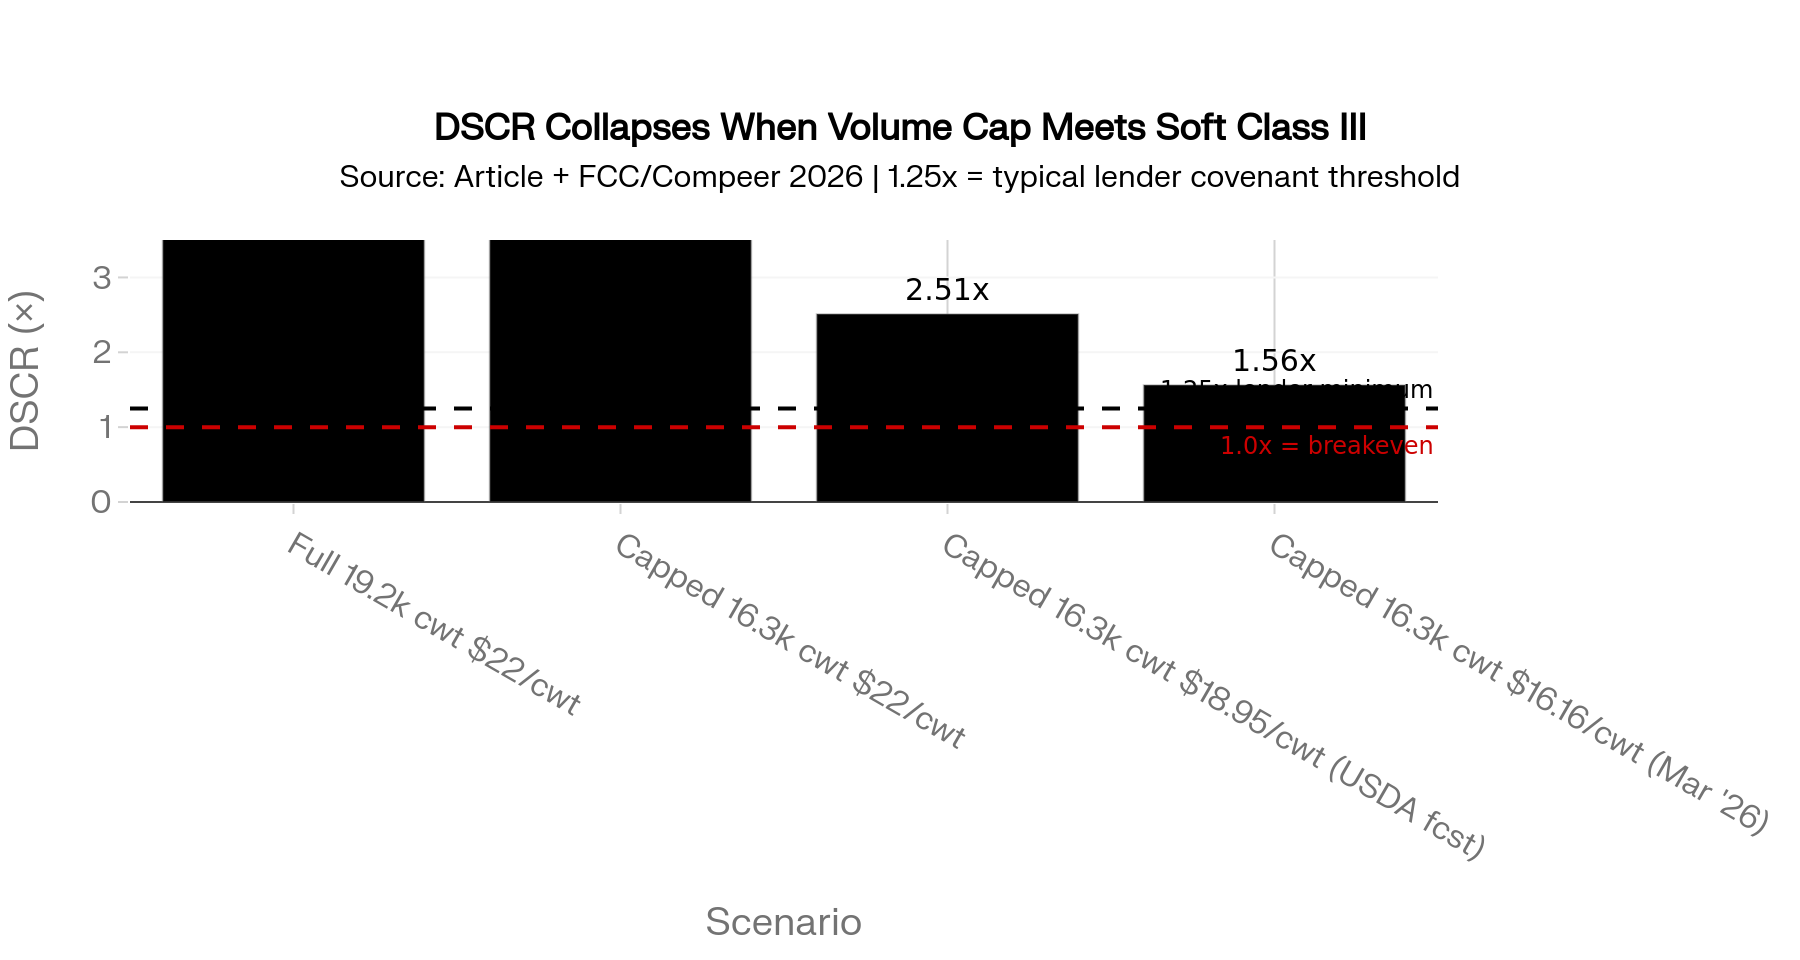
Layer one is direct revenue loss on capped milk — in the 800-cow case, roughly $63,000 a month at $22/cwt. Layer two is uncovered fixed costs: feed on milk with no buyer, robot debt that doesn’t pause, labor already scheduled. Layer three is the one your banker cares about — debt service coverage ratio. FCC flags 1.25x DSCR as a common ag lending threshold for expansion loans, and most US lenders sit in the same range. Once a 90-day cap event lands on top of that, the math turns fast. 

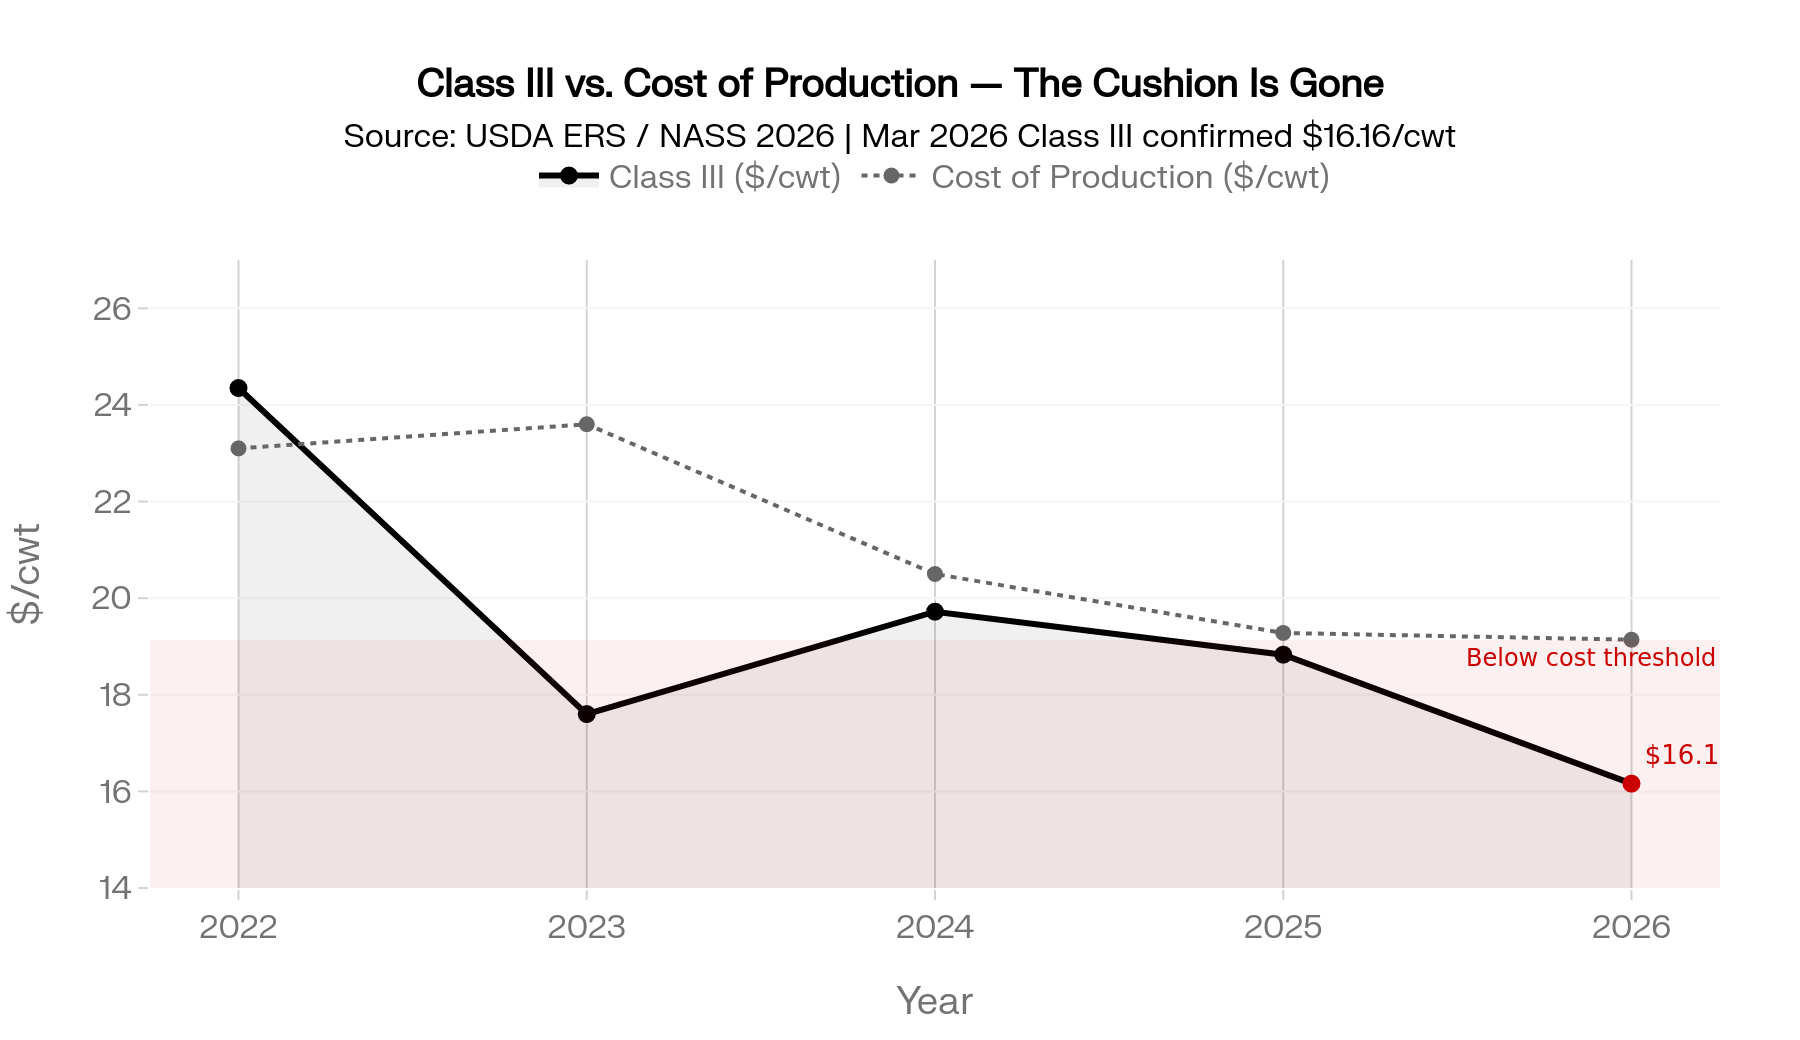
Run this through the kind of DSCR worksheet most ag lenders use, and a 90-day cap during a Class III soft patch compresses trailing DSCR straight toward covenant thresholds — even when every payment is current. With Class III at $16.16/cwt confirmed for March 2026 and Class IV at $18.94/cwt the same month, the cushion between forecast and covenant is already thin. That’s the moment the conversation with the bank shifts from planning to workout. 

Is Your Co-Op Bylaw Doing The Same Thing As An Exclusive Contract?

For a lot of North American producers, the answer is yes. Most haven’t read the document closely enough to see it. Co-op membership agreements often include exclusive supply requirements, disciplinary powers for “bringing the co-op into disrepute,” and rules about how losses from recalls or lost retail accounts get spread across the pool. 

The mechanics look different from a private supply agreement. The leverage is similar. Members can’t easily ship elsewhere, and the board controls how downstream pain gets allocated. Watch for “termination for cause” clauses tied to vague conduct standards, capital-retain rules that lock equity in the co-op for years after you stop shipping, and notification language that lets the co-op invoke recall-loss allocation without member consent. 

The ByHeart organic infant formula recall in late 2025 is a recent reminder of how downstream brand-owner events can hit upstream producers without warning. Producers inside contamination footprints often discover only after a recall what their notification rights actually were — or weren’t. Contract risk lives in bylaws too, not just in the supply agreement on top of them. 

Options and Trade-Offs for Farmers

There’s no single fix here. Four paths are showing up in producer–processor conversations right now. Each carries a real trade-off. 

ProtectionAustralia (Dairy Code 2020)UK (FDOM 2024–25)Canada (Supply Mgmt)USA (Federal Order)
Defined minimum price across full term✅ Required✅ Required✅ Quota price set provincially❌ No requirement
Volume cap with exclusivity release✅ Prohibited without release✅ Must offer non-exclusive alternativeN/A — quota governs volume❌ No requirement
Closed deduction list✅ Required✅ Fairness testPartial — provincial variation❌ Processor discretion
Minimum notice on volume reduction✅ Defined in Code✅ 3-month minimum✅ Quota adjustment via board❌ Varies by contract; often 30–60 days
Co-op bylaw conduct/discipline rulesCode overrides bylawRegulatedProvincial oversight❌ Member agreement only; no federal floor
Producer redress mechanism✅ ACCC enforcement✅ AHDB / Groceries Code✅ Provincial marketing boards❌ Litigation only

1. Negotiate an exclusivity release tied to volume reductions. This is the highest-leverage clause to push for. Plain language: if the buyer cuts accepted volume below the monthly minimum by more than 10%, exclusivity is suspended on the surplus and you can ship it elsewhere. Best fit on any 5-year-plus contract tied to new debt. Bring your banker into the conversation as a second voice — a lender’s signature on the loan gives you cover to ask. The risk: many North American processors and co-ops will say no, possibly flat. Your fallback is shorter notice periods, defined minimums, and a closed list of allowable deductions instead of a true release. 

2. Define the minimum price. Replace “competitive pricing tied to Class III” with a real formula — Class III monthly average minus a stated spread, plus a closed list of premiums and deductions, with any change requiring a written amendment. This is the exact gap ACCC alleged against Brownes. Worth pushing whenever the contract runs more than two years. You’ll need a clean set of recent milk cheques to negotiate the spread. The buyer may push back on locking in a five-year formula — an annual review window is a reasonable compromise. 

3. Buy the price floor in the market, not the contract. If the contract won’t define a minimum price, hedging tools — DMC, Dairy Revenue Protection, private margin contracts — can synthesize one. Best fit when the contract is otherwise acceptable but the pricing language is vague. You’ll need an adviser who actually understands DRP basis risk. Hedging costs eat margin in normal years, and they don’t fix the volume-cap problem at all. 

4. Right-size the operation to the contract, not the barn. If you can’t get a release clause, the next-best move is to scale to guaranteed volume, not theoretical max. If the buyer commits to 16,000 cwt, build the herd, ration, and labor plan around 16,500–17,000 cwt — not 19,200. Makes sense in one-buyer regions where there’s no realistic alternate market. Requires discipline on heifer inventory and culling. 

The trade-off on Path 4: lost upside if the buyer never invokes the cap. With Class III sitting at $16.16/cwt for March 2026 and Compeer’s May 2026 published outlook flagging tighter dairy margins ahead, the cost of being right-sized is smaller than the cost of being over-built into a soft market. 

30-Day Action — Do This Now. Pull every supply contract, membership agreement, and co-op bylaw out of the file cabinet and read the exclusivity, volume, notice, and termination language line by line. Mark every clause that lets the buyer adjust volume or price without your written consent. Bring that marked-up copy to your banker before your next renewal meeting. That’s the audit list for negotiation, and the document your loan officer needs to actually price the risk you’re being asked to carry. 

Key Takeaways

  • If your contract has exclusivity AND a volume cap AND no written release, treat any expansion debt tied to it as carrying unpriced counterparty risk. Tell your banker before they tell you.
  • If “competitive pricing tied to Class III” is the only price language in your contract, that’s not a price — it’s the same gap ACCC alleged against Brownes. Push for a defined formula and a closed list of deductions before signing.
  • If a “minus 15% volume” scenario drops your DSCR below 1.0x, that’s the number you take to your lender — not a hypothetical worth ignoring.
  • If your principal-and-interest payments run above $2.50/cwt of production, your robot loan is already carrying more weight than Compeer’s own published guidance recommends. Adding contract risk on top of that is two compounding strikes.
  • If your buyer won’t add an exclusivity release, ask for two fallbacks instead: 90- to 120-day minimum notice on volume reductions, and a hard floor below which exclusivity automatically suspends.
  • If you ship through a co-op, read the bylaws on discipline, recall loss allocation, and notification rights this month. That’s where most of the real risk lives.
  • If your contract renewal is on the desk in the next 90 days, the audit conversation with your banker happens before the negotiation, not after.

If your processor or co-op invokes every option the contract gives them tomorrow, what does your DSCR look like 90 days later? And does anyone at your bank actually know that number?

Run Your Numbers

Farm Benchmark Snap Check — Pressure-test your own contract exposure against the $386,000 scenario. Plug in your herd size, milk price, feed cost, and debt service to see what a 90-day volume cap actually does to your DSCR before the renewal lands on your desk.

Complete references and supporting documentation are available upon request by contacting the editorial team at editor@thebullvine.com.

Learn More

The Sunday Read Dairy Professionals Don’t Skip.

Every week, thousands of producers, breeders, and industry insiders open Bullvine Weekly for genetics insights, market shifts, and profit strategies they won’t find anywhere else. One email. Five minutes. Smarter decisions all week.

NewsSubscribe
First
Last
Consent

The $221,760 Corridor Trap Hitting 600‑Cow Upper Midwest Dairies in 2026

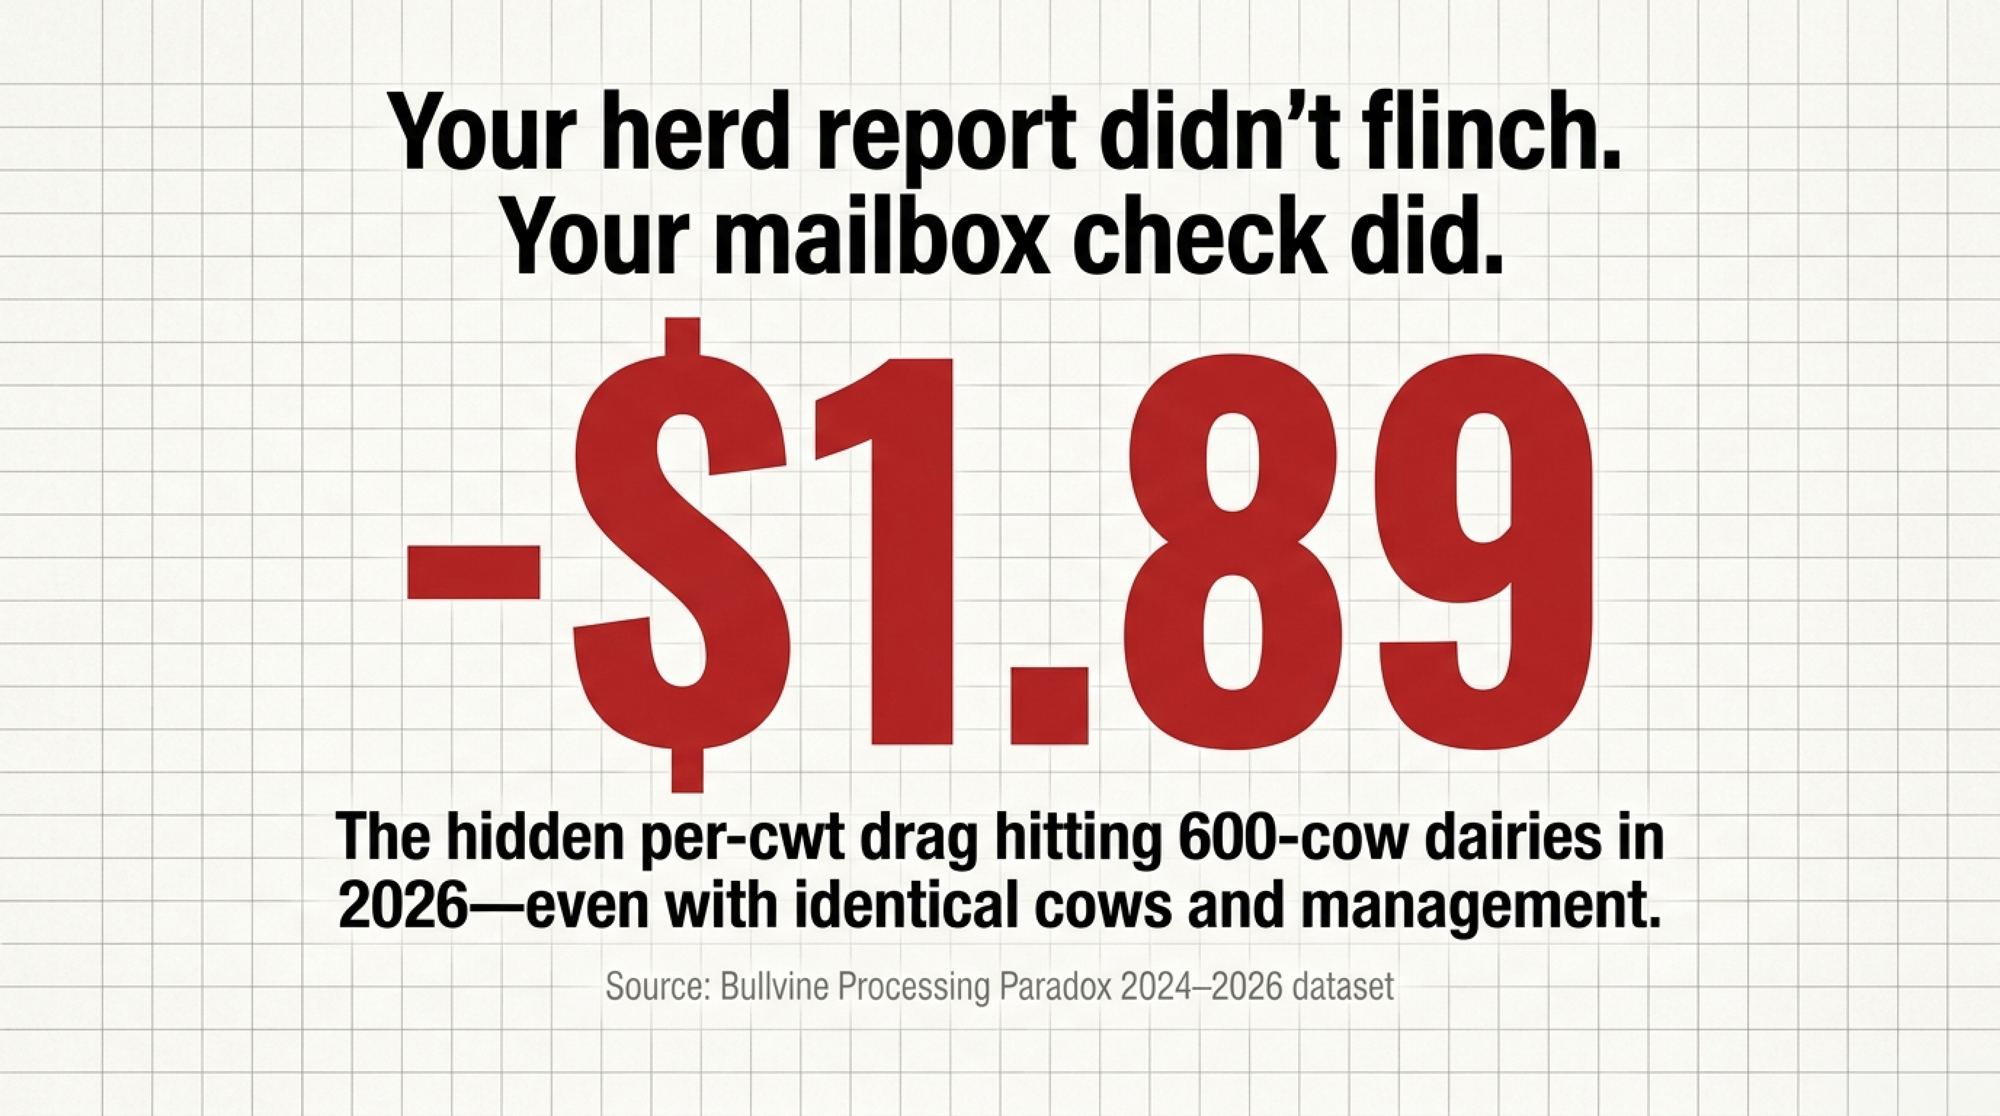
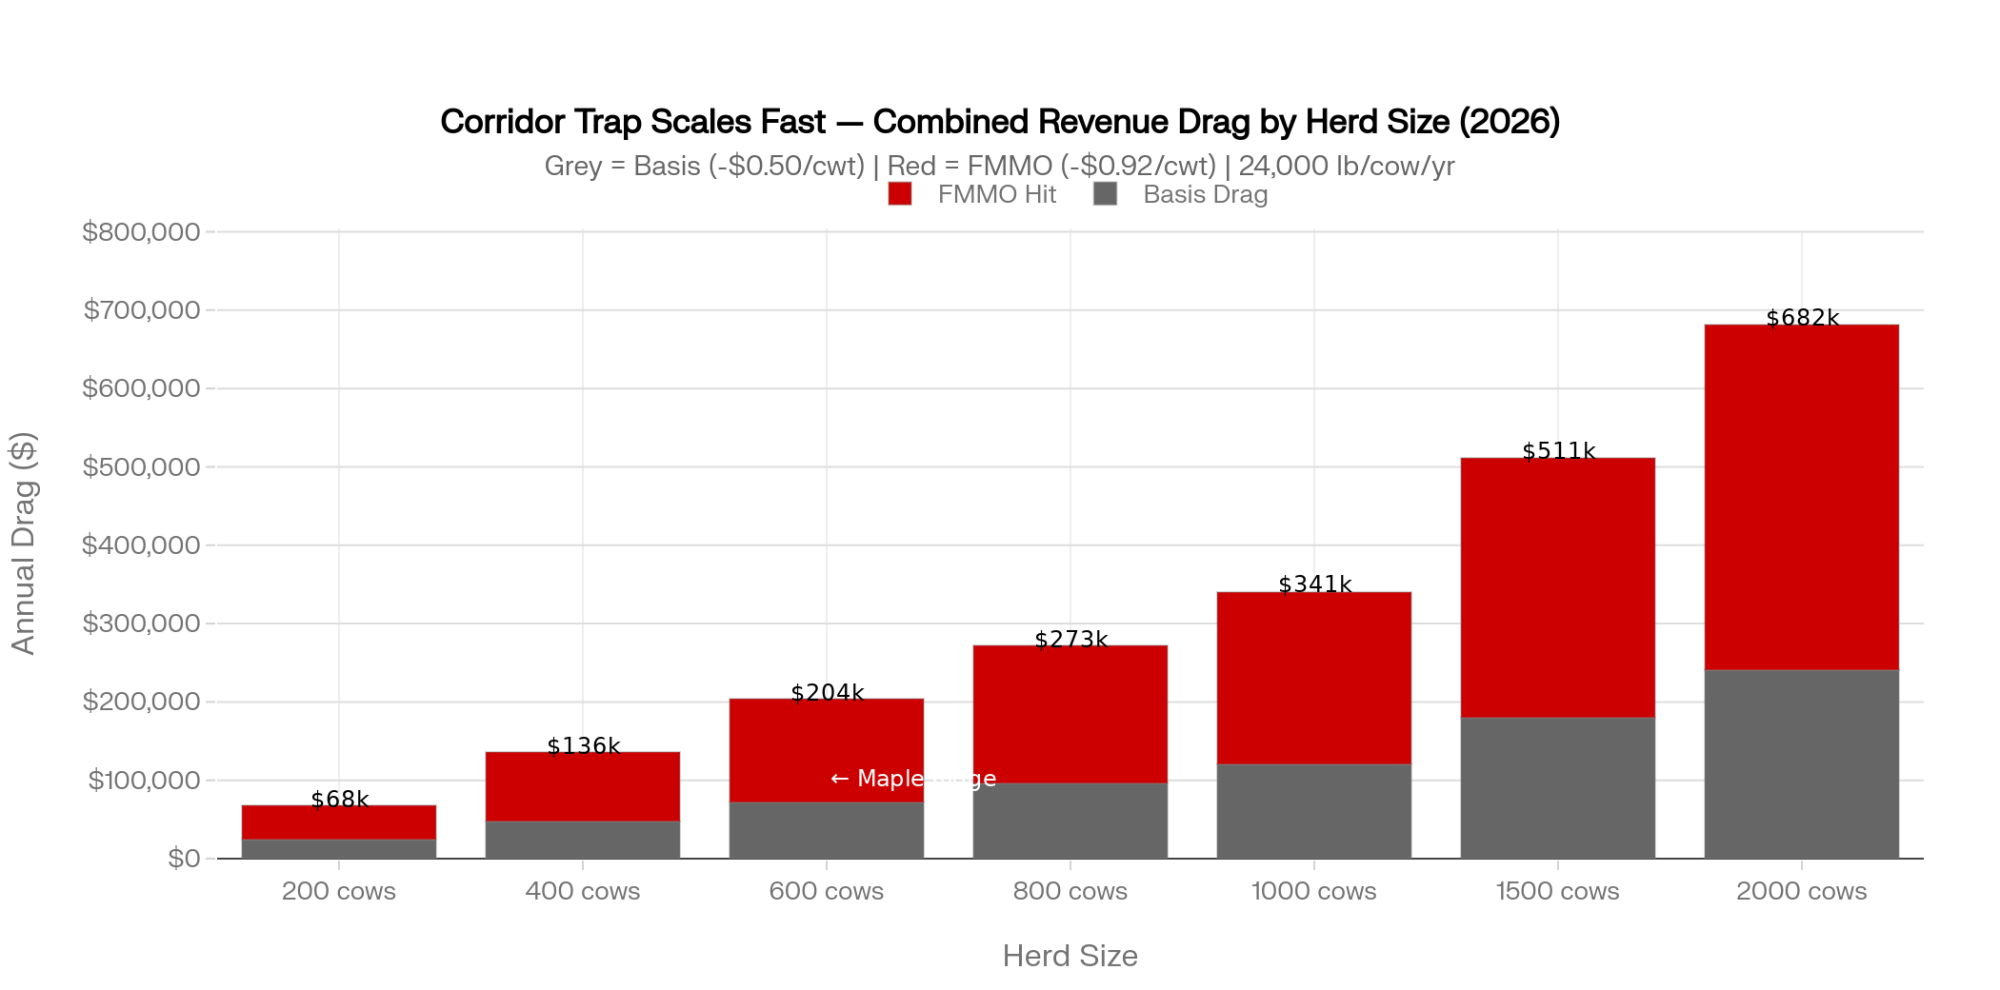
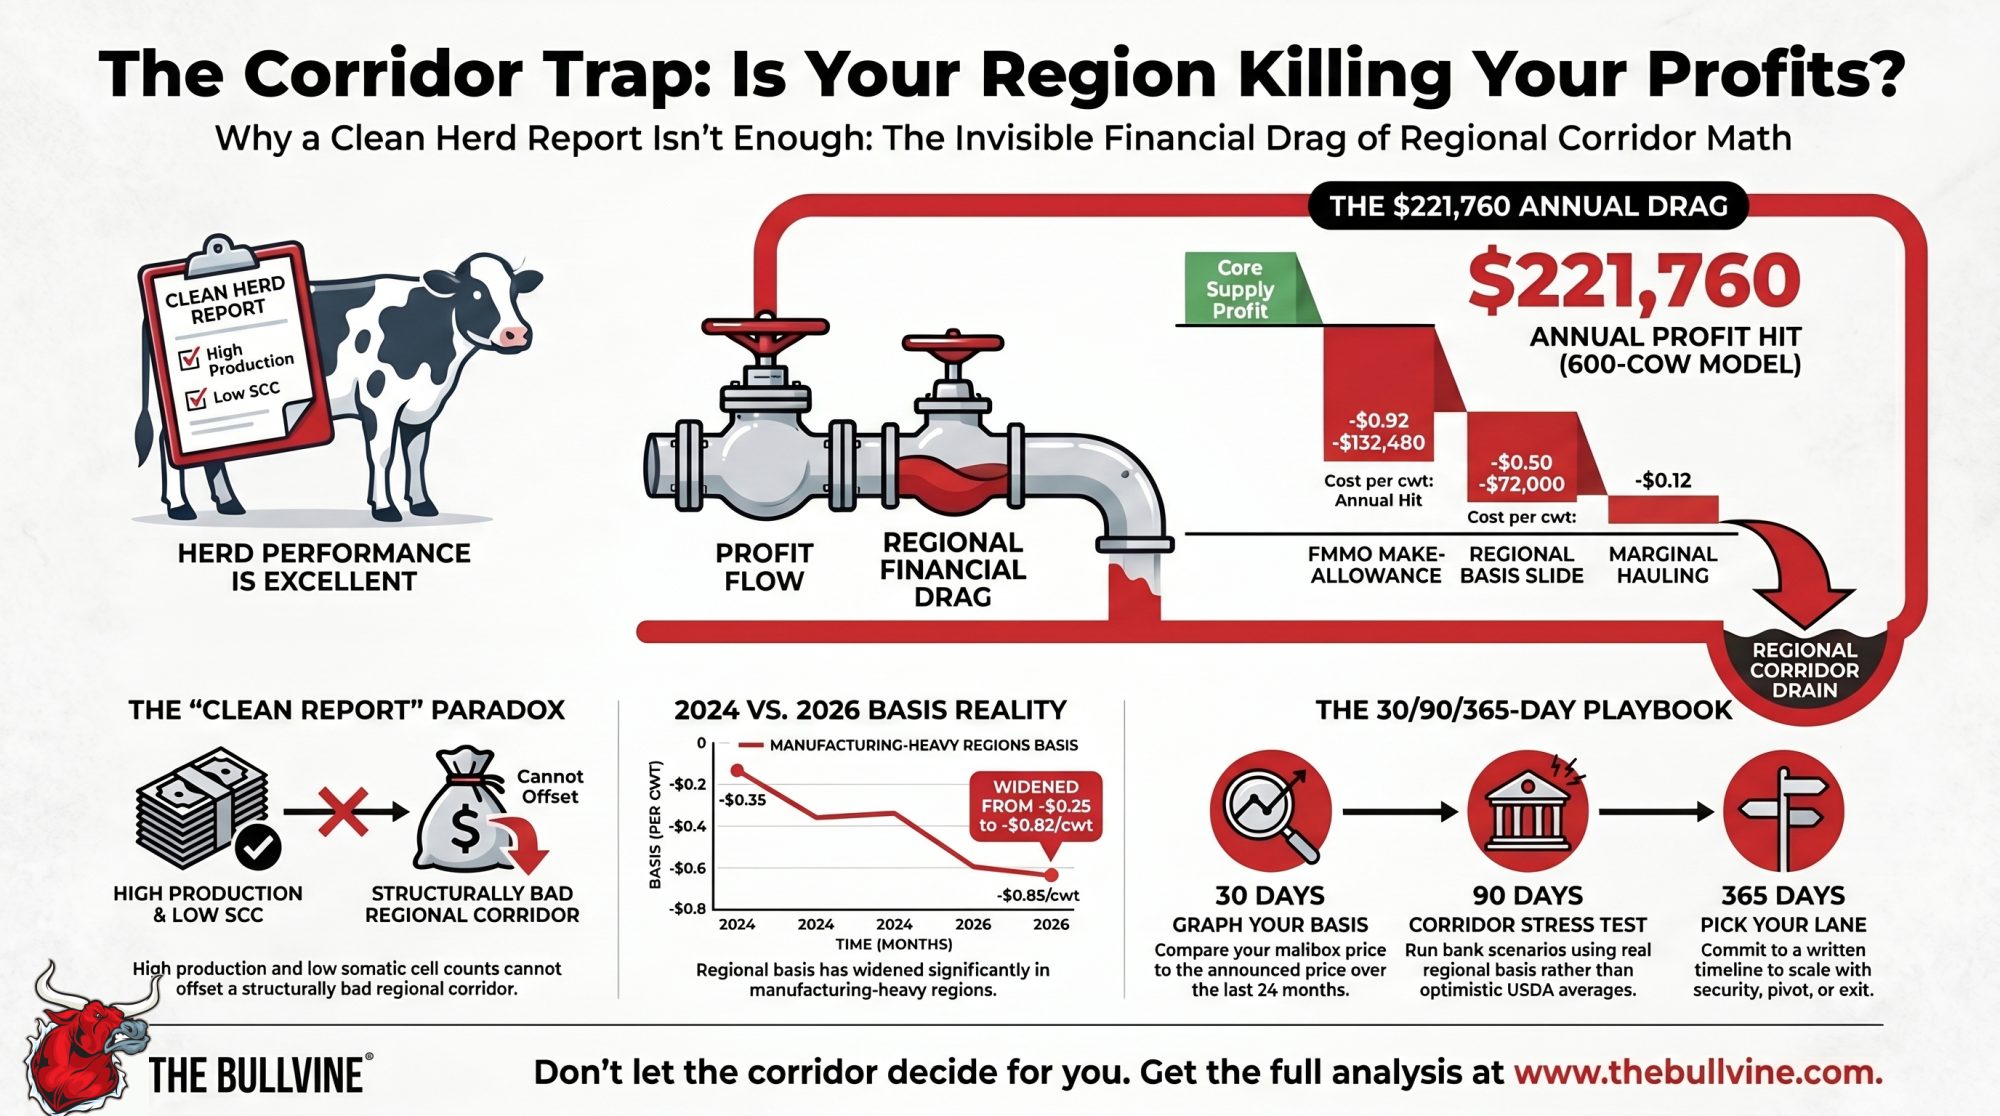
Same cows. Same management. A different corridor — and a $221,760 annual drag. Basis went from ‑$0.35 to ‑$0.85/cwt while the FMMO make‑allowance took another $0.92 off Class III. The herd report still looks clean.

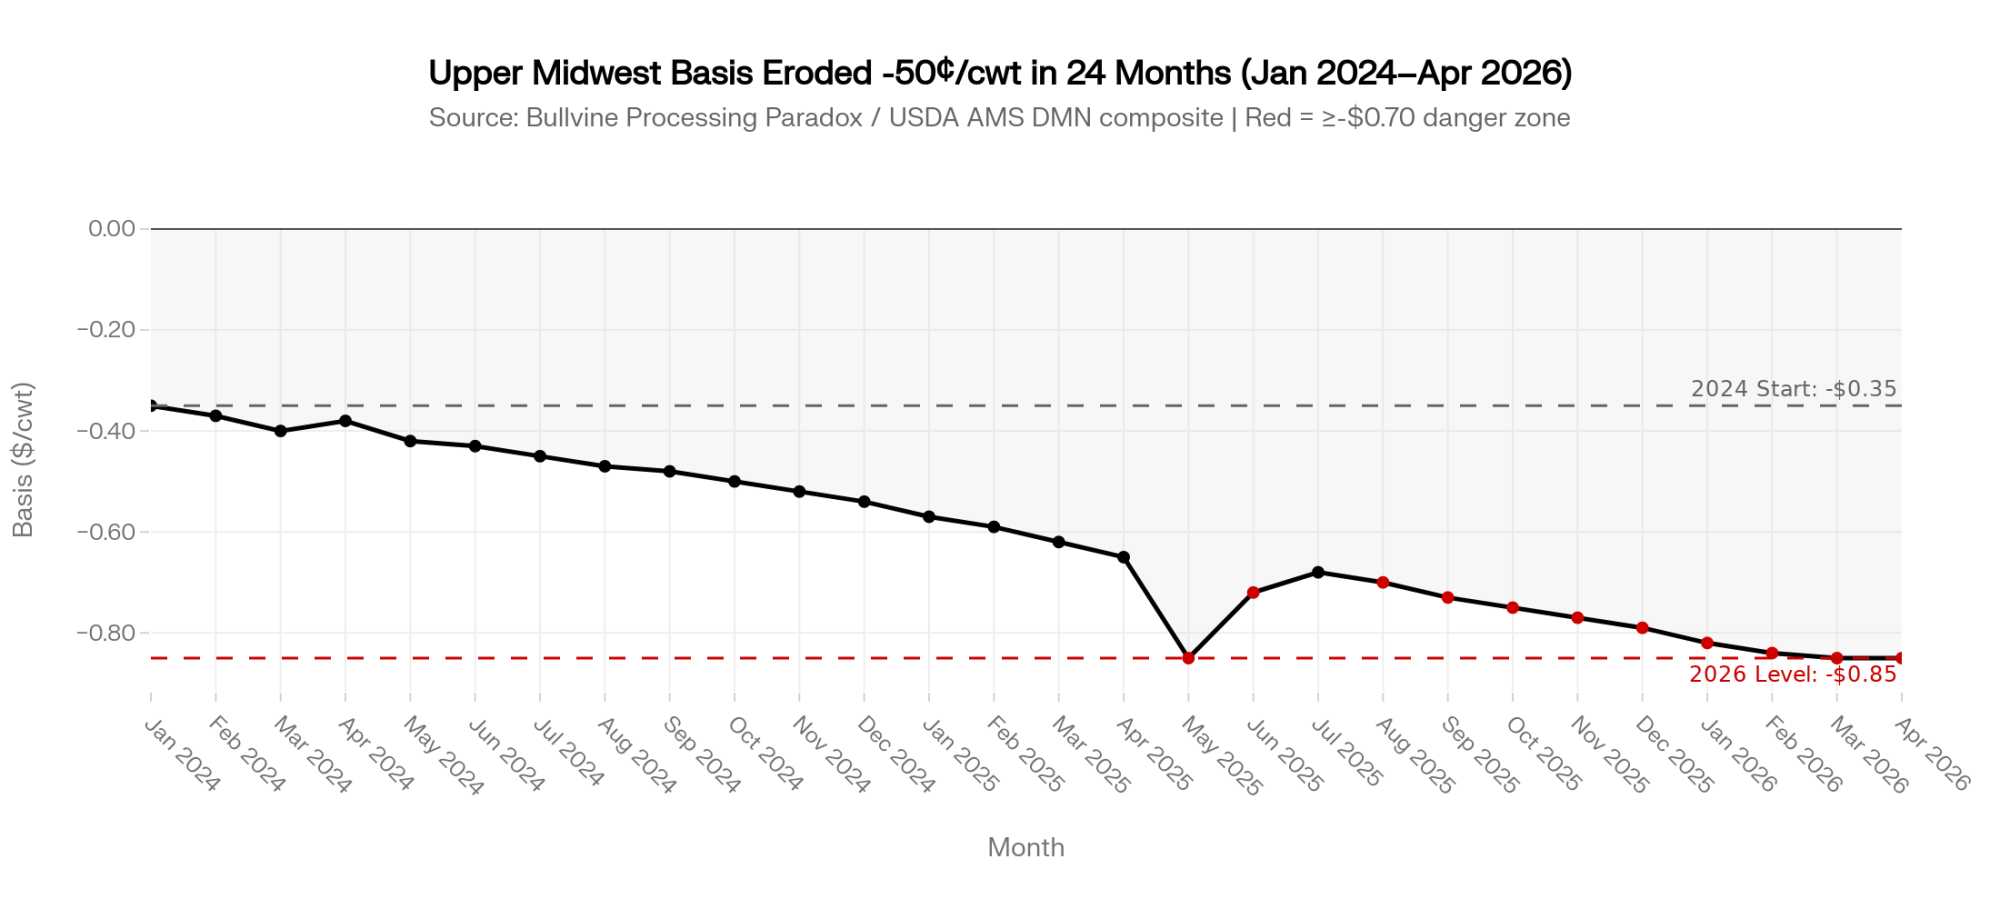
On a 600‑cow Upper Midwest dairy we’ll call Maple Ridge, the all‑in basis on the milk check has moved from roughly ‑$0.35/cwt in 2024 to about ‑$0.85/cwt in early 2026. Same cows. Same management. A different corridor.

USDA ERS’s April 2026 Livestock, Dairy, and Poultry Outlook puts 2026 all‑milk near $20.40–$20.50/cwt, while CME Class III futures for mid‑2026 contracts have traded mostly in the mid‑$16s to upper‑$17s through early Q2 2026 sessions. That $2–$3/cwt gap is the budget anchor argument every dairy lender is now having. Maple Ridge’s gap isn’t on the screen. It’s on the milk check.

Maple Ridge is a composite operation drawn from Bullvine reporting and the Processing Paradox 2024–2026 dataset, used here so we can show real numbers without exposing a real farm’s milk check. The rule‑change inputs are verified against published USDA and Bullvine analysis. The herd‑level inputs are illustrative. Plug in your own.

A 2,000‑cow Western dairy we’ll call Dos Arroyos — also a composite, modeled on the kind of core‑supply contracts Bullvine has documented along the High Plains and I‑29 corridor — is staring at the same kind of basis pressure and adding 400 cows anyway. The processing capacity dairy 2026 question lives right in the gap between those two decisions.

This isn’t a story about milk per cow. It’s about whether your region’s plants want your next pound or not.

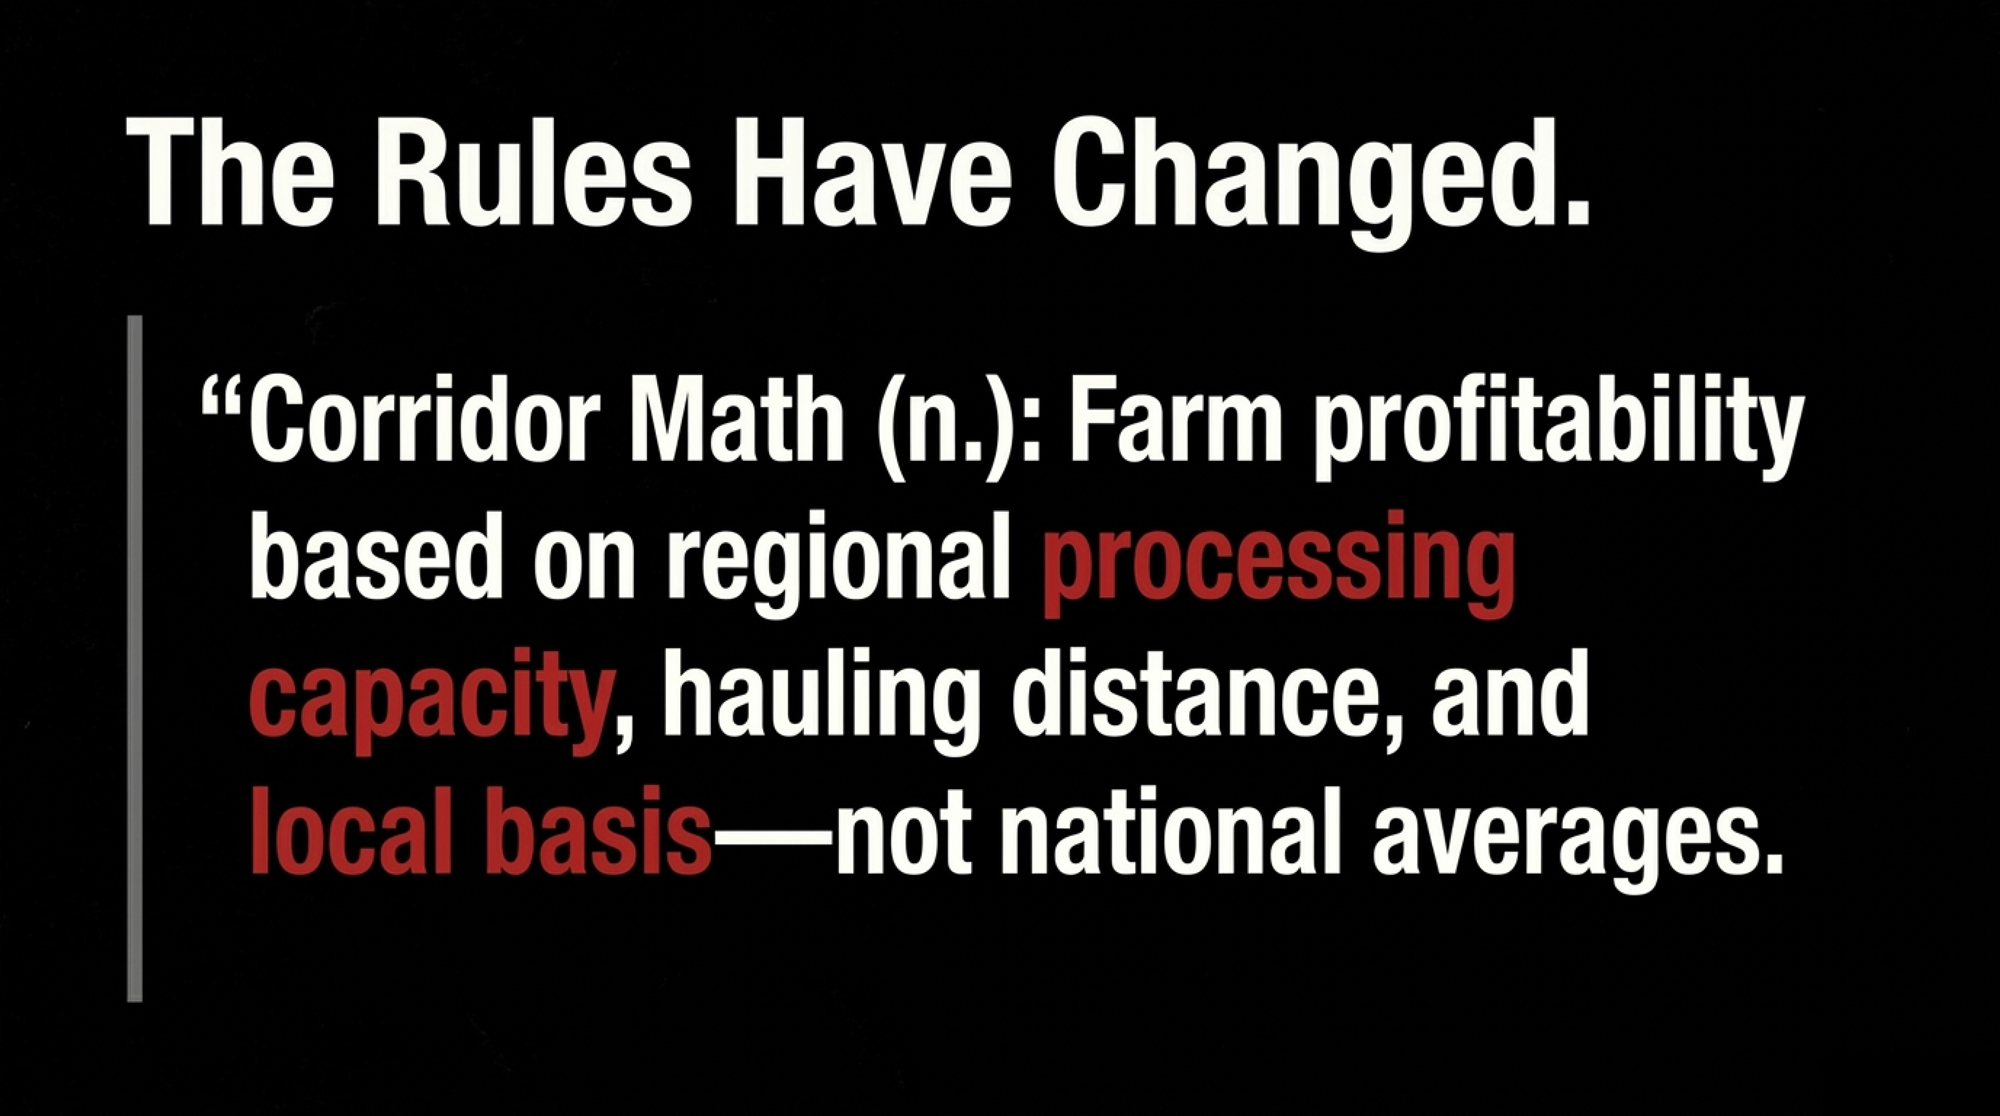
Bullvine Definition — Corridor Math (n.): The calculation of farm profitability based on regional processing capacity, hauling distance to marginal plants, and local basis, rather than national Class III averages. Two farms with identical herd reports can sit on opposite ends of Corridor Math if their plants, hauling lanes, and basis trends diverge.

Quick note for Ontario and Canadian readers: Corridor Math applies under supply management too. The levers change — base allocation, P5 pooling, plant access, CDC pricing signals — but the question is the same: does your buyer’s plant want your next hectolitre, and at what net mailbox price?

How Maple Ridge’s $221,760 Annual Drag Hid Inside a Clean Herd Report

Maple Ridge ships into a cheese‑heavy Upper Midwest milkshed inside Federal Order 30. Components are solid, somatic cell count is low, and debt per cow sits under the $3,500/cow “strong” threshold cited in Cornell PRO‑DAIRY Dairy Farm Business Summary–style benchmarks referenced in the Processing Paradox analysis (Cornell PRO‑DAIRY DFBS, 2024 edition). By the herd report, nothing’s wrong.

The corridor changed around them.

  • Bullvine’s Processing Paradox reporting — drawing on USDA AMS Dairy Market News and operator public statements — documented reduced weekend and overtime processing at several Upper Midwest cheese plants through 2024–2025, alongside tighter volume caps and base‑excess plan use. Operators cited labor and energy costs.
  • Regional herd consolidation in the same buyer’s draw radius tightened the local milk‑to‑capacity ratio over 2024, consistent with the relocation and consolidation patterns Bullvine has documented along the I‑29 corridor.
  • USDA AMS Dairy Market News reported Midwest spot Class III milk trading flat to as much as $7.00 under Class III during the spring 2025 flush cycle, with the deepest discounts in the week ending May 2, 2025 (USDA AMS DMN, April–May 2025 weekly issues).

Stack those forces and a 50¢/cwt basis slide isn’t a mystery. It’s the price tag on a corridor that quietly went long on milk.

The 2025 FMMO modernization sits on top of all this. Bullvine’s April 2026 analysis, The New FMMO Rule Costs a 500‑Cow Dairy $97,750 a Year, pegs the make‑allowance update at roughly $0.85–$0.93/cwt off Class II–IV values once fully phased in, with Class III near $0.92/cwt, based on USDA AMS, Final Rule on Amendments to Federal Milk Marketing Orders (January 2025) and the University of Wisconsin Extension review of the AMS final decision (2025). That’s before a single mile of freight. Before basis. Before a balancing fee.

Deep Dive → The New FMMO Rule Costs a 500‑Cow Dairy $97,750 a Year — Tier 3 pillar, April 2026.

What Does a 50¢/cwt Basis Slide Actually Cost a 600‑Cow Dairy in 2026?

This is where you stop talking corridors and run the numbers like your banker would.

The Maple Ridge 2026 Reality — 600 Cows, Upper Midwest, Illustrative Composite

Factor2024 Impact (per cwt)2026 Impact (per cwt)Annual Bottom‑Line Shift vs 2024
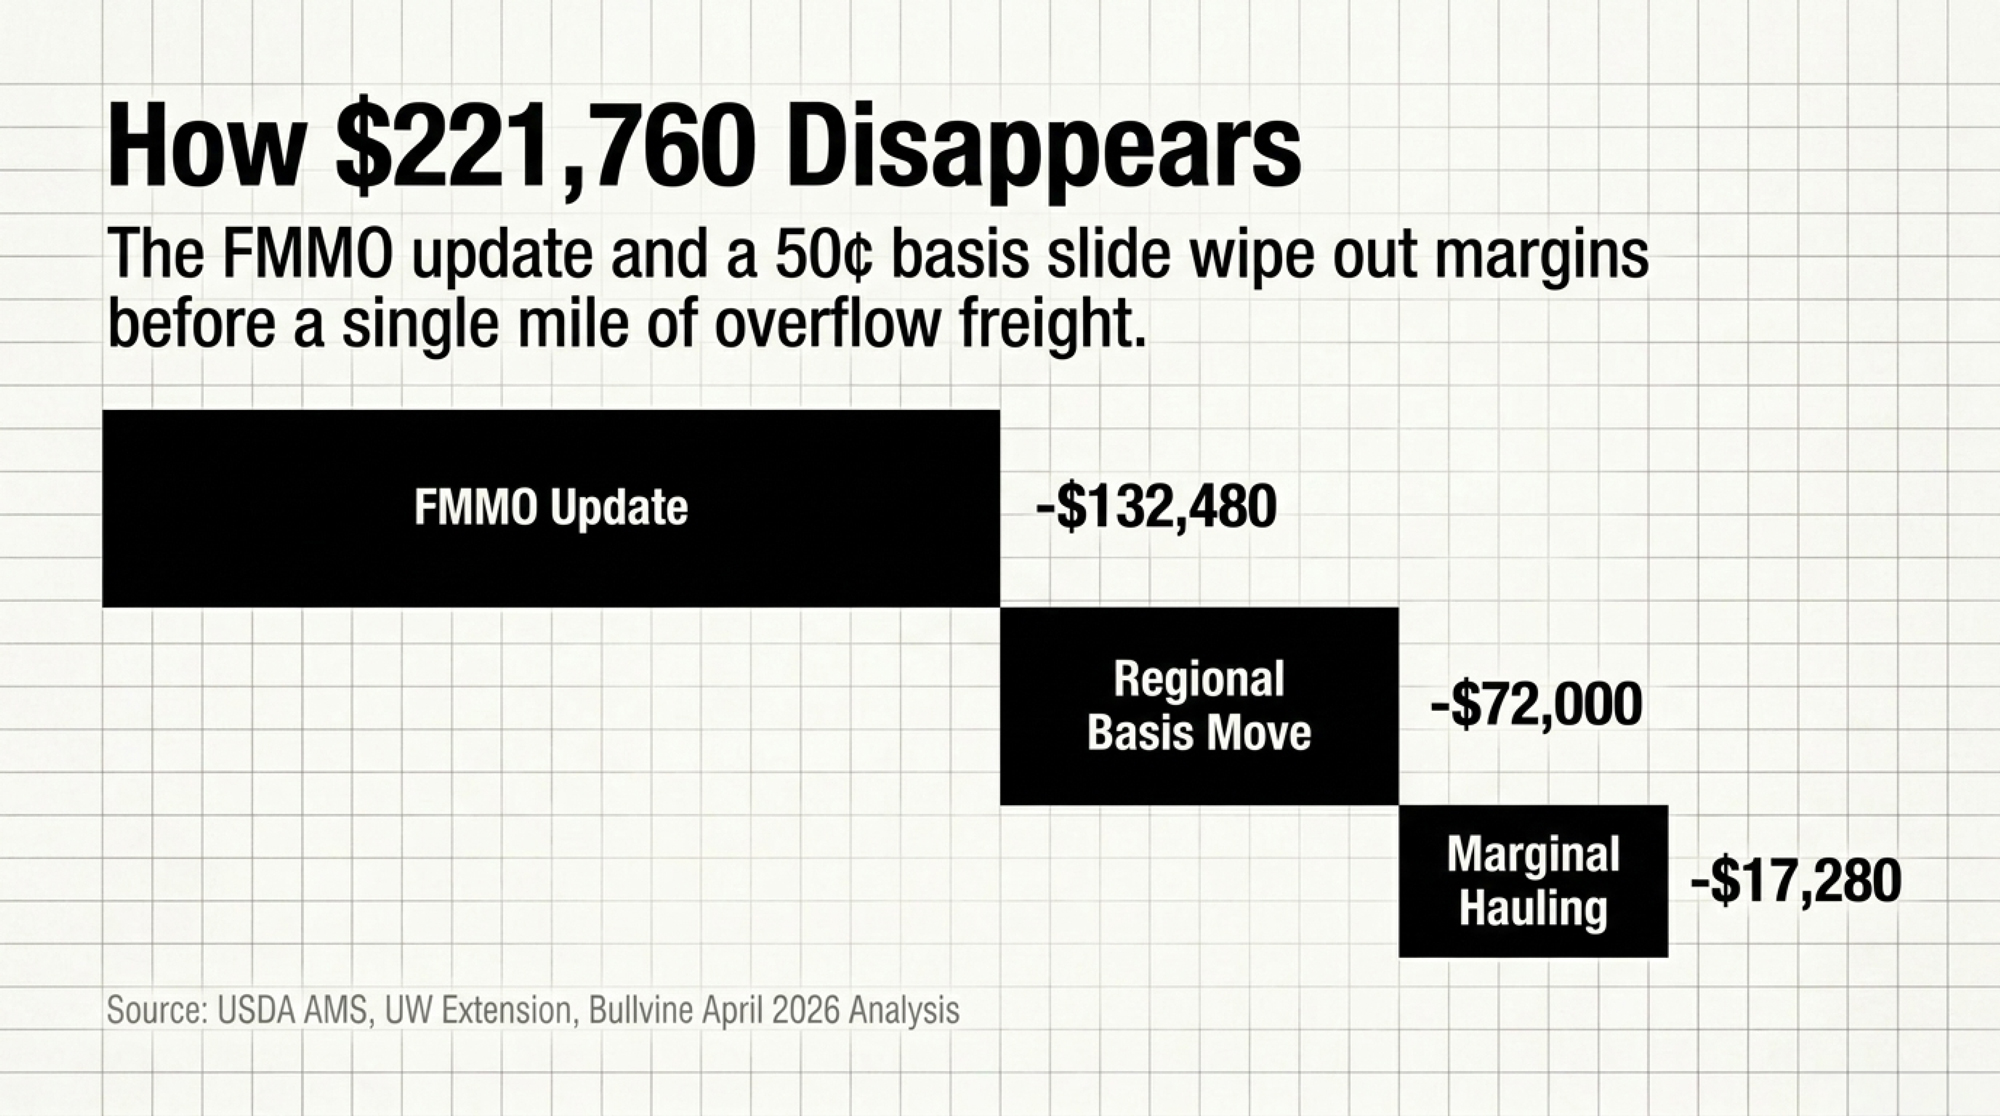
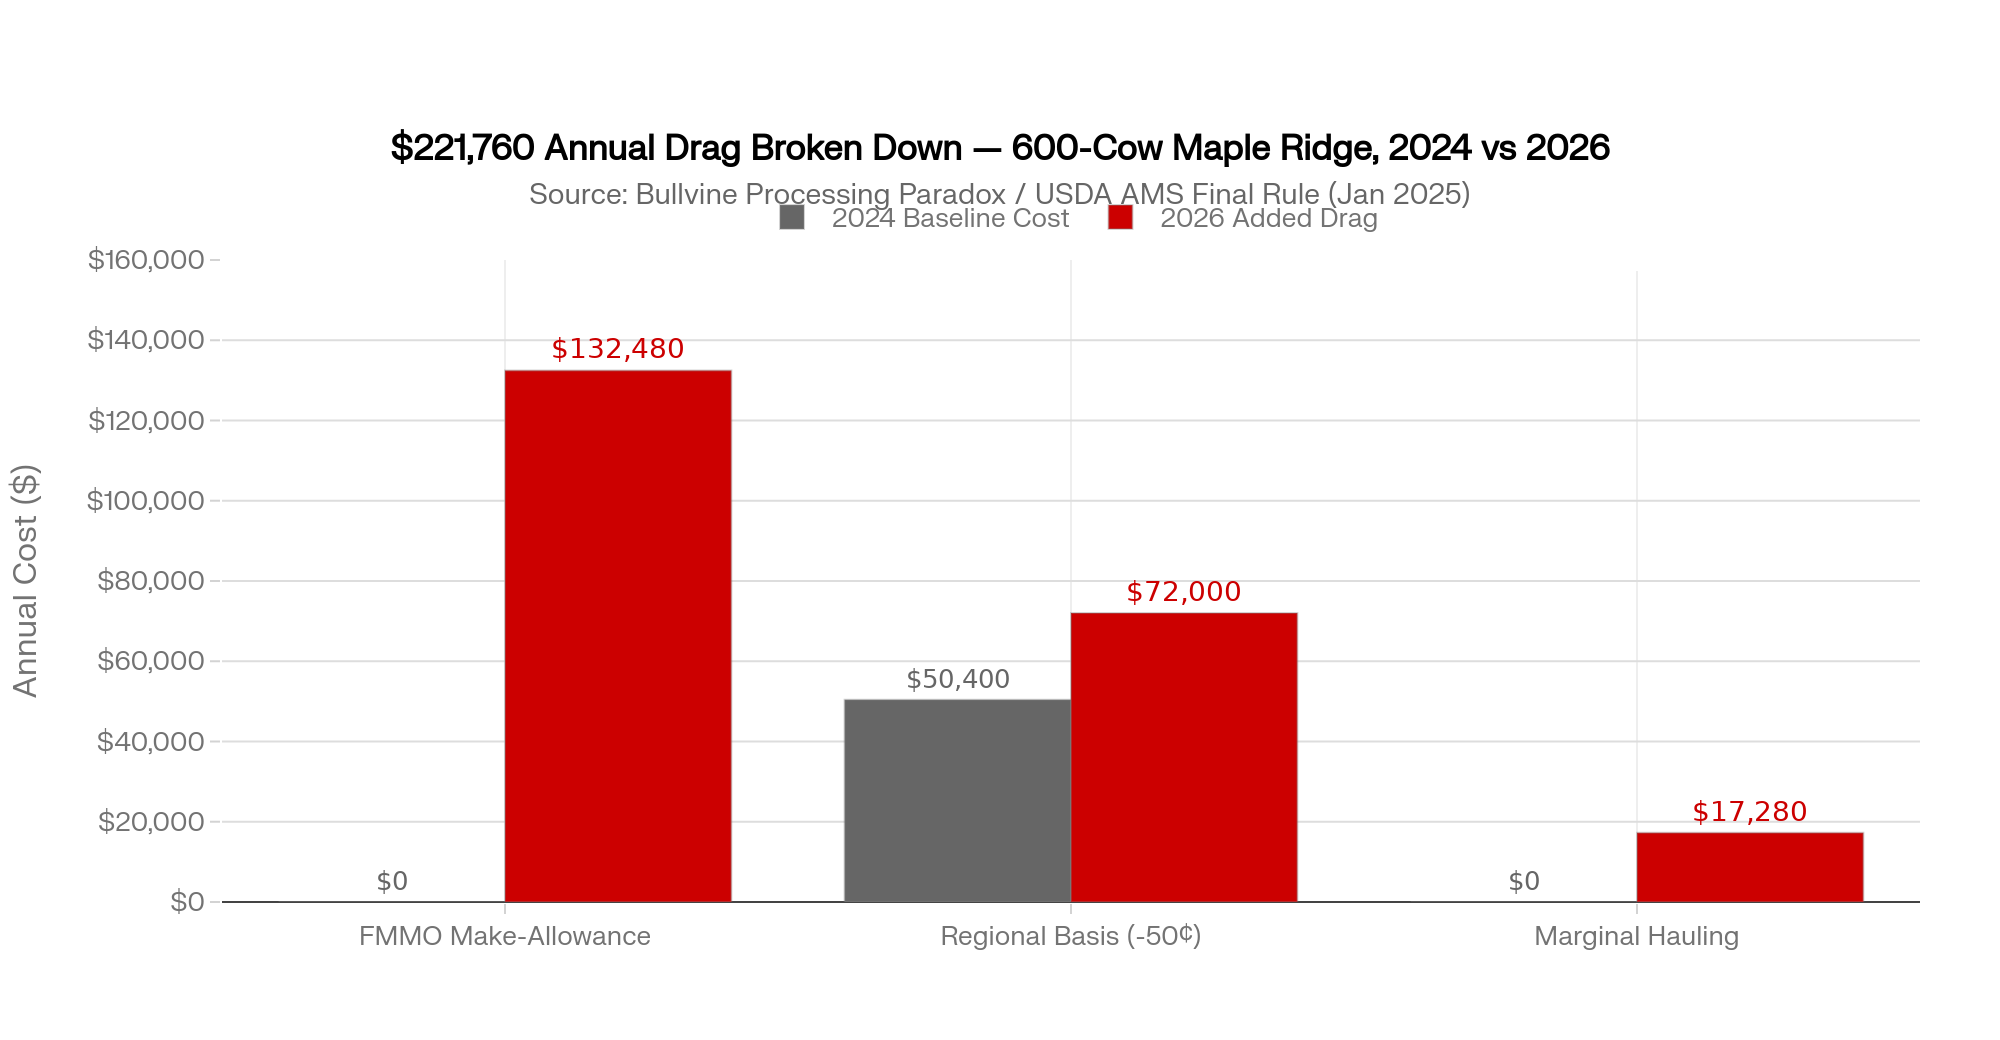
FMMO Make‑Allowance$0.00(‑$0.92)(‑$132,480)
Regional Basis(‑$0.35)(‑$0.85)(‑$72,000) on the 50¢/cwt move
Marginal Hauling (weighted)*$0.00(‑$0.12)(‑$17,280)
Total Drag vs 2024 Baseline(‑$0.35)(‑$1.89)(‑$221,760)

Weighted across marginal loads, assuming ~30% of volume moves as overflow at an extra $0.40/cwt above the $0.80/cwt core rate documented in the Processing Paradox dataset. At a 15% marginal share, the hauling line is closer to ‑$0.06/cwt, or about ‑$8,640/year.

How to read this table: The Regional Basis line shows the delta vs 2024 — the 50¢/cwt move, not the full 2026 basis cost. The Total Drag row sums the 2026 deltas against that 2024 baseline.

Running the Numbers — Maple Ridge, 600 Cows, Upper Midwest, 2024 vs 2026 (illustrative composite)

Verified inputs: USDA NASS Milk Production 2025 annual production averages; USDA AMS Final Rule on Amendments to FMMOs (January 2025); UW Extension AMS final‑decision review (2025); Bullvine April 2026 New FMMO Rule analysis; Bullvine Processing Paradox 2024–2026 dataset. Illustrative inputs: Maple Ridge’s herd‑level basis trend, marginal‑load share, and hauling differential. Plug in your own numbers and your own statements.

  • Herd: 600 milking cows, Upper Midwest, manufacturing‑heavy FMMO.
  • Production: ~24,000 lb/cow/year, in line with the 24,390 lb 2025 U.S. average from USDA NASS Milk Production (2025).
  • Annual shipped: 600 × 24,000 lb = 14.4 million lb = 144,000 cwt/year.

Industry rule‑change impact: 144,000 cwt × $0.92/cwt FMMO Class III hit = ~$132,480/year.

Corridor basis impact: $0.50/cwt move × 144,000 cwt = ~$72,000/year.

Marginal hauling drift (illustrative scenarios):

  • Scenario A — 15% marginal: 144,000 × 0.15 × $0.40 = ~$8,640/year.
  • Scenario B — 30% marginal: 144,000 × 0.30 × $0.40 = ~$17,280/year.

Combined drag range: ~$213,000–$222,000/year, against an operation that hasn’t changed cows, ration, or management since 2023.

Scale the basis‑only piece to your herd:

  • 400 cows shipping ~96,000 cwt: 50¢/cwt basis move = ~$48,000/year.
  • 1,000 cows shipping ~240,000 cwt: same move = ~$120,000/year.

The herd report didn’t flinch. The mailbox check did. That’s the gap most barn KPIs aren’t built to catch.

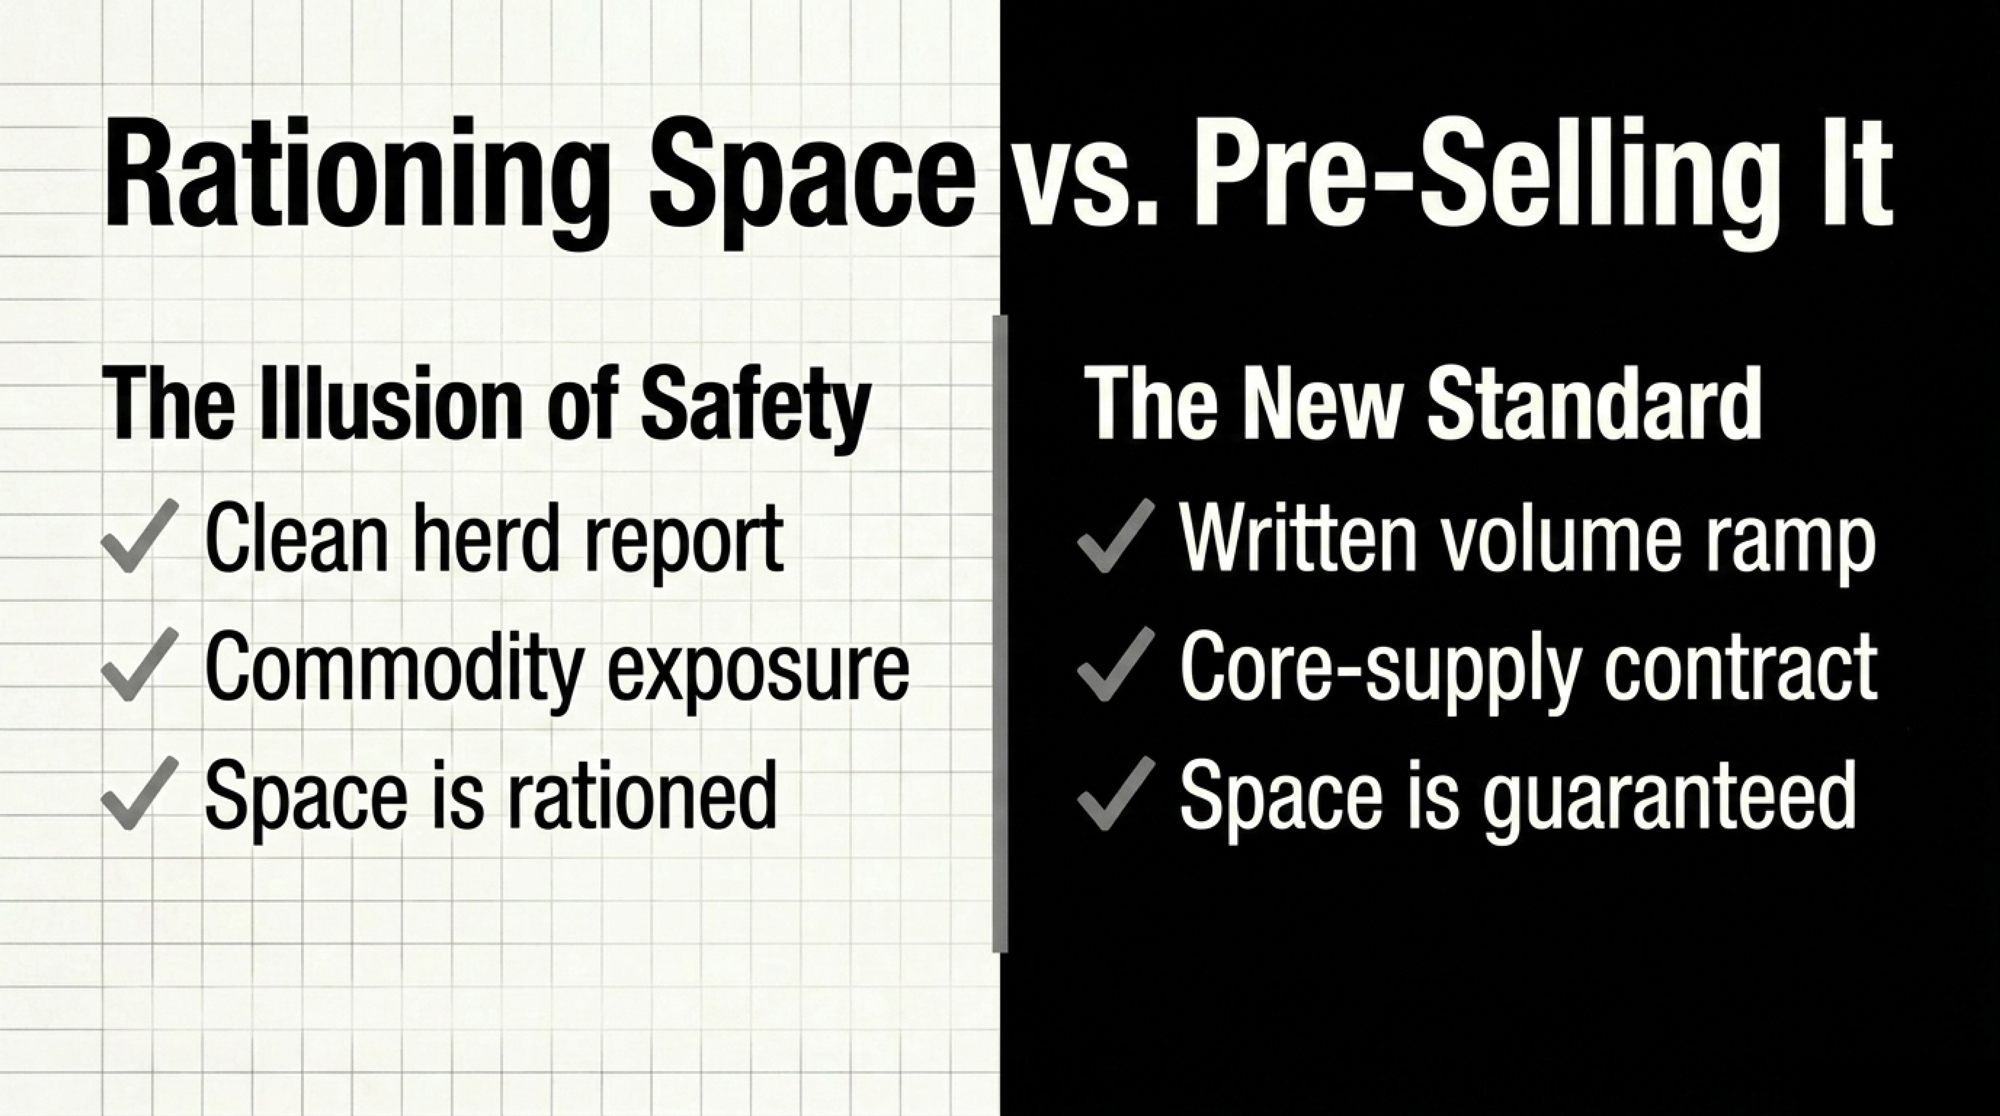
The Continental Divide: Rationing Space vs Pre‑Selling It

While the Upper Midwest is rationing space, the High Plains is pre‑selling it. The difference isn’t the cows. It’s the contract.

FactorMaple Ridge (Upper Midwest)Dos Arroyos (High Plains/I-29)
Herd size600 cows2,000 cows (+ 400 planned)
Federal OrderFO-30 (cheese-heavy)High Plains / non-pooled
2026 All-in Basis-$0.85/cwt~-$0.35/cwt (core supply)
FMMO Class III impact-$0.92/cwt (2025 rule)-$0.92/cwt (same rule)
Marginal hauling (overflow)$1.10–$1.20/cwt<$0.80/cwt within 60 mi
Plant capacity statusRationing / base-excessPre-sold / volume ramp
Core supply statusSwing/dispensableWritten core-supply contract
Total 2026 annual drag vs 2024-$221,760Largely offset by contract premiums
Robot/capex DSCR (corridor case)1.05–1.10× (yellow light)>1.25× (green)
Strategic pathPivot, exit, or repositionScale with concrete
Regional farm count trend-630 farms, 2022–2025Expansion corridor

Most producers can name the bull behind their best heifer. Few can name the closest plant project in their draw radius. Dos Arroyos can.

Their state, by the headline numbers in Processing Paradox 2024–2026 (USDA NASS state‑level Milk Production, 2014 vs 2024), looks bad. New Mexico shed roughly 2.2 billion pounds of annual milk and about 83,000 cows over that decade. California gave back more than 2.0 billion pounds and around 72,000 cows. The Ogallala Aquifer projection — up to 70% of the aquifer’s saturated thickness potentially unusable in the Texas Panhandle expansion zone within 20 years, per the Texas Tech and USGS‑linked aquifer research cited in Processing Paradox — isn’t a footnote.

Their corridor still tells a different story.

Dos Arroyos isn’t ahead because they’re better farmers. They’re ahead because they bought Processing Security in writing before they bought concrete. The era of producing milk and hoping for a check is over inside their basin.

The corridor’s public cheese build‑out — Hilmar (Lubbock, TX project announced 2021), Leprino (Lubbock, TX complex announced 2022), and Valley Queen (Milbank, SD expansion announced 2022) — sets the public context, per each operator’s project announcements and Processing Paradox.

The contract terms described below are a Bullvine composite of corridor practice, drawn from Processing Paradox. They are not attributable to Hilmar, Leprino, Valley Queen, or any other named processor.

  • Dos Arroyos’s milk feeds into the $1.6 billion High Plains and I‑29 cheese build‑out underway since 2020.
  • Their 2025 supply agreement, as composited from Processing Paradox, carries defined base‑excess terms, component premiums tied to plant product mix, and a written volume ramp.
  • That ramp is what makes the 400‑cow expansion pencil. In the composite, throughput is committed in writing before concrete is poured. The base‑excess clause prices growth pounds inside core‑supply terms for the duration of the ramp, not at swing‑load discounts.
  • Their marginal load travels under 60 miles to a plant still bidding for volume, not rationing it.

The assumption that “Western dairy is doomed” doesn’t survive a corridor‑level read. The assumption that Upper Midwest dairy is structurally safe because it’s always been there doesn’t either. The Upper Midwest lost roughly 630 farms between 2022 and 2025 while regional milk climbed to 43.2 billion pounds (Bullvine Processing Paradox, drawing on USDA NASS, 2024–2026). The volume stayed. The mid‑size families didn’t.

Must‑Read → The $11 Billion Dairy Rush: Growth Corridor or Dead Zone? — Tier 3 hidden gem.

Why Maple Ridge’s Owner Stopped Trusting the Old Lender Spreadsheet

The turn for Maple Ridge came in early 2026, in a robotic milking conversation with a regional ag lender.

The opening was familiar. Rolling 12‑month averages. A USDA‑style price near $20.40/cwt for 2026, pulled from ERS and WASDE ranges. A generic stress test at $15/cwt with a flat ‑$0.25/cwt basis. Ag operating loans in the mid‑7% range, consistent with the lender environment Federal Reserve district and Purdue Center for Commercial Agriculture outlooks have tracked through late 2025 and into early 2026.

On those numbers, robots penciled.

Maple Ridge’s owner put three different numbers on the table.

  • A real trailing 24‑month all‑in basis: ‑$0.85/cwt, not ‑$0.25/cwt.
  • Marginal hauling reality from this composite operator’s dispatch profile: about $1.10–$1.20/cwt on overflow loads, versus the $0.80/cwt core rate documented across Processing Paradox herds.
  • Post‑FMMO Class III math reflecting the ~$0.92/cwt make‑allowance hit per the UW Extension review and the Bullvine April 2026 analysis, instead of pre‑2025 class values.

Bullvine’s 2025–2026 lender reporting describes the same pattern in plainer terms. The binding constraint isn’t a lower headline price. It’s a lower effective floor once basis, hauling, and post‑FMMO Class values are layered in.

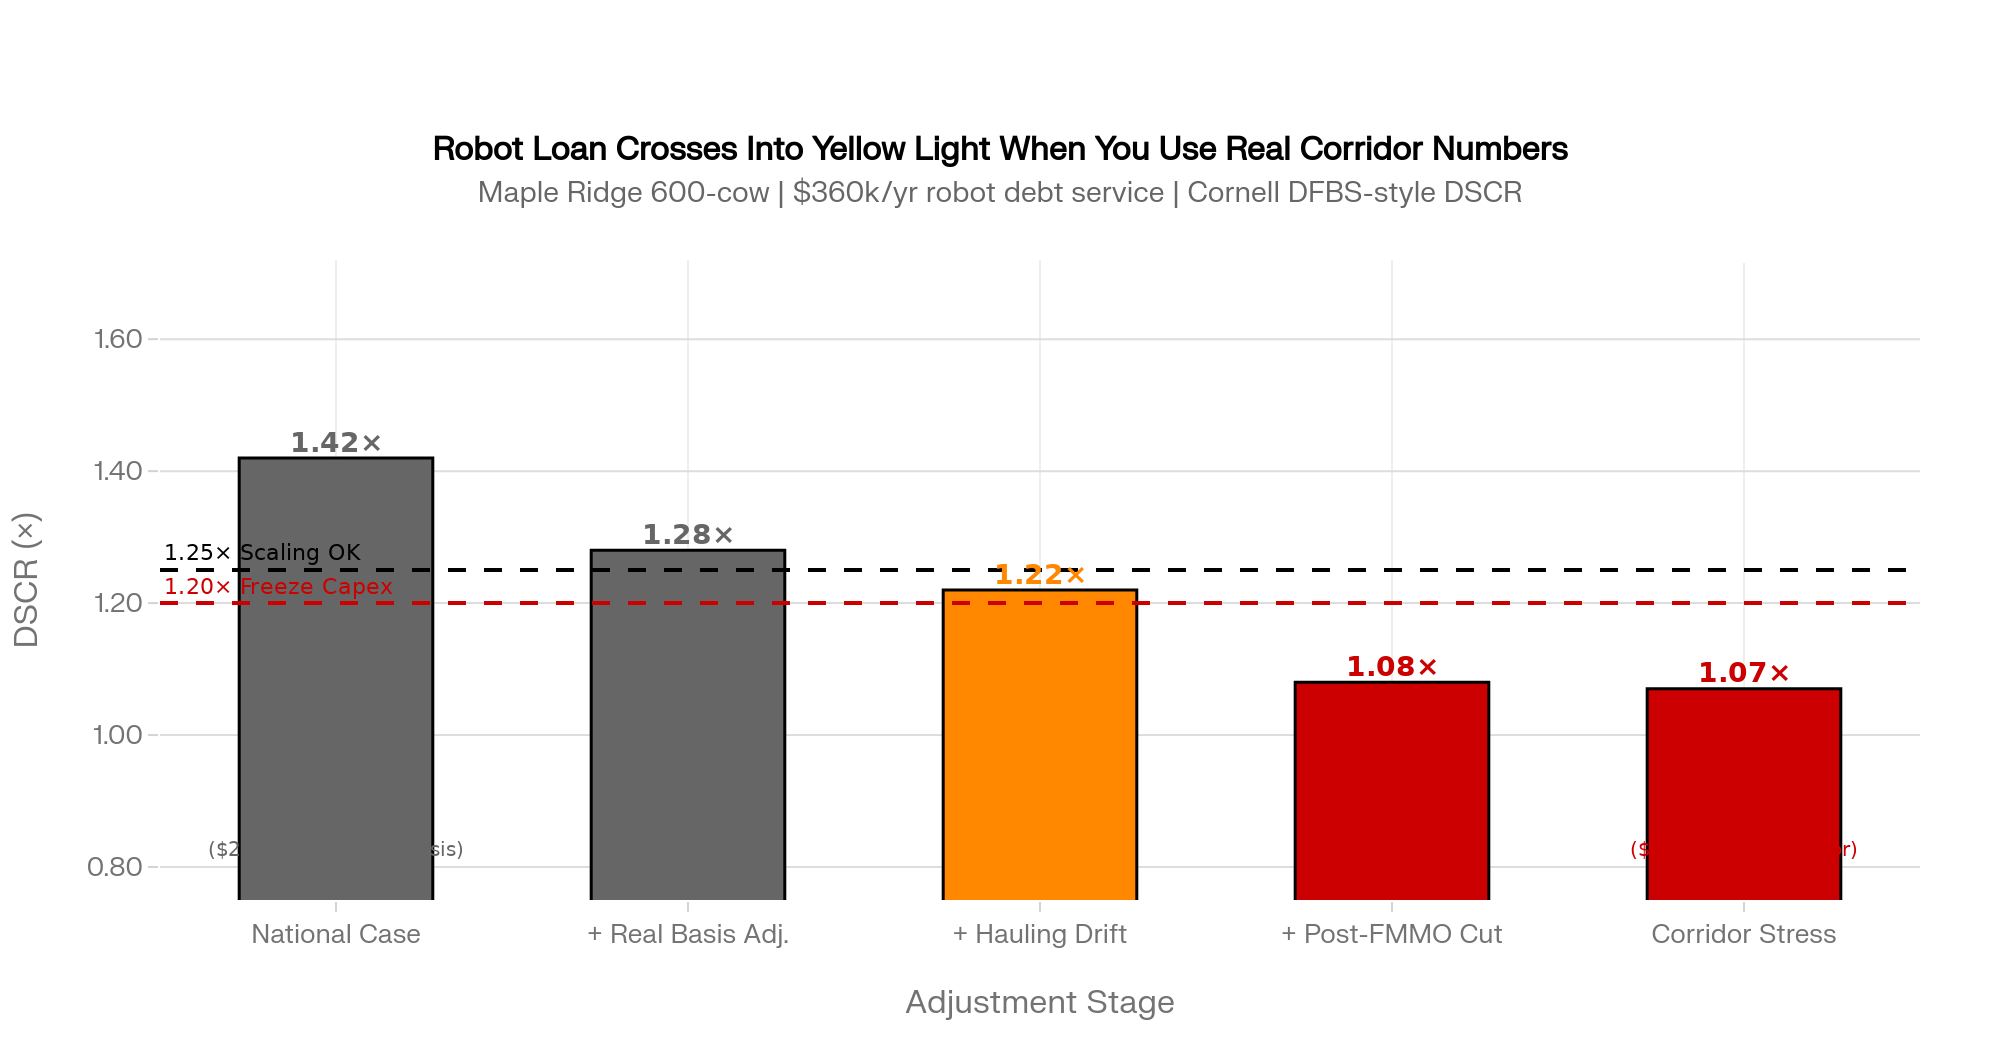
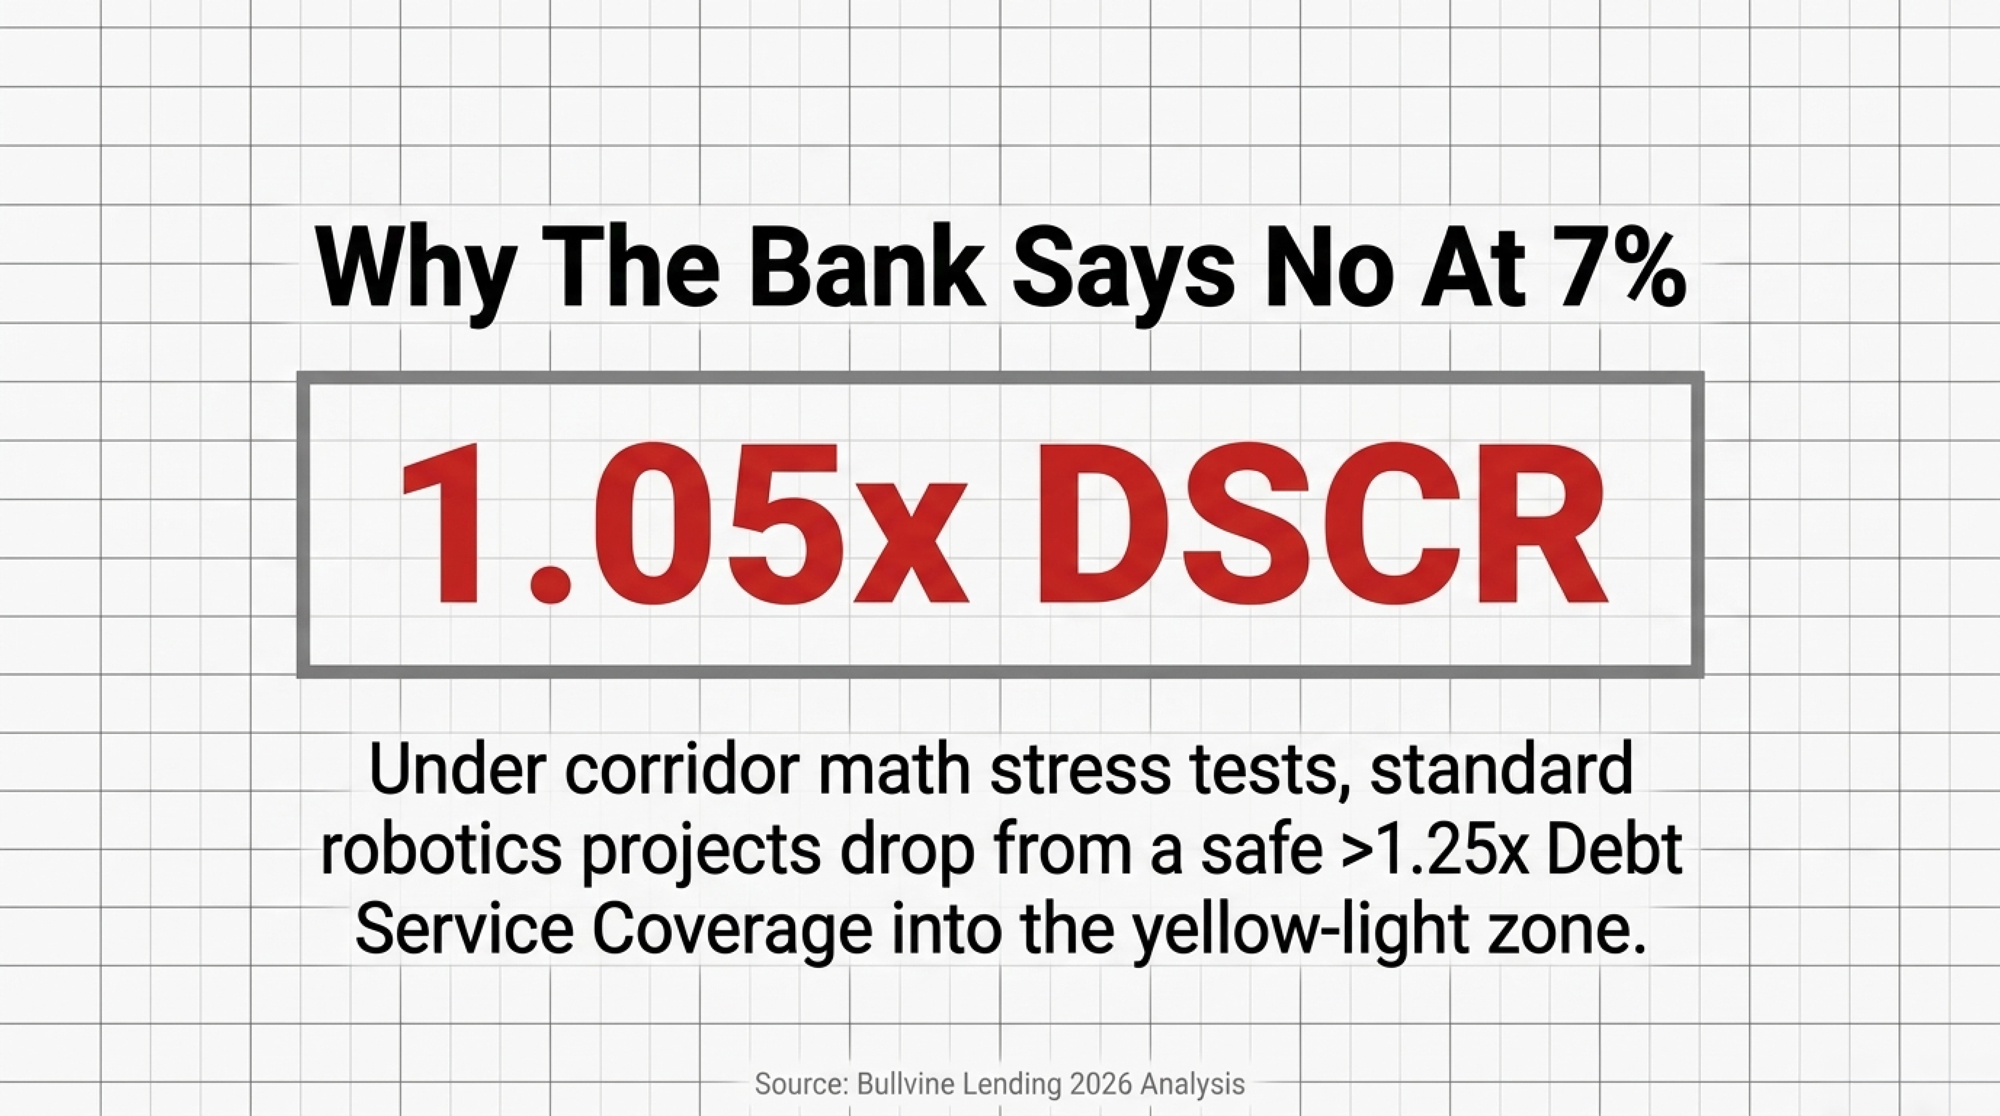
A robotic milking project at this herd profile typically carries roughly $360,000/year in annual debt service on the parlor and related infrastructure portion of the loan, drawn from Bullvine’s prior reporting on robotic ROI in the 300–600 cow range and standard amortization on 7%‑range term money. Re‑run with the corridor inputs above against that debt service, the project moved from comfortably above 1.25× DSCR into the 1.05–1.10× range under a $15/cwt corridor stress case — the “yellow light” zone Cornell DFBS‑style benchmarks (referenced in Processing Paradox) flag for tighter scrutiny.

The DSCR shift is illustrative. The inputs that drove it are real: the basis trend, the marginal hauling, the post‑FMMO Class values, and the debt service.

The robots didn’t become impossible. They became a different decision.

The question is no longer “how do we squeeze more milk out of this barn.” It’s “do we want to leverage 7%‑range money against a corridor that’s losing capacity, or use that equity to reposition?”

Deep Dive → Dairy Lending 2026: Why Your Banker Says No at 7% Money — prior Tier 3 economics analysis.

What Maple Ridge’s 24‑Month Basis Trend Means For Your Operation

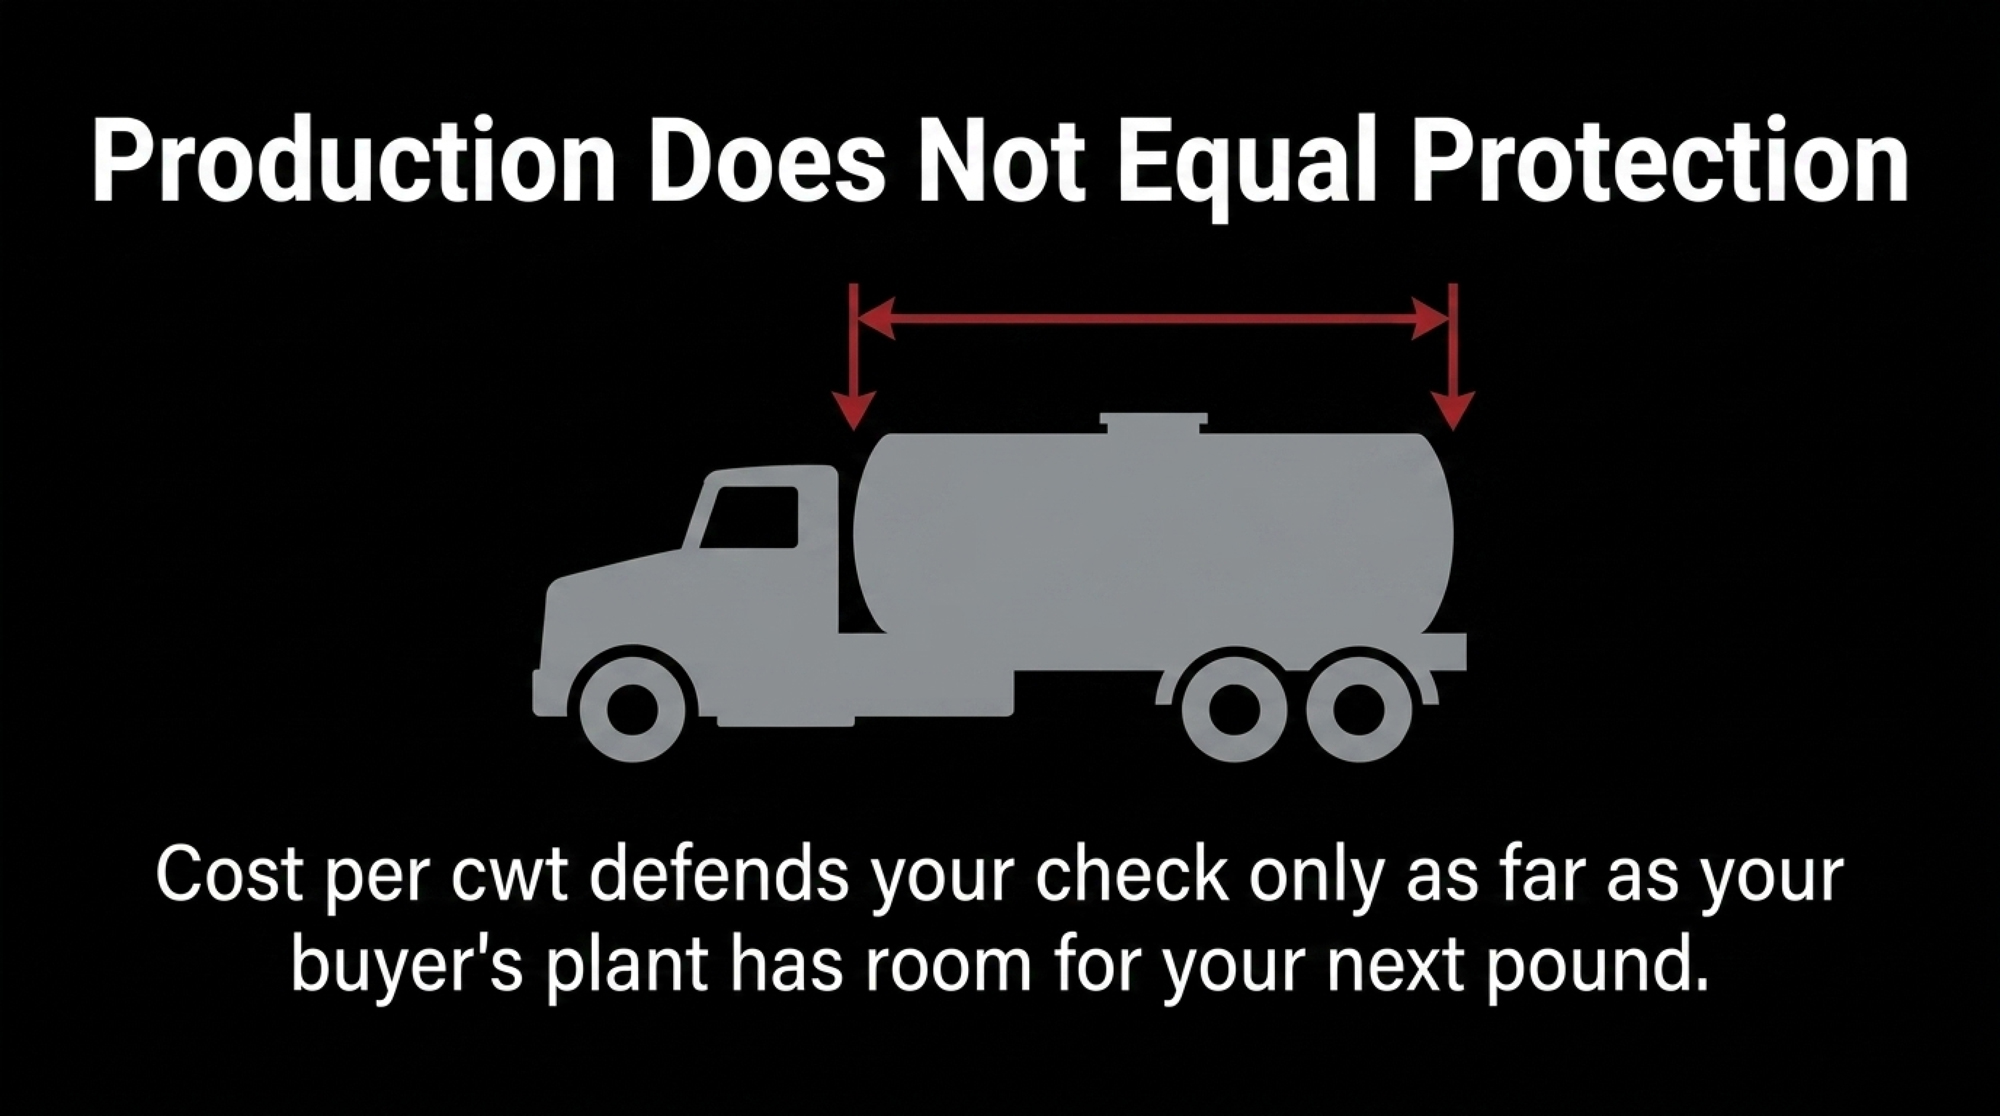
Maple Ridge’s herd report stayed clean while its corridor quietly repriced every cwt. That’s the lesson worth carrying off this page: cost per cwt and milk per cow defend the milk check only as far as your buyer’s plant has room for your next pound. Corridor structure decides how much of any cost or component advantage you actually keep.

There are three honest paths from here, and you don’t get to skip the diagnosis to pick one.

  • Scale with a processor. Real only if your buyer puts core‑supply status, base terms, and component premiums in writing, and your corridor‑aware DSCR holds.
  • Pivot to a premium or niche channel. Smaller volume, higher complexity, slower onboarding, but partial escape from commodity basis.
  • Plan an orderly exit or relocation. Preserves equity in a structurally bad basin; forecloses generational continuity in the existing barn.

The trade‑off underneath all three: speed of decision versus depth of corridor diagnosis. Move too fast and you lock in the wrong path. Stall and the basis keeps deciding for you.

The 30/90/365‑Day Playbook for Herds Like Maple Ridge’s

Adapt the thresholds to your own statements and your own basin. Don’t copy them.

30‑Day Actions — urgent checks

  • Pull 24 months of milk checks and graph all‑in basis: mailbox − announced price, including hauling and any “marketing” or “balancing” adjustments.
    • Requires: bookkeeping time, statements, a spreadsheet.
    • Red‑flag trigger: basis widened by more than 25¢/cwt over 18 months without a corresponding national price move.
    • Backfire risk: averaging across very different months hides flush‑season pain. Look at flush separately.
  • Separate loads into core versus marginal. Calculate actual hauling cost per cwt on overflow loads.
    • Requires: dispatch tickets, co‑op statements, an hour of cross‑checking.
    • Red‑flag trigger: marginal‑load hauling 50% or more above your core rate.
    • Watch for: milk‑check formats that combine freight with basis or place it under “other,” making marginal hauling hard to isolate.
  • Confront your field rep with three direct questions, on the record. Are we core, swing, or dispensable supply over the next 5–10 years? Where do our marginal loads physically go, and at what discount, when milk is long? What plant additions or closures are in your 3–5‑year network plan?
    • Requires: one meeting, no spin in your own answers.
    • Red‑flag trigger: vague answers or “we’ll get back to you” on all three.
  • Escalate if your DSCR has been under 1.20× for three straight months on your lender’s or CPA’s standard method. This list moves to the top of the next 30 days.

90‑Day Actions — structural adjustments

InputStandard Lender ModelCorridor-Aware ModelDifference
All-milk price used$20.40–$20.50/cwt (USDA ERS 2026)$15.00/cwt (corridor floor)-$5.40–$5.50/cwt
Basis assumption-$0.25/cwt (generic flat)-$0.85/cwt (trailing 24-month actual)-$0.60/cwt
FMMO Class III valuesPre-2025 class valuesPost-rule: -$0.92/cwt make-allowance-$0.92/cwt
Marginal hauling %0% (core rate only)15–30% of volume at overflow rate+$0.06–$0.12/cwt
Effective floor (combined)~$20.15/cwt~$13.71/cwt-$6.44/cwt
Robot project DSCR result>1.25× ✓ (pencils)1.05–1.10× ✗ (yellow light)Crosses freeze threshold
Capex decisionProceedFreeze or resizeMaterial divergence
Risk to lender if national model usedLow (on paper)High (basis keeps widening)Model blind spot
  • Force a corridor‑aware stress test at your bank. Two scenarios, side by side.
    • National case: USDA‑style all‑milk price, flat basis, generic hauling.
    • Corridor case: post‑FMMO Class values reflecting the 2025 make‑allowance changes (per the UW Extension review and Bullvine’s April 2026 analysis), your trailing 12–24‑month basis minus another 25–50¢/cwt, and marginal‑load hauling on at least 15–30% of volume.
    • Requires: milk check history, dispatch records, current contract, lender model.
    • Threshold: corridor‑case DSCR below 1.20× should freeze any non‑essential capital project.
    • Backfire risk: if a lender won’t run the corridor case alongside the national case, factor that into your read of how flexible the relationship is likely to be when margins tighten.
  • Pressure‑test a “minus 10–15% intake” scenario. If your primary buyer cut your base by 10–15% tomorrow, where does that milk go, and at what discount?
    • Requires: honest conversations with two or three alternative buyers.
    • Threshold: if you can’t name a plant and a realistic price within two to three weeks, your marketing risk is bigger than your production risk.
    • Watch for: verbal interest that disappears when you ask for a number.
  • Revisit any contracted or planned capital project — robots, freestall expansion, parlor upgrade — against the corridor case, not the national case.
    • Requires: vendor flexibility, willingness to walk back announced plans.
    • Threshold: re‑size, re‑time, or shelve if the corridor case pushes DSCR below 1.20×.
    • Backfire risk: sunk‑cost thinking on deposits and engineering work.

Deep Dive → Robotic Milking ROI Under 500 Cows — Tier 2 management pillar.

365‑Day Moves — strategic positioning

  • Pick your lane on a written timeline: scale, pivot, or exit. Bullvine’s December 2025 piece, Squeezed Out? A 12‑Month Decision Guide for 300–1,000 Cow Dairies, lays out the logic.
    • Requires: a family or partnership meeting that ends with a decision, not another meeting.
    • Opportunity signal: if a buyer puts core‑supply status, base terms, and component premiums in writing, and your corridor‑aware DSCR stays above 1.25×, scaling is defensible.
    • Backfire risk: leveraging into hope without both a written commitment and a corridor‑aware model.
  • Condition any expansion on a written processor commitment. No contract, no concrete.
    • Requires: legal review of base‑excess and force‑majeure clauses.
    • Threshold: walk away if base‑excess deductions are deeper or longer than the plant’s own escape clauses.
  • Evaluate relocation or premium transition before equity erosion makes the call, if you sit in a legacy region with no new steel within reasonable hauling distance. Processing Paradox closure analysis documents a $15,000–$45,000/quarter equity erosion range across negative margin cycles (Bullvine, 2024–2026).
    • Requires: appraisals, tax planning, succession conversations 12–24 months before any move.
    • Opportunity signal: if a growth‑corridor buyer expresses written interest in backing a relocated supply, that timing window is real but short.
    • Watch for: emotional attachment overriding the math. This is where families lose the most.

Must‑Read → Squeezed Out? A 12‑Month Decision Guide for 300–1,000 Cow Dairies — Tier 3 pillar, December 2025.

From the human side → More Milk, Fewer Farms, $250K at Risk: The 2026 Numbers Every Dairy Needs to Run — what the corridor squeeze looks like at the kitchen‑table level.

What This Means On Your Next Statement

Maple Ridge’s 50¢/cwt basis slide didn’t show up in herd software, ration sheets, or somatic cell graphs. It showed up in 24 months of milk checks — and it turned a robot decision into a corridor decision. Dos Arroyos sees the same pressure on the horizon and is leaning into it because its composite contract and its plants give it room.

Your next pound of milk is worth what your corridor is willing to pay for it, less what hauling and base‑excess take on the way there.

Pull your current milk supply agreement and your last three milk checks tonight. Find the language that governs base‑excess, hauling, and any “marketing” or “balancing” adjustments. Match that language against the basis trend you’ve actually lived since 2024.

What does your current processor contract say about basis and base‑excess when your region’s milk goes long — and does that language describe the corridor you’re still in, or the one you used to be in?

Key Takeaways

  • A clean herd report won’t save you from a bad corridor. Maple Ridge’s 50¢/cwt basis slide plus the post‑2025 FMMO Class III hit stacks to ~$1.89/cwt — about $221,760/year on 600 cows shipping ~144,000 cwt.
  • Stress‑test on your real basis, not the USDA all‑milk price. If your lender won’t run a corridor case with trailing 24‑month basis and 15–30% marginal hauling, the spreadsheet that says robots pencil isn’t the one you should bet on.
  • The capex question changed shape. Below 1.20× DSCR on the corridor case, freeze any non‑essential project. Below 1.25× even with national‑case math, scaling isn’t defensible without a written core‑supply commitment.
  • Pick your lane on a written timeline — scale, pivot, or exit — inside 12 months. Stall, and the basis keeps deciding for you while $15K–$45K/quarter of equity quietly walks off the farm.

This analysis uses composite operator profiles (Maple Ridge, Dos Arroyos) drawn from Bullvine’s Processing Paradox dataset. Contract structures described are illustrative composites and do not describe the actual contracts of any named processor.

Learn More

The Sunday Read Dairy Professionals Don’t Skip.

Every week, thousands of producers, breeders, and industry insiders open Bullvine Weekly for genetics insights, market shifts, and profit strategies they won’t find anywhere else. One email. Five minutes. Smarter decisions all week.
NewsSubscribe
First
Last
Consent

Is the Summer Heat Finally Over? Dairy Farmers See Milk Production Stabilize but Challenges Remain!

Is the summer heat finally over? Discover how dairy farmers see milk production stabilize and what their ongoing challenges are in the changing market.

Summary: As summer draws close, dairy milk production is stabilizing, but the market remains tight, especially for spot milk, which commands premium prices. Cream supplies stay restricted even though butter production has increased. There is a stark contrast in exports: butter has significantly risen, while nonfat dry milk (NDM) exports continue to struggle. Cheese prices have shown resilience after a dip due to fluctuations in milk supply. Whey prices, after reaching multi-year highs, are now declining. Meanwhile, grain and feed prices have seen volatility, impacting producer margins. Farmers must navigate these shifts as fall approaches to capitalize on any market opportunities amid ongoing uncertainties.

  • Spot milk remains in high demand, with premiums averaging $1.25 over Class III prices in the Central U.S.
  • Butter production increased by 2.8% yearly to 169.2 million pounds in June.
  • Despite higher butter production, cream supplies are tight, prompting strategies like micro-fixing.
  • Butter exports surged by 31.8% yearly, with notable demand from Canada.
  • NDM exports struggled with a 10% decline in June compared to last year.
  • Cheese production fell by 1.4% in June, with American types like Cheddar seeing the most significant drops.
  • Cheddar block prices recovered from $1.84/lb on Monday to $1.9575/lb by Friday.
  • Whey protein isolate production rose 34% yearly, while dry whey production decreased by 7.5%.
  • Grain and feed prices experienced volatility but ended the week lower, potentially benefiting farmer margins.
Tranquil Texas meadow at sunrise with hay bales strewn across the landscape

Have you felt the high summer heat strain your cows and your patience? This summer has been a trial by fire for dairy producers, with high temperatures disrupting milk production. The persistent heat stressed out herds and taxed resources, causing productivity drops and narrowing margins. However, as the season progresses and temperatures stabilize, the question remains: are we through, or are there more challenges ahead? Despite some reprieve from the extreme heat, many dairy producers are still dealing with the effects. Tight milk supply and increasing prices exacerbate the continuing issues, keeping everyone on their toes as demand patterns change at the end of summer and the start of autumn. Your perseverance in the face of these hurdles is highly admirable.

ProductJune 2023 Production% Change Year Over YearSpot Price (End of Week)
Milk$1.25 over Class III prices
Butter169.2 million lbs+2.8%$3.0975/lb
Nonfat Dry Milk (NDM)188.3 million lbs-15.1%$1.20/lb
Cheddar Blocks1.161 billion lbs-1.4%$1.9575/lb
Dry Whey-7.5%$0.5625/lb

Can You Feel It? The Subtle Shift Signaling the End of Summer 

Could you sense it? The slight change in the air indicates the end of summer. Dairy producers around the country are breathing a sigh of relief as the blazing heat starts to subside, returning milk production to normal seasonal levels. However, not everything is going well just yet.

In certain parts of the nation, persistently high temperatures are reducing milk supply, creating a challenge to producers. Despite this, the business is resilient, with farmers working to satisfy demand. The spot milk market is very competitive, with producers paying a premium for more fabulous cargoes. For example, spot premiums in the Central United States are averaging $1.25 more than Class III pricing, up from last year.

This tight milk market is exacerbated by impending bottling facilities preparing for the school year. The strain is on, and as a dairy farmer, you probably feel it physically and metaphorically. How are you handling these fluctuations? Do these changes affect your production and costs?

Spot Milk Becomes the Season’s ‘White Gold’ as Demand Skyrockets

MonthClass III Milk Price ($/cwt)
May 2024$18.23
June 2024$18.06
July 2024$18.84
August 2024$19.30

Spot milk remains a popular item as the summer comes to an end. Many places have limited supply, forcing firms to pay a premium for more shipments. How much more, you ask? Dairy Market News reports that spot premiums in the Central United States average $1.25 over Class III pricing. That’s a 25-cent increase from last year. This increase is not a coincidence; it directly results from the persistent heat and humidity wreaking havoc on milk production. Given these challenges, it’s no surprise that demand and prices are soaring as the autumn season approaches.

The Never-Ending Demand: Cream Supplies Stay Tight Despite Butter Production Boost

Despite an increase in the butterfat composition of the milk supply, cream supplies have been somewhat limited this summer. It’s a mixed bag; although greater component levels have increased butter output, the availability of additional cream loads remains limited. Butter output in June increased by 2.8% yearly to 169.2 million pounds. Nonetheless, butter manufacturers nationwide strongly need an increased cream supply to satisfy production demands. The need for cream is never-ending—as soon as it rises, it’s gone, leaving everyone hungry for more.

The Resilient Butter Market: Stability Amid Seasonal Shifts 

Week EndingButter Market Price ($/lb)
June 7, 2024$2.75
June 14, 2024$2.85
June 21, 2024$2.90
June 28, 2024$2.95
July 5, 2024$3.00
July 12, 2024$3.05
July 19, 2024$3.10
July 26, 2024$3.07
August 2, 2024$3.09
August 9, 2024$3.10

The butter market has remained remarkably stable despite the periodic ebb and flow. The spot price at the Chicago Mercantile Exchange (CME) finished at $3.0975, down 0.75¢ from the previous week. While these data point to a relatively steady industry, there are still worries regarding future demand. With the baking and holiday season approaching, stakeholders will be watching closely to see whether retail activity picks up to match the expected increase in consumer demand. Will the market remain stable, or will there be a mad rush to buy more stocks? Stay tuned as the next several months expose the fundamental dynamics at work.

Butter’s Star Rises While NDM Fades: A Tale of Two Exports 

MonthButter Exports (million pounds)NDM Exports (million pounds)
June6.8134.4
Year-over-Year Change+31.8%-10%

Butter and nonfat dry milk (NDM) exports present a stark difference. Butter’s success has been nothing short of amazing, with exports up 31.8% in June, primarily due to rising demand from Canada. In concrete terms, it amounts to up to 6.8 million pounds sent overseas.

However, NDM exports are failing. They fell 10% compared to the same month last year, resulting in the lowest June volume since 2019. The United States shipped just 134.4 million pounds of NDM in June.

While a strong market drives butter exports, the NDM industry struggles with low demand. This lackluster performance has kept NDM spot prices relatively stable, preventing a substantial surge. Furthermore, the year-to-date results for NDM exports are down 11.6% from the previous year.

The NDM Puzzle: Low Supply Matches Tepid Demand, Keeping Prices Static

Week EndingNDM Spot Price ($/lb)
August 9, 20241.20
August 2, 20241.24
July 26, 20241.22
July 19, 20241.25
July 12, 20241.18
July 5, 20241.21

The supply and demand dynamics for nonfat dry milk (NDM) have been intriguing. Demand has been tepid, but so has the supply. In June, combined production of NDM and skim milk powder totaled only 188.3 million pounds, marking a significant 15.1% decrease from last year. However, this decline hasn’t yet led to a price surge, primarily because demand hasn’t picked up its pace. 

The spot price for NDM seems trapped in a tight range. Despite last week’s brief price rally, the NDM spot price dipped on four out of five trading days, losing 4 cents over the week to close at $1.20 per pound. During this period, 27 powder loads were traded, a notably high activity, with 17 loads moving on Tuesday alone. The low supply and weak demand keep everyone guessing when the market might see a dynamic shift.

Cheese’s Comeback Story: From Dips to Resilience and Everything In Between

ProductBeginning of Week Price (Aug 5, 2024)End of Week Price (Aug 9, 2024)Price Change
Cheddar Blocks$1.84/lb$1.9575/lb+10.75¢
Cheddar Barrels$1.93/lb$2.005/lb+7.5¢

Recently, cheese markets have shown to be quite resilient. Despite a decrease to $1.84/lb on Monday—the lowest since May—cheddar block prices returned to $1.9575/lb on Friday, representing a 10.75¢ rise from the previous week.

Overall, cheese exports started to drop in June. U.S. exporters delivered 85.7 million pounds of cheese overseas, a 9.1% rise yearly but lower than prior months’ record highs. Mexican demand remained strong, with 31.6 million pounds shipped, but down from May’s record of 40.4 million pounds.

Production data also show a slight decline. June witnessed a 1.4% year-over-year decrease to 1.161 billion pounds, with American cheeses, notably Cheddar, bearing the brunt of the downturn. Despite these obstacles, the cheese market’s essential stability remains, providing a bright spot in an otherwise complicated environment of shifting pricing and variable export levels.

Whey’s Wild Ride: From Multi-Year Highs to a Slow Descent 

Week EndingSpot Price per Pound (¢)
August 9, 202456.25
August 2, 202461.00
July 26, 202458.00
July 19, 202453.00
July 12, 202455.75
July 5, 202460.00

Despite prior highs, the dry whey market has significantly decreased this week. From Tuesday to Friday, the spot price progressively declined. By the end of the week, it had been reduced to 56.25¢ per pound, down 4.75¢ from the previous Friday.

Several causes have contributed to the current decline. Reduced cheese production has had a substantial influence on the whey stream. As cheese manufacturing slows, the supply of whey—a byproduct—dwindles. Manufacturers are also concentrating more on high-protein goods such as whey protein isolates, with production up 34% yearly in June.

Furthermore, export demand for whey remains high. Recovering pork prices in China has sparked a rebound in hog breeding, increasing demand for dry whey and permeate as piglet feed. This strong demand has helped to maintain market tension even as prices fall. The following weeks will indicate whether these dynamics have stabilized or continue distorting pricing.

Let’s Talk Grains and Feed: Did You Notice the Recent Jolt in Corn and Soybean Futures? 

DateCorn Futures (DEC24)Soybean Futures (DEC24)
August 5, 2024$4.02/bu$10.25/bu
August 6, 2024$4.01/bu$10.22/bu
August 7, 2024$4.00/bu$10.18/bu
August 8, 2024$3.99/bu$10.10/bu
August 9, 2024$3.97/bu$10.08/bu

Let’s discuss cereals and feed. Did you see the recent spike in maize and soybean futures? Monday’s market pandemonium spiked, but don’t get too excited—it didn’t stay. By Thursday, DEC24 corn futures had dropped to $3.97/bu, down nearly a cent from the previous week’s closing. Soybeans settled at $10.0825/bu., down roughly 20¢ from last Friday.

Despite the market instability, the drop in grain and feed costs is encouraging. Lower pricing might offer producer profits the boost they urgently need. When your inputs are less expensive, you may boost your earnings. Could this imply brighter days for your bottom line? We will have to wait and see.

Brace Yourself for Fall: Market Dynamics and Environmental Factors That Could Shake Things Up 

As we enter the winter months, dairy producers can expect a combination of market dynamics and environmental variables. The recent stability of milk output suggests that things are returning to normal, but don’t get too comfortable. Experts believe that demand for spot milk will stay strong owing to increasing bottling operations once schools resume. This might keep milk premiums high, reducing profit margins even further. Cream supplies are anticipated to remain limited, especially as butter production increases. While this may benefit butter producers, people relying on cream can expect continued shortages and increased prices.

Do not anticipate a significant increase in nonfat dry milk (NDM). Prices will remain stable as supply and demand are in a holding pattern. However, there is a ray of light as several Southeast Asian regions see growing demand. Despite recent turbulence in global stocks, cheese markets seem to have stabilized. The present prices are stable, but increased prices may ultimately reduce demand. Keep a watch on exports; they’ve dropped but remain robust, especially in Mexico.

Finally, the grain and feed markets have seen short rises before returning to their previous levels. This change may reduce feed prices, which is always good news as we approach a season in which every penny matters. Dairy producers should be careful. The market is a complicated web of possibilities and problems, ranging from limited cream supply to steady cheese pricing and fluctuating grain markets. Prepare for a tumultuous few months, and keep an eye on market signals to navigate this complex terrain effectively.

Surviving the Roller Coaster: How Dairy Farmers Can Profit Amid Market Chaos 

The current market circumstances have critical economic ramifications for dairy producers. Price fluctuations in milk, butter, cheese, and other dairy products may substantially influence farm profitability. As spot milk becomes the season’s ‘white gold’, with manufacturers paying premiums for more loads, milk sales income may rise. On the other hand, tighter supplies may put farmers under pressure, particularly in the heat of late summer. High butter prices provide some comfort but create concerns about future demand as retail activity for the baking and holiday season gradually increases.

So, how can farmers deal with these economic challenges? Diversify product offers to ensure consistent cash sources. Instead of focusing on a single dairy product, diversify into butter, cheese, and whey protein isolates. Diversification may protect against price volatility in any particular category. Stay informed about industry developments and export prospects. Recognize demand increases in Southeast Asia for milk powder or rising butter demand from Canada to use resources more wisely.

Invest in technology and process upgrades to boost manufacturing efficiency. Use data analytics to forecast trends, stress-resistant feed to keep yields high during harsh weather, and invest in sustainable practices to satisfy regulatory requirements. Farmers may effectively handle economic changes by taking a proactive strategy that includes diversification, trend research, and strategic investments.

The Bottom Line

As we go through these cyclical adjustments, essential conclusions emerge. Milk production has mostly returned to normal. However, regional heat remains a cause of disturbance. The struggle for spot milk heats up, with cream and cheese markets showing mild resistance. Butter production expands after the summer, but NDM fails to gain momentum. Despite price volatility, the cheese business has experienced a spectacular recovery, although grain and feed costs vary, reflecting the more significant market uncertainty. So, what does this mean for you, a dairy farmer? It is essential to remain alert and adaptable. Are your operations prepared to endure market swings and capitalize on new opportunities? Stay informed and adaptive, and keep an eye on market trends. The dairy industry is continuously evolving; being prepared might make a difference. What strategies will you use to flourish in these uncertain times?

Learn more: 

Send this to a friend