Archive for FMMO make-allowance

Fonterra Owners Found Out 2 Years Late. Your Co-op Bylaws Might Hide the Same Gap.

Fonterra’s lawyers reached the PM’s adviser through a personal email. Its 8,300 owners learned it from the news, two years on. Does your bylaw even require the board to tell you?

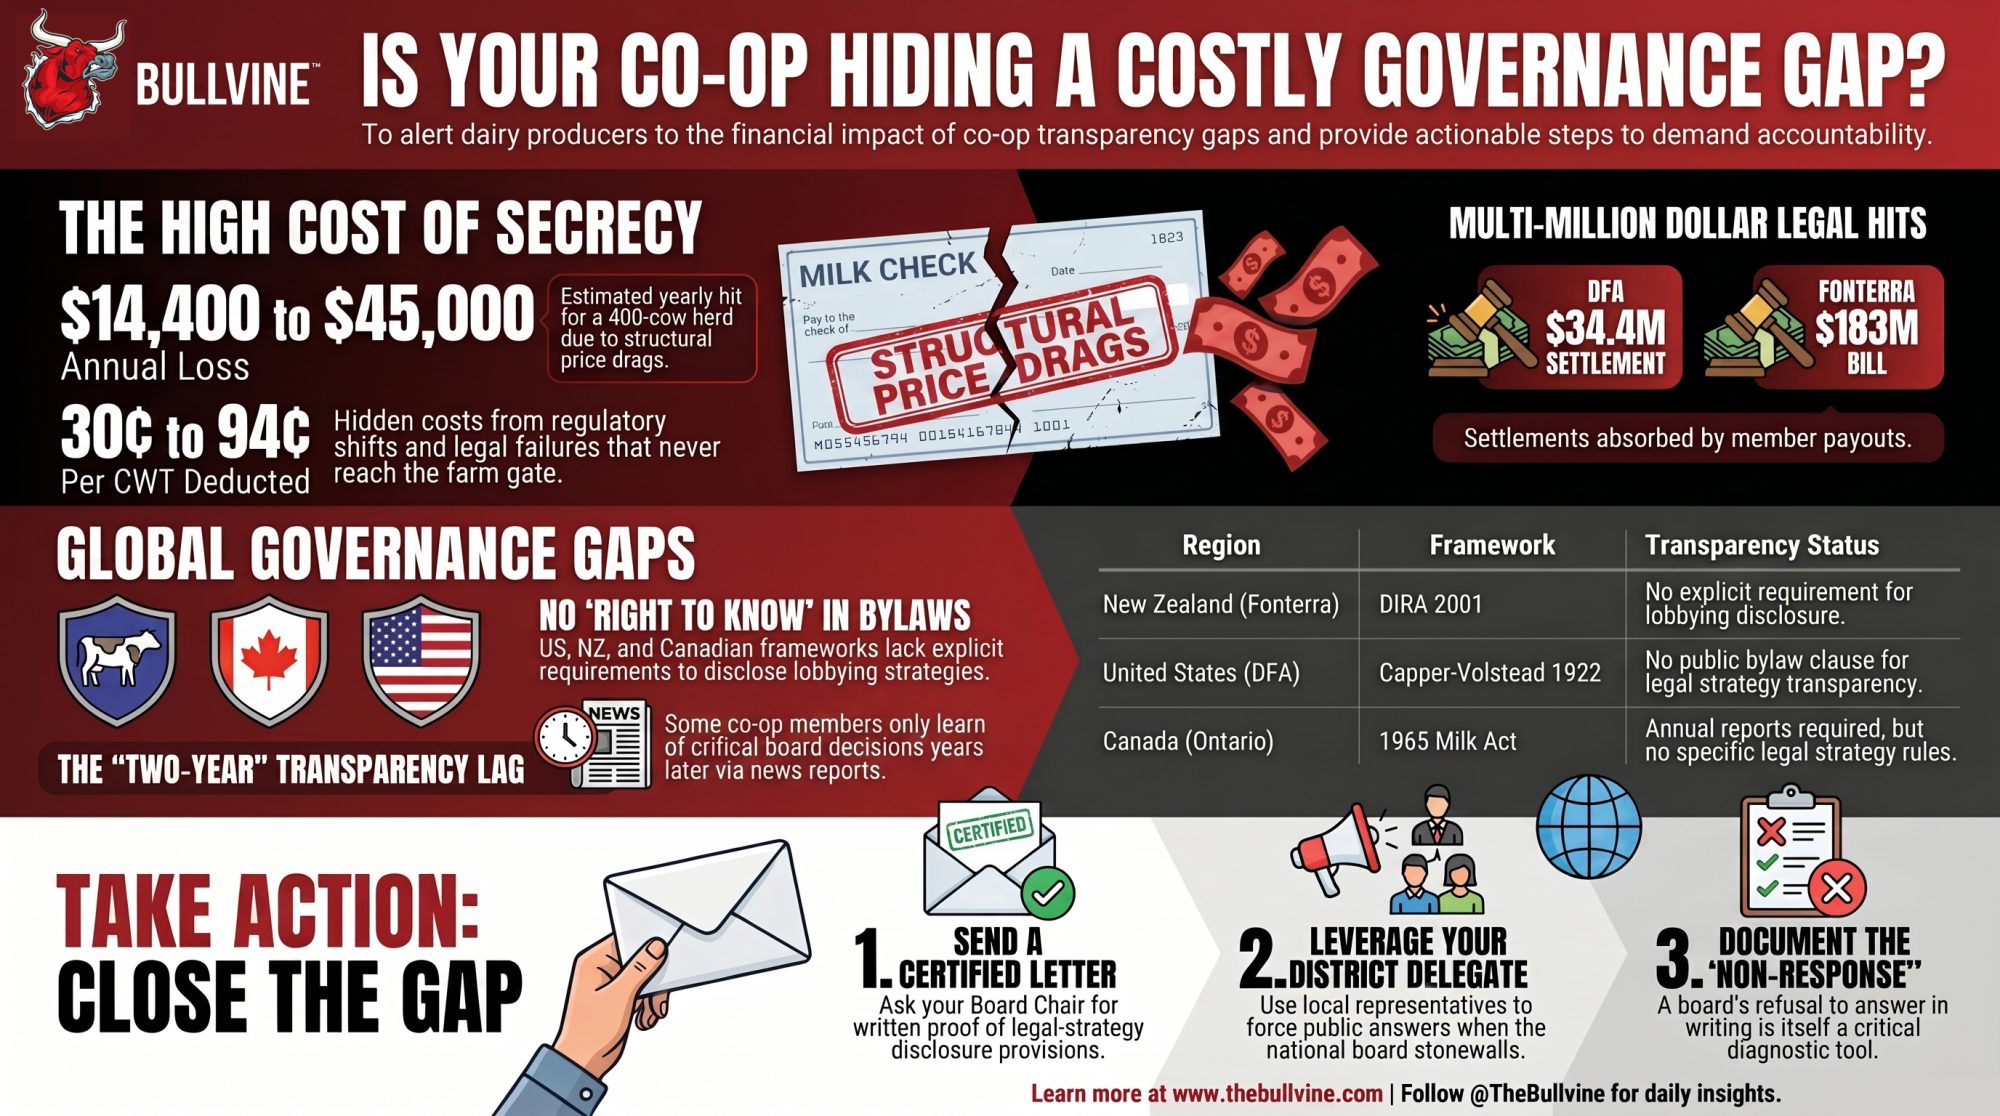
Executive Summary: Fonterra sent a confidential briefing — its legal strategy to kill the Smith v Fonterra climate case, complete with draft statutory wording — to the Prime Minister’s chief policy adviser through his personal email in mid-2024, and the co-op’s 8,300 farmer-owners didn’t find out until RNZ reported it two years later. New Zealand’s Ombudsman and Department of Internal Affairs are both investigating; nobody’s been found to have broken the law, and Fonterra concedes the private-email route wasn’t “consistent with its own policies”. But the real story isn’t NZ politics — it’s that no co-op bylaw, in NZ, the U.S., or Canada, forces a board to tell members about legal strategy before it lands on their milk check. That gap has a price: the 2025 FMMO make-allowance hike (cheddar up 25.8%) trimmed roughly $0.30/cwt off the all-milk price, and on a 400-cow herd shipping 48,000 cwt, even a 30¢ drag runs $14,400 a year — closer to $45,000 at the documented 94¢ total. Add co-op legal exposure like DFA’s $34.4M Othart settlement or Fonterra’s NZD $183M Danone bill, and you’re looking at owner money that quietly never reaches the farm gate. If you ship to a processing co-op, the move this week is a signed, dated letter to your board chair asking — in writing — for the exact bylaw provision covering legal-strategy disclosure.
co-op bylaw transparency

The news broke this month. What it revealed happened in secret two years ago. In mid-2026, RNZ reported — and Prime Minister Christopher Luxon’s office confirmed — that back on or around June 26, 2024, a member of Fonterra’s government affairs team printed a briefing note and handed it to Luxon’s then chief policy adviser, Matt Burgess, and also sent it to his personal email account. Burgess himself hasn’t been accused of wrongdoing; the open questions concern disclosure and record-keeping, and the investigations are still ongoing. The document wasn’t a milk price update or a sustainability report. It was a briefing on Smith v Fonterra — the climate tort case the NZ Supreme Court had cleared for trial in February 2024 —, and it proposed a two-sentence amendment to the Climate Change Response Act that would shut the case down.

For two years, Fonterra’s farmer-owners had no idea. They weren’t in that room. They didn’t get a memo. They found out the way everyone else did — off a news report, in 2026. And here’s the detail that should stop any co-op member cold: that personal inbox sat outside the official systems an Official Information Act request would normally search. When the Environmental Law Initiative asked the PM’s office in March 2025 for records tied to the case, the reply — released in May 2025 — never mentioned the briefing note.

This reads like a New Zealand political story. It isn’t. Strip away the Beehive and the climate case, and you’re left with one question that lands on every farmer who’s ever signed a milk contract with a processing co-op: Does your bylaw give you the right to know what your board is doing before it shows up on your check?

What’s Actually Confirmed — and What Isn’t Yet

Let’s be careful here, because this is an accountability story and the details matter. Fonterra told RNZ the document was sent to the personal address “at the staff member’s request” and acknowledged that this was “not appropriate, nor consistent with its own policies”. Luxon said it “has definitely not met the high standard that I have of staffers in the Beehive” and that communicating through private email “doesn’t help build transparency or public trust”. Mike Smith, the iwi leader who won the right to sue in 2024, has accused the government of “a coordinated campaign of secret lobbying”.

One thing worth stating plainly: nobody’s been found to have broken the law. The Ombudsman is investigating the “apparent withholding” of official information, and the Department of Internal Affairs is reviewing the former staffer’s accounts to capture anything that should’ve been on the public record. Neither has reported back. We’re not getting ahead of it.

But here’s what doesn’t need a verdict to be true. The co-op’s own structure let this happen. No bylaw stopped it, and no member-disclosure rule flagged it. Fonterra has roughly 8,300 farmer-shareholders who own the co-op and elect its board. It also runs an elected Co-operative Council whose published job is to keep members informed about the co-op’s performance and strategy and to hold the board to account. None of that machinery surfaced in the lobbying before a reporter did.

What’s Changing and Why

The shift here isn’t Fonterra’s behavior. It’s visibility. Most farmers have never read the fine print on what their board can do without telling them — and this case dragged that gap into daylight for the whole industry.

The pattern shows up across continents and across completely different legal systems, which tells you it’s structural, not a one-off. The U.S. Capper-Volstead Act of 1922 handed dairy cooperatives an antitrust exemption so farmers — the little guys — could band together against powerful processors. New Zealand’s Dairy Industry Restructuring Act of 2001 put guardrails on Fonterra, preventing a dominant company from squeezing its suppliers. Good architecture for its moment. Both were built to protect the farmer from outside power.
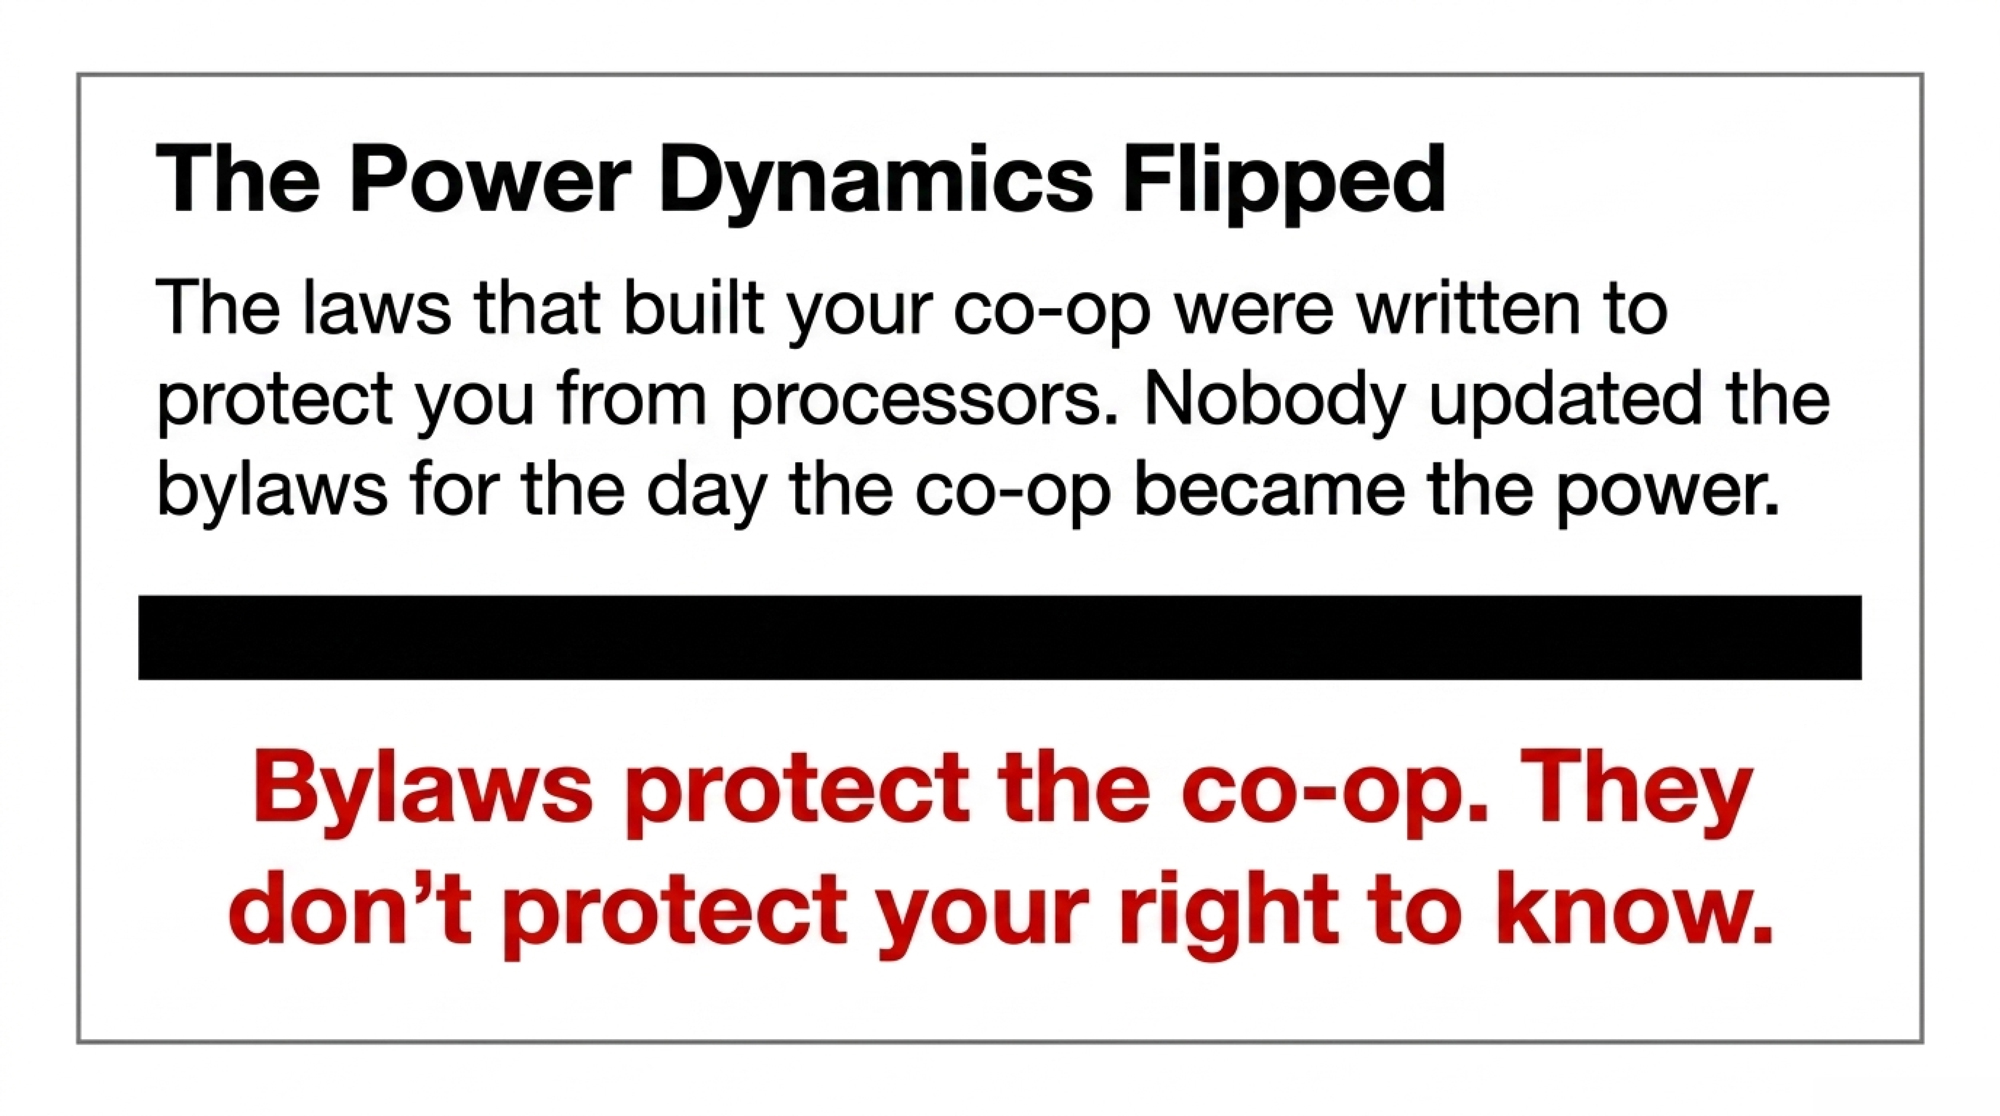
Nobody rewrote those rules for the day the co-op became the power. And that’s not hypothetical. In April 2022, a group of New Mexico producers led by Othart Dairy Farms sued Dairy Farmers of America and Select Milk Producers, alleging that the two used a joint agency to underpay farmers for raw milk across New Mexico, Texas, and parts of three other states. A federal judge allowed the case to proceed in March 2024 — a procedural step, not a finding of wrongdoing — and the cooperatives later settled in 2025 for $34.4 million without admitting liability. That figure split $24.5 million from DFA and $9.9 million from Select, under a deal that dissolved the joint marketing agency at the center of the case. The loyalty scaled up. The accountability rules didn’t.

How This Plays Out on Real Farms

A governance gap doesn’t show up as a scandal on your farm. It shows up as a smaller number on your milk check, and you usually can’t trace it back to the room where the decision got made.
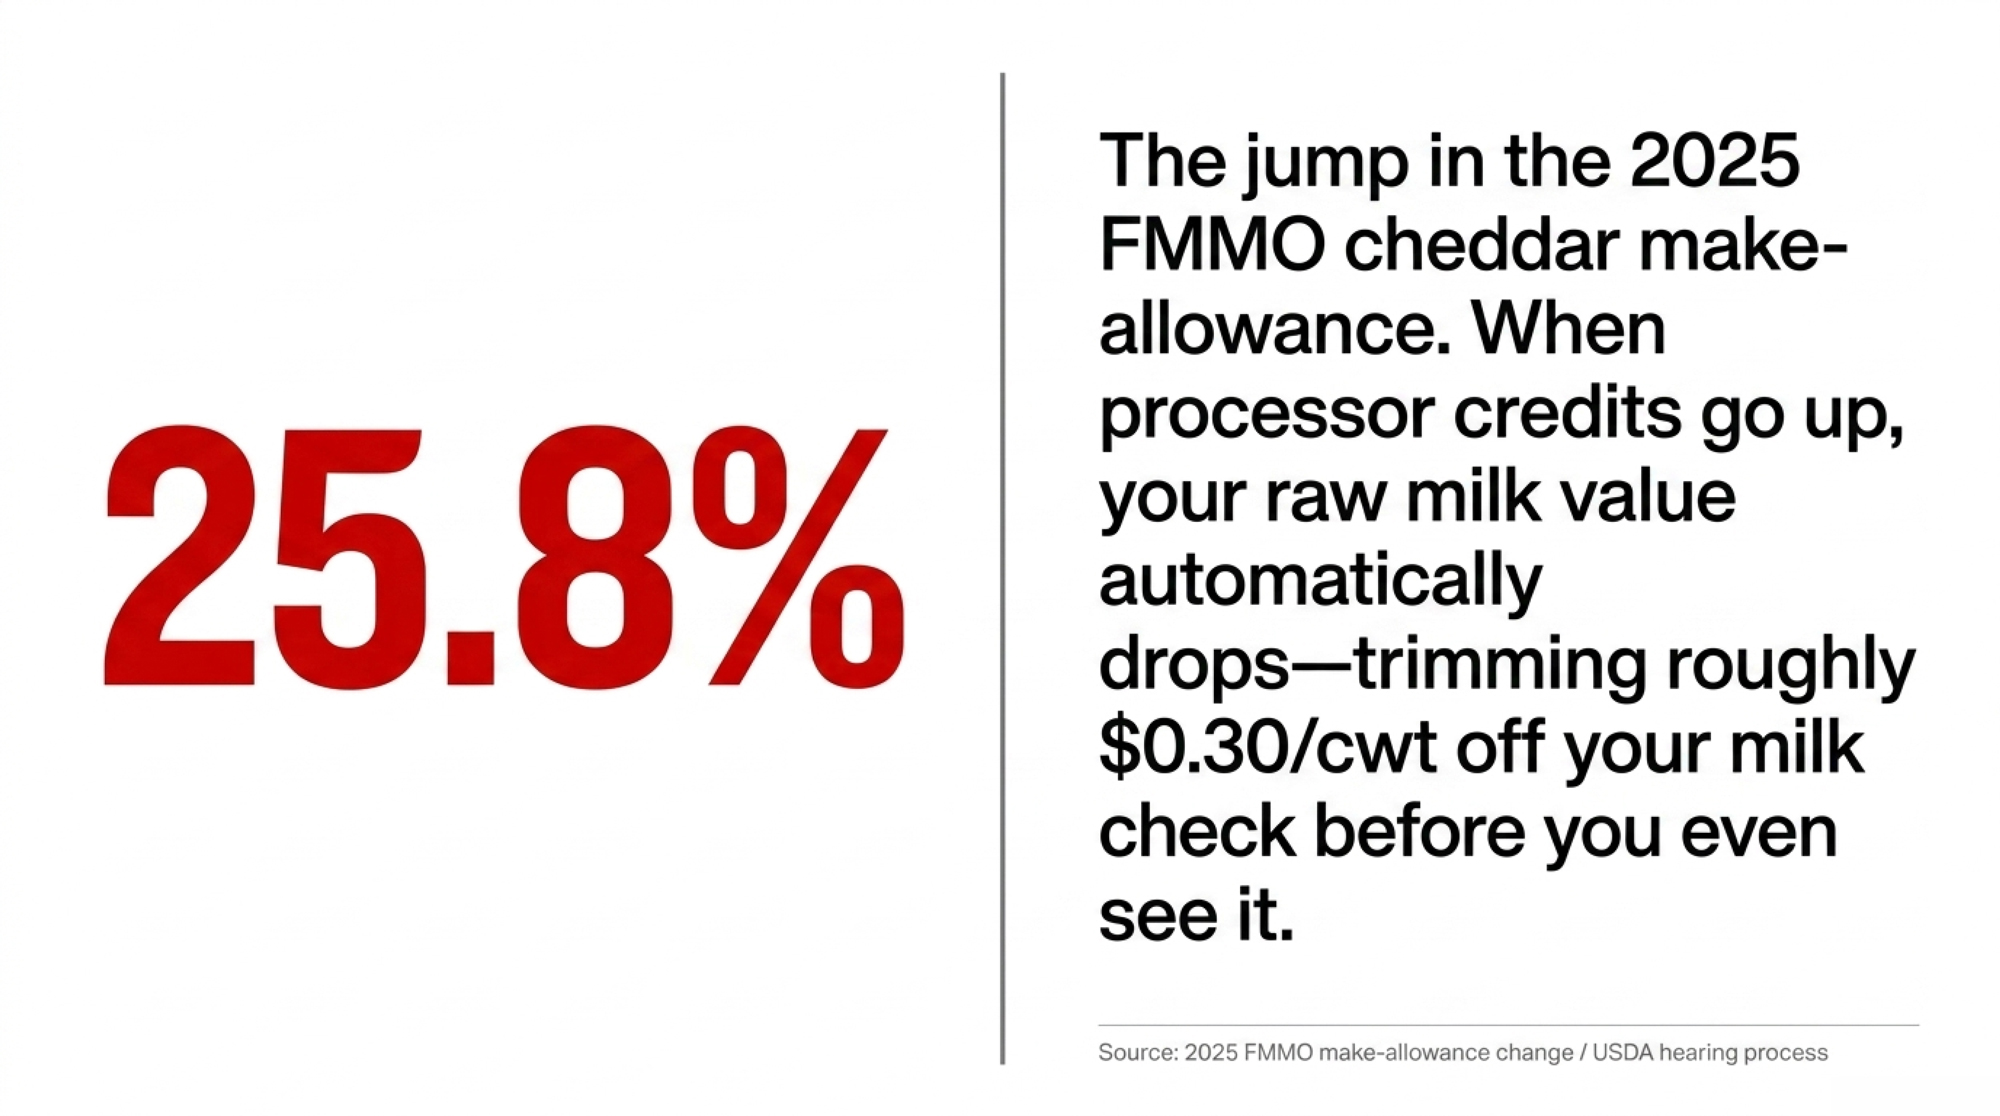
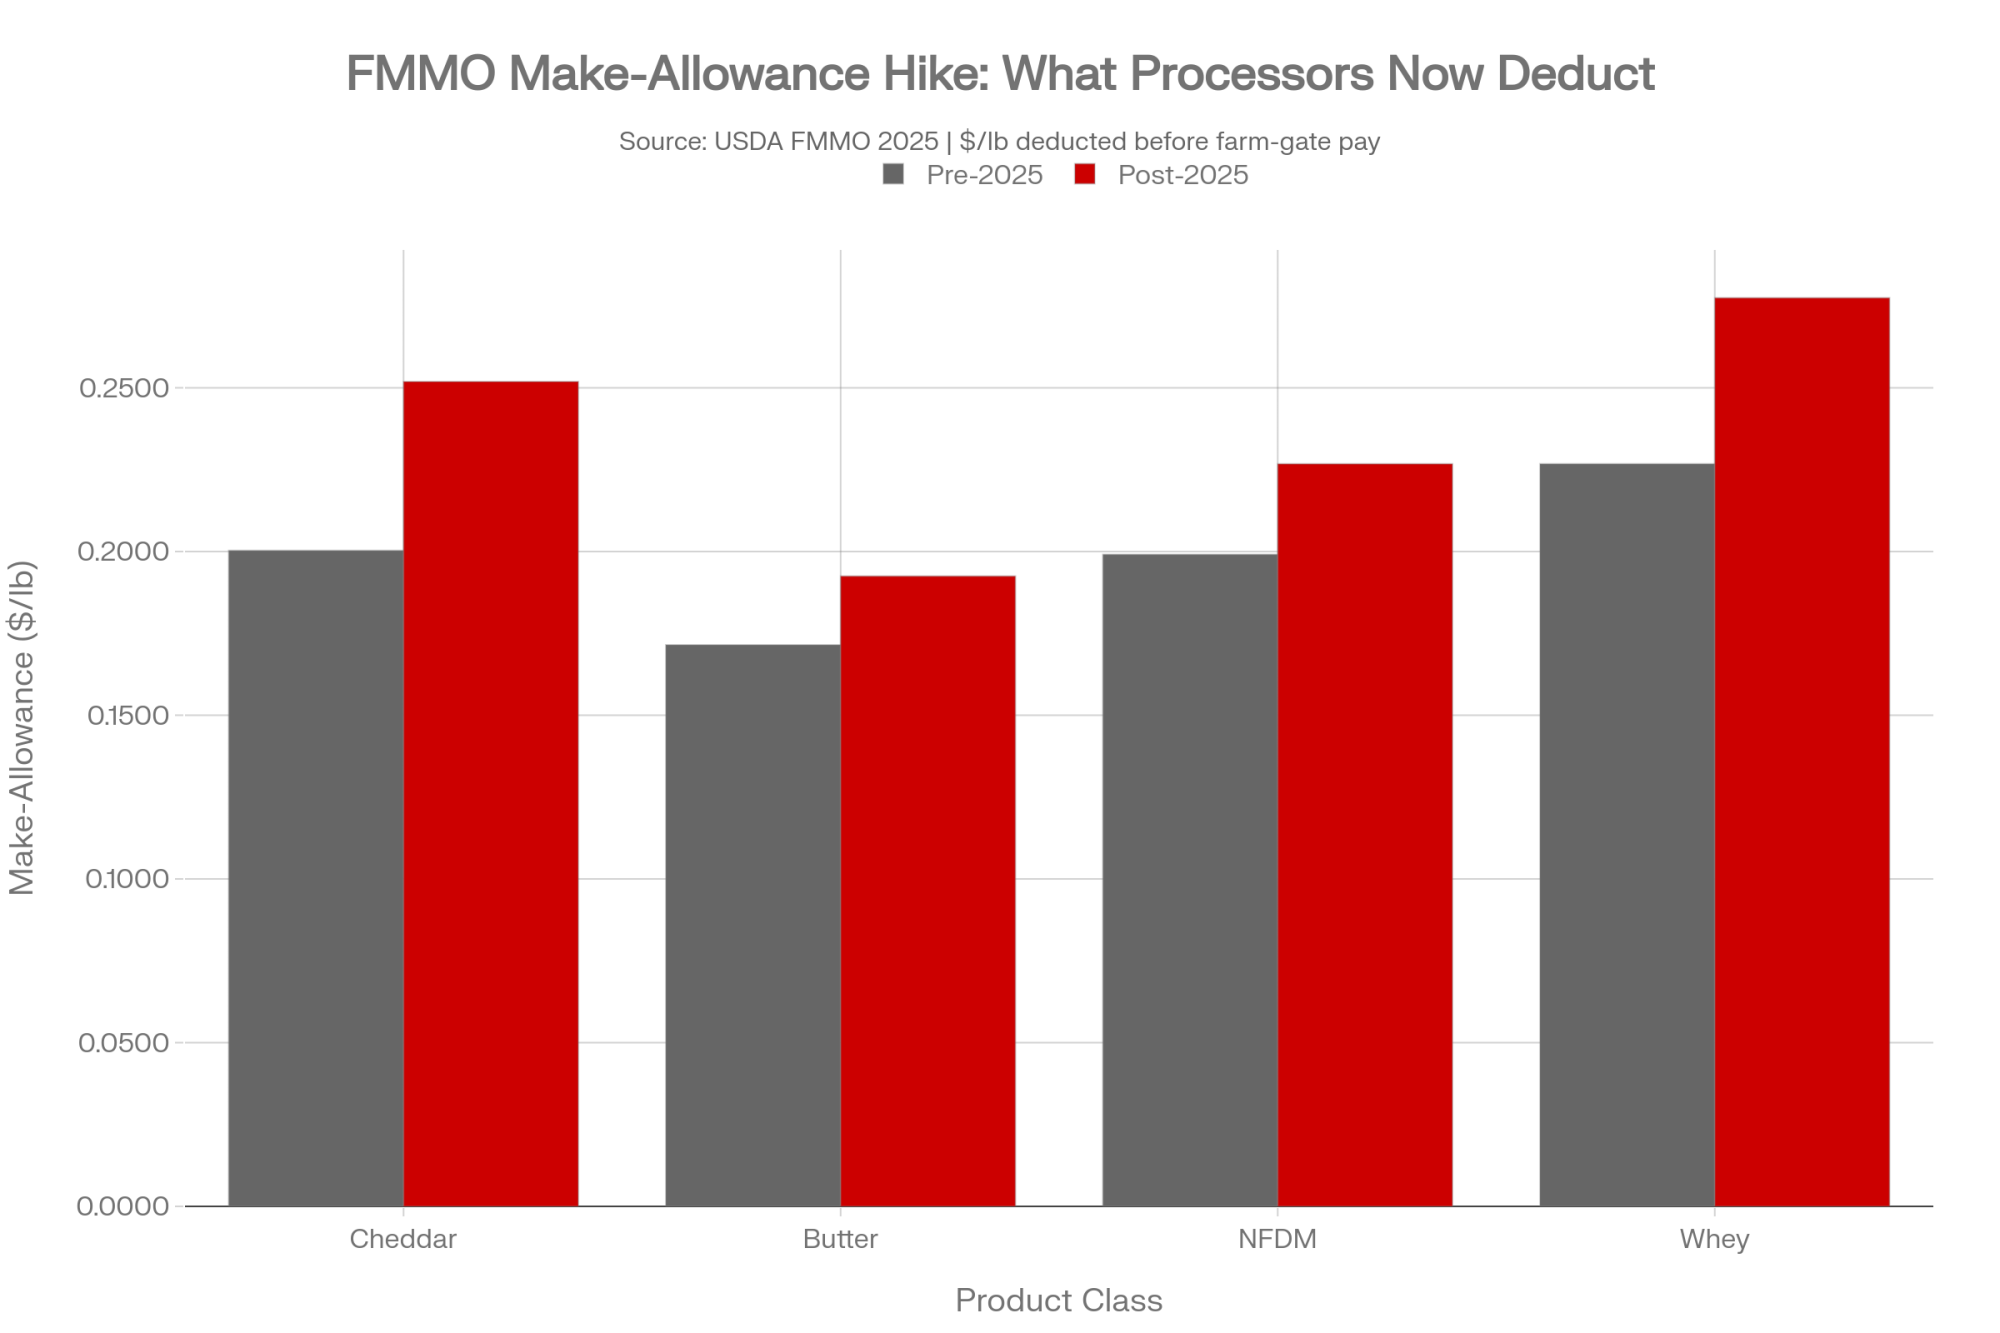
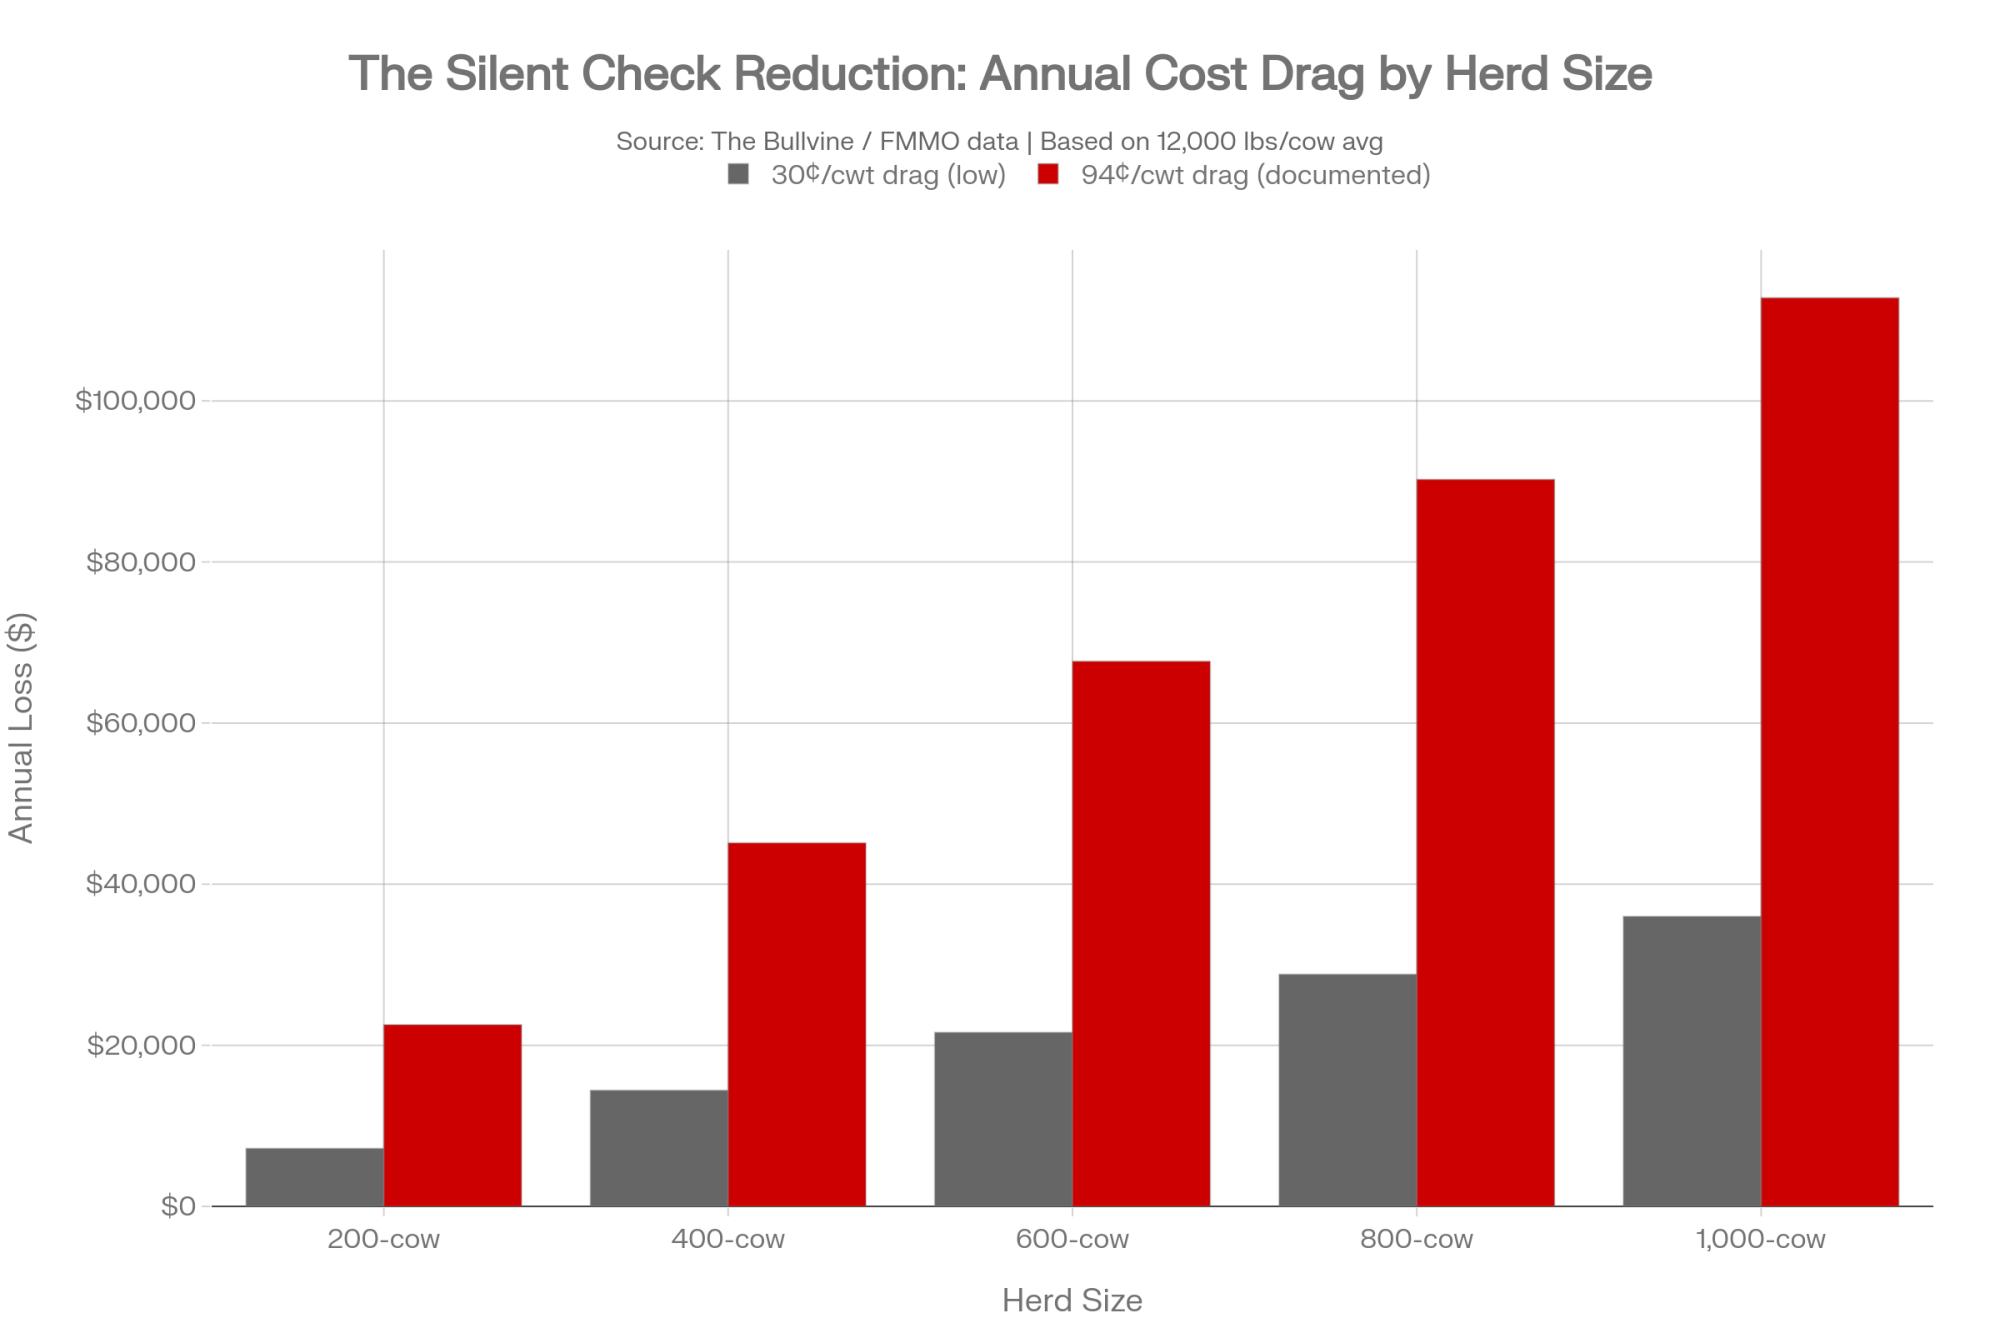
Look at the 2025 Federal Milk Marketing Order make-allowance change — the cost credits processors deduct before they calculate your pay. The cheddar make-allowance jumped from $0.2003 to $0.2519 a pound, a 25.8% increase. Here’s why that lands directly on you: Federal Order end-product pricing formulas calculate the raw milk component values by subtracting the manufacturing make allowance from wholesale commodity prices. So when the processor’s credit goes up, the raw milk value the formula spits out goes down — automatically, before anyone touches your contract. A higher make allowance is a direct deduction from your base pay. The adjustment had a real basis; processing costs had genuinely climbed. But the reforms cut the U.S. all-milk price by roughly $0.30/cwt at the outset, before later component updates clawed some of it back for high-component herds. The rulemaking played out in Washington, shaped by industry input through USDA’s hearing process. The farmers who paid for it found out at the mailbox.
Here’s the math you can run against your own operation. Take a 400-cow herd shipping about 48,000 hundredweight a year — that’s a deliberately conservative 12,000 lbs per cow, and a higher-producing herd would roughly double the numbers below. Hit that herd with even a 30-cent-per-cwt structural drag, the low end of what the FMMO change delivered, and you’re looking at about $14,400 a year. Push it to the 94-cent total drag. The Bullvine has documented after premiums and class moves, and it’s closer to $45,000 a year. That’s not a basis move you can hedge. So run your own version: your annual CWT times whatever shift you think is realistic, against your current pay price.
And this isn’t a U.S.-only problem. Fonterra’s 2013 contamination scare — later confirmed a false alarm — triggered the Danone arbitration. In November 2017, the Singapore tribunal ordered Fonterra to pay Danone NZD $183 million — about €105 million, or US$125 million at the time. Money that never reached the farm gate. No member voted on that legal exposure. They just absorbed it, one season’s payout at a time.

How Much Does Staying Silent Actually Cost You?
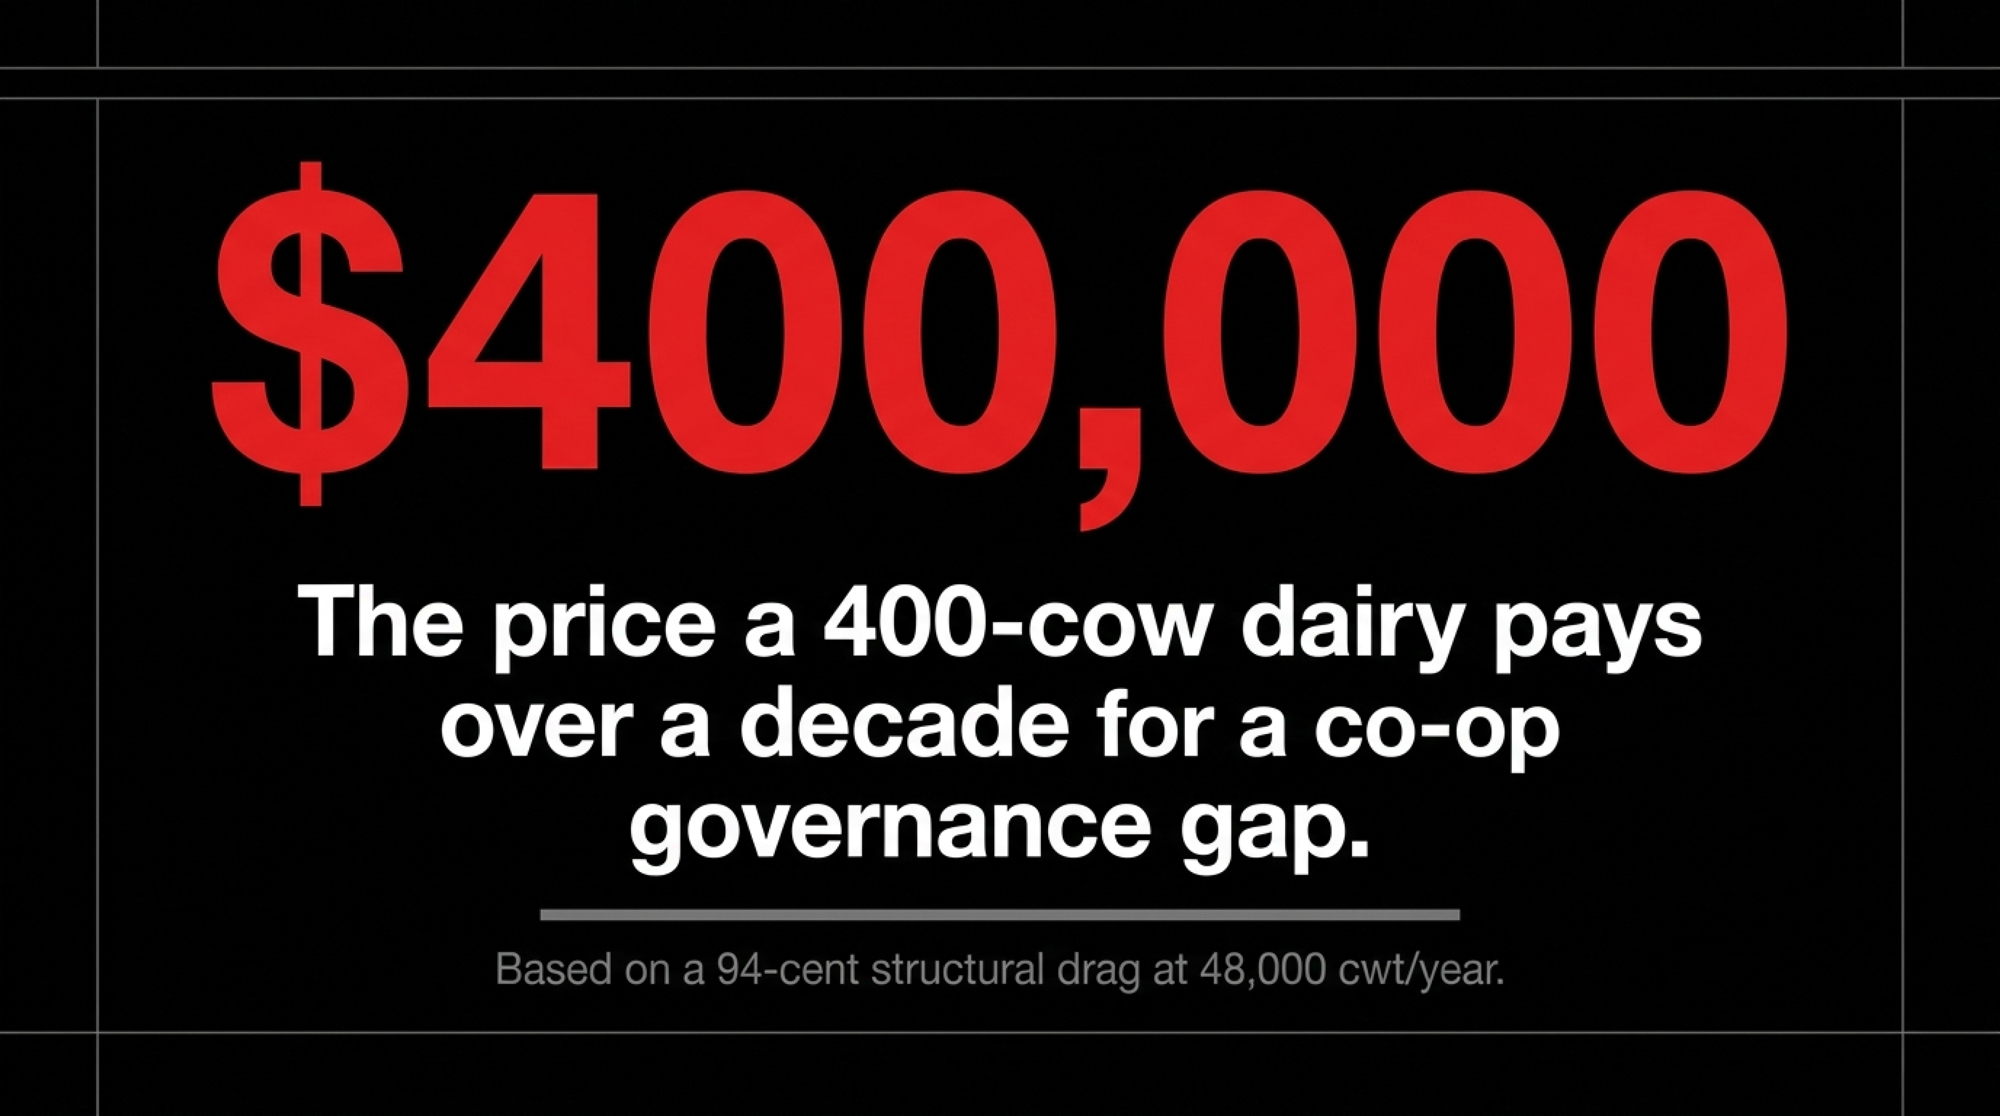
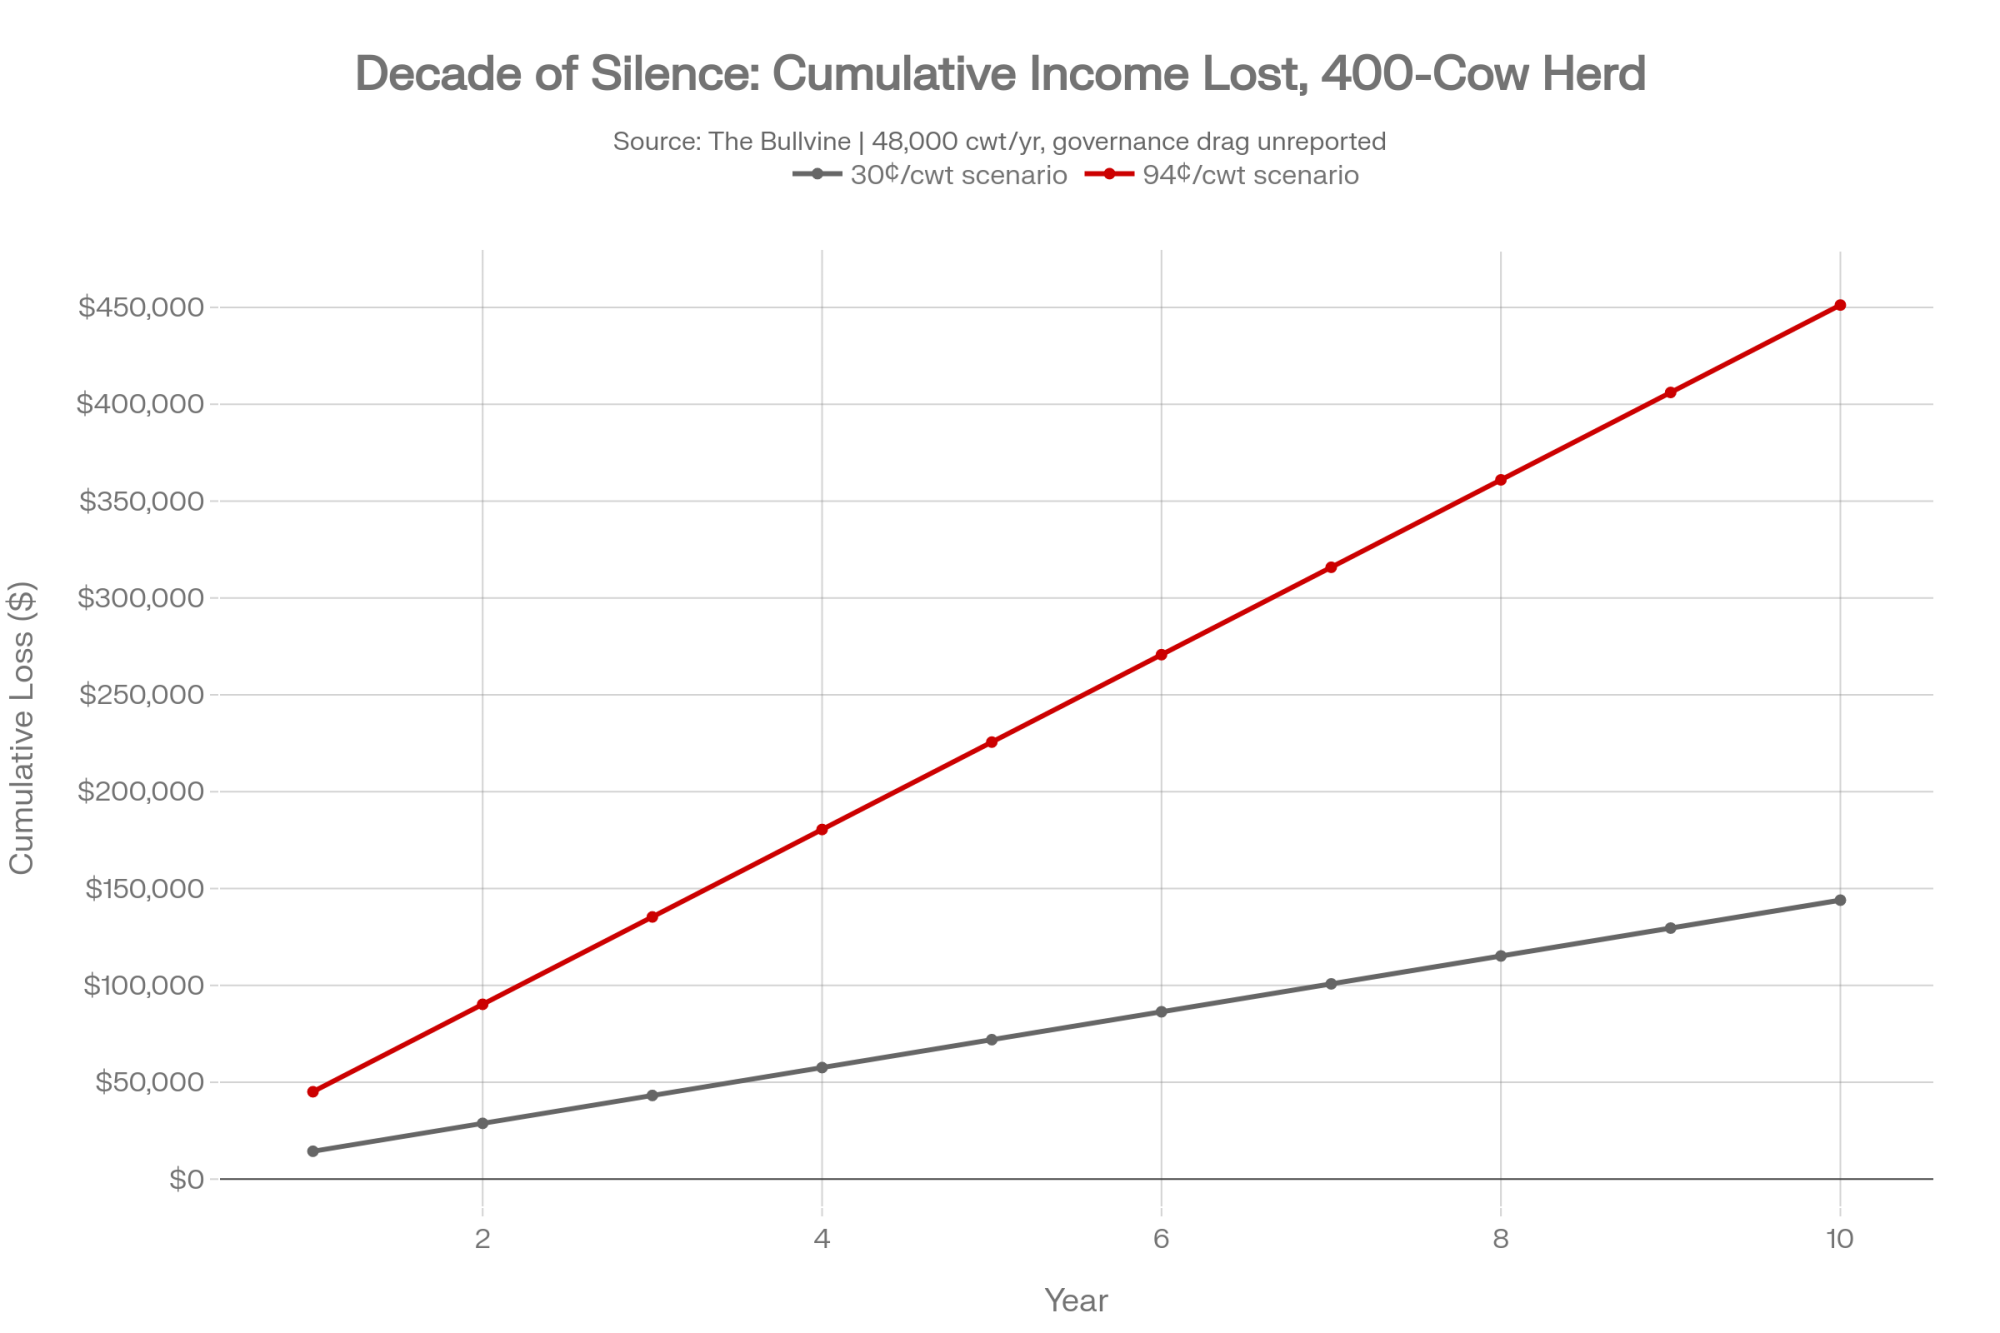
Stack it across a decade, and the picture sharpens fast. A 30-to-94-cent structural drag, held over ten years, runs from roughly $140,000 to well over $400,000 on that same 400-cow herd — and that’s only if you assume the pressure holds, which is a big if. Add a co-op legal failure on top, like the Danone bill or a $34.4 million settlement split across members, and you’re looking at earnings that quietly never make it to your account. Each hit is survivable. The compounding is what gets you.
But there’s a cost here that isn’t a number, and it’s the one worth sitting with. The farmer who never asks loses the standing to complain when the next failure surfaces. Three or four years from now, someone’s going to ask, “Did you send the letter?” Did you raise it at the annual meeting? If the answer’s no, then the co-op’s failure becomes partly a story about owners who didn’t act like owners — and you’ll know it. That’s harder to carry than a check reduction.
The Mechanics Behind the Outcomes

So why does the gap survive in co-op after co-op? Because the rulebooks were written when the co-op was the underdog, and nobody went back to update them when it stopped being one.

Dig into the statutes, and the pattern’s the same across three countries. Plenty about milk pricing transparency, financial reporting, and antitrust standing — almost nothing requiring the board to tell members about legal strategy or government lobbying before it lands on their payout. Here’s how the three big frameworks stack up side by side:

Governance LeverFonterra — New ZealandDairy Farmers of America — U.S.Dairy Farmers of Ontario — Canada
Founding frameworkDairy Industry Restructuring Act 2001Capper-Volstead Act 1922; FMMO system1965 Ontario Milk Act; O. Reg. 209/99
Financial disclosure to membersAnnual report to shareholdersBylaws subordinate farmer payments to debt serviceAudited annual statement within 4 months of year-end
Disclosure of legal strategy / lobbyingNo explicit bylaw requirementNo public bylaw clause; separately enjoined from sharing sensitive dataNo explicit rule beyond annual operations report
Accountability bodyElected Co-operative CouncilElected delegate / board structureLocal producer committees + DFO board
Recent flashpointRNZ lobbying disclosure case, 2024–26$34.4M Othart settlement, 2025Glengarry committee resigned in protest, 2020

The takeaway isn’t that one co-op is the villain. It’s that across three completely different systems, the disclosure rule that would’ve caught the Fonterra briefing doesn’t exist in any of them. Ontario at least forces an audited annual report into producers’ hands within four months — more than Fonterra’s or DFA’s documents promise on legal strategy. And the DFA settlement hints at where this is heading: the deal required the cooperatives to dissolve the joint agency and stop sharing certain non-public pricing information. Courts are starting to bolt on the disclosure rules that the bylaws never contained.

Options and Trade-Offs for Farmers

You can’t rewrite your bylaws by Friday. But you’re not stuck waiting for the next failure, either. Here’s what farmers are actually using.

  • Send one written question this week — the 30-day move. Not an email. A signed letter, certified or hand-delivered with a date stamp, to your board chair or CEO, asking one thing: show me, in writing, the bylaw provision that gives me the right to know about material legal strategy or government lobbying before it affects my milk price. When it makes sense: always, any co-op, any herd size. What it takes: 20 minutes and about $6 for certified mail. The risk: you get a non-response — but a documented non-response is itself information, and it’s the start of your paper trail.
  • Work with your district delegate. Big co-ops route governance through elected district or regional reps who answer to local members in a way the national board doesn’t. When the Glengarry County producer committee in Ontario hit a program it couldn’t stomach in 2020, the whole committee resigned in protest — and made the board answer for it publicly. When it makes sense: when you want leverage beyond one voice. What it takes: knowing who your delegate is. The limit: delegates vary a lot in how engaged they actually are.
  • Push accountability to the body, not just the board. If your co-op has a Co-operative Council or equivalent, holding the board accountable is literally its job. When it makes sense: when the board stonewalls. What it takes:knowing the body’s real mandate. The risk: some of these look stronger on paper than they are in the room.
  • Read what you actually signed. Pull your member agreement and bylaws and hunt for three things: any disclosure obligation on the board, the process for filing an annual-meeting question that requires a written response, and the threshold to propose a bylaw amendment. The catch: DFA’s bylaws aren’t posted publicly in full — outsiders mostly learn their terms through credit ratings and court filings — so if yours aren’t public either, document that fact and raise it in your letter.

The forward-looking signal sits inside that first path. The DFA settlement already forced new pricing-conduct obligations through the courts, and the Fonterra disclosure question is now out in the open in New Zealand. The pressure’s moving in one direction. Getting your question on record now means you’re ahead of it, not chasing it after the fact.

Is Asking Hard Questions Worth the Social Cost?

Let’s be honest about what really stops a farmer with a hand half-raised at the annual meeting. It’s rarely the bylaws. It’s the room. Your father shipped to this co-op. Your neighbor sits on the district committee. The field rep who walked you through that mastitis problem last February is standing by the coffee urn. You don’t interrogate the people who show up for you, and that loyalty is real and earned.
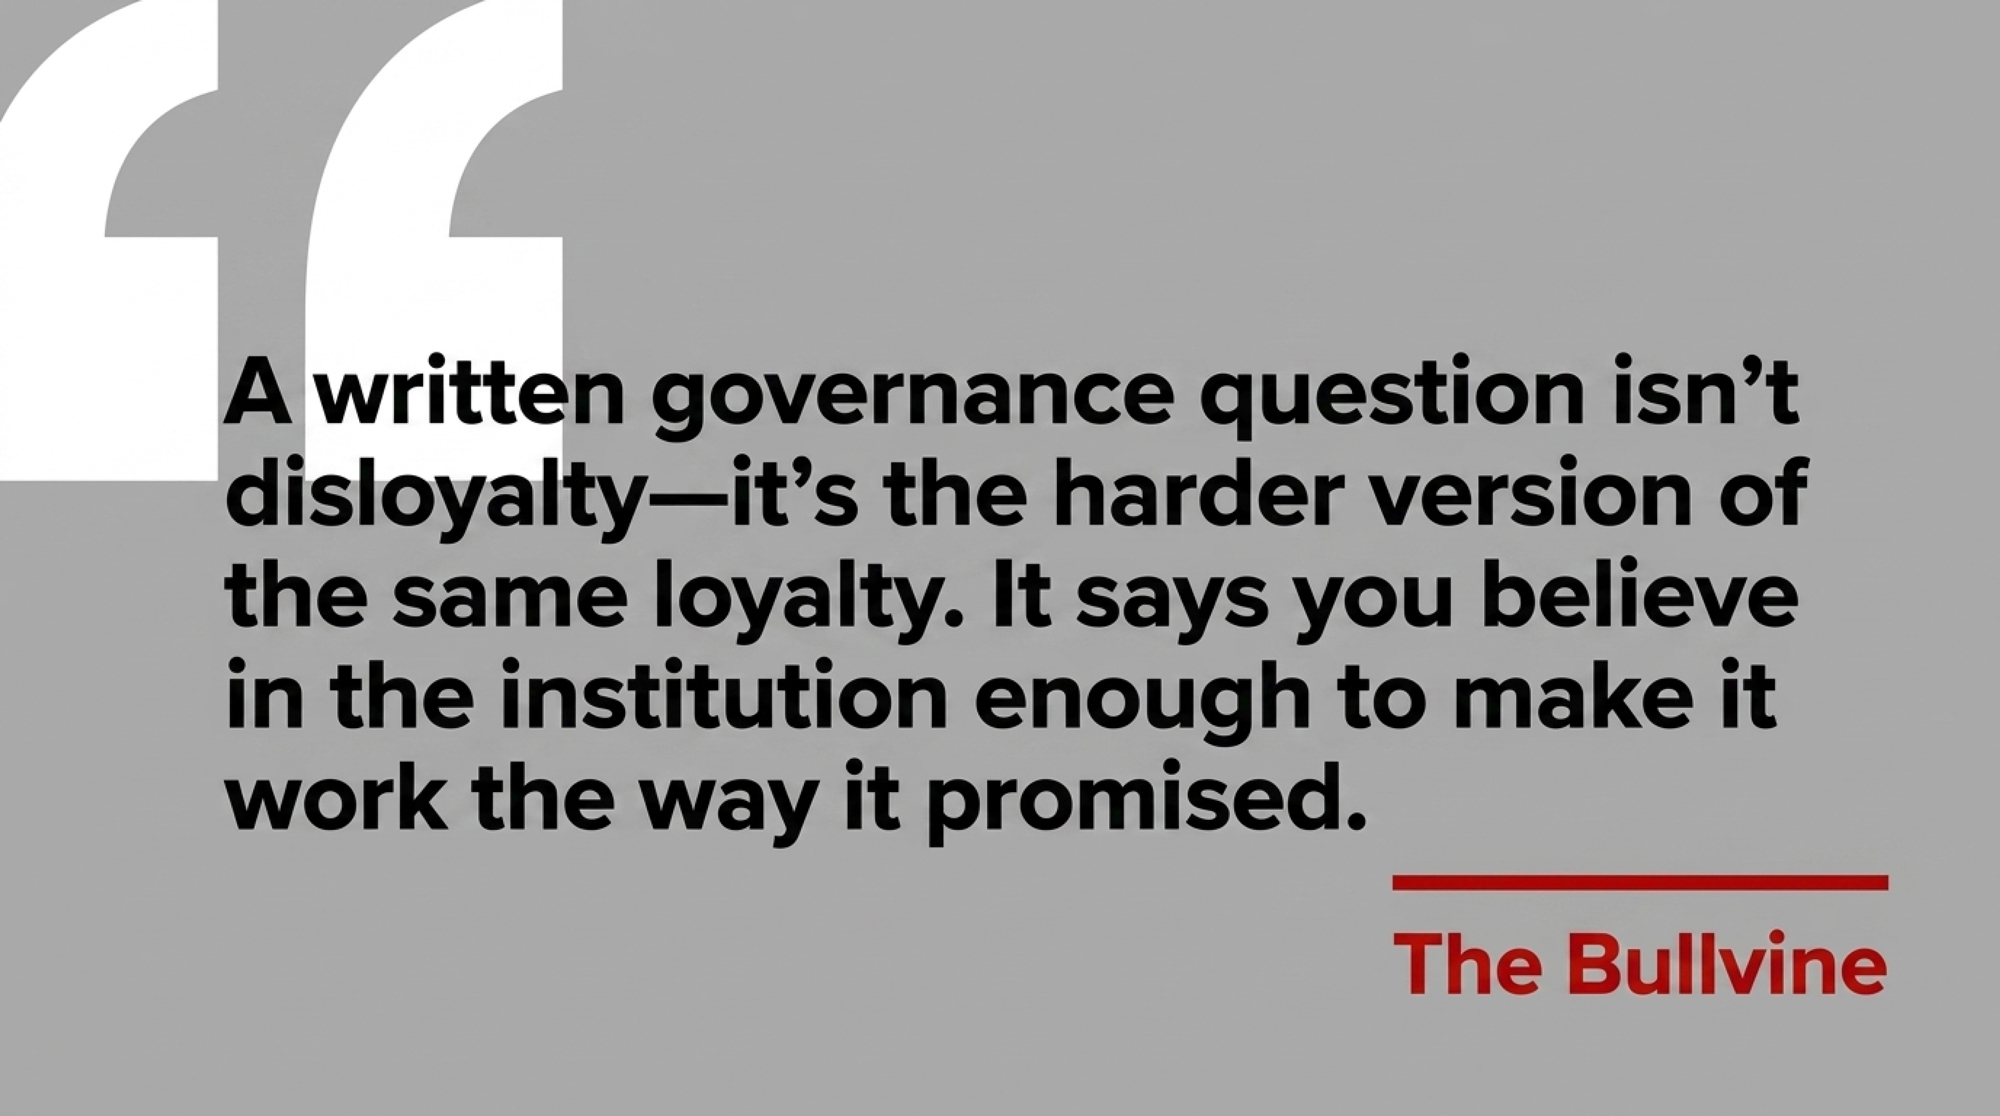
Here’s the reframe. A written governance question isn’t disloyalty — it’s the harder version of the same loyalty. It says you believe in the institution enough to make it work the way it promised. The Glengarry committee that walked out in 2020 wasn’t disloyal to Ontario dairy — they were the most invested people in the room. And if a board gets cagey when a member asks for a written disclosure policy? That discomfort is diagnostic. It’s telling you something the bylaws won’t.
Key Takeaways

  • If you can’t find your co-op’s full bylaws posted publicly — and DFA members can’t — treat that as a flag worth documenting, then ask for them in writing.
  • If your board hasn’t put a legal-strategy disclosure policy in front of its members, send a signed, dated letter this month requesting the exact provision. Verbal answers don’t count — get it in writing.
  • If your next annual meeting is more than 60 days out, find your district delegate or committee rep now, before the agenda deadline closes.
  • If you want your real exposure, take your annual CWT times a 30- to 94-cent drag against your current pay price — that’s your cost from regulatory and legal decisions you didn’t vote on.
  • If the board answers verbally rather than in writing, send a follow-up letter noting that you asked for a written response. Build the paper trail before you need it, not after.
  • If you’re the only one asking, find two or three other members in your district doing the same. Not a coalition — a conversation. It changes what a board can quietly manage.

The Fonterra matter will run its course, and New Zealand will sort out who knew what and when. But that’s not the question that should keep you up. The closer one is this: if your board made a decision tomorrow that reshaped your contract or your regulatory environment, would you hear about it before it hit your check, or two years later, off a news report?

You can start answering that this week, for the price of a certified letter. The deeper work — how a governance gap converts into real cost-per-cwt by herd size, and what enforceable disclosure language actually looks like inside a co-op bylaw — is where this gets operational. 

Complete references and supporting documentation are available upon request by contacting the editorial team at editor@thebullvine.com.

Learn More

The Sunday Read Dairy Professionals Don’t Skip.

Every week, thousands of producers, breeders, and industry insiders open Bullvine Weekly for genetics insights, market shifts, and profit strategies they won’t find anywhere else. One email. Five minutes. Smarter decisions all week.
NewsSubscribe
First
Last
Consent

The $221,760 Corridor Trap Hitting 600‑Cow Upper Midwest Dairies in 2026

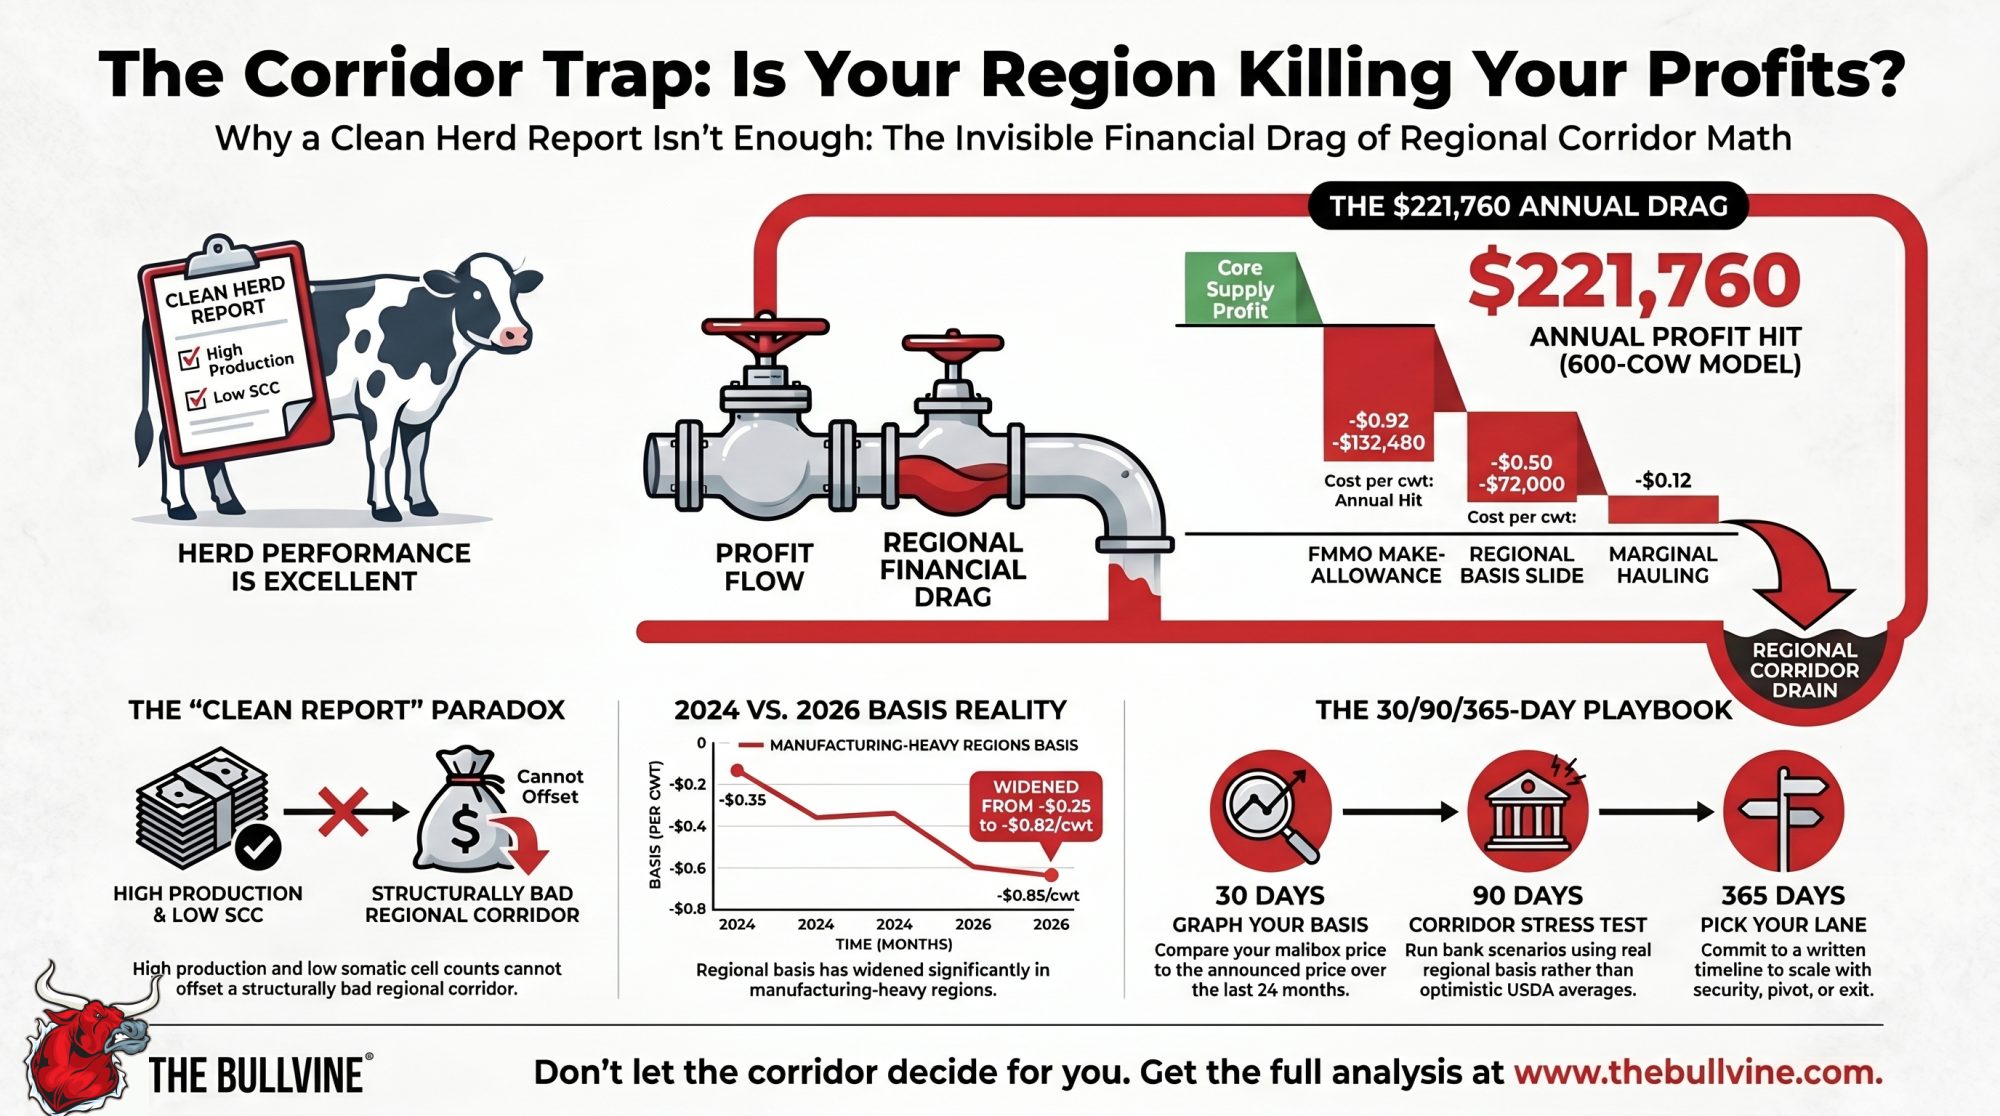
Same cows. Same management. A different corridor — and a $221,760 annual drag. Basis went from ‑$0.35 to ‑$0.85/cwt while the FMMO make‑allowance took another $0.92 off Class III. The herd report still looks clean.

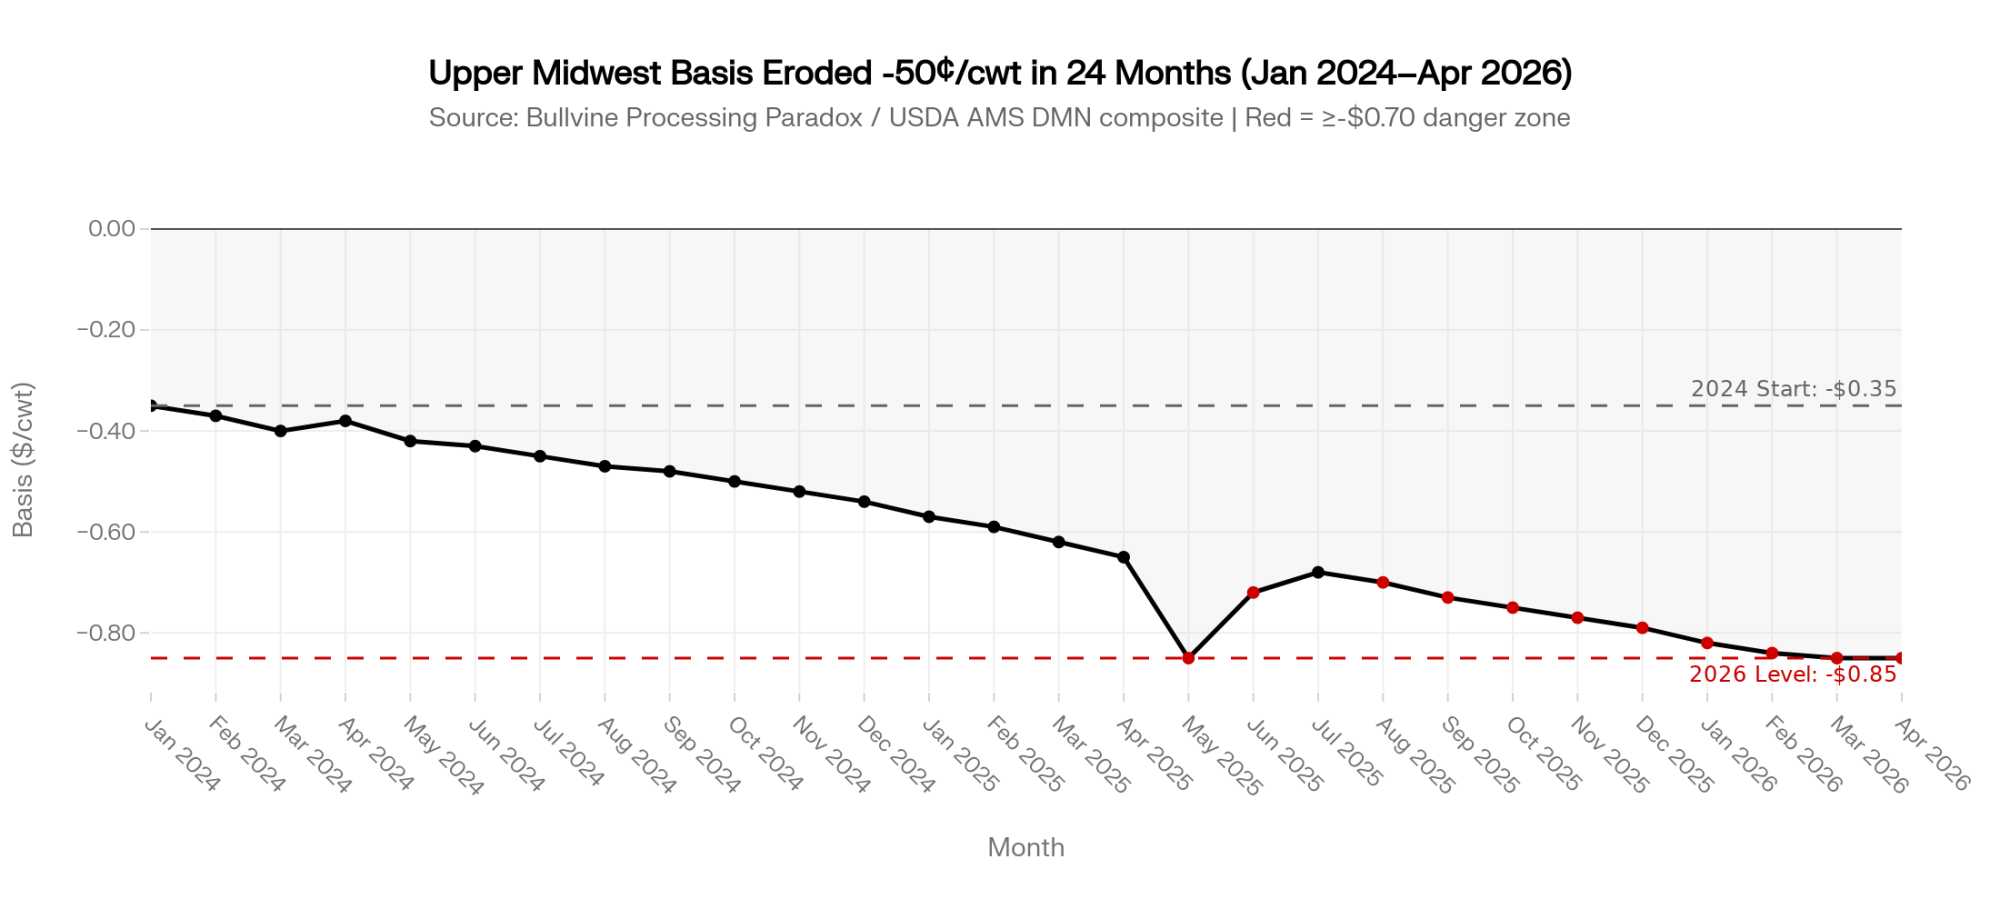
On a 600‑cow Upper Midwest dairy we’ll call Maple Ridge, the all‑in basis on the milk check has moved from roughly ‑$0.35/cwt in 2024 to about ‑$0.85/cwt in early 2026. Same cows. Same management. A different corridor.

USDA ERS’s April 2026 Livestock, Dairy, and Poultry Outlook puts 2026 all‑milk near $20.40–$20.50/cwt, while CME Class III futures for mid‑2026 contracts have traded mostly in the mid‑$16s to upper‑$17s through early Q2 2026 sessions. That $2–$3/cwt gap is the budget anchor argument every dairy lender is now having. Maple Ridge’s gap isn’t on the screen. It’s on the milk check.

Maple Ridge is a composite operation drawn from Bullvine reporting and the Processing Paradox 2024–2026 dataset, used here so we can show real numbers without exposing a real farm’s milk check. The rule‑change inputs are verified against published USDA and Bullvine analysis. The herd‑level inputs are illustrative. Plug in your own.

A 2,000‑cow Western dairy we’ll call Dos Arroyos — also a composite, modeled on the kind of core‑supply contracts Bullvine has documented along the High Plains and I‑29 corridor — is staring at the same kind of basis pressure and adding 400 cows anyway. The processing capacity dairy 2026 question lives right in the gap between those two decisions.

This isn’t a story about milk per cow. It’s about whether your region’s plants want your next pound or not.

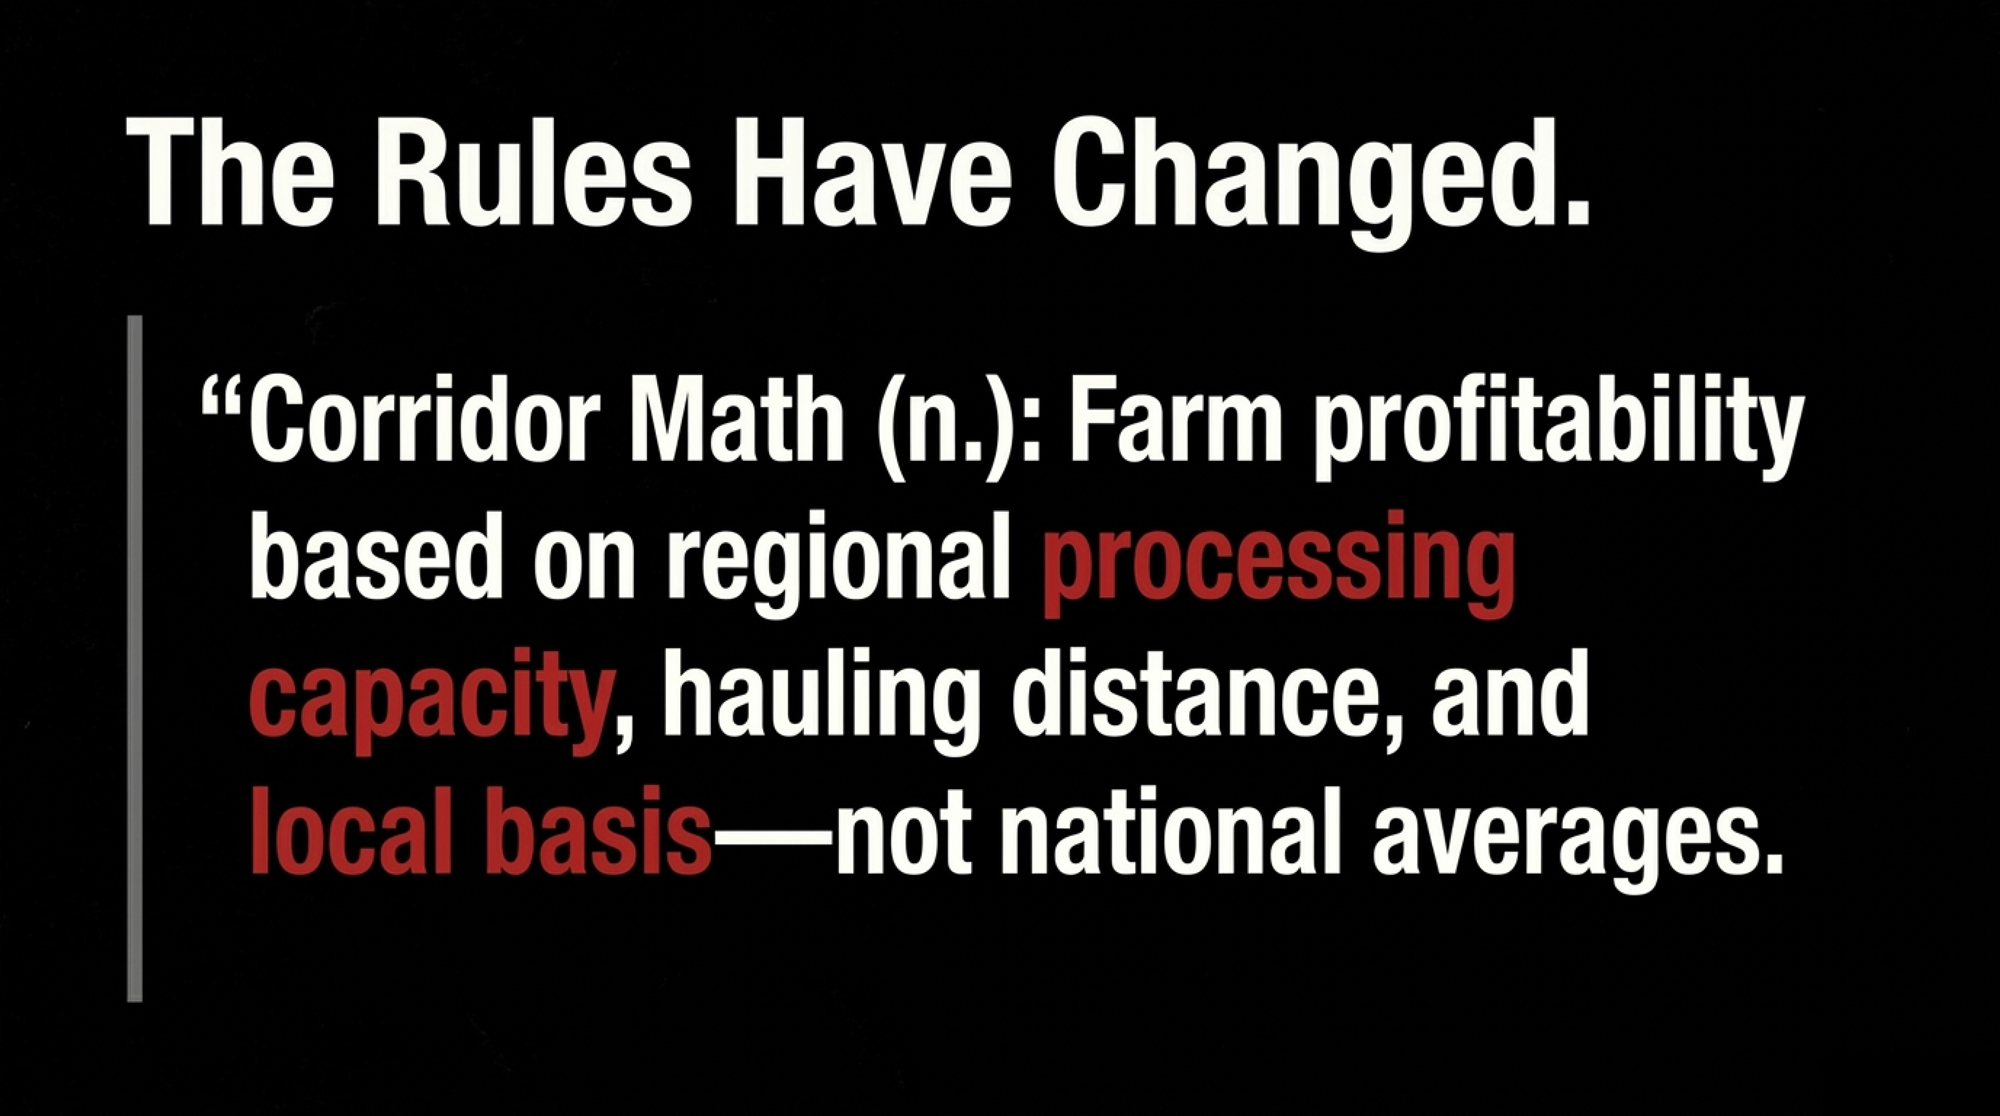
Bullvine Definition — Corridor Math (n.): The calculation of farm profitability based on regional processing capacity, hauling distance to marginal plants, and local basis, rather than national Class III averages. Two farms with identical herd reports can sit on opposite ends of Corridor Math if their plants, hauling lanes, and basis trends diverge.

Quick note for Ontario and Canadian readers: Corridor Math applies under supply management too. The levers change — base allocation, P5 pooling, plant access, CDC pricing signals — but the question is the same: does your buyer’s plant want your next hectolitre, and at what net mailbox price?

How Maple Ridge’s $221,760 Annual Drag Hid Inside a Clean Herd Report

Maple Ridge ships into a cheese‑heavy Upper Midwest milkshed inside Federal Order 30. Components are solid, somatic cell count is low, and debt per cow sits under the $3,500/cow “strong” threshold cited in Cornell PRO‑DAIRY Dairy Farm Business Summary–style benchmarks referenced in the Processing Paradox analysis (Cornell PRO‑DAIRY DFBS, 2024 edition). By the herd report, nothing’s wrong.

The corridor changed around them.

  • Bullvine’s Processing Paradox reporting — drawing on USDA AMS Dairy Market News and operator public statements — documented reduced weekend and overtime processing at several Upper Midwest cheese plants through 2024–2025, alongside tighter volume caps and base‑excess plan use. Operators cited labor and energy costs.
  • Regional herd consolidation in the same buyer’s draw radius tightened the local milk‑to‑capacity ratio over 2024, consistent with the relocation and consolidation patterns Bullvine has documented along the I‑29 corridor.
  • USDA AMS Dairy Market News reported Midwest spot Class III milk trading flat to as much as $7.00 under Class III during the spring 2025 flush cycle, with the deepest discounts in the week ending May 2, 2025 (USDA AMS DMN, April–May 2025 weekly issues).

Stack those forces and a 50¢/cwt basis slide isn’t a mystery. It’s the price tag on a corridor that quietly went long on milk.

The 2025 FMMO modernization sits on top of all this. Bullvine’s April 2026 analysis, The New FMMO Rule Costs a 500‑Cow Dairy $97,750 a Year, pegs the make‑allowance update at roughly $0.85–$0.93/cwt off Class II–IV values once fully phased in, with Class III near $0.92/cwt, based on USDA AMS, Final Rule on Amendments to Federal Milk Marketing Orders (January 2025) and the University of Wisconsin Extension review of the AMS final decision (2025). That’s before a single mile of freight. Before basis. Before a balancing fee.

Deep Dive → The New FMMO Rule Costs a 500‑Cow Dairy $97,750 a Year — Tier 3 pillar, April 2026.

What Does a 50¢/cwt Basis Slide Actually Cost a 600‑Cow Dairy in 2026?

This is where you stop talking corridors and run the numbers like your banker would.

The Maple Ridge 2026 Reality — 600 Cows, Upper Midwest, Illustrative Composite

Factor2024 Impact (per cwt)2026 Impact (per cwt)Annual Bottom‑Line Shift vs 2024
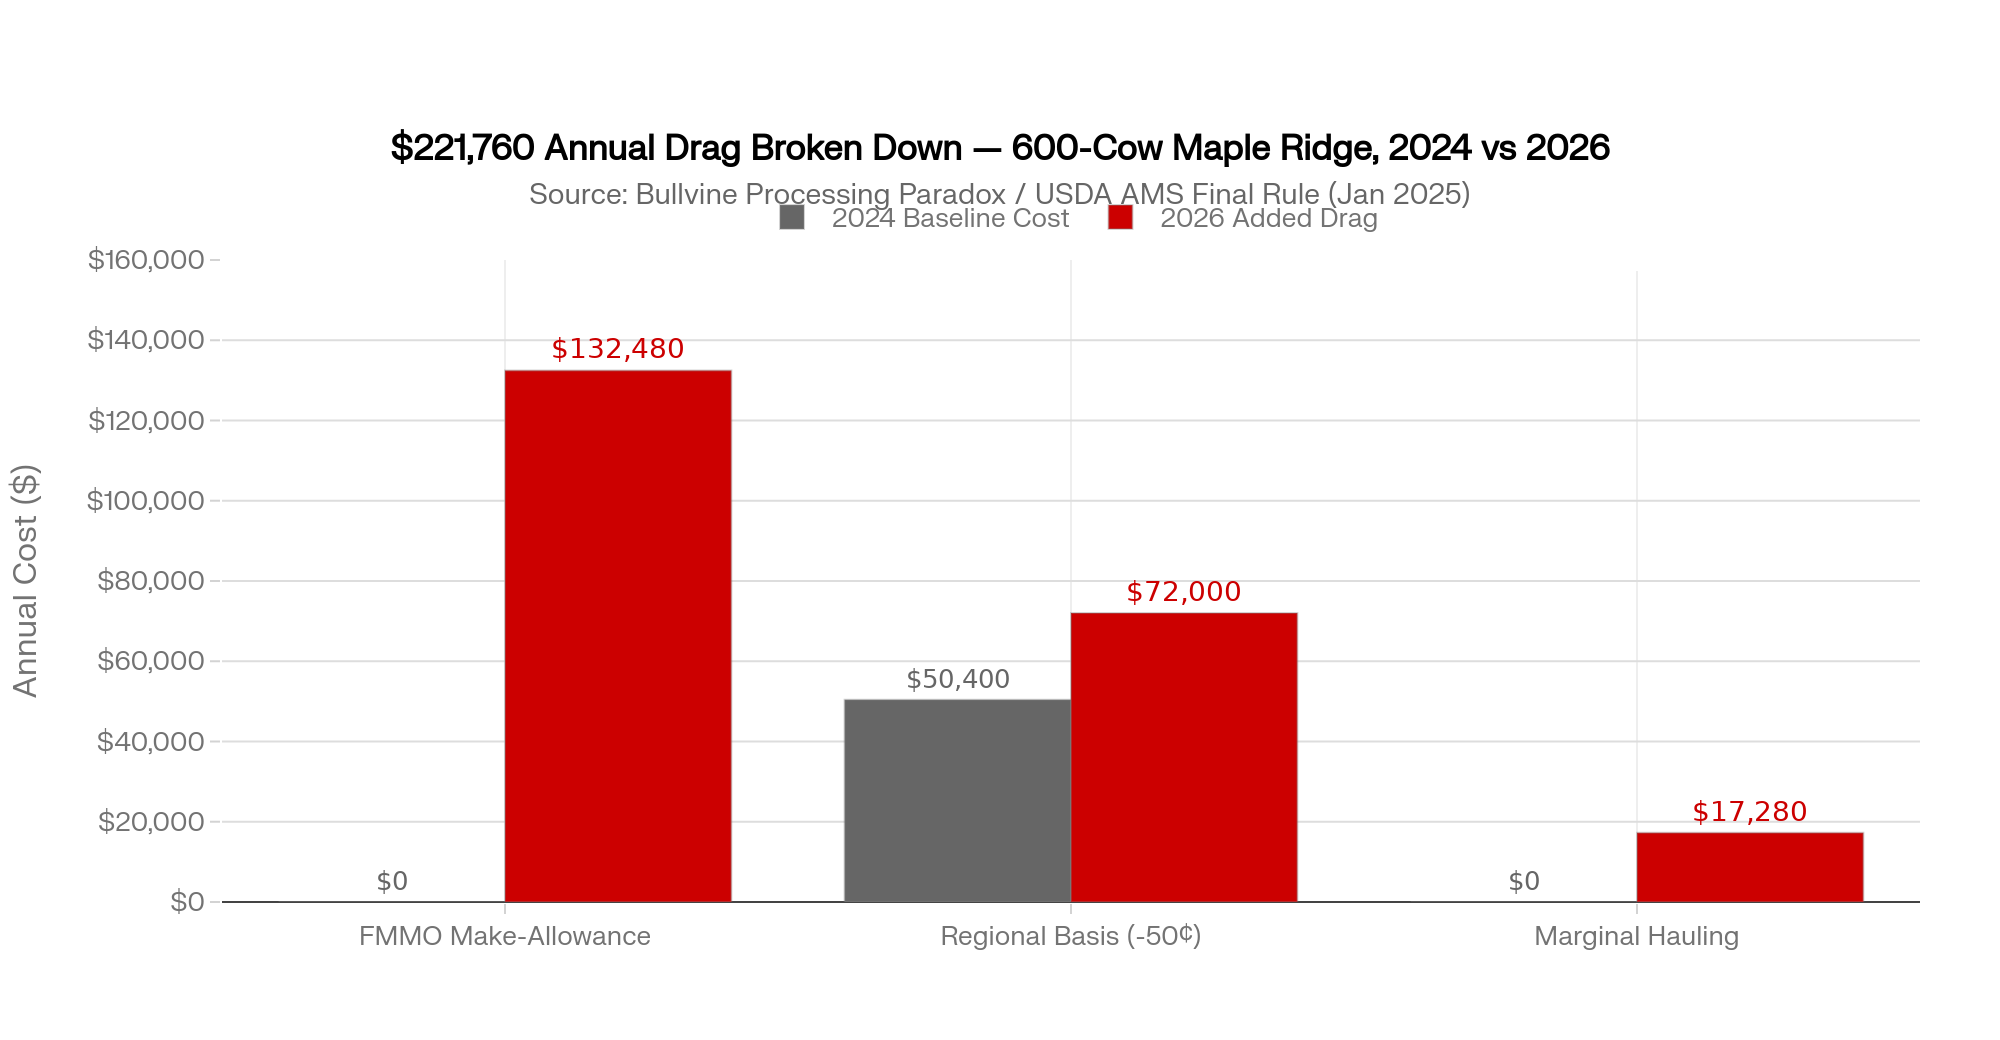
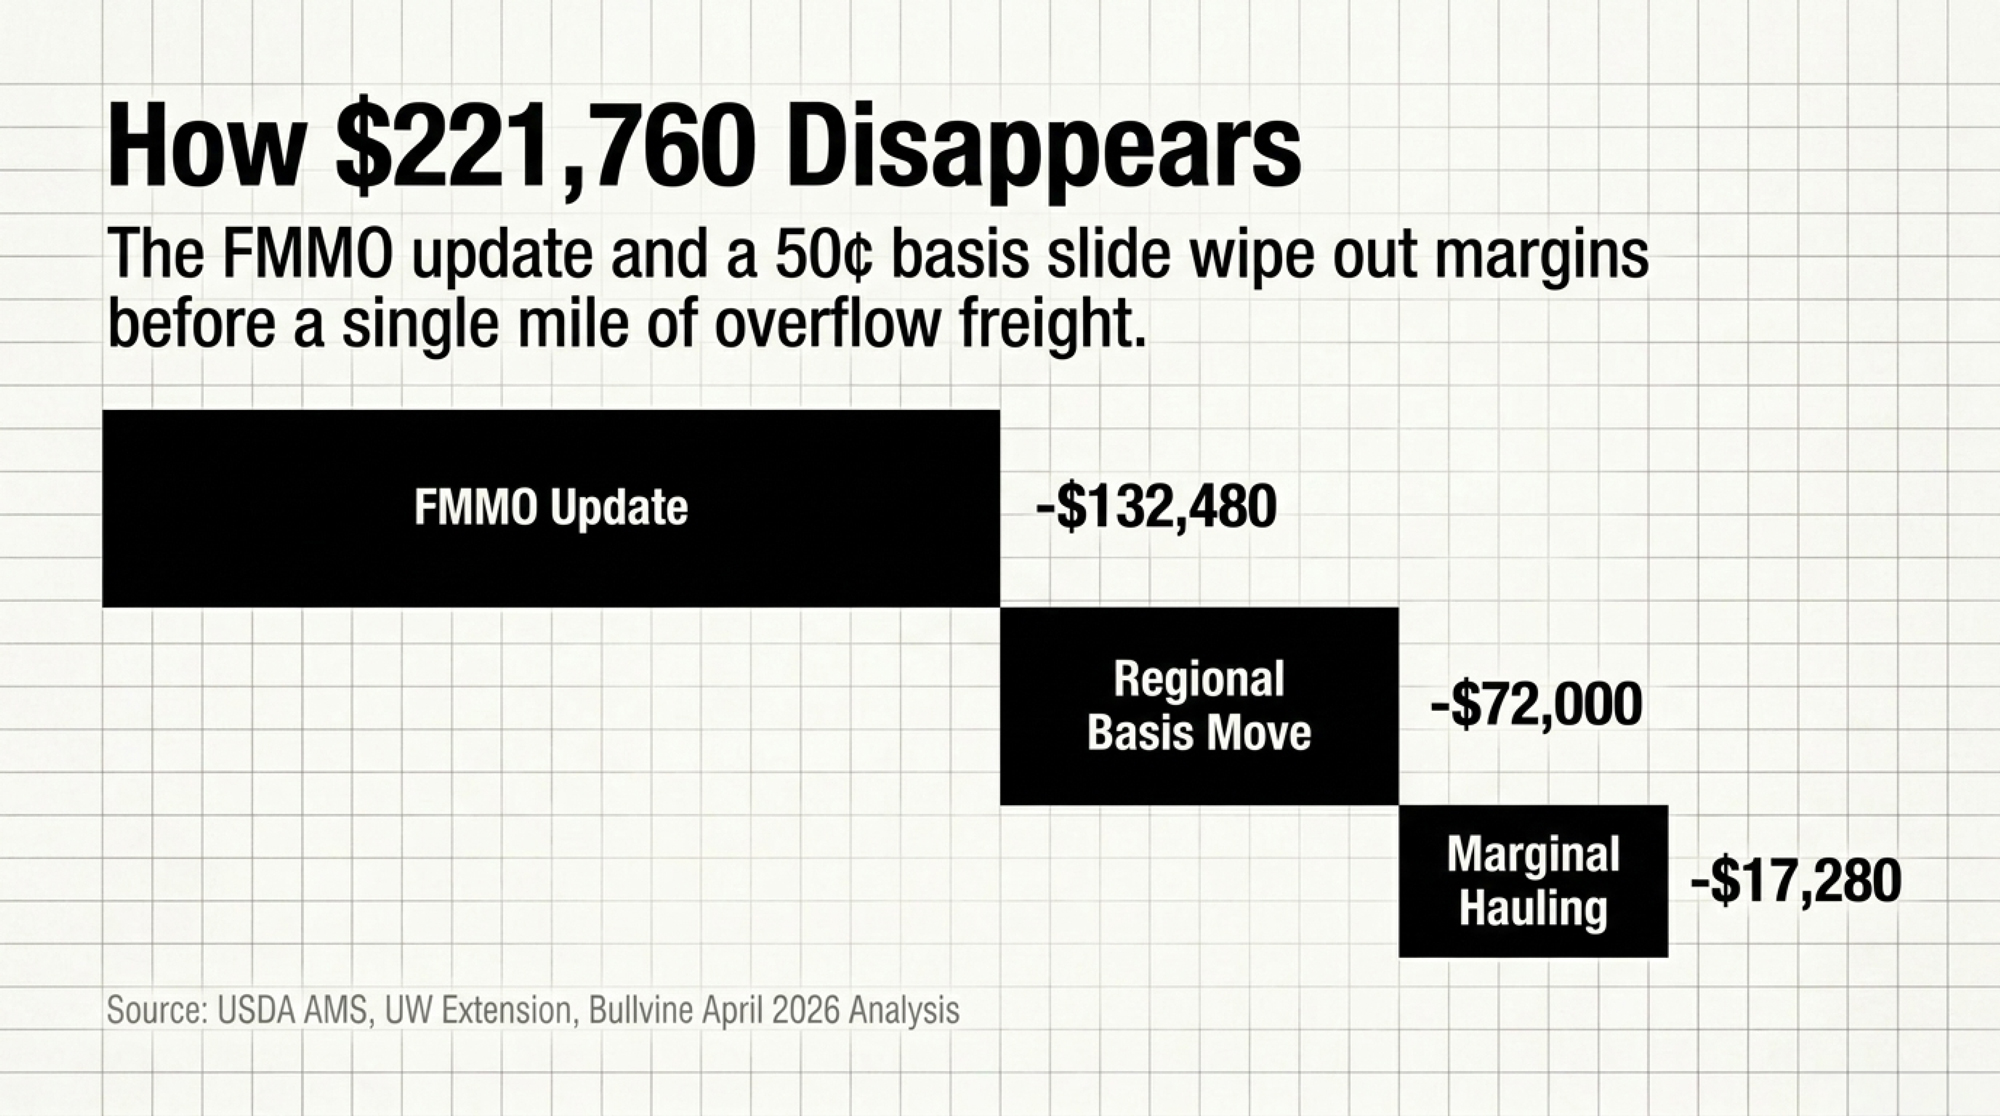
FMMO Make‑Allowance$0.00(‑$0.92)(‑$132,480)
Regional Basis(‑$0.35)(‑$0.85)(‑$72,000) on the 50¢/cwt move
Marginal Hauling (weighted)*$0.00(‑$0.12)(‑$17,280)
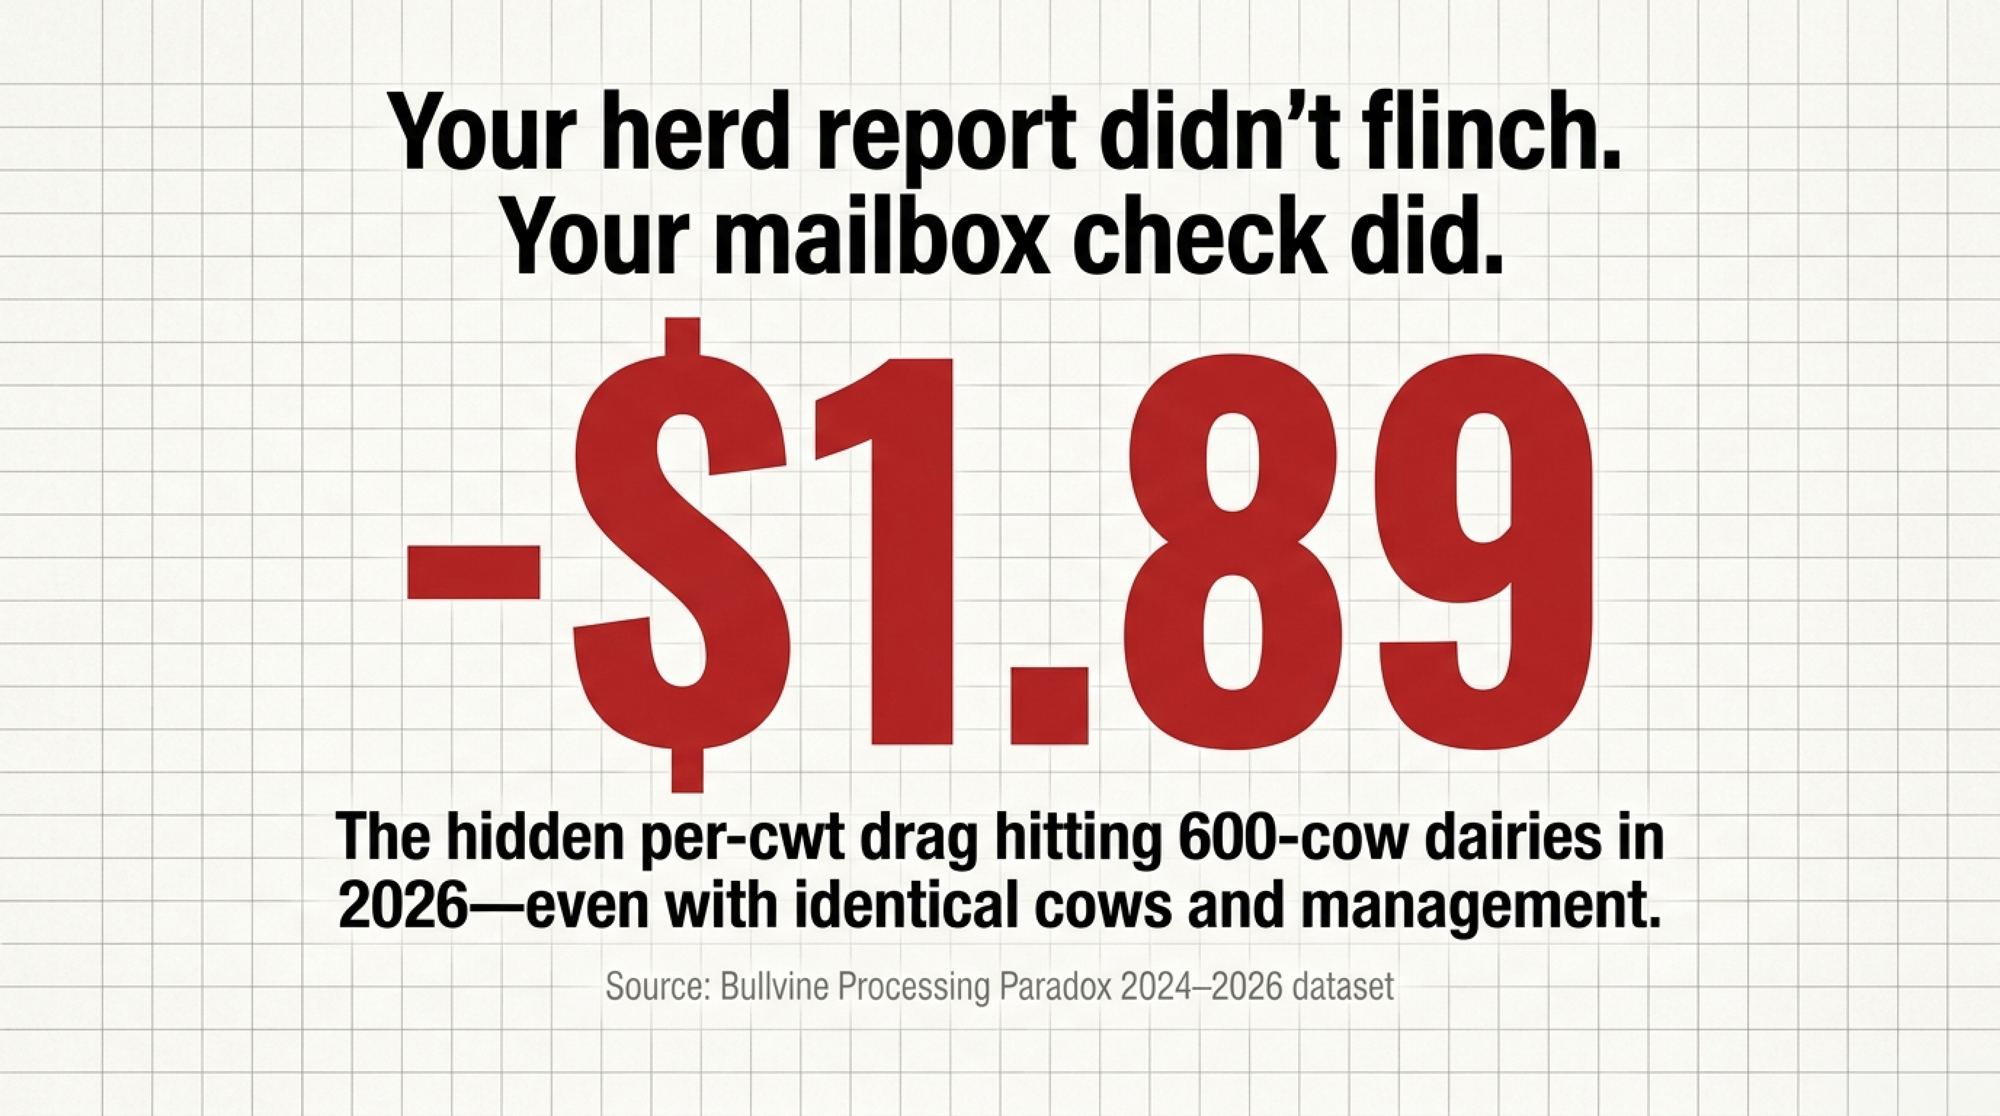
Total Drag vs 2024 Baseline(‑$0.35)(‑$1.89)(‑$221,760)

Weighted across marginal loads, assuming ~30% of volume moves as overflow at an extra $0.40/cwt above the $0.80/cwt core rate documented in the Processing Paradox dataset. At a 15% marginal share, the hauling line is closer to ‑$0.06/cwt, or about ‑$8,640/year.

How to read this table: The Regional Basis line shows the delta vs 2024 — the 50¢/cwt move, not the full 2026 basis cost. The Total Drag row sums the 2026 deltas against that 2024 baseline.

Running the Numbers — Maple Ridge, 600 Cows, Upper Midwest, 2024 vs 2026 (illustrative composite)

Verified inputs: USDA NASS Milk Production 2025 annual production averages; USDA AMS Final Rule on Amendments to FMMOs (January 2025); UW Extension AMS final‑decision review (2025); Bullvine April 2026 New FMMO Rule analysis; Bullvine Processing Paradox 2024–2026 dataset. Illustrative inputs: Maple Ridge’s herd‑level basis trend, marginal‑load share, and hauling differential. Plug in your own numbers and your own statements.

  • Herd: 600 milking cows, Upper Midwest, manufacturing‑heavy FMMO.
  • Production: ~24,000 lb/cow/year, in line with the 24,390 lb 2025 U.S. average from USDA NASS Milk Production (2025).
  • Annual shipped: 600 × 24,000 lb = 14.4 million lb = 144,000 cwt/year.

Industry rule‑change impact: 144,000 cwt × $0.92/cwt FMMO Class III hit = ~$132,480/year.

Corridor basis impact: $0.50/cwt move × 144,000 cwt = ~$72,000/year.

Marginal hauling drift (illustrative scenarios):

  • Scenario A — 15% marginal: 144,000 × 0.15 × $0.40 = ~$8,640/year.
  • Scenario B — 30% marginal: 144,000 × 0.30 × $0.40 = ~$17,280/year.

Combined drag range: ~$213,000–$222,000/year, against an operation that hasn’t changed cows, ration, or management since 2023.

Scale the basis‑only piece to your herd:

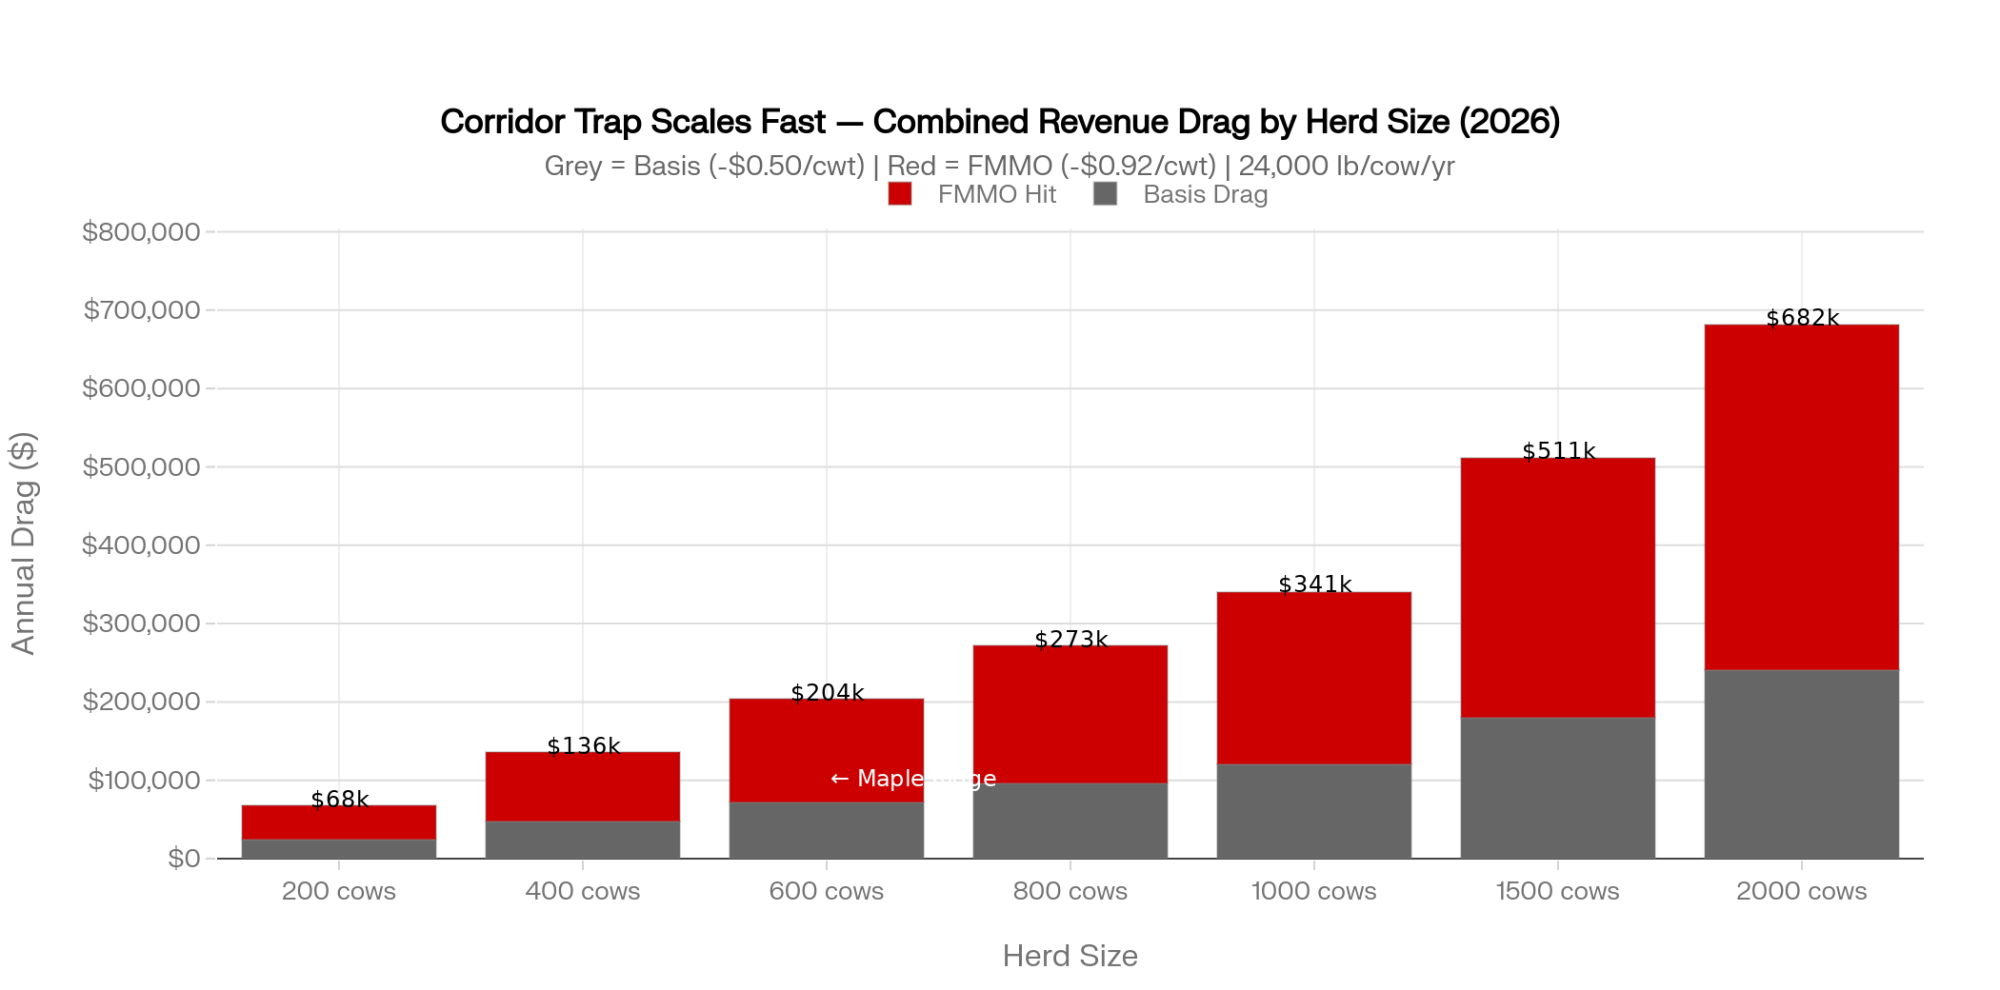
  • 400 cows shipping ~96,000 cwt: 50¢/cwt basis move = ~$48,000/year.
  • 1,000 cows shipping ~240,000 cwt: same move = ~$120,000/year.

The herd report didn’t flinch. The mailbox check did. That’s the gap most barn KPIs aren’t built to catch.

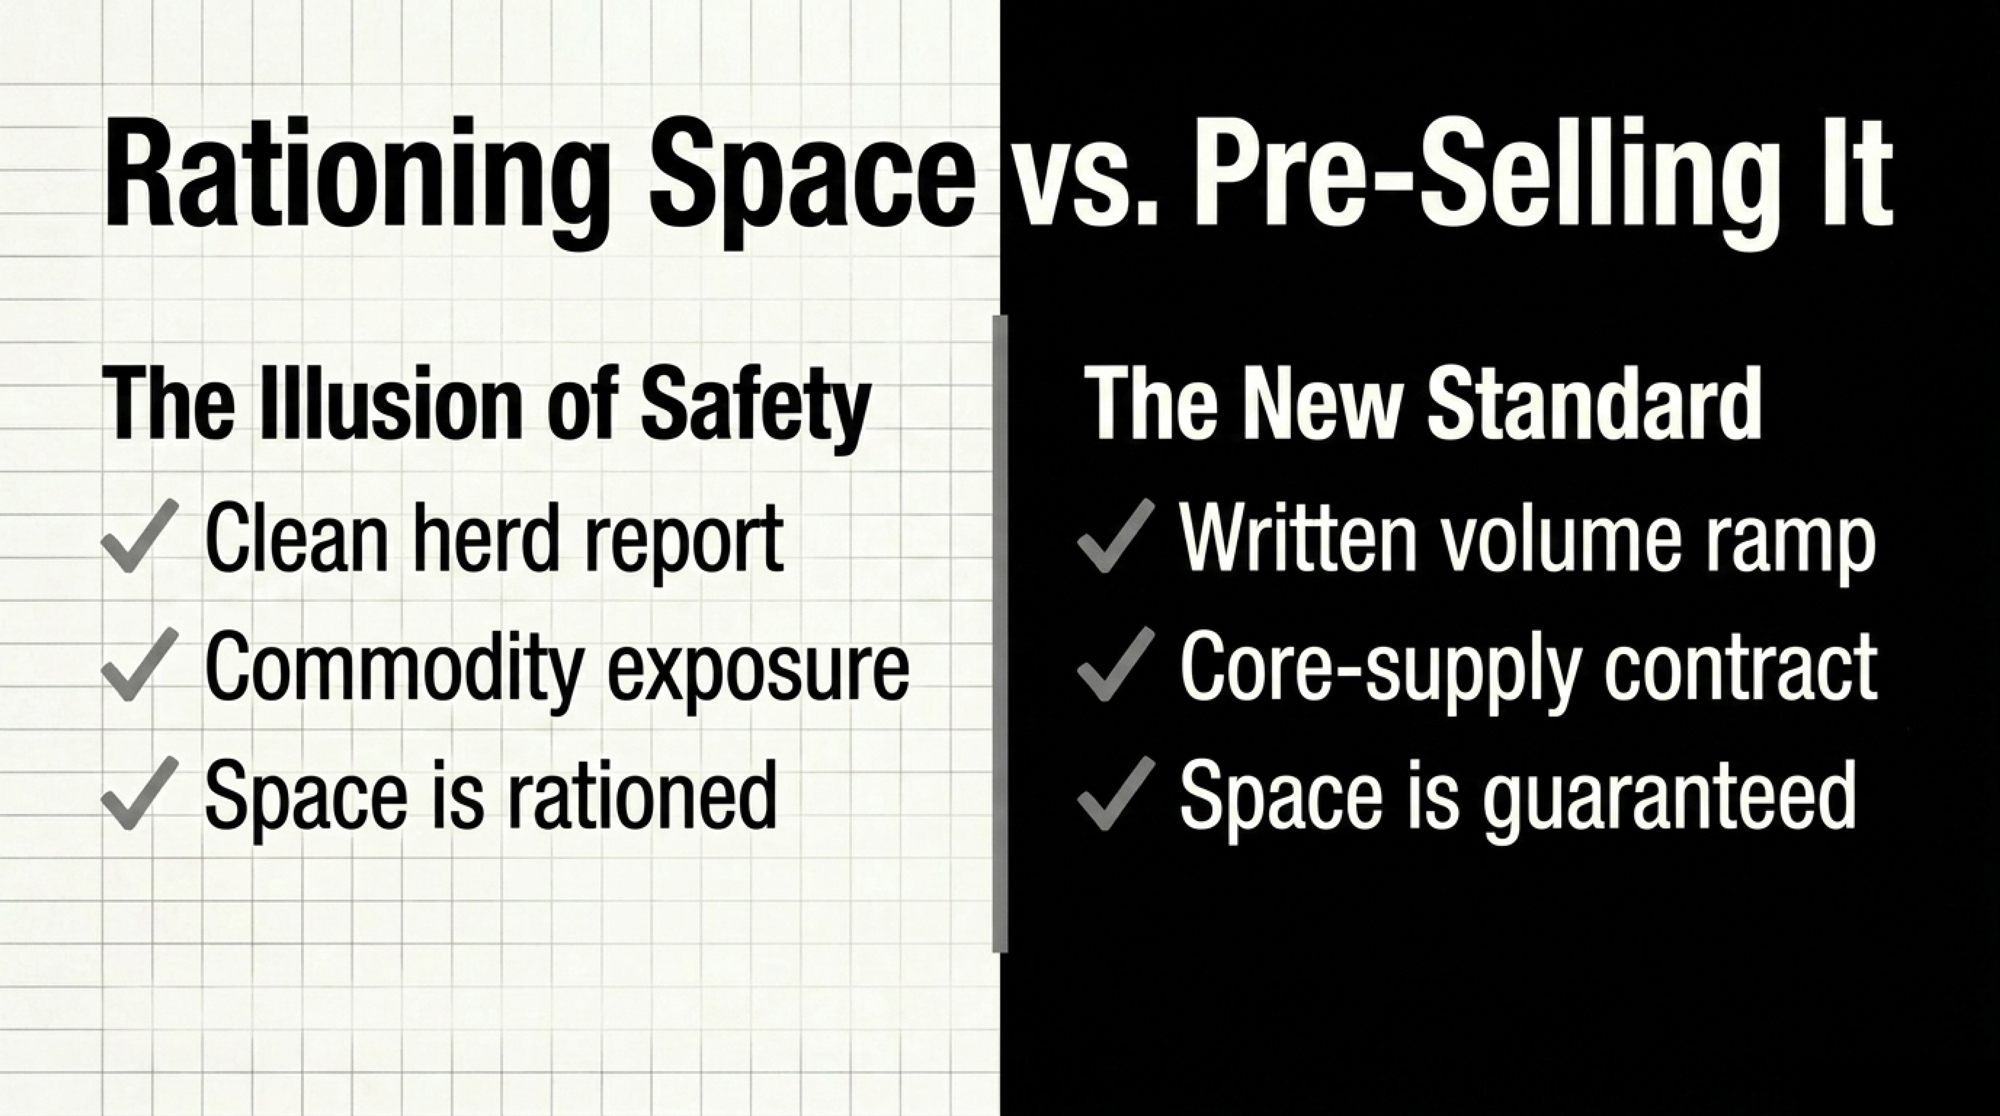
The Continental Divide: Rationing Space vs Pre‑Selling It

While the Upper Midwest is rationing space, the High Plains is pre‑selling it. The difference isn’t the cows. It’s the contract.

FactorMaple Ridge (Upper Midwest)Dos Arroyos (High Plains/I-29)
Herd size600 cows2,000 cows (+ 400 planned)
Federal OrderFO-30 (cheese-heavy)High Plains / non-pooled
2026 All-in Basis-$0.85/cwt~-$0.35/cwt (core supply)
FMMO Class III impact-$0.92/cwt (2025 rule)-$0.92/cwt (same rule)
Marginal hauling (overflow)$1.10–$1.20/cwt<$0.80/cwt within 60 mi
Plant capacity statusRationing / base-excessPre-sold / volume ramp
Core supply statusSwing/dispensableWritten core-supply contract
Total 2026 annual drag vs 2024-$221,760Largely offset by contract premiums
Robot/capex DSCR (corridor case)1.05–1.10× (yellow light)>1.25× (green)
Strategic pathPivot, exit, or repositionScale with concrete
Regional farm count trend-630 farms, 2022–2025Expansion corridor

Most producers can name the bull behind their best heifer. Few can name the closest plant project in their draw radius. Dos Arroyos can.

Their state, by the headline numbers in Processing Paradox 2024–2026 (USDA NASS state‑level Milk Production, 2014 vs 2024), looks bad. New Mexico shed roughly 2.2 billion pounds of annual milk and about 83,000 cows over that decade. California gave back more than 2.0 billion pounds and around 72,000 cows. The Ogallala Aquifer projection — up to 70% of the aquifer’s saturated thickness potentially unusable in the Texas Panhandle expansion zone within 20 years, per the Texas Tech and USGS‑linked aquifer research cited in Processing Paradox — isn’t a footnote.

Their corridor still tells a different story.

Dos Arroyos isn’t ahead because they’re better farmers. They’re ahead because they bought Processing Security in writing before they bought concrete. The era of producing milk and hoping for a check is over inside their basin.

The corridor’s public cheese build‑out — Hilmar (Lubbock, TX project announced 2021), Leprino (Lubbock, TX complex announced 2022), and Valley Queen (Milbank, SD expansion announced 2022) — sets the public context, per each operator’s project announcements and Processing Paradox.

The contract terms described below are a Bullvine composite of corridor practice, drawn from Processing Paradox. They are not attributable to Hilmar, Leprino, Valley Queen, or any other named processor.

  • Dos Arroyos’s milk feeds into the $1.6 billion High Plains and I‑29 cheese build‑out underway since 2020.
  • Their 2025 supply agreement, as composited from Processing Paradox, carries defined base‑excess terms, component premiums tied to plant product mix, and a written volume ramp.
  • That ramp is what makes the 400‑cow expansion pencil. In the composite, throughput is committed in writing before concrete is poured. The base‑excess clause prices growth pounds inside core‑supply terms for the duration of the ramp, not at swing‑load discounts.
  • Their marginal load travels under 60 miles to a plant still bidding for volume, not rationing it.

The assumption that “Western dairy is doomed” doesn’t survive a corridor‑level read. The assumption that Upper Midwest dairy is structurally safe because it’s always been there doesn’t either. The Upper Midwest lost roughly 630 farms between 2022 and 2025 while regional milk climbed to 43.2 billion pounds (Bullvine Processing Paradox, drawing on USDA NASS, 2024–2026). The volume stayed. The mid‑size families didn’t.

Must‑Read → The $11 Billion Dairy Rush: Growth Corridor or Dead Zone? — Tier 3 hidden gem.

Why Maple Ridge’s Owner Stopped Trusting the Old Lender Spreadsheet

The turn for Maple Ridge came in early 2026, in a robotic milking conversation with a regional ag lender.

The opening was familiar. Rolling 12‑month averages. A USDA‑style price near $20.40/cwt for 2026, pulled from ERS and WASDE ranges. A generic stress test at $15/cwt with a flat ‑$0.25/cwt basis. Ag operating loans in the mid‑7% range, consistent with the lender environment Federal Reserve district and Purdue Center for Commercial Agriculture outlooks have tracked through late 2025 and into early 2026.

On those numbers, robots penciled.

Maple Ridge’s owner put three different numbers on the table.

  • A real trailing 24‑month all‑in basis: ‑$0.85/cwt, not ‑$0.25/cwt.
  • Marginal hauling reality from this composite operator’s dispatch profile: about $1.10–$1.20/cwt on overflow loads, versus the $0.80/cwt core rate documented across Processing Paradox herds.
  • Post‑FMMO Class III math reflecting the ~$0.92/cwt make‑allowance hit per the UW Extension review and the Bullvine April 2026 analysis, instead of pre‑2025 class values.

Bullvine’s 2025–2026 lender reporting describes the same pattern in plainer terms. The binding constraint isn’t a lower headline price. It’s a lower effective floor once basis, hauling, and post‑FMMO Class values are layered in.

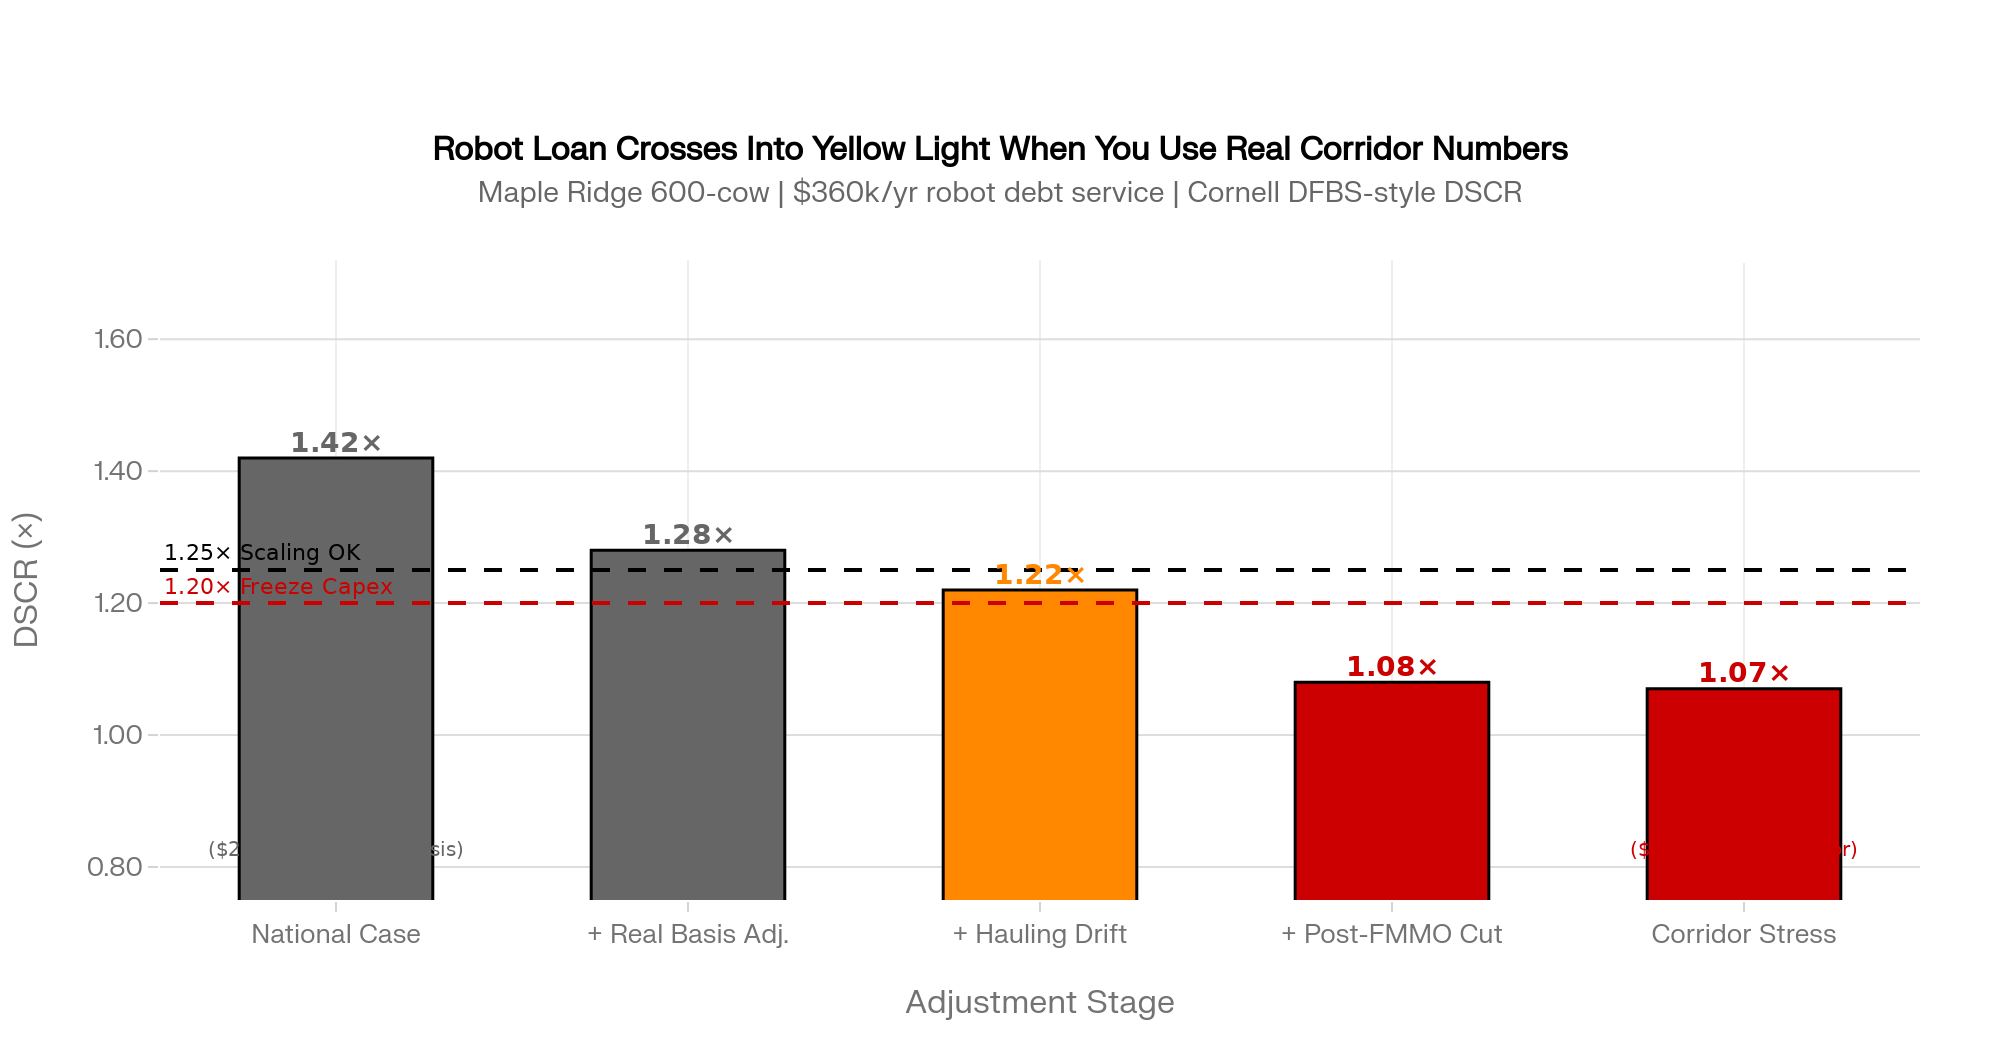
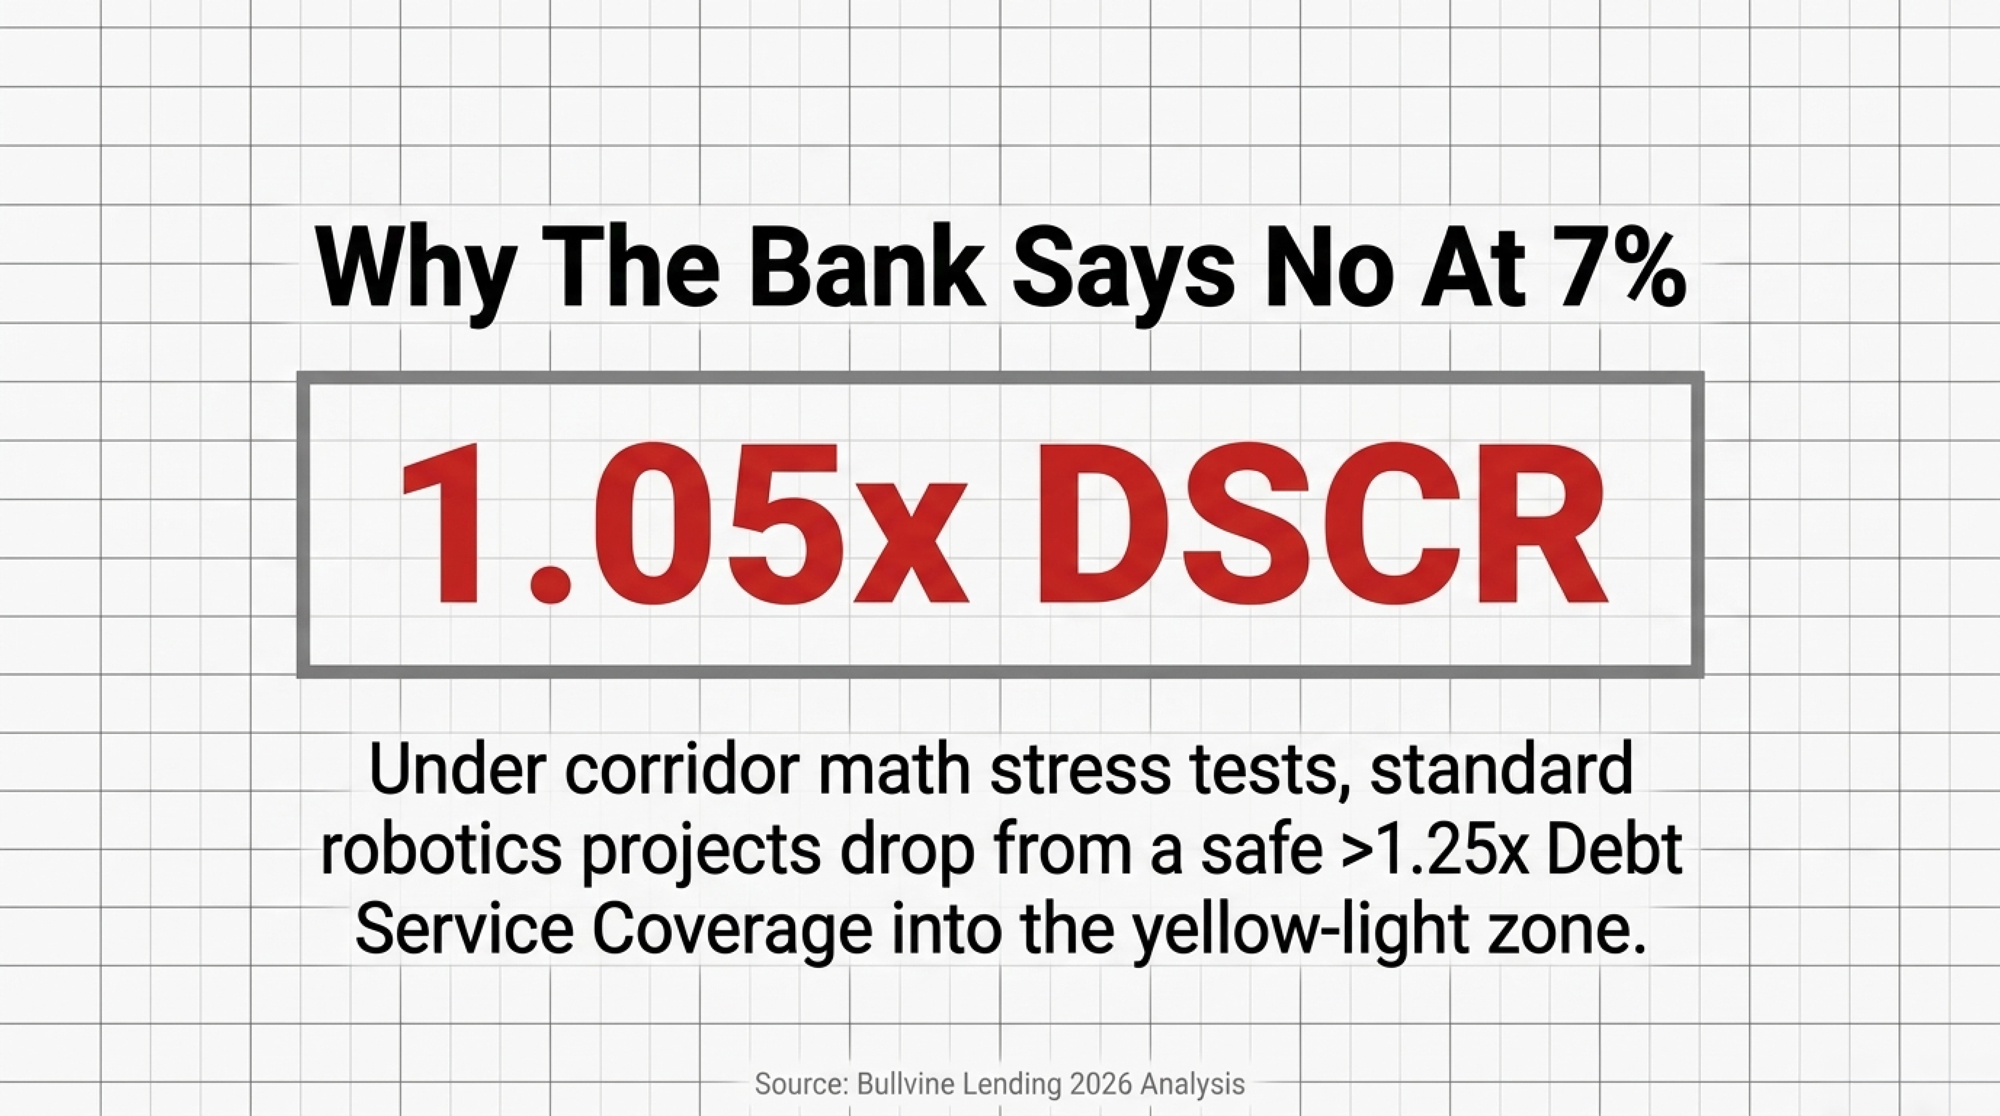
A robotic milking project at this herd profile typically carries roughly $360,000/year in annual debt service on the parlor and related infrastructure portion of the loan, drawn from Bullvine’s prior reporting on robotic ROI in the 300–600 cow range and standard amortization on 7%‑range term money. Re‑run with the corridor inputs above against that debt service, the project moved from comfortably above 1.25× DSCR into the 1.05–1.10× range under a $15/cwt corridor stress case — the “yellow light” zone Cornell DFBS‑style benchmarks (referenced in Processing Paradox) flag for tighter scrutiny.

The DSCR shift is illustrative. The inputs that drove it are real: the basis trend, the marginal hauling, the post‑FMMO Class values, and the debt service.

The robots didn’t become impossible. They became a different decision.

The question is no longer “how do we squeeze more milk out of this barn.” It’s “do we want to leverage 7%‑range money against a corridor that’s losing capacity, or use that equity to reposition?”

Deep Dive → Dairy Lending 2026: Why Your Banker Says No at 7% Money — prior Tier 3 economics analysis.

What Maple Ridge’s 24‑Month Basis Trend Means For Your Operation

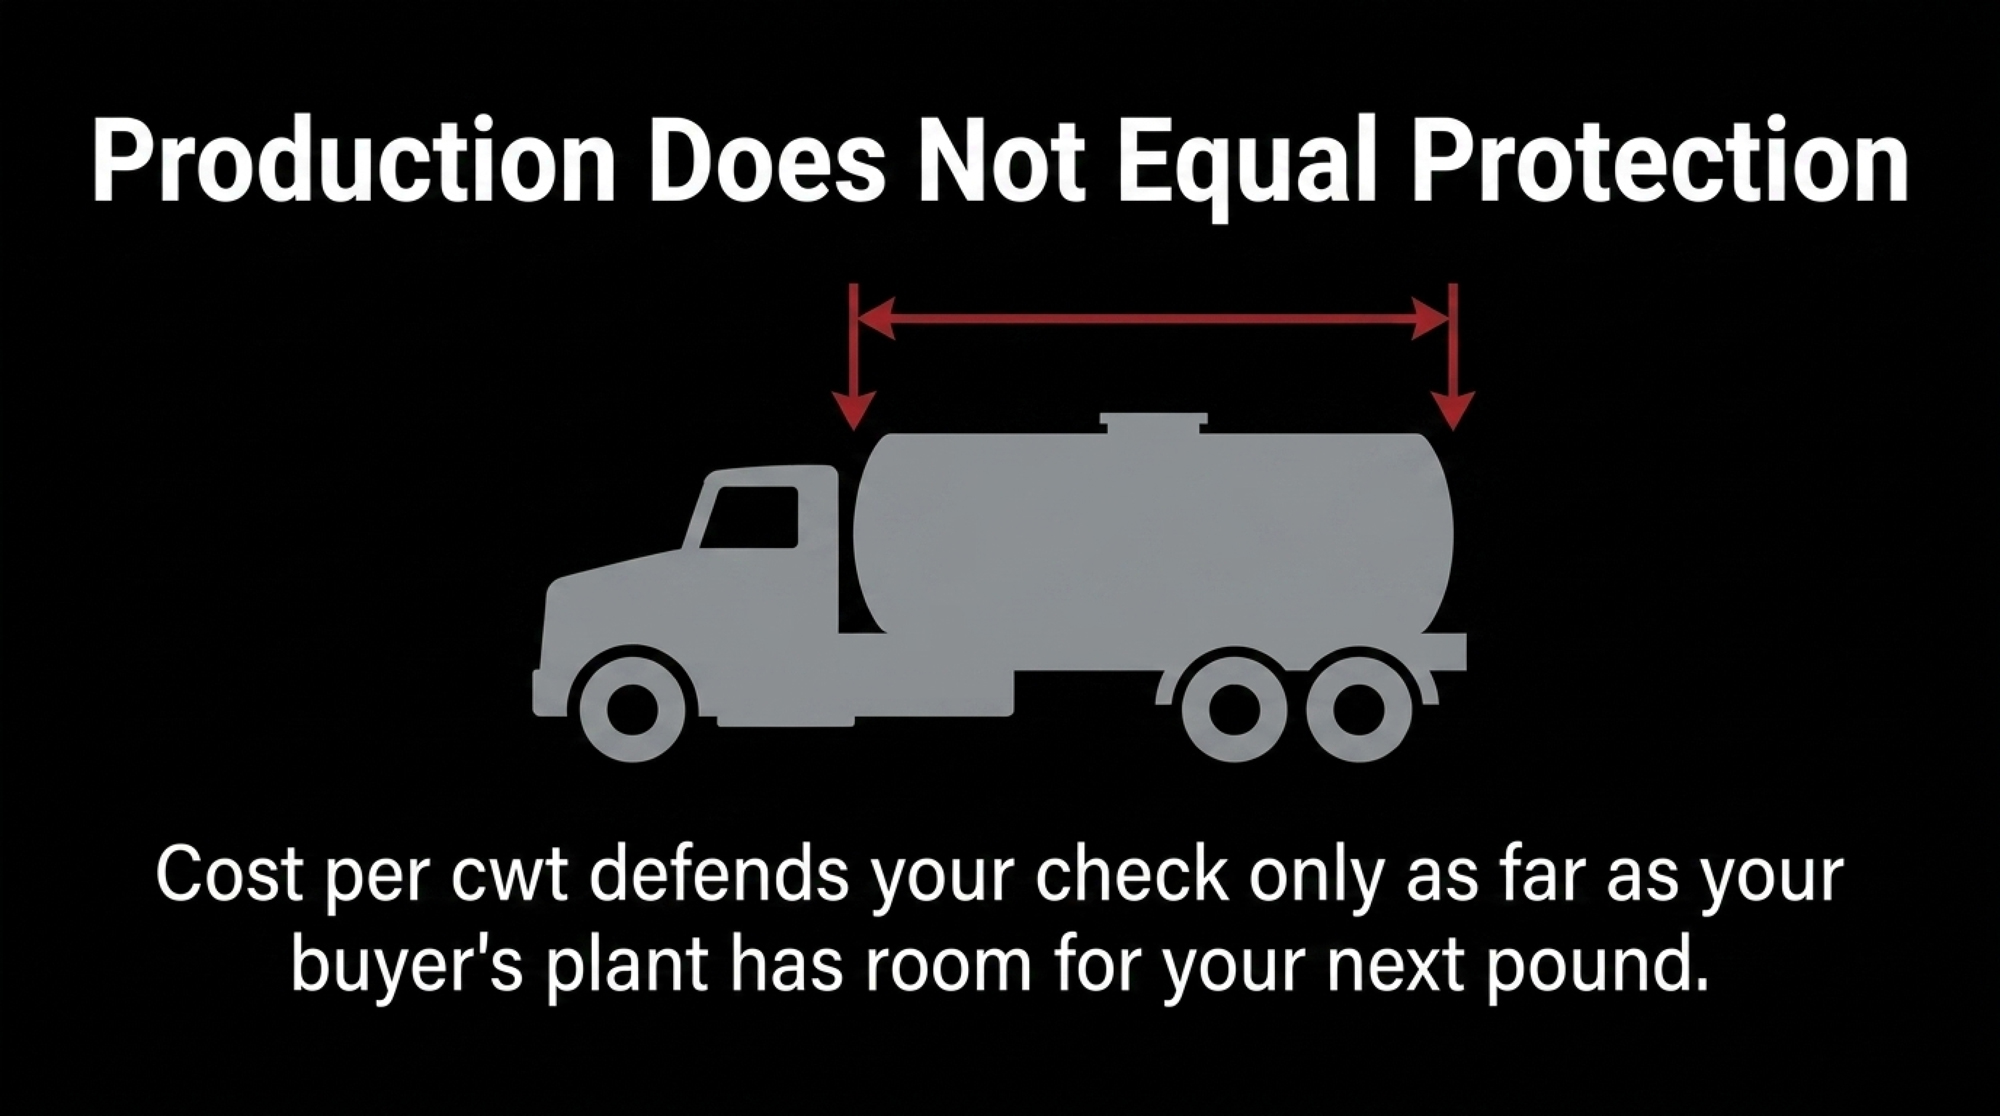
Maple Ridge’s herd report stayed clean while its corridor quietly repriced every cwt. That’s the lesson worth carrying off this page: cost per cwt and milk per cow defend the milk check only as far as your buyer’s plant has room for your next pound. Corridor structure decides how much of any cost or component advantage you actually keep.

There are three honest paths from here, and you don’t get to skip the diagnosis to pick one.

  • Scale with a processor. Real only if your buyer puts core‑supply status, base terms, and component premiums in writing, and your corridor‑aware DSCR holds.
  • Pivot to a premium or niche channel. Smaller volume, higher complexity, slower onboarding, but partial escape from commodity basis.
  • Plan an orderly exit or relocation. Preserves equity in a structurally bad basin; forecloses generational continuity in the existing barn.

The trade‑off underneath all three: speed of decision versus depth of corridor diagnosis. Move too fast and you lock in the wrong path. Stall and the basis keeps deciding for you.

The 30/90/365‑Day Playbook for Herds Like Maple Ridge’s

Adapt the thresholds to your own statements and your own basin. Don’t copy them.

30‑Day Actions — urgent checks

  • Pull 24 months of milk checks and graph all‑in basis: mailbox − announced price, including hauling and any “marketing” or “balancing” adjustments.
    • Requires: bookkeeping time, statements, a spreadsheet.
    • Red‑flag trigger: basis widened by more than 25¢/cwt over 18 months without a corresponding national price move.
    • Backfire risk: averaging across very different months hides flush‑season pain. Look at flush separately.
  • Separate loads into core versus marginal. Calculate actual hauling cost per cwt on overflow loads.
    • Requires: dispatch tickets, co‑op statements, an hour of cross‑checking.
    • Red‑flag trigger: marginal‑load hauling 50% or more above your core rate.
    • Watch for: milk‑check formats that combine freight with basis or place it under “other,” making marginal hauling hard to isolate.
  • Confront your field rep with three direct questions, on the record. Are we core, swing, or dispensable supply over the next 5–10 years? Where do our marginal loads physically go, and at what discount, when milk is long? What plant additions or closures are in your 3–5‑year network plan?
    • Requires: one meeting, no spin in your own answers.
    • Red‑flag trigger: vague answers or “we’ll get back to you” on all three.
  • Escalate if your DSCR has been under 1.20× for three straight months on your lender’s or CPA’s standard method. This list moves to the top of the next 30 days.

90‑Day Actions — structural adjustments

InputStandard Lender ModelCorridor-Aware ModelDifference
All-milk price used$20.40–$20.50/cwt (USDA ERS 2026)$15.00/cwt (corridor floor)-$5.40–$5.50/cwt
Basis assumption-$0.25/cwt (generic flat)-$0.85/cwt (trailing 24-month actual)-$0.60/cwt
FMMO Class III valuesPre-2025 class valuesPost-rule: -$0.92/cwt make-allowance-$0.92/cwt
Marginal hauling %0% (core rate only)15–30% of volume at overflow rate+$0.06–$0.12/cwt
Effective floor (combined)~$20.15/cwt~$13.71/cwt-$6.44/cwt
Robot project DSCR result>1.25× ✓ (pencils)1.05–1.10× ✗ (yellow light)Crosses freeze threshold
Capex decisionProceedFreeze or resizeMaterial divergence
Risk to lender if national model usedLow (on paper)High (basis keeps widening)Model blind spot
  • Force a corridor‑aware stress test at your bank. Two scenarios, side by side.
    • National case: USDA‑style all‑milk price, flat basis, generic hauling.
    • Corridor case: post‑FMMO Class values reflecting the 2025 make‑allowance changes (per the UW Extension review and Bullvine’s April 2026 analysis), your trailing 12–24‑month basis minus another 25–50¢/cwt, and marginal‑load hauling on at least 15–30% of volume.
    • Requires: milk check history, dispatch records, current contract, lender model.
    • Threshold: corridor‑case DSCR below 1.20× should freeze any non‑essential capital project.
    • Backfire risk: if a lender won’t run the corridor case alongside the national case, factor that into your read of how flexible the relationship is likely to be when margins tighten.
  • Pressure‑test a “minus 10–15% intake” scenario. If your primary buyer cut your base by 10–15% tomorrow, where does that milk go, and at what discount?
    • Requires: honest conversations with two or three alternative buyers.
    • Threshold: if you can’t name a plant and a realistic price within two to three weeks, your marketing risk is bigger than your production risk.
    • Watch for: verbal interest that disappears when you ask for a number.
  • Revisit any contracted or planned capital project — robots, freestall expansion, parlor upgrade — against the corridor case, not the national case.
    • Requires: vendor flexibility, willingness to walk back announced plans.
    • Threshold: re‑size, re‑time, or shelve if the corridor case pushes DSCR below 1.20×.
    • Backfire risk: sunk‑cost thinking on deposits and engineering work.

Deep Dive → Robotic Milking ROI Under 500 Cows — Tier 2 management pillar.

365‑Day Moves — strategic positioning

  • Pick your lane on a written timeline: scale, pivot, or exit. Bullvine’s December 2025 piece, Squeezed Out? A 12‑Month Decision Guide for 300–1,000 Cow Dairies, lays out the logic.
    • Requires: a family or partnership meeting that ends with a decision, not another meeting.
    • Opportunity signal: if a buyer puts core‑supply status, base terms, and component premiums in writing, and your corridor‑aware DSCR stays above 1.25×, scaling is defensible.
    • Backfire risk: leveraging into hope without both a written commitment and a corridor‑aware model.
  • Condition any expansion on a written processor commitment. No contract, no concrete.
    • Requires: legal review of base‑excess and force‑majeure clauses.
    • Threshold: walk away if base‑excess deductions are deeper or longer than the plant’s own escape clauses.
  • Evaluate relocation or premium transition before equity erosion makes the call, if you sit in a legacy region with no new steel within reasonable hauling distance. Processing Paradox closure analysis documents a $15,000–$45,000/quarter equity erosion range across negative margin cycles (Bullvine, 2024–2026).
    • Requires: appraisals, tax planning, succession conversations 12–24 months before any move.
    • Opportunity signal: if a growth‑corridor buyer expresses written interest in backing a relocated supply, that timing window is real but short.
    • Watch for: emotional attachment overriding the math. This is where families lose the most.

Must‑Read → Squeezed Out? A 12‑Month Decision Guide for 300–1,000 Cow Dairies — Tier 3 pillar, December 2025.

From the human side → More Milk, Fewer Farms, $250K at Risk: The 2026 Numbers Every Dairy Needs to Run — what the corridor squeeze looks like at the kitchen‑table level.

What This Means On Your Next Statement

Maple Ridge’s 50¢/cwt basis slide didn’t show up in herd software, ration sheets, or somatic cell graphs. It showed up in 24 months of milk checks — and it turned a robot decision into a corridor decision. Dos Arroyos sees the same pressure on the horizon and is leaning into it because its composite contract and its plants give it room.

Your next pound of milk is worth what your corridor is willing to pay for it, less what hauling and base‑excess take on the way there.

Pull your current milk supply agreement and your last three milk checks tonight. Find the language that governs base‑excess, hauling, and any “marketing” or “balancing” adjustments. Match that language against the basis trend you’ve actually lived since 2024.

What does your current processor contract say about basis and base‑excess when your region’s milk goes long — and does that language describe the corridor you’re still in, or the one you used to be in?

Key Takeaways

  • A clean herd report won’t save you from a bad corridor. Maple Ridge’s 50¢/cwt basis slide plus the post‑2025 FMMO Class III hit stacks to ~$1.89/cwt — about $221,760/year on 600 cows shipping ~144,000 cwt.
  • Stress‑test on your real basis, not the USDA all‑milk price. If your lender won’t run a corridor case with trailing 24‑month basis and 15–30% marginal hauling, the spreadsheet that says robots pencil isn’t the one you should bet on.
  • The capex question changed shape. Below 1.20× DSCR on the corridor case, freeze any non‑essential project. Below 1.25× even with national‑case math, scaling isn’t defensible without a written core‑supply commitment.
  • Pick your lane on a written timeline — scale, pivot, or exit — inside 12 months. Stall, and the basis keeps deciding for you while $15K–$45K/quarter of equity quietly walks off the farm.

This analysis uses composite operator profiles (Maple Ridge, Dos Arroyos) drawn from Bullvine’s Processing Paradox dataset. Contract structures described are illustrative composites and do not describe the actual contracts of any named processor.

Learn More

The Sunday Read Dairy Professionals Don’t Skip.

Every week, thousands of producers, breeders, and industry insiders open Bullvine Weekly for genetics insights, market shifts, and profit strategies they won’t find anywhere else. One email. Five minutes. Smarter decisions all week.
NewsSubscribe
First
Last
Consent
Send this to a friend