










In 2024, Bullvine headlined a $33,000 high-oleic soybean opportunity. Two university trials now put the observed fat response between zero and 0.20 lb per cow per day. The number that actually decides the purchase is one most rations never calculate.
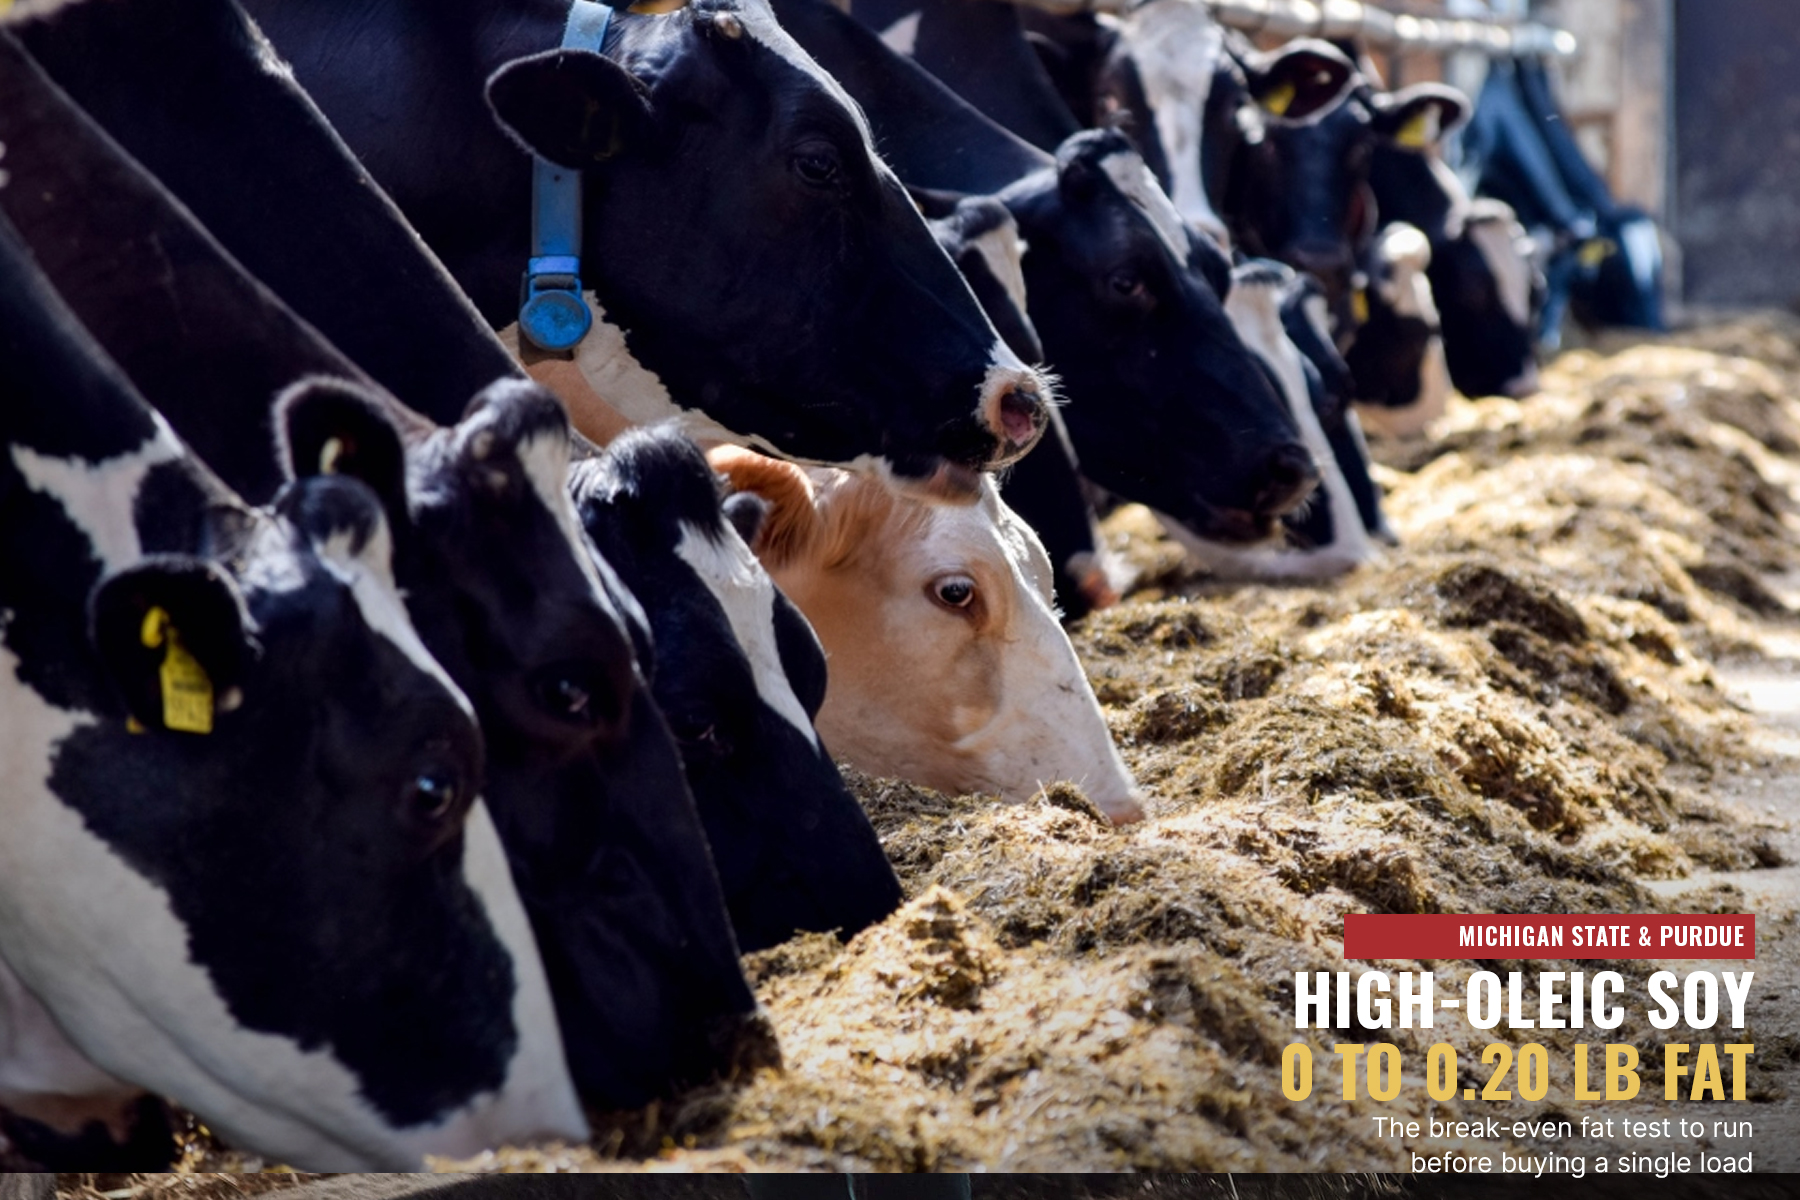
When high-oleic soybeans hit the research barn, they produced anywhere from no significant fat-yield gain to 0.20 lb more fat per cow per day. Purdue University fed high-oleic soybean oil and saw no significant change in fat yield. Michigan State University’s 8% roasted high-oleic soybean diet produced 0.20 lb more fat than its control. Neither result shows the beans cut feed cost. That depends on one farm-specific number: the break-even milk-fat response, in pounds per cow per day.
What did the $33,000 actually measure?
Bullvine’s May 27, 2024 article put a $33,000 annual gain for a 500-cow herd in the headline, and cited milk income less feed cost of up to $0.27 per cow per day in the text. Those figures came from two different points in the same Cornell-led model. Nicholson et al. reported a mean of $0.1787 and a maximum of $0.2730 per cow per day, using U.S. prices from January 2014 through September 2020. The research was supported by the United Soybean Board.

Bullvine math: 500 cows × 365 days × $0.1787 = $32,613, which is the $33,000. The maximum works out to $49,823. So the $33,000 wasn’t a multiplication error. The article printed the maximum per-cow figure next to the mean whole-herd figure without saying they were different numbers. Neither was measured on a working dairy.
Which assumptions dropped out of the headline?
Nicholson’s base case had raw high-oleic beans replace raw conventional beans at 5% of ration DM, about 1.4 kg per cow per day. It assumed 50 g of extra milk fat, roughly 0.11 lb. It also used a $0.50/bu premium, no extra freight or logistics, no processing difference, and no change in milk, protein, reproduction or longevity. The authors called it a “first approximation.” The headline kept the dollar figure and dropped those conditions.
That substitution answers a narrower question than the one a feed buyer has to answer. Swapping raw high-oleic beans for raw conventional beans at equal fat isn’t the choice most nutritionists are pricing. The real choice is among three complete protein-and-fat packages: conventional roasted beans plus commercial fat; roasted high-oleic beans replacing that combination; or soybean meal plus commercial fat. All three need to be held equal on NEL and MP, with digestible amino acids, total FA, RUFAL, NDF, starch and DMI reported, so the “cheap” ration isn’t just moving a shortfall somewhere else.
What did Michigan State establish?
Michigan State ran 24 multiparous Holsteins through a replicated 4 × 4 Latin square on diets with 0%, 8%, 16% or 24% roasted high-oleic soybeans. The beans were roasted at 157°C for two hours and ground through a 10-mm screen. Before treatment, the cows were at 122 ± 57 DIM and averaged 50.7 kg (about 112 lb) of milk. Funding came from the Michigan Alliance for Animal Agriculture and the United Soybean Board, and Caledonia Farmers Elevator supported a graduate fellowship.
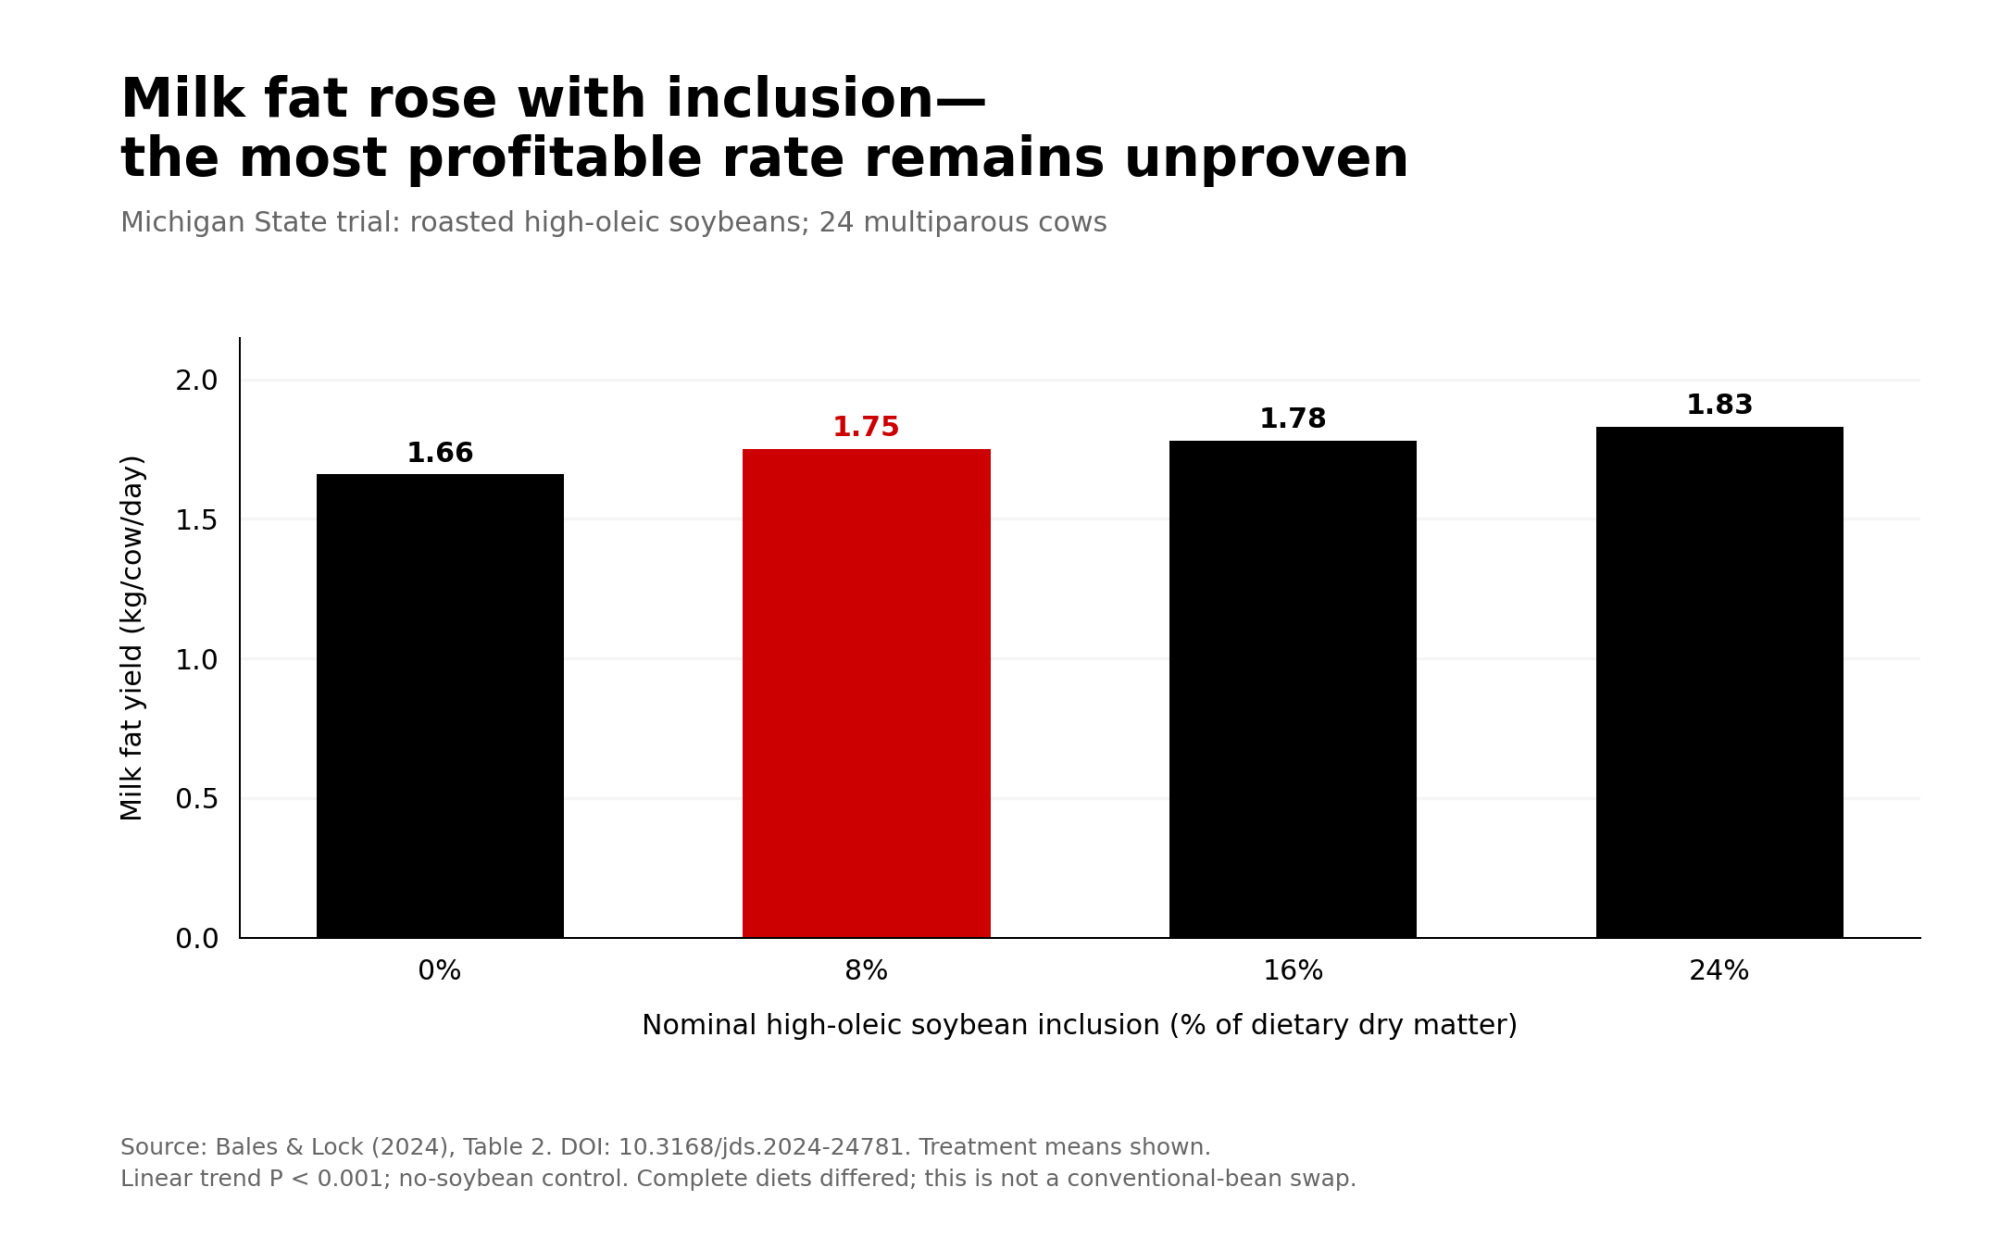
At 8% inclusion, cows ate 2.58 kg of beans a day. Compared with control, milk went from 48.2 to 51.4 kg, ECM from 49.4 to 51.3 kg, fat from 1.66 to 1.75 kg, and protein from 1.56 to 1.63 kg. The 0.09-kg fat difference is 0.198 lb. The treatment diets weren’t matched on energy, RUP or amino-acid supply, so the whole response can’t be credited to oleic acid.
Bullvine’s incremental-response math, using the bean intakes the paper reports (2.58, 4.97 and 7.43 kg/day):
| Inclusion step | Added beans | Added ECM | Added fat | Added protein | Fat per kg of beans added |
| 0% → 8% | 2.58 kg | 1.90 kg | 0.09 kg | 0.07 kg | ~35 g |
| 8% → 16% | 2.39 kg | 0.50 kg | 0.03 kg | 0.00 kg | ~13 g |
| 16% → 24% | 2.46 kg | 0.60 kg | 0.05 kg | −0.02 kg | ~20 g |
These are differences between treatment means, not causal marginal returns, and they don’t show 8% to be an economic optimum. They do show that fat kept rising as inclusion went up, but each extra kilogram of beans after the first 8% bought far less ECM and no more protein.
Why didn’t better digestibility pay at Purdue?
Purdue’s 30-cow crossover (16 first-lactation, 14 older cows, 87 ± 26 DIM) replaced 1.5% wheat middlings with 1.5% high-oleic soybean oil. Apparent FA digestibility rose from 66.8% to 79.6% in first-lactation cows and from 72.8% to 84.1% in older cows. The Indiana Soybean Alliance funded the work, and Benson Hill supplied the oil.
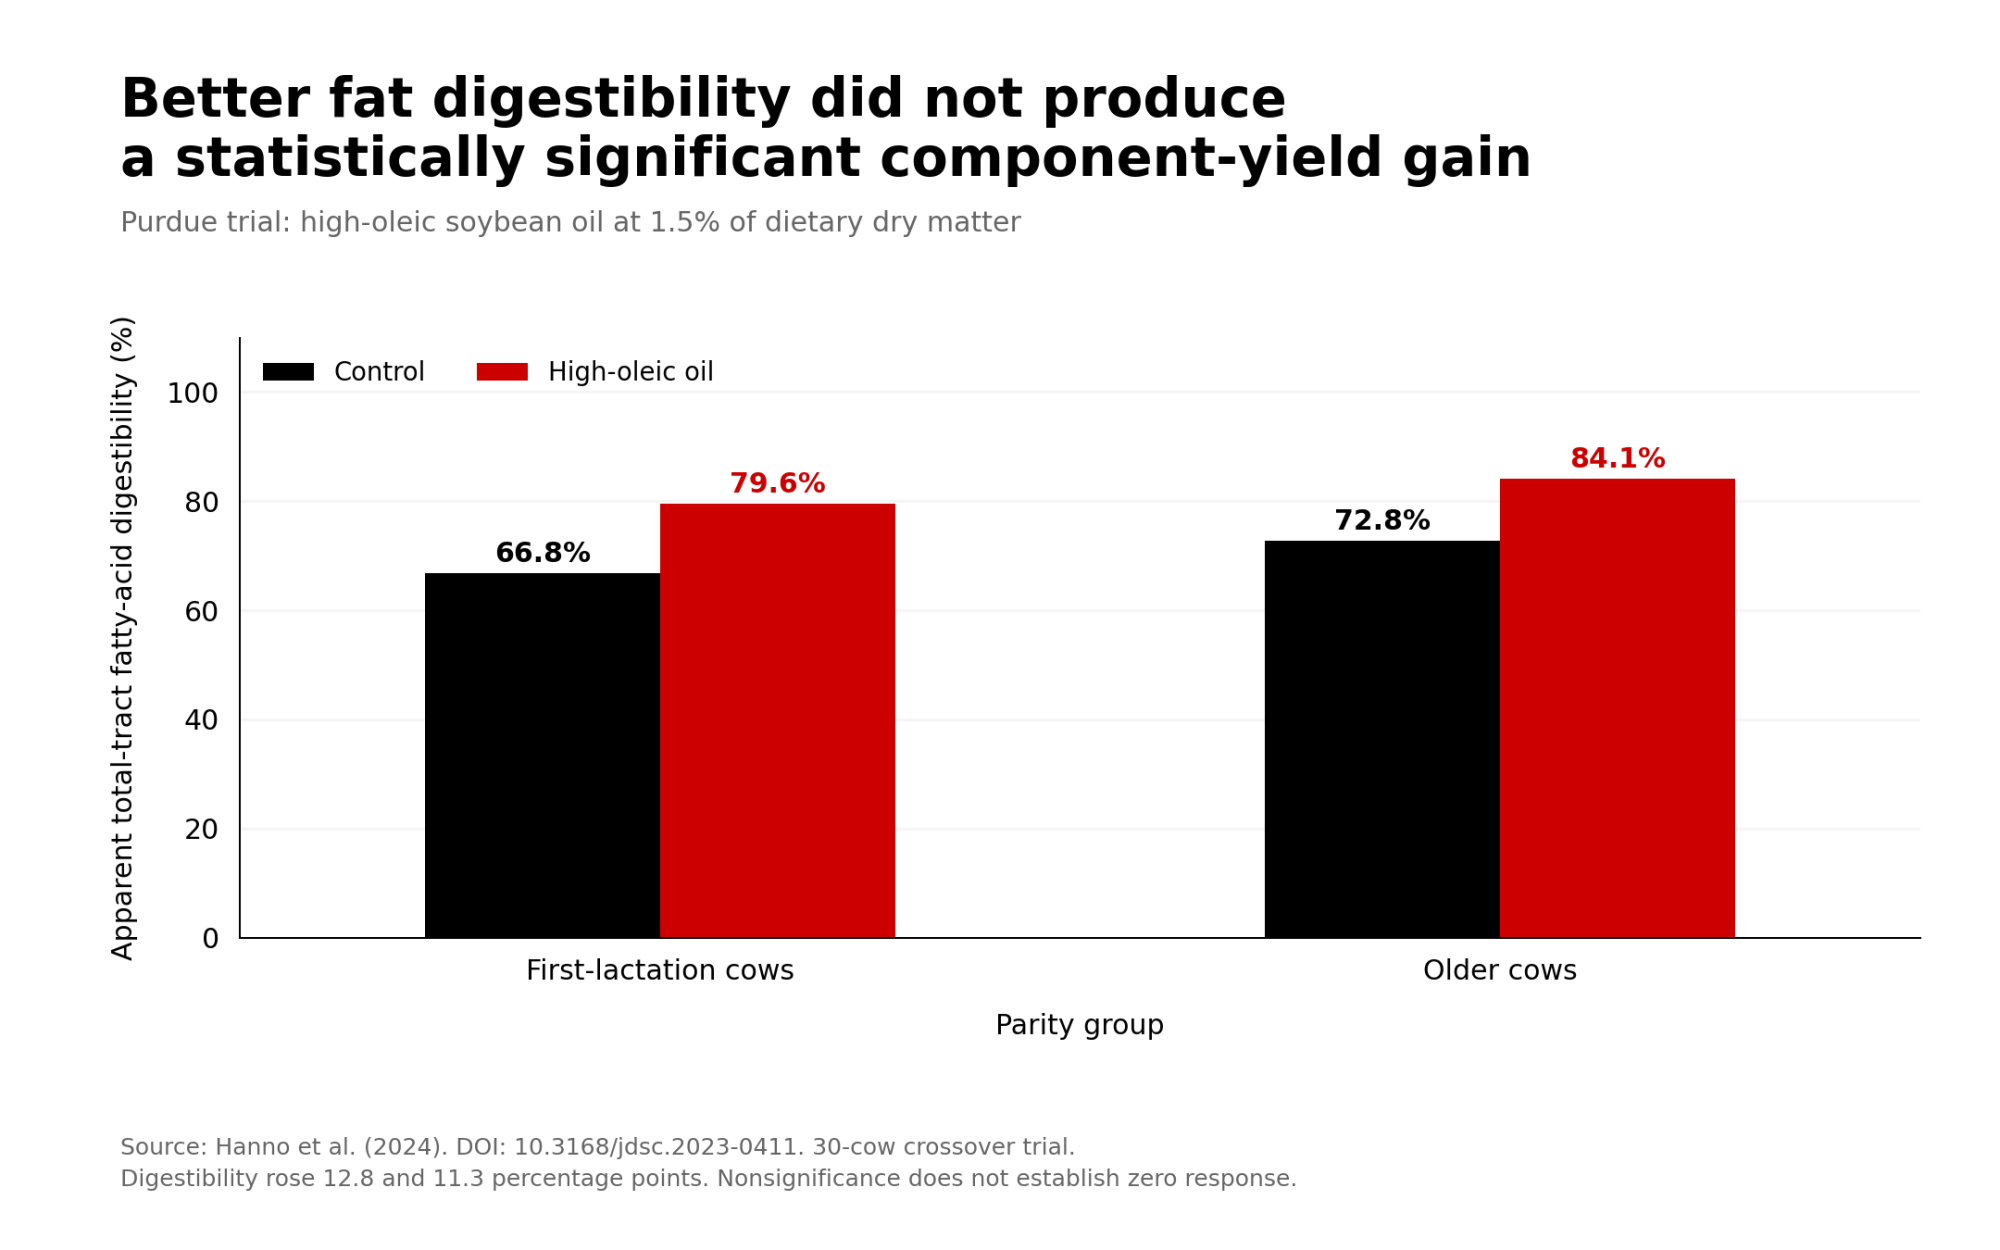
The oil diet also had more energy than the control: 1.70 vs. 1.65 Mcal/kg NEL. Even so, DMI, milk, ECM and component yields didn’t change. Fat yield rose 0.03–0.04 kg, which wasn’t significant (P = 0.20). Fat test tended upward by 0.16 points, and backfat depth rose 0.44 mm. The authors tied the missing ECM response partly to energy going into body fat. Both diets also contained HMTBa, which may have reduced milk fat depression risk.
This doesn’t contradict Michigan State. Purdue fed oil. Michigan State fed roasted whole beans, which also changed protein supply, rumen escape and how fast the fat was released. What Purdue shows is the floor: more digestible fat and more NEL on paper don’t guarantee more fat in the tank, because a cow can put that energy on her back instead. You’re paid on pounds of components.
Where does the invoice mislead?
A high-oleic quote may or may not include the commodity bean, the grower’s identity-preserved premium, handling, testing, roasting, shrink and freight. Before comparing quotes, confirm whether each price is per raw ton at the elevator or per finished ton delivered to your mixer. In August 2024, the U.S. Soybean Export Council put grower premiums at $1.00–$1.75/bu. That’s not a current dairy-buyer price, but it’s two to three and a half times the $0.50 Nicholson assumed.
One processor’s 2026 schedule shows the costs that come after the beans. Farmers’ Grain & Feed LLC in Wisconsin, effective September 19, 2026, charges $35/ton to roast beans at 13% moisture, plus $3 per full moisture point, up to $47. It lists 12% shrink on swapped beans, rolling at $13 per finished ton, and trucking to its elevator at $0.25/wet bu within 30 miles or $0.30 beyond, with a $150 minimum. Moisture shrink, storage and quality discounts are charged separately, and the schedule is marked subject to change without notice. These are one mill’s terms, not a national average.
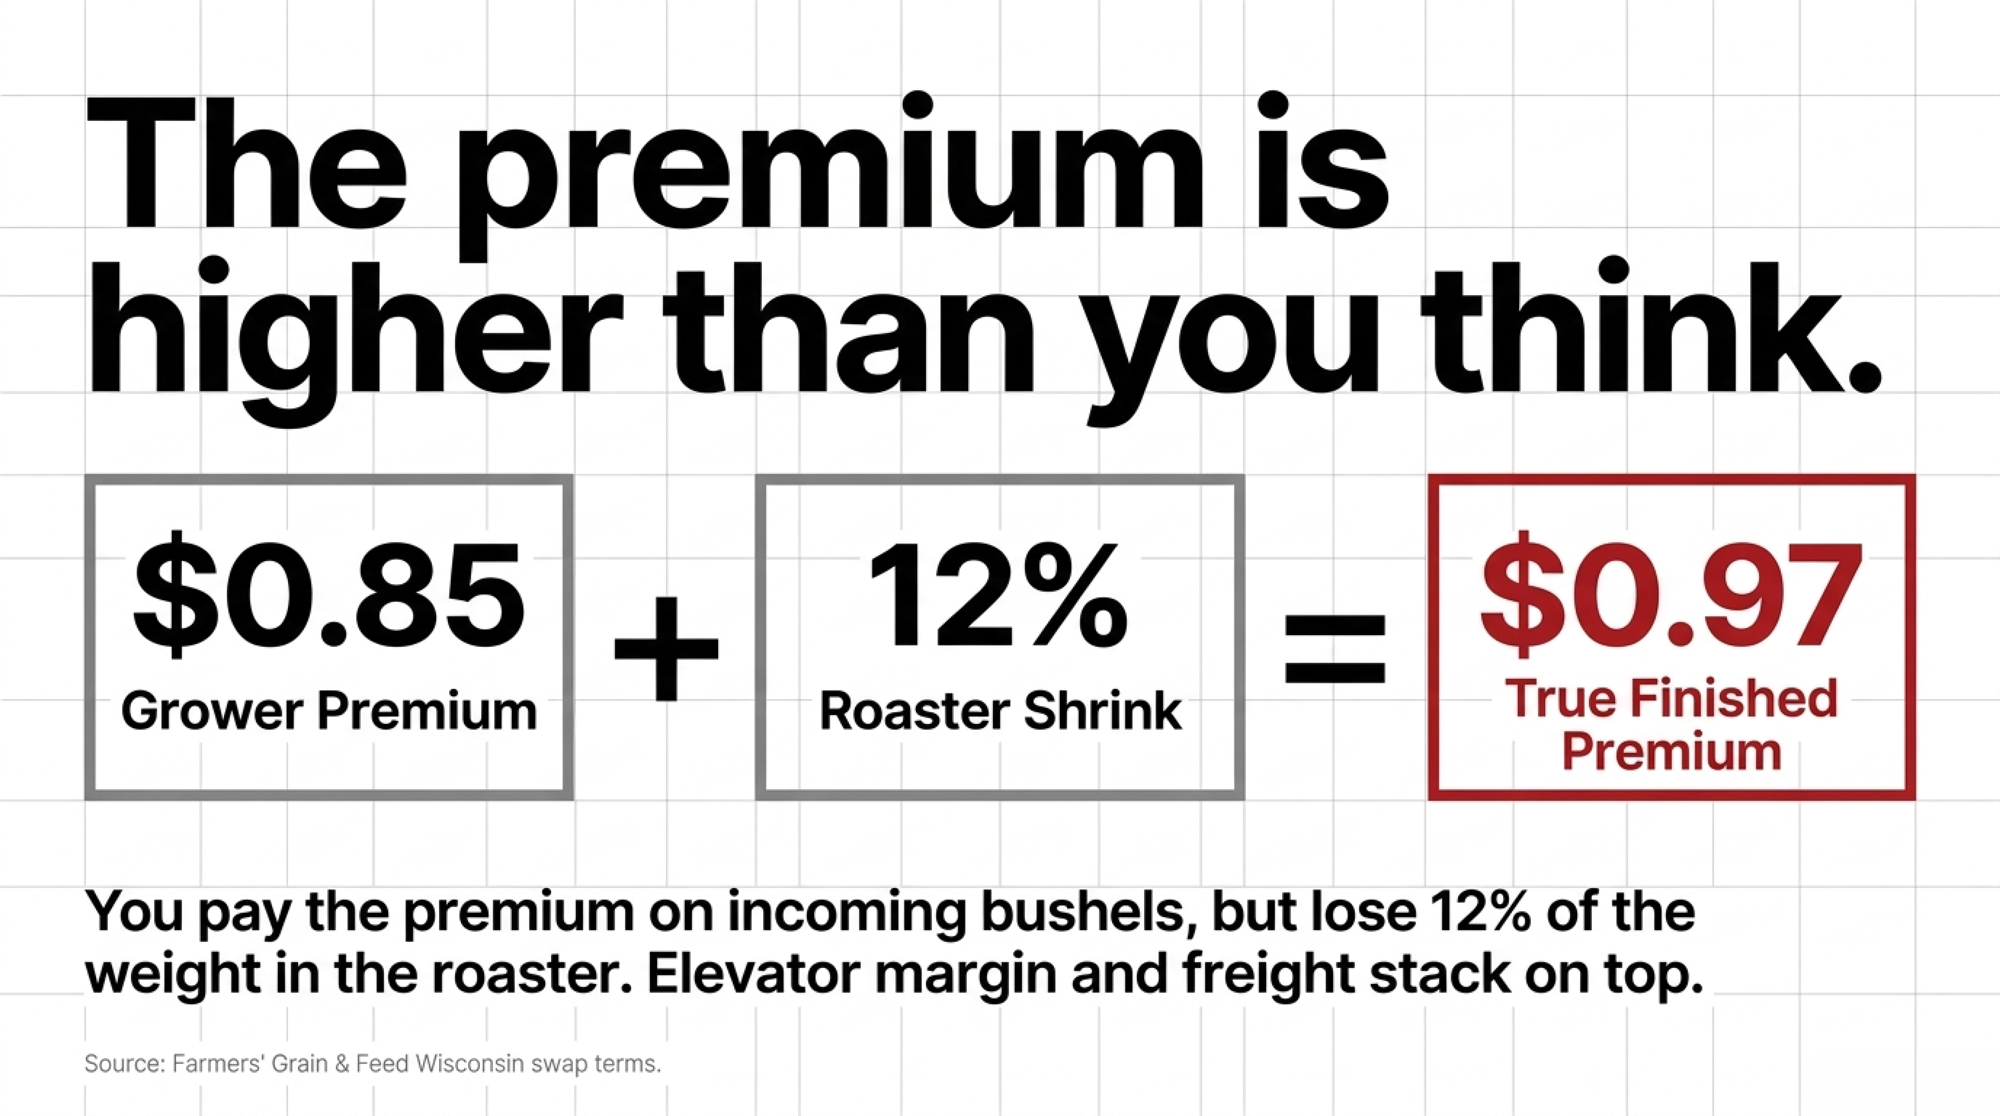
At 12% shrink, it takes 1.136 incoming tons to make one finished ton. That doesn’t mean 12% of the nutrients disappeared, because some of the lost weight is water. The model has to compare tons on a dry-matter basis, using an analysis of the finished feed.
Running the Numbers
Published evidence: Michigan State fed 2.58 kg of roasted high-oleic beans per cow per day at 8% and saw +0.198 lb of fat vs. control. Purdue saw no significant change in fat yield. Nicholson assumed +0.110 lb. Farmers’ Grain & Feed lists 12% swap shrink.
Stated assumptions: 500 lactating cows. Inclusion of 2.58 kg of finished beans per cow per day, used only to show tonnage. 12% shrink. No dollar values, because current prices and milk-pay values are missing.

Bullvine calculation: 2.58 kg × 500 cows = 1,290 kg/day, or 1.422 short tons of finished beans. Divided by 0.88, that’s 1.616 incoming tons a day. Over a year, that’s about 519 finished tons from 590 incoming tons, a 71-ton difference in weight.
| Response used | Fat/cow/day | Fat/500 cows/day | Source |
| Floor | 0 lb (no significant change) | 0 lb | Purdue, high-oleic oil |
| Model assumption | 0.110 lb | 55 lb | Nicholson, raw-bean swap |
| Trial treatment difference | 0.198 lb | 99 lb | Michigan State, 8% roasted |
These come from different ingredients and designs. They’re stress tests, not a forecast range, and shouldn’t be averaged.
What does your cow have to produce?
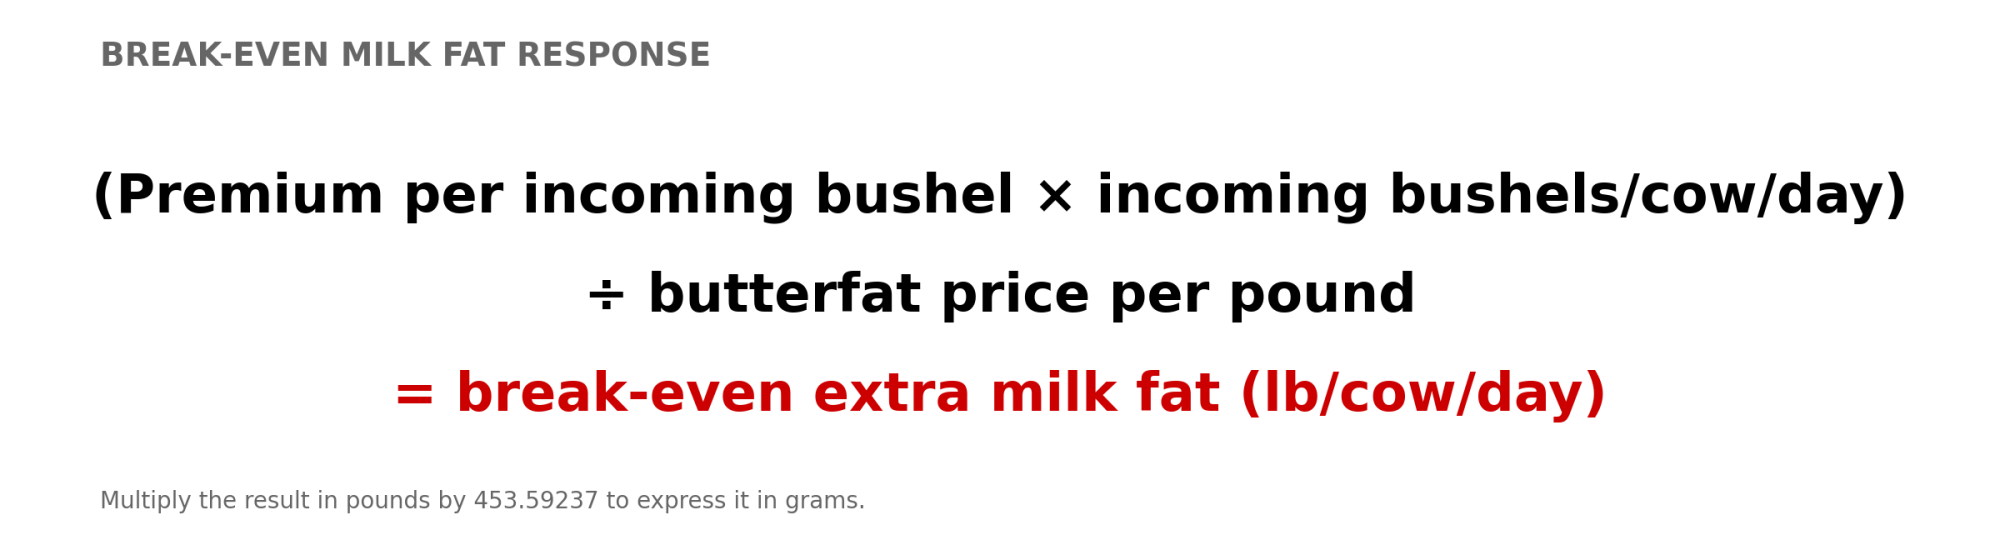
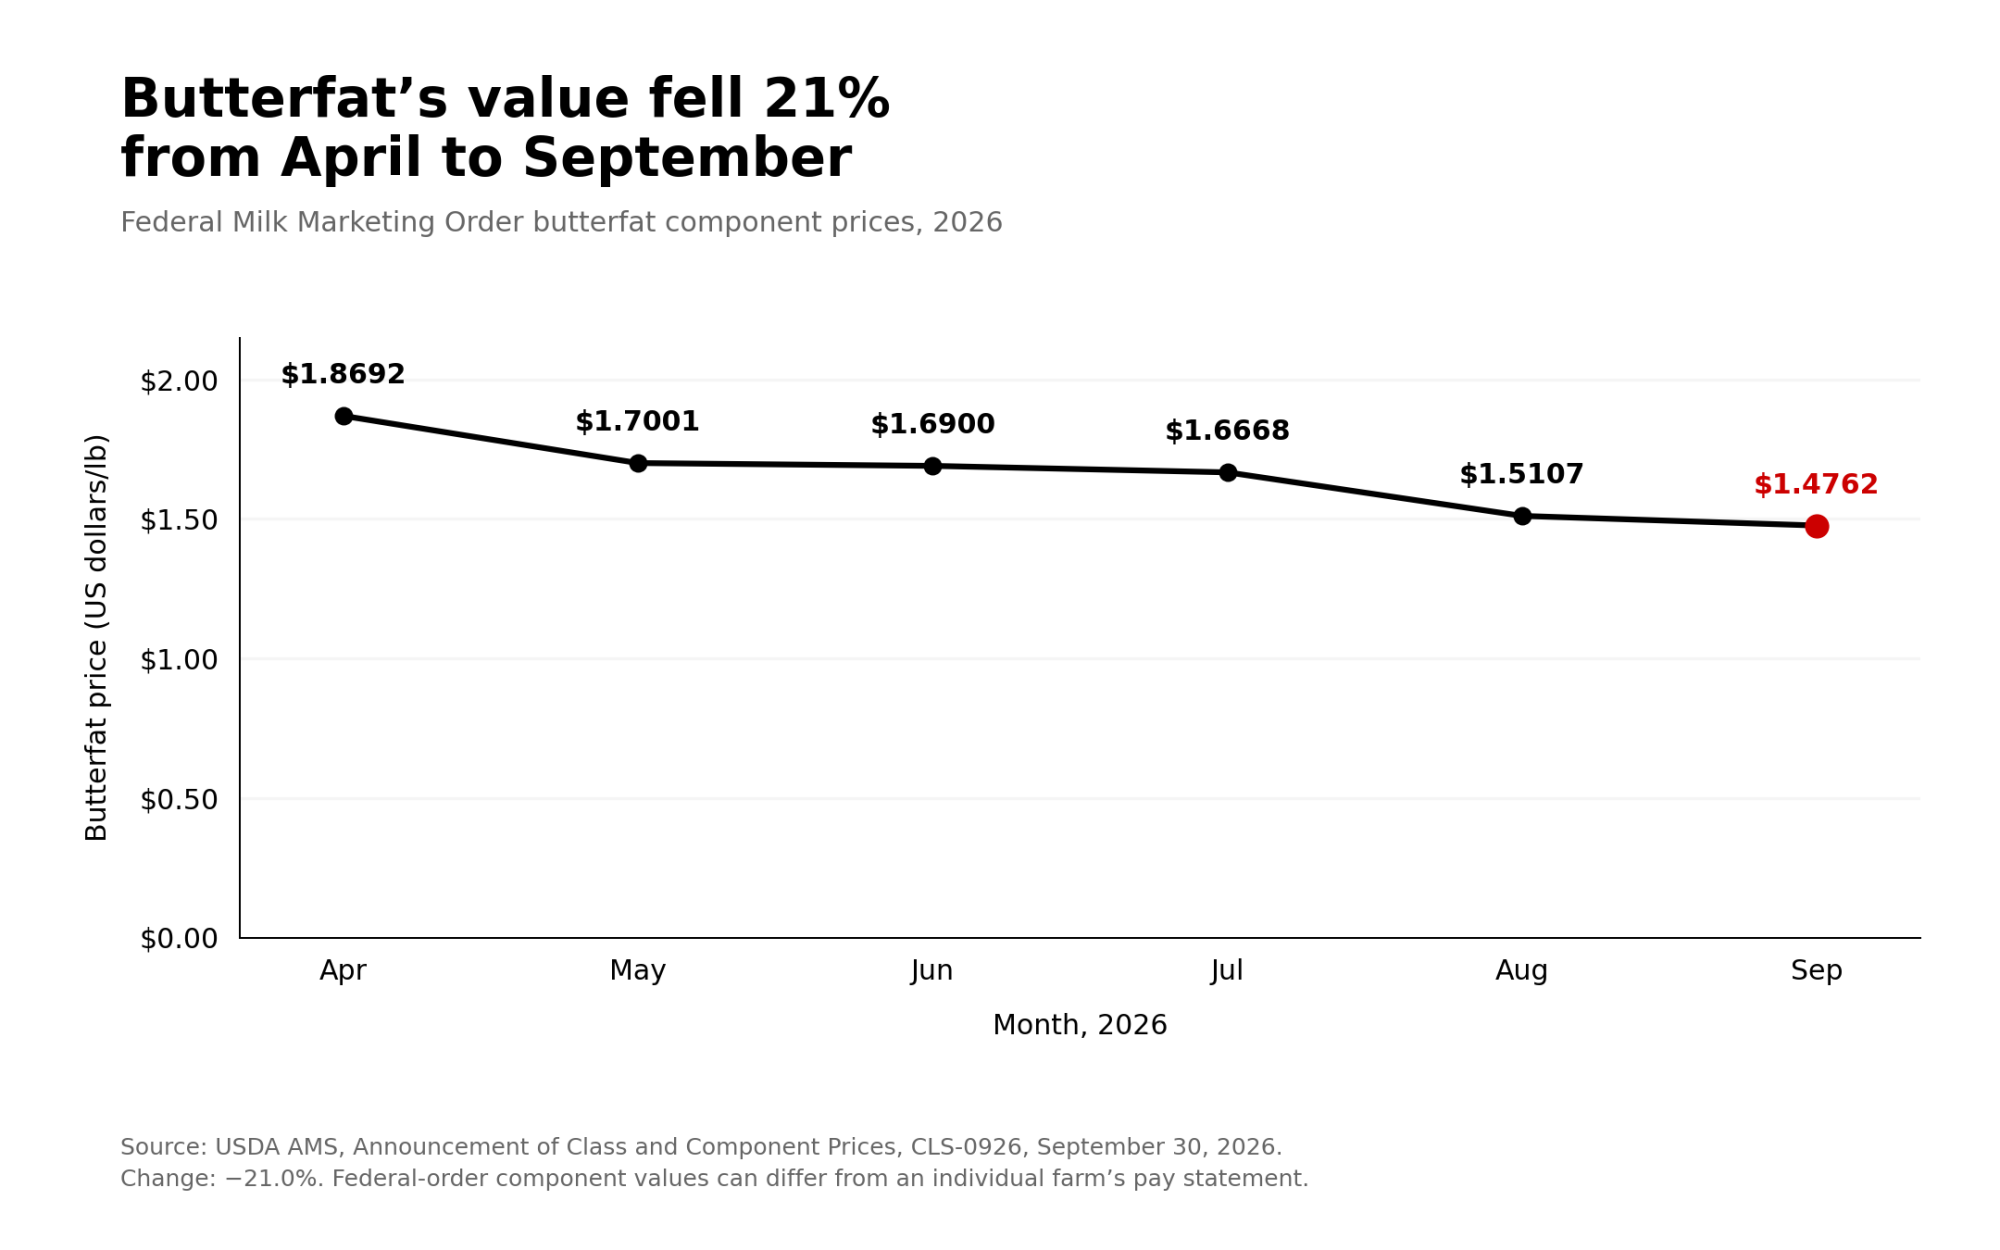
The high-oleic ration cost has to include beans, premium, roasting, true DM loss, rolling, freight, storage, testing and any MP fix. The alternative is the least-cost ration at equal NEL, MP and digestible amino acids, not conventional beans pound for pound. Use your own milk check’s fat value. Bullvine’s September 2026 Order 30 analysis put August protein at 1.87 times butterfat, and a weaker fat price raises the break-even.
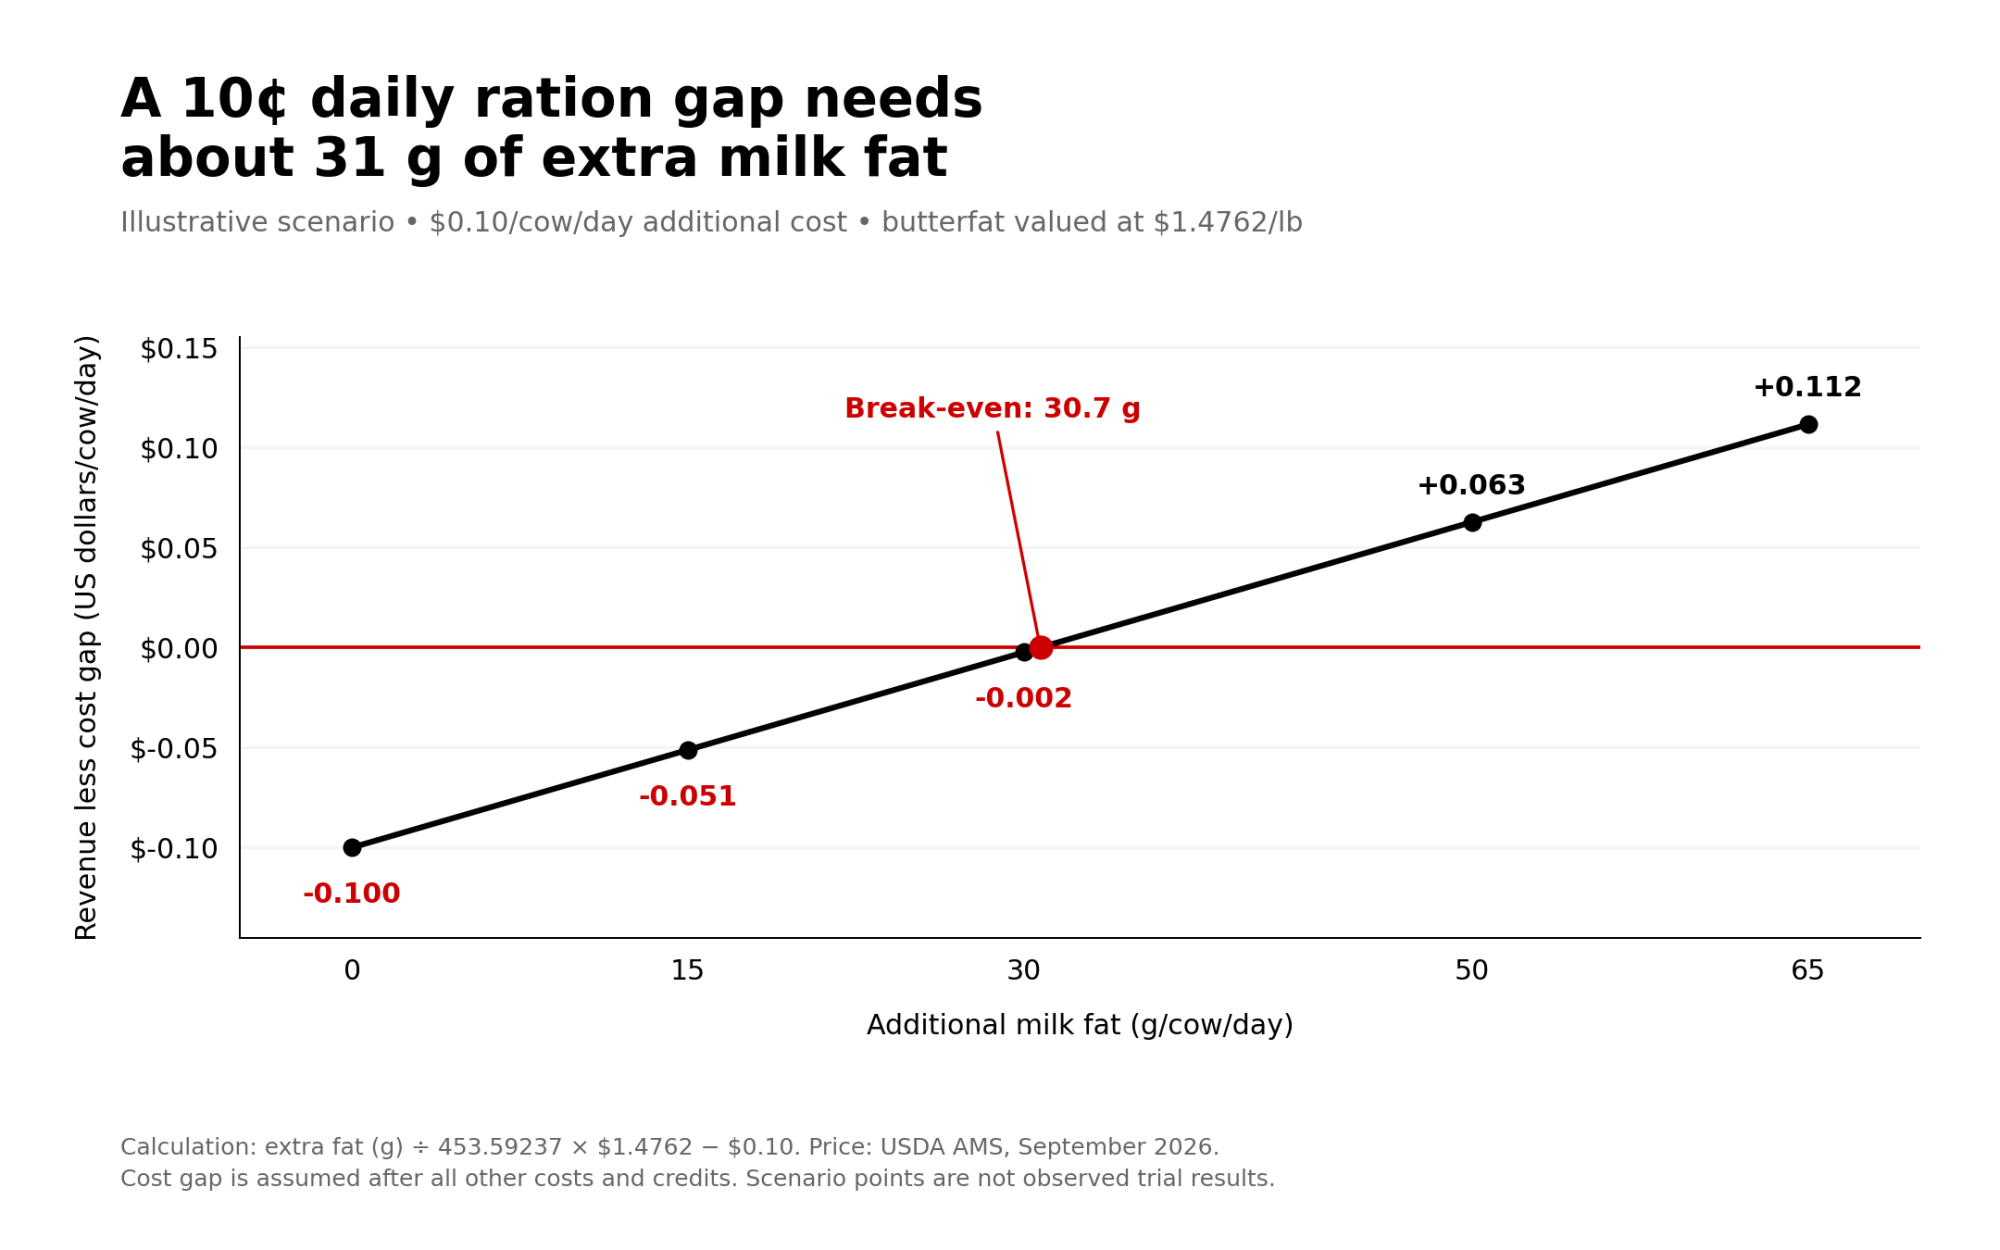
The decision rule is simple. If your break-even is above Michigan State’s 0.198 lb, the best available bean trial doesn’t support the purchase. If the high-oleic ration is cheaper at equal nutrients with no fat response at all, it wins on cost alone. The beans pay at the bulk tank, not at the invoice.
What should you do next?
| Timing | What to do | What it requires | Act now if | Where it backfires |
| 30 days | Price three rations at equal NEL and MP | Delivered quotes, processing terms, freight, lab values, your nutritionist’s formulations | A quote doesn’t say whether it’s per raw or finished ton, or at what moisture | Comparing raw tons to finished tons, or counting roasting twice |
| 90 days | Run a farm trial only once the break-even fat number is written down | Stable forage, recorded DMI, component pounds, your milk-pay formula | Your break-even is near or above 0.198 lb | Counting a higher fat test while milk drops and fat pounds stay flat |
| 365 days | Decide on a supply contract | Seasonal IOFC, roaster QC, consistent oleic profile, verified shrink | Paid response averages below break-even over the season | Locking in a premium off your best month or one unusually good load |
The 30-day step is the one that matters. Get the break-even fat number in pounds per cow per day from your nutritionist before you sign the first purchase order.
High-Oleic Soybean Break-Even Calculator
Calculate the daily milk fat response required to cover your local premium.
Methodology Note
Break-Even Fat Response = (daily cost premium of the high-oleic ration − value of other supported responses) ÷ the farm’s net value per lb of fat. All three rations are balanced at equal NEL and MP, with digestible amino acids, FA, RUFAL, NDF, starch and DMI reported. Costs are compared delivered, as finished feed, on a dry-matter basis. The incremental table uses the HOSB intakes Michigan State reports. The tonnage example uses Michigan State’s 8% intake and Farmers’ Grain & Feed’s 12% swap shrink, and it describes tonnage only. The 0, 0.110 and 0.198-lb responses are stress tests, not a probability distribution.
Learn More
- How to Calculate Income Over Feed Cost From Paid Components — Lock in your true margin before testing new feed additives. This operational breakdown dismantles the obsession with gross milk yield, proving exactly why isolating component revenue against ration premiums dictates survival in a high-input market.
- How RUFAL Changes Your Herd’s Milk Fat Depression Risk — Unsaturated fats in the rumen determine whether your expensive high-oleic swap actually yields bulk tank butterfat. Exposes the biological bottleneck behind component drops, arming you with a targeted feeding protocol to protect daily milk cheques.
- The Hidden Maintenance Overhead: Calculating Hold-to-Proof Costs — Carrying unproven genetics to their first official proof burns capital just like inefficient feed contracts. Analyzes the crushing maintenance overhead of housing sires, delivering a hard-math framework to identify which investments actually warrant the operating cost.
The Sunday Read Dairy Professionals Don’t Skip.

Every week, thousands of producers, breeders, and industry insiders open Bullvine Weekly for genetics insights, market shifts, and profit strategies they won’t find anywhere else. One email. Five minutes. Smarter decisions all week.
