Archive for per-cow cost

A 200-Cow Dairy Can Afford $268,683 in H-2A Costs and Still Be Denied

Replacing half a crew costs $268,683 under current Virginia wage floors. But as the June 17 USCIS memo proves, clearing the financial hurdle doesn’t mean you clear the regulatory one.
H-2A dairy costs
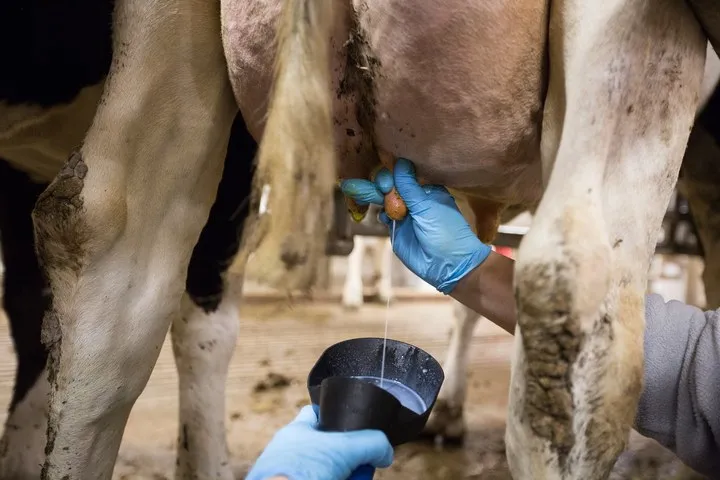
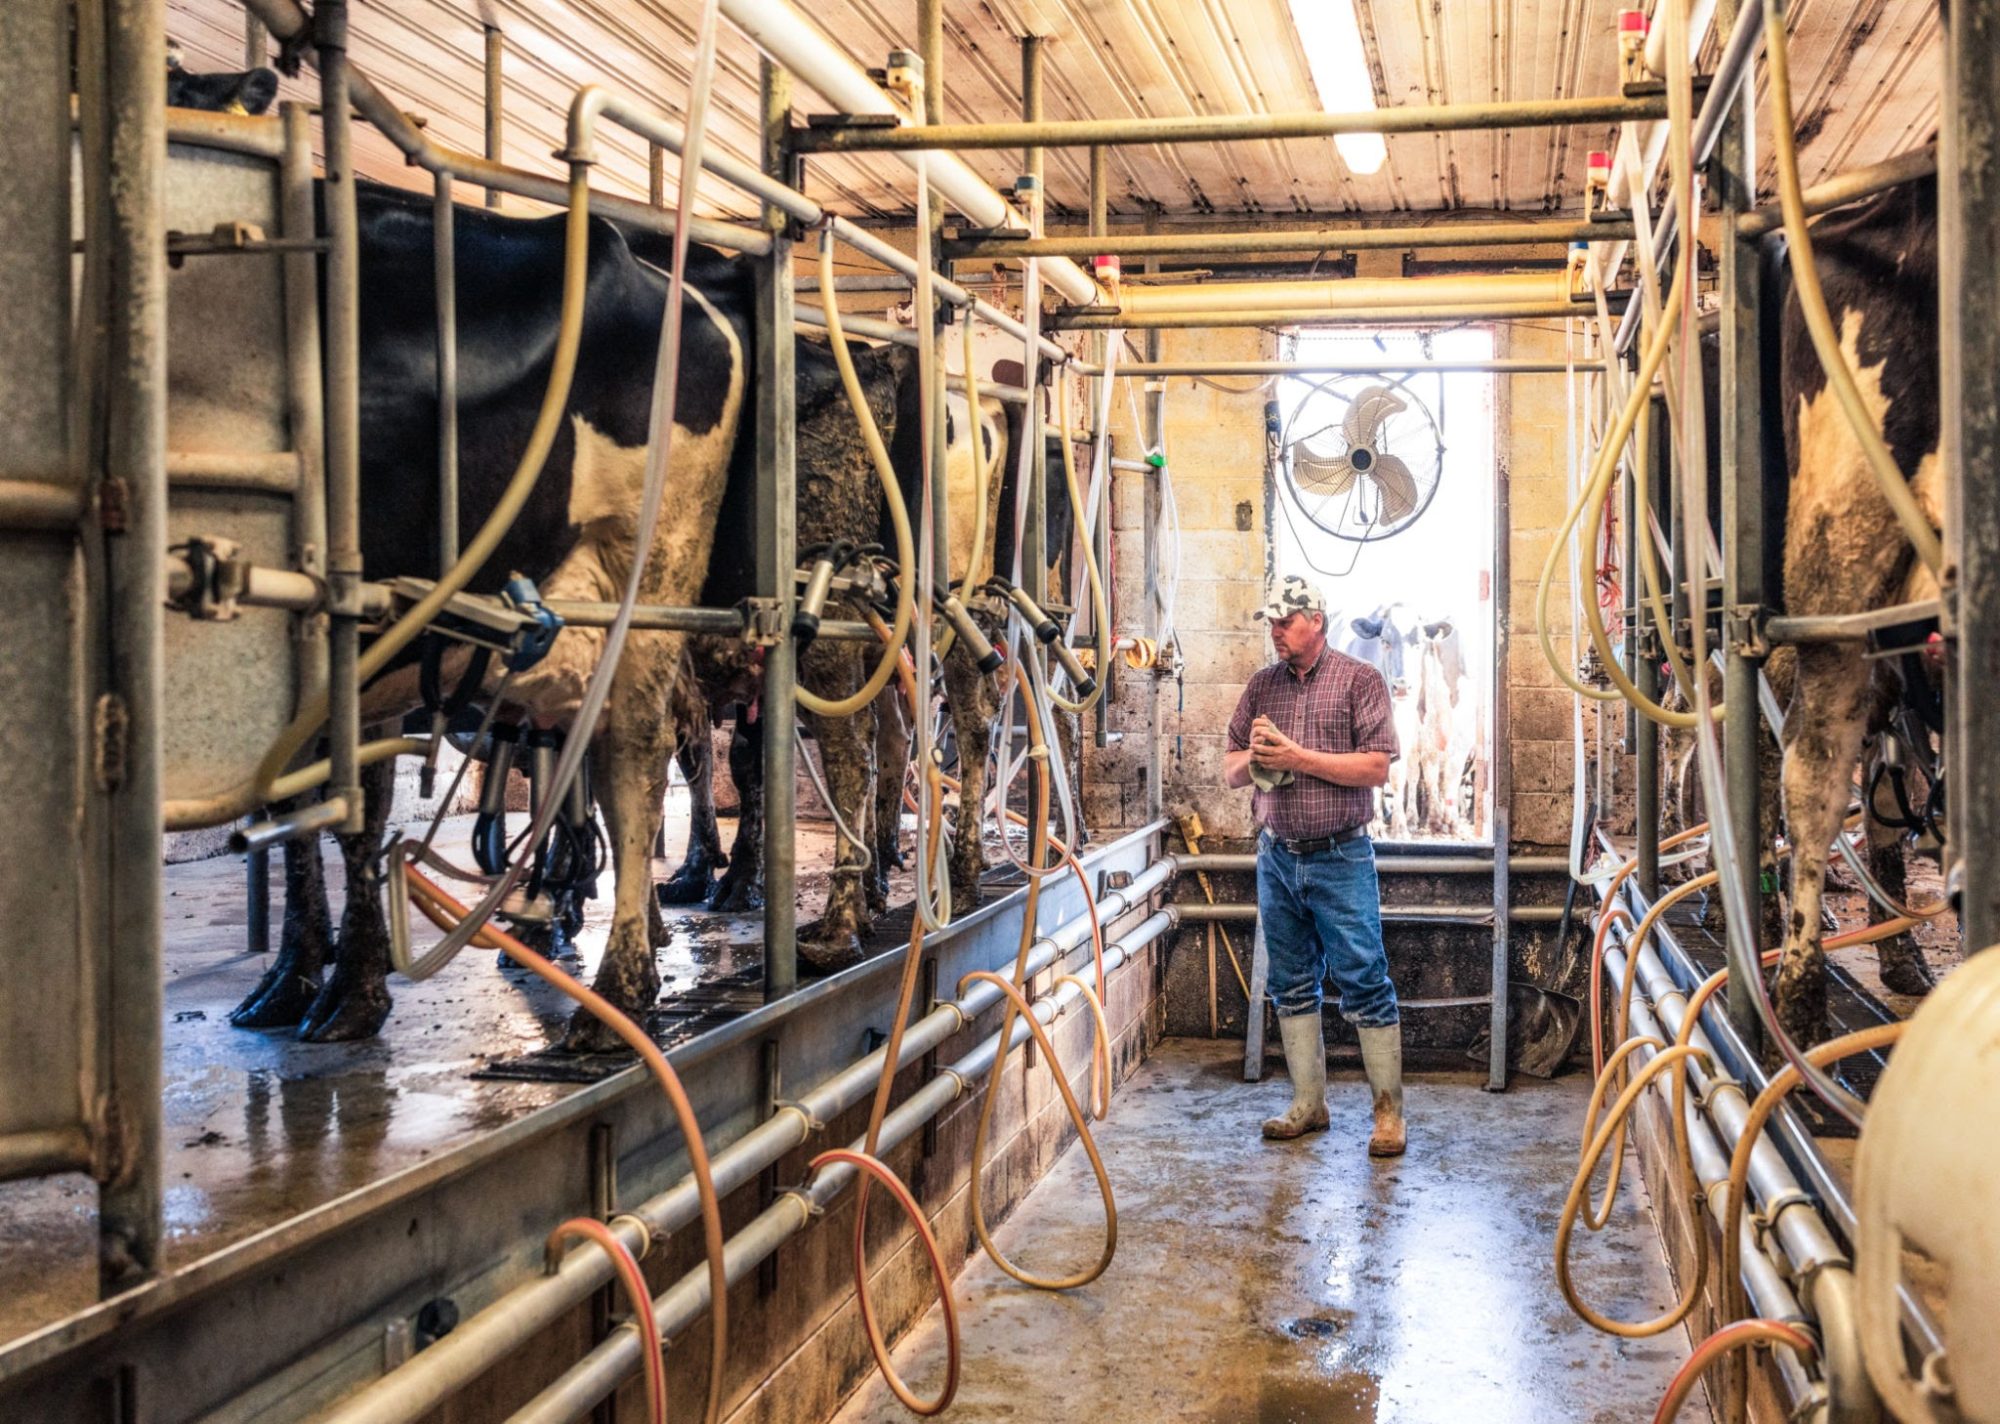
A farmer checking the cows and milking equipment in the cowshed during milking.

Virginia’s H-2A wage floor didn’t move August 3 with most states — it moved August 17, under the court order in Kansas et al. v. U.S. Dep’t of Labor. Two costs almost nobody budgets: the housing obligation reaches domestic workers in corresponding employment, and the three-fourths guarantee turns the wage line into a floor you owe whether the work is there or not. USCIS opened dairy petitions June 17, but case by case, on proven temporary or seasonal need. The Bullvine ran the four-worker model on a 200-cow Virginia dairy across 12,480 annual hours.
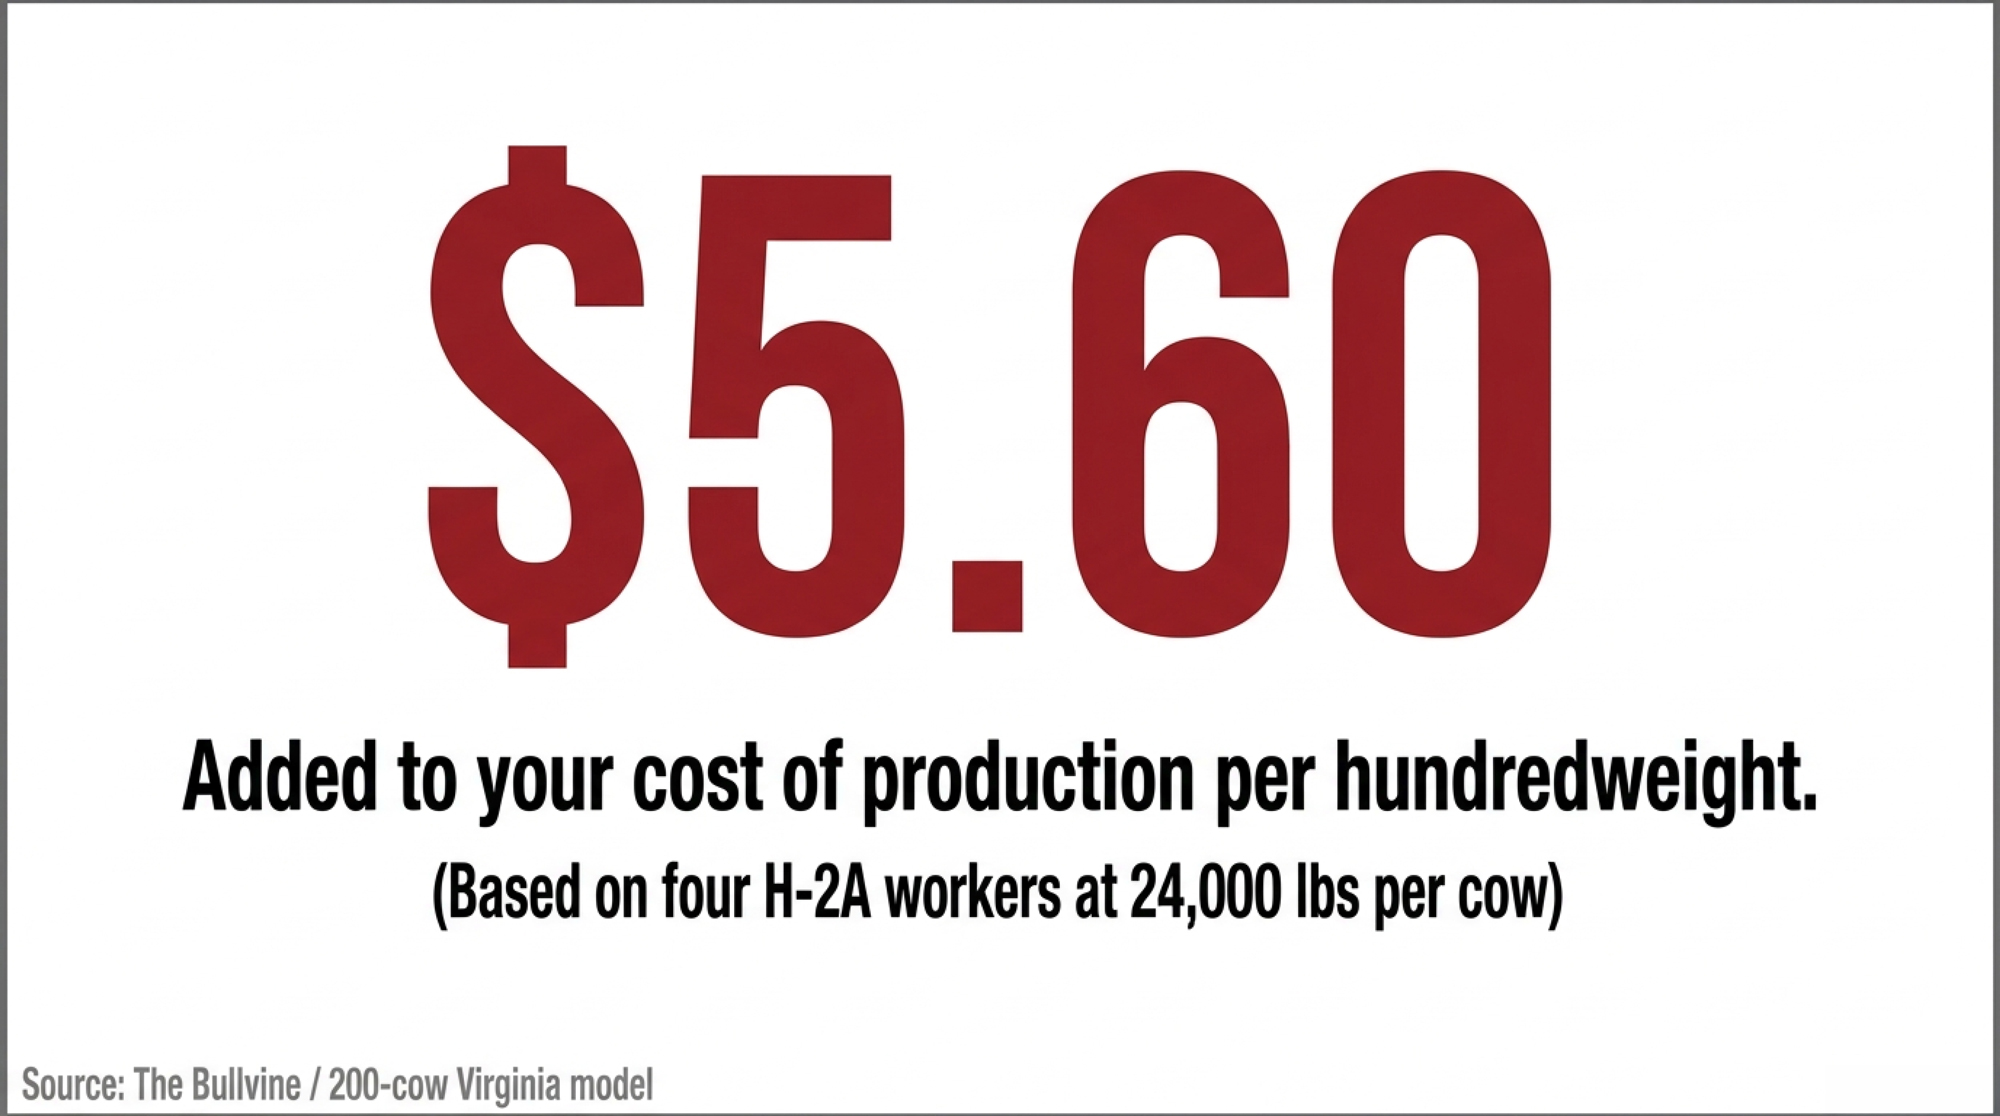
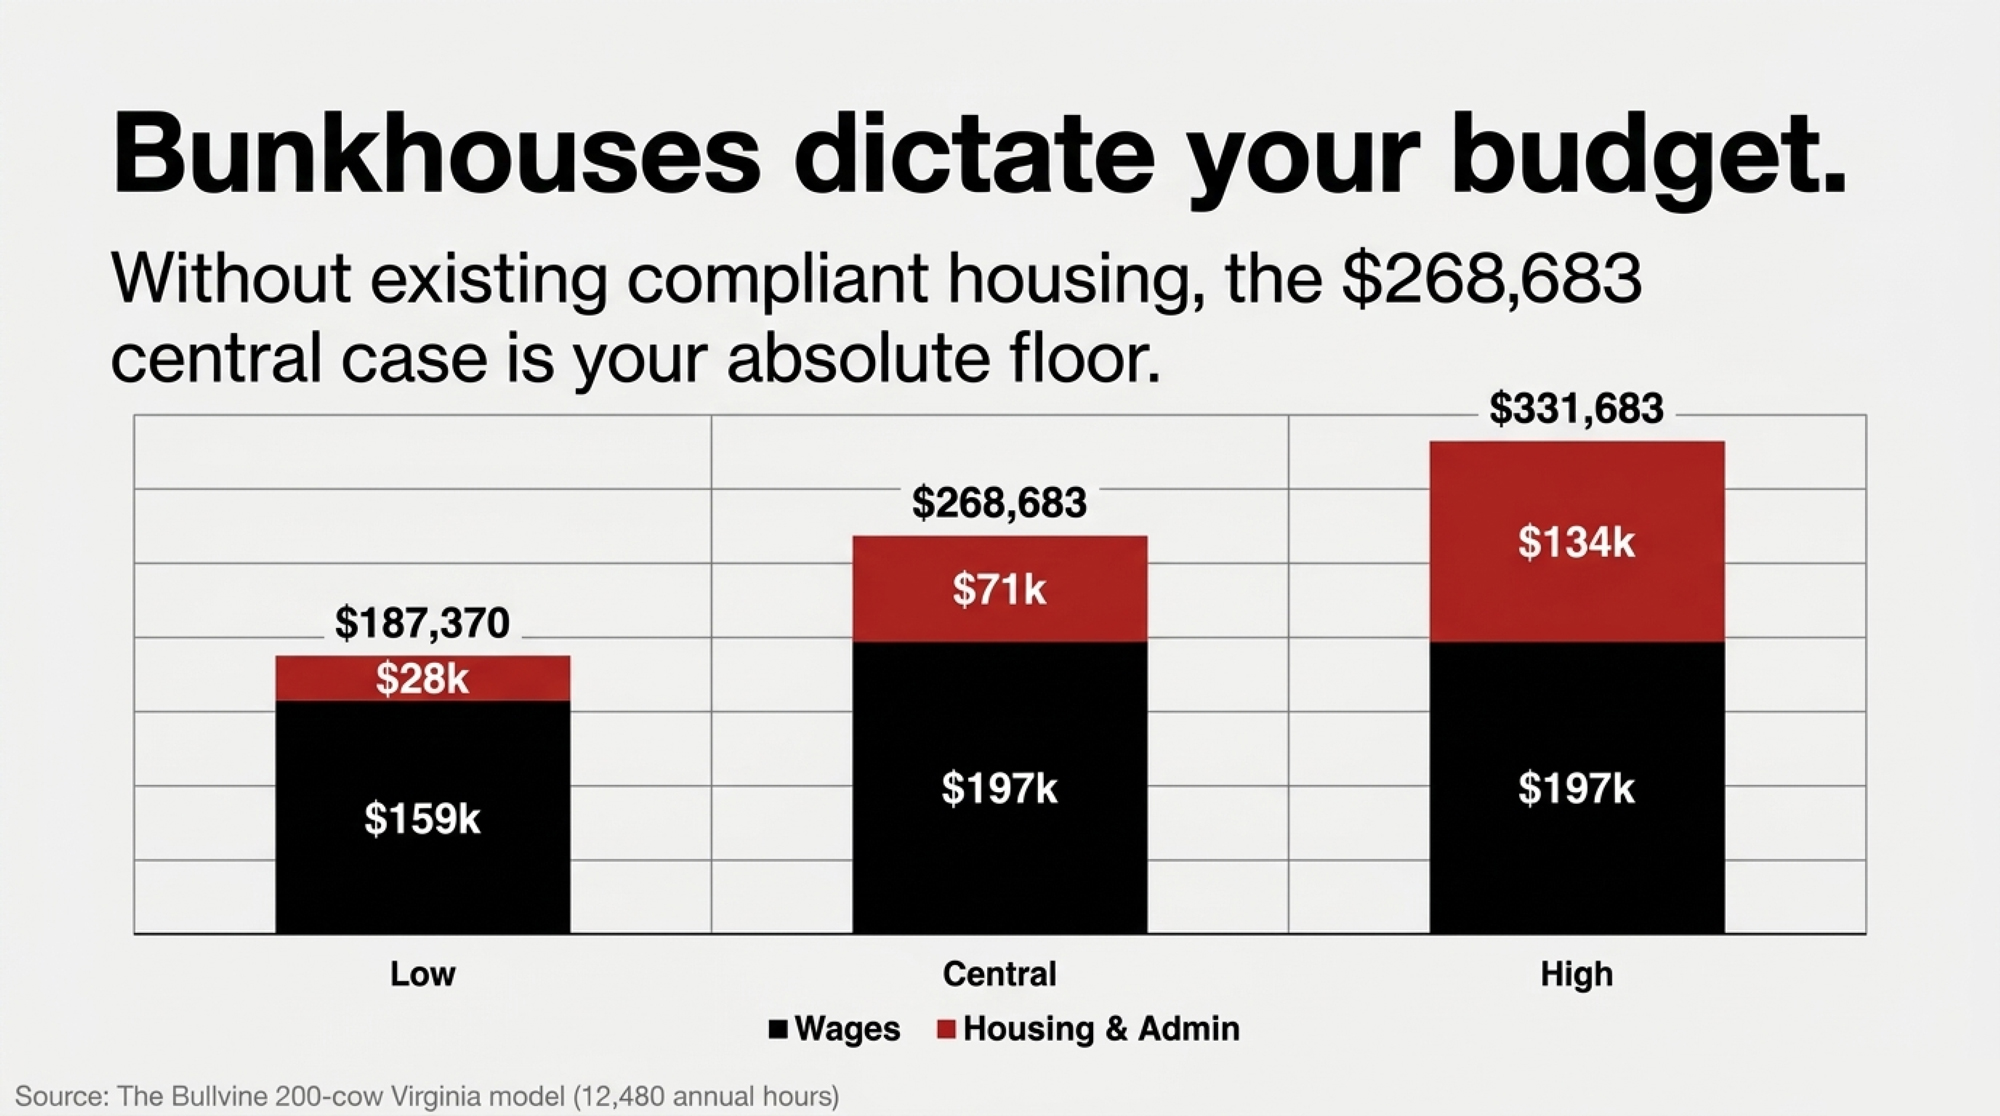
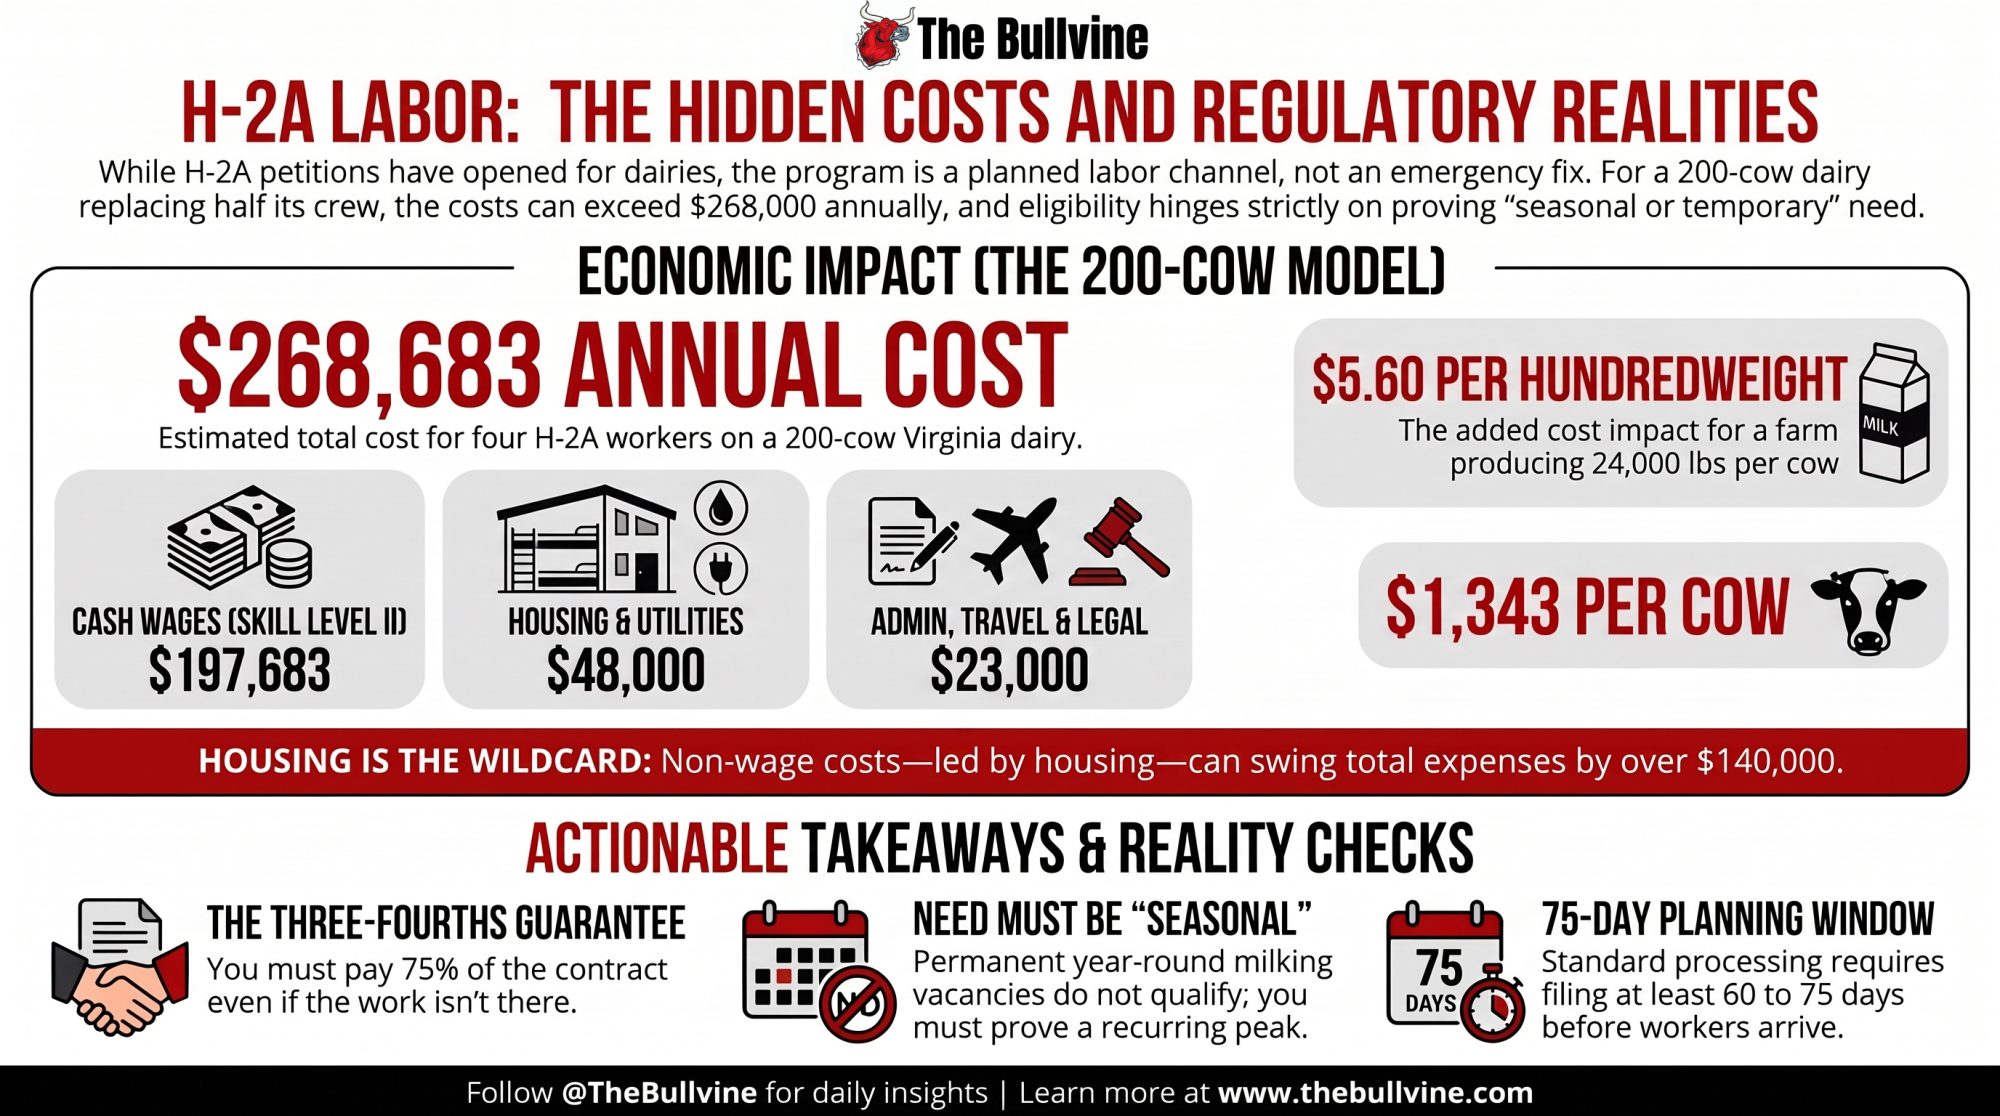
A 200-cow Virginia dairy replacing four of eight employees through H-2A is looking at roughly $268,683 a year — $67,171 per worker, $1,343 per cow, and $5.60 per hundredweight at 24,000 pounds per cow. Low case: $187,370; high case: $331,683; and the spread is almost entirely housing. Two things worth checking before you file: your state’s effective date may not be August 3, and the housing credit that lowers the H-2A wage doesn’t reach your domestic crew. Cost is still the second question. The first is whether those four jobs qualify at all.
What Happened in June

On June 12, 2026, U.S. Immigration and Customs Enforcement conducted a regional operation in Page County, Virginia. ICE confirmed 16 arrests in an action coordinated with the Page County Sheriff’s Office, Greene County Sheriff’s Office, and Gordonsville Police Department.

WMRA reported on August 10 that four of eight employees at a Luray-area dairy were among those detained, and that all four were removed during June. ICE confirmed two removals to Honduras and did not publicly confirm the other two in its response to the station. The Bullvine has not independently verified the farm-level details in this paragraph; all of them are WMRA’s reporting, attributed as such.

Five days later, on June 17, U.S. Citizenship and Immigration Services issued Policy Memorandum PM-602-0200, opening H-2A petitions to dairies that can demonstrate temporary or seasonal need. Nothing connects those two events. The interval is a coincidence of timing and is treated as one here.

The sequence does illustrate something structural: the policy channel that exists runs on a calendar measured in months. A crew loss runs on a calendar measured in hours.

The Dates That Move Your Wage Bill

DateEventEffect
May 2026BLS publishes OEWS estimates used to set new ratesFloor reflects May 2025 OEWS wage estimates (BLS)
June 17, 2026USCIS issues PM-602-0200, effective immediatelyDairy petitions adjudicated case by case on temporary or seasonal need (USCIS)
August 3, 2026DOL publishes 2026–2027 AEWRs at 91 FR 48946Two-tier skill-based structure replaces single state rate (Federal Register)
August 17, 2026New rates take effect in VirginiaDelayed effective date for 17 states under Kansas et al. v. U.S. Dep’t of Labor, 749 F. Supp. 3d 1363 (S.D. Ga. 2024) (Federal Register, DATES)
September 2, 2026DOL OFLC implementation noticeCurrent rates stand; future wage adjustments possible (DOL OFLC)

The other 16 states on the August 17 schedule: Arkansas, Florida, Georgia, Idaho, Indiana, Iowa, Kansas, Louisiana, Missouri, Montana, Nebraska, North Dakota, Oklahoma, South Carolina, Tennessee and Texas.

What June 17 Changed, and What It Didn’t

PM-602-0200 did not create a dairy visa. It told adjudicators that dairying can fall within H-2A where the petitioning employer proves that its need — not the existence of dairy work generally — is temporary or seasonal.

Temporary need generally runs no longer than one year absent extraordinary circumstances. Seasonal need must tie to a recurring time-of-year pattern that pushes labor requirements materially above the farm’s ongoing level.

USCIS gave examples, not blanket approval. A defined calving season could support a petition up to 10 months. A farm without concentrated calving might qualify if herdsman duties and labor demand change materially in identifiable periods. Year-round milking doesn’t automatically kill a petition — but a permanent year-round milking vacancy doesn’t become seasonal because the paperwork says so.

Adjudicators can pull payroll, schedules, staffing levels, contracts, workload records, prior petitions, and the gaps between requested employment periods. Back-to-back petitions covering substantially identical work without a meaningful break support a finding that the need is permanent.

USCIS also caps the stay: classification runs up to the certification period, extends in increments of up to one year, and maxes at three years — after which the worker must leave for at least 60 uninterrupted days (USCIS, H-2A Temporary Agricultural Workers).

Urgency is not eligibility. Losing four permanent employees creates the first and does nothing for the second.

The Lead Time You Don’t Have

USDA’s Farmers.gov guidance puts the standard process at 60 to 75 days — state job order 60 to 75 days ahead of the requested start, federal temporary labor certification filed at least 45 days out (USDA, Farmers.gov).

Emergency filing can waive parts of the 45-day schedule. It does not erase DOL review, USCIS adjudication, consular processing, or worker travel. H-2A is a planned labor channel. It is not four people waiting outside the milkhouse.

The Four-Worker Model

Four positions at 60 hours a week across 52 weeks: 3,120 hours per worker, 12,480 hours across four.

The 52-week frame is a costing device, not a petition. A genuine 52-week need is precisely what fails the USCIS temporary-or-seasonal test. This annualizes exposure so it can be compared against a current wage bill. It is not a claim that USCIS would certify a full-year dairy petition.

Which wage floor applies

Dairy work sits in SOC 45-2093, Farmworkers, Farm, Ranch, and Aquacultural Animals — one of the occupation codes in the field-and-livestock (combined) category (BLS, SOC 45-2093; occupational coverage at 91 FR 48946).

DOL now sets rates at two skill levels from BLS OEWS data: Level I for entry positions requiring no formal credential, Level II for experienced or fully proficient workers (91 FR 48946, methodology).
Virginia’s listed field-and-livestock figures for H-2A workers receiving free housing are $11.76 at Skill Level I and $15.84 at Skill Level II (DOL OFLC, H-2A Adverse Effect Wage Rates). Three qualifications attach:

The lower figure is conditional. It reflects a downward “H-2A Adverse Compensation Adjustment,” calculated from HUD Fair Market Rents for a four-bedroom unit, and applies only where the employer provides compliant housing at no cost (20 CFR 655.120(b)(3); adjustment methodology at 91 FR 48946).

The “highest of” rule overrides it. Employers pay the highest of the adjusted AEWR, the prevailing wage, any collective bargaining rate, the federal minimum, or the state minimum (20 CFR 655.120(a)). Virginia’s 2026 minimum wage is $12.77, so no Virginia H-2A dairy job can be budgeted at $11.76 (Virginia Department of Labor and Industry). Planning floors: $12.77 (Level I) and $15.84 (Level II).

Worker / planning categoryListed or assumed wage floorWhat actually controls the budgetCompliance and cost implication
H-2A Skill Level I with compliant free housing$11.76/hrVirginia’s 2026 minimum wage of $12.77/hr overrides the adjusted AEWRDo not budget a Virginia Level I dairy job at $11.76/hr
H-2A Skill Level II with compliant free housing$15.84/hrThe applicable “highest of” wage testCentral four-worker model uses $15.84/hr across 12,480 annual hours
Domestic corresponding employmentFull unadjusted AEWR appliesSame-job domestic workers must receive no less than the H-2A offerMixed crews can require a higher domestic wage code than the H-2A Level I rate
Corresponding worker unable to return home dailyWage plus housing exposureHousing obligation extends beyond visa headcountHousing capacity may exceed the four-worker petition count
Four-worker central H-2A model$197,683 cash wagesLevel II wage assumption at 12,480 hoursThree-fourths guarantee puts roughly $148,262 of that wage line at risk regardless of workload

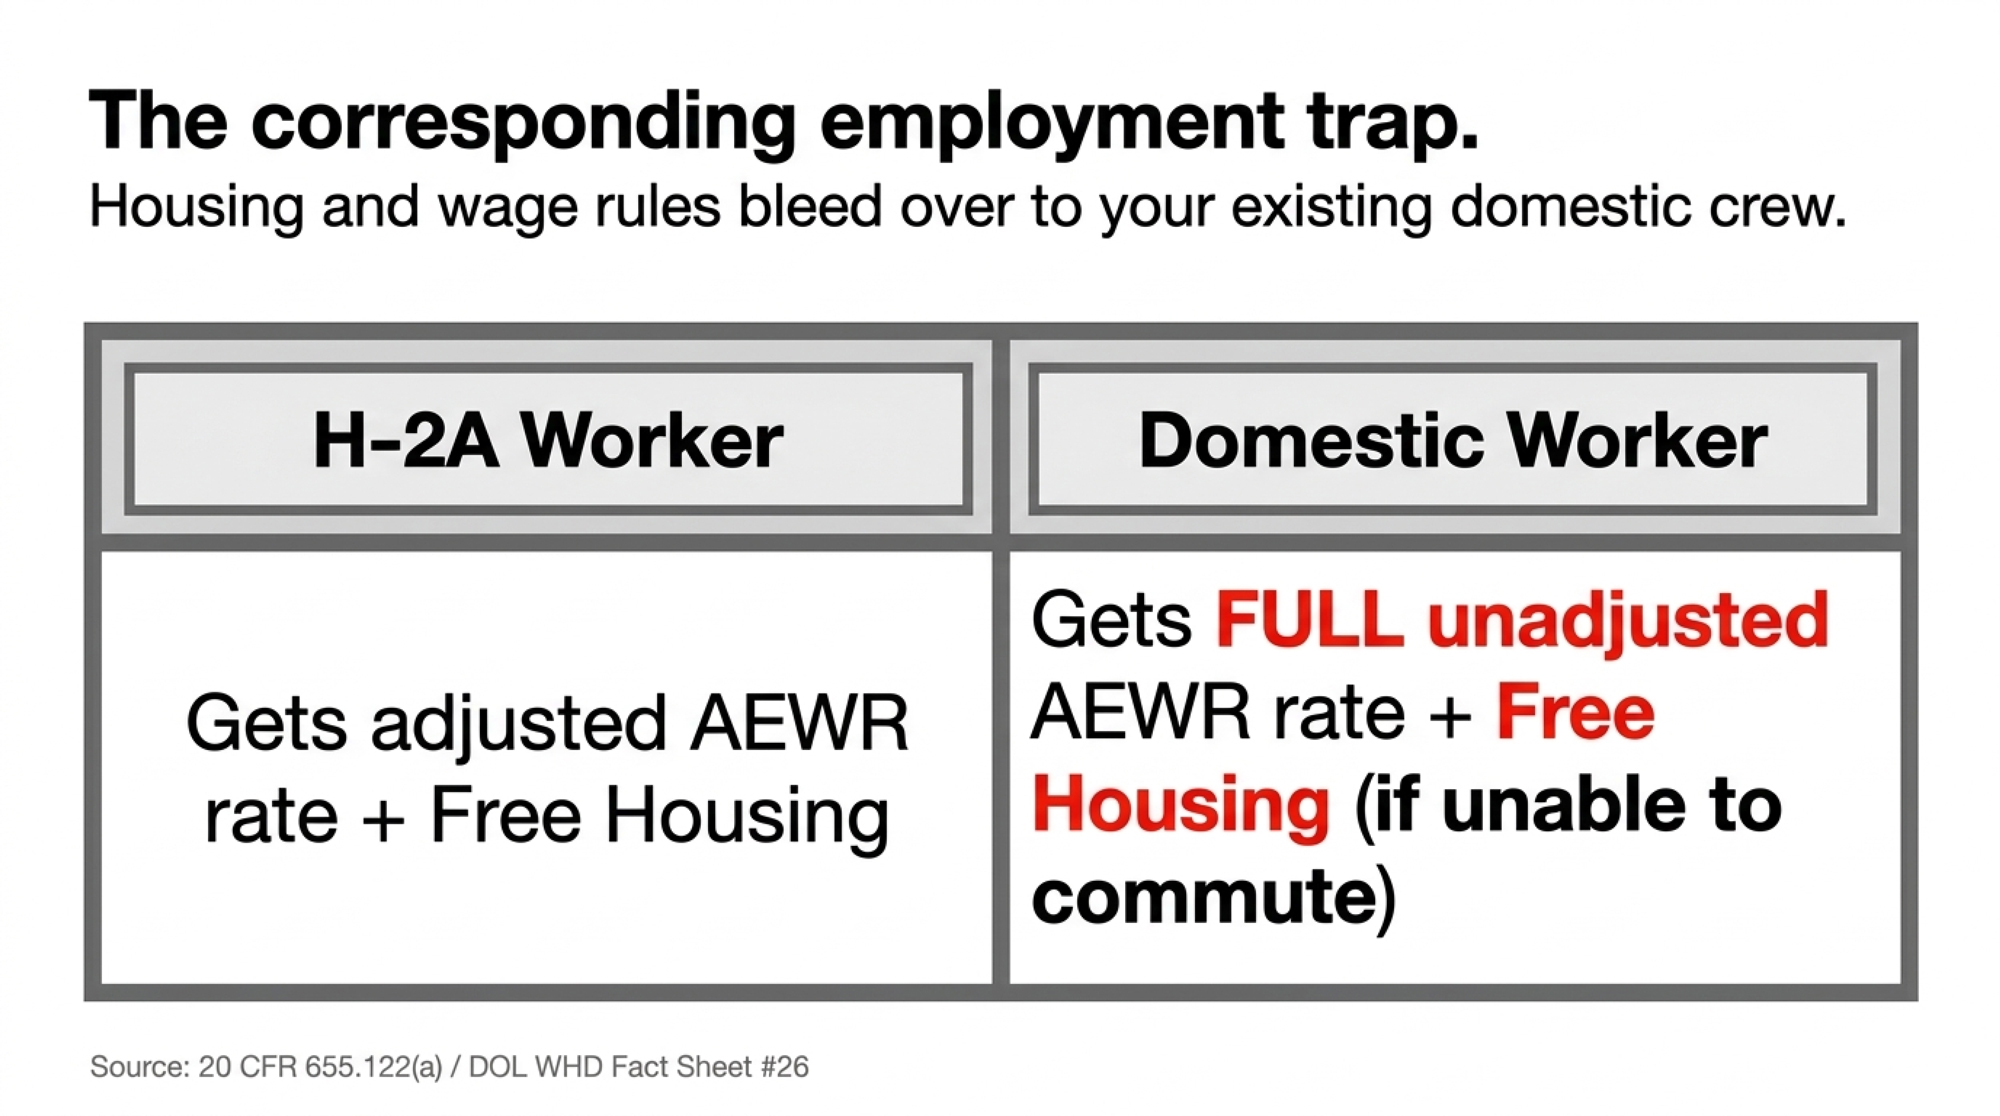
Then the corresponding-employment trap, which runs two ways. The job offer must give U.S. workers in corresponding employment no less than the H-2A workers receive, and the housing adjustment applies to H-2A workers only — so a domestic worker on the same job takes the full, unadjusted AEWR (20 CFR 655.122(a)). And the housing obligation itself extends past your H-2A crew: employers must provide housing at no cost to H-2A workers and to corresponding-employment workers who aren’t reasonably able to return to their residence the same day (DOL Wage and Hour Division, Fact Sheet #26).

Run a mixed crew, and you are running two wage codes; the domestic one is higher, and your housing headcount may be larger than your visa headcount.

The guarantee that makes the wage line a floor

Under 20 CFR 655.122(i), the employer guarantees work equal to at least three-fourths of the workdays in the contract period. The ETA-790A clearance order carries the same commitment (DOL ETA-790A).

That changes the character of the number, not just its size. The $197,683 central wage line is not a dial you turn down in a slow month — roughly three-quarters of it is an obligation you owe whether the work materializes or not. A domestic crew you can send home early. An H-2A contract you largely cannot.

Non-wage inputs, benchmarked

Two government figures anchor this. The Congressional Research Service, citing USDA, puts H-2A housing at $9,000 to $13,000 per worker and transportation at $400 to $650 per worker, and identifies housing as the major non-wage cost in the program (Congressional Research Service, R48614, July 31, 2025). Working from the same USDA 2024 estimates, Choices magazine puts minimum total non-wage cost near $10,000 per worker (Choices, Agricultural and Applied Economics Association).

Those are national seasonal-contract benchmarks, not Virginia dairy figures. They do not cover a farm building or substantially retrofitting housing.
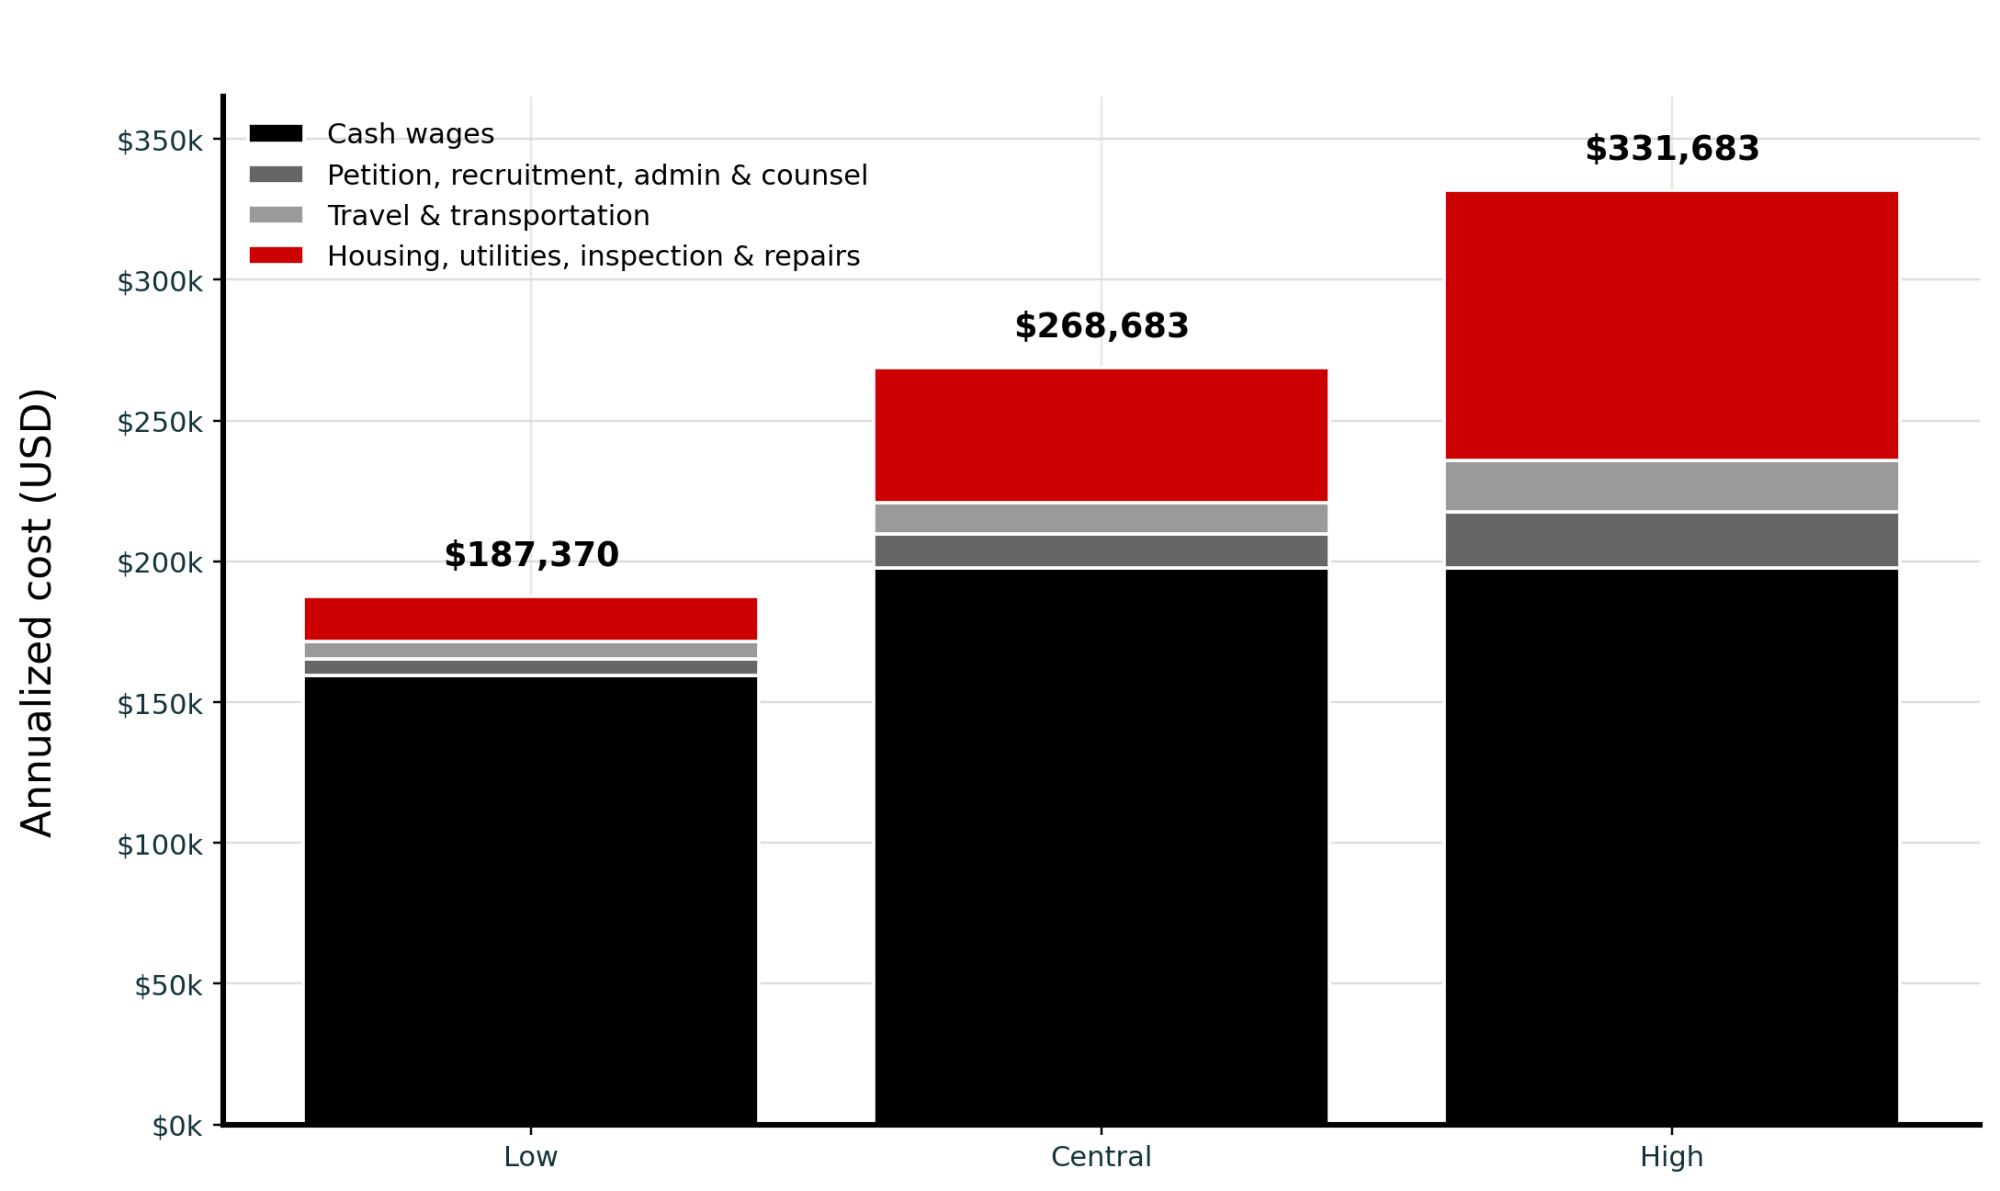
Input, four workersLowCentralHigh
Annual labor hours12,48012,48012,480
Wage assumption$12.77 (Level I, VA min.)$15.84 (Level II)$15.84 (Level II)
Cash wages$159,370$197,683$197,683
Petition, recruitment, admin, counsel$6,000$12,000$20,000
Travel and transportation$6,000$11,000$18,000
Housing, utilities, inspection, repairs$16,000$48,000$96,000
Non-wage subtotal$28,000$71,000$134,000
Total annualized$187,370$268,683$331,683
Per worker$46,843$67,171$82,921
Per cow at 200 cows$937$1,343$1,658

Per-worker non-wage cost runs $7,000 / $17,750 / $33,500. Read the low case carefully — at $7,000 it sits below the roughly $10,000 minimum in the USDA data. It is only reachable with compliant housing already built and paid for. If you’re planning from zero, the central case is your floor, not your midpoint.

Transportation is built from the CRS $400–$650 travel benchmark plus daily work transport — vehicle, fuel, insurance, maintenance — which is an employer obligation for workers in employer-provided housing. Timing matters as much as the amount: inbound transportation and subsistence are reimbursed once the worker completes 50% of the contract period, and return transportation is owed on completion (DOL Wage and Hour Division, Fact Sheet #26).

Subsistence has its own caps. USDA’s guidance lists a maximum daily meal charge of $16.78, with higher reimbursement available against receipts (USDA, Farmers.gov). DOL updates these rates annually by Federal Register notice — confirm the current figures before you file, not from this table.

Excluded from all three cases: payroll taxes, workers’ compensation, benefits, overtime exposure, emergency relief labor, meals or cooking-facility costs, and the production cost of running short-handed.

Per hundredweight

These figures cover the four replacement positions only — not your total farm labor bill. Production levels are reader inputs; substitute your own shipped hundredweight.
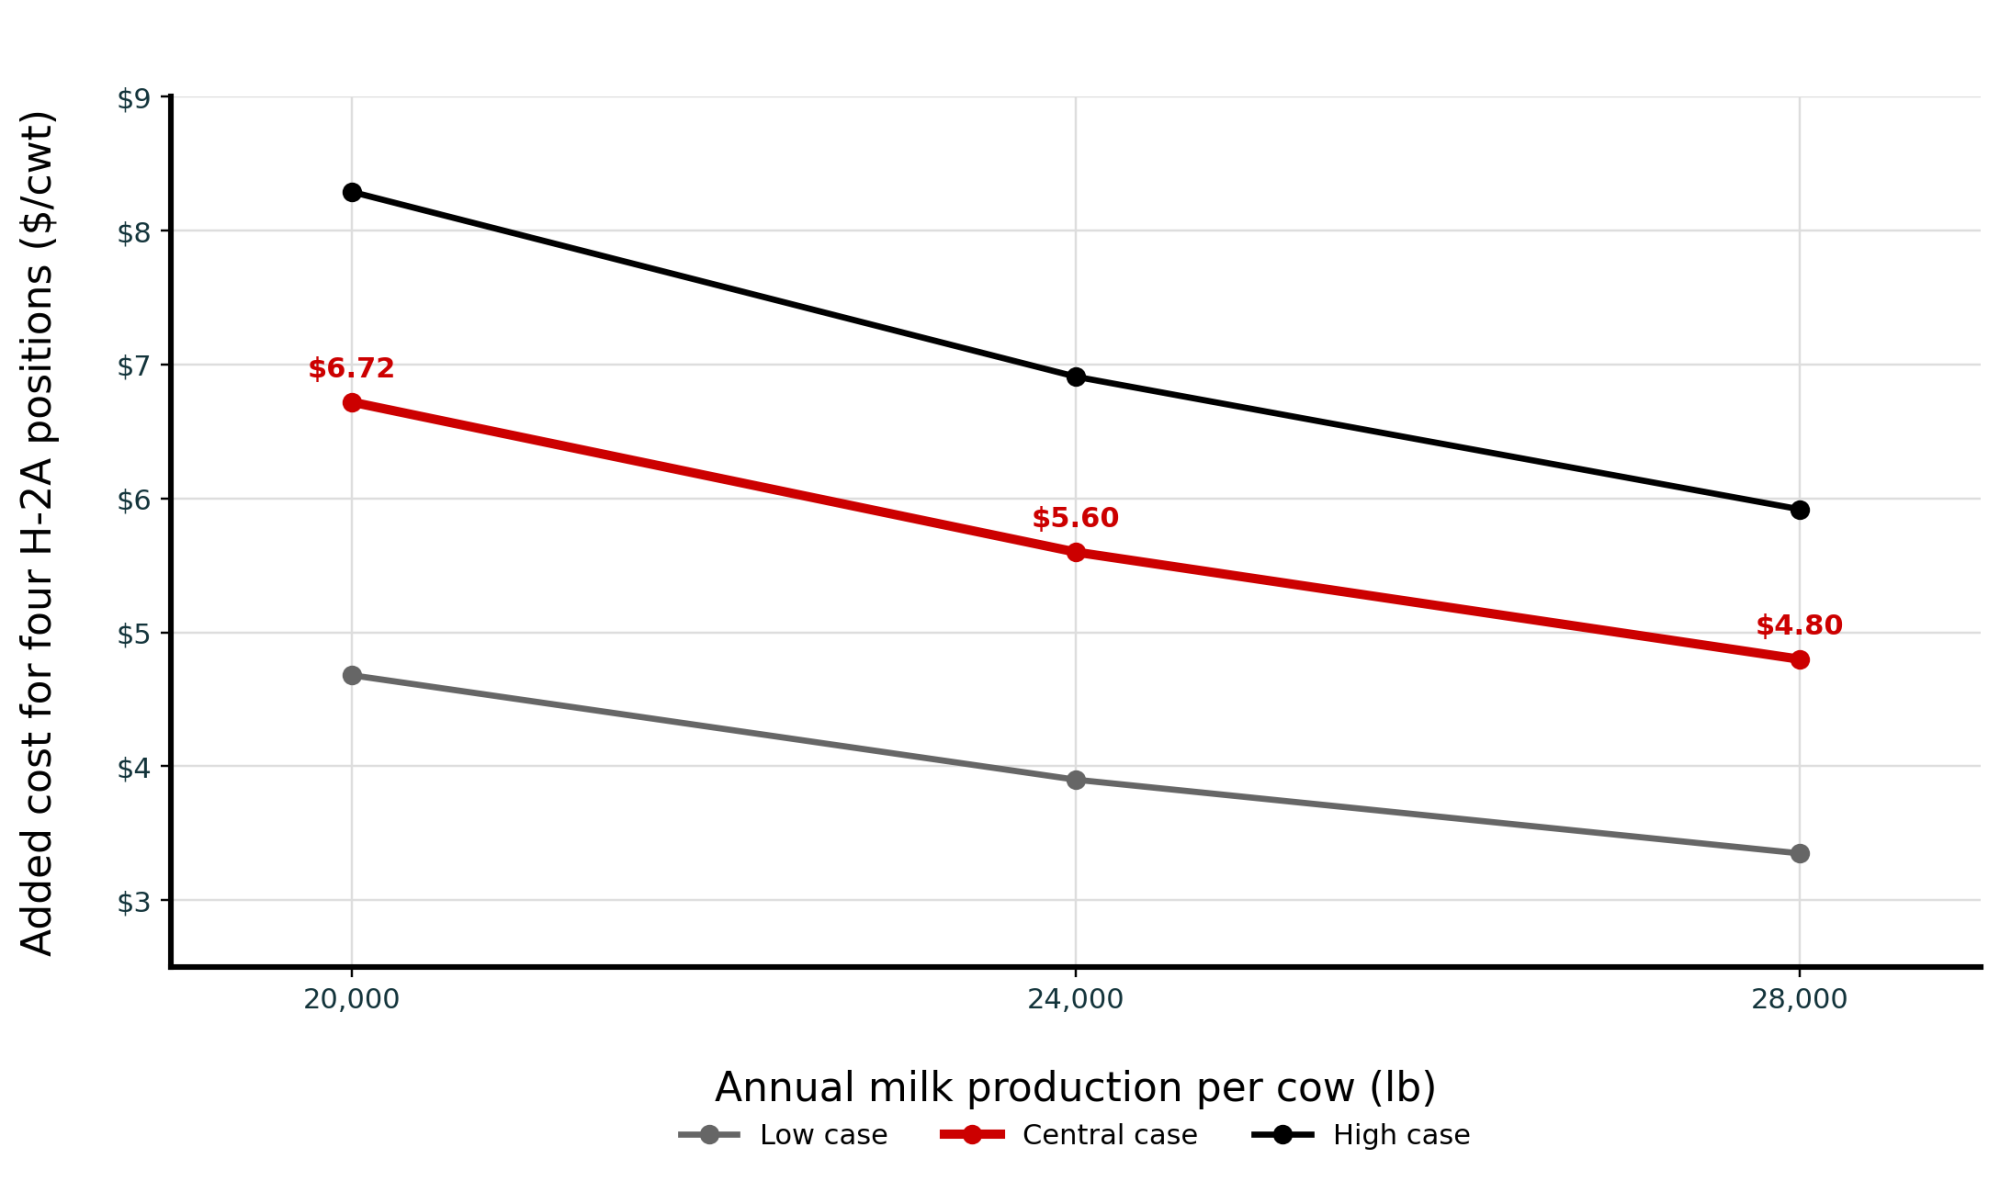
Annual milk per cowTotal cwt (200 cows)LowCentralHigh
20,000 lb40,000$4.68$6.72$8.29
24,000 lb48,000$3.90$5.60$6.91
28,000 lb56,000$3.35$4.80$5.92

For scale — and this is a different unit — USDA ERS puts total labor at $13.18 per cwt on herds under 50 cows and $1.85 per cwt above 2,000 cows (USDA Economic Research Service, Milk Cost of Production Estimates). Four H-2A positions at 200 cows consuming $5.60 of that is not a like-for-like comparison, but it tells you the program doesn’t fix a scale disadvantage. It prices one.

Against a domestic crew

The comparison farm’s actual wage bill isn’t public. Labeled planning rates:

CaseAssumed local billH-2A modelDifference
Low$187,200 at $15/hr$187,370+$170
Central$212,160 at $17/hr$268,683+$56,523
High$249,600 at $20/hr$331,683+$82,083

Central runs about $56,500 above a $17-per-hour domestic cash-wage bill, and $48,000 of that gap is housing. On a 200-cow dairy, the bunkhouse decision matters nearly as much as the wage rate.

The low case reaching near-parity is not a finding that H-2A is cheap. It’s a finding that H-2A is cheap for a farm that already owns compliant housing — which is the farm least likely to need this analysis. And even at parity, the three-fourths guarantee means the two columns don’t carry the same risk.

Dairy’s Exposure, Correctly Dated

The National Milk Producers Federation — which represents dairy cooperatives and advocates for agricultural labor reform — reports immigrant employees at 51% of U.S. dairy labor and farms employing immigrant workers producing 79% of the nation’s milk (NMPF, Labor and Immigration Reform). Both figures come from an NMPF-sponsored Texas A&M study published in 2015, built on a producer survey and economic model (NMPF, The Economic Impacts of Immigrant Labor on U.S. Dairy Farms, 2015). Not a current federal workforce count. Any piece citing them without that date and sponsor is overstating their authority.

What This Means for Your Operation

Map a 50% crew loss this week. Who covers milking, feeding, calves, treatments, and manure handling if 25% or 50% of the crew is gone tomorrow? One name in three essential jobs is not a plan.

Run the per-cwt number today. Annual payroll divided by hundredweight shipped, then compare against the ERS bracket for your herd size. You’re looking for the gap between what you pay now and the $4.80–$6.72 range four H-2A positions would add at 200 cows.

Start 75 days early or don’t start. A June 1 need belongs on the calendar by mid-March.

Build a month-by-month labor curve. Hours by duty and month — milking, maternity, calves, breeding, fieldwork, maintenance. Twelve months of payroll and schedules is how you demonstrate a seasonal increase exists, or admit it doesn’t.

Cost housing before you cost counsel. Benchmark against $9,000–$13,000 per worker, then get your actual structures evaluated. A farmhouse or camper already occupied by employees is not automatically compliant. Sleeping rooms require at least 50 square feet per person, and 100 square feet per person where workers cook, live, and sleep in the same room (DOL WHD, Fact Sheet #26G).

Count your housing headcount, not your visa headcount. Corresponding employment domestic workers who can’t get home the same day are owed housing too. Budget it before you file, not after an audit.
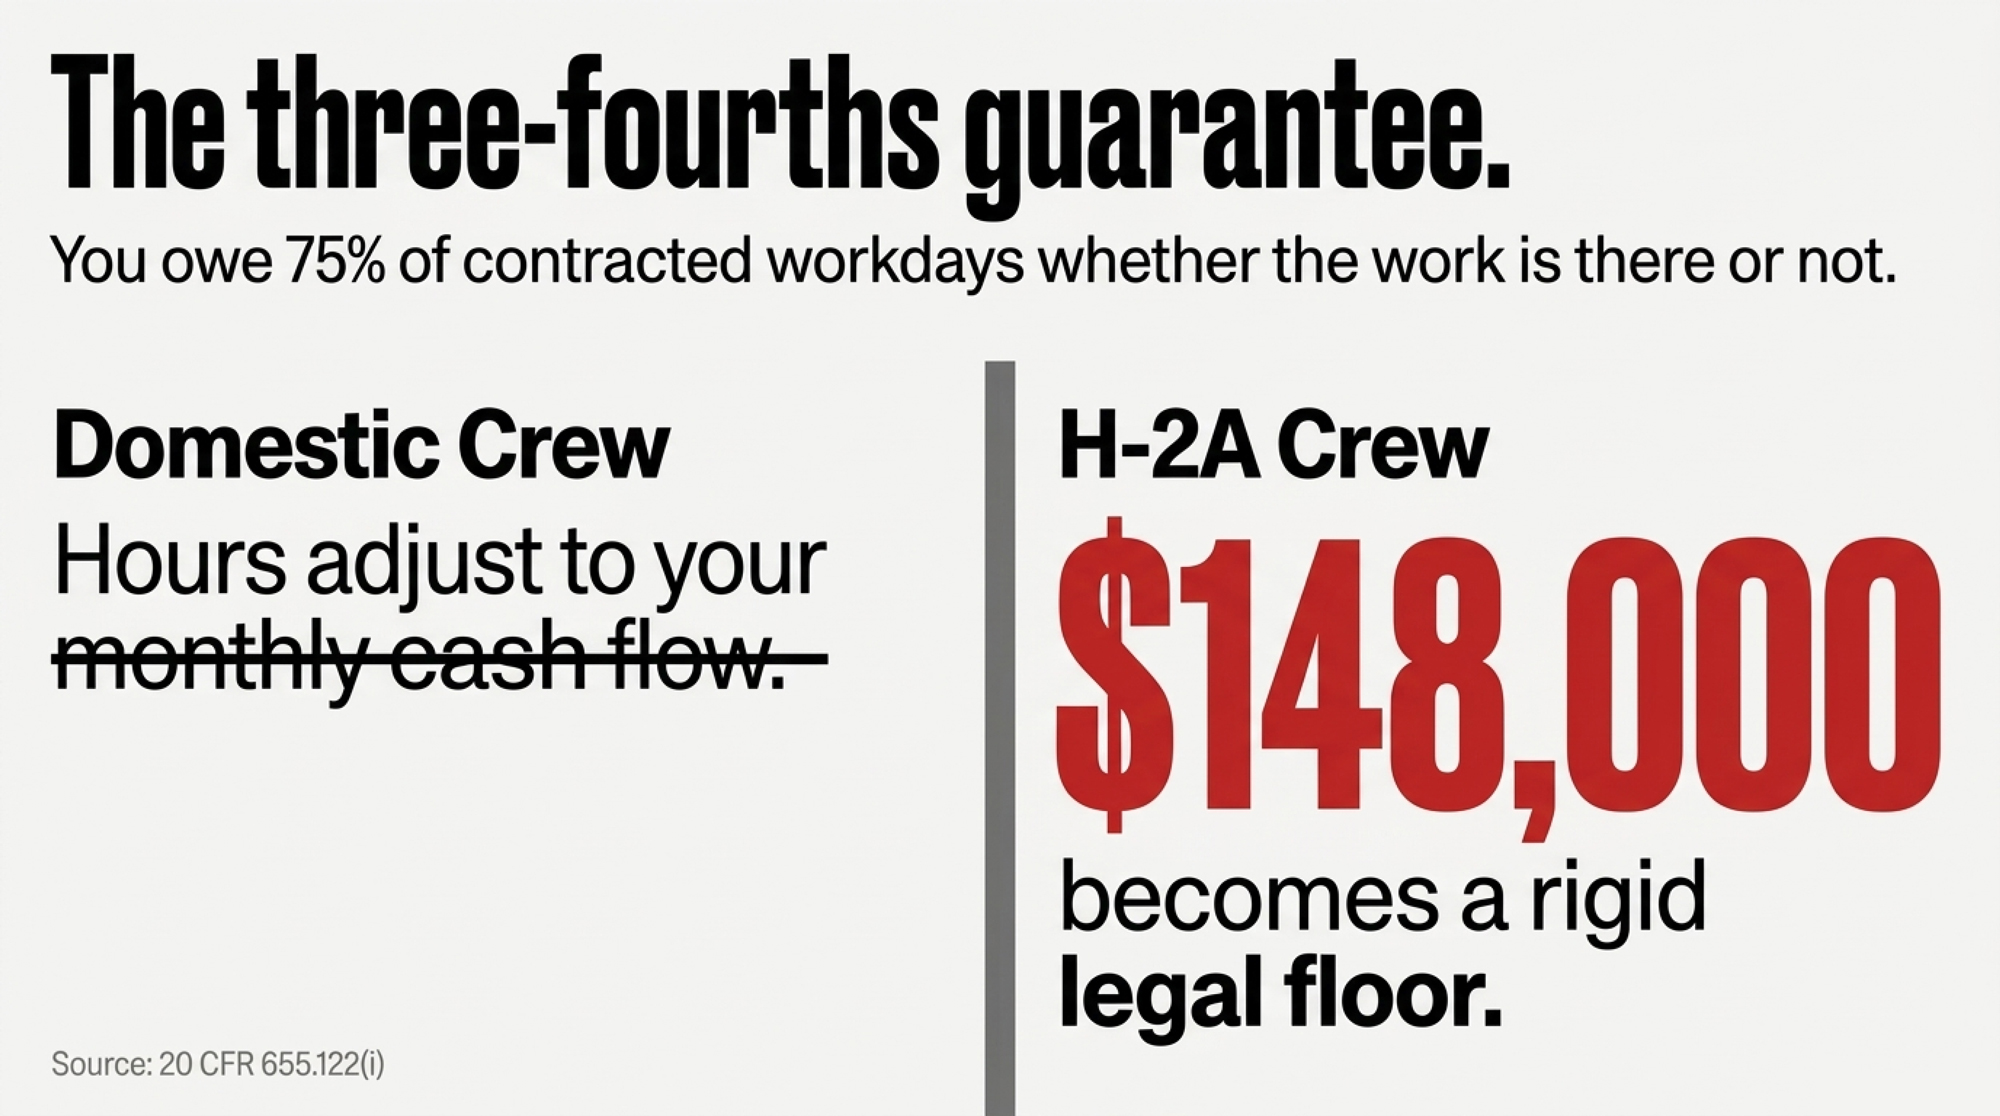
Model the three-fourths guarantee, not just the hourly rate. Under 20 CFR 655.122(i), you owe roughly 75% of contracted workdays regardless of workload, on the central case that’s roughly $148,000 of the $197,683 wage line owed whether the work is there or not. Run your slowest quarter against the contract and see what you’d be paying for.

Price both skill levels and check your state’s effective date. Virginia after August 17: $12.77 and $15.84 before housing and travel. Sixteen other states share that date; the rest moved August 3 (Federal Register, FR Doc. 2026-15673).

Set up three pay codes now. H-2A Level I, H-2A Level II, and domestic corresponding employment at the full unadjusted rate — the structure 20 CFR 655.122(a) requires once you run a mixed crew. A blended average hides a mid-season duty shift, and that is exactly what a DOL reclassification dispute looks for.

Keep wage records tight after September 2. Workers employed during the court-identified period may later qualify for adjustments. Nothing is owed yet. That is not the same as nothing being owed.

Run a privileged I-9 review while the crew is intact. Through qualified immigration counsel, not a DIY audit. Reverifying foreign-born employees on your own creates discrimination exposure of its own.

The Next 30 to 90 Days

DOL’s replacement wage methodology. The September 2 notice signals a rule is coming. Until it publishes, every Virginia H-2A wage you pay is provisional.

The Securing Agriculture’s Workforce Act (H.R. 9535), introduced June 30, 2026, would open H-2A to more categories of agricultural work, set entry wages at the 17th percentile and experienced wages at the 50th, eliminate the prevailing wage, fix contract wages for the contract duration, allow multiyear housing certifications and permit capped housing deductions tied to HUD fair market rent (Alston & Bird analysis; bill text at Congress.gov). Introduced, not law.

H.R. 3227 proposes a limited pool of non-temporary H-2A visas with a dairy reservation (Congress.gov). Also introduced, but not law.

None helps a staffing decision this week. All three change a 2027 budget, and the housing provisions in H.R. 9535 would move the largest single line in the model above.

The policy that exists was never built to refill half a permanent crew after the barn is already short. It was built to be planned for. Cost the four-worker case, test whether the work is genuinely seasonal, and inspect the housing while everyone is still showing up.
Key Takeaways

  • Four replacement workers on a 200-cow Virginia dairy run $187,370 to $331,683 a year across 12,480 hours — housing swings nearly the whole spread, so price the bunkhouse before you price the petition.
  • Check your effective date. Virginia’s new AEWR didn’t start August 3 with most states; it started August 17 under the Kansas v. DOL order, and a wage line filed on the wrong date is a compliance problem, not a rounding error.
  • The housing credit that lowers your H-2A wage doesn’t reach domestic workers in corresponding employment — they get the full unadjusted rate, and some of them are owed housing too.
  • Under 20 CFR 655.122(i), you owe three-fourths of contracted workdays whether the work is there or not. Clearing $268,683 doesn’t clear eligibility either, so build the labor curve while the crew’s intact.
The Bullvine H-2A Replacement Cost Calculator

Run the math on wages, housing, and regulatory liabilities before you file a petition.

1. Labor Needs

2. Annual Cost Inputs

3. Farm Scale & Comparison

Total Annualized H-2A Cost
$0
Wages + Housing + Admin + Travel
Cost Per Cow
$0
Cost Per Cwt
$0.00
3/4 Guarantee Liability
$0
75% of cash wages owed whether work exists or not.
Premium Over Local Crew
+$0
How much extra this H-2A crew costs vs local hires at your specified domestic wage.

Complete references and supporting documentation are available upon request by contacting the editorial team at editor@thebullvine.com.

Learn More

  • How to Attract and Retain Exceptional Labor for Your Dairy Farm — Arms you with concrete retention strategies that cut turnover expenses and protect your parlor’s efficiency. Dismantles the idea that wages alone keep teams intact, showing how structured communication and performance tracking reduce labor flight by up to 25 percent.
  • Dairy Farm Economics 2026: Milk Pricing, Margins & Risk Playbook — Exposes the structural margin squeeze hitting your 2026 milk check, delivering a playbook for navigating a projected $23.66/cwt economic cost. Breaks down how formula modernizations and risk management caps dictate whether you optimize, expand, or exit.
  • Robotic Milking Labor Math: Fix the Problem or Grow Debt? — Follows the money on automation, pitting a $48,000 variable wage hike against fixed $150,000 debt payments. Reveals why eight percent of early adopters save zero labor hours and forces you to stress-test dealer proposals against $18 milk.

The Sunday Read Dairy Professionals Don’t Skip.

Every week, thousands of producers, breeders, and industry insiders open Bullvine Weekly for genetics insights, market shifts, and profit strategies they won’t find anywhere else. One email. Five minutes. Smarter decisions all week.
NewsSubscribe
First
Last
Consent

The $128,320 Additive Bill: Why the First Dairy Carbon Credit Wasn’t Bovaer

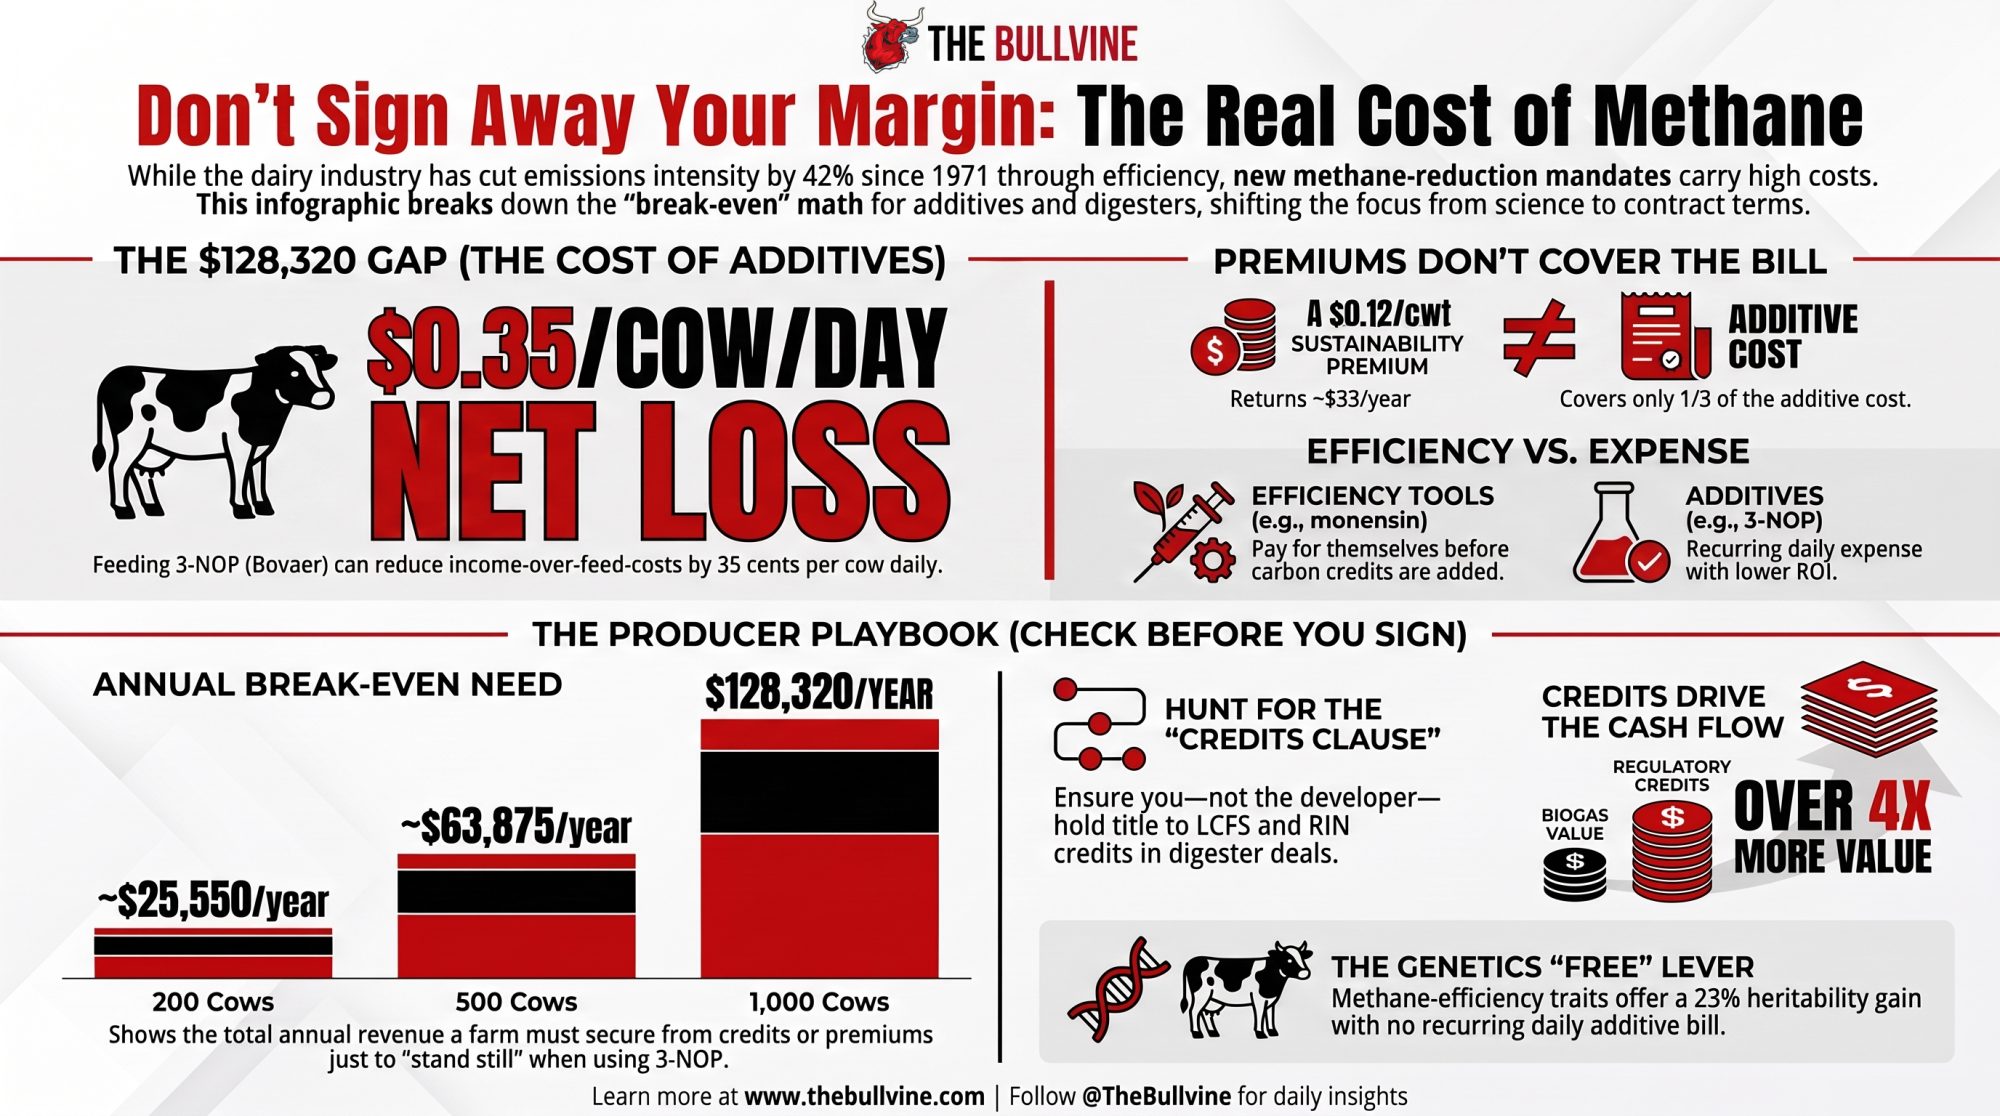
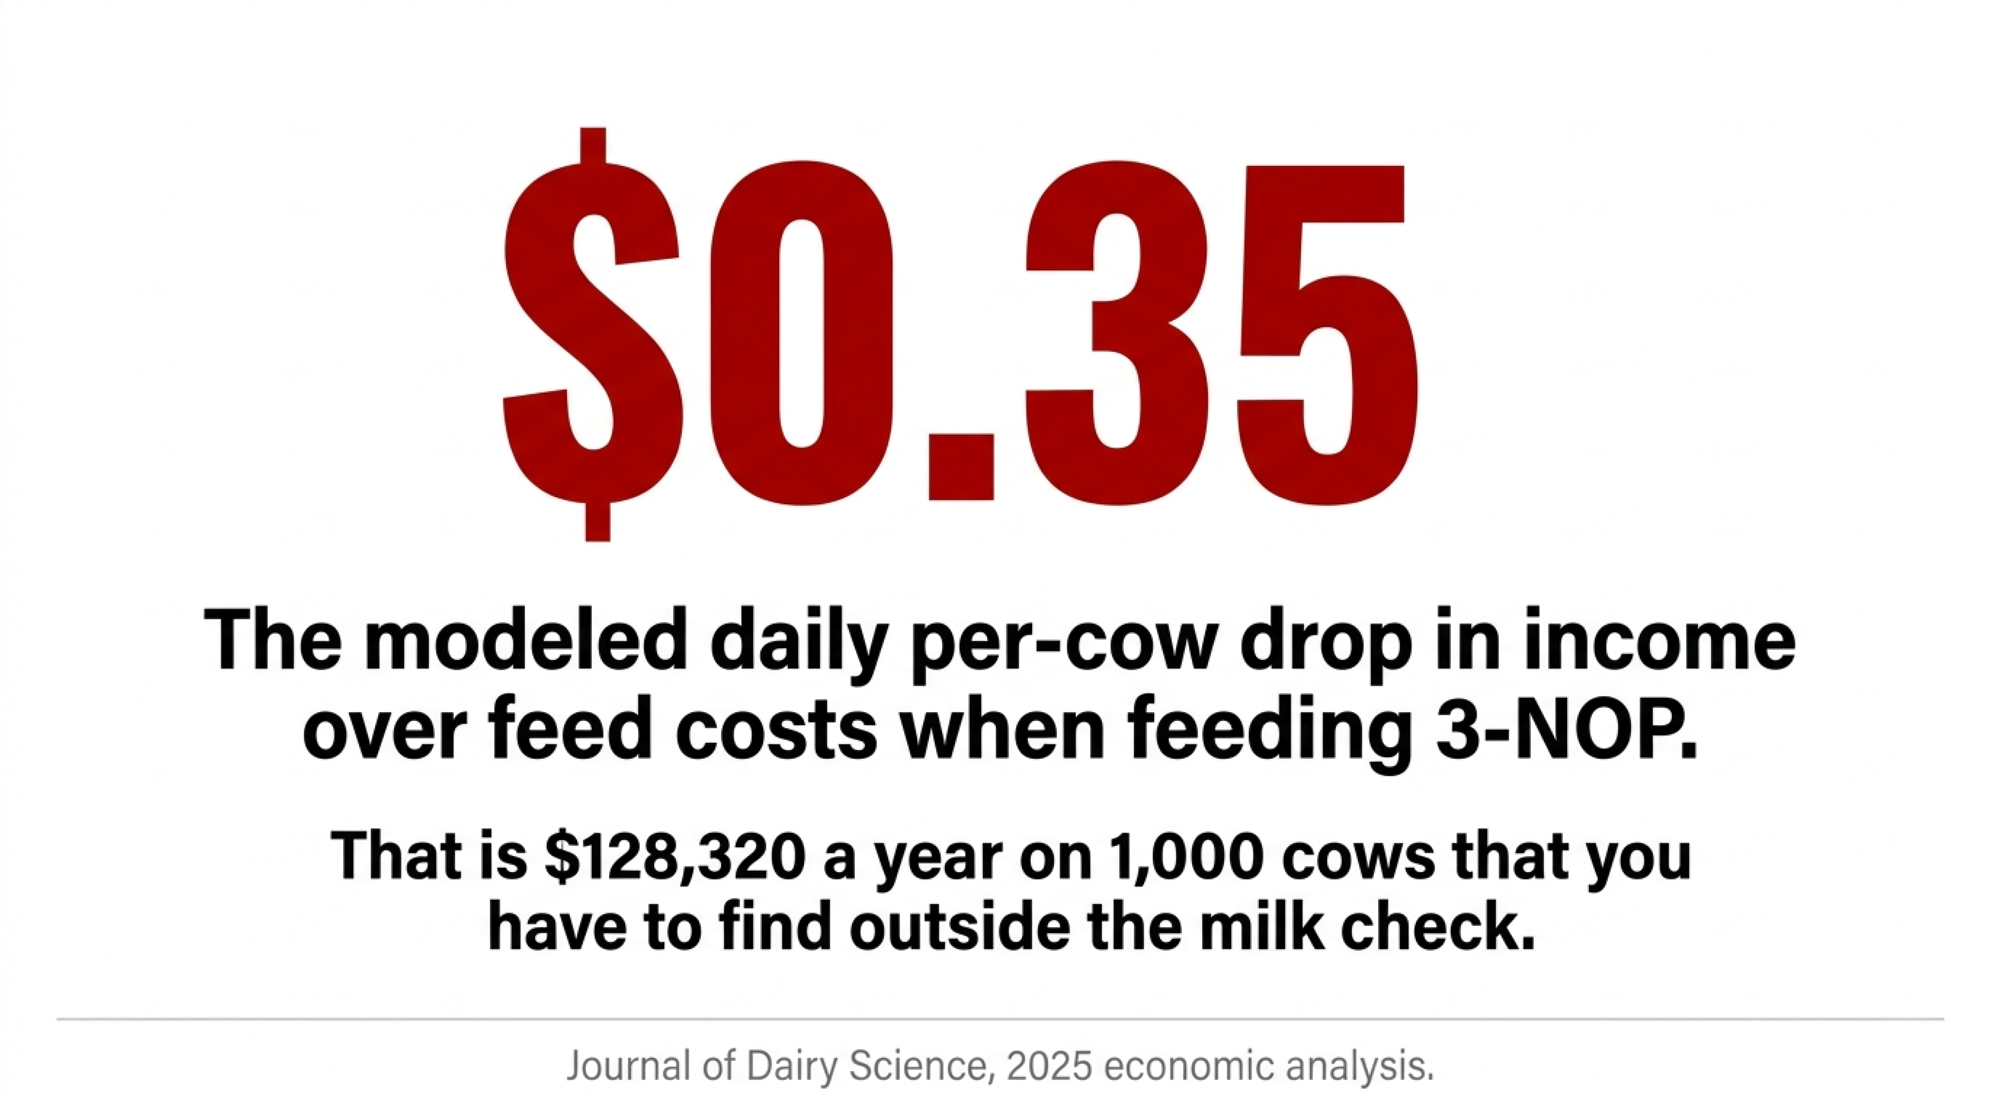
$128,320 a year on 1,000 cows, and 35 cents a cow a day you don’t get back. The first U.S. dairy methane credit ever sold came off a different product entirely — and the difference is the contract.

Start with the number that belongs on every whiteboard in every barn office. A 2025 economic analysis in the Journal of Dairy Science modeled a 1,000-cow dairy feeding 3-nitrooxypropanol, the methane additive sold as Bovaer and made by DSM-Firmenich. Feeding it cut income over feed costs by roughly $0.35 per cow per day, which on that herd works out to about $128,320 a year the farm has to find somewhere other than the milk check . That’s not a worst case. That’s the modeled outcome.

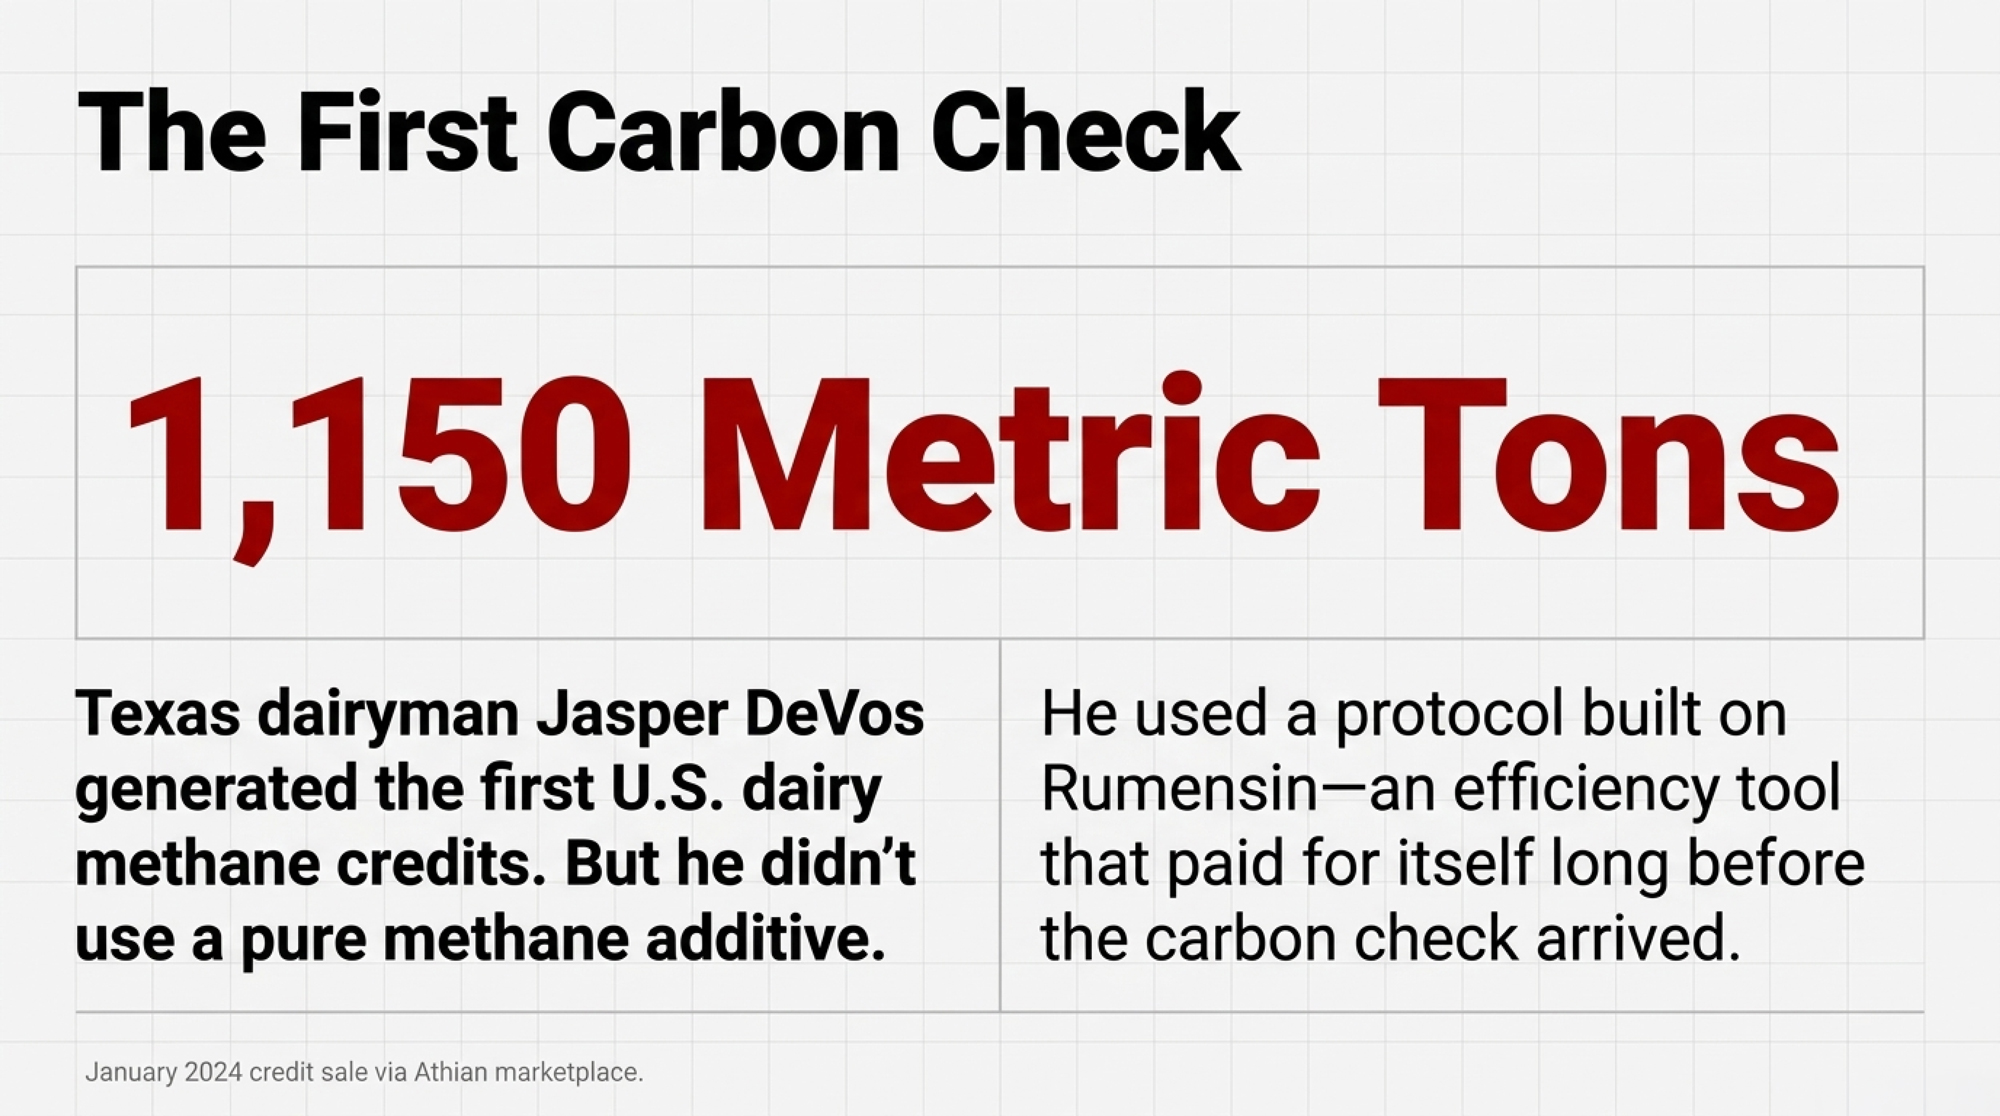
Now set it beside what happened the first time an American dairy farmer got paid for methane. In January 2024, Texas dairyman Jasper DeVos generated nearly 1,150 metric tons of verified carbon credits, the first sale of its kind in the U.S. livestock market, purchased by Dairy Farmers of America through a marketplace called Athian . Here’s the detail most coverage flattened: DeVos used Athian’s first accepted protocol, built on Rumensin, Elanco’s monensin product, FDA-approved to improve milk production efficiency and cut roughly half a metric ton of CO₂e per cow per year, depending on the herd’s animals and management .

Read those two paragraphs together and you’ve got the hinge of dairy’s next twenty years. The first farmer paid for methane reduction used a tool that improves feed efficiency — it was already earning its keep before the carbon check showed up. The tool the whole industry is now being pitched costs money every day and doesn’t. So the question was never whether you can cut methane. It’s who pays when the cut doesn’t pay for itself, and that’s a contract question headed for your desk.

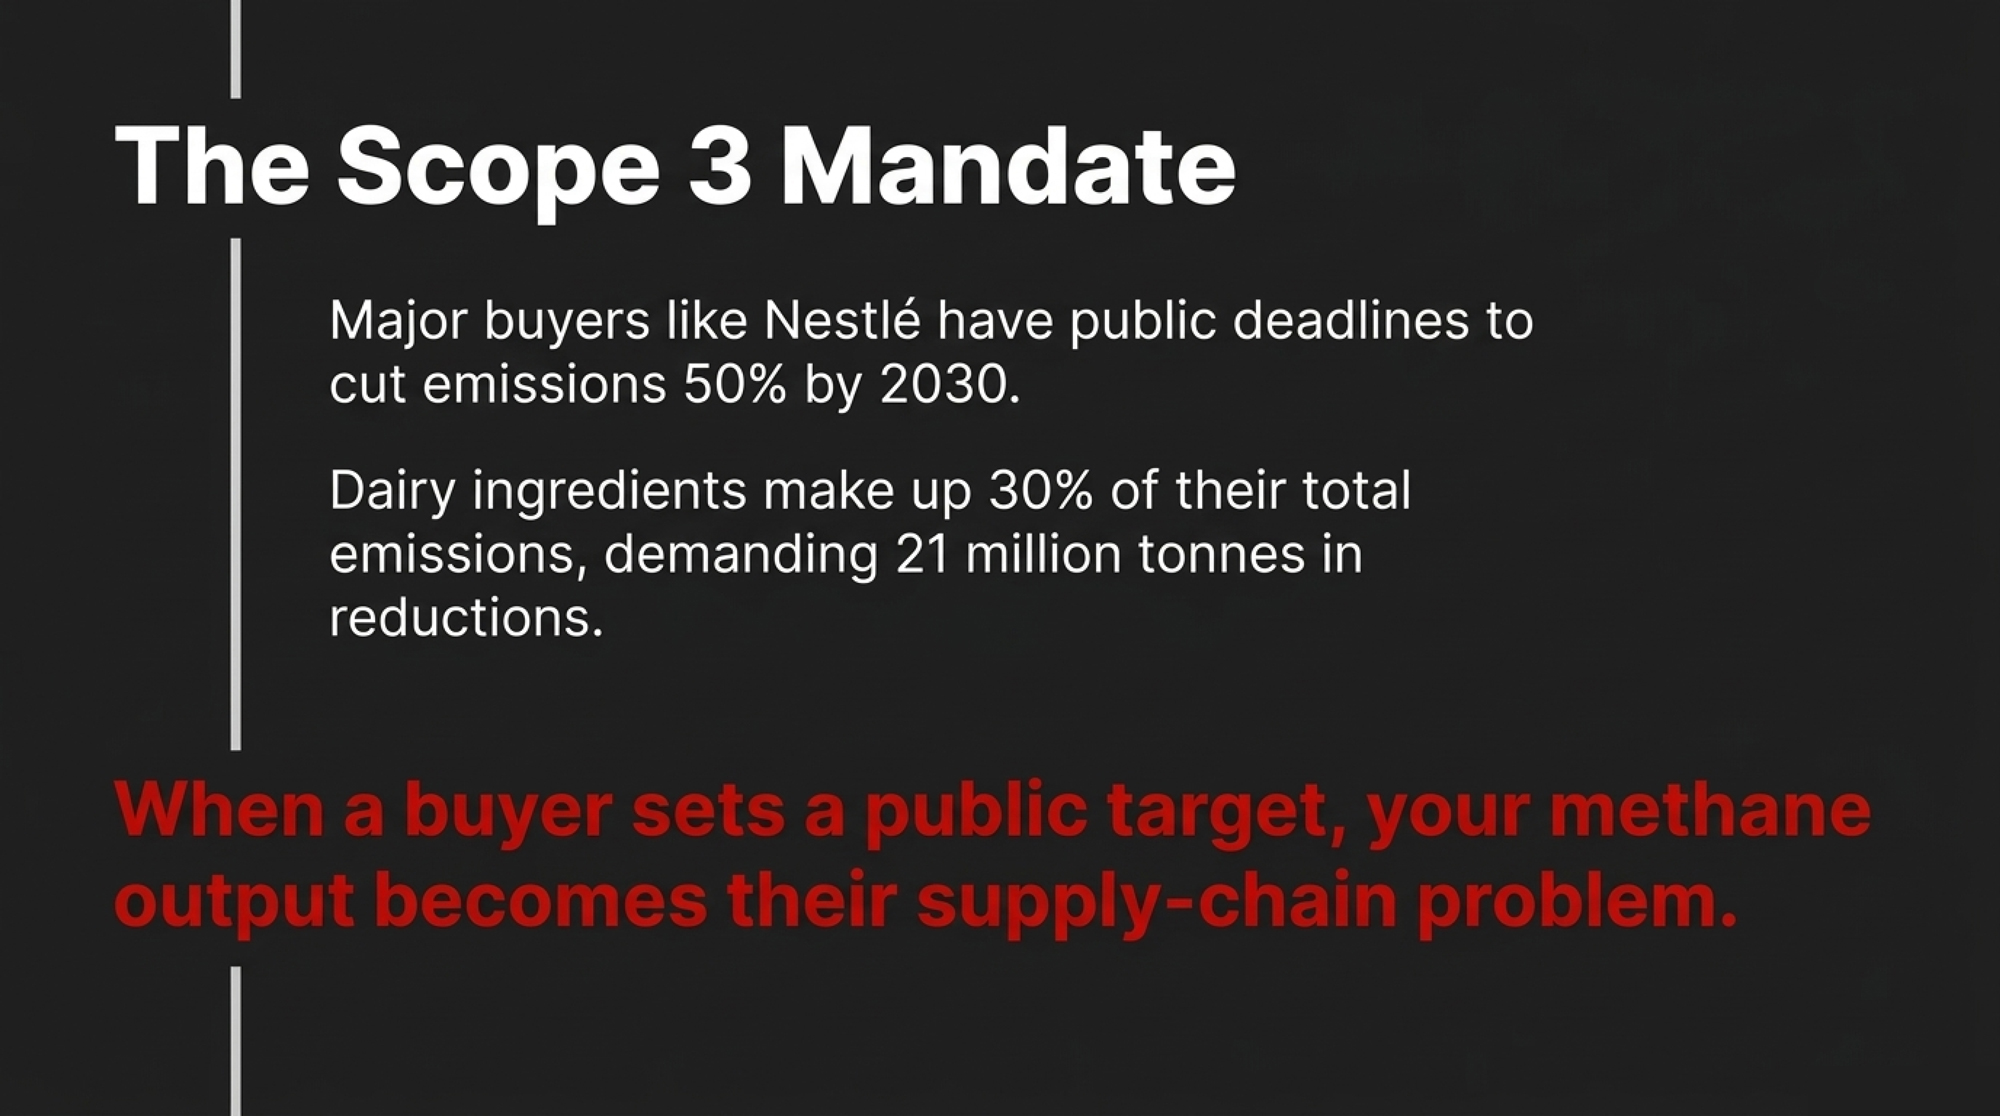
Why now, in 2026? Because the buyers at the other end of your milk have public deadlines. Nestlé, one of the largest dairy purchasers on the planet, has committed to cutting greenhouse gas emissions 50% by 2030 against a 2018 baseline and reaching net zero by 2050, with roughly 95% of its footprint sitting in Scope 3 . Dairy and livestock ingredients are its single largest Scope 3 source at about 30% of total emissions, and its roadmap targets 21 million tonnes of reductions from that category by 2030 . When a buyer that size sets a public target that depends on farm-level methane cuts, the cost of achieving those cuts becomes a supply-chain question. Producers are part of that chain.

The win nobody outside the barn talks about

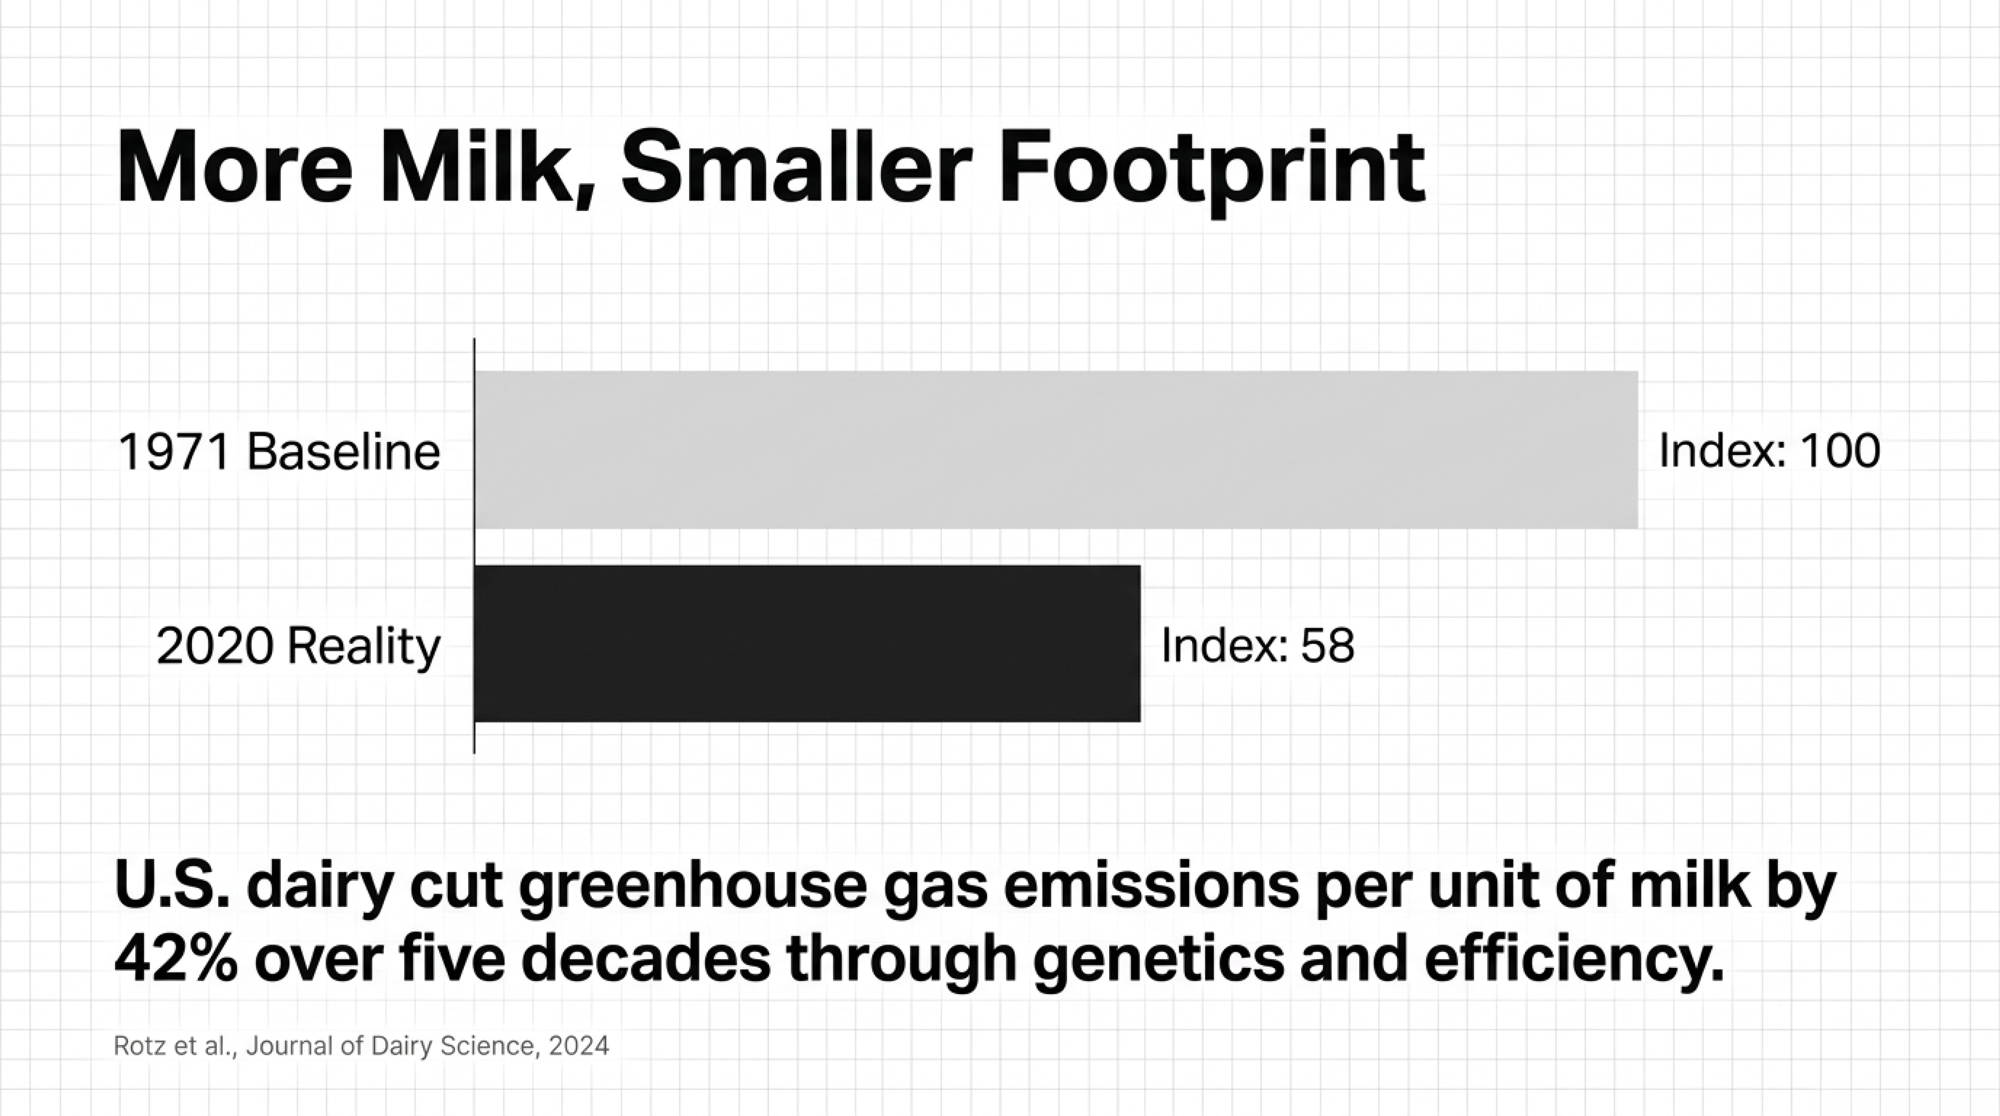
Here’s the part that should make you stand up straighter. Between 1971 and 2020, U.S. dairy farms cut greenhouse gas emissions per unit of milk by 42% while milking about 20% fewer cows and producing roughly twice the milk. That isn’t a marketing line. It’s peer-reviewed work from Rotz and colleagues in the Journal of Dairy Science, 2024 .

The rest of that study holds up just as well: fossil energy use per unit of milk down 54%, water-use intensity down 28%, and modeled nitrogen and phosphorus runoff per unit of milk down between 27% and 51%. Cornell’s Northeast analysis lands in the same place, with milk carbon intensity down 42% across the same span and absolute emissions in that region down 24% .

So why does your kid come home from school saying cows are bad for the planet? Because the public conversation never got the memo. Two research teams, one national and one regional, landed within a point of each other on intensity.

Why “per glass” and “in total” are both true

This is the line that won’t fit on a bumper sticker. Total emissions from all U.S. dairy farms still rose about 14% across those five decades, because total production climbed and a good share of it moved west into dry regions that lean hard on irrigation. Per glass, way down. In total, up. Both real.

Why does that matter to you? Because a critic reaches for the 14% and a checkoff ad reaches for the 42%, and if you can’t hold both in one breath you sound like you’re hiding something. You’re not. The footprint of each glass fell while the country drank more of it, which is productivity, not a cover-up. The Northeast figure is your best friend in that argument: in that region, absolute emissions came down 24% while intensity fell 42%. Regional stories differ, and saying so out loud is what makes you credible.

What drove the per-glass gains wasn’t a trick, and it wasn’t hormones. USDA’s Economic Research Service reported in February 2026 that the share of milk sales from farms using bovine somatotropin fell from 35% in 2000 to 2% by 2021 . The progress came from genetics, nutrition, reproduction, and management. More milk out of every cow, every acre, every gallon of diesel, and it paid for itself on the way. That’s exactly what DeVos’s credit was built on: Rumensin improves production efficiency, and the methane reduction rode along with it. The old deal, with a carbon check stapled on. The next round breaks it.

What does feeding 3-NOP actually cost you?

The science isn’t the problem. A meta-analysis in the Journal of Dairy Science found 3-NOP reduced methane production, yield, and intensity by 30.9% to 32.7% at an average dose of 70.5 mg/kg of dry matter . Van Gastelen and colleagues followed Holstein-Friesians over a full lactation and reported 21% lower daily methane, 20% lower methane yield, and 27% lower methane intensity, with a positive effect on production characteristics — Journal of Dairy Science, volume 107, 2024. It works.

The economics are the problem, and two different numbers get confused here. Bovaer’s price has been reported in trade coverage at roughly $0.30–$0.40 per cow per day, or about $93–$105 per cow per year on a lactating-cow basis . Separately, the 2025 JDS analysis found a net income-over-feed-cost decline of about $0.35 per cow per day, driven substantially by reduced feed intake and milk yield in the trials modeled . Similar-looking figures, different metrics. The second one matters because it’s what lands on your bottom line after the production response.

Read that twice before you sign anything. You’re not simply buying a feed additive — you’re absorbing a modeled production effect. Trial results vary, and some studies report no significant yield penalty, which is precisely why you run the number against your own herd instead of against a brochure.

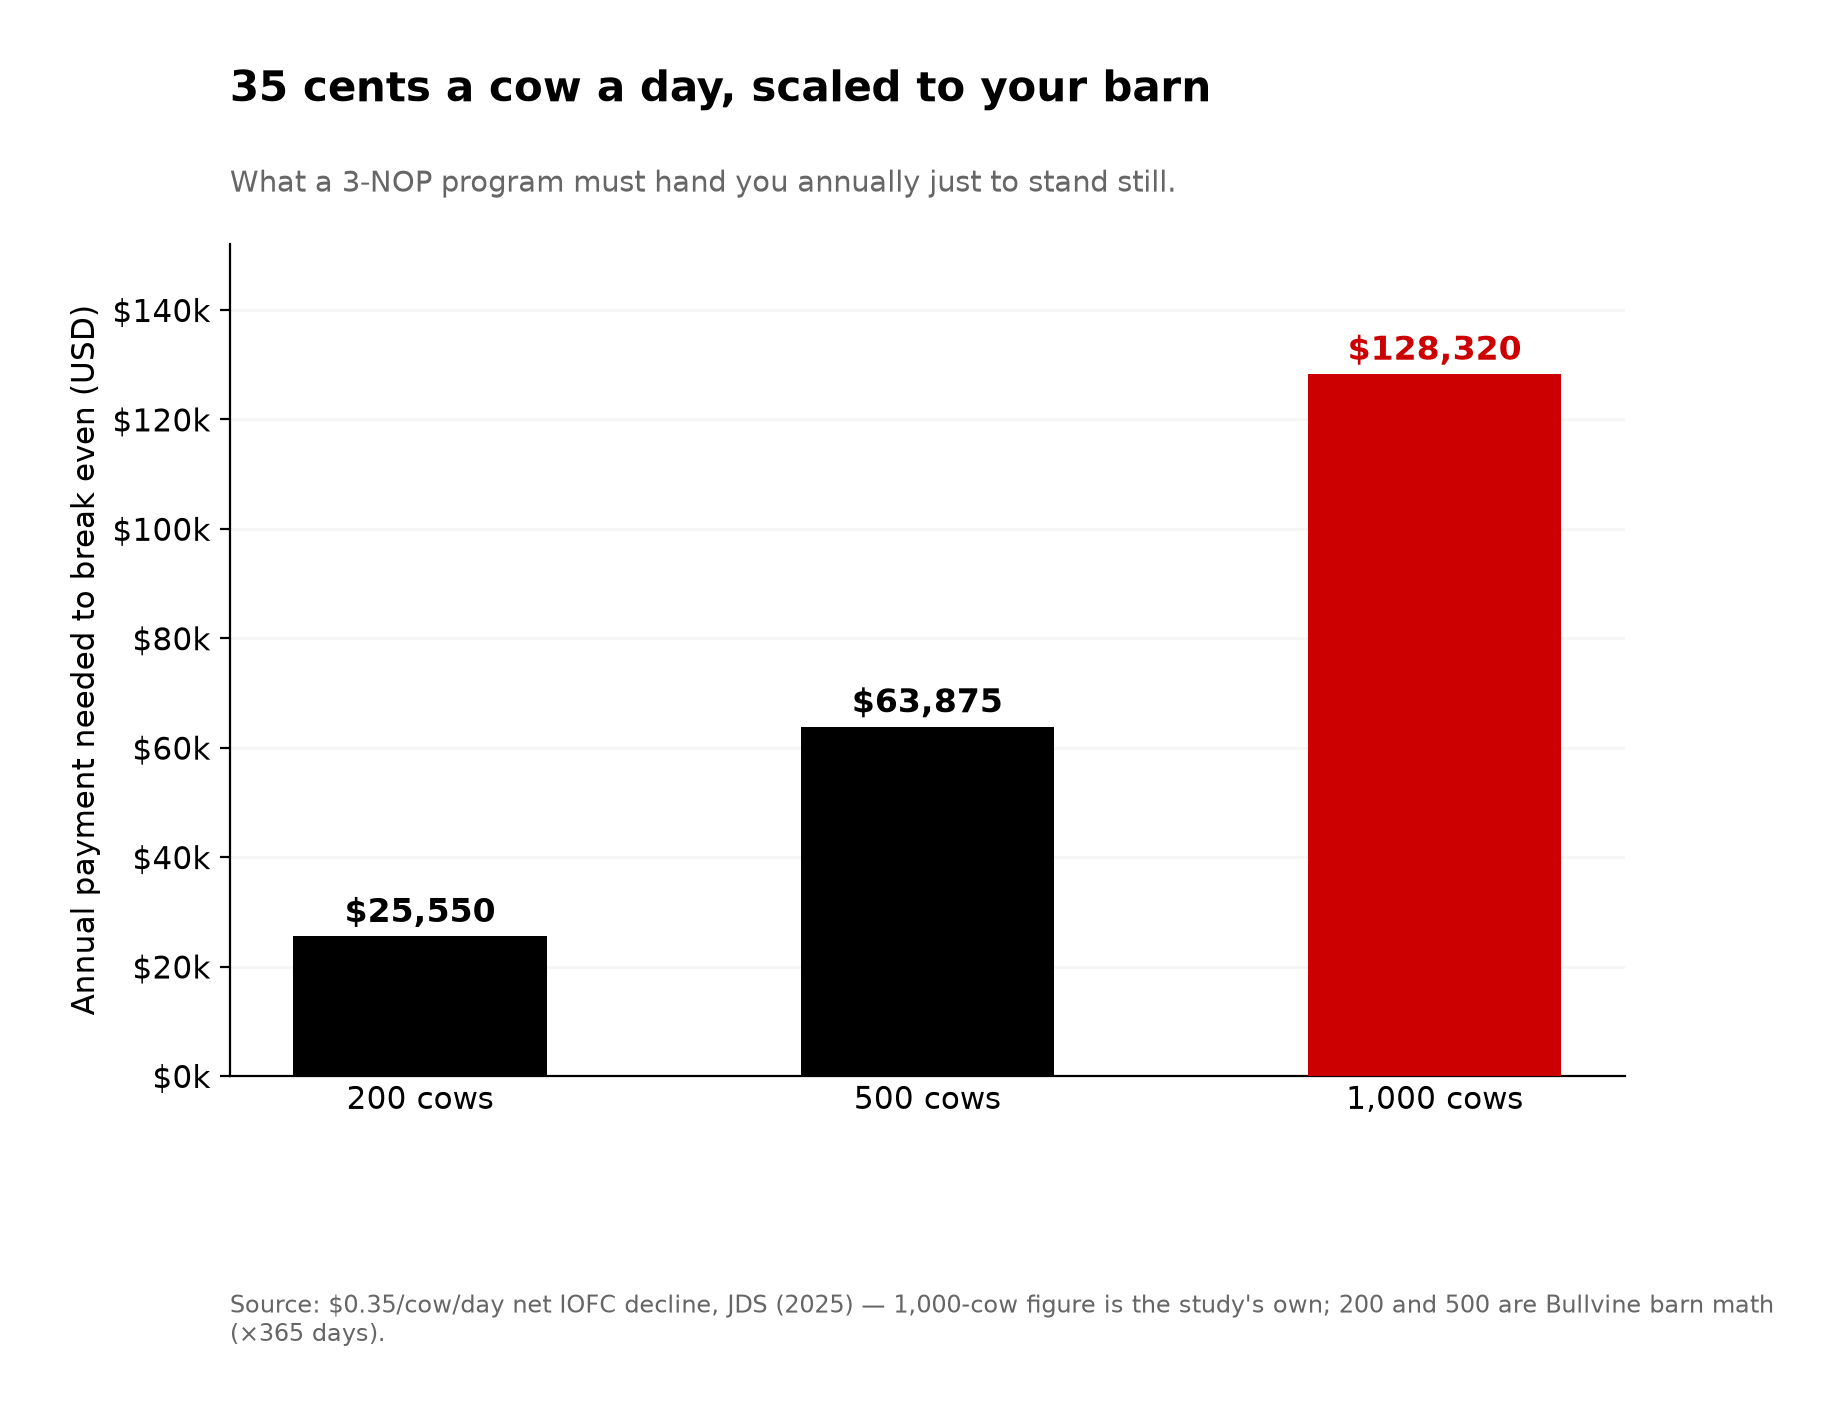
So run it. At the published $0.35 per cow per day net decline, here’s what your operation needs handed to it annually to stand still, applying that figure across herd scale:

Herd sizeBreak-even need at $0.35/cow/day
200 cows~$25,550/yr
500 cows~$63,875/yr
1,000 cows~$128,320/yr

Table note: the 1,000-cow figure is the JDS-modeled annual shortfall, the study’s own number. The 200- and 500-cow rows are Bullvine’s barn math, scaling the published $0.35/cow/day across 365 days, giving $25,550 and $63,875. A straight-line 1,000-cow calculation returns $127,750, fractionally under the study’s $128,320; that difference is in the model, not a typo.

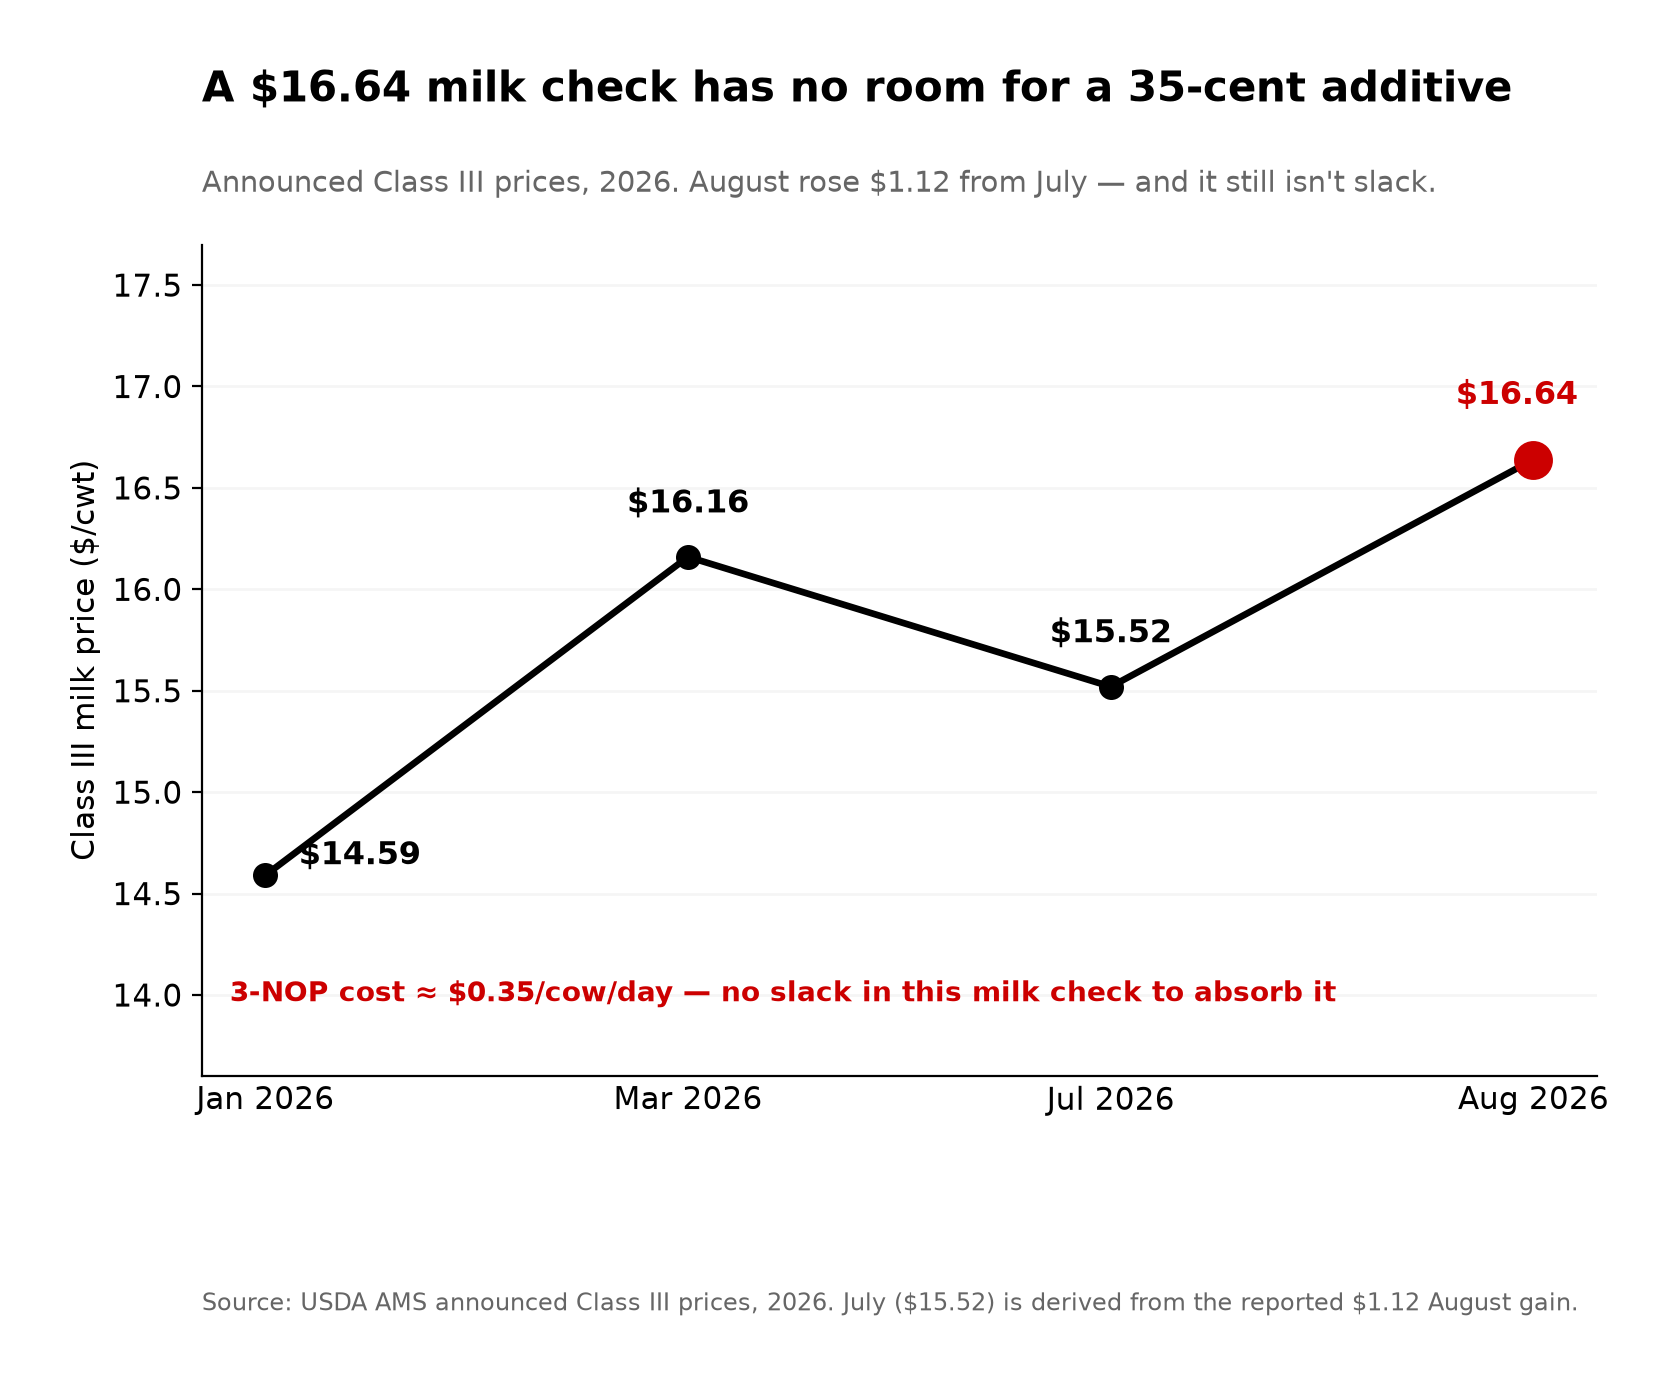
That money comes from a credit, a premium, or a buyer’s check. It isn’t coming from more milk in the tank. USDA AMS put the announced August 2026 Class III price at $16.64/cwt, up $1.12 from July , and Class III opened this year at $14.59 in January before working up through $16.16 in March . There’s no slack in that milk check to quietly absorb 35 cents a cow a day.

On the premium side, the arithmetic is thinner than the pitch. A $0.12/cwt sustainability premium on a 75-lb cow returns only about $33 per cow per year, and Elanco has publicly projected carbon-market returns around $20 per cow per year on top of that — which against a $93–$105 additive bill still leaves a gap of roughly $40–$73 per cow . We’ve walked that contract math clause by clause in the $73-a-cow gap hiding in your 2027 Bovaer contract.

Line itemPer cow / yearPer 1,000-cow herdSource
Bovaer additive cost−$93 to −$105−$93,000 to −$105,000Trade-reported price, $0.30–$0.40/cow/day
$0.12/cwt sustainability premium (75-lb cow)+$33+$33,000Bullvine barn math
Elanco projected carbon-market return+$20+$20,000Elanco public projection
Net gap left on the farm−$40 to −$73−$40,000 to −$73,000Bullvine calculation
Modeled net IOFC decline (separate metric)−$128−$128,320JDS 2025 economic analysis

Who actually keeps the carbon money?

The money is large. It just mostly isn’t yours.

Start with what a digester costs to build, because the regulator publishes its own arithmetic. CARB sets out the cost formulas it uses for dairy manure digesters in Appendix F of its Short-Lived Climate Pollutant Reduction Strategy, and the ICCT’s 2023 California renewable natural gas outlook applied them: capital expense scaling with herd size, operations and maintenance at 6% of capital, pipeline at $200,000 a mile, biogas upgrading at $8 per MCF, and a $2 million interconnection fee on a single-farm project against $5.5 million on a centralized one, plus $250,000 a truck where the gas has to move by road. theicct

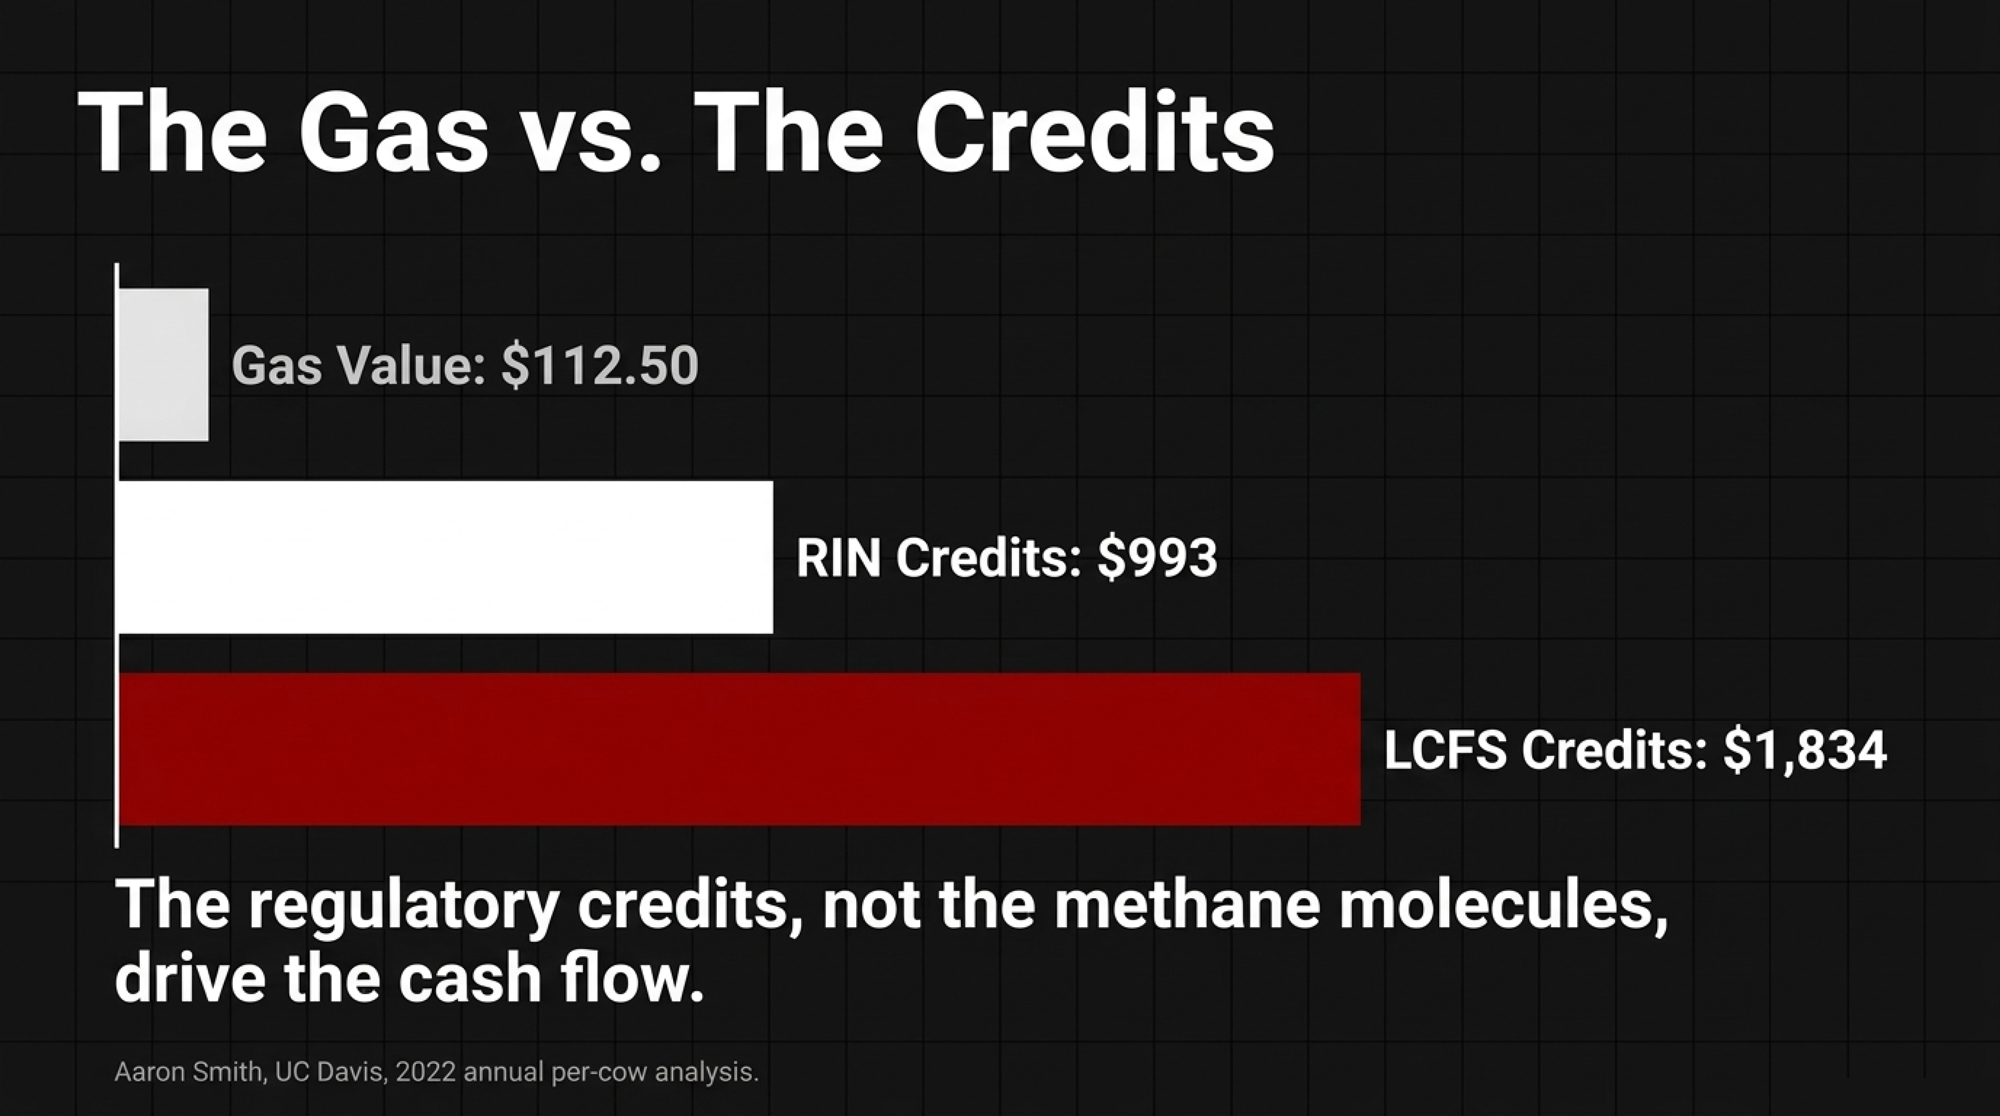
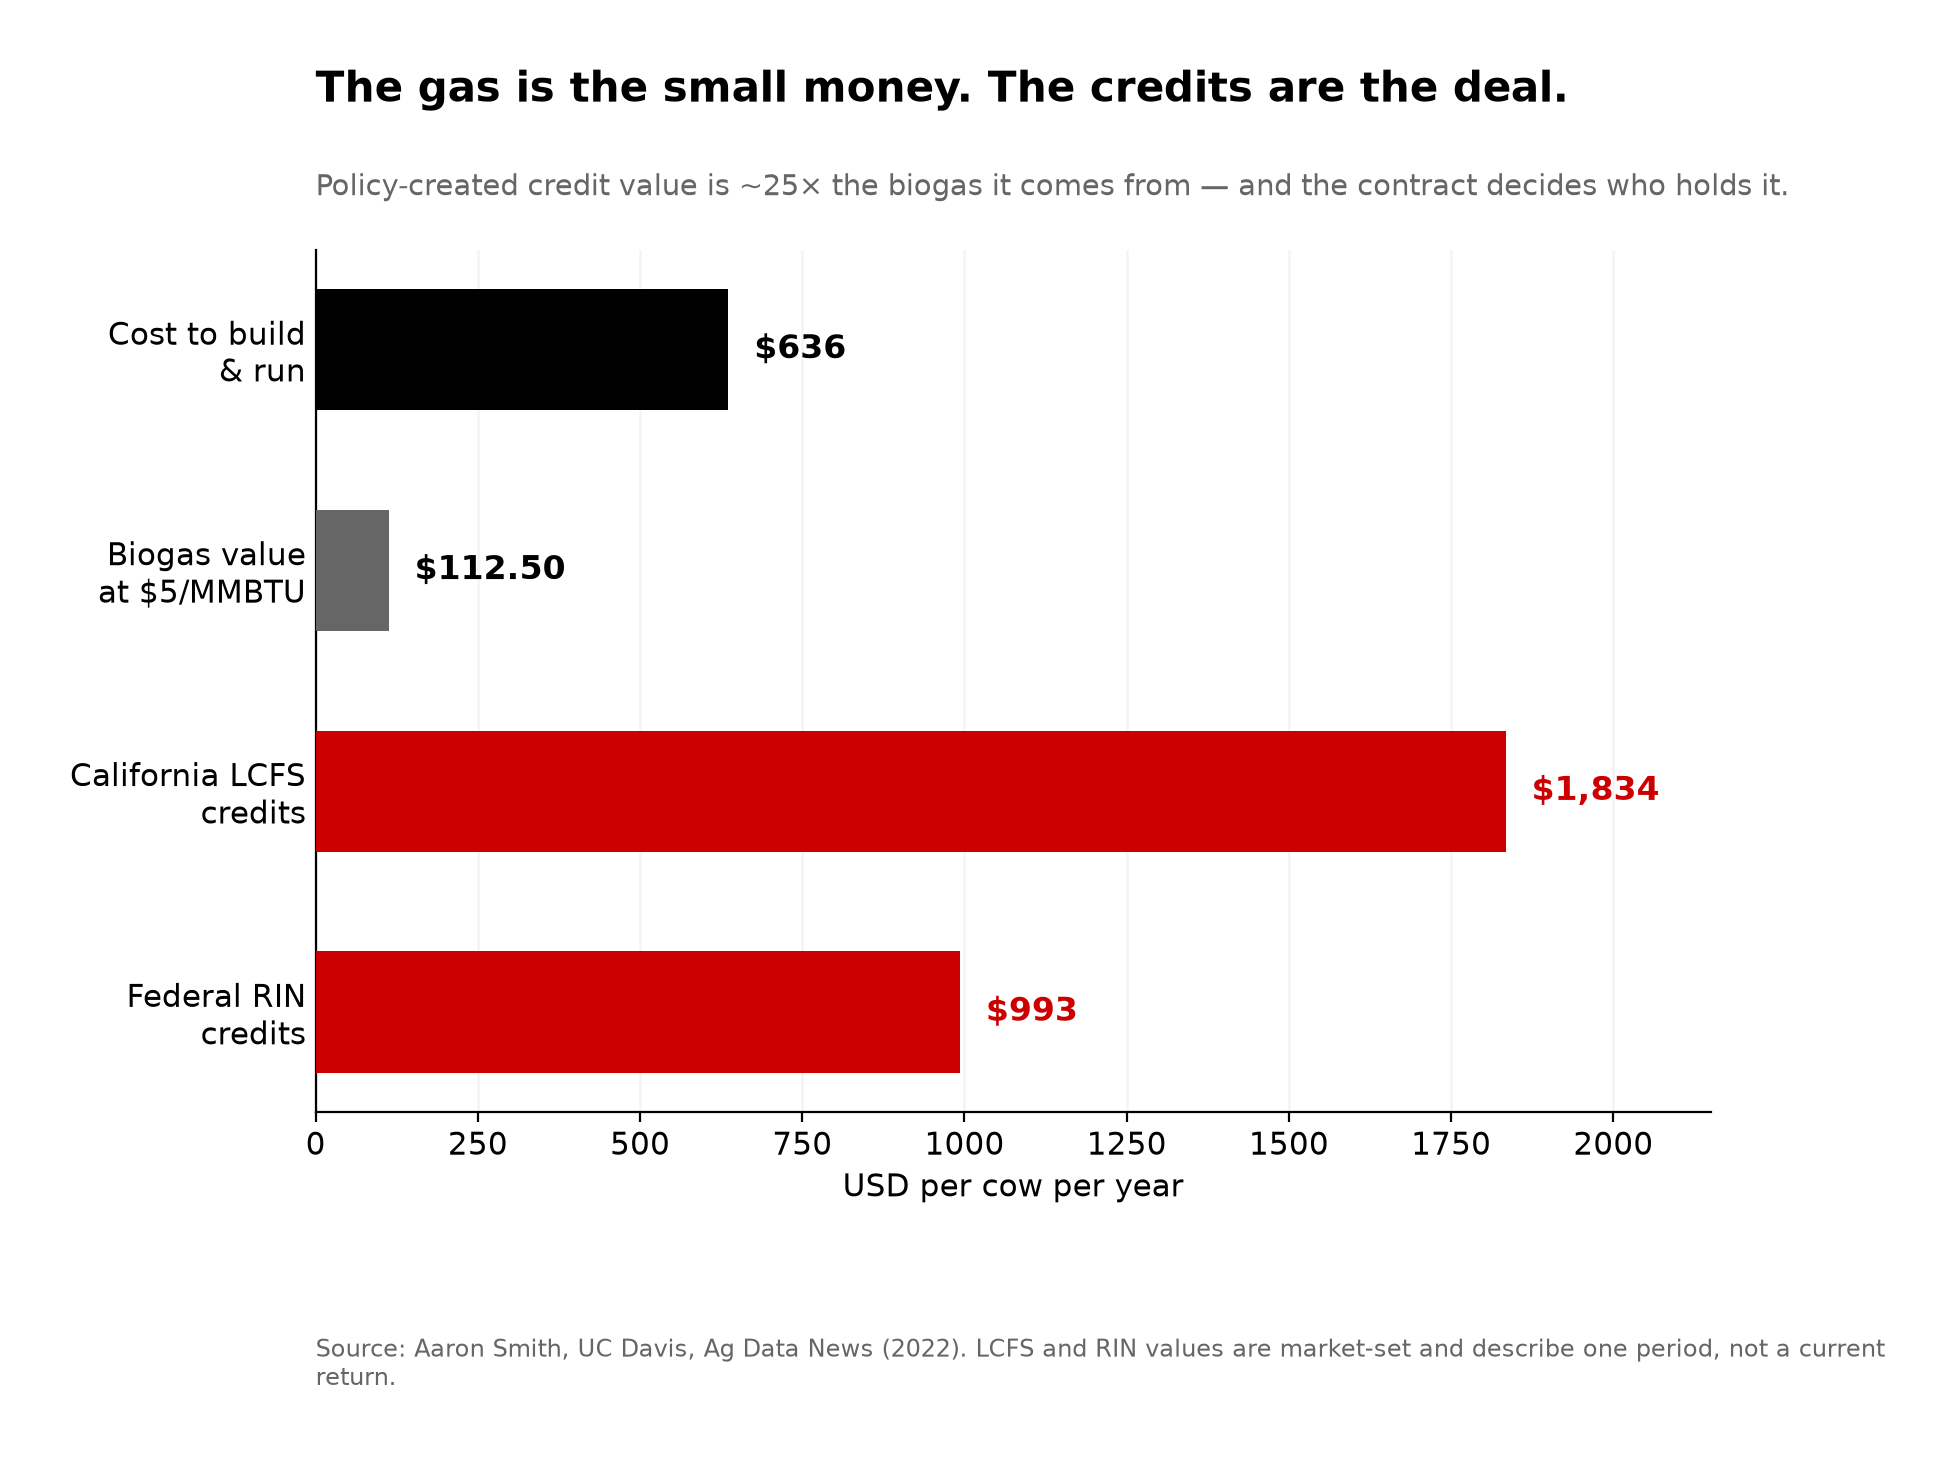
Now the per-cow view. UC Davis agricultural economist Aaron Smith, in a 2022 analysis, put a digester at roughly 22.5 MMBTU of biogas per cow per year at a cost of about $636 per cow, operating cost plus capital amortized over ten years, with the gas worth about $112.50 per cow at $5/MMBTU . On the gas alone, you’d never build it.

Then come the credits. Smith calculated that the same cow’s biogas earns approximately $1,834 per cow in California Low Carbon Fuel Standard credits and another $993 per cow in federal Renewable Identification Numbers, about $2,827 per cow in policy-created value . That’s more than four times the value of the gas. Don’t read it as a guaranteed margin on a deal you’re offered today: LCFS and RIN credits are market-set instruments, their value moves with program rules and market conditions, and Smith’s figure is a snapshot of one period rather than a fixed return . What doesn’t move is the underlying dynamic — the regulatory credits, not the methane molecules, drive the cash flow. A 2025 Terrain Ag analysis found the fuel is typically the smallest share of the revenue stream, which is the same finding from the lender’s side of the table .

Project scale tells the same story. Writing in October 2024, Smith reported that data provided to CARB put a typical 2023-built digester on a 2,500-cow dairy at $8.6 million to construct, about $1.2 million a year amortized over a decade, and roughly $1.1 million a year to operate, against gas sales of approximately $230,000 at 2023 city-gate prices. Net operating cost before credits: about $870,000 a year, plus another $500,000 if the gas has to be trucked. Over the first ten years he puts the net cost of building and running a digester at $2,730 to $3,380 per ton of methane abated, and notes that California grants can cover up to half of capital costs. agdatanews.substack

None of that credit stream is hypothetical. LCFS credit generation from manure digester projects has grown roughly 1,000% since 2020 and has produced more than a billion dollars’ worth of credits. California has put about $214 million of state money into 131 dairy digester projects in the San Joaquin Valley alone, and CARB’s own August 2024 dairy sector workshop draws its project data from CDFA’s grant records, EPA AgSTAR, and verified LCFS and cap-and-trade filings. sciencedirect

So the decisive question on any digester deal isn’t whether the project pencils. The question is who holds the credits, and the contracts are written on that point. Guidance published for developers in Biomass Magazine in 2022 advises that the agreement should state the developer owns all rights to the environmental credits, tax credits, and similar benefits arising from the project; lenders and offtakers want clean title in the project entity. Compeer Financial’s 2025 producer guidance puts it plainly: understanding the fine print is crucial . DeVos got a check because his tool earned on performance first, and the carbon was upside. Digester operators sit on top of substantial public subsidy value and mostly don’t hold title to it. The difference isn’t the science. It’s the contract. Our earlier breakdown of a larger covered-lagoon project runs in $1,130 per cow, $128 back.

When does a methane tool actually pencil?

The decision rule is simple even when the answer isn’t. A methane tool pencils only when the outside payment reliably clears the break-even gap and stays cleared after the marketplace or developer takes its share.

LeverRecurring cost to youWho keeps the created valueProven payout to a farmer?Time to effect
Rumensin / monensin (efficiency + credits)None — earns on feed efficiencyFarmer held the creditYes — 1,150 t sold, Jan 2024, DFA via AthianImmediate
3-NOP / Bovaer−$0.35/cow/day net IOFC($128,320 per 1,000 cows)Depends entirely on the premium clauseNo banked U.S. dairy credit to dateImmediate, ~31% methane cut
Manure digester$636/cow/year to build and runDeveloper-side templates assign LCFS, RINs and tax credits to the project entityGas only: ~$112.50/cow vs ~$2,827/cow in creditsMulti-year build, 10-year amortisation
Methane Efficiency genetics (Lactanet)$0 on DHI-enrolled femalesFarmer — it’s in the herdNo credit protocol yet; 23% heritability, >70% reliability5–7 years to herd-level expression
  • For 3-NOP: you need a locked premium above $0.35 per cow per day net, roughly $25,550 a year on 200 cows and $128,320 on 1,000. A $0.12/cwt premium returning $33 a cow doesn’t reach it. A handshake or a one-year pilot price is not a floor.
  • For a digester: ask who holds the LCFS credits and the RINs before you ask anything else, and ask it again about any state grant that covered construction. That clause decides whether the project is your asset or your neighbor’s.
  • For an efficiency tool that also earns credits: a different question entirely. If the product pays its own way on performance, the Rumensin case, carbon revenue is upside rather than justification.
  • For genetics: the one lever with no recurring bill. Lactanet’s Methane Efficiency trait runs 23% heritability with better than 70% reliability on genotyped young animals and costs nothing extra on DHI-enrolled females, though herd-level expression takes five to seven years.

What can you do before the contract hits your desk?

Plenty, and most of it is free. The highest-value move isn’t financial: get the story straight before a reporter, a neighbor, or your kid’s teacher gets it wrong for you. A 2025 Dairy MAX consumer survey found that consumers see farmers as the most trusted source of information on dairy sustainability . Use that standing before somebody else fills the silence.

The second move is to treat every carbon pitch as a contract problem, not a science problem. The science on 3-NOP is settled enough at roughly 31% methane reduction. The open question is who keeps the value when it works. For the genetics side of that answer, see why methane-efficiency breeding beats Bovaer’s $73 gap.

The Producer Playbook: What to Do Before Signing

  • Run 35 cents a cow a day against any additive offer before you sign — $25,550 a year on 200 cows, $128,320 on 1,000. If the premium doesn’t clear that with margin, the answer is no.
  • Check what the premium actually pays. A $0.12/cwt sustainability premium returns about $33 a cow a year, roughly a third of a $93–$105 additive bill. That’s why the gap keeps landing on the farm.
  • On a digester, find the credits clause before you read anything else. The regulatory credits, not the gas, carry the cash flow, and developer-side contract templates assign them to the project entity.
  • Ask what the grant paid for. California grants can cover up to half of digester capital cost, and who took that money shapes who owns the output.
  • Copy the model that actually worked. The only U.S. dairy methane credit ever banked came off Elanco’s Rumensin protocol, not Bovaer: a tool already paying for itself on feed efficiency, with carbon as upside.

DeVos got a check because his tool worked twice, once on efficiency and once on carbon. Most farms won’t get that deal. So where does your operation sit right now: positioned to get paid for the methane you’re being asked to cut, or about to absorb the cost alone?

That splits hard by herd size and region. We’re building the full cost-per-cow model — 3-NOP, digesters, and carbon programs by herd size and region — in next week’s Bullvine Weekly.

Methodology Note: Long-term greenhouse-gas, energy, water, and nutrient figures come from Rotz et al., Journal of Dairy Science (2024), a national U.S. life-cycle assessment comparing 1971 with 2020. These are national averages and will not match every region or operation. Northeast figures are from Cornell CALS reporting on the same body of work. The 3-NOP economics ($0.35/cow/day income-over-feed-cost decline; $128,320/year on a modeled 1,000-cow herd) are from a 2025 JDS economic analysis in which the decline reflected reduced feed intake and milk yield in the trials modeled; individual herd results will differ with feed cost, component values, and dose, and the published figure is a single modeled central value rather than a range. Bovaer’s reported price of $0.30–$0.40/cow/day and $93–$105/cow/year is a separate figure from that net IOFC decline and should not be read as the same number. The 200- and 500-cow rows are Bullvine’s barn math scaling the published per-cow figure across 365 days. Methane-reduction efficacy of 30.9–32.7% at 70.5 mg/kg dry matter is from a JDS meta-analysis; the full-lactation figures of 21%, 20%, and 27% are van Gastelen et al., JDS volume 107 (2024). Jasper DeVos’s January 2024 credit sale used Athian’s first accepted protocol, based on Elanco’s Rumensin (monensin); Bovaer/3-NOP is a DSM-Firmenich product and was not the tool used in that sale. Digester cost formulas are CARB’s own, published in Appendix F of its Short-Lived Climate Pollutant Reduction Strategy and applied in the ICCT’s May 2023 California renewable natural gas outlook. Digester per-cow figures — $636 cost, $112.50 gas value at $5/MMBTU, $1,834 LCFS, and $993 RIN credit value — are Aaron Smith’s 2022 calculations at UC Davis; LCFS and RIN credit values are market-set and move with program rules and market conditions, so those per-cow figures describe one period rather than a current return. Project-scale figures and the $2,730–$3,380 per ton abated range are Smith’s October 2024 analysis, published at the Energy Institute at Haas and Ag Data News, drawing on data provided to the California Air Resources Board; Bullvine has not obtained individual project submissions. LCFS credit growth and cumulative credit value for manure digester projects are from peer-reviewed analysis of CARB program data; the $214 million across 131 San Joaquin Valley projects is CDFA data as cited in peer-reviewed work. CARB’s August 2024 dairy sector workshop presentation identifies its project data sources as CDFA’s Dairy Digester Research and Development Program records, EPA AgSTAR, and verified LCFS and cap-and-trade filings. Contract-structure findings are from 2022 Biomass Magazine developer guidance, a 2025 Terrain Ag/American AgCredit analysis, and Compeer Financial’s 2025 producer guidance. Class III at $16.64/cwt is the USDA AMS announced August 2026 price. Bovine somatotropin figures are from USDA Economic Research Service, February 2026. Methane Efficiency heritability and reliability figures are from Lactanet. Nestlé’s targets are from its published Net Zero Roadmap. Currency pass completed September 14, 2026. Dollar figures are USD. We welcome producer numbers and corrections.

Learn More

The Sunday Read Dairy Professionals Don’t Skip.

Every week, thousands of producers, breeders, and industry insiders open Bullvine Weekly for genetics insights, market shifts, and profit strategies they won’t find anywhere else. One email. Five minutes. Smarter decisions all week.
NewsSubscribe
First
Last
Consent

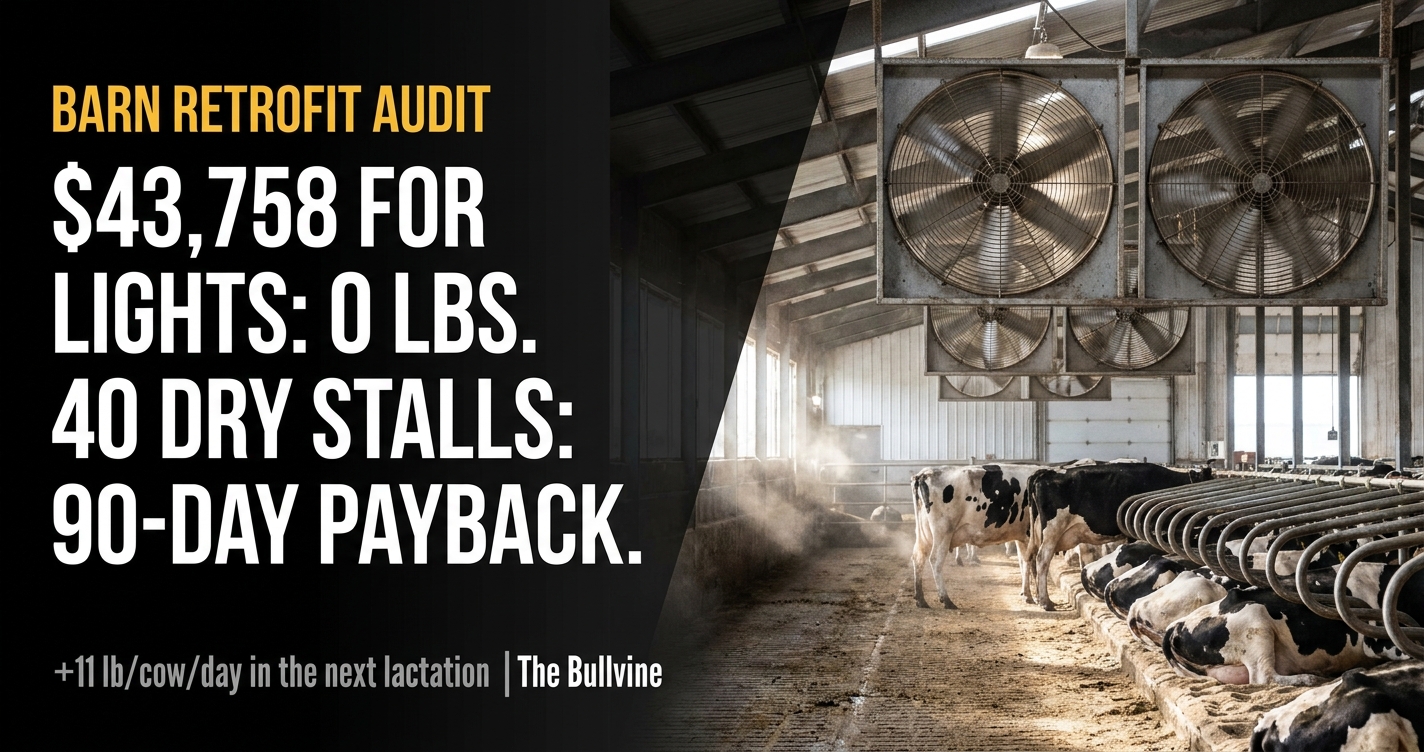
$43,758 for Zero Extra Pounds — and 40 Dry Stalls That Pay Back in Months, Not Years

The lights measured zero. The dry pen didn’t. On a 250-cow herd that’s 41 freshenings a year at $459 each — and one hour in the herd software to find out.

EXECUTIVE SUMMARY

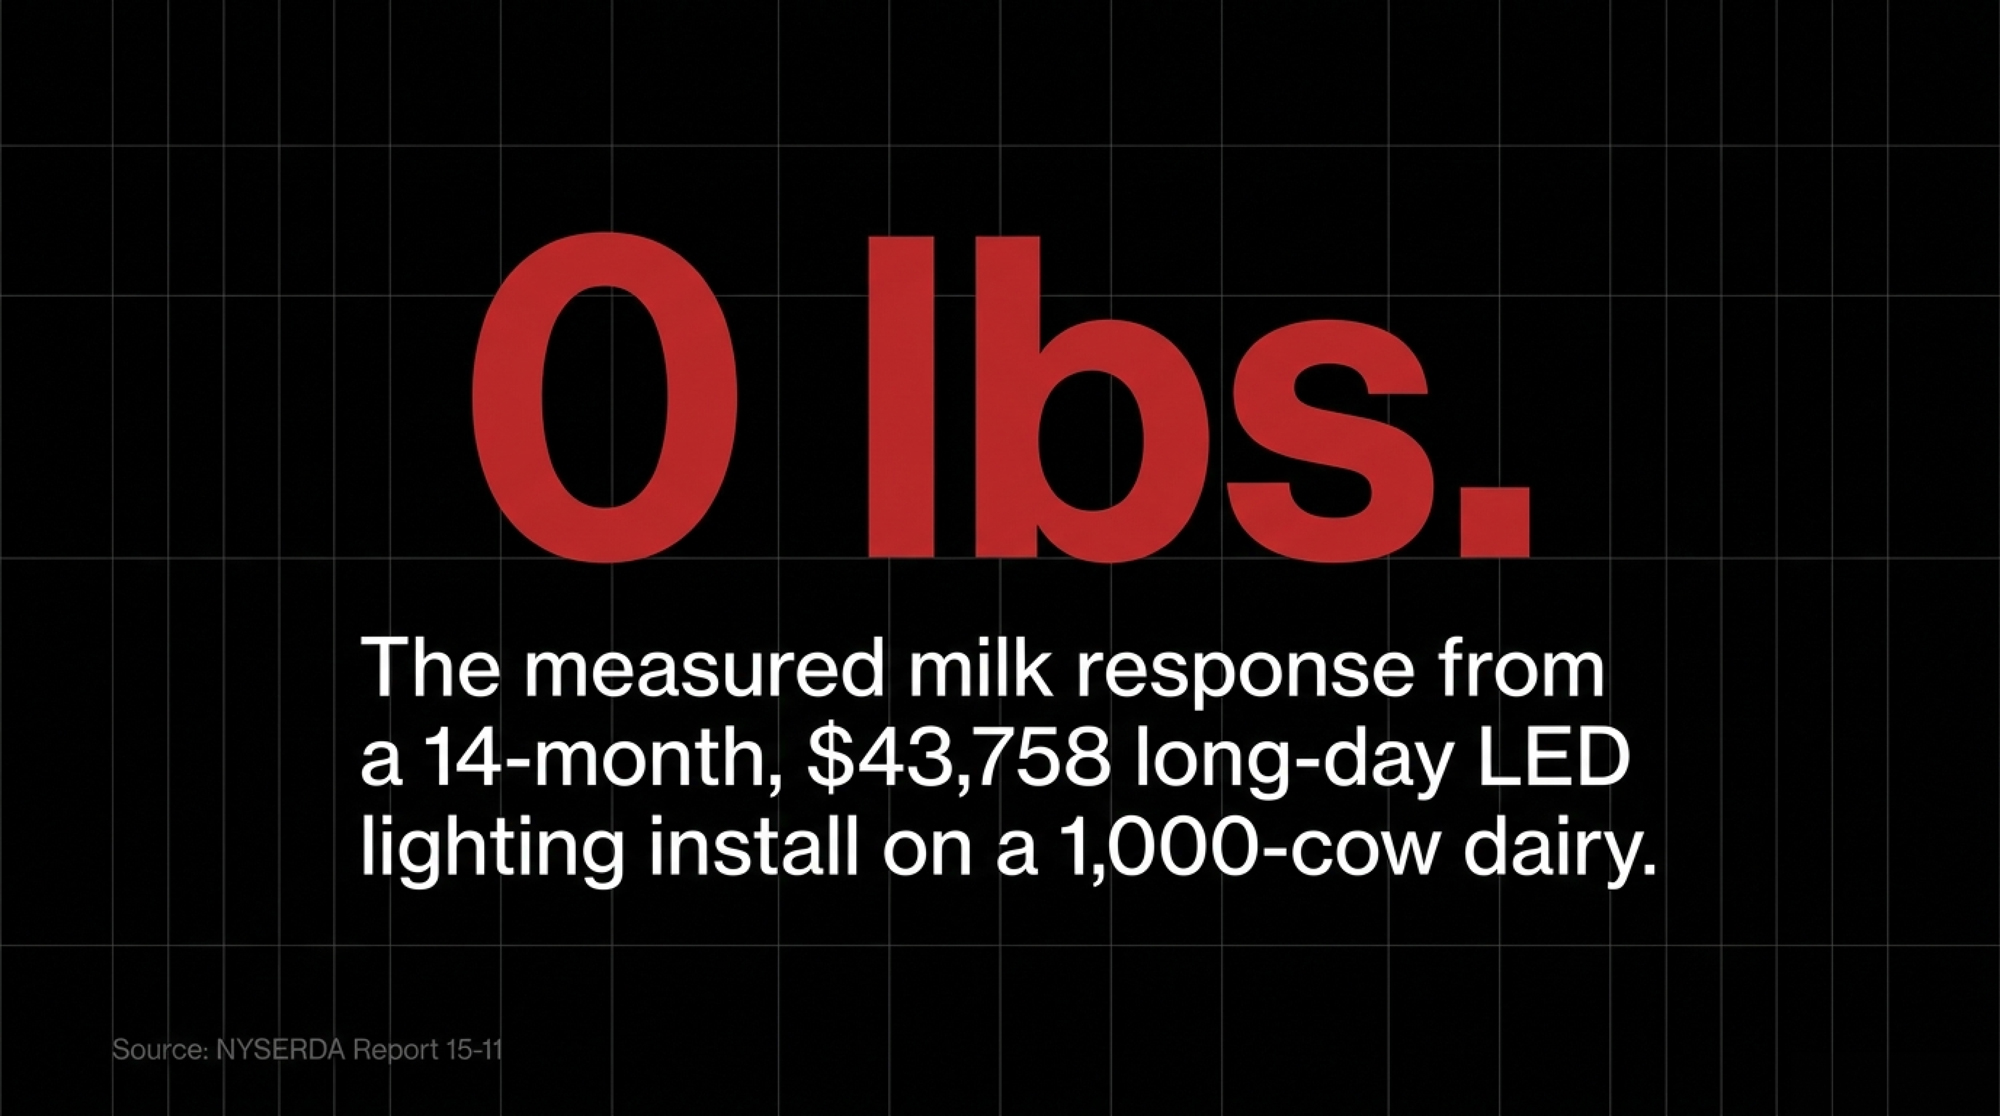
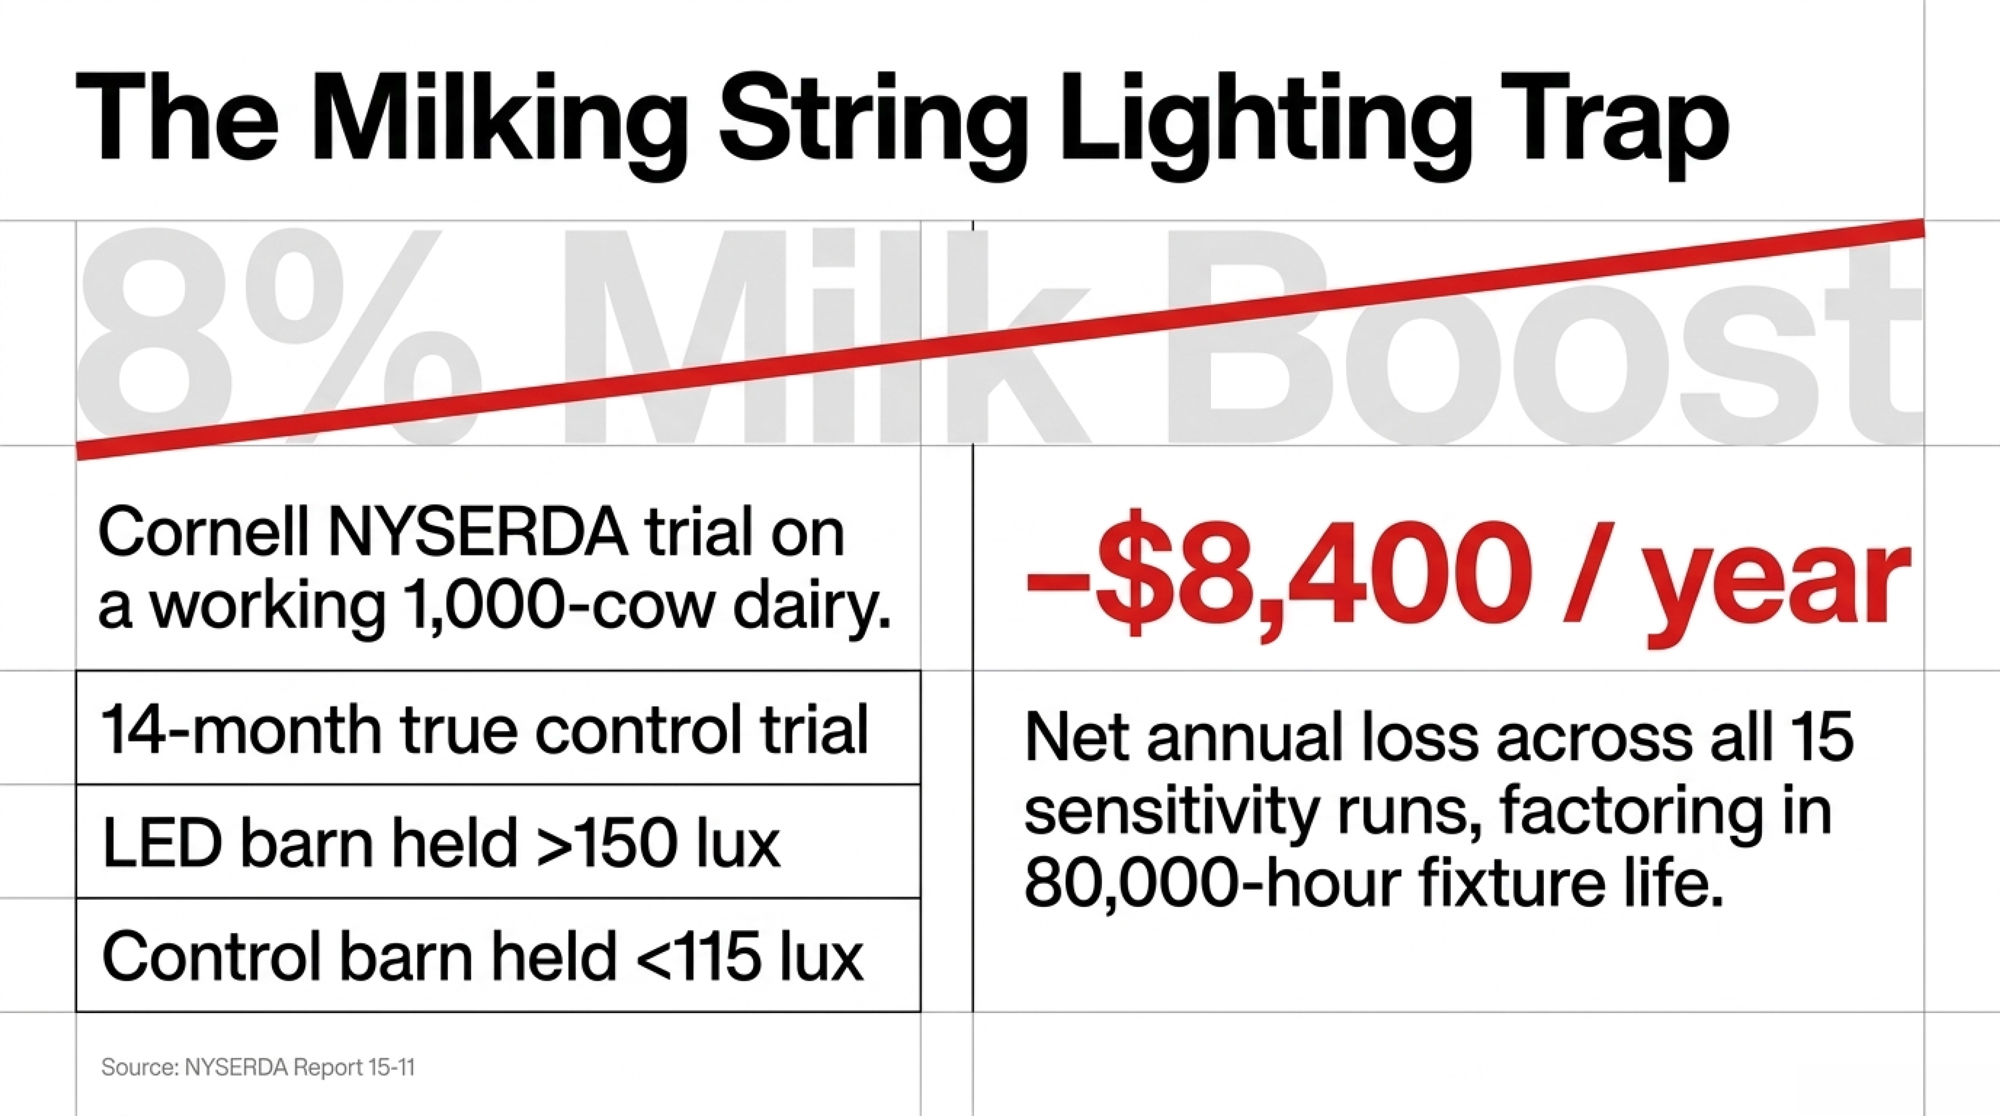
  • The lighting trap. Cornell Cooperative Extension fitted a 1,000-cow western New York dairy with long-day lighting, tracked milk for 14 months against a true control, and measured zero response — turning a $43,758 install into a net loss across all fifteen sensitivity runs.
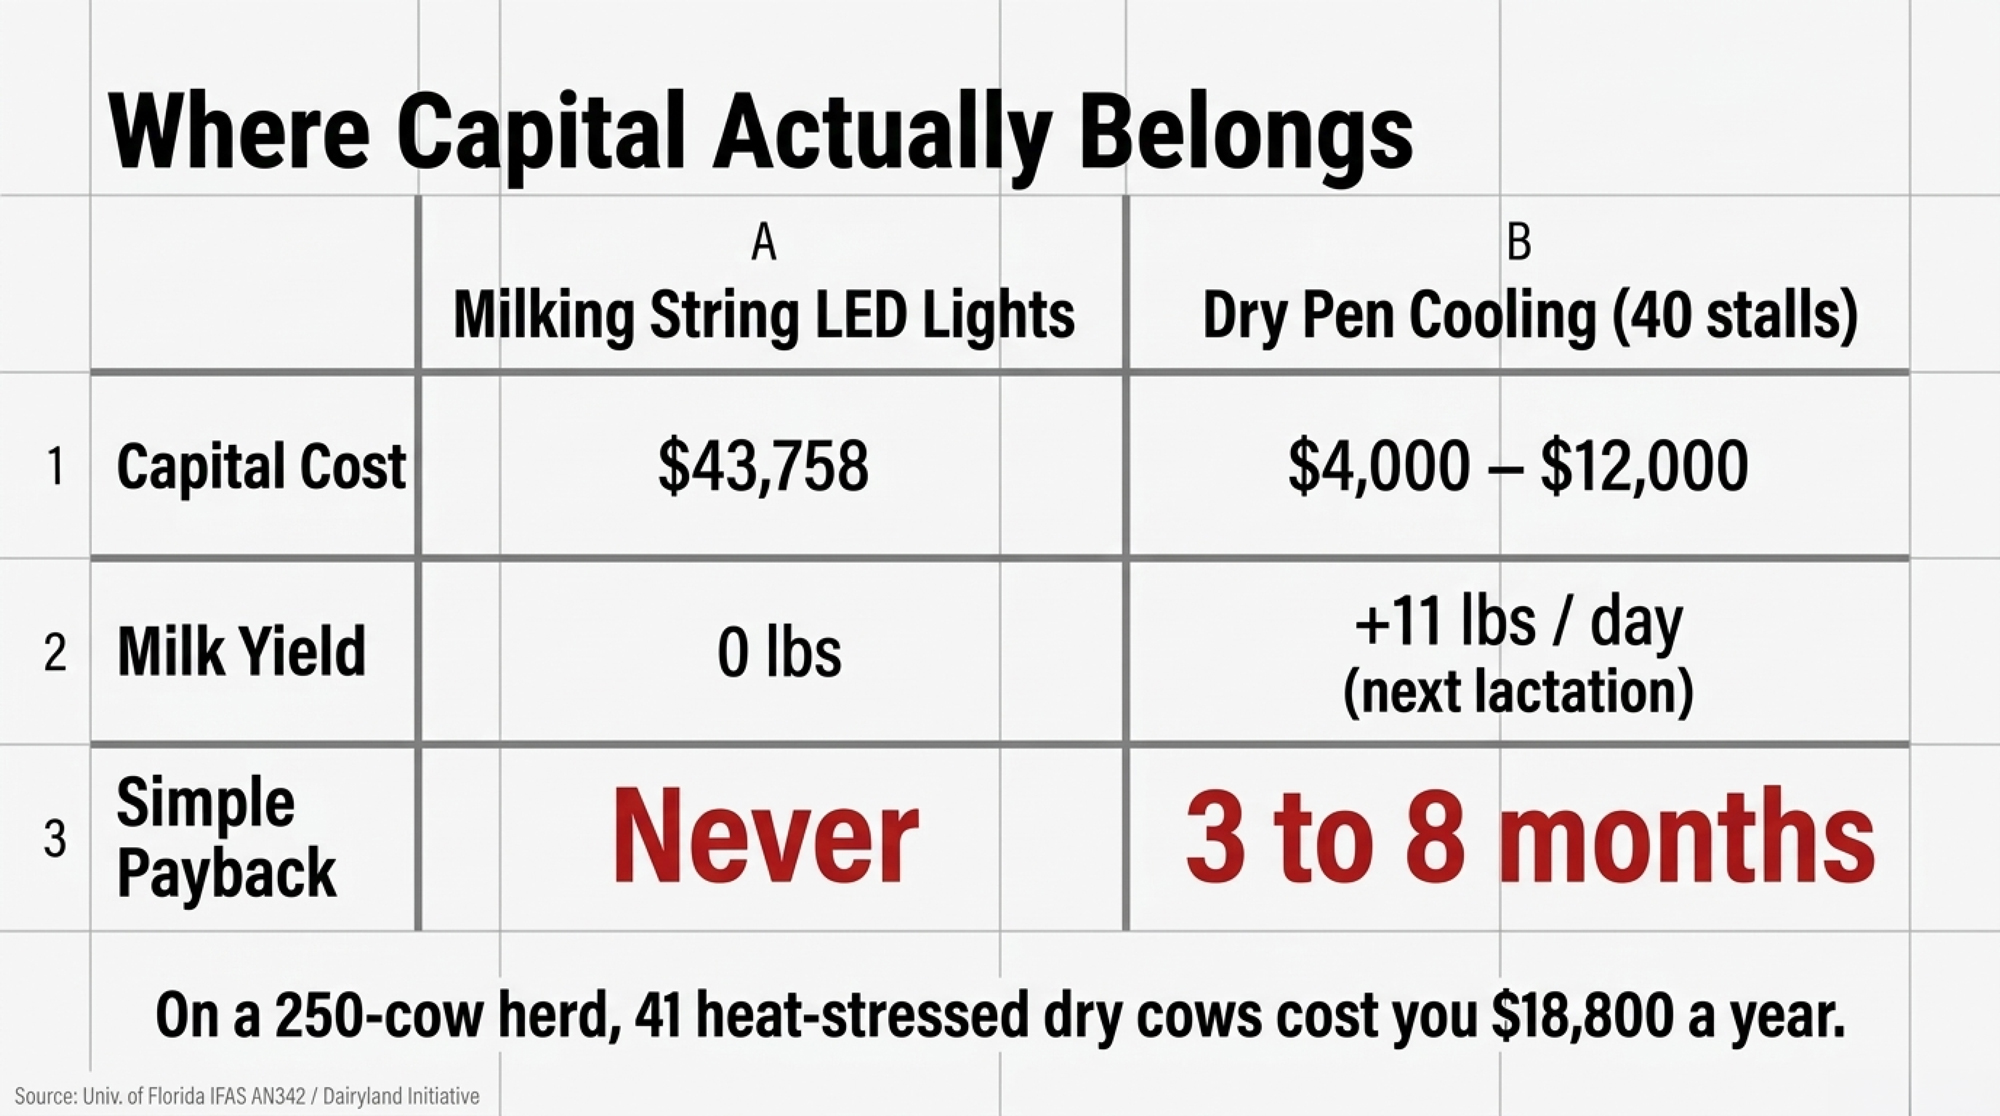
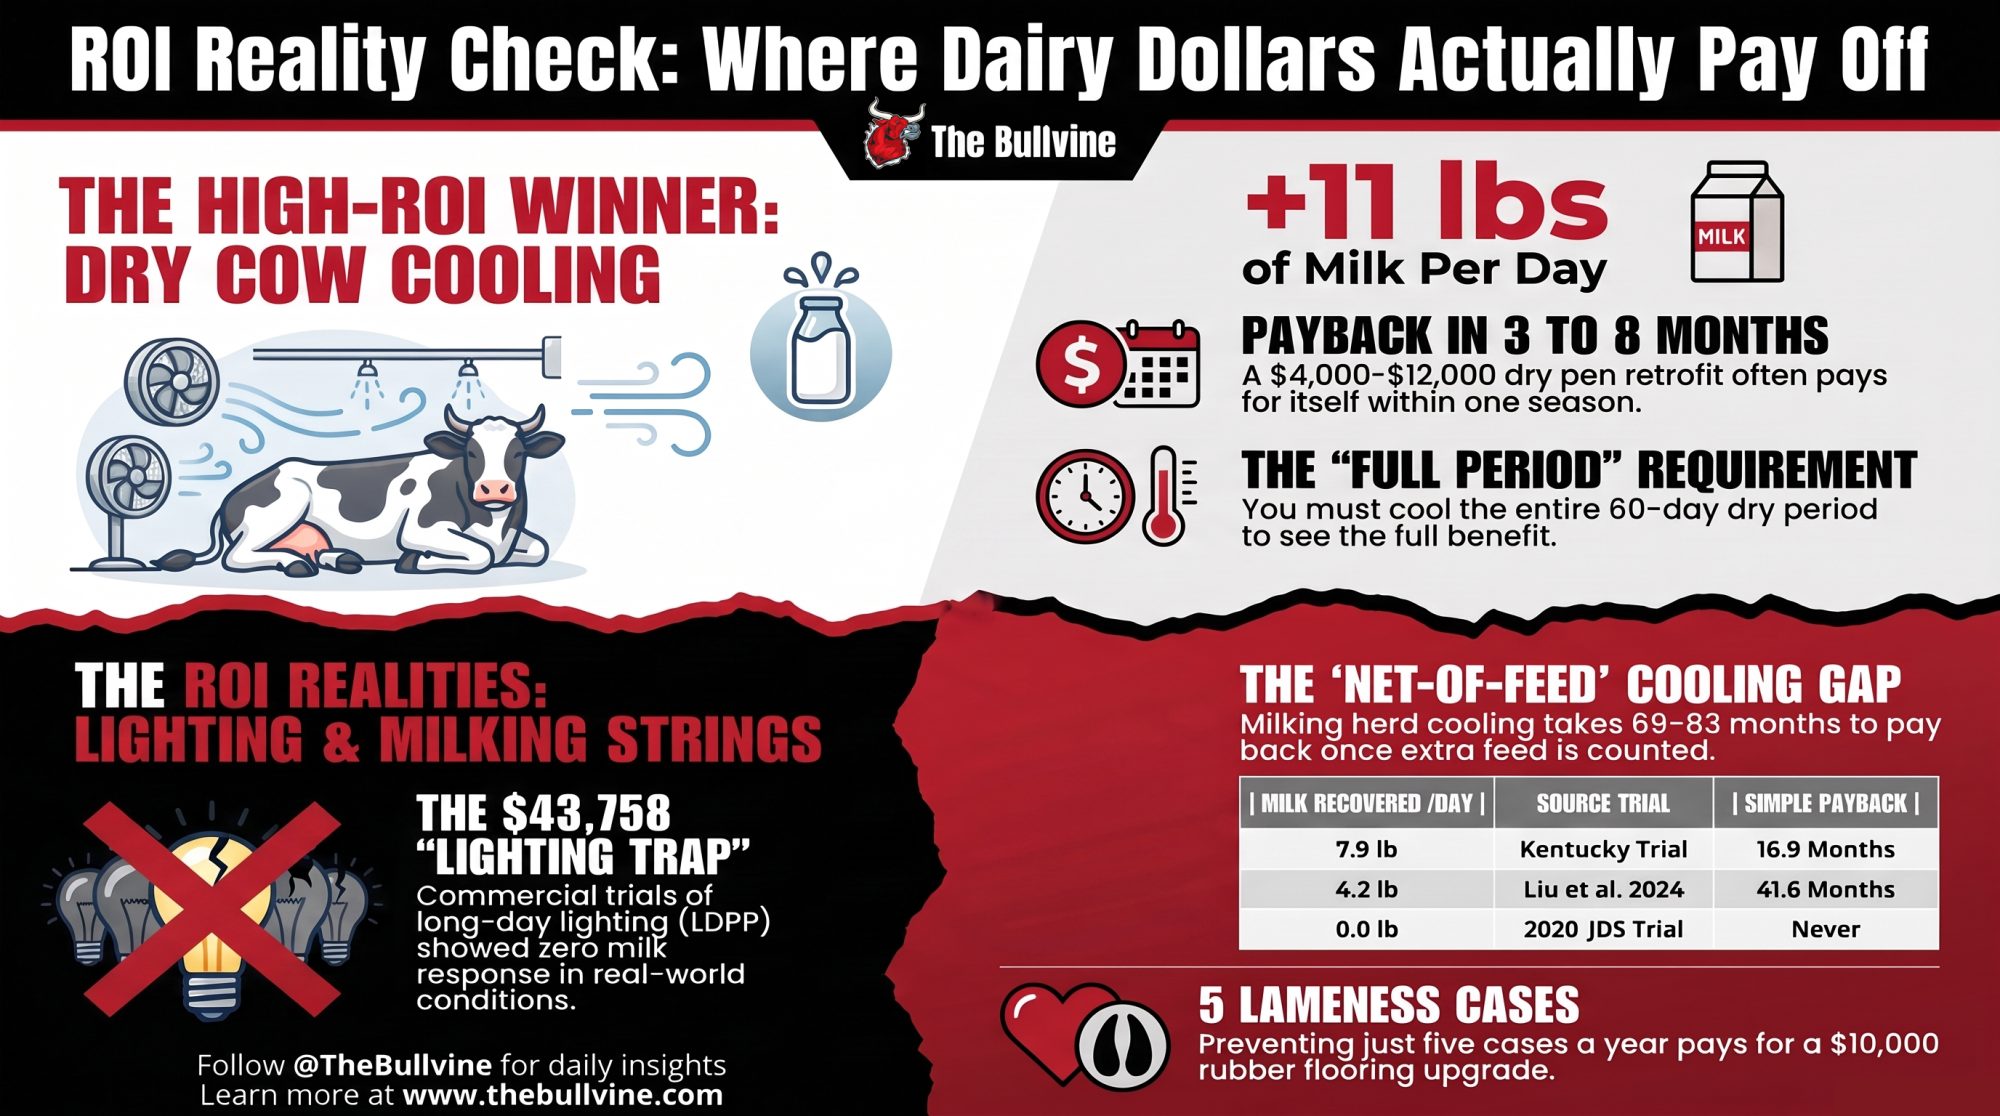
  • The overlooked pen. University of Florida’s IFAS puts dry cows given cooling and shade at 11 lb/day more milk in the next lactation than cows given shade only. On a 250-cow herd with 60 heat-stress days, that’s 41 affected freshenings and $459 a cow — roughly $18,800 a year against a $4,000–$12,000 install, paying back in under three to eight months. The ranking holds at $17 milk as well as $22.
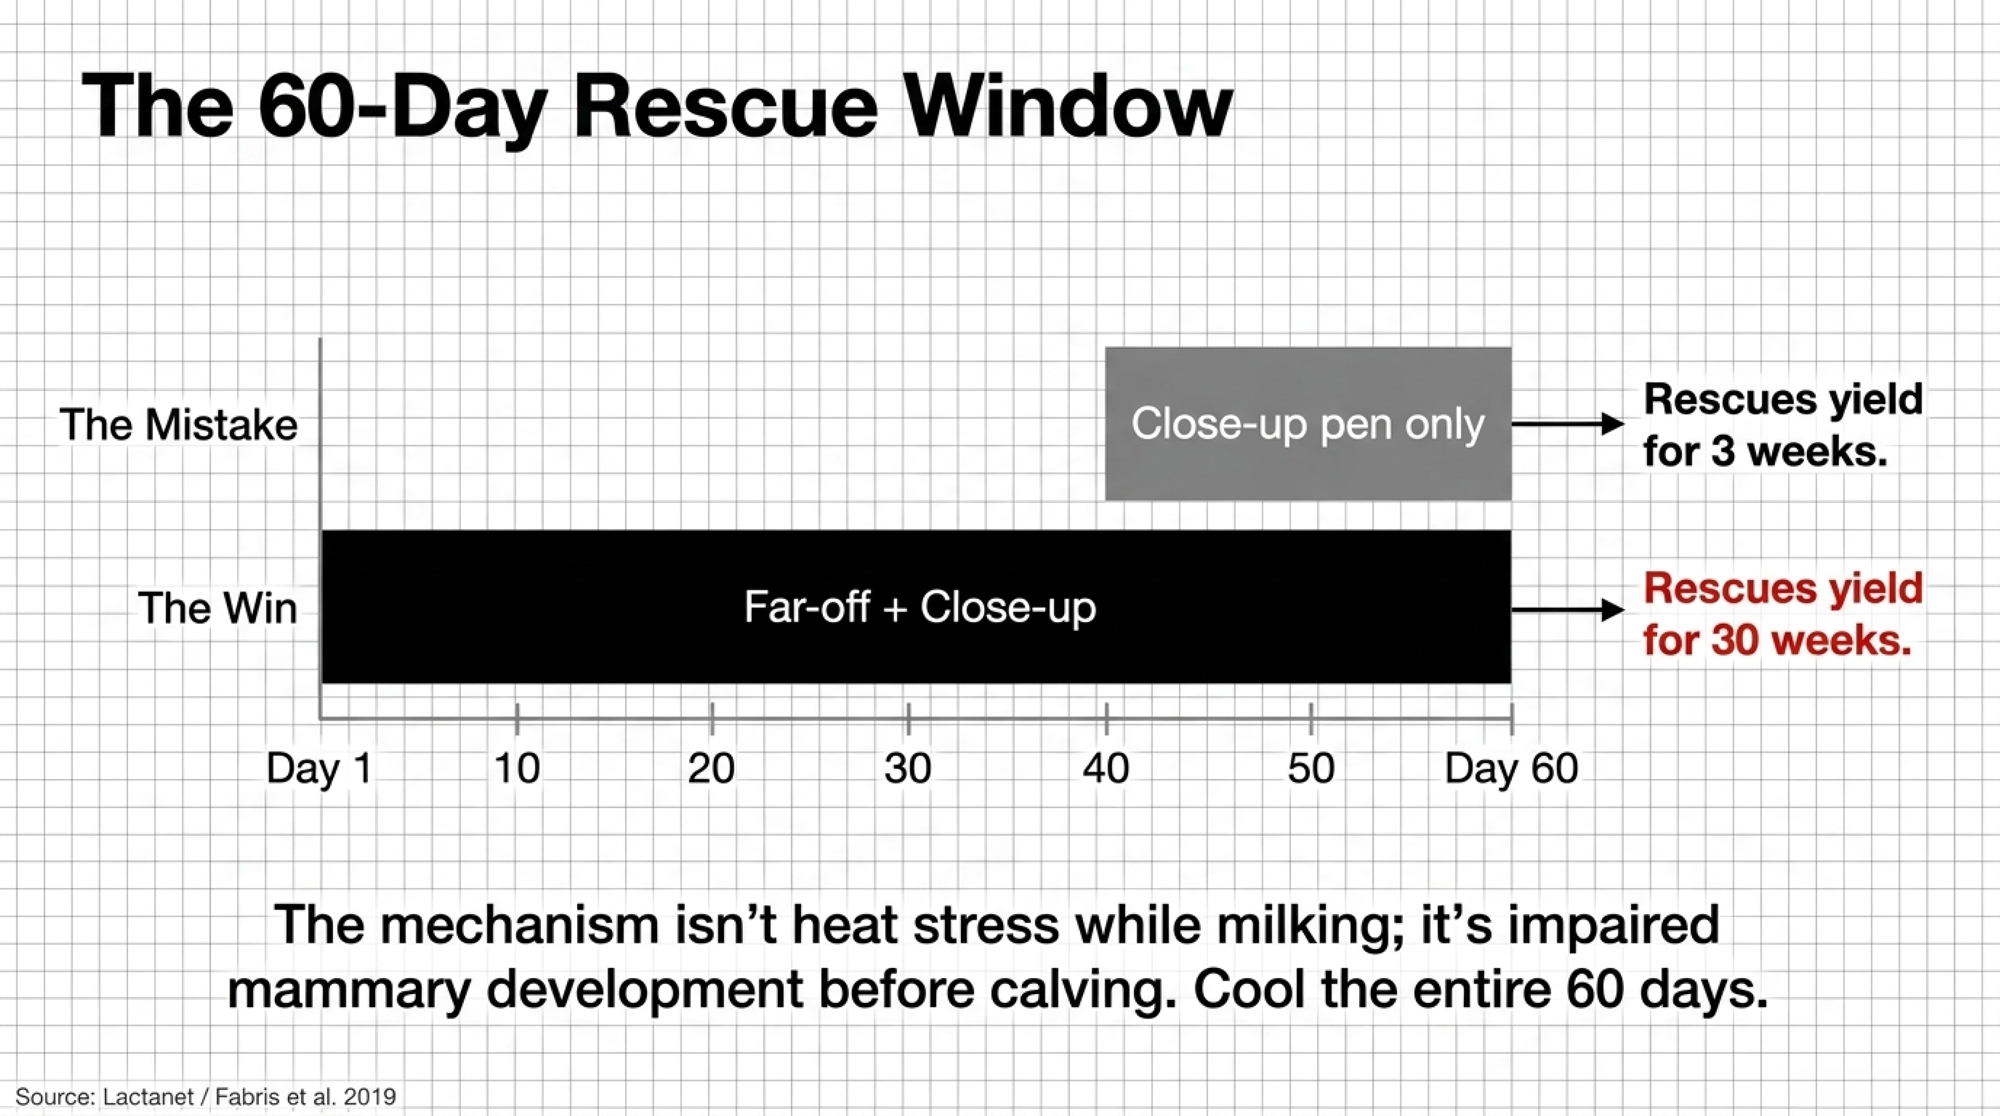
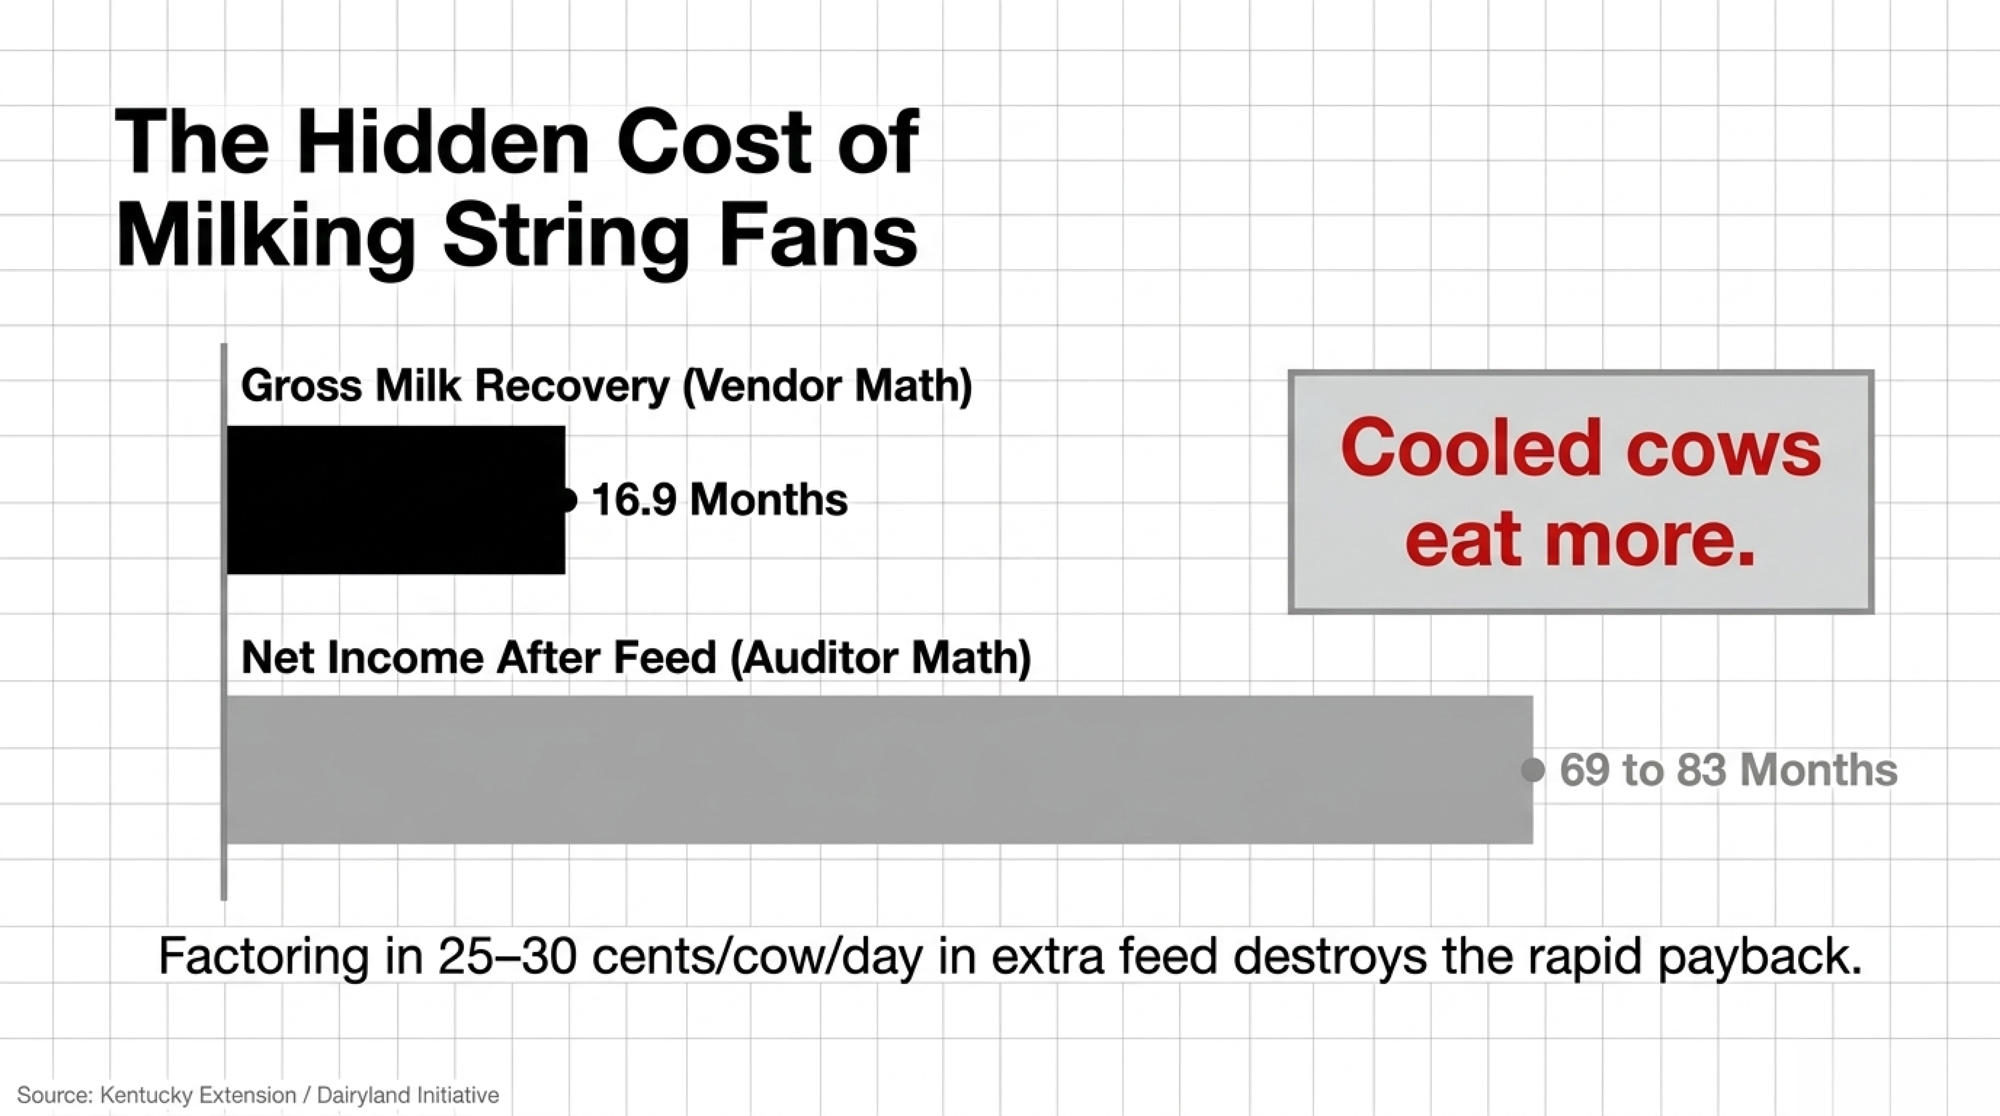
  • The catches. Cool the entire 60-day dry period: partial cooling rescues yield for about three weeks instead of thirty. And count the feed. On the milking string, a $26,000 fan retrofit runs 16.9 months on gross milk recovery but 69 to 83 months once Kentucky’s net-of-feed figure is applied.
 dry cow cooling payback

Equipment costs retrieved August 31, 2026. Milk price: $19.85 USD/cwt (USDA ERS Livestock, Dairy and Poultry Outlook, August 19, 2026 — the most recent all-milk forecast as of publication). Exchange rate: $1 USD = $1.3825 CAD (Bloomberg, September 10, 2026, 10:16 a.m. EDT). All dollar figures are USD unless marked CAD. Retrofit basis, not new construction.

In September 2012, Libby Eiholzer and Michael Capel started rewiring a dairy barn in western New York.

Eiholzer is a bilingual dairy specialist with Cornell Cooperative Extension’s North West New York Dairy, Livestock and Field Crops Team. Capel is a veterinarian at Perry Veterinary Clinic. On a NYSERDA-funded study, they built something the industry had talked about for thirty years and rarely actually measured on a working farm: a controlled test of long-day lighting, with a real control group, on a 1,000-cow commercial dairy, running fourteen months.

Three barns. LED on a 16-to-18-hour photoperiod. T8 fluorescent on the same photoperiod. And one barn deliberately held below the light threshold as a control. They checked it with a photometer — both treatment barns stayed above 150 lux; the control never cleared 115. Milk came off monthly DHIA tests across roughly 300 days per cow.

Clean design. And to be clear about what they were doing: testing a published hypothesis on a working farm, not going after anybody’s product.

What did the trial actually find?

Nothing. No milk response at all.

From the conclusions of NYSERDA Report 15-11, April 2015: “Despite previous research results, LDPP did not result in an increase in milk yield in this study. There was no statistical difference in milk production detected between the first lactation animals in the LDPP LED and the LDPP T8 treatment groups, nor between the mature cattle in the LDPP LED, the LDPP T8 and the control T8 treatment groups.”

Fitting that LED barn cost $43,758 USD in 2012 dollars. With no milk response and an 80,000-hour fixture life, the partial budget came back at negative $8,400 a year. Then they ran fifteen combinations of fixture lifetime and electricity cost, looking for one that worked. All fifteen came back negative.

The biology isn’t junk. Peters and colleagues reported it in Science in 1978: sixteen hours of light daily at 114 to 207 lux raised milk yield 10 to 15% against cattle on natural photoperiods of 9 to 12 hours at 39 to 93 lux. Dahl, Buchanan and Tucker’s 2000 review in the Journal of Dairy Science confirmed long-day stimulation across numerous studies and pointed to IGF-I as the likely mediator. That’s the foundation under every lighting quote you’ve been handed — including our own coverage of the 8% claim, which this piece corrects.

That same 2000 review flagged something the industry mostly forgot. Relative to long days, short-day treatment during the dry period produced the largest magnitude of milk-yield response in the subsequent lactation. Hold that thought.

But Eiholzer and Capel were straight about why their farm might not have shown the lactating-cow effect. Long-day photoperiod needs six to eight hours of genuinely uninterrupted dark. Milking three times a day, cows kept ending up in the holding pen or the parlor under lights during what was supposed to be their dark window. Two waterers froze in the LED barn over the winter of 2013–14, restricting water for part of the season.

One trial isn’t a verdict. It’s also the only independent commercial trial, and it measured zero.

The pen you drive past on the way to the parlor

Here’s what holds up. And notice where it points — the same place the photoperiod work pointed twenty-six years ago.

The University of Florida program — Geoffrey Dahl, Sha Tao and colleagues — established that cows heat-stressed in late gestation give less milk in their next lactation than herdmates that were cooled. The mechanism is impaired mammary development before she calves, not heat stress while she’s milking. Tao and Dahl published the core work in JDS in 2013, and Fabris and colleagues extended it across the full dry period in 2019.

For the number to plan around, UF’s own extension economics publication is the place to go. IFAS document AN342, updated August 2026, puts it plainly: dry cows given evaporative cooling and shade produced on average 11 lb per day (5 kg) more milk in the next lactation than cows given shade only, citing do Amaral et al. 2009 and Tao et al. 2011 and 2012.

Other sources land higher or lower — University of Maryland Extension cites 9 pounds, and Purina’s summary of the same Florida work says 14 in the first 30 weeks. IFAS’s 11 is the conservative middle, and it comes from the publication written specifically to answer the economics question, so that’s what we use below.

Here’s the condition most people miss. Lactanet’s summary of the Florida work is blunt: cooling for the entire dry period raised milk yield out to 30 weeks into lactation. Cooling only the early or only the late dry period partially rescued yield for just the first three weeks. If you cool the close-up pen and leave the far-off pen in the sun, you’re buying three weeks of benefit, not thirty.

Run the number on your own herd

Say you milk 250 cows, your dry period runs 60 days, and you carry roughly 60 days a year where heat genuinely costs you milk. About 41 of your annual freshenings will have spent their dry period inside that window — 250 × 60 ÷ 365.

Take IFAS’s 11 pounds across the 30-week measurement window:

11 lb × 210 days = 2,310 lb, or 23.1 cwt — about $459 USD a cow.

Multiply by 41 cows, and you’re at roughly $18,800 USD a year. Milking 200? Thirty-three cows fall in that window — about $15,100.

That $459 moves with the milk price, obviously. At $17 — the number your lender is probably modeling — it drops to $393 a cow, or $16,100 across the herd. At $22, it’s $508 and $20,800. The ranking doesn’t change at any of those prices, which is more than you can say for most of what’s below.

One caveat on that 41: it treats partial heat exposure as proportional. Fabris found late-gestation exposure matters most, so a cow stressed for twenty of her sixty dry days may not take exactly a third of the hit. The number could move either way.

Why does it pay so fast? The dry pen is small. Cooling 40 stalls costs a fraction of cooling 250, and the return per cow is bigger and lasts longer. Scaling the University of Wisconsin–Madison Dairyland Initiative’s published figure of $104 USD per cow, fans and soakers over a 40-stall dry pen lands in the $4,000 to $12,000 USD range. Against roughly $600 USD a year to run them, that pays back in under three to eight months — the low end if you’re at the cheap end of that install range, the high end if you’re not.

Two things to know about that cost. It’s scaled from a published per-cow number, not a contractor quote. And the Dairyland figure comes from an 800-cow barn in Green Bay, so scaling down to 40 stalls understates it — electrical service and mobilization don’t shrink proportionally.

Nobody sends a rep out to quote a 40-stall dry pen. That’s most of the story right there.

And this model doesn’t count the upside. Urdaz and colleagues (2006) ran 475 prepartum cows and found adding shade and fans to an existing feed bunk sprinkler system produced a significant lift in 60-day milk production and an economic benefit over the cooling system already in place. Separately, UF extension work reports daughters of heat-stressed dry cows produce 4.9 lb/day less in first lactation and 5.1 lb/day less in second, with effects documented across up to three lactations. Cooling the dry pen buys milk you won’t see for three years.

Does cooling the milking herd actually pay at $19.85 milk?

The Dairyland Initiative publishes two numbers for a natural-ventilation retrofit with fans over the stalls: $104 USD per cow installed, and $20.05 USD per cow per year to run them. Our own first draft only used one of them. On 250 cows that’s $26,000 in and about $5,012 a year in electricity.

Now the part that matters. Fans and soakers mitigate heat stress — they don’t erase it. So the driver isn’t the milk you’re losing. It’s the milk cooling actually gets back, and that’s been measured across several trials.

University of Kentucky extension engineers pulled four sprinkler-and-fan trials into one table. Florida: 39.8 lb up to 44.4, a gain of 4.6 (11.6%). Kentucky: 50.1 to 58.0, a gain of 7.9 (15.8%). Missouri: 51.4 to 55.8, a gain of 4.4 (8.6%). Israel: 72.8 to 78.0, a gain of 5.2 (7.1%). Rectal temperature fell a full degree Fahrenheit in the Kentucky work.

Liu and colleagues, publishing peer-reviewed work in Animals in 2024, ran an automated sprinkler system and found milk yield of 31.3 kg against 29.4 in controls — up 1.9 kg, or 4.2 lb (P = 0.046, nine cows per group). And a 2020 JDSstudy of alternative cooling strategies found no milk difference at all, which the authors attributed to low heat load during the study period.

Milk recovered /cow/daySource trialNet annual gain, 250 cows @ $19.85 USD/cwtSimple payback on $26,000 USD install
0 lb (low heat load year)2020 JDS trial–$5,012 (electricity loss)Never
4.2 lb (1.9 kg)Liu et al. 2024, Animals$7,49441.6 months
4.4 lbMissouri trial$8,08938.6 months
5.2 lbIsrael trial$10,47129.8 months
7.9 lbKentucky trial$18,51016.9 months

Payback reflects gross milk recovery minus $5,012 USD in annual electricity. It doesn’t subtract the additional feed those cows will eat — see below.

Read the column header carefully. It says recovered, not lost.

And here’s the cost that table leaves out, which is exactly the thing we’ve been complaining about. Cooled cows eat more. Rather than estimate the feed line ourselves, look at what Kentucky Extension reports as the bottom line: 25 to 30 cents USD per cow per day in additional net income, after paying for the increased feed, water, and electricity. On 250 cows across 60 days, that’s $3,750 to $4,500 a year — and a payback closer to 69 to 83 months.

That is a different investment than the one in the table. Same equipment, same barn. The gap is feed, and it’s the single largest omission in most cooling proposals — including our own, until we went looking.

BasisMilk recovered/cow/dayAnnual value, 250 cows @ $19.85/cwtPayback on $26,000 install
Gross milk recovery (Kentucky trial)7.9 lb$18,51016.9 months
Net-of-feed, water, electricity (Kentucky Extension)7.9 lb$3,750–$4,50069–83 months
Difference attributable to feed/water/power—$14,010–$14,76052–66 months added

Where you farm changes the answer

Gunn and colleagues (2019) projected abatement economics under mid- and late-century climate scenarios and put mean annual net values at –$30 to $190 a cow for High abatement, and –$20 to $590 for Intense. Note the negative floor on both — and that the biggest returns sit late-century rather than today. Reviewing that same paper in 2025, Hutchins and colleagues summarized it bluntly: heat abatement is only cost-effective in the most intense heat.

USDA’s ERS (Key et al., ERR-175) sorted states into four tiers by long-run THI load. The Pacific Northwest and Northeast carry the lightest exposure. The Desert Southwest, Southern Plains, and Southeast have the heaviest. If you’re farming in the top tier, everything in the table above moves toward the bottom row. If you’re in the lightest, it drifts toward the top — and the top row is a loss.

That doesn’t mean you’ve got nothing to spend on. It means the two break-evens further down — five lameness cases, seventeen minutes a day — are where your capital has to earn its keep instead, because neither one depends on how hot your July gets.

How do you know if your barn has a problem worth spending on?

Pull last July’s daily milk weights. Not the monthly test, and not the bulk tank — the per-cow dailies.

The Dairyland Initiative’s own diagnostic is a drop of more than 5 pounds per cow per day in warm weather. That tells you heat is costing you something. What you recover depends on what you install and how you run it. And it’s exactly why monthly testing misses this: heat comes and goes between tests, so a monthly number can look fine while you bled milk for nine straight days.

The management detail matters more than the equipment brochure. Ohio State extension guidance is specific: about 30 seconds of soaking at 0.9 to 1.4 gal/min to wet a cow’s coat through, then four to five minutes of fan-only time to dry her. Air should reach cow height at 8 to 10 ft/sec. Start the system at THI 65 to 68 — roughly 70 to 75°F with moderate humidity — because preventing a rise in body temperature is far easier than pulling one back down.

Flow rate is its own lever. Tresoldi and colleagues, in JDS in 2019, found milk yield roughly 5 kg/day higher in cows soaked at 1.25 and 2.0 L/min than at 0.5 L/min. Same fans, same barn, different nozzle.

For your own local picture, UW–Madison Extension’s Heat Abatement Investment Scouter turns your coordinates into ten years of hourly temperature and humidity and estimates annual hours above THI 68. In Wisconsin, that’s 1,000 to 2,000 hours a year — call it 42 to 83 full-day equivalents. Lactanet, working from a lower THI-60 threshold, reports the Canadian average at 117 days outside the comfort zone.

What Ontario’s incentive program changes

If you farm in Ontario, check the incentives before you price equipment. Everything in this section is in Canadian dollars.

Save on Energy’s Retrofit program lists recirculation ventilation fans as an eligible agriculture measure, and on the schedule effective June 30, 2026, the incentive runs up to $4,820 CAD per high-volume low-speed fan. High-efficiency ventilation exhaust fans draw up to $500 CAD each. Also on the agribusiness list: dairy plate coolers at $1,800 CAD, milk scroll compressors at $1,620 CAD, low-energy livestock waterers at $580 CAD, and solar hot water collectors for dairy at $2,380 CAD.

Two things to watch. The program’s per-cow natural ventilation measure — $56 CAD a cow — is written for tie-stalls, not freestalls, so a freestall dry pen doesn’t qualify. And every figure above is a maximum: IESO states plainly that actual amounts depend on equipment size and eligible cost caps.

Now convert before you compare. The Dairyland figure of $104 USD per cow is roughly $144 CAD at today’s rate, so a 40-stall dry pen at the middle of our range — $7,000 USD — is about $9,700 CAD installed.

Against that:

  • At the HVLS rate, a $4,820 CAD incentive covers roughly half the project. Net cost lands near $4,900 CAD, or about $3,500 USD — a payback around two and a half months.
  • Under the $500 CAD exhaust measure, net cost is about $9,200 CAD, or $6,700 USD — a payback of around four and a half months.
  • If the project fits no prescriptive measure, the Custom stream pays $1,800 CAD/kW or $0.20 CAD/kWh, whichever is higher, up to 50% of eligible project costs — which on a larger cooling retrofit may beat the prescriptive route outright.
Incentive streamMax incentive (CAD)Net install cost (CAD)Net cost (USD)Approx. payback
HVLS fan rate$4,820~$4,900~$3,500~2.5 months
Exhaust fan rate$500~$9,200~$6,700~4.5 months
Custom stream (if no prescriptive fit)50% of eligible costsVaries by projectVariesCase-by-case

One honest limit on those paybacks: the milk revenue behind them uses the USDA all-milk price, because we don’t have a verified Ontario blend price for this analysis. Substitute your own, and the months will move. The cost side of the comparison is sound regardless — halving your install price halves your payback, whatever you’re getting paid for milk.

Either way, it’s the fastest thing in this article, and the difference between those numbers is one phone call: IESO at 1-844-303-5542 or retrofit@ieso.ca. Program terms change, and prescriptive measures require pre-approval and follow one-for-one replacement rules. Confirm eligibility and current amounts before you build a budget on any figure here.

Two upgrades you can settle with a break-even

For these, the cost side is well documented, and the benefit side isn’t. So here’s the break-even instead of a payback — check it against your own records.

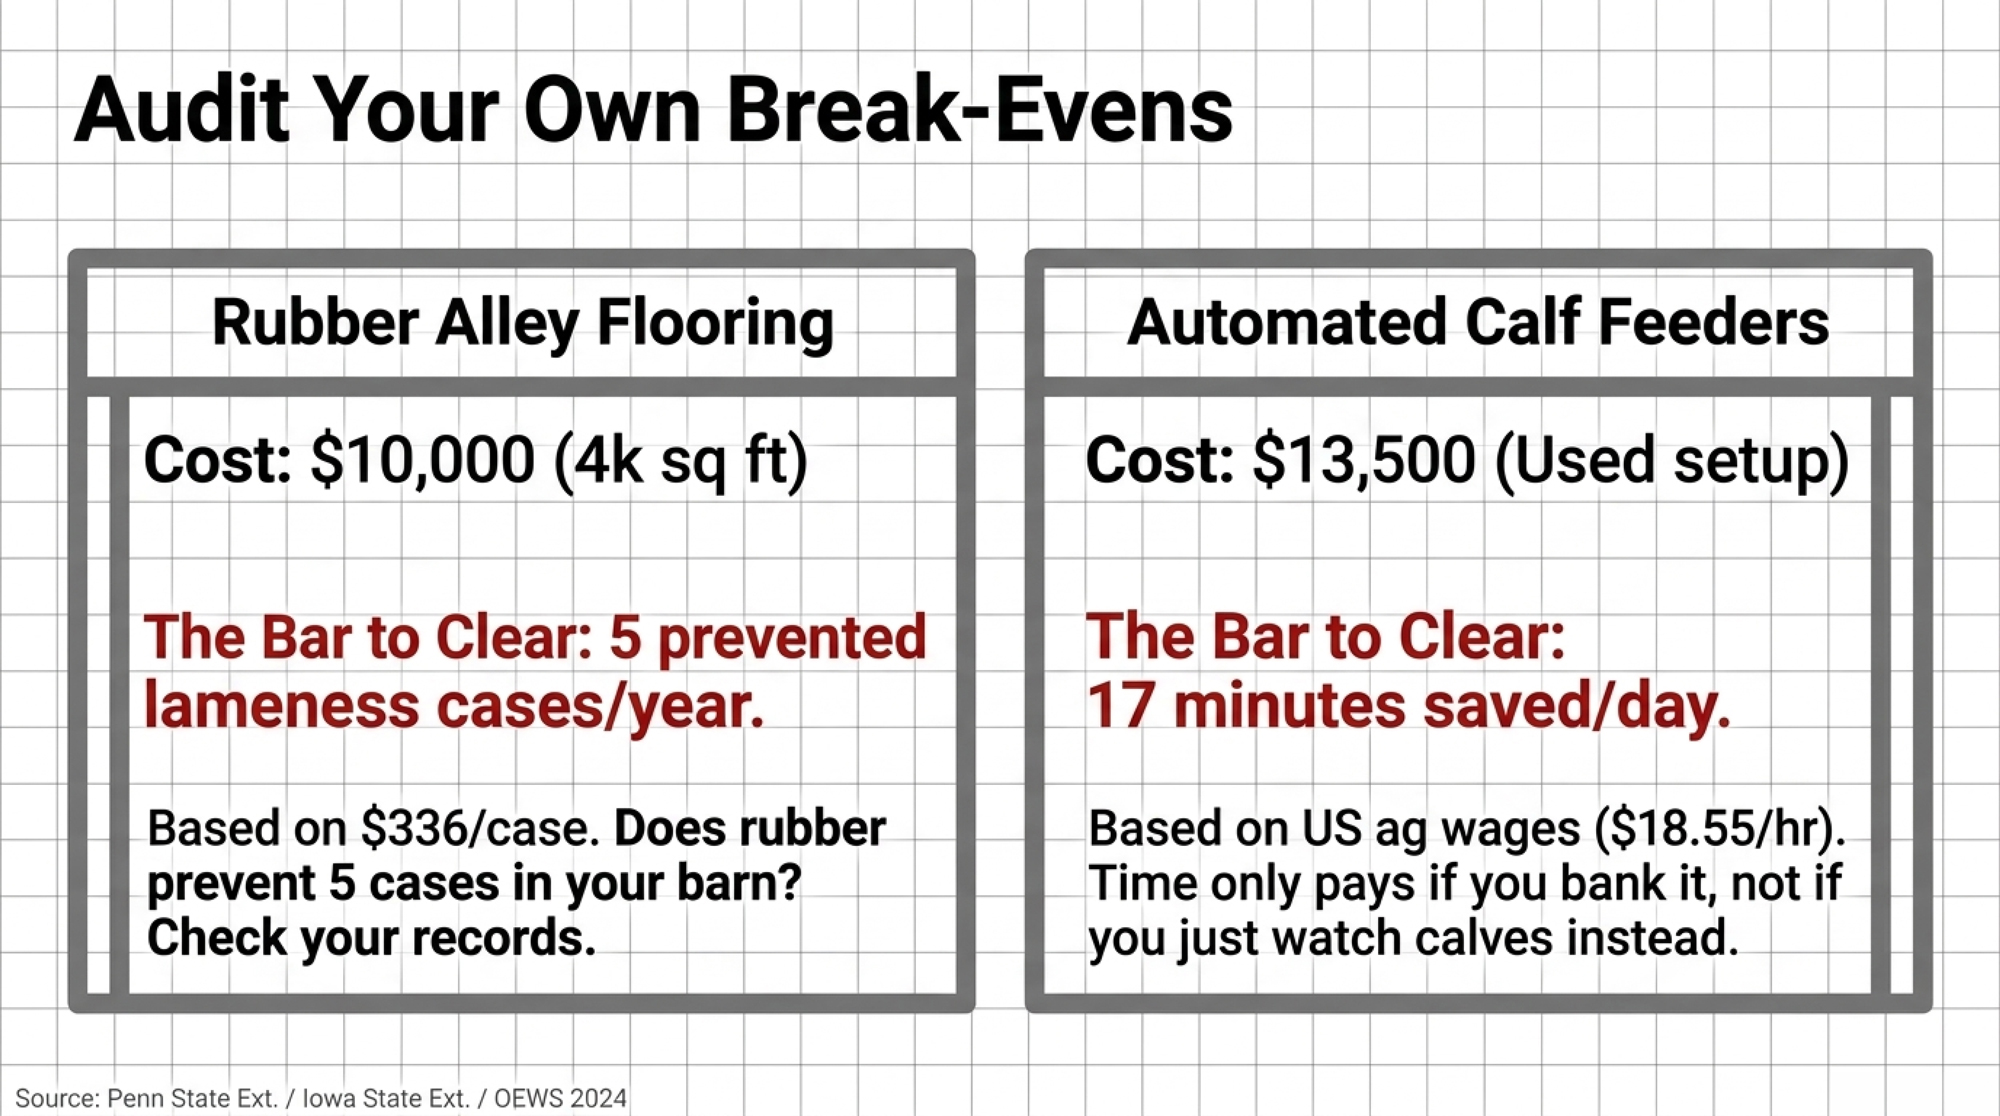
Rubber flooring in alleys. Cornell’s NYSCHAP flooring module puts grooved rubber belting at $2.25 to $2.75 USD per square foot installed. Cover 4,000 square feet of transfer alley and holding area, and you’re near $10,000. Vanegas and colleagues (2006) documented reduced claw growth and wear versus bare concrete — a real, peer-reviewed hoof-health benefit.

Lameness cost is documented too. Penn State Extension, updated January 2026, cites Dolecheck and Bewley’s summary at $76 to $533 USD per case, with one study averaging $336.91. Cha and colleagues (2010) broke it out by lesion: $216 for sole ulcer, $133 for digital dermatitis, $121 for foot rot.

So: $10,000 over eight years at 7% needs about $1,675 a year back. At $336.91 a case, you need to prevent five cases a year. At the low end of the published range, twenty-two. Whether rubber prevents five cases in your barn is the number nobody has published. Count last year’s cases and decide.

Automated calf feeders. Iowa State Extension puts stations at $2,000 to $28,000 USD, using $5,500 as a used-equipment default. CalfStar listed new CalfExpert units from $23,250 USD as of August 2026. Two used stations plus a computer runs about $13,500.

Run the break-even in your own currency, because the wage rates differ. In the US, OEWS 2024 puts livestock farmworkers at $18.55 USD an hour — against a $13,500 setup over ten years at 7%, break-even is 17 minutes a day. On the CalfStar figure, 29 minutes. In Ontario, FARMS Ontario’s October 1, 2025 schedule runs $17.60 CAD lower-skilled and $19.06 CAD higher-skilled, with the provincial minimum moving to $17.95 CAD on October 1, 2026 — and that same used setup converts to roughly $18,700 CAD, putting break-even nearer 25 minutes a day.

That US figure comes from OEWS now because USDA’s NASS canceled the Farm Labor Survey on August 28, 2025, and posted the discontinuance to the Federal Register on September 3. The long-running quarterly benchmark for farm wages no longer exists.

Iowa State’s producer survey found farms averaging 2.2 hours a day feeding calves, with some who switched reporting 1.5 hours a day saved — about a 16-month payback at the US wage. But the same survey recorded others saying flatly that no labor was saved at all; the hours just moved from feeding into monitoring. Seventeen minutes is a low bar. Whether you clear it depends on whether you bank the time or spend it watching calves.

UpgradeInstall costAnnualized cost (8yr @ 7% or 10yr @ 7%)Break-even requirement
Rubber alley flooring (4,000 sq ft)~$10,000~$1,675/yr5 prevented lameness cases/yr @ $336.91 avg
Used automated calf feeder (2 stations)~$13,500 USD / ~$18,700 CAD—17 min/day saved (US wage) or ~25 min/day (Ontario wage)

Three we won’t put a payback on

These fail for three different reasons — a contested effect, a missing cost, and a null result. Worth knowing which is which, because they don’t all mean the same thing.

Cow brushes — the effect size is contested. The 2.2-pound figure everyone cites traces to one 2009 Cornell study by Schukken and Young at Sprucehaven Farm. Their abstract puts it precisely: installing the brushes produced either no difference in daily milk production in lactation 1 and lactation 3-and-higher, or roughly a 3.5% (1 kg) increase— that increase falling in second lactation. Clinical mastitis dropped by more than 30% in second-and-higher lactation animals. We found the field study on a cow-brush manufacturer’s website. Readers can find the funding and disclosure details in the paper itself.

Two later studies don’t line up with it. Li and colleagues, in Veterinary Sciences in 2024, found the milk response in higher-parity animals — fourth and fifth — with no significant difference in second and third. Griffin’s 2025 Mississippi State thesis found brushes lowered cortisol, but milk didn’t differ statistically: 19.9 versus 22.4 kg/day, P = 0.18. The numerical gap ran the wrong way, with the brush group producing less, which usually means a sample too small to settle it either way.

Three studies, three answers. On Schukken’s number, five brushes pay back in about seven months. On Griffin’s, never. Buy brushes for the welfare case and the mastitis finding — both better supported than the yield claim.

Sand bedding — the cost side doesn’t exist. Where brushes have a disputed benefit, sand has a well-established one and no published price. OMAFRA puts sand at $8–10 per tonne against $40–50 for organic bedding, and the comfort case is solid. What nobody publishes is the retrofit manure-handling cost, and on an existing barn that decides everything. Patz names converting existing barns as a distinct cost. McLanahan notes reclaimed sand offsets 90–95% of purchase. Neither publishes a price for the separation system a barn without one has to add. We checked university, extension, and ministry sources across several passes and found no figure, so we’re not handing you one. Treat sand as a new-build decision until somebody prices that equipment.

Automated feed push-up — the one trial measured nothing. And this one has both a cost and a benefit study. The problem is what the study found. Kary Babb, working through a Vita Plus Dairy Technical Extended Internship in partnership with UW–Platteville, tested a Lely Juno against skid-loader push-up at the university’s Pioneer Farm over four months in an ABA design. Her result: “no significant change in milk production and only a slight change in dry matter intake.” That’s one machine, on one farm, over four months — a result about this trial, not a verdict on the technology.

The detail that lands hardest is Babb’s own explanation. “This farm has been well managed prior to implementing the Lely Juno 100. Feed was pushed up at least six times a day using the skidloader.” They tested the machine where it had almost nothing left to improve.

The labor case is better sourced and still tight. Jack Rodenburg of DairyLogix, working a Progressive Dairy Operators survey of 115 herds from 40 to over 1,000 cows, found the average herd pushing feed 4.27 times a day at 6.07 minutes a go — 158 hours a year, $2,256 in labor at $14.31 an hour. Against a then-quoted $24,675 machine at 5% over 15 years, his read: the average farm comes “about $100 per year short on covering the cost of ownership from the labour saved.” The two farms in that survey that already owned one pushed feed 11 and 18 times a day. Well above average.

That’s your rule — the labor case strengthens the more often you do it by hand, and collapses if you’re already at two. Same discipline we applied to sensors, where precision monitoring ran past a six-year payback on health benefits aloneonce Cornell’s real 2.1-day warning window replaced the five days in the marketing.

The Bullvine action checklist

Audit last July’s per-cow dailies. Not the monthly test, not the bulk tank. A drop over 5 lb/cow/day in warm weather tells you heat is costing you something. Under 3 lb and a $26,000 USD fan retrofit won’t clear its own $5,012 annual electricity bill, let alone the feed.

Price the dry pen before the milking string. Forty stalls at $4,000–12,000 USD return about $459 USD a cow, roughly $18,800 a year on a 250-cow herd, and it holds that ranking from $17 milk to $22. Cover the entire 60-day dry period — cooling one pen and not the other buys about three weeks of the effect instead of thirty.

Check the nozzles before you buy more fans. Tresoldi found roughly a 5 kg/day difference between cows soaked at 1.25–2.0 L/min and those at 0.5 L/min. Same equipment, different flow rate.

Strip two lines out of every quote you’re handed. Electricity at $20.05 USD/cow/year, and the feed those cooled cows will eat. Kentucky’s net-of-everything number is 25–30 cents USD per cow per day — compare any vendor’s milk-response math against that before you sign.

Work the break-even on the contested ones. Rubber flooring needs five prevented lameness cases a year. A used calf feeder needs 17 minutes a day at US wages, or about 25 in Ontario. Both are numbers sitting in your own records right now.

In Ontario, phone IESO before you phone a dealer. Whether your fans draw $4,820 CAD or $500 CAD roughly halves or barely touches your install cost — and that changes the ranking, not just the payback.

What’s your dry pen actually costing you?

Most of us can quote a robot to the dollar and a load of sand to the tonne. Fewer of us have ever put a number on forty stalls of dry cows standing in August heat, because nobody has driven out to the farm and asked us to.

Twenty-six years ago, a review in the Journal of Dairy Science said the largest photoperiod response showed up in the dry period. The industry went and sold lights for the milking string instead. That’s worth sitting with.

So run the hour. Count how many cows went dry between June and August, multiply by $459, and set that against whatever you were about to spend somewhere else. If it surprises you, you’re in good company — it surprised us enough that we threw out our first ranking and rebuilt it. Twice.

The full model goes out to Bullvine Weekly subscribers with the spreadsheet attached: every assumption, the NPV and IRR runs, milk-price sensitivity at $17 and $22, and the interaction math on which upgrades genuinely stack against which ones double-count each other through dry matter intake.

And if you’ve cooled a dry pen, send us the invoice. The weakest number in this article is what that retrofit actually costs, because no university publishes it and we won’t invent it. Reply with a real quote, and we’ll run it in next year’s update with your farm’s name on it.

Run Your Numbers

Dairy Profit Projector — Cooling only pays if the extra milk survives the extra feed. Drop in your herd size, production, milk price and ration cost, and the Projector returns your IOFC per cow per day and breakeven milk price — the two numbers that decide whether a cooling quote’s payback is real or gross.

Learn More

The Sunday Read Dairy Professionals Don’t Skip.

Every week, thousands of producers, breeders, and industry insiders open Bullvine Weekly for genetics insights, market shifts, and profit strategies they won’t find anywhere else. One email. Five minutes. Smarter decisions all week.
NewsSubscribe
First
Last
Consent

The Real Price of World Dairy Expo: $3,800 a Cow, Ten Days, and What Nobody Writes Down

It’s August. Entry deadline’s next week, the good heifer’s coming along nice — and you’re doing the math you never write down. $3,800 a cow. Ten days gone. Only $280 of it is Expo’s. Go — but go knowing what you’re trading.

A longtime exhibitor who’s been showing since the 1970s ran the numbers out loud for us. About $3,000 to exhibit one animal, another $2,000 for travel, meals, and a hotel. Call it $5,000. Then he figured that matched a Hawaii trip for two, and said one word.

“Aloha.”

He wasn’t complaining. He was doing something most of us avoid: pricing the thing honestly and saying the number out loud.

Here’s the number we built. A family hauling their own five-cow string to Madison spends roughly $3,800 per cow, all in. Not five cows for $3,800 — $3,800 each. And that’s the efficient version, where you’re spreading a tack fee, one vet call, one fuel bill, and one hotel room across five head.

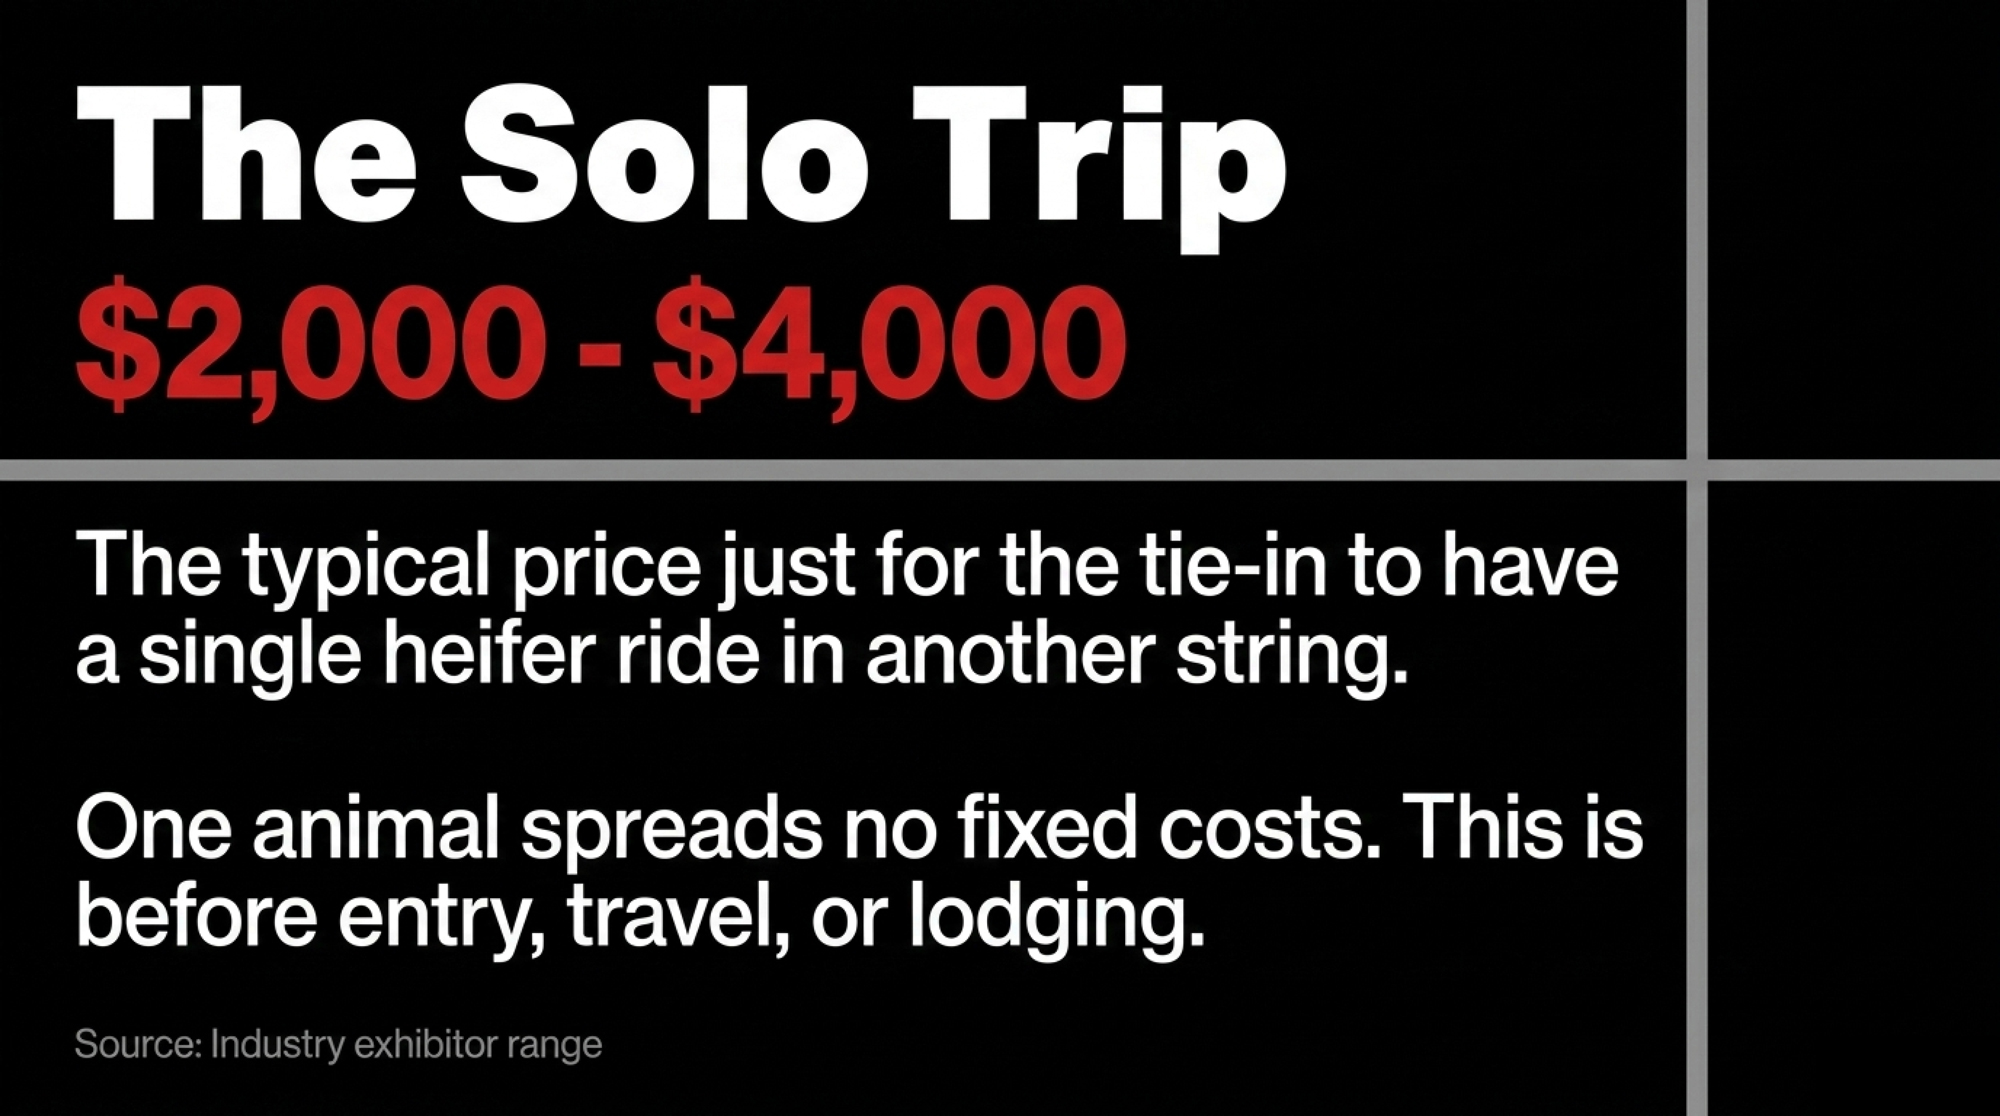
Want the benchmark that makes it real? An exhibitor who sends a single animal to ride along with someone else’s string — no truck, no tent, no crew of their own — typically pays $2,000 to $4,000 just for the tie-in, depending on age, because cows are more work than heifers. That’s before entry. Before their own travel. Before lodging. Before the days away. That’s the industry range from exhibitor conversations, not a published rate.

Sit with that for a second. Somebody pays up to four thousand dollars for the privilege of having their heifer ride in another man’s trailer.

So when you haul your own five head, and it lands near $3,800 a cow, you’re not saving money. You’re paying the same freight in a different currency — your labor, your ten days, your hired milker, your week that didn’t go to anything else.

This is not an argument against going. Read that twice. Madison is still where the dairy cattle world does business, and the education, the people, and the market that exist in that building don’t exist anywhere else. The argument is that you should go knowing precisely what you’re trading — and that “we go every year” is a decision you should make on purpose instead of by habit.

Editor’s note: This is opinion and analysis. The cost breakdowns and recommendations are The Bullvine’s alone, not World Dairy Expo’s position. The Bullvine shared this analysis with World Dairy Expo before publication. Expo responded but did not provide a statement for publication. The $5,000 exhibitor estimate and the $2,000–$4,000 tie-in range reflect composite exhibitor testimony gathered by The Bullvine — not published rates, and not one named source. Fixed fees come from WDE’s published 2025 entry materials. Hotel figures are a dated third-party booking snapshot pulled in July 2026, not a quoted Expo housing-bureau rate. Anything not a published fee is tagged [ESTIMATE]. An earlier version of this analysis modeled a single-cow entry at about $4,142; WDE’s display and tack-space fee applies to strings of 5 to 14 head, so that model overstated one line and has been rebuilt.

What Does Expo Actually Charge? Less Than You Think

Start here, because it’s the part that surprises people and it matters for where you point your frustration.

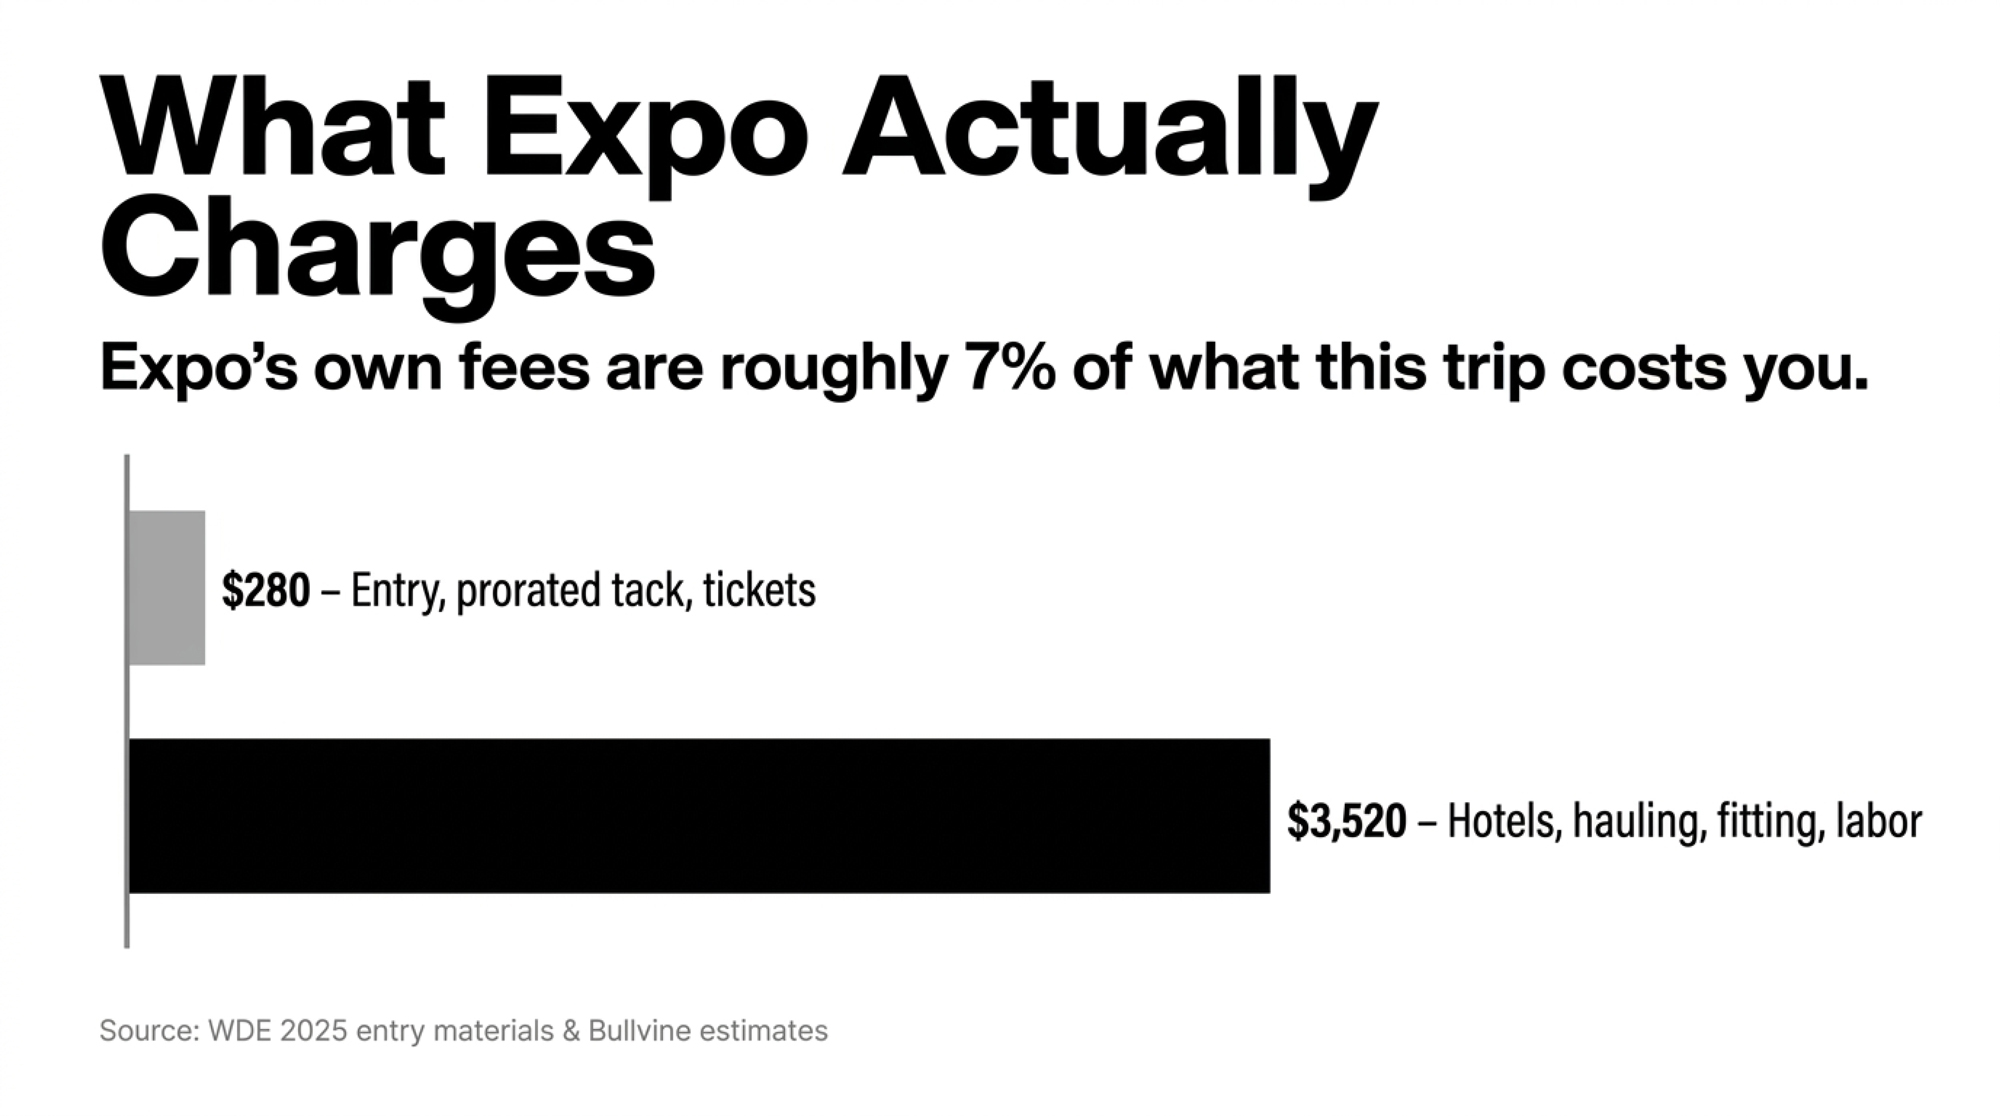
WDE 2025 ran September 30 through October 3 at the Alliant Energy Center in Madison. Per WDE’s 2025 entry materials, entry was $100 per head by the online deadline, $250 late. A substitution after the first free change ran $150. Display and tack space for a 5-to-14-head string was $450 for one booth or tent — about $90 per cow across five. Exhibitor season tickets ran a discounted $30, up to four per entry. Youth showmanship and fitting contests: $10 on time.

Entry, prorated tack, and three exhibitor tickets: about $280 per cow.

For access to the deepest concentration of elite dairy cattle, buyers, classifiers, and genetics decision-makers on the planet, $280 is not the problem. WDE’s own materials say plainly that entry fees don’t cover what goes into a walk on the colored shavings, and they’re right.

Expo’s charges are roughly 7% of what this trip costs you. The other 93% is hotels, hauling, fitting, feed, health paperwork, meals, and somebody covering your barn. That’s the part nobody itemizes, and it’s the part that’s been quietly climbing.

Where the Money Actually Goes

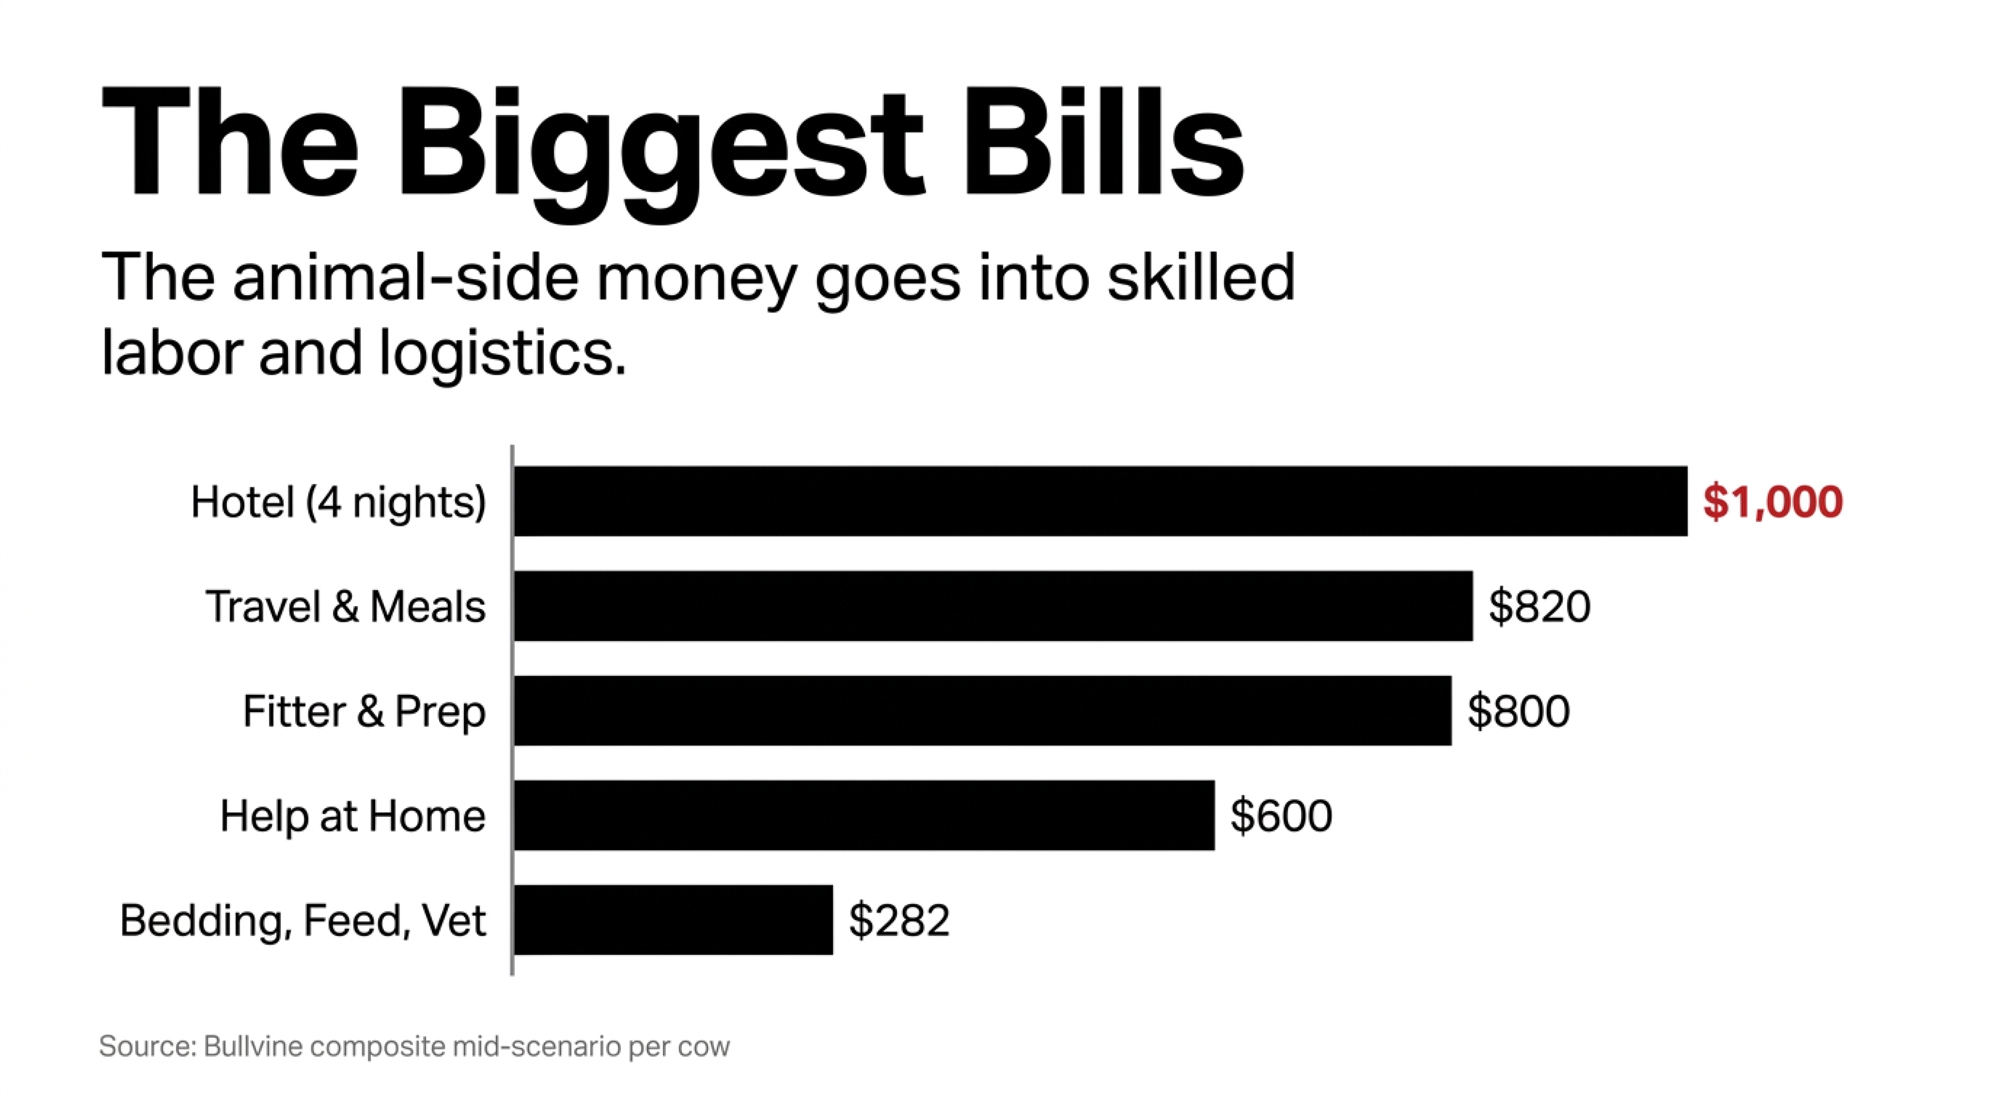
Fitting and prep. The animal-side money goes into fitters and full-service crews. It rarely appears in a premium book, but it’s real — and WDE’s entry agreement makes exhibitors responsible for anyone, fitters included, who preps or shows the animal. For a sense of what skilled show-barn labor commands: Chandler Barber, the first-ever Night Man of the Year at the Royal Agricultural Winter Fair, earns premium overnight rates reported at $900 a night for the cattle in his care. That’s overnight watch at another show, not a Madison clipping rate — but it tells you this work is priced like a trade, not a favor. We budget $800 per cow for the entire week [ESTIMATE, $600–$1,000 range] covering clipping, daily washing, topline work, and ring prep. Given what the market pays for skilled hands, treat $800 as a floor and substitute your own crew’s real rate.

Hotels — the largest single line and the softest sourcing here. A July 2026 booking snapshot near the Alliant Energy Center showed quiet-period rooms far cheaper and event-heavy stretches climbing into the low $300s a night. That’s a consumer aggregator checked once, months early, for a September event — not an Expo housing quote. The model uses $220–$280 a night for a shared room. If you have a real quote, use yours.

Hauling. At 11 mpg and $3.75 diesel, a 300-mile round trip burns about $102 in fuel; call it $150–$200 with wear. A 600-mile haul: $250–$350. Eight hundred-plus miles off the East Coast, $400–$500. All [ESTIMATE].

Health paperwork. APHIS updated its guidance on interstate movement of lactating dairy cattle, easing federal HPAI testing requirements for cattle moving from Unaffected states. Confirm WDE’s own current health requirements before you enter — a show’s rules can be stricter than the federal baseline, and they have changed year to year. Expect at minimum a current CVI and official RFID identification, and budget for milk testing if your state’s status calls for it. Your vet sets that price, not Expo — roughly $100–$150 for the call and CVI [ESTIMATE], and it’s the same bill whether you haul one head or ten.

Coverage at home. USDA’s Farm Labor report put hired-worker wages in the Lake Region — Michigan, Minnesota, and Wisconsin — at $19.17 an hour in the April 2024 reference week and $19.46 in October 2024. Call it about $19. Six to eight hours of daily coverage across four days runs $450–$610 in cash [ESTIMATE] — before your own unpaid time.

What Does One Cow Cost in a Five-Cow String?

Four nights, hired fitter, shared room, three exhibitor tickets, 600-mile round trip. Every figure below is per cow — string-level costs have already been divided across five head.

Line itemPer-cow amountTypeBasis
Entry fee, on time$100FIXED, per headWDE 2025 entry materials
Display/tack space$90FIXED, prorated$450 string fee ÷ 5 head; WDE 2025 entry materials
Exhibitor tickets$90FIXED, per entry3 × $30; WDE 2025 entry materials
Vet call + CVI$120ESTIMATE, proratedOne farm call, split across the string; vet-set, not a WDE fee
Milk testing, where required$30ESTIMATE, per headState status and show rules dependent
Bedding$60ESTIMATE, per head3–5 bags
Feed increment$72ESTIMATE, per headFour-day increment
Fitter/show preparation$800ESTIMATE, per headConservative floor; $600–$1,000 range
Travel, fuel and tolls$300ESTIMATE, proratedOne 600-mile round trip ÷ 5 head
Hotel, four Expo-week nights$1,000ESTIMATE, proratedShared rooms for the crew ÷ 5 head
Meals, two people × four days$520ESTIMATE, prorated$65/person/day ÷ 5 head
Help at home$600ESTIMATE, proratedRelief milking at ~$19/hour ÷ 5 head
Total per cow≈ $3,800Mid scenario9 of 12 lines estimated

How to read this table: every number is what one cow costs you. Shared expenses — the truck, the rooms, the vet call, the relief milker, the food — are string-level bills already divided across five head, so a bigger string spreads them further and a single animal absorbs them alone. Bring one cow instead of five, and the prorated lines don’t shrink; they land on her by herself. That’s why a lone entry can cost more per animal than a full string.

Nine of twelve lines are estimates. This is a scenario, not a fact — and change four assumptions and it swings hard:

ScenarioAssumptionsPer cow
LeanOwn clipping, 300-mi haul, shared room off-peak, one traveler, family covers home≈ $1,800–$2,200
MidTable above≈ $3,800
HeavyFull-service crew, 800+ mi, five nights, three travelers, full hired coverage≈ $5,500–$6,500

Anyone quoting one number for “the cost of Expo,” us included, is quoting a scenario. Build yours before you enter, not after you get home.

The Bill That Never Gets Written

Now the part the table can’t hold, and the part that actually drives people out.

It isn’t four days. It’s closer to ten. Clipping starts the week before. Then loading, hauling, setup, four days on your feet, teardown, the drive home, unloading — and the day afterward when you’re useless. Ten days out of a farm year, gone.

Somebody else is milking your cows. You’re paying them, you’re worried about them, and you’re checking your phone at 6 am from a hotel room in Madison, wondering whether the parlor’s running. Every experienced exhibitor knows that feeling, and nobody puts it on the invoice.

The week didn’t go anywhere else. Same days, same money. For most operations, this is genuinely the family trip that didn’t happen — and that’s where the Hawaii comparison stops being a joke. It’s not that Maui is better. It’s that you only get one week, and you spent it in a barn.

The farm work that waited. The field, the repair, the breeding decision, the fence. It’s all still there when you get back, and now you’re ten days behind.

Four days of being “on.” The ring, the buyers, the small talk, the placings — and the disappointment if it goes sideways in front of people whose opinion genuinely matters to you. That’s real cost, and it lands hardest on the people who care most.

And here’s the honest other side, because a piece that only counts the losses is lying. Those ten days are also the barn at eleven at night. The people you see once a year. The kid who watches a class and decides this is what they want. The conversation by the wash rack that becomes a sale two years later. Nobody who’s been there would trade all of it away.

All of that is real. None of it is a financial return. And that distinction is the whole game.

Can You Actually Name What You’re Getting?

Here’s where we have to be straight about an asymmetry in our own reporting.

We can document the cost to the dollar. We cannot document the return.

The one concrete upside figure available is four decades old. Brookview Tony Charity walked into a 1981 ring with swollen hocks and a cooling crowd; Peter Heffering paid $47,000 anyway. Four years later, Romandale Farms bought a 50% share for a Canadian-record $1.4 million. One animal. Once. During the Reagan administration.

ScenarioWhat’s IncludedPer-Cow CostFinancial Return Documented?
Individual ExhibitorOwn clipping, 300-mi haul, off-peak shared room, one traveler$1,800–$2,200No — same asymmetry applies
Typical Herd/Exhibitor Hired fitter, 600-mi haul, 4 nights, 3 tickets$3,800No — no published average resale/added-value figure exists
Big Time ExhibitorFull-service crew, 800+ mi, 5 nights, 3 travelers, full hired coverage$3,000–$6,000Depends, if they have any winners that they can market/sell.
Champion / sale animal (top tier)Any scenario above, plus buyers already in the barnSame as aboveYes — Brookview Tony Charity sold for $47,000 in 1981, then $1.4M for a 50% share in 1985

Beyond that, published data doesn’t give a reliable average resale or added-value figure for a typical mid-class Expo cow. We’re not inventing one, and we’re not claiming we’ve proven there isn’t one.

And the sale ring isn’t the only ledger. A twelfth-place heifer won’t pay for the trip on hammer price, but the barn aisle is a marketplace of its own — international buyers walking stalls, embryo interest, semen conversations, a cow family getting seen by people who make mating decisions for a living. That return is real, and it’s why plenty of serious breeders keep going. It also only exists if you work the aisles: standing up, talking to strangers, having your pedigrees and your story ready. Sit on the showbox for four days, and it doesn’t happen.

But the asymmetry itself is the finding. No one has produced evidence that a mid-pack Madison placing generates a measurable financial return. Absence of proven return isn’t proof of absence — for a family deciding in August, though, it functions the same way. If a benefit can’t be documented, measured, or predicted, you cannot finance a decision on it. You can still choose it. You just can’t call it a return.

At the top, the math genuinely works. A champion, a real sale animal, a flush prospect with buyers already in the barn — those trips pay, and Madison is where that ceiling exists. That’s a thin slice of the stalls, and most of us know before we load which slice we’re in.

So Should You Send Her This Year?

Here’s our position, and it’s a judgment call rather than a proven fact: for most of us, going every single year no longer pencils — and that’s fine, because it was never supposed to be an obligation.

Go when you have the animal. Sit out when you don’t. That’s not retreat; it’s how people stay in this long enough to have the year that matters.

Three questions before you enter:

  1. Name the commercial vehicle. Is there a specific embryo contract, consignment, semen deal, buyer conversation, or classification goal this trip is meant to serve? If yes — go, and work the aisles. If no, that’s not disqualifying, but stop calling it an investment.
  2. Make the honest ring call. Not her genomic number. Can she stand at the top of her class on that day, against that competition, under that judge? You usually know before you load.
  3. Run the farm resilience audit. Can the herd at home absorb ten days on relief labor without something breaking? Not the money — the days. That’s the answer that usually decides it and the one people examine last.

If you’d go with zero dollars coming back, go. You’ve priced it correctly, and family, tradition, the next generation, and the love of good cattle are legitimate reasons to spend $3,800 and ten days. They’re the same reasons people spend it on Hawaii — and nobody apologizes for that.

If you’d only go if it pays, be honest about whether this is that cow and that year.

The trouble was never the cost. It’s telling yourself it’s an investment, then feeling like a failure when the ledger won’t cooperate.

Key Takeaways

  • Roughly $3,800 a cow in a five-cow string. Expo’s own fees are about $280 of it — the other 93% is everything around the show.
  • Tying in one animal runs $2,000–$4,000 before entry and travel. One animal spreads no fixed costs; five spread them all.
  • It’s ten days, not four. Price the whole commitment, including whoever milks and what waits when you get back.
  • The sale ring isn’t the only return — but barn-aisle marketing only pays if you’re up working it.
  • Go when you have the animal, not because it’s October. Sitting out a year isn’t quitting.

Related reading: We made the case that the cattle were never the problem, and neither was the ring, when we looked at why Expo’s crowds thinned while the show ring stayed magnificent.

What actually happens is quieter than a decision. One August a family sits at the kitchen table, runs the numbers, looks at the ten days, thinks about the few minutes in the ring — and it doesn’t add up. Nobody announces it. They don’t enter, and then they don’t enter again, and the hardest part is that they still love it.

Going deliberately is what prevents that — the right cow, the right year, priced honestly, with your eyes open about the ten days and the milker and the week you didn’t spend somewhere else.

Madison is still worth it. It’s just worth it on purpose.

Estimate Your Costs to Show at World Dairy Expo

World Dairy Expo: Calculate Your True Cost Per Cow

Adjust your origin, string size, and labor options to model your farm’s bottom line.

Total String Cost $19,000
Cost Per Head $3,800
Includes: WDE entry & tack space, health tests, bedding/feed, fuel, hotel ($250/nt), meals ($65/day), fitting, and $150/day home relief labor.

Complete references and supporting documentation are available upon request by contacting the editorial team at editor@thebullvine.com.

Learn More

The Sunday Read Dairy Professionals Don't Skip.

Every week, thousands of producers, breeders, and industry insiders open Bullvine Weekly for genetics insights, market shifts, and profit strategies they won't find anywhere else. One email. Five minutes. Smarter decisions all week.

NewsSubscribe
First
Last
Consent

The $65-a-Day Habit Draining Your Bulk Tank — and 83% of Us Do It

Same cow, same bug — one farm pays $120, another $330. The gap isn’t the infection. It’s the extra “just to be safe” days, at about $65 apiece in dumped milk.

Executive Summary: Michigan State’s Pam Ruegg tracked 37 commercial dairies and found the same mastitis case costing anywhere from $120 to $330 to treat — and the gap wasn’t the bug, it was how long crews kept tubing. Every extra treatment day past label minimum runs about $65, almost all of it dumped milk: on an 80-lb cow at $18/cwt, that’s $14.40 a day gone, roughly $43 over three needless days. It’s not a fringe habit either — Canadian data (Aghamohammadi 2018) show that 83% of producers treat longer than the label calls for, chasing milk that “looks clean” even as clinical cure already lags biological cure by 24–48 hours. Scale it, and a 500-cow herd bleeds around $6,500 a year in unnecessary discard alone, before you touch subclinical and culling losses. Culture-guided treatment cuts antibiotic use roughly in half with no hit to cure rates, and a $2,500–3,000 quad-plate setup typically pays back in 60–90 days — but only if your sampling’s clean and your crew trusts the plate over the reflex. Before you buy any “alternative,” the practicality test one Australian mastitis researcher lives by still holds: if it can’t save time, pencil out, and fit your routine, it won’t survive the barn no matter how good the trial looks. The 30-day move is free — pull your treatment records, sort clinical cases by duration, and that column past label minimum is your habit’s price tag in ink.

mastitis overtreatment cost

The Numbers at a Glance

MetricFigureWhat it means
Same-case cost spread$120 vs. $330Nearly triple, driven by habit — not biology
Cost per extra treatment day~$65Mostly dumped milk, not the drug
Daily milk value, 80-lb cow @ $18/cwt$14.40~$43 lost over three needless days
Producers treating past label83%~2 extra days on average (Canadian data)
Biological vs. clinical cure lag24–48 hrsYou’re often treating inflammation, not infection
Wasted discard, 500-cow herd~$6,500/yrBefore subclinical and culling losses
Culture-guided antibiotic cut~50%No hit to cure rates
Quad-plate culture setup / payback$2,500–3,000 / 60–90 daysIf sampling’s clean and the crew trusts it

It’s 5 a.m. and a cow flags in the parlor. Flakes in the milk, maybe a firm quarter. You know the drill, because your hands know it before your brain does: grab a tube, start treating, keep going until the milk runs clean. It feels responsible. It feels like insurance.

Here’s the number that should stop that reflex cold. Michigan State University research led by Dr. Pam Ruegg — tracking 37 commercial dairies averaging around 1,300 cows each — found that out-of-pocket costs for essentially identical mastitis cases ran anywhere from $120 to $330 per farm. Same antibiotics. Same case severity. Nearly triple the cost. And the difference wasn’t biology. It was habit.

Same Cow, Same Bug, Triple the Cost — Why?

The reason the spread is so wide comes down to one thing most of us never think of as a decision at all: how long you keep treating.

Ruegg’s team put a price on it. Each additional treatment day beyond label minimum costs roughly $65 in discarded milk and extended withdrawal, and milk discard — not the drug — is the bulk of what you’re paying for. Here’s the math on your own cows: an 80-pound cow at $18/cwt makes about $14.40 in daily milk value. Stretch treatment three days past what the case actually needed, and that’s roughly $43 in dumped milk per cow, before you count the antibiotic and the labor. It adds up faster than most of us realize.

Ruegg is blunt about why farms keep waiting. Producers treat until the milk looks normal — but, as she explains, the abnormal appearance stems from inflammation and isn’t predictive of whether bacteria are still present. Clinical cure lags biological cure by 24 to 48 hours. So those extra days are often spent treating a cow whose infection already cleared. You’re medicating inflammation. And paying dumped milk for the privilege.

The 83% Problem

If this were a fringe habit, it’d be a footnote. It isn’t.

The Canadian Bovine Mastitis Research Network study (Aghamohammadi et al., 2018) found that among producers using a single protocol for mild or moderate cases, 83% treated longer than the labeled regimen — averaging about two extra days. Only 17% followed the label exactly. And the classic decision-tree work from Pinzon-Sanchez and Ruegg, published in the Journal of Dairy Science in 2011, laid out why that habit costs money: for mild and moderate cases, the economically optimal play is a two-day course for gram-positive infections and no antibiotics at all for gram-negative or no-growth cases.

The extended five- and eight-day regimens? They consistently produced the worst economic outcomes in that model, because a small bump in bacteriological cure couldn’t cover the milk you dumped chasing it. As Ruegg put it flatly in Veterinary Clinics of North America in 2018, “using antibiotics to treat many cases of nonsevere clinical mastitis does not result in improved bacteriologic or clinical outcomes.” The tube you grabbed for peace of mind, in a lot of cases, bought you nothing the cow wasn’t going to do herself.

The Barn Math on a 500-Cow Herd

Put real numbers to it. For a 500-cow herd, The Bullvine’s analysis of the MSU work pegs treating past label minimum at roughly $6,500 a year in unnecessary discard alone — money that vanishes purely because the decision runs on reflex rather than results. That’s before you touch the bigger hidden buckets the same analysis flags: subclinical losses and culling each account for close to half of total mastitis cost in the Canadian data.

Cost BucketApprox. Share of Total Mastitis CostDriven By
Subclinical lossesClose to 50%Reduced milk yield, undetected without SCC testing
CullingClose to 50% (combined w/ subclinical)Chronic/repeat cases, treatment failures
Unnecessary discard (over-treatment)~$6,500/yr on 500 cowsTreating past label minimum, habit not biology
Drug and labor costSmaller shareAntibiotic units, treatment time per case

Treat the $6,500 as a starting illustration, not gospel — it moves with your milk price, your incidence, and your pathogen mix. But the direction is never in doubt. Farms that culture before they treat consistently report around 50% reductions in antibiotic use while holding or improving cure rates, with a quad-plate culture setup running $2,500–3,000 and typical payback in 60–90 days.

None of this needs a new gadget or a bigger drug budget. It needs the decision slowed down just long enough to ask what you’re actually treating.

What “Sample First, Treat Later” Really Costs to Run

The fix isn’t new, and the evidence for it is solid. A multi-state clinical trial in the Journal of Dairy Science found that using on-farm culture to guide clinical mastitis treatment reduced intramammary antibiotic use by about half and trimmed roughly a day off milk withholding — with no significant difference in clinical cure, bacteriological cure, recurrence, or culling compared with treating everything. Dairy Farmers of Canada’s 2024 stewardship guidance now formally recommends selective treatment of non-severe cases based on rapid diagnostics within 24 hours.

MetricTreat Everything (status quo)Culture-Guided Treatment
Intramammary antibiotic useBaseline (100%)~50% lower
Milk withholding timeLonger, ~1 day more~1 day shorter
Clinical/bacteriological cureNo significant differenceNo significant difference
Recurrence and culling ratesNo significant differenceNo significant difference
Setup cost$0 (no new equipment)$2,500–3,000 quad-plate
Payback periodN/A60–90 days
Failure modeReflex over-treatment, hidden costContaminated samples erode crew trust

So why doesn’t every barn run it? Because on a big dairy with lean labor, “sample first” is a systems change, not a tweak. It means aseptic sampling at the parlor, a small on-farm culture setup or a disciplined send-out, and — this is the part that breaks — a protocol short enough that a weekend relief milker follows it at 4 a.m. without guessing.

The predictable failure point isn’t the science. It’s the crisis of faith around Day 3, when the milk still looks abnormal, and the crew wants to keep treating. Herds that have made the switch consistently describe that first month as the hard part: staff need to see, firsthand, that milk clears on its own after a short course before they’ll trust the protocol. Contaminated samples and SOPs nobody follows are the other two killers. The protocol that lives in a binder instead of on the wall is the one that quietly reverts to “just grab a tube.”

Can a Machine Do What the Tube Can’t?

Here’s where the conversation gets genuinely tricky. Once you accept that reflex-tubing is expensive, the door opens to non-antibiotic tools — and the market is happy to sell you a lot of them. Most aren’t ready. A few are.

Of the non-antibiotic options, Acoustic Pulse Therapy (APT) has the strongest peer-reviewed evidence published to date. A 2024 PLoS One retrospective across four Israeli commercial herds (Merin et al.) reported 65.8% subclinical udder recovery at 90 days versus 11.5% in untreated controls, and mastitis culling of 1.35% versus 16.7%. The paper estimates a benefit of $15,106 per 100 cows per year against roughly $1,440 in APT cost. Striking numbers. Read the fine print, though: the study’s authors disclose that the device’s maker was involved in the work, and it’s a retrospective across four Israeli herds with subclinical cases defined by SCC over one million — promising evidence worth testing on your own cows, not a closed case.

The rest of the “natural” toolbox — probiotics, botanicals, immune modulators — isn’t there yet. A 2018 critical appraisal concluded that treating clinical infections with lactic acid bacteria “cannot be recommended” in current practice. Interesting science, the whole category — but the independent evidence hasn’t caught up to the marketing yet. If a product’s best support lives in a brochure, your milk cheque shouldn’t depend on it.

The Test That Kills Good Products: Will a Farmer Actually Use It?

Tiana Sherry, a genetics-and-law-trained PhD researcher in Australia working on non-antibiotic mastitis therapies, makes a point that should reframe how you read every “next big thing” pitched at your parlor. A treatment can’t just work in a lab — it has to survive the barn.

“There’s just no point in creating a different research direction or trying to implement a new practice on farm,” Sherry told the Dairy Black Belt podcast, “if farmers were never going to go for it in the first place.” She runs producer surveys alongside her lab work precisely because the graveyard of dairy innovation is full of compounds that were effective and completely impractical. Her own read on the antibiotic treadmill is blunt: churning out new antibiotic derivatives teaches bacteria to beat the next one, “so I believe the antibiotic journey should be stopping, and we should be looking for alternatives.”

Distill her logic into a filter you can use tomorrow: does the treatment save time, does it pencil out, and does it fit the way your barn already runs? A product that demands twice-a-day dosing — something Sherry flags as a real barrier in large systems — is a non-starter no matter how clean the trial data looks. Her own candidate compounds are years from a barn; she puts commercialization on the familiar six-to-eight-year horizon. The takeaway isn’t “wait for the miracle.” It’s that the same three questions are the ones you should run on anything a rep sets on your office desk today.

The 30-Day Mastitis Audit & Decision Framework

The hard part was never the bug. It’s that the most expensive input on most dairies — the reflex to reach for a tube — never shows up as a line item. It hides in dumped milk and vague vet bills, which is exactly why it survives. Here’s how to drag it into the light and decide what, if anything, to change. Work it in order.

  1. Pull and sort your records (this week, free). Export your last 12 months of clinical mastitis cases and sort by treatment duration. Count how many ran past label minimum. At roughly $65 a day in dumped milk, that column is your number — the cost of habit, in ink.
  2. Write the rule down. Do you have a written rule for which cases wait for culture and which get treated immediately, or does it live in one person’s head? If it isn’t on the parlor wall, a 4 a.m. relief milker can’t follow it — and it reverts to “just grab a tube.”
  3. Carve out the sick cows first. Flag severe cases (fever, off-feed, systemic signs) for immediate treatment, so “sample first” never delays a genuinely sick cow. This is the guardrail that makes selective treatment safe.
  4. Decide if culture-guided treatment fits your herd. Best for mid-to-large herds with the labor to sample cleanly and the case volume to justify the $2,500–3,000 setup, paying back in 60–90 days at ~50% less antibiotic use. It backfires when sampling is sloppy — contaminated plates are worse than no plates, because the crew stops trusting results. And if you culture, actually act on gram-negative and no-growth results by withholding the tube.
  5. Check whether selective dry cow therapy is on the table. Fits herds with reliable SCC records, lower bulk tank counts, and internal teat sealant on hand; AABP’s 2024 guidelines set the readiness criteria, with roughly a 50% antibiotic cut and about $5.37/cow in savings at equivalent udder health. Weak records or poor hygiene? Stay blanket until the basics are fixed rather than under-treat blind.
  6. Run the practicality test on anything a rep is selling. Before you buy any non-antibiotic tool — APT included — ask the three questions: does it save time, does it pencil out, does it fit your routine (or demand twice-a-day dosing your crew can’t sustain)? And does its best evidence live in an independent trial or a vendor’s slide deck? For APT specifically, run your own numbers against the manufacturer-linked Israeli-herd data before committing a full budget.

Bottom Line Takeaways

  • If you’ve never audited your treatment durations, assume you’re in the 83% — and that the fix is a records pull, not a purchase.
  • Milk that “looks clean” isn’t the finish line. When a mild or moderate case comes back gram-negative or no-growth, the decision-tree math says the tube likely earns you nothing.
  • A culture setup that pays back in 60–90 days isn’t an affordability question — it’s whether your case volume justifies it. Below a certain scale, discipline on treatment duration matters more than the plates.
  • No trial result survives a barn it doesn’t fit. If a therapy can’t clear time, cost, and routine fit, how good the data looks is beside the point.

You already run the numbers on a ration before you feed it and a bull before you breed to him. So next time you’re standing in the parlor on Day 3, staring at milk that still looks off — what’s your treatment log actually telling you about the peace of mind you’ve been buying?

Run Your Numbers

Health ROI Calculator — This article puts $65 a day on the overtreatment habit. The Health ROI Calculator turns that into your number: run your mastitis case load, milk-withdrawal losses, and cull pressure to see whether tightening treatment durations or moving to culture-guided protocols actually pays on your herd.

Complete references and supporting documentation are available upon request by contacting the editorial team at editor@thebullvine.com.

Learn More

The Sunday Read Dairy Professionals Don’t Skip.

Every week, thousands of producers, breeders, and industry insiders open Bullvine Weekly for genetics insights, market shifts, and profit strategies they won’t find anywhere else. One email. Five minutes. Smarter decisions all week.
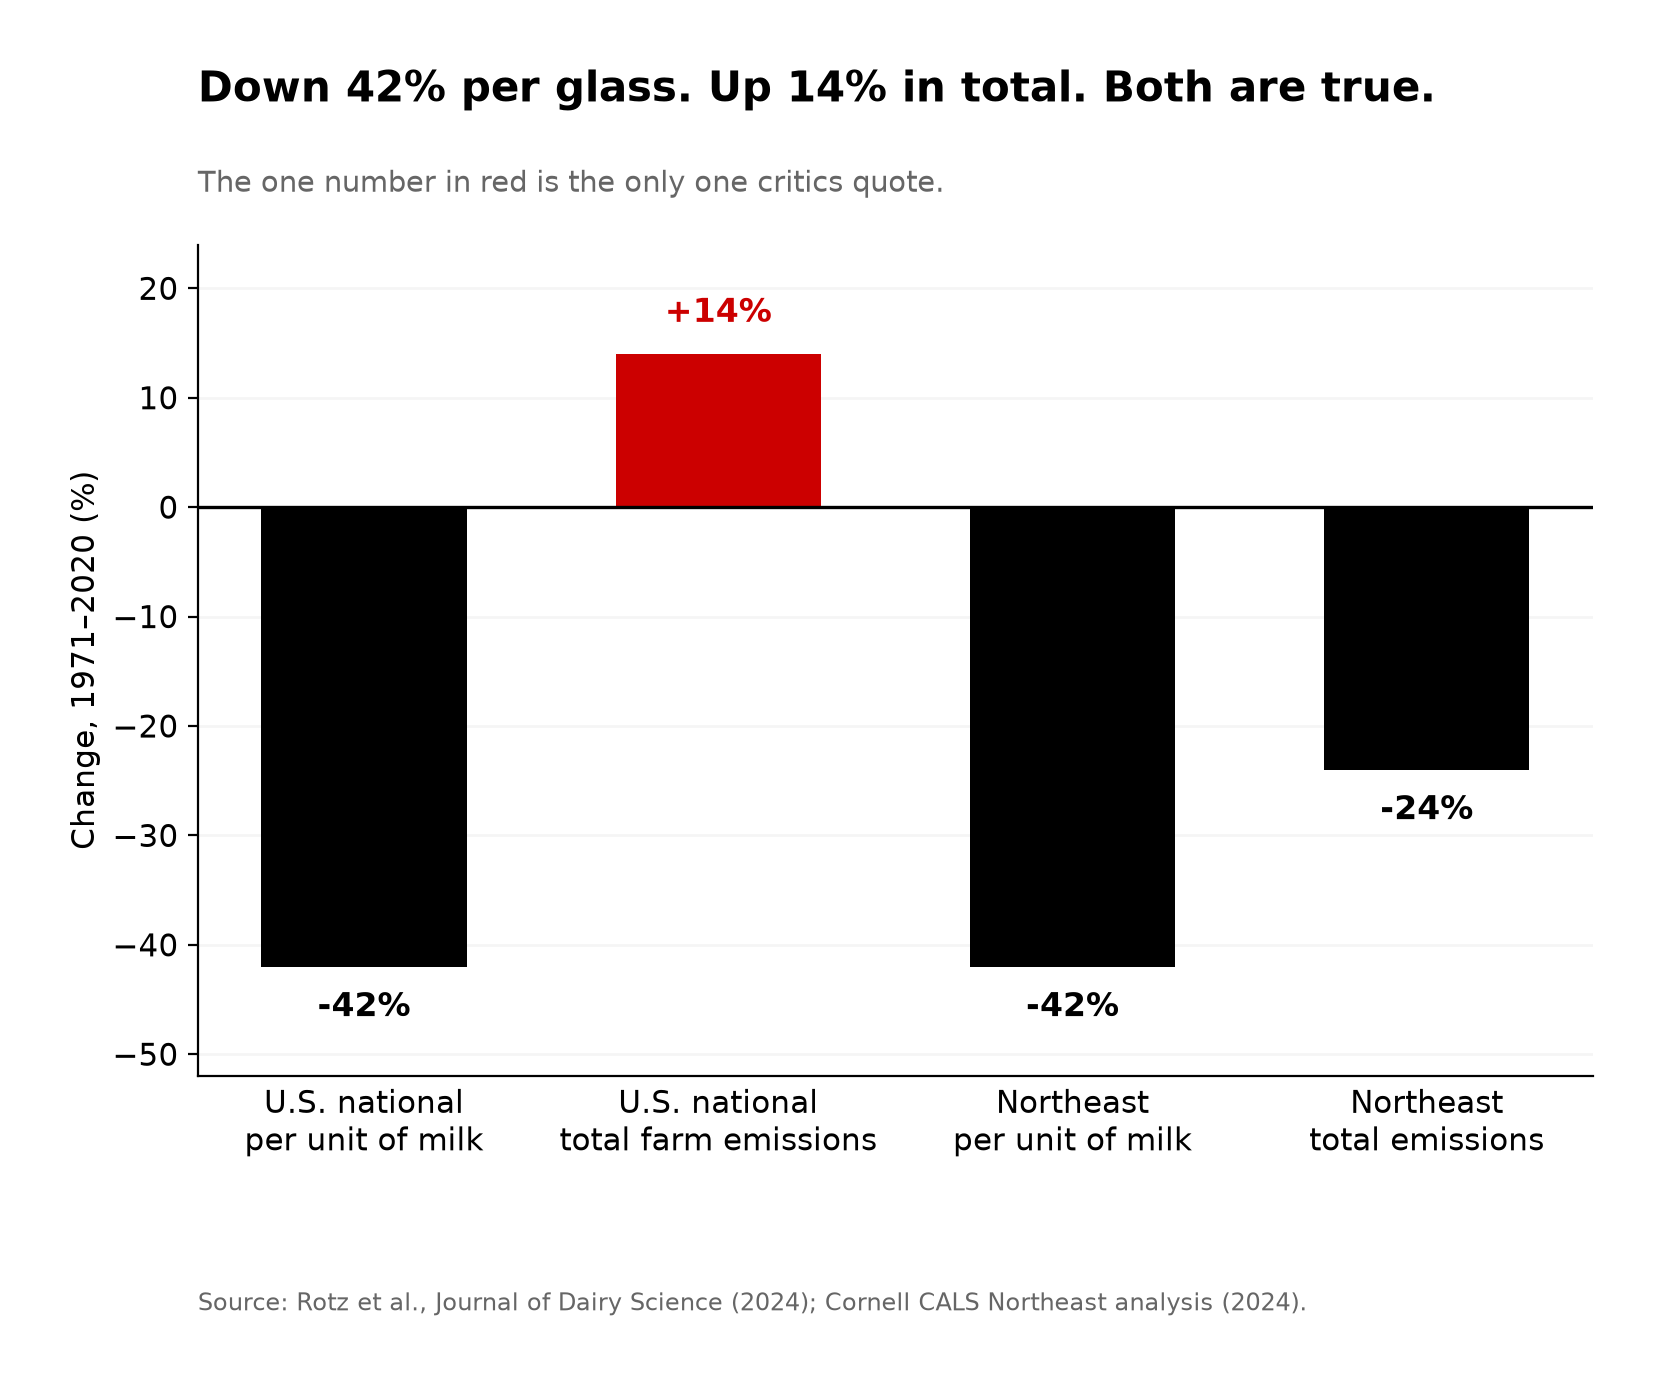
NewsSubscribe
First
Last
Consent

The 9.99% Holstein Inbreeding Bill: Are You Breeding for Profit or Just Index Points?

At 9.99% inbreeding, every extra point can quietly strip up to $44 per cow — before you even argue TPI vs Net Merit.

Lovhill Sidekick Kandy Cane takes the fist-bump and the banner — Grand Champion of the International Holstein Show at World Dairy Expo. Bred by Michael and Jessica Lovich on 72 tie-stall cows in Balgonie, Saskatchewan, and later classified EX-97, she’s living proof that a deep, functional udder and real longevity still win the ring — the same traits a narrowing gene pool is quietly pricing every breeder out of.

Michael and Jessica Lovich milk 72 cows in a tie-stall barn in Balgonie, Saskatchewan. They mostly ignore genomics. They breed off cow families and their own eye. And they’ve now bred two separate World Dairy Expo Holstein Grand Champions — Lovhill Goldwyn Katrysha in 2015 and Lovhill Sidekick Kandy Cane in 2025. They’re the first and only breeders in history to pull that off. (Read more: Lovholm Holsteins: The Only Farm to Breed 2 World Dairy Expo Holstein Champions Milks 72 Cows in Tie-Stalls)

Here’s the part that should make you pause. The herd that walked away from the index list ended up breeding the kind of functional, long-lasting cows the commercial indices are quietly moving toward anyway. They succeeded by breeding out of a broader, more diverse gene pool — the exact opposite of where the rest of the industry is rushing. And while everyone keeps arguing about show cattle versus commercial cattle versus “just use the index,” a number nobody chose keeps climbing in the background: Holstein inbreeding hit 9.99% for Canadian heifers born in 2024 — the highest of the four major breeds, ahead of Jersey at 7.56%, and up from 9.61% the year before — according to Lactanet’s August 2025 update. That number lands on all three camps at once, no matter which side of the argument you stand on.

What’s Changing and Why

For thirty years, the dairy genetics argument has had two sides. One camp says the show ring proves what a valuable cow looks like. The other says the milk cheque does. This summer a third voice got loud enough to matter: “Both of you are wasting time — just breed off the top GTPI or Net Merit list.”

All three are answering different questions, and the numbers now prove it. In April 2026, Holstein Association USA changed its TPI formula to weight protein at 24% and fat at just 14%, up from a 19/19 split. CDCB’s Net Merit 2025 revision went the opposite direction — fat at 31.8%, protein down to 13.0%, with Feed Saved climbing to a combined 17.8% and Body Weight Composite at −11%. Two flagship indices, both claiming to describe a profitable cow, now point in genuinely opposite directions on fat versus protein.

Here’s the split at a glance:

IndexPrimary FocusKey Trait Heavyweights (2025/2026 updates)Ideal Cow Profile
HAUSA TPIComponent ratio & typeProtein 24%, Fat 14%; stature penalty above 60″Balanced, moderate-sized, high-protein yielders
CDCB Net Merit (NM$)Commercial marginFat 31.8%, Protein 13.0%, Feed Saved 17.8%Shorter, highly efficient, high-butterfat producers

Then there’s the classification change most show barns are still processing. Starting with the May 2026 run, HAUSA set 60 inches as the ideal stature and applied a sliding-scale penalty for cows taller than that — shaving points off the final classification score as height climbs past the limit, so a tall, extreme-framed cow that once scored well can now come in lower on paper for the exact trait that used to help her. The official language is about normalizing size. But underneath it is a harder admission: decades of breeding taller cows collided with feed cost, stall fit, and longevity. The breed association put a measurable penalty on the exact trait the show ring spent a generation chasing.

How This Plays Out on Real Farms

The Lovich story looks like a fairy tale until you read the fine print. They sold both champions. Katrysha went south, and Kandy Cane went to Oakfield Corners Dairy in New York as a four-year-old, well before she walked into Madison as a five-year-old and later reclassified EX-97. For a lot of small tie-stall herds, selling your best cows is how the barn stays viable — the premium on an elite animal funds the operation. And their cows tend to milk well past the age most Holsteins are culled, which flips the whole economics toward longevity rather than peak yield.

The tap that started a dynasty: Lovhill Goldwyn Katrysha is confirmed Grand Champion of the International Holstein Show at World Dairy Expo 2015. Her win put a 72-cow tie-stall herd in Balgonie, Saskatchewan on the map — the first of two World Dairy Expo Grand Champions Michael and Jessica Lovich would breed off cow families and their own eye, not a genomic list, while the rest of the breed narrowed toward it.

The number that reaches every barn is inbreeding, and it carries a real bill. The Virginia Tech research pegged it at $22 to $24 in lifetime net income per cow for each 1% rise in inbreeding — but that’s in 1999 dollars. Adjust it forward on cumulative inflation alone and the same drag lands near $44 per cow per 1% today (a Bullvine CPI-based estimate — layer in higher modern milk and feed values and the case for the top of that range only gets stronger). Run the math your own way. On a 200-cow herd that lets average inbreeding drift up four points, that’s roughly $35,000 in lost lifetime net income across the herd — not index points on a page, real money bleeding out of the barn. Newer Canadian work backs the mechanism: the Canadian Dairy Network found a cow that’s 10% inbred, versus 5%, loses about 92 kg of milk, 5.3 kg of fat, and 2.6 kg of protein per lactation, adds 1.4 days open, and loses roughly 65 days of productive life. It never shows up on a semen invoice. It hides in open days, mastitis cases, and calves that don’t make it.

Metric (per lactation unless noted)5% Inbred Cow10% Inbred CowLoss at 10%
Milk yieldBaseline−92 kg−92 kg
FatBaseline−5.3 kg−5.3 kg
ProteinBaseline−2.6 kg−2.6 kg
Days openBaseline+1.4 days+1.4 days
Productive lifeBaseline−65 days−65 days

That’s why this reaches every camp. The show breeder, the Net Merit devotee, and the top-50-list herd are all pulling from an increasingly related bull population, and the compounding cost lands the same way on all of them.

The Deeper Read: For where that shrinking bull pool actually concentrates — and the USDA sires your stud may not be pushing — see Holstein’s inbreeding bill and the USDA bulls your stud isn’t selling you.

The Mechanics Behind the Outcomes

Think of it as three different experiments, not three answers to one question. Show-and-type selection asks whether breeding for conformation and classification produces cows that win and sell. The commercial camp runs a different test entirely: through Net Merit or LPI, does a cow throw the most profit under your actual costs? And the index-first crowd is betting on speed — trust the highest-ranked young bulls, shorten the generation interval, and try to outrun everyone else’s genetic gain.

None of those experiments settles the others, because each measures something different. A judge at World Dairy Expo isn’t scoring feed intake per day or days open. Net Merit ignores ring presence entirely. And the index itself isn’t neutral — it’s an editorial choice about what matters, built on national-average price assumptions that may not match your processor. So when TPI says protein and Net Merit says fat, a breeder who “just uses the index” without checking which one fits their cheque is quietly optimizing for someone else’s barn.

The inbreeding problem sits underneath all three. The top of any genomic list — GTPI or Net Merit — isn’t a random draw. It’s a tight cluster of high-relationship sires that trace back through a handful of grandsires, and the concentration is stark: research finds the vast majority of today’s Holstein AI bulls funnel back to just two ancestral sires, with a single foundation bull, Pawnee Farm Arlinda Chief, still echoing through the population decades later. Ride the list harder, and you stack that relationship faster. CDCB has confirmed its genetic base changes now include Expected Future Inbreeding (EFI) adjustments to account for future inbreeding, not just observed genetic trends — which is why individual PTAs no longer track the base change as cleanly as they once did. When the statisticians pre-discount the future, that tells you something.

How Much Does Sticking With the Wrong Index Actually Cost?

More than most herds realize, and the loss is invisible because it’s “index-approved.” A herd that keeps breeding off TPI out of habit, while getting paid on butterfat, can drift toward higher protein ratios its cheque doesn’t reward at current component prices. Bullvine’s own modeling of the 2026 TPI shift put the exposure as high as $17,500 for a mid-size herd chasing the protein signal in a fat-heavy market — a figure that depends on your herd size and your component spread, so treat it as a scenario, not a guarantee.

The mirror image is just as real. A cheese-plant herd still breeding off Net Merit’s fat signal can leave protein premiums on the table — a gap Bullvine modeled at roughly $134 per cow per lactation, or about $67,000 across 500 cows. Either way, nobody traces it back to the semen order. They blame feed, labor, the processor — everything except the objective function they never chose on purpose.

Barn SituationIndex Being UsedWhere It LeaksModeled Cost Exposure
Fat-heavy market, chasing proteinHAUSA TPI (2026)Higher protein ratios the cheque doesn’t reward~$17,500 (mid-size herd)
Cheese plant, breeding for fatCDCB Net Merit (2025)Protein premiums left on the table~$134/cow/lactation
Same, scaled to the barnCDCB Net Merit (2025)Compounded across the herd~$67,000 (500 cows)
Any herd, wrong index by habitEitherBlamed on feed, labor, processor — never the semen orderInvisible / untraced

The Deeper Read: For the full walkthrough of how the Net Merit 2025 reweighting hits your milk cheque, see our breakdown of what changed and what it costs your barn.

Is Your Herd’s Genetic Diversity Already Behind?

Maybe — and the tie-stall clock makes it more urgent for some. Canada’s updated code of practice requires that continuously tethered cows get untethered freedom of movement, with the key provisions phasing in by 2027.

Connect the dots and the three storylines turn out to be one. HAUSA’s 60-inch stature penalty isn’t an aesthetic call — it’s a structural necessity, because modern Holsteins have been outgrowing the physical dimensions of the tie-stalls and freestalls North American barns were built around. That’s the same logic driving Net Merit’s −11% Body Weight Composite: a bigger cow costs more to feed and fits the barn worse. The logic points one way — a shorter, more genetically diverse cow should fit a retrofitted stall better and carries less of the fertility and health drag that inbreeding stacks on, which is exactly what you want walking into the 2027 deadline. Head in tall and closely related, and you’re solving two problems at once, with only one of them showing up on your classification report.

Options and Trade-Offs for Farmers

Path 1: Pick your index deliberately, then match it to your pay stub. This is the 30-day move. Pull last year’s milk cheques and figure out your actual dollar-per-pound split on fat versus protein. If you’re component-heavy on butterfat, Net Merit’s 31.8% fat weighting likely fits better than TPI’s protein-heavy 2026 formula. It takes an afternoon with your statements and your rep. Skip it, and you leak margin for years while your cows look better on paper.

Path 2: Build an explicit inbreeding ceiling into your mating program. This one’s for any herd riding the top of the GTPI or Net Merit lists year after year. It means telling your mating software — or your rep — a hard limit and holding to it, even when a high-index bull is closely related to your cows. Lactanet notes the average inbreeding level today is roughly 9% and advises aiming matings below that average; its own tools flag %INB so you can screen out mates that push a calf too high. You may give up a few index points per mating. The payoff is not stacking that $22-to-$24-per-cow-per-percent bill — closer to $44 in today’s dollars — that you won’t feel for three years.

Path 3: Borrow across camps instead of picking a tribe. Take the show world’s eye for udders and legs, the commercial index’s discipline on feed efficiency and longevity, and genomic testing’s speed on sorting replacements. Works for most mid-size herds. The trap is doing it by accident — a little TPI, a little Net Merit, a little show type — and ending up with a bull battery optimized for nothing. Lovhill reached the top of the show ring twice by holding one clear standard, not by hedging across three — and that discipline is the part worth copying, whichever camp you land in.

Key Takeaways

  • If you don’t know your actual dollar-per-pound split on fat versus protein from last year’s cheques, run that number before your next semen order — it decides whether Net Merit or TPI fits your barn.
  • If your herd’s average inbreeding is at or above the 9% breed average, pull your number from your genetic-management software this month and ask your rep to project it forward before your next mating run.
  • If your cows skew tall, factor in that the May 2026 stature penalty and Net Merit’s −11% Body Weight Composite now both work against extreme size.
  • If you show and sell as part of your business model, be honest about whether your plan includes selling your best cows the way the Lovich family did — that’s what made their math work.
  • If your index “feels safe” because it’s familiar, remember the TPI and Net Merit formulas both changed in the last 18 months — familiarity isn’t the same as fit.
  • If you’re shipping to a cheese plant with a protein-to-fat ratio below 0.80, run the per-cow math on your own component prices — that’s the danger band where the wrong index quietly costs the most.

Here’s the uncomfortable question worth sitting with. The show breeder confuses a ring result with an economic verdict. The index-first herd confuses trusting the formula with running a strategy. Both outsourced their judgment — one to a judge, one to a formula — and neither stopped to ask whether the thing they trusted still fits the cows they actually need. So which one are you? And when did you last check whether the tool you rely on is optimizing for your barn, or for the average barn someone modeled years ago?

The short version: genetics is an economics question, and the only real mistake is not knowing which experiment you’re running. The longer version — the full cost-per-cow inbreeding math, broken down by herd size and index choice — is where the decisions actually get made. We’re running those numbers in next week’s Bullvine Weekly. If you want to map this to your own operation, that’s where the real math lives.

Hold-to-Proof Cost & Inbreeding Drag Simulator

Map the 2026 TPI/Net Merit formula updates and genetic drag directly to your herd’s bottom line.

200
9.5%
8.0%

Annual Inbreeding Penalty
$0
Annual Index Revenue Leak
$0
Total Invisible Annual Margin Leak
$0

Calculated using updated 2026 genetic values and modern inflationary baselines.

Complete references and supporting documentation are available upon request by contacting the editorial team at editor@thebullvine.com.

Learn More

  • Dairy Cattle Genetics Explained: TPI, NM$, GTPI and Genomics — Arms you with an immediate operational blueprint to navigate the 2026 formula divergence, showing exactly when to deploy TPI’s high-protein selection versus Net Merit’s aggressive butterfat and feed-efficiency weighting.
  • Net Merit 2025 — Exposes why national genetic indexes lag behind current marketplace realities, tracking the multi-year commodity averages that create a hidden financial mismatch between your tank’s actual value and your long-term breeding goal.
  • The Proof You Waited Three Years For Averaged a $72 Markdown — Delivers a brutal, data-driven reality check on daughter-proven strategies, demonstrating how holding famous bulls to proof stacks an expensive maintenance bill while sacrificing an entire generation of genetic velocity.

The Sunday Read Dairy Professionals Don’t Skip.

Every week, thousands of producers, breeders, and industry insiders open Bullvine Weekly for genetics insights, market shifts, and profit strategies they won’t find anywhere else. One email. Five minutes. Smarter decisions all week.
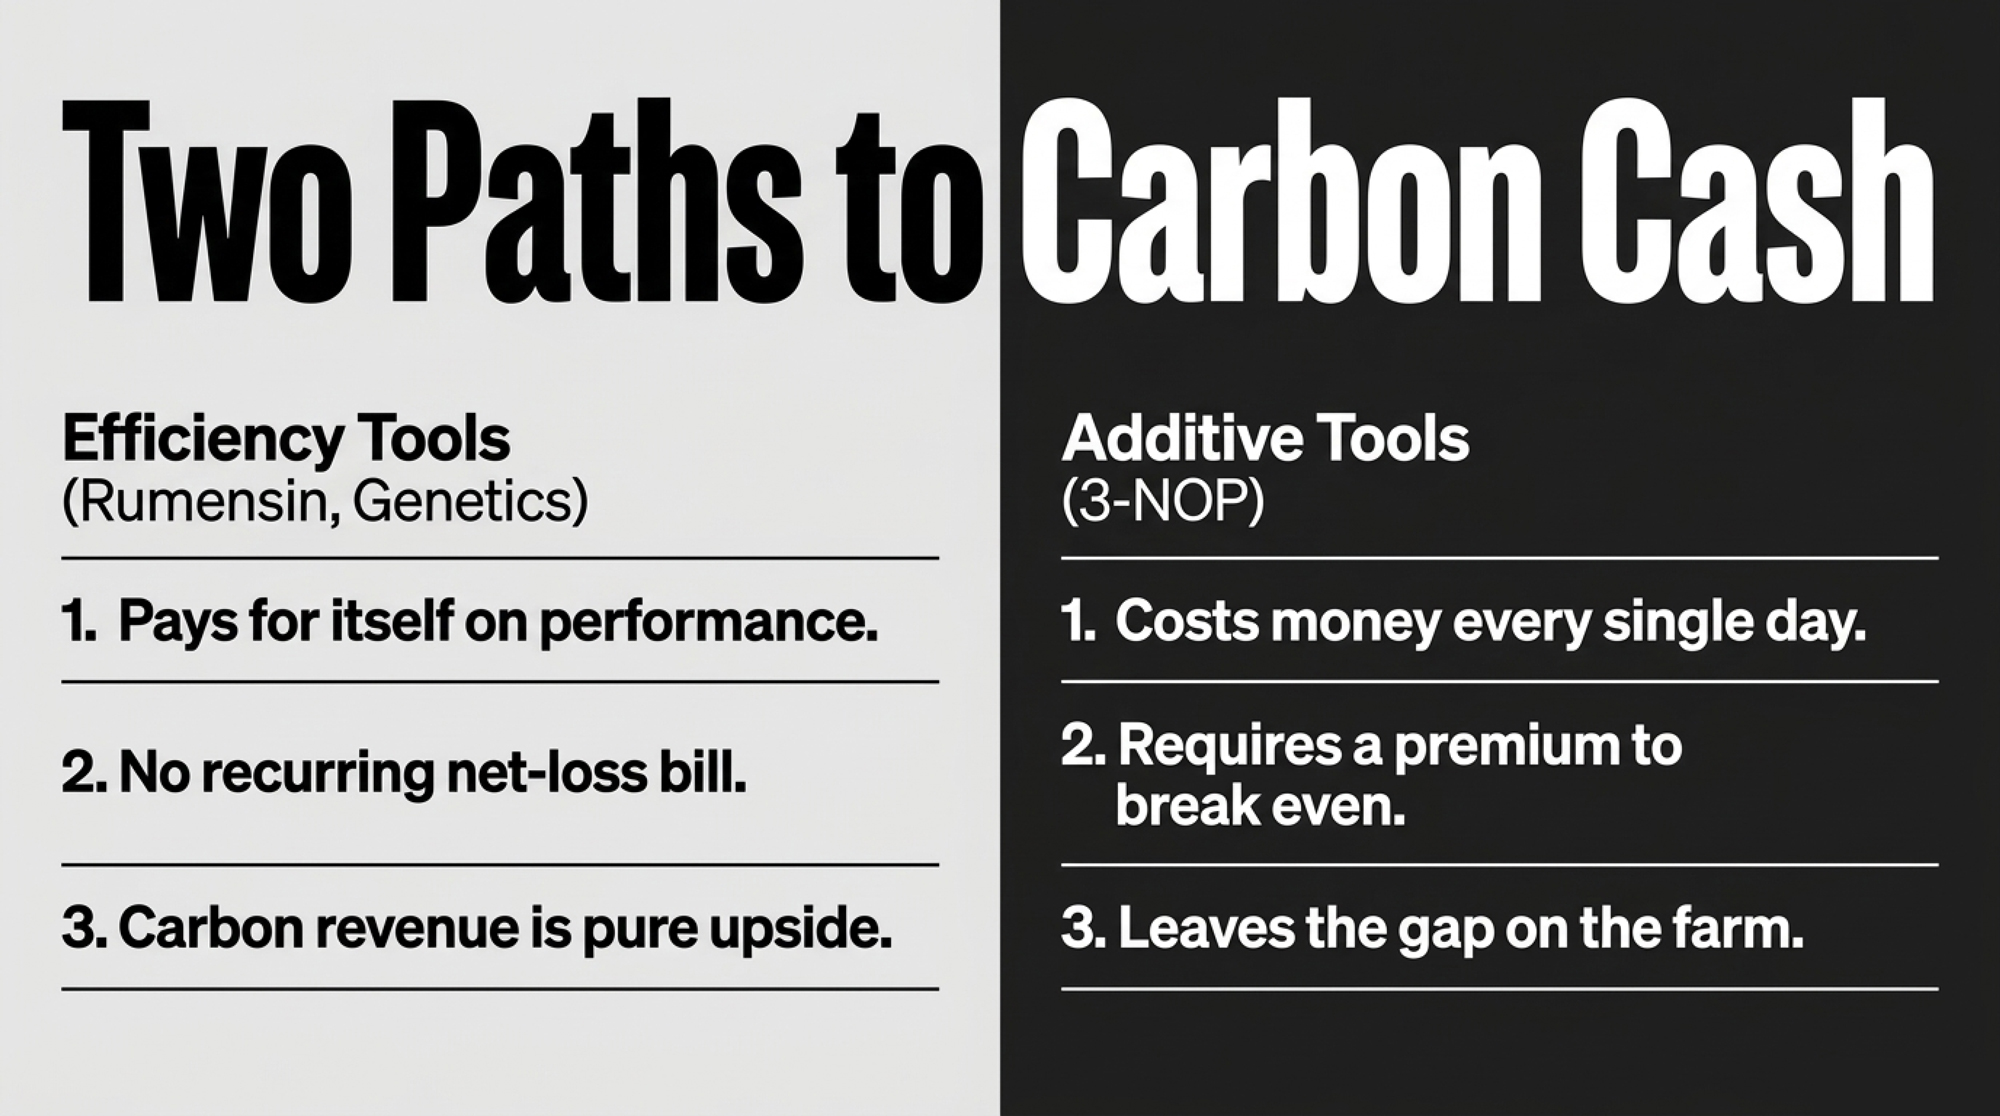
NewsSubscribe
First
Last
Consent
Send this to a friend