


99.84% of active Holstein AI bulls trace paternally to two grandfathers. Penn State proved the lineages we walked away from in the 1980s still work. So why aren’t they in your spring catalog?
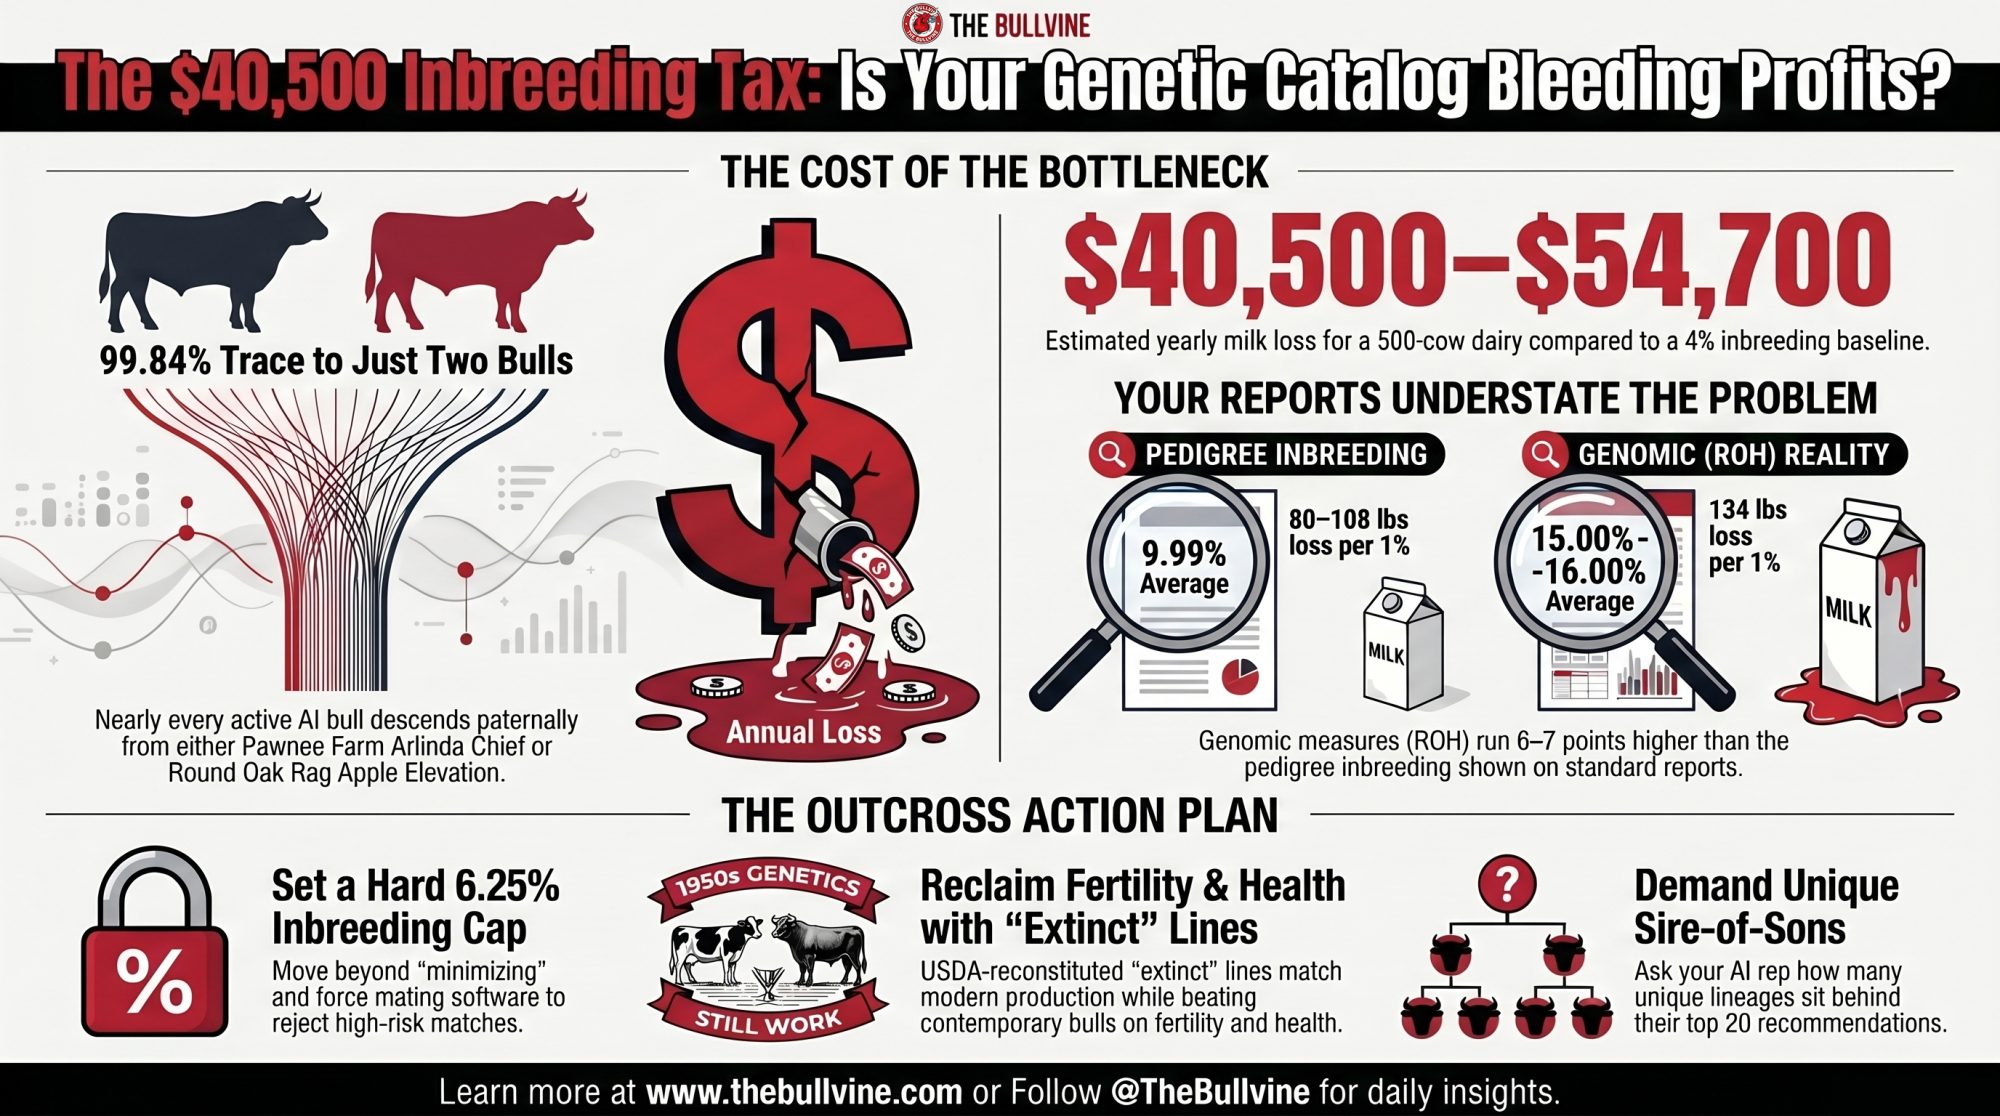
Executive Summary: 99.84% of active Holstein AI bulls in North America trace paternally to two grandfathers — Pawnee Farm Arlinda Chief and Round Oak Rag Apple Elevation — and Canadian heifers born in 2024 are now averaging 9.99% pedigree inbreeding (Yue et al., 2015, J. Dairy Sci.; Lactanet, August 2025). Using the Doekes/Makanjuola loss curve of 80–108 lbs of milk per 305-day lactation per 1% inbreeding, that’s roughly $81–$110 per cow per year versus a 4% baseline at Q2 2026 Class III pricing — $40,500 to $54,700 quietly bleeding out of a 500-cow dairy every year, before fertility, SCC, and culling losses. Penn State’s Chad Dechow proved in 2020 (with USDA’s Harvey Blackburn) that bulls reconstituted from two “extinct” Y-lineages — Netherland Prince and Colantha, frozen in the USDA NAGP vault since the 1950s — produced daughters that matched modern elite contemporaries on production and beat them on fertility. Genomic ROH inbreeding runs 6–7 percentage points higher than pedigree numbers, so what shows on your DC305 report is the smaller of the two real numbers. The escape hatches exist: hard 6.25% inbreeding caps in your mating program, VikingHolstein/CRV outcross sires, Blondin’s diversity lineup, or research-channel access to the Dechow/NAGP reconstituted bulls through Select Sires and TransOva. No formal Y-lineage program has been identified at Holstein USA, NAAB, or CDCB as of publication — meaning the conversation has to start with you, this spring, before your stud finalizes the catalog. If you can’t tell your AI rep how many unique sires-of-sons sit behind the top 20 bulls in your mating plan, that’s the first phone call.
In a USDA vault in Fort Collins, Colorado, the National Animal Germplasm Program has been holding semen straws from two Holstein bulls — Zimmerman Alstar Pilot and Cuthbert — born in the early 1950s. They carry Y-chromosome lineages, Netherland Prince and Colantha, that vanished from commercial Holstein AI roughly 40 years ago. And in 2020, Penn State’s Chad Dechow proved they still work.
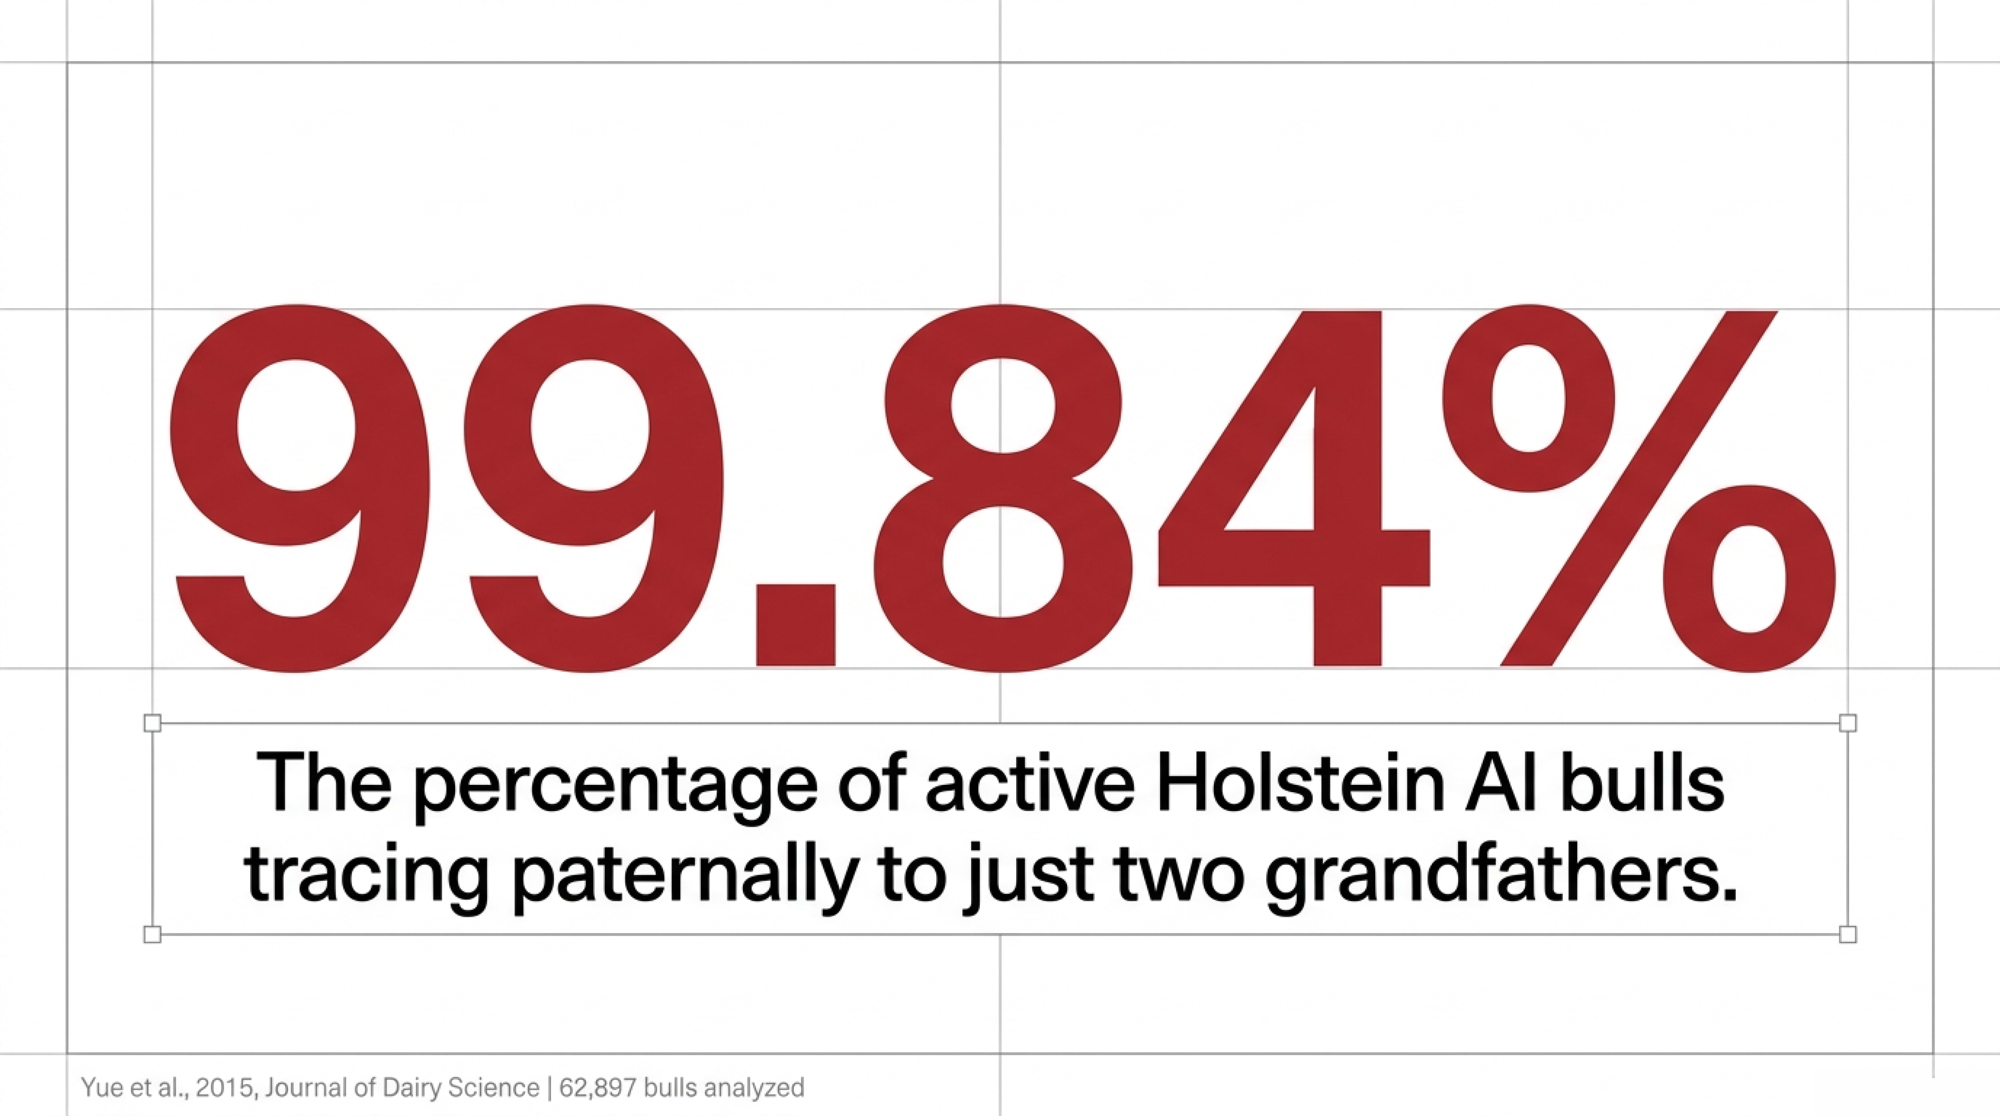
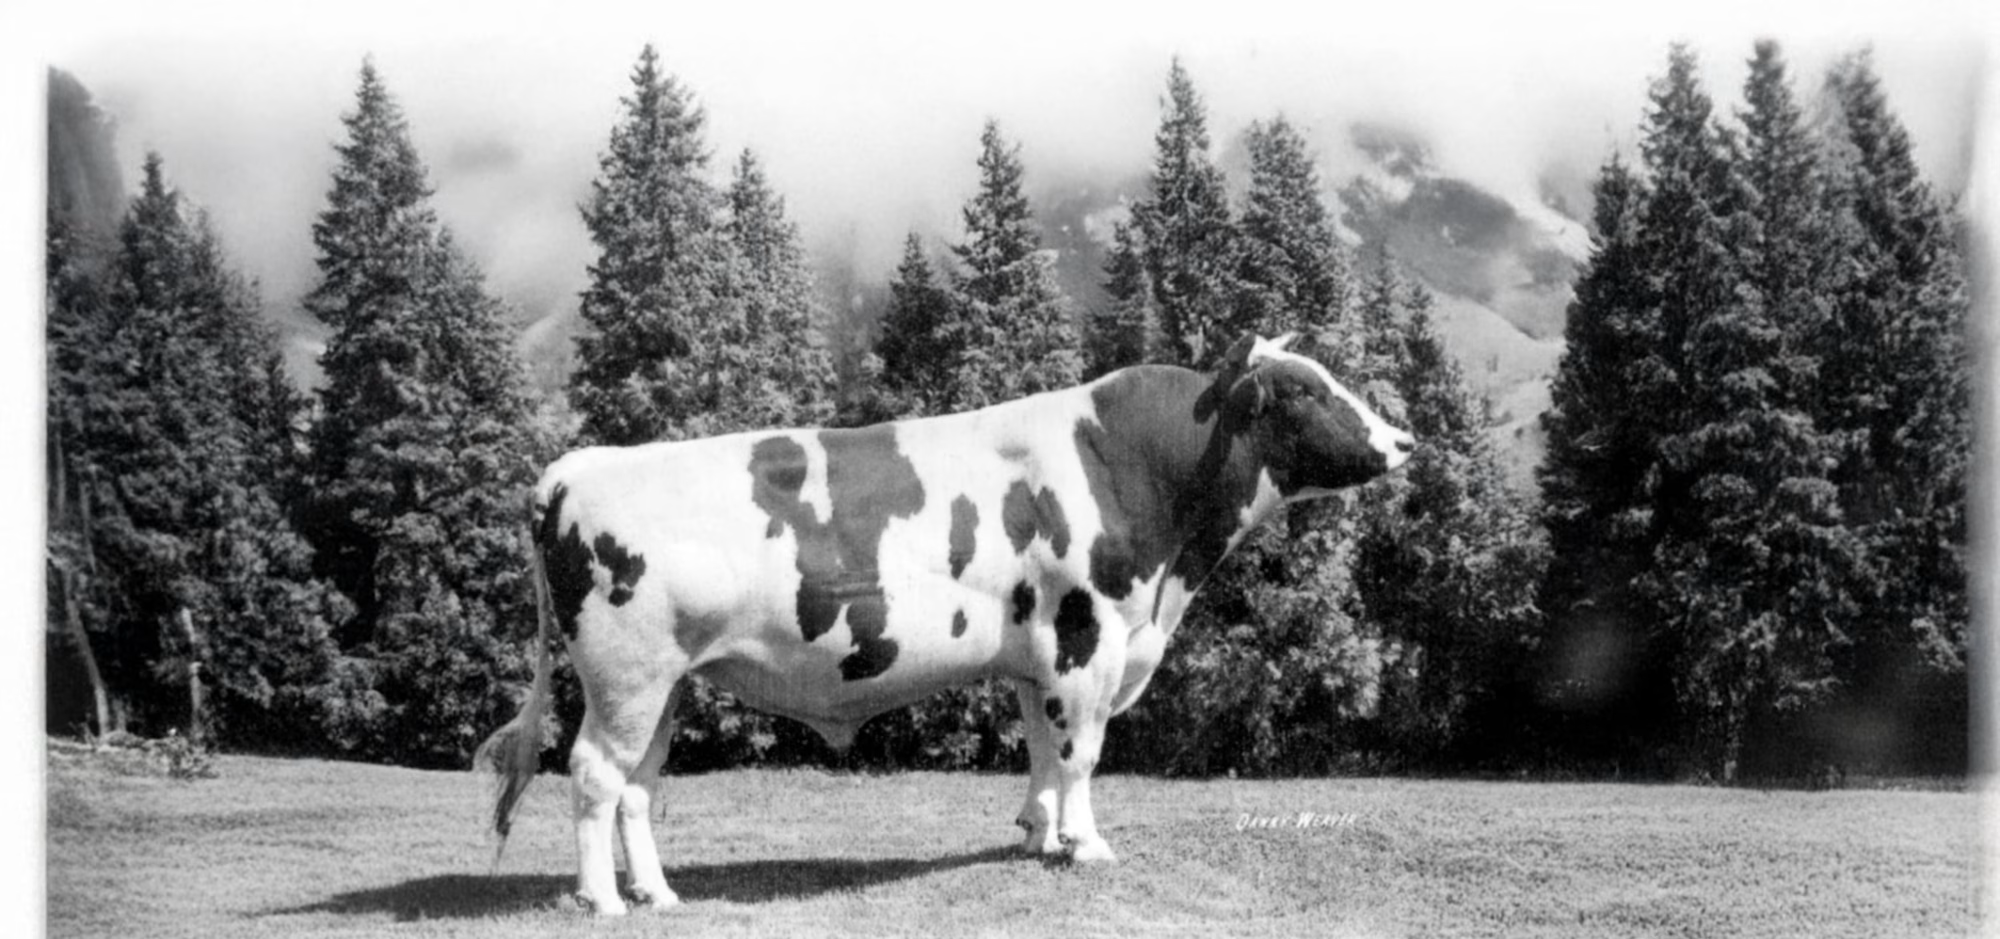
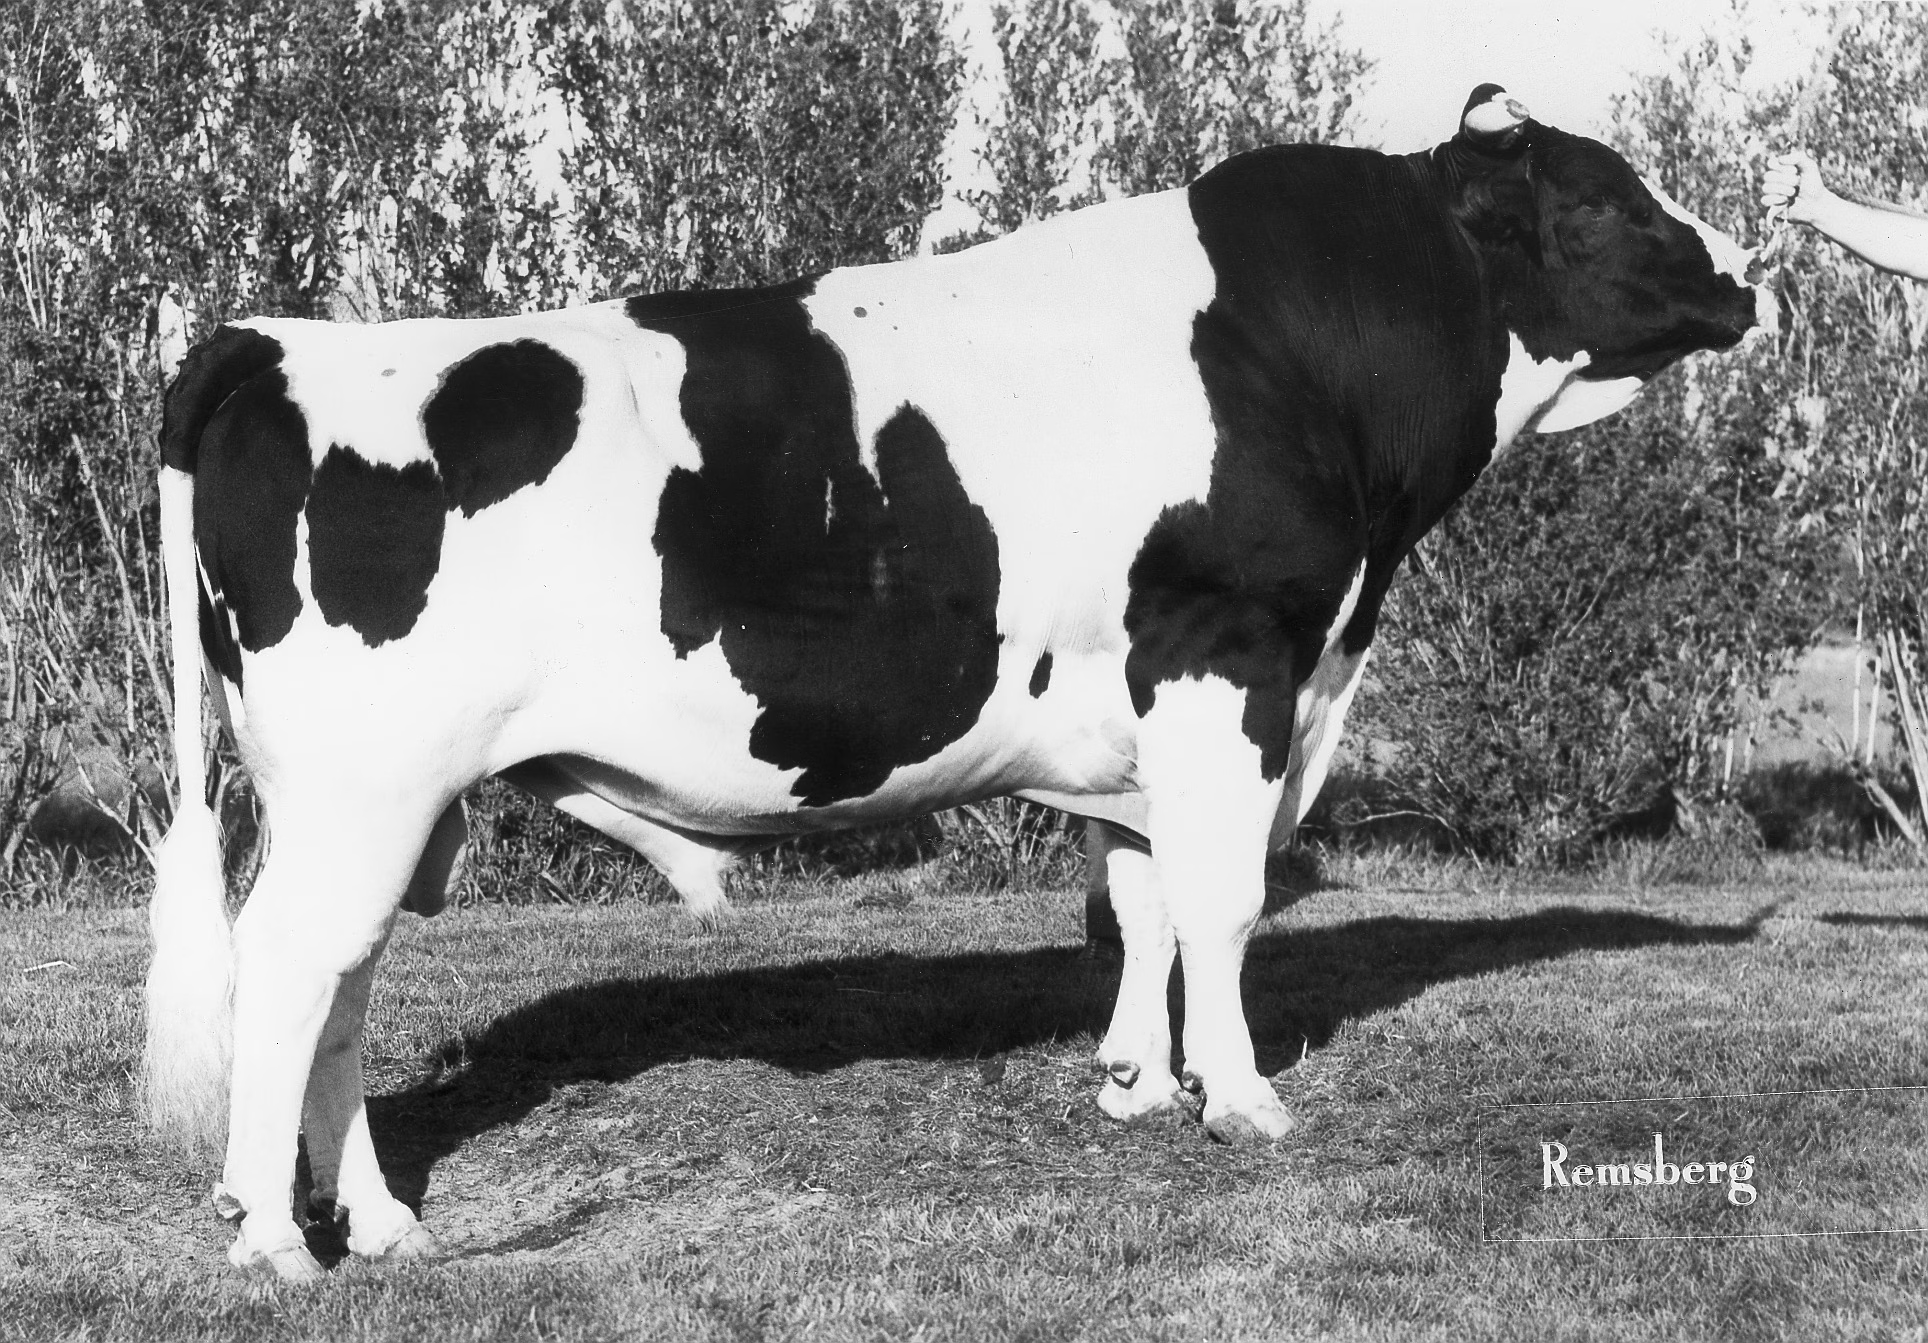
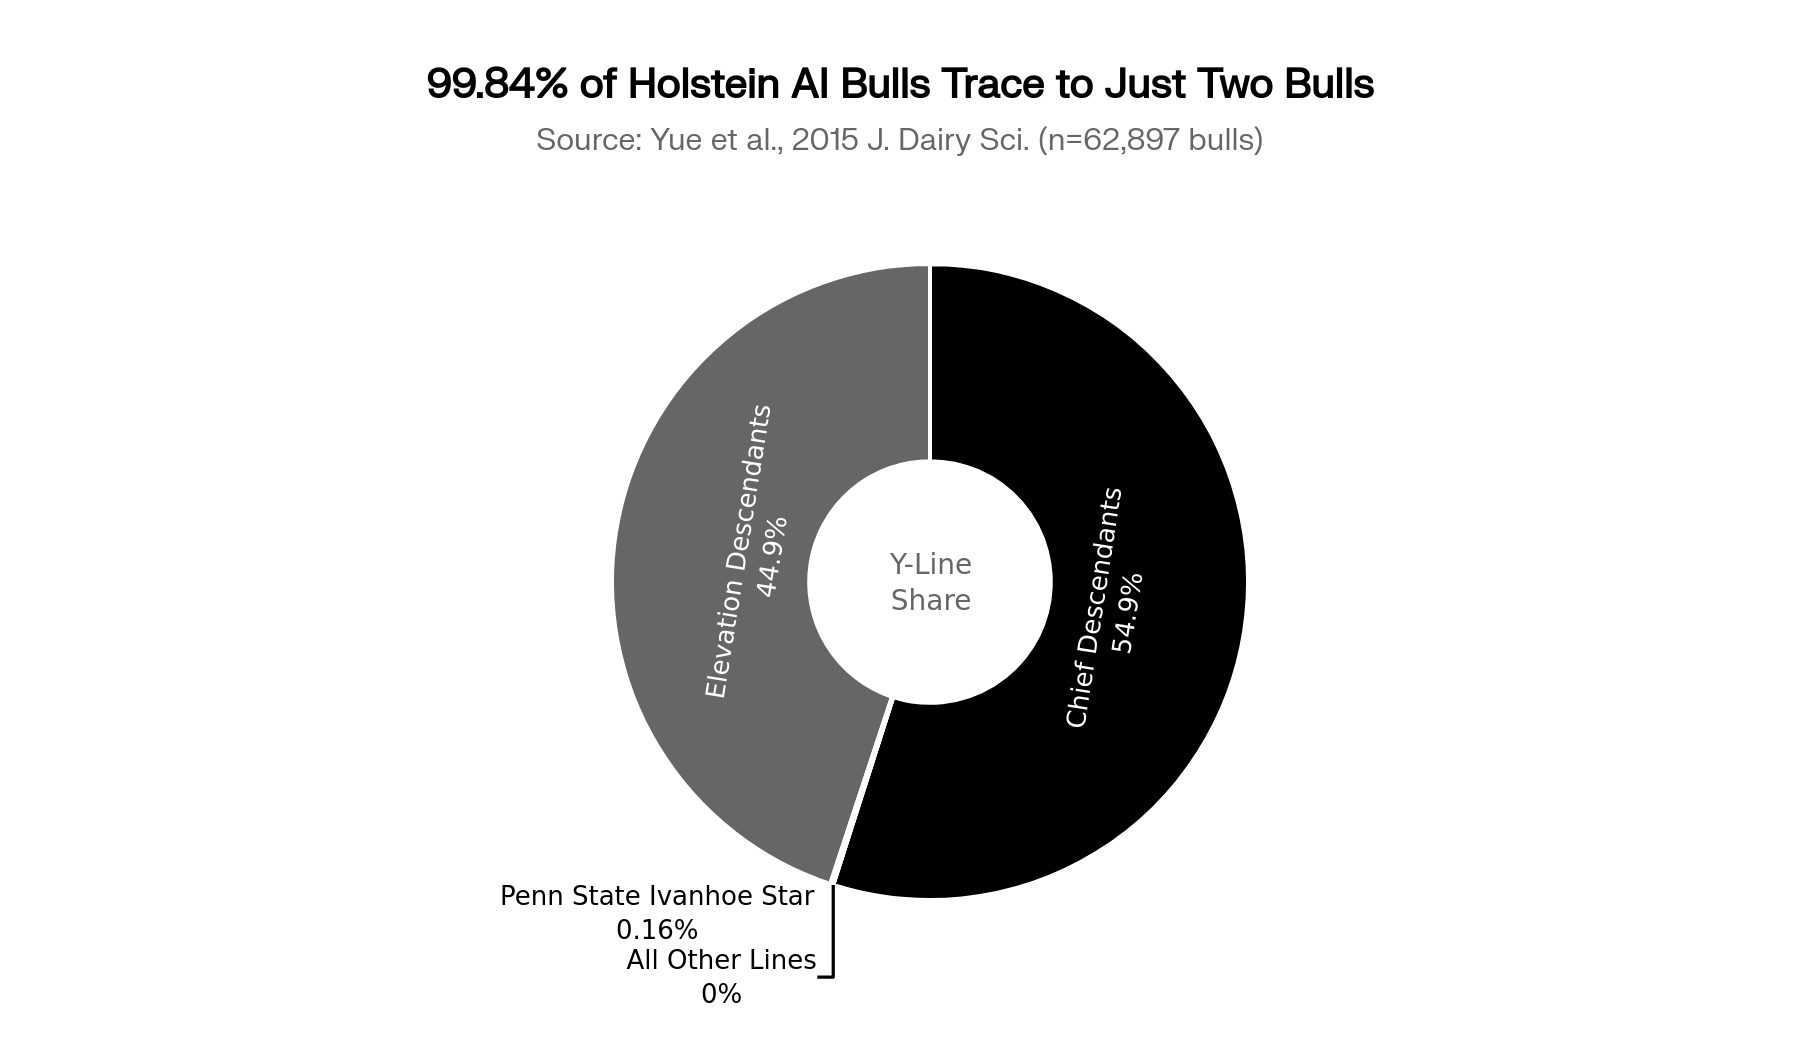
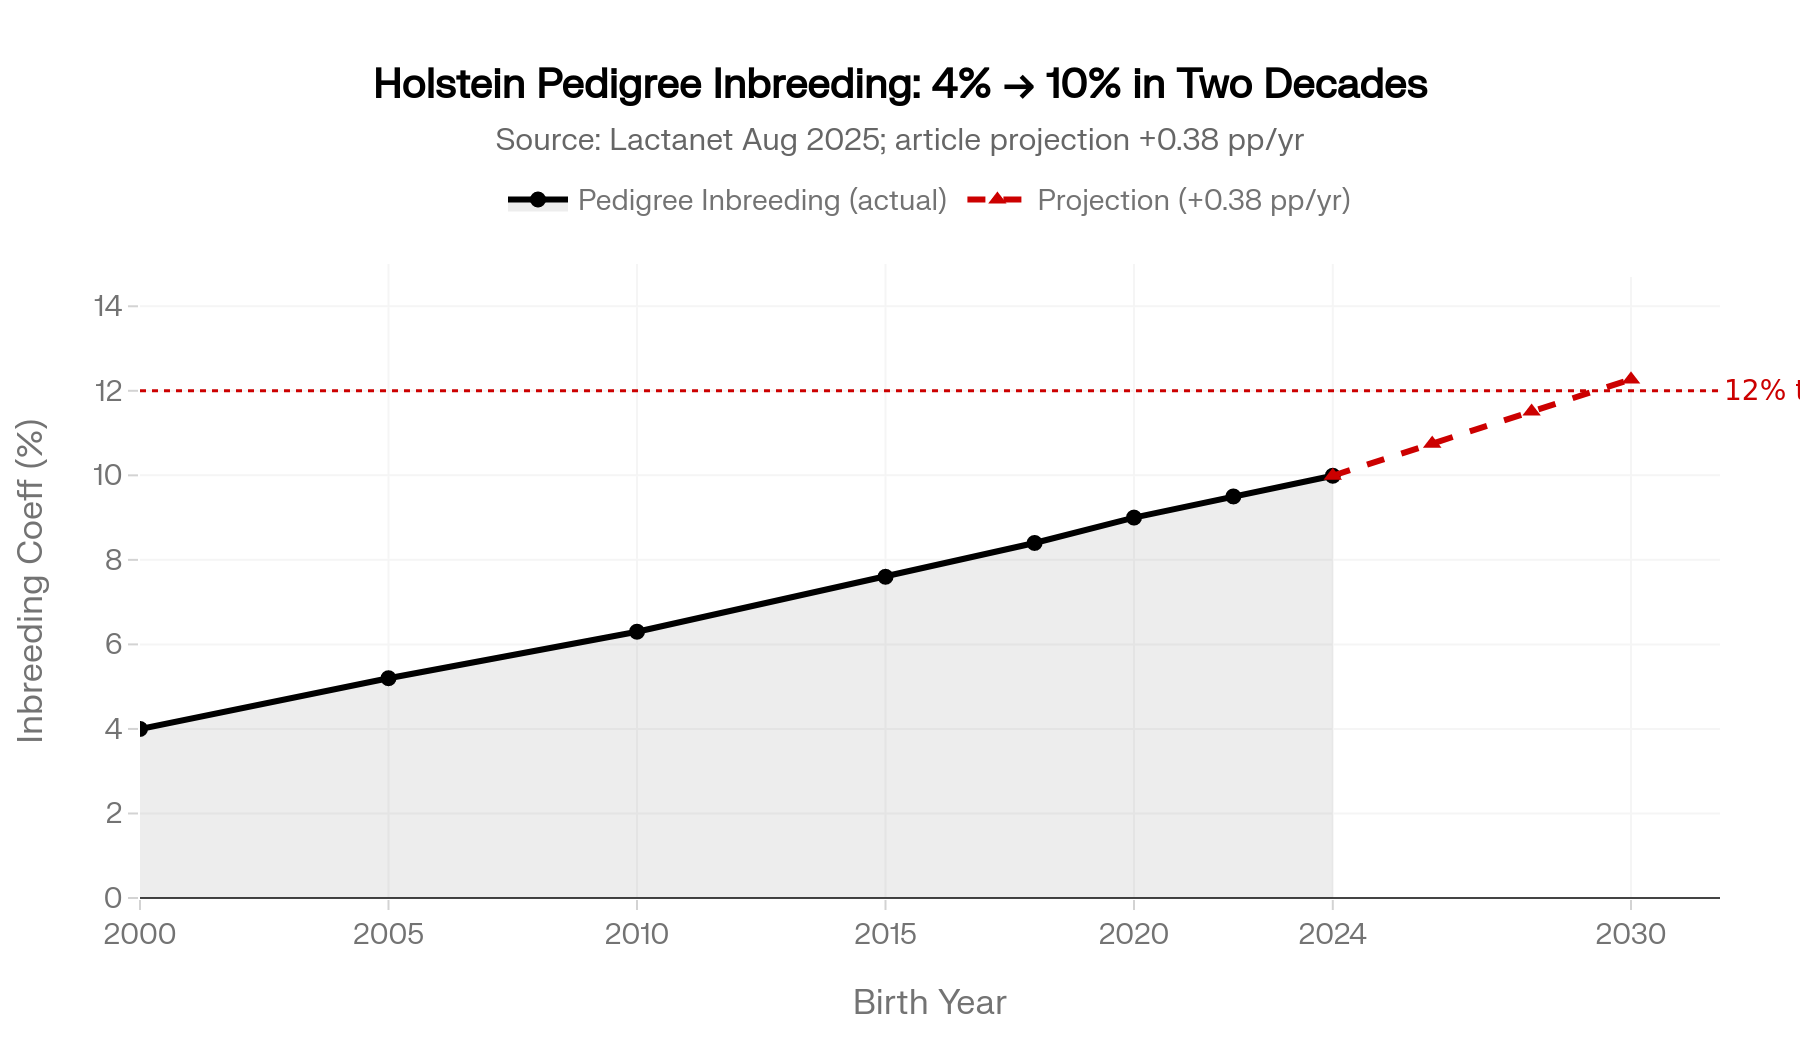
Two numbers tell you why those vault straws matter to your spring 2026 semen order. 99.84% of active Holstein AI bulls in North America trace paternally to just two grandfathers, Pawnee Farm Arlinda Chief and Round Oak Rag Apple Elevation. That’s from Yue, Dechow, and colleagues’ 2015 study in the Journal of Dairy Science, which ran across 62,897 bulls. The other number: 9.99% is the average pedigree-based inbreeding coefficient of Canadian Holstein heifers born in 2024, per Lactanet’s August 2025 update. The breed is now sitting on two Y-chromosomes, and those Y-chromosomes are stacking on top of each other.
Dechow, working with Wansheng Liu, Leon Specht, and USDA’s Harvey Blackburn, pulled the vault straws back into a breeding program. They mated long-frozen 1950s semen to elite modern females through IVF, raised the calves, and milked the daughters. The daughters didn’t underperform. The 2020 JDS paper reports that the resulting bulls were “above the expected level and equal to their counterparts from the current Holstein genetic base born in the same year”in production, with “high genetic merit for daughter fertility” and “high somatic cell scores.” The breed walked away from those genetics in the 1980s. Independent, peer-reviewed work says they still work.
And right now, they’re not on the page in front of you.
The Bottleneck Is Two Y-Chromosomes Wide
A third surviving Y-line, Penn State Ivanhoe Star, was holding on at 0.16% of active bulls in the 2010s. It’s effectively gone today. That leaves the entire active Holstein AI bull population — every catalog you’ll see this spring — sitting on Chief or Elevation paternally.
The 9.99% inbreeding figure is what that bottleneck does to your barn. It’s Canadian, from Lactanet’s August 2025 update on heifers born in 2024. CDCB doesn’t publish a single breed-average inbreeding number for U.S. Holsteins in the same format as Lactanet, but the trend lines CDCB does publish — plus genomic studies in commercial U.S. herds — point in the same direction as the Canadian number.
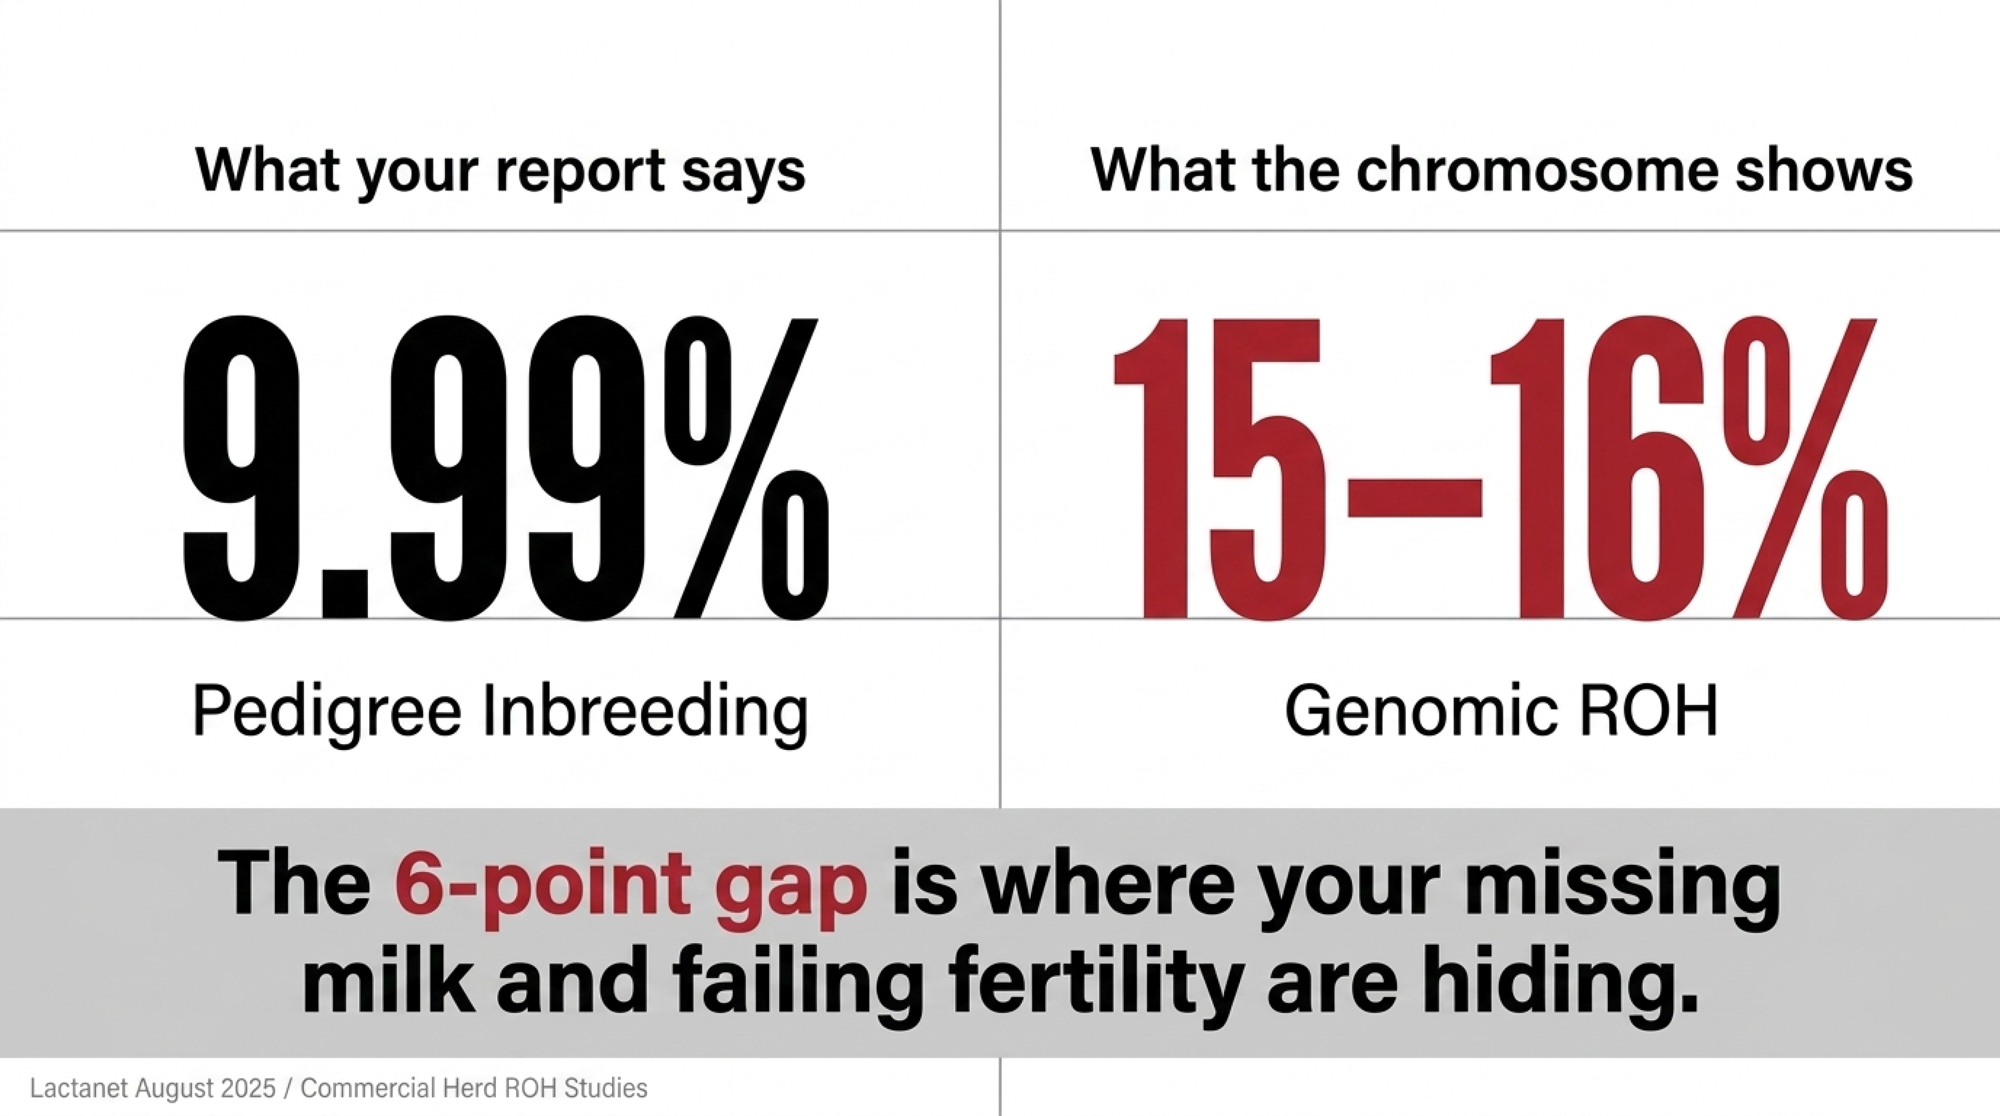
Genomic measures run higher than pedigree-based ones. Studies of commercial Holstein herds put runs-of-homozygosity inbreeding around 15–16% — roughly 6–7 percentage points above pedigree numbers. Pedigree understates what’s actually happening at the chromosome level. That gap matters when you’re trying to figure out why your fresh cows aren’t bouncing back the way they used to.
The trajectory: Lactanet’s Holstein inbreeding is climbing by about 0.38 percentage points per year in the current cohort. Project that forward at current selection intensity and the breed walks past 12% pedigree inbreeding well inside the next breeding decade.
How This Plays Out on Real Farms
You won’t see “inbreeding loss” on any single report. It shows up scattered. A few extra services per conception. Slightly higher SCC. Cows that don’t quite make it to a third lactation. Each item alone looks like ordinary herd noise. Stacked together, they’re a recurring tax.
Peer-reviewed estimates of how big the tax is land in a fairly tight range. Doekes (2019) and Makanjuola (2020) both report that roughly 80–108 lbs of milk are lost per 305-day lactation for each 1% increase in inbreeding. Ablondi (2023), using genomic ROH measurements in Italian Holsteins, estimates the loss at about 134 lbs per 1%. CDCB’s own Norman 2020 analysis sits at the lower end of the same range.
Here’s the micro barn math. Assumptions stated up front, treated as a model — not a guarantee:
- Current average inbreeding: 9.99% (Lactanet, August 2025)
- Pre-genomic baseline: 4.0% (typical Holstein average in the early 2000s)
- Delta: roughly 6 percentage points
- Loss rate: 80–108 lbs/lactation per 1% increase (Doekes/Makanjuola)
- Class III equivalent used in this model: $16.90/cwt, in line with USDA AMS Class III price reporting in the second quarter of 2026
That works out to roughly 480–650 lbs of milk per cow per lactation, quietly missing about $81–$110 per cow per year at that price. On a 500-cow dairy, the annual drag lands in the $40,500 to $54,700 range every year, before you count extended days open, mastitis events, and early culls that come with rising homozygosity.
That’s not a number that comes up in a normal semen-order conversation. But it’s the number you’re already paying.
How Did the Catalog Get This Narrow?
The mechanics aren’t mysterious. AI was commercialized in the 1950s and 1960s. Chief and Elevation sons proved out early, got used heavily, then got used more. Their sons did the same. Generation interval dropped, IVF compressed it further, and a small group of major studs ended up controlling the majority of North American Holstein sire influence.
Every Y-chromosome lineage outside Chief and Elevation lost ground until those lines essentially disappeared from commercial AI by the late 1980s. We’ve covered the broader genetics war reshaping AI catalogs in a separate Bullvine piece worth reading alongside this one. The CDCB system handles inbreeding by adjusting PTAs. That’s mathematically correct, but in our reading, it has a quiet side effect: every five-year base change resets the zero point against the current, more inbred population. In the April 2025 base change, inbreeding adjustments accounted for roughly 18% of PTA shifts in Holsteins. That’s not a small accounting note. It’s a meaningful share of why some producers saw smaller-than-expected proof movement.
Whose surprise that is depends on which side of the kitchen table you’re sitting on. Some of the smaller-than-expected drop reflects real genetic progress. Some of it reflects the cost of inbreeding being absorbed into a new baseline. Both things are technically true. Together, they tell completely different stories.
What Did the USDA Actually Prove?
Dechow’s 2020 paper, with Liu, Specht, and Blackburn, didn’t just thaw old straws and hope. The team recovered semen from Pilot (Netherland Prince line) and Cuthbert (Colantha line), produced 15 calves through IVF using elite modern females — seven bulls and eight heifers — and tracked the daughters into lactation.
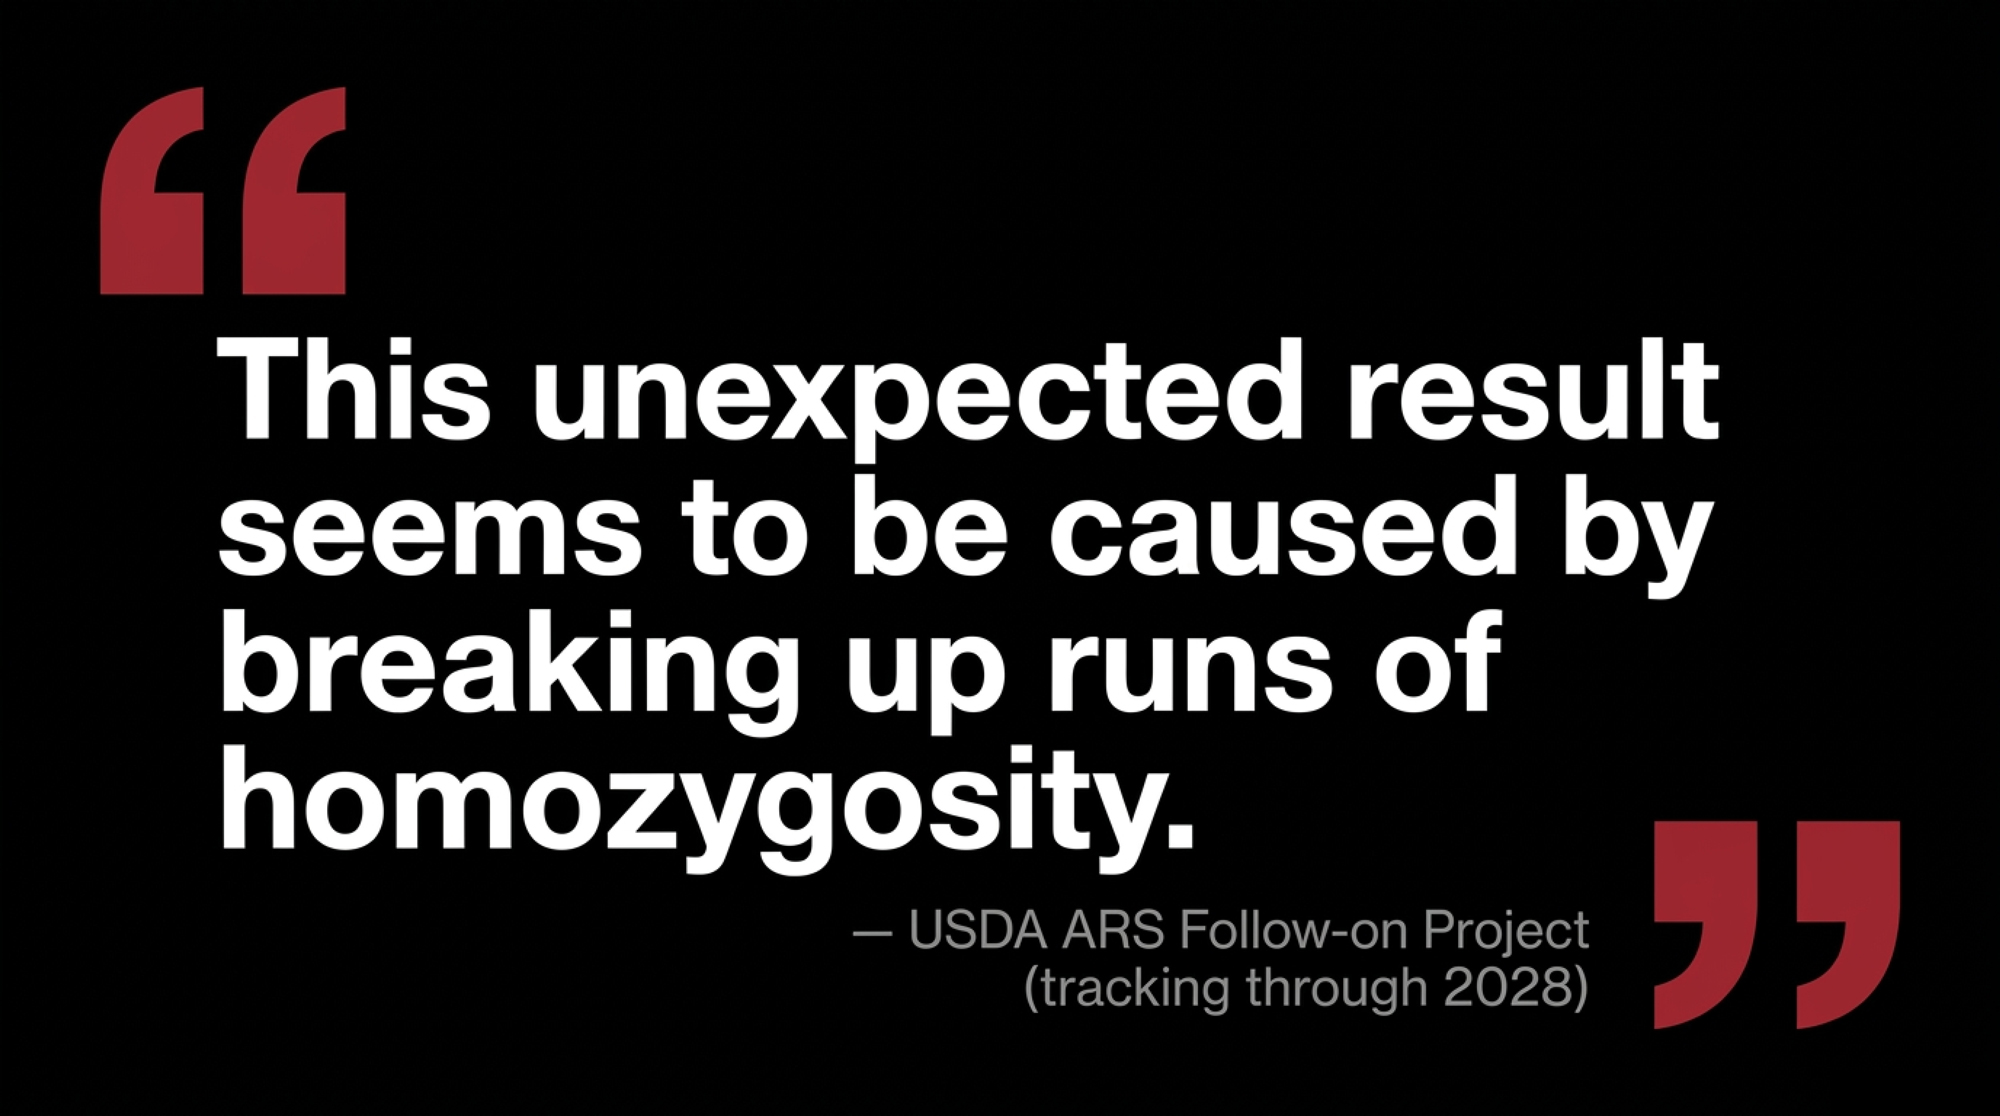
The published finding, in plain language: one generation of mating these “lost” bulls to elite modern cows produced bulls that were breed average for total economic merit, with high genetic merit for fertility and somatic cell scores, and near-average milk components. A USDA ARS follow-on project running through 2028 is now looking at the granddaughters. The project documentation puts the early result this way: “Results to date indicate that daughters’ performance was similar or exceeded daughters sired by contemporary bulls. This unexpected result seems to be caused by breaking up runs of homozygosity and therefore creating more heterozygous loci.”
That’s heterosis showing up inside a purebred program — from a Y-chromosome that’s been gone 60 years. The point isn’t that 1950s bulls are magically better. It’s that the breed currently carries enough hidden homozygosity that simply restoring lineage diversity yields a measurable bump on the very traits that have been getting harder to hold: fertility, health, and survivability. Readers who want the longer arc on how the breed got here can pair this story with our earlier piece on the four bulls that built today’s catalog.
Options and Trade-Offs for Farmers
| Option | Pedigree Diversity Level | Expected NM$ Trade-off | Best Fit |
|---|---|---|---|
| Hard 6.25% Inbreeding Cap (mating software) | Moderate improvement | −3 to −5 NM$ per mating | Any herd ≥ breed avg (~9–10%) inbreeding |
| VikingHolstein / CRV Nordic Outcross Sires | High — ~20 unique sires-of-sons | −10 to −20 NM$ vs. top domestic | Herds with fertility & longevity drag |
| Blondin Diversity Lineup (Quebec) | High maternal breadth | Small NM$ discount | Herds stacking Chief/Elevation maternal lines |
| Dechow/NAGP Reconstituted Bulls (Select Sires / TransOva) | Maximum — extinct Y-lines restored | Below top-genomic on NM$; high fertility | 20–30 cow pilot herds; research-minded farms |
| USDA Animal-GRIN Direct Request | Maximum — full vault access | Research-scale only; no NM$ data | University or breed-org partnerships only |
There’s no single playbook. There are realistic paths producers are starting to walk.
1. Tighten the inbreeding cap in your mating program — this month. Most mating software has an “expected progeny inbreeding” setting that defaults to “minimize” rather than a hard ceiling. Setting a hard cap — a common starting point in the literature is around 6.25%, going back to Weigel’s WCDS mating-program work — forces the algorithm to reject some matings rather than sort them. When it makes sense: Any herd at or above breed-average inbreeding. What it requires: A 30-minute call with whoever runs your mating program — your AI rep, your independent mating service, or your own herdsman if you run it in-house. Ask specifically whether your software supports a hard cap, not just a sort. Risks/limits: You’ll give up a few index points on individual matings. Lifetime profit math still favors the cap if the published loss curves hold.
2. Use Nordic or pedigree-diverse sires as a partial outcross. VikingGenetics builds its program around using bulls from about 20 different sires-of-sons each year, with strict caps on sons-per-sire and short marketing windows. CRV emphasizes broader pedigree breadth than is typical in North American catalogs, with explicit attention to sire-of-sons diversity. Blondin Sires in Quebec markets bulls deliberately built around outcross maternal lines — we’ve covered Blondin’s diversity-built lineup and the 75% growth that followed it in a separate piece. When it makes sense: Herds where pedigree concentration is already showing up as fertility or longevity issues. What it requires: Willingness to accept a small NM$/TPI gap for genuinely different genetics. Risks/limits: These bulls aren’t from extinct lineages. They still trace through Chief or Elevation paternally — just with broader maternal backgrounds. A partial fix, not a reset.
3. Ask your stud about access to the Dechow/NAGP reconstituted bulls. The 2020 JDS paper says explicitly: “Semen from the bulls is commercially available to facilitate Y chromosome research and efforts to restore lost genetic diversity.” Select Sires and TransOva were the industry partners on the project. That’s research-channel availability, not a routine catalog listing — and any conversation with a stud needs to start there. When it makes sense: Herds willing to run a small pilot — 20 to 30 matings — and track fertility, SCC, and survivability against a control group. What it requires: A direct conversation with someone at or above the district-rep level. These bulls aren’t in standard catalogs and may involve a research-style use agreement. Risks/limits: Access is informal. Production won’t beat your top genomic sire on paper. The upside shows up in fertility and homozygosity reduction, not in NM$.
4. Request directly through USDA’s Animal-GRIN portal. The portal at agrin.ars.usda.gov accepts germplasm requests for research, genetic-defect resolution, or diversity restoration. NAGP has released thousands of samples over more than two decades — research-scale, not retail-scale, when it makes sense: If you can partner with a university or breed organization on a documented project. What it requires: A formal application explaining the purpose. NAGP keeps a “Core Collection” of each breed that’s legally protected from commercial release. Risks/limits: Research access route, not a commercial channel. Best treated as a partnership, not a purchase.
The forward-looking signal sits inside paths 2 and 3. If a meaningful share of producers start asking studs about VikingHolstein outcross options or NAGP-derived sires this spring, the catalog you see in 2028 will look different than the one you’re holding now. If they don’t ask, it won’t.
How Much Is Your Current Catalog Costing You?
Pull your last semen invoice and your DC305 inbreeding report side by side. If your herd-average pedigree inbreeding is north of 8% and your top mating recommendations trace paternally through Shottle, Goldwyn, Planet, or O-Man within three generations — all widely used Chief or Elevation descendants — you’re stacking the same Y-chromosome on the same Y-chromosome. That doesn’t make the bulls bad. It makes the catalog narrow.
Holding the same Doekes/Makanjuola loss curve used in the headline math, knocking expected progeny inbreeding down by even two percentage points — by mixing in pedigree-diverse or minority-line sires — recaptures somewhere in the $27–$37 per cow per year range, or up to roughly $45 if you weight toward the higher Ablondi 2023 ROH-based estimate. On a 200-cow herd, that’s $5,400–$9,000 a year currently sitting on the table. The same dynamic shows up on the maternal side — the maternal-side concentration trap is where we’ve put the longer numbers on cow-family stacking.
| Scenario | Inbreeding Level | Loss vs. 4% Baseline | Cost/Cow/yr (Doekes 80 lbs/pp) | Cost/Cow/yr (Ablondi ROH 134 lbs/pp) | 500-Cow Annual Impact |
|---|---|---|---|---|---|
| Early 2000s Holstein baseline | 4.0% | — | $0 | $0 | $0 |
| Breed average 2020 | 9.0% | +5.0 pp | $67.60 | $113.30 | $33,800–$56,650 |
| Breed average 2024 (Lactanet) | 9.99% | +5.99 pp | $81.07 | $135.78 | $40,535–$67,890 |
| Projected 2028 (+0.38 pp/yr) | 11.51% | +7.51 pp | $101.61 | $170.23 | $50,805–$85,115 |
| After 2 pp reduction via outcross | 7.99% | +3.99 pp | $54.00 | $90.47 | $27,000–$45,235 |
Is Your Genetics Conversation Asking the Right Questions?
When your AI rep walks in this spring, the standard question is, “Who’s your top NM$ bull?” That’s the question the catalog is built to answer. It’s also the question that produced 9.99% inbreeding. A different conversation starts with these four:
- What percentage of your active Holstein lineup traces paternally to bulls other than Chief or Elevation descendants?
- How many unique sires-of-sons sit behind the top 20 bulls you’d recommend for my herd?
- What’s the expected pedigree and genomic inbreeding of progeny under your default mating plan — and how much can you knock it down with substitutions?
- Do you have access to any of the USDA NAGP reconstituted-lineage bulls, or to VikingHolstein/CRV outcross sires for a portion of my matings?
You may not get clean answers. The questions still do their job. They signal that the customer is evaluating offerings on dimensions beyond NM$, giving the stud a reason to surface diversity-relevant options, if any exist, in their lineup. Any reader who hasn’t already seen our coverage of the 9.99% Bell 2.0 number itself should pair that piece with this one.
The Institutional Blindspot
The trend itself isn’t being ignored. Holstein USA, the National Association of Animal Breeders, and the Council on Dairy Cattle Breeding have all published commentary or data on rising Holstein inbreeding. The gap is at the next level down: a formal initiative aimed specifically at the Y-chromosome bottleneck Yue and colleagues documented in 2015.
Based on a review of each organization’s public materials as of publication, no formal initiative specifically targeting Y-chromosome lineage concentration has been identified at any of the three. The peer-reviewed proof has existed since 2020. The freezer in Fort Collins has been running since 1999. The barn-level cost is being paid right now in fertility, SCC, and lost lactations. Whether industry institutions choose to lead on this or wait for producers to drag them into the conversation is a story this publication will keep covering — and any formal Y-lineage program announced by Holstein USA, NAAB, or CDCB after publication will be reflected in updates here.
Key Takeaways
- If your herd’s pedigree-based inbreeding is at or above breed average (~9–10%), the modeled production drag at current milk prices is realistically $81–$110 per cow per year versus a 4% baseline — $40,500–$54,700 annually on a 500-cow dairy before you count fertility and longevity effects.
- If you only look at pedigree inbreeding, you’re working with the smaller of the two real numbers. Genomic ROH inbreeding runs 6–7 percentage points higher. Ask whether your mating program can also report ROH or genomic future inbreeding.
- If you haven’t set a hard cap on expected progeny inbreeding, do it this month. Start near 6.25% and watch which matings the algorithm rejects. That’s your information.
- If your AI rep can’t answer how many unique sires-of-sons sit behind your top 20 recommendations,you’ve found a gap worth closing before you order.
- If you’re considering a pilot with reconstituted-lineage or pedigree-diverse semen, plan it as a 20–30-cow trial with a matched control group and full health and fertility tracking. Anecdotes won’t move your operation. Recorded data will.
- If your stud has no answer on NAGP-derived sires, VikingHolstein, CRV outcross options, or Blondin’s diversity lineup, treat that silence as a data point worth raising at your next genetics review.
What Are You Going to Do Before Spring Orders Close?
The peer-reviewed research has been sitting in the Journal of Dairy Science since 2020. The freezer in Fort Collins has been there since 1999. The 9.99% number arrived last summer. None of that changes what’s in your tank this morning. But it does change the question worth asking before your next breeding season starts: of the bulls your stud will sell you in the next 60 days, how many are doing anything genuinely different than the bulls your stud sold you five years ago — and what’s that costing you per cow, per lactation, in a market where margins are already thin?
If you want to walk the math on your own operation — herd size, current inbreeding, expected loss versus available alternatives — the per-cow and per-lactation calculator goes live in this week’s Bullvine Weekly, along with the producer-to-stud script for actually getting answers about lineage diversity. That’s where the numbers come home.
Complete references and supporting documentation are available upon request by contacting the editorial team at editor@thebullvine.com.
Learn More
- Holstein inbreeding hit 9.99%: the Bell 2.0 trap — Arms you with an immediate 30-day tactical roadmap to overhaul mating software defaults, activate critical haplotype blocking, and source genuine outcross alternatives before your next breeding run.
- 9.99% Inbreeding and Rising: How Blondin Sires Turned a Holstein Bottleneck into 75% Growth — Follows the money on how commercial concentration forces a
lifetime per-cow penalty and details the multi-year commercial strategy one major stud used to achieve rapid growth by deliberately prioritizing outcross maternal lines.
- The $8,100 Gamble on Missy, 198 Dragged Genes, and the 20-Year Breeding Blind Spot Hiding in Your Herd— Exposes the hidden genomic “hitchhiking” mechanism behind the acceleration of inbreeding under modern selection and dismantles the illusion of rapid index gains by mapping the true, profit-erasing cost of high herd turnover.
 The Sunday Read Dairy Professionals Don’t Skip.
 The Sunday Read Dairy Professionals Don’t Skip.
Every week, thousands of producers, breeders, and industry insiders open Bullvine Weekly for genetics insights, market shifts, and profit strategies they won’t find anywhere else. One email. Five minutes. Smarter decisions all week.
