
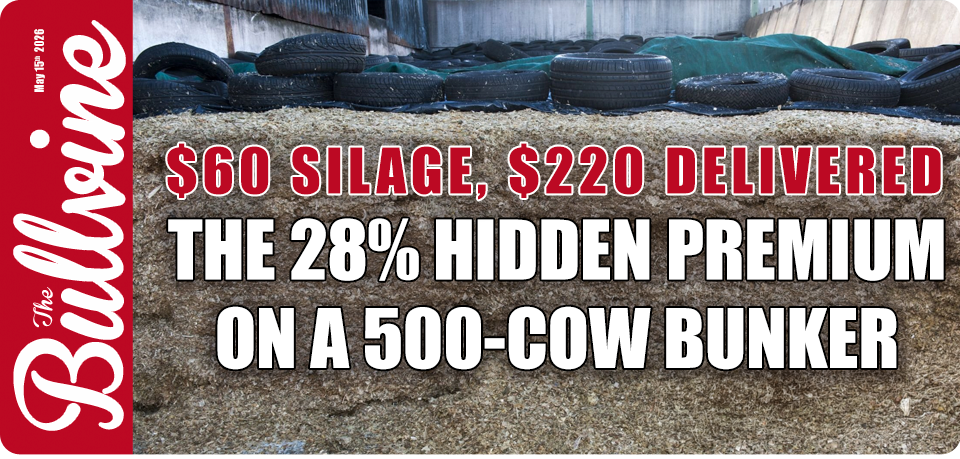


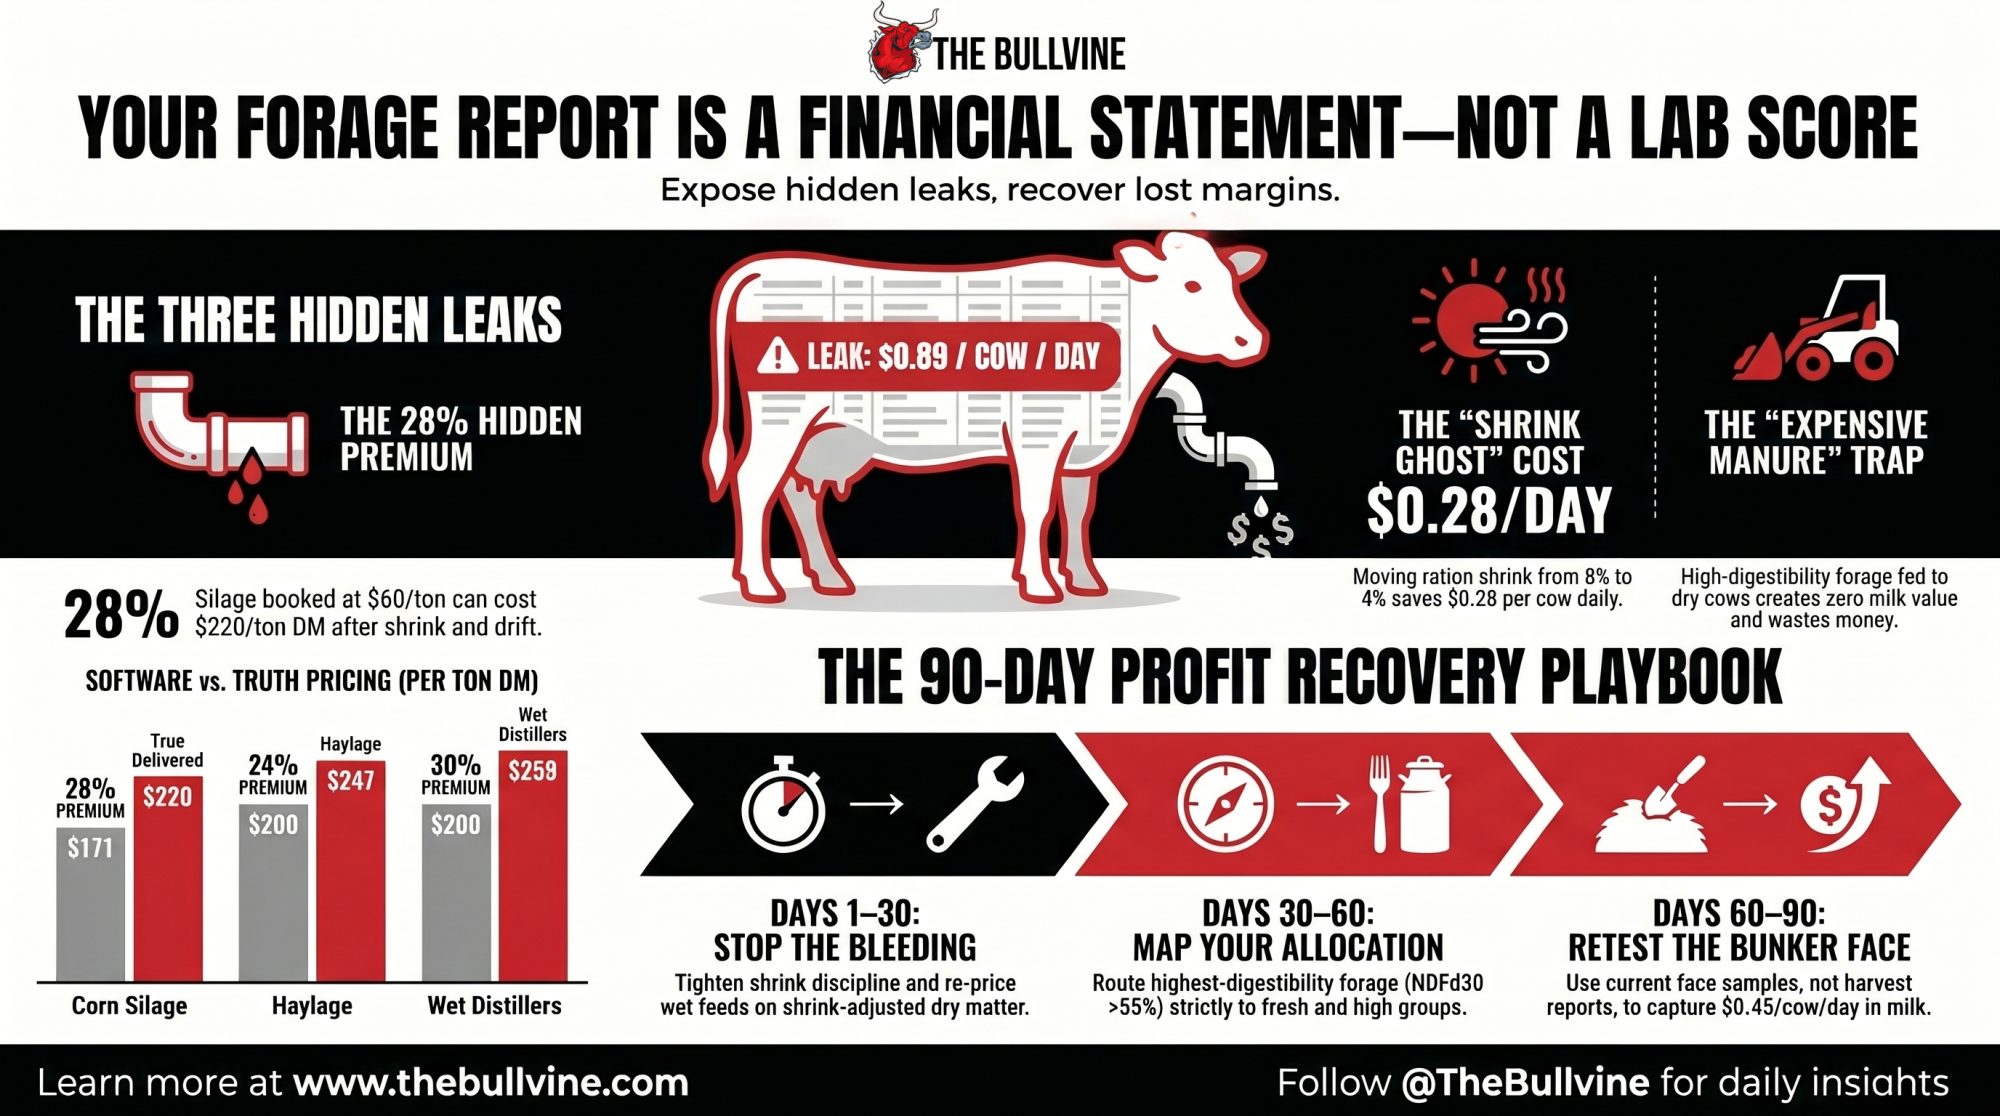
A 500-cow Southwest dairy booked corn silage at $60/ton. Shrink-adjusted, the cows ate $220/ton DM. Same pit, same lab sheet, $0.89/cow/day bleeding out before the milk hit the tank.
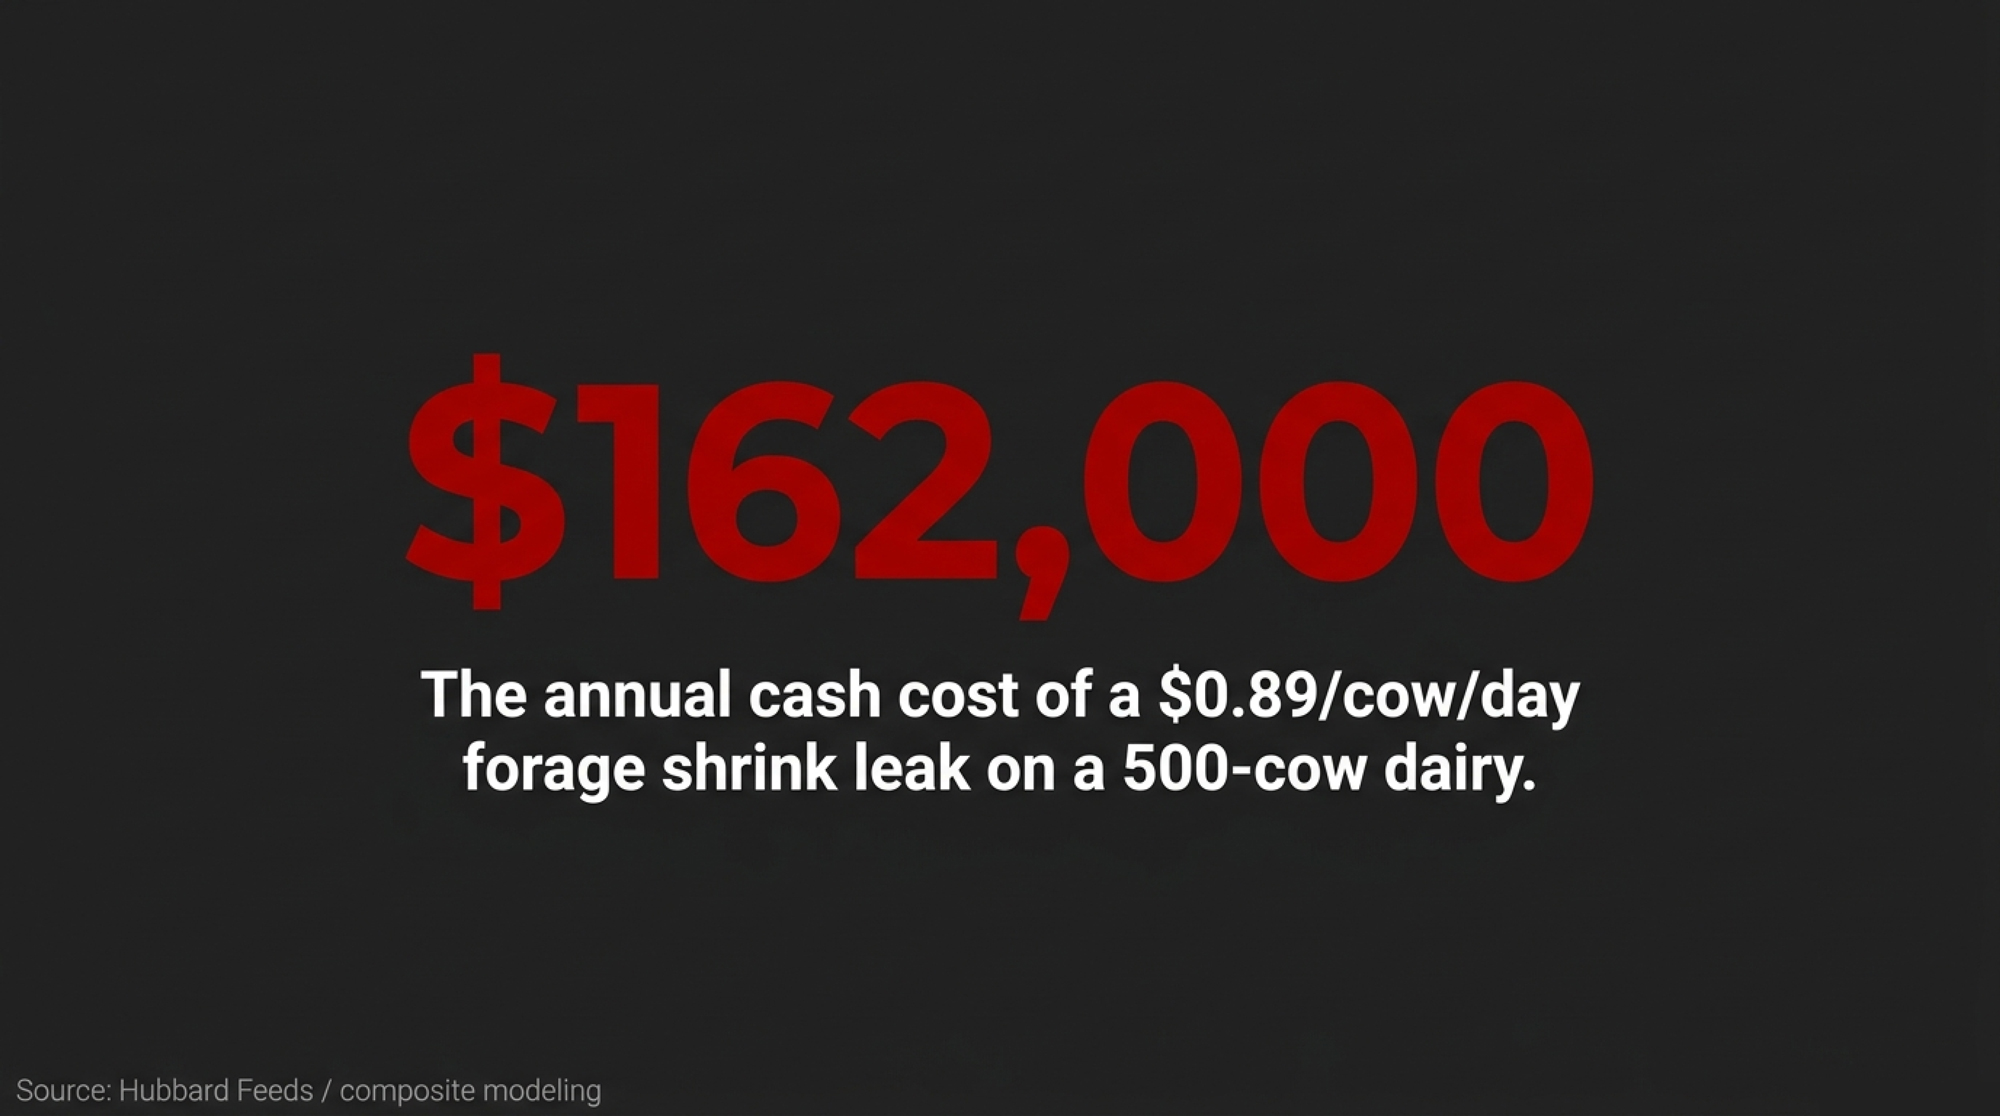
Run that $0.89 daily leak across 500 cows for 365 days and you land at $162,000 a year — the cash cost of treating a forage report as a lab score instead of a delivered-cost statement. Hubbard Feeds’ 2021 shrink-cost work documents the per-cow-per-day mechanics behind that order of magnitude on a comparable 300- to 500-cow herd running an $8 ration with loose shrink discipline. That’s what a forage economics blind spot costs in cash on a Southwest dairy in 2026.
Editor’s note: This walkthrough is an explicitly composite scenario, modeled by The Bullvine from documented forage-economics research and editorial observation across early-2026 Southwest feed-center conversations. No individual farm, operator, processor, or lab is identified. One Southwest dairy nutritionist is quoted on background at their request. Figures are modeled within documented research ranges; your own numbers will move with herd size, milk price, ration cost, regional shrink exposure, and group structure.
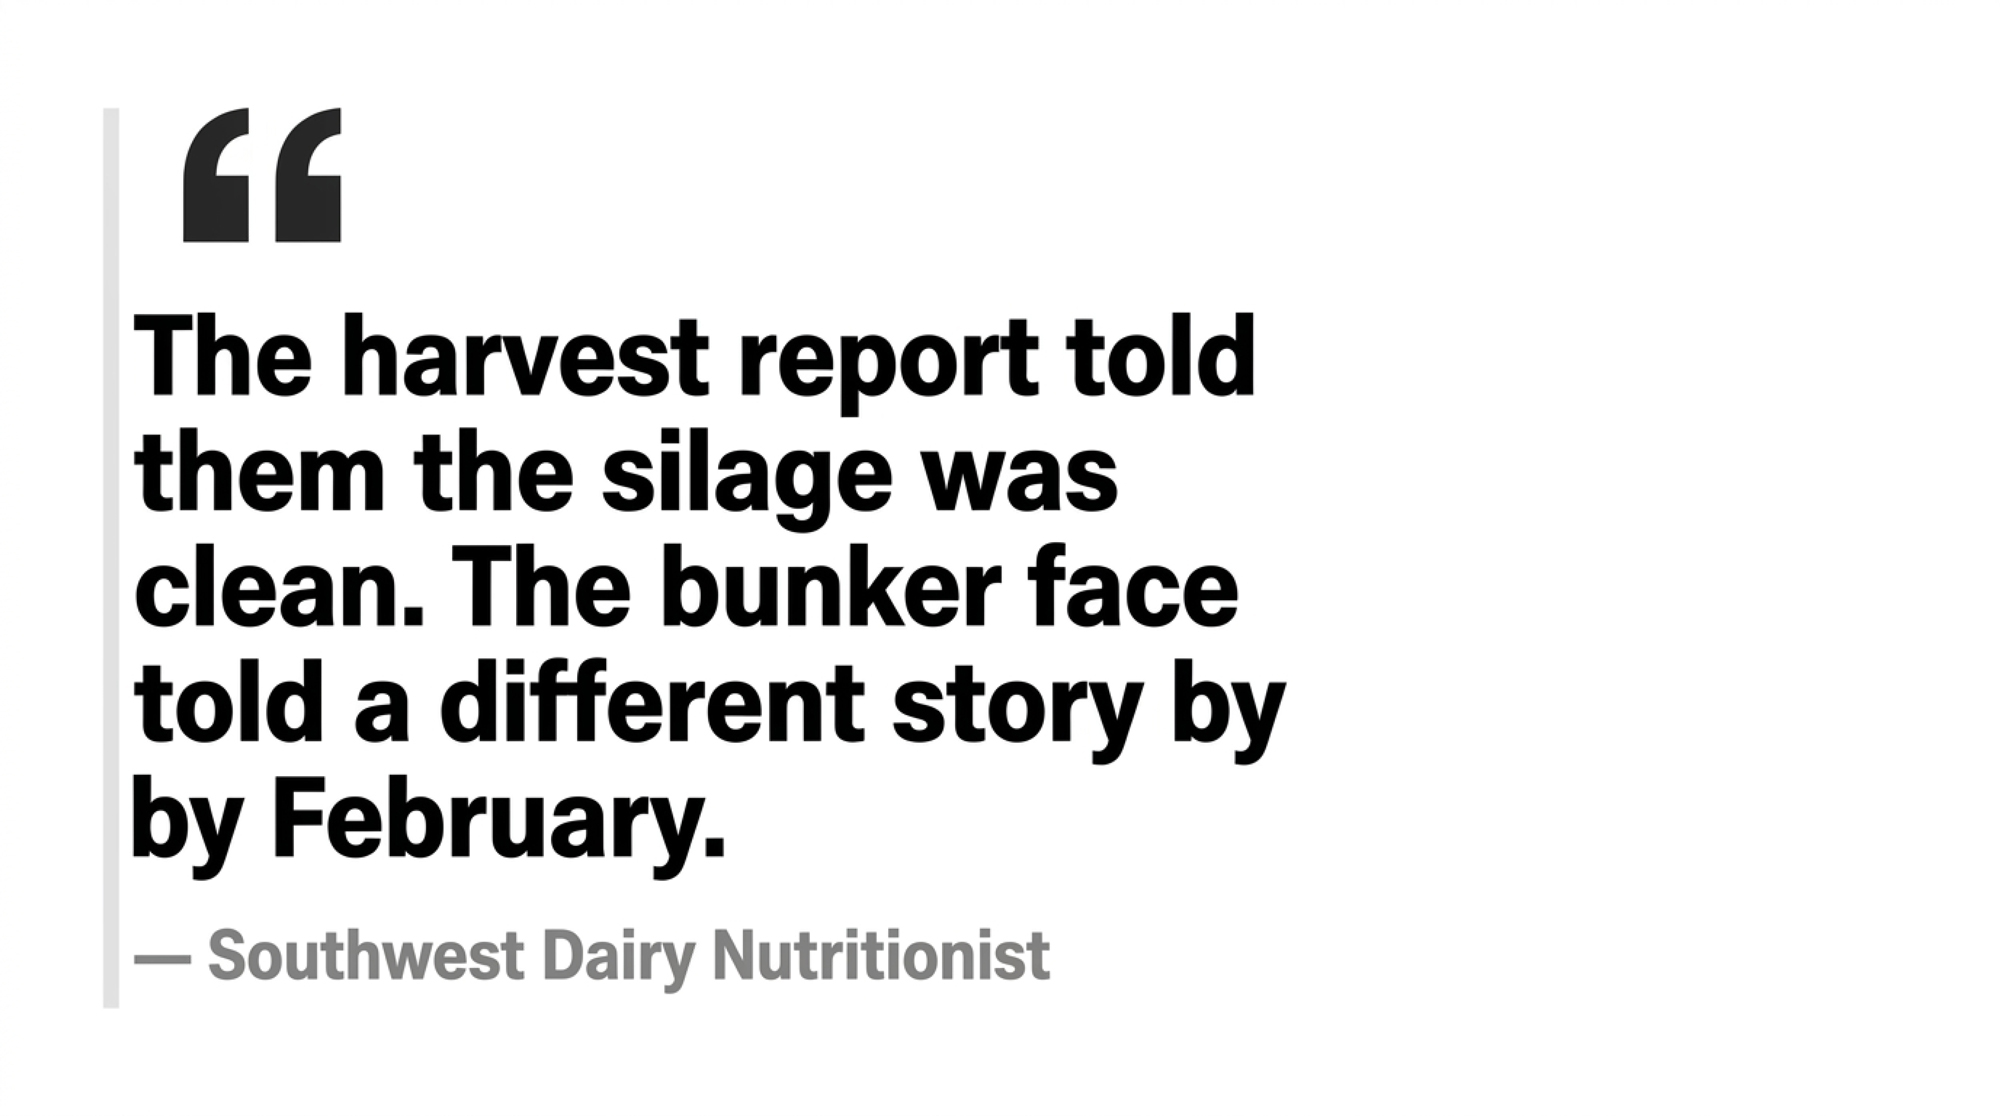
“The harvest report told them the silage was clean. The bunker face told a different story by February.” That’s how one Southwest dairy nutritionist, speaking to The Bullvine on background in early 2026, described the pattern.
Your forage report isn’t a report card. It’s a financial statement. Plenty of 300- to 500-cow dairies still read it as lab scores instead of delivered-cost economics, and the gap never shows up on the forage sheet — it shows up on the feed-cost-per-cwt line.
Why a “Good” Forage Test Can Still Hide a $0.89 Leak
The composite operation has the structural setup typical of a 300- to 500-cow Southwest dairy: multiple milking groups, dry-cow pens, and on-farm forage storage. The 2025 harvest report looked clean — RFV in a solid range, CP where it should be, NDF inside the window. On paper, the high group had no reason to stall.
It stalled anyway.
Everyone assumed the lab sheet was the answer. The lab sheet is a starting point, not a destination. The trap has three layers, and a herd like this pays into all three at once.
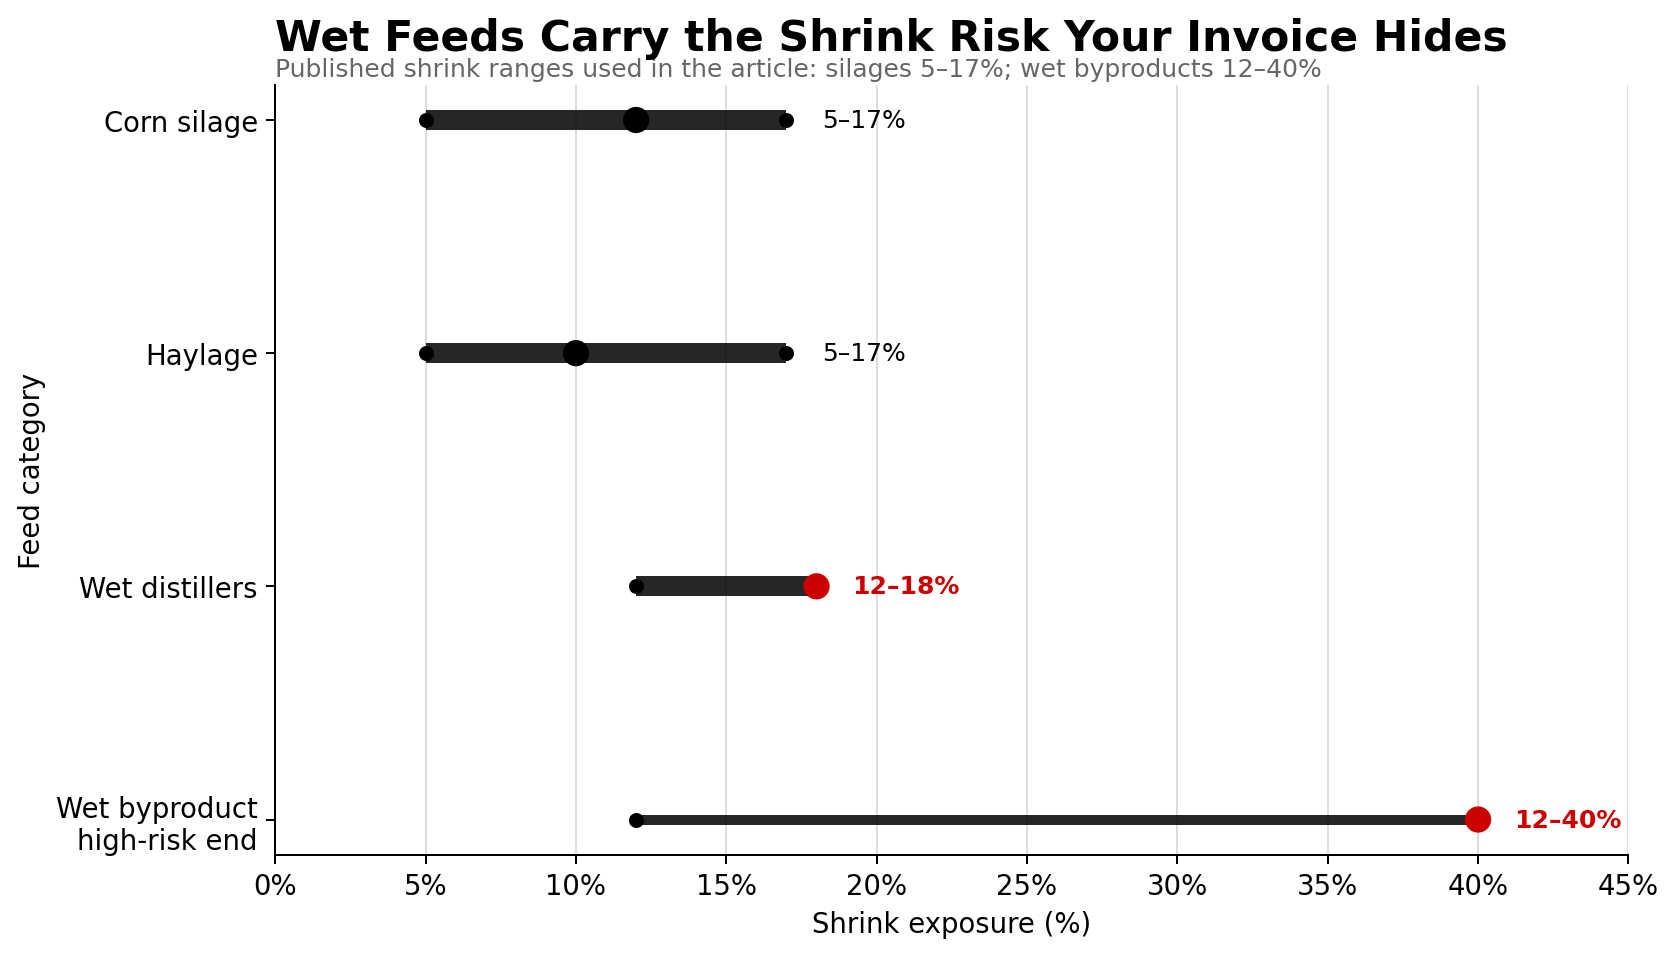
Layer one: shrink as a ghost line. On-farm corn silage and haylage shrink typically runs 5–17%; wet-byproduct shrink runs 12–40% (Hubbard Feeds, 2021). Hubbard’s own shrink math shows that moving ration shrink from ~8% to ~4% cuts true feed cost by about $0.28/cow/day on an $8 ration. Cornell PRO-DAIRY’s published feed-shrink case work on commercial dairies has reported similar per-head-per-day savings — in the same order of magnitude — from cutting ingredient shrink in half. Neither figure lives on the ration sheet. Both show up as “feed cost per cwt feels high,” and nothing more specific.
Layer two: DM drift, with Southwest 2026 heat as the accelerant. Penn State Extension’s 2023 feed-inventory guidance is blunt: wet forages need frequent DM testing through winter and at every weather change. In a 2026 Southwest summer, the bunker face isn’t drifting — it’s cooking. Sustained heat speeds secondary aerobic fermentation at the exposed face, where yeasts and molds metabolize residual sugars and lactic acid the moment oxygen reaches them (Kung, U Delaware; Shaver, UW–Madison Extension, Silage Spoilage and Aerobic Stability). DM disappears as CO₂ and water before the loader touches it.
A corn silage face booked at 35% DM in late summer can drift to 31% DM by February — illustrative for the composite, but inside published Penn State and Miner Institute field ranges. The high-group feeding rate doesn’t move. Real delivered DM drops by (35 − 31) / 35, or about 11%. At a 50-lb as-fed feeding rate, that’s ~2 lb of silage DM per cow per day the ration model thinks it’s feeding and isn’t.
Layer three: group misallocation. The better lot runs across every pen — high, mid, close-up, far-off dry — because it’s closest to the mixer. UW–Madison Extension’s 2021 Does Forage Quality Pay? bulletin is direct: feed the most digestible forage to cows in early lactation. Michigan State puts the uNDF240 gut-fill ceiling near 0.4% of body weight for high-producing cows; Miner Institute and Cornell peg the rumen uNDF240 pool ceiling at roughly 0.48–0.62% of body weight.
Dry cows don’t convert extra NDFd into salable milk. Often, they benefit from more uNDF240 by design. Feeding your highest-NDFd silage to far-off dry cows isn’t being kind to the cows — it’s an expensive way to produce high-quality manure.
Three leaks. One ration model that can’t see any of them. And a regional milk-price picture that won’t forgive the drift.
How Much Milk Is 4 NDFd30 Points Actually Worth on Your Operation?
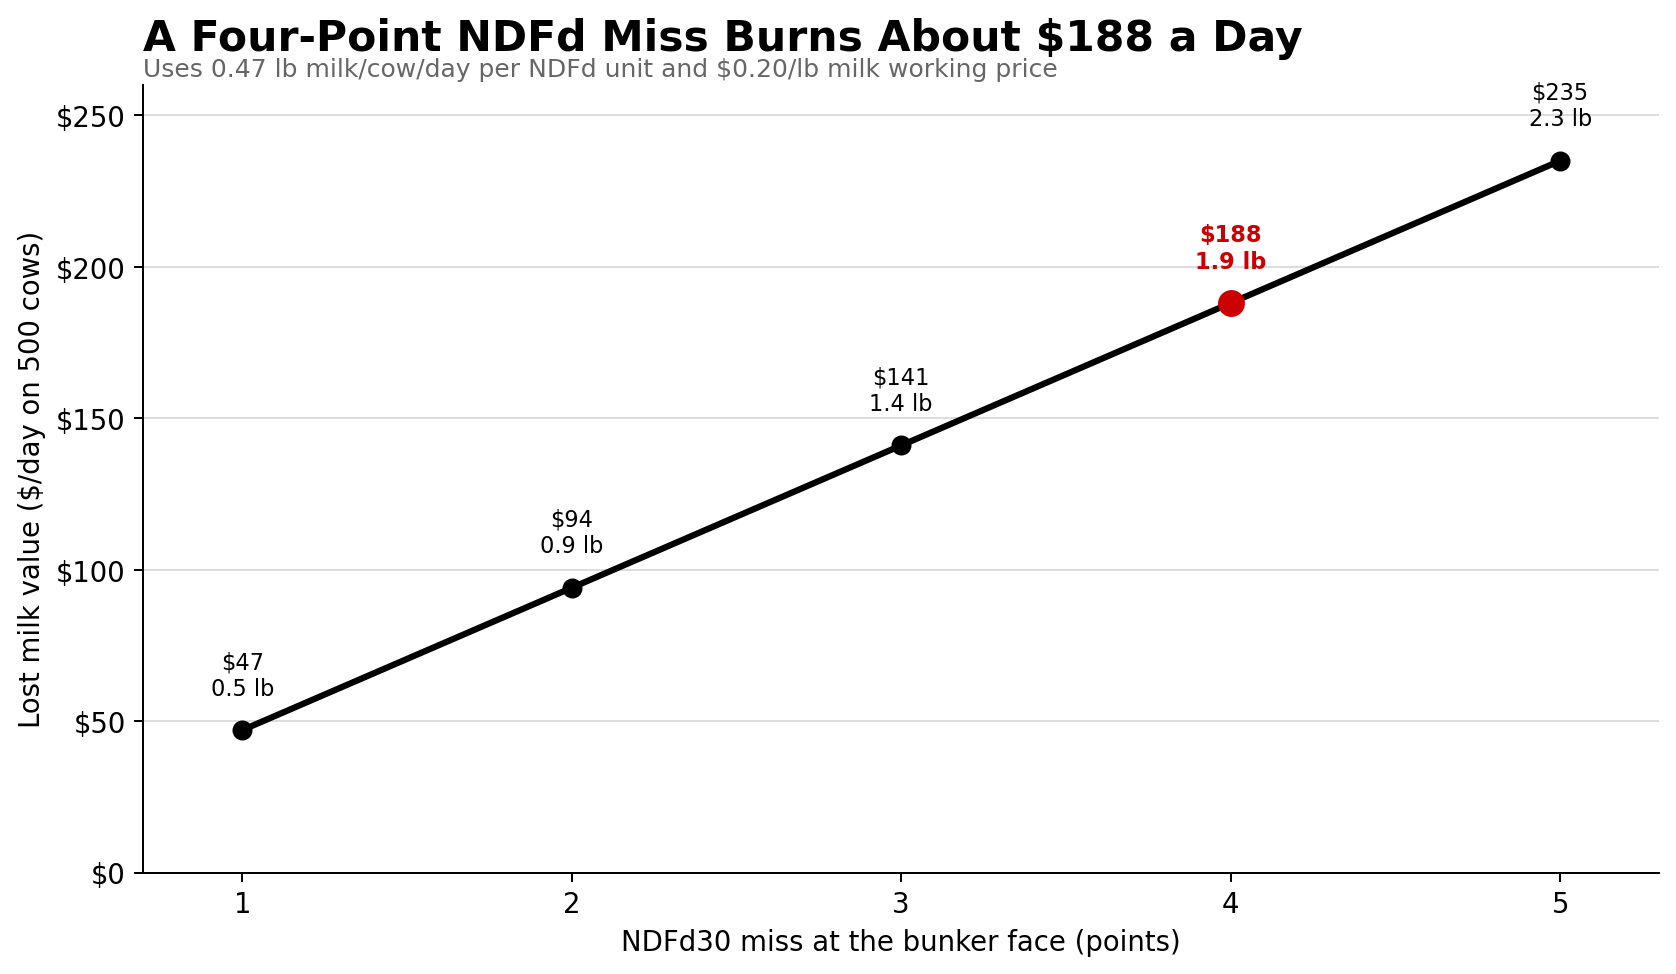
Oba and Allen’s 1999 Journal of Dairy Science meta-analysis is still the anchor: about 0.25–0.55 lb per day of 4% fat-corrected milk per one-unit bump in in vitro NDF digestibility within a forage class, with a central estimate near 0.47 lb. A four-point NDFd miss on the bunker face actually feeding your high group pencils to roughly 1.9 lb of milk per cow per day the model promised and the cow never delivered.
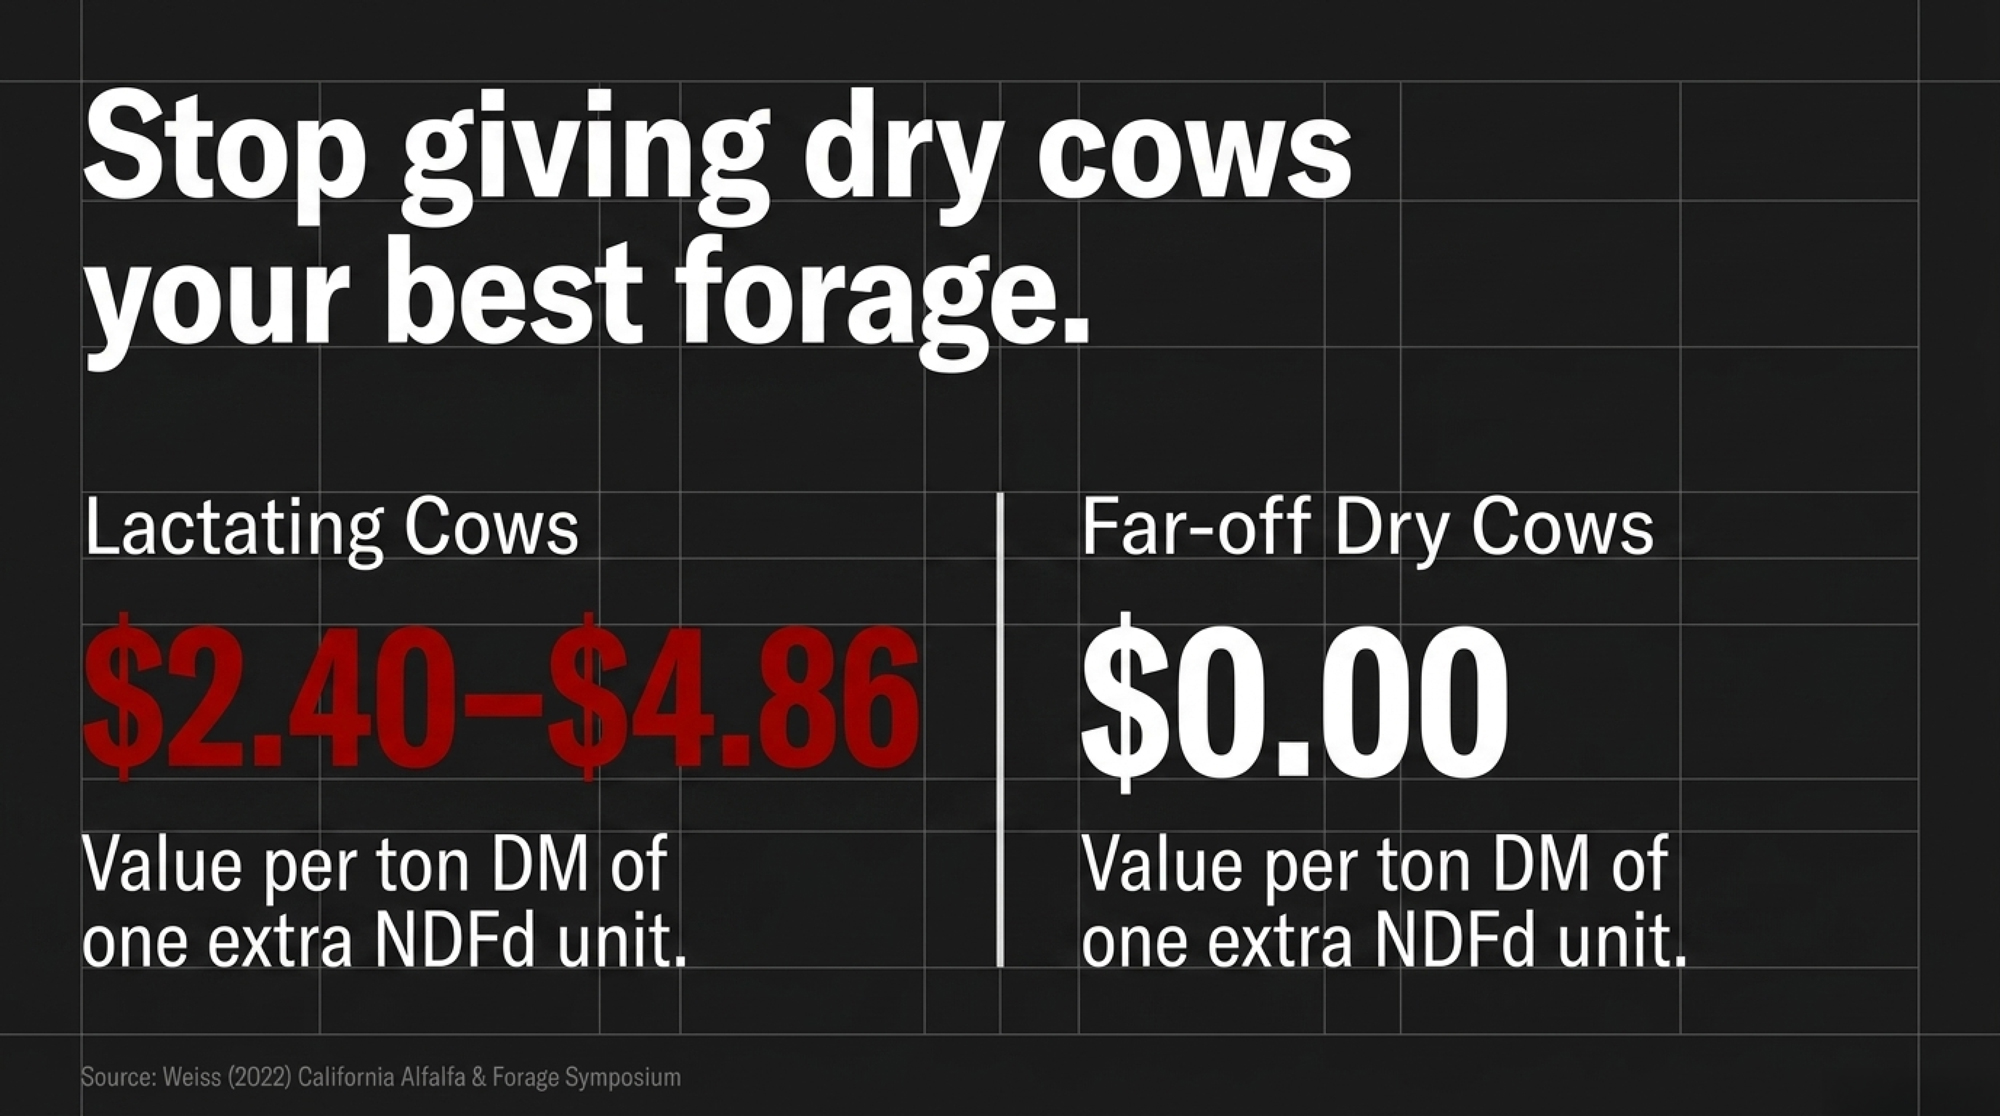
Bill Weiss’s 2022 California Alfalfa & Forage Symposium paper translated that biology into ration economics at roughly $2.40 to $4.86 per ton of DM per IVNDFD unit, scaled to milk-price band. The same NDFd unit is worth effectively zero in far-off dry cows.
Same ton of silage. Two entirely different economies. One pen pays you for quality. The other doesn’t.
Related reading: Dairy Cow Nutrition 2026: Ration Formulation, Forage Quality, Feed Efficiency — thebullvine.com/nutrition-2026-ration-formulation
What’s the Difference Between $/Ton As-Fed and Shrink-Adjusted $/Ton DM?
“Once we re-priced the silage on what the cows actually got, the cheap pit wasn’t cheap anymore.” That’s how the same Southwest nutritionist framed the moment the math flipped.
The shift isn’t complicated. It’s arithmetic most farms never run.
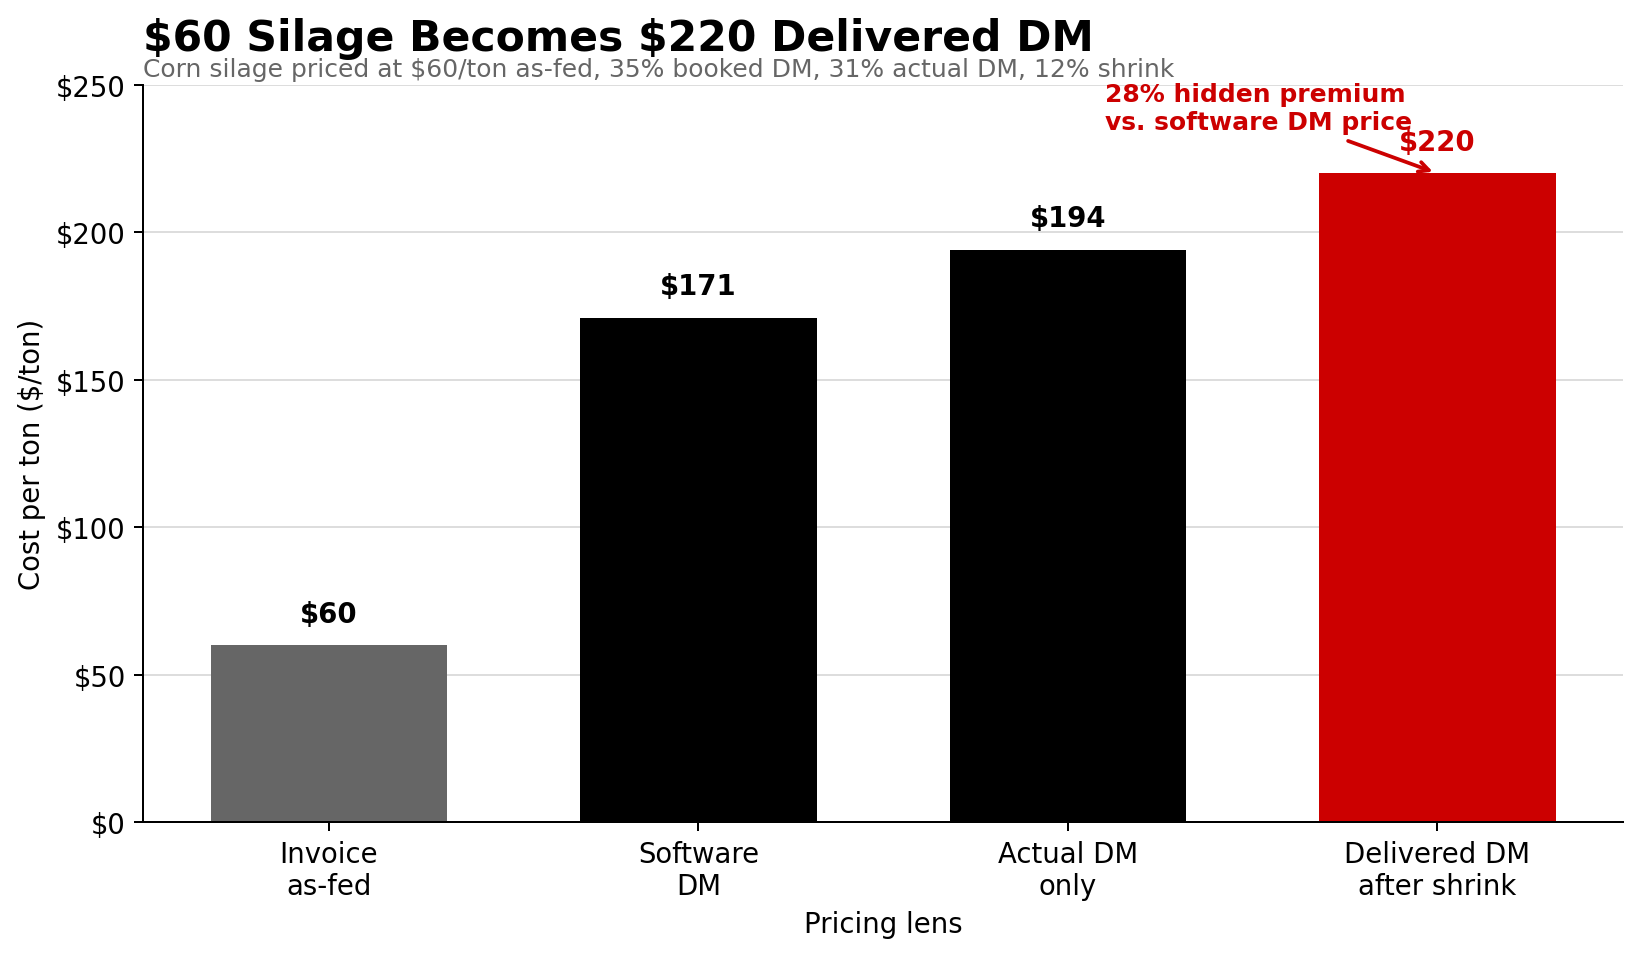
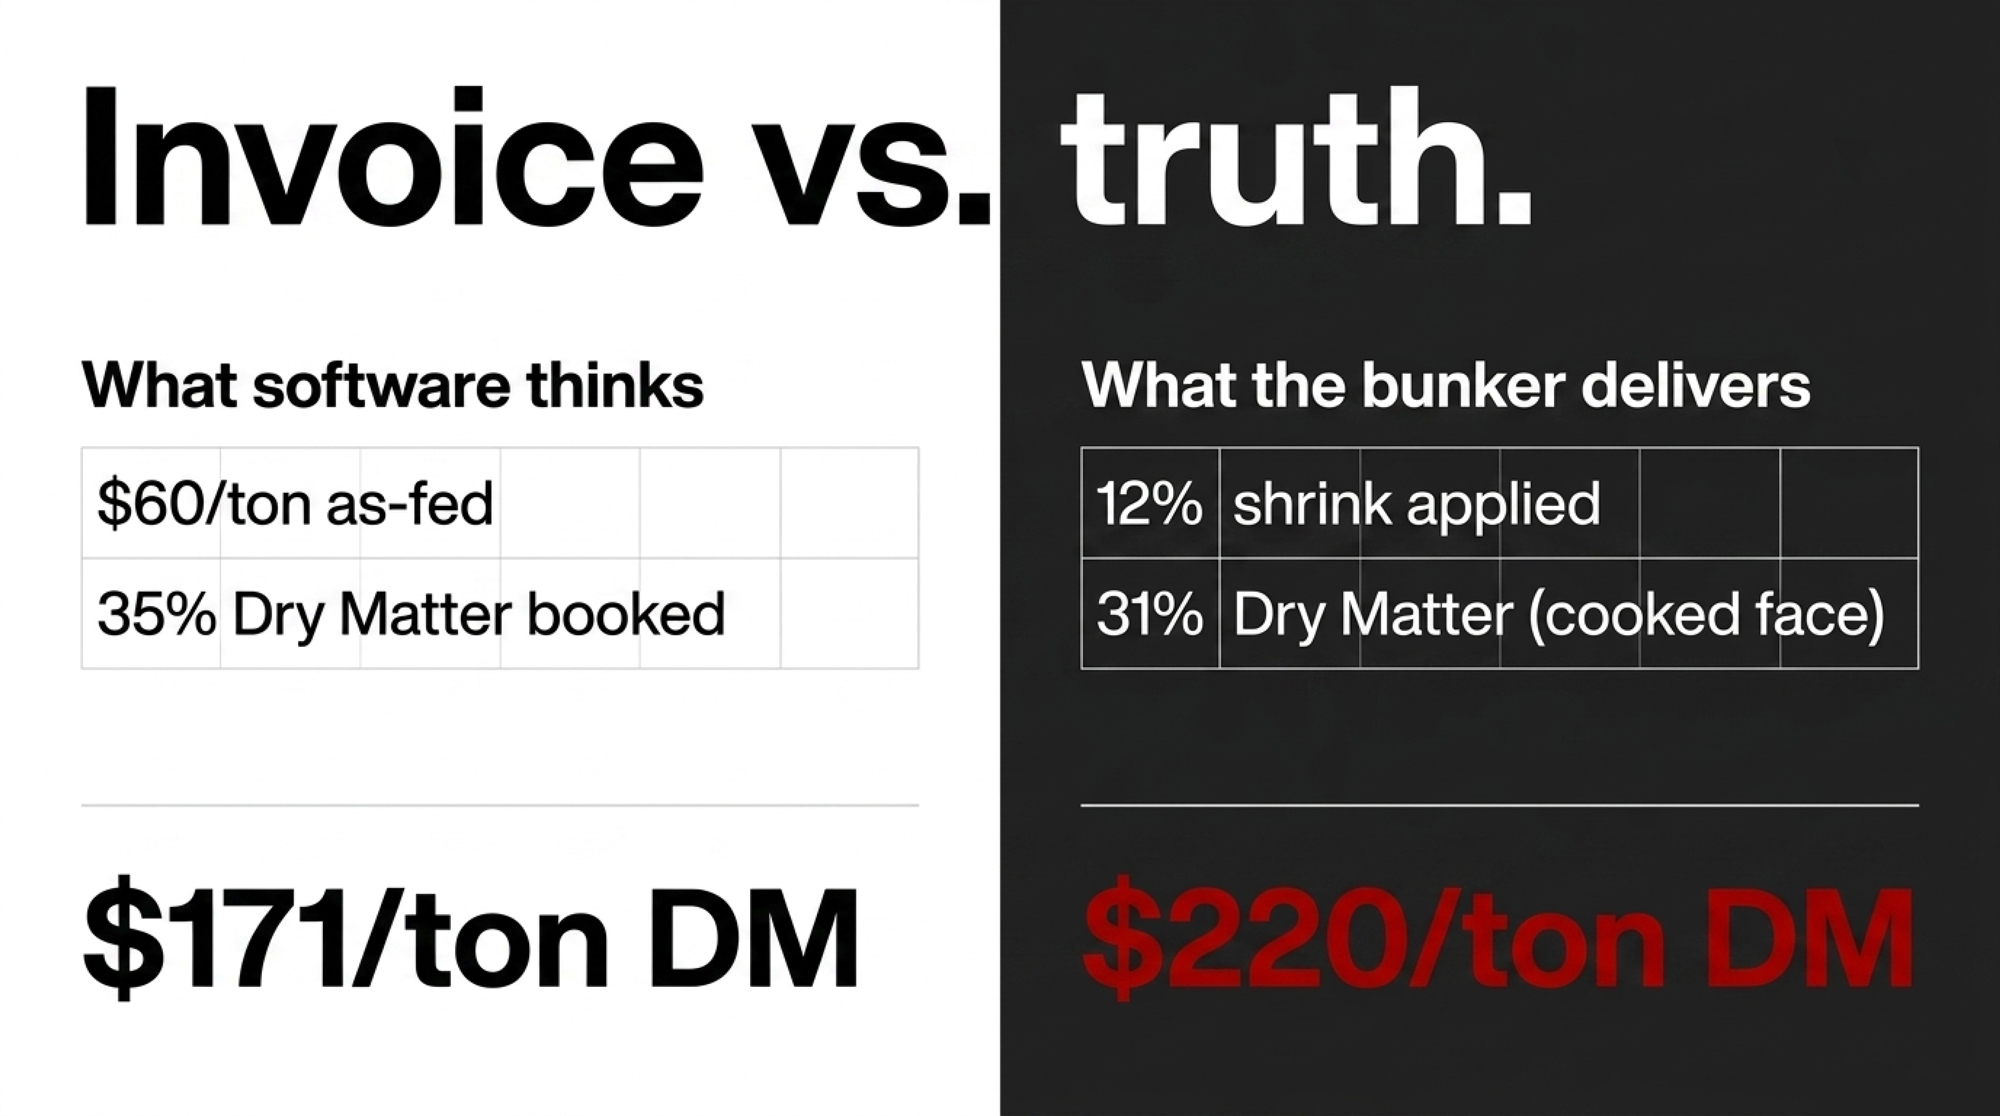
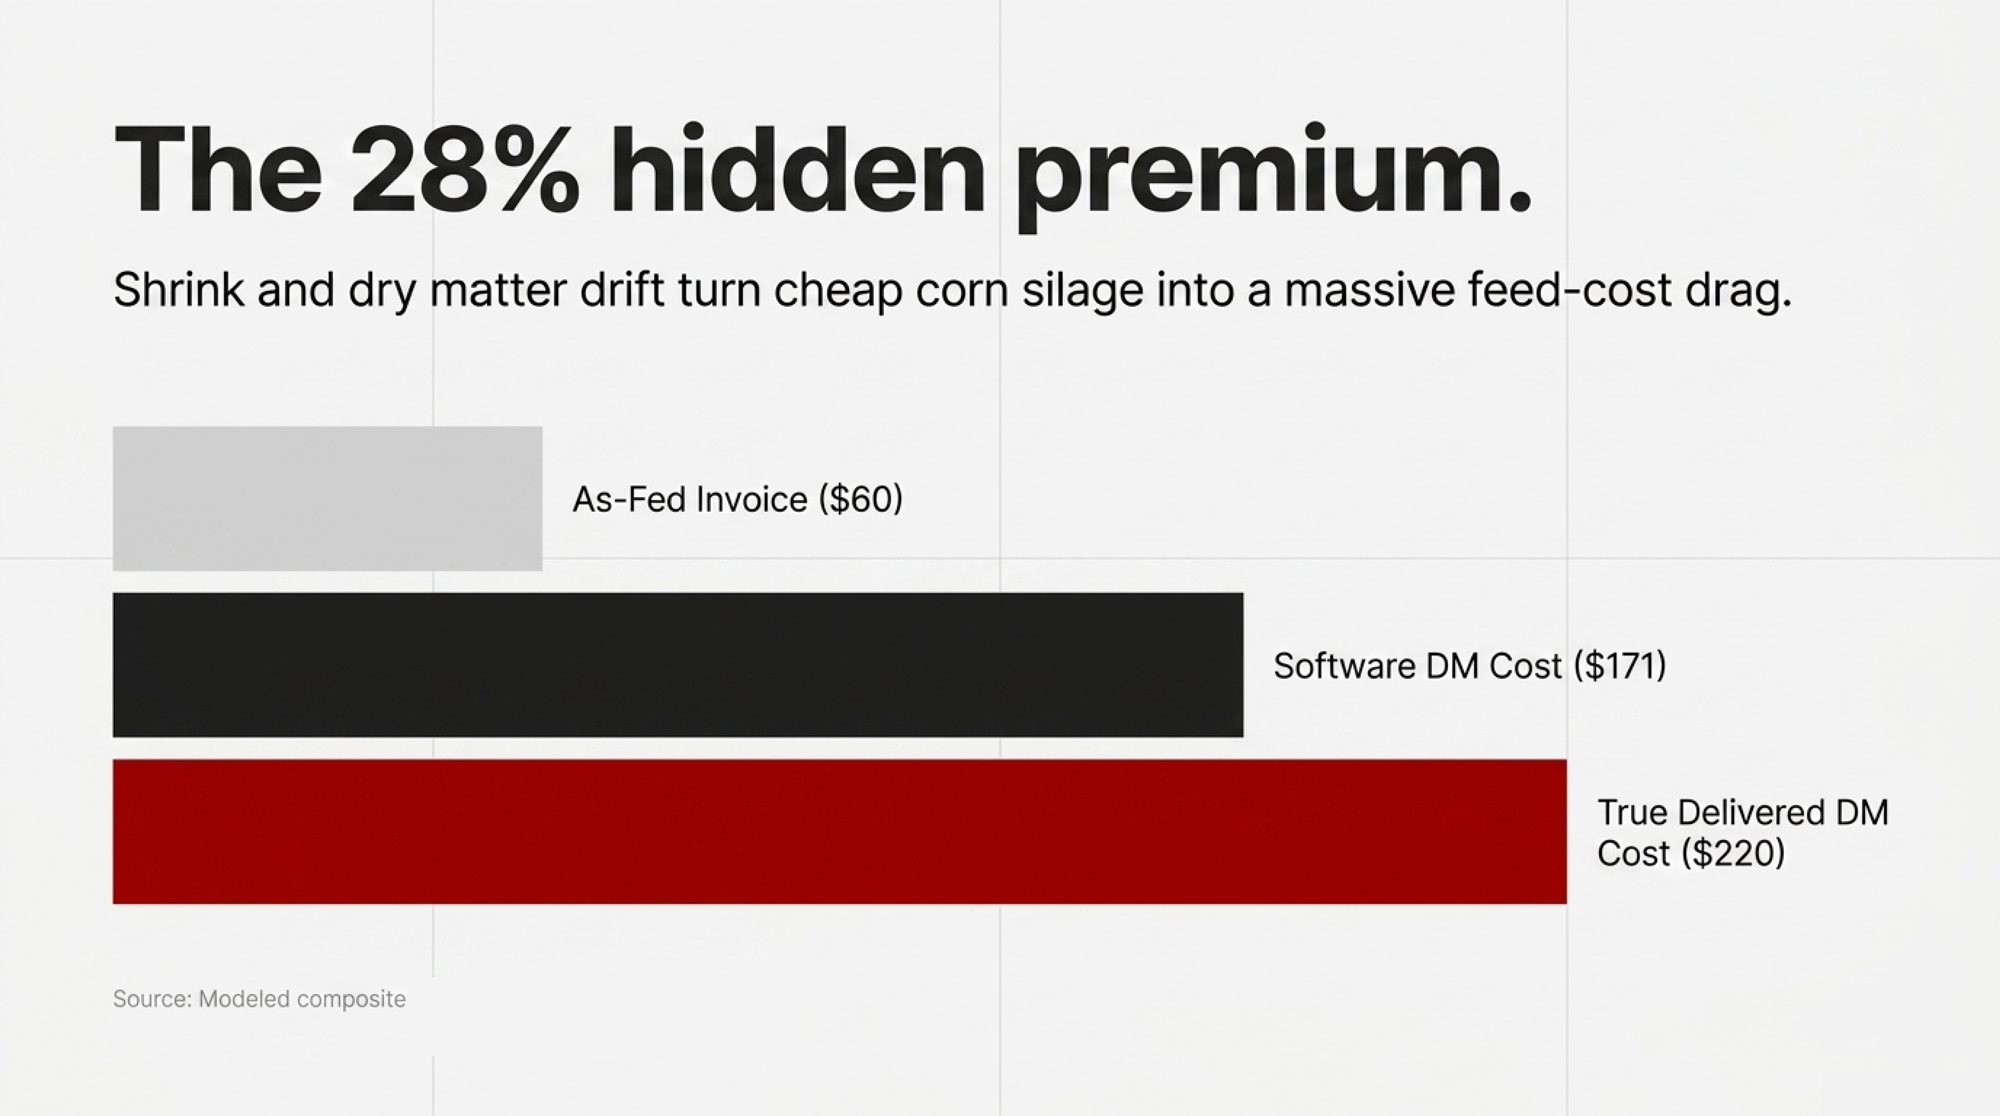
Priced two ways, the same lot tells two different stories. The ration software has a lot booked at $60/ton as-fed and 35% DM. Cost per ton DM on the invoice: $60 ÷ 0.35 = $171/ton DM. Re-run the same lot at the real 31% DM and a 12% shrink loss, and the true cost per delivered ton of DM is $60 ÷ (0.31 × (1 − 0.12)) = $220/ton DM. That’s a 28% hidden premium on a feed the software treated as cheap.
Before vs After: What Your Ration Software Thinks vs What the Bunker Delivers
| Feed | Book DM % | Actual DM % | Shrink % | $/ton as-fed | Software $/ton DM | True $/ton DM | Hidden Premium |
|---|---|---|---|---|---|---|---|
| Corn silage | 35% | 31% | 12% | $60 | $171 | $220 | 28% warning |
| Haylage | 40% | 36% | 10% | $80 | $200 | $247 | 24% warning |
| Wet distillers | 35% | 33% | 18% | $70 | $200 | $259 | 30% warning |
| Wet byproduct, high-risk shed | 32% | 30% | 25% | $72 | $225 | $320 | 42% warning |
Re-price every forage and wet feed on shrink-adjusted DM and two things happen fast. Ingredients that looked cheap on invoice slide off the inclusion list. Forages that looked expensive suddenly pencil, because the “cheap” alternative was hauling an 18% shrink penalty (AgProud, 2022, wet-byproduct range: 12–40%). Distillers at 18% shrink in an open commodity shed under Southwest summer heat isn’t hypothetical — it sits comfortably inside AgProud’s documented 12–40% range, and the heat that drives face fermentation drives commodity-shed shrink right alongside it.
The second move is a forage allocation map. One page, one ID per lot, with NDFd30, uNDF240, 7-hour IVSD, CP, and starch tagged on each, and a written group assignment. Fresh and high groups get NDFd30 above 55% and uNDF240 below 10% of DM — inside MSU, Miner, and Cornell thresholds. Dry cows get the higher-uNDF, lower-digestibility lot on purpose. Not by accident. Not by loader convenience.
The myth — “good forage is good for everyone” — dies on that whiteboard.
| Group | Best-Fit Forage Profile | Economic Logic | Warning if Misallocated |
|---|---|---|---|
| Fresh cows | NDFd30 >55%, uNDF240 <10% DM, strong 7-hr IVSD | Converts digestibility into milk, components, and early-lactation intake | Lost peak milk and slower start |
| High group | Highest NDFd lot, stable face, current DM test | Pays for premium forage through milk response | 1.9 lb milk/cow/day at risk on 4-point NDFd miss |
| Mid/late lactation | Moderate NDFd, consistent DM, balanced starch | Protects margin without burning the best lot | Overfeeding quality where response is smaller |
| Far-off dry cows | Higher uNDF, lower digestibility, controlled energy | Fill and rumen health matter more than salable milk | Premium forage becomes expensive manure |
| Close-up dry cows | Controlled uNDF, stable palatability, clean fermentation | Intake consistency beats headline RFV | Palatability dip can cost transition performance |
Running the Numbers: A 500-Cow, 90-Day Forage Economics Walkthrough
Modeled composite scenario. Inputs drawn from documented 2020–2026 response ranges applied to a 500-cow Southwest baseline. Milk price working figure: $0.20/lb, approximating the early-2026 US all-milk price band reported in USDA NASS’s Agricultural Prices monthly release. Federal Milk Marketing Order pool prices and basis will move the end result materially in the Northeast versus the Southwest, and Canadian producers should adjust for their provincial board component-pricing structure. Ration cost working figure: $8/cow/day, from Hubbard Feeds 2021 carried forward — 2026 ration costs may run higher; scale your $/cow/day savings proportionally. NDFd30 lab cost: ~$25–$40/sample at recently published rates from DairyOne, Rock River Laboratory, and Cumberland Valley Analytical.
Step 1 — Shrink correction (Days 1–30). Ration shrink moves ~8% → ~4%. Hubbard Feeds (2021): about $0.28/cow/day saved on an $8 ration. 500 × $0.28 × 30 = $4,200.
Step 2 — DM drift fix and re-pricing fake-cheap ingredients (Days 1–30). Silage DM corrected (35% → 31%); high-shrink wet byproducts removed or re-priced on shrink-adjusted DM. Documented savings range: $0.10–$0.30/cow/day (AgProud, 2022; Cornell PRO-DAIRY commercial-dairy case work). Midpoint $0.20. 500 × $0.20 × 30 = $3,000.
First 30-day cost-side subtotal: ~$7,200.
Step 3 — Group allocation fix (Days 30–60). Top lot routed to fresh and high; mid lot to mid and late; lowest-quality lot to dry cows. UW–Madison 2021 documents per-cow-per-day IOFC gains above $2.00 in top-responding high groups. Applied here as a conservative herd-weighted midpoint of $0.75/cow/day (range $0.50–$1.00 in documented cases, scaled by the share of cows in the high group). 500 × $0.75 × 30 = $11,250.
Running total through Day 60: ~$18,450.
Step 4 — Honest NDFd and IVSD on the current bunker face (Days 60–90). Updated NDFd30 and 7-hour IVSD; ration rebalanced. Capture half of a 4-unit NDFd miss on the high group, weighted to herd average — assuming the high group represents the bulk of milk production: ~1.5 lb milk/cow/day × $0.20 = $0.30/cow/day. Add $0.15 in smarter concentrate use as the ration stops chasing phantom forage energy. 500 × $0.45 × 30 = $6,750.
Total Impact — 90-Day Win on 500 Cows
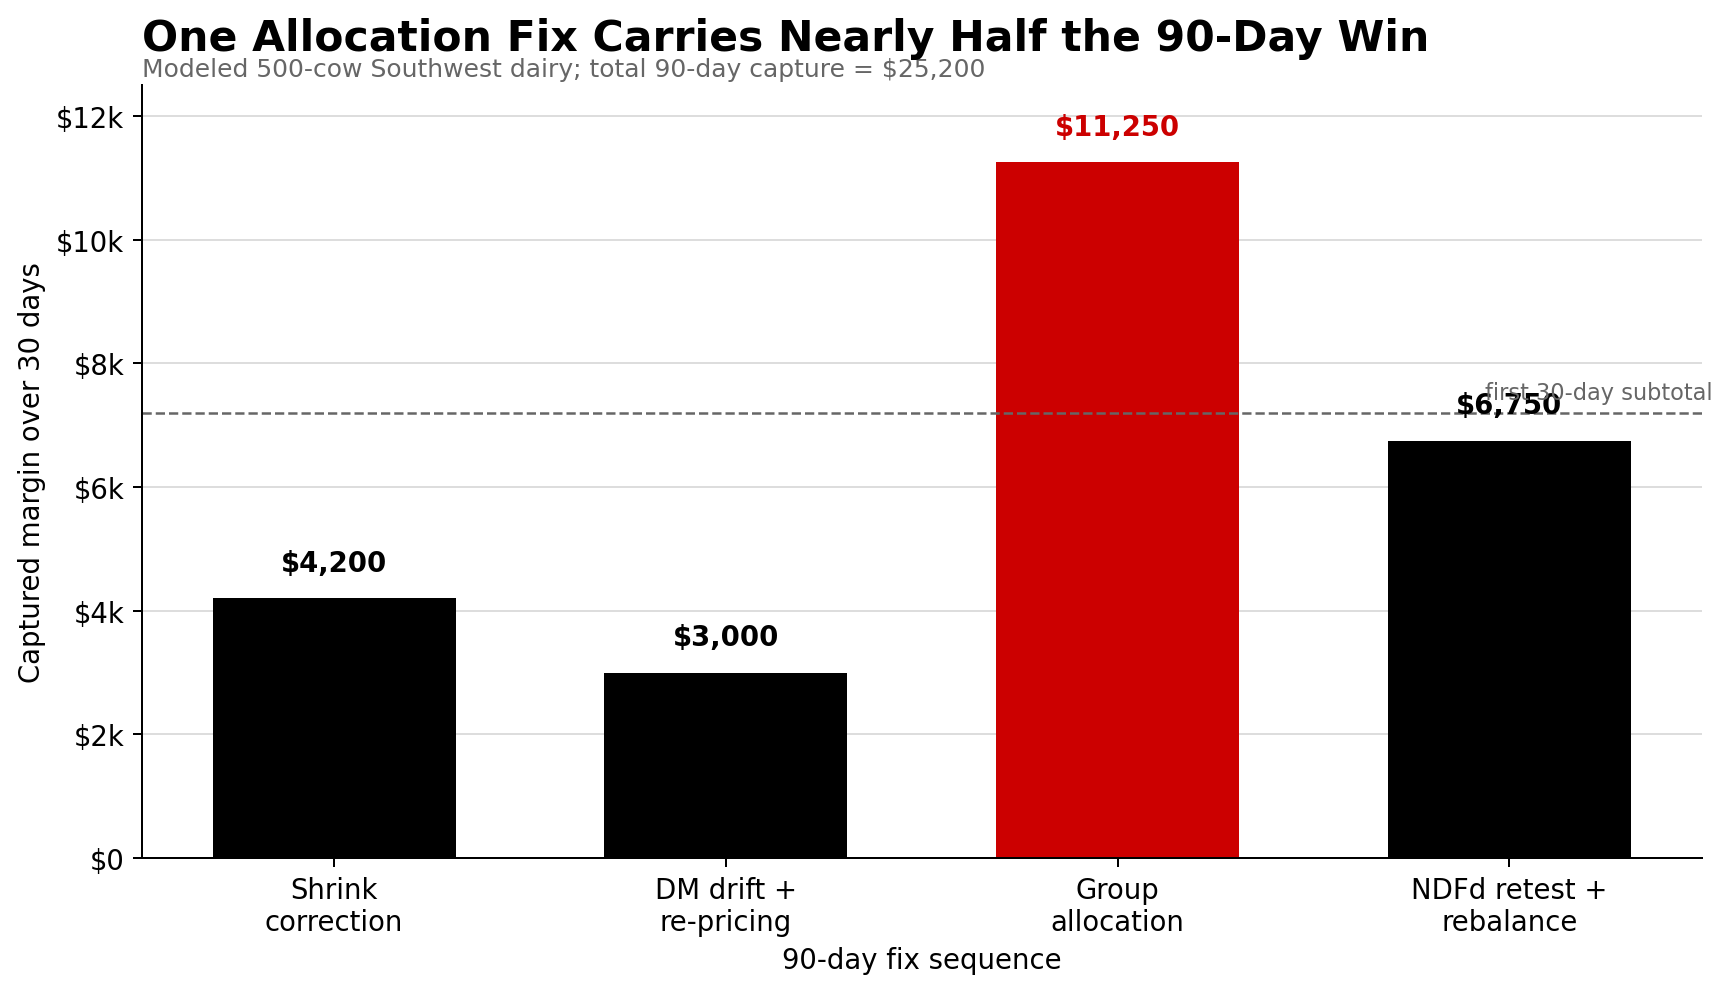
Step 1 (Shrink correction): $4,200 Step 2 (DM drift + re-pricing): $3,000 Step 3 (Group allocation fix): $11,250 Step 4 (Honest NDFd retest): $6,750
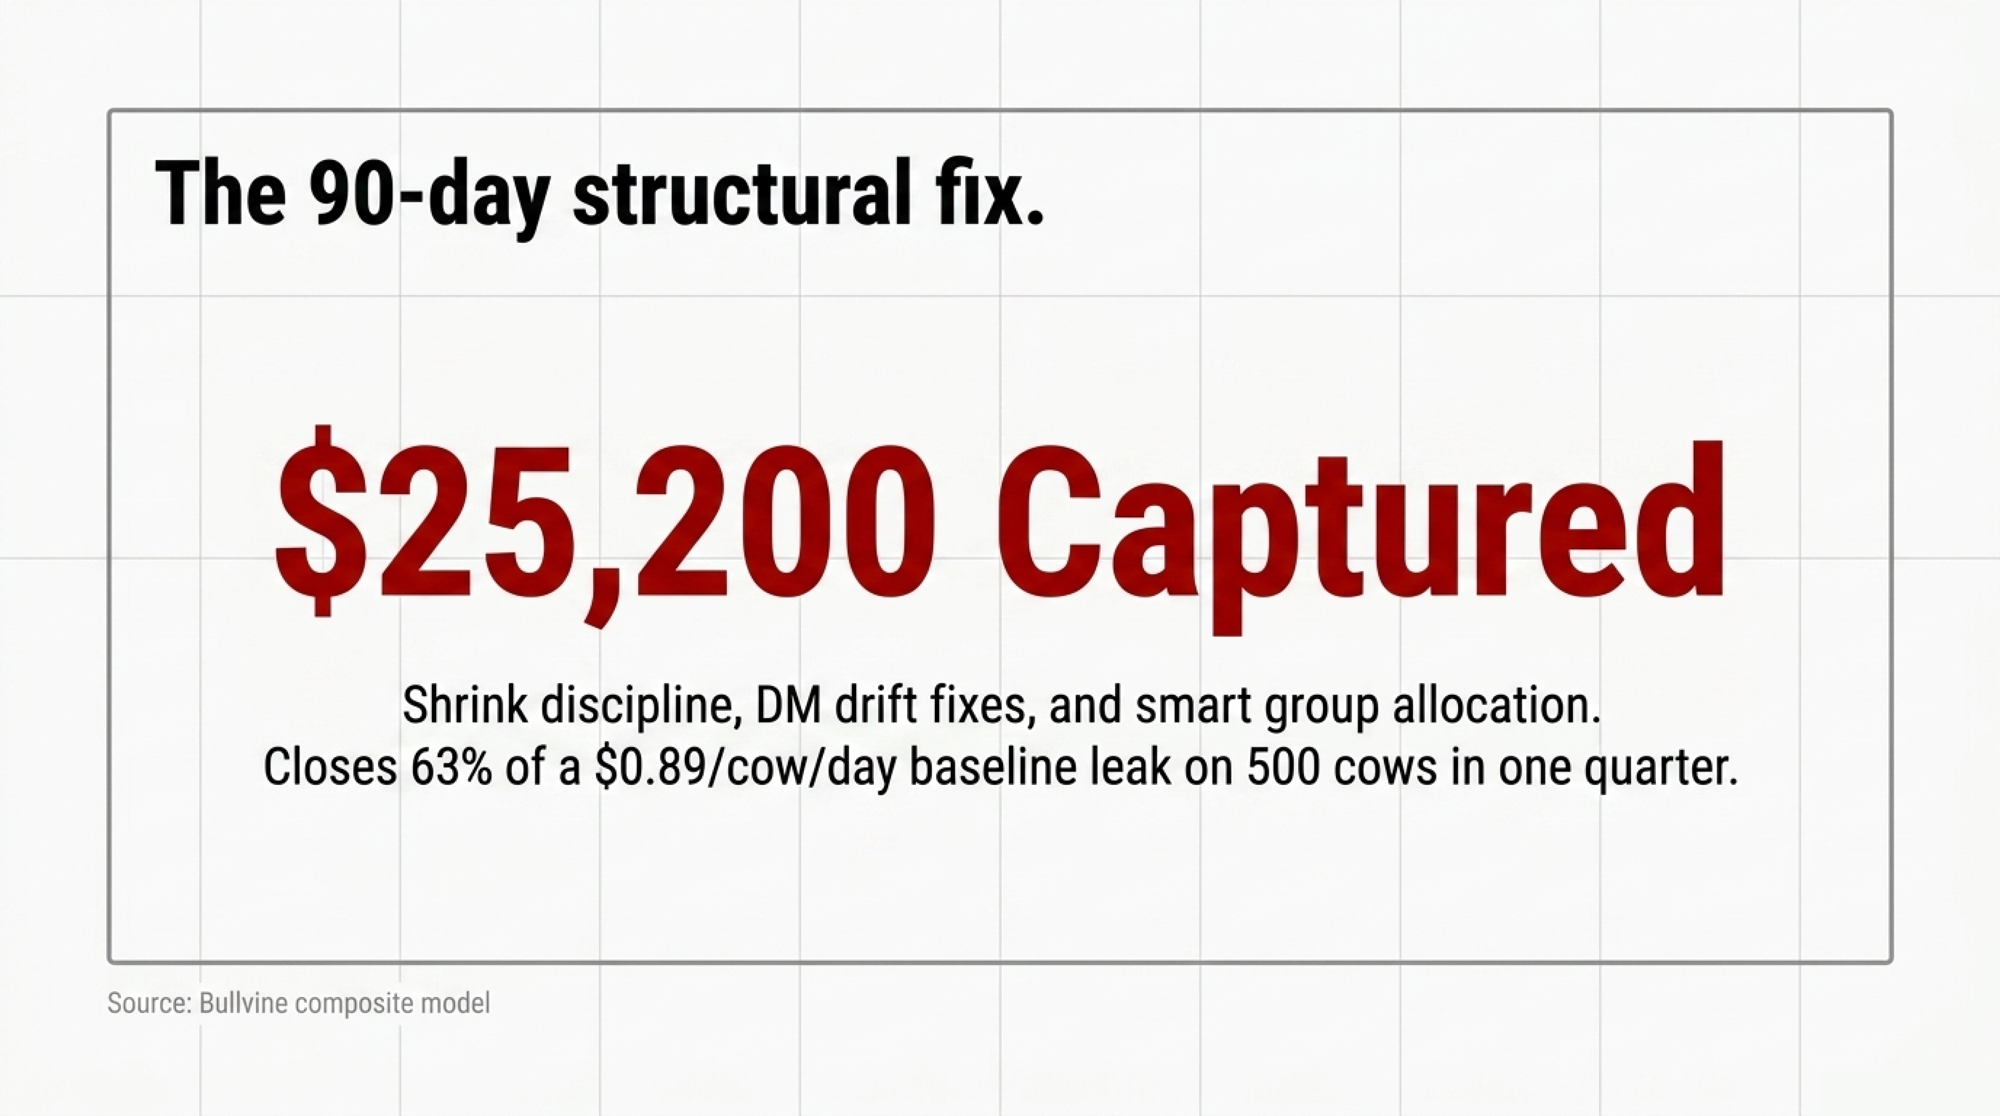
90-day total: ~$25,200. That’s roughly $0.56/cow/day captured across the 90-day window — closing about 63% of the $0.89/cow/day baseline leak in a single quarter. Most of that capture is structural, not seasonal.
Don’t annualize that linearly. Shrink correction and the allocation fix are one-time structural captures; their ongoing run-rate continues only if the discipline holds. A modeled first-year range, with the fixes held in place all year, is $60,000–$100,000 on 500 cows — an editorial projection from the 90-day walkthrough, not a Bullvine-surveyed benchmark. A modeled Year-2 ongoing benefit lands closer to $40,000–$60,000, driven by sustained shrink discipline and NDFd accuracy rather than fresh structural fixes.
Breakeven check for premium forage purchases: buy up when (IVNDFD unit gain × milk response × milk price per lb) > (cost/ton DM premium ÷ feeding rate in lb DM per cow per day). Plug in your own herd size, ration cost, milk price, and shrink estimate. The formula doesn’t care about your logo.
What Does a Shrink-Adjusted Ration Mean for Your Operation in 2026?
Many commercial ration models drift on three inputs at once: as-fed prices instead of shrink-adjusted DM prices, stale forage DM that no longer matches the face, and a harvest-composite NDFd that stopped reflecting reality the day the bunker opened. Fix those three, and group allocation, grain inclusion, and protein strategy all start optimizing against what’s actually in the ration — not a report card from last August.
Weiss’s 2022 framework puts the quality premium at roughly $2.40–$4.86 per ton of DM per IVNDFD unit in lactating cows, and effectively zero in far-off dry cows. On a farm burning top-tier forage on dry cows, that’s money lit on fire every day.
Regional exposure varies, and Southwest 2026 is its own category. Heat-driven secondary fermentation lengthens the spoilage zone behind the face, raises commodity-shed shrink on wet byproducts, and chews through DM in the carryover pit between morning and afternoon feedings. Midwest farms with shorter feedout windows and tighter-packed bunkers tend to land near the low end of published shrink ranges. Northeast operations on haylage-heavy rations face a different DM-drift exposure, and FMMO pool prices shift the milk-response math.
Canadian producers under supply management run the same biology with a different economic overlay. An Ontario dairy on DFO component pricing earns most of its forage-quality return through butterfat and protein yield, not fluid volume — quota cost, butterfat differential, and the provincial blend price all change what one extra pound of NDFd-driven milk is actually worth in a given month. Same shrink math, same allocation logic, different milk-revenue side of the equation.
One watch-out: when shrink and DM fixes expose previously masked energy deficits, don’t let grain creep solve a forage problem. Higher-digestibility forage matched to honest intake is the goal. A bigger concentrate line is not a substitute.
When peak milk stalls, the first number to re-check isn’t CP or RFV. It’s NDFd30 on the current bunker face — not the harvest report. A single retest can be worth more than a day’s milk response on a four-unit NDFd miss on a 300-cow herd.
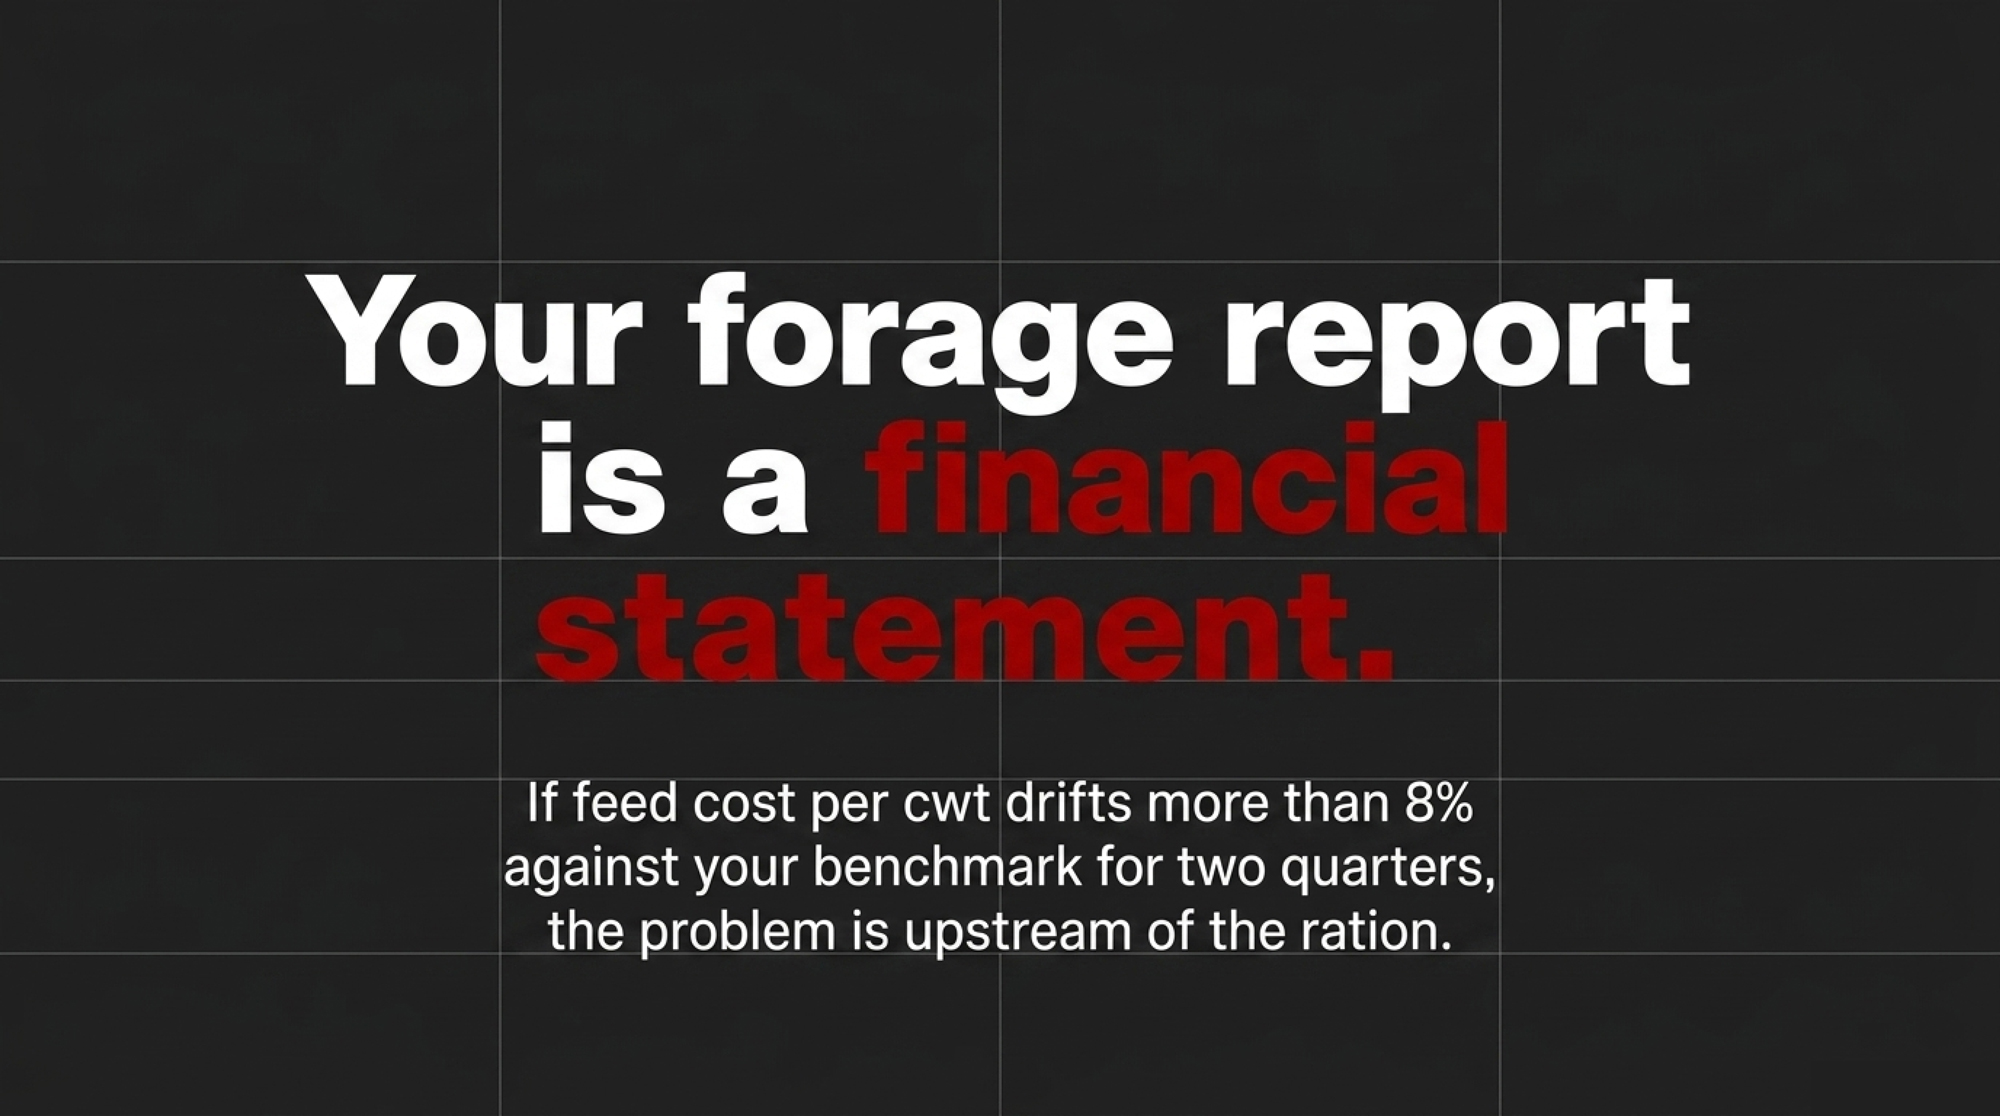
A working benchmark some lenders and nutritionists watch: if your feed cost per cwt drifts more than ~8% against your regional DHIA or extension benchmark for two consecutive quarters with no ration change, the problem is almost certainly upstream of the ration. Your lender is already looking at that drift, even if you aren’t.
The 30/90/365-Day Playbook for Southwest 500-Cow Operations
30-Day Actions — stop the bleeding.
- Pull a current DM on every wet forage and wet byproduct this week. Trigger: any silage face not DM-tested recently, per Penn State Extension’s 2023 guidance to test frequently and at every weather change. Under Southwest summer heat with visible heating at the face, tighten the editorial floor to weekly. Requires: a Koster or microwave test and one ration update. Backfire risk: sampling only the center of the face — pull top, middle, and bottom.
- Re-price every forage and wet feed on shrink-adjusted DM, not invoice. Use a real shrink estimate from the AgProud 2022 range (5–17% silages, 12–40% wet byproducts). Red-flag trigger: if nobody on your team can state your current ration shrink percentage in one sentence, this goes to the top of the list.
- Pull an updated NDFd30 and 7-hour IVSD on the exact bunker face feeding your high group — not a harvest composite. Cost: ~$25–$40/sample at recently published rates from DairyOne, Rock River, and Cumberland Valley. Backfire risk: a single sample tells you one point — pull two across the face.
- Build a one-page forage allocation map. Every open lot gets an ID and a written group assignment based on NDFd30, uNDF240, IVSD, CP, and starch. Related reading: Fine-Tuning Haylage and Cereal Silage Quality for Different Life Stages Within the Dairy Herd — thebullvine.com/haylage-cereal-silage-life-stages
90-Day Actions — structural change.
- Split rations more aggressively. Route top-tier forage to fresh and high (NDFd30 >55%, uNDF240 <10% of DM, inside MSU/Miner/Cornell thresholds). Push higher-uNDF forage to dry cows and heifers by design. Requires: nutritionist time, two weeks of baseline IOFC data, and loader-route discipline. Backfire risk: mid group squeezed on energy when the top lot moves — monitor DMI and milk in mid cows for 14 days post-change.
- Reconcile what the ration thinks you feed against what actually leaves the feed center. The composite 500-cow walkthrough above closes about 63% of a $0.89/cow/day baseline leak on this reconciliation alone. Related reading: The 89¢ Per Cow Per Day Leak Found in a Feed Center — thebullvine.com/89-cent-per-cow-leak-feed-center
- Re-run breakeven milk response on every premium forage purchase before the next growing season, using Weiss’s 2022 $2.40–$4.86/ton DM per IVNDFD unit framework at your milk-price band. Backfire risk: anchoring on milk-price highs — model at both a conservative and an optimistic band before committing.
- Watch palatability and DMI when you trim wet byproducts. You can gain $0.20/cow/day on ingredient cost and lose it right back on a 1.5-lb DMI drop.
365-Day Moves — strategic positioning.
- Rebuild your harvest plan around time-in-silo economics and Southwest face-management reality. UW–Madison Extension and Penn State silage-fermentation work, including 2023 Journal of Dairy Sciencepublications on zein protein matrix proteolysis, show corn silage 7-hour IVSD climbing roughly 10–15 percentage units over four to six months of ensiling. Opportunity signal: if your IVSD at pit-opening is below 70% and you have carryover inventory, defer feeding that lot to the high group by 60–90 days rather than blending it in early.
- Move to lot-level forage accounting. Each bunker, bag, or stack gets an ID, a lab sheet, a shrink estimate, and a written group assignment. Forage inventory becomes a portfolio with assigned margin roles, not a pile.
- Stand up a quarterly review with your nutritionist and lender where feed cost per cwt, IOFC, feed efficiency (ECM lb / DMI lb), and shrink percentage all sit on the same page. Trigger: feed cost per cwt drifts more than ~8% against your regional DHIA or extension benchmark for two consecutive quarters with no ration change — escalate. Opportunity signal: shrink holds under 5% and NDFd30 stays above 55% on your high-group face for two quarters — you’ve earned room to buy premium hybrids for the next harvest without blowing your ration cost ceiling.
The Contract Check That Closes the Loop
The acres didn’t change. The cows didn’t change. The forage math did. That’s the entire story.
You gain margin when you price forage on shrink-adjusted DM, allocate it by digestibility, and re-test the bunker face rather than the harvest core. What you give up is the comfort of a single “good” lab sheet and a loader route that treats every pen identically. That’s the trade-off. It’s worth making.
Two questions before your next nutritionist meeting. What is the real shrink-adjusted DM cost of the forage feeding your high group this week? And when was NDFd30 on that specific bunker face last re-tested — not the harvest report, the current face?
If you can’t answer both in under two minutes, your forage report isn’t a report card. It’s a financial statement you’re not reading.
What does your current ration sheet actually price your silage at — invoice, or truth?
Methodology: This walkthrough is an explicitly composite scenario. It blends documented per-cow-per-day response ranges from Oba & Allen (1999, Journal of Dairy Science), Weiss (2022, California Alfalfa & Forage Symposium), Hubbard Feeds (2021), AgProud / Progressive Forage (2022), UW–Madison Extension (2021, Does Forage Quality Pay?), Michigan State Extension, Miner Institute, Cornell PRO-DAIRY, and Penn State Extension (2023), with editorial observation drawn from Bullvine Q1 2026 Southwest feed-center conversations.
Key Takeaways
- Price every forage and wet feed on shrink-adjusted DM, not invoice. The $60/ton silage that eats $220/ton DM after shrink and drift is a 28% hidden premium your ration software won’t flag.
- Same ton of silage, two different economies. NDFd is worth $2.40–$4.86/ton DM per unit in lactating cows and effectively zero in far-off dry cows — feed your best lot to fresh and high, not to the closest pen.
- The 90-day fix on a 500-cow Southwest herd closes about 63% of a $0.89/cow/day leak. Most of that is shrink discipline, group allocation, and an honest NDFd30 retest on the current bunker face.
- If your feed cost per cwt has drifted more than ~8% against your regional benchmark for two quarters with no ration change, the problem is upstream of the ration — and your lender is already looking at it.
Complete references and supporting documentation are available upon request by contacting the editorial team at editor@thebullvine.com.
Learn More
- Feed Shrink: The Silent Profit Killer — Recover $0.30/head/day through an audit of commodity bay protocols and loader operator discipline. Arms you with a checklist to identify exactly where “ghost” tons vanish before reaching the mixer.
- Dairy Farm Profitability: Strategies for 2025 — Secure your feed-cost-per-cwt against 2027 market volatility by quantifying the multi-year ROI of bunker infrastructure upgrades. Dismantles the myth that weather alone dictates your silage quality and bottom line.
- Precision Dairy Farming: The Future of Feed Management — Capture a technical edge using automated bunk-monitoring sensors and real-time DM adjustment tools. Follows the money on hardware that replaces the Koster tester with laser-accurate intake data for high-producing groups.
 The Sunday Read Dairy Professionals Don’t Skip.
 The Sunday Read Dairy Professionals Don’t Skip.
Every week, thousands of producers, breeders, and industry insiders open Bullvine Weekly for genetics insights, market shifts, and profit strategies they won’t find anywhere else. One email. Five minutes. Smarter decisions all week.
