


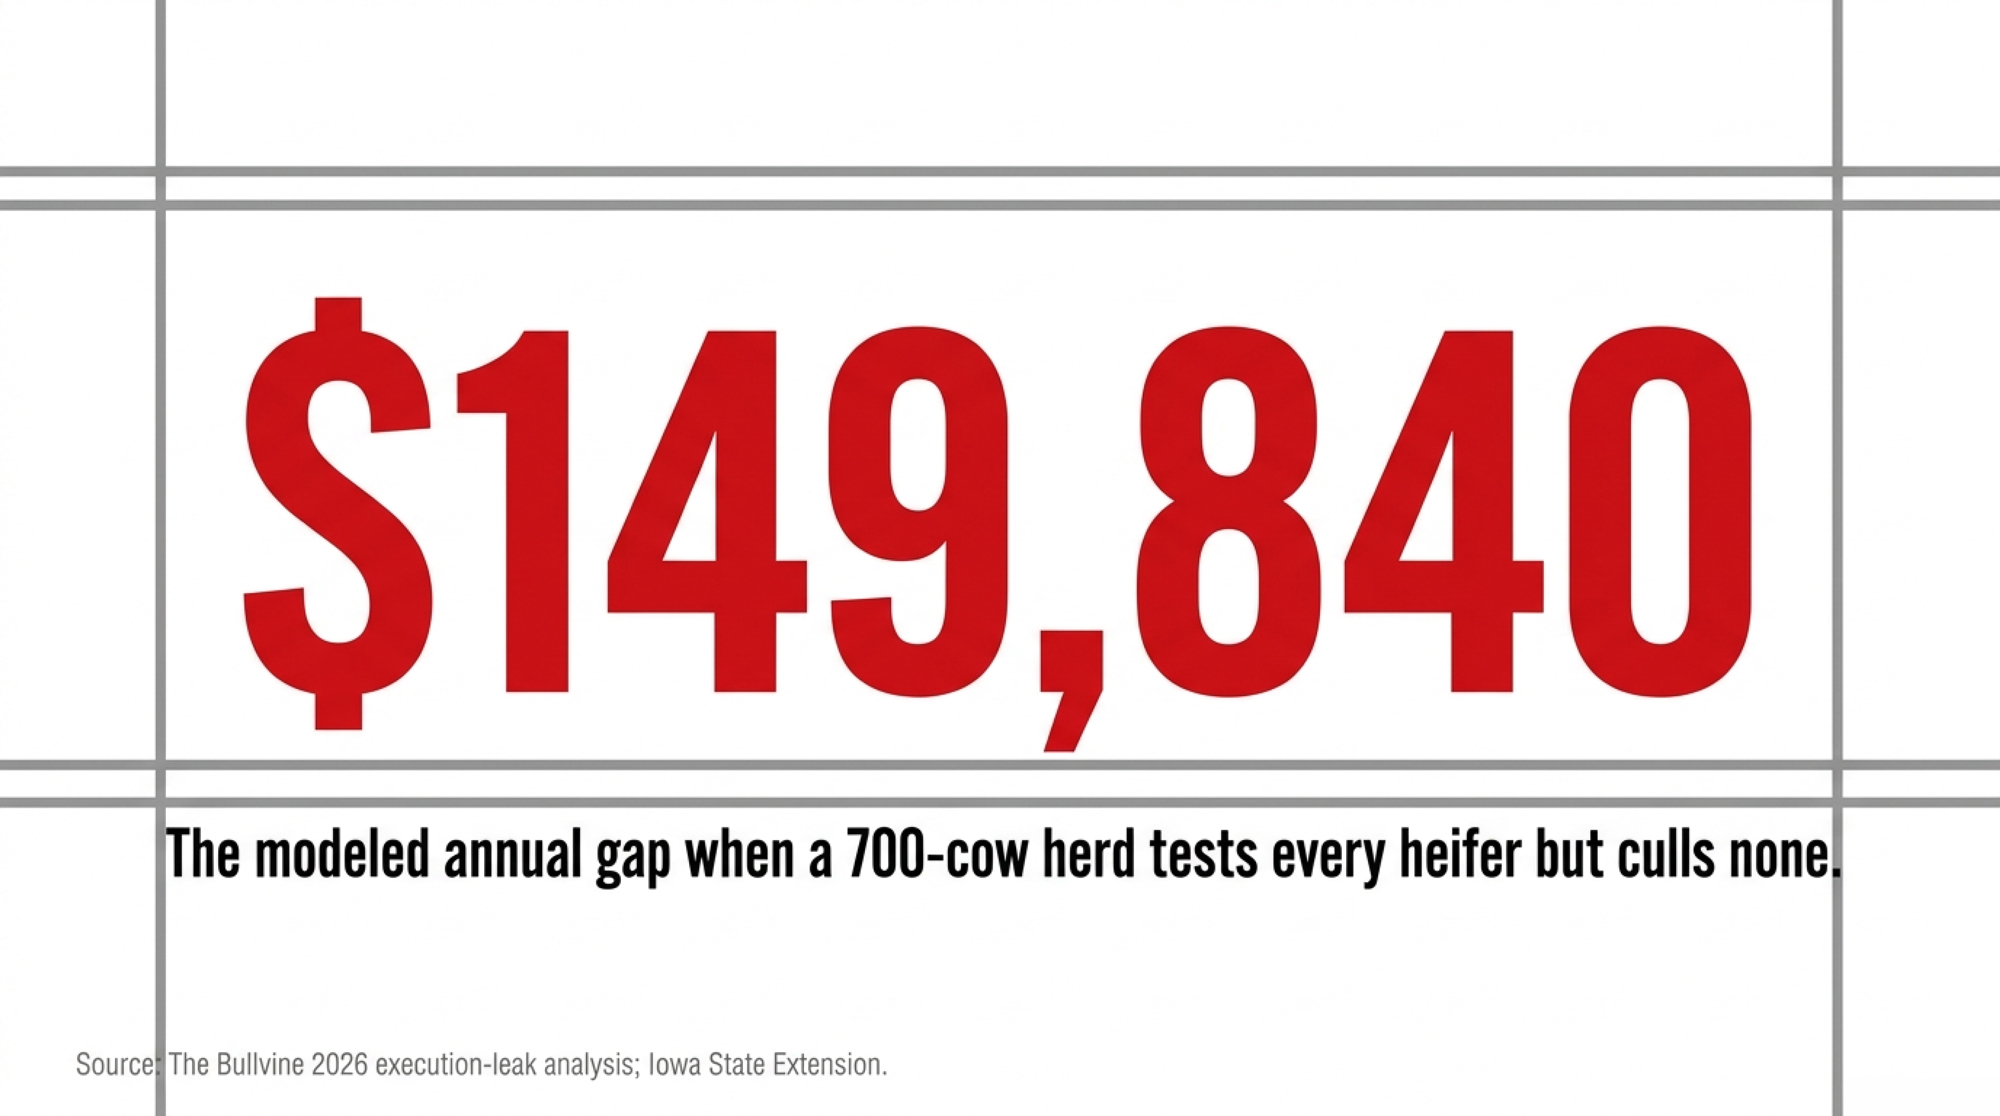
A 700-cow Kansas freestall tests 250 heifer calves at $45/head, files the report, and breeds the herd the same way it bred last year. The 2026 modeled gap: $149,840.
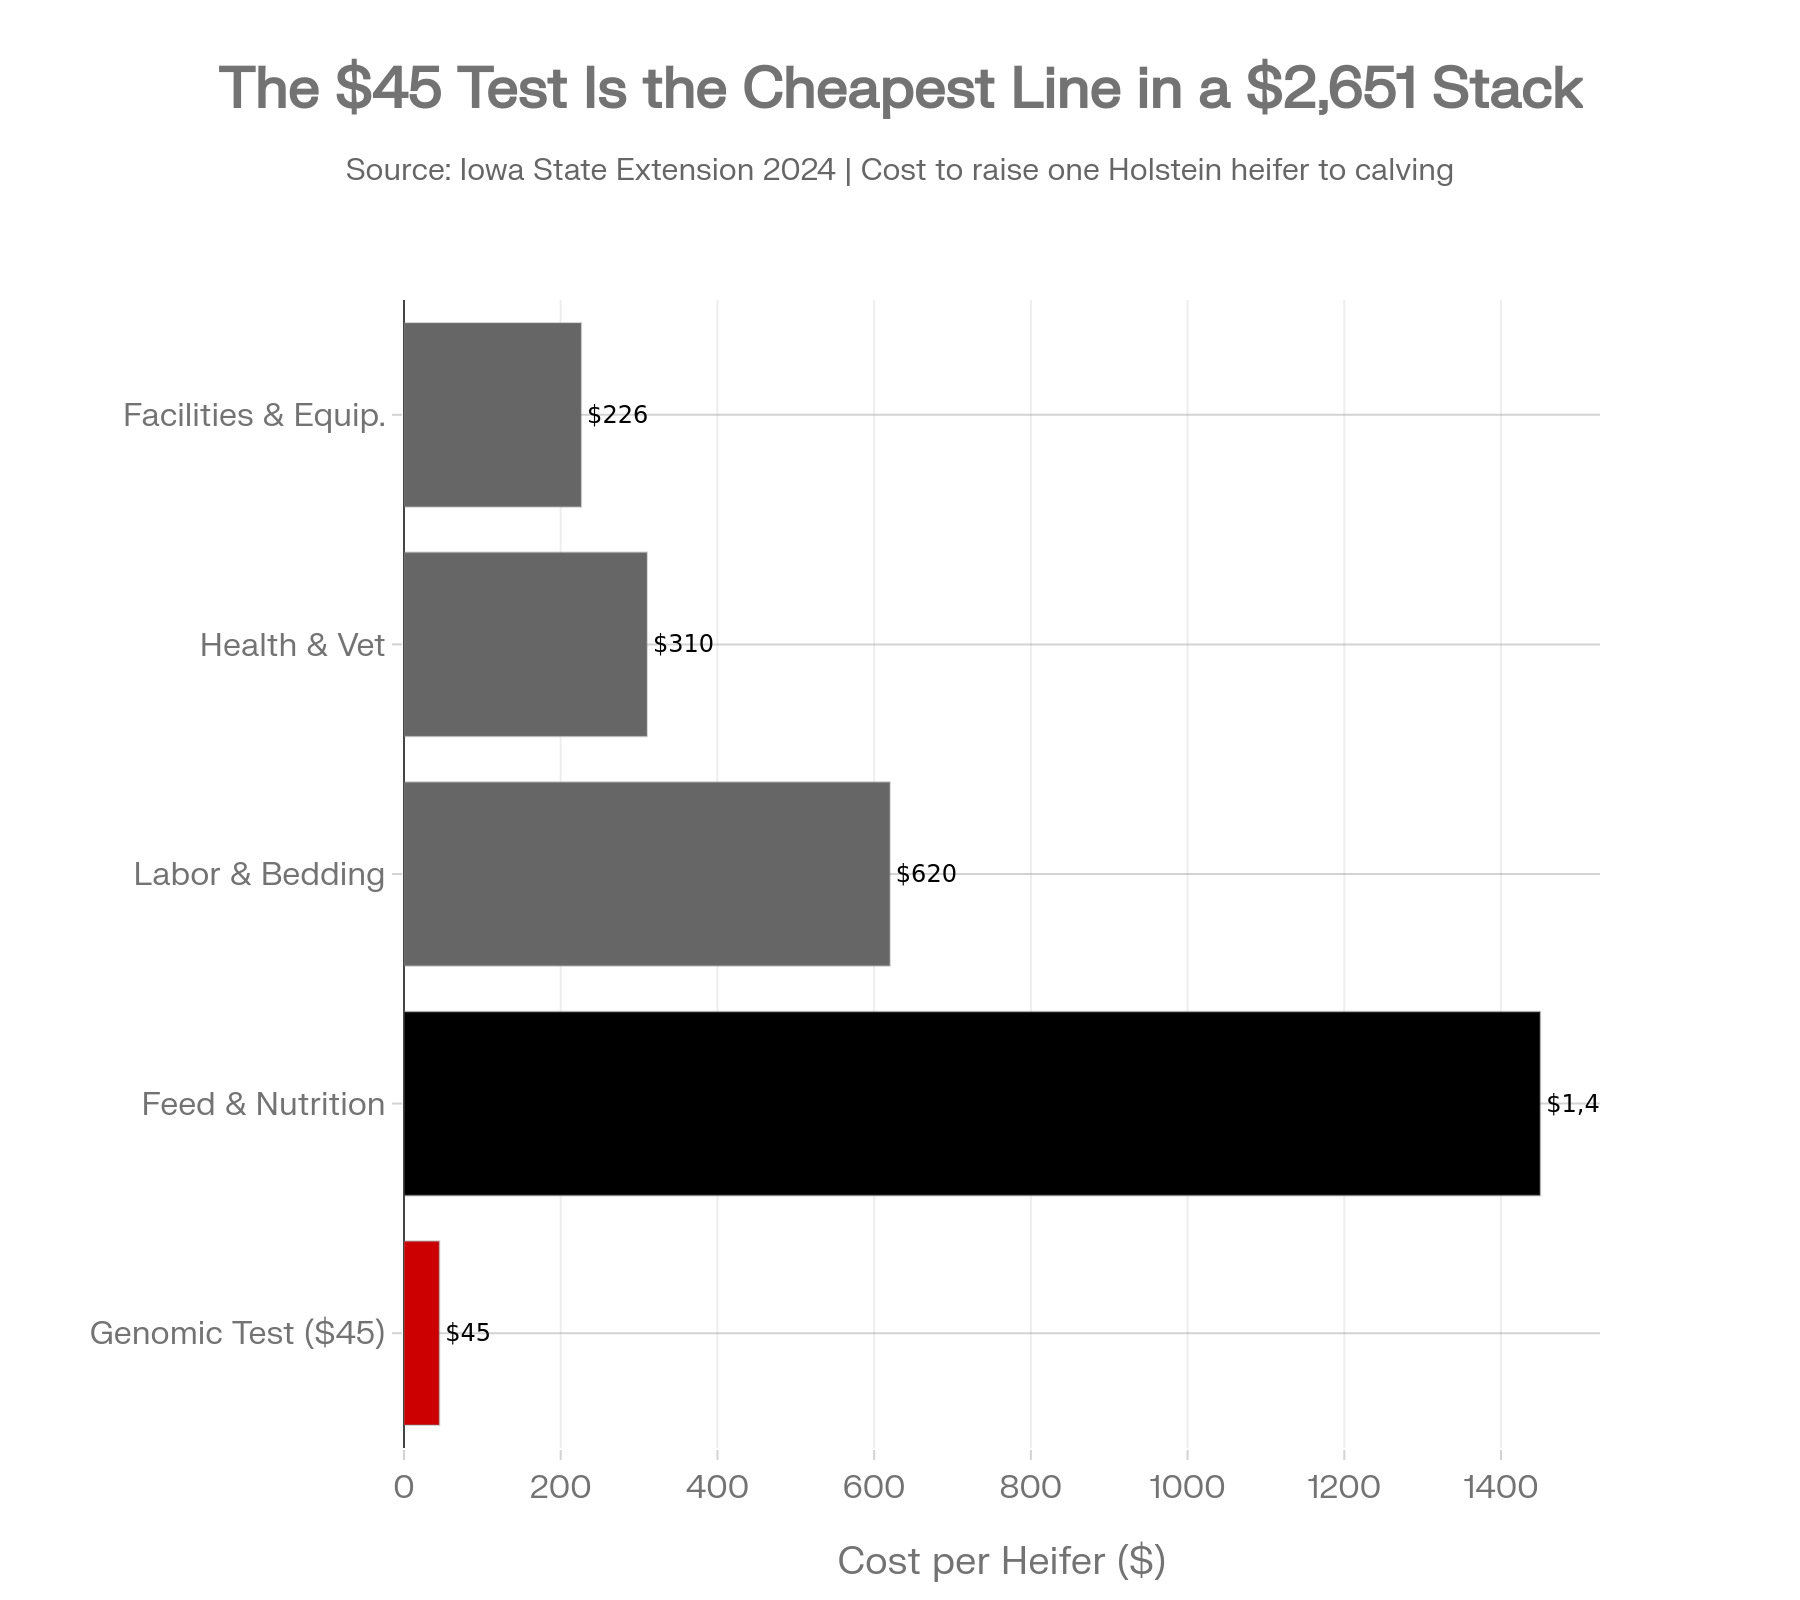
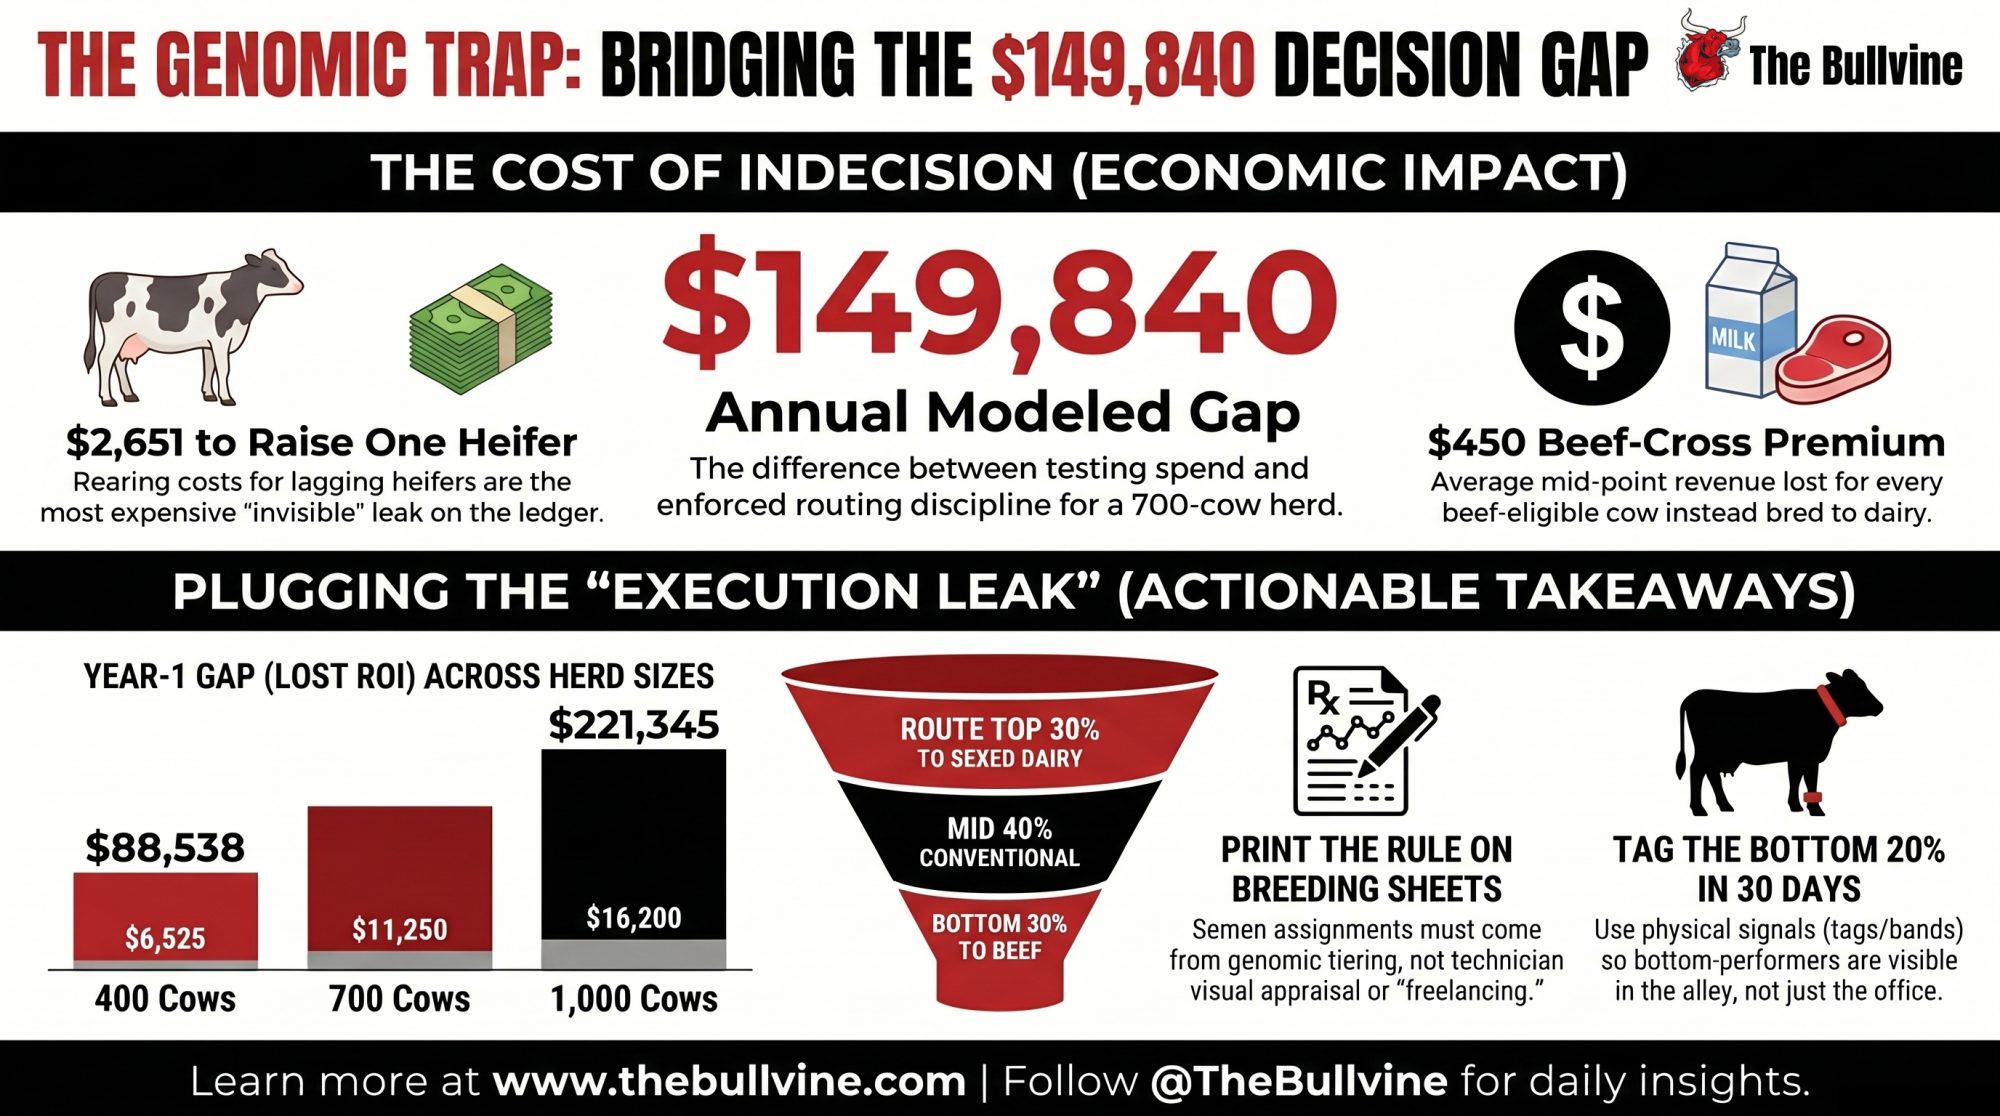
For U.S. commercial freestall dairies in the 500–1,500-cow band, it costs $2,651 to raise one Holstein heifer to calving, per Iowa State University Extension’s heifer cost of production work. The $45 line on your genomic testing invoice is the cheapest number in the stack. The expensive number is what that test didn’t change in the alley at 4:30 a.m.
Run that math on a 700-cow Kansas freestall that tests its full 2024 heifer crop and then keeps every heifer anyway, and the 2026 dairy economics of genomic testing produce a modeled 9,840 annual gap between testing spend and routing discipline. That figure is a scenario comparison against an enforced genomic-routing benchmark, built from a $45-per-head lab contract and published Iowa State Extension, CDCB, Lactanet, and Bullvine inputs. Not a P&L forecast.
Same test. Different decisions. Different milk checks.
Is Genomic Testing Worth It for Commercial Dairy Herds in 2026?
U.S. benchmark pricing on commercial genomic tests has held in the $40–$45/head range through 2024–2026. Reliability on Net Merit and Productive Life now runs 73–79%, with Daughter Pregnancy Rate around 74%, based on CDCB-published reliability tables cited in that same guide. Genetic gain in NM$ has accelerated to roughly per year under genomic selection, consistent with CDCB’s published national trend data reported in the Bullvine May 2025 guide.
| Trait | CDCB Reliability Range | What It Means in Practice | Enforcement Implication |
|---|---|---|---|
| Net Merit (NM$) | 73–79% | High confidence — ranking is stable across re-runs | Safe to print on breeding sheet as decision rule |
| Productive Life (PL) | 73–79% | Longevity signal strong at this reliability | Bottom-quartile PL animals are real culling targets |
| Daughter Pregnancy Rate (DPR) | ~74% | Solid — fertility signal actionable at farm level | Use to flag beef-routing candidates, not just sire selection |
| Fat Yield (PTA Fat) | ~78–82%* | Highest reliability in the index post-2025 revision | 31.8% NM$ weight now makes this the dominant sort variable |
| Feed Saved | ~65–70%* | Improving but widest confidence band in the index | Use directionally; don’t cull solely on Feed Saved at this stage |
Layer in the 2025 NM$ revision. CDCB’s April 2025 NM$ formula revision moved PTA Fat near 31.8% relative emphasis and Feed Saved to roughly 14%, as reported in the May 2025 guide and anchored to the CDCB primary release linked there. On paper, the case writes itself.
Some commercial herds use genomic data primarily for sire selection and donor identification, where ROI capture doesn’t require the kind of cull-and-route discipline this article emphasizes. Those strategies have their own economics. The case below is built for the much larger commercial cohort that buys the test, files the report, and breeds the herd the way it bred last year.
For Canadian and other supply-managed readers, the cull-and-route economics shift under quota systems — the beef-cross premium and rearing-avoidance lines still apply, but the replacement-pressure math changes when quota expansion governs herd growth rather than market-priced milk volume. The thesis below is built for U.S. market-priced systems.
The recommended commercial playbook surfacing across major U.S. genomic test provider strategy guides and university extension materials The Bullvine has reviewed across 2024–2026 looks consistent: test the full heifer crop at the lab’s $40–$45 contract rate, cull the bottom 15–20% as calves, route the bottom cows to beef semen, pull donor candidates from the top 5%.
Plan on paper. Plan in practice: often barely touched.
What Does It Cost When a 700-Cow Herd Tests Every Heifer But Culls None?
The pattern The Bullvine has documented across commercial freestalls in 2024–2026 breaks one assumption flat. Everyone assumed genomic data and genomic decisions were the same thing. The 2024 barns say otherwise.
A run of transition wrecks tightens springer inventory. A load of heifers moves at a strong price right after calving and tightens it further. By the time the genomic reports land, the quiet decision has already been made in herds this size: keep every heifer, use the rankings to pick donors, move on.
In herds The Bullvine reviewed during 2024–2026 where genomic testing was paid for but routing wasn’t enforced on paper, the observable pattern is that breeding decisions often continue to follow visual and temperament cues rather than the genomic ranking. The ranking isn’t wrong. It just isn’t the rule. Where the ranking isn’t printed on the daily breeding sheet, it’s rarely the operative input at the tank. That’s an enforcement pattern, not a technician failing.
Three forces keep this pattern alive in 500–1,500-cow herds. Muscle memory beats spreadsheets when the tech is working in the dark. Visual bias defends favorite cow families against any ranking that contradicts them. Pay structures tie breeding staff to pregnancy rate and services-per-conception, not to whether the semen pulled matched the genomic tier.
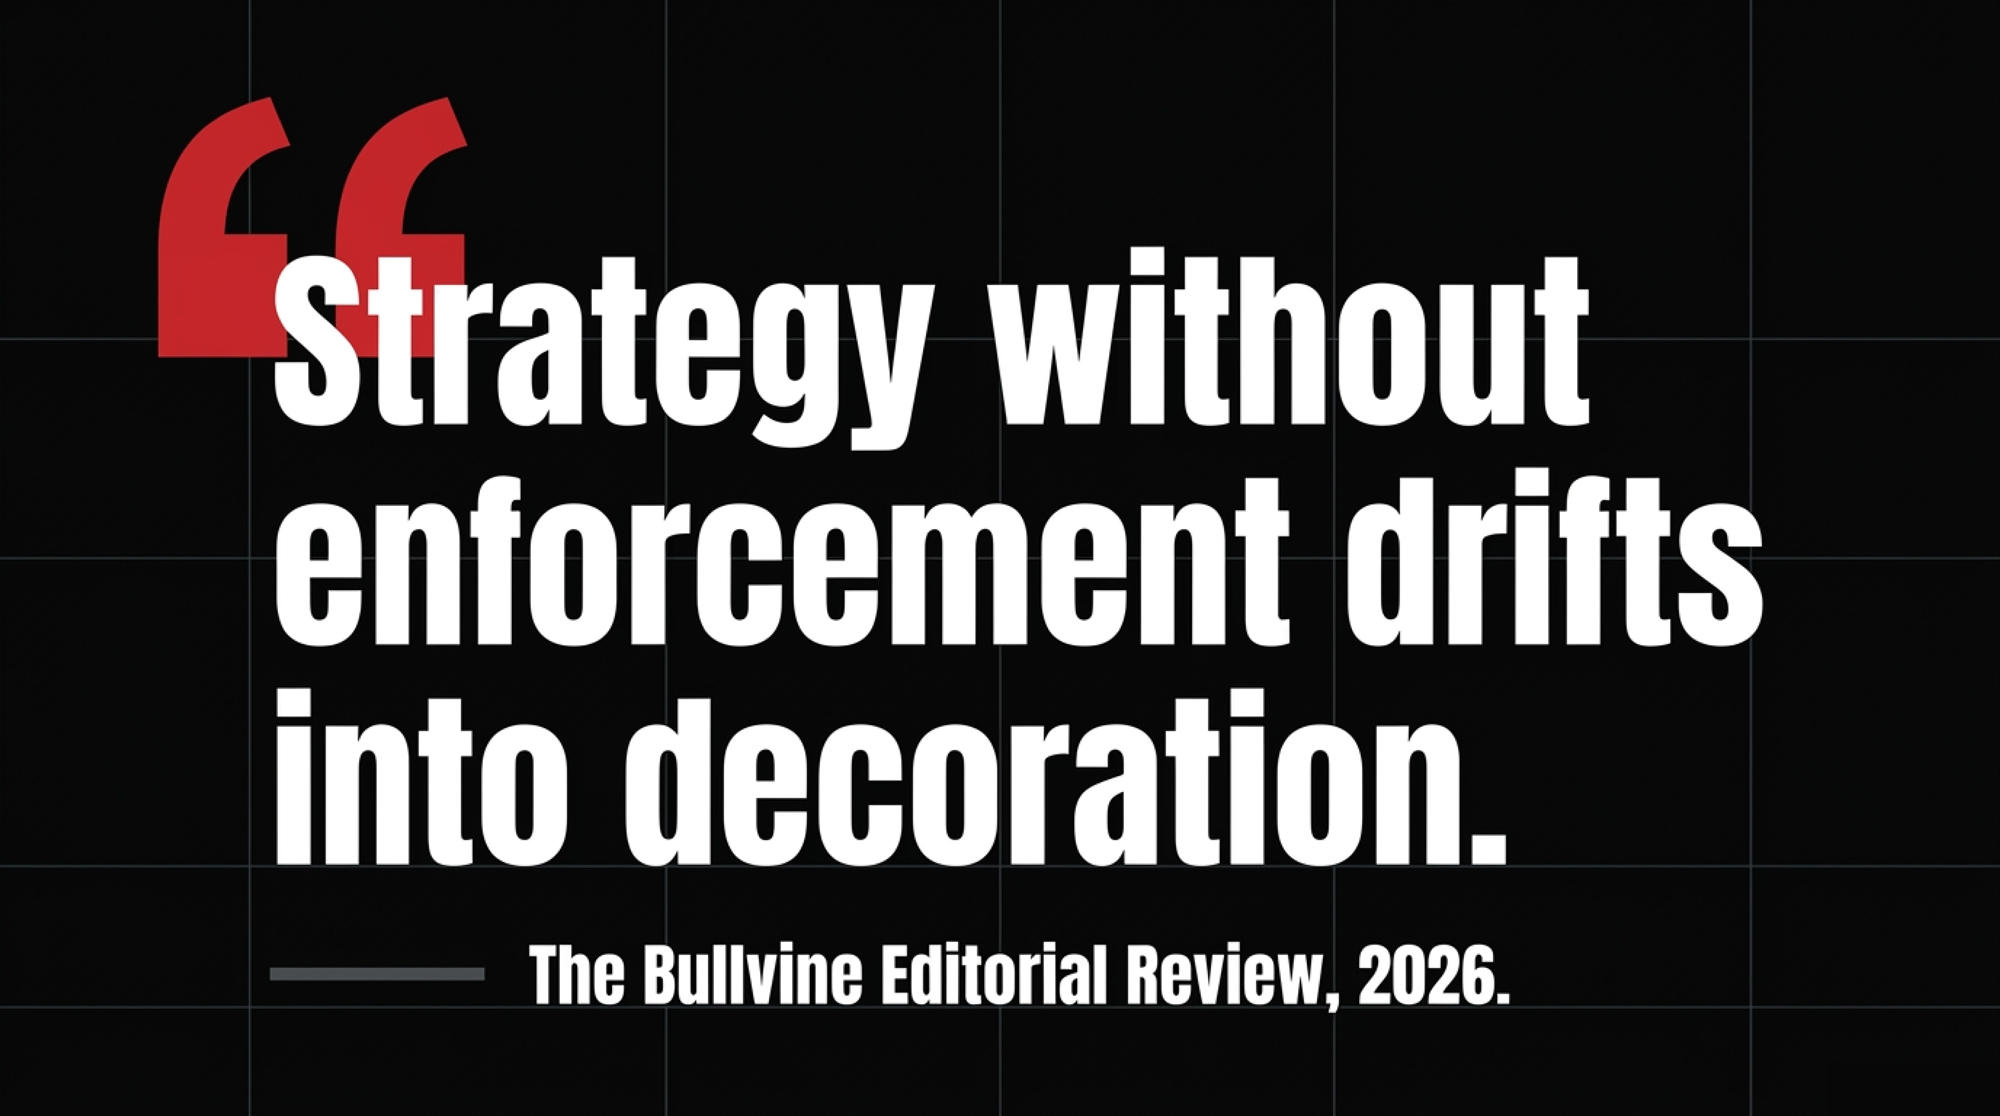
Strategy without enforcement drifts into decoration. That’s what the testing line item is paying for when it pays for nothing else.
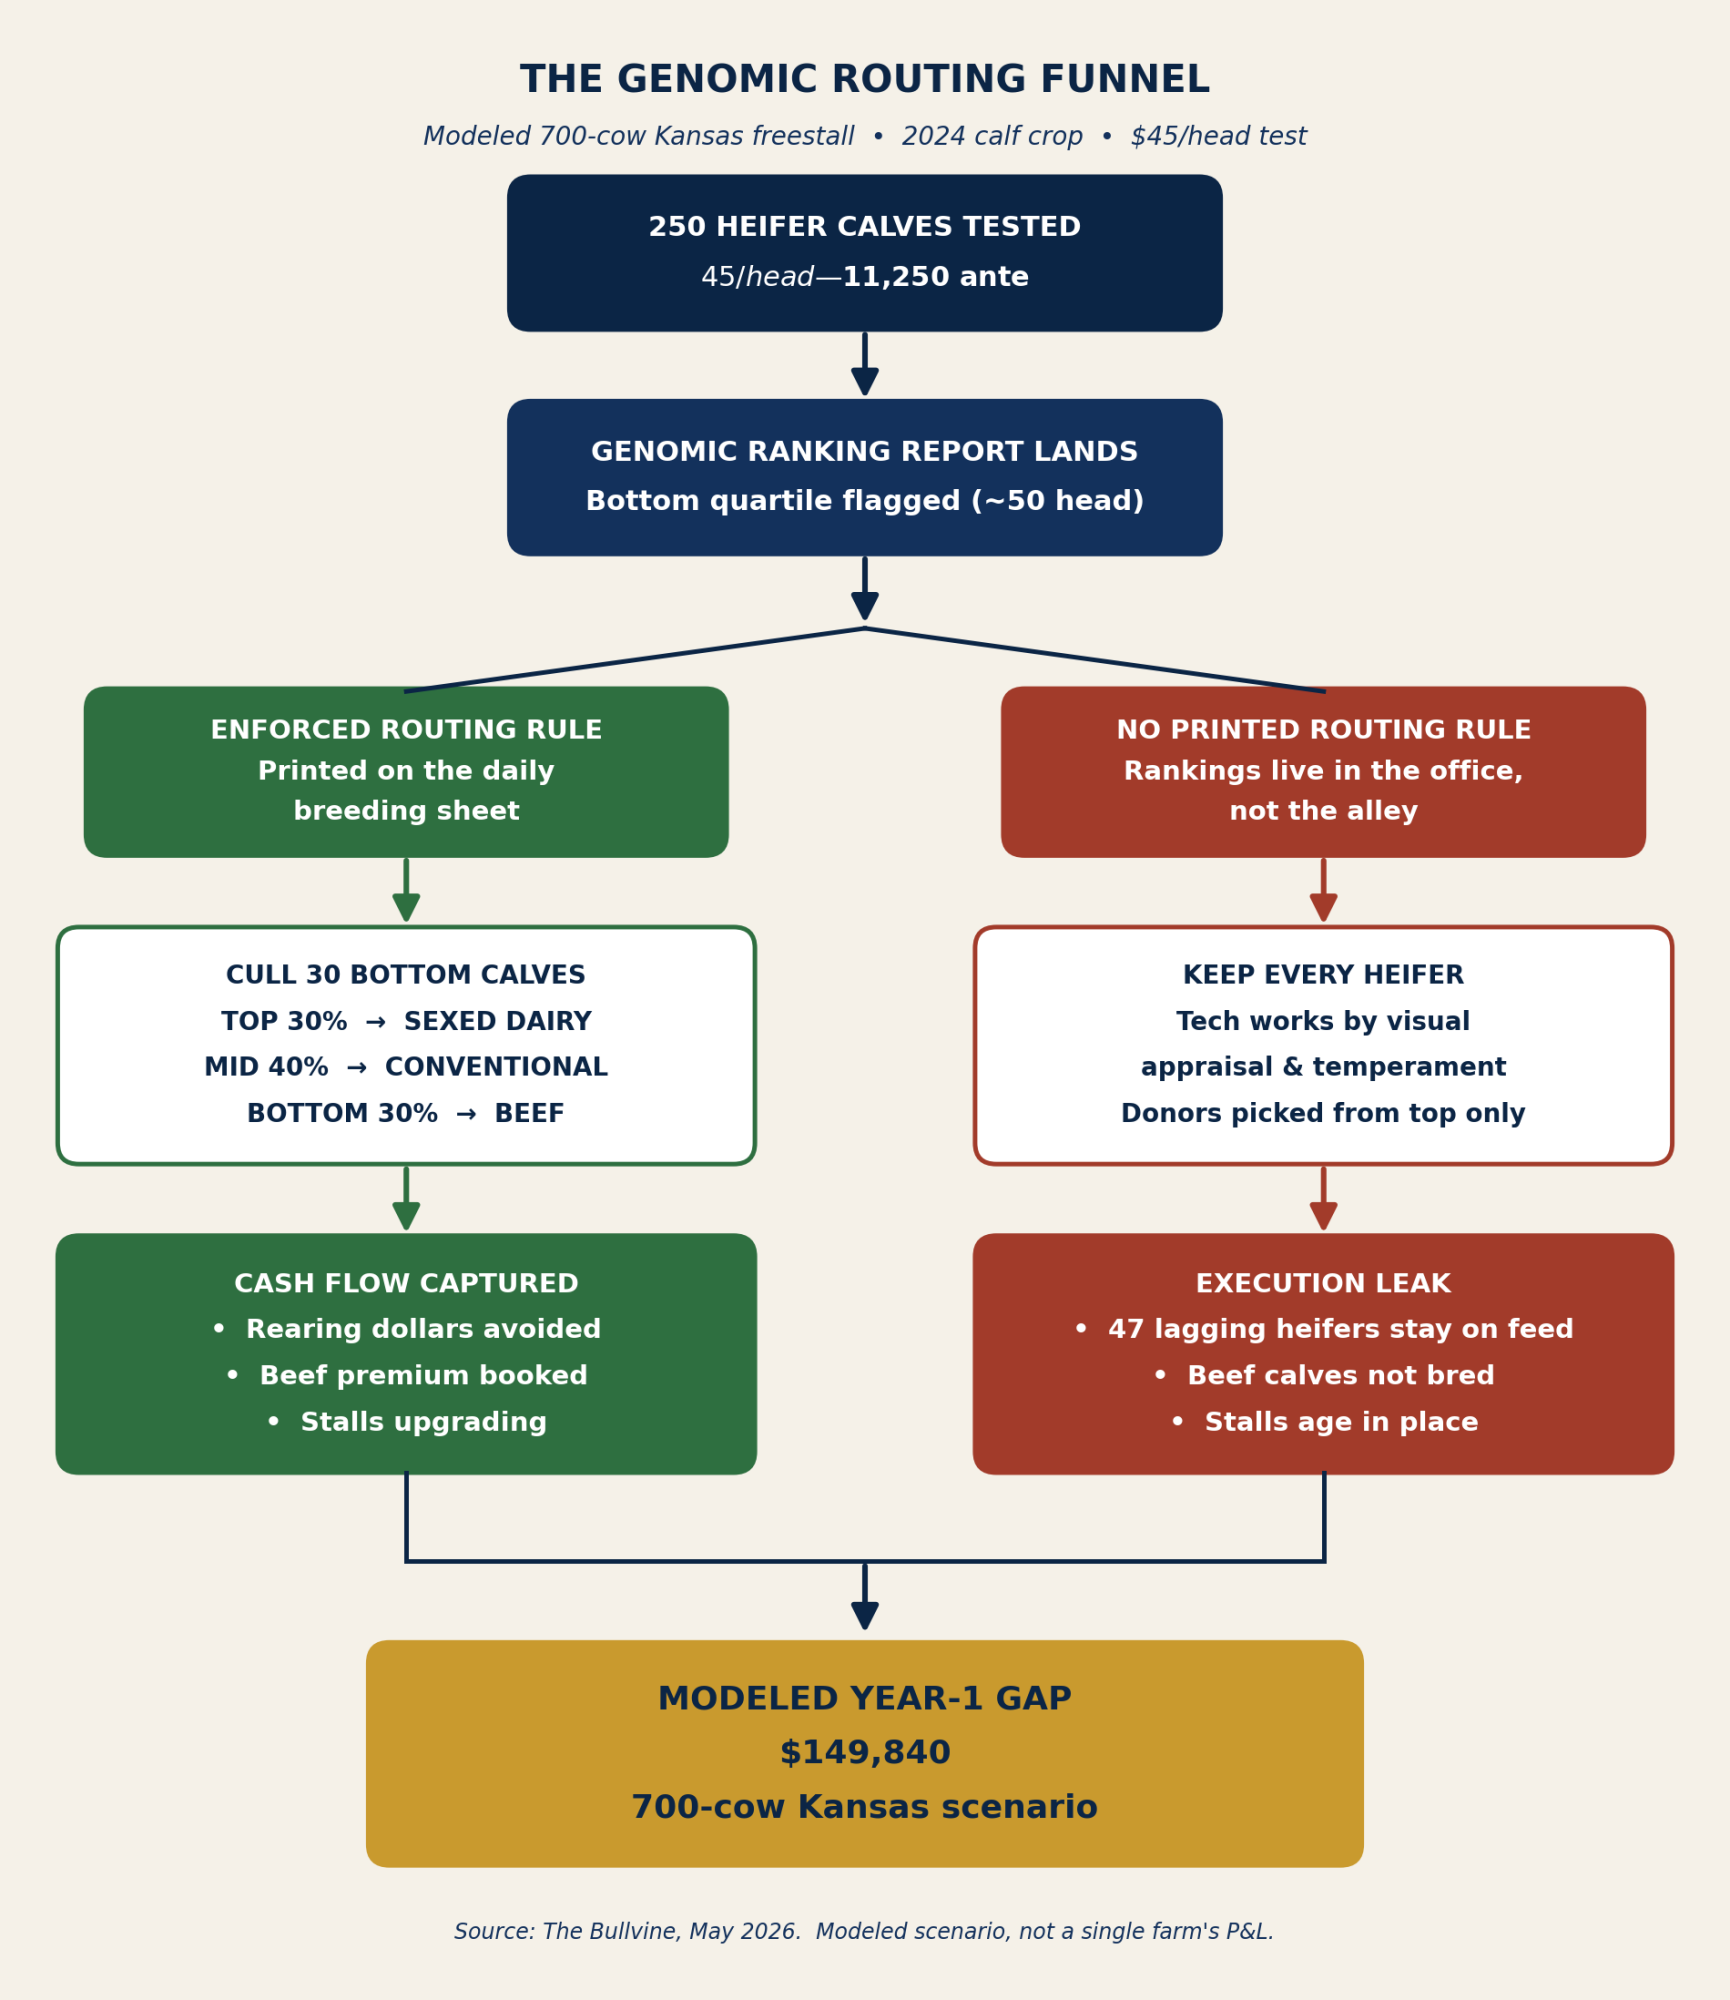
How the Execution Leak Happens — The Genomic Routing Funnel
Three Cash Flows That Move the Wrong Way
Against an enforced routing benchmark, three lines on the 700-cow Kansas scenario’s 2024 cash flow move in the wrong direction.
Rearing dollars not recaptured. Rearing dollars not recaptured. A $45 × 250-heifer test flags a clear bottom-quartile group — roughly 50 animals running below the top half on NM$ and components. Pull 30 as calves under a disciplined sort-and-cull plan modeled on The Bullvine’s February 2026 execution-leak work, and you avoid roughly 30 × $2,651 in rearing cost over the next 24 months. Pull three instead of 30, and the other 47 stay on feed, in pens, on the balance sheet.
Beef-cross revenue not captured. The beef-cross premium over a straight Holstein bull calf ran $350–$700 per head through late 2024 and into 2025, consistent with USDA AMS bull calf price ranges over the same period. That’s a national/trade-press benchmark; Kansas and Plains-region premiums vary, so cross-check against local sale barn or regional trade reporting before applying this range to your own math. At 450 cows bred in a cycle and an enforced top-half-dairy/bottom-half-beef rule — a framework consistent with routing discipline operators have described to The Bullvine in 2024–2026 interviews — 220–225 cows land in the beef-eligible bucket. When a herd this size books 95 beef-cross calves for the year, the modeled gap sits at roughly 125 additional cows not routed (rounded to 120 in the table below for arithmetic simplicity).
Stall value that ages poorly. A third- or fourth-lactation cow can carry genetics $250–$400 behind the 2023–2024-born heifers coming up behind her, derived from 85/year NM$ gain (CDCB national trend data). The Bullvine’s November 2025 Retention Payoff framework puts the three-year advantage of swapping a genetically lagging cow for a top-index replacement at roughly $1,350 per cow, with an approximate $233 per cow per year genetic opportunity cost derived from that same gain rate. Without genomic culling pressure, stalls age in the wrong direction.
Running the Numbers — Modeled Kansas Scenarios at 400, 700, and 1,000 Cows
This is a modeled comparison, not any single operation’s P&L. Inputs come from Iowa State Extension’s 2024 heifer cost work, CDCB trend figures, Lactanet 2024 inbreeding data, The Bullvine’s 2024–2025 reporting, and a $45/head lab contract. Convention: Year-1 gap = rearing avoided + beef premium captured + stall drag. Testing investment is shown separately as the ante. Beef-routing line uses 120 cows at the 700-cow scenario for table simplicity (exact math = 125).
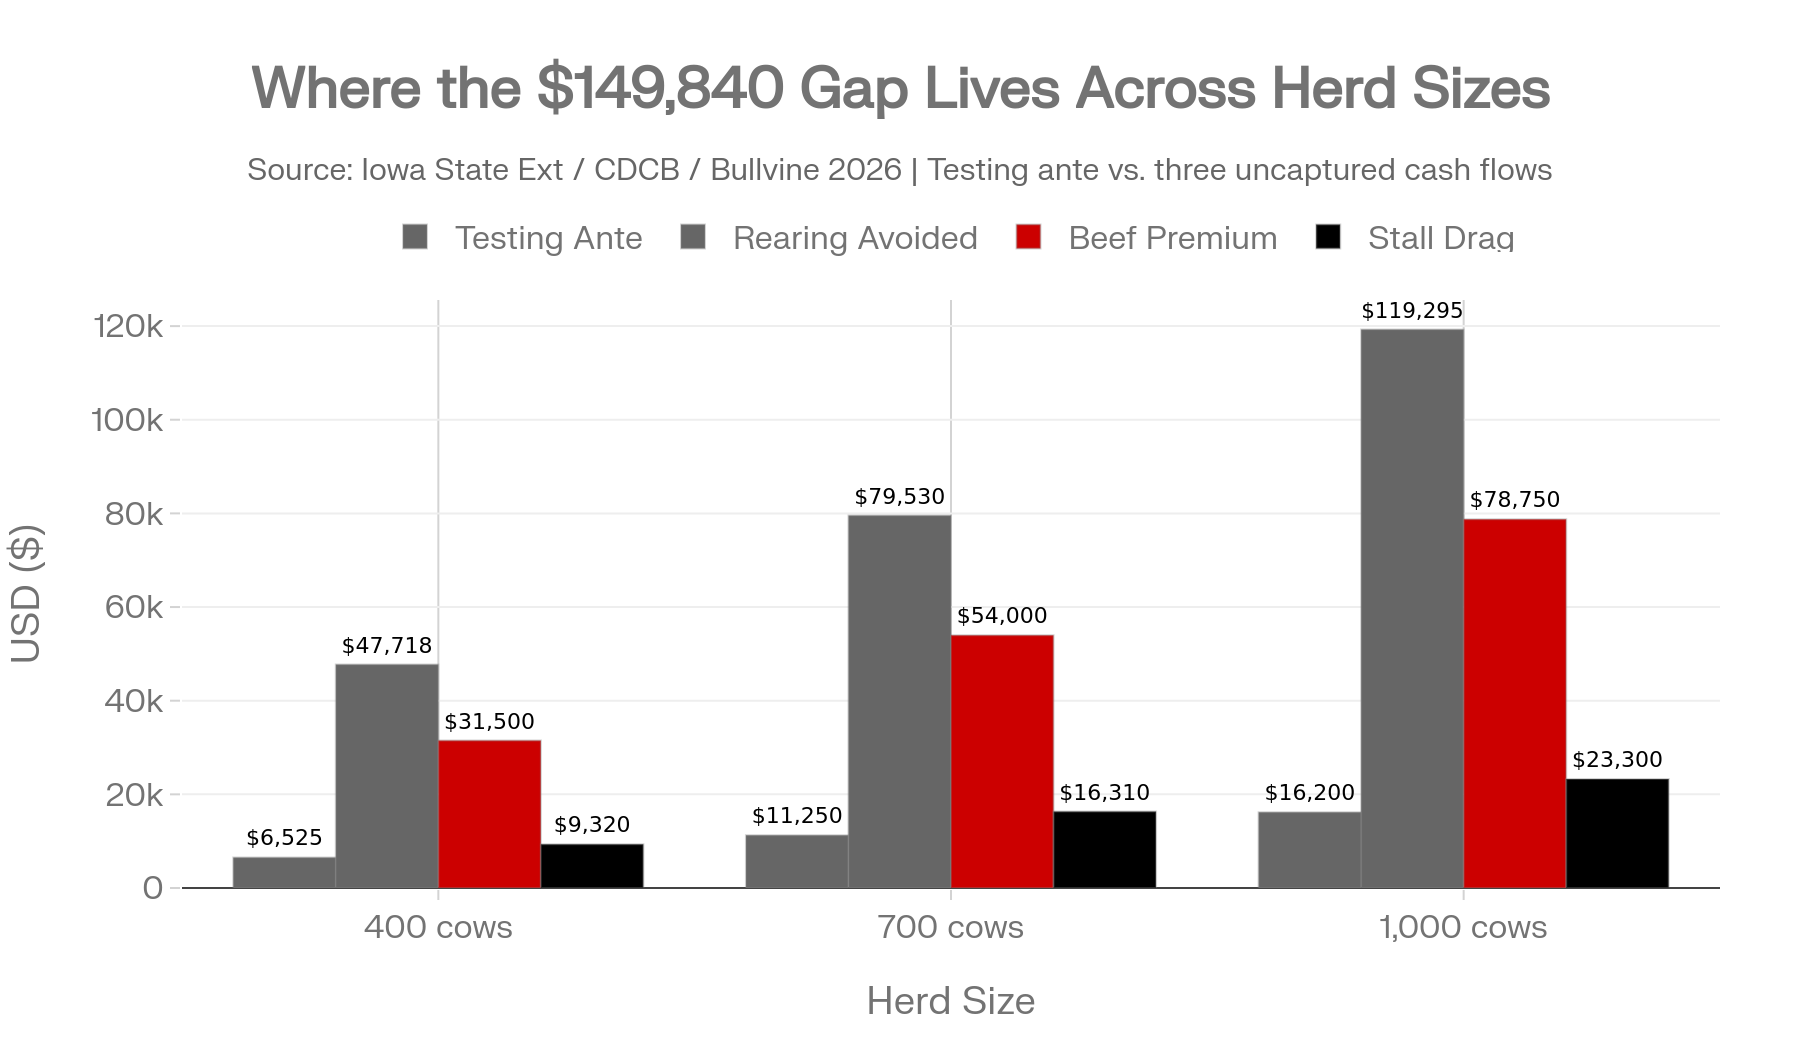
| Herd Size | Testing Ante | Rearing Avoided (24-mo) | Beef Premium (Year 1) | Stall Drag (Opportunity) | Total Year-1 Gap |
| 400 cows | $6,525 | $47,718 | $31,500 | $9,320 | $88,538 |
| 700 cows (lead scenario) | $11,250 | $79,530 | $54,000 | $16,310 | $149,840 |
| 1,000 cows | $16,200 | $119,295 | $78,750 | $23,300 | $221,345 |
Inputs behind the table
- Herd: 32% replacement rate, Kansas freestall, 2024 calf crop tested at $45/head.
- Heifer raising cost: $2,651/head to calving (Iowa State Extension, 2024).
- Beef-cross premium: $350–$700/head, $450 midpoint (USDA AMS, 2024–2025).
- Stall drag: ~$233/cow/year, derived from 85/year NM$ gain (CDCB national trend data).
- Rearing line is realized over 24 months; beef premium and stall drag are Year-1.
- Cull depth and beef-eligible count move with your replacement strategy, not just your herd size.
Separate three-year frame (700-cow scenario)
- Retention Payoff on 70 stall upgrades: 70 × $1,350 = $94,500 across three years, or roughly $31,500 per year amortized (Bullvine, November 2025). Don’t fold this into the Year-1 number. It’s a different horizon.
Plug in your own cull depth, routing rate, and beef premium midpoint. The range is directional.
Why the Testing Line Is the First Thing Lenders Ask About in 2026
The turn is showing up in Q4 lender meetings, not in the barn.
In The Bullvine’s 2025–2026 editorial conversations with commercial dairy operators in the 500–1,500-cow segment across the U.S. Midwest and Plains, multiple operators reported that their regional ag lenders raised a version of the same question at 2025 working capital renewals: the genomic testing line is up, where is it showing up on the milk check? Operators who can’t tie specific animals on the ranking report to specific routing decisions are finding those conversations harder to navigate than in prior cycles. That pattern aligns directionally with widely reported 2024–2025 ag-credit tightening across U.S. dairy.
EDITOR’S INSIGHT
In 2026, the milk check tells the story of your past decisions. The genomic report tells the story of your next ones.
One 2025 Lender Conversation, Illustrative and Anonymized
Read this as composite, not verbatim. The figures below are derived from the modeled 700-cow Kansas scenario above, not from any single operator’s records. It reflects the pattern operators have described to The Bullvine across the U.S. Midwest and Plains during 2025 renewal cycles, not any single exchange.
Lender: Your testing line went from $7,400 in 2023 to $11,250 in 2024. Walk me through what changed on the milk check.
Operator: We’re testing every heifer now.
Lender: I can see that. Your beef-cross calf count went from 82 to 95. Your springer inventory is up eleven head year-over-year. Which animals on the 2024 ranking report did you cull or route differently because of what the test said?
Operator: (pause) We’d have to pull the list.
That silence is the product. Not the $45 invoice.
A 2024 DSCR under 1.2 — the working-capital threshold widely used by U.S. ag lenders — sitting on the ledger next to a five-figure genomic testing bill and a ranking report whose bottom-quartile heifers are still in the springing pen answers the lender’s question for them. The test wasn’t the product. The decision rule was.
The other half of the pattern shows up at the barn level. The list wasn’t the rule, so the list wasn’t the input. Visual appraisal won because nothing in the daily workflow required anything else. That single dynamic explains most of the daylight The Bullvine has been documenting across commercial dairies reviewed in 2025–2026.
The 30/90/365-Day Playbook for Herds Testing Without a Rule
The fix isn’t more testing. It’s less freelancing. This playbook blends the restructured 2025–26 protocols The Bullvine has reviewed, the routing discipline operators have described, and the February 2026 execution-leak findings.
30 Days: Stopping the Bleed
- Tag the bottom 20% so the alley can see them. Rank every heifer on hand by NM$ from your 2024 and 2025 genomic reports. Tag the bottom 20% with a physical signal — leg band, ear tag color, pen flag — within 30 days. Requires one morning with your genomicist and your software. Red-flag trigger: if your genomic testing spend is up year-over-year and your beef-cross calf count hasn’t moved, this is week one. Backfire watch: over-culling into a replacement shortage if your sexed semen program isn’t already creating surplus. Pull your 12-month projected heifer inventory before acting.
- Print the ranking on the daily breeding sheet. Rewrite the daily breeding sheet with your AI tech. Every line prints with an assigned semen type — SEXED DAIRY, CONVENTIONAL DAIRY, or BEEF — derived from genomic tier, not tech discretion. Requires 2–3 hours in your herd management software (DairyComp, MPT, or equivalent). Trigger: if semen calls are being made at the tank rather than from a printed list, this is the highest-leverage 30-day fix.
- Track tier compliance for one month. Target 95% by day 30, per The Bullvine’s editorial recommendation. Watch for excuses that start with “she looked good.”
90 Days: Systematizing the Rule
- Install the one barn rule in writing. Band the breeding herd into top 30% sexed dairy only, middle 40% conventional or flex, bottom 30% beef only. Publish it in writing to everyone who touches the tank. Requires current genomic indexes on every eligible animal, a family meeting, and a plan for cultural pushback before it happens at 4:30 a.m. Threshold: if compliance runs below 90% in month two, the rule isn’t the rule yet. Backfire watch: resentment if you enforce without backing the tech when a well-presenting cow in the bottom band gets beef. The rule isn’t the rule until the tech has been backed up in front of the owner.
- Pay for the rule, not just the pregnancy. Rewrite your breeding tech’s performance metric to include tier compliance alongside conception rate, tracked as paired numbers on the same weekly dashboard. Requires one conversation and one line change. Watch for gaming — compliance without conception progress isn’t the goal.
- Audit inbreeding before the next mating cycle. Have your genomicist generate genomic inbreeding coefficients and Genomic Future Inbreeding scores for every breeding candidate. Flag any potential mating over 9% projected progeny inbreeding. Canadian Lactanet 2024 data points to roughly $60–$78 per cow per lactation of drag per additional 1% inbreeding. On a 300-cow herd, a 2-point reduction held across three lactations pencils to about 300 × 2 × $70 × 3 = $126,000 in avoided lifetime drag, using the $70 midpoint of the Lactanet $60–$78 range.
365 Days: Repositioning the Operation
- Re-baseline the heifer pen around enforced culling. By end of year one, your heifer pen should be smaller, genetically stacked at the top, and funding a visible beef-cross calf revenue line on the cash flow your lender reviews. Requires one full breeding cycle under the rule. Opportunity signal: if your 2026 calf crop shows beef-cross count rising while springer projections hold within your 24-month replacement target, you have room to tighten the top tier further.
- Run the donor program on index, not pedigree alone. Commercial IVF pregnancies typically run into the several-hundred-dollar range per confirmed pregnancy; confirm current rates with your provider before committing. The Bullvine’s editorial view on donor economics: the strongest pedigrees don’t always produce the strongest genomic profiles, and donor economics work best when the index decision leads the pedigree decision. For the legacy view of how disciplined index-led mating built famous breeding programs.
- Rebuild sire selection around the 2025 NM$ weightings. Review sire selection through a component and inbreeding lens, not a top-10 list lens. Align your bull roster to the 2025 NM$ weightings and layer genomic relationship checks on top. Requires your mating software provider’s current release and a half-day with your genetics consultant.
What This Means for Your Operation
Testing isn’t the product. The rule is. That’s why the same $45 test lands as a six-figure decision on one farm and a line item on another.
The trade-off is plain. You gain margin by letting genomic ranks decide who gets raised, who gets bred dairy, who gets beef. You give up the comfort of family tradition, eye appraisal, and the peace of never arguing with your herdsman at 4:30 a.m. You also need a sexed semen program already doing real work. No surplus, no cull room. No cull room, no ROI on the test.
Across the commercial herds The Bullvine reviewed in 2025–2026 that installed a printed tier-routing rule, the editorial pattern has been beef-cross calf counts rising in the first full breeding cycle under the rule, testing spend holding roughly flat, and tier compliance converging on the 90–95% range within a quarter. The sample is the herd cohort described in the Behind the Numbers toggle below, not a national survey. October 2026 working capital reviews are five months out. The math is already moving on the herds that rewrote their breeding sheets this spring.
▶ RUN YOUR NUMBERS — Open the Genomic Testing ROI Calculator
The calculator walks you through your own herd’s test cost, cull depth, beef-routing rate, and replacement value in under ten minutes. Pull it up before your next breeding-sheet review.
Pull your 2024 and 2025 genomic reports. Answer one question honestly. Which specific animals did you actually treat differently — culled, routed to beef, moved out of the replacement pipeline — because of what the test said? Walk to the office. Find last week’s breeding sheet. Count the semen assignments that came from the genomic tier versus the tech’s judgment.
Key Takeaways
- The $45 invoice isn’t the cost. The $149,840 modeled gap on a 700-cow Kansas freestall is what happens when the ranking lives in the office and the breeding sheet doesn’t change.
- Genomic ROI shows up only when the rule is printed: top 30% sexed dairy, middle 40% conventional, bottom 30% beef — and the tech gets backed up the first time a well-presenting cow in the bottom band gets beef.
- Tag the bottom 20% in 30 days, install the routing rule in writing in 90, and re-baseline the heifer pen by the 2026 calf crop. Your October 2026 working capital review is the deadline, not your next lab invoice.
- If your testing line is up year-over-year and your beef-cross calf count hasn’t moved, your lender already knows the answer. Pull last week’s breeding sheet before they ask again.
What does your current breeding protocol actually say, on paper, about the bottom 30% — and when did it last change a single decision at the tank?
This article draws on The Bullvine’s 2024–2026 editorial review of commercial freestall dairies in the 500–1,500-cow segment, built from aggregated operator interviews and on-farm record reviews conducted across the U.S. Midwest and Plains during that window. The cohort referenced in the article reflects herds The Bullvine has reviewed in that segment during 2024–2026; specific herd counts are not disclosed to protect operator anonymity. The 700-cow Kansas scenario is modeled, not drawn from any single operation’s records.
The anonymized 2025 lender conversation is composite and illustrative, constructed from the pattern of exchanges operators described to The Bullvine during 2025 working capital renewal cycles. The dialogue’s specific figures are derived from the modeled 700-cow Kansas scenario inputs, not from any single operator’s ledger. No individual operator, herdsman, or lender is named or profiled. The DSCR-under-1.2 threshold reflects a working-capital line widely used by U.S. ag lenders and is cited as a common-practice benchmark, not as a specific institution’s policy.
Learn More
- Beef-on-Dairy Calf Profit: The $150 Leak Killing Your Premium — Exposes the hidden financial penalty feedlots charge when crossbred calves arrive with poor passive transfer. Arms you with weaning protocols to protect up to $88,000 annually before the auction block permanently discounts your farm’s reputation.
- 9.57 Million Cows, 3.9 Million Replacements: Genetics Built This Dairy Herd Paradox – and 2027 Ends It — Follows the money on the national heifer shortage against a thirty-year high in cow numbers. Dismantles forced retention myths and positions your breeding strategy for a fast-approaching market defined by an 800,000-head replacement deficit.
- Dairy Cattle Genetics 2026: TPI, NM$ and Genomics — Breaks down the latest index overhaul pushing Feed Saved to nearly eighteen percent of Net Merit. Recalibrates your sire roster for modern efficiency benchmarks, ensuring you capture the maximum lifetime profit gap from genomic testing.
 The Sunday Read Dairy Professionals Don’t Skip.
 The Sunday Read Dairy Professionals Don’t Skip.
Every week, thousands of producers, breeders, and industry insiders open Bullvine Weekly for genetics insights, market shifts, and profit strategies they won’t find anywhere else. One email. Five minutes. Smarter decisions all week.
