


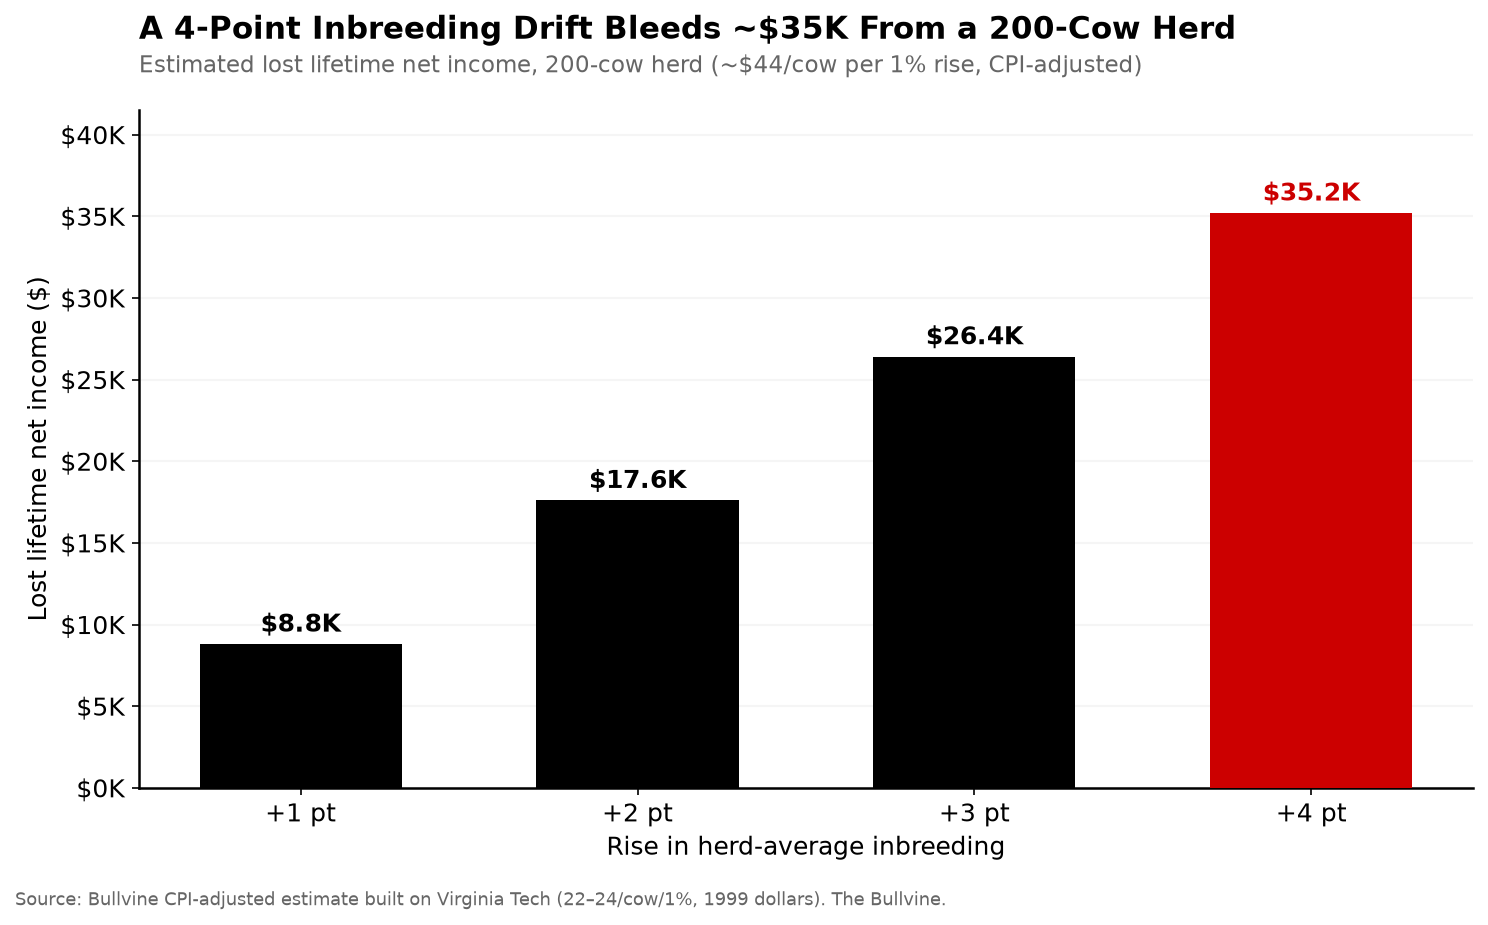
At 9.99% inbreeding, every extra point can quietly strip up to $44 per cow — before you even argue TPI vs Net Merit.
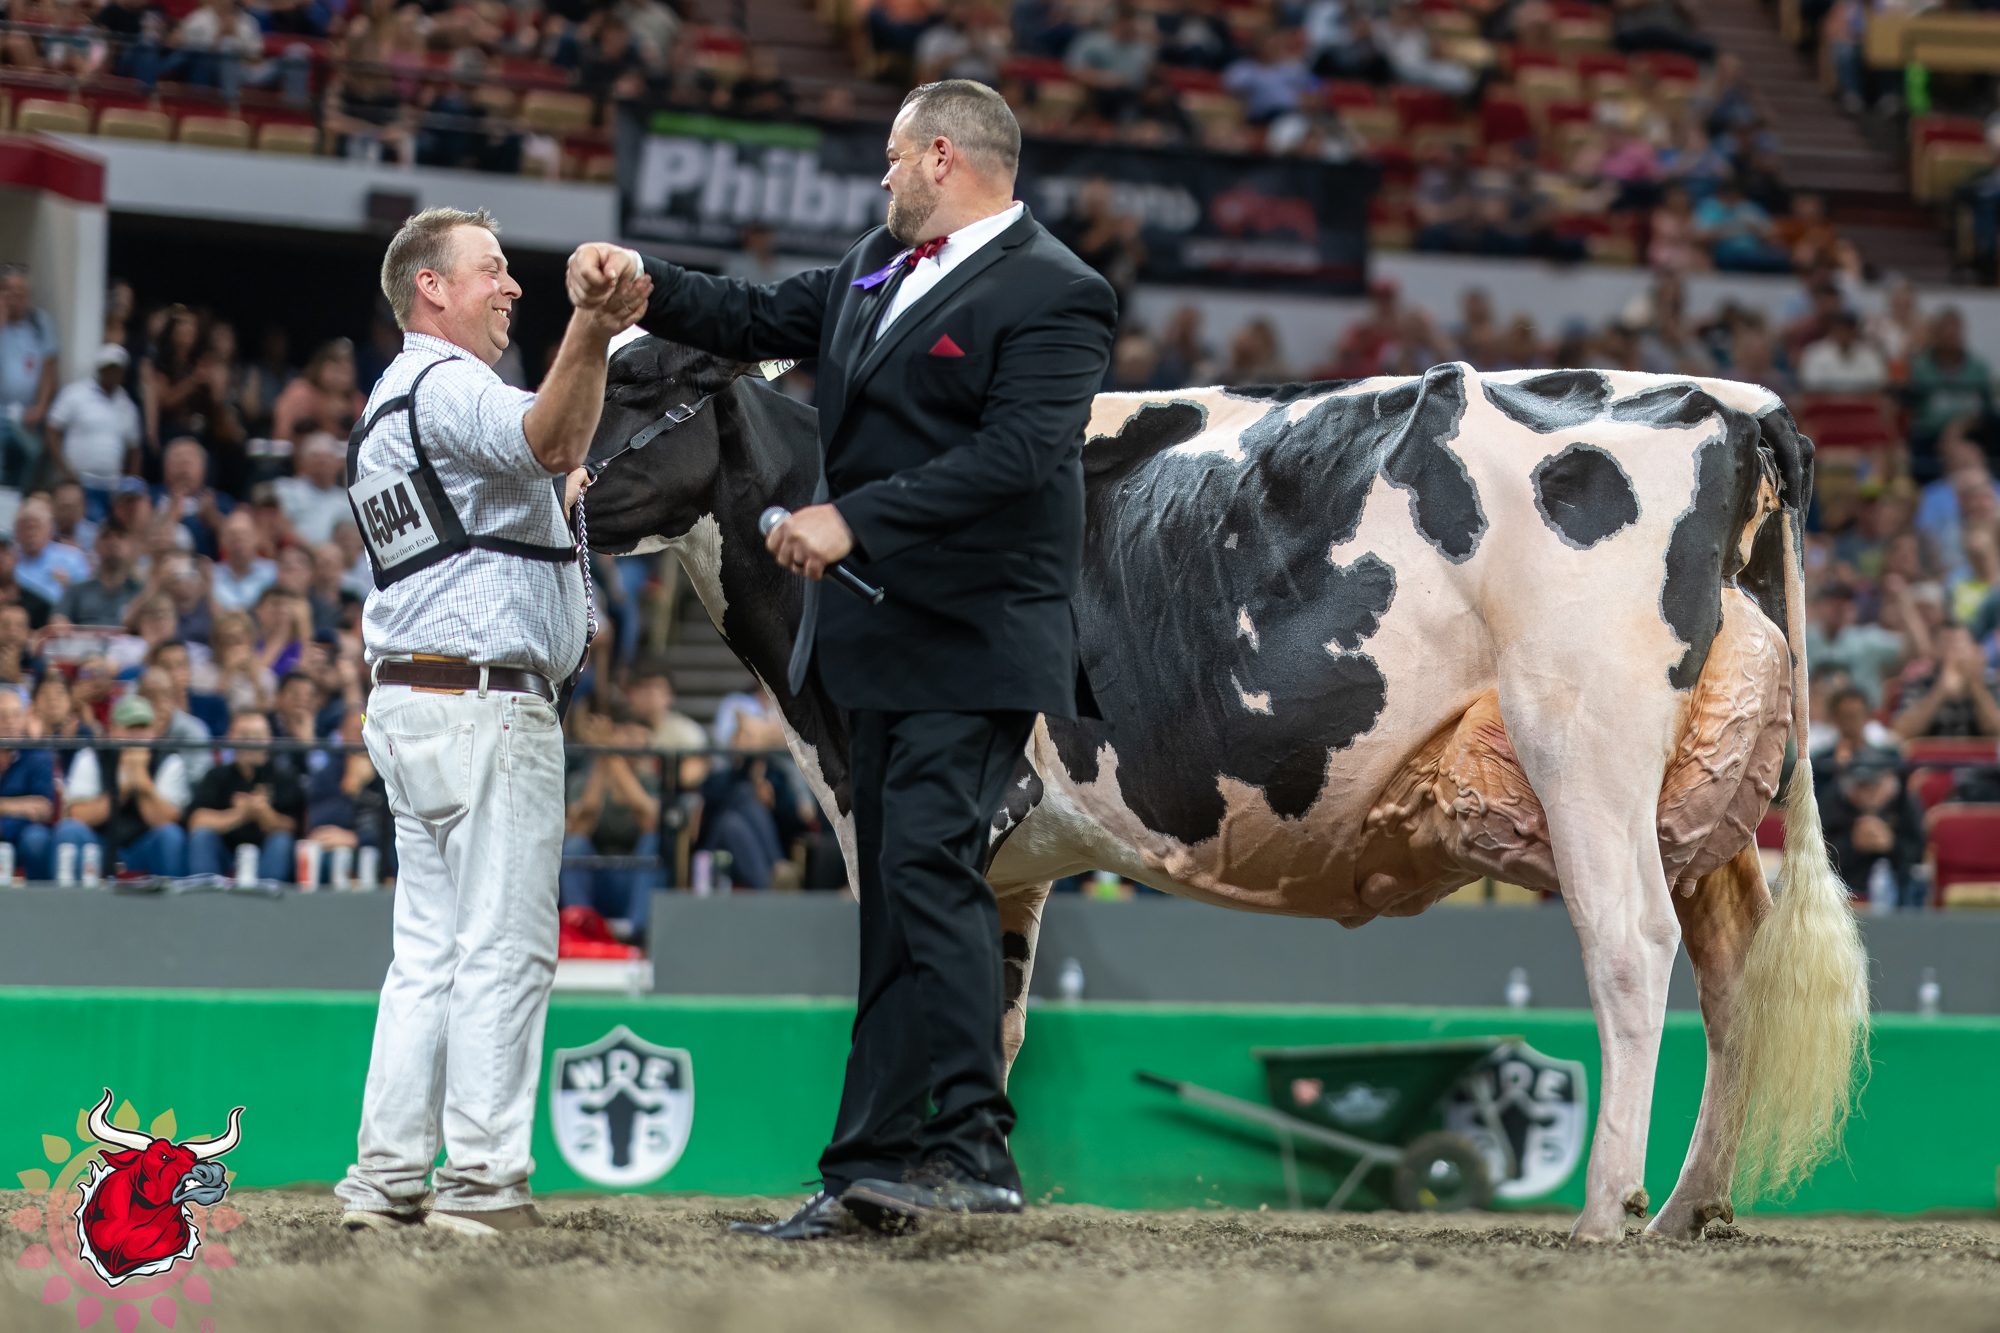
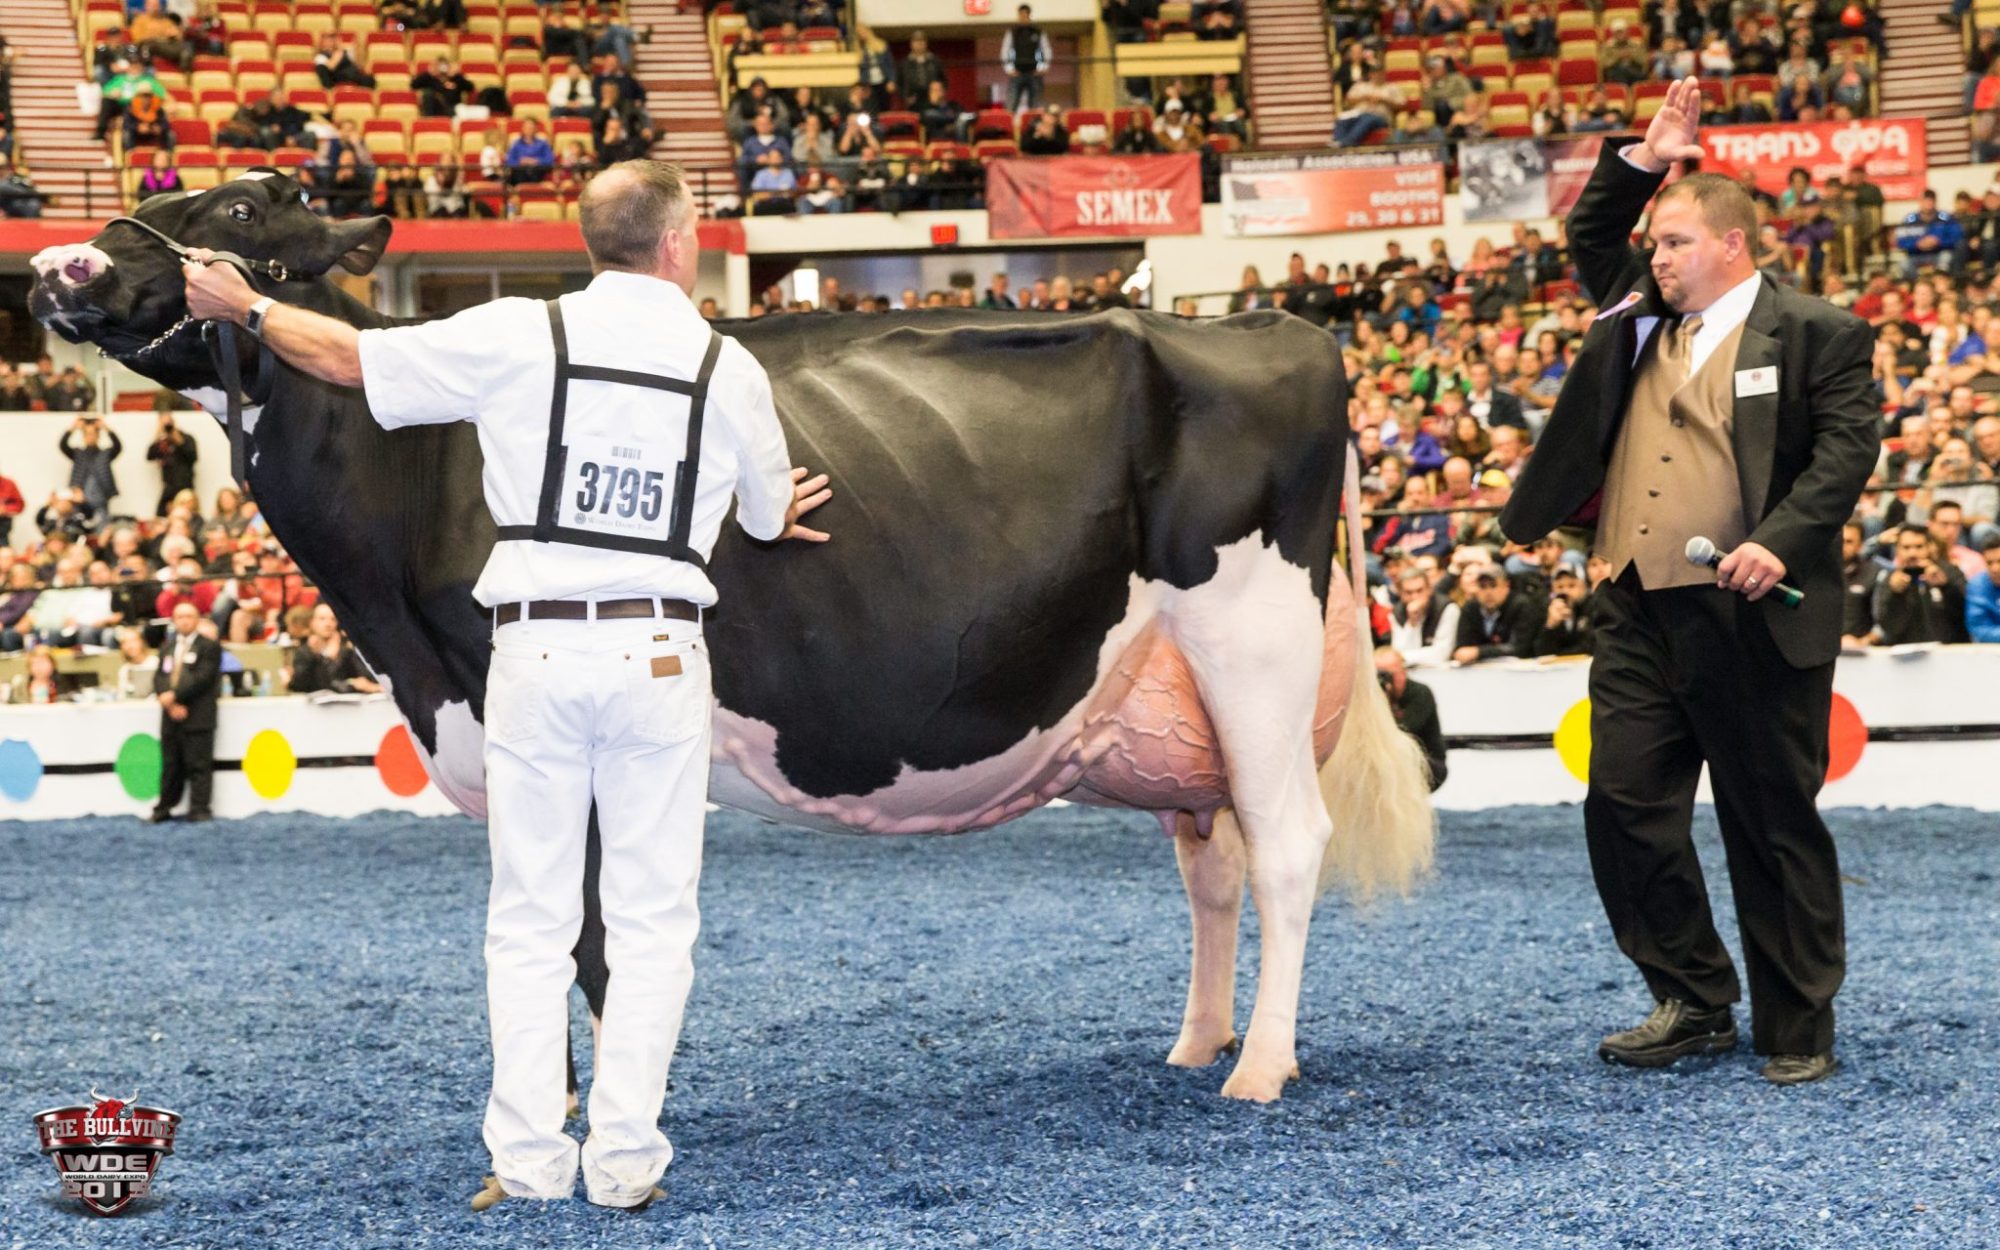
Michael and Jessica Lovich milk 72 cows in a tie-stall barn in Balgonie, Saskatchewan. They mostly ignore genomics. They breed off cow families and their own eye. And they’ve now bred two separate World Dairy Expo Holstein Grand Champions — Lovhill Goldwyn Katrysha in 2015 and Lovhill Sidekick Kandy Cane in 2025. They’re the first and only breeders in history to pull that off. (Read more: Lovholm Holsteins: The Only Farm to Breed 2 World Dairy Expo Holstein Champions Milks 72 Cows in Tie-Stalls)
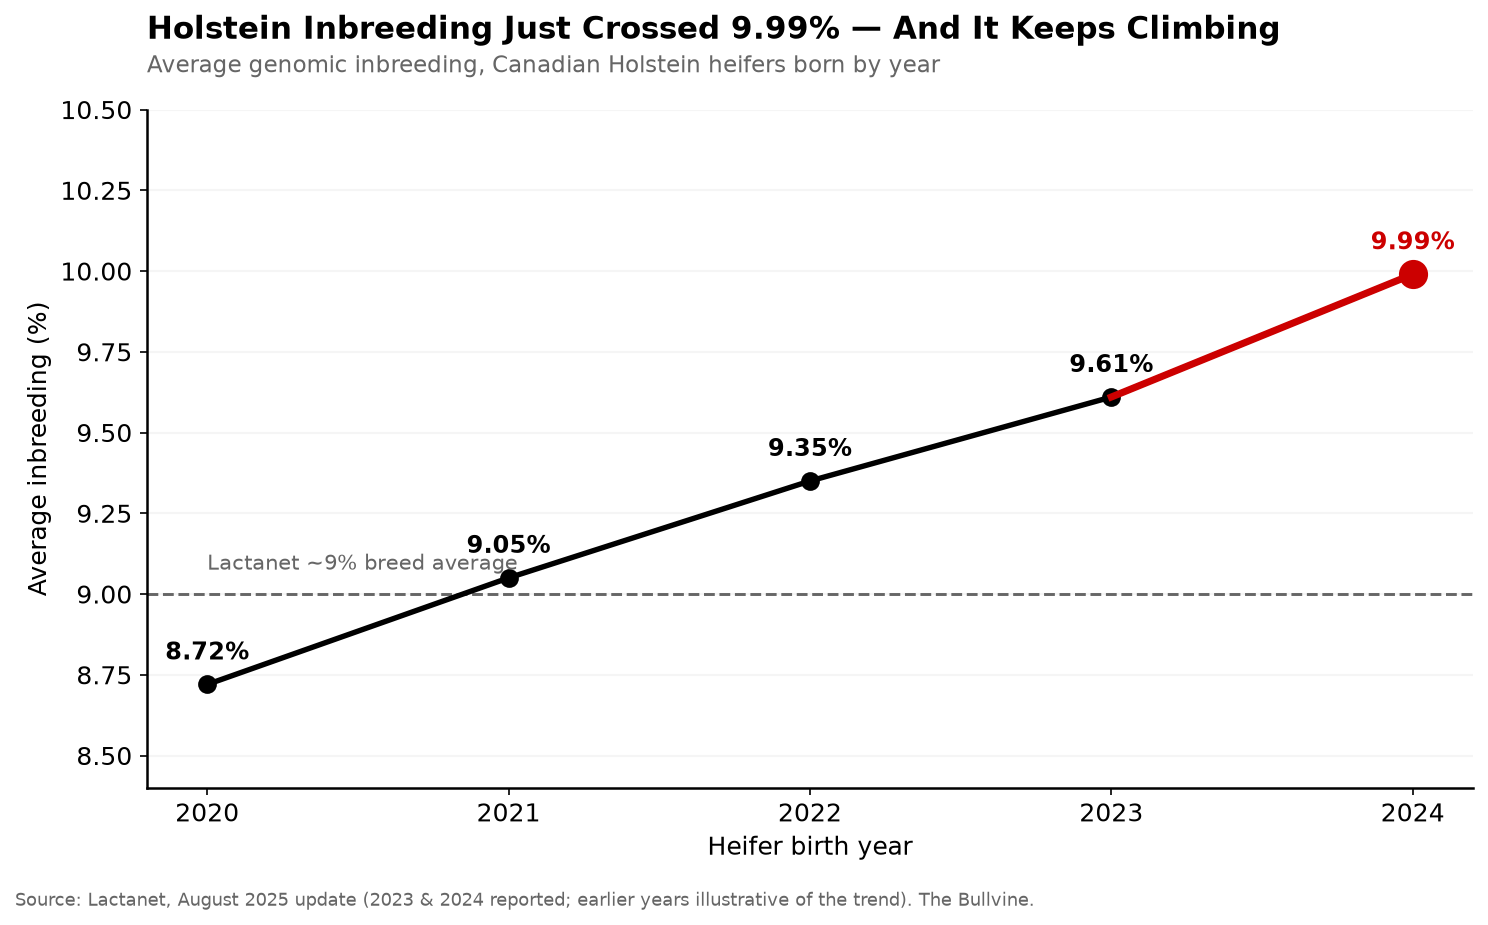
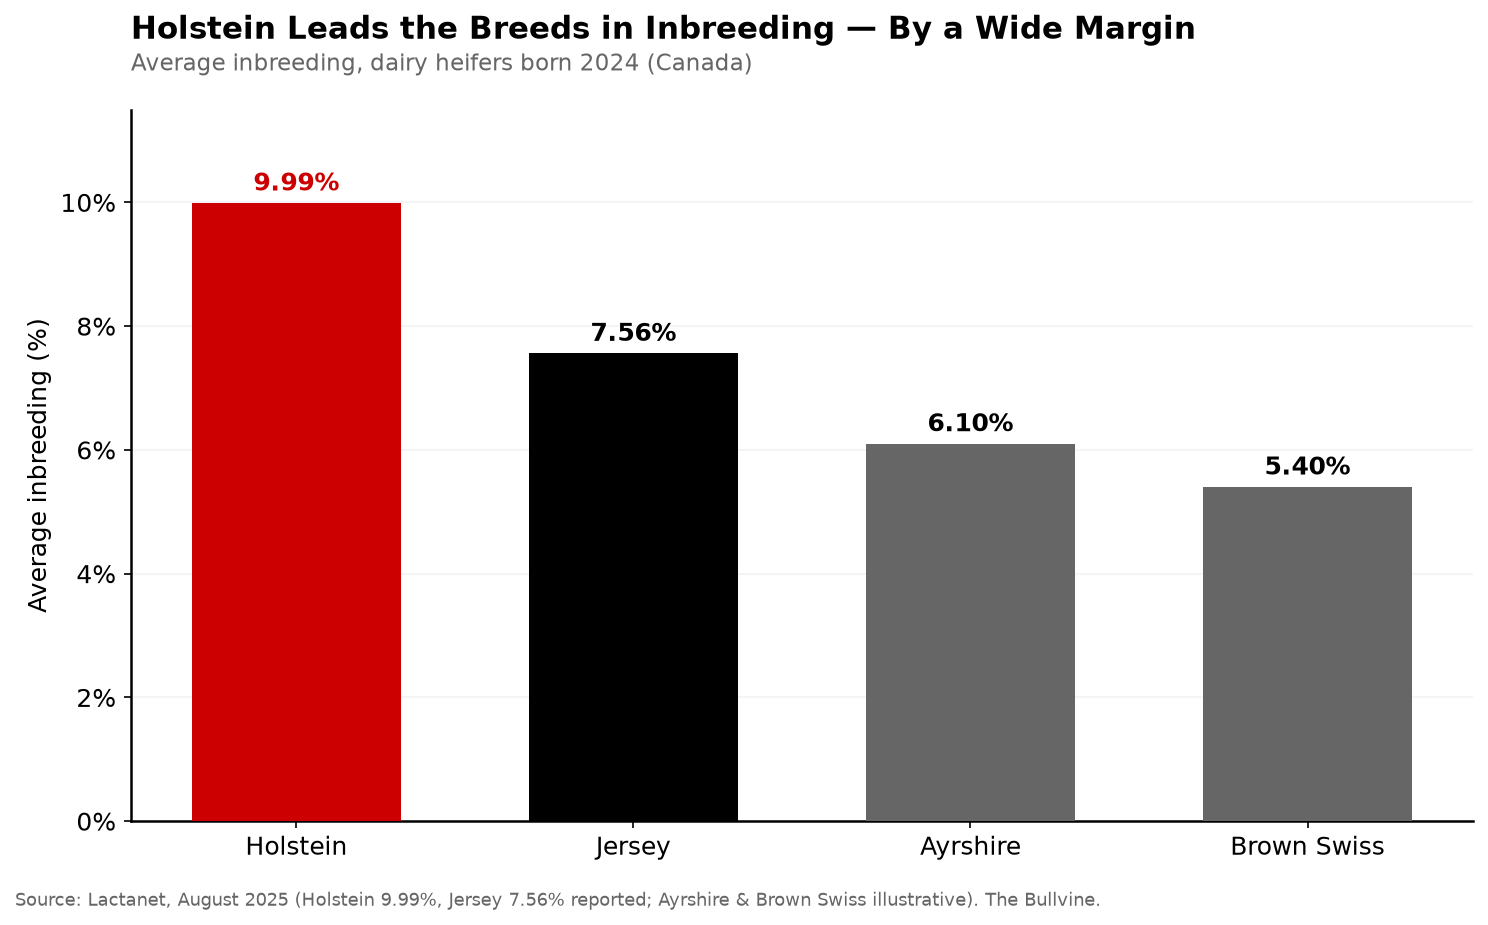
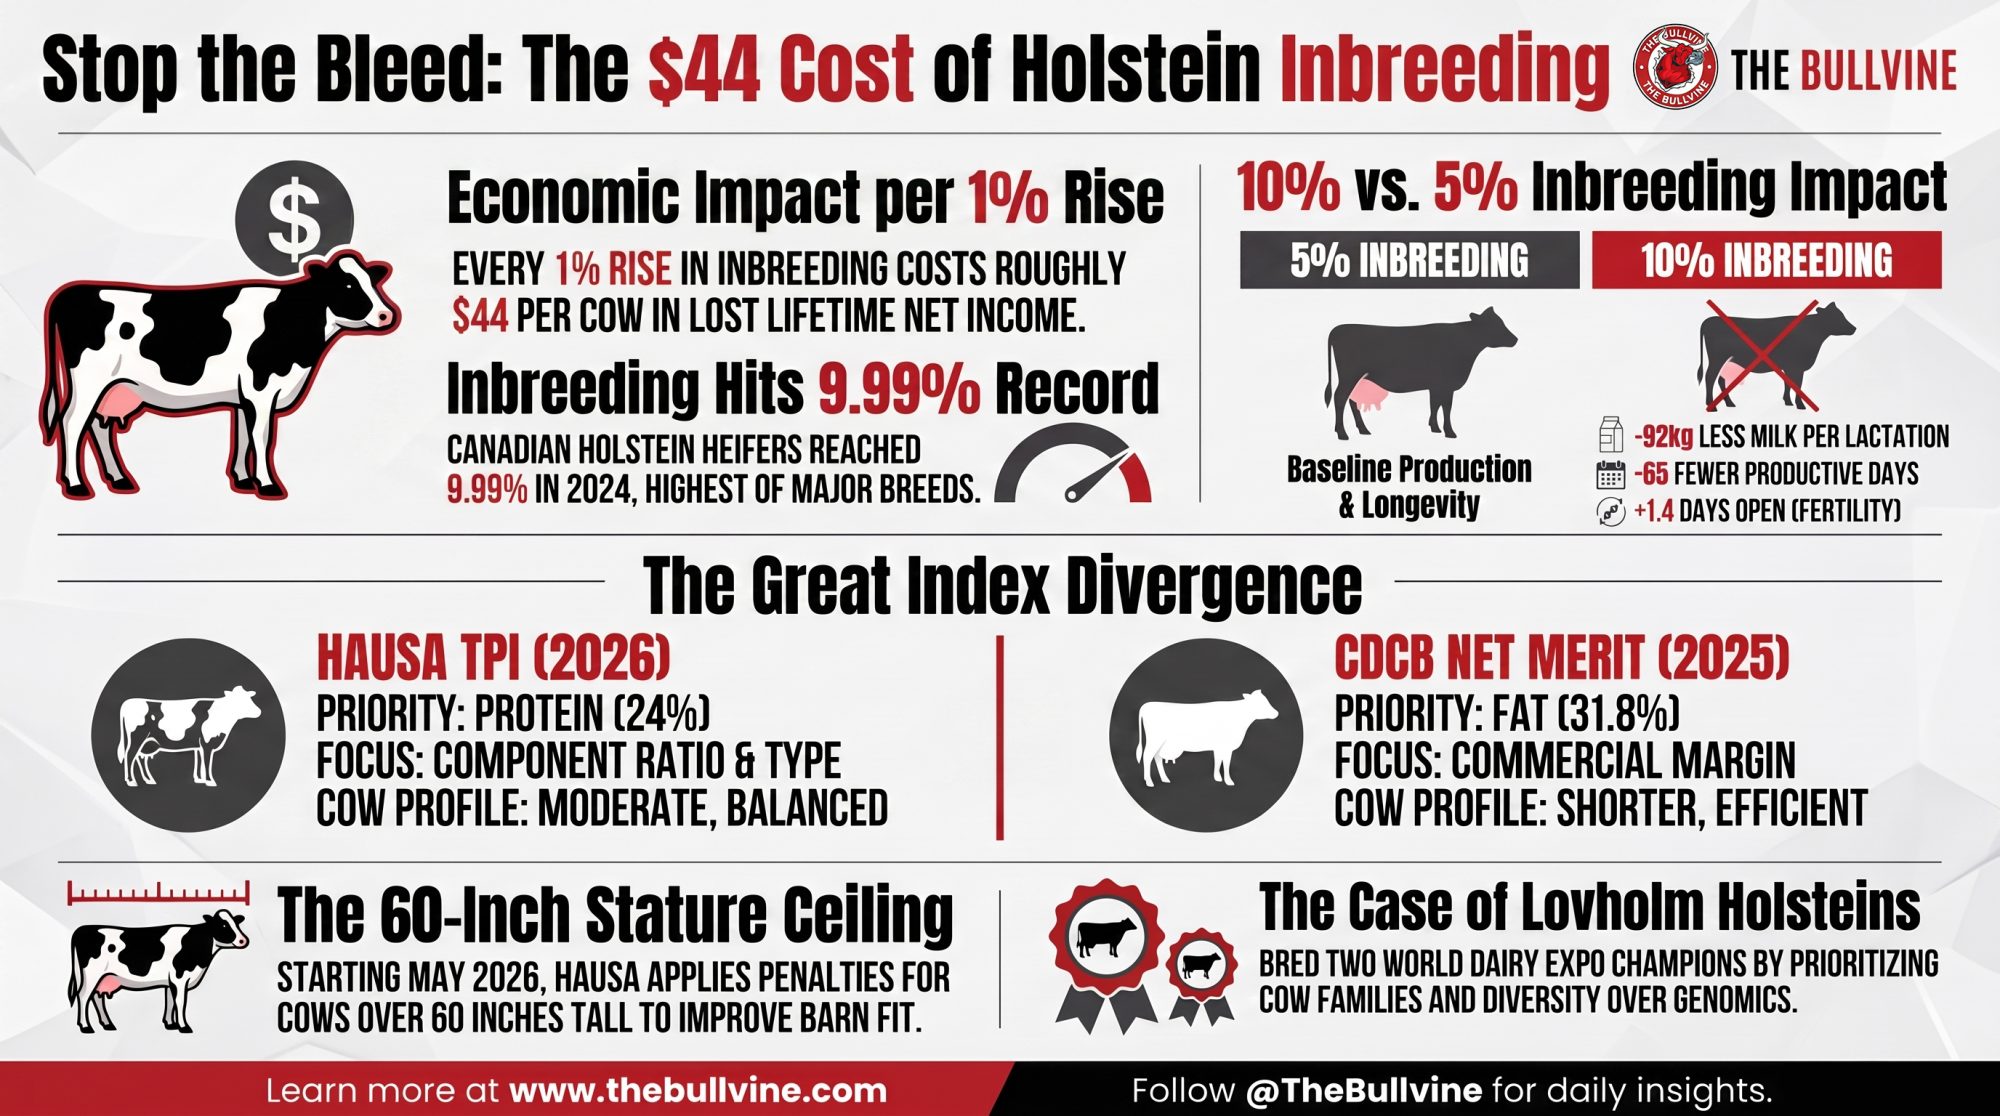
Here’s the part that should make you pause. The herd that walked away from the index list ended up breeding the kind of functional, long-lasting cows the commercial indices are quietly moving toward anyway. They succeeded by breeding out of a broader, more diverse gene pool — the exact opposite of where the rest of the industry is rushing. And while everyone keeps arguing about show cattle versus commercial cattle versus “just use the index,” a number nobody chose keeps climbing in the background: Holstein inbreeding hit 9.99% for Canadian heifers born in 2024 — the highest of the four major breeds, ahead of Jersey at 7.56%, and up from 9.61% the year before — according to Lactanet’s August 2025 update. That number lands on all three camps at once, no matter which side of the argument you stand on.
What’s Changing and Why
For thirty years, the dairy genetics argument has had two sides. One camp says the show ring proves what a valuable cow looks like. The other says the milk cheque does. This summer a third voice got loud enough to matter: “Both of you are wasting time — just breed off the top GTPI or Net Merit list.”
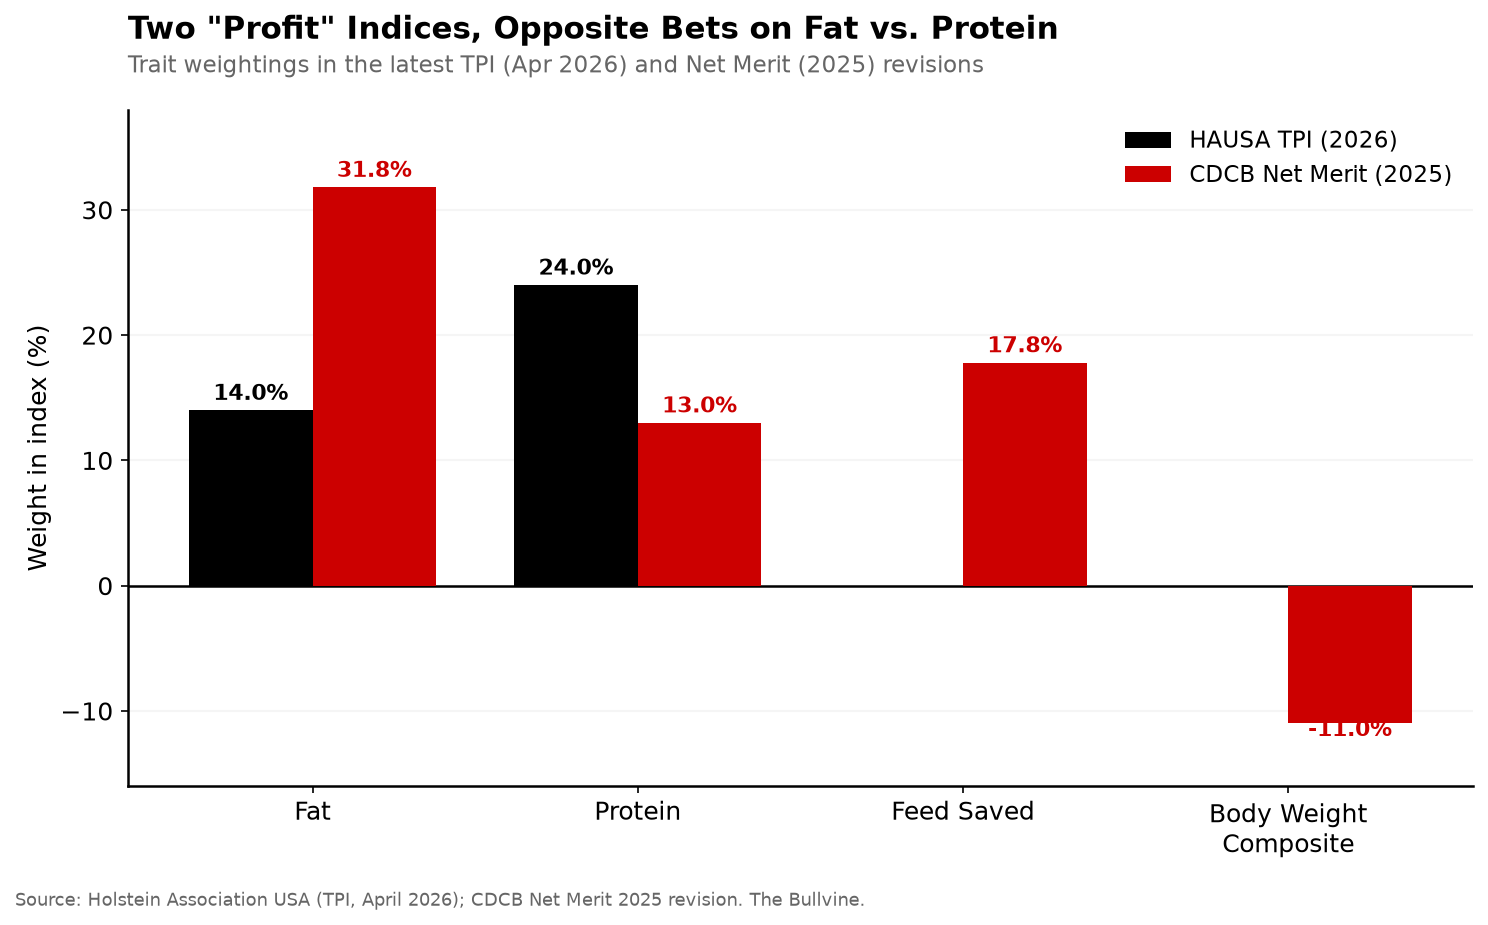
All three are answering different questions, and the numbers now prove it. In April 2026, Holstein Association USA changed its TPI formula to weight protein at 24% and fat at just 14%, up from a 19/19 split. CDCB’s Net Merit 2025 revision went the opposite direction — fat at 31.8%, protein down to 13.0%, with Feed Saved climbing to a combined 17.8% and Body Weight Composite at −11%. Two flagship indices, both claiming to describe a profitable cow, now point in genuinely opposite directions on fat versus protein.
Here’s the split at a glance:
| Index | Primary Focus | Key Trait Heavyweights (2025/2026 updates) | Ideal Cow Profile |
| HAUSA TPI | Component ratio & type | Protein 24%, Fat 14%; stature penalty above 60″ | Balanced, moderate-sized, high-protein yielders |
| CDCB Net Merit (NM$) | Commercial margin | Fat 31.8%, Protein 13.0%, Feed Saved 17.8% | Shorter, highly efficient, high-butterfat producers |
Then there’s the classification change most show barns are still processing. Starting with the May 2026 run, HAUSA set 60 inches as the ideal stature and applied a sliding-scale penalty for cows taller than that — shaving points off the final classification score as height climbs past the limit, so a tall, extreme-framed cow that once scored well can now come in lower on paper for the exact trait that used to help her. The official language is about normalizing size. But underneath it is a harder admission: decades of breeding taller cows collided with feed cost, stall fit, and longevity. The breed association put a measurable penalty on the exact trait the show ring spent a generation chasing.
How This Plays Out on Real Farms
The Lovich story looks like a fairy tale until you read the fine print. They sold both champions. Katrysha went south, and Kandy Cane went to Oakfield Corners Dairy in New York as a four-year-old, well before she walked into Madison as a five-year-old and later reclassified EX-97. For a lot of small tie-stall herds, selling your best cows is how the barn stays viable — the premium on an elite animal funds the operation. And their cows tend to milk well past the age most Holsteins are culled, which flips the whole economics toward longevity rather than peak yield.
The number that reaches every barn is inbreeding, and it carries a real bill. The Virginia Tech research pegged it at $22 to $24 in lifetime net income per cow for each 1% rise in inbreeding — but that’s in 1999 dollars. Adjust it forward on cumulative inflation alone and the same drag lands near $44 per cow per 1% today (a Bullvine CPI-based estimate — layer in higher modern milk and feed values and the case for the top of that range only gets stronger). Run the math your own way. On a 200-cow herd that lets average inbreeding drift up four points, that’s roughly $35,000 in lost lifetime net income across the herd — not index points on a page, real money bleeding out of the barn. Newer Canadian work backs the mechanism: the Canadian Dairy Network found a cow that’s 10% inbred, versus 5%, loses about 92 kg of milk, 5.3 kg of fat, and 2.6 kg of protein per lactation, adds 1.4 days open, and loses roughly 65 days of productive life. It never shows up on a semen invoice. It hides in open days, mastitis cases, and calves that don’t make it.
| Metric (per lactation unless noted) | 5% Inbred Cow | 10% Inbred Cow | Loss at 10% |
|---|---|---|---|
| Milk yield | Baseline | −92 kg | −92 kg |
| Fat | Baseline | −5.3 kg | −5.3 kg |
| Protein | Baseline | −2.6 kg | −2.6 kg |
| Days open | Baseline | +1.4 days | +1.4 days |
| Productive life | Baseline | −65 days | −65 days |
That’s why this reaches every camp. The show breeder, the Net Merit devotee, and the top-50-list herd are all pulling from an increasingly related bull population, and the compounding cost lands the same way on all of them.
The Deeper Read: For where that shrinking bull pool actually concentrates — and the USDA sires your stud may not be pushing — see Holstein’s inbreeding bill and the USDA bulls your stud isn’t selling you.
The Mechanics Behind the Outcomes
Think of it as three different experiments, not three answers to one question. Show-and-type selection asks whether breeding for conformation and classification produces cows that win and sell. The commercial camp runs a different test entirely: through Net Merit or LPI, does a cow throw the most profit under your actual costs? And the index-first crowd is betting on speed — trust the highest-ranked young bulls, shorten the generation interval, and try to outrun everyone else’s genetic gain.
None of those experiments settles the others, because each measures something different. A judge at World Dairy Expo isn’t scoring feed intake per day or days open. Net Merit ignores ring presence entirely. And the index itself isn’t neutral — it’s an editorial choice about what matters, built on national-average price assumptions that may not match your processor. So when TPI says protein and Net Merit says fat, a breeder who “just uses the index” without checking which one fits their cheque is quietly optimizing for someone else’s barn.
The inbreeding problem sits underneath all three. The top of any genomic list — GTPI or Net Merit — isn’t a random draw. It’s a tight cluster of high-relationship sires that trace back through a handful of grandsires, and the concentration is stark: research finds the vast majority of today’s Holstein AI bulls funnel back to just two ancestral sires, with a single foundation bull, Pawnee Farm Arlinda Chief, still echoing through the population decades later. Ride the list harder, and you stack that relationship faster. CDCB has confirmed its genetic base changes now include Expected Future Inbreeding (EFI) adjustments to account for future inbreeding, not just observed genetic trends — which is why individual PTAs no longer track the base change as cleanly as they once did. When the statisticians pre-discount the future, that tells you something.
How Much Does Sticking With the Wrong Index Actually Cost?
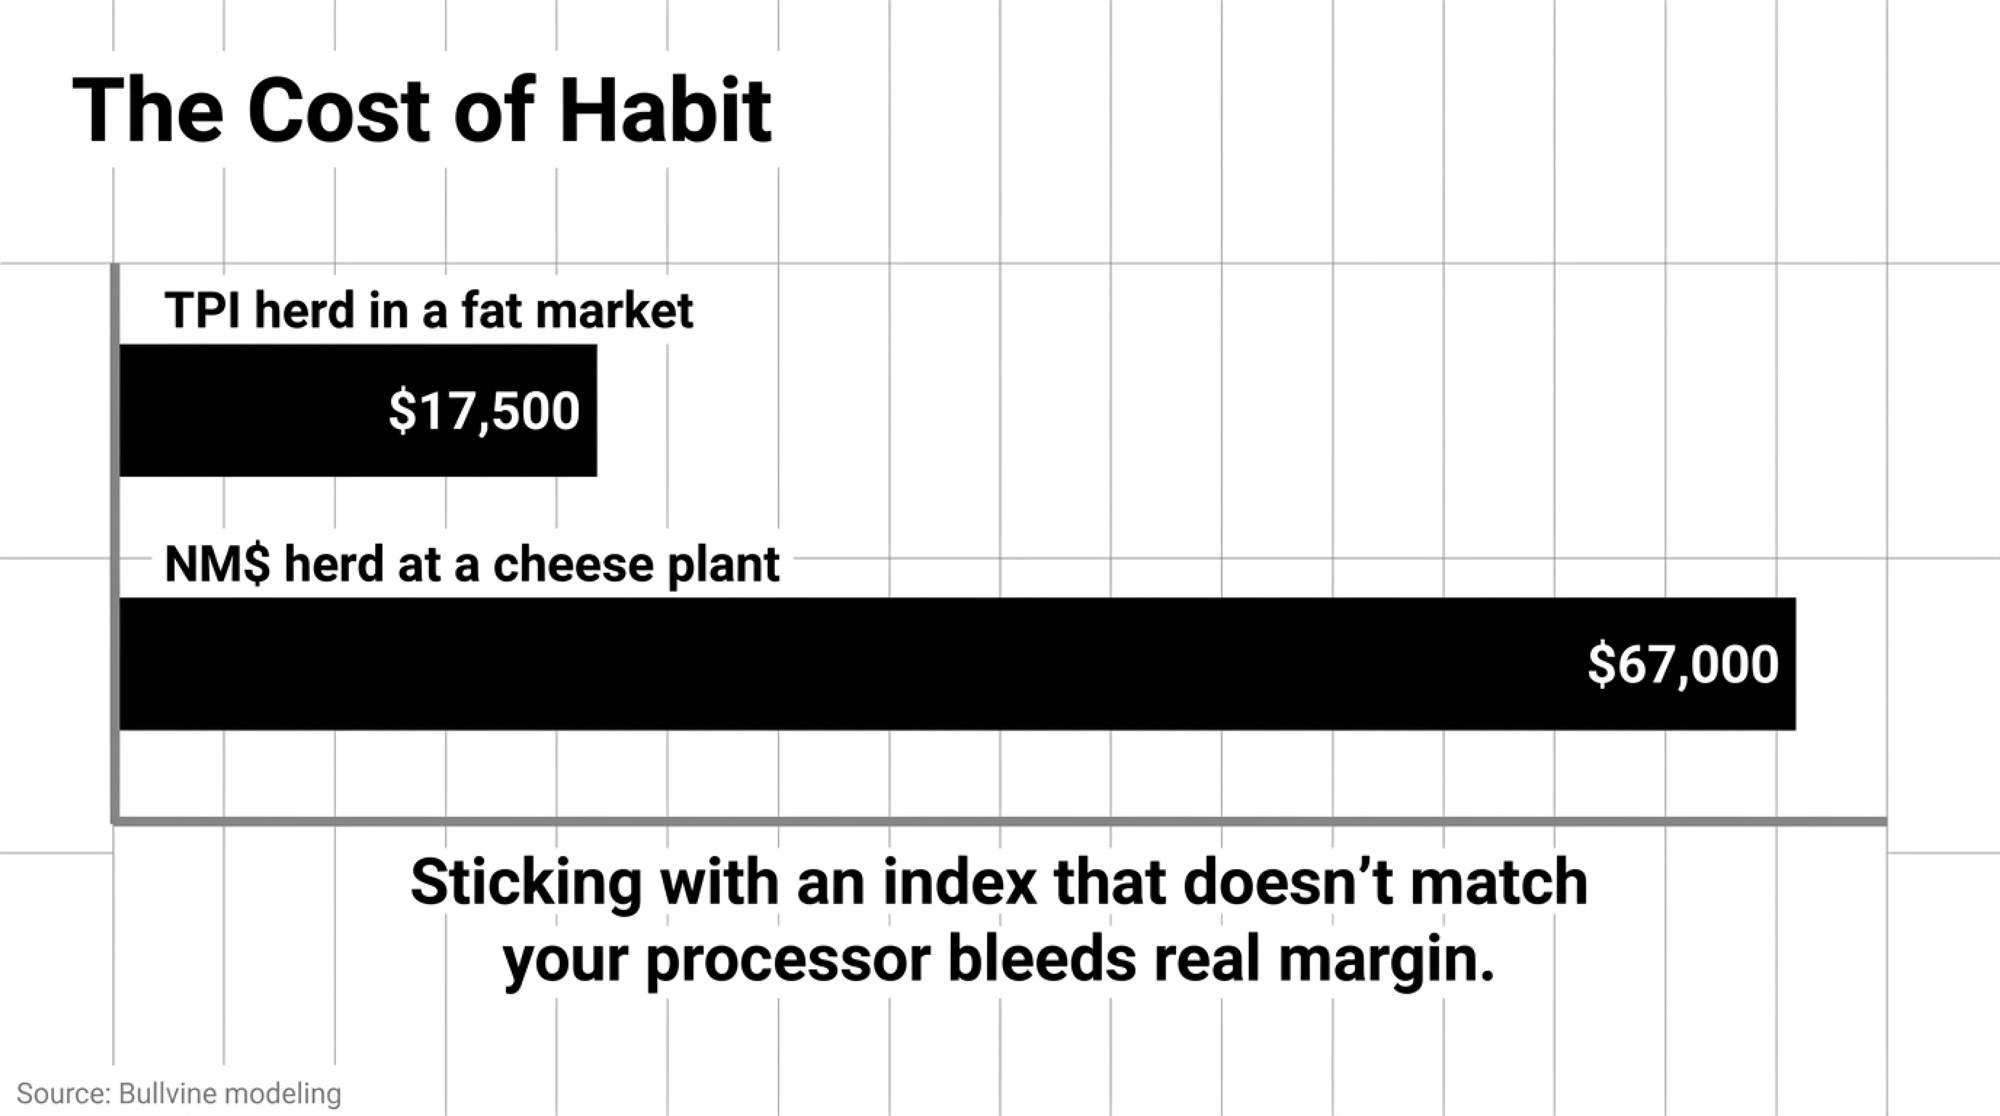
More than most herds realize, and the loss is invisible because it’s “index-approved.” A herd that keeps breeding off TPI out of habit, while getting paid on butterfat, can drift toward higher protein ratios its cheque doesn’t reward at current component prices. Bullvine’s own modeling of the 2026 TPI shift put the exposure as high as $17,500 for a mid-size herd chasing the protein signal in a fat-heavy market — a figure that depends on your herd size and your component spread, so treat it as a scenario, not a guarantee.
The mirror image is just as real. A cheese-plant herd still breeding off Net Merit’s fat signal can leave protein premiums on the table — a gap Bullvine modeled at roughly $134 per cow per lactation, or about $67,000 across 500 cows. Either way, nobody traces it back to the semen order. They blame feed, labor, the processor — everything except the objective function they never chose on purpose.
| Barn Situation | Index Being Used | Where It Leaks | Modeled Cost Exposure |
|---|---|---|---|
| Fat-heavy market, chasing protein | HAUSA TPI (2026) | Higher protein ratios the cheque doesn’t reward | ~$17,500 (mid-size herd) |
| Cheese plant, breeding for fat | CDCB Net Merit (2025) | Protein premiums left on the table | ~$134/cow/lactation |
| Same, scaled to the barn | CDCB Net Merit (2025) | Compounded across the herd | ~$67,000 (500 cows) |
| Any herd, wrong index by habit | Either | Blamed on feed, labor, processor — never the semen order | Invisible / untraced |
The Deeper Read: For the full walkthrough of how the Net Merit 2025 reweighting hits your milk cheque, see our breakdown of what changed and what it costs your barn.
Is Your Herd’s Genetic Diversity Already Behind?
Maybe — and the tie-stall clock makes it more urgent for some. Canada’s updated code of practice requires that continuously tethered cows get untethered freedom of movement, with the key provisions phasing in by 2027.
Connect the dots and the three storylines turn out to be one. HAUSA’s 60-inch stature penalty isn’t an aesthetic call — it’s a structural necessity, because modern Holsteins have been outgrowing the physical dimensions of the tie-stalls and freestalls North American barns were built around. That’s the same logic driving Net Merit’s −11% Body Weight Composite: a bigger cow costs more to feed and fits the barn worse. The logic points one way — a shorter, more genetically diverse cow should fit a retrofitted stall better and carries less of the fertility and health drag that inbreeding stacks on, which is exactly what you want walking into the 2027 deadline. Head in tall and closely related, and you’re solving two problems at once, with only one of them showing up on your classification report.
Options and Trade-Offs for Farmers
Path 1: Pick your index deliberately, then match it to your pay stub. This is the 30-day move. Pull last year’s milk cheques and figure out your actual dollar-per-pound split on fat versus protein. If you’re component-heavy on butterfat, Net Merit’s 31.8% fat weighting likely fits better than TPI’s protein-heavy 2026 formula. It takes an afternoon with your statements and your rep. Skip it, and you leak margin for years while your cows look better on paper.
Path 2: Build an explicit inbreeding ceiling into your mating program. This one’s for any herd riding the top of the GTPI or Net Merit lists year after year. It means telling your mating software — or your rep — a hard limit and holding to it, even when a high-index bull is closely related to your cows. Lactanet notes the average inbreeding level today is roughly 9% and advises aiming matings below that average; its own tools flag %INB so you can screen out mates that push a calf too high. You may give up a few index points per mating. The payoff is not stacking that $22-to-$24-per-cow-per-percent bill — closer to $44 in today’s dollars — that you won’t feel for three years.
Path 3: Borrow across camps instead of picking a tribe. Take the show world’s eye for udders and legs, the commercial index’s discipline on feed efficiency and longevity, and genomic testing’s speed on sorting replacements. Works for most mid-size herds. The trap is doing it by accident — a little TPI, a little Net Merit, a little show type — and ending up with a bull battery optimized for nothing. Lovhill reached the top of the show ring twice by holding one clear standard, not by hedging across three — and that discipline is the part worth copying, whichever camp you land in.
Key Takeaways
- If you don’t know your actual dollar-per-pound split on fat versus protein from last year’s cheques, run that number before your next semen order — it decides whether Net Merit or TPI fits your barn.
- If your herd’s average inbreeding is at or above the 9% breed average, pull your number from your genetic-management software this month and ask your rep to project it forward before your next mating run.
- If your cows skew tall, factor in that the May 2026 stature penalty and Net Merit’s −11% Body Weight Composite now both work against extreme size.
- If you show and sell as part of your business model, be honest about whether your plan includes selling your best cows the way the Lovich family did — that’s what made their math work.
- If your index “feels safe” because it’s familiar, remember the TPI and Net Merit formulas both changed in the last 18 months — familiarity isn’t the same as fit.
- If you’re shipping to a cheese plant with a protein-to-fat ratio below 0.80, run the per-cow math on your own component prices — that’s the danger band where the wrong index quietly costs the most.
Here’s the uncomfortable question worth sitting with. The show breeder confuses a ring result with an economic verdict. The index-first herd confuses trusting the formula with running a strategy. Both outsourced their judgment — one to a judge, one to a formula — and neither stopped to ask whether the thing they trusted still fits the cows they actually need. So which one are you? And when did you last check whether the tool you rely on is optimizing for your barn, or for the average barn someone modeled years ago?
The short version: genetics is an economics question, and the only real mistake is not knowing which experiment you’re running. The longer version — the full cost-per-cow inbreeding math, broken down by herd size and index choice — is where the decisions actually get made. We’re running those numbers in next week’s Bullvine Weekly. If you want to map this to your own operation, that’s where the real math lives.
Hold-to-Proof Cost & Inbreeding Drag Simulator
Map the 2026 TPI/Net Merit formula updates and genetic drag directly to your herd’s bottom line.
Calculated using updated 2026 genetic values and modern inflationary baselines.
Complete references and supporting documentation are available upon request by contacting the editorial team at editor@thebullvine.com.
Learn More
- Dairy Cattle Genetics Explained: TPI, NM$, GTPI and Genomics — Arms you with an immediate operational blueprint to navigate the 2026 formula divergence, showing exactly when to deploy TPI’s high-protein selection versus Net Merit’s aggressive butterfat and feed-efficiency weighting.
- Net Merit 2025 — Exposes why national genetic indexes lag behind current marketplace realities, tracking the multi-year commodity averages that create a hidden financial mismatch between your tank’s actual value and your long-term breeding goal.
- The Proof You Waited Three Years For Averaged a $72 Markdown — Delivers a brutal, data-driven reality check on daughter-proven strategies, demonstrating how holding famous bulls to proof stacks an expensive maintenance bill while sacrificing an entire generation of genetic velocity.
 The Sunday Read Dairy Professionals Don’t Skip.
 The Sunday Read Dairy Professionals Don’t Skip.
Every week, thousands of producers, breeders, and industry insiders open Bullvine Weekly for genetics insights, market shifts, and profit strategies they won’t find anywhere else. One email. Five minutes. Smarter decisions all week.
