


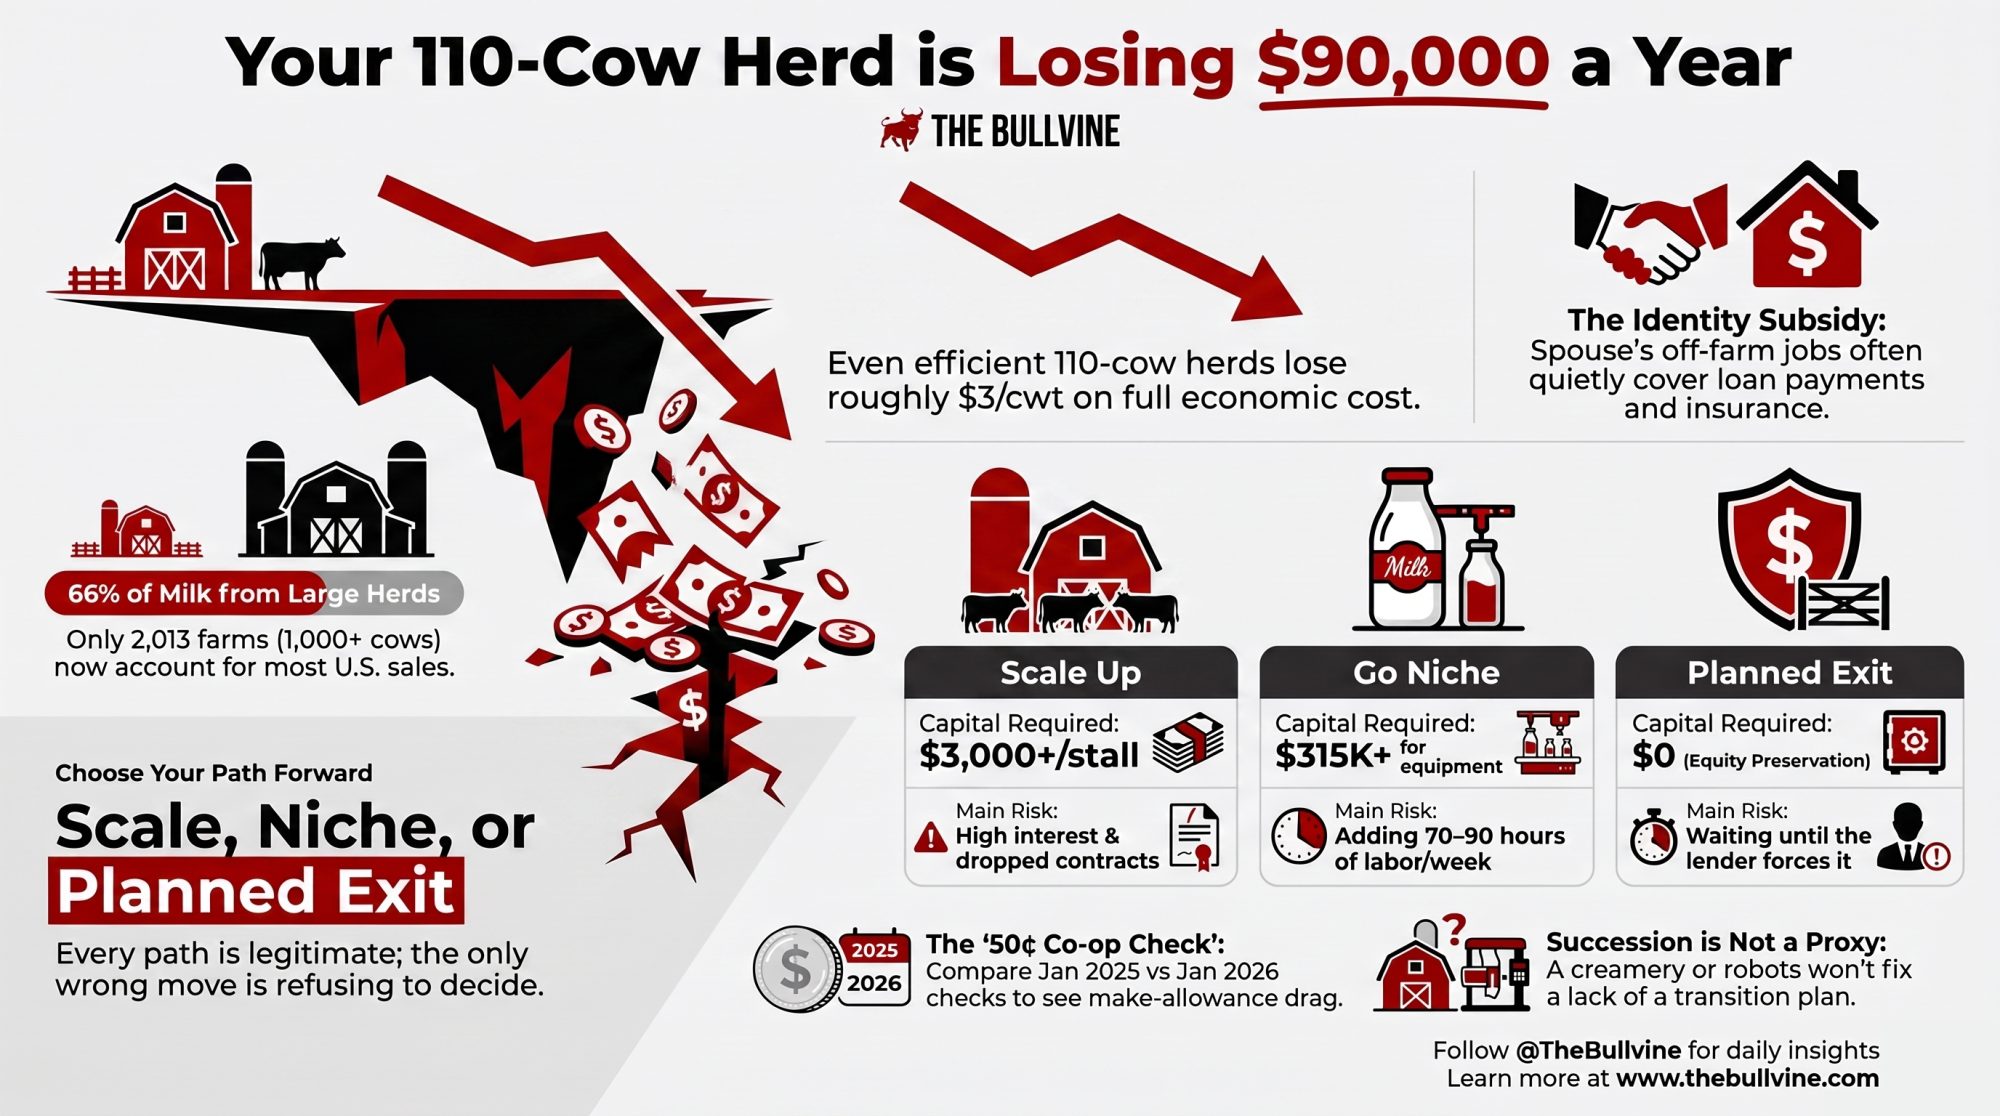
At $42.70 to make and $20.70 to sell, even a tight 110-cow herd erodes ~$90K a year. The chain above runs smoother when you don’t quit — here’s your move before the bank makes it.
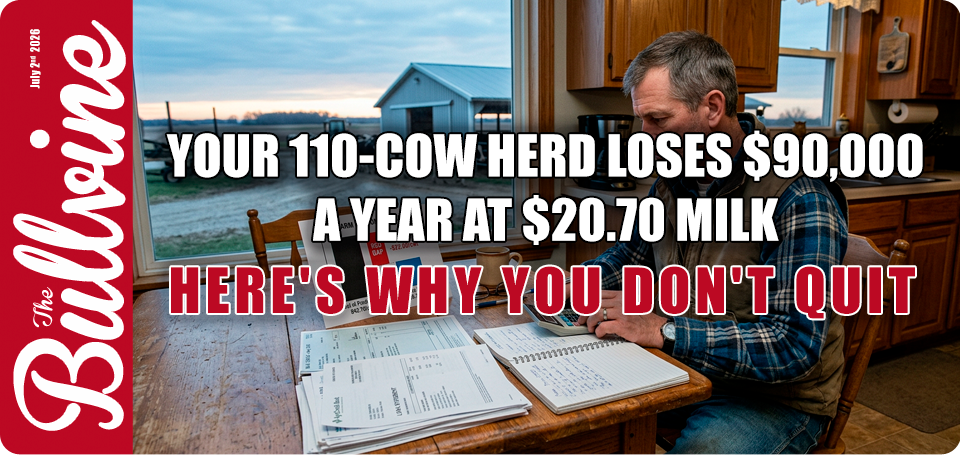
Picture a 110-cow family herd in a county that used to support 35 licensed dairies and now has 9. Two owners, one hired hand, a high-school kid on the morning milking. They’ve run negative on a full-cost basis two years in a row, and the banker’s been warmer about expansion than about “we’ll just keep doing what we’re doing.” Nobody at that kitchen table has said the quiet part out loud: staying small on commodity milk without a plan is already a decision. It’s just the one with the worst odds.
A dairy farmer still captures about 51 cents of every retail dollar spent on fresh fluid milk, but only about 25 cents across the full basket of dairy products people actually buy — cheese, butter, yogurt, ice cream (USDA ERS Food Dollar / price-spread data, 2024 release, March 2026). They milk below the national herd-size average, and they stay in anyway, because “dairy farmer” isn’t a job to them. It’s who they are. And somewhere up the chain, the system runs smoother when you don’t quit.
What’s Changing and Why
The math on small herds turned hard, and it turned fast. USDA’s Economic Research Service reports the average U.S. dairy herd grew from 112 cows in 2000 to 283 by 2021 (USDA ERS, Amber Waves: Fewer Farms, More Milk, Feb. 2026). Progressive Dairy’s annual stats push it further — about 377 cows on average in 2024, around 402 in 2025 (U.S. Dairy Statistics). Licensed herds fell from roughly 45,000 in 2014 to 24,811 in 2024, then to 23,609 in 2025.
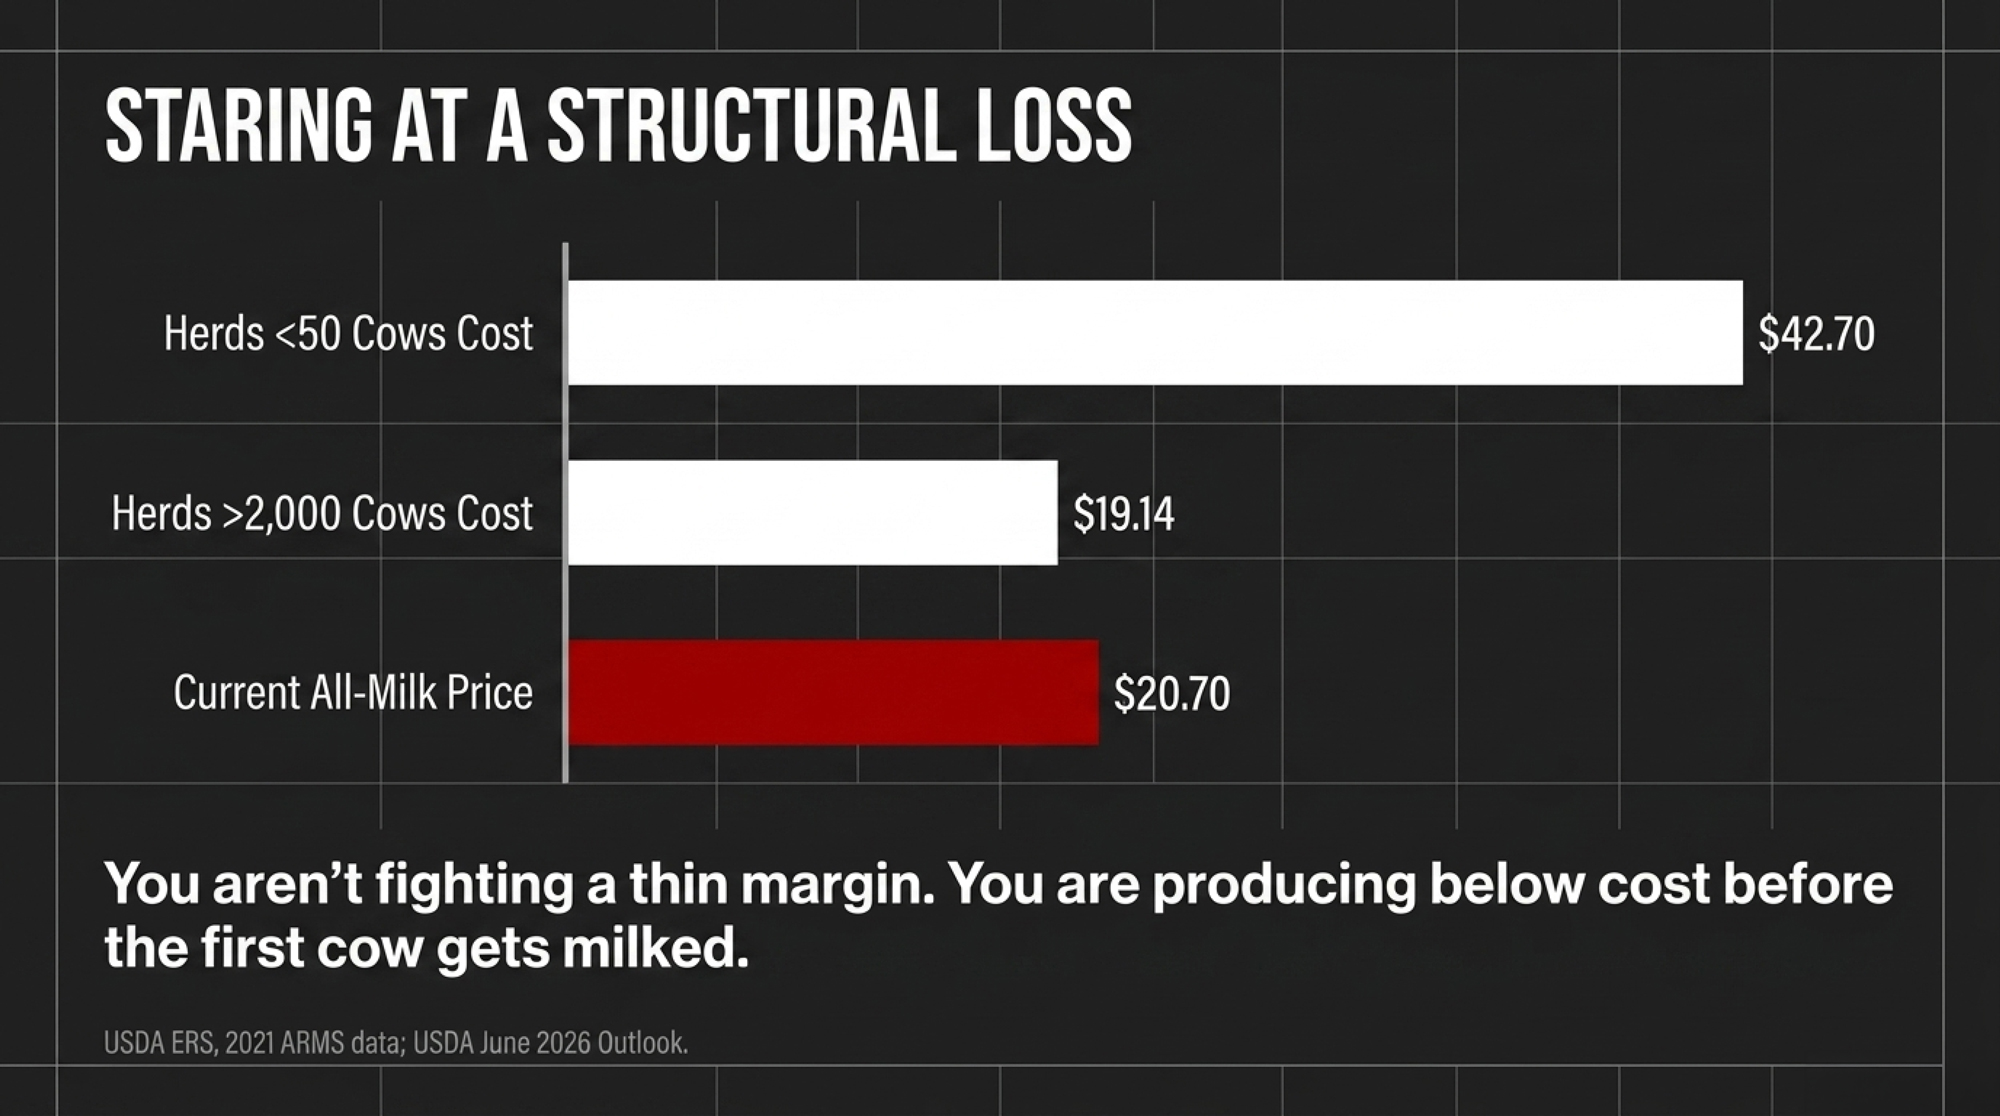
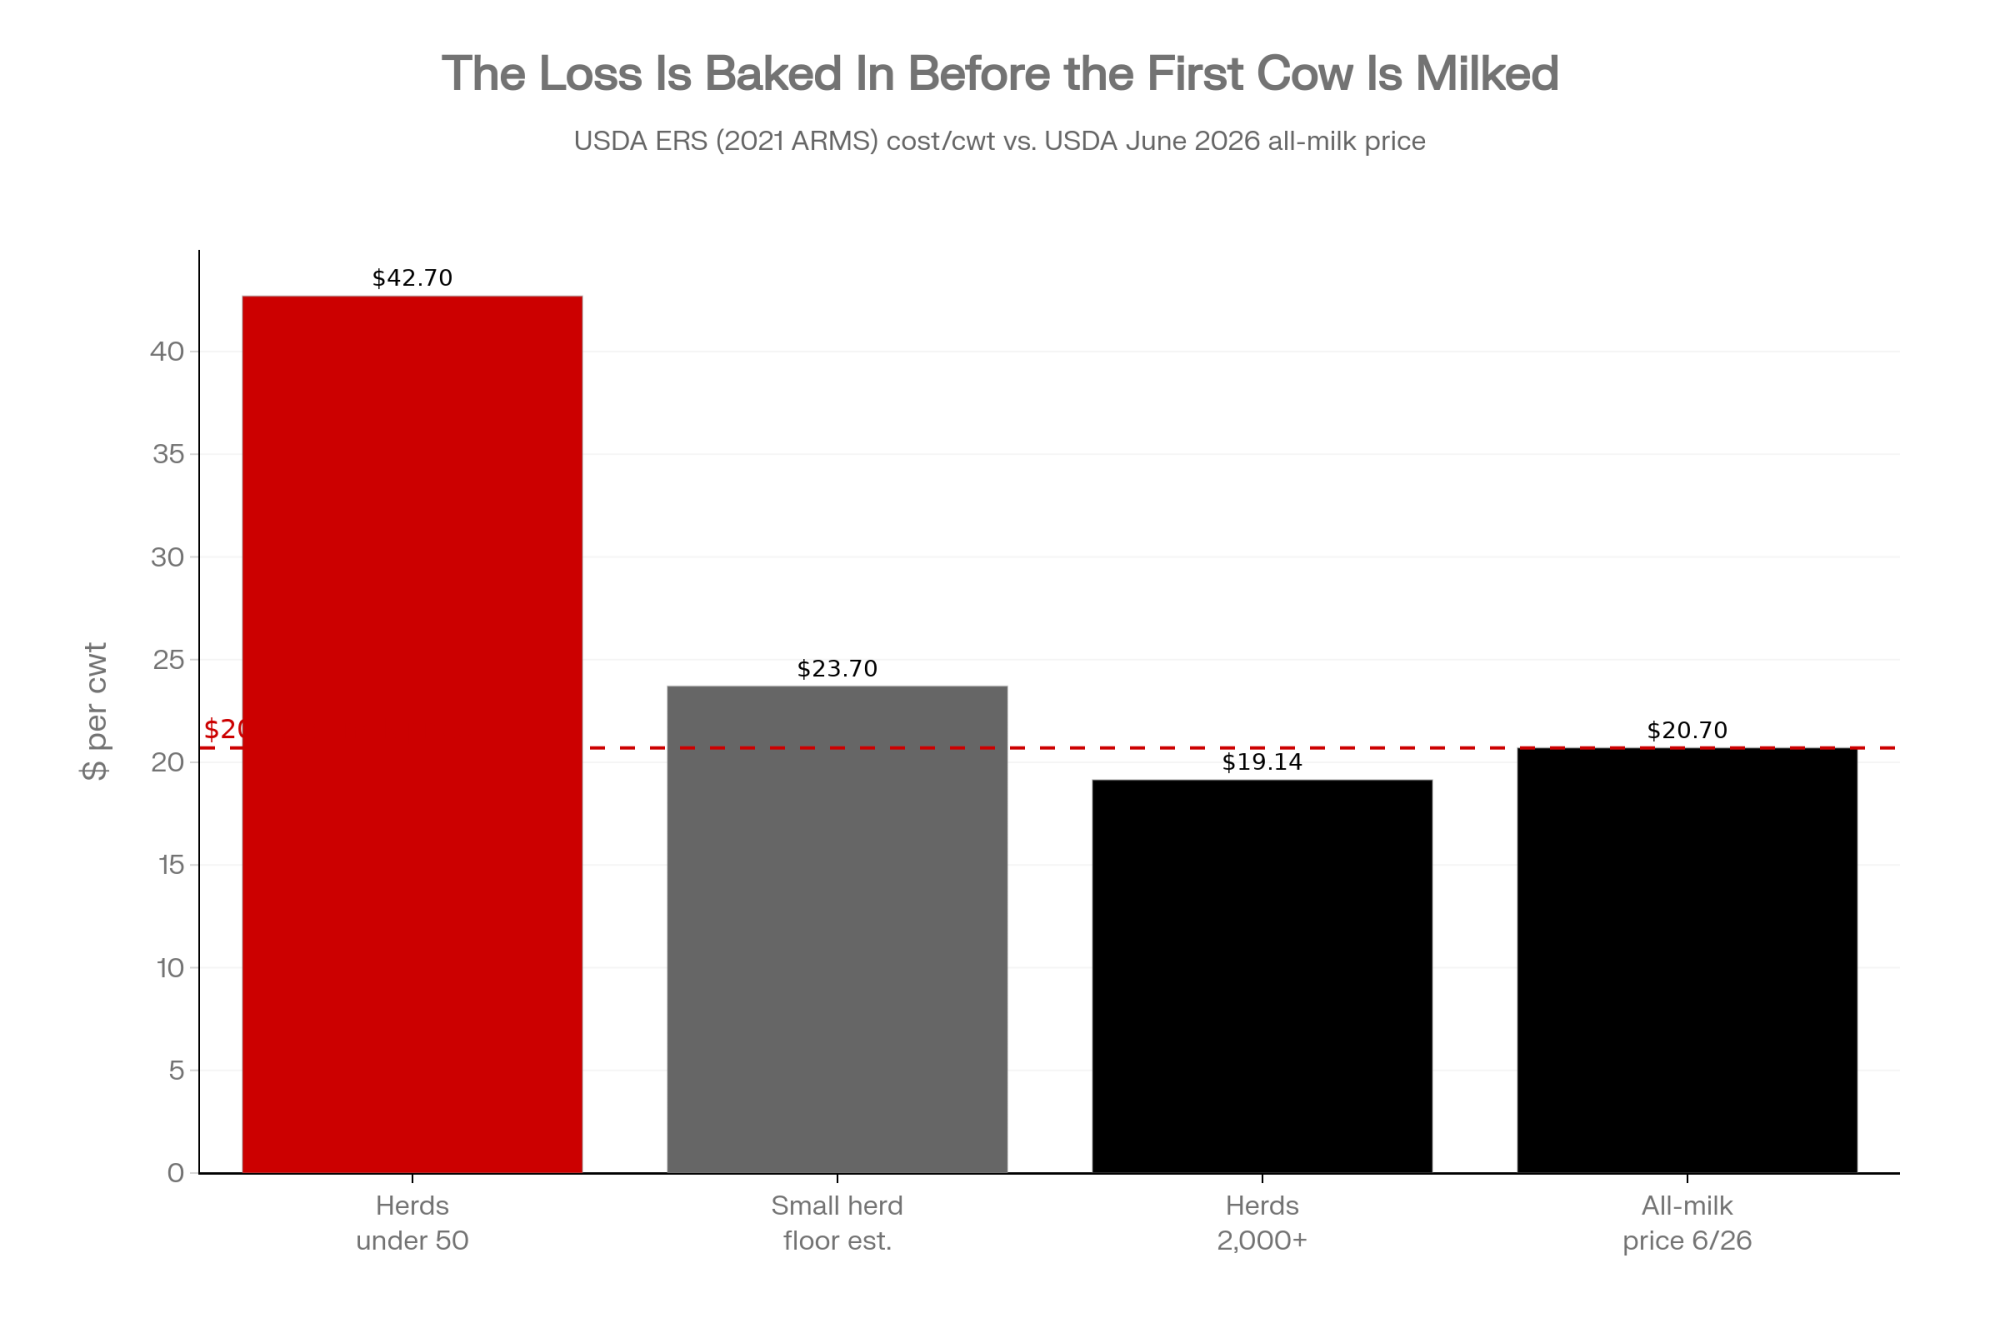
So if you’re milking 60 to 140 cows — like our composite family — you’re not behind the curve. You’re a statistical outlier. And the cost curve doesn’t love outliers: in 2021, ERS pegged the total cost to produce 100 pounds of milk at $42.70 for herds under 50 cows, versus $19.14 for herds of 2,000 or more (USDA ERS, Amber Waves, Feb. 2026, from 2021 ARMS survey data). Set that against USDA’s June 2026 outlook — a $20.70/cwt all-milk price, revised down 55 cents from the month before (USDA Livestock, Dairy, and Poultry Outlook, June 16, 2026) — and the smallest herds aren’t fighting a thin margin. They’re staring at a structural loss baked in before the first cow gets milked.
Who’s most exposed? Commodity producers under roughly 200 cows, especially anyone carrying land and equipment debt refinanced at 6.5–7% instead of the 3–4% that felt routine a decade ago. The farms in real danger aren’t the ones who can’t read a balance sheet. They’re the ones who never ran the full number — cash costs, unpaid family labor, depreciation, interest — until the lender ran it for them.
How This Plays Out on Real Farms
Here’s where it gets concrete. The Bullvine already ran the barn math on this once — the 143-hour week at Clark Farms laid out what “fixing” thin margins with an on-farm creamery actually costs in hours and equity. When full-cost breakeven sits above the all-milk price for two years running, that gap comes straight out of family equity, while the processing side continues to benefit from relatively cheap raw milk. Now shrink it back to that 110-cow kitchen table.
First, understand how the gap scales, because there’s a wide band between the headline number and what a well-run small herd actually lives. That $42.70 ERS figure is the structural ceiling — the absolute worst-case for an ultra-small or heavily indebted setup — and, against a $20.70 price, it implies a brutal ~$22/cwt hole. And since that cost figure is from 2021 while the price is current, the real-world gap today is more likely wider than narrower. Most small herds don’t sit at the ceiling. But here’s the uncomfortable floor: even a tight, efficient small operation, once you load in unpaid family labor, depreciation, and interest, is leaking at least $3/cwt on full economic cost. So $3 isn’t the likely number — it’s the best case, the smallest gap a sharp small-herd manager can expect once the real costs are counted.
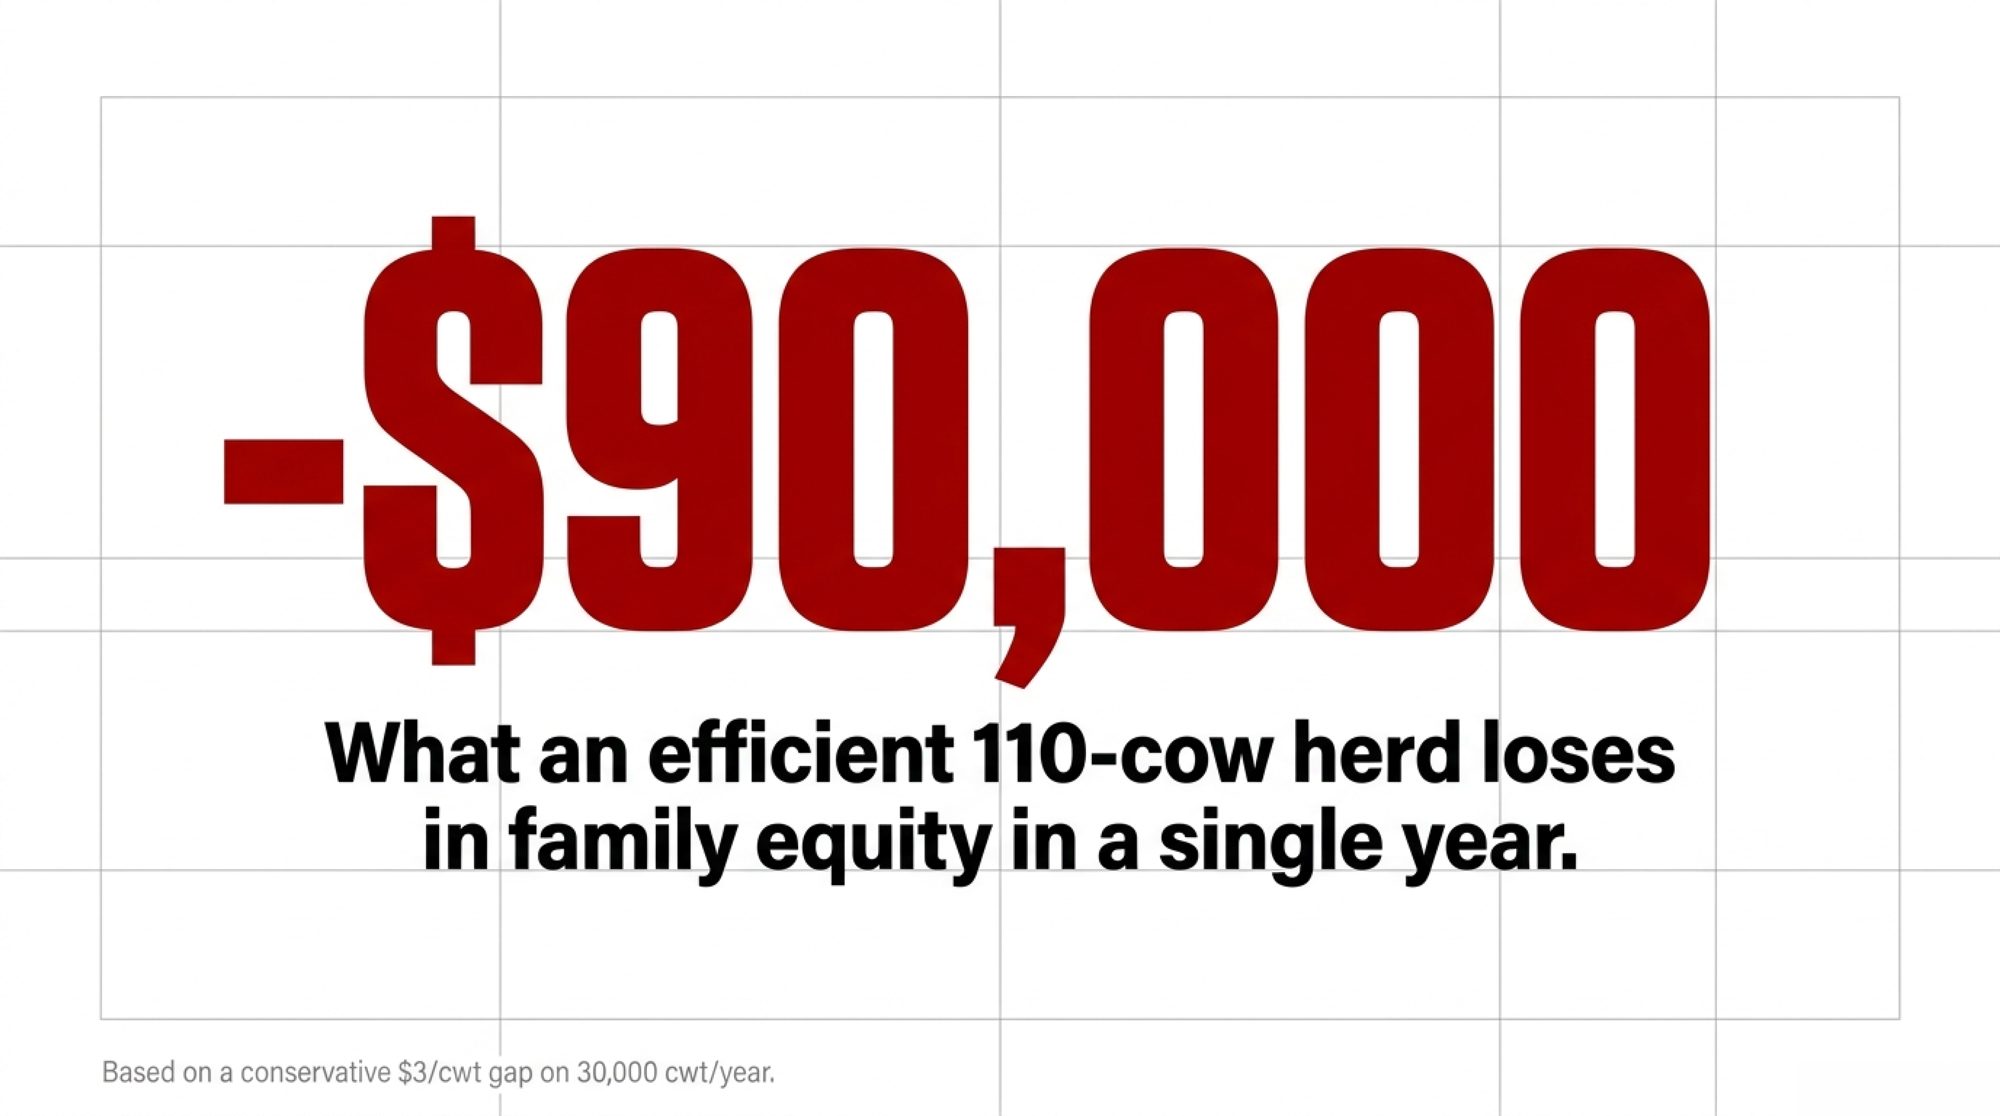
Quick barn math, at that conservative floor. On a 110-cow herd shipping ~75 lbs/cow/day, you’re moving roughly 30,000 cwt a year. A $3/cwt gap amounts to about $90,000 per year from family equity. Now slide that number up the band — at $6/cwt it’s $180,000; nearer the ERS ceiling it’s a figure no family balance sheet survives for long. Either way, the best case is a second mortgage you never signed.
🛠️ Toolroom: Don’t guess your equity drain. Run your numbers through The Bullvine Dairy Profit Projector to calculate your IOFC, true breakeven milk price, and whole-herd margin in under three minutes.
Often the thing keeping that farm afloat isn’t the milk check at all. The Dairy Margin Coverage figure — milk price over feed cost — is projected to bottom out as low as $7.09/cwt in 2026, with the low point landing early in the year (Farm Credit East, Dairy Industry Snapshot, Feb. 2026). So the spouse’s town job quietly covers the loan payment, the health insurance, the shortfall. On paper that’s “household diversification.” In the barn, it’s the invisible subsidy that lets the identity keep running after the milk stopped paying for it.
The Mechanics Behind the Outcomes
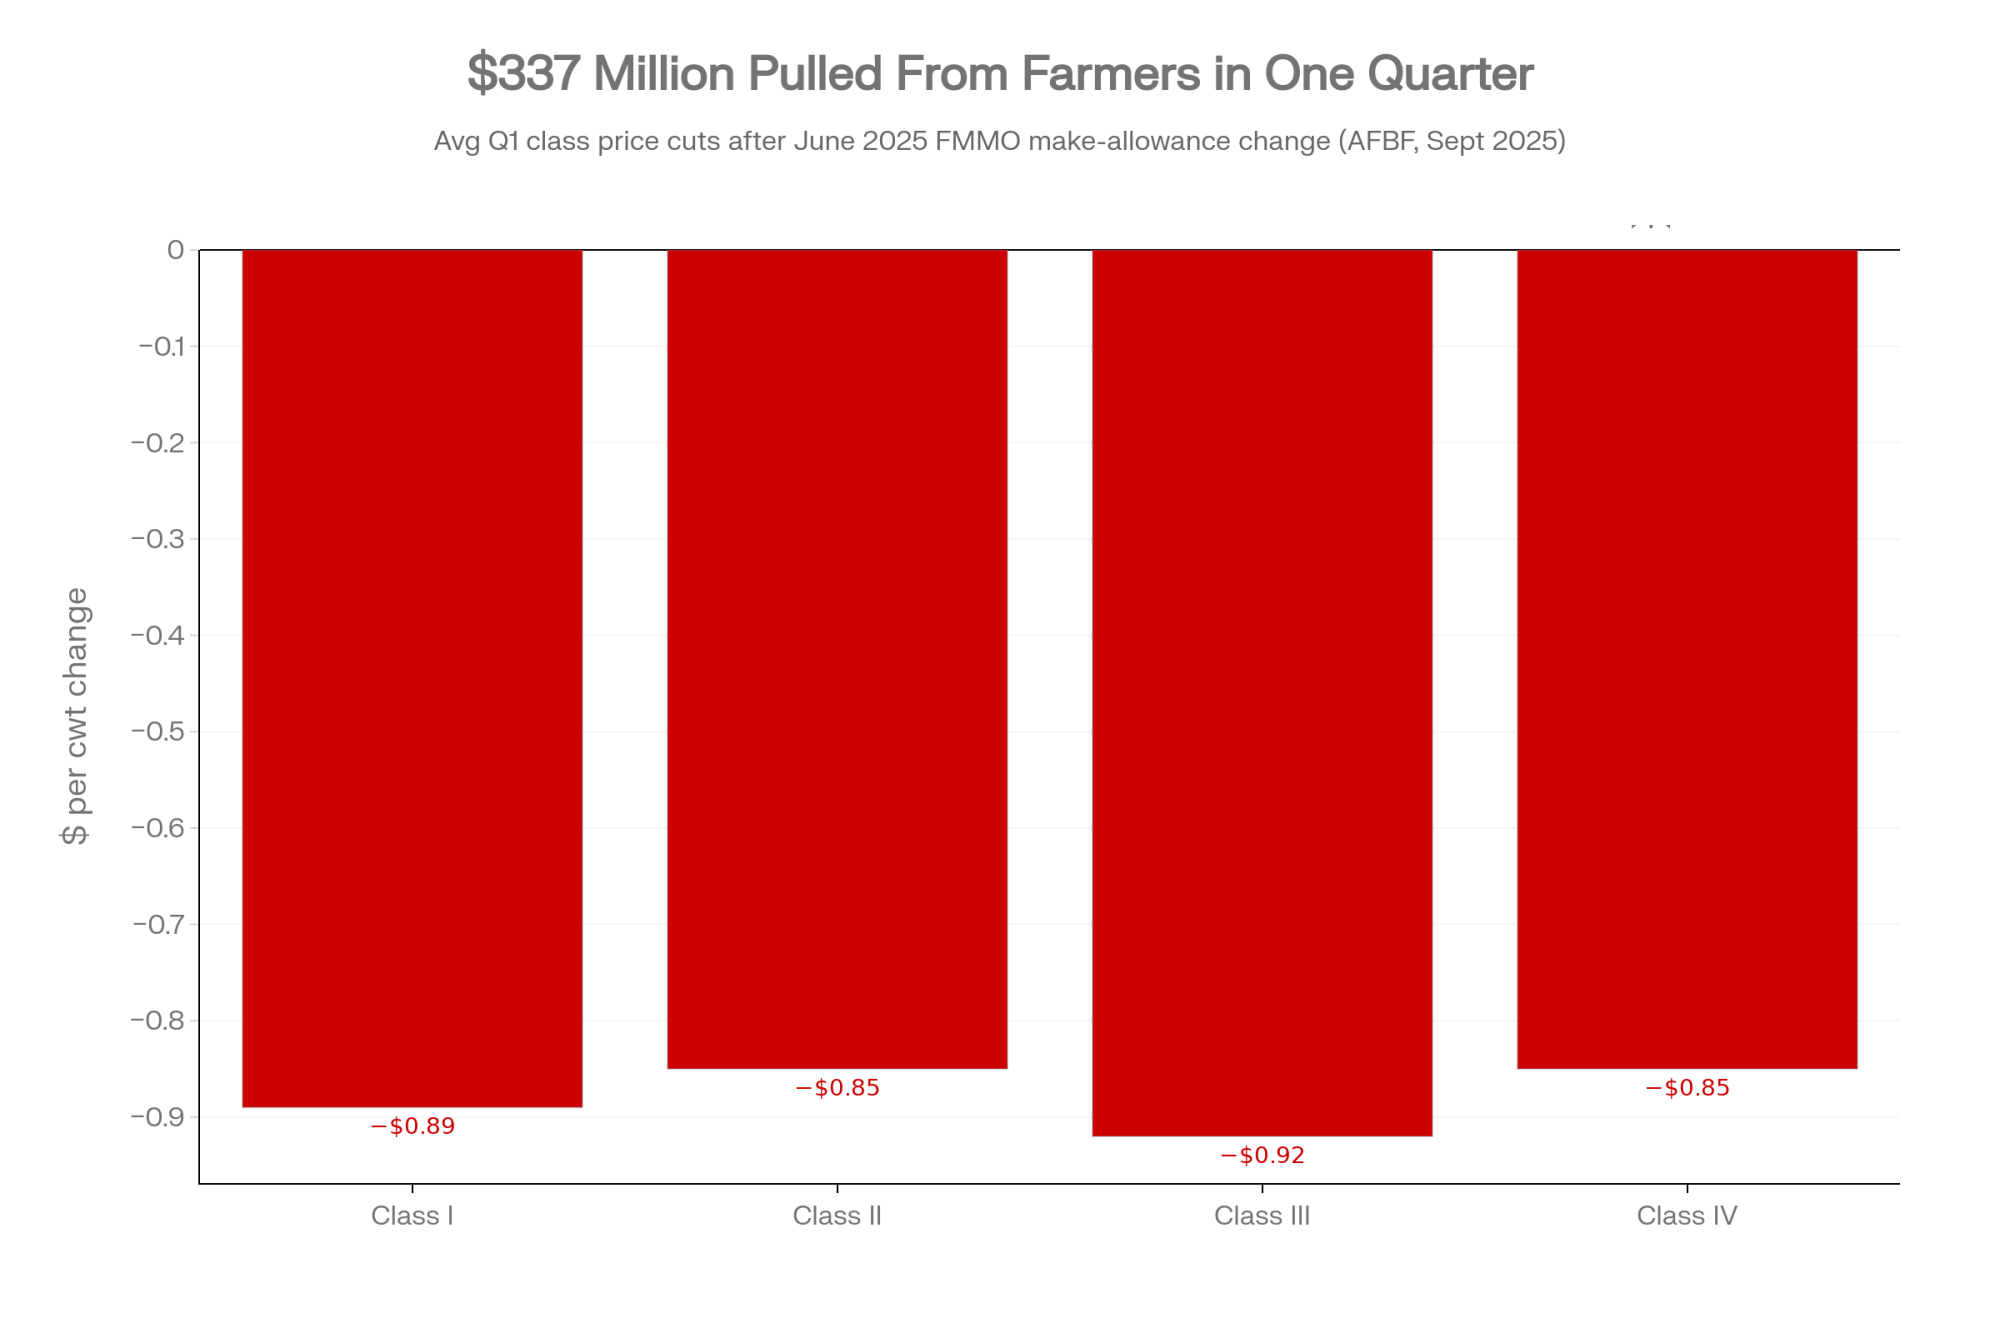
Why does cheap milk keep flowing if so many small herds lose money on it? Because the rest of the chain works better when the milk shows up no matter what. After the Federal Milk Marketing Order amendments took effect June 1, 2025, increased processor make allowances immediately squeezed the farm gate, cutting average class prices across the first quarter by:
- Class I: −$0.89/cwt
- Class II: −$0.85/cwt
- Class III: −$0.92/cwt
- Class IV: −$0.85/cwt
That pulled $337 million out of producer pool revenues nationwide in just the first three months (American Farm Bureau Federation, Market Intel, Sept. 2025). And this isn’t the story of one co-op’s policy — it’s the architecture of a consolidated system doing what it’s built to do. In fiscal 2024, S&P Global Ratings reported that Dairy Farmers of America generated $485 million in free operating cash flow and cut net debt by $315 million. That’s the scale a member-owned co-op operates at; The Bullvine’s reporting puts DFA at roughly 30% of U.S. milk and 44 processing plants. Whether that scale is returning enough to the farm gate is the open question — DFA has publicly positioned itself as a single, connected cooperative built to return value to its member-owners (DFA public communications, 2024).
Here’s the uncomfortable read, offered as analysis rather than accusation: intentional or not, the structure rewards farmers who keep producing below cost. And inertia is just as costly as design when the bill lands on someone else’s kitchen table. The concentration is real and documented — University of Illinois researchers, working from the 2022 Census of Agriculture, found that the 2,013 farms running 1,000 or more cows accounted for 66% of all U.S. milk sales in 2022, up from 57% in 2017 (farmdoc daily, Feb. 2024). The fastest-growing tier sits even higher up: the number of dairies milking 2,500-plus head actually grew — from 714 to 834 between 2017 and 2022 — even as every smaller size class shrank, with herds of 20 to 99 cows declining the most (farmdoc daily, Feb. 2024). Roughly 23,000 smaller farms now split what’s left. That trajectory — 15,000 U.S. farms by 2035 and under 10,000 by 2050 — is already priced into the industry’s planning.
| Retail category | Farmer’s share of retail $ | What the rest of the chain keeps | Direction |
| Fresh fluid milk | 51¢ | 49¢ | Highest farm share |
| Full dairy basket (cheese, butter, yogurt, ice cream) | ~25¢ | ~75¢ | Where most volume actually sells |
| All U.S. food (2024) | 11.8¢ | 88.2¢ | Down from 12.1¢ in 2023 |
| Net effect on 110-cow commodity herd | Price-taker, no pricing power | Processor gains from cheap raw milk | Structural, not cyclical |
The food-dollar trend tells the rest without spin. Across all U.S. food, the farm share fell to just 11.8 cents in 2024, down from 12.1 cents the year before; for the broad dairy basket, the farm-value share sits near 25% (USDA ERS Food Dollar, 2024 data, March 2026). That’s not a bad year. That’s the shape of the gap.
How Much Is “Staying Small Without a Plan” Actually Costing You?
Run the real number, not the feed-bill-plus-vet version. Pull two years of records and add all of it: cash costs, family labor at a fair illustrative wage (say $18–22/hour), depreciation at replacement cost, a management return, and every dollar of interest and principal. Divide by hundredweights shipped. Then set that against the $20.70 all-milk outlook — if your full breakeven lands above it, you’re selling below cost, and the first problem isn’t efficiency. It’s the price you’re accepting.
There’s a faster version you can run this week — call it the 50¢ co-op check. It requires no complex spreadsheets — just two milk checks and a calculator.
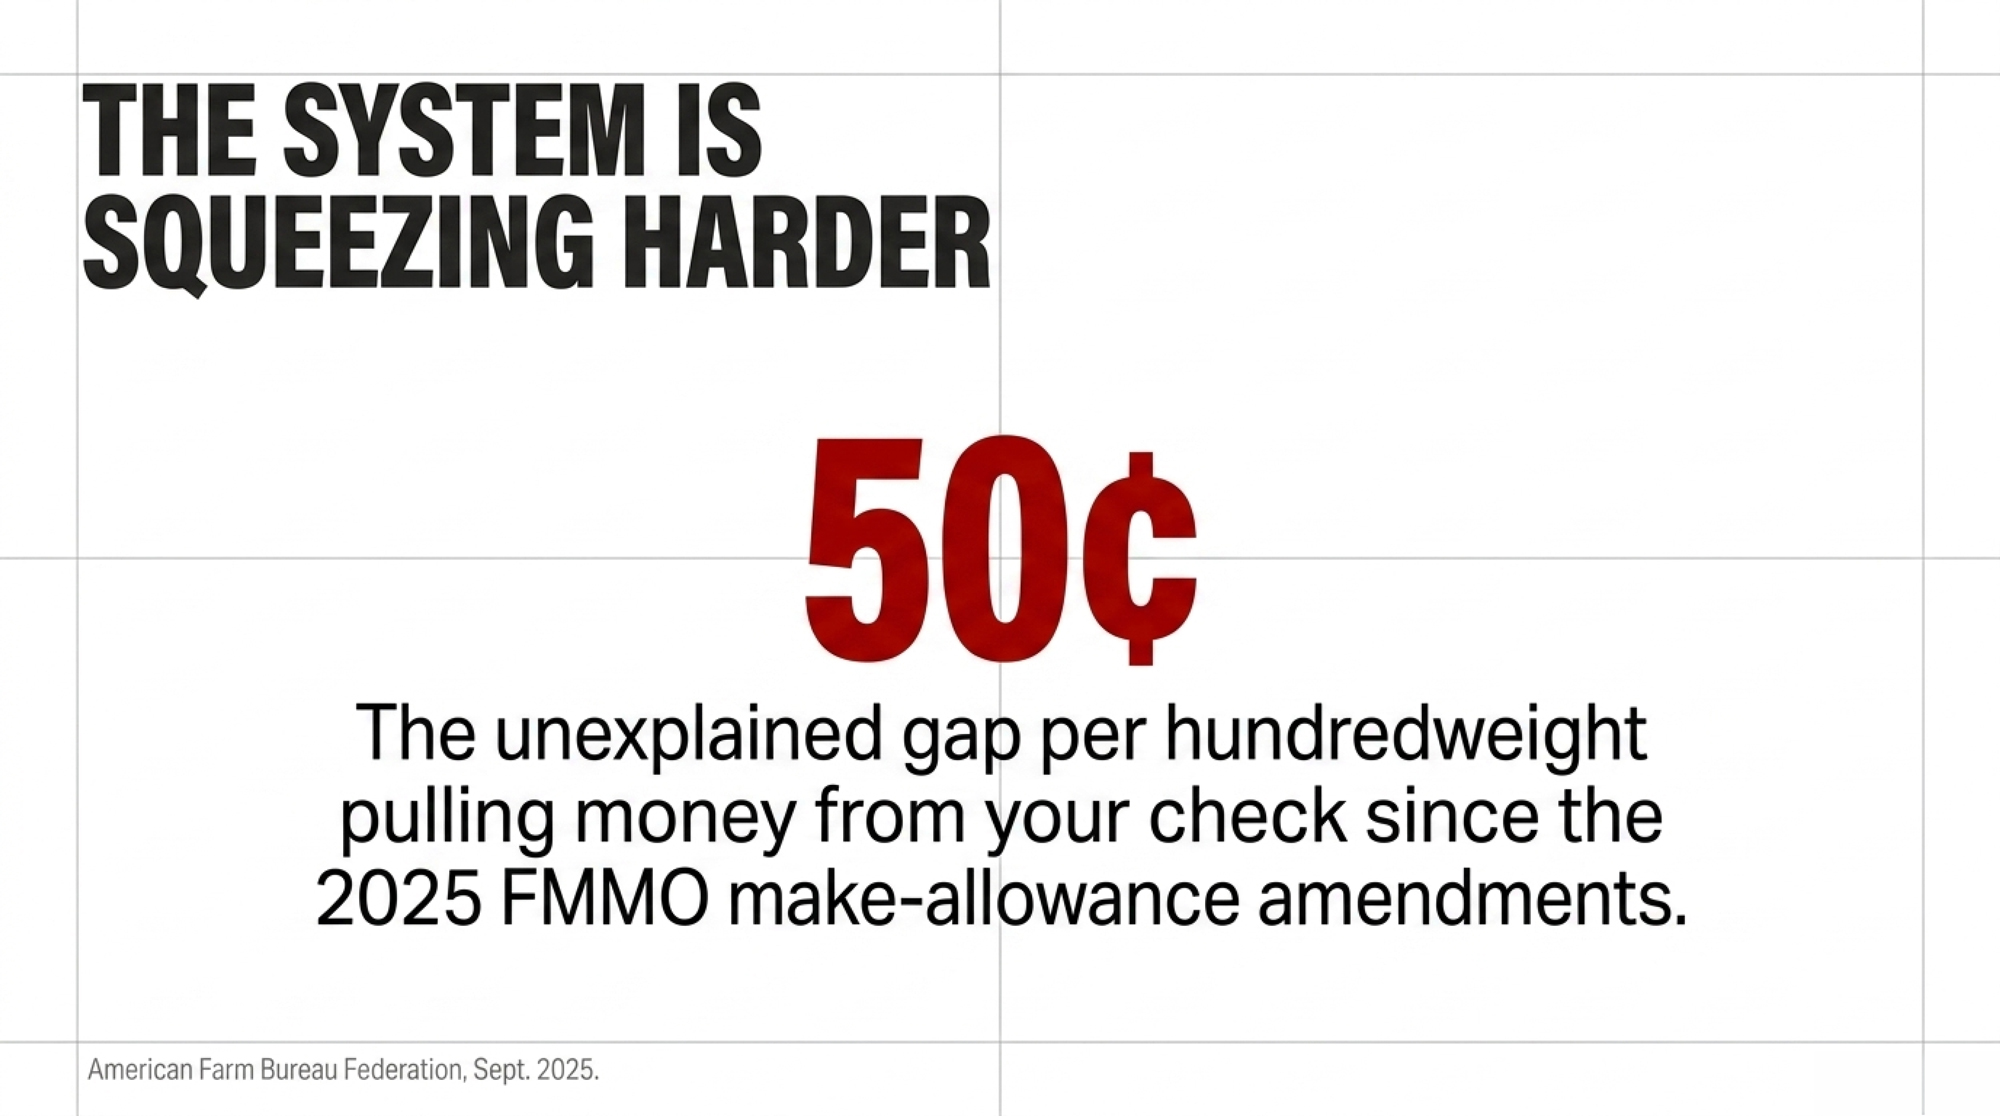
The 50¢ Co-op Check
- Pull your January 2025 and January 2026 milk statements.
- Divide net pay by total hundredweights (cwt) shipped on each.
- Subtract the 2026 value from the 2025 value.
- If you find an unexplained gap of roughly 50¢/cwt or more — outside normal Class III, Class IV, and butter swings — a good chunk of it is likely the post-June 2025 FMMO make-allowance drag, not just a soft month.
Land underwater and didn’t know it? That’s not a character flaw — it’s the most common spot for herds your size. But it changes what your next move should be.
Is a Creamery Plan Actually a Succession Plan in Disguise?
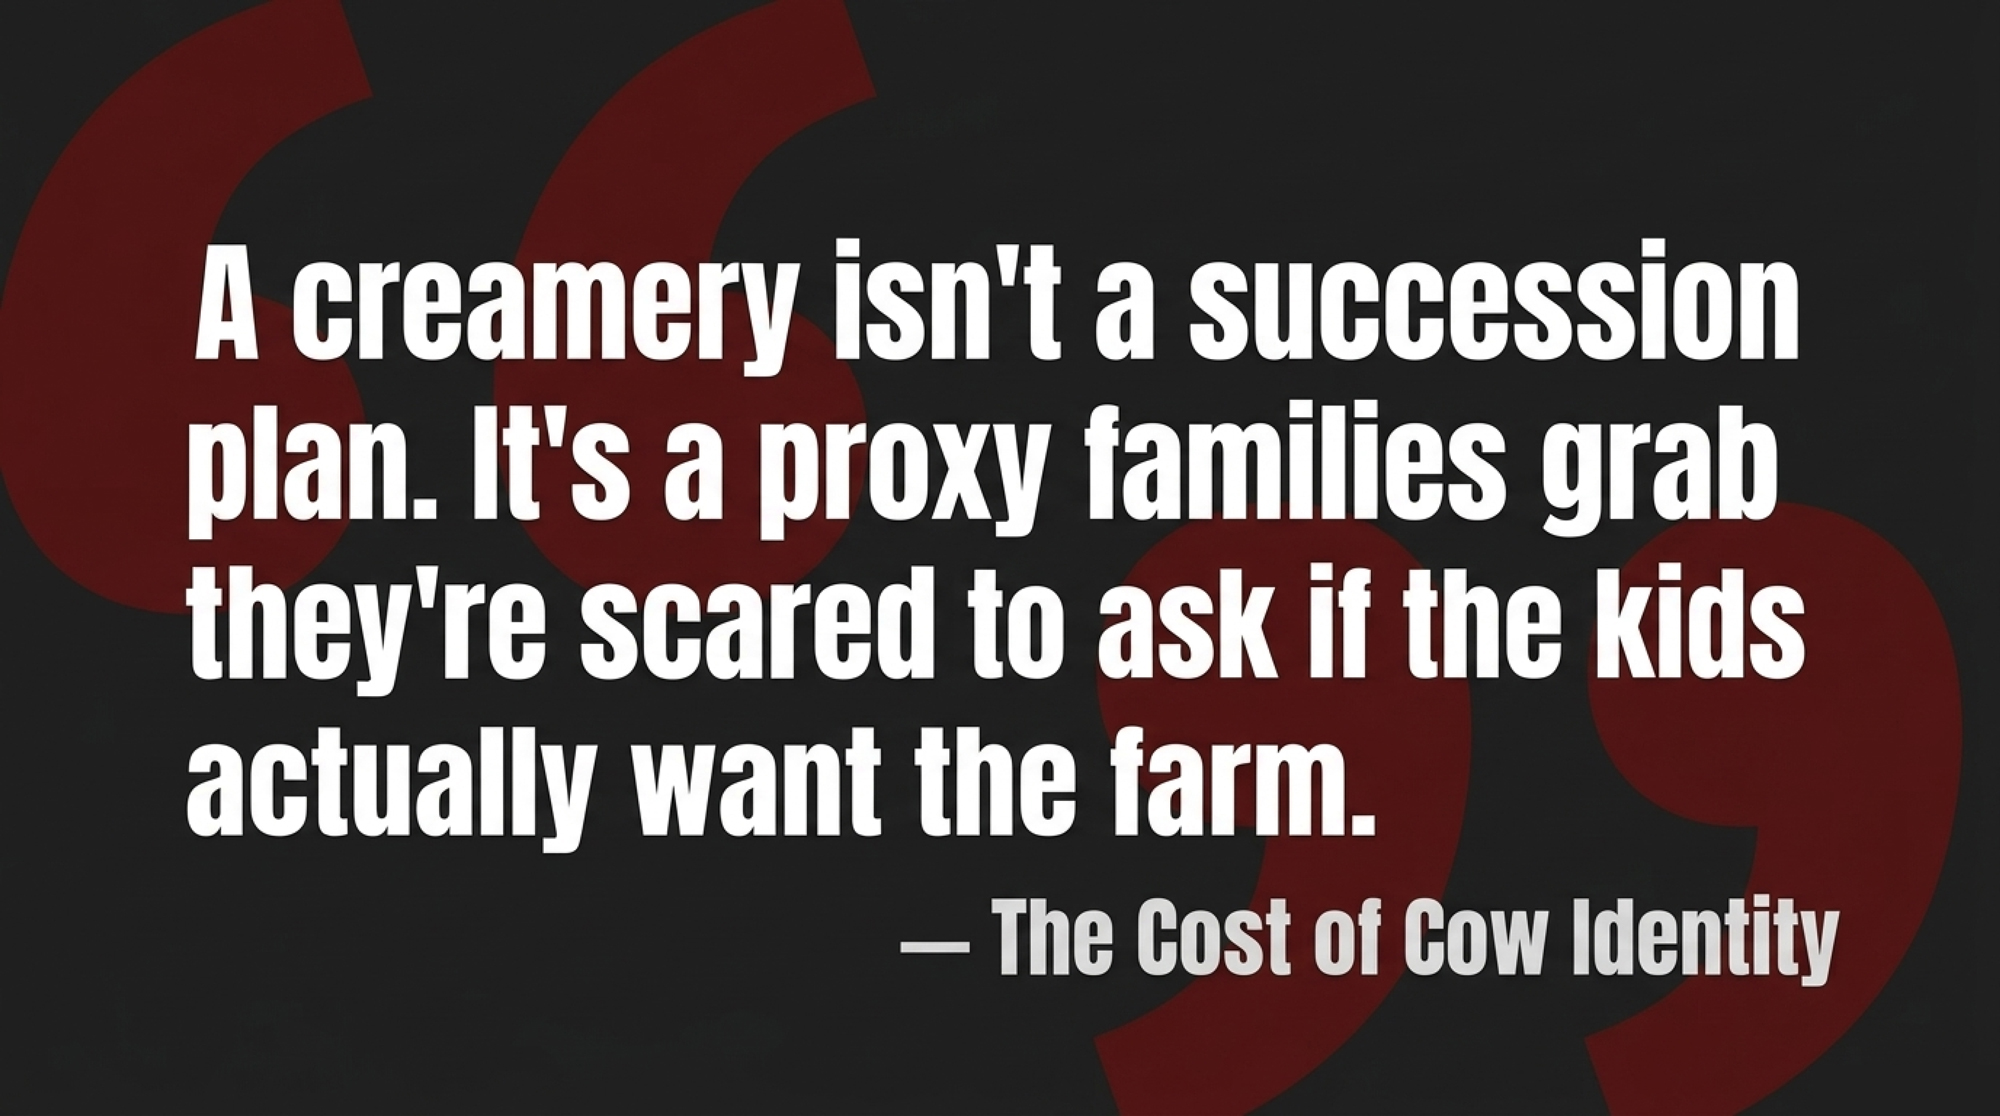
A lot of families — our 110-cow couple included — reach for the creamery, the robots, or the expansion because it looks like one lever that fixes three problems at once: thin margin, dependence on one buyer, and a reason for the kids to come back. It’s not irrational. It’s a pretty elegant theory of the farm. The trouble is it usually solves the wrong constraint, because the hardest problem isn’t price. It’s whether anyone’s actually committed to running this thing in five years.
The succession numbers are sobering. Farm-transition research consistently finds that only about 30% of family farms survive into the second generation and roughly 12–16% into the third, that a large majority of farmers have no formal estate or transition plan, and that most family dairies never complete a successful transfer — usually because the real conversation never happened (widely reported farm-succession research; see The Bullvine succession coverage, 2025). The conversations that work start ugly and specific: “Are we trying to continue this farm, or cash it out well?” Then, one-on-one with each kid: “Do you actually want this — and on what terms?” A creamery plan isn’t a succession plan. It’s a succession proxy families grab when they’re scared to ask the question straight.
Options and Trade-Offs for Farmers
There’s no “back to 1985” lane. The credible analysis keeps landing on three live paths — scale, niche, or a planned exit. Each one is legitimate. Each one can fail. Here’s how they line up side by side:
| Path | Capital Required | Labor / Time Commitment | The Fatal Flaw / Primary Risk |
| 1. Scale up (300–500+ cows) | ~$3,000–$3,500/stall before electrical and plumbing (Dairy Challenge / extension, 2022); one expansion budget ran $1.5–$2M for facilities plus $1.3M for cattle (The Bullvine, May 2025) — often refinanced at 6.5–7% | Shifts from physical farming to managing a 4–8 person team | A sub-$20 milk year stacked on high interest can force a distressed sale — or leave you with a massive facility and a dropped milk contract |
| 2. Go niche (on-farm / value-add) | ~$315K for equipment inside a ~$1.5M facility (UT Institute of Agriculture); or skip on-farm pasteurization ($30K–$50K+) and use a co-packer (The Bullvine, Dec. 2025) | ~70–90 extra hours/week for processing, bottling, delivery, and marketing | Running out of hours, not milk — failure lands in the bottling room, licensing office, and customer pipeline |
| 3. Planned exit (protect equity) | $0 — equity-preservation mode | 30 days to run true costs and start an intentional transition | Waiting too long, until the lender or processor forces the exit on their terms |
A few things the table can’t carry. Scaling makes sense only when you can pencil a credible path toward that $19.14 ERS cost benchmark, and you’ve locked a milk home first — the same genetics-and-capital shakeout that’s reshaping herd values is the backdrop for that bet. Niche makes sense when you’re within driving distance of population and genuinely want to run a food business on top of a dairy. And the exit path — the one the industry rarely says to a farmer’s face — makes sense when you don’t see a committed successor or a route to competitive cost, and you’d rather protect equity, relationships, and your own health than grind another decade. It’s not hypothetical: five farmers walked away with $575,000 in preserved equity precisely because they left on their own terms.
Not sure which path your own numbers point to? Answer five questions in the Consolidation Clock, and it’ll tell you whether your farm’s signal reads expand, optimize, pivot, transition, or exit.
That third path isn’t failure. A planned exit belongs on the same whiteboard as a new parlor. And if the weight of that decision gets heavy, you’re not carrying it alone — the Farm Aid hotline (1-800-FARM-AID / 1-800-327-6243), the 988 Suicide & Crisis Lifeline, and most state extension programs offer free, confidential support.
Key Takeaways
- If your true cost of production — family labor, depreciation, and interest included — lands above the $20.70 all-milk outlook, run the scale-vs-niche-vs-exit comparison now, not after the next refinance.
- If your unexplained January-over-January milk-check gap runs around 50¢/cwt or more, treat a good chunk of it as make-allowance drag and bring those two statements to your next co-op meeting.
- If a spouse’s town job is quietly covering loan payments or insurance, name it out loud and decide whether it’s a temporary bridge or a permanent subsidy.
- Before you spend a dollar on a creamery, robots, or expansion, confirm in writing who’s committed to running the farm in five years. Capital should follow a succession decision, not stand in for one.
- If you’re eyeing a niche, budget 70–90 extra hours a week before you budget for equipment — and check whether a real customer base is within reach before you pour concrete.
- Have a one-on-one conversation with each family member, not just the group one, and treat “I don’t want in” as useful information rather than a betrayal.
- Put a planned, dignified exit on the table as a valid outcome you’re allowed to design — not a failure you delay until someone forces it.
So — Which Future Do You Actually Belong In?
The honest answer isn’t pick-a-side. Staying, scaling, going niche, or leaving are all legitimate. The only wrong move is refusing to decide until the bank or the processor decides for you. The 2035 trajectory — fewer farms, bigger herds, co-op tables run by the operations shipping two-thirds of the milk — is already largely locked in. The open question is which side of it your operation lands on, and whether you chose it.
So where does your breakeven actually sit this morning? And if the DMC margin really does sink toward $7/cwt early next year, how many months of equity do you have before the choice gets made for you? Pull the two-year number first, then have the conversation you’ve been putting off.
Should You Expand, Hold, or Exit?
5 questions. 60 seconds. Get your signal.
Editor’s note: The 110-cow family in this story is a composite, modeled from multiple Upper Midwest and Northeast herds and the USDA cost-of-production data cited throughout. The numbers are real. The single farm is illustrative. Financial figures attributed to S&P Global Ratings and the American Farm Bureau Federation reflect those organizations’ reporting as of June and September 2025, respectively.
Learn More
- $18.95 Milk, $19.14 Costs: The $287500 Equity Decision Facing Mid‑Size Wisconsin Dairies — Arms you with a timeline-driven burn-rate protocol and a concrete financial framework to determine whether a proactive, equity-preserving strategic exit outpaces a forced liquidation when long-term cash flow sits underwater.
- GT Thompson’s 2026 Farm Bill Math: DMC Pays Your 200‑Cow Dairy $1800, Make Allowances Cut $42240 – a 23 to 1 Hit — Exposes the deep structural imbalance embedded in national regulatory policy, detailing how a modest $1,800 federal safety net payout gets utterly wiped out by an automatic $42,240 deduction from your check.
- Robotic milking ROI: the 7-year $8776 cash-flow hole — Dismantles aggressive equipment sales pitches by mapping the severe, seven-year capital valley that traps independent producers when heavy automated debt service outpaces real-world parlor labor savings.
 The Sunday Read Dairy Professionals Don’t Skip.
 The Sunday Read Dairy Professionals Don’t Skip.
Every week, thousands of producers, breeders, and industry insiders open Bullvine Weekly for genetics insights, market shifts, and profit strategies they won’t find anywhere else. One email. Five minutes. Smarter decisions all week.
