Archive for LCFS credits

$80M on Her Land, $0 in Carbon Credits: Inside Curtis Creek’s RNG Trade

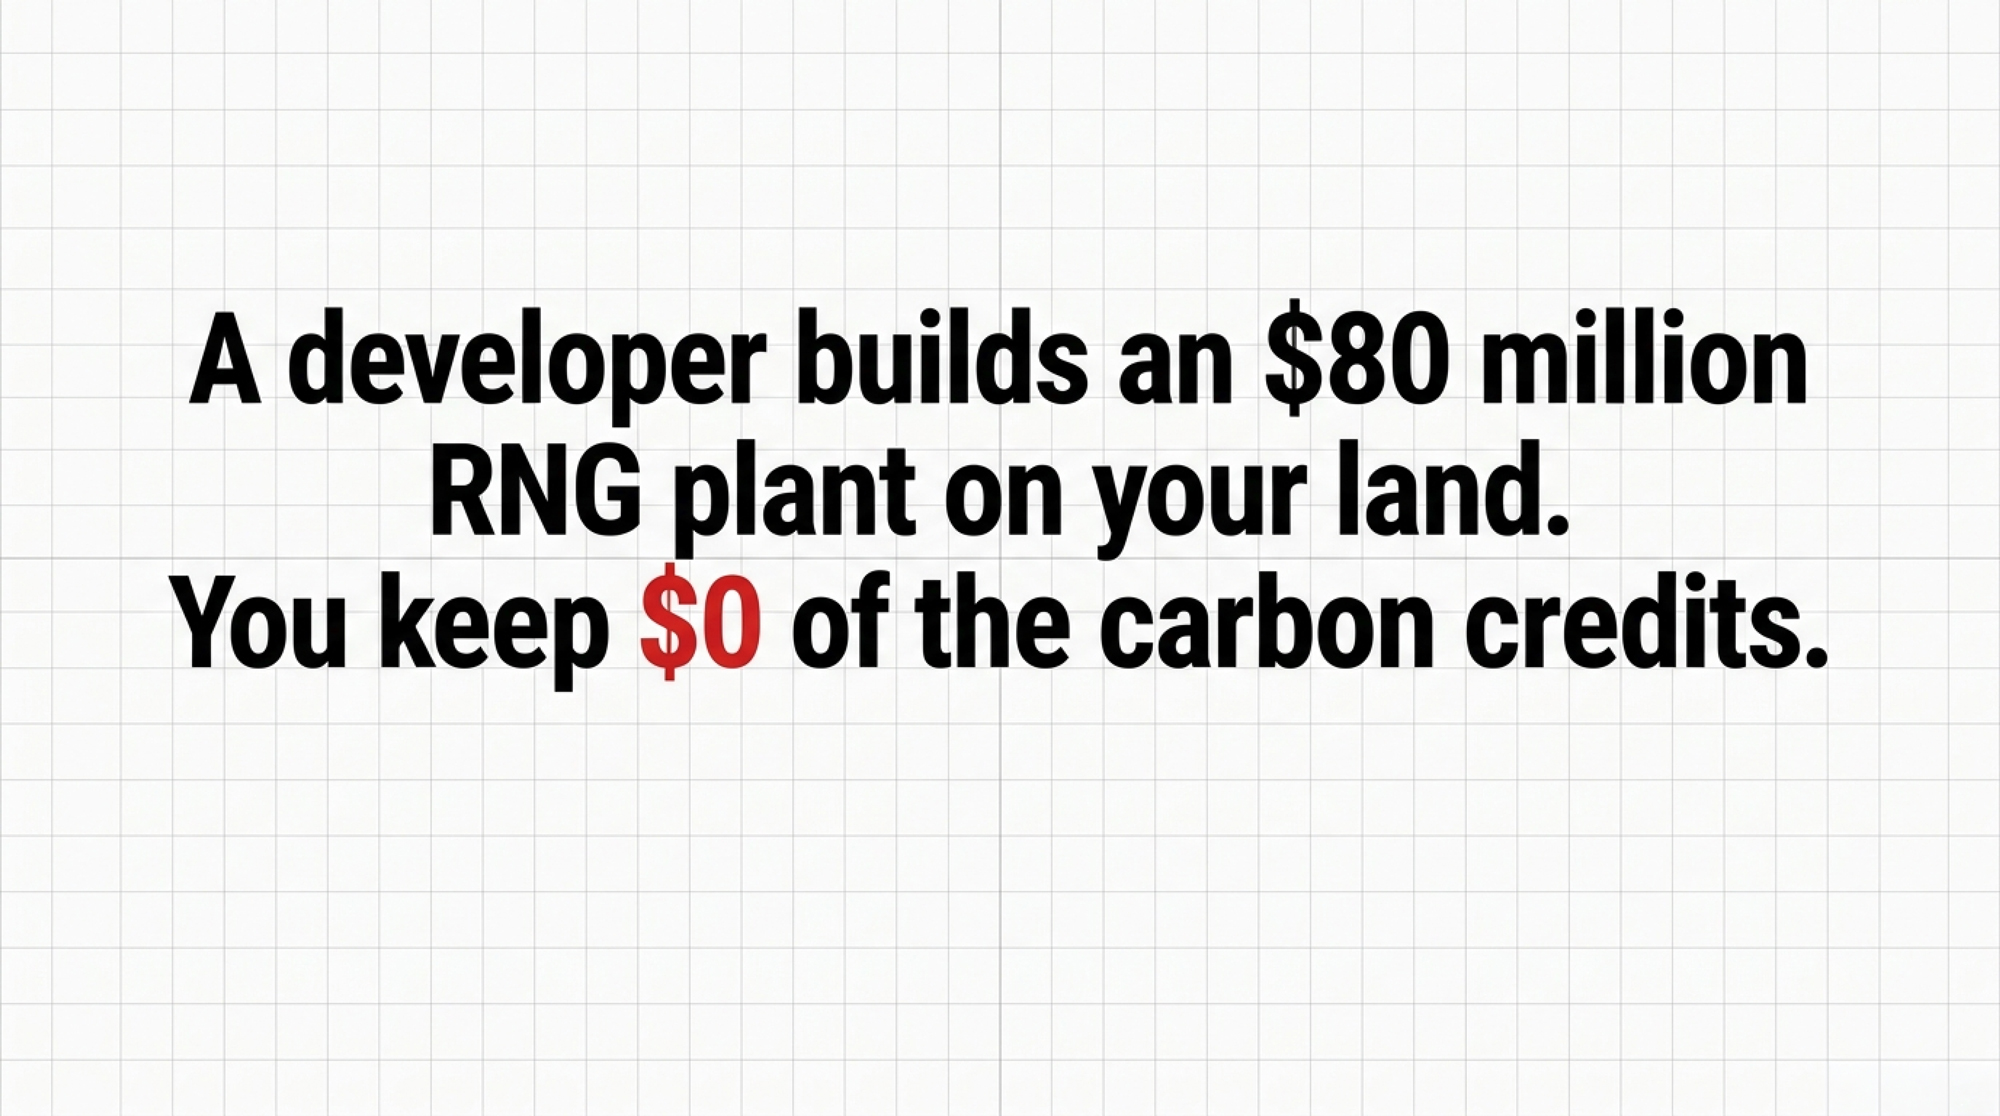
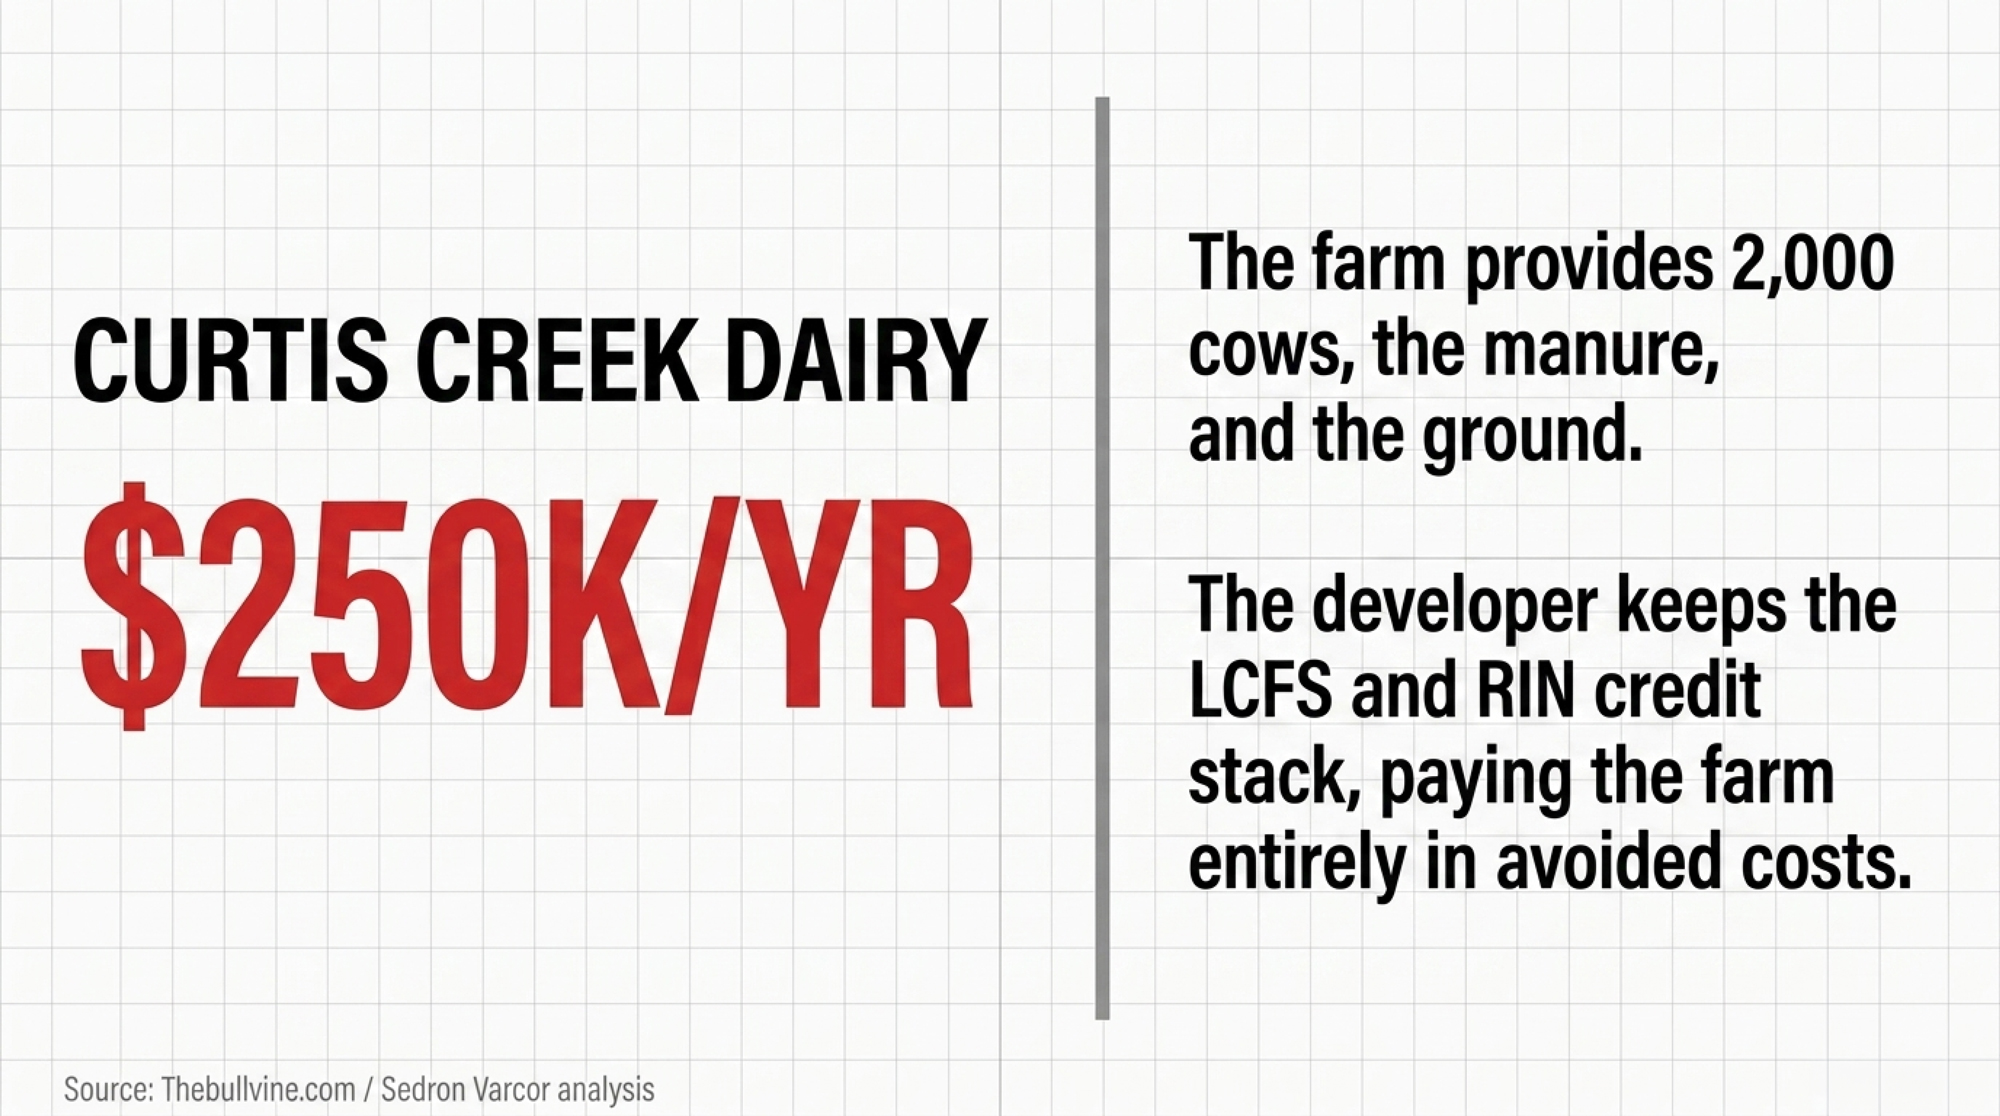
An $80M Sedron Varcor nutrient-recovery plant now sits on Curtis Creek ground, alongside the dairy’s separate anaerobic digester and RNG operation. The farm keeps about $250K/year in avoided costs — and a 20-year manure contract. The credit stack? Not theirs.

Correction (May 19, 2026): An earlier version of this article incorrectly stated that Sedron operates the anaerobic digesters and produces RNG at Curtis Creek. Sedron’s Varcor system processes digestate into dry fertilizer, liquid ammonium nitrate fertilizer, and clean water; the digester and RNG production are run by a separate party. The article has been updated accordingly.

Executive Summary: Curtis Creek Dairy… now hosts an $80M Sedron Varcor nutrient-recovery plant that processes digestate from the dairy’s separate anaerobic digester — and the developer, not the farm, owns the carbon credits. The 2,000‑cow herd (with publicly reported plans toward 3,200) puts up the manure and the land; The RNG developer (not Sedron) owns the LCFS and RIN credit stack tied to gas production. Sedron’s role is downstream nutrient recovery via Varcor. That stack is where the money lives: $3 base gas vs. $60–$90/MMBtu once 2025 LCFS credits ($57.77/ton avg, $40.75–$75.50 range, Stillwater) and D3 RINs (~$2.40 avg, EPA EMTS) are layered in. The farm’s payoff comes in avoided costs — modeled at roughly $250K/year, or about $50–$100/cow on the manure side alone — locked in against a 15–25‑year manure‑supply contract recorded against the property. Compare that to a hypothetical farm‑owned 2,500‑cow build at ~$3,400/cow capital with ~$525K/year net cash flow, and the trade‑off is obvious: stability and zero project debt, or upside and policy risk you carry yourself. With USDA’s REAP grant window paused in early 2026 and similar pitches landing in producer inboxes weekly, the 30‑day move is simple — get any draft term sheet in front of a lender and an attorney who’ve read manure‑to‑energy contracts before they get in front of a pen.

dairy RNG contract

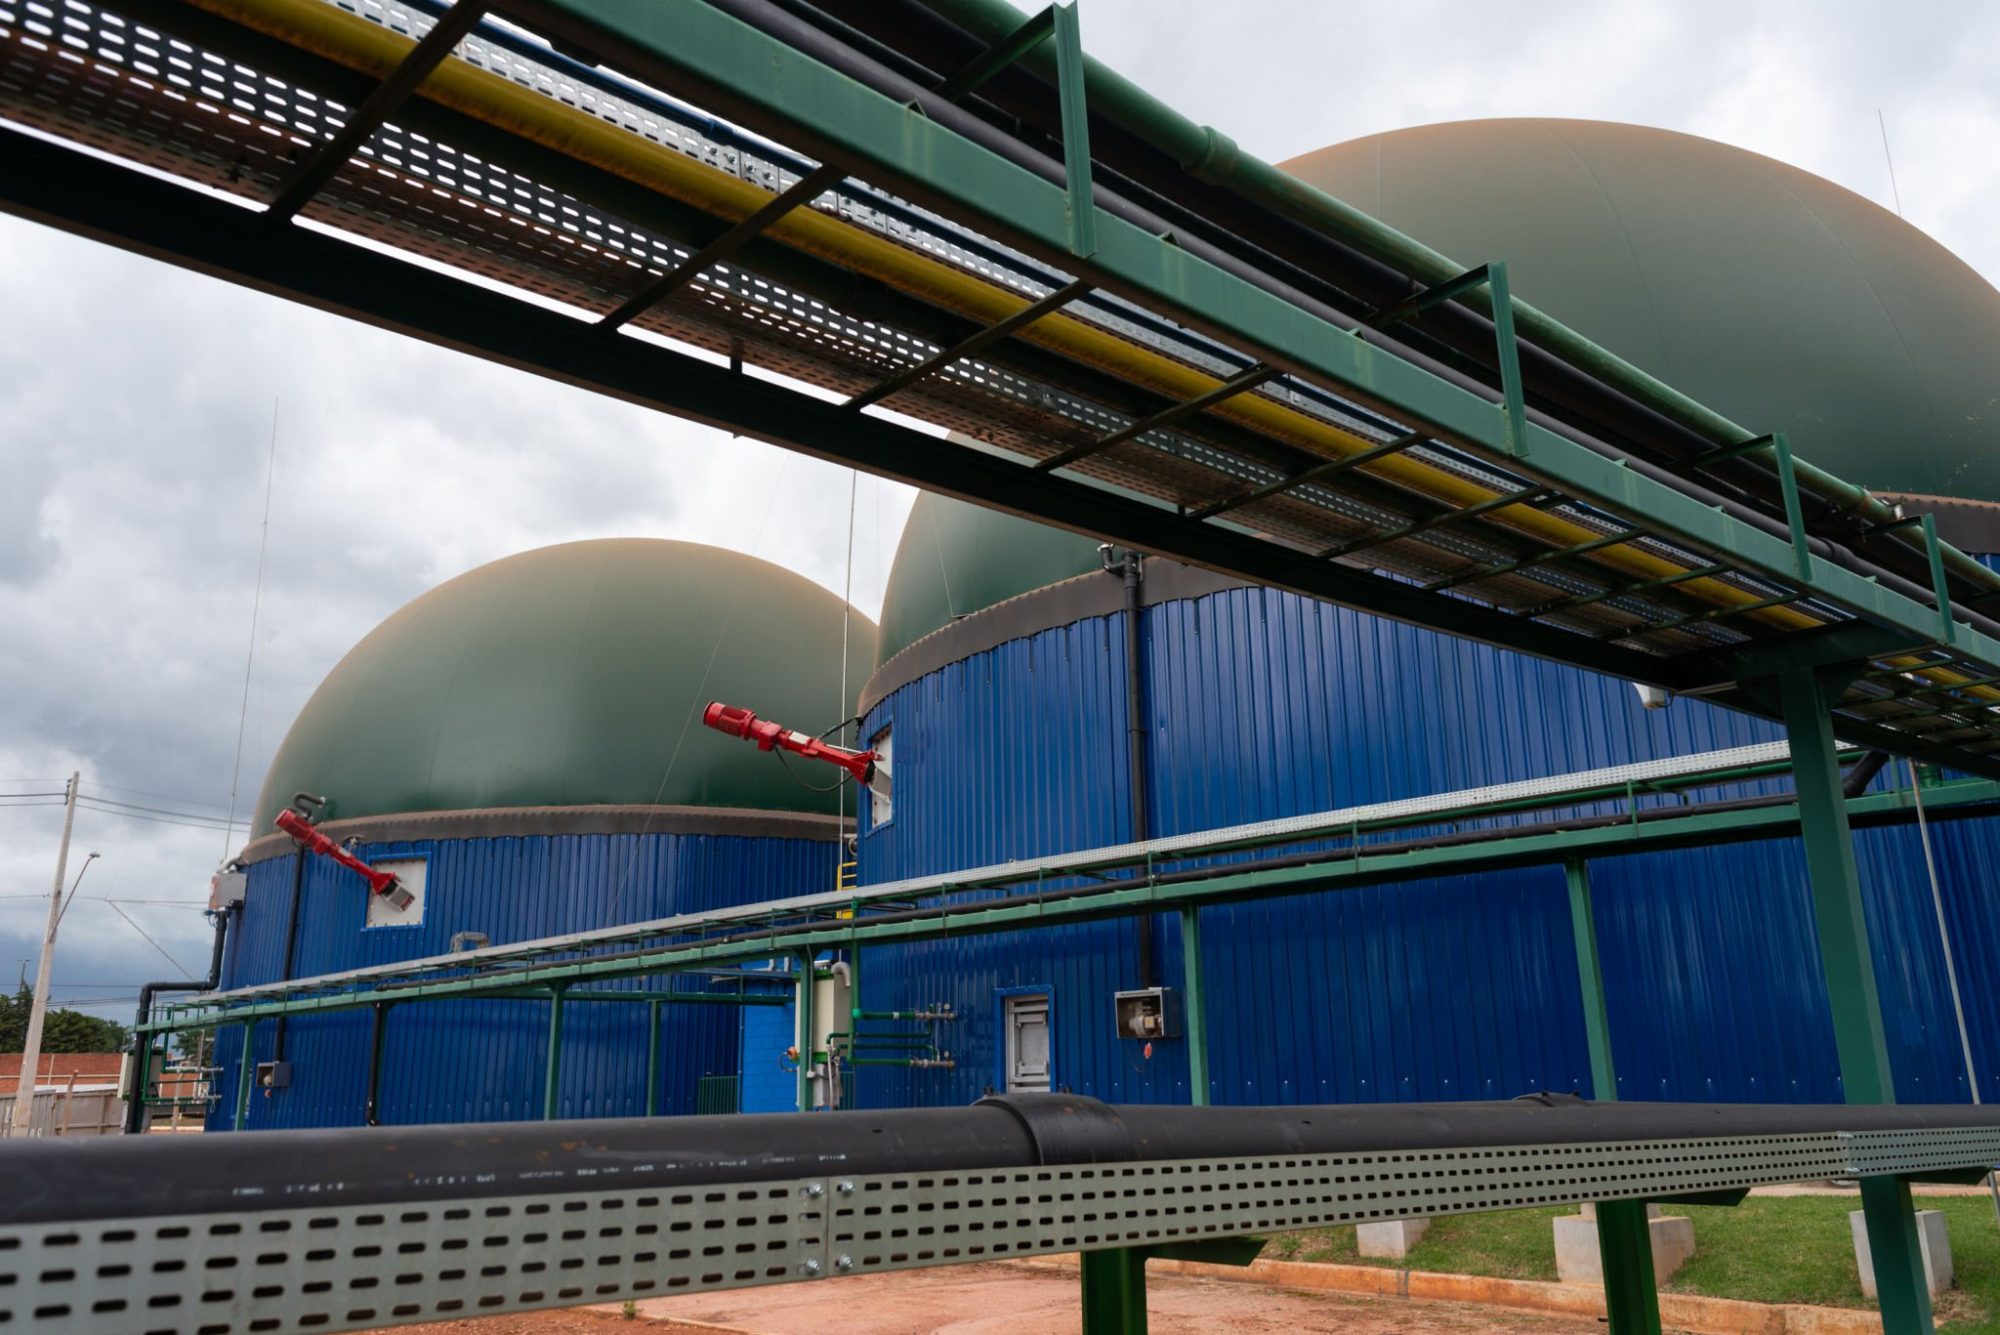
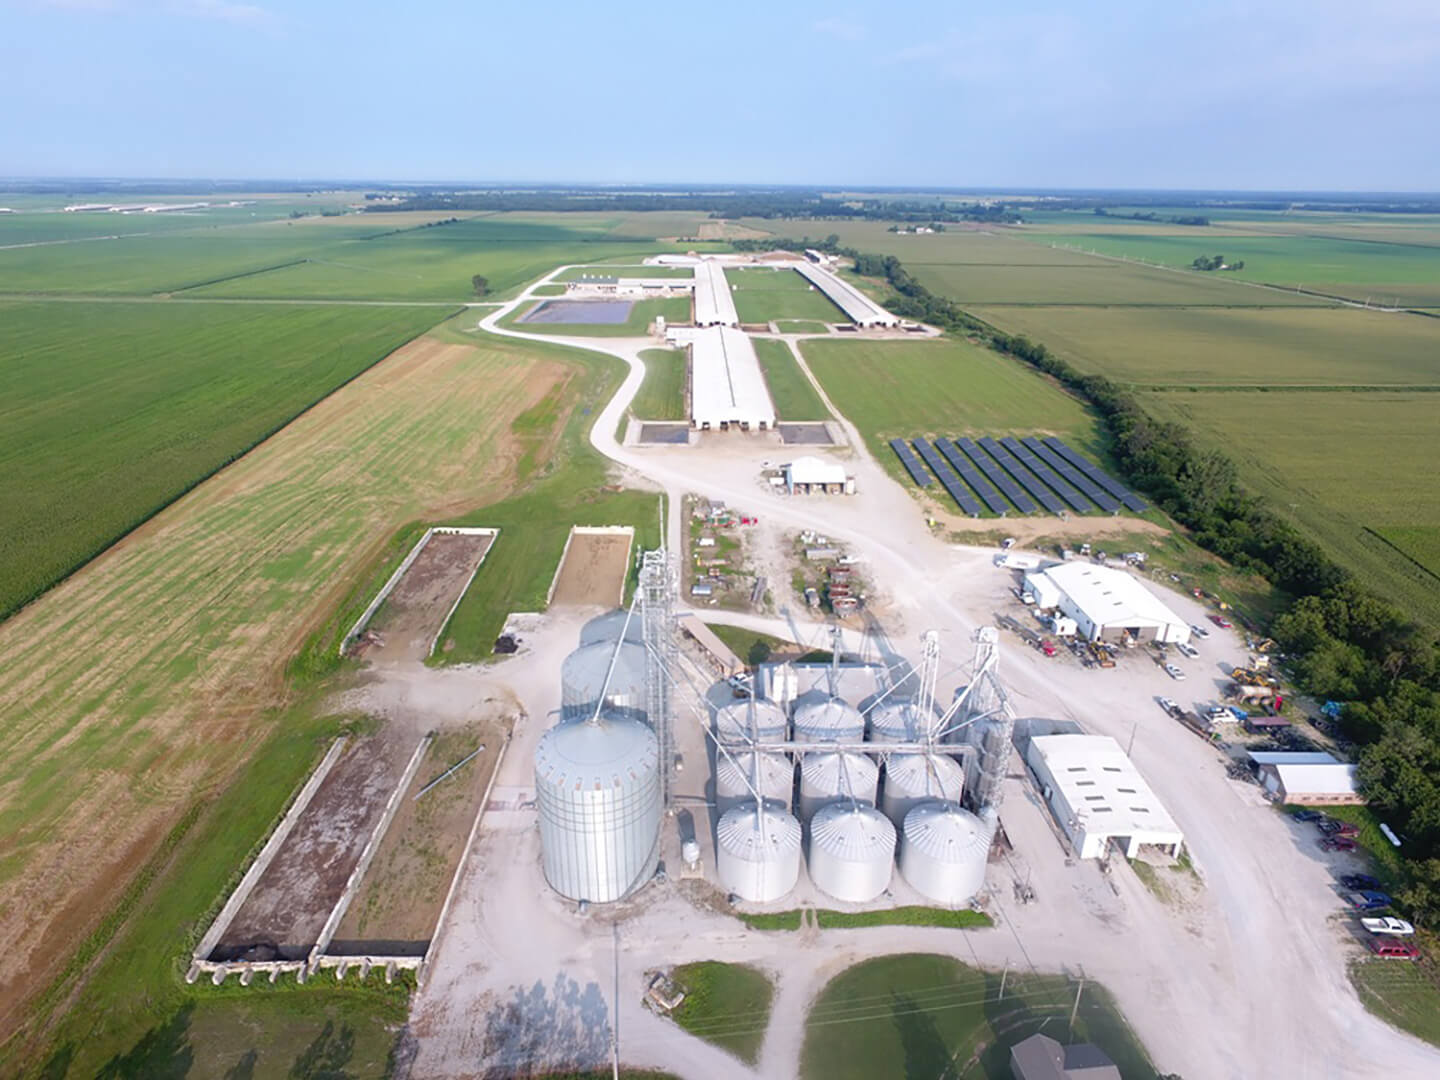
Carl Ramsey doesn’t really manage a manure lagoon anymore. He carries the title Manager of Digester Operations at Curtis Creek Dairy in Newton County, Indiana — a role that started as Farm Manager back in 1999 and has since grown into oversight of a 7.5‑million‑gallon DVO plug‑flow digester and a 50,000-square-foot Sedron Varcor facility that processes digestate from the dairy’s digester into dry fertilizer, liquid ammonium nitrate fertilizer, and clean water. Curtis Creek is milking about 2,000 cows today, with publicly reported plans to grow toward 3,200, but the real story sits on the other side of the flush barn — an $80 million Sedron Varcor plant that recovers nutrients and water from digestate. The pipeline gas and California carbon credits come from the dairy’s separate digester/RNG project. “Their facility is going to use the manure from our cows for the basis of their feedstock,” Ramsey told Brownfield Ag News in May.

If you’re being courted for a digester or RNG project, this is the kind of deal that’s likely headed your way.

What’s Actually Changing Around the Manure Pit

For most of dairy’s history, manure has been a cost and a compliance headache. You scraped it, stored it, hauled it, and hoped the inspector didn’t show up the week after a big rain. Early digesters didn’t change that much. They knocked down odor and spun a generator, but the economics were usually thin — low power buy‑back rates, high maintenance, and more than a few farms quietly shutting them off after a rough run.

Curtis Creek represents a different era. Here, manure flows first to the dairy’s anaerobic digester, which produces RNG. The leftover digestate is then piped to Sedron’s Varcor plant for nutrient and water recovery, which is backed by private‑equity firm Ara Partners. Your cows and land become the steady input for a facility whose real profit centre is not the gas molecule itself, but the environmental “attributes” attached to it.

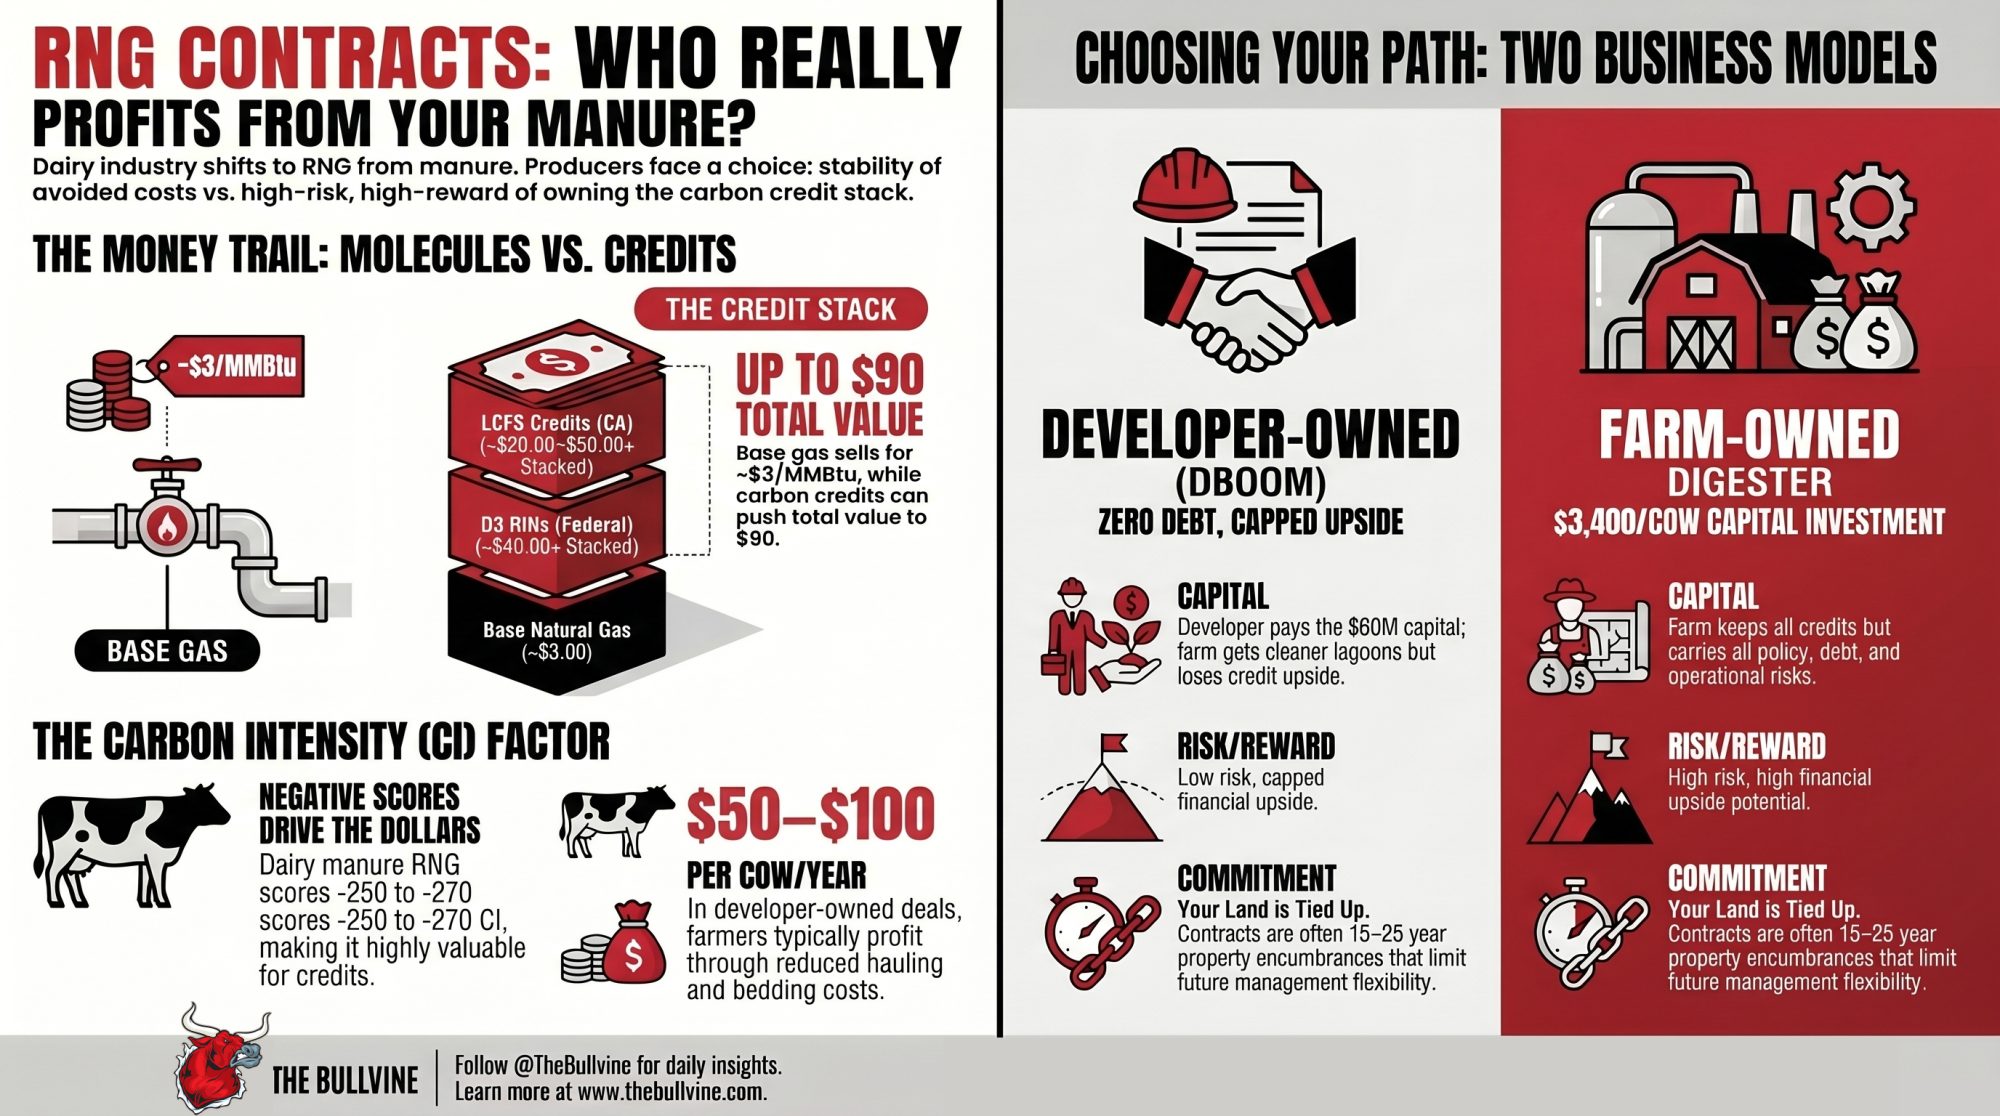
That’s where the money gets interesting. A million BTUs of methane might sell for roughly $3 at the city gate, but the credit stack on dairy RNG is where the real dollars sit. In 2025, D3 cellulosic RINs — the federal credits tied to dairy RNG — averaged about $2.40 per RIN, based on EPA EMTS data and trade press averages. California’s LCFS credit price averaged $57.77 per metric ton CO₂e that same year, with trades ranging from $40.75 to $75.50 and a credit‑clearance market price ceiling indexed up toward $275.39 per ton in 2026 (CARB and Stillwater Associates, 2025–26). When your project scores a deeply negative carbon intensity (often ‑250 to ‑270 g CO₂e/MJ for dairy manure RNG), those numbers stack fast.

Translation: this isn’t a milk‑cheque play. It’s a credit‑market play, and the policy math decides who eats.

Quick glossary for your boardroom brain

  • MMBtu: million British thermal units — the unit gas is sold in.
  • RIN (D3): Renewable Identification Number under the Renewable Fuel Standard, cellulosic biofuel category.
  • LCFS: California’s Low Carbon Fuel Standard credit; pays for displacing fossil fuel based on carbon intensity.
  • CI score: carbon intensity, in grams CO₂‑equivalent per megajoule. Dairy manure RNG often scores deeply negative.
  • DBOOM: Design‑Build‑Own‑Operate‑Maintain. The developer owns and runs the plant; you provide manure and site access.

How This Plays Out on a Real Farm

At Curtis Creek, manure handling is no longer just a herd‑side job — Ramsey’s title, Manager of Digester Operations, captures the shift. According to Sedron’s public materials, the site processes 200 million gallons of digestate a year, which means feedstock consistency, throughput, and biology are now operational priorities alongside the scraper schedule. The farm provides the cows, the manure, and the ground. Sedron provides the $80 million Varcor facility, the plant staff (about four full‑time employees on their payroll), and the contracts with the pipeline and credit markets.

That’s a real change in scope for a role that started as Farm Manager in 1999. The cows still come first, but on this site, the lagoon now functions as the feedstock source for an industrial process feeding the pipeline.

Sedron’s own materials describe Curtis Creek as a 200‑million‑gallon‑per‑year processing site and their flagship agricultural project. The Varcor system takes digestate and separates it into three product streams: clean, nearly pathogen‑free water; roughly 37,000 tons a year of dry organic fertilizer; and a liquid ammonium nitrate fertilizer, per Sedron’s Varcor product spec. The digester/Varcor complex sits alongside a 1.7 MW solar array that helps power the site and farm, supported by a 0,000 USDA REAP grant documented in USDA Rural Development’s 2024 Indiana Earth Day release. For a glimpse of where lower‑tech nutrient recovery is heading, it’s worth comparing this with the lower‑tech nutrient recovery bet one farm is making with worms instead of distillation.

In the forensic modeling for a Curtis Creek–scale setup, the avoided‑cost value comes in around $250,000 per year, conservatively — that’s lagoon dredging avoided, bedding replaced with dry solids (worth $20,000–$50,000 annually), water reuse, and solar‑offset energy. In other words, the dairy sees its manure problem shrink and some line items drop.

Now stack that against a farm‑owned version, using industry‑typical barn math instead of Curtis Creek’s internal books. A hypothetical 2,500‑cow digester, built and owned by the farm, takes on about $8.5 million in capital cost. Under conservative assumptions:

  • Gross revenue (gas plus credits): about $2.83 million/year
  • Operating cost: about $1.1 million/year
  • Debt service (7%, 10‑year term): about $1.21 million/year

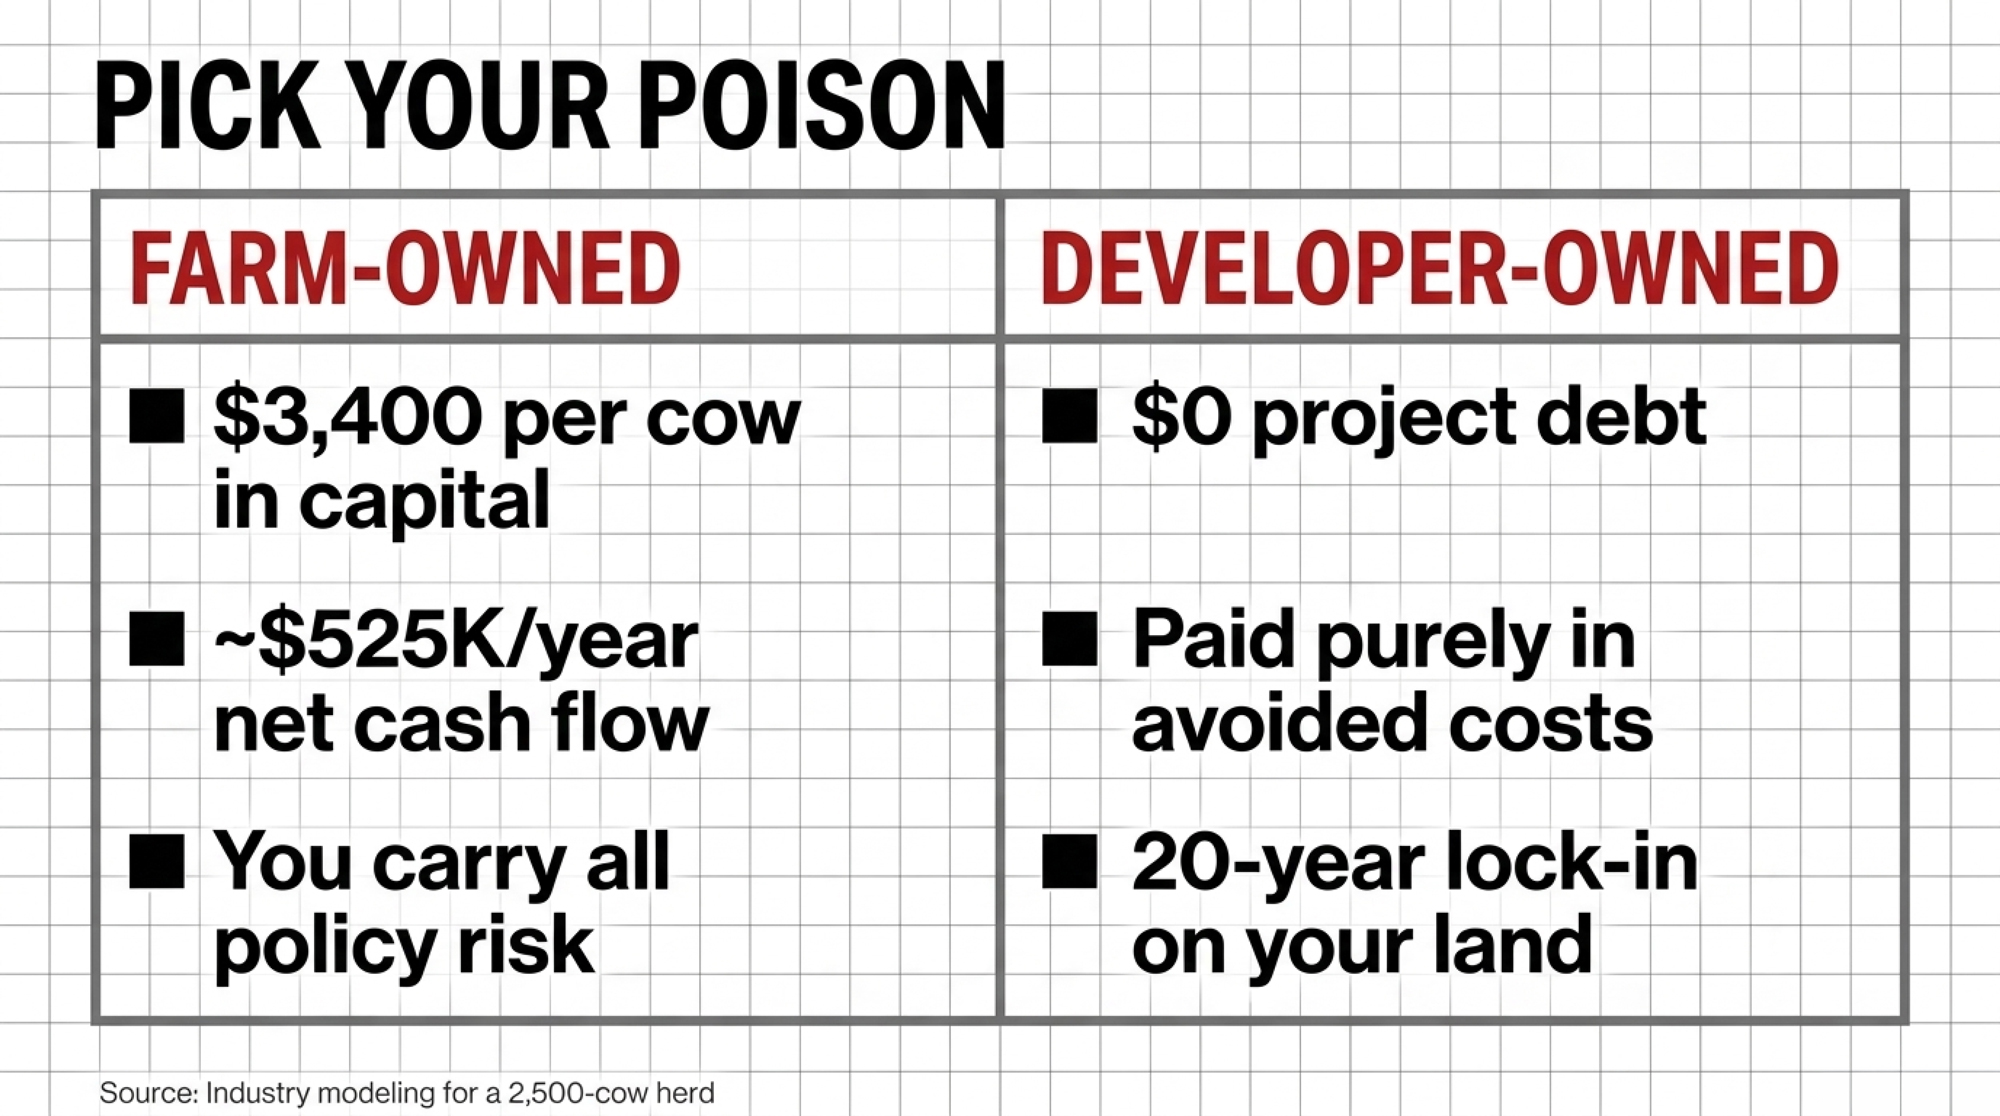
You’re left with roughly $525,000 a year in net cash flow. That’s the upside. The downside: every swing in RIN and LCFS prices hits you directly.

At 45,000 MMBtu/year of gas output, a stacked value of per MMBtu means about .7 million in credit‑driven revenue before operating costs. That credit‑driven upside is a big part of why private capital is so interested in these projects. The real question is how much of that flow will ever reach your farm account.

How Much Money Actually Flows Back to Your Farm?

Short answer: in a typical developer‑owned deal, your gain shows up more in avoided costs than in a direct share of credit revenue.

In most DBOOM‑style deals, the developer’s profits come primarily from the credit stack, not the base gas price. On the farm side, the payoff usually shows up as avoided cost rather than a cheque tied to every RIN or LCFS credit. That’s still real money. But unless the contract ties your compensation to RIN or LCFS prices, your avoided‑cost benefit stays flat even if credit prices climb. We’ve dug into how carbon contracts are reshaping farm balance sheets if you want to see how this plays out beyond manure.

What kind of avoided cost are we talking about?

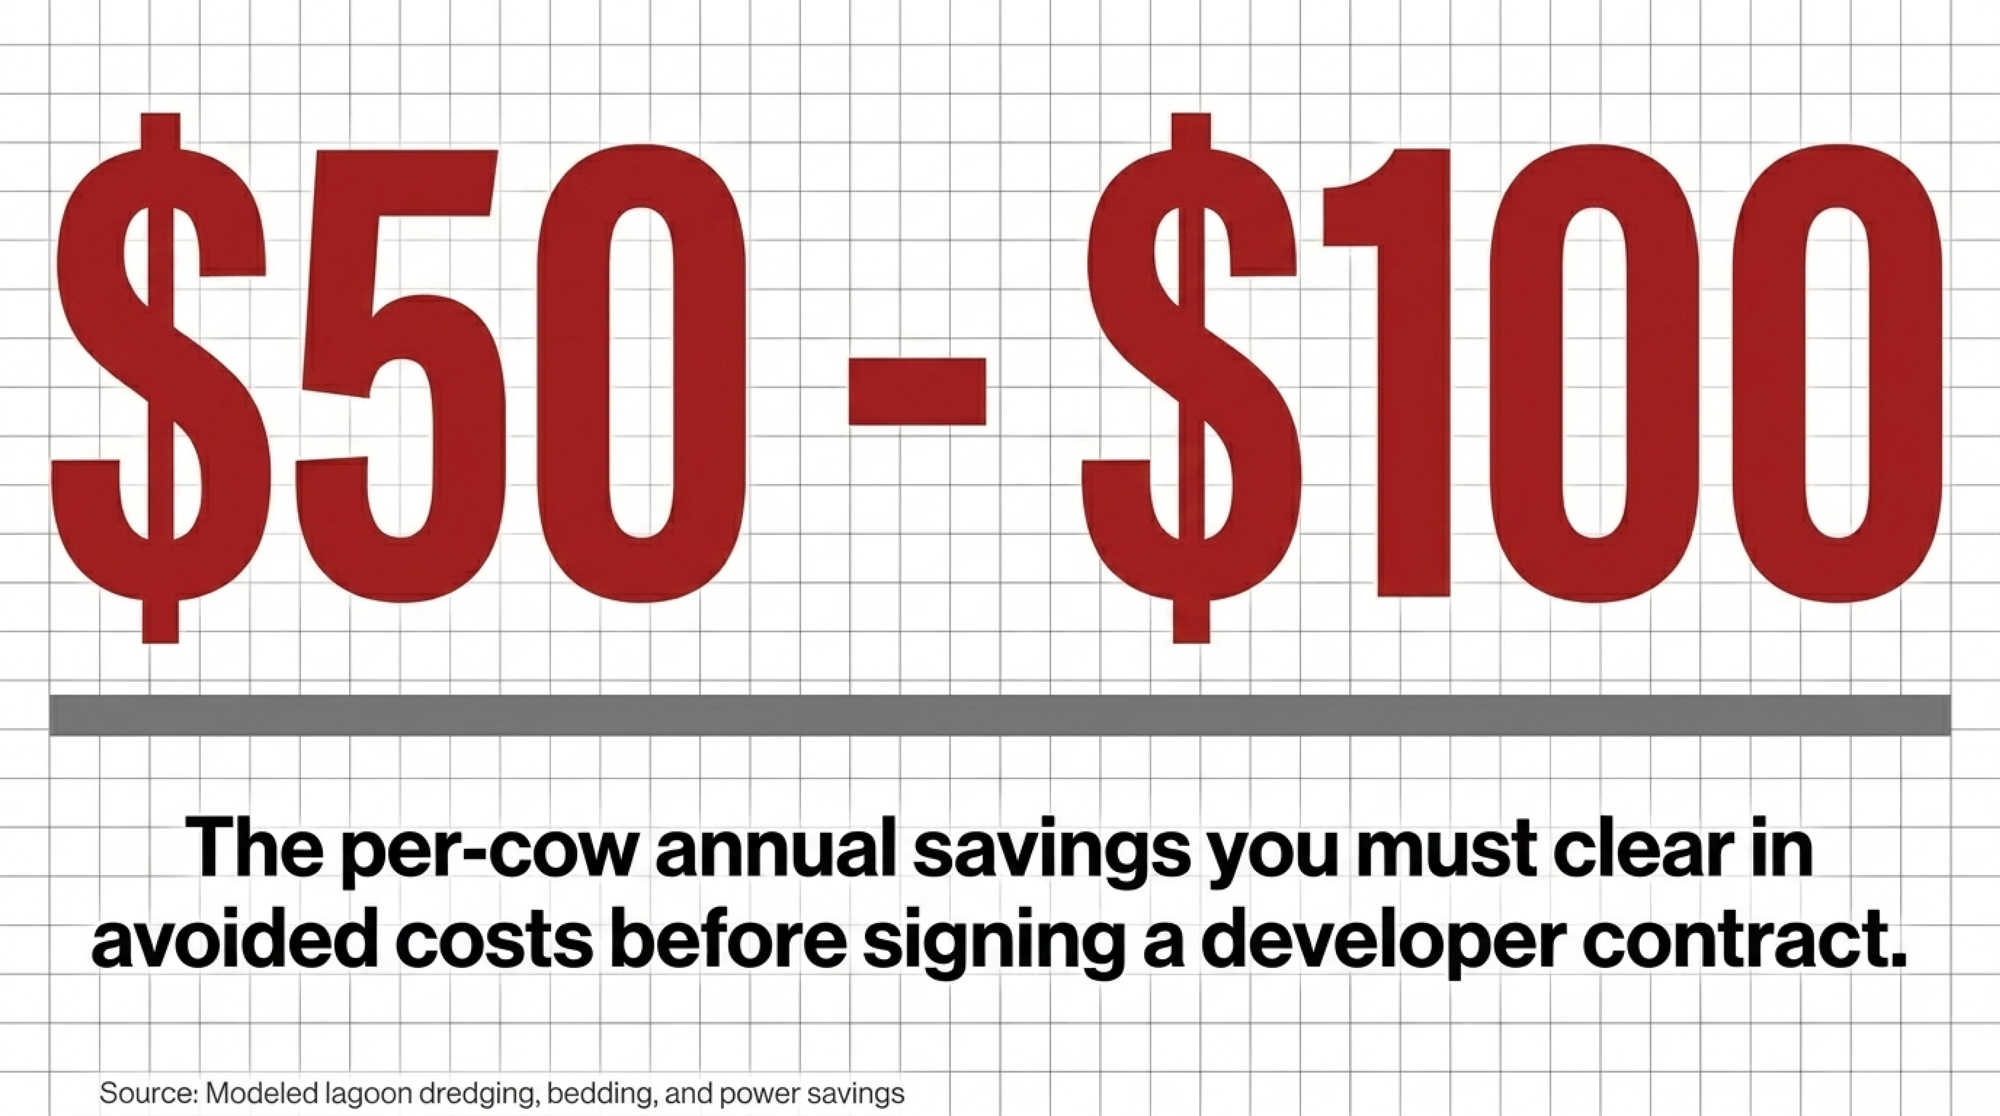
  • $50–$100 per cow per year in reduced lagoon dredging and handling.
  • Bedding savings using dry separated solids, modeled at $20,000–$50,000 a year on a Curtis Creek–size herd.
  • Distilled water reused for cows and irrigation instead of pumping new water.
  • Solar and digester heat offsetting roughly $139,850/year in farm electricity.
Benefit CategoryLow EstimateHigh EstimatePer-Cow Range (2,000 cows)Notes
Lagoon dredging avoided$50K/yr$100K/yr$25–$50/cowDepends on lagoon size and frequency
Dry solids bedding replacement$20K/yr$50K/yr$10–$25/cowReplaces purchased sand/straw
Water reuse (irrigation/cows)$10K/yr$30K/yr$5–$15/cowSite-specific; distilled effluent quality
Solar & digester heat offset~$140K/yr~$140K/yr~$70/cowBased on $139,850/yr REAP-supported array
Total avoided cost~$220K/yr~$320K/yr~$110–$160/cowArticle models ~$250K/yr mid-point

On a 2,000‑cow herd, that $50–$100/cow range is $100,000–$200,000 a year, before bedding and power savings. That’s meaningful — especially if your lagoon headaches are getting worse — but it’s also a capped upside. Your side doesn’t automatically rise with higher LCFS or RIN prices unless the contract says so.

And those credits move. In 2025, LCFS credits traded between about $40.75 and $75.50 per ton, with an average around $57.77 (Stillwater Associates LCFS data, 2025). That’s after sliding from earlier levels that pushed up close to the program’s price ceiling. Meanwhile, D3 RINs sat around $2.40 on average in 2025, with futures already pricing in some policy uncertainty. Terrain’s 2025 “Economic Sustainability of Dairy Digesters” report, prepared for the Farm Credit System, was blunt: the feasibility of dairy digesters producing RNG “hinges on the value of LCFS, RIN credits and tax incentives,” not just base gas value.

From a lender’s point of view, that means an RNG project is only as strong as the policy stack it sits on. Layer a 15–25‑year manure‑supply contract on top of that, recorded against your land, and they have to think hard about what happens to your debt‑service coverage and collateral if credit prices dip mid‑contract.

Is Your Land’s Future Tied Up for 25 Years?

For a lot of projects, it can be.

A typical RNG contract runs 15 to 25 years and is often recorded as an encumbrance against the property, which means it shows up in a title search. If you ever want to sell the farm, bring in a partner, or carve out land for development, a recorded manure‑supply obligation and a large industrial plant on site can narrow the pool of potential buyers and influence how they look at price.

The contract is usually built around a feedstock guarantee. You’re committing to:

  • A minimum volume of manure.
  • A certain solids content and methane potential.
  • Operating practices that won’t dilute or disrupt the feedstock.

That’s where flexibility can disappear. If the document says a change in bedding or ration that lowers gas yield brings “lost gas” penalties, you’re effectively treating your manure as a tightly specified feedstock. You need to decide whether living inside those limits for 20 years fits how you want to run the herd. Before you sign anything that touches feed, it’s also worth running through what a methane‑reducing additive actually costs per cow on your operation.

Force‑majeure language matters too. If H5N1 or another disease forces a depopulation, you want the supply guarantee clearly paused without penalties, not a lawyer arguing that “disease risk was foreseeable.” Those are the lines you want to see in black and white, not just implied in a brochure.

Contract Clause🔴 Red Flag Language🟢 Green Light Language
Credit ownership“All attributes, RINs, LCFS, and low-carbon premiums assigned to Developer”Farm retains or receives revenue share on RINs/LCFS above a price floor
Feedstock specificationPenalty triggered by bedding or ration changes that affect gas yieldReasonable tolerance range (+/–15%) with no penalty
Contract term20–25 years with no exit clause15-year base with mutual renewal options or buyout provisions
Title encumbranceAgreement recorded against fee title with no subordination clauseSubordinated to farm’s primary lender; carve-out for sale
Force majeureDisease risk listed as “foreseeable” or not listedExplicit coverage: disease depopulation, regulatory shutdown, Act of God
DecommissioningSilent on removal responsibilityDeveloper solely responsible for removal and site restoration
Expansion rightsDeveloper has right of first refusal on herd expansion manureFarm retains full rights over additional cows and future infrastructure

Options and Trade‑Offs for Farmers

Three main models are on the table for most dairies. Each trades a different mix of capital, control, and upside.

Farm‑owned digester

  • When it makes sense: Big herds with capital room, strong tax appetite, and the desire to own the upside.
  • What it requires: Comfort with policy risk, a solid O&M plan, real offtake agreements, and a lender fluent in RNG.
  • Risks/limits: Long payback if credits soften; potential to strain your balance sheet; a new operational discipline on top of your cows.

You put up the capital — roughly $3,400 per cow for a plug‑flow system without distillation, plus about $440/cow/yearin operating cost. You own the digesters, the gas upgrading, and usually the interconnect. You also own the credits, the downtime, and the policy risk.

30‑day action: if a developer sends you a proposal, ask them for a build‑cost estimate for a farm‑owned system and ask your lender for a term sheet. You don’t have to build it. You just need real numbers to compare. Then run that same capital against your next‑best options — pellet‑free robotics, spray drones, cow‑comfort work — using your own numbers and Bullvine’s ROI pieces as benchmarks. If $3,400/cow in digester capital can’t beat the return on a robotics or cow‑comfort upgrade on your farm, that’s a loud signal. The $36,740‑per‑200‑cows robotics math is a good starting comparison.

Developer‑owned (DBOOM)

  • When it makes sense: You want manure headaches reduced and you’re okay trading upside for stability.
  • What it requires: Comfort with a long‑term manure contract, clarity on title encumbrance, and trust in the developer’s staying power.
  • Risks/limits: Limited share in credit booms; dependence on a third party’s solvency; less flexibility in future herd or management changes.

Curtis Creek is the textbook example. Sedron designs, builds, owns, operates, and maintains the Varcor nutrient-recovery plant. The anaerobic digester and RNG facility are owned and operated separately by the developer under their own DBOOM-style arrangement. You put up no project capital, take on no project debt, and get paid in avoided costs and, sometimes, a modest lease or royalty.

The big trade‑off is control. A DBOOM contract will spell out how much manure you must supply, what you can and can’t do that might affect gas yield, and for how long. As of early 2026, USDA has halted new REAP grantapplications while it rewrites program rules and rescinds earlier funding notices, even as the guaranteed loan side of REAP remains open (USDA Rural Development; Brownfield Ag News; DTN, 2026). That means the grant layer that helped sharpen Curtis Creek’s solar economics may not be available in the same way for the next wave of projects.

Community hub

  • When it makes sense: Mid‑size farms in a cluster, or regions where a hub exists or is planned.
  • What it requires: Haulage or piping to the hub, coordination with neighbouring farms, and a clear tipping‑fee and revenue‑share formula.
  • Risks/limits: You’re one step removed from the credits; your economics depend on decisions made at the hub and policy levels you don’t control.

Think Fair Oaks: several dairies in a region truck or pipe manure to a central digester and RNG upgrading plant. You might pay a small hookup or haul fee and get a tipping fee or revenue share back. The key is the tipping‑fee math. What does it cost you per cow to get manure to the hub, and what do you get back per MMBtu or per ton? Put those numbers next to your lagoon, hauling, and nutrient‑plan costs, not just on a “feel” basis. If you’re weighing capital between manure and other operations, the 980‑acre breakeven on owned spray drones is another useful side‑by‑side.

MetricFarm-Owned DigesterDBOOM (Curtis Creek model)Community Hub
Capital cost (per cow)~$3,400/cow$0Low (haulage/hookup only)
Annual net cash flow~$525K/yr~$250K avoided costVaries (tipping fee + revenue share)
Owns RINs & LCFS creditsYesNo — developer keeps allPartial (hub-level split)
Contract lengthNegotiable15–25 years10–20 years typical
Title encumbrance riskLowHigh — recorded on propertyModerate
Policy price exposureFull (you carry all downside)ShieldedPartial
O&M responsibilityFullO&M responsibility (Varcor): Sedron, 4 FTEs on Sedron payroll. O&M responsibility (digester/RNG): separate developer.Hub operator
Best fitLarge herds, capital + tax appetiteFarmers prioritizing stabilityMid-size farms in a cluster

30‑day action: if an RNG pitch has landed in your inbox, get the draft term sheet — even a non‑binding one — into the hands of (1) an attorney who’s read manure‑to‑energy contracts before, and (2) your primary lender. Ask both of them one simple question: “What’s the worst‑case scenario for our farm in this deal?”

Key Takeaways

  • If your avoided‑cost benefit in a DBOOM offer comes out under about $80/cow/year on your numbers, you’re likely giving away too much of the manure value for too little return.
  • If the contract hands all “attributes” — RINs, LCFS credits, and any low‑carbon‑milk premiums — to the developer, assume you’ve sold your future green‑milk story along with your gas.
  • If a routine ration or bedding change would trigger “lost gas” penalties, you’re effectively signing up for a tightly specified feedstock supply role — decide if you can live with that for 20 years.
  • If decommissioning responsibilities aren’t clearly spelled out, assume that taking the plant off your land could become your problem down the road.
  • If $3,400/cow in digester capital can’t beat the ROI on robotics, drones, or cow‑comfort investments on your own farm, don’t let a “free money” pitch rush your decision.
  • If you’re a mid‑size herd, don’t write off digesters until you’ve checked whether a community hub option exists within hauling distance.
  • If your lender and lawyer haven’t seen an RNG agreement before, make sure they do — in full — before anyone at your farm touches a pen.

You don’t have to become an energy trader to milk cows in 2026. But if your manure is about to feed a multimillion‑dollar industrial plant, you do need to know whether you’re trading that manure for durable value or just getting cleaner lagoons while someone else rides the credit stack.

So, if a Sedron‑style pitch showed up on your phone tomorrow, which version of the deal would actually fit your balance sheet and your family’s plans — farm‑owned, developer‑owned, or a community hub? And just as important, what happens to that deal if the credits that make it all pencil don’t hold?

Run Your Numbers

Farm Benchmark Snap Check — Before you sign a 20‑year manure‑supply contract, pressure‑test the offer against your own herd. Plug in your cow numbers and avoided‑cost line items to see whether a DBOOM deal clears the $80/cow threshold — or quietly trades your manure value away.

Complete references and supporting documentation are available upon request by contacting the editorial team at editor@thebullvine.com.

Learn More

  • The Carbon Credit Conversation: What’s Really Happening on Dairy Farms Today — Secure your share of the upcoming $130-per-acre 45Z tax credit using proven farm-level methods. Real-world cash flow data from Midwest operations demonstrates exactly how targeted solar installations and feed additives rapidly defend operational margins.
  • The State of the Dairy Industry 2026: Policy, Markets & Change — Mandatory climate laws and Scope 3 reporting are transforming abstract environmental metrics into concrete business risks. Following the money on processor-level carbon insetting ensures your dairy remains competitive ahead of tightening milk supply contracts.
  • The $73-a-Cow Gap Hiding in Your 2027 Bovaer Contract — Breaks down the hidden math behind Bovaer feed additives to expose a $73-per-cow revenue shortfall. You can close this dangerous margin gap without adding another budget line item by deploying overlooked genomic selection tools instead.

The Sunday Read Dairy Professionals Don’t Skip.

Every week, thousands of producers, breeders, and industry insiders open Bullvine Weekly for genetics insights, market shifts, and profit strategies they won’t find anywhere else. One email. Five minutes. Smarter decisions all week.
NewsSubscribe
First
Last
Consent

$1,130 Per Cow, $128 Back: Where the Rest of Your RNG Money Really Goes

A 400‑cow herd can be $584,000 in the hole even after “sustainability” premiums. The math isn’t a scare tactic — it’s what happens when credits don’t hit your milk check.

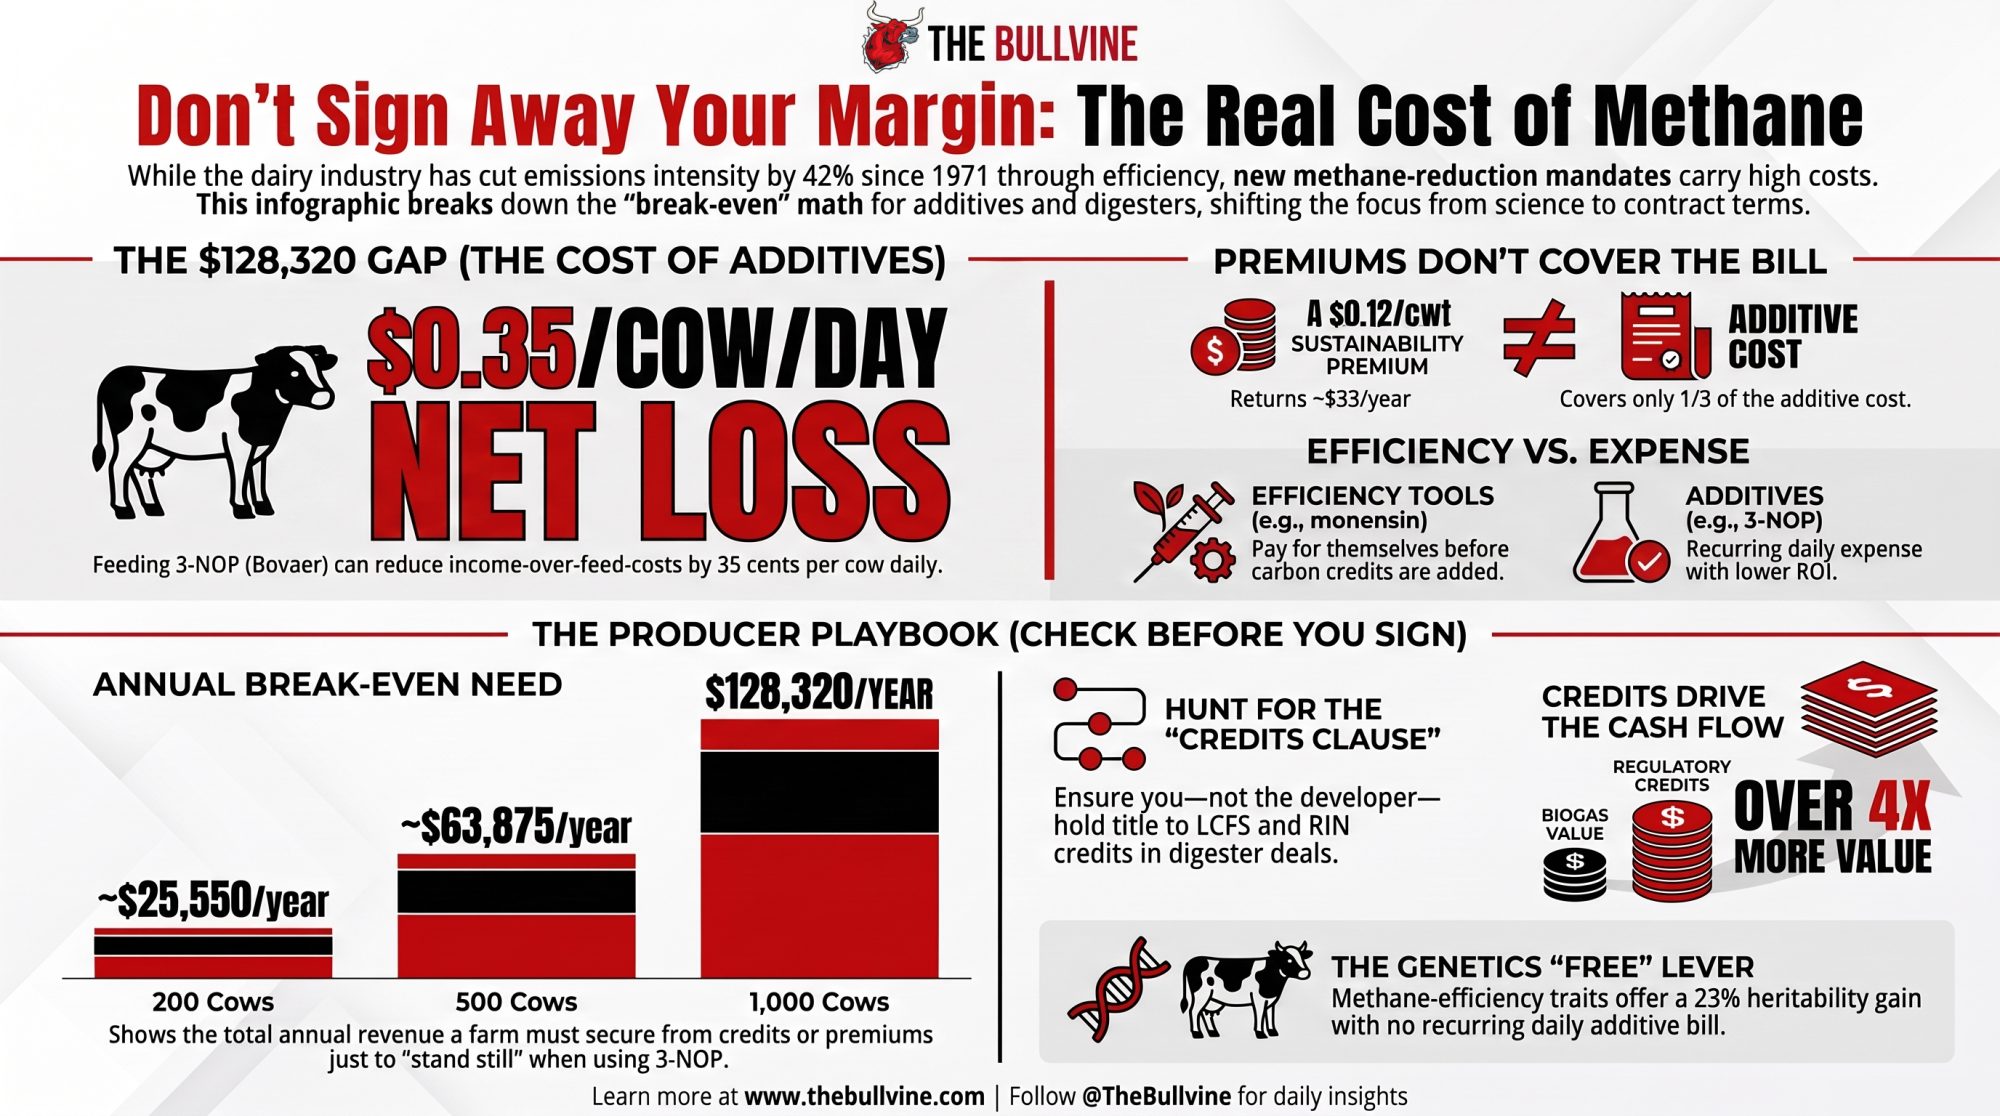
Executive Summary: A UC Davis analysis shows that a typical dairy digester costs about $1,130 per cow per year,while the gas is worth only $128 per cow, so nearly $1,000 has to come from credits, incentives, and premiums. Standard RNG contracts and lender requirements usually assign those LCFS credits, RINs, tax breaks, and Scope 3 “wins” to the project and processor, not the farm, which means the climate value created in your lagoon often lands on someone else’s balance sheet first. Using 2022 Illinois cost data and a modeled 400‑cow herd shipping 100,000 cwt, the article walks through how a farm already losing $5.49/cwt on full cost can end up $5.84/cwt in the hole — $584,000/year — even after a $1.00/cwt sustainability premium. It shows how 10‑ to 20‑year manure deals can behave like an encumbrance on your land and succession plan, tying you to minimum volumes and lender‑friendly terms long after the RNG hype cycle or policy incentives shift. For herds in the 300–1,200‑cow band looking at digesters, feed additives, or “climate‑smart” bundles, the risk is quietly self‑funding someone else’s ESG story out of your equity if the premium per cwt never catches up to the true sustainability bill. The piece gives you a 30/90/365‑day playbook to calculate your own sustainability gap, read the fine print on environmental credit ownership, and push for a milk price floor plus a defined share of the credit stack before you sign. 

Dairy digester economics

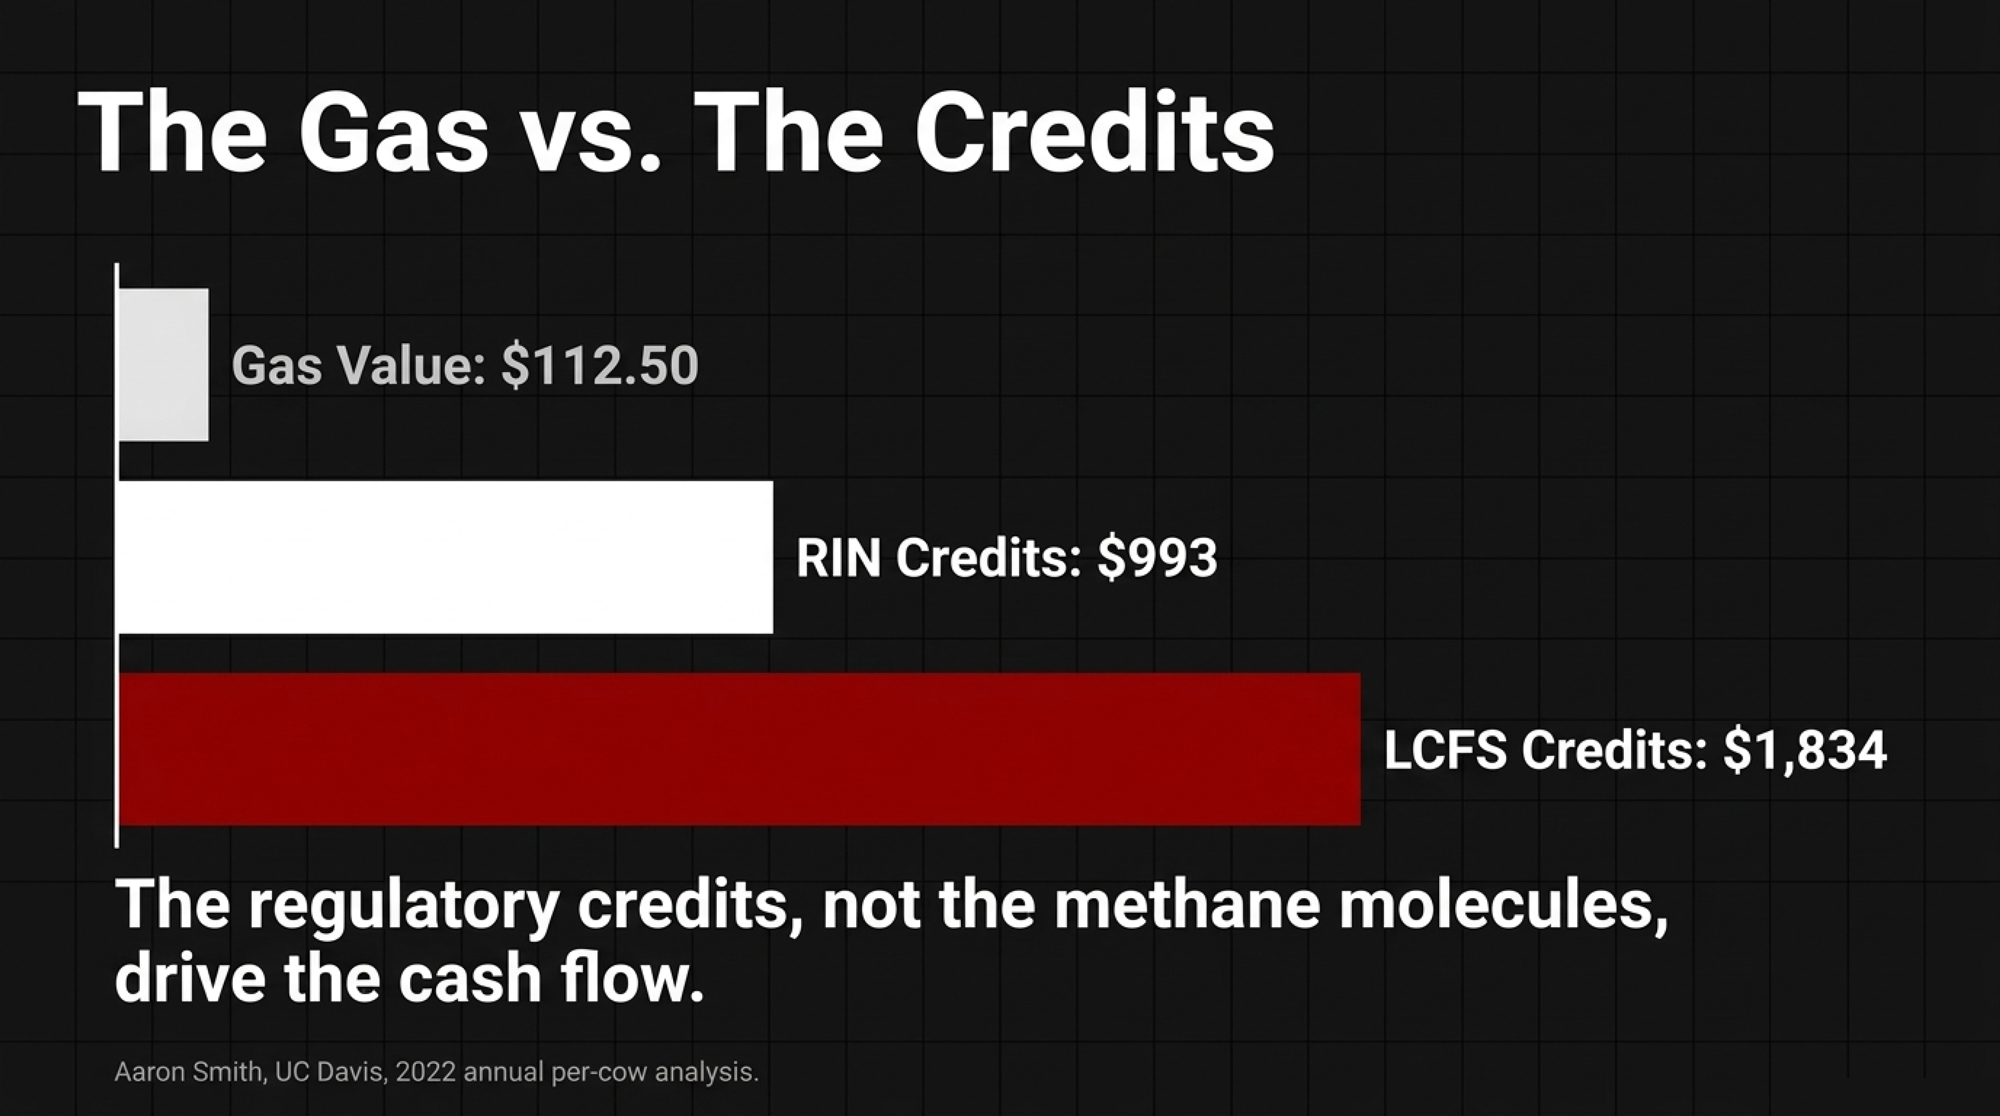
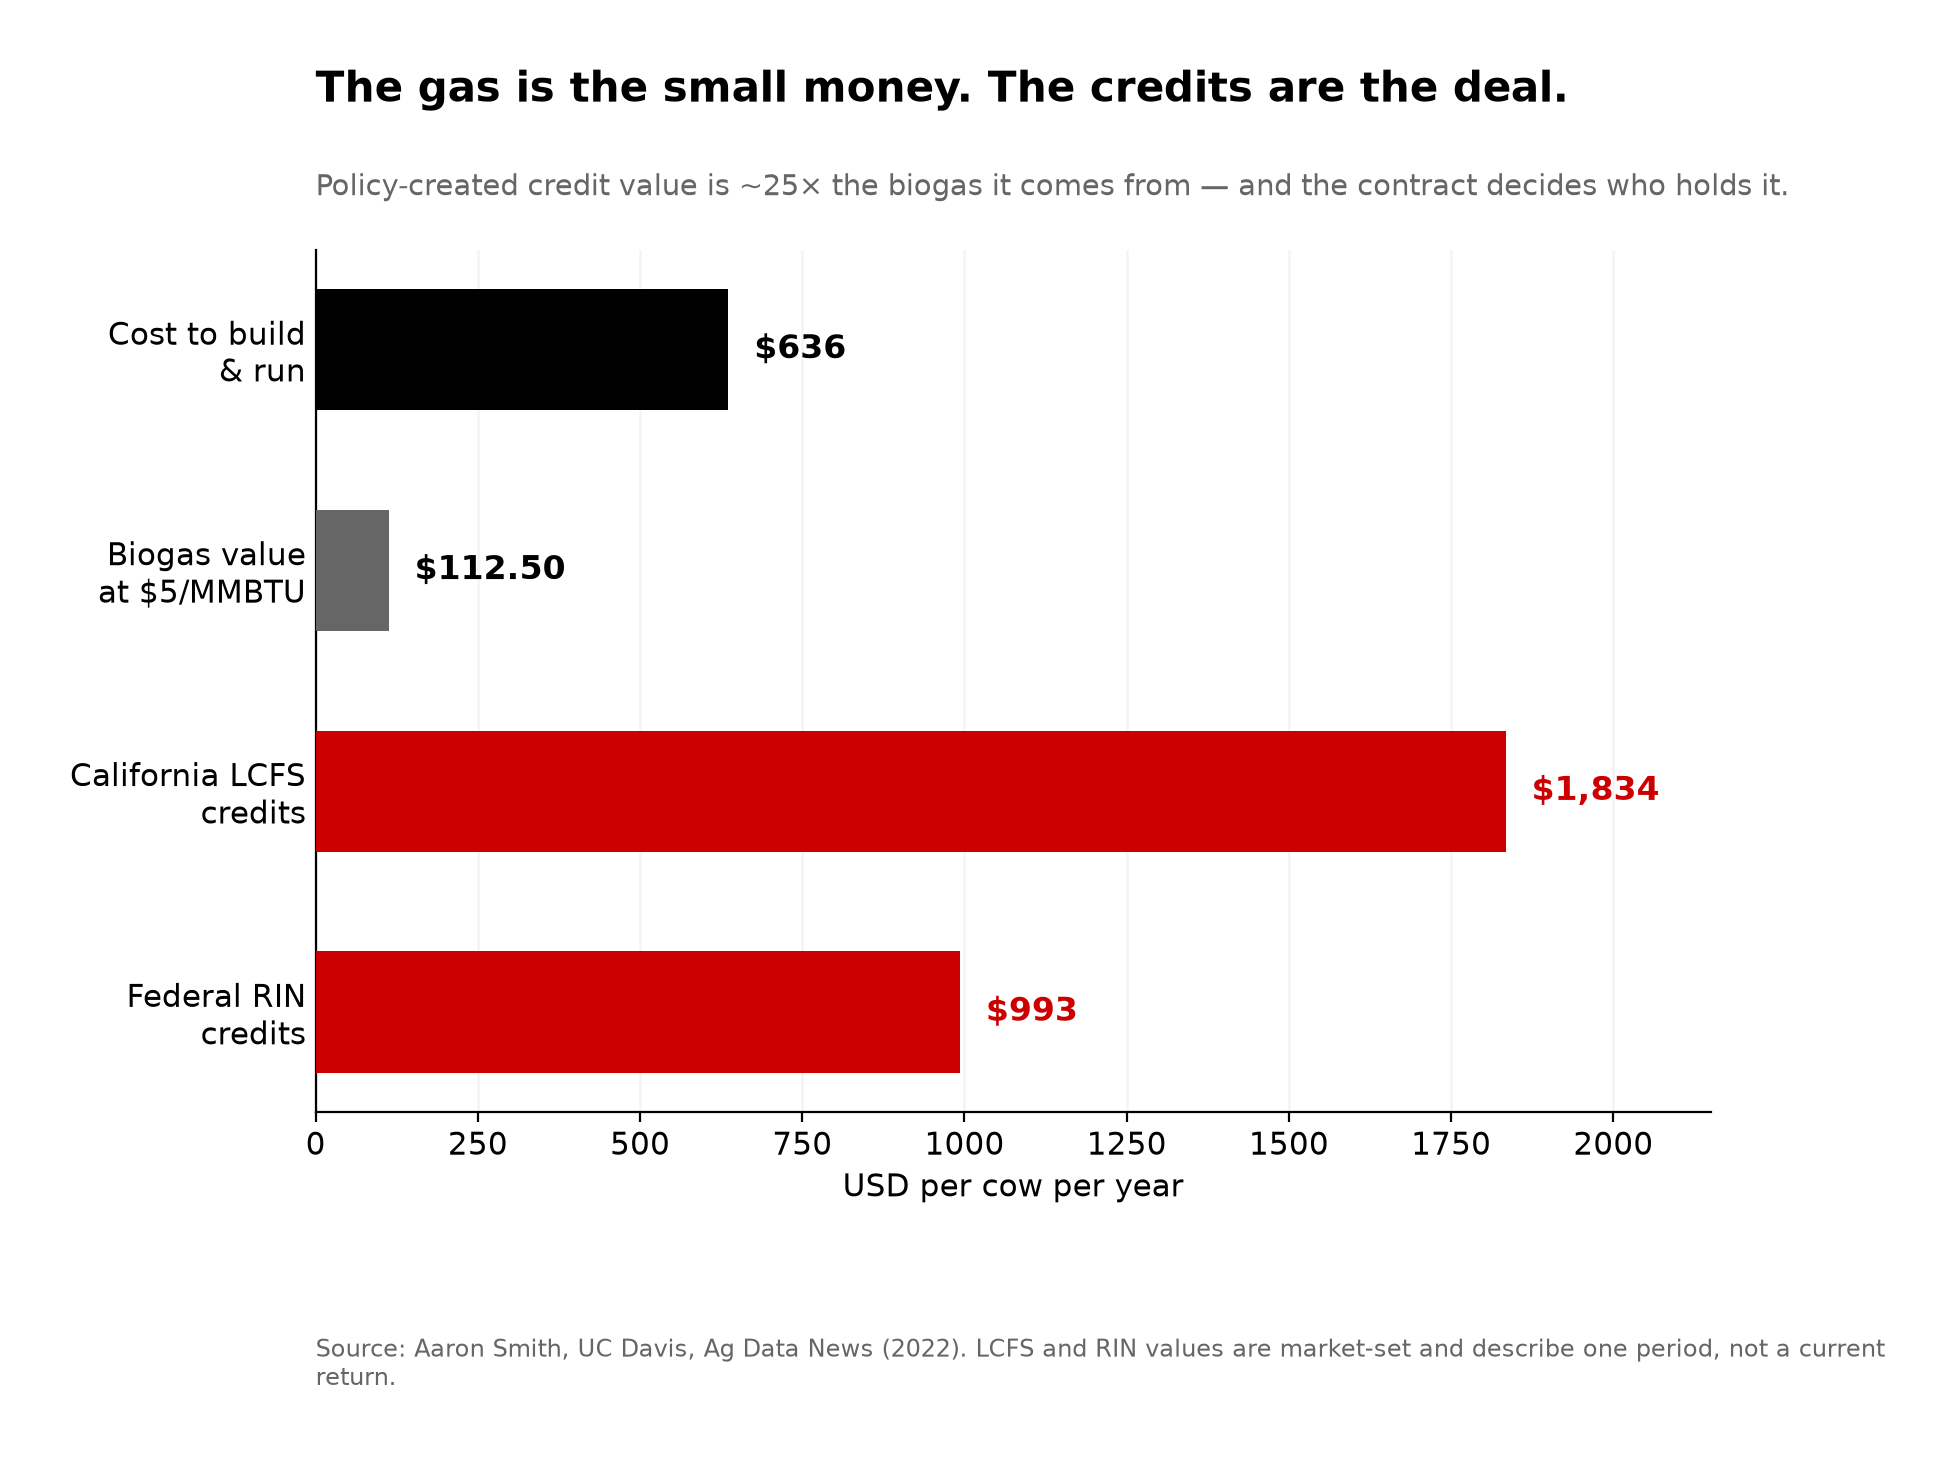
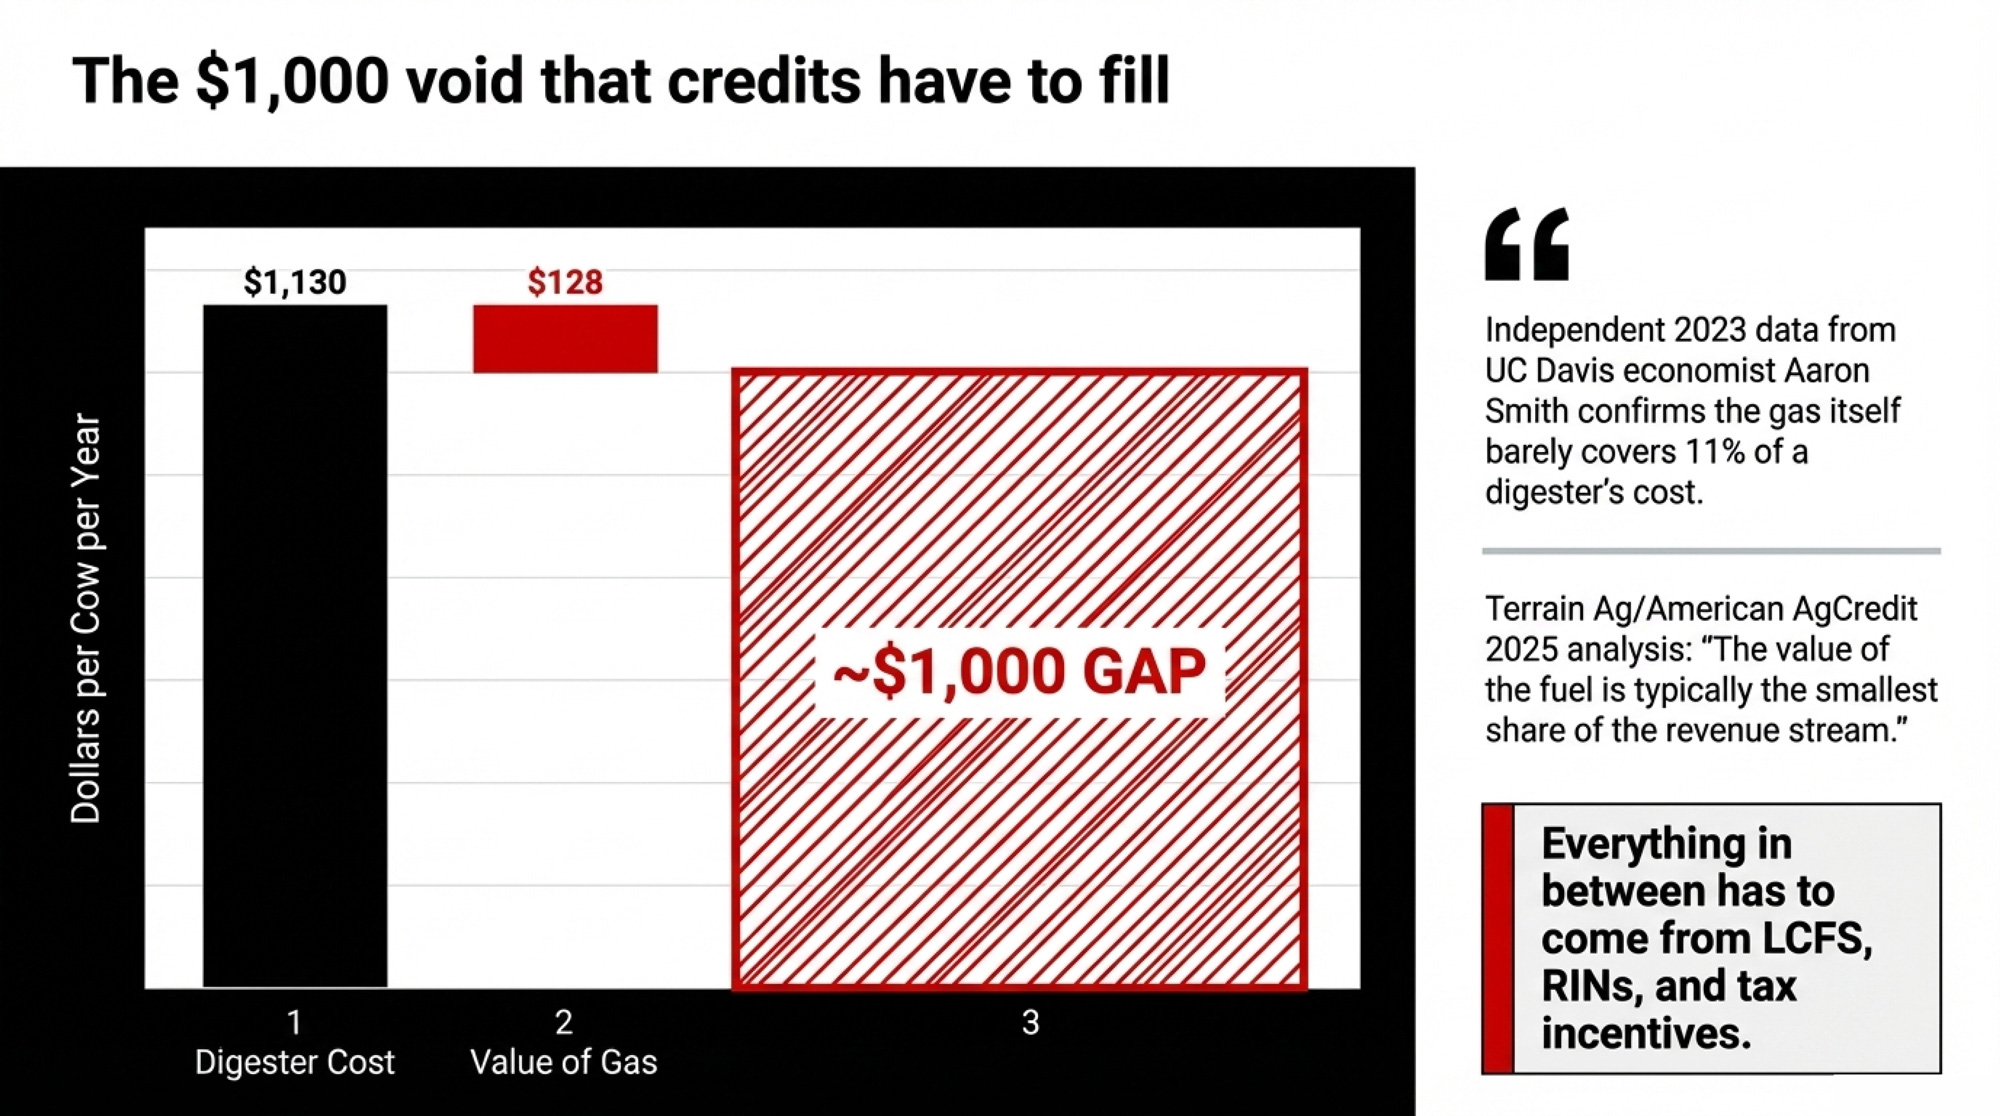
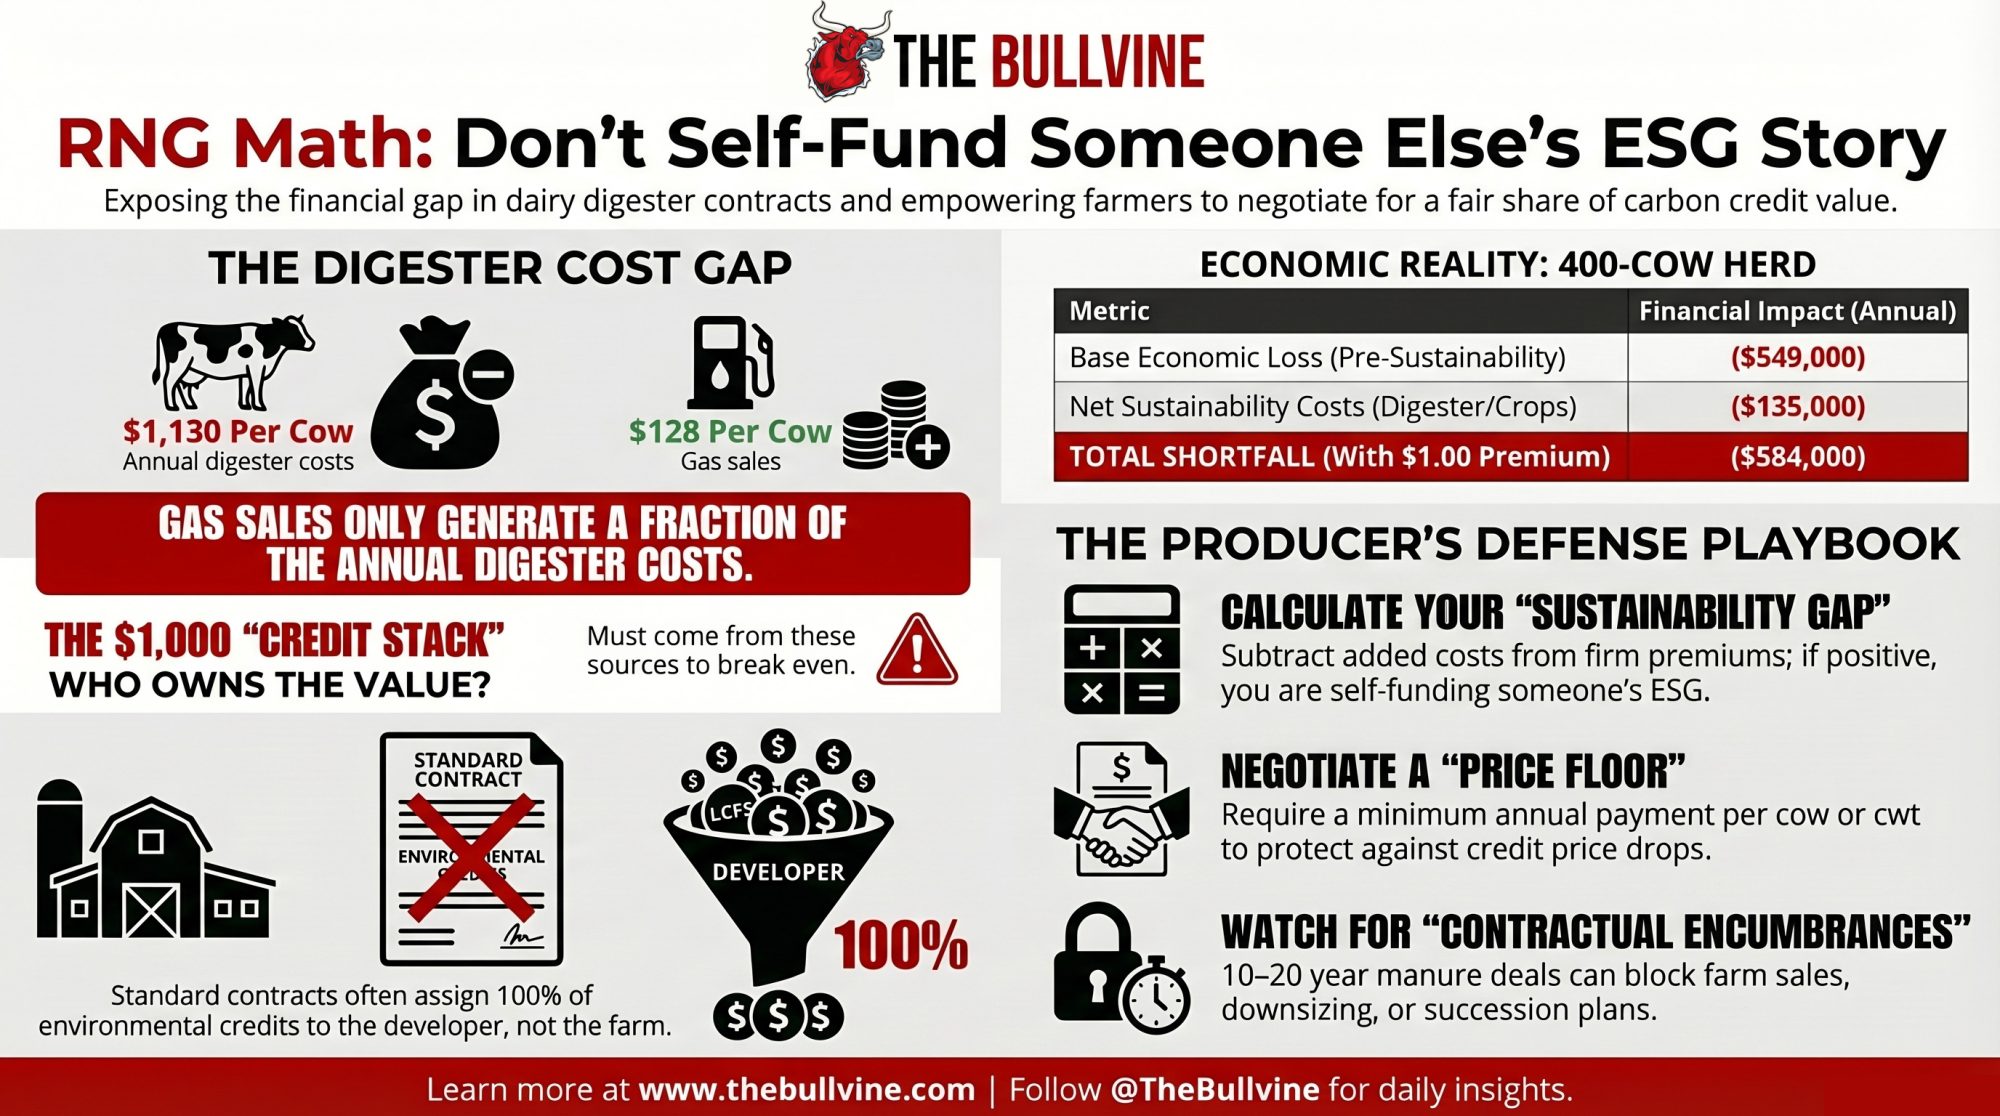
When a 1,000‑cow producer in Virginia, we’ll call Ben Smith, finally sat down with the numbers on his new digester, one line item stopped him cold. Independent 2023 work by UC Davis economist Aaron Smith estimated that a dairy digester on a 2,500‑cow covered‑lagoon project costs about $1,130 per cow per year, while the gas itself is worth only about $128 per cow per year. Everything in between — almost $1,000 per cow — has to come from somewhere other than the gas. 

A 2025 Terrain Ag/American AgCredit analysis of digester economics confirmed the same thing in plain language: “The value of the fuel is typically the smallest share of the revenue stream.” The real money sits in LCFS credits, RIN credits, and tax incentives. And standard RNG contracts are designed to keep most of that value on the developer’s side of the ledger. 

Ben Smith is a composite of several 800–1,200‑cow dairies we’ve spoken with over the past 18 months. His name isn’t real. The math and the contract patterns are. 

The Price Gap Before Sustainability Even Enters the Room

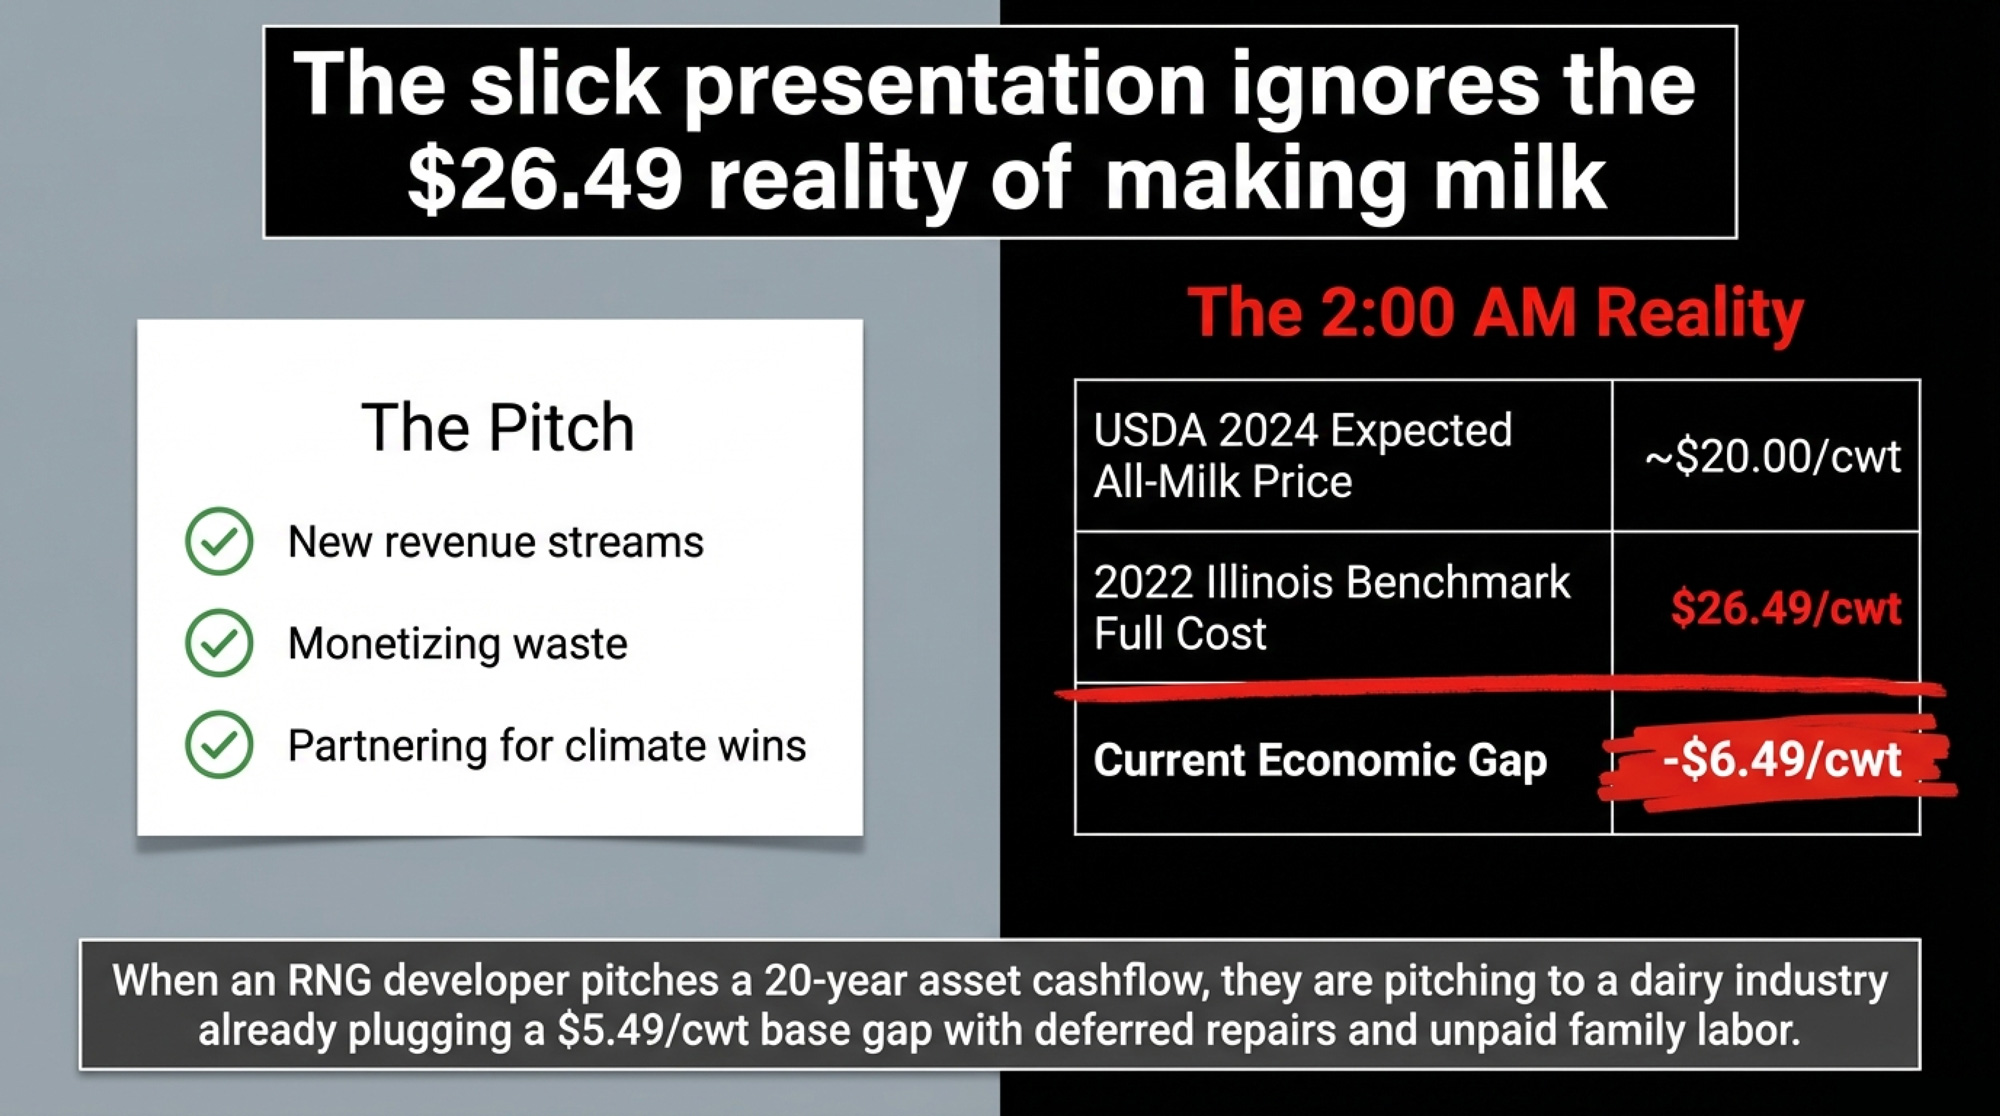
Ben’s herd operates in the same economic band that 2022 Illinois data spelled out: full economic costs around $26.49 per cwt, average net price at $25.36 per cwt, a gap of about $1.13 per cwt in economic losses for the average herd in that dataset. 

Set that against USDA’s expectation of a roughly $20.00 per cwt national all‑milk price for 2024, and you see the backdrop when an RNG developer pulls into your yard with a slick deck. 

They roll through slides about “new revenue streams,” “monetizing waste,” and “partnering for climate wins.” You picture a stronger milk check. On the other side of the table, the pitch is built around 20‑year asset cashflows, LCFS credit strips, and tax incentives layered on top. 

If you aren’t at the table for the LCFS credit discussion, you’re not really a partner in how that value gets split.

How RNG Contracts Turn Your Manure Into Someone Else’s Climate Asset

The standard story is that sustainability programs are here to help you transition. In practice, these deals also turn your manure and management into tradable climate value — and that value is usually booked somewhere other than your milk check. 

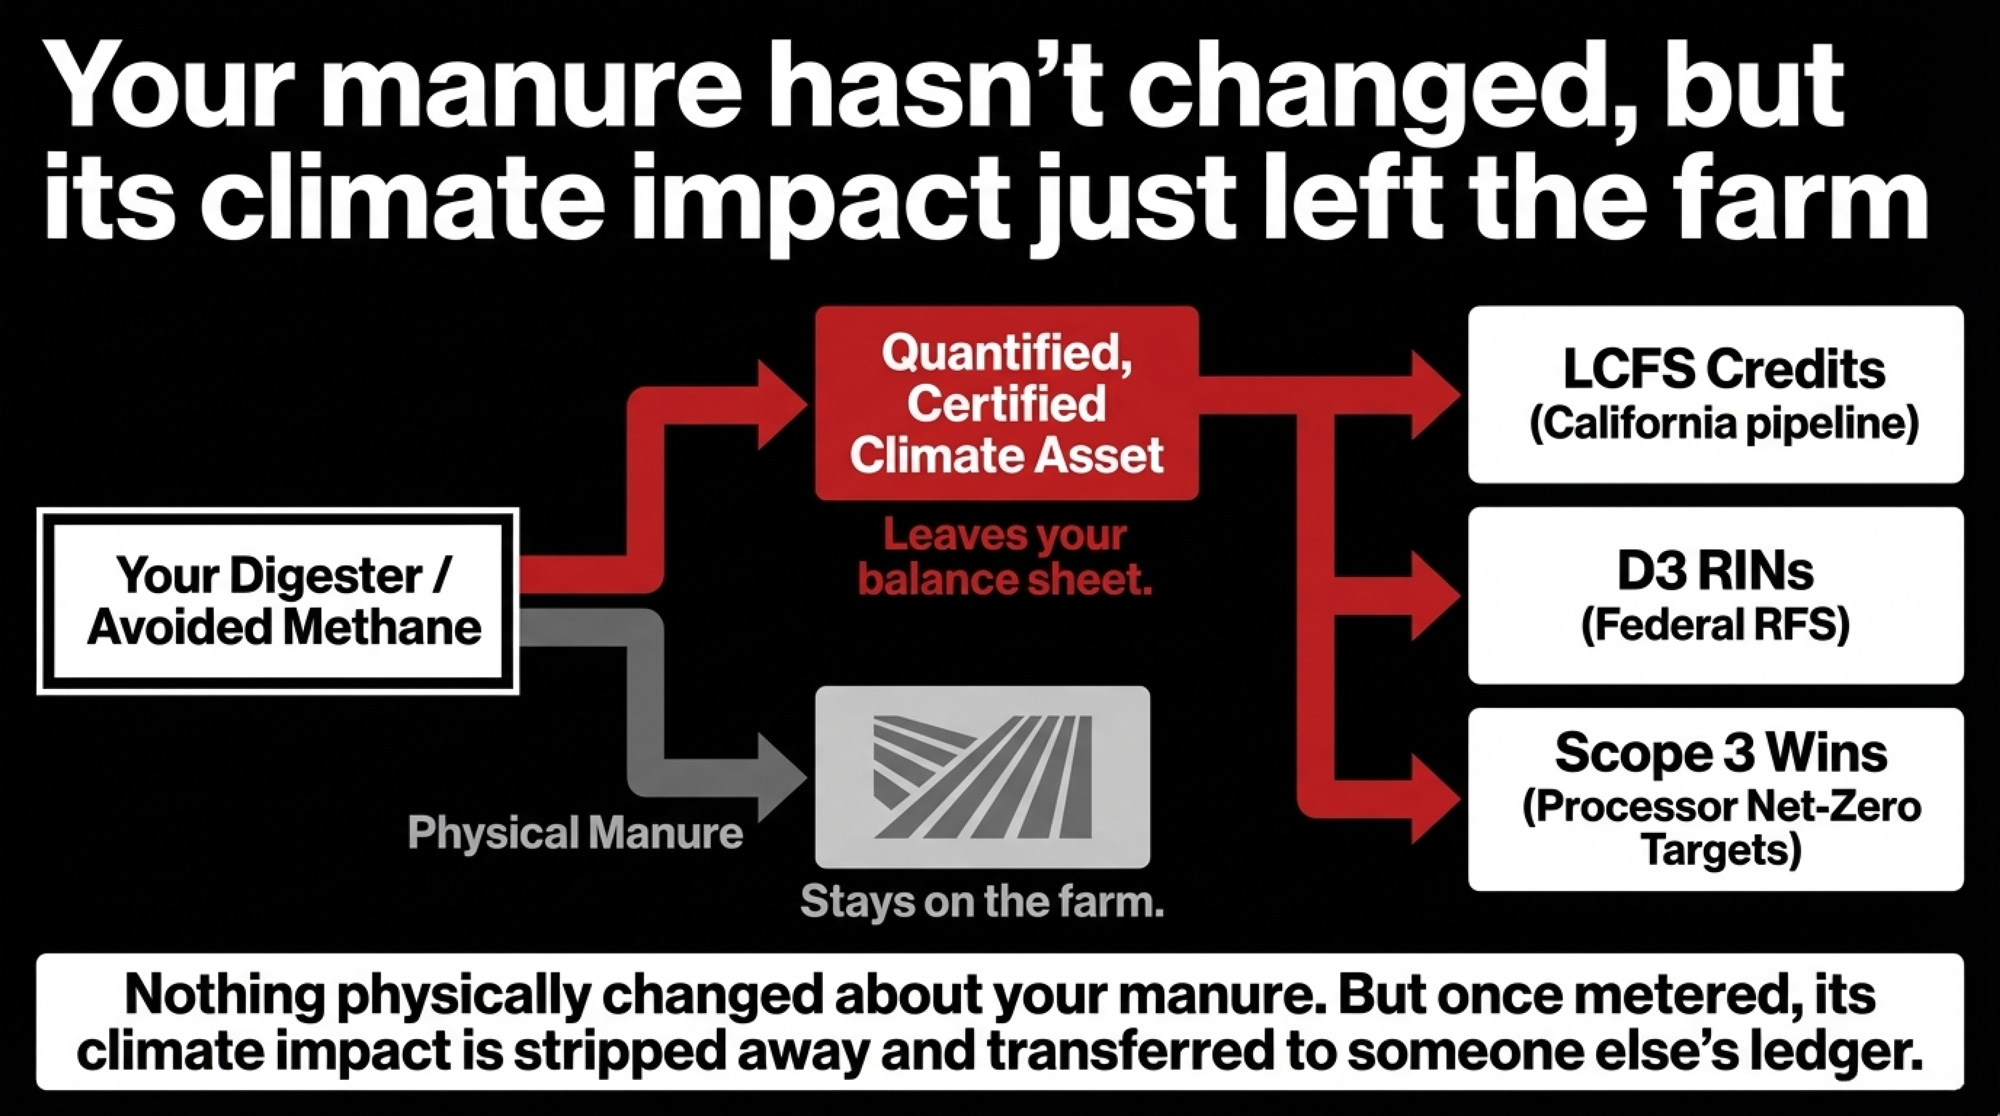
Your digester makes methane a measurable commodity. Protocols like the Climate Action Reserve’s U.S. Livestock standard treat the difference between your old lagoon and your new digester as avoided methane emissions. Those avoided tonnes of CO₂e become: 

  • LCFS credits are awarded when RNG with very low or negative carbon intensity hits a California pipeline. 
  • D3 RINs under the federal Renewable Fuel Standard. 
  • In some cases, additional voluntary carbon credits are layered on top. 
ScenarioEnvironmental credit ownershipContract term & volume obligationsImpact on milk check per cwt
Typical developer templateDeveloper owns LCFS, RINs, tax credits <span style=”color:#FF0000;”>(farmer: 0%)</span>10–20 years, strict minimum manure volume <span style=”color:#FF0000;”>locked in</span>Small fixed payment, no defined share of credit value
Producer assumes “50/50 partnership”Shared in theory, but no explicit credit split in contractLong term, volumes loosely defined, lender rights unclearRevenue share only after costs recovered; payout highly variable
Contract with defined credit‑share clauseDeveloper holds title; farmer guaranteed <span style=”color:#FF0000;”>10–30%</span> of LCFS/RIN revenue10–15 years, minimum volumes tied to realistic herd sizePer‑cwt formula ties credit value directly to milk check
Producer‑led negotiation with floorJointly structured entity or royalty on all climate valueTerm aligned with lender horizon; flexible volumes on downsizingMilk price floor plus per‑cwt climate bonus; downside risk reduced

Nothing about the manure changed physically. But once the system is metered and verified, its climate impact becomes quantified, certified, and tradable. 

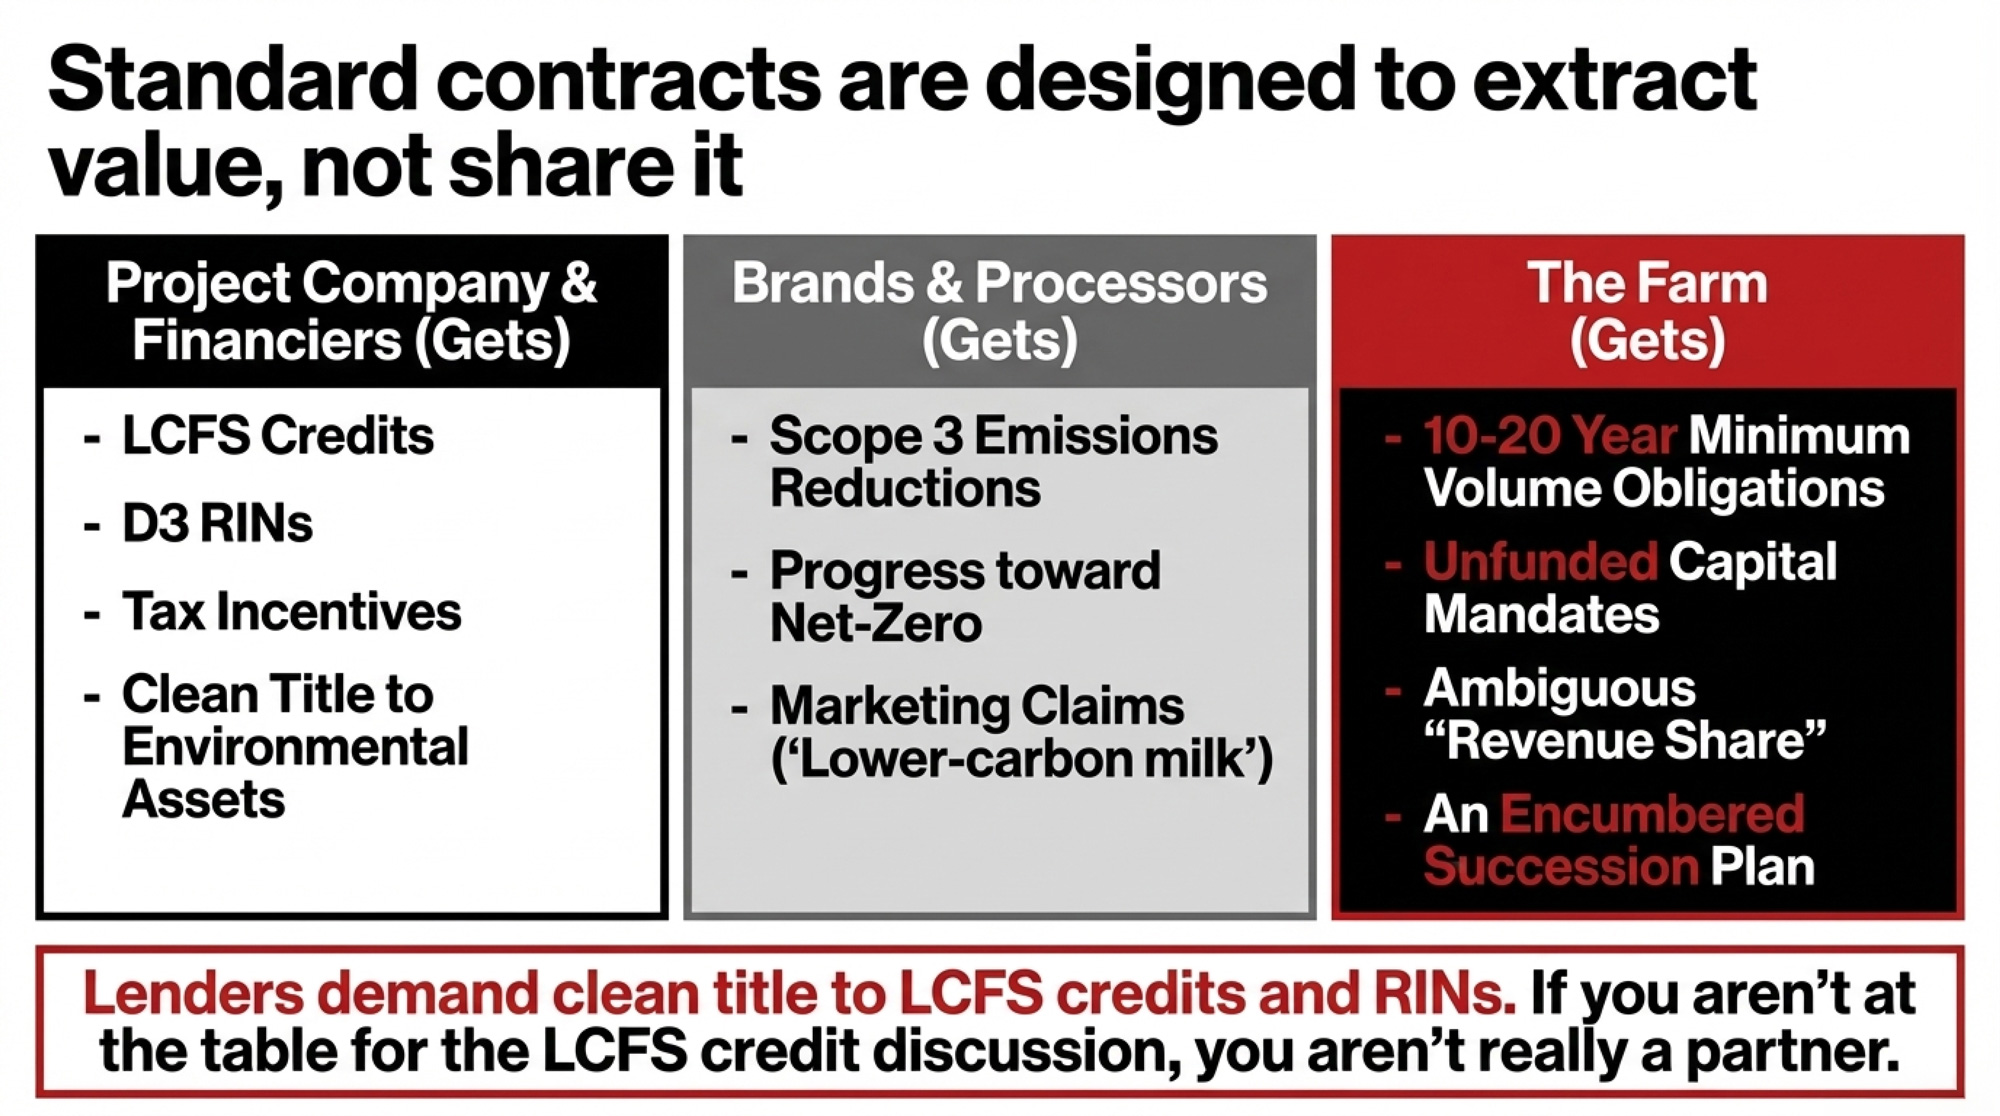
Standard RNG contracts push that value upstream. Guidance written for developers is blunt about who’s supposed to own those credits. A 2022 Biomass Magazine article on manure‑supply agreements advises developers that the contract should “clearly state that the developer owns all rights to the environmental credits, tax credits, and similar benefits arising from the project.” 

Lenders and offtakers want the project entity to have a clean title to LCFS credits, RINs, and tax incentives — not shared or ambiguous ownership. Compeer Financial’s 2025 guidance to producers echoed the same concern from the farmer’s side: “Understanding the fine print is crucial to ensure a successful and sustainable partnership.” 

In many of the digester and RNG project templates and legal guides The Bullvine has reviewed, the pattern looks like this:

  • You sign a 10‑ to 20‑year manure‑supply agreement with minimum daily volumes keyed to your current herd size. 
  • They — the project company and its financiers — own the LCFS credits, RINs, and tax incentives. 
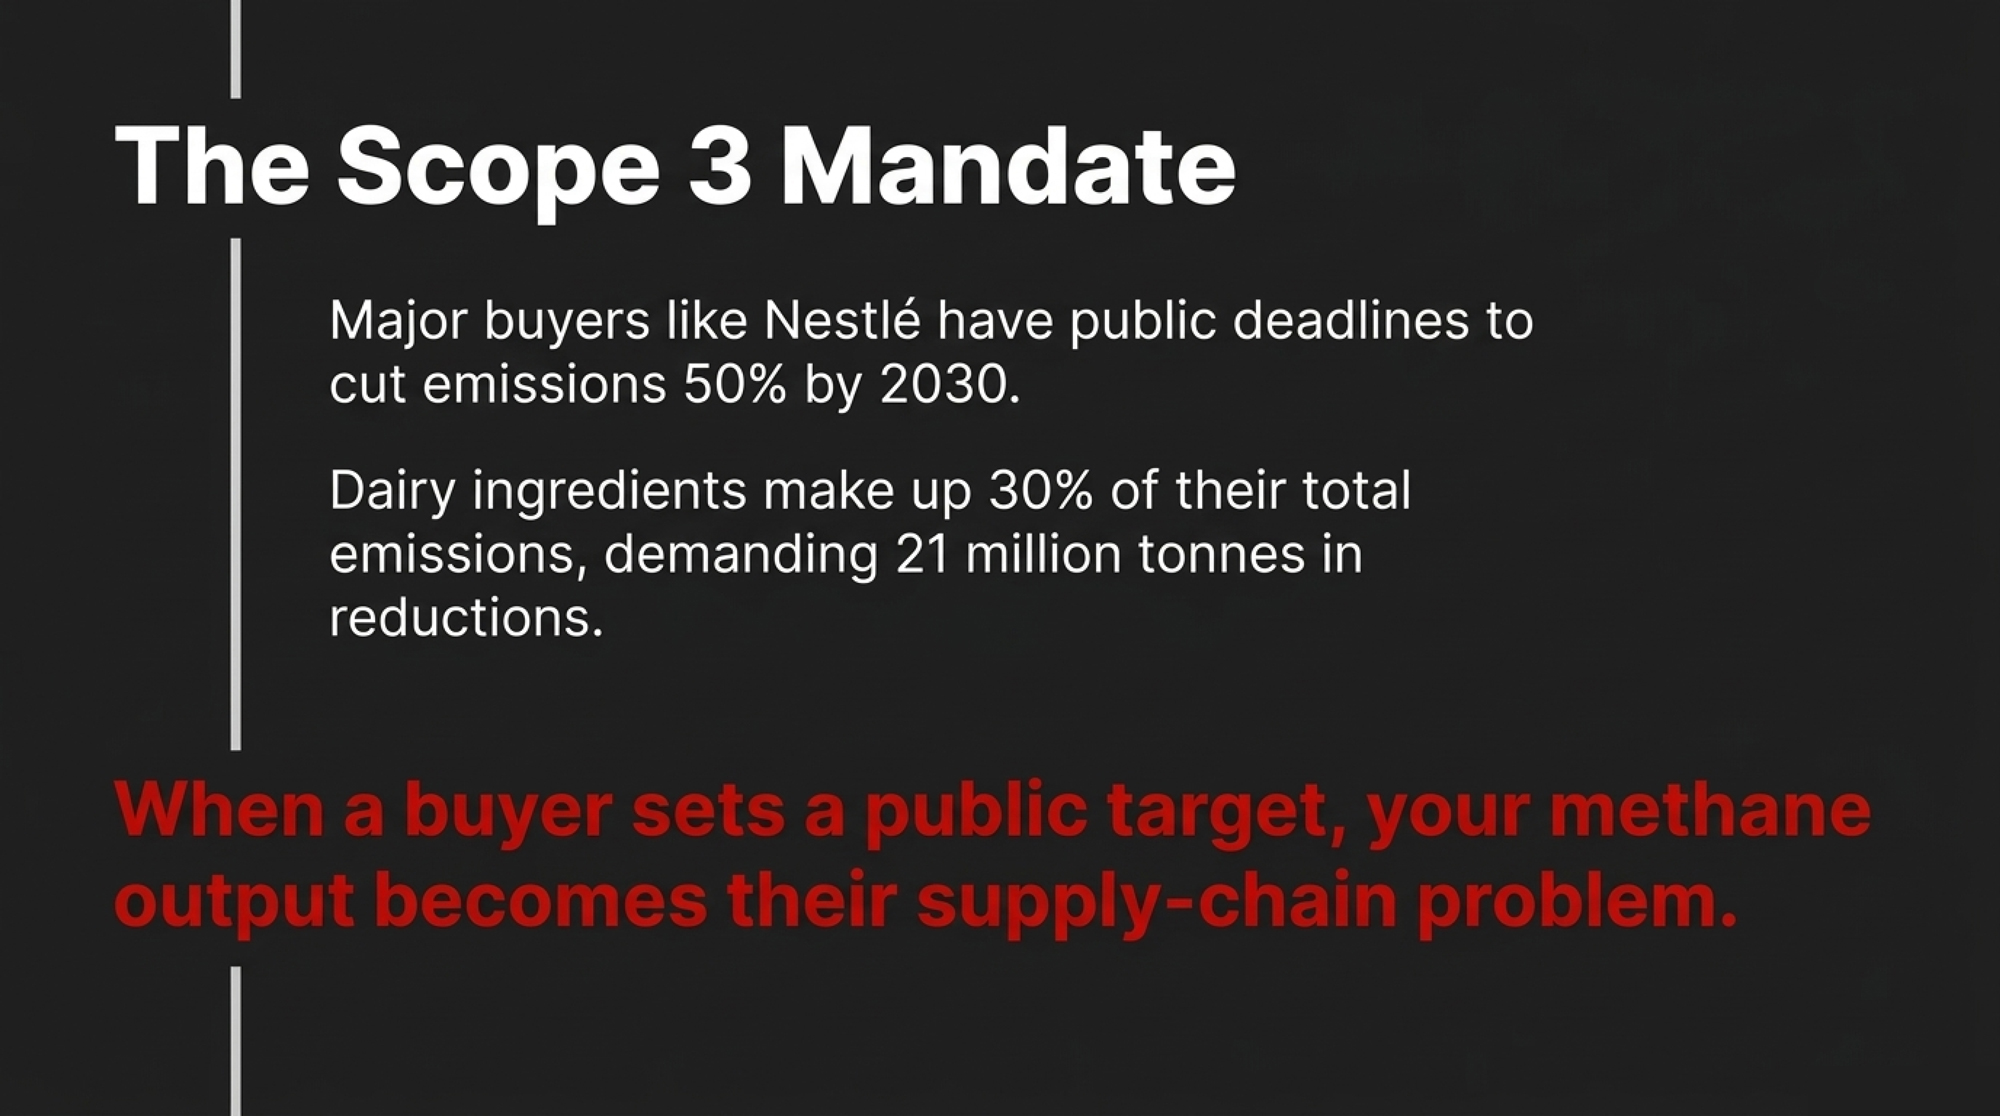
  • Your processor or brand counts the resulting emissions reduction toward its Scope 3 targets. 

The climate asset your farm creates doesn’t vanish. Under most current contract and policy setups, it’s usually recognized first on the developer’s or buyer’s balance sheet, not on your milk check. 

Processors book Scope 3 wins off your barn. Under the Greenhouse Gas Protocol, processors report supply‑chain emissions from purchased milk under Scope 3 Category 1. If they can show that milk from farms like yours carries less embedded CO₂e — because of digesters, feed additives, or manure practices — they can claim progress toward net‑zero targets and market “lower‑carbon milk” to retailers. 

Those wins are real. But they don’t automatically show up in your mailbox price unless the contract forces them to. 

The Premiums Are Real — But Thin

Brands and co‑ops are right to say they’re not asking for all this for free. There are real premiums out there, especially in Europe and New Zealand. 

  • ING’s 2024 work on dairy companies’ path to net zero notes that a “couple of cents per liter” is the sort of sustainability premium discussed in parts of Western Europe — and that dairy companies struggle to pass even that level on to end customers. 
  • Fonterra’s 2025/26 incentives include a new Emissions Excellence payment of 1–5 cents per kgMS, plus an Emissions Incentive of 10–25 cents/kgMS for the roughly 300–350 farms (out of ~10,000 suppliers) with the very lowest emissions intensity. A separate Fonterra–Nestlé partnership adds 1–2 cents/kgMS for farmers hitting certain sustainability levels. 

Convert those kgMS figures into U.S. units, and you’re usually in the sub‑$1 to low‑$2 per cwt range for top‑performing farms, depending on solids and exchange rates. Real dollars. But not unlimited — and not guaranteed across every herd. 

Region or programPremium per cwt (USD, est.)Added sustainability cost per cwt (USD, est.)Net effect on margin per cwt
Western Europe “couple of cents/liter”~1.50–2.001.00–2.50 (manure, feed, verification)Often near zero; can slip negative in high‑cost years
Fonterra top‑tier incentives (NZ)~1.00–2.000.75–1.75 (emissions, auditing, practice changes)Small positive spread for elite low‑emission herds
USDA climate‑smart pilots (U.S.)0.25–0.750.75–1.50 (cover crops, data, management time)Many farms underwater on true full cost
Modeled 400‑cow herd in article example1.001.35 (digester, cover crops, grazing shifts)–0.35 per cwt; $35,000/year gap

In North America, published premium examples are thinner. USDA’s climate‑smart commodities projects describe incentives in modest terms, not major price shifts. And while the developer’s PowerPoint always looks clean, nobody’s putting the 2:00 a.m. frozen‑pump repair on a slide. 

What Does $21 Milk Plus RNG Costs Mean for a 400‑Cow Herd?

Here’s where it stops being theory and becomes barn math you can run on a legal pad. These numbers are a modeled example — not a specific farm — so you can plug in your own herd size and cost structure. 

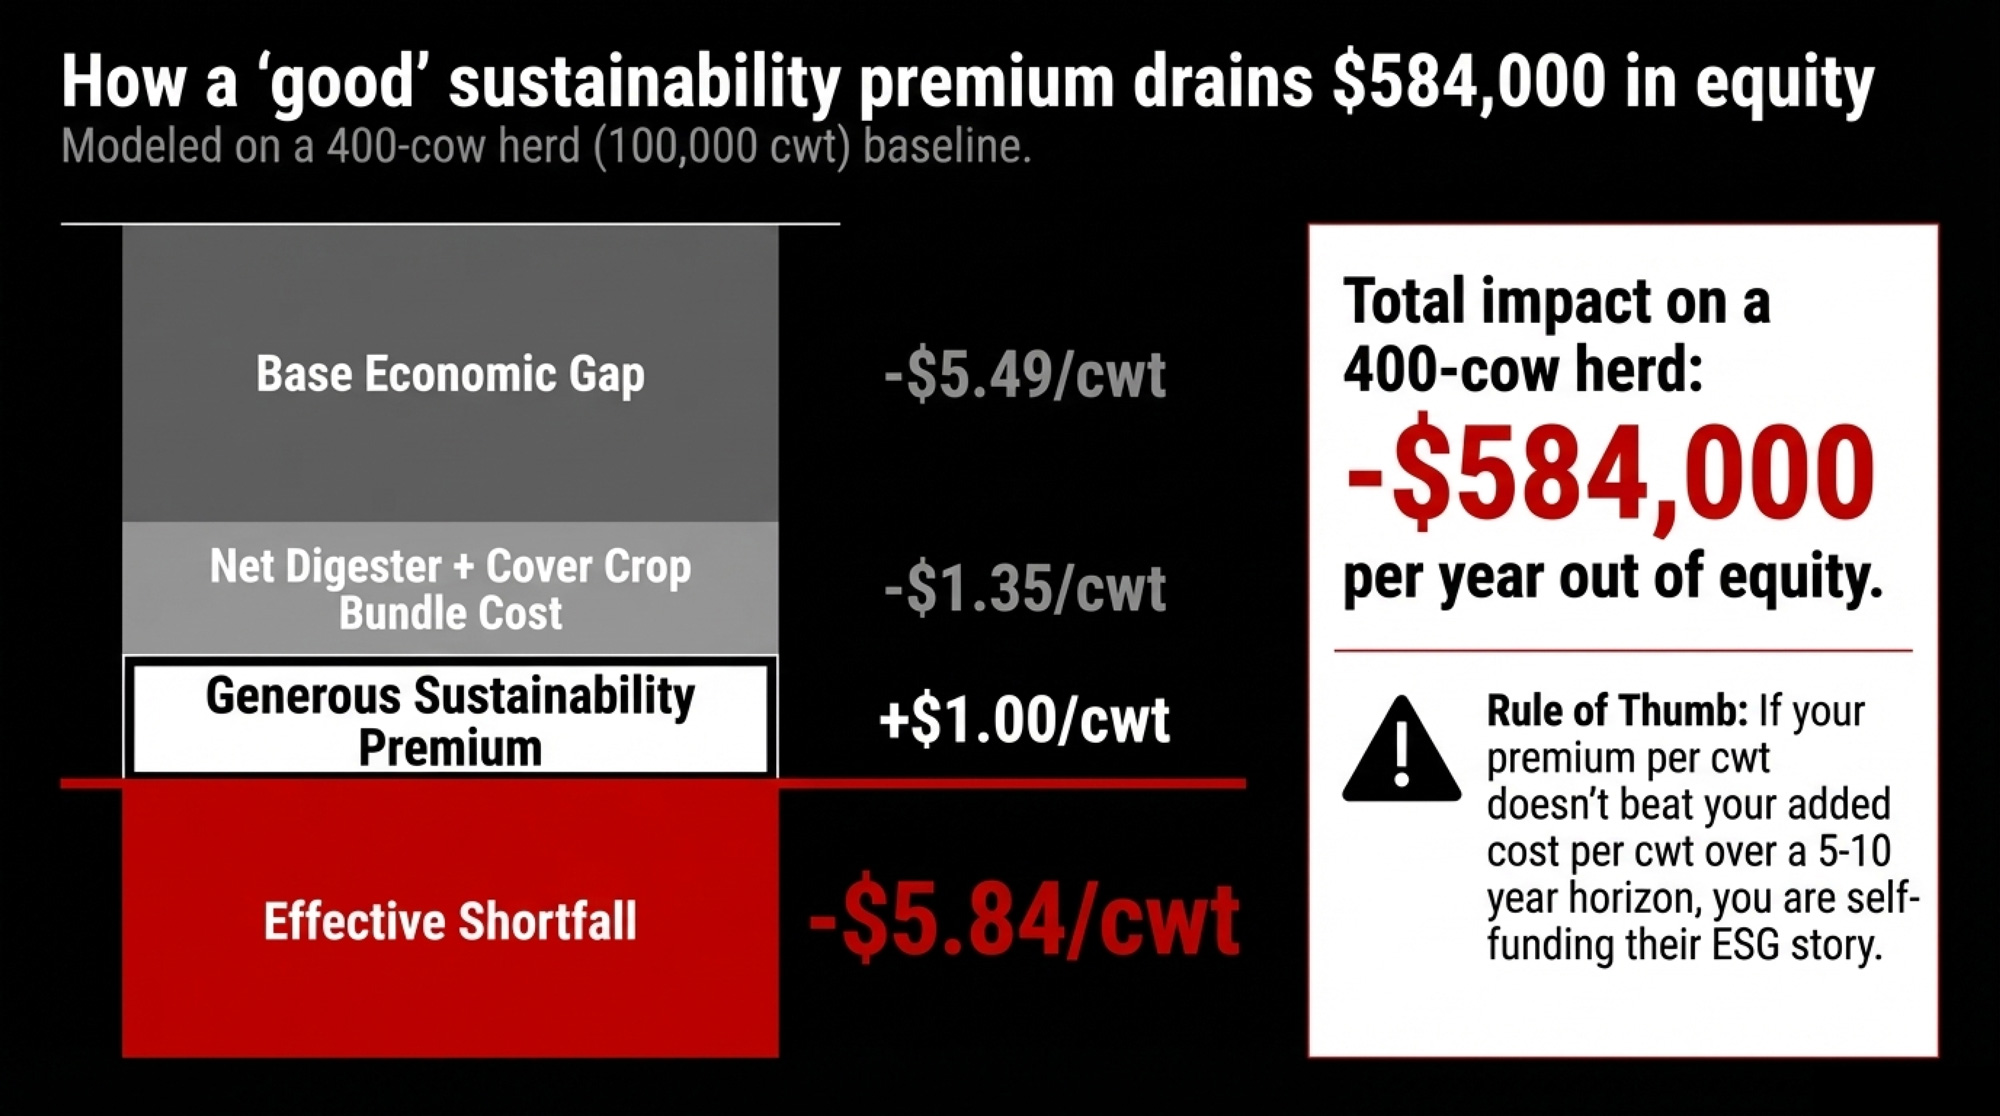
Take a 400‑cow conventional herd shipping roughly 10 million pounds of milk per year — about 100,000 cwt.

Step 1: Your base gap before sustainability.
Say your average milk check over the last year sat around $21 per cwt. Stack that against a full‑cost level like the Illinois benchmark at $26.49 per cwt

  • Gap: $5.49 per cwt.
  • On 100,000 cwt: $549,000 per year

If your full cost beats your price, you’re already plugging a hole with deferred repairs, restructured loans, or unpaid family labor. This is the hole many “sustainability” deals are quietly being asked to fill.

Step 2: Add a reasonable sustainability bundle.
Working from digester economics and extension budgets:

  • Digesters: ~$0.75–$1.25 per cwt in net required margin after gas revenue, based on the $1,130/$128 per‑cow gap scaled to a mid‑sized herd.
  • Cover crops: ~$0.15–$0.30 per cwt
  • Grazing/forage shifts: ~$0.10–$0.25 per cwt in early years. 

Pick mid‑points: $1.00 + $0.20 + $0.15 = $1.35 per cwt, or $135,000 per year

Step 3: Add a strong sustainability premium.
Assume a relatively generous $ 1.00-per-cwt premium on all your milk, above what many North American programs currently pay. 

  • Extra revenue: $100,000.
  • Sustainability costs: $135,000.
  • Net sustainability gap: $35,000 per year, or $0.35 per cwt.

Whole‑farm picture:

  • Base economic gap: $5.49 per cwt.
  • Plus net sustainability gap: $0.35 per cwt.
  • Effective economic shortfall: about $5.84 per cwt, or $584,000 per year.

Here’s the breakeven rule of thumb: if your sustainability premium per cwt is lower than your added sustainability costs per cwt over a 5‑ to 10‑year horizon, you’re self‑funding the program out of equity.

Remember — this is a modeled 400‑cow herd, not a specific farm. Your numbers will shift depending on the cost structure and premiums you can actually lock in. 

The Turn: When Ben Read His Own Contract

For Ben, the moment things clicked wasn’t a bad milk check. It was a Scope 3 slide deck. 

His main buyer laid out how it planned to cut Scope 3 supply‑chain emissions by about 30% by 2030 using “value‑chain interventions” — digesters, feed additives, manure upgrades — on farms that supply it. Ben sat there looking at the tonnes of CO₂e on the screen and thinking about the $1,130/$128 per‑cow math and his own cost per cwt. 

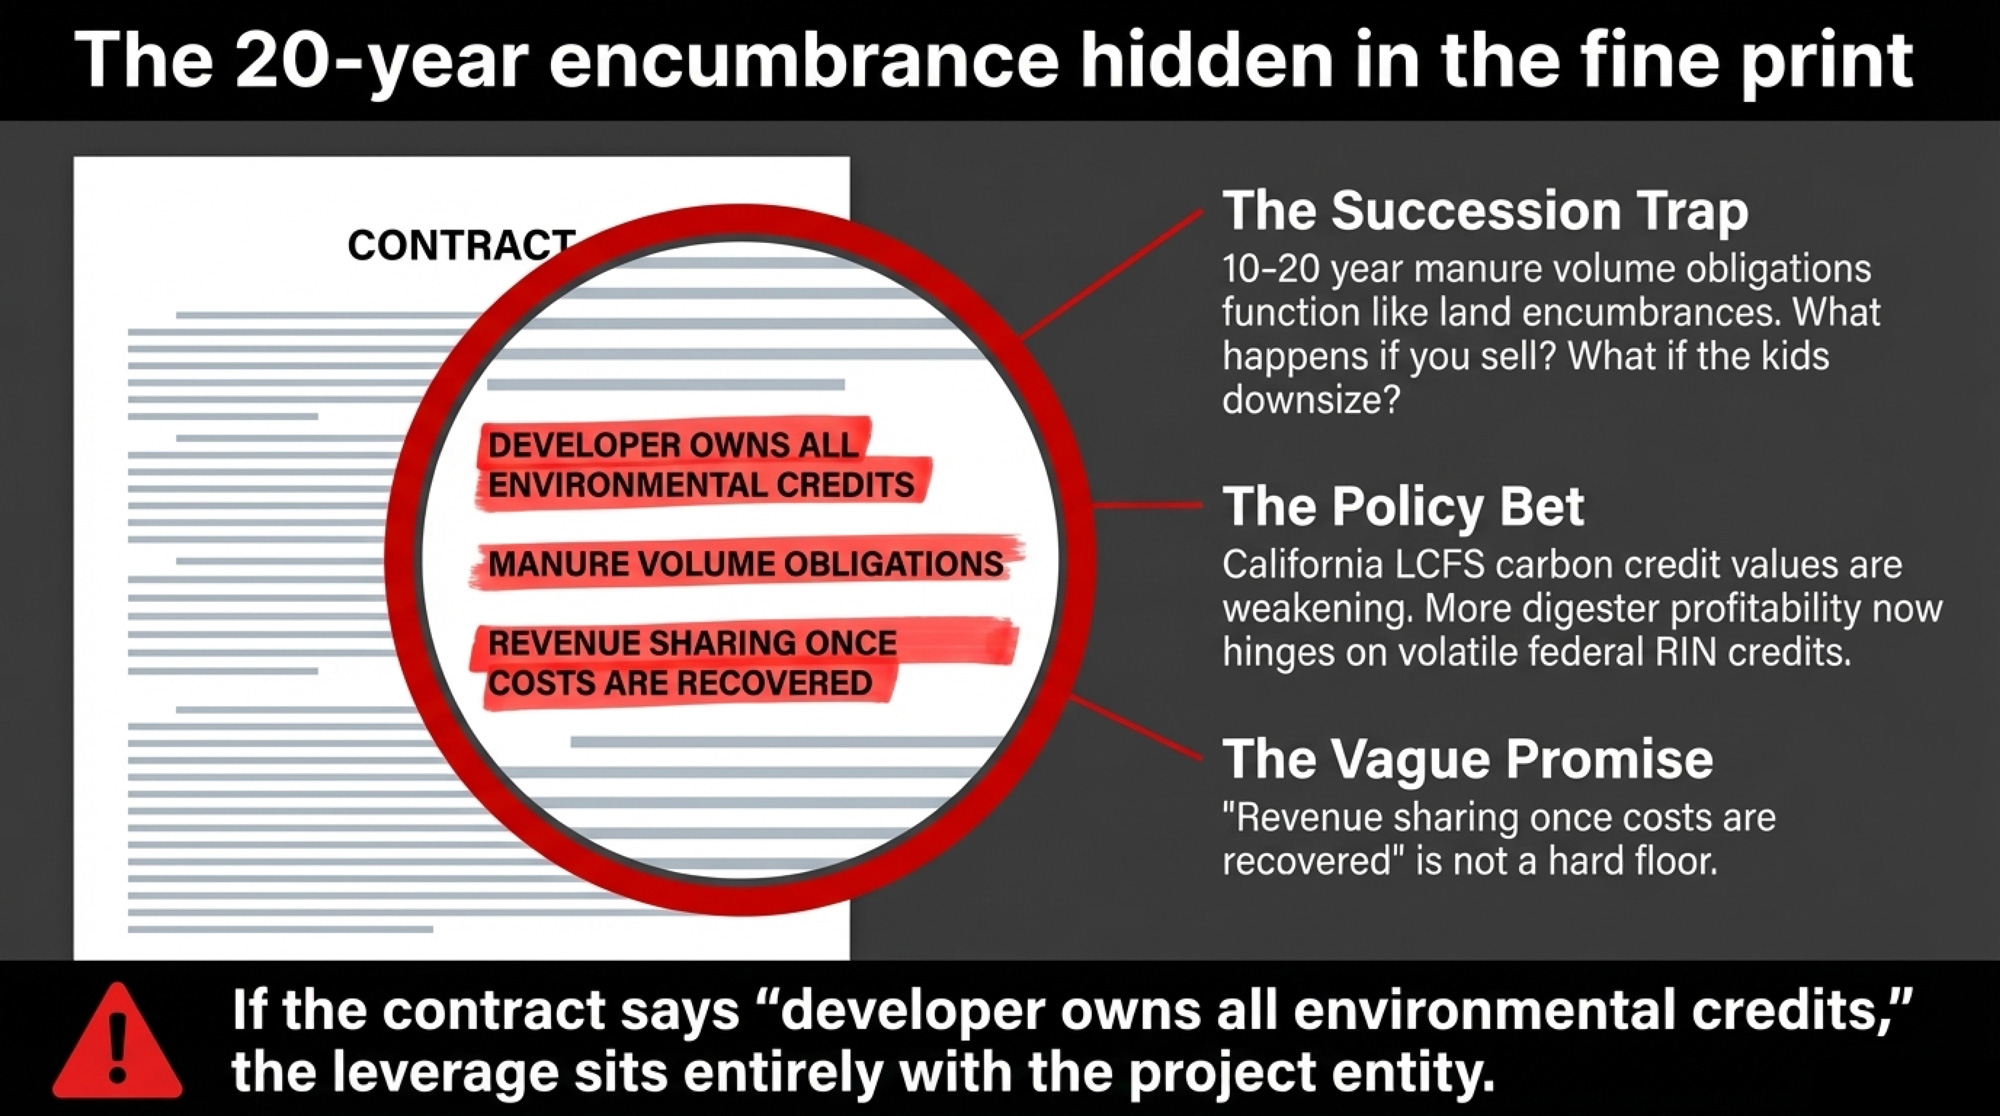
Then he re‑read his manure supply agreement. The developer had a long‑term commitment (10–20 years), minimum-volume obligations, environmental and tax-credit ownership, and lender protections upon termination. Ben had a promise of revenue sharing once costs were recovered — payments tied to project performance and policy, not a hard floor. 

His wife asked the question that changed the conversation: What happens to this contract if we want to sell or if the kids want to downsize? The answer wasn’t simple. Legal and project guidance on RNG deals makes clear that lenders want long terms and enforceable feedstock commitments. A 10‑ or 20‑year manure obligation can function like an encumbrance — something a bank, buyer, or lawyer must clear before a sale, retirement, or transition. 

A May 2025 Brownfield Ag News report underlined the policy risk: one dairy analyst noted that “the future of dairy digester projects is contingent on federal and state incentive programs continuing” and that “a larger portion of profitability hinges on RIN credits as the value of California’s carbon credit weakens.” 

Ben’s takeaway is blunt: “Sustainability wasn’t just about practices anymore. It felt like a financial product. And from where I sat, I was the only one who didn’t have a clearly defined share written into the deal.” 

That’s the assumption this piece pushes on. Not that digesters or climate‑smart programs are automatically bad — but that they’re structured financial assets, and as a producer, you need to negotiate like you’re part of that asset, not just a convenient source of manure and data.

Your 30 / 90 / 365‑Day RNG & Sustainability Playbook

You can’t control the LCFS market or your buyer’s ESG strategy. You can control how you show up in the next conversation. 

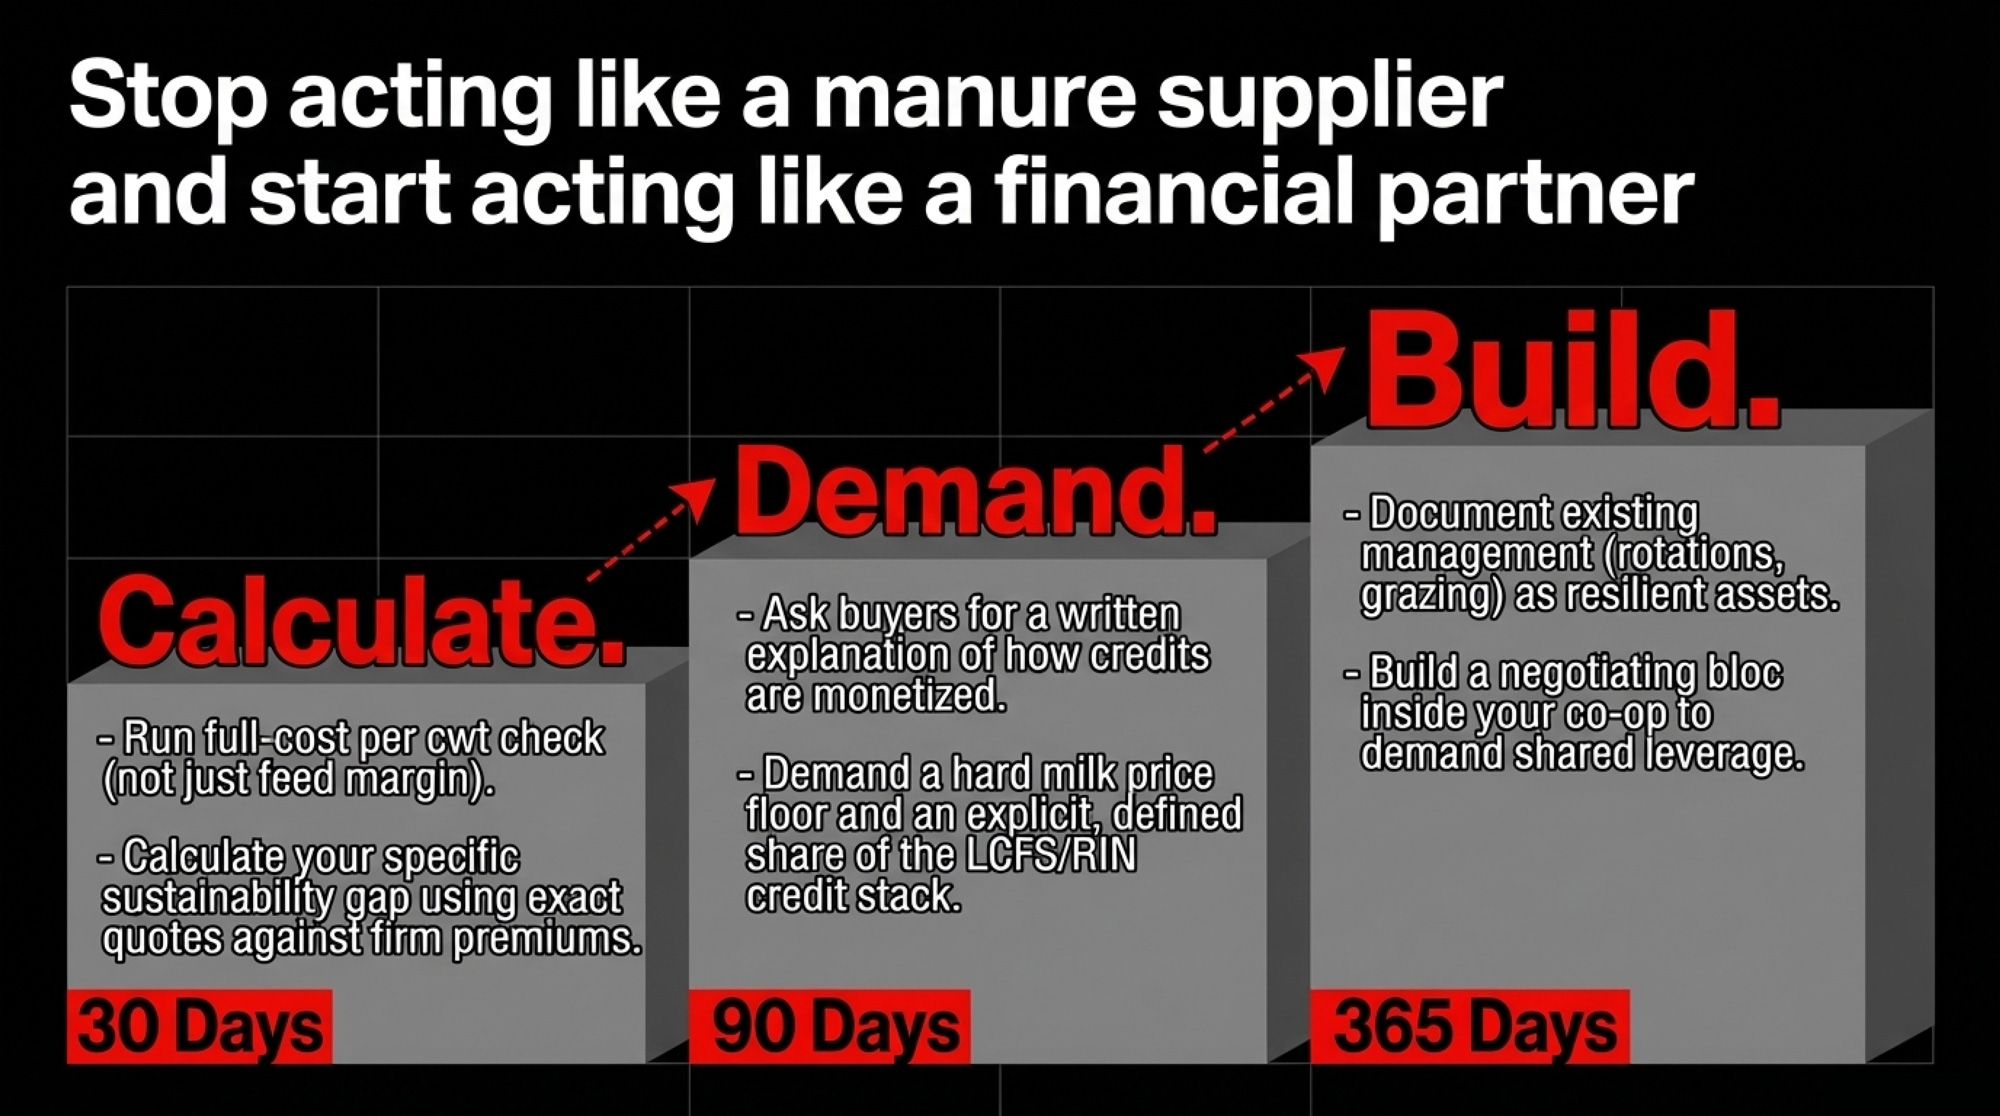
Next 30 days: put real numbers on your own sheet.

  • Run a full‑cost per cwt check, not just margin over feed. Pull your last 12 months of books — feed, labor at a realistic rate, vet/med, fuel, repairs, insurance, interest, depreciation, overheads — and divide by cwt shipped. 
  • Compare that to a benchmark like $26.49 per cwt from Illinois, and your actual average milk price is around $20–$21 per cwt. If your price falls below your full cost, any unfunded sustainability obligation will come out of your equity. 
  • List every sustainability ask on the table — from co‑ops, developers, and lenders — and mark whether each one has a firm per‑cwt premium, a duration, and capital support. 
  • Use your own quotes and the ranges above to calculate your sustainability gap per cwt. If that number is positive, you’re paying to make someone else’s emissions profile look better. 

Next 90 days: change the conversation with your co‑op and developers.

  • Take your numbers to the next co‑op or processor meeting. Frame it: “This bundle costs us $X per cwt. Your sustainability premium is $Y per cwt. Who’s funding the X–Y gap?”
  • Ask for a written explanation of how they value emissions reductions from your farm, how those reductions are monetized (credits, brand claims, Scope 3 targets), and how that value gets back to producers in predictable per‑cwt terms. 
  • Before signing or renewing any RNG contract, push for:
    • clear formula for your share of total project revenue, including LCFS, RIN, and carbon credit value — not just gas sales. 
    • minimum annual payment per cow or per cwt, indexed over time, so your return doesn’t disappear if credit prices sag. 
    • Either partial ownership of environmental credits or a defined share of the revenue they generate, spelled out in dollars. 
    • Exit and assignment terms that define what happens if you sell or retire before the term ends, including who pays what to unwind the obligations. 

If the contract instead says “developer owns all environmental and tax credits” and only describes “revenue sharing” in broad terms, it’s very likely that most of the formal credit ownership — and the leverage over how it’s used — sits with the project entity, not your farm. 

Next 365 days: build leverage instead of just compliance.

  • Turn your existing management into a documented sustainability asset. Many mid‑size dairies already use rotations, grazing, and manure cycling that soil and climate researchers describe as resilient. Write it down: rotations, grazing plans, soil tests, input changes. 
  • Add someone to your advisory circle for protocols and policy: LCFS/RFS updates, Scope 3 guidance, Farm Bill debates. Their job is simple — translate each change into dollars per cwt on your farm. 
  • Build a bloc inside your co‑op. A group of producers who’ve done their own sustainability‑gap math and are asking for a contractual price floor plus a share of the credit stack is harder to ignore than one lone voice. 

What This Means for Your Operation

  • Calculate your sustainability gap per cwt in the next 30 days. Use your own quotes for digesters, cover crops, and grazing shifts, plus the ranges above, to calculate added costs per cwt; subtract firm premiums and project payments. If the result is positive, you’re self‑funding someone else’s climate target. 
  • Read your contracts for where the climate value sits. Look for language that assigns all environmental and tax credits to the project entity and locks in long-term commitments with minimum volumes and lender rights. Bring those clauses to your advisor or lawyer before you sign. 
  • Tie your “yes” to a floor and a formula. Before agreeing to any new sustainability requirement or label, ask for a written milk price floor for participating farms and a simple per‑cwt formula showing your share of any climate‑related value — credits, premiums, or brand payments. 
  • Factor manure contracts into your succession plan. If you’re planning a transition in the next 10–20 years, treat long‑term manure and RNG deals like major debt instruments. Your lender, lawyer, and kids need to understand what their limits are before anyone signs. 
  • Watch RIN and LCFS credit prices, not just milk futures. Brownfield’s coverage and energy‑market analysis make it clear that more digester profitability is tied to RINs as LCFS weakens. If incentives shift, your developer’s ability — and willingness — to share revenue shifts too. 
  • Ask one blunt question in every sustainability pitch. “Over the life of this deal, in dollars per cwt, how much of the climate value created on my farm comes back to my milk check, and how much stays on your balance sheet?” If nobody answers plainly, you’re not looking at a partnership yet. 

Key Takeaways

  • Standard RNG contracts assign LCFS credits, RINs, tax incentives, and Scope 3 reductions to developers and processors, not farms — by design, to satisfy lenders and offtakers.
  • Aaron Smith’s analysis puts digester costs at ~$1,130/cow/year and gas value at ~$128/cow/year, a gap backed up by the 2025 Terrain Ag report’s finding that fuel is “the smallest share of the revenue stream.”
  • If your sustainability premium per cwt doesn’t match your added sustainability costs per cwt over a realistic timeframe, you’re financing climate goals out of equity — and the $584,000 modeled gap on a 400‑cow herd shows how fast that adds up.
  • Policy risk is real: with LCFS values weakening and more profitability tied to RINs and federal incentives, any long‑term manure contract that assumes today’s credit value is exposing you to someone else’s policy bet.
  • Your best defense is to treat sustainability as a financial product and negotiate for a contractual milk price floor, a defined share of the climate value stack in dollars per cwt, and exit terms that don’t trap the next generation.

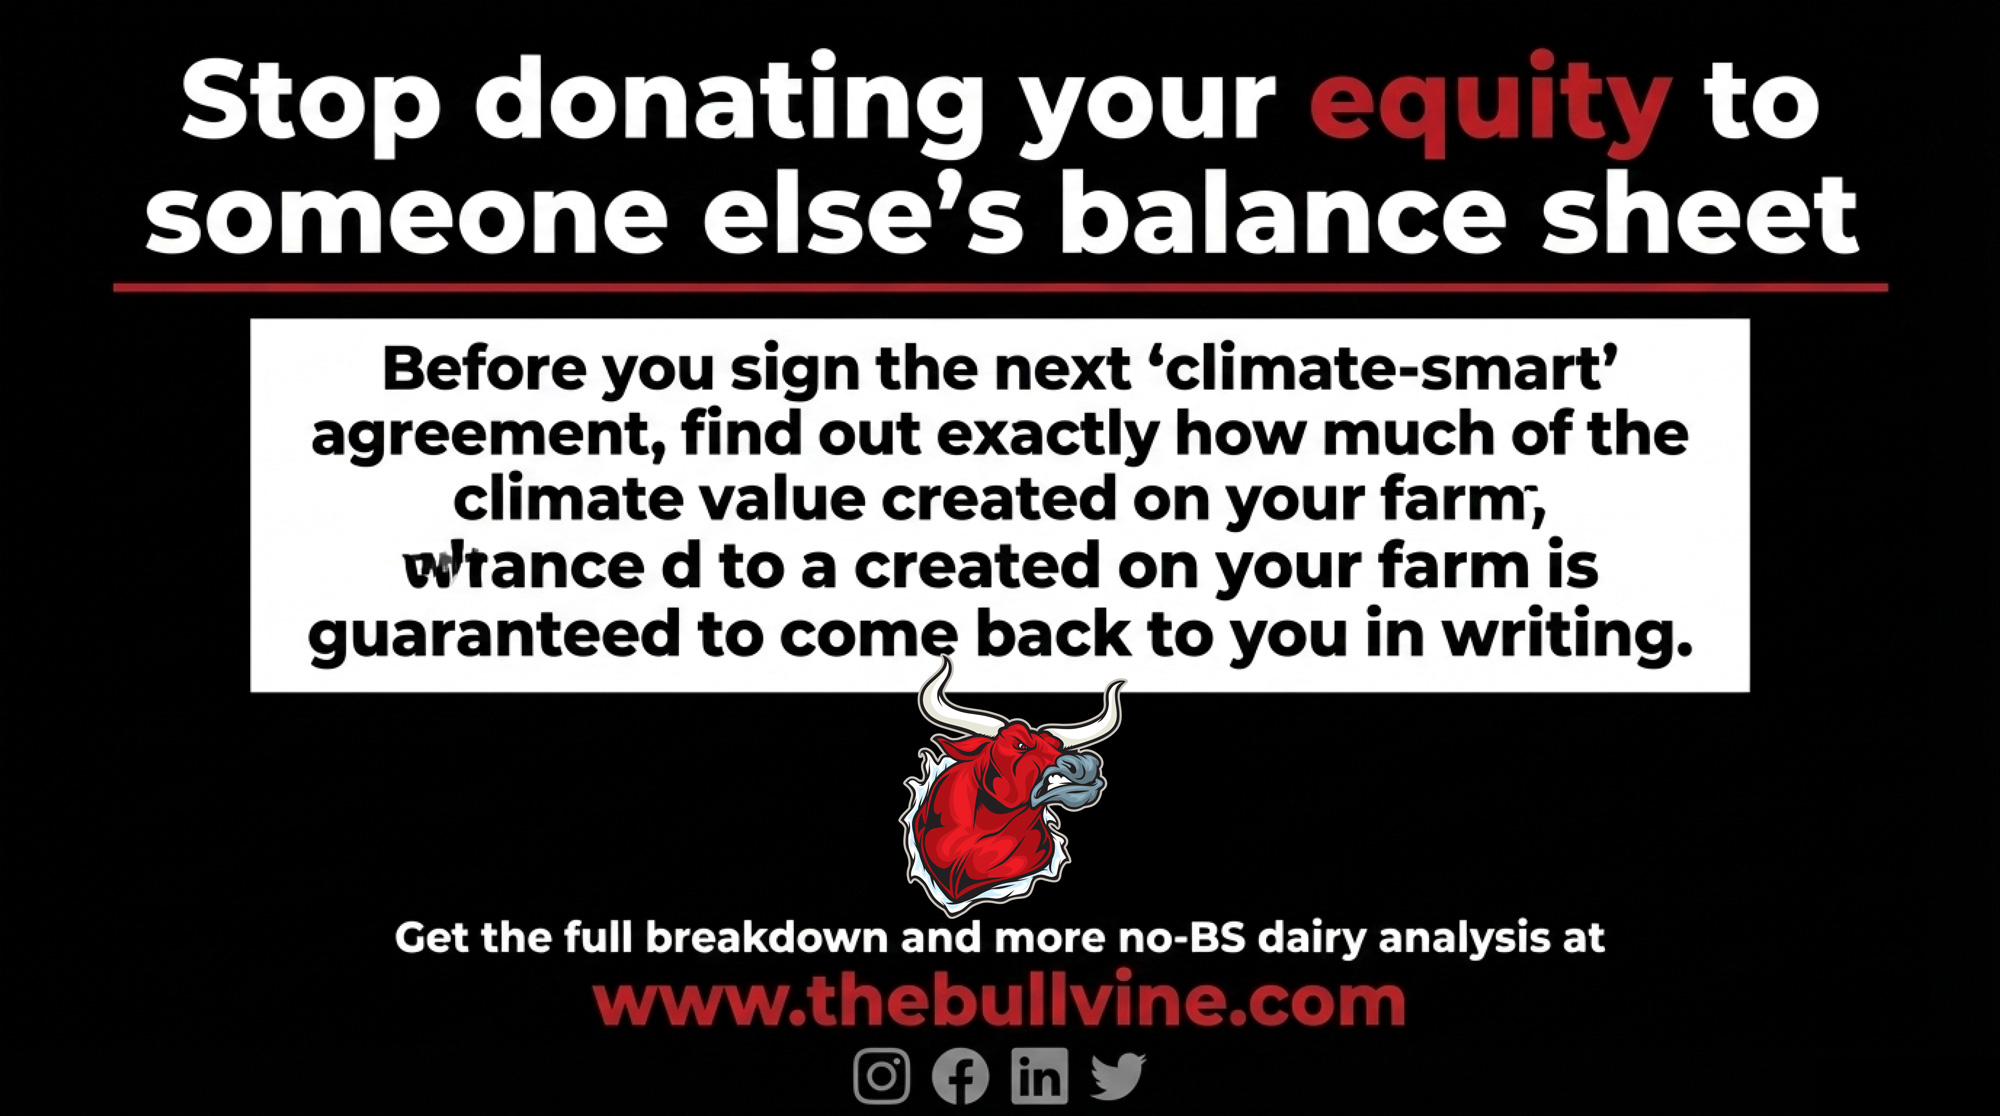
Before you sign the next “climate‑smart” agreement, pull your last year of milk checks and your cost‑of‑production worksheet. What’s your actual full cost per cwt — and how many dollars per cwt of the climate value created on your farm are guaranteed to come back to you in writing?

That spread is the only sustainability metric that really decides what happens to your operation.

Complete references and supporting documentation are available upon request by contacting the editorial team at editor@thebullvine.com.

Learn More

The Sunday Read Dairy Professionals Don’t Skip.

Every week, thousands of producers, breeders, and industry insiders open Bullvine Weekly for genetics insights, market shifts, and profit strategies they won’t find anywhere else. One email. Five minutes. Smarter decisions all week.
NewsSubscribe
First
Last
Consent
Send this to a friend