Archive for Holstein Inbreeding

Why Cow Family Beats a +3000 GTPI Calf: The $12,000 Embryo Math Every Breeder Should Run

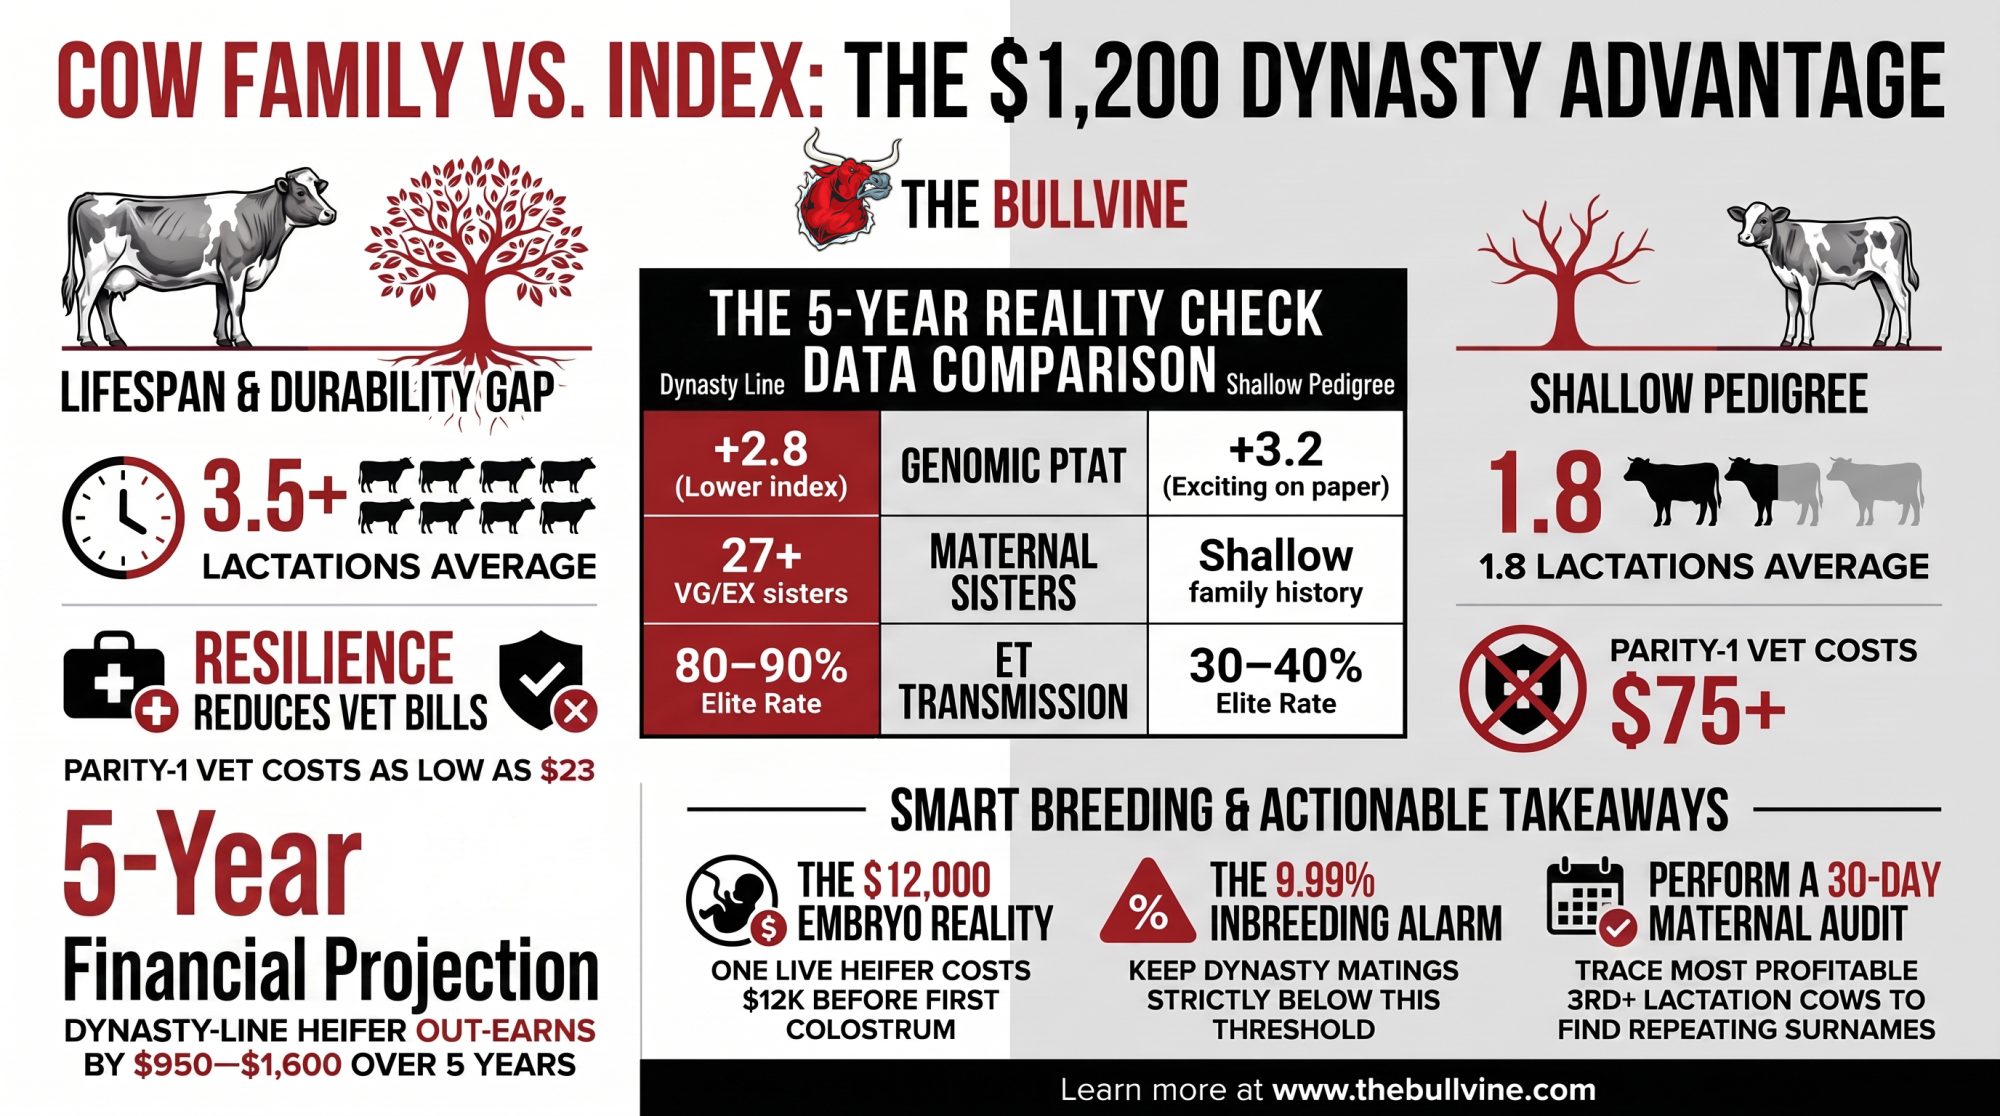
A dynasty-line heifer can out-earn a flashier genomic pick by roughly $950 to $1,600 over five years — here’s the barn math, and why the surname on your best cow’s ear tag matters more than the index on top.

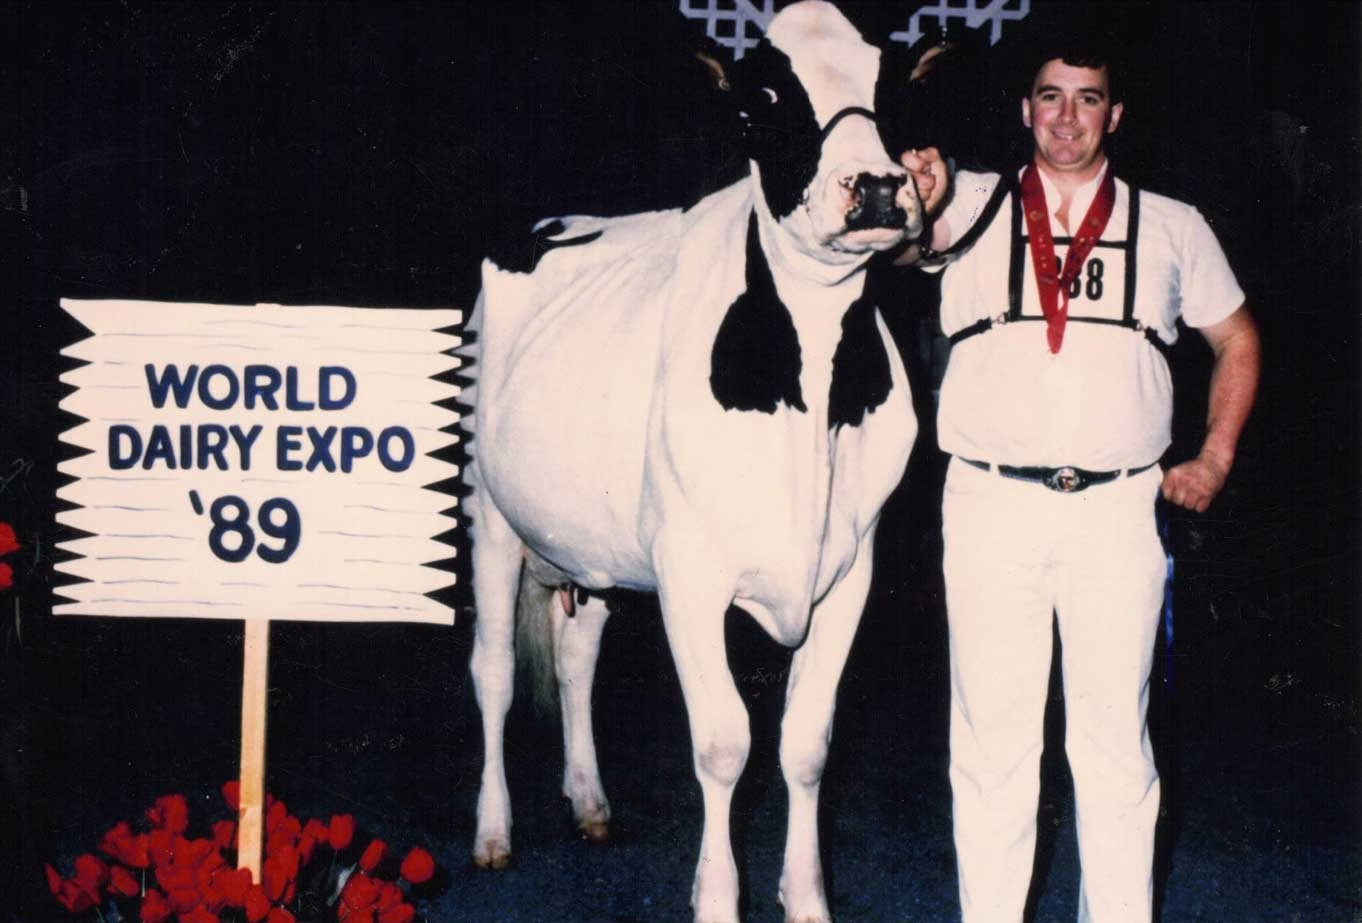
Marc Comtois with Comestar Laurie Sheik VG-88-23* at World Dairy Expo, 1989 — second in her Senior 2-Year-Old class. The judge put another cow ahead of her that day. History didn’t. This is the cow that would go on to anchor 14 Semex Class EXTRA bulls and four millionaire sires — the living proof, decades before genomics, that cow family beats a flashy card.  (Read more: The Cow That Built an Empire: Comestar Laurie Sheik’s Unstoppable Genetic Legacy)

The best argument for cow family over index sheets showed up on Marc Comtois’s trailer in 1985. It was Elysa Anthony Lea EX-15*, one of Willowholme Mark Anthony’s best daughters, and the most important thing he ever bought. Bred to Puget-Sound Sheik, she produced Comestar Laurie Sheik VG-88-23* in December 1986. That one cow went on to anchor 14 Semex Class EXTRA bulls and four millionaire sires — Leader, Lee, Lheros, and Outside. That’s a maternal dynasty, fully cashed in.

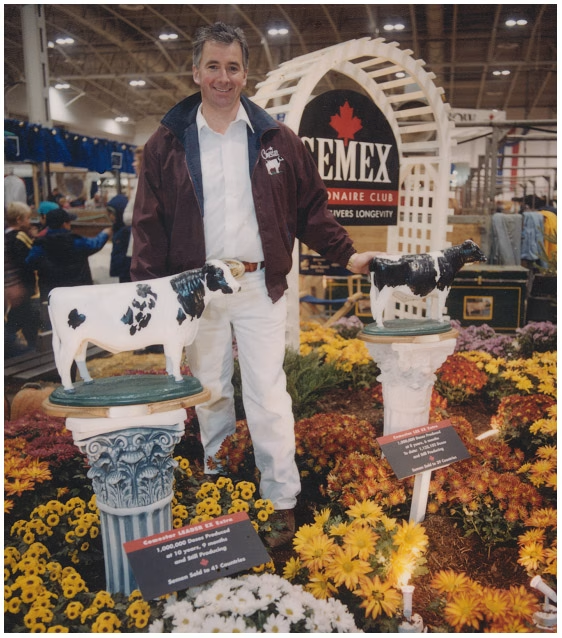
Marc Comtois at the Semex Millionaire Club display, flanked by models of Lee and Leader — two of the four millionaire sires bred off Comestar Laurie Sheik. The placards tell the story in numbers: over a million doses, semen sold in 43 countries. No single index built that. One cow family did — which is exactly the case this article makes

The uncomfortable question is what’s happening in your own barn right now. You’re spending on genomic tests, elite semen, and $3,000-plus embryos without asking whether the cow family underneath those numbers can actually stay in your barn for three or four lactations. That gap between paper merit and staying power is what this piece is about.

From Bull-of-the-Month to Cow Families That Don’t Miss

Genomics promised we could skip generations of slow, patient pedigree-building. But as the index race speeds up, a paper-thin pedigree is turning into a high-maintenance luxury. Let’s look at the real math of what a shallow family costs you once the honeymoon of her first proof wears off.

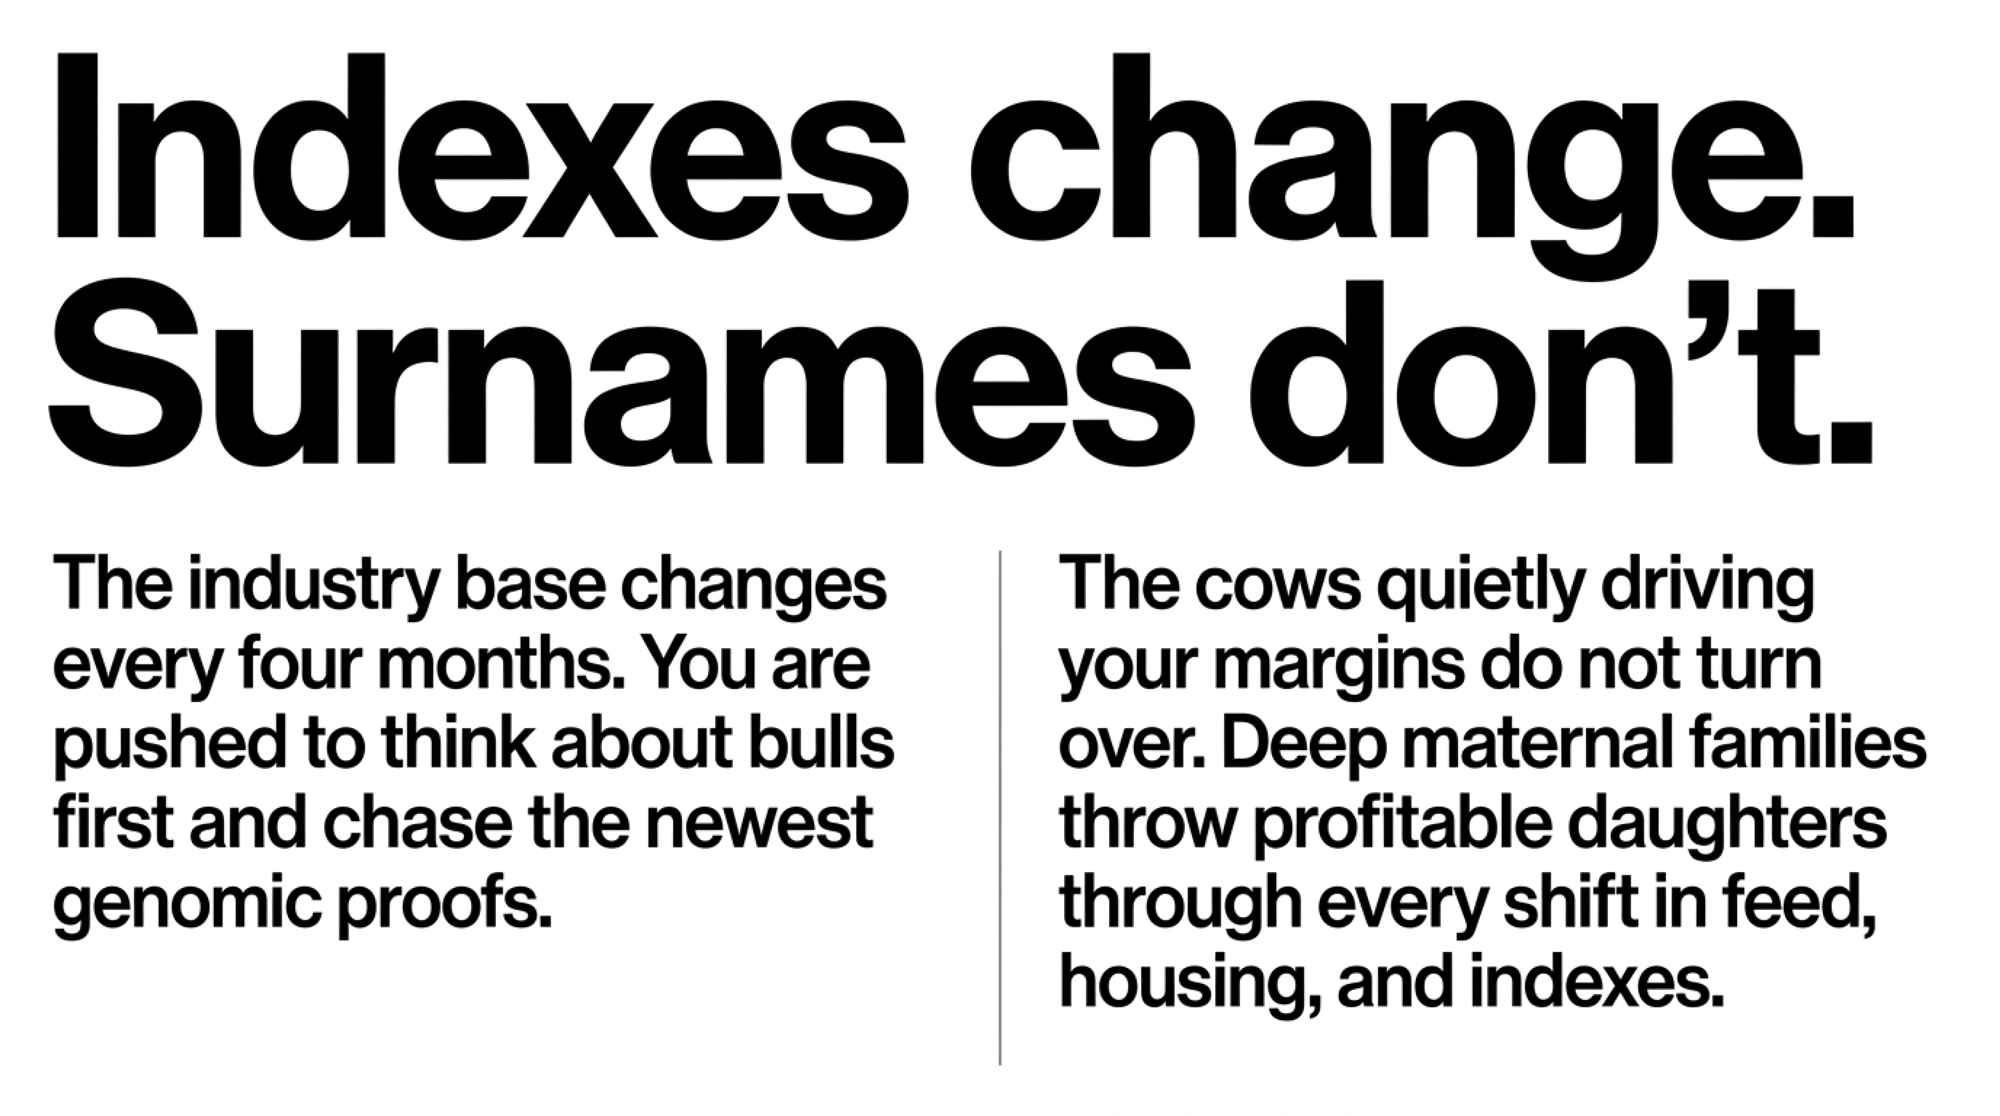
The industry still runs on a four-month heartbeat — new proofs in April, August, December, fresh catalogs, a fresh list of must-use sires. CDCB’s April 2025 base change reset every TPI value in the system, moving the reference point from cows born in 2015 to those born in 2020, and the April 2026 run reshuffled the rankings again, with STgen alone holding 36% of the proven TPI top 100. By design, you’re pushed to think bulls first.

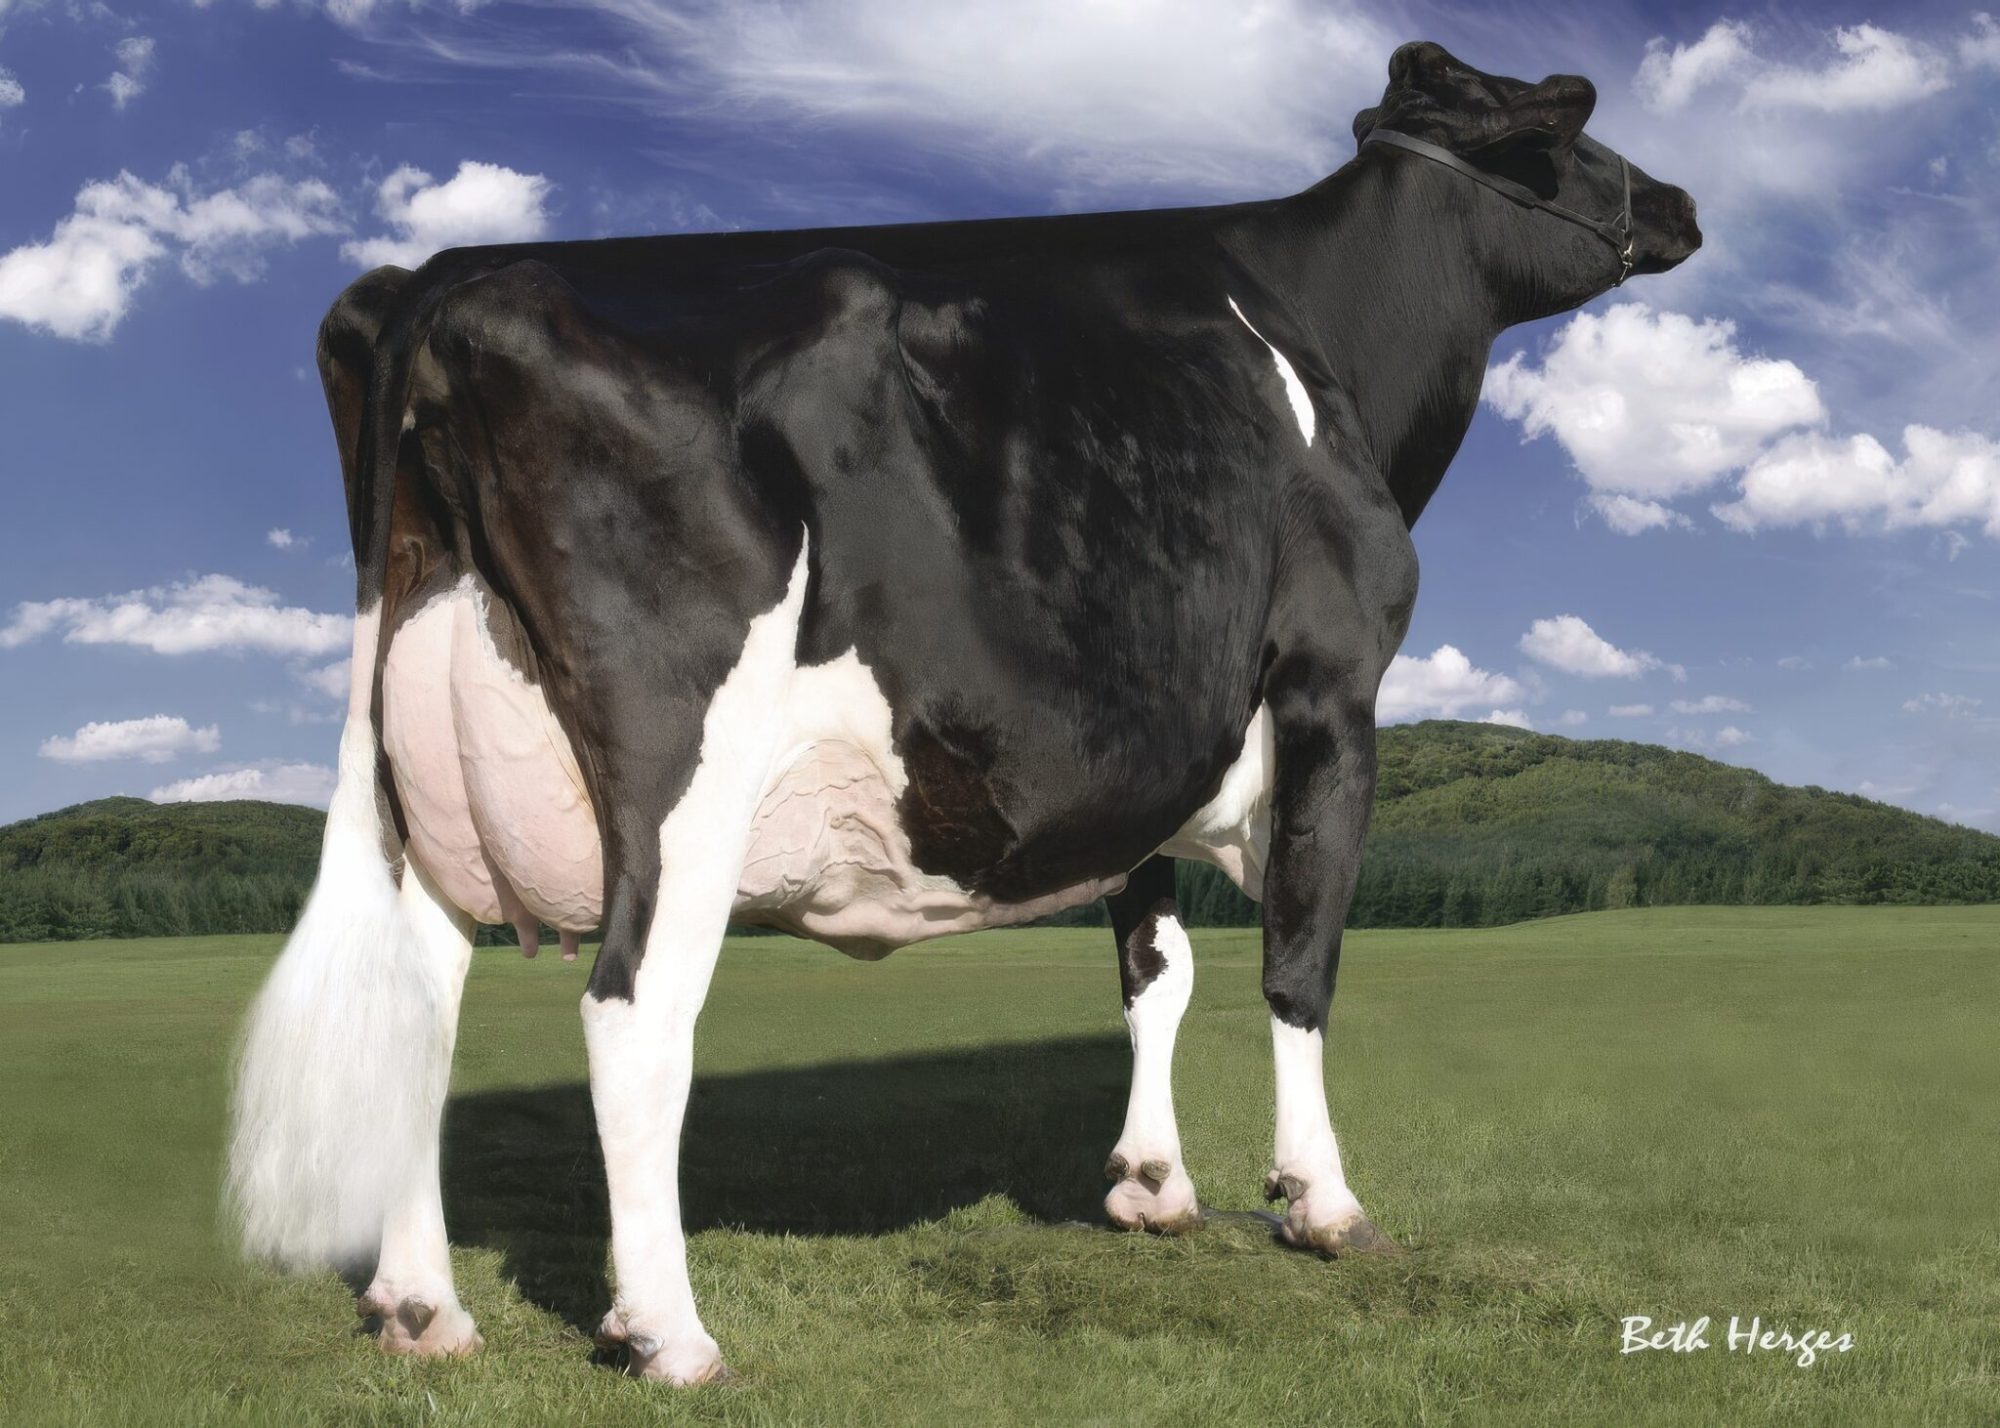
Glenridge Citation Roxy EX-97 — the American answer to the same argument. No genomic test ever scored her; her record did. Generations of Goldwyns, Atwoods, and show-ring champions trace to this one cow, proof that a great maternal line compounds value long after the index that ranked her contemporaries has been forgotten. Read more: Glenridge Citation Roxy: The Legendary “Queen of the Breed”

The cows quietly driving your margins don’t turn over every four months. Strip the brand names off the catalogs, follow the cow side, and the same surnames keep surfacing: Comestar Laurie Sheik, Snow-N-Denises Dellia and her granddaughter Regancrest-PR Barbie, Glenridge Citation Roxy. These families do what no single sire can — throw profitable daughters, generation after generation, through changes in feed cost, housing, indexes, and tools. For the wider story of how 16 years of genomics rewrote which bulls get used — and what it didn’t touch on the cow side — see The Great Holstein Shakeup.

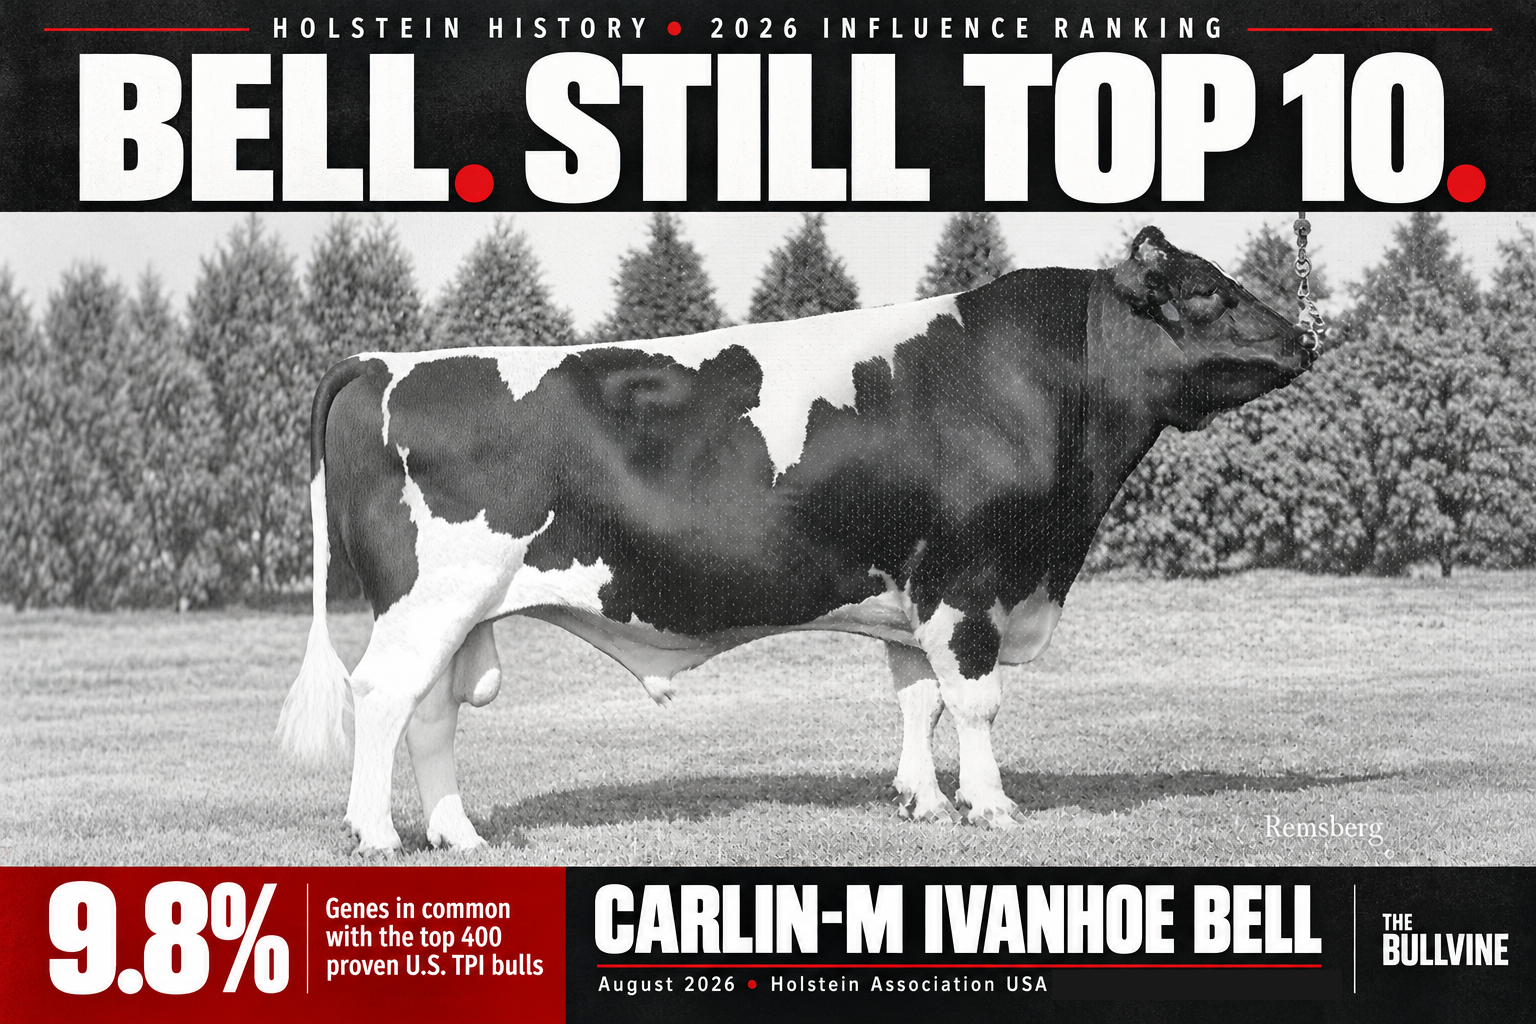
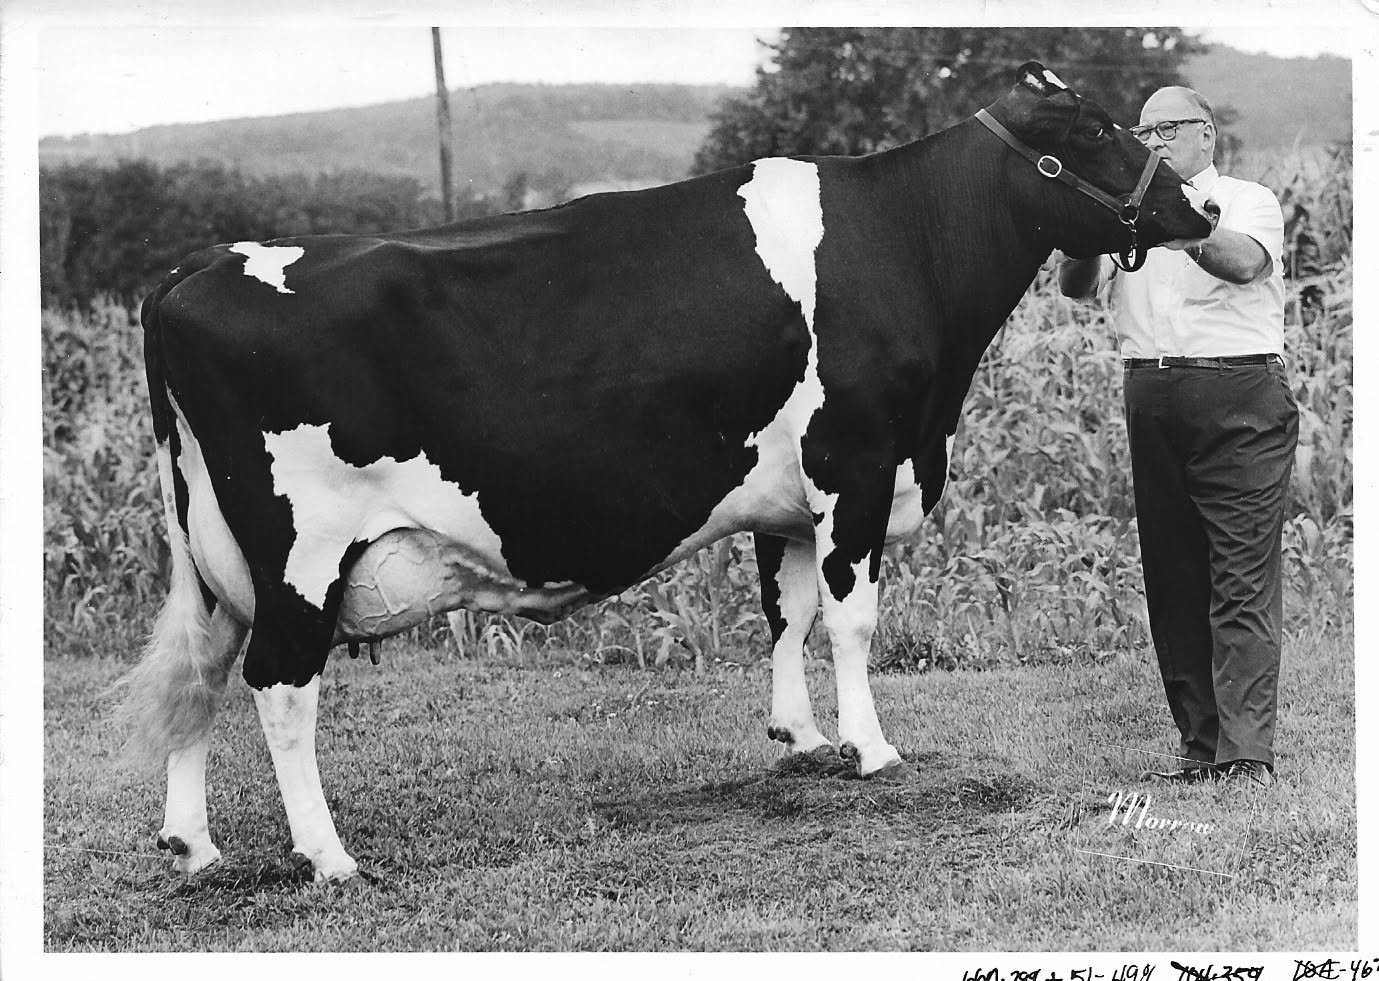
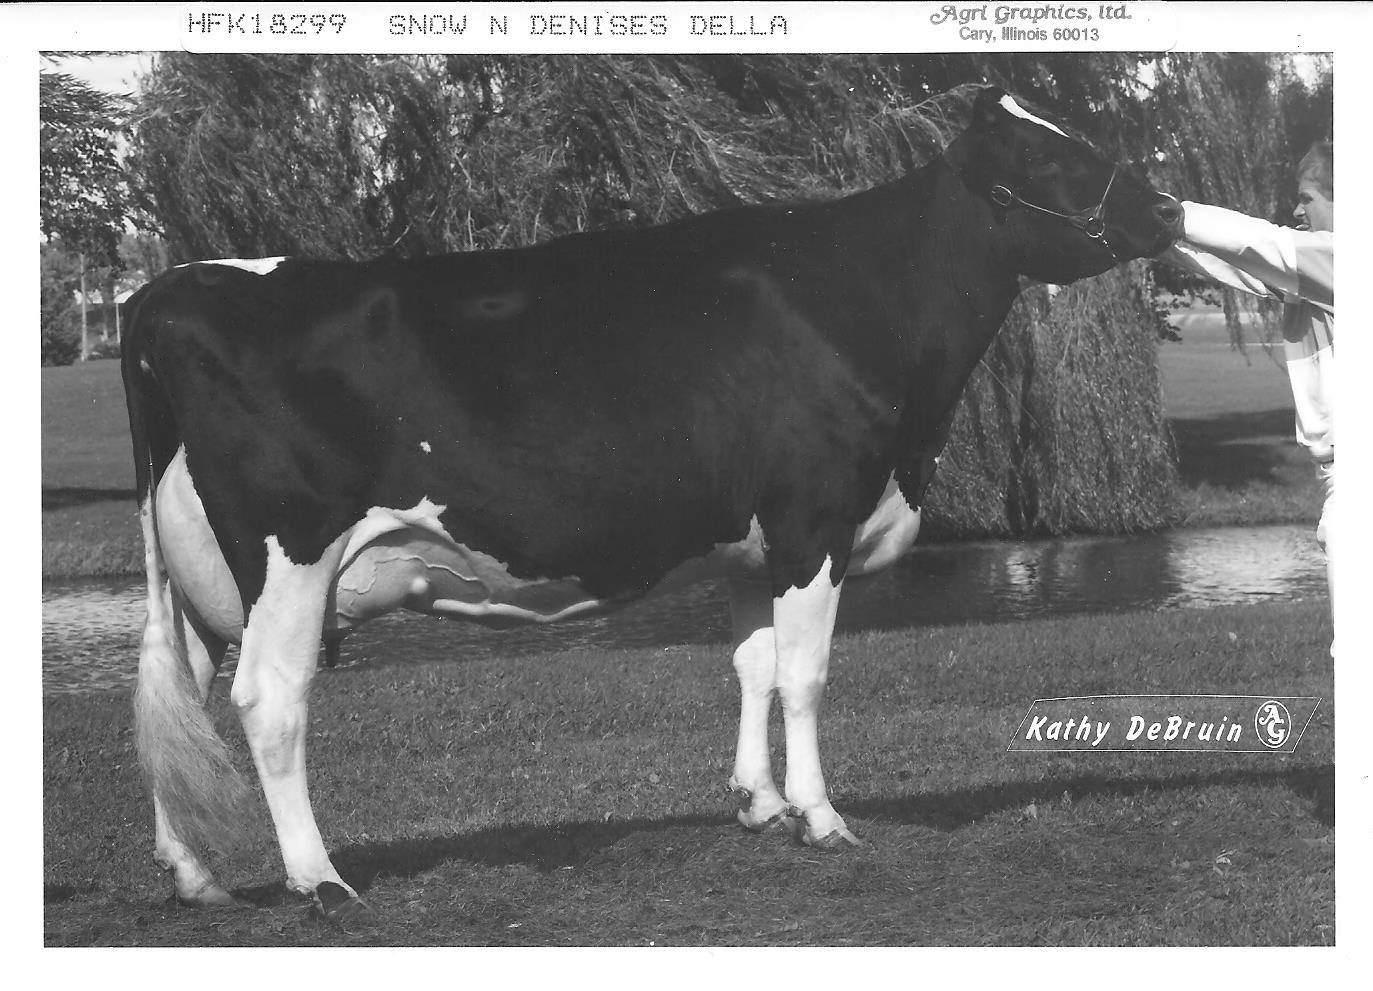
Snow-N Denises Dellia, EX-95-2E-GMD-DOM—Walkway Chief Mark out of Snow-N Dorys Denise, with Carlin-M Ivanhoe Bell as maternal grandsire. “Tall, sharp, clean, beautifully uddered, and trouble-free,” judge Niles Wendorf called her the day she stood grand champion at the 1991 Wisconsin Spring Show. This is the cow Select Sires had passed on. (Read more: Three Gold Medal Sons From One Cow the Studs Didn’t Want)

How Does a Shallow Pedigree Actually Cost You Money?

Bring it down to two heifers walking into your parlor next spring.

Heifer A is +3.2 PTAT on a genomic-only proof. Her dam’s a GP cow with two quick lactations and not much behind her. On paper, she’s exciting. In reality, you’ve got no idea whether that maternal line survives heat, robot glitches, or your transition pen. Heifer B is +2.8 PTAT — less flashy on the sheet. But she comes from a Barbie-type line where more than 27 daughters have been scored, all but one landing VG or EX on first classification, and where the family now sits behind roughly 36% of top-tier PTAT rankings.

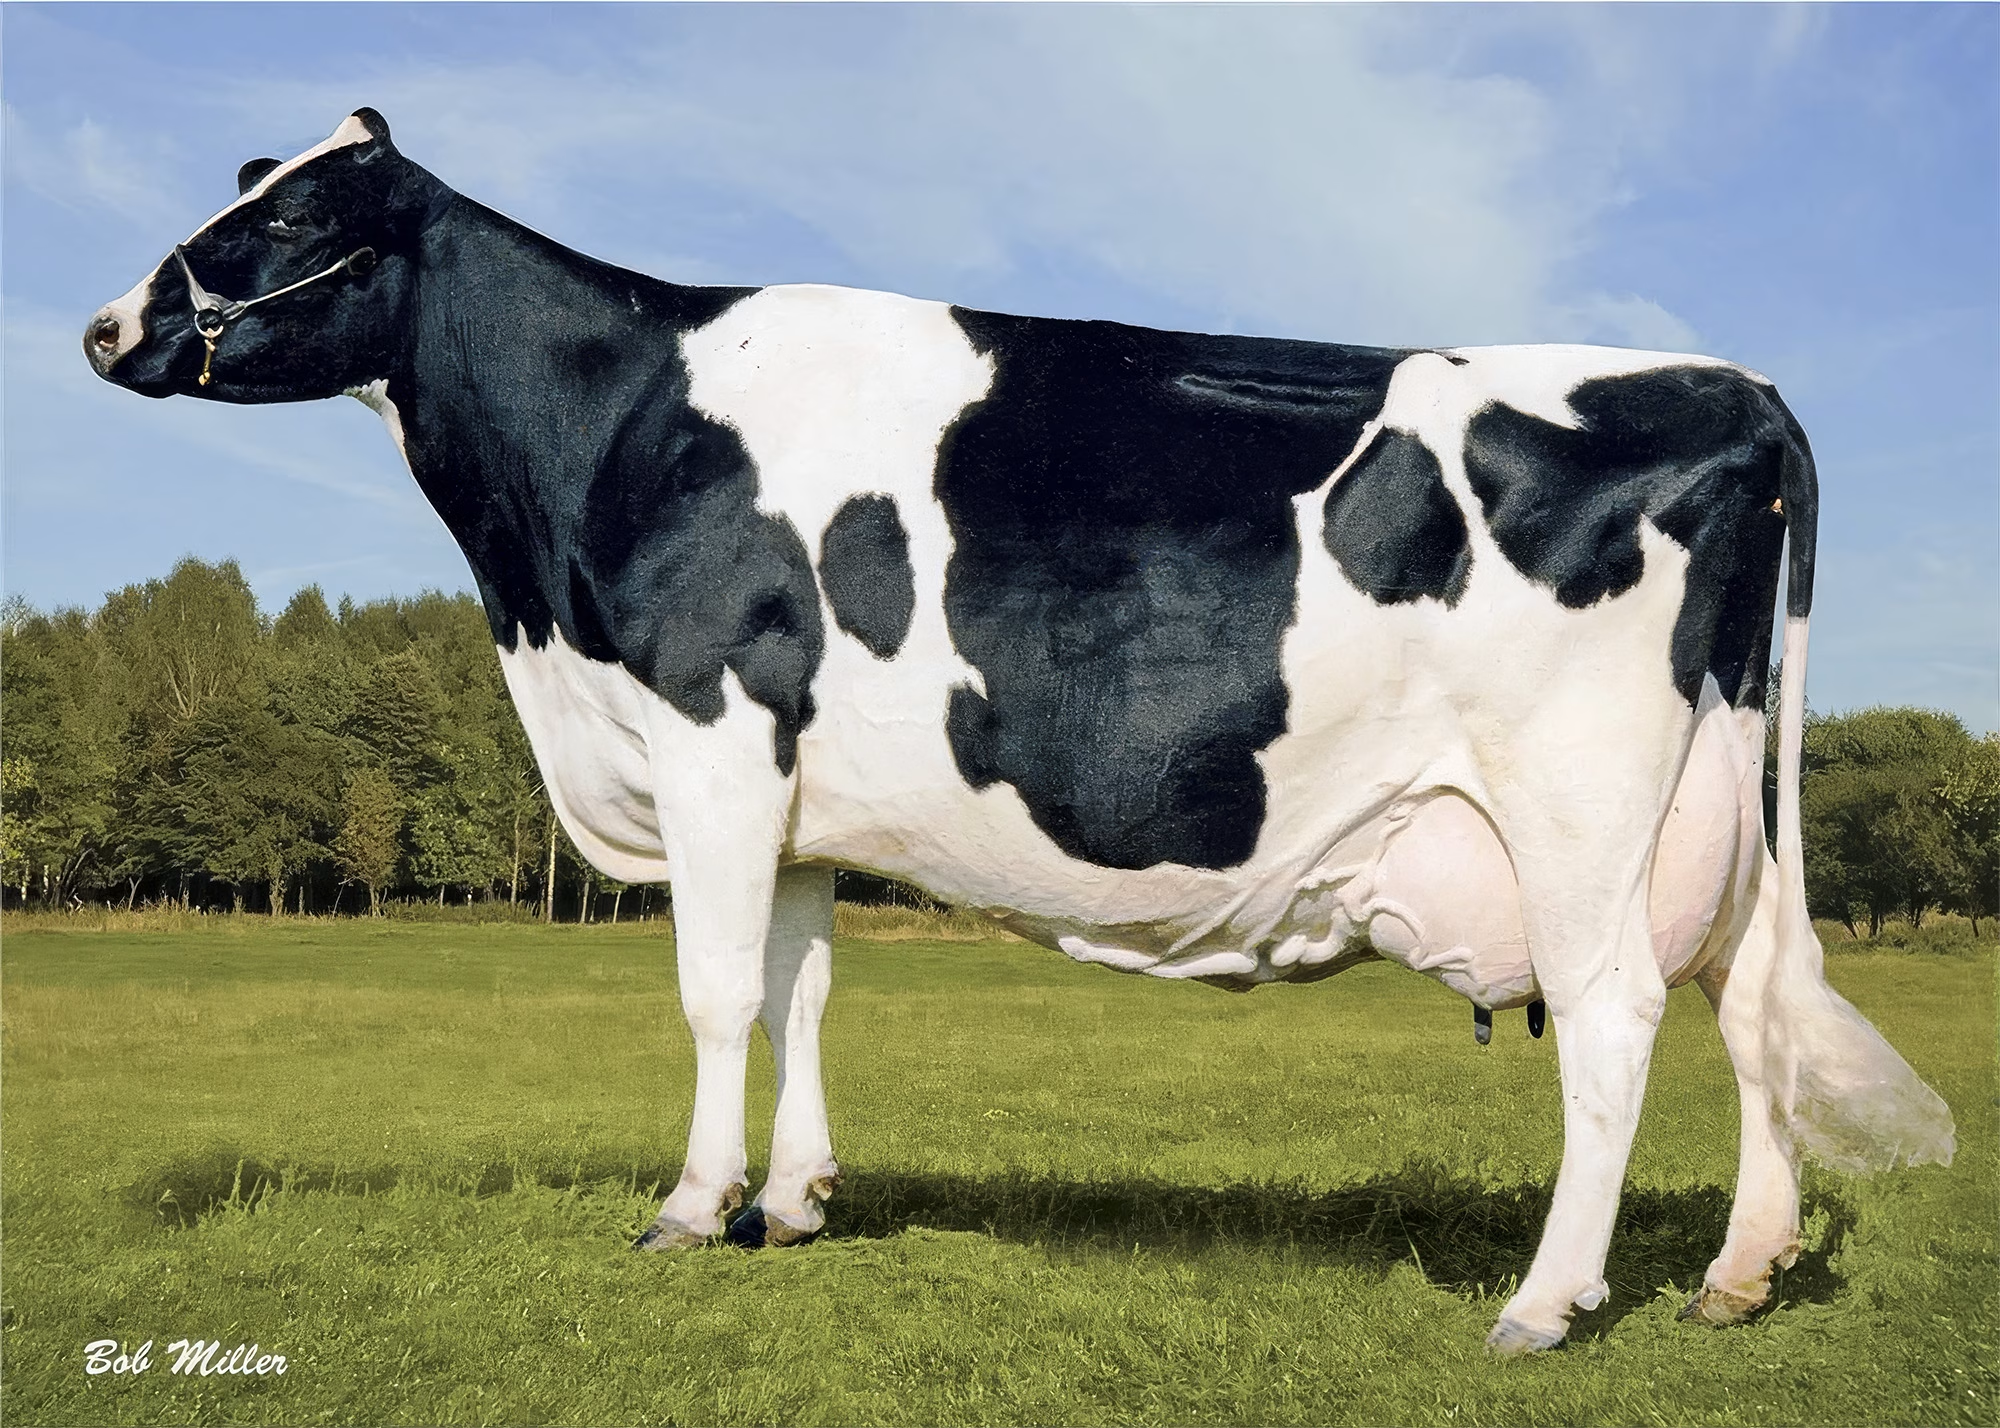
Regancrest-PR Barbie — the cow family that refused to be made obsolete. When genomics arrived promising to replace pedigree with a number, Barbie answered by stacking her sons and daughters at the top of the same index lists. The dynasty didn’t fight the new system. It won inside it — which is the whole point.  (Read more: When Breeding Genius Meets Perfect Timing: How Regancrest-PR Barbie Shaped the Future of Holstein Genetics)

Heifer Comparison: Dynasty vs. Shallow Pedigree

AttributeHeifer A (Shallow Pedigree)Heifer B (Dynasty Line — “Barbie/Roxy”)
Genomic PTAT+3.2 (exciting on paper)+2.8 (slightly lower index)
Maternal backingGP dam, shallow familyDeep line (27+ VG/EX maternal sisters)
Expected lifespan~1.8–2 lactations (early cull risk)3.5+ lactations (proven durability)
Parity-1 vet costs~$75+ (higher stress susceptibility)~$23–$35 (resilient, low drama)
ET/IVF viabilityHigh risk (unproven transmission)High reward (80–90% elite transmission)
5-year est. marginBaseline+$950 to +$1,600 (midpoint +$1,200)

Note: Parity-1 vet costs (Blom et al., 2023) and maternal backing reflect documented records. Expected lifespan and ET transmission rates are Bullvine illustrative estimates comparing dynasty and shallow lines — not measured population values.

Fast-forward five years. The Barbie-line heifer is far more likely to still be milking in her third or fourth lactation. Published herd-life economics — De Vries (2017, Journal of Dairy Science) on the longevity-versus-genetic-gain trade-off, and Gazzarin et al. (2025, JDS) on optimal productive lifespan — consistently show that spreading rearing cost across more lactations while banking extra peak-milk cycles adds real profit per cow. Our Bullvine analysis, built on those ranges, pegs each additional successful lactation at roughly $400 to $600 per cow, depending on your system.

Health stacks on top. A 2023 study of eight high-performance Minnesota Holstein herds (Blom et al., Animals) found parity-1 treatment costs ranging from about $23 to $75 per cow — and that’s direct vet cost only, before lost milk, discard, and breeding delays. Add it up across three or four lactations and the dynasty cow pulls clear. Our model lands the five-year cash gap between a dynasty-line heifer and an equally fancy but shallow-pedigree heifer at roughly $950 to $1,600 per head — call it $1,200 at the midpoint. Hold that in pencil. It moves with your feed cost, your milk price, and how hard you lean on ET.

On a 300-cow herd raising 40 to 50 donor-candidate heifers over a few years, that gap scales into five-figure territory. The genomic test bills you today. The shallow family bills you in year three.

Three Fingerprints a Dynasty Can’t Fake

The Comestar, Regancrest, and Roxy families don’t look alike. One leans functional type, one extreme PTAT, one fertility and herd-life. Lay their histories side by side, though, and the same fingerprints show up.

a historic moment for the Comtois family as they receive Holstein Canada’s most prestigious individual honor for Comestar Lamadona Doorman EX-94-2E 27*. The presentation marks a remarkable full-circle achievement, as Lamadona becomes the 2022 Cow of the Year exactly 27 years after her ancestor, Comestar Laurie Sheik, received the inaugural award in 1995. Standing proudly before the Holstein Canada backdrop, the family displays a commissioned portrait of this extraordinary cow who combines exceptional type (EX-94) with remarkable genetic transmission (27 brood stars). Lamadona continues the Laurie Sheik dynasty through her influence on modern breeding programs, with sons like LEMAGIC (Semex), LOYALL (Blondin Sires), LATAYO (Semex) and BARLOT (Semex) carrying her genetics forward. This moment represents not just an individual achievement, but the validation of a breeding philosophy focused on maternal lines that has shaped Holstein breeding across four decades and 51 countries worldwide.
A historic moment for the Comtois family as they receive Holstein Canada’s most prestigious individual honor for Comestar Lamadona Doorman EX-94-2E 27*. The presentation marks a remarkable full-circle achievement, as Lamadona becomes the 2022 Cow of the Year exactly 27 years after her ancestor, Comestar Laurie Sheik, received the inaugural award in 1995.

Depth, not a spike. In the Laurie Sheik family, herdbook stars stack in a way most herds never see once. Laurie Sheik carries 23 brood-cow stars, her Blackstar daughter Laura Black topped her with 24, and L Or Black earned 16. Holstein Canada named Laurie Sheik the inaugural Cow of the Year in 1995; her descendant Comestar Lamadona Doorman took the same title in 2022 — 27 years apart. That one purchase Comtois made in 1985 is still winning national hardware nearly four decades later. Not a one-hit wonder. A conveyor belt. The full story lives in The Cow That Built an Empire.

Barbie’s line runs the same pattern — dams, daughters, granddaughters carrying multiple Excellent daughters and top PTAT slots, not one freak cow surrounded by also-rans. Glenridge Citation Roxy EX-97-4E had 16 Excellent daughters, over 300 Excellent descendants, and a 30-star brood cow in Mil-R-Mor Roxette EX. Families that flat-out refuse to miss.

Volume with the same result. Dynasties don’t get judged on three daughters. Barbie produced more than 27; all but one classified VG or better on first lactation, and by 2010 she’d stacked eight Excellent and nineteen Very Good, with at least eleven daughters in the top-25 PTAT rankings. Give a family 20 to 30 daughters by different bulls and they still hit 80 to 90% of the time — that’s zero-failure transmission in barn terms. No genomic prediction fakes that.

And here’s the real separator: the results hold across different sires and different barns. In the Barbie family, Goldwyn and Shottle daughters both show the same mammary quality. In the Laurie Sheik line, Blackstar, Prelude, and Storm all threw daughters and sons that lifted herds from Quebec to Belgium to modern robot barns — at Bois Seigneur Holstein, roughly 70% of the herd traces back to her. Roxy’s descendants have milked in tie-stalls, free-stalls, and on pasture without losing their reputation for fertility and low SCC. A printout ranks a calf in a population. It can’t tell you how her granddaughters behave across 30 matings and five proof runs. That’s where dynasties live. Read the family trees in Roxy, Dellia and The Mothers Who Built the Breed.

Dynasty familyDepth (brood-cow stars / EX daughters)Volume testedRepeatability signal
Comestar Laurie Sheik23 brood stars; Laura Black 24, L Or Black 16Anchored 14 Class EXTRA bulls2 Cow-of-the-Year titles, 27 yrs apart
Regancrest-PR Barbie8 EX + 19 VG daughters by 201027+ daughters classifiedAll but 1 hit VG/EX on 1st lactation
Glenridge Citation Roxy16 EX daughters; 300+ EX descendantsMil-R-Mor Roxette = 30-star brood cowHeld type across tie-stall, free-stall, pasture
Millionaire sires producedLeader, Lee, Lheros, Outside (Laurie Sheik)Comestar Lee: 1.5M dosesSame result across Goldwyn, Shottle, Blackstar

What Does a $3,000 Embryo Really Buy You?

Here’s the flip side, and it’s the other half of our $93,300-a-year “three cow families” warning. Not the trap of leaning too hard on a handful of dynasties — the opposite mistake, ignoring proven cow families entirely.

Hand over $3,000 for an embryo and you’re not buying a guarantee. You’re playing biological telephone. Here’s how the cash actually drains:

The Cold Math on $3,000 Embryos

  • The buy-in: 4 embryos × $3,000 = $12,000 spent
  • The reality check: ~50% conception rate = 2 pregnancies
  • The coin flip: ~50% heifer rate = 1 live heifer

You just paid $12,000 for one live heifer before she drinks her first bag of colostrum — and that’s before the $3,500 to $4,000 to raise her to calving. If her donor’s a one-generation wonder, you’ve got a real shot at that $12,000 washing out early. If she’s a Roxy or a Barbie, she’s got the maternal infrastructure to back the price tag. Those conception rates aren’t guesses, either: Demetrio et al. (2020, Animal Reproduction) put in vivo pregnancy at about 51% in lactating cows and 63% in virgin heifers.

Now overlay the family. From a Barbie/Laurie/Roxy-level dynasty, family data suggests 80 to 90% of those embryo-derived daughters land in your top tier. From a high-genomic young cow with nothing behind her, that “elite” hit rate can realistically slide to 30 to 40% once health, fertility, and cull reasons pile on. Using the upper end of our earlier range — roughly $1,500, since embryo heifers are pre-selected for merit rather than average — the expected margin per $12,000 investment looks like this:

  • Dynasty donor: 0.8 × $1,500 ≈ $1,200 expected margin
  • Shallow donor: 0.4 × $1,500 ≈ $600 expected margin

Ignore maternal proof and you’ve taken a 50% haircut, purely because you never asked whether the donor’s family had proven anything past three generations of names on paper. Run 20 embryos a year in a 300-cow herd and that’s five-figure lost upside over five years — before you count the drain of watching can’t-miss heifers turn into problem cows.

How Do You Lean on Dynasties Without Breeding Yourself Into an Inbreeding Hole?

There’s a real catch. Double down on a few cow families, ignore the sire mix, and you dig an inbreeding hole fast.

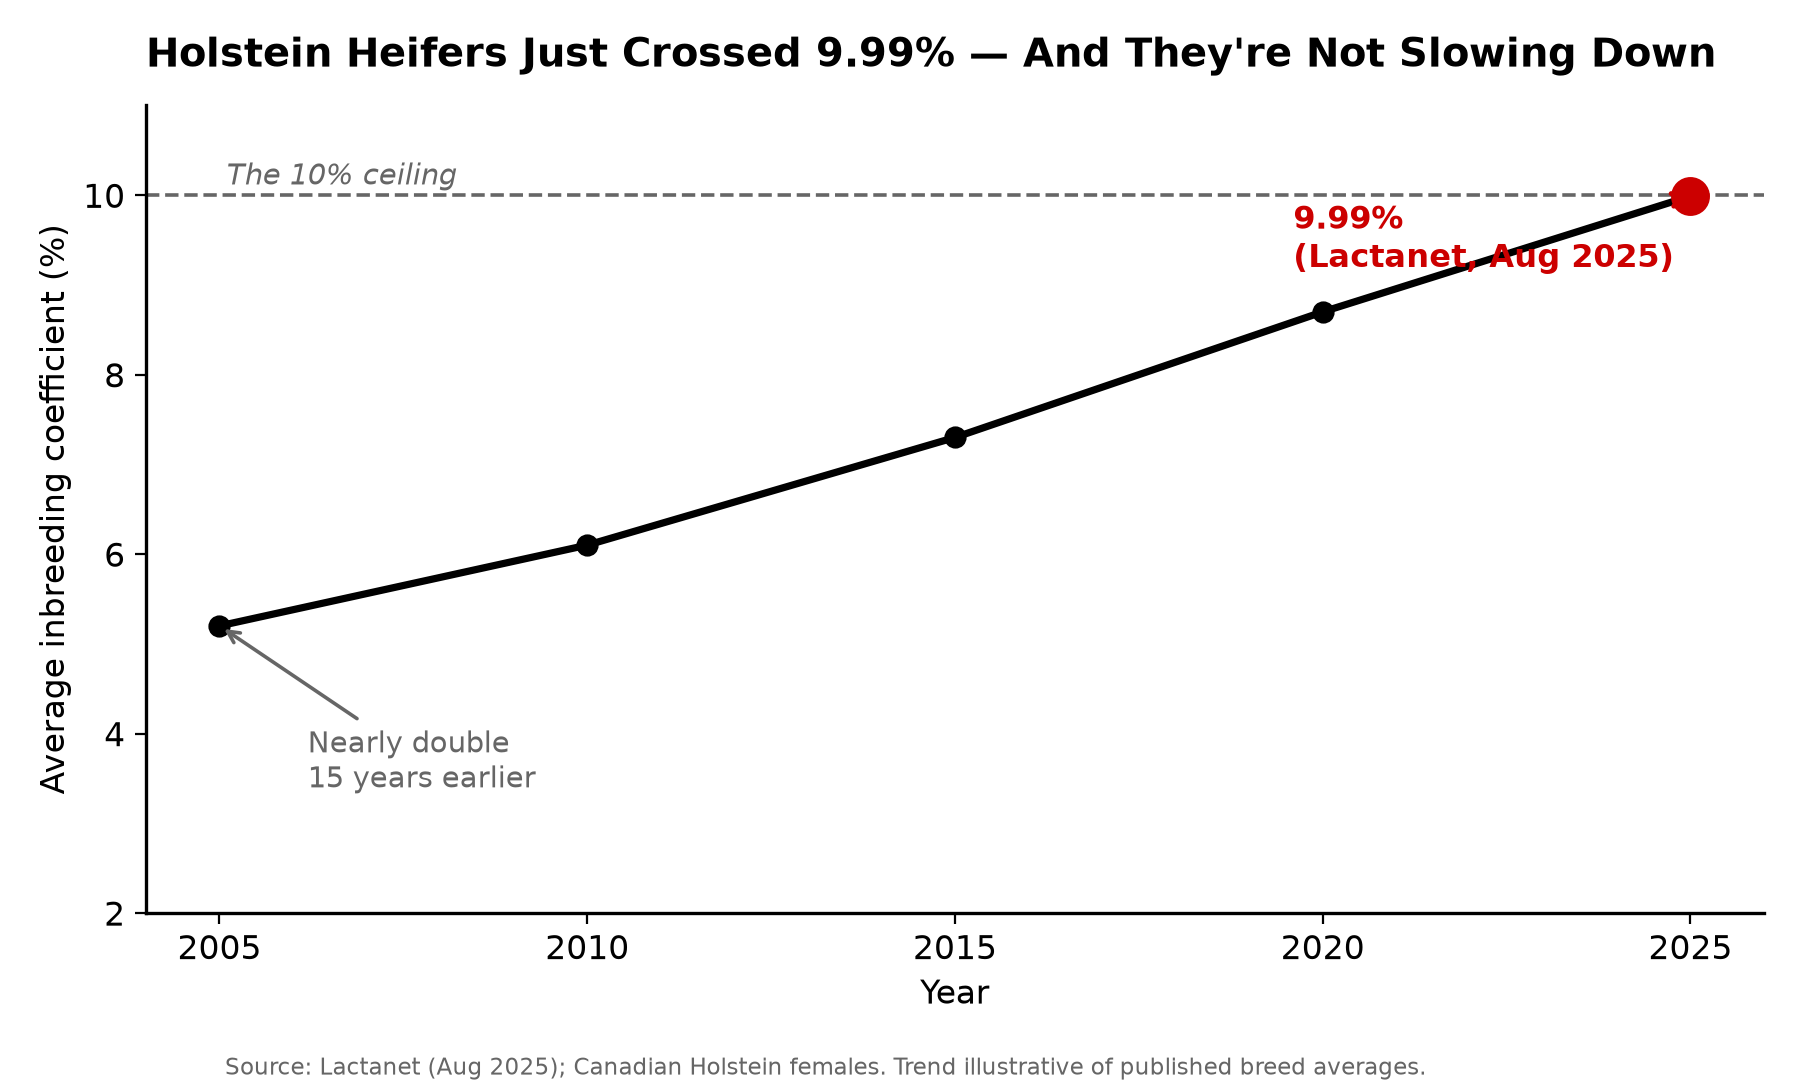
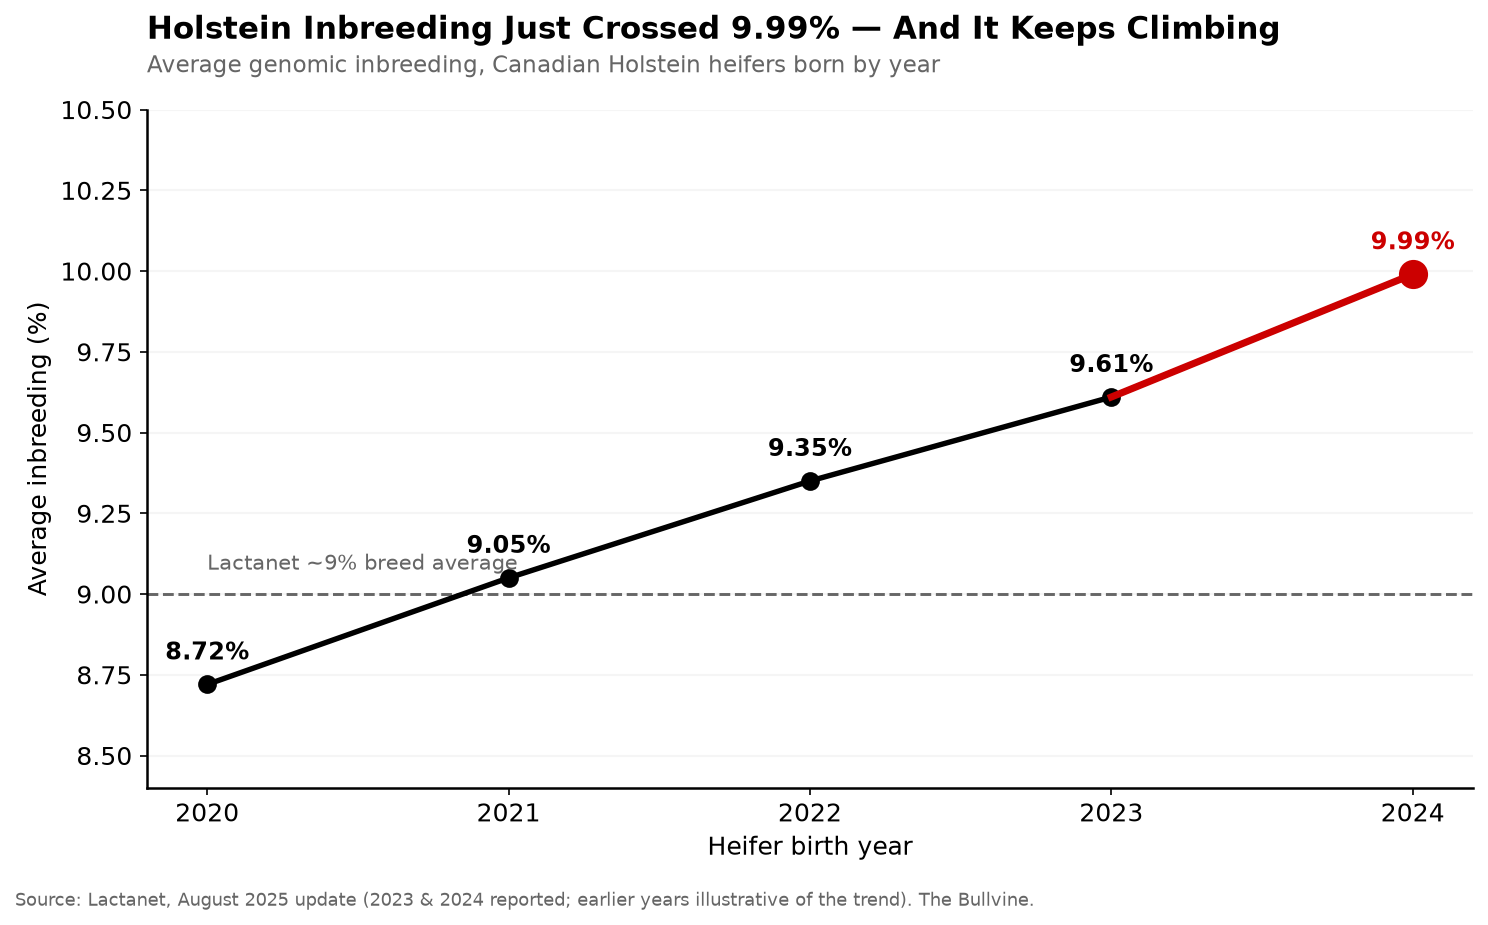
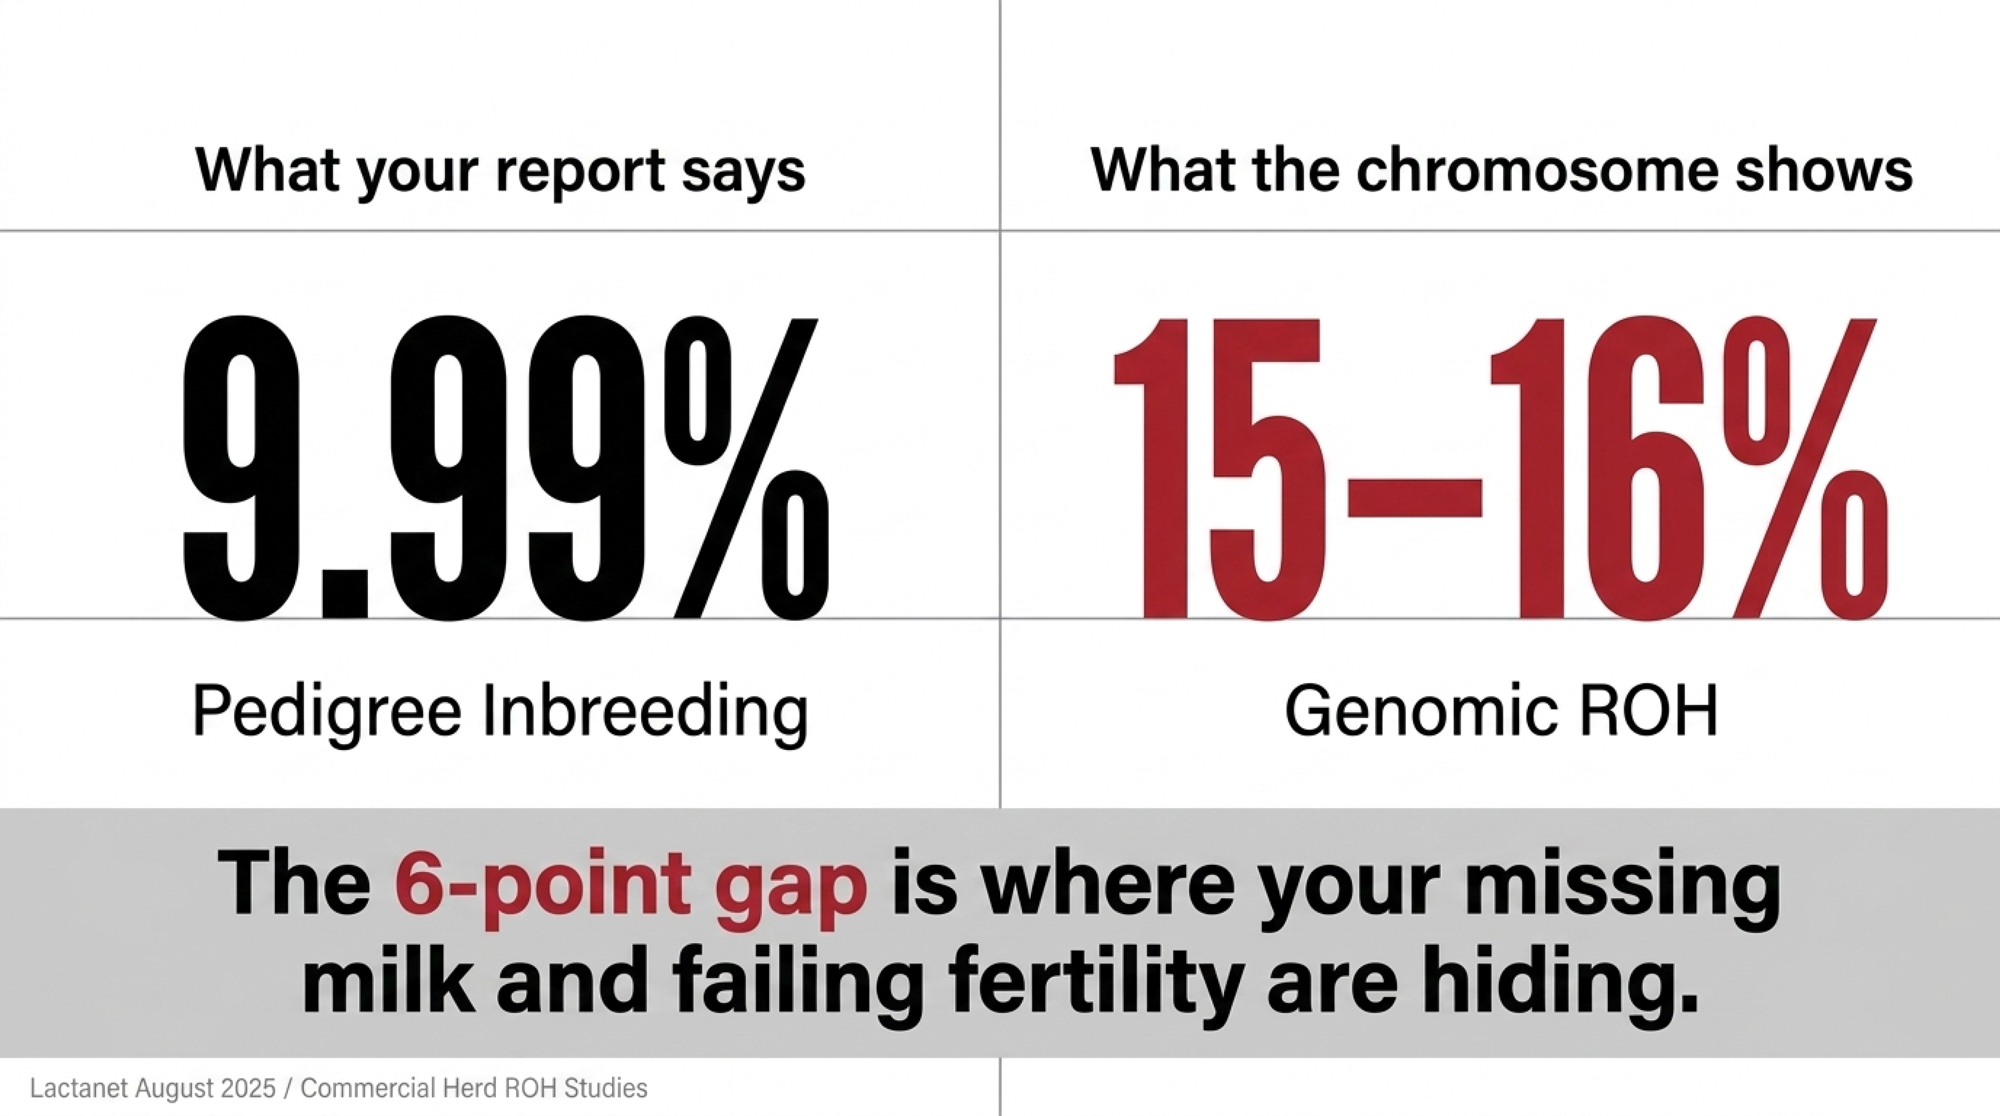
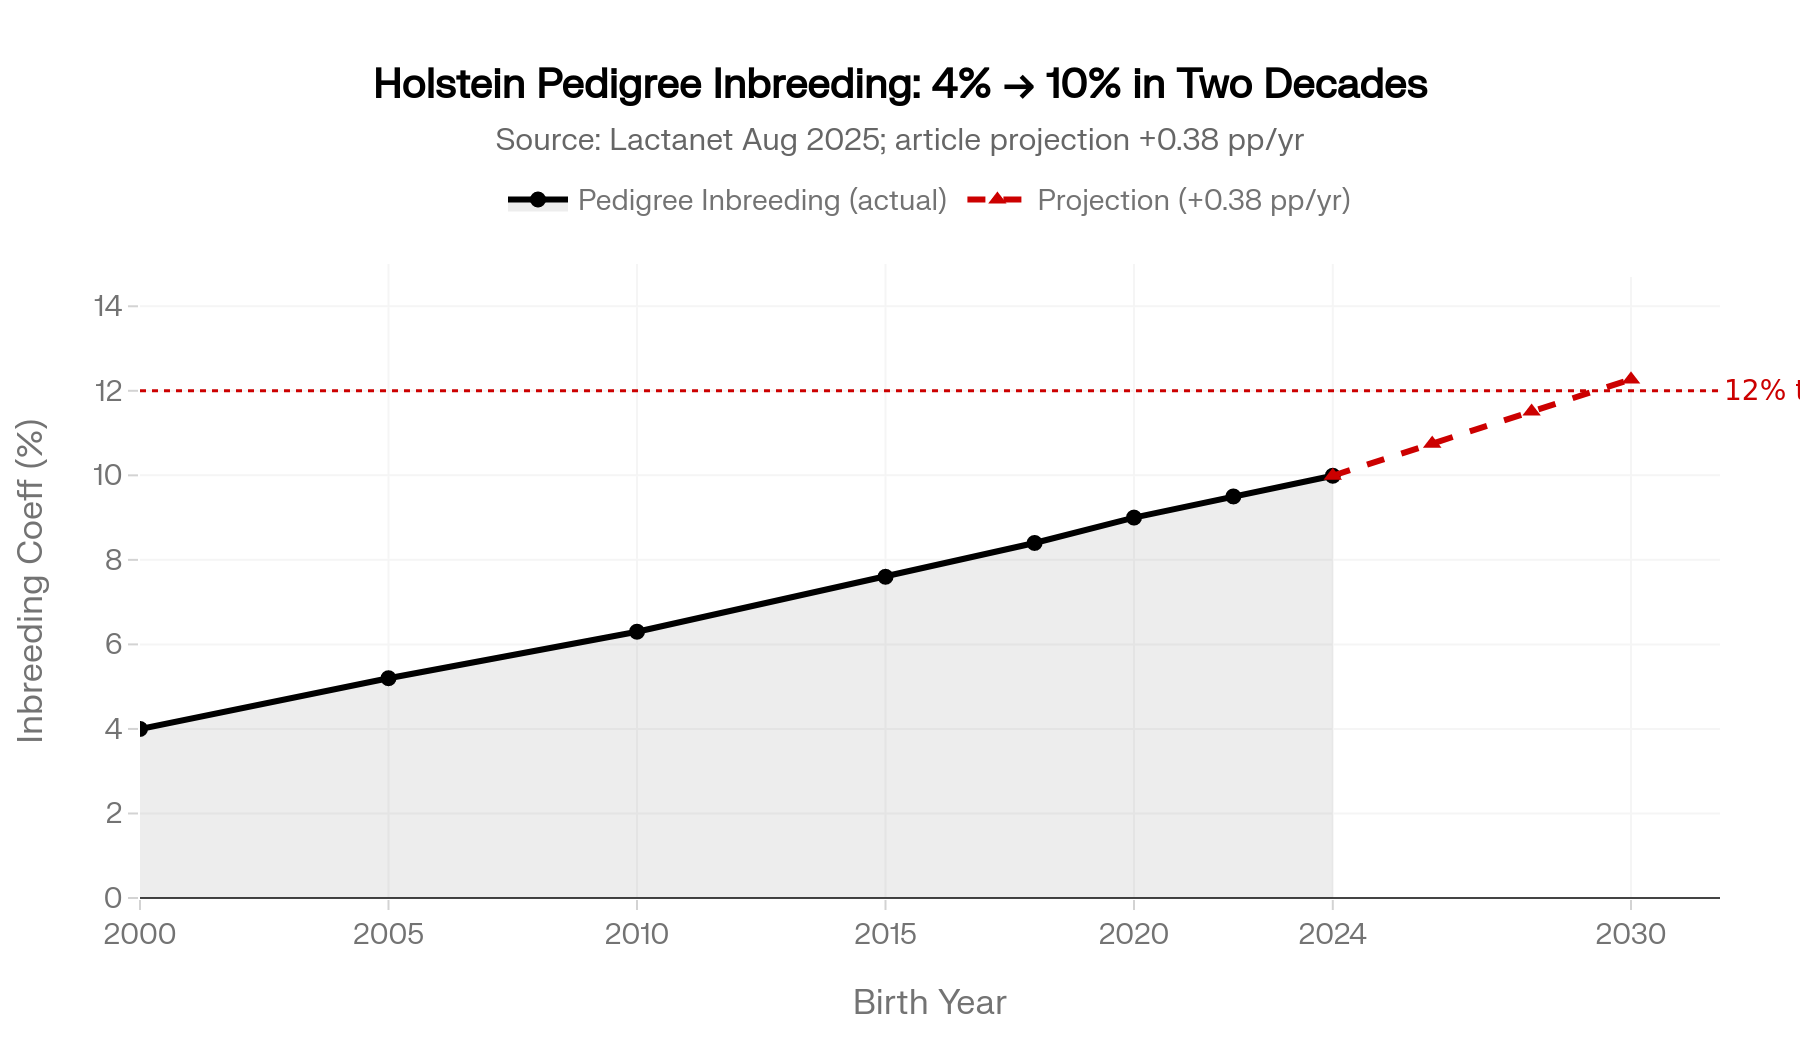
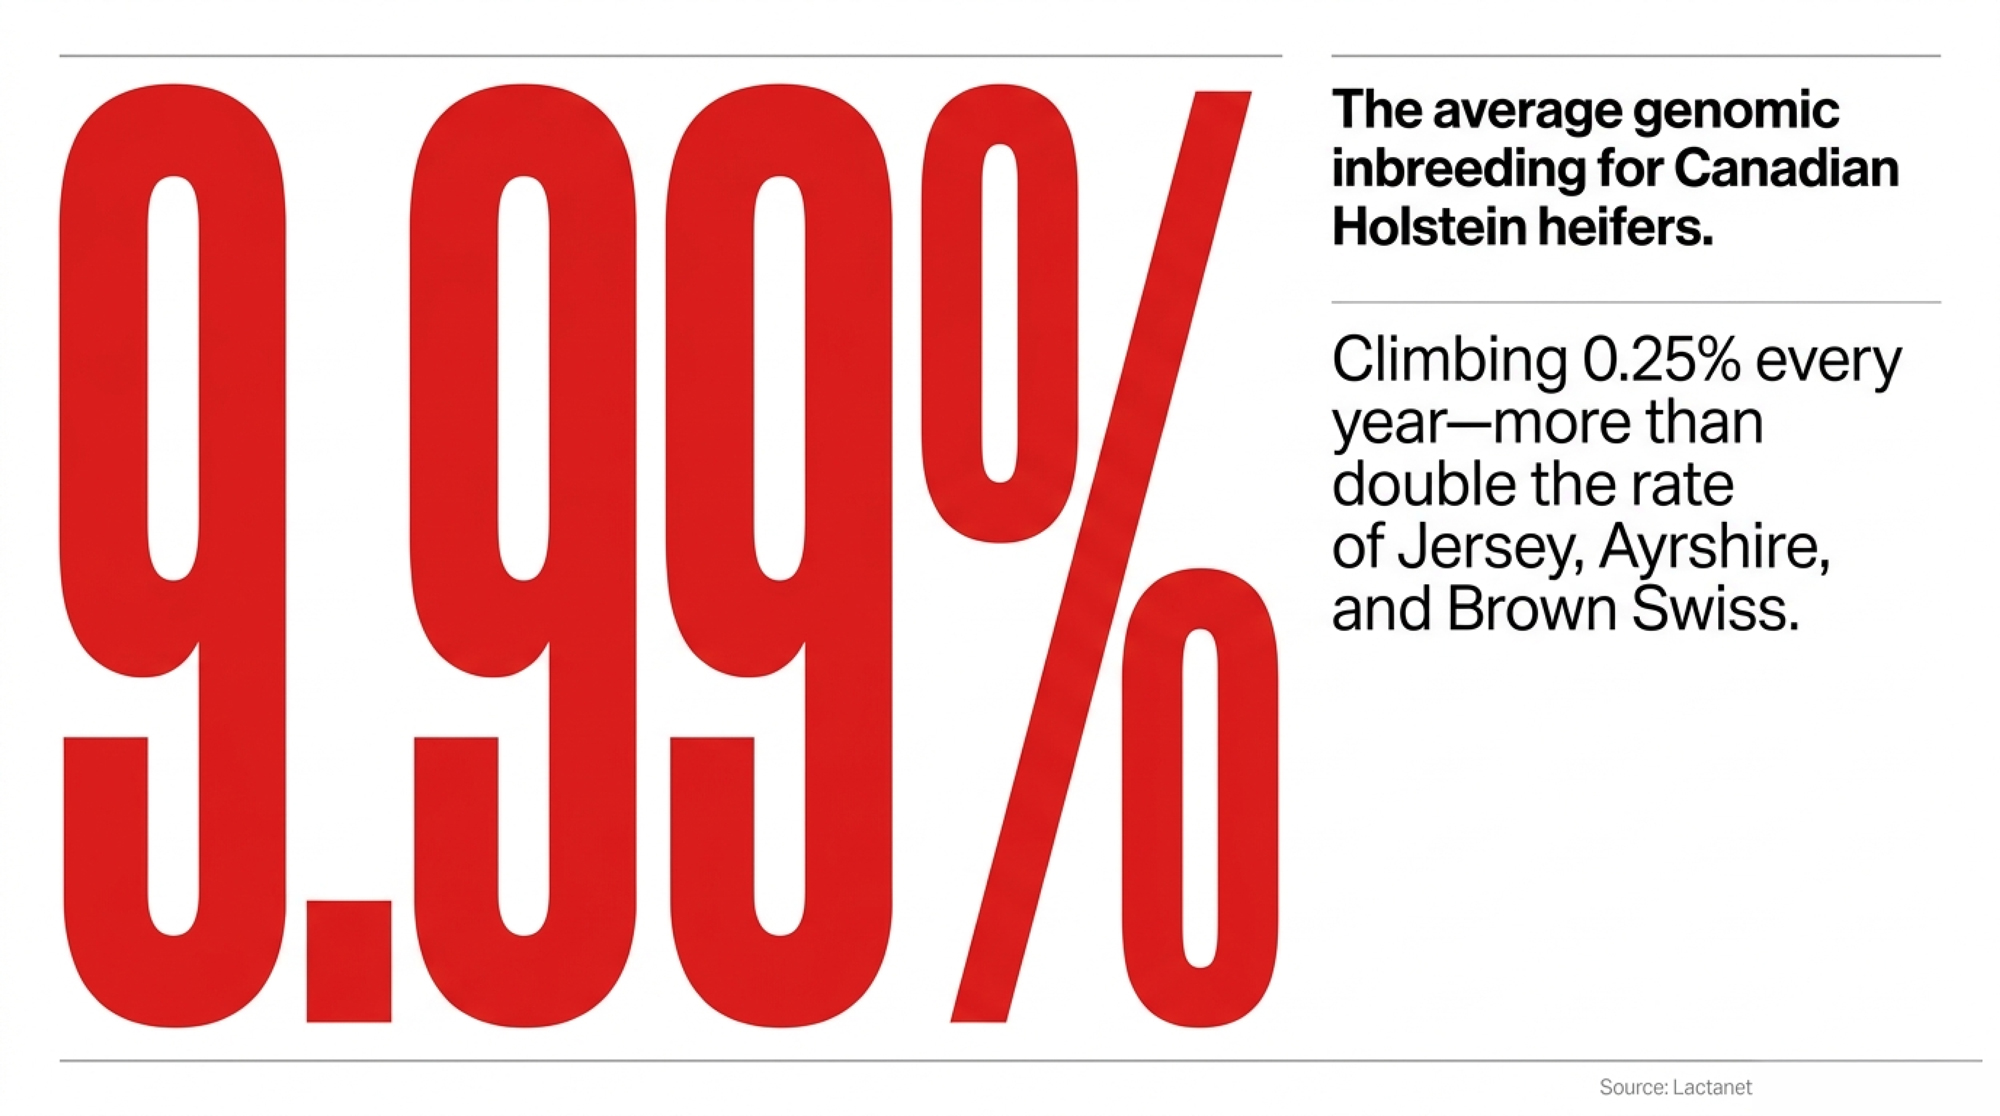
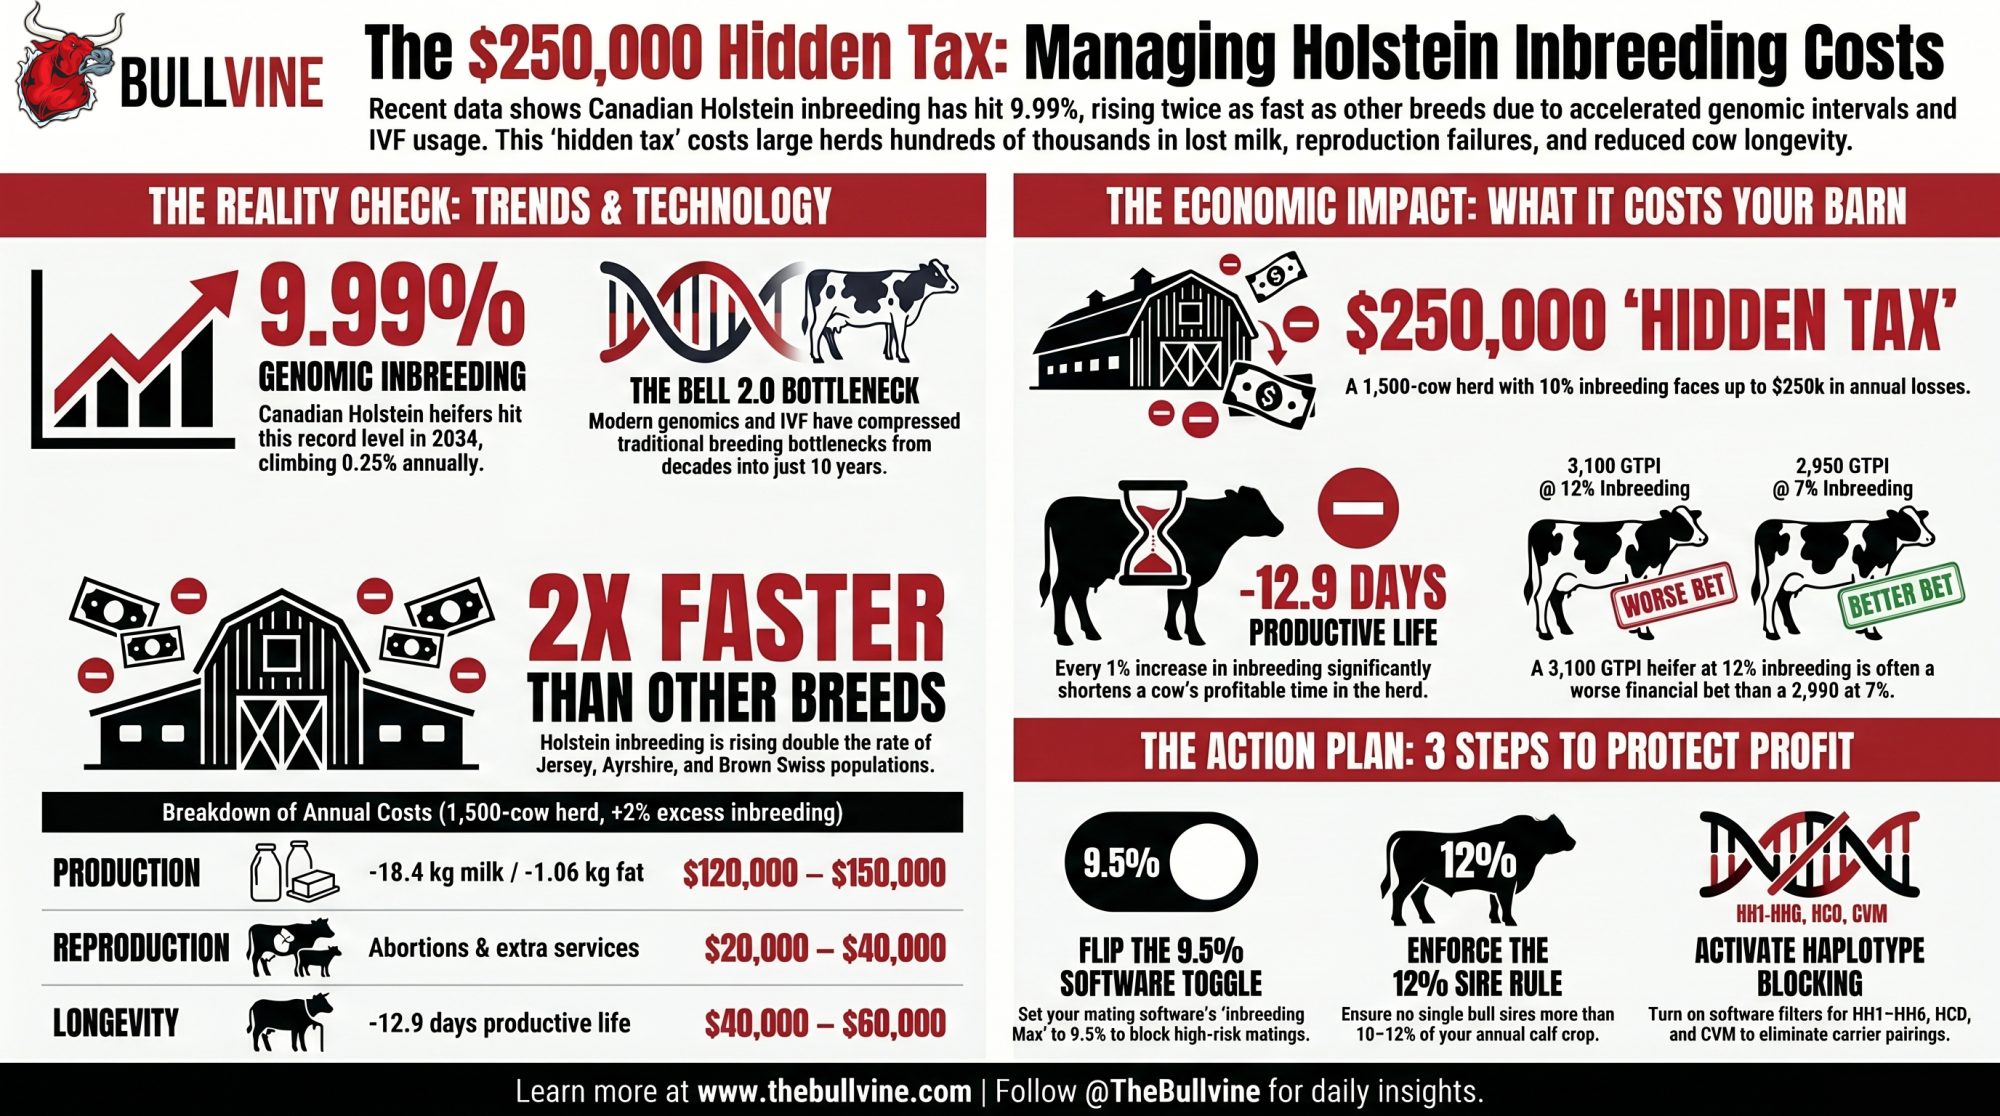
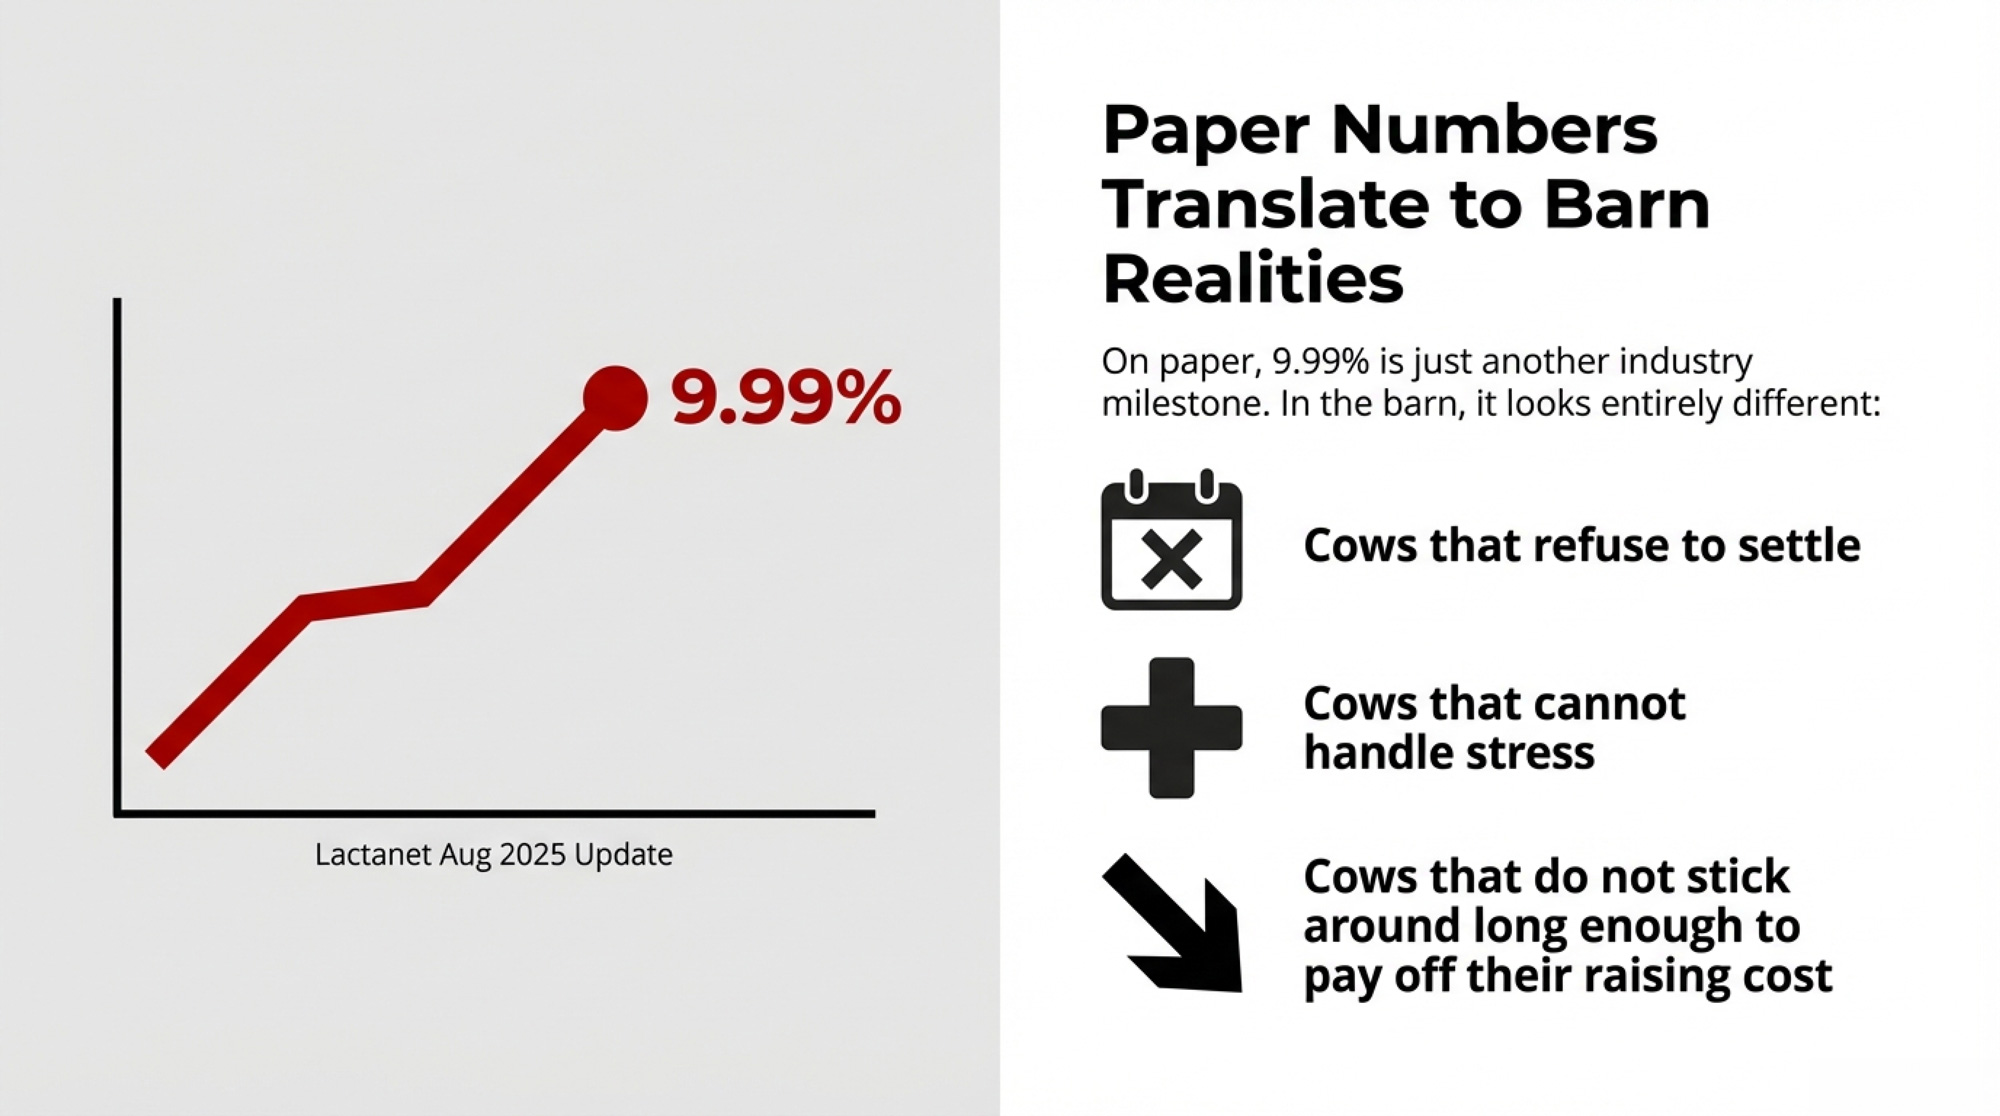
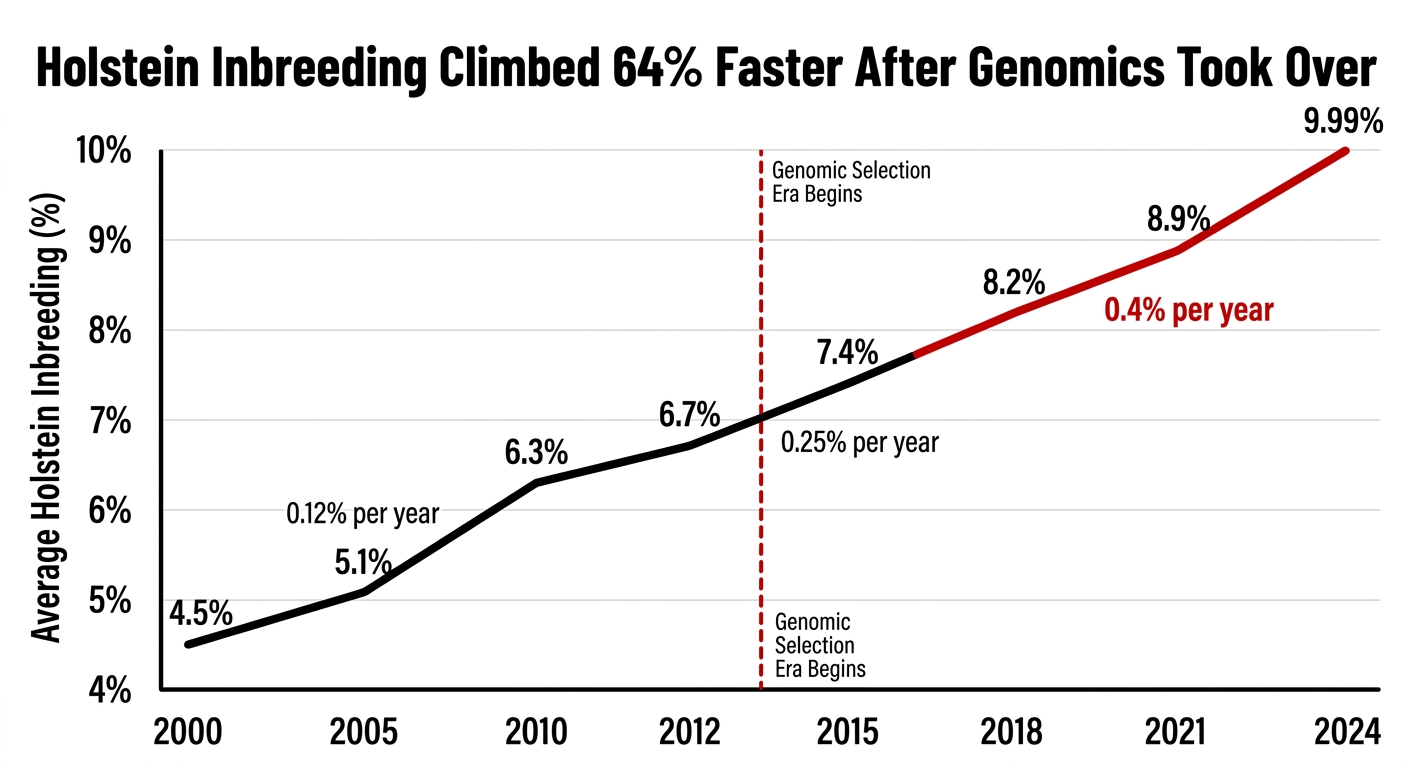
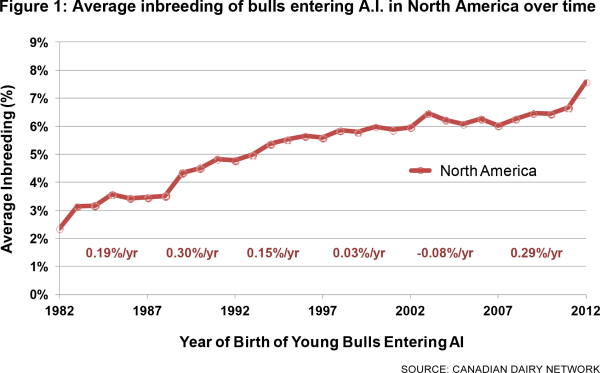
Canadian Holstein heifers born in 2024 now average 9.99% inbreeding, per Lactanet’s August 2025 update — up from 9.61% the year before, and nearly double where it sat 15 years ago. The US doesn’t publish one breed-average figure, but CDCB’s base-change work tells the same story: average Expected Future Inbreeding jumped from 7.5% to 9.4% between the 2015 and 2020 cow bases. Different yardstick. Same direction.

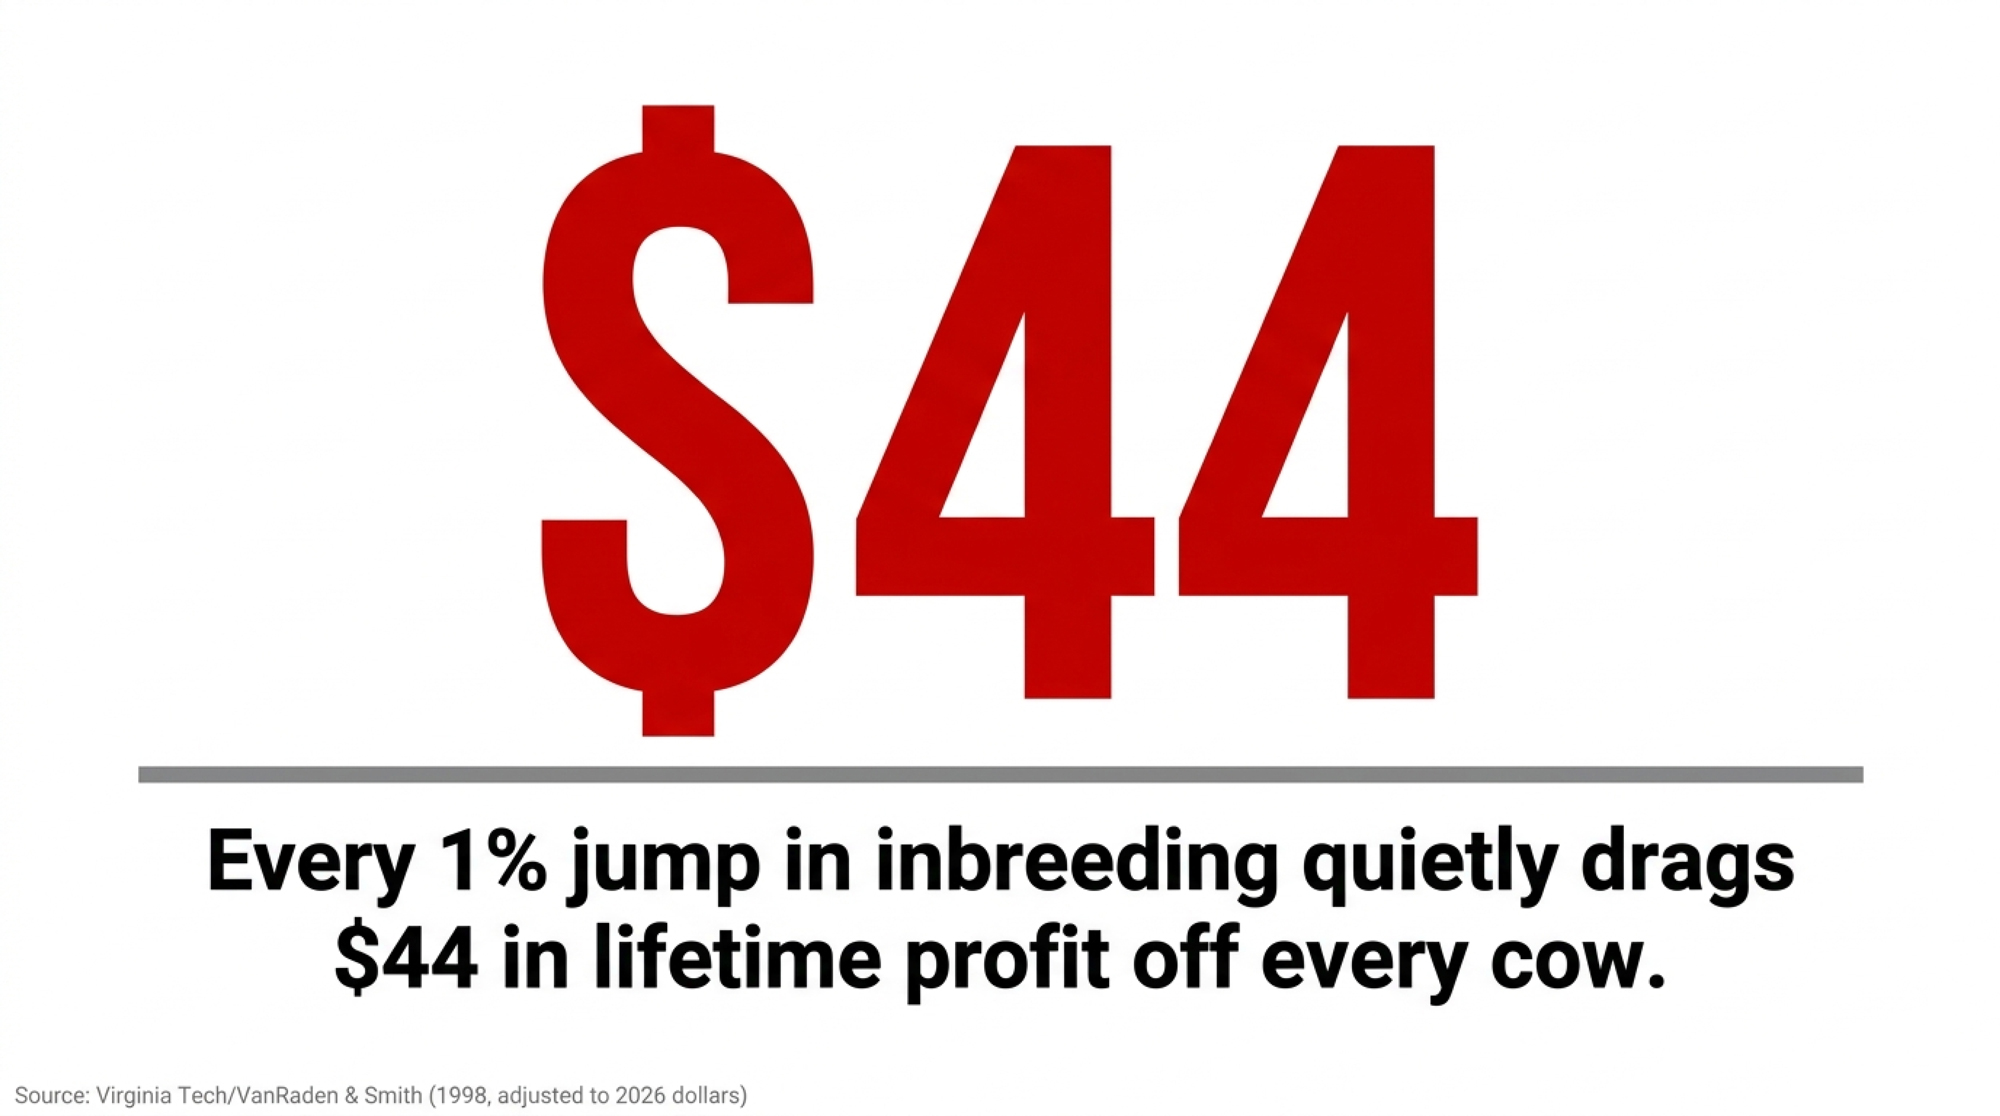
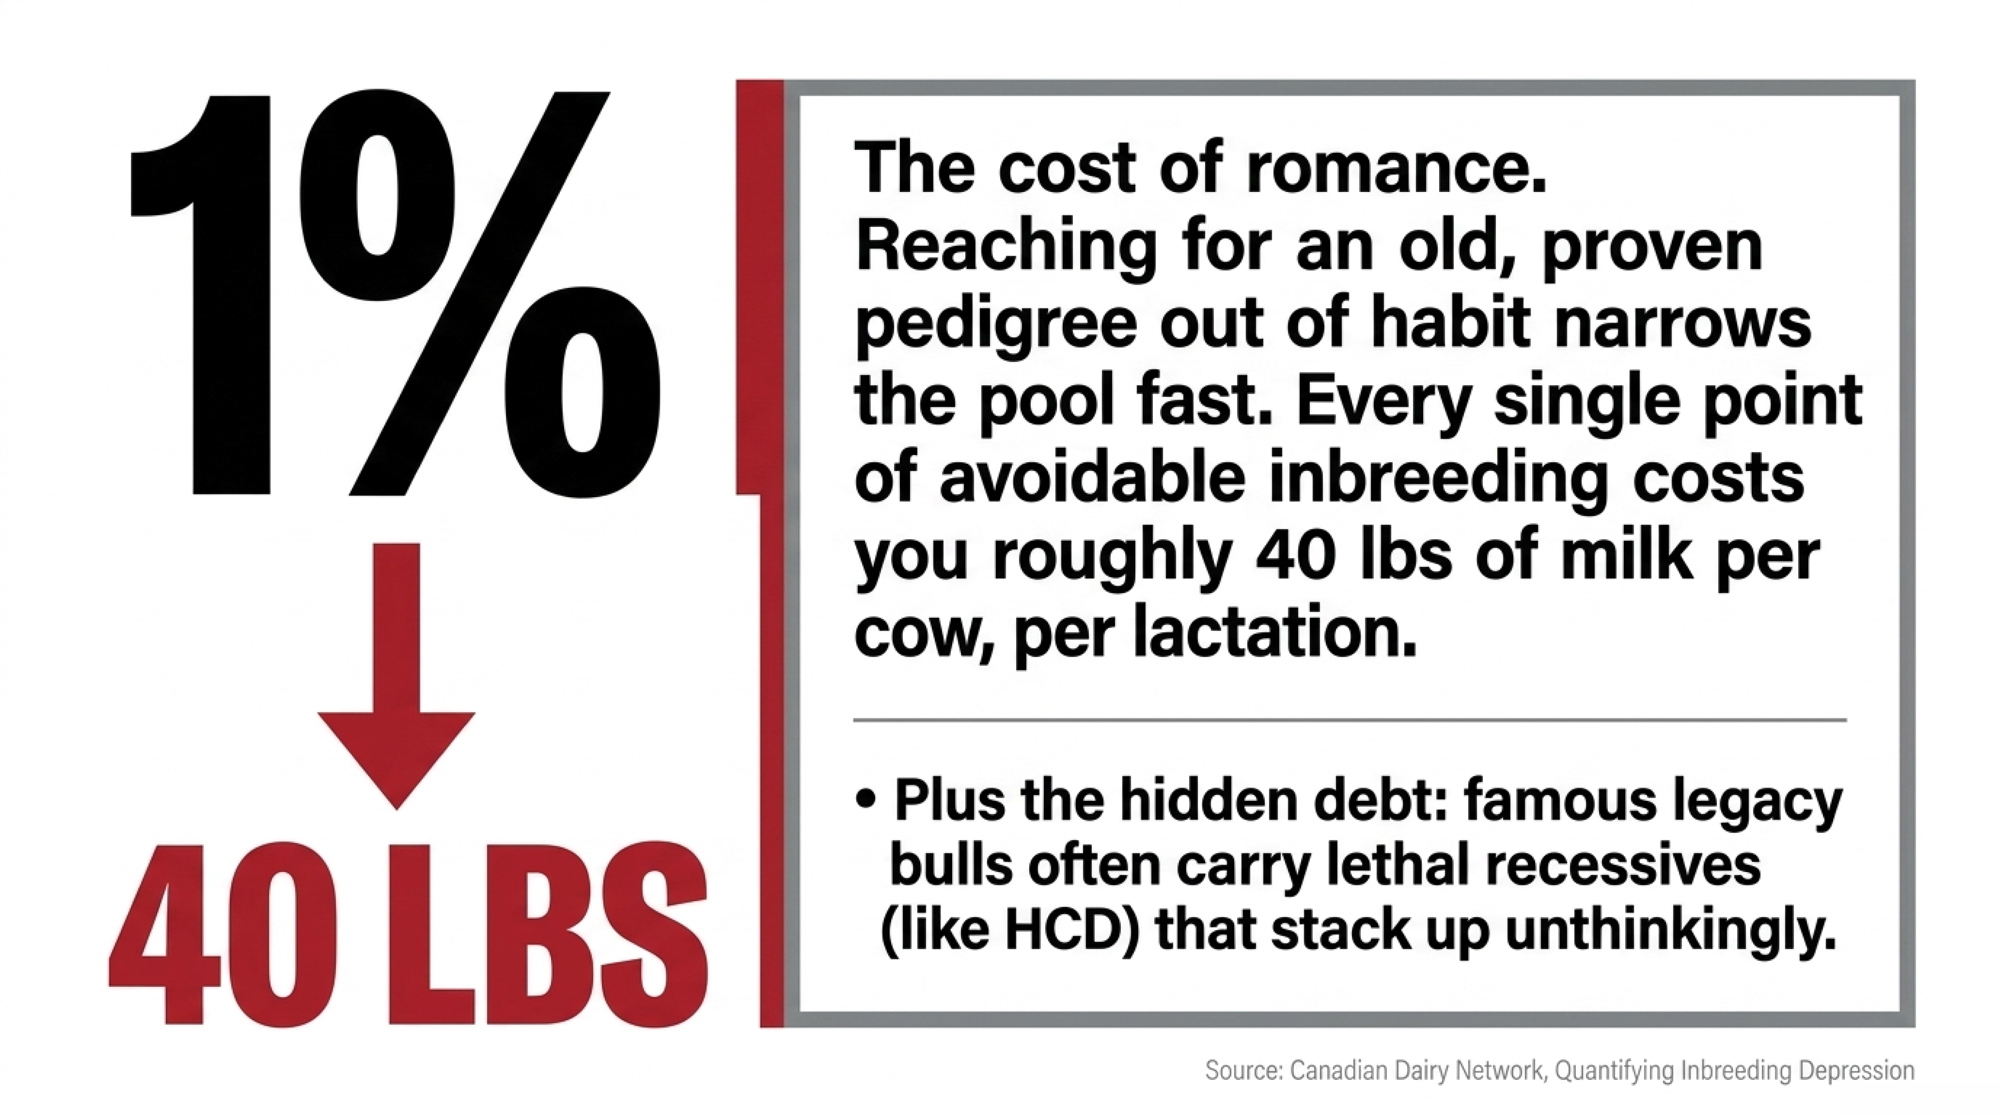
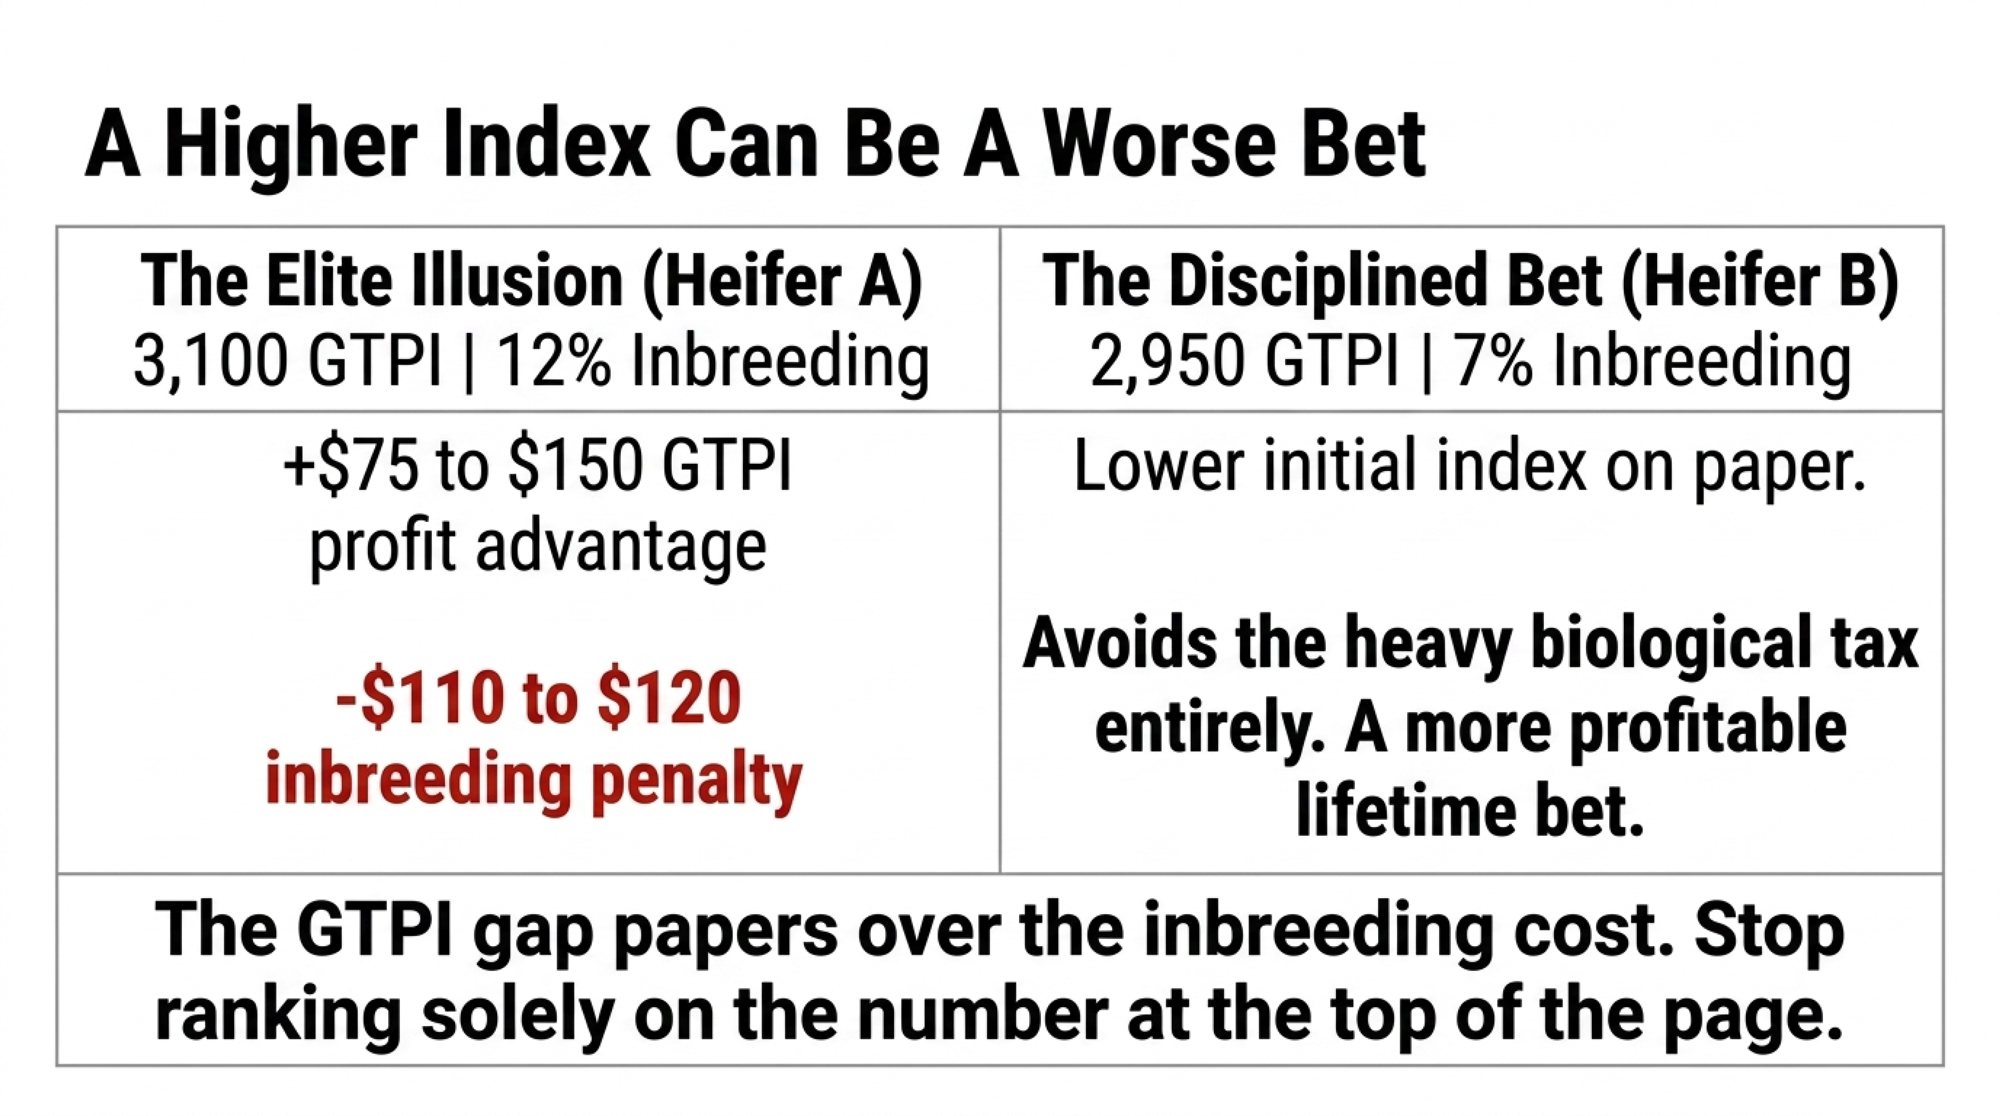
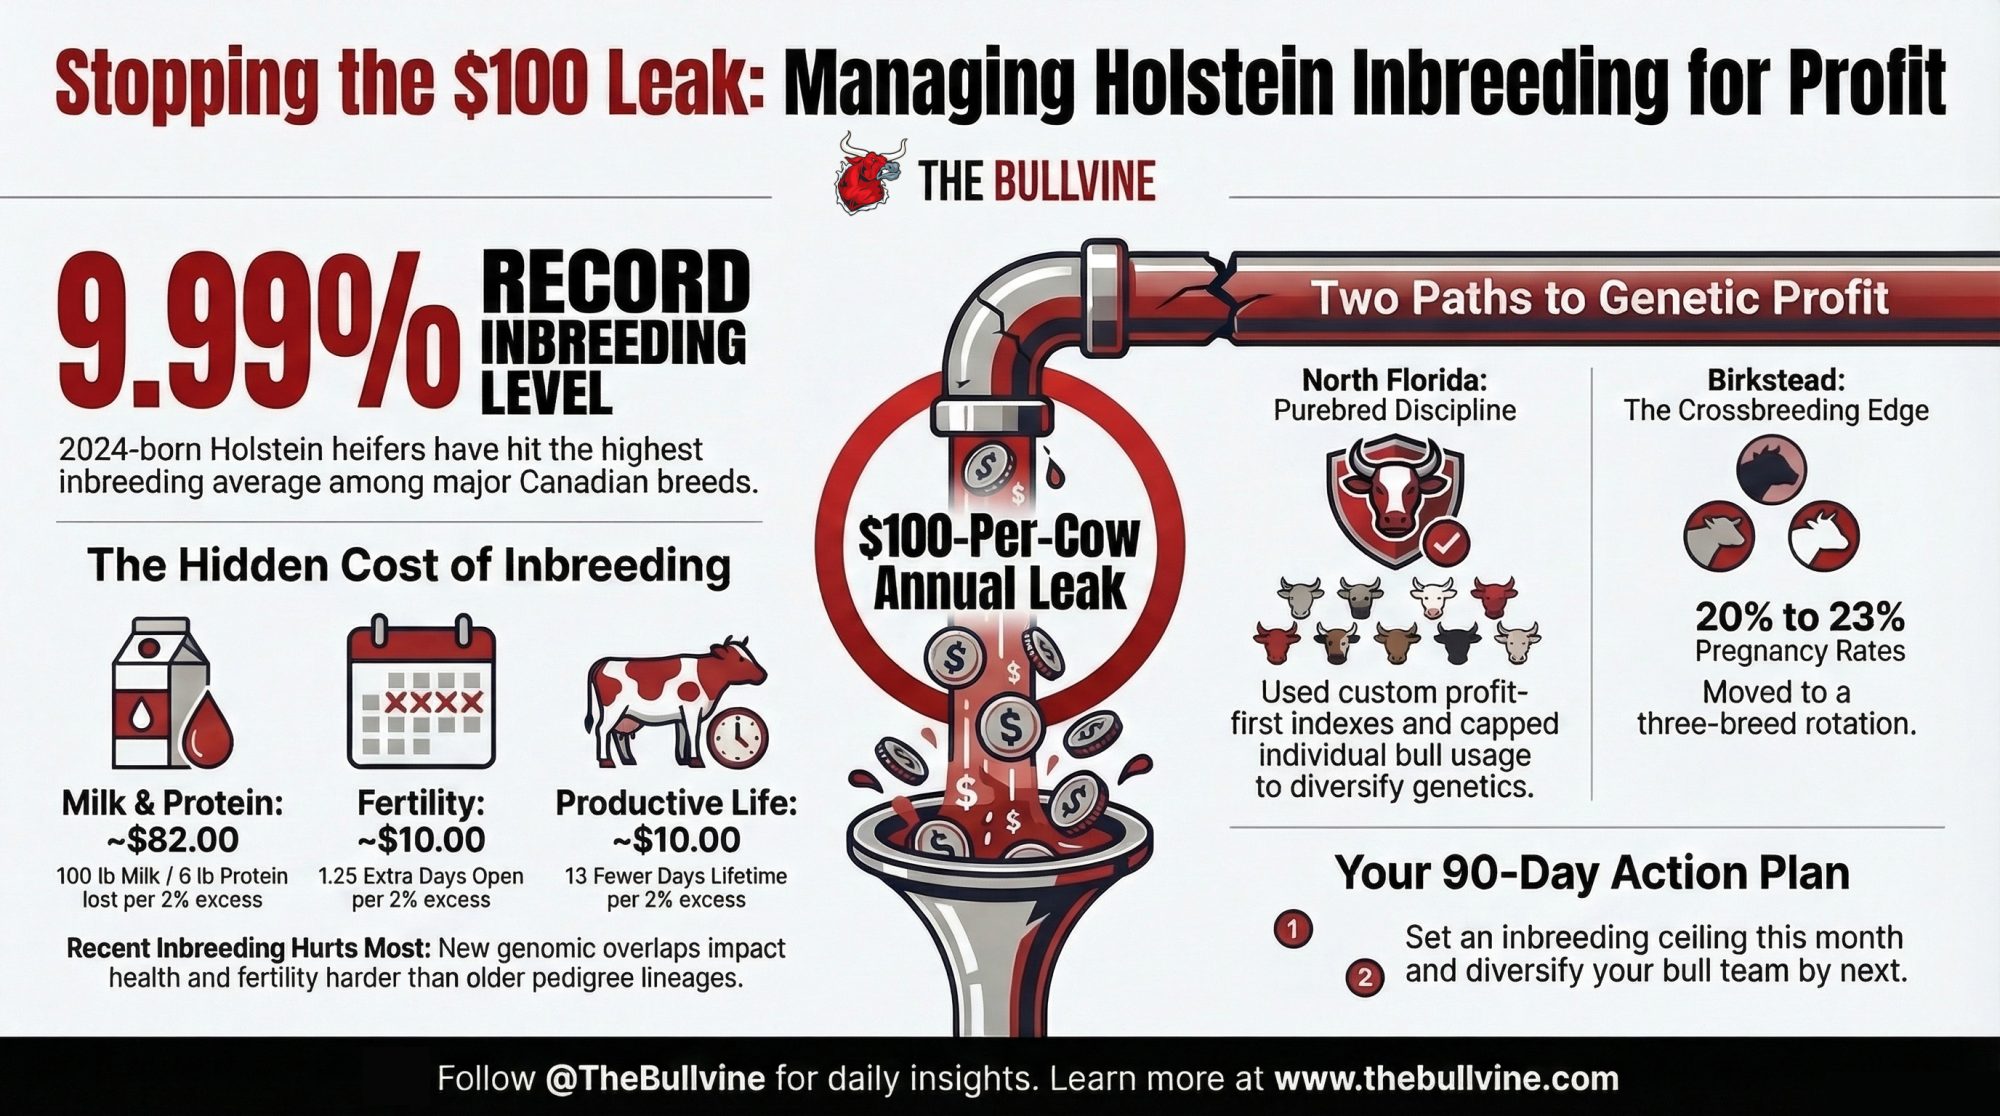
The Inbreeding Alarm: With breed averages sitting at a historic 9.99%, doubling down on “popular” branches of a dynasty without a strict mating guardrail is genetic self-sabotage. Virginia Tech’s benchmark work (Smith et al., 1998, JDS) pegged each 1% rise in inbreeding at roughly $22 to $24 in lost lifetime net income per cow — but that’s in 1999 dollars. Inflation-adjusted and paired with newer genomic milk-loss data, real-world estimates now run about $44 to $100 per cow. And it hits exactly where dynasties are supposed to protect you: fertility, stillbirths, immune-system slack.

So you manage a dynasty like a long-term investment, not a shortcut:

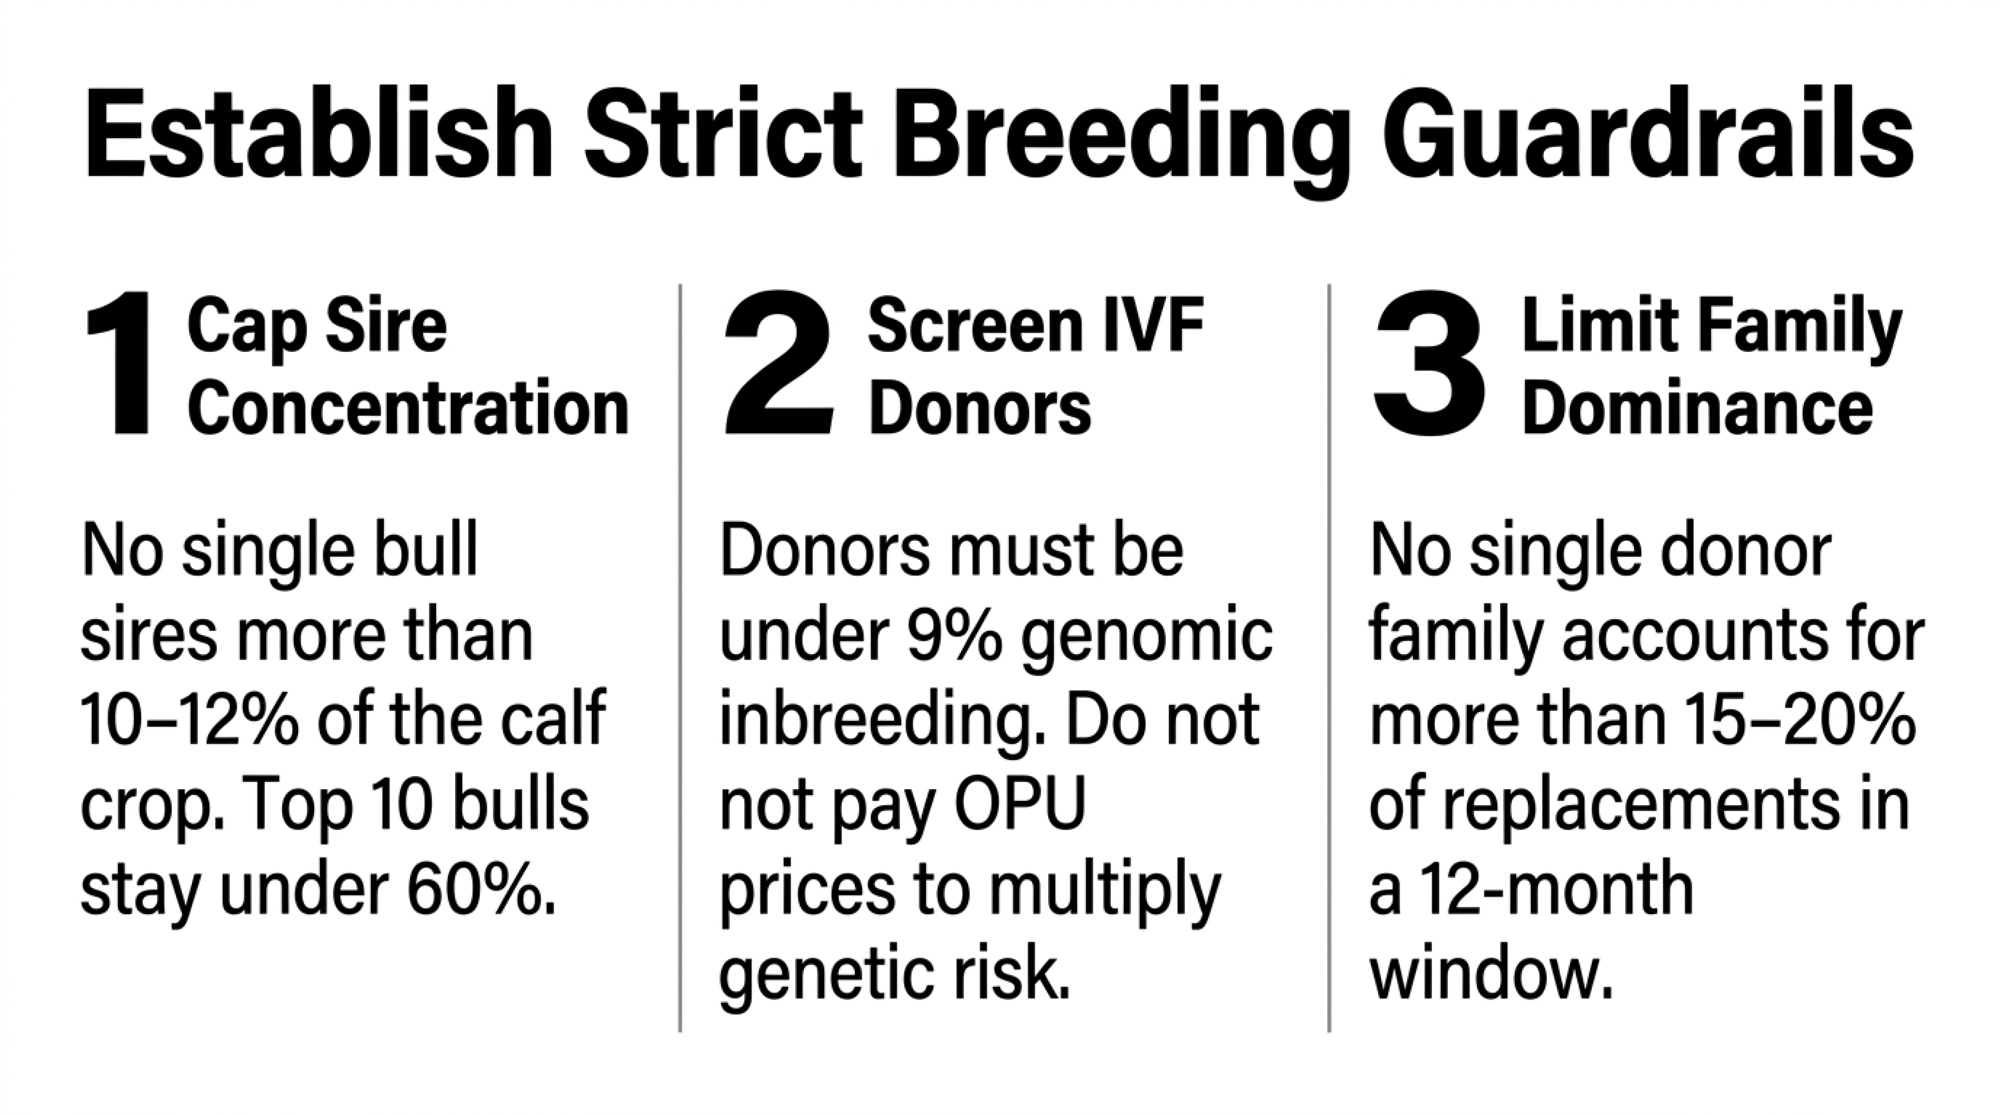
  • Track inbreeding animal by animal, not just as a herd average.
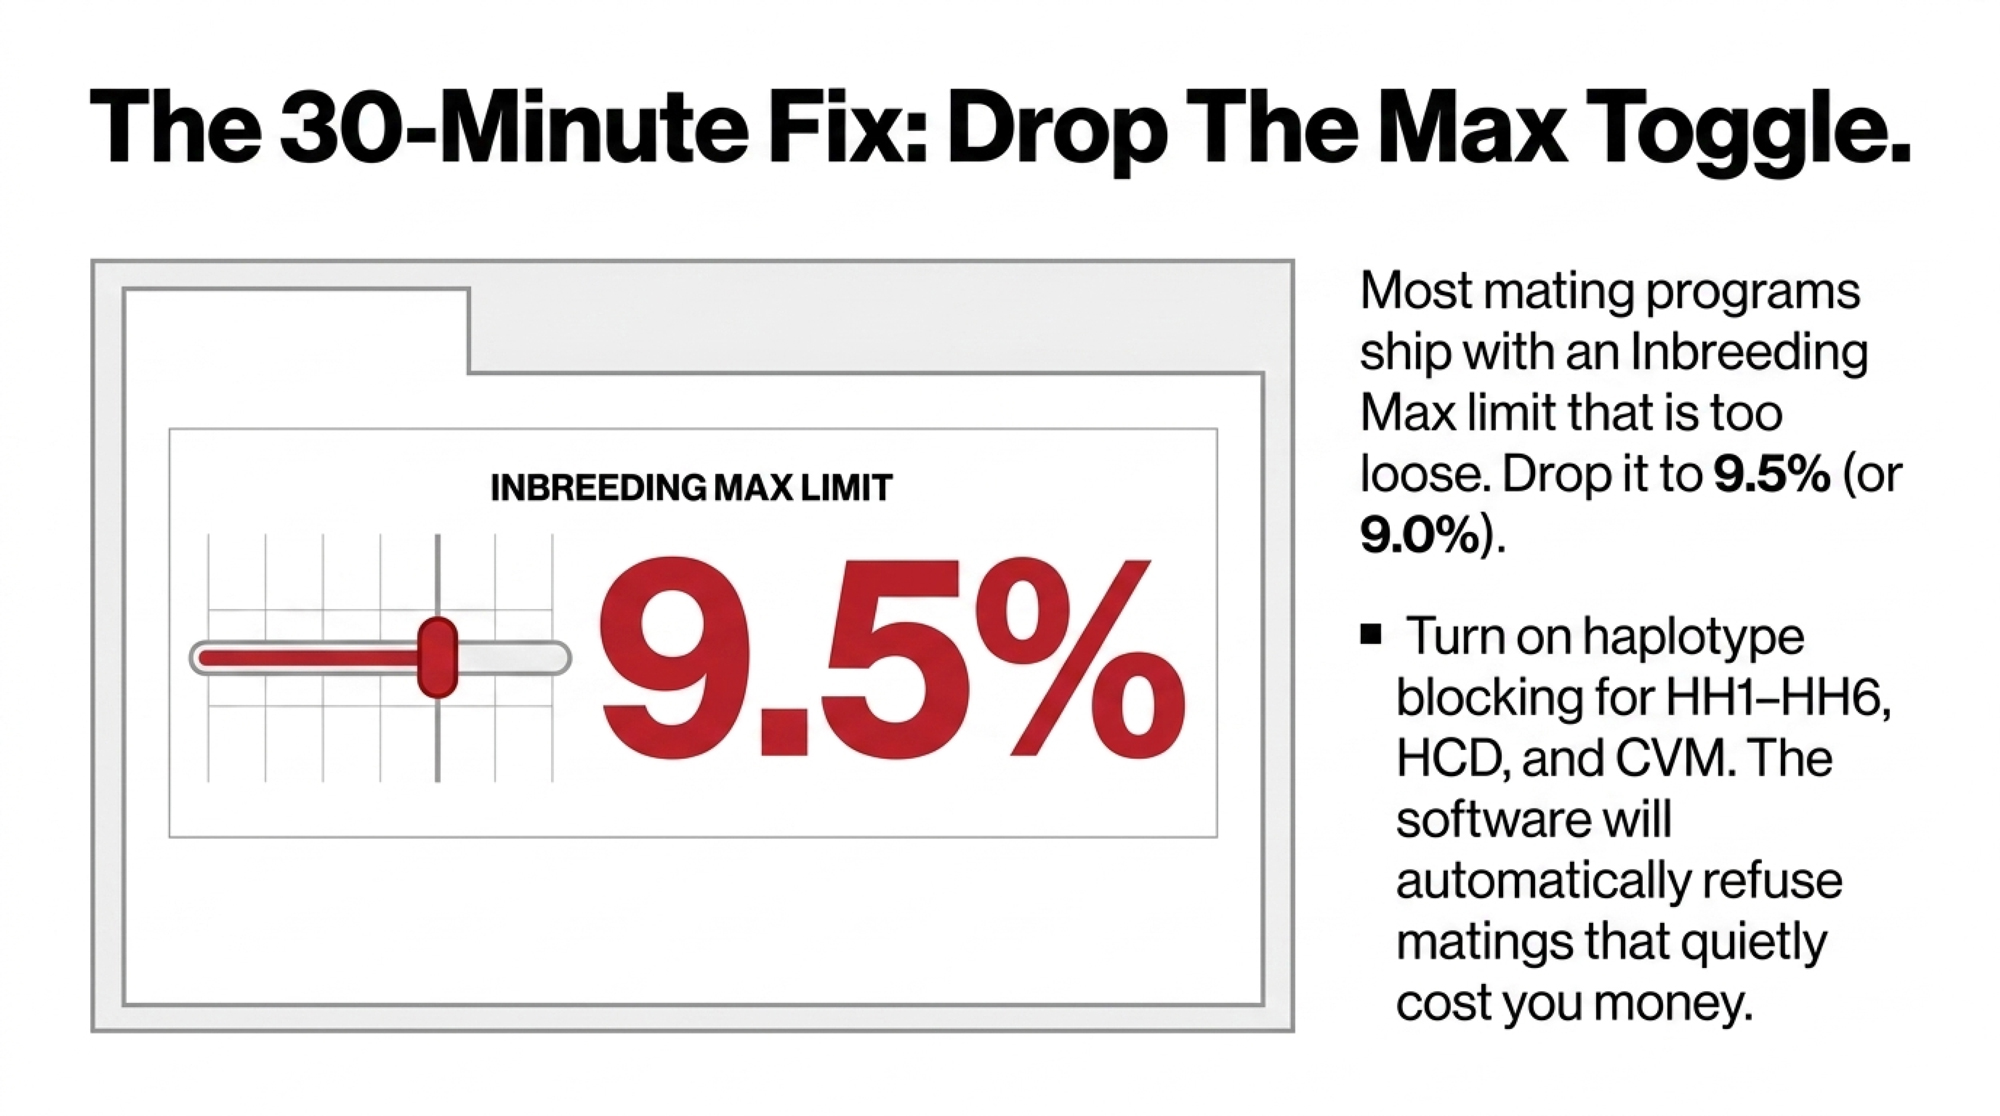
  • Hold expected heifer-crop inbreeding well below the 9.99% breed average — treat whatever number you pick as a brake pedal, not a target.
  • Don’t blackball elite carrier bulls. A +3,200 GTPI carrier mated only to clear (Code 0) cows beats a +2,800 GTPI clean bull — you bank the genetics and dodge the homozygous risk.
  • Use genomic relationship data to find less-related bulls that still fit your dynasty’s type and production goals.

The full barn math on what each point of inbreeding costs is in Holstein’s $40,500 Inbreeding Bill, and the outcross-sourcing playbook is in How Blondin Sires Turned a Bottleneck into 75% Growth. You’re not giving up pedigree depth. You’re keeping inbreeding depression from erasing the exact traits that made you love the family.

Options and Trade-Offs for Farmers

Every herd sits in a different spot on the genetics curve. Three paths fit most 200- to 1,500-cow operations staring at this maternal blind spot.

The 30-Day Maternal Audit (start here). Print three to four years of cows sorted by lifetime milk or margin. Highlight the ones in third lactation or better with solid components and no chronic problems. Trace them back three maternal generations and circle the surnames that repeat. When it makes sense: any herd over ~150 cows with a few years of records. What it takes: a couple hours with herd software and a pen — no consulting fee. The limit: if your records don’t track lifetime performance well, you’ll lean on cull notes and memory as a stopgap. Even that beats flying blind. Tag those dynasty animals in your software this month, and you’ve already started changing daily decisions.

The Dynasty-First Semen Plan. Redirect the budget you already spend. Sexed, high-end semen goes to your top 20 to 30 dynasty cows and heifers first; conventional Holstein or beef goes on the rest unless one has a clear role. Cap expected inbreeding well under 9.99% on dynasty matings, and when a sire pushes those animals toward the line, swap him. When it makes sense: herds already spending real money on elite or sexed semen. The trade-off: you give up chasing every new bull and run a tighter sire list longer. As genomic evaluations put more weight on health and fertility, the smartest move won’t be overriding maternal proof — it’ll be sharpening which sires you use inside families that have already earned their spot in your barn.

The “Stop Guessing” Embryo Rule. Write one rule before the next sale catalog hits: if the donor’s family can’t show three generations of daughters with solid production, decent classification, and real herd life, you don’t write a $3,000 check. When it makes sense: any herd using ET/IVF or tempted by purchased embryos. The trade-off: you’ll walk past a hot donor with sizzling numbers and no cow-family proof, and you might miss the rare new family that would’ve panned out. You’ll dodge far more expensive disappointments. As more ET programs chase feed efficiency and sustainability, donors from proven dynasties are the ones that hit under real-world stress.

Key Takeaways

  • If you can’t name the maternal lines behind your top 10 cows without opening the herd book, run the 30-day audit before you spend another dollar on semen or embryos.
  • If a donor’s family can’t show three generations of daughters that milk, breed back, and stay out of the dead pile, don’t pay brood-cow prices for her embryos.
  • If you’re running more than 15 to 20 Holstein sires in a 300-cow herd over two or three years, you’re spreading the budget too thin — tighten the list and aim it at your top three families.
  • If your embryo-derived heifers aren’t beating your herd’s average retention to a third lactation, your program’s riding shallow families. Rebuild it around lines that have proven they stay.
  • If your herd inbreeding is creeping toward 9.99%, cap dynasty matings below that line, mate elite carriers to Code 0 cows only, and check inbreeding animal by animal — not just as a herd average.

Nobody’s arguing whether Barbie, Laurie Sheik, and Roxy created value. Four millionaire sires — with Comestar Lee alone reaching 1.5 million doses — 16 Excellent daughters in one family, a third of the elite PTAT list: that answer’s already written. The open question is whether your program is built to reward the dynasties quietly carrying your barn, or whether you’re still spending 2026 money like it’s 1998, letting catalogs call the shots instead of the surnames on your best cows’ tags.

So here’s the one to sit with before the next proof run lands in your inbox: print that three-to-four-year cow list tomorrow morning and see which three families are actually holding your barn together. Once you see it, you can’t unsee it. And when you want the full model — exactly how much extra profit per lactation a dynasty cow throws off at 200 cows versus 1,500 — that’s the deeper per-cow math we’re building next, and where Bullvine Weekly readers get it first.

Run Your Numbers

Genomic Testing ROI Calculator — Before you flush a donor or write another $3,000 embryo check, run the numbers on which animals are actually worth testing. It puts a dollar value on the spread between your best and worst genetic quartiles, flags where inbreeding risk needs tighter control, and pressure-tests whether the decision pencils under conservative assumptions — not just the aggressive ones.

Complete references and supporting documentation are available upon request by contacting the editorial team at editor@thebullvine.com.

Learn More

The Sunday Read Dairy Professionals Don’t Skip.

Every week, thousands of producers, breeders, and industry insiders open Bullvine Weekly for genetics insights, market shifts, and profit strategies they won’t find anywhere else. One email. Five minutes. Smarter decisions all week.
NewsSubscribe
First
Last
Consent

Dairy Strength, Not Height: The Proof Rule Hiding in Every Holstein Pedigree

Holstein heifers just crossed 9.99% inbreeding — and the drift is quietly dragging money off every cow. Here’s the one linear rule that keeps “dairy strength” from turning into expensive frailty.

O-Bee Manfred Justice-ET — look at that deep, powerful front end. That’s the strength the breed was starving for, so it bred him, his sons, and his grandsons into damn near everything. Twenty years later, the bill for all that concentration shows up as 9.99% inbreeding on the milk check.

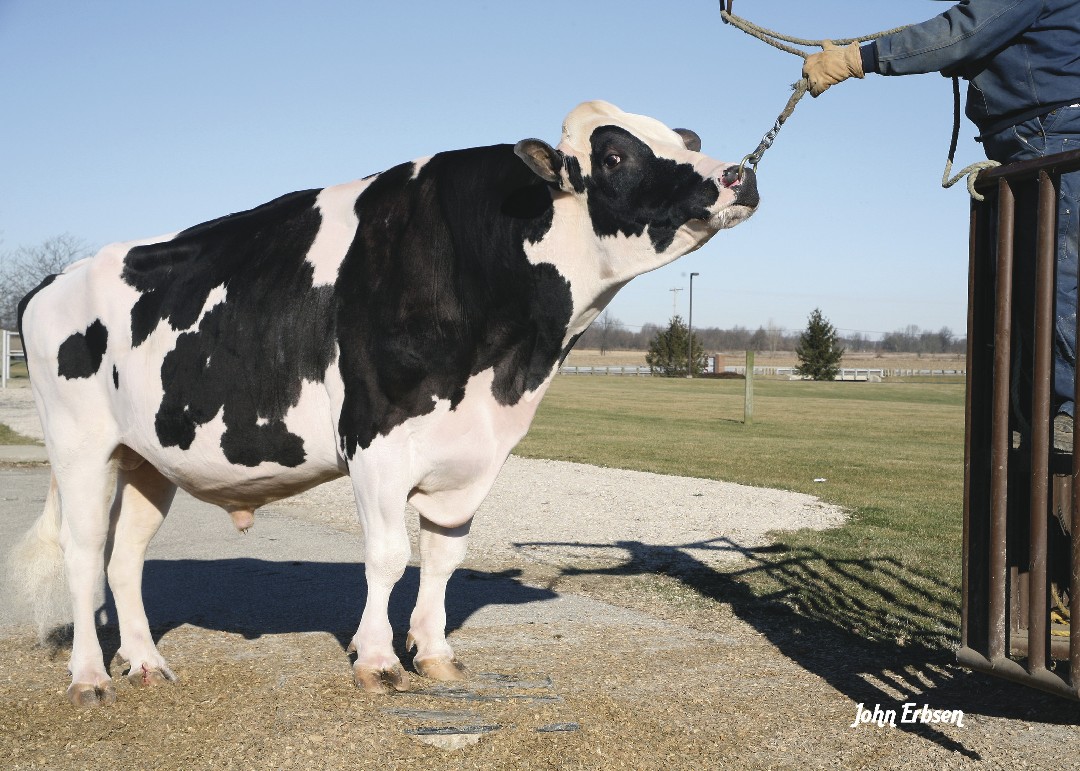
There was a stretch, not that long ago, when you could feel smart just rattling off O-Man’s proof. O-Bee Manfred Justice-ET. Fat, protein, health traits, calving ease — the exact toolkit the breed was starving for — wrapped around type nobody bragged about. He fixed real problems. So the industry did what it always does with a bull that fixes real problems. It bred him, his sons, and his grandsons into damn near everything.

And that’s the part nobody was pricing at the time. Somebody, somewhere, is at a bull catalog this morning stacking a mating a shade more inbred than the last one. Not on purpose. It never is.

The Bull the Breed Couldn’t Stop Using

O-Man was born in 2004. By the back half of that decade his sons stacked the top of the lists — Snowman, Man-O-Man, the whole run — while O-Man himself kept climbing on health and components long after most bulls his age had faded. And his daughters became brood-cow royalty: Seagull-Bay Oman Mirror, an O-Man daughter, went on to anchor a family that threads through modern sire stacks. 

One semen order at a time, the breed wired one bull deep into nearly every pedigree. That’s not a knock on O-Man. He earned the demand. But here’s what should land differently than it would have five years ago: the bill for all that concentration is finally showing up on the milk check.

What’s Really at Stake

The problem and its price tag sit side by side. Here’s the bottleneck on the left, and the money it’s pulling off your cows on the right.

Metric / HorizonThe Current Bottleneck (2025/2026)The Invisible Economic Drag
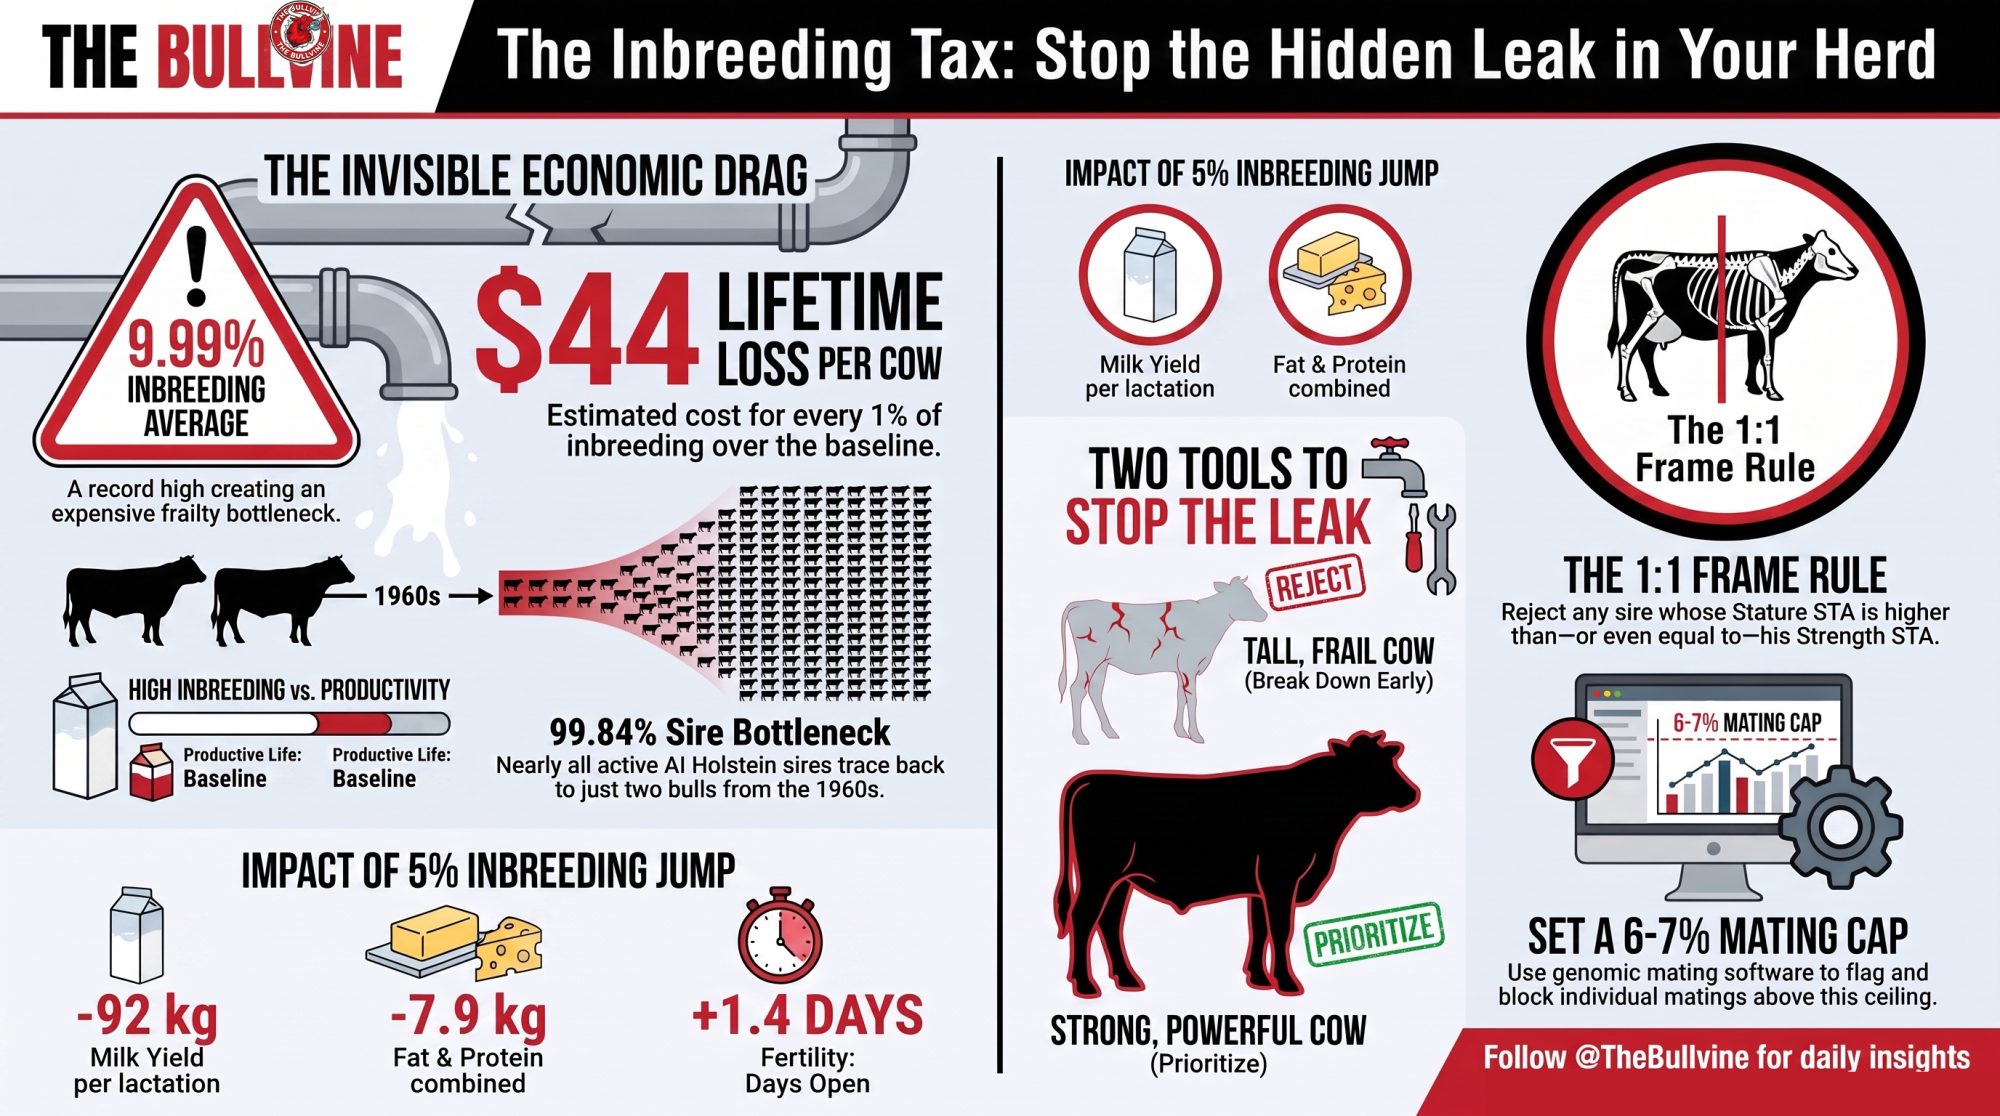
Breed BaselineCanadian Holstein heifers average 9.99%inbreeding (Lactanet, Aug 2025)  $44 per cow, per point in lifetime drag over baseline 
AI Lineup ShrinkFemale inbreeding now climbs ~3× fasterthan the pre-genomic era (~0.3–0.4%/yr)  $60 to $100 loss per cow, per lactation in high-inbreeding herds  
Pedigree Core99.84% of active AI sires trace to just two male lines — Elevation and Chief  −92 kg milk, −65 days productive life per 5% inbreeding jump (CDN)

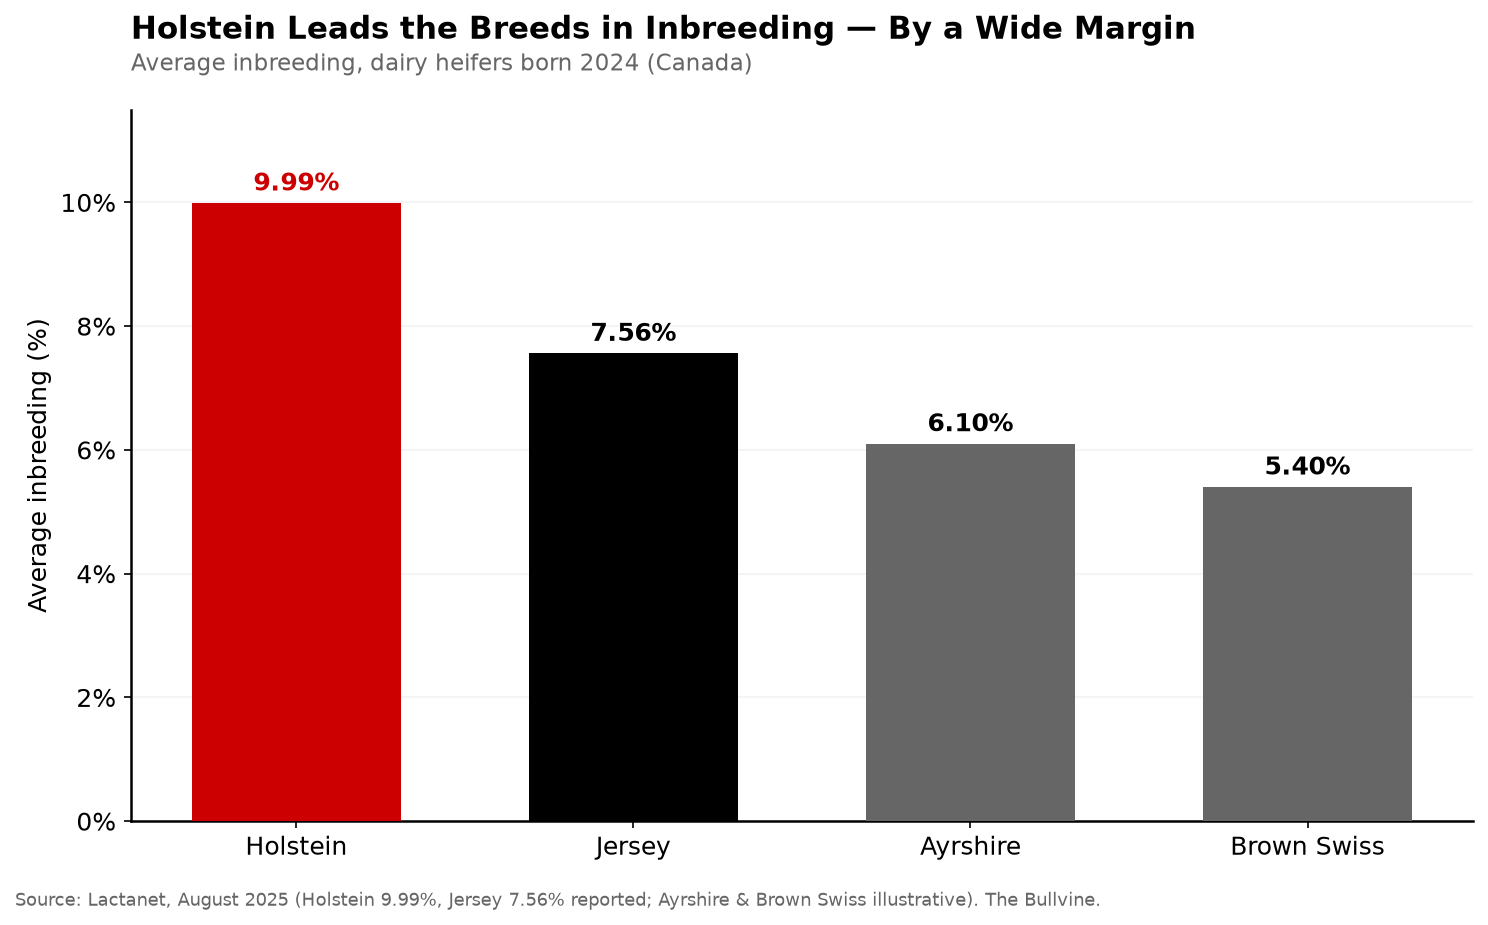
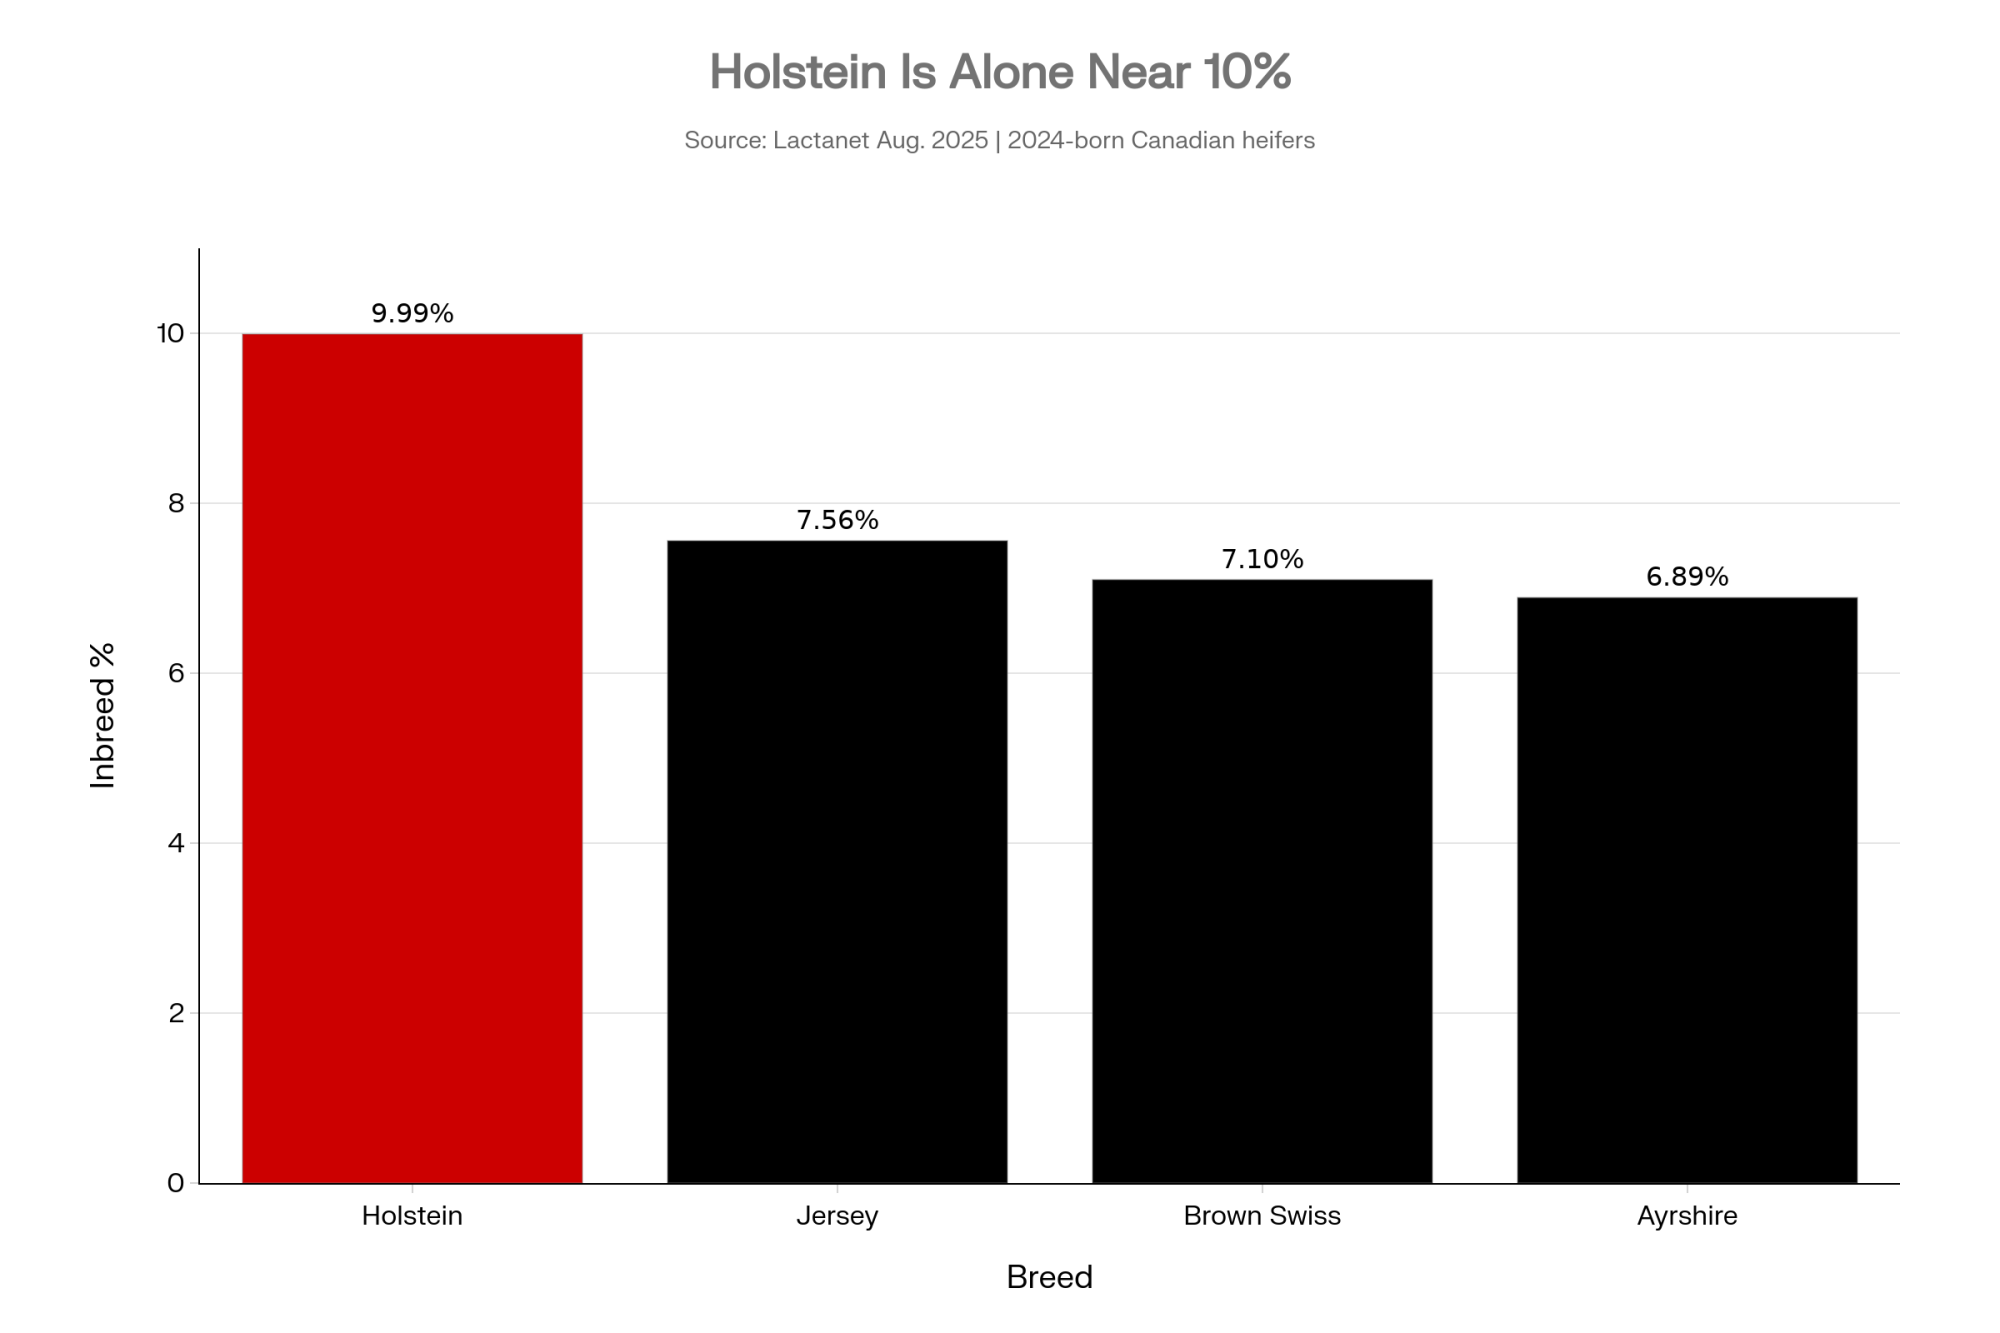
That 9.99% is nearly double where the breed sat 15 years ago. And it’s not a Holstein-only story — the black-and-whites lead Jersey (7.56%), Brown Swiss (7.10%), and Ayrshire in the same 2024 crop. That Canadian figure from Lactanet tracks the same direction U.S. data shows through CDCB and Holstein USA, so this isn’t a border quirk.

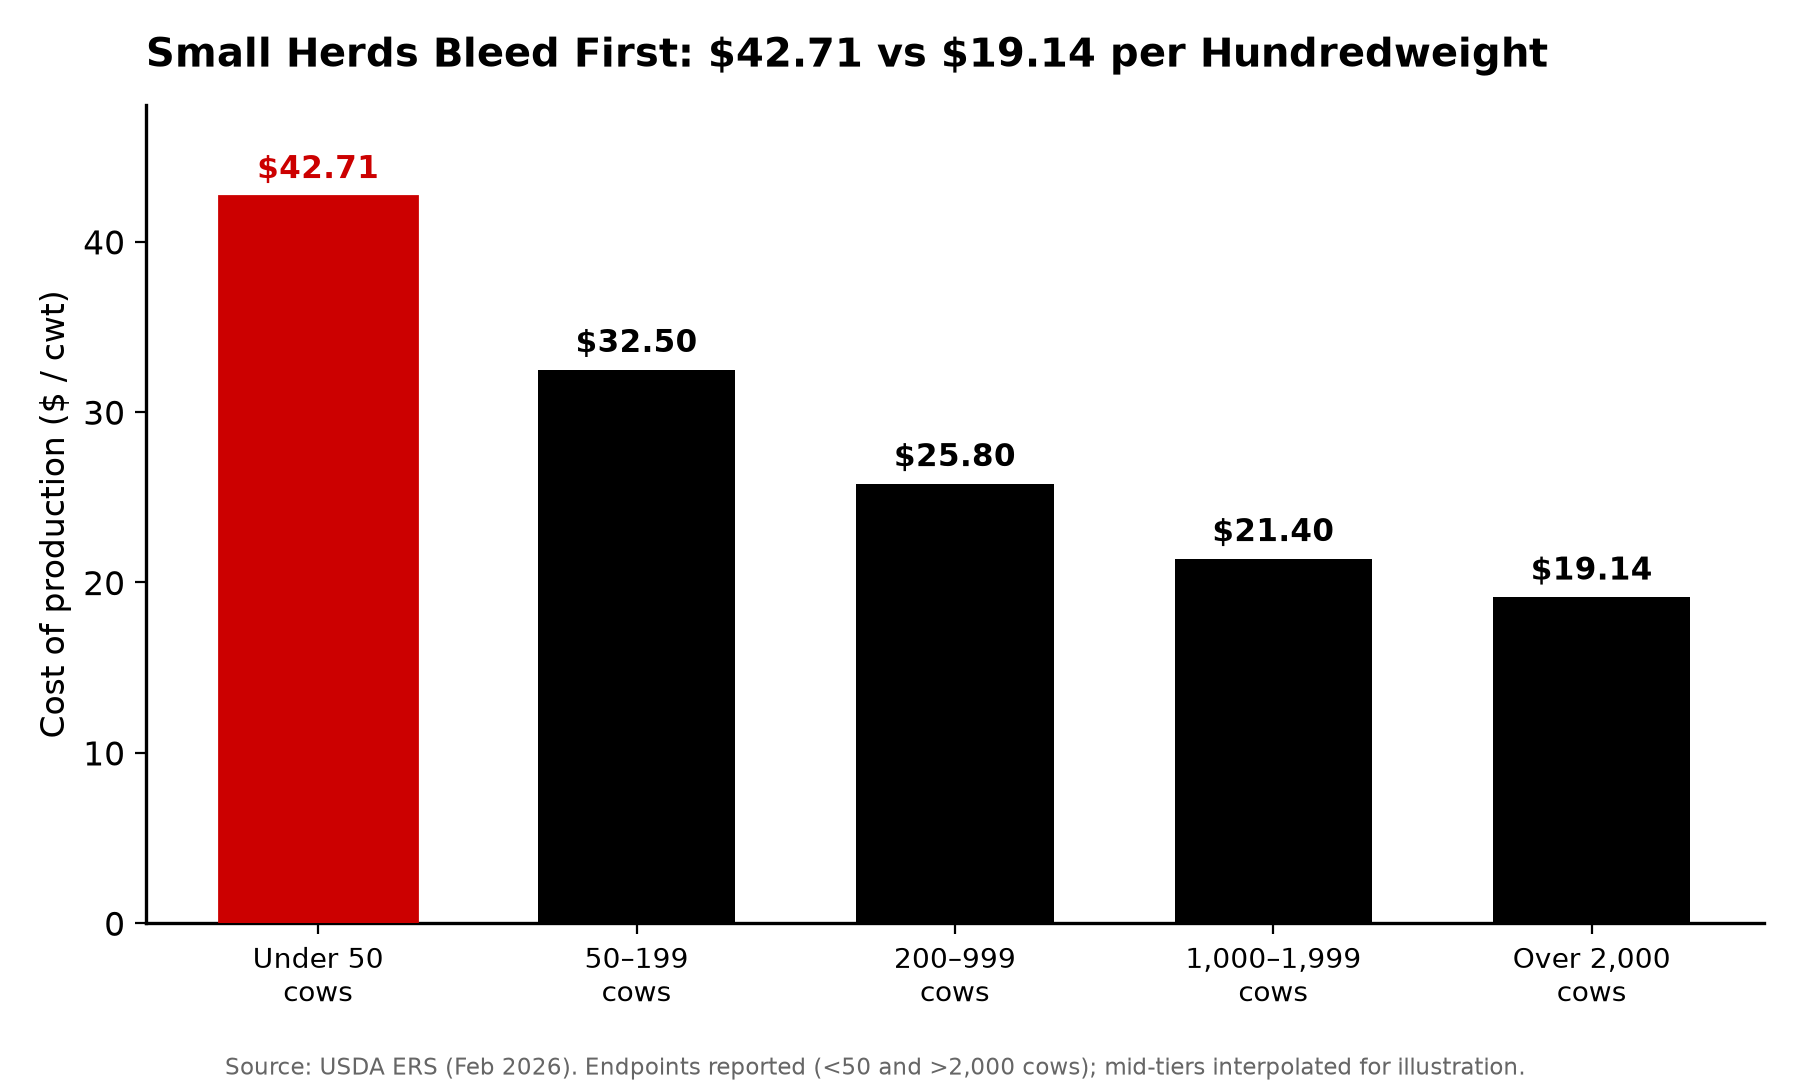
Who eats the cost first? The smaller and mid-size herds. USDA ERS reported in February 2026 that cost of production runs about $42.71 per hundredweight in herds under 50 cows versus $19.14 in herds over 2,000. When your breakeven’s already thin, this drift stings more.

Have You Ever Called a Cow “Too Strong”?

Inbreeding depression doesn’t knock. It’s the cow that milks fine but won’t settle. The calf that never quite thrives. The good one that leaves a lactation early. And it has a look — as inbreeding climbs, that depression tends to surface as narrow, frail cows that impress on height and wear out faster. Hold that thought. It’s the bridge between the DNA problem and the type sheet.

Ask yourself two questions standing at the pen. Have you described a cow recently as “too strong”? Have you seen cows that are “too frail”? Almost nobody says yes to the first. Everybody’s seen the second. That tells you which way the breed’s been drifting.

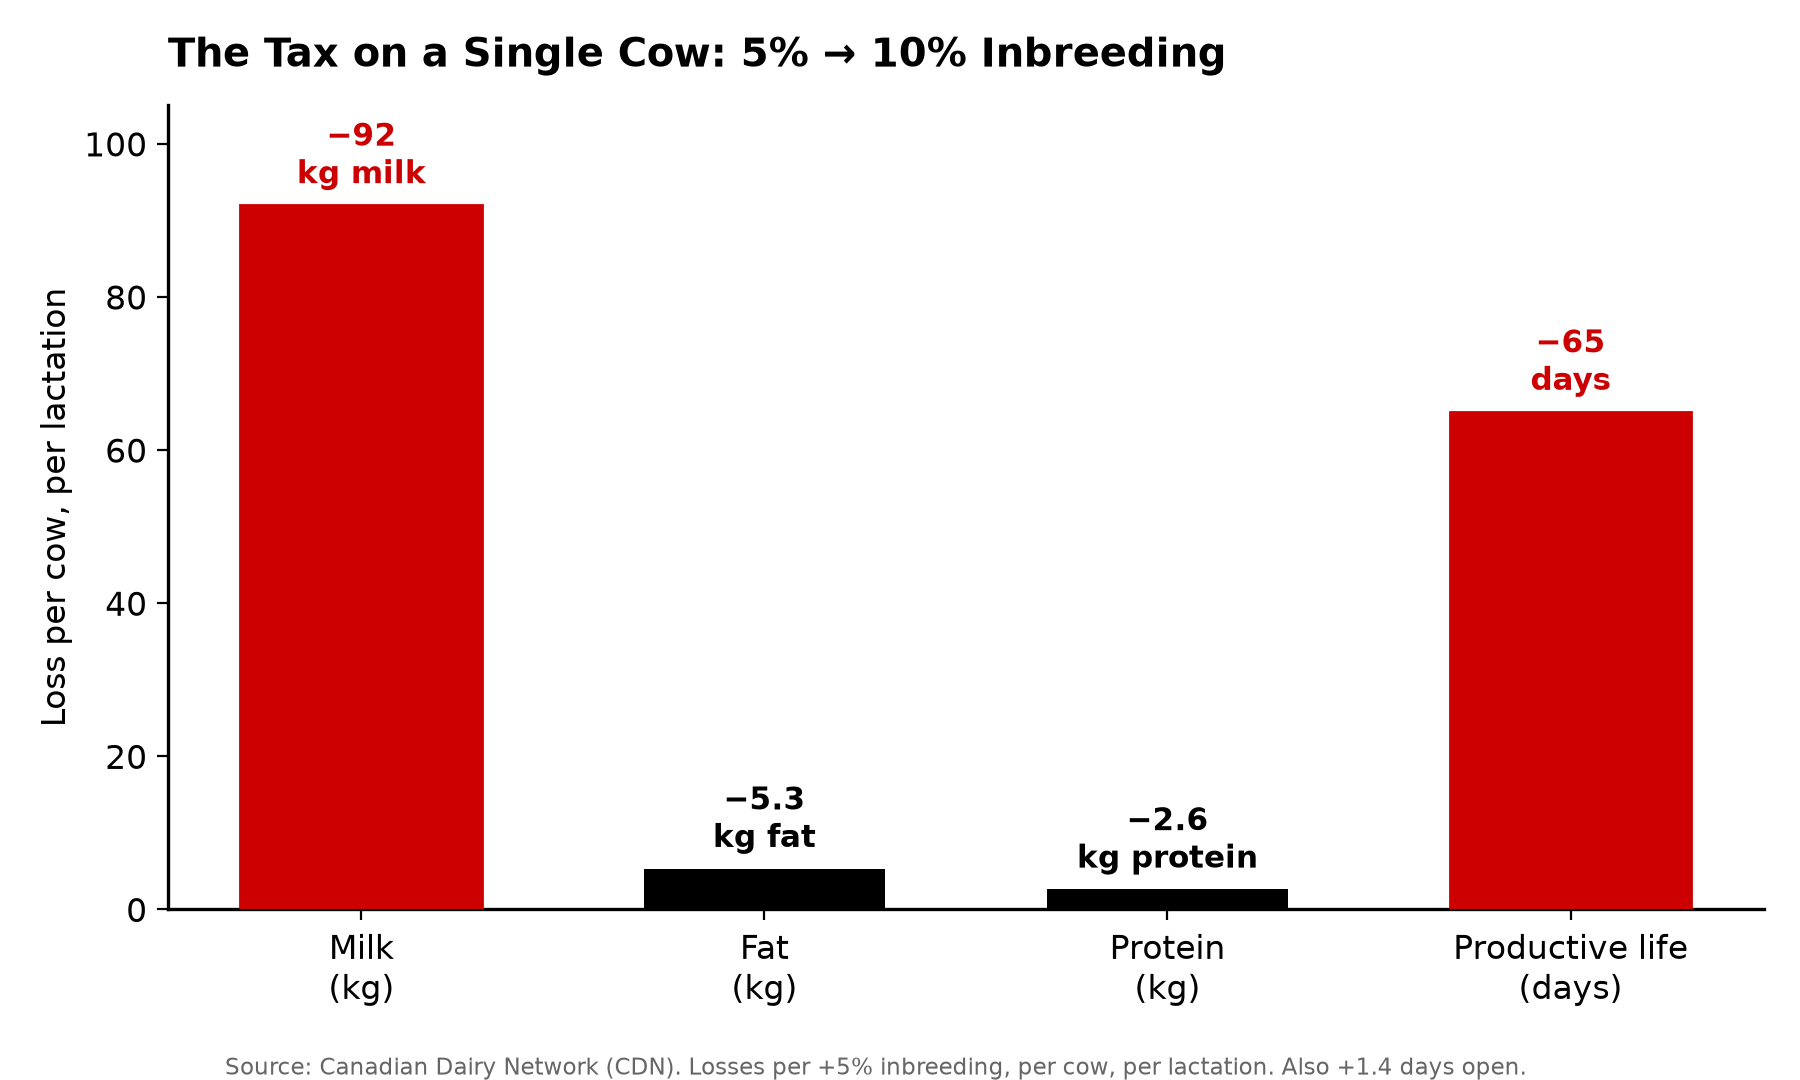
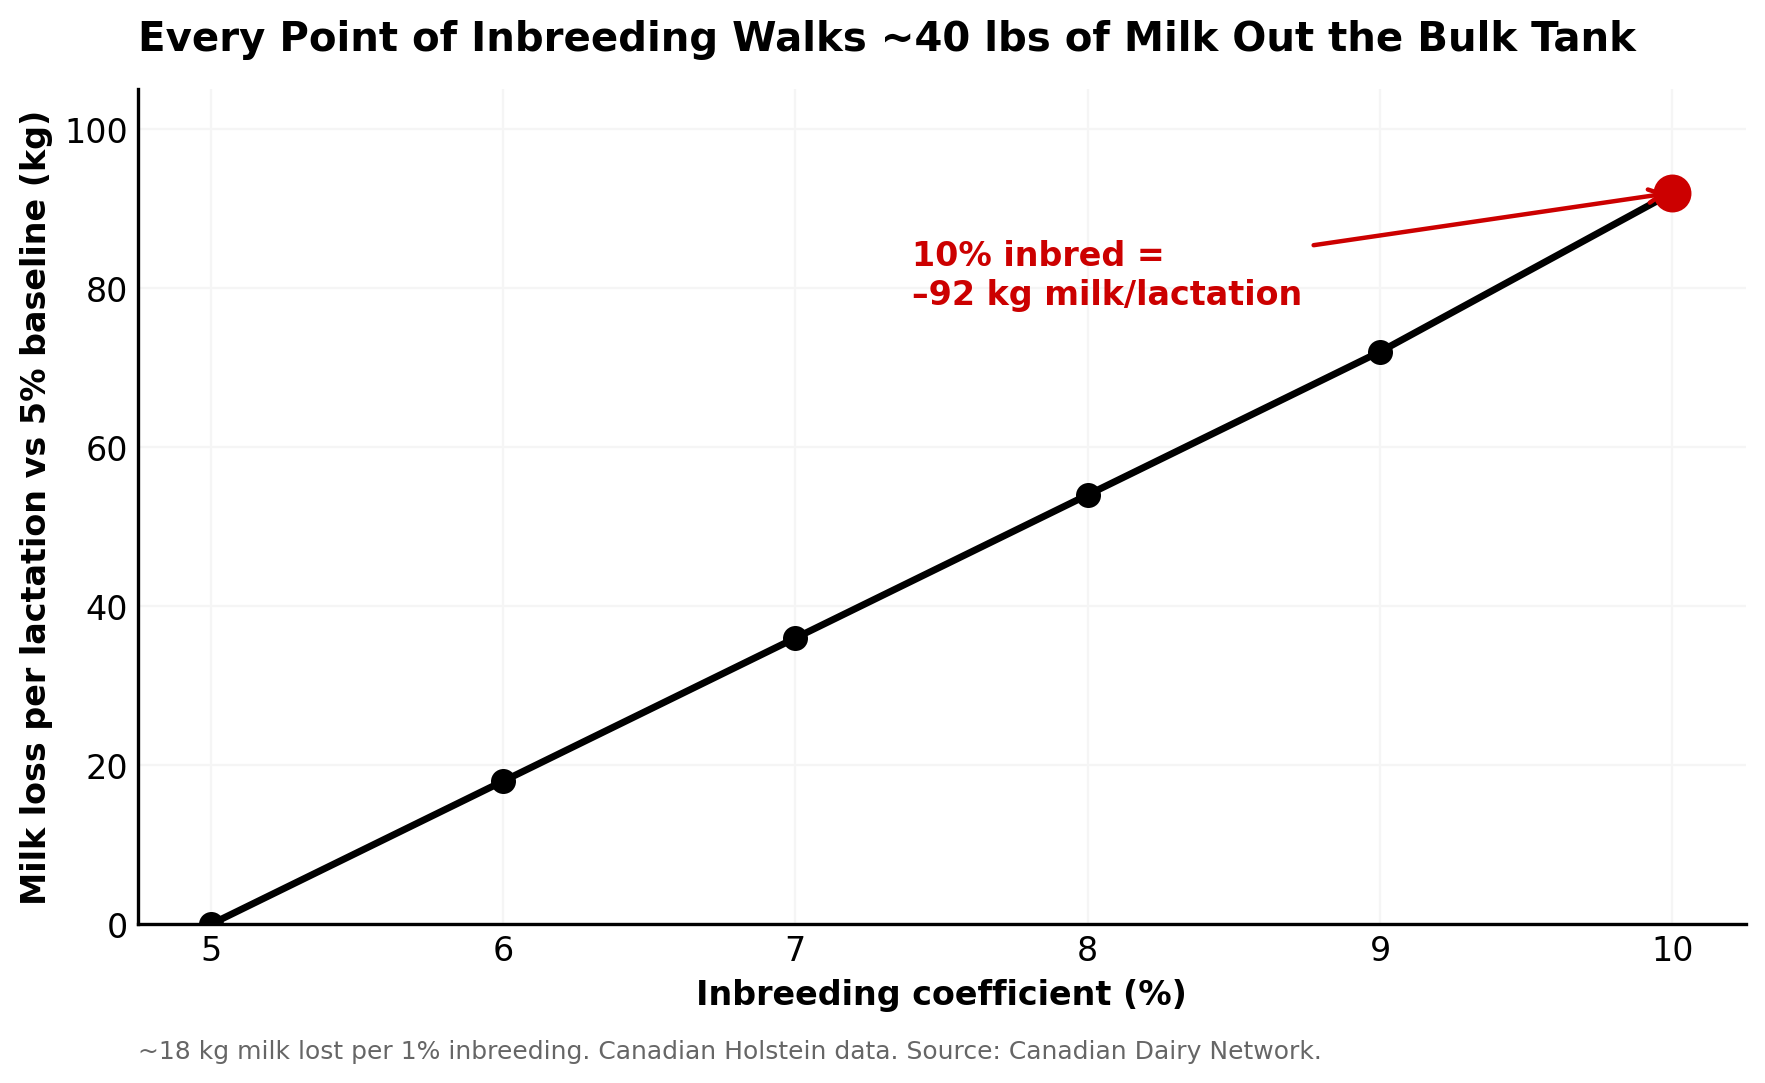
Here’s what a jump from 5% to 10% inbreeding costs on a single cow, every lactation, per Canadian Dairy Network:

−92 kg milk  ·  −5.3 kg fat  ·  −2.6 kg protein  ·  +1.4 days open  ·  −65 days of productive life

None of those alone ends a cow. Stack them across a whole heifer crop, though, and you’re running a herd that milks a little lighter, breeds back a little slower, and turns over a little faster than the one your neighbor built off a wider gene pool. That’s the tax. It’s quiet, it’s cumulative, and it never sends an invoice.

The Barn Math: Two Numbers That Stack

You’ll bump into two different dollar figures, and they measure different windows. Don’t let them cancel out in your head — they add.

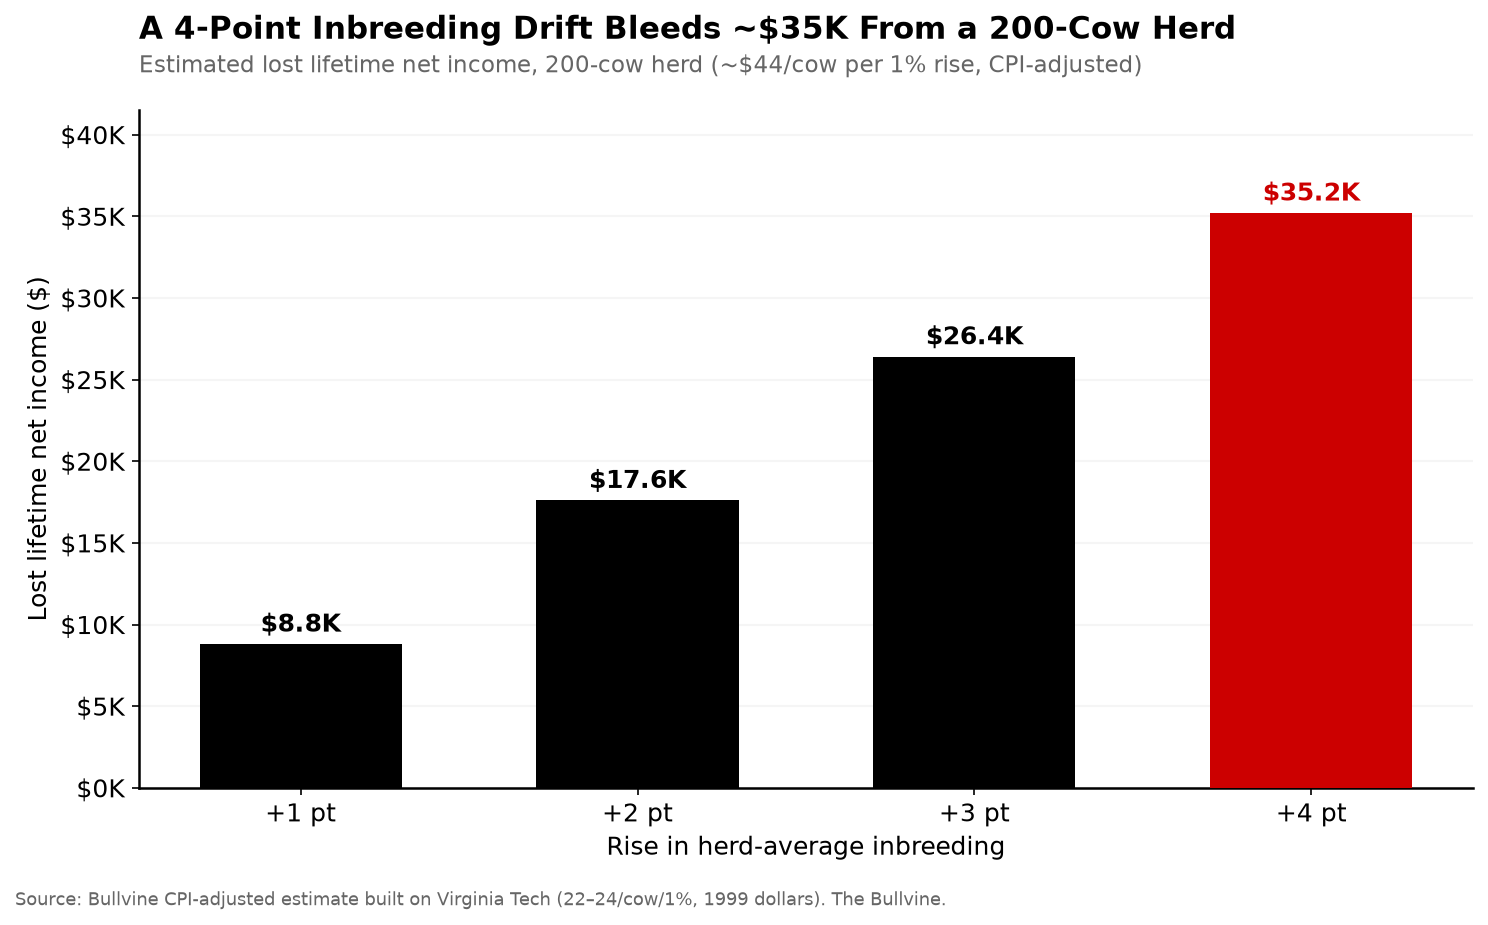
The lifetime number comes from Virginia Tech’s VanRaden and Smith (1998), who pegged the cost at $22 to $24 per cow for every 1% of inbreeding. Adjusted for inflation to 2026 dollars, that becomes roughly $44 per cow, per point — a lifetime figure, not an annual one. Run it on a real herd: a 200-cow herd that’s drifted from 6% to 10% — four points — carries about 200 × 4 × $44 = $35,200 in lifetime drag. Money you never see leave, because it never shows up as a line item. 

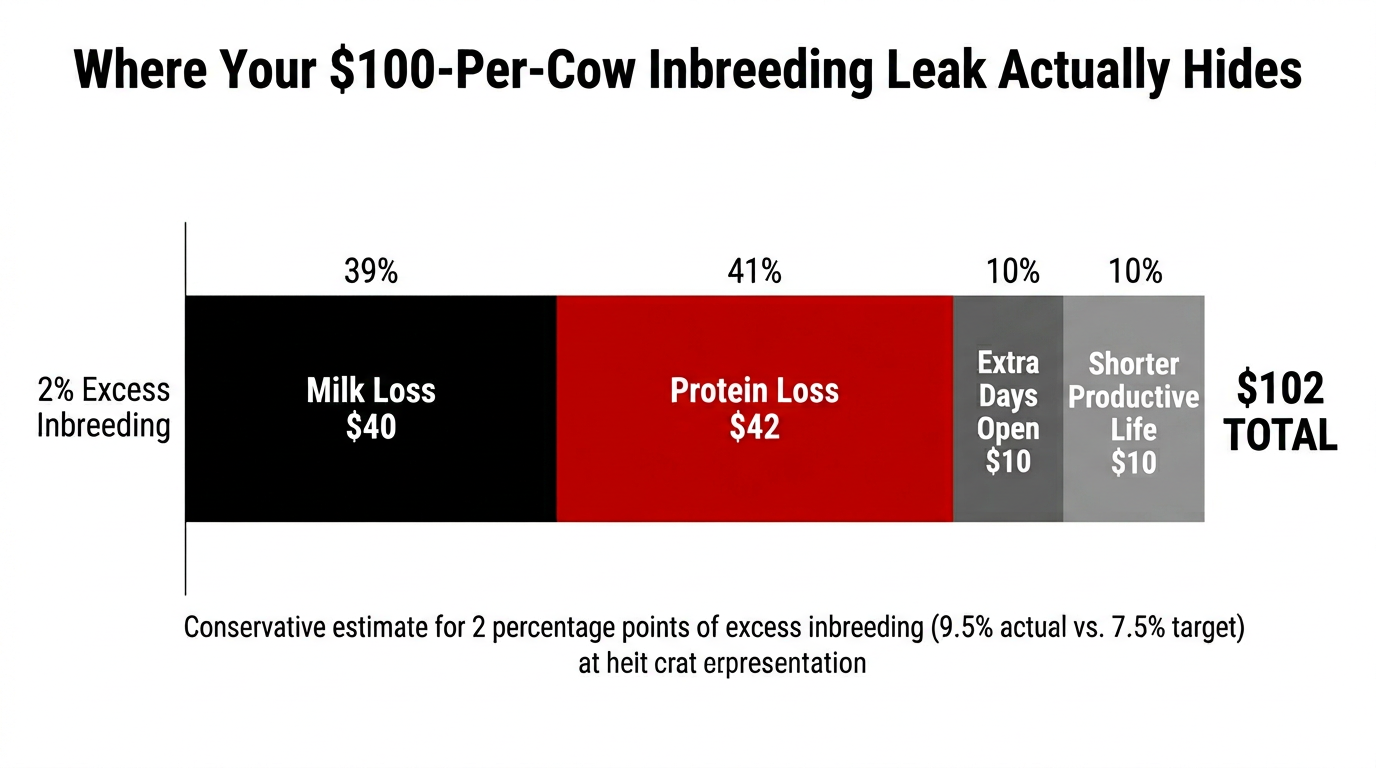
The second figure is a per-year bleed, and it’s grounded in peer-reviewed production losses, not guesswork. Makanjuola and colleagues (2020) found each 1% jump in genomic inbreeding cut first-lactation 305-day milk by roughly 40–50 kg in Canadian Holsteins; Doekes et al. (2019) landed in the same range. Add lost protein, extra days open, and shorter productive life, and Bullvine’s worked barn-math lands at roughly $60 to $102 per cow, per lactation for a herd carrying about two points of excess. On a 300-cow herd, even the $60 floor is about $18,000 a year until your mating strategy changes. 

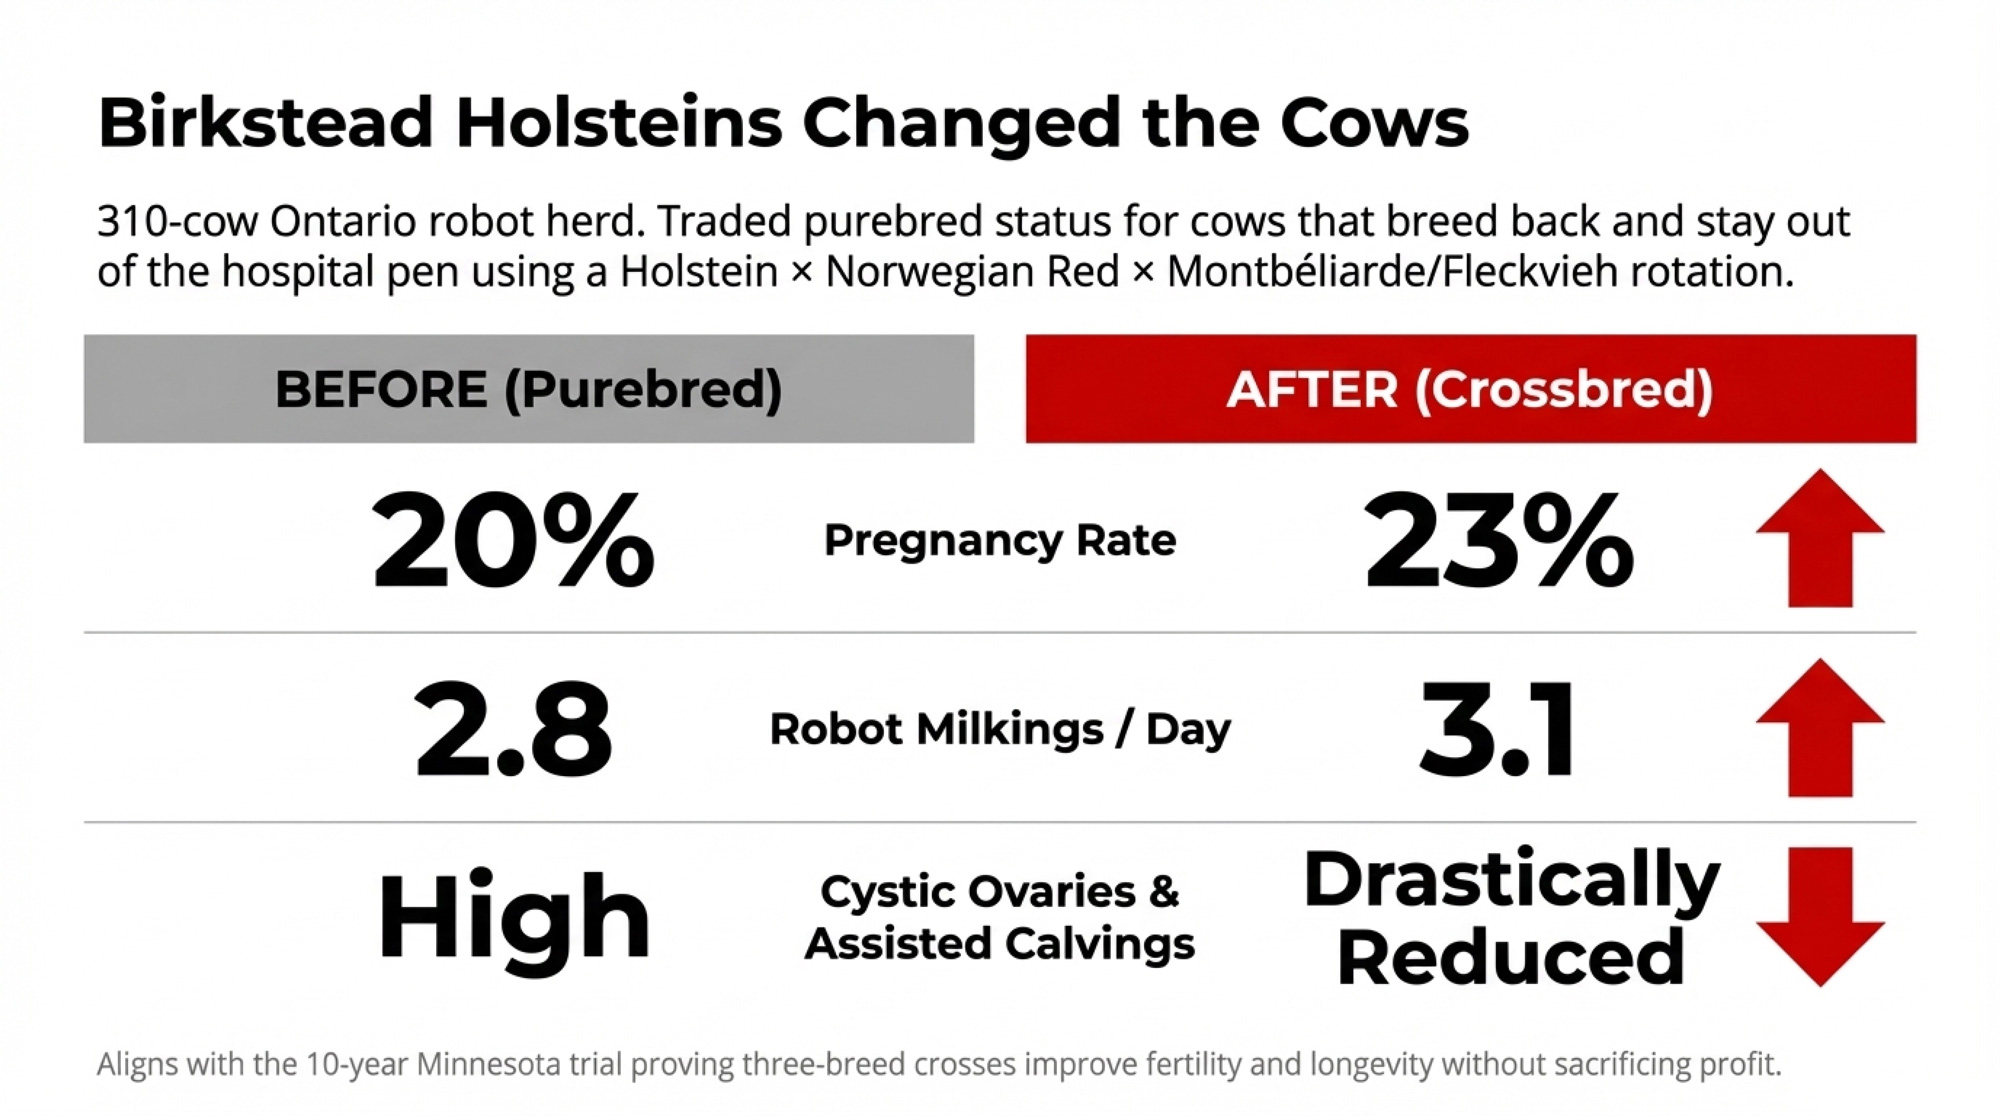
Some herds have pushed back and watched it pay. Bullvine’s coverage of the Birkstead and North Florida operations documented both farms using tighter inbreeding management — tracking coefficients on every mating, steering clear of closely related sires — to stop that per-cow leak. The peer-reviewed research prices the cost of ignoring it. The herds show what managing it looks like. 

Why the Gene Pool Keeps Shrinking

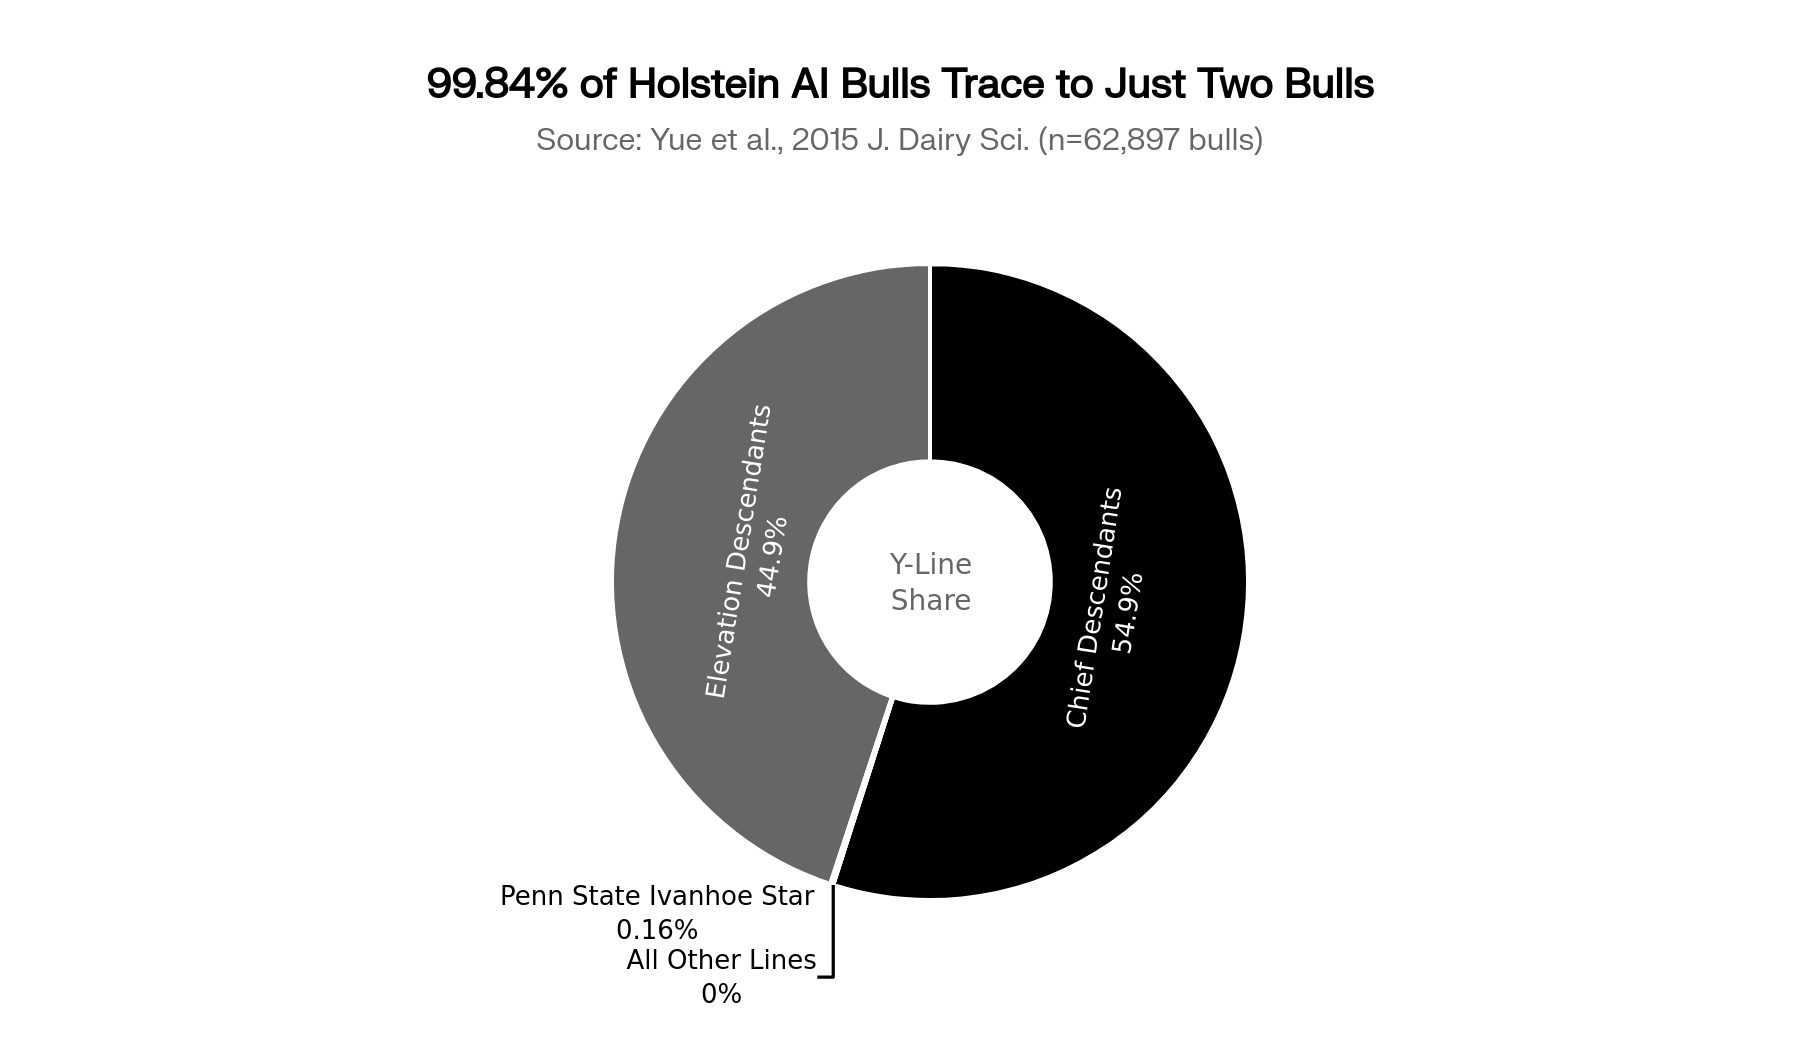
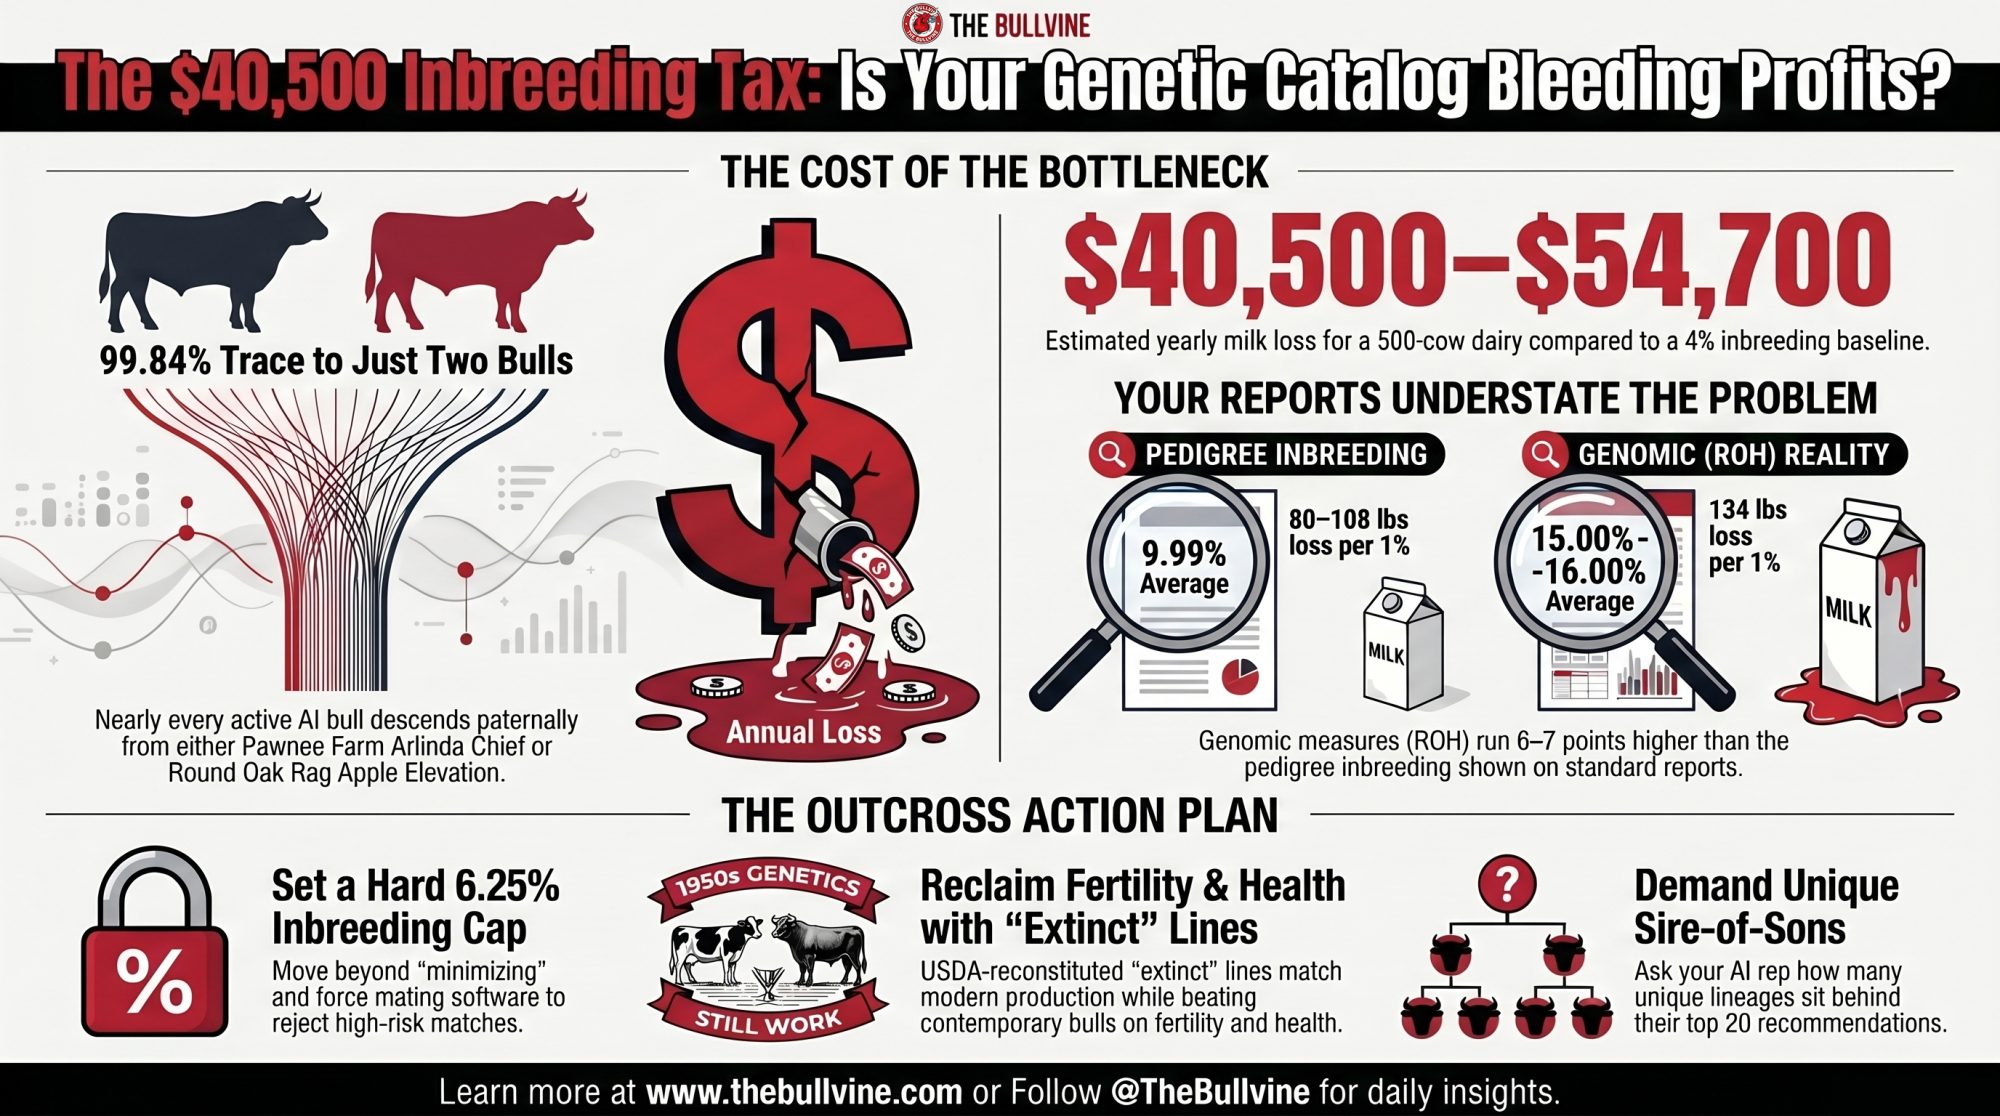
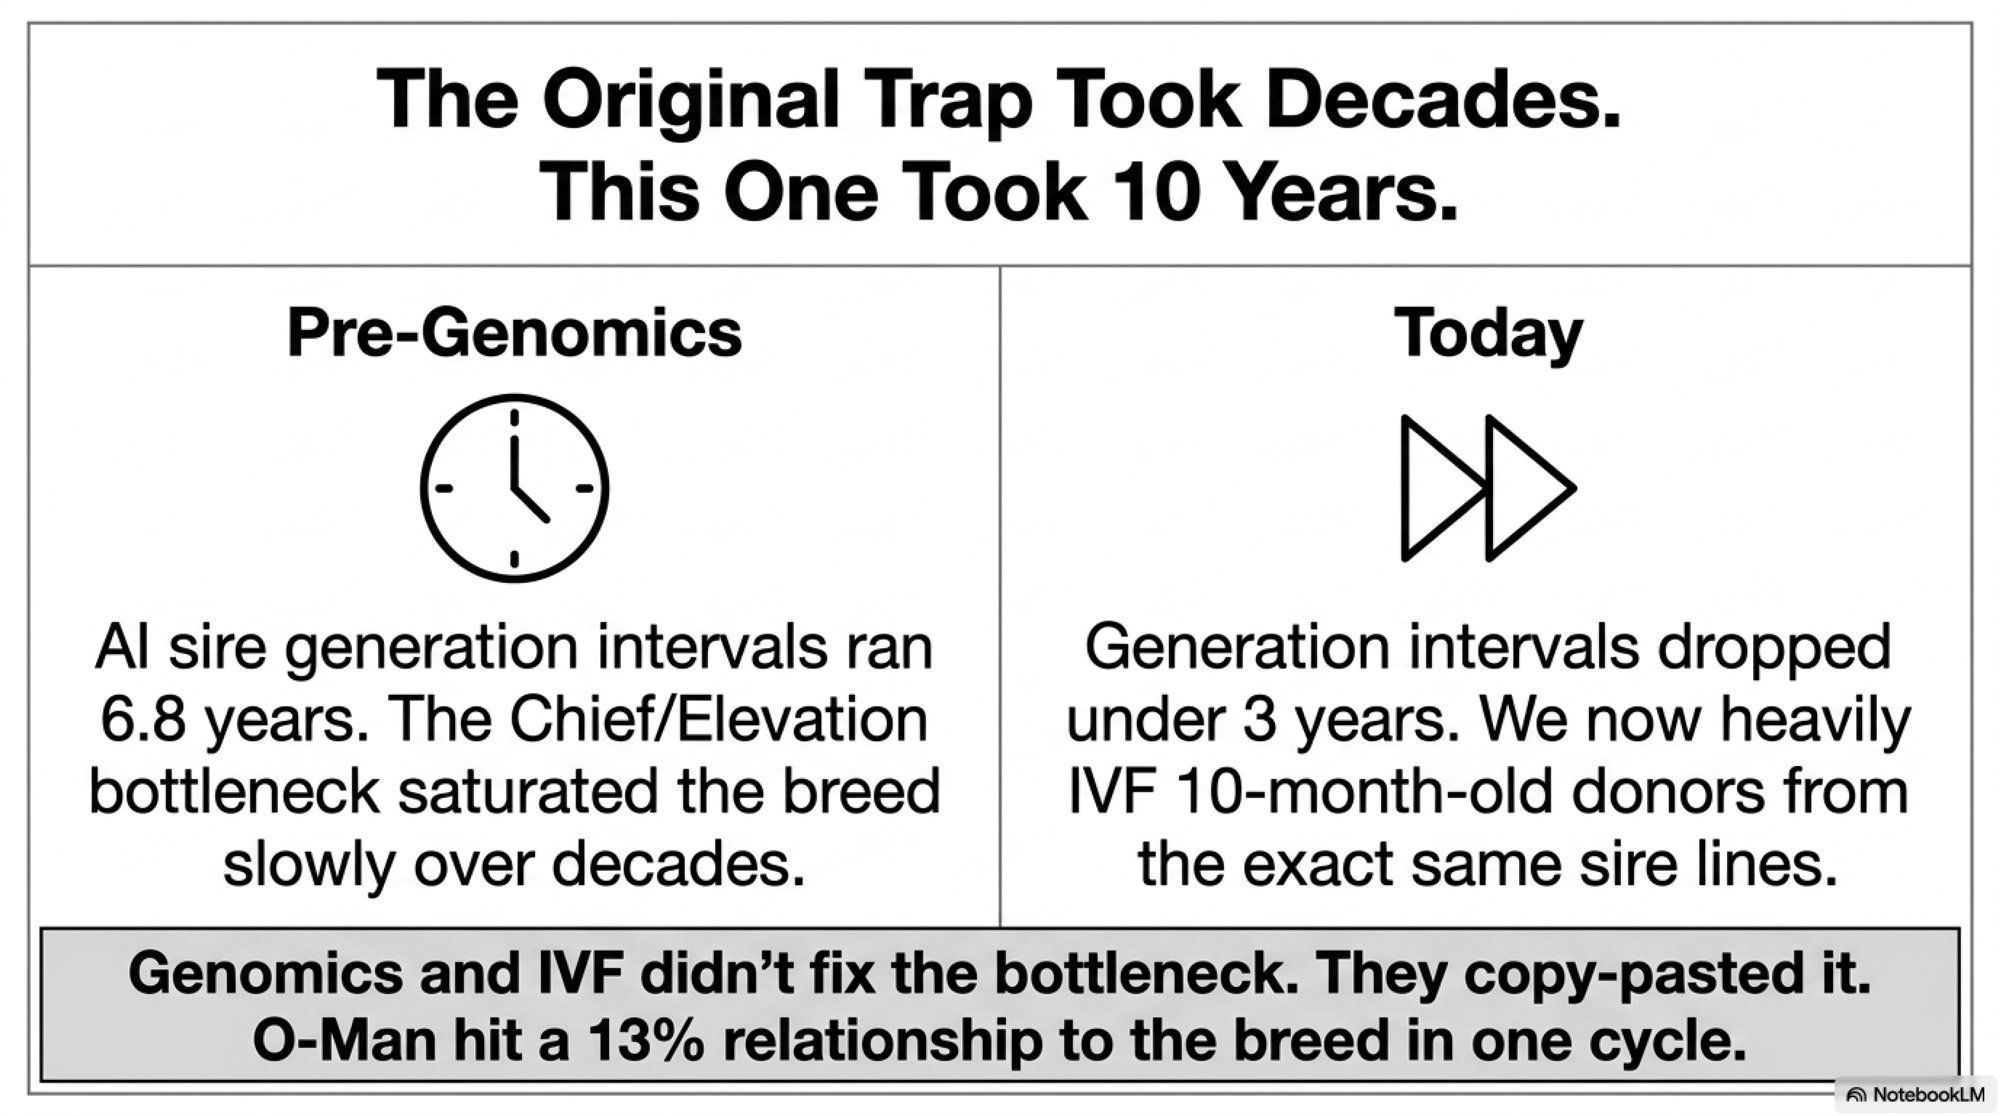
The root cause isn’t any one bull — not even O-Man. It’s a base that keeps narrowing. A Y-chromosome study of 62,897 bulls (Yue et al., 2015, Journal of Dairy Science) found virtually every active North American Holstein AI bull traces its paternal line to two grandfathers born in the 1960s: Round Oak Rag Apple Elevation and Pawnee Farm Arlinda Chief. Bullvine’s analysis of that dataset puts the figure at 99.84% — split almost evenly between the two. 

Read that again. Nearly the entire active AI Holstein population funnels back through two bulls. Every “outcross” you order is, at the male-line level, probably a cousin of the last one. That’s the bottleneck O-Man got poured into. Not the cause of it.

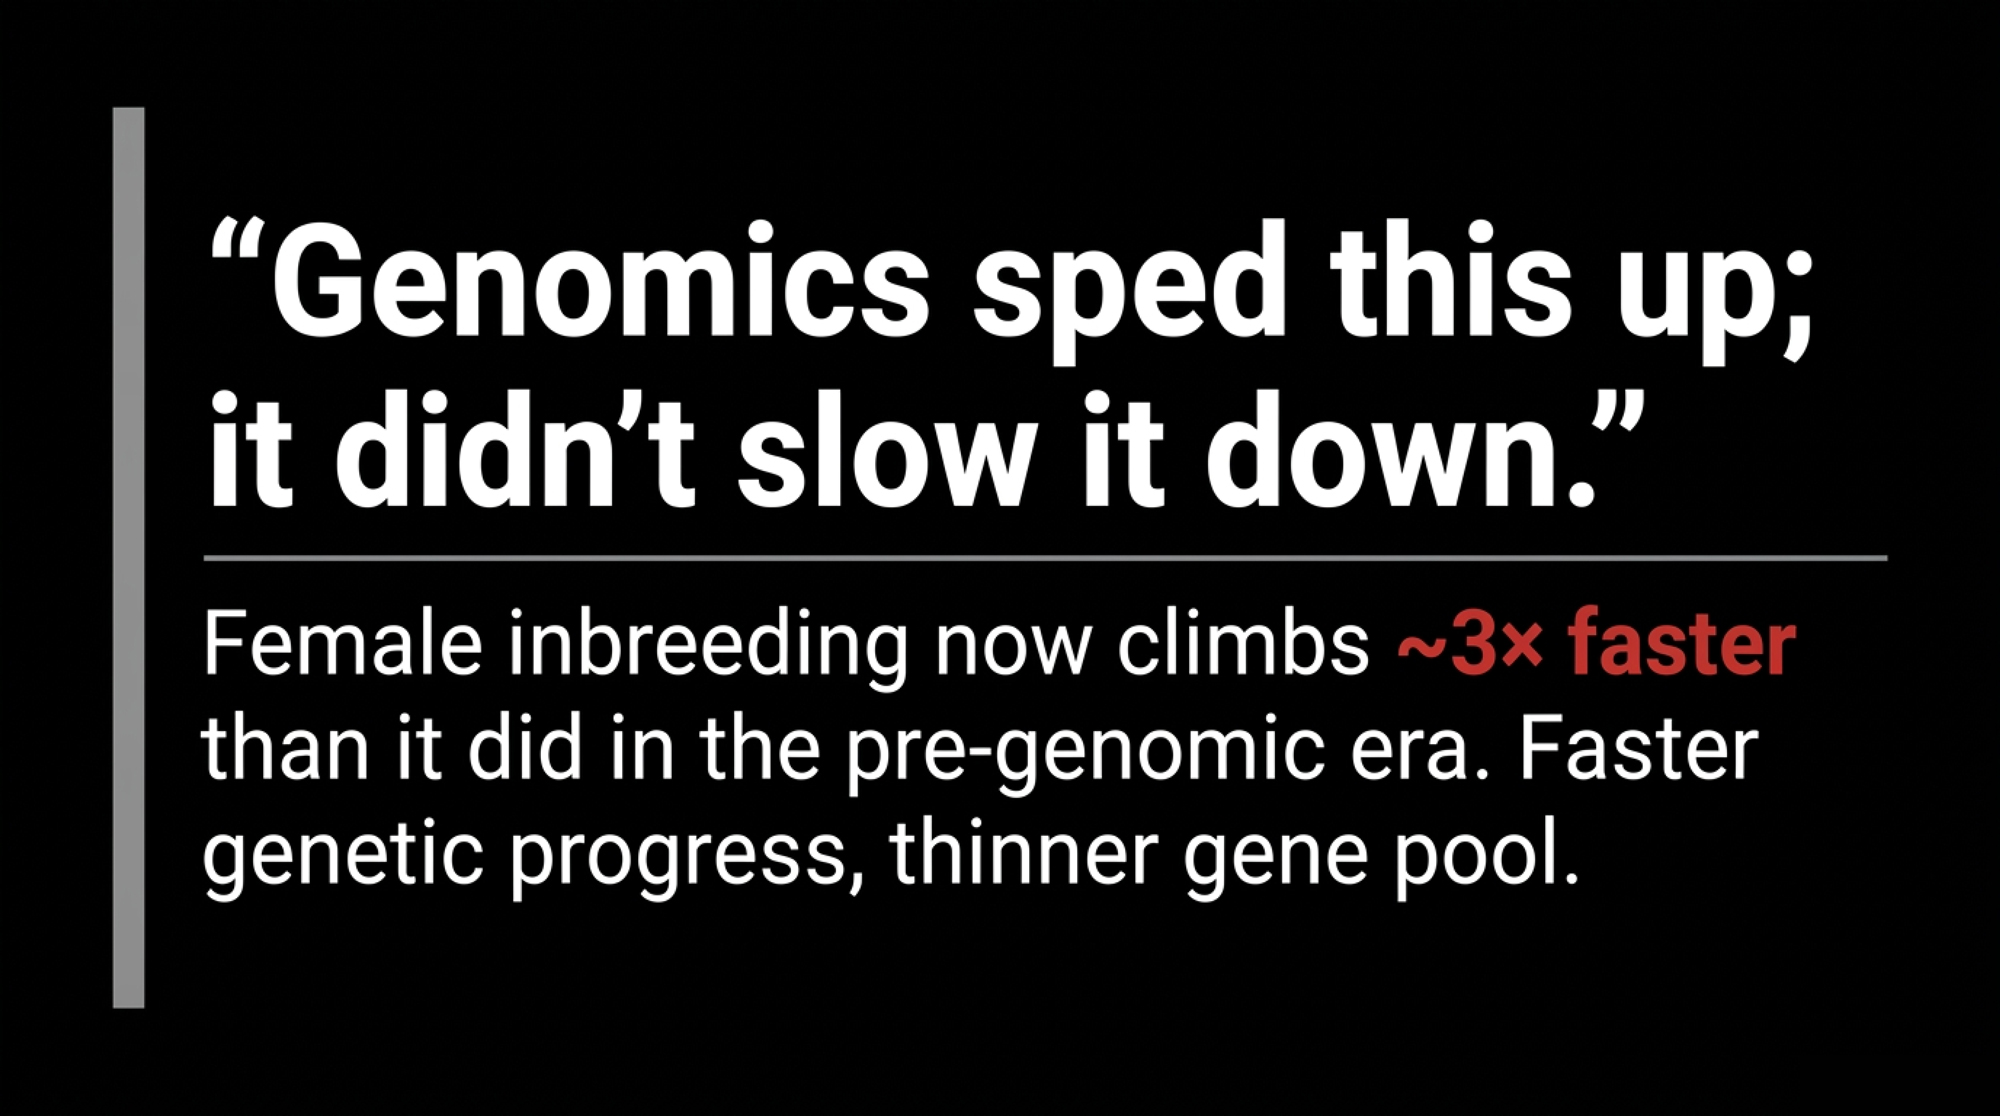
Genomics sped this up; it didn’t slow it down. Under progeny testing, a bull took years to prove out before he could flood the market — a brake nobody appreciated until it was gone. Now the sires of sons turn over in a fraction of that time, and female inbreeding climbs about three times faster than it did in the pre-genomic era. Faster genetic progress, thinner gene pool. Same coin, two sides. 

And the index won’t rescue you. Net Merit added Daughter Pregnancy Rate in 2003 and Feed Saved in 2021, and NM$ 2025 cut Body Weight Composite to −11% emphasis while lifting Feed Saved to 17.8%. But catch the gap: Net Merit prices size and efficiency. It carries no penalty for inbreeding. That part lives entirely in your matings and your stud’s lineup.

Two Tools for Two Different Problems

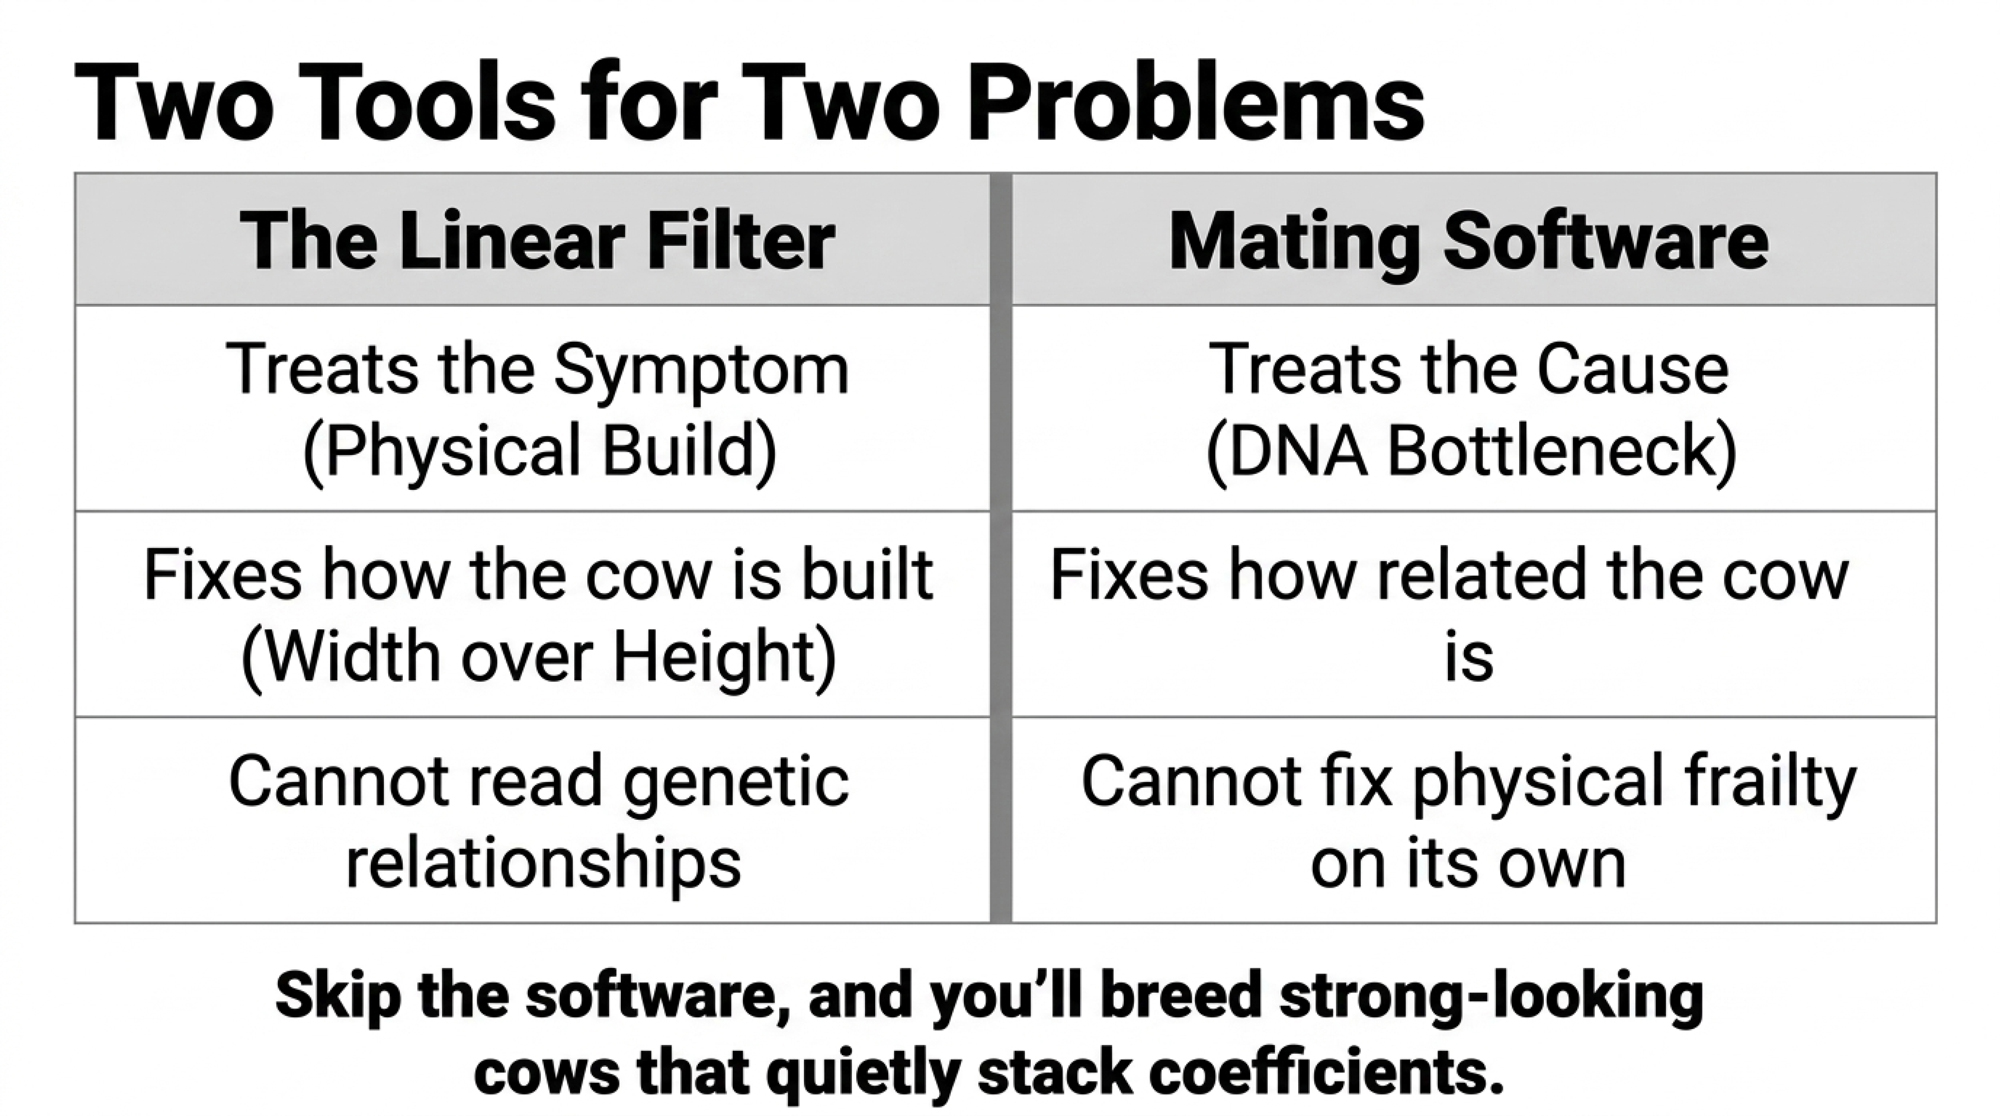
Here’s where catalog decisions go sideways. The frail, hollow cow inbreeding produces is a physical symptom. But inbreeding itself is a pedigree problem. You need two separate tools, and one won’t cover for the other.

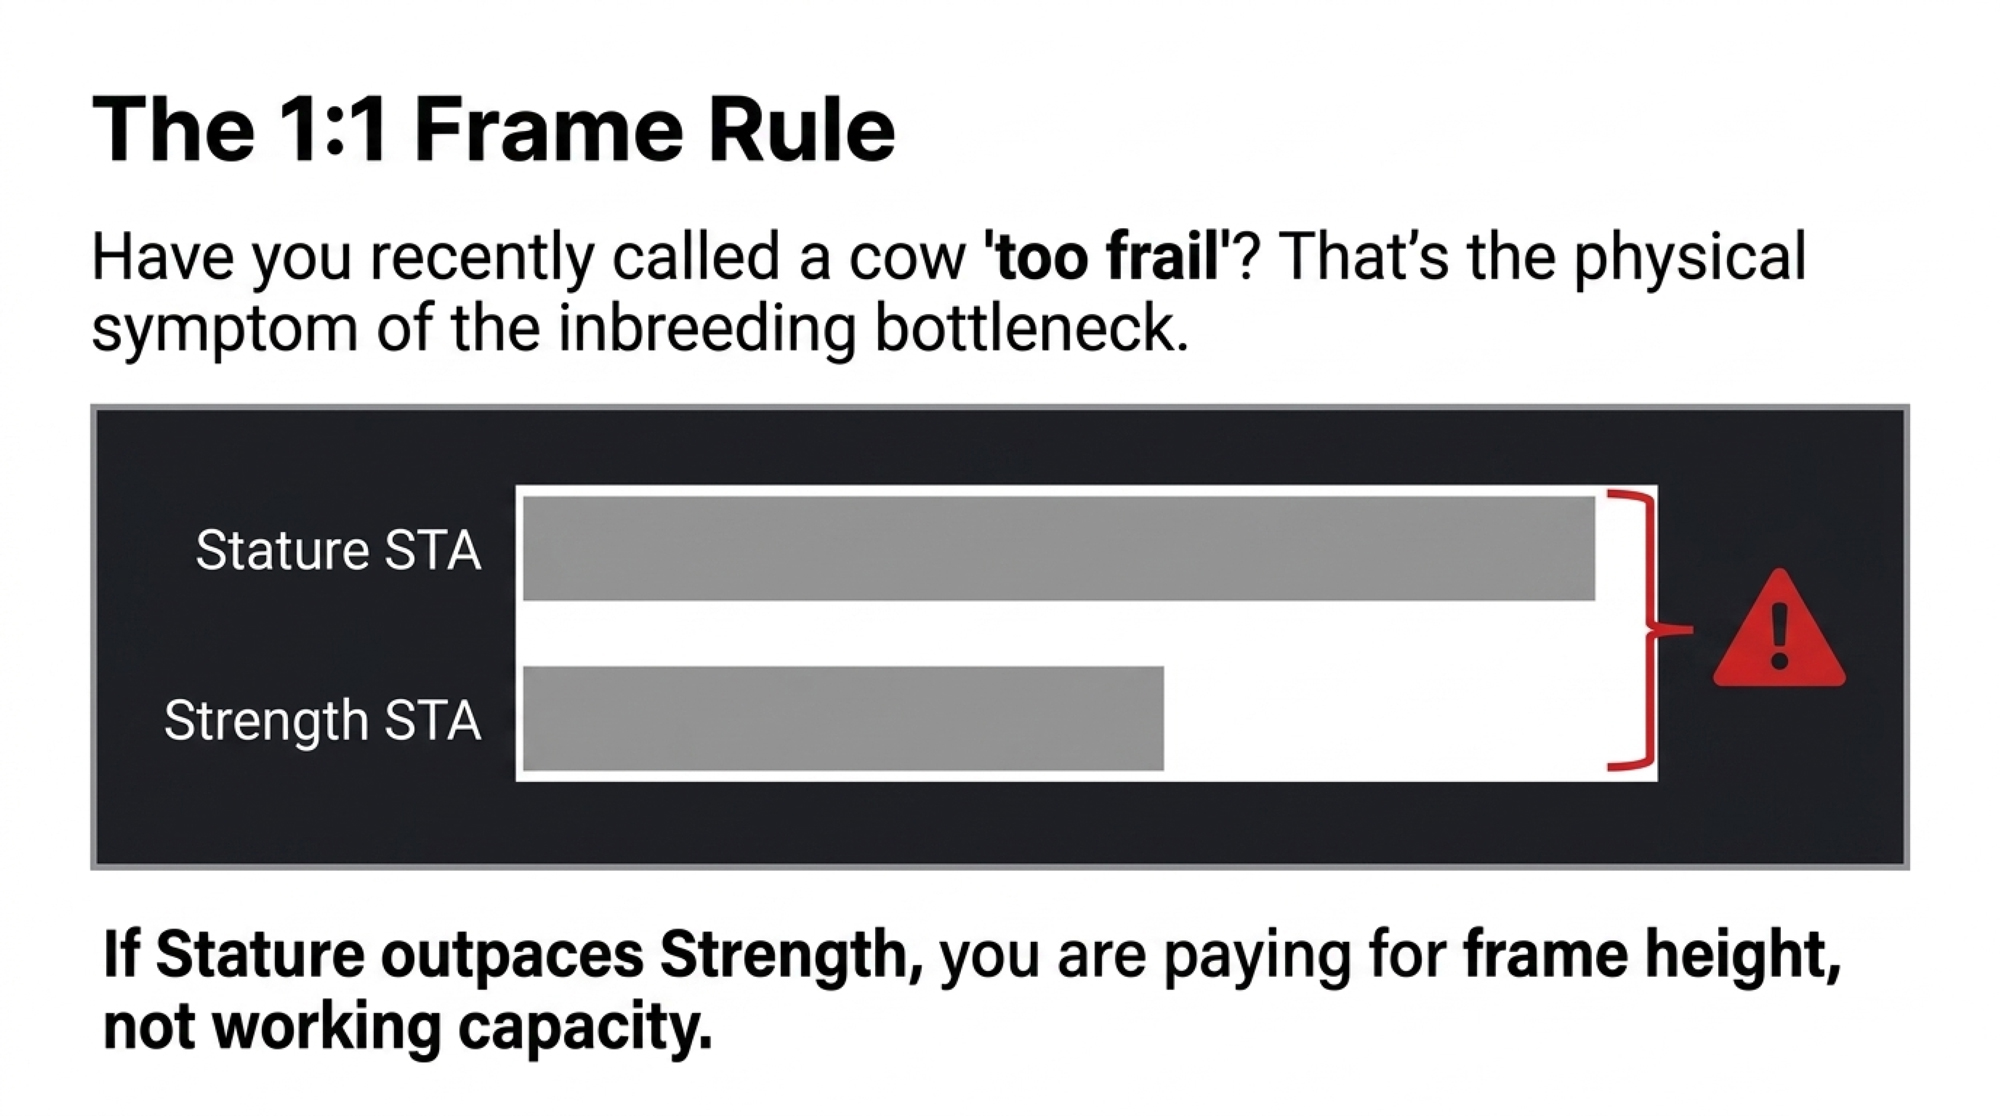
Tool 1 — the linear filter — treats the symptom. In the U.S. linear system, Body Weight Composite weights strength three times heavier than stature — 0.72 versus 0.23. A bull who’s tall but only moderately strong is building his daughters out of height, not working power.

🛑 The 1:1 Frame Rule

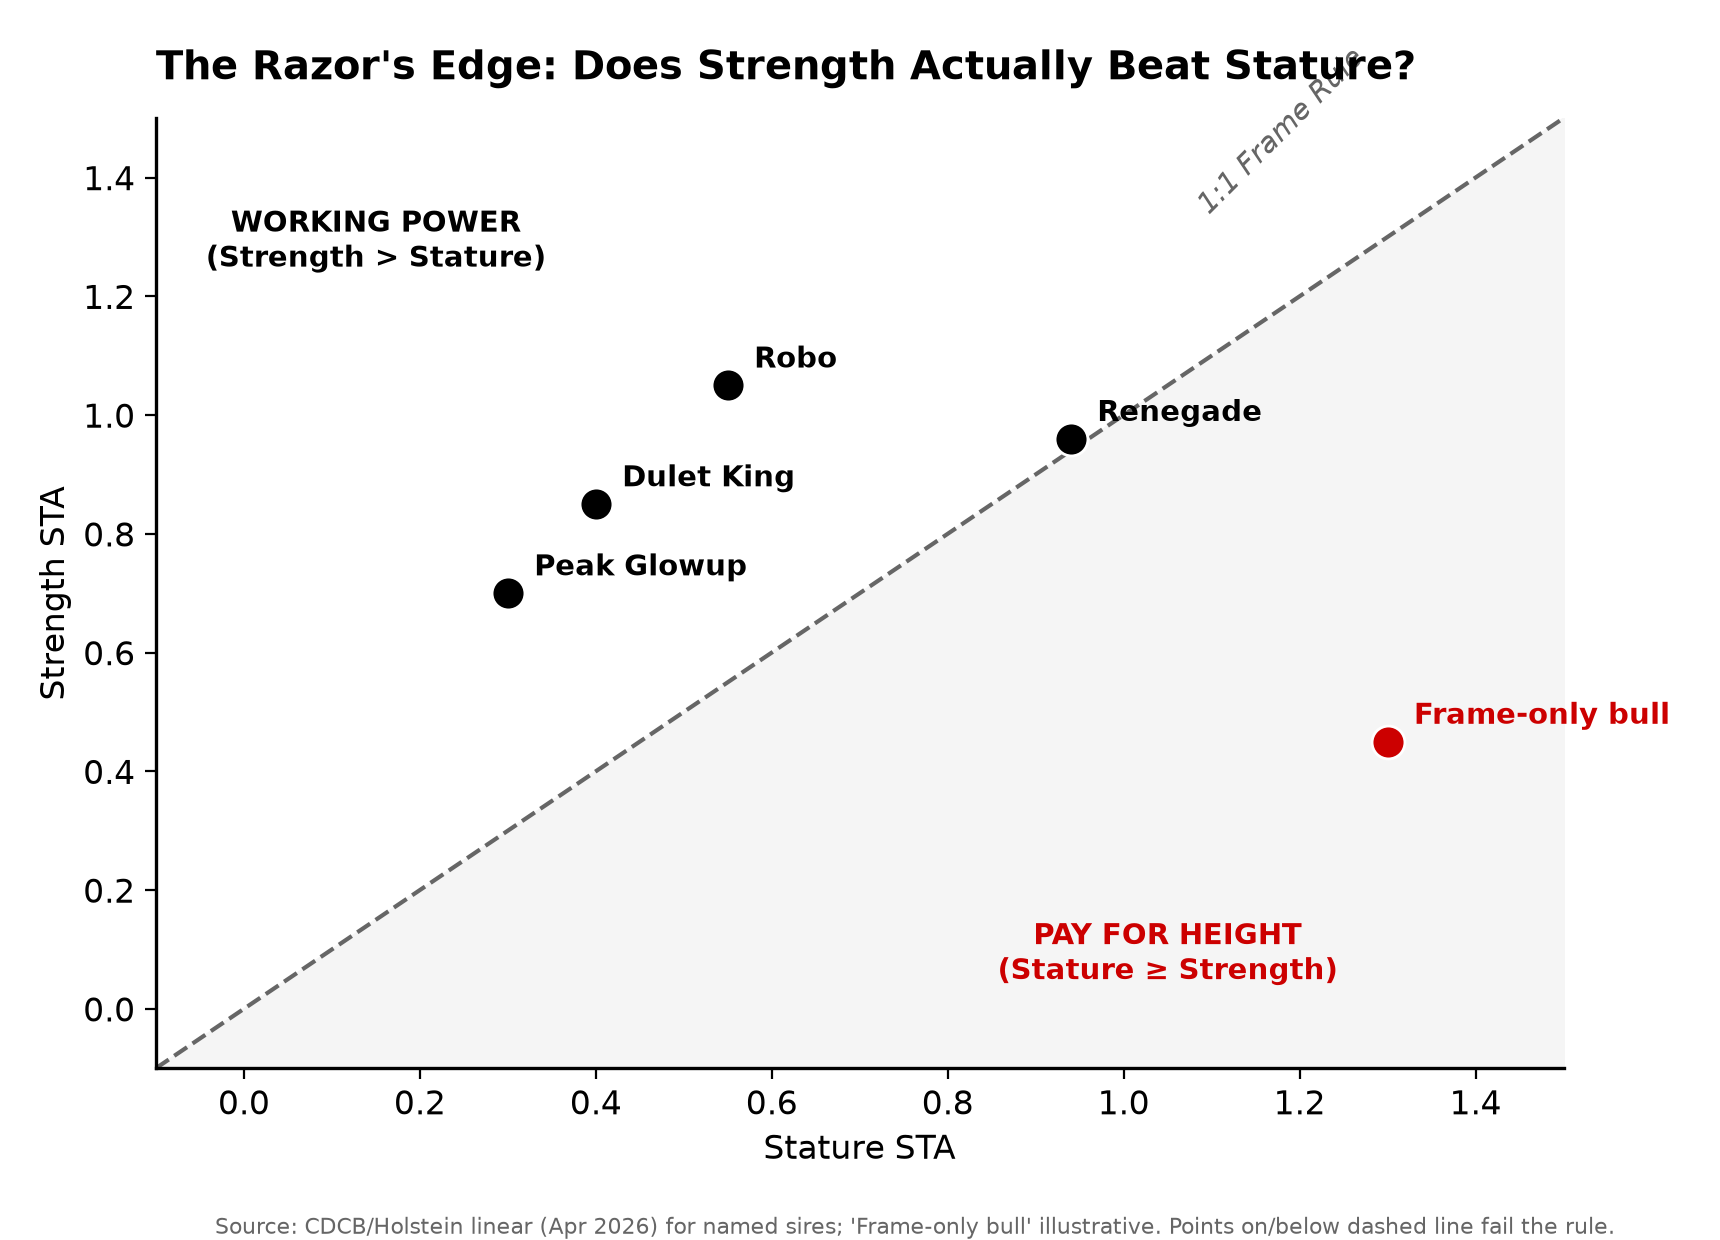
If a bull’s Stature STA is higher than — or even equal to — his Strength STA, you’re paying for frame height, not working capacity. In an era of high beef-cross values on cull cows, you want a deep, powerful, wide-chested front end — not a hollow, tall cow that overshoots the stalls and breaks down early.

Tool 2 — pedigree mating software — treats the cause. The 1:1 Frame Rule can’t read relationship. Only a mating program running genomic inbreeding on each specific pairing catches the DNA bottleneck before you order semen. Run the linear filter to fix how the cow is built. Run the mating software to fix how related she is. Skip the second, and you’ll breed strong-looking cows that quietly stack coefficients.

So Where Do You Actually Find Strength?

Talk about strength long enough and it stays abstract. So here are four real, active sires, each run through both tools — the phenotype (does Strength beat Stature?) and the pedigree (how much of that narrow base is stacked in?).

S-S-I PR Renegade (250HO14134) — The Baseline.

  • Phenotype: Strength +0.96 barely edges Stature +0.94 (CDCB/Holstein, April 2026). He passes the physical test — just. 
  • Pedigree: His maternal line runs back through the Seagull-Bay Oman Mirror family, so there’s O-Man on the bottom of his pedigree. Use him with caution if your herd already runs close to the 9.99% ceiling. 

Aurora Sheepster Robo (796HO10201) — The Trap.

  • Phenotype: A genuine powerhouse — strength, milk, and teat placement in one package. 
  • Pedigree: The Renegade blood stacks in through his dam side — his MGS is Siemers Rengd Parfect, a Renegade son. For herds already deep in Renegade, that triggers immediate relationship flags on a big chunk of the cows you’d point him at. 

Dulet King (799HO112) & Peak Glowup (1HO17864) — The Alternates.

  • Phenotype: Both bring strength off a different profile — King is Alcove-sired and A2A2; Glowup leans health and components with lower milk. Pull each bull’s live linear card to confirm the strength-over-stature ratio matches your cows.
  • Pedigree: Both sit off the Renegade line, which makes them genetic relief valves — a way to add strength without stacking the same family you’re already carrying.

The point isn’t “buy these four.” It’s the method. Renegade shows how thin the strength-over-stature margin can be even on a bull everyone calls strong. Robo shows a phenotypic powerhouse can still be the wrong bull once you run the relationship test. King and Glowup show you can hunt strength off a different family — if you verify the ratio yourself. Two tools, every time.

Options and Trade-Offs for Your Operation

No single move fixes this. A few are working right now.

  • Cap inbreeding on every AI mating. Ask your mating program or rep to flag anything projected above your ceiling; many breeders aim to keep a mating under roughly 6–7%. Cheap and immediate. The catch: it protects your herd, not the breed, and you’ll pass on a hot bull now and then.
  • Run the 1:1 Frame Rule. Best for herds fighting cows that overshoot the stalls and eat more without lasting longer. Costs nothing but discipline at the catalog. Where it backfires: it’s structure, not relationship, so pair it with the inbreeding check.
  • Diversify your bull team on purpose. Makes most sense for herds with the scale to run several sire lines at once. Costs homework, and sometimes a few index points traded for lower future coancestry.
  • Lean on Net Merit for commercial goals. NM$ 2025’s Feed Saved and BWC weights point at the moderate, efficient cow the economics now reward. The limit is blunt: even flawless NM$ selection won’t manage inbreeding for you.

Three Things to Do Before You Order Semen Again

  1. Audit your tank (next 30 days). Pull your herd’s average inbreeding coefficient. If you’re hovering at or above 9.99%, set a hard mating ceiling in your software immediately — many breeders hold matings under 6–7%. 
  2. Apply the strength filter. Reject any incoming catalog sire whose Stature outpaces — or even ties — his Strength. Even Renegade’s +0.96 over +0.94 is a razor’s-edge pass. 
  3. Never let a line card substitute for software. A bull can look beautifully wide on paper and still be a first cousin to the heifer you’re trying to correct. Use linear filters to design the cow; use genomic mating tools to protect the pedigree. 

O-Man’s real lesson isn’t that he got overused. It’s that the breed only noticed after the fact — years after the semen was in the tanks and the daughters were in the barns. So walk your holding pen some morning and count honestly: how many separate families are actually standing there, and how many are the same handful wearing different names? The studs decide how wide the pipeline runs. Your call at the catalog decides how much of that bottleneck your own cows carry. Which bull are you about to order — and do you actually know how related he is to the cow he’s going on?

Key Takeaways

  • Canadian Holstein heifers hit 9.99% inbreeding — the drift costs about $44/cow per point over a lifetime, plus $60–100 per cow per lactation in the herds carrying the most of it. Pull your herd average before your next semen order.
  • Run two separate tools, because they fix two different problems: the 1:1 Frame Rule (if Stature STA beats or ties Strength STA, you’re buying height, not cow) fixes how she’s built; genomic mating software fixes how related she is. Neither covers for the other.
  • A strong bull can still be the wrong bull. Robo checks every phenotype box but stacks Renegade through his dam — and even Renegade’s own +0.96 strength over +0.94 stature is a razor-thin pass. Look off the line (King, Glowup) when your herd’s already near the ceiling.

The Invisible Invoice

Herd Inbreeding & Pedigree Bottleneck Auditor

9.9%
5.0% (Outcross) 9.9% (2026 Breed Avg) 15.0% (Severe)
6.5%
5.0% Strict 6.5% Conservative Goal 10.0% No Cap

Real-Time Financial Exposure Audit

Annual Milk Loss per Cow: 153 kg
Total Herd Annual Volume Deficit: 38,250 kg
Annual Revenue Leakage (@$0.43/kg margin): $16,448
⚠️ Invisible Operational Drain Detected
$37,400
Estimated total cumulative lifetime drag across this generation if mating strategies are not capped.
Data Matrix verified via peer-reviewed JDS literature. Source: The Bullvine

Complete references and supporting documentation are available upon request by contacting the editorial team at editor@thebullvine.com.

Learn More

  • The Shottle Legacy: A Lesson in Balance — Arms you with a masterclass in outcross selection by studying the precise sire line that resisted the O-Man onslaught, delivering a roadmap to inject structural soundness and functional width back into your stalls this week.
  • The Genomic Revolution: 15 Years Later — Exposes the long-term structural blind spots created by aggressive turnaround times in young sires, positioning your 5-year mating strategy to survive the hidden coancestry collapse that current major index formulas completely ignore.
  • Is Linebreeding Dead or Just Rebranded? — Dismantles standard catalog marketing by pulling back the curtain on modern “outcross” claims, revealing how elite operations leverage controlled relationships to lock in high-margin consistency without triggering catastrophic inbreeding depression.

The Sunday Read Dairy Professionals Don’t Skip.

Every week, thousands of producers, breeders, and industry insiders open Bullvine Weekly for genetics insights, market shifts, and profit strategies they won’t find anywhere else. One email. Five minutes. Smarter decisions all week.
NewsSubscribe
First
Last
Consent

The 9.99% Holstein Inbreeding Bill: Are You Breeding for Profit or Just Index Points?

At 9.99% inbreeding, every extra point can quietly strip up to $44 per cow — before you even argue TPI vs Net Merit.

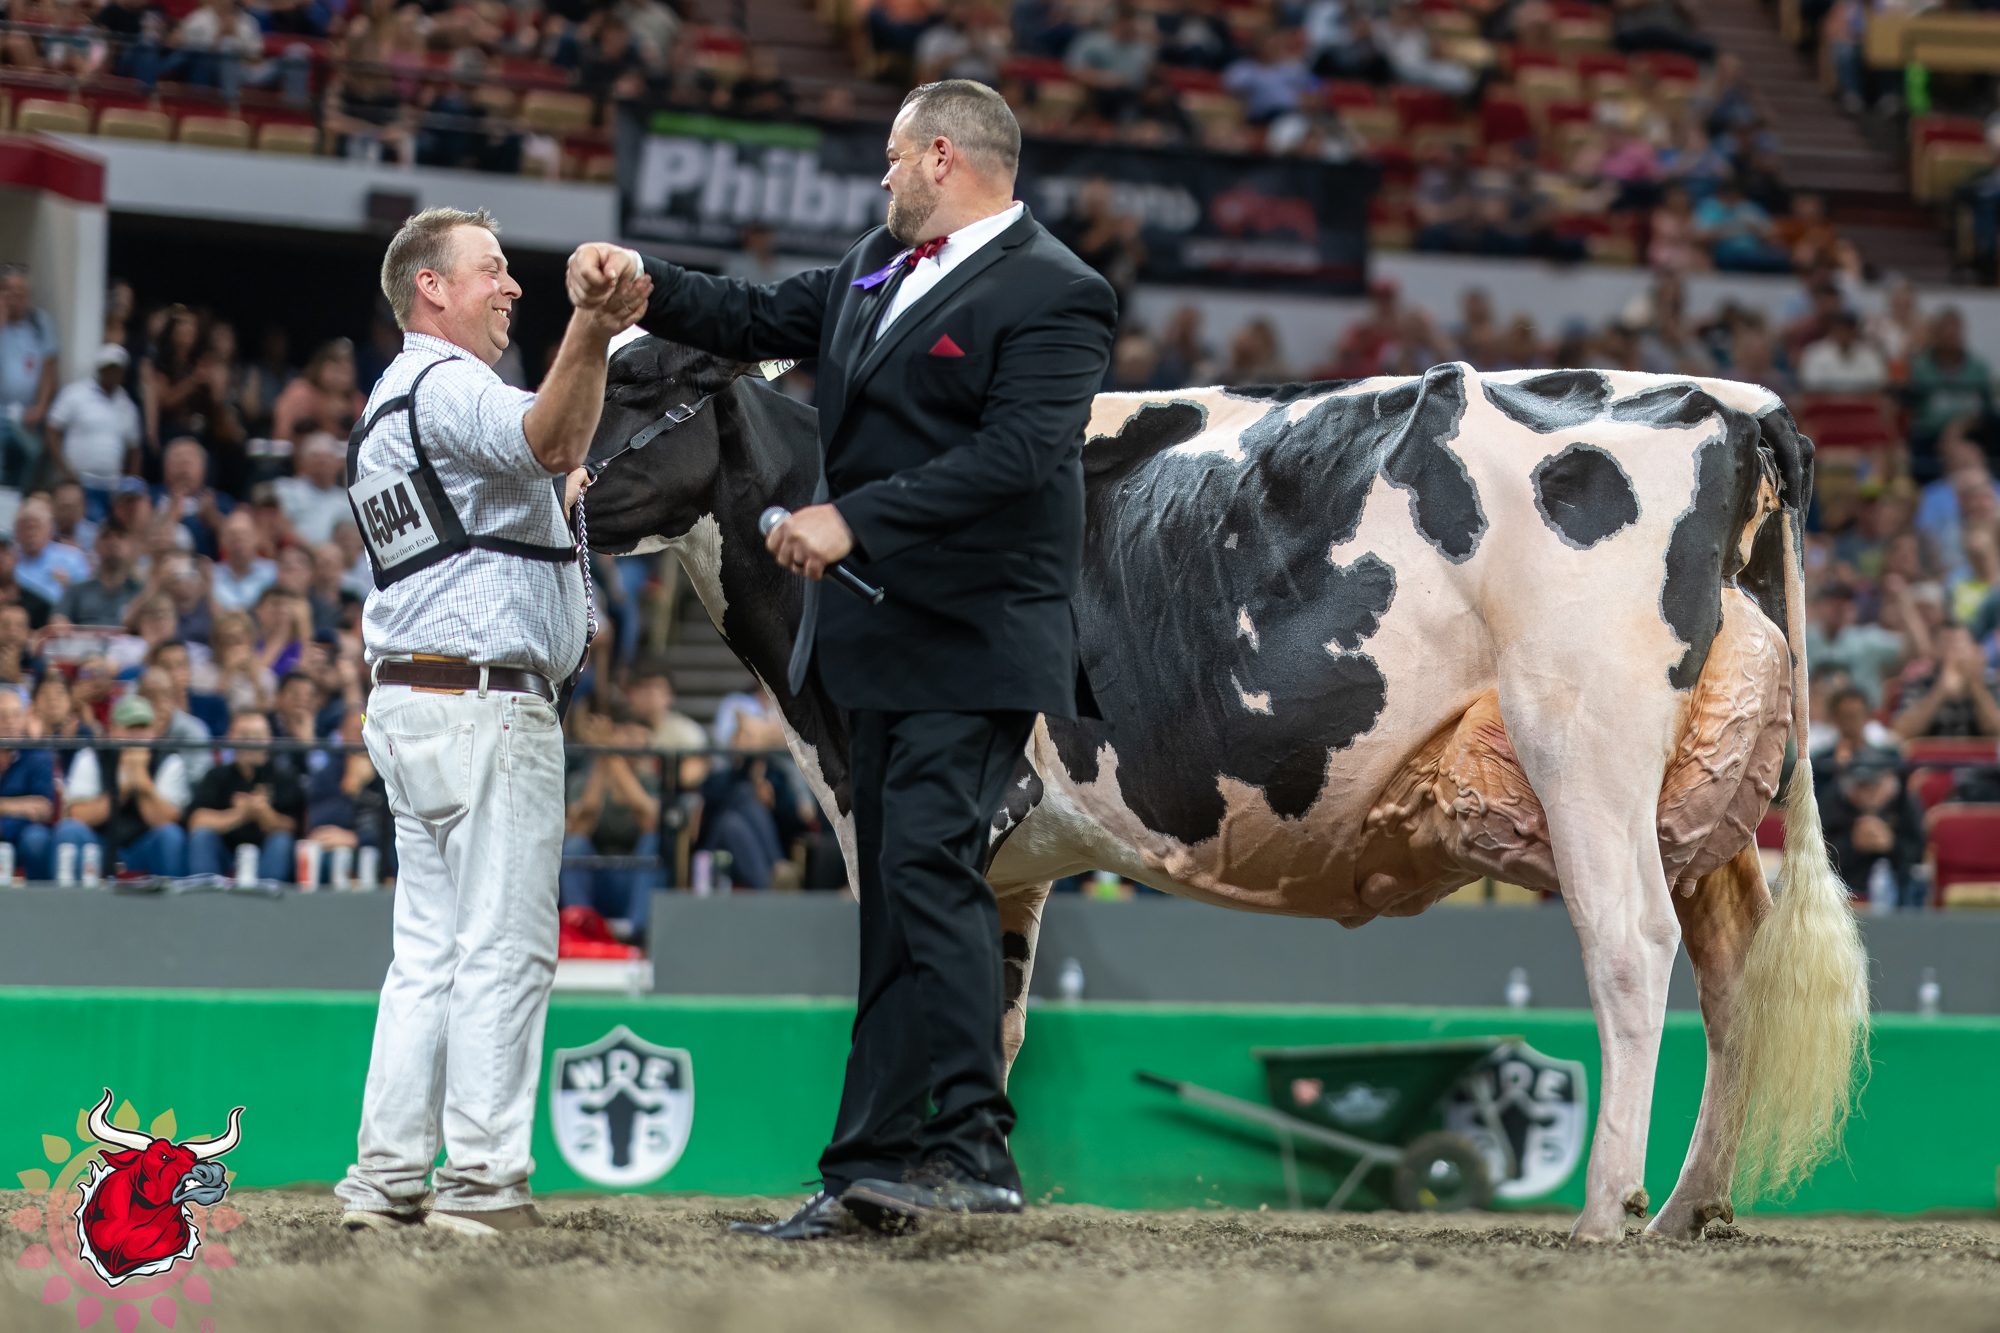
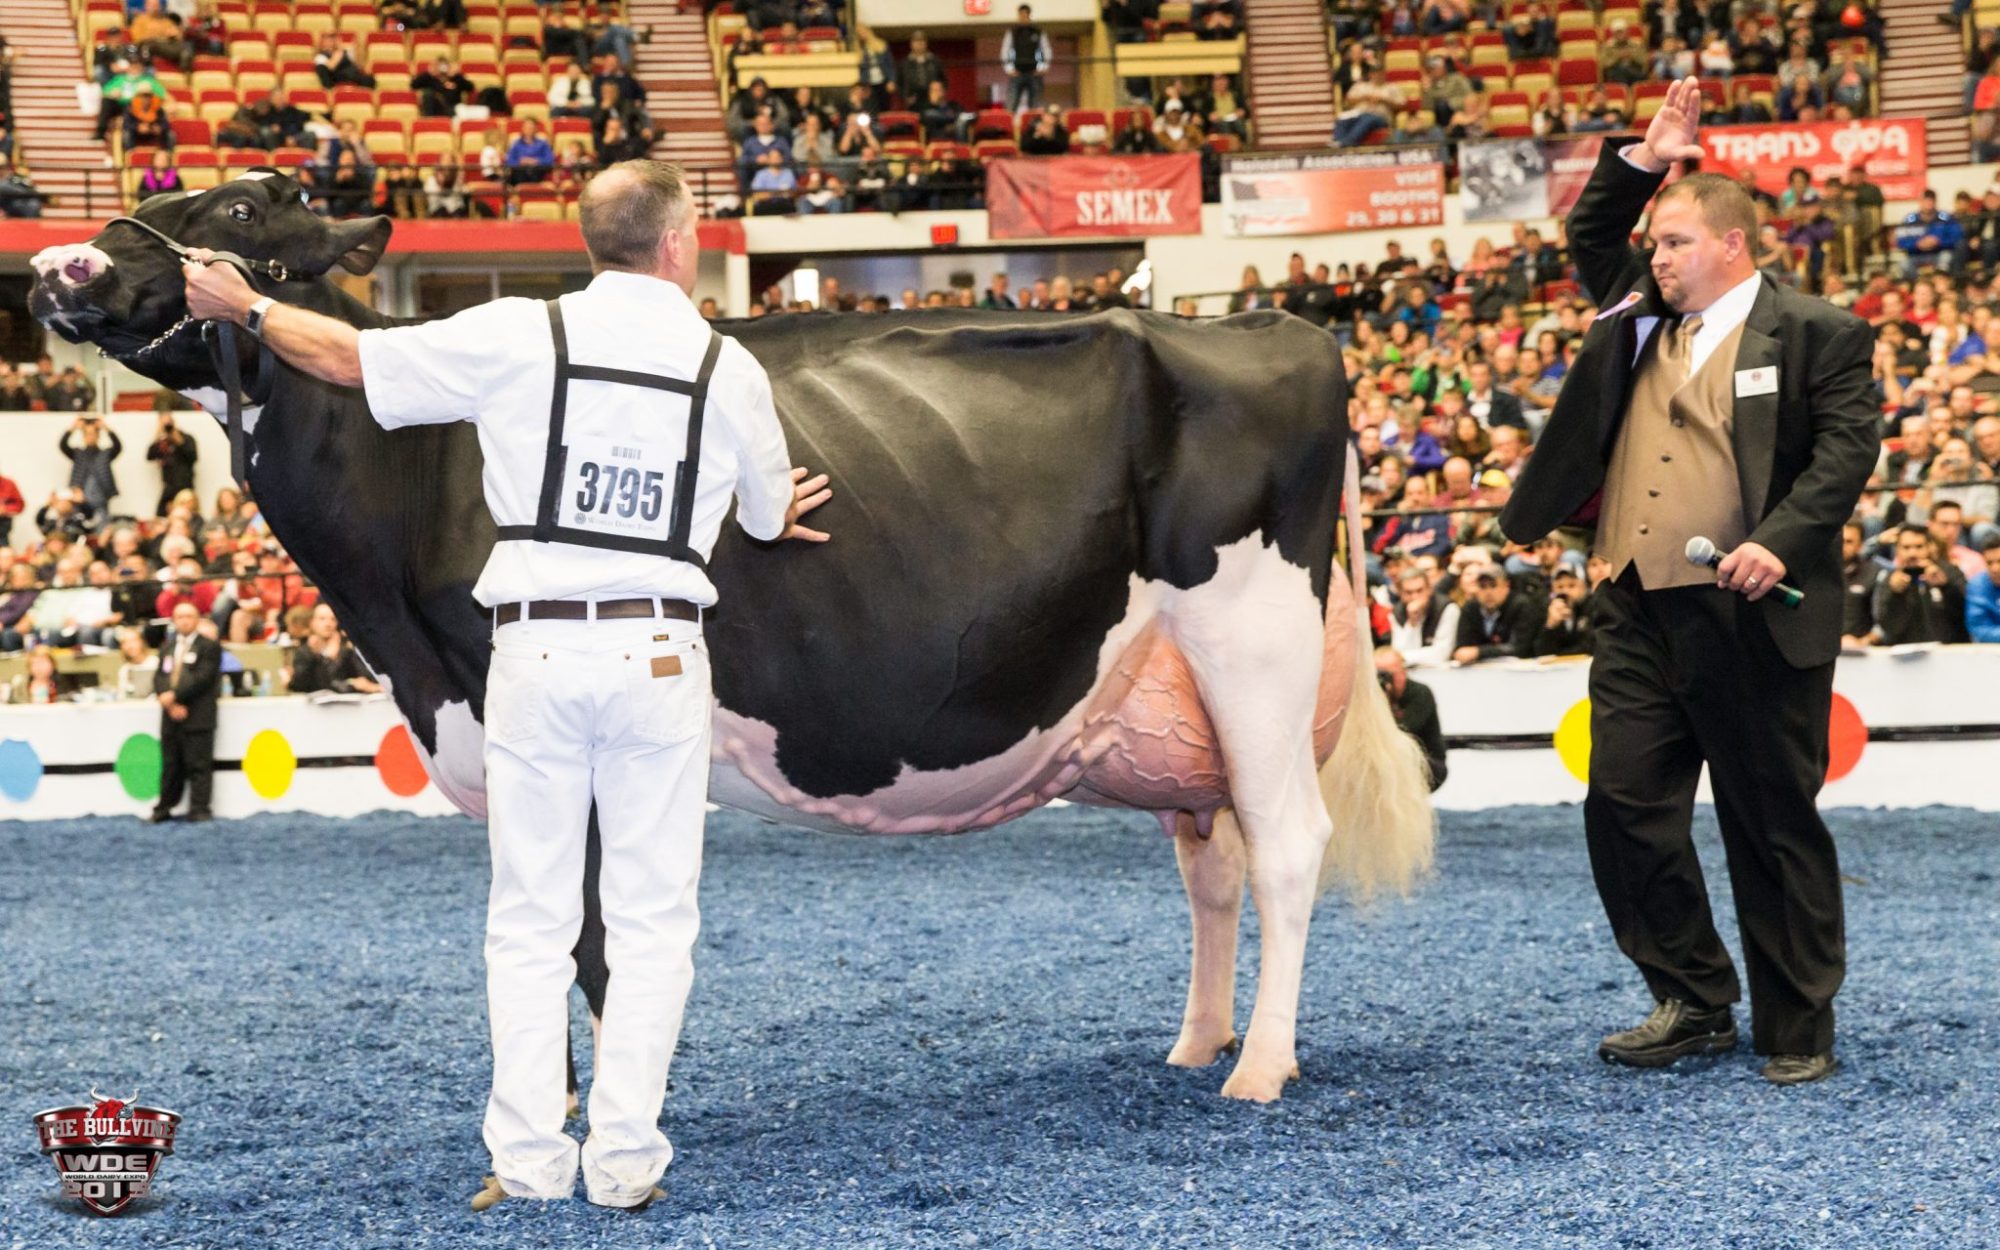
Lovhill Sidekick Kandy Cane takes the fist-bump and the banner — Grand Champion of the International Holstein Show at World Dairy Expo. Bred by Michael and Jessica Lovich on 72 tie-stall cows in Balgonie, Saskatchewan, and later classified EX-97, she’s living proof that a deep, functional udder and real longevity still win the ring — the same traits a narrowing gene pool is quietly pricing every breeder out of.

Michael and Jessica Lovich milk 72 cows in a tie-stall barn in Balgonie, Saskatchewan. They mostly ignore genomics. They breed off cow families and their own eye. And they’ve now bred two separate World Dairy Expo Holstein Grand Champions — Lovhill Goldwyn Katrysha in 2015 and Lovhill Sidekick Kandy Cane in 2025. They’re the first and only breeders in history to pull that off. (Read more: Lovholm Holsteins: The Only Farm to Breed 2 World Dairy Expo Holstein Champions Milks 72 Cows in Tie-Stalls)

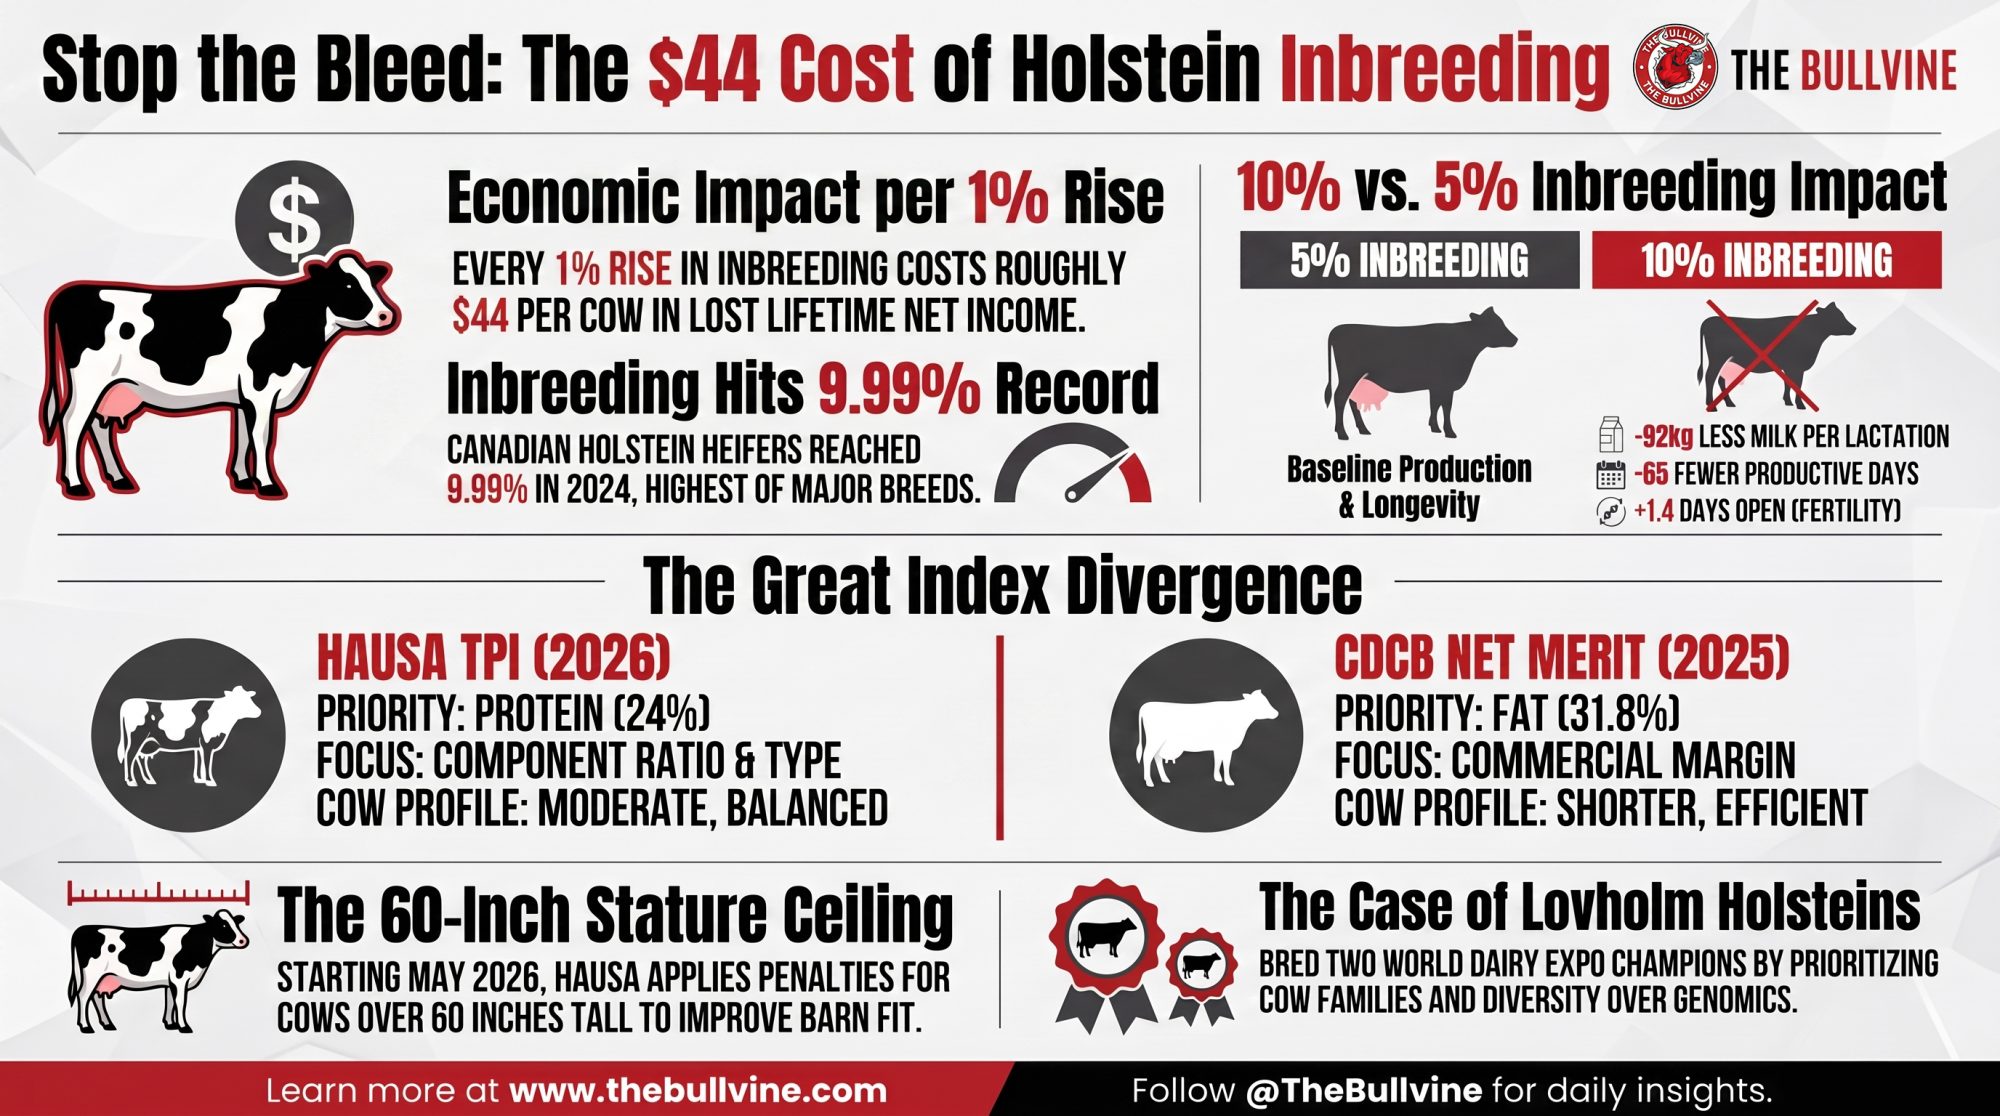
Here’s the part that should make you pause. The herd that walked away from the index list ended up breeding the kind of functional, long-lasting cows the commercial indices are quietly moving toward anyway. They succeeded by breeding out of a broader, more diverse gene pool — the exact opposite of where the rest of the industry is rushing. And while everyone keeps arguing about show cattle versus commercial cattle versus “just use the index,” a number nobody chose keeps climbing in the background: Holstein inbreeding hit 9.99% for Canadian heifers born in 2024 — the highest of the four major breeds, ahead of Jersey at 7.56%, and up from 9.61% the year before — according to Lactanet’s August 2025 update. That number lands on all three camps at once, no matter which side of the argument you stand on.

What’s Changing and Why

For thirty years, the dairy genetics argument has had two sides. One camp says the show ring proves what a valuable cow looks like. The other says the milk cheque does. This summer a third voice got loud enough to matter: “Both of you are wasting time — just breed off the top GTPI or Net Merit list.”

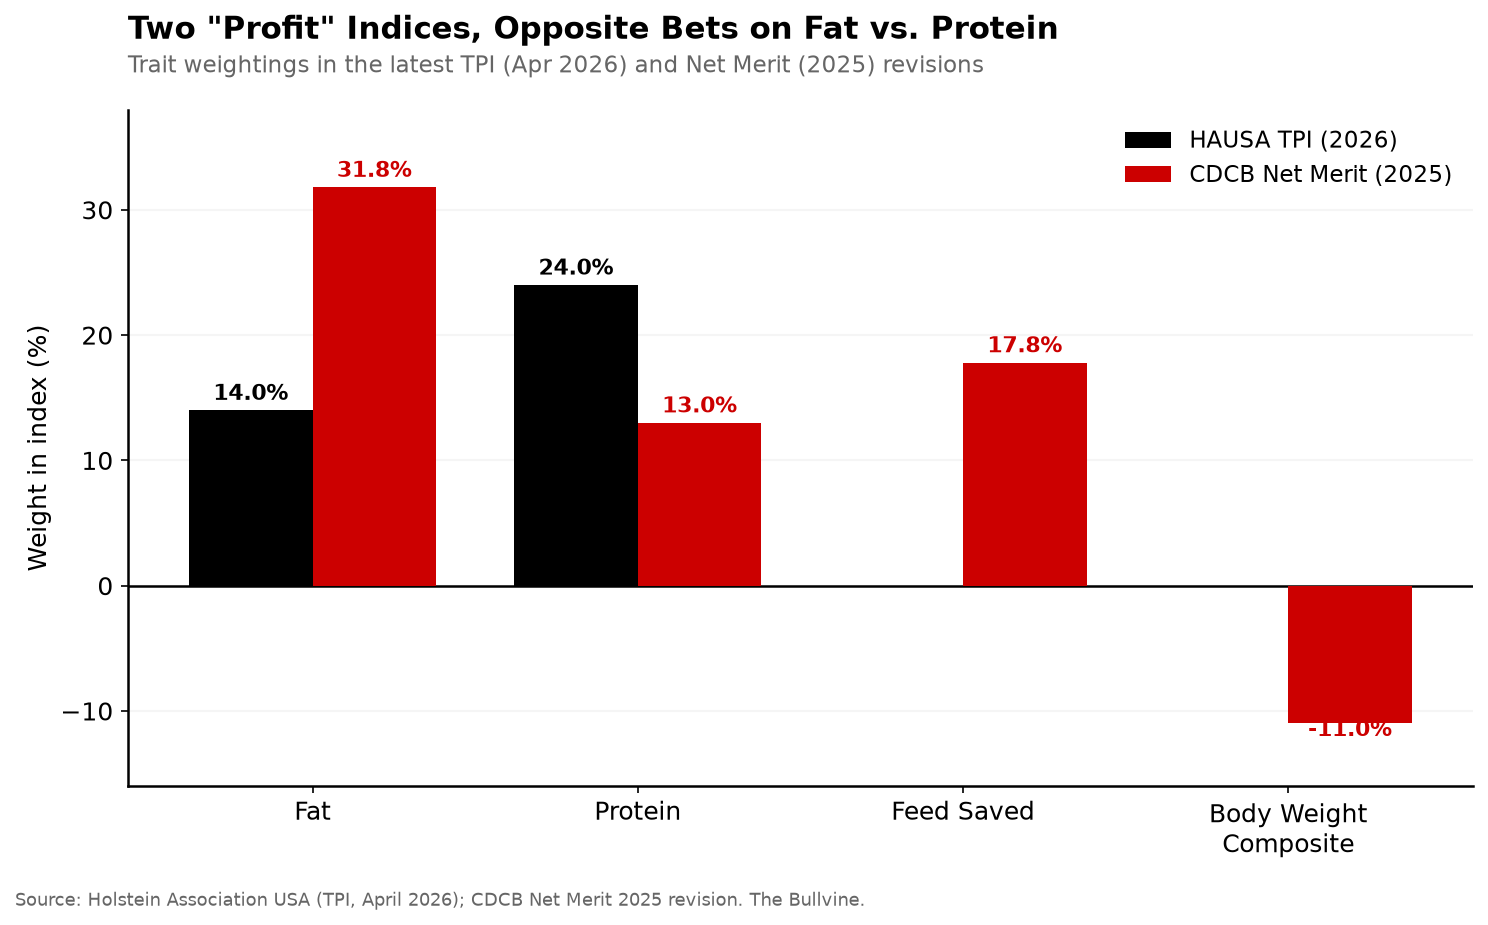
All three are answering different questions, and the numbers now prove it. In April 2026, Holstein Association USA changed its TPI formula to weight protein at 24% and fat at just 14%, up from a 19/19 split. CDCB’s Net Merit 2025 revision went the opposite direction — fat at 31.8%, protein down to 13.0%, with Feed Saved climbing to a combined 17.8% and Body Weight Composite at −11%. Two flagship indices, both claiming to describe a profitable cow, now point in genuinely opposite directions on fat versus protein.

Here’s the split at a glance:

IndexPrimary FocusKey Trait Heavyweights (2025/2026 updates)Ideal Cow Profile
HAUSA TPIComponent ratio & typeProtein 24%, Fat 14%; stature penalty above 60″Balanced, moderate-sized, high-protein yielders
CDCB Net Merit (NM$)Commercial marginFat 31.8%, Protein 13.0%, Feed Saved 17.8%Shorter, highly efficient, high-butterfat producers

Then there’s the classification change most show barns are still processing. Starting with the May 2026 run, HAUSA set 60 inches as the ideal stature and applied a sliding-scale penalty for cows taller than that — shaving points off the final classification score as height climbs past the limit, so a tall, extreme-framed cow that once scored well can now come in lower on paper for the exact trait that used to help her. The official language is about normalizing size. But underneath it is a harder admission: decades of breeding taller cows collided with feed cost, stall fit, and longevity. The breed association put a measurable penalty on the exact trait the show ring spent a generation chasing.

How This Plays Out on Real Farms

The Lovich story looks like a fairy tale until you read the fine print. They sold both champions. Katrysha went south, and Kandy Cane went to Oakfield Corners Dairy in New York as a four-year-old, well before she walked into Madison as a five-year-old and later reclassified EX-97. For a lot of small tie-stall herds, selling your best cows is how the barn stays viable — the premium on an elite animal funds the operation. And their cows tend to milk well past the age most Holsteins are culled, which flips the whole economics toward longevity rather than peak yield.

The tap that started a dynasty: Lovhill Goldwyn Katrysha is confirmed Grand Champion of the International Holstein Show at World Dairy Expo 2015. Her win put a 72-cow tie-stall herd in Balgonie, Saskatchewan on the map — the first of two World Dairy Expo Grand Champions Michael and Jessica Lovich would breed off cow families and their own eye, not a genomic list, while the rest of the breed narrowed toward it.

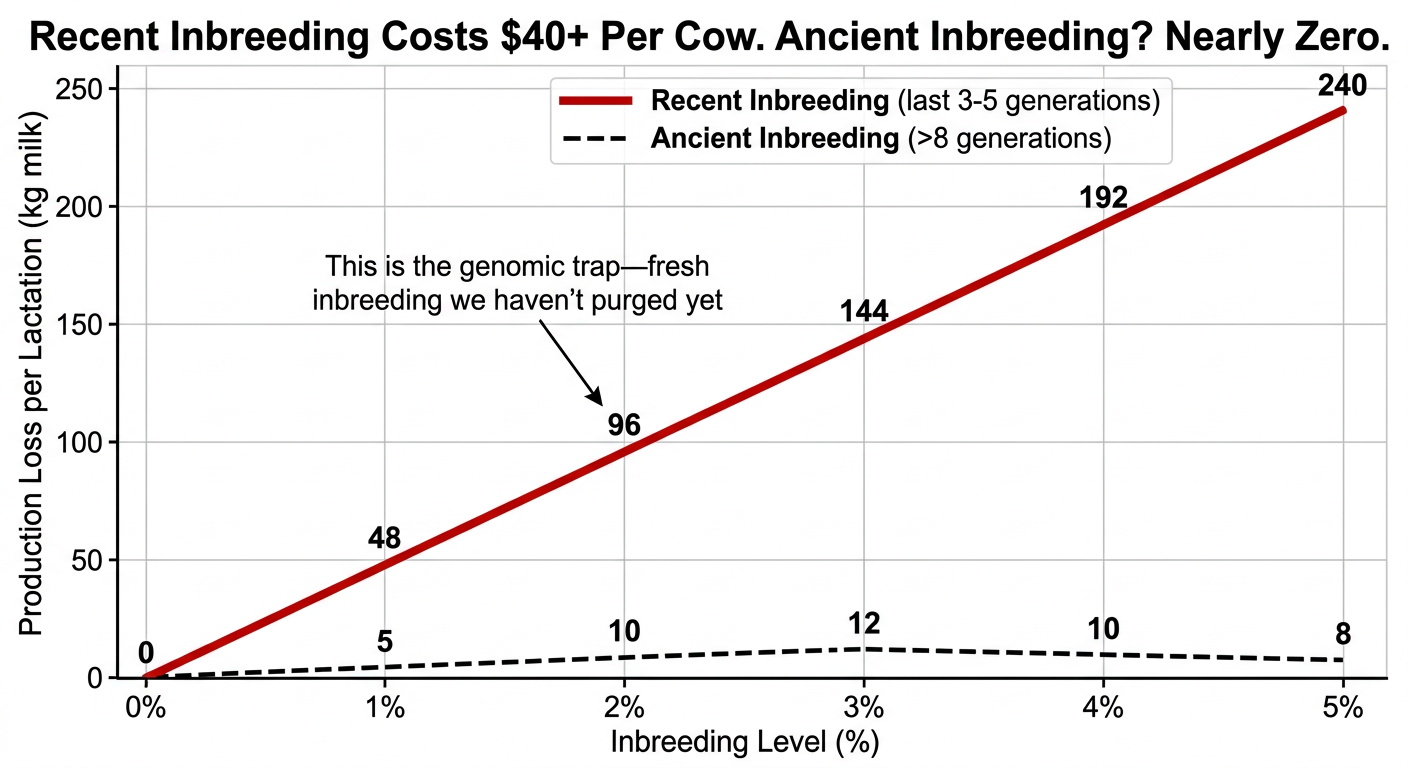
The number that reaches every barn is inbreeding, and it carries a real bill. The Virginia Tech research pegged it at $22 to $24 in lifetime net income per cow for each 1% rise in inbreeding — but that’s in 1999 dollars. Adjust it forward on cumulative inflation alone and the same drag lands near $44 per cow per 1% today (a Bullvine CPI-based estimate — layer in higher modern milk and feed values and the case for the top of that range only gets stronger). Run the math your own way. On a 200-cow herd that lets average inbreeding drift up four points, that’s roughly $35,000 in lost lifetime net income across the herd — not index points on a page, real money bleeding out of the barn. Newer Canadian work backs the mechanism: the Canadian Dairy Network found a cow that’s 10% inbred, versus 5%, loses about 92 kg of milk, 5.3 kg of fat, and 2.6 kg of protein per lactation, adds 1.4 days open, and loses roughly 65 days of productive life. It never shows up on a semen invoice. It hides in open days, mastitis cases, and calves that don’t make it.

Metric (per lactation unless noted)5% Inbred Cow10% Inbred CowLoss at 10%
Milk yieldBaseline−92 kg−92 kg
FatBaseline−5.3 kg−5.3 kg
ProteinBaseline−2.6 kg−2.6 kg
Days openBaseline+1.4 days+1.4 days
Productive lifeBaseline−65 days−65 days

That’s why this reaches every camp. The show breeder, the Net Merit devotee, and the top-50-list herd are all pulling from an increasingly related bull population, and the compounding cost lands the same way on all of them.

The Deeper Read: For where that shrinking bull pool actually concentrates — and the USDA sires your stud may not be pushing — see Holstein’s inbreeding bill and the USDA bulls your stud isn’t selling you.

The Mechanics Behind the Outcomes

Think of it as three different experiments, not three answers to one question. Show-and-type selection asks whether breeding for conformation and classification produces cows that win and sell. The commercial camp runs a different test entirely: through Net Merit or LPI, does a cow throw the most profit under your actual costs? And the index-first crowd is betting on speed — trust the highest-ranked young bulls, shorten the generation interval, and try to outrun everyone else’s genetic gain.

None of those experiments settles the others, because each measures something different. A judge at World Dairy Expo isn’t scoring feed intake per day or days open. Net Merit ignores ring presence entirely. And the index itself isn’t neutral — it’s an editorial choice about what matters, built on national-average price assumptions that may not match your processor. So when TPI says protein and Net Merit says fat, a breeder who “just uses the index” without checking which one fits their cheque is quietly optimizing for someone else’s barn.

The inbreeding problem sits underneath all three. The top of any genomic list — GTPI or Net Merit — isn’t a random draw. It’s a tight cluster of high-relationship sires that trace back through a handful of grandsires, and the concentration is stark: research finds the vast majority of today’s Holstein AI bulls funnel back to just two ancestral sires, with a single foundation bull, Pawnee Farm Arlinda Chief, still echoing through the population decades later. Ride the list harder, and you stack that relationship faster. CDCB has confirmed its genetic base changes now include Expected Future Inbreeding (EFI) adjustments to account for future inbreeding, not just observed genetic trends — which is why individual PTAs no longer track the base change as cleanly as they once did. When the statisticians pre-discount the future, that tells you something.

How Much Does Sticking With the Wrong Index Actually Cost?

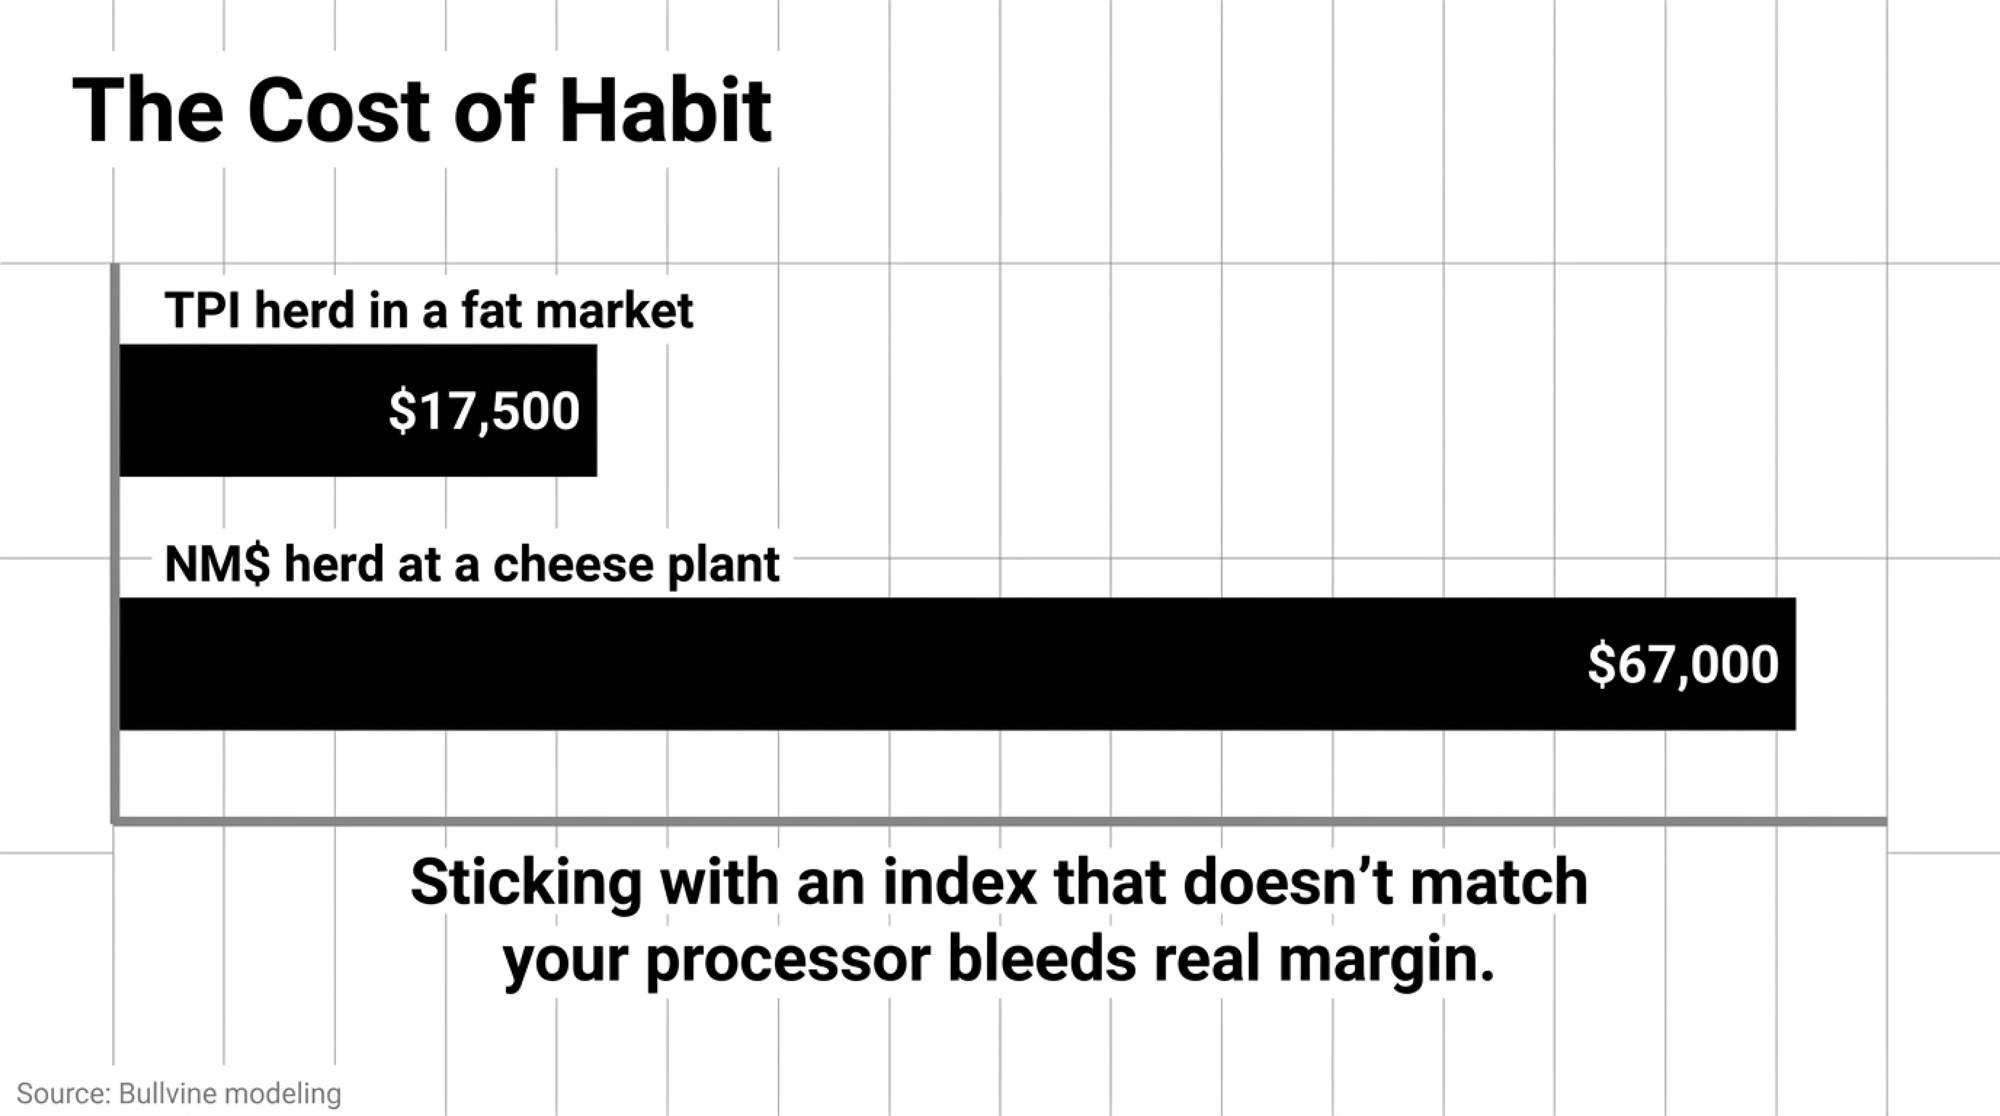
More than most herds realize, and the loss is invisible because it’s “index-approved.” A herd that keeps breeding off TPI out of habit, while getting paid on butterfat, can drift toward higher protein ratios its cheque doesn’t reward at current component prices. Bullvine’s own modeling of the 2026 TPI shift put the exposure as high as $17,500 for a mid-size herd chasing the protein signal in a fat-heavy market — a figure that depends on your herd size and your component spread, so treat it as a scenario, not a guarantee.

The mirror image is just as real. A cheese-plant herd still breeding off Net Merit’s fat signal can leave protein premiums on the table — a gap Bullvine modeled at roughly $134 per cow per lactation, or about $67,000 across 500 cows. Either way, nobody traces it back to the semen order. They blame feed, labor, the processor — everything except the objective function they never chose on purpose.

Barn SituationIndex Being UsedWhere It LeaksModeled Cost Exposure
Fat-heavy market, chasing proteinHAUSA TPI (2026)Higher protein ratios the cheque doesn’t reward~$17,500 (mid-size herd)
Cheese plant, breeding for fatCDCB Net Merit (2025)Protein premiums left on the table~$134/cow/lactation
Same, scaled to the barnCDCB Net Merit (2025)Compounded across the herd~$67,000 (500 cows)
Any herd, wrong index by habitEitherBlamed on feed, labor, processor — never the semen orderInvisible / untraced

The Deeper Read: For the full walkthrough of how the Net Merit 2025 reweighting hits your milk cheque, see our breakdown of what changed and what it costs your barn.

Is Your Herd’s Genetic Diversity Already Behind?

Maybe — and the tie-stall clock makes it more urgent for some. Canada’s updated code of practice requires that continuously tethered cows get untethered freedom of movement, with the key provisions phasing in by 2027.

Connect the dots and the three storylines turn out to be one. HAUSA’s 60-inch stature penalty isn’t an aesthetic call — it’s a structural necessity, because modern Holsteins have been outgrowing the physical dimensions of the tie-stalls and freestalls North American barns were built around. That’s the same logic driving Net Merit’s −11% Body Weight Composite: a bigger cow costs more to feed and fits the barn worse. The logic points one way — a shorter, more genetically diverse cow should fit a retrofitted stall better and carries less of the fertility and health drag that inbreeding stacks on, which is exactly what you want walking into the 2027 deadline. Head in tall and closely related, and you’re solving two problems at once, with only one of them showing up on your classification report.

Options and Trade-Offs for Farmers

Path 1: Pick your index deliberately, then match it to your pay stub. This is the 30-day move. Pull last year’s milk cheques and figure out your actual dollar-per-pound split on fat versus protein. If you’re component-heavy on butterfat, Net Merit’s 31.8% fat weighting likely fits better than TPI’s protein-heavy 2026 formula. It takes an afternoon with your statements and your rep. Skip it, and you leak margin for years while your cows look better on paper.

Path 2: Build an explicit inbreeding ceiling into your mating program. This one’s for any herd riding the top of the GTPI or Net Merit lists year after year. It means telling your mating software — or your rep — a hard limit and holding to it, even when a high-index bull is closely related to your cows. Lactanet notes the average inbreeding level today is roughly 9% and advises aiming matings below that average; its own tools flag %INB so you can screen out mates that push a calf too high. You may give up a few index points per mating. The payoff is not stacking that $22-to-$24-per-cow-per-percent bill — closer to $44 in today’s dollars — that you won’t feel for three years.

Path 3: Borrow across camps instead of picking a tribe. Take the show world’s eye for udders and legs, the commercial index’s discipline on feed efficiency and longevity, and genomic testing’s speed on sorting replacements. Works for most mid-size herds. The trap is doing it by accident — a little TPI, a little Net Merit, a little show type — and ending up with a bull battery optimized for nothing. Lovhill reached the top of the show ring twice by holding one clear standard, not by hedging across three — and that discipline is the part worth copying, whichever camp you land in.

Key Takeaways

  • If you don’t know your actual dollar-per-pound split on fat versus protein from last year’s cheques, run that number before your next semen order — it decides whether Net Merit or TPI fits your barn.
  • If your herd’s average inbreeding is at or above the 9% breed average, pull your number from your genetic-management software this month and ask your rep to project it forward before your next mating run.
  • If your cows skew tall, factor in that the May 2026 stature penalty and Net Merit’s −11% Body Weight Composite now both work against extreme size.
  • If you show and sell as part of your business model, be honest about whether your plan includes selling your best cows the way the Lovich family did — that’s what made their math work.
  • If your index “feels safe” because it’s familiar, remember the TPI and Net Merit formulas both changed in the last 18 months — familiarity isn’t the same as fit.
  • If you’re shipping to a cheese plant with a protein-to-fat ratio below 0.80, run the per-cow math on your own component prices — that’s the danger band where the wrong index quietly costs the most.

Here’s the uncomfortable question worth sitting with. The show breeder confuses a ring result with an economic verdict. The index-first herd confuses trusting the formula with running a strategy. Both outsourced their judgment — one to a judge, one to a formula — and neither stopped to ask whether the thing they trusted still fits the cows they actually need. So which one are you? And when did you last check whether the tool you rely on is optimizing for your barn, or for the average barn someone modeled years ago?

The short version: genetics is an economics question, and the only real mistake is not knowing which experiment you’re running. The longer version — the full cost-per-cow inbreeding math, broken down by herd size and index choice — is where the decisions actually get made. We’re running those numbers in next week’s Bullvine Weekly. If you want to map this to your own operation, that’s where the real math lives.

Hold-to-Proof Cost & Inbreeding Drag Simulator

Map the 2026 TPI/Net Merit formula updates and genetic drag directly to your herd’s bottom line.

200
9.5%
8.0%

Annual Inbreeding Penalty
$0
Annual Index Revenue Leak
$0
Total Invisible Annual Margin Leak
$0

Calculated using updated 2026 genetic values and modern inflationary baselines.

Complete references and supporting documentation are available upon request by contacting the editorial team at editor@thebullvine.com.

Learn More

  • Dairy Cattle Genetics Explained: TPI, NM$, GTPI and Genomics — Arms you with an immediate operational blueprint to navigate the 2026 formula divergence, showing exactly when to deploy TPI’s high-protein selection versus Net Merit’s aggressive butterfat and feed-efficiency weighting.
  • Net Merit 2025 — Exposes why national genetic indexes lag behind current marketplace realities, tracking the multi-year commodity averages that create a hidden financial mismatch between your tank’s actual value and your long-term breeding goal.
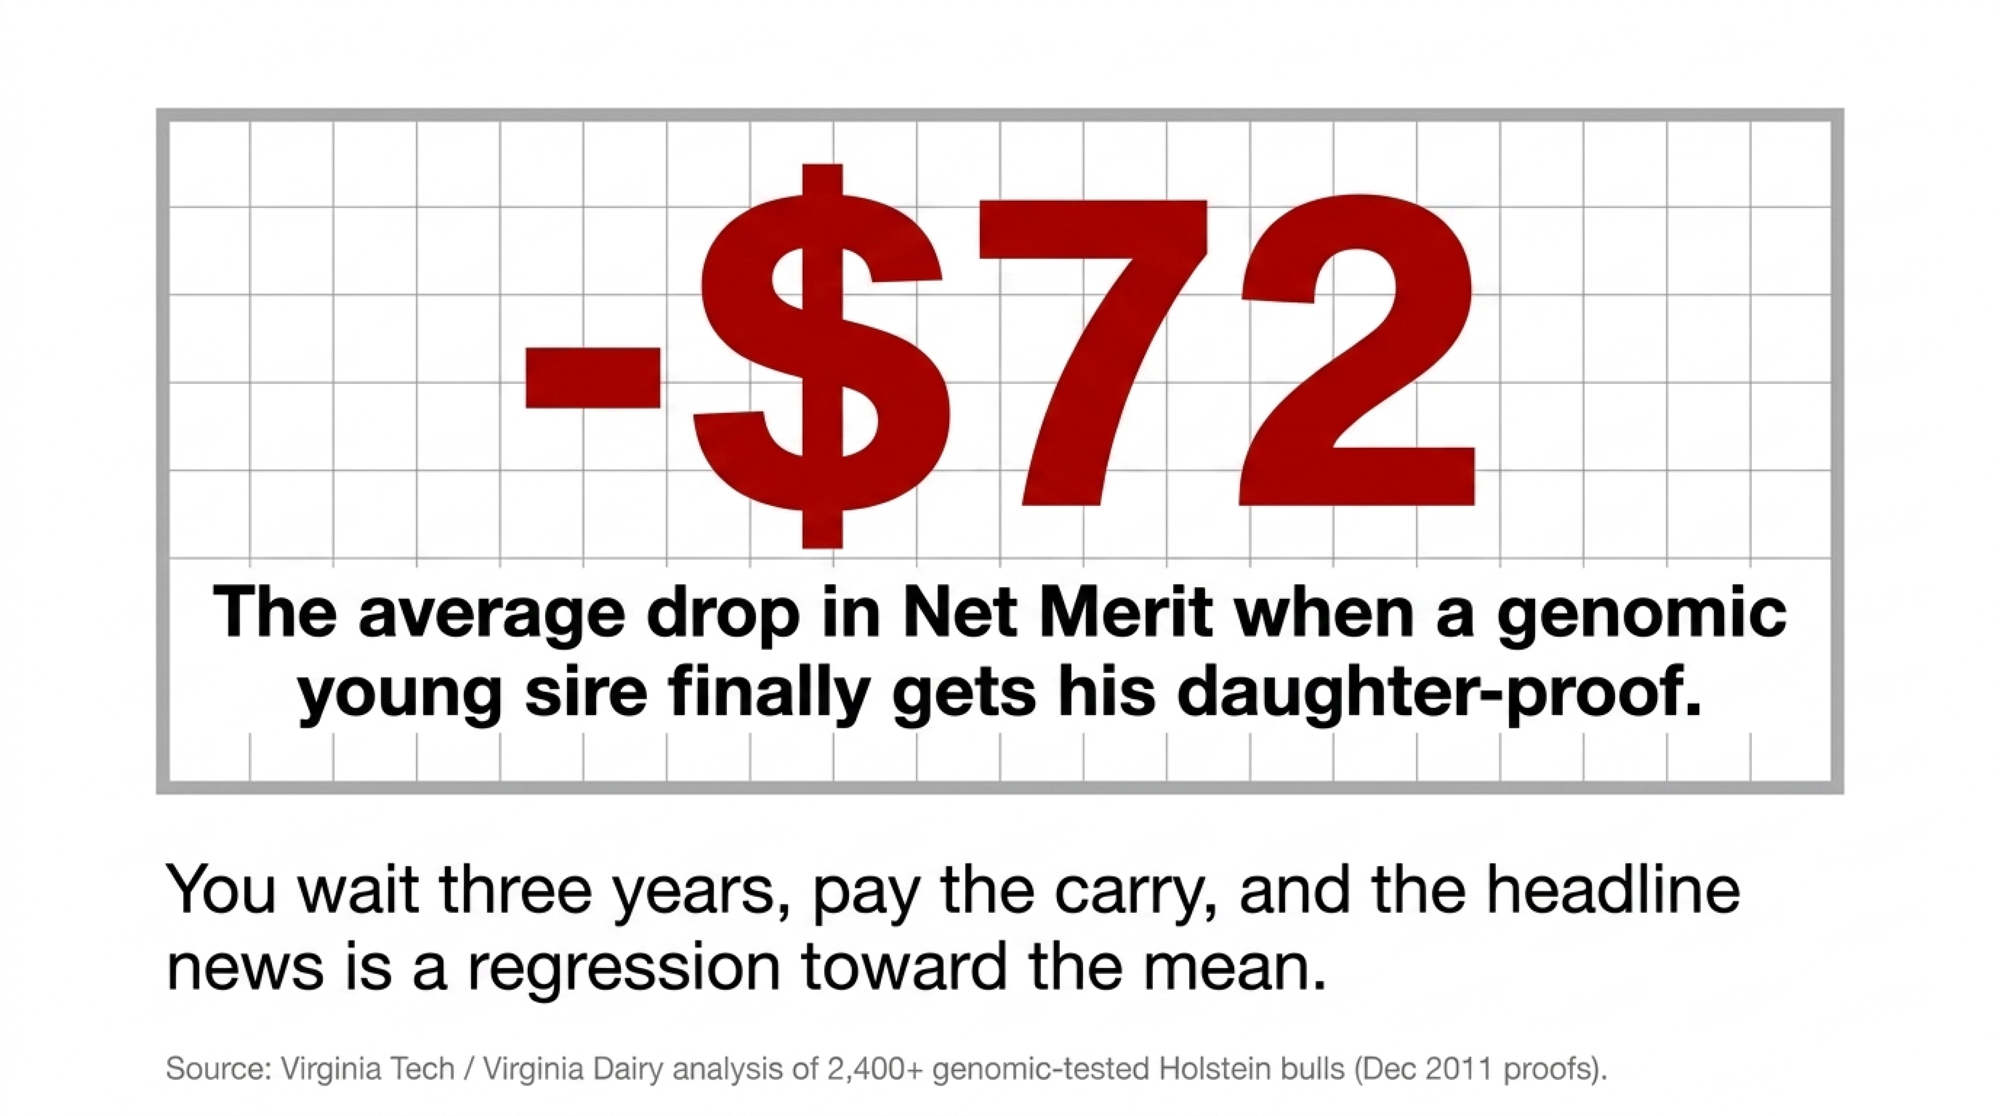
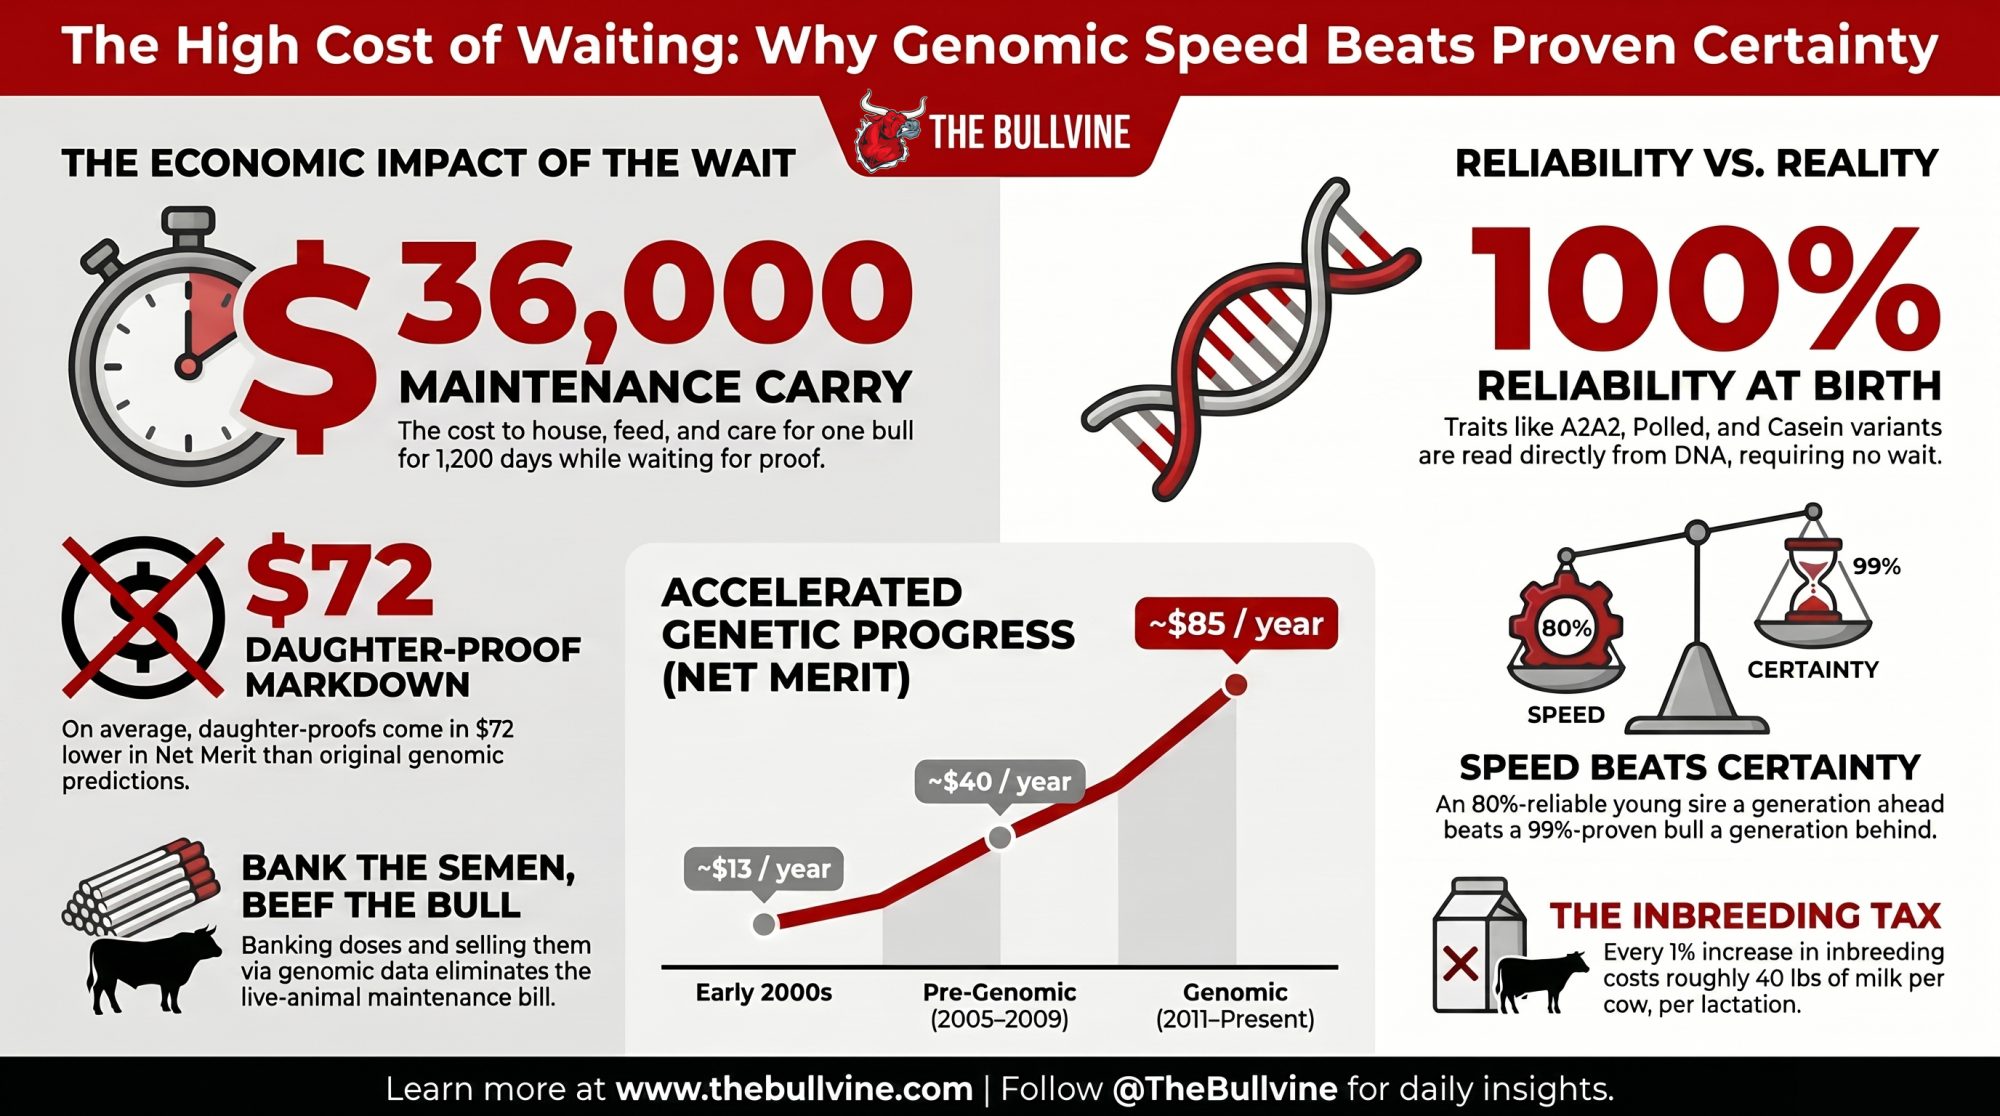
  • The Proof You Waited Three Years For Averaged a $72 Markdown — Delivers a brutal, data-driven reality check on daughter-proven strategies, demonstrating how holding famous bulls to proof stacks an expensive maintenance bill while sacrificing an entire generation of genetic velocity.

The Sunday Read Dairy Professionals Don’t Skip.

Every week, thousands of producers, breeders, and industry insiders open Bullvine Weekly for genetics insights, market shifts, and profit strategies they won’t find anywhere else. One email. Five minutes. Smarter decisions all week.
NewsSubscribe
First
Last
Consent

99.84% of Holstein AI Bulls Trace to Just Two Fathers

Two bulls born in the 1960s—Chief and Elevation—sit behind 99.84% of today’s AI sires. The gift: more milk, better udders. The bill: a 9.99% inbreeding tab now in your heifer pen.

Picture every Holstein in North America walking into one barn for Father’s Day dinner.

Millions of black-and-white cows, shoulder to shoulder, in a building the size of a county. They’ve come to toast their fathers, the way families do this time of year. And here’s the part that ought to stop you cold while you’re scraping the parlor this Sunday: almost every animal in that impossible room would be raising a glass to the same two dads.

Not two dozen. Not two hundred. Two.

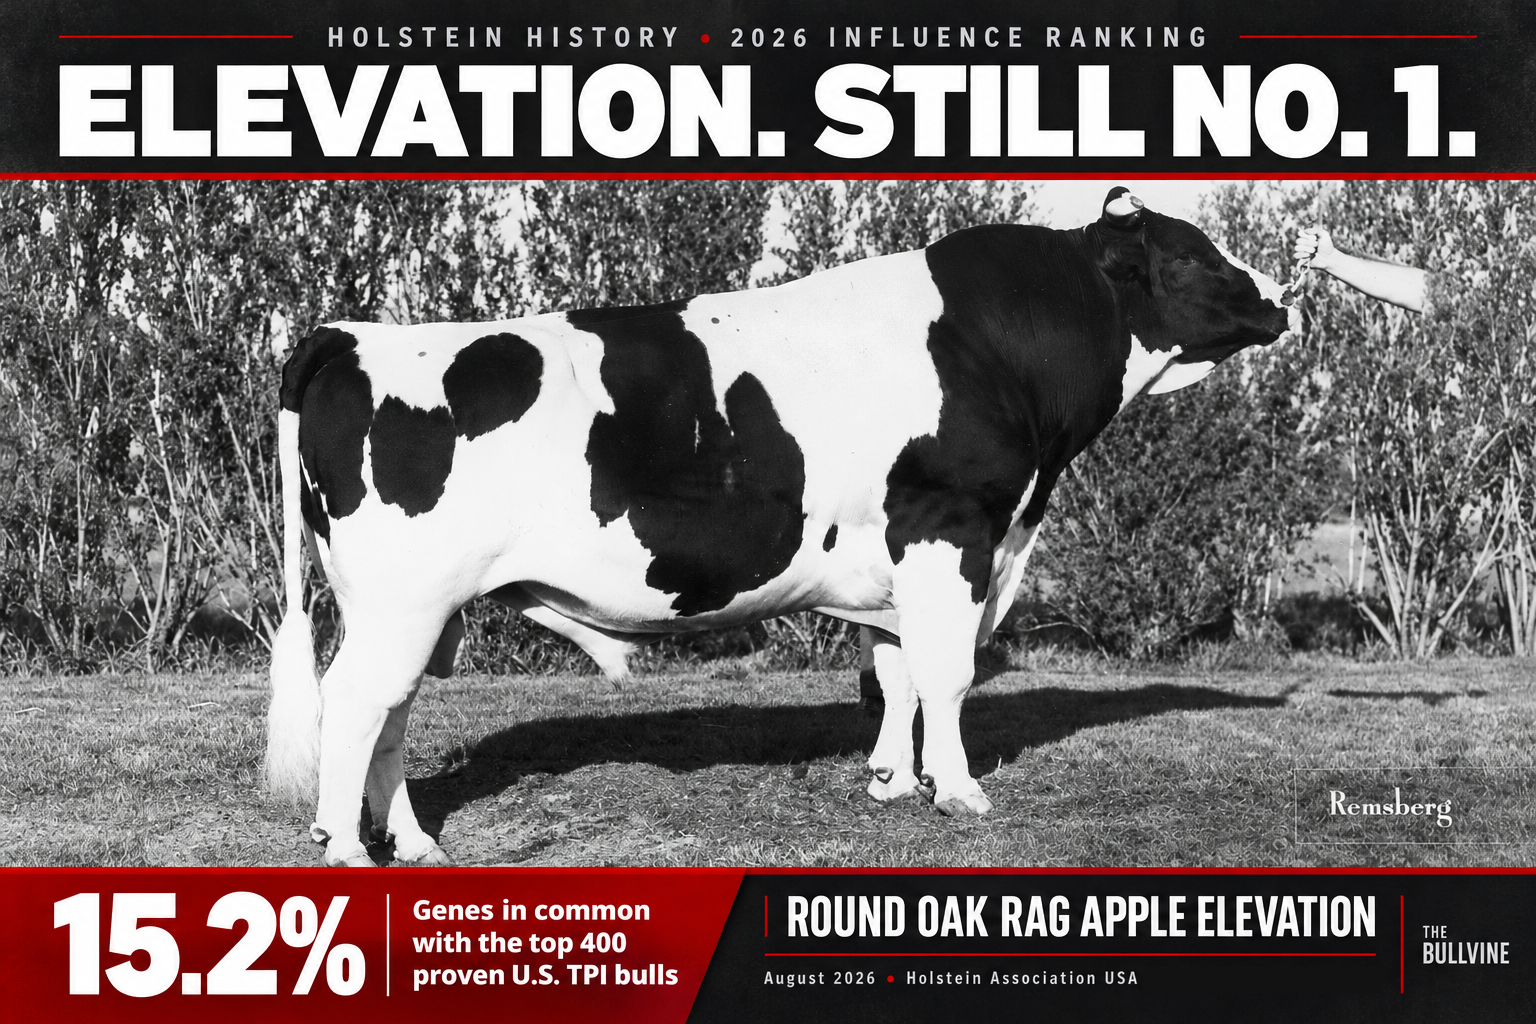
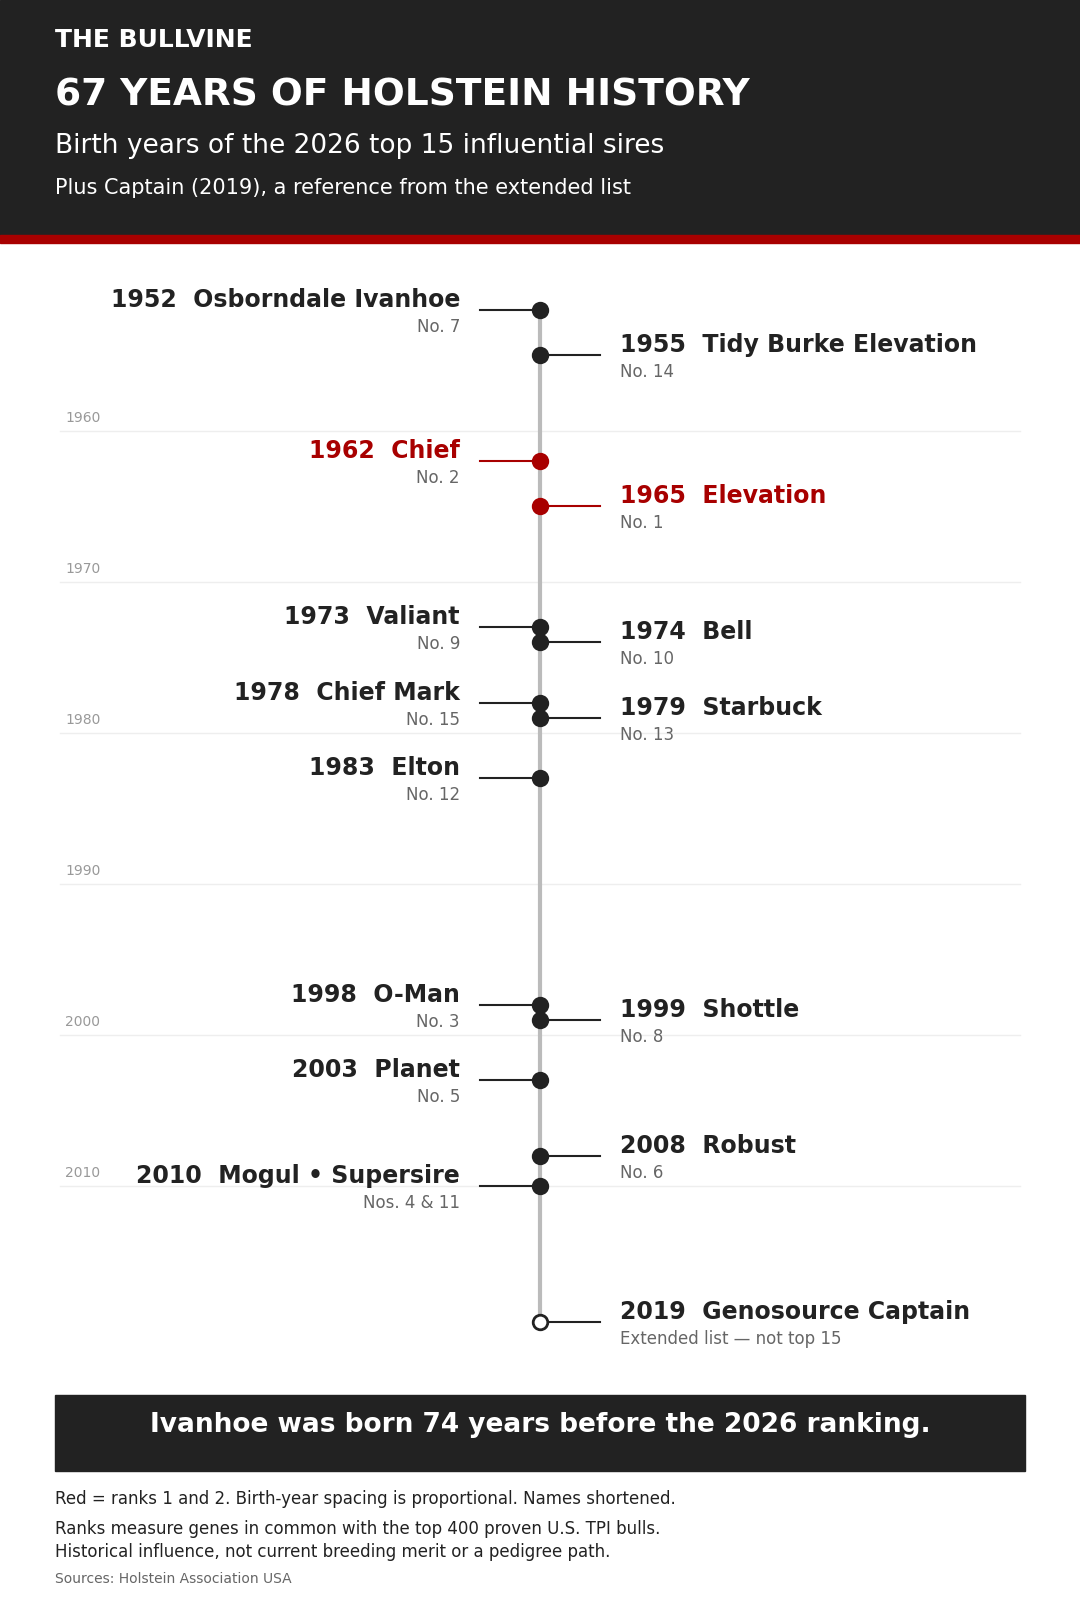
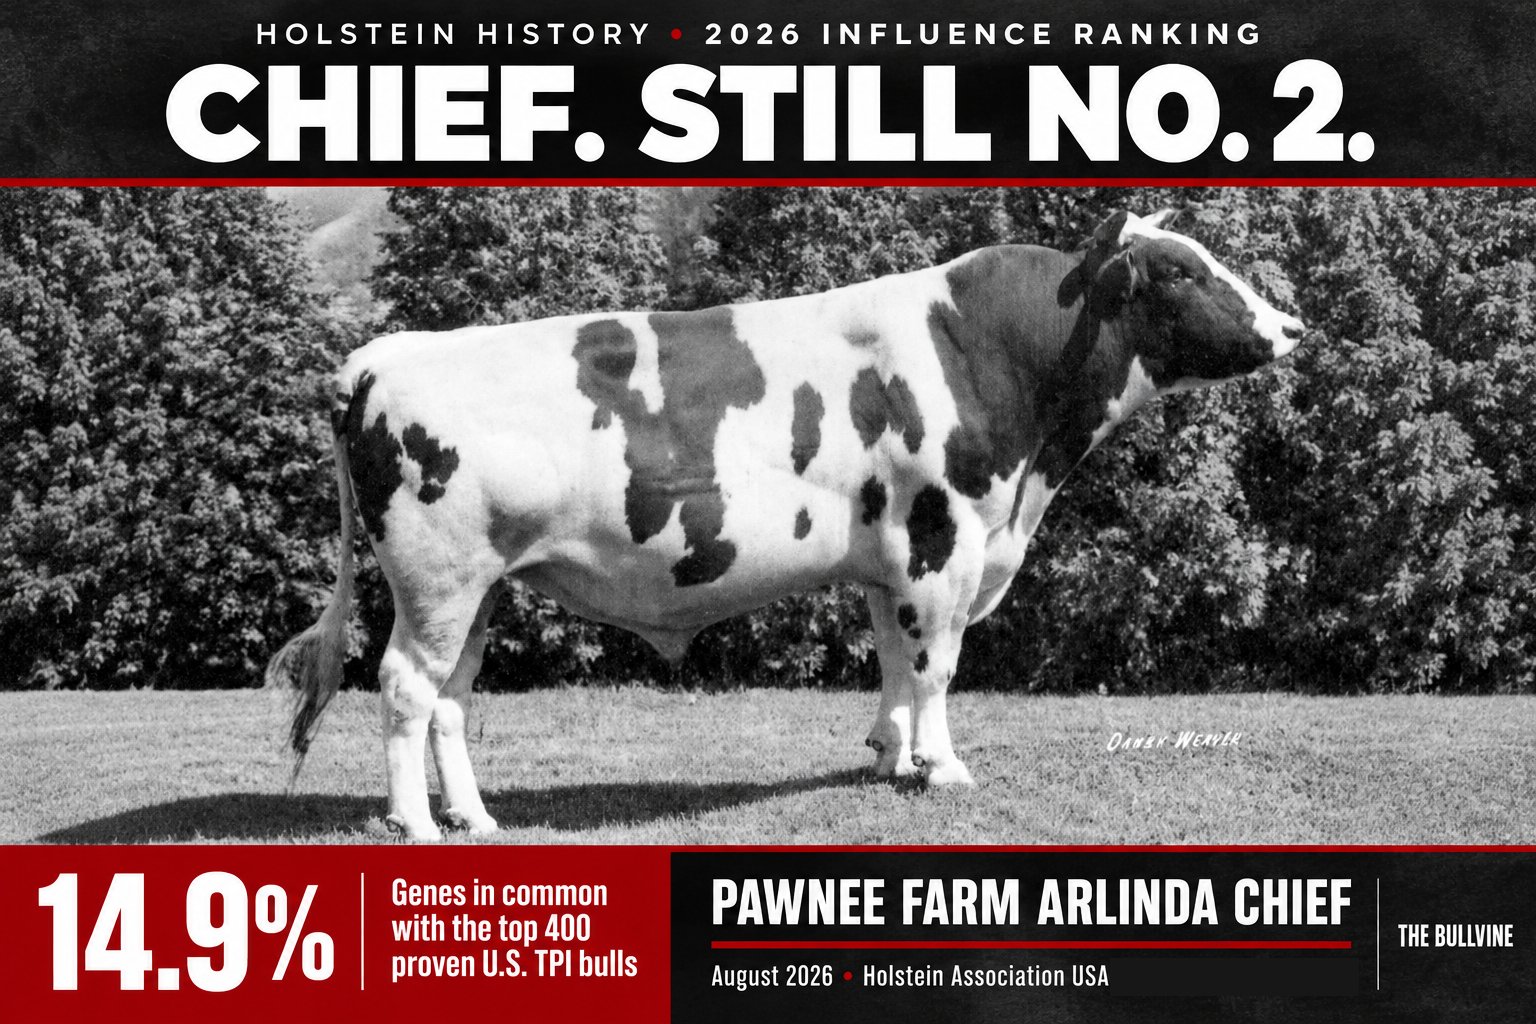
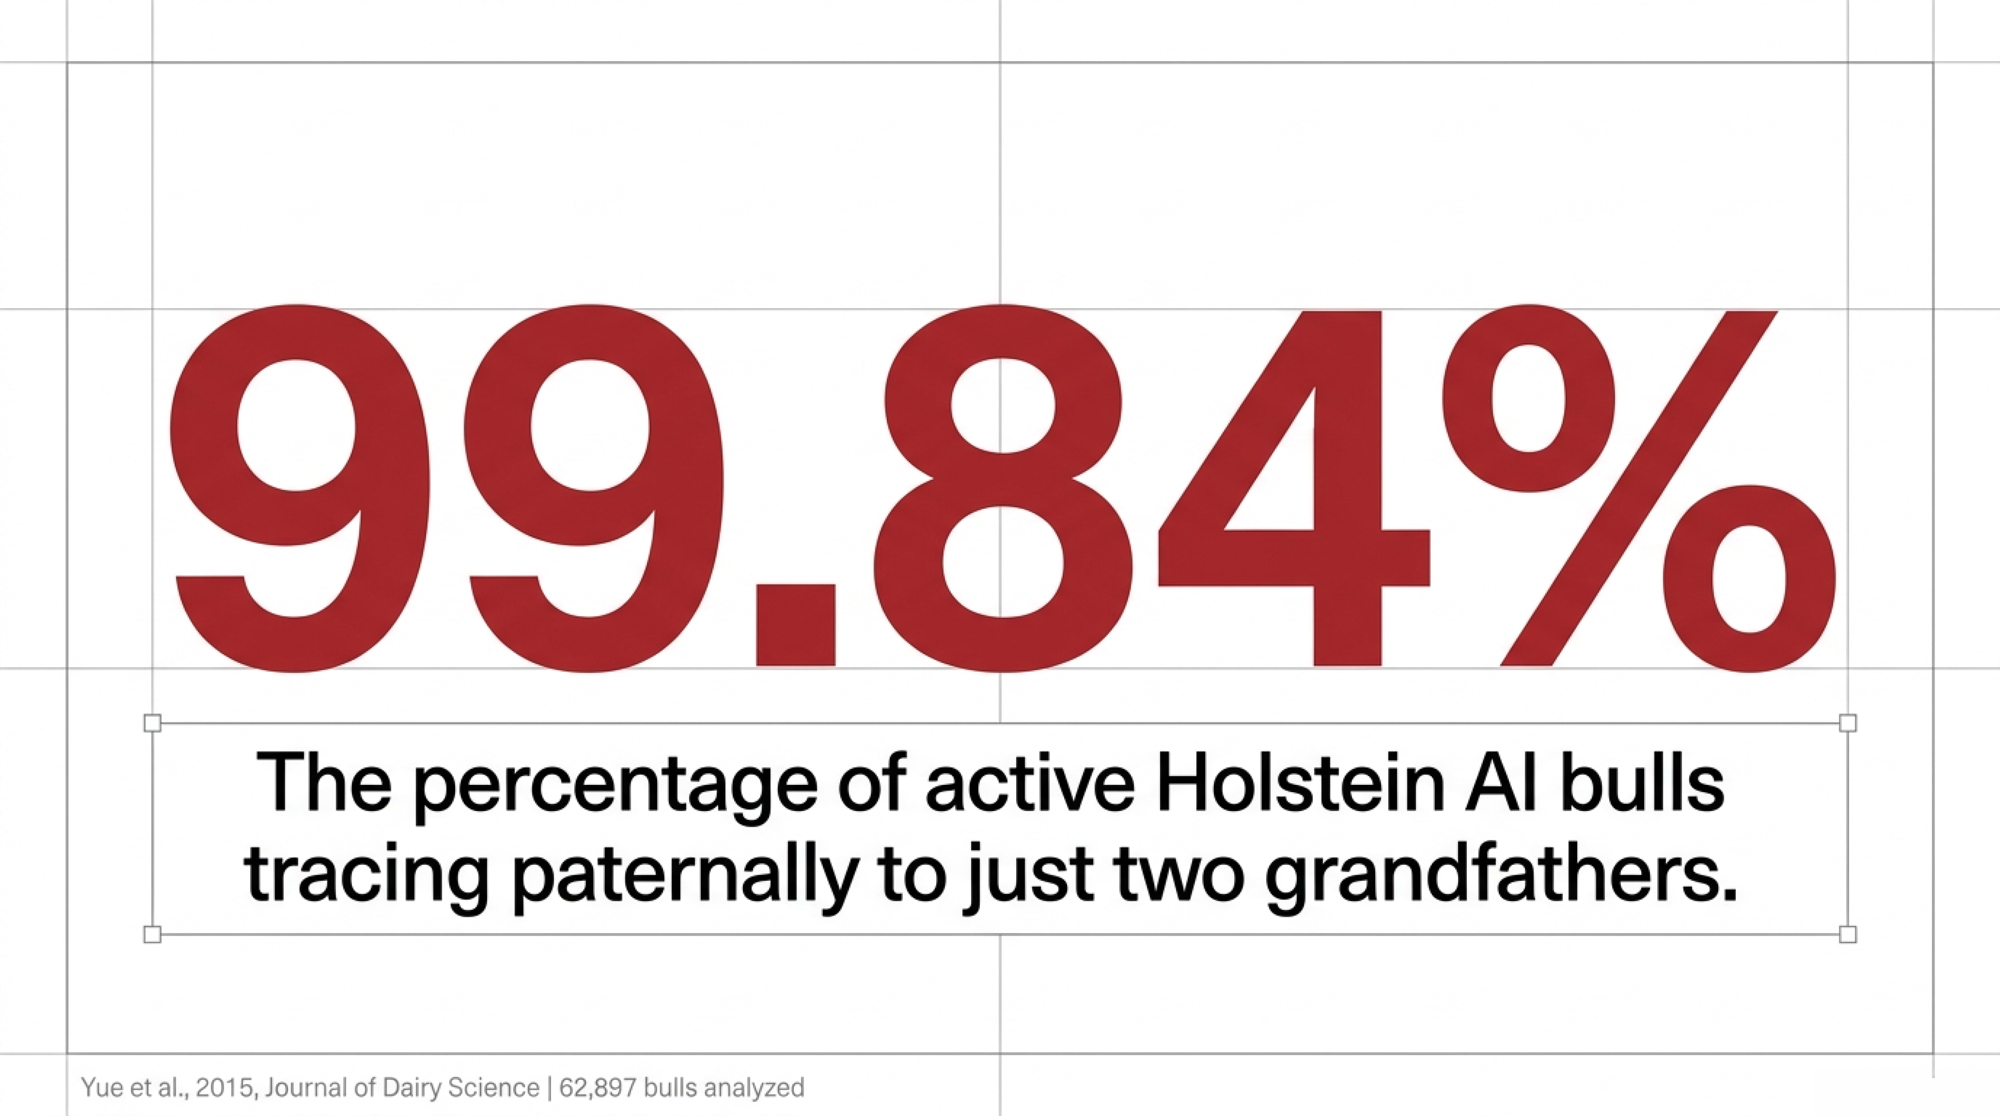
Their names were Pawnee Farm Arlinda Chief and Round Oak Rag Apple Elevation. One arrived on an Indiana spring morning in 1962. The other showed up in 1965, on a modest Virginia farm nobody had heard of. Neither ever knew the other. And yet a Y-chromosome study that combed through 62,897 bulls born between 1950 and 2013 found that virtually every active North American Holstein AI bull traces its paternal line back to just these two grandfathers. The Bullvine’s own analysis of that work puts the figure at 99.84% of active AI bulls — split almost eerily down the middle, roughly half Chief and half Elevation. 

Read that number again. Ninety-nine point eight four percent. It’s as if the entire breed flipped a coin sixty years ago and has been living with the result ever since.

So, before you pour your coffee and head out to check the fresh pen, let me properly introduce you to the two dads at the head of your herd’s table. Once you know their story, you’ll never look at your milking string the same way again.

The $4,300 gamble that started a dynasty

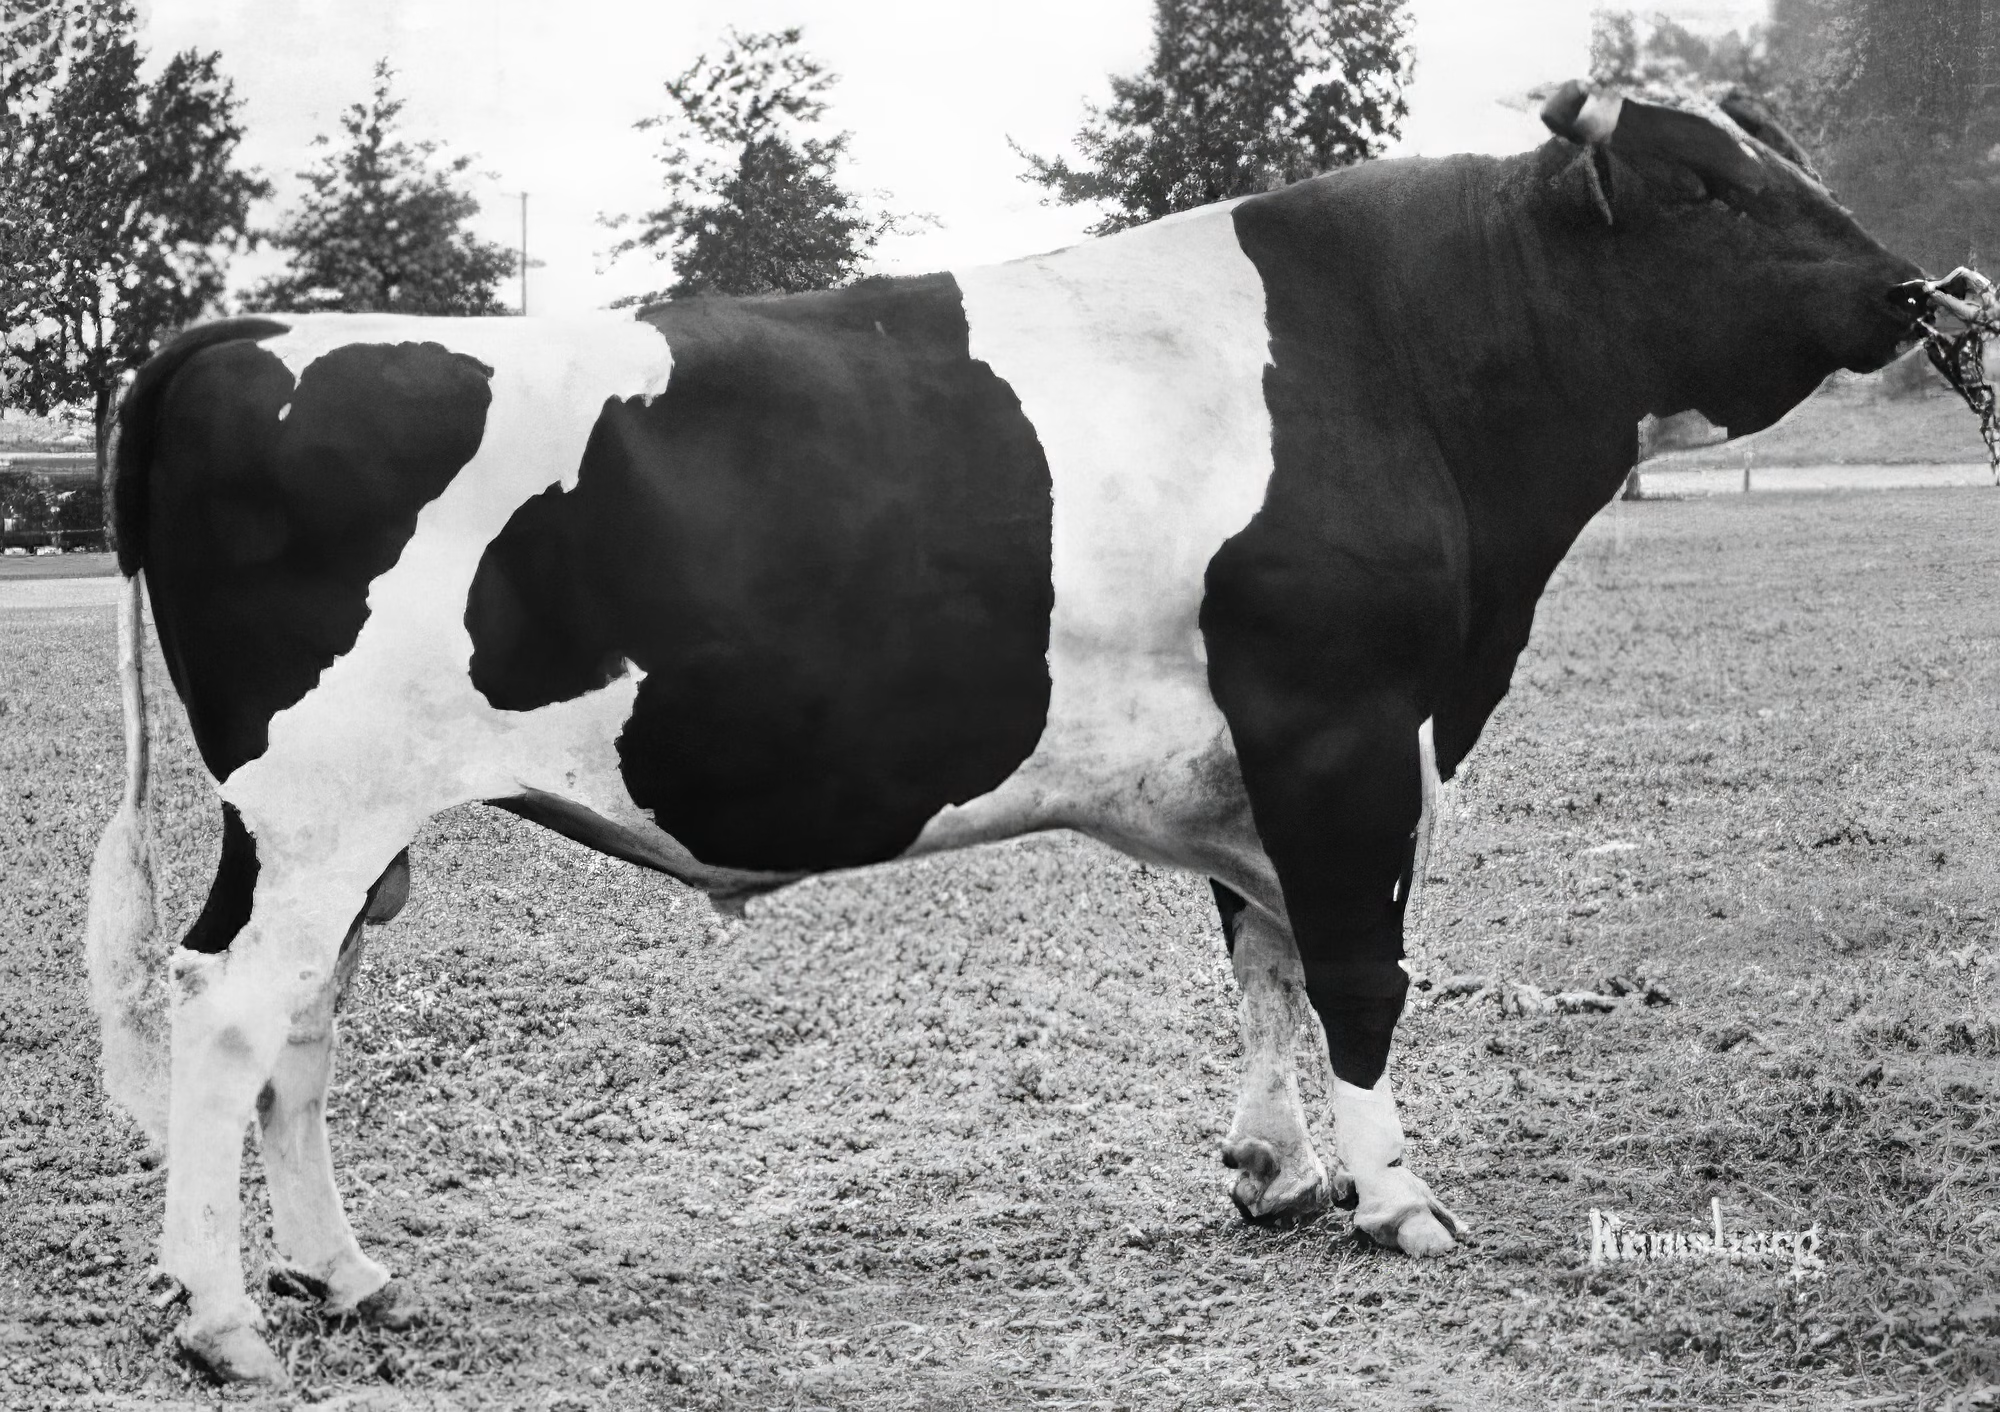
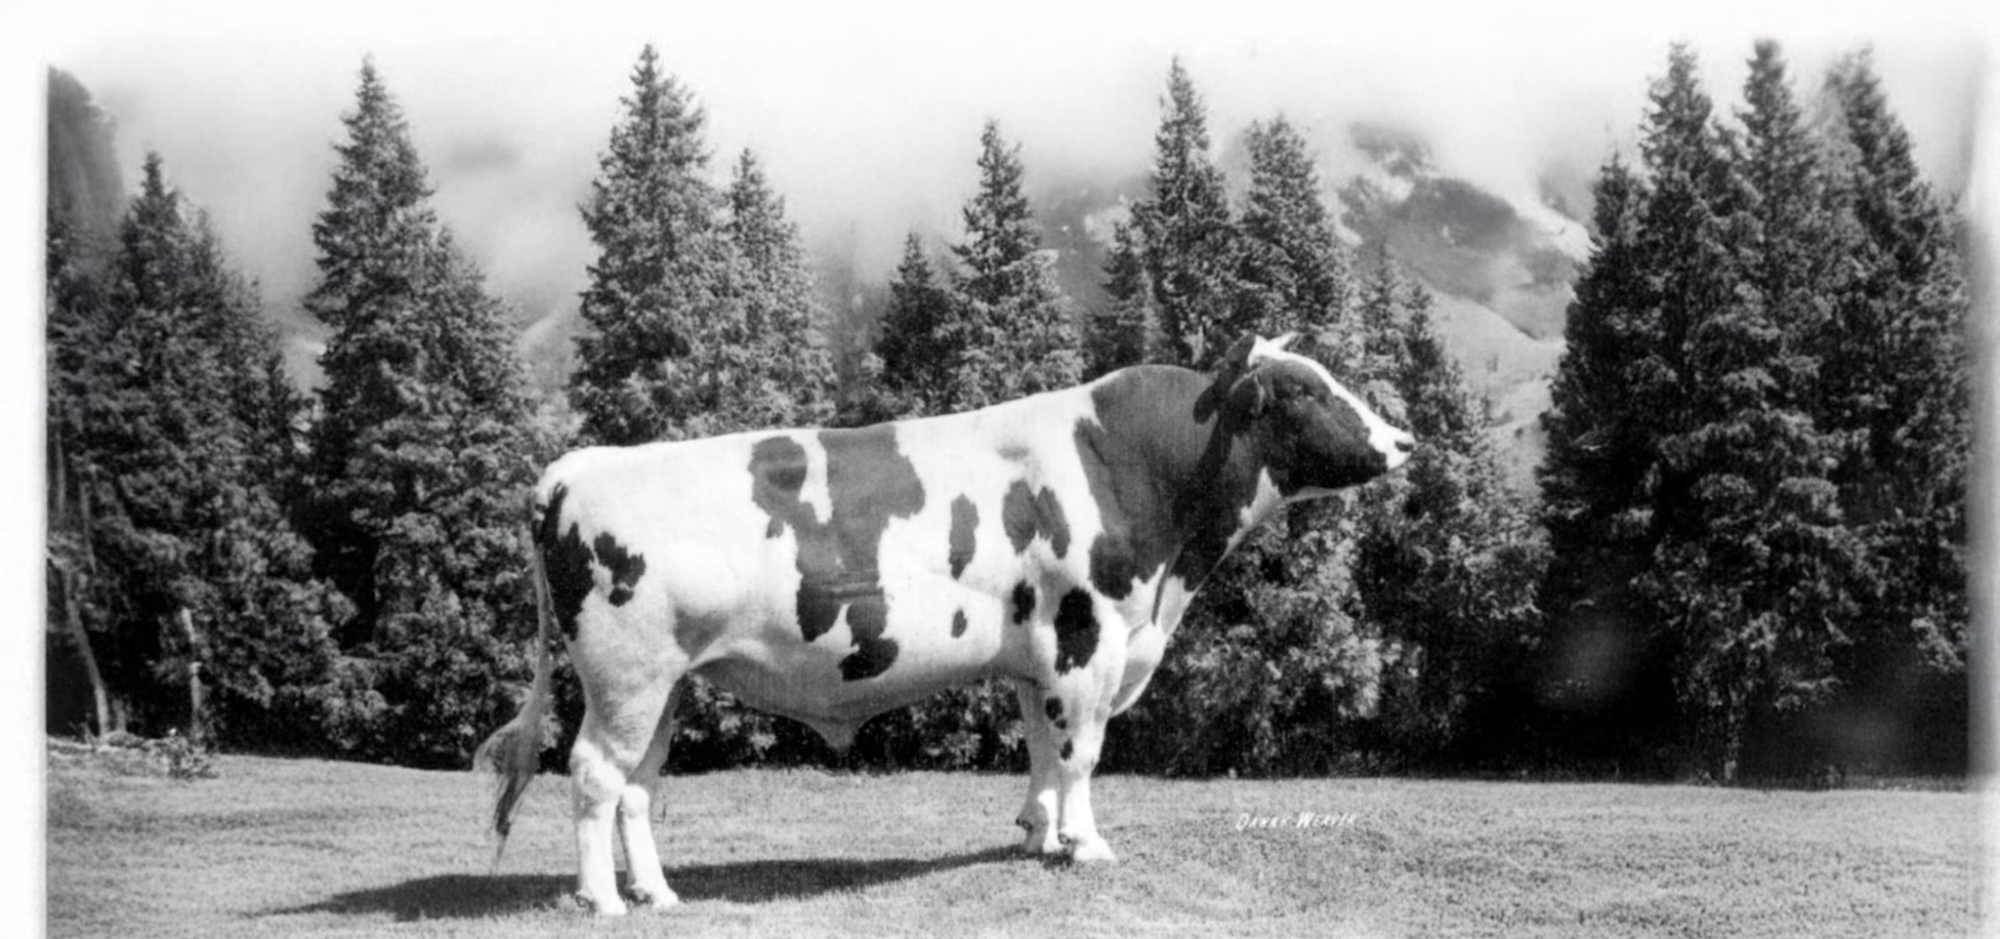
Pawnee Farm Arlinda Chief (1962–1982). The bull behind half the breed. From a dam who sold for $4,300, Chief sired 16,000 daughters and more than two million great-granddaughters—and carried a hidden HH1 recessive that the breed wouldn’t decode for fifty years. Read more: The $4,300 Gamble That Reshaped Global Dairy Industry: The Pawnee Farm Arlinda Chief Story

Start with the elder. In a family reunion, you always start with the elder.

Here’s the thing about Chief, though — the gamble that made him happened before he ever drew breath. At the Pawnee Farm dispersal, his dam, Pawnee Farm Glenvue Beauty (EX-90), crossed the auction block and sold for $4,300. Now, picture what that meant in 1962. You could buy a new car twice over. You could put serious money down on land. Somebody stood at that ring, looked at a cow, and decided she was worth more than a house lot. 

They turned out to be right in a way nobody could have predicted.

Because Beauty’s son became a kind of one-animal continent. By the time the dust settled, Chief had produced 16,000 daughters, 500,000 granddaughters, and more than two million great-granddaughters. Stack that against the cow your grandfather was proud to own, and you start to feel the gravity of the thing. This wasn’t a good bull. This was a whole population’s worth of fatherhood compressed into one animal. 

And his daughters could milk. The proof has a name — Beecher Arlinda Ellen. In 1975, on Harold Beecher’s farm near Rochester, Indiana, Ellen completed a lactation of 55,661 pounds, the first cow in the entire Holstein breed to crack 55,000 in a single year — a world record that would stand for nearly two decades.

Here’s the part worth sitting with. Reporters came calling, the way they do when a farm makes history, and asked what magic ration he’d been feeding her. By Harold Beecher’s own account, he hadn’t done anything special at all. Think about that for a second. A humble Indiana dairyman, a world record standing in his tie-stall, and his honest answer was a shrug. He knew what every good cowman knows — you don’t feed your way to a number like that. You breed your way there. Ellen wasn’t a fluke. She was Chief’s signature, written in the milk tank.

And here’s what made Chief’s story the hard one. This was the era before genomics — no DNA test to whisper which young bull was worth sampling. You bred him, you waited, and you milked his daughters for years before the herd finally told you whether you were holding a fortune or a flop. Chief’s people waited. And the daughters kept coming back with the same verdict, herd after herd, in barns that had never heard of Pawnee Farm: more milk, again, and again. A father proves himself slowly. Chief proved himself the only way the times allowed — and the breed was never the same after the proof came in.

When sons become legends in their own right

Great fathers don’t just have great children. They have children who become great fathers themselves — and that’s where Chief’s story gets bigger than one bull.

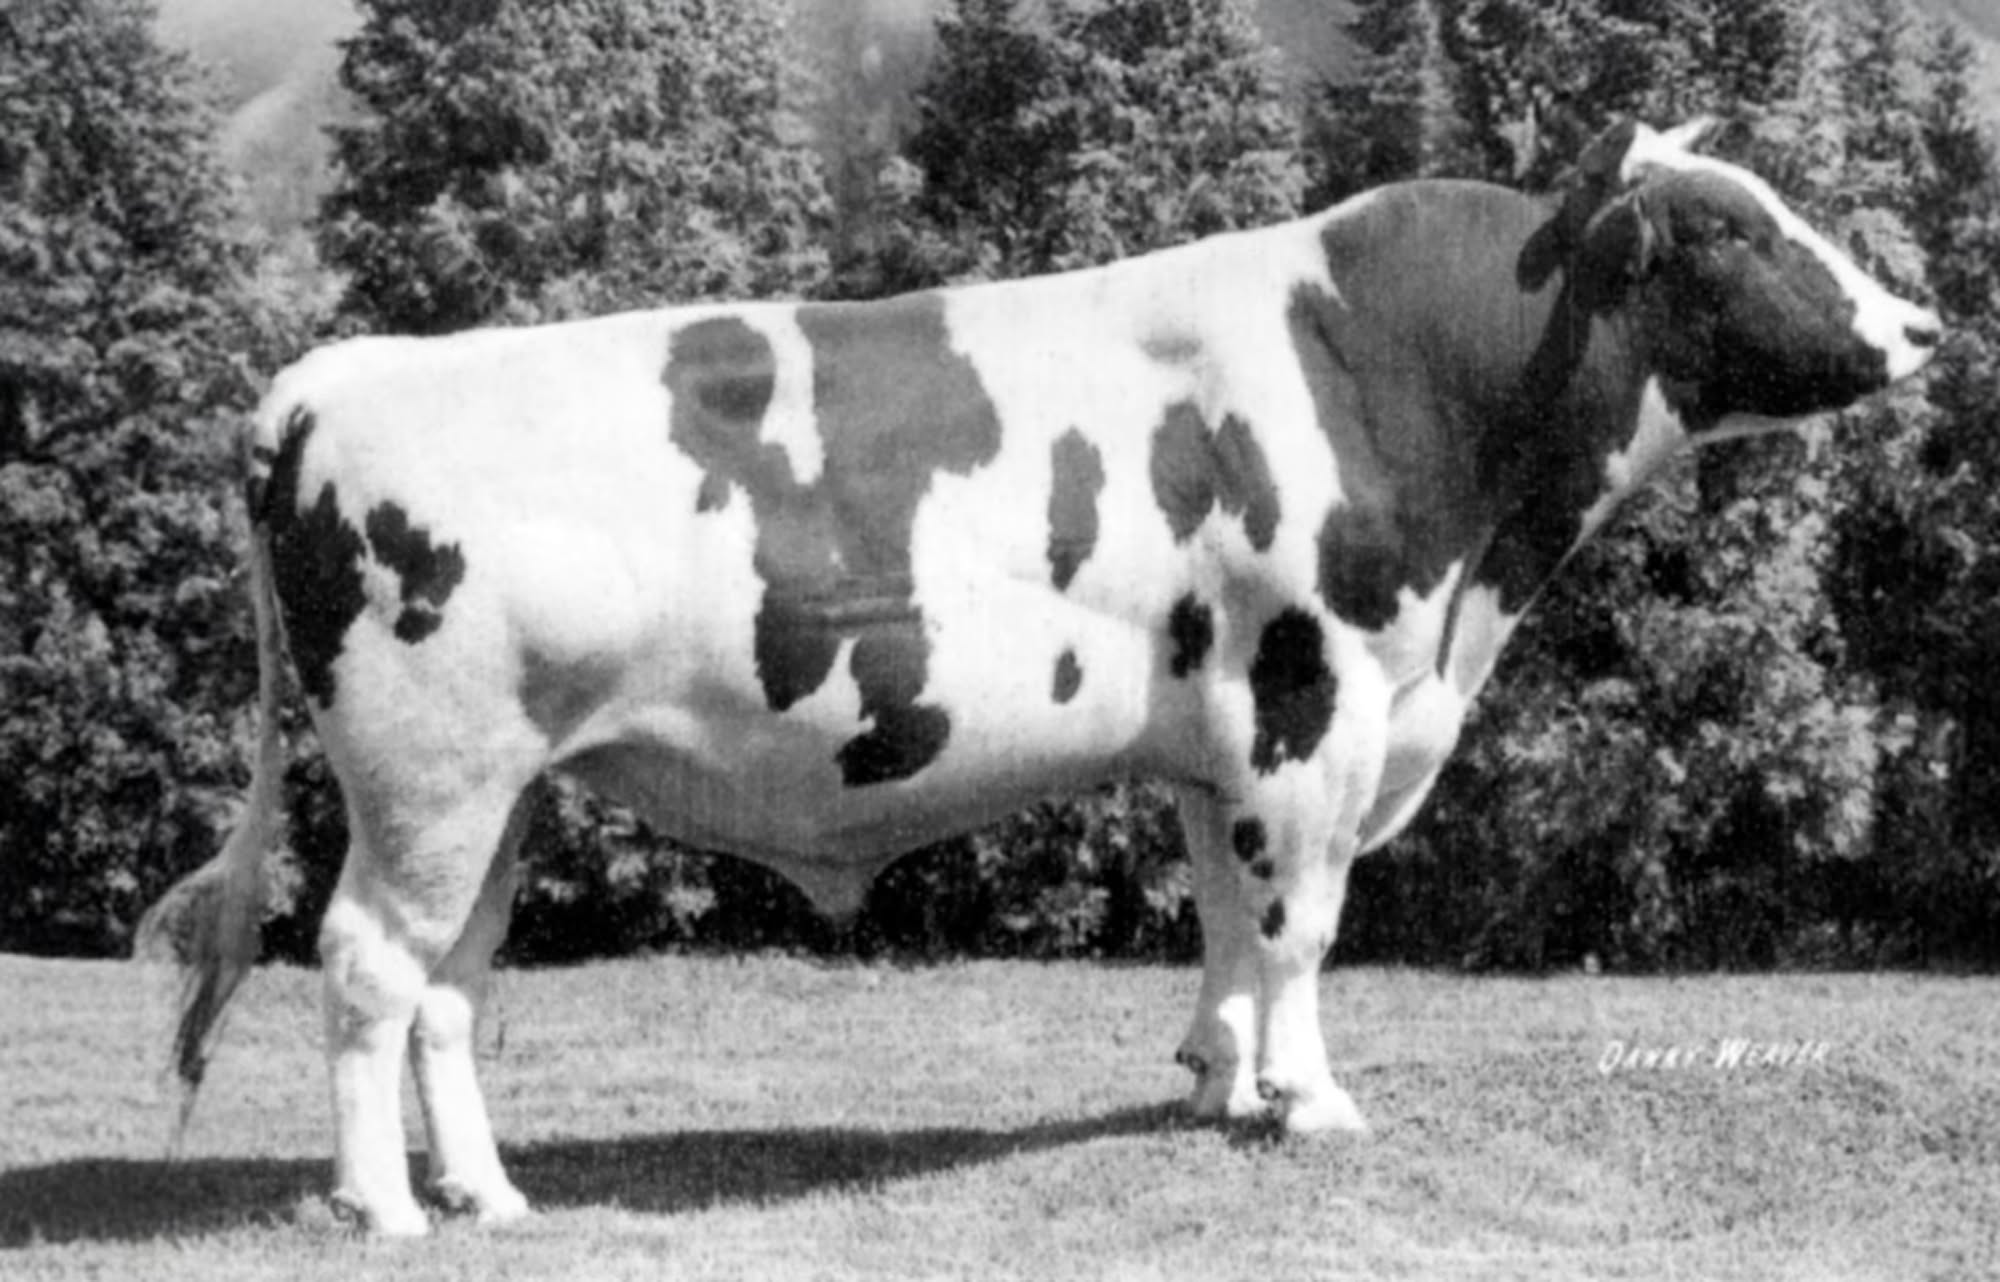
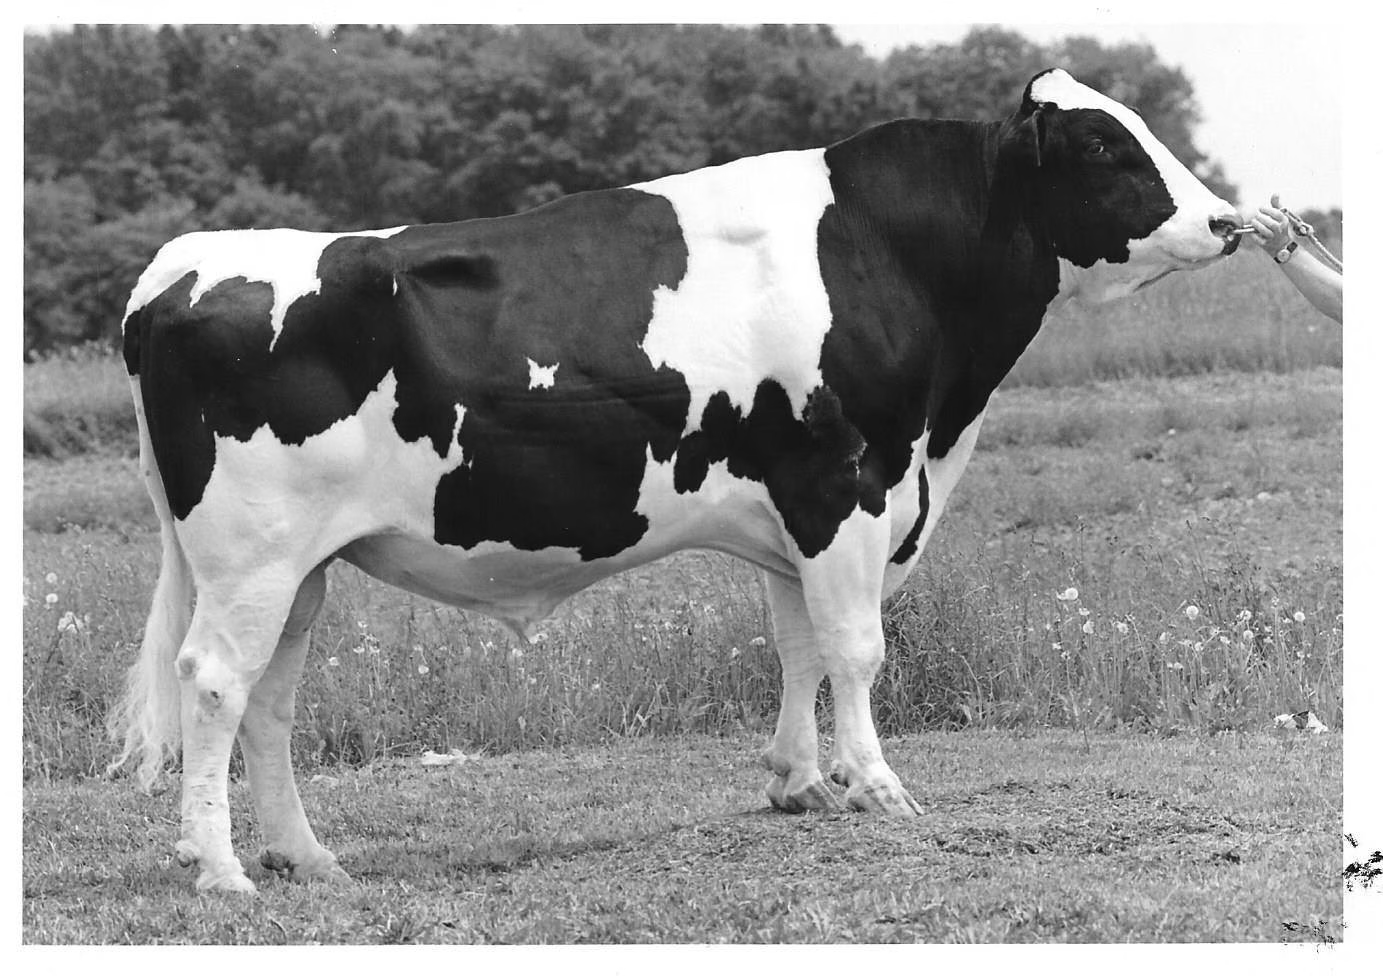
S-W-D Valiant (EX-95 GM). One of Chief’s great sons. Born June 28, 1973, out of a VG-85 Admiral dam, Valiant took his father’s milk and added show-ring type—the kind of son who becomes a legend in his own right and keeps the family table growing. Read more: The S-W-D Valiant Story: How Genetics Promised Everything and Changed How We Think About Breeding

His most influential sons read like a roll call: Walkway Chief Mark, S-W-D Valiant, Glendell Arlinda Chief, and Milu Betty Ivanhoe Chief. Take Walkway Chief Mark. He was only ever sampled because his full brother died, and somebody needed a backup. The spare. That backup bull accounted for roughly 7% of every Holstein genome on this continent. (The Bullvine has told that whole strange, wonderful story in full in Walkway Chief Mark’s profile — it’s one of the great accidents in breeding history.) 

Seven percent. From the understudy.

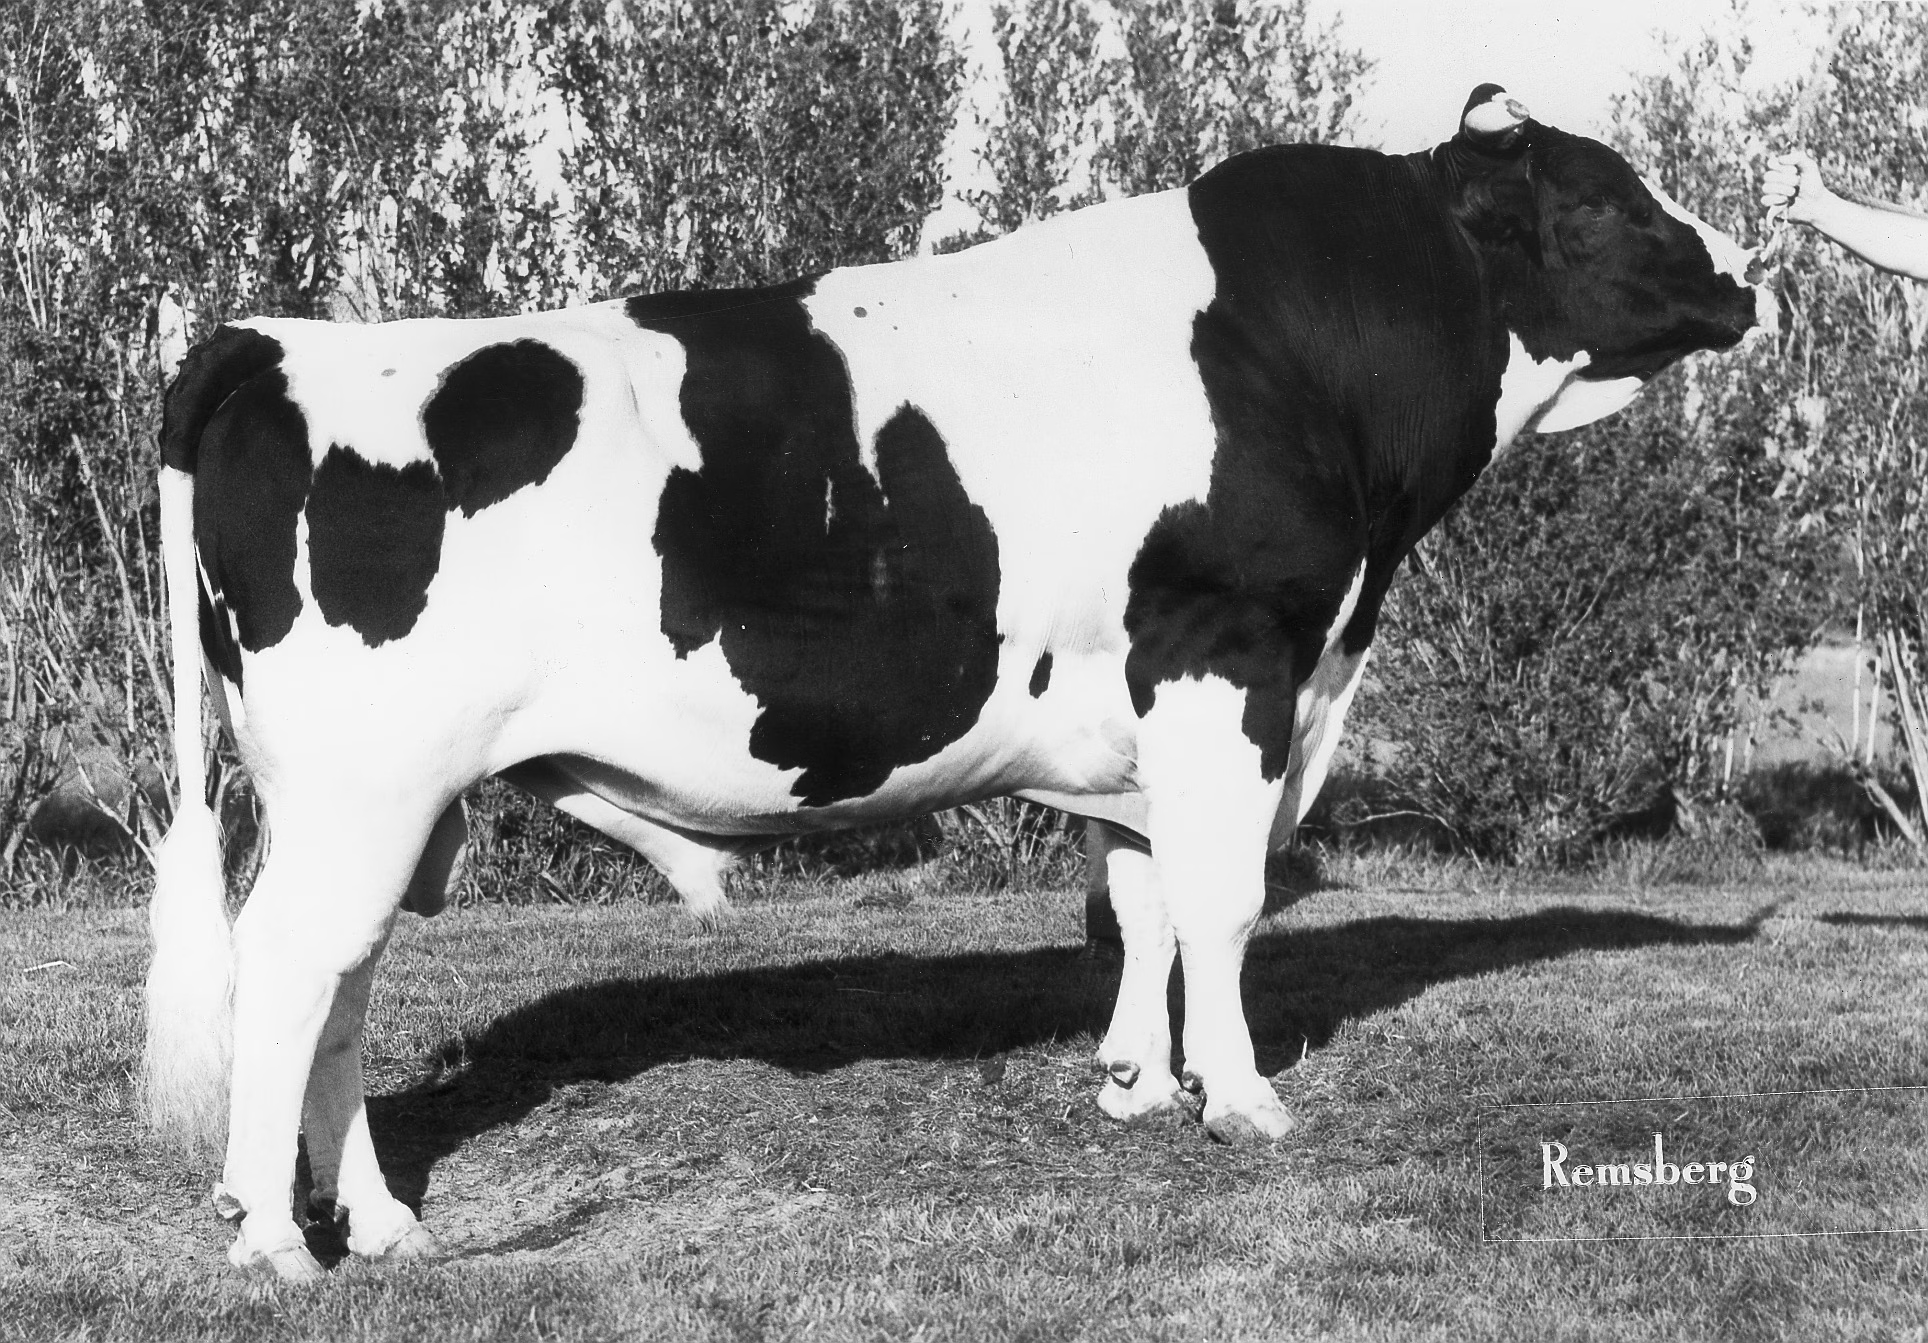
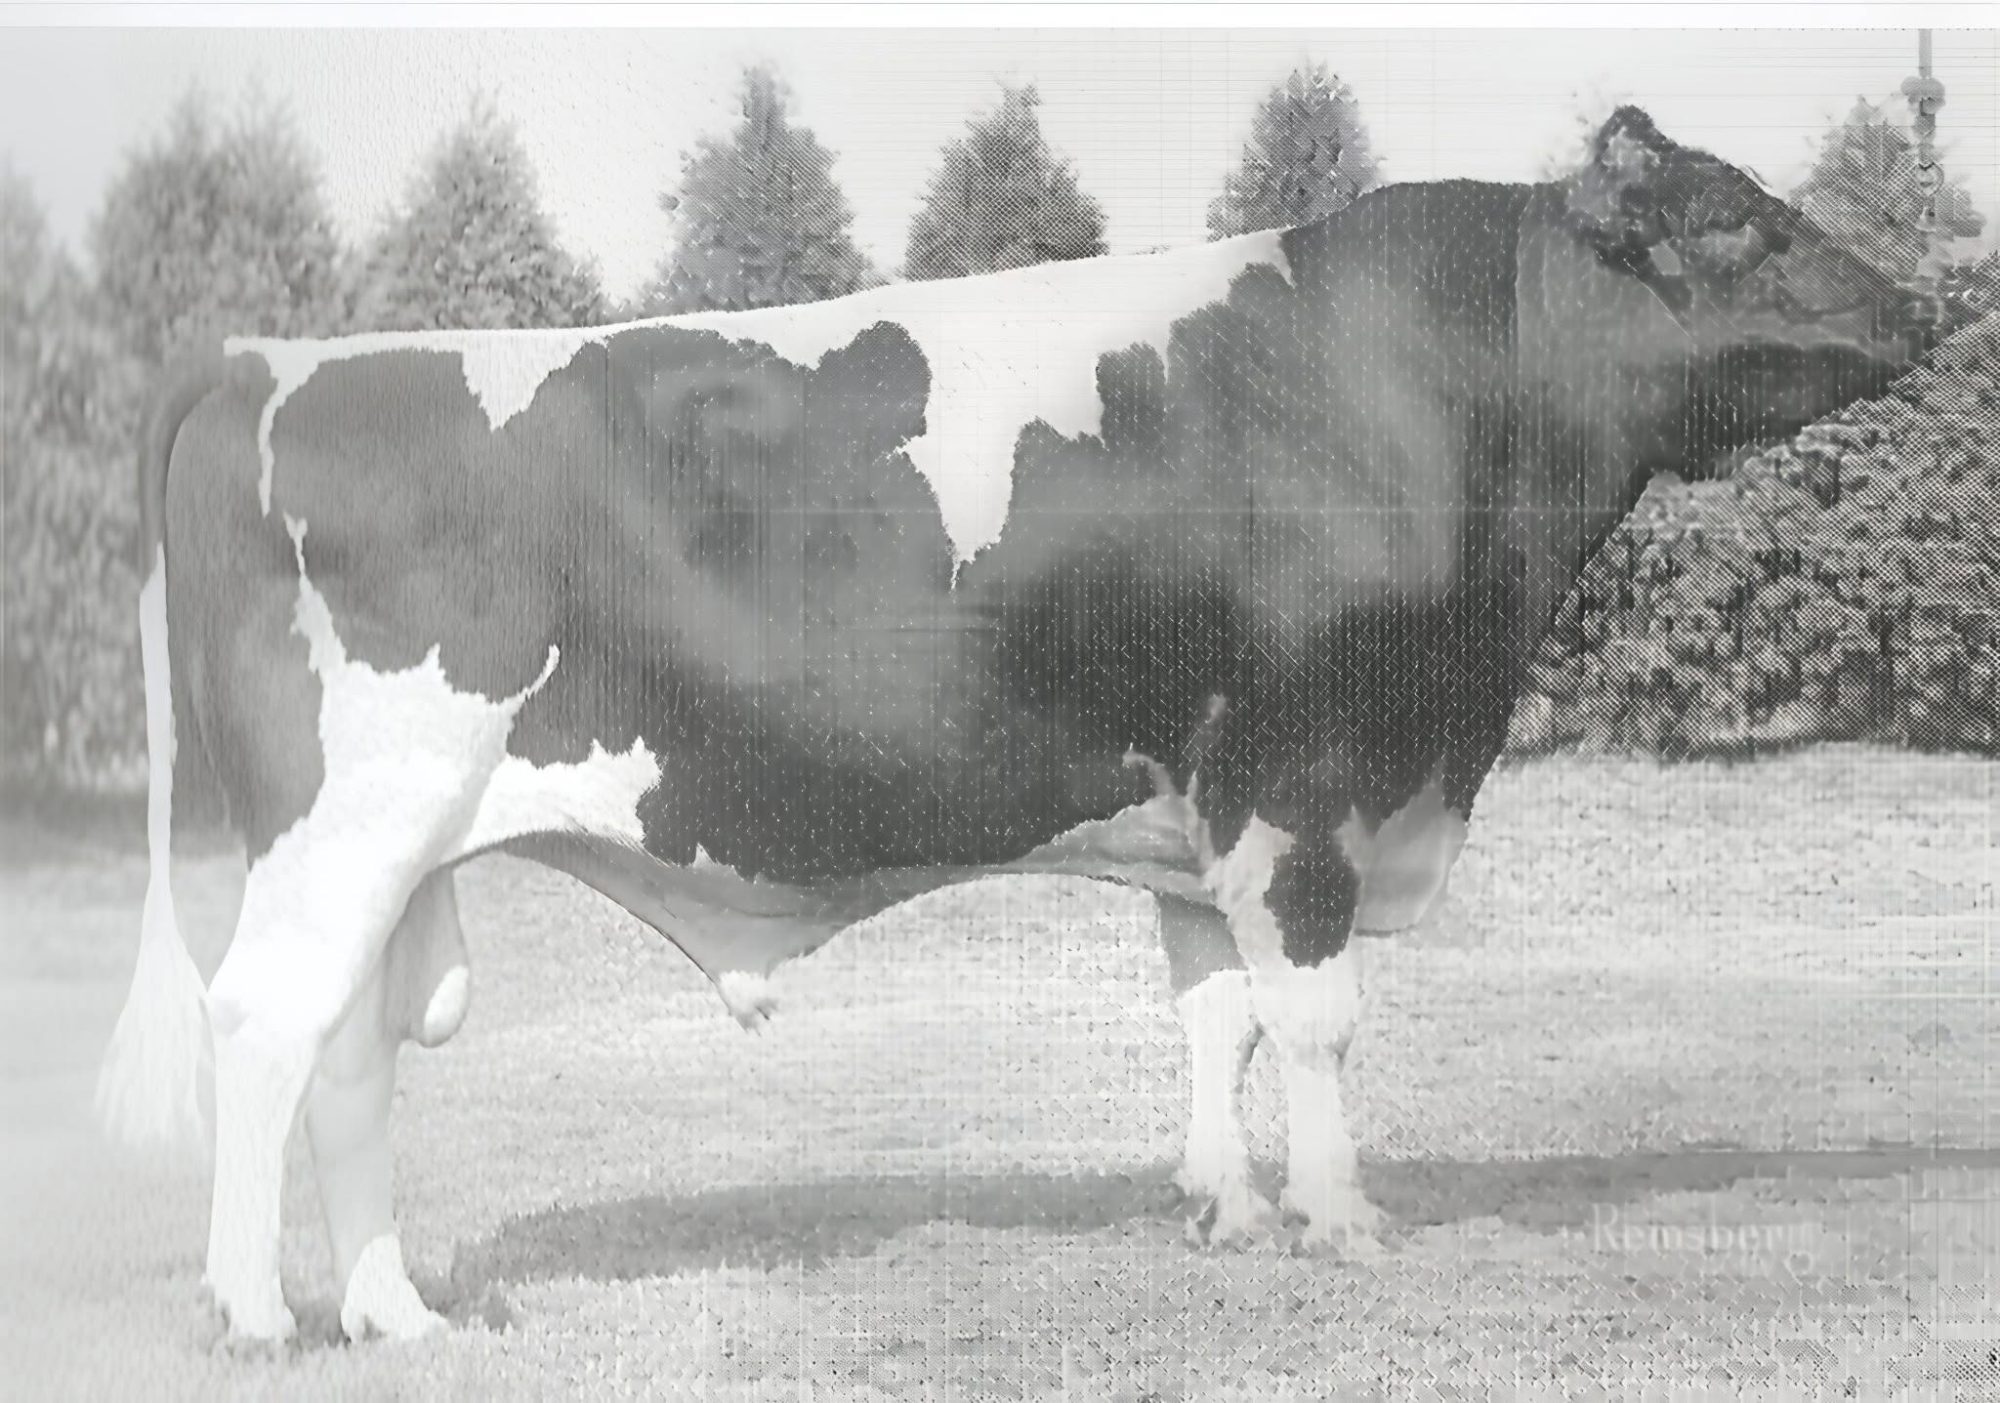
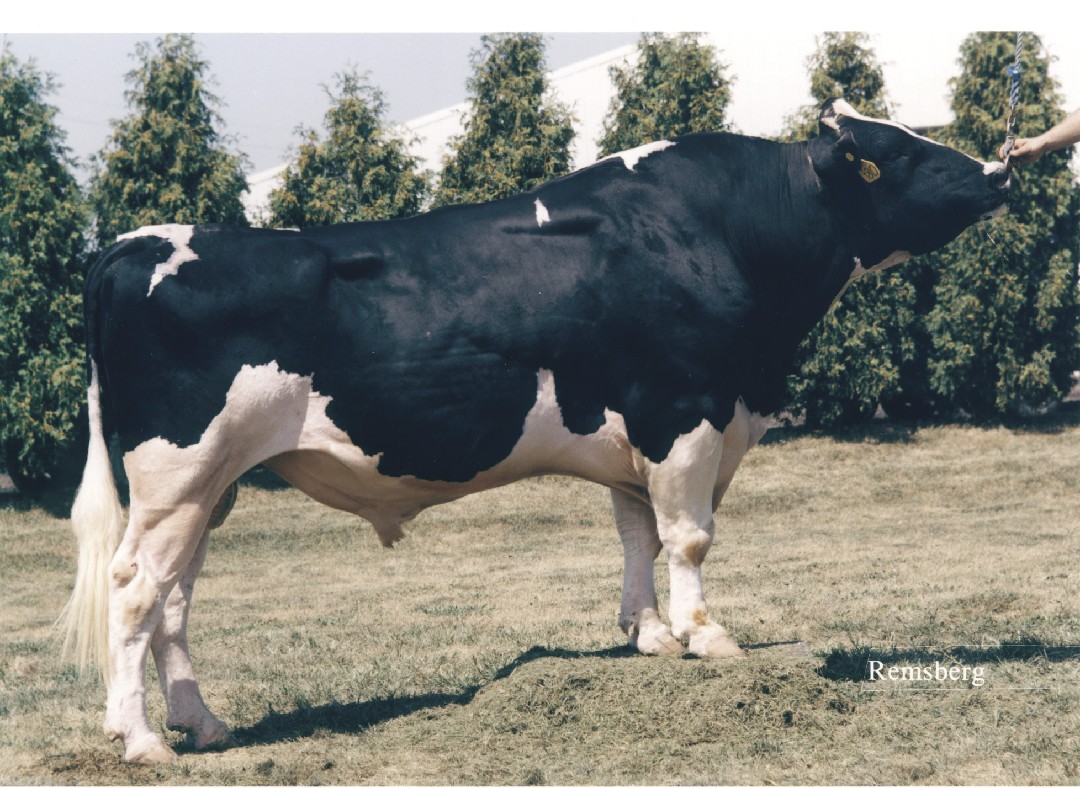
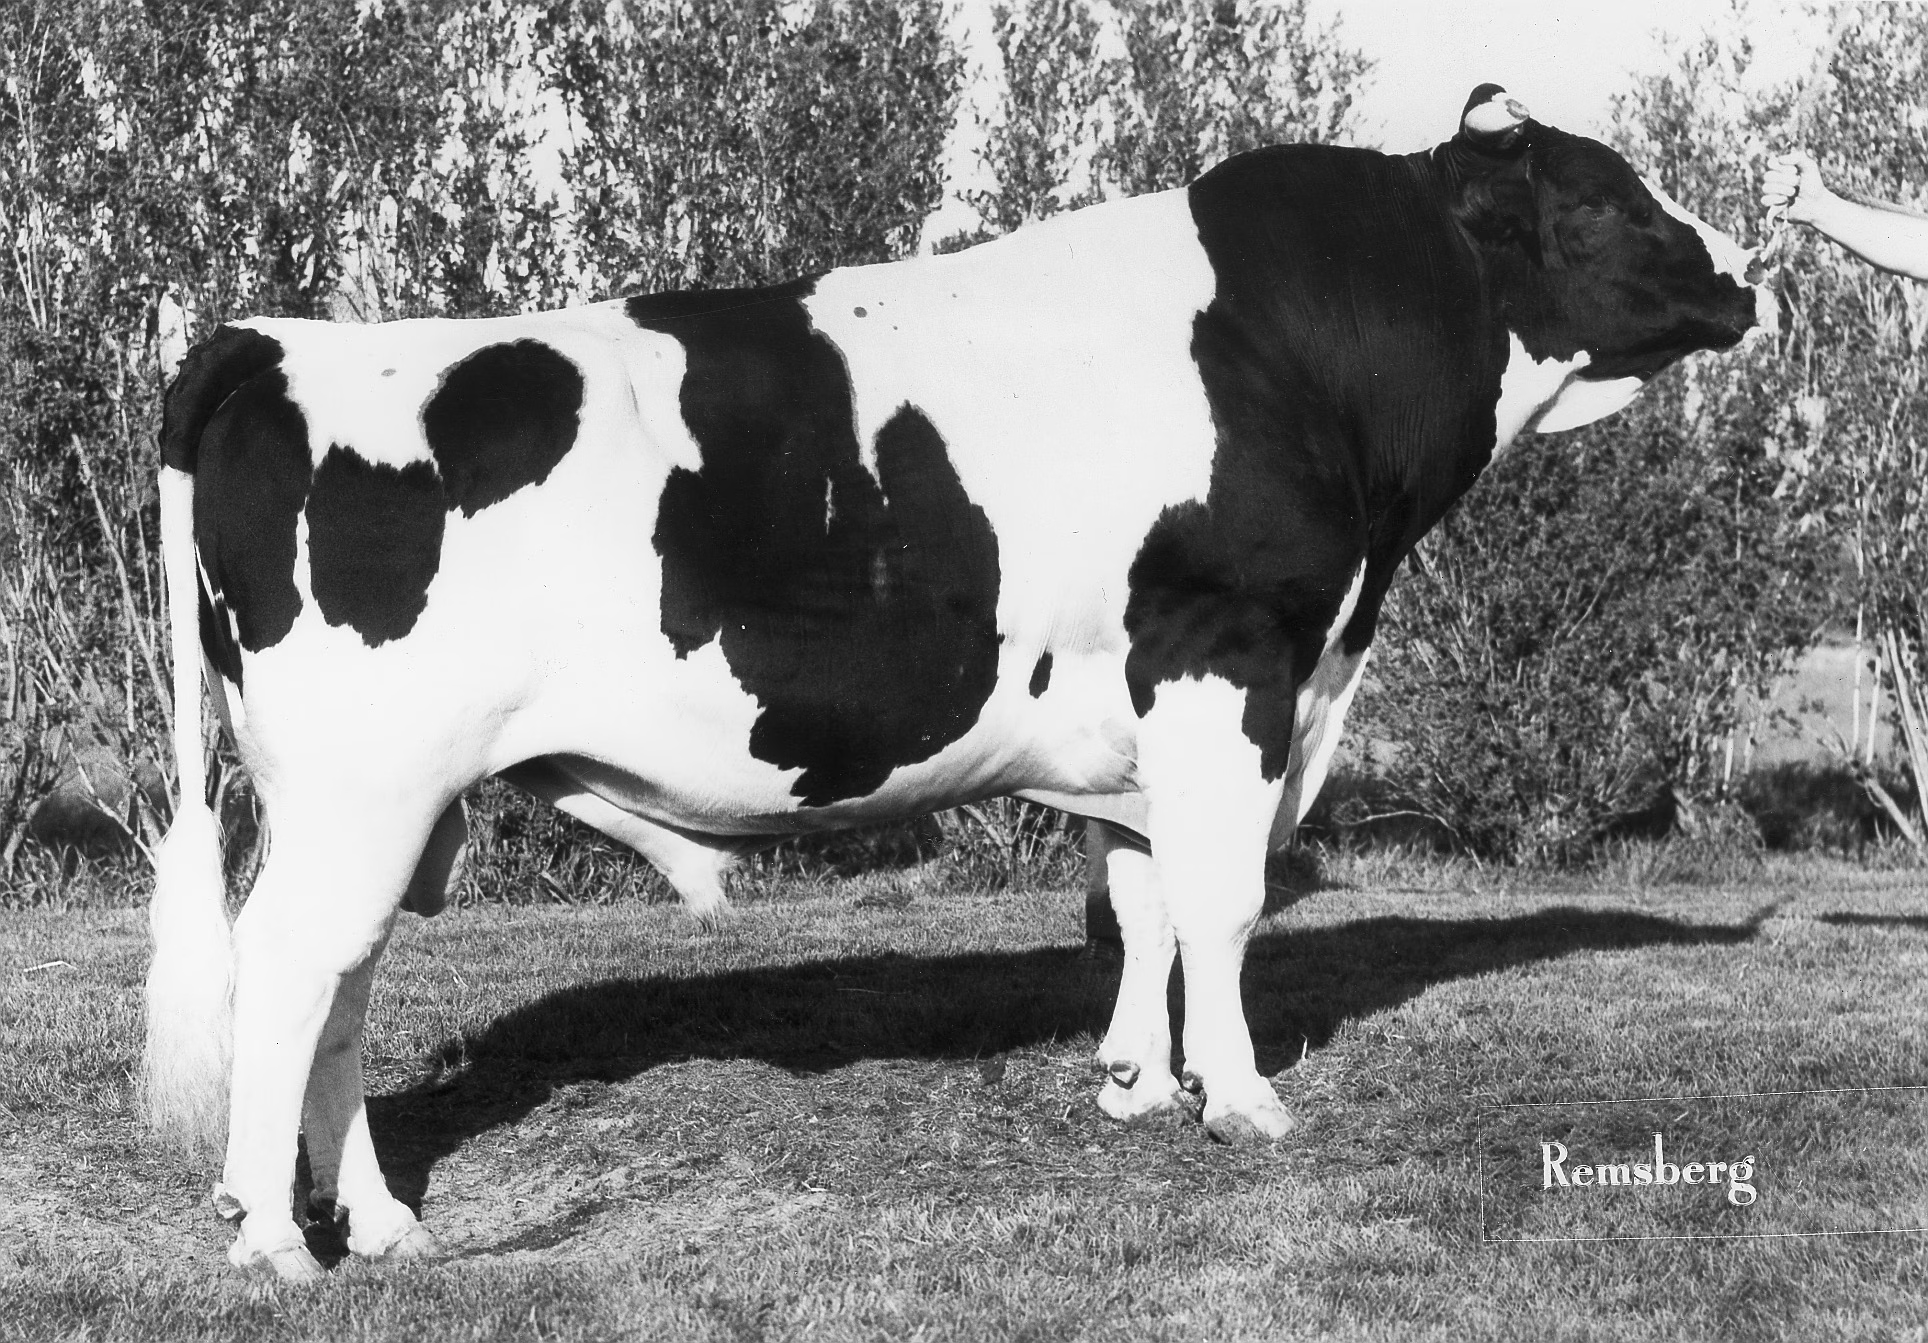
Walkway Chief Mark (VG-87 GM). The spare that ran the breed. Only sampled because his full brother died and Foster Walk’s Illinois herd needed a backup, Mark went on to account for roughly 7% of every Holstein genome in North America. Select Sires later named him an Impact Sire of the Breed. The understudy nobody saw coming. Photo: Remsberg. Read more: Walkway Chief Mark: The Backup Bull Behind Seven Percent of Every Holstein Cow

A powerful father’s influence doesn’t stop with his own kids. It compounds. It ripples down through sons, and their sons, until you can’t open a modern catalog without bumping into the old man’s name a dozen times over. Chief didn’t just have a big family. He had a big family that kept having big families, branch after branch — one line eventually threading down to To-Mar Blackstar, himself one of the most heavily used bulls in breed history. Generation after generation, the table just kept getting longer, and the gambler who paid $4,300 for a cow back in 1962 kept looking smarter. 

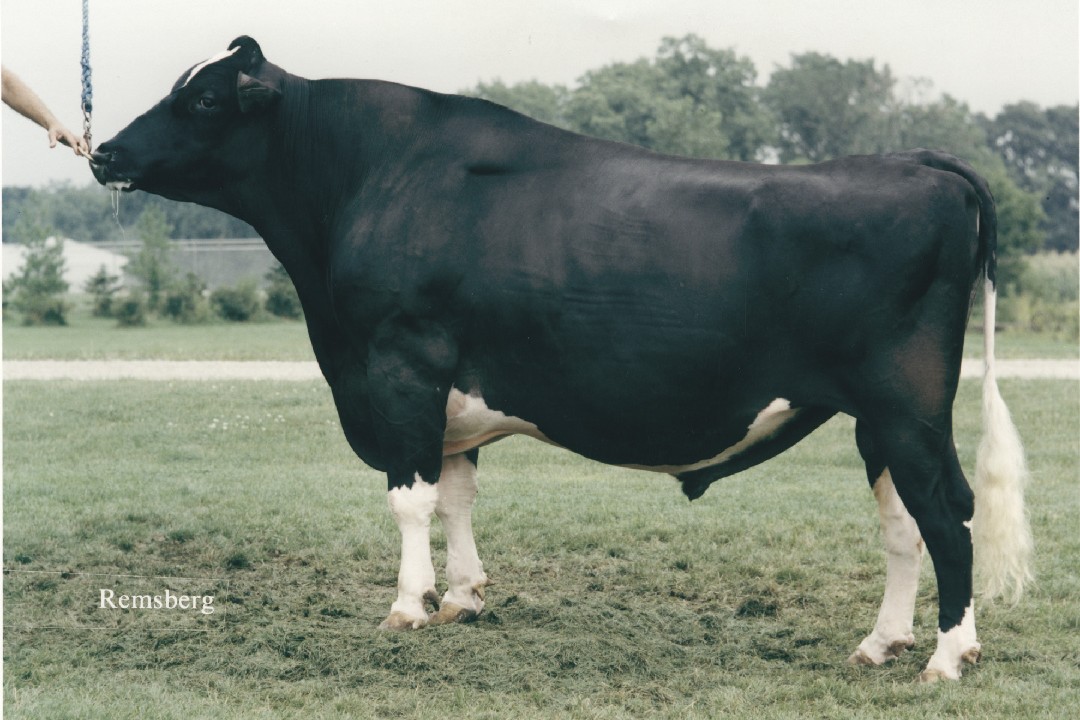
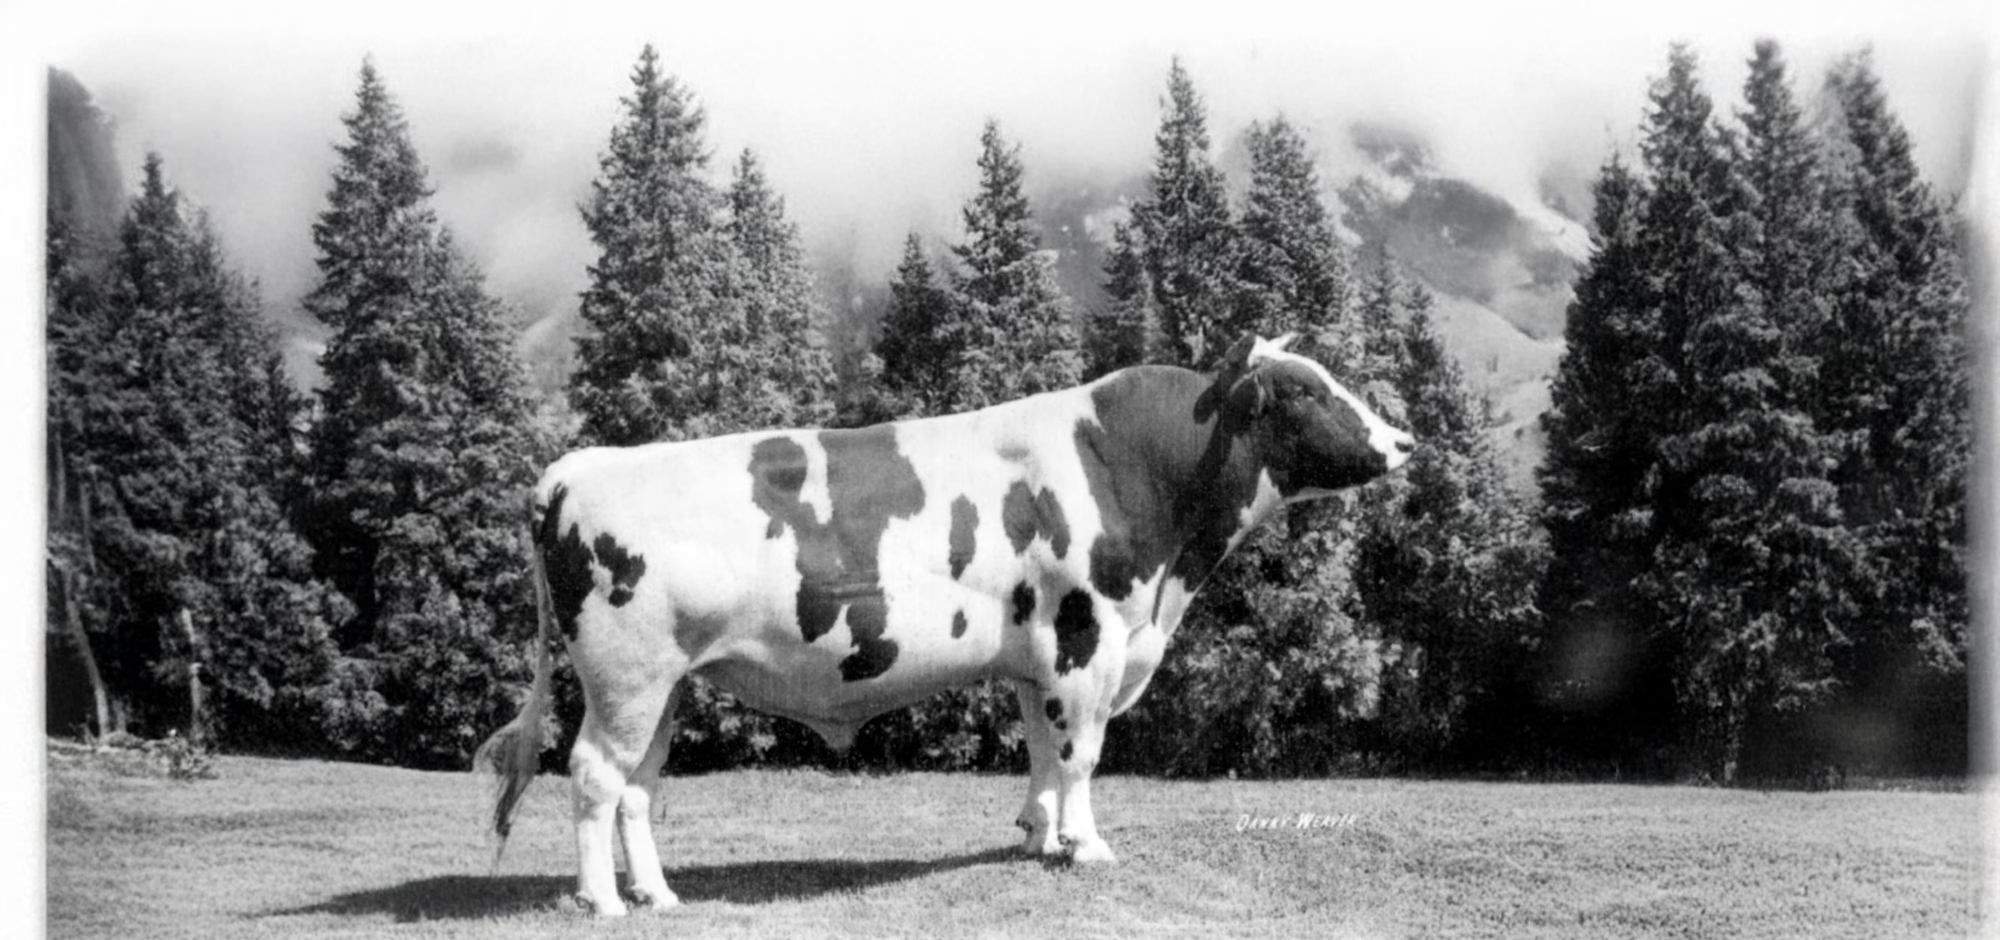
To-Mar Blackstar. The branch that kept growing. Down one of Chief’s many lines, Blackstar became one of the most heavily used bulls in breed history—proof of how a great father’s influence doesn’t stop with his sons, but compounds, generation after generation, until you can’t open a catalog without bumping into the old man’s name. Photo: Remsberg. Read more: To-Mar Blackstar: The One-Embryo Holstein Sire Behind 15.8% of Today’s DNA – and the Genetic Debt in Your Herd

The B-team mating that produced the Bull of the Century

Round Oak Rag Apple Elevation (1965–1979). The Bull of the Century. He came from a fertility-troubled sire and a “B-team” dam nobody expected anything from—then sired over 10,000 AI sons across 45 countries and an estimated nine million descendants worldwide. The cousin’s hunch that built the barns at Select Sires. Photo: Remsberg. Read more: Round Oak Rag Apple Elevation: The Bull That Changed Everything

Now, meet the other grandfather. And get ready to be surprised, because Elevation’s beginning was the opposite of a sure thing.

Down on Round Oak Farm in the Virginia piedmont, Ronald A. Hope and his family were running a working dairy, not a genetics empire — the kind of modest operation you’d have driven past a hundred times without a second look. The mating that produced Elevation wasn’t some master plan off a proof sheet. It came from Ron Hope’s cousin, George Miller, who suggested the cross. Just a hunch, passed down within the family. Try this one. 

And honestly, on paper, you’d have shrugged and moved on. The sire, Tidy Burke Elevation, had fertility trouble. The dam, Round Oak Ivanhoe Eve, had been shuffled onto the farm’s B-team because she matured too slowly. A questionable father. An overlooked mother. A cousin’s offhand suggestion.

What walked out of that barn in 1965 changed the world. 

I don’t say that lightly. He would later be named the “Bull of the Century.” But forget the title for a second and walk into a parlor full of his daughters instead. Look up. There it is — the udder. High, wide, held tight to the body, still bolted on the way you’d want it two and three lactations after the cows around it had broken down and shipped. Watch one of those daughters walk: sound on her feet into her sixth lactation, settling back in calf as if it were nothing, walking up to milk at an age when her contemporaries were long gone. That’s what Elevation transmitted — and the remarkable thing is he transmitted it all at once: production, udder quality, mobility, fertility, and longevity, in one package, when breeders had spent generations trading one good trait away to get another.

Put numbers on it, and your cup goes down on the table. His daughters averaged about 29,500 pounds in their first lactation — roughly 15% above their contemporaries in the 1970s. And while the industry average was near 2.8 lactations per cow, Elevation’s daughters averaged 4.2. 

Do the barn math on that. Your average cow leaves after 2.8 lactations. Your neighbor’s Elevation daughters are still walking into the parlor at 4.2. Same feed bill to raise the heifer, same calving, and he’s getting roughly half again the productive life out of every replacement. That’s not a show-ring statistic. That’s a mortgage payment. For the farmer living it, the whole thing came down to a simple difference: a cow you fought all year, versus one you forgot to worry about.

A father whose children fill 45 countries

If Chief built his dynasty through a few towering sons, Elevation built his through sheer abundance.

Over 10,000 of his sons became registered AI sires. His semen was shipped to 45 countries. And his descendants — brace yourself — run an estimated 8.8 to 9 million worldwide. There are whole nations with fewer people than this one bull has grandchildren. 

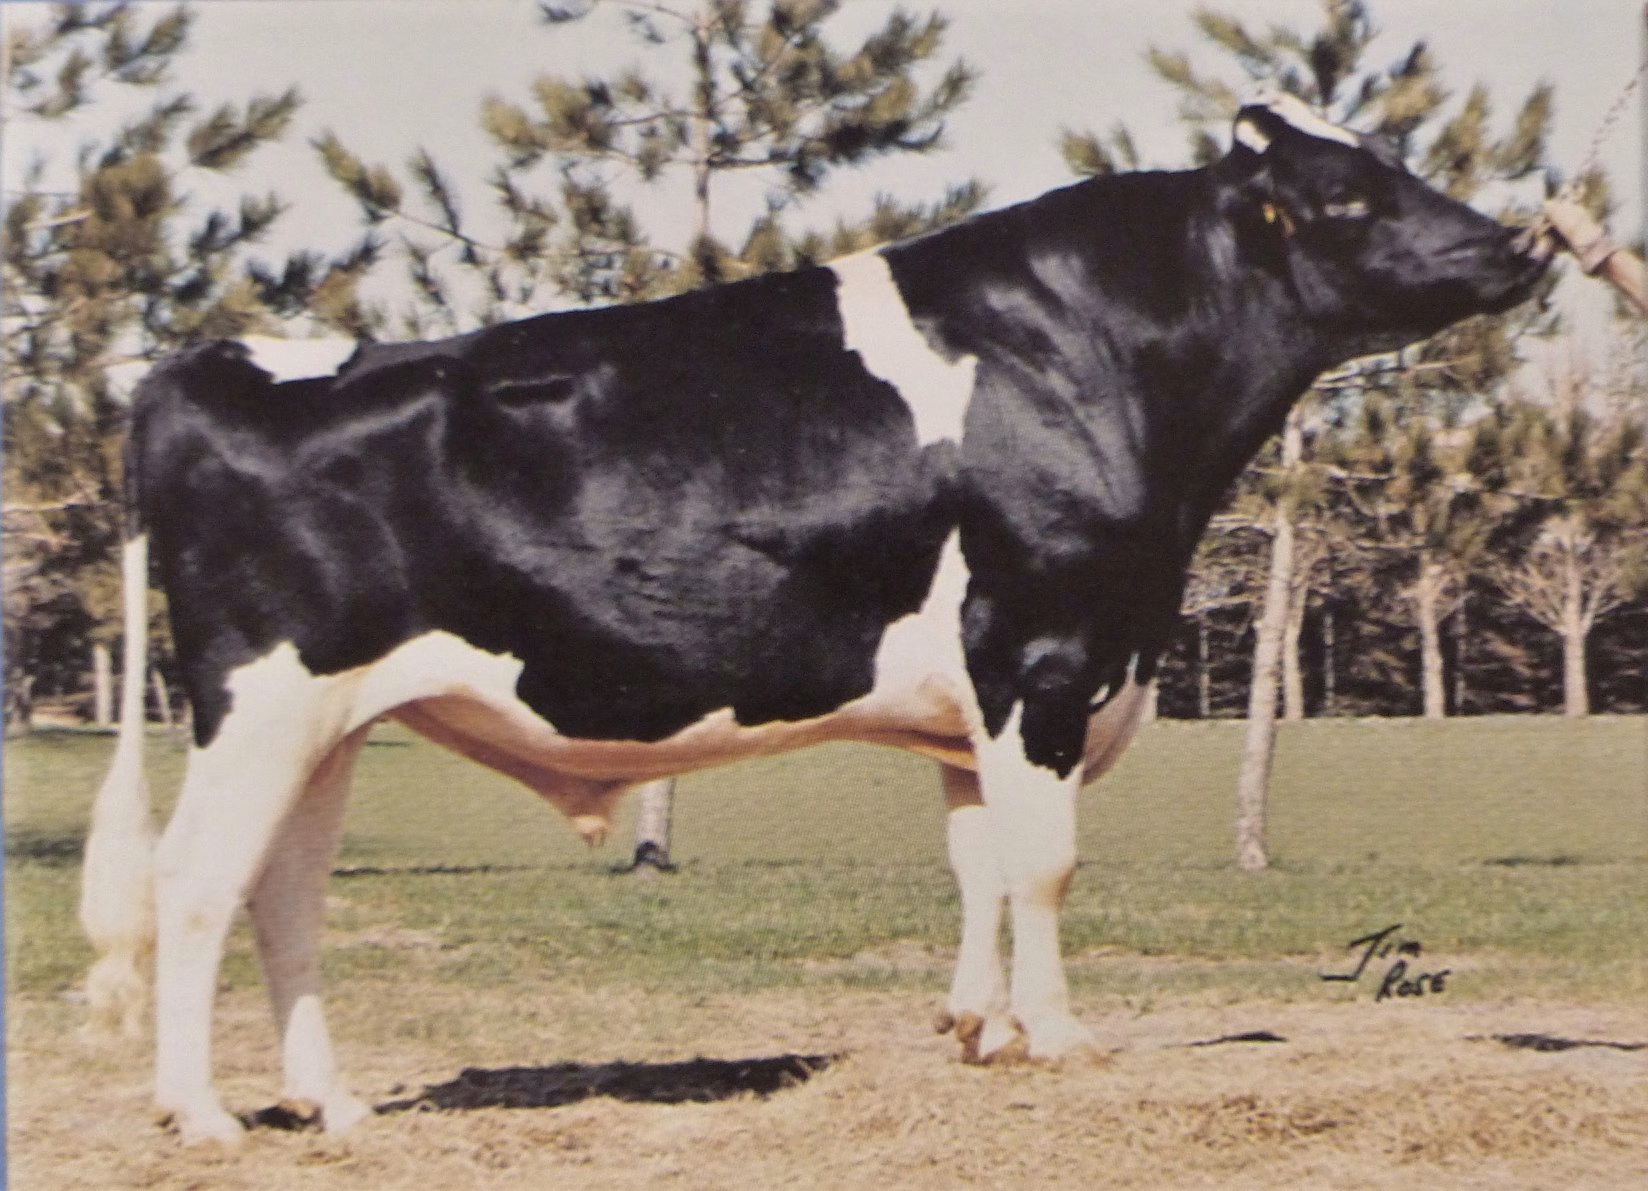
Hanoverhill Starbuck (1979–1998). Elevation’s most famous son. A $2,500 calf whose semen would eventually sell for roughly $25 million, Starbuck sired over 200,000 daughters across 45 countries—and by the early 2000s, some 93% of Canadian Holsteins traced back to him. The Canadian Holstein Association called him, simply, “the Best.” Shown here at five. Photo: Jim Rose. Read more: Hanoverhill Starbuck’s DNA Dynasty: The Holstein Legend Bridging 20th-Century Breeding to Genomic Futures

The most famous of those children crossed the border into Canada and became a legend in his own right: Hanoverhill Starbuck, a $2,500 calf whose semen eventually sold for roughly $25 million. (Starbuck’s story deserves its own evening — The Bullvine has told it in full.) Through Starbuck and ten thousand other sons, Elevation became the patriarch at the head of dinner tables from Wisconsin to the Netherlands to Japan. 

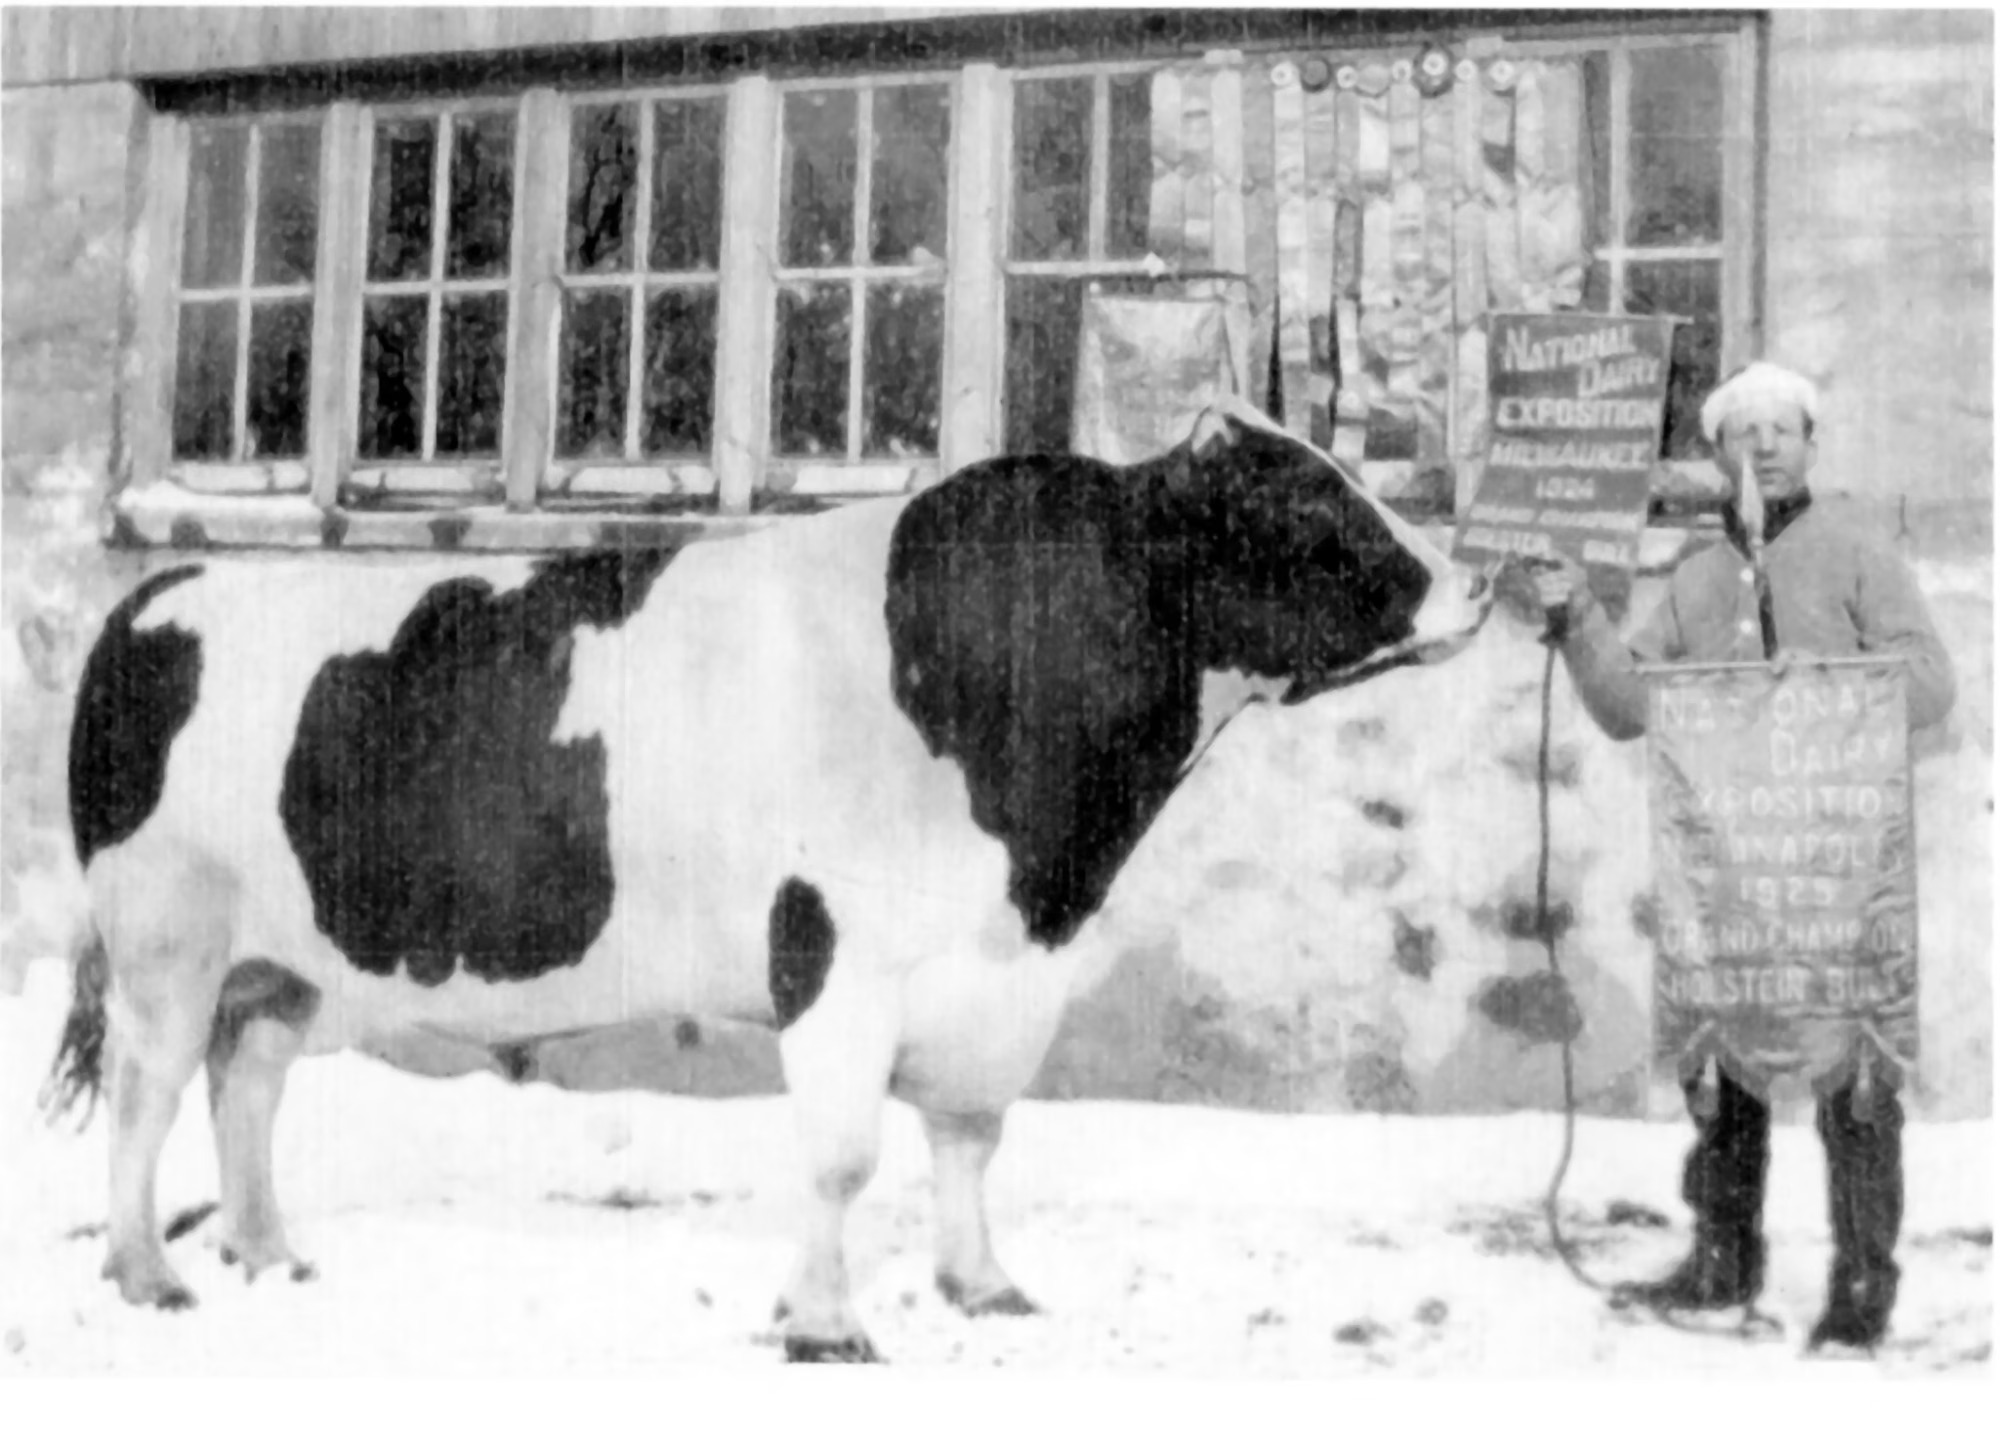
Johanna Rag Apple Pabst, Grand Champion, mid-1920s. Where the family tree begins. The “Rag Apple” buried in Chief’s name and the bloodline behind Elevation’s dam both run back to this one Wisconsin bull—undefeated in 1924 and the foundation ancestor whose name still rides in pedigrees a century on. Walk far enough up the tree, and both grandfathers shake hands here. Read more: The Bull Who Changed Everything: The Johanna Rag Apple Pabst Story

And here’s a detail that ties the whole tree together. Eve — the overlooked B-team mother nobody expected anything from — traced back twenty times to a foundation cow named Johanna Rag Apple Pabst. The “Rag Apple” buried in Chief’s name comes from the same deep well. These two grandfathers, born to different farms in different decades, weren’t strangers at all. Walk far enough up the family tree, and they shake hands. The reunion was always a family affair. 

Northcroft Ella Elevation (EX-97 4E GMD DOM). Both grandfathers in one cow. Born February 26, 1974, Ella carried Elevation on top and an EX-91 Chief daughter underneath—the two bloodlines that fathered half the breed, shaking hands in a single pedigree. The reunion, made flesh. Photo: Remsberg.

Two fathers, two temperaments

Set the two old bulls down at the same table, and you’d have spotted the difference fast. They were nothing alike.

Chief was the quiet workhorse — a production sire whose genius announced itself in the milk tank, lactation after lactation, value measured in pounds and years rather than ribbons. Elevation was the showman with substance, one of the first proven bulls of the modern era who could put a daughter in the ring and fill the bulk tank. One made cows that paid. The other made cows that paid and turned heads on the colored shavings.

Elevation did something else, too — he changed the very machinery that moves genetics around the world. His semen, by one account, helped finance Select Sires and solidify it as a cooperative during its fragile early years. As his own breeder’s cousin, George Miller, put it: “It’s been said that Elevation built the barns at Sire Power and Select Sires.” 

And his fingerprints are still all over the modern toolbox. Here’s the mind-bender: by The Bullvine’s analysis, Elevation’s DNA makes up about 8.3% of the CDCB’s genomic reference population — the very dataset that modern genomic predictions are trained on. Think about that the next time a young genomic bull’s numbers flash up on your screen. The math ranking him was partly based on his own great-great-grandfather. 

The roots run deeper than you think

Speaking of walking up the tree, the story doesn’t actually start with these two.

Dr. Chad Dechow’s work shows that all the great 1960s pillars of the breed trace their male lines back to just two bulls born in the early 1880s: one called Neptune H, born in 1880, and one named Hulleman, born in 1881.

Sit with that. The Father’s Day table you’ve been picturing doesn’t have two chairs at the head — it has two chairs in this generation. Keep walking back, and the whole enormous family narrows again and again until, in the 1880s, it comes down to a pair of bulls who lived before the automobile, before the milking machine, before electricity reached most farms.

We like to think we’re steering. Our index, our matings, our careful selection — surely that puts us in the driver’s seat. And it does, a little. But we’re steering a river that’s been running in the same channel for nearly 140 years. Someday, a breeder none of us will ever meet will trace a herd back to a bull you used this week, and they’ll feel exactly the way you feel as you read these names right now. That’s the strange gift of a breed this old. You’re never just raising cattle. You’re handing something down.

The morning the numbers didn’t add up

Now comes the hard part of every honest Father’s Day — the part where you love somebody and still have to tell the truth about them.

It started, in a way, with researchers staring at a spreadsheet that made no sense.

In 2011, USDA scientists were studying haplotypes — long stretches of chromosome inherited as a single block — when they noticed something wrong on chromosome 5. A particular haplotype was common across the breed. Carriers were everywhere. By the plain arithmetic of inheritance, there should have been thousands of living animals carrying two copies of it. They went looking for those animals. There were none. Not a single one. The double-carriers weren’t dying young or growing up sickly — they were never being born at all. 

Five years later, a team led by Heather Adams with USDA’s Paul VanRaden ran the cause to ground: a single “nonsense” mutation in a gene called APAF1, a typo that truncates more than half the protein it’s supposed to build. 

One copy, and a calf is just a carrier — perfectly healthy. But breed a carrier to a carrier, which is heartbreakingly easy when half the breed descends from the same grandfather, and two copies quietly kill the embryo before it’s ever born.

They traced the haplotype straight back to Chief. And before anyone knew it was there, that single inherited flaw is estimated to have caused roughly half a million spontaneous abortions worldwide — and about $420 million in losses over 35 years. The flip side runs staggeringly in the other direction: the same researchers estimate that Chief’s beneficial genetics added about $30 billion in increased milk production. The gift and the bill, written into the same animal. 

Half a million calves conceived and quietly lost. Half a million heat checks that came up empty — a farmer standing in the barn at dusk, wondering what went wrong, never knowing the answer had been written into the breed’s most celebrated father sixty years before he was born.

That’s no reason to resent Chief. A father doesn’t choose the genes he carries. But it’s the unavoidable math of a narrow family tree: when everyone shares the same grandfather, his hidden flaws stop being rare. The good news — once the mutation had a name, breeders could test for it and breed around it, and U.S. carrier frequency fell from roughly 8% to about 2% within a few years. The defect didn’t end Chief’s legacy. It just made us smarter about how we carry it forward. 

The number landing in your heifer pen right now

Here’s where the history stops being history.

According to Lactanet’s August 2025 update, the average pedigree-based inbreeding of Canadian Holstein heifers born in 2024 hit 9.99%. Nearly ten percent. A generation ago, that figure would have set off alarms. Today it’s just Tuesday. 

That’s what two grandfathers at the head of the table eventually costs a family. Every percentage point of inbreeding chips away at fertility, at calf vigor, at the very longevity that made Elevation famous in the first place. The traits these great fathers gave us are exactly the ones a too-narrow pedigree slowly takes back. By the USDA’s measure, Dr. Dechow puts both Chief and Elevation at a genetic relationship of about 14% to the modern Holstein cow. Two bulls, wearing different hides, make up a huge chunk of your herd. (The Bullvine has run the dollars-and-cents of where this is heading in its breakdown of Holstein’s inbreeding bill.) 

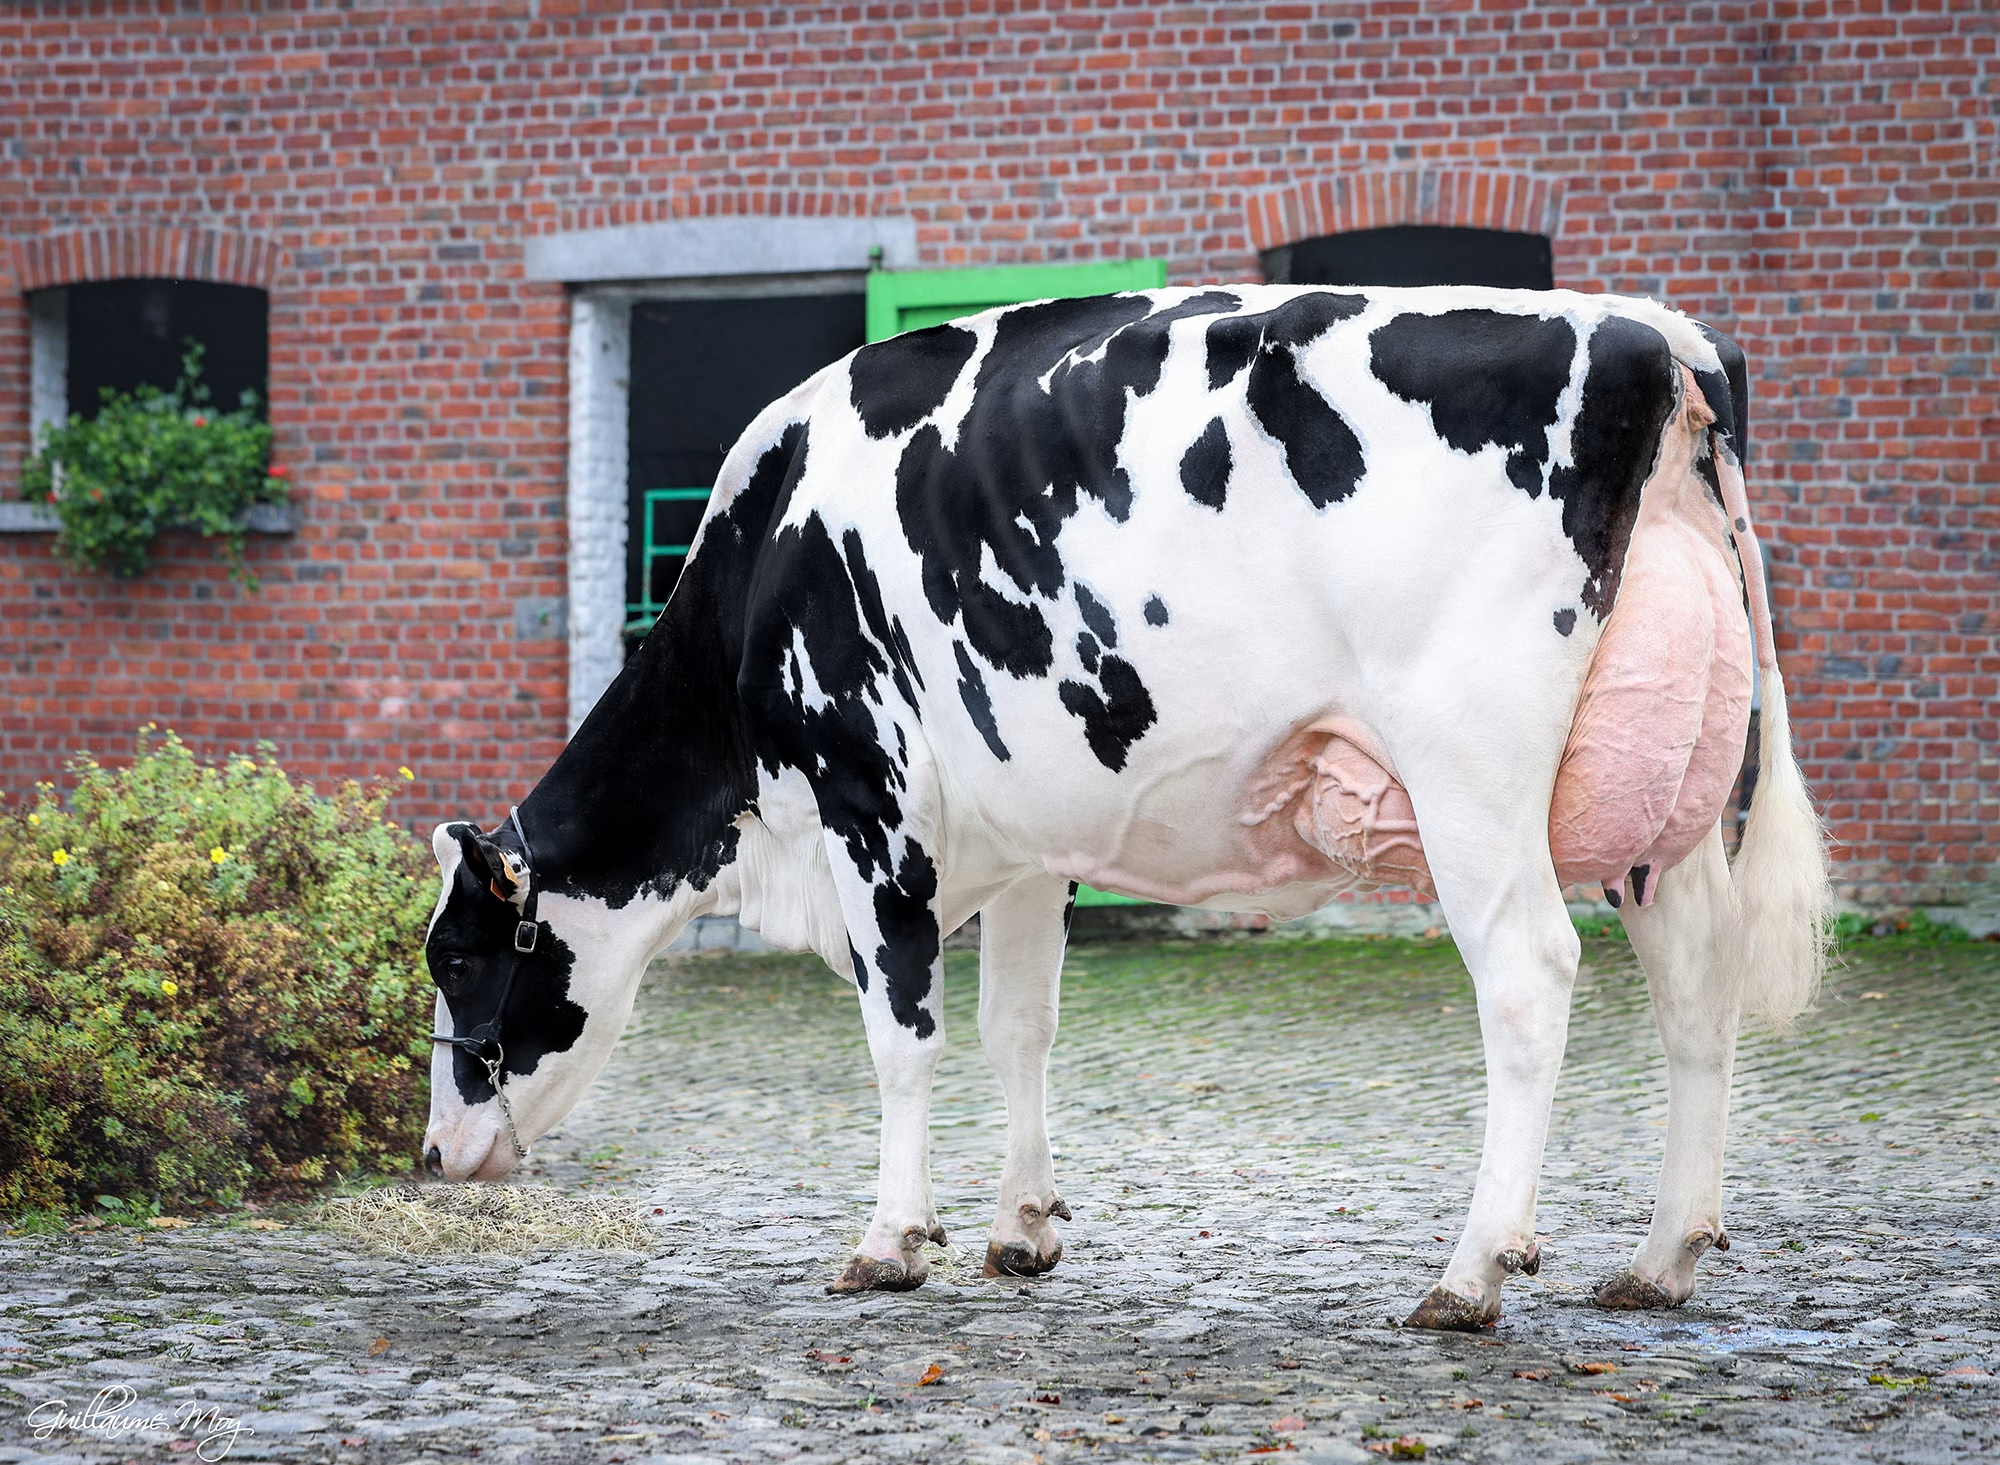
Maxima de Bois Seigneur. Sixty years later, still in the room. A daughter of Stantons Chief—and a direct descendant of Pawnee Farm Arlinda Chief—Maxima stands in a Belgian farmyard as living proof that the old grandfather never left the table. Every time you see a modern cow like her, you’re looking at his influence. Photo: Guillaume Moy. Read more: From Laurie Sheik to Robotic Milking: Bois Seigneur Holstein’s Journey of Innovation

What this means for your operation

Here’s the good news in all of this: knowing the family history is exactly what lets you manage it. So you’ve met the grandfathers — what do you actually do with this on Monday morning? A few concrete things.

Run your matings through a genomic inbreeding tool, not just a pedigree check. With 99.84% of AI sires tracing to two bulls, pedigree alone hides how related your “outcross” really is. The genomic future inbreeding value tells the truth.

Check carrier status for HH1 (APAF1) before you breed a deep-Chief cow. Most catalogs list it. Avoiding carrier-to-carrier matings is the cheapest insurance you’ll ever buy against an empty calving pen.

Put a hard ceiling on expected progeny inbreeding. Many breeders aim to keep a mating under roughly 6–7%. With the Canadian average heifer already at 9.99%, every mating you pull below that line is a small win for the next generation.

Actively hunt the rare outcross lines. They exist. They’re harder to find, and they’re worth the search — the breed’s long-term fertility depends on the breeders who refuse to let the family tree narrow any further.

None of this is a knock on Chief or Elevation. You’d have made the same call any of those old breeders made — the production was real, the longevity was real, the money was real. This is simply the next chapter of stewardship: honoring what the grandfathers built while quietly widening the table for everyone who comes after.

The reunion, and what we owe the dads at the table

Come back to that impossible barn one last time.

The millions of cows. The two chairs at the head. The two old bulls who never met and yet fathered nearly all of it — one a $4,300 gamble out of Pawnee Farm, one a cousin’s hunch off a modest Virginia hillside that had no business working and changed everything anyway. Between them, they handed the dairy world more milk, better udders, longer-lasting cows, and a uniformity that built the modern industry. They also handed down a narrower gene pool and a few hidden flaws their children are still reckoning with. Both things are true. That’s what it means to inherit from a great father — the gifts and the burdens come in the same package, and the work of a lifetime is sorting out what to do with each.

So this Sunday, when somebody asks what you do for a living, tell them the truth. You’re raising the great-great-grandchildren of two bulls born in the 1960s — who themselves came down from a pair born in the 1880s — in a family reunion that has never once adjourned, and never will.

Pour a little extra in the cup. The grandfathers earned it.

Key Takeaways

  • That “outcross” bull on your mating list probably isn’t one — 99.84% of active AI sires trace to Chief or Elevation, so run matings through a genomic inbreeding tool, not just the pedigree.
  • Before you breed a deep-Chief cow, check HH1 (APAF1) carrier status on both sides; a carrier-to-carrier mating is the cheapest way to end up with an empty calving pen.
  • The traits these two gave us — milk, udders, longevity — are the same ones a narrow pedigree quietly takes back, so aim to keep expected progeny inbreeding under roughly 6–7%, against a breed-average heifer already at 9.99%. 
  • The breed’s long-term fertility depends on the breeders who hunt and use the rare outcross lines — they’re harder to find, and they’re worth the search. 

Methodology Note

This article uses several distinct measures of genetic influence that should not be conflated. The 99.84% figure is a paternal Y-chromosome lineage measure derived from Yue et al. (2015, Journal of Dairy Science 98(4):2738–2745, examining 62,897 bulls) — it describes male-line descent, not total genome share; the 99.84% / roughly-half-each breakdown is The Bullvine’s analysis of that dataset. The genetic relationship to the modern Holstein cow (~14% for both bulls) comes from Dr. Chad Dechow’s USDA-affiliated analysis, as reported in Hoard’s Dairyman. The Bullvine reports that Elevation accounts for approximately 8.3% of the CDCB genomic reference population. The HH1/APAF1 facts come from the 2011 USDA haplotype discovery (VanRaden et al., J. Dairy Sci. 94:6153–6161) and Adams et al. (2016, J. Dairy Sci. 99(8):6693–6701), which identified the causative APAF1 nonsense mutation. The estimates of roughly half a million abortions, about $420 million in losses over 35 years, and about $30 billion in beneficial milk production are reported by UC Davis (2016). The 9.99% inbreeding figure is a pedigree-based coefficient for Canadian Holstein heifers born in 2024 (Lactanet, August 2025) and may differ from U.S. CDCB genomic measures. National figures may not reflect your region or herd; verify carrier status and inbreeding values against current CDCB/Lactanet data for your own matings.

Questions, corrections, or a number you’d like us to double-check? Reach out to editor@thebullvine.com

Continue the Story

The Sunday Read Dairy Professionals Don’t Skip.

Every week, thousands of producers, breeders, and industry insiders open Bullvine Weekly for genetics insights, market shifts, and profit strategies they won’t find anywhere else. One email. Five minutes. Smarter decisions all week.
NewsSubscribe
First
Last
Consent

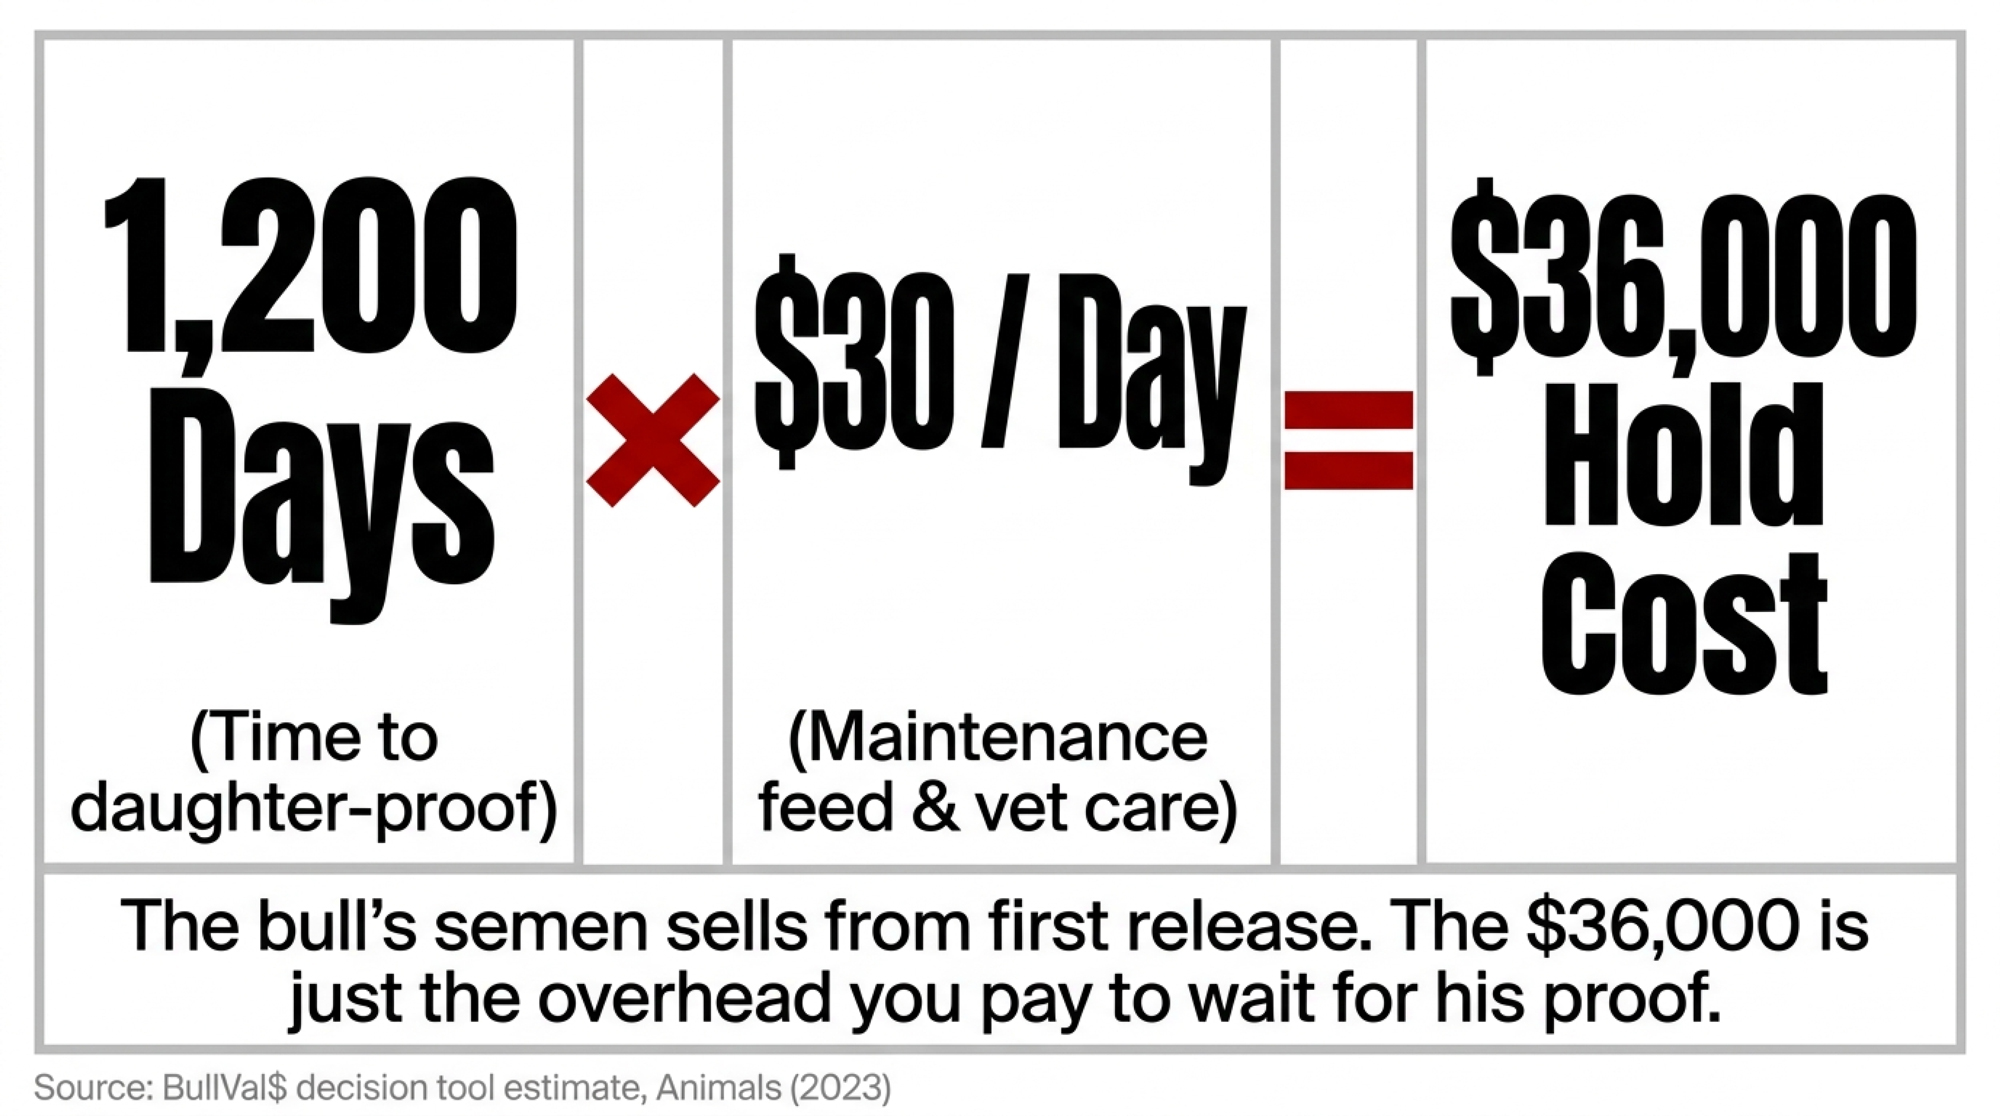
The Proof You Waited Three Years For Averaged a $72 Markdown

A young bull sells semen from first release to proof and beyond — he’s earning the whole time. So the only thing the wait actually buys you is the proof itself. And on average, the proof tells you less than his DNA already did.

Editor’s Note: The stud manager in the opening is a composite scenario modeled on publicly reported AI-stud practices, used to illustrate a real industry dynamic. It does not depict a specific individual.

Run the scenario at a typical mid-size AI stud in spring 2026. The manager’s got roughly 100 young bulls in the lineup, each one a genomic bet placed two or three years ago. Every one was genotyped as a calf. He already knows, to a tight reliability band, what most of them transmit — and their semen has been selling the whole time. The question isn’t whether they earn their keep; they do. The question is what he’s still paying for on the ones he holds all the way to a traditional daughter-proof. Because that wait carries a cost almost nobody puts a number on — and buys something worth less than most people assume.

Holstein International ran a tidy table on this. Fifty studs, one column, retention rates running from “less than 5%” to a flat 100%. Aberekin keeps everything. Elitest and VikingGenetics keep almost nothing. The takeaway, more or less: proven bulls still sell, philosophies differ, isn’t that interesting.

It is interesting. It’s also a snapshot dressed up as an answer.

What does the wait for a proof actually buy?

Less than you’d think — and here’s the number nobody puts on it.

Start with what the proof costs to chase. A peer-reviewed decision tool, BullVal$, published in Animals in 2023, uses an AI company’s own estimate of $30 per bull per day to cover physical maintenance — feeding, housing, and veterinary care. That $30 is one company’s published figure, not an industry average, so treat it as order of magnitude. Hold a bull from his genomic debut as a yearling until his daughters milk and a proof lands — three to four years, call it 1,200 days — and that’s roughly $36,000 in maintenance.

The carry, in one line

$30/day × 1,200 days ≈ $36,000 per bull in maintenance — running on top of, not instead of, the semen he’s selling the whole time. The doses earn; the wait is the cost.

His semen sells the entire time he stands, often at full price from first release. So the $36,000 isn’t money spent on an idle animal — it’s the overhead of running him long enough to reach a daughter-proof. Which raises the real question: what does that proof actually tell you that his genotype didn’t?

Here’s the answer, with a number on it. Virginia Tech tracked the December 2011 proofs on more than 2,400 genomic-tested Holstein bulls — bulls already marketed on their genomic predictions. When the daughters finally milked, the average daughter-proof came in $72 lower in Net Merit than the genomic figure those bulls had been sold on, and dropped nearly a month of Productive Life (Cassell, Virginia Tech / Virginia Dairy). You waited three to five years, paid the carry, and the proof’s headline news was a markdown.

That’s the trade nobody prices. As the same analysis put it, waiting to lift reliability from about 70% to about 85% is “a questionable decision on young bulls with some pretty fantastic genomic predictions.” Genomic young-sire semen often sells at a premium before a proof; the proof, on average, doesn’t add value — it regresses the bull toward the mean and sometimes docks his price just as his daughters arrive.

Proof-Chasing Overhead Simulator

Progeny Testing Carry Costs vs. Accelerated Genomic Pipelines

Pipeline Input Variables

100 bulls
10350 bulls
$30 / day
$10$60/day
1,200 days
8001,600 days
10%
5%30% select
Total maintenance overhead to reach proof
$3,600,000
Maintenance overhead while holding to proof — incurred on top of ongoing semen sales.
Amortized Burden Per Active Catalog Survivor
$360,000
The overhead penalty each successful genomic survivor must recoup to clear out the bulls culled down the road.
Pipeline Efficiency Balance Matrix High Structural Capital Drag
🔴 Overhead on bulls that don’t make the final catalog (90%) 🔵 Active Revenue Sires (10%)
Equations Formulated from Peer-Reviewed BullVal$ Financial Datasets (Animals, 2023).

Why did genomics speed up genetic gain — better predictions, or less waiting?

Less waiting. That's the part the proven-bull conversation keeps skipping.

When the U.S. moved to genomic selection, the rate of genetic progress jumped a gear. The Net Merit trend tells it plainly:

EraAnnual genetic trend (Holstein bulls, Net Merit)
Early 2000s~$13 / year
Pre-genomic (2005–2009)~$40 / year
Genomic (service since 2011)~$85 / year

That's more than double the pre-genomic pace. The published trend lines in Frontiers in Genetics spell it out, and The Bullvine has walked through this doubling before. Net Merit values shift with each base change and formula revision — the index was rebased to 2020-born cows in April 2025 — but nobody disputes the direction or the scale of the jump.

The why is where the genetics literature stops arguing. A 2024 review in the Journal of Animal Science concluded that "most of the increased genetic gain is attributed to reduced generation intervals." VanRaden's group put it plainer — genomics doubled gain "primarily through halving the generation interval," with bull-parent ages "now near the biological minimum." The landmark García-Ruiz study in PNAS measured U.S. Holstein generation intervals collapsing right after 2009.

So sit with the contradiction. The engine of modern progress is turning generations faster. The sample-and-prove model does the opposite — it deliberately slows the interval back down on the bulls it holds. A bull you keep until proof is, by definition, old by the time that proof lands. You bought a little certainty with a lot of time, and time is the one input genetics can't spare anymore. Peer-reviewed simulation work confirms the mechanism: pairing genomic selection with a sharply shorter generation interval can double the rate of gain.

"But genomic reliability is only 70%" — true, and mostly beside the point

This is the proven-bull camp's strongest card. Genomic indexes sit around 70–80% reliability, so there's roughly a 30% chance a bull transmits differently than predicted. Proven bulls hit 90–99%. Why gamble?

Fair question. But it quietly assumes every trait you care about is equally uncertain at the genomic stage. It isn't. Sort the traits, and most of the gamble evaporates:

What you're selecting forGenomic reliability todayThe real situation
Milk, fat, protein~75–82%Plenty. Genomic testing reveals ~75% of an animal's genetic potential before she ever milks.
A2A2, BB kappa-casein, β-lactoglobulin, polled, recessive haplotypes~99–100%Single-gene traits read straight off the DNA — not predictions.
Health & fertilityLowest today, climbingMore female genotypes lift accuracy every year.

On production, 80% is plenty. Milk, fat, and protein are moderately heritable — CDCB uses 15–29% for yield, with butterfat and protein around 20–25%. When you're chasing pounds of components, an 80%-reliable young sire who's three years of gain ahead beats the proven option that's three years behind. You give up a sliver of per-bull certainty and pick up a generation of population progress.

And on the traits that increasingly decide whether your milk gets sold at all, reliability isn't 70% — it's effectively 99–100%. Take BB kappa-casein, the "cheese-yield gene." Peer-reviewed work confirms the long-cited Ng-Kwai-Hang finding: milk with the BB variant shows roughly 10–40% shorter coagulation time and 20–140% greater curd firmness than AA milk, with BB delivering the highest curd firmness of any genotype. A2A2 beta-casein, beta-lactoglobulin, polled, clean haplotype status — you don't wait three years for a proof to know any of it. You know the day you genotype the bull. UW–Madison Extension reports that a quick survey of five AI stud websites turned up over 800 A2A2 Holstein bulls — "by far the most common" genotype — and says the breed "is quickly moving to be an A2A2 only breed."

Reliability is also a moving floor. Genotyping has collapsed in price — commercial dairy panels now run around $43/head, down from roughly $100 a decade ago — so genotyping every heifer calf at birth is becoming routine. That flood of female records is exactly what lifts accuracy on the health and fertility traits genomics is weakest on. Push young-bull reliability up 10 points, and the case for waiting on a proof gets thinner still.

The clearest signal isn't in the survey answers — it's in what the inventory tanks already show. Serious studs freeze deep inventory on a bull — a few thousand doses on a routine young sire, tens of thousands on the high-genomic standouts — then send the bull himself to beef. The semen sits in a tank and keeps selling; the bull doesn't keep eating. And every one is genotyped, so the DNA's on file for re-analysis as new traits get added. You never needed the live, housed bull to keep selling him — the banked doses sell whether he's standing in a stall or sitting in a freezer. The only thing the live bull adds is the maintenance bill while you wait for a proof that, on average, docks his value.

FactorHold to daughter-proofBank semen + beef the bull
Maintenance cost to reach decision~$36,000/bull (≈$30/day × 1,200 days)$0 — doses sell from the tank
What the wait adds to valueAverage −$72 Net Merit + ~0.8 mo Productive LifeNothing lost; DNA on file for re-analysis
Reliability gained~70% → ~85%Stays ~70–85% (plenty for yield)
Position on the gain curveA full generation behindA generation ahead
Single-gene / contract traitsAlready known at genotypingAlready known at genotyping

Are you keeping proven bulls for a customer who's disappearing?

Maybe. The honest core of the proven-bull case is that they "continue to sell" — and that's true and current. Cogent's December 2025 sire summary still leads with proven sires "for farmers who value consistency," and Semex still markets daughter-proven bulls at the top of its lineups. Real demand is real demand. Nobody should torch a profitable product line on theory.

There's a fair argument on the other side, too. The American Jersey Cattle Association's own Jersey Journal breed-improvement series argues that breeders have leaned too heavily on individual young sires and should use high-ranking proven bulls heavily while sampling young bulls lightly to find the next great ones. The AJCA has since backed that with hard structure — its new GenProgress sampling program, announced in late 2025, requires nominated young bulls to come from proven A.I. sires and documented maternal lines. That's disciplined sampling working as designed. The question this piece raises isn't whether to sample — it's who should carry the cost of that sampling, and whether a live, housed bull is still the cheapest way to do it when the semen can sit in a tank instead.

Then look at who that customer is becoming. U.S.-licensed dairy farms have fallen by about 45% since 2014, down to roughly 24,800, while average herd size has climbed to about 377 cows. Per the American Farm Bureau's analysis of USDA data, the largest operations now make most of the milk. The 200-to-500-cow family dairy buying a "safe" proven bull from a catalog — the exact customer this model was built for — is the segment getting squeezed hardest as consolidation grinds on. The buyer of the 2030s runs two or three times today's herd, employs a nutritionist and a geneticist, and thinks in rate-of-gain and component contracts. That buyer pays for speed, not for the privilege of waiting.

Are you still breeding to a bull that died in 2008?

Here's where this stops being a story about studs and starts being about you. The proven-bull instinct doesn't live only in semen barns — it lives in mating decisions made by breeders who reach for a name they trust rather than a plan they follow. Goldwyn. Lambda. Captain.

Braedale Goldwyn was born on January 3, 2000, and died in 2008. Chase his look in 2026, and you're linebreeding to a 26-year-old pedigree while the genomic frontier has moved three or four full generations past him. We get the romance — a favorite sire is a relationship, a genomic list is a spreadsheet. But the habit carries a bill most breeders don't see until it lands.

That bill is inbreeding. When everyone piles onto the same admired sire, the pool narrows fast:

Here's the barn-math version you can map to your own herd. A Canadian Dairy Network analysis found that cows that are 10% inbred lose about 92 kg of milk per lactation compared with cows at 5% inbreeding — roughly 18 kg, or about 40 lbs, of milk for every 1% inbreeding climbs. On a 100-cow herd, a single point of avoidable inbreeding is roughly 4,000 lbs of milk per lactation walking out the bulk tank. Keep it in proportion, though: fewer than 5% of Canadian Holsteins are even above 10% inbred. This is a real, manageable leak — not a catastrophe. (Those figures are Canadian Holstein data; the biology travels, but U.S. herds should confirm against their own evaluations.)

And the legends carry hidden debts. Goldwyn is a known carrier of Cholesterol Deficiency (HCD), a lethal recessive traced to the APOB gene. Breed unthinkingly toward his pedigree, and you stack carrier on carrier without meaning to.

Options and trade-offs

There's no single right answer here — there's the answer that fits your operation, your breed, and what your milk buyer pays for. A few honest paths:

Stud running Holstein: go all-genomic, bank deep, keep the DNA. Makes sense when production traits dominate your breeding goal, and you've got the deepest reference population on earth working for you. What it requires is the discipline to send good-looking bulls to beef once their semen is banked. The risk: you give up a legacy product line some loyal clients still want — so hold a handful to proof if a profitable market asks, but call it a niche, not your gain engine.

Stud in Jersey, Brown Swiss, or a colored breed: lean hard on genomics, but sample with intent. Same $30/day housing cost, smaller population, higher stakes per decision. The Jersey camp makes a real case for disciplined sampling to find the next proven sires — the open question is whether you need a live bull in a stall to do it, or whether banked semen and DNA-on-file get you there more cheaply. For most thin-market breeds, the cost math leans hard toward banking.

Breeder with a favorite sire: trade the scrapbook for a plan. The fix isn't a different favorite — it's not having one. Set your breeding goal first, then refresh the bull team after each proof run against it, using the best young genomics available now and managing relationships to keep inbreeding down. The cow doesn't care that the bull is famous; she cares that he's the right outcross at the right reliability for the trait you're chasing.

Do this within 30 days: before your next mating run, pull your current sire shortlist and flag any bull born before 2015 or any sire you're using mostly out of habit. Run those matings through your herd's inbreeding/outcross tool against this season's young-genomic options. If a young sire gives you equal or better merit on your priority traits with lower inbreeding, the loyalty pick is costing you — and now you can see exactly how much.

Key Takeaways

  • The bull sells the whole time he stands, so the $36,000 hold-to-proof cost buys you one thing: the proof. And Virginia Tech found the average daughter-proof came in ~$72 lower in Net Merit than the genomic prediction the bull was sold on. Bank the semen, beef the bull, keep the DNA.
  • If your breeding goal is pounds of components, an ~80% genomic young sire a generation ahead beats a 99% proven bull a generation behind. Reliability is the wrong thing to optimize when speed is what pays.
  • If a trait decides whether your milk sells — A2A2, BB kappa-casein, polled, clean haplotypes — buy it straight off the genotype today at 99–100%. There's no proof worth waiting three years for on a single-gene trait.
  • If you've used a sire born before 2015 mostly out of loyalty, price the habit: roughly 40 lbs of milk per cow per lactation for every 1% of inbreeding you stack, plus the carrier risk a famous pedigree can hide.

So, where does your bull team actually sit? Pull your last three mating runs and check how many of your top sires are genomic young bulls versus names you've trusted for years — then ask whether that ratio is a plan or a habit. If you want the full per-bull hold-cost model, the trait-by-trait reliability breakdown, and the thin-market-breed numbers worked all the way through, that's the deeper dive in The Bullvine's genetics coverage and the weekly newsletter — where this argument gets the spreadsheet it deserves.

Methodology note: The opening stud manager is a composite scenario modeled on publicly reported AI-stud practices, not a specific individual. Genomic young-sire semen is sold continuously from first release; the per-bull figure here is maintenance overhead concurrent with semen sales, not idle carry. The $30/bull/day maintenance estimate is from the peer-reviewed BullVal$ decision-support tool (Animals, 2023) — one company's figure, not an industry average — applied over a ~1,200-day hold-to-proof window; actual costs vary widely by facility, country, labor model, and bull. The proof-regression figure (average ~$72 Net Merit drop and ~0.8-month Productive Life drop from genomic prediction to daughter-proof, on December 2011 proofs of 2,400+ genomic-tested Holstein bulls) is from D. Cassell's Virginia Tech / Virginia Dairy analysis; individual bulls vary and regression direction can differ by trait and era. Genetic-trend figures (~$13/year early 2000s, ~$40/year pre-genomic, ~$85/year genomic) and the generation-interval/gain-doubling claims are drawn from the peer-reviewed sources linked throughout (PNAS — García-Ruiz et al.; a 2024 Journal of Animal Science review; Frontiers in Genetics — VanRaden; and peer-reviewed simulation work); Net Merit values shift with each base change, including the April 2025 rebasing to 2020-born cows. The inbreeding-on-milk figure (~18 kg of milk per 1% inbred, derived from a 92 kg loss between 5% and 10% inbreeding) is from the Canadian Dairy Network's "Quantifying Inbreeding Depression" analysis and reflects Canadian Holstein data; U.S. herds should confirm against their own evaluations. Kappa-casein BB cheese-yield effects (~10–40% shorter coagulation time; ~20–140% greater curd firmness vs AA, per Ng-Kwai-Hang) are reported in peer-reviewed work (Animals, 2023). Single-gene trait status (A2A2, kappa-casein, beta-lactoglobulin, polled, haplotypes) is determined by direct genotyping rather than genomic prediction reliability. The proven-bull product lines of Cogent and Semex are confirmed against the companies' own 2025 sire summaries; the disciplined-sampling argument is from the AJCA's Jersey Journal breed-improvement series and its GenProgress program; the Global Alliance housing-cost quote and the retention percentages by stud originate with Holstein International. National averages may not reflect your region, breed, or operation. Spot an error or have stud or on-farm numbers that sharpen the math? Tell us — corrections and counter-data are welcome.

Learn More

The Sunday Read Dairy Professionals Don't Skip.

Every week, thousands of producers, breeders, and industry insiders open Bullvine Weekly for genetics insights, market shifts, and profit strategies they won't find anywhere else. One email. Five minutes. Smarter decisions all week.

NewsSubscribe
First
Last
Consent

Against All Odds: The Dreamers, Rebels, and Risk-Takers Who Built the Modern Holstein

In the fall of 1972, a bright-red calf walked into a New York sale ring where the whole Holstein establishment still called his color a defect to be bred out. When the gavel cracked at $60,000—a world record—the barn erupted: “They paid WHAT for a red calf?” The ABS man holding the card had just blown clean past what his boss authorized. That calf was Triple Threat. And the bet everyone laughed at? It runs in your barn today.

Hanover-Hill Triple Threat-Red—the red bull calf the Holstein establishment wrote off as a “defect,” who sold for a world-record $60,000 at the 1972 Hanover Hill sale. The black-and-white photo hides the very thing that made him controversial: his color. Read more: They Called Him the Three-Legged Bull. He Created the Modern Red Holstein: The Untold Story of Hanover-Hill Triple Threat-Red)

Fall 1972. Hanover Hill sale barn.

The air in that old New York barn had the usual mix—coffee, tobacco smoke, sawdust, and the sharp warm smell of washed Holsteins standing under bright sale-ring lights. Men flipped through catalogs with rough thumbs, tracing pedigrees while the auctioneer’s voice bounced off the rafters. Then a calf stepped into the ring that didn’t belong.

Bright red in a sea of black-and-white fashion, he moved across the shavings as if he’d wandered into the wrong sale. Heads turned, not because the crowd wanted him, but because they wanted to see who would be foolish enough to pay serious money for a “defect.”

That calf was Hanover-Hill Triple Threat-Red.

The man holding the bidder’s card was Ken Young from American Breeders Service.

Young hadn’t come to Hanover Hill to become a story. He came with a job and a limit. Back in Wisconsin, Dr. Bob Walton had given him the go-ahead for a “certain price” on a red calf—enough to show ABS was serious about the color, not enough to gamble the company on a long shot .

Now, the thing about that era is simple: Red & Whites weren’t just unfashionable. The Holstein establishment still treated the red gene as undesirable. There wasn’t a Red & White program to build around. Red calves were the kind of thing breeders usually tried to breed out, not lean into.

So when the bidding started, most people in that barn treated it like a curiosity. The high money that day was supposed to go to black-and-white sons of great cow families. This red calf was just there to make people talk.

The number started to climb anyway.

Past what a sensible buyer should pay for a red calf. Beyond what anybody expected an AI company to risk on something the rulebook still called a mistake. Past the figure Walton had in mind when he’d hung up the phone.

Young kept his hand in the air.

You can almost hear the cadence change as the auctioneer leans into it—fifty… fifty-five… pushing into a range usually reserved for the very best black-and-white pedigrees. In the seats, you’d have seen raised eyebrows, quick head shakes, maybe a few muttered comments about ABS losing the plot.

When the gavel finally came down at 60,000 dollars—a world record for a Red & White calf at the time—the barn didn’t just hum. It erupted. Some men clapped. Some whistled. Quite a few turned in their seats and said, “They paid WHAT for a red calf?”

Think about that for a second.

Sixty thousand 1972 dollars, for a calf whose color pattern the establishment still called a defect. This was the kind of money farms and studs were putting into fashionable black-and-white sons of great cow families, not into a calf that looked wrong the moment he stepped into the ring.

Young walked out of that sale knowing two things. He had the calf. And he had gone beyond what his boss meant by “a certain price.”

According to ABS’s own retelling, Walton asked one simple question when Young got home: “How much did you pay?” The answer—60,000—was more than the number Walton had in his head when he’d said yes . The exact words that followed have been polished in every retelling, but the sentiment everyone remembers is the same:

Sometimes it’s easier to ask for forgiveness than to ask for permission.

One can imagine the silence on the other end of that line.

If Triple Threat had been a dud, that’s all Ken Young would be remembered for: the ABS buyer who blew 60,000 dollars on a calf the breed register still called defective.

What people don’t always realize is that this wasn’t a one-person gamble. Young’s bid was the last domino in a line that started years earlier, with a young Swiss breeder who got off a Greyhound bus three miles too early and walked toward a company that had no reason to take him seriously.

The Swiss Who Wouldn’t Take “No”

In 1968, a young Swiss dairyman named Jean-Louis Schrago boarded a Greyhound bus in Wisconsin with a problem in his head and not much more than a suitcase in his hand .

Back in Europe, Red & Whites weren’t a joke. Farmers liked them. Some markets preferred them. There was real demand for cows with red coats and Holstein capacity. The problem was brutal: the top Holstein genetics—the cows rewriting the record books on type and production—were almost all black-and-white.

Most of the world had shrugged and accepted that. Schrago hadn’t.

He and a Swiss friend rode that bus toward Madison, got off in DeForest—three miles too early—and, as ABS’s own history tells it, walked the rest of the way along the side of the road, two young foreigners hauling suitcases in a country they barely knew . They finally arrived at ABS’s door, tired and probably wondering if they looked as out of place as they felt.

Dr. Bob Walton could have brushed them off. Instead, he did something small that ended up mattering a lot. He picked them up. Took them to dinner. Then paid for their rooms at the YMCA in Madison .

The next day, over a table instead of a barn rail, Schrago laid out a plan that must have sounded crazy. He wanted ABS to help him build Red & Whites that didn’t look like second-rate Holsteins. To do that, he needed the very cow families that North America had spent a generation turning into global royalty.

That brought him to Hanover Hill Holsteins.

Hanover Hill, co-owned by R. Peter Heffering, was home to some of the most talked-about cows in the world. The Barb family, in particular, had become a signal of quality in every catalog they appeared in. The idea of “wasting” one of those pedigrees on a red-factor mating sounded like heresy.

On that first go-round, Schrago asked to use a top Barb cow on a red-factor mating. Heffering said no . In his world, that was the responsible answer. Why risk the reputation of your best cow family on a color the rulebook still calls undesirable?

Here’s what made Schrago different. He didn’t throw up his hands and go home for good. He went back to Switzerland, kept working, kept talking, kept pulling together data and demand from Europe. Then he came back. And came back again. Over the next three years—not the “decade” some versions claim, but three focused years between 1968 and 1971—he stayed on it .

By 1971, he had something new to put on the table.

He’d secured two units of semen from Canadian superstar Roybrook Telstar. Getting those two units took an international phone call that, according to ABS’s own records, cost 2,500 U.S. dollars in call charges alone . Two units. 2,500 dollars. In that era, that’s the kind of bill that makes accountants nervous.

This time, the target wasn’t just any Barb descendant. It was C Tara-Hills Pride Lucky Barb EX-94—the greatest daughter in that family at Hanover Hill. Different sources list her prefix slightly differently, but everyone agrees on two things: she was a Barb, and she was very, very good. 

This is the cow that made the request sound like heresy. Pride Lucky Barb, EX-94—the greatest daughter of the Barb family at Hanover Hill, and exactly the kind of pedigree the establishment said you didn’t “waste” on a red-factor mating. Schrago wanted her bred to Telstar to make a red calf. Heffering’s first answer was no. 

Suggesting a Telstar × Pride Lucky Barb mating to produce a red-factor calf wasn’t a polite request. It was a challenge.

Something shifted. Whether it was the picture Schrago painted of the European market, the credibility he’d built by showing up in person and not sulking after that first “no,” or simply the attraction of Telstar’s proof, Heffering finally said yes.

The moment that calf hit the straw in April 1972, a lot of quiet bets came due. A flat-coated red bull calf out of Pride Lucky Barb, by Telstar, in a barn that lived and breathed black-and-white fashion. On paper, he was one of the most daring matings Hanover Hill had ever made. In practice, he was a calf that didn’t fit any existing marketing plan. 

Six months later, that calf walked into the Hanover Hill sale ring and into history.

By the time the gavel fell at 60,000 dollars and Ken Young walked out with Triple Threat on ABS’s account, three different people’s convictions had fused into one moment. 

Schrago’s belief that red cattle deserved world-class genetics.

Heffering’s willingness to risk his best cow on a mating the rest of the industry mocked.

Young’s decision to blow past a “certain price” because his eye told him this calf was different.

Look at the depth, the udder, the sheer presence—then remember the establishment once wanted this color bred out. KHW Regiment Apple-Red-ET, the “Million Dollar Cow,” carries Triple Threat’s blood in her pedigree. The red calf nobody wanted in 1972 helped build a cow the whole world wanted half a century later.

Today, you can trace that line straight into cows every breeder knows by name. Triple Threat’s blood shows up throughout the modern Red & White population, including cows like KHW Regiment Apple-Red-ET—the Apple-Red who became known as the Million Dollar Cow and changed the way the world viewed red Holsteins. Every time you see a Red & White with type and production that can stand alongside the best black-and-whites, you’re looking, in part, at the shadow of that three-mile walk from DeForest and that $60,000 bid. 

This is where that 1972 sale ring leads. A Red & White Holstein—the very color the establishment once called a defect to breed out—draped in the Supreme Champion banner, the highest honor the show ring offers. Ken Young bet his job on a red calf nobody wanted; generations later, red cattle don’t just compete with the best black-and-whites, they beat them. 

The Farmer Who Wouldn’t Let Go

If Schrago’s story is about refusing to accept someone else’s limits, Aldo Panciera’s is about what it costs to trust your own.

April 26, 1952. Osborndale Farms in Derby, Connecticut. 

A bull calf landed in the straw that morning, which did not look like anyone’s idea of a future legend. Too long in the legs, too short on strength, the kind of calf that makes a seasoned breeder mutter “too bad” under his breath and start thinking about the next one.

On paper, the mating had been special enough that Professor Osborn had reserved the calf before birth. He walked into the pen, took one look at the reality before him, and backed out of the deal. 

That should have been the end of it.

The calf had one thing going for him: a pedigree that, even in that moment, couldn’t be undone by long pasterns and a narrow frame. The cows behind him had already proven they could transmit what the breed needed. Where most people saw disappointment, Aldo Panciera saw that paper and refused to ignore it.

He talked another breeder, Causey, into coming along for the ride. Between them, they bought quarter interests in the calf for 1,250 dollars each—a serious outlay in 1950s New England. For that kind of money, a young dairyman could have bought land, equipment, or a lot of feed. Instead, they bought a scrawny bull that almost everybody else had written off. 

That calf grew into Osborndale Ivanhoe.

Hard to believe this is the same calf his breeder almost couldn’t give away. Osborndale Ivanhoe—long-legged and narrow at birth, rejected by the man who’d reserved him—grew into the bull that topped the U.S. Type-Production Sire Summary eight straight years, a run still unmatched. Read more: Osborndale Ivanhoe: How a “Scrawny Bull Calf” Revolutionized an Entire Breed

If this were a tidy story, Ivanhoe’s first daughters would have hit the ground looking like walking proofs, and Panciera’s neighbors would have been lining up to apologize. Reality was rougher.

The early daughters were nothing to brag about. As yearlings, they were as awkward as their sire had been. Narrow. Shallow. The kind of heifers that make AI reps shake their heads and say, “See? We told you.” The studs that had turned Ivanhoe down bragged publicly about their good judgment.

You can picture the coffee shop conversations.

“That’s the bull you spent your money on, Aldo?”

“Those Ivanhoe heifers of yours don’t look like much.”

Those years must have been heavy. Every new crop of mediocre yearlings was another round of evidence that Panciera had made an expensive mistake. There were no genomic evaluations to whisper “trust the process” to him. Just heifers, and the memories of a decision he couldn’t take back.

He didn’t bail.

Not because he was sure he was right, but because something in that pedigree and a few hints in those calves told him the story wasn’t finished yet. He held on long enough to see the daughters freshen.

That’s when everything changed.

The same heifers that had looked like poor yearling bets walked into the milking string with udders the breed badly needed—high, tightly attached, with quality and strength. They had the frame and power to go with them. They didn’t just avoid the cull rail; they started pulling up the herd average.

Here’s the answer to every coffee-shop crack about Aldo Panciera’s bet. Miss Ivanhoe Scranton, EX-94—Osborndale Ivanhoe’s standout show daughter—stood Grand Champion at the 1969 Central National and earned All-American Aged Cow honors that same year, all while milking well over 100,000 pounds in her lifetime. The scrawny calf had bred a champion who could fill a tank, too.

From 1964 through 1971, Osborndale Ivanhoe sat at the top of the U.S. Type-Production Sire Summary eight consecutive years—a run that, to this day, has never been matched. Eight years of data saying, “That scrawny calf you laughed at is the best sire in the business.” 

The vindication was spectacular. But the heart of Panciera’s story isn’t the eight-year reign. It’s the quiet mornings in the middle, standing by fences looking at underwhelming heifers, knowing everyone thought he’d made a mistake, and choosing, day after day, to hold his ground.

If you’ve ever bred a group of heifers to a young bull that didn’t impress early, listened to the local commentary, and still decided to give those daughters another lactation, you’ve already walked a mile in his boots.

The Family Who Trusted What They Knew

By the late 1990s, the Holstein world was running on speed.

Shorter generation intervals. Young sires on the hottest heifers. Genomic testing was starting to whisper to breeders that they could see the future in a strand of hair. The line at many barns was, “Why waste semen on old cows when you can breed your best heifers to the newest #1?”

Inside that mindset, an eight-year-old cow might as well have been a piece of furniture.

Condon Aero Sharon didn’t look like furniture to the Pickford family at Spot Acre Grange near Stafford, England. She looked like the kind of cow most herds pray for—a Holstein who had come back, year after year, with a sound udder, decent feet and legs, and milk that kept the tank honest. 

Condon Aero Sharon (EX-91) - The eight-year-old Canadian cow deemed "ancient by artificial insemination standards" whose breeding to Carol Prelude Mtoto defied every convention in the AI industry. When the Pickfords and Genus's Judges Choice program chose to "give excellence a chance" with this aging matriarch, they bet £10,000 on what would become "arguably the most powerful brood cow in United Kingdom history" - a gamble that produced Picston Shottle and revolutionized global Holstein genetics.
Condon Aero Sharon (EX-91) – The eight-year-old Canadian cow deemed “ancient by artificial insemination standards” whose breeding to Carol Prelude Mtoto defied every convention in the AI industry. When the Pickfords and Judges Choice program chose to “give excellence a chance” with this aging matriarch, on what would become “arguably the most powerful brood cow in United Kingdom history” – a gamble that produced Picston Shottle and revolutionized global Holstein genetics.

The Pickfords had been breeding Holsteins long enough to remember before TPI was a household term. Over kitchen tables and milking parlors, they’d seen hot young sires drop out of sight when the second or third proof came. They’d also seen “unfashionable” cow families quietly keep herds profitable.

Their records told a clear story about Sharon: years of solid production and trouble-free health. Visitors didn’t stop to take pictures of her. But when you watched her walk or looked at her udder attachments after that many lactations, you knew you were looking at something that mattered more than a moment in a show ring.

Here’s what most people don’t realize: when you’ve watched a cow like that hold herself together through that many calves, that’s data no proof sheet can match.

Around that time, many AI reps were pushing the same plan: flush your youngest high-index heifers to the latest genomic star. The Pickfords listened, nodded, and then did something different. Working with ABS’s Judges Choice program—a channel designed to find alternative pedigrees the mainline sampling pipeline might miss—they made the case that Sharon, an older cow well past the fashionable age, was exactly the kind of cow who deserved a shot. 

By all accounts, the logic at their table the night they signed off ran something like this: they knew this cow, they’d watched her work, and if it didn’t pay they’d live with it—but if it did, it might be something special.

They bred her to Carol Prelude Mtoto, a bull with his own twist of irony. In the UK, Mtoto had been so lightly regarded at one point that he was sold as “The £40 failure”—forty pounds sterling for a bull who would later be recognized as one of the most important sires of his time. Pairing an unfashionable older cow with a bull that had been sold off for £40 wasn’t the mating a risk-averse herd makes. 

Forty pounds sterling. That’s what this bull was sold for when the establishment decided he wasn’t worth keeping around. Carol Prelude Mtoto—”The £40 failure”—who turned out to be one of the most important sires of his era. The Pickfords were about to pair him with an old cow nobody else would have bothered to flush. 

They did it anyway.

On July 23, 1999, that mating produced Picston Shottle. 

The £40 bull’s son, out of a cow most breeders thought was past her prime. Picston Shottle went on to become a millionaire sire with EX daughters by the thousands worldwide—cows people remembered less for their scores than for the fact that they bred back, walked sound, and stayed out of the sick pen. Read more: From Depression-Era Auction to Global Dominance: The Picston Shottle Legacy

Looking back now, it’s easy to say “of course.” ABS called him a “world-famous” and “millionaire” sire. Holstein International and other analysts later ranked him among the most influential Holstein bulls in the world, one of the few European-based sires to crack that echelon in lists dominated by North American names. 

His daughters piled up Excellent classifications by the thousands, all over the world—the kind of EX-daughter count that belongs in an official registry table, not a sentence pretending we re-counted it tonight. But whatever the exact tally, it was a flood of genuinely good cows.

Ask the people who milked them what they remember, and the answers sound familiar.

“They bred back.”

“They walked out sound.”

“They stayed out of the sick pen.”

This is what those words look like in the flesh: Huntsdale Shottle Crusade EX 95 3E, a Picston Shottle daughter, working the colored shavings at World Dairy Expo, where she was named Nasco International Type and Production Award Winner. Look at the udder—the same kind of attachment that kept Shottle daughters in the milking string long after the show banners were packed away.

In an era obsessed with squeezing one more notch on the genetic progress meter, Shottle’s story—and Sharon’s—reminds you of a simple truth: there’s real power in betting on the cows you know, not just the heifers with the newest numbers.

The Hard Lessons We Didn’t See Coming

Of course, not every bull that shaped this breed leaves you with a warm glow.

Hanoverhill Starbuck is a good place to start. On the surface, he’s an almost perfect success story. Farmers loved his daughters. They worked in commercial herds and looked the part on show strings. AI studs pushed him hard. By the time the dust settled, Holstein Canada analysis and follow-up reporting showed that more than 80 percent of North American Holsteins carried Starbuck’s DNA, and in Quebec, his influence in sequenced cows was in the mid-90 percent range by 2000. 

Hanoverhill Starbuck (EX-Extra) at 15 years old with Carl Saucier in 1994, photographed at Mount Victoria Farm in Quebec—the same ground where his ancestor Johanna Rag Apple Pabst posed 66 years earlier. This legendary bull exemplifies Ivanhoe's compound genetic influence: sired by Round Oak Rag Apple Elevation (EX-96 GM), whose dam was Round Oak Ivanhoe Eve, and out of Anacres Ivanhoe Astronaut (VG-88), a daughter of Hilltop Apollo Ivanhoe (VG-GM). With Ivanhoe genetics flowing through both sides of his pedigree, Starbuck generated his own revolution—siring over 200,000 daughters across 45 countries and establishing a lineage now present in over 80% of North American Holsteins. His extraordinary impact demonstrates how Ivanhoe's genetic gifts continued to compound across generations, proving that the "earth-shaking" begun in 1952 reverberates through modern dairy herds worldwide.

Hanoverhill Starbuck (EX-Extra) at 15 years old with Carl Saucier in 1994, photographed at Mount Victoria Farm in Quebec—the same ground where his ancestor Johanna Rag Apple Pabst posed 66 years earlier. This legendary bull exemplifies Ivanhoe’s compound genetic influence: sired by Round Oak Rag Apple Elevation (EX-96 GM), whose dam was Round Oak Ivanhoe Eve, and out of Anacres Ivanhoe Astronaut (VG-88), a daughter of Hilltop Apollo Ivanhoe (VG-GM). With Ivanhoe genetics flowing through both sides of his pedigree, Starbuck generated his own revolution—siring over 200,000 daughters across 45 countries and establishing a lineage now present in over 80% of North American Holsteins. His extraordinary impact demonstrates how Ivanhoe’s genetic gifts continued to compound across generations, proving that the “earth-shaking” begun in 1952 reverberates through modern dairy herds worldwide. (Read more: Hanoverhill Starbuck’s DNA Dynasty: The Holstein Legend Bridging 20th-Century Breeding to Genomic Futures)

That’s the dream if you’re trying to build a global sire. It’s also a reminder of how quickly influence can become saturation.

When you lean that heavily on one bull, you’re not just getting more of his good traits. You’re squeezing your gene pool around him. Today, managing inbreeding back to Starbuck is basic mating-program hygiene.

Carlin-M Ivanhoe Bell tells a harder story.

Carlin-M Ivanhoe Bell. Big production, daughters that filled tanks, a milk check that told breeders to use him hard—so they did, all over the world. Nobody in this photo knew what he was also passing along, hidden in a single recessive gene. He wasn’t a villain. He was the best bull of his moment, doing exactly what the industry asked of him. Read more: Bell’s Paradox: The Worst Best Bull in Holstein History

Bell looked like the complete package for his time. Big jumps in production. Daughters who filled tanks. Breeders used him heavily because the milk checks said they should. For a while, it felt like you couldn’t afford to.

Then calves started coming wrong.

Stillborn. Twisted spines. Severe spinal deformities that punched you in the gut the second you saw them. It took years—and a lot of heartbreak—before geneticists identified Complex Vertebral Malformation, a lethal recessive mutation in the SLC35A3 gene, and traced its worldwide spread back to Bell. 

If you’ve ever had to pull one of those calves, Bell’s name doesn’t feel theoretical. You remember the cow, the night, the smell in the pen. You remember the cost.

Pawnee Farm Arlinda Chief is a different kind of warning.

Pawnee Farm Arlinda Chief, born May 9, 1962, stands as one of the most influential Holstein sires in history, contributing nearly 15% to the breed’s genome. His legacy revolutionized milk production and reshaped global dairy genetics.

Pawnee Farm Arlinda Chief, born May 9, 1962, stands as one of the most influential Holstein sires in history, contributing nearly 15% to the breed’s genome. His legacy revolutionized milk production and reshaped global dairy genetics. Read more: The $4,300 Gamble That Reshaped Global Dairy Industry: The Pawnee Farm Arlinda Chief Story

When UC Davis researchers examined the modern U.S. Holstein genome, they found that Chief and his son, Walkway Chief Mark, each account for about 7 percent of it. Taken together, that’s roughly 14 percent—nearly a sixth—of what we now call the Holstein gene pool tracing back to one sire line. 

Walkway Chief Mark (VG-87-GM) — the backup bull from Foster Walk’s Neoga, Illinois herd whose genetics now account for roughly seven percent of every Holstein genome in North America. Named one of Select Sires’ “Impact Sires of the Breed,” his udder-transmitting brilliance and structural trade-offs shaped the modern Holstein in ways nobody saw coming when this photo was taken. Read more: Walkway Chief Mark: The Backup Bull Behind Seven Percent of Every Holstein Cow

Chief’s descendants gave the breed a lot of what it wanted. But now, decades later, you can’t sit down with mating software without constantly watching how often Chief and Mark show up in the background. Every time you see a high inbreeding number, you’re often looking at a pedigree that circles back to them too many times.

None of these bulls were villains.

They were outstanding sires used by breeders who, to a large extent, were doing their best with the information they had. It’s what happened afterward that matters.

Bell’s fallout pushed the industry to adopt routine genetic testing for lethal recessives. CVM, BLAD, DUMPS—those acronyms moved from obscure papers into sire cards and then into everyday farm talk. Chief and Mark’s dominance pushed conversations about diversity from genetics conferences into AI sampling rooms. Starbuck’s saturation made it impossible to ignore the need for tools that treat inbreeding as more than an afterthought. 

The lesson isn’t “don’t use popular bulls.” The lesson is that every time we pile a generation’s hopes on a short list of sires, we’re not just shaping the next proof run—we’re deciding what the breed will look like a generation or two down the road.

Where We Are Now

Genomics was supposed to change everything.

In a lot of ways, it did.

Instead of staring at a yearling bull in a stud barn and trying to read his future off his legs and his head, you can stare at a screen full of numbers: GTPI, NM$, DPR, health traits, feed efficiency. You can make decisions on calves that don’t have a single daughter on the ground yet.

But the risk didn’t disappear. It just moved.

GenoSource Captain is a good example of what the new system looks like when it works as intended.

The proof sheet, made flesh: GenoSource Captain in front of a wall of his daughters’ udders—the first Holstein bull to top Holstein USA’s International TPI list for seven straight proof runs. But before any of those daughters existed, somebody had to look at his genomic numbers and decide to use him anyway. Same leap of faith Panciera and the Pickfords made—just with a screen full of data instead of a pedigree on paper.  Read more: CAPTAIN: The Bull That Rewrote the Rules for Modern Breeding

By GenoSource’s own account, Captain became the first Holstein bull to sit #1 on Holstein USA’s Top 100 International TPI list for seven consecutive proof runs—a run that spans the genomic-young-sire-to-daughter-proven divide. As those daughters came in, he held his place among the breed’s elite for both overall merit and production, with reliability building on his core traits the way a proven sire’s does. 

What does that mean when you’re standing in your own parlor?

It means that, in herds milking Captain daughters, you’re seeing cows that put extra milk in the tank compared to your herd average, convert feed into that milk more efficiently, and carry health and fertility traits that keep them out of the vet’s notebook and in the milking line. Those aren’t abstract gains. They’re dollars.

But here’s the part that feels a lot like the old stories: before anybody had proof sheets in hand on Captain’s daughters, somebody had to decide to use him anyway.

Sire analysts in AI offices and breeders in kitchen chairs looked at his genomic profile and chose to trust it. They didn’t have daughter pictures. They had numbers and a gut feeling about those numbers. They were doing, in a different key, exactly what Panciera did with Ivanhoe and what the Pickfords did with Sharon.

The tools have changed. The courage required to act on them hasn’t.

OCD Captain Rae 63785-ET: The genetic powerhouse behind RIPCORD. This exceptional Captain daughter isn’t just continuing her sire’s legacy – she’s amplifying it. As the dam of the high-ranking TPI sire RIPCORD (+3399 GTPI), Rae embodies the multi-generational impact of CAPTAIN’s genetics.

What These Stories Mean for Your Operation

It’s easy to treat this kind of history like something that belongs in breed books and old sale catalogs. The truth is, you’re living the same patterns every time you sit down with your mating list or flip through a sire directory.

Here’s what all of this looks like in your own barn:

  1. Question what everyone else ignores.
    Every era has its “defects” and unfashionable traits. A2A2 before processors started paying attention. Polled before labor and welfare pressures made dehorning a hot topic. Today, it might be moderate-sized, high-health cow families that don’t photograph well. Before you ship those genetics, ask yourself if you’re walking past your own version of Triple Threat because the package doesn’t fit the current fashion.
  2. Don’t confuse awkward with hopeless.
    Ivanhoe’s yearling daughters didn’t look like much. They became some of the best cows in the barn once they freshened. In a genomic world, there’s a temptation to make permanent decisions early. If a line comes from proven cows and the first calves are underwhelming, give them a fair trial through that first lactation before you write the family off.
  3. Balance your sire lineup like a portfolio.
    Starbuck and Chief teach the same lesson from different angles: leaning too hard on a short list of bulls can paint you into a corner, even when those bulls are very good. Use your Captain-type sires. Use the ones that pencil out best for your goals. Just spread the risk. Check inbreeding coefficients honestly. Make sure your future herd isn’t hanging off the same branch of the family tree.
  4. Make one deliberate “Sharon move” a year.
    Once a year, look around and pick out the cow that’s quietly done everything you’ve asked for six or eight lactations. The one who calves back, stays healthy, and raises daughters you don’t cuss at. Ask yourself what would happen if you flushed that cow or bred her to a complementary sire with your best semen, instead of always saving those doses for the newest heifer. Sharon says that kind of move can change things.
  5. Use genomics as a tool, not a crutch.
    Bulls like Captain show that genomic predictions can nail it. Bell reminds us we can still miss things. Use your genomic tests. Use your proofs. Then stack them alongside what your cows are actually doing—days open, mastitis cases, feet and legs, cull reasons. Trust the math without firing your eyes and your gut.

Whether you’re milking eighty cows or eight hundred, you’re sitting in the same seat these people sat in decades ago: making calls that will still be walking your alleys long after this month’s milk price is forgotten.

The Heart Behind the Numbers

When you sit with these stories long enough, the numbers start to fall away, and the people remain.

A young Swiss breeder walking three miles from a DeForest bus stop after getting off the Greyhound too early, carrying an idea about red cows that nobody wanted to hear .

A Connecticut dairyman leaning on a fence while neighbors question his sanity over a skinny calf he can’t quite bring himself to give up. 

An English family sitting at the table, looking at an older cow who’s been there for them every season and deciding, against the grain, that she deserves the best mating they can give her. 

None of them had a guarantee.

Schrago didn’t know that Triple Threat, born in 1972 would help build a Red & White market where cows like Apple-Red could sell for six figures and win on the world stage. Panciera had no promise that Ivanhoe wouldn’t end up as a story people told about an expensive mistake. The Pickfords couldn’t see Shottle’s daughters filling herds far beyond Stafford when they bred Sharon to Mtoto. 

They had pedigrees. Records. The evidence of their own eyes. And the willingness to live with the outcome.

Trust your judgment—but remember it’s not infallible.

Persist through doubt—but let real evidence change your mind when it comes.

And every so often, look hard at what’s standing right in front of you. Don’t let the hunt for the next big thing blind you to the quiet excellence that’s already working in your own barn.

Every time you choose a bull, keep or cull a cow, or decide which calf gets another chance, you’re writing a tiny piece of the breed’s future. Most of those decisions will never be famous. Some of them, though, will turn out to matter more than you can see from where you’re standing.

Somewhere today, a calf is lying in a pen that doesn’t look special yet. Maybe it’s out of a cow that your neighbors don’t notice. Maybe it’s by a bull that the coffee shop crowd doesn’t like. Maybe it carries a trait nobody’s paying much attention to.

Somebody’s going to see it anyway.

Somebody always does.

Key Takeaways

  • The genetics in your barn today came from people who bet on animals the experts wrote off—Triple Threat, Ivanhoe, and Shottle were all “mistakes” before they were legends.
  • Don’t cull a family on first impressions. Ivanhoe’s awkward yearlings became the breed’s best udders, so give daughters from proven cows an honest shot through that first lactation.
  • Make one deliberate “Sharon move” a year: flush or breed your best to the quiet cow who’s calved back and stayed sound for six-plus lactations, not just the newest high-index heifer.
  • Run your sires like a portfolio. Starbuck, Chief, and Mark show how fast a great bull becomes an inbreeding problem—spread the risk and check your coefficients honestly.

The Sunday Read Dairy Professionals Don’t Skip.

Every week, thousands of producers, breeders, and industry insiders open Bullvine Weekly for genetics insights, market shifts, and profit strategies they won’t find anywhere else. One email. Five minutes. Smarter decisions all week.
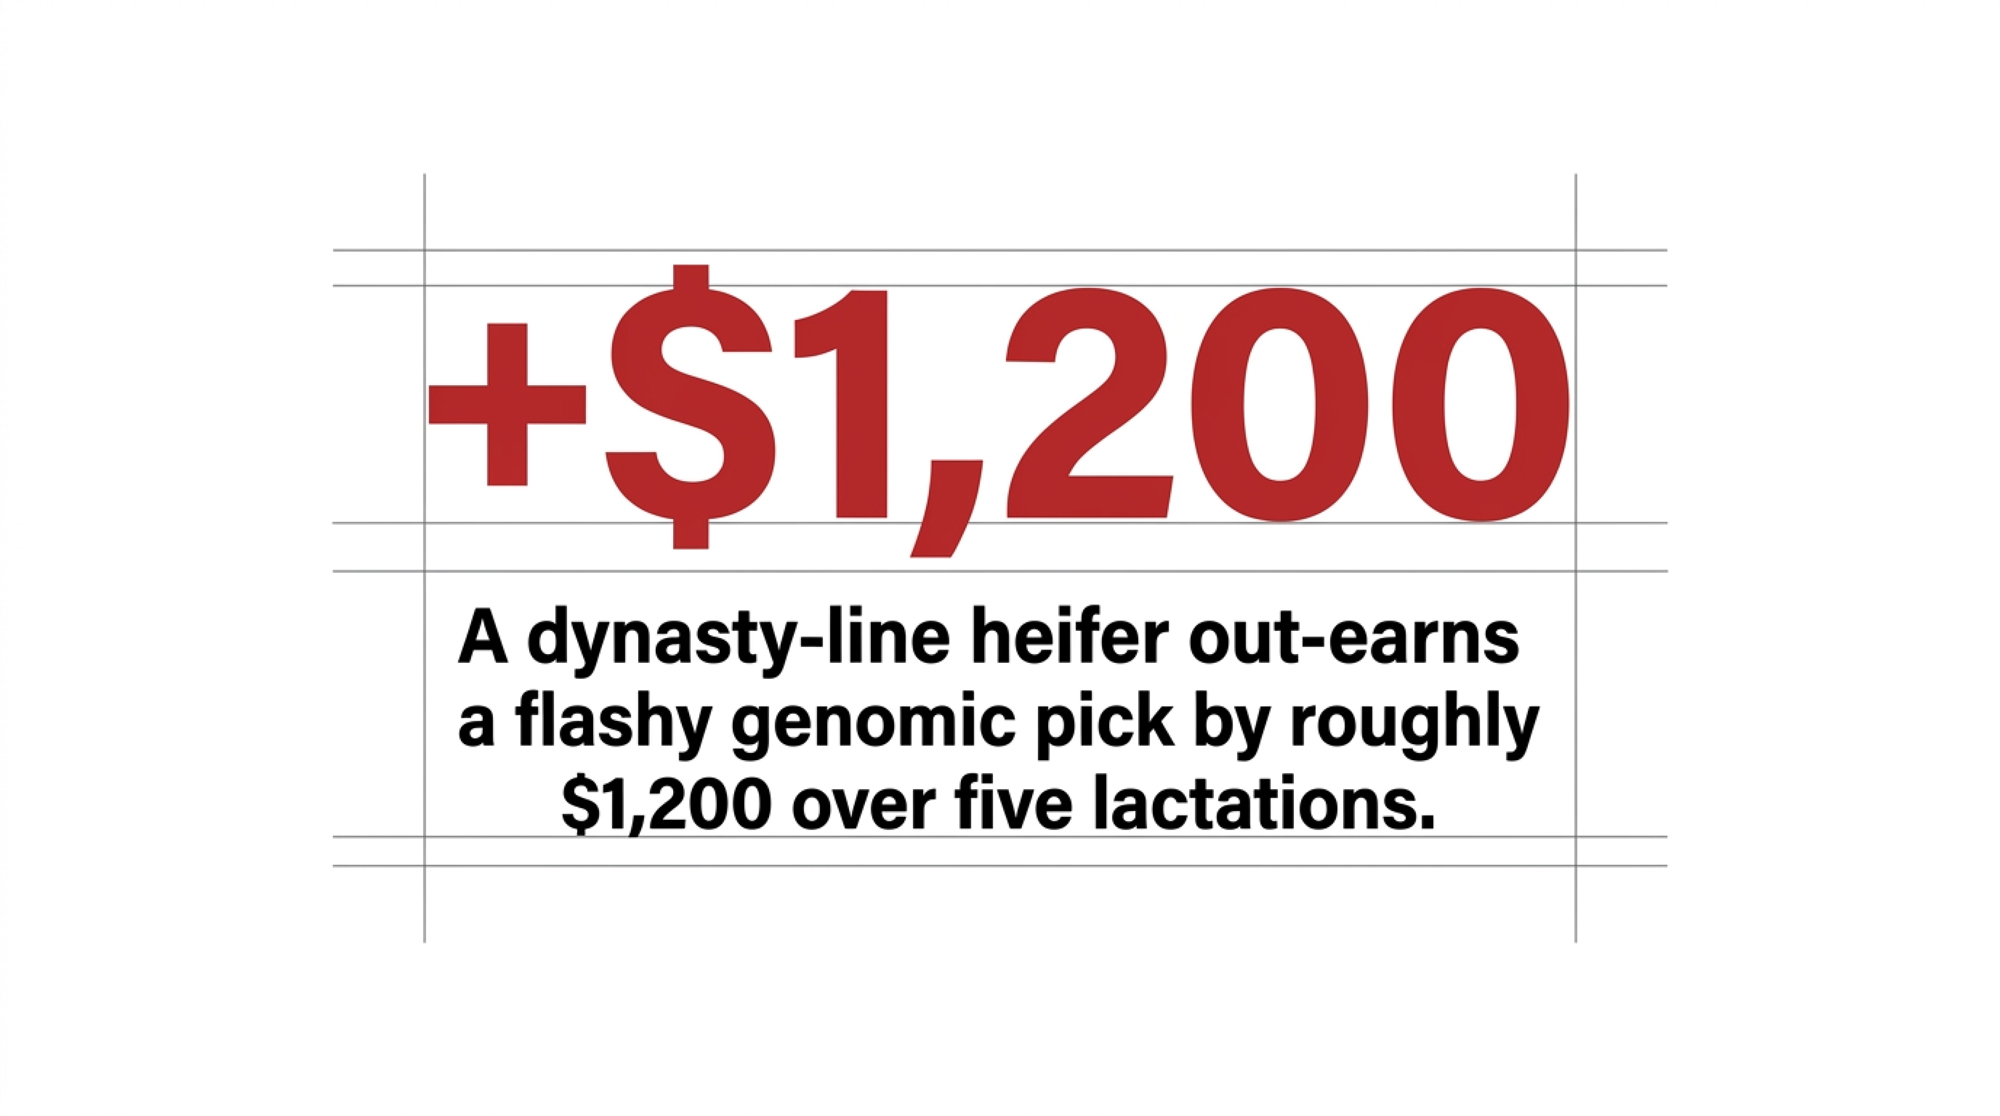
NewsSubscribe
First
Last
Consent

Learn More

Holstein’s $40,500 Inbreeding Bill – and the USDA Bulls Your Stud Isn’t Selling You

99.84% of active Holstein AI bulls trace paternally to two grandfathers. Penn State proved the lineages we walked away from in the 1980s still work. So why aren’t they in your spring catalog?

Executive Summary: 99.84% of active Holstein AI bulls in North America trace paternally to two grandfathers — Pawnee Farm Arlinda Chief and Round Oak Rag Apple Elevation — and Canadian heifers born in 2024 are now averaging 9.99% pedigree inbreeding (Yue et al., 2015, J. Dairy Sci.; Lactanet, August 2025). Using the Doekes/Makanjuola loss curve of 80–108 lbs of milk per 305-day lactation per 1% inbreeding, that’s roughly $81–$110 per cow per year versus a 4% baseline at Q2 2026 Class III pricing — $40,500 to $54,700 quietly bleeding out of a 500-cow dairy every year, before fertility, SCC, and culling losses. Penn State’s Chad Dechow proved in 2020 (with USDA’s Harvey Blackburn) that bulls reconstituted from two “extinct” Y-lineages — Netherland Prince and Colantha, frozen in the USDA NAGP vault since the 1950s — produced daughters that matched modern elite contemporaries on production and beat them on fertility. Genomic ROH inbreeding runs 6–7 percentage points higher than pedigree numbers, so what shows on your DC305 report is the smaller of the two real numbers. The escape hatches exist: hard 6.25% inbreeding caps in your mating program, VikingHolstein/CRV outcross sires, Blondin’s diversity lineup, or research-channel access to the Dechow/NAGP reconstituted bulls through Select Sires and TransOva. No formal Y-lineage program has been identified at Holstein USA, NAAB, or CDCB as of publication — meaning the conversation has to start with you, this spring, before your stud finalizes the catalog. If you can’t tell your AI rep how many unique sires-of-sons sit behind the top 20 bulls in your mating plan, that’s the first phone call.

Pawnee Farm Arlinda Chief (1962–1978). His sons and grandsons were used so heavily that today, more than 60 years after he was born, an estimated 14% of the Holstein genome in North America still traces directly to him — and 99.84% of active Holstein AI bulls share his Y-chromosome or Round Oak Rag Apple Elevation’s. The bottleneck this article opens with starts here. (Read more: The $4,300 Gamble That Reshaped Global Dairy Industry: The Pawnee Farm Arlinda Chief Story)

In a USDA vault in Fort Collins, Colorado, the National Animal Germplasm Program has been holding semen straws from two Holstein bulls — Zimmerman Alstar Pilot and Cuthbert — born in the early 1950s. They carry Y-chromosome lineages, Netherland Prince and Colantha, that vanished from commercial Holstein AI roughly 40 years ago. And in 2020, Penn State’s Chad Dechow proved they still work.

Two numbers tell you why those vault straws matter to your spring 2026 semen order. 99.84% of active Holstein AI bulls in North America trace paternally to just two grandfathers, Pawnee Farm Arlinda Chief and Round Oak Rag Apple Elevation. That’s from Yue, Dechow, and colleagues’ 2015 study in the Journal of Dairy Science, which ran across 62,897 bulls. The other number: 9.99% is the average pedigree-based inbreeding coefficient of Canadian Holstein heifers born in 2024, per Lactanet’s August 2025 update. The breed is now sitting on two Y-chromosomes, and those Y-chromosomes are stacking on top of each other.

Round Oak Rag Apple Elevation (1965–1979). Bred at Round Oak Farm in Virginia and proven through ABS, Elevation became the most-used Holstein sire of his era and the second pillar of the modern bottleneck — every active North American Holstein AI bull that doesn’t trace paternally to Chief traces here. Together they account for 99.84% of the breed’s active Y-chromosome. (Read more: Round Oak Rag Apple Elevation: The Bull That Changed Everything)

Dechow, working with Wansheng Liu, Leon Specht, and USDA’s Harvey Blackburn, pulled the vault straws back into a breeding program. They mated long-frozen 1950s semen to elite modern females through IVF, raised the calves, and milked the daughters. The daughters didn’t underperform. The 2020 JDS paper reports that the resulting bulls were “above the expected level and equal to their counterparts from the current Holstein genetic base born in the same year”in production, with “high genetic merit for daughter fertility” and “high somatic cell scores.” The breed walked away from those genetics in the 1980s. Independent, peer-reviewed work says they still work.

And right now, they’re not on the page in front of you.

The Bottleneck Is Two Y-Chromosomes Wide

A third surviving Y-line, Penn State Ivanhoe Star, was holding on at 0.16% of active bulls in the 2010s. It’s effectively gone today. That leaves the entire active Holstein AI bull population — every catalog you’ll see this spring — sitting on Chief or Elevation paternally.

The 9.99% inbreeding figure is what that bottleneck does to your barn. It’s Canadian, from Lactanet’s August 2025 update on heifers born in 2024. CDCB doesn’t publish a single breed-average inbreeding number for U.S. Holsteins in the same format as Lactanet, but the trend lines CDCB does publish — plus genomic studies in commercial U.S. herds — point in the same direction as the Canadian number.

Genomic measures run higher than pedigree-based ones. Studies of commercial Holstein herds put runs-of-homozygosity inbreeding around 15–16% — roughly 6–7 percentage points above pedigree numbers. Pedigree understates what’s actually happening at the chromosome level. That gap matters when you’re trying to figure out why your fresh cows aren’t bouncing back the way they used to.

The trajectory: Lactanet’s Holstein inbreeding is climbing by about 0.38 percentage points per year in the current cohort. Project that forward at current selection intensity and the breed walks past 12% pedigree inbreeding well inside the next breeding decade.

How This Plays Out on Real Farms

You won’t see “inbreeding loss” on any single report. It shows up scattered. A few extra services per conception. Slightly higher SCC. Cows that don’t quite make it to a third lactation. Each item alone looks like ordinary herd noise. Stacked together, they’re a recurring tax.

Peer-reviewed estimates of how big the tax is land in a fairly tight range. Doekes (2019) and Makanjuola (2020) both report that roughly 80–108 lbs of milk are lost per 305-day lactation for each 1% increase in inbreeding. Ablondi (2023), using genomic ROH measurements in Italian Holsteins, estimates the loss at about 134 lbs per 1%. CDCB’s own Norman 2020 analysis sits at the lower end of the same range.

Here’s the micro barn math. Assumptions stated up front, treated as a model — not a guarantee:

  • Current average inbreeding: 9.99% (Lactanet, August 2025)
  • Pre-genomic baseline: 4.0% (typical Holstein average in the early 2000s)
  • Delta: roughly 6 percentage points
  • Loss rate: 80–108 lbs/lactation per 1% increase (Doekes/Makanjuola)
  • Class III equivalent used in this model: $16.90/cwt, in line with USDA AMS Class III price reporting in the second quarter of 2026

That works out to roughly 480–650 lbs of milk per cow per lactation, quietly missing about $81–$110 per cow per year at that price. On a 500-cow dairy, the annual drag lands in the $40,500 to $54,700 range every year, before you count extended days open, mastitis events, and early culls that come with rising homozygosity.

That’s not a number that comes up in a normal semen-order conversation. But it’s the number you’re already paying.

How Did the Catalog Get This Narrow?

The mechanics aren’t mysterious. AI was commercialized in the 1950s and 1960s. Chief and Elevation sons proved out early, got used heavily, then got used more. Their sons did the same. Generation interval dropped, IVF compressed it further, and a small group of major studs ended up controlling the majority of North American Holstein sire influence.

Every Y-chromosome lineage outside Chief and Elevation lost ground until those lines essentially disappeared from commercial AI by the late 1980s. We’ve covered the broader genetics war reshaping AI catalogs in a separate Bullvine piece worth reading alongside this one. The CDCB system handles inbreeding by adjusting PTAs. That’s mathematically correct, but in our reading, it has a quiet side effect: every five-year base change resets the zero point against the current, more inbred population. In the April 2025 base change, inbreeding adjustments accounted for roughly 18% of PTA shifts in Holsteins. That’s not a small accounting note. It’s a meaningful share of why some producers saw smaller-than-expected proof movement.

Whose surprise that is depends on which side of the kitchen table you’re sitting on. Some of the smaller-than-expected drop reflects real genetic progress. Some of it reflects the cost of inbreeding being absorbed into a new baseline. Both things are technically true. Together, they tell completely different stories.

What Did the USDA Actually Prove?

Dechow’s 2020 paper, with Liu, Specht, and Blackburn, didn’t just thaw old straws and hope. The team recovered semen from Pilot (Netherland Prince line) and Cuthbert (Colantha line), produced 15 calves through IVF using elite modern females — seven bulls and eight heifers — and tracked the daughters into lactation.

The published finding, in plain language: one generation of mating these “lost” bulls to elite modern cows produced bulls that were breed average for total economic merit, with high genetic merit for fertility and somatic cell scores, and near-average milk components. A USDA ARS follow-on project running through 2028 is now looking at the granddaughters. The project documentation puts the early result this way: “Results to date indicate that daughters’ performance was similar or exceeded daughters sired by contemporary bulls. This unexpected result seems to be caused by breaking up runs of homozygosity and therefore creating more heterozygous loci.”

That’s heterosis showing up inside a purebred program — from a Y-chromosome that’s been gone 60 years. The point isn’t that 1950s bulls are magically better. It’s that the breed currently carries enough hidden homozygosity that simply restoring lineage diversity yields a measurable bump on the very traits that have been getting harder to hold: fertility, health, and survivability. Readers who want the longer arc on how the breed got here can pair this story with our earlier piece on the four bulls that built today’s catalog.

Options and Trade-Offs for Farmers

OptionPedigree Diversity LevelExpected NM$ Trade-offBest Fit
Hard 6.25% Inbreeding Cap (mating software)Moderate improvement−3 to −5 NM$ per matingAny herd ≥ breed avg (~9–10%) inbreeding
VikingHolstein / CRV Nordic Outcross SiresHigh — ~20 unique sires-of-sons−10 to −20 NM$ vs. top domesticHerds with fertility & longevity drag
Blondin Diversity Lineup (Quebec)High maternal breadthSmall NM$ discountHerds stacking Chief/Elevation maternal lines
Dechow/NAGP Reconstituted Bulls (Select Sires / TransOva)Maximum — extinct Y-lines restoredBelow top-genomic on NM$; high fertility20–30 cow pilot herds; research-minded farms
USDA Animal-GRIN Direct RequestMaximum — full vault accessResearch-scale only; no NM$ dataUniversity or breed-org partnerships only

There’s no single playbook. There are realistic paths producers are starting to walk.

1. Tighten the inbreeding cap in your mating program — this month. Most mating software has an “expected progeny inbreeding” setting that defaults to “minimize” rather than a hard ceiling. Setting a hard cap — a common starting point in the literature is around 6.25%, going back to Weigel’s WCDS mating-program work — forces the algorithm to reject some matings rather than sort them. When it makes sense: Any herd at or above breed-average inbreeding. What it requires: A 30-minute call with whoever runs your mating program — your AI rep, your independent mating service, or your own herdsman if you run it in-house. Ask specifically whether your software supports a hard cap, not just a sort. Risks/limits: You’ll give up a few index points on individual matings. Lifetime profit math still favors the cap if the published loss curves hold.

2. Use Nordic or pedigree-diverse sires as a partial outcross. VikingGenetics builds its program around using bulls from about 20 different sires-of-sons each year, with strict caps on sons-per-sire and short marketing windows. CRV emphasizes broader pedigree breadth than is typical in North American catalogs, with explicit attention to sire-of-sons diversity. Blondin Sires in Quebec markets bulls deliberately built around outcross maternal lines — we’ve covered Blondin’s diversity-built lineup and the 75% growth that followed it in a separate piece. When it makes sense: Herds where pedigree concentration is already showing up as fertility or longevity issues. What it requires: Willingness to accept a small NM$/TPI gap for genuinely different genetics. Risks/limits: These bulls aren’t from extinct lineages. They still trace through Chief or Elevation paternally — just with broader maternal backgrounds. A partial fix, not a reset.

3. Ask your stud about access to the Dechow/NAGP reconstituted bulls. The 2020 JDS paper says explicitly: “Semen from the bulls is commercially available to facilitate Y chromosome research and efforts to restore lost genetic diversity.” Select Sires and TransOva were the industry partners on the project. That’s research-channel availability, not a routine catalog listing — and any conversation with a stud needs to start there. When it makes sense: Herds willing to run a small pilot — 20 to 30 matings — and track fertility, SCC, and survivability against a control group. What it requires: A direct conversation with someone at or above the district-rep level. These bulls aren’t in standard catalogs and may involve a research-style use agreement. Risks/limits: Access is informal. Production won’t beat your top genomic sire on paper. The upside shows up in fertility and homozygosity reduction, not in NM$.

4. Request directly through USDA’s Animal-GRIN portal. The portal at agrin.ars.usda.gov accepts germplasm requests for research, genetic-defect resolution, or diversity restoration. NAGP has released thousands of samples over more than two decades — research-scale, not retail-scale, when it makes sense: If you can partner with a university or breed organization on a documented project. What it requires: A formal application explaining the purpose. NAGP keeps a “Core Collection” of each breed that’s legally protected from commercial release. Risks/limits: Research access route, not a commercial channel. Best treated as a partnership, not a purchase.

The forward-looking signal sits inside paths 2 and 3. If a meaningful share of producers start asking studs about VikingHolstein outcross options or NAGP-derived sires this spring, the catalog you see in 2028 will look different than the one you’re holding now. If they don’t ask, it won’t.

How Much Is Your Current Catalog Costing You?

Pull your last semen invoice and your DC305 inbreeding report side by side. If your herd-average pedigree inbreeding is north of 8% and your top mating recommendations trace paternally through Shottle, Goldwyn, Planet, or O-Man within three generations — all widely used Chief or Elevation descendants — you’re stacking the same Y-chromosome on the same Y-chromosome. That doesn’t make the bulls bad. It makes the catalog narrow.

Holding the same Doekes/Makanjuola loss curve used in the headline math, knocking expected progeny inbreeding down by even two percentage points — by mixing in pedigree-diverse or minority-line sires — recaptures somewhere in the $27–$37 per cow per year range, or up to roughly $45 if you weight toward the higher Ablondi 2023 ROH-based estimate. On a 200-cow herd, that’s $5,400–$9,000 a year currently sitting on the table. The same dynamic shows up on the maternal side — the maternal-side concentration trap is where we’ve put the longer numbers on cow-family stacking.

ScenarioInbreeding LevelLoss vs. 4% BaselineCost/Cow/yr (Doekes 80 lbs/pp)Cost/Cow/yr (Ablondi ROH 134 lbs/pp)500-Cow Annual Impact
Early 2000s Holstein baseline4.0%$0$0$0
Breed average 20209.0%+5.0 pp$67.60$113.30$33,800–$56,650
Breed average 2024 (Lactanet)9.99%+5.99 pp$81.07$135.78$40,535–$67,890
Projected 2028 (+0.38 pp/yr)11.51%+7.51 pp$101.61$170.23$50,805–$85,115
After 2 pp reduction via outcross7.99%+3.99 pp$54.00$90.47$27,000–$45,235

Is Your Genetics Conversation Asking the Right Questions?

When your AI rep walks in this spring, the standard question is, “Who’s your top NM$ bull?” That’s the question the catalog is built to answer. It’s also the question that produced 9.99% inbreeding. A different conversation starts with these four:

  • What percentage of your active Holstein lineup traces paternally to bulls other than Chief or Elevation descendants?
  • How many unique sires-of-sons sit behind the top 20 bulls you’d recommend for my herd?
  • What’s the expected pedigree and genomic inbreeding of progeny under your default mating plan — and how much can you knock it down with substitutions?
  • Do you have access to any of the USDA NAGP reconstituted-lineage bulls, or to VikingHolstein/CRV outcross sires for a portion of my matings?

You may not get clean answers. The questions still do their job. They signal that the customer is evaluating offerings on dimensions beyond NM$, giving the stud a reason to surface diversity-relevant options, if any exist, in their lineup. Any reader who hasn’t already seen our coverage of the 9.99% Bell 2.0 number itself should pair that piece with this one.

The Institutional Blindspot

The trend itself isn’t being ignored. Holstein USA, the National Association of Animal Breeders, and the Council on Dairy Cattle Breeding have all published commentary or data on rising Holstein inbreeding. The gap is at the next level down: a formal initiative aimed specifically at the Y-chromosome bottleneck Yue and colleagues documented in 2015.

Based on a review of each organization’s public materials as of publication, no formal initiative specifically targeting Y-chromosome lineage concentration has been identified at any of the three. The peer-reviewed proof has existed since 2020. The freezer in Fort Collins has been running since 1999. The barn-level cost is being paid right now in fertility, SCC, and lost lactations. Whether industry institutions choose to lead on this or wait for producers to drag them into the conversation is a story this publication will keep covering — and any formal Y-lineage program announced by Holstein USA, NAAB, or CDCB after publication will be reflected in updates here.

Key Takeaways

  • If your herd’s pedigree-based inbreeding is at or above breed average (~9–10%), the modeled production drag at current milk prices is realistically $81–$110 per cow per year versus a 4% baseline — $40,500–$54,700 annually on a 500-cow dairy before you count fertility and longevity effects.
  • If you only look at pedigree inbreeding, you’re working with the smaller of the two real numbers. Genomic ROH inbreeding runs 6–7 percentage points higher. Ask whether your mating program can also report ROH or genomic future inbreeding.
  • If you haven’t set a hard cap on expected progeny inbreeding, do it this month. Start near 6.25% and watch which matings the algorithm rejects. That’s your information.
  • If your AI rep can’t answer how many unique sires-of-sons sit behind your top 20 recommendations,you’ve found a gap worth closing before you order.
  • If you’re considering a pilot with reconstituted-lineage or pedigree-diverse semen, plan it as a 20–30-cow trial with a matched control group and full health and fertility tracking. Anecdotes won’t move your operation. Recorded data will.
  • If your stud has no answer on NAGP-derived sires, VikingHolstein, CRV outcross options, or Blondin’s diversity lineup, treat that silence as a data point worth raising at your next genetics review.

What Are You Going to Do Before Spring Orders Close?

The peer-reviewed research has been sitting in the Journal of Dairy Science since 2020. The freezer in Fort Collins has been there since 1999. The 9.99% number arrived last summer. None of that changes what’s in your tank this morning. But it does change the question worth asking before your next breeding season starts: of the bulls your stud will sell you in the next 60 days, how many are doing anything genuinely different than the bulls your stud sold you five years ago — and what’s that costing you per cow, per lactation, in a market where margins are already thin?

If you want to walk the math on your own operation — herd size, current inbreeding, expected loss versus available alternatives — the per-cow and per-lactation calculator goes live in this week’s Bullvine Weekly, along with the producer-to-stud script for actually getting answers about lineage diversity. That’s where the numbers come home.

Complete references and supporting documentation are available upon request by contacting the editorial team at editor@thebullvine.com.

Learn More

The Sunday Read Dairy Professionals Don’t Skip.

Every week, thousands of producers, breeders, and industry insiders open Bullvine Weekly for genetics insights, market shifts, and profit strategies they won’t find anywhere else. One email. Five minutes. Smarter decisions all week.

NewsSubscribe
First
Last
Consent

Holstein Inbreeding Hit 9.99%. Genomics Didn’t Fix the Chief/Elevation Trap – It Built Bell 2.0.

Lactanet just clocked Canadian Holstein heifers at 9.99% inbreeding — climbing 0.25% a year, more than double Jersey. On 1,500 cows, that’s a modeled $180–250K hit. The fix? A toggle most mating programs ship loose.

Executive Summary: Lactanet’s August 2025 update clocked Canadian Holstein heifers born in 2024 at 9.99% genomic inbreeding, climbing 0.25% a year — more than double Jersey, Brown Swiss, and Ayrshire. Push the Cassell (1999) and CDN (2008) coefficients through a 1,500‑cow Holstein herd running 10% heifer inbreeding instead of 7–8%, and the modeled annual drag lands at $180,000–$250,000 in lost milk, extra abortions and services, and shorter productive life. Genomics didn’t fix the Chief/Elevation bottleneck — it cut sire generation intervals from 6.8 years to under 3 and put O‑Man at 13% relationship to the breed in one cycle. IVF now multiplies it from the other side: a 3,100 GTPI heifer at 12% inbreeding is a worse financial bet than a 2,950 at 7%, and most herds have never audited the gap. The highest‑leverage fix is a 30‑minute job — drop your mating software’s Inbreeding Max toggle to 9.5%, turn on HH1–HH6 / HCD / CVM blocking, cap any single sire at 10–12% of the calf crop, and screen IVF donors under 9%. Hold that discipline three years and the modeled recovery on a 1,500‑cow herd runs $150,000–$300,000 a year once the new cohort cycles through. Read the full piece if your last semen order went in without anyone in the room being able to quote your herd’s inbreeding number.

Holstein inbreeding 9.99%

Composite scenario: the southwestern Ontario manager in this story is a synthesis of patterns showing up in well‑run 1,500‑cow Holstein herds. The herd numbers are illustrative; the inbreeding‑depression math and Lactanet data behind them are real.

Picture a breeding manager on a 1,500‑cow Holstein operation in southwestern Ontario, pulling a report he’d never bothered with before: average genomic inbreeding on his 0–12‑month heifers. The number lands at 10.3%.

On paper, everything looked right. Seven years of buying top‑5% genomic sires, flushing the best young donors through IVF, pushing NM$ higher with every proof run. Every proof sheet and semen invoice said elite genetics.

That 10.3% told a different story. Mapped against the kind of repro records most large herds keep — conception by sire group, mid‑term abortions, second‑calf cull reasons — the pattern jumps off the page in herd after herd. The tightest, most “elite” matings are also the worst performers in the breeding barn.

He isn’t an outlier, and the herd average isn’t either. Lactanet’s August 2025 inbreeding update put Canadian Holstein heifers born in 2024 at 9.99% genomic inbreeding — ahead of Jersey (7.56%), Brown Swiss (7.10%) and Ayrshire (6.89%). And Holstein is climbing at +0.25% per year since 2010, more than double the rate of Jersey (+0.11%), Ayrshire (+0.12%) and Brown Swiss (+0.12%) over the same window. If your herd has been leaning on the same handful of hot genomic sires and IVF donors, your number likely looks a lot like that 10.3%.

The Original Trap Took Decades. This One Took 10 Years.

The first Holstein bottleneck is familiar history, even if it rarely comes up when we’re picking bulls.

Pawnee Farm Arlinda Chief, born in 1962, now shows up in roughly 14% of the global Holstein genome. Round Oak Rag Apple Elevation, born in 1965, sits around 15.2%. To‑Mar Blackstar has climbed higher still at about 15.8%relationship to the breed.

Those bulls and their sons drove enormous gains. The collective milk production impact of the Chief/Elevation era has been estimated in the tens of billions of dollars over the late 20th and early 21st centuries.

But Chief carried the APAF1 nonsense mutation we now call HH1. Published estimates tie that single mutation to roughly 525,000 mid‑term abortions worldwide over 35 years at about $800 per fetus — in the $420–450 millionrange in lost calves, vet time, and milk that never got made.

Run the math and the ratio still works out heavily in favour of the production gain. That’s why HH1 rode along undetected for so long. The upside hit every milk cheque. The downside hid in vet invoices, open‑cow lists, and “unexplained” pregnancy failures nobody connected to pedigree.

Back then, AI sire generation intervals ran close to 6.8 years. Chief and Elevation’s DNA took decades to saturate the breed.

Genomics changed the pace. Published US Holstein data show AI sire generation intervals dropping from about 6.8 years pre‑genomics to under 3 years afterward. Fewer young bulls now sire a larger share of the next generation, and they’re more closely related to each other than at any point in Holstein history. O‑Bee Manfred Justice — O‑Man — is the clearest example: roughly 13% relationship to the Holstein population, approaching Chief and Elevation territory in essentially one genomic generation.

IVF made the new bottleneck two‑sided. In North America, IVF embryo production has surpassed conventional flushing, and many programs collect embryos from donors well before their first calving, sometimes starting around 10 months of age. Both sides of the pedigree are tightening at once. Effective population size (Ne) for Holsteins — how genetically diverse the breed actually behaves, regardless of the millions of cows on the ground — has been estimated between 74 and 171 across recent multi‑country studies (Salehi et al., 2025, Veterinary Medicine and Science). For a global population this big, that’s conservation‑biology territory.

What Does 2% Extra Inbreeding Actually Cost in Your Barn?

Virginia Tech’s benchmark inbreeding work (Cassell, 1999) put the lifetime economic loss at roughly –24 per cowfor every 1% increase in inbreeding — in 1999 dollars, with current impact likely higher once you adjust for today’s milk price, replacement costs, and inflation.

The Canadian Dairy Network’s “Quantifying Inbreeding Depression” analysis (Van Doormaal, 2008) sits behind the trait‑level numbers most breeders use today: per 1% inbreeding, roughly 18.4 kg less milk (about 41 lb), 1.06 kg less fat (about 2.3 lb), 0.53 kg less protein (about 1.2 lb), and 12.9 days less productive life across Holsteins.

Stack those coefficients across multiple lactations on a 1,500‑cow herd whose replacement heifers average 10% inbreeding instead of 7–8%, and the modeled annual drag looks like this:

The Silent Drag: Modeled Annual Cost of +2% Inbreeding in a 1,500‑Cow Holstein Herd

Cost bucketImpact per +1% inbreedingModeled +2% herd impactWhy it matters
Production−18.4 kg milk; −1.06 kg fat$120,000–$150,000/yearBiggest visible drag, but still usually blamed on feed or transition management
ReproductionMore abortions, extra services, longer days open$20,000–$40,000/yearShows up as “random” pregnancy loss and repeat-breeder noise
Longevity−12.9 days productive life$40,000–$60,000/yearPushes more cows out before they pay back rearing cost
TotalHidden inbreeding tax$180,000–$250,000/yearLarge enough to beat many bull-list index gains
Recovery targetRemove 2 excess points over time$150,000–$300,000/yearFrames the 9.5% cap as a cash-flow decision, not a genetics lecture

Modeled example built from Cassell (Virginia Tech, 1999) and CDN/Lactanet trait coefficients (Van Doormaal, 2008). Production line assumes ~200 lb less milk and proportional fat across the productive life of the affected cohort at current component returns. Reproduction line assumes 10–30 extra mid‑term abortions at $800–1,200 each plus added services and days open. Longevity line assumes 20–30 extra annual replacements at $1,800–2,200 each. Not an audited herd P&L.

A composite back‑of‑the‑barn version using realistic 1,500‑cow abortion counts, repro spend, and milk price lands squarely in the middle of that range. The lesson sitting underneath it: too many managers spend years arguing over 20 points of NM$ on the bull lineup while ignoring a cost roughly three times larger.

IVF: Your Best Tool or Your Fastest Bottleneck?

IVF and OPU are powerful when they multiply diversity and merit together. They’re brutal when they copy and paste a bottleneck.

Walk through the pattern that’s playing out on farms right now.

A donor heifer is 10 months old, top 2% on NM$, and already sitting at 9.5–10% genomic inbreeding because the same popular sire lines built both sides of her pedigree. She looks like the obvious IVF candidate. The program mates her to the same handful of high‑index sires already in heavy use across the herd. Over the next year, she produces 20–40 embryos.

If nobody has checked her inbreeding or her relationship to those sires, a big chunk of those embryos will sit in the 10–12% expected‑inbreeding range. If haplotype blocking isn’t turned on, some of those combinations can be carrier × carrier for HH1–HH6 or HCD.

Here’s the trap: the GTPI or NM$ number at the top of the genomic report is so high it papers over the inbreeding coefficient sitting two columns to the right. A 3,100 GTPI heifer with 12% inbreeding can be a worse financial betthan a 2,950 GTPI heifer with 7% inbreeding. Run the math: the 150‑point GTPI gap is worth roughly $75–$150 in lifetime profit on most index conversions. The 5‑point inbreeding gap costs $110–120 in Cassell’s framework. Stop ranking on the number at the top of the page.

Fast‑forward two years. Those IVF daughters hit the fresh pen with impressive genomic proofs and a frustrating pattern: slightly worse conception, a few more transition events, a tendency for some to leave before their third lactation. On paper, they’re the future of the herd. In the parlour, they’re not quite paying their rent.

Feed gets blamed. Housing gets blamed. The IVF lab gets blamed. The unglamorous answer is often simpler: the program multiplied a bottleneck.

Here’s a fast way to check. Pull average genomic inbreeding on your IVF‑bred heifers born in the last 12 months, then the same number on your conventionally bred group. If the IVF calves are running 1–2 points higher — and in herds that haven’t audited this, they often are — your highest‑cost genetics program is working against your longevity and repro numbers. At Cassell’s $22–24 per 1% per cow per lifetime, even a 1‑point gap across 200 IVF‑bred replacements adds up to roughly $4,400–4,800 in modeled lifetime drag before those heifers ever calve.

Who Gets Paid — and Who Holds the Bill?

AI companies earn margin on every straw, and the business model rewards concentration: when a small number of high‑index bulls move large volumes of doses, marketing, proof rollouts, and rep activity tend to follow. That’s how the industry has worked for decades.

Most AI reps are paid in significant part on volume and market share. You’re paid on margin and longevity. Those incentives don’t always pull in the same direction.

You need cows pregnant on time, healthy through transition, and milking through three or more lactations. Every mid‑term abortion, every repeat breeder, every second‑calf cow that crashes and leaves early — those costs hit your P&L, not your stud’s.

Layered across the inbreeding‑depression literature — Cassell at Virginia Tech, CDN/Lactanet’s quantification work, and later reviews — the lifetime economic loss at today’s Holstein inbreeding levels lands in roughly the 0–400 per cow range. That’s not one paper. It’s a range that keeps showing up when you stack the milk, fat, longevity, fertility, and health hits together.

Many reps work hard to steer breeders toward responsible matings, and several companies have invested in better relationship and expected‑inbreeding tools inside their mating programs. The critique here is of the default incentive structure, not of any individual rep or company. But the structural reality remains: it’s still not the default view in most catalogs, and relationship data rarely leads the conversation when a rep arrives with a bull list sorted by NM$, TPI and Pro$.

The studs monetise concentration. The herd absorbs the long tail of it — in abortions, repro costs, and replacements.

Can a 9.5% Cap and 20 Sires Really Change Anything?

This is where the composite Ontario manager’s playbook gets useful — because it tracks closely with what disciplined large herds are actually doing right now.

After seeing a 10.3% heifer inbreeding report, the move isn’t to scrap the genetics program. The move is three specific changes, committed to for at least three years.

First, turn on a mating‑level inbreeding cap. Most software already calculates expected inbreeding on proposed matings, but in many installs we’ve reviewed the default sits well above the threshold most large Holstein herds need today. Move the toggle to 9.5% and make it a hard rule: no mating allowed if the resulting calf’s expected inbreeding exceeds that threshold. The program simply blocks those proposals. Some go‑to sires suddenly disappear as options on certain cows. That stings — but the cap isn’t banning bulls, it’s banning bad matings.

Second, enforce a sire‑use rule. No single bull sires more than 10–12% of the calf crop in a calendar year. The top 10 bulls, collectively, stay under 60% of the calves. That forces sire groups drawn from genuinely different sire stacks — not eight sons of the same bull with different prefixes.

Third, put IVF under guardrails. Donors under 9% genomic inbreeding. Every potential sire screened for relationship to that specific donor. No donor family accounts for more than 15–20% of replacement heifers in any 12‑month window.

Sit down with your vet and accountant and agree on farm‑specific numbers for the cost of a mid‑term abortion, an extra service, and the rearing cost per replacement. Those three numbers turn the inbreeding conversation from interesting genetics talk into a line on the cash flow.

Within 90 days of switching on the 9.5% cap and tightening IVF, the breeding tech notices something simple: fewer ugly proposed matings, fewer repeated carrier pairings, and fewer head‑scratching combinations on problem cows.

How Long Before You See It in the Barn?

The payoff doesn’t arrive all at once, and it doesn’t show up first on the milk sheet.

Managers who implement this kind of package — 9.5% cap, sire diversity, IVF guardrails, haplotype blocking — describe a three‑phase timeline.

0–12 months: repro and abortions. Within about 90 days, conception rates stop sliding and, in many herds, start ticking up. The worst inbreeding‑driven matings are out of the pool. Turn on recessive haplotype blocking (HH1–HH6, HCD, CVM) and carrier × carrier matings drop to zero as soon as the new rules are in place. Within one gestation length — roughly 9–10 months — mid‑term abortions linked to those combinations trend toward zero.

12–24 months: fresh‑cow health. The first “new‑protocol” heifers calve in. Lower‑inbreeding heifers tend to show fewer transition issues and more resilience through the first 60 days in milk. It’s not dramatic — but classify your fresh cows by inbreeding band and the differences usually jump off the page. Fewer crash‑and‑burn second‑calf cows show up on the cull list.

2–5 years: lifetime profit and replacement pressure. By year 3, lifetime economics begin to shift. More cows last into third and fourth lactations. Replacement rate comes down because you’re not culling as many cows for fertility and health before they’ve paid off their rearing cost. Over a 5‑year window, a herd that holds this discipline is positioned to pull average heifer inbreeding from around 10% closer to 7–8%. Run Cassell’s and CDN’s coefficients in the opposite direction and the modeled annual recovery from eliminating 2 points of excess inbreeding in a 1,500‑cow herd falls in the $150,000–300,000 range once the full replacement cohort has cycled under the new rules.

None of that is a guarantee. Weather, management, feed, and markets all move the needle too. But change nothing about inbreeding and sire concentration and your numbers will keep drifting in the same direction as the national curve.

What This Means for Your Operation

  • Can you quote your heifer‑crop average inbreeding right now? If not, that’s your first ask before the next semen order. It’s the quickest read on whether the last five years of bull decisions are building resilience or quietly eroding it.
  • Pull conception and abortion numbers by inbreeding band. Compare cows over 10% to those under 8%. Gaps of several points in conception rate or higher abortion rate in the more inbred group are real money on the table.
  • Ask your semen rep a different question next time: “What’s this bull’s relationship to my herd?” If they can’t answer, push for expected inbreeding and relationship reports alongside index rankings.
  • Stop ranking by GTPI/NM$ alone. Sort your bull short list by expected inbreeding against your specific cow before you order semen. A 150‑point GTPI gap can be cheaper than a 4‑point inbreeding gap on the wrong cow.
  • Put inbreeding on the same quarterly dashboard as pregnancy rate, SCC, and cull rate. If it’s not a KPI, it won’t get managed.

The 30‑Day Action Plan: Flip the Toggle Most People Miss

Most mating software — DairyComp, Lactanet’s mating module, and the major AI‑company mating programs — ships with an Inbreeding Max or Expected Inbreeding Limit toggle. In many installs we’ve reviewed, that default sits well above the threshold most modern Holstein herds actually need — high enough that it rarely blocks anything. The single highest‑leverage move you can make this month is to drop it to 9.0% or 9.5% and let the software start refusing the matings that are quietly costing you money.

  • Week 1: Log into your mating program. Find the Inbreeding Max / Expected Inbreeding setting. Move it to 9.5% (9.0% if your herd average is already under 8%). Turn on haplotype blocking for HH1–HH6, HCD, and CVM while you’re in there.
  • Week 2: Pull the average genomic inbreeding on your 0–12‑month heifer crop and on your most recent IVF cohort. Compare them. If IVF is higher, run the audit.
  • Week 3: Re‑run your active sire list against the new cap. Identify the bulls that suddenly aren’t usable on big chunks of the herd and source 2–4 genuine outcross alternatives.
  • Week 4: Sit down with your vet and accountant. Lock in your farm’s per‑abortion cost, per‑extra‑service cost, and rearing cost per replacement. Add inbreeding to your quarterly KPI dashboard.

Key Takeaways

  • If your 0–12‑month Holstein heifers average 9% or higher genomic inbreeding, run a 9.5% mating cap and a 15–20‑sire rotation — don’t just chase the top of the proof list. The cap is available in most major mating programs. The default is usually too loose. Turn it down.
  • A 3,100 GTPI heifer with 12% inbreeding can be a worse financial bet than a 2,950 GTPI heifer with 7% inbreeding. Stop ranking your short list on index alone.
  • If your IVF calves are your most inbred group, you’re paying OPU/IVF prices to multiply genetic risk. Tighten donor and sire relationship guardrails before the next flush cycle.
  • If nobody in your breeding conversation — not you, not your consultant, not your rep — can quote your herd’s inbreeding band and sire concentration, you’re flying blind on a six‑figure line item.

The industry built the original Chief/Elevation bottleneck by accident over decades. Genomics and IVF can rebuild Bell 2.0 in under ten years — quietly, across thousands of herds at once. The science to manage it is already loaded in your mating software and genomic reports. The only real question is whether your next breeding meeting starts with your herd’s inbreeding number — or with the first page of the semen catalog.

Complete references and supporting documentation are available upon request by contacting the editorial team at editor@thebullvine.com.

Learn More

The Sunday Read Dairy Professionals Don’t Skip.

Every week, thousands of producers, breeders, and industry insiders open Bullvine Weekly for genetics insights, market shifts, and profit strategies they won’t find anywhere else. One email. Five minutes. Smarter decisions all week.
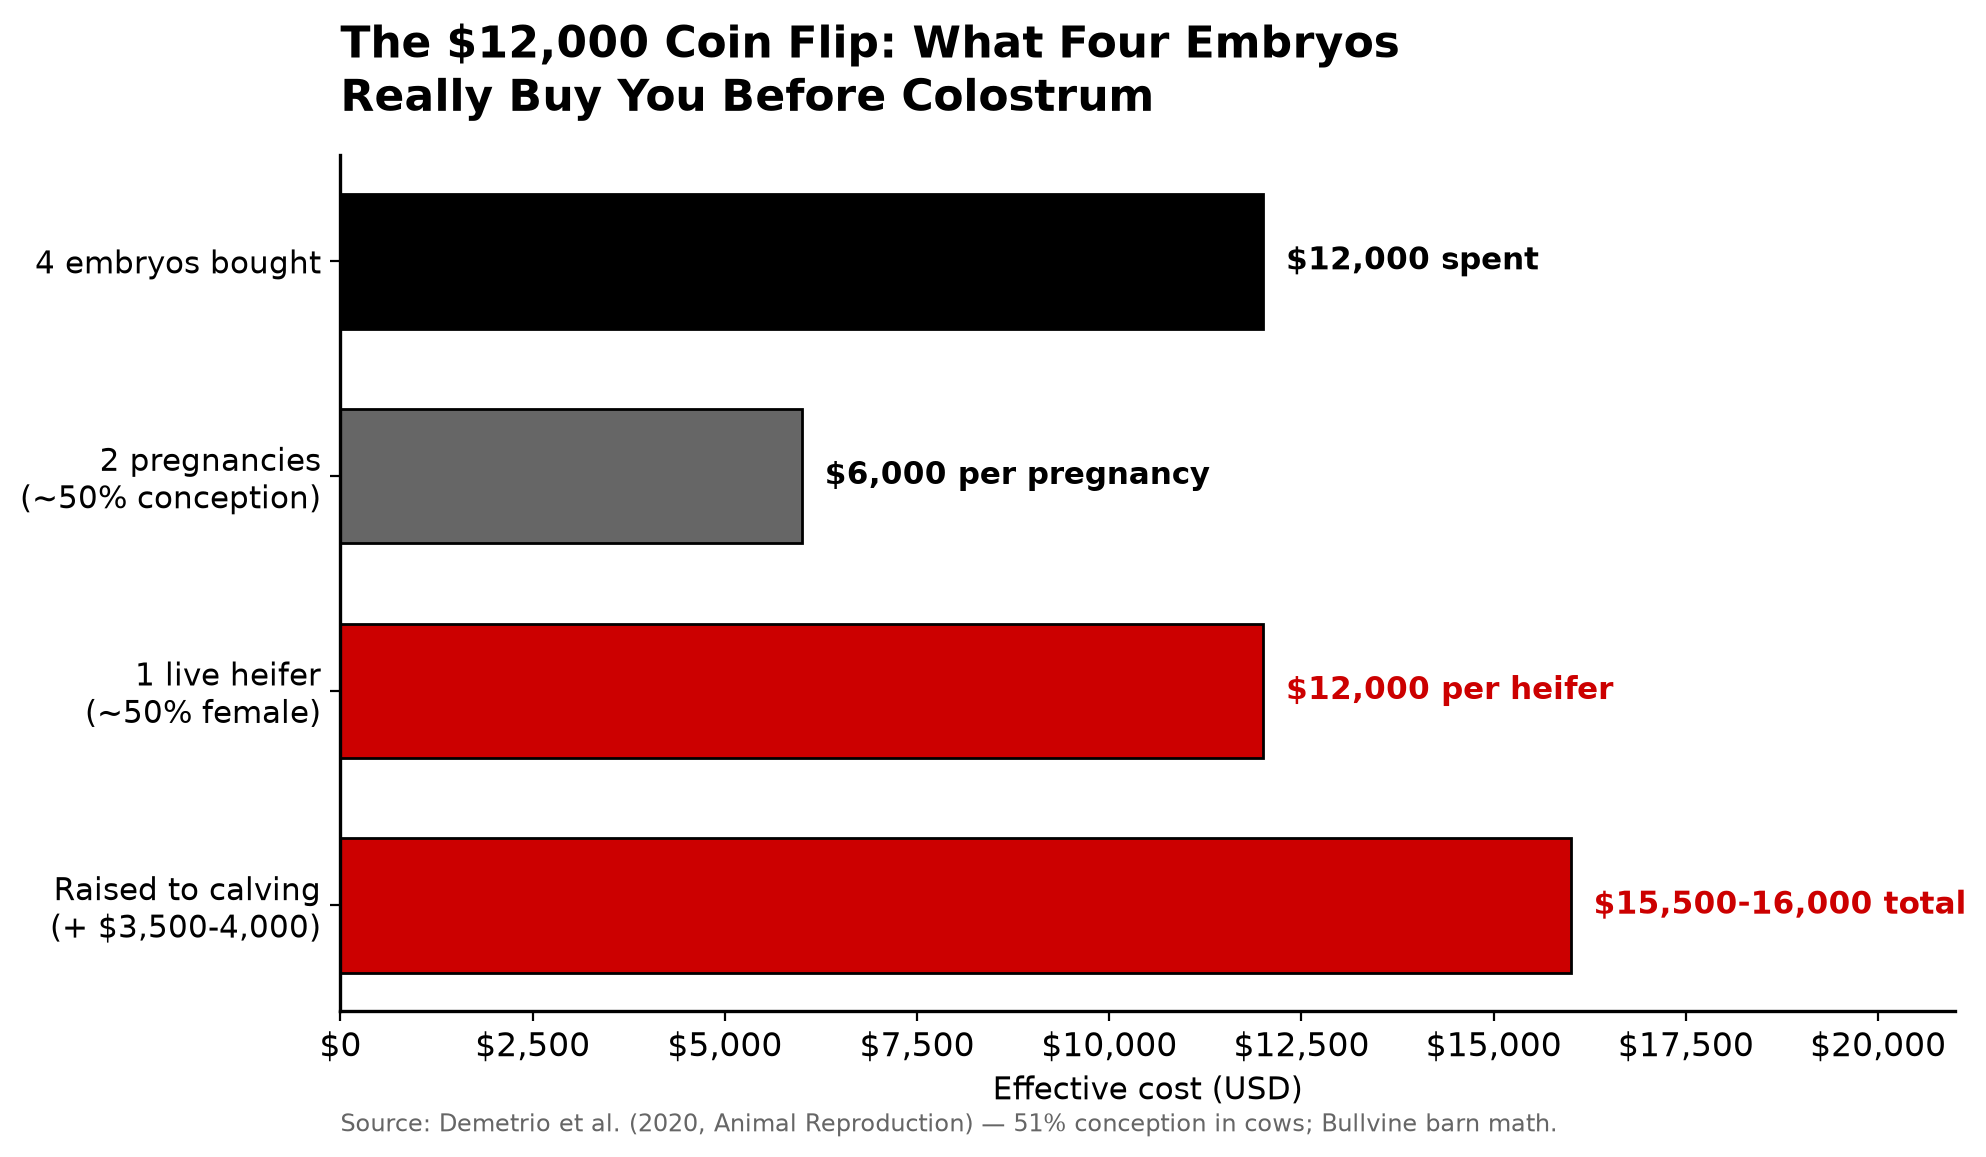
NewsSubscribe
First
Last
Consent

Holstein Inbreeding Hit 9.99%. Birkstead and North Florida Found Two Ways to Stop the $100-Per-Cow Leak.

Holstein inbreeding hit 9.99%. Birkstead and North Florida took opposite paths to slash a $60–$ 100-per-cow leak without sacrificing genetic progress.

Executive Summary: Holstein heifers born in 2024 now average 9.99% inbreeding, and conservative barn‑math from peer‑reviewed studies puts the cost at roughly $60–$100 per cow per lactation. The article shows how that hit comes together — a little lost milk and protein, a few extra days open, shorter productive life — and why recent inbreeding does more damage than old pedigree overlap. It then uses two real herds as case studies: Birkstead Holsteins in Ontario, which pushed a 20% pregnancy rate higher and cut health problems by moving to a Holstein × Norwegian Red × Montbéliarde/Fleckvieh cross, and North Florida Holsteins, which stayed pure Holstein but built its own profit‑first index and capped how much any single bull could influence the herd. The core argument is that the real risk isn’t genomics itself, but letting catalog rankings quietly stack the same sire lines until inbreeding becomes a five‑figure annual leak. For a 300–600‑cow herd, the piece lays out a simple playbook: in the next 30 days, turn on and enforce an inbreeding ceiling in your mating program, over the next 90 days build a genuinely diverse bull team, and over the next breeding season stop raising replacements from the most inbred, lowest‑merit females. It’s written for owners and breeding decision‑makers who want to keep riding the top of the genetics wave without paying for 9.99% inbreeding on every proof run.

Holstein inbreeding costs

Canadian Holstein heifers born in 2024 now average 9.99% inbreeding, according to Lactanet’s August 2025 inbreeding update. That’s up from 9.61% the year before and the highest among the major dairy breeds in Canada. On paper, it’s just another number. In the barn, it’s the cows that don’t settle, don’t handle stress, and don’t stick around long enough to pay off their raising cost.

Thomas Wantenaar at Birkstead Holsteins in Elora, Ontario, was already seeing that drag in his own herd numbers. In 2008, with a purebred Holstein herd and a new robot barn, he was staring at an annual pregnancy rate of about 20% and, as he told Progressive Dairy, “spending half the morning just treating cows.” A thousand miles south at North Florida Holsteins, Don Bennink was looking at the same breed from the other end of the telescope: about 4,800 cows and 4,400 heifers on roughly 2,400 acres in Florida heat, and a classification and type evaluation system he publicly described as “180 degrees away from cattle that pay the bills.”

Neither herd was willing to let inbreeding dictate its future. One changed how it used Holstein genetics. The other changed the cows.

How Much Does 1% of Holstein Inbreeding Really Cost Per Cow?

You’ve heard for years that inbreeding costs money. That doesn’t help when you’re trying to decide whether one more high‑index bull out of the same sire line is worth it.

Lactanet and other summaries estimate that every 1% increase in inbreeding knocks roughly $60–$78 off a cow’s lifetime profit, once you add up lost milk, weaker fertility, and fewer productive days. Makanjuola and colleagues (2020) put a finer point on it for Canadian Holsteins: each 1% increase in genomic inbreeding cut 305‑day first‑lactation milk yield by about 40–50 kg. At typical Canadian milk prices, that’s over $40 per cow per lactationfrom milk volume alone.

That’s still fairly abstract. The real question is: if your herd is, say, 2 percentage points more inbred than you’d like, what’s the per‑cow, per‑lactation hit?

Step 1: Define “excess inbreeding”

Suppose you’d be comfortable with a herd average around 7.5% inbreeding. Instead, your young stock are coming in around 9.5%, which isn’t unusual given where Holsteins are heading. That’s 2 percentage points of excess inbreedingcompared with the level you’d like to be at.

Step 2: Milk and protein that never make it onto the truck

Doekes et al. (2019) and Makanjuola (2020) both found that each 1% increase in inbreeding reduced 305‑day milk by roughly 36–49 kg (80–108 lb). To stay conservative and easy to work with, call that about 100 lb of milk per 1%.

  • At 2 excess points: ~200 lb less milk per cow per lactation.
  • At $20/cwt: 200 ÷ 100 × $20 = $40 per cow per lactation from milk.

StrataGEN work suggests about 25 lb lifetime protein loss per 1% inbreeding, which averages out to roughly 6–7 lb per lactation. Use 6 lb per 1%.

  • At 2 excess points: 12 lb less protein per lactation.
  • At $3.50/lb: 12 × $3.50 = $42 per cow per lactation from protein.

Right there, you’re at around $82 per cow per lactation in very basic, conservative component math.

Step 3: Days open that hide inside your repro numbers

Genetic and economic work often uses about 1 extra day open per 1% inbreeding as a planning number, once you account for later first service, lower conception rates, and early embryonic loss. It’s not a hard rule, but it’s a realistic average.

  • At 2 excess points: assume 2.5 extra days open.
  • At $4 per day open (mid‑range of common $3–$5 estimates): 2.5 × $4 = $10 per cow per lactation

You can argue the exact cost per day. You can’t honestly argue that it’s zero.

Step 4: Productive life and replacements

StrataGEN data show about 13 fewer productive days per 1% inbreeding; at 2 excess points, that’s around 26 fewer productive days in that cow’s lifetime.

Spread across a cow you expect to last around 3½ lactations, that’s about 7–8 fewer productive days per lactation. Put a conservative $10 per cow per lactation value on that in terms of extra replacement pressure, fewer older “easy money” cows, and more fresh‑heifer risk.

Step 5: Put the conservative math together

Conservative totals on 2 points of excess inbreeding per cow, per lactation:

  • Milk loss: ~$40
  • Protein loss: ~$42
  • Extra days open: ~$10
  • Shorter productive life/replacements: ~$10

That’s roughly $100 per cow per lactation.

Loss CategoryImpact per 1% InbreedingCost at 2% “Excess” (per lactation)
Milk Yield~100 lb$40.00
Protein~6 lb$42.00
Fertility (Days Open)1.25 Days$10.00
Productive Life13 Days (Lifetime)$10.00
ESTIMATED TOTAL$102.00 per cow

If you squeeze every assumption down to the low end and ignore some of the lifetime effects, you can justify a smaller number in the $60–$70 per cow range. If you take the upper end of the published production losses and value days open closer to $5, you can also defend numbers over $100 without exaggerating.

Either way, on a 300‑cow milking herd, even a $60 per cow leak is around $18,000 per year until your mating strategy changes. On a 500‑cow herd, you’re looking at $30,000–$55,000 per year — not in theory, but in realistic, research‑based barn math.

At Birkstead, that money didn’t show up on a line called “inbreeding.” It showed up as a 20% pregnancy rate, more sick cows than they liked, and robots spending too much time fetching stubborn Holsteins. At North Florida Holsteins, it showed up in a Holstein system that rewarded the same narrow sire lines and type composites even as inbreeding climbed.

Why Recent Inbreeding Hurts More Than Old Inbreeding

One of the traps with inbreeding is treating all of it as doing the same damage. It doesn’t.

Doekes and co‑authors split inbreeding into “recent” (last few generations) and “ancient” (deeper in the pedigree) and then tracked what each type did to production and fitness in Holsteins. Each 1% of new inbreeding cuts fat yield by about 2.4 kg per lactation, while the oldest pedigree class had little to no negative effect — in some models, even a small positive one.

Makanjuola’s work on Canadian Holsteins using runs of homozygosity (ROH) told the same story: recent inbreeding reduced milk and protein yields, while ancient inbreeding had far weaker effects. When you turn that into dollars, you end up in that >$40 per lactation per 1% range for first‑lactation milk alone.

Why the difference?

  • Ancient inbreeding has already been through decades of selection. The worst double‑copy combinations have largely been purged from the population.
  • Recent inbreeding creates new double copies in parts of the genome that haven’t had enough generations under selection pressure, especially for fertility and health.

Irish Holstein‑Friesian work suggests that purging has been more effective for production traits than for fertility.We’ve been selecting hard for milk and components for a long time. Fertility and health only really got major index weight in the past 10–15 years. The harshest fertility and survival recessives haven’t been under the hammer as long.

Once you layer genomics on top, the curve steepens. Hansen showed that Holstein female inbreeding rose at about 0.12% per year from 2000 to 2012, then 0.25% per year from 2013 to 2016, and then around 0.4% per year as genomic selection really took over. By the early 2020s, average Holstein females were already in the 8–9% inbreeding range, and by 2024, Canadian Holstein heifers hit 9.99%.

Genomics helped us identify the top animals faster. It also helped us stack the same families faster than purging could clean up fertility and survival.

The Bottleneck Hiding Inside Every Bull Catalog

Talk about Elevation and Chief dominating Holstein pedigrees can sound like coffee‑shop folklore. The data back it up.

Round Oak Rag Apple Elevation (1965-1979), the legendary Holstein sire dubbed “Bull of the Century,” photographed in his prime at Select Sires. This unassuming black and white bull from Virginia transformed global dairy genetics with his exceptional ability to transmit production, conformation, and longevity traits simultaneously. Note his balanced frame, strong topline, and characteristic Elevation profile—physical traits that would be passed to over 8.8 million descendants worldwide. While unremarkable by today’s extreme standards, this bull’s genetic blueprint revolutionized Holstein <a href='https://www.thebullvine.com/news/russia-lifts-ban-on-european-union-dairy-breeding-cattle/' data-lazy-src=

The $4,000 Heifer Paradox: Why Record Prices Signal a Genetic Meltdown

Record $4K heifer prices hide a genetic meltdown: Holstein inbreeding jumped 167% in a decade. Are we mortgaging tomorrow for today’s profits?

dairy heifer prices, beef on dairy breeding, Holstein inbreeding, dairy replacement shortage, genetic diversity crisis

While dairy farmers celebrate $4,000 springer prices as the ultimate seller’s market, a silent crisis is brewing in the genetic backbone of American dairy. Holstein genomic inbreeding has skyrocketed from 5.7% to 15.2% in just one decade, and the beef-on-dairy revolution is accelerating this dangerous trend by concentrating all dairy breeding within an ever-shrinking nucleus of elite genetics. The very market forces creating today’s windfall profits are simultaneously engineering tomorrow’s genetic catastrophe.

Let’s cut through the industry cheerleading for a moment. If you’re selling bred heifers right now, you’re living in paradise. USDA’s National Agricultural Statistics Service reported a record national average of $2,870 per head for milk cows in April 2025—the highest figure in the history of this data series. Premium springers near freshening command over $4,000 per head at auctions nationwide.

But here’s the uncomfortable truth nobody wants to discuss while counting those commission checks: we’re witnessing the most dramatic genetic bottleneck in modern dairy history, and it’s accelerating faster than a first-calf heifer’s learning curve.

The Numbers That Should Terrify Every Progressive Dairy Operation

The data paints a story that should make every forward-thinking producer pause before their next breeding decision:

Breeding Pool Collapse:

  • Active AI Holstein bulls plummeted 61% from 2,734 to 1,079 between 2010 and 2020
  • This isn’t gradual attrition—this is the systematic elimination of genetic diversity

Genomic Inbreeding Acceleration:

  • Elite Holstein bulls: 5.7% genomic inbreeding in 2010 to 15.2% by 2020
  • Expected Future Inbreeding of Holstein base population: 7.5% (2015-born) to 9.4% (2020-born)
  • Projections suggest elite Holstein bulls could reach 18-22% genomic inbreeding by 2030

Economic Impact Per Cow:

  • Every 1% inbreeding increase costs 177-400 pounds of lifetime milk production
  • First-lactation fat and protein yields drop ~2 pounds each per 1% inbreeding increase
  • Net Merit declines $23-25 per 1% inbreeding increase

Reality Check: A Holstein cow with 15% genomic inbreeding—increasingly common in today’s elite genetics—could experience lifetime profit reductions of $1,035 to $1,890 compared to a cow with 5% inbreeding.

Ask yourself this: Are we so blinded by today’s heifer windfall that we’re willing to mortgage our genetic future?

The Economic Engine Driving Genetic Destruction

The beef-on-dairy revolution didn’t emerge from some industry boardroom—it was born from brutal economic necessity. When heifer prices crashed to $1,140 per head in April 2019, producers were hemorrhaging roughly $1,000 on every replacement they kept. Meanwhile, beef-cross calves commanded $1,000 or more than Holstein bull calves worth around $414.

The transformation has been staggering:

  • Beef semen sales to dairy farms exploded from 2.54 million units in 2017 to 7.9 million units by 2023
  • This represents 84% of total U.S. beef semen sales
  • Today, approximately 72% of U.S. dairy farms incorporate beef genetics into their breeding programs

Here’s the math that should keep you awake at night: For every 1% of dairy cows bred to beef semen, we lose approximately 95,000 dairy heifers annually. With millions of dairy cows receiving beef semen each year, we’re systematically removing potential dairy genetics from the pipeline.

The result? USDA’s January 2025 Cattle Inventory Report shows only 2.5 million dairy heifers expected to calve in 2025—the lowest number since USDA began tracking this metric in 2001.

Supply Crisis by the Numbers

MetricCurrent StatusHistorical Context
Dairy Heifers (500+ lbs)3.914 million head (Jan 2025)Lowest since 1978
Heifers Expected to Calve2.5 million head (2025)Lowest since tracking began in 2001
Year-over-Year Change-0.9% (2024 to 2025)Sixth consecutive year of decline
Average Heifer Price$2,870 (April 2025)Highest in USDA history

Sources: USDA NASS Agricultural Prices Report, USDA Cattle Inventory Report

The Beef-on-Dairy Amplification Effect: Creating Our Own Genetic Desert

Here’s where the industry’s collective decision-making becomes truly problematic. The beef-on-dairy trend isn’t just reducing heifer numbers—it’s concentrating all remaining dairy breeding within an elite subset smaller than the registered population of most heritage breeds.

When 72% of farms use beef semen on their lower-merit animals, guess what happens to dairy genetics? They get concentrated into the top-tier animals like cream rising to the surface.

This creates a vicious cycle:

  1. Lower-merit cows get bred to beef, removing their genetics from the dairy pipeline
  2. Only elite genetics remain in the dairy breeding pool
  3. Elite genetics become increasingly related due to concentrated selection pressure
  4. Genomic inbreeding accelerates within the remaining dairy population
  5. Genetic diversity plummets while runs of homozygosity soar

Industry estimates suggest that if current trends continue, the effective population size for Holsteins could fall below 50—a threshold geneticists consider the minimum for maintaining long-term adaptability.

Here’s the uncomfortable question: Are we so focused on maximizing short-term profits that we’re willing to dismantle the genetic foundation our industry was built on systematically?

Quick Assessment Tool: Evaluate Your Genetic Risk

Rate your operation’s genetic sustainability (1-5 scale):

Breeding Strategy Assessment:

  • [ ] Genomic testing usage: Do you genomically test all potential replacement females? (5=Always, 1=Never)
  • [ ] Beef semen targeting: Do you strategically apply beef semen only to lower-genetic merit cows? (5=Always strategic, 1=Random application)
  • [ ] Replacement planning: Do you breed precise numbers for your replacement needs? (5=Precisely planned, 1=No planning)

Genetic Diversity Management:

  • [ ] Inbreeding monitoring: Do you track genomic inbreeding levels in breeding decisions? (5=Always, 1=Never)
  • [ ] Sire diversity: Do you avoid overuse of popular sires? (5=Highly diverse, 1=Use same popular sires)

Score 20-25: Low genetic risk Score 15-19: Moderate risk—implement improvements Score below 15: High risk—immediate strategy revision needed

Strategic Responses: What Smart Operations Are Actually Doing

The most progressive operations aren’t waiting for industry-wide solutions—they’re implementing precision breeding programs that balance economic opportunity with genetic stewardship:

Precision Breeding Strategies

  • Using sexed dairy semen on genetically superior females to generate precise numbers of replacements
  • Applying beef semen strategically to lower-merit cows not designated for producing replacements
  • Genomic testing to identify the best candidates for each breeding strategy

Longevity Focus

  • Implementing management practices to extend productive lifespan (targeting 4-6 lactations per cow)
  • Recognizing that each additional lactation reduces replacement needs by approximately 25%
  • Investing in health protocols, nutrition, and housing to minimize involuntary culling rates

Economic Risk Management

  • Understanding that a $4,000 replacement heifer requires 18% higher milk prices to achieve breakeven compared to less expensive alternatives
  • Developing internal heifer-raising programs where current market prices exceed raising costs ($2,600-$2,900)

Action Items: Your 30-Day Genetic Sustainability Plan

Week 1: Assessment

  • [ ] Genomically test all breeding-age females in your herd
  • [ ] Calculate current replacement needs based on culling rates and expansion plans
  • [ ] Review inbreeding levels of your current AI sire lineup

Week 2: Strategy Development

  • [ ] Identify the top 30% of females for dairy breeding (based on genomic merit)
  • [ ] Map beef semen application to the bottom 40% of genetic merit
  • [ ] Calculate optimal sexed semen usage for replacement needs

Week 3: Financial Analysis

  • [ ] Compare the cost of raising vs. purchasing replacements at current market prices
  • [ ] Evaluate potential returns from extended cow longevity investments
  • [ ] Budget for genomic testing and sexed semen premiums

Week 4: Implementation

  • [ ] Adjust breeding protocols based on genetic assessments
  • [ ] Train staff on new breeding strategy protocols
  • [ ] Establish a monthly genetic progress monitoring system

The Bottom Line: Stop Mortgaging Tomorrow for Today’s Profits

The $4,000 heifer market represents a perfect storm of short-term economic thinking colliding with long-term genetic consequences. While beef-on-dairy strategies deliver immediate profits, they’re systematically dismantling the genetic foundation of American dairy.

We’re essentially conducting a massive, uncontrolled genetic experiment with the national dairy herd. The results won’t be fully visible for years, but the trajectory is clear: increasing genomic inbreeding, declining genetic diversity, and potential long-term productivity losses that could dwarf today’s replacement cost savings.

The smartest operators will find ways to profit from current market conditions while positioning themselves for genetic sustainability. That means strategic breeding decisions using both genomic testing and traditional breeding principles, investment in cow longevity, and recognition that today’s record prices reflect fundamental supply constraints that may persist longer than a typical lactation cycle.

Your Critical Decision Point

Stop and honestly assess your current breeding program right now. When did you last evaluate the genomic inbreeding levels of your breeding decisions? Can your operation sustain $4,000+ replacement costs long-term?

Here’s your challenge: For the next breeding cycle, calculate the true long-term cost of every beef-cross breeding decision. Factors include the immediate calf value, the lost genetic potential, and the increasing cost of replacement heifers.

The choice is yours, but the genetic clock is ticking. Unlike heifer prices, genetic diversity doesn’t bounce back quickly once it’s been culled from the population. Your breeding decisions today will determine whether your grandchildren operate a genetically robust dairy or struggle with the consequences of our short-sightedness.

Will you be part of the solution or part of the problem? The industry’s genetic future may depend on how you answer that question in your breeding shed next week.

Key Takeaways

  • Genetic Concentration Crisis: Holstein inbreeding has accelerated dramatically (5.7% to 15.2% in a decade) while available AI bulls dropped 61%, creating dangerous genetic bottlenecks that could cost $1,035-$1,890 per cow in lifetime profits
  • Supply-Driven Price Surge: Unlike previous peaks driven by high milk prices, current record heifer values ($2,870 average, $4,000+ premium) stem from critical scarcity—only 2.5 million dairy heifers expected to calve in 2025, the lowest since 2001
  • Beef-on-Dairy Double-Edged Sword: While generating immediate profits ($1,000+ per beef-cross calf vs. $414 for Holstein bulls), this trend systematically removes 95,000 potential dairy heifers annually for every 1% of cows bred to beef
  • Strategic Breeding Imperative: Success requires precision breeding programs using genomic testing and sexed semen on elite females for replacements while strategically applying beef semen to lower-merit cows
  • New Economic Reality: High replacement costs may persist long-term, demanding extended cow longevity (4-6 lactations), conservative culling strategies, and potential shifts toward internal heifer-raising programs where market prices exceed production costs

Executive Summary

While dairy farmers celebrate record $4,000 heifer prices driven by unprecedented scarcity, a silent genetic crisis is accelerating beneath the surface. The beef-on-dairy revolution that created today’s profitable market has simultaneously concentrated all dairy breeding within an ever-shrinking elite genetic pool, pushing Holstein inbreeding from 5.7% to 15.2% in just one decade. With active AI Holstein bulls dropping 61% and only 2.5 million dairy heifers expected to calve in 2025—the lowest since tracking began—the industry faces a genetic bottleneck that threatens long-term sustainability. Unlike the 2014 price peak driven by exceptional milk prices, today’s record valuations stem from critical supply shortages created by economic incentives favoring beef-cross calves over dairy replacements. The cumulative effect: potentially ,035-,890 in lifetime profit losses per cow due to inbreeding depression, creating a paradox where today’s windfall profits may engineer tomorrow’s genetic catastrophe. Smart operators must now balance immediate economic opportunities with strategic breeding decisions that preserve genetic diversity for future generations.

Learn more:

The Sunday Read Dairy Professionals Don’t Skip.

Every week, thousands of producers, breeders, and industry insiders open Bullvine Weekly for genetics insights, market shifts, and profit strategies they won’t find anywhere else. One email. Five minutes. Smarter decisions all week.
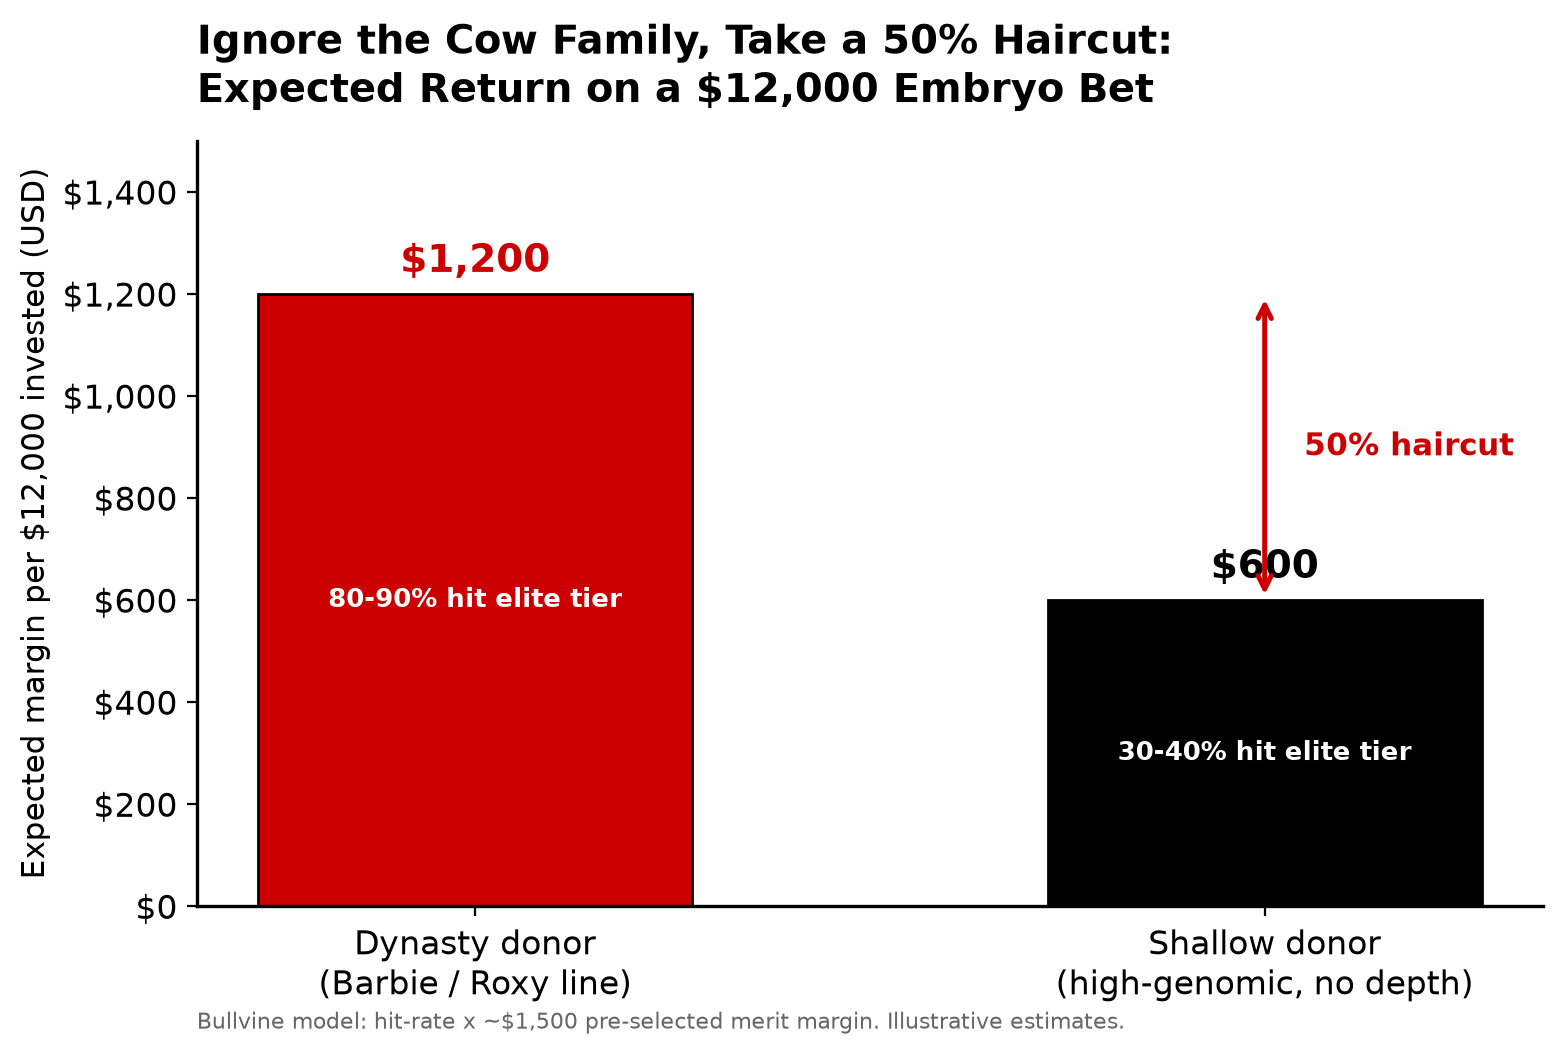
NewsSubscribe
First
Last
Consent

The Silent Genetic Squeeze: Is Holstein Breeding Painting Itself into a Corner?

Holstein inbreeding has tripled in a decade. Discover how hidden genomic risks threaten dairy profits and what you can do to protect your herd’s future.

The relentless pursuit of genetic advancement in Holsteins has created an uncomfortable truth the industry refuses to confront: we’re creating a narrow genetic highway with no exit ramps. While milk production has soared through genomic selection, inbreeding has silently tripled in elite lines over just one decade. This genetic narrowing threatens long-term sustainability and demands immediate action from every stakeholder in the dairy industry – including YOU.

Remarkable genetic progress in Holstein cattle has transformed dairy production, but beneath the celebrated gains lurks a concerning trend that many farmers either don’t notice or choose to ignore. The genomic revolution that accelerated genetic improvement has simultaneously accelerated inbreeding at rates unprecedented in breed history.

You’ve probably heard whispers about this at dairy conferences or read passing references in industry publications. Perhaps you’ve noticed subtle changes in the “modern Holstein” – that increasingly angular, refined animal appearing in show rings and high-ranking genomic lists. But few connect these dots to the underlying genetic squeeze right before our eyes. And why would they? The major AI companies aren’t highlighting this problem in their glossy catalogs, are they?

The Inbreeding Paradox: What the Numbers Tell Us

When did you last scrutinize the inbreeding metrics in your genetic evaluations? If you’re like most producers, you monitor Expected Future Inbreeding (EFI) values when selecting service sires. But here’s the uncomfortable truth: EFI isn’t telling you the whole story – and the organizations supplying your genetics know it.

The divergence between genomic inbreeding levels in Holstein bulls (rising to 15.2%) and the declining number of active AI bulls (down 61%) creates a dangerous genetic bottleneck.

The difference between EFI and genomic inbreeding is like comparing your TMR formulation to what the cow’s sort and consume. One gives you the big picture; the other tells you what’s happening where rubber meets road.

EFI measures a bull’s average relationship to the broader population (currently heifers born in 2020), while genomic inbreeding (F_ROH) directly measures actual homozygosity in an individual’s DNA. This distinction matters tremendously when making mating decisions in your breeding program.

What makes this particularly troubling is that the base population used to calculate EFI is becoming more inbred each year. Between 2015 and 2020, the average EFI of the Holstein base population jumped from 7.5% to 9.4%. This means the genetic “yardstick” we use to measure inbreeding is shrinking, creating the illusion of stability when inbreeding is accelerating. It’s like measuring water depth in a sinking boat – the numbers stay the same while you slowly drown.

DEBUNKED: “If a bull’s EFI is low, he’s an outcross.” This common assumption falls apart under scrutiny. A bull can show a low EFI relative to today’s highly inbred base population yet still be closely related to other elite lines. This creates a false sense of security when making breeding decisions, particularly when using multiple “elite” bulls across your herd that secretly share recent common ancestry.

Contract limitations on elite bulls further distort the picture. When high Net Merit$ sires are restricted to specific breeding programs or available only through exclusive contracts, their genetics eventually enter the broader population through sons and maternal grandsons. By then, a new generation of even more inbred sires dominates the market, continuing a cycle of intensifying homozygosity that isn’t fully captured by EFI values.

Follow the Numbers: A Decade of Genetic Narrowing

The data tells a compelling story of rapidly diminishing genetic diversity. In just one decade (2010-2020), genomic inbreeding in Holstein bulls skyrocketed from approximately 5.7% to 15.2% – a staggering 168% increase.

Meanwhile, active AI bulls declined precipitously, from 2,734 in 2010 to just 1,079 in 2020. That’s a 61% reduction in the available gene pool in just 10 years.

Let’s put this in perspective:

Metric20102020Change
Elite Genomic Sires5.7%15.2%+168%
Active AI bulls2,7341,079-61%
EFI base population7.5%9.4%+25%

You might think, “But genomic selection has dramatically improved our herds. Isn’t this just the price of progress?”

That’s partly true. Genomics allows us to identify elite genetics with unprecedented accuracy and speed. But the unintended consequence is that we’re now selecting from an increasingly narrow pool of animals that share more and more of their ancestry.

Only 75-100 top genomic young bulls enter AI programs annually today, compared to over 1,000 pedigree-selected bulls pre-2010. With three major U.S. cooperatives now controlling over 80% of semen sales, we’re essentially drinking from the same concentrated genetic well – and it’s getting more focused every year. Is anyone asking what happens when that well runs dry?

What’s Driving This Trend?

This genetic bottleneck didn’t happen by accident. Several forces are working together to squeeze our Holstein gene pool:

Genomic selection efficiency

Genomic testing has revolutionized our ability to identify genetic outliers earlier and more accurately. That’s the good news. The flip side? We’re identifying the same families repeatedly because we’re selecting for the same traits using the same algorithms. It’s like using the same filter on your DHIA sheets month after month – you’ll keep identifying the same cows as top performers. As these related animals dominate the rankings, they’re used more intensively, concentrating their genetics in the population.

Restricted access to elite genetics

Have you noticed that the most exciting new bulls often have fine-print limitations? These restrictions aren’t just marketing gimmicks- they fundamentally alter how genes flow through the population. Elite bulls primarily mate with elite cows, creating a separate genetic stream that only gradually filters down to commercial herds, by which time inbreeding has intensified further within the elite nucleus. When did you last have unrestricted access to the industry’s absolute top genomic sires? The answer is likely never.

Industry consolidation

Remember when there were dozens of competitive AI organizations, each with distinct breeding philosophies? Today’s landscape looks vastly different. Stud consolidation means fewer decision-makers directing the genetic future of the breed, often with similar selection objectives driven by identical economic indices like NM$, TPI, and JPI.

The beef-on-dairy effect

The explosive growth of beef-on-dairy breeding, 7.9 million units of beef semen used in dairy herds in 2023, means fewer dairy females contribute to the next generation of purebred Holsteins. This further shrinks the dairy genetic pool, concentrating selection on a smaller nucleus of elite cows bred to elite bulls. It’s like how keeping fewer replacement heifers intensifies selection pressure – except now we’re doing it across the entire breed.

The Real-World Impact on Your Herd

This isn’t just an abstract genetic discussion; inbreeding has tangible effects on your bottom line and day-to-day operation.

The economic impact of inbreeding rises from 10% to 20%, the lifetime profit loss per cow escalates dramatically from $450 to over $3,700, with corresponding declines in production and fertility. *

For every 1% increase in inbreeding:

  • Lifetime milk production decreases by 177-400 pounds
  • First-lactation fat and protein yields drop by about 2 pounds each
  • Productive life shortens by approximately 6 days
  • Calving interval extends by 0.19-0.34 days
  • Net Merit declines by about $23-25

These might seem like small numbers individually, but they compound quickly, much like subclinical milk fever impacts that aren’t obvious day-to-day but erode profitability over time. A cow at 15% inbreeding (now increasingly common) could face production losses of 584-730 kg of milk, extended calving intervals of 5-8.5 days, and lifetime profit reductions of $1,035-1,890 compared to a cow at 5% inbreeding.

However, perhaps the most concerning thing for some breeders is the emerging correlation with linear type traits. While research hasn’t definitively linked inbreeding directly to specific conformational changes, there’s growing evidence that our current selection path is creating a “modern type” characterized by:

  • Decreased strength scores
  • Shallower body depth
  • Higher pin placement

These trends align with recent changes to selection indices. The April 2025 update to the CDCB Net Merit formula explicitly increased emphasis on “smaller stature cattle with more focus on dairy form” while penalizing stature at -$0.45/lb.

What if… we’re selecting a dairy cow that excels on paper but lacks the physical robustness to thrive in real-world conditions? What if the next major disease outbreak targets a genetic pathway we’ve inadvertently narrowed through intense selection?

Is this the robust dairy cow we want for the future? Or are we blindly following economic indices without questioning the long-term consequences? The answer depends on your perspective and breeding goals. Still, the narrowing genetic base means we’re increasingly locking ourselves into a particular type with fewer options to course-correct if needed.

Where Are We Headed? Projecting the Future

If current trends continue unabated, with inbreeding increasing at 0.25-0.44% annually, elite Holstein bulls could reach 18-22% average genomic inbreeding by 2030. The effective population size could drop below 50, which geneticists consider the minimum threshold for maintaining long-term adaptability.

What happens after another decade of accelerating genetic concentration? The risks intensify:

Emerging recessive disorders

As homozygosity increases, so does the probability of expressing harmful recessive genes. Through testing, we’ve managed known haplotypes like HH1-6, CVM, and BLAD, but new, currently unidentified recessives will inevitably emerge as inbreeding intensifies. Without genetic diversity to provide alternative alleles, these conditions could become increasingly difficult to manage, like controlling digital dermatitis when every cow in your herd carries the same susceptibility genes.

Reduced genetic resilience

A narrow genetic base means less capacity to adapt to new challenges, whether emerging diseases, climate shifts affecting heat tolerance, or evolving consumer demands requiring different milk components. The traits we might need in the future could be the ones we’re inadvertently selecting against today. Are we removing the very genes that might help dairy cattle survive in an uncertain climate future?

Diminishing returns on genetic progress

Eventually, we hit what geneticists call the “genetic ceiling”-the point where progress slows or stalls because we’ve exhausted the available genetic variation. The very tools that accelerated our progress could ultimately limit our future options.

The economic impact compounds over time:

Inbreeding LevelMilk Yield Loss (kg)Calving Interval (+days)Lifetime Profit Loss ($)
10%259-4061.9-3.4230-450
15%584-7305.1-8.51,035-1,890
20%1,168-1,46010.2-17.02,300-3,780

Taking Control: Practical Solutions for Your Breeding Program

Despite these concerning trends, you’re not powerless. Here are practical steps you can take to balance genetic progress with maintaining diversity:

ACTION CHECKLIST: 5 STEPS TO MANAGE INBREEDING TODAY

  1. DEMAND genomic inbreeding information (F_ROH) from your genetic provider
  2. IMPLEMENT genomic audits of your replacement heifers
  3. SET a maximum acceptable inbreeding increase per generation (<0.1%)
  4. DESIGNATE 15-20% of matings to true outcross sires
  5. MONITOR linear traits for signs of reduced robustness

Look beyond EFI

When evaluating bulls, don’t just check the EFI value. Demand genomic inbreeding information (F_ROH) from your genetic provider. Some progressive AI companies now include this data, particularly for bulls marketed as “outcross” options. Understanding the homozygosity in your prospective matings gives you a more accurate picture of inbreeding risk.

Implement genomic audits

Consider genomic testing your replacement heifers, not just for selection, but specifically to monitor inbreeding levels. Pay special attention to runs of homozygosity (ROH) greater than 4 Mb, which indicate recent inbreeding that’s particularly concerning. These genomic audits can reveal inbreeding hotspots in your herd that pedigree analysis might miss, like how milk culturing identifies specific pathogens that bulk tank SCC alone doesn’t reveal.

Utilize advanced mating software

Modern mating programs like Select Mating Service (SMS), Optimal Genetic Pathways, and Genetic Audit can optimize for genetic gain and inbreeding control. Set a maximum acceptable inbreeding increase per generation (ideally <0.1%) and let the software help you balance progress with diversity. Tools like MateSel or the CDCB’s Inbreeding Calculator can help identify matings that minimize inbreeding while maximizing genetic gain.

Strategic crossbreeding

Consider structured crossbreeding systems like ProCROSS (Montbeliarde × Viking Red × Holstein) for a portion of your herd. Research consistently shows these systems maintain productivity while improving fertility, reducing calving difficulties, and eliminating inbreeding concerns in the crossbred animals. Dedicating 20% of your matings to well-planned crossbreeding can provide valuable genetic risk management, like diversifying your feed inventory rather than relying on a single forage source.

Seek true outcross genetics

Work with your genetic provider to identify bulls less related to your cow families. Sometimes these aren’t the highest-ranking bulls on popular indices, but they may offer valuable genetic diversity that pays dividends in future generations. Don’t just look at the bull’s inbreeding- examine his relationship to your specific herd’s genetic makeup.

Consider embryos from gene banks

The US National Animal Germplasm Program (NAGP) preserves 98.2% of segregating loci found in Holsteins. Access to this genetic material could provide true outcross options that are increasingly rare in commercial channels. These “genetic time capsules” represent diversity rapidly disappearing from the active population.

The Industry’s Responsibility

Individual farmers can’t solve this challenge alone. The entire dairy genetics industry needs to acknowledge the problem and take collective action:

CDCB reforms

The CDCB should report genomic inbreeding (F_ROH) alongside EFI in evaluations to provide a more complete picture. They could also implement inbreeding caps within selection indices to discourage excessive homozygosity. Making inbreeding more visible in evaluations would bring much-needed transparency to the issue.

Sire diversity quotas

AI studs should maintain genetic diversity by ensuring that 15-20% of their catalogs feature bulls with less than 8% genomic inbreeding and low kinship to the top 100 sires. This provides accessible outcross options to all breeders, not just those with the resources to seek specialty genetics. Why don’t we demand this level of transparency from our genetic suppliers?

Transparent reporting

Breed associations like Holstein Association USA should regularly publish trends in genomic inbreeding, not just in population averages, but specifically in the elite breeding nucleus where future AI sires originate. This data should be publicly available and easily understood, allowing farmers to make informed decisions.

Research incentives

Universities and the USDA-AGIL should prioritize research on optimizing the balance between genetic gain and diversity preservation, including developing selection indices that explicitly value genetic uniqueness. Current economic indices focus almost exclusively on short-term production traits without accounting for the long-term value of genetic diversity.

Education initiatives

Extension services and industry organizations must help farmers understand the full implications of inbreeding and provide practical guidance on managing it effectively. Many producers don’t realize how dramatically inbreeding has increased or how it might affect their operations over the long term.

The Bottom Line

The Holstein breed stands at a genetic crossroads. We’ve made remarkable progress in productivity, but we’re borrowing from the future to pay for today’s genetic gains. The narrowing genetic base, evidenced by skyrocketing inbreeding coefficients and a shrinking bull population, threatens the long-term sustainability and adaptability of the breed we depend on.

As one dairy geneticist bluntly stated, “We’re mining genetic capital faster than replenishing it. The bill will come due in calves born with recessive defects we can’t even name yet.”

You have the power to influence this trajectory, both through individual breeding decisions and by demanding more transparency and commitment to genetic diversity from industry organizations. The Holstein breed has thrived because of its adaptability, ensuring it maintains enough genetic variation to evolve for the next century.

Ask yourself: Are you selecting for the subsequent lactation or breeding for the next generation? Like balancing your ration for immediate milk production versus long-term cow health, your genetic strategy requires thinking beyond immediate results. The answer will determine not just your herd’s future, but the future of the Holstein breed itself.

The time for action is now. Start by examining the true inbreeding levels in your herd. Challenge your genetic provider to supply bulls with verified low genomic inbreeding. Implement mating strategies that actively manage homozygosity. And most importantly, join the conversation about genetic diversity at industry meetings, breed association gatherings, and in discussions with AI representatives.

What will you do differently in your next genetic selection decision? How will you balance your breeding program’s immediate needs with the long-term sustainability of the genetic resources we all share? What’s the ONE change you’ll make to your breeding strategy after reading this?

The time for this conversation isn’t somewhere in the future- it’s now, while we still have genetic diversity to preserve.

Key Takeaways:

  • Elite Holstein genomic inbreeding tripled (5% → 15%) in 10 years, faster than EFI metrics reveal.
  • EFI vs. reality gap: Base population adjustments mask elite subgroup risks, enabling “hidden” homozygosity.
  • Rising inbreeding correlates with -400 lbs milk/1%, +9-day calving intervals, and weaker conformation traits.
  • $1,890+/cow profit loss at 15% inbreeding; 20% levels could double losses by 2030.
  • Solutions: Crossbreeding (ProCROSS), gene banks, and industry-wide sire diversity quotas.

Executive Summary:

Modern Holstein breeding faces a silent crisis: genomic inbreeding in elite lines has surged from 5% to 15% in 10 years, driven by AI consolidation and overreliance on top sires. While industry metrics like Expected Future Inbreeding (EFI) downplay risks, true genomic inbreeding correlates with reduced milk yields, fertility issues, and a concerning “modern type” of weaker, shallower cows. With active AI bulls halved since 2010 and studs controlling 80% of genetics, unchecked trends could slash lifetime profits by $3,700/cow by 2030. The article urges immediate action, from crossbreeding to demanding genomic inbreeding (F_ROH) data, to balance genetic progress with diversity before the breed hits a genetic ceiling.

Learn more:

The Sunday Read Dairy Professionals Don’t Skip.

Every week, thousands of producers, breeders, and industry insiders open Bullvine Weekly for genetics insights, market shifts, and profit strategies they won’t find anywhere else. One email. Five minutes. Smarter decisions all week.
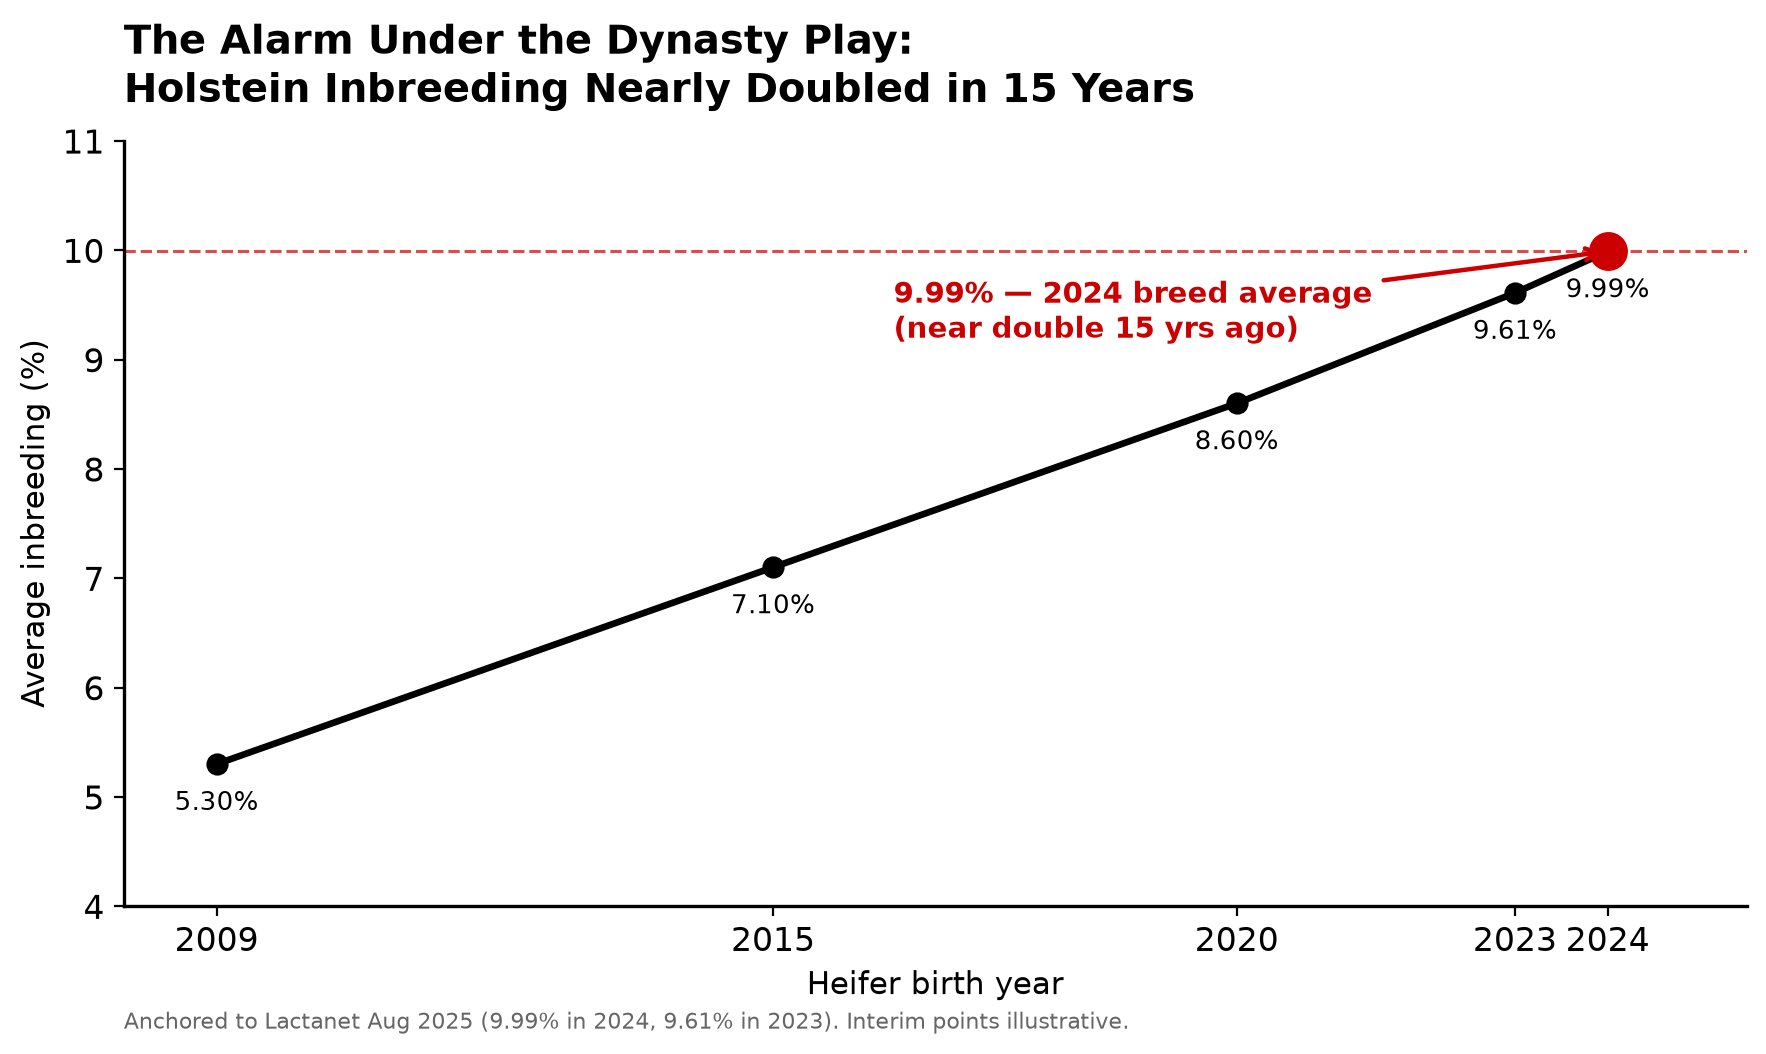
NewsSubscribe
First
Last
Consent

2025 U.S. Genetic Base Change: Final Values and Strategic Implications

Two thousand twenty-five genetic base shifts are most substantial for the Holsteins. Calving traits delayed amid inbreeding surge – what it means for your herd’s future.

EXECUTIVE SUMMARY: The 2025 U.S. genetic base change reveals accelerated progress but new complexities, with Holsteins facing amplified inbreeding impacts on PTAs. While most traits now reflect 2020-born cows, calving trait updates remain delayed until August due to calculation anomalies. Breed-specific adjustments demand revised selection strategies, particularly for semen use decisions. Updated Lifetime Net Merit indices reflect shifting market realities, while enhanced reliability calculations improve non-Holstein-type evaluations. This reset demands immediate breeder action to maintain genetic momentum.

KEY TAKEAWAYS:

  • Base Change Magnitude: The largest adjustment in years reflects a 5-year genetic leap, requiring recalibration of PTA benchmarks
  • Calving Traits On Hold: Phenotypic calculation quirks delay updates until August 2025 despite other traits going live
  • Holstein Inbreeding Effect: Rising inbreeding rates amplify PTA shifts, demanding revised selection thresholds
  • Economic Index Overhaul: NM$ revisions align with current milk prices and feed costs, altering sire rankings
  • Strategic Imperative: Breeders must reassess sexed/beef semen use criteria to capitalize on new genetic realities

The April 2025 U.S. genetic base change represents one of the most significant updates in recent years, reflecting unprecedented genetic progress in dairy cattle over the past five years. As the base shifts from cows born in 2015 to those born in 2020, dairy producers will need to recalibrate their genetic selection strategies. The final values reveal substantial changes across breeds, with adjustments to PTA values, breeding indices, and reference populations. Notably, calving traits have been temporarily excluded due to unexpected results when applying the base change calculations, with updates for these traits postponed until August 2025 following further investigation. The accelerated genetic progress demonstrated by this base change, combined with increasing inbreeding rates, especially in Holsteins, signals both positive advancement and new challenges for dairy breeders.

Table 1: Value of the genetic change between cows born in 2020 and cows born in 2015.

TraitUnitsAyrshireBrown SwissGuernseyHolsteinJerseyMilking Shorthorn
MilkPounds142381687523556
FatPounds3904416-7
ProteinPounds51422914-3
Productive lifeMonths0.080.90.722.311.610.37
Somatic cell score (SCS)Log base 2 units0.02-0.040-0.10.020.02
Daughter pregnancy rate%-0.99-0.61-0.45-0.21-0.39-0.53
Heifer conception rate%-0.690.14-0.320.941.41-0.52
Cow conception rate%-1.15-0.48-0.850.450.05-0.37
Cow livability%-0.860.47-0.030.410.61-0.04
Gestation length2Days0.15-0.080.16-0.650.28̶
Residual Feed IntakePounds̶̶̶-42.34̶̶
Milk fever / Hypocalcemia%̶̶̶0.070.1̶
Displaced abomasum%̶̶̶0.350.21̶
Ketosis%̶̶̶1.04-0.06̶
Mastitis%̶-0.01̶0.7-1.05̶
Metritis%̶̶̶1.02-0.02̶
Retained Placenta%̶̶̶0.01-0.11̶
Early first calvingDays-0.250.660.232.371.93-1.72
Heifer LivabilityDays̶̶̶0.460.18̶
Final ScorePoints0.20.20.3*0.50.2
StaturePoints0.50.4-0.1*0.50.2
StrengthPoints00.10.1*0.10
Dairy formPoints0.20-0.1*0.40.2
Front Teat AttachmentPoints0.30.20.2*0.20.1
Rear Legs – Side ViewPoints-0.10-0.2*0-0.1
Body depthPoints0.100*00.1
Rump anglePoints00.2-0.5*-0.30
Rump widthPoints0.20.10.2*0.30.2
Fore udder attachmentPoints0.5̶0.5̶0.7*0.90.2
Rear udder heightPoints0.4̶0.4̶0.5*0.50.2
Rear udder widthPoints0.20.20.2*0.10.1
Udder depthPoints0.60.40.6*0.70.2
Udder cleftPoints0.30.10.1*0.20.1
Front teat placementPoints0.30.30.2*0.40.2
Teat LengthPoints-0.2-0.4-0.2*0.1-0.1
Rear Legs – Rear ViewPoints̶0.10.2*00.1
MobilityPoints̶0.1̶̶00.1
Milking SpeedPoints̶0̶̶00
Rear teat placement – rear viewPoints̶0.1̶̶0.3̶
Rear teat placement – side viewPoints̶̶̶̶-0.1̶
Lifetime Net Merit**Dollars71130-15404179-12
Lifetime Cheese Merit**Dollars65117-17375166-4
Lifetime Fluid Merit**Dollars73135-13417184-15
Lifetime Grazing Merit**Dollars47104-39386151-30

– Trait not calculated and published for the breed
* Trait calculated by Holstein Association USA
** Economic weights applied to Lifetime Merit Indices are also updated in April 2025.

Understanding the Genetic Base Change Process

The U.S. genetic base update is a routine recalibration every five years to align selection tools with the current dairy herd’s genetic capabilities. Beginning April 1, 2025, the genetic evaluations produced by the Council on Dairy Cattle Breeding (CDCB) will shift their reference point from cows born in 2015 to those born in 2020. This shift resets the baseline against which all animals are measured, ensuring that genetic evaluations remain relevant in a rapidly improving population.

Every dairy animal with genetic evaluations based on CDCB and Holstein USA data is compared to this breed population average, known as the base. Traits are measured as Predicted Transmitting Abilities (PTAs) relative to this established baseline. As genetic progress continually advances, this five-year recalibration provides dairy producers with an accurate point of comparison, essentially serving as a genetic report card that demonstrates progress compared to the previous generation.

The 2025 base change is particularly notable because it’s larger than previous adjustments, directly reflecting the industry’s accelerated genetic progress in the preceding five years. Genomic evaluations and advanced reproductive technologies, including sexed semen, embryo transfer, and in-vitro fertilization, primarily drive this acceleration.

Key Adjustments and Their Implications

The genetic base change involves complex adjustments beyond measuring the genetic difference between cow populations from different years. After determining the genetic difference between cows born in 2020 and those born in 2015, inbreeding and heterosis adjustments are applied, significantly impacting the final PTA values.

In the Holstein breed particularly, the increasing rate of inbreeding over the five years has amplified the effect of these adjustments on PTA values. This means the numerical shifts in genetic evaluations reflect genetic advancement and changing population dynamics. Understanding these nuances is critical for correctly interpreting the new genetic evaluations for dairy producers.

Along with the base change, the Lifetime Net Merit (NM$) index is being revised, including updates to Cheese, Fluid, and Grazing Merit. This 2025 revision adjusts methods for estimating trait values and updates numerous income and cost variables, such as milk prices, feed requirements, and reproductive options. Such revisions ensure that selection indices reflect current economic realities and production objectives.

Breed-Specific Impacts

The magnitude of the base change adjustments varies considerably across breeds, reflecting different rates of genetic progress. These differential impacts underscore the importance of breed-specific genetic selection strategies. Dairy producers must adjust their selection thresholds accordingly, particularly when deciding which cows to breed with sexed semen versus beef semen.

Calving Traits: A Notable Exception

A significant aspect of the 2025 base change is the decision to maintain calving traits in their current base. The calving traits—Daughter Calving Ease, Sire Calving Ease, Daughter Stillbirth, and Sire Stillbirth—represent a unique category in which genetic evaluations are reported on an observed (phenotypic) scale, meaning both genetic and phenotypic bases must be updated during a base change.

Unexpected results emerged when these base updates were applied for the April evaluation. Due to the timing of this discovery, the CDCB decided to maintain calving traits using the same genetic and phenotypic bases used to calculate them in December 2024. This decision ensures reliability while allowing time for further investigation. The CDCB expects to update the bases for calving traits in August 2025 after completing a thorough analysis.

This temporary maintenance of the previous base for calving traits will not impact other characteristics in the genetic evaluations. New phenotypic data received since December will still be incorporated, ensuring the evaluations remain current despite using the previous base.

Updates to Reference Populations and Calculation Methods

Breed Base Representation Changes

In addition to the core base change, April 2025 brings significant updates to the Breed Base Representation (BBR) reference population. These updates implement refined business rules for selecting purebred bulls, made possible by increasing the availability of genotyped animals and advancements in data quality, methodologies, and technology.

The BBR reference population will now be selected from genotyped, progeny-tested bulls with at least 10 enrolled daughters (excluding bulls with status codes C and N), complete pedigrees, and are classified as purebred within each breed of evaluation. When rounded to the nearest integer, a purebred bull must have a pedigree-based heterosis value ≤ 1%.

These changes will affect the percentage of animals receiving new BBR values differently across breeds—from approximately 25% in Ayrshire to only about 1% in Holstein. Generally, the new methodology will decrease BBR values across breeds, as it improves the detection of animals with non-purebred ancestors.

Type Trait Reliability Calculations

For non-Holstein breeds, April 2025 brings a significant methodological update to type trait reliability calculations. Historically, while PTAs for type evaluations have been derived from a multiple-trait model, reliabilities were calculated using a single-trait model. The growing volume of appraisal data has prompted the alignment of both processes to follow the multiple-trait methodology.

As a result, traditional PTAs will remain unchanged. Still, reliabilities for most traits will increase, particularly those with limited data, which will now benefit from genetic correlations with other characteristics. Genomic PTAs will see more noticeable impacts as reliability adjustments affect SNP solutions and weighting factors in final calculations.

Strategic Implications for Dairy Producers

The 2025 base change presents dairy producers with a significant opportunity to reassess their genetic improvement strategies. With genetic progress accelerating, an effective selection strategy becomes increasingly crucial. Selection indices like Herd Health Profit Dollars® (HHP$®) provide efficient approaches to simultaneous improvement across multiple traits.

The adjustments coming in April mean producers will likely need to recalibrate their selection thresholds for A.I. sires and adjust criteria for determining which cows are bred to beef or sexed semen. This recalibration process is essential to maintain genetic progress and ensure that genetic selection decisions align with updated evaluations.

While potentially disruptive in the short term, the magnitude of this base change ultimately reflects the industry’s success in accelerating genetic improvement. It signals that dairy producers are making faster genetic progress than ever, necessitating corresponding evolution in genetic evaluation systems to maintain their accuracy and relevance.

Conclusion

The 2025 U.S. genetic base change represents both remarkable progress and an opportunity for strategic realignment. The substantial shifts in genetic evaluations across breeds demonstrate the dairy industry’s success in accelerating genetic improvement through advanced technologies and selection practices. While the adjustment process may temporarily disrupt established selection thresholds, it ultimately provides dairy producers with more accurate tools for genetic selection.

The special handling of calving traits highlights the complexity of genetic evaluation systems and the importance of maintaining evaluation integrity even when unexpected challenges arise. Meanwhile, the updates to reference populations and calculation methodologies further refine the precision of genetic evaluations.

This base change is a milestone for dairy producers, marking five years of genetic advancement and prompting them to reevaluate selection strategies to ensure continued progress. By understanding these changes and adjusting breeding decisions accordingly, producers can leverage this base change to enhance their herds’ genetic potential and profitability in the years ahead.

Read more:

Join the Revolution!

Join over 30,000 successful dairy professionals who rely on Bullvine Daily for their competitive edge. Delivered directly to your inbox each week, our exclusive industry insights help you make smarter decisions while saving precious hours every week. Never miss critical updates on milk production trends, breakthrough technologies, and profit-boosting strategies that top producers are already implementing. Subscribe now to transform your dairy operation’s efficiency and profitability—your future success is just one click away.
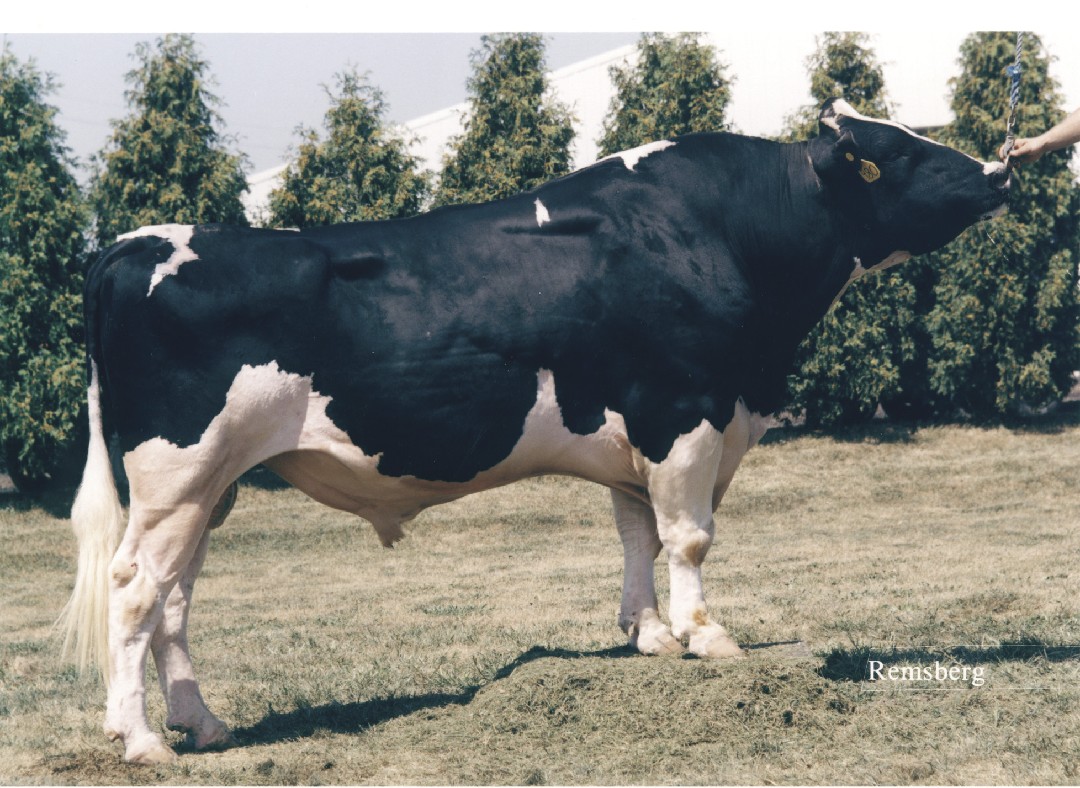
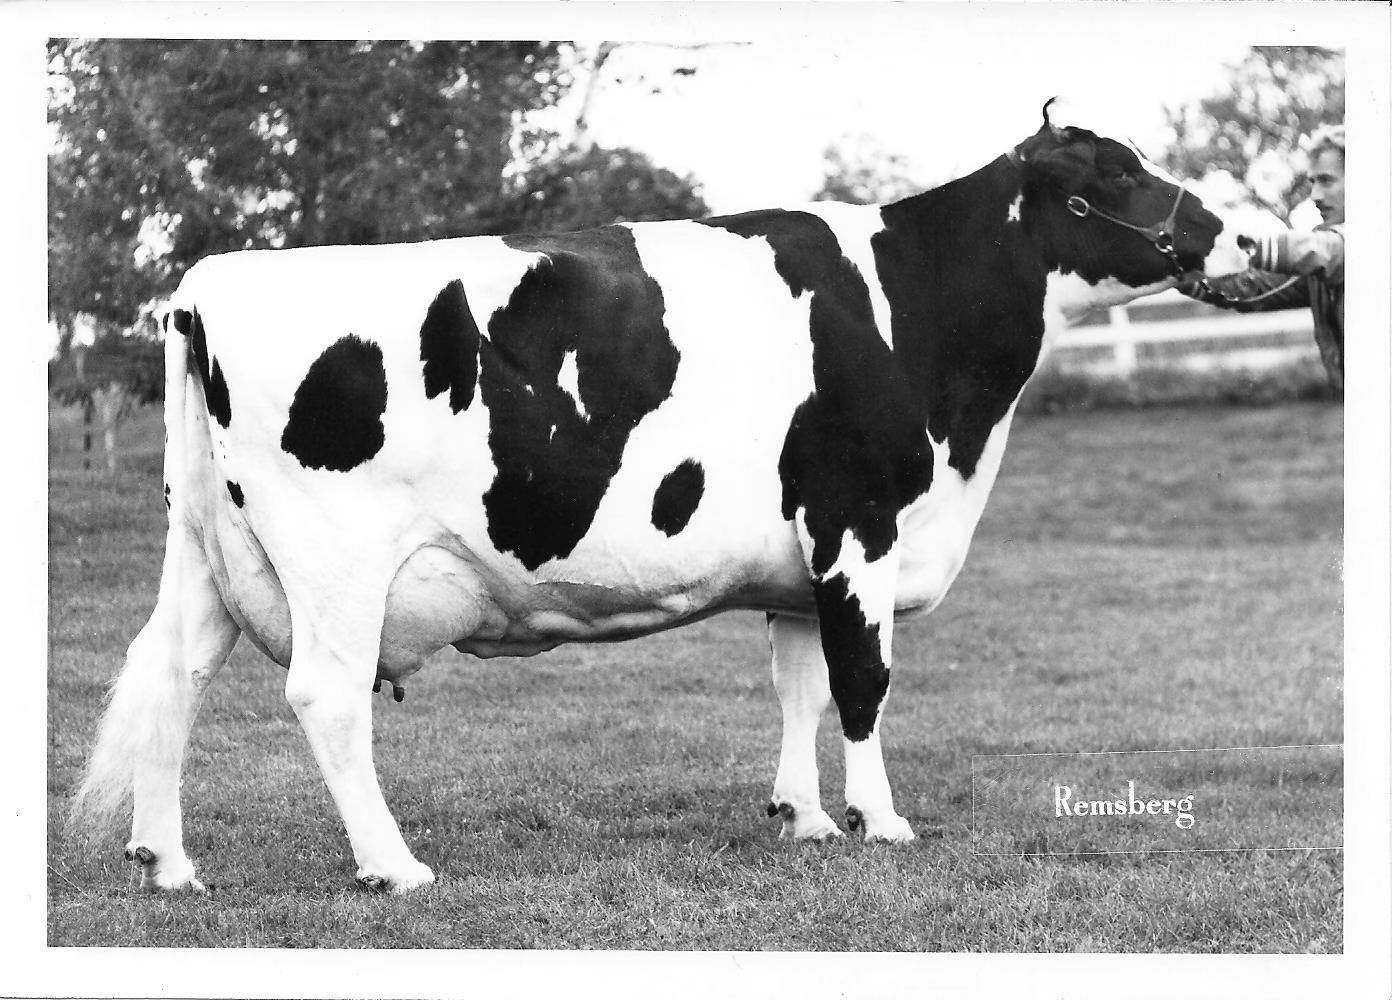

NewsSubscribe
First
Last
Consent

12 Outcross Sires to Help Control Inbreeding

With dairy breeder`s constant objective of   breeding the highest genetic index animals possible, inbreeding has become more of a problem than ever.  Looking through the top index lists you realize with each new generation of sires that the rate of inbreeding is increasing at an alarming rate.

Genetic Diversity and Inbreeding Article - September 2014-3

In 2011, nine bulls sired 50% of the 1,300 young bulls that entered A.I. in North America. A mere 18 bulls sired 50% of the 3,000 that entered A.I. globally.  In sires entering AI in 2011, the rate of inbreeding increased 1% that year alone and is now over 7%.  That is over 2% higher than it was in 1992 and 5% higher than it was in 1982.

In order to help breeders find outcross sires, the Bullvine has prepared this list of 12 sires that offer the greatest genetic diversity while still offering a high level of genetic gain.

Overall Performance Improvement

If you are looking for an outcross sire that offers balanced improvement for production, durability and health and fertility, you cannot go wrong with these three sires:

Dairy Bull - 014HO05936 - Coyne-Farms Bolton Dom-ETDom *BY

014HO05936
Coyne-Farms Bolton Dom-ET  BY
Bolton x Bret CV x Rudolph

DOM offers breed leading overall performance and has no Goldwyn, Shottle, Planet or Oman in the first three generations of his pedigree.  He is a carrier of Brachyspina (BY) but Brachyspina is a recessive trait, and, to be an affected calf, both sire and dam must have passed the recessive gene to their offspring. So unless you are mating him to a BY female you should be okay.  Dom is a very balanced sire offering strong overall production (+1558 lbs. milk) and solid components (+0.10 %F +0.01 %P) He is also strong for type and durability (+2.75 PTAT, +2.51 UDC, +2.92 FLC) and has solid health and fertility traits.  Dom will need to be protected on his straightness of rear legs (posty), as well as his rumps, specifically his pin width.


Dairy Bull - 029HO14142 - Coyne-Farms Dorcy-ETDorcy

029HO14142
Coyne-Farms Dorcy-ET  BY
Bolton x Bret CV x Rudolph

There is Dom`s better-known full brother Dorcy.  Dorcy is proving to be an outstanding longevity improvement sire, both through his sons and daughters. Breeders interested in a Bolton son from an outcross pedigree, top-notch udders, very good feet & legs and functional traits may consider DORCY. Dairy Strength and Rump are only slightly above breed norms.  Like Dom he will need to be protected on his straightness of rear legs (posty) as well as his pin width.


Dairy Bull - 007HO12165 - Bacon-Hill Montross-ETMontross

007HO12165
Bacon-Hill Montross-ET   TY
Mogul x Bolton x AltaRolex

If you are looking for a high genomic sire that offers overall improvement and is still an outcross, Montross will fit the bill.  Montross is a Dorcy grandson (through sire Mogul, who is a Dorcy from a Marsh).  As is typically the case with many actual outcross pedigrees, his maternal side is not that well known. However, his dam UNIQUE-STYLE BOLTON MONEY EX-91 DOM has certainly become a popular bull mother, with 15 sons at five different AI units. At +845 NM$ there is no question that MONTROSS will offer an excellent production kick and have enough durability, health and fertility to last. At over two points for UDC and FLC MONTROSS has strong functional type but should be protected for straightness of rear legs and overall frame and capacity traits. However, as we have seen from research in the past, you don’t need extreme frame traits in order to achieve extreme lifetime production. (Read more: She Ain’t Pretty – She Just Milks That Way!).


Production Improvement

For those of you that are more commercially focused or maybe those of you who have not focused enough on production and the milk check is showing it, in addition to Montross, here are our recommendations:

Dairy Bull - 029HO13991 - Kings-Ransom B RubleRuble

029HO13991
Kings-Ransom B Ruble   TY
Bolton x Boliver x Bombay

With no Goldwyn, Shottle, Planet or Oman, Ruble is a very unique high production sire.  The cow family behind RUBLE features five consecutive generations of AI bull mothers. RUBLE’s five closest dams all produced milk records in excess of 32,000 lbs. RUBLE’s grand dam, Bombay Rale was a tremendous brood cow leaving 6-VG & 4-EX daughters in the herd by seven different sires. RUBLE daughters are moderate stature and dairy. Protect for strength as they can be narrow through the chest. Udders are everything you would expect from the two popular pedigrees. High, wide rear udders, smooth blending foreudders, and a deep seam to carry their high production through many lactations. Daughters track straight with a correct foot, though you need to protect for a slight set to rear legs and protect rumps for pin width.


Dairy Bull - 097HO40076 - Claytop Js Predestine-ETPredestine

097HO40076
Claytop Js Predestine-ET   TY
Jet Stream x Toystory x Boliver

A very popular outcross production sire is Predestine. At +2657 lbs milk and solid components, Predestine offers extreme production improvement.  His daughters are durable (+2.8 PL) but not fancy (+1.63 PTAT, +1.68 UDC, +0.69 FLC).  You will have to watch him on his SCS, but if you have a low producing solid conformation heifer with a big frame that needs a quick shot of production, Predestine will do just that.


Dairy Bull - 526HO00004 - RocketRocket

526HO00004
Rocket  TL TD
Sudan x Freddie x Bolton

A genomic young sire that catches our eye is Rocket.  Rocket is a Sudan son from Vieuxsaule Freddie Tanya VG-88, who is a grand daughter of Vieuxsaule Allen Dragonfly EX-94 2E 12* (Read more: VIEUX SAULE ALLEN DRAGONFLY: 2013 Canadian Cow of the Year Nominee). While there is Oman in this pedigree (3rd generation through Freddie), given that Rocket is sired by Sudan, an extreme outcross sire, and has Bolton and Allen as the maternal great and great great grand sire, Rocket has a very low expected future inbreeding value.   Rocket should sire component improvement (+0.09 %F and +0.02 %P) and strong production (1784 lbs milk).  He also has the bonus of having very strong health and fertility traits (+3.5 PL, +2.78 SCS).  While Rocket has a solid type evaluation (+2.68 PTAT, +2.28 UDC, +2.32 FLC), he will need to be protected on his bone quality and loin strength.


Longevity Improvement

For those of you that are looking to breed cattle that last lactation after lactation or maybe you are having problems with your 2 year olds not coming back for a 2nd lactation, in addition to Dorcy, we recommend the following outcross sires:

Dairy Bull - 007HO12105 - S-S-I Mogul ReflectorReflector

007HO12105
S-S-I Mogul Reflector   TY
Mogul x Super x Ramos

From the same family that produced Bookem, Reflector is an outcross sire that should get much attention.   Bred through the ART program at Select Sires that was designed to produce outcross sires, Reflector is a great example of this.  (Read more: Select Sires vs. Semex – A Contrast in Cooperatives  and Should A.I. Companies Own Females?).  At +6.6 for PL and over two points on all type composites (+2.77 PTAT, +2.16 UDC, +2.22 FLC) and at +2.8 DPR and +2.67 SCS, Reflector daughters are going to last. While show ring enthusiasts may not be quick to use Reflector (-7 height at front end, 0 for body depth), he will sire strong mammary systems and feet and leg improvement.


Dairy Bull - 179HO00099 - Mr Apples Mcgucci-ET

McGucci

179HO00099
Mr Apples McGucci-ET  RC TY
McCutchen x Regiment-RED x Durham

From the legendary KHW Regiment Apple-Red-ET CV EX-96 3E DOM, comes McGucci an outcross longevity improvement sire, that you should be taking a look at. (Read more: KHW Regiment Apple-Red – Beauty, performance, and even more record) When Jerry Jorgensen of Ri-Val-Re Holsteins purchased a whole flush from Apple he was looking to produce something a little different and that is exactly what he got when he crossed her on McCutchen. (Read more: BREEDING RI-VAL-RE: Where Looking Good in the Stall Is Just As Important As Looking Good On Paper).   While McGucci will not be considered an overall production improver, he does offer solid component improvement (+0.27%F and +0.16 %P), with high durability (+3.4 PL) and very high conformation (+4.03 PTAT, +3.20 UDC, +3.78 FLC), with solid health traits (+2.77 SCS, +0.01 DPR).  He will need to be protected on his shortness of teats and high pins.


Dairy Bull - 147HO02426 - Ronelee Dorcy Deligent-ETDeligent

147HO02426
Ronelee Dorcy Deligent-ET  BY
Dorcy BY x Boliver x Outside

Combining two popular outcross pedigree`s, Deligent is a longevity improvement sire that you should consider using.   His dam Ronelee Boliver Dreary-ET VG-86 2Y is a maternal sister to the popular, proven sire Domain. Deligent was bred to deliver long lasting daughters. With outstanding Herd Life/Productive Life, breed leading mammary systems scores and strong Feet and Legs scores, Deligent is a longevity specialist, though he does need to be somewhat protected for dairy strength. Look for DELIGENT to combine this longevity with reliable production and type numbers.


Health and Fertility Improvement

One area that is starting to get more attention by most breeders is health and fertility. While there is no question that every breeder knows that more pregnancies equals more profits, many of the top ranking sires actually have negative values for key health and fertility traits.   In addition to Reflector and Predestine, here are three outcross sires that will help you improve the health and fertility in your herd.

Dairy Bull - 007HO10647 - Ladinodale Aaron-Red-ETAaron-Red

007HO10647
Ladinodale Aaron-Red-ET   TY
LB P-Red x Paradox-RED x Rudolph

If you are looking for an outcross sire that will help improve the health traits in your herd, you need to consider Aaron-Red.  While he is certainly not a production improvement sire (+17 lbs Milk), he does offer some significant improvement in productive life (+3.7), DPR (+2.3) as well as calving ease (+4.8% SCE & 4.7% DCE).  Aaron offers reliable type improvement (+2.01 PTAT, +2.06 UDC and +1.53 FLC). He will need to be protected on his high pins and overall dairy strength.


Dairy Bull - 029HO13566 - Brandt-View Howard-ETHoward

029HO13566
Brandt-View Howard-ET   TY
Alton CV x Capri x Manfred

This reliably proven Alton son is from a 2E-92 Capri (by JUROR) with a top record of almost 58,000 in one lactation.  The family is consistently noted for their extreme production values, consistent type and excellent health/fitness traits.   Howard daughters are profit makers. They increase milk production while lowering SCS to qualify for milk premiums and possess outstanding health and fertility numbers (+3.3 PL, +1.2 DPR, 3.9% SCE). Typical Howard daughters are clean boned, hardworking and moderate sized and long necked, open in the rear rib and very clean through the thigh.  Rear udders are high, wide, and capacious.  He will need to be protected on his overall size and stature as well as his dairy strength.


Dairy Bull - 011HO11116 - Rosylane-Llc AltabowieAltaBowie

011HO11116
Rosylane-Llc Altabowie   TY
Bowser x Ramos x O Man

Yes there is O Man in AltaBowie`s pedigree, but considering that he is sired by Bowser (Jet Stream x Boliver) and his dam is a Ramos daughter, AltaBowie has very low expected future inbreeding values (5.9%).  From the exceptional breeding program at Rosy-Lane Holsteins (Read more: ROSY-LANE HOLSTEINS – “Don’t Follow the Herd!”), AltaBowie offers many plusses.  He is +1419 for lbs milk (though low fat %), durable type (+7.6 PL), and high DPR (+3.6) and low calving ease (4.2% SCE and 3.7% DCE).  While his conformation break down will not wow you (+1.44 PTAT, +1.67 UDC and +1.90 FLC), he is correct where he needs to be, (Udder depth, fore and rear attachments, as well as foot angle and heal depth).  He will certainly need to be protected on his dairy strength and rumps.


The Bullvine Bottom Line

Genetic diversity is a critical problem in the Holstein dairy cattle breeding industry.  Indeed the rate of genetic gain has accelerated. But so too has the rate of inbreeding.  With $23 lifetime cost per percent inbreeding, it is easy to overreact and try to avoid inbreeding at all costs. The trick is not to use sires that are inferior, but rather to have a balance of genetic improvement and enough of an outcross not to accelerate the inbreeding.   These 12 sires will do just that and help control the rate of inbreeding in your herd.


The Dairy Breeders No BS Guide to Genomics


Not sure what all this hype about genomics is all about?

Want to learn what it is and what it means to your breeding program?

Download this free guide.


[related-posts-thumbnails]

Send this to a friend