







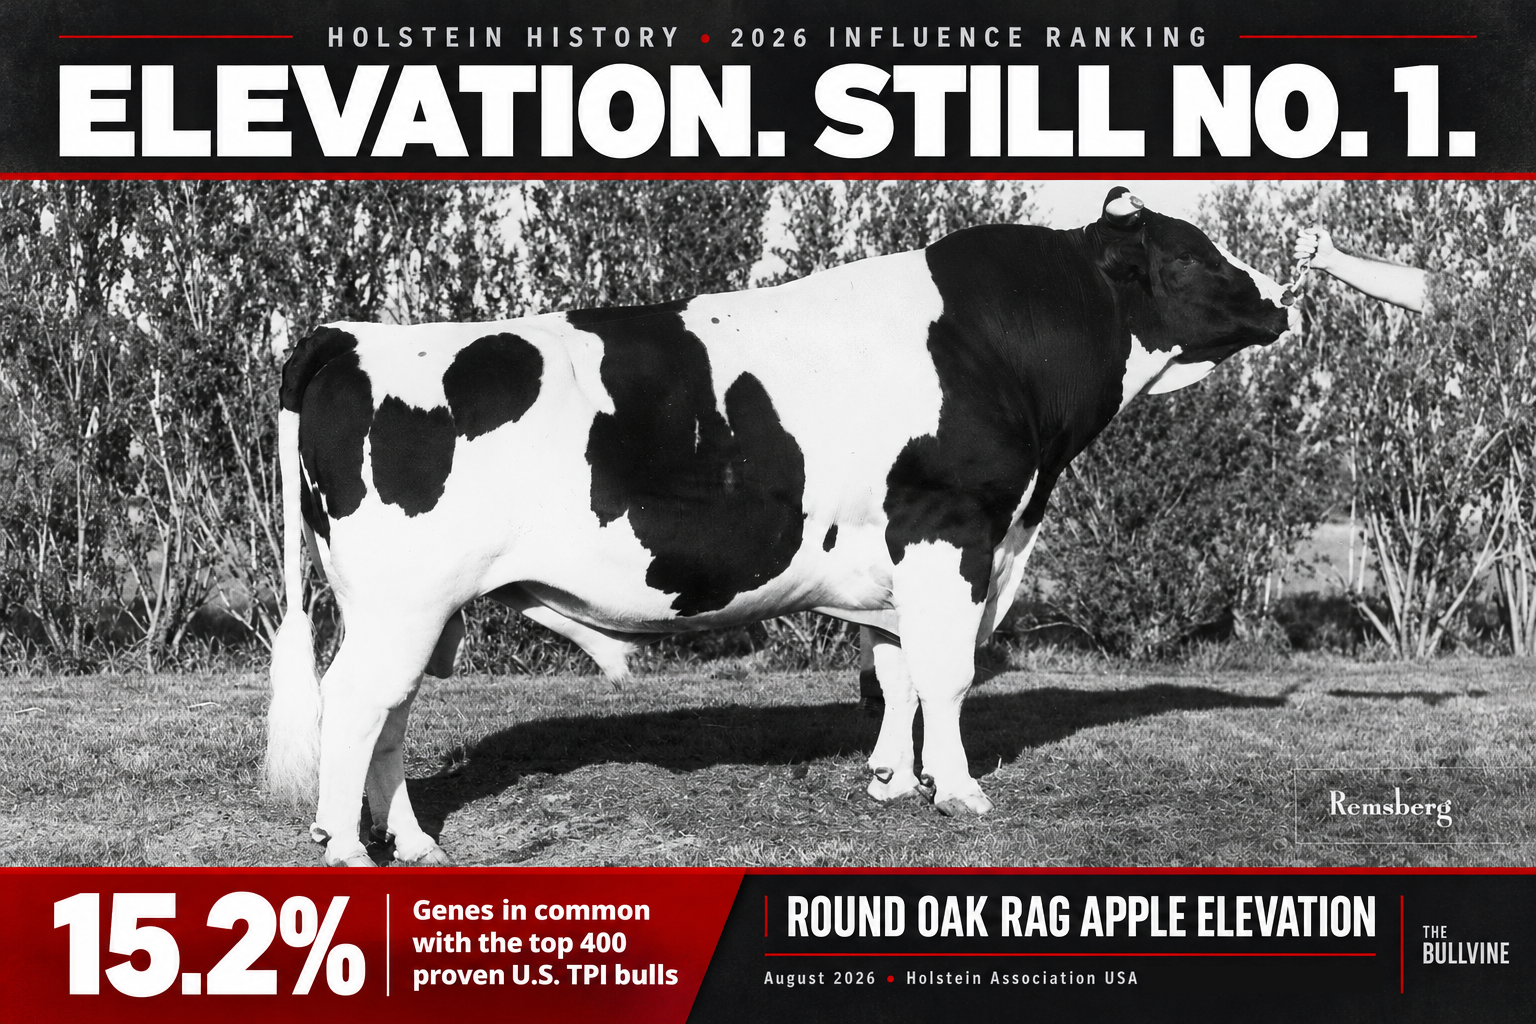
15.2%. That’s the share of genes a bull born in 1965 still has in common with the top 400 proven U.S. sires. We mapped how Elevation, Chief and 13 more link within four generations.
In early July 1966, Ronald Hope took Walter McClure to see a bull calf. The calf was tied up at Round Oak Farm near Purcellville, Virginia, being readied for show season. McClure had just left his job as Loudoun County’s Extension dairy agent to join the Virginia Animal Breeders Association (VABA).
“Ronald stated that we needed to purchase this bull calf for the stud.” — Walter McClure, Virginia Holstein Association centennial feature
It almost didn’t happen. The following Monday, McClure went to VABA manager George Miller. Miller already knew the calf, because he’d talked Hope into the mating. But Miller said he and Hope couldn’t make a deal, and told McClure to take it to the sire committee himself.
The seven-member committee came later that month, after the state Holstein field day at neighboring Foxlease Farm. Hope asked $3,000. VABA had never paid more than $1,000 for a young sire. The committee sent Miller back with an offer, and he came back with a deal: $2,800, with Hope keeping the bull until after the Eastern National Show.
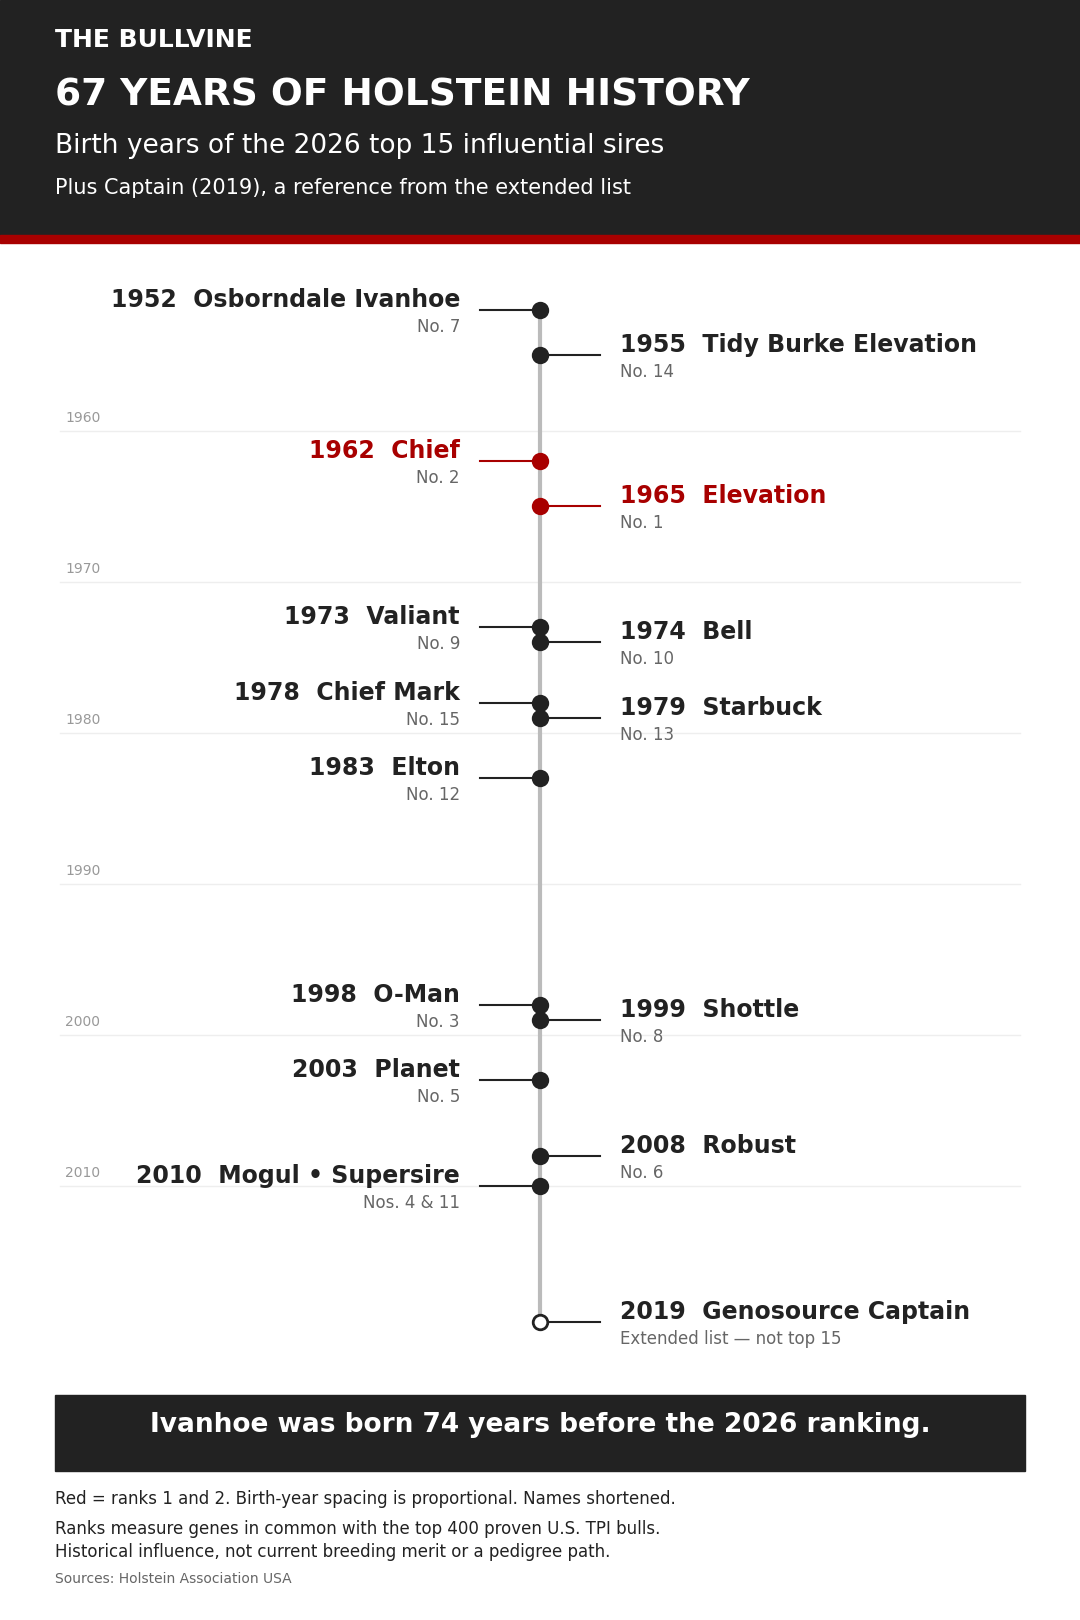
That ten-month-old calf was Round Oak Rag Apple Elevation. Sixty years later, he’s No. 1 in this influence ranking. No. 2 was born three years earlier, in California, to a cow whose Nebraska breeder never got to see how far his bull’s influence would reach. Below, The Bullvine traces how all 15 bulls at the top of the list connect within four generations, and what the ranking can’t tell you about your next mating.
What the 2026 Holstein Influence Ranking Measures
Holstein Association USA ranks sires by the percentage of genes they share with the top 400 progeny-proven TPI bulls in the United States. It’s an American measure built on elite proven bulls, not a census of cows. These figures should be broadly similar elsewhere, because American bulls have been used so heavily worldwide.
| Order | Sire | NAAB code | Genes in common | Born |
| 1 | Round Oak Rag Apple Elevation | 7HO58 | 15.2% | 1965 |
| 2 | Pawnee Farm Arlinda Chief | 40HO2025 | 14.9% | 1962 |
| 3 | O-Bee Manfred Justice (O-Man) | 7HO6417 | 13.6% | 1998 |
| 4 | Mountfield SSI DCY Mogul | 7HO11314 | 13.4% | 2010 |
| 5 | Ensenada Taboo Planet | 7HO8081 | 10.2% | 2003 |
| 6 | Roylane Socra Robust | 7HO10524 | 10.2% | 2008 |
| 7 | Osborndale Ivanhoe | 15HO54 | 10.0% | 1952 |
| 8 | Picston Shottle | 29HO12209 | 9.9% | 1999 |
| 9 | S-W-D Valiant | 29HO2851 | 9.8% | 1973 |
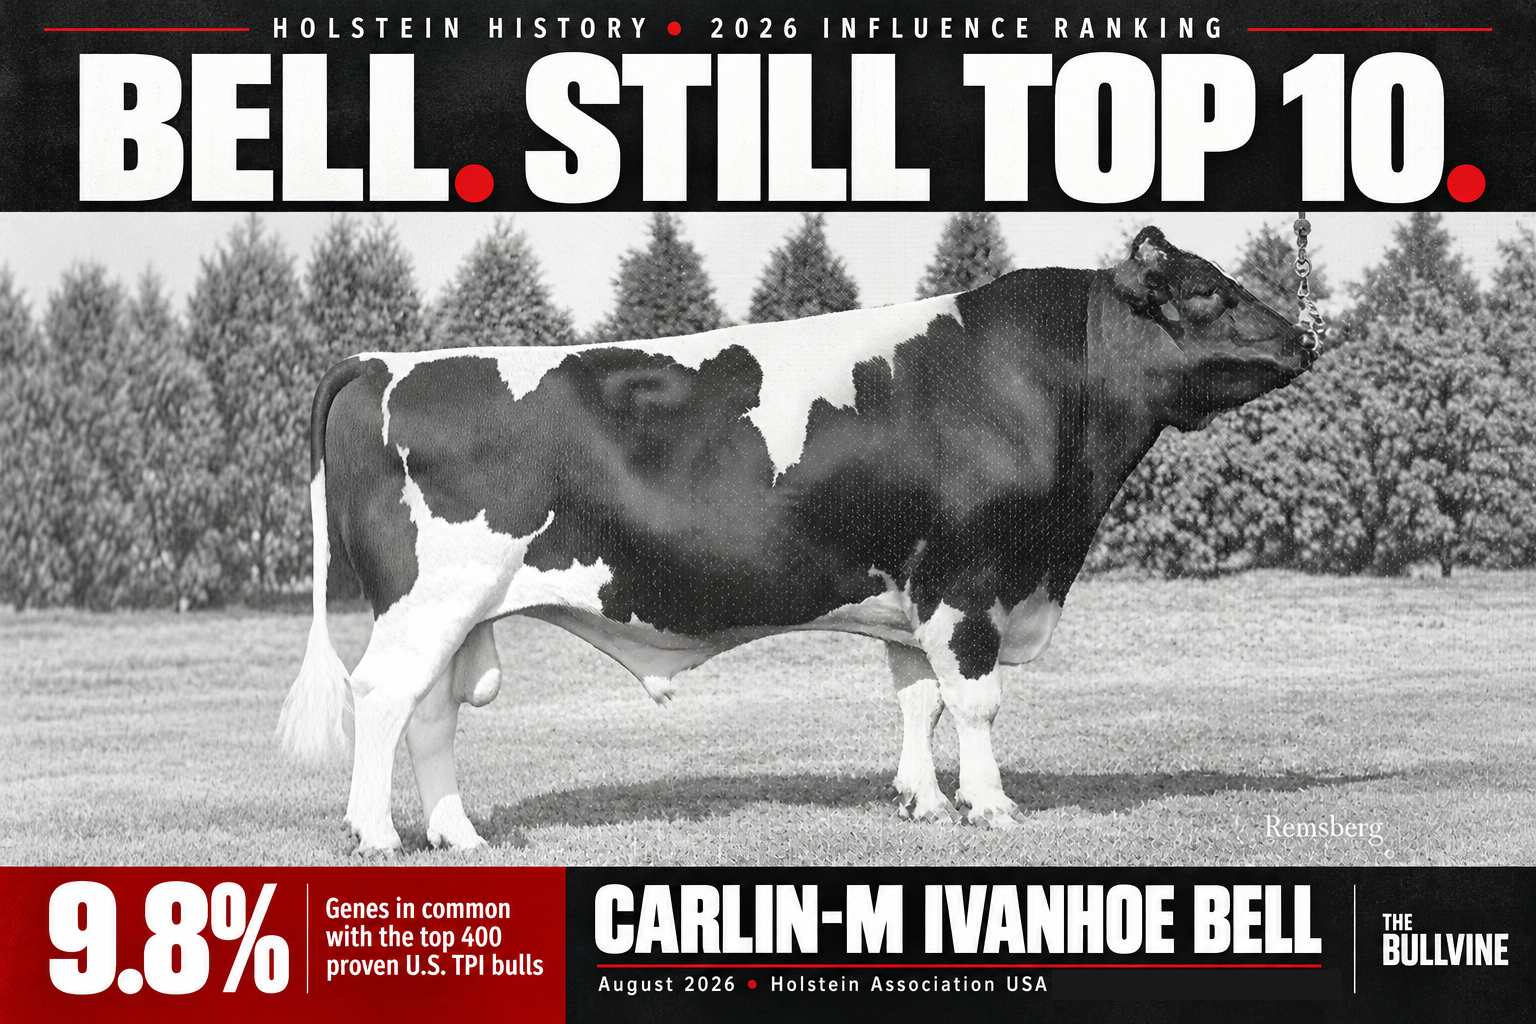
| 10 | Carlin-M Ivanhoe Bell | 7HO543 | 9.8% | 1974 |
| 11 | Seagull-Bay Supersire | 7HO11351 | 8.7% | 2010 |
| 12 | Emprise Bell Elton | 7HO2236 | 7.9% | 1983 |
| 13 | Hanoverhill Starbuck | 73HO431 | 7.7% | 1979 |
| 14 | Tidy Burke Elevation | 1HO79 | 7.6% | 1955 |
| 15 | Walkway Chief Mark | 7HO980 | 7.5% | 1978 |
Source: Holstein Association USA, August 2026. Birth years are as published. NAAB codes are shown in short form (7HO58 = 007HO00058), as listed in NAAB, Select Sires, ST Genetics, Alta and ABS records; each code links to its source.
How to read the table:
- Bulls appear in Holstein USA’s published order.
- Equal figures are equal only at the precision shown: Planet and Robust, Valiant and Bell, and Chief Mark and No. 16, Pawnee Farm Reflection Admiral.
- The percentages overlap and can’t be added together. Tidy Burke Elevation shows exactly half his son’s figure, and Reflection Admiral approximately half of Chief’s. Much of the same DNA is counted for both father and son.
This measures historical influence, not current breeding merit.
Round Oak Rag Apple Elevation: The 1966 Purchase
Elevation was born on August 30, 1965. Dairy Agenda Today’s centennial series describes his breeding as “the magical mating of two inbred Holsteins”, a joint effort by Hope and his cousin, George Miller.
- His sire, Tidy Burke Elevation, was an inbred Wis Burke Ideal son. He traced 11 times to Wisconsin Admiral Burke Lad, the foundation of the Burke bloodlines.
- His dam, Round Oak Ivanhoe Eve 4E-94, was “a big, tall, open-ribbed Ivanhoe daughter.” She traced 20 times to Johanna Rag Apple Pabst, founder of the Rag Apple lines.
McClure had watched Eve since she was born, and he called her a tremendous cow in both production and type. She had two Excellent daughters, both full sisters to Elevation. Even so, McClure writes, Elevation was the only one of her offspring to make a significant contribution to the breed. Round Oak sold Eve in its first sale, on March 5, 1970, for $11,000, before Elevation was well known.
Elevation didn’t win everything. Shown as a calf at the 50th Anniversary Virginia Spring Holstein Show, he placed second in his class.
Eve’s sire, Osborndale Ivanhoe, ranks seventh today, and not just because of Elevation. Thanks to a series of influential daughters and several sons, including Fleetridge Monitor, Hilltop Apollo Ivanhoe, Provin Mtn Ivanhoe Jewel and Penstate Ivanhoe Star.
Elevation’s First Daughters: Doubt, Then a Guarantee
When Elevation went into stud, AI was moving from fresh to frozen semen. VABA was collecting semen two or three times a week, then diluting and refrigerating it and shipping it to technicians by bus or mail.
His first daughters began calving in the late 1960s. McClure writes that there were initial concerns when breeders looked at his first crop of bred heifers. Once those heifers calved, it was clear he was a very special bull.
Miller didn’t wait. Elevation was at Michigan-Select Sires with a group of young sires awaiting their proofs. McClure writes that Miller persuaded the stud to start collecting him.
Miller convinced them to start collecting Elevation, “stating that he would purchase all of the semen he produced if necessary.” — Walter McClure, Virginia Holstein Association centennial feature
That gave Virginia the first Elevation daughters and a head start on the next generation. VABA’s most-used Holstein at the time was Oregon Challenger Baron. His daughters were strong, with good feet and legs, but their udders needed help. McClure says Elevation fixed those udders consistently.
After VABA joined Select Sires, McClure writes, Elevation’s daughters were bred to Chief, Valiant and the breed’s other leading bulls.
The Virginia Holstein Association centennial series and USDA give three measures of how far his genetics spread:
- AI sons: He was the first Holstein sire with more than 600 sons in AI, according to the centennial series.
- Daughters on test: He had 54,843 in 1984, a record at the time for any sire worldwide.
- Descendants: By 2007, USDA was citing him for more than 80,000 daughters, 2.3 million granddaughters and 6.5 million great-granddaughters.
Pawnee Farm Arlinda Chief: A Pedigree Built in Nebraska
On April 14, 1962, buyers from seven states gathered on Lester Fishler’s farm near Central City, Nebraska, as he sold his entire herd. Fishler had bred both of Chief’s parents in his own Pawnee herd. This resulted from successful imports from Canada. Illness forced the dispersal.
Chief’s dam, Pawnee Farm Glenvue Beauty, went to Wally Lindskoog in California while pregnant, and Chief was born there. “Arlinda” was Lindskoog’s prefix. Fishler wasn’t able to see the legend he’d created.
If Elevation’s story is about a stud’s bet, Chief’s is about what that Nebraska pedigree produced. Rus Shortridge, a California Holstein fieldman at the time, remembered the young bull as having “a front end like a bulldozer”.
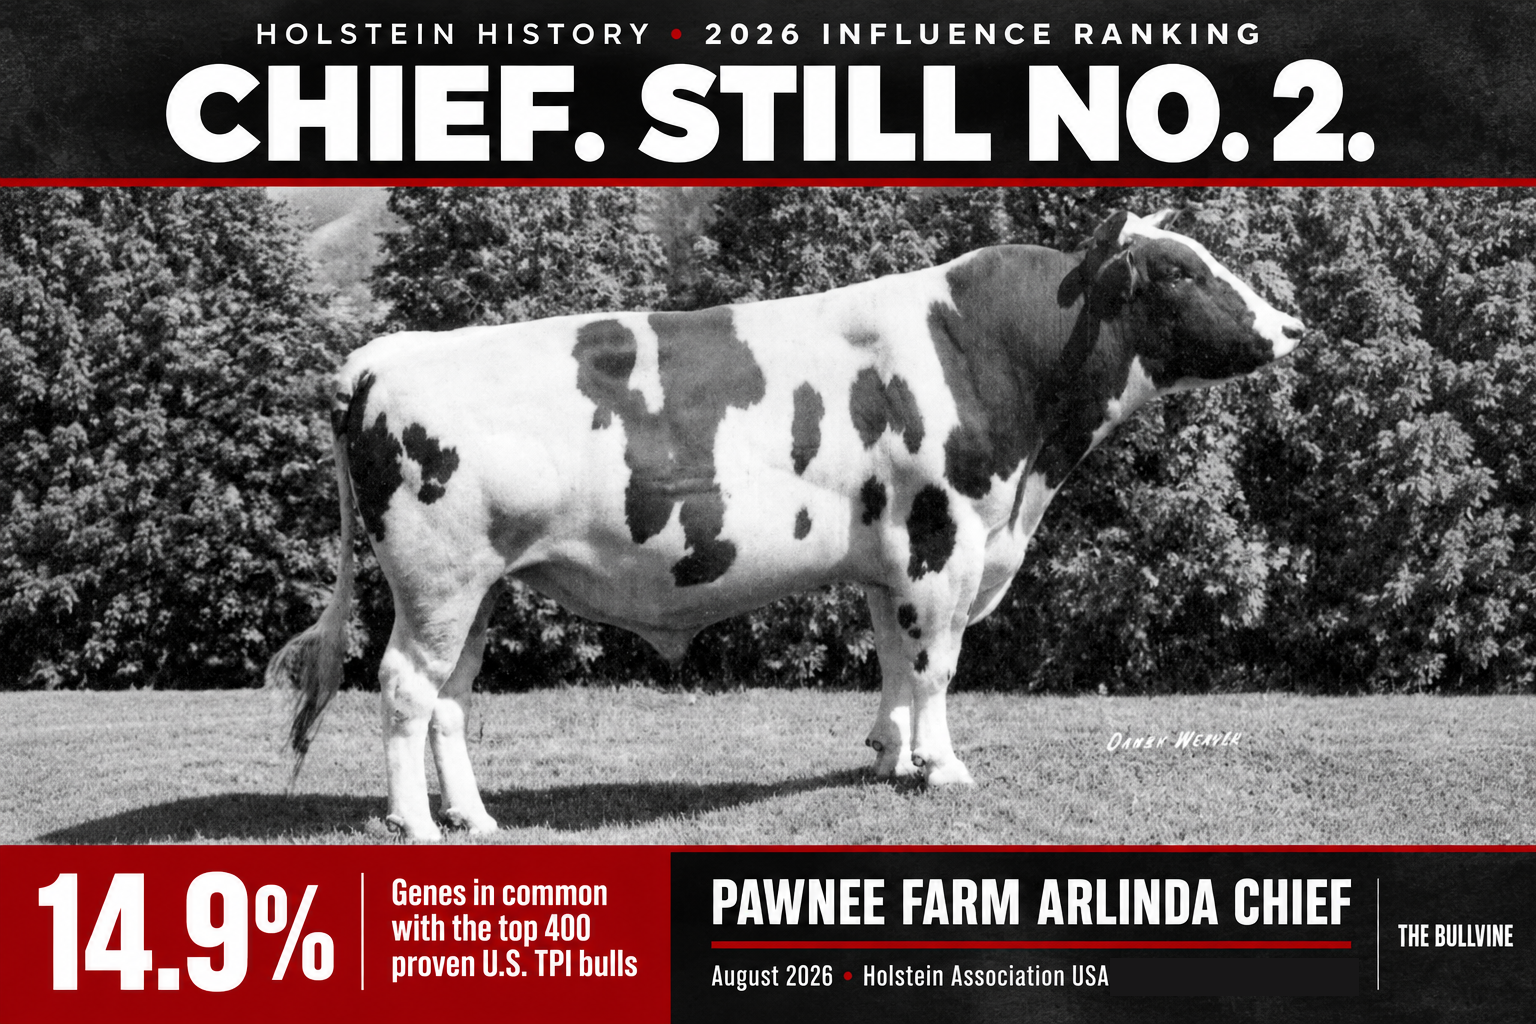
The numbers show how heavily breeders used him. A 2016 UC Davis account credited Chief with 16,000 daughters, 500,000 granddaughters and more than 2 million great-granddaughters. It also noted that his sons were popular sires in their own right. Two of them are in the top 15: Walkway Chief Mark and S-W-D Valiant. Valiant is out of Allied Admiral Rose Vivian, by Irvington Pride Admiral.
UC Davis’s 2016 account said Chief’s chromosomes made up almost 14% of the U.S. Holstein population’s genome at that time. That’s a different measure from the 14.9% in the table, which is about the top 400 proven bulls, not the whole cow population. His sire, Reflection Admiral, is No. 16 today at 7.5%.
How the Lead Changed Hands, and Came Back
Holstein USA started publishing the list in 1988, with Chief first at 15.5% and Elevation second at 14.9%. In 1989 they swapped places, Elevation at 17.1% and Chief at 16.6%. From 1991 until around 2000, Chief led again.
Then two newer bulls overtook them both: To-Mar Blackstar and Carlin-M Ivanhoe Bell. This is a result of all the sons the pair launched into the top 400, and calls Blackstar the world’s most widely used sire of all time. It traces their lines this way:
- Bell is a son of Penstate Ivanhoe Star, who ranks 23rd largely because of him.
- Emprise Bell Elton, 12th, is Bell’s most significant son and O-Man’s maternal grandsire.
- Blackstar has fallen to 19th. His strongest link to today’s top bulls likely runs through his son Emory, several generations back in Robust’s pedigree.
Elevation and Chief were back on top by 2009, in that order, and they’ve stayed there. Their figures are almost the same as in 1988, despite every change to the TPI formula since. The published record doesn’t explain why they returned to the top in 2009.
Valiant, Starbuck and Chief Mark: The 1970s Sires
- S-W-D Valiant (1973) was third when the list began in 1988, and he’s still ninth. He sired two millionaires, one of them Hanover-Hill Inspiration (Holstein Canada), who is Shottle’s maternal great-grandsire. Shottle’s dam, Condon Aero Sharon, is by Madawaska Aerostar, No. 20 on the extended list at 6.9%. Her dam, Condon Inspiration Sally, is by Inspiration.
- Hanoverhill Starbuck (1979) is one of Elevation’s most important sons. For many years he was the leading sire of All-Americans. He first appeared on this list in 1996 and is now 13th. He’s also Aerostar’s sire.
- Walkway Chief Mark (1978) rounds out the top 15 at 7.5%, equal at this precision with his grandsire, Reflection Admiral.
O-Bee Manfred Justice: The Fitness Turn
O-Bee Manfred Justice was born on March 8, 1998, bred by Gary, Gaylon and Steve Obert of Dakota, Illinois. He’s a Manfred son out of Meier-Meadows EL Jezebel EX-92, with Elton as maternal grandsire.
In the May 2003 USDA/Interbull summary, he jumped from 21st to No. 1 for Net Merit at $759. He also topped Holstein USA’s TPI list at 1872.
A 2007 USDA paper by geneticist Paul VanRaden named him the best bull in the world as of August 2007, based on the international evaluation. It compared his daughters with average herdmates:
| Trait | Justice daughters | Herdmates |
| Protein | 2.82 lb/day | 2.62 lb/day |
| Somatic cell count | 231,000 cells/mL | 288,000 cells/mL |
| Productive life | 34.0 months | 27.7 months |
| Pregnancy rate | 23.9% | 21.0% |
Across all the traits in USDA’s 2007 comparison, an average O-Man daughter was worth $778 more over her lifetime than her herdmates.
Mountfield SSI DCY Mogul: “The Modern Day Elevation”
O-Man, Mogul and Planet have held third through fifth, in that order, since 2022. The gap between O-Man and Mogul is now 13.6% to 13.4% Mogul is edging ever closer to O-Man and may well be chasing third place.
Mogul came out of the Mountfield herd. His dam, Mountfield Marsh Maxine-ET VG-88, is a Pasen Marsh daughter out of an O-Man dam, which makes O-Man Mogul’s maternal great-grandsire. His sire, Coyne-Farms Dorcy, is on the extended list at 7.2%.
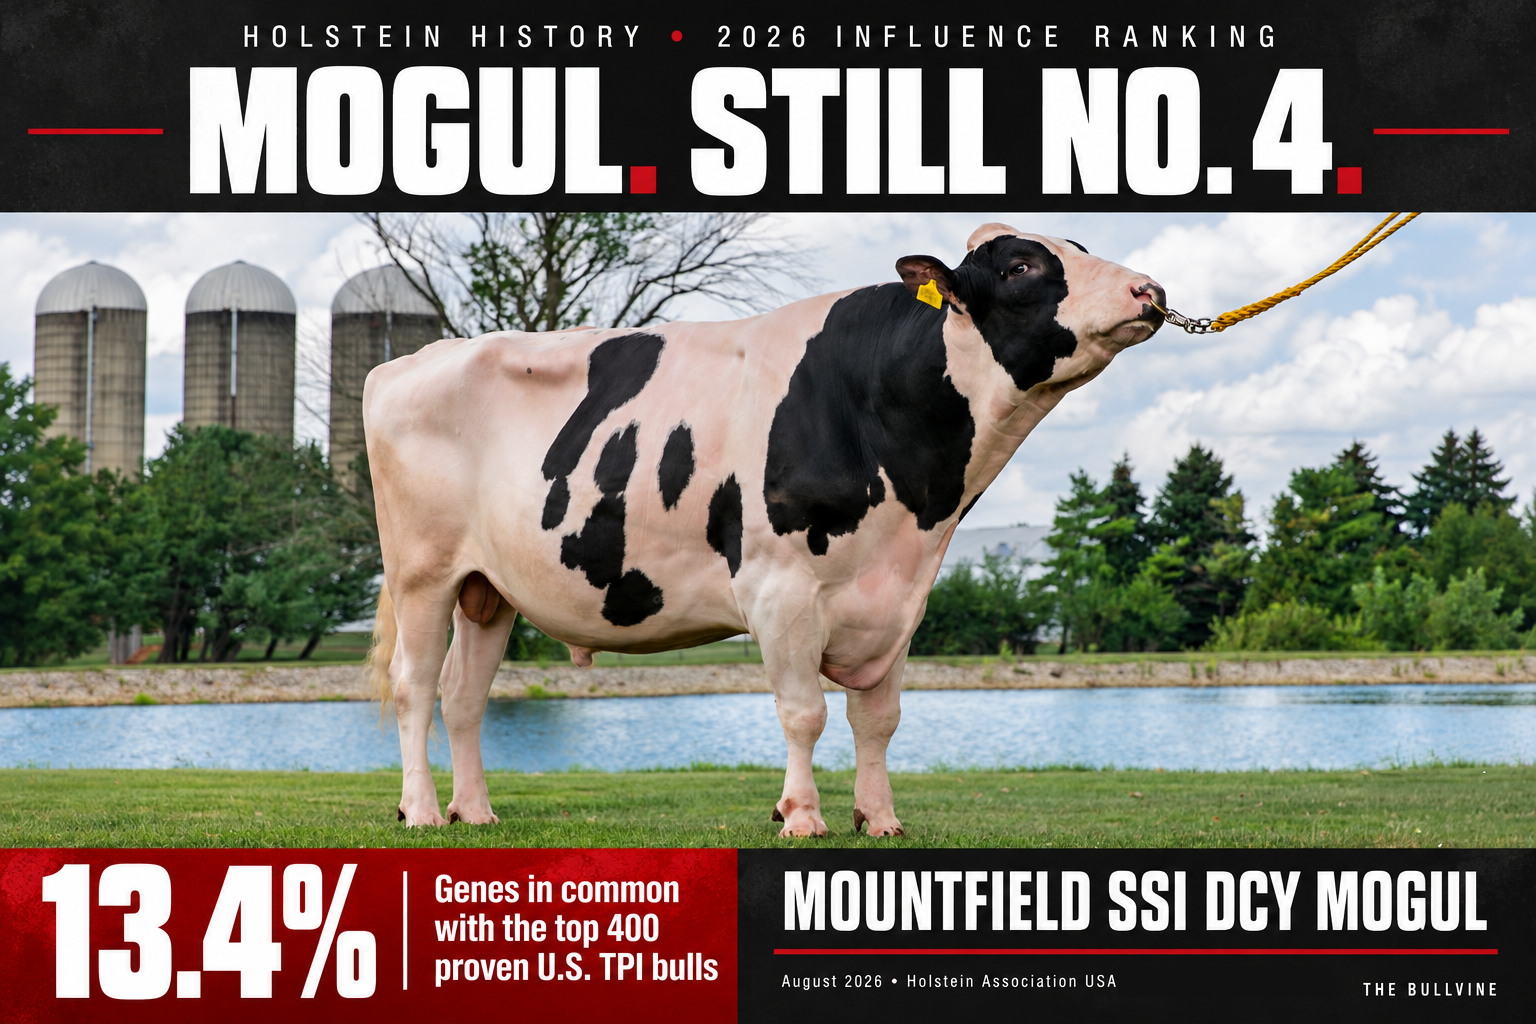
In September 2017, at seven, Mogul passed one million units in sales. Select Sires’ announcement drew the comparison to No. 1 directly.
“He is referred to as the modern day 7HO58 ELEVATION because of that consistent dominance.” — Rick VerBeek, Select Sires, September 25, 2017 release
Roylane Socra Robust: Influence Without Numbers
Roylane Socra Robust was born on December 23, 2008, bred by Gary and Bruce Roylance of Warden, Washington. He’s by Velvet-View-KJ Socrates, who’s on the extended list at 5.3%, out of the O-Man daughter Seagull-Bay Oman Mirror.
He has climbed from tenth at 9.6% in 2022 to sixth at 10.2% today. He died young and sired only a few offspring. His August 2026 Select Sires page lists 2,697 production daughters in 648 herds, which is a small figure in this company.
Counting a bull’s sons alone can undersell his reach. Miss OCD Delicious, alongside the millionaire Supersire, are key to Robust’s rise.
His son Seagull-Bay Supersire debuted in April 2015 as the breed’s No. 1 daughter-proven GTPI sire. He held that spot for four straight evaluations.
Planet, Shottle and Supersire: Where the Branches Meet
Ensenada Taboo Planet, born in 2003, became the eighth sire in Select Sires’ history to pass one million units, the cooperative announced in late 2013.
Picston Shottle was born on July 23, 1999, at the Pickford family’s Spot Acre Grange near Stafford, England, out of Condon Aero Sharon EX-91. ABS says he topped TPI for seven straight proof runs, January 2008 through January 2010. He sold 1,174,948 units and left more than 100,000 daughters in 20,000 herds across 22 countries. His sire, the Italian bull Carol Prelude Mtoto, is on the extended list at 5.9%.
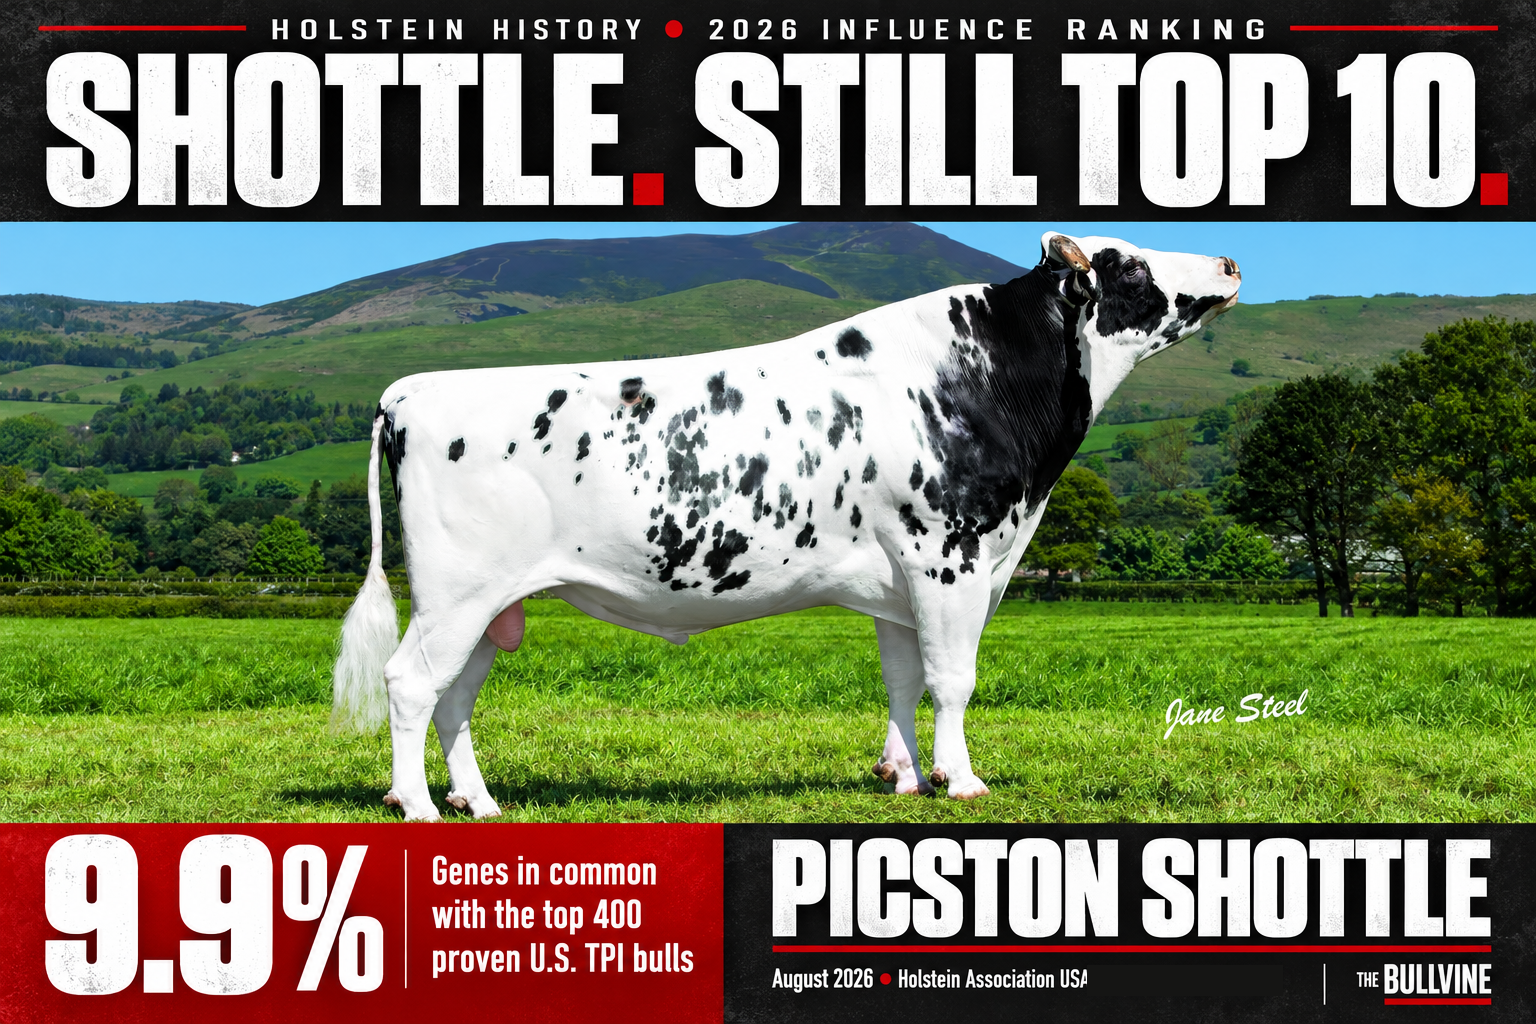
Seagull-Bay Supersire was born on December 28, 2010, bred by Seagull-Bay Holsteins of American Falls, Idaho. His pedigree reads Robust x Planet x Shottle, so three top-15 bulls sit in his first three generations.
How the Top 15 Connect: A Bullvine Pedigree Cross-Reference
The influence table ranks each bull separately. The Bullvine compared their pedigrees using registry and AI-company pedigree records and the sources cited above. Every bull in the 2026 top 15 is linked to at least one other top-15 bull within four generations. The 15 relationships below also join all 15 into a single connected web.
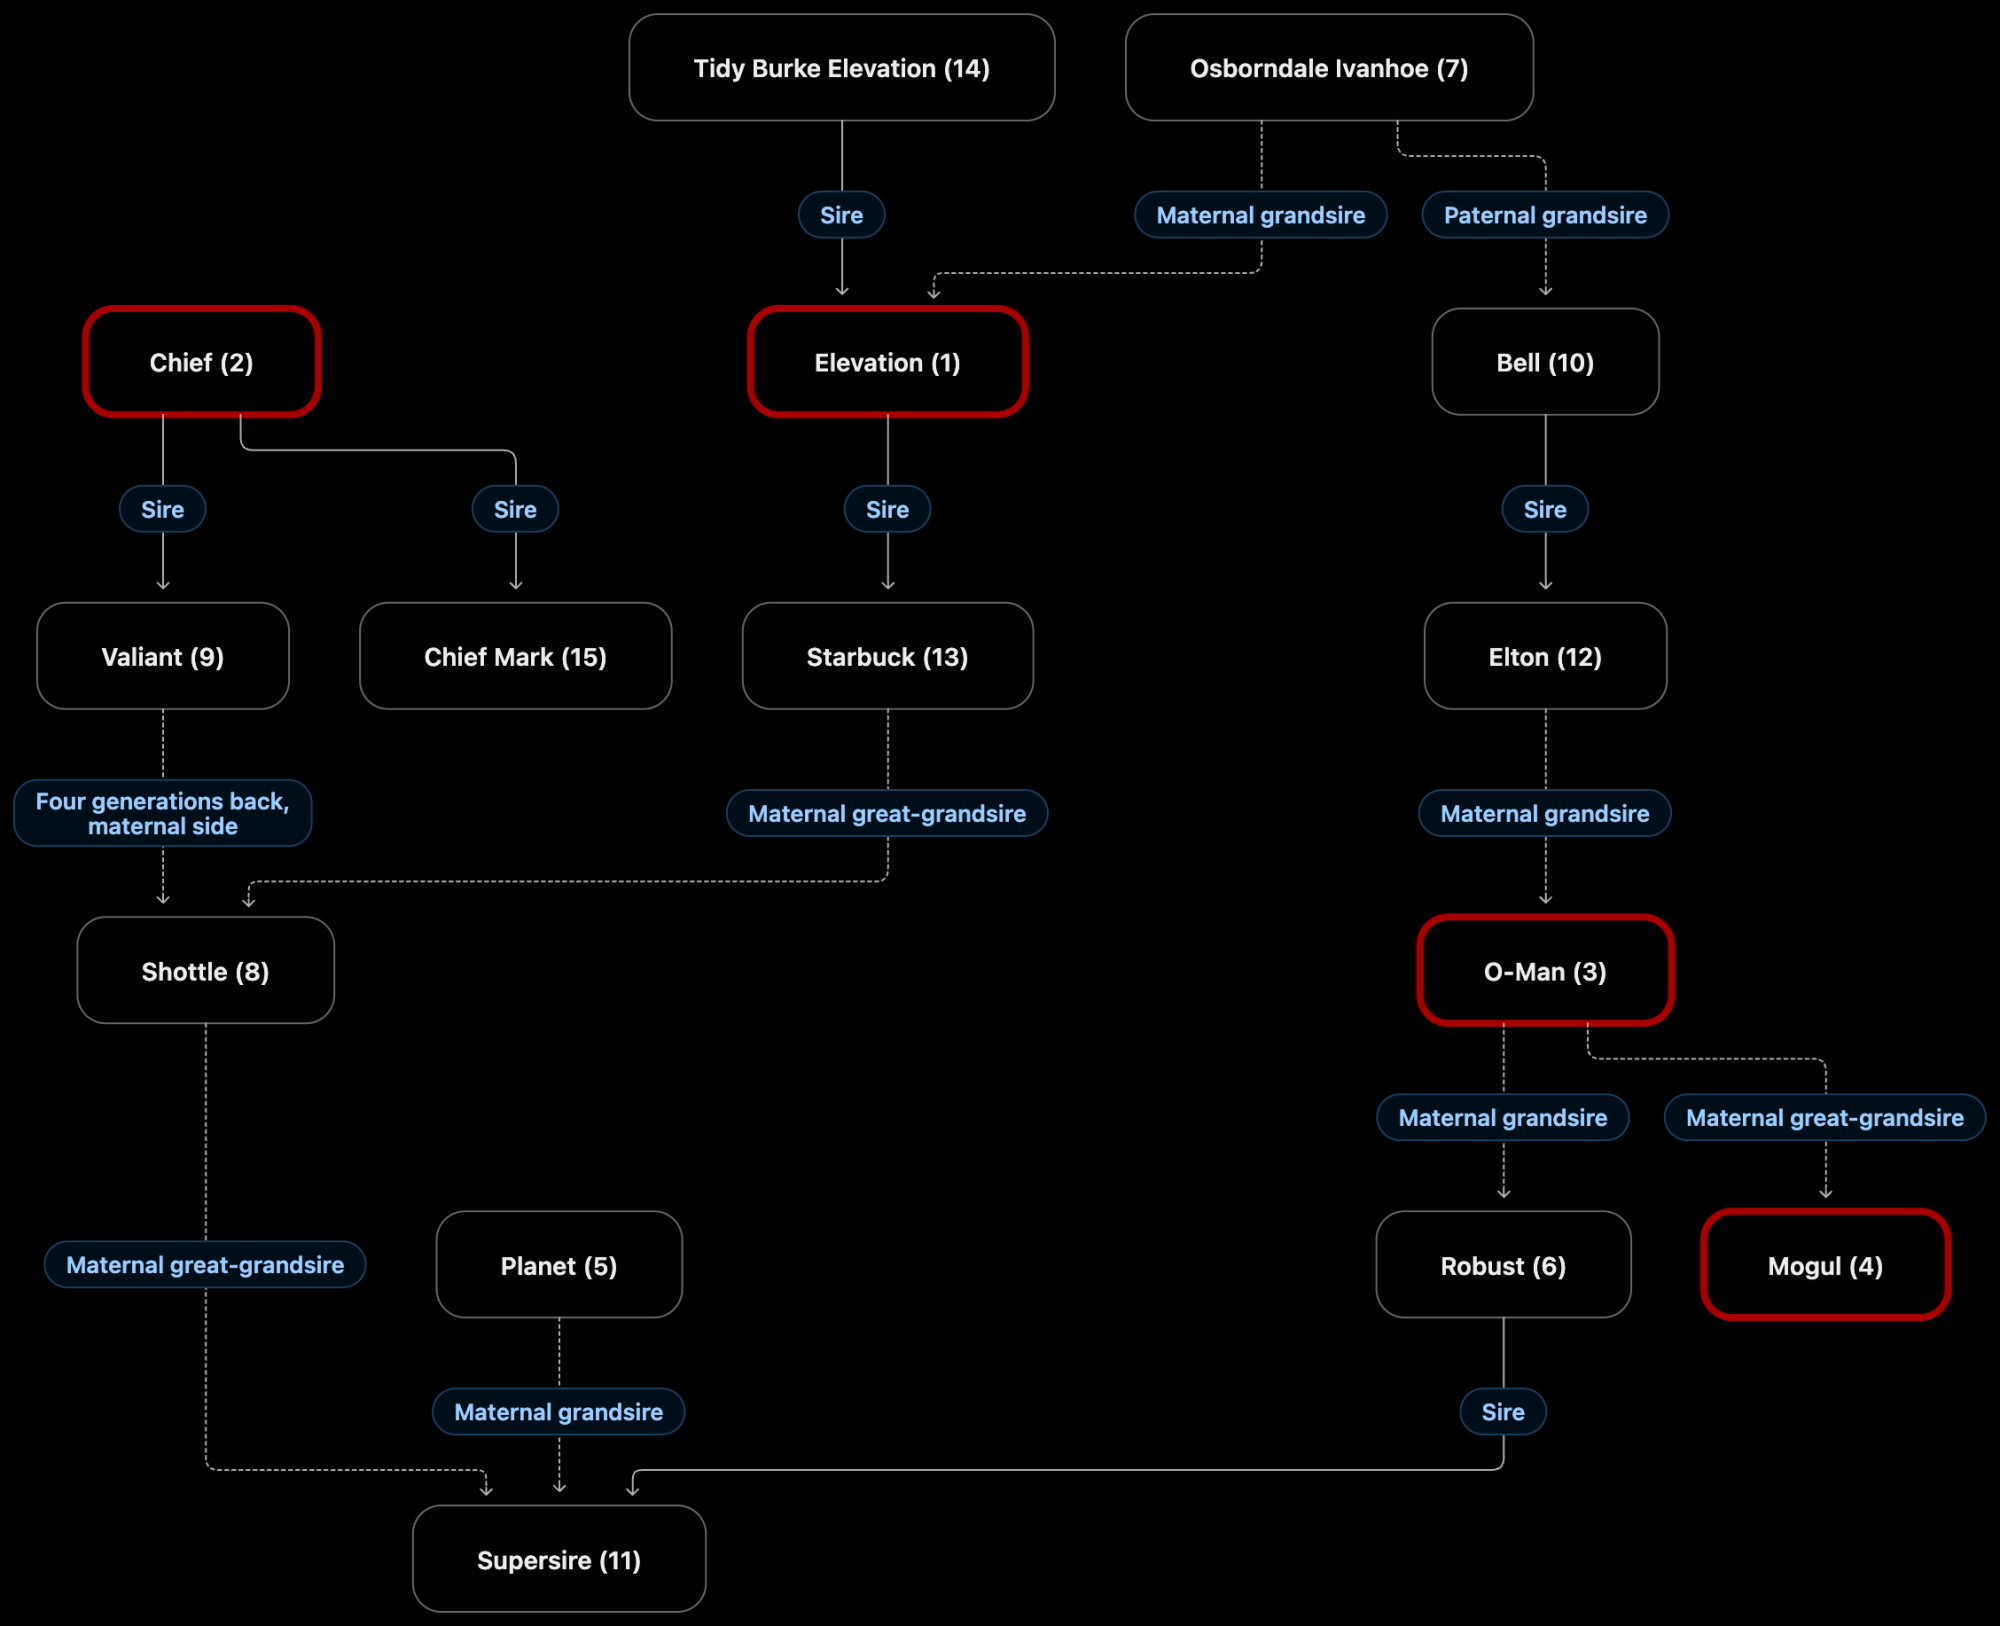
Source: Bullvine cross-reference of registry and AI-company pedigree records.
| Ancestor (2026 rank) | Descendant (rank) | Relationship |
| Tidy Burke Elevation (14) | Elevation (1) | Sire |
| Osborndale Ivanhoe (7) | Elevation (1) | Maternal grandsire, through Eve |
| Elevation (1) | Starbuck (13) | Sire |
| Chief (2) | Chief Mark (15) | Sire |
| Chief (2) | Valiant (9) | Sire |
| Osborndale Ivanhoe (7) | Bell (10) | Paternal grandsire, through Penstate Ivanhoe Star |
| Bell (10) | Elton (12) | Sire |
| Elton (12) | O-Man (3) | Maternal grandsire |
| O-Man (3) | Robust (6) | Maternal grandsire |
| O-Man (3) | Mogul (4) | Maternal great-grandsire |
| Starbuck (13) | Shottle (8) | Maternal great-grandsire, through Aerostar and Shottle’s dam |
| Valiant (9) | Shottle (8) | Four generations back on the maternal side: Valiant → Inspiration → Condon Inspiration Sally → Condon Aero Sharon → Shottle |
| Robust (6) | Supersire (11) | Sire |
| Planet (5) | Supersire (11) | Maternal grandsire |
| Shottle (8) | Supersire (11) | Maternal great-grandsire |
Bullvine cross-reference. This is a selection of documented relationships, not a complete or random sample. Eight of the 15 relationships shown involve the descendant’s maternal side. That doesn’t prove how influence moves through the breed as a whole. It does show that reading sire lines alone would miss several of these connections, including the ones that link Chief and Elevation to Shottle.
The Cost of Concentration: Recessives and Inbreeding
The influence ranking shows how widely a bull’s genes run through today’s elite proven bulls. It doesn’t show what came along with them.
A haplotype is a stretch of DNA variants that’s inherited together. Haplotypes let researchers follow a section of chromosome through pedigrees before they know which variant inside it causes a problem.
Chief and APAF1. USDA researchers linked a haplotype on chromosome 5 to lower fertility and embryo loss, and traced it back to Chief. UC Davis researchers had already sequenced Chief and his carrier son, Walkway Chief Mark, in 2009. With that head start, they found a candidate nonsense mutation in the APAF1 gene in under 24 hours. Chief Mark’s August 2026 Select Sires page still lists him as HH1C, an HH1 carrier. (For the full story of how Chief Mark ended up in AI at all, see Walkway Chief Mark: The Backup Bull Behind Seven Percent of Every Holstein Cow.)
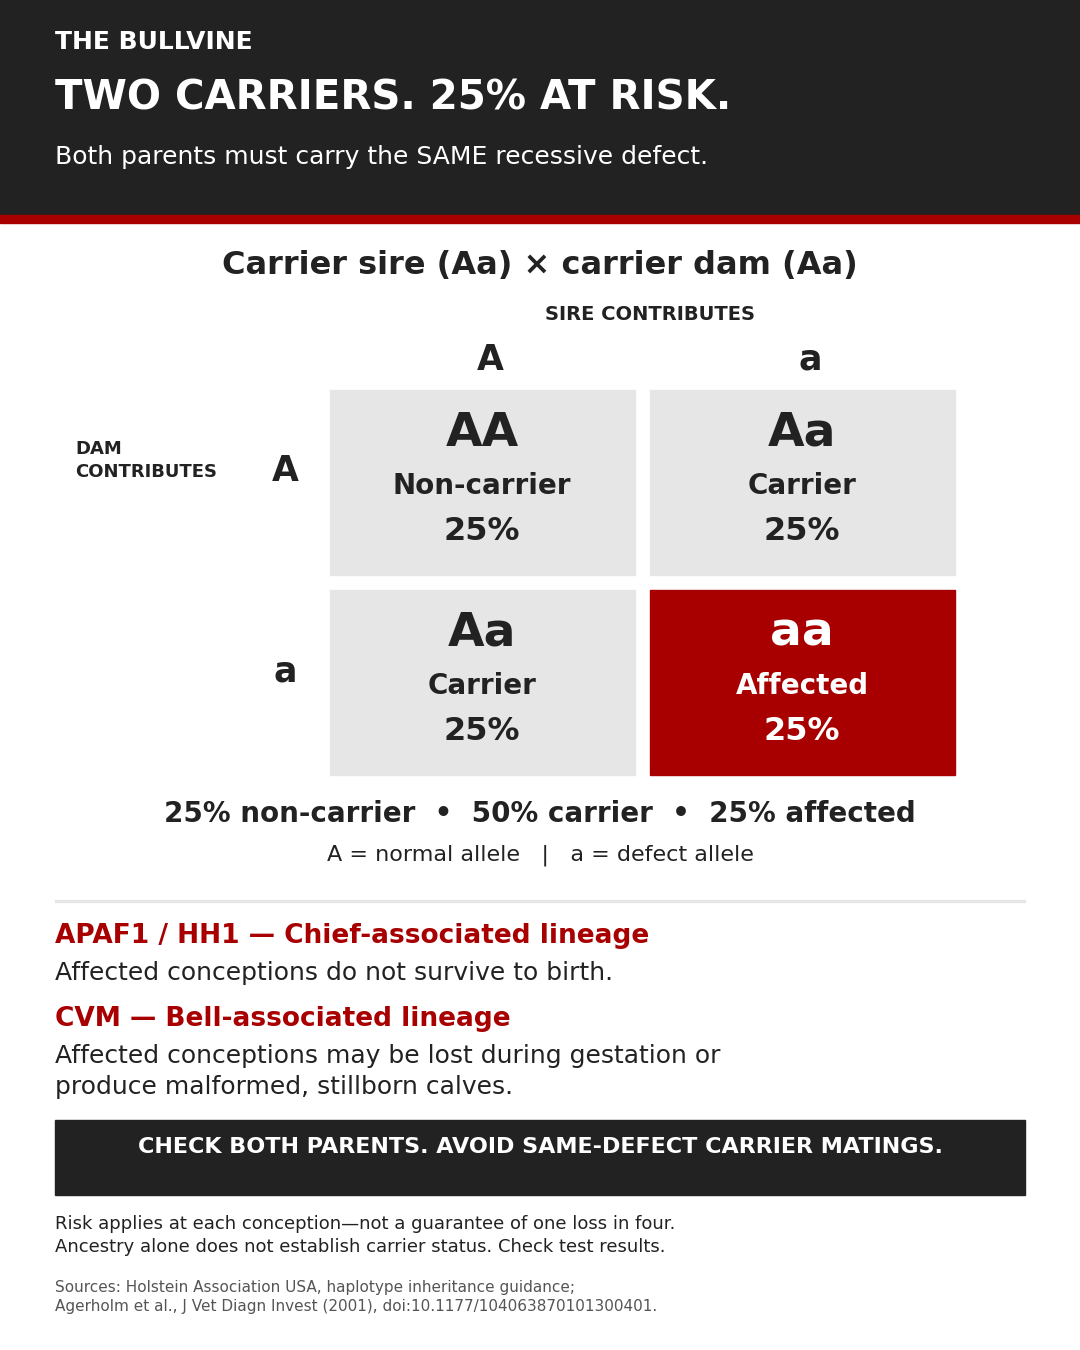
One copy makes an animal a carrier. An embryo inheriting two copies doesn’t survive to birth. None of the 758 animals tested in the study had two copies, and neither did any of the more than 246,000 Holsteins in commercial testing.
The study’s loss figures are modeled estimates, not counted cases:
- More than 100,000 lost calves in the U.S. and about half a million worldwide over a 30-year period.
- About $420 million worldwide over the past 35 years. UC Davis separately puts the cost of a single midterm abortion to a dairy at about $800.
UC Davis separately reports an estimate that Chief’s genetic contribution is worth about $30 billion in increased milk production. The benefit and loss figures cover different periods and use different methods. Taken together, they show the scale on both sides, but they aren’t a complete cost-benefit analysis.
CVM. Danish researchers described complex vertebral malformation (CVM) in 2001 and traced affected calves to two common ancestors, both former elite U.S. Holstein sires. Alta and ST Genetics still list Bell’s sire, Penstate Ivanhoe Star, with the CV code for CVM carriers (Alta). (For how that played out through Bell himself, see Bell’s Paradox: The Worst Best Bull in Holstein History.)
Calf muscle weakness. A 2024 Journal of Dairy Science study of 5.6 million genotyped Holsteins found a common haplotype on chromosome 16 that traces back to 1952. Southwind, born in 1984, carried two copies of that haplotype. Sequencing found a candidate missense mutation inside it, but Southwind carried only one copy of the mutation.
So the old haplotype and the newer harmful mutation aren’t interchangeable: plenty of animals carry the haplotype without the mutation. And finding the mutation in Southwind doesn’t establish that it originated with him.
The authors’ conclusion matters for anyone reading a pedigree. Because the original haplotype is so common, a new mutation inside it is hard to track even with accurate pedigrees, so direct tests are needed. Among 46 heifers with livability records that had two copies and traced only to Southwind on both sides, 52% died before 18 months. The figure for non-carriers was 2.4%.
Robust’s August 2026 Select Sires page reports him as HMWC. That’s a reported haplotype status for muscle weakness, not a direct test result for the mutation.
What This Means for Your Operation
Before your next mating, check these three things:
- Relationship. A calf’s expected inbreeding depends on how closely its sire and dam are related to each other. Genomic future inbreeding (GFI) and expected future inbreeding (EFI) measure an animal against a reference population. They’re useful for comparing bulls, but they don’t predict the outcome with a particular cow.
- Carrier status. Compare both parents’ results, and check whether each one is a reported haplotype status or a direct gene test. For muscle weakness (HMW), that difference matters. Descending from a famous carrier doesn’t tell you an animal’s status. A test does.
- Current merit. Compare both parents’ current evaluations against your herd’s breeding goal. Where an ancestor sits in this ranking can’t establish the calf’s expected merit.
A Chain of Decisions, Still Counted
Fishler built Chief’s pedigree on Canadian imports. Lindskoog gave the calf the Arlinda name. At Round Oak, Hope and Miller mated two inbred animals. A stud committee then paid more than it ever had for a young sire, and Miller backed the bull when his first heifers raised doubts.
Every Holstein USA influence ranking since 2009 has put the results of those decisions first and second, at almost the shares recorded in 1988. Breeding and selection decisions made in Nebraska and Virginia more than six decades ago still measurably shape the breed.
Key Takeaways
- Holstein USA’s August 2026 ranking puts Elevation at 15.2% and Chief at 14.9%, nearly where they stood in 1988. It measures historical influence, not what either line adds to your next mating.
- The Bullvine’s pedigree cross-reference links all 15 top sires within four generations, and 8 of the 15 links shown run through the dam’s side. Read only sire lines and you’ll miss Chief and Elevation behind Shottle.
- UC Davis put Chief’s APAF1 losses at about half a million calves worldwide over 30 years, and separately estimated his genetic contribution at $30 billion in milk. Different methods, same lesson: influence this deep cuts both ways.
Your Turn
Among the youngest bulls on the extended 2026 list are Genosource Captain (born 2019, 5.3%), Hurtgen-Lea Richard Charl (2016, 4.1%) and S-S-I Montross Jedi (2014, 3.4%). Which younger sire do you expect to climb furthest by 2036, and why? Share your pick in the comments below or on our Facebook page.
Learn More
- 99.84% of Holstein AI Bulls Trace to Just Two Fathers follows the direct sire line (father to son) of U.S. Holstein AI bulls. That’s a narrower measure than the genes-in-common figure used here.
- The Proof You Waited Three Years For Averaged a $72 Markdown uses the Hold-to-Proof Cost Simulator to estimate what it costs to hold young sires until their daughter proofs arrive. The results depend on the article’s stated assumptions about timing and maintenance costs.
- From Depression-Era Auction to Global Dominance: The Picston Shottle Legacy is the full Sire Spotlight on No. 8.
- More on Pawnee Farm Arlinda Chief collects The Bullvine’s Chief coverage, including the dispersal story.
The Sunday Read Dairy Professionals Don’t Skip.

Every week, thousands of producers, breeders, and industry insiders open Bullvine Weekly for genetics insights, market shifts, and profit strategies they won’t find anywhere else. One email. Five minutes. Smarter decisions all week.