










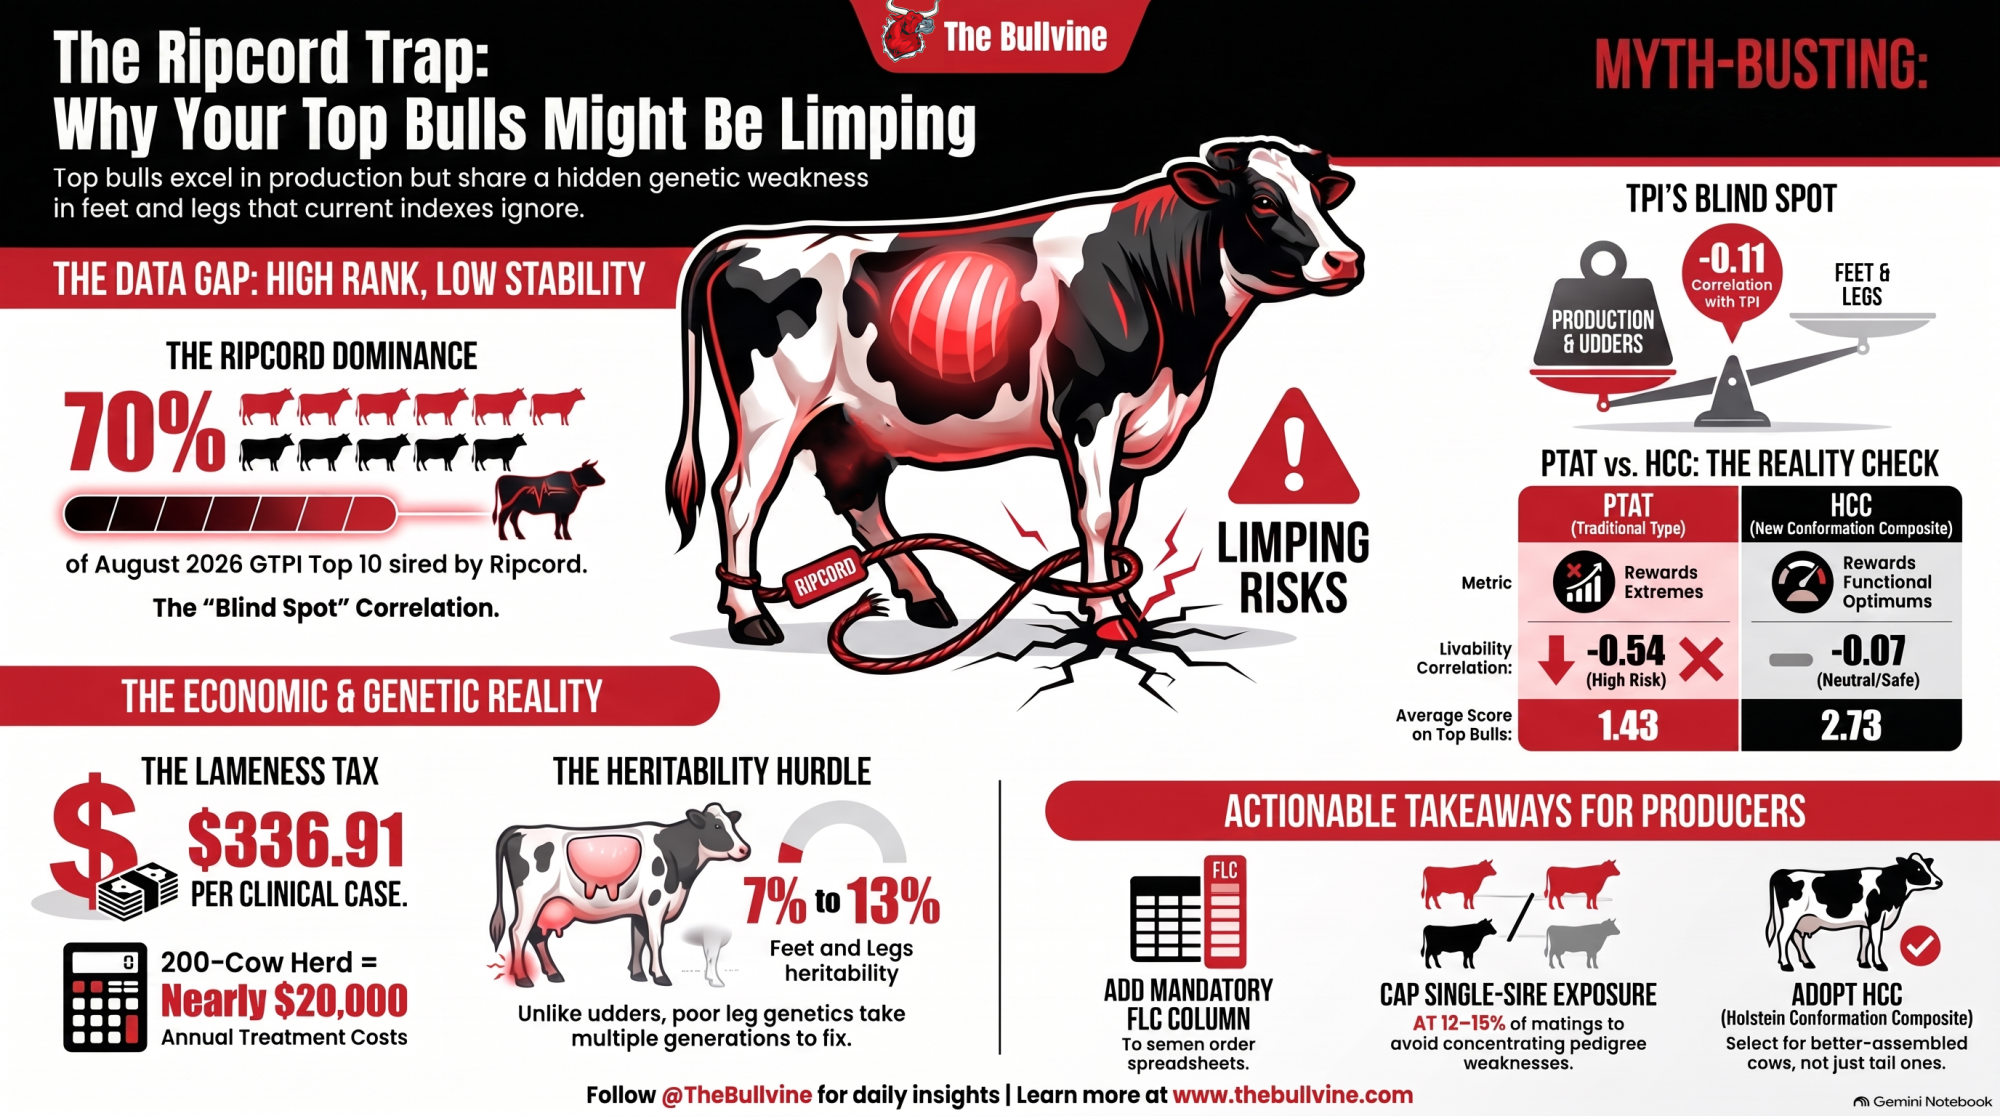
Seven of the ten highest-GTPI bulls in the U.S. share one father. Every one is positive on udders, negative on feet and legs. Feet and legs correlate −0.11 with TPI — your ranking won’t flag it.
EXECUTIVE SUMMARY:
- What happened: Seven of the ten highest-GTPI bulls in the August 12, 2026 U.S. run trace to one father — Ocd Thorson Ripcord-ET — and eight of the top ten on Net Merit $. Every one of those GTPI sons carries a positive Udder Composite alongside a negative Feet & Legs Composite.
- Why your ranking won’t catch it: In Holstein Association USA’s own August matrix, FLC correlates −0.11 with TPI across 630,295 females born in 2020. That’s not a formula that penalizes legs. It’s a formula that can’t see them. And legs are the slowest thing in the barn to fix — Lactanet puts Holstein Feet & Legs heritability at 13% and Foot Angle at 7%, below the .10 threshold Holstein USA itself says you need for meaningful progress, against stature at 46%.
- What it costs, and what to do: At $336.91 per clinical lameness case, a 200-cow herd running 20% incidence pays $13,476 a year; one at the 29.5% published median pays $19,878 — a $6,400 swing on the same milk check. The new Holstein Conformation Composite is the first index in years that weights legs heavily, and it correlates just 0.64 with PTAT, which itself runs −0.54 against Livability in that cohort. Before your next semen order, add one column: pull FLC on every straw and note where Ripcord shows up as sire or maternal grandsire.
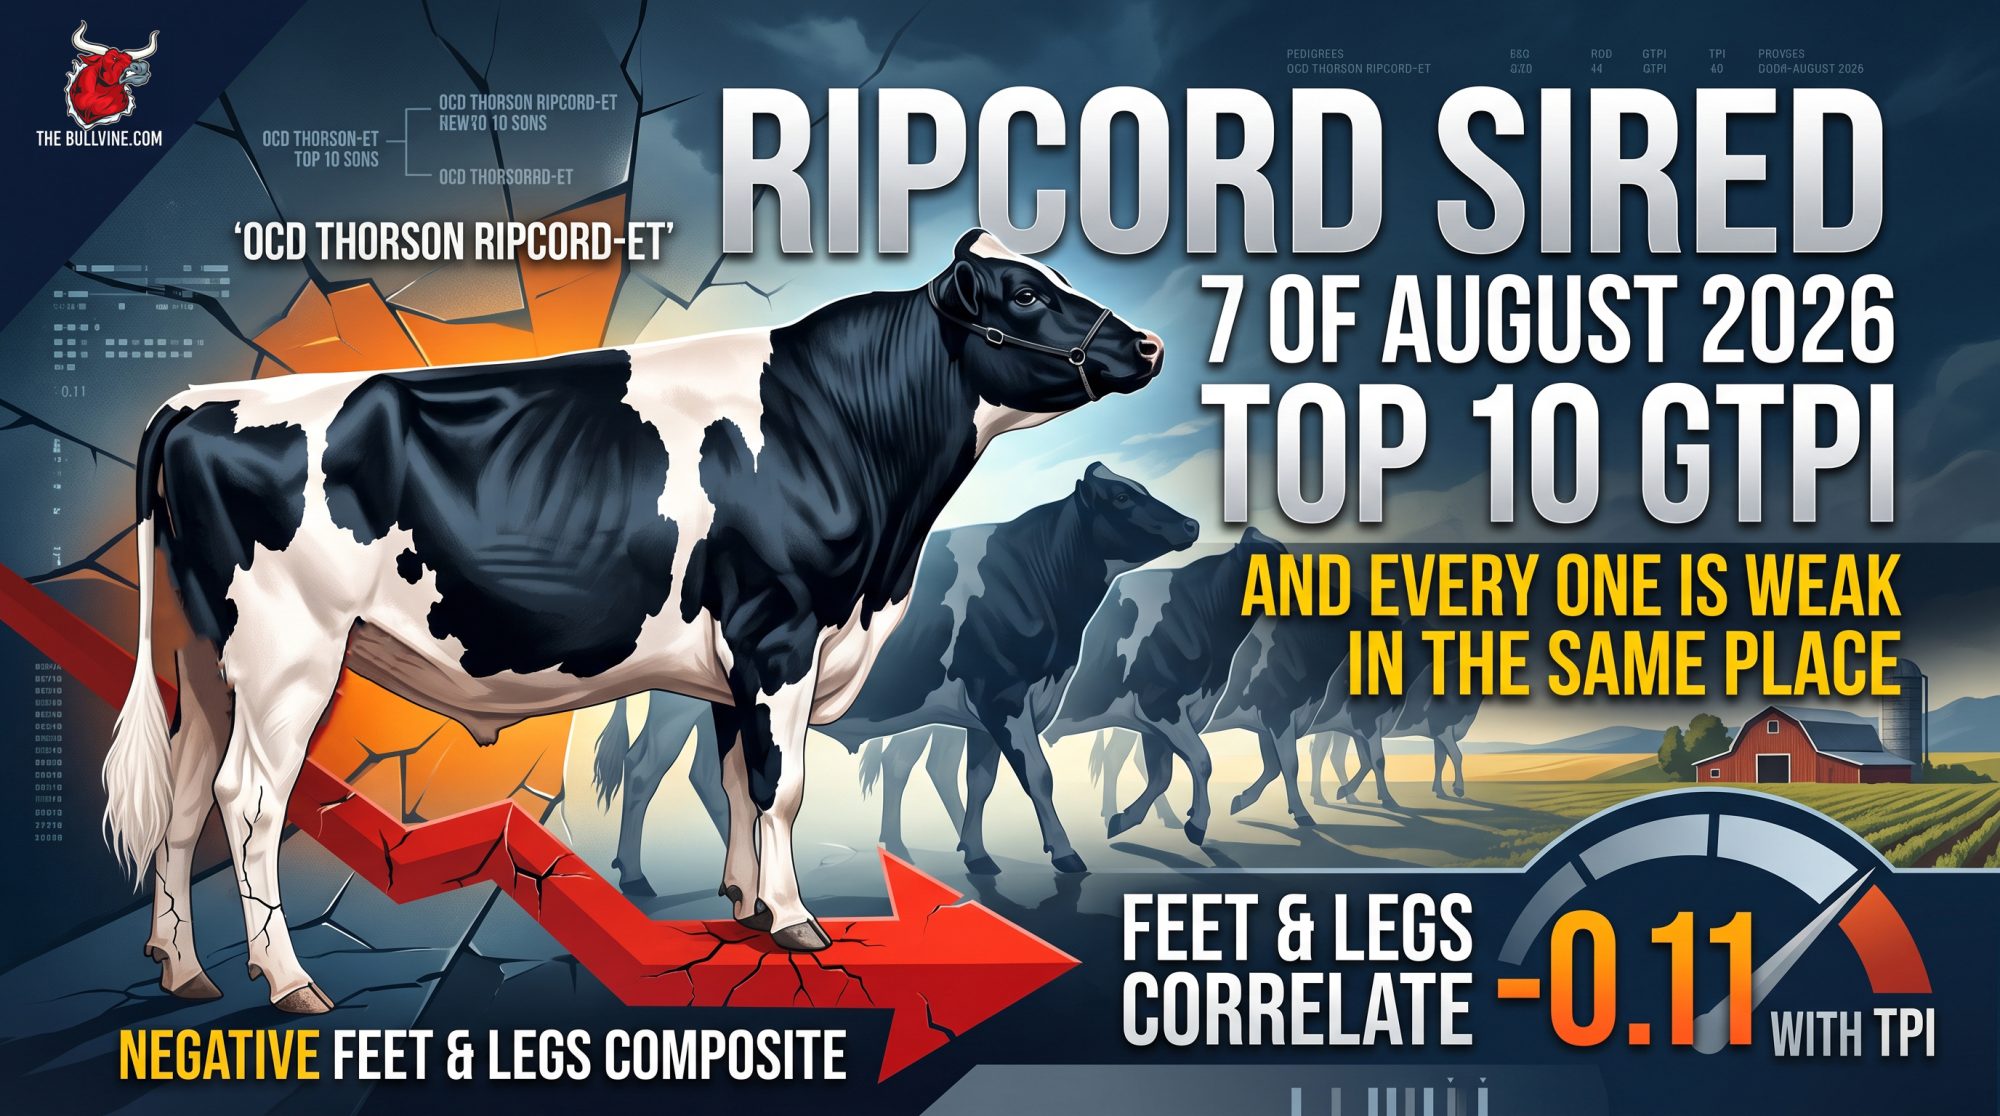
Open the August 12, 2026 evaluation, pull the U.S. GTPI top ten, and check the sires. Seven of those bulls trace to one father: Ocd Thorson Ripcord-ET. On the Net Merit $ top ten, it’s eight of ten.
Now look at their type numbers. The Ripcord sons in that GTPI top ten show a consistent pattern in our review of the August run — positive Udder Composite alongside negative Feet & Legs Composite. Individual values vary, so pull each bull’s own UDC and FLC rather than trusting the pattern. But the direction is the direction, seven times over.
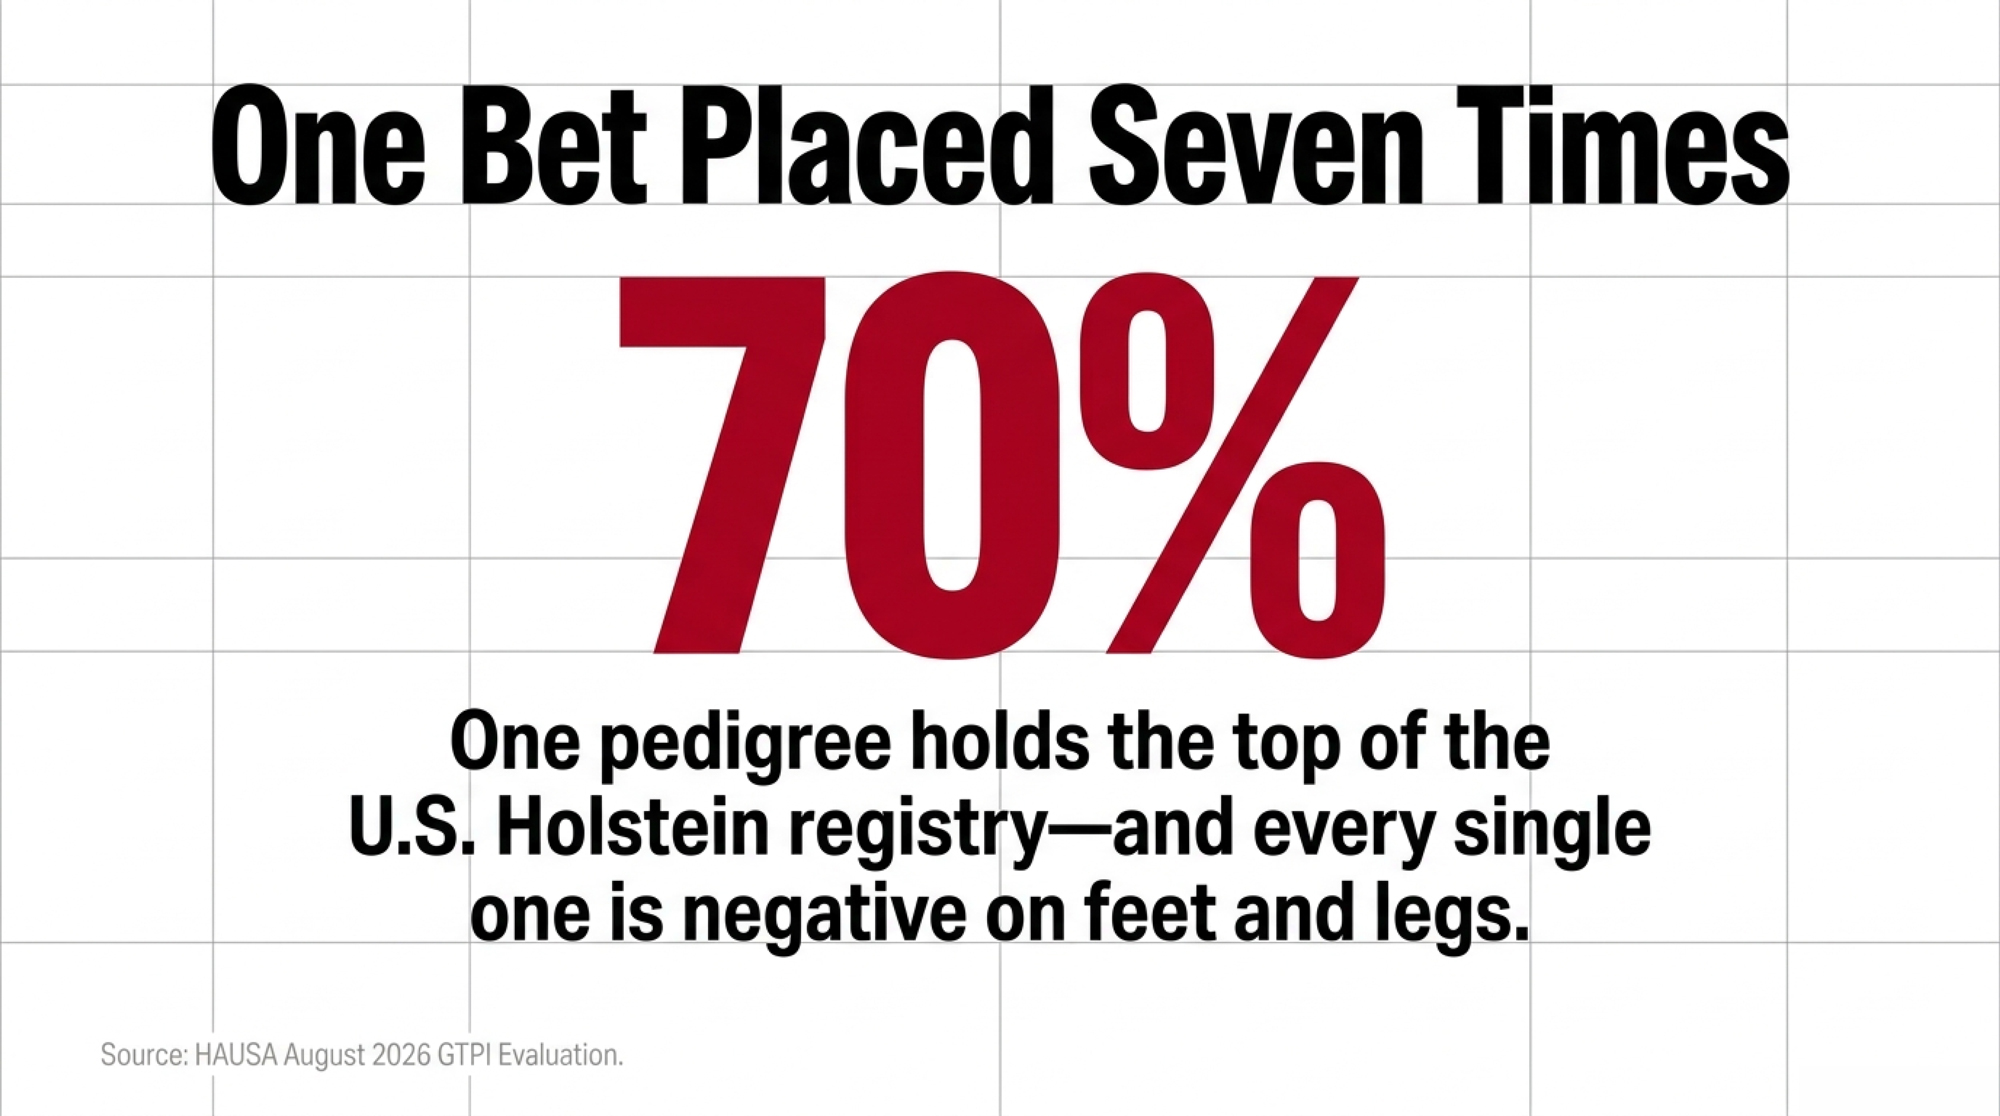
That’s not a popular-sire story. Holsteins have had those for sixty years. That’s one pedigree holding 70 to 80 percent of the top of the U.S. Holstein registry while the trait group most likely to shorten a cow’s stay sits in the same place on all of them.
Why Won’t the Index Catch This?
Because feet and legs barely register in it.
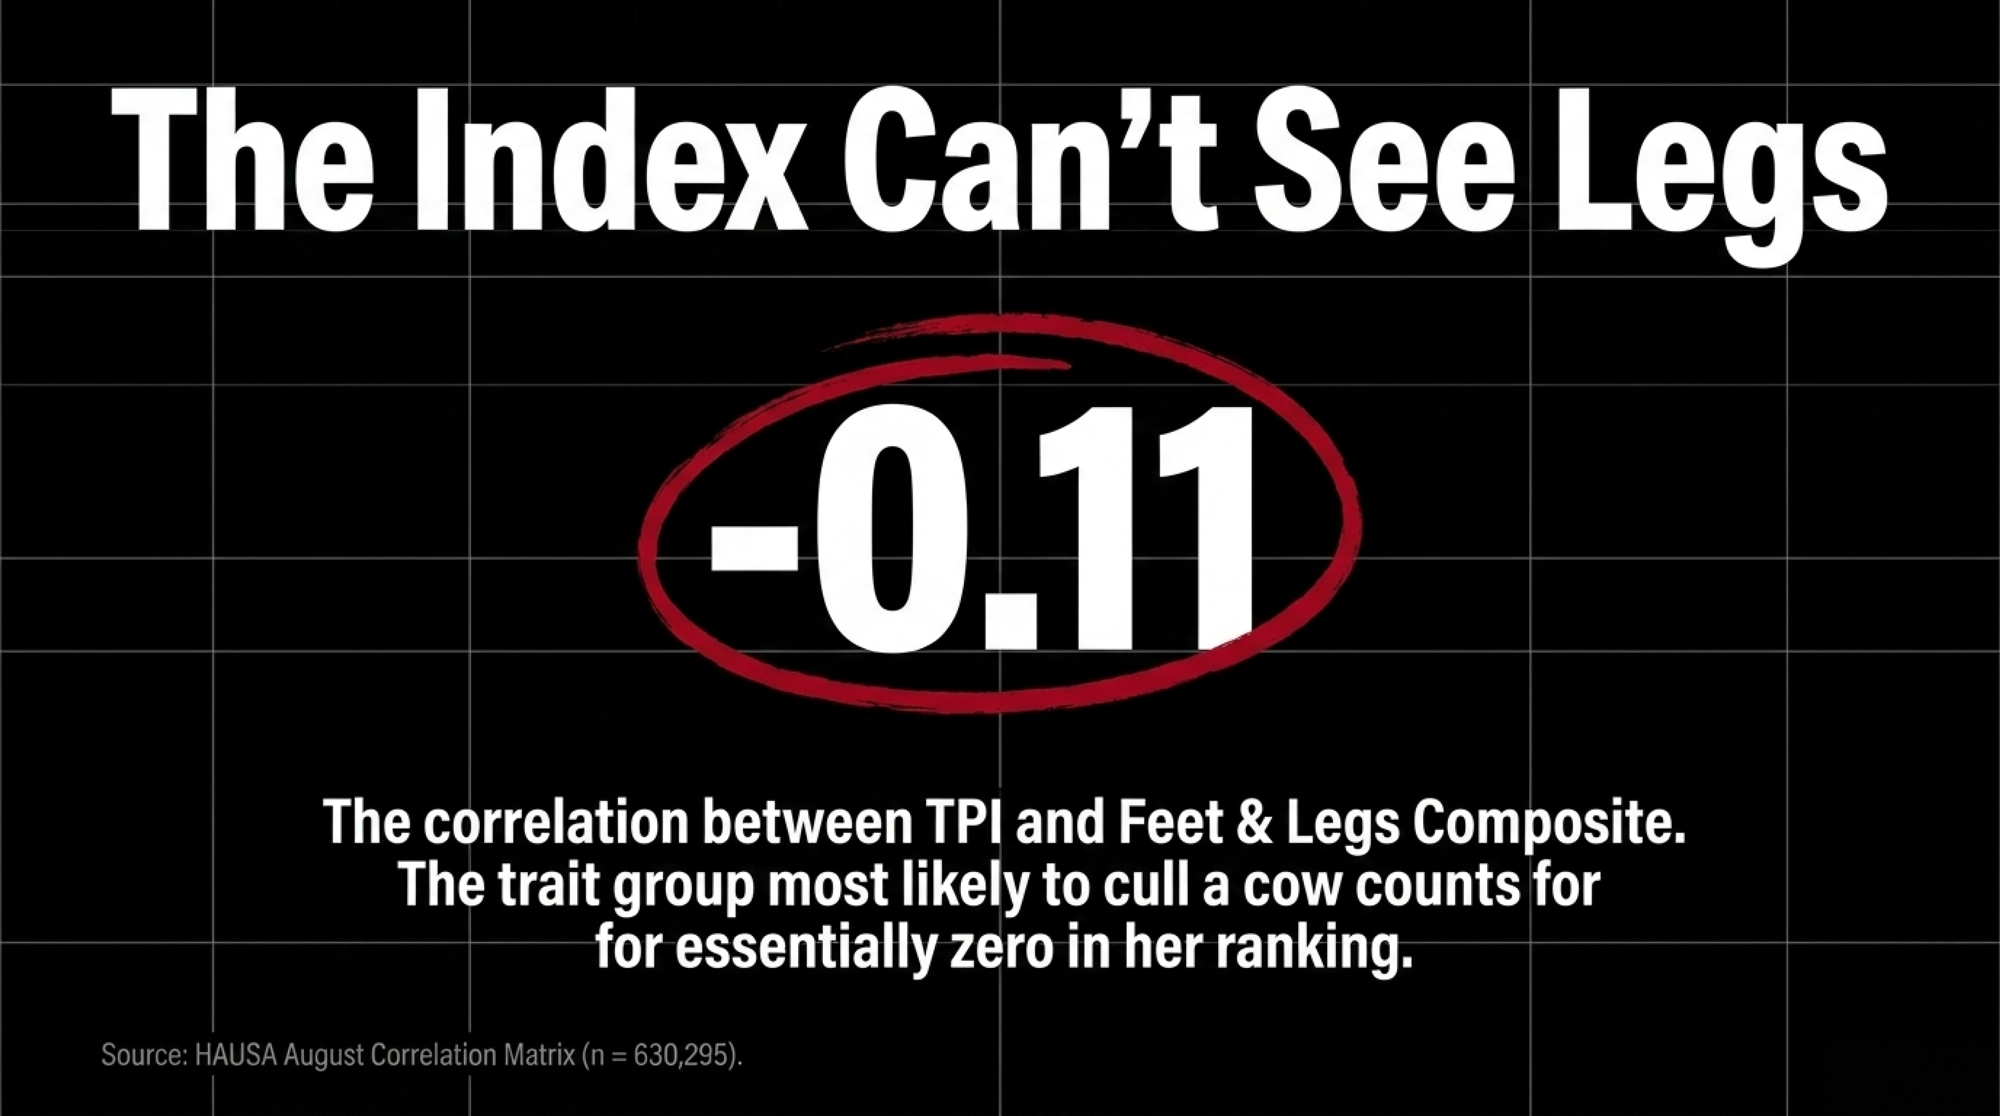
In the correlation matrix Dr. Jason Graham and Dr. Sam Comstock published for the August run — females born 2020, n = 630,295 — Feet & Legs Composite correlates −0.11 with TPI. Call it zero. A bull’s leg composite tells you essentially nothing about where he’ll rank.
Holstein Association USA publishes UDC and FLC separately on every bull, so both numbers sit on every proof sheet you pull. They don’t move a TPI ranking in either direction. A breeder sorting on GTPI or Net Merit sees production, health, and fertility shift the number — and sees nothing from the trait group that decides how many of those daughters are still walking sound at 30 months.
What HCC Actually Rewards
The same run published the Holstein Conformation Composite for every animal in the HAUSA database, and April-to-August scores correlate at 0.99 across 4,055 animals. The calculation is stable out of the gate.
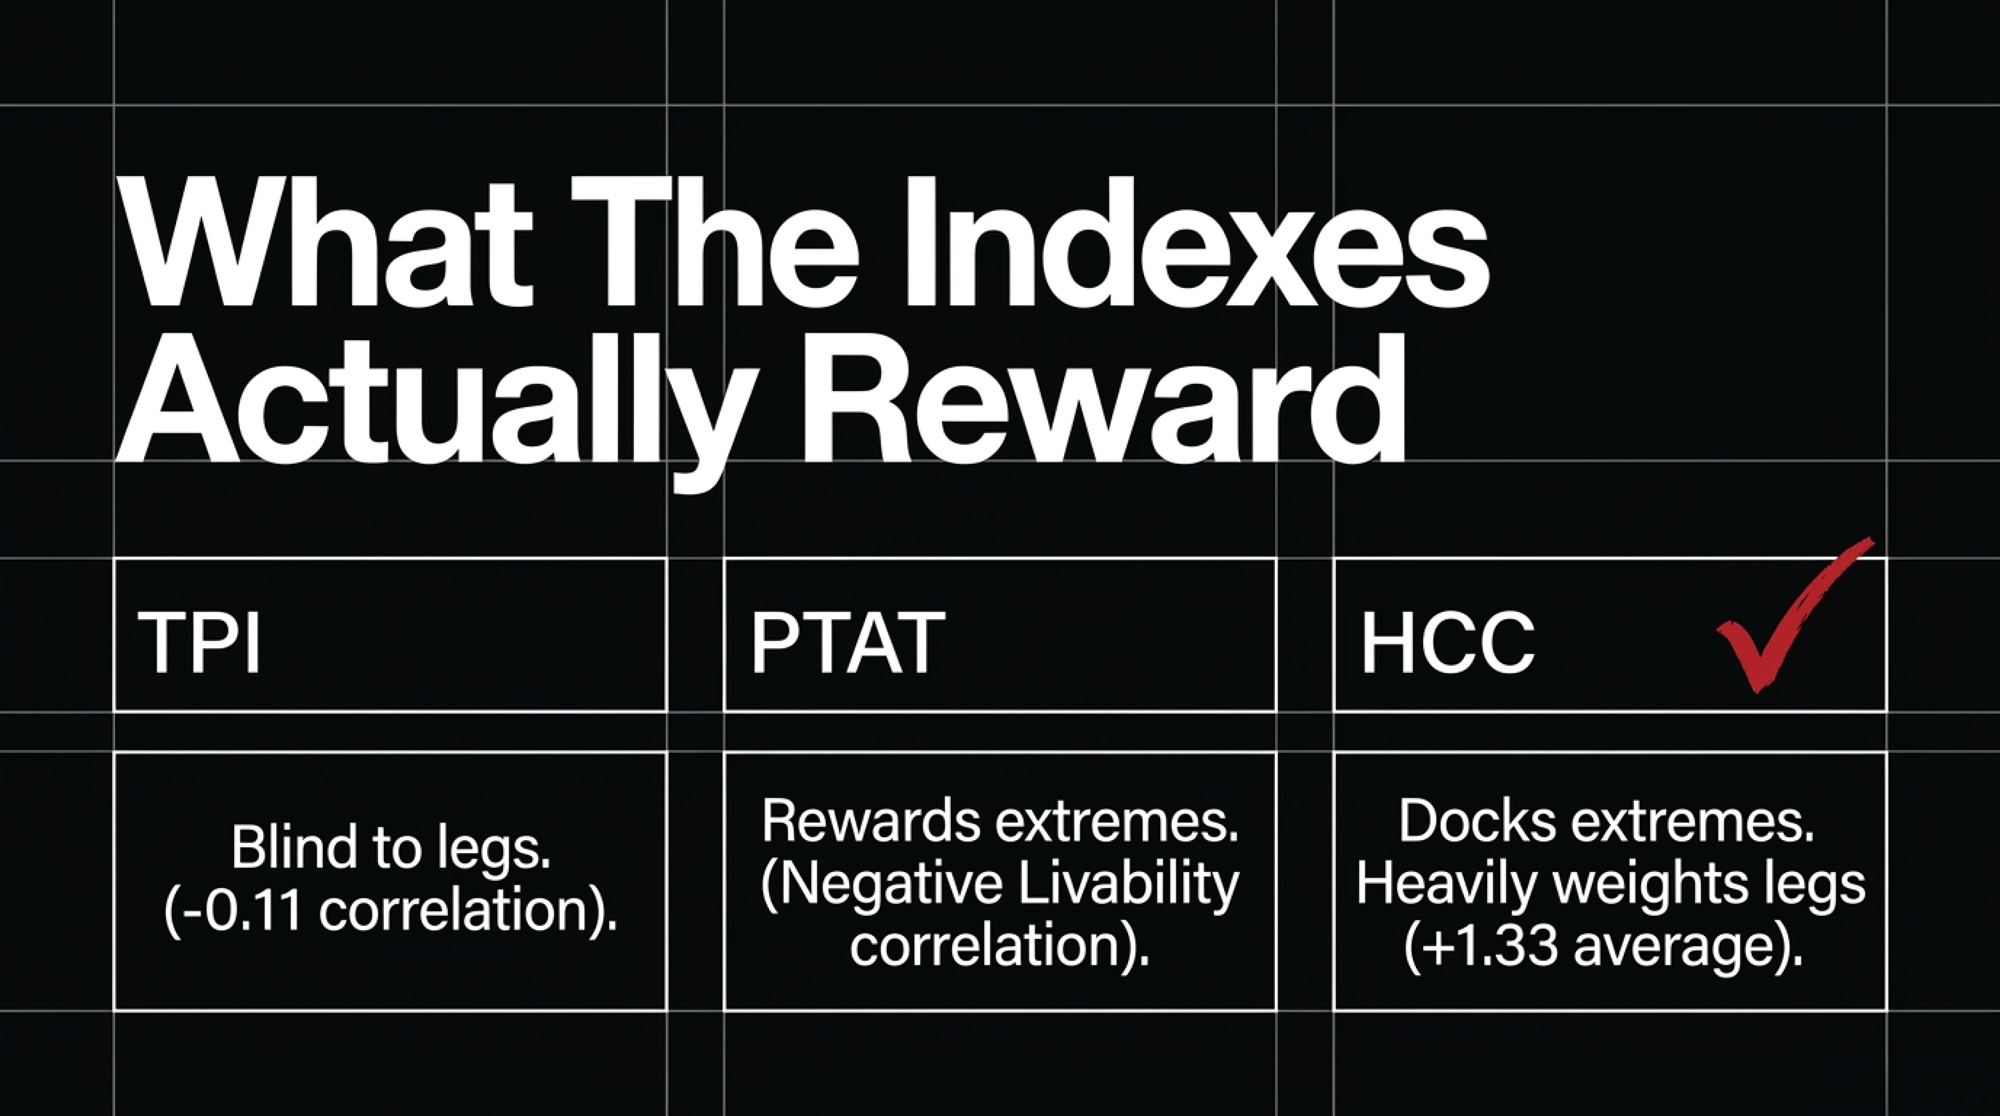
Graham and Comstock pulled the top 25 HCC bulls and averaged all 18 linear traits. Rear Legs Rear View averages +1.61 — the strongest trait in the whole profile. Feet & Legs Score: +1.33. Foot Angle: +0.86. Stature? −0.42. These aren’t tall bulls. They’re better-assembled ones.
That’s the design working as intended. HCC scores each linear trait against a functional optimum and penalizes deviation in either direction. Traditional type evaluation rewards extremes; HCC docks them. Rump angle averages +0.25 across that group, body depth +0.14, rump width +0.52 — near the middle, none pushed.
Across those 25 bulls, HCC runs 2.58 to 3.08 and averages 2.73. PTAT across the same animals averages just 1.43. Same bulls, more than a full point of disagreement between the two scores.
| Metric | HCC (Holstein Conformation Composite) | PTAT (Traditional Type) | What it means |
|---|---|---|---|
| Average score, top 25 bulls | 2.73 | 1.43 | Same bulls score a full point apart |
| Rear Legs Rear View (avg deviation) | +1.61 | Not separately weighted | HCC’s single strongest trait |
| Correlation with Livability | −0.07 (essentially none) | −0.54 | PTAT selection tracks with cows leaving sooner |
| Correlation with Productive Life | Not published in this run | −0.38 | Same pattern, second metric |
| Correlation with Feet & Legs Composite | +0.57 | +0.64 | Both “see” legs; TPI (−0.11) doesn’t |
| Correlation between HCC and PTAT | 0.64 | 0.64 | Related, not interchangeable |
The Longevity Number Worth Arguing With
In that 630,295-female cohort, PTAT correlates −0.54 with Livability and −0.38 with Productive Life. HCC correlates a milder −0.18, and essentially nothing at −0.07.
Cows bred for higher PTAT left the herd sooner. Graham and Comstock flag the caveat themselves — correlations shift with the population you sample. Fair enough. But the direction holds in both their bull-list work and their cow-level matrix, and the two composites correlate just 0.64 with each other. Related. Not interchangeable.
Feet & Legs Composite correlates +0.57 with HCC and +0.64 with PTAT. Both type composites see legs. TPI doesn’t.
The Barn Math on a Leg Decision
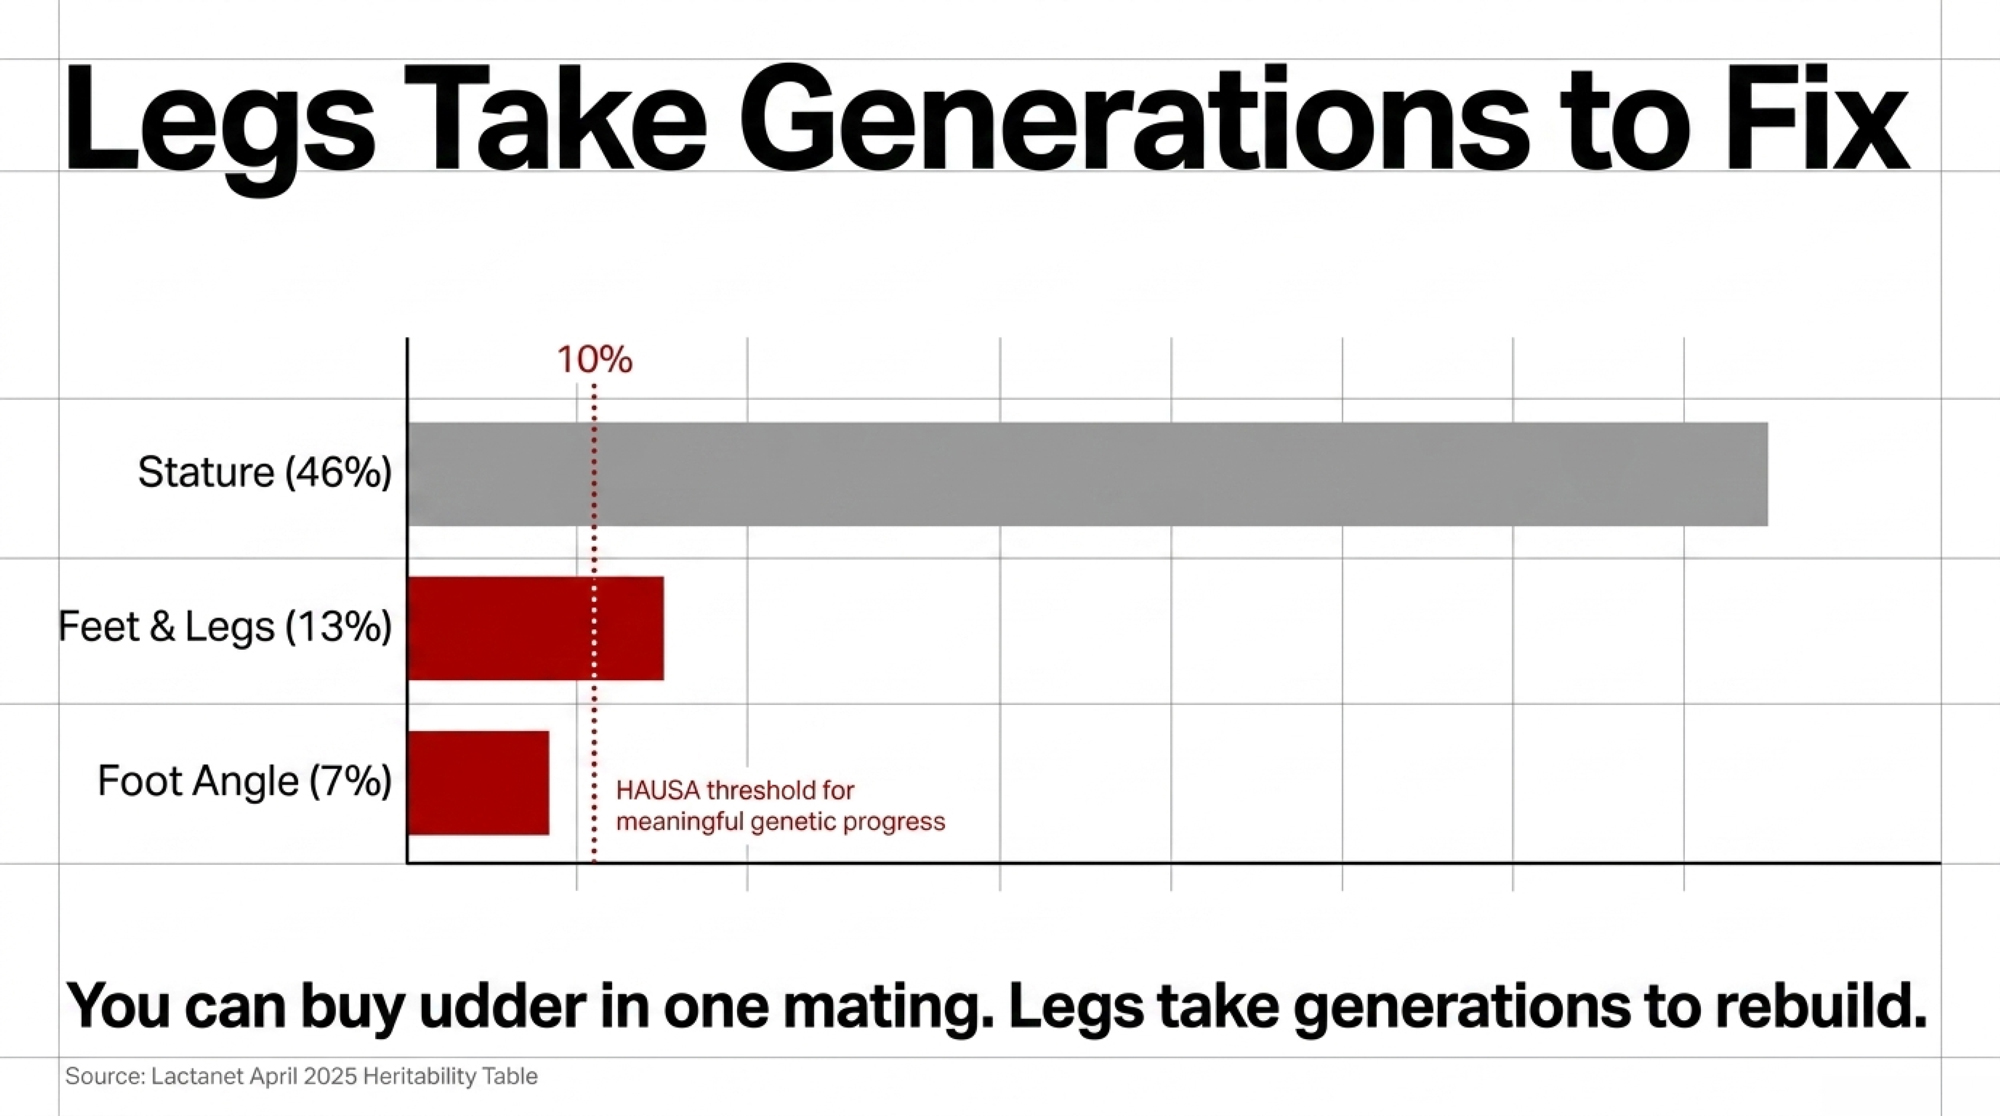
Legs build slowly and erode fast, and the heritability numbers are worse than most breeders assume. Lactanet’s April 2025 heritability table puts Holstein Feet & Legs at 13% and Foot Angle at just 7% — against stature at 46% and rump angle at 41%. Rear Legs Rear View, the trait topping the HCC profile, sits at 11%. Locomotion is 5%.
Holstein Association USA puts the threshold plainly on its Linear Type Evaluations page: “It is difficult to make much genetic progress through selection and mating unless a trait has a heritability of .10 or higher.”
Foot Angle doesn’t clear that bar. Feet & Legs barely does. Stature clears it by a factor of four. You can move udder in a mating cycle. Legs take generations — exactly the wrong shape of problem to inherit from seven bulls at once.
So price the downside. The average clinical lameness case runs $336.91, climbing $13.26 for every additional week a cow stays lame, per Robcis and colleagues in the Journal of Dairy Science.
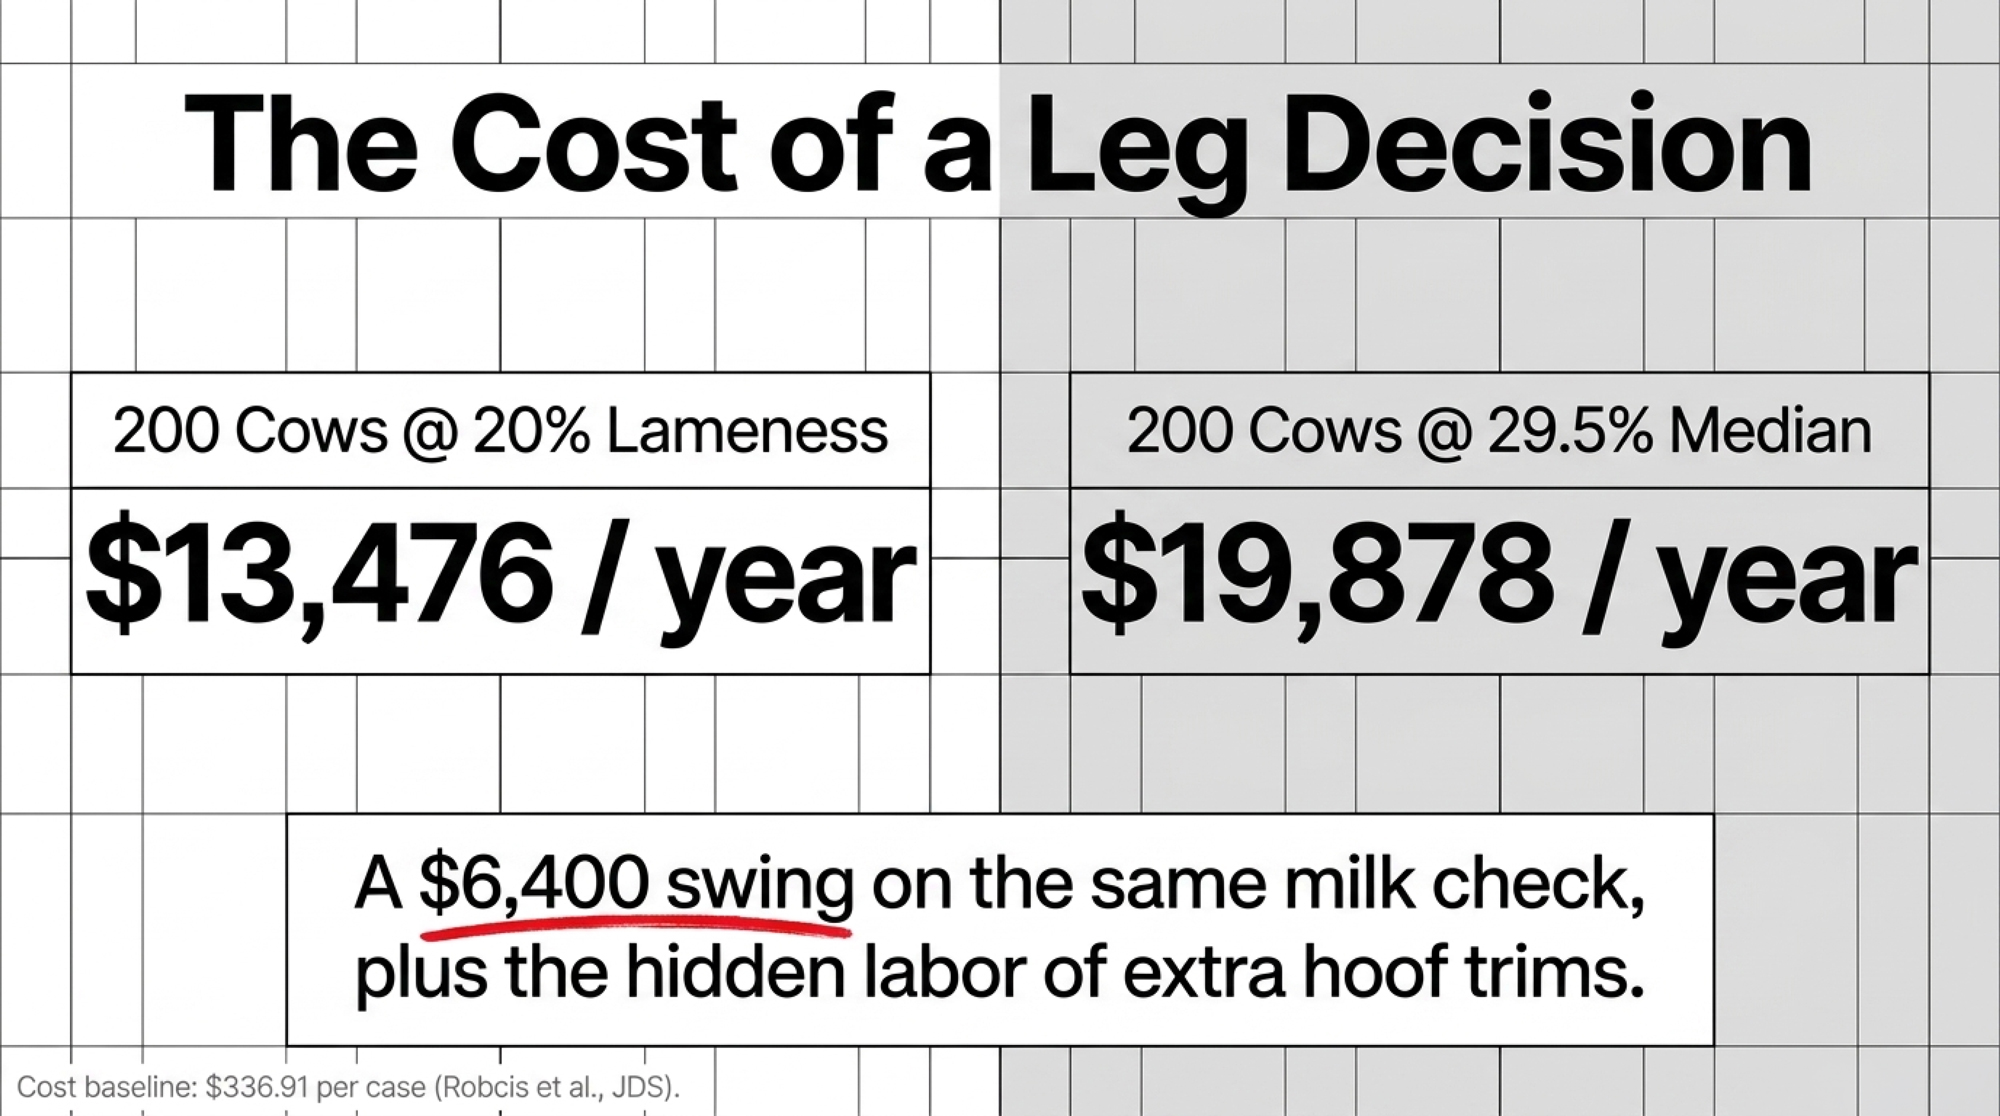
Two scenarios on a 200-cow herd. At a conservative 20% annual incidence — 40 cases, $13,476 a year. At the 29.5% median cow-level prevalence found across the published literature — 59 affected cows and roughly $19,878, though prevalence and annual case count aren’t the same measure. Either way, the gap between those two herds runs about $6,400 a year, and genetics is one of the levers moving you between them.
Lameness accounted for 9.1% of the total U.S. cull rate in the 2018 USDA/NAHMS survey, with injuries adding 3.5%. That puts locomotion third among involuntary culling reasons, behind infertility at 23.3% and mastitis at 18.6%.
The Part That Costs Labor, Not Just Dollars
Treatment cost is the easy number. The harder one is what a low-FLC group does to your routine.
Two or three hoof trimmings during first lactation improve hoof health in early second lactation — and improve survival into that second lactation. Read that alongside the heritability math and the shape of the problem changes. A group of daughters with weaker feet and legs doesn’t just generate treatment invoices. It generates trim appointments, restraint time, and labor you’d budgeted somewhere else.
The disease genetics are thinner still. Finnish work on 24,685 Holstein cows found hoof disorder heritabilities running from 0.02 for sole hemorrhage and heel horn erosion up to 0.13 for digital dermatitis, with feet and leg conformation traits landing between 0.10 and 0.19. Most genetic correlations between hoof disorders and conformation traits came in low and statistically indistinguishable from zero — meaning conformation is a proxy for hoof health, not a substitute.
Worth knowing how the composite was built. Both the Udder Composite and the Feet & Legs Composite carry a −0.20 weight on stature, documented by Holstein Association USA, so breeders can improve udders and legs “without making their cows taller.” Someone anticipated this exact trade decades ago and engineered against it inside the composites. The index doesn’t carry that logic upward into TPI.
The Fertility Correction Was the Dress Rehearsal
Here’s why this run should make you uneasy about more than feet and legs.
The August evaluation rewrote the fertility scale, and Fertility Index carried 69% of all TPI movement — roughly seven times the next-largest trait. Males in the top 10% for DPR dropped 9.08 PTA points. April-to-August male ranking correlation for DPR came in at 0.31, against 0.93 for Heifer Conception Rate. An April DPR ranking told you almost nothing about an August one.
That’s what it looks like when a component of the index gets recalibrated after two decades of use. Nothing about the old number was hidden — it was published, it moved the index, breeders used it. Then CDCB changed how DPR accounts for the voluntary waiting period, and TPI moved for all 12.6 million evaluated females at once: top-decile animals up, everything below them down.
Now apply that to legs. Feet and legs aren’t mismeasured — they’re barely visible, at −0.11 against TPI. Different failure, same exposure. The fertility correction arrived as a scale change breeders could see in a single run. A locomotion correction, if it comes, arrives as culls — three years after the mating decision, spread across a herd, with nothing in the index to have warned you.
Why Index Moves Punish Concentrated Pedigrees Hardest
We’ve watched this pattern before, and the numbers are on record.
Our five-year tracking of 401 elite genomic Holstein bulls from April 2020 through their December 2025 proofs found the retained bulls dropped an average of 42.5 TPI points — most of it from base changes and formula rewrites, not failed biology. Correlations between 2020 genomic predictions and 2025 proven results held strong on core traits: 0.81 for PTAT, 0.76 for fat, 0.71 for protein. The DNA didn’t change its mind. The formula did.
The bulls that crashed hardest shared a profile: over-predicted type stacked on thin functional traits. Homecoming lost 414 TPI points with PTAT dropping 0.87. Supercharge lost 396, including a 2.32-point PTAT collapse from +1.18 to −1.14. Sire lines heavy on Legacy and Heroic up top, with Delta on the maternal side, were over-represented in that group.
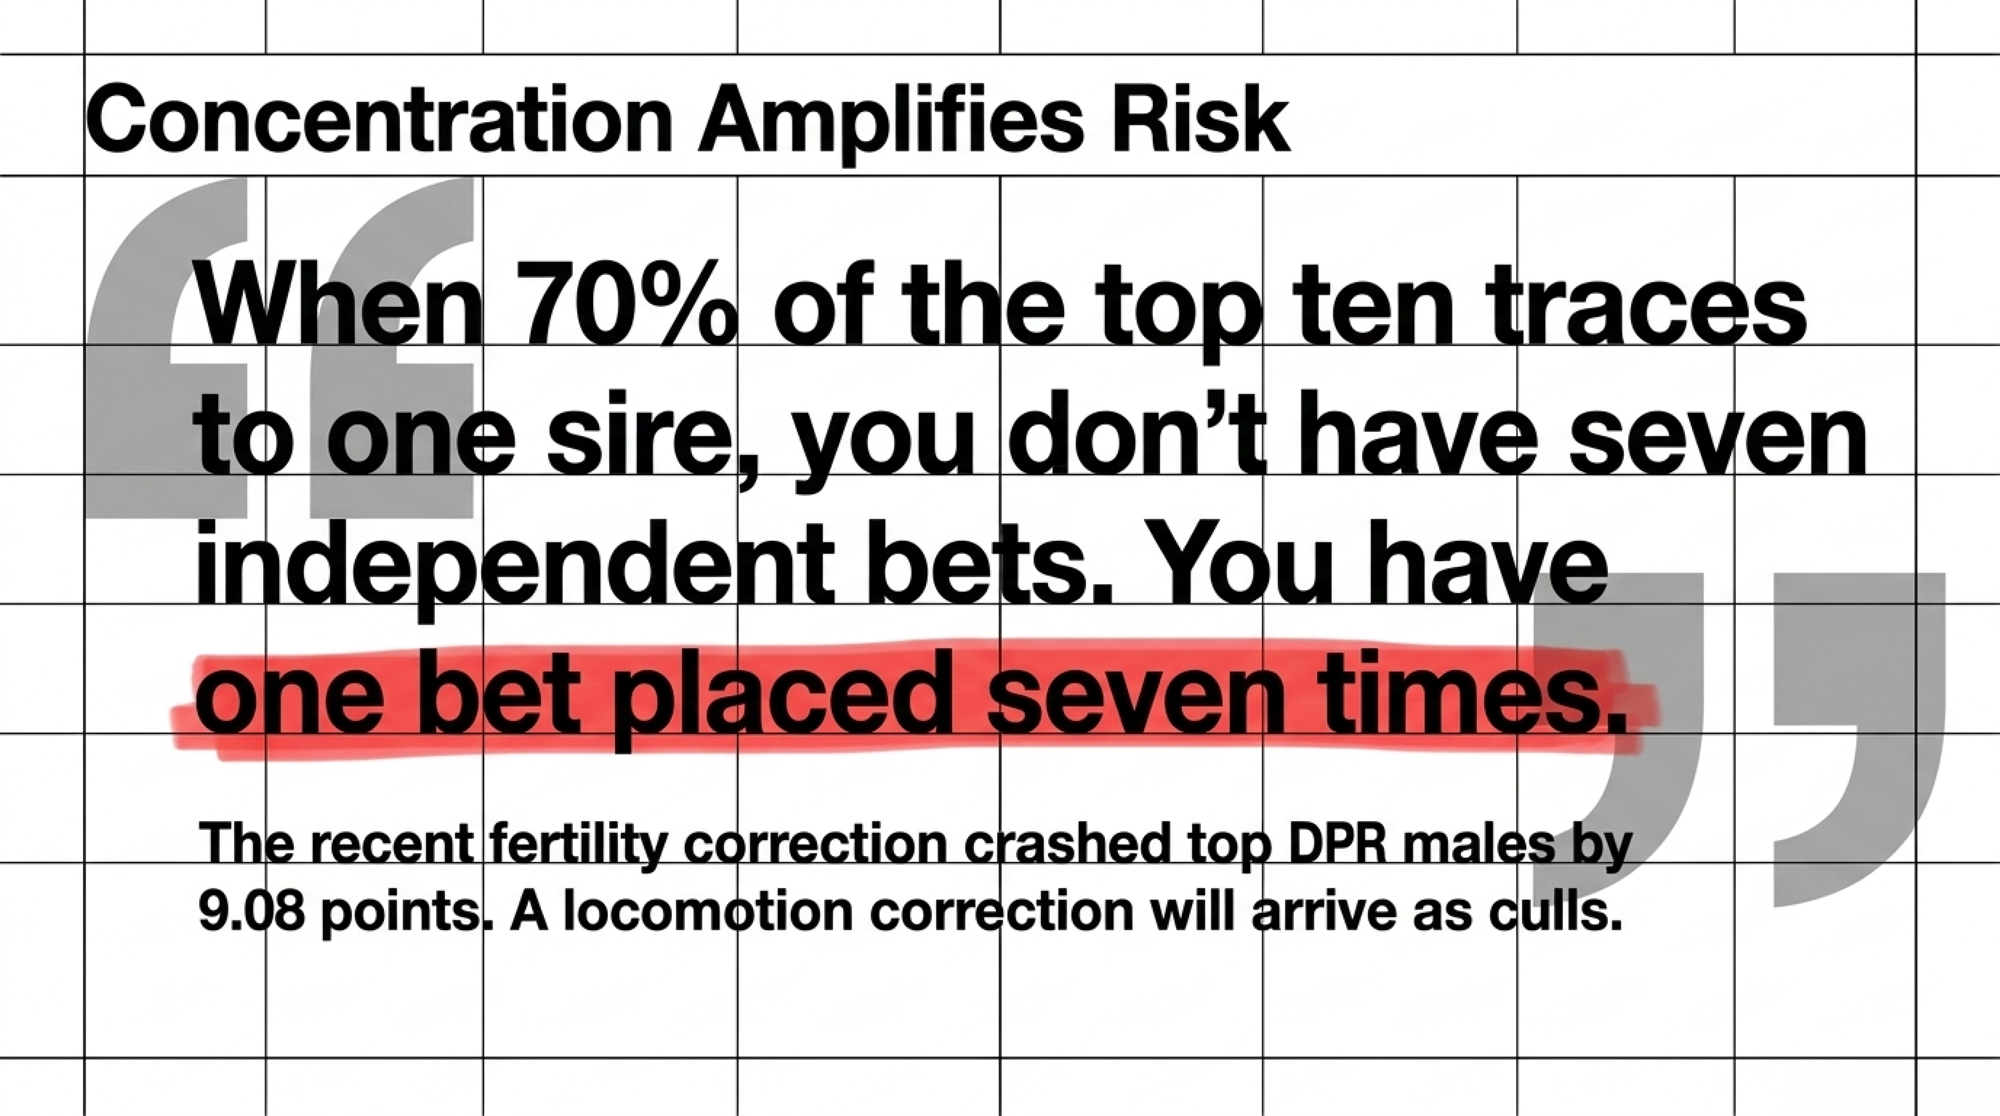
Concentration amplifies whatever the formula decides to reward or ignore. When 70 to 80 percent of a top-ten list traces to one sire, and they all sit weak in the same trait group, you don’t have seven independent bets. You have one bet placed seven times.
Fertility is where that already bites hardest. Annual genetic gain outruns inbreeding depression for every index trait except one — daughter pregnancy rate, running a net loss of 0.02 PTA units per year, on figures calculated before this run’s revision. Holstein heifers born in 2024 averaged 9.99% inbreeding per Lactanet Canada’s August 2025 update — a Canadian figure, not a U.S. one, and up from 9.61% the year before.
Looking for an Outcross
Concentration this deep makes clean pedigrees worth hunting, and the August lists offer one credible candidate near the top.
Genosource Jaco-ET sits at #8 GTPI at +3608 with 82% reliability, no daughters yet, and he was the biggest riser in the top ten at +128. Under the new 36-month rule holding daughter data out of DPR, CCR, and FSC, a bull like Jaco has no fertility daughter records feeding his numbers — so weight him on production confidence, not fertility confidence.
Whether he’s a genuine outcross for your herd depends on your own pedigree stack. That’s a check to run against the HAUSA database with your straw inventory in front of you, not something a proof sheet answers for you.
The honest read: with one sire behind 70 to 80 percent of the top ten, options up there are thin, and the ones that exist come with compromises — no daughters, limited status, or family overlap you’ll need to verify yourself.
Three Paths, and What Each One Costs
| Approach | Works best for | What it costs | Where it backfires |
|---|---|---|---|
| Add FLC as its own spreadsheet column with a floor | Any herd ranking primarily on TPI/NM$ | ~1 hour of spreadsheet work; occasionally a lower GTPI pick | Setting the floor at zero cuts most of the current top 10 |
| Select on HCC for longevity-focused herds | Herds culling heavily on feet, legs, udder breakdown | Lower PTAT, lower show-ring ceiling | Expecting fast results — 13% heritability is a 3-generation play |
| Place one deliberate outcross sire in the rotation | Herds where a third+ of active straws trace to Ripcord | Real compromise — top candidates near GTPI top 10 also carry limitations | Swapping one concentration risk for another unverified one |
- Pull FLC as its own column and set a floor. Works for any herd ranking on index. Costs an hour of spreadsheet work and occasionally a lower GTPI on the bull you pick. Backfires if you set the floor at zero — you’ll cut most of the top ten and forfeit real production merit. Set it against your herd’s actual leg problem, not an arbitrary line.
- Use HCC where longevity is the goal. Works for herds culling heavily on feet, legs, and udder breakdown rather than by choice. Costs you a lower PTAT and a lower show ceiling sometimes. Backfires if you expect speed — at 13% heritability on Feet & Legs this is a three-generation play, not a first-crop answer.
- Place one deliberate outcross in the lineup. Works where a third or more of active straws trace to Ripcord. Costs real compromise, because the candidates near the top all carry one. Backfires if you swap one concentration for another, so verify the pedigree yourself before you commit.
The Action Checklist
Do this in the next 30 days:
- Put your April and August proofs side by side for every sire in your active lineup. Sort by TPI change. Flag any bull whose drop is more than double his cohort’s — that short list, not the full drop list, is where re-evaluation belongs.
- Add an FLC column to that same sheet. If you rank on TPI or NM$ alone, feet and legs are not currently in your decision. The index correlates −0.11 with FLC. Add the column or accept that you’re not selecting on it.
- Note sire and maternal grandsire on every straw. Where Ripcord appears, pull each bull’s individual FLC rather than judging by pedigree — the pattern is directional, the numbers are what you breed to.
- Cap single-sire exposure. No one bull on more than 12 to 15 percent of your matings, and build the team from at least eight unrelated sires. That’s the same discipline North Florida Holsteins applied when it capped how much any single bull could influence the herd.
- Locomotion-score your herd this quarter. Published prevalence spans 2.6% to 63.7% across studies, so the breed average tells you nothing about your barn — and the difference between 20% and 29.5% on 200 cows is roughly $6,400 a year.
Nobody built TPI to ignore feet and legs. It worked out that way — a composite weighting production, health, and fertility, with a trait group that washes out to −0.11 in the arithmetic. And nothing about that arithmetic changes on its own: at 13% heritability on Feet & Legs and 7% on Foot Angle, you can buy udder in one mating cycle and spend three generations paying it back. The 2029 version of this decision won’t arrive as a scale change you can see in a proof run. It arrives as culls and trim appointments. HCC is the first tool in a while that puts legs back in the conversation with real weight behind it. So before your next semen order, the question isn’t which bull ranks highest. It’s which column you’re adding to the spreadsheet first.
Learn More
- The Hidden Cost of Lameness: Is AI Exposing Dairy’s Biggest Profit Thief? — Exposes the true financial toll of subclinical locomotion breakdown, delivering early-detection protocols and automated vision metrics that stop the $336-per-case margin leak before cows hit the involuntary culling list.
- Holstein Inbreeding Hit 9.99%: Birkstead and North Florida Found Two Ways to Stop the $100-per-Cow Leak— Arms commercial herds with proven pedigree-capping rules to halt reproductive drag and eliminate the $100-per-cow lifetime loss, showing how two top dairies protect daughter fertility without sacrificing genetic gain.
- Captain Gained 369 TPI Points, Homecoming Lost 414: Inside the 59% Failure Rate of April 2020’s Top Genomic Sires — Dismantles the reliability myth of unproven sire rankings by tracking 401 genomic bulls over five years, pinpointing the exact trait formulas that collapse under daughter proof pressure.
The Sunday Read Dairy Professionals Don’t Skip.

Every week, thousands of producers, breeders, and industry insiders open Bullvine Weekly for genetics insights, market shifts, and profit strategies they won’t find anywhere else. One email. Five minutes. Smarter decisions all week.
