Archive for sire selection strategy

Nordic Holstein Coancestry Rose Twentyfold. Your Inbreeding Percentage Won’t Show You.

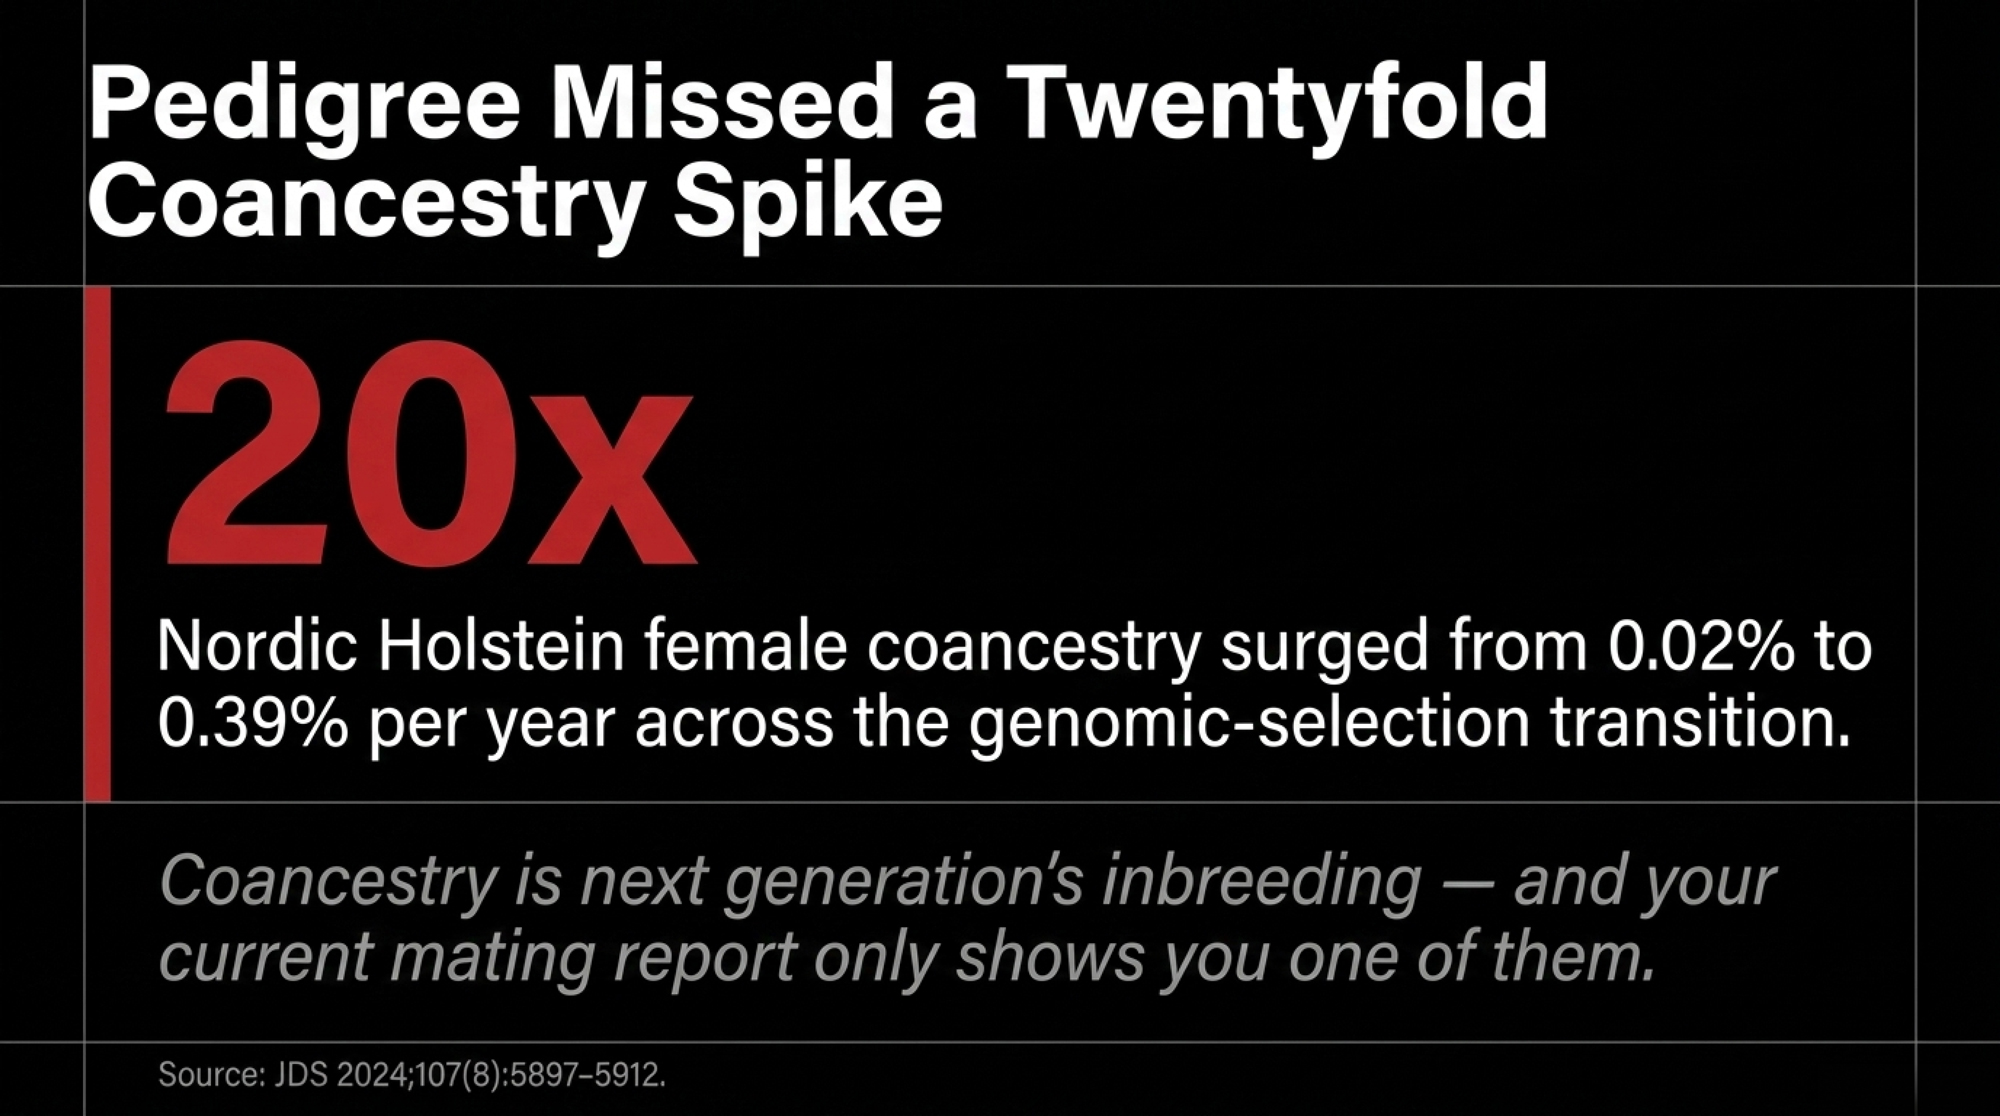
Nordic Holstein female coancestry climbed from 0.02% to 0.39% per year while pedigree inbreeding looked harmless. Coancestry is next generation’s inbreeding — and your current mating report only shows you one of them.

You’re placing a semen order off the August 2026 GTPI list. You take four bulls, spread across the top ten, figuring that spread covers you. Odds are three of them are sons of Ocd Thorson Ripcord-ET — he sired seven of that top ten, and eight of the top ten for Net Merit $, per The Bullvine’s analysis of that run.

Go one generation further back and it gets tighter, not looser. One great-granddam sits behind seven bulls across those two lists.

A proposal circulating in European trade press argues North American studs should voluntarily set aside index thresholds for roughly 5% of young-sire intake, so European-origin sires get a shot they wouldn’t otherwise get. It’s pointing at something real. But it picks the wrong criterion — and the evidence for that runs through a Nordic population where female coancestry climbed nearly twentyfold across the genomic-selection transition, while the pedigree analysis of the same herd found nothing wrong at all.

Holstein Is Climbing at Twice the Rate of Everything Else

Lactanet’s Inbreeding Update – August 2025, authored by Brian Van Doormaal, put Canadian Holstein heifers born in 2024 at 9.99% average pedigree inbreeding. Highest of the four major breeds — ahead of Jersey at 7.56%, Brown Swiss at 7.10% and Ayrshire at 6.89%.
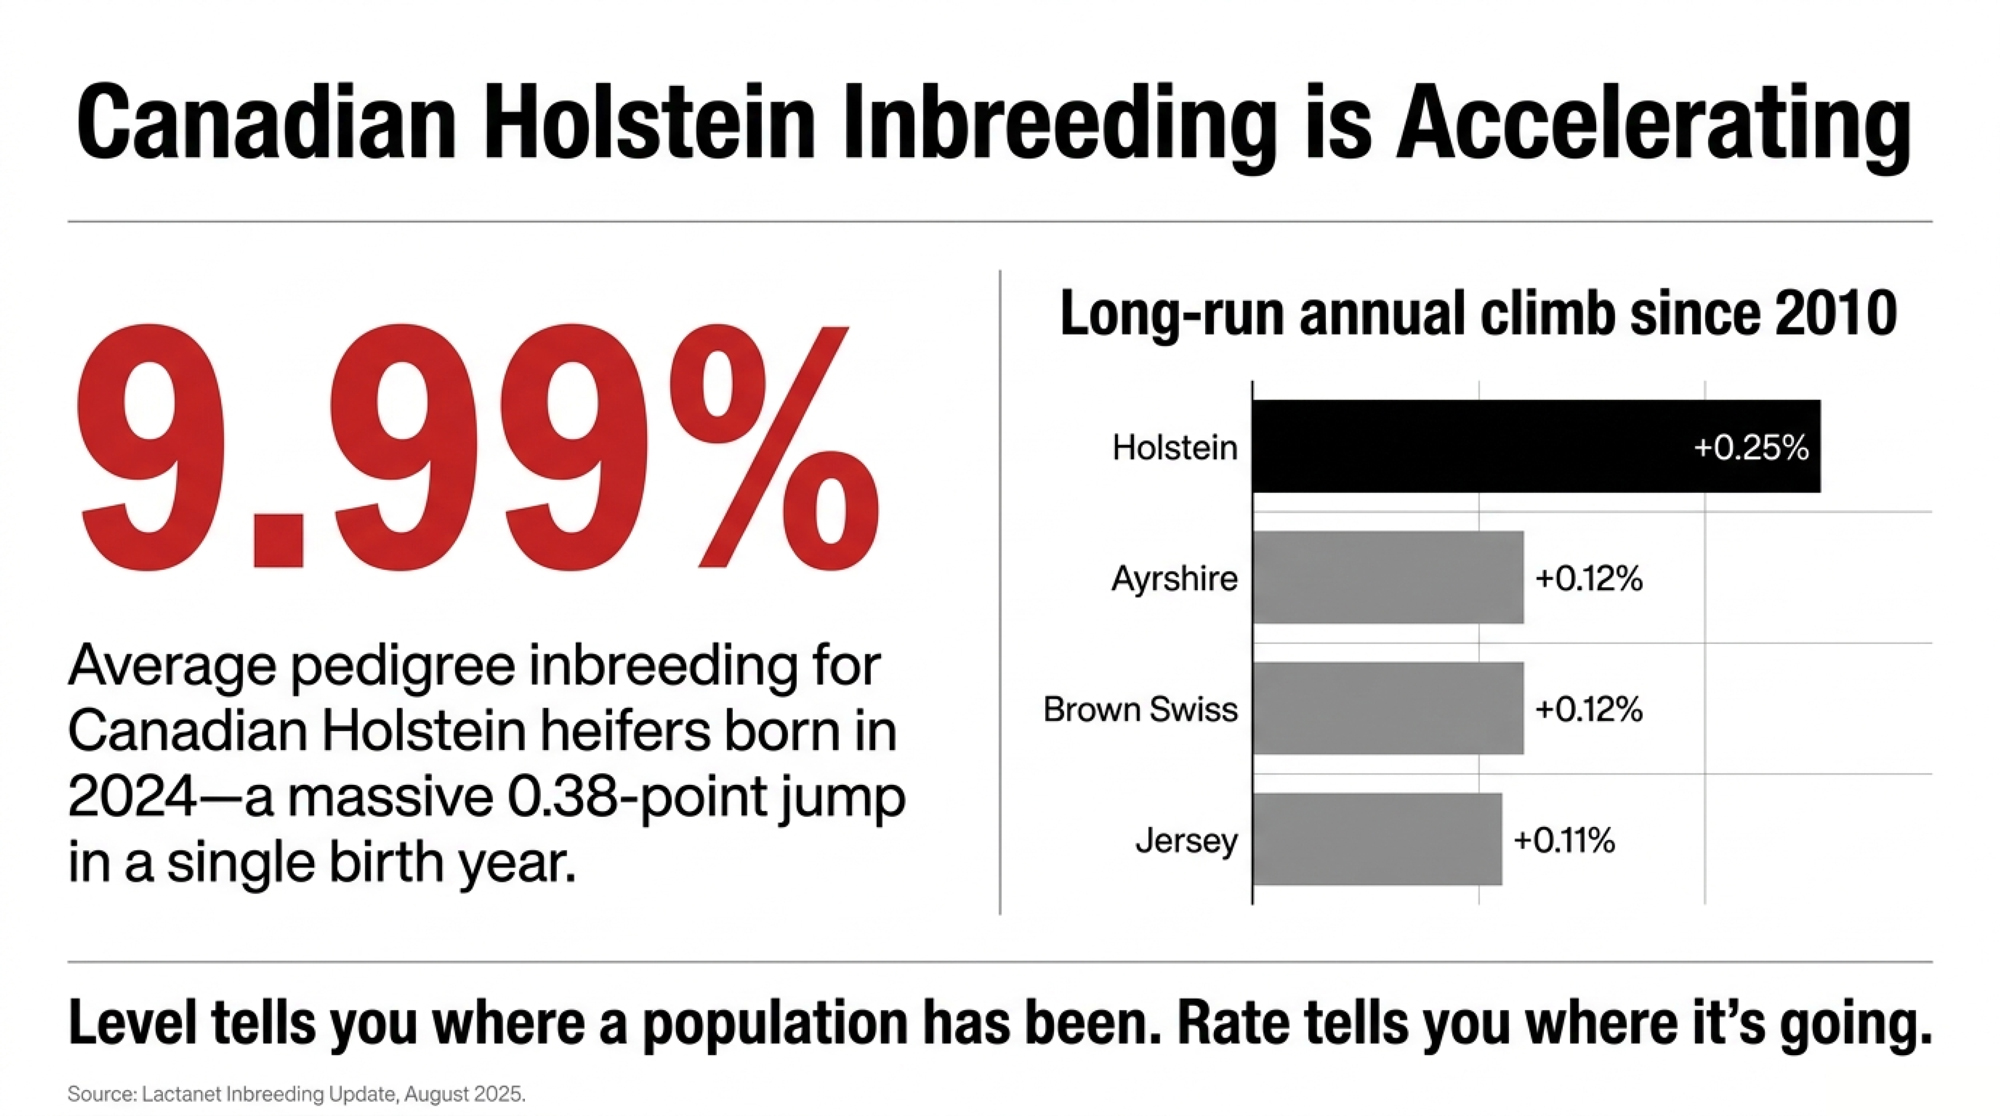
That 9.99% is up from 9.61% for heifers born in 2023. A 0.38-point jump in a single birth year, against a long-run trend of +0.25%. The climb isn’t just continuing. It steepened.

The rate is the number that should bother you. For females born since 2010, Jersey has averaged +0.11% per year, Ayrshire and Brown Swiss +0.12%, and Holstein +0.25%. Better than double.

Worth noting what that rate does and doesn’t tell you. Canadienne actually carries the highest average inbreeding of any Canadian dairy breed at 10.33% — but its rate of increase since 2010 is the lowest of the group at +0.09% per year. High level, slow climb. Holstein is the reverse. Level tells you where a population has been. Rate tells you where it’s going. Hold that distinction, because the whole argument in this piece turns on a version of it.
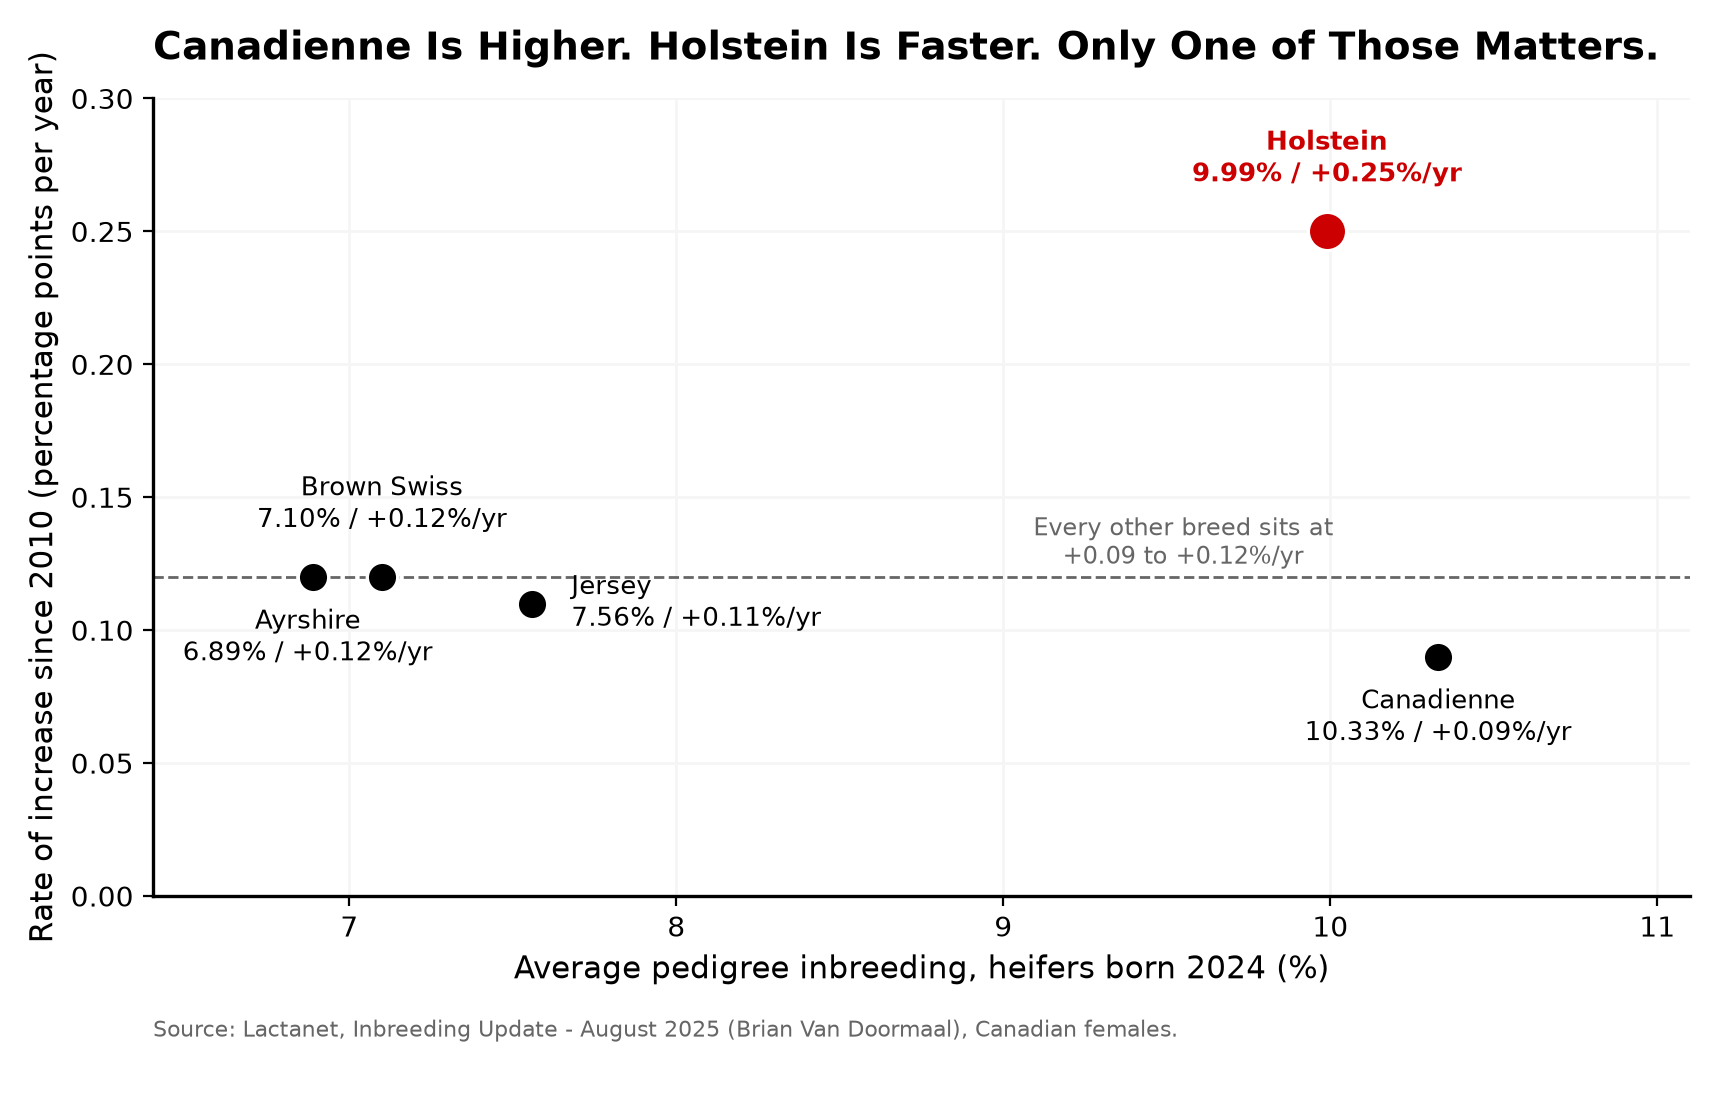
Four breeds. One country. One evaluation system. The same genomic tools sitting on the shelf for every one of them. Holstein moving twice as fast as the others. Whatever’s driving that, it isn’t a shortage of foreign germplasm — Jersey and Ayrshire breeders in Canada aren’t running set-asides either. (See our companion breakdown: What 9.99% Inbreeding Costs in a Herd Under 50 Cows.)

The Nordic Result Everybody Quotes

At the 2022 World Congress on Genetics Applied to Livestock Production, Tenhunen, Thomasen, Sørensen, Aamand, Berg and Kargo — Aarhus University, VikingGenetics and Nordic Cattle Genetic Evaluations — presented pedigree analysis on 372,955 Nordic Holstein females born January 2016 through November 2018, traced back an average of 12.4 generations.

One term you need before the table. Effective population size — Ne — is the number of breeding animals a population behaves like genetically. Not how many cows exist; how many genuinely independent lines are contributing. A breed with two million cows can run an Ne under 50. The lower it goes, the faster relatedness accumulates. Future Ne is the same idea projected forward off coancestry: where the population is heading if current mating patterns hold. That second number is the one that matters most here.

Their finding travelled fast, and you can see why:

Birth CohortPeriodΔF (per yr)ΔC (per yr)Generation IntervalNeExpected Future Ne
2007–2010Pre-genomics0.00160.00184.86 yr6859
2011–2014Transition0.00170.00144.08 yr7188
2015–2018Genomic era0.00160.00183.17 yr10487

Annual inbreeding rate flat at 0.0016 before and after. Generation interval collapsing from 4.86 years to 3.17. Effective population size apparently rising by half again, and expected future Ne improving from 59 to 87. The authors reported they could not detect any increase in inbreeding or coancestry, contrary to what had been published for Dutch, French and Canadian Holstein.

Two things to hold onto before you bank that. WCGALP proceedings are conference papers, not peer-reviewed journal articles. And the analysis ran on pedigree data.

Then the Same Team Ran It With Genomics

Tenhunen, Thomasen, Sørensen, Berg and Kargo published a follow-up in the Journal of Dairy Science — 2024 Aug;107(8):5897–5912, doi 10.3168/jds.2023-24553 — covering Nordic Jersey and Nordic Holstein, comparing pedigree and genomic measures of inbreeding and coancestry before and after genomic selection, split across females, bulls and approved AI sires. It’s open access, so you can read it yourself.

Nordic Holstein went the other way.

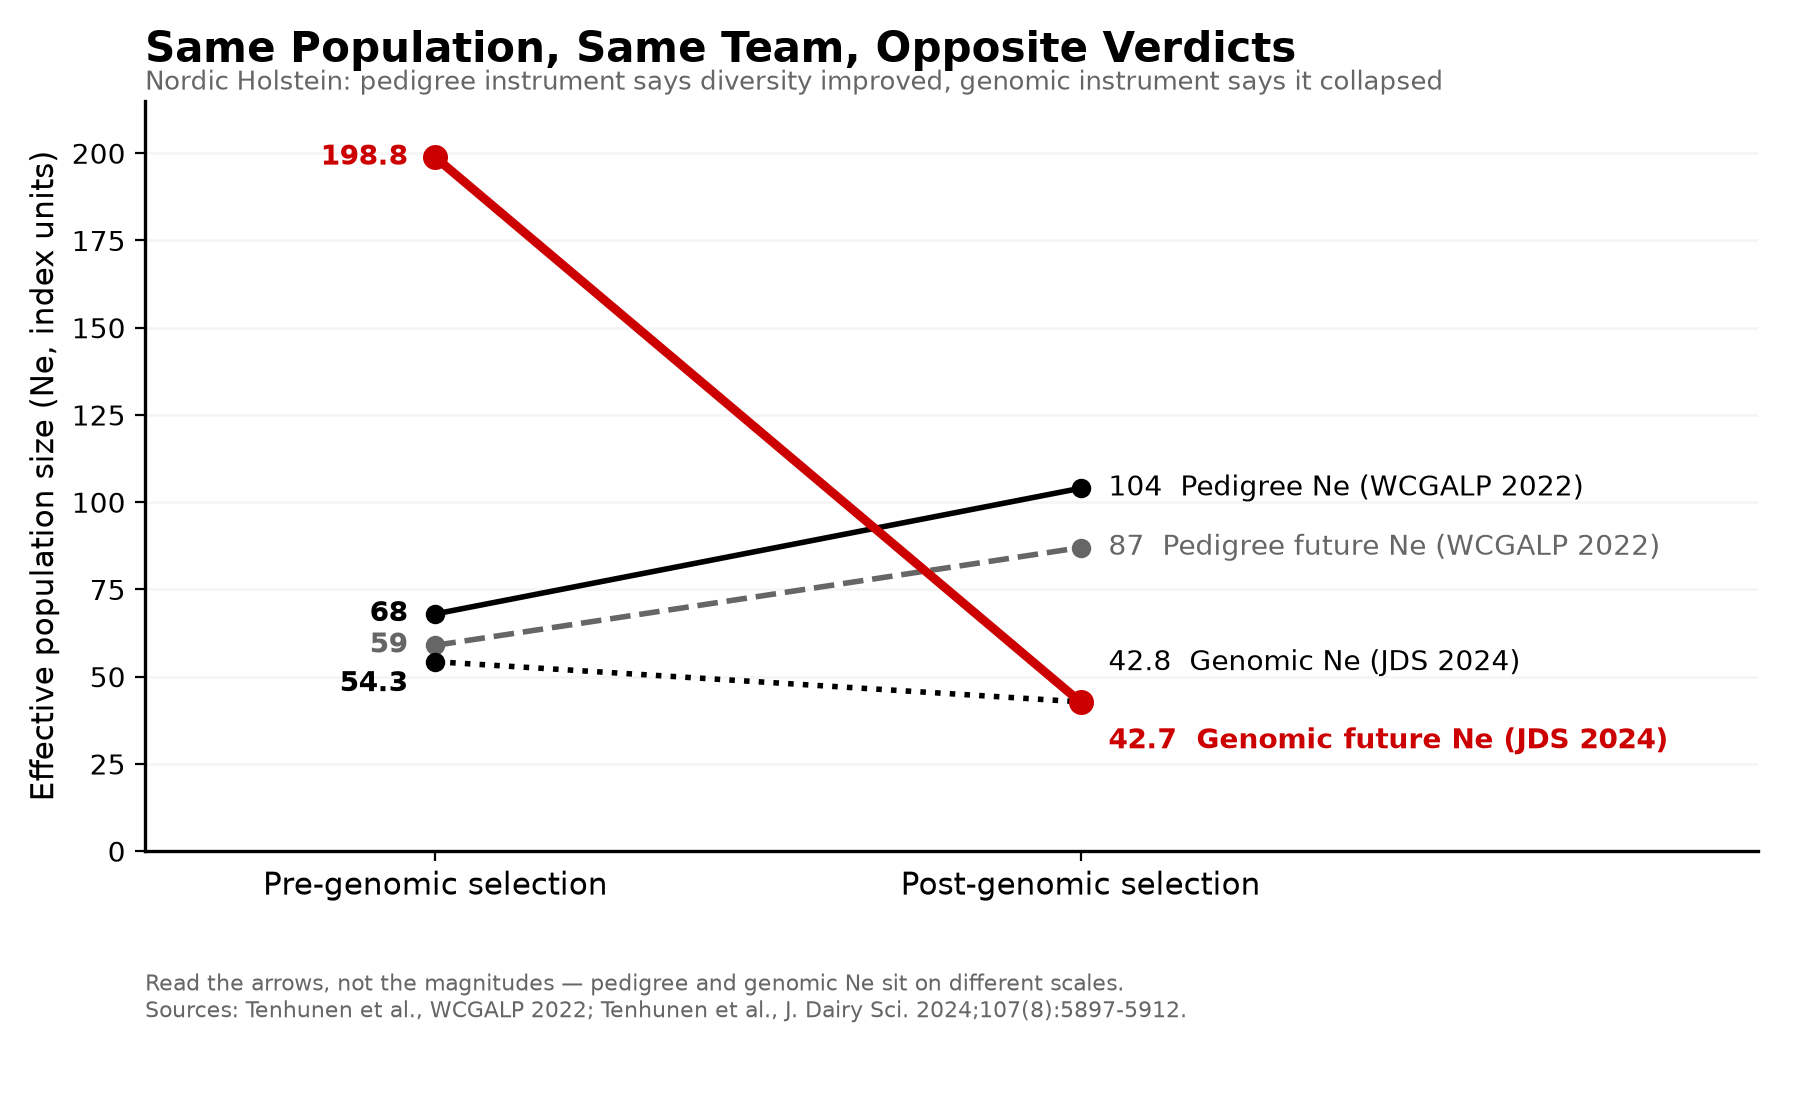
On the genomic measures, effective population size fell from 54.3 before genomic selection to 42.8 after. Future effective population size, the coancestry-derived figure, fell from 198.8 to 42.7 across the same transition.Coancestry rate rose across every Holstein animal group, with the female population surging from 0.02% to 0.39% per year. Yearly ΔF rose for most groups in both breeds.
Two Instruments, Two Verdicts
Measure (source)Pre-GSPost-GSWhat it says
Pedigree Ne — WCGALP 202268104Up 53% — diversity improving
Pedigree expected future Ne — WCGALP 20225987Up 47% — future looks safe
Genomic Ne — JDS 202454.342.8Down 21% — base narrowing
Genomic future Ne — JDS 2024198.842.7Down 79% — the warning
Female coancestry rate, Holstein — JDS 20240.02%/yr0.39%/yr~20x — next generation’s inbreeding
Genomic future Ne, Nordic Jersey — JDS 202440.757.2Up 41% — same program, opposite result

Read that table across the rows, not down the columns. These are not four readings of one quantity. Pedigree Ne and genomic Ne are computed on different scales and cannot be compared to each other by size — 68 is not “bigger than” 54.3 in any meaningful sense. What’s comparable is the arrow. The pedigree instrument said the population was opening up. The genomic instrument, run by the same team on the same population, said it was closing down. Row two and row four are the same conceptual quantity — where the population is headed — measured two ways, pointing opposite directions.

Nordic Jersey, measured the same way over the same transition, went the opposite direction from Holstein: Ne essentially stable, and future Ne improving from 40.7 to 57.2. Same program, same country, same analysis — different outcome by breed.

The authors’ summary is blunt. Genomic methods detect differences between populations and changes in ΔF and ΔC more efficiently than pedigree methods. Genomic selection produced positive coancestry outcomes in Jersey and the opposite in Holstein. Nordic Holstein “faces more pressing concerns,” and the findings “underscore the necessity of genomic control of inbreeding and coancestry with strategic changes to the Nordic breeding schemes.”

So Which Analysis Do You Believe?

The genomic one. That’s not a close call, and it’s the position the research team itself takes.

Be precise about what disagrees here. The two studies don’t offer competing readings of a single number — they used different instruments on the same population and reached opposite conclusions about the direction of travel. Pedigree analysis found diversity holding or improving. Genomic analysis found it deteriorating. One of those instruments missed something.

Pedigree inbreeding measures expected relatedness from recorded ancestry. Genomic measures capture what actually got transmitted — including relatedness that pedigree can’t see because it predates the recorded generations or runs through paths the herdbook doesn’t connect. When the two disagree, the genome is the ground truth and the pedigree is the estimate.

There’s real signal in the 2022 work that survives, and the 2024 paper confirms part of it. Generation interval genuinely fell — across every animal cohort in both breeds, more sharply in males than females. Bulls and AI sires in both breeds showed reduced generational ΔF. Nordic Holstein AI sires were the single group showing a slight decrease in yearly ΔF. The male side of the program did something right.

The Female Side Is Where It Came Apart
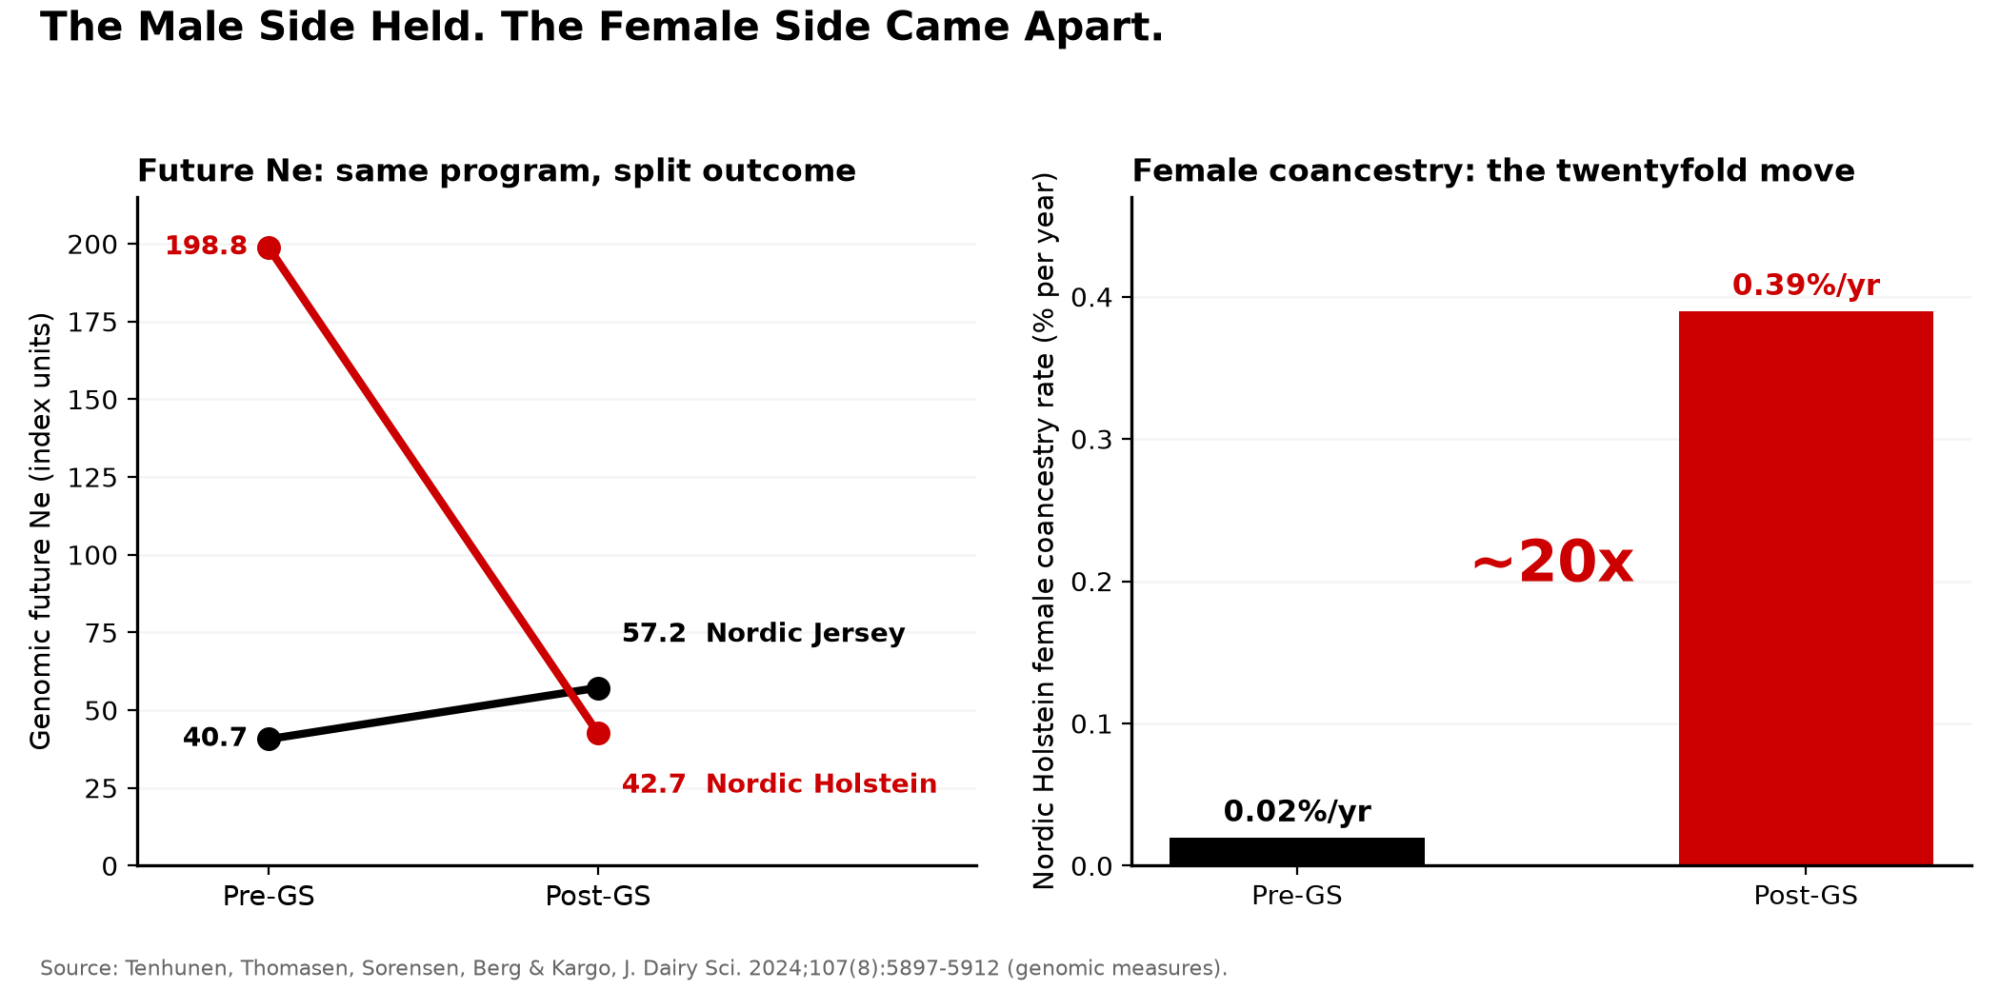
Female groups in both breeds showed a negative Ne trend while males were neutral or positive, and Holstein female coancestry climbed nearly twentyfold. A shorter generation interval spun the flywheel faster without widening the base underneath it.

Why the female side specifically? The 2024 paper doesn’t assign a cause, so what follows is inference from how the program is built — but the timing is hard to ignore.

Nordic genomic selection reached full implementation in 2014, the year females were included in the reference populations. Once you can rank a heifer at birth, the elite female pool stops being defined by proven performance across a lactation and starts being defined by a score available on day one. The same top-ranked heifers then get used, repeatedly, as donors. VikingGenetics program material published in 2017 described roughly 10,000 genomic tests on females annually, about 450 heifers contracted for flushing, and some 4,000 embryos produced per year. Its embryo program moves top heifer candidates to a donor station at five to eight months old for flushing or IVF. The stated aim is as many offspring as possible from the top NTM animals.

Note where 2017 sits. It falls inside the 2015–2018 birth cohort the Nordic analysis treats as the genomic era — so those figures describe the program during exactly the window where the coancestry rise shows up.

That is a deliberate and effective design for genetic gain. It is also, by construction, a narrowing of the female base — more calves from fewer dams, selected earlier, on a score that correlates strongly across close relatives. The male side of the program spread its risk across a wider set of sires. The female side concentrated.

One honest caveat in Nordic Holstein’s favour: the authors note ΔF there remains modest compared with what’s been observed in other Holstein populations. Nordic isn’t the cautionary tale. It’s the well-run program whose coancestry problem only became visible when the better instrument came out.

What the Authors Say to Do About It

This is the part that matters for your tank. The 2024 paper’s own conclusion points at mating strategy: analysis of the coancestry data hints at the potential to decrease future inbreeding through informed mating.

In practice that means the coancestry figures identify which pairings will compound relatedness before you make them, rather than showing up as an inbreeding coefficient on a calf that’s already on the ground.

Not passports. Measured relatedness. That’s a selection lever, and it’s the one a herd actually controls — which is a different thing from the supply question the set-aside raises. Hold that distinction; it matters in a minute.

Which is exactly what a Guelph-led team built the tool for.

Somebody Already Built That Tool

Makanjuola, Obari, Condello, Miglior, Maltecca, Cole, Schenkel and Baes — through the Centre for Genomic Improvement of Livestock at Guelph, with Lactanet, NC State, CDCB and Florida — published in the Interbull journal on November 17, 2025.

They pulled Lactanet data: 168,995 genotyped animals, a 616,258-animal pedigree, 8,491 bulls born 2000–2023, and 131,139 cows born 2010–2024. Pedigree completeness above 99%, maximum depth 30 generations. The reference population was active cows and heifers in milk recording with no left-herd date as of the April 2024 test day.

Then they measured how much DNA each bull actually shares with that live Canadian cow population — expected from pedigree (R-value), and realized from genotypes (GR-value).

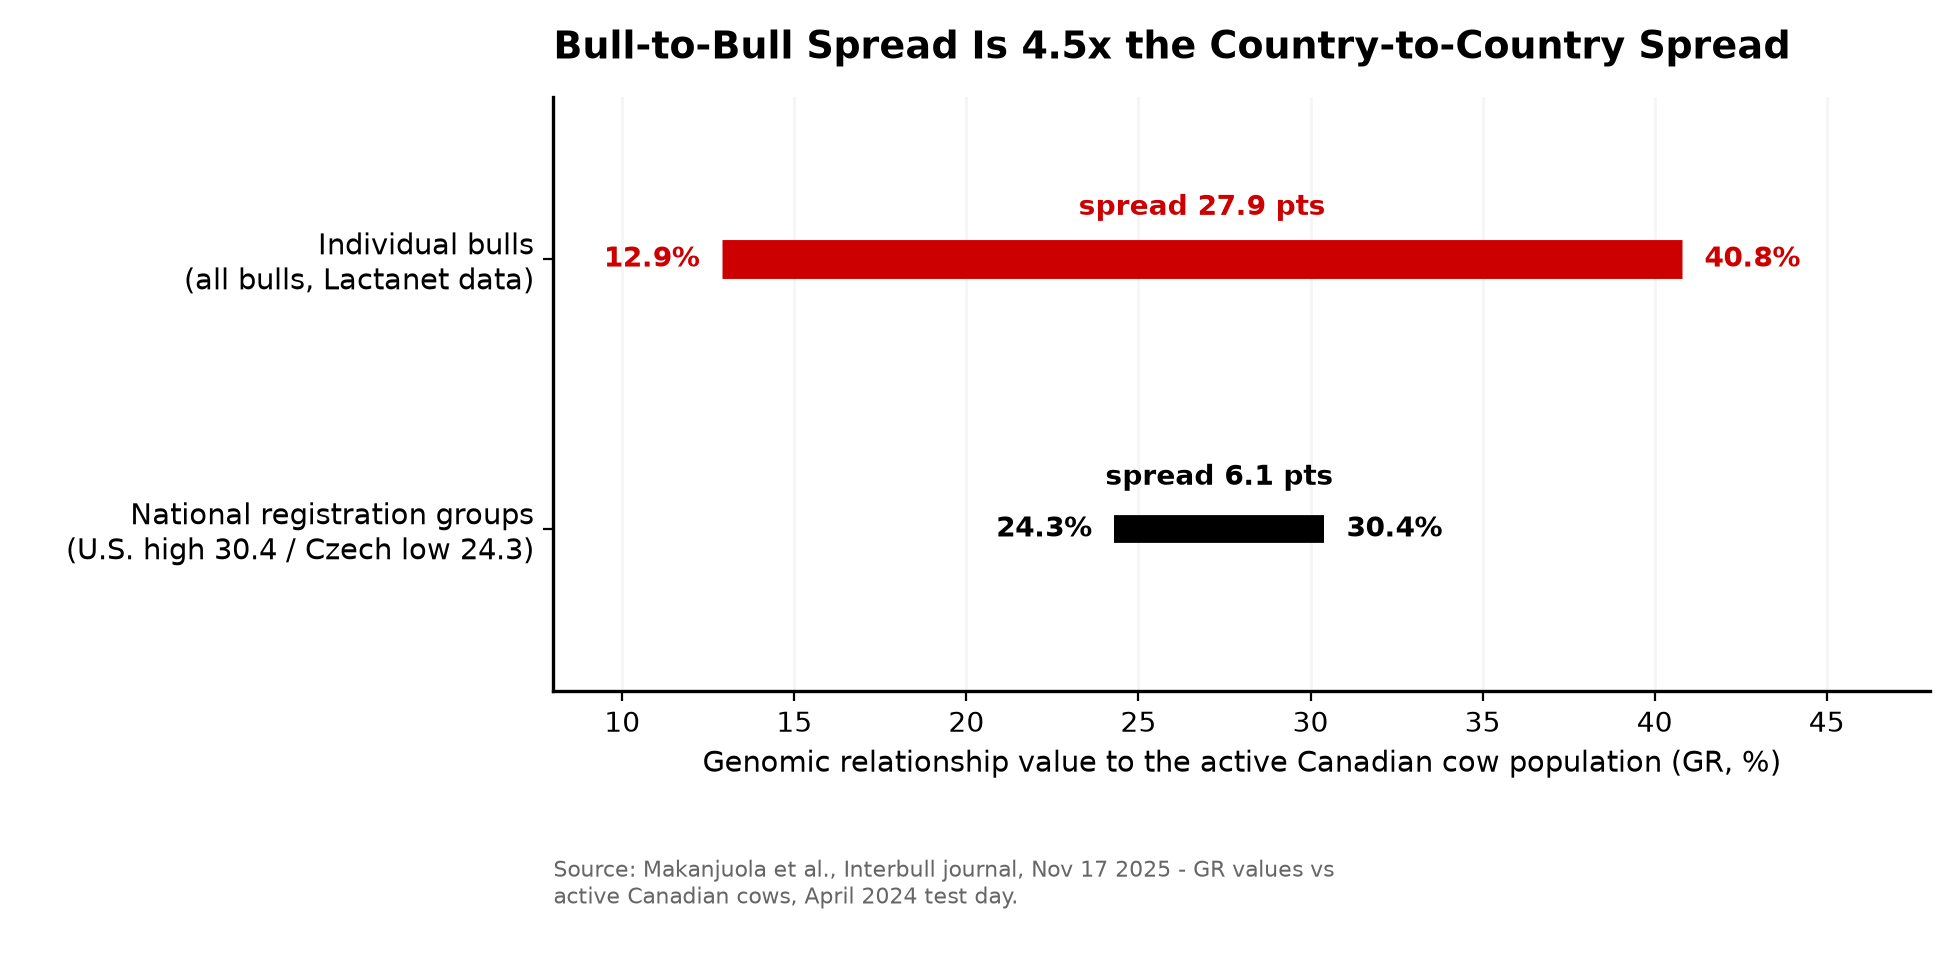
Across all bulls, R-value ran from 9.3% to 26.5%. GR-value ran from 12.9% to 40.8%. Bulls with United States registration codes came in highest at 20.8% and 30.4%. Bulls registered in the Czech Republic came in lowest, at 17.1% and 24.3%.

Doesn’t the Czech Result Prove the European Case?

Give the set-aside argument its due first, because it raises something a relationship-value screen cannot answer on its own.

Funnel width versus screening precision. You can’t run a GR value on a bull nobody collected. Screening works on the population that already exists — bulls that got sampled, genotyped and entered into an accessible database. The set-aside is about who gets into that population in the first place. Those are two levers on two different parts of the pipeline, and a narrow funnel upstream caps what any downstream screen can possibly find. Widen the funnel and you widen the range of relationship values available to select from. The two are complementary, not competing.

Grant all of that, and the criterion still doesn’t hold.

Read what the Guelph authors actually recommend: select sires with low average relationship values to a defined reference population, as a mating strategy, to reduce or hold inbreeding at acceptable levels while preserving genetic diversity. That’s a relationship-value screen, not a passport screen — and the same logic applies to what you let into the funnel as to what you pick out of it.

The Czech figure isn’t a case for Czech genetics. A Czech-registered bull ranks low here because of how Canadian breeding history ran, not because of where he was born. Run the same math against a different national herd and the order shifts.
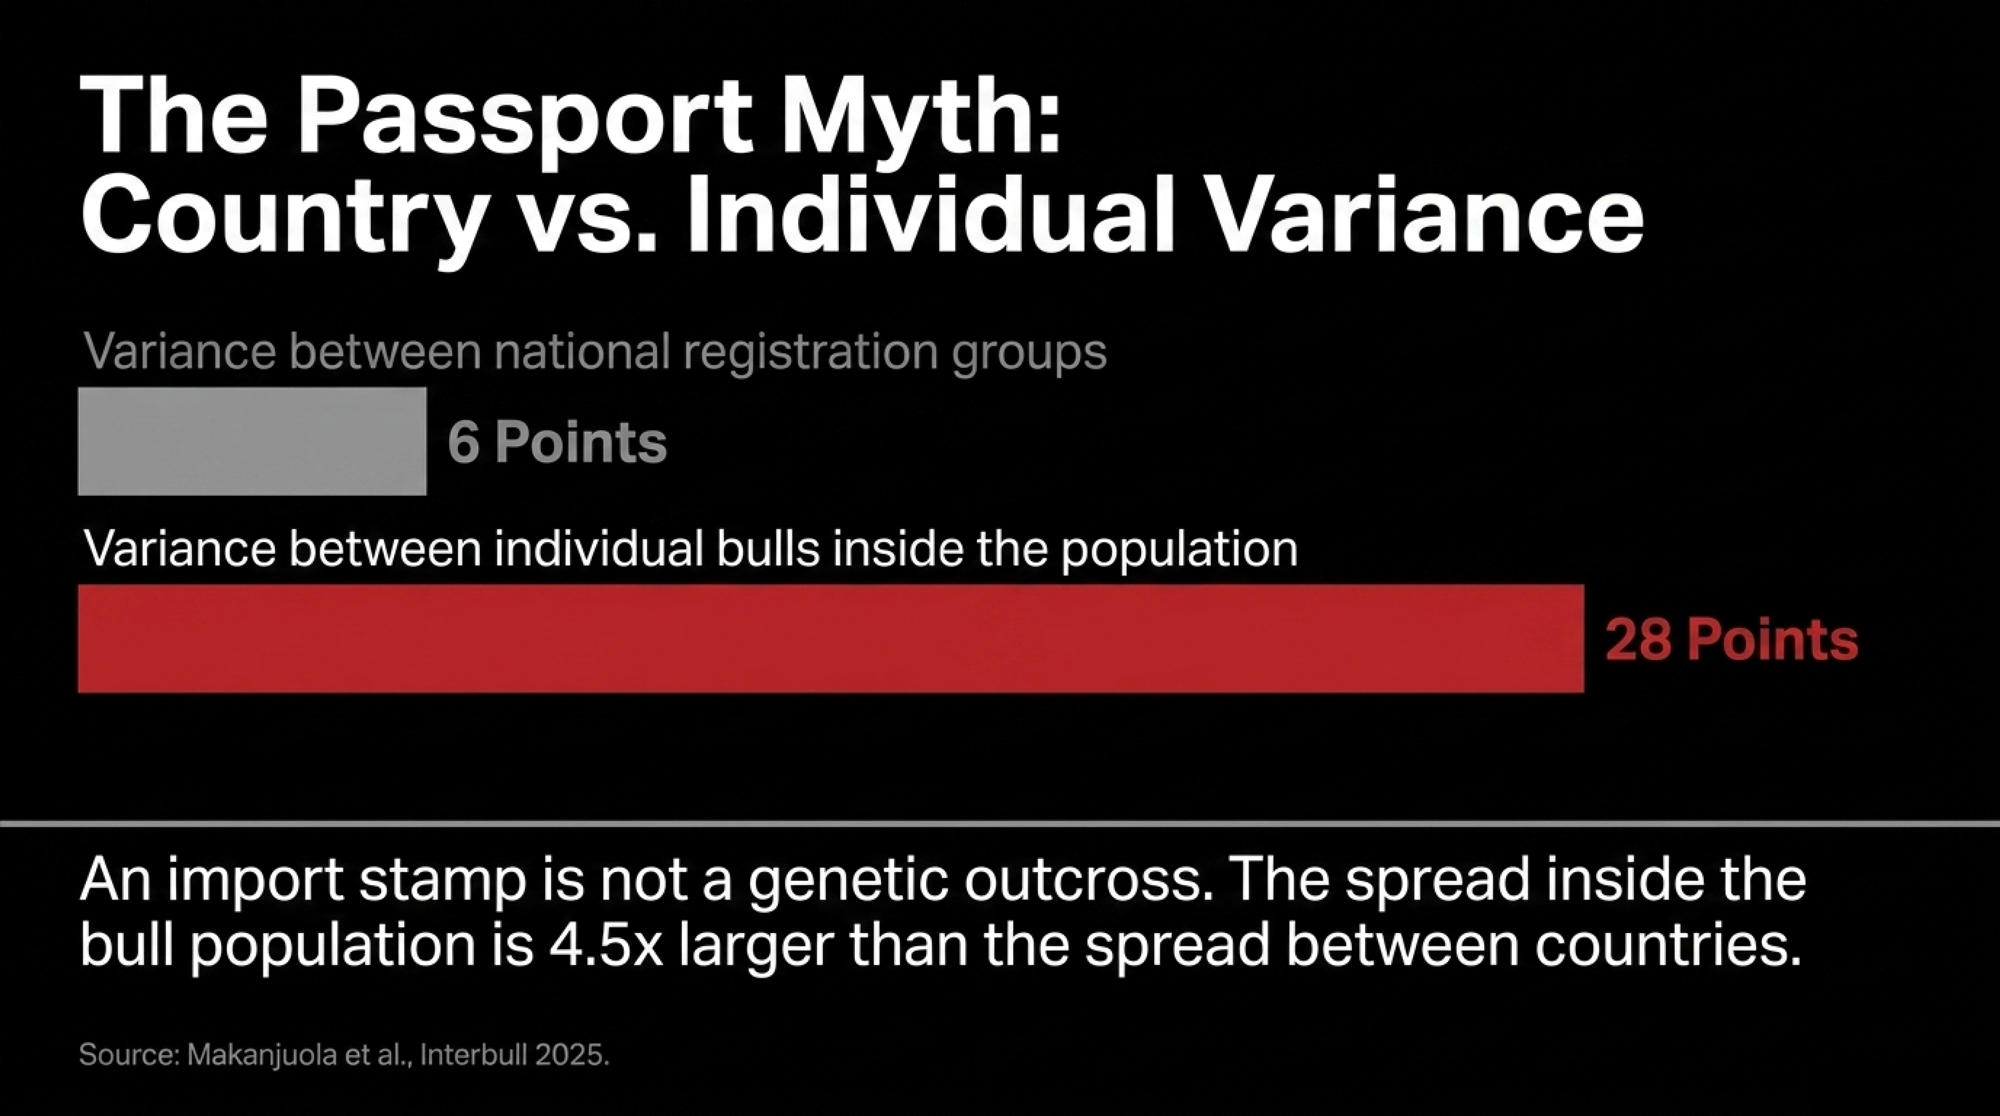
And look at the size of the gaps. Between the highest and lowest national groups: about 6 points on the genomic measure. Between individual bulls: nearly 28. The spread inside the bull population is roughly four and a half times the spread between countries. So if you’re going to reserve intake slots — and there’s a real argument you should — reserve them for bulls with low measured relatedness to your reference population, whatever their registration code. A 5% carve-out sorted by passport captures the 6-point axis and leaves the 28-point axis untouched. (Related reading: Genomic Future Inbreeding Shows Relatedness That Pedigree Misses.)
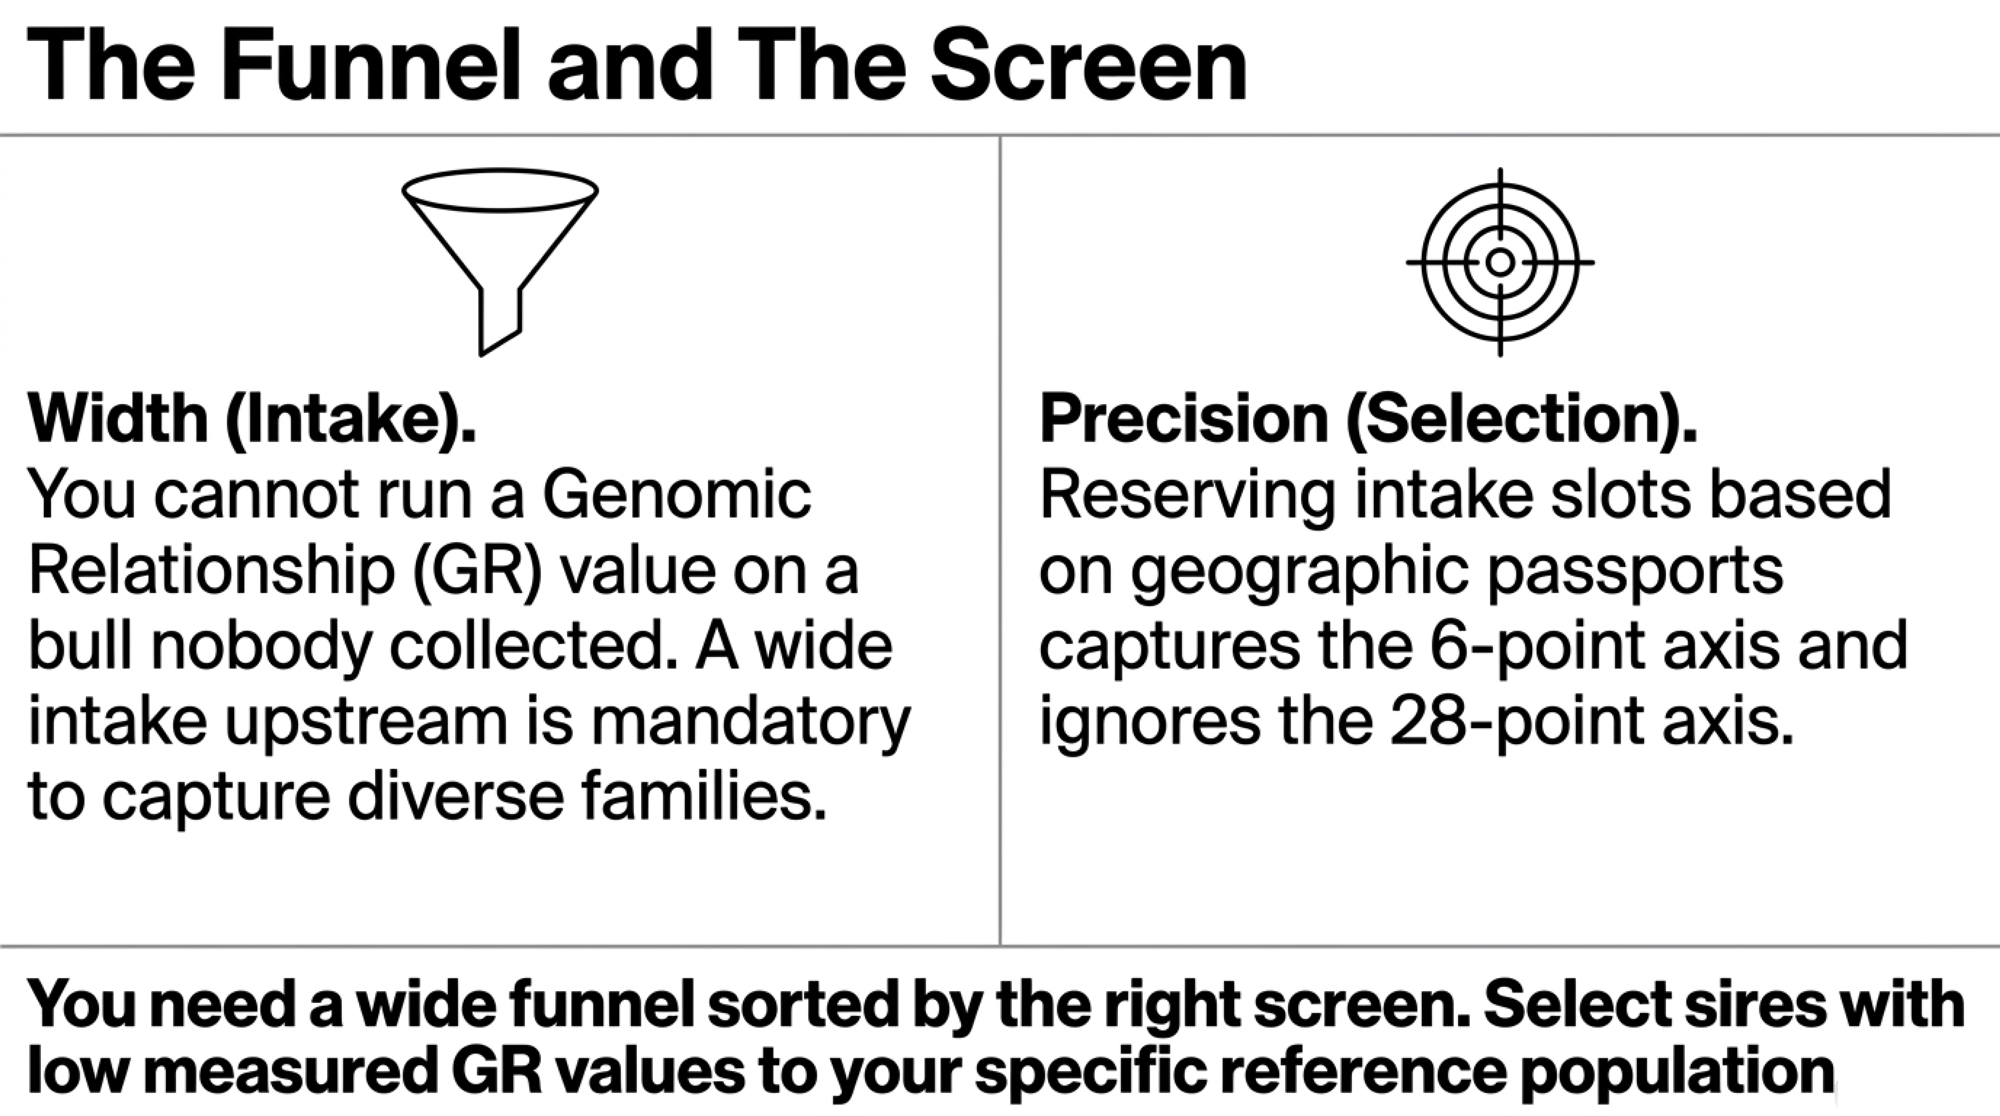
One catch: what the Guelph team published is a method, not a product. Someone still has to run it against your reference population and put the number in front of you. Ask your supplier whether they can — and notice what the answer tells you.

The Number That Isn’t Published Anywhere

The set-aside argument runs on the European-origin bulls that worked. What it doesn’t include is how many got sampled in North America over the same decades and never made a second lineup.

Studs have modelled sampling attrition since at least 1992, when Lohuis published on probability of success and predicted returns for progeny-test sires in the Journal of Dairy Science. Without that denominator broken out by origin, the case rests entirely on the sires that succeeded. Any group of bulls looks strong when only the successes get counted.

Industry Transparency Note: A review of public materials from CDCB, Lactanet, Holstein Association USA and NAAB found no published sire-sampling attrition data broken out by country of origin. That data is held by individual AI companies rather than evaluation bodies, and no association standard or regulatory requirement currently calls for it to be published.

Try to Price the Set-Aside

Meyer et al. (Journal of Dairy Science, 2001) described 1990s U.S. conditions with over 600 new young sires available annually. Five percent of that 1990s figure is about 30 bulls a year across the whole industry — and genomic-era intake is almost certainly lower than 600, which would shrink the number further.

Thirty bulls is small and checkable. It’s also where the math stops. No current published figure exists for genomic-era sampling volume, and no stud has published a per-bull cost breakdown running from acquisition through housing, genomic testing, collection and marketing to a usable proof.

Meanwhile the spread from Net Merit $ #1 to #10 in the August 2026 run is $47 per animal — roughly $4,700 across 100 daughters — per The Bullvine’s analysis of that run. That’s a PTA differential, not money in the tank, but it’s a number the industry can put a decimal on. What it costs to widen the funnel by thirty bulls isn’t published anywhere. (Full run detail: The August 2026 Lists, Bull by Bull.)

The One Historical Case Worth Citing

Carol Prelude Mtoto gets invoked constantly as proof that European testing unlocks genetics North America would have missed. His sire line traces to Ronnybrook Prelude, a Canadian-registered sire confirmed in Holstein Canada’s animal information records. Mtoto’s Italian proving history appears in two independent published accounts rather than a primary herdbook entry, so treat the detail accordingly.

What the case actually shows is a North American pedigree that got its shot in Italy. That’s a story about somebody widening the funnel for an unproven pedigree — which is the set-aside argument’s strongest instinct, and it has nothing to do with where the genetics came from. One case isn’t a pattern either way, and building a procurement policy on it would repeat the same shortcut. (Background: The Full Mtoto Story.)

One Study Nobody Reopened

Powell, Sanders and Norman at USDA’s Animal Improvement Programs Laboratory examined May 2005 Interbull evaluations using Holstein full-brother families — 24,611 bulls for yield traits (Journal of Dairy Science, July 2008, 91(7):2885–92). Bulls from Australia, Germany, Great Britain and Japan showed greater EBV for milk yield than their own full brothers evaluated in the United States, on all countries’ scales. Causes were reported as unknown, and eighteen years on, nobody has replicated it with genomic-era data.

Nilforooshan’s 2022 JDS invited review found that bulls proven in more than one country are “highly selected and a biased representation of the national sire populations.” Sallam et al. (2022) found MACE may not fully account for genotype-by-environment interactions. Neither quantifies direction or magnitude for sires entering North America.

Tie that back to your order. A foreign proof can read differently on a North American scale for reasons that have nothing to do with the bull’s genes — selection bias in which bulls got exported and evaluated abroad, genotype-by-environment effects the conversion may not fully absorb, and in the 2008 case something nobody has identified in eighteen years of trying. None of that makes foreign-tested bulls better or worse than domestic ones. It makes their index numbers harder to read with confidence. Which is one more argument for buying on measured relatedness to your own cow population, where the number means the same thing no matter which country ran the evaluation. An import stamp is not a genetic outcross, and a foreign index is not a like-for-like comparison.

What This Means for Your Operation

What you’re buying onThe numberWhat it actually means
Top 10 GTPI bulls sired by Ocd Thorson Ripcord-ET7 of 10Four picks off the list, three likely half-brothers
Top 10 Net Merit $ bulls sired by Ripcord8 of 10Switching index does not switch families
Bulls tracing to one shared great-granddam7 across both listsOne generation back it tightens, not loosens
Net Merit $ spread, #1 to #10$47/animal (~$4,700 per 100 daughters)A PTA differential, not cash in the tank
Reliability: genomic young sires vs daughter-proven65–82% vs 84–99%On contract heifers, reliability is the decision
Canadian Holstein average inbreeding, 2023 → 2024 heifers9.61% → 9.99% (+0.38 pt in one year)Steeper than its own +0.25%/yr long-run rate

Trust genomic relatedness over pedigree relatedness

Nordic Holstein’s pedigree analysis reported no deterioration. The genomic analysis, from the same team, put future Ne at 42.7 after genomic selection. If your herd manages diversity off pedigree inbreeding alone, you’re reading the estimate instead of the measurement.

Audit your sire-of-sons base

Pull the last twelve months of semen invoices. List sire and maternal grandsire for every straw, then count the distinct sires of sons. Seven of ten top GTPI bulls in the August 2026 run traced to one sire — buy four off that list without checking and the odds say three are half-brothers. Vendor diversity is not family diversity.

Ask for genomic relationship values

Request GR values benchmarked against your national or herd reference base rather than trusting outcross claims on a catalogue page. Individual bulls in the Guelph study spanned 12.9% to 40.8% — roughly four and a half times the spread between the highest and lowest national registration groups. The method exists. Ask who’s willing to run it.

Ask about the funnel too, not just the screen

Screening only works on bulls somebody collected. If your supplier’s young-sire intake is narrow, no amount of GR filtering on the survivors fixes it. Ask how many bulls enter their program each year and how many distinct families those bulls come from — then ask what the relationship-value spread looks like across that intake.

Watch your own donor concentration

The Nordic female result is a warning that applies at herd level. If you’re flushing or aspirating, count how many distinct dams produced your last two calf crops. Genomic pre-selection makes it easy to keep going back to the same three heifers because the score says so. That’s how a female base narrows without anyone deciding to narrow it.

Don’t mistake a shorter generation interval for progress

Nordic Holstein cut generation interval across every cohort and still lost ground on coancestry, because the female side kept drawing on related lines. Faster turnover only expands the effective population if the parents come from genuinely different families.

Watch coancestry, not just inbreeding

Nordic Holstein female coancestry went from 0.02% to 0.39% per year while inbreeding stayed modest. Coancestry is next generation’s inbreeding. Your current inbreeding percentage won’t warn you.

Treat reliability as the decision on contract heifers

Genomic bulls in the August 2026 run carried 65–82% reliability against 84–99% for daughter-proven sires. On heifers you’re committing, that spread is the choice, not the index.

Don’t compare indexes across systems

TPI, LPI, NVI, RZG and gPFT are non-comparable without an explicit MACE-conversion caveat — and treat any foreign-tested proof as carrying an open country-of-testing question, because the 2008 full-brother finding was never revisited.
Key Takeaways

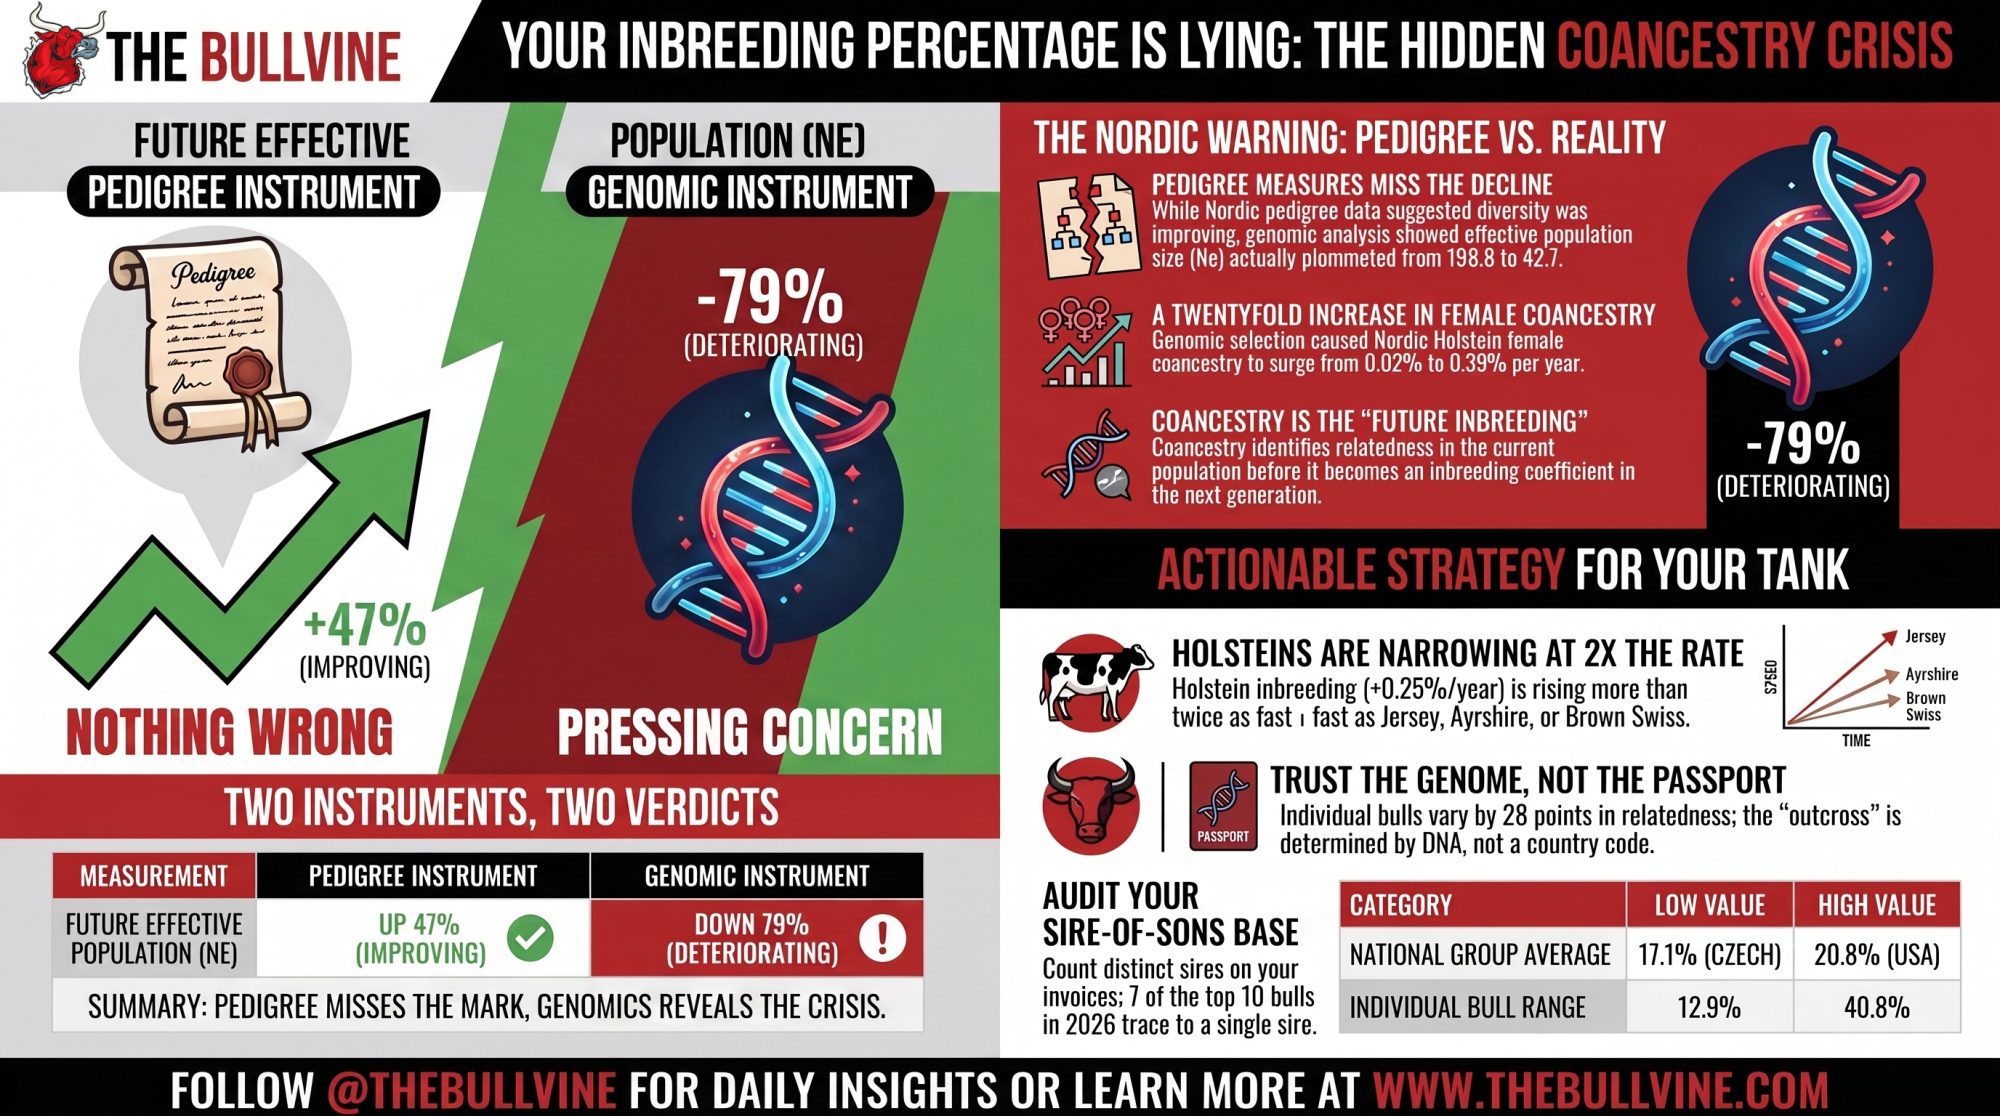
  • If you’re managing diversity off pedigree inbreeding alone, you’re using the instrument that found nothing wrong with Nordic Holstein. In the next 30 days, run the invoice audit above and ask your supplier for genomic relationship values against your national reference base.
  • Funnel width and screening precision are different problems, and you need both. A narrow intake caps what any screen can find; a wide intake sorted by the wrong criterion wastes the width.
  • Canadian Holstein went from 9.61% to 9.99% average inbreeding in one birth year — a steeper jump than its own +0.25% long-run rate, and better than double the pace of Jersey, Ayrshire and Brown Swiss.
  • Same program, same country, same genomic analysis: Nordic Jersey’s future Ne improved from 40.7 to 57.2 across the genomic-selection transition while Holstein’s fell from 198.8 to 42.7. This isn’t an argument about genomics as a technology — it’s about how a breed’s female base gets used.
  • If one bull sits at 30.4% genomic relatedness to your reference population and another at 24.3%, the second one is your outcross — whatever flag is on the catalogue page.
  • If your coancestry rate is climbing while your inbreeding percentage looks stable, that’s the Nordic Holstein pattern, and it resolves into inbreeding one generation later.
  • Ask your stud how many foreign-origin sires they’ve sampled and how many made a second lineup. Whether that number is even available is worth knowing before your next order.
Interbull got built because fragmentation carried a cost the whole industry felt. InterGenomics got built because accuracy had a shared incentive. CDCB publishes its base-change methodology because everybody’s numbers depend on it. Sire attrition data sits at a different level — held by individual companies, with no standard calling for it. Meanwhile the Nordic team went back with a better instrument and published a result that undercut its own earlier finding, and a Guelph-led group has already built the measurement that answers the selection half of the question — and tells you what a wider funnel should be screening for. So the question isn’t whether North America needs European semen. It’s whether anybody’s going to ask their supplier for a relationship value — and whether they’ll get one. What’s yours?

Genetic evaluation figures are from the August 2026 CDCB/Holstein Association USA run. Relationship values are from Makanjuola et al., Interbull journal, November 17, 2025, calculated against the active Canadian cow population as of the April 2024 test day. Inbreeding figures are Canadian, from Lactanet’s Inbreeding Update – August 2025 (Brian Van Doormaal), covering heifers born in 2023 and 2024. Nordic pedigree figures are from Tenhunen et al., WCGALP 2022 conference proceedings; Nordic genomic figures are from Tenhunen, Thomasen, Sørensen, Berg and Kargo, Journal of Dairy Science 2024;107(8):5897–5912, doi 10.3168/jds.2023-24553, open access — all Nordic Ne and future Ne values quoted from that paper are genomic measures compared before and after the genomic-selection transition. Pedigree and genomic Ne are computed on different scales and are not directly comparable by magnitude. Embryo-program figures are from VikingGenetics program material published in 2017, plus its current embryo program description; the 2024 paper does not assign a cause for the female coancestry trend, and the connection drawn here is The Bullvine’s inference. Both Nordic studies cover Denmark, Finland and Sweden. Analysis and conclusions are The Bullvine’s.

Learn More

The Sunday Read Dairy Professionals Don’t Skip.

Every week, thousands of producers, breeders, and industry insiders open Bullvine Weekly for genetics insights, market shifts, and profit strategies they won’t find anywhere else. One email. Five minutes. Smarter decisions all week.
NewsSubscribe
First
Last
Consent

The Ripcord Risk: Correcting the Genetic Blind Spot in Legs

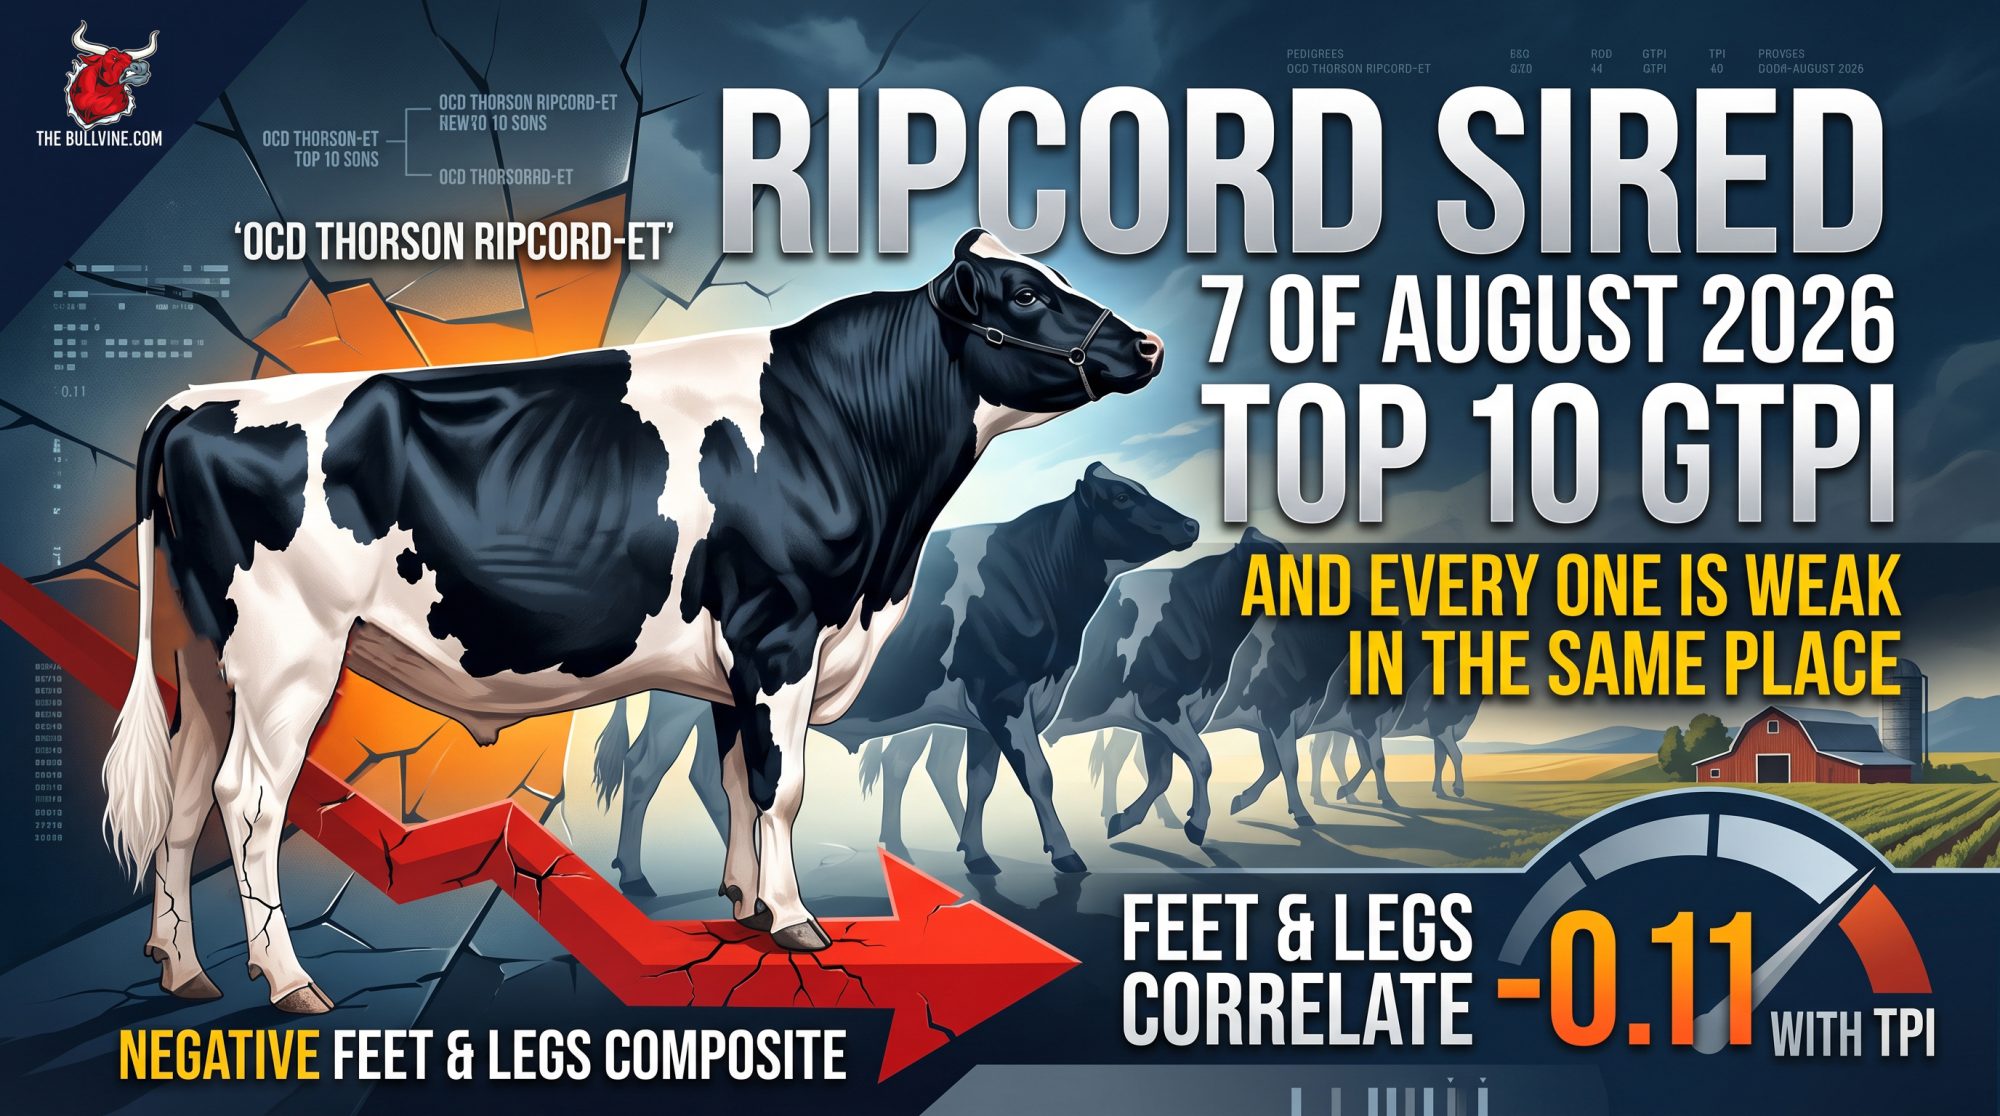
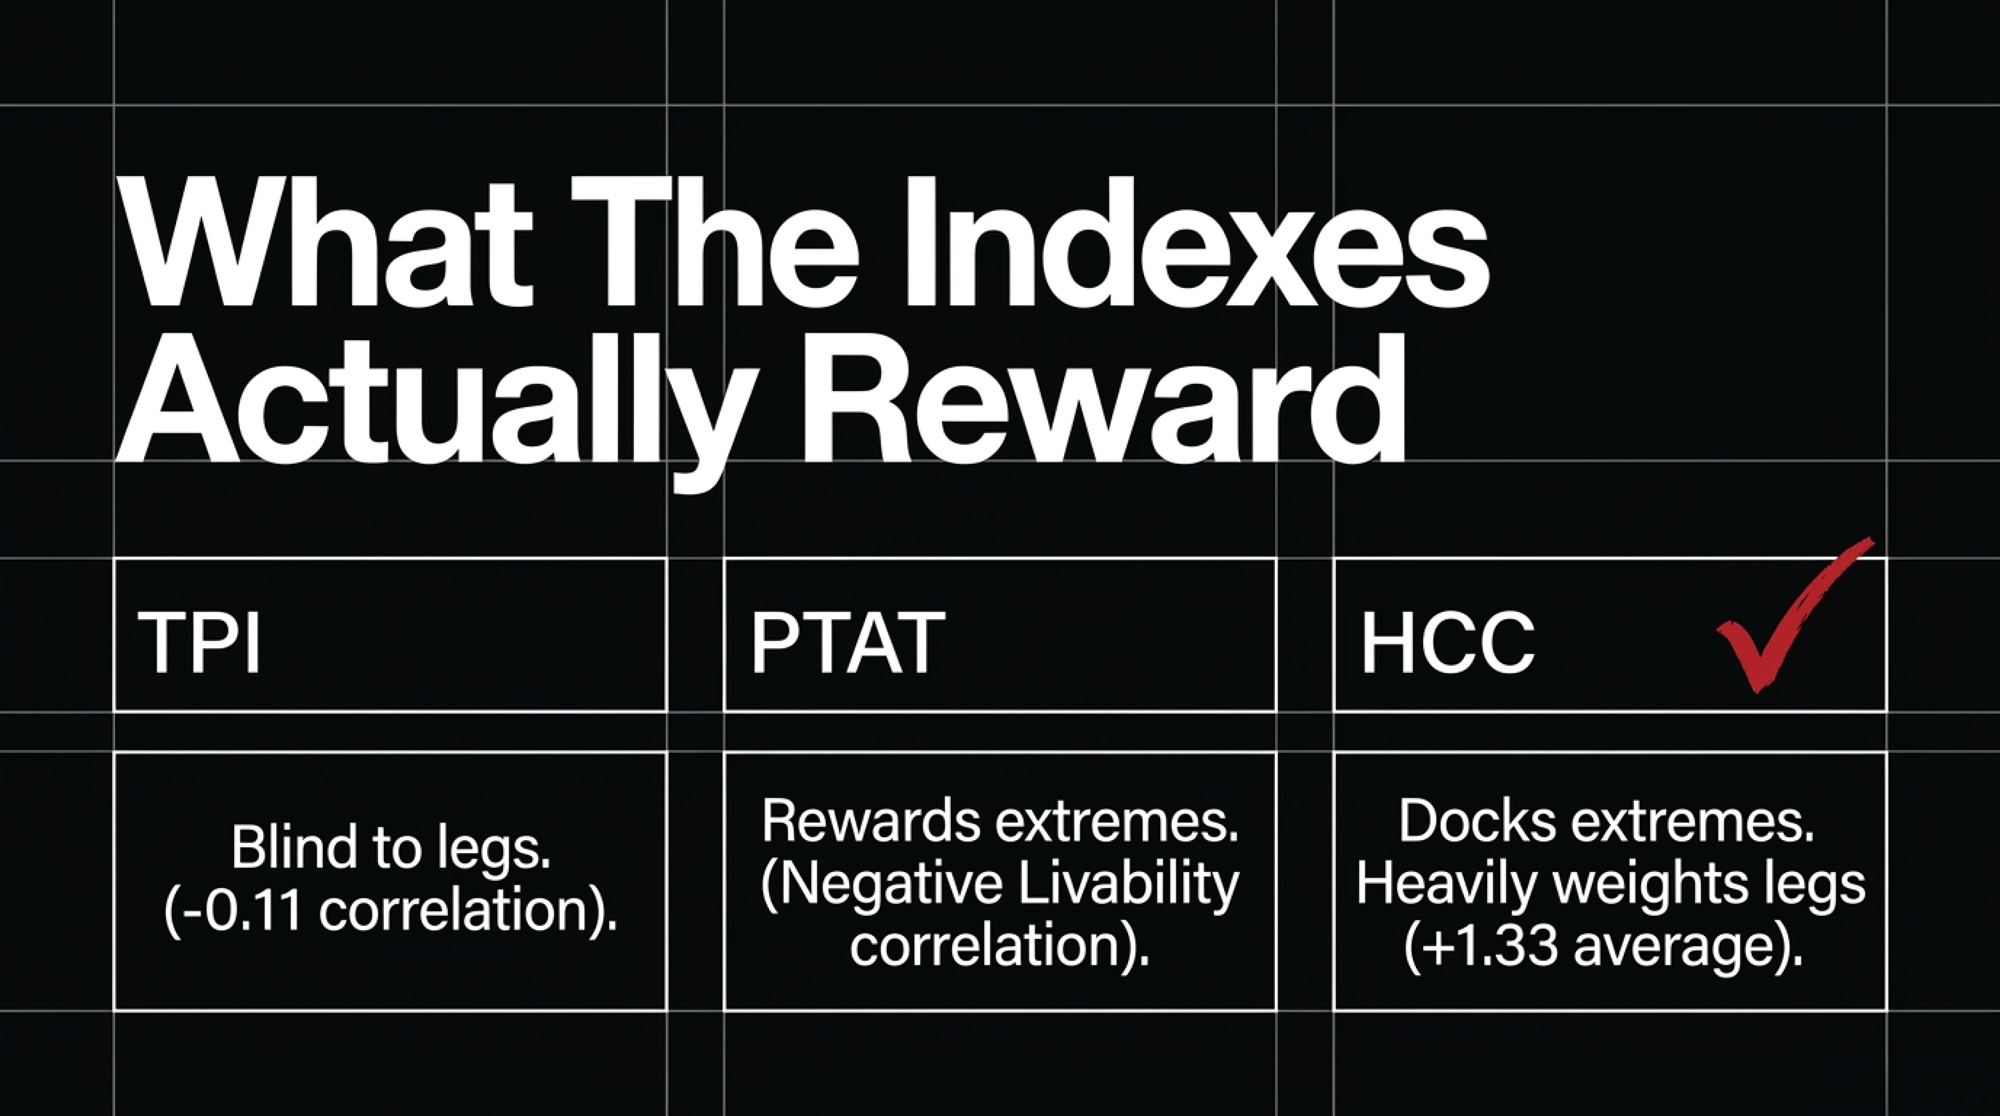
Seven of the ten highest-GTPI bulls in the U.S. share one father. Every one is positive on udders, negative on feet and legs. Feet and legs correlate −0.11 with TPI — your ranking won’t flag it.

EXECUTIVE SUMMARY:

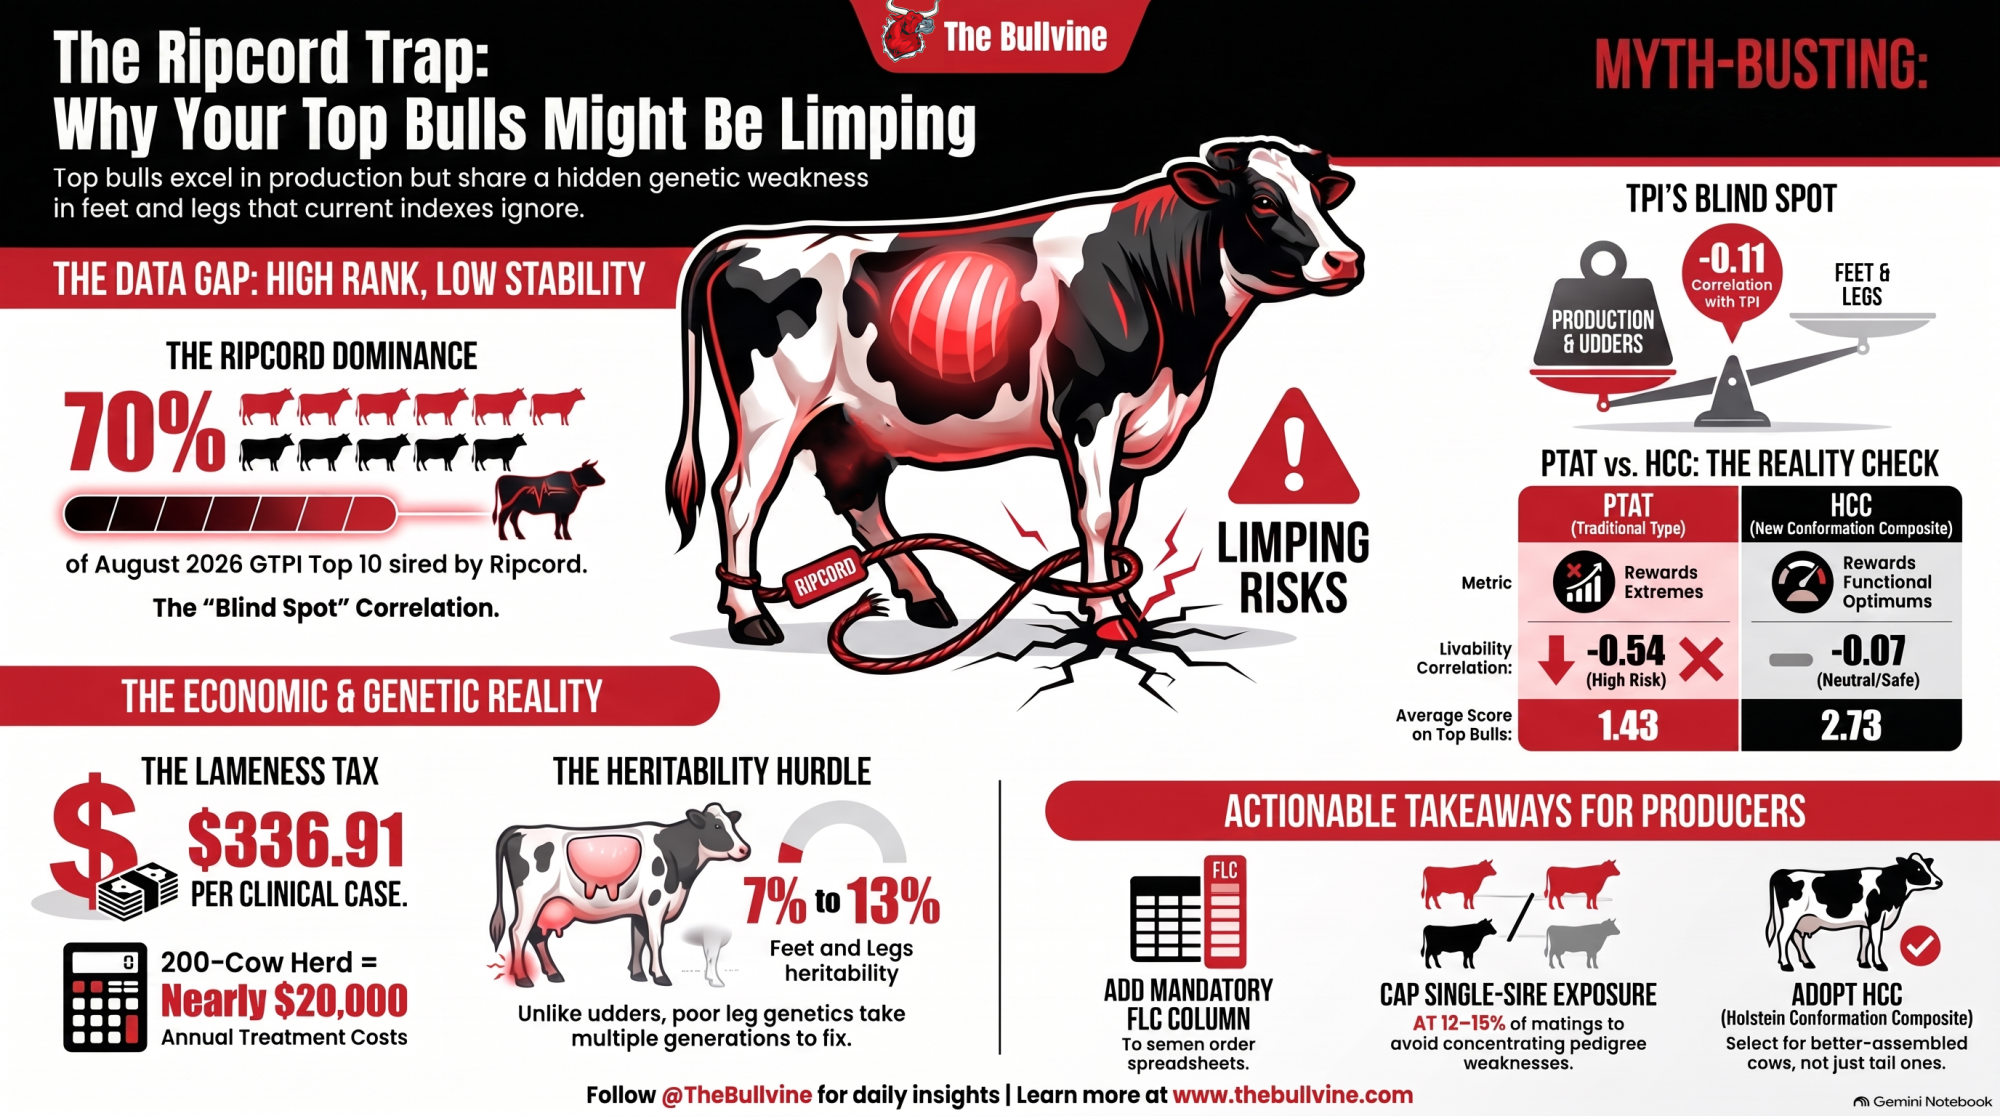
  • What happened: Seven of the ten highest-GTPI bulls in the August 12, 2026 U.S. run trace to one father — Ocd Thorson Ripcord-ET — and eight of the top ten on Net Merit $. Every one of those GTPI sons carries a positive Udder Composite alongside a negative Feet & Legs Composite.
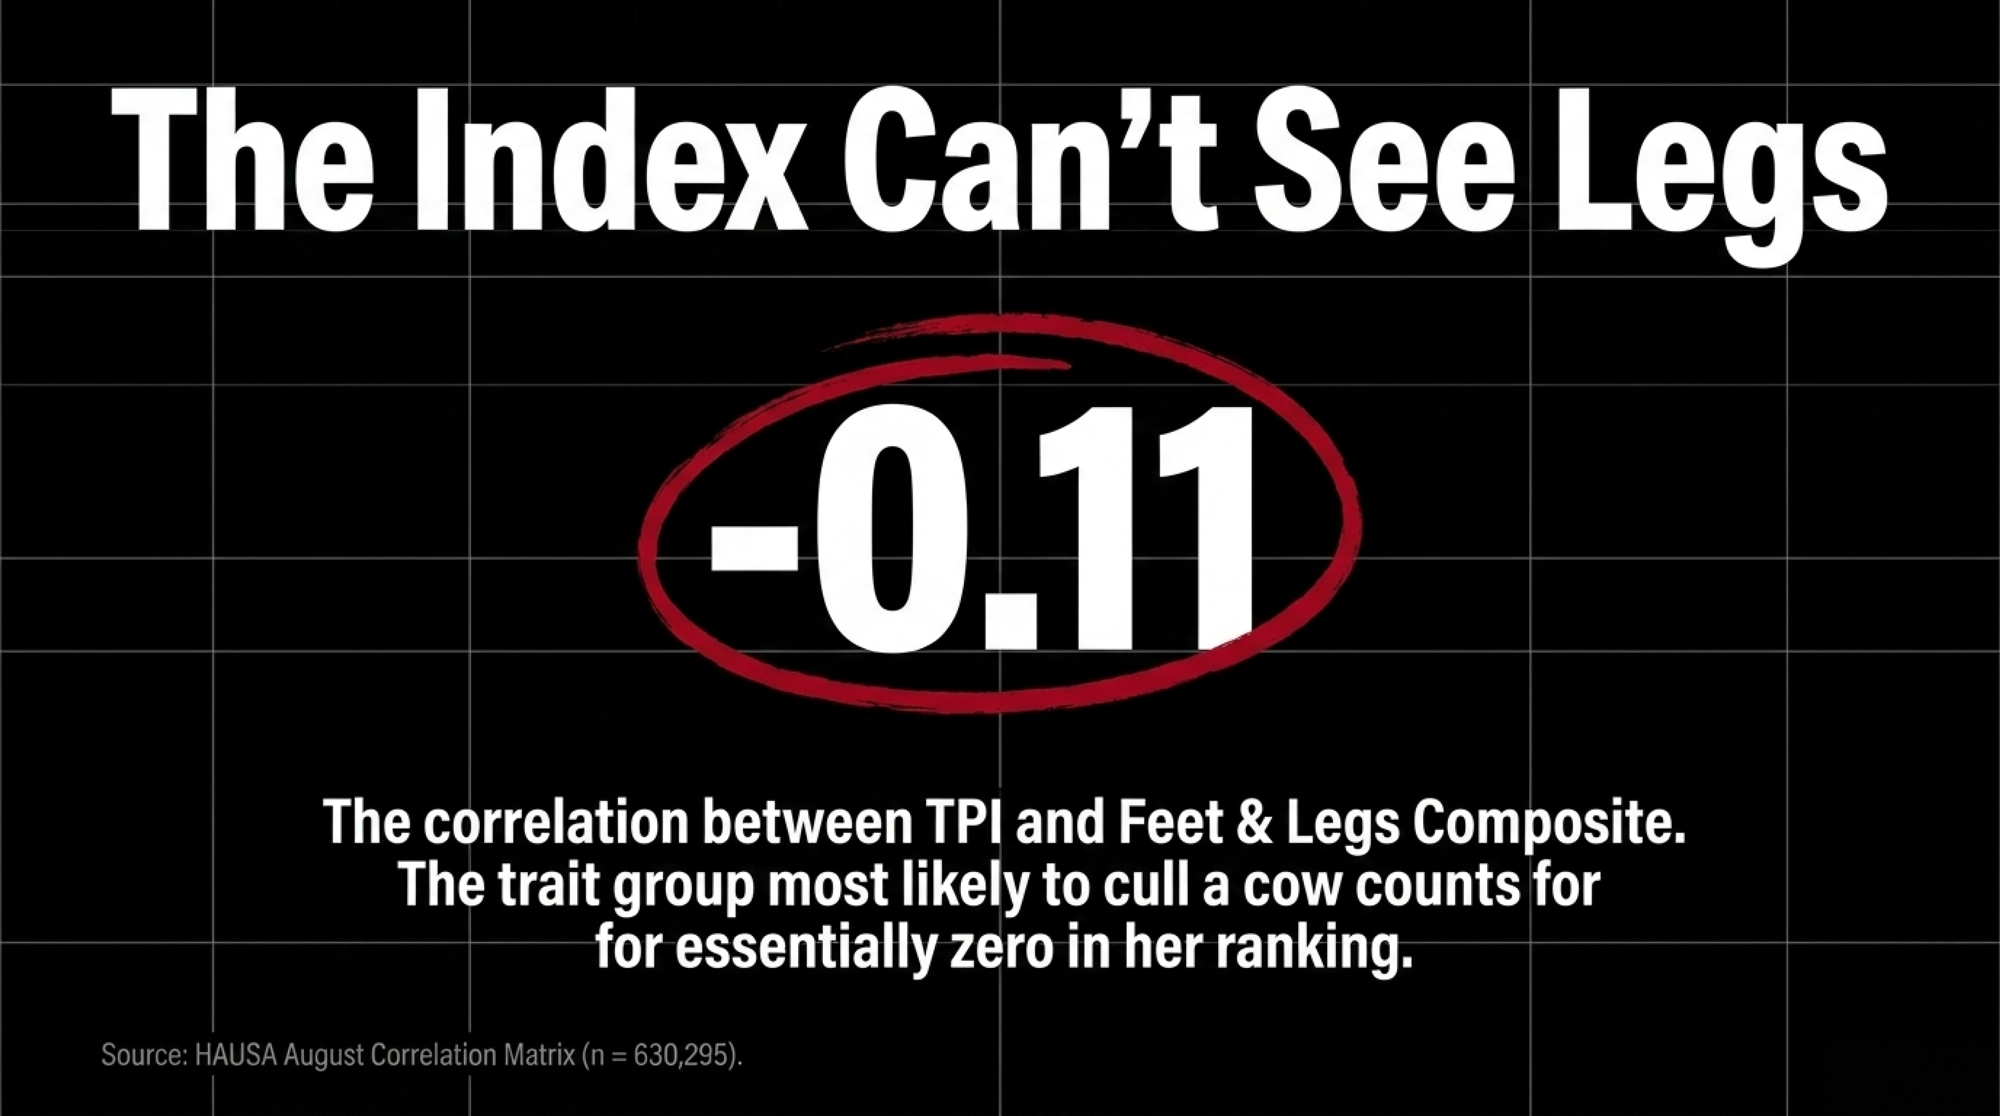
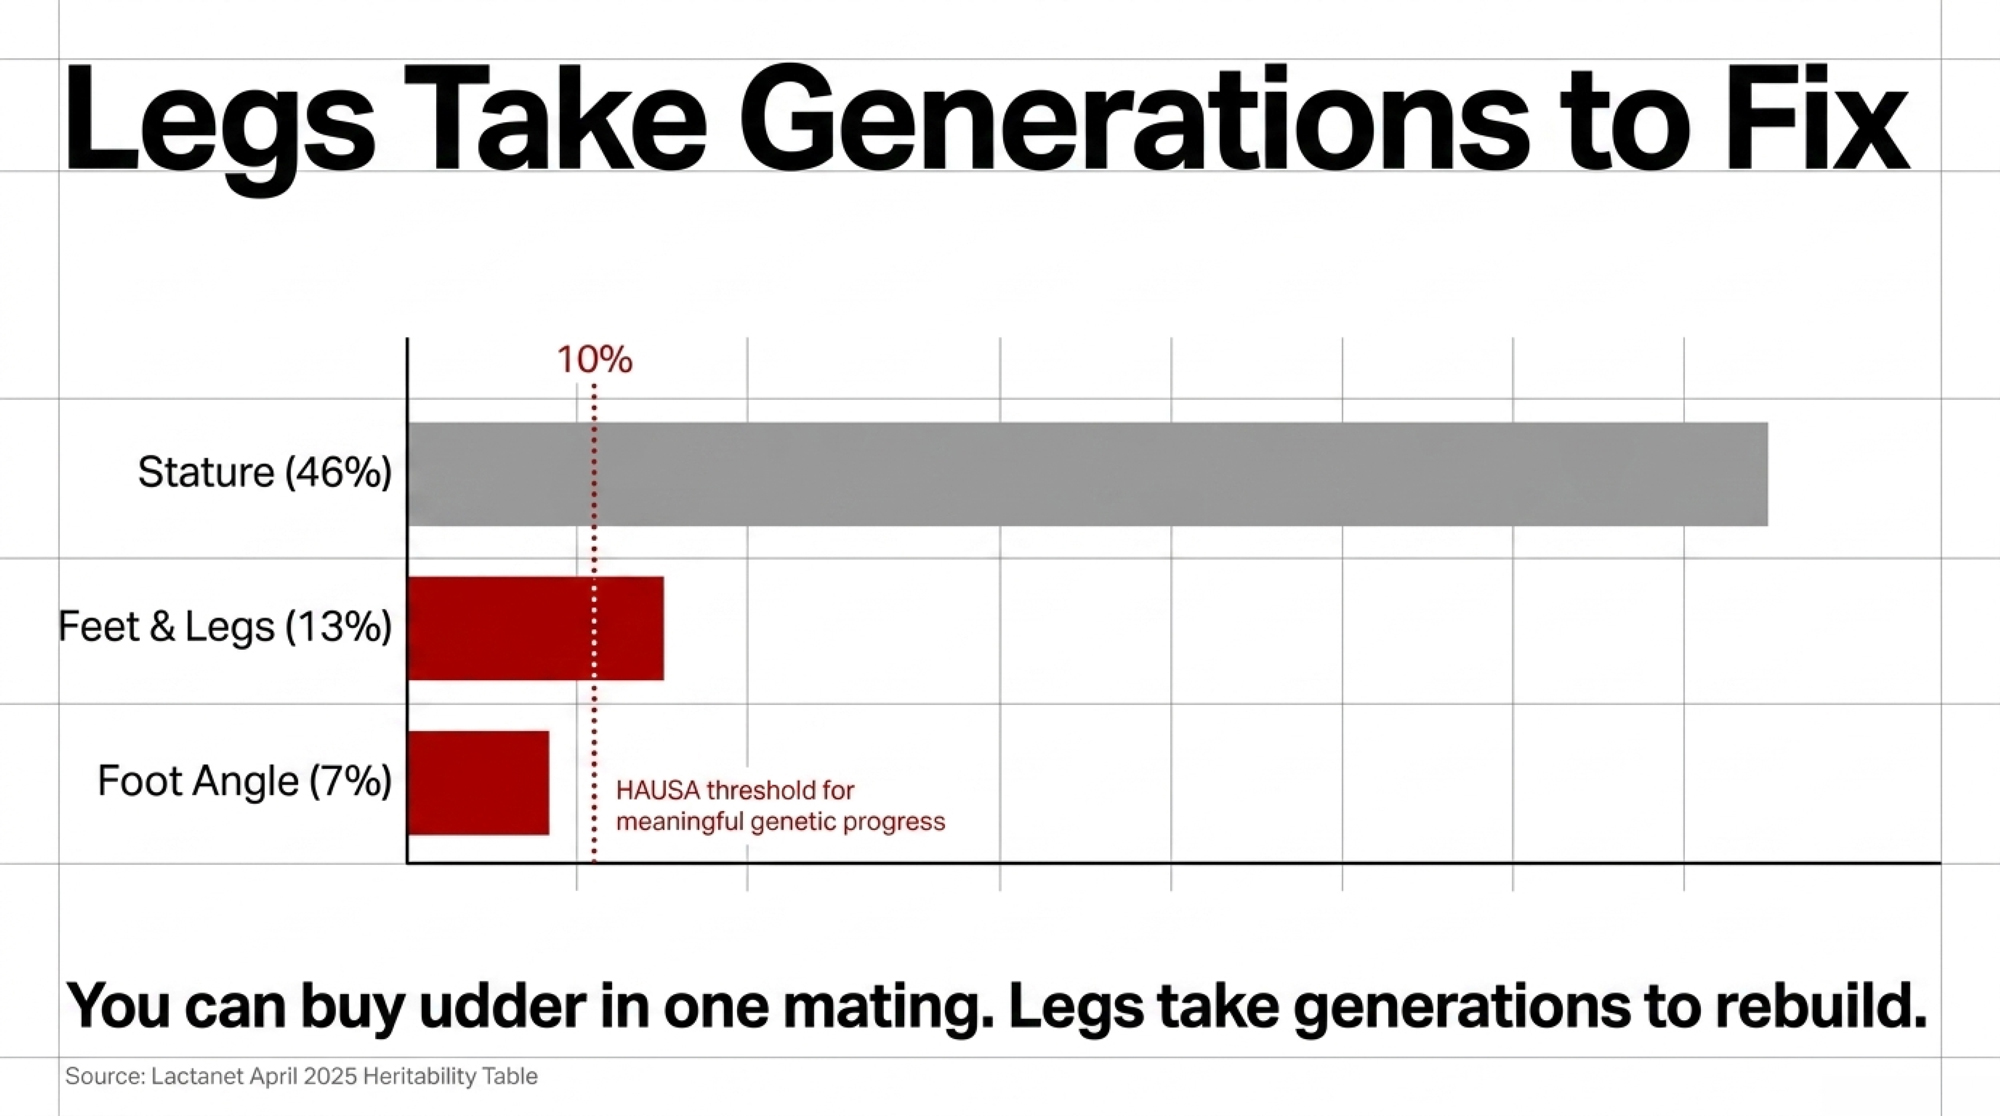
  • Why your ranking won’t catch it: In Holstein Association USA’s own August matrix, FLC correlates −0.11 with TPI across 630,295 females born in 2020. That’s not a formula that penalizes legs. It’s a formula that can’t see them. And legs are the slowest thing in the barn to fix — Lactanet puts Holstein Feet & Legs heritability at 13% and Foot Angle at 7%, below the .10 threshold Holstein USA itself says you need for meaningful progress, against stature at 46%.
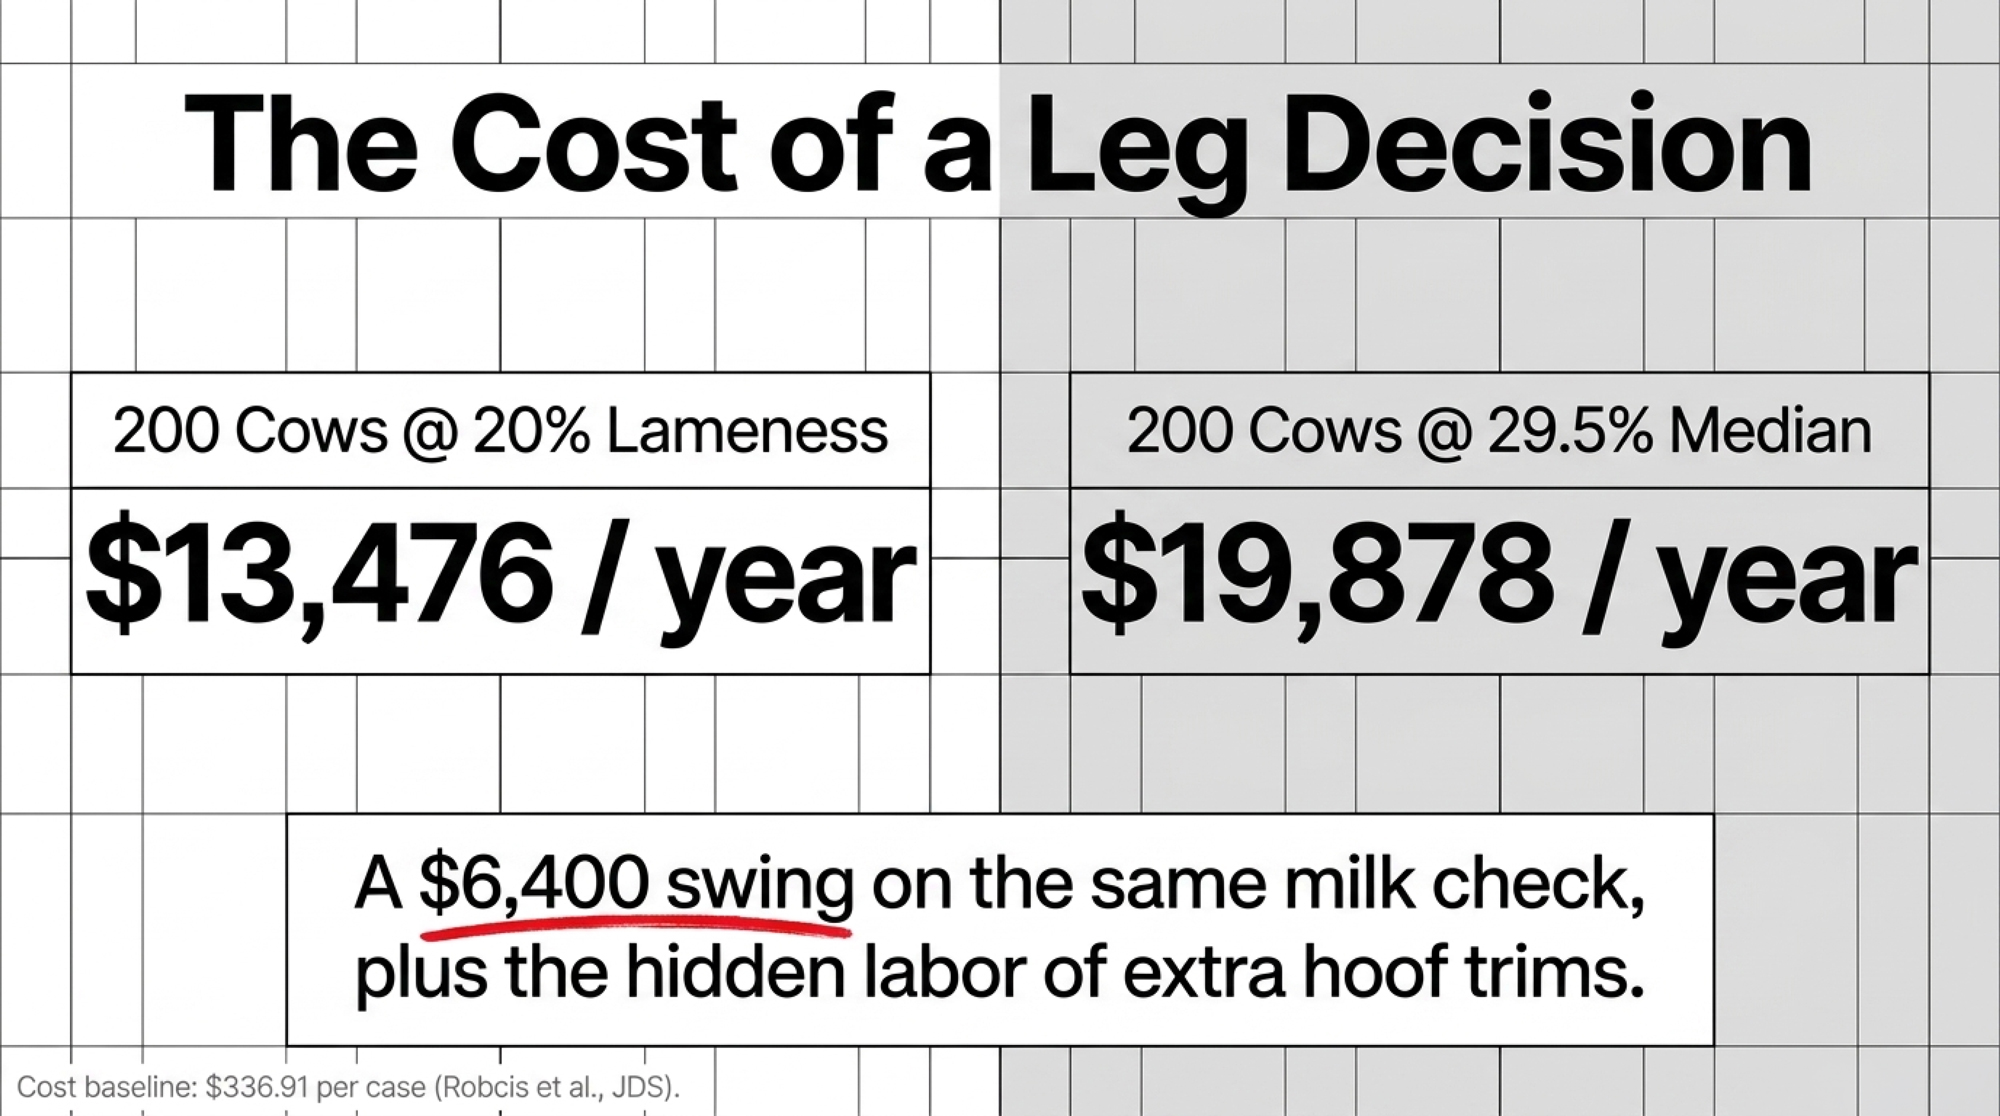
  • What it costs, and what to do: At $336.91 per clinical lameness case, a 200-cow herd running 20% incidence pays $13,476 a year; one at the 29.5% published median pays $19,878 — a $6,400 swing on the same milk check. The new Holstein Conformation Composite is the first index in years that weights legs heavily, and it correlates just 0.64 with PTAT, which itself runs −0.54 against Livability in that cohort. Before your next semen order, add one column: pull FLC on every straw and note where Ripcord shows up as sire or maternal grandsire.
Feet and Legs Composite

Open the August 12, 2026 evaluation, pull the U.S. GTPI top ten, and check the sires. Seven of those bulls trace to one father: Ocd Thorson Ripcord-ET. On the Net Merit $ top ten, it’s eight of ten.

Now look at their type numbers. The Ripcord sons in that GTPI top ten show a consistent pattern in our review of the August run — positive Udder Composite alongside negative Feet & Legs Composite. Individual values vary, so pull each bull’s own UDC and FLC rather than trusting the pattern. But the direction is the direction, seven times over.

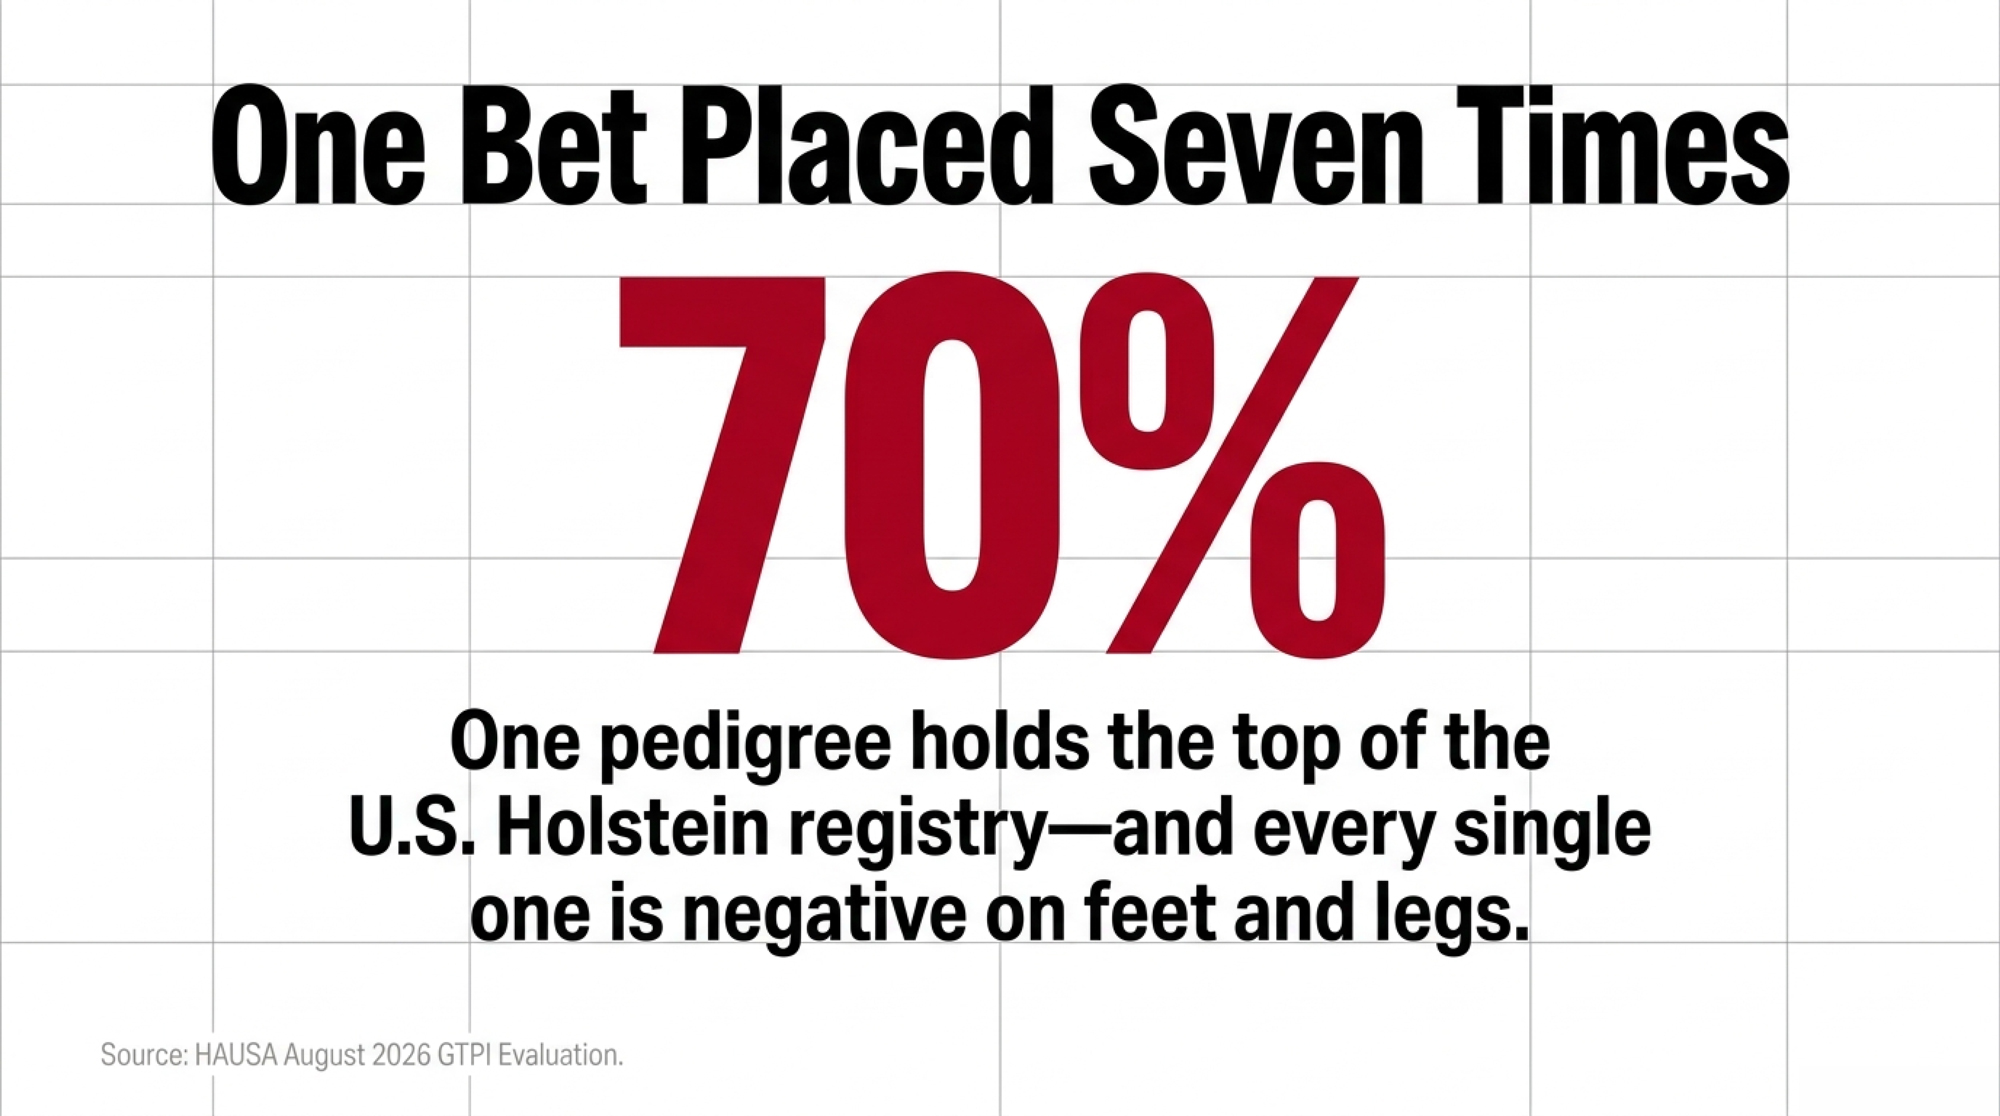
That’s not a popular-sire story. Holsteins have had those for sixty years. That’s one pedigree holding 70 to 80 percent of the top of the U.S. Holstein registry while the trait group most likely to shorten a cow’s stay sits in the same place on all of them.

Why Won’t the Index Catch This?

Because feet and legs barely register in it.

In the correlation matrix Dr. Jason Graham and Dr. Sam Comstock published for the August run — females born 2020, n = 630,295 — Feet & Legs Composite correlates −0.11 with TPI. Call it zero. A bull’s leg composite tells you essentially nothing about where he’ll rank.

Holstein Association USA publishes UDC and FLC separately on every bull, so both numbers sit on every proof sheet you pull. They don’t move a TPI ranking in either direction. A breeder sorting on GTPI or Net Merit sees production, health, and fertility shift the number — and sees nothing from the trait group that decides how many of those daughters are still walking sound at 30 months.

What HCC Actually Rewards

The same run published the Holstein Conformation Composite for every animal in the HAUSA database, and April-to-August scores correlate at 0.99 across 4,055 animals. The calculation is stable out of the gate.

Graham and Comstock pulled the top 25 HCC bulls and averaged all 18 linear traits. Rear Legs Rear View averages +1.61 — the strongest trait in the whole profile. Feet & Legs Score: +1.33. Foot Angle: +0.86. Stature? −0.42. These aren’t tall bulls. They’re better-assembled ones.

That’s the design working as intended. HCC scores each linear trait against a functional optimum and penalizes deviation in either direction. Traditional type evaluation rewards extremes; HCC docks them. Rump angle averages +0.25 across that group, body depth +0.14, rump width +0.52 — near the middle, none pushed.

Across those 25 bulls, HCC runs 2.58 to 3.08 and averages 2.73. PTAT across the same animals averages just 1.43. Same bulls, more than a full point of disagreement between the two scores.

MetricHCC (Holstein Conformation Composite)PTAT (Traditional Type)What it means
Average score, top 25 bulls2.731.43Same bulls score a full point apart
Rear Legs Rear View (avg deviation)+1.61Not separately weightedHCC’s single strongest trait
Correlation with Livability−0.07 (essentially none)−0.54PTAT selection tracks with cows leaving sooner
Correlation with Productive LifeNot published in this run−0.38Same pattern, second metric
Correlation with Feet & Legs Composite+0.57+0.64Both “see” legs; TPI (−0.11) doesn’t
Correlation between HCC and PTAT0.640.64Related, not interchangeable

The Longevity Number Worth Arguing With

In that 630,295-female cohort, PTAT correlates −0.54 with Livability and −0.38 with Productive Life. HCC correlates a milder −0.18, and essentially nothing at −0.07.

Cows bred for higher PTAT left the herd sooner. Graham and Comstock flag the caveat themselves — correlations shift with the population you sample. Fair enough. But the direction holds in both their bull-list work and their cow-level matrix, and the two composites correlate just 0.64 with each other. Related. Not interchangeable.

Feet & Legs Composite correlates +0.57 with HCC and +0.64 with PTAT. Both type composites see legs. TPI doesn’t.

The Barn Math on a Leg Decision

Legs build slowly and erode fast, and the heritability numbers are worse than most breeders assume. Lactanet’s April 2025 heritability table puts Holstein Feet & Legs at 13% and Foot Angle at just 7% — against stature at 46% and rump angle at 41%. Rear Legs Rear View, the trait topping the HCC profile, sits at 11%. Locomotion is 5%.

Holstein Association USA puts the threshold plainly on its Linear Type Evaluations page: “It is difficult to make much genetic progress through selection and mating unless a trait has a heritability of .10 or higher.”

Foot Angle doesn’t clear that bar. Feet & Legs barely does. Stature clears it by a factor of four. You can move udder in a mating cycle. Legs take generations — exactly the wrong shape of problem to inherit from seven bulls at once.

So price the downside. The average clinical lameness case runs $336.91, climbing $13.26 for every additional week a cow stays lame, per Robcis and colleagues in the Journal of Dairy Science.

Two scenarios on a 200-cow herd. At a conservative 20% annual incidence — 40 cases, $13,476 a year. At the 29.5% median cow-level prevalence found across the published literature — 59 affected cows and roughly $19,878, though prevalence and annual case count aren’t the same measure. Either way, the gap between those two herds runs about $6,400 a year, and genetics is one of the levers moving you between them.

Lameness accounted for 9.1% of the total U.S. cull rate in the 2018 USDA/NAHMS survey, with injuries adding 3.5%. That puts locomotion third among involuntary culling reasons, behind infertility at 23.3% and mastitis at 18.6%.

The Part That Costs Labor, Not Just Dollars

Treatment cost is the easy number. The harder one is what a low-FLC group does to your routine.

Two or three hoof trimmings during first lactation improve hoof health in early second lactation — and improve survival into that second lactation. Read that alongside the heritability math and the shape of the problem changes. A group of daughters with weaker feet and legs doesn’t just generate treatment invoices. It generates trim appointments, restraint time, and labor you’d budgeted somewhere else.

The disease genetics are thinner still. Finnish work on 24,685 Holstein cows found hoof disorder heritabilities running from 0.02 for sole hemorrhage and heel horn erosion up to 0.13 for digital dermatitis, with feet and leg conformation traits landing between 0.10 and 0.19. Most genetic correlations between hoof disorders and conformation traits came in low and statistically indistinguishable from zero — meaning conformation is a proxy for hoof health, not a substitute.

Worth knowing how the composite was built. Both the Udder Composite and the Feet & Legs Composite carry a −0.20 weight on stature, documented by Holstein Association USA, so breeders can improve udders and legs “without making their cows taller.” Someone anticipated this exact trade decades ago and engineered against it inside the composites. The index doesn’t carry that logic upward into TPI.

The Fertility Correction Was the Dress Rehearsal

Here’s why this run should make you uneasy about more than feet and legs.

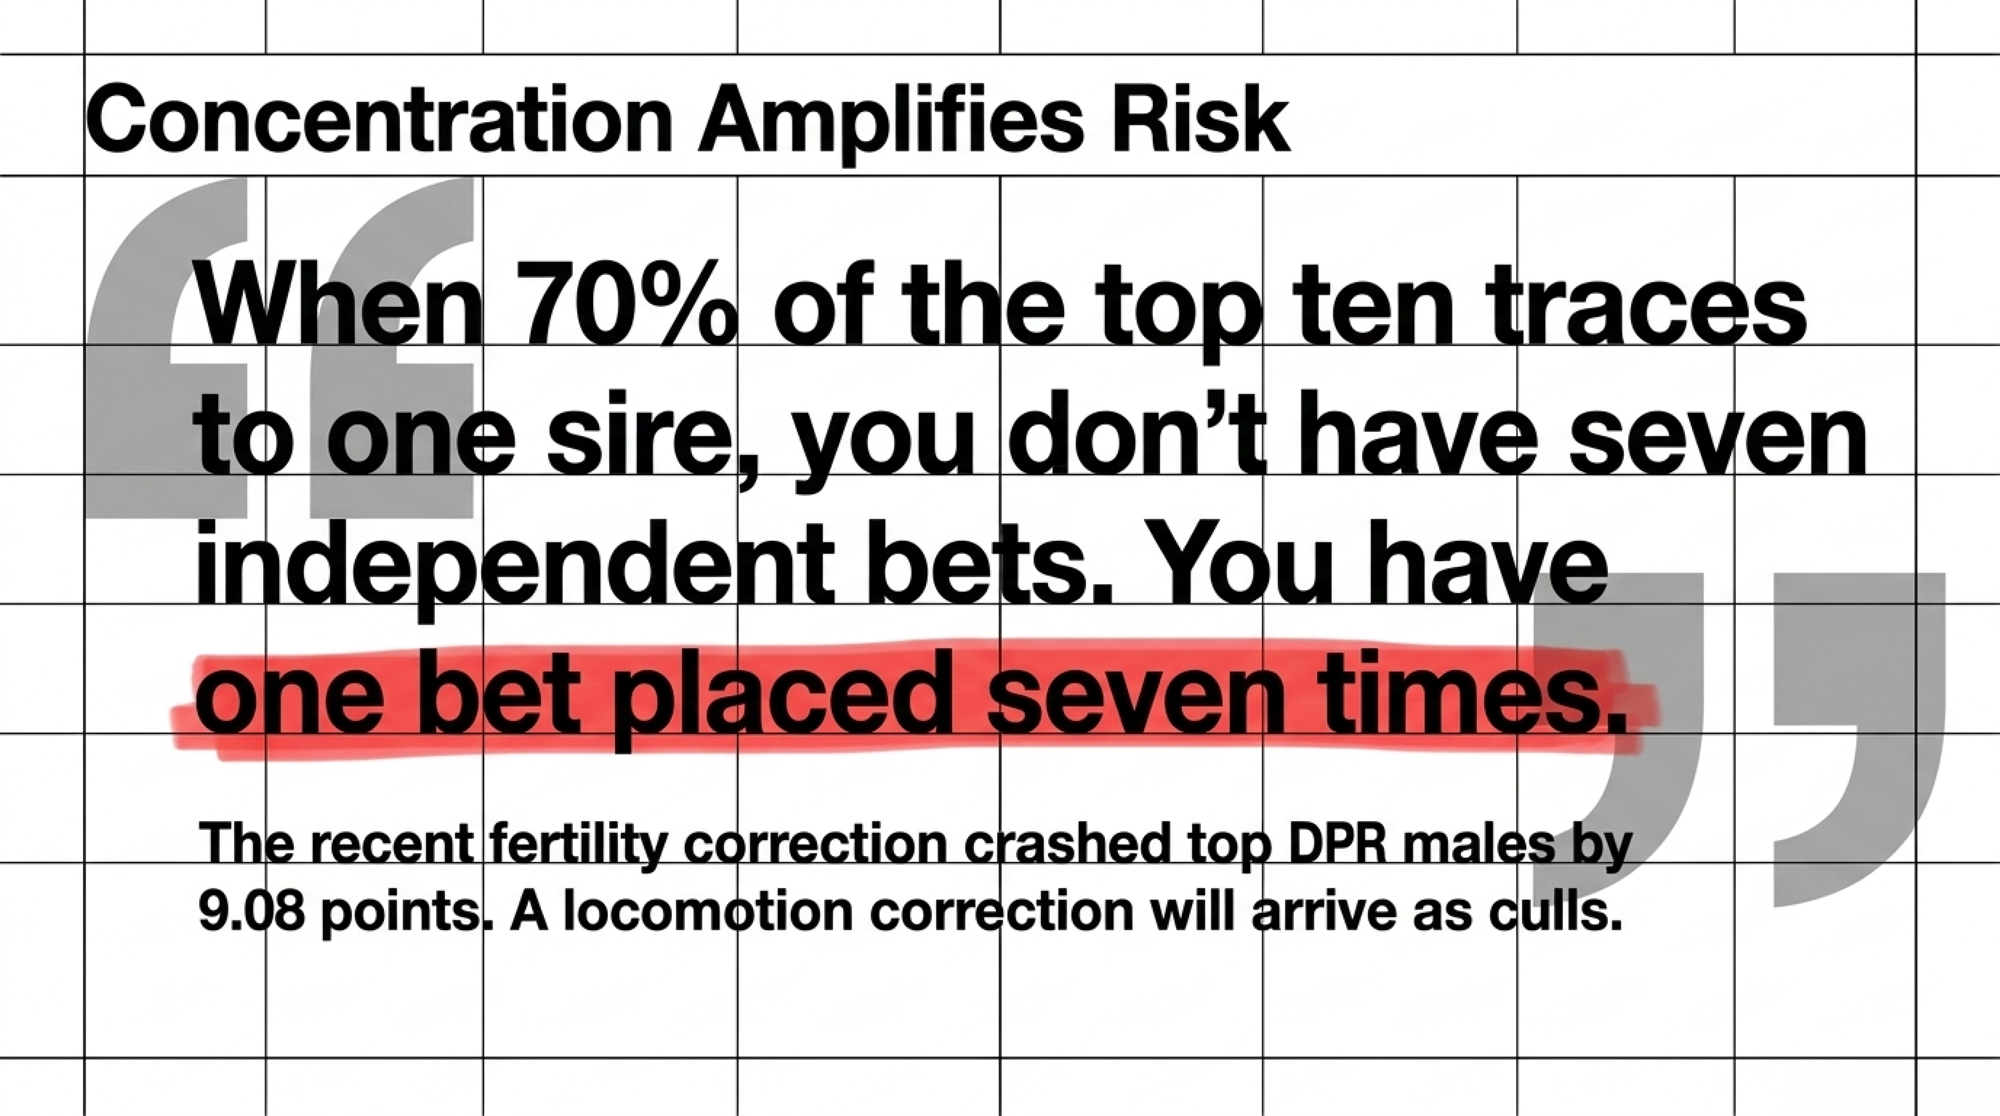
The August evaluation rewrote the fertility scale, and Fertility Index carried 69% of all TPI movement — roughly seven times the next-largest trait. Males in the top 10% for DPR dropped 9.08 PTA points. April-to-August male ranking correlation for DPR came in at 0.31, against 0.93 for Heifer Conception Rate. An April DPR ranking told you almost nothing about an August one.

That’s what it looks like when a component of the index gets recalibrated after two decades of use. Nothing about the old number was hidden — it was published, it moved the index, breeders used it. Then CDCB changed how DPR accounts for the voluntary waiting period, and TPI moved for all 12.6 million evaluated females at once: top-decile animals up, everything below them down.

Now apply that to legs. Feet and legs aren’t mismeasured — they’re barely visible, at −0.11 against TPI. Different failure, same exposure. The fertility correction arrived as a scale change breeders could see in a single run. A locomotion correction, if it comes, arrives as culls — three years after the mating decision, spread across a herd, with nothing in the index to have warned you.

Why Index Moves Punish Concentrated Pedigrees Hardest

We’ve watched this pattern before, and the numbers are on record.

Our five-year tracking of 401 elite genomic Holstein bulls from April 2020 through their December 2025 proofs found the retained bulls dropped an average of 42.5 TPI points — most of it from base changes and formula rewrites, not failed biology. Correlations between 2020 genomic predictions and 2025 proven results held strong on core traits: 0.81 for PTAT, 0.76 for fat, 0.71 for protein. The DNA didn’t change its mind. The formula did.

The bulls that crashed hardest shared a profile: over-predicted type stacked on thin functional traits. Homecoming lost 414 TPI points with PTAT dropping 0.87. Supercharge lost 396, including a 2.32-point PTAT collapse from +1.18 to −1.14. Sire lines heavy on Legacy and Heroic up top, with Delta on the maternal side, were over-represented in that group.

Concentration amplifies whatever the formula decides to reward or ignore. When 70 to 80 percent of a top-ten list traces to one sire, and they all sit weak in the same trait group, you don’t have seven independent bets. You have one bet placed seven times.

Fertility is where that already bites hardest. Annual genetic gain outruns inbreeding depression for every index trait except one — daughter pregnancy rate, running a net loss of 0.02 PTA units per year, on figures calculated before this run’s revision. Holstein heifers born in 2024 averaged 9.99% inbreeding per Lactanet Canada’s August 2025 update — a Canadian figure, not a U.S. one, and up from 9.61% the year before.

Looking for an Outcross

Concentration this deep makes clean pedigrees worth hunting, and the August lists offer one credible candidate near the top.

Genosource Jaco-ET sits at #8 GTPI at +3608 with 82% reliability, no daughters yet, and he was the biggest riser in the top ten at +128. Under the new 36-month rule holding daughter data out of DPR, CCR, and FSC, a bull like Jaco has no fertility daughter records feeding his numbers — so weight him on production confidence, not fertility confidence.

Whether he’s a genuine outcross for your herd depends on your own pedigree stack. That’s a check to run against the HAUSA database with your straw inventory in front of you, not something a proof sheet answers for you.

The honest read: with one sire behind 70 to 80 percent of the top ten, options up there are thin, and the ones that exist come with compromises — no daughters, limited status, or family overlap you’ll need to verify yourself.

Three Paths, and What Each One Costs

ApproachWorks best forWhat it costsWhere it backfires
Add FLC as its own spreadsheet column with a floorAny herd ranking primarily on TPI/NM$~1 hour of spreadsheet work; occasionally a lower GTPI pickSetting the floor at zero cuts most of the current top 10
Select on HCC for longevity-focused herdsHerds culling heavily on feet, legs, udder breakdownLower PTAT, lower show-ring ceilingExpecting fast results — 13% heritability is a 3-generation play
Place one deliberate outcross sire in the rotationHerds where a third+ of active straws trace to RipcordReal compromise — top candidates near GTPI top 10 also carry limitationsSwapping one concentration risk for another unverified one
  • Pull FLC as its own column and set a floor. Works for any herd ranking on index. Costs an hour of spreadsheet work and occasionally a lower GTPI on the bull you pick. Backfires if you set the floor at zero — you’ll cut most of the top ten and forfeit real production merit. Set it against your herd’s actual leg problem, not an arbitrary line.
  • Use HCC where longevity is the goal. Works for herds culling heavily on feet, legs, and udder breakdown rather than by choice. Costs you a lower PTAT and a lower show ceiling sometimes. Backfires if you expect speed — at 13% heritability on Feet & Legs this is a three-generation play, not a first-crop answer.
  • Place one deliberate outcross in the lineup. Works where a third or more of active straws trace to Ripcord. Costs real compromise, because the candidates near the top all carry one. Backfires if you swap one concentration for another, so verify the pedigree yourself before you commit.

The Action Checklist

Do this in the next 30 days:

  1. Put your April and August proofs side by side for every sire in your active lineup. Sort by TPI change. Flag any bull whose drop is more than double his cohort’s — that short list, not the full drop list, is where re-evaluation belongs.
  2. Add an FLC column to that same sheet. If you rank on TPI or NM$ alone, feet and legs are not currently in your decision. The index correlates −0.11 with FLC. Add the column or accept that you’re not selecting on it.
  3. Note sire and maternal grandsire on every straw. Where Ripcord appears, pull each bull’s individual FLC rather than judging by pedigree — the pattern is directional, the numbers are what you breed to.
  4. Cap single-sire exposure. No one bull on more than 12 to 15 percent of your matings, and build the team from at least eight unrelated sires. That’s the same discipline North Florida Holsteins applied when it capped how much any single bull could influence the herd.
  5. Locomotion-score your herd this quarter. Published prevalence spans 2.6% to 63.7% across studies, so the breed average tells you nothing about your barn — and the difference between 20% and 29.5% on 200 cows is roughly $6,400 a year.

Nobody built TPI to ignore feet and legs. It worked out that way — a composite weighting production, health, and fertility, with a trait group that washes out to −0.11 in the arithmetic. And nothing about that arithmetic changes on its own: at 13% heritability on Feet & Legs and 7% on Foot Angle, you can buy udder in one mating cycle and spend three generations paying it back. The 2029 version of this decision won’t arrive as a scale change you can see in a proof run. It arrives as culls and trim appointments. HCC is the first tool in a while that puts legs back in the conversation with real weight behind it. So before your next semen order, the question isn’t which bull ranks highest. It’s which column you’re adding to the spreadsheet first.

Learn More

The Sunday Read Dairy Professionals Don’t Skip.

Every week, thousands of producers, breeders, and industry insiders open Bullvine Weekly for genetics insights, market shifts, and profit strategies they won’t find anywhere else. One email. Five minutes. Smarter decisions all week.
NewsSubscribe
First
Last
Consent

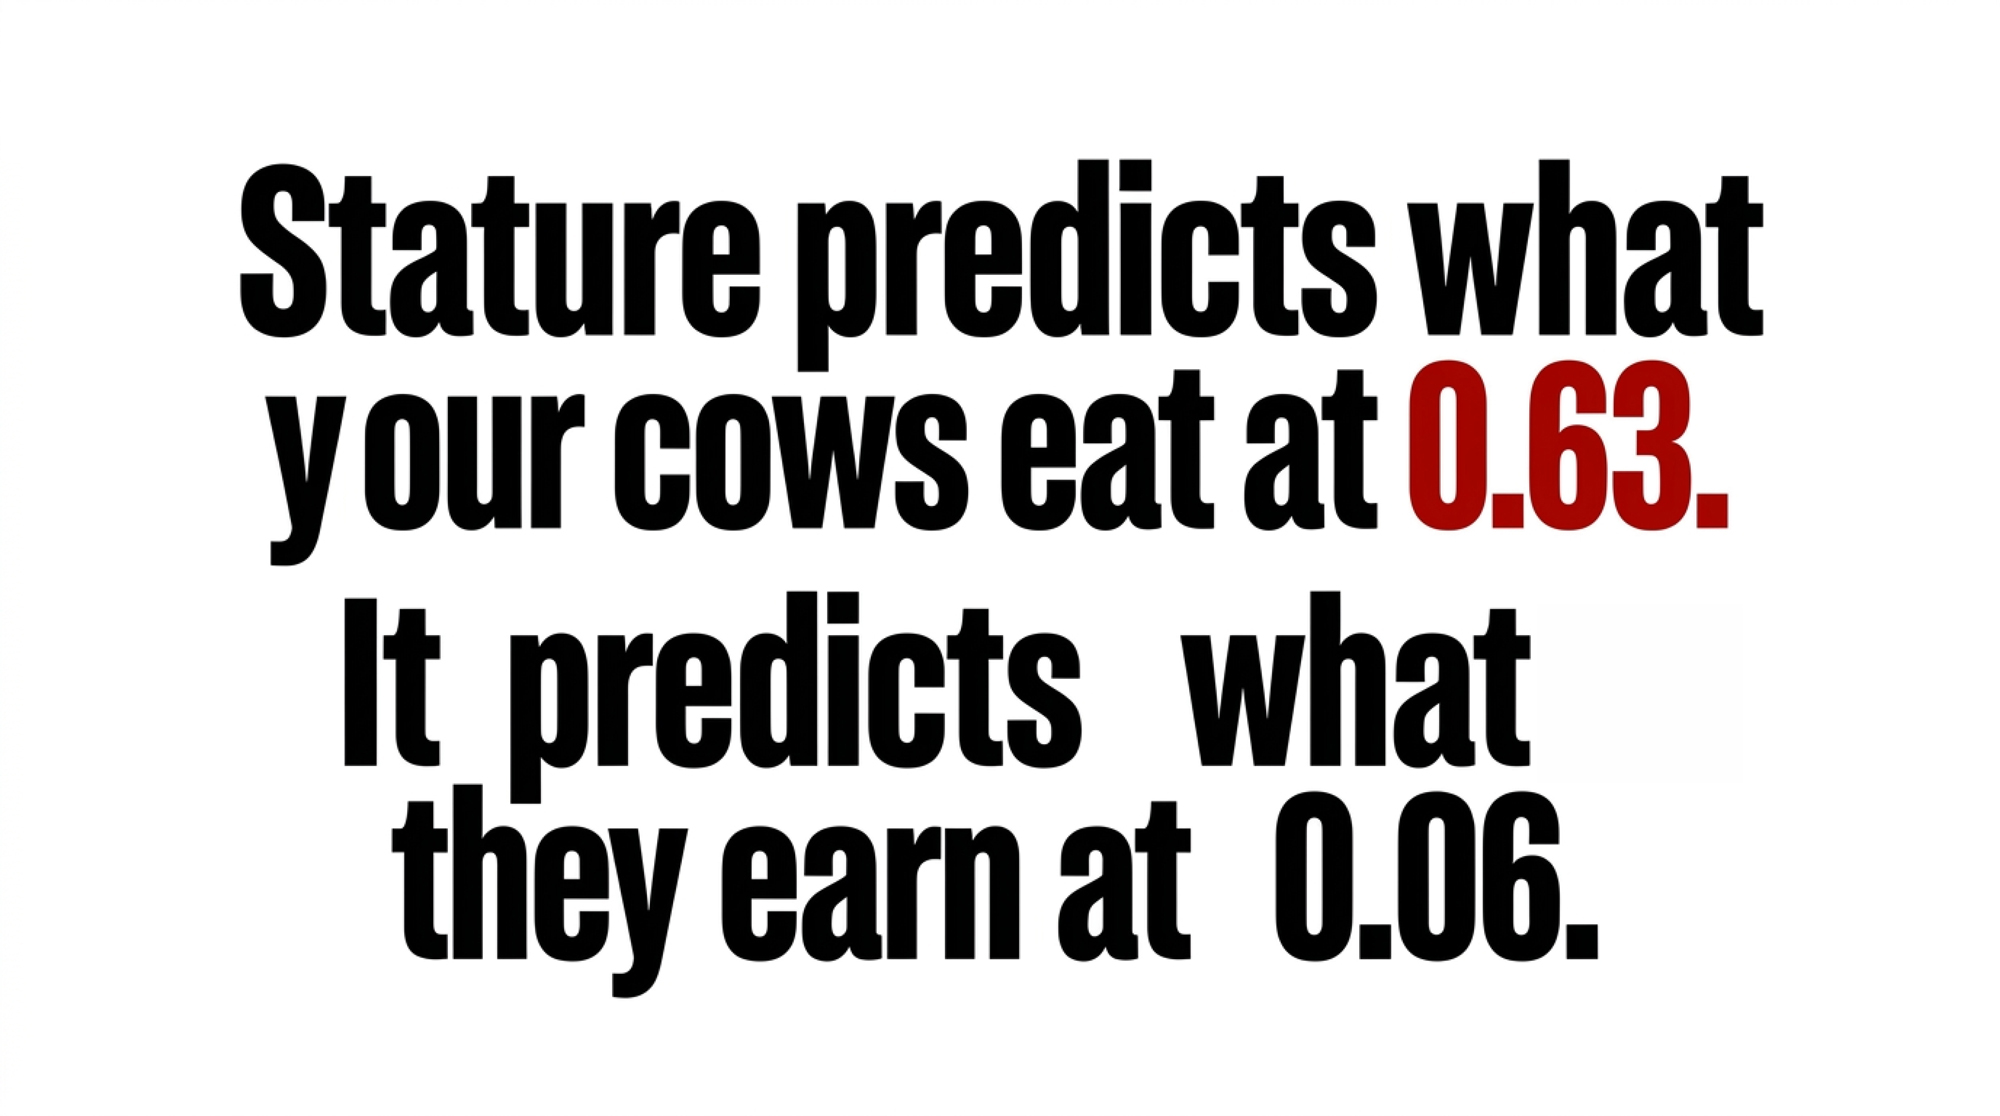
Stature Predicts Your Feed Bill at 0.63. It Predicts Profit at 0.06.

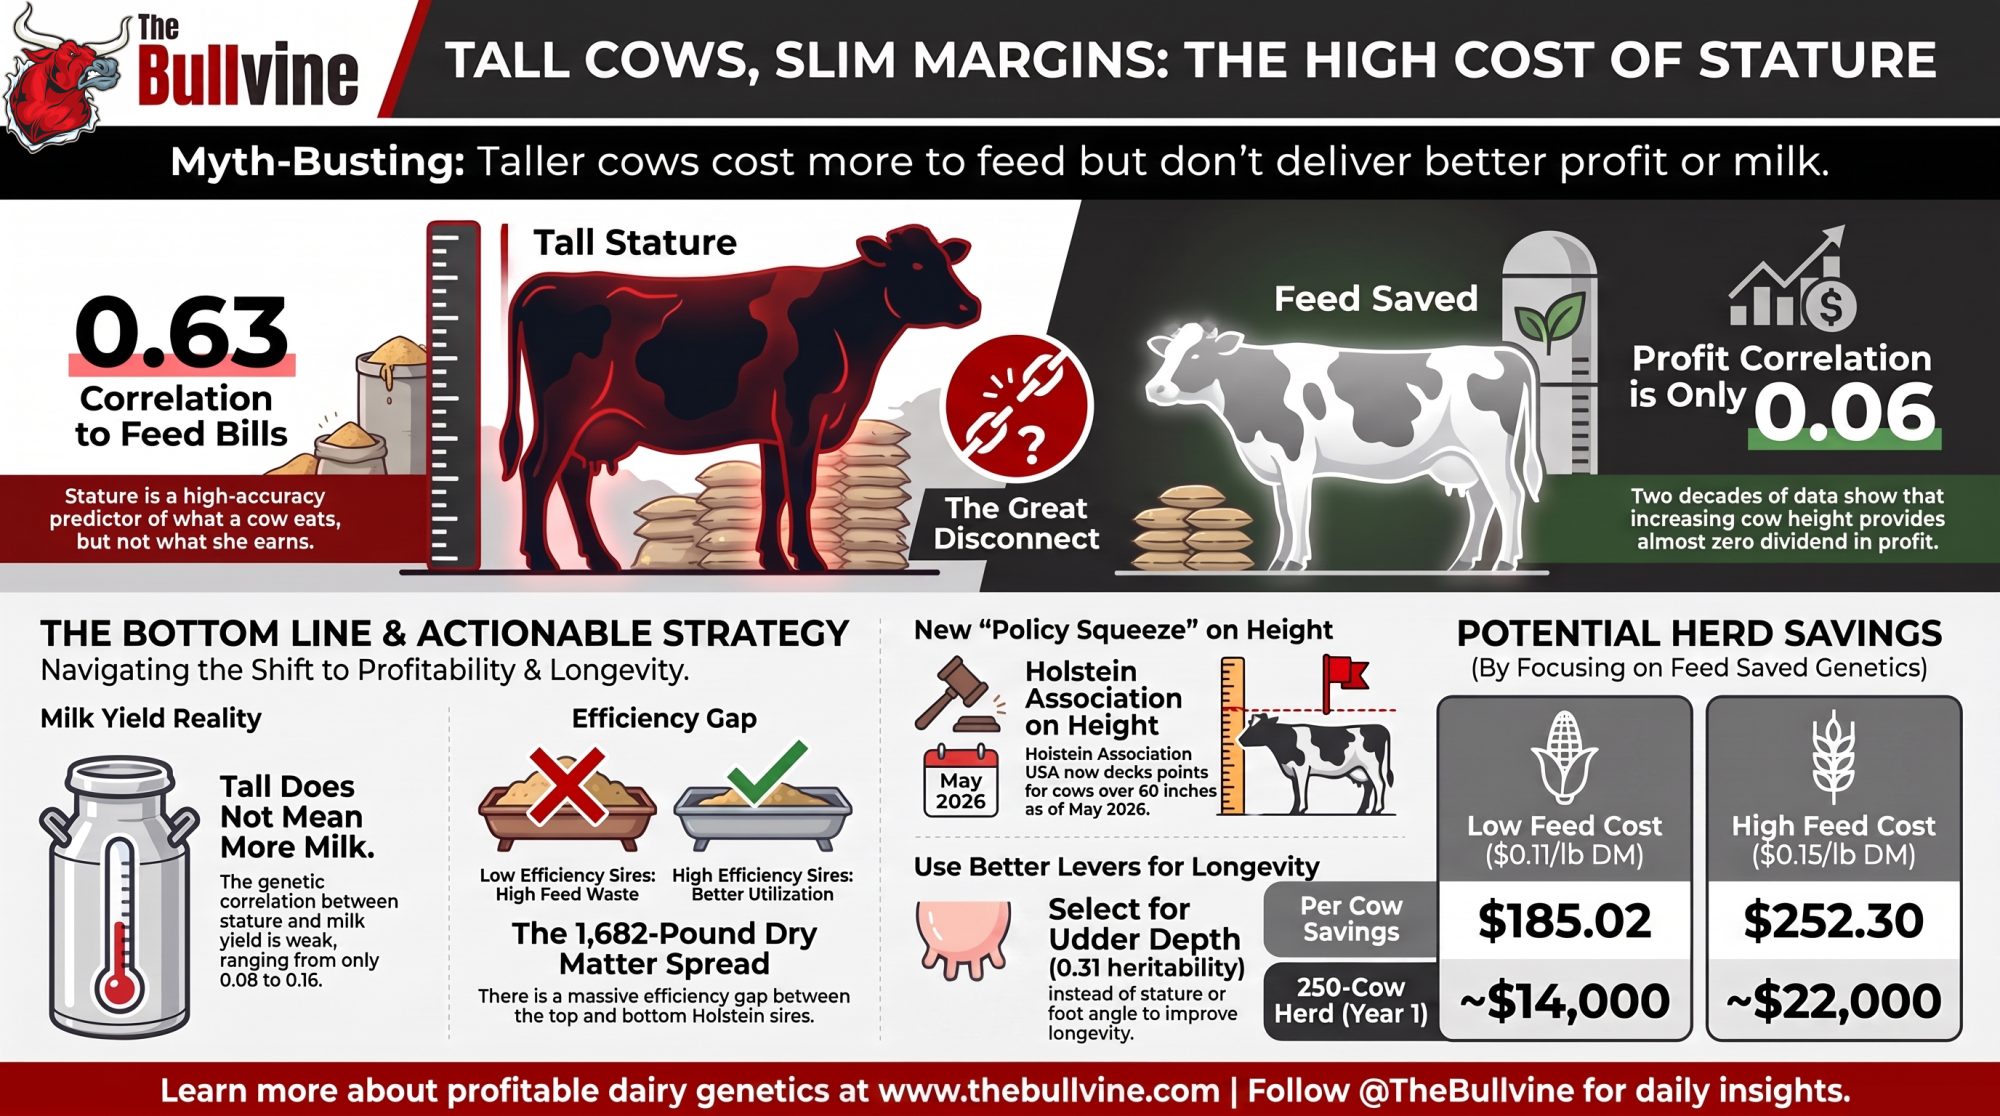
Two decimals, two decades of peer-reviewed data. Stature tracks what your cows eat at 0.52–0.63 and what they earn at 0.06 — and CDCB just priced the spread at 1,682 pounds of dry matter.

EXECUTIVE SUMMARY:

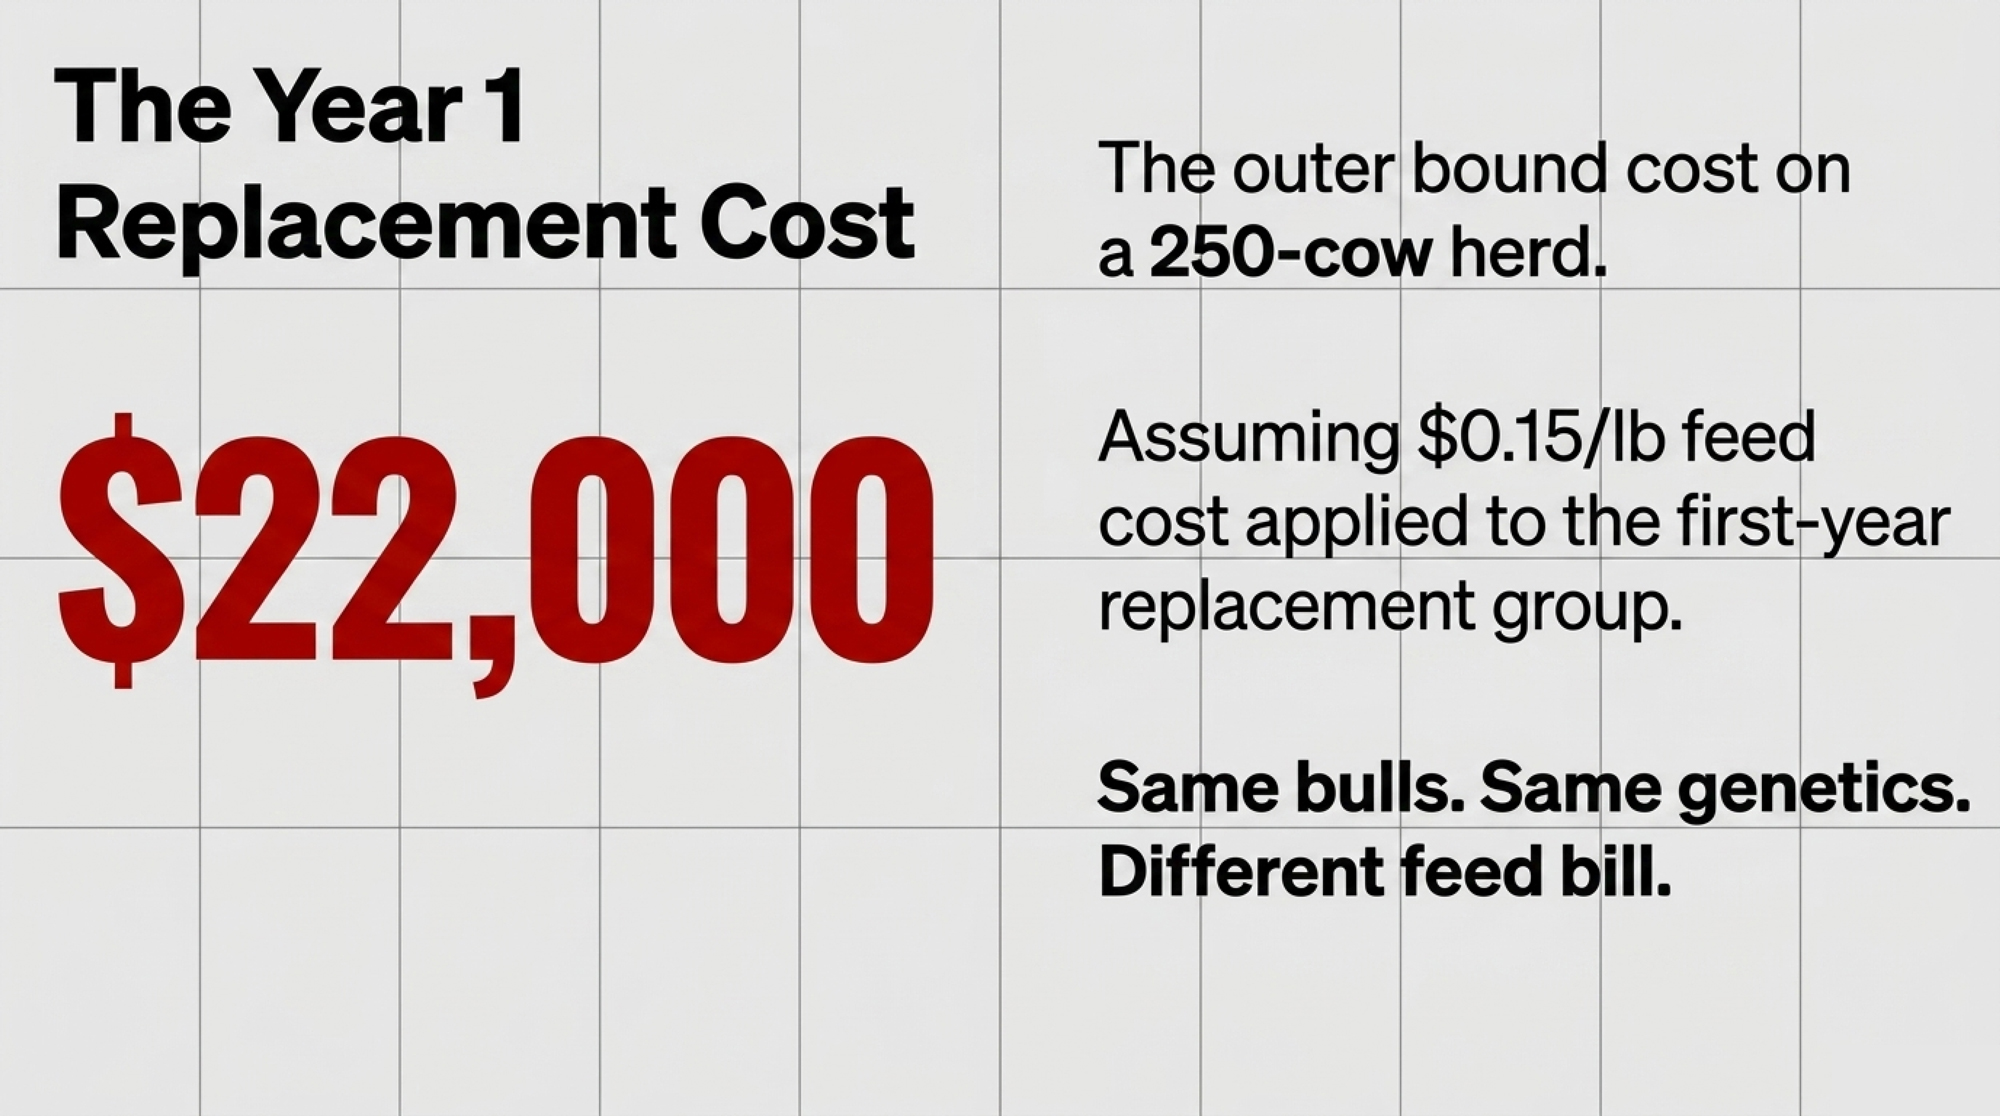
  • The Feed Spread: CDCB’s Feed Saved evaluations show a 1,682-lb dry matter spread per lactation between top and bottom Holstein sires. At $0.11–$0.15/lb DM, that’s $185 to $252 per cow — or $14,000 to $22,000 in Year 1 on a 250-cow herd once you apply it to the replacement group.
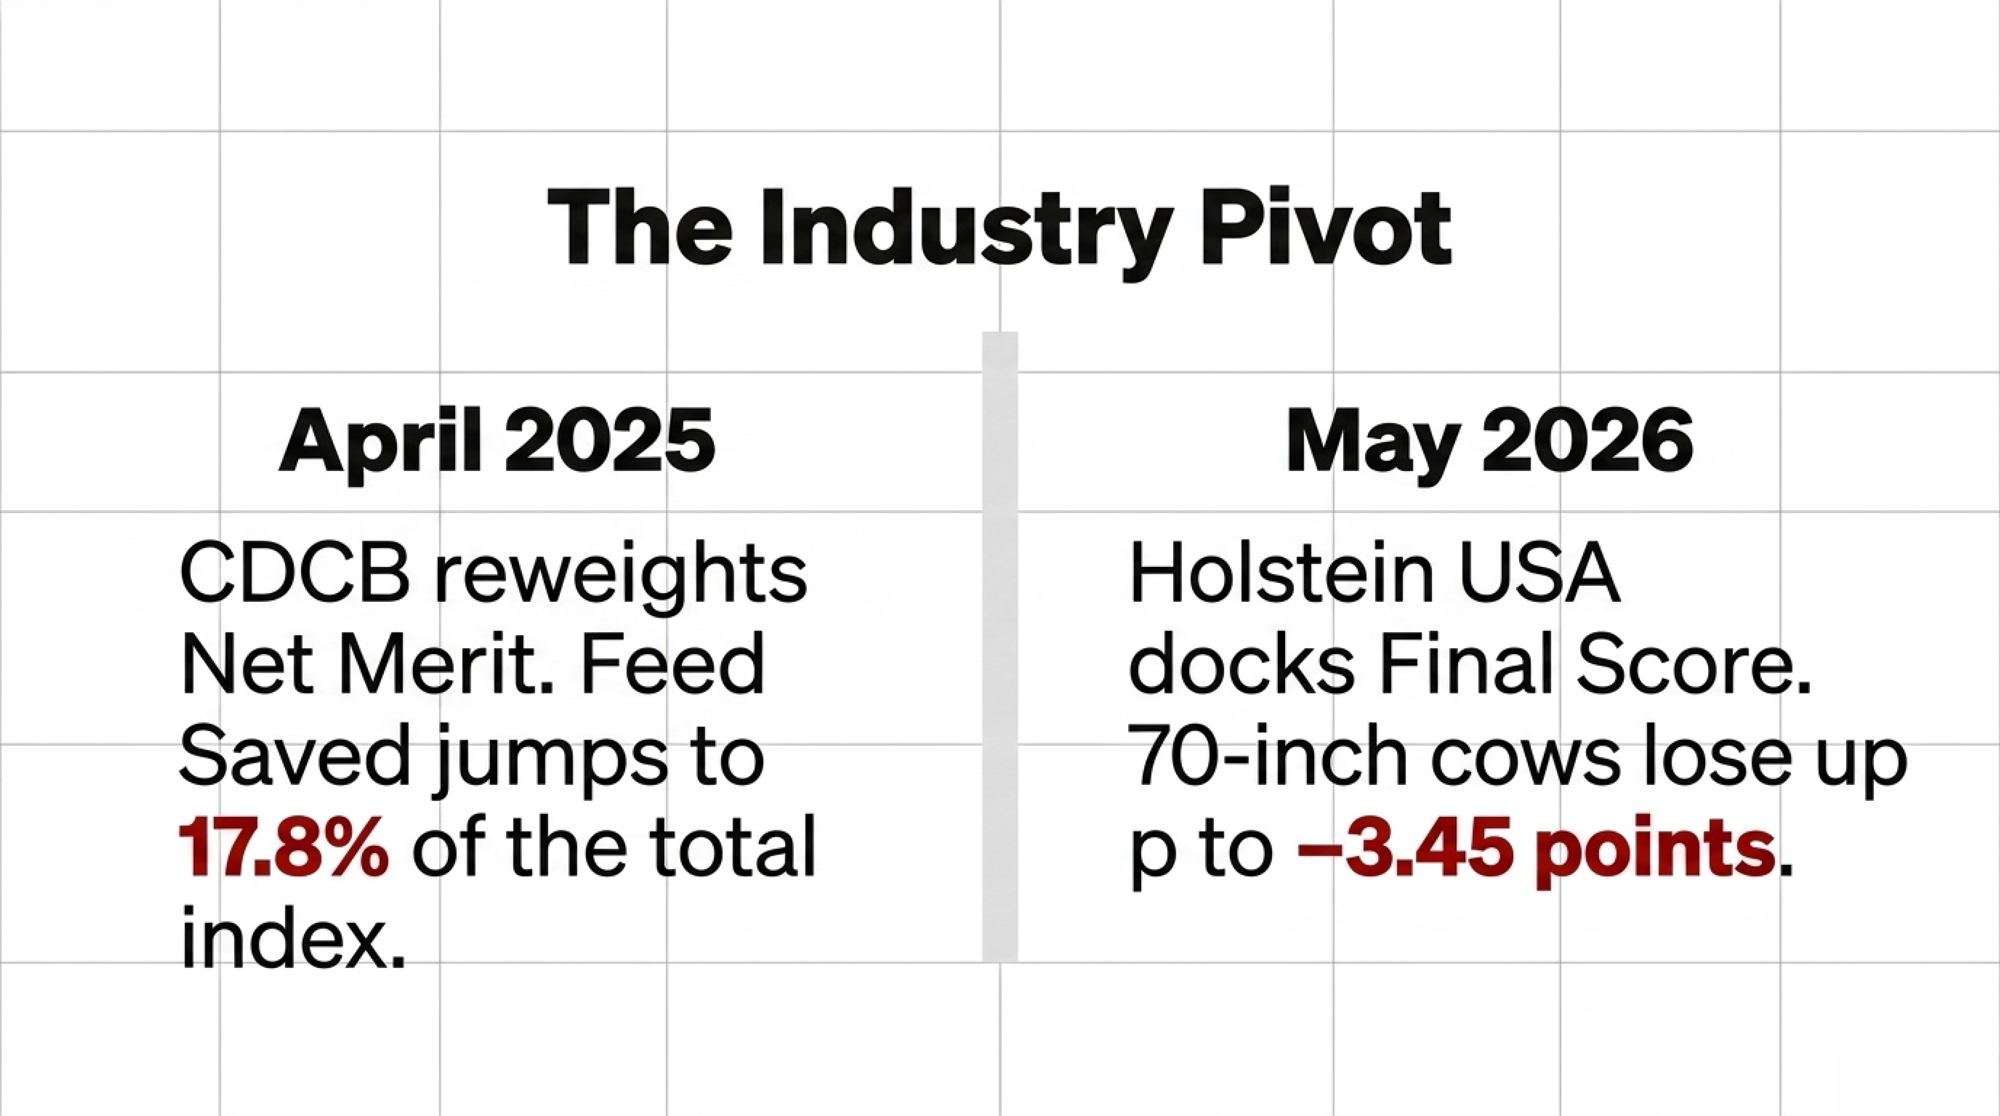
  • The Policy Squeeze: Holstein Association USA now docks Final Score up to 3.45 points for 70-inch cows (May 2026), while CDCB raised Feed Saved to 17.8% of Net Merit (April 2025). Two separate organisations, thirteen months apart, no evidence of coordination.
  • The Selection Reality: Feed Saved reliability averages 28% on young genomic sires versus 38% on proven bulls — use it to weed out extremes, not to split hairs. And if you’re capping stature expecting longevity to follow, Productive Life heritability sits at 0.05–0.13.
  • Same milk. Different feed bill. And nothing on your monthly milk statement will ever tell you which side of that 1,682-pound dry matter spread your herd landed on.
  • That range is current, too. CDCB’s August 2026 evaluation update introduced three new traits and revised four female reproductive traits, but left Feed Saved untouched.

Two Changes, Seventeen Months Apart, Pointing Opposite Ways

On December 1, 2024, Holstein Association USA threw out its stature linear scale. The old 51-to-61-inch range became 55 to 65 inches, five points per inch. Behind it was a 2023 cow-measurement project that found the breed had physically outgrown the old ruler.

Seventeen months later, the same organization started docking height. From the May 2026 classification run forward, 60 inches is the ideal, and every inch above it costs Final Score — taken out of Front End and Capacity, which is 15% of the score.

  • 60 inches — breed standard ideal, no deduction
  • 61 inches — −0.15 points
  • 65 inches — −1.20 points
  • 68 inches — −2.55 points
  • 70 inches — −3.45 points

Source: Holstein Association USA, Spring 2026 Pulse

Widen the scale, then penalise what you made room for. It reads like whiplash.

It isn’t, quite. December was a ruler problem. The association’s rationale: cows were bunching at the top of the old 61-inch ceiling, leaving classifiers little room to separate them, and their measurements showed the scale no longer matched the population. Under the new one, 60 inches reads as 25 and 65 reads as 50. Nothing got punished. Tall cows just got measured honestly.

May 2026 is a different instrument, and the association was explicit about why. The sliding scale “defines a breed standard for ideal stature for the first time” and is “designed to discourage extreme stature in the Holstein breed, while continuing to reward cows that combine balance, strength and functional correctness.” Both changes came from recommendations by the association’s Conformation Advisory Committee and Genetic Advancement Committee.

The Change That Didn’t Get a Headline

Underneath both, on its own track, CDCB revised Net Merit effective April 1, 2025.

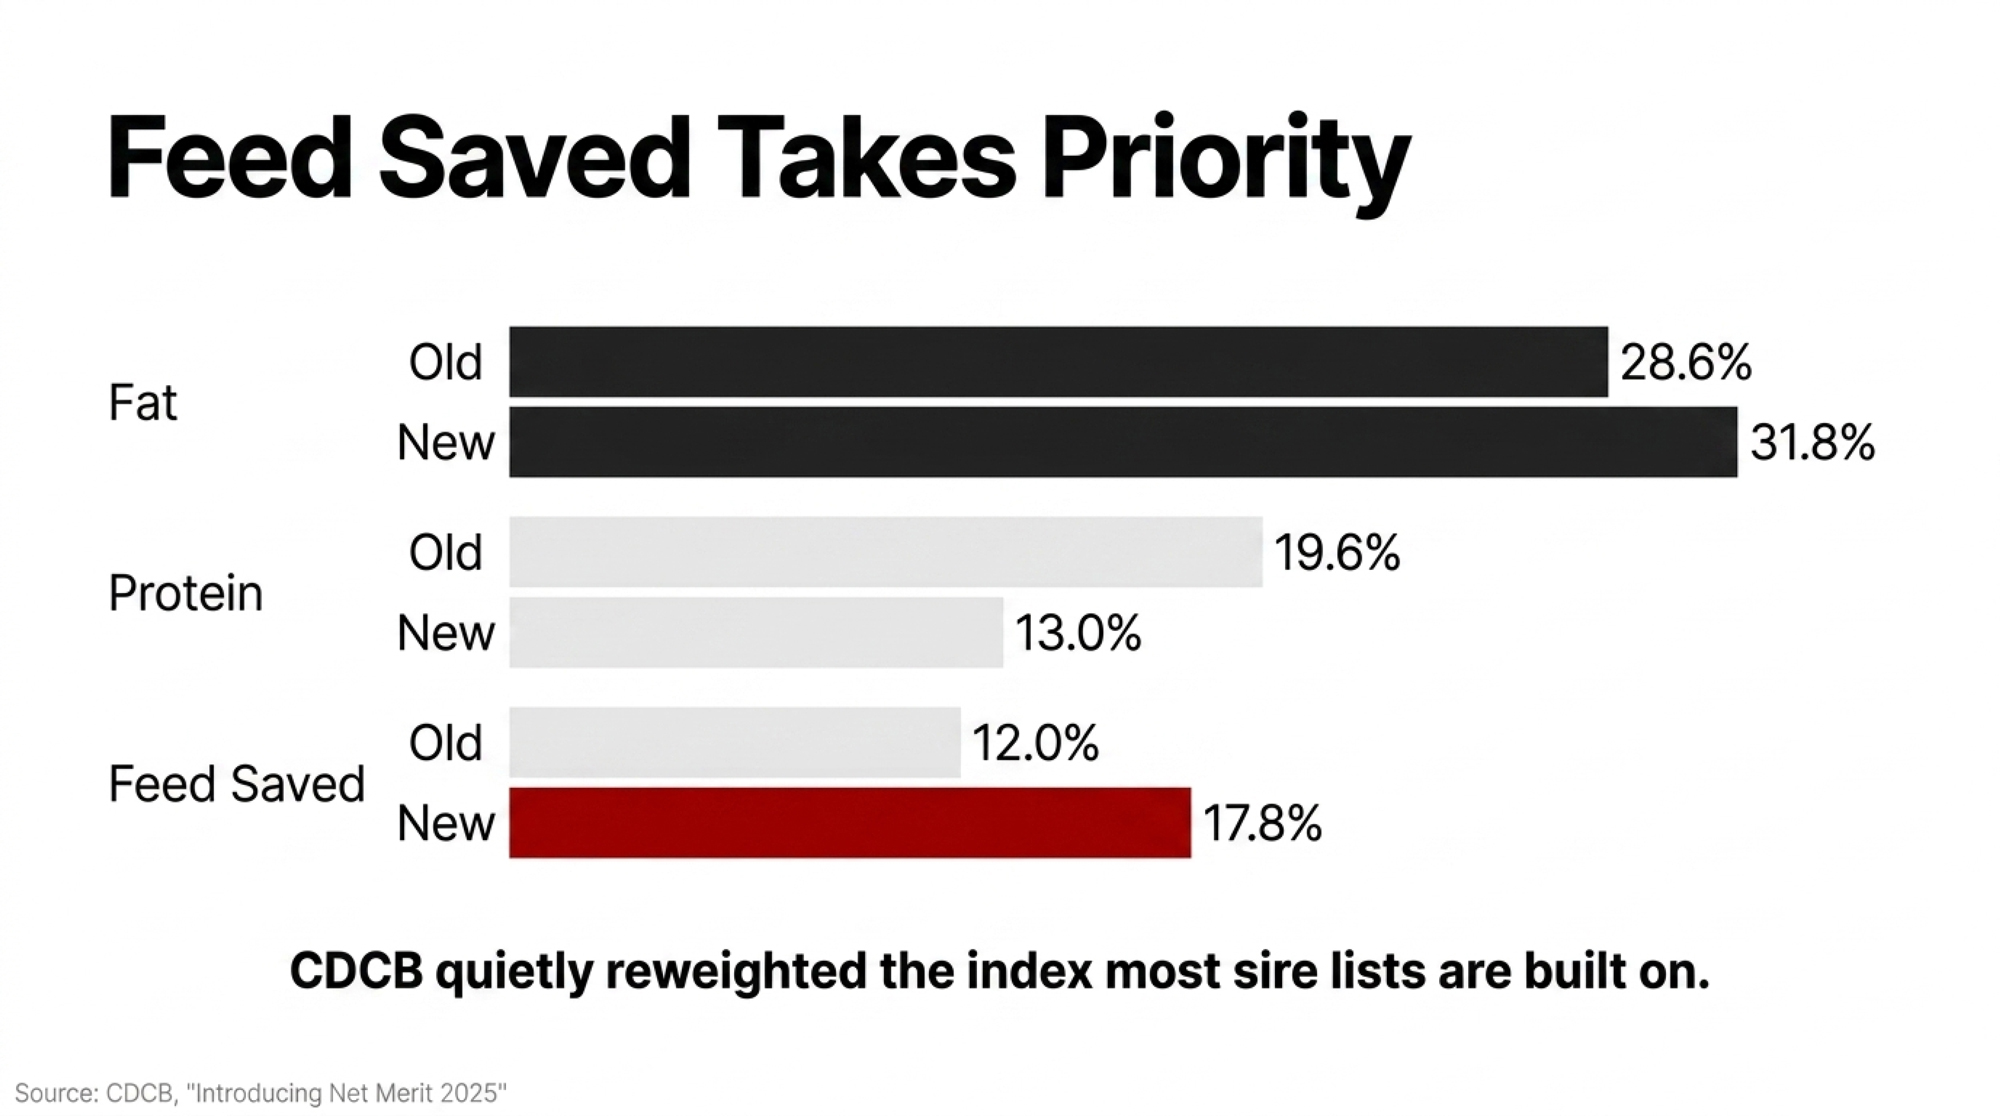
Net Merit Weighting Shift — Effective April 1, 2025

TraitBeforeAfter
Fat28.6%31.8%
Protein19.6%13.0%
Feed Saved (combined)12.0%17.8%
Body Weight CompositeIncluded in Feed Saved bundleEconomic weight more negative — CDCB states the direction; no standalone percentage published

Source: CDCB, “Introducing Net Merit 2025,” January 30, 2025. Board approval December 18, 2024.

No classification-run headline for that one. It just quietly reweighted the index a lot of sire lists get built on.

Careful what you read into the timing, though. CDCB and Holstein Association USA are separate organisations with separate boards and separate review cycles. Holstein Association USA’s published rationale for the stature penalty cites breed standards and functional correctness — not feed costs or Net Merit. And CDCB’s revision arrived without any public cross-reference to classification policy either. Thirteen months between CDCB’s April 2025 index change and Holstein USA’s May 2026 classification change isn’t evidence they were coordinating. Both could be downstream of the same peer-reviewed literature, which has been sitting in the Journal of Dairy Science since at least 2010.

What 1,682 Pounds Actually Costs

Here’s the barn math, and read the assumptions, because this isn’t a published finding. It’s CDCB’s spread times a feed cost, and it’s arithmetic you can check.

University of Wisconsin Extension’s feed-efficiency worked example prices dry matter at $0.15 per pound against milk revenue of $0.21 per pound. Toghiani et al. priced U.S. Holstein rations at $12 per 100 Mcal NEL and $73 per 100 kg metabolizable protein — near $0.109 per pound on a typical lactating ration. Call the working range $0.11 to $0.15, and know your own forage and ration costs can land outside it either way.

Financial Sensitivity Breakdown

ScenarioLow feed cost ($0.11/lb DM)High feed cost ($0.15/lb DM)
Per cow, per lactation$185.02$252.30
100-cow herd, outer bound$18,502/yr$25,230/yr
250-cow herd, outer bound$46,255/yr$63,075/yr
500-cow herd, outer bound$92,510/yr$126,150/yr

Bullvine calculation: 1,682 lb DM spread × feed cost. Herd figures are outer bounds only — they assume every cow descends from either the best or worst Feed Saved sire available. At a 30–35% replacement rate, you’d need roughly three years of one-directional mating to approach even half of it. A realistic first-year target is the per-cow figure applied to that year’s replacement group: on 250 cows, roughly 75–88 head, or $14,000–$22,000 depending on feed cost.

Across all genotyped animals, the range is tighter: −738 to +613 pounds, with an average PTA of about 10 pounds saved, per USDA-ARS. Use the wider bull range when you’re shopping. Use the narrower one when you’re setting herd expectations.

And here’s the part that should nag at you. On 250 cows, the gap between a $0.11 feed cost and a $0.15 one is roughly $17,000 a year all by itself. Same bulls. Same genetics. Your feed price moves this answer hard — and that’s a number you can’t get off a proof sheet.

Feed Cost ScenarioPer-Cow/Lactation250-Cow Herd (Outer Bound)Gap vs. Low Scenario
$0.11/lb DM (low)$185.02$46,255/yr
$0.13/lb DM (mid)$218.66$54,665/yr+$8,410
$0.15/lb DM (high)$252.30$63,075/yr+$16,820

Does the Tall Cow Actually Milk More?

This is where most stature conversations end at the rail, usually in the tall cow’s favour. The genetic data doesn’t really back it.

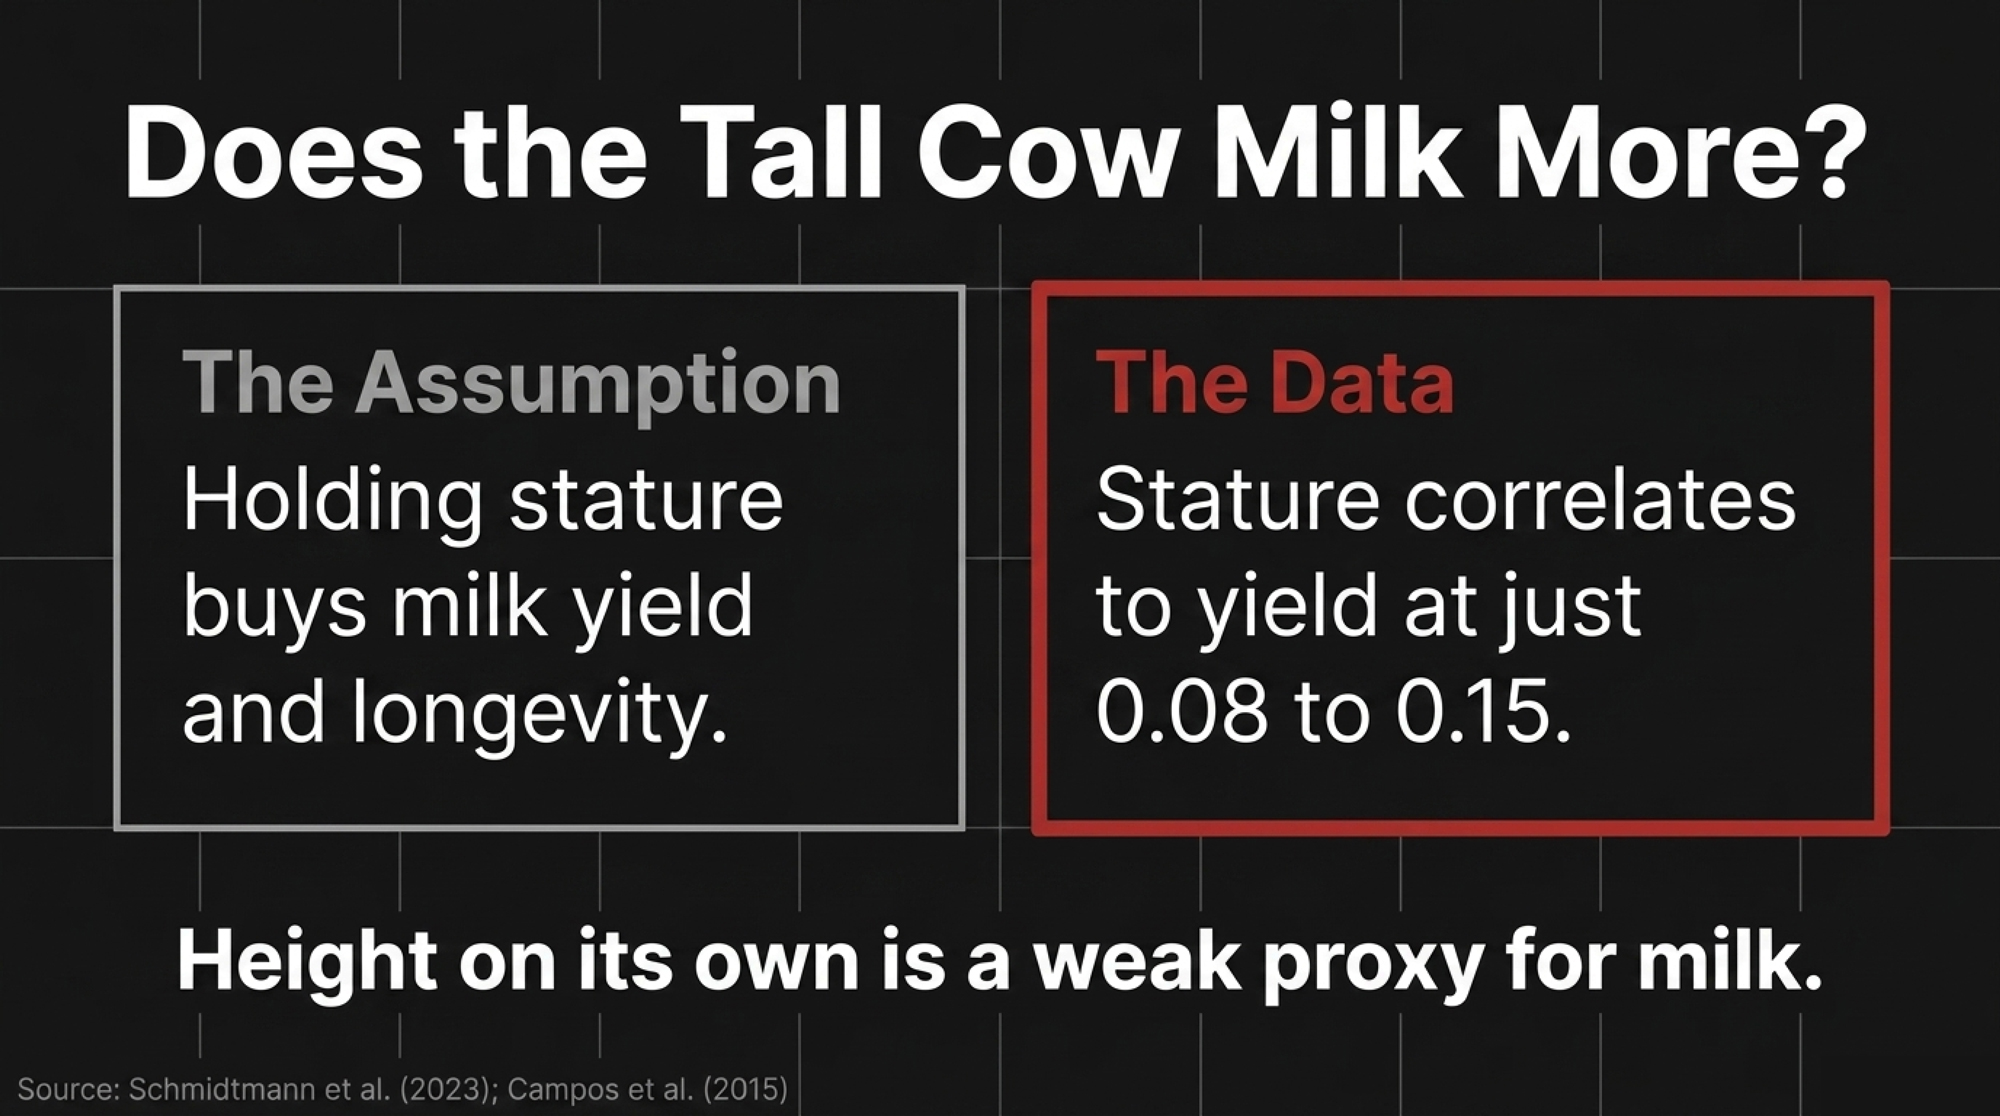
Schmidtmann et al. (2023), using German Holstein data, found stature’s genetic correlations with production traits ranged from 0.084 to 0.158 across milk, fat, and protein yield. Campos et al. (2015), looking across 21 linear type traits, put most yield correlations under 0.20 — stature well inside that band.

Body weight is a different animal — heavier cows do yield more, with the correlation shifting once you account for body condition. But height on its own is a weak proxy for milk.

Genetic Levers: Reality vs. Perception

TraitHeritabilityCorrelation to DMICorrelation to lifetime profitPractical takeaway
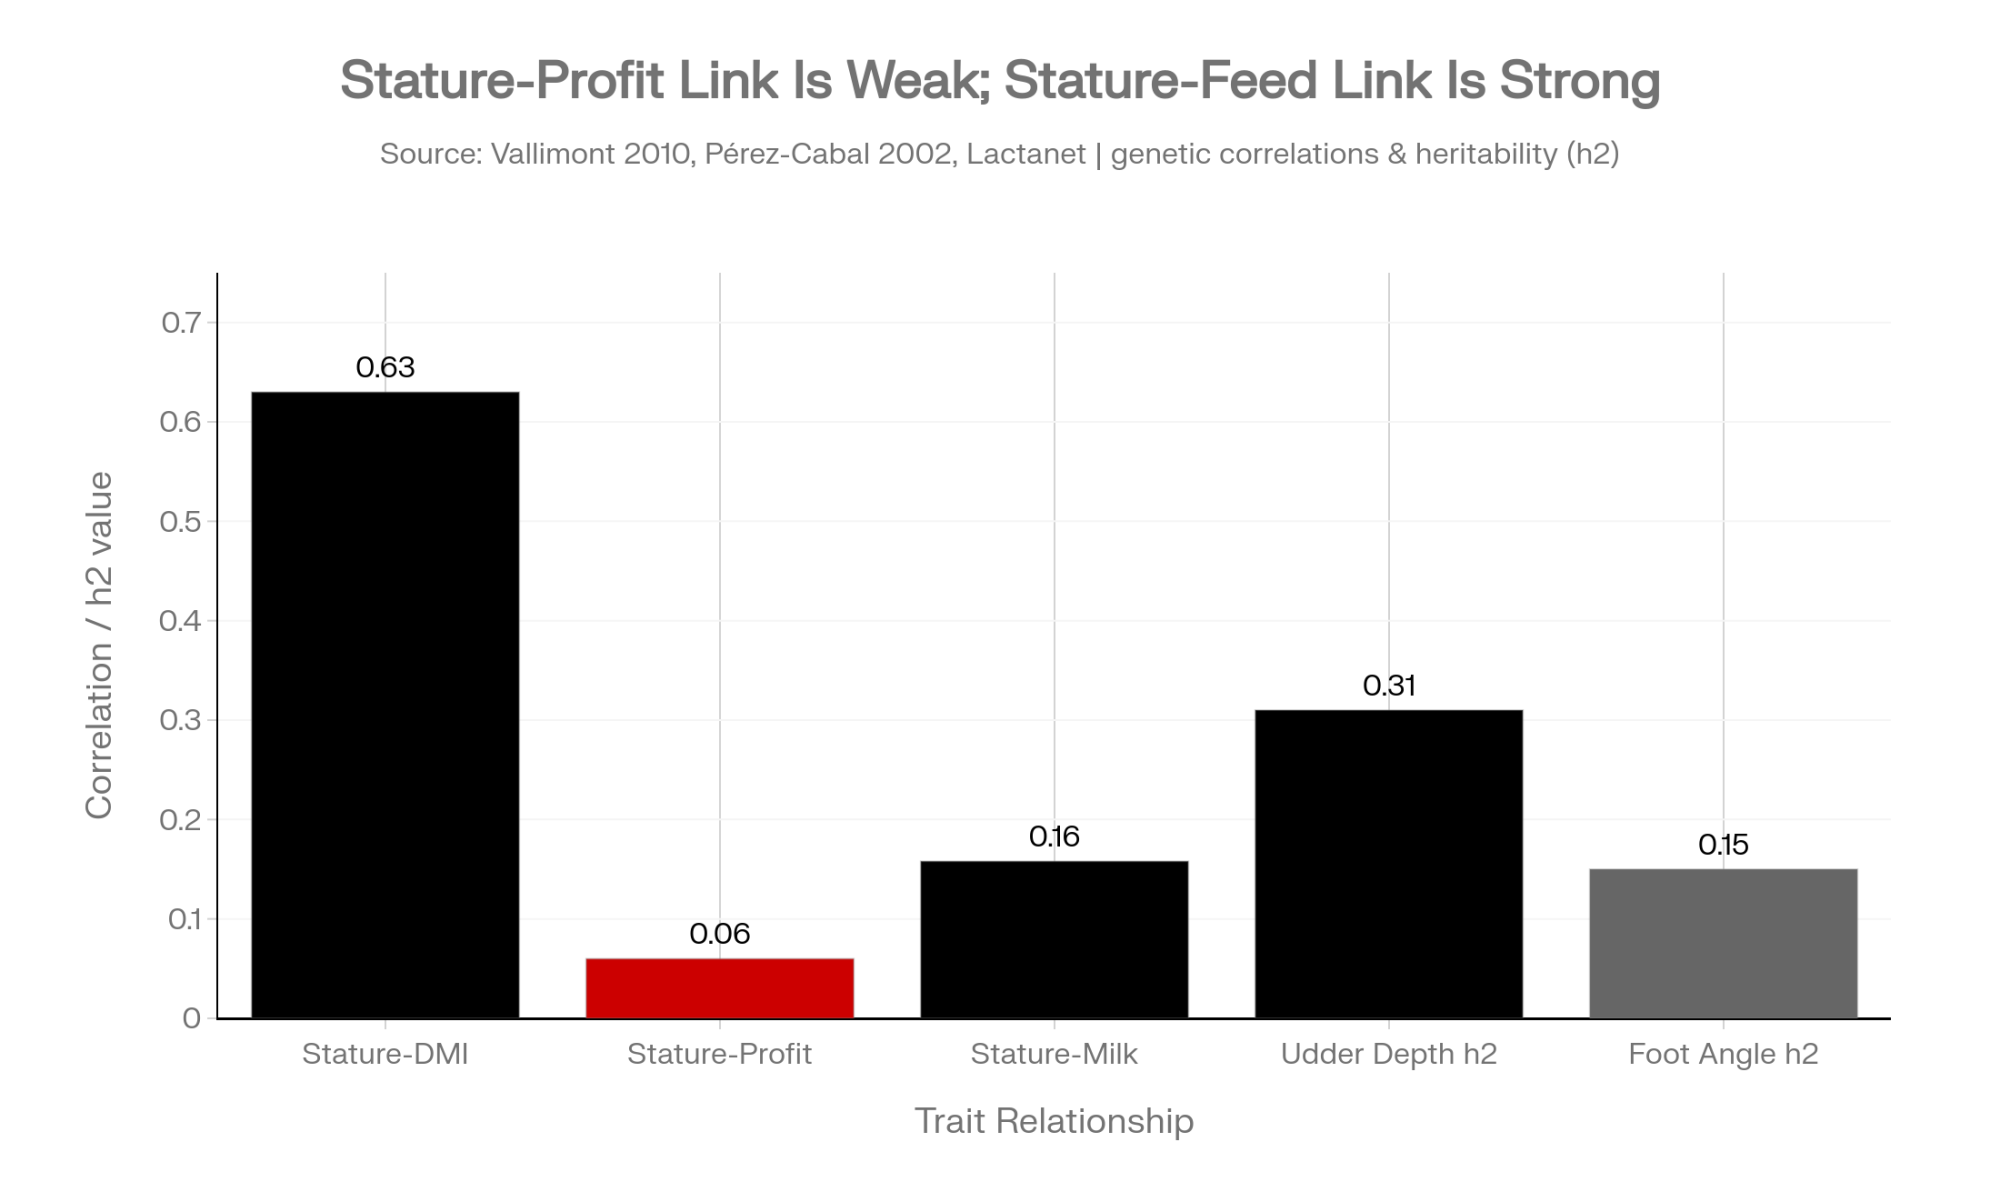
Stature0.49–0.63+0.52 to +0.63+0.06 (negligible)High genetic response — builds size and feed cost fast with virtually no profit dividend
Productive Life0.05–0.13Low / variable*High*Direct progress is slow; work it through management and correlated composite traits
Udder Depth0.31Not established*Moderate*Roughly twice as responsive as foot angle (0.08–0.15); prime lever if culling traces to udders
Feed Saved~0.14Direct negative (saves DM)High — inferred from its 17.8% Net Merit weightingReal dollars, but 28–38% reliability — separate extremes, don’t split hairs

Heritabilities and the stature correlations are sourced as follows: Vallimont et al., JDS 2010 (Pennsylvania research herd); Pérez-Cabal et al., Journal of Dairy Science, 2002 (Spanish Holstein population — a 24-year-old estimate, and the most direct one available); Kern et al. 2015 (Brazilian); Wasana et al. 2015 (Korean); Holstein Association USA Linear Type EvaluationsCanadian Dairy Network.

*Cells marked with an asterisk are directional professional assessments, not values drawn from the cited studies.

So the trait you can size up from across the yard tracks a cost you can’t see, barely tracks the profit you’re after, and only weakly tracks the milk you assumed you were buying. Nobody chose that on purpose. It’s a measurement gap that ran for decades before the tools existed to close it.

Put the heritability columns side by side and the last forty years make sense. Cow size moved fast because it was easy to select. Longevity — the thing every breeder says they want — is among the hardest traits in the barn to shift through genetics alone.

Four Paths, and What Each One Costs

PathHeritability / ReliabilityDollar ImpactBest Fit
Cap stature as a filterN/A — policy lever$0 cost, no direct gainAlmost any herd
Rank on Feed Saved + BWC28% (young) / 38% (proven)$185–$252/cow/lactationHerds chasing feed cost first
Chase longevity via udder depth0.31 h² (vs. 0.15 foot angle)Indirect, high long-termCulling problems traced to udders
Wait / hold steadyN/AOpportunity cost onlyModerate-framed, decent feed conversion herds

Path 1 — Cap stature as a filter, not a ranking trait

  • Set the ceiling near 0.0 PTA, then rank survivors on everything else
  • Fits almost any herd; costs nothing to apply
  • Limit: a ceiling buys you nothing if you then rank survivors on the same traits you always did

Path 2 — Move Feed Saved and BWC into primary ranking

  • This is where the dollars are: $185–$252 per cow per lactation across the full spread
  • Reliability caution: CDCB reports Feed Saved reliabilities averaging 28% for young genomic bulls, 38% for progeny-tested. Thin against traits you’re used to trusting, because the dry matter intake phenotype database is still small
  • Feed efficiency heritability sits near 14%
  • Practical read: separate clear extremes, don’t split hairs between two bulls three points apart. Firmer ground on progeny-tested sires

Path 3 — Chase longevity sideways

  • Direct PL selection is slow at 0.05–0.13 heritability
  • Udder depth carries 0.31 heritability against foot angle’s 0.15 — roughly twice the response for the same selection pressure
  • Lactanet’s Canadian estimates run the same direction: udder depth 0.31, foot angle 0.08
  • Best fit: herds whose culling sheet keeps pointing at udders
  • Honest caveat: no study in hand quantifies how much faster indirect selection moves Productive Life in this specific context

Path 4 — Or wait

  • Reasonable if your herd’s already moderate-framed and feed conversion is decent
  • Cost of waiting: each lactation is another cycle of Body Weight Composite drag before any correction compounds
  • Context: VikingGenetics roughly doubled Saved Feed’s weighting in its Holstein NTM index, from 6.2% to 11.4%, per the company’s own documentation. Several evaluation systems are moving in the same direction independently.

Is Your Sire List Behind, or Is the Data Just Too New?

Depends which change you mean. Net Merit’s revision took effect April 1, 2025, so it’s had four full proof runs to work through rankings. The classification penalty started with the May 2026 run — roughly three months of data as of now.

Which is why one claim circulating in trade coverage deserves a flag: that cows under 60 inches show 25% longer longevity. No primary source for it turned up in this research. No named study, no institution, no population — it appears only in secondary aggregation. Don’t build a culling threshold on it.

Use the same caution on the softer version, common in recent coverage, that the May 2026 penalty has already delivered measurable longevity or profitability gains. Three months of classification data can’t carry that, whatever direction the underlying biology points.

What This Means for Your Operation

  • Pull Feed Saved and BWC on every bull in your tank this month. If your rep quotes index totals only, ask for the component traits by name. That’s the 30-day move, and it’s one phone call.
  • Ask whether each Feed Saved figure came from a progeny-tested or young genomic bull. At 38% versus 28% reliability, that distinction should change how hard you lean on it.
  • Work out your own feed cost per pound of dry matter before using any per-cow figure here. The $185–$252 range swings entirely on that input.
  • If a bull’s stature PTA sits above 0.0, ask what you’re getting for it. Correlation to milk yield is 0.084–0.158. If the answer is “he’s just tall,” that’s not a reason.
  • If longevity is the problem, put the pressure on udder depth before foot angle. Twice the response for the same effort.
  • Treat the May 2026 penalty as policy, not proven outcome. Three months isn’t a longevity dataset.

Key Takeaways

  • If your ration runs near $0.15/lb DM, the Feed Saved spread is worth roughly $252/cow/lactation — first trait to fix. Nearer $0.11 and it’s $185, still real money, but other traits may earn the priority.
  • If you’re selecting young genomic bulls on Feed Saved, treat 28% reliability as a reason to separate extremes only.
  • If you’ve held stature because you believe it buys milk, the published correlation is 0.084–0.158. That belief is doing less work than you think.
  • If your culling problem is udders rather than feet, you’re in luck — udder depth is the more heritable trait by a factor of two.
  • If anyone quotes you a “25% longer longevity” figure for sub-60-inch cows, ask for the study. There doesn’t appear to be one.
  • If you’re changing sire strategy this fall, plan on the replacement-group figure — $14,000–$22,000 on a 250-cow herd in year one — not the upper bound.

Run It Against Your Own Records

Pull your top and bottom quartile by frame. Look at their lifetime margin across three lactations. See whether your barn agrees with Pérez-Cabal’s 0.06 or argues with it — because a Spanish population estimate from 2002 can tell you where the odds sit, but it can’t tell you what happened in your own freestalls.

That’s answerable from your records this month. So what would you do differently if the tall ones came out ahead?

Complete references and supporting documentation are available upon request by contacting the editorial team at editor@thebullvine.com.

Learn More

The Sunday Read Dairy Professionals Don’t Skip.

Every week, thousands of producers, breeders, and industry insiders open Bullvine Weekly for genetics insights, market shifts, and profit strategies they won’t find anywhere else. One email. Five minutes. Smarter decisions all week.
NewsSubscribe
First
Last
Consent

August 2025 Proofs: New Kings, Big Swings, and What It Means for Your Herd

Bulls losing 102 points overnight while proven sires gain $2,400/cow advantage? August’s genomic chaos changes everything we know.

EXECUTIVE SUMMARY

The August 2025 genetic evaluations reveal a critical shift in the dairy industry, as the proven reliability of daughter-backed sires increasingly outshines the volatile promise of their genomic counterparts. This trend is highlighted by major ranking changes, including Stantons Remover PP leaping to the #1 proven spot in Canada, while genomic bulls like Cookiecutter Hadley-ET experienced dramatic drops. The displacement of established sires like Genosource Captain in the UK further signals a rapid industry shift towards functional traits, such as health and efficiency. This dynamic underscores a move by breeders to prioritize real-world economic performance, exemplified by GENOSOURCE RETROSPECT-ET’s dominance in the US Net Merit rankings, leading to breeding strategies that now favor the stability of proven genetics.

KEY CHANGES

  • Stantons Remover PP: The biggest mover, leaping from #7 to become the new #1 proven sire in Canada (LPI) after his first daughters validated his genomic potential.
  • Cookiecutter Hadley-ET: A prime example of genomic volatility, going from #2 to #10 in the Italian genomic rankings in a single evaluation cycle.
  • OCD Trooper Sheepster: Emerged as the new #1 daughter-proven sire in the UK (£PLI), showcasing a desirable combination of production and a high lifespan improvement.
  • GENOSOURCE RETROSPECT-ET: The new leader for Net Merit ($NM) in the US, headlining Genosource’s complete domination of the economic-focused index.
  • Genosource Captain: A significant change, this former industry-leading sire dropped to fifth place in the UK and 3rd place in the US, highlighting the rapid genetic progress and shifting priorities towards health and efficiency traits.
  • Evenstar & Pennywise: A pair of “twin” sires who became the new #1 genomic leaders in Germany ($RZG), both achieving an elite score of 164.
  • Peak Spellbound-ET: Surged to become the new #1 genomic sire in Italy ($gPFT), noted for his exceptional component percentages that appeal to the cheese market.

The August 2025 genetic evaluations have delivered the most dramatic ranking reshuffles we’ve seen in years, with proven sire Stantons Remover PP leaping from #7 to #1 in Canada, while Italian genomics swung by 100+ points in single evaluations. The real story? Proven reliability is increasingly outperforming genomic promises as economic pressures force progressive breeders to prioritize profitable genetics over flashy TPI numbers.

Look, I’ve been watching genetic evaluations for over two decades, and what just dropped in August 2025 has me scratching my head in the best possible way. We’re seeing ranking shifts that would’ve been unthinkable just a few years ago—and the implications for your breeding program are massive.

The thing that’s really got my attention isn’t just the new leaders (though they’re impressive), it’s this growing tension between what genomics promise and what proven bulls actually deliver. And frankly, some of the volatility we’re seeing should prompt every breeder to pause before they become too aggressive with unproven genetics.

The Great Genomic Reality Check—And Why It Matters to Your Bottom Line

Here’s what’s happening across the major Holstein markets, and it’s telling a story that every progressive breeder needs to understand. We’re looking at the United States, Canada, the UK, Germany, and Italy—basically the genetic powerhouses that drive most of our industry decisions.

The pattern that’s emerging? Genomic predictions are becoming increasingly volatile, while proven bulls are demonstrating the kind of consistency that actually pays the bills. Take what just happened in Italy—Cookiecutter Hadley-ET dropped from #2 to #10 genomic, losing 102 points in one evaluation cycle. That’s not a small adjustment; that’s a complete reversal of fortune.

Meanwhile, proven sire ZFZ Crisalis RF gained 29 points, strengthening his position as #1. The guy has thousands of daughters, actually milking in real barns, dealing with real feed costs and real heat stress. There’s something to be said for that kind of validation.

What really drives this home is the German comparison. Their genomic leaders, Evenstar and Pennywise, both reached RZG 164—that’s a 17-point advantage over proven leader Zivet, who reached RZG 147. Now, if you’re doing the math on lifetime profit, that gap represents serious money… if the predictions hold true.

Marco Winters from AHDB put it perfectly when he looked at the UK situation: “The six new graduates in the top 10 already have around 7,000 heifers registered in UK milk-recorded herds, with some now milking. Their proven £PLI values deviate by just one point on average from their earlier genomic predictions.”

That’s the kind of validation that makes you feel good about using genomics early. But here’s the thing—not every market is showing that kind of accuracy.

North America: Where Economic Reality Meets Genetic Hype

The United States: Genosource’s Economic Domination

What’s fascinating about the US August proofs is how they reveal a fundamental shift toward economic reality. Sure, BEYOND HI-LEVEL-ET claimed the #1 genomic spot at +3539 TPI, but honestly, that’s not the story that’s going to matter to your milk check.

The real story is how Genosource has completely taken over the Net Merit rankings. I mean completely. GENOSOURCE RETROSPECT-ET leads at +1317 NM$, followed by his stable mates GENOSOURCE ENDURANCE-ET (+1233NM) and GENOSOURCE PURDY-ET (+1222 NM$).

This isn’t a coincidence—this is systematic breeding for traits that actually make money rather than chasing TPI points that look good on paper but don’t always translate to profitability. And with feed costs where they are in 2025, that focus on economic merit is becoming non-negotiable.

In the proven ranks, SDG CAP GARZA-ET is leading at +3488 TPI with 98% reliability. What I like about Garza is his balance—+146 lbs fat, +53 lbs protein, and +3.7 PL. Those are the kind of numbers that keep operations profitable when everything else goes sideways.

Canada: The Remover Revolution (And What It Really Means)

Now this is where August got really interesting. Stantons Remover PP made this spectacular jump from #7 in April to #1 in August (+3897 LPI). That’s not just a statistical blip—this bull’s backed by 234 daughters across 32 herds, which means we’re looking at real-world validation of genomic predictions.

What strikes me about Remover is his profile. He’s not just high-scoring, he’s balanced in exactly the ways that Canadian producers need as replacement costs keep climbing. The durability traits are there, the production is solid, and crucially, he’s proving himself in diverse management systems across the country.

The genomic young sire category is where things get really exciting, though. OCD Milan-ET leads at +4118 GPA LPI, and his numbers tell a story: +638 Milk, +108 Fat, plus strong type (+10 Mammary System, +6 Feet & Legs). This combination of production and structural soundness is exactly what the Canadian industry has been selecting for—cattle that can handle our diverse climate and management challenges.

European Markets: The Functional Excellence Revolution

United Kingdom: When Genomic Predictions Actually Work

The UK market gave us probably the strongest validation of genomic accuracy we’ve seen recently. Six new daughter-proven sires graduated into the top 10 PLI positions, and here’s the kicker—their proven values are matching their genomic predictions almost perfectly.

OCD Trooper Sheepster emerged as the new proven leader at £779 PLI. His production numbers are impressive (47.8kg fat, 35.7kg protein), but what really catches my attention is the +113-day lifespan improvement. With replacement costs exceeding £ 2,000 per animal, longevity traits like these are becoming the difference between profit and loss.

The genomic leader, Peak AltaValuepack, at £877 PLI, shows even stronger longevity (+122 days) while maintaining solid production (+785kg milk). This represents what I think is the modern ideal—comprehensive genetic merit that addresses both production and durability.

What’s particularly noteworthy is how Genosource Captain dropped to fifth place (£723 PLI) despite having over 2,000 UK milking daughters. This displacement illustrates how rapidly genetic progress can transform breeding hierarchies when functional traits take precedence over other traits. The Captain has been a reliable choice for years, but the industry’s moving toward health, fertility, and efficiency traits faster than many expected.

Germany: Precision Breeding at Its Finest

German evaluations consistently demonstrate why their breeding program is considered world-class. Proven leader Zivet commands RZG 147 through this impressive balance: +1,971 kg milk, +88 kg fat, +86 kg protein, combined with functional traits (RZN 121, RZGes 113) that actually work in commercial settings.

The genomic sphere produced these twin leaders in Evenstar and Pennywise, both at RZG 164. Evenstar’s projections (+2,090 kg milk, +120 kg fat, +69 kg protein, RZN 134) position him as a premium choice for operations serious about maximizing both production and longevity.

What’s interesting is how Red Holstein genetics keep showing up in top rankings. Ginger leads proven sires at RZG 143 with +2,638 kg milk through 510 daughters. In genomics, Schach achieved RZG 161. This demonstrates continued genetic progress in color variants—something that’s becoming increasingly important as producers seek ways to differentiate their cattle.

Italy: The Volatility That Should Worry Everyone

The Italian evaluations provided the starkest illustration of genomic volatility I’ve seen. Peak Spellbound-ET surged to #1 genomic position at 5458 gPFT—he’s an Overdrive son showing impressive components (+1.07% fat, +0.54% protein) that appeal to Italy’s cheese-focused industry.

But here’s what should concern every breeder: the dramatic swings in genomic rankings. Bulls gaining or losing 100 points or more in a single evaluation raise serious questions about reliability. This underscores why the Italian proven bull rankings, where ZFZ Crisalis RF maintains steady leadership at 5169 gPFT, provide such important stability.

The Italian ICS-PR€ index tells another story entirely. Smartie P-ET leads with 1398 ICS-PR€, demonstrating the economic reality that in value-added dairy systems, components matter more than volume. This is particularly relevant as more operations explore premium markets.

The Trends That Are Reshaping Everything

Health and Longevity: No Longer Optional

What’s becoming increasingly clear across all markets is that health and longevity traits are no longer nice-to-have features—they’re essential for profitability. PROGENESIS WATCHMAN’s elite 8.6 Health Index represents the kind of defensive genetics that operations need against rising veterinary costs.

The UK’s emphasis on HealthyCow values and Germany’s focus on RZGes scores reflect an industry-wide recognition that profitable cows must first be healthy cows. This isn’t just about animal welfare (though that matters), it’s about economic survival in an environment where every sick cow threatens your bottom line.

Component Production: The New Economic Reality

The shift toward fat and protein production rather than volume alone is evident everywhere you look. German proven sire Ginger’s +2,638 kg milk production demonstrates that volume still matters, but bulls like Peak Spellbound-ET, with +1.07% fat, are capturing attention in component-focused markets.

This trend makes sense when considering where milk prices are headed. Component premiums are becoming more significant, and operations that can deliver high-quality fat and protein are seeing better returns than those focused purely on volume.

Polled Integration: Finally Happening Seamlessly

Polled genetics are showing up in top rankings without the performance compromises we used to see. Germany’s Create P achieving RZG 161 and Canada’s Vogue A2P2-PP maintaining +15 CONF demonstrate successful integration of polled traits into elite genetic packages.

This matters because consumer pressure around dehorning isn’t going away, and having polled options that don’t sacrifice performance removes a major management headache.

The Bloodline Concentration Problem

Here’s something that should concern everyone: the dominance of specific sire lines across multiple countries. Overdrive sons appear in top rankings across markets, while Genosource genetics dominate US economic merit rankings.

This concentration delivers short-term genetic progress, but it’s creating long-term risks to breed adaptability. We’ve seen this movie before with other breeds, and it doesn’t end well if we’re not careful about maintaining genetic diversity.

Economic Pressures Driving Everything

Feed Efficiency: The Make-or-Break Trait

With feed costs still elevated in 2025, bulls showing superior feed conversion are becoming premium choices. The UK’s emphasis on Maintenance Index scores and Italy’s ICS-PR€ rankings reflect an industry that can no longer afford inefficient genetics.

Genosource Captain’s Feed Advantage, with a +255, exemplifies why these traits matter so much. When margins are this tight, feed efficiency often determines profitability more than raw production numbers. This is basic math that every operation needs to understand.

Replacement Costs: Why Longevity Pays

Rising replacement heifer costs are elevating longevity traits to critical importance. OCD Trooper Sheepster’s +113 days lifespan improvement and Peak AltaValuepack’s +122 days longevity represent real economic value when replacements cost $2,000+ per animal.

The math here is straightforward—every additional lactation from a cow represents thousands of dollars in value. Operations that ignore longevity traits in favor of short-term production are essentially choosing to hemorrhage money on replacement costs.

What This Means for Your Breeding Strategy

The Portfolio Approach (Because Balance Matters)

The volatility we’re seeing suggests genetic diversification rather than relying on a single bloodline. Successful operations are adopting portfolio approaches—combining proven reliability with selective use of high-potential genomics. My recommendation? Build genetic portfolios with 60-70% proven sires and 30-40% genomic young sires, adjusting based on your risk tolerance and genetic progress objectives. This captures advancement while maintaining reliability.

Market-Specific Selection (One Size Doesn’t Fit All)

Each market’s payment systems and management conditions require tailored strategies. Italian producers focused on cheese production, with weight component percentages, differently than Canadian operations that sell fluid milk.

UK producers must balance production with stringent health and welfare requirements.

This means you can’t just follow rankings blindly—you need to understand what traits actually drive profitability in your specific market situation.

Timing Genomic Adoption (When to Jump, When to Wait)

The UK’s validation of genomic predictions through proven daughters provides confidence for early adoption of superior young sires. However, the Italian experience suggests that extensive use of unproven genetics carries a substantial risk.

Successful breeders are adopting measured approaches—using genomic bulls selectively while maintaining core breeding programs on proven genetics. It’s about being progressive without being reckless.

Looking Forward: The Real Strategic Imperatives

What the August 2025 evaluations really reveal is that the industry is striking a balance between the promise of genomics and economic reality. The winners aren’t chasing the highest TPI or PLI scores—they’re building profitable, sustainable herds adapted to their specific conditions.

Success belongs to breeders who strategically combine proven genetics as their foundation with selective genomic advancement. The future isn’t about choosing between proven and genomic selection—it’s about leveraging both approaches to create cattle that thrive in an increasingly challenging environment.

The real winners are already emerging, and they’re not just showing up in rankings. They’re showing up in milk checks and bottom lines of operations that have learned to balance genetic potential with economic reality. Because at the end of the day, that’s what actually matters in this business.

Read complete breakdowns for each country here:

The Sunday Read Dairy Professionals Don’t Skip.

Every week, thousands of producers, breeders, and industry insiders open Bullvine Weekly for genetics insights, market shifts, and profit strategies they won’t find anywhere else. One email. Five minutes. Smarter decisions all week.
NewsSubscribe
First
Last
Consent
Send this to a friend