Archive for feed efficiency genetics

The Wall of Milk: Making Sense of 2025’s Global Dairy Crunch

This downturn feels different because it is. Four major exporters expanded at once, and $15 milk is testing every assumption. Here’s what the resilient dairies know.

EXECUTIVE SUMMARY: When producers say this downturn feels different, they’re right. For the first time, the U.S., EU, New Zealand, and Argentina all expanded production within the same window—creating a “wall of milk” that pushed July 2025 output to 19.0 billion pounds while Class III dropped from the $20s to around $15. Here’s what makes it unusual: exports are at record levels, confirming this is a supply squeeze, not a demand collapse. Dairy’s 24-month biological timeline means decisions that made complete sense at $22 milk are now delivering into a $15 market, with no quick reversal possible. Beef-on-dairy has added real value but also reduced the number of replacement heifers to 3.9 million head—the lowest since 1978—limiting culling flexibility when some operations need it most. The dairies navigating this effectively share common strategies: precision culling using income-over-feed-cost data, margin protection through DMC and Dairy Revenue Protection, and breeding for feed efficiency using traits like Feed Saved. This cycle will accelerate consolidation, but producers who know their numbers and deploy available tools will emerge stronger when markets rebalance.

As milk checks tightened through 2025, I kept hearing the same thing from producers across the country: “We’ve seen low prices before, but this one feels different.” And as many of you have probably sensed on your own operations, they’re right. This isn’t just one region working through a rough patch. The U.S., the European Union, New Zealand, and key South American exporters all pushed production higher within a fairly tight window. A lot of that milk is now competing for the same buyers at the same time.

The 24‑month lag exposed: production peaks just as prices crash, proving this downturn is about too much milk, not weak demand

What makes this cycle particularly challenging is that feed, labor, interest, and environmental compliance costs haven’t returned to the levels we saw a decade ago. That’s especially true in higher-cost regions like California and parts of Western Europe. So you’ve got more milk hitting the market, softer world prices, and cost structures that remain stubbornly elevated. That combination is creating what many are calling the “wall of milk.”

In this piece, we’ll walk through what farmers and analysts are learning about this cycle: how the 24-month expansion lag plays out in practice, how beef-on-dairy has delivered real benefits while also creating some unexpected ripple effects, why lenders and processors kept supporting growth even as signals shifted, how different regions are experiencing this downturn in very different ways, and what the operations navigating this well seem to have in common. The goal is to offer a clearer view of the bigger picture so the decisions you’re making—about cows, facilities, or risk management—are grounded in how this system actually works.

Why This Cycle Really Does Feel Different

Let’s start with the production numbers and work back toward the parlor.

USDA’s Milk Production reports paint a stark picture:

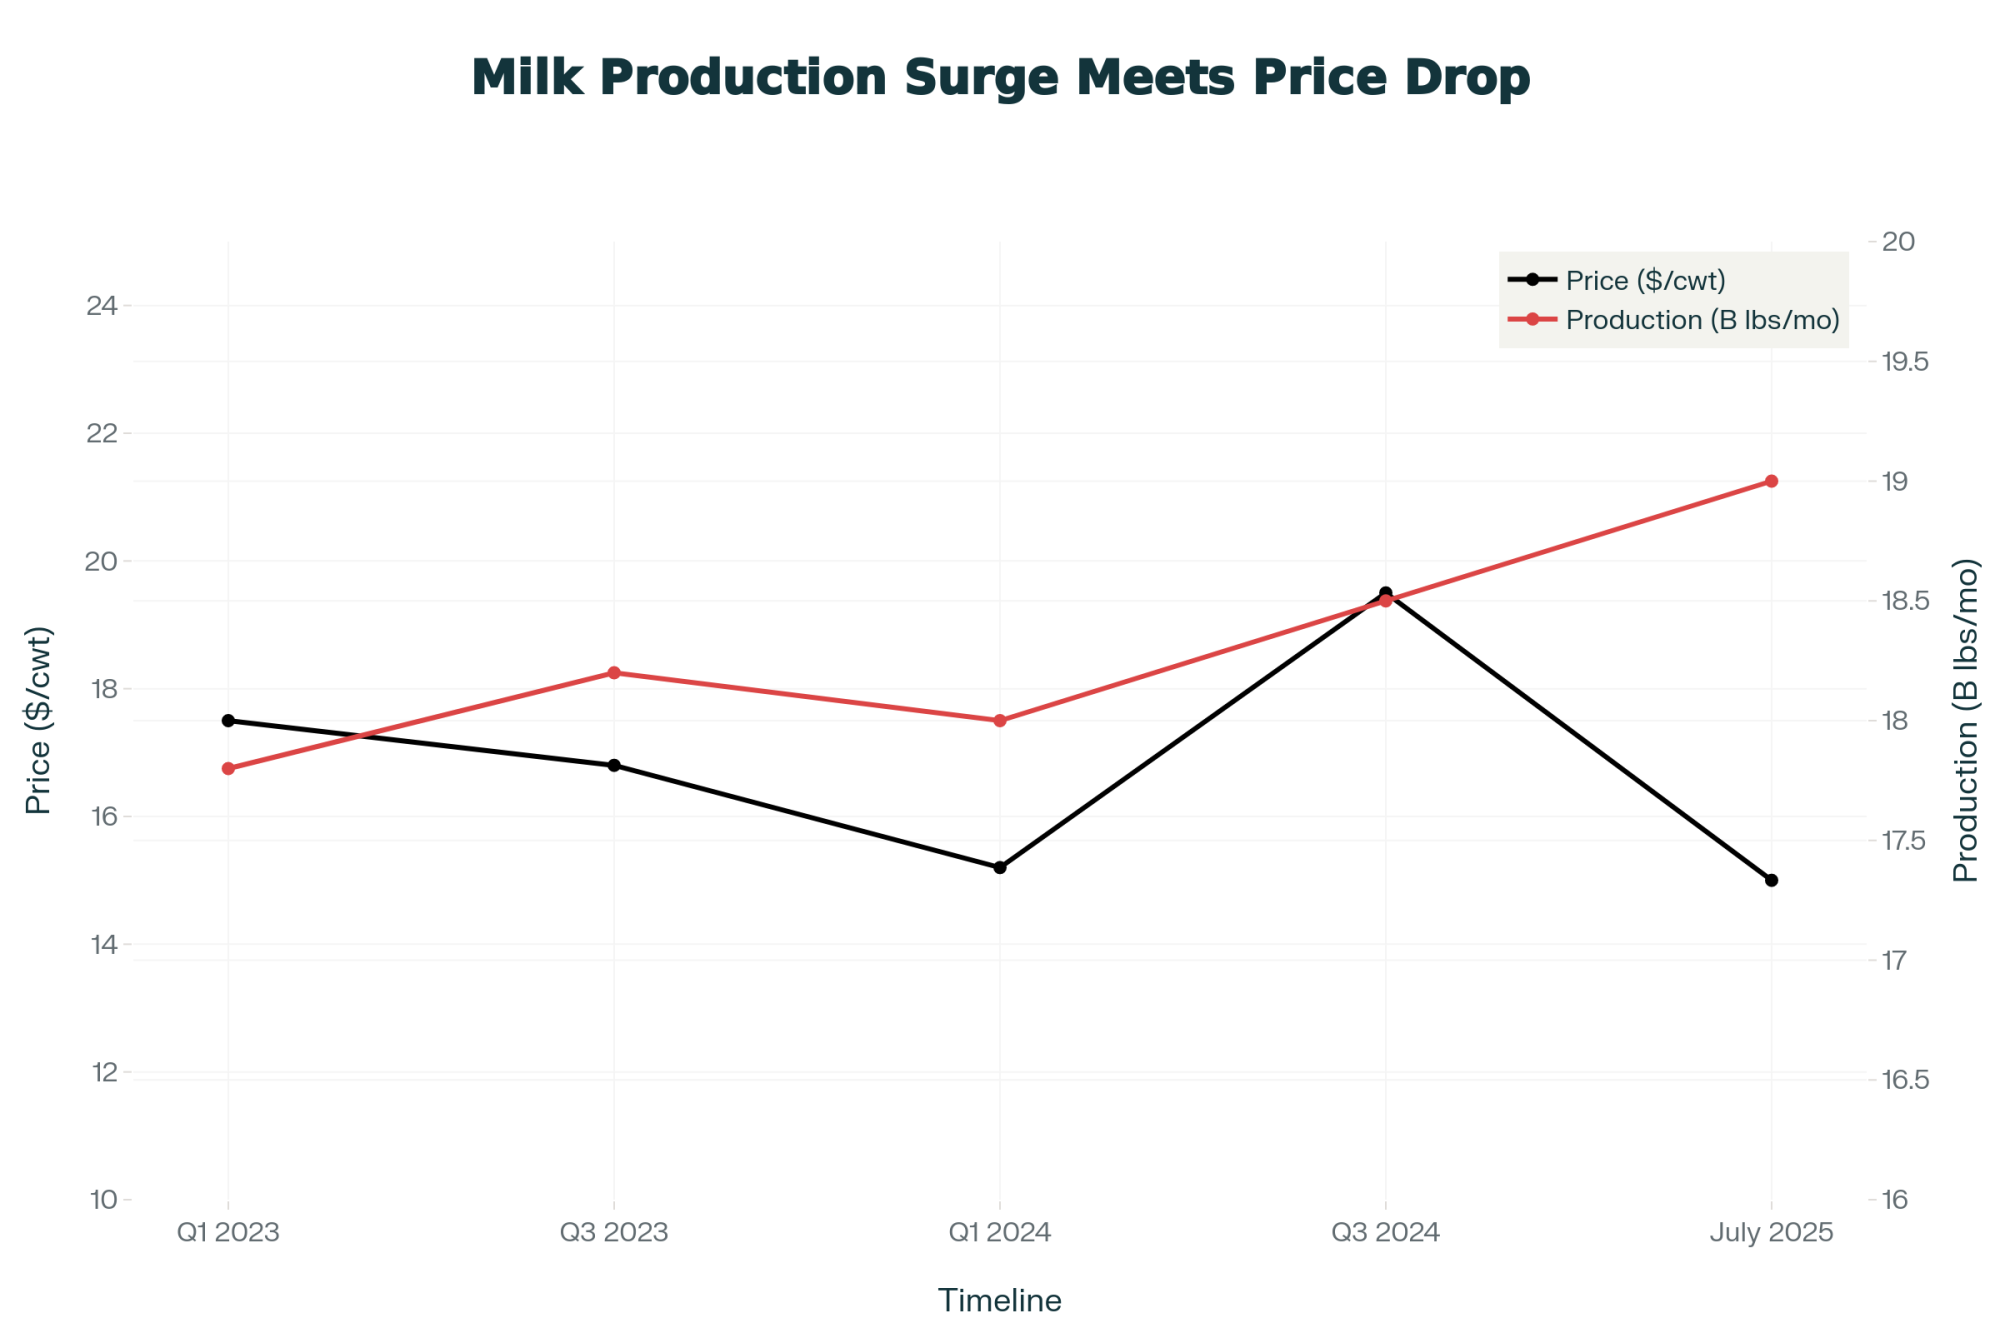
  • July 2025 Output (24 major states): 18.8 billion pounds initially, revised to 19.0 billion
  • Year-Over-Year Growth: +4.2%—the strongest since 2021
  • Total National Production: 19.6 billion pounds
  • Cow Numbers: Approaching the highest levels seen in decades

On the infrastructure side, the industry has been busy. More than 50 new or expanded dairy plants—particularly cheese and powder facilities in the Upper Midwest, Texas, and the High Plains—have come online, representing roughly $8 billion in capital investment over the past several years.

Leonard Polzin, the Dairy Economist and Farm Management Outreach Specialist at UW-Madison Division of Extension, framed it well at the 2025 Wisconsin Agricultural Outlook Forum. He noted that the industry is seeing “a substantial increase in processing capacity,” with an estimated $8 billion in gross investment creating new demand for milk. The challenge, as he pointed out, is that policy uncertainties—including potential tariffs and questions about labor availability—could affect prices before that demand fully materializes.

The picture looks similar in other major producing regions:

  • European Union: EU Milk Market Observatory data show deliveries climbing modestly in 2024, with product stocks building in early 2025 as cheese, butter, and powder production outpaced demand growth
  • New Zealand: Fonterra’s 2025/26 season forecast shows milk solids volumes running several percent ahead of the prior year, with farmgate payouts around NZ$10 per kg of milksolids
  • Argentina: Ministry data and Tridge reports show national milk output in early 2025 running 10.9% above the same period in 2024, with March posting gains of 15.9% year-over-year

Here’s where it gets interesting on the demand side. Exports have actually performed well:

  • July 2025 U.S. Exports: 1.6 billion pounds (milk-fat basis)
  • Year-Over-Year Export Growth: +53%—a record for any single month
  • Yet Class III/IV Futures: Trading in the mid-teens through much of 2025, below full-cost breakeven for many conventional operations
July 2025 was the strongest export month in U.S. history, with shipments up 53% year‑over‑year—yet total production still outran demand by another 4.2%. That’s not a demand collapse; it’s too much milk from too many exporters at once.

The takeaway? World demand hasn’t collapsed. Exports are actually quite strong. But supply from multiple major exporting regions has grown faster than demand can absorb in the near term. That’s what makes this feel different from the regional downturns many of us have worked through before.

The 24-Month Expansion Timeline: When Biology Meets Economics

One of the lessons this cycle keeps reinforcing is how much dairy expansion is a commitment you can’t easily unwind. The biology and capital requirements simply don’t move on futures-market time.

Think back to 2023 and early 2024. Milk prices were strong, butterfat levels were excellent across many herds, and balance sheets looked healthier than they had in years. In that environment, deciding to add a pen, upgrade the parlor, or build out the dry cow facilities made a lot of sense. The numbers supported it.

Land-grant extension economists who model these decisions describe a fairly predictable timeline. In those first few months, you’re signing contracts, ordering equipment, and closing on financing. As one University of Wisconsin farm management publication notes, by the time the ink is dry, most of the financial risk is already committed—even though no extra milk has shipped yet.

Through months four to twelve, the facility goes up while you’re either buying bred heifers or ramping up your own replacement program with sexed semen. Cash is flowing out, but the additional milk revenue hasn’t started. Then in months thirteen through twenty-four, those heifers freshen, pens fill, and milk per stall climbs. The challenge is that the broader market—running on that same 18-24 month biological timeline—may have shifted considerably since you started.

Peter Vitaliano, who served as Vice President of Economic Policy and Market Research at the National Milk Producers Federation before retiring at the end of 2024, was already flagging concerns back in February 2024. He noted that “due to a number of factors, we’ll probably see a larger drop than usual” in dairy farm numbers, partly because USDA counts were likely collected before additional farms closed at the end of 2023 due to margin pressure. He added that any margin improvement wouldn’t “constitute anywhere near a full recovery from the financial stress that dairy farms, pretty much of all sizes, are experiencing.”

The 24-Month Trap in Action

I’ve been hearing about situations like this from lenders and consultants: a 900-cow Wisconsin operation signed expansion contracts in early 2024 for 300 additional stalls, with heifers due to freshen by mid-2025. By the time that barn was full, Class III had dropped from the low $20s to around $15.

The extra milk revenue is real, but so is the debt service. Over six months, the gap between projected and actual margins consumed roughly $180,000 in working capital that had been earmarked for feed prepays and equipment upgrades.

The family isn’t in crisis, but there’s no cushion left. They’re working with their lender on revised cash-flow projections and tightening culling criteria to protect equity.

Decisions that made complete sense at $22 milk are now playing out in a $15 world.

Beef-on-Dairy: Real Benefits with Some Unexpected Effects

Beef-on-dairy has been one of the more significant developments in recent years, and it’s delivered genuine value to many operations. At the same time, as it’s scaled across the industry, it’s also changed some dynamics that historically helped balance supply. What I’ve noticed talking with producers is that most understand the benefits clearly—but the systemic effects are only now becoming apparent.

Where the Value Has Been Clear

The research and market data are consistent on this: well-managed beef-on-dairy programs substantially increase calf value compared to straight dairy bull calves. Day-old beef-cross calves often fetch several hundred dollars more, and in program relationships where carcass performance is documented, they can approach native beef calf values.

With milk prices softening in the first half of 2025, beef has become a driver of dairy farm profitability through both cull cows and dairy-beef calves. For many operations, this revenue stream has made a meaningful difference in a tight-margin year.

Some Effects Worth Understanding

What’s become clearer over the past year is how beef-on-dairy interacts with culling decisions and replacement availability when prices fall.

Consider the culling dynamic. A few years ago, that seven- or eight-year-old cow with middling production and some foot issues—bred to a dairy bull and carrying a $50-100 calf—was an easier decision when milk prices dropped. Today, if she’s carrying a beef pregnancy that could bring four figures at calving, the economics pull toward keeping her “one more lactation.” Across a larger herd, those decisions on the bottom 15-20 percent of cows can add meaningful volume that wouldn’t have been in the tank in previous downturns.

Culling DecisionDaily Milk RevenueDaily Direct CostsDaily Net MarginStrategic Action
Keep Low Performer$9.00$8.00$1.00Deferred culling
Replace with High Performer$13.00$9.00$4.00Aggressive culling
Daily Margin Difference+$4.00+$1.00+$3.00Per stall advantage
Impact Over 6 Months$540Single cow (180 days)
Scale: 30 Cows in 600-Cow Herd$16,20030 decisions

On the replacement side, the numbers tell a striking story:

  • January 2025 USDA Cattle Report: Dairy replacement heifers over 500 pounds dropped to just 3.914 million head—the lowest since 1978
  • Heifer-to-Cow Ratio: 41.9%, the smallest since 1991 (per CoBank lead dairy economist Corey Geiger)
  • Primary Driver: More matings going to beef semen, fewer dairy heifer calves being raised

That pruning made sense when heifer-raising costs were high, and beef calves commanded strong premiums. But it also means some operations that would like to cull more aggressively now don’t have the springers available to maintain stall utilization.

From windfall to choke point:” day‑old beef‑cross calves jumped from roughly $650 to $1,400, replacement heifers surged past $3,000, and heifer inventories fell nearly 20%. The same strategy that rescued margins is now what’s limiting culling options in a $15 milk world.

And there’s a productivity element worth noting. Because the heifers that are raised tend to come from the top of the genetic pool—identified through genomic testing—they often bring stronger milk and component performance than the animals they replace. Leonard Polzin noted at the 2025 Wisconsin Ag Forum that “despite a 0.35 percent year-to-date decline in total milk production, calculated milk solids production increased by 1.35 percent.” The industry is meeting demand “more quickly than in the past,” even with somewhat fewer total gallons.

None of this suggests beef-on-dairy is problematic. It’s been valuable for many operations. The consideration is managing it as part of an overall herd and business strategy rather than simply as a breeding decision.

Understanding Why Growth Continued

A reasonable question producers ask is why banks, co-ops, and processors kept supporting expansion even as supply signals shifted. You know, it’s easy to look back and wonder what everyone was thinking. But looking at the incentive structures helps explain the pattern—and honestly, it makes more sense than it might first appear.

The Lender Perspective

Ag lenders work within risk models and regulatory frameworks that emphasize historical cash flow, current balance sheet strength, and collateral values. In 2022-2023, many dairy clients showed multiple years of positive returns and improved equity. Land values in dairy regions were firm. Cull cow and breeding stock values had recovered.

Farm finance research consistently shows that lenders lean heavily on these historical and collateral metrics rather than attempting to time commodity cycles. Add competitive pressure—banks and farm credit systems competing for the same well-run operations—and you can see how turning down an expansion with strong historical numbers often meant losing that relationship to a lender willing to proceed.

From the credit committee’s perspective at the time, financing expansion with their strongest clients appeared reasonable and well-supported by the available data. The depth of the 2025 correction wasn’t yet visible in those metrics.

The Processor View

For processors, the math centers on fixed costs and throughput. Depreciation, labor, and energy don’t decline proportionally when a plant runs below capacity. With billions invested in new cheese, powder, and specialty facilities over the past decade, plant managers face pressure to run at high utilization, spread fixed costs effectively, and maintain market share.

That creates incentives to encourage volume growth from existing shippers, sign new suppliers, and move cautiously on base-excess programs that might push producers toward competitors. Some buyers have implemented tiered pricing systems that discount over-base milk, but these tools are often adopted late in the cycle and rarely coordinate across an entire region.

The result is a system in which internal metrics rewarded growth and utilization, even as external data pointed to a building supply. That’s not a criticism—it’s recognizing how institutional incentives shape behavior.

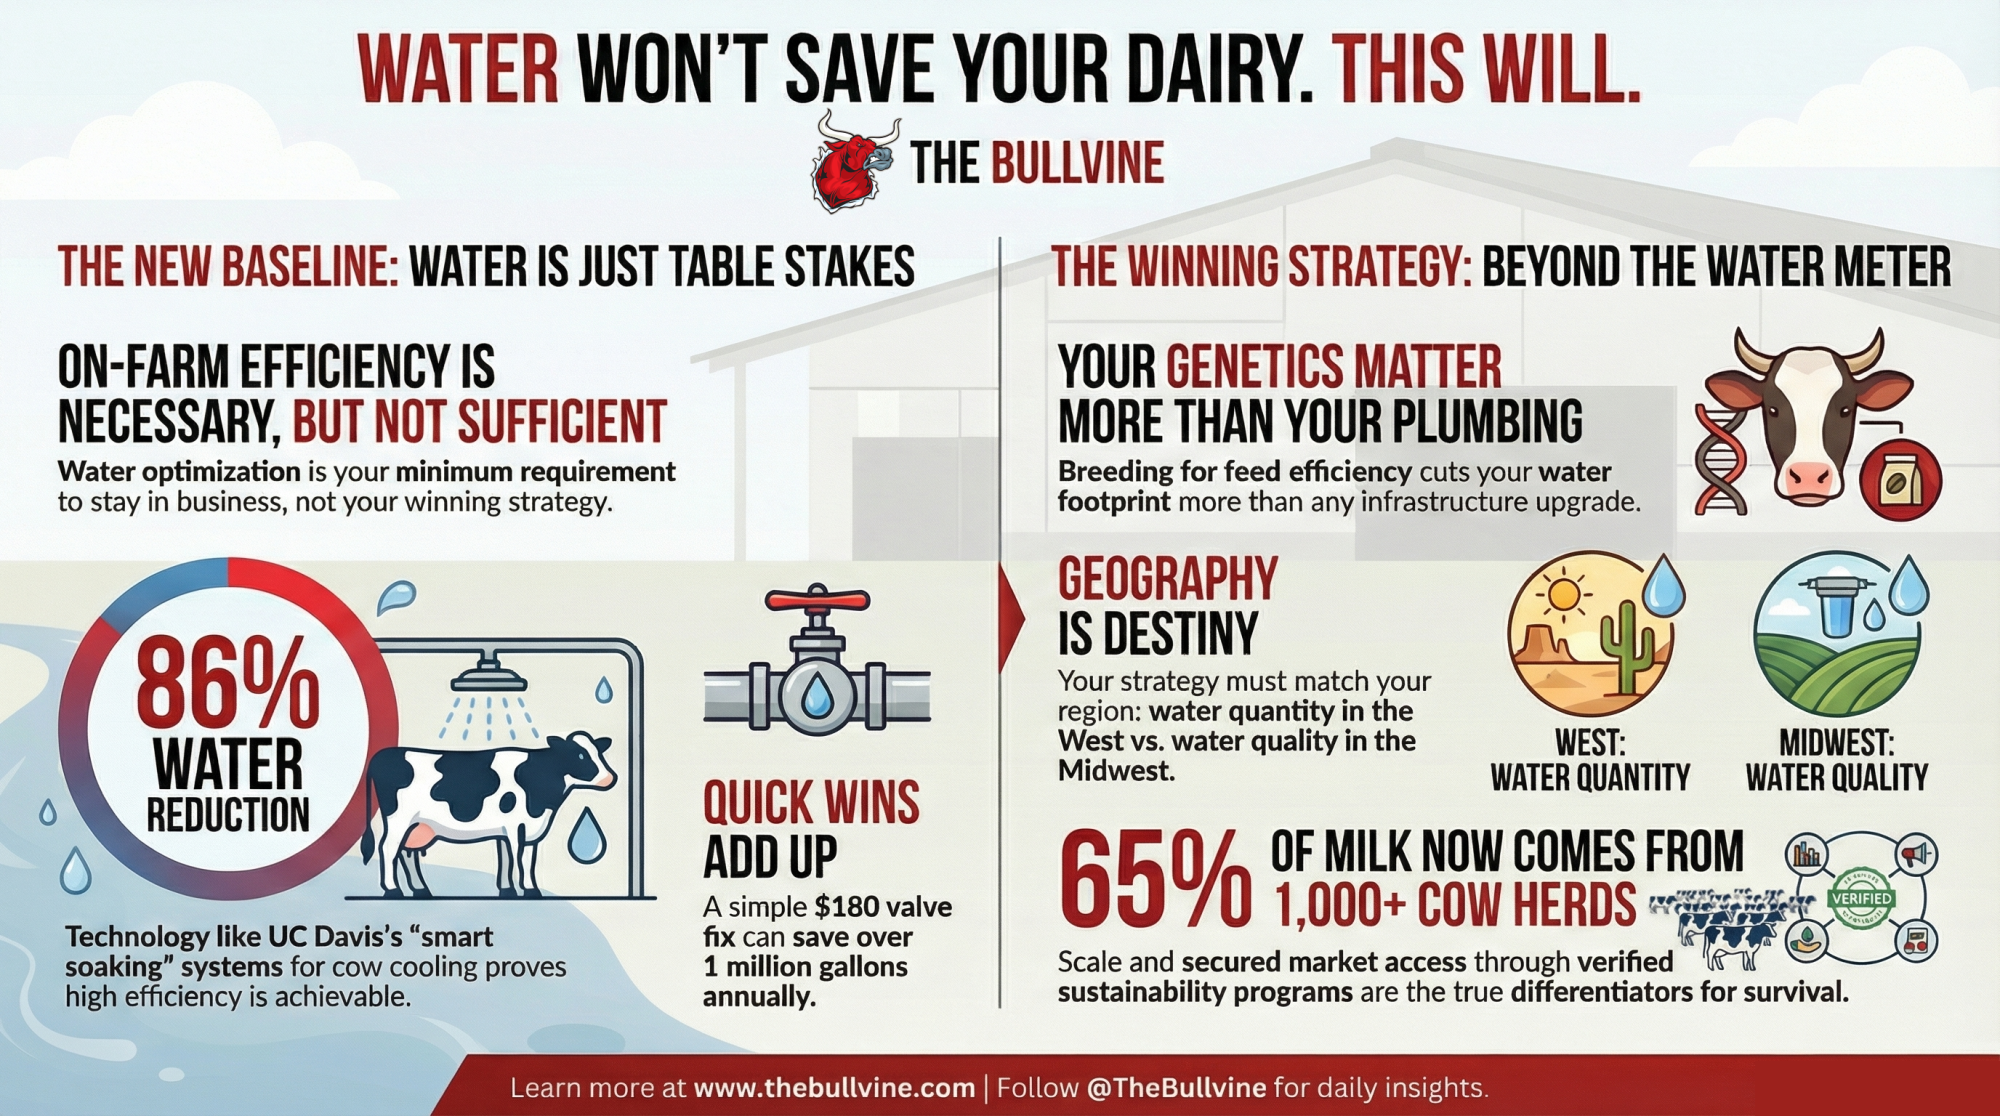
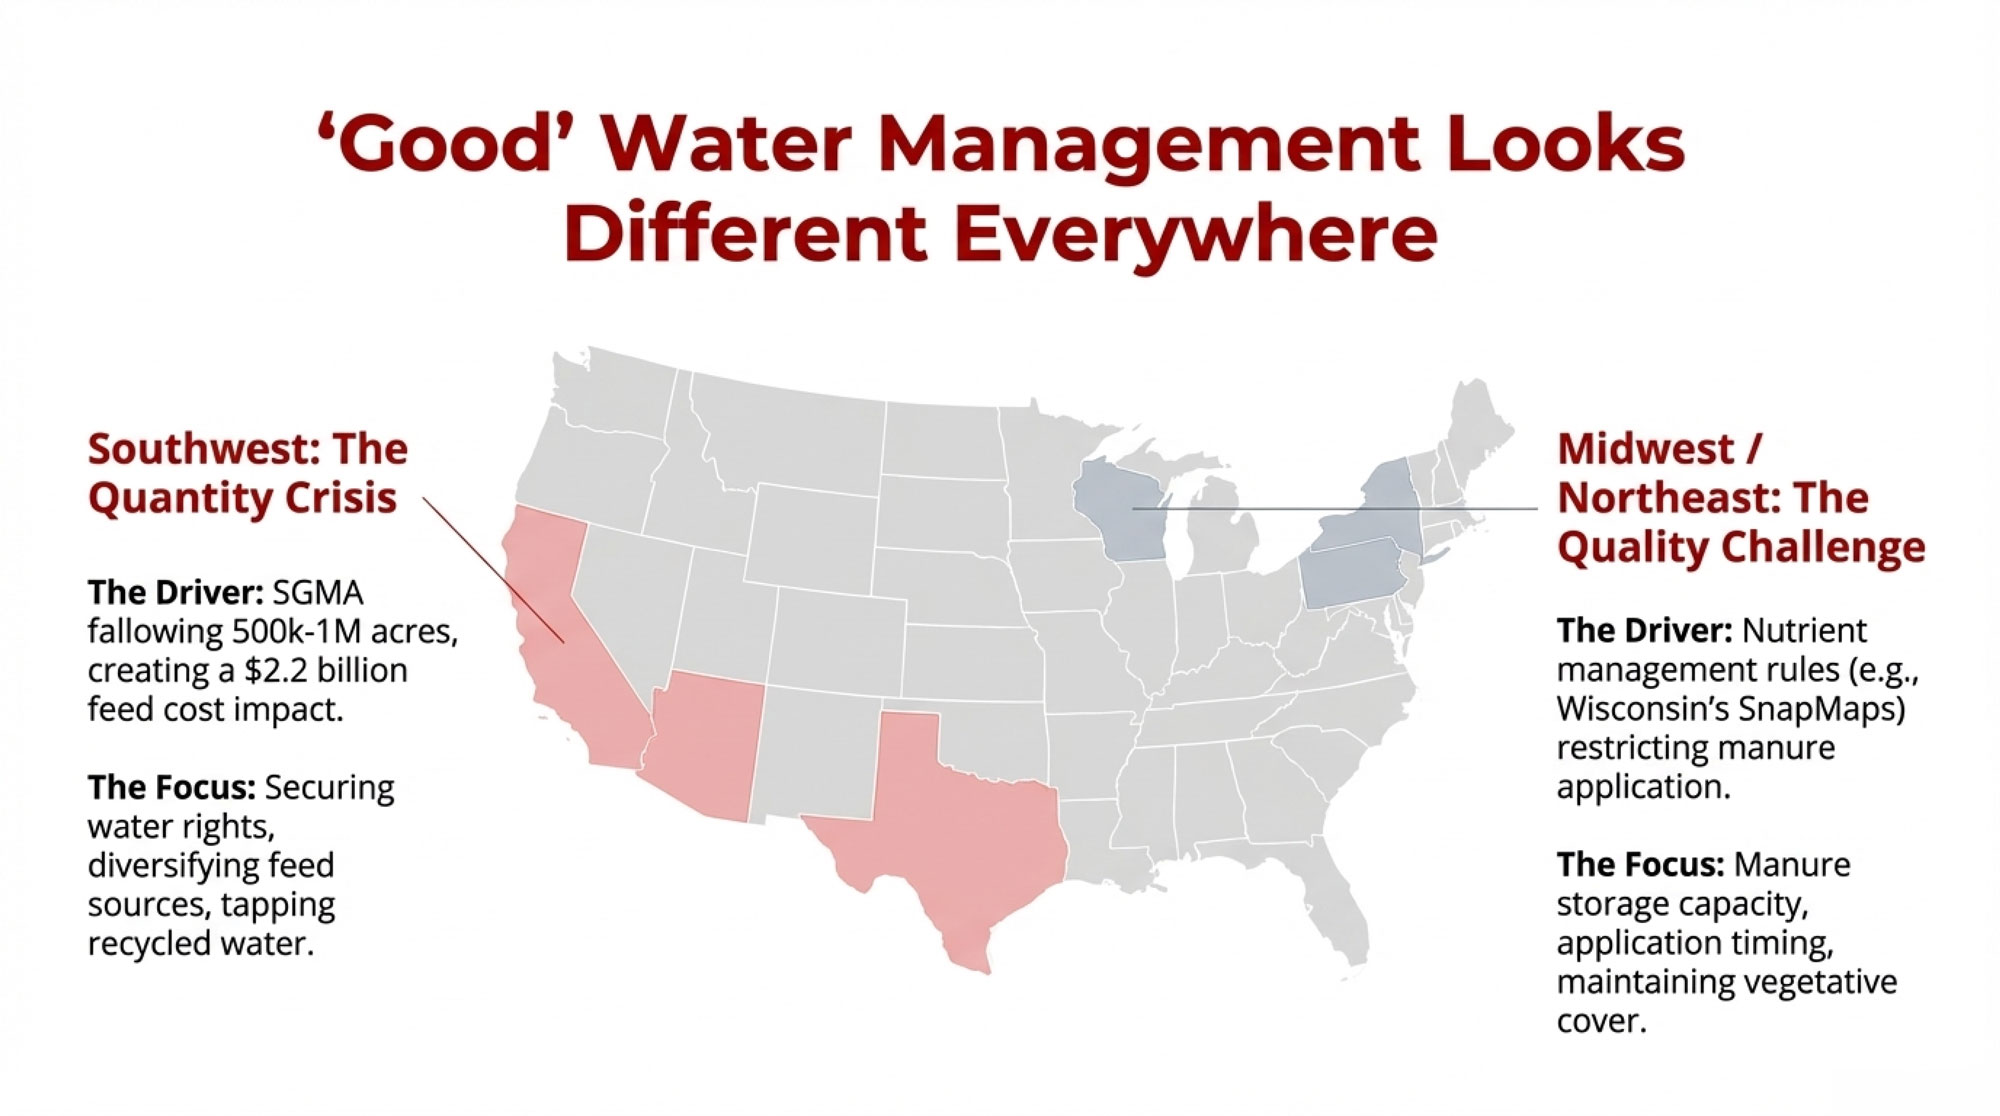
Regional Variations: Same Prices, Different Realities

One aspect that gets lost in national averages is how differently the same price environment affects operations across locations. As many of us have seen firsthand, cost structure, regulatory environment, and market access all matter enormously.

California: Navigating Significant Headwinds

California operations face several overlapping pressures this cycle.

Water constraints continue tightening. Implementation of the Sustainable Groundwater Management Act and new dairy waste discharge requirements from the State Water Resources Control Board are limiting groundwater pumping and establishing stricter nitrate standards in parts of the Central Valley. Environmental compliance costs—for covered lagoons, digesters, and monitoring systems—continue adding capital and operating expenses. And labor costs, housing prices, and land values remain substantially higher than in most other dairy regions.

When Class IV prices are in the low teens and world butter and powder prices are soft, those structural costs make breakeven difficult, particularly for operations that recently invested in facility upgrades. Understandably, some families are evaluating whether another 20-year investment cycle makes sense in that regulatory and cost environment.

Upper Midwest: Cost Structure Advantages

Wisconsin and neighboring states present a different picture.

A November 2024 University of Wisconsin-Madison study found that dairy contributes about $52.8 billion annually to Wisconsin’s economy, with substantial value coming through processing rather than just farm-level milk sales. The region’s processing network has grown considerably, with cheese plant expansions and new facilities drawing milk from an expanding geography. Feed costs benefit from local production, and land and labor costs, while rising, remain below coastal levels.

Low Class III prices continue to pressure margins, and smaller operations face ongoing consolidation. But many Upper Midwest producers describe having a cost structure that provides a path through this downturn with good management, even if it’s not comfortable.

New Zealand: Low Costs, High Exposure

New Zealand’s pasture-based system delivers meaningful cost advantages—solids produced with less purchased feed and lower energy use in favorable seasons. The 2025/26 forecast payout around NZ$10 per kgMS suggests many operations are maintaining positive margins, though narrower than recent years.

The trade-off is exposure. New Zealand sells the vast majority of its production into export markets. Shifts in Chinese demand, Southeast Asian buying patterns, or currency movements translate quickly into payout adjustments. Low production costs provide resilience, but global market volatility is a constant factor.

Europe and South America: Policy and Economic Dynamics

EU production has edged modestly higher overall, but policy pressure to limit cow numbers in high-density areas for environmental reasons is influencing regional patterns. The bloc appears to be shifting toward cheese and higher-value products while moderating output of commodity powders and butter.

Argentina’s production surge—that 10.9 percent first-quarter increase—reflects improved weather and on-farm economics. But Argentine producers also navigate inflation, policy uncertainty, and volatile input costs that can shift margins dramatically in short periods.

The point is that $15 milk creates very different situations in Tulare, Green County, Canterbury, and Santa Fe. Regional context matters enormously.

The Breeding Solution: Selecting for Feed Efficiency in a Low-Margin World

Here’s something that deserves more attention in these conversations: your genetic decisions today are one of the most powerful tools you have for navigating tight margins over the next decade. And there are now specific, measurable traits designed exactly for this environment.

Feed Saved: A Trait Built for This Moment

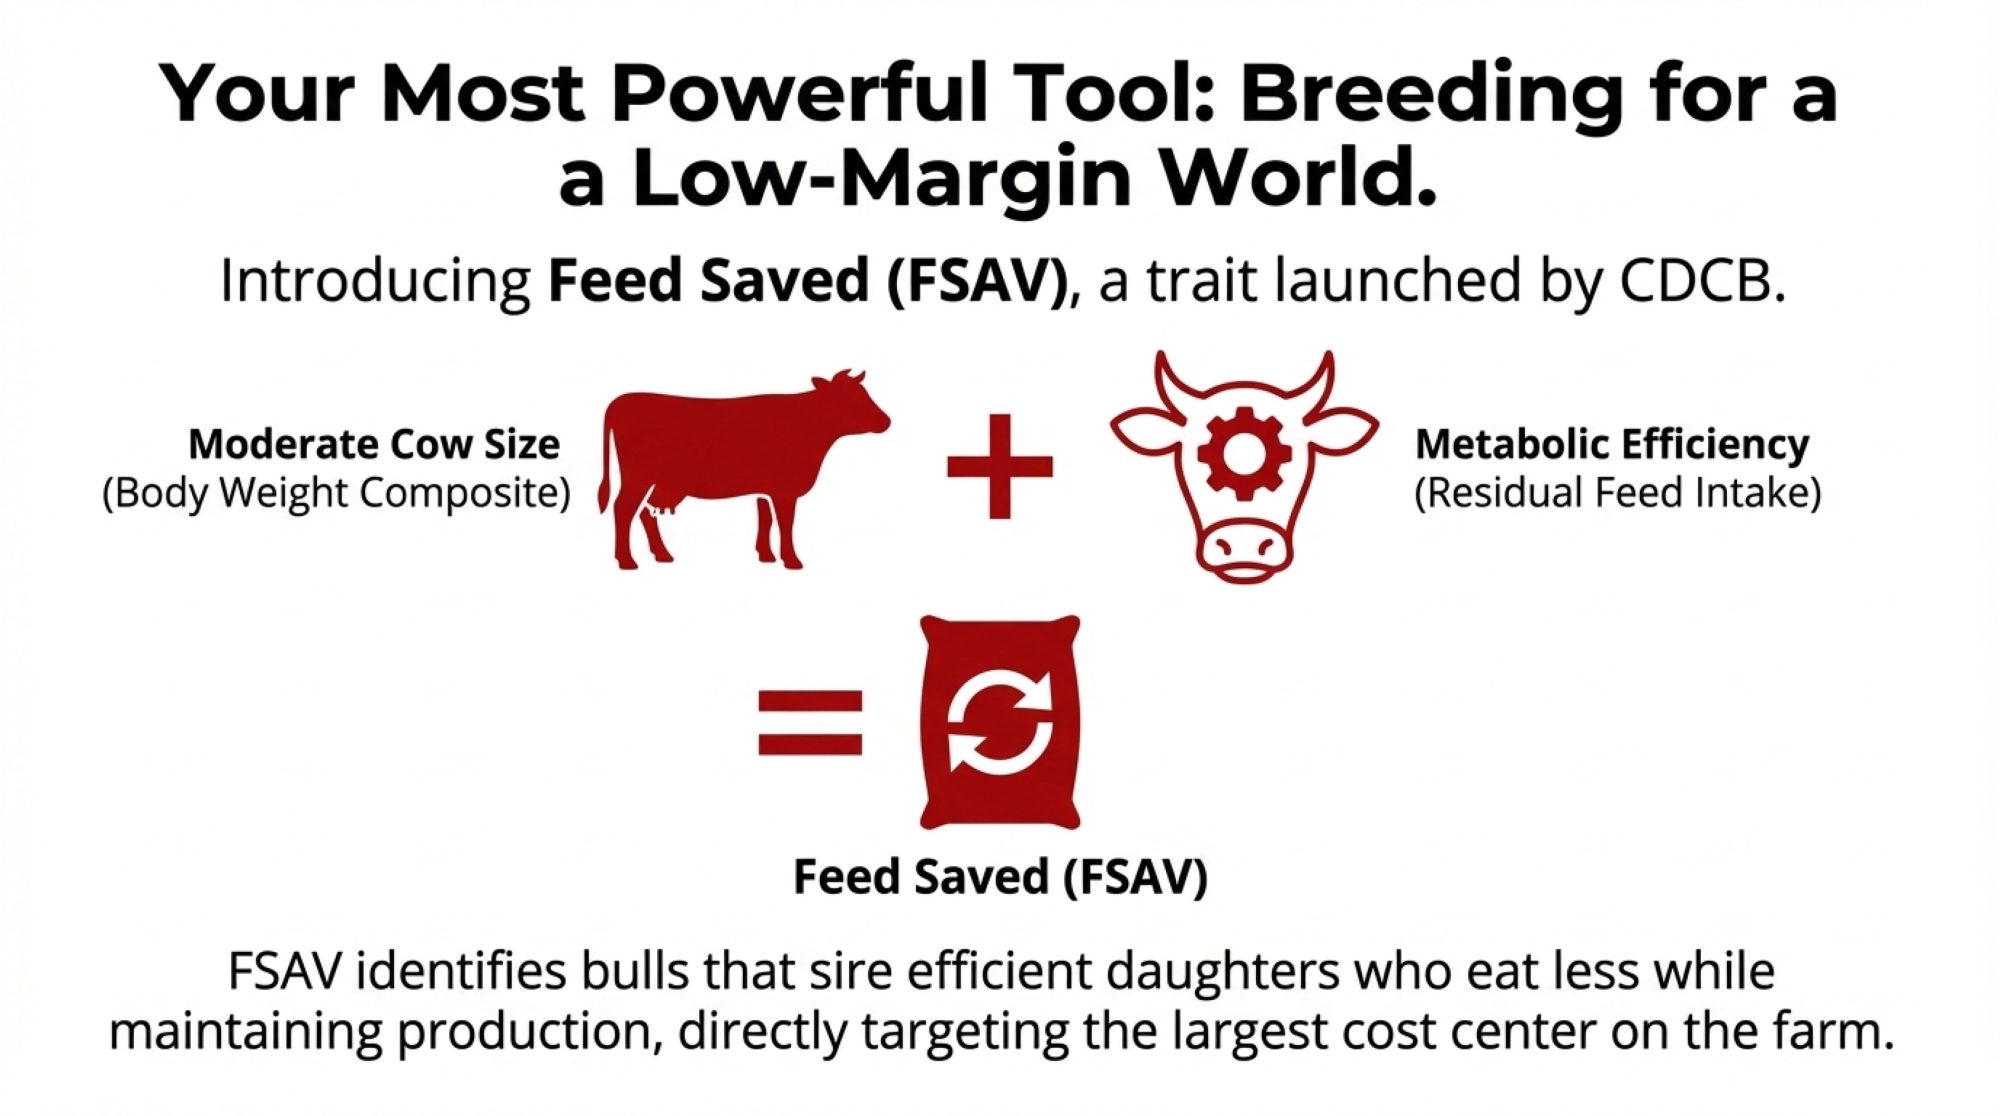
The Council on Dairy Cattle Breeding (CDCB) launched Feed Saved (FSAV) back in December 2020, and it’s become increasingly relevant as margins compress. The trait combines two components:

  • Body Weight Composite (BWC): Selecting for moderate-sized cows that require less feed for maintenance
  • Residual Feed Intake (RFI): Identifying cows that are metabolically more efficient—eating less than expected based on their production and body weight

According to Holstein USA’s April 2025 TPI formula update, every pound of feed saved returns approximately $0.13 per cow per lactation. That might sound modest, but across a 500-cow herd over multiple generations, the cumulative impact is substantial.

What’s particularly interesting is the research backing this. A November 2024 study published in Frontiers in Geneticsexamining genomic evaluation of RFI in U.S. Holsteins found that the difference between the most and least efficient first-lactation cows averaged 4.6 kg of dry matter intake per day—while producing similar amounts of milk. Over a 305-day lactation, that’s a significant difference in feed costs. The same study found even larger spreads in second-lactation animals.

How the Industry Is Weighting Efficiency

The April 2025 Net Merit update from CDCB reflects this shift. As Holstein Association USA’s TPI formula now shows:

  • Production (including Feed Efficiency): 46% of total index weight
  • Feed Efficiency $ Index: Combines production efficiency, lower maintenance costs from moderate body weight, and better feed conversion (RFI)

What’s encouraging is that research shows meaningful genetic variation in feed efficiency—the November 2024 Frontiers in Genetics study found RFI heritability in lactating U.S. Holsteins at approximately 0.43 (43%), indicating substantial potential for genetic progress through selection. That’s higher than many health and fertility traits, which means you can actually move the needle on this.

Efficiency MetricDaily Feed (lbs DM)Annual Feed Cost @ $0.12/lbMilk Production (lbs/day)Breeding Strategy Impact
Standard Efficiency Cow55$2,40985Baseline
High Efficiency Cow (Feed Saved)50$2,19085RFI + Feed Saved traits
Annual Advantage per Cow-5 lbs/day$219 savedSame outputImmediate selection
500-Cow Herd Annual Impact$109,500Same outputHerd-wide savings
10-Year Genetic Improvement$1,095,000Same outputCompound benefits

Practical Application

For producers looking to incorporate feed efficiency into their breeding programs:

  • Look for bulls with positive Feed Saved (FSAV) values in their genomic evaluations
  • Consider Body Weight Composite alongside production traits—extreme frame size increases maintenance costs
  • Balance feed efficiency with health and fertility traits; the most efficient cow isn’t profitable if she doesn’t breed back or stay healthy
  • Work with your AI representative or genetics consultant to model how different selection emphases might affect your herd’s economics over 5-10 years

This isn’t about abandoning production goals. It’s about recognizing that in a low-margin environment, the cow that produces 85 pounds while eating 10% less feed may be more profitable than the cow producing 90 pounds at average efficiency.

What the More Resilient Operations Have in Common

Every downturn separates operations that preserve equity and position well for the recovery from those that don’t. Several patterns are emerging among farms navigating this cycle effectively—and what’s encouraging is that most of these are things within a producer’s control.

Making Culling Decisions with Better Data

Operations that are doing well are generally bringing greater precision to culling. That means tracking income over feed cost by pen or individual cow, using parlor data and feed records to identify animals that are not covering their direct costs, plus a reasonable share of overhead. It means using genomic information and reproductive performance to spot heifers and cows unlikely to generate positive returns. And it means connecting culling plans to realistic replacement availability rather than culling until pens feel empty and then scrambling for springers.

The math consultants’ walk-through is straightforward: a cow generating $9 in milk revenue and consuming $7 in feed, plus $1 in bedding, breeding, and health costs, clears $1 in labor, debt, and margin costs. Replace her with a fresher or higher-producing animal netting $4 daily above direct costs, and over six months, that stall contributes $720 more. Scale that to 30 similar decisions in a 600-cow herd, and the difference exceeds $20,000 in half a year. That kind of analysis is making some producers more willing to make uncomfortable culling decisions earlier.

Managing Margins Rather Than Guessing Prices

Another pattern is shifting from attempting to call price tops to protecting survivable margin ranges.

Dairy Margin Coverage continues providing value for eligible operations, particularly smaller herds. A 2025 Government Accountability Office review noted that USDA paid out nearly $2.7 billion more to DMC participants than it collected in premiums from 2019 through 2024—significant catastrophic protection.

More operations are using Dairy Revenue Protection to establish floors on portions of future production, sometimes combined with feed contracts that define at least a rough margin band. The approach isn’t about optimizing returns; it’s about narrowing the range of outcomes to avoid truly damaging quarters.

Suppose you haven’t explored these tools recently. In that case, your local FSA office or an extension dairy specialist can walk you through current enrollment options and help you model how different coverage levels might fit your operation’s risk profile.

Treating Beef-on-Dairy as a Managed Program

Operations that consistently achieve value from beef-on-dairy tend to approach it systematically rather than opportunistically. That means selecting sires with documented growth, feed efficiency, and carcass data—often aligned with specific feedlot or packer programs. It means coordinating with buyers on calving timing, health protocols, and genetics to capture available premiums. And it means maintaining enough high-merit dairy genetics to ensure replacement availability as conditions change.

This program approach doesn’t eliminate beef market volatility, but it improves the odds of consistent returns and preserves flexibility on the dairy side. If you’re looking to establish these relationships, many breed associations and AI companies now maintain lists of feedlots and packers actively seeking dairy-beef partnerships.

Continuous Focus on Feed Efficiency

Feed remains the largest expense for most operations, and in low-margin periods, every pound of dry matter needs to perform. The farms that manage well keep returning to fundamentals: grouping by lactation stage so rations match requirements, reducing shrink through bunker management and feed-handling practices, and monitoring feed efficiency as a core metric.

Relatively modest improvements—a tenth or two-tenths improvement in feed efficiency, a few percentage points less silage waste—can represent $0.50-1.00 per hundredweight in income over feed cost. Across millions of pounds of annual production, that compounds into meaningful dollars.

Looking Toward 2027-2028: Reasonable Expectations

Forecasting specific prices years out isn’t realistic, but we can identify directions based on current trends and policy trajectories. These are scenarios, not predictions—individual outcomes will vary considerably.

The consolidation pattern is well-documented. Lucas Fuess, Senior Dairy Analyst at Rabobank, noted in his analysis of the 2022 Census of Agriculture that the U.S. lost nearly 40 percent of its dairy farms between 2017 and 2022—from about 39,300 to around 24,000—while total production rose because “larger farms show lower production costs.” This downturn will likely accelerate that trend.

By the late 2020s, several developments seem probable:

The total number of licensed U.S. dairies may fall below 20,000, with an increasing share of national volume coming from herds milking several hundred to several thousand cows. Regional patterns may sharpen, with lower-cost areas—much of the Upper Midwest and Central Plains—holding or gaining share, while higher-cost, more regulated regions see gradual declines in cow numbers as families choose not to reinvest. Beef-on-dairy will likely remain prevalent but may stratify further between well-structured programs that capture consistent premiums and undifferentiated approaches that face greater volatility.

Globally, New Zealand will remain important in the powder and butterfat markets, while the EU continues to shift toward cheese and value-added products within environmental constraints.

The Bottom Line

These are the conversations I’m hearing producers have with their teams, advisers, and families. Every operation faces unique circumstances, and general advice only goes so far—but these questions seem to be helping people think through their situation:

  • Where are you in your own expansion timeline? How many heifers are scheduled to freshen over the next 18-24 months? Do those numbers align with what your facilities, labor, feed base, and market access can profitably support at current price levels?
  • Do you have clear visibility on cow-level economics? Which animals are covering feed plus a reasonable share of labor, debt, and overhead—and which aren’t? What would tightening culling criteria by 5-10 percent look like, and is your replacement pipeline ready for that?
  • How much of your margin is protected versus hoped for? What portion of the next 12-24 months could you realistically put under DMC, DRP, or forward contracts? Have you had direct conversations with your lender about your risk management approach?
  • Is your beef-on-dairy program intentional? Do you know what your calf buyers specifically want, and are you breeding to those specifications? Are you confident that your current approach will leave enough high-quality dairy replacements for the herd you want to be running in three years?
  • Are your genetic criteria aligned with a low-margin reality? Are you selecting strictly for high production, or are you also prioritizing Feed Saved, moderate frame size through Body Weight Composite, and Residual Feed Intake to lower lifetime maintenance costs? In an environment where feed represents 50-60% of production costs, breeding decisions made today will shape your cost structure for the next decade.
  • Are you making decisions for this week or for the next several years? Culling, breeding, feeding, capital allocation, and even family succession—are these being decided tactically or within a longer-term framework?

This cycle is demonstrating that individually sensible decisions—expanding when returns were strong, adding beef value to calves, filling new processing capacity—can produce collective oversupply when everyone responds to the same signals simultaneously. None of us individually controls global supply and demand. What each operation can control is understanding its position within the bigger picture, knowing its own numbers thoroughly, and using available tools—biological, genetic, and financial—to improve the odds of still being here, on your own terms, when conditions improve.

KEY TAKEAWAYS 

  • This is a global supply collision, not a demand problem. The U.S., EU, New Zealand, and Argentina all expanded at once—yet exports hit record highs. Pure oversupply.
  • The 24-month trap is unforgiving. Decisions that made sense at $22 milk are now delivering into a $15 market. Biology doesn’t wait for prices to recover.
  • Beef-on-dairy reshaped the culling equation. Replacement heifers dropped to 3.9 million—the lowest since 1978—limiting flexibility exactly when operations need it most.
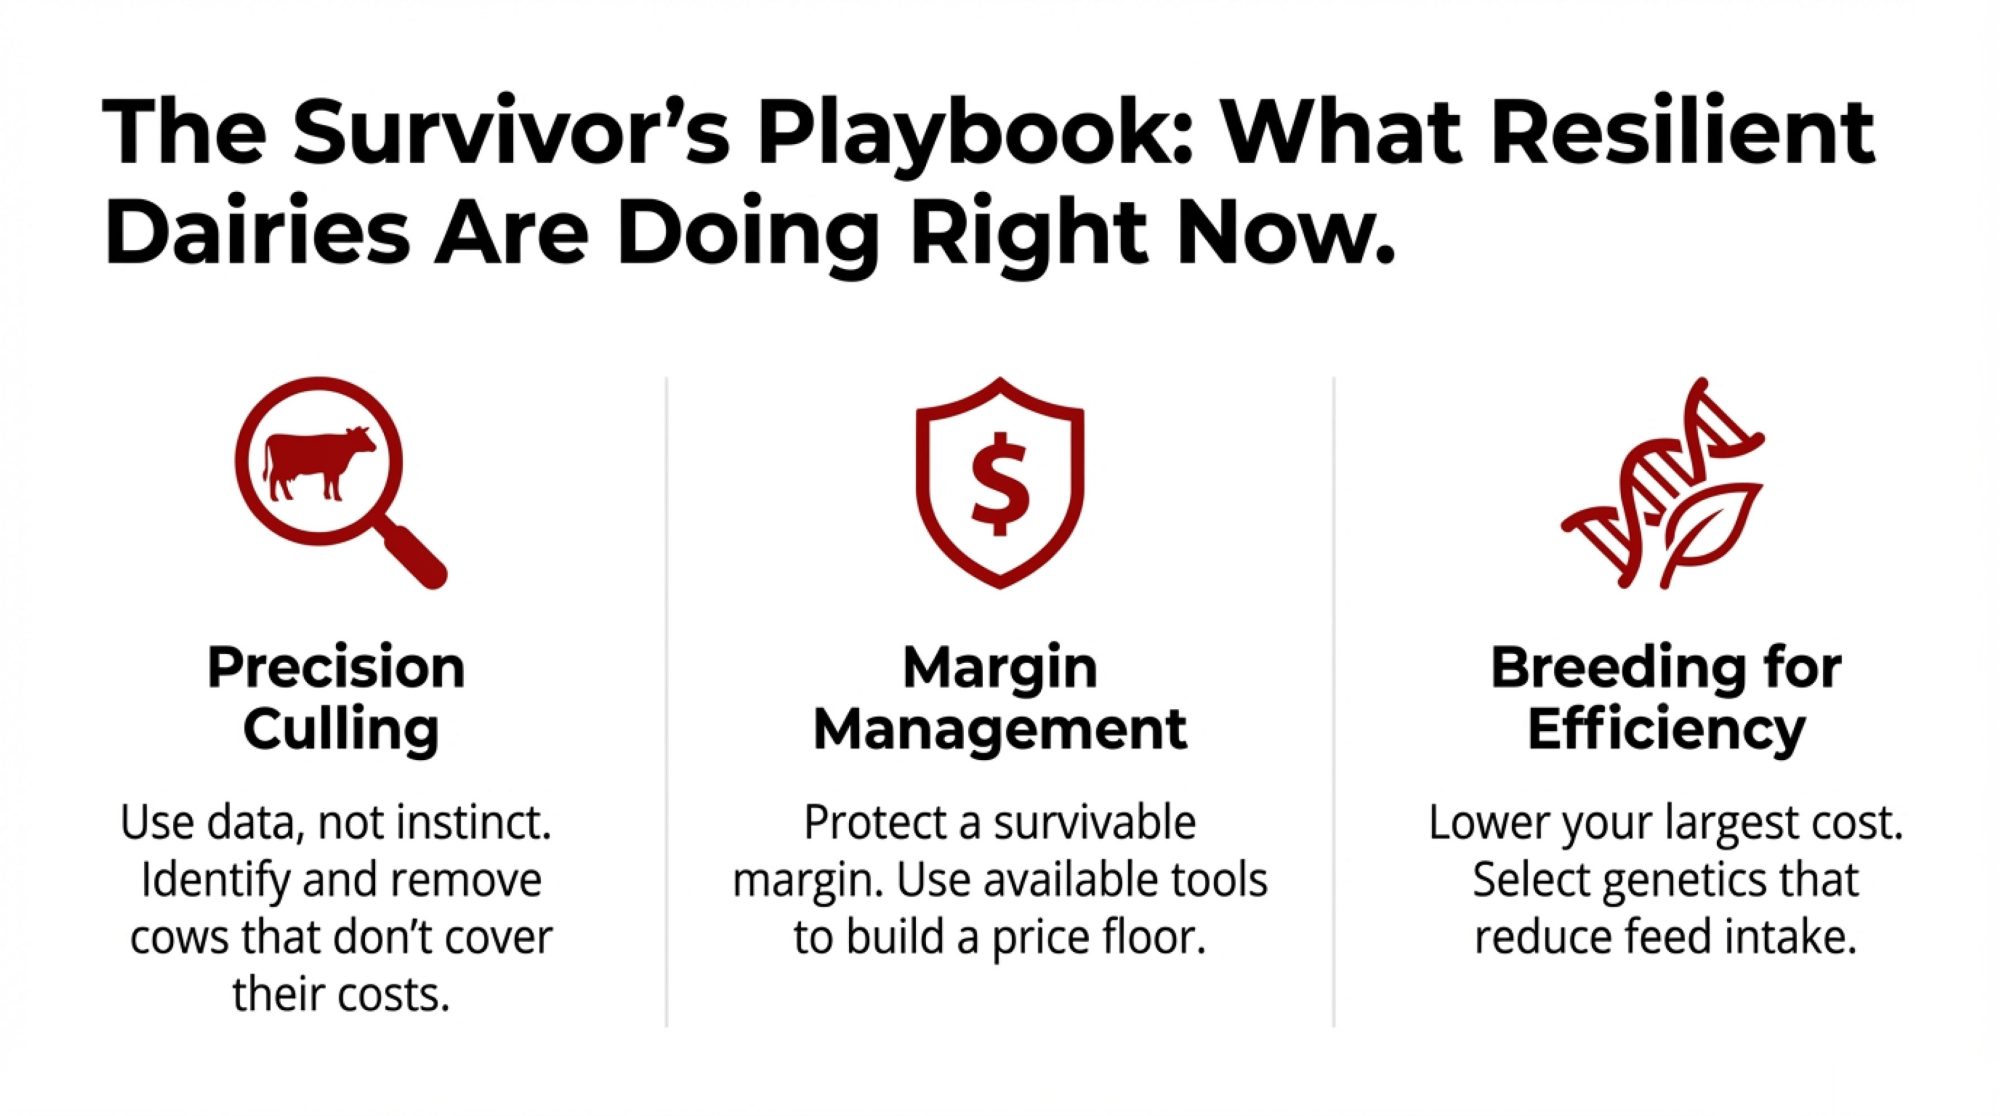
  • Resilient dairies share three priorities: precision culling based on income over feed cost, margin protection through DMC and DRP, and breeding for feed efficiency traits.
  • Consolidation will accelerate—preparation separates outcomes. Producers who know their numbers and deploy available tools now will emerge stronger when markets turn.

Complete references and supporting documentation are available upon request by contacting the editorial team at editor@thebullvine.com.

Learn More:

The Sunday Read Dairy Professionals Don’t Skip.

Every week, thousands of producers, breeders, and industry insiders open Bullvine Weekly for genetics insights, market shifts, and profit strategies they won’t find anywhere else. One email. Five minutes. Smarter decisions all week.

NewsSubscribe
First
Last
Consent

Water Excellence Is Table Stakes – Market Position Is the Game

California: No water to buy. Wisconsin: Can’t spread when you need to. Texas: Just add cows. Geography is destiny in dairy.

Dairy Water Management

Executive Summary: Water management has shifted from competitive advantage to survival requirement—but paradoxically, excellence alone won’t save your farm. As California’s SGMA eliminates up to one million irrigated acres by 2040 and drives $2.2 billion in feed cost impacts, the industry is discovering that breeding for feed efficiency reduces water footprint more dramatically than infrastructure improvements. Meanwhile, consolidation has concentrated 65% of milk production in 1,000+ cow operations, where scale economics overcome any efficiency gains smaller farms achieve. Yes, that $180 valve fix, saving a million gallons, matters, and UC Davis’s smart soaking systems, cutting water use by 86%, are revolutionary—but only if you have market access and verification infrastructure to monetize sustainability, which drives 1.7% higher sales growth. The uncomfortable truth: water optimization is your entry fee to stay in business, while genetics, scale, and secured buyer relationships determine whether you’re still milking cows in 2035.

You know, sitting here thinking about where we’ve ended up with water management, it’s pretty remarkable how fast things have shifted. Just a couple of years ago, we were mostly talking about upgrading plate coolers and fixing leaky valves. Now? Water’s become this baseline competency that basically determines who’s still milking cows five years from now. But here’s what keeps me up at night—and maybe you’ve been thinking this too—water excellence alone won’t save your operation. The farms that survive the next decade? They’re the ones who’ve figured out market access, understood their regional water reality, and locked in the right scale or specialty positioning. That’s the uncomfortable conversation most of us are having over coffee these days.

Why This Matters Now (Even Though It Won’t Save Us by Itself)

So here’s what’s driving all this. Out West, you’ve probably heard about SGMA—California’s Sustainable Groundwater Management Act—, and it’s systematically pulling irrigated acres out of production. The Public Policy Institute of California (PPIC) projects that one-fifth of irrigated acreage in the San Joaquin Valley will go offline by 2040. We’re talking somewhere between 500,000 and nearly a million acres getting fallowed, with counties like Kern, Tulare, and Fresno taking the worst of it. And you know what? That’s not a drought we can wait out. That’s permanent structural change in how we access water for growing feed.

What’s encouraging, though—and this caught my attention in the latest McKinsey research with the dairy executives—is that products marketed as sustainable are growing sales at a rate 1.7 percentage points higher than conventional products—accumulating 28% total growth versus 20% over the last five-year cycle. So when farms can credibly verify and tell their water story, the market responds. That’s real money sitting there.

What I’ve found talking to producers across different regions is that these two realities—the physical water limits out West and these measurable market rewards for doing sustainability right—they’re completely redefining what “good water management” even looks like. And it’s not the same everywhere, which is something we all need to understand better.

The Four-Stage System We’ve All Settled On (And Why It Actually Works)

Here’s what’s interesting about where most progressive operations have landed—and maybe you’re already doing this. We’ve pretty much standardized on this four-stage cascade that gets every drop working multiple times. You start with clean cold water to plate-cool the milk, then capture that warmed water for sanitizing equipment, move it to barn cleaning, and finally, that nutrient-rich effluent goes out to irrigate feed crops.

UC Davis laid out the science on why that first stage—the plate cooler—is such a workhorse. The countercurrent heat exchanger pulls heat out way more efficiently than relying only on bulk tank refrigeration. And when you capture that warmed water for the next job, you’re essentially getting free preheating for your sanitation cycle. Pretty slick when you think about it.

What’s also catching attention—especially for those of us dealing with summer heat—is the innovation happening in cow cooling. UC Davis has been running trials showing ‘smart soaking’ systems—which rely on sensors to spray only when cows are present—that cut cooling water use by up to 86% while also dropping energy use. In those Central Valley operations where it’s triple digits all summer, that’s huge. The field results suggest you can maintain cow comfort with targeted, intermittent cooling, using a fraction of the energy traditional systems require.

Now, the technical playbook for all this is proven and honestly not that expensive—we’re talking $3,000 to $5,000 for basic improvements on a 200-cow dairy. But here’s the thing we need to be honest about: doing this well in 2025 is table stakes. It’s not your winning strategy by itself anymore.

The Genetics Piece Nobody’s Talking About (But Should Be)

While we’re all focused on plumbing and plate coolers—and those matter—we can’t ignore the cow herself. You probably know this already, but feed production accounts for the lion’s share of our water footprint, especially when we irrigate alfalfa and corn silage. So, the fastest way to cut water use? Breed a more efficient cow that needs less feed to make the same pounds of fat and protein.

That’s why we’re seeing such rapid uptake of feed efficiency indices. Feed Saved, which the Council on Dairy Cattle Breeding publishes, is fascinating—it combines residual feed intake with body weight composite to tell you expected pounds of feed saved per lactation. Higher is better, obviously. It’s our first national evaluation that directly targets feed efficiency in dairy cattle, and the logic is pretty straightforward: cows delivering the same components on less dry matter need fewer irrigated acres behind them.

We’re also seeing proprietary indices like EcoFeed gaining traction, with independent trials showing real improvements in feed conversion on participating herds. The direction is clear—if you’re selecting sires today, you want high feed efficiency and moderate mature size. That cuts your feed needs for both maintenance and production, freeing up water without sacrificing butterfat performance.

I’ll be direct here: if water efficiency isn’t part of your sire selection today, you’re basically locking in higher resource costs for the next three generations of cows. That’s a long time to be on the wrong side of this trend. And with the current heifer shortage limiting expansion options, genetic progress becomes even more critical for improving efficiency within your existing herd size.

Regional Realities (Because California’s Crisis Isn’t Wisconsin’s Challenge)

Looking at this across regions, what’s become clear is that we’re not all dealing with the same problem.

Out in the Southwest, it’s all about quantity. SGMA enforcement is fundamentally a water-access story more than a parlor-efficiency story. The PPIC figures that about one-fifth of Valley irrigated acres could be gone by 2040, which flows straight into feed costs. California’s dairy and beef sectors are looking at impacts of about $2.2 billion by 2040, mostly through higher feed costs as those acres go offline.

Ryan Junio, who runs 4,200 Jerseys over in Pixley, put it pretty bluntly: “As a dairy producer, this is an ever-growing challenge and is my top concern.” And he’s not worried about some future problem—he’s looking at potential 50% groundwater cuts in the next couple of years. For operations like his, “good” water management means securing allocations, maybe tapping recycled municipal water, definitely diversifying feed sourcing, including outside the basin.

Now, flip over to the Northeast and Upper Midwest—completely different game. Water’s abundant, sometimes too abundant. The focus is solely on protecting groundwater and surface water from nutrient pollution. Wisconsin’s SnapMaps system, for instance, doesn’t care about your gallons per cow. It maps where you can spread manure based on soil vulnerability and groundwater flow.

Jim Risser, who farms 700 acres in Pennsylvania’s Susquehanna watershed, explained it well: keep fields planted and vegetated, and you’re creating a natural filter before water hits the streams. His operation maintains vegetation cover for about 50 weeks a year, specifically to improve water quality.

In those Midwest operations with sandy soils and shallow water tables, storage capacity and timing become everything. Producers there are investing heavily in concrete storage and injection equipment—not to save water, but to protect it. The April spreading windows that used to work don’t anymore with our changing weather patterns.

Market Signals That Are Reshaping Everything

Three things are steering every water investment decision I’m seeing in 2025:

First, these structural constraints aren’t temporary. SGMA’s glide path and surface flow rules will idle acreage regardless of how efficient any single farm gets. That repricing rations everywhere—not just in California—because the West supplies a huge chunk of U.S. dairy production.

Second, sustainability has become a baseline. McKinsey’s latest survey found it dropped from executives’ “priority” lists, but not because it matters less—it’s because 84% of companies already have programs running. Still, that cumulative growth advantage for sustainable products? That keeps everyone’s attention.

Third, the innovation pipeline is now all about water performance. Those UC Davis smart-soaking trials showing up to an 86% reduction? They’re attracting serious interest from operations where summer cooling can run $20,000 to $30,000 monthly when the heat really sets in.

What Actually Works (The Practical Toolkit)

Here’s something you can literally do tomorrow for zero cash outlay (just 20 minutes of your time). Grab a 20-liter bucket and a stopwatch. Time how long does it takes to fill that bucket at your plate cooler discharge. Do the same at your wash hoses, alley flush lines. Now you’ve got flow rates. During a full milking, track how long each run lasts. Multiply it out. You’ve just mapped your water use by process, and I guarantee you’ll find surprises.

In Wisconsin operations, audits often reveal that yard wash varies by 15 gallons per cow or more between morning and afternoon milkings. Usually, it’s a sticky valve, or someone changed protocols seasonally and forgot to change back. Cost to fix that sticky valve? Often less than $200 for a plumber, or $20 for parts if you do it yourself. If that saves 15 gallons per cow per day year-round on a 200-cow dairy, you’re looking at roughly 1,095,000 gallons saved annually. Even if it’s just during the 165 hot days when you’re doing heavier yard washing, that’s still about 495,000 gallons. Either way, the math gets impressive fast.

From there, your biggest return is completing that reuse loop. Capture plate-cooler water—it’s already done its cooling job—route it to equipment cleaning, then to barn washing, and finally to irrigation. Every progressive operation I know runs some version of this.

💧 WATER SAVINGS QUICK WINS

Things you can do this month that actually matter:

  • Fix those leaky valves – Usually $50-200 for repair; saves 10,000-50,000 gallons yearly, depending on how bad the leak is
  • Install trigger nozzles – About $400-600 total; typically cuts parlor water 15-25% just by eliminating continuous flow
  • Adjust cooling timers or sensors – $400-600; can reduce cooling water up to 70% when tied to cow presence and actual heat load
  • Capture plate-cooler water – $500-1,500 in basic plumbing; recovers 50-70% of your cooling water for the next job

The Follow-Through Problem We Don’t Talk About

Let’s be honest about something. Most of us don’t struggle to start these projects—we struggle to keep going when fresh cows start coming hard, feed prices jump, or we lose a key employee. That’s why those cooperative and processor programs actually matter. They provide benchmarking, third-party verification, and—this is key—those quarterly check-ins that keep us honest.

The industry tracking shows farms in structured programs maintain their measurement discipline at 3 to 4 times the rate of farms trying to go it alone. That’s the difference between having a good idea at a conference and actually improving your operation.

Making Water Performance Mean Something to Consumers

The data suggests consumers really do reward credible stewardship—that 28% versus 20% growth differential over five years is real money. But only when they can understand and trust what you’re claiming.

Try framing it like this: “Our 200-cow dairy saves about half a million gallons annually—that’s enough water for roughly 35 families for a year.” People get that. Then explain the cascade simply: “The water that cools our milk then cleans our equipment, flushes our barns, and finally irrigates our crops with captured nutrients.”

And always, always anchor it to third-party verification—whether that’s your co-op’s sustainability report or your processor’s benchmarking program. Verified beats vague every single time.

The Uncomfortable Truth About Who Survives

I’m going to say the quiet part out loud here, because I think we owe each other honesty. Water excellence won’t overcome structural gaps in market access and scale. Consolidation has shifted most milk to bigger operations—about 65% now comes from herds over 1,000 cows—and that percentage keeps climbing.

In the West, SGMA will reduce irrigated acres regardless of your parlor efficiency. In the Northeast, nutrient rules are a manageable cost if you plan ahead. But everywhere, the farms positioned actually to thrive tend to fit three profiles: larger herds with committed buyers and capital; regional operations embedded in verified sustainability programs; or specialty producers—organic, regenerative, grass-fed—with contracts that support the extra cost of certification and long-term measurement.

Water management is a baseline competency now. Important? Absolutely. But it’s not the differentiator by itself.

What California’s Teaching the Rest of Us

California’s showing us all a preview of water-constrained dairying. UC Davis and the state energy folks are deploying cooling tech that cuts both water and energy use. It’s promising stuff. But even with those wins, SGMA-driven acreage losses keep feed pressure high.

A Central Valley nutritionist I know recently told me, “We’re completely reworking our rotations, partnering with growers outside the basin, even bringing in more feed from the Midwest. The efficiency helps, but feed sourcing is the real challenge now.”

And this is where that breeding piece pays off—higher feed efficiency and moderate cow size reduce the feed needed per unit of fat and protein you’re shipping. It all connects.

Your Action Plan (Because We All Need One)

I know you’re juggling all this alongside transition cows, labor issues, trying to hold butterfat levels, maintaining drylots—everything that makes dairy farming what it is. The key is starting somewhere. Even that bucket-and-stopwatch audit gives you a baseline.

Today (20 minutes of time): Map those flow rates and run times. Build your baseline.

This month ($500-3,000): Fix the obvious stuff—leaks, oversized nozzles, cleaning protocols that run too long.

This quarter ($5,000-15,000): Complete your reuse loop. If you’re in a hot region, seriously look at the new smart soaking technology.

This year (varies): Connect your numbers to verification—co-op benchmarking, processor reporting—so your performance actually turns into market value.

What’s Coming Next

Watch these three things, because they’ll shape how we all think about water:

Western feed markets under SGMA—as acres get fallowed, expect more cross-regional feed sourcing and different ration economics.

Smart cooling innovation hitting commercial scale—if those UC Davis sensor-based results hold up, expect rapid adoption wherever summer cooling regularly tops $10,000 per month.

Verification infrastructure expanding—more co-ops and processors are tying into the 2050 industry water goals, giving us clearer paths to turn performance into premiums.

The Bottom Line for Your Operation

Water optimization has become necessary but not sufficient for survival. The farms thriving through water pressure aren’t just the ones measuring every gallon—they’re the ones who’ve secured buyers, found their scale or specialty lane, and built the support system to keep measuring when the barn gets crazy.

For Southwest dairies, that means water rights and feed security come first. For Northeast operations, it’s all about nutrient management and water quality. For everyone, it means genetics that deliver higher feed efficiency and moderate mature size to reduce the feed—and water behind it—per unit of milk solids.

Measure and reuse water like the strategic asset it’s become. But make your biggest decisions based on your region and your market position. Water management keeps you in the game. Scale, specialty positioning, efficient genetics, and secured buyers? That’s what determines whether you win it.

KEY TAKEAWAYS:

  • Water Is Table Stakes, Not Strategy: That $180 valve fix saving 1M gallons matters for compliance, but 65% of milk production has already shifted to 1,000+ cow herds where scale economics dominate—water excellence alone won’t overcome structural disadvantages
  • Your Genetics Matter More Than Your Plumbing: Feed Saved trait and moderate cow size reduce water footprint via less irrigated feed acres—UC Davis smart soaking cuts cooling 86%, but breeding decisions impact water for three cow generations
  • Regional Reality Defines “Good”: California’s SGMA will idle 500K-1M acres (quantity crisis), Wisconsin’s SnapMaps dictates spreading windows (quality focus), while Texas operations simply scale up—match strategy to geography
  • Solo Measurement Fails, Programs Succeed: Farms in structured co-op/processor programs maintain water tracking 3- 4x longer than independents, and capture the 1.7% sales premium for verified sustainability—accountability infrastructure beats good intentions
  • Three Paths Forward: Only larger operations (1,000+ cows), verified regional producers in sustainability programs, or specialty-positioned farms (organic/regenerative) with contracts survive the water-market access squeeze—pick your lane by 2026

Complete references and supporting documentation are available upon request by contacting the editorial team at editor@thebullvine.com.

Learn More:

The Sunday Read Dairy Professionals Don’t Skip.

Every week, thousands of producers, breeders, and industry insiders open Bullvine Weekly for genetics insights, market shifts, and profit strategies they won’t find anywhere else. One email. Five minutes. Smarter decisions all week.

NewsSubscribe
First
Last
Consent

Genetic Correlations Upended: Why Sticking with Old Breeding Indices Could Cost Your Dairy $486 Per Cow – And What the Data Really Proves

April 2025 genetic reset proves TPI costs $486/cow. Feed Saved varies 900 lbs/lactation. Are you breeding for profit or pretty cows?

EXECUTIVE SUMMARY: The April 2025 genetic base change just shattered every assumption about Holstein breeding – and most producers are missing the $486 per cow profit opportunity hiding in plain sight. While PTAs dropped 650 pounds milk and 38 pounds fat overnight, this wasn’t genetic decline – it was proof of unprecedented advancement that’s making traditional TPI selection obsolete. Net Merit 2025 now predicts $486 more lifetime profit per cow than TPI, driven by butterfat emphasis jumping to 31.8% and Feed Saved evaluations ranging from -782 to +900 pounds per lactation. Research confirms every 1% increase in inbreeding costs 94.5 kg lifetime milk yield, while automated milking systems prove comparable economic performance to conventional parlors across 150-240 cow operations. Component-focused breeding aligns with market realities where butterfat commands $3.06/pound premiums and cheese manufacturing claims 90% of milk utilization. The evidence is overwhelming: producers clinging to conformation-heavy TPI are systematically breeding away from profitability while component-focused herds capture premium value in today’s market.

KEY TAKEAWAYS

  • Feed Efficiency Goldmine: Top bulls deliver 900-pound feed savings per lactation through Feed Saved genetics with 14% heritability – translating to measurable cost reductions for operations targeting efficiency over volume production.
  • Component Premium Capture: Net Merit 2025’s 31.8% butterfat weighting reflects real market premiums of $3.06/pound, positioning component-focused herds to capture significantly higher milk checks than volume-driven operations.
  • Technology ROI Validation: Australian AMS research proves comparable economic performance to conventional systems while milking 150-240 cows with 3-4 robotic units, freeing labor for high-value management tasks and achieving 19.3-26.3 kg daily production per cow.
  • Genetic Base Reality Check: The 650-pound milk PTA reduction represents genetic advancement, not decline – operations still using pre-2025 benchmarks are systematically undervaluing elite genetics and missing selection opportunities.
  • Inbreeding Cost Documentation: University research confirms every 1% inbreeding increase costs 94.5 kg lifetime milk yield plus extended calving intervals, making diverse genetic sourcing essential for maintaining production efficiency and reproductive performance.
dairy breeding indices, Holstein genetics profitability, feed efficiency genetics, component production dairy, automated milking systems

Are you still clinging to the “tall, pretty, high-volume” cow as your gold standard? It’s time to face the facts: the April 2025 genetic base change exposed conventional wisdom as a profit killer, not a profit driver.

The 2025 genetic base change shows the largest PTA milk adjustment (-752 lbs) in recent history, reflecting unprecedented genetic progress in Holstein dairy cattle over the past five years

The Pain Point: The Numbers Don’t Lie – But They Do Change

Let’s get real. The Council on Dairy Cattle Breeding’s (CDCB) April 2025 genetic base adjustment delivered significant changes, with Holstein PTAs dropping 650 lbs of milk, 38 lbs of fat, and 26 lbs of protein overnight – changes that were actually smaller than initially projected but still substantial. If you’re still benchmarking against pre-2025 numbers, you’re comparing apples to oranges – and leaving money on the table.

According to USDA’s May 2025 supply and demand report, U.S. milk production is projected at 227.3 billion pounds for 2025, with the all-milk price increased to $21.60 per hundredweight. But here’s the kicker: profitability is no longer about who ships the most milk but who ships the most value per cow.

Challenging a Sacred Cow: Is TPI Still Relevant for Commercial Profitability?

Net Merit’s 2025 formula emphasizes butterfat (31.8%) and feed efficiency (17.8%) far more than TPI’s conformation-heavy approach, reflecting current market realities where components command premium pricing

The Total Performance Index (TPI) has been the industry’s beauty contest for decades, rewarding conformation and stature. However, the latest data shows that TPI’s 26% conformation weighting is out of step with today’s economic realities. Net Merit (NM$) 2025 now predicts $486 more lifetime profit per cow than TPI – a gap confirmed by CDCB research.

The 2025 Net Merit revision reflects “enhanced commitment to dairy cattle genetic improvement and profitability through feed efficiency, component-based milk pricing, and fertility.” The formula puts 31.8% weight on butterfat and doubled emphasis on cow livability to 8.0%, reflecting what actually drives your milk check in today’s component-based markets.

Why does this matter? Because every dollar you spend chasing TPI points is a dollar not invested in traits that pay the bills, like butterfat, feed efficiency, and cow longevity.

The Feed Efficiency Revolution: Hard Numbers on Profit Impact

Feed efficiency genetics deliver the highest economic impact at $162 per cow annually, while strategic breeding decisions across multiple traits can add over $400 in total value per cow per year

Let’s talk feed. Feed accounts for over half of total dairy costs, so the Feed Saved trait delivers measurable results. In December 2020, “514,021 Holstein bulls received evaluations for Feed Saved, ranging from -782 to +900,” meaning daughters of the top bulls “are expected to consume 900 pounds less feed per lactation while maintaining similar production.”

Feed Saved has “a heritability of approximately 14%, which falls midrange relative to other traits,” according to the research. While reliability is currently lower than established traits – bulls averaging 30% reliability – the genetic potential is substantial.

Imagine two trucks hauling the same load – one gets 15 MPG, the other 12 MPG. Over a 100,000-mile lifespan, the efficient truck saves $2,500 in fuel. Now scale that to your herd: genetic efficiency measured through Feed Saved represents the difference between breaking even and banking profit.

Inbreeding: The Silent Profit Killer with Documented Losses

Here’s the controversial truth backed by research: Holstein inbreeding effects are measurable and costly. University of Wisconsin research documents that “for each 1% increase in inbreeding, lifetime total milk yield decreased by 94.5 kg, lifetime total fat yield decreased by 3.3 kg, and lifetime total protein yield decreased by 2.9 kg.”

The reproductive impacts are equally concerning: research shows “a 0.7-d increase in calving interval and a 0.3% decrease in survival to second lactation per 1% increase in inbreeding.” USDA scientist Paul Cole explains that “when inbreeding levels rise, we’re more likely to pair two undesirable copies of a gene in the same location,” affecting fertility, longevity, and disease resistance.

Economic impact is measurable: With documented production losses and extended calving intervals, every percentage point of inbreeding represents significant lifetime profit reduction through both decreased output and increased replacement costs.

Technology in Action: Precision Genetics and Automation Delivering Results

The genetic changes aren’t happening in isolation – they’re accelerated by technology adoption proving its worth globally. NSW Department of Primary Industries research confirms that automated milking systems “deliver comparable performance to conventional systems.”

Key AMS findings from Australia:

  • Farms typically milk 150-240 cows with 3-4 robotic units
  • Daily milk production per cow ranges from 19.3 to 26.3 kilograms
  • Cows are milked an average of 2.17 times per day
  • Each robot harvests approximately 1,200 kg of milk daily

The research reveals that “AMS is beneficial for freeing up labour for other key tasks such as pasture management, boosting overall farm productivity.” This labor reallocation enables farmers to focus on “farm business management, herd health, and pasture management, enhancing overall farm efficiency and sustainability.”

The Global Market Reality: Components Command the Premium

Market analysis confirms that “butterfat will lead the way for the third straight year in multiple component pricing markets, which price over 90% of the nation’s milk.” In November 2024, “butterfat brought $3.06 per pound and protein was $2.32.”

Global market trends support component focus:

  • International butter and cheese prices are stronger than U.S. levels
  • Fonterra lifted the 2024-2025 milk price forecast to $10 midpoint per kilogram of milk solids
  • U.S. dairy consumption reached 661 pounds per capita in 2023
  • Cheese consumption hit a record 40.5 pounds per person

With USDA forecasting the 2025 all-milk price at $21.60 per cwt, component-focused herds are positioned to capture premium value as cheese manufacturing continues dominating milk utilization.

Why This Matters for Your Operation

  • Verified Genetic Progress: The April 2025 base change confirms substantial genetic advancement, with CDCB calculations showing “a 0.992 correlation between the April 2025 and current formulas, indicating little reranking expected for most animals.”
  • Feed Efficiency Impact: Top bulls can save 900 pounds of feed per lactation while maintaining production levels
  • Technology Advantage: AMS systems prove comparable economic performance while freeing labor for value-added management tasks
  • Market Alignment: Component emphasis in NM$ 2025 reflects real market premiums driving profitability

Implementation Timeline and Practical Steps

  • Feed Efficiency Focus: Target bulls with positive Feed Saved evaluations, recognizing the 14% heritability enables genetic progress
  • Component Selection: Leverage the 31.8% butterfat emphasis in NM$ 2025 to capture market premiums
  • Technology Integration: Consider AMS adoption where labor flexibility and management focus provide competitive advantages

Barriers and Solutions

  • Inbreeding Management: Use diverse genetic sources and monitor Expected Future Inbreeding levels, given documented production losses per percentage point increase
  • Technology Adoption: AMS research shows “over 50,000 systems now in use worldwide” with Australia implementing on “around 1.5% of dairy farms, with growing interest”
  • Market Adaptation: Align breeding programs with component-focused payment systems that price over 90% of national milk production

Rhetorical Reality Checks

  • Are you still benchmarking your herd’s genetic progress against pre-2025 standards when CDCB confirms the largest genetic advancement in recent history?
  • How many of your breeding decisions account for the documented $3.06/pound butterfat premiums driving component-focused markets?
  • Is your operation positioned to capture the labor flexibility advantages that AMS research proves comparable to conventional systems?

The Bottom Line: What the Verified Data Proves

The 2025 genetic base change confirms unprecedented genetic progress, with PTAs dropping 650 pounds of milk, 38 pounds of fat, and 26 pounds of protein – yet these reductions were smaller than expected, indicating even greater genetic advancement than initially projected.

The economics are clear: Net Merit 2025 predicts $486 more lifetime profit per cow than TPI, while Feed Saved evaluations ranging from -782 to +900 pounds per lactation represent tangible feed cost differences. Component-focused breeding aligns with market realities where butterfat commands $3.06/pound premiums.

Your next steps – backed by verified research:

  1. Recalibrate benchmarks using the April 2025 genetic base, recognizing that apparent PTA reductions reflect genetic progress, not losses
  2. Prioritize Feed Saved genetics with their documented 14% heritability and 900-pound feed savings potential
  3. Leverage component emphasis as NM$ 2025’s 31.8% butterfat weighting reflects real market premiums
  4. Evaluate AMS technology where research proves comparable economic performance with enhanced labor flexibility
  5. Monitor inbreeding levels given documented production losses of 94.5 kg of milk per 1% increase

Ready to capitalize on genetic advancement? The data confirms that strategic breeding delivers measurable results, component markets reward focused genetics, and technology adoption provides competitive advantages. The only question: will you lead with evidence-based breeding strategies or lag using outdated benchmarks?

Complete references and supporting documentation are available upon request by contacting the editorial team at editor@thebullvine.com.

Learn More:

The Sunday Read Dairy Professionals Don’t Skip.

Every week, thousands of producers, breeders, and industry insiders open Bullvine Weekly for genetics insights, market shifts, and profit strategies they won’t find anywhere else. One email. Five minutes. Smarter decisions all week.

NewsSubscribe
First
Last
Consent
Send this to a friend