Archive for lameness cost per cow

The Ripcord Risk: Correcting the Genetic Blind Spot in Legs

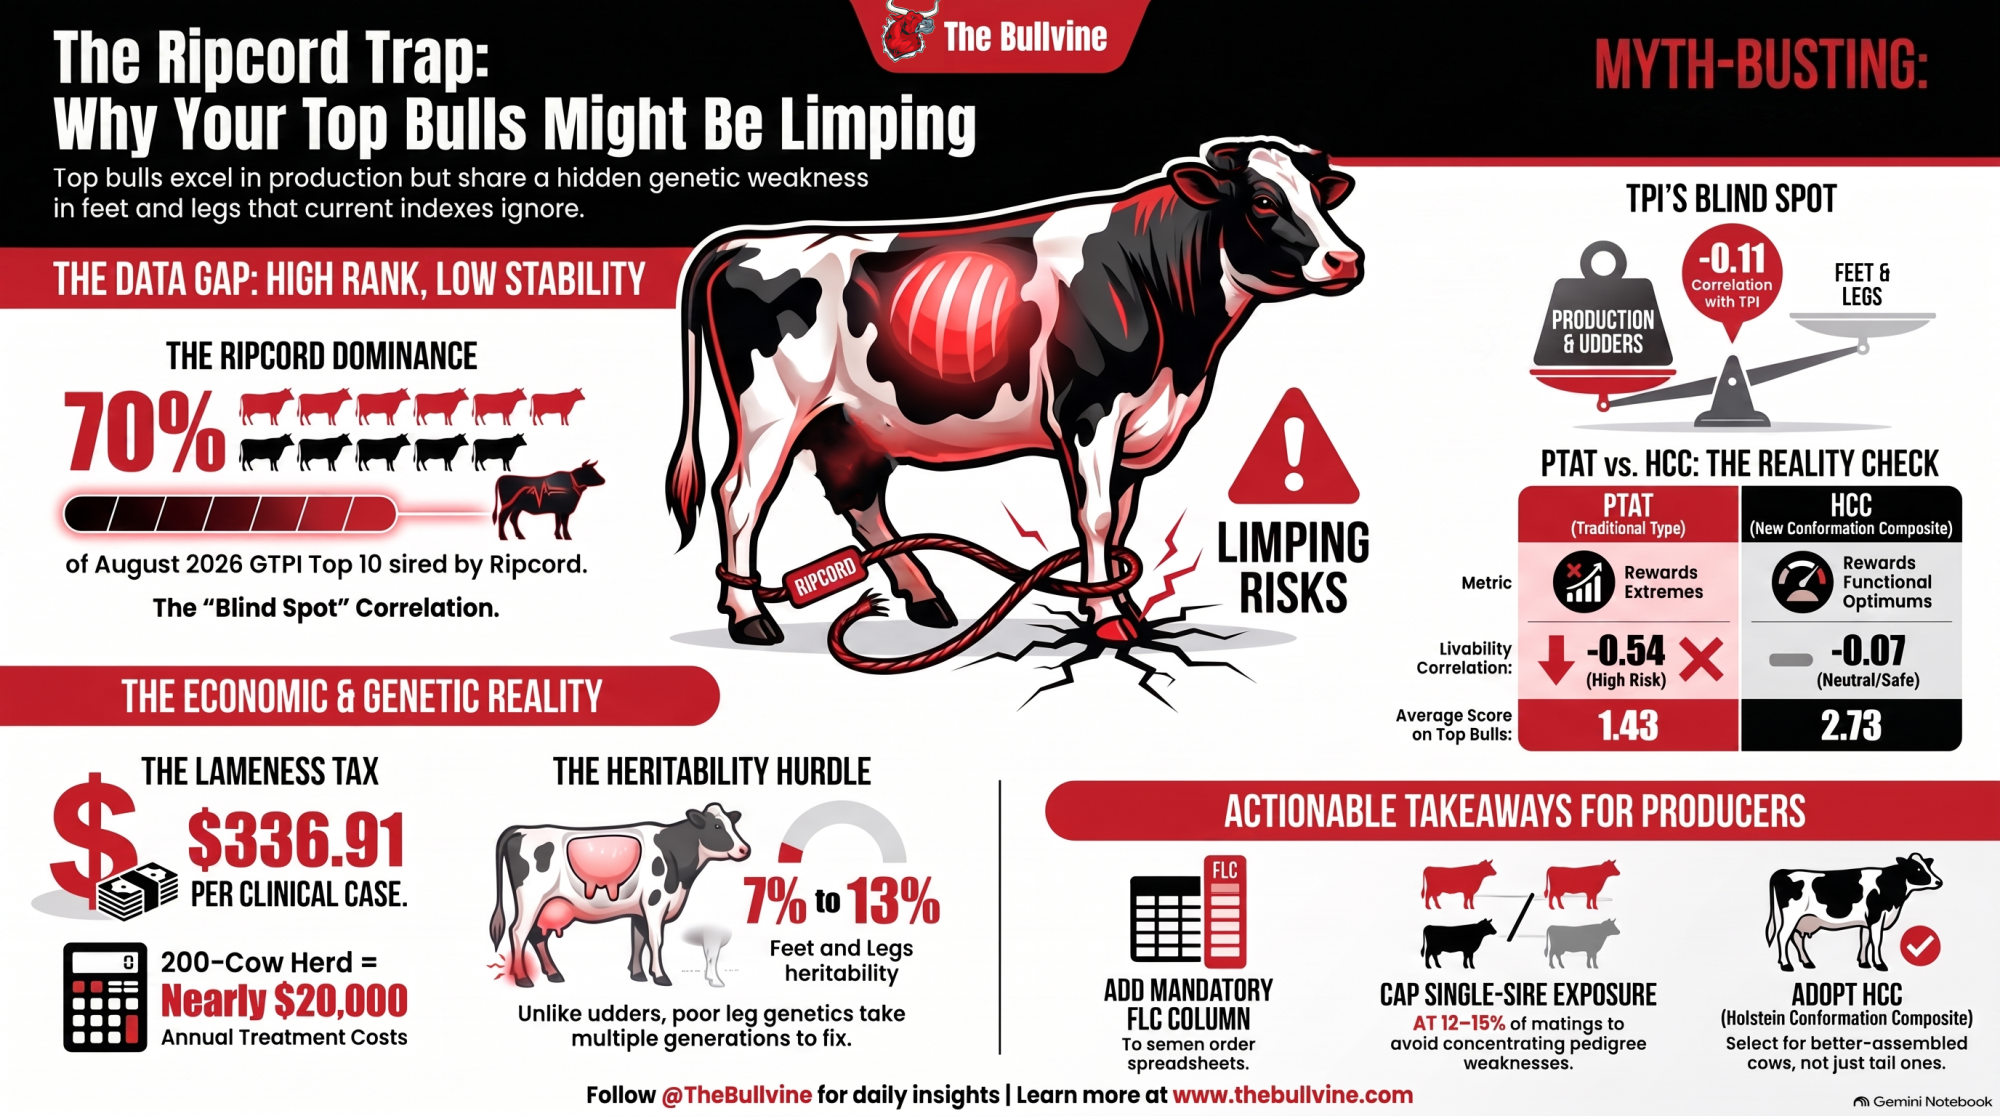
Seven of the ten highest-GTPI bulls in the U.S. share one father. Every one is positive on udders, negative on feet and legs. Feet and legs correlate −0.11 with TPI — your ranking won’t flag it.

EXECUTIVE SUMMARY:

  • What happened: Seven of the ten highest-GTPI bulls in the August 12, 2026 U.S. run trace to one father — Ocd Thorson Ripcord-ET — and eight of the top ten on Net Merit $. Every one of those GTPI sons carries a positive Udder Composite alongside a negative Feet & Legs Composite.
  • Why your ranking won’t catch it: In Holstein Association USA’s own August matrix, FLC correlates −0.11 with TPI across 630,295 females born in 2020. That’s not a formula that penalizes legs. It’s a formula that can’t see them. And legs are the slowest thing in the barn to fix — Lactanet puts Holstein Feet & Legs heritability at 13% and Foot Angle at 7%, below the .10 threshold Holstein USA itself says you need for meaningful progress, against stature at 46%.
  • What it costs, and what to do: At $336.91 per clinical lameness case, a 200-cow herd running 20% incidence pays $13,476 a year; one at the 29.5% published median pays $19,878 — a $6,400 swing on the same milk check. The new Holstein Conformation Composite is the first index in years that weights legs heavily, and it correlates just 0.64 with PTAT, which itself runs −0.54 against Livability in that cohort. Before your next semen order, add one column: pull FLC on every straw and note where Ripcord shows up as sire or maternal grandsire.

Feet and Legs Composite

Open the August 12, 2026 evaluation, pull the U.S. GTPI top ten, and check the sires. Seven of those bulls trace to one father: Ocd Thorson Ripcord-ET. On the Net Merit $ top ten, it’s eight of ten.

Now look at their type numbers. The Ripcord sons in that GTPI top ten show a consistent pattern in our review of the August run — positive Udder Composite alongside negative Feet & Legs Composite. Individual values vary, so pull each bull’s own UDC and FLC rather than trusting the pattern. But the direction is the direction, seven times over.

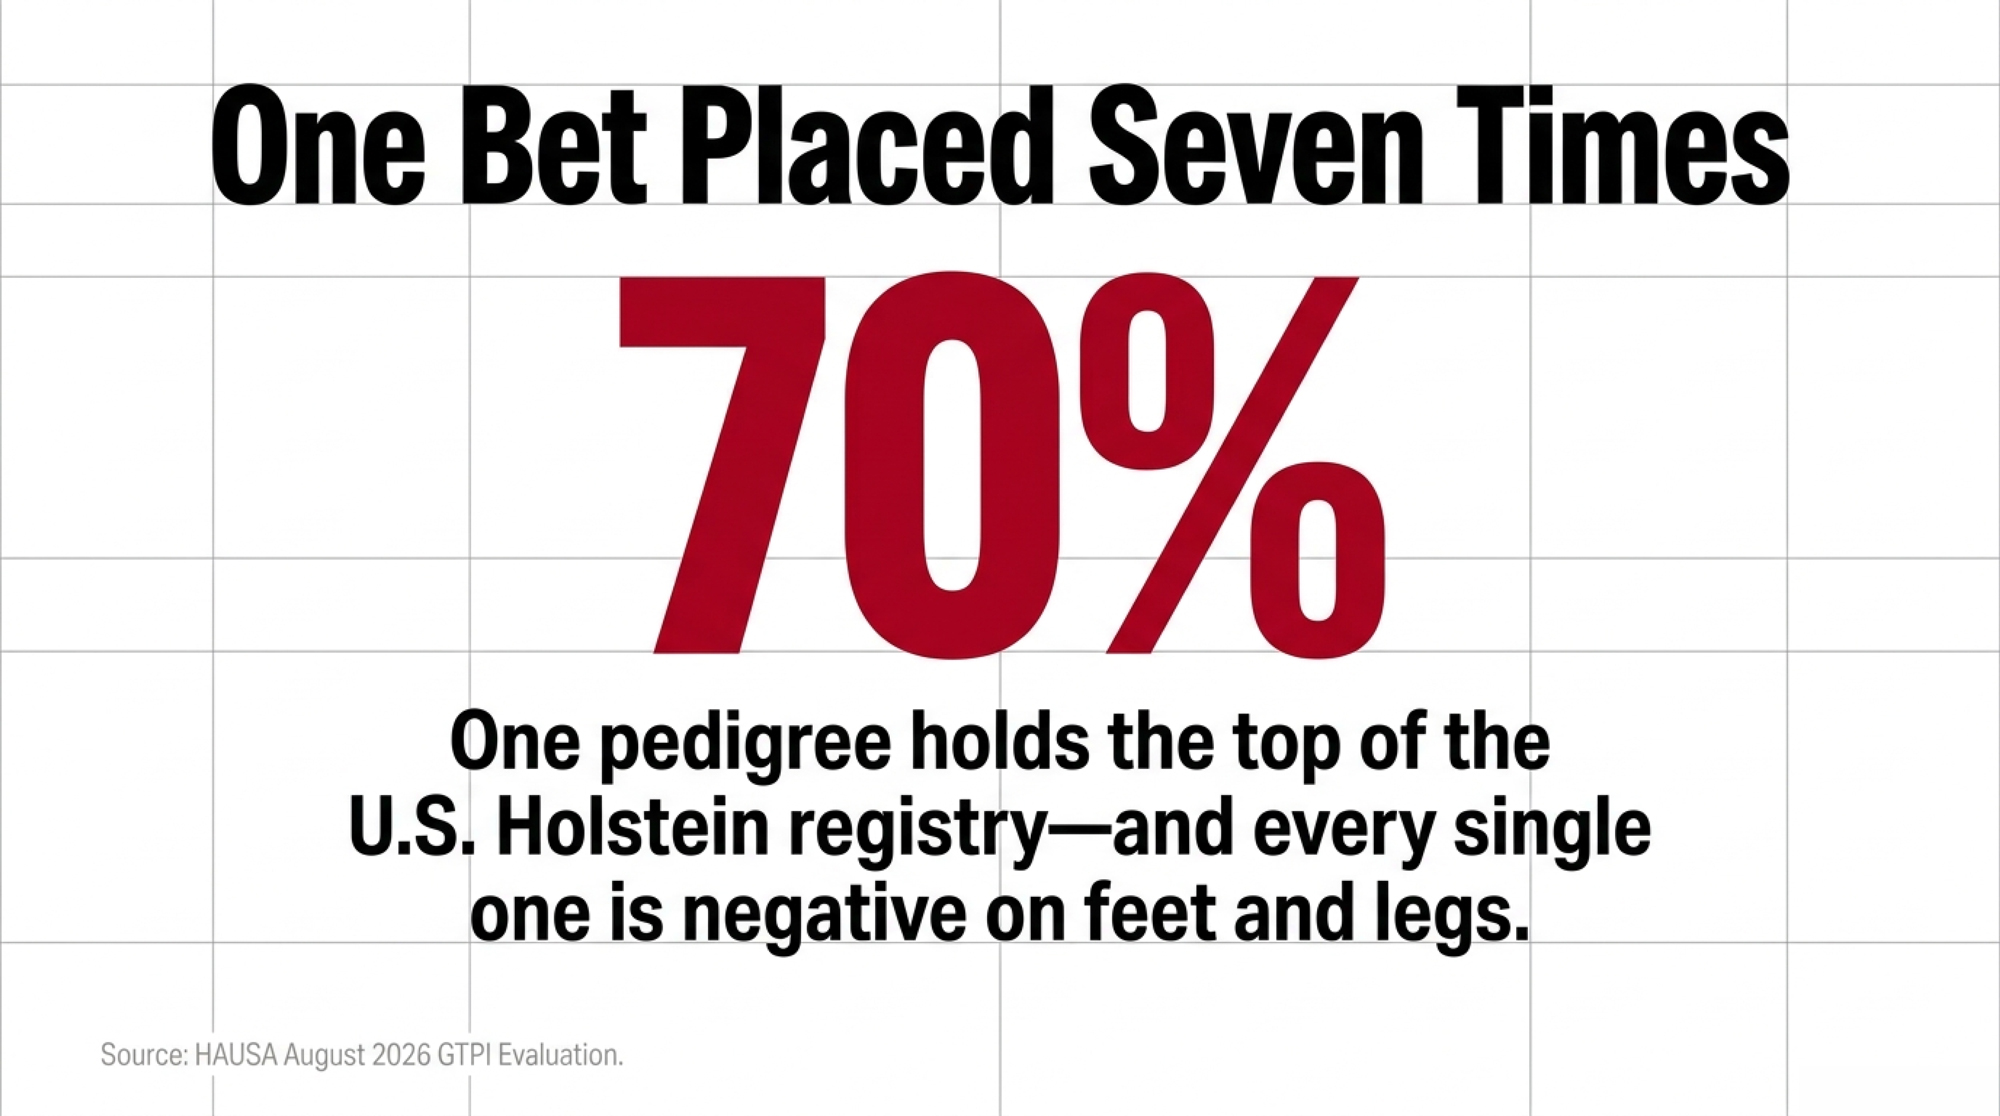
That’s not a popular-sire story. Holsteins have had those for sixty years. That’s one pedigree holding 70 to 80 percent of the top of the U.S. Holstein registry while the trait group most likely to shorten a cow’s stay sits in the same place on all of them.
Why Won’t the Index Catch This?

Because feet and legs barely register in it.
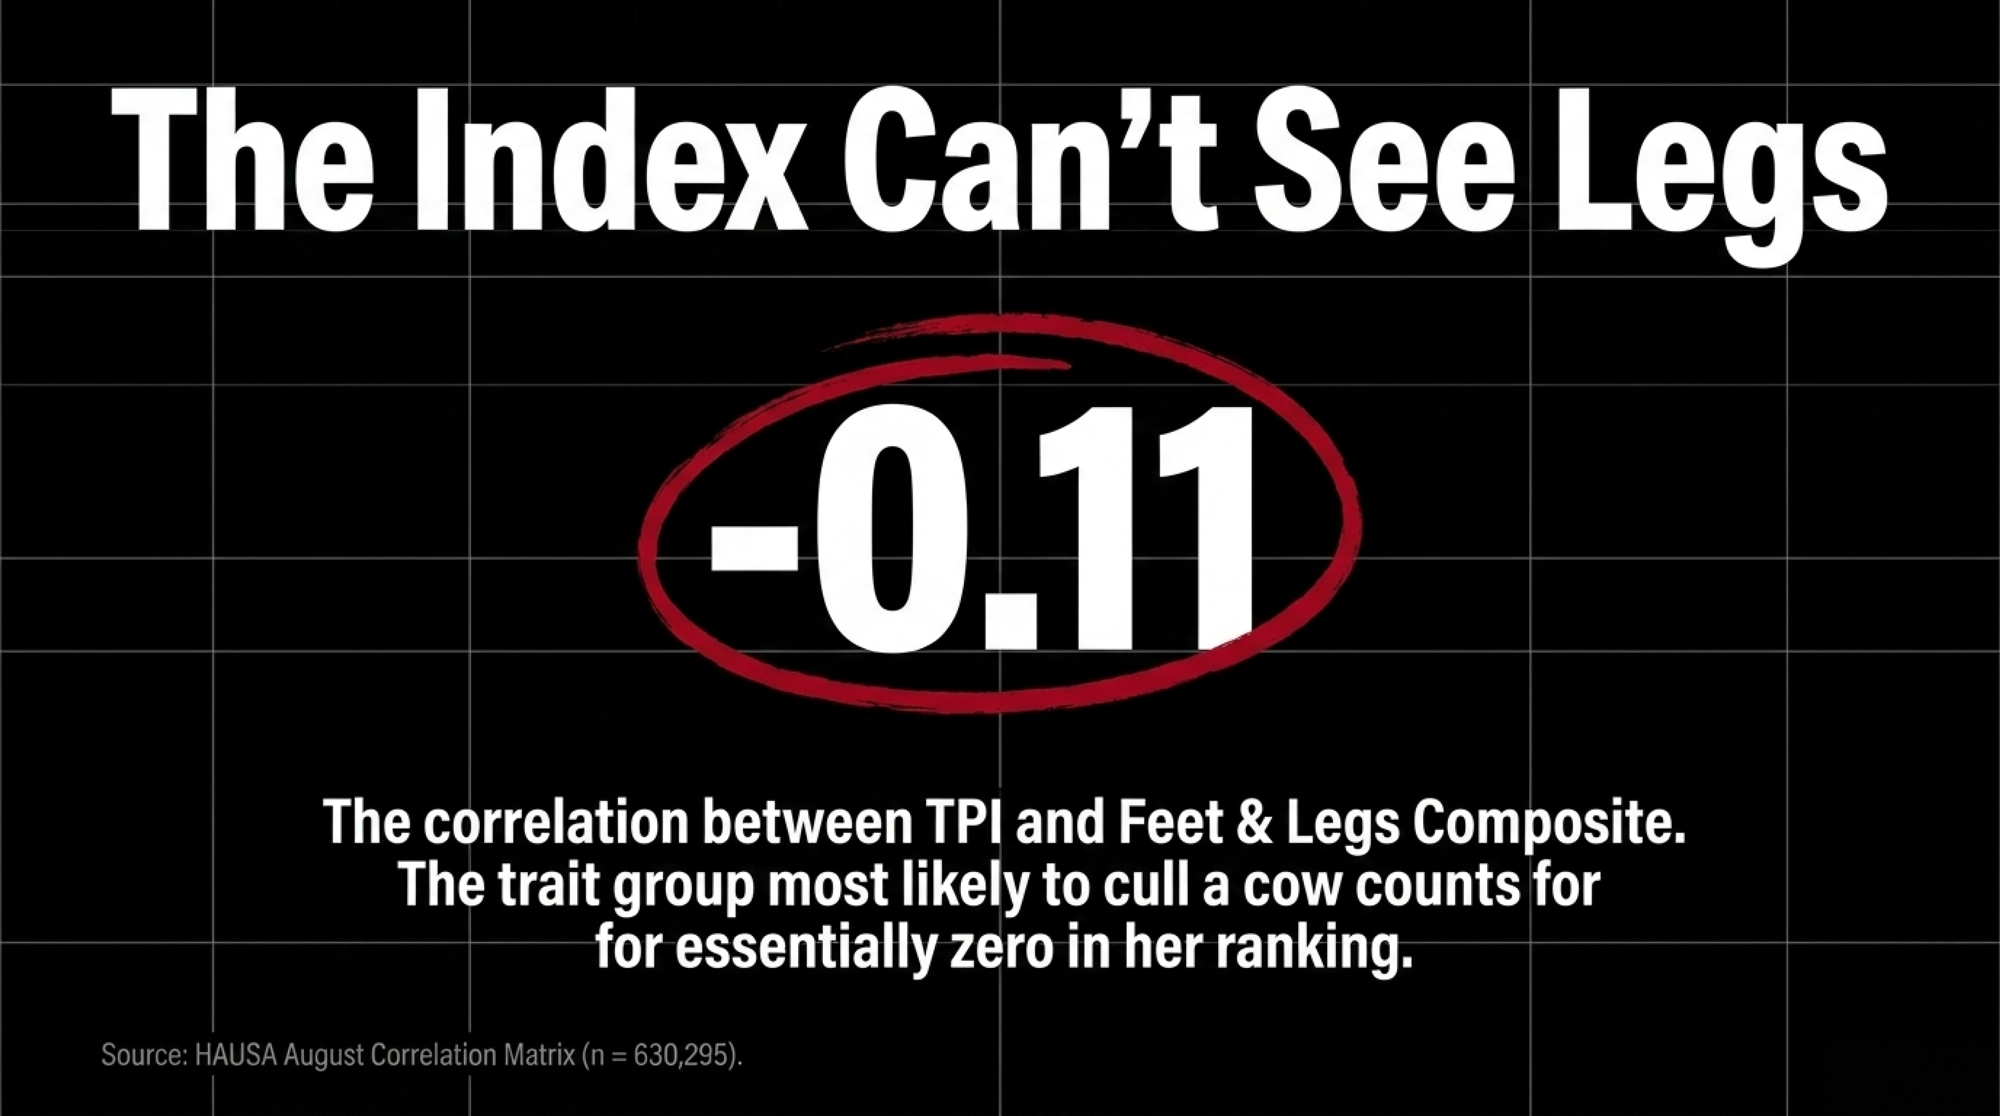
In the correlation matrix Dr. Jason Graham and Dr. Sam Comstock published for the August run — females born 2020, n = 630,295 — Feet & Legs Composite correlates −0.11 with TPI. Call it zero. A bull’s leg composite tells you essentially nothing about where he’ll rank.

Holstein Association USA publishes UDC and FLC separately on every bull, so both numbers sit on every proof sheet you pull. They don’t move a TPI ranking in either direction. A breeder sorting on GTPI or Net Merit sees production, health, and fertility shift the number — and sees nothing from the trait group that decides how many of those daughters are still walking sound at 30 months.

What HCC Actually Rewards

The same run published the Holstein Conformation Composite for every animal in the HAUSA database, and April-to-August scores correlate at 0.99 across 4,055 animals. The calculation is stable out of the gate.
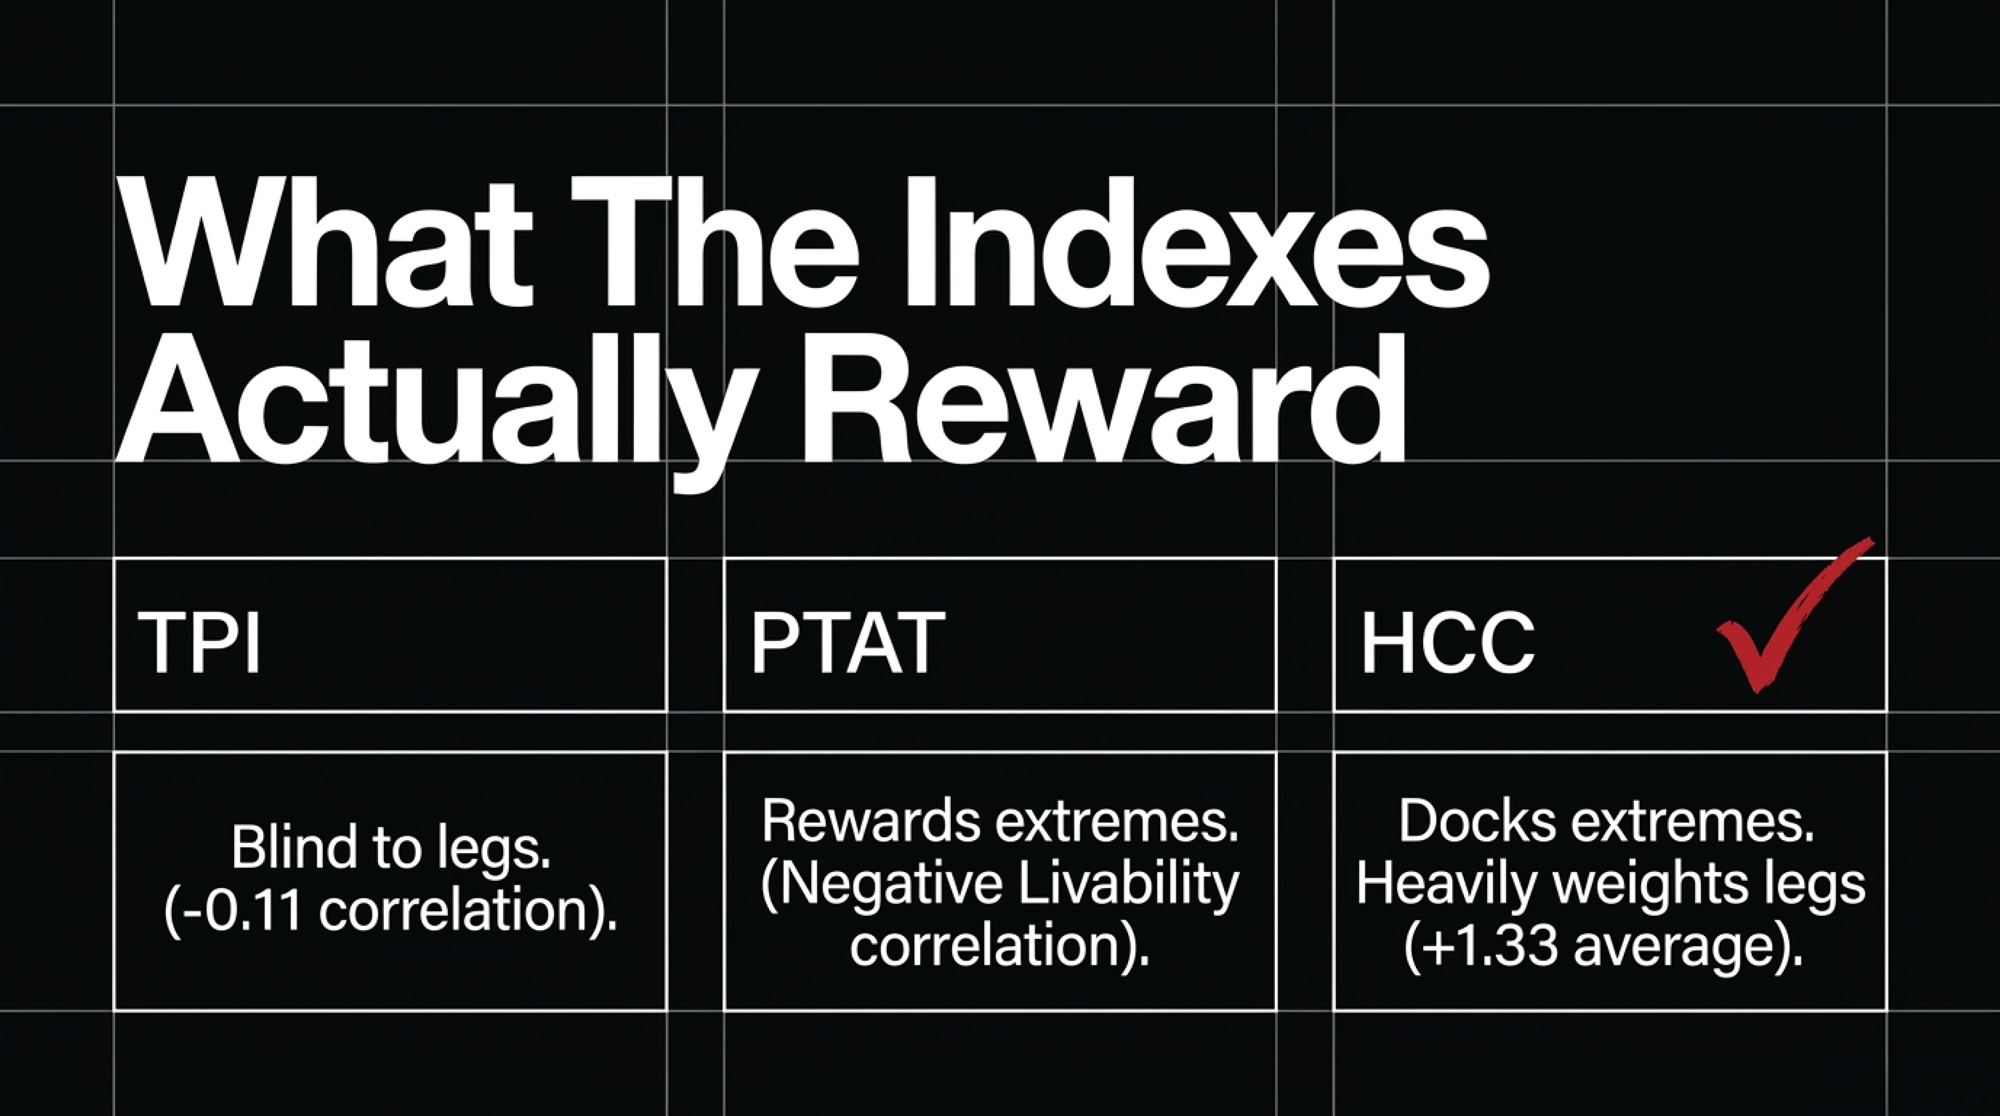
Graham and Comstock pulled the top 25 HCC bulls and averaged all 18 linear traits. Rear Legs Rear View averages +1.61 — the strongest trait in the whole profile. Feet & Legs Score: +1.33. Foot Angle: +0.86. Stature? −0.42. These aren’t tall bulls. They’re better-assembled ones.

That’s the design working as intended. HCC scores each linear trait against a functional optimum and penalizes deviation in either direction. Traditional type evaluation rewards extremes; HCC docks them. Rump angle averages +0.25 across that group, body depth +0.14, rump width +0.52 — near the middle, none pushed.

Across those 25 bulls, HCC runs 2.58 to 3.08 and averages 2.73. PTAT across the same animals averages just 1.43. Same bulls, more than a full point of disagreement between the two scores.

MetricHCC (Holstein Conformation Composite)PTAT (Traditional Type)What it means
Average score, top 25 bulls2.731.43Same bulls score a full point apart
Rear Legs Rear View (avg deviation)+1.61Not separately weightedHCC’s single strongest trait
Correlation with Livability−0.07 (essentially none)−0.54PTAT selection tracks with cows leaving sooner
Correlation with Productive LifeNot published in this run−0.38Same pattern, second metric
Correlation with Feet & Legs Composite+0.57+0.64Both “see” legs; TPI (−0.11) doesn’t
Correlation between HCC and PTAT0.640.64Related, not interchangeable

The Longevity Number Worth Arguing With

In that 630,295-female cohort, PTAT correlates −0.54 with Livability and −0.38 with Productive Life. HCC correlates a milder −0.18, and essentially nothing at −0.07.

Cows bred for higher PTAT left the herd sooner. Graham and Comstock flag the caveat themselves — correlations shift with the population you sample. Fair enough. But the direction holds in both their bull-list work and their cow-level matrix, and the two composites correlate just 0.64 with each other. Related. Not interchangeable.

Feet & Legs Composite correlates +0.57 with HCC and +0.64 with PTAT. Both type composites see legs. TPI doesn’t.

The Barn Math on a Leg Decision
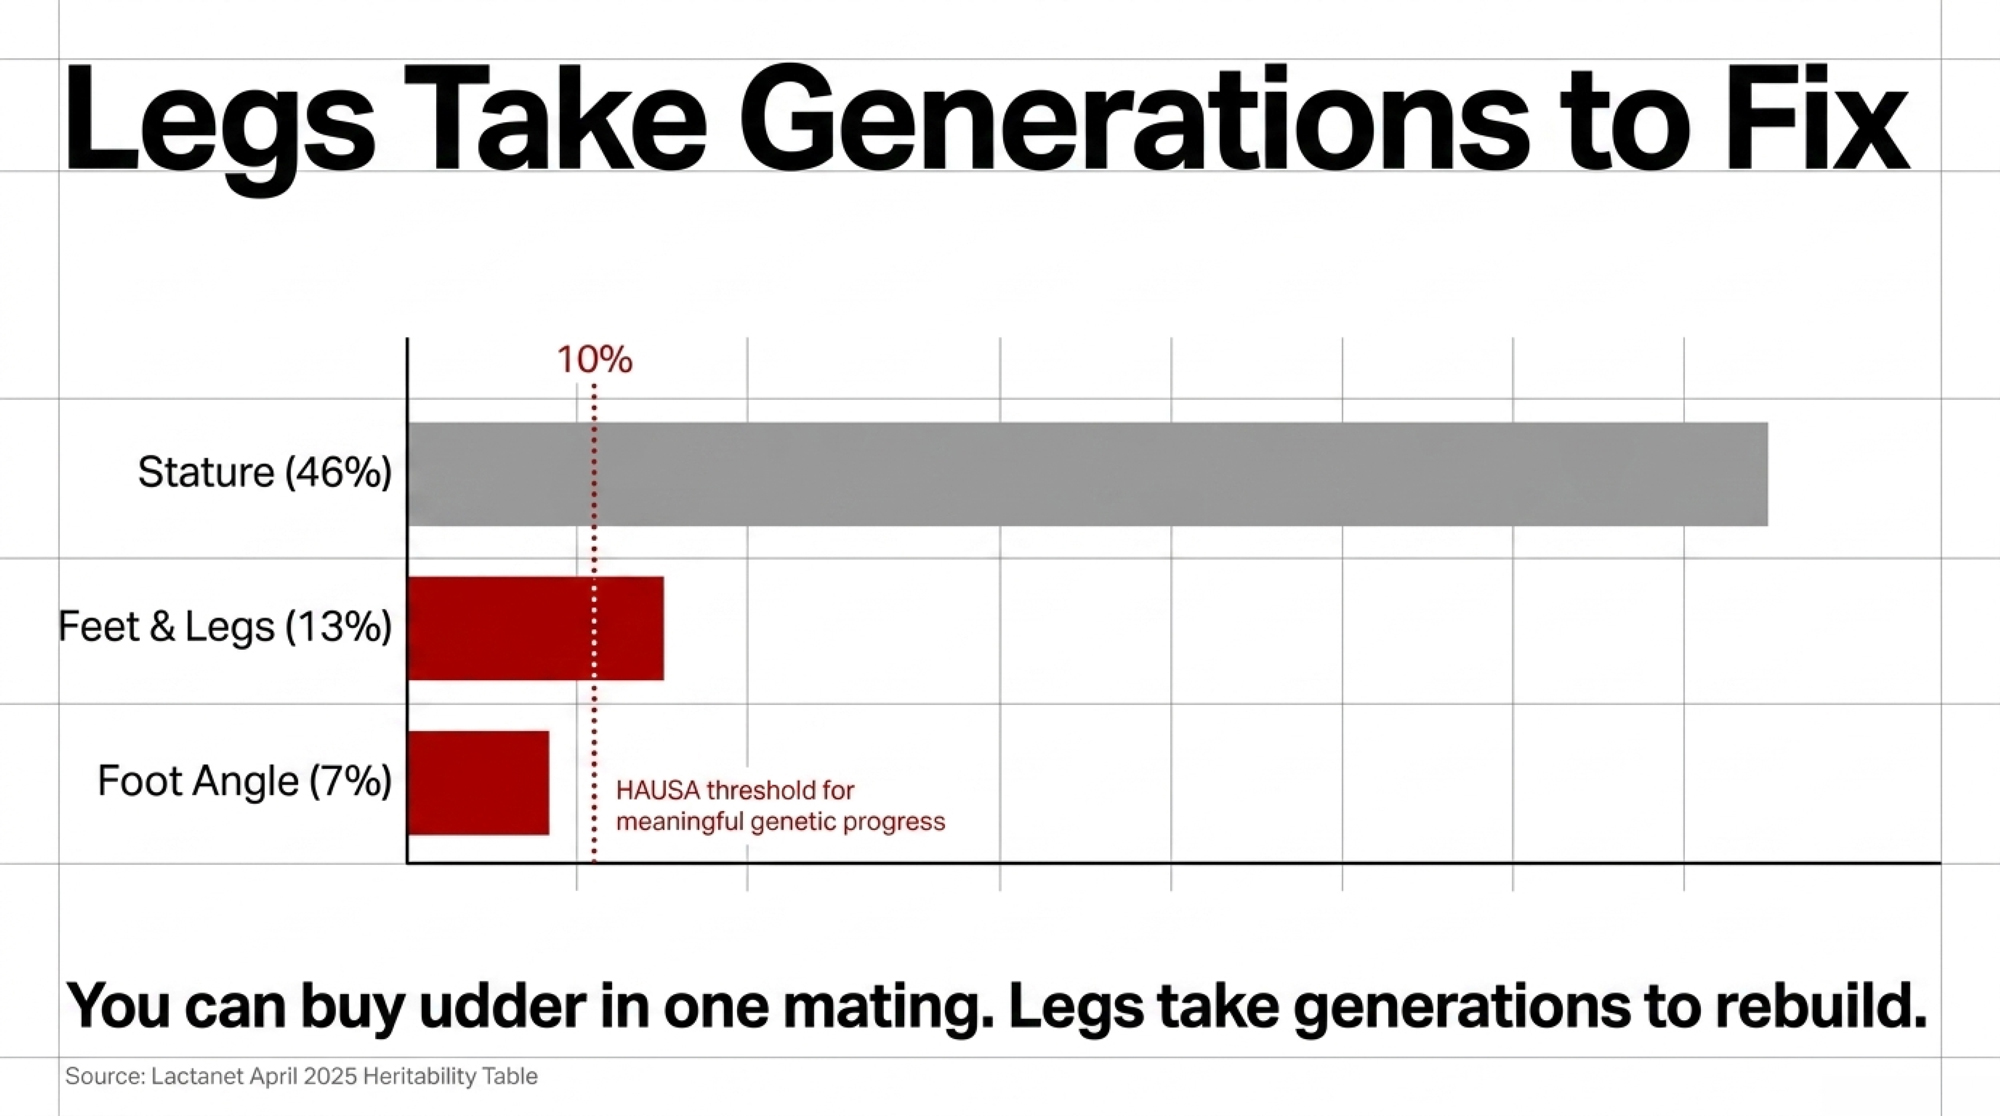
Legs build slowly and erode fast, and the heritability numbers are worse than most breeders assume. Lactanet’s April 2025 heritability table puts Holstein Feet & Legs at 13% and Foot Angle at just 7% — against stature at 46% and rump angle at 41%. Rear Legs Rear View, the trait topping the HCC profile, sits at 11%. Locomotion is 5%.

Holstein Association USA puts the threshold plainly on its Linear Type Evaluations page: “It is difficult to make much genetic progress through selection and mating unless a trait has a heritability of .10 or higher.”

Foot Angle doesn’t clear that bar. Feet & Legs barely does. Stature clears it by a factor of four. You can move udder in a mating cycle. Legs take generations — exactly the wrong shape of problem to inherit from seven bulls at once.

So price the downside. The average clinical lameness case runs $336.91, climbing $13.26 for every additional week a cow stays lame, per Robcis and colleagues in the Journal of Dairy Science.
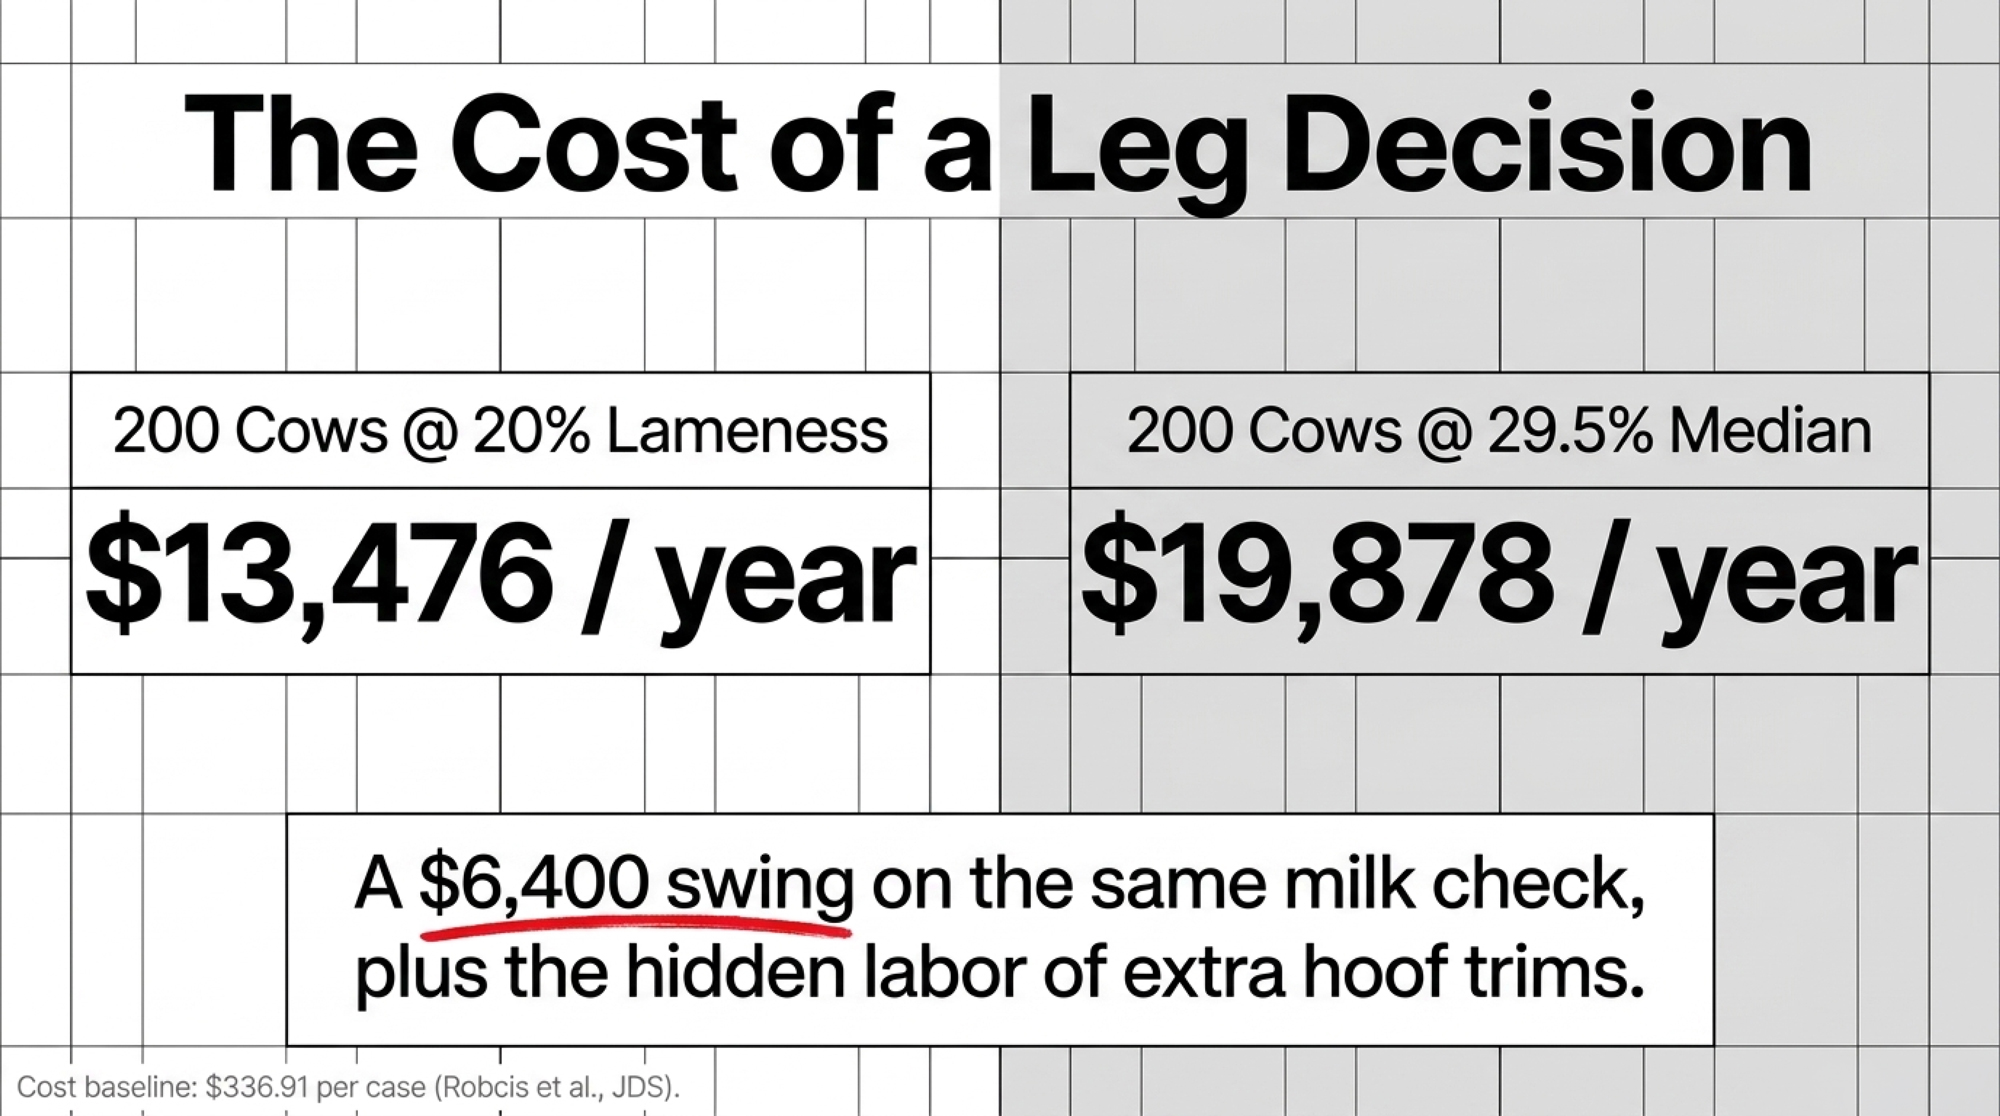
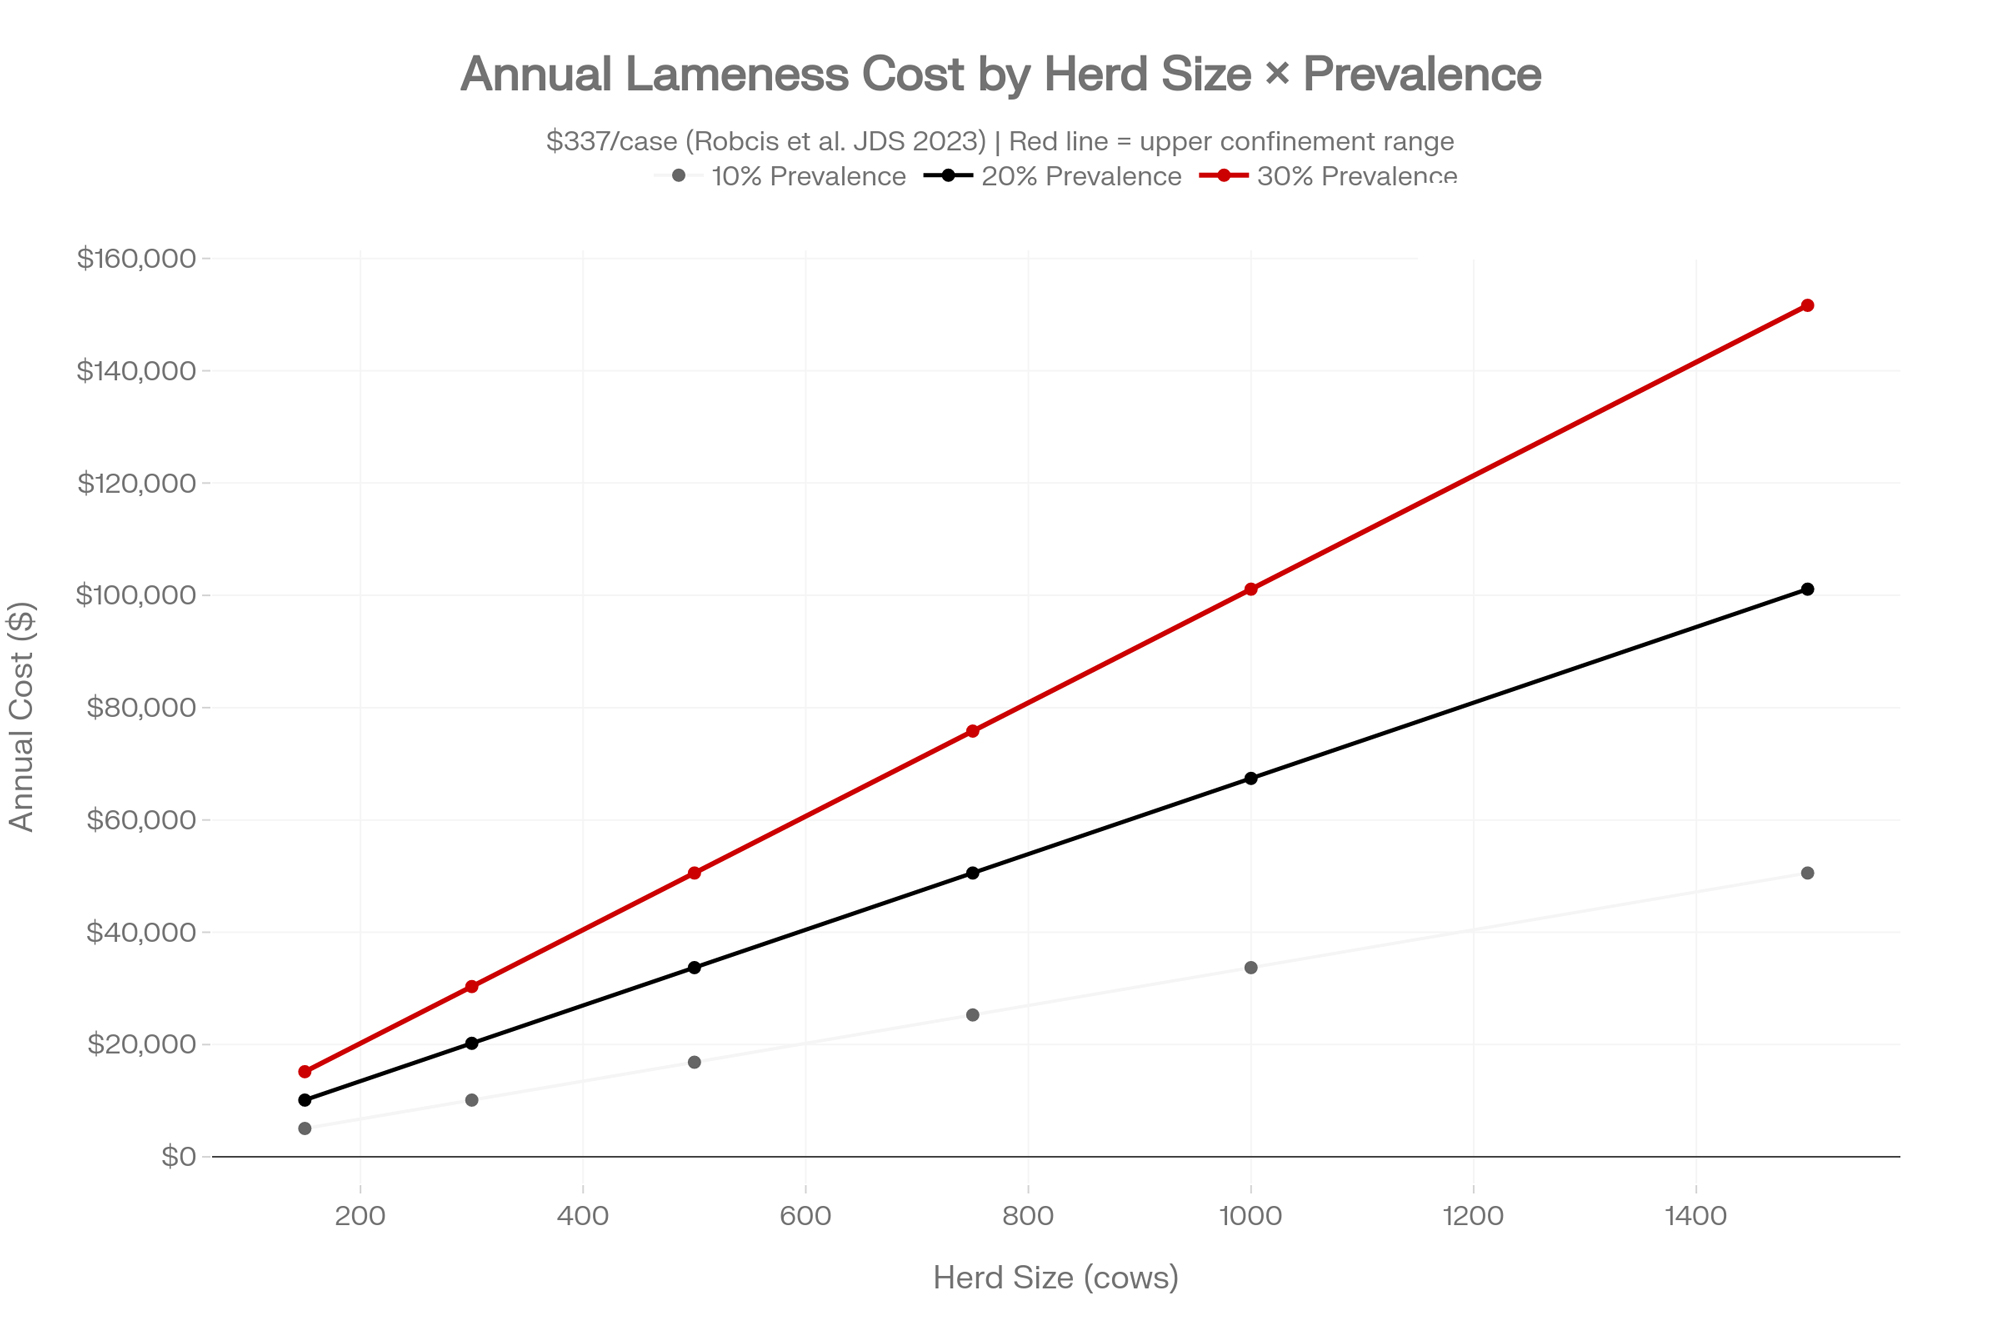
Two scenarios on a 200-cow herd. At a conservative 20% annual incidence — 40 cases, $13,476 a year. At the 29.5% median cow-level prevalence found across the published literature — 59 affected cows and roughly $19,878, though prevalence and annual case count aren’t the same measure. Either way, the gap between those two herds runs about $6,400 a year, and genetics is one of the levers moving you between them.

Lameness accounted for 9.1% of the total U.S. cull rate in the 2018 USDA/NAHMS survey, with injuries adding 3.5%. That puts locomotion third among involuntary culling reasons, behind infertility at 23.3% and mastitis at 18.6%.

The Part That Costs Labor, Not Just Dollars

Treatment cost is the easy number. The harder one is what a low-FLC group does to your routine.

Two or three hoof trimmings during first lactation improve hoof health in early second lactation — and improve survival into that second lactation. Read that alongside the heritability math and the shape of the problem changes. A group of daughters with weaker feet and legs doesn’t just generate treatment invoices. It generates trim appointments, restraint time, and labor you’d budgeted somewhere else.

The disease genetics are thinner still. Finnish work on 24,685 Holstein cows found hoof disorder heritabilities running from 0.02 for sole hemorrhage and heel horn erosion up to 0.13 for digital dermatitis, with feet and leg conformation traits landing between 0.10 and 0.19. Most genetic correlations between hoof disorders and conformation traits came in low and statistically indistinguishable from zero — meaning conformation is a proxy for hoof health, not a substitute.

Worth knowing how the composite was built. Both the Udder Composite and the Feet & Legs Composite carry a −0.20 weight on stature, documented by Holstein Association USA, so breeders can improve udders and legs “without making their cows taller.” Someone anticipated this exact trade decades ago and engineered against it inside the composites. The index doesn’t carry that logic upward into TPI.

The Fertility Correction Was the Dress Rehearsal

Here’s why this run should make you uneasy about more than feet and legs.

The August evaluation rewrote the fertility scale, and Fertility Index carried 69% of all TPI movement — roughly seven times the next-largest trait. Males in the top 10% for DPR dropped 9.08 PTA points. April-to-August male ranking correlation for DPR came in at 0.31, against 0.93 for Heifer Conception Rate. An April DPR ranking told you almost nothing about an August one.

That’s what it looks like when a component of the index gets recalibrated after two decades of use. Nothing about the old number was hidden — it was published, it moved the index, breeders used it. Then CDCB changed how DPR accounts for the voluntary waiting period, and TPI moved for all 12.6 million evaluated females at once: top-decile animals up, everything below them down.

Now apply that to legs. Feet and legs aren’t mismeasured — they’re barely visible, at −0.11 against TPI. Different failure, same exposure. The fertility correction arrived as a scale change breeders could see in a single run. A locomotion correction, if it comes, arrives as culls — three years after the mating decision, spread across a herd, with nothing in the index to have warned you.

Why Index Moves Punish Concentrated Pedigrees Hardest

We’ve watched this pattern before, and the numbers are on record.

Our five-year tracking of 401 elite genomic Holstein bulls from April 2020 through their December 2025 proofs found the retained bulls dropped an average of 42.5 TPI points — most of it from base changes and formula rewrites, not failed biology. Correlations between 2020 genomic predictions and 2025 proven results held strong on core traits: 0.81 for PTAT, 0.76 for fat, 0.71 for protein. The DNA didn’t change its mind. The formula did.

The bulls that crashed hardest shared a profile: over-predicted type stacked on thin functional traits. Homecoming lost 414 TPI points with PTAT dropping 0.87. Supercharge lost 396, including a 2.32-point PTAT collapse from +1.18 to −1.14. Sire lines heavy on Legacy and Heroic up top, with Delta on the maternal side, were over-represented in that group.
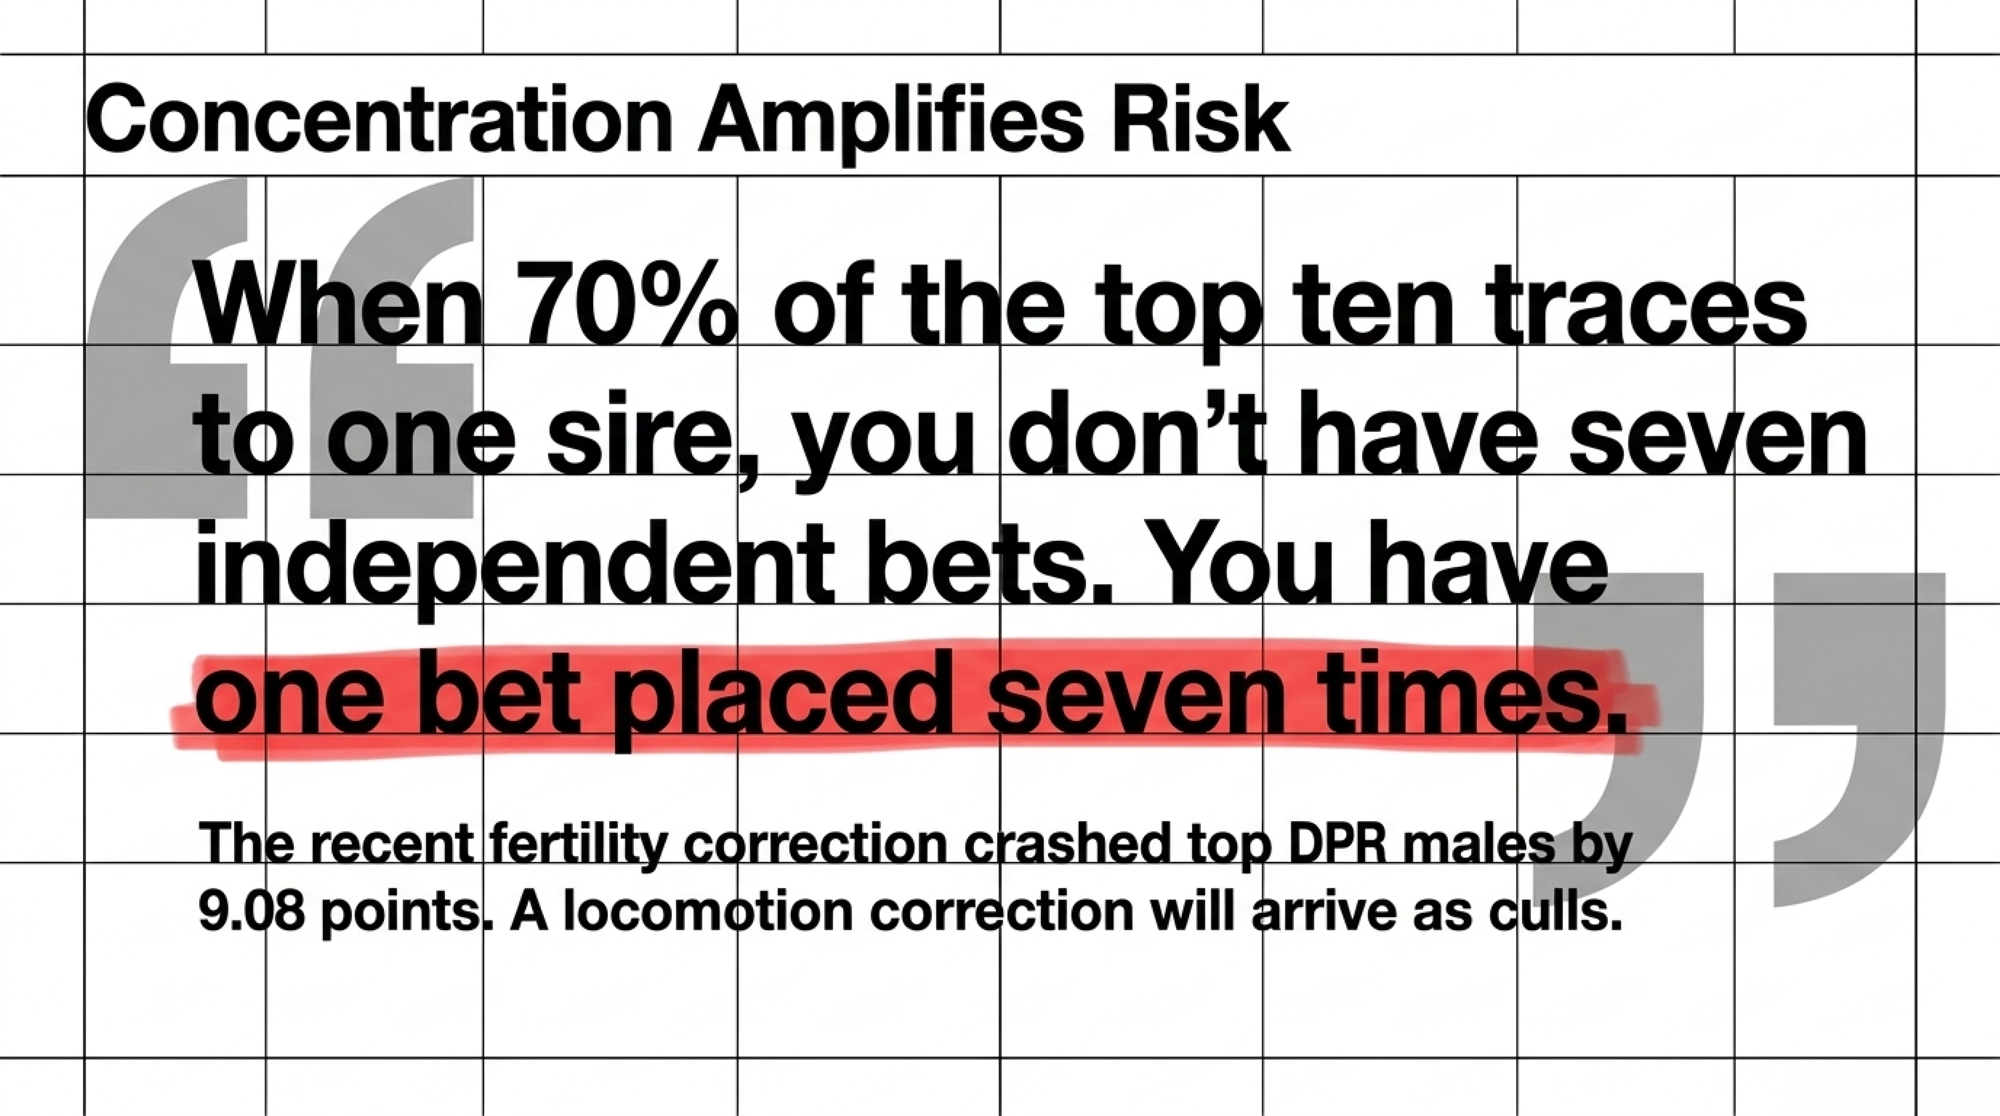
Concentration amplifies whatever the formula decides to reward or ignore. When 70 to 80 percent of a top-ten list traces to one sire, and they all sit weak in the same trait group, you don’t have seven independent bets. You have one bet placed seven times.

Fertility is where that already bites hardest. Annual genetic gain outruns inbreeding depression for every index trait except one — daughter pregnancy rate, running a net loss of 0.02 PTA units per year, on figures calculated before this run’s revision. Holstein heifers born in 2024 averaged 9.99% inbreeding per Lactanet Canada’s August 2025 update — a Canadian figure, not a U.S. one, and up from 9.61% the year before.

Looking for an Outcross

Concentration this deep makes clean pedigrees worth hunting, and the August lists offer one credible candidate near the top.

Genosource Jaco-ET sits at #8 GTPI at +3608 with 82% reliability, no daughters yet, and he was the biggest riser in the top ten at +128. Under the new 36-month rule holding daughter data out of DPR, CCR, and FSC, a bull like Jaco has no fertility daughter records feeding his numbers — so weight him on production confidence, not fertility confidence.

Whether he’s a genuine outcross for your herd depends on your own pedigree stack. That’s a check to run against the HAUSA database with your straw inventory in front of you, not something a proof sheet answers for you.

The honest read: with one sire behind 70 to 80 percent of the top ten, options up there are thin, and the ones that exist come with compromises — no daughters, limited status, or family overlap you’ll need to verify yourself.

Three Paths, and What Each One Costs

ApproachWorks best forWhat it costsWhere it backfires
Add FLC as its own spreadsheet column with a floorAny herd ranking primarily on TPI/NM$~1 hour of spreadsheet work; occasionally a lower GTPI pickSetting the floor at zero cuts most of the current top 10
Select on HCC for longevity-focused herdsHerds culling heavily on feet, legs, udder breakdownLower PTAT, lower show-ring ceilingExpecting fast results — 13% heritability is a 3-generation play
Place one deliberate outcross sire in the rotationHerds where a third+ of active straws trace to RipcordReal compromise — top candidates near GTPI top 10 also carry limitationsSwapping one concentration risk for another unverified one
  • Pull FLC as its own column and set a floor. Works for any herd ranking on index. Costs an hour of spreadsheet work and occasionally a lower GTPI on the bull you pick. Backfires if you set the floor at zero — you’ll cut most of the top ten and forfeit real production merit. Set it against your herd’s actual leg problem, not an arbitrary line.
  • Use HCC where longevity is the goal. Works for herds culling heavily on feet, legs, and udder breakdown rather than by choice. Costs you a lower PTAT and a lower show ceiling sometimes. Backfires if you expect speed — at 13% heritability on Feet & Legs this is a three-generation play, not a first-crop answer.
  • Place one deliberate outcross in the lineup. Works where a third or more of active straws trace to Ripcord. Costs real compromise, because the candidates near the top all carry one. Backfires if you swap one concentration for another, so verify the pedigree yourself before you commit.
The Action Checklist

Do this in the next 30 days:

  1. Put your April and August proofs side by side for every sire in your active lineup. Sort by TPI change. Flag any bull whose drop is more than double his cohort’s — that short list, not the full drop list, is where re-evaluation belongs.
  2. Add an FLC column to that same sheet. If you rank on TPI or NM$ alone, feet and legs are not currently in your decision. The index correlates −0.11 with FLC. Add the column or accept that you’re not selecting on it.
  3. Note sire and maternal grandsire on every straw. Where Ripcord appears, pull each bull’s individual FLC rather than judging by pedigree — the pattern is directional, the numbers are what you breed to.
  4. Cap single-sire exposure. No one bull on more than 12 to 15 percent of your matings, and build the team from at least eight unrelated sires. That’s the same discipline North Florida Holsteins applied when it capped how much any single bull could influence the herd.
  5. Locomotion-score your herd this quarter. Published prevalence spans 2.6% to 63.7% across studies, so the breed average tells you nothing about your barn — and the difference between 20% and 29.5% on 200 cows is roughly $6,400 a year.

Nobody built TPI to ignore feet and legs. It worked out that way — a composite weighting production, health, and fertility, with a trait group that washes out to −0.11 in the arithmetic. And nothing about that arithmetic changes on its own: at 13% heritability on Feet & Legs and 7% on Foot Angle, you can buy udder in one mating cycle and spend three generations paying it back. The 2029 version of this decision won’t arrive as a scale change you can see in a proof run. It arrives as culls and trim appointments. HCC is the first tool in a while that puts legs back in the conversation with real weight behind it. So before your next semen order, the question isn’t which bull ranks highest. It’s which column you’re adding to the spreadsheet first.

Learn More

The Sunday Read Dairy Professionals Don’t Skip.

Every week, thousands of producers, breeders, and industry insiders open Bullvine Weekly for genetics insights, market shifts, and profit strategies they won’t find anywhere else. One email. Five minutes. Smarter decisions all week.
NewsSubscribe
First
Last
Consent

The Footbath Works. Your 5 a.m. Crew Doesn’t.

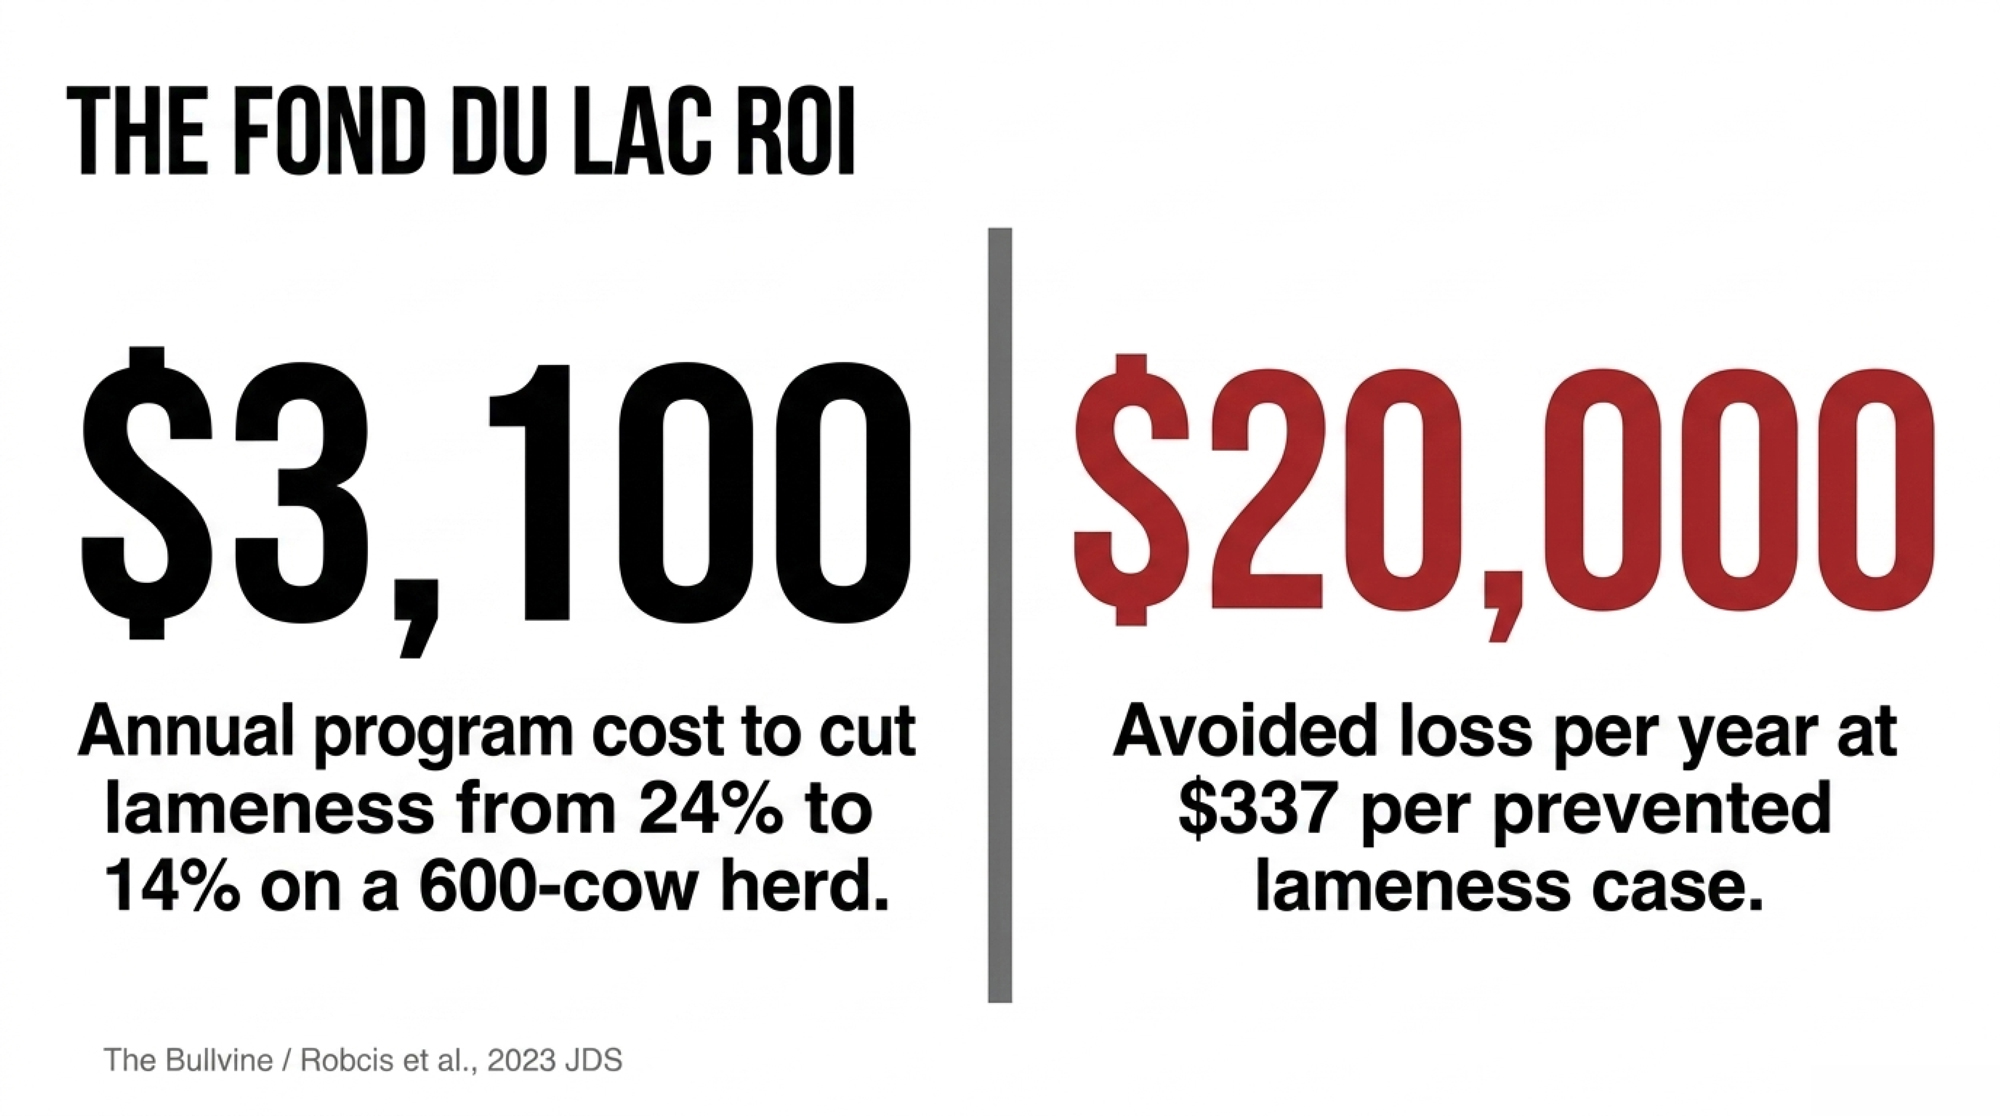
One Fond du Lac herd ran the exact same 5% copper bath as everyone else and cut lameness 24% to 14% for $3,100 a year. The fix wasn’t the chemical. It was who owned the job.

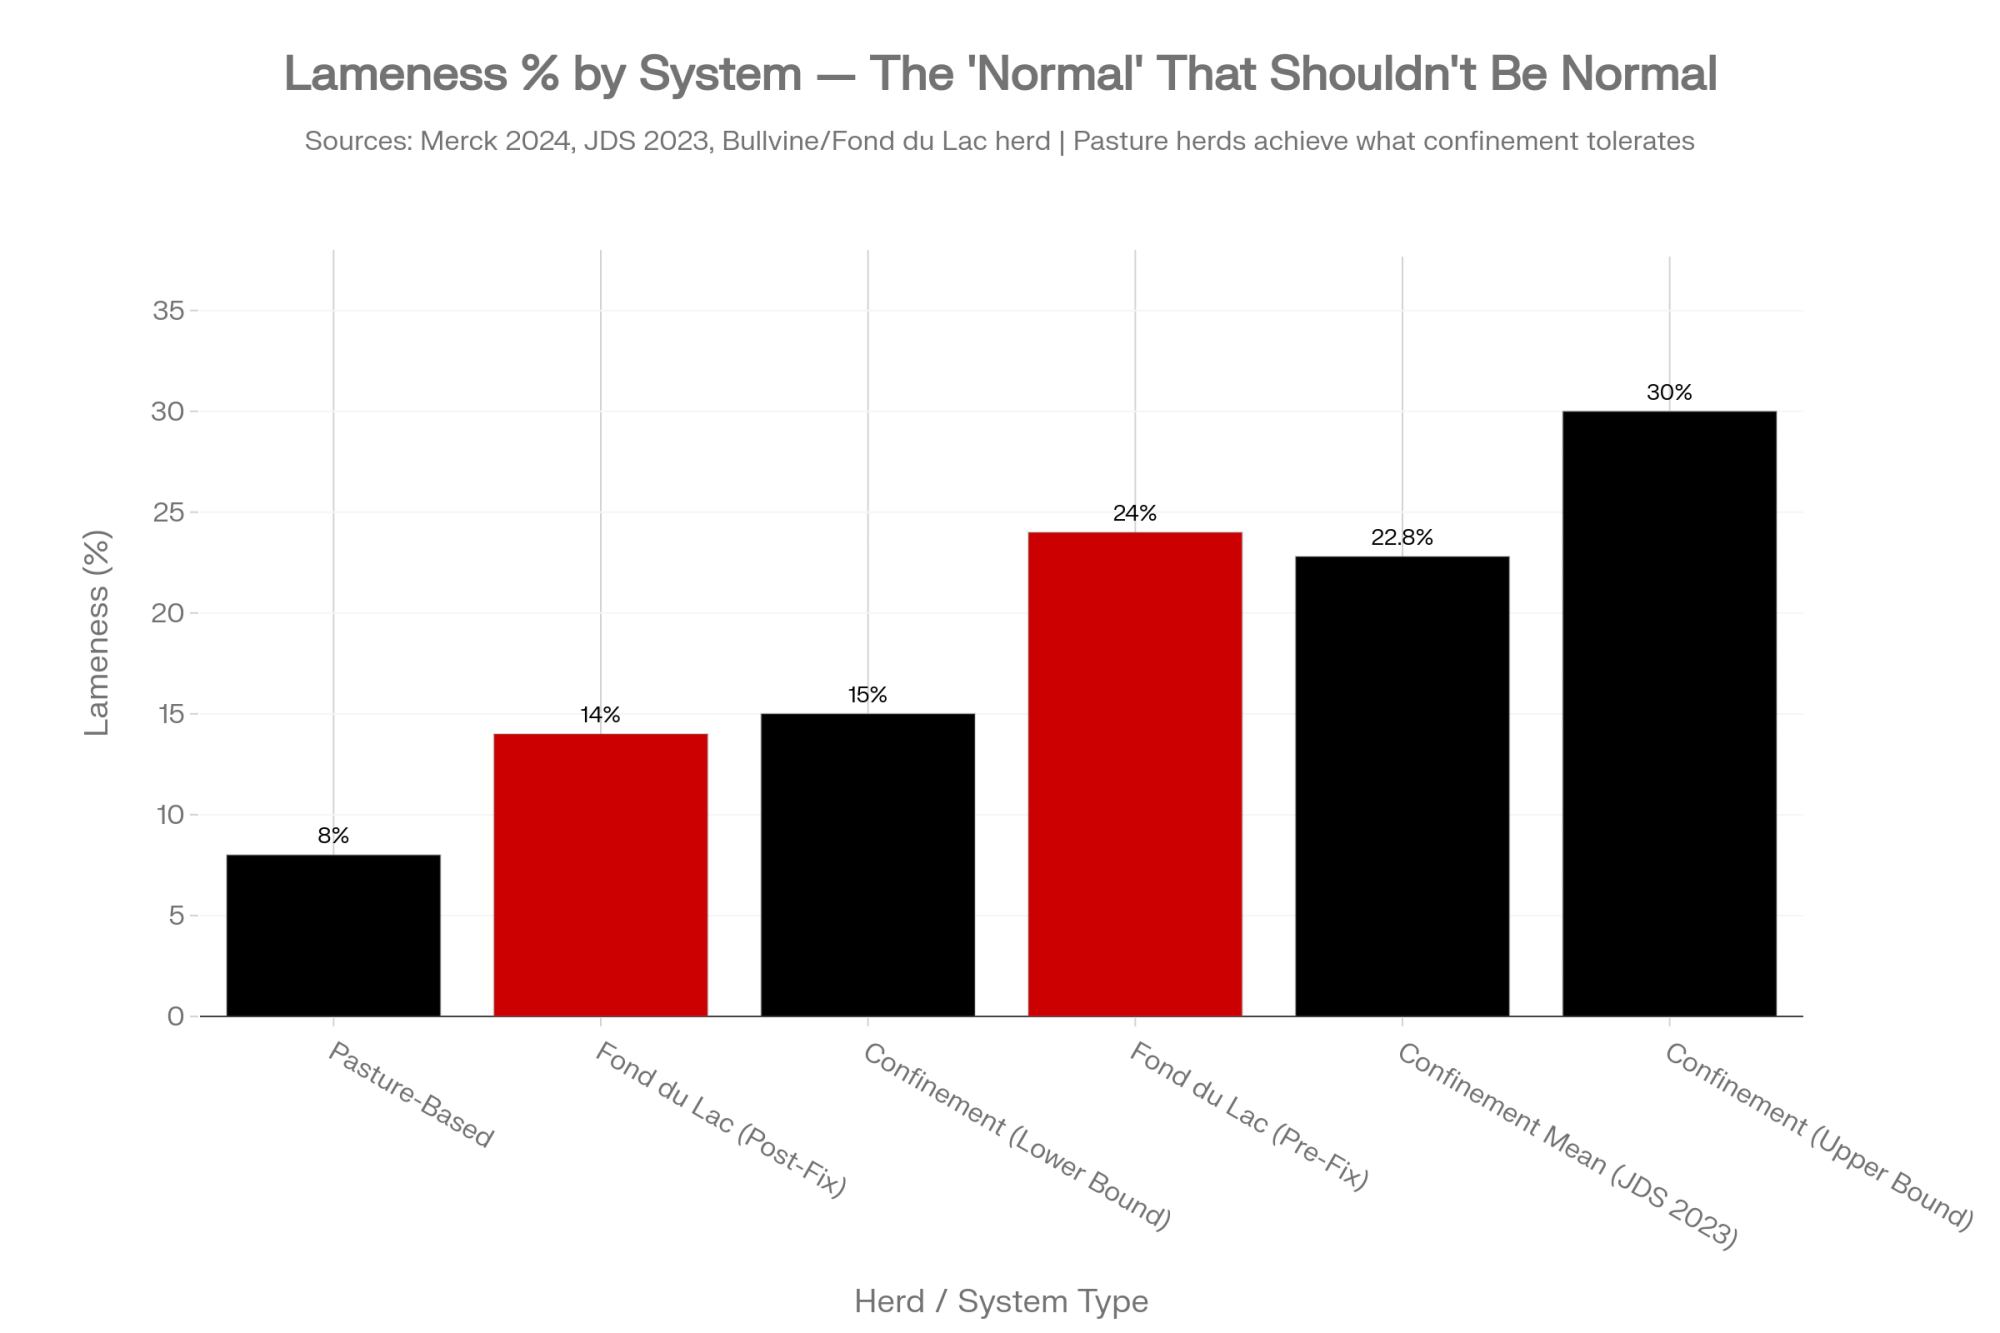
Executive Summary: Most confinement herds run around 22.8% lame (2023 JDS review) and genuinely can’t see it — in one German study, farmers caught as few as 24% of their own lame cows. A 600-cow Fond du Lac herd proved the fix is cheap: they cut lameness from a reported 24% to 14% for about $3,100 a year, no $45,000 cameras, no consultant. What changed wasn’t the chemical — it was putting one named employee on a fixed footbath schedule and checking pH and concentration instead of eyeballing them. At roughly $337 a case, that 10-point drop on a herd that size is near $20,000 in avoided loss against a rounding-error spend, and the subclinical cows are bleeding 3.3 lbs of milk a day before they ever limp. The catch worth weighing: a decade of copper sulfate loads your soil and forage — one UW-studied herd averaged 433 ppm liver copper — so if you’re running Jerseys, pull a forage test before you defend the status quo. Score your own 100–200 cows this month, set that number next to your gut estimate, and you’ll know in an afternoon whether this is your problem too.

footbath protocol

Editor’s note: The 5 a.m. scene below is a composite drawn from extension research and patterns common across many operations; it is not a single real morning at a single farm. The Fond du Lac herd, its cost and outcome figures, and all research data are real and sourced. Figures reflect studies and guidance available as of June 2026.

The footbath looks fine at 5 a.m. It’s full enough, the color’s about right, and the cows are filing through it on their way out of the parlor. So why is digital dermatitis still moving through the herd?

That’s the question that should keep more producers up at night. Because the honest answer usually isn’t the bottle. The copper sulfate works. The zinc works. What breaks is the human layer around it — the mixing, the changing, the consistency, and the simple question of who actually owns the job. Footbath management is one of the cleanest tells in the whole barn. Get a real look at how it runs at 5 a.m., and you’ve got a pretty good read on how the rest of the operation runs too.

What’s Really at Stake

Here’s the uncomfortable part. If you run a confinement herd and you’ve quietly accepted that some lameness is just the cost of doing business, this story is about you. Not in a finger-wagging way — in a “you genuinely might not be seeing what’s in front of you” way. And the research backs that up hard.

Most herds aren’t where they think they are. A 2023 systematic review in the Journal of Dairy Science reported a mean lameness prevalence of 22.8%, with a median of 22.0% and a between-study range of 5.1% to 45%, and within-herd numbers ranging from 0% to 88%. Merck’s 2024 epidemiology chapter frames the working reality as 8% in pasture-based systems versus 15–30% in confinement. Digital dermatitis is the engine behind most of it: UW–Madison Extension estimates DD is present in roughly 70% of U.S. dairies and 95% of large herds. That’s the global picture. The single-herd picture is often worse than the owner believes — and the footbath is frequently where the gap starts.

How It Falls Apart at 5 a.m.

Walk through a real morning. The bath isn’t quite full, so the concentration drifts. Nobody measures the product — it gets eyeballed, and even a small change in solution depth can move the working concentration enough to matter, according to industry hoof-care guidance. The solution doesn’t get changed when it should. And on a genuinely busy morning, the bath just doesn’t run at all.

None of those are catastrophic failures. That’s the trap. They’re small shortcuts that make the program invisible on good days and worthless on bad ones. A 2016 survey of 45 Wisconsin dairies found that while copper sulfate was used on 67% of farms, 27% of those farms ran it at a concentration of 12–30% — more than three times the recommended level. Only a third offered a footbath four or more times a week. These aren’t knowledge problems. They’re consistency problems.

What does “right” actually look like? Check these against your own barn wall:

ParameterTarget SpecDanger ZoneWhat Breaks When You Miss It
Bath length10–12 feet< 8 feetCows get fewer than 2 rear-foot dunks per pass
Solution depth4–6 inches< 3 inchesCoronary band and dewclaws don’t contact chemical
Change frequencyEvery 150–300 cow passes> 400 passes without changeSolution becomes diluted slurry — no bactericidal effect
pH range3.5–5.0> 5.5 or < 3.0Above 5.5: chemical inactive. Below 3.0: skin burns
Copper sulfate concentration2–5%> 8% or < 1.5%27% of WI farms ran 12–30% (triple recommended) — wastes product, increases soil load
Run frequency≥ 4×/week≤ 2×/weekFrequency beats formulation — 4× at spec beats “when we remember” every time
Named protocol owner1 dedicated employee“Whoever’s around”The Fond du Lac 24%→14% drop was entirely about accountability — not chemistry
  • Length: 10–12 feet — ensures at least two dunks per rear foot per pass
  • Depth: 4–6 inches — must cover the coronary band and dewclaws
  • Change frequency: every 150–300 cow passes, sooner when legs come in dirty
  • pH: 3.5–5.0 for copper or zinc sulfate — above 5.5 it stops working, below 3.5 it burns skin
  • Concentration: copper sulfate 2–5% (UW Dairyland Initiative); zinc sulfate 10–20%

Miss two or three of those at 5 a.m., and you haven’t run a footbath. You’ve run cows through an expensive puddle. As Progressive Dairy put it back in 2022, “Without a simple, well-defined footbath protocol, the only consistent result will be poor footbath management and poor hoof health.”

What One Wisconsin Herd Actually Did

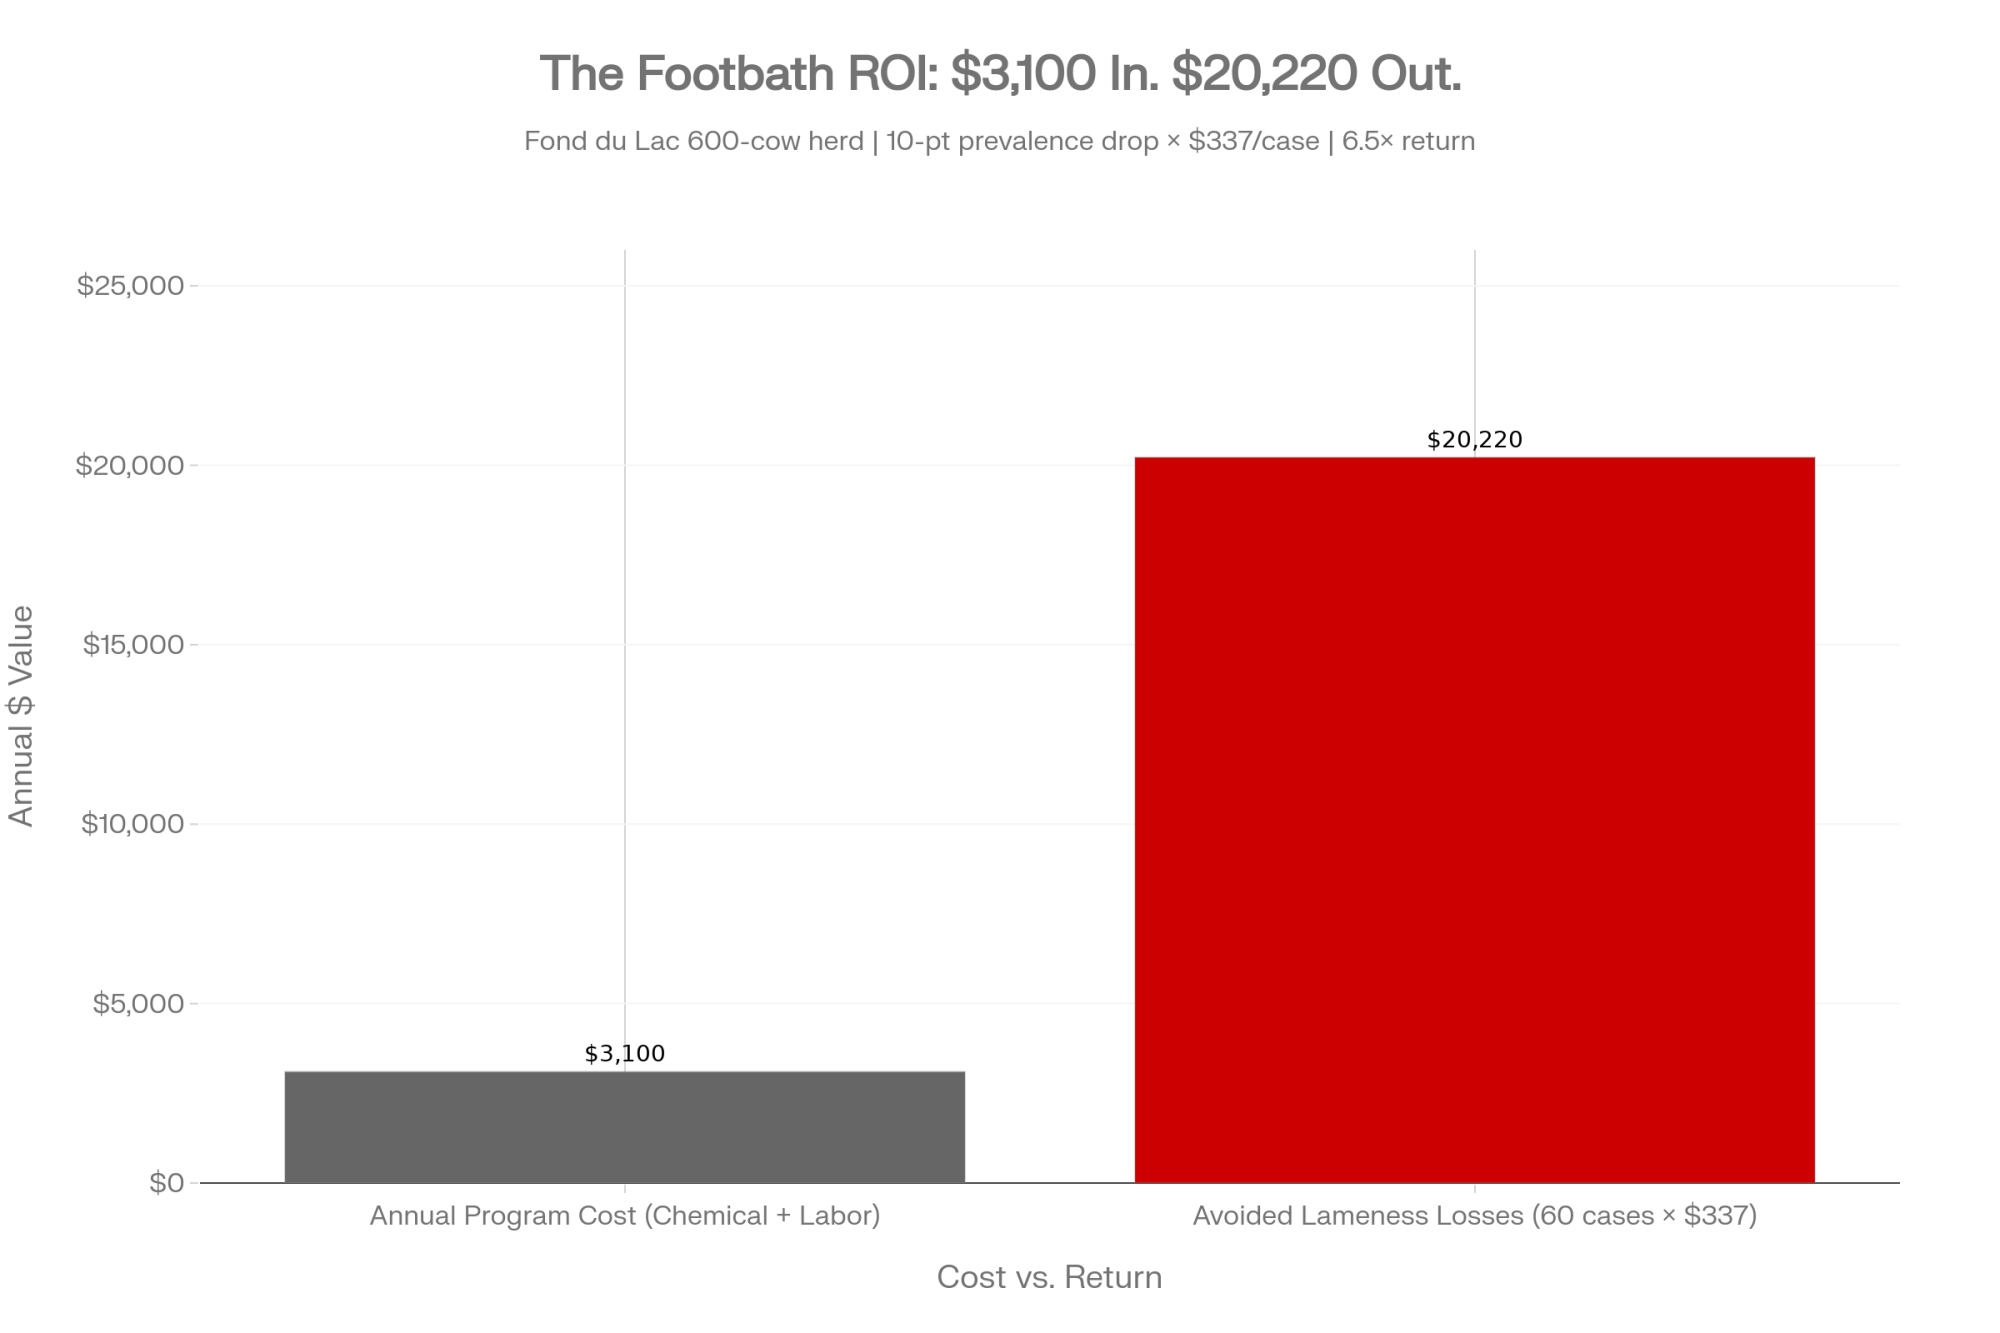
Near Fond du Lac, Wisconsin, a 600-cow herd reported lameness around 24% — right in that “normal” confinement range nobody likes to look at too hard. Over 18 months, the operation pulled it down to 14%, a 42% reduction, on about $3,100 a year. No $45,000 detection cameras. No outside consultant. Just protocol.

What flipped the switch wasn’t a new product. It was deciding the bath wasn’t an afterthought anymore — assigning one employee to own it and running it like a milking shift. As the owner told The Bullvine: “We treat footbaths like milking — non-negotiable, same times, same concentrations, every single week. That consistency matters more than any camera could.” The protocol itself was almost boring on paper — 5% copper sulfate, changed every 200 cow passes, run four times weekly on a fixed Tuesday-Thursday-Saturday-Monday rotation, with pH checked rather than guessed.

That ownership piece is the part most herds skip. The chemistry on that farm wasn’t special. The schedule was, and so was the fact that one person’s name was attached to it. At an estimated $337 per lameness case, the herd’s math worked out to roughly $20,000 a year in avoided losses against that $3,100 spend — a payback measured in weeks, not years.

Which Chemistry — and What It Costs You

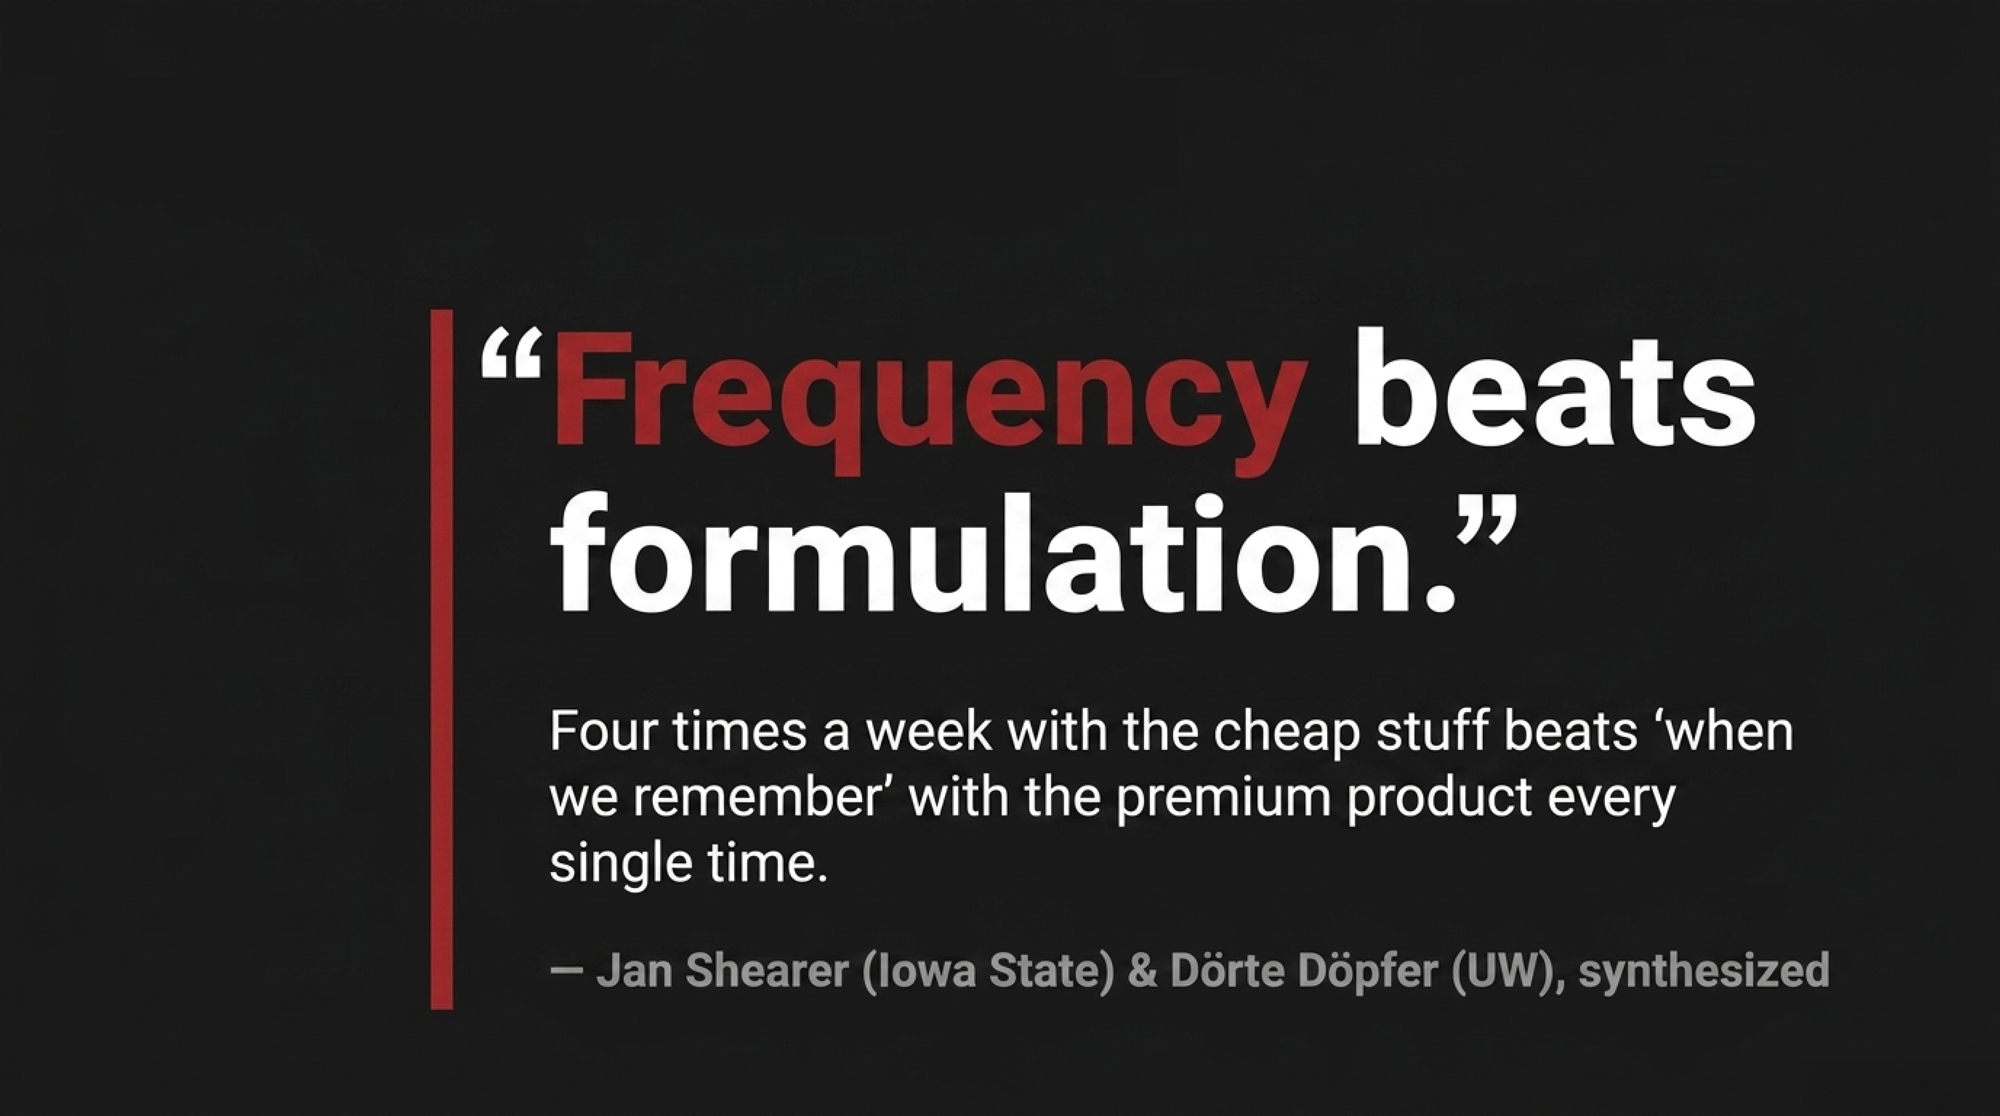
Before anyone argues copper versus zinc versus formalin, get one thing straight: the product matters far less than whether it’s mixed right and changed often enough. Iowa State’s Jan Shearer and UW’s Dörte Döpfer have both made the same point across years of work — frequency beats formulation. Four times a week with the cheap stuff beats “when we remember” with the premium product every time.

ChemicalWorking RateCost SignalCatch / Key Risk
Copper sulfate2–5%~$2–3/lb; most widely used workhorseDoesn’t break down — accumulates in manure, soil, and forage; decade-long programs average 433 ppm liver copper (UW, 2022)
Zinc sulfate10–20%Higher per-bath cost than copperLower environmental load; fewer large-herd efficacy trials vs. copper
Formaldehyde2–5%Cheapest per bathRegistered carcinogen — hard to justify for hand-mixing crews
Stannous fluoridePer labelPremium tier2024 JDS trial controlled DD at far lower copper loading — strongest environmental case for switching

The all-in cost is smaller than most producers assume. The Fond du Lac herd ran its full program — chemical plus labor — for about $3,100 a year. The chemical was never the expensive part. The lameness you don’t prevent is.

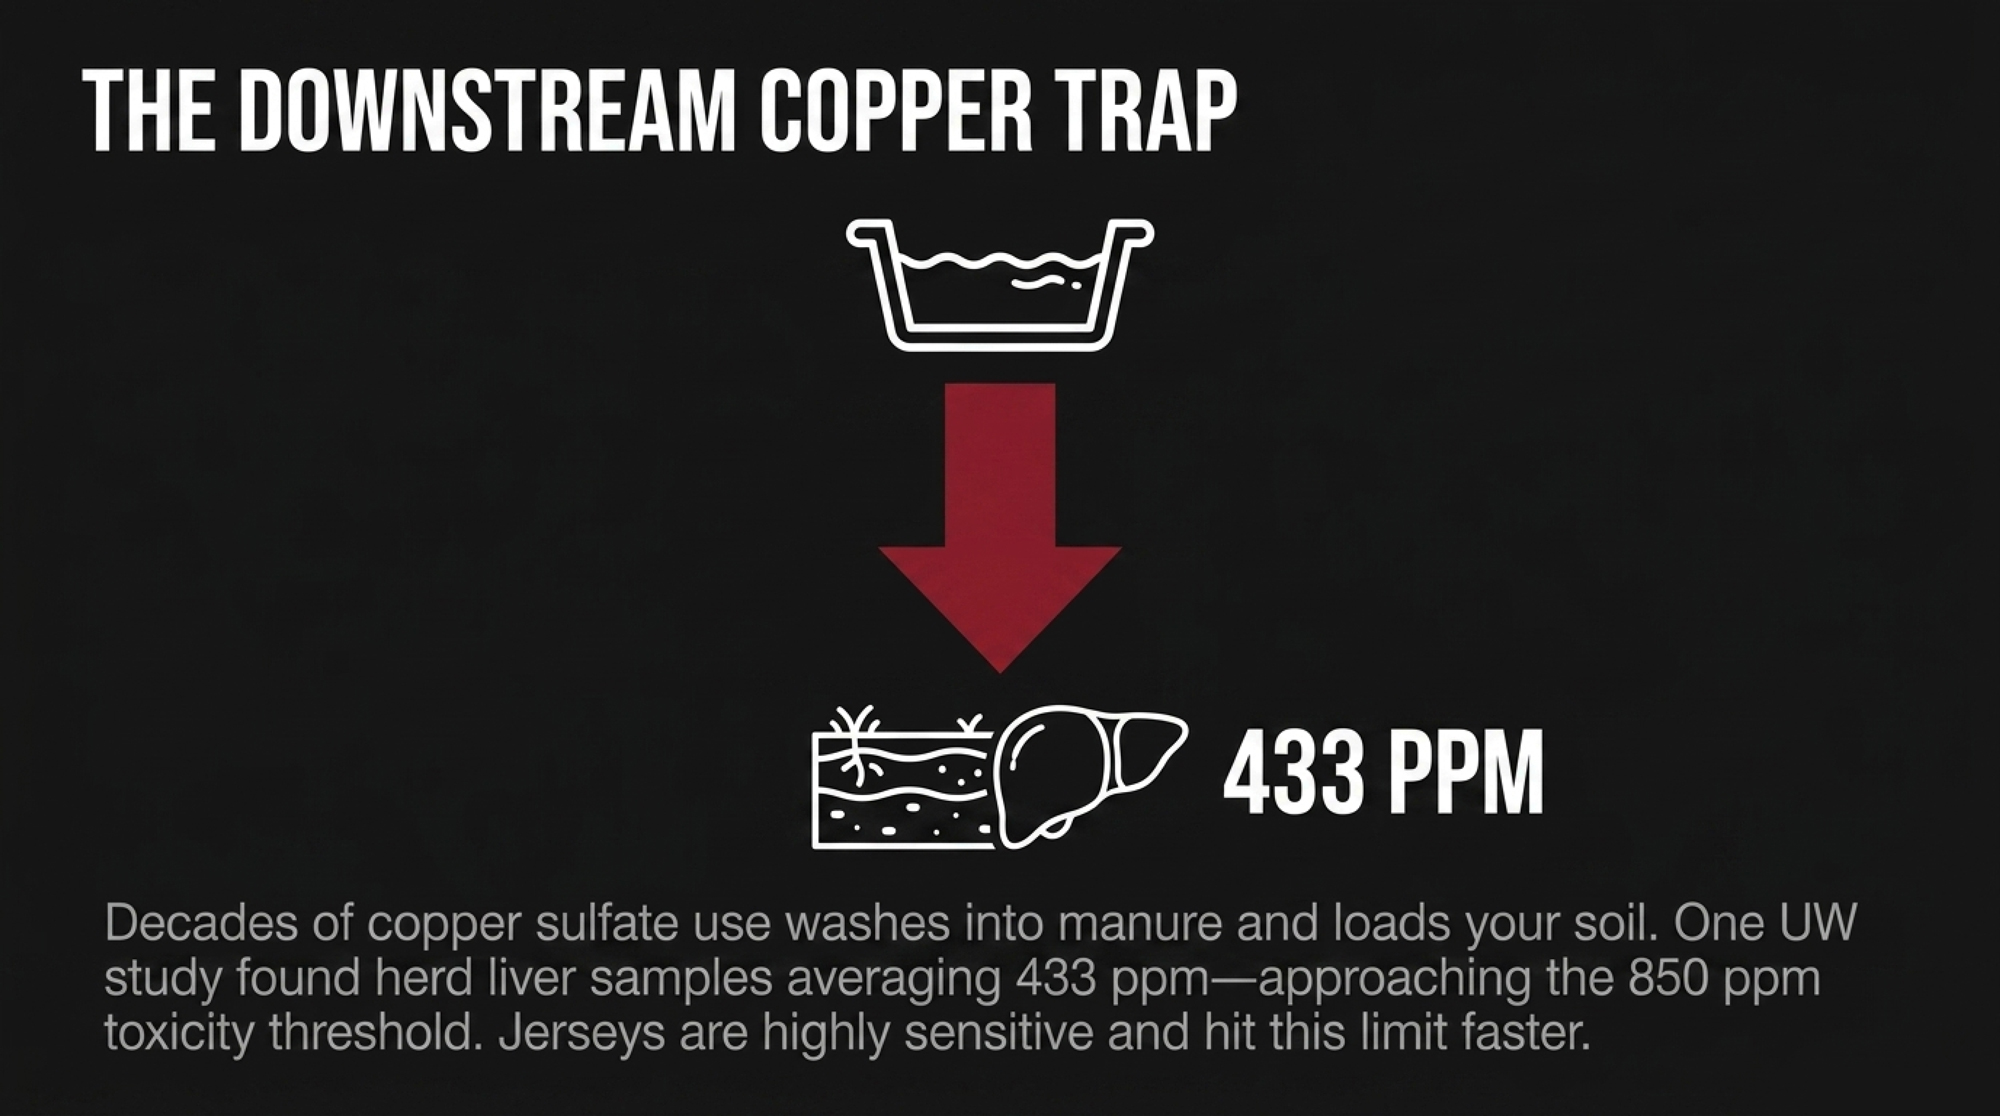
But copper has a cost that doesn’t show up on the invoice. It doesn’t break down — once it’s on your farm, it stays. Spent footbath solution usually gets washed into the manure storage and ends up back on the fields. A 2022 UW–Madison field study across 20 eastern Wisconsin dairies found that farms using copper sulfate footbaths had alfalfa copper levels nearly double a 2005 baseline, with third-cut forage “teetering on the boundary” of recommended TMR copper limits. Liver samples from one participating herd averaged 433 ppm copper, with a high of 740 ppm, well into the range UW flags as concerning (over 500 ppm) and approaching toxicity territory (850 ppm).

Warning for color-bred herds: Jersey cattle are significantly more sensitive to copper accumulation than Holsteins. If you’re running a mixed or pure Jersey herd, the downstream liver-toxicity limits in the UW study apply much sooner, and a forage or liver test moves from “good idea” to “do it this year.”

So the chemistry question isn’t only “does it work.” It’s “what’s it doing to my soil and my cows five years out.” That’s exactly why zinc sulfate, acidified copper at lower rates, and stannous-fluoride products are getting a serious look. None has clearly beaten copper on efficacy in well-run trials. The reason to switch is environmental, not performance.

The Tell: When the Bath Fails, So Does the Rest

A failing footbath is rarely an isolated problem. It’s a symptom.

When the bath is too short, mis-mixed, and run “when we remember,” you tend to find the same casualness elsewhere — overstocked pens, long standing times in the holding area, dirty alleys, and trimming that happens reactively instead of on a schedule. A 2022 Journal of Dairy Science study of automated-milking herds in Europe tied higher lameness to poor stall design, inadequate feed access, higher stocking density, and lower body condition. The herds running sand bedding and better feed access had lower lameness and better milk quality.

The paperwork tells the same story. An Irish survey found only 22% of farmers kept records of lame cows, just 15% had a written lameness herd-health plan, and 28% waited more than 48 hours to treat a cow they’d already spotted as lame. That’s not a knowledge gap. It’s a belief gap. These producers don’t think they’ve got a problem worth planning for.

Which is exactly why the “we’ve got it under control” conversation is so hard. They’re not bluffing you. They genuinely can’t see it.

Run Your Own Numbers

The Fond du Lac herd’s $3,100-for-$20,000 trade is convincing, but the number that moves a skeptic is their own. So here’s the tool, not another lecture on case costs.

Take your herd size, multiply by your honest prevalence, and multiply that by $337 — the per-case figure Robcis and colleagues landed on in a 2023 Journal of Dairy Science analysis (milk loss, reproduction, treatment, culling, and labor combined). A 350-cow herd at 20% is 70 cases, or about $23,590 a year. Regional labor costs shift the number — higher-wage regions land above the average, lower-wage regions below — and be skeptical of the $400–533 figures in equipment sales decks, which lean on inflated 30–40% prevalence assumptions that may not match your barn.

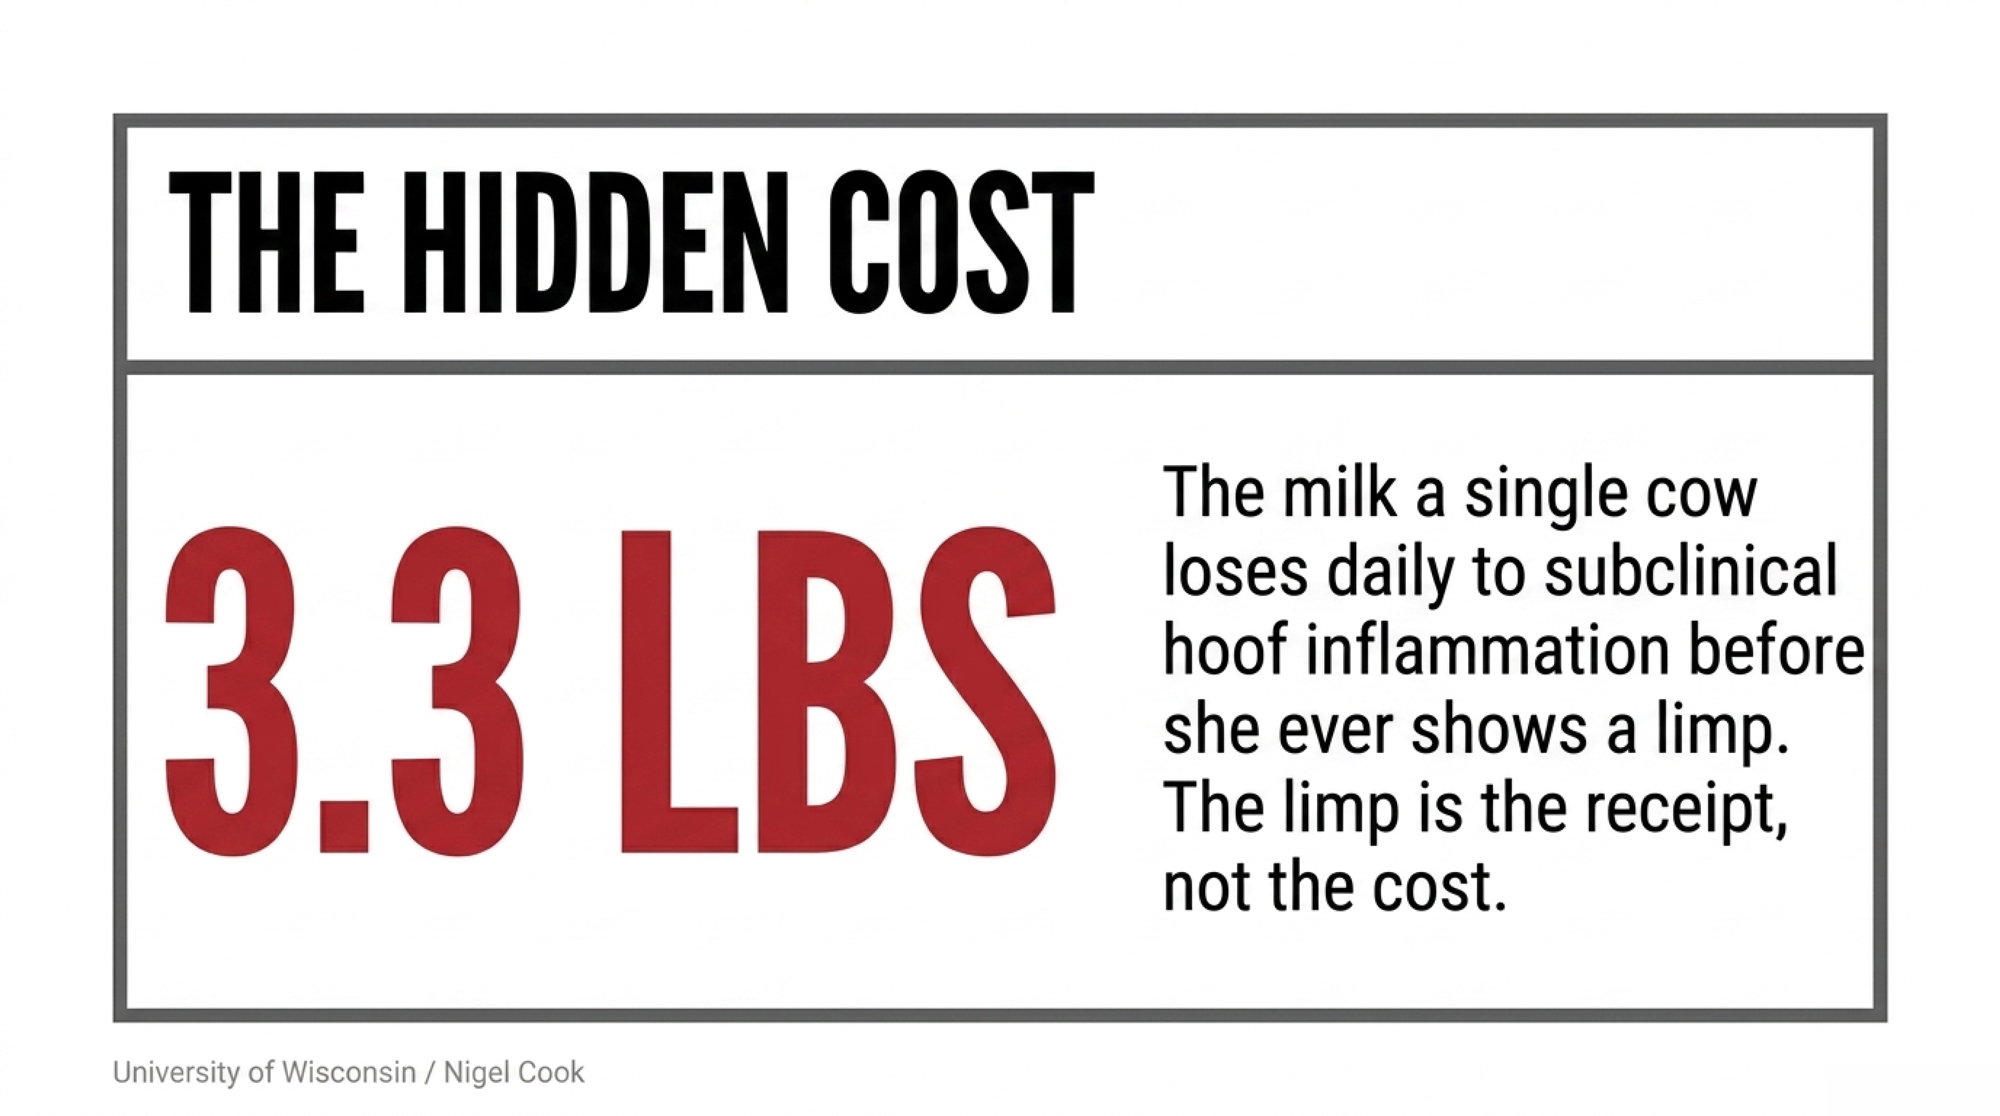
And the subclinical piece is where it gets quietly expensive. University of Wisconsin work led by Nigel Cook, as reported by The Bullvine, found that cows with subclinical hoof inflammation lose an average of 3.3 pounds of milk per day before they ever look lame, which is tied to as much as 17% of net farm profit in some herds. Read that as “in some operations,” not “in yours.” The point stands either way: the limp is the receipt, not the cost.

Why Did “10–20%” Ever Become Normal?

Somewhere along the way, an average became a standard. And, in our view, producers started defending a number that the industry shouldn’t be comfortable with.

Here’s where it came from. The literature kept reporting confinement herds in the low-20s. Merck repeated “15–30% in confinement.” Busy people shaved the top off that range in conversation until “10–20%” started to sound like a target rather than a symptom. Nobody ever published a paper calling that level acceptable. It just hardened into a norm through repetition.

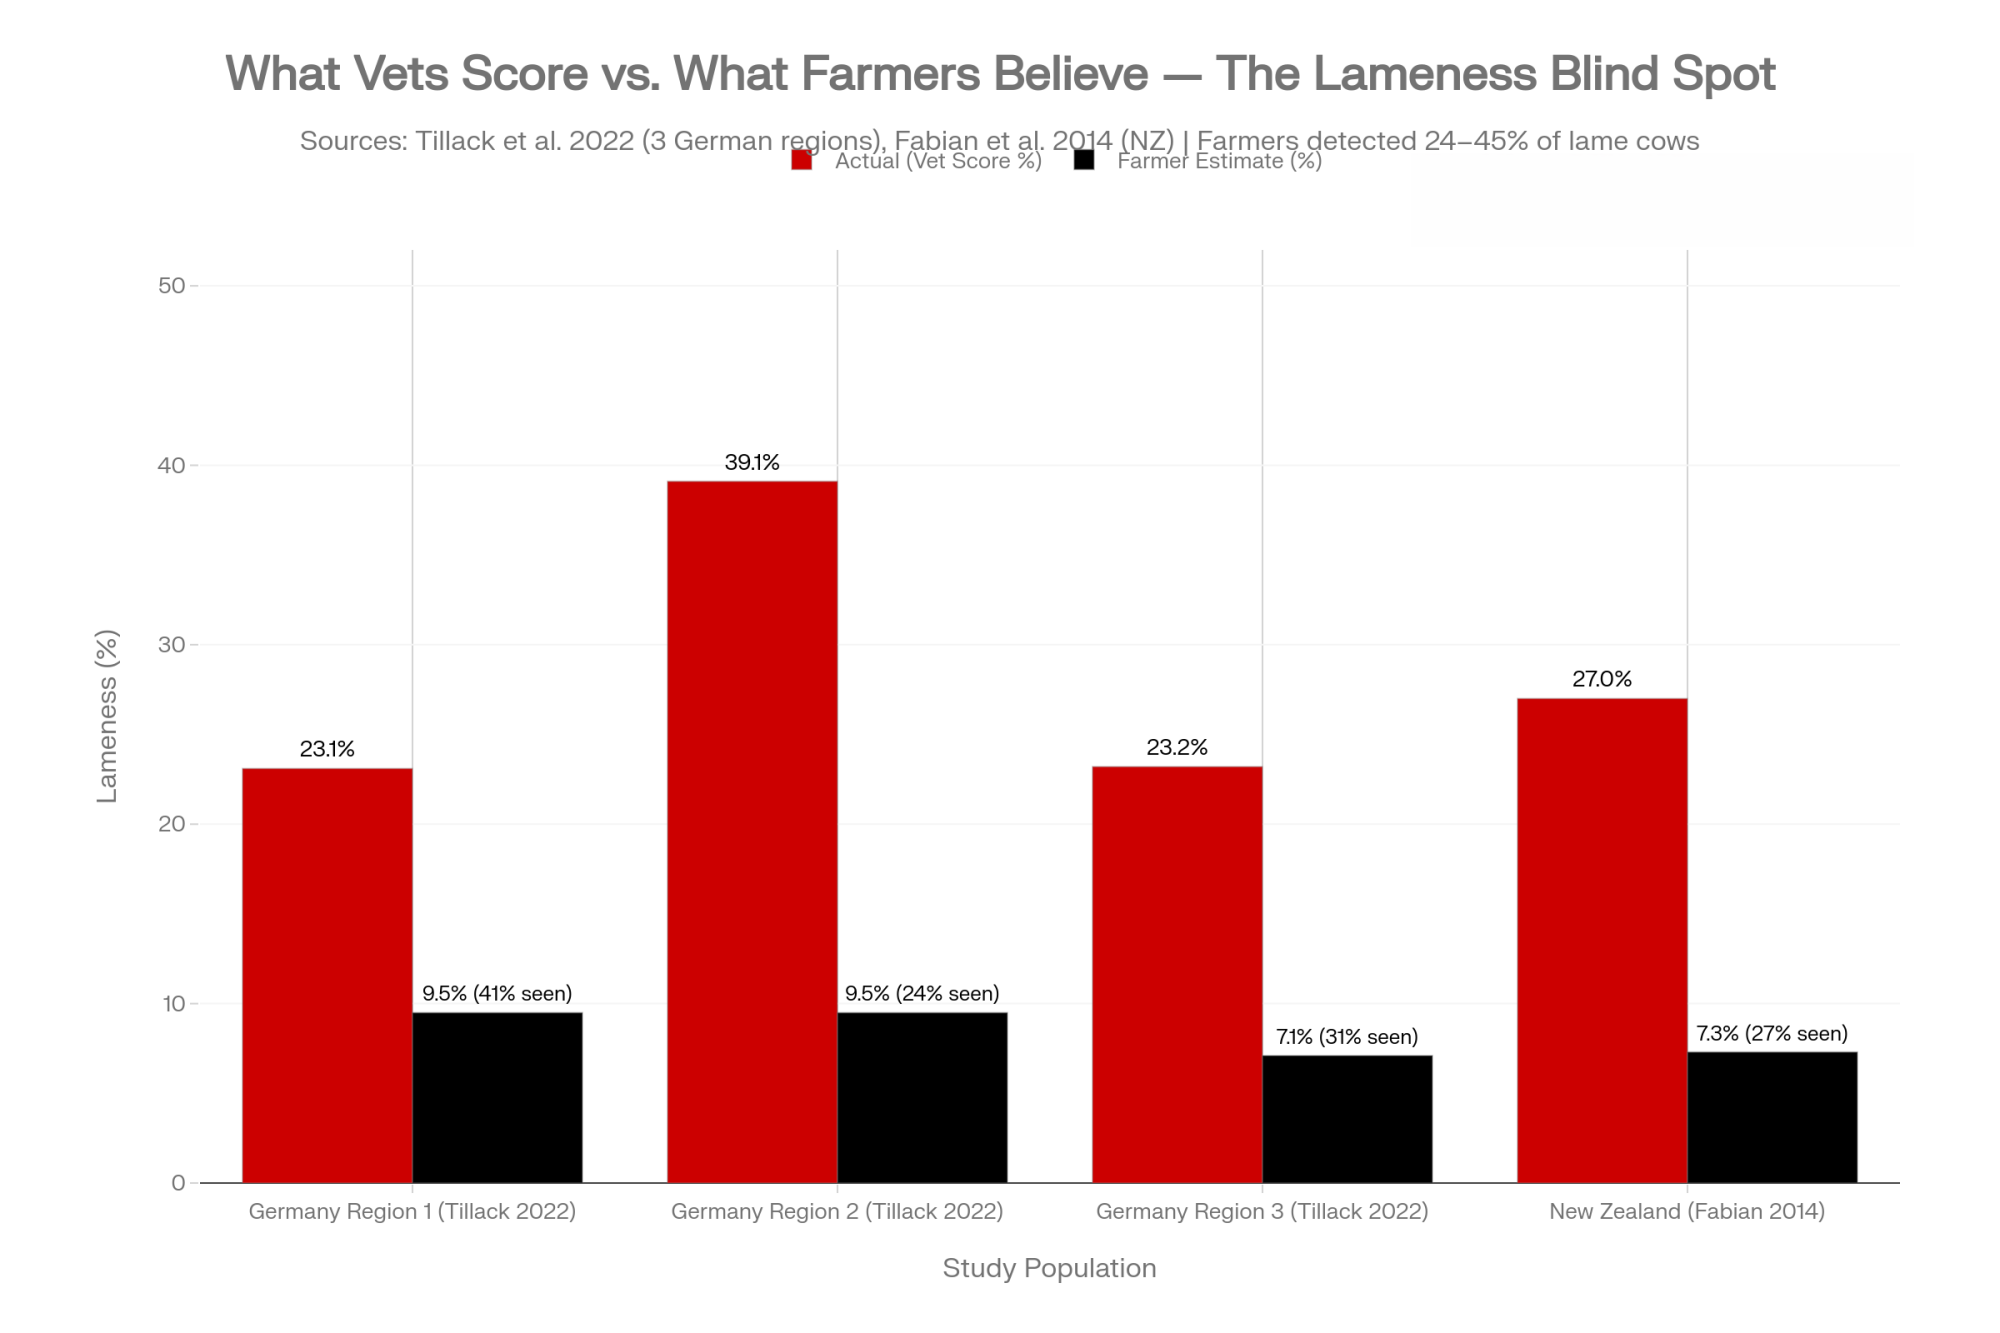
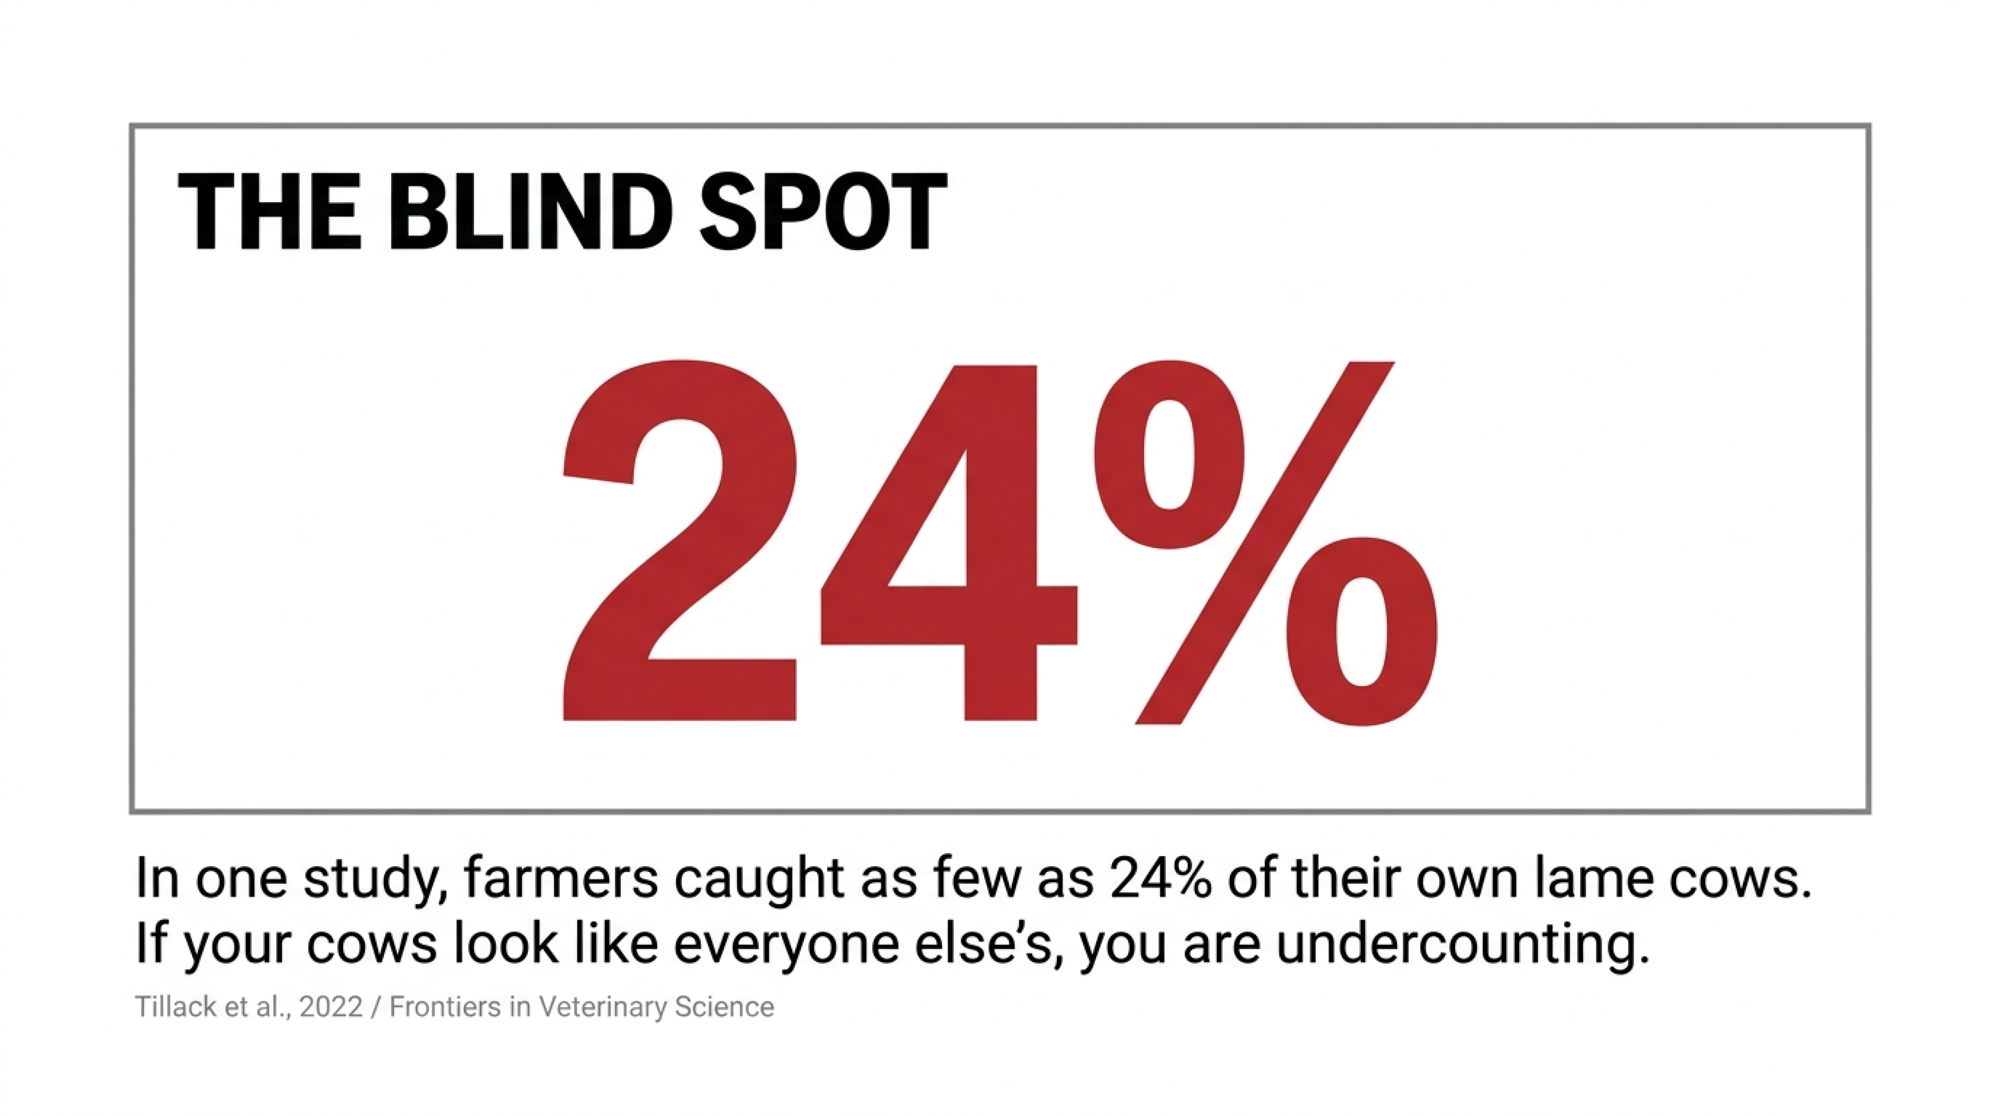
The detection failure cemented it. A 2022 German study (Tillack and colleagues, Frontiers in Veterinary Science) had veterinarians score median lameness at 23.1%, 39.1%, and 23.2% across three regions, while the farmers in those same herds estimated 9.5%, 9.5%, and 7.1%. On average, those farmers were consciously aware of only 45.3%, 24.0%, and 30.0% of their lame cows. A 2014 New Zealand study (Fabian and colleagues) found nearly the same pattern: farmers recognized only about 27% of cows with reduced mobility.

So you get a region where every herd sits somewhere between 10% and 30%, everyone’s eyes are undercounting, and the lived experience becomes “my cows look like everyone else’s, so we’re fine.” That feeling is almost impossible to argue with — until a clipboard and a scoring chart make it visible.

The Window Most Herds Miss: Dry Cows and Heifers

If your footbath schedule only covers the milking string, you’re treating the symptom and ignoring the nursery. Digital dermatitis doesn’t wait for the first lactation. Heifers can carry lesions into the parlor on day one, and the dry-cow pen is where much of the infection quietly resets and reloads for the next lactation. Canada’s proAction footbath guidance is blunt about it: don’t forget the dry cows and the heifers.

The trim window matters as much as the bath here. University of Bristol research found that moving the functional trim to the dry period — before the metabolic and hormonal stress of calving lands — cut hoof lesions by 62%. But timing isn’t one-size-fits-all. Minnesota’s Gerard Cramer, whose 2025 randomized trial tested dry-off trimming methods, now argues trimming should be “targeted, not automatic” — his data showed the biggest payoff in first-lactation cows, where a modeling-focused trim at dry-off cut the odds of hoof-horn lesions by 76%, while blanket whole-herd trimming mostly burned chute time better spent on at-risk animals.

The economics back the targeted approach. A 2024 study found partial-herd trimming delivered a higher three-year net benefit than whole-herd trimming 100% of the time, and Bullvine-reported data pegs a well-timed mid-lactation trim (after 110 days in milk) at roughly $308 per cow per lactation in retained milk. So the practical move is to fold heifers and dry cows into the same hygiene discipline as the milk cows — footbath passes where the facility allows, clean dry housing, and a trim plan timed to dry-off and the right cows, rather than “whenever the trimmer’s already here.” The herds that reach single-digit lameness rarely do so by managing the milking string alone.

What “Good” Actually Looks Like

Set a real target, because “better than last year” isn’t one. The Fond du Lac herd’s 14% wasn’t even the ceiling — an Idaho operation cited by The Bullvine ran the full prevention bundle to 12%, then layered in cameras and held 8% consistently. The 8% you see quoted for pasture systems isn’t physics. It’s what consistent foot hygiene, low standing time, and timely trimming buy you, and some confinement herds get close.

The herds that live there share a short list of habits, and none of them are exotic. The footbath runs on a fixed schedule with one named owner. Concentration and pH checked, not guessed. Trim records reviewed quarterly, not pulled out only when a cow’s already three-legged. New lame cows treated within 48 hours, not parked until the next chute day. Locomotion scoring is done monthly by the same person, so the trend line means something.

Notice what’s not on that list: a more expensive chemical, a fancier bath, a bigger budget. The gap between a 24% herd and a 14% herd — the exact gap that Wisconsin farm closed — wasn’t money. It was about standards and whether anyone was actually accountable for upholding them.

What This Means for Your Operation

Walk your own barn against these. Each one pairs the question with a number that indicates whether your answer is good enough.

  • Are you counting, or guessing? Farmers in the German study were consciously aware of as few as 24% of their lame cows (Tillack 2022), while DD is present in 70–95% of U.S. herds (UW). Locomotion-score a random 100–200 cows this month and set that figure next to your gut estimate. If they’re far apart, you’ve found your problem.
  • Who owns the protocol? The Fond du Lac herd put one named employee on the bath and went from a reported 24% to 14%. If you can’t name the exact person responsible for mixing and monitoring, your program is running on luck.
  • Is your chemistry actually at spec? 27% of surveyed Wisconsin farms ran copper at triple the recommended rate. Check concentration and pH against a written spec — not by eye — this week.
  • Are the dry cows and heifers on the schedule? If only the milking string gets the bath, you’re reloading the infection every lactation. Fold them in, and time the dry-off trim to the cows that benefit most — Cramer’s trial showed a 76% cut in hoof-horn lesion odds in first-lactation cows.
  • Can you treat a new lame cow within 48 hours? The best herds don’t park her until the next chute day. If yours waits, that’s where chronic, expensive cases are born.
  • What’s your downstream copper footprint? If you’ve run copper sulfate for more than a decade, pull a third-cut alfalfa forage sample and test for accumulated loading — UW found farm forage copper near double its baseline and liver levels averaging 433 ppm.

Key Takeaways

  • If you can’t name the owner of your footbath, fix that first. The Wisconsin herd’s 24%-to-14% drop was driven by accountability, not equipment — one employee, a fixed four-day rotation, no skipping.
  • If your bath misses on length, depth, pH, or change frequency, the chemical doesn’t matter. Frequency beats formulation; 5% copper run four times a week on spec beats a premium product run “when we remember.”
  • If you’ve never measured prevalence, your gut is probably undercounting by half. Score 100–200 cows in the next 30 days — the cheapest, highest-value move on this list.
  • If you’ve been running copper for 10+ years, test your forage before switching products. The performance reason to change is thin; the soil-and-liver reason is real, and it shows up first in Jersey herds.

Most producers carry lameness as a bill they pay. The reframe that walks someone out to the alley with a clipboard is simpler and harder: lameness isn’t a bill, it’s a choice you make every day in how you measure, who you hold accountable, and what you’re willing to see. So which number are you defending — and would it survive a real score?

Run Your Numbers

Health ROI Calculator — That $337-a-case figure is an average, not your barn. Run your own herd size, prevalence, and protocol cost through the Health ROI Calculator to see whether tightening your footbath program actually pays back in lower culling, less milk loss, and fewer chronic cases — before you spend a dollar.

Complete references and supporting documentation are available upon request by contacting the editorial team at editor@thebullvine.com.

Learn More

The Sunday Read Dairy Professionals Don’t Skip.

Every week, thousands of producers, breeders, and industry insiders open Bullvine Weekly for genetics insights, market shifts, and profit strategies they won’t find anywhere else. One email. Five minutes. Smarter decisions all week.
NewsSubscribe
First
Last
Consent
Send this to a friend