Archive for Holstein Conformation Composite

The Ripcord Risk: Correcting the Genetic Blind Spot in Legs

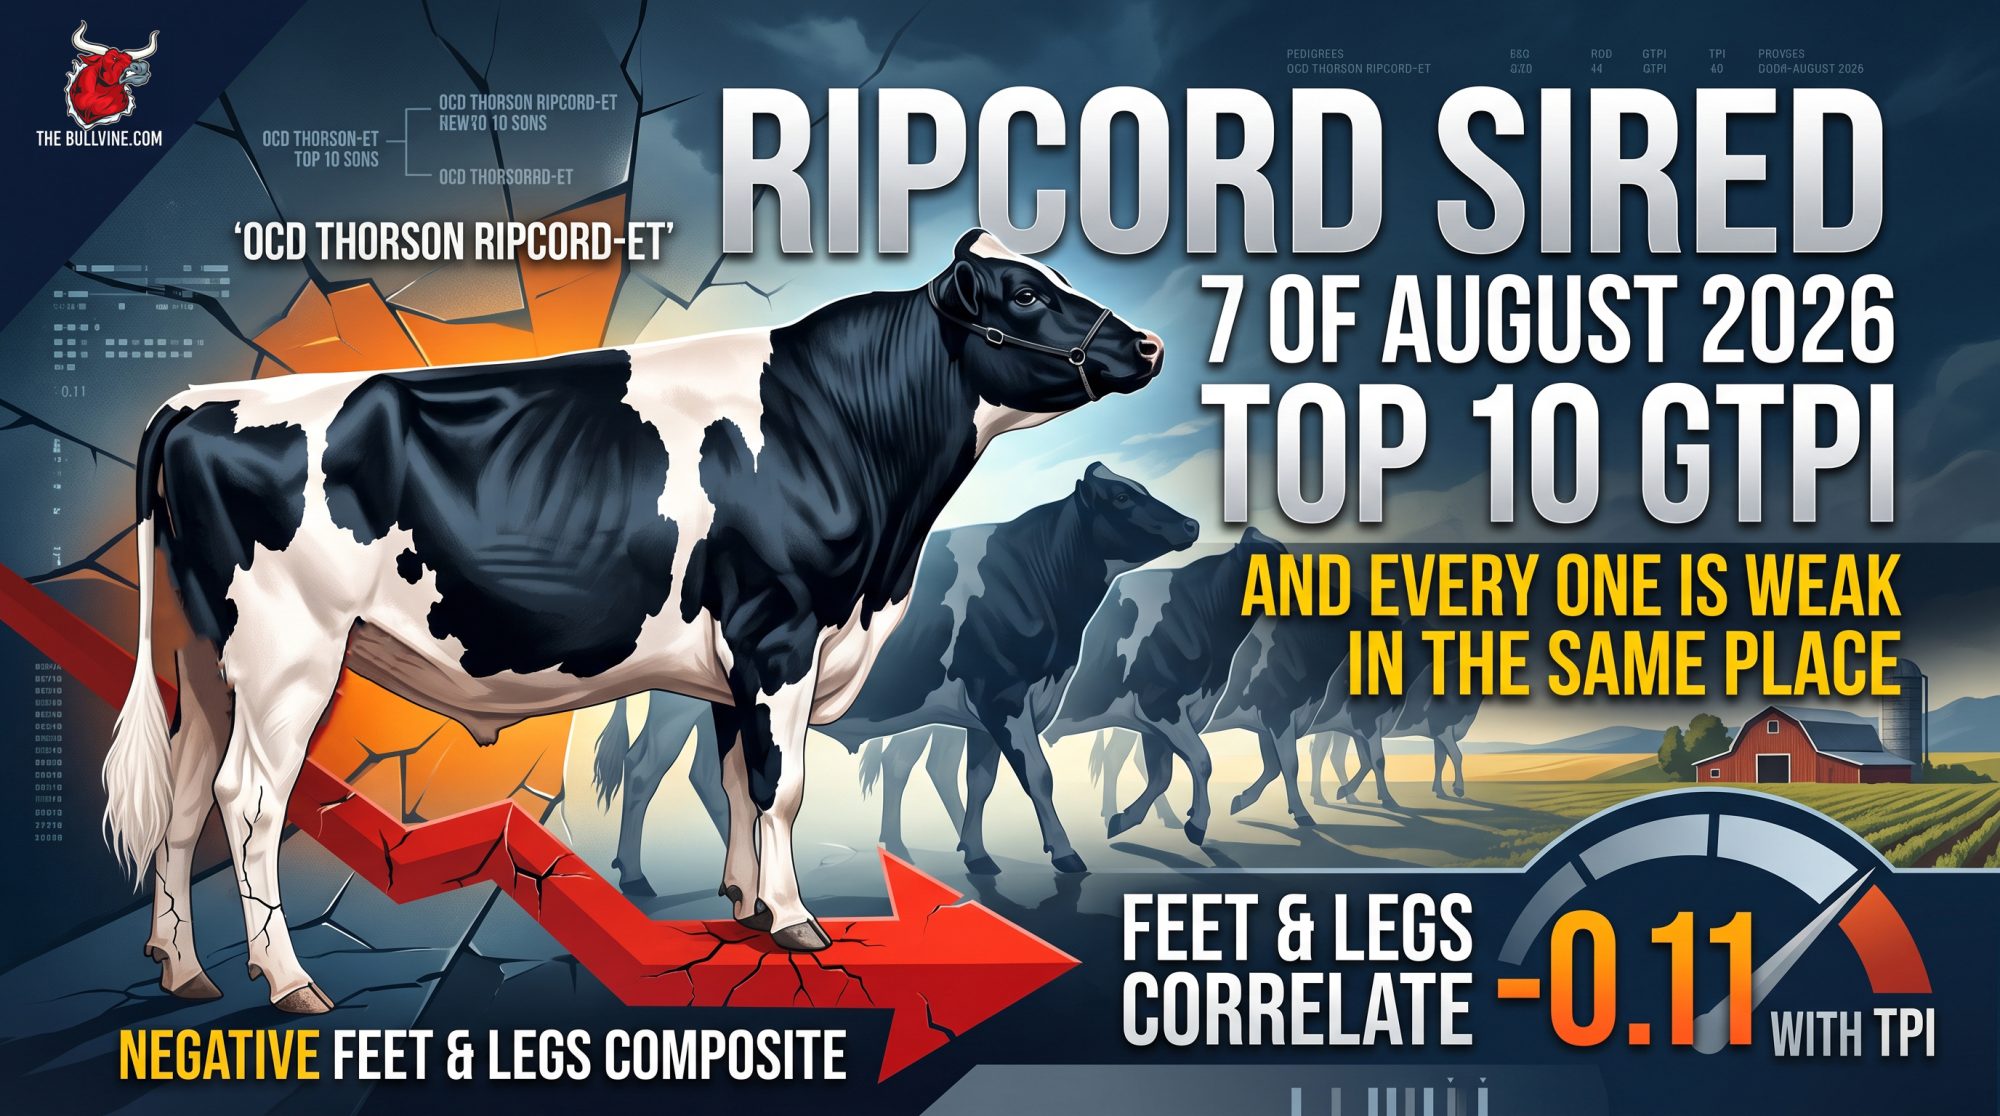
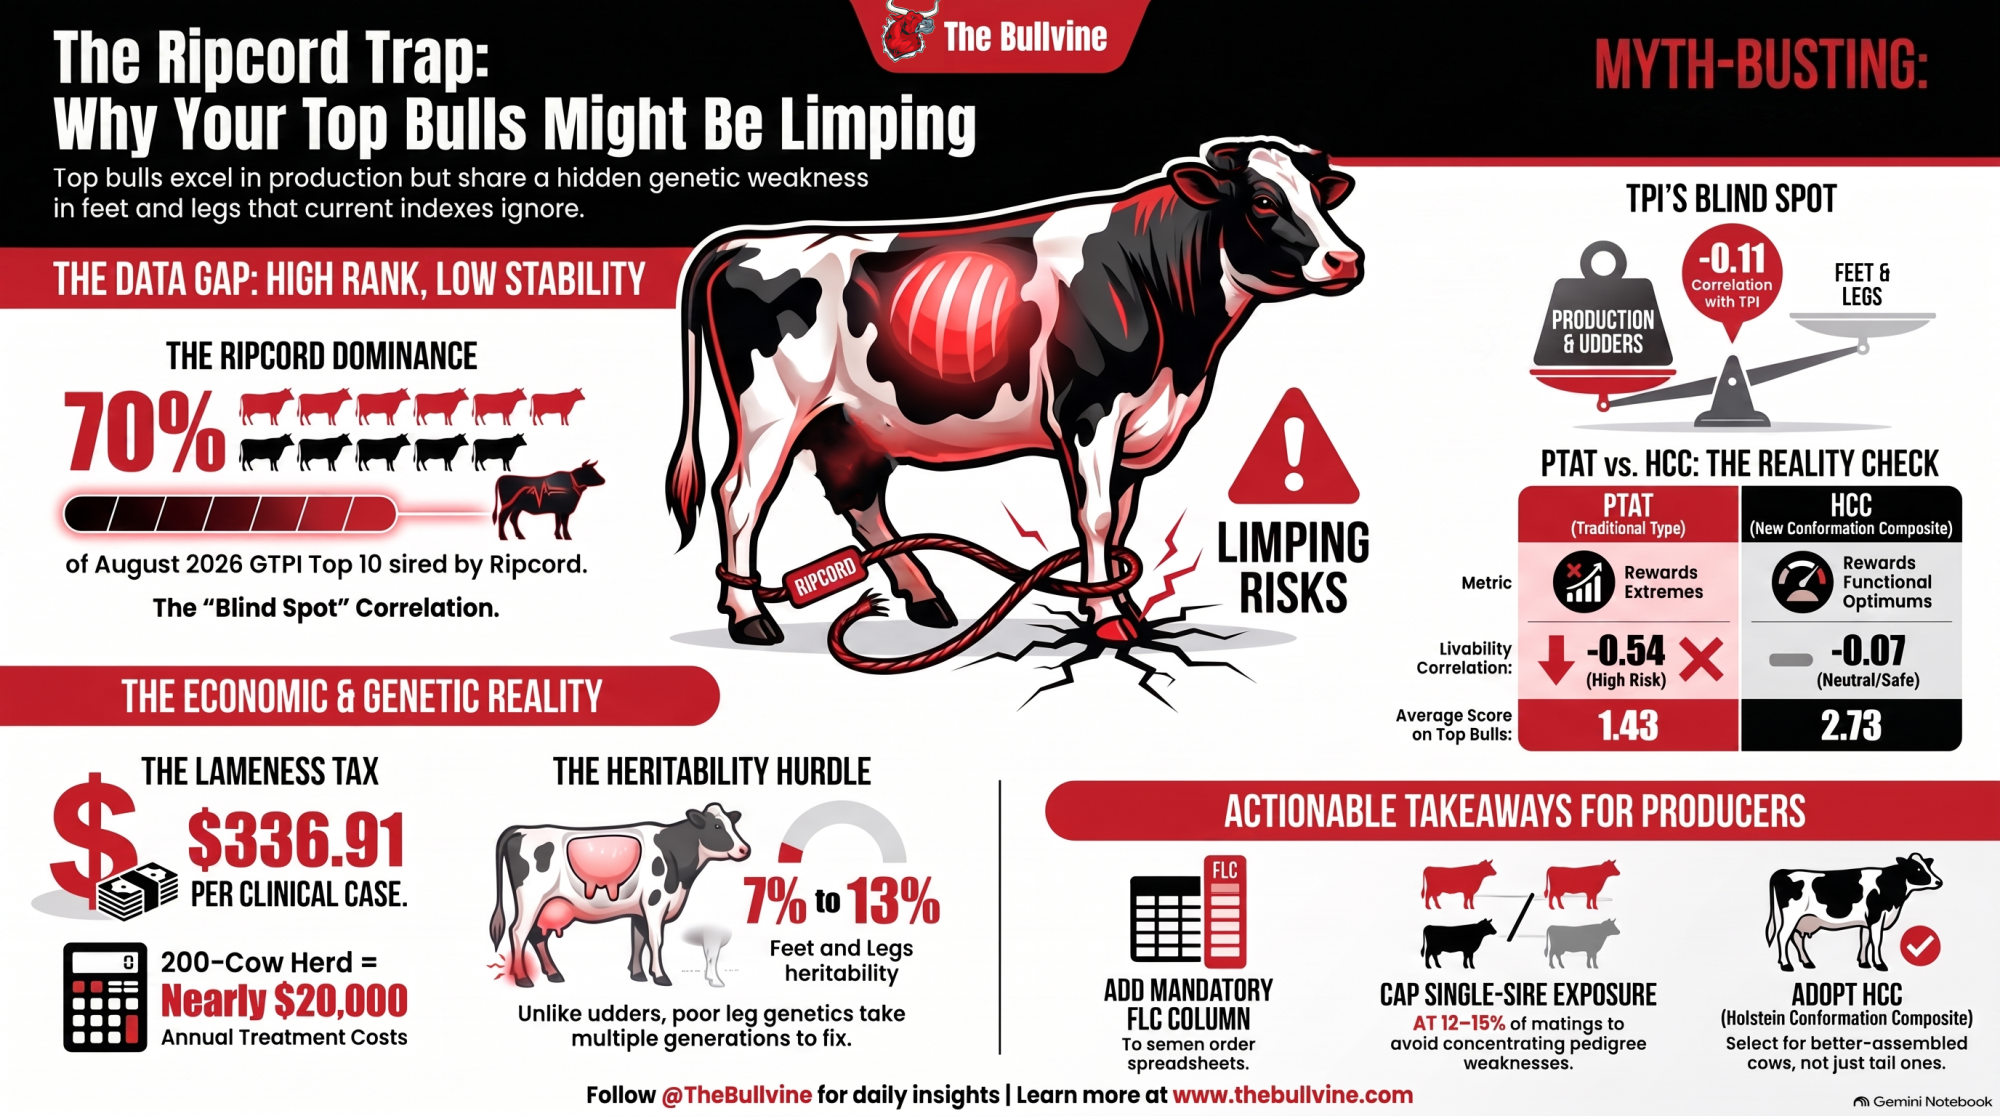
Seven of the ten highest-GTPI bulls in the U.S. share one father. Every one is positive on udders, negative on feet and legs. Feet and legs correlate −0.11 with TPI — your ranking won’t flag it.

EXECUTIVE SUMMARY:

  • What happened: Seven of the ten highest-GTPI bulls in the August 12, 2026 U.S. run trace to one father — Ocd Thorson Ripcord-ET — and eight of the top ten on Net Merit $. Every one of those GTPI sons carries a positive Udder Composite alongside a negative Feet & Legs Composite.
  • Why your ranking won’t catch it: In Holstein Association USA’s own August matrix, FLC correlates −0.11 with TPI across 630,295 females born in 2020. That’s not a formula that penalizes legs. It’s a formula that can’t see them. And legs are the slowest thing in the barn to fix — Lactanet puts Holstein Feet & Legs heritability at 13% and Foot Angle at 7%, below the .10 threshold Holstein USA itself says you need for meaningful progress, against stature at 46%.
  • What it costs, and what to do: At $336.91 per clinical lameness case, a 200-cow herd running 20% incidence pays $13,476 a year; one at the 29.5% published median pays $19,878 — a $6,400 swing on the same milk check. The new Holstein Conformation Composite is the first index in years that weights legs heavily, and it correlates just 0.64 with PTAT, which itself runs −0.54 against Livability in that cohort. Before your next semen order, add one column: pull FLC on every straw and note where Ripcord shows up as sire or maternal grandsire.
Feet and Legs Composite

Open the August 12, 2026 evaluation, pull the U.S. GTPI top ten, and check the sires. Seven of those bulls trace to one father: Ocd Thorson Ripcord-ET. On the Net Merit $ top ten, it’s eight of ten.

Now look at their type numbers. The Ripcord sons in that GTPI top ten show a consistent pattern in our review of the August run — positive Udder Composite alongside negative Feet & Legs Composite. Individual values vary, so pull each bull’s own UDC and FLC rather than trusting the pattern. But the direction is the direction, seven times over.

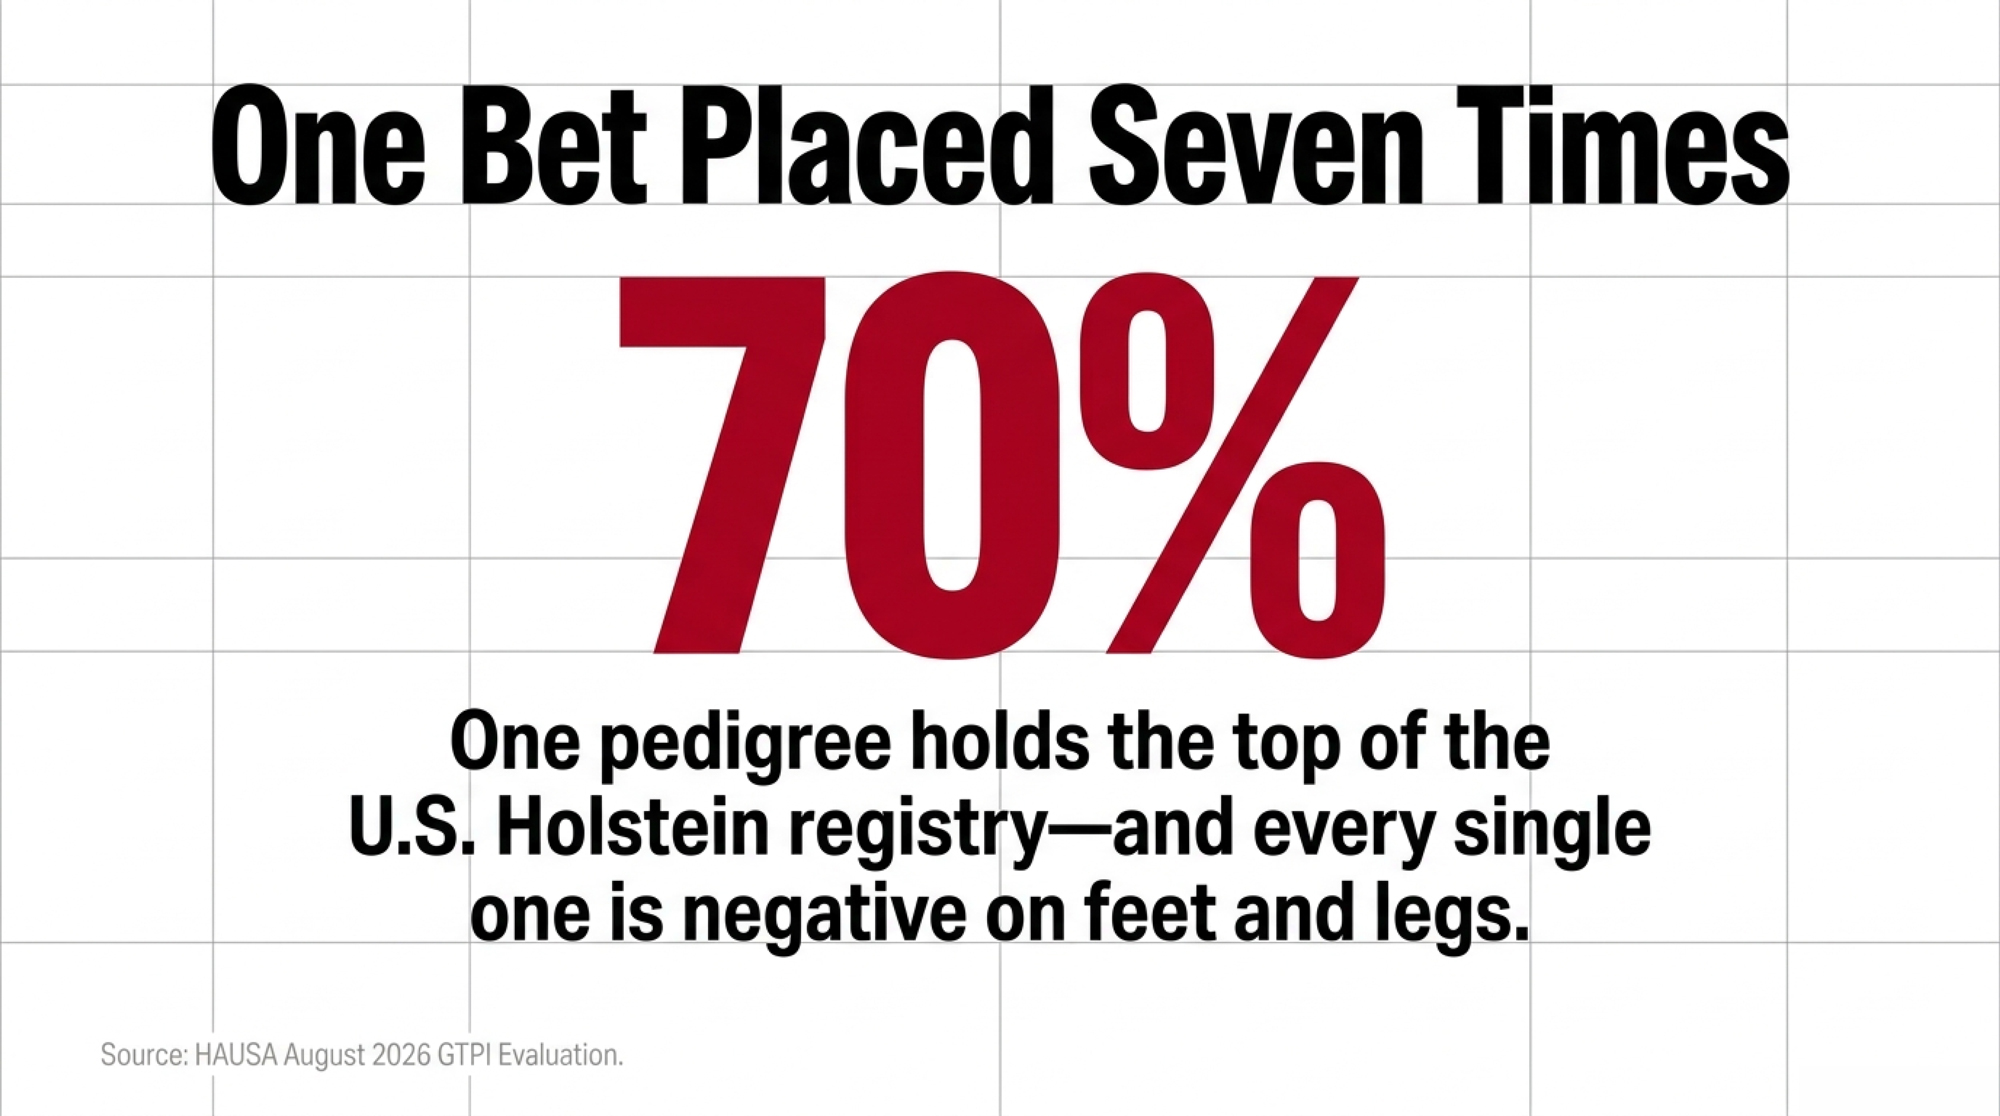
That’s not a popular-sire story. Holsteins have had those for sixty years. That’s one pedigree holding 70 to 80 percent of the top of the U.S. Holstein registry while the trait group most likely to shorten a cow’s stay sits in the same place on all of them.
Why Won’t the Index Catch This?

Because feet and legs barely register in it.
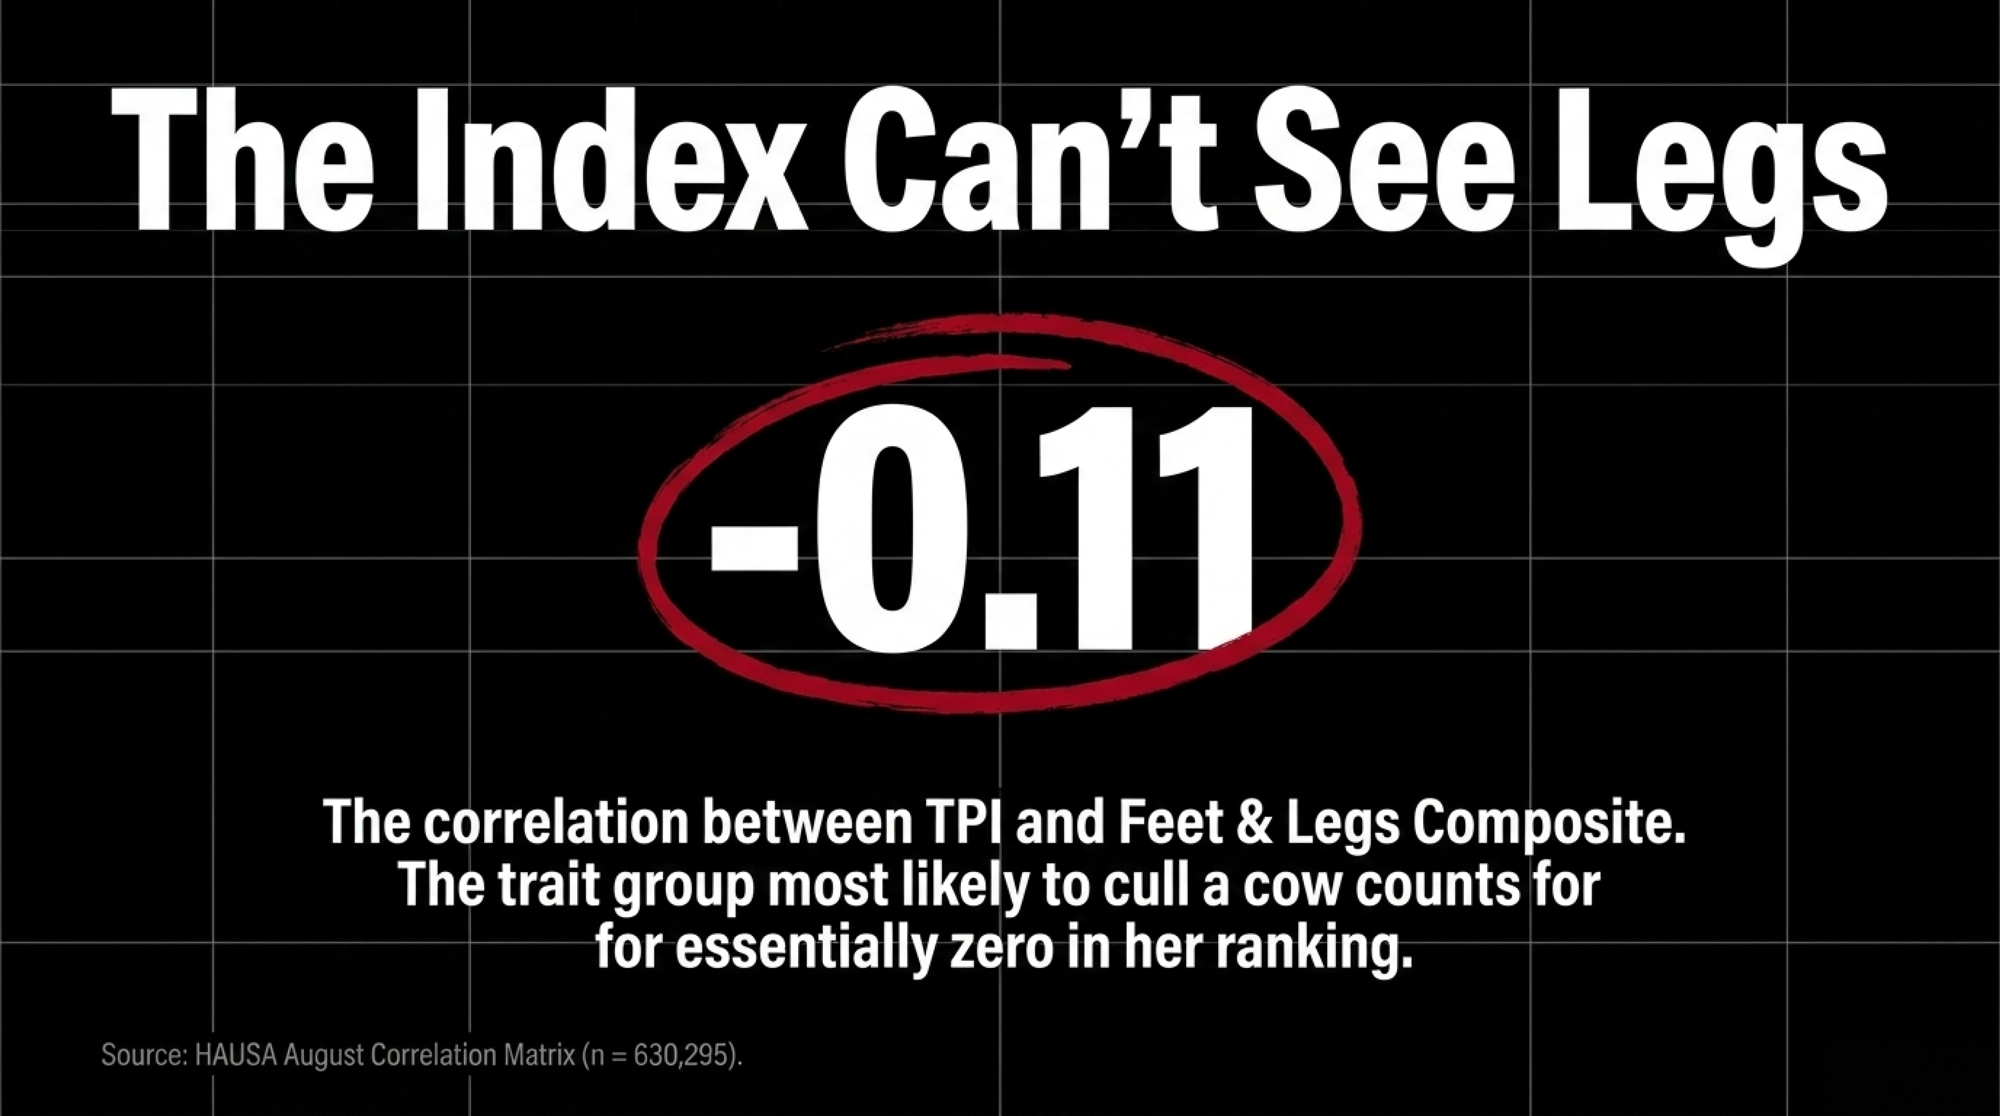
In the correlation matrix Dr. Jason Graham and Dr. Sam Comstock published for the August run — females born 2020, n = 630,295 — Feet & Legs Composite correlates −0.11 with TPI. Call it zero. A bull’s leg composite tells you essentially nothing about where he’ll rank.

Holstein Association USA publishes UDC and FLC separately on every bull, so both numbers sit on every proof sheet you pull. They don’t move a TPI ranking in either direction. A breeder sorting on GTPI or Net Merit sees production, health, and fertility shift the number — and sees nothing from the trait group that decides how many of those daughters are still walking sound at 30 months.

What HCC Actually Rewards

The same run published the Holstein Conformation Composite for every animal in the HAUSA database, and April-to-August scores correlate at 0.99 across 4,055 animals. The calculation is stable out of the gate.
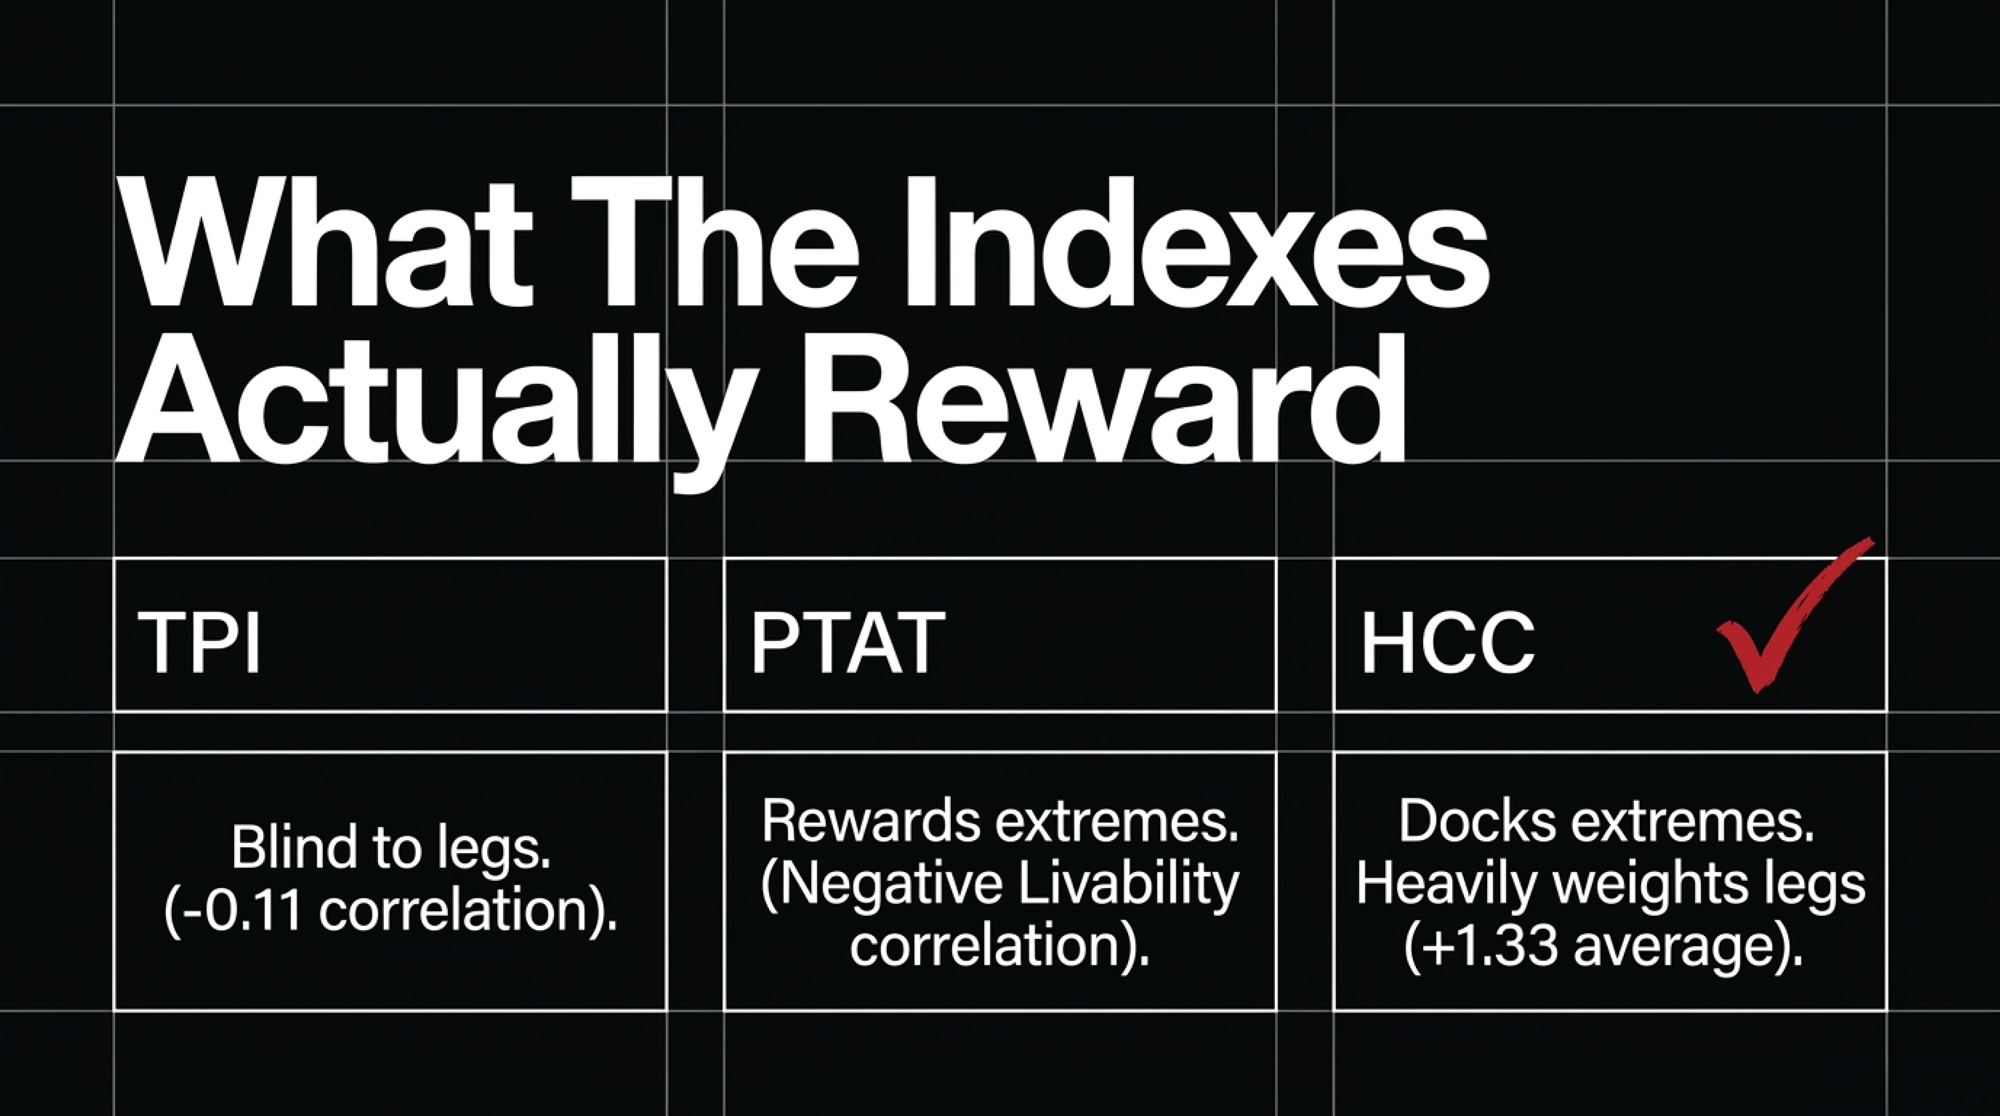
Graham and Comstock pulled the top 25 HCC bulls and averaged all 18 linear traits. Rear Legs Rear View averages +1.61 — the strongest trait in the whole profile. Feet & Legs Score: +1.33. Foot Angle: +0.86. Stature? −0.42. These aren’t tall bulls. They’re better-assembled ones.

That’s the design working as intended. HCC scores each linear trait against a functional optimum and penalizes deviation in either direction. Traditional type evaluation rewards extremes; HCC docks them. Rump angle averages +0.25 across that group, body depth +0.14, rump width +0.52 — near the middle, none pushed.

Across those 25 bulls, HCC runs 2.58 to 3.08 and averages 2.73. PTAT across the same animals averages just 1.43. Same bulls, more than a full point of disagreement between the two scores.

MetricHCC (Holstein Conformation Composite)PTAT (Traditional Type)What it means
Average score, top 25 bulls2.731.43Same bulls score a full point apart
Rear Legs Rear View (avg deviation)+1.61Not separately weightedHCC’s single strongest trait
Correlation with Livability−0.07 (essentially none)−0.54PTAT selection tracks with cows leaving sooner
Correlation with Productive LifeNot published in this run−0.38Same pattern, second metric
Correlation with Feet & Legs Composite+0.57+0.64Both “see” legs; TPI (−0.11) doesn’t
Correlation between HCC and PTAT0.640.64Related, not interchangeable

The Longevity Number Worth Arguing With

In that 630,295-female cohort, PTAT correlates −0.54 with Livability and −0.38 with Productive Life. HCC correlates a milder −0.18, and essentially nothing at −0.07.

Cows bred for higher PTAT left the herd sooner. Graham and Comstock flag the caveat themselves — correlations shift with the population you sample. Fair enough. But the direction holds in both their bull-list work and their cow-level matrix, and the two composites correlate just 0.64 with each other. Related. Not interchangeable.

Feet & Legs Composite correlates +0.57 with HCC and +0.64 with PTAT. Both type composites see legs. TPI doesn’t.

The Barn Math on a Leg Decision
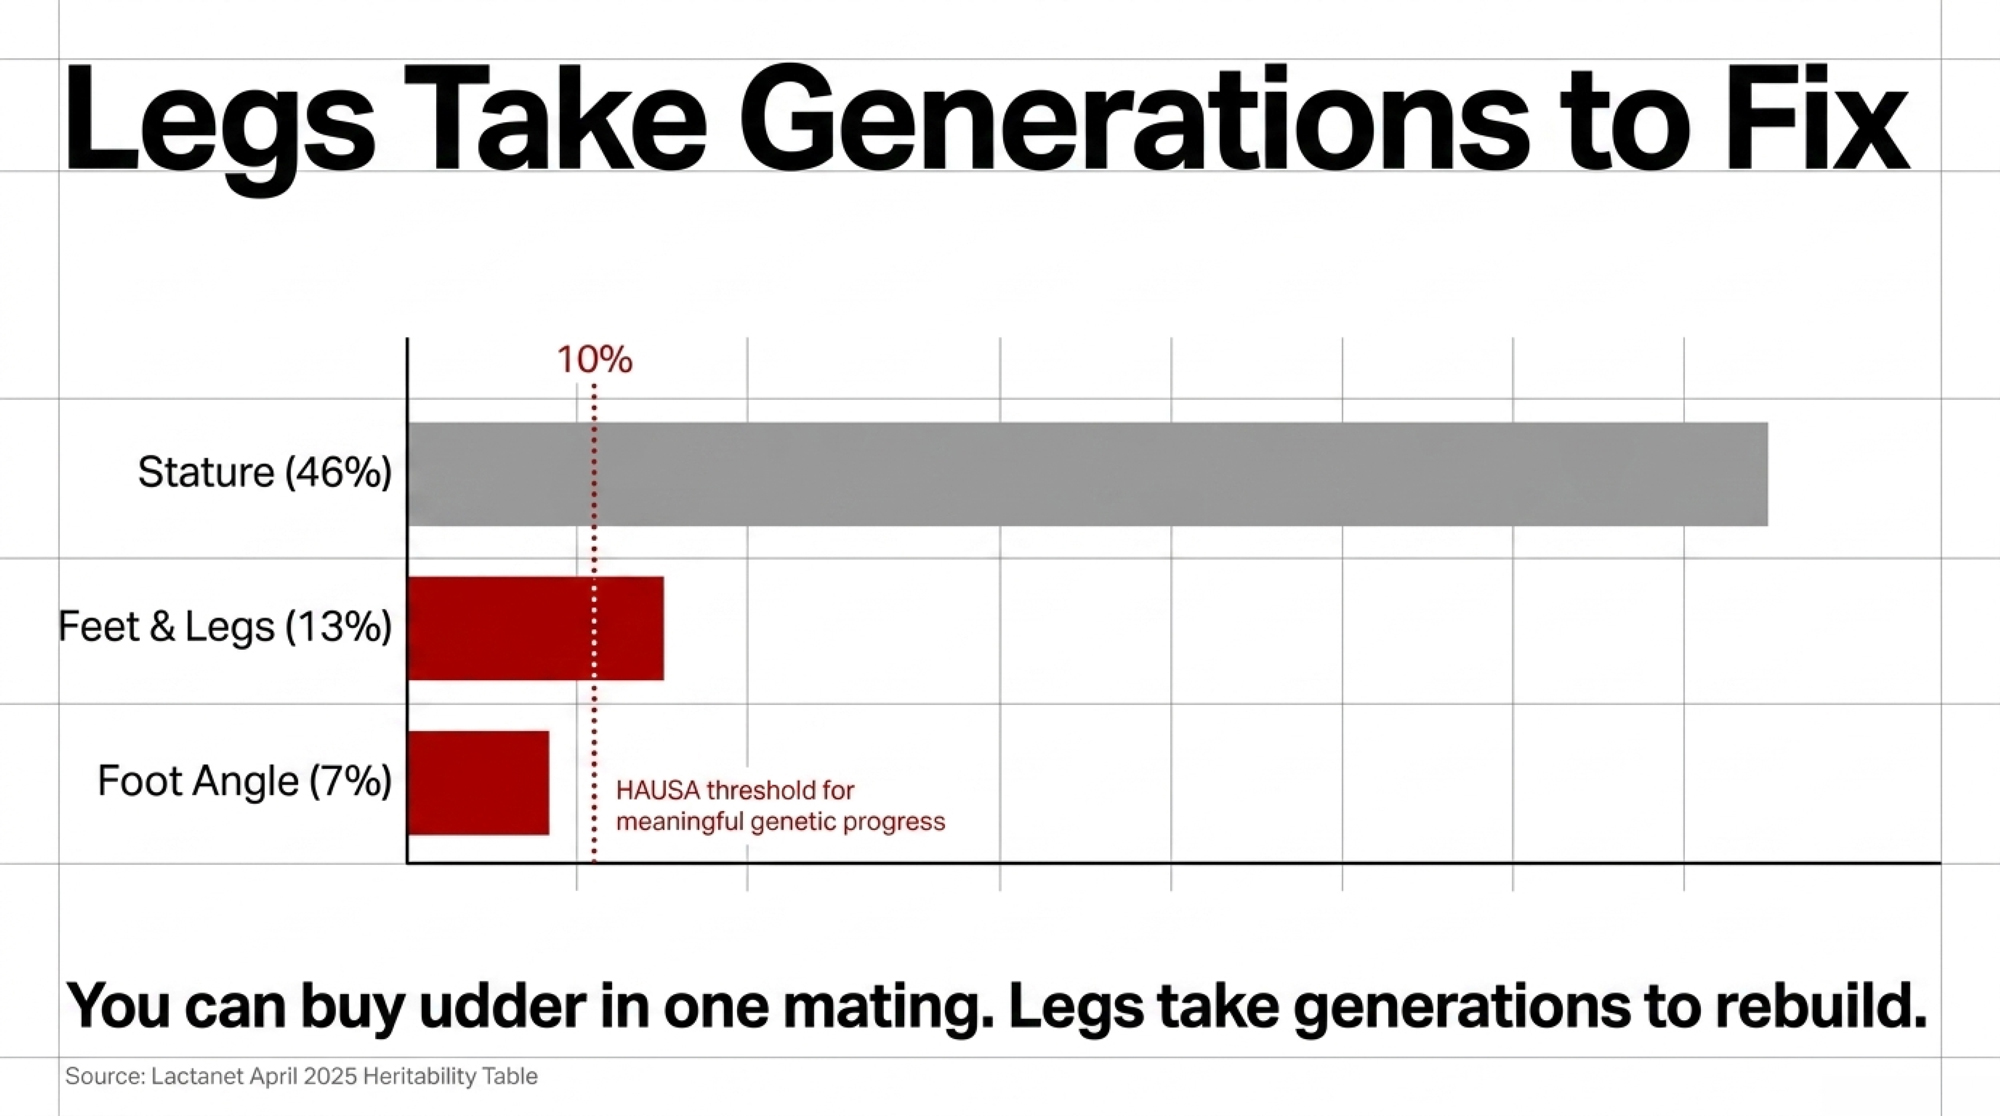
Legs build slowly and erode fast, and the heritability numbers are worse than most breeders assume. Lactanet’s April 2025 heritability table puts Holstein Feet & Legs at 13% and Foot Angle at just 7% — against stature at 46% and rump angle at 41%. Rear Legs Rear View, the trait topping the HCC profile, sits at 11%. Locomotion is 5%.

Holstein Association USA puts the threshold plainly on its Linear Type Evaluations page: “It is difficult to make much genetic progress through selection and mating unless a trait has a heritability of .10 or higher.”

Foot Angle doesn’t clear that bar. Feet & Legs barely does. Stature clears it by a factor of four. You can move udder in a mating cycle. Legs take generations — exactly the wrong shape of problem to inherit from seven bulls at once.

So price the downside. The average clinical lameness case runs $336.91, climbing $13.26 for every additional week a cow stays lame, per Robcis and colleagues in the Journal of Dairy Science.
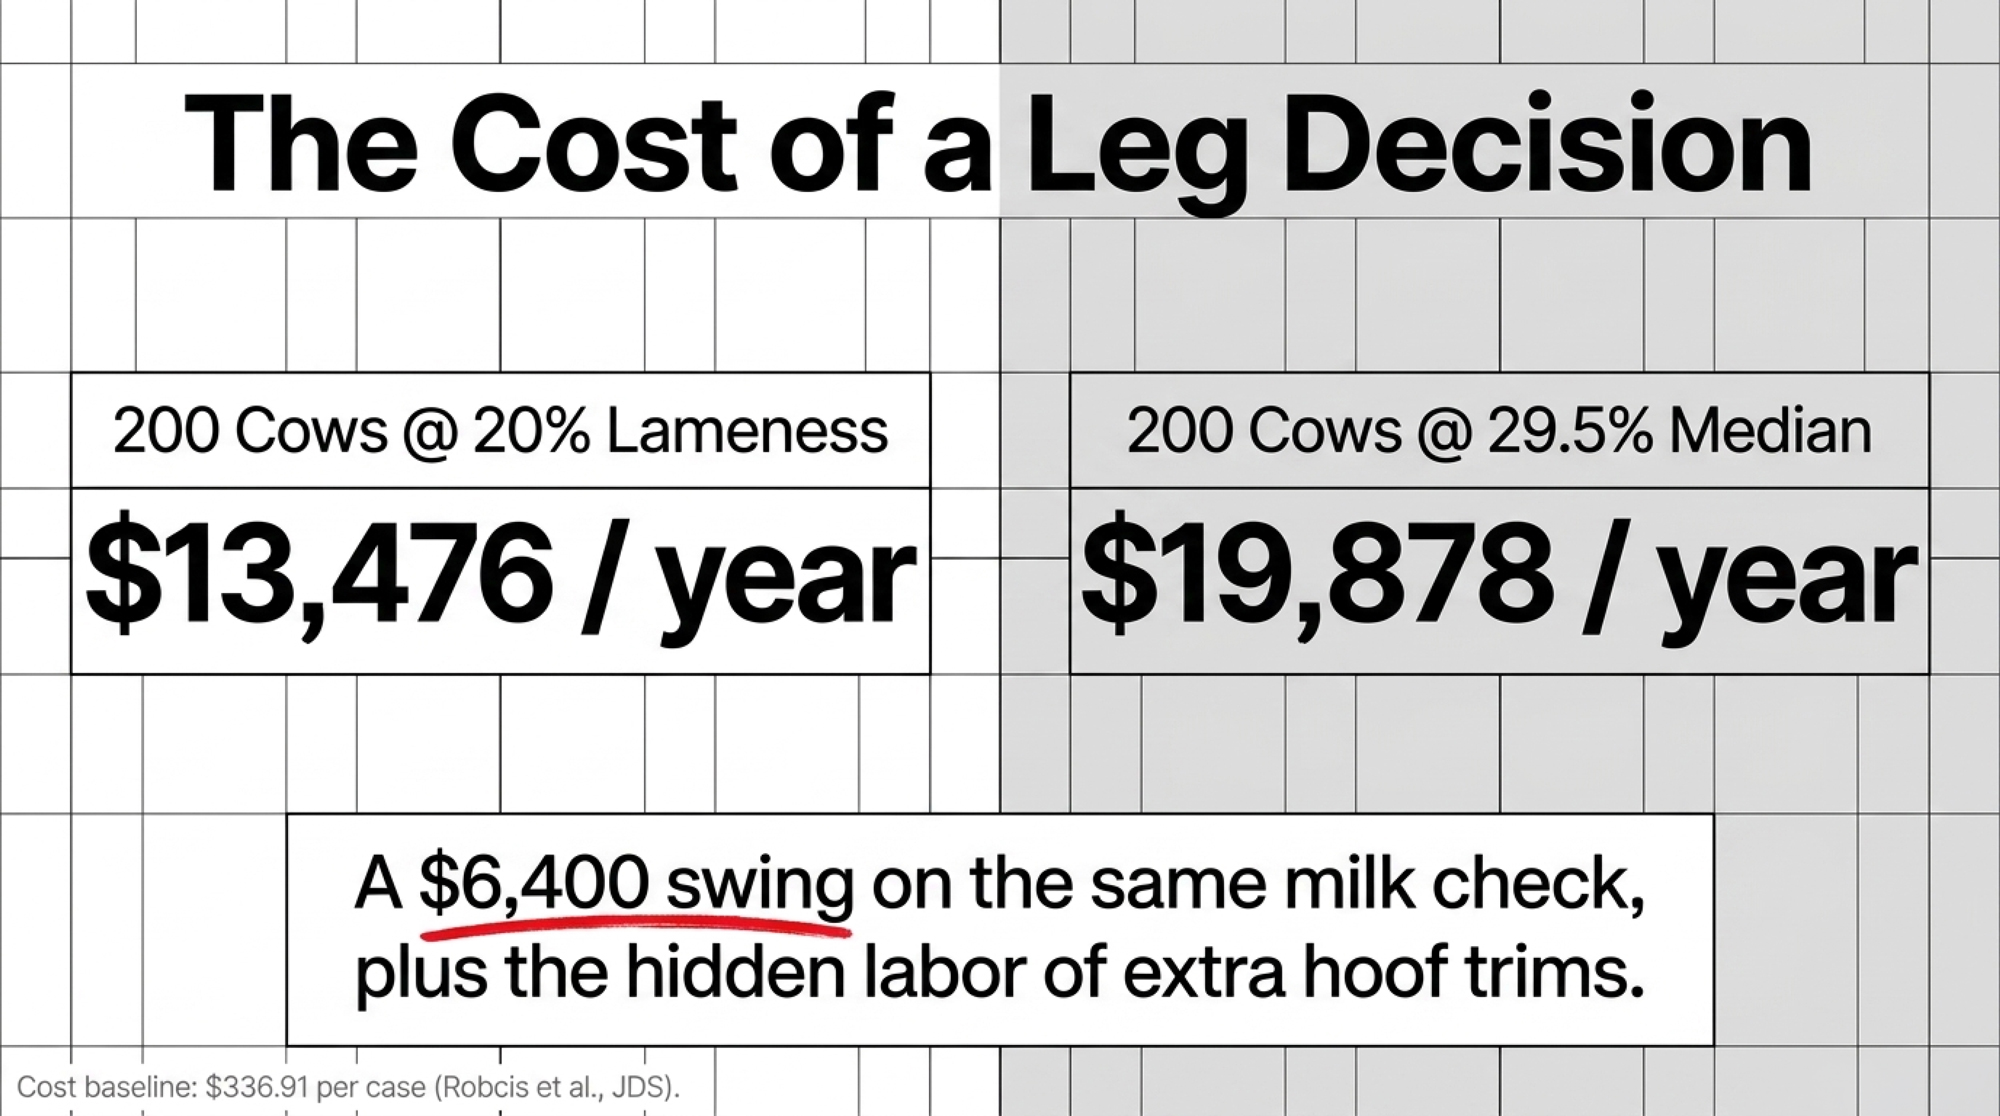
Two scenarios on a 200-cow herd. At a conservative 20% annual incidence — 40 cases, $13,476 a year. At the 29.5% median cow-level prevalence found across the published literature — 59 affected cows and roughly $19,878, though prevalence and annual case count aren’t the same measure. Either way, the gap between those two herds runs about $6,400 a year, and genetics is one of the levers moving you between them.

Lameness accounted for 9.1% of the total U.S. cull rate in the 2018 USDA/NAHMS survey, with injuries adding 3.5%. That puts locomotion third among involuntary culling reasons, behind infertility at 23.3% and mastitis at 18.6%.

The Part That Costs Labor, Not Just Dollars

Treatment cost is the easy number. The harder one is what a low-FLC group does to your routine.

Two or three hoof trimmings during first lactation improve hoof health in early second lactation — and improve survival into that second lactation. Read that alongside the heritability math and the shape of the problem changes. A group of daughters with weaker feet and legs doesn’t just generate treatment invoices. It generates trim appointments, restraint time, and labor you’d budgeted somewhere else.

The disease genetics are thinner still. Finnish work on 24,685 Holstein cows found hoof disorder heritabilities running from 0.02 for sole hemorrhage and heel horn erosion up to 0.13 for digital dermatitis, with feet and leg conformation traits landing between 0.10 and 0.19. Most genetic correlations between hoof disorders and conformation traits came in low and statistically indistinguishable from zero — meaning conformation is a proxy for hoof health, not a substitute.

Worth knowing how the composite was built. Both the Udder Composite and the Feet & Legs Composite carry a −0.20 weight on stature, documented by Holstein Association USA, so breeders can improve udders and legs “without making their cows taller.” Someone anticipated this exact trade decades ago and engineered against it inside the composites. The index doesn’t carry that logic upward into TPI.

The Fertility Correction Was the Dress Rehearsal

Here’s why this run should make you uneasy about more than feet and legs.

The August evaluation rewrote the fertility scale, and Fertility Index carried 69% of all TPI movement — roughly seven times the next-largest trait. Males in the top 10% for DPR dropped 9.08 PTA points. April-to-August male ranking correlation for DPR came in at 0.31, against 0.93 for Heifer Conception Rate. An April DPR ranking told you almost nothing about an August one.

That’s what it looks like when a component of the index gets recalibrated after two decades of use. Nothing about the old number was hidden — it was published, it moved the index, breeders used it. Then CDCB changed how DPR accounts for the voluntary waiting period, and TPI moved for all 12.6 million evaluated females at once: top-decile animals up, everything below them down.

Now apply that to legs. Feet and legs aren’t mismeasured — they’re barely visible, at −0.11 against TPI. Different failure, same exposure. The fertility correction arrived as a scale change breeders could see in a single run. A locomotion correction, if it comes, arrives as culls — three years after the mating decision, spread across a herd, with nothing in the index to have warned you.

Why Index Moves Punish Concentrated Pedigrees Hardest

We’ve watched this pattern before, and the numbers are on record.

Our five-year tracking of 401 elite genomic Holstein bulls from April 2020 through their December 2025 proofs found the retained bulls dropped an average of 42.5 TPI points — most of it from base changes and formula rewrites, not failed biology. Correlations between 2020 genomic predictions and 2025 proven results held strong on core traits: 0.81 for PTAT, 0.76 for fat, 0.71 for protein. The DNA didn’t change its mind. The formula did.

The bulls that crashed hardest shared a profile: over-predicted type stacked on thin functional traits. Homecoming lost 414 TPI points with PTAT dropping 0.87. Supercharge lost 396, including a 2.32-point PTAT collapse from +1.18 to −1.14. Sire lines heavy on Legacy and Heroic up top, with Delta on the maternal side, were over-represented in that group.
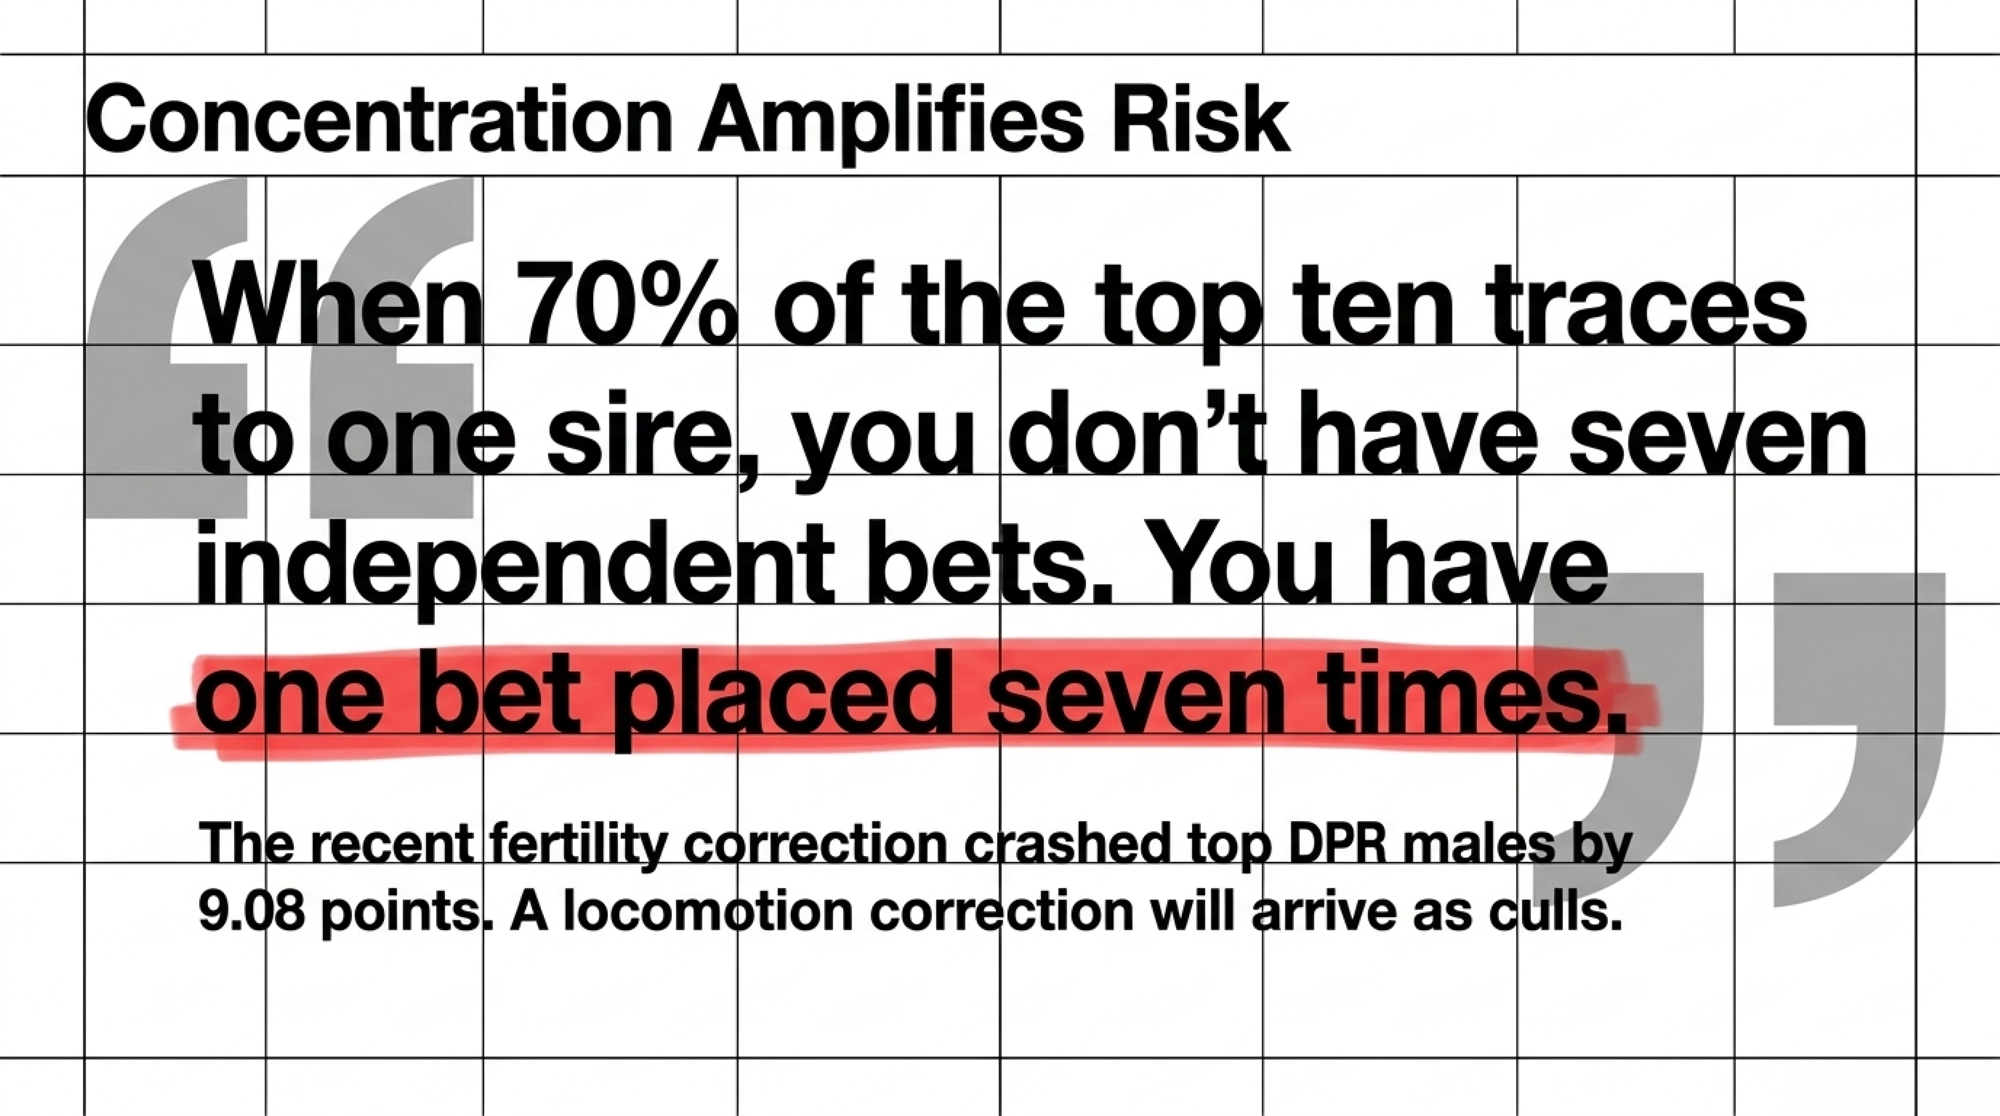
Concentration amplifies whatever the formula decides to reward or ignore. When 70 to 80 percent of a top-ten list traces to one sire, and they all sit weak in the same trait group, you don’t have seven independent bets. You have one bet placed seven times.

Fertility is where that already bites hardest. Annual genetic gain outruns inbreeding depression for every index trait except one — daughter pregnancy rate, running a net loss of 0.02 PTA units per year, on figures calculated before this run’s revision. Holstein heifers born in 2024 averaged 9.99% inbreeding per Lactanet Canada’s August 2025 update — a Canadian figure, not a U.S. one, and up from 9.61% the year before.

Looking for an Outcross

Concentration this deep makes clean pedigrees worth hunting, and the August lists offer one credible candidate near the top.

Genosource Jaco-ET sits at #8 GTPI at +3608 with 82% reliability, no daughters yet, and he was the biggest riser in the top ten at +128. Under the new 36-month rule holding daughter data out of DPR, CCR, and FSC, a bull like Jaco has no fertility daughter records feeding his numbers — so weight him on production confidence, not fertility confidence.

Whether he’s a genuine outcross for your herd depends on your own pedigree stack. That’s a check to run against the HAUSA database with your straw inventory in front of you, not something a proof sheet answers for you.

The honest read: with one sire behind 70 to 80 percent of the top ten, options up there are thin, and the ones that exist come with compromises — no daughters, limited status, or family overlap you’ll need to verify yourself.

Three Paths, and What Each One Costs

ApproachWorks best forWhat it costsWhere it backfires
Add FLC as its own spreadsheet column with a floorAny herd ranking primarily on TPI/NM$~1 hour of spreadsheet work; occasionally a lower GTPI pickSetting the floor at zero cuts most of the current top 10
Select on HCC for longevity-focused herdsHerds culling heavily on feet, legs, udder breakdownLower PTAT, lower show-ring ceilingExpecting fast results — 13% heritability is a 3-generation play
Place one deliberate outcross sire in the rotationHerds where a third+ of active straws trace to RipcordReal compromise — top candidates near GTPI top 10 also carry limitationsSwapping one concentration risk for another unverified one
  • Pull FLC as its own column and set a floor. Works for any herd ranking on index. Costs an hour of spreadsheet work and occasionally a lower GTPI on the bull you pick. Backfires if you set the floor at zero — you’ll cut most of the top ten and forfeit real production merit. Set it against your herd’s actual leg problem, not an arbitrary line.
  • Use HCC where longevity is the goal. Works for herds culling heavily on feet, legs, and udder breakdown rather than by choice. Costs you a lower PTAT and a lower show ceiling sometimes. Backfires if you expect speed — at 13% heritability on Feet & Legs this is a three-generation play, not a first-crop answer.
  • Place one deliberate outcross in the lineup. Works where a third or more of active straws trace to Ripcord. Costs real compromise, because the candidates near the top all carry one. Backfires if you swap one concentration for another, so verify the pedigree yourself before you commit.
The Action Checklist

Do this in the next 30 days:

  1. Put your April and August proofs side by side for every sire in your active lineup. Sort by TPI change. Flag any bull whose drop is more than double his cohort’s — that short list, not the full drop list, is where re-evaluation belongs.
  2. Add an FLC column to that same sheet. If you rank on TPI or NM$ alone, feet and legs are not currently in your decision. The index correlates −0.11 with FLC. Add the column or accept that you’re not selecting on it.
  3. Note sire and maternal grandsire on every straw. Where Ripcord appears, pull each bull’s individual FLC rather than judging by pedigree — the pattern is directional, the numbers are what you breed to.
  4. Cap single-sire exposure. No one bull on more than 12 to 15 percent of your matings, and build the team from at least eight unrelated sires. That’s the same discipline North Florida Holsteins applied when it capped how much any single bull could influence the herd.
  5. Locomotion-score your herd this quarter. Published prevalence spans 2.6% to 63.7% across studies, so the breed average tells you nothing about your barn — and the difference between 20% and 29.5% on 200 cows is roughly $6,400 a year.
Nobody built TPI to ignore feet and legs. It worked out that way — a composite weighting production, health, and fertility, with a trait group that washes out to −0.11 in the arithmetic. And nothing about that arithmetic changes on its own: at 13% heritability on Feet & Legs and 7% on Foot Angle, you can buy udder in one mating cycle and spend three generations paying it back. The 2029 version of this decision won’t arrive as a scale change you can see in a proof run. It arrives as culls and trim appointments. HCC is the first tool in a while that puts legs back in the conversation with real weight behind it. So before your next semen order, the question isn’t which bull ranks highest. It’s which column you’re adding to the spreadsheet first.

Learn More

The Sunday Read Dairy Professionals Don’t Skip.

Every week, thousands of producers, breeders, and industry insiders open Bullvine Weekly for genetics insights, market shifts, and profit strategies they won’t find anywhere else. One email. Five minutes. Smarter decisions all week.
NewsSubscribe
First
Last
Consent

HCC vs. PTAT: Holstein’s 2026 Stature Penalty and the New 60-Inch Line

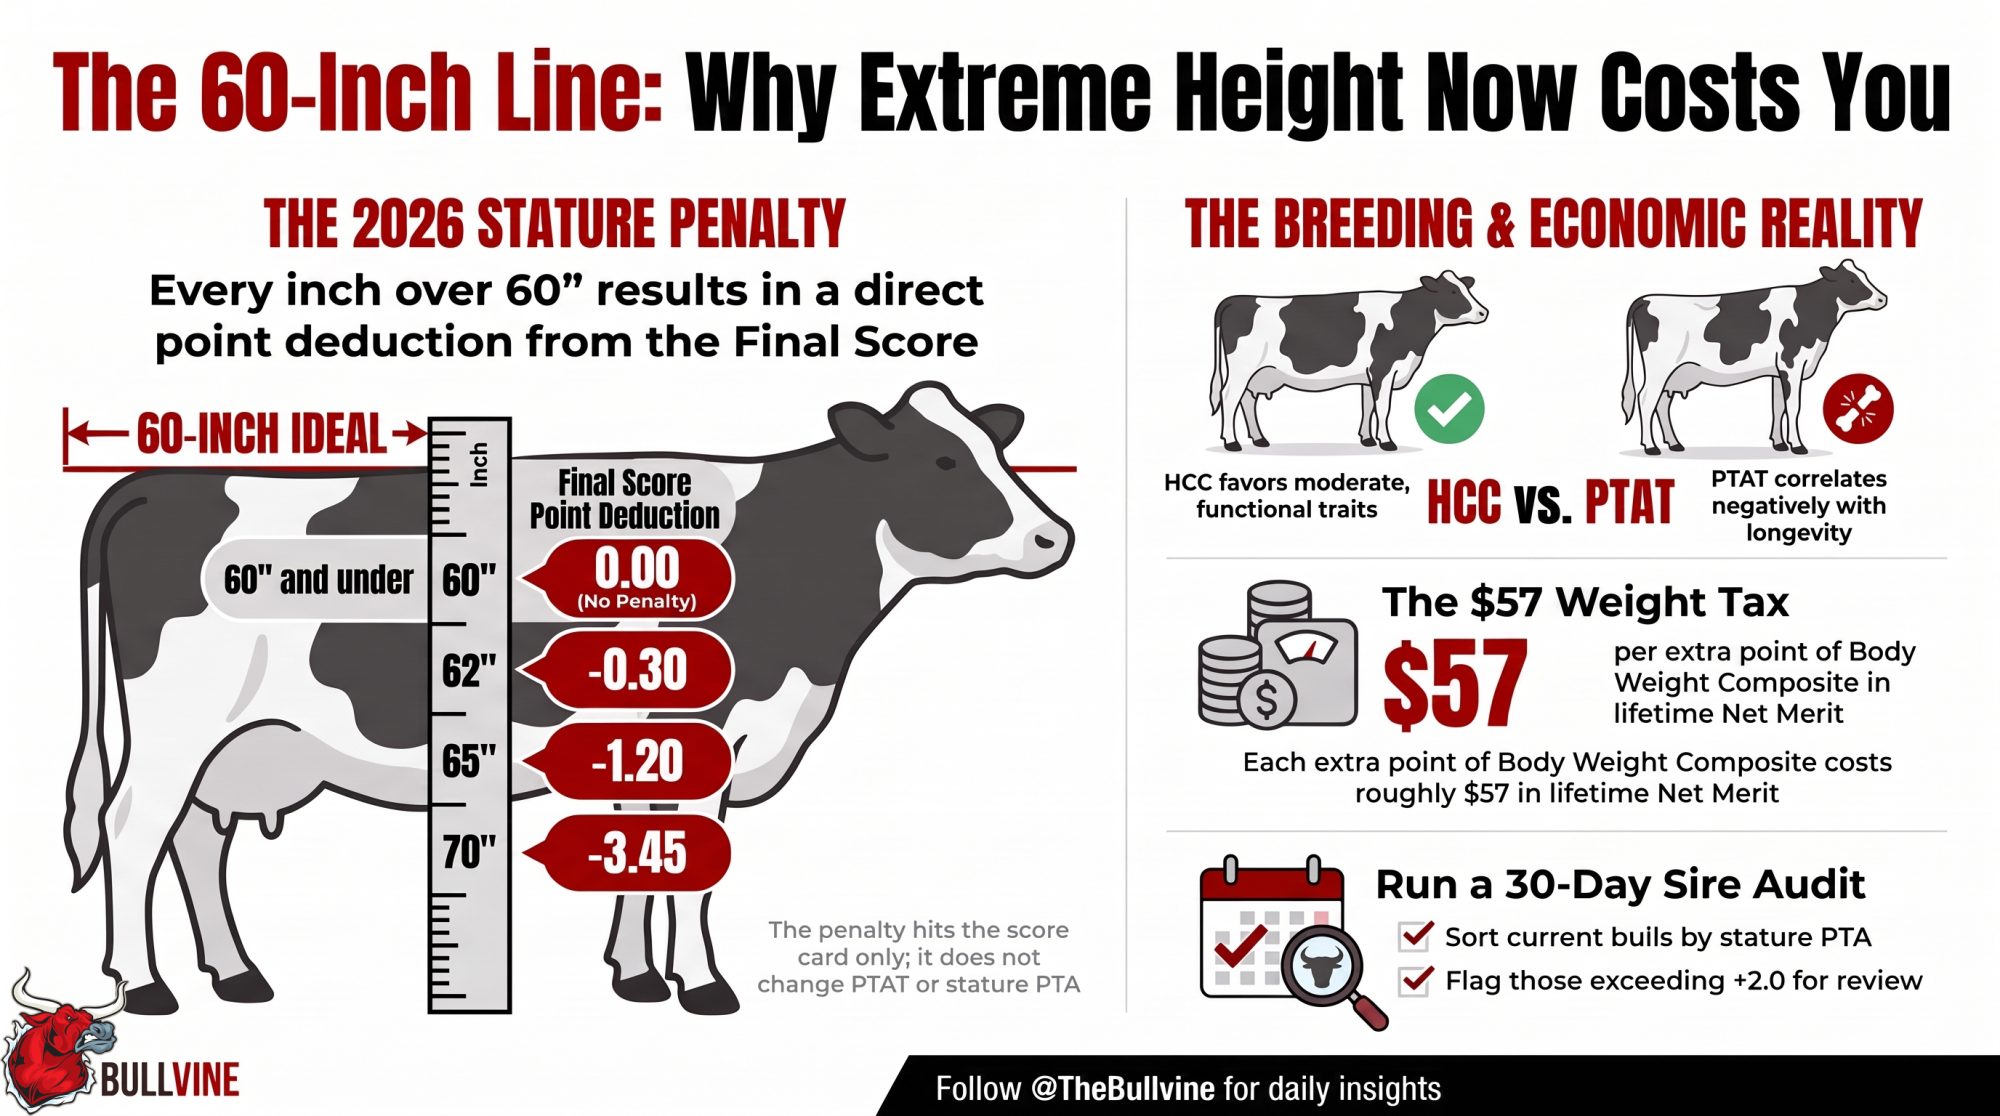
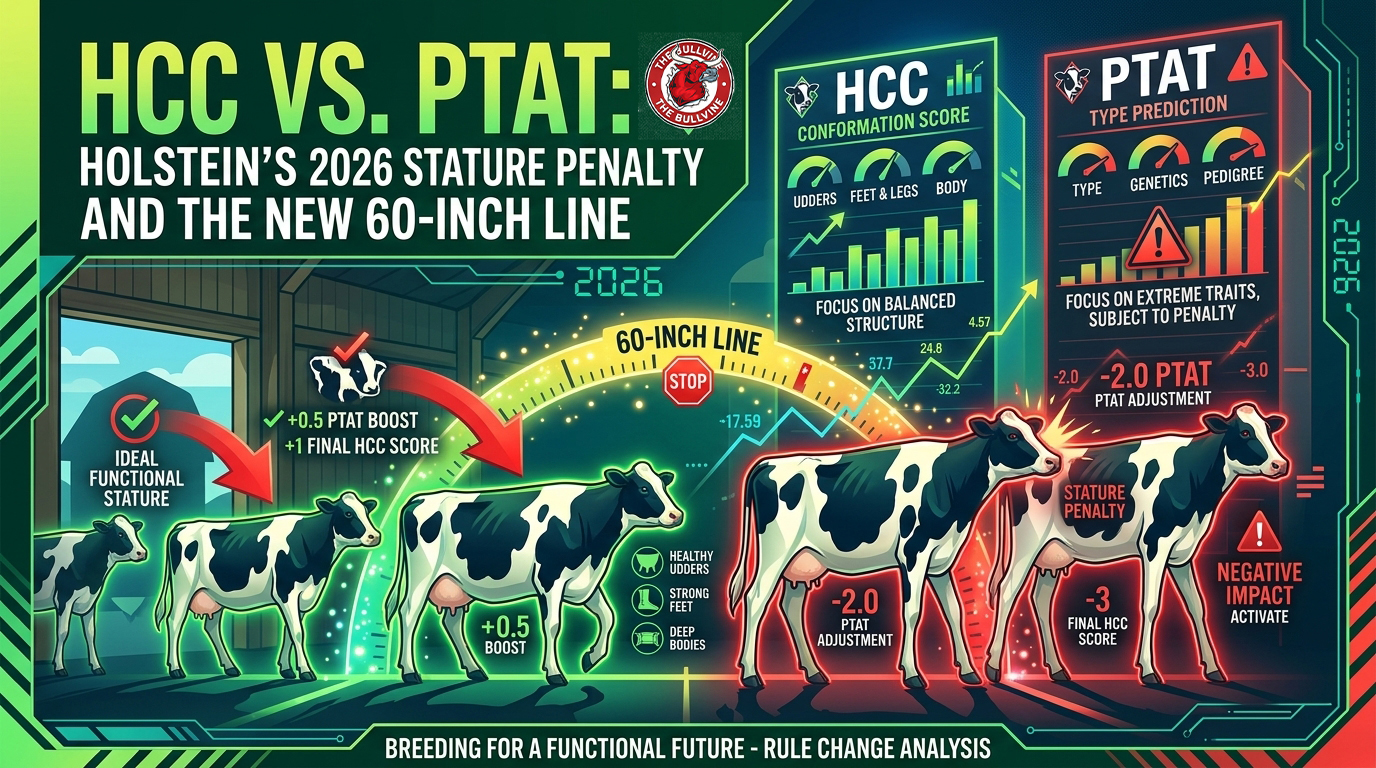
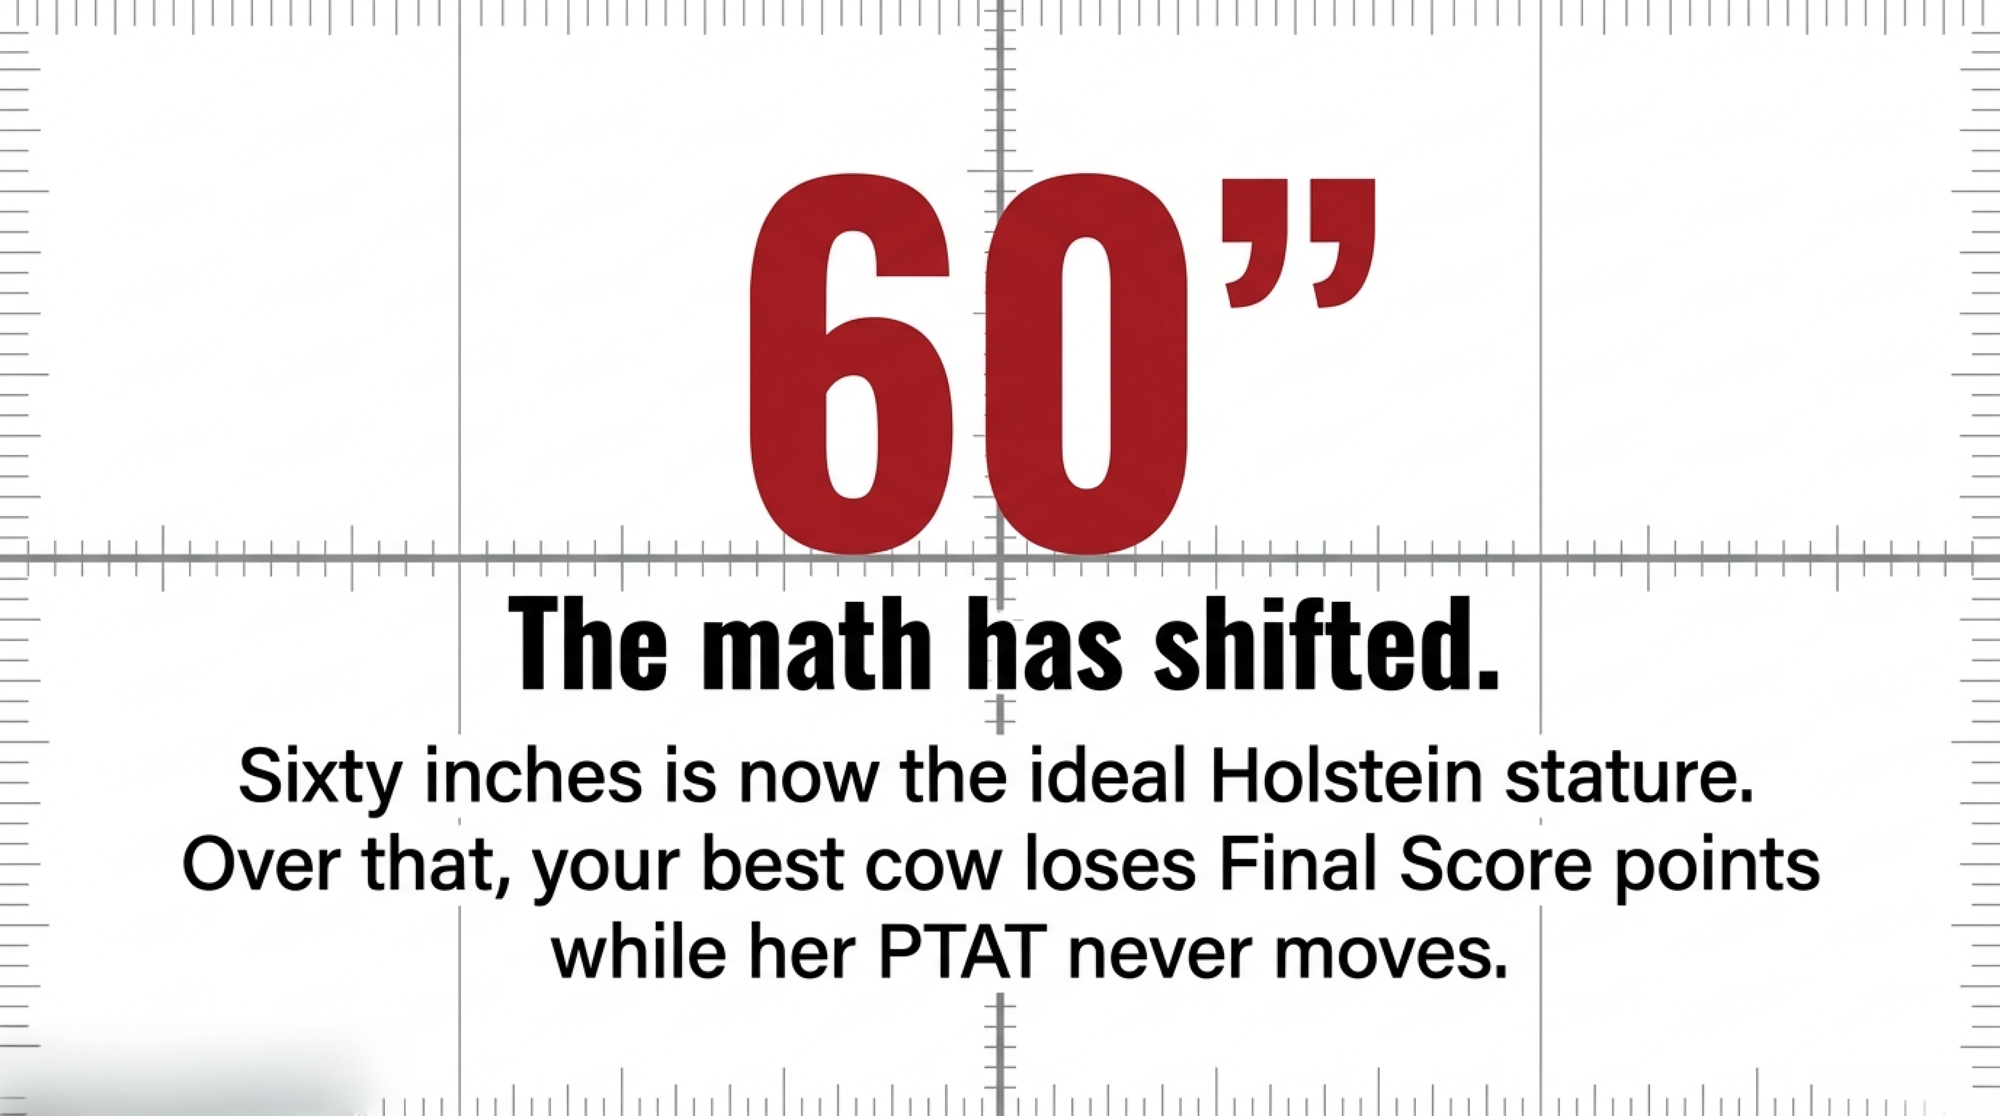
Sixty inches is the new line. Over it, your best show cow loses Final Score points — 0.15 at 61″, 1.20 at 65″ — while her PTAT never moves. Here’s the table, and why HCC reads what PTAT can’t.

Executive Summary: Starting with the May 2026 classification run, Holstein USA made 60 inches the ideal stature — and every inch over it now docks Final Score, from 0.15 at 61″ to 1.20 at 65″ and 3.45 at 70″, pulled straight out of Front End & Capacity. Here’s the part that trips people up: the penalty applies only to the classification card. Your bull’s PTAT and stature PTA don’t move an inch, so if you’ve been buying high-PTAT, high-stature semen, your daughters can still grade down on the day the classifier puts the stick on them. The board paired it with two more changes — the new 18-trait Holstein Conformation Composite (HCC), which weights Stature highest but favors lower values and actually correlates positively with Productive Life where PTAT correlates negatively, and a BAA rule that only counts cows calved in the last 24 months. Stack the classification hit on the 2025 Net Merit math — about $57 off lifetime NM$ per extra point of Body Weight Composite — plus more lameness and robot misses in stalls built for average cows, and the case against extreme height is now genetic, economic, and on the card all at once. The tell? The 2025 Star of the Breed, Oakfield Solomon Sunset, was bred for width and correctness over height.

Holstein stature penalty

Picture the best-looking cow you’ve ever raised. The one that turned heads down the chute, framed up beautiful on the halter, filled the alley like she owned it. Now picture the classifier putting the stick on her in the May 2026 Holstein classification run — and knocking points off her card for the exact height you spent years breeding into her. This is the Holstein classification 2026 stature penalty in a sentence, and it changes your next mating decision. 

That’s the shift. At their March 2026 meeting, Holstein Association USA’s board approved a package of changes that all lean one way — away from extreme height, toward cows built to last. And it lands hardest on the animals a lot of show-focused programs spent twenty years building. Whether you halter cows or want them to last four lactations in a freestall, this one touches your next mating decision. 

What’s Really at Stake

Three changes arrived together out of the same March board meeting, and they reinforce each other. The centerpiece is a sliding-scale stature penalty, recommended by HAUSA’s Conformation Advisory Committee and approved by the board, setting 60 inches as the breed’s ideal stature for the first time — over that, cows take a progressive deduction on their classification score. Alongside it came the Holstein Conformation Composite (HCC), a new selection index built to identify animals with the combination of traits tied to balance, function, and longevity, rather than Final Score alone. And a quieter rule now ties Breed Age Average to cows that calved within the previous 24 months, so only currently productive animals count. 

Read this line twice, because it’s the one that trips people up: the penalty hits your classification score only. It doesn’t touch PTAT, stature PTA, or any genetic evaluation for stature or any other trait. Your bull’s numbers haven’t moved. What changed is what his daughters score the day the classifier puts the stick on them. 

If you breed for the ring, you’ll feel this most. If you’re a commercial breeder chasing durability, you’ll mostly nod — because the change is pushing toward the cow you already want.

What Does the Stature Penalty Actually Cost? (The Official Table)

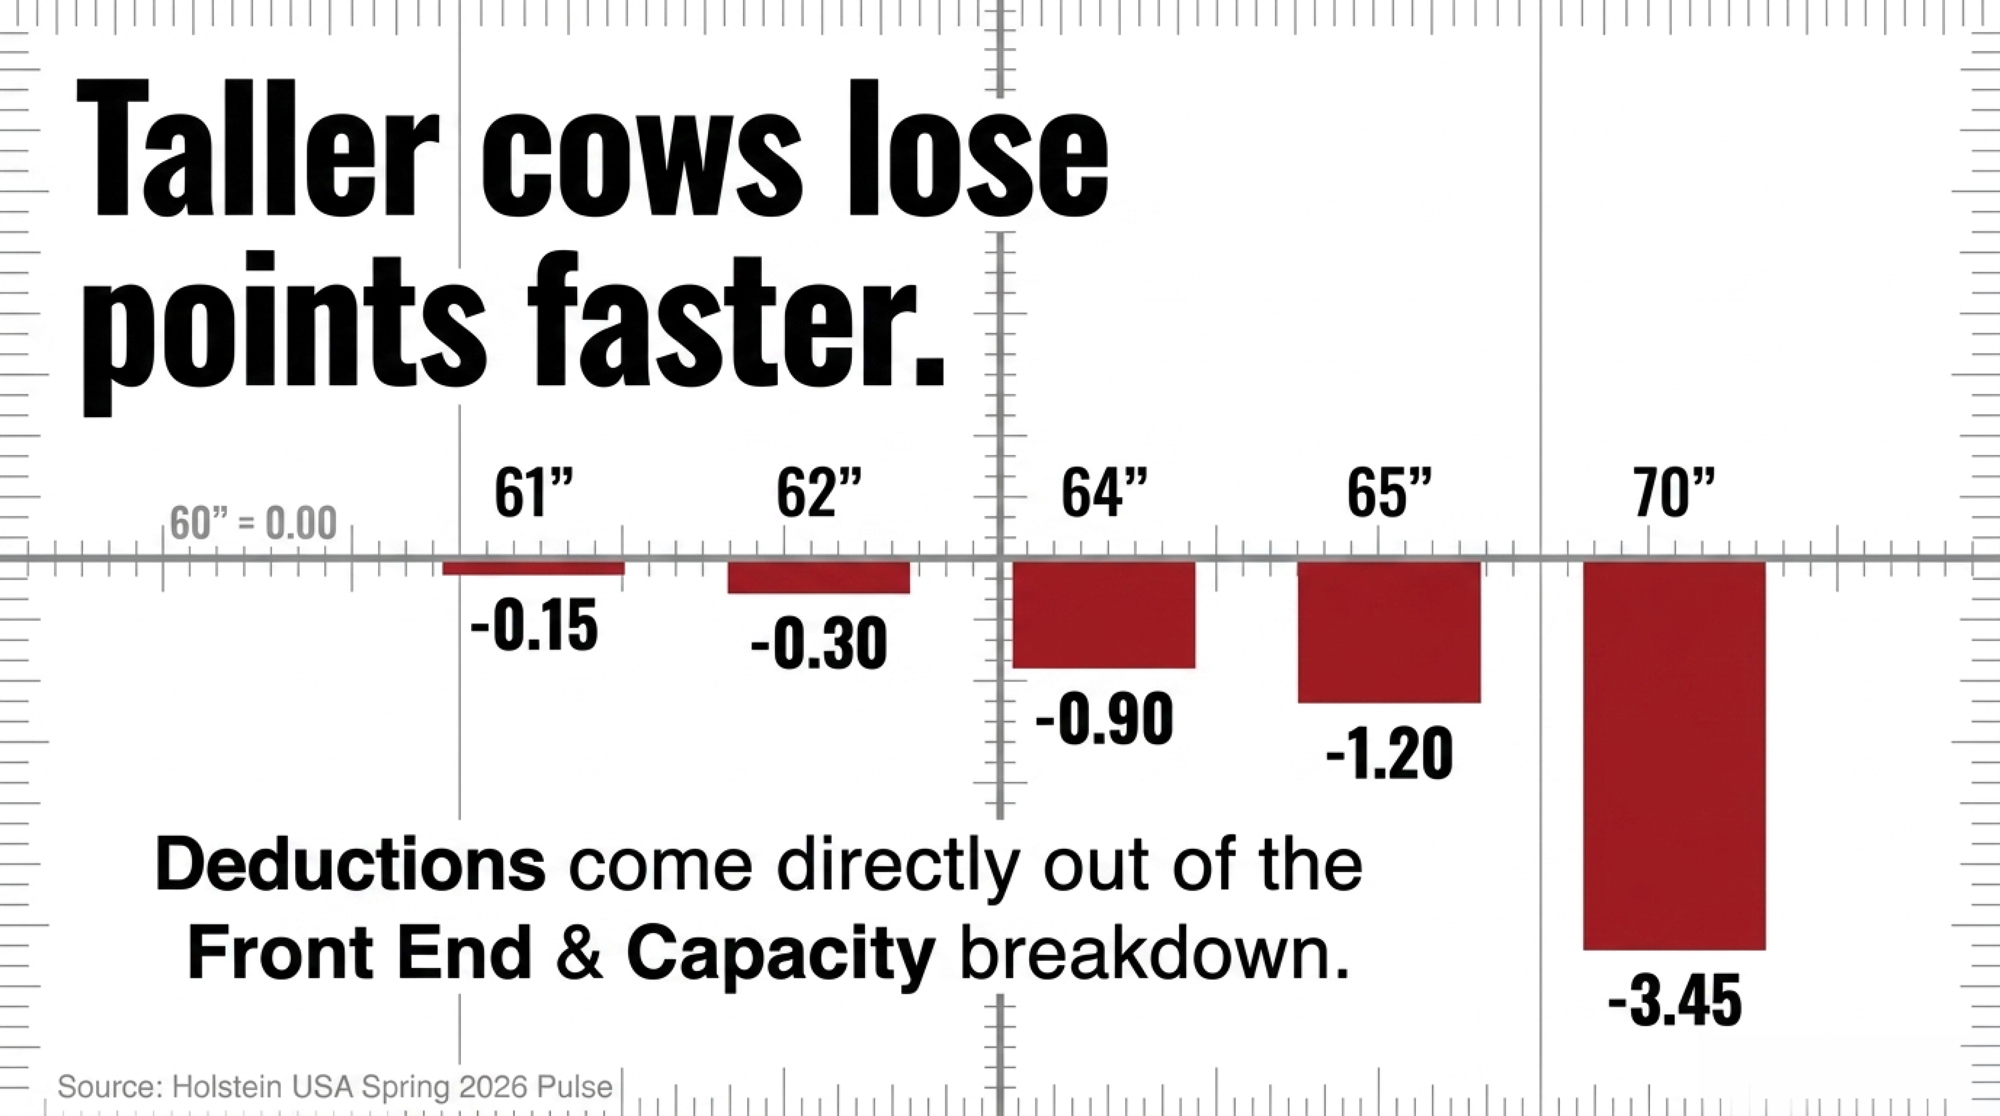
Here’s the part breeders keep asking about — the exact numbers, now published in Holstein USA’s Spring 2026 Pulse. Cows at or below 60 inches take no penalty. Stature is measured at the hips, top of the spine to the ground. Above 60″, the deduction comes out of the Front End and Capacity major breakdown, which is 15% of the final classification score. 

StaturePoint deduction from Final Score
60″ and under0.00 (no penalty) 
61″−0.15 
62″−0.30 
64″−0.90 
65″−1.20 
68″−2.55 
70″−3.45 

Notice the curve. At 61 inches it’s a rounding error — fifteen-hundredths of a point. But the penalty accelerates fast: by 65 inches you’re down more than a full point, and at the tall extremes it bites hard. For a cow sitting right on the VG/EX line, even a half-point can move her final designation. 

Don’t Confuse This With the 2024 Scale Change

Two different things happened, roughly a year apart, and breeders keep mixing them up at the coffee shop. So let’s split them clean.

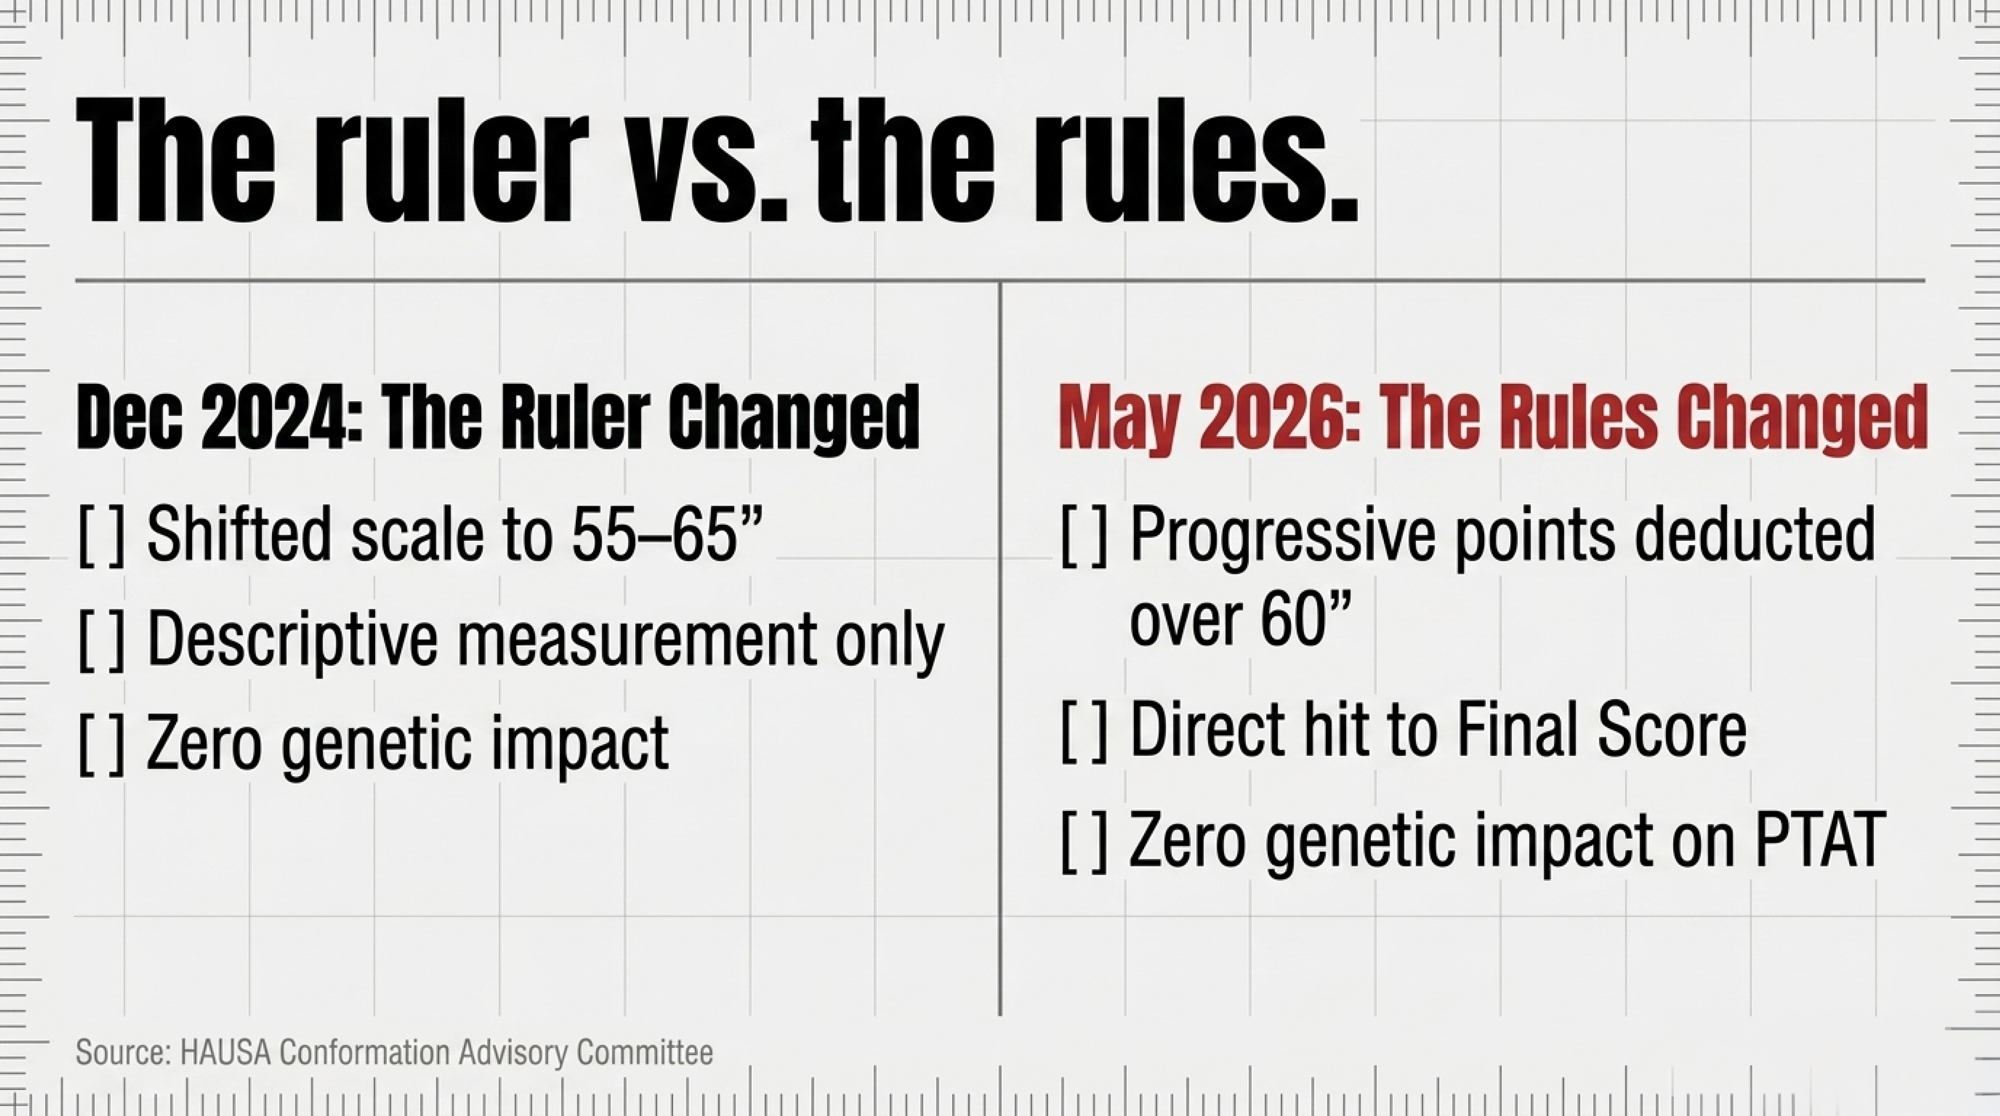
The December 2024 change was a measurement recalibration. After Dr. Jeffrey Bewley’s 2023 cow-measurement project found the breed had physically outgrown the old ruler, Holstein USA shifted the linear stature scale from the old 51-to-61-inch range to a new 55-to-65-inch range, effective December 1, 2024, with each inch worth five points on the linear scale. It didn’t punish anything. It just measured tall cows more honestly — 60″ now reads as 25 on the scale, 65″ as 50. 

The May 2026 change is a penalty — the first time excessive height actually costs points on the final card. One fixed the ruler. The other put a price on being tall. 

Feature / ChangeDecember 2024 Scale ShiftMay 2026 Stature Penalty
What it didShifted linear scale from 51–61″ to 55–65″ Progressive point deductions for cows over 60″ 
The impactDescriptive only; each inch = 5 linear points Direct deduction from Final Score, via Front End & Capacity 
Genetic impactNone — ruler calibration None on PTA stature or any trait; classification score only 

This Didn’t Come Out of Nowhere

The 2026 penalty is the loud version of a change the breed started making quietly years ago. Holstein USA has been restructuring how stature feeds into its evaluations for a while — pulling height back out of the numbers it had been quietly propping up, so a very tall bull couldn’t post shiny composite figures on frame alone. The 2026 penalty moves that logic onto the classification card itself, where every breeder can see it. 

There’s history worth naming here. For a generation, the tall, sharp, angular daughter was the ideal — and no bull embodied it like Braedale Goldwyn, the greatest type sire of his era, who became the first bull ever to produce 1,000 Excellent daughters in Canada. Goldwyn didn’t do anything wrong; he delivered exactly the phenotype the industry rewarded at the time. But the cow the new penalty docks is, in large part, the cow that era taught breeders to chase. That’s not an attack on the breeders who built those pedigrees — it’s the whole point. The target moved, and the scorecard just caught up to it. The industry keeps admitting, one step at a time, that cows were getting credit for being tall rather than being good. 

The Genetics and Economics Behind the Line

The move isn’t a hunch. Dr. Jeffrey Bewley’s “A Million Reasons Why Conformation Matters” project matched classification records against lifetime production data across the breed’s database, and HAUSA’s own internal research consistently shows that extremely tall cattle don’t last as long as more moderate-stature animals. The functional traits — udders, feet and legs, capacity — drove the biggest lifetime differences, not raw frame. Height for height’s sake was never what paid. That’s the whole logic of the 2026 direction. 

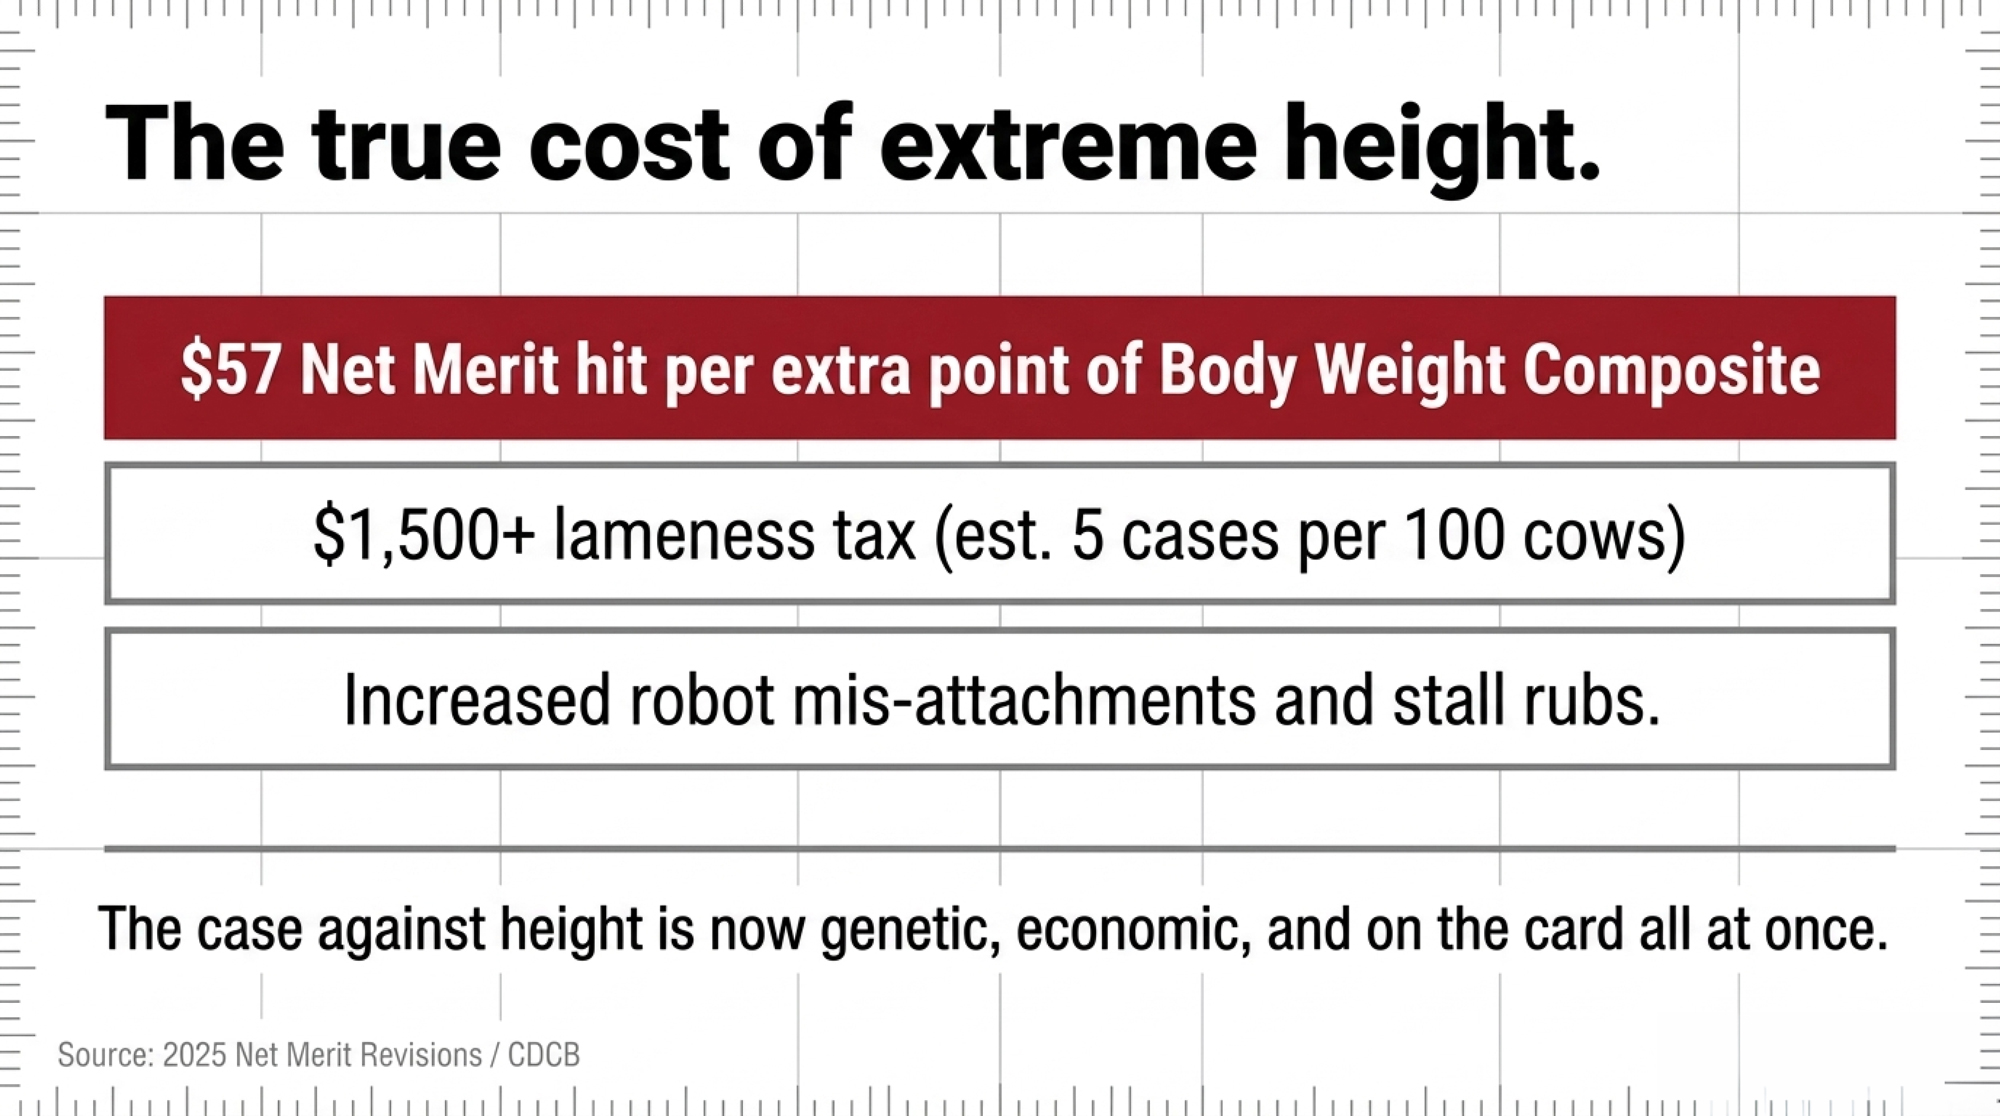
Where does a tall cow cost you before the classifier even arrives? Usually in the stalls and around the robot. Freestalls get sized for the typical mature Holstein. Push cows well past that, and you see more lameness, more hock rubs, more robot mis-attachments. Bigger cows also eat more to haul the extra frame — which is why the 2025 Net Merit revision cut Body Weight Composite to −11% and lifted Feed Saved, knocking roughly $57 off lifetime Net Merit for every extra point of Body Weight Composite. 

Try the barn math — an illustration, not a herd average. Run 100 cows and say oversized cows push your lameness rate up by 5 cases a year. At $300 a case — a conservative figure; real cases often run higher — that’s $1,500. Small on its own. But stack it on that $57-per-point weight tax, faster culling, and now a classification hit, and it’s the math you’ve been putting off.

Cost driverWhere it hitsIllustrative annual cost (100-cow herd)
Body Weight Composite tax (2025 NM$)Lifetime Net Merit, per extra BWC point−$57 per point, per cow
Added lameness (oversized cows)~5 extra cases/yr @ $300−$1,500
Classification deduction (65″ cow)Final Score → sale value−1.20 pts (can move VG/EX line)
Faster culling / robot missesProductive Life, throughputVariable, compounding

HCC vs. PTAT: What’s the New Composite Reading?

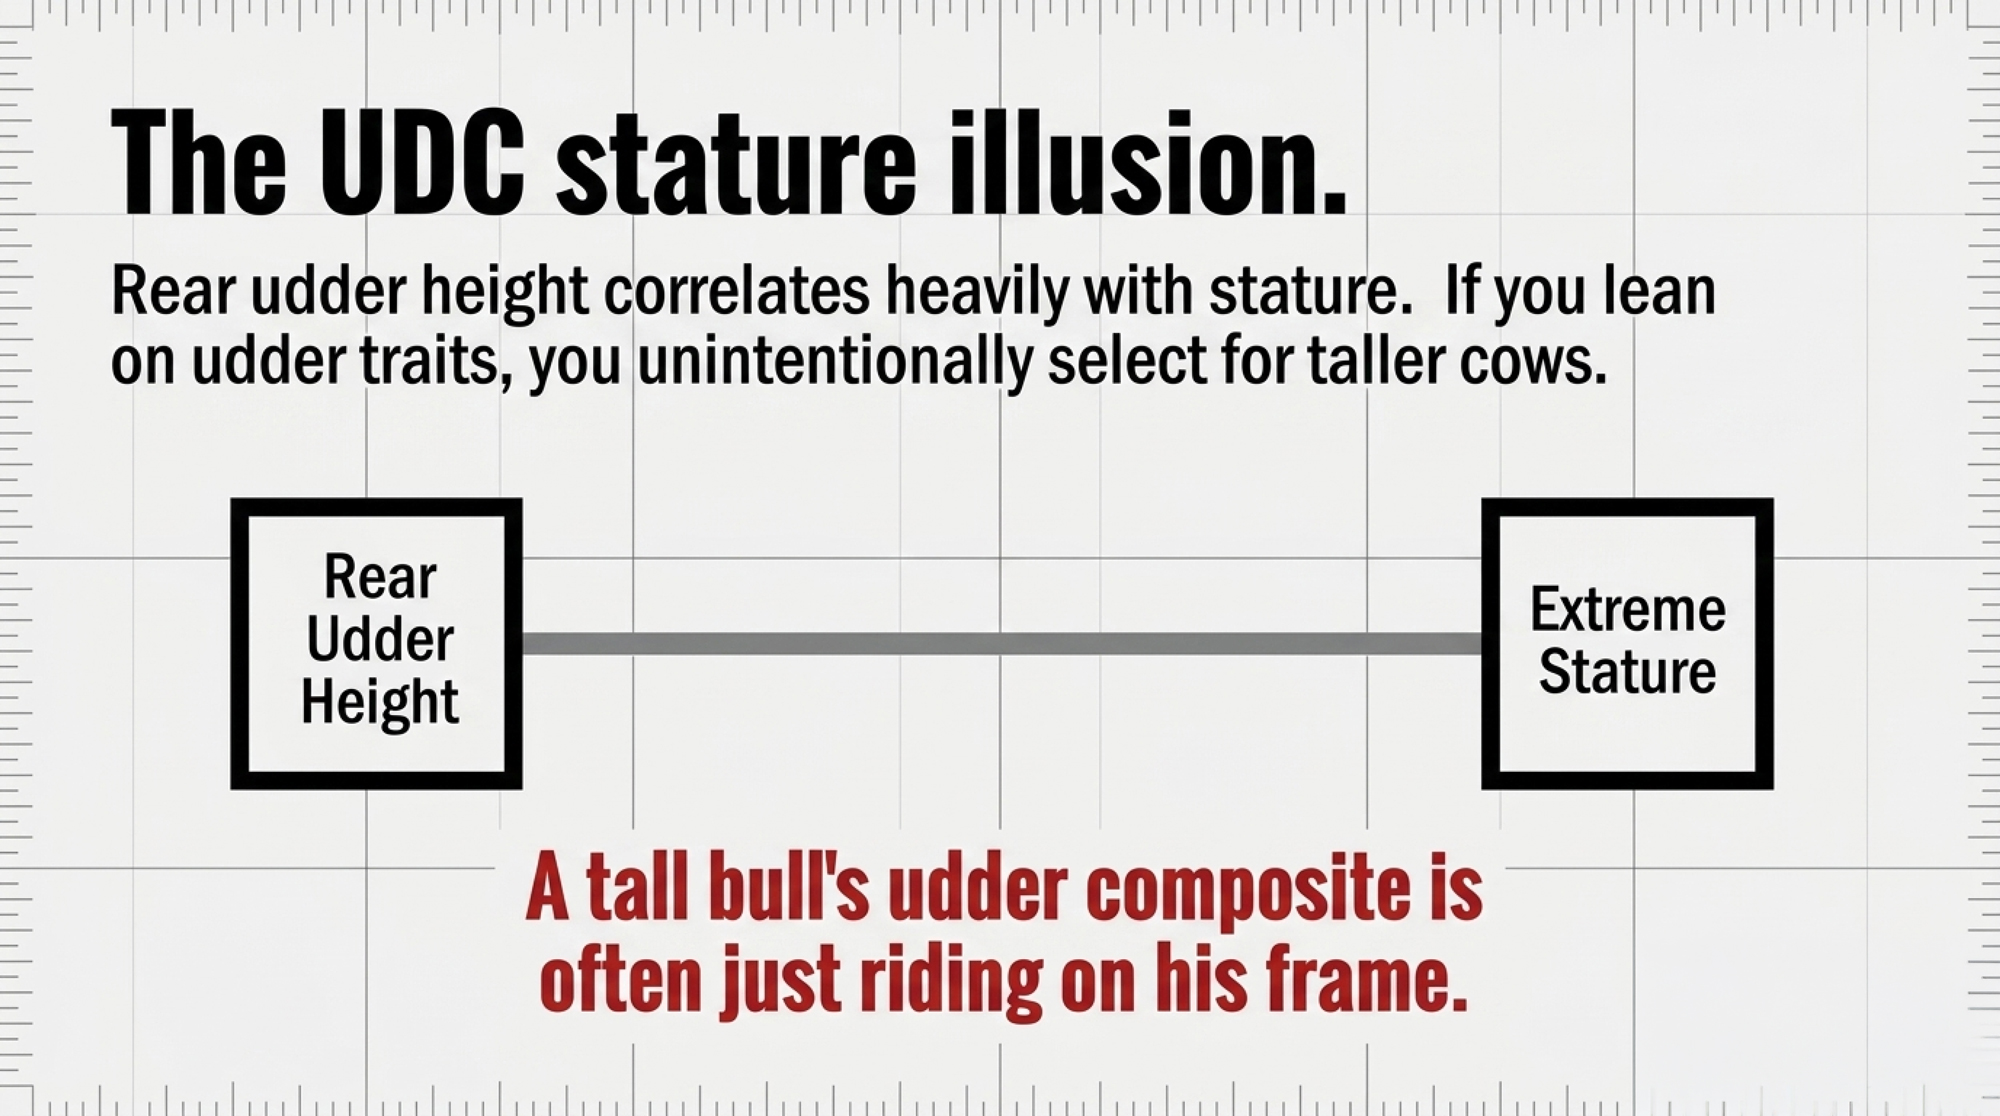
Tall bulls keep sneaking into mating plans because of how the numbers are built. Stature is highly heritable, so it moves to daughters reliably. And here’s the trap Holstein USA spelled out plainly: rear udder height and width carry a high genetic correlation with stature — so if you lean on those udder traits, you unintentionally select for taller cows. A very tall bull can post a flattering udder composite that’s riding on frame, not genuine udder quality. Read it as one number, and you’d miss it. 

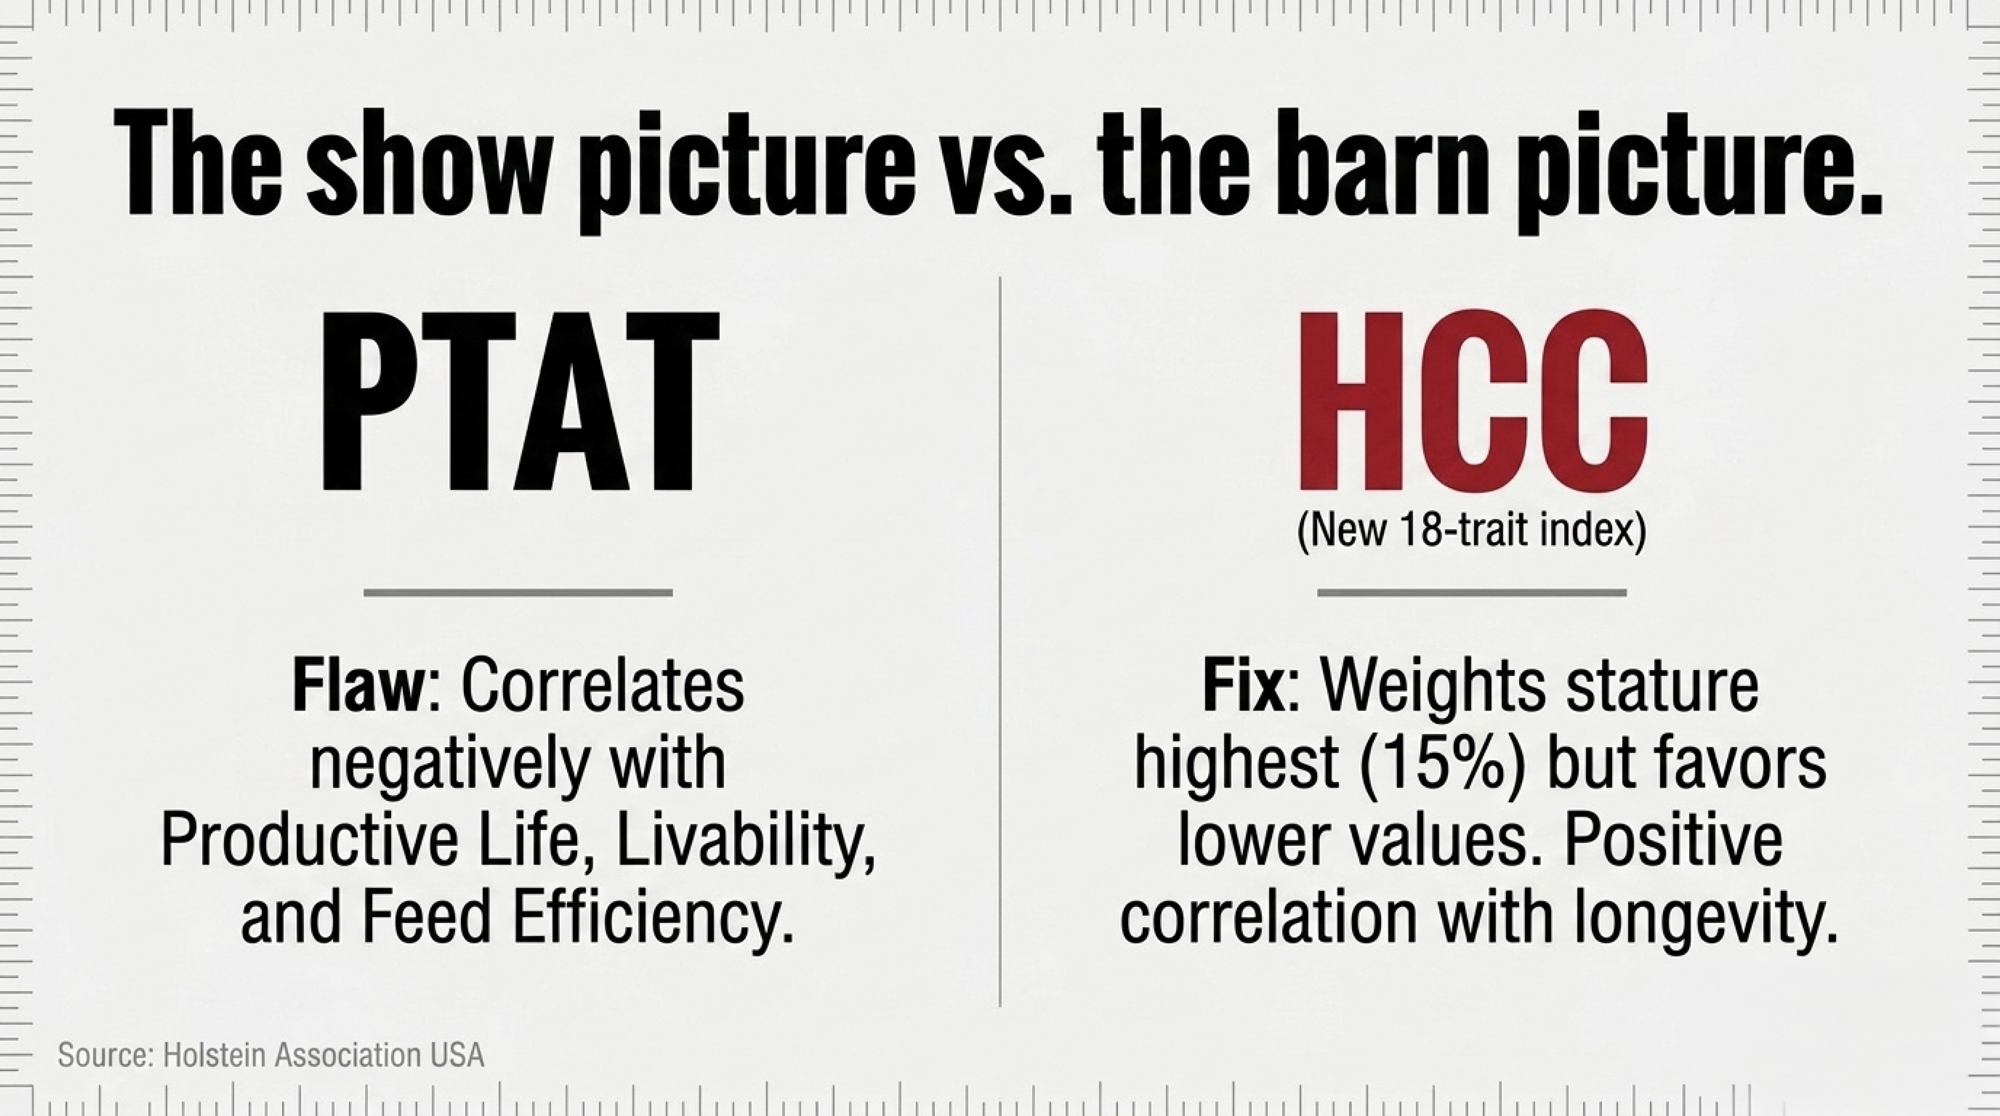
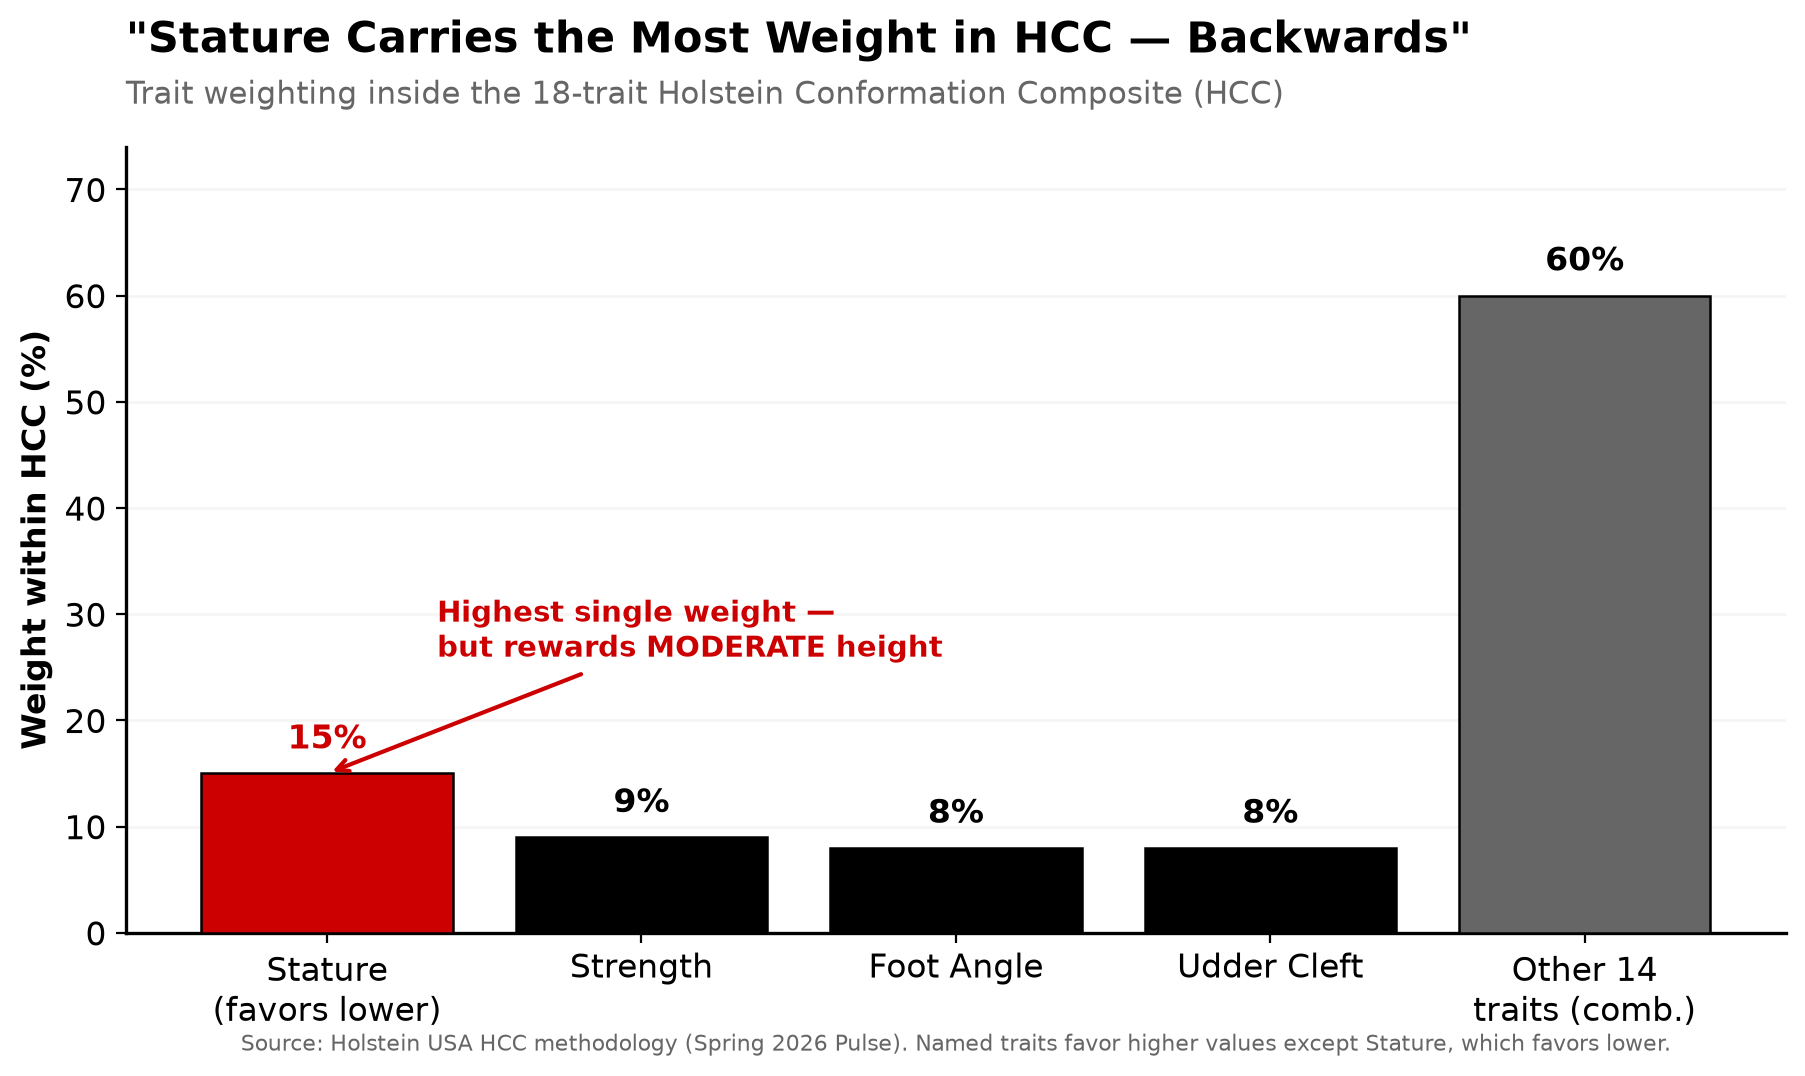
That’s the gap HCC is built to close, and the design is aggressive about it. HCC is a composite of 18 linear conformation traits, weighted by how each relates to functional balance and longevity — not by Final Score. Stature carries the single highest weight at 15%, but it favors lower values: a bull transmitting moderate or shorter stature scores higher on HCC, all else equal. Strength gets 9%, Foot Angle and Udder Cleft 8% each, all favoring higher values. 

The kicker is in the correlations. Holstein USA published that PTAT shows negative correlations with Productive Life, Livability, Feed Efficiency, and Cow Conception Rate — meaning the highest-type bulls, by the old measure, tend to work slightly against those functional traits. HCC shows near-zero to slightly positive correlations with the same traits. Put plainly: PTAT is the show picture, HCC is the barn picture. 

Two things to keep straight. HCC values for active AI bulls were published before July 1, 2026, alongside PTAT, UDC, FLC, and BWC — it’s an added lens, not a replacement. And its move into TPI is under consideration, not decided: the committees will evaluate HCC performance and weigh incorporating it into TPI later in 2026. Treat it as a compass, not gospel. (Full 18-trait weighting breakdown coming in a follow-up — watch for it.)

Rosy-Lane Holsteins in Wisconsin has run a version of this playbook for years. Their published breeding strategy sorts bulls by Net Merit first, then discriminates against any bull over +2.0 for Stature — a two-filter approach that lines up almost exactly with where classification is now heading.

The Show Ring Is Reading the Same Room

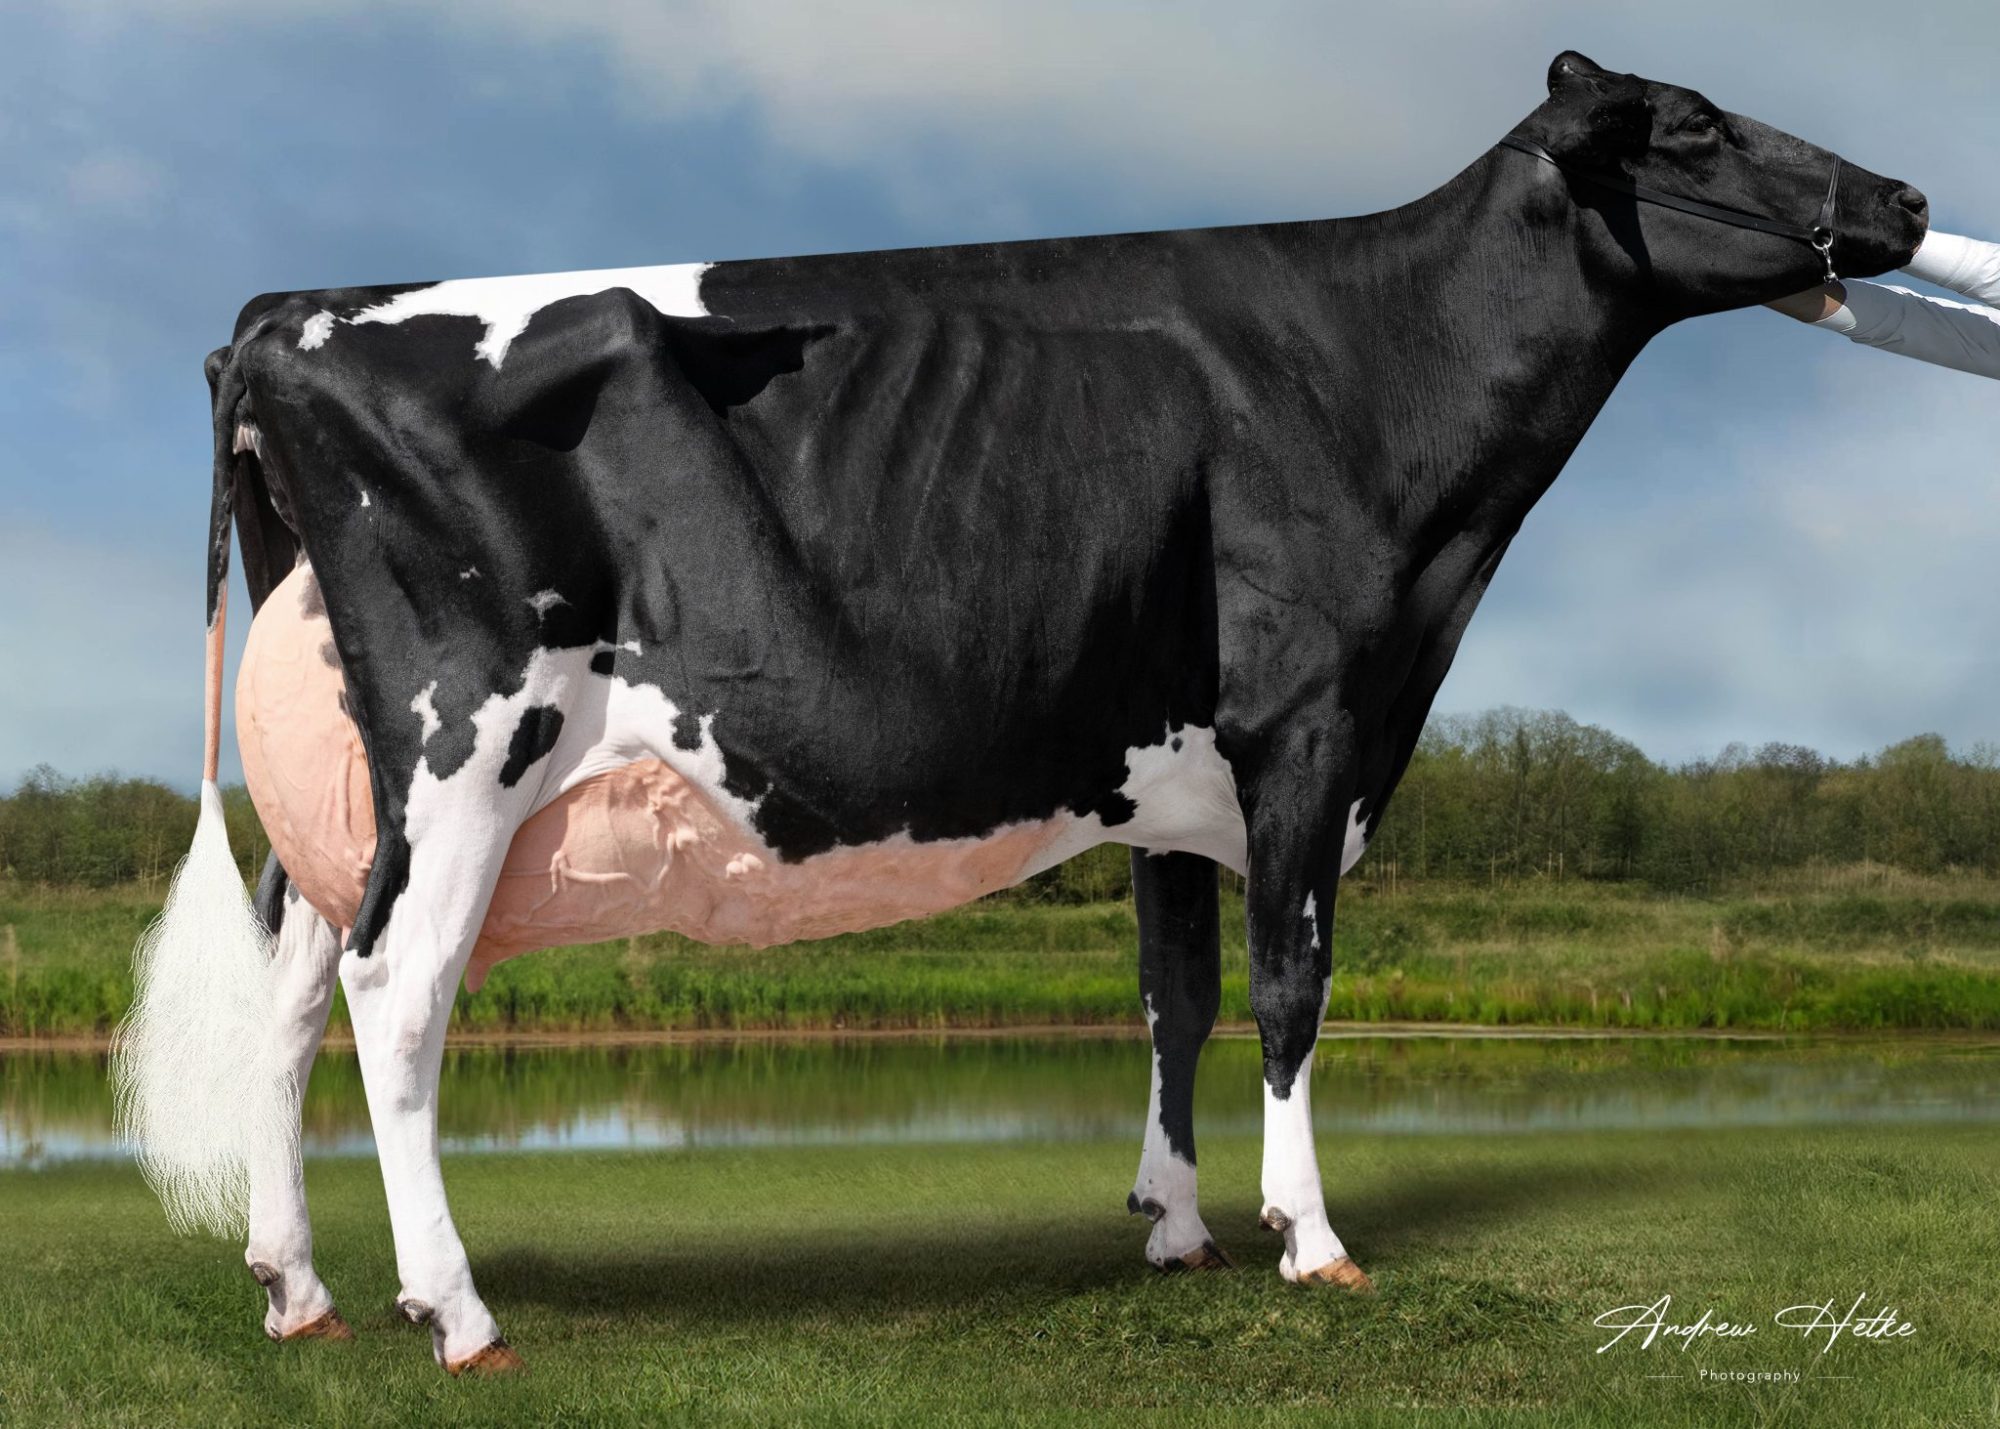
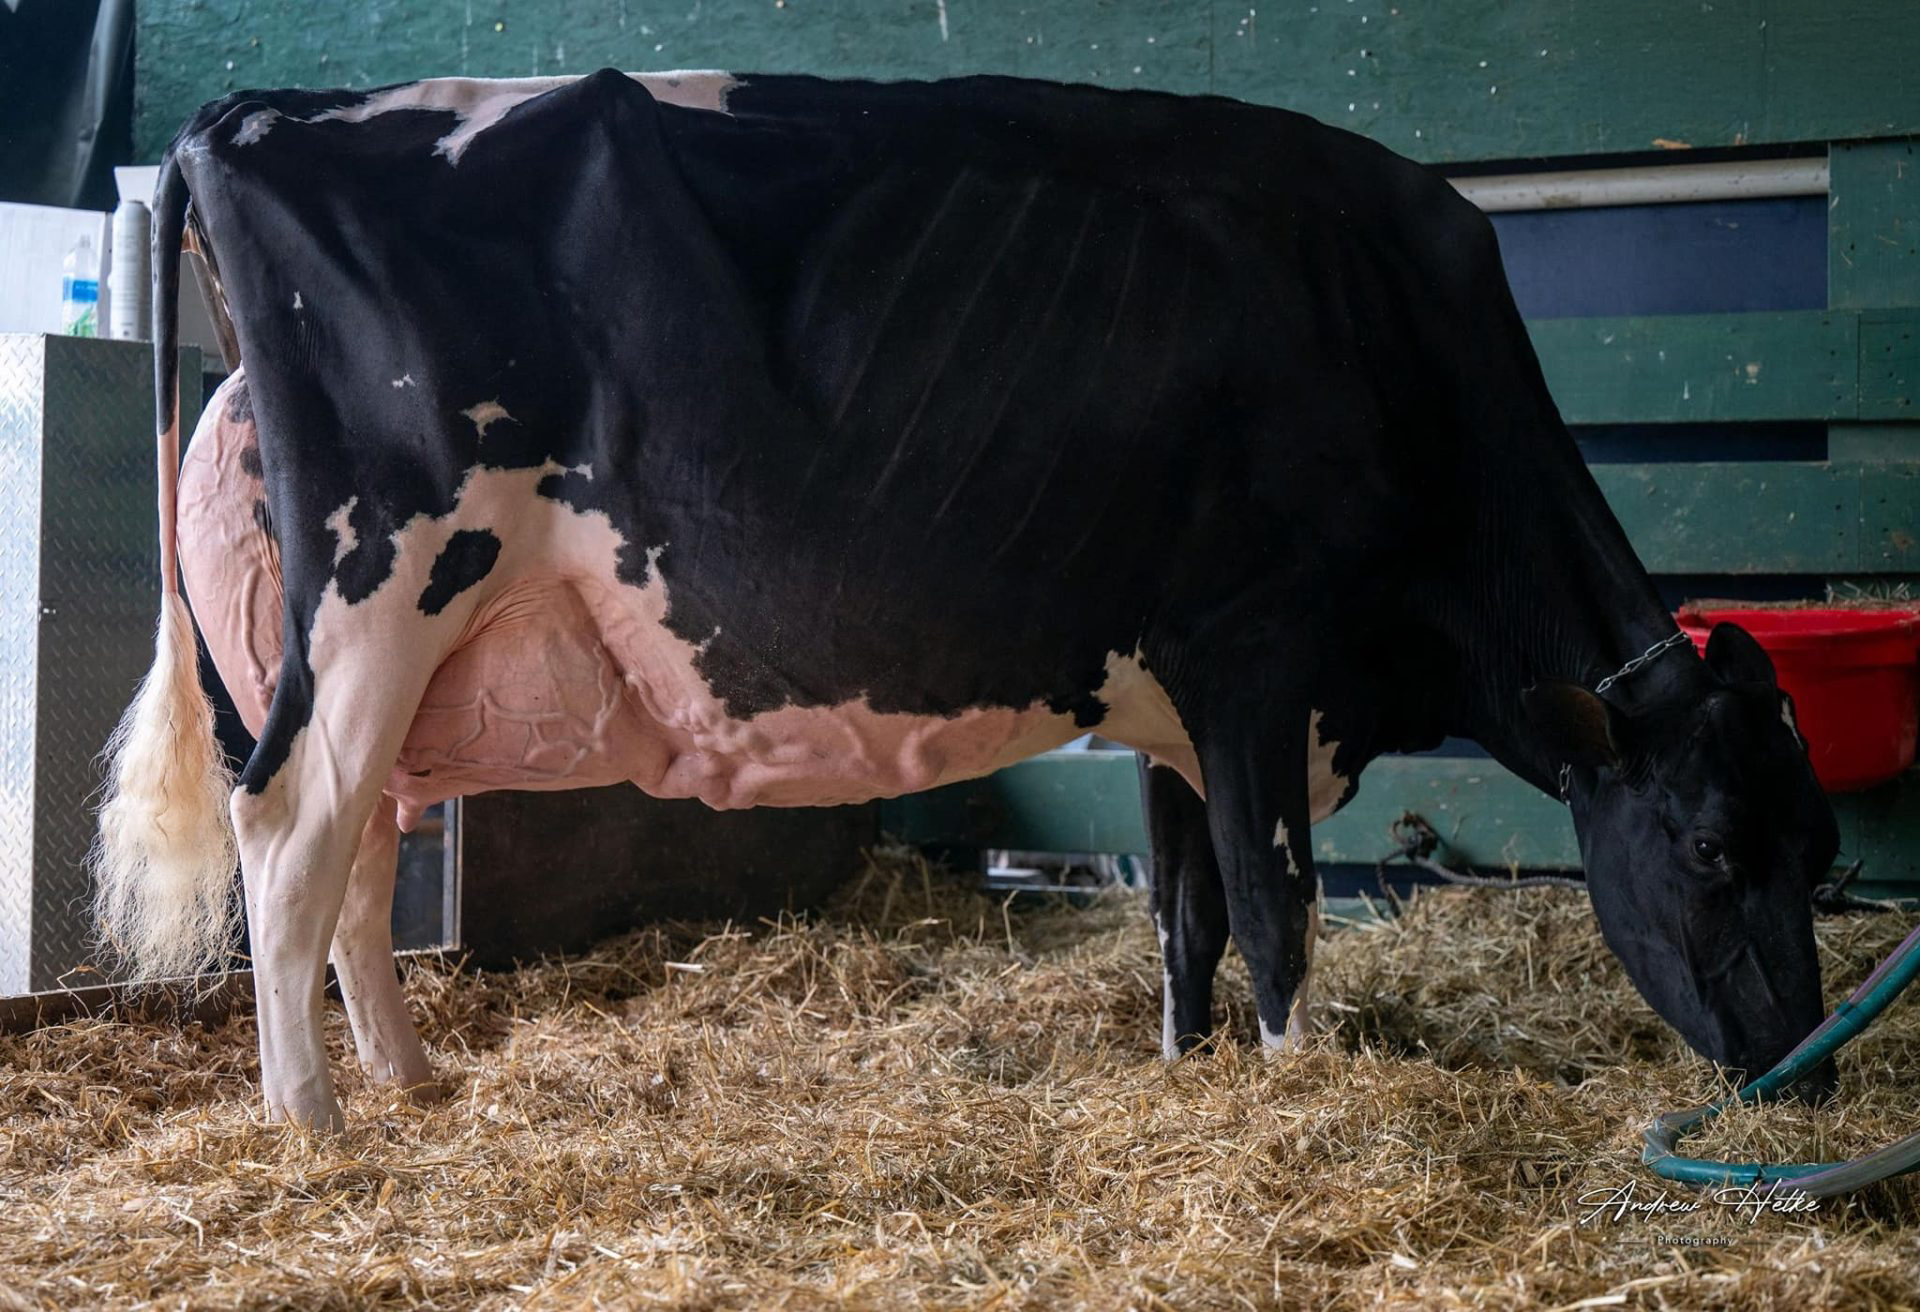
Oakfield Solomon Sunset-ET EX-96 2E — Holstein USA’s 2025 Star of the Breed, bred and owned by the Lamb family of Oakfield Corners Dairy. Look at the depth, the spring of rib, that mammary — power and width, not extreme height. A 51,710-lb five-year-old, and exactly the cow the 2026 stature penalty was written to reward. (Photo: Andrew Hetke Photography)

Here’s the tell that this isn’t just committee talk. Holstein USA’s 2025 Star of the Breed is Oakfield Solomon Sunset-ET EX-96 2E, bred and owned by Jonathan and Alicia Lamb of Oakfield Corners Dairy in New York — a cow the family describes in almost exactly the language the new rules reward. Her production backs it: a five-year-old record of 51,710 lbs milk, 2,087 lbs fat (4.0%), 1,674 lbs protein (3.2%) on 2x 365-day, with more than 178,000 lbs lifetime milk. 

Listen to how her breeders talk about her. “We don’t want to have the biggest, but we want to have the most correct — and we certainly want them to have plenty of width and power and strength,” Jonathan Lamb says. Her dam, Bella-Rosa GW Sara, wasn’t the prototypical tall show cow either — “she wasn’t super tall or extreme, but she was perfectly balanced, which is the kind we really appreciate,” per Alicia Lamb. That’s the breed’s highest type-and-production honor going to a cow explicitly bred for width and correctness over height. The award and the penalty are pointing the same direction. 

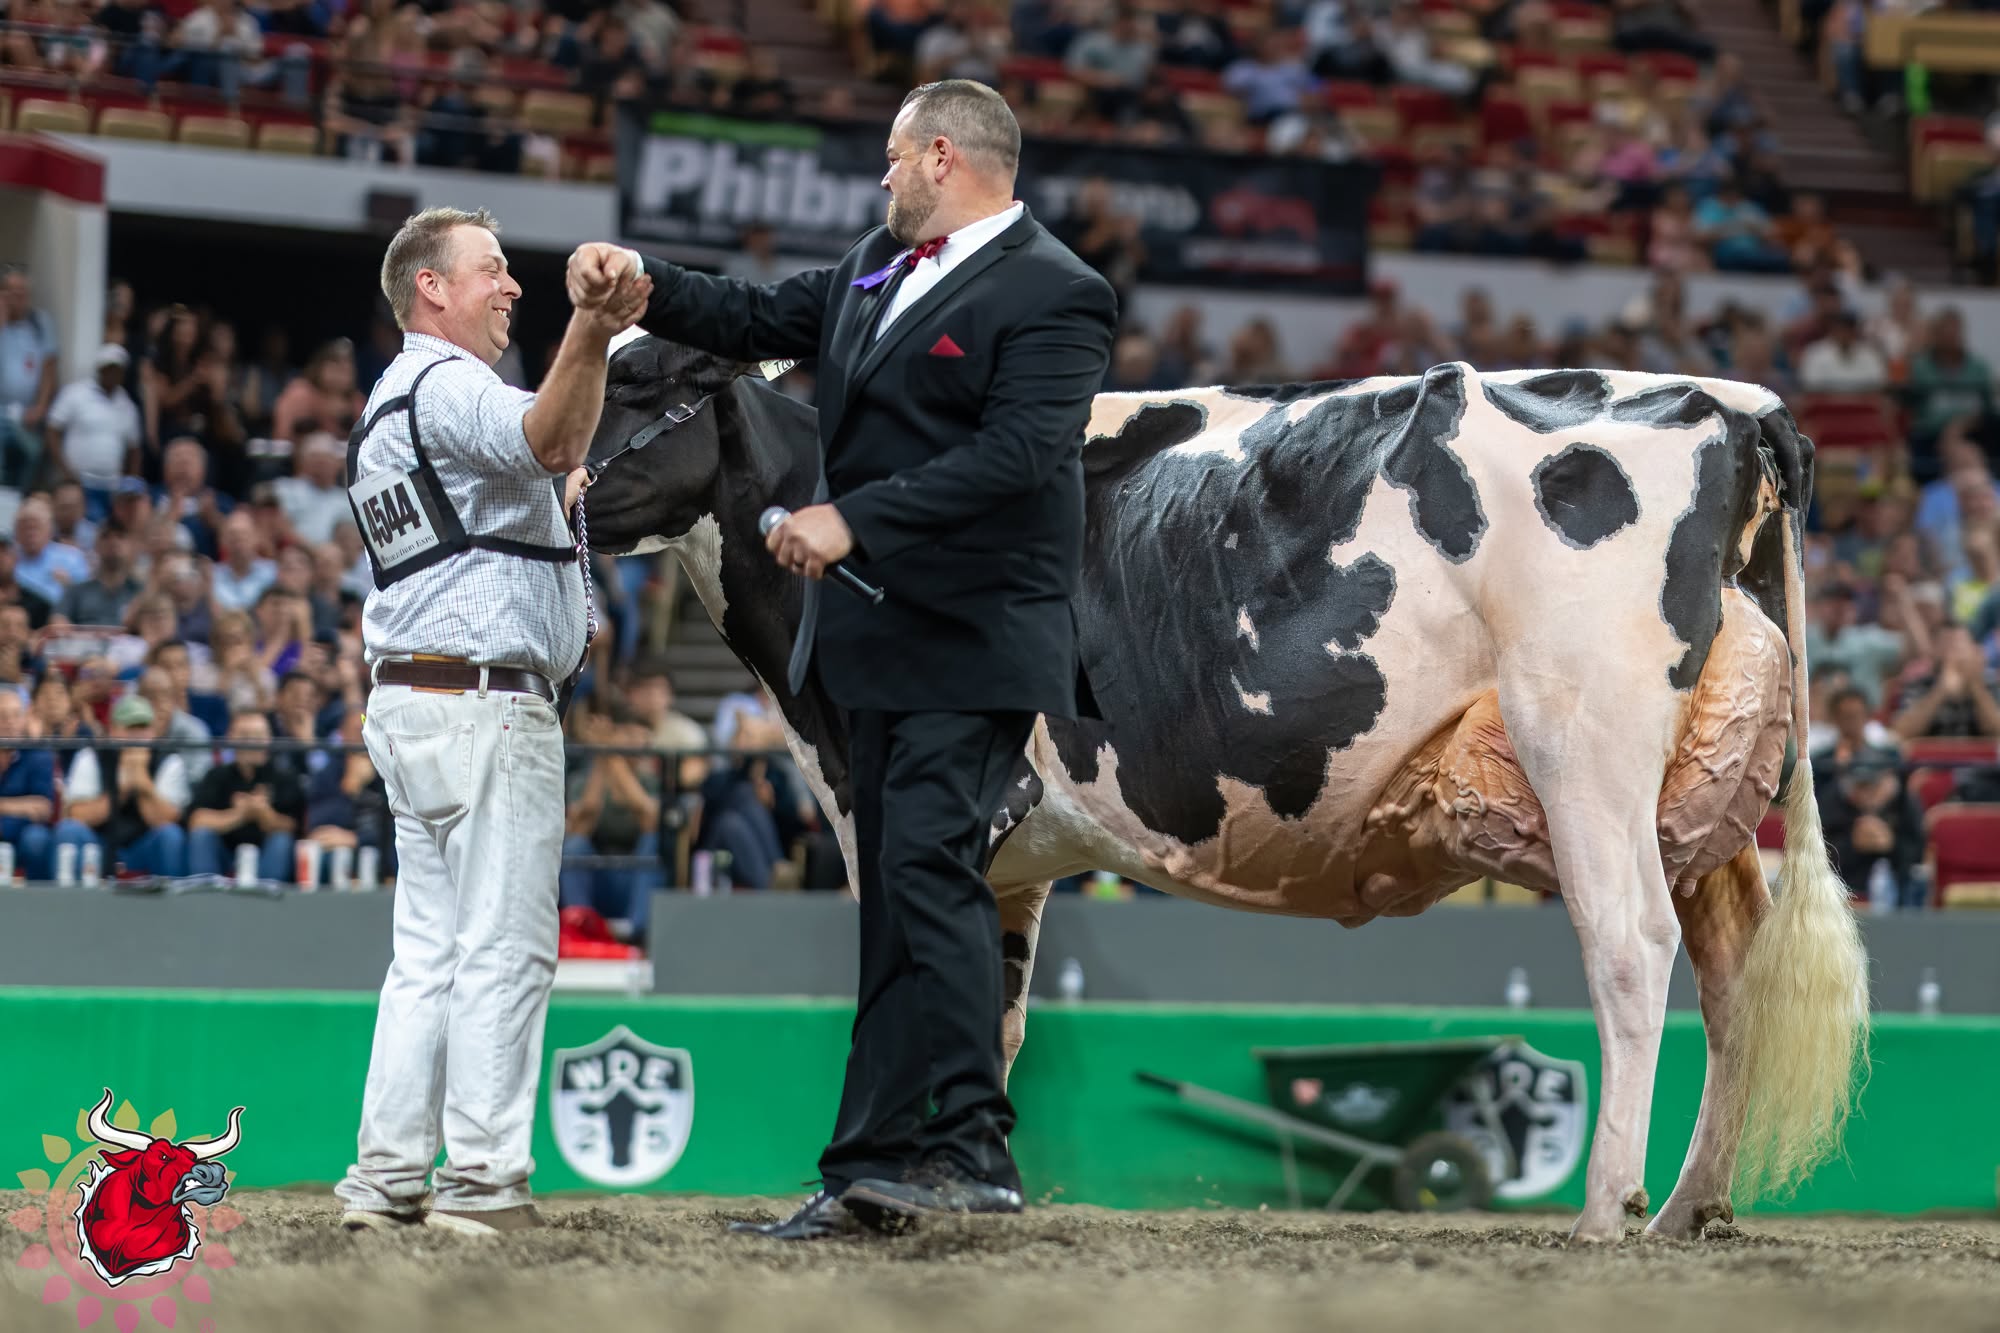
Lovhill Sidekick Kandy Cane takes the handshake — the Lamb family’s five-year-old, tapped Grand Champion at the 2025 World Dairy Expo. Judge Aaron Eaton’s reasoning leaned on maturity, added width and power, not sheer height — the same vocabulary the 2026 classification card and HCC are now built to reward. What she’d measure on the stick is anyone’s guess; the language crowning her isn’t.

The ring itself said much the same thing at Madison. The same Lamb family owned the 2025 World Dairy Expo Grand Champion, the five-year-old Lovhill Sidekick Kandy Cane, whom Judge Aaron Eaton put to the top on her added width, and power rather than sheer height. Here’s the honest caveat: Kandy Cane’s exact classification stature isn’t public, so nobody can say whether she’d trip the new penalty — that’s an open question, not a prediction. But the language a top judge reaches for to crown a champion — width, power, balance — is now the same language the classification card and HCC are built to reward. When the show ring and the formula start using the same adjectives, the direction isn’t in doubt. 

What Canada Already Figured Out

The Americans aren’t the first to draw a line on height. Canada’s classification system, run through Holstein Canada, has long treated its conformation composites so that extreme stature doesn’t buy its way into the score, and its evaluations are recognized worldwide for stability. If you sell semen or cattle across the border, or read Canadian proofs, you’ve already been living with a version of what the U.S. just adopted. 

That matters for two reasons. First, the 2026 U.S. change isn’t a lone experiment — it’s the American system catching up to a direction others validated a while back. Second, if you use Canadian genetics, the bulls that look moderate and balanced under that stature-neutral math are the ones most likely to throw daughters who clear the new 60-inch lens cleanly. The systems are converging, not diverging — a rare thing in an industry where cross-border index differences usually cause headaches, not alignment.

What This Means for Your Operation

None of this makes tall cows worthless, or the show ring wrong. It means the barns, the economics, and the profit indexes have all shifted. Here’s how different herds can play it.

  • Run a 30-day sire audit. This month, pull your current bull list, sort by stature PTA, flag the tallest transmitters, then check Body Weight Composite, Productive Life, and now HCC on the ones you flagged. Costs nothing but an evening. Works for any herd — the single most concrete step available right now. 
  • Gate on Net Merit, then cap stature. Best for commercial and dual-purpose herds chasing durability — the Rosy-Lane approach, essentially. It demands discipline to pass on a flashy tall bull. Where it backfires: pure show programs may find it narrows their pipeline of ring-competitive genetics. 
  • Keep breeding show-type — but go in with eyes open. Makes sense if marketing show cattle is your business. What it demands: accept that a daughter measuring 64–65 inches now gives back nearly a full point of Final Score she’d have kept a year ago, which can move a sale price. Read individual linear traits, not just composites, when PTAT and HCC disagree. 
  • Split your herd’s strategy. For larger operations, breed a show string one way and a commercial string another. It demands more record-keeping and a clear-eyed read of which cows earn their keep where.

The Big Picture: The steady stature decoupling in the evaluations, Canada’s long-standing “too-tall” stance, the 2024 scale shift, the 2025 Net Merit weight tax, the 2026 penalty, and a Star of the Breed bred for width over height are not separate events. They represent a decade of unified industry direction. Betting against it is a bet that economics and genetics will reverse course — and the data says they won’t. 

Your 2026 Pre-Classification Audit

Run these three checks before your classifier’s next visit.

  • [ ] Identify the UDC/stature illusion. Flag bulls that are both exceptionally tall and high for udder composite — because rear udder height and width correlate strongly with stature, that composite may be riding on frame. Inspect the individual linear traits, and cross-check HCC, before buying more semen. 
  • [ ] Recalculate your BAA expectations. Look at your aged, dry EX cows. Under the new 24-month rule (effective for May 2026 classifications and after), they’re temporarily out of your BAA calculation until they freshen again — expect a lower baseline herd figure. 
  • [ ] Run the penalty table against your tallest cows. Measure — or estimate from prior classification — where your biggest cows sit. A 62-incher gives back 0.30; a 65-incher, 1.20. Know it before the classifier does, so a designation surprise doesn’t cost you at sale time. 

One more if you buy across the border: lean on the stature-neutral Canadian proofs that already fit this direction. And if you’re already gating on Net Merit and capping stature, take the win — this is a tailwind, not a warning. 

Key Takeaways

  • If your ideal cow measures over 60 inches, she now costs you classification points — 0.15 at 61″, climbing to 1.20 at 65″ and 3.45 at 70″ — but not one point of PTAT or stature PTA. The show-card hit and the genetic value no longer move together. 
  • If you rely on PTAT and UDC alone, add HCC to the read. Holstein USA’s own data shows PTAT correlates negatively with Productive Life, Livability, and Feed Efficiency; HCC was built to flip that. Pull the individual linear traits when a tall bull’s udder composite looks great. 
  • If you already gate on Net Merit and cap stature (the Rosy-Lane +2.0 rule), you’re ahead of the change, not behind it — the 2025 weight tax and the 2026 penalty both reward that discipline. 
  • The show ring already moved. The 2025 Star of the Breed, Oakfield Solomon Sunset, was bred for width and correctness over height — the award and the penalty are pointing the same way. 

Beyond the Ruler

The tall, angular cow ruled North American type for a generation, and by the measures of that era — tie-stalls, show strings, Final Score — she delivered. What’s shifted is the environment around her, not the quality of the cow. The breeders who feel the 2026 changes least are the ones who already moved toward moderate, durable, functional cattle — the Lambs, the Rosy-Lanes, anyone who decided years ago they didn’t want to milk the biggest cow in the barn. So here’s the question worth chewing on this week: if you measured your ten best-looking cows tomorrow, how many would clear that 60-inch line — and are they the same cows staying longest in your herd?

Learn More

The Sunday Read Dairy Professionals Don’t Skip.

Every week, thousands of producers, breeders, and industry insiders open Bullvine Weekly for genetics insights, market shifts, and profit strategies they won’t find anywhere else. One email. Five minutes. Smarter decisions all week.
NewsSubscribe
First
Last
Consent
Send this to a friend