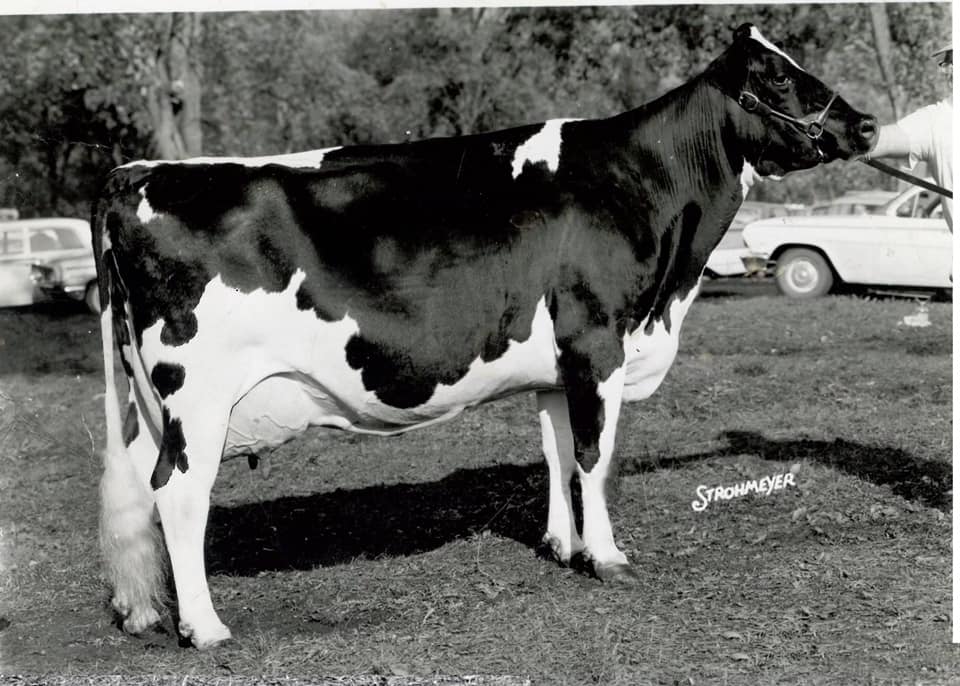
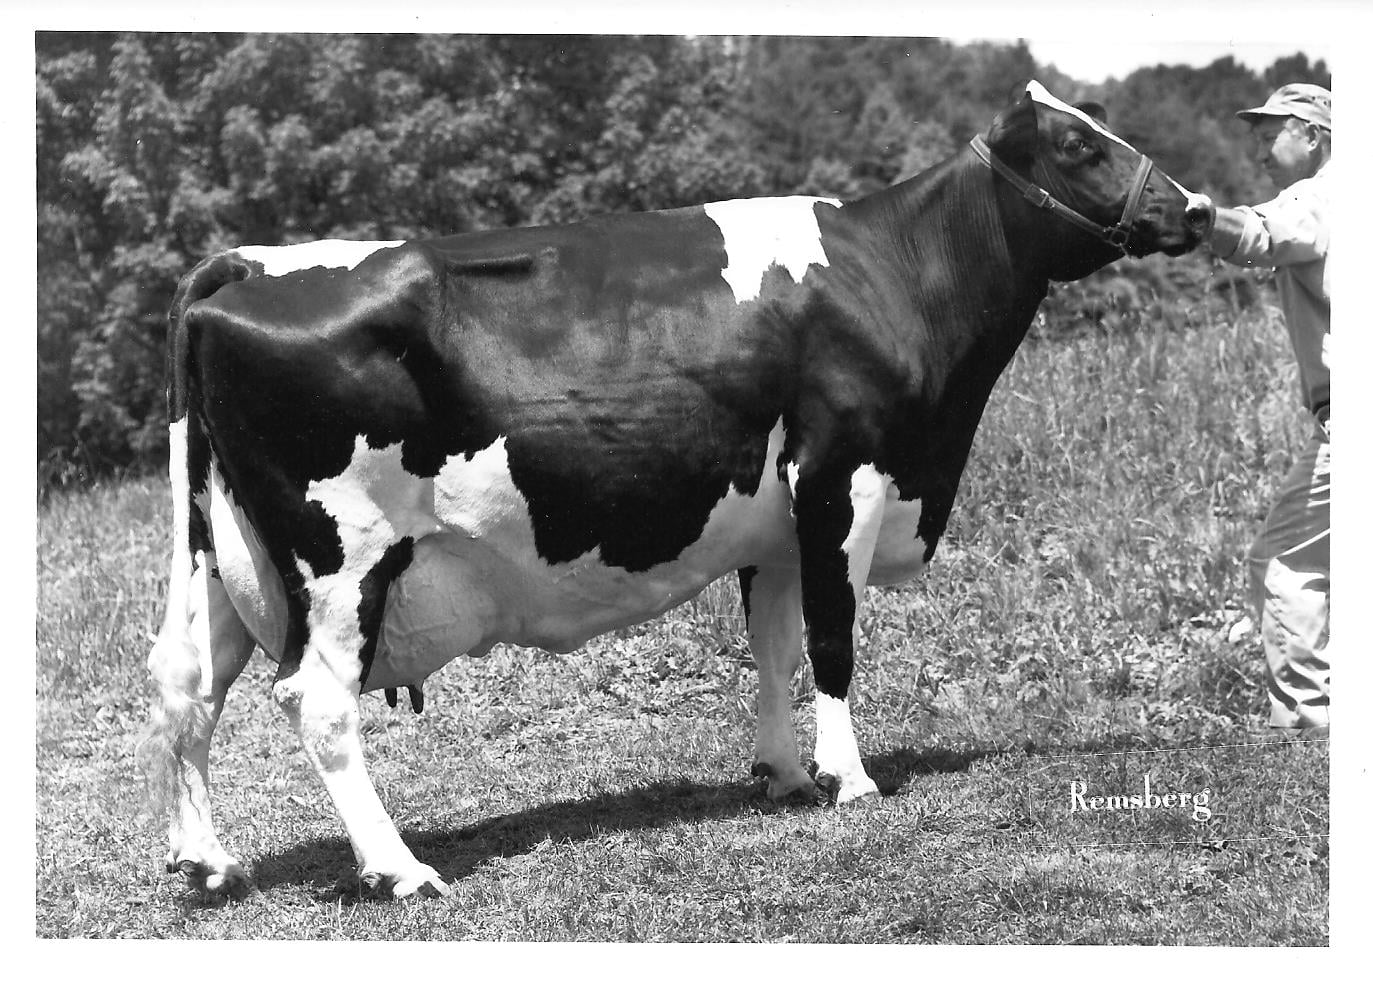
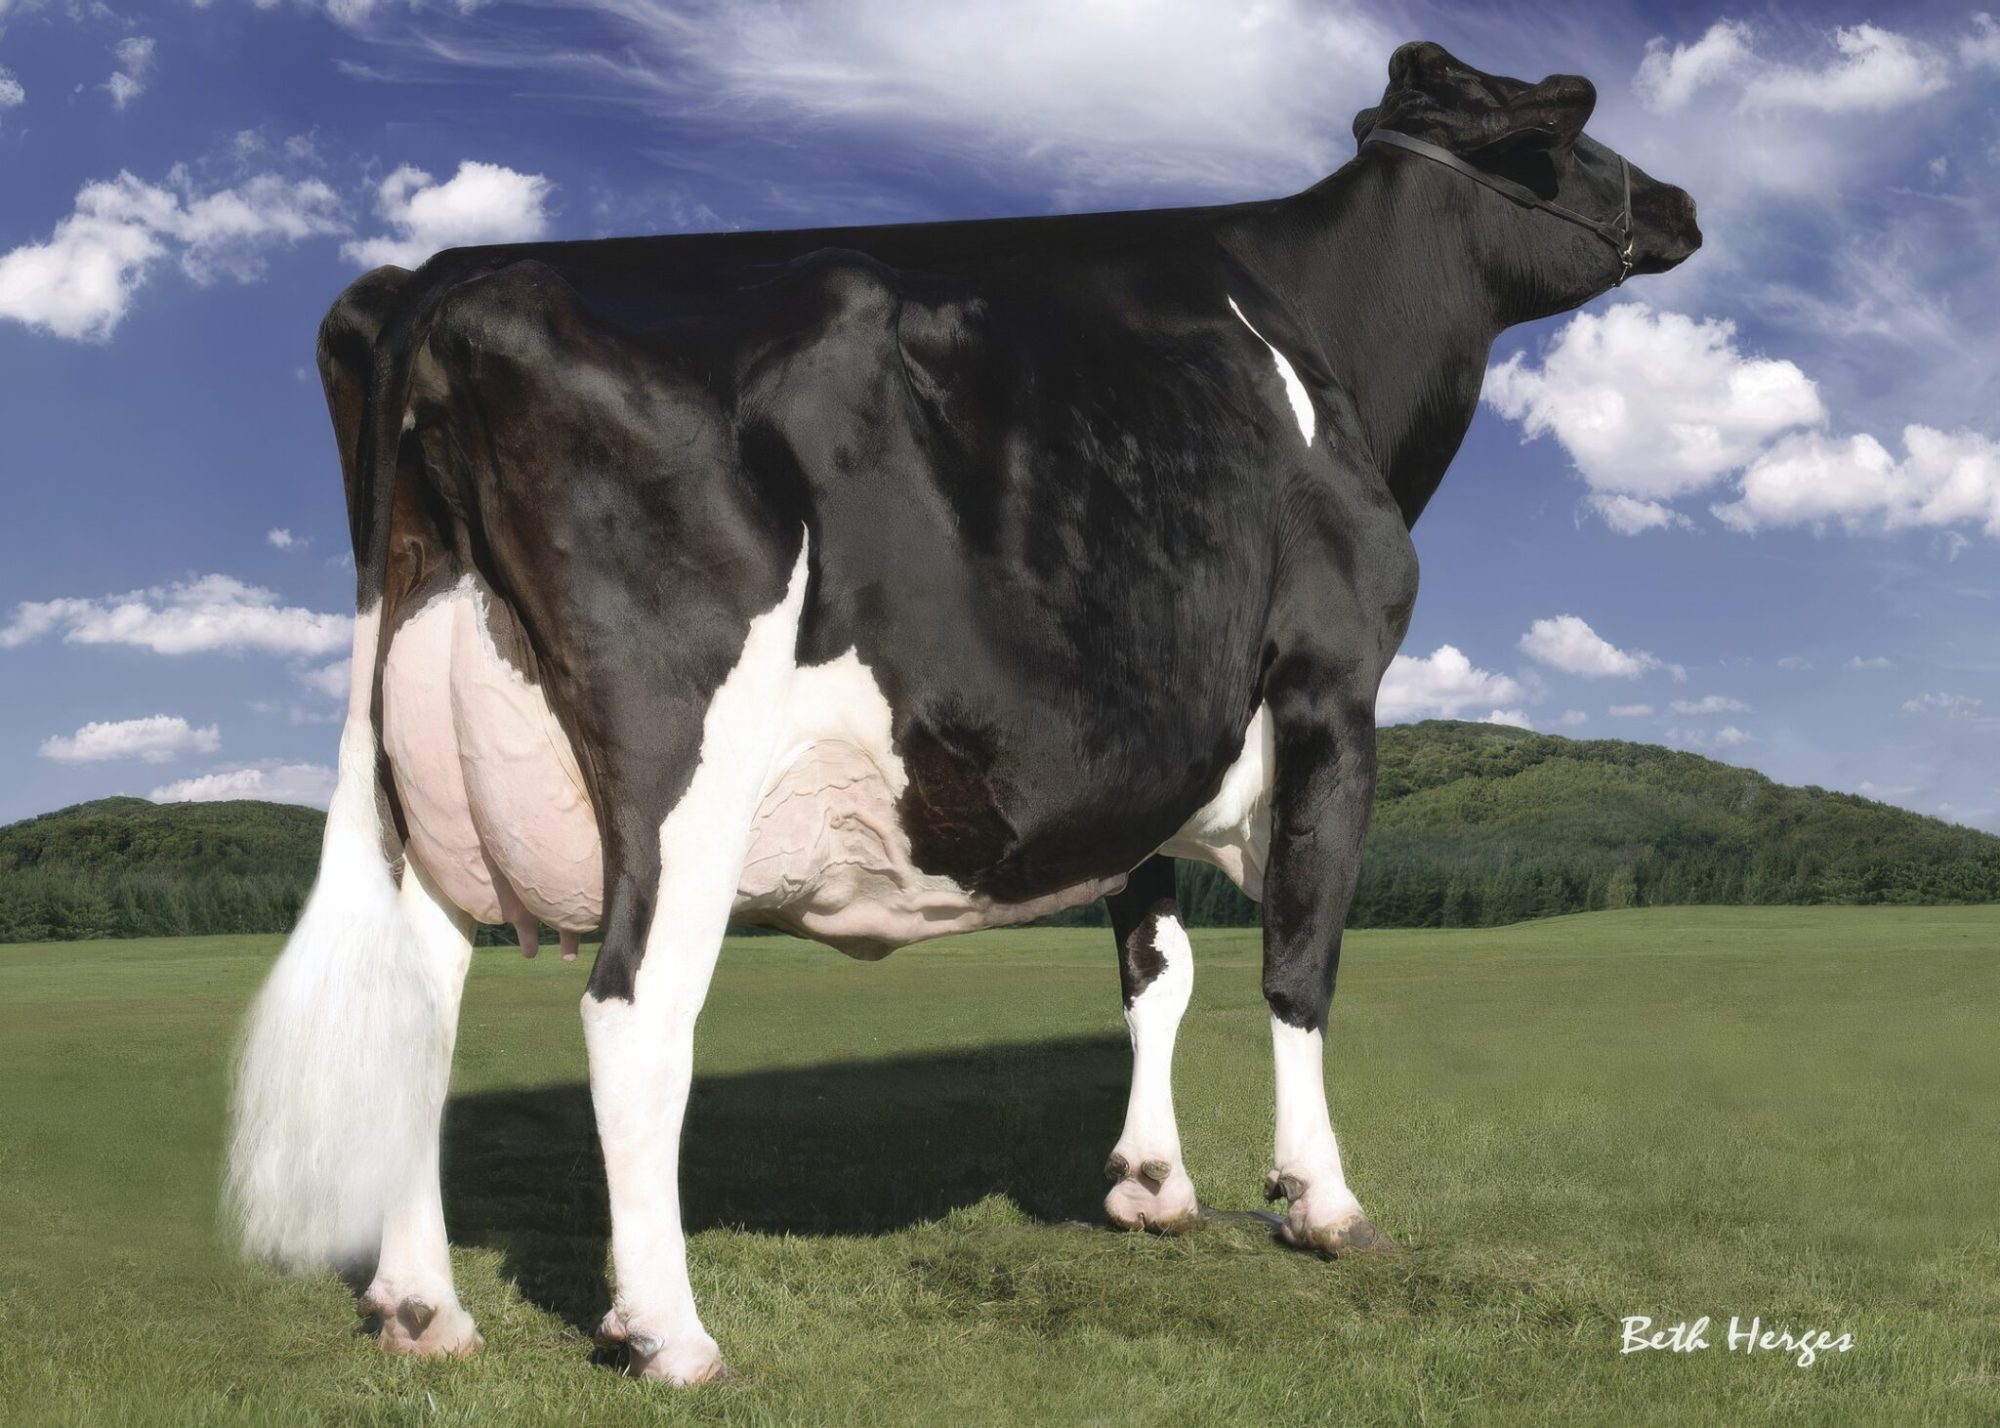
Blondin used partnerships. Jacobs made its prefix travel. Pierre Boulet trusted the cow before the catalog. Kueffner and Packard resisted show-ring excess. Budjon bred cattle that kept winning under new ownership. The real test is which systems produced another generation.
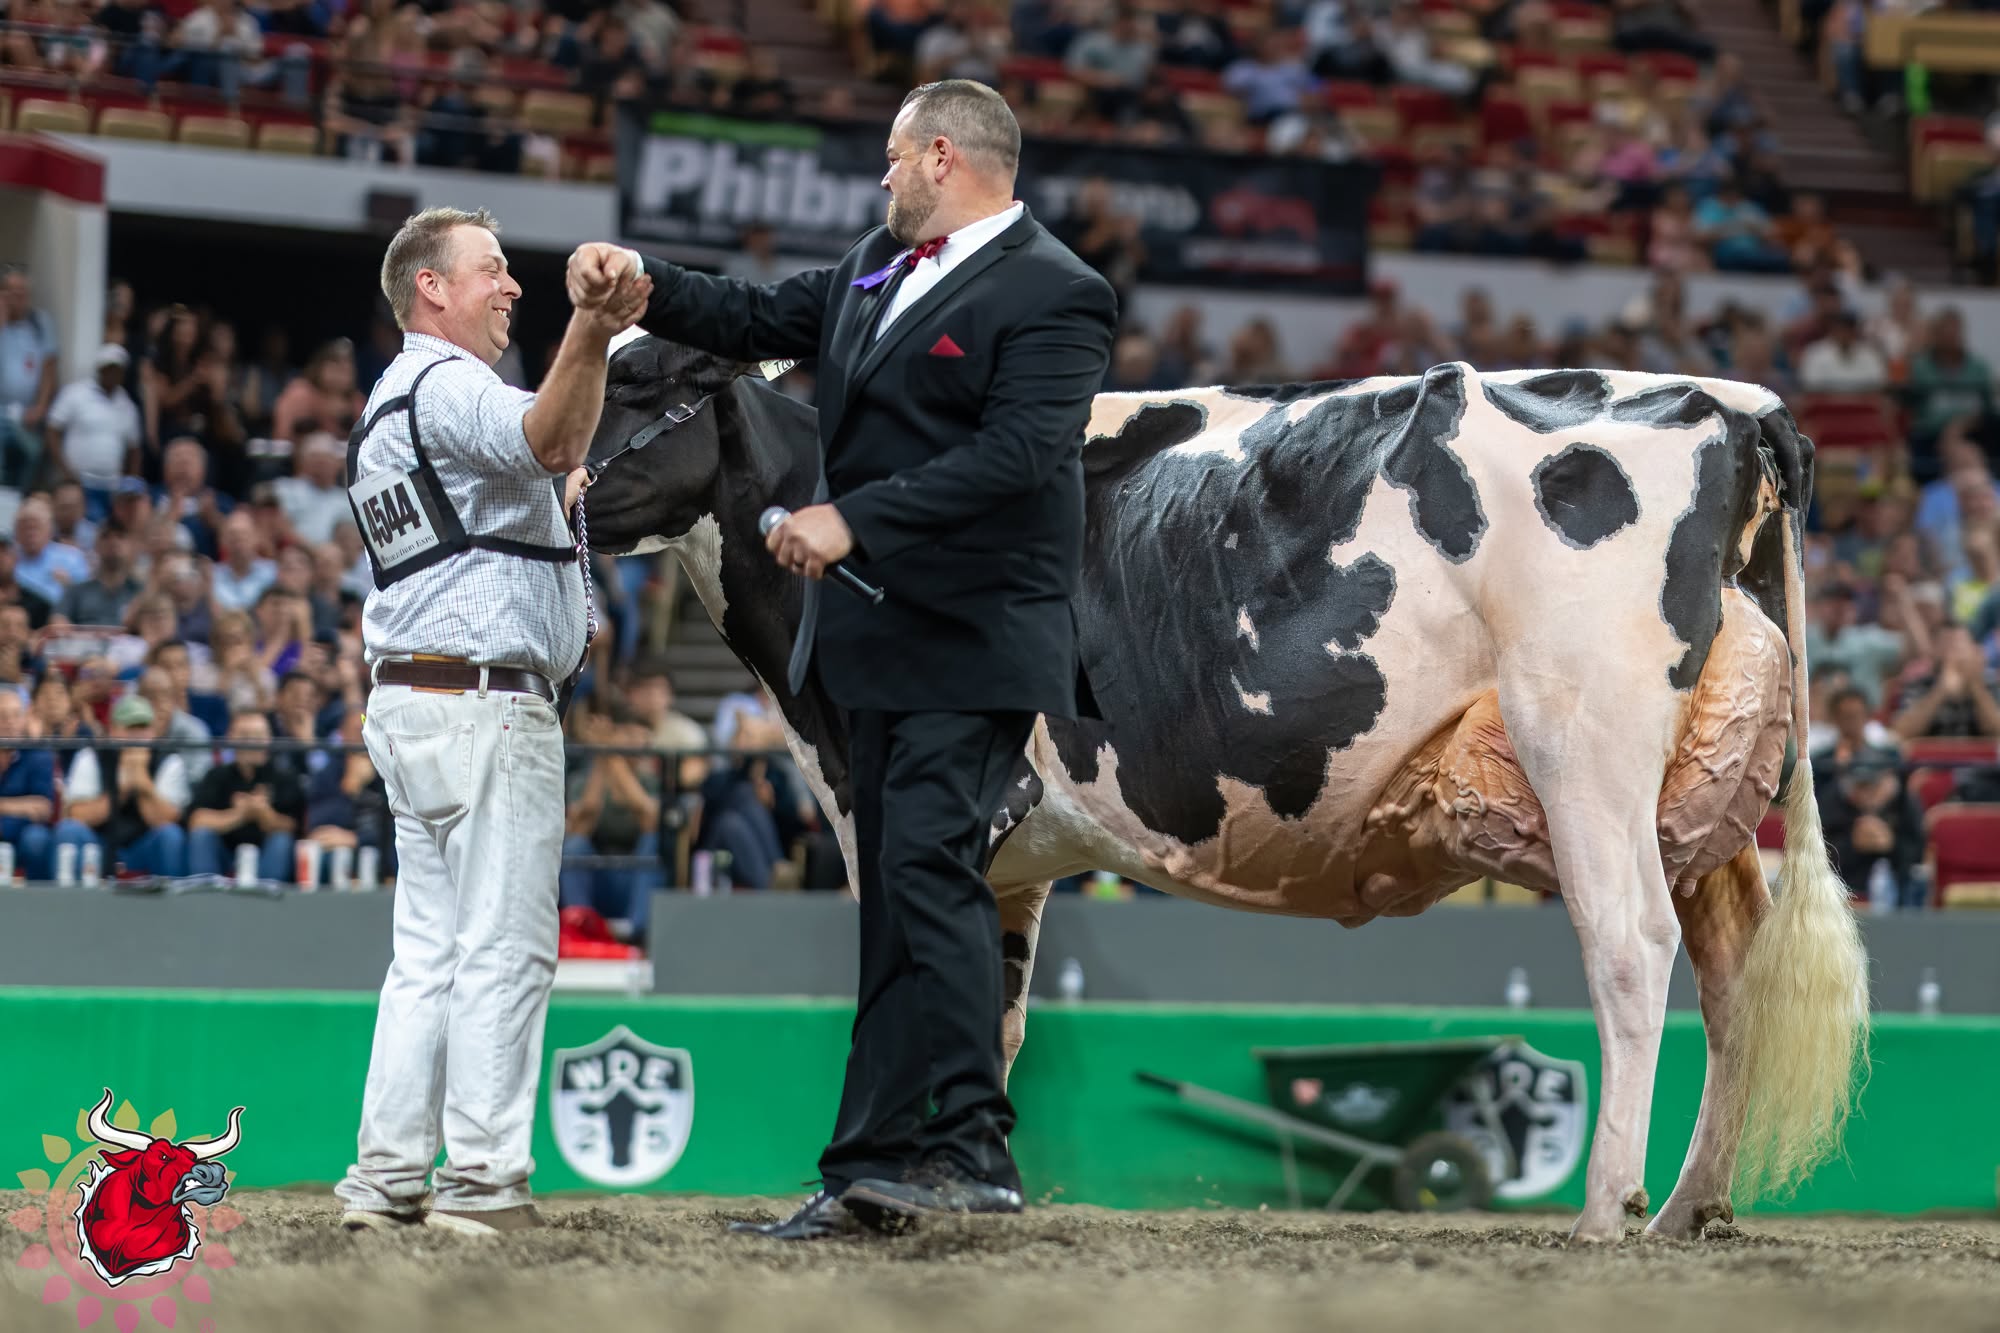
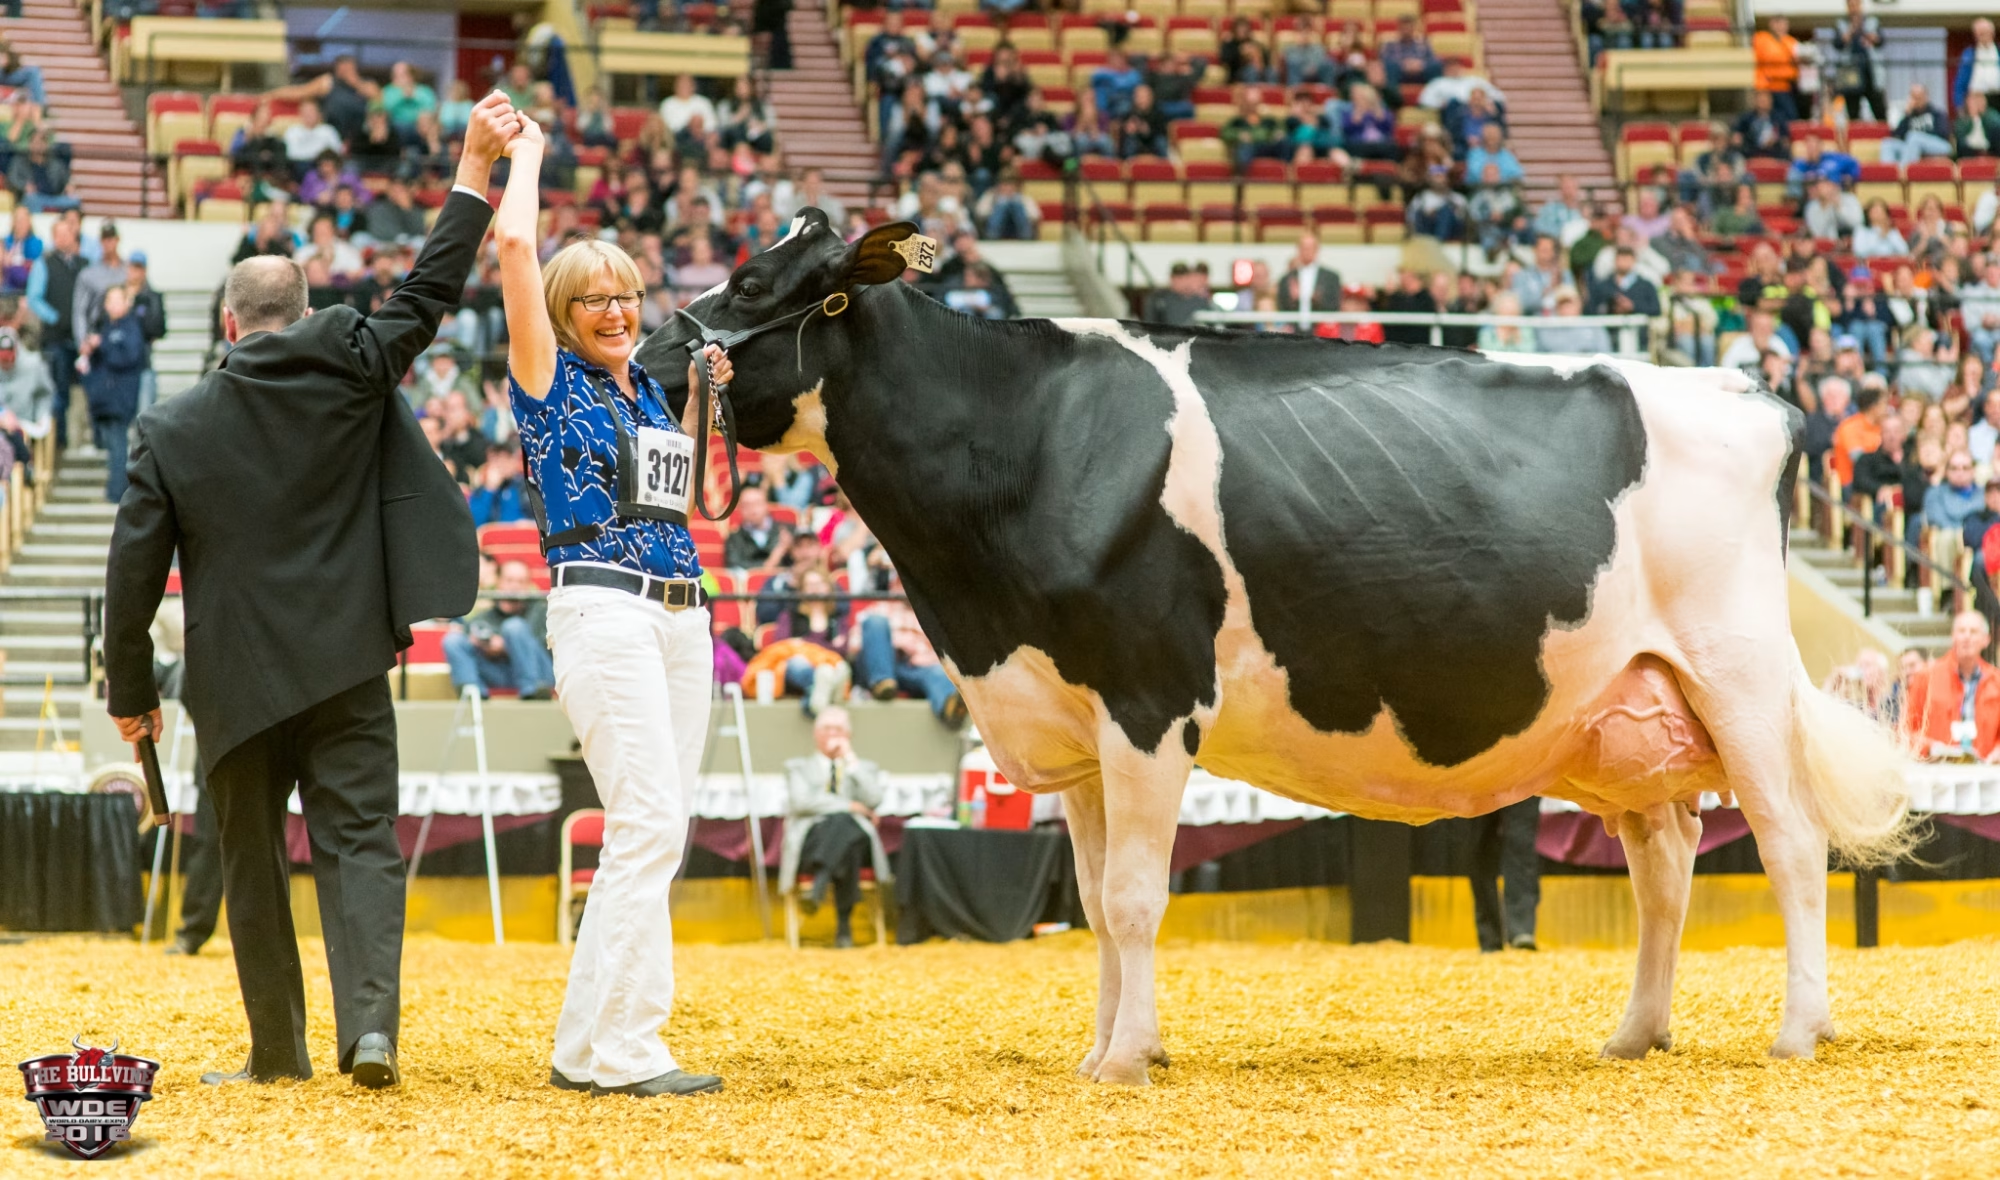
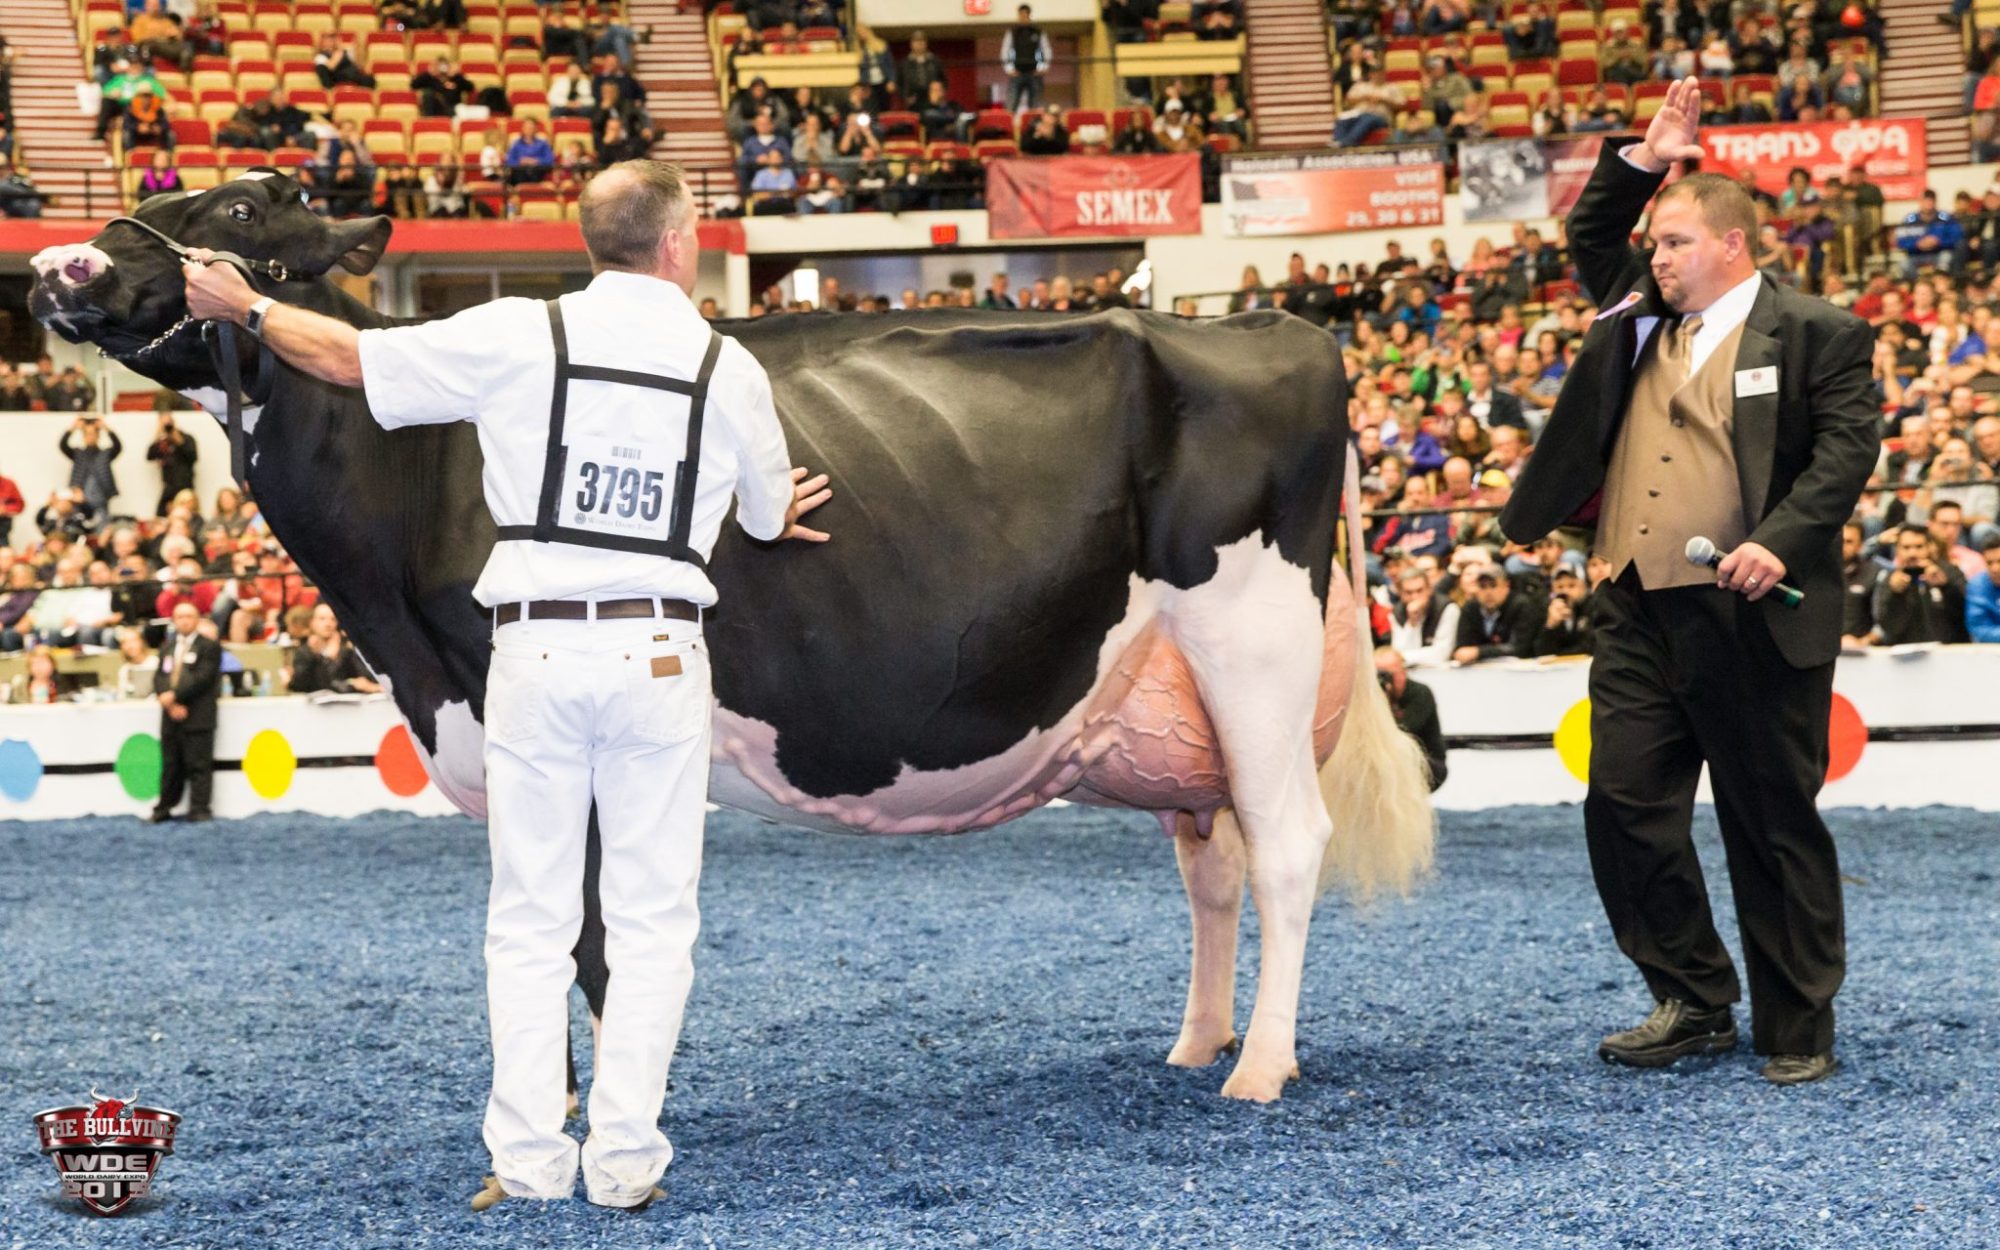
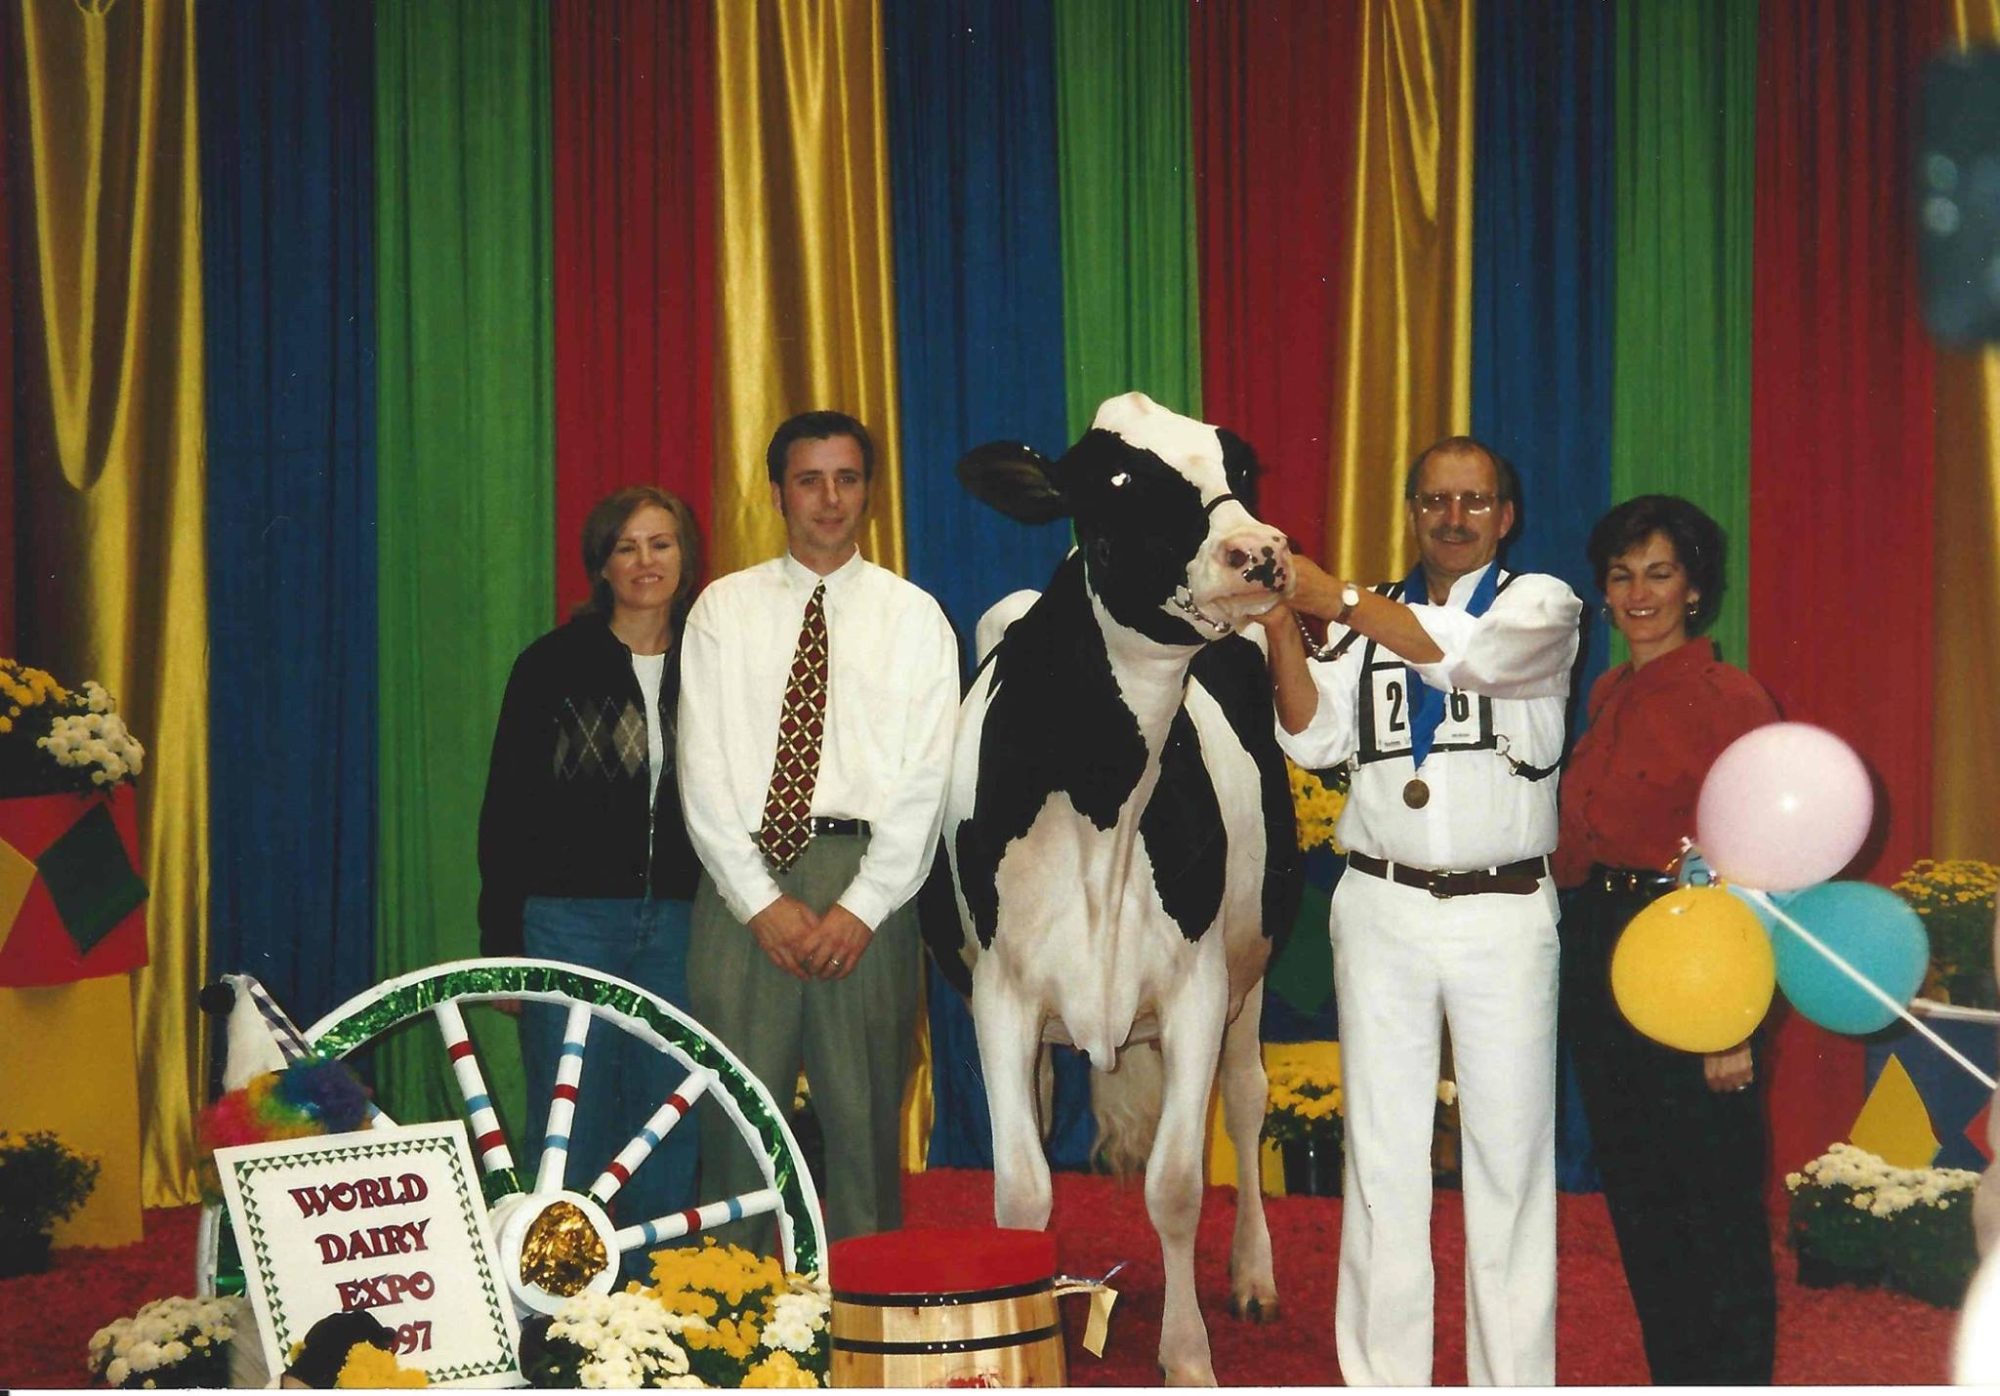
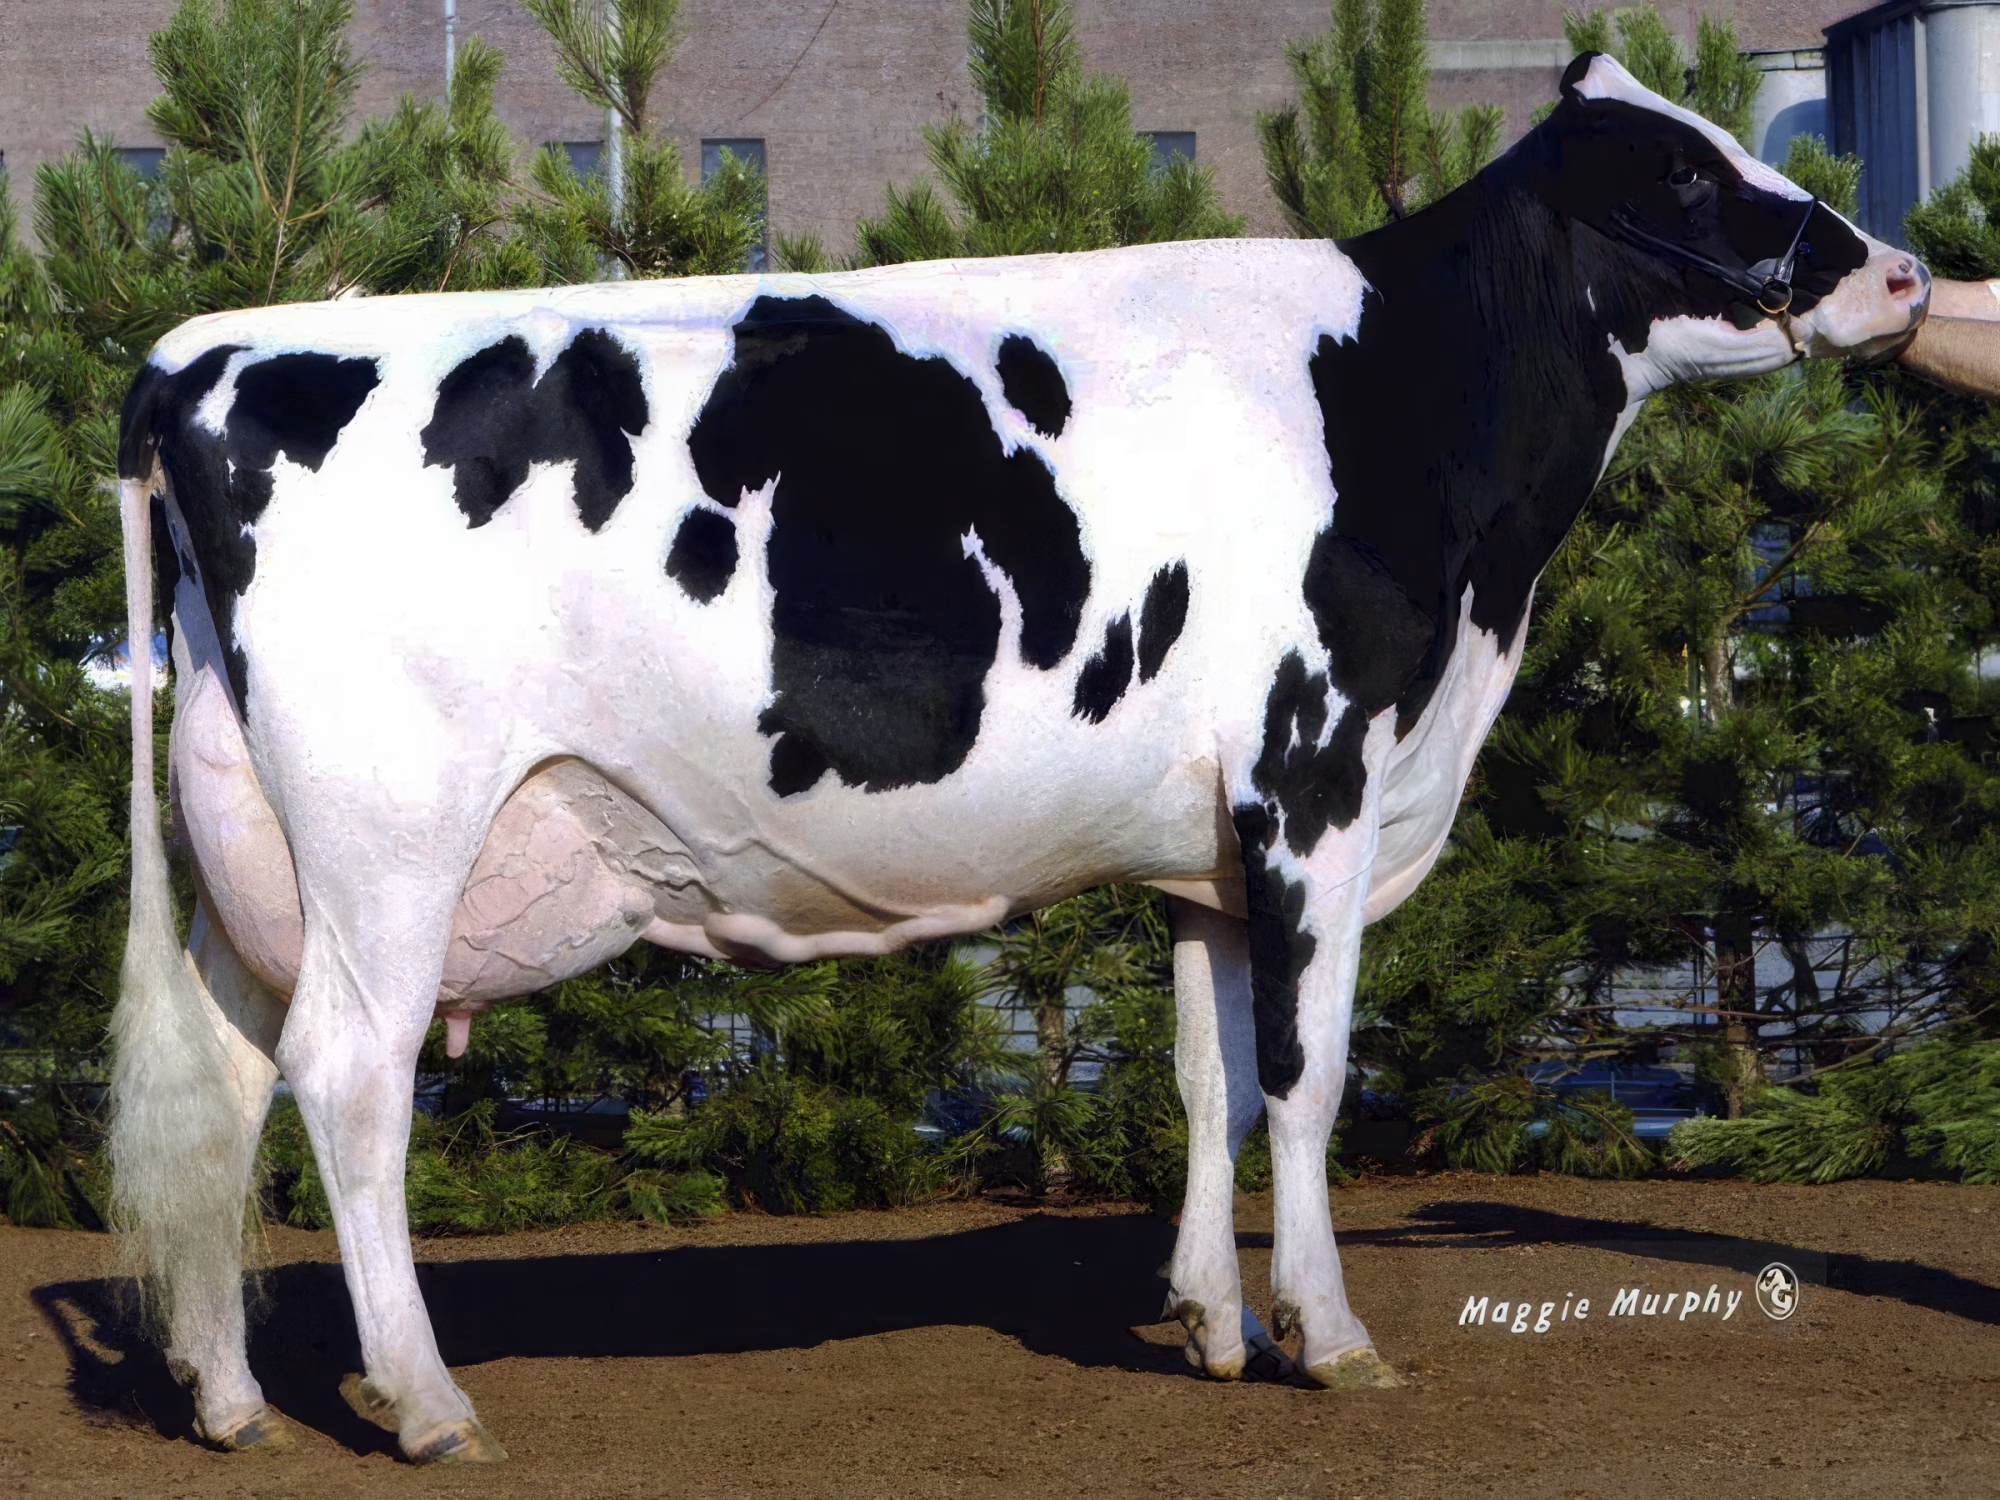
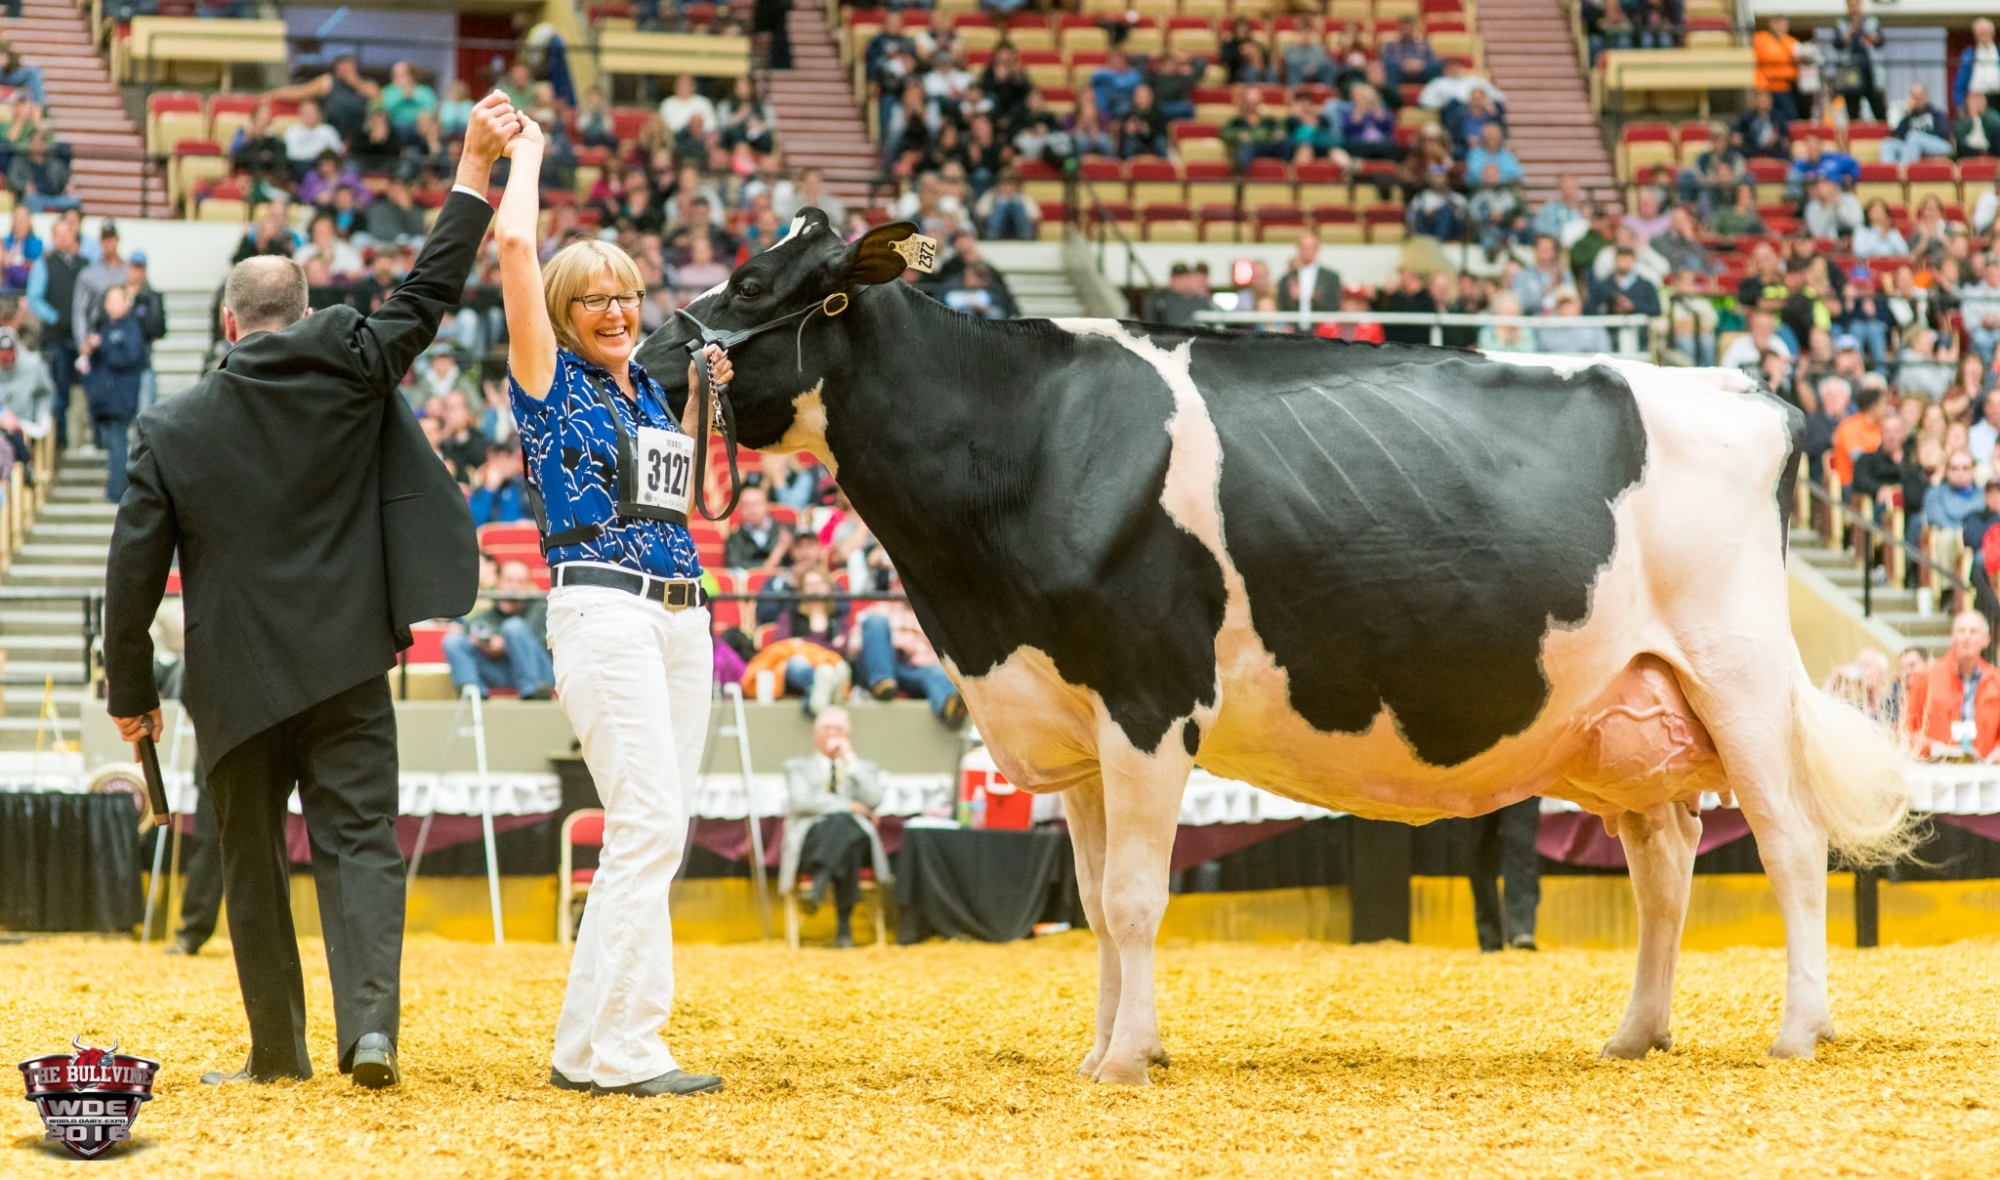
Ferme Jacobs could have protected Jacobs Lauthority Loana EX-96-2E after she swept the 2018 International Holstein Show. She won Senior Champion, Grand Champion, and Champion Bred & Owned for Ferme Jacobs and Pat Conroy.
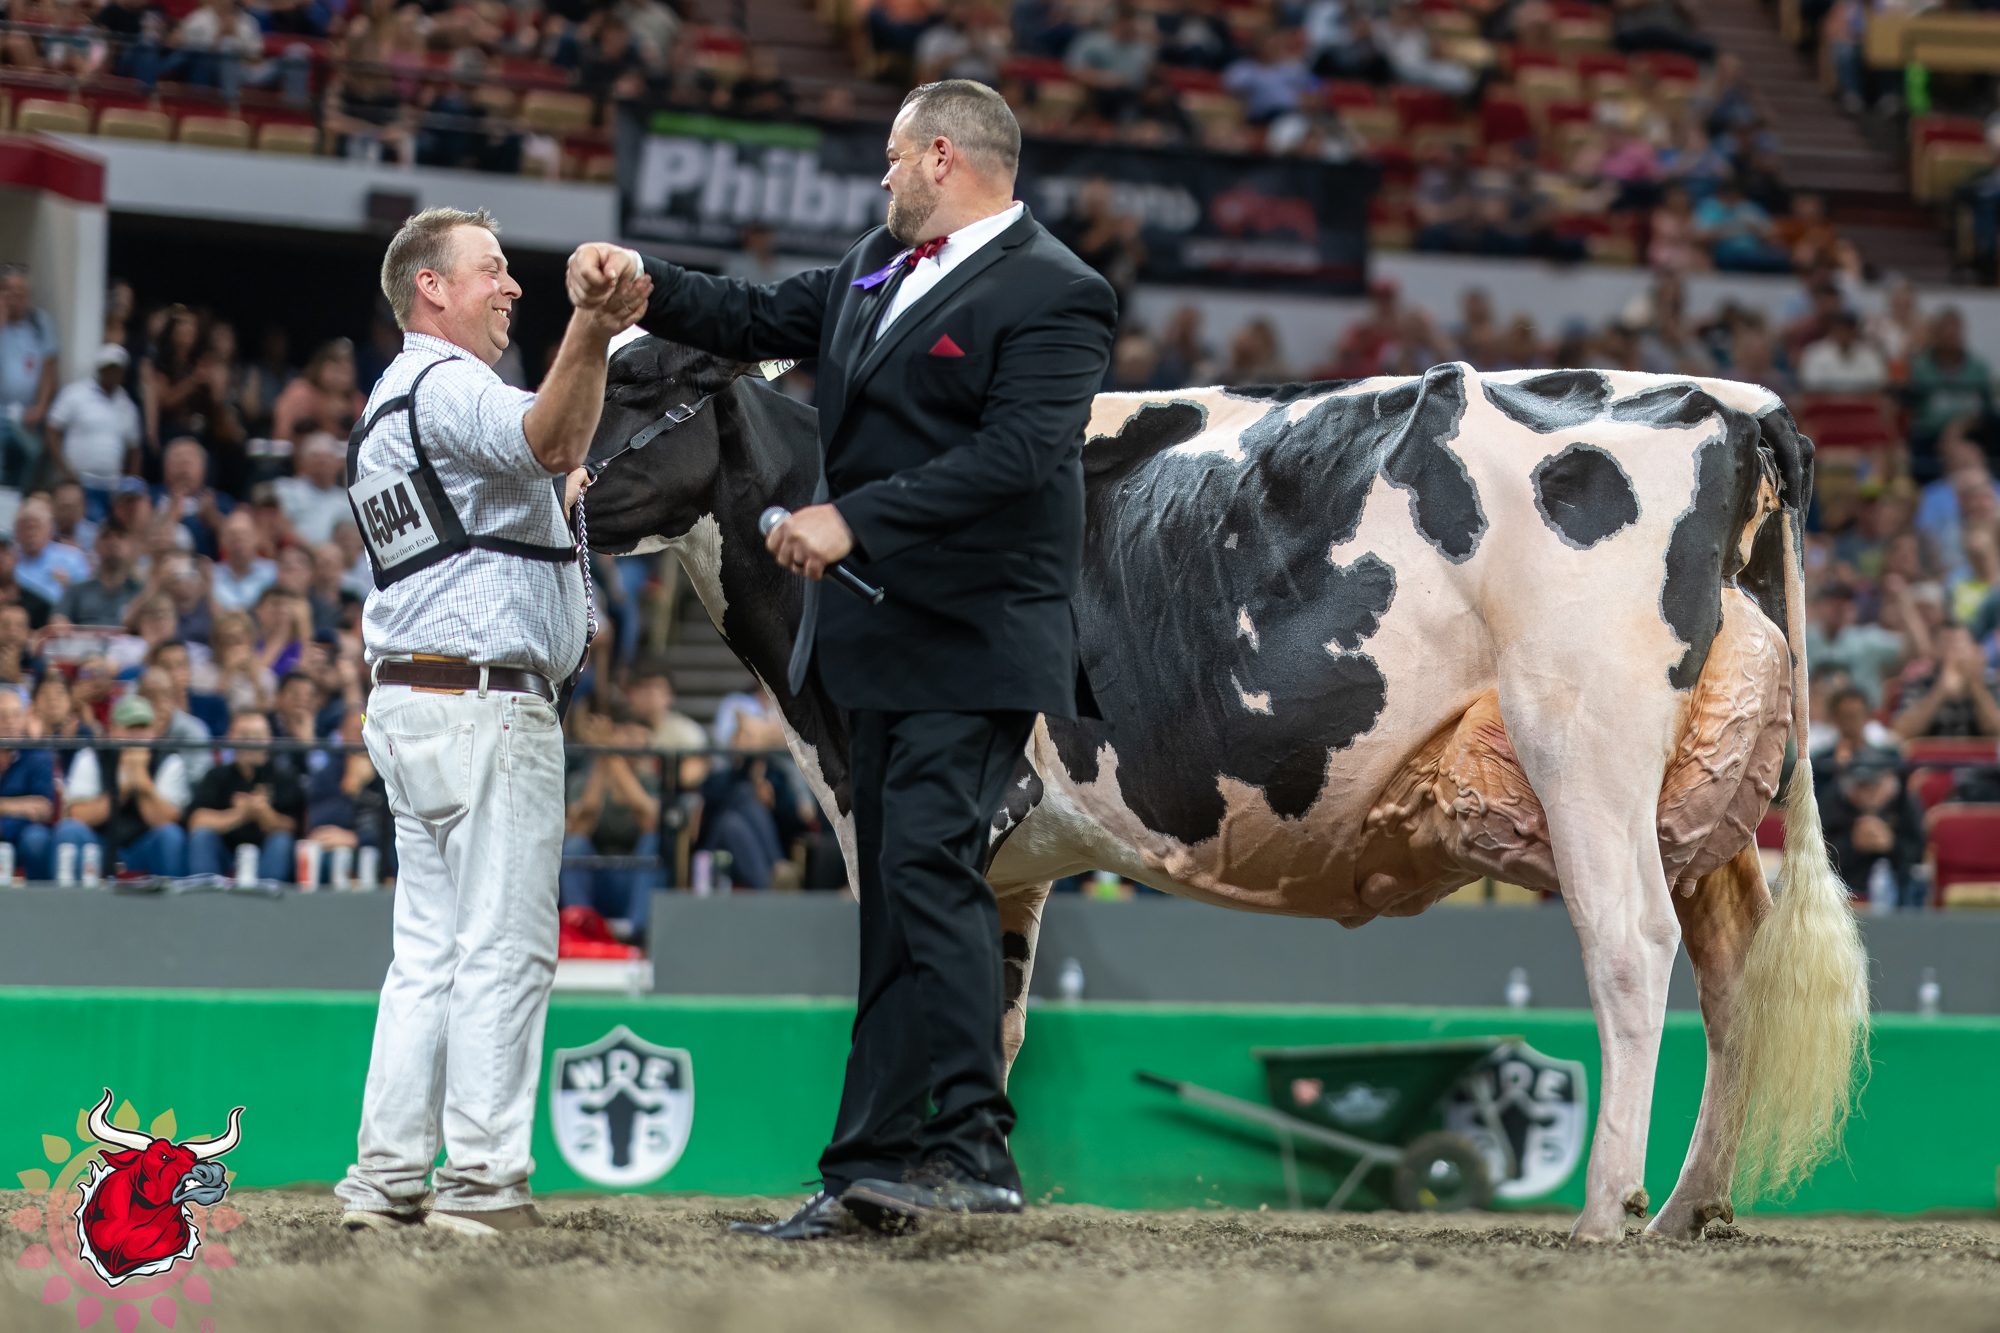
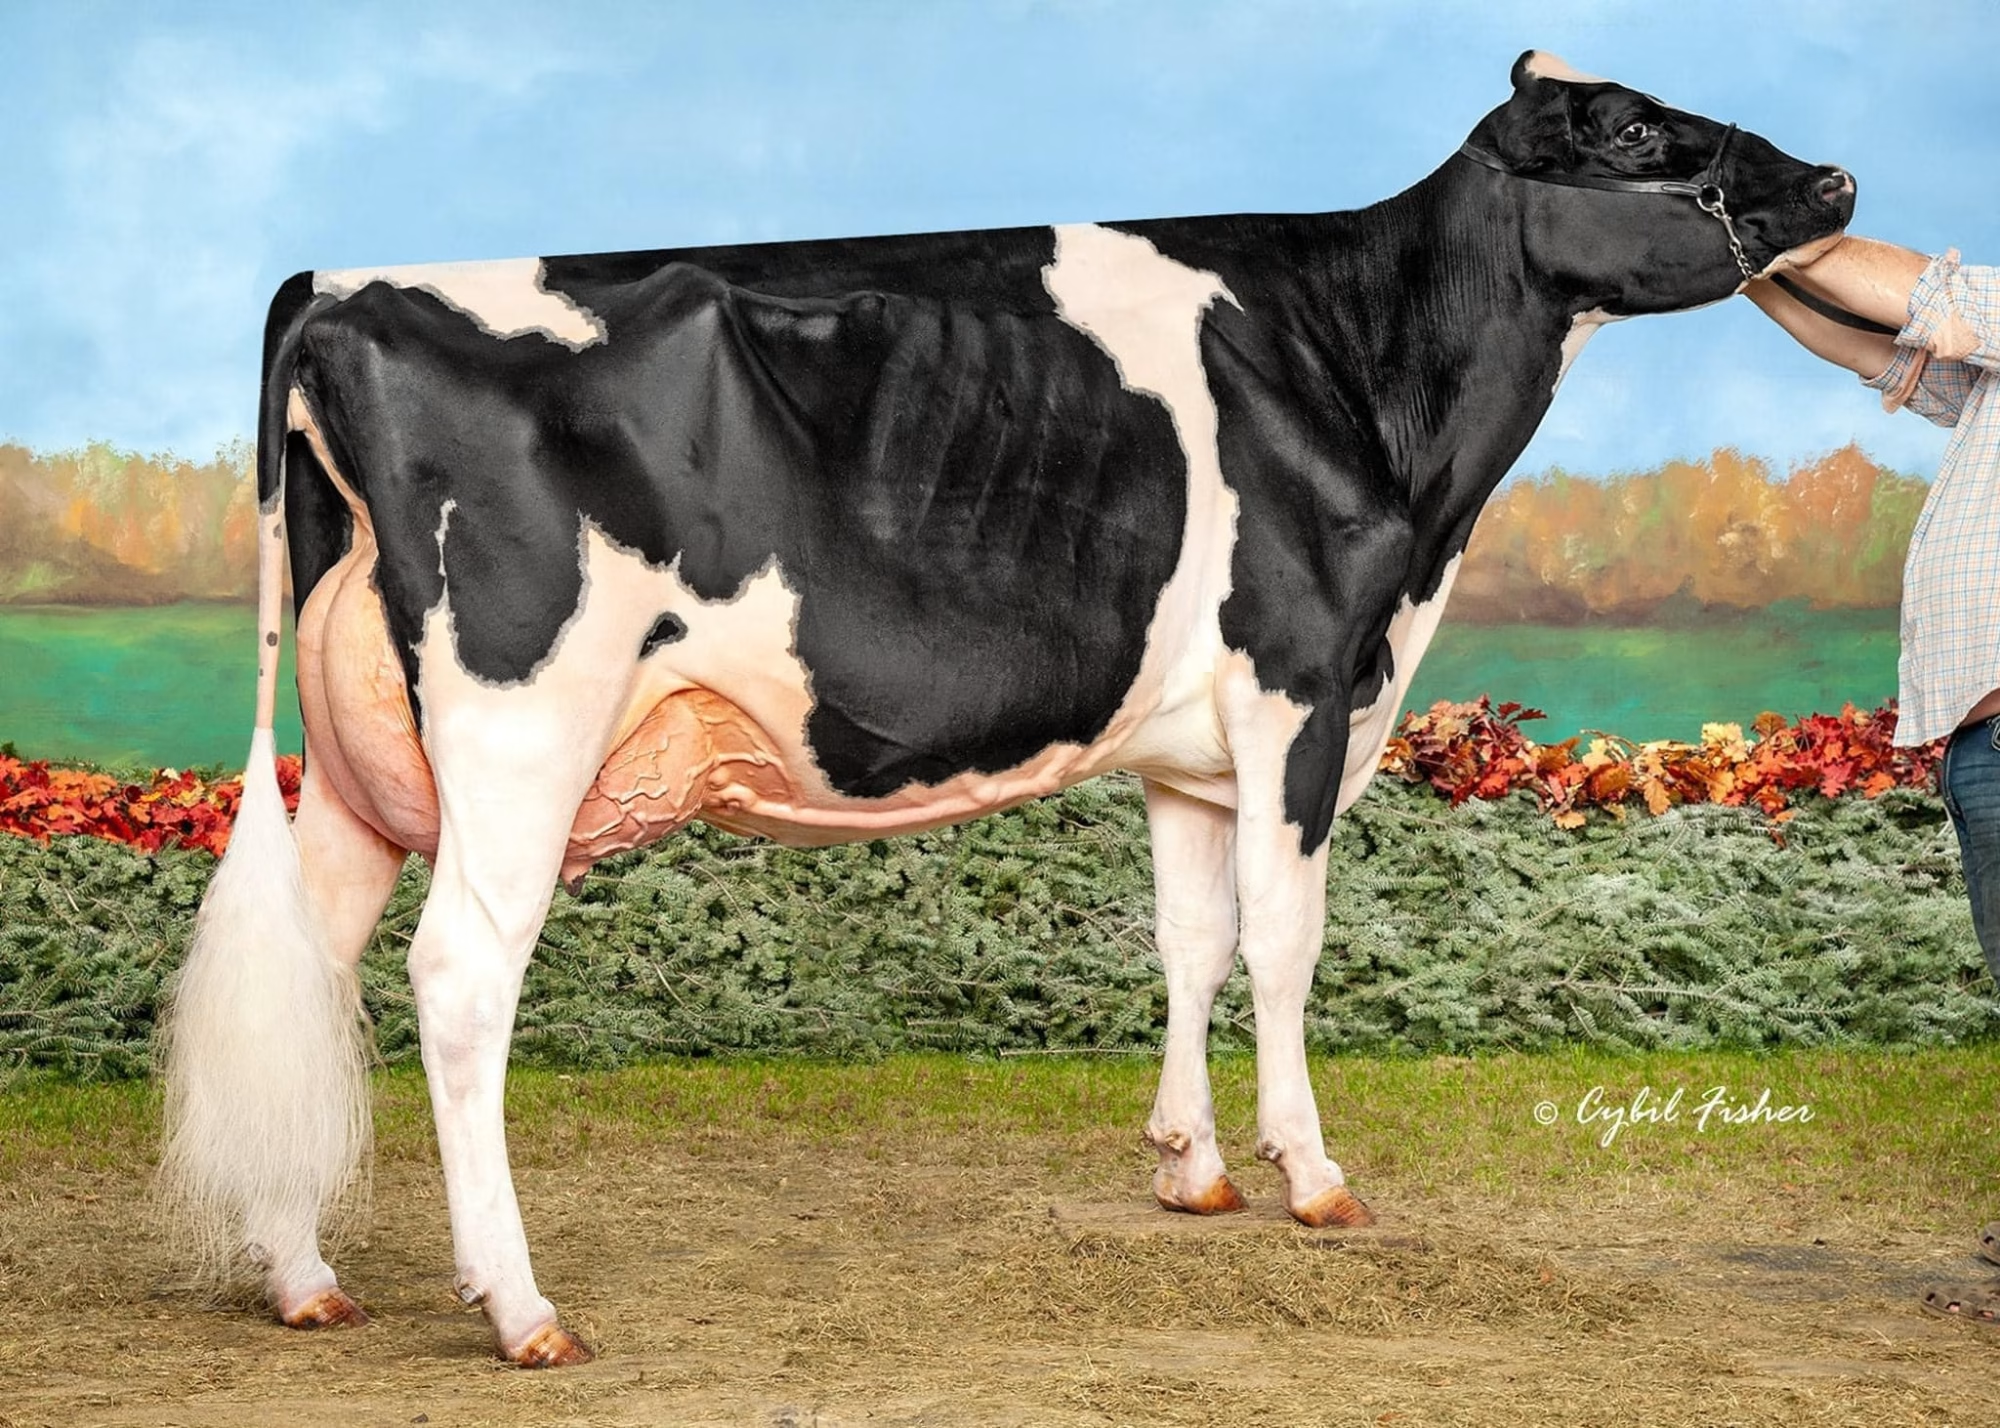
The high-five that sealed it: Jacobs Lauthority Loana EX-96-2E wins Grand Champion of the 2018 International Holstein Show at World Dairy Expo, adding to her Senior Champion and Champion Bred & Owned titles for Ferme Jacobs and Pat Conroy. The family’s next move was to take her to Toronto.
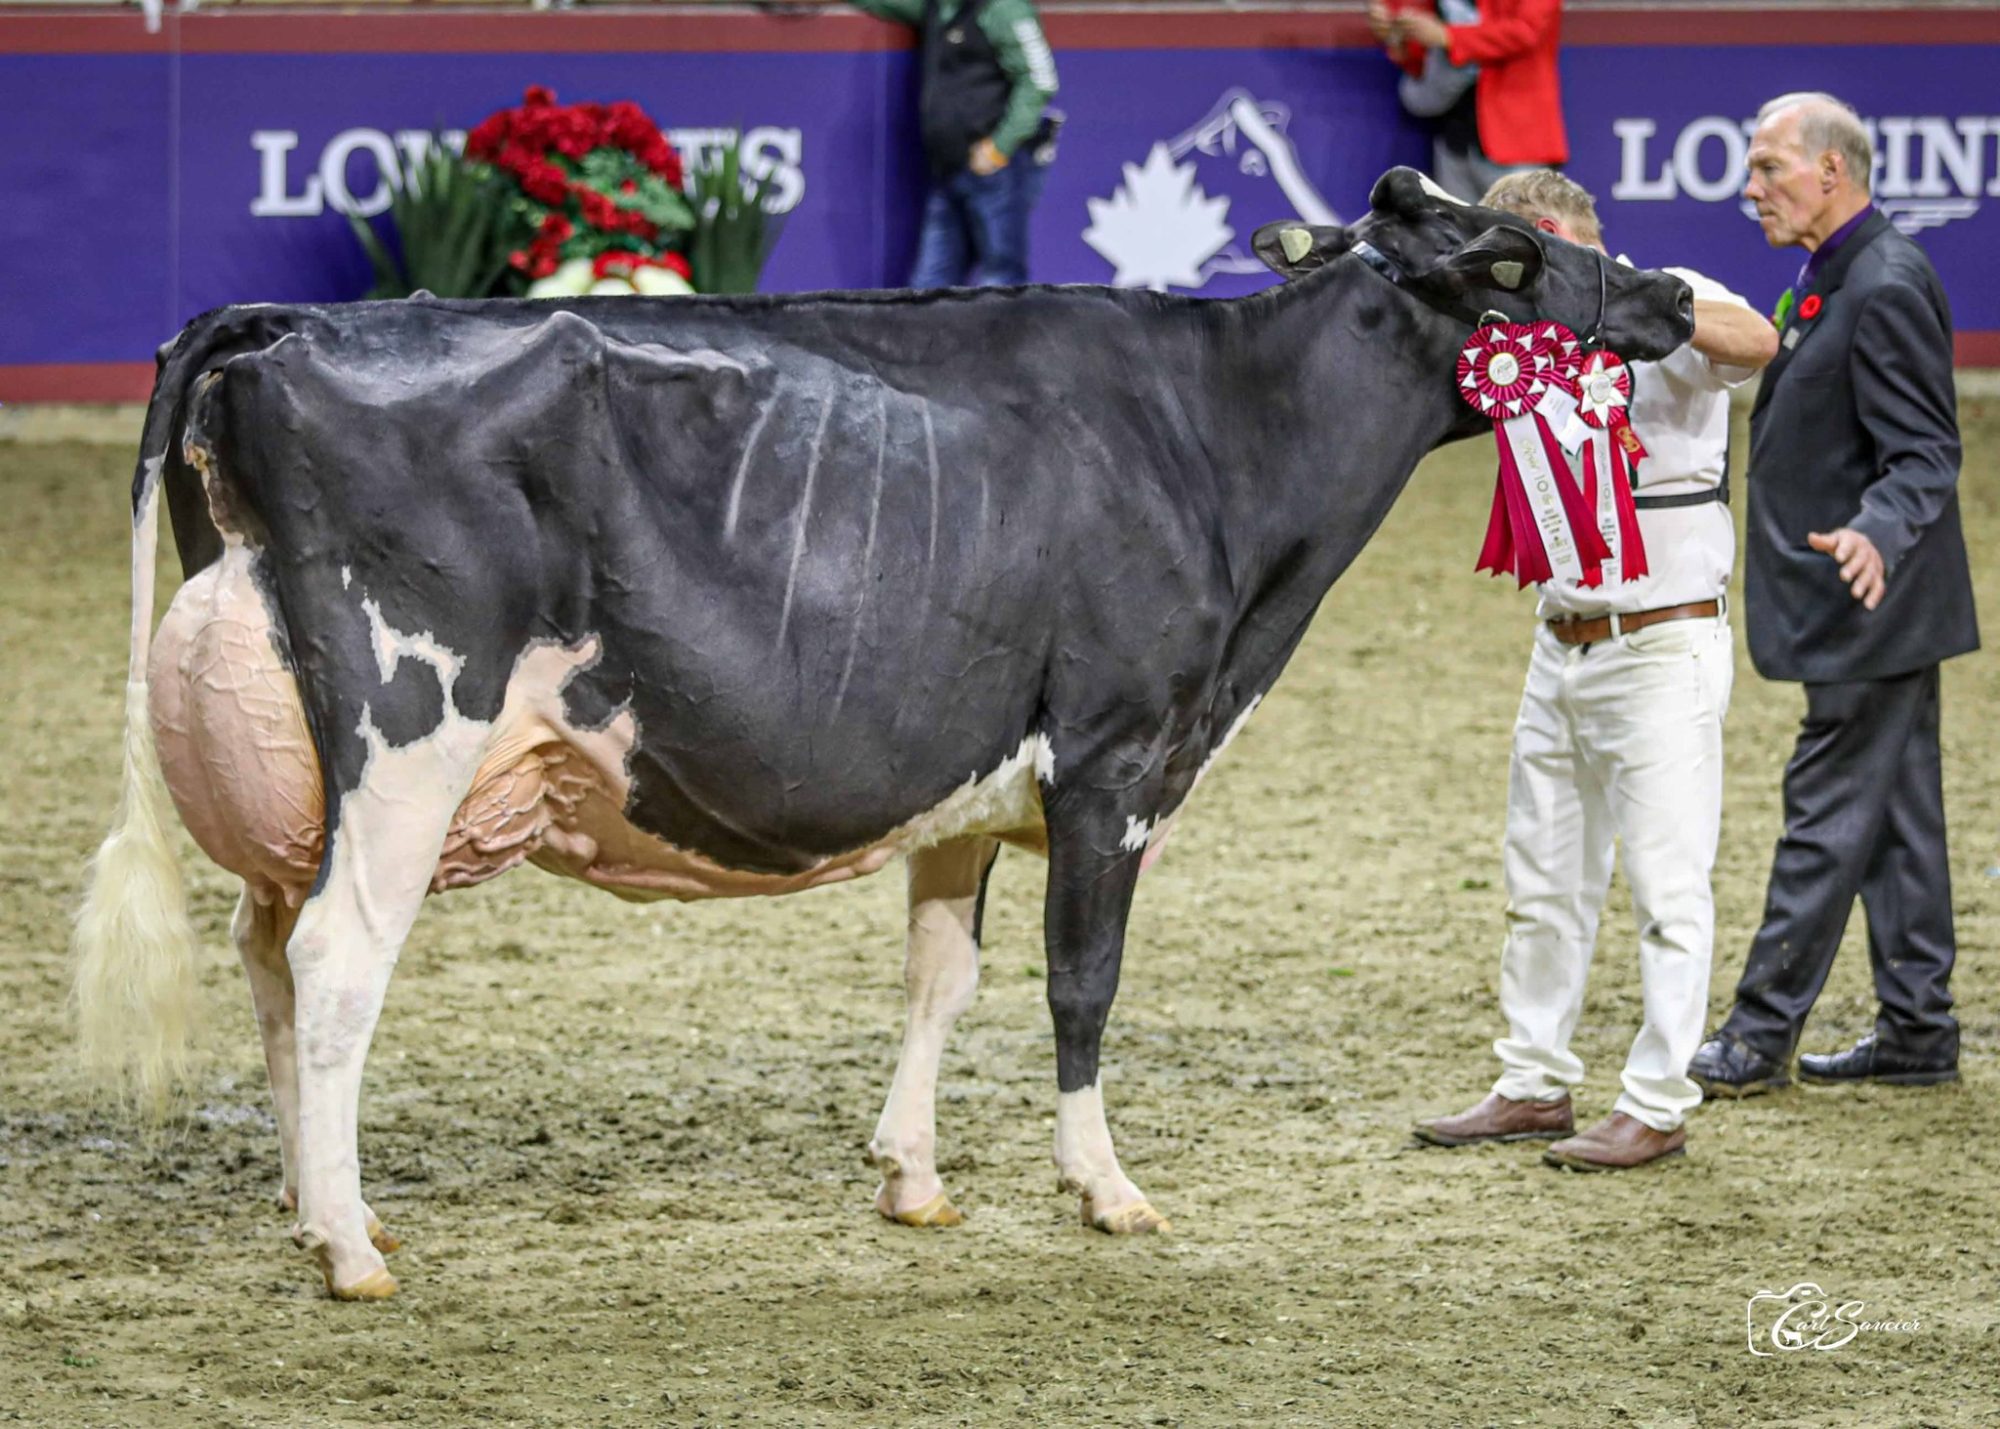
Instead, the family brought her back out at The Royal one month later.
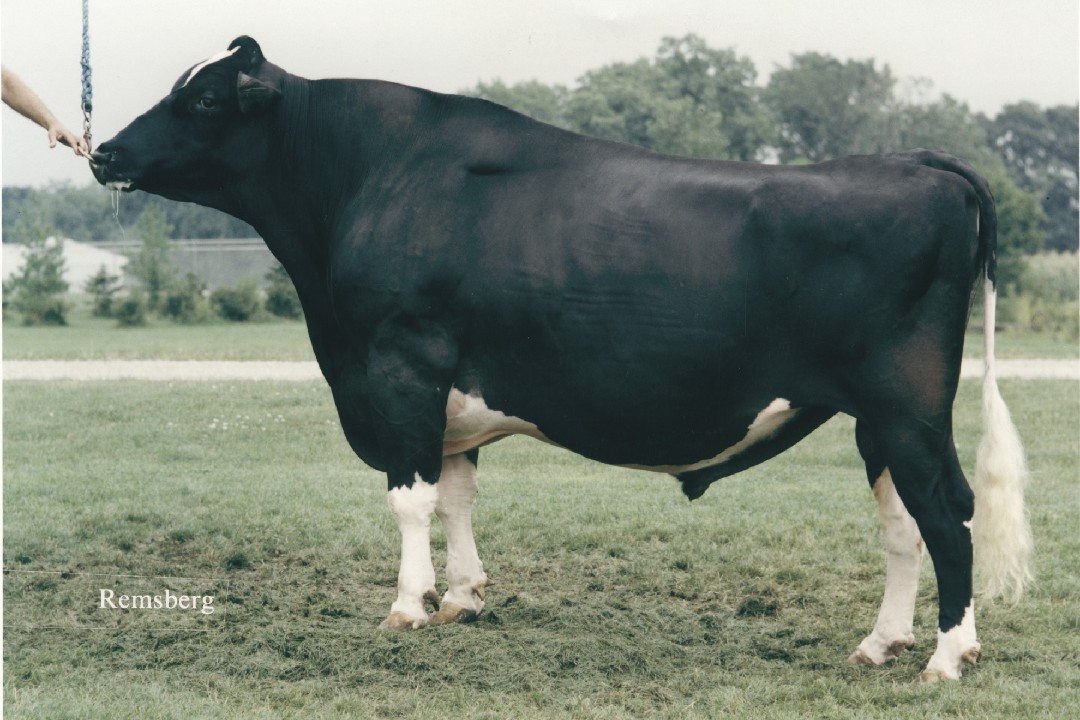
Jacobs Windbrook Aimo EX-95 beat her.
Aimo took Grand Champion and Loana Reserve. It was the first Grand-and-Reserve sweep by homebred entries at the Royal Holstein Show since Agro Acres did it in 1969.
The Jacobs family knew the risk. Loana had been perfect at Madison. Aimo was ready to challenge her in Toronto. Once both cows walked in looking as good as the family could make them, the decision belonged to the judge.
Winning with one cow can happen. Breeding two cows capable of beating each other is a program.
That’s the standard behind these five operations. The question isn’t just which famous cows they owned, bred, developed, or showed. It’s what they kept, what they fixed, and whether the families kept producing after the champion photos were taken.
The 2026 International Holstein cows enter the World Dairy Expo Coliseum at 7 a.m. on October 2. The Parade of Champions and Supreme selections follow at 4 p.m. Ryan Krohlow of Poynette, Wisconsin, will make the official placings, with Kelly Barbee of Concord, North Carolina, as associate judge. The cattle will meet in one ring. The breeding systems behind them were built very differently. (Read our show preview here – World Dairy Expo 2026 Holstein Show Preview: 11th Place Is Now The Favorite)
What 2026 Already Revealed
The August 2026 Le Suprême Laitier Holstein Show gave a current read on three Quebec programs.
Ferme Jacobs won Premier Breeder and finished second for Premier Exhibitor. Blondin won Premier Exhibitor without placing among the top three breeders. Pierre Boulet was second for Premier Breeder and third for Premier Exhibitor.
Those banners measured three different things.
Jacobs made its prefix travel. Jacobs-bred cattle earned breeder points across several ownership groups.
Blondin assembled the string. Its owned and jointly owned cattle put up the strongest exhibitor total.
Boulet worked both sides. Pierstein cattle earned breeder points, and Boulet’s exhibited animals scored too.
The difference matters. Under Holstein Canada’s rules, Premier Breeder points follow the animal’s registered prefix, and no more than 10 females count. The cattle don’t have to stay in the breeder’s ownership. Premier Exhibitor counts no more than 10 females owned by the exhibitor, and jointly owned cattle count as a separate exhibitor.
World Dairy Expo uses different Holstein rules. Holstein Association USA defines the breeder as whoever owned the dam when she was serviced. It counts no more than six animals toward each Premier award and treats every distinct partnership as a separate breeder or exhibitor.
So the Le Suprême banner split points in a direction, but it doesn’t carry over directly to Madison. It shows how Jacobs, Blondin, and Boulet build competitive depth. It can’t predict how WDE’s breeder-of-record and partnership rules will add up the points.
World Dairy Expo doesn’t publish a full public Holstein entry list in advance. This article doesn’t claim that every operation or animal discussed here is entered for 2026. It looks at the breeding and management systems Madison has tested over time.
Ferme Blondin: Families and Partnerships
Blondin Skychief Supra EX-93-3E wasn’t a fashionable purchase. She came from one of the first purebred families Simon Lalande began developing after his father bought him a heifer at Holstein Canada’s 100th-anniversary sale in 1984.
The mating behind Supra says more than her show record. Her dam was Blondin Starbuck Superlass VG-87, a 17-star brood cow. Lalande believed Starbuck daughters generally had the legs he wanted but only average udders, and that Skychief could add the mammary system.
He made the mating to combine those strengths instead of doubling down on one fashionable trait.
That’s pedigree breeding at its most useful. Know what the female family already does, name what it’s missing, and pick a bull to fix that one thing.
Supra became Holstein Canada’s 2009 Cow of the Year. Bullvine’s 2013 profile called her a 24-star brood cow. Holstein Canada’s current record lists her at 35 stars, with the notation 12/163.
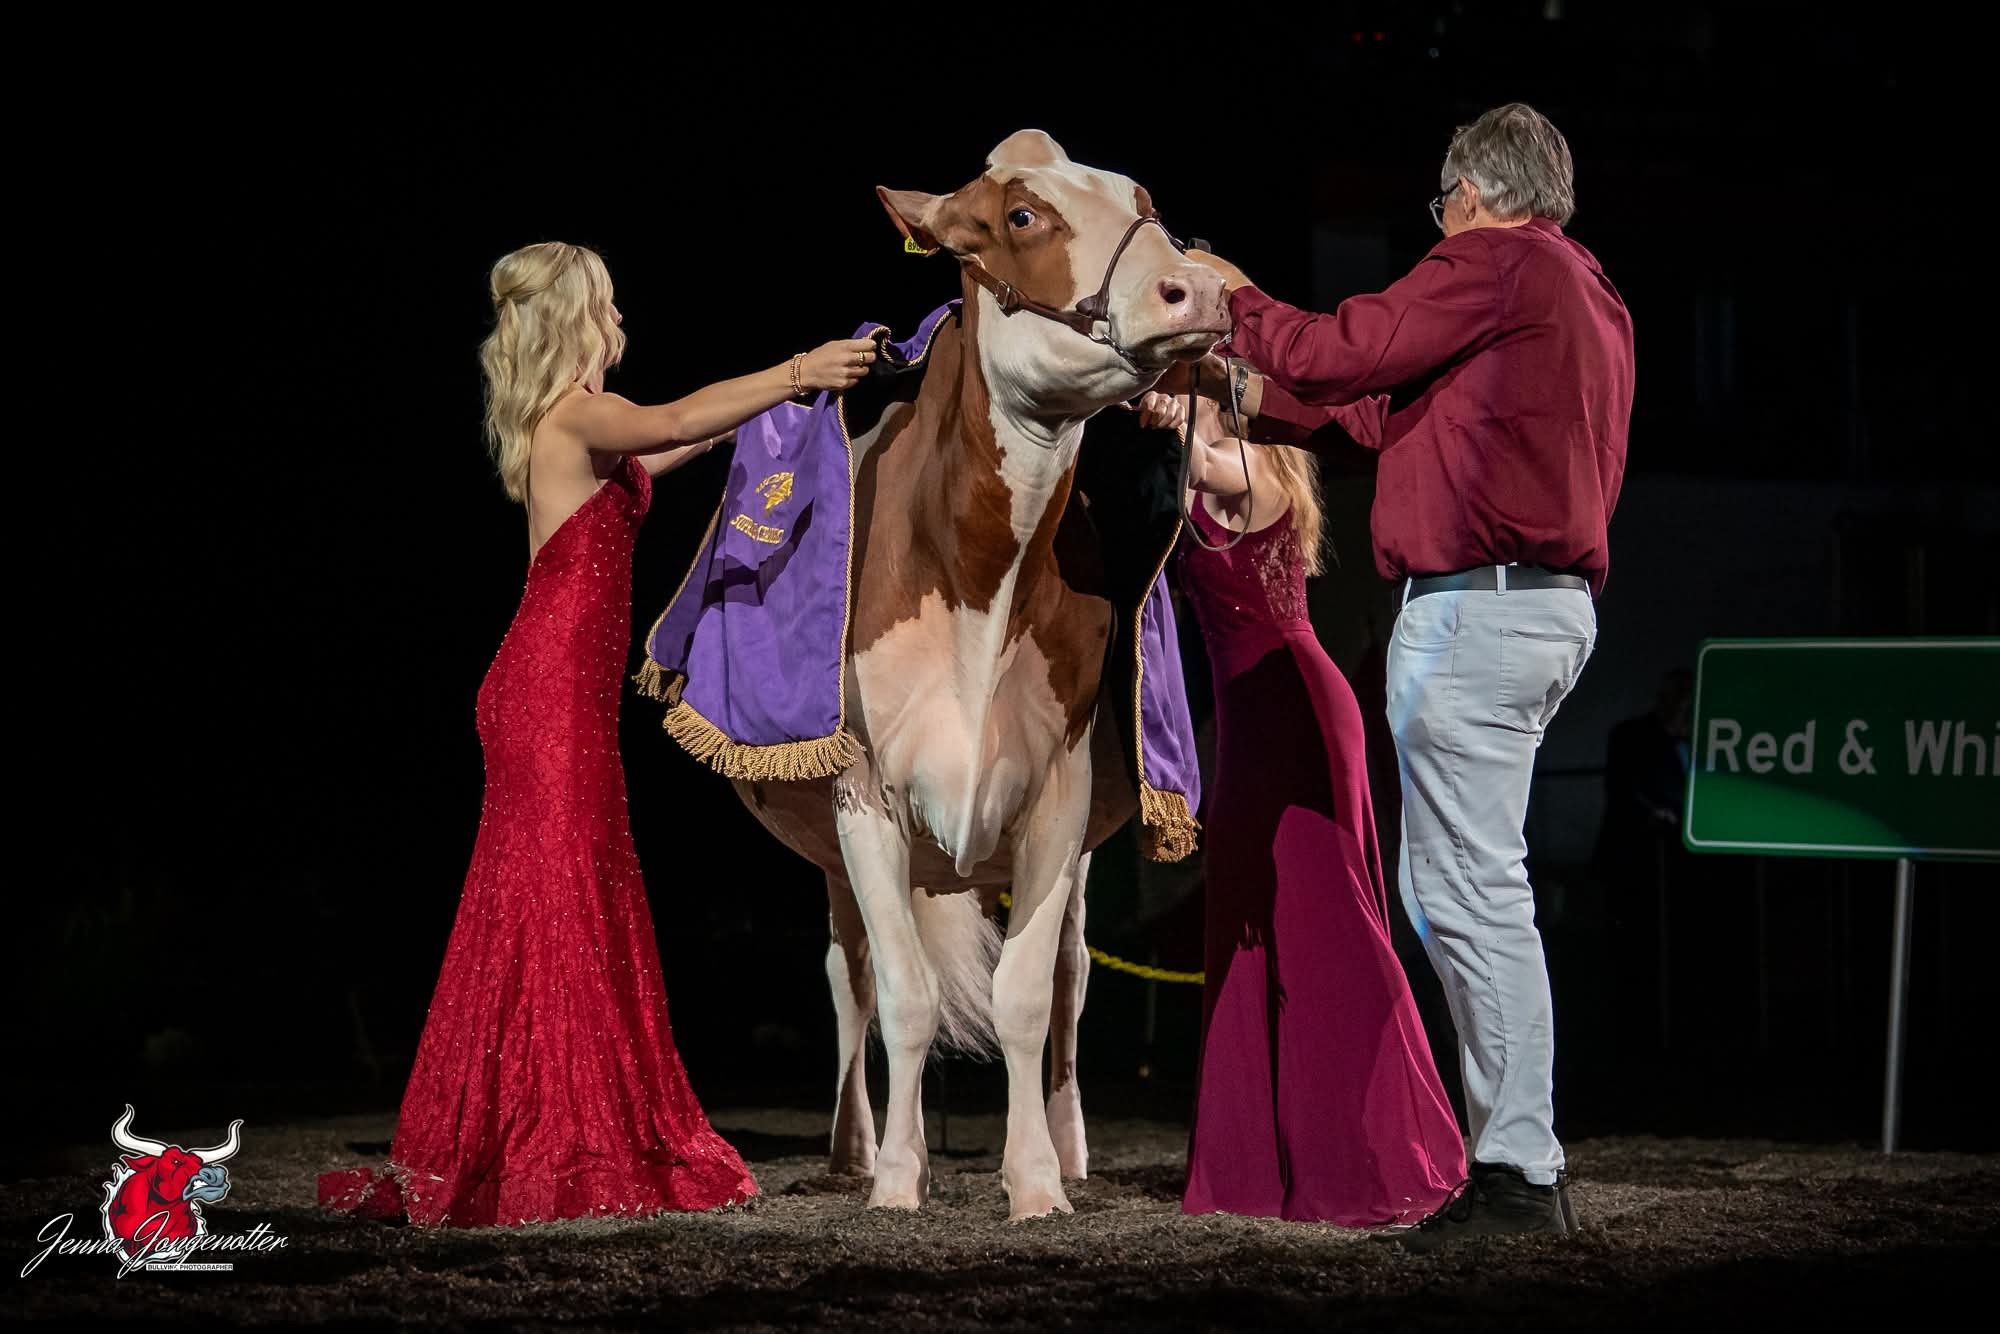
Blondin Redman Seisme-Red EX-97 with Wisconsin’s Alice in Dairyland after winning Grand Champion of the International Red & White Show at World Dairy Expo. Seisme won that title in 2010 and 2012. She’s Skychief Supra’s granddaughter, and the proof that Blondin’s foundation family could breed on to Madison’s biggest stage.
Her descendants make the stronger case. Blondin R Marker Supra VG-89, a Red Marker daughter of Skychief Supra, produced Blondin Redman Seisme-Red EX-97. Seisme was Grand Champion of the Red & White Show at World Dairy Expo in 2010 and 2012, and Supreme Champion at The Royal in 2010.
That’s transmission a breeder can see. Supra didn’t just classify high or win a Cow of the Year vote. A later generation took the family onto the biggest stages in North America.
Rockymountain Talent Licorice EX-95 was Blondin’s other route into an important family. Lalande bought her fresh as a senior 3-year-old at World Dairy Expo in 2010. He looked at the individual first, then her mammary system, legs, dairy strength, maternal family, and sire stack.
Licorice was a Talent tracing through Skychief and Rudolph daughters to Ravenswell Lydia EX-92. Lydia is the brood cow behind other influential show families, including Idee Lustre EX-95. Holstein Canada’s current record lists Licorice as an 8-star brood cow with 40 progeny in the calculation.
One year after Simon Lalande bought her fresh as a senior 3-year-old in Madison, Rockymountain Talent Licorice EX-95 came back to win the 4-year-old class at the 2011 International Holstein Show.
She was Intermediate Champion at The Royal in 2010. In 2011, she won the 4-year-old class and Reserve Senior Champion at World Dairy Expo. She sold for $420,000 in the 2011 International Intrigue Sale.
Supra and Licorice did different jobs. Supra proved Blondin could build a family from within. Licorice showed it could spot a cow from an established maternal line, develop her, and fit her into a bigger genetics and marketing program.
Partnerships extended that reach. In 2013, Blondin reported managing more than 225 partnership-owned animals. That came with the registrations, genomic tests, imports, exports, accounting, and partner communication attached to each one.
That’s also where the system can break. Every added partner can affect mating authority, flush schedules, show decisions, sale timing, and how returns are split. Access to a better cow family only matters if the owners can agree on what to do with it.
Ferme Jacobs: The Prefix Travels
Loana and Aimo showed that Ferme Jacobs could breed two cows good enough to fight for the same championship. The tougher test is whether the Jacobs prefix keeps working after cattle leave Cap-Santé.
Premier Breeder, 2025 International Holstein Show. At Madison, breeder credit goes to the owner of the dam at service. That makes this banner a measure of what Ferme Jacobs bred, not just what it led into the ring.
Recent results say it does. Ferme Jacobs won Premier Breeder at the 2025 International Holstein Show at World Dairy Expo. At Le Suprême Laitier in August 2026, it won Premier Breeder again and finished second for Premier Exhibitor.
The prefix earned points through cattle in several ownership groups. Jacobs Unix Britain was shown with Ferme Gillette and T-Wave. Milk&Honey Im A Sexy Baby, Jacobs Tatoo Branelle and Jacobs Sidekick Bee also carried Jacobs breeding into other owners’ strings.
That’s what a traveling prefix looks like. The breeder gives up day-to-day control over feeding, fitting and show decisions. The family still earns breeder credit in somebody else’s hands.
Inside the Jacobs herd, selection has never just been a chase for more type. The family told Bullvine it would use older proven sires when the cross justified it and wouldn’t use minus-milk bulls. It was adding milk because it felt the herd already had enough extreme type.
Loana and Aimo were that argument on four legs. Ysabel Jacobs leaned toward Loana’s balance. Yan Jacobs preferred more of Aimo’s extreme look. They wanted the same general kind of cow but didn’t agree on how far to push every trait.
That disagreement stops the Jacobs cow from becoming a caricature of whatever trait the market is paying for this year.
The family was just as deliberate about embryo work. Ferme Jacobs reported selling 500 embryos in 2018. It still avoided flushing cows that were being prepared for shows, because it didn’t want hormone work interfering with their campaigns.
That choice left embryo revenue on the table. Jacobs showed the cow first and flushed her later.
The wider family record shows why transmission matters more than one banner. Jacobs High Octane Babe EX-96-2E was Holstein Canada’s 2025 Cow of the Year. That came eight years after Jacobs Goldwyn Britany, from the same maternal family, won the honor for 2017.
Babe’s family also produced Jacobs Destiny Balla, Jacobs Lambda Baz and Jacobs Alligator Bawl. Bruins, Bullding and Bubble entered AI service through Semex.
That’s when a family becomes more than a show string. Cows, sale animals, and AI sons start carrying the same maternal line into different markets.
The weak point is control. Once a Jacobs animal is sold, the prefix travels, but management authority doesn’t. The breeder’s reputation can rise or suffer on decisions made in another barn.
Pierre Boulet: Cow Before Catalogue
Pierre Boulet starts with the animal, not the catalog.
If he doesn’t like the cow or heifer in front of him, he doesn’t look at the pedigree. Only after she passes that first inspection does he study the maternal family and sire stack.
The order matters. A fashionable pedigree can’t excuse an animal Boulet doesn’t want to work with. A good-looking individual doesn’t get a free pass either. The family still has to be consistent enough to suggest she’ll breed on.
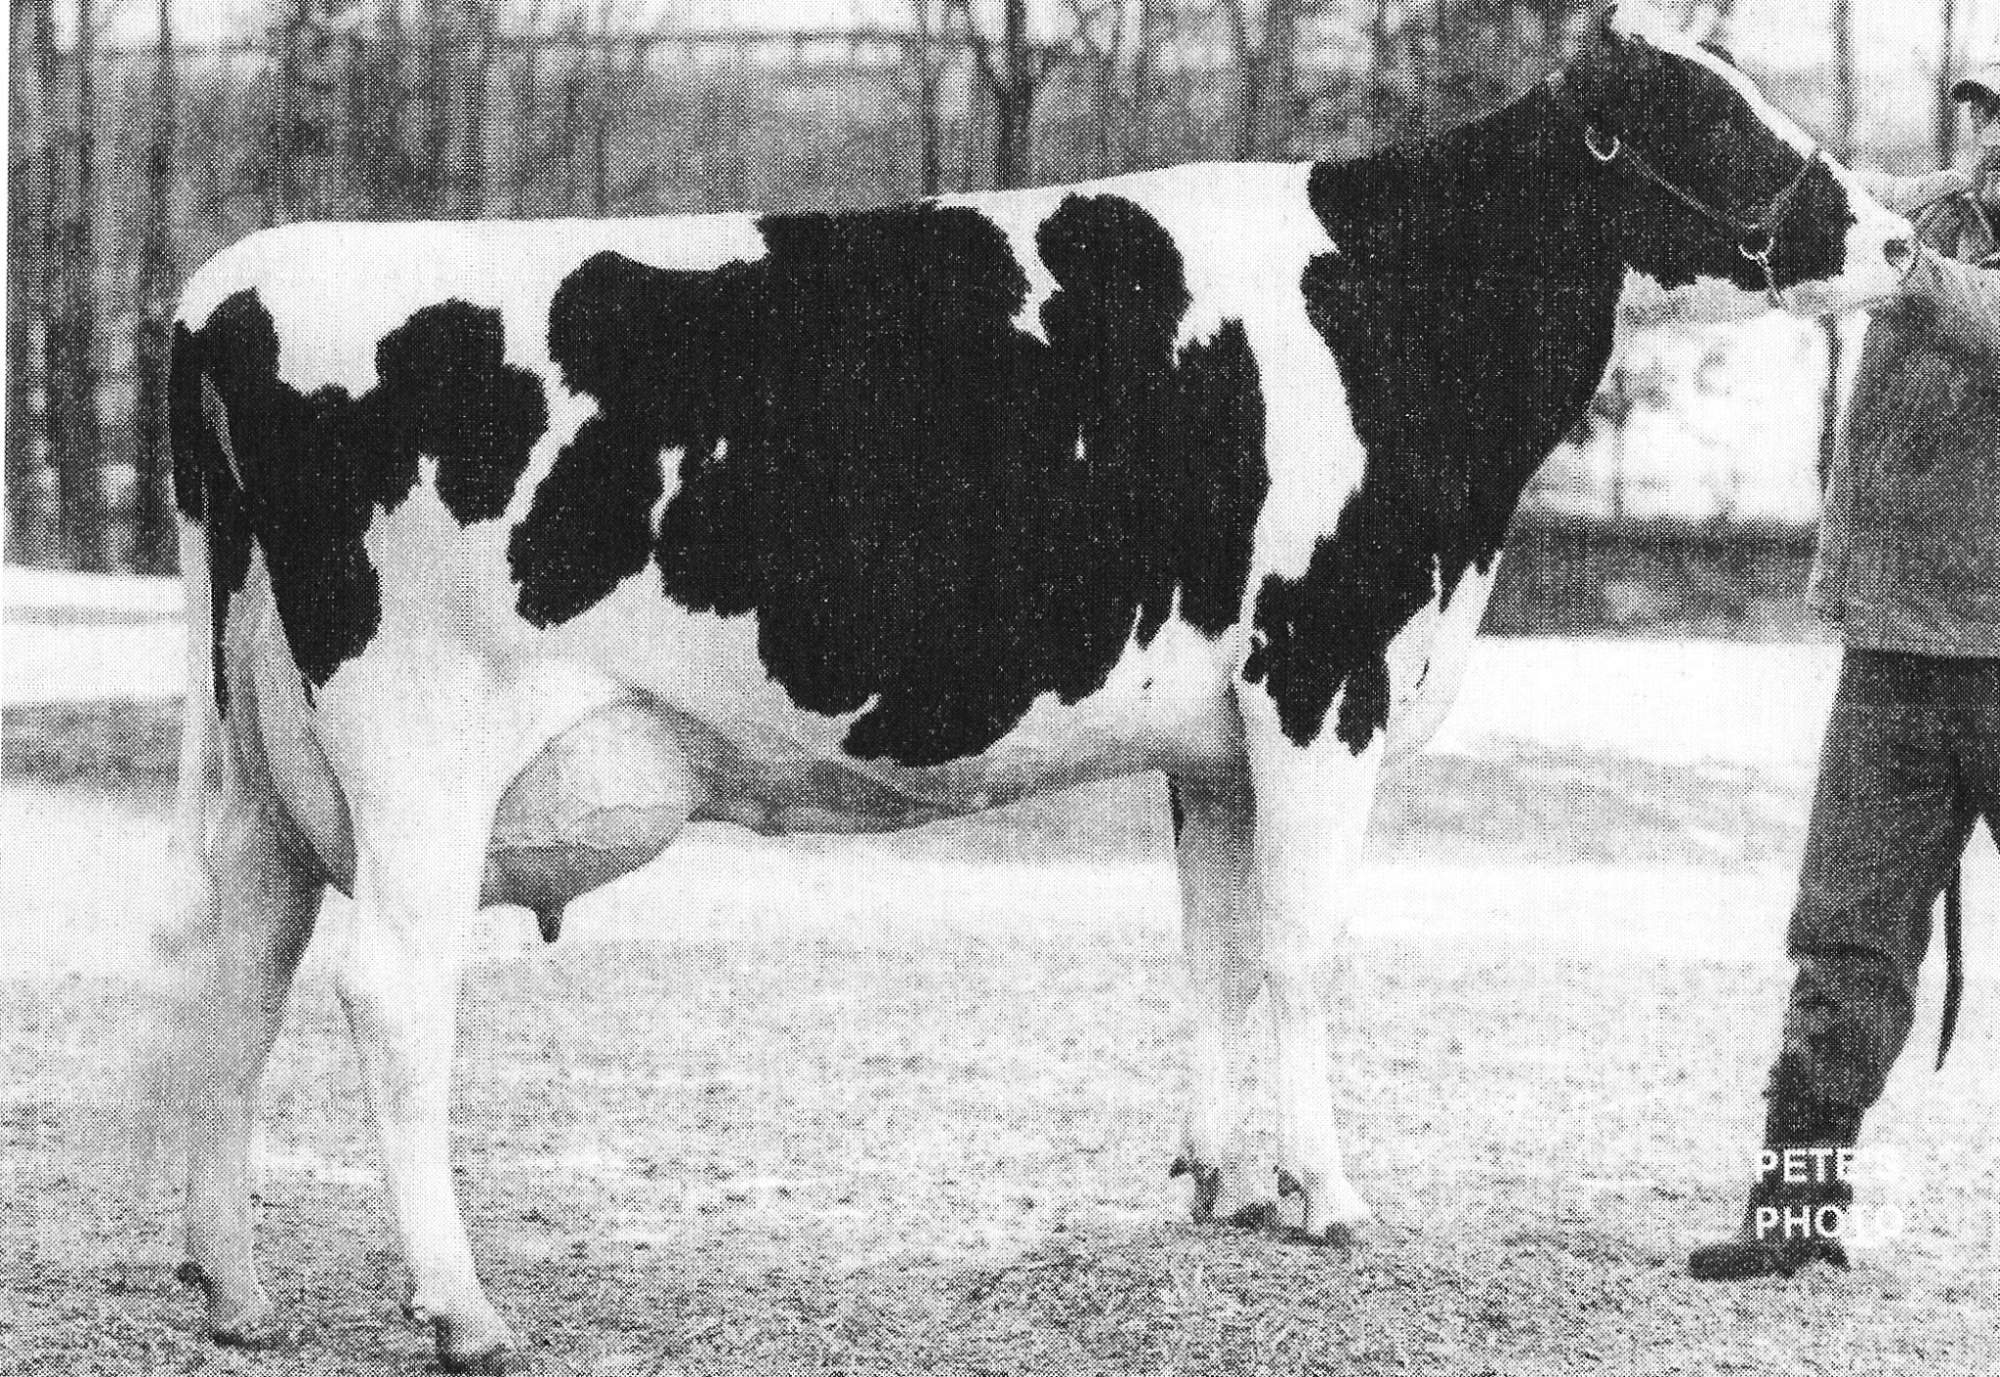
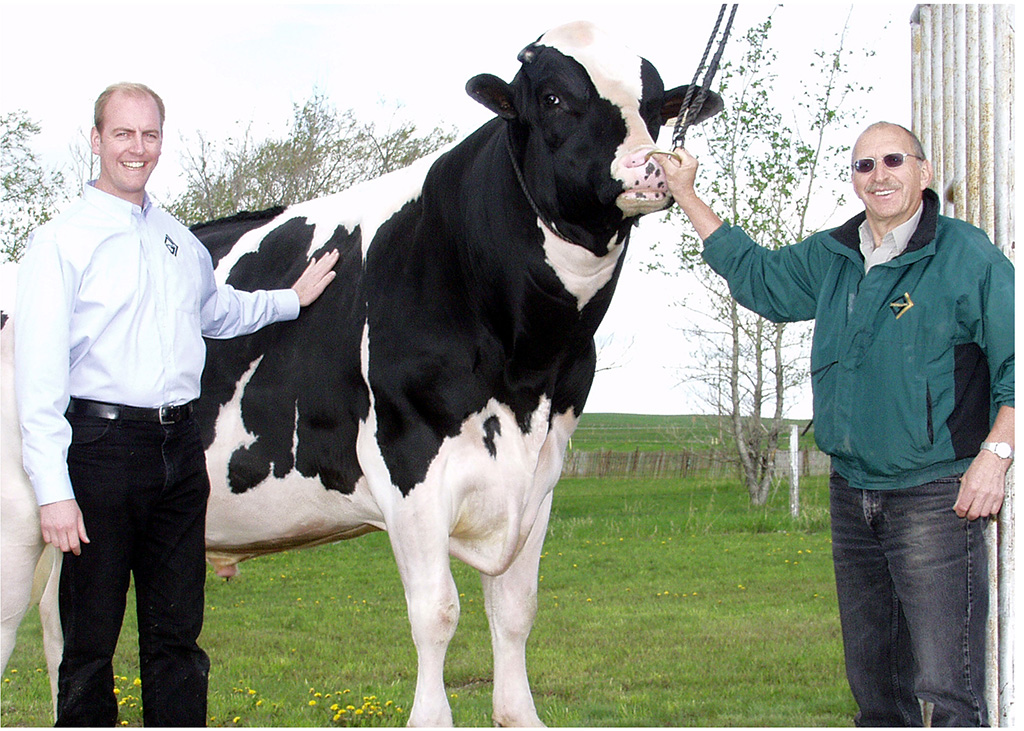
Pierre Boulet with Loyalyn Goldwyn June at the Willows. His buying rule starts where this photo does: with the cow in front of him, not the catalogue.
Viapax B C Madison VG 6* became one of his most important purchases because she created value beyond herself. Boulet bought her as a heifer. He then built the family by flushing Madison, her daughters, and her granddaughters.
Her value came from repeatability. One cow turned into several generations of mating, embryo, and marketing decisions.
Pierre Boulet and Katie Coates with Thrulane James Rose EX-97 after she was named Supreme Champion at World Dairy Expo in 2008. Rose didn’t come from the Pierstein prefix, but Boulet credited her with drawing visitors to the farm and interest in cattle unrelated to her.
Thrulane James Rose EX-97 paid off differently. Rose was Grand and Supreme Champion at World Dairy Expo in 2008, shown by Boulet. Boulet said the attention she drew brought visitors to his farm and raised interest in cattle unrelated to her.
Rose shouldn’t be mistaken for a Pierstein-bred foundation cow. She gave Boulet’s program visibility, show-ring credibility, and market traffic. Madison gave it a family.
That distinction matters, because buying a champion and breeding a family aren’t the same achievement.
Boulet’s published advice reflects different levels of risk. A buyer with more capital can target a VG first-calf cow that has already made it through calving. A buyer with less money can get into an established family through embryos.
The entry price changes. The family still has to breed on.
The limit of that method is fertility. Boulet recalled paying $40,000 for a cow that could win shows but never produced an embryo or a calf. Phenotype, a consistent maternal line, and a proven sire stack reduce the risk. None of them guarantees that a purchase will produce enough embryos or descendants to earn back her cost.
The wider Pierstein record shows the system has worked again and again. Holstein Association USA’s judging biography notes that Boulet has used the Pierstein prefix since 1993 and has bred more than 200 Excellent cows.
That number takes the argument past one purchased star. Boulet’s eye helped build a whole population.
Kueffner & Packard: Function Over Fashion
One barn, two breeds, three titles. Hillcroft Leader Melanie EX-96 was named Supreme Champion, Huronia Centurion Veronica EX-97 (left) Reserve Supreme Champion and Ernest-Anthony Ariel EX-94 Supreme Champion of the Futurity. All three came through Arethusa Farm while Ernie Kueffner and Terri Packard managed the herd.
Ernie Kueffner has never hidden his worry that the show ring can reward the wrong version of a good trait.
He warned that the push for bigger rear udders led some exhibitors to bring cows in overfull, costing them crease definition and mammary quality. He put more weight on fore-udder attachment, teat placement, and feet and legs. Those are the parts that decide whether a cow comes back for another lactation.
In Kueffner’s view, the rear udder might catch the judge’s eye. The whole mammary system and sound locomotion are what keep a cow useful.
Six years after she was Intermediate Champion in Madison, Butz-Butler Gold Barbara EX-95 (EX-96 MS) came back to win Grand Champion of the 2019 International Holstein Show for an ownership group that included Ernie Kueffner and Terri Packard. The Goldwyn daughter of Regancrest Brasilia carries the Regancrest-PR Barbie family, and she’s the kind of cow Kueffner’s standard is built for: one that’s still winning years after her first banner.
Tri-Day Ashlyn-ET, KHW Regiment Apple-Red-ET and Huronia Centurion Veronica became the clearest proof of that standard. Each was a major show winner. But Kueffner’s case for them rested on what came after, through sons and daughters.
Ashlyn Made Excellent Daughters
Tri-Day Ashlyn EX-96-2E was Supreme Champion at World Dairy Expo. She became one of the Holstein breed’s most prolific sources of high-classifying daughters, and current reporting credits her with 73 Excellent daughters worldwide.
Tri-Day Ashlyn at World Dairy Expo in 2001. Banners made her famous. Seventy-three Excellent daughters worldwide made her the proof behind Ernie Kueffner’s function-first standard.
Her daughters included EO Siemers Ashlyns Angel EX-92 and EK-Oseeana Ambrosia EX-95-2E. Earlier records also list eight Excellent sons.
The exact classification total grew over time, but the pattern is clear. Ashlyn’s influence didn’t stop with one show-winning daughter or one AI son.
Apple Built a Red Dynasty
KHW Regiment Apple-Red became one of the defining cows of modern Red Holstein breeding. Her daughter MS Candy Apple-Red was Honorable Mention Grand Champion of the 2013 International Red & White Show. Apple’s clone, KHW Regiment Apple 3-Red, won Grand Champion at the same show.
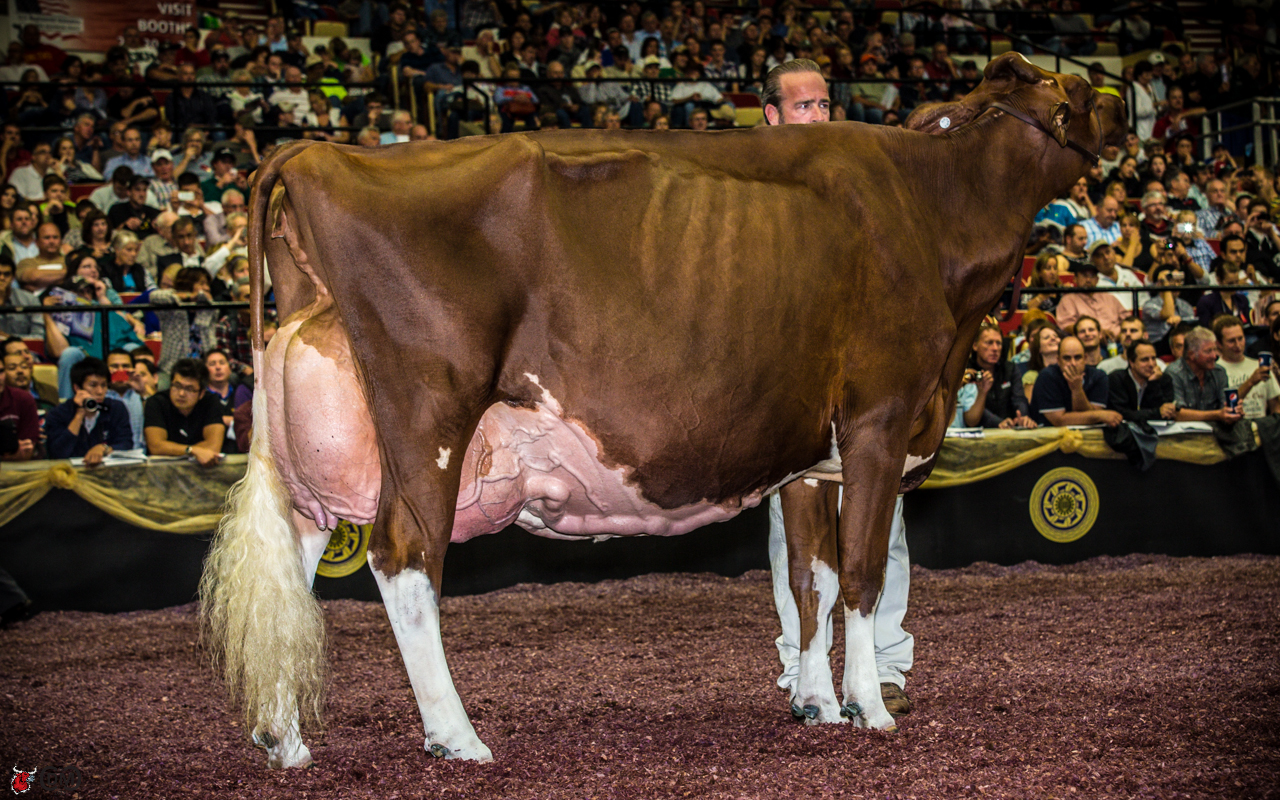
KHW Regiment Apple-Red-ET on the coloured shavings at World Dairy Expo. A WDE Grand Champion in her own right, Apple mattered more for what came after: daughters, sons and a red family that kept breeding on. She died in January 2020.
Apple’s influence also ran through her sons. Apples Absolute-Red and Mr Apples Armani-RC became widely used sires. They carried the family into herds that would never own an Apple daughter.
That combination matters. A show cow can give you another good-looking female. A breed-changing brood cow gives you daughters, sons, and whole families that keep showing up after her own campaign is over.
Veronica Worked Both Sexes
Huronia Centurion Veronica became a foundation of the modern Jersey show herd. Records list 110 registered sons and daughters. Four daughters scored EX-95: Elliots Golden Vista, Arethusa Primetime Déjà Vu, Arethusa Veronicas Dasher and Arethusa Veronicas Comet.
Her EX-96 daughter, Arethusa Response Vivid, was Grand Champion Jersey and Reserve Supreme Champion at World Dairy Expo in 2012.
Veronica’s sons included Vindication, Verbatim and Voltage. Their daughters added more WDE winners and All-American cattle to the family.
That’s why Ashlyn, Apple and Veronica belong together. Their breeds, pedigrees, and markets differed, but all three transmitted through more than one route.
Kueffner and Packard still had to live with the weakness built into their approach. The market doesn’t always reward functional restraint right away. When exaggerated udders or extreme frames are selling, skipping the trend can mean passing on animals that would bring short-term attention and money.
Their standard only wins the argument if the cattle stay sound and keep producing the next generation.
Budjon Farms: A Prefix That Bred On
Budjon Farms isn’t a boarding operation that happened to show good cows. The prefix built its reputation by breeding cattle that could win at the national level, and it repeated that across several animals and generations.
The foundation was Krull Broker Elegance EX-96, bought by Tom Cull and Joel Kietzman in 1996. Elegance became the taproot of a family that continued through Budjon-bred females. One of them was Budjon-JK Linjet Eileen EX-96-4E GMD DOM, whose official Canadian record lists six brood-cow stars and 30 progeny in the calculation.
The proof came in 2005.
That year, Budjon became the first U.S. prefix to have three different cows named Grand Champion, Best Bred & Owned, and Best Udder at three National Holstein Shows.
Budjon-JK Linjet Eileen did it at the Midwest Spring National Show. Budjon Redmarker Desire EX-95 did it at the International Holstein Show at World Dairy Expo. Budjon Stardust Anisa EX-96 completed the sweep at the Mideast Fall National Show in Louisville.
That wasn’t one great cow carrying a whole program.
It was three Budjon-bred cows winning three national shows in the same year.
Desire’s win in Madison is still the headline. The homebred Red Marker daughter was Grand Champion of the 2005 International Holstein Show. Budjon’s breeding record later grew to six World Dairy Expo Premier Breeder banners.
Those Premier Breeder awards matter because they credit the cattle Budjon bred, not just the animals in its string. They measure how far the breeding program reaches.
Budjon-Vail Drm Sunshine-ET EX-95-2E is the next generation of proof. Bred by Tom and Kelli Cull with Peter Vail, she was Grand Champion Bred & Owned at the 2021 Midwest Spring National Show.
Chandler and Calvin Bening later bought her, and she kept winning while still housed at Budjon Farms. Holstein Association USA named her its 2023 Star of the Breed. It’s the association’s highest individual honor, given to a cow that combines type and production.
Sunshine qualified with a fourth-lactation record of 42,130 pounds of milk, with 2,244 pounds of fat at 5.3% and 1,508 pounds of protein at 3.6%. When she won the award, her lifetime total was 145,590 pounds of milk.
Her show record includes Grand Champion and Reserve Supreme Champion at the 2022 North American International Livestock Exposition Junior Show. She followed that with Senior and Grand Champion in the open Mid-East Fall National Holstein Show. A second-place finish in the aged-cow class at the 2023 Midwest Spring National Show completed her show requirement for Star of the Breed.
That’s a traveling prefix in its own right. Budjon and Vail bred the cow, and another family later owned and showed her. The Budjon-Vail name stayed on a cow that combined national-show form with Star of the Breed production.
Tom Cull holds the Klussendorf Trophy after receiving the 82nd Klussendorf Award at World Dairy Expo in 2024. It’s the show ring’s highest individual honour, awarded for ability, character, sportsmanship and dedication to dairy cattle showing.
Budjon’s boarding and development business sits beside that breeding record. It doesn’t replace it. The operation uses the same observation, feeding, and recovery systems for its homebred cattle, partnership cattle, and cattle bred by clients.
Budjon’s boarding and development business belongs beside that breeding record, not in place of it. The operation has applied the same observation, feeding and recovery systems to its homebred cattle, partnership cattle and animals bred by clients.
That system reached its peak in 2017, when Rosiers Blexy Goldwyn-ET won the six-year-old class, Senior and Grand Champion of the International Holstein Show and then Supreme Champion of World Dairy Expo for Budjon, Vail, Abbot, Van Excel and Woodmansee.
Rosiers Blexy Goldwyn-ET, Grand Champion of the 2017 International Holstein Show at World Dairy Expo. She won the 6-year-old and older class for Budjon, Vail, Abbott, Van Exel and Woodmansee, and was later classified EX-97. She’s a Rosiers-bred cow brought to Madison’s top title by the Budjon team.
Blondin Goldwyn Subliminal-ETS EX-97-4E is a strong example of that management. Ferme Blondin bred her, and she was later owned by Budjon Farms with Peter and Lyn Vail. Budjon didn’t create her maternal genetics. What it did was help an injured cow recover, get back into production, and reach 310,707 pounds of lifetime milk.
Two years after the hip dislocation that put her in slings at Budjon Farms, Blondin Goldwyn Subliminal-ETS won Grand Champion of the 2015 International Junior Holstein Show and was later named Supreme Champion of the Junior Show. Chandler Bening leads the Ferme Blondin-bred cow he owned with his brother, Trevor Tuman.
That gives both programs proper credit. Blondin bred Subliminal. Budjon and its partners developed her and kept her going through a remarkable career.
So Budjon’s record is bigger than either “breeder” or “boarder.” It has bred national champions under the Budjon and Budjon-Vail names. It has carried the Elegance family forward through later generations. And it has developed cattle bred by other herds to the top of the industry.
The complete Budjon record is therefore broader than either “breeder” or “boarder.” The operation has bred national champions under the Budjon and Budjon-Vail names, extended the Elegance family through later generations and developed cattle carrying other prefixes to the highest levels of the industry. Most recently, B-Wil Kingsire Willow was Senior and Grand Champion of the 2025 International Ayrshire Show for Budjon Farms and Peter Vail.
One champion can build a reputation. Three bred-and-owned national champions in one year, six WDE Premier Breeder banners and a Star of the Breed show that the prefix itself belongs in this conversation.
Which Family Are You Building?
Pick the three females getting the most breeding, show, or partnership money in your herd. For each one, write down the family trait you’re trying to keep, the fault you’re trying to fix, and the evidence that the mating can do both.
Then describe the daughter you expect the cross to produce.
Not the genomic number you hope to print. Not the sale average you hope to announce. Not the banner you hope to photograph.
The daughter.
If the only answer is “more marketable,” you have a sales plan. You don’t have a breeding plan yet.
When the Holstein cows enter the Coliseum on October 2, the easy question will be which cow can win.
The better question is whether the family, the mating, and the management behind her can produce another one.
Key Takeaways
The 2026 Le Suprême banner split won’t predict Madison. Canadian Premier Breeder counts 10 females by registered prefix, while WDE counts six and credits whoever owned the dam at service.
Jacobs won Premier Breeder at Le Suprême and placed second as exhibitor because its prefix scored in other owners’ strings. Judge your prefix by what wins when somebody else holds the halter.
Boulet screens the cow before the pedigree, and that still didn’t stop him from paying $40,000 for a show cow that never produced an embryo or calf. A good eye and a deep sire stack lower the risk, but they can’t promise fertility.
In 2005, three different Budjon-bred cows won Grand, Bred & Owned and Best Udder at three national shows. That’s proof the family transmits, which one champion can never give you.
7 Habits of Highly Successful Dairy Breeders — Arms you with the specific management routines separating profitable elite herds from average operations. Tracks the daily operational protocols that drive higher conception rates and lower cull rates across top-tier genetics programs.
The Show Ring vs. The Commercial Dairyman — Follows the money on where show-ring type traits align—or collide—with commercial milk production margins. Evaluates the long-term economic shift toward functional conformation, measuring the exact cost of extreme stature in commercial freestall environments.
Genomics vs. Progeny Testing: Which is Better? — Dismantles the traditional timeline of genetic advancement by weighing early genomic predictions against established progeny proofs. Exposes how accelerated generation intervals reduce maintenance overhead while identifying the true risk-to-reward ratio for your breeding budget.
The Sunday Read Dairy Professionals Don’t Skip.
Every week, thousands of producers, breeders, and industry insiders open Bullvine Weekly for genetics insights, market shifts, and profit strategies they won’t find anywhere else. One email. Five minutes. Smarter decisions all week.
Marc Comtois bought an 18-cow farm at 18. Fifty years later, one Comestar cow family has put at least 4.5 million doses into the world, and a 2003 border closure rebuilt the farm around milk.
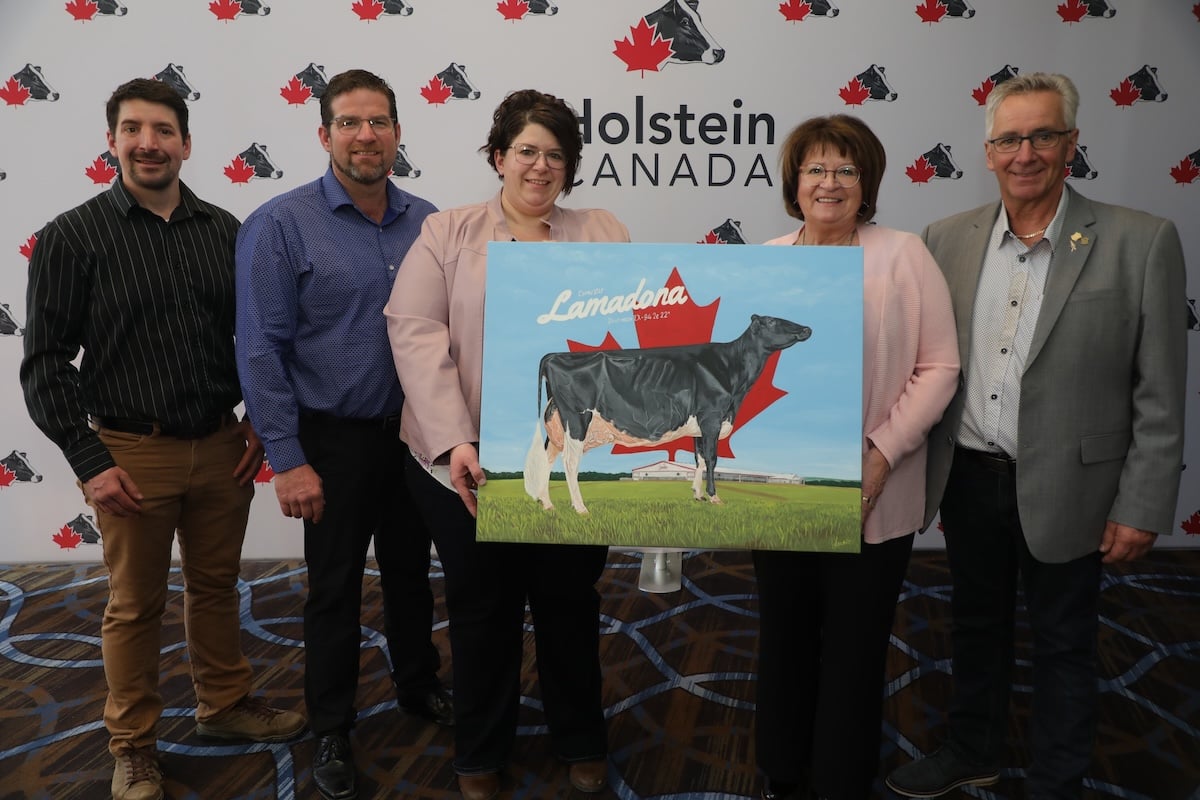
Comestar’s next generation and its founders, from left: Steve Comtois, Julien Turmel, Julie Comtois, France Lemieux and Marc Comtois, with a portrait of Comestar Lamadona Doorman EX-94-2E, Holstein Canada’s 2022 Cow of the Year. She’s the eighth generation of Comestar Laurie Sheik, the first Cow of the Year, in 1995.
On May 20, 2003, nine of every ten dollars Comestar Holstein earned came from selling genetics: bulls, embryos, heifers and cows. That day, Canada confirmed a case of BSE, and borders closed immediately to Canadian live animals and bovine products. The export business that had made Comestar one of the most famous prefixes in the breed stopped overnight.
That month, Marc Comtois and France Lemieux started bidding on milk quota. They have bid every month since, except one.
On September 13, 2026, the farm they started with 18 milking cows turned 50. Marc named it in 1976 for what he wanted it to become: come + star, the farm that wants to become a star. “That’s still our goal,” Marc told Le Bulletin des agriculteurs this month.
The banners are real: two Holstein Canada Cows of the Year, four millionaire AI sires and two Master Breeder shields. The more useful story is how a genetics house survived losing its main market, and what that cost in quota.
What 50 years changed, by the numbers
Metric
Earlier record
Later record
Cows
18 milking, 1976 · 119-cow herd, 2008
370 milking on six robots, 2021
Milk quota
630 kg butterfat/day, 2021
Close to 800 kg/day, 2026
Class Extra bulls bred
8, 2008
14, the all-time record for any breeder, 2021
All-Canadian nominations
51, 2008
72, 2021
Revenue mix
90% genetics / 10% milk, 2003
90% milk / 10% genetics, 2021
The last row is the story. In under two decades, Comestar flipped its revenue mix end to end without giving up the genetics that built the name.
It started with 18 cows and a father’s example.
Marc was the seventh of nine children, raised at Ferme Comtoise in Victoriaville, Centre-du-Québec. He left school at 15 to work with cattle. At 18, he bought a Princeville farm milking 18 cows. “It was a modest farm,” Marc says.
The example at home was his father, Edgar Comtois, a Holstein Canada Master Breeder in 1985. “I had a passion for cows — really for the animals more than the land,” Marc says. “We started with not much, but we moved up fairly quickly by always buying better-quality animals. I was a genetics fan. I always looked at the bull crosses and the cow crosses. That’s what took us around the world.”
Aramis Marquis sold the prefix abroad in 1979
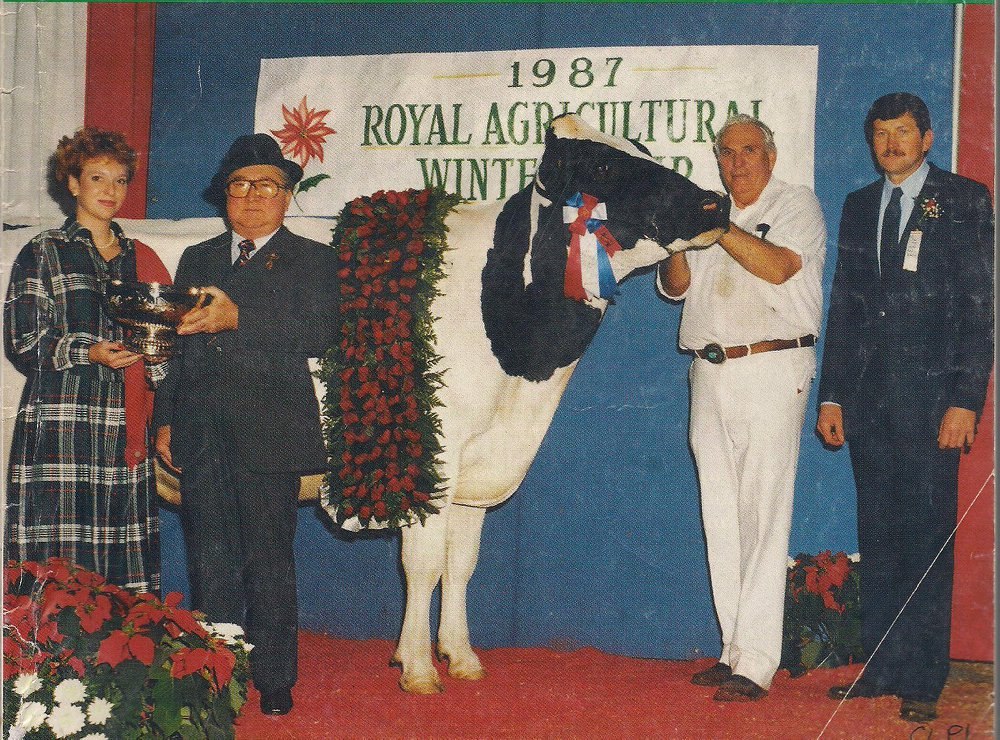
Three years in, Comestar Aramis Marquis won his class at the Royal Agricultural Winter Fair in Toronto and went All-Canadian, the farm’s first. Italian buyers paid $8,000 for him, serious money in 1979. The ribbon and the sale took the Comestar name outside Quebec.
That set the pattern for the next 24 years: win in the ring, then sell to the world. By 2021, that single All-Canadian had grown into 72 nominations: 11 All-Canadian, 10 Reserve and 15 Honorable Mention awards.
The $45,000 cow in 40% of a year’s herdbook
In 1985, Marc bought Elysa Anthony Lea EX-15*, a Willowholme Mark Anthony daughter, and bred her to Puget-Sound Sheik. Comestar Laurie Sheik-ET arrived December 1, 1986.
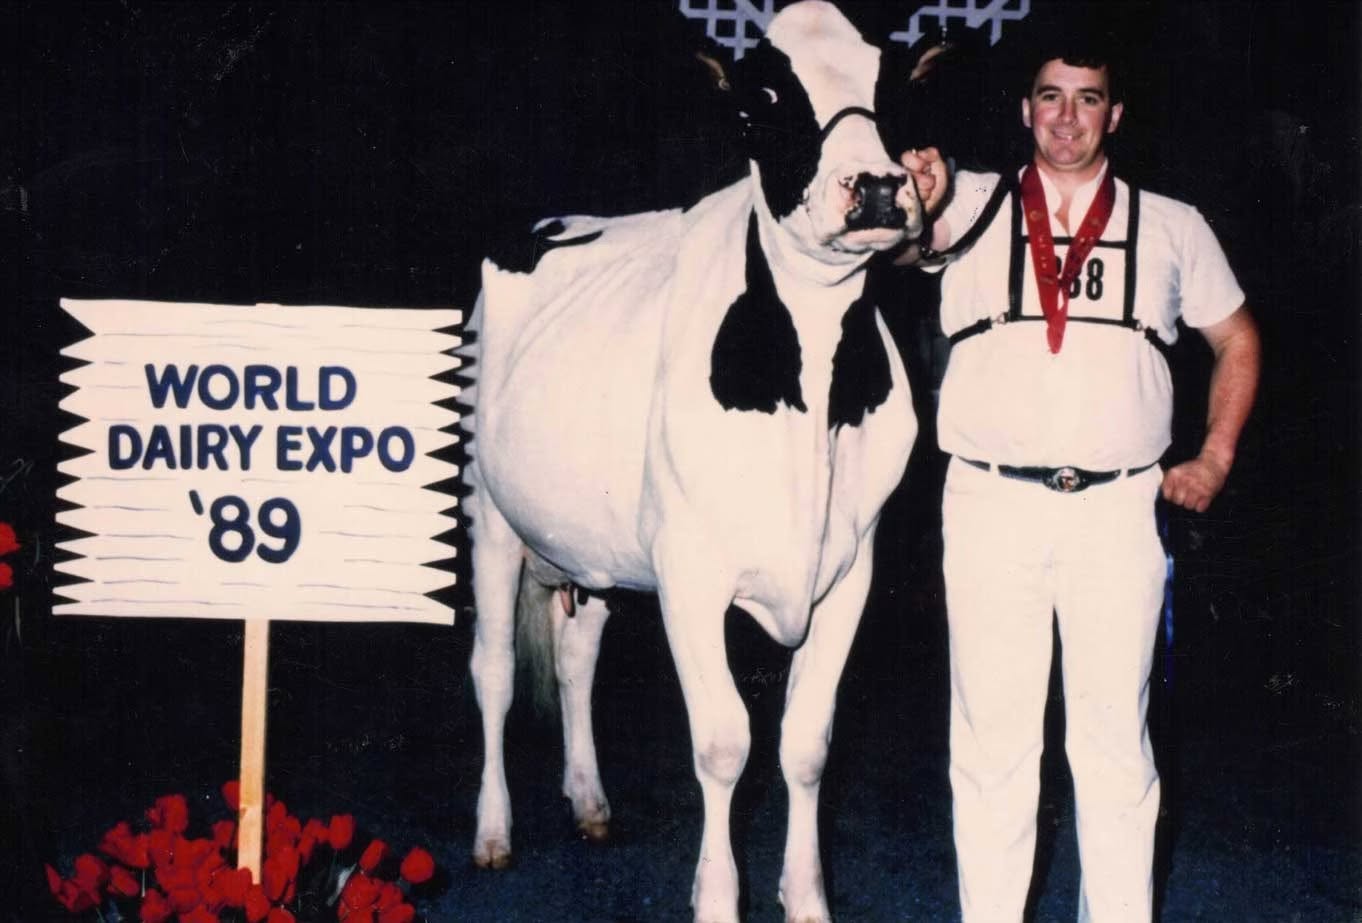
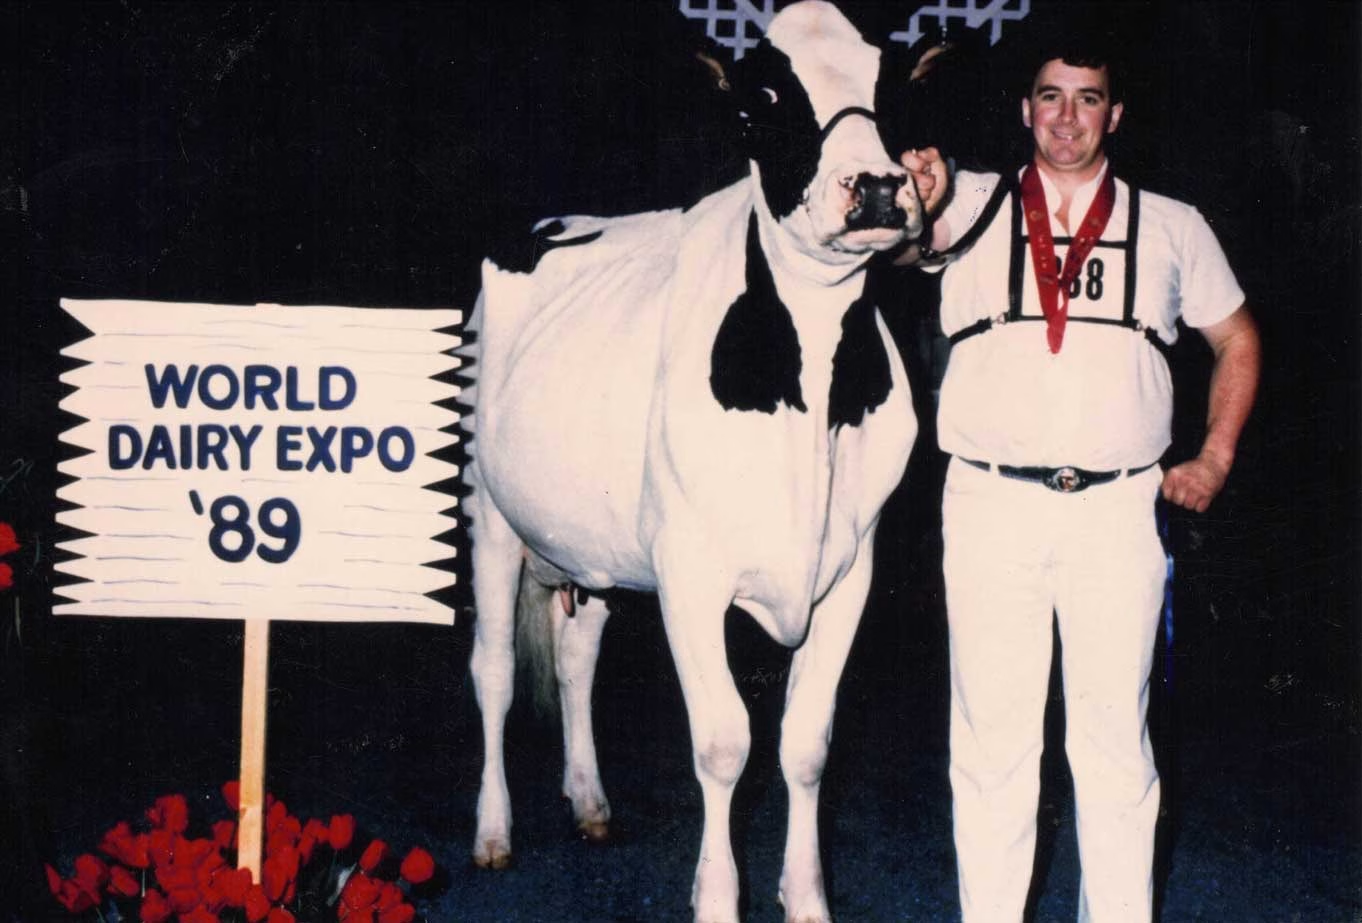
Marc Comtois with Comestar Laurie Sheik-ET at the 1989 World Dairy Expo, where she placed second in the Senior Two-Year-Old class behind Dupasquier Starb Winnie. Six years later, she became Holstein Canada’s first Cow of the Year.
In 1989, she won the Senior Two-Year-Old class at Victoriaville, then went to World Dairy Expo, where she placed second and took the class’s Best Udder nod after the milk-out re-sort. That autumn, she topped Comestar’s first sale at $45,000. Eddy and Annie Pussemier of Bois Seigneur Holstein in Belgium bought half of her. Belgium wouldn’t take live Canadian cattle, so her genetics crossed the Atlantic as embryos. “Today, about 70% of our herd traces back to Laurie Sheik,” the Pussemier family says.
The mating that made her a legend was the one with To-Mar Blackstar. It produced two sons, Leader EX Extra and Lanky EX-Spain, and four famous daughters. Three stayed in Canada and went VG-87: Laura Black 24*, L’Or Black 16*, and Lausan Black 23*. The fourth, Black Laure de Bois Seigneur EX-90, was Grand Champion at Belgium’s 1996 National Show. Laura Black and L’Or Black each made the Cow of the Year final twice. Lausan Black is the only cow to put both a daughter, Lausian Astre, and a son, Stormatic, at No. 1 on Canada’s LPI lists. By 2006, Laurie Sheik sat in the pedigrees of 40% of the animals admitted to Holstein Canada’s herdbook that year.
She was Holstein Canada’s first Cow of the Year in 1995 and died April 30, 2004. Her descendant Comestar Lamadona Doorman EX-94-2E took the same title for 2022, 27 years after she did.
Four millionaire sires add up to at least 4.5 million doses
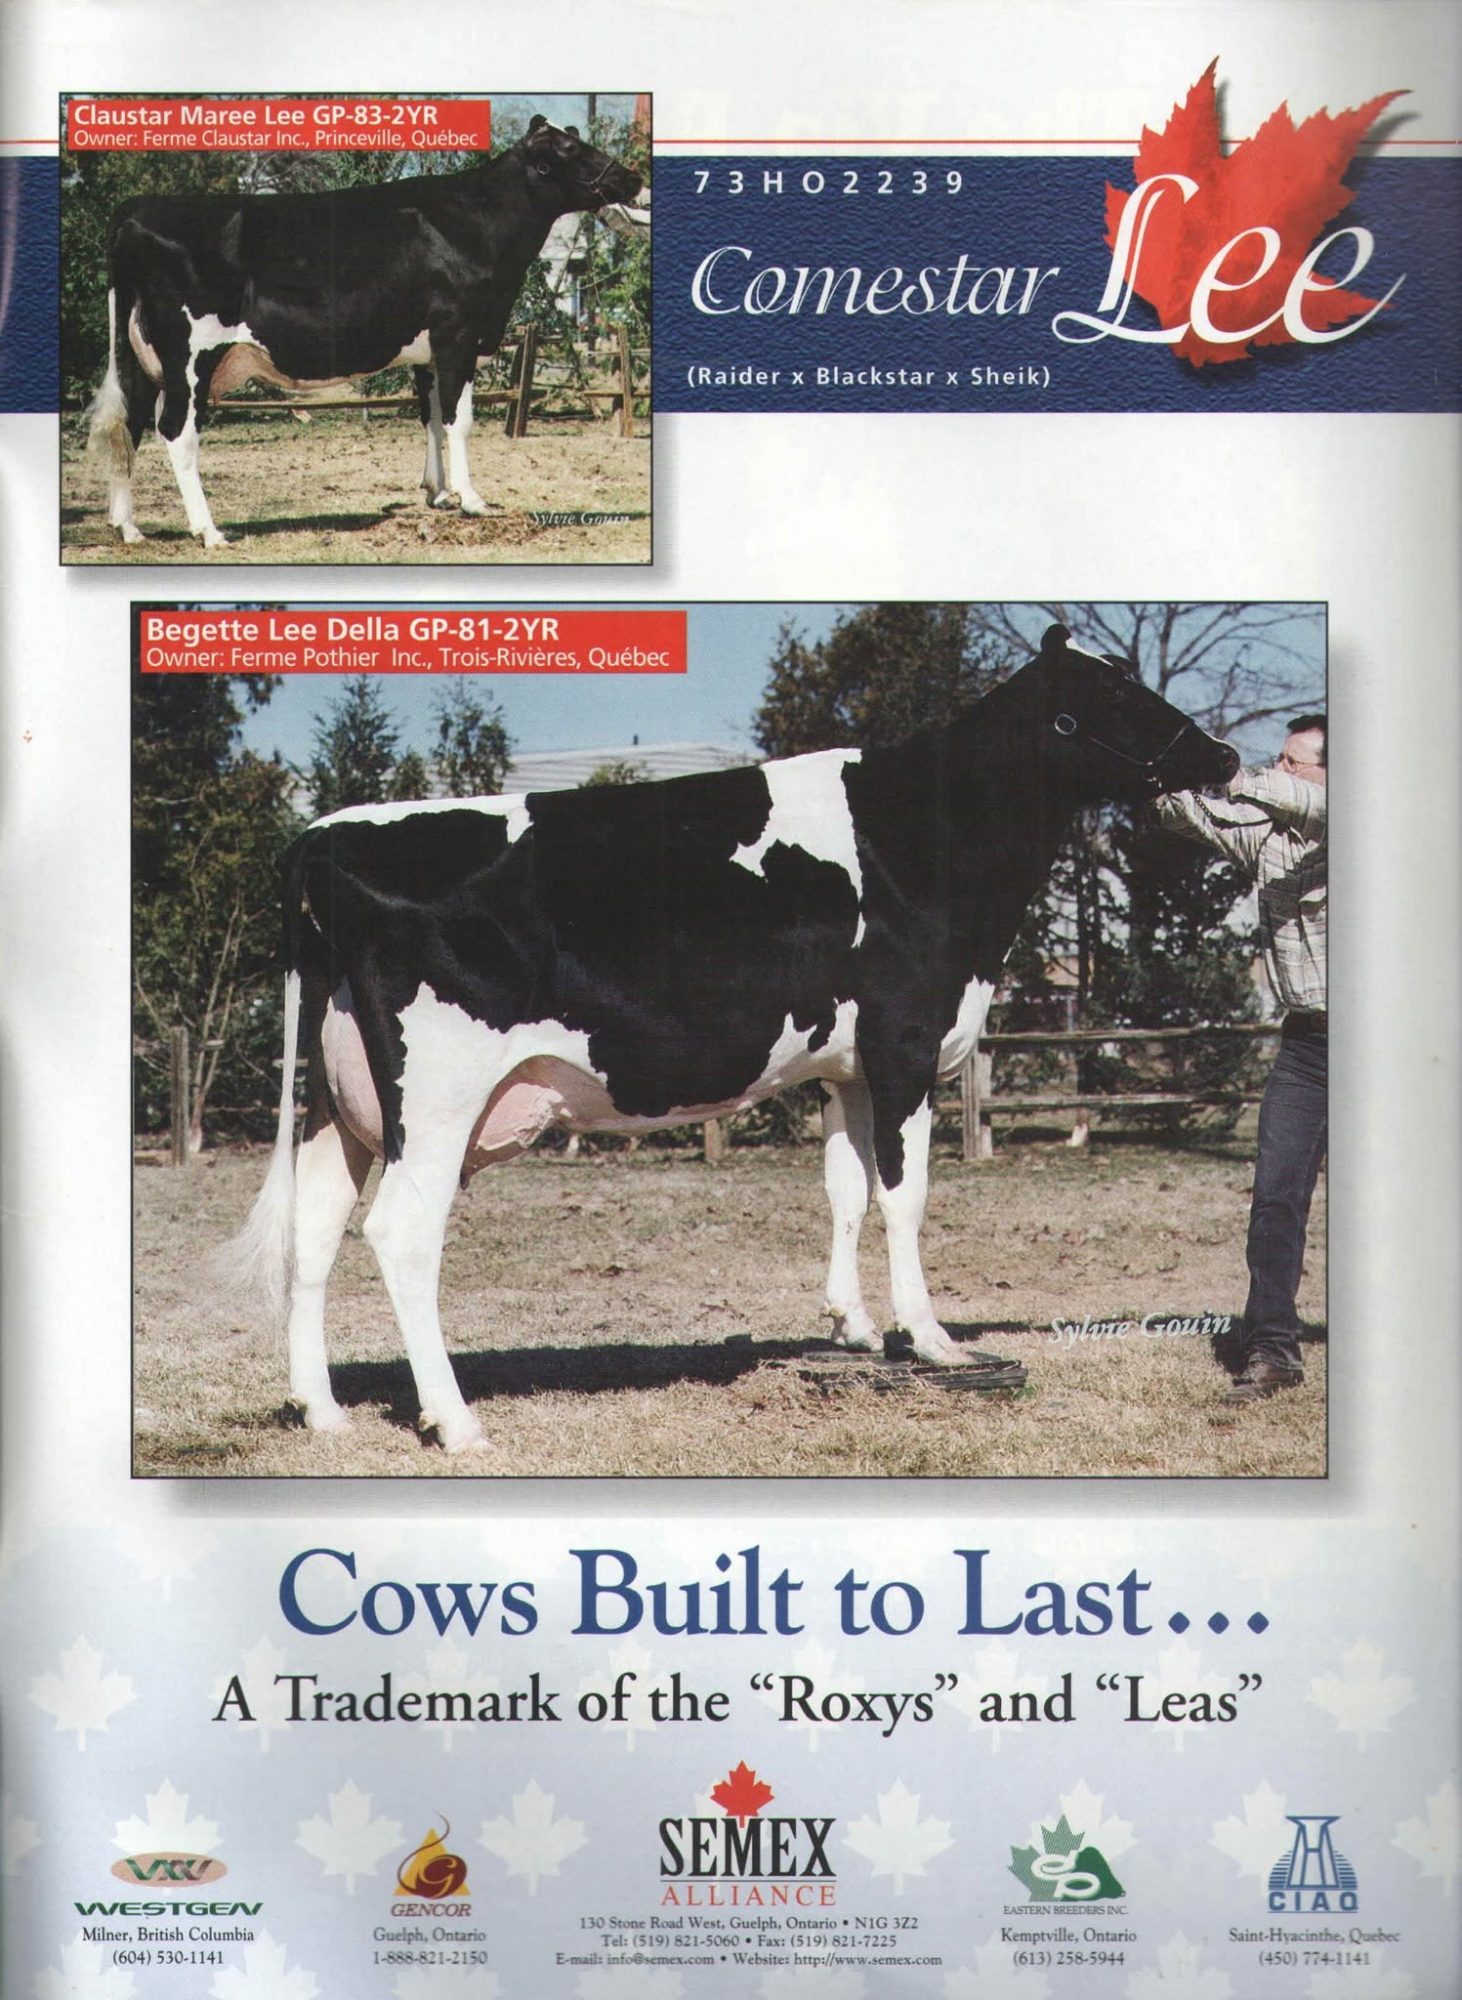
Comestar Lee 73HO2239 in a Semex Alliance ad: by Raider, out of Laura Black, Laurie Sheik’s Blackstar daughter. The pitch was “Cows Built to Last,” shown on two-year-old daughters Claustar Maree Lee GP-83 and Begette Lee Della GP-81.
“A big part of Comestar’s reputation is the bulls in the AI centres,” Marc says. “We’re the only ones in the world to have produced four millionaire bulls — bulls that produced more than a million doses. And we have one that’s a super-millionaire — more than 1.5 million doses.”
Now the floor. Lee’s 1.5 million, plus at least one million each for the other three, comes to no fewer than 4.5 million doses from one cow’s son and grandsons. That’s a minimum, not an estimate.
Three of the four trace to a single daughter. Laura Black is the dam of Lee, his brother Top Gun, and Lheros EX-97 Extra, a former No. 1 LPI sire and Canada’s first 97-point bull. Outside, EX-95 Extra came from L’Or Black. Leader is Laurie Sheik’s own son.
Lee almost never got sampled. CIAQ tested him and Top Gun off a first-calf dam scored Good Plus 84, below the Very Good bar bull studs usually demanded. Both went Extra, and Lee became the family’s super-millionaire.
A partner at home freed Marc to sell the world.
Marc Comtois gives his reasons as official judge of the 2016 National Holstein Show at the Royal Agricultural Winter Fair, his second time in that ring. He named Jacobs Gold Liann Grand Champion and called her “the cow of the future.”
Rewind to 1993, four years after Laurie Sheik’s $45,000 sale and two years before her Cow of the Year title. Overseas demand for Marc was pulling him off the farm. He and France sold half the business to Freddy and Nicole Steen, Belgian breeders who had settled in Quebec looking to buy a farm. With Freddy running things at home, Marc could travel without worrying about the farm.
The Steen years stacked up the results. The first Master Breeder shield came in 1995. In 1996, Marc won the Royal’s Curtis Clark award for exhibitor sportsmanship. A 100-cow barn went up in 1998. In 1999, Marc judged the Holstein show at the Royal. He’d take that ring again in 2016, and he has judged in more than 20 countries.
In 2000, Comestar hosted the Holstein Québec picnic for 8,000 visitors. The same year, the two-day Comestar Sale 2000 sold 269 head at an $8,036 average, topped by Comestar Model Lady VG-89 at $95,000. By 2021, Marc had sold more than 7,000 embryos into 33 countries.
May 20, 2003, turned a genetics house into a milk business
When the border shut, milk made up just 10% of Comestar’s revenue. Marc and France didn’t wait for exports to reopen. They started buying quota to rebalance the farm between milk and genetics.
“Since May 20, 2003, there’s been only one month we didn’t bid on milk quota,” Marc says. Twenty-three years of that discipline adds up to this:
Value at the cap: 800 × $24,000 = about CA$19.2 million
Growth since 2021: 630 kg to about 800 kg = about 170 kg, or 27%, roughly CA$4.1 million at the cap
How scarce it is: on Quebec’s July 2026 exchange, buyers bid for 29,453.80 kg and got 588.74 kg, a 2.0% fill rate
Comestar’s gain since 2021 equals about 29% of everything sold on the entire provincial exchange that month.
The $19.2 million is a ceiling value, not a sale price. It ignores debt, doesn’t split holdings between Comestar and the family’s second company, and starts from a rounded “close to 800.” What the math does prove is that in a market filling 2% of bids, nobody reaches 800 kg by waiting for a good month.
Genomics rewrote the market, and Comestar bred against it
The second shock was genomics, which Semex dates to 2008. AI companies started producing their own bulls and wouldn’t release semen from their top young sires to breeders. Heifers mattered more than cows, the selling window for one shrank, and outside the elite genomic heifers there was no good market for the rest.
“Genomics changed the way I could do business,” Marc told Semex in 2021. “My sales changed. My job of making bulls didn’t exist anymore. It changed my vision.”
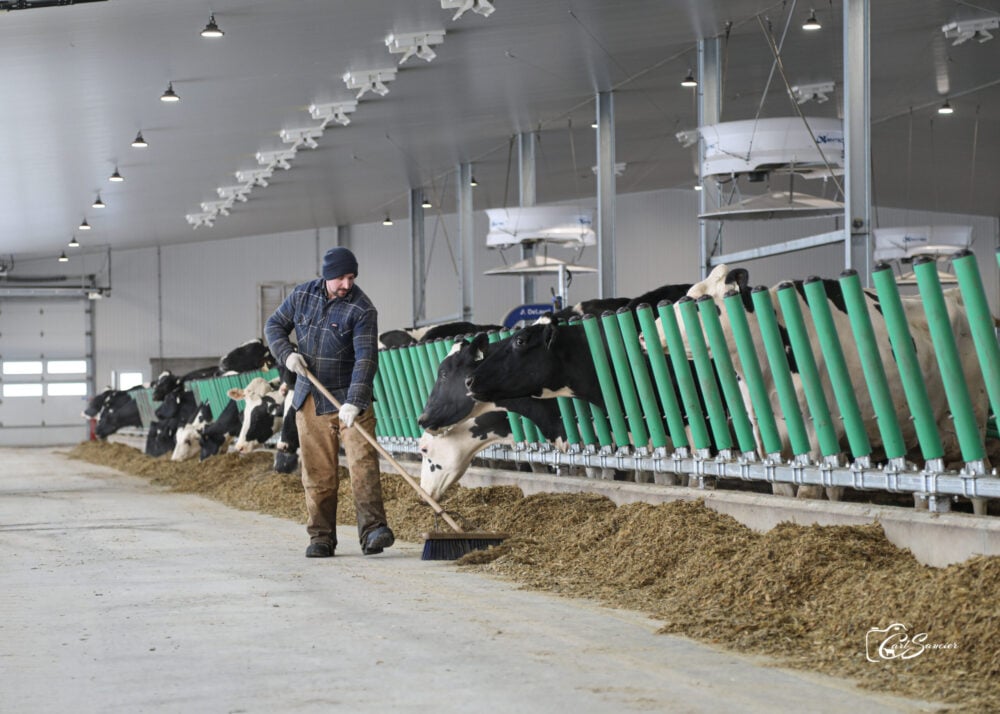
Steve Comtois pushes up feed at the bunk. By 2021, he was overseeing the herd’s genetics, its breeding decisions and the new barn. Today he runs the genetics, and his father says he’s excellent at it.
Comestar’s answer went against the grain. In 2021, the herd was still bred about 80% to proven bulls, 10–12% to young genomic sires, and the rest to beef, with sexed semen on every first and second breeding. The farm raised more heifers than it needed and sold the surplus as fresh heifers and second-lactation cows. Marc’s breeding target was a cow that calves three or more times, and he had raised four that reached 18 years old.
The cow family kept delivering on both sides of the switch. Comestar Lautamie Titanic VG-89 33* was Canada’s No. 1 LPI cow in 2006, 2007 and 2008. Lamadona, from the same Laurie Sheik line, won the Junior Three-Year-Old class and the Genetic & Production trophy at World Dairy Expo in 2016, went Reserve All-American that year, and was HM All-Canadian in 2015 and 2016. She’s the eighth generation of Laurie Sheik to classify VG or EX. The 2023 Comestar Legacy Sale still topped at $42,000.
Succession came before the robot barn.
Even before the genomic shockwaves hit the market, Comestar had already begun future-proofing its ownership. In 2007, Marc and France bought back the Steens’ half, since the Steen children weren’t interested in farming. Julie, her husband Julien Turmel, and Steve had told them they wanted in.
The family handed over the farm in stages. In 2010, it created Oli-Fay Holstein, named after the first two grandchildren, Olivier and Marie-Fay. In 2013, Julie, Steve, Kathleen and Julien became shareholders, and consultant Ann Louise Carson spent three months helping the family set roles, weekly meetings and decision rules.
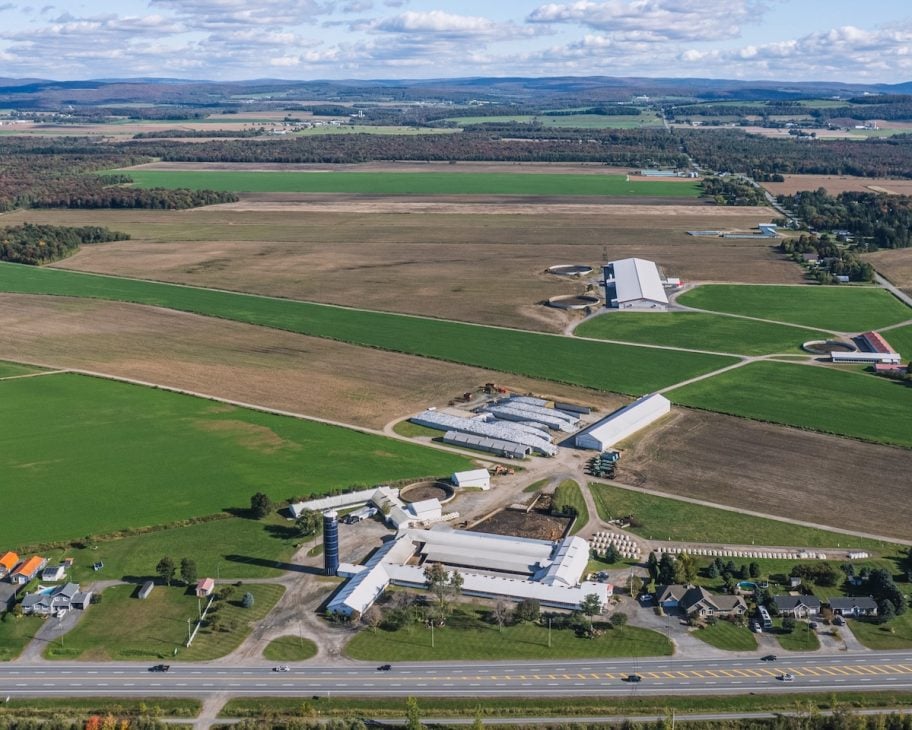
Comestar Holstein from the air, 50 years after Marc Comtois and France Lemieux started with 18 milking cows. The farm now holds close to 800 kg/day of quota, and the family’s 2020 robotic barn went up near the original farm.
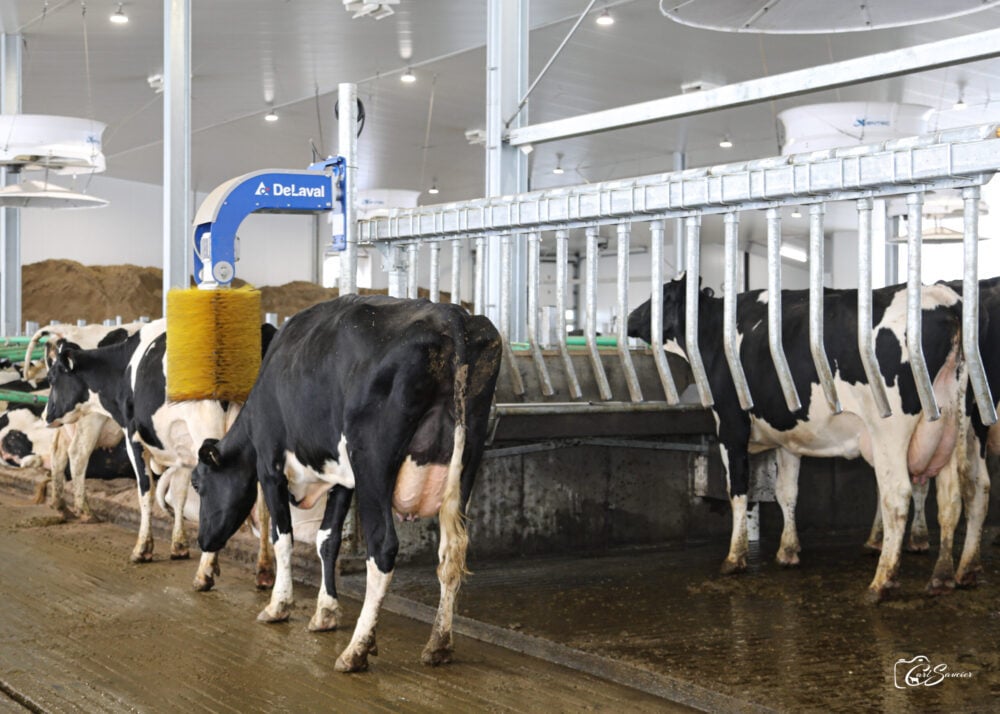
The barn came last. Cows started milking in the new robotic freestall on October 13, 2020: 722 by 142 feet, 586 sand-bedded stalls and room for eight DeLaval VMS 300 units. Natural herd growth filled it without a single purchased animal.
Cows in Comestar’s robotic freestall. “The first cows to move into the new freestall barn were our tiestall cows, because our cows can work anywhere,” Marc told Semex in 2021. “They are all built the same.”
Steve runs the genetics now, and he’s excellent at it, Marc says. Julie handles herd management and the reporting that comes with it. Julien does the embryo transfer and runs the crops. Nicole Steen still keeps the books, 19 years after the partnership ended. Two of the four children, Julie and Steve, are in the business today, and the grandchildren are already showing an interest in farming.
Marc Comtois and France Lemieux (centre) with three generations of the Comtois and Turmel families. “My dream is to see my grandkids have the same passion for cows as I do,” Marc told Semex in 2021.
Five decades of honors
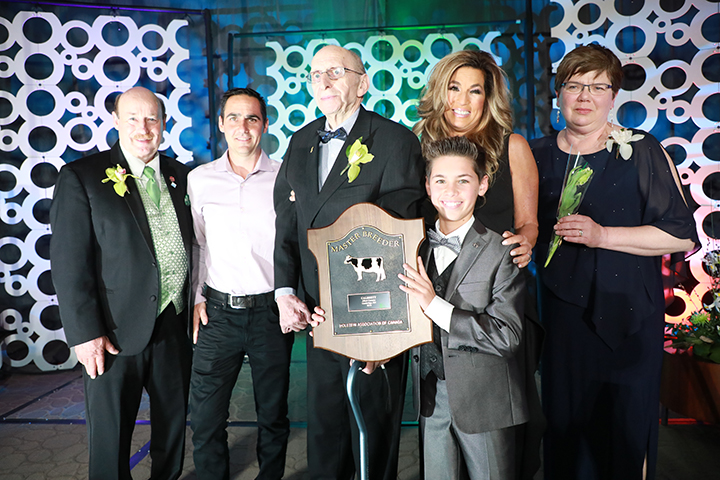
1995, 2009: Holstein Canada Master Breeder
1996: Curtis Clark Award, Royal Agricultural Winter Fair
2007: Premier Breeder, Royal Agricultural Winter Fair
2008:National Dairy Shrine Distinguished Dairy Cattle Breeder, the 36th recipient and the second Canadian, after Roy Ormiston in 1989. “It goes to a breeder who has distinguished himself, who shows sportsmanship and who sets a good example,” France says.
Ask Marc for his proudest achievement, and he doesn’t have to think long. “Being in the Agricultural Hall of Fame in Quebec and in Canada,” he says. “That sums it all up.”
What Comestar’s 50 years say to a breeder today
Stress-test your revenue concentration. In May 2003, 90% of Comestar’s income ran through export channels. If one border, one buyer, or one stud carries more than half your revenue, write down now what you’d do the week it closes.
Build a cow family, not a star cow. Laurie Sheik multiplied through four Blackstar daughters on two continents. One of them, Laura Black, gave AI three Extra bulls, including a super-millionaire her own first-lactation score nearly kept out of sampling. One great cow tops a sale. Several strong daughters make a breeding program.
In quota provinces, bid every month your cash flow can carry it. At a 2% fill rate, the herds that end up with kilograms are the ones in every exchange, not the ones timing it. Price each bid at the full cap (in Quebec, $24,000/kg) and run it past your lender first.
Settle ownership before you pour concrete. Comestar went from new entity (2010) to shares and outside facilitation (2013) to barn (2020). The barn was built for people who already owned the business.
Half a century after an 18-year-old named a Princeville farm for a star it hadn’t reached yet, Marc still says the goal hasn’t changed. By any measure the breed keeps, they reached it a long time ago. The family is still acting like they haven’t.
Learn More
The Proof You Waited Three Years For Averaged a $72 Markdown — Arms you with the math to stop waiting on daughter proofs. Runs the Hold-to-Proof Cost Simulator to quantify the maintenance overhead per sire, exposing why acting on early genomic predictions outpaces the traditional sampling model.
Revolutionary Sperm Testing Exposes Hidden Bull Fertility Crisis — Secures your AI investment against hidden subfertility that conventional testing misses. Breaks down how time-dependent metabolic analysis catches rapidly deteriorating semen, preventing an $8,200 annual drain on your margins from extended calving intervals.
The Sunday Read Dairy Professionals Don’t Skip.
Every week, thousands of producers, breeders, and industry insiders open Bullvine Weekly for genetics insights, market shifts, and profit strategies they won’t find anywhere else. One email. Five minutes. Smarter decisions all week.
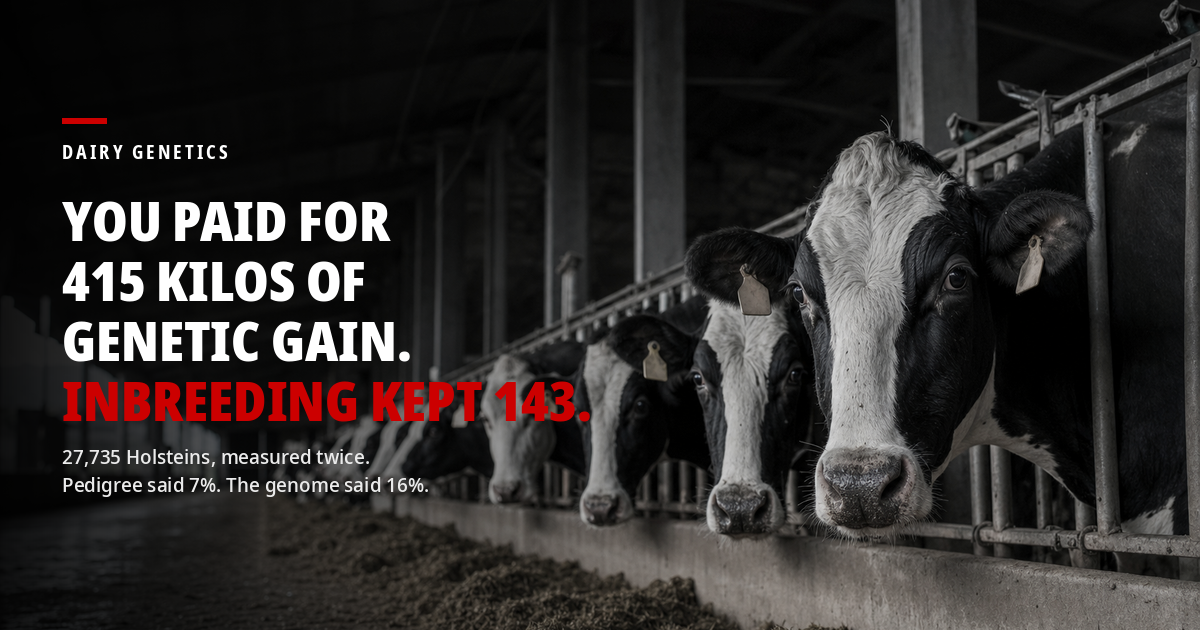
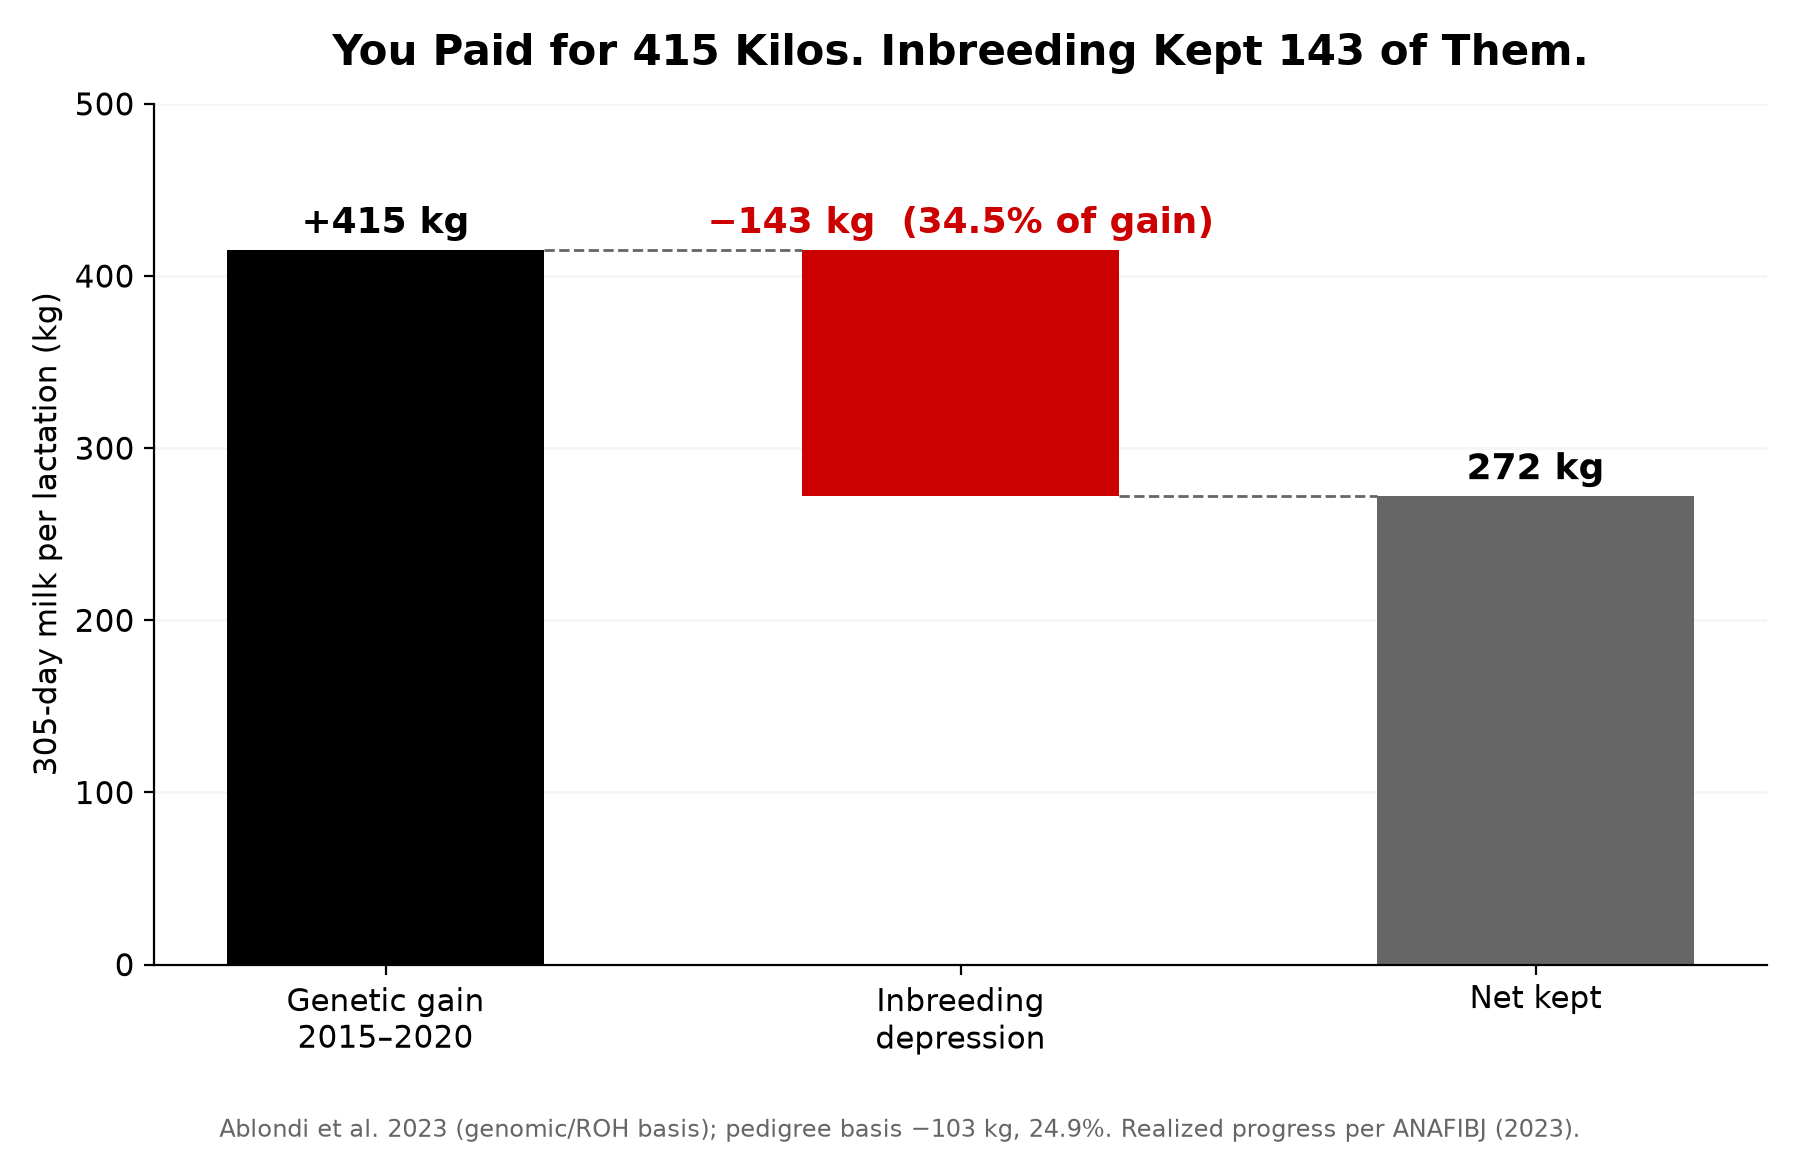
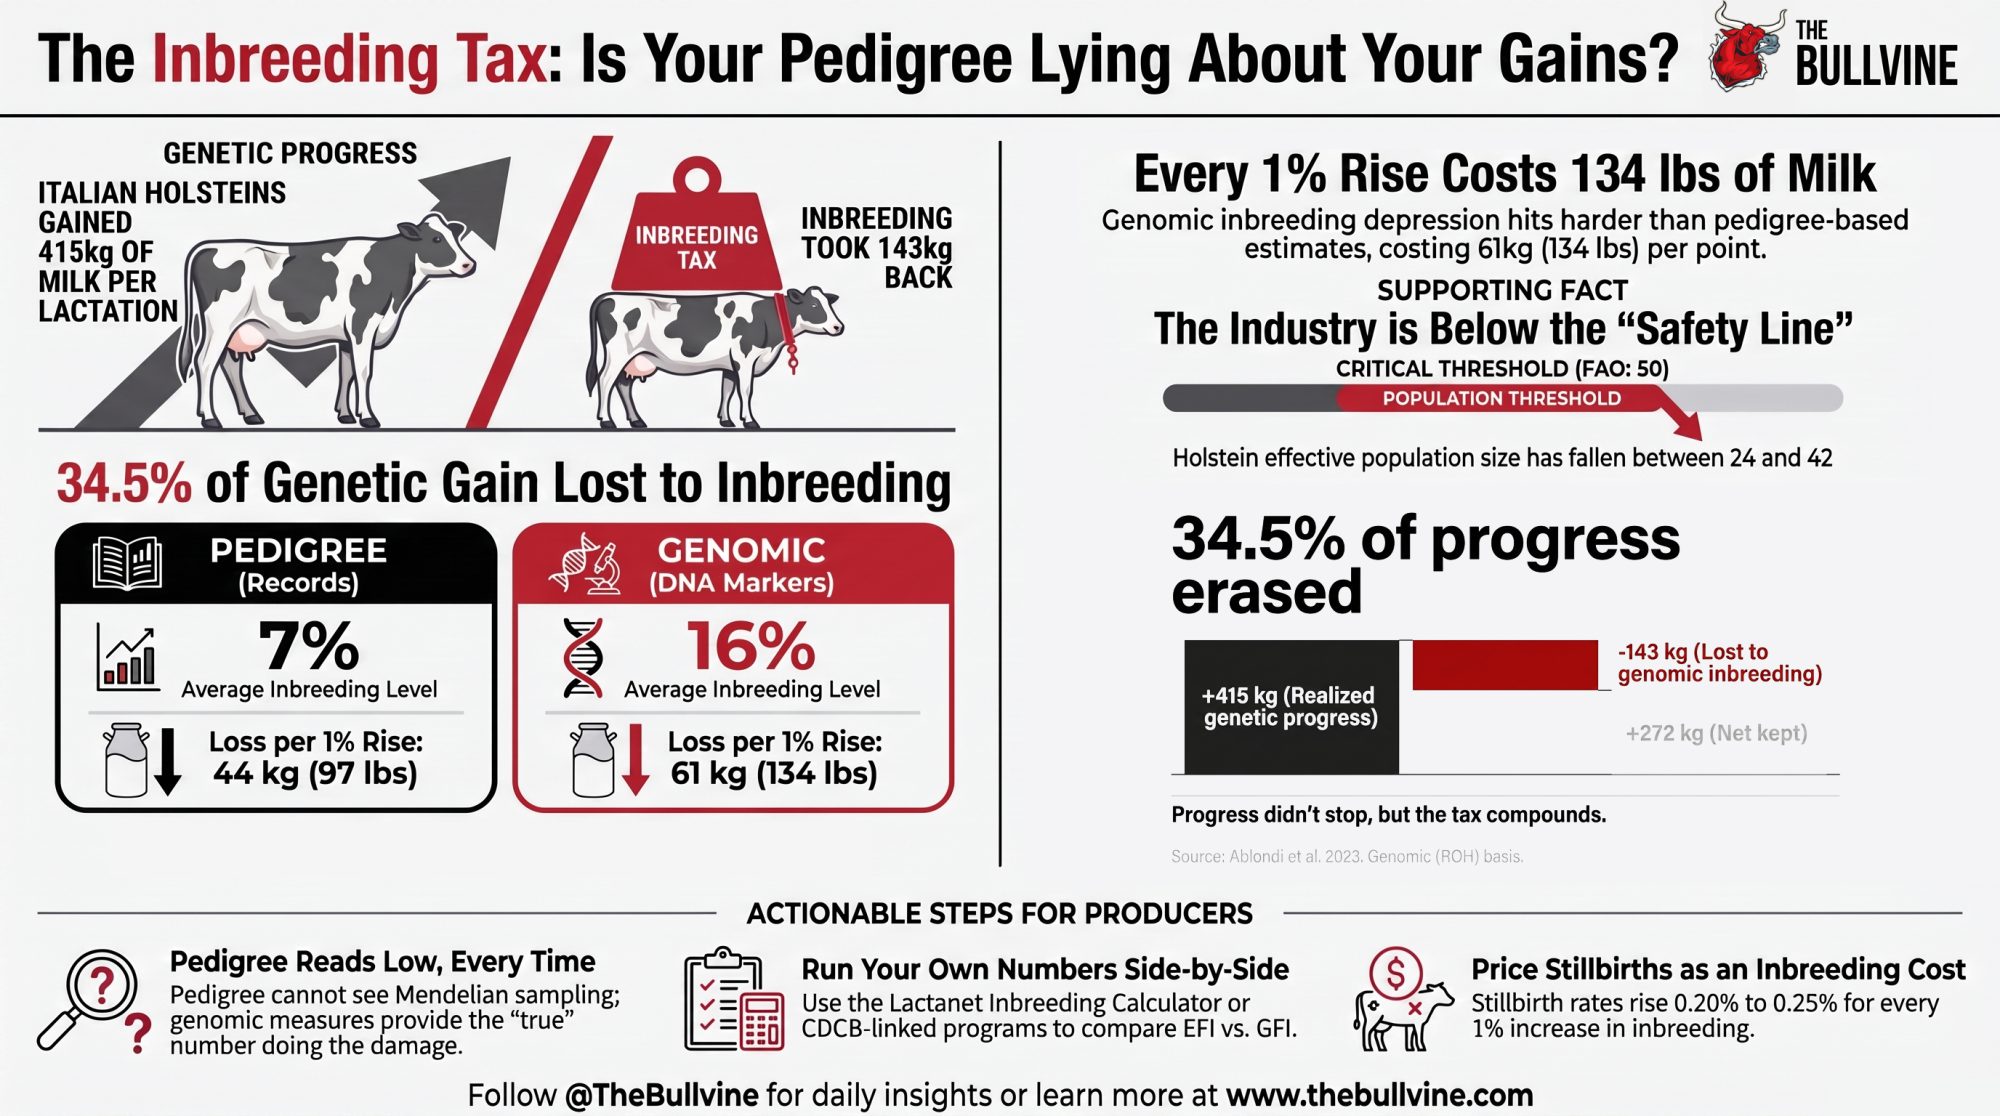
Italian researchers tracked 27,735 Holsteins for five years. The breed earned 415 kilos of genetic gain per lactation. Inbreeding took 143 back. Do you know your own herd’s number?
Executive Summary: Ablondi’s Parma team measured the same 27,735 Holsteins twice, and pedigree said 7% inbred while the genome said 16% — with the milk loss tracking the bigger number, 61 kg per point against 44. That gap matters to anyone genomic-testing females and still running matings off pedigree EFI, because you’re managing to the instrument that reads low. Across 2015 to 2020 the Italian Holstein banked 415 kg of genetic gain per lactation and inbreeding depression took 143 of it back, though the authors are careful to say the breed still kept 272 kg net; the worry is the trajectory, not a bill already due. Run Pryce’s scaling on your own operation — 0.4 to 0.6% of your rolling herd average per point of inbreeding — and a decade at the U.S. rate of 0.36 points a year costs a 12,000 kg herd 170 to 260 kg per cow, per lactation. North American Holstein’s genomic-era effective population size sits somewhere between 24 and 42, and even the optimistic end is under the FAO’s critical threshold of 50. Four major studs built internal elite-female programs between 2008 and 2015, only Select Sires has published a sourcing split, and none of the eight organizations we contacted responded — so nobody outside those companies can say where your next bull came from. The tools that fixed this in the 2000s are still available; the open question is whether anyone uses them at a 2.2-year generation interval, and whether you’ve ever seen your own two numbers side by side.
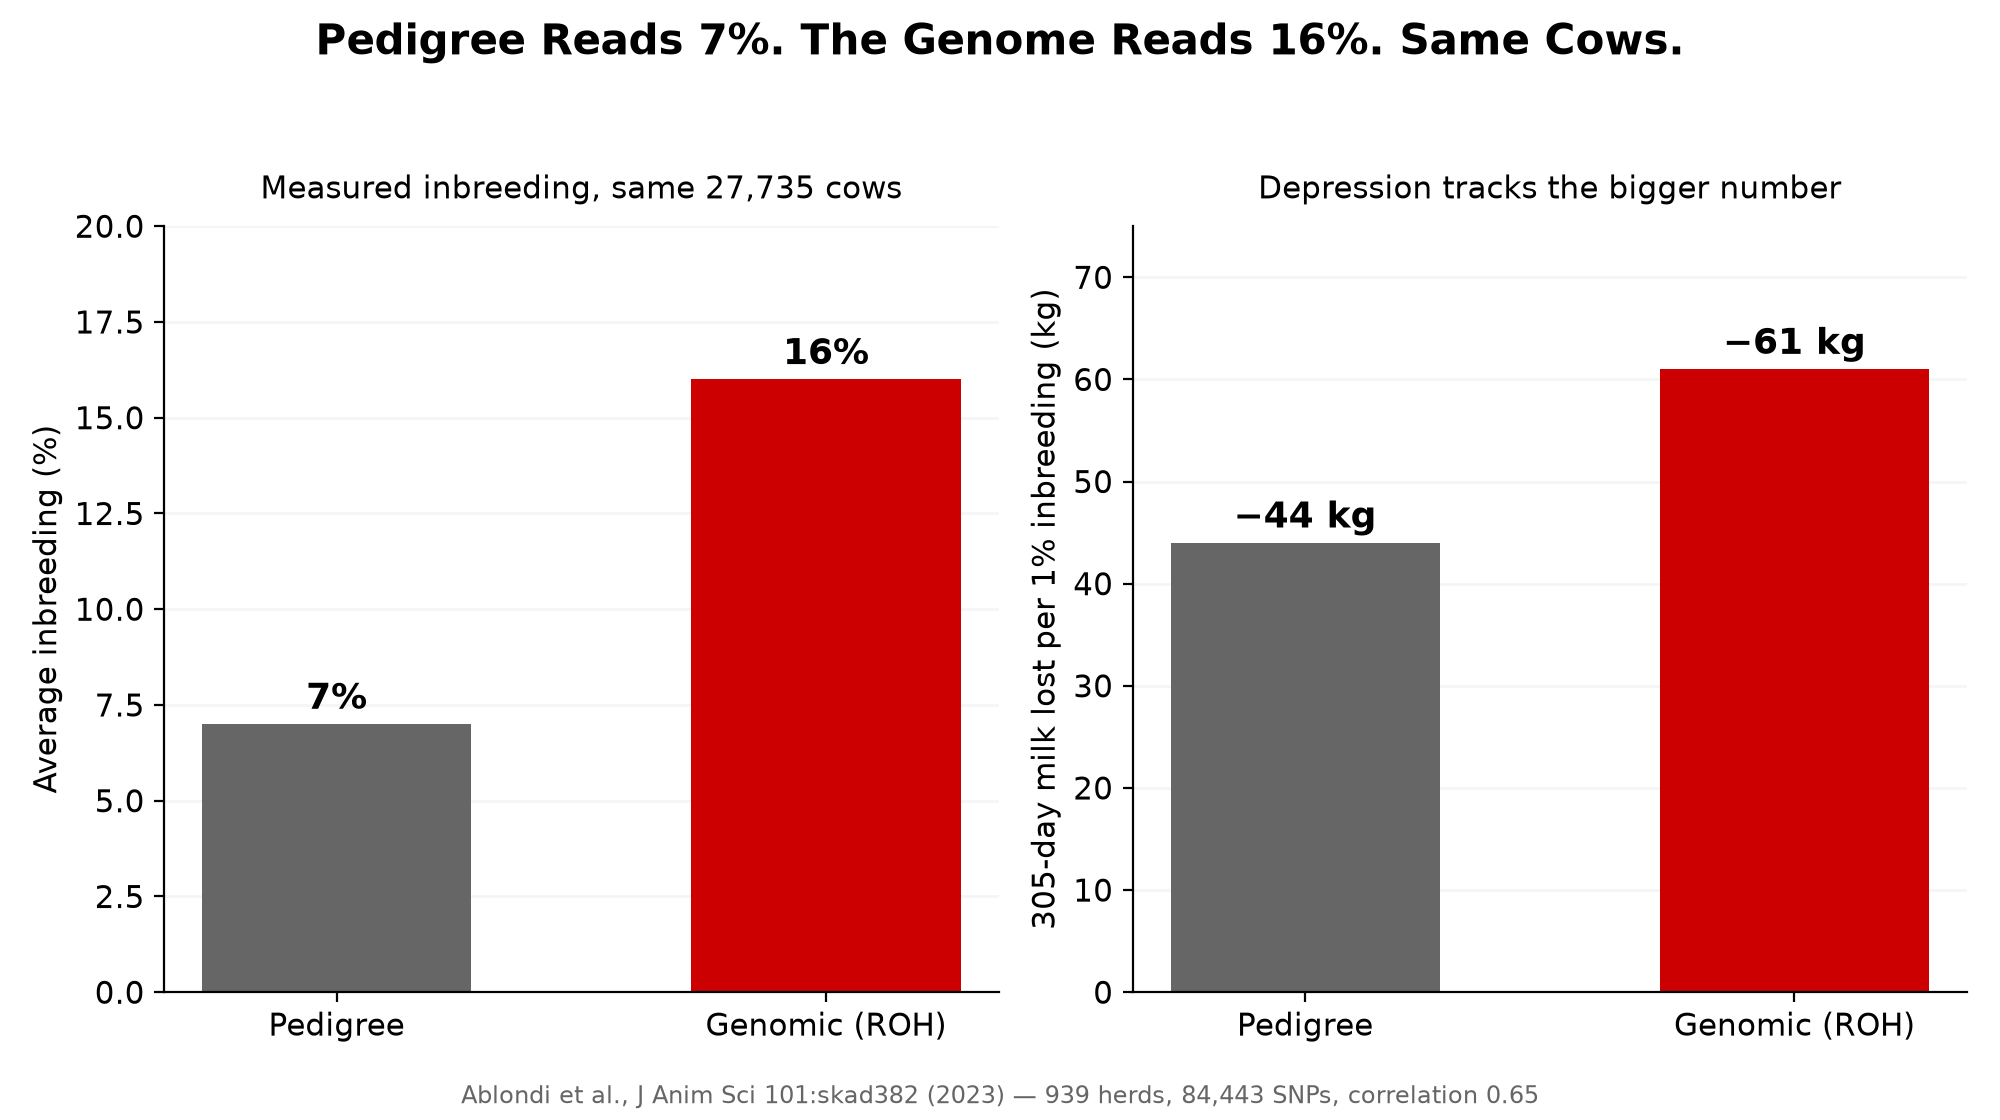
Michela Ablondi’s team at the University of Parma did something most inbreeding studies skip. They measured the same 27,735 Holstein cows twice.
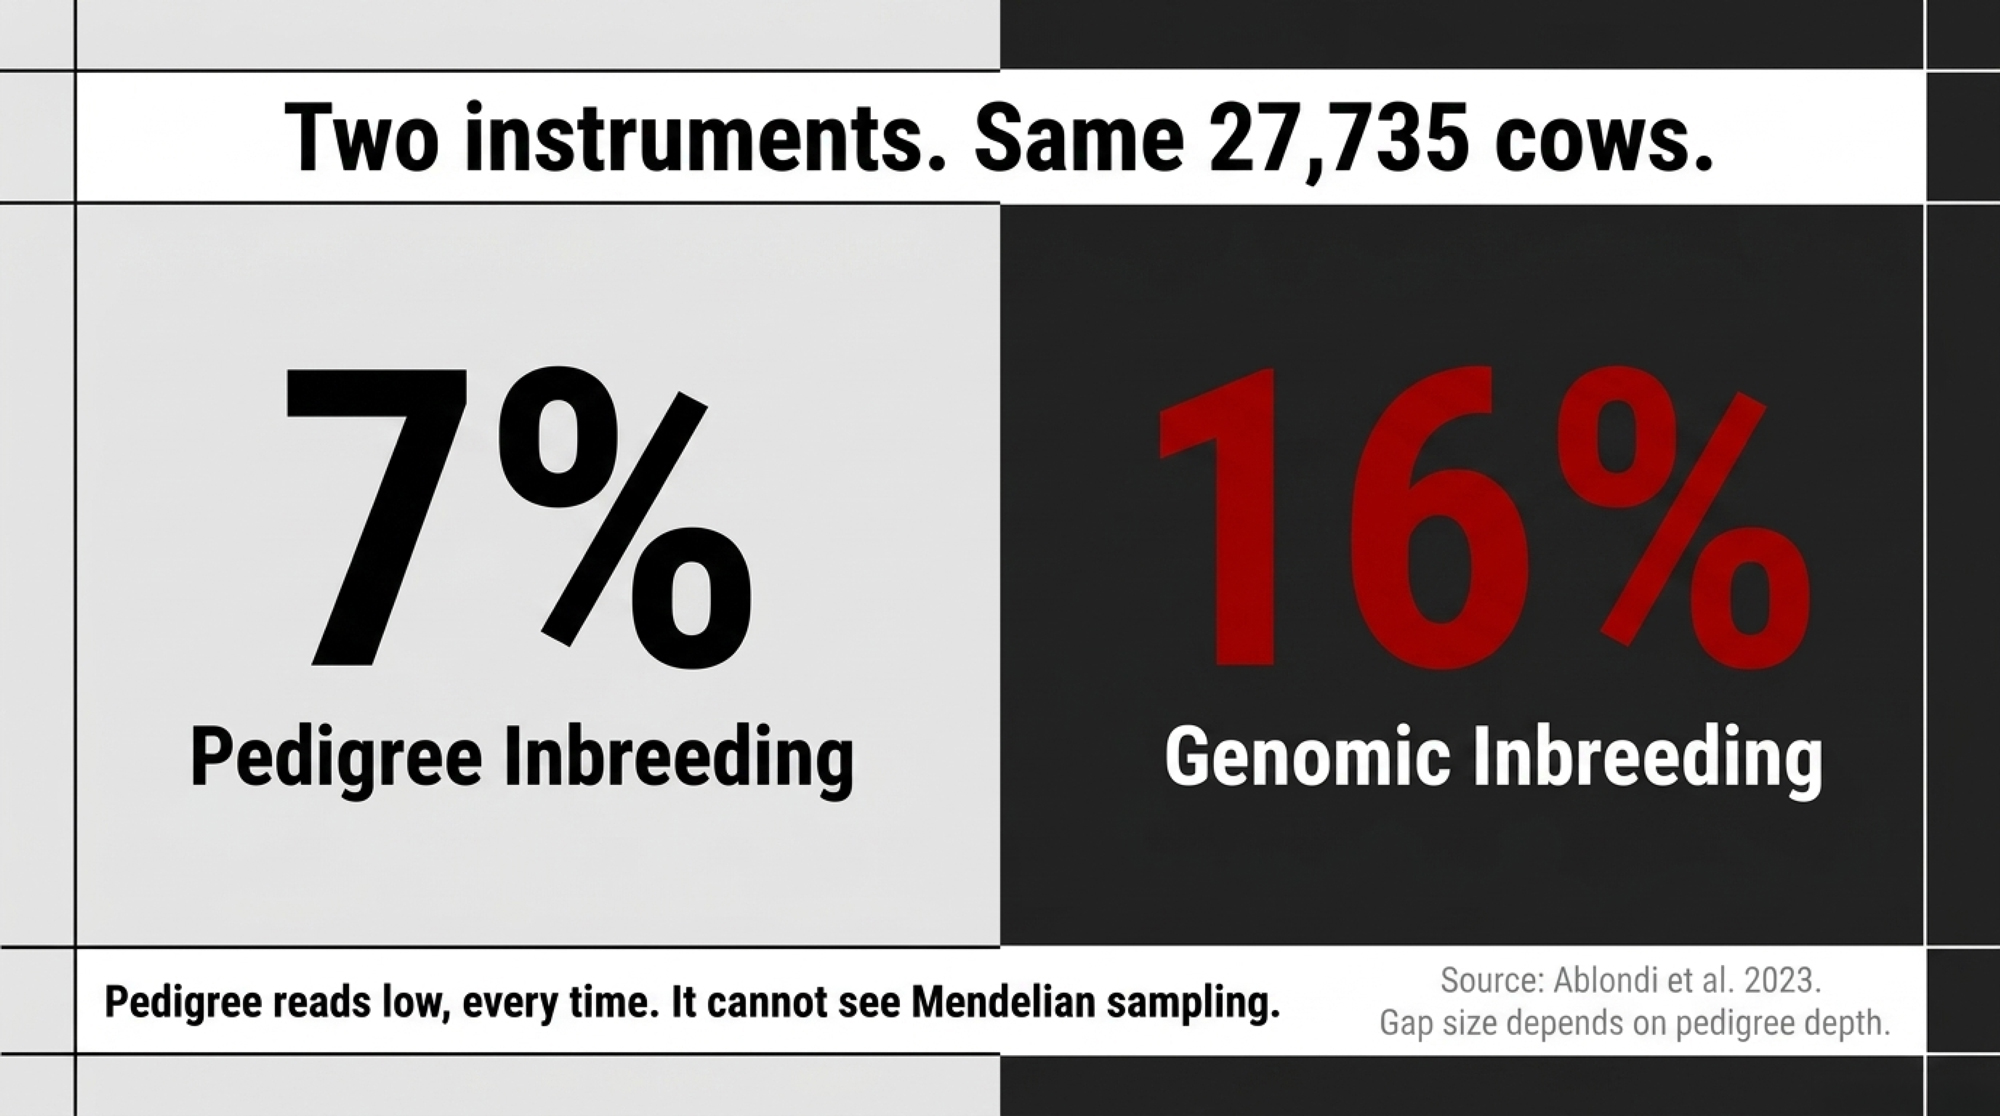
Once on pedigree — the way most mating programs still calculate it, working back through recorded ancestors. Once on genome, marker by marker across 84,443 SNPs. Pedigree came back at 7% average inbreeding. The genome came back at 16%.
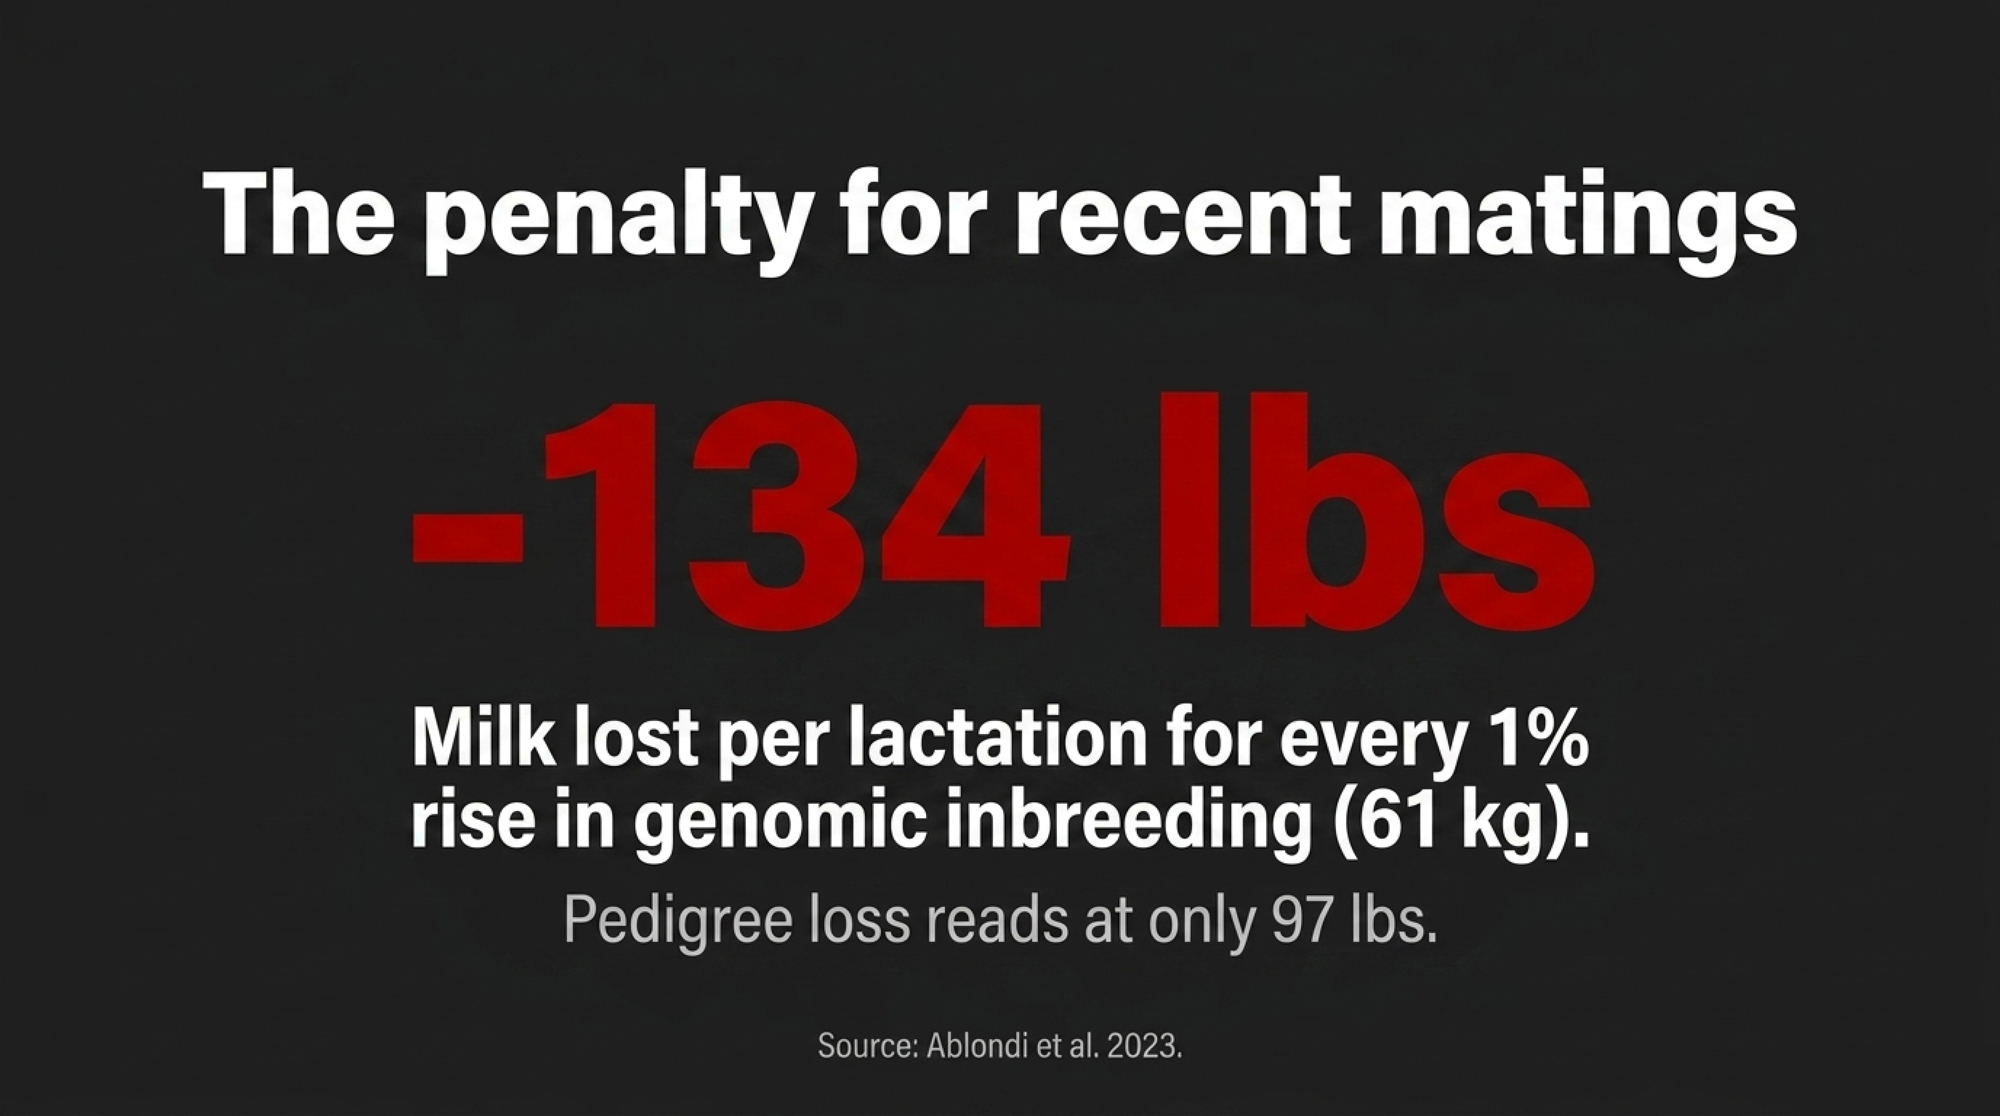
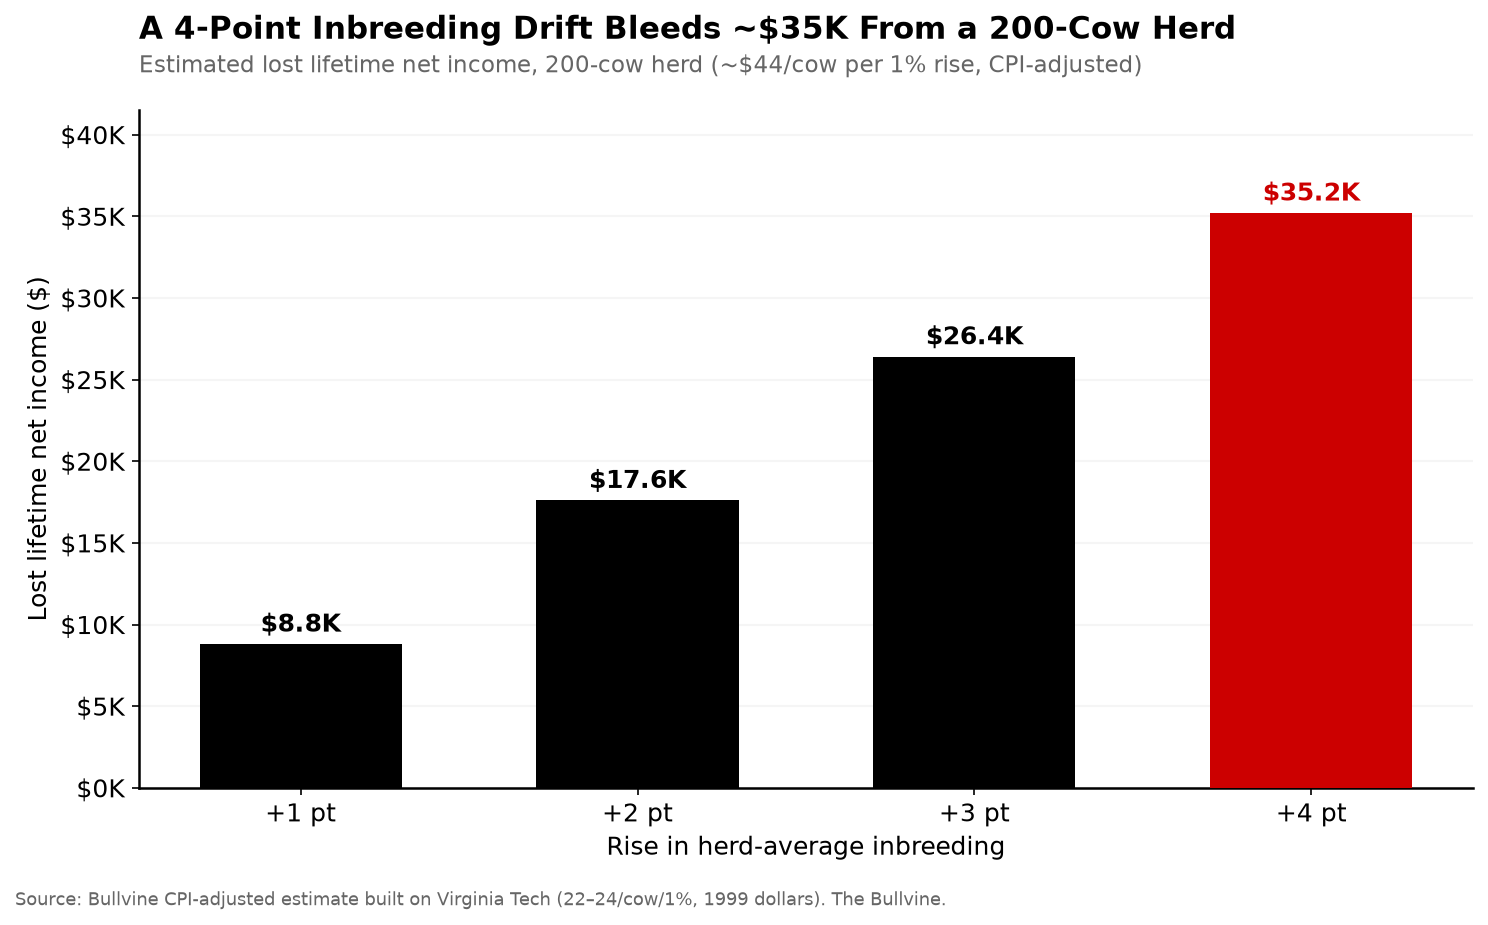
Then they checked which number the cows agreed with. Each 1% rise in pedigree inbreeding cost 44 kg (97 lbs) of 305-day milk. Each 1% rise in genomic inbreeding cost 61 kg — 134 lbs. Same animals, same lactations, and the depression tracked the bigger figure.
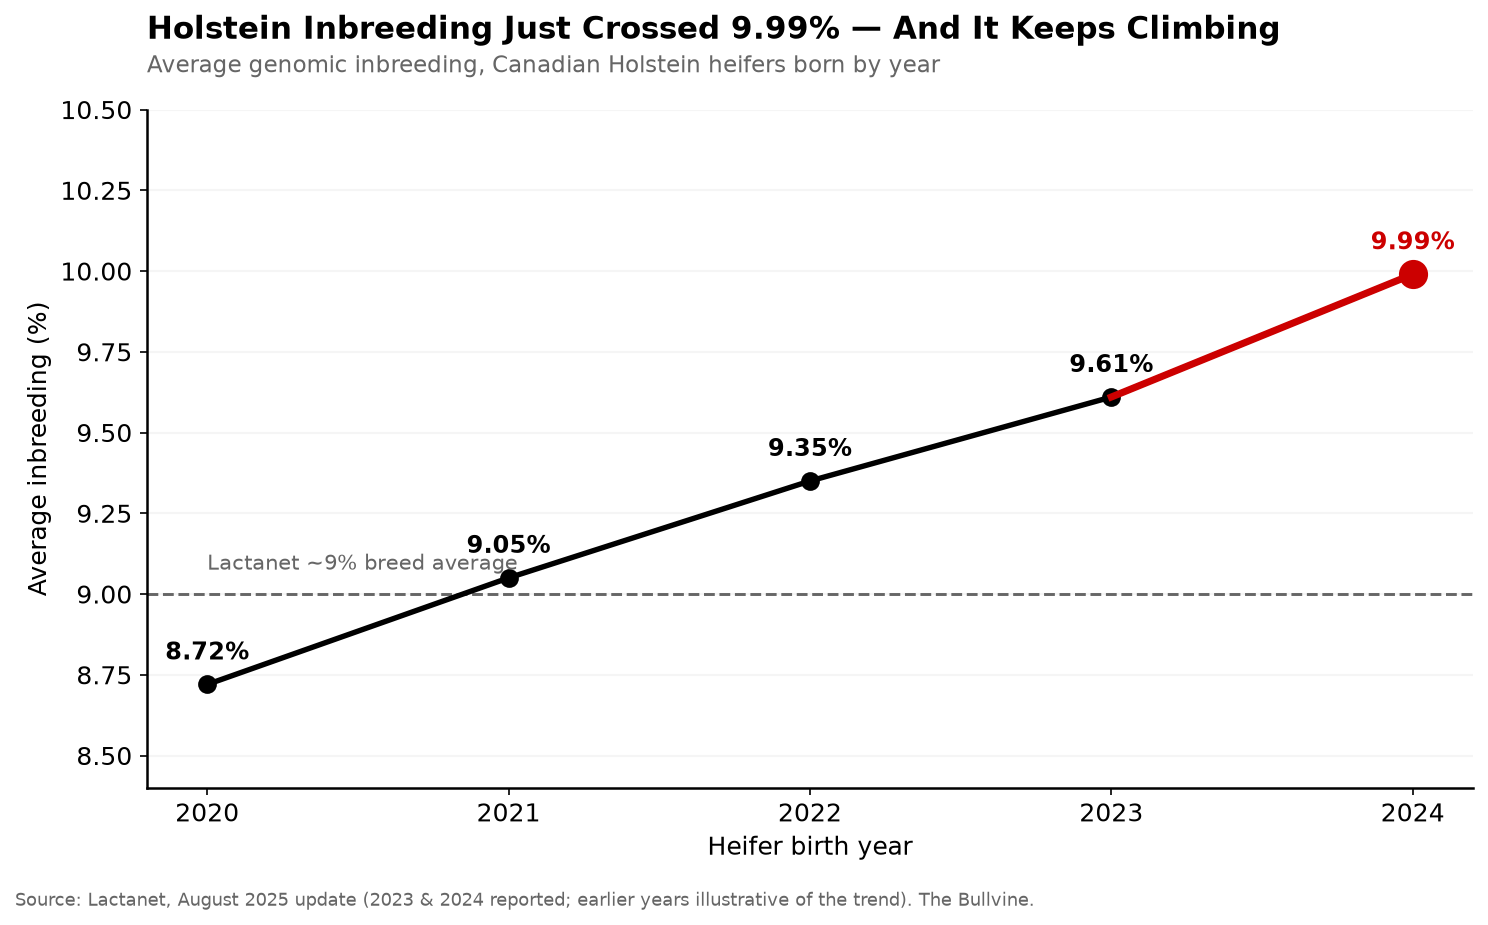
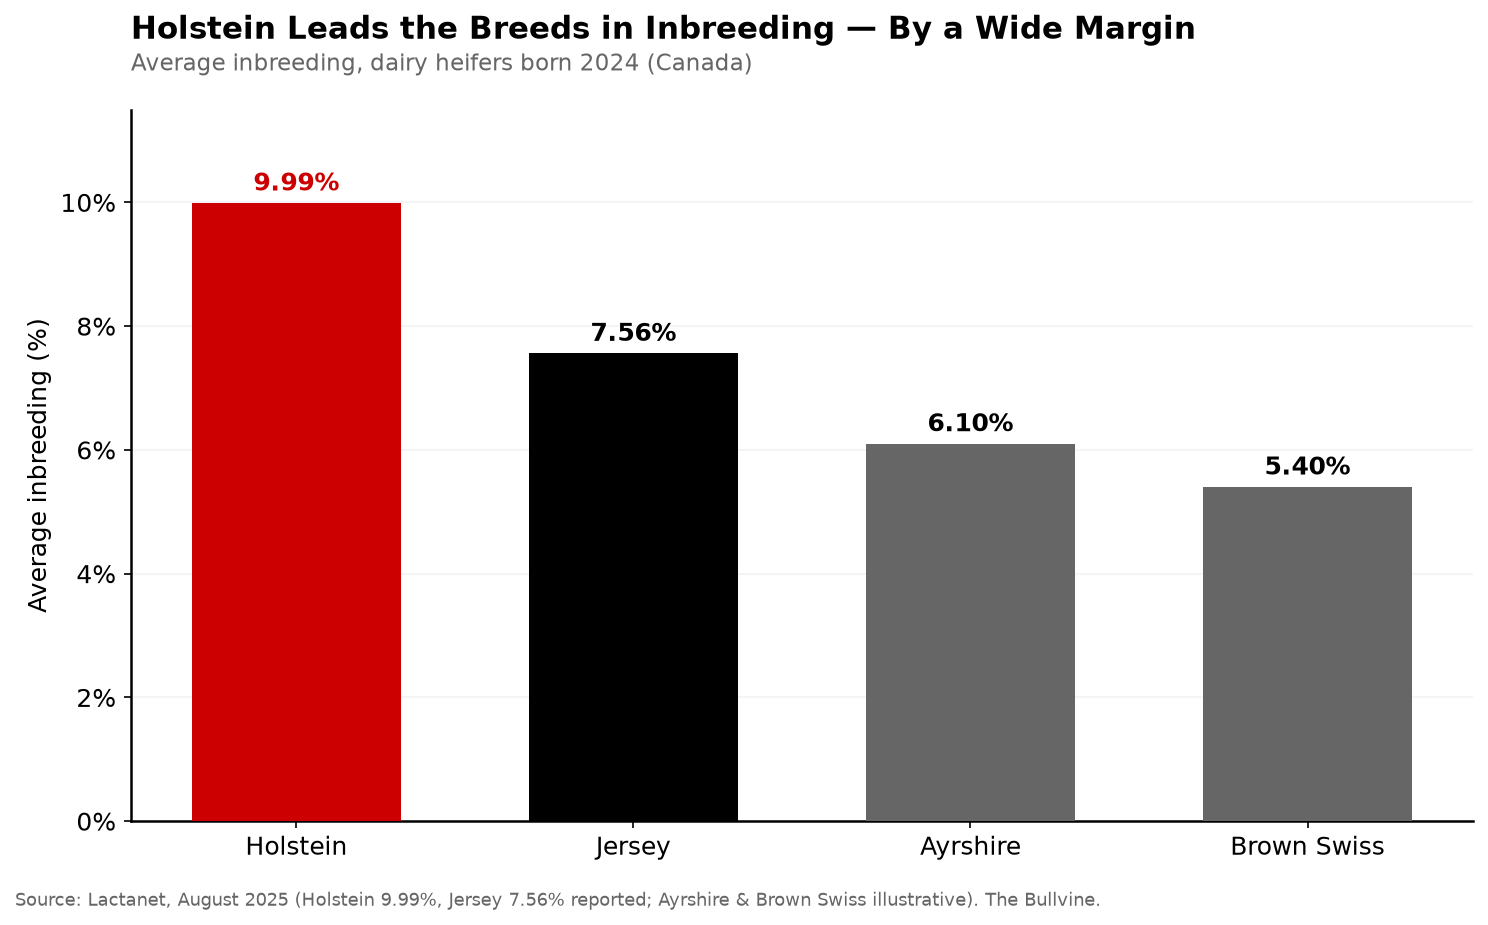
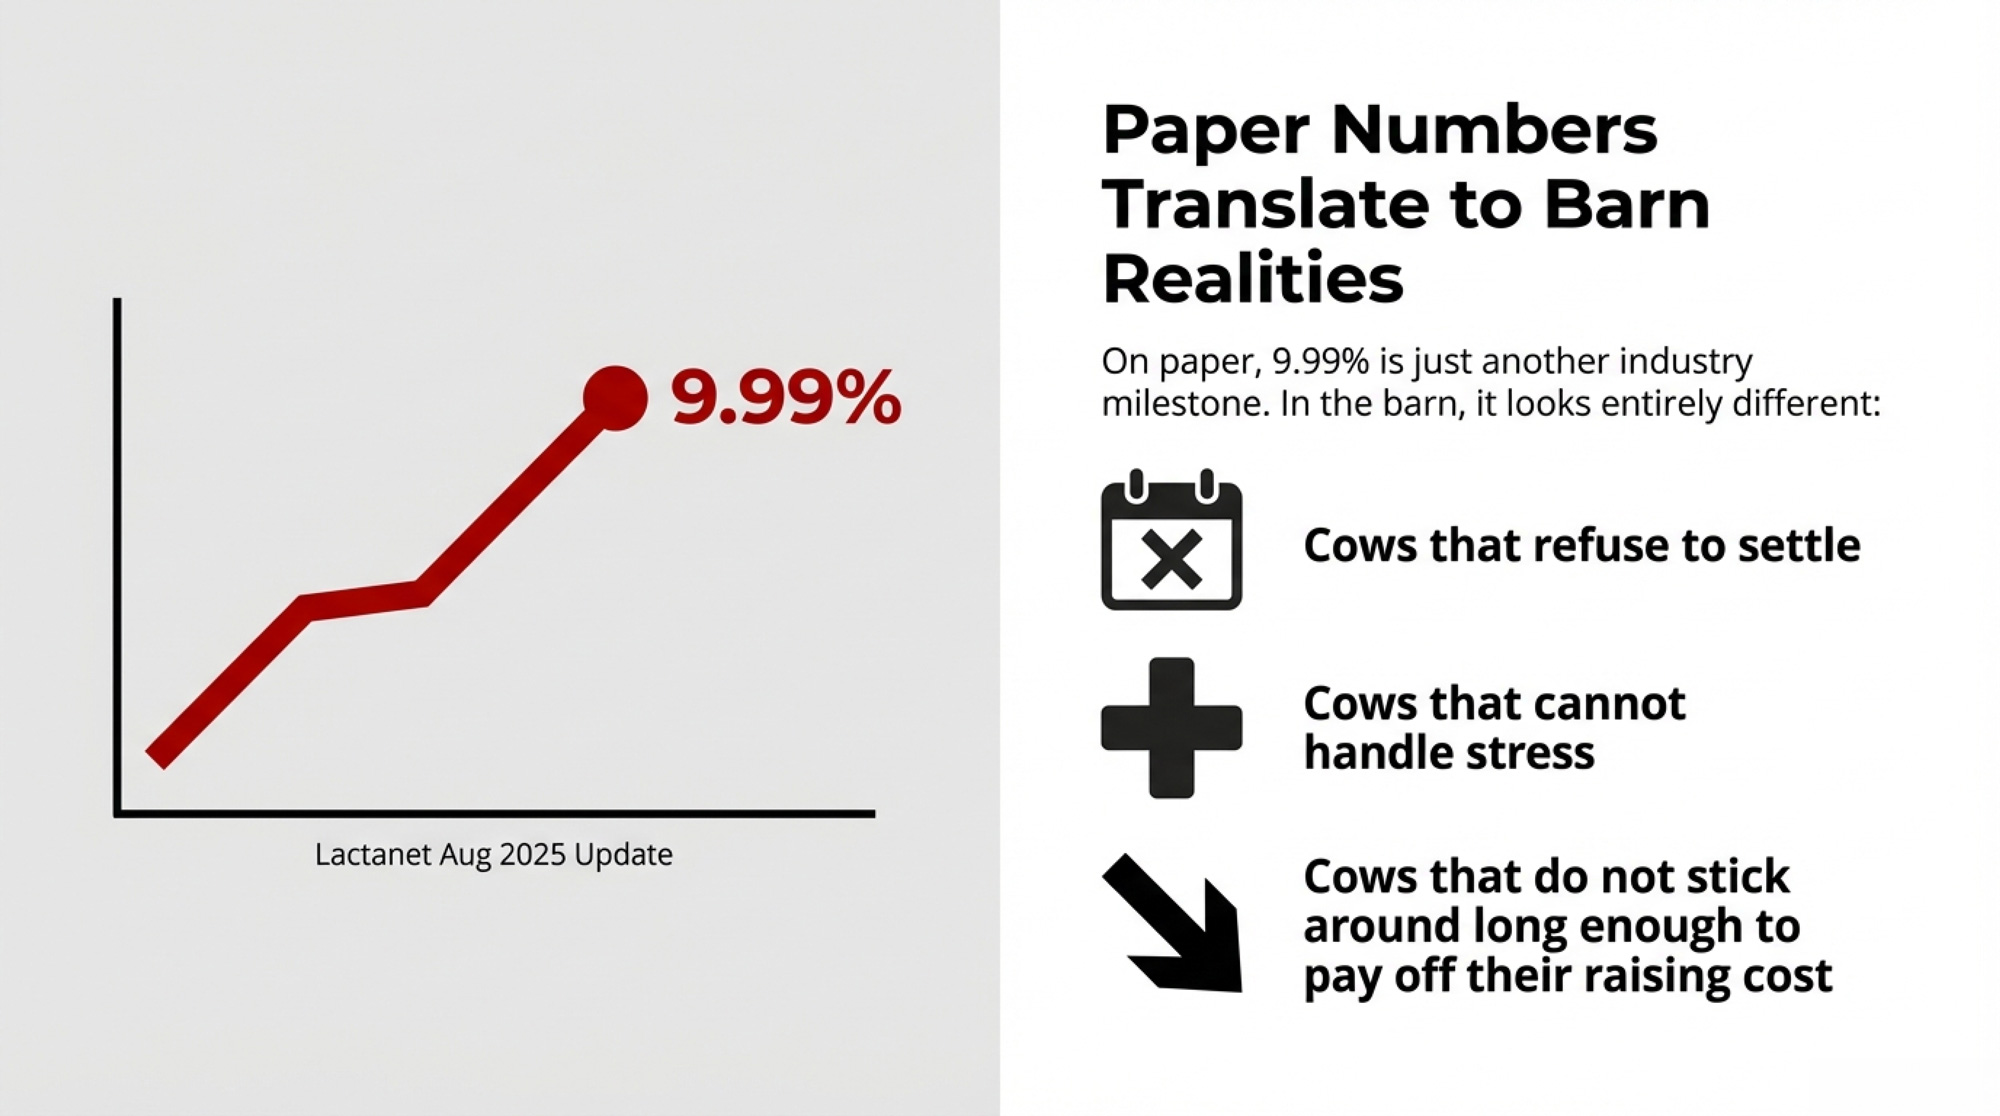
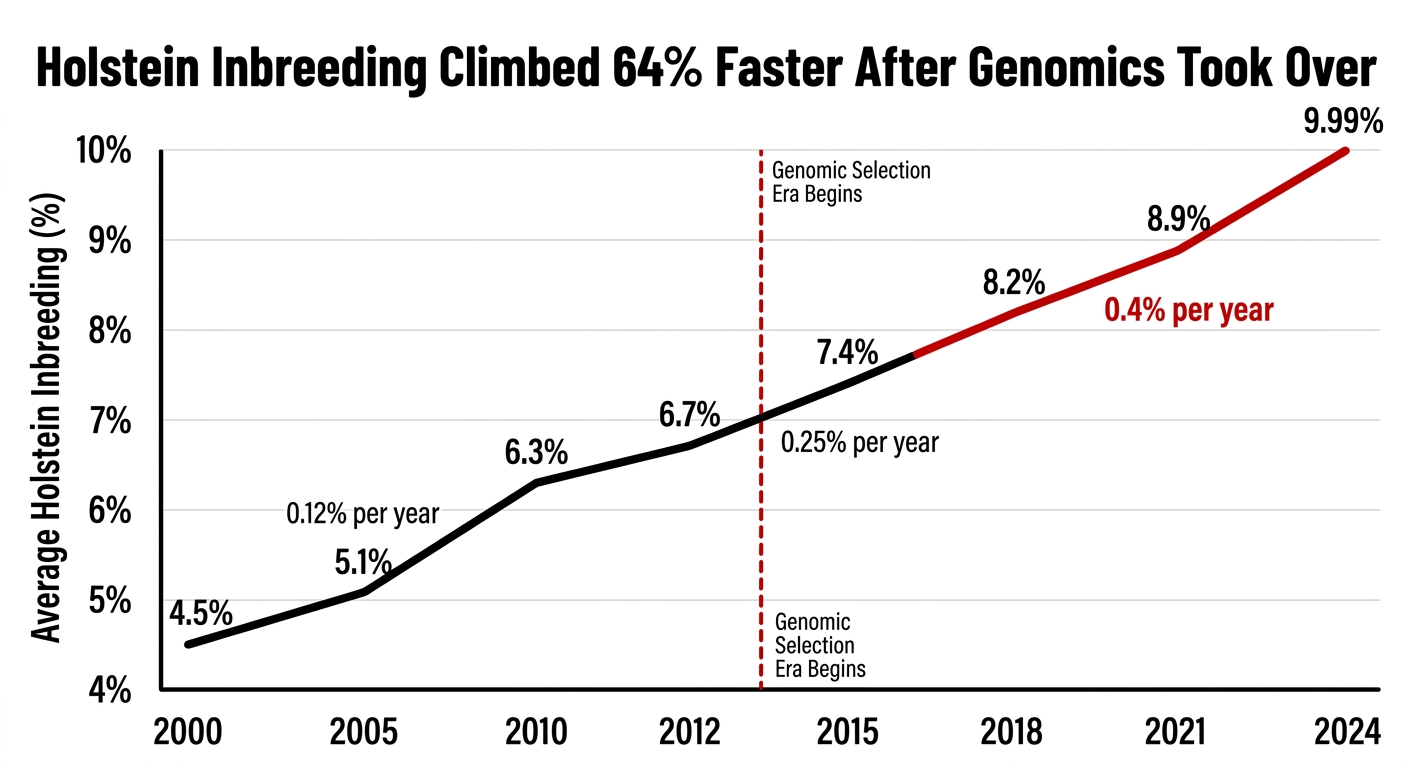
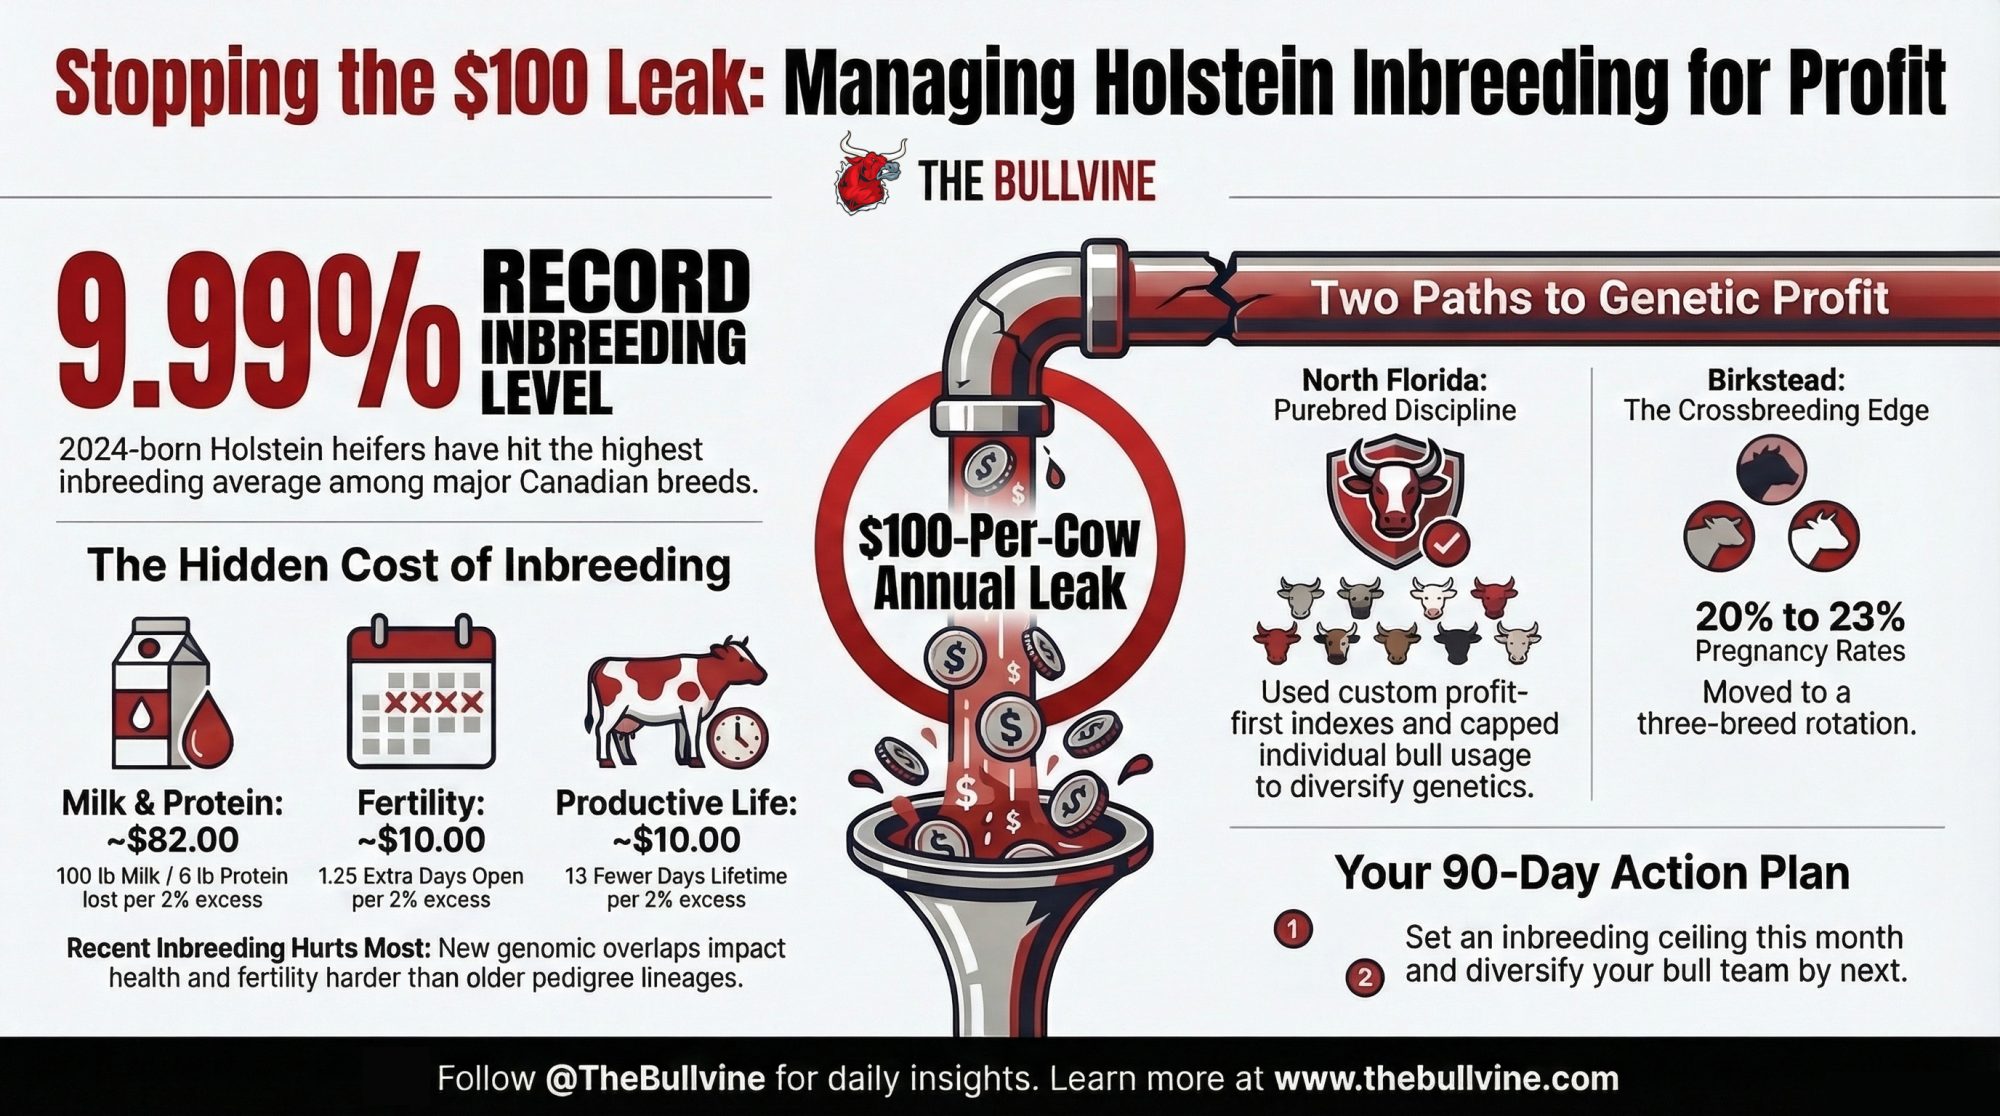
That’s the part worth sitting with, because Lactanet’s August 2025 figures put average inbreeding for Canadian Holstein heifers born in 2024 at 9.99%, climbing about a quarter point a year on a pedigree basis. If pedigree is the instrument reading low, then the number most producers are watching is not the number doing the damage.
Two Instruments, Same Cows, One Reads Low
The correlation between the two measures came in at 0.65. Related, nowhere near interchangeable. The reason matters: pedigree can’t see Mendelian sampling, and it’s only as good as the records behind it. Ablondi’s group had 24 generations to work with and a complete generation equivalent of 10.6 — deep by any standard — and pedigree still read less than half what the genome showed.
Your own two numbers won’t be 7 and 16 exactly. Ablondi’s herds had unusually complete records, and the size of your gap depends on your pedigree depth and how much recent breeding runs back through the same bulls. What won’t change is which direction the error runs. Pedigree reads low, every time.
Ablondi’s group also split inbreeding by age. Runs of homozygosity longer than 8 Mb — the fingerprint of recent inbreeding — carried the negative effect across every trait. Pryce and colleagues found the same thing in Australia a decade earlier with 8,853 Holsteins and 4,138 Jerseys: ROH over 3 Mb cut milk yield and captured recent inbreeding independently of overall homozygosity. Two teams, two continents, ten years apart. Recent inbreeding is what hurts.
In the U.S., Steyn and colleagues documented the annual increase accelerating from 0.11 percentage points a year between 2000 and 2008 to 0.36 between 2013 and 2021, working from CDCB data in the Journal of Dairy Science in 2022. Three continents, same direction.
The 143 Kilos You Paid For and Didn’t Keep
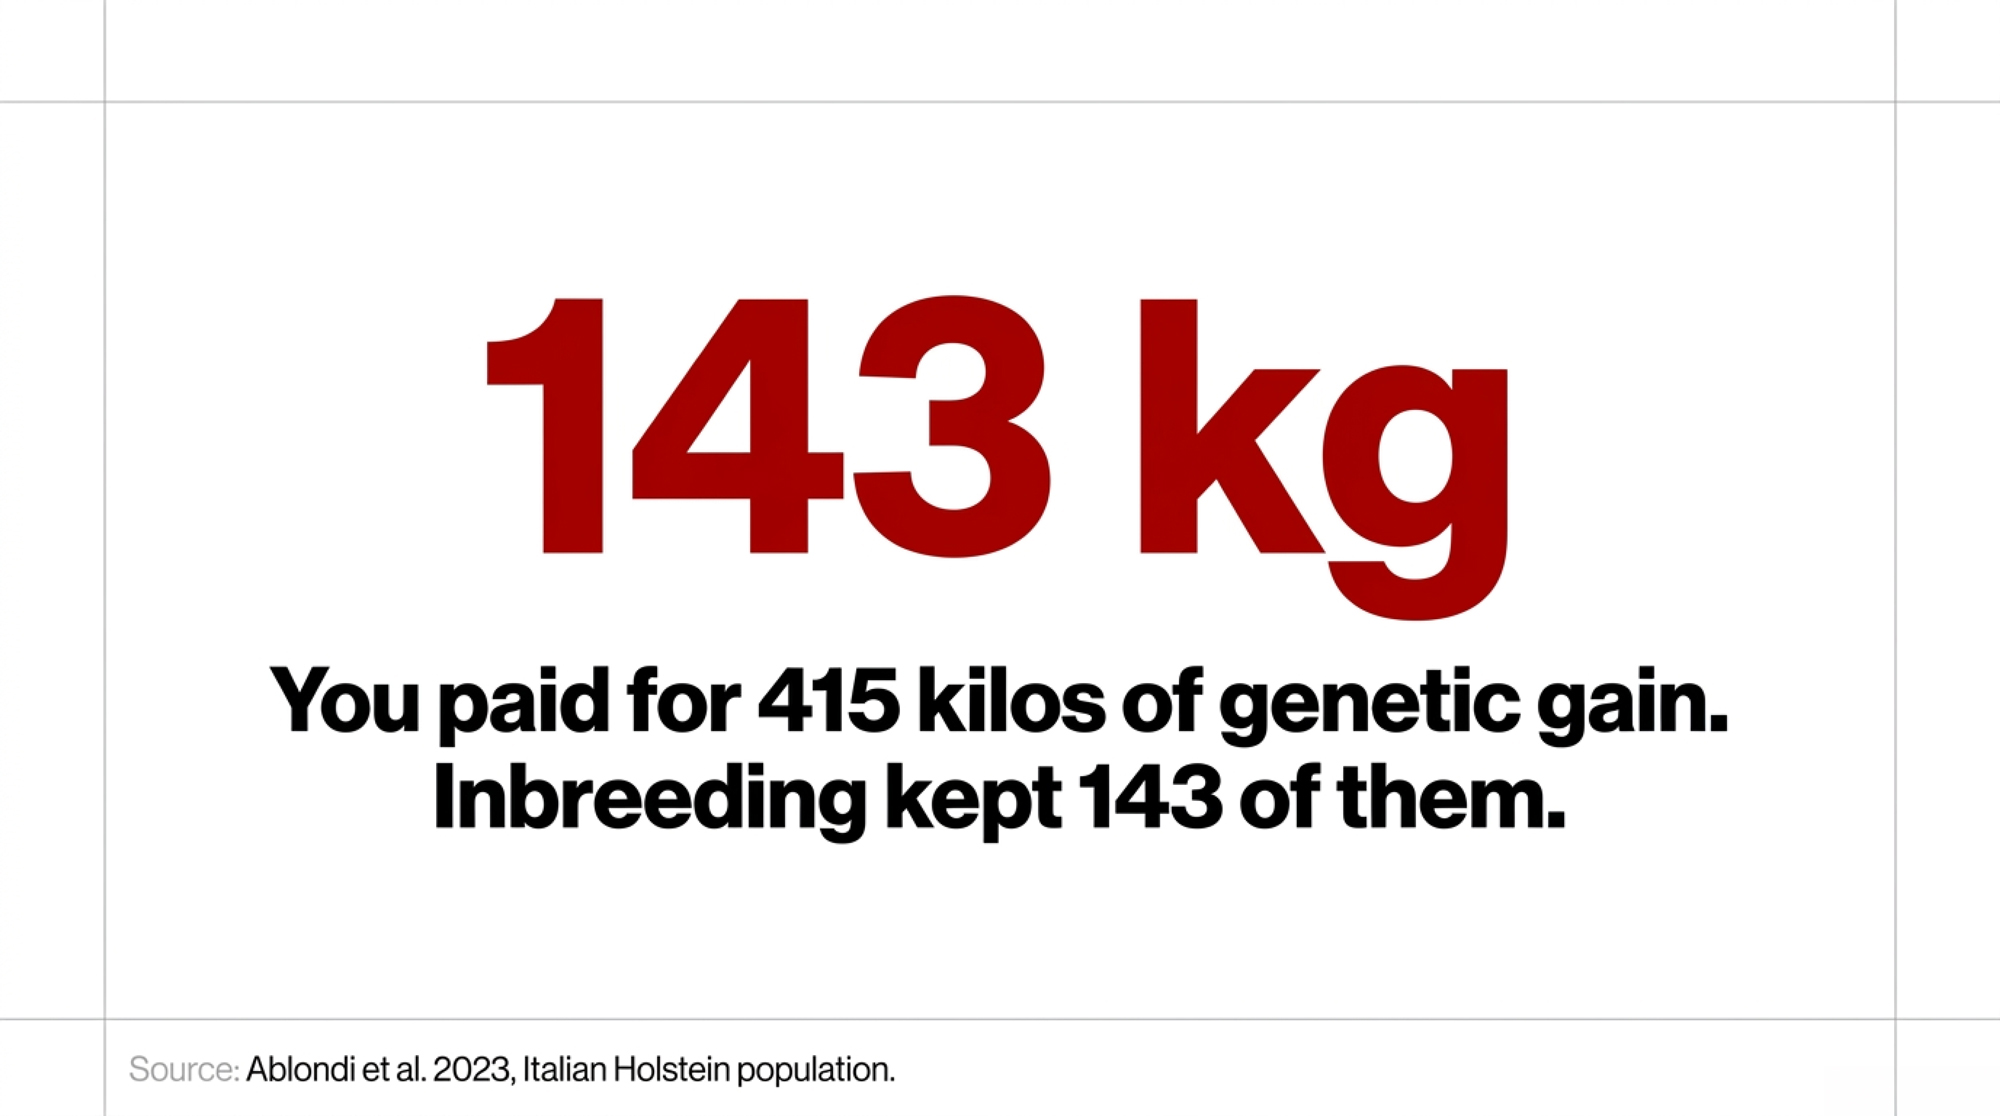
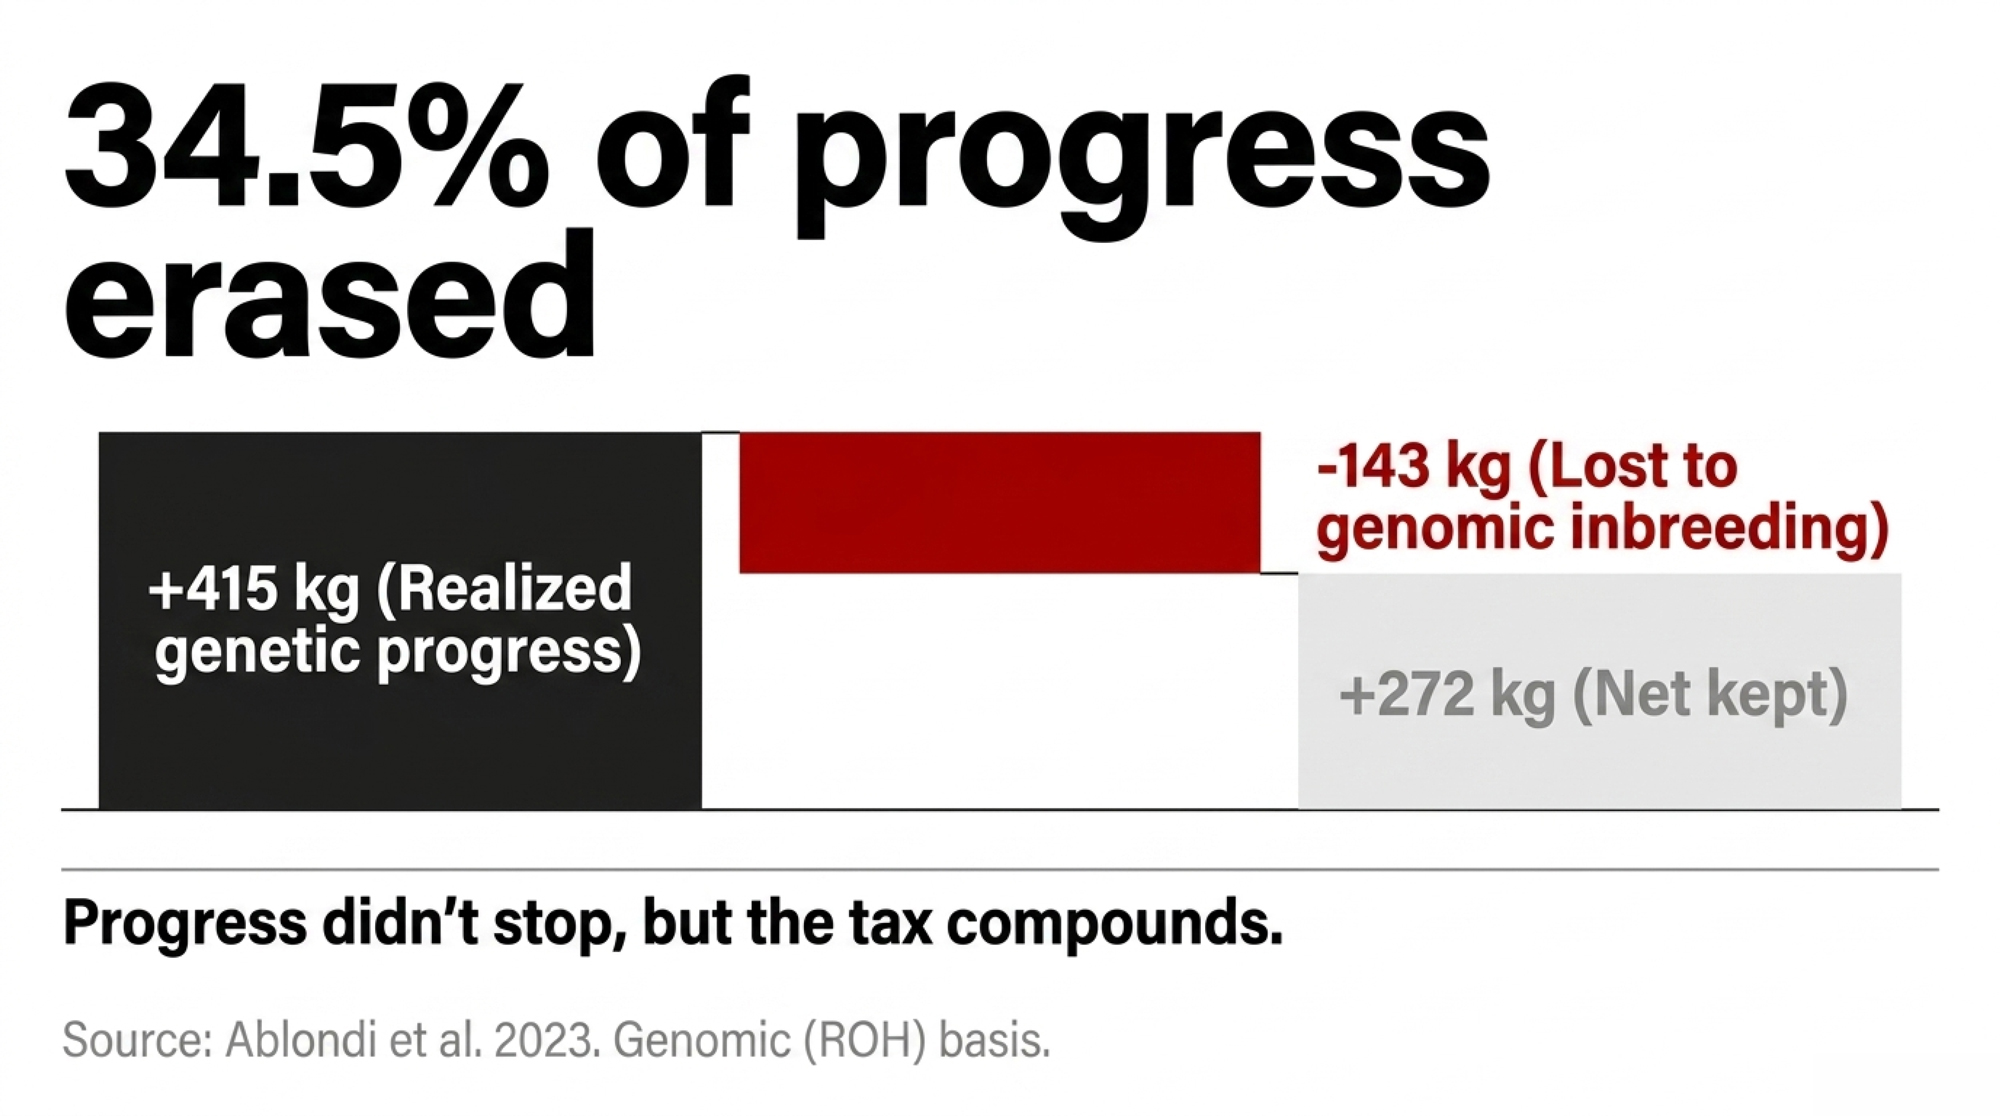
Now the cost at breed scale. Between 2015 and 2020, the Italian Holstein’s pedigree inbreeding climbed 2.35%. Realized genetic progress for milk came in at +415 kg (915 lbs) per lactation.
Inbreeding depression took back 143 kg — 315 lbs. That’s 34.5% of the gain.
Be precise about what that means, because the authors are. Their own conclusion is that “the realized genetic progress has so far successfully counterbalanced the negative effect of inbreeding” for milk yield. The breed kept 272 kg net. Progress didn’t stop, and anyone telling you the Holstein is going backwards isn’t reading the paper.
What worries Ablondi’s group is the trajectory. The tax compounds, it lands on fitness traits this study didn’t even measure, and inbreeding is projected to climb faster in the generations ahead. Run the same arithmetic on the pedigree measure and you get a smaller bill — 103 kg, 24.9%. Two instruments, two answers again, and only one of them is telling you what your matings actually cost.
Compare the extremes and it gets uglier. Moving from the 5th-lowest to the 95th-highest inbreeding percentile cost 263 kg (580 lbs) per lactation on pedigree — 2.4% of the herd average — and 561 kg, 1,237 lbs, on genomics, or 5.2% of the herd’s 10,836 kg (23,890 lbs) average. Fat dropped 1.31 kg and protein 2.45 kg on the genomic measure.
What nobody can measure is which bulls are driving it, because no public database records where an AI sire came from.
Below the Line Where Fitness Erodes
The FAO puts the critical effective population size at 50. Not 50 cows in a barn — 50 in the genetic sense, the number of breeding animals that would produce the inbreeding rate you’re actually seeing.
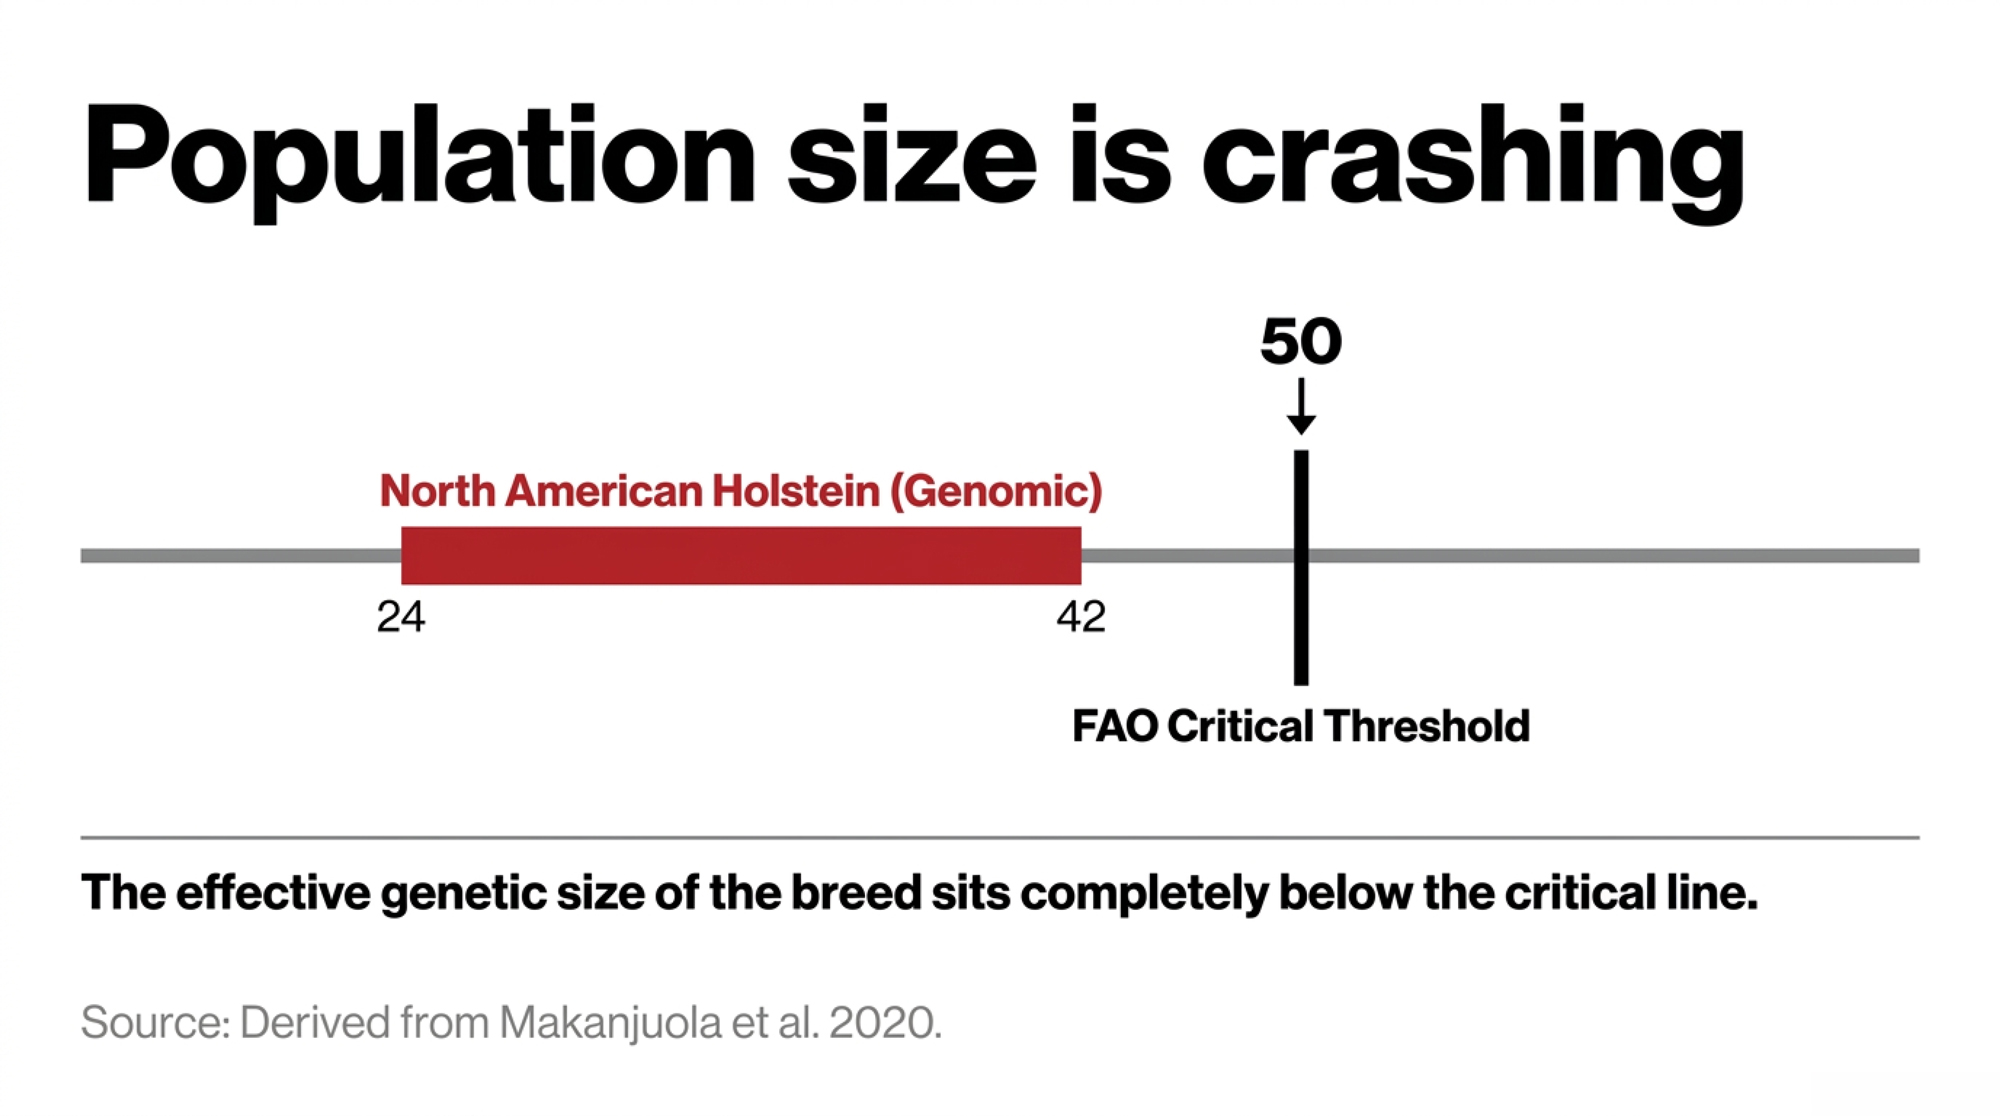
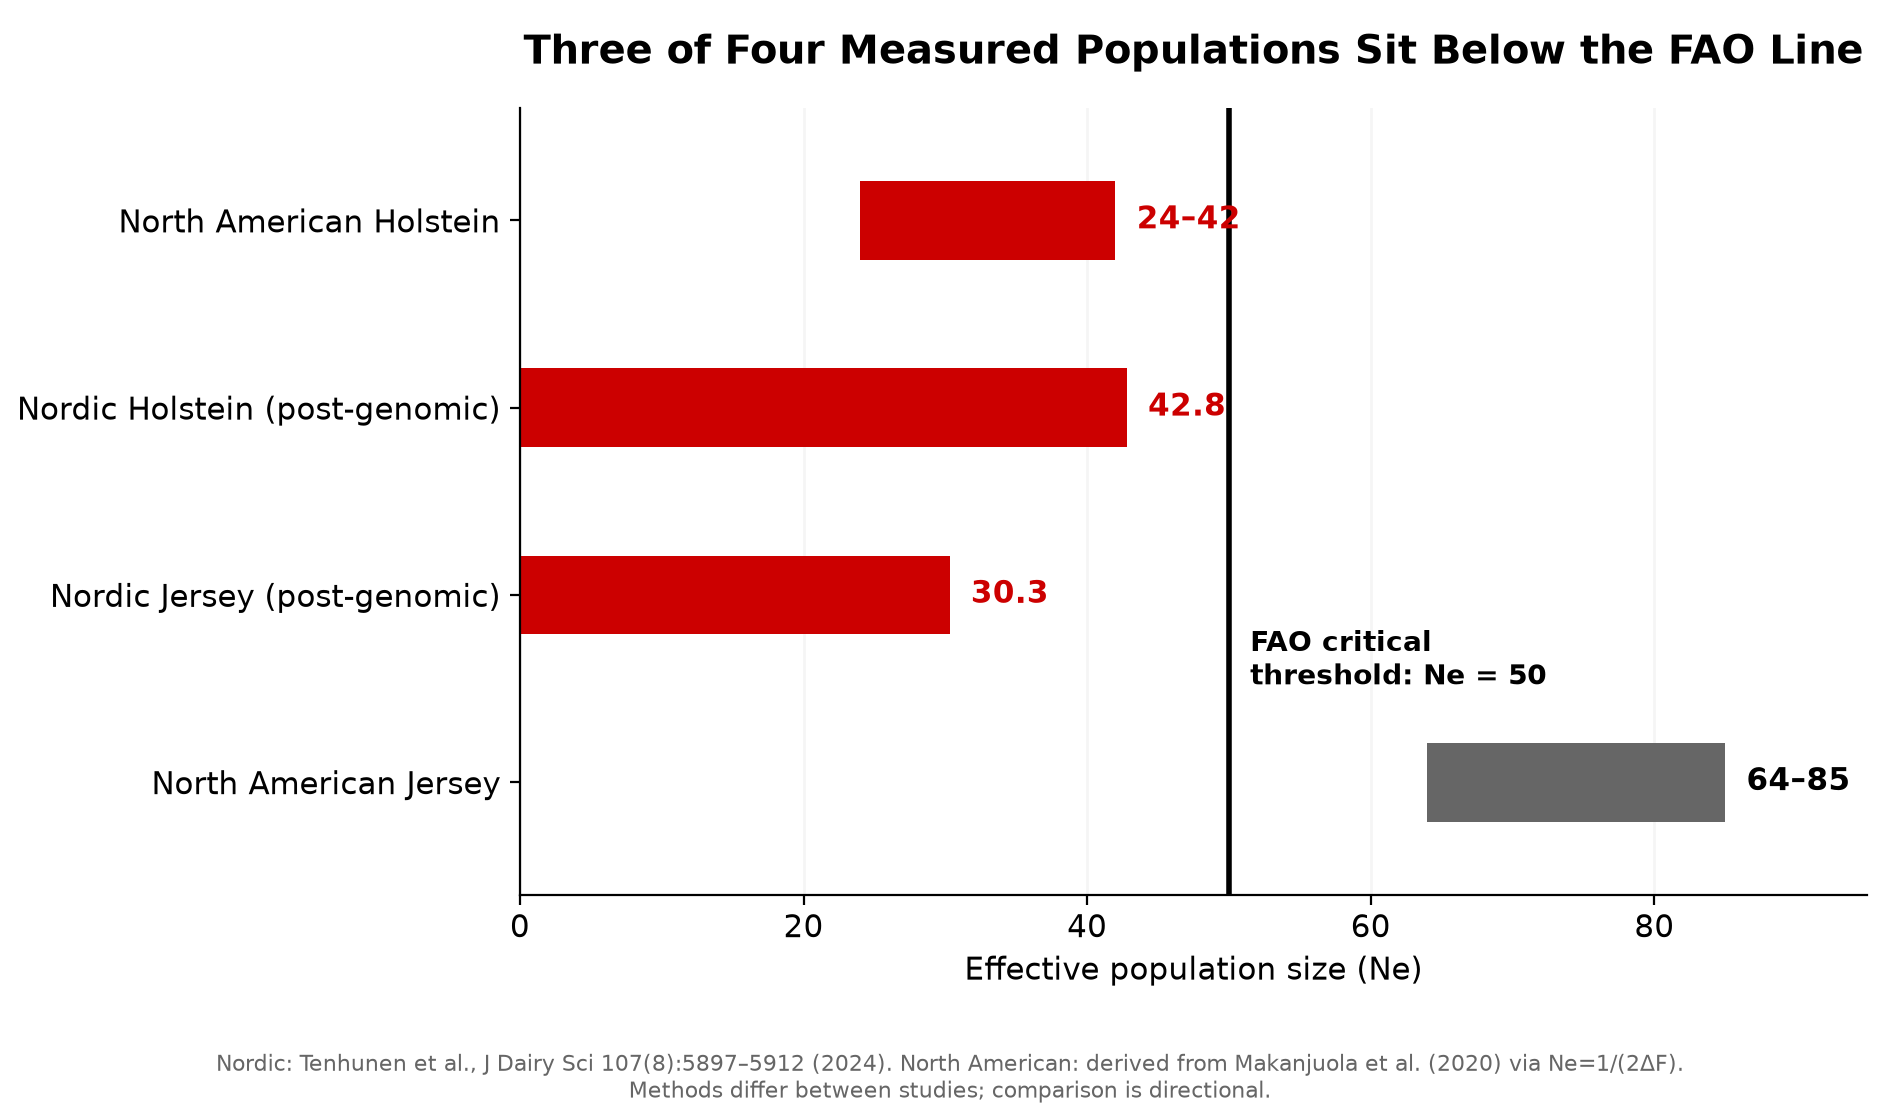
Makanjuola and colleagues measured it for North American Holstein and Jersey using Canadian Dairy Network records on 676,594 Holsteins, publishing in the Journal of Dairy Science in 2020. Across 1990 to 2018, Holstein Ne came in at 66 on pedigree and 43 to 46 on genomic measures. Jersey held up better at 64 to 85.
Narrow to the genomic-selection era and the rate of inbreeding per generation climbs to between 1.19% and 2.06%, depending on the measure. That puts Holstein Ne somewhere between 24 and 42.
Which is why you’ll never see an honest single number here. Pedigree and genomic measures disagree on the rate of inbreeding per generation by nearly a factor of two, so North American Holstein Ne isn’t a dot — it’s a corridor running from 24 to 42, and both ends sit under the FAO line. Same argument as the 7-versus-16 gap, one level up.
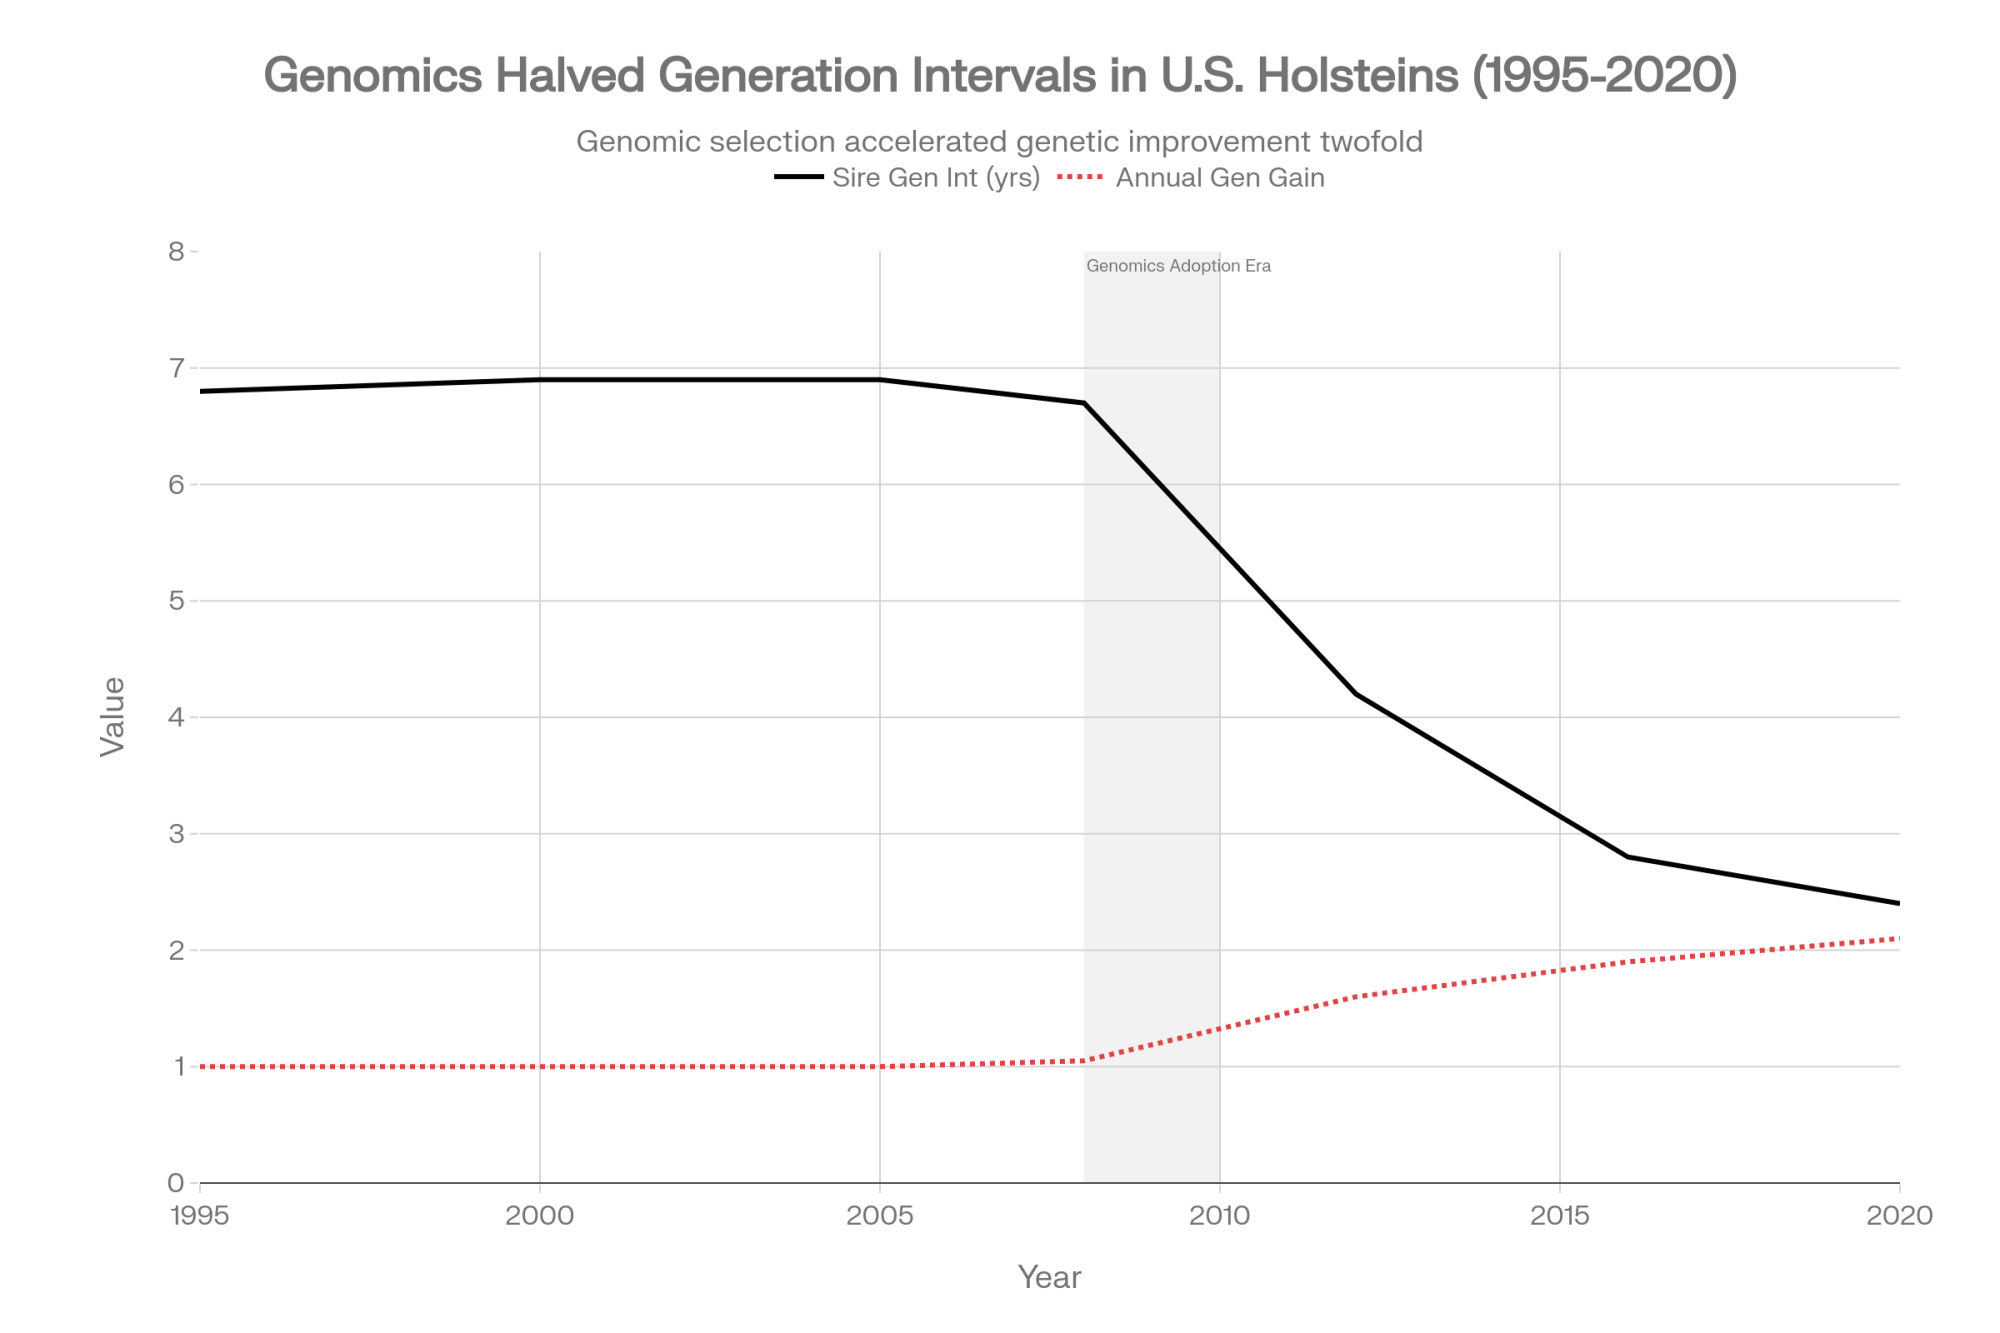
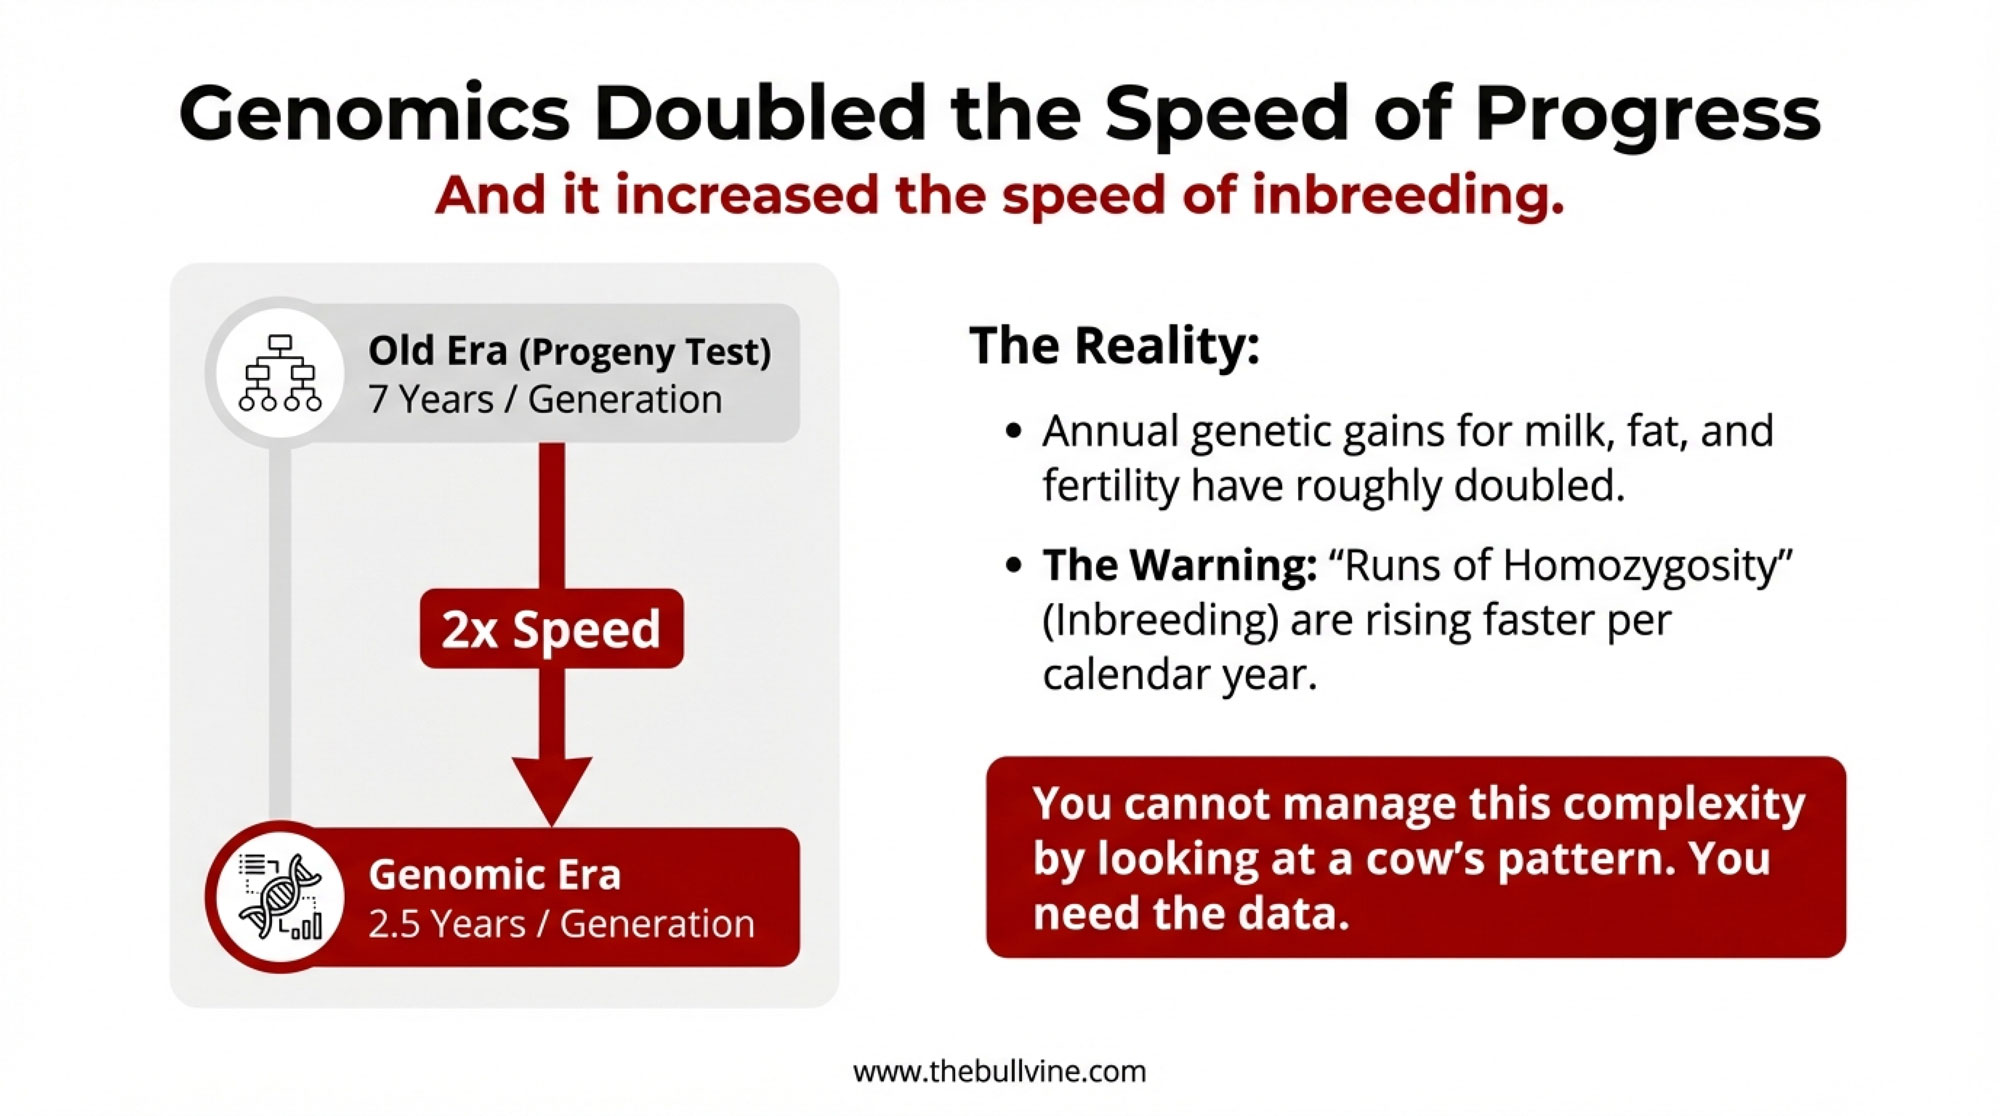
Behind it sits a generation-interval collapse. Holstein sires of bulls averaged 8.08 years in 1990 and 2.32 by 2016 — a 71% reduction. Guinan and colleagues documented the same trajectory in U.S. data on the sire-of-bulls pathway, 7.1 years down to 2.2.
Nordic populations get held up as the counterexample, and the picture is genuinely mixed. Tenhunen and colleagues found Nordic Holstein Ne falling from 54.3 before genomic selection to 42.8 after, with future Ne dropping from 198.8 to 42.7 and female coancestry rising from 0.02% to 0.39%. Their conclusion: Nordic Holstein “faces more pressing concerns.”
But read that comparison carefully. At 42.8, Nordic Holstein sits at the optimistic end of North America’s 24-to-42 corridor — better than the pessimistic read, roughly level with the generous one. Methods and study periods differ between the two papers, so treat it as directional, not a scoreboard. Nordic Jersey held essentially flat at 29.4 before and 30.3 after.
Against the FAO line the pattern is blunt. North American Holstein on genomic measures, Nordic Holstein, and Nordic Jersey all sit below 50. North American Jersey is the only measured population that clears it.
Can Anyone Tell You Where Your Next Bull Came From?
Not from anything published.
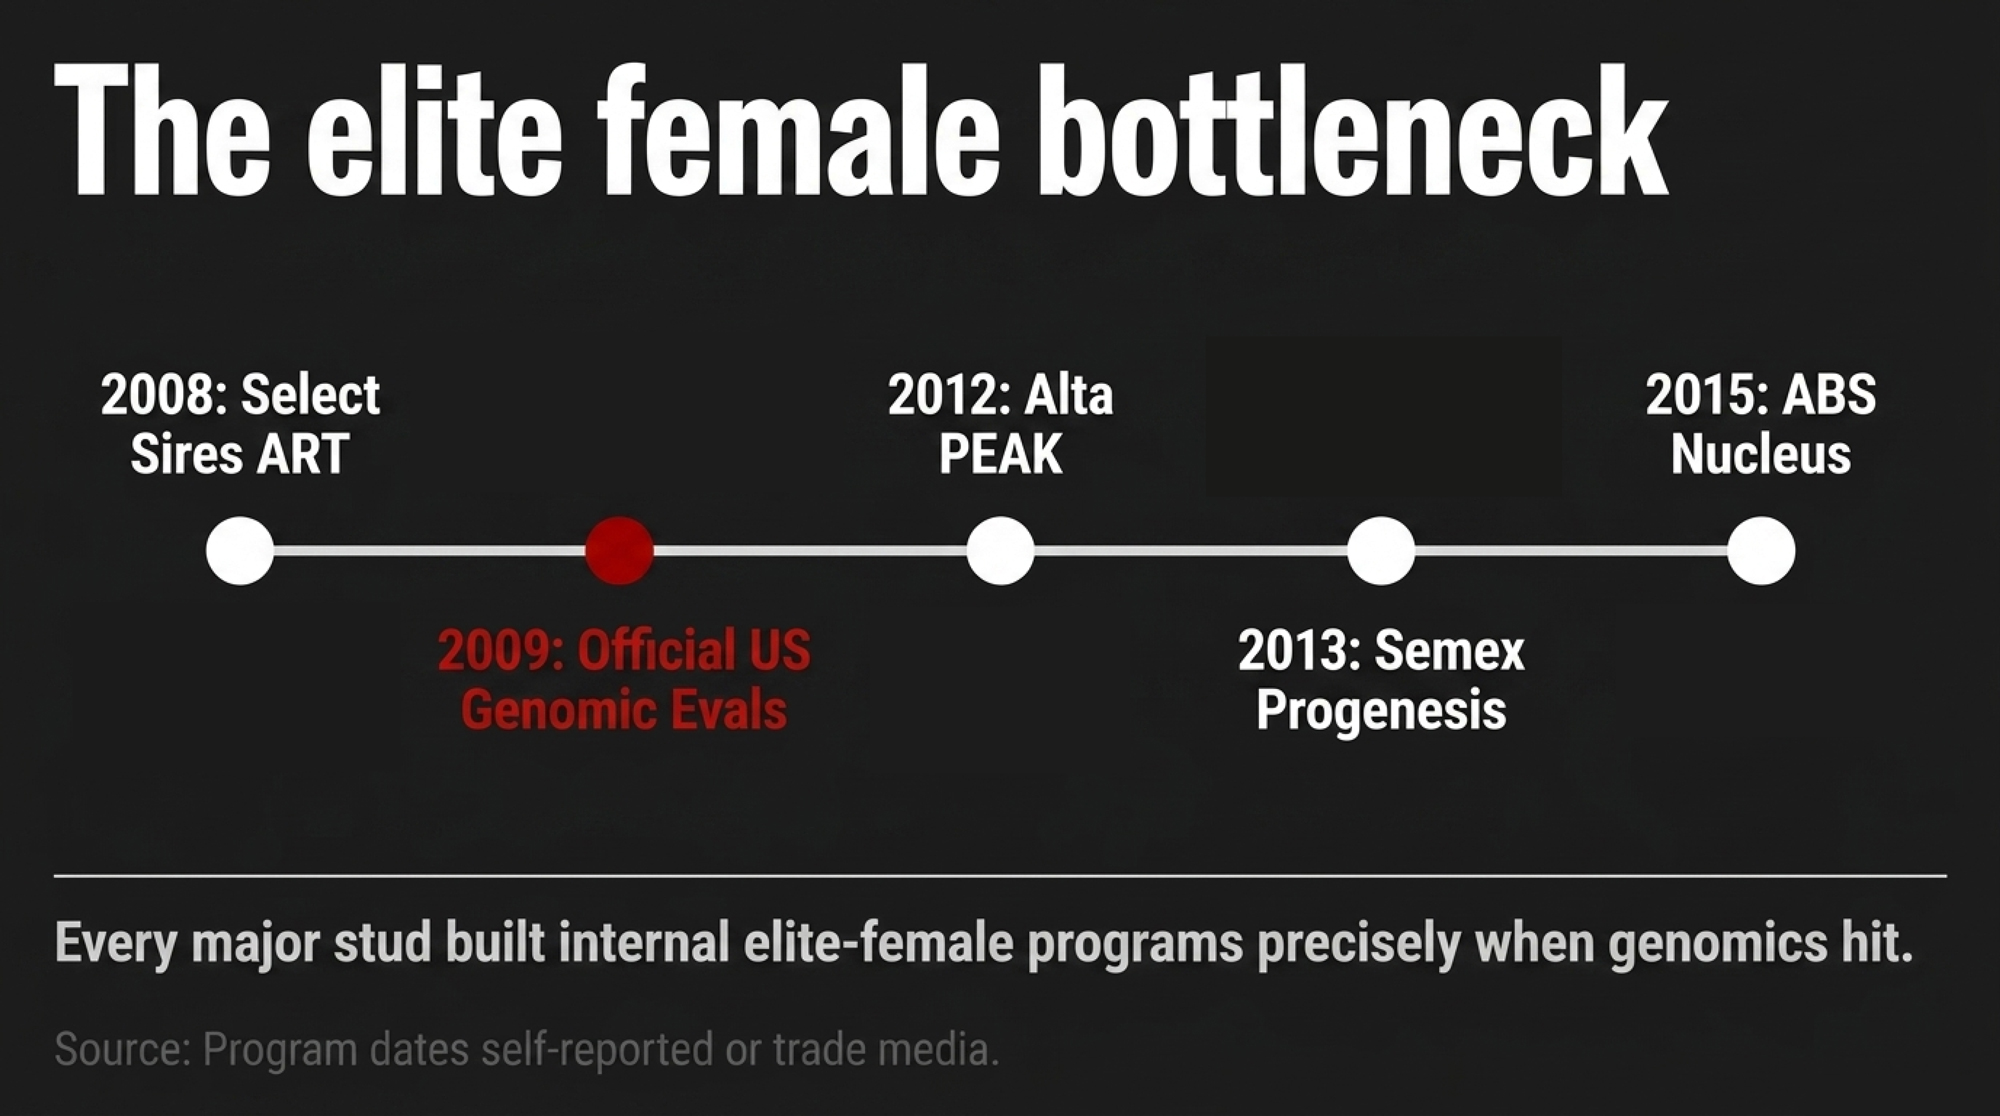
Every major stud runs an internal elite-female program now, and most say so openly. Select Sires launched ART in 2008, targeting Holsteins “genetically unique compared to those found in the general population.” Alta started PEAK in 2012 as its genetics development arm during a restructuring built around genomics, and PEAK joined URUS when that holding company formed in October 2018 — PEAK’s own materials date the entity to 2018. Semex founded Progenesis in 2013, calling it “Semex’s industry-leading internal dairy breeding program.” ABS Global shipped its first commercial units from an elite female nucleus herd in 2015.
Look at the dates. 2008, 2012, 2013, 2015 — every major stud built an internal elite-female program inside a seven-year window, and that window opens the year before USDA-AIPL published the first official U.S. genomic evaluations in January 2009. Four companies didn’t independently arrive at the same structure by coincidence. They read the same new tool the same way.
Four programs. One published split.
Select Sires puts roughly 40% of the Holstein bulls it samples each year as ART graduates, with 60% acquired from producers across the U.S. and Canada. That figure appeared in a January 2024 company post, and ART program manager Mark Kerndt repeated it on the record in a July 2025 Select Sires podcast, describing an internal female donor program running since 2008 and transferring roughly 15,000 IVF embryos a year. Two independent company sources, one of them a named executive speaking on tape.
Credit where it’s owed. That’s the only proportional sourcing figure any of the four has put in public, nobody made them do it, and it’s now better documented than anything else in this section. ABS, Semex and PEAK describe their programs without quantifying what share of released sires come through them — which leaves the one company that disclosed as the only one whose disclosure can be picked apart.
Semex says the Progenesis team “continues to add bloodlines that diversify the program.” That sentence is the whole problem in miniature. It’s substantive, it’s checkable in principle, and it’s unverifiable from outside. Semex may be entirely right. Nobody outside Semex can confirm it.
Past what companies volunteer, the trail goes cold. NAAB’s Semen Sales Report tracks units by breed and category, and we found no field recording origin. CDCB publishes proof runs and reliability figures on every sampled bull in the U.S. system, and we located no public output sorting sires by nucleus, contracted, or open-market origin.
The Counterweight Nobody Expected
Here’s what complicates everything above.
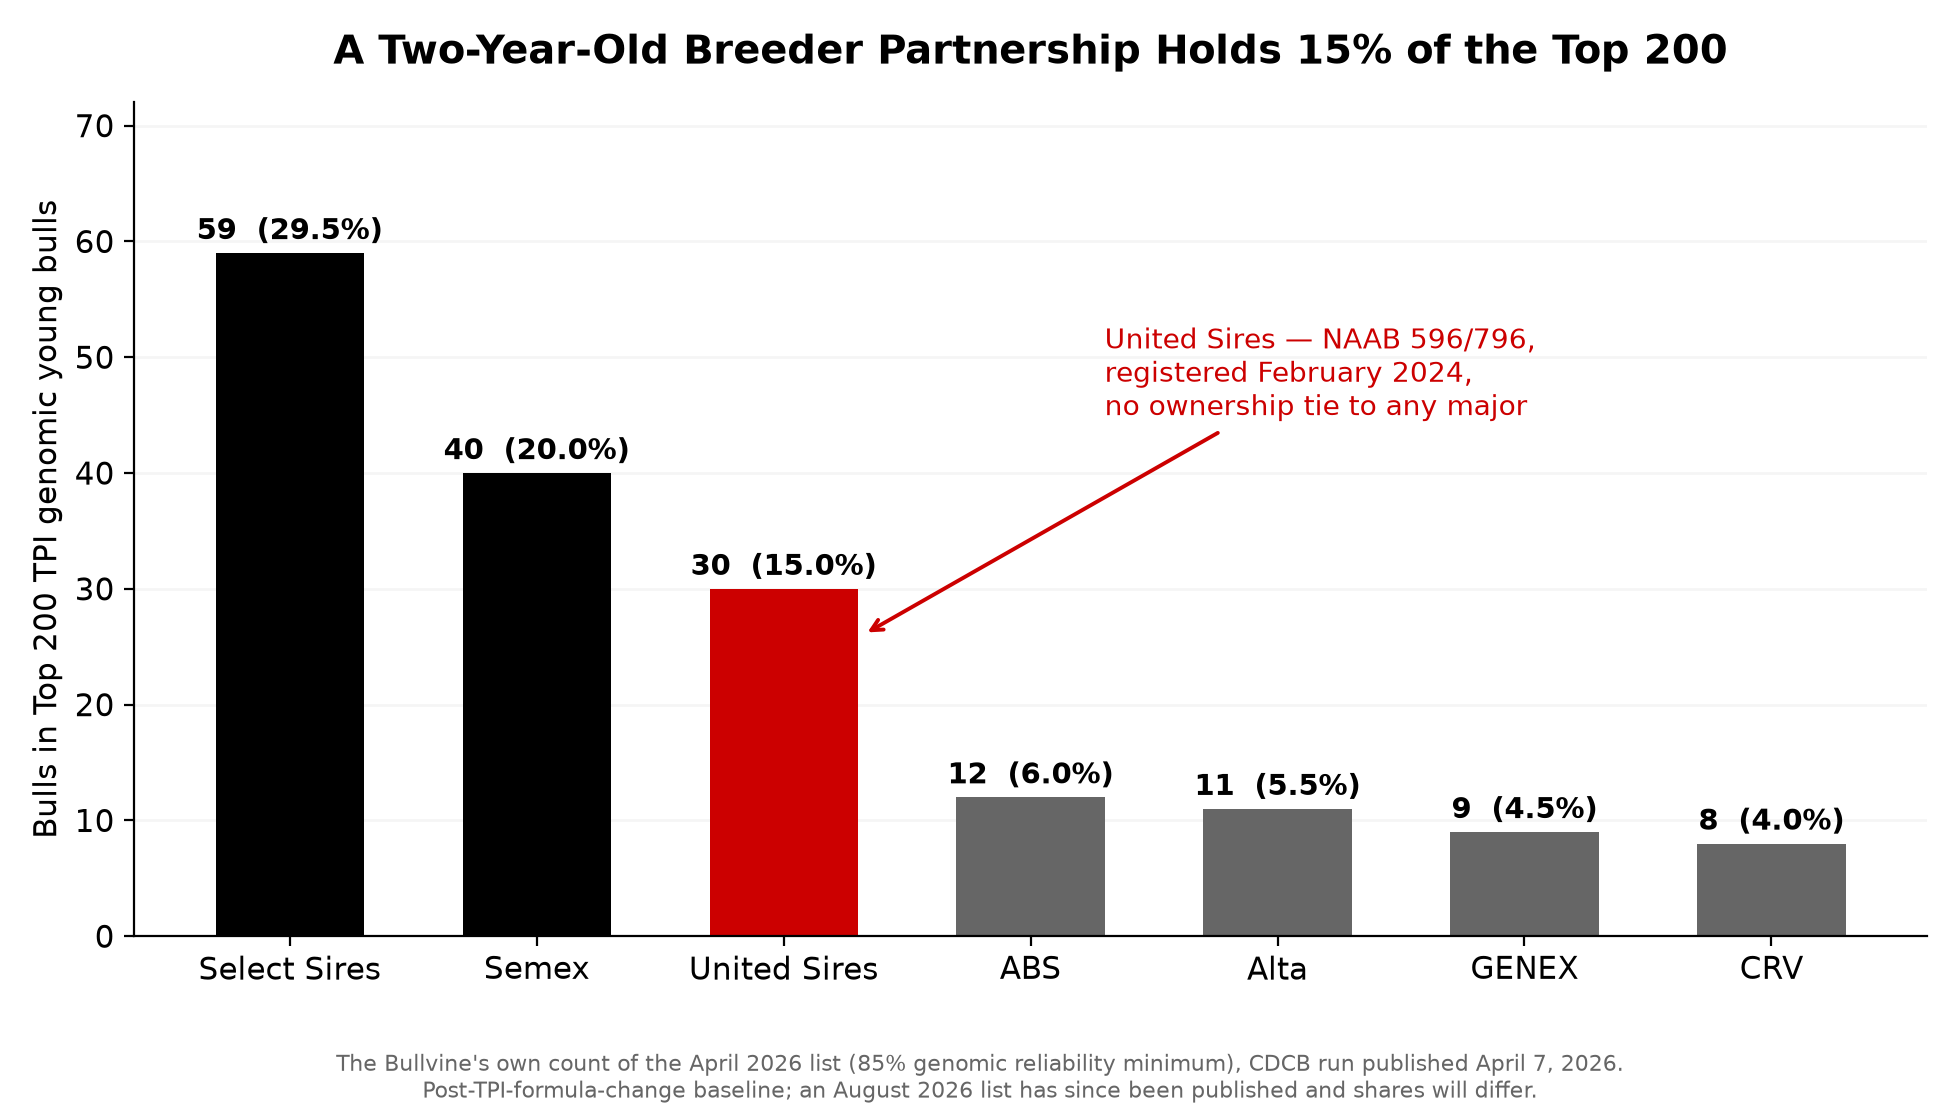
United Sires — NAAB codes 596 and 796, registered with NAAB in February 2024 — is an independent breeder partnership with no ownership tie to any of the majors. By The Bullvine’s count of Holstein Association USA’s top 200 TPI genomic young bulls — 85% genomic reliability minimum, from the CDCB run published April 7, 2026 — it holds 30 of them, 15%. That’s third behind Select Sires’ 59 (29.5%) and Semex’s 40 (20%), and ahead of ABS at 12, Alta at 11, GENEX at 9 and CRV at 8.
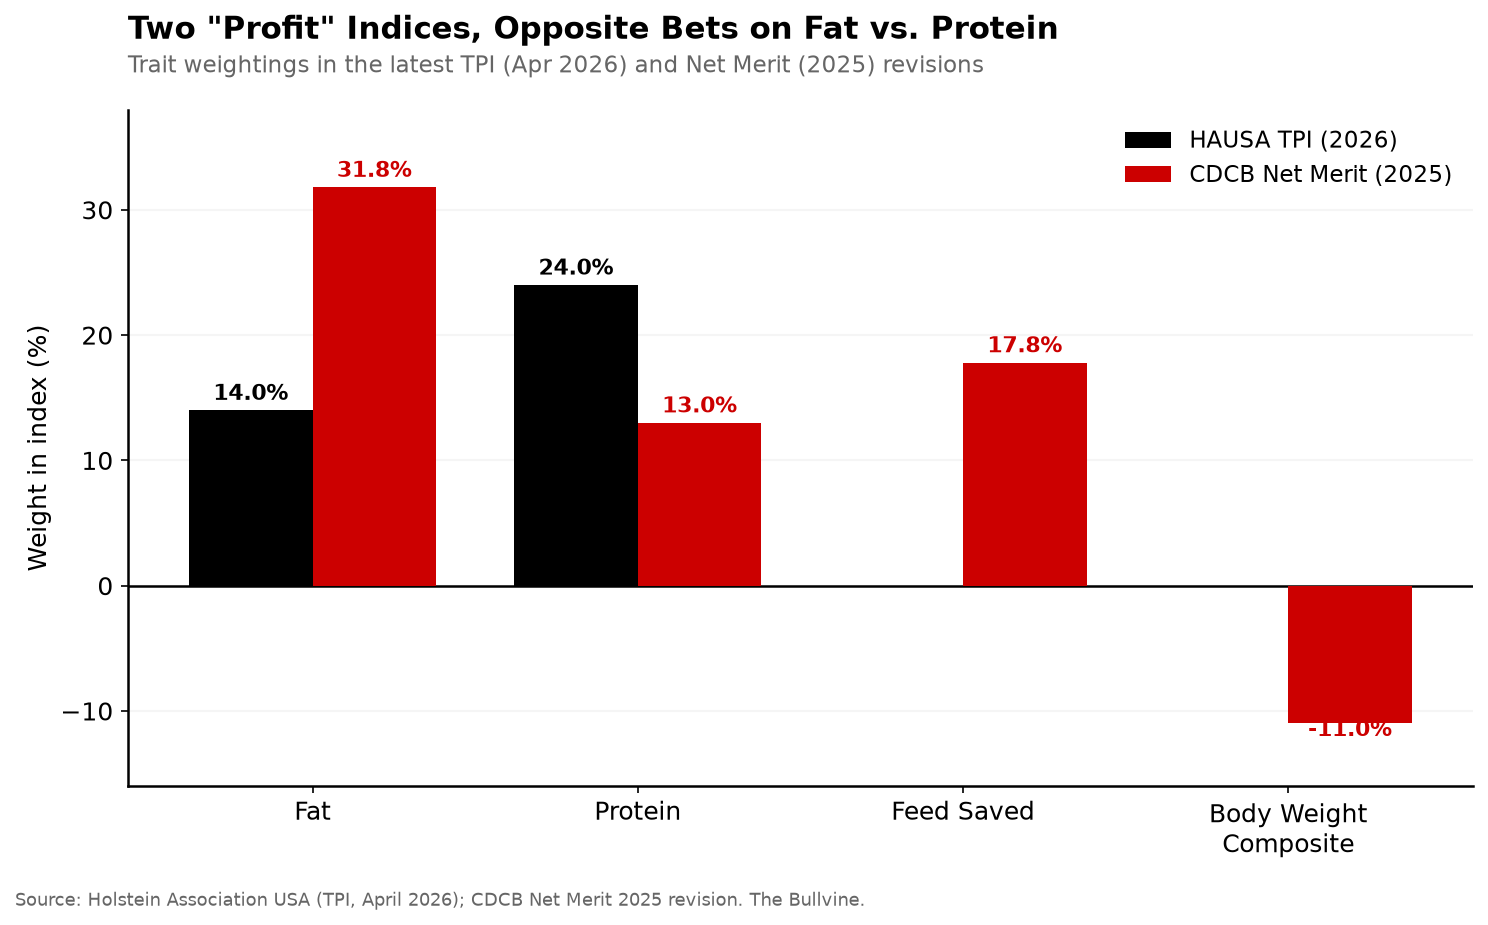
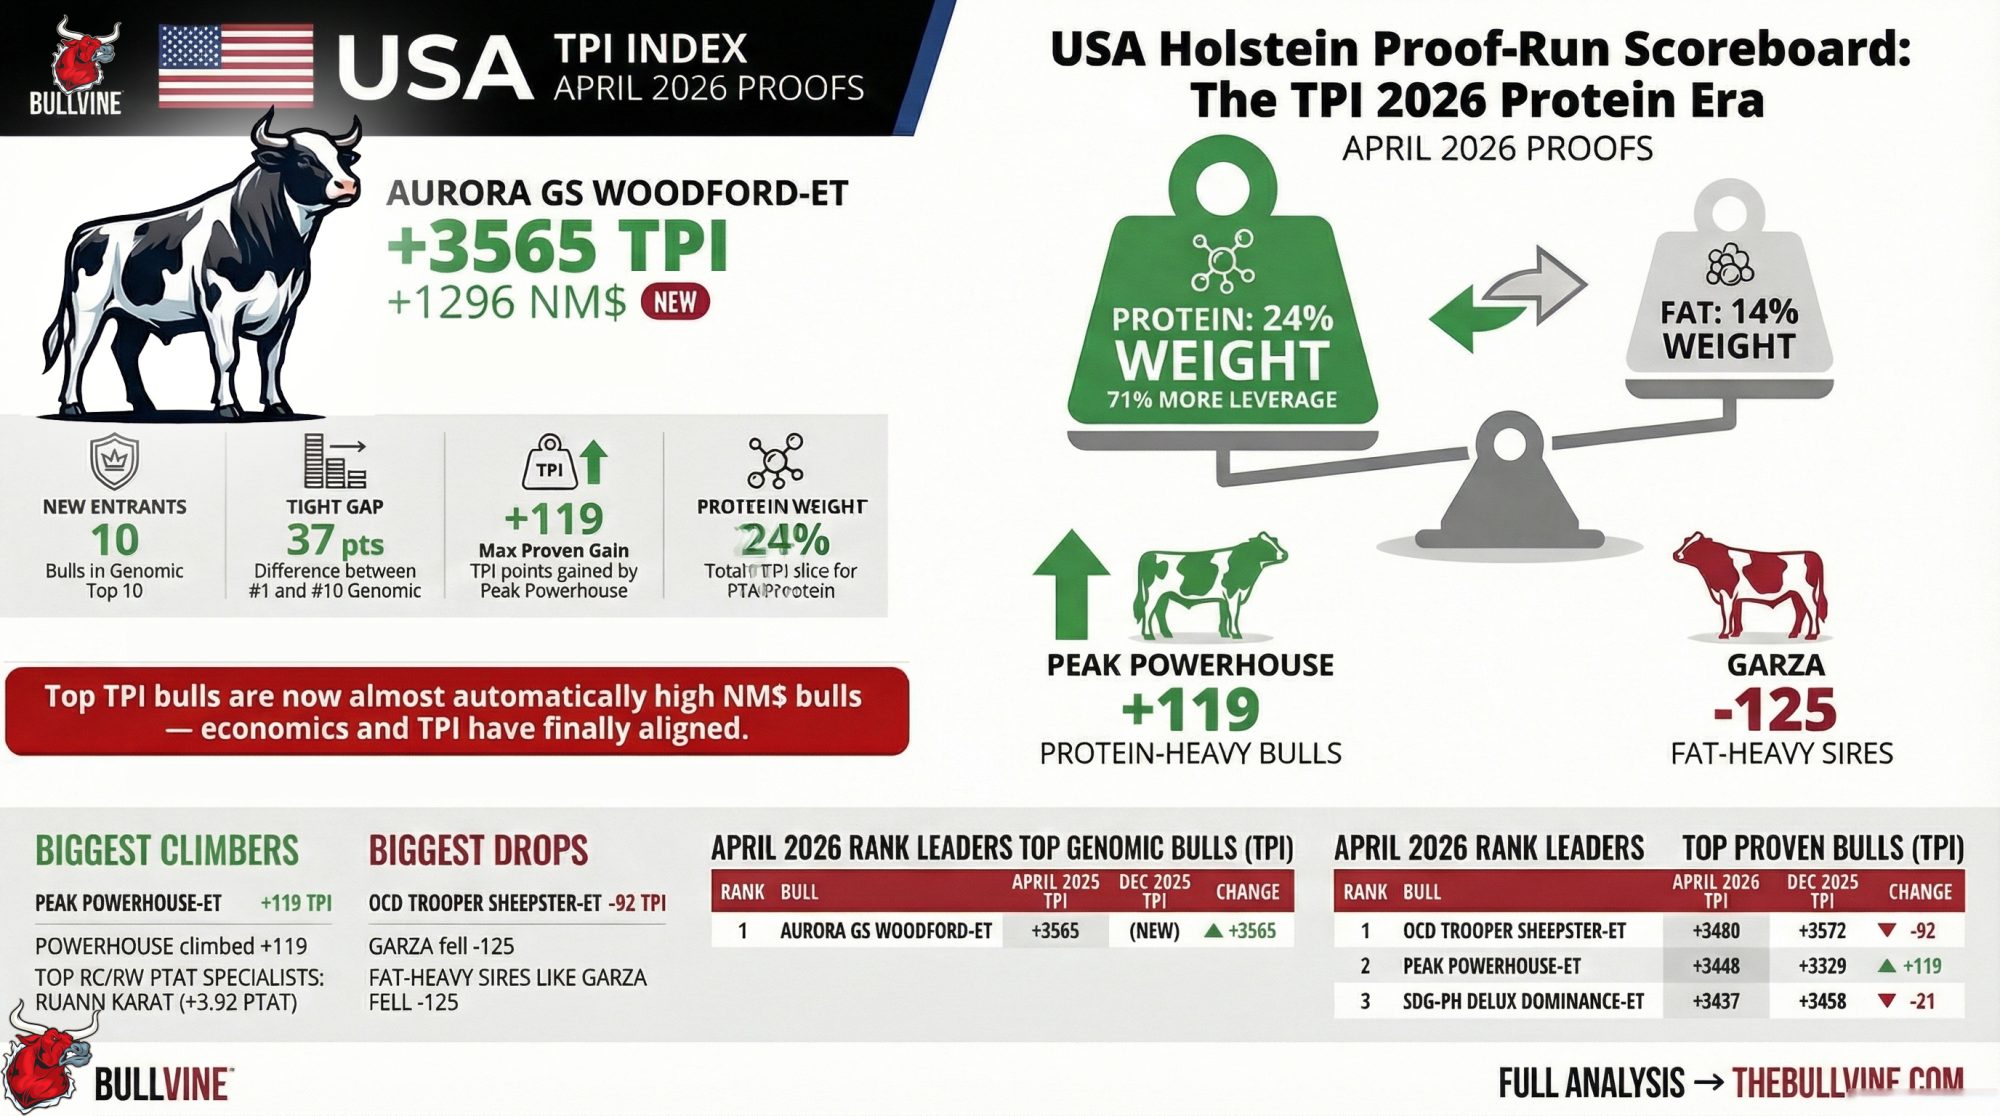
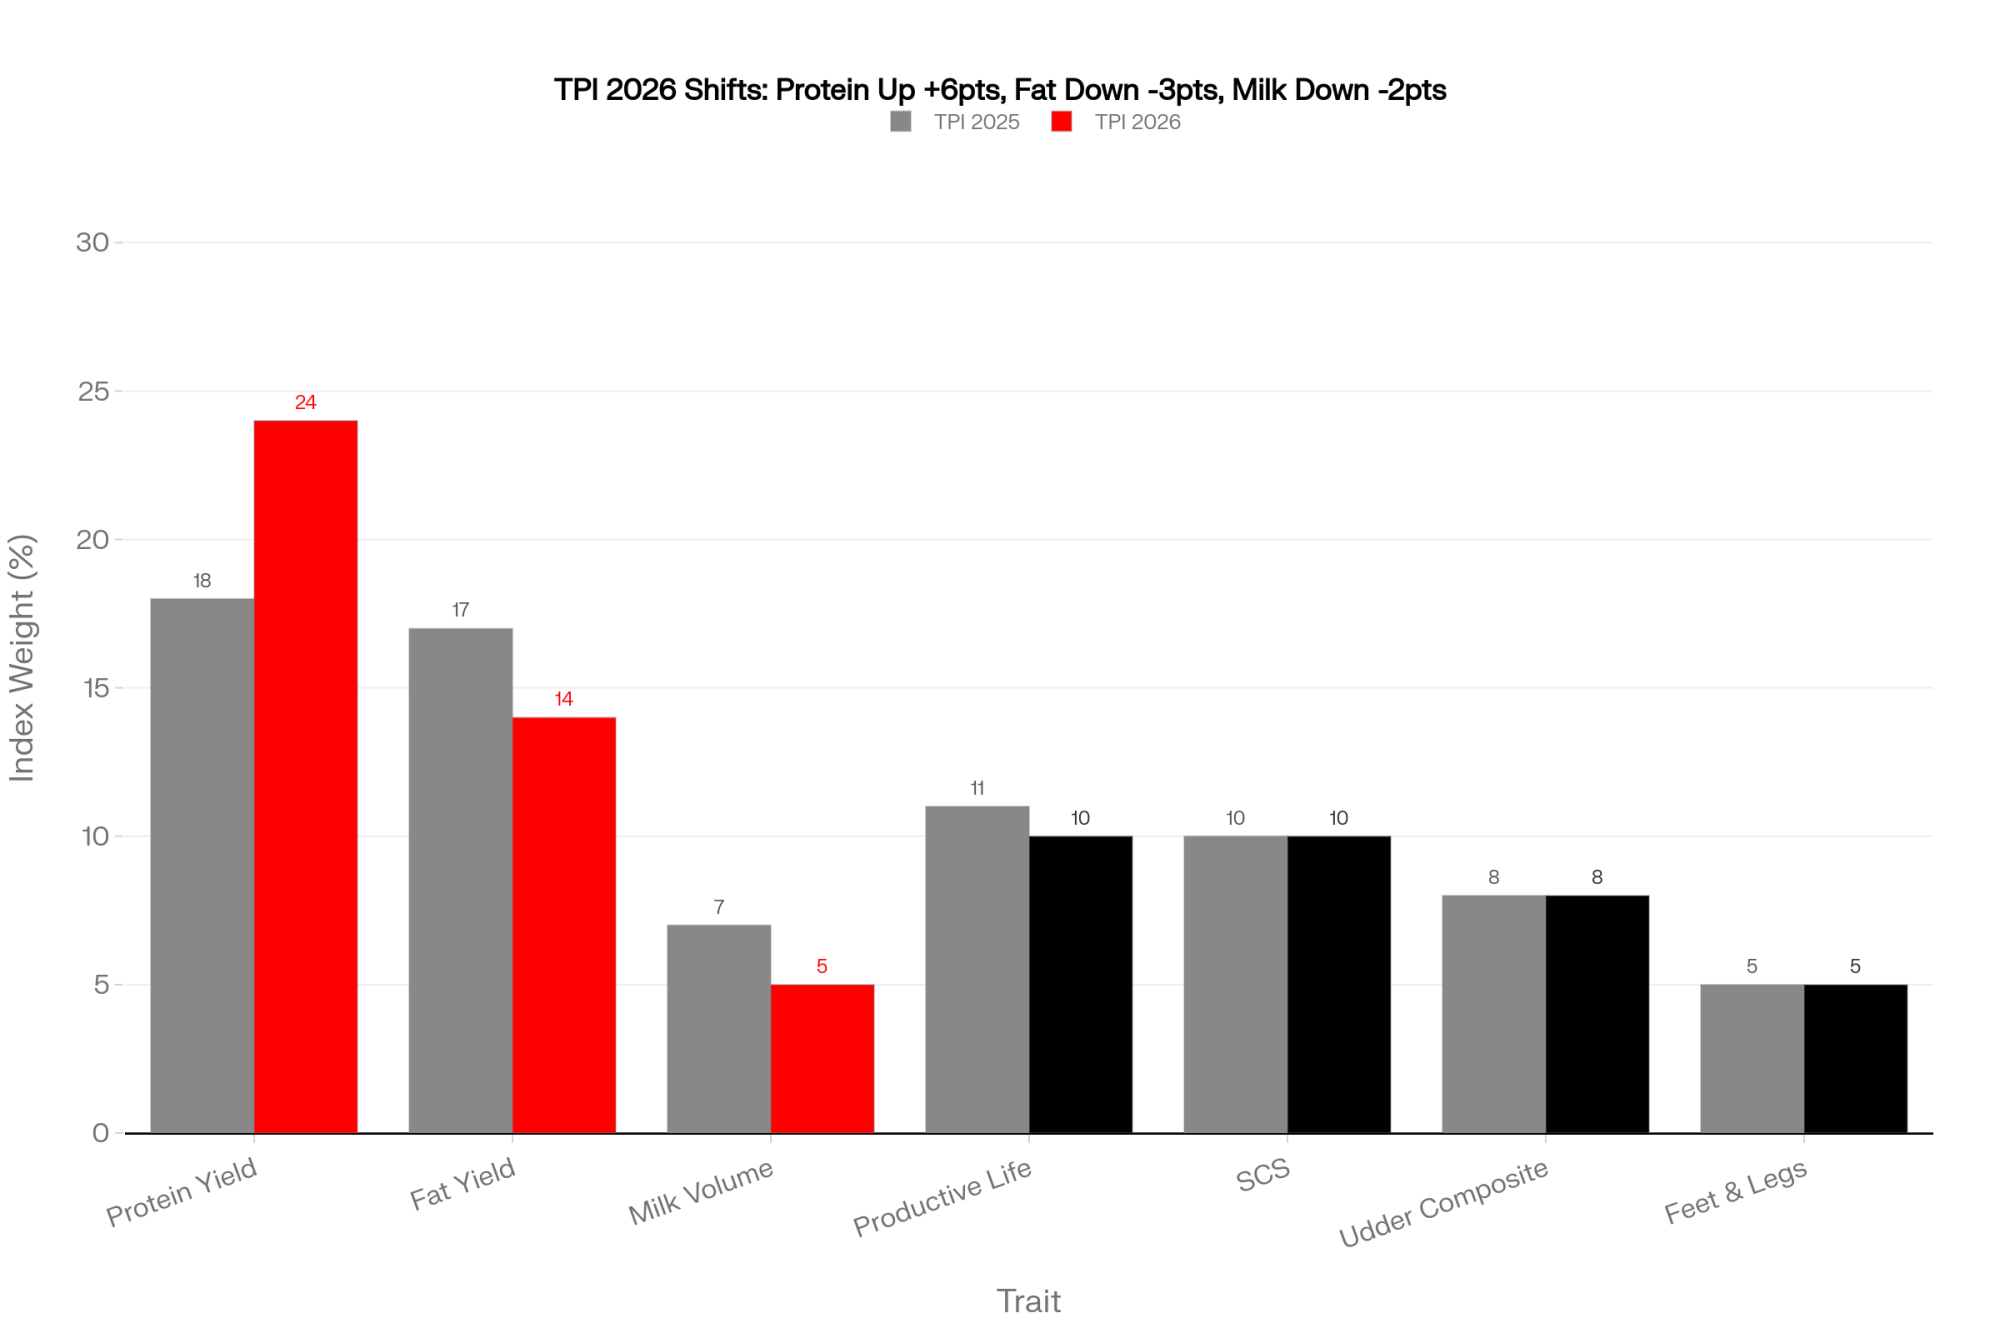
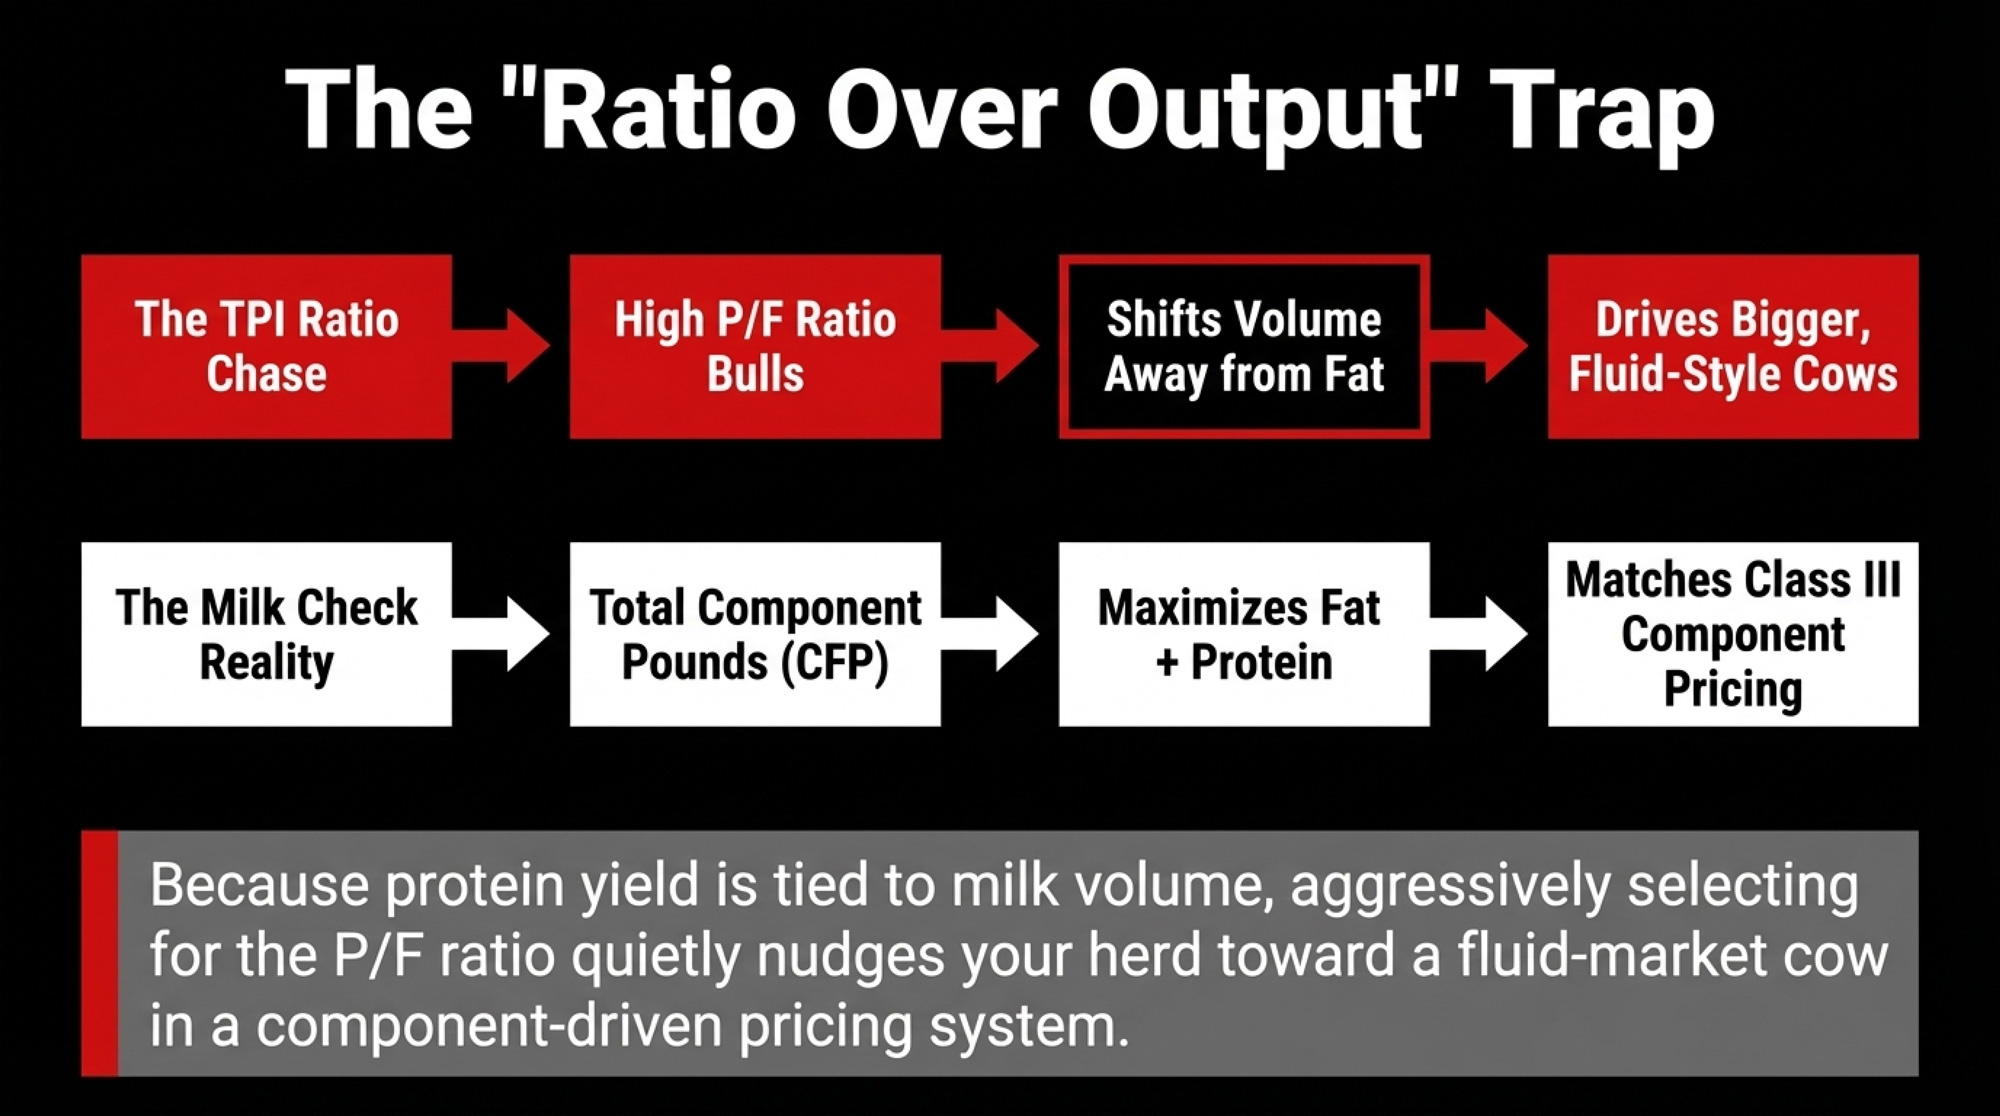
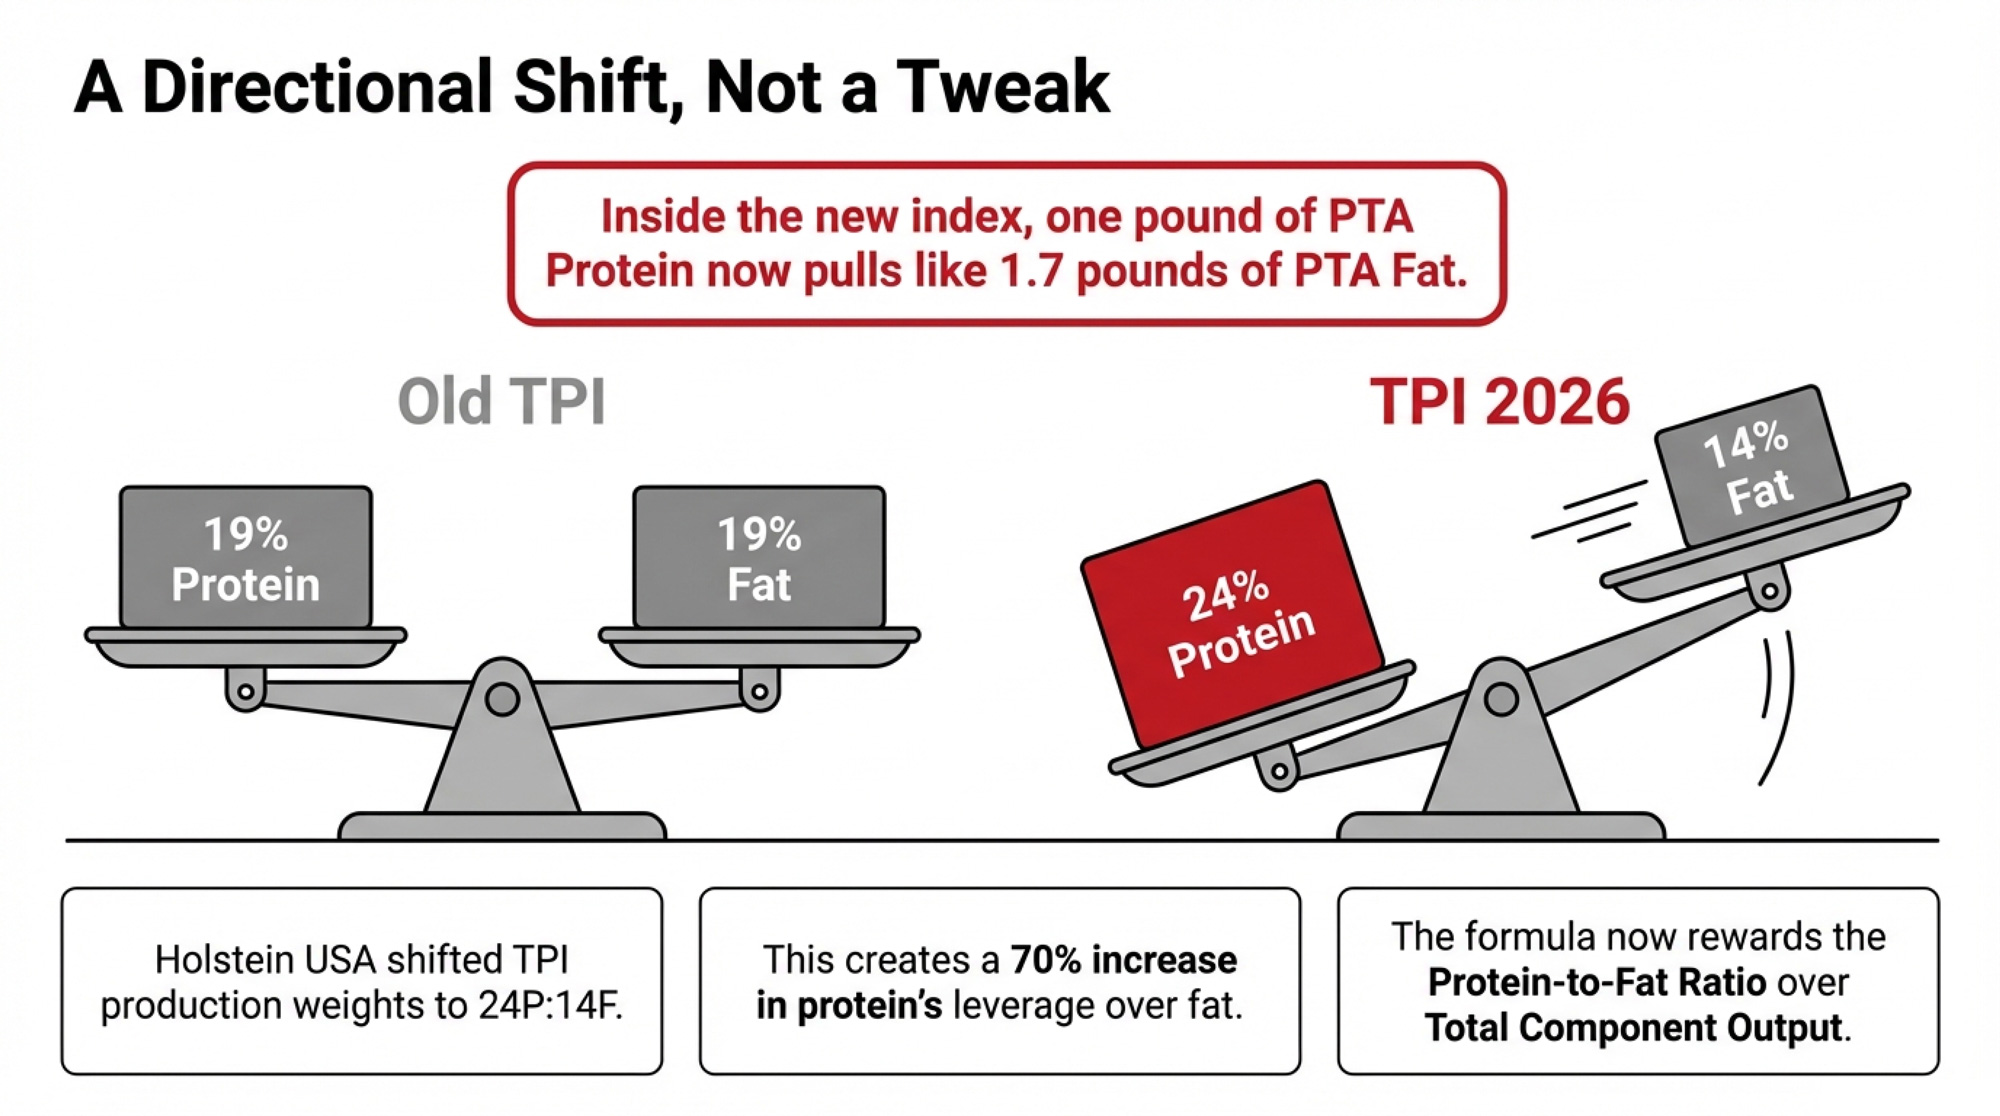
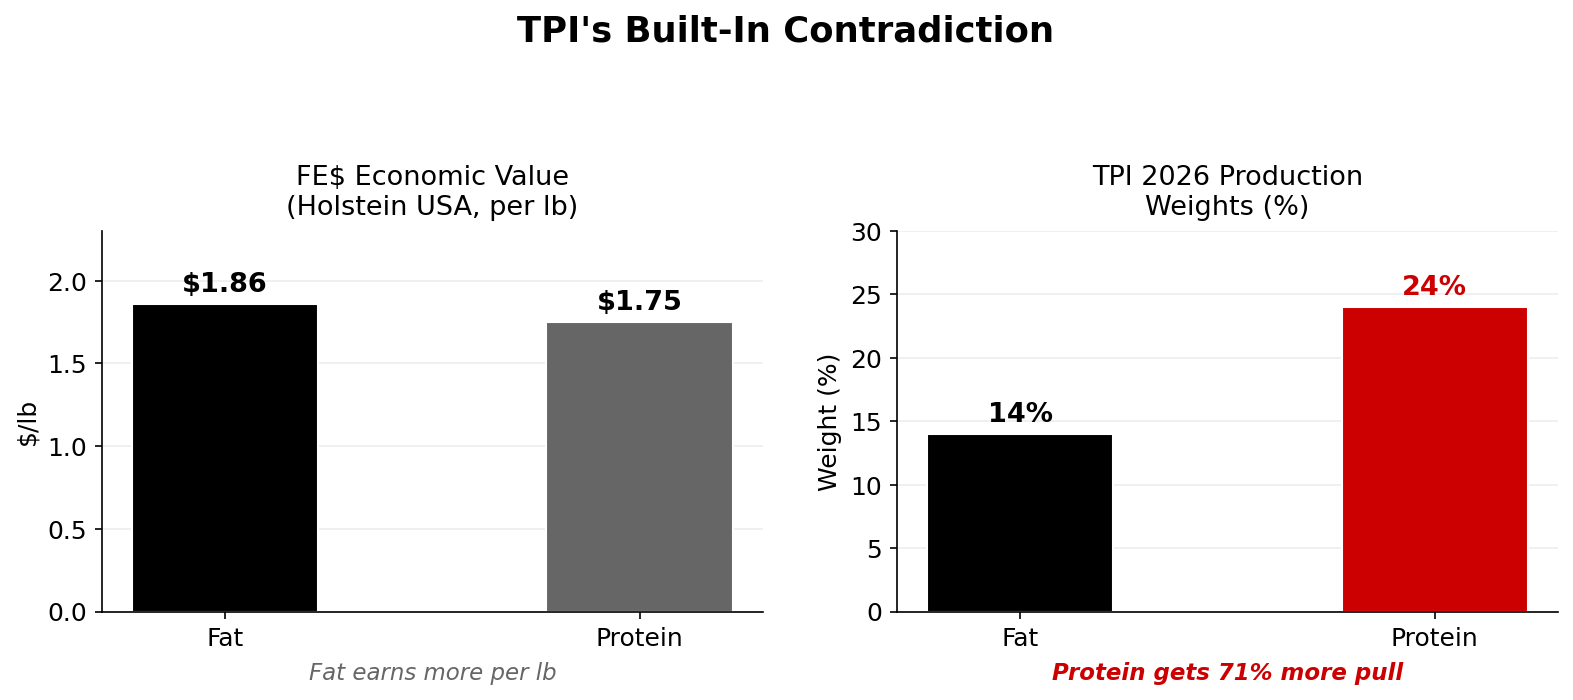
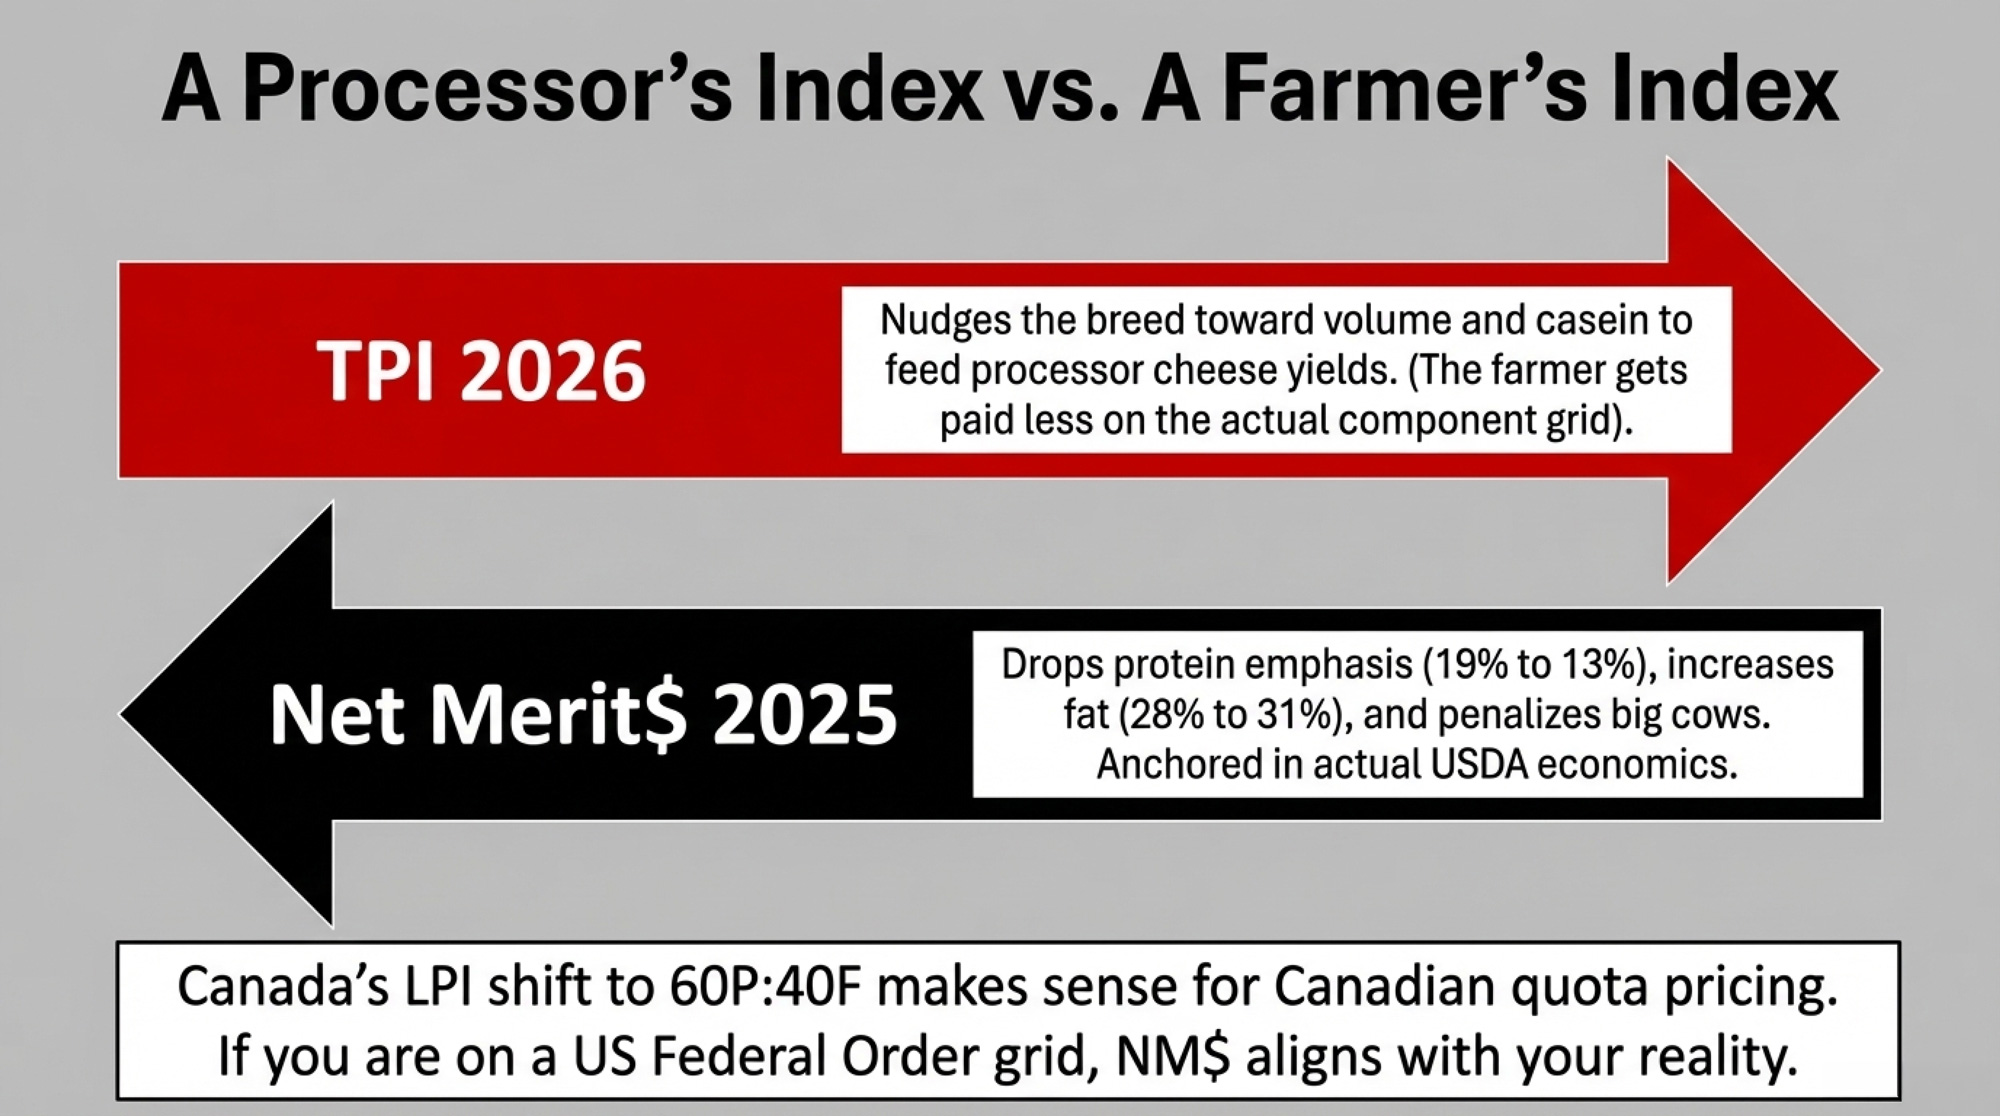
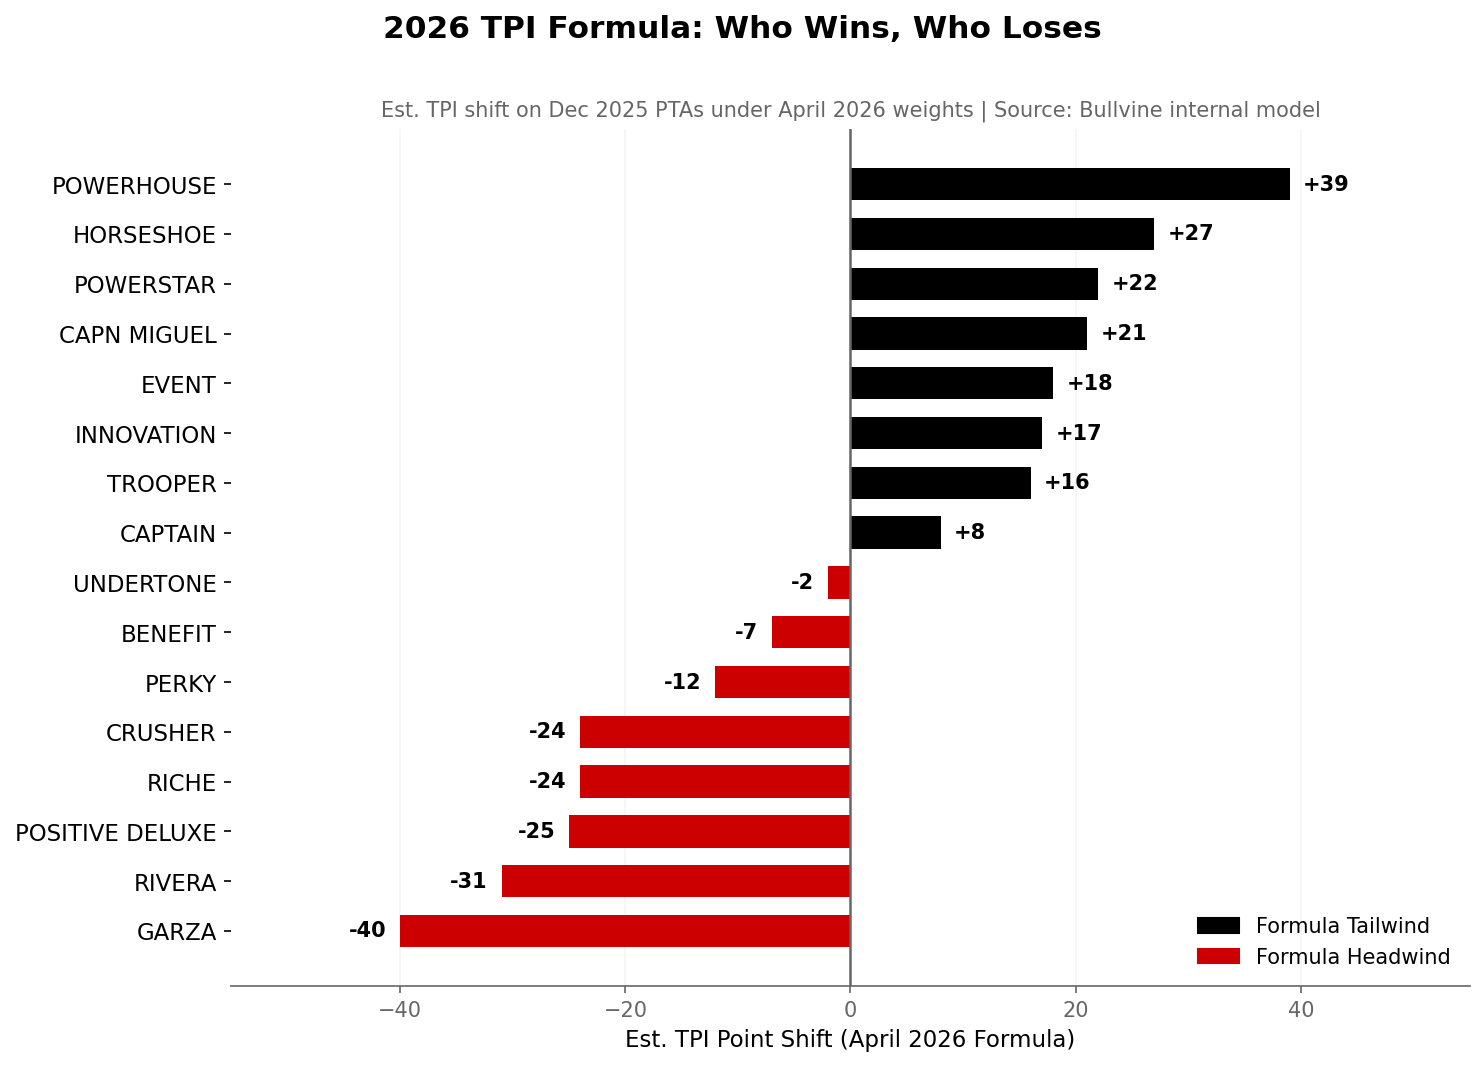
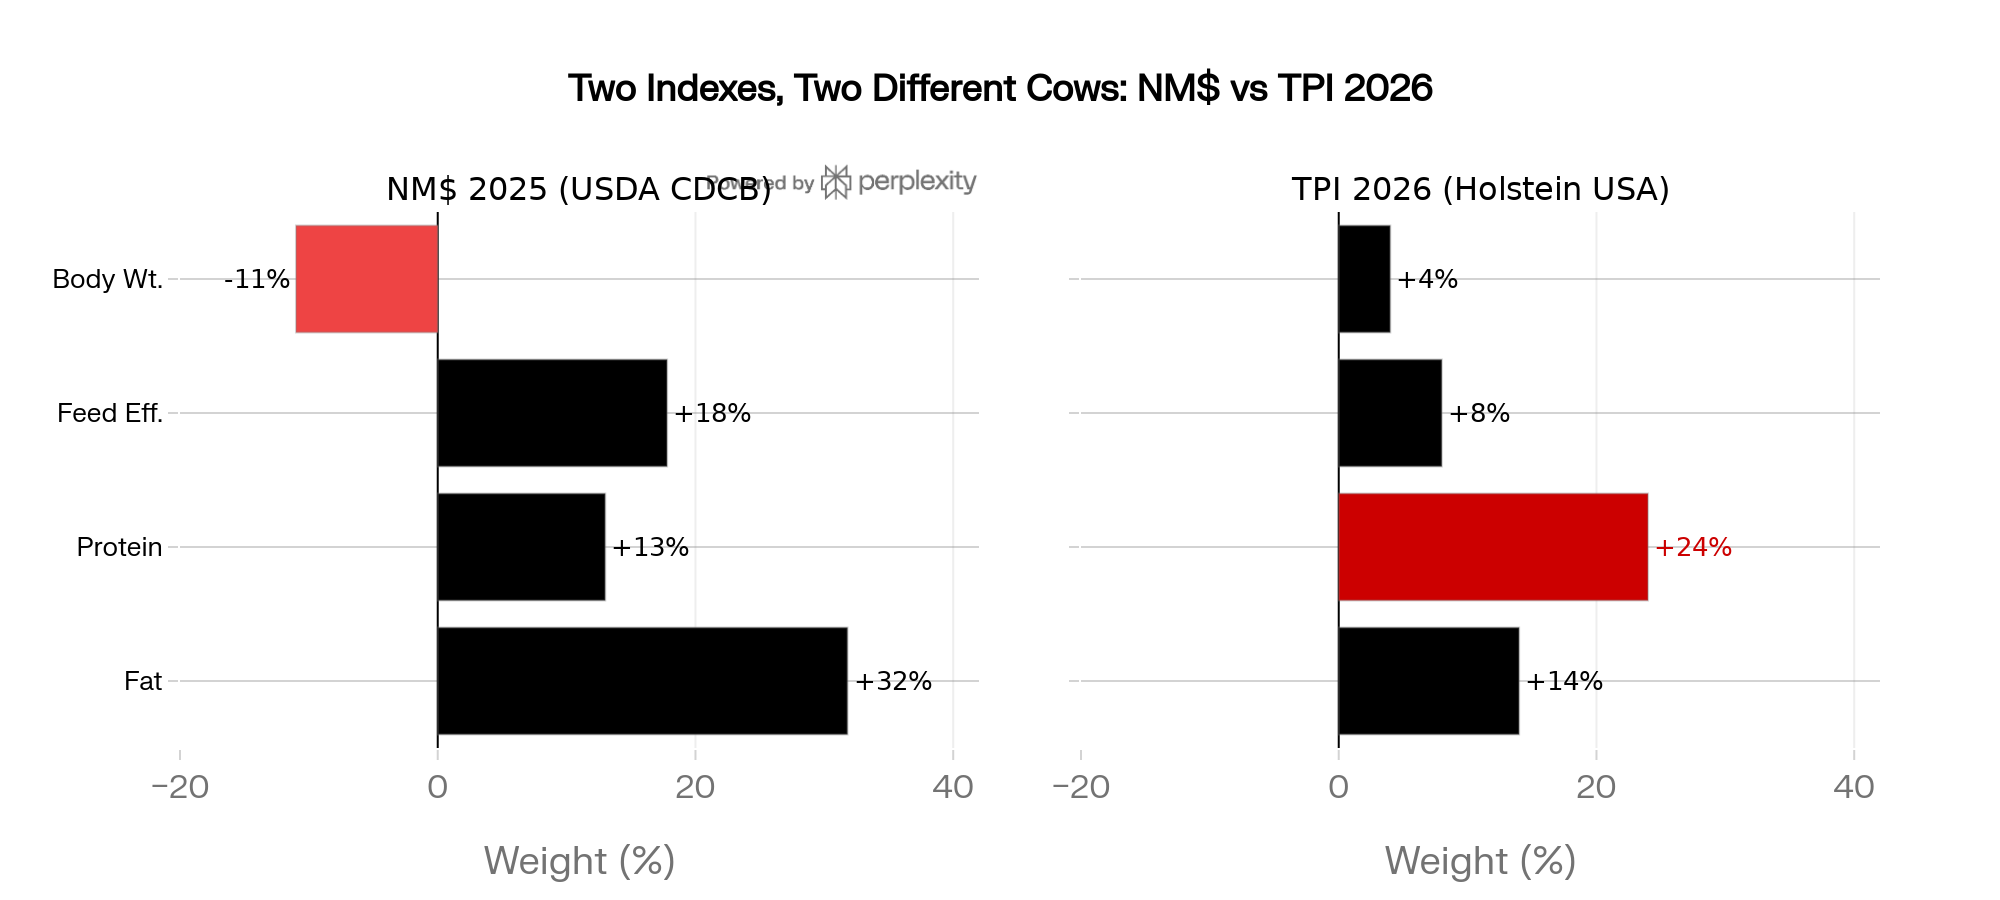
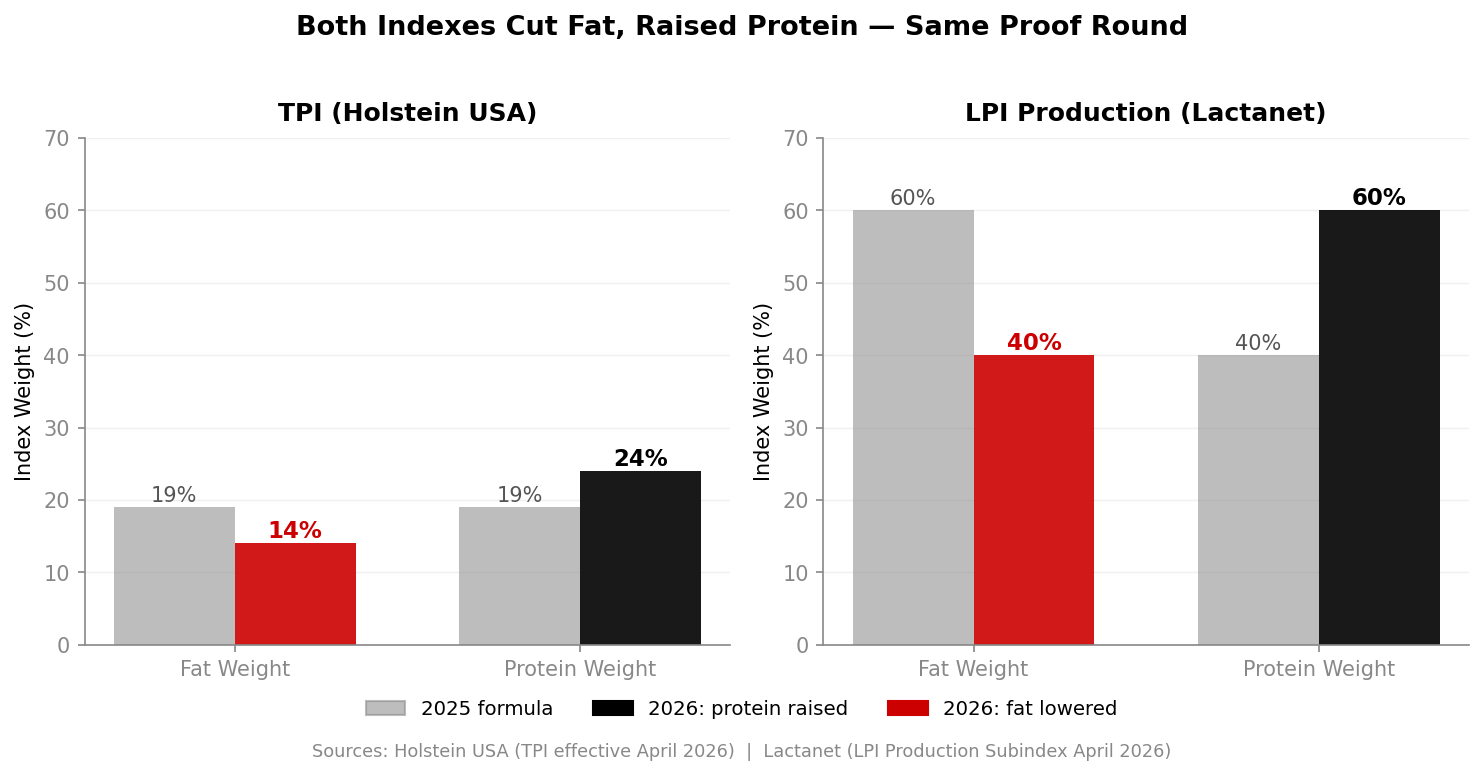
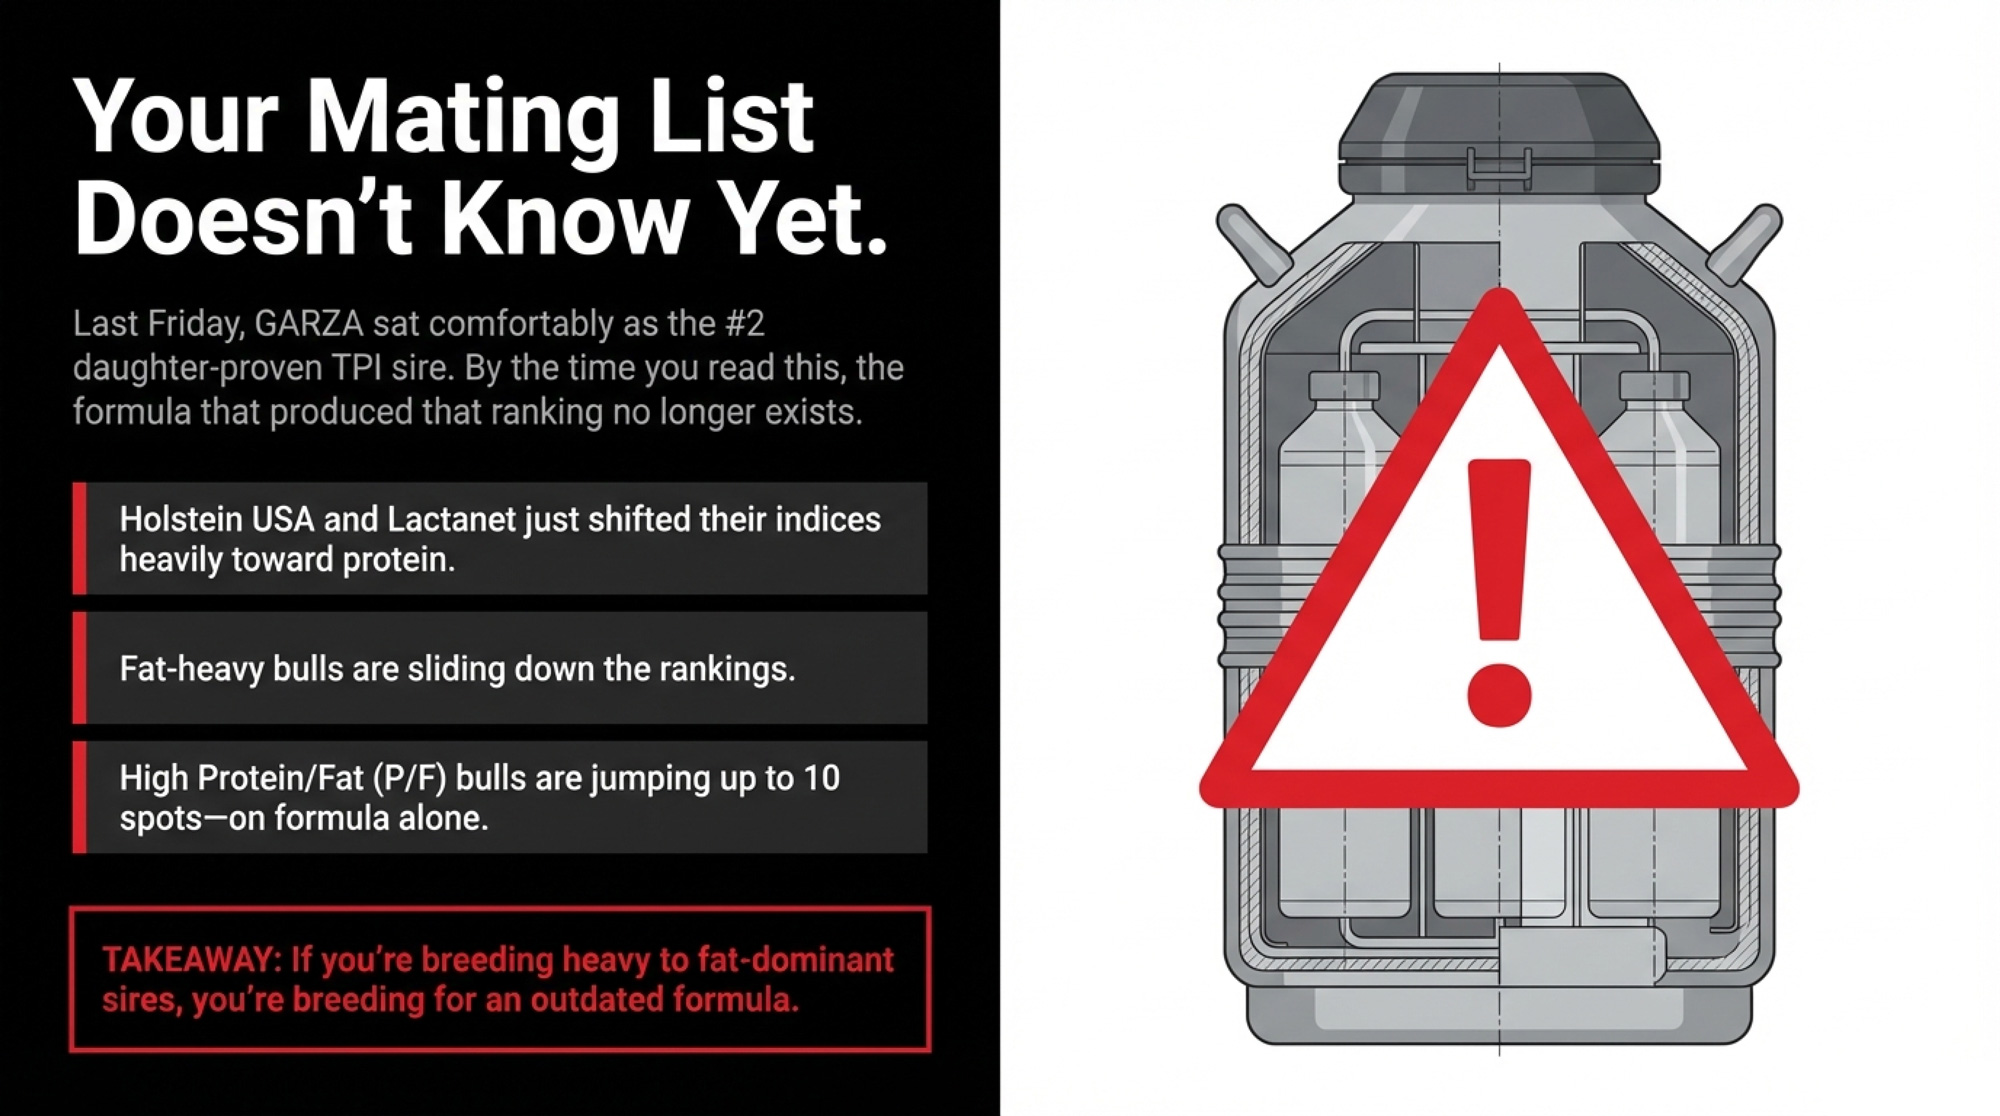
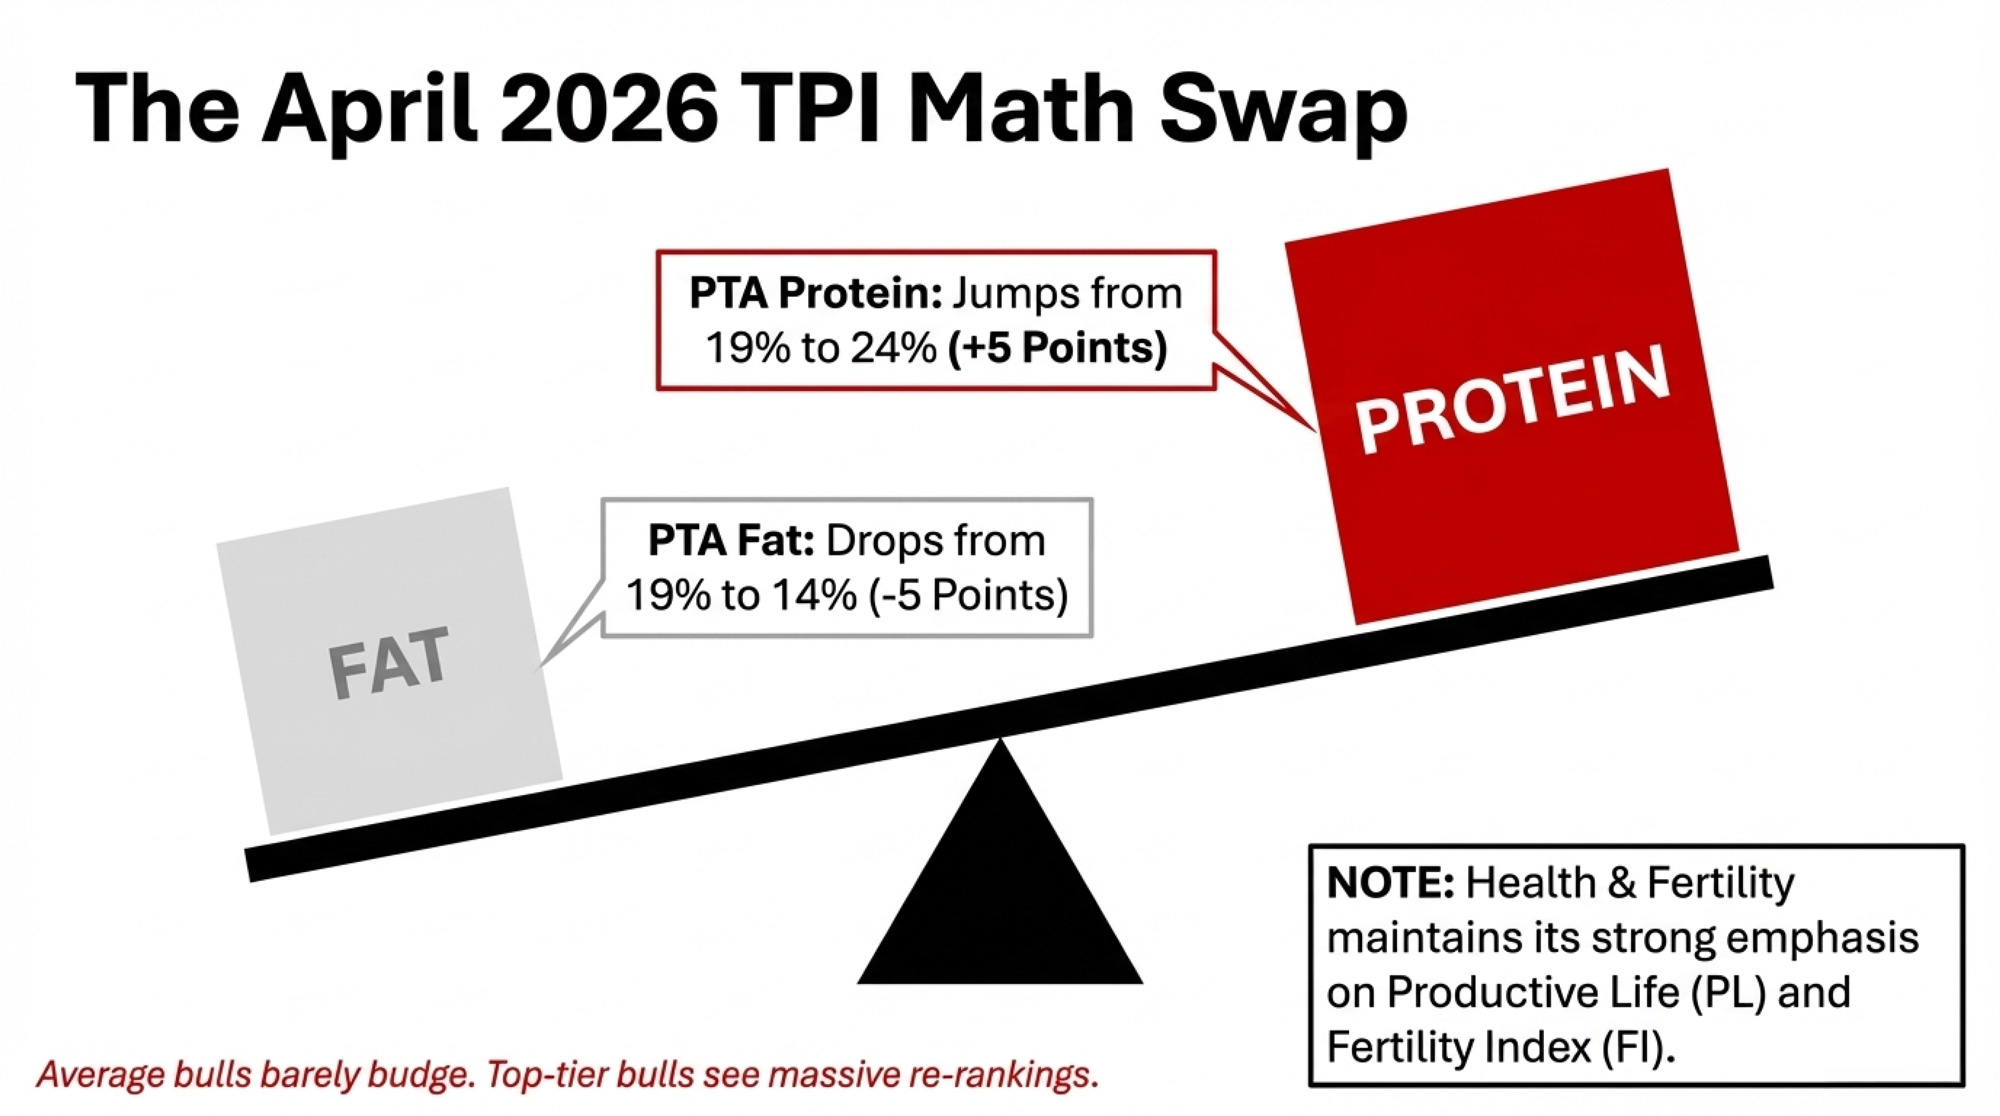
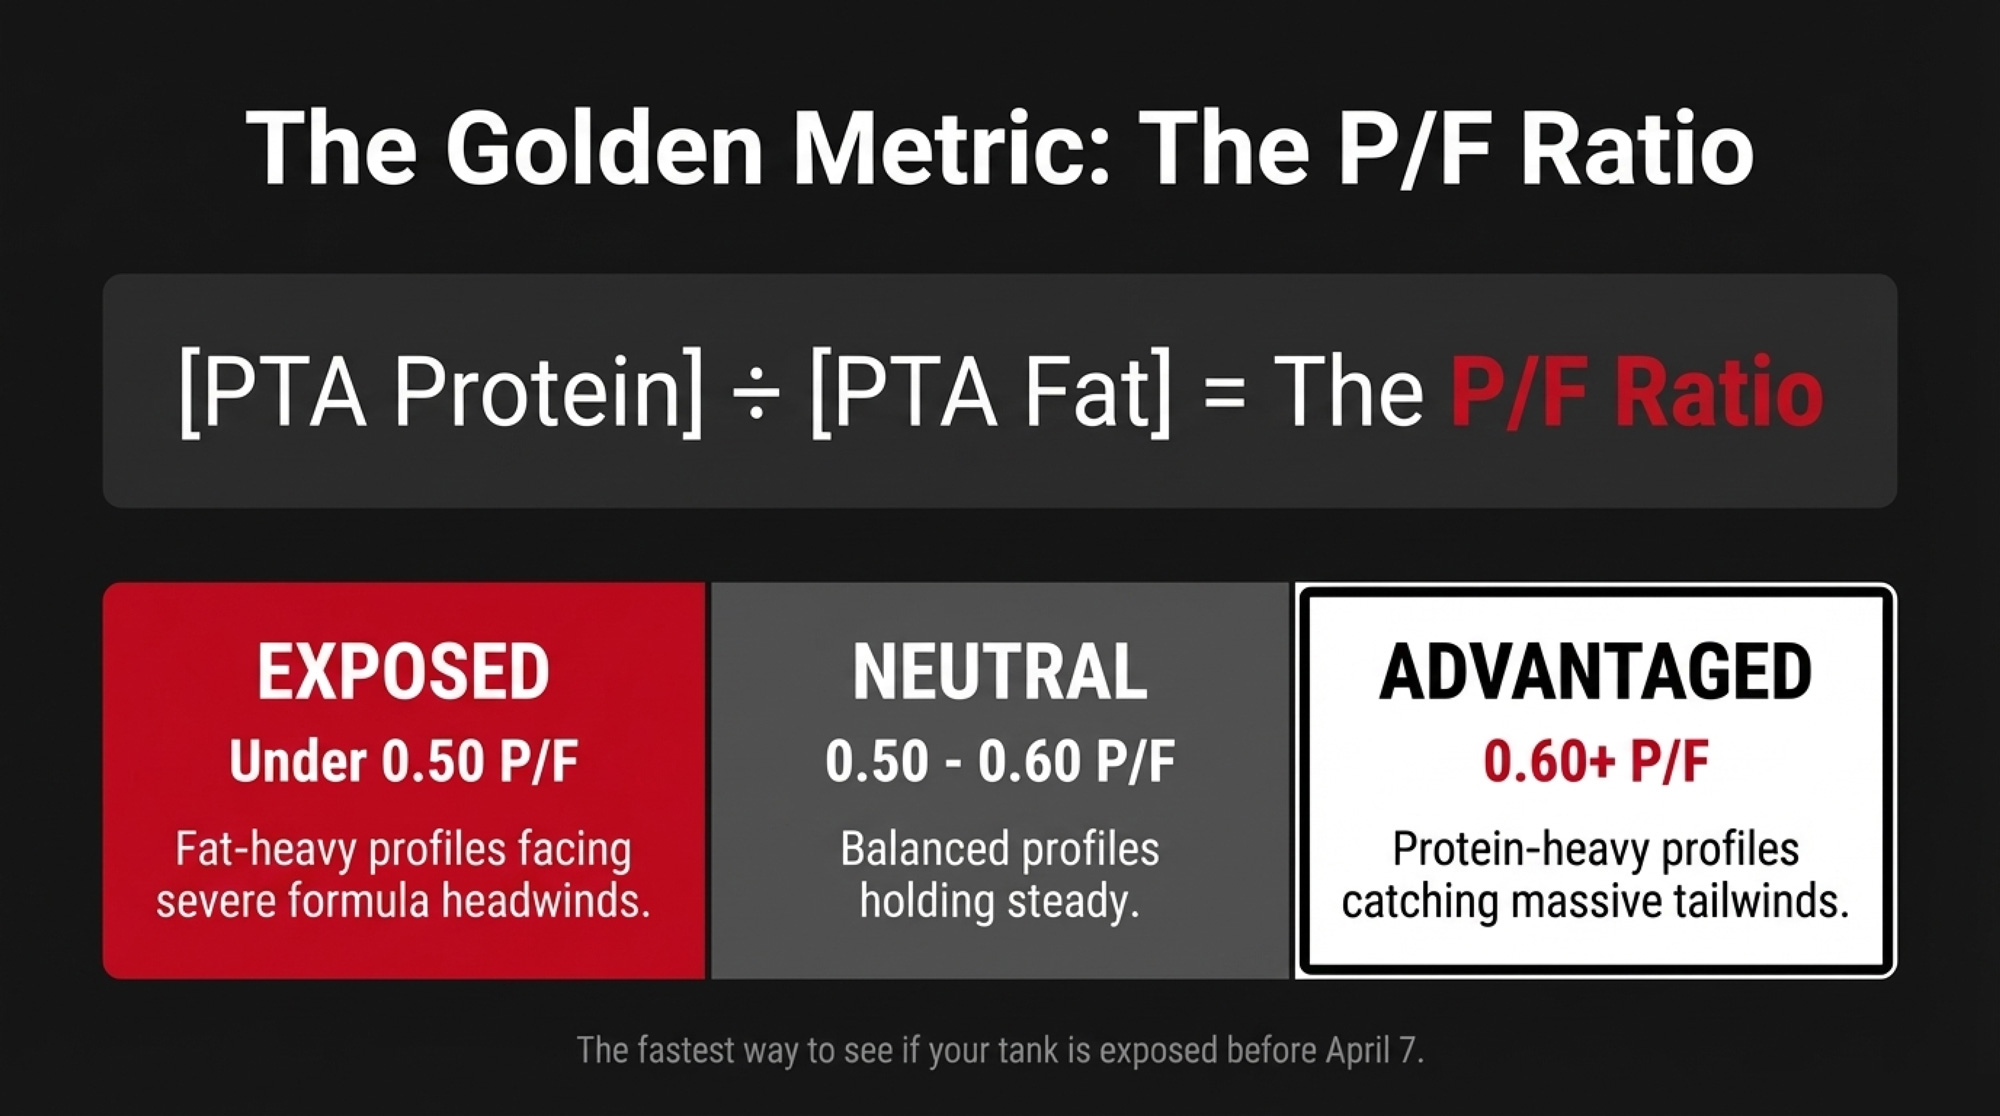
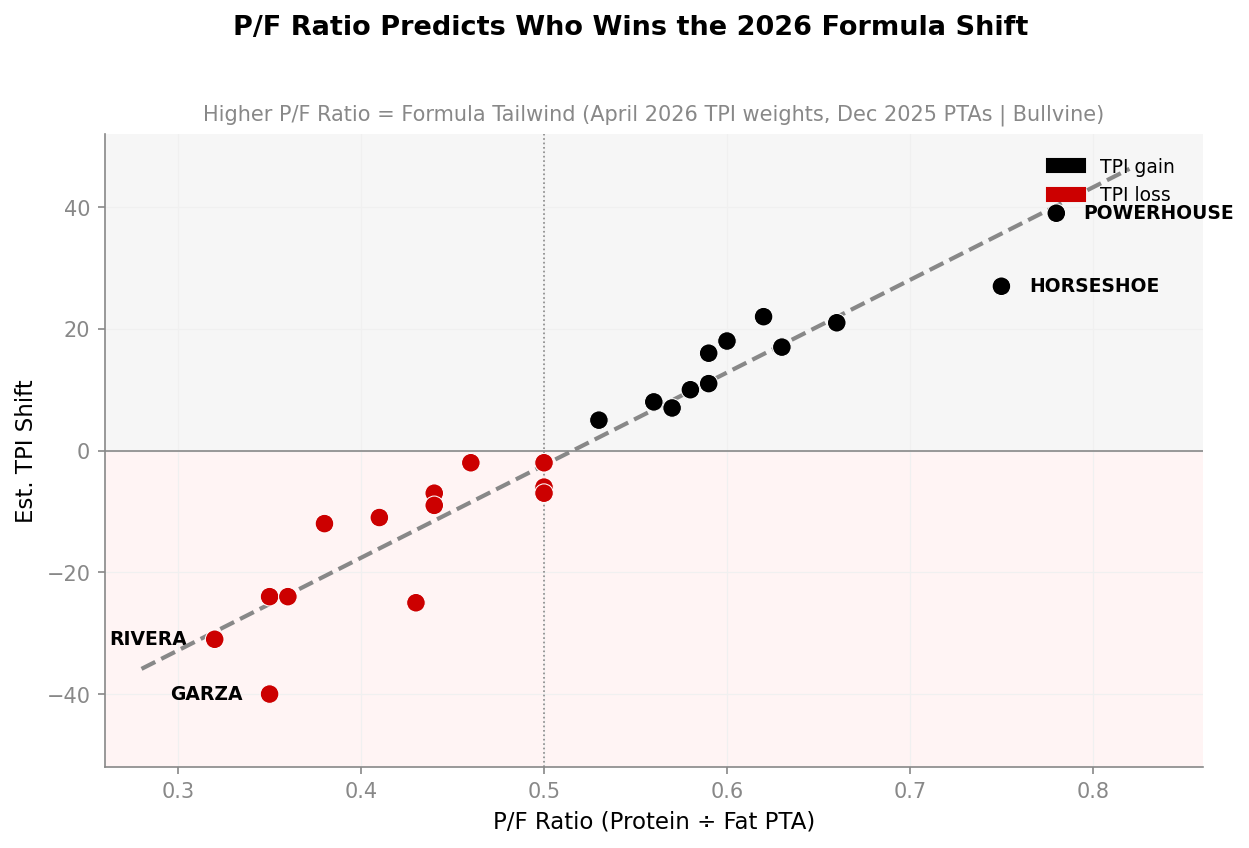
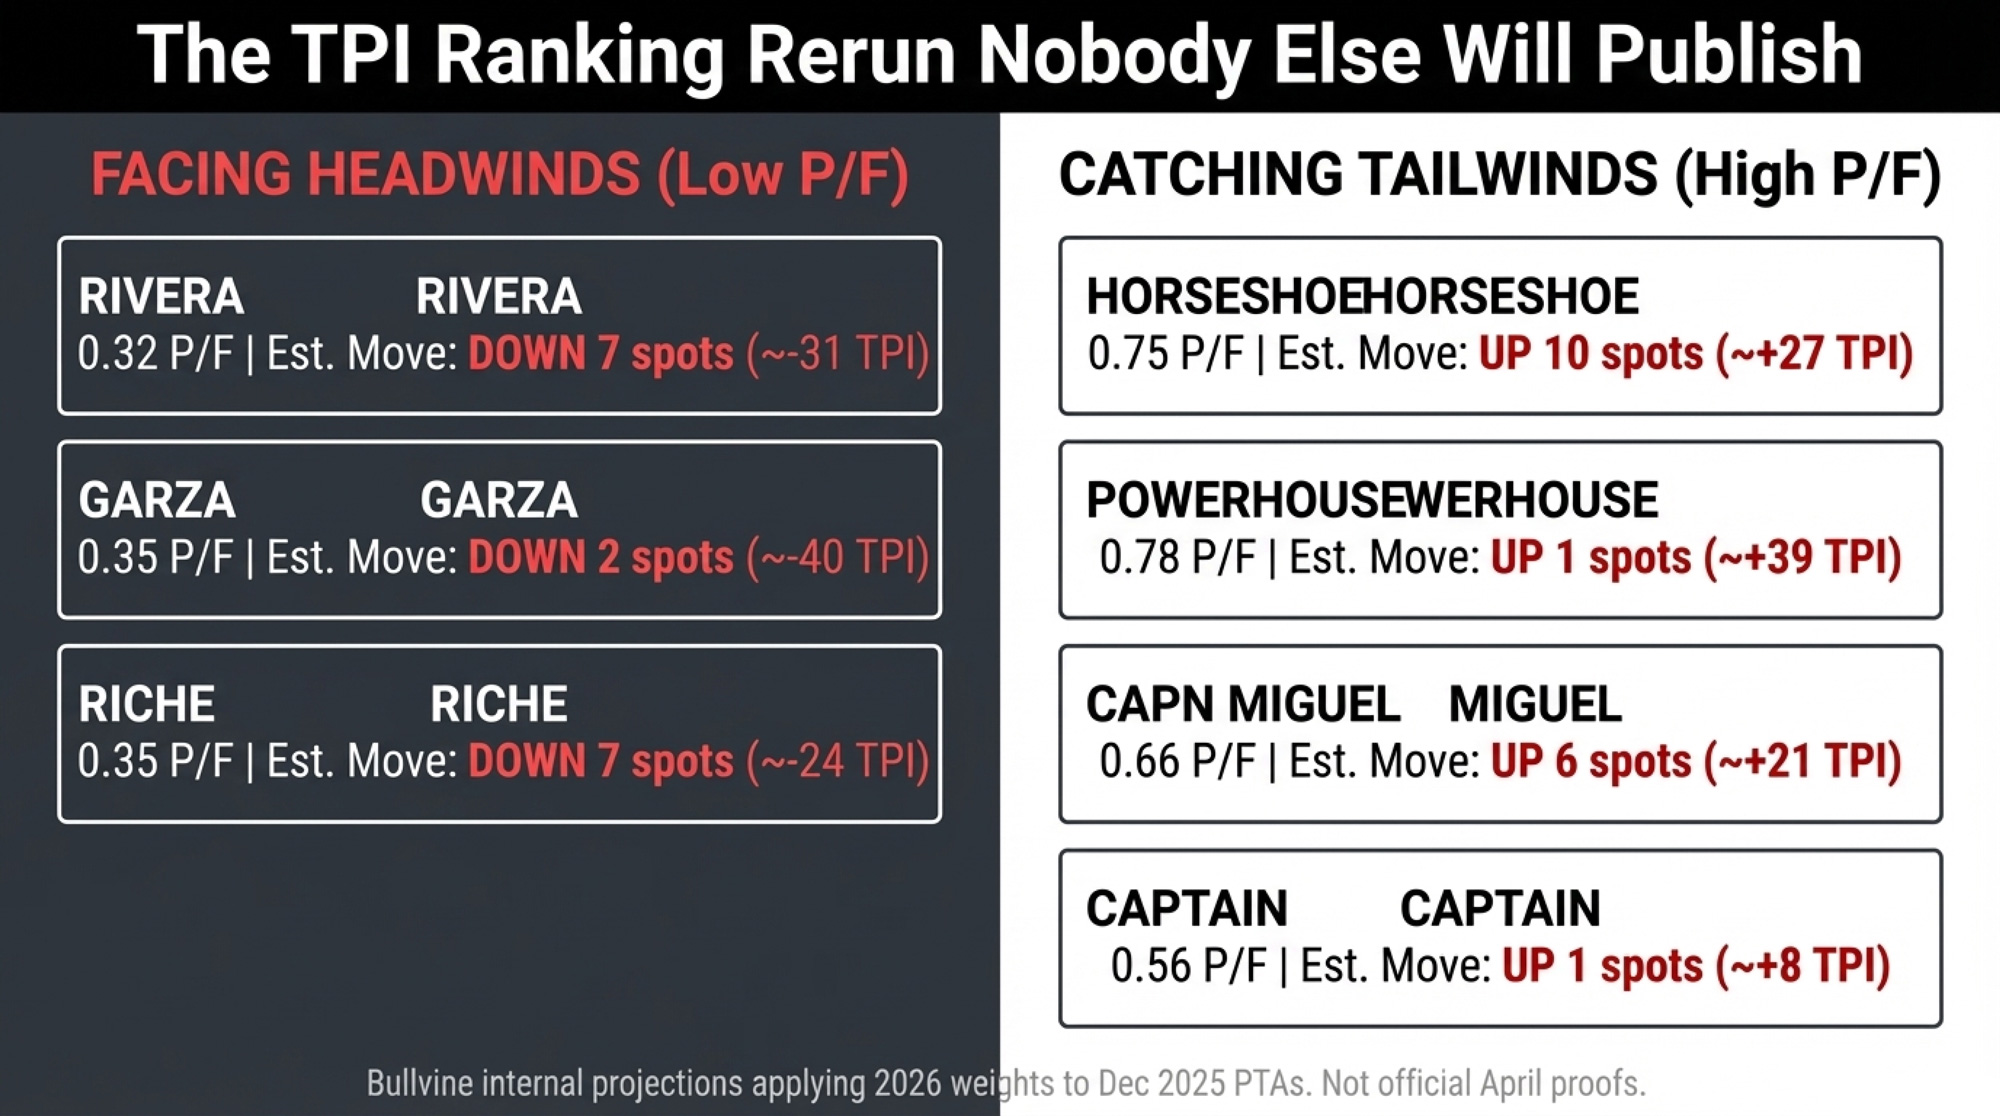
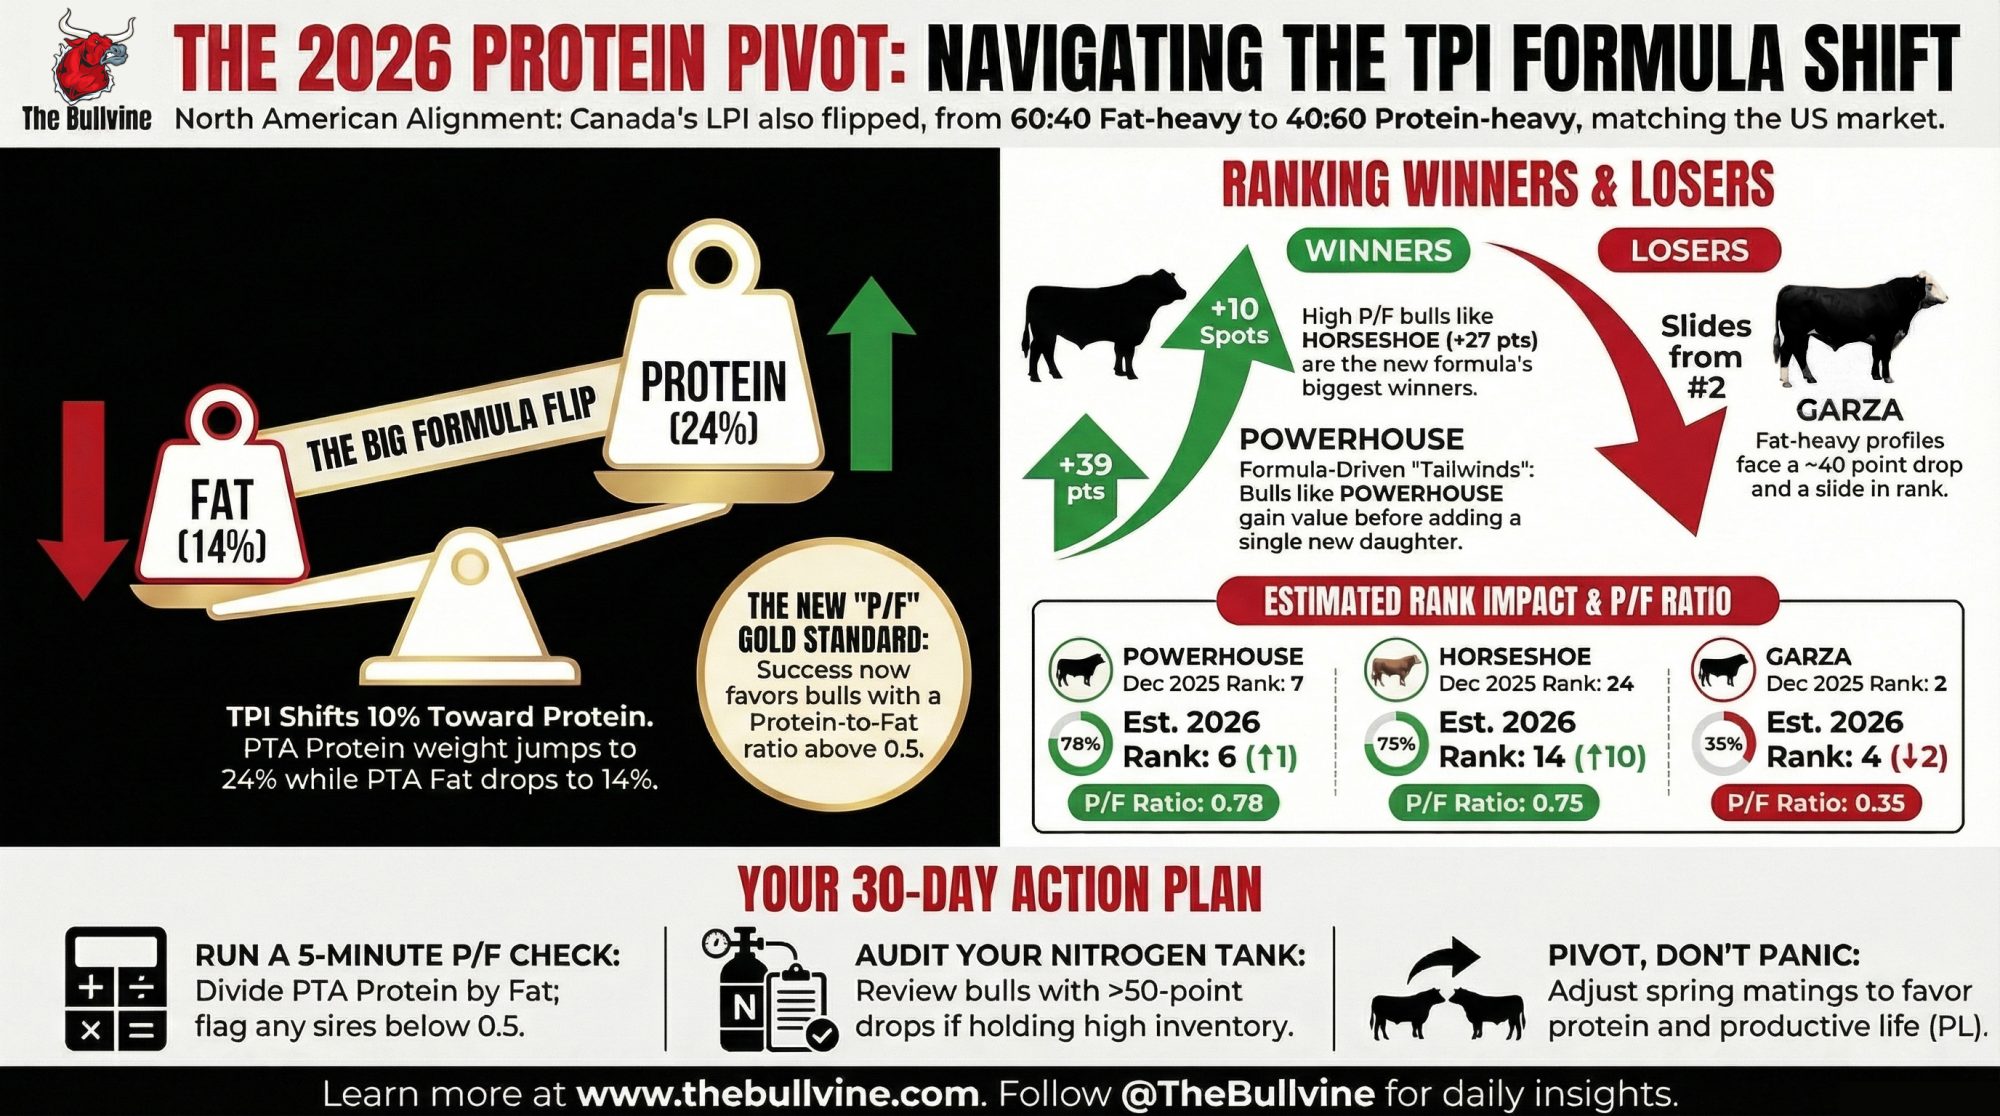
We’re citing April rather than the August 2026 run on purpose. April is when Holstein Association USA changed the TPI formula, shifting production weights from 19% protein and 19% fat to 24% protein and 14% fat, and it’s the snapshot that isolates what that change did to the standings. Bulls moved as much as 125 points in either direction without a single new daughter. Same bulls, same daughters, different instrument — the third time in this article that swapping the measuring tool has swapped the answer. Holstein Association USA has since published an August 2026 list, and the shares will have shifted some with it; treat the April figures as the post-formula-change baseline rather than today’s standings.
So whatever’s happening to the independent breeder, “shut out” doesn’t cover it. The pipeline is concentrating and a two-year-old breeder-owned partnership just took 15% of the top of the list. Both are true. Neither reconciles without the origin data nobody publishes — if the nucleus programs are as dominant as their scale implies, United Sires shouldn’t rank where it does.
Worth knowing what the modelling said before any of this got built. Dekkers and Shook, at Wisconsin-Madison, modelled nucleus schemes for commercial AI firms in the Journal of Dairy Science in 1990 (73:1920). Their finding, replicated since and echoed in Roden’s 1994 review: opening a nucleus raises both the intensity and the accuracy of female selection, and open systems deliver a higher rate of genetic gain than closed ones. They also found closed schemes could stay competitive at large nucleus sizes — so the easy version, closed bad and open good, is only half right. Design matters more than the label, which is exactly why the design should be public.
What It Costs, Country by Country
Four populations have been measured for inbreeding depression. Every one is negative:
Study
Population
Per 1% inbreeding increase
Ablondi et al. 2023
Italian Holstein, 27,735 cows
−61 kg 305-day milk (ROH); −44 kg (pedigree)
Doekes et al. 2019
Dutch Holstein-Friesian, 38,792 first-parity cows
−36.25 kg (ROH); −37.95 kg (pedigree); −48.07 kg (genomic relationship)
Bjelland et al. 2013
U.S. Holstein, University of Wisconsin
−20 kg 205-day milk (ROH); −47 kg (genomic relationship); −53 kg (percent homozygosity)
Pryce et al. 2014
Australian Holstein and Jersey, 12,991 genotyped cows
−0.4% to −0.6% of phenotypic mean for milk, fat and protein
Figures as published. Multiply kg by 2.205 for pounds — 61 kg is 134 lbs, 36.25 kg is 80 lbs, 20 kg is 44 lbs.
Pryce’s framing is the one to run on your own operation, because it scales to whatever you produce. At 0.4 to 0.6% of the mean per 1% of inbreeding, a decade at the U.S. rate — 0.36 points a year, 3.6 points total — costs 1.4% to 2.2% of your herd average. On a 12,000 kg (26,455 lbs) herd, that’s 170 to 260 kg — 375 to 573 lbs — per cow, per lactation.
Ablondi’s team costed it in terms their readers feel immediately. Eighty percent of Italian milk goes into cheese, so they priced the loss in Parmigiano Reggiano — the country’s second-largest PDO consortium, 160,097 tonnes in 2022. Between the most and least inbred 5% of cows, the difference came to over half a wheel per cow per lactation on pedigree and more than a full wheel on genomics. Roughly €310 and €600 — about $360 and $700 USD, or $495 and $960 CAD, at 24-month-aged prices.
Pryce’s group mapped the damage to specific regions, finding stretches that cost up to 260 L of milk and 12.5 days of calving interval when fully homozygous. Ablondi’s team saw the same chromosome by chromosome — 16 of 29 autosomes carried a measurable hit to milk yield, with BTA14 the worst at −3.53 kg per 1% of homozygosity on that chromosome alone.
Bjelland’s U.S. work adds a cost that usually gets filed under calving management: stillbirths rose 0.25% for bull calves and 0.20% for heifer calves per 1% increase in inbreeding.
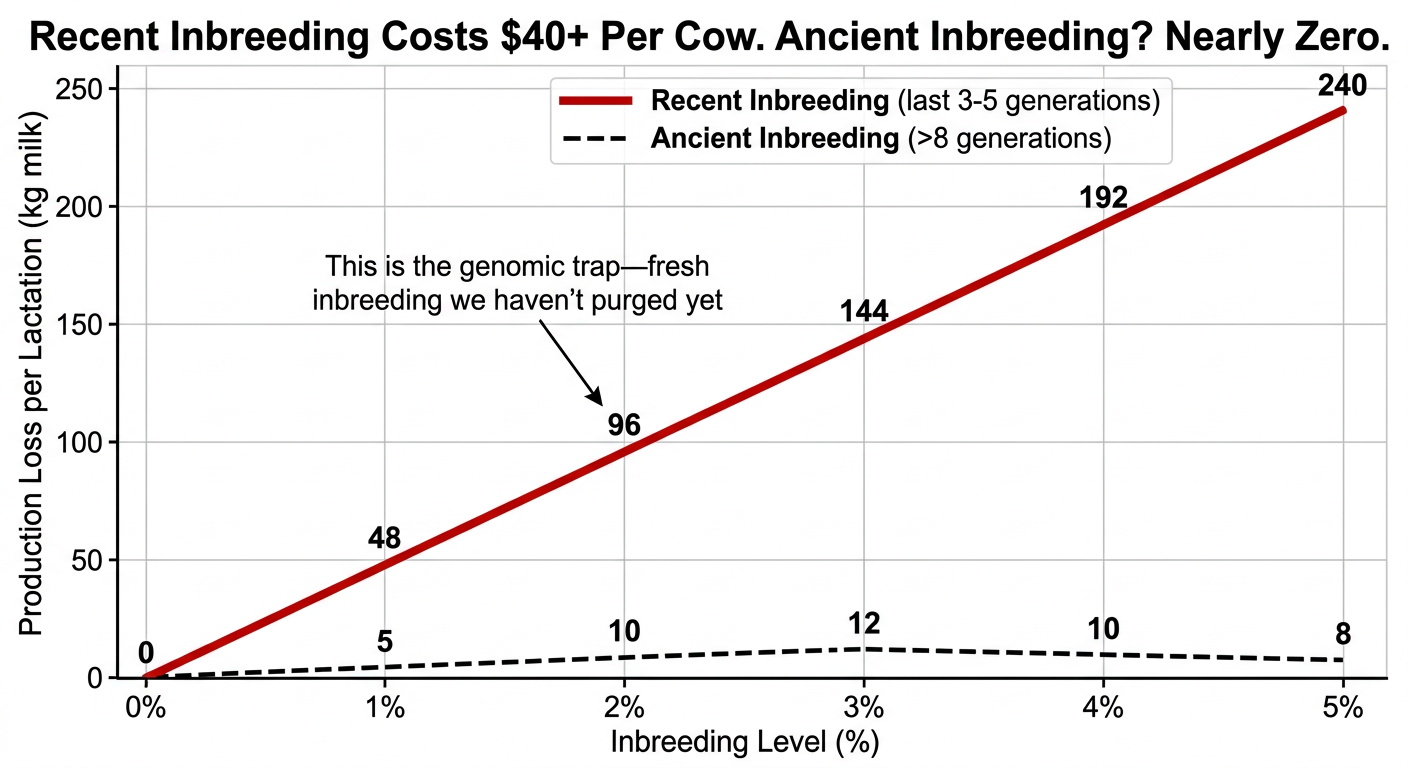
Doekes explains why recent matings matter most. New inbreeding — alleles identical-by-descent for the first time — cost 2.42 kg (5.3 lbs) of fat per 1%. Ancestral inbreeding cost essentially nothing, +0.03 kg. The damage lives in the matings you’re making right now.
The Tools You’re Probably Underusing
Tool
What It Measures
Data Basis
CDCB Expected Future Inbreeding (EFI)
Population-level inbreeding impact
Pedigree relationship to heifers born in the past 48 months; adjusts PTA accordingly
Genomic Future Inbreeding (GFI)
True genomic relationship
Direct DNA marker overlap; consistently higher and more realistic than EFI
Lactanet Inbreeding Calculator
Mating-specific inbreeding and parent average
Pedigree-based; flags haplotypes and genetic conditions (LactanetGen.ca)
The EFI-versus-GFI choice isn’t academic. Makanjuola’s team found the correlation between pedigree and genomic inbreeding in Holsteins weakening materially across the period they studied — pedigree is getting worse at tracking reality, not better. Pryce’s conclusion was blunt: genomic measures can replace pedigree for estimating depression, using either the genomic relationship matrix diagonal or the proportion of homozygous SNPs.
Genomic-testing your females and then mating off pedigree inbreeding means managing to the number that understates the problem. That’s the whole finding, in one sentence.
One stud has published constraint evidence. C. Sun and colleagues at STgenetics presented Chromosomal Mating at ADSA in 2019 — a linear-programming system built on CDCB genomic relationship files covering 5,731 bulls and more than 1.3 million females, against a pedigree database of over 5 million animals. They reported average progeny predicted producing value up 17% and inbreeding down 30% against random mating.
Their design choice is the interesting part. Rather than setting a hard inbreeding ceiling, the system prices inbreeding as an economic penalty inside the optimization — a defensible way to handle a variable nobody has set a herd-level limit for. It’s also a company-authored conference abstract, seven years old and not independently validated, which is how you should read it.
Two Ways to Buy Pedigree Distance
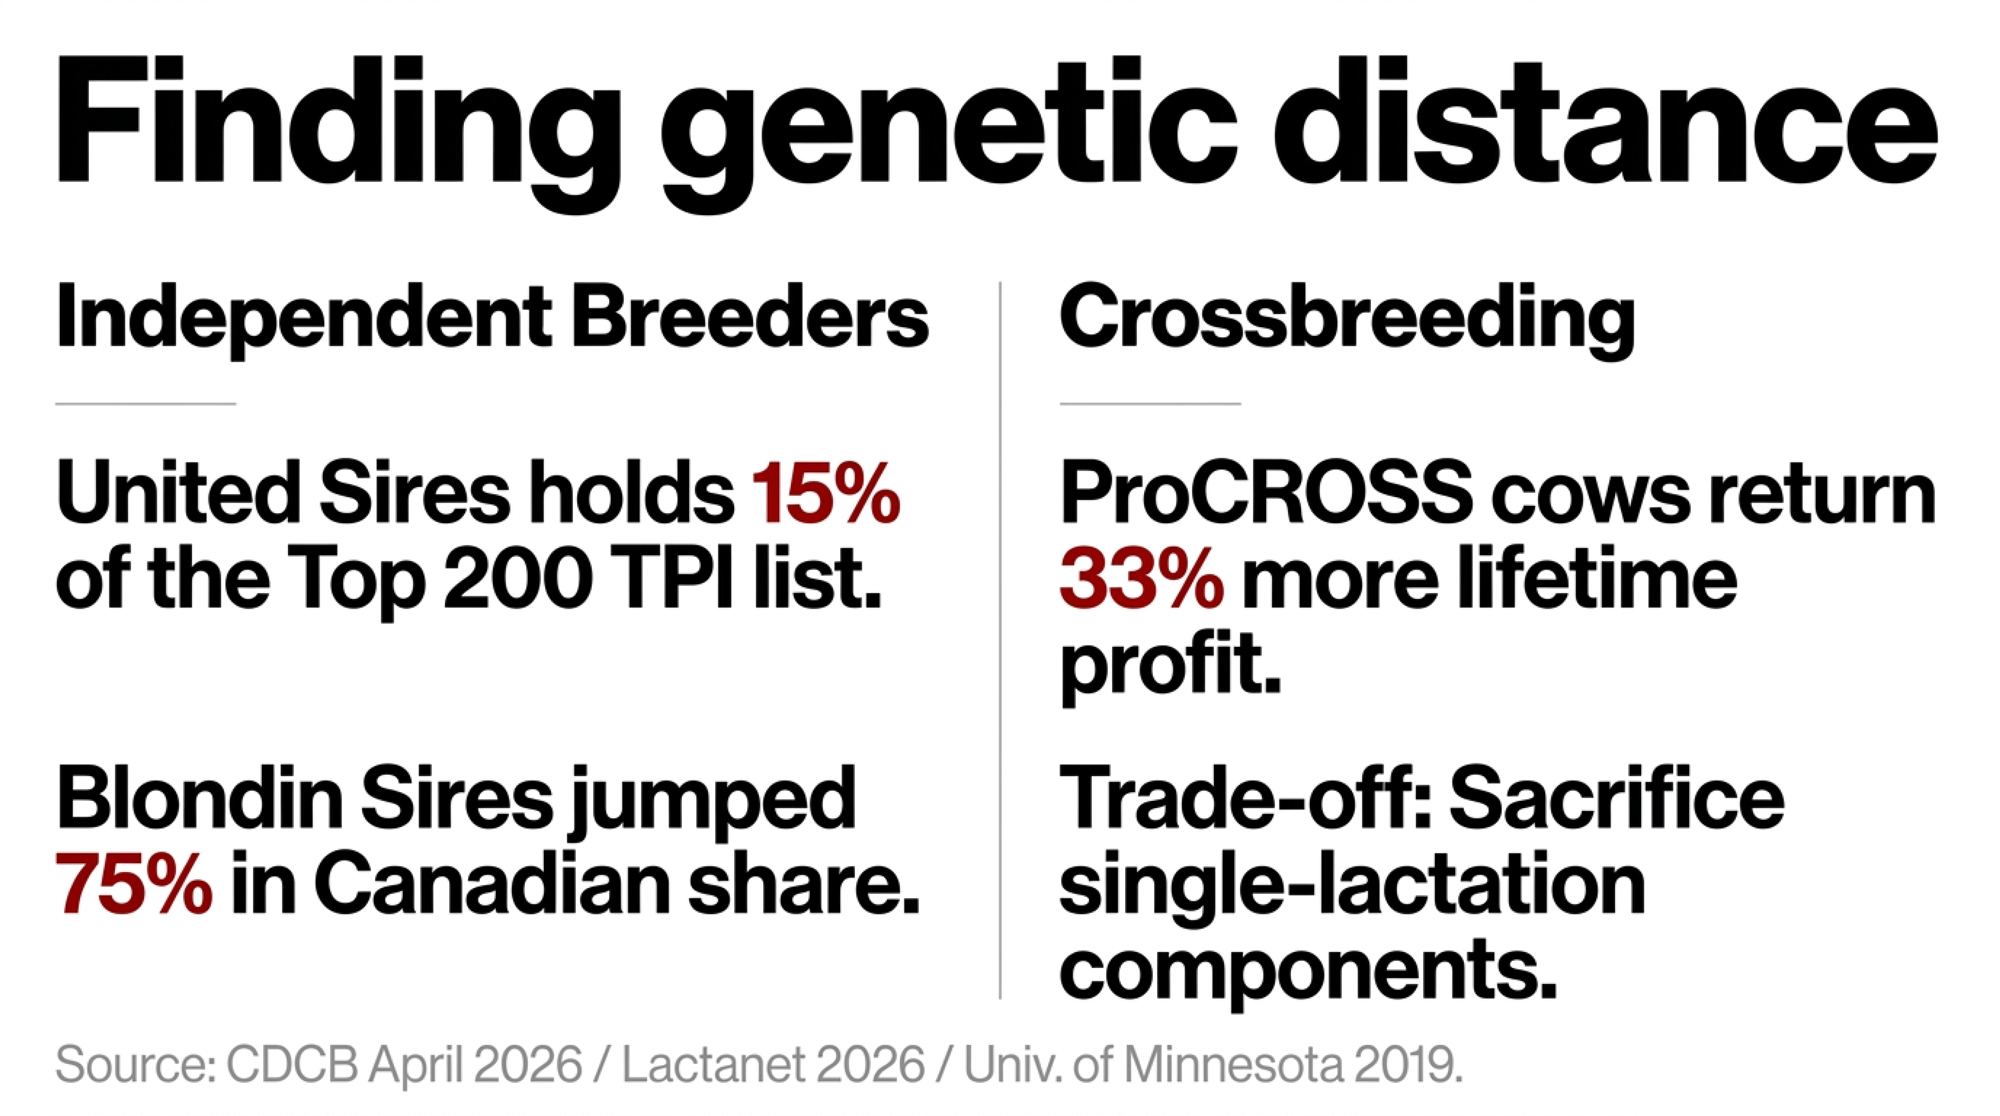
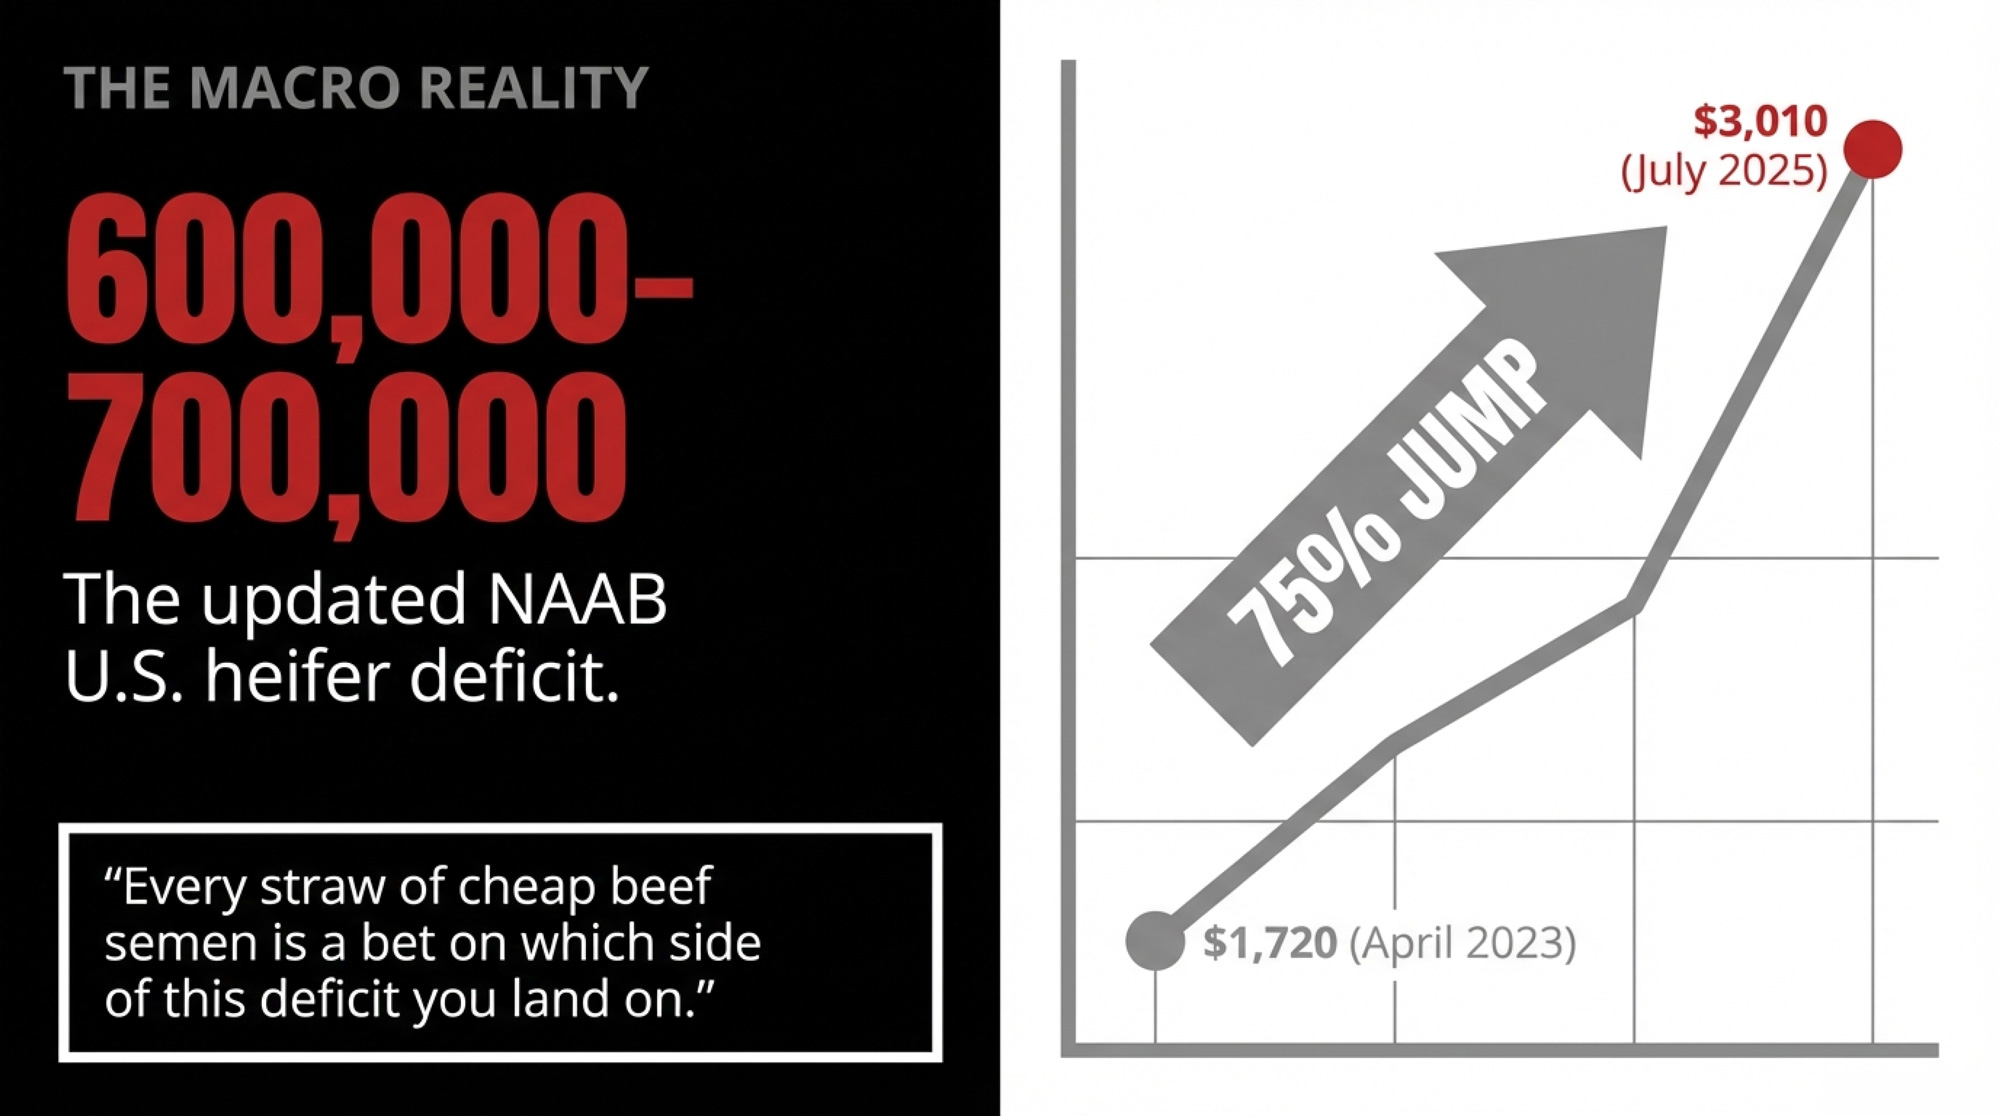
One route stays inside the breed, and there’s a working example of it in Quebec. Blondin Sires — NAAB code 799, owned by Simon Lalande, Dann Brady and Nicolas Lalande — grew its share of Canadian sire usage from 2.8% in 2022 to 4.9% in 2023, a 75% jump in one year per Lactanet market data reported by The Bullvine in February 2026. The pitch is separation from the mainstream stack while staying Holstein; they prioritize proven performance in both conformation and productio, and use different sires than those targeting the top TPI or NM$ lists.
Be sure to check out our article with Dann Brady and team on their breeding strategy tomorrow.
United Sires’ 15% share of the top 200 says there’s more room in that lane than the concentration story implies. The trade-off is real, though: independent-sourced bulls may carry lower reliability figures, and you’re still drawing from a gene pool whose effective size sits under the FAO line.
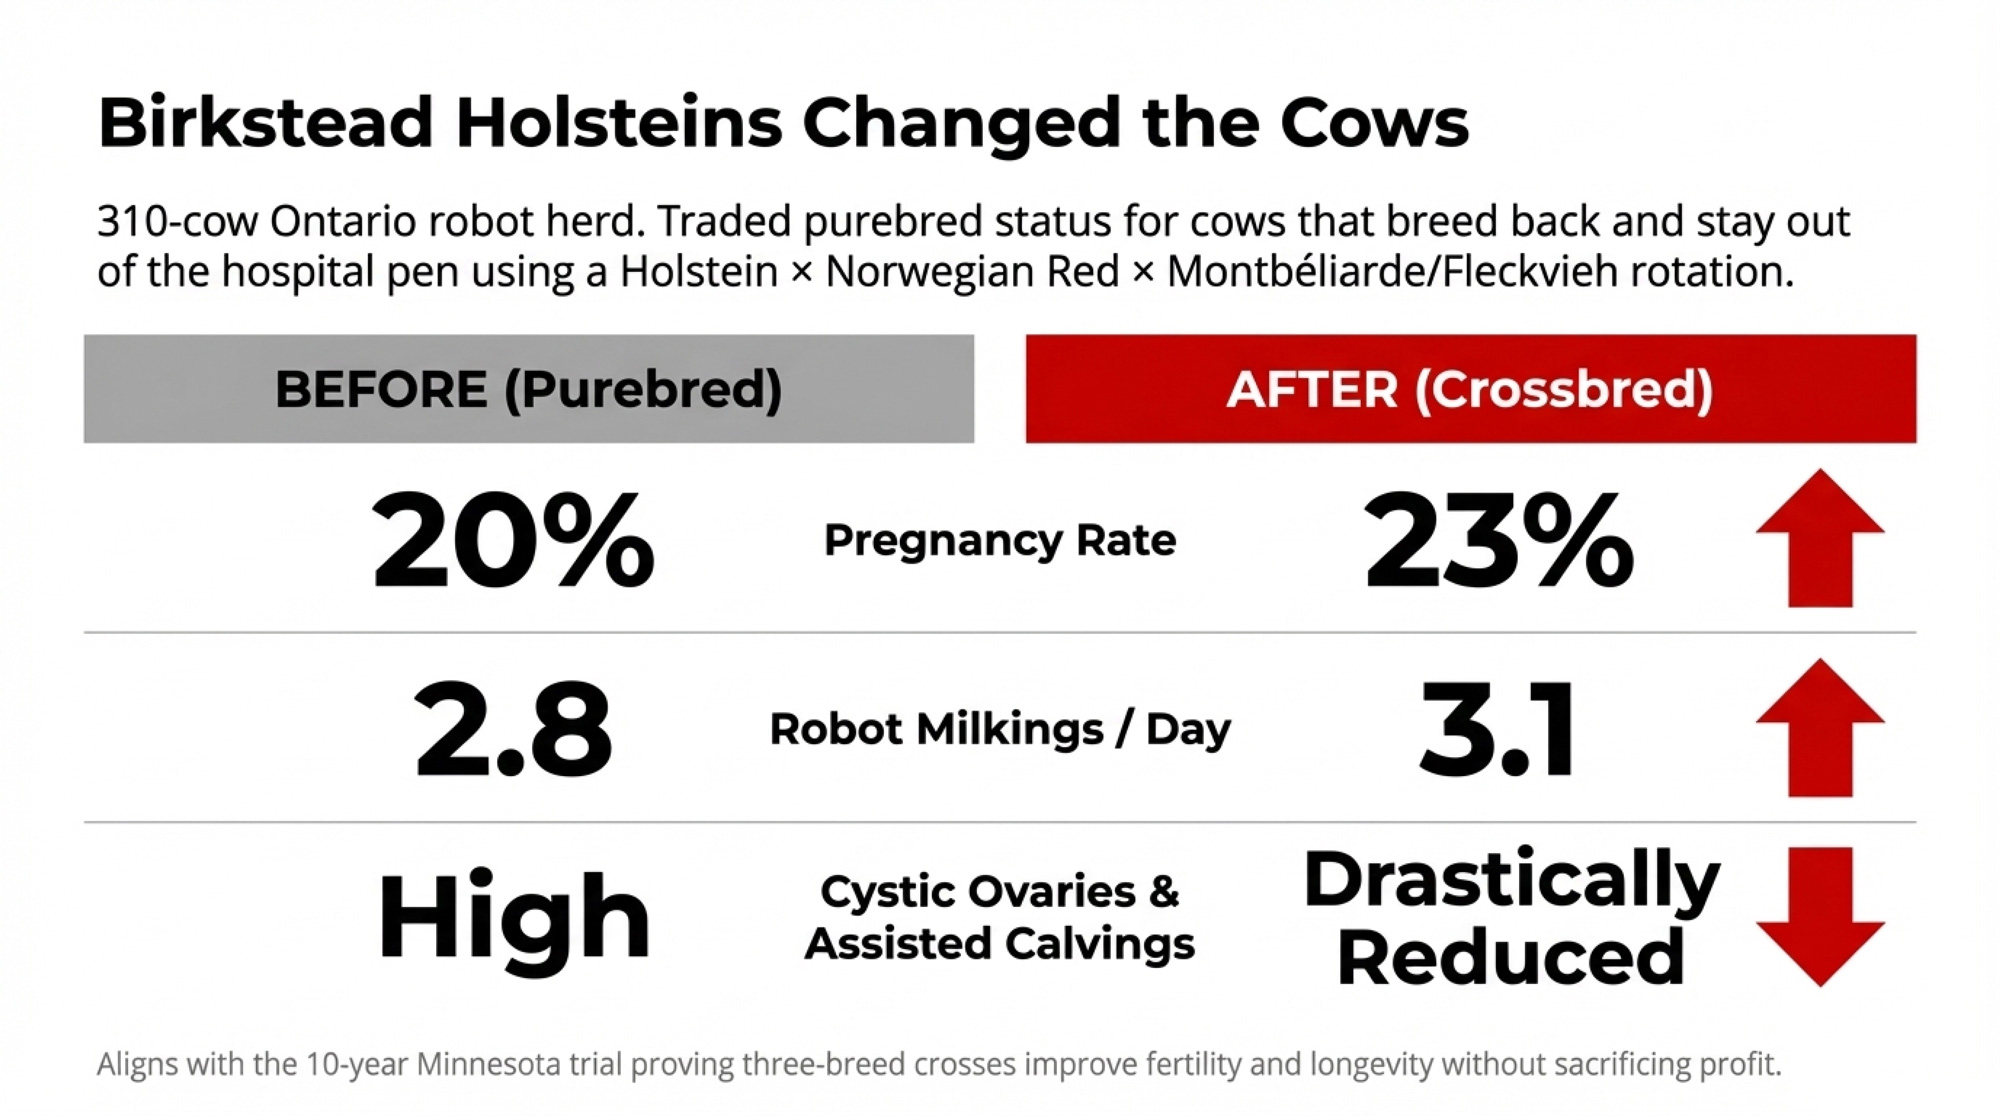
Going across breeds has a decade of peer-reviewed production data behind it. VikingGenetics’ ProCROSS rotates VikingHolstein, VikingRed and Coopex Montbéliarde, and a ten-year University of Minnesota study led by Les Hansen with Amy Hazel and Brad Heins measured it in high-performance Minnesota herds. ProCROSS cows returned 33% more lifetime profit and more daily profit — 13% for two-breed crosses, 9% for three-breed. Forty-one percent reached a fourth lactation against 21% of the Holsteins.
They also stayed 147 days longer, though Hansen’s own conference presentation of the combined two- and three-breed groups puts that at 153. Conception rate to first service in second and third lactation ran 45% against the Holsteins’ 35% — 1.9 services instead of 2.4. Health treatment costs came in 23% lower for two-breed crossbreds and 17% lower for three-breed across their lifetimes, with cull value 16% higher.
What does all that do to income over feed cost? Shonka-Martin and colleagues published twice in the Journal of Dairy Science in 2019, and the numbers favour the crossbreds. First-lactation crossbreds ate 2,807 kg (6,189 lbs) of dry matter over 4 to 150 days in milk against the Holsteins’ 2,948 kg (6,499 lbs) — about 5% less — with a further 6.5% reduction later while producing the same fat plus protein. Income over feed cost ran $0.34 to $0.60 higher per cow per day.
Read the inbreeding claim carefully, though. VikingGenetics’ ProCROSS material tells producers there are “no worries about inbreeding,” and for the crossbred animal in front of you that’s essentially right — heterosis does the work. It doesn’t mean the source populations are exempt. “No worries” is marketing shorthand, and the company’s own researchers documented real pressure on those source populations. They documented it in a peer-reviewed journal, which is the opposite of hiding it.
The component question depends entirely on your basis, and this is where a lot of crossbreeding arguments go sideways. On a single 305-day lactation, crossbreds produced less fat plus protein than purebred Holsteins in the Minnesota work — 24 kg (53 lbs) less for Montbéliarde crosses, 29 kg (64 lbs) less for Scandinavian Red. Across a lifetime the picture flips: daily fat plus protein ran 1% higher for two-breed crossbreds and 1% lower for three-breed, because they stuck around long enough to make it up. A rotation is also a multi-year commitment you can’t reverse next season, and crossbred replacements are harder to move if you sell breeding stock.
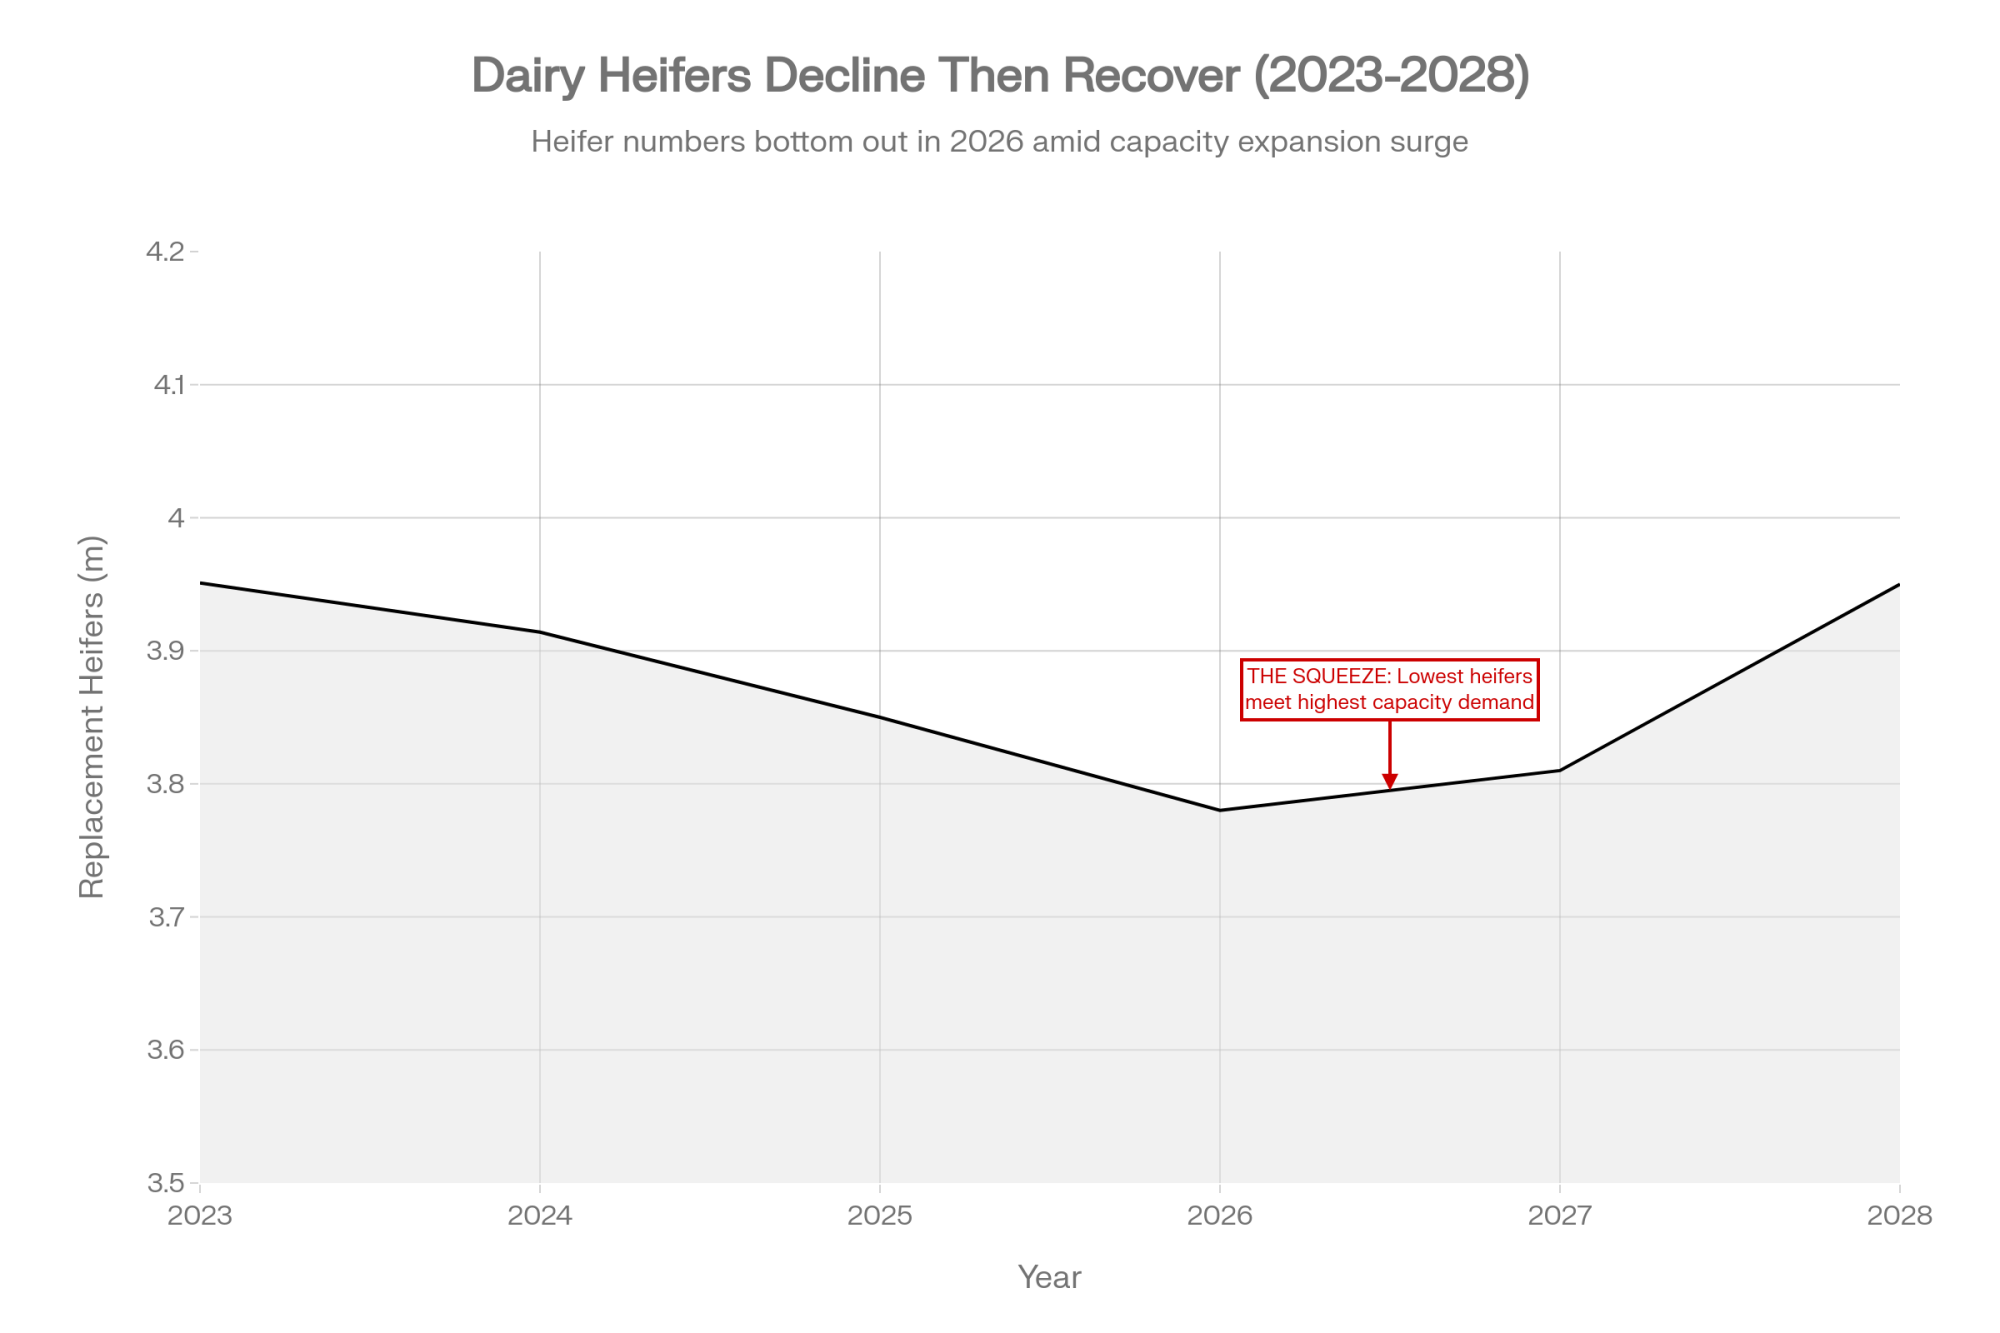
Then weigh all of it against a replacement market that punishes mistakes. USDA put the U.S. national average for milk cows sold as dairy herd replacements at $3,130 per head in April 2026, up from $2,980 in January and $2,860 a year earlier — 5% on the quarter, 9% on the year. USDA NASS put milk replacement heifer inventory at 3.90 million headon January 1, 2026, down slightly from the prior year. Fixing a genetic misstep costs more than it did two years ago, which argues for care in both directions.
Your Pre-Breeding Action Checklist
Pull your inbreeding report in the next 30 days. Run your last three years of sire selections through the Lactanet Inbreeding Calculator or your CDCB-linked mating program and count how many trace to a shared maternal grandsire. A few hours of records work, no new spend, before breeding starts.
Run both measures on the same animals, then move your matings to the genomic one. Ablondi’s cows read 7% on pedigree and 16% on genomics, and the depression tracked the bigger figure — 61 kg per point against 44. If you’ve never seen your own two numbers side by side, you don’t know which one your program has been deciding from.
If more than two of your last ten sire picks share a maternal grandsire, raise it with your mating consultant. Editorial rule of thumb, not a published standard — no threshold defines “too much overlap” at herd level, so you’re setting a baseline rather than measuring against one.
Check whether your TPI cutoff still means what it meant last year. The April 2026 formula change moved bulls up to 125 points without new daughter data. If your program screens on a fixed threshold, some sires dropped off your list on arithmetic alone.
Run Pryce’s scaling on your own rolling herd average — 0.4 to 0.6% per point of inbreeding, rather than borrowing an Italian or Dutch figure measured on a different population. At the U.S. rate, a decade costs a 12,000 kg herd 170 to 260 kg per cow per lactation. Multiply your own average by 1.4% to 2.2% to get your version.
Ask your supplier for its sourcing split at proof-run specificity, then log the answer or the non-answer. Not proof of anything on its own — but a pattern across several suppliers should shape how much of your lineup comes from one place. Select Sires has published 40% and put an executive on tape saying it; the others haven’t.
Before you compare any crossbreeding numbers, establish the basis. Single-lactation and lifetime daily figures point opposite directions on components: 24 to 29 kg less fat plus protein in one lactation, 1% more across a lifetime. Quoting one while meaning the other is the most common way that pitch gets made.
Price stillbirth rate as an inbreeding cost, not a calving-management line item. Bjelland’s work puts it in the first column.
Between 2000 and 2009 the industry drove Holstein rate of inbreeding down to 0.37% per generation and pushed Ne up to roughly 135, using optimum contribution selection, expected future inbreeding, and publicly posted relationship values. Those tools worked. Then genomic selection outran them, and they’re still sitting there unused at scale.
The measurement problem is the cheaper of the two fixes. Nobody has to build an origin database or rewrite an index for you to run both numbers on your own females and see which one your matings have been following. Ablondi’s team needed 84,443 markers and 939 herds to prove it at breed scale. You need an afternoon and a report you’re already paying for. The question is whether you’ll like what it says — and whether you’d breed differently if someone finally published where those bulls came from.
Run Your Numbers
Genomic Testing ROI Calculator — This article says pedigree reads low and only genomics shows the real number. The calculator prices what testing is worth on your farm, and flags the families where inbreeding risk needs tighter control. Run the conservative scenario first.
Methodology note: The 7% and 16% figures in this article’s headline are the pedigree and genomic inbreeding averages for Ablondi’s Italian Holstein population and are not presented as a universal read on any individual herd; the size of the divergence depends on pedigree completeness and recent breeding patterns. Nucleus program descriptions and dates are self-reported or from trade media: Select Sires ART (company history page, January 4, 2024 blog post, and a July 2025 Select Sires podcast interview with ART program manager Mark Kerndt, in which the roughly 40% figure refers to bulls sampled each year); PEAK (2012 program start, though official as PEAK in 2018); Semex Progenesis (company pages, founded 2013); ABS Global (company history, first commercial units 2015). USDA-AIPL published the first official U.S. genomic evaluations in January 2009; CDCB assumed responsibility for U.S. genetic evaluations in 2013. Only Select Sires has published a proportional sourcing split.
Stud-share counts are The Bullvine’s own independent count of the Holstein Association USA Top 200 TPI Genomic Young Bulls list, April 2026 (85% genomic reliability minimum), drawn from the CDCB run published April 7, 2026, with stud assignment by the official NAAB marketing codes table. The April run is cited rather than a later one because Holstein Association USA implemented a TPI formula change in that run, moving production weights from 19% PTA Protein and 19% PTA Fat to 24% PTA Protein and 14% PTA Fat; individual bulls moved up to 125 TPI points with no new daughter data, so April 2026 shares are not comparable to earlier runs and represent the first post-change snapshot. An August 2026 list has since been published and current shares will differ. United Sires, LLC (NAAB 596/796) registered with NAAB on February 8, 2024. Blondin Sires Inc. (NAAB 799, St. Placide, Quebec) is owned by Simon Lalande, Dann Brady and Nicolas Lalande.
Italian figures: Ablondi, M., A. Summer, G. Stocco, R. Finocchiaro, J.-T. van Kaam, M. Cassandro, C. Dadousis, A. Sabbioni and C. Cipolat-Gotet, Journal of Animal Science 101:skad382 (2023), doi:10.1093/jas/skad382 — 27,735 cows, 939 herds, 84,443 autosomal SNPs, 24 generations of pedigree depth. The 2.35% five-year rate is drawn from Ablondi et al. (2022) and the +415 kg realized progress from ANAFIBJ (2023). Three co-authors are affiliated with ANAFIBJ, which supplied the data and part-funded the work; the authors declare no conflicts of interest. The Parmigiano Reggiano comparison appears in Results and Discussion, using 24-month-aged wheel prices per CLAL (2022), and reflects the difference between the most and least inbred 5% of cows — not a typical per-cow loss. USD and CAD equivalents are editorial conversions at approximately €1 = $1.16 USD and €1 = $1.60 CAD as of September 3, 2026; because the underlying euro figure derives from 2022 cheese prices, the conversion is indicative of present-day value rather than a 2022 dollar equivalent.
Other depression studies use different lactation bases and are not directly interchangeable. Doekes, H.P. et al., Genetics Selection Evolution 51:54 (2019), doi:10.1186/s12711-019-0497-z. Bjelland, D.W., K.A. Weigel, N. Vukasinovic and J.D. Nkrumah, Journal of Dairy Science 96(7):4697–4706 (2013), doi:10.3168/jds.2012-6435 — 205-day, not 305-day. Pryce, J.E., M. Haile-Mariam, M.E. Goddard and B.J. Hayes, Genetics Selection Evolution 46:71 (2014), doi:10.1186/s12711-014-0071-7.
North American population figures: Makanjuola, B.O. et al., Journal of Dairy Science (2020), doi:10.3168/jds.2019-18013 — 676,594 Holstein and 304,676 Jersey pedigree records from the Canadian Dairy Network. Genomic-era Ne is derived from the paper’s reported 1.19–2.06% rate of inbreeding per generation using Ne = 1/(2ΔF), which is why it is reported here as a range rather than a point estimate; an earlier ADSA abstract from the same group reported 30 to 48, differing from the published paper. FAO critical Ne of 50 cited therein (FAO, 2015). Nordic figures: Tenhunen, S., J.R. Thomasen, L.P. Sørensen, P. Berg and M. Kargo, Journal of Dairy Science 107(8):5897–5912 (2024), doi:10.3168/jds.2023-24553; four of five authors are affiliated with VikingGenetics, and the study is open access and peer-reviewed. Methods and periods differ between Makanjuola and Tenhunen, so comparisons are directional.
Generation interval: Guinan, F.L. et al., Journal of Dairy Science 106(2):1110–1129 (2023), doi:10.3168/jds.2022-22205, with corrigendum; figures are for the sire-of-bulls pathway. García-Ruiz et al., PNAS 113(28) (2016), independently found that interval falling from roughly 7 years to under 2.5 between 1975 and 2015. U.S. inbreeding rates: Steyn, Y. et al., Journal of Dairy Science 105(12):9810–9821 (2022), doi:10.3168/jds.2022-22143, citing CDCB (2021).
Crossbreeding: ten-year University of Minnesota study of high-performance Minnesota herds led by L.B. Hansen with A.R. Hazel and B.J. Heins, published 2019. Single-lactation 305-day and lifetime daily component figures use different bases and are reported separately above. Shonka-Martin, B.N., A.R. Hazel, B.J. Heins and L.B. Hansen, Journal of Dairy Science 102:871–882 (2019), doi:10.3168/jds.2018-15318; and Shonka-Martin, B.N., B.J. Heins and L.B. Hansen, Journal of Dairy Science 102:3661–3673 (2019), doi:10.3168/jds.2018-15682. See also Hazel, A.R., B.J. Heins and L.B. Hansen, Journal of Dairy Science (2020). VikingGenetics’ “no worries about inbreeding” statement is a company marketing claim, not independently verified.
Mating programs: Sun, C., S. Westberry, D. Kendall and D. Castellani (STgenetics, Navasota, TX), ADSA Annual Meeting 2019, Abstract #365 — company-authored, not independently validated. Nucleus modelling: Dekkers and Shook, J. Dairy Sci. 73:1920 (1990). Replacement price: USDA, April 2026, U.S. national average with significant regional variation. Heifer inventory: USDA NASS Cattle, released January 30, 2026.
Stud Wars April 2026 — The Empire Strikes Back — Exposes how major studs and corporate lab mergers consolidate breeding power, revealing why formula shifts moved bulls 125 TPI points overnight without a single fresh daughter.
Every week, thousands of producers, breeders, and industry insiders open Bullvine Weekly for genetics insights, market shifts, and profit strategies they won’t find anywhere else. One email. Five minutes. Smarter decisions all week.
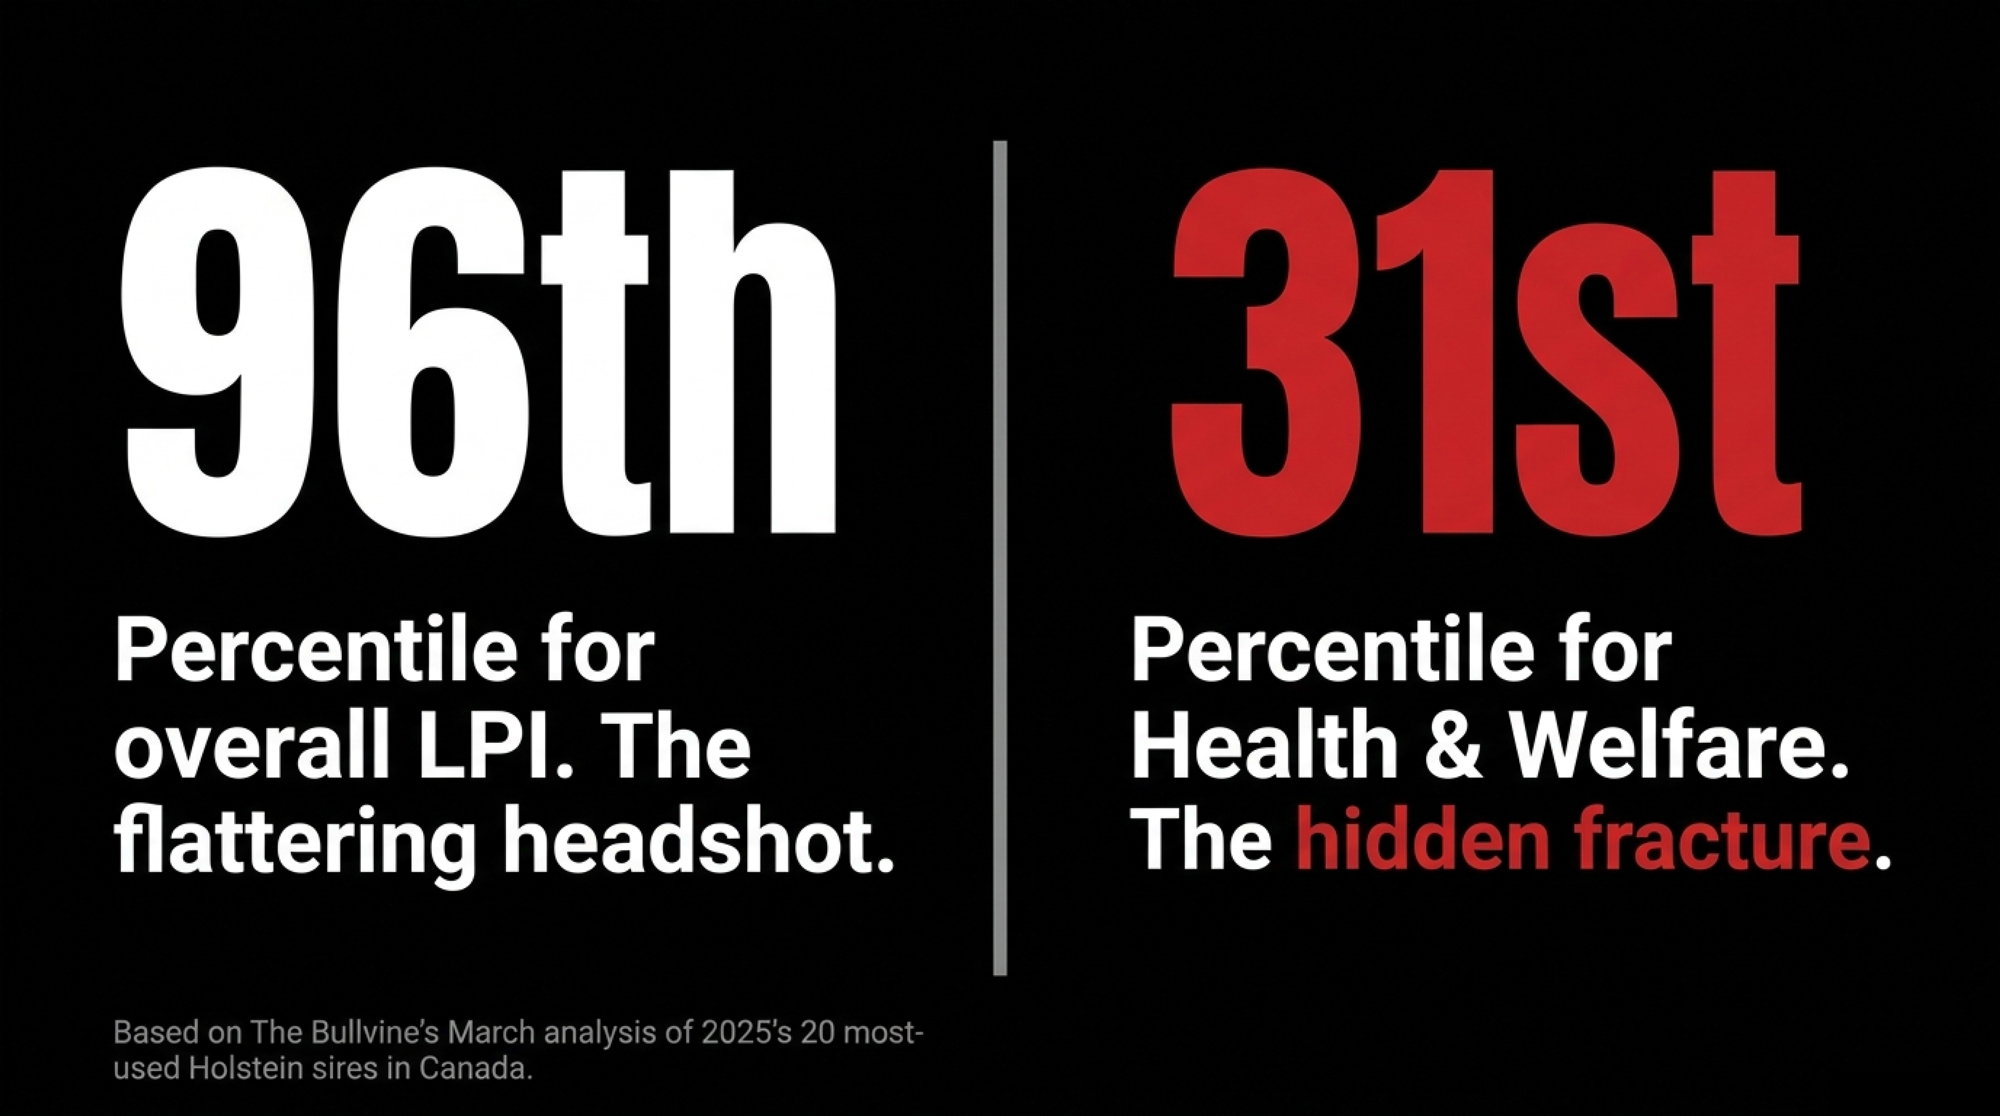
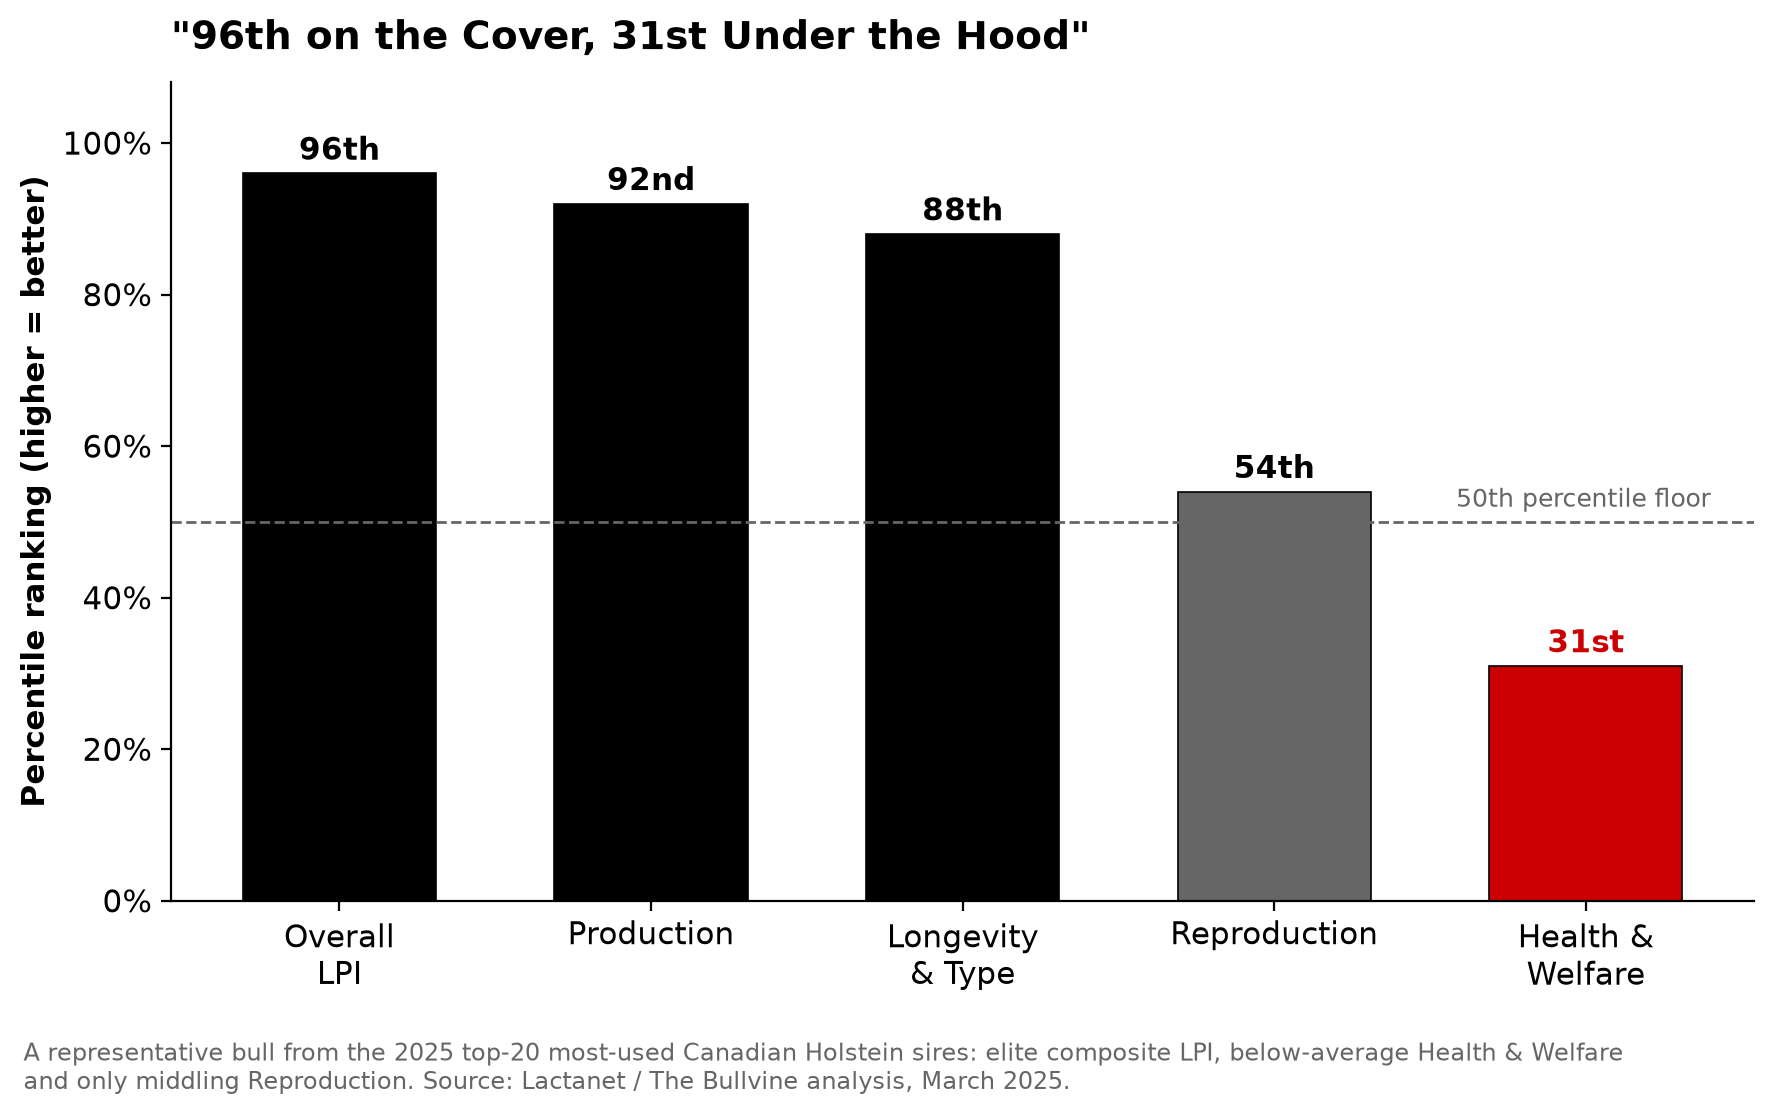
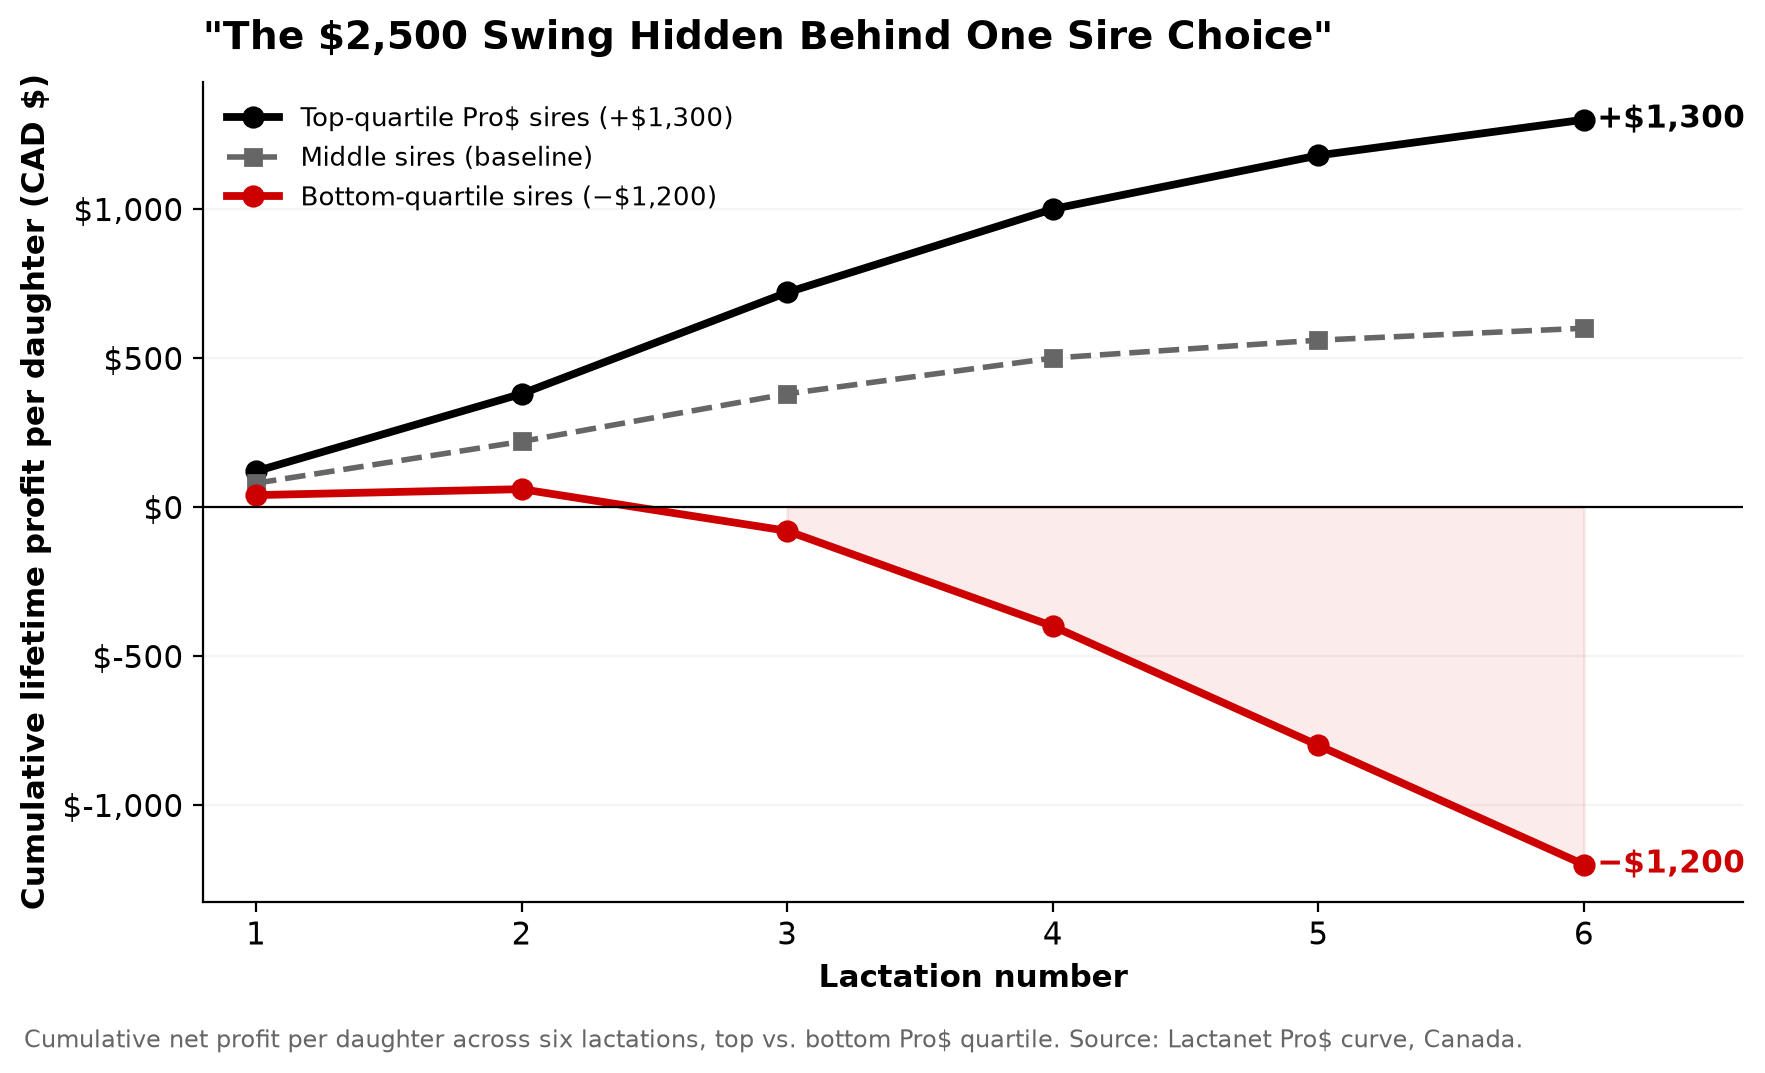
A 96th-percentile LPI bull can rank 31st for health — costing up to $1,300 a daughter in lifetime profit. Here is how taking two minutes with subindexes prevents a multi-generation mistake.
Back in 1970, for my Masters at Guelph under Ted Burnside, I built an index called the Production Dollar Difference Guide (PDDG). The idea was simple enough to fit on one line: measure, in real dollars, how much more profit a bull’s daughters would return over a lactation than an average cow. It became Canada’s first composite sire ranking index, and the profit thinking behind it is the same thinking that eventually produced today’s Pro$. But the arithmetic started earlier than any thesis — it started at my kitchen table, with a pencil and a stack of milk records from Huntsdale, asking which cows actually paid the bills and which bulls made more of them.
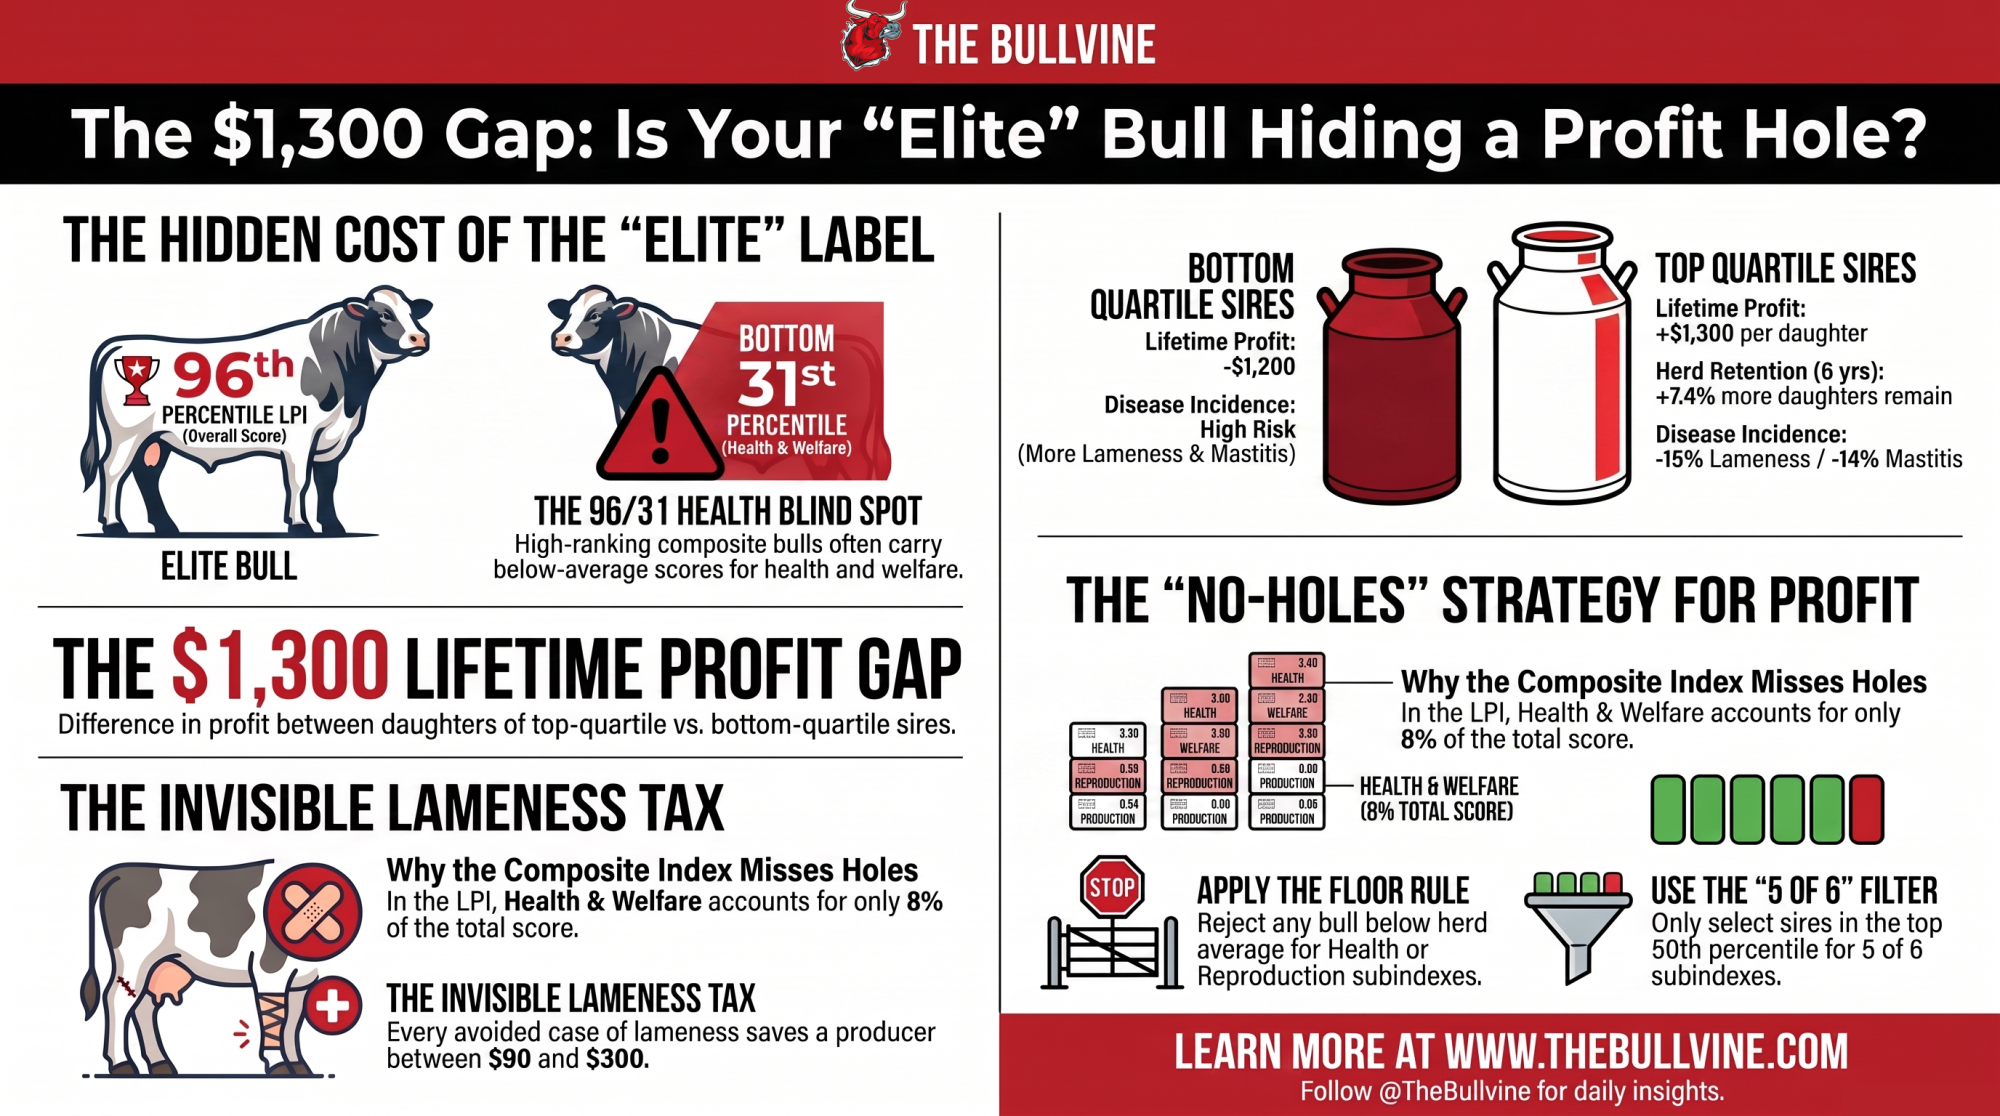
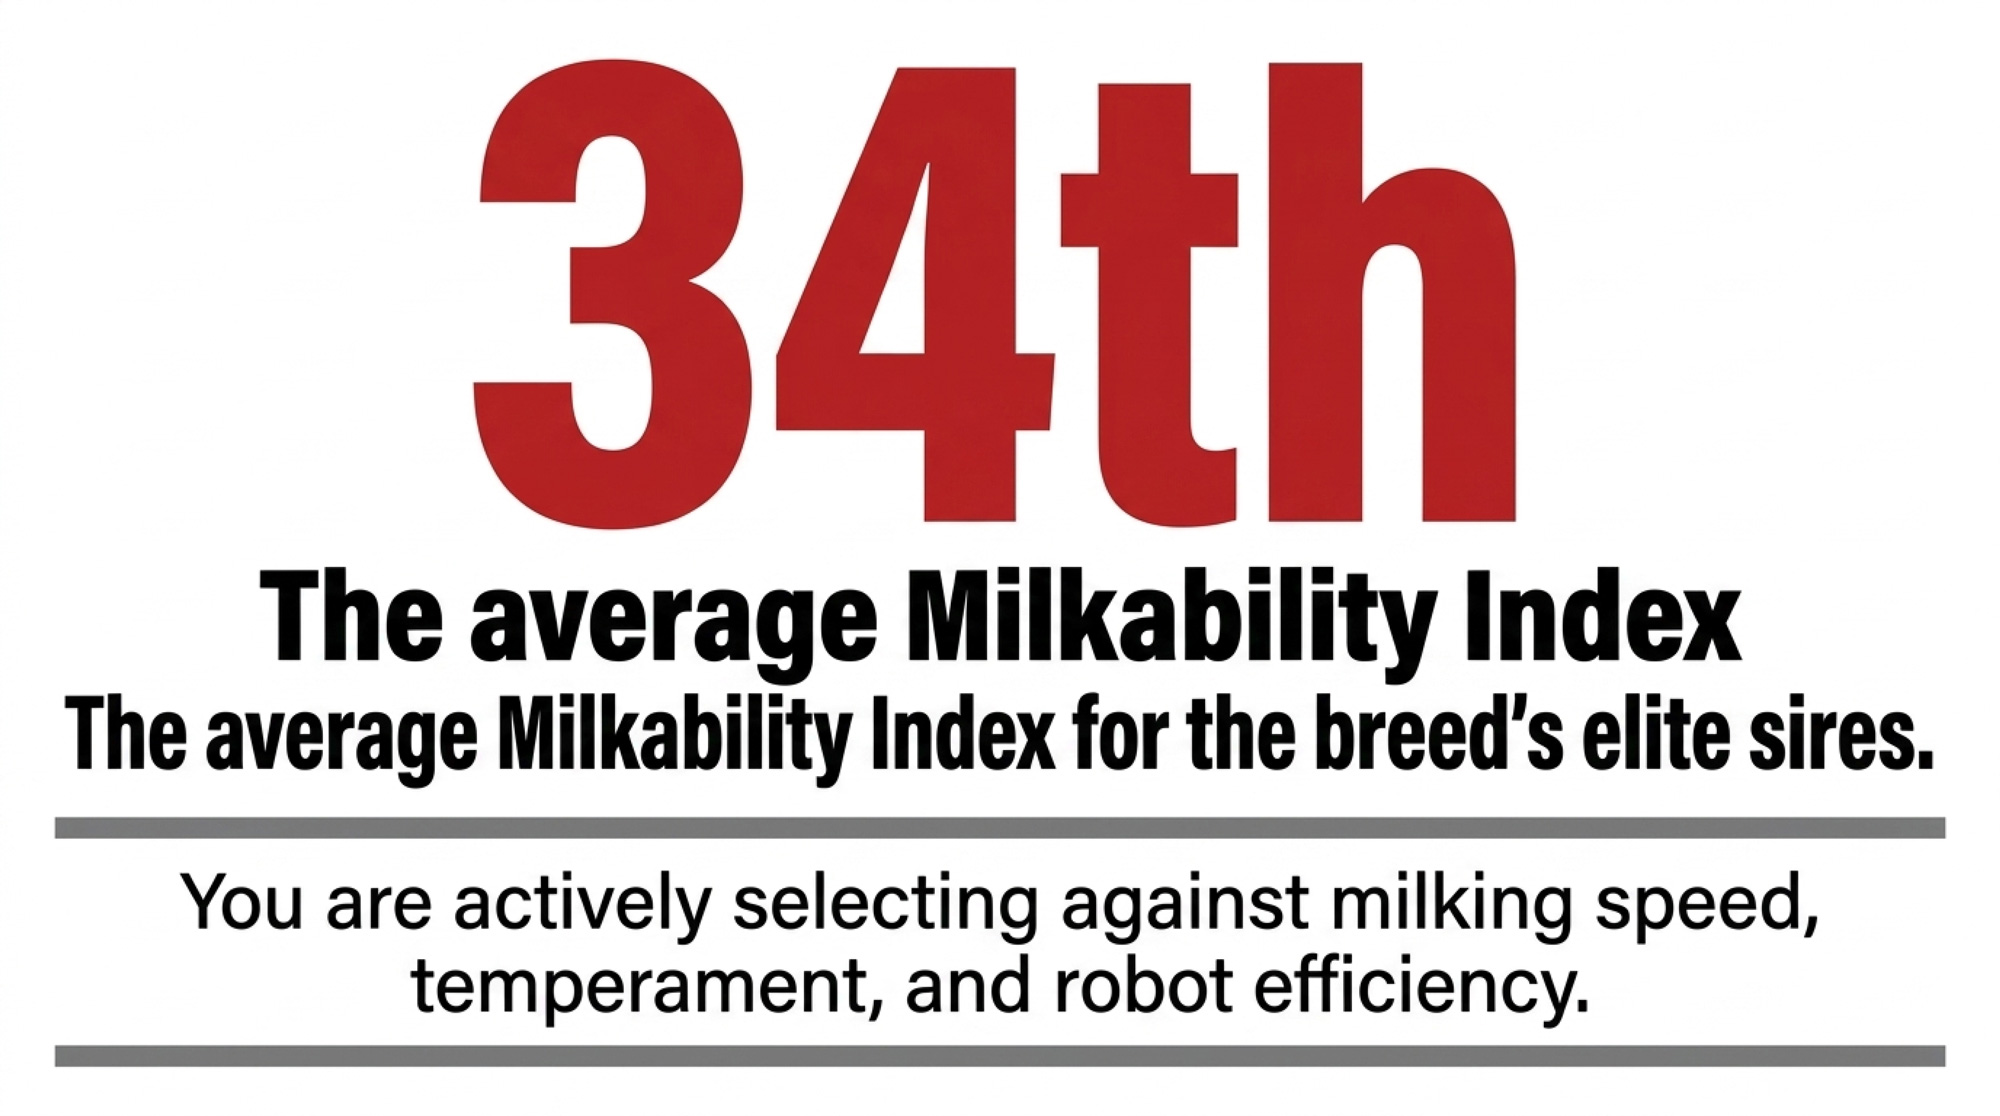
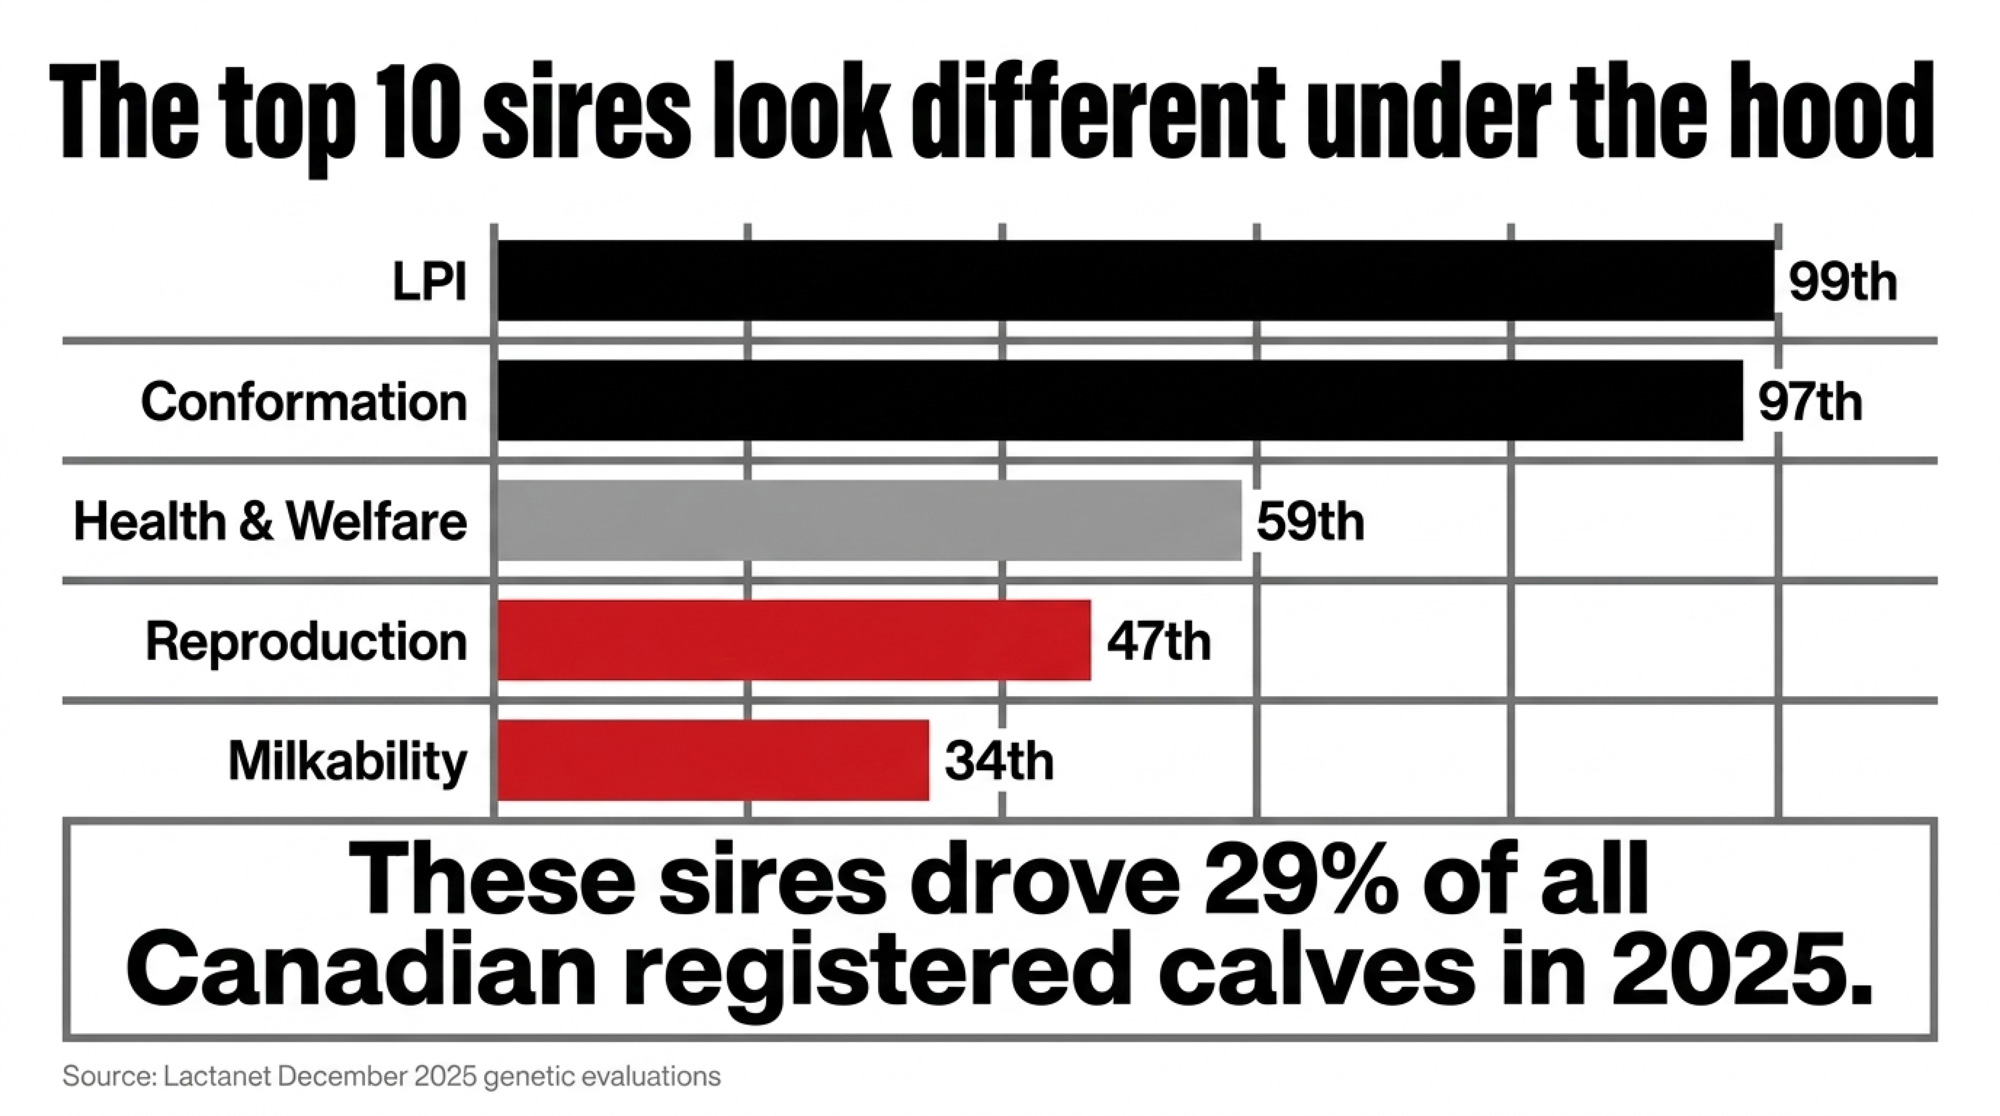
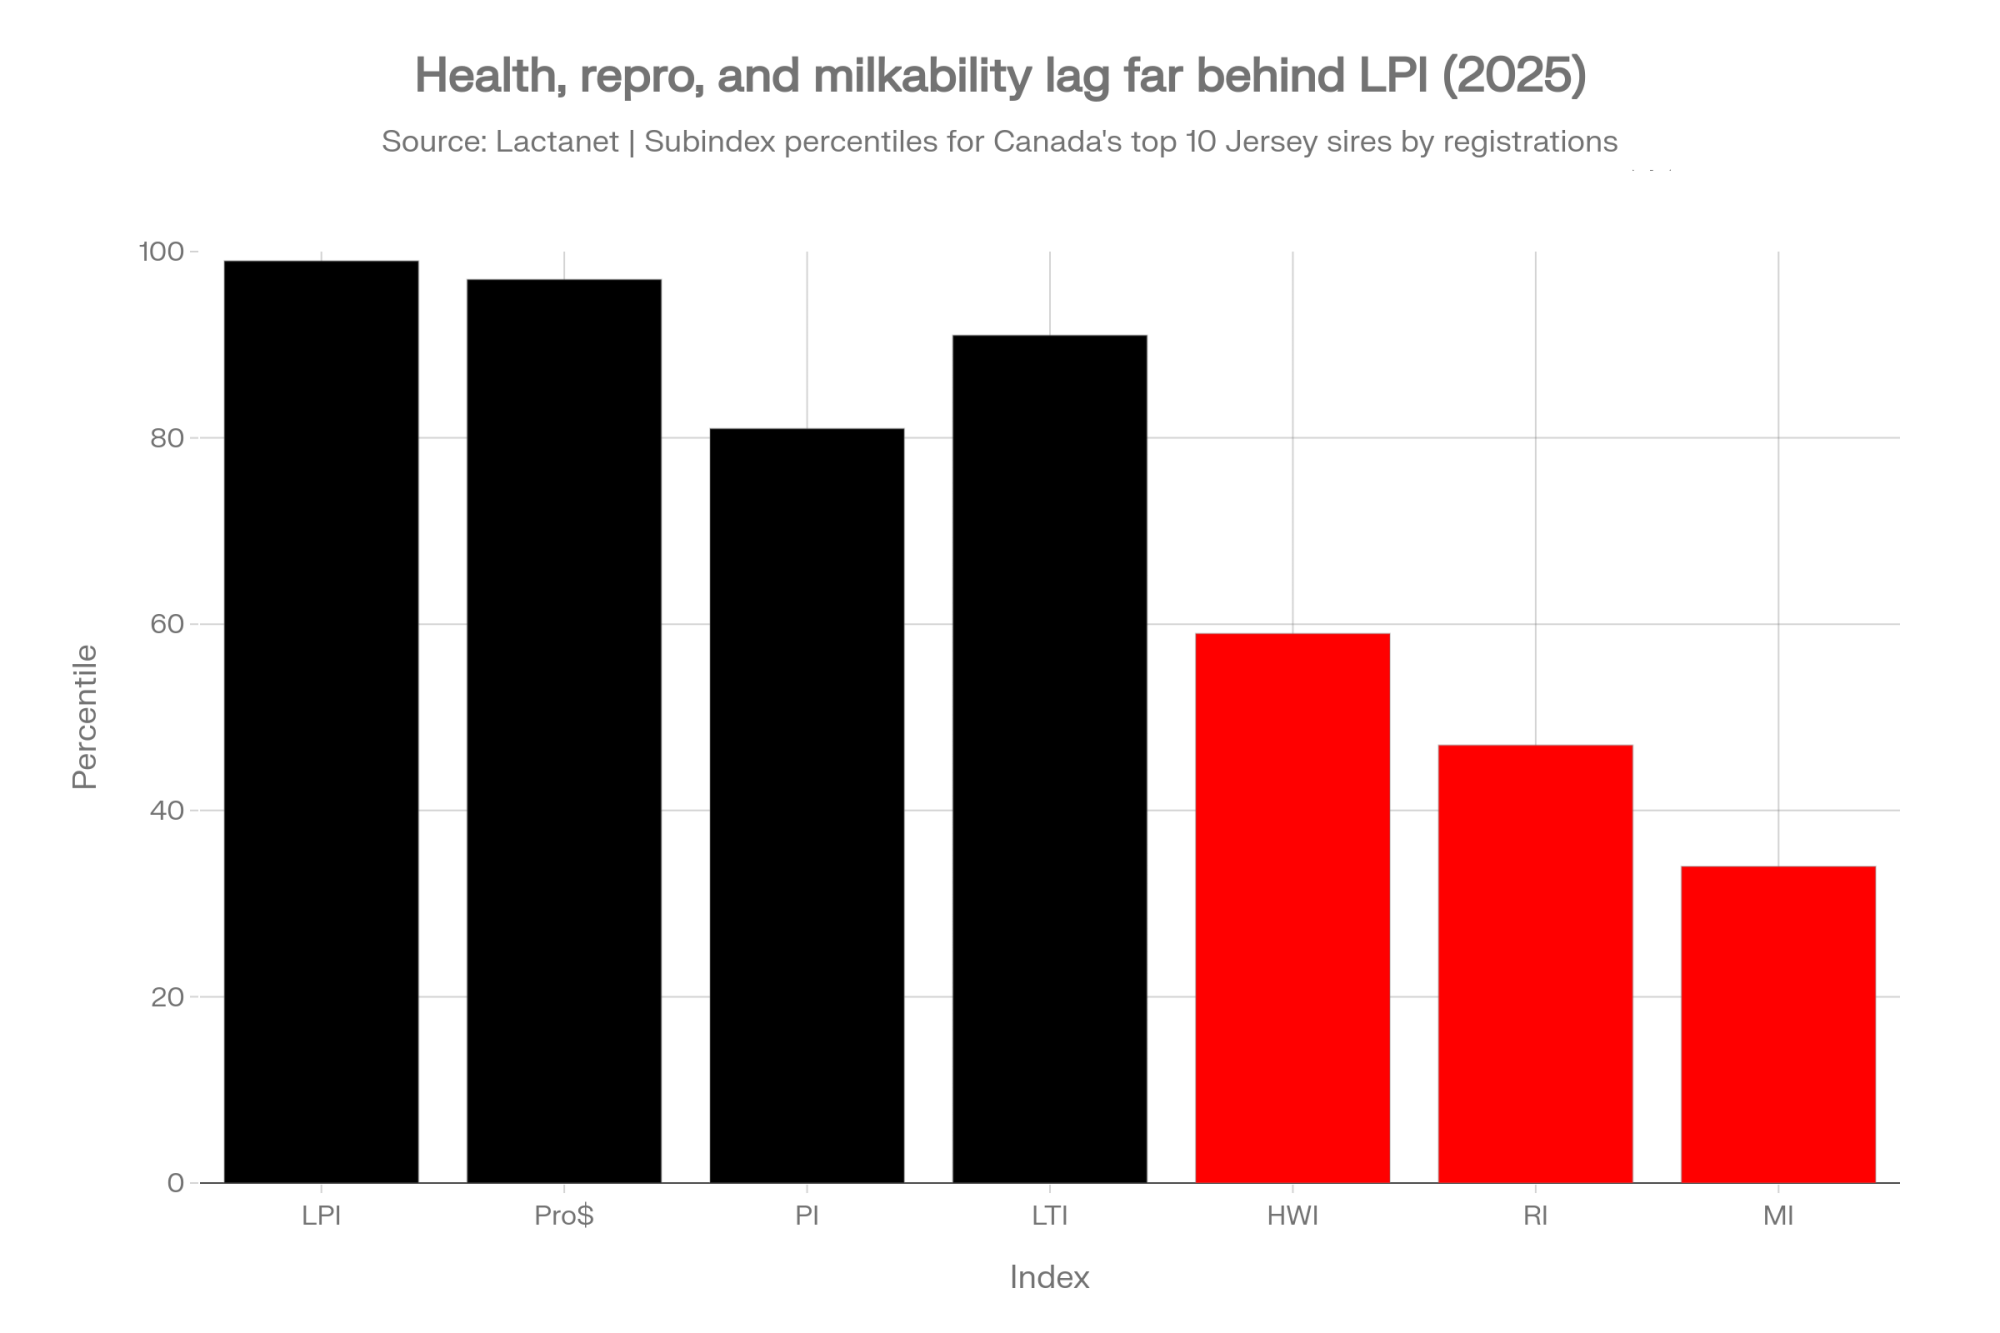
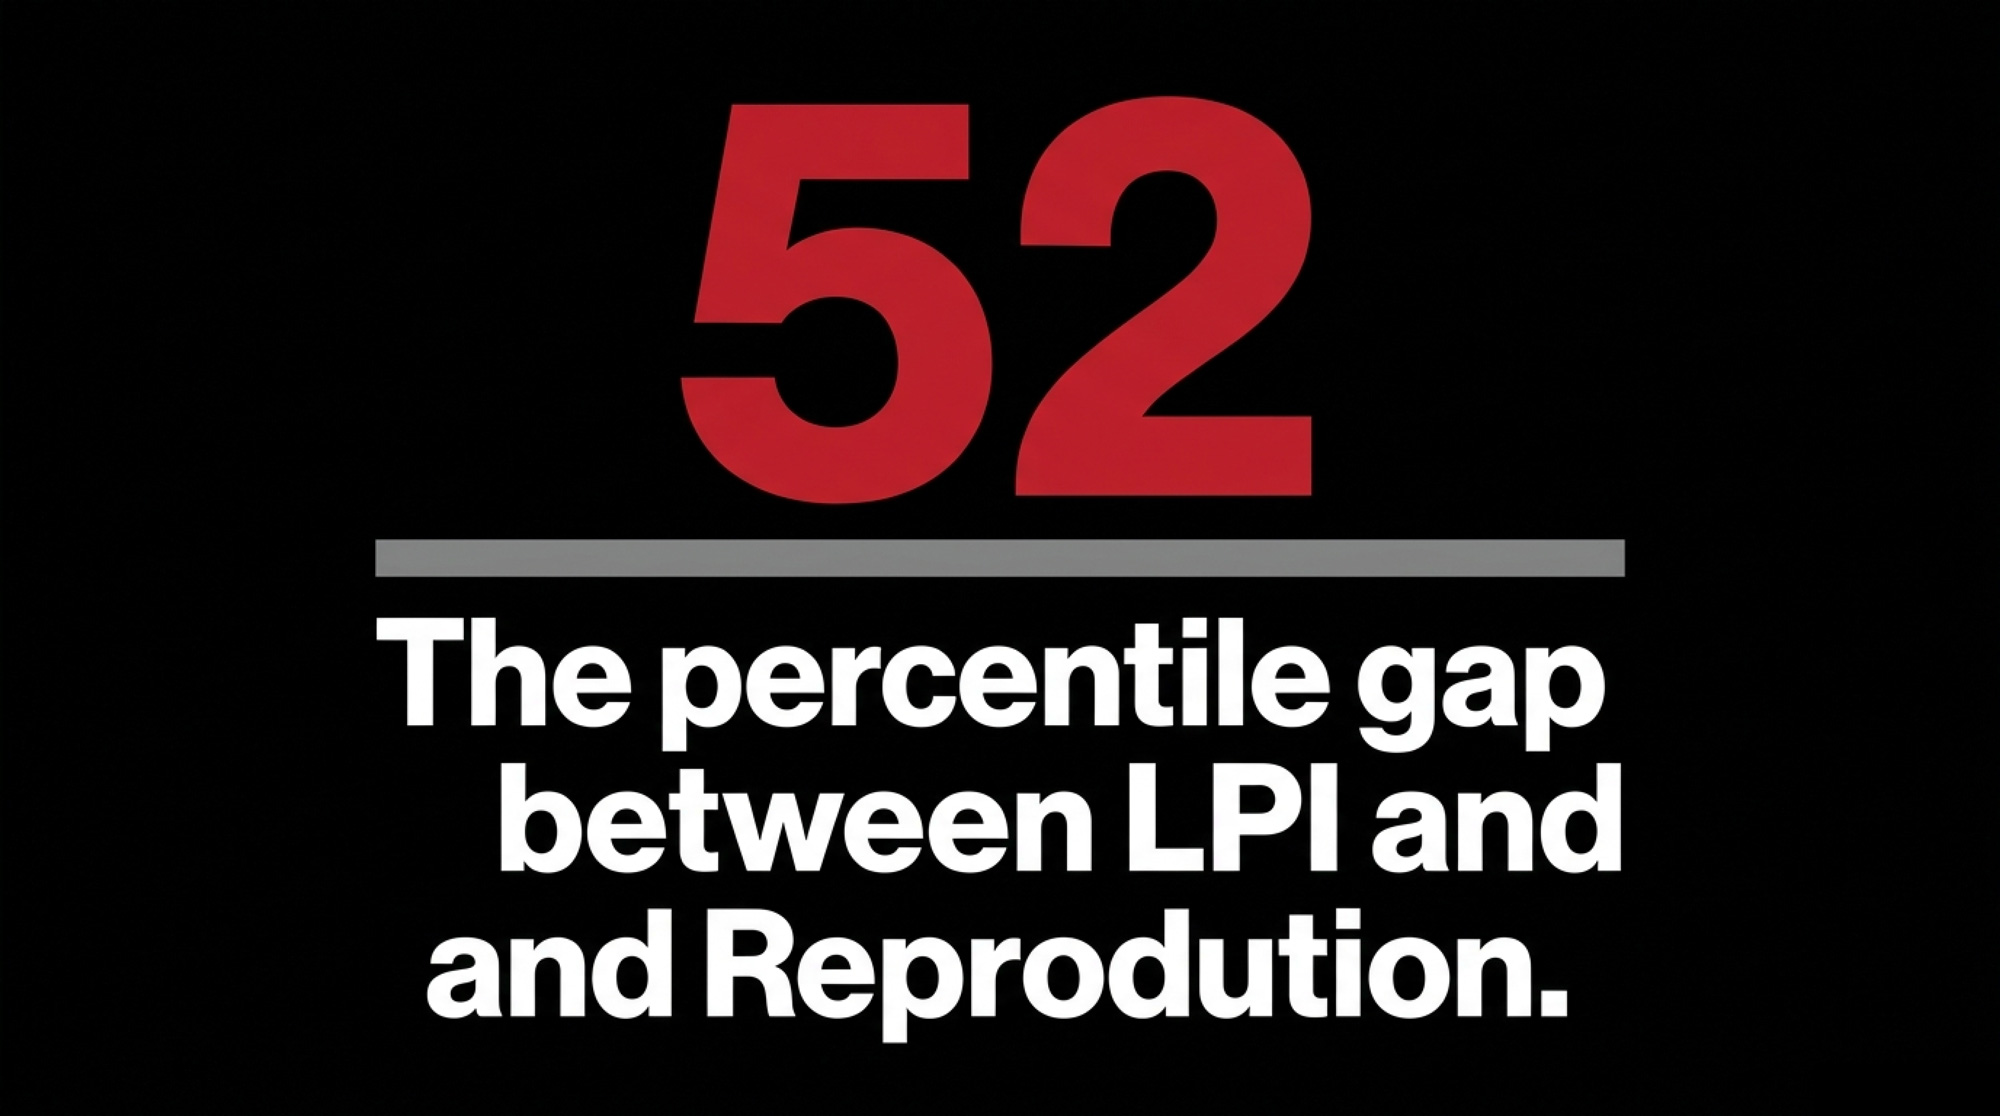
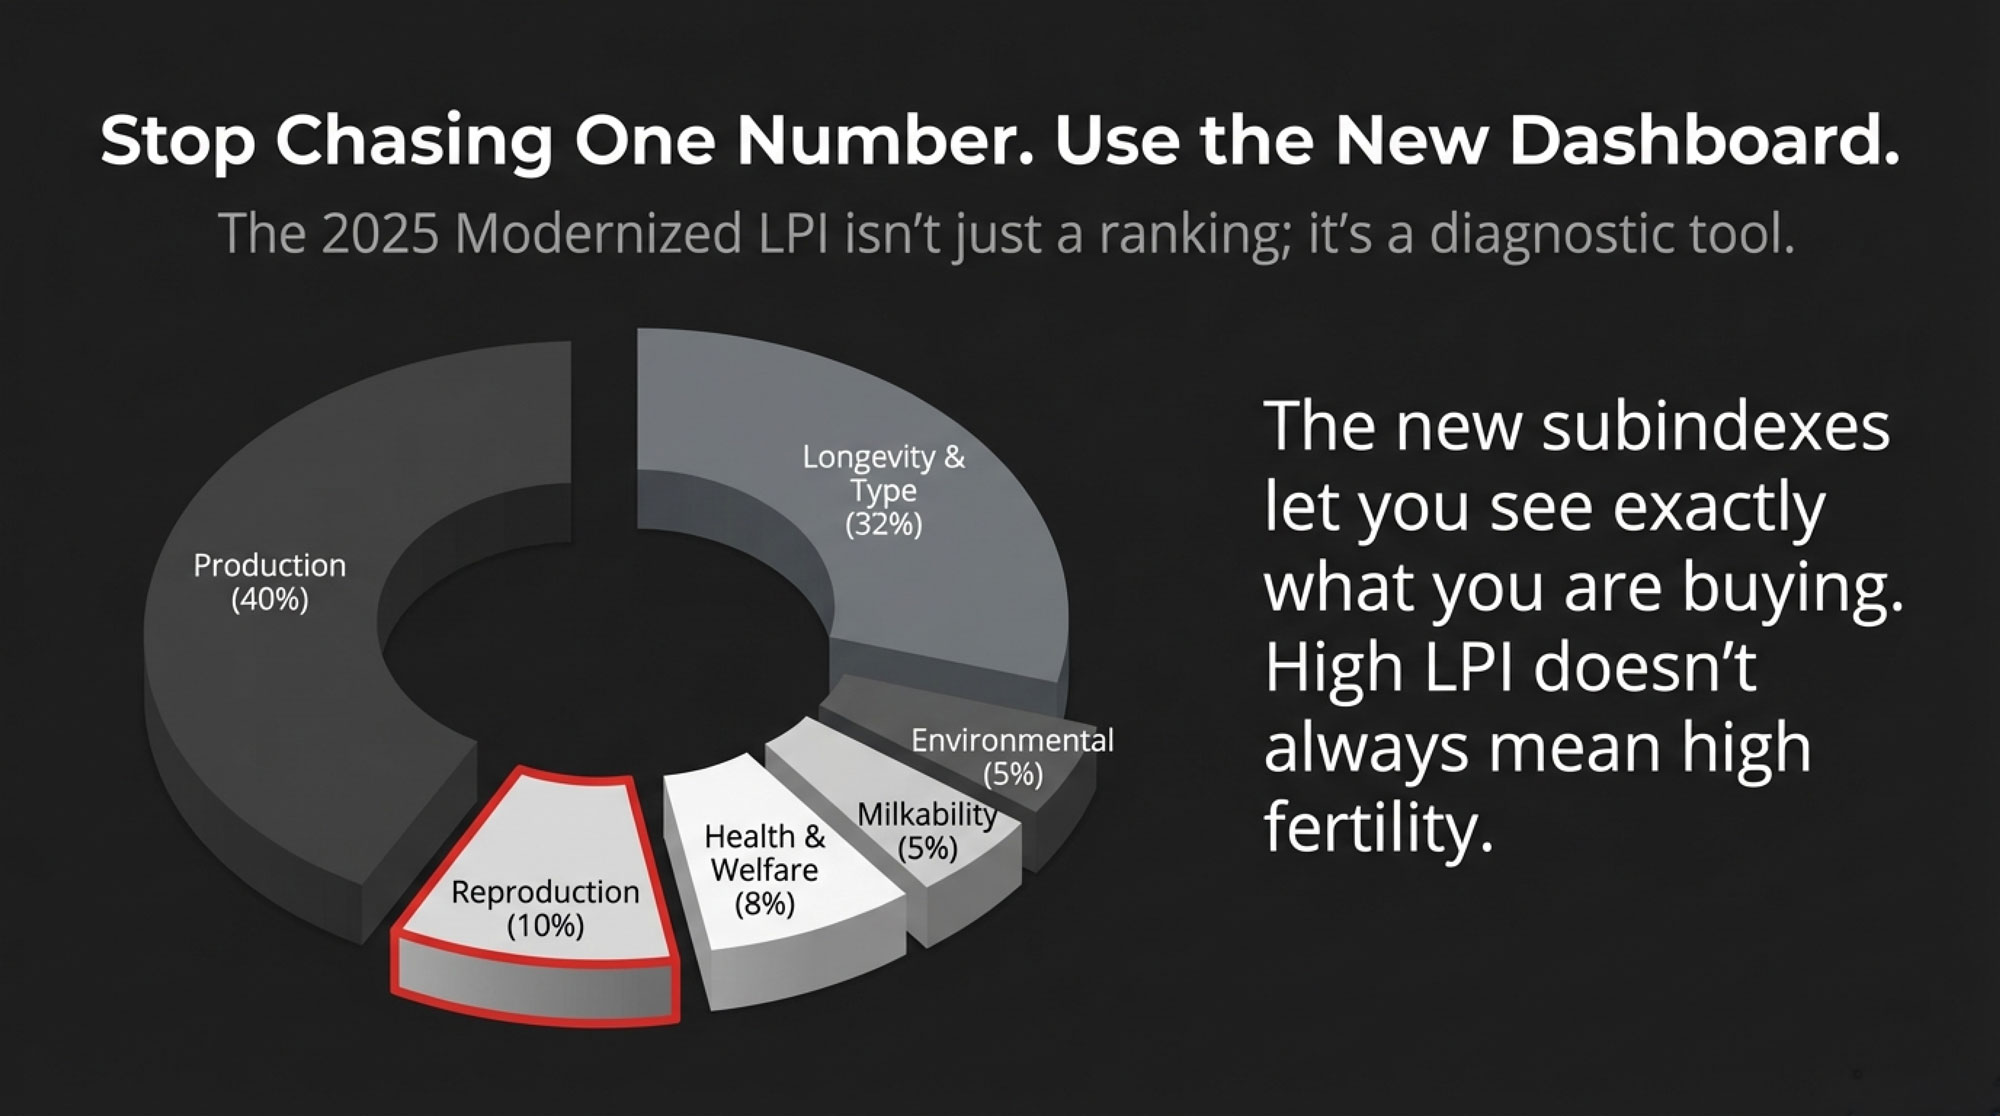
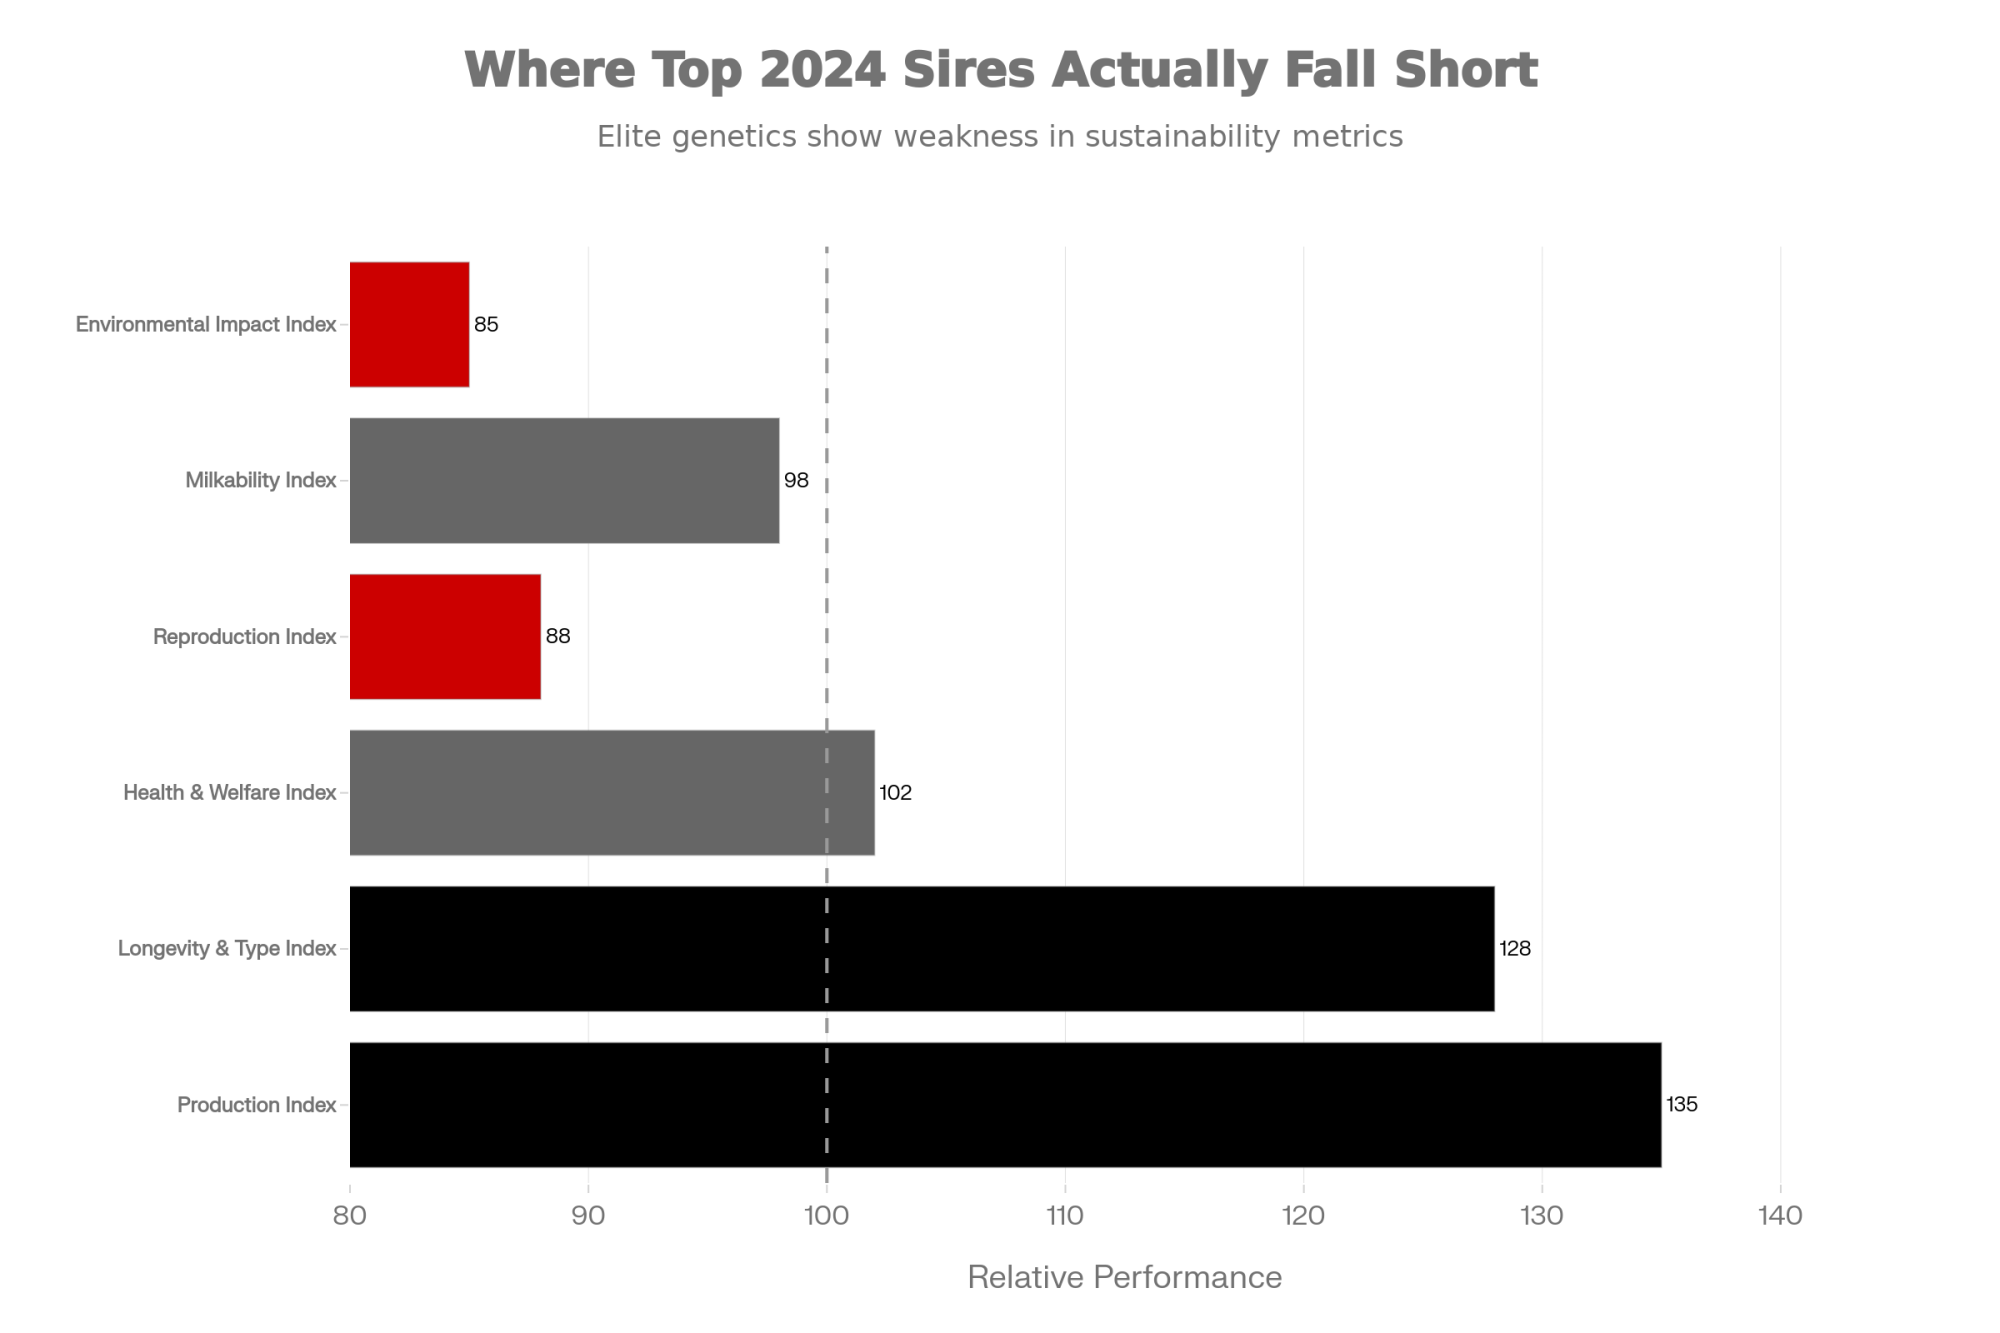
Fifty-six years later, the industry has finally built the machinery to answer that question at scale — six published subindexes including wellness, welfare and reproduction indexes that use lifetime profit curves. And most producers still aren’t using them. They circle the big composite number instead. That number has a blind spot, and it has a face now: when The Bullvine ran Canada’s 2025 20 most-used Holstein sires against Lactanet’s new subindexes this past March, it found bulls sitting at the 96th percentile for overall LPI yet only the 31st percentile for Health & Welfare— a pattern our analysis links to sires behind roughly a quarter of the registered calves born in 2025. That’s our own analysis, not a wire story. If you’re picking sires this month, give me two minutes before you circle a name.
The Core Problem: A Headshot, Not a Scan
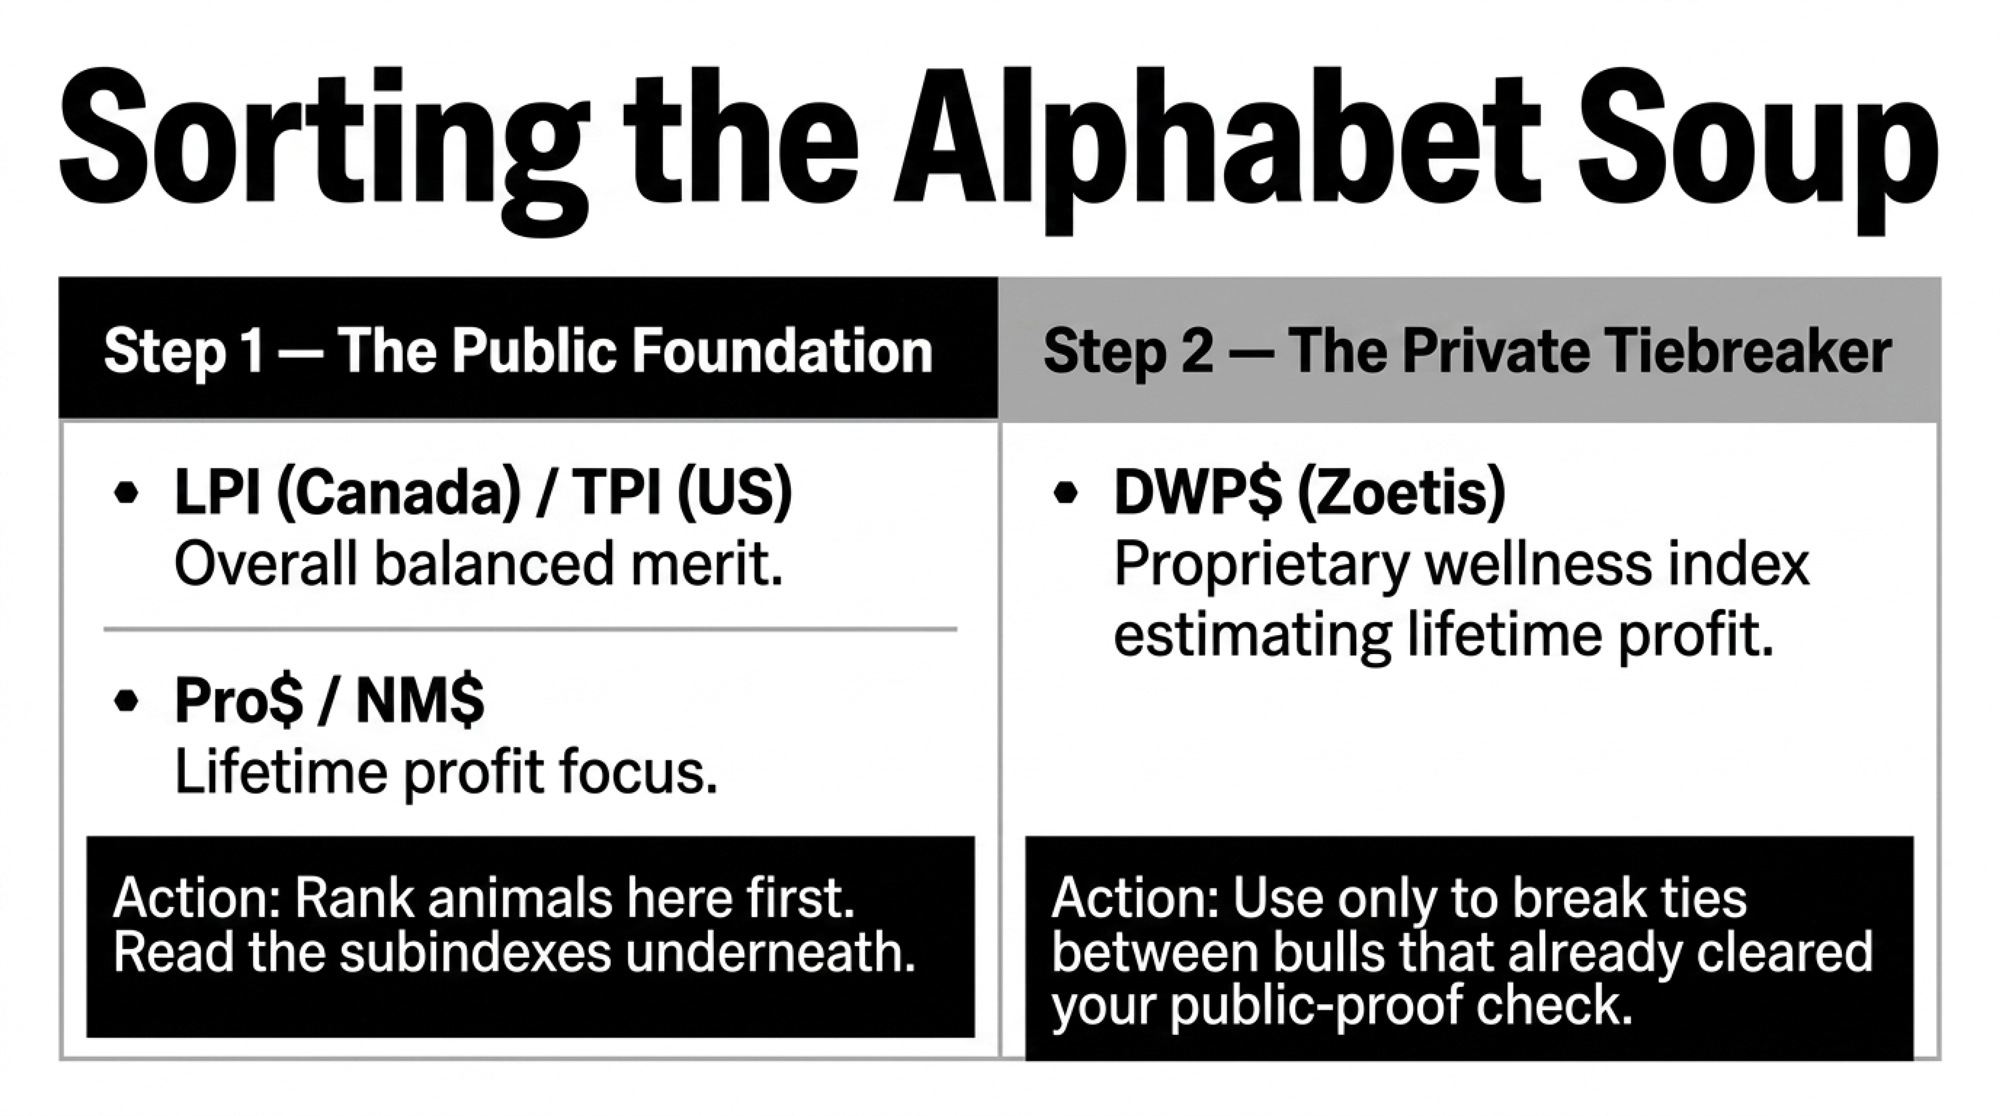
For years, “#1” meant something clean. Top 10 TPI or LPI was a badge, and everybody knew what it stood for. That clarity has quietly frayed — not through anybody’s bad faith, but because there are now a dozen ways to be number one. TPI and NM$ anchor U.S. proofs, LPI and Pro$ run Canada, and Zoetis owns DWP$, a proprietary index built to estimate genetic potential for lifetime profit. When every stud keeps its own leaderboard, a bull can honestly be “#1” on a definition narrow enough to flatter him. And when the whole industry circles the same few names, the bill comes due in a different column — 99.84% of Holstein A.I. bulls now trace to just two fathers.
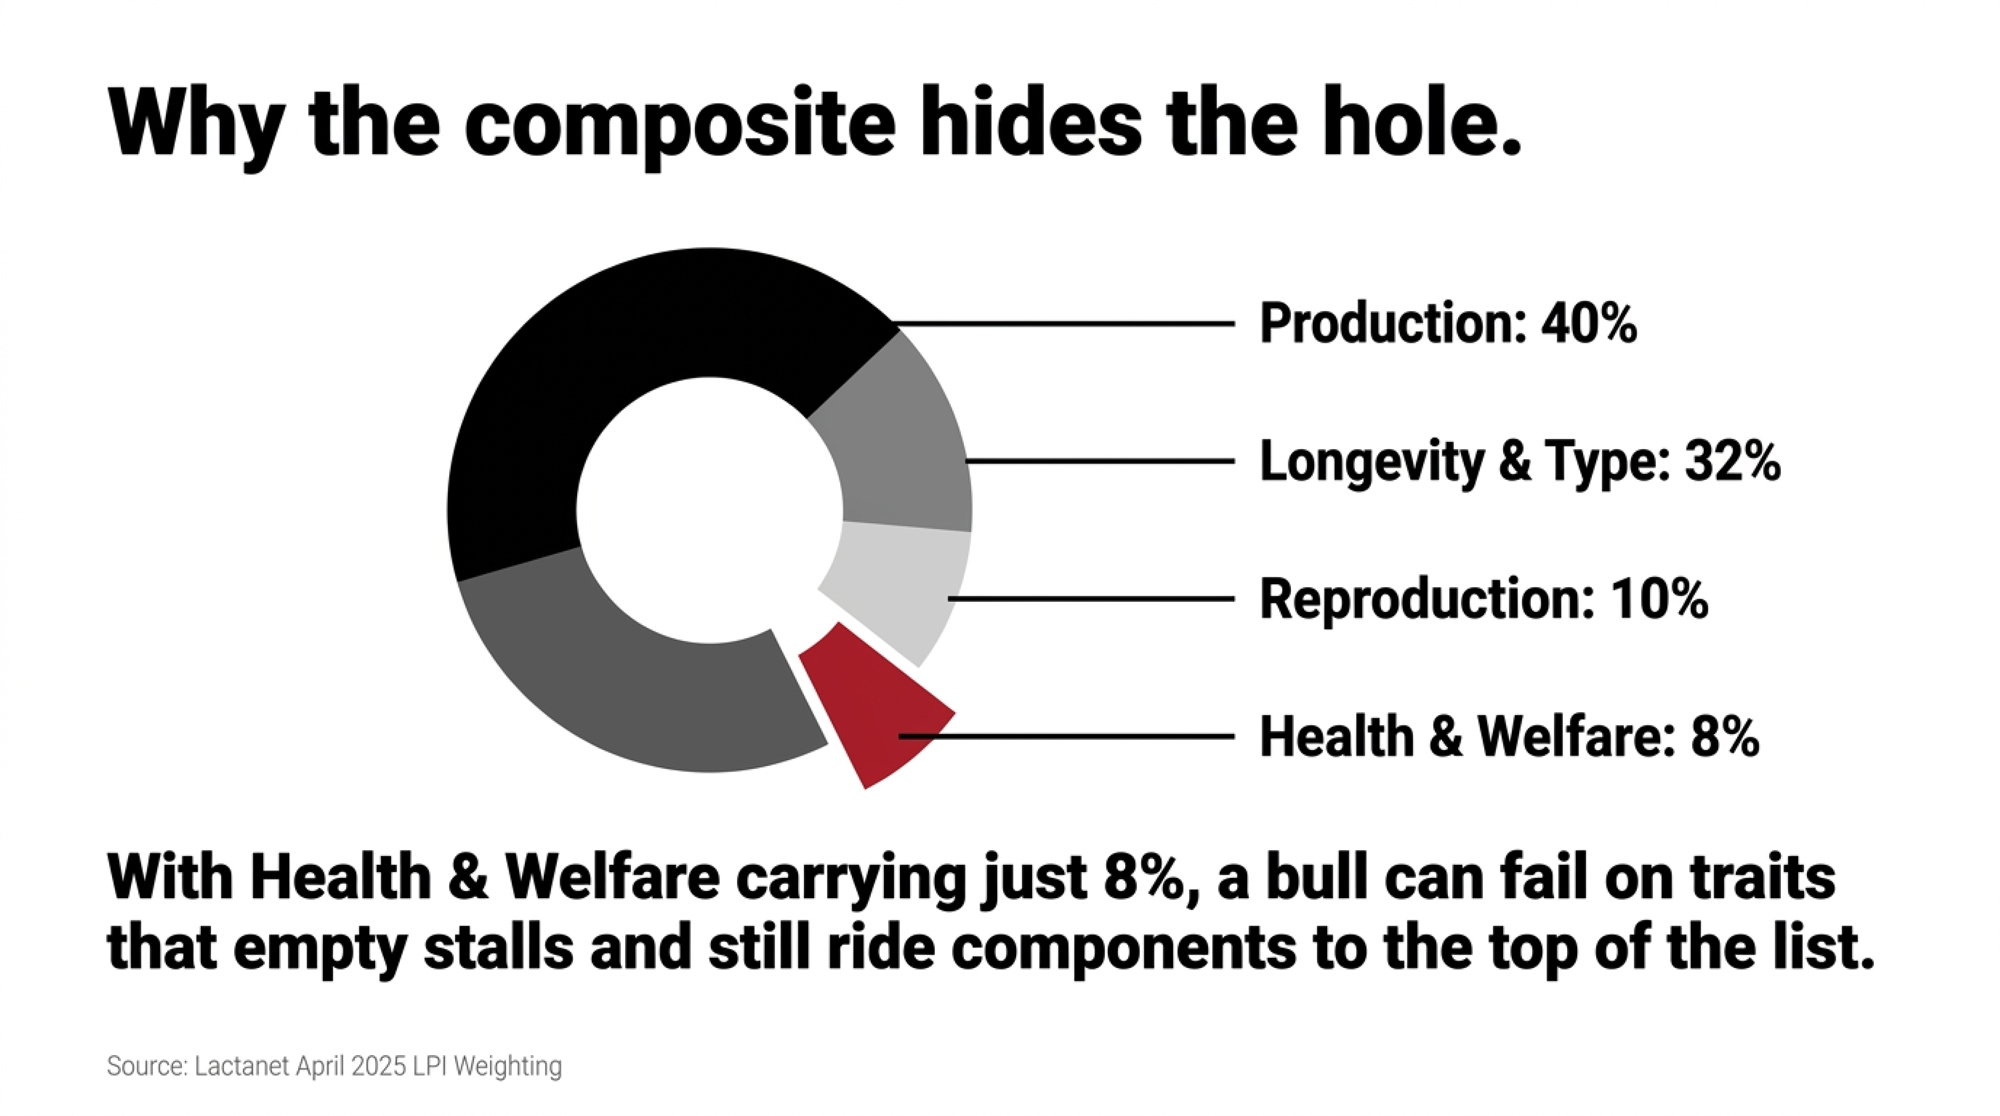
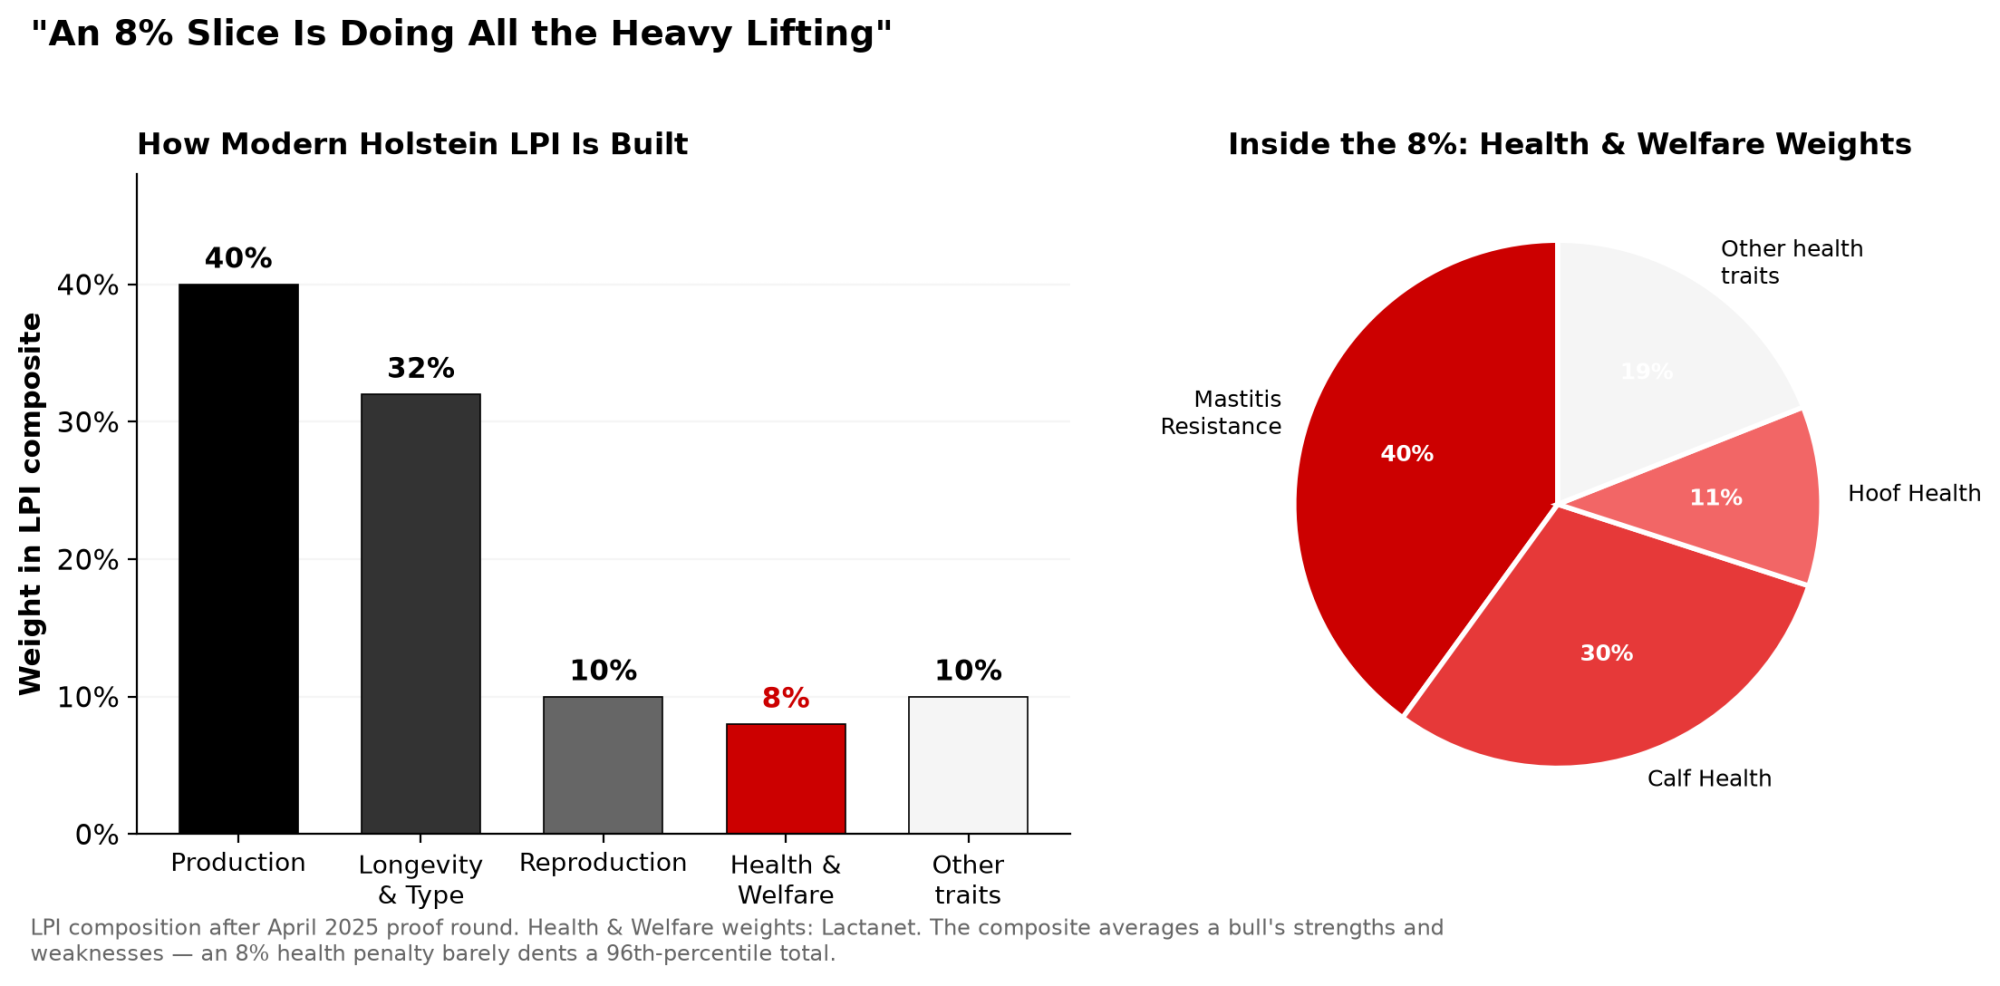
So why does the composite miss the health hole? Because it’s doing exactly what it was built to do — averaging. A bull can post huge components and functional type, ride those into a 96th-percentile LPI, and carry a below-average health score that barely dents the total. The number isn’t lying to you. It just isn’t telling you where the soft spot sits.
“The composite index is a flattering headshot — one number, easy to post, easy to sell. The subindexes are the MRI scan that shows exactly where the joint is failing.”
Lactanet even built a tool called pLPI that lets any producer log in, re-weight the six subindexes to match the herd’s own priorities and read the result beside the official LPI. It’s been live since April 2025. Most producers have never opened it.
Which Index Comes From Where?
The alphabet soup is less confusing once you sort the tools by who runs them and what they’re built to do. Rank animals on your public national index first, then read the health, welfare and fertility details underneath before a private or personalized index ever breaks a tie.
Index
Who runs it
Region
What it is
LPI
Lactanet
Canada
Overall merit, now split into six readable subindexes
Pro$
Lactanet
Canada
Lifetime-profit focus ($); the direct heir to the 1970 PDDG logic
TPI
Holstein Association USA
US
A balanced index across production, health, and type
NM$
USDA / CDCB
US
Ranks animals on combined merit for economically important traits; expected lifetime profit ($)
DWP$
Zoetis (proprietary)
US
Multi-trait wellness index estimating genetic potential for lifetime profit ($); a tiebreaker after the public-proof check
The Hard Math: Top Quartile vs. Bottom
A high-index total merit bull doesn’t fail loudly. His daughters look terrific on paper and freshen fine. Then, a couple of lactations in, they start showing up on the lists nobody wants — the lame pen, the mastitis log, the breeding sheet with too many open cows. The composite averaged his strength and his weakness into one tidy number, and weighting in a weakness doesn’t erase it. It just hides it until your cull list does the accounting for you.
Here’s what the published data says that gap is worth. Read the source column carefully: the retention and profit figures come from Lactanet’s Canadian Pro$ curve, while the disease figures come from a US DWP$ validation across five herds. Two countries, same story.
Metric / Risk Area
Bottom Quartile
Top Quartile
Bottom-Line Impact
Source
Herd retention at 6 years
Baseline
+7.4% more daughters remain
+$1,300 lifetime profit per daughter (bottom sires: −$1,200)
Pro$, Canada
Lameness incidence
High
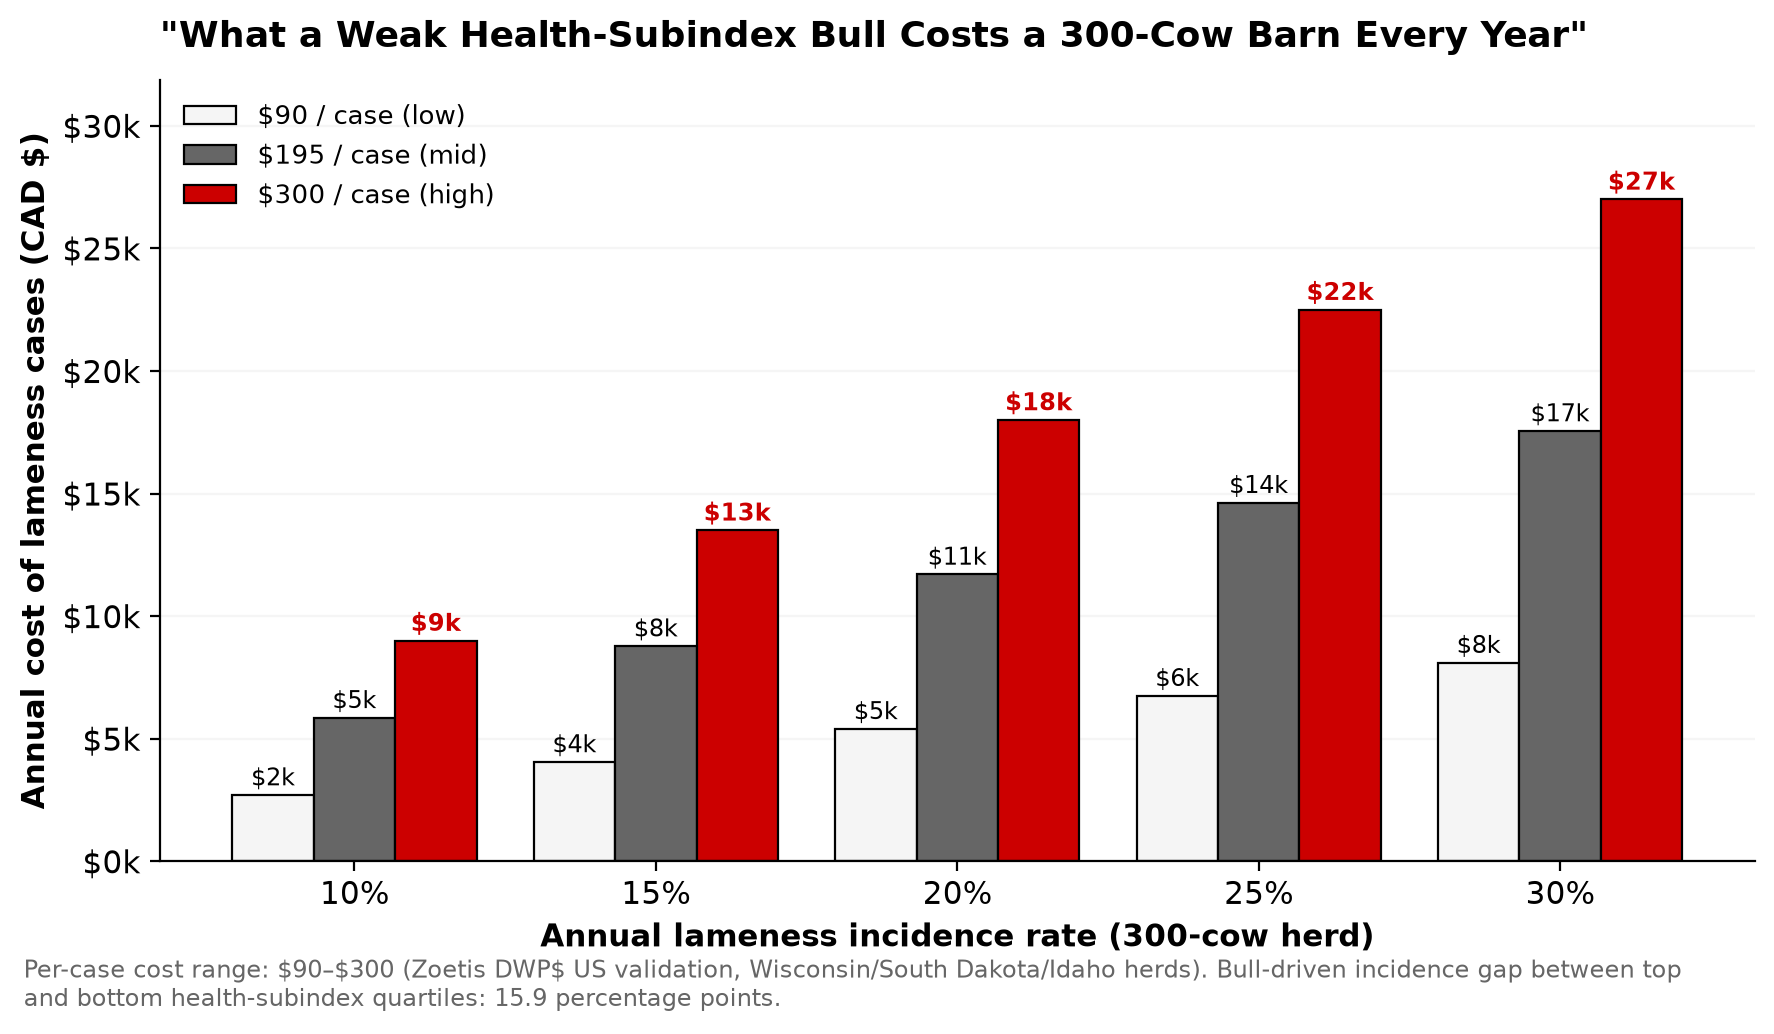
−15.9 percentage points
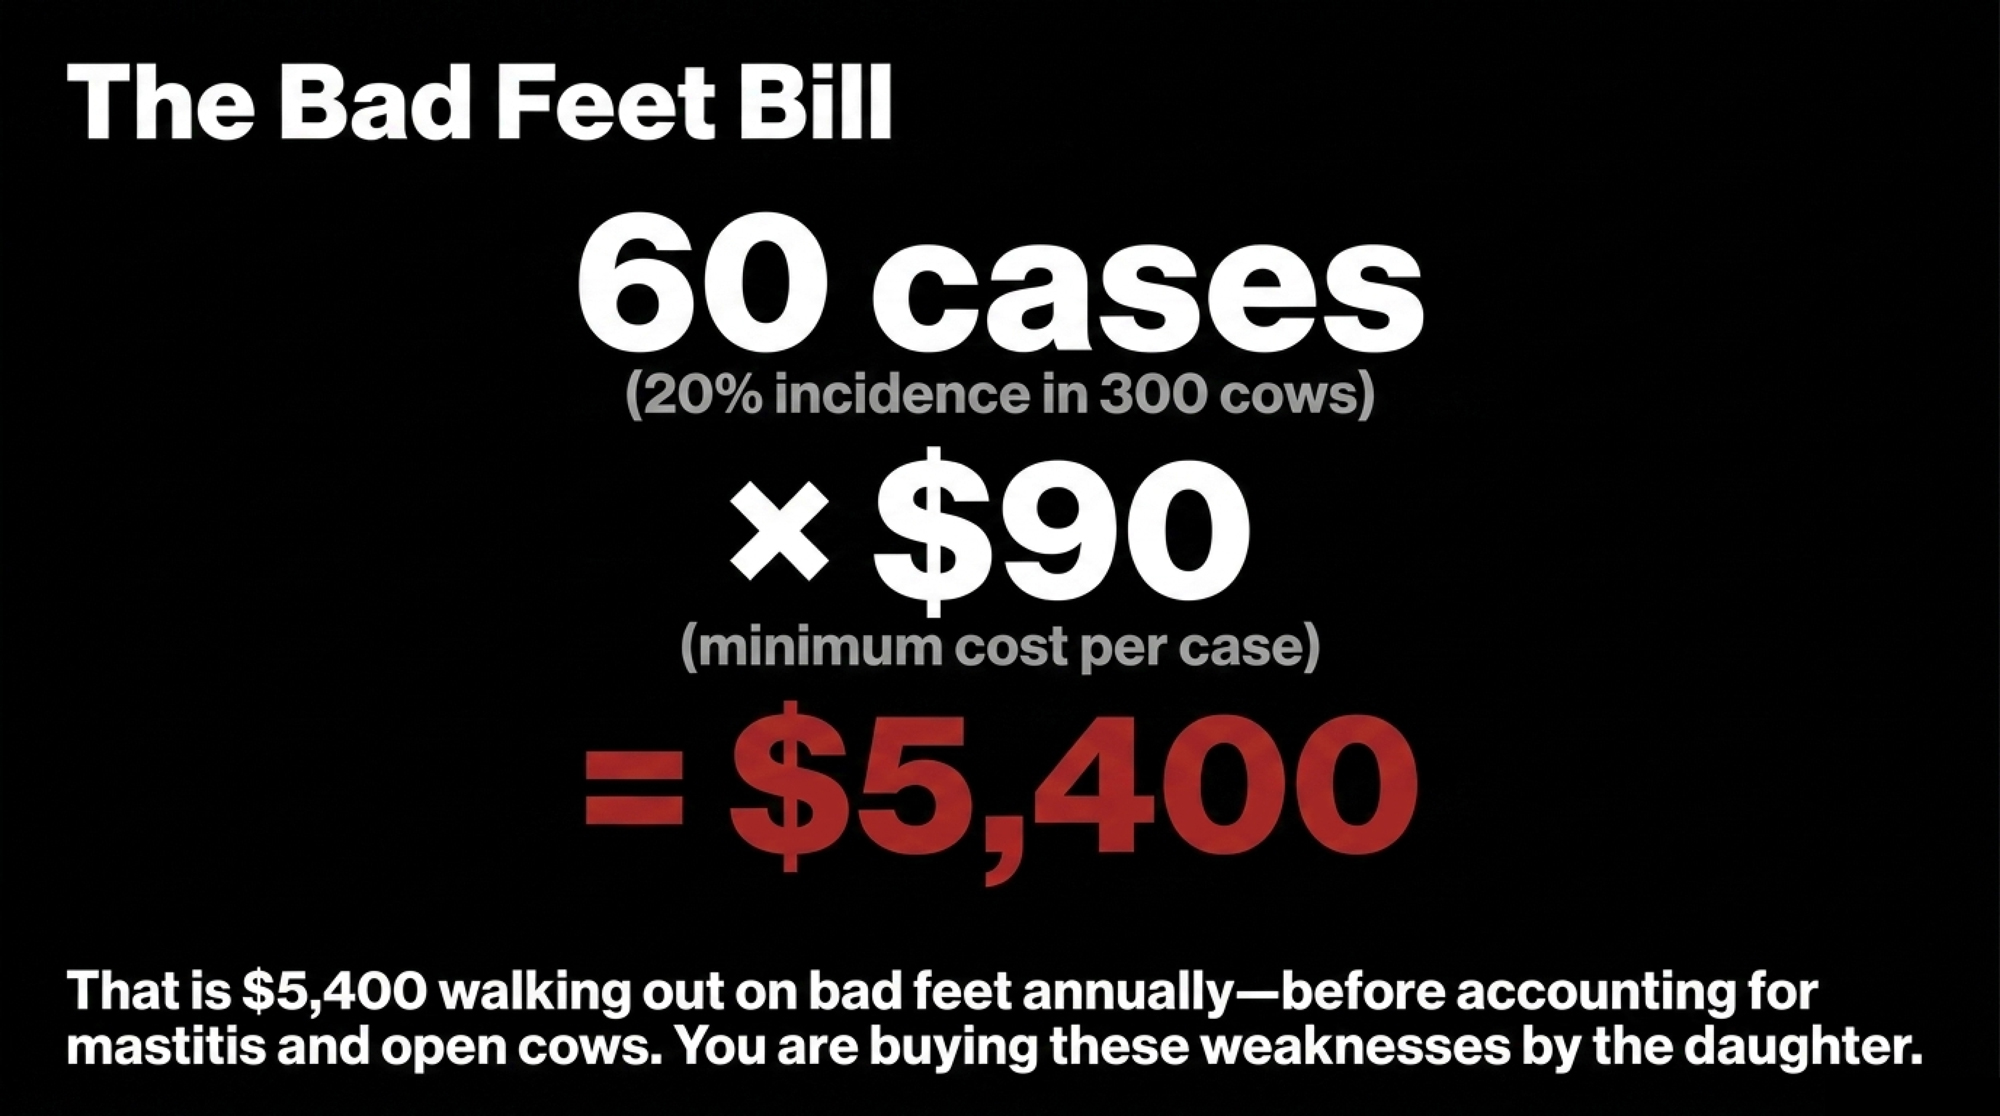
$90–$300 saved per case avoided
DWP$ US validation
Mastitis incidence
High
−14.9 percentage points
Fewer treatments and less dumped milk; +$811 lifetime profit overall
DWP$ US validation
Retention and profit figures: Lactanet Pro$ (Canada). Disease figures: Zoetis DWP$ validation across five US herds in Wisconsin, South Dakota, and Idaho.
Now run it on your own barn. Take a 300-cow herd with 20% lameness incidence — 60 cases a year. Even at the low $90 figure, that’s $5,400 walking out on bad feet annually, before the mastitis and open cows that tend to travel with weak health genetics. Buy those weaknesses in through a bull, and you’re buying them by the daughters, year after year. If you want to put your own incidence and treatment costs against that, run them through our Health ROI Calculator before your next proof day.
The LPI Weighting Dilemma
The reason the composite can hide a hole is right there in the math. Here’s how modern Holstein LPI is built — and the two changes that landed in April’s proof round:
Production — 40%. Shifted this past April from 60% fat / 40% protein to 40% fat / 60% protein.
Longevity & Type — 32%.
Reproduction — 10%.
Health & Welfare — 8%. Got sharper in April: Calf Health added at 30% weight, Mastitis Resistance at 40%, Hoof Health at 11%.
Read that stack plainly. With Health & Welfare carrying just 8% of the total, a bull can be well below average on the traits that empty stalls and still ride his components to a 96th-percentile LPI. That’s the whole blind spot in one line. It’s the same arithmetic behind the 9.99% Holstein inbreeding bill — are you breeding for profit, or just for index points?
What I’d Do With The Six Subindexes Today
I’d welcome them — because they’re the Production Dollar Difference Guide with better arithmetic. My 1970 thesis argued that the way to lift genetic progress was to sample far more young sires each year and let the proven ones rise; at the peak of young sire sampling, Canada was testing over 500 A.I. young dairy bulls annually on that logic. That shield at Huntsdale wasn’t won chasing the hottest bull of the month. It came from breeding cows that lasted, bred back, kept milking and threw enough surplus breeding stock to sell. Holstein Canada recognized the prefix with a Master Breeder Shield in 1984.
Holding a direction takes nerve, mind you. Plenty of bulls get written off early and prove the room wrong — they called Mogul’s heifers fat, and then came the million doses. The point isn’t to avoid every bull with a critic. It’s to avoid the bull with a hole you can already see on the page.
The through-line to today is simple. A sire stack built the way I built one isn’t a shopping list of favorites — it’s a direction you hold across generations, layering balanced bulls so longevity, fertility, and functional type compound while production keeps climbing. The subindexes make that direction visible on a screen instead of in a shoebox of milk records. My rule hasn’t changed in over fifty years: trust the system, improve the system, and use it to produce a continually better product.
How Much Does Chasing the #1 Bull Actually Cost You?
Map it to your own herd, and it stops being abstract. If your “elite” sire’s daughters run even one extra lameness case per ten cows over their productive lives, that’s roughly $900 to $3,000 per hundred daughters at Wisconsin’s cost range. Set that against the $1,300-per-daughter profit swing Pro$ documents between top and middle sires, and the composite-chasing decision starts looking expensive in a column the sire catalog never shows you. The exciting bull isn’t free. You pay for him later, in vet bills and empty stalls.
Is Your Herd’s Genetic Strategy Already a Step Behind?
Here’s a fair gut check, no judgment attached: when did you last look at a bull’s Health & Welfare or Reproduction subindex before you bought him? If the honest answer is “never” or “the rep handles that,” you’re in the same boat as thousands of good producers — the difference is that the tool to do better has been sitting on Lactanet’s site since April 2025. The herds that’ll be ahead in five years won’t be the ones with the flashiest catalog. They’ll be the ones whose cull lists got boring because the same problems stopped showing up.
The Rules for Farmers: The “No-Holes” Strategy
You don’t need a consultant or a spreadsheet to close this gap. You need a filter and the nerve to hold to it. Three moves, in order.
1. The Floor Rule — do this within 30 days. Before you circle any bull, check his Health & Welfare and Reproduction subindexes (or Pro$/DWP$ if that’s your system). Below your herd average on either? He doesn’t become a main sire for your herd — no matter how big his composite index. Costs two minutes. The catch: you’ll pass on some exciting bulls, and that stings.
2. The “No-Holes” Filter — clear 5 of 6. Use only sires that clear at least five of the six LPI Subindexes above the 50th percentile — above average almost everywhere. Best when you’re breeding replacements you plan to keep. The catch: your shortlist gets shorter and a little boring. Boring is the point. It’s about genetics for profit.
3. The Multi-Gen Stack — build for consistency. Sequence balanced bulls across generations so the good traits compound — the PDDG logic in modern dress. The catch: it’s slow to show, and it means ignoring the monthly “new #1” noise sire. With the Production subindex reweighted in April, a written direction keeps you steady when the index itself moves under you.
And use private indexes as a tiebreaker, not a verdict. DWP$ and the like are useful for breaking ties after the public-proof check — not for overruling a hole you can already see.
The Rep Checklist: Four Questions Before You Buy
Where does this bull sit for Health & Welfare and Reproduction — not just overall merit?
How many of his six subindexes are above the 50th percentile?
Which of my cows would you actually mate him to, and why?
If I lined up your top three picks by health and fertility instead of by total merit index, would the order change?
Key Takeaways
If you’ve never checked a sire’s Health & Welfare or Reproduction subindex, do it this proof run — a 96th-percentile LPI bull can sit at the 31st for health.
If a bull falls below your herd average on health or fertility, keep him off your main-sire list regardless of composite rank.
If you’re keeping your own replacements, run the five-of-six-above-50th filter on your current catalog or in-tank group and count how many “elite” bulls survive it.
If lameness is creeping up, do the math yourself: $90–$300 a case times your incidence times your daughter count.
If you’ve never opened Lactanet’s pLPI tool, log in once and re-weight the six subindexes to your herd’s real priorities.
If a rep leads with a private index like DWP$, use it to break ties after the public-proof check — not to overrule a visible hole.
So, here’s the question I’ll leave you with for your next proof day: are you picking bulls your future self won’t have to fix — or bulls that look elite tonight and quietly fill your cull list in 2030? Pull your last three sire purchases and check their health and fertility subindexes. You might be pleasantly surprised. You might not.
If you want the deeper cut — how the no-holes filter reshapes a real 20-sire shortlist, one subindex at a time — that’s the breakdown we’re running next in Bullvine Weekly. That’s where the real numbers live.
Sire Health & Hold-to-Proof Cost Simulator
Calculate your herd’s financial exposure to high-index sires with weak health subindexes
Annual Lameness Cost Burden:$5,400
Daughter Lifetime Pro$ Gap Impact:-$1,300 / daughter
Estimated 5-Year Genetic Exposure:$39,000
Run Your Numbers
Health ROI Calculator — The article puts lameness at $90–$300 a case. This tool turns your own incidence, treatment costs, and herd size into a dollar figure, so you can see what a sire’s health hole is actually worth before you circle a name.
The McCarty Magic: How a Family Farm Became the Dairy Industry’s Brightest Star — Breaks down the long-term capital strategy behind scaling farm infrastructure, securing direct processor contracts, and structuring multi-generational risk protection to insulate high-volume dairy operations against severe commodity price swings.
Bull in a China Shop: How Juan Moreno Turned the Dairy World Upside Down — Follows the money on sexed semen technology and commercial genomic sorting, detailing how aggressive reproductive disruption reshaped AI economics and opened massive new margin streams through targeted beef-on-dairy breeding strategies.
The Sunday Read Dairy Professionals Don’t Skip.
Every week, thousands of producers, breeders, and industry insiders open Bullvine Weekly for genetics insights, market shifts, and profit strategies they won’t find anywhere else. One email. Five minutes. Smarter decisions all week.
Emeric Lebacle, a Quebec breeder, dropped it into our comment section almost as an afterthought, and it turned out to be the most important thing anyone said about Holstein’s new stature penalty. His point: stature inherits more than twice as reliably as feet and legs, so if you actually want to move a herd, you pull the lever that responds. That’s exactly what Holstein USA did in its May 2026 classification run — and if your bull lineup still leans tall, this is the number that should stop you cold.
Stature
Point deduction from Final Score
60″ and under
0.00 (no penalty)
61″
−0.15
62″
−0.30
64″
−0.90
65″
−1.20
68″
−2.55
70″
−3.45
We figured the thread would split the usual way. Show people furious, commercial people cheering. That’s not what came back.
The One Number That Explains the Whole Penalty
What came back was working breeders doing the genetics math the association never spelled out. Stature is one of the most heritable traits on the card. Feet and legs? Not close. And that gap is the whole argument.
The data backs the Lebacle, hard. Lactanet pegs stature heritability at 53% — the highest of any Holstein type trait — with frame/capacity at 41%, while the Feet & Legs major score sits at just 21% and Foot Angle drops to 13%. Holstein USA runs the same direction: U.S. studies put stature in the low-to-mid 0.4 range, and the association states flatly that “it is difficult to make much genetic progress through selection and mating unless a trait has a heritability of .10 or higher”. This isn’t a 2026 discovery, either. Cassell reported back in 1973 that “stature showed the highest heritability while estimates for udder quality, hind legs, feet… were low”.
Keep the borders straight — Canada’s 53% and the U.S.’s low-0.4 range aren’t the same figure, but they tell the same story. Selecting hard on feet and legs is like pushing a rope. You can weight them heavy in your index and still crawl, because a 21% trait doesn’t inherit the way a 53% trait does. Stature does. So the association went after the trait that actually responds, knowing it drags a lot of correlated durability along with it.
Trait
Lactanet heritability (Canada)
U.S. studies (Holstein USA)
Selection response
Stature
53% — highest of any type trait
Low-to-mid 0.4 range
Fast — moves the herd
Frame / Capacity
41%
Comparable frame estimates
Moderate
Feet & Legs (major score)
21%
Below stature
Slow — like pushing a rope
Foot Angle
13%
Near the .10 floor
Barely responds
Does the Penalty Punish a Good Tall Cow?
This was the loudest fear in the thread, and one farm answered it with a real classification result. A producer walked into this spring’s round braced for damage and didn’t get it. Her classifier docked stature — then handed it right back on front-end capacity and width. Her balanced cows came out neutral.
That’s one farm’s experience, not a controlled study. But it lines up with how Holstein USA actually builds its numbers. Both the Udder Composite and the Feet & Legs Composite carry a −0.20 weight on stature — on purpose, so breeders can “improve udders and feet & legs without making their cows taller”. The penalty isn’t anti-tall. It’s anti-tall-and-narrow. A wide, strong, deep-ribbed cow who happens to stand over 60 inches carries her frame, and the score shows it. The cow it’s aimed at is the narrow one riding on height alone.
Another breeder made the same case from the skeptic’s chair. He doesn’t care how big a cow is, long as she’s got the width and strength to last — and frail, he noted, comes in every size. He’s right. And the penalty agrees with him. Height was never the disease. Height without substance is.
Is the Real Problem Height — or the Feet Nobody’s Culling?
The sharpest pushback deserves a full hearing, because it’s fair. One breeder’s argument: this penalty makes classifiers look political, and it’s aiming at the wrong target. Pull up the current top-GTPI list, he says, and look at the feet and legs on that group. Weak. Nobody’s thinning the sorry-walking bulls hard enough. So why chase height when the real durability killer is legs?
Here’s the honest answer, and it’s a “yes, and” — not a rebuttal. He’s right that top-GTPI feet and legs have slid; genomics chased production and type composites while feet and legs quietly eroded, a drift Holstein USA’s own million-cow conformation study laid bare. But the stature penalty and the feet-and-legs problem aren’t competing fixes. They’re the same fight. Height-for-height’s-sake breeding is part of what wrecked the legs in the first place — and at 53% against 21%, stature is the trait you can move fast. The lever this breeder wants pulled directly, feet and legs, responds less than half as well. So push both. Just don’t mistake the more-heritable tool for a distraction. “Watch how they walk and get up and down, not the number on the stick,” another put it — and he’s making the same point. Mobility is what matters. Height is the proxy the system can actually select on.
The Barn-Floor Longevity File
You can argue heritability estimates all day. It’s harder to argue with a cull sheet. Several breeders volunteered the same pattern from their own alleys.
One producer runs an older freestall barn — shorter stalls, slatted floor. His read was blunt: tall cows leave earlier than short cows, so he now hunts for a minus on stature when he buys Holstein semen. That’s a breeder rewriting his own index based on what the stalls told him. Another gave the version with detail. Years back he had a cow that flirted with 70 inches — big producer, decent career, until her joints gave out. Her daughter, still tall but not as extreme, aged better and stayed athletic to the end. His verdict: somewhat-tall cows with good feet and legs generally weren’t the problem. Tall plus weak legs was. A third put it flatter — taller cows go down more, and they’re less likely to get back up.
Now put a number on “they leave earlier.” Raising a Holstein replacement to calving runs about $2,016 in confinement, and anywhere from $1,700 to $2,400 depending on your setup (Overton, Journal of Dairy Science, 2020) — and recent land-grant figures have crept to the $2,400–$2,500 range as feed costs climbed. A cow culled a full lactation early strands a chunk of that before she’s paid you back. On a 100-cow herd, cutting five early exits a year protects roughly $10,000 in replacement investment — call it the ceiling, not the take-home, since salvage value and the milk she already shipped claw some of it back. That’s why breeders in older, shorter stalls treat a stature minus as risk management, not fashion. None of these are studies. They’re decades of watching cows come and go, and they all point where the data already does.
Don’t Blame the Ring
Here’s where this whole conversation usually goes sideways. The show ring gets blamed for every tall, narrow, fragile Holstein in the country. That’s too easy. And it lets everyone who actually built her off the hook.
Lovhill Sidekick Kandy Cane takes Grand Champion at the Largest Dairy Show in the world— The ring is a mirror — it rewards the cow breeders, studs, and buyers chose to build. The only question that matters walking out: would she still be here in her fifth lactation?
The ring rewarded what breeders walked into it. Breed associations printed the scorecards. AI companies marketed the pedigrees. Commercial herds kept buying daughters of bulls that looked impressive at 24 months — before anyone asked how they’d hold up through three lactations. We chased bigger for 30 years, then the math caught up: big cows eat more just to exist, and the science flipped so hard the industry now docks stature and even built a whole trait, Feed Saved, to reward the opposite of what it rewarded for a generation. Same people. Opposite advice.
So don’t blame the ring. The ring is a mirror. It shows you exactly what you selected for — and the penalty is just the glass finally being honest.
The Cow That Still Stings
Then there’s the story that stopped the thread cold. A longtime breeder recalled hauling a cow to slaughter decades back — an 18-year-old downer, a small black cow, scored 88, with strength, width, and a beautiful udder. By his telling, she was among the first cows in Wisconsin to top 300,000 pounds of milk lifetime. Yet she never scored Excellent, he says, because she wasn’t tall enough. U.S. bull studs wanted nothing to do with a son of hers. That son went to Europe and did great things.
We couldn’t independently verify the record, so take it as one breeder’s memory, not documented history. But the shape of it rings true to anyone who bred cows in that era. One of the most productive cows in her state, denied the top score and shut out of the bull pipeline for a single reason — too short — back when short was the sin. The pendulum that beat her is the same one now swinging back to penalize the cows that replaced her. The trait didn’t change. The fashion did.
Options and Trade-Offs for Your Herd
The thread wasn’t just venting. Read together, your peers left a working playbook.
Your situation
Recommended move
The trade-off you accept
Warning flag
Weighting F&L hard, no progress
Push stature (53%), work the cull sheet for legs
Legs still improve slowly
21% won’t move on its own
Older / shorter stalls, slatted floor
Treat a stature minus as a feature
Pass on tall pedigrees
Tall cows leave earlier here
Want durability, no show hit
Breed width, strength, capacity first
Skip flashy narrow-tall bulls
Balanced tall scores neutral
Breed show-type
Price the penalty before you commit
Read linear traits, not just composites
64–65″ ≈ −1 Final Score point
Run the 30-day sire audit — do this before your next semen order. Pull your bull list this month. Sort by stature PTA, and on your tallest transmitters check productive life and the Feet & Legs Composite too. If you’re in older, shorter stalls on slatted floors, do what that breeder did and treat a stature minus as a feature, not a flaw. Costs you an evening. It’s the fastest way to see whether your lineup is still ordering the cow the scorecard now penalizes.
Chase substance, let height fall where it lands. Best for herds that want durability without a show hit. Select for width, strength, and capacity first — a balanced tall cow scores neutral, as that spring classification proved. The trade-off is real: you’ll pass on flashy, narrow, tall pedigrees that still photograph like a magazine cover.
Push feet and legs directly, too — the critics earned that. Don’t let the stature debate become an excuse to ignore legs. But know the catch going in: at 21% against stature’s 53%, progress comes slow, so lean on the composite and your own cull records rather than chasing one bull’s foot-angle number.
If you breed show-type, price the change with your eyes open. A daughter at 64–65 inches now gives back close to a full point of Final Score she’d have kept a year ago. Read the individual linear traits, not just the composites, and decide the trade honestly.
Key Takeaways
If you’re weighting feet and legs hard and seeing no herd progress, that’s the heritability talking. F&L sits at 21%; stature runs 53% in Canada and low-0.4 in the U.S.. Push where it moves, and work the cull sheet for the rest.
If you’re scared the penalty guts a good tall cow, breed width and strength and quit worrying. Both composites carry a −0.20 stature weight by design, so capacity earns back what height docks.
If you run older or shorter stalls, treat a stature minus as risk management, not heresy. At roughly $2,000 a replacement, early exits are the expensive kind of tall.
If your best-ever cow would’ve been too short for Excellent a generation ago, ask what today’s fashion is costing you that you can’t see yet. Fashions reverse. Function doesn’t.
What Fashion Is Your Herd Really Built For?
The best breeders can stand in front of a gorgeous cow and still ask the only question that pays the bills on Monday morning. So walk out to your tallest, flashiest heifer — the one that photographs like progress — and ask it straight: would you want 500 more of her in the milking string? If the answer’s no, that was never the ring’s mistake. It was yours.
Pull ten of your best cows this week and run the stick next to the cull history. See which fashion your herd is actually built for. We laid out the full penalty schedule and the Net Merit math in our earlier breakdown of Holstein’s 60-inch line — this piece was your answer to it, and the reply thread isn’t closed. Keep it coming.
Hold-to-Proof Cost Simulator
Calculate the structural retention balance of your replacement pipeline
% of annual culls leaving before Lactation 3 due to frame/leg weakness
Operational Capital Impact
Annual Replacement Pipeline Requirements:175 heifers / year
Stature-Linked Early Exits:9 animals / year
Stranded Heifer Investment:$18,144
Formula assumes early structural exits fail to fully amortize their initial $2,016 rearing asset cost prior to third lactation. Benchmark figures adapted from Overton & Dhuyvetter, Journal of Dairy Science.
Complete references and supporting documentation are available upon request by contacting the editorial team at editor@thebullvine.com.
Learn More
HCC vs. PTAT: Holstein’s 2026 Stature Penalty and the New 60-Inch Line — Arms you with a diagnostic tactical breakdown to separate physical classification risk from paper genetic evaluations. This evaluation explains how high-stature bulls mask weak traits and why the new Holstein Conformation Composite index corrects this blind spot.
Ed Bos Picked the Same Traits for 50 Years. A Million-Cow Study Just Proved He Was Right — Delivers an unvarnished data analysis proving that intermediate-framed cows generate an extra $2,678 in lifetime revenue over heavy-framed contemporaries. This massive multi-year dataset validates the economic benefit of rejecting extreme height for functional durability.
The Sunday Read Dairy Professionals Don’t Skip.
Every week, thousands of producers, breeders, and industry insiders open Bullvine Weekly for genetics insights, market shifts, and profit strategies they won’t find anywhere else. One email. Five minutes. Smarter decisions all week.
Sixty inches is the new line. Over it, your best show cow loses Final Score points — 0.15 at 61″, 1.20 at 65″ — while her PTAT never moves. Here’s the table, and why HCC reads what PTAT can’t.
Executive Summary: Starting with the May 2026 classification run, Holstein USA made 60 inches the ideal stature — and every inch over it now docks Final Score, from 0.15 at 61″ to 1.20 at 65″ and 3.45 at 70″, pulled straight out of Front End & Capacity. Here’s the part that trips people up: the penalty applies only to the classification card. Your bull’s PTAT and stature PTA don’t move an inch, so if you’ve been buying high-PTAT, high-stature semen, your daughters can still grade down on the day the classifier puts the stick on them. The board paired it with two more changes — the new 18-trait Holstein Conformation Composite (HCC), which weights Stature highest but favors lower values and actually correlates positively with Productive Life where PTAT correlates negatively, and a BAA rule that only counts cows calved in the last 24 months. Stack the classification hit on the 2025 Net Merit math — about $57 off lifetime NM$ per extra point of Body Weight Composite — plus more lameness and robot misses in stalls built for average cows, and the case against extreme height is now genetic, economic, and on the card all at once. The tell? The 2025 Star of the Breed, Oakfield Solomon Sunset, was bred for width and correctness over height.
Picture the best-looking cow you’ve ever raised. The one that turned heads down the chute, framed up beautiful on the halter, filled the alley like she owned it. Now picture the classifier putting the stick on her in the May 2026 Holstein classification run — and knocking points off her card for the exact height you spent years breeding into her. This is the Holstein classification 2026 stature penalty in a sentence, and it changes your next mating decision.
That’s the shift. At their March 2026 meeting, Holstein Association USA’s board approved a package of changes that all lean one way — away from extreme height, toward cows built to last. And it lands hardest on the animals a lot of show-focused programs spent twenty years building. Whether you halter cows or want them to last four lactations in a freestall, this one touches your next mating decision.
What’s Really at Stake
Three changes arrived together out of the same March board meeting, and they reinforce each other. The centerpiece is a sliding-scale stature penalty, recommended by HAUSA’s Conformation Advisory Committee and approved by the board, setting 60 inches as the breed’s ideal stature for the first time — over that, cows take a progressive deduction on their classification score. Alongside it came the Holstein Conformation Composite (HCC), a new selection index built to identify animals with the combination of traits tied to balance, function, and longevity, rather than Final Score alone. And a quieter rule now ties Breed Age Average to cows that calved within the previous 24 months, so only currently productive animals count.
Read this line twice, because it’s the one that trips people up: the penalty hits your classification score only. It doesn’t touch PTAT, stature PTA, or any genetic evaluation for stature or any other trait. Your bull’s numbers haven’t moved. What changed is what his daughters score the day the classifier puts the stick on them.
If you breed for the ring, you’ll feel this most. If you’re a commercial breeder chasing durability, you’ll mostly nod — because the change is pushing toward the cow you already want.
What Does the Stature Penalty Actually Cost? (The Official Table)
Here’s the part breeders keep asking about — the exact numbers, now published in Holstein USA’s Spring 2026 Pulse. Cows at or below 60 inches take no penalty. Stature is measured at the hips, top of the spine to the ground. Above 60″, the deduction comes out of the Front End and Capacity major breakdown, which is 15% of the final classification score.
Stature
Point deduction from Final Score
60″ and under
0.00 (no penalty)
61″
−0.15
62″
−0.30
64″
−0.90
65″
−1.20
68″
−2.55
70″
−3.45
Notice the curve. At 61 inches it’s a rounding error — fifteen-hundredths of a point. But the penalty accelerates fast: by 65 inches you’re down more than a full point, and at the tall extremes it bites hard. For a cow sitting right on the VG/EX line, even a half-point can move her final designation.
Don’t Confuse This With the 2024 Scale Change
Two different things happened, roughly a year apart, and breeders keep mixing them up at the coffee shop. So let’s split them clean.
The December 2024 change was a measurement recalibration. After Dr. Jeffrey Bewley’s 2023 cow-measurement project found the breed had physically outgrown the old ruler, Holstein USA shifted the linear stature scale from the old 51-to-61-inch range to a new 55-to-65-inch range, effective December 1, 2024, with each inch worth five points on the linear scale. It didn’t punish anything. It just measured tall cows more honestly — 60″ now reads as 25 on the scale, 65″ as 50.
The May 2026 change is a penalty — the first time excessive height actually costs points on the final card. One fixed the ruler. The other put a price on being tall.
Feature / Change
December 2024 Scale Shift
May 2026 Stature Penalty
What it did
Shifted linear scale from 51–61″ to 55–65″
Progressive point deductions for cows over 60″
The impact
Descriptive only; each inch = 5 linear points
Direct deduction from Final Score, via Front End & Capacity
Genetic impact
None — ruler calibration
None on PTA stature or any trait; classification score only
This Didn’t Come Out of Nowhere
The 2026 penalty is the loud version of a change the breed started making quietly years ago. Holstein USA has been restructuring how stature feeds into its evaluations for a while — pulling height back out of the numbers it had been quietly propping up, so a very tall bull couldn’t post shiny composite figures on frame alone. The 2026 penalty moves that logic onto the classification card itself, where every breeder can see it.
There’s history worth naming here. For a generation, the tall, sharp, angular daughter was the ideal — and no bull embodied it like Braedale Goldwyn, the greatest type sire of his era, who became the first bull ever to produce 1,000 Excellent daughters in Canada. Goldwyn didn’t do anything wrong; he delivered exactly the phenotype the industry rewarded at the time. But the cow the new penalty docks is, in large part, the cow that era taught breeders to chase. That’s not an attack on the breeders who built those pedigrees — it’s the whole point. The target moved, and the scorecard just caught up to it. The industry keeps admitting, one step at a time, that cows were getting credit for being tall rather than being good.
The Genetics and Economics Behind the Line
The move isn’t a hunch. Dr. Jeffrey Bewley’s “A Million Reasons Why Conformation Matters” project matched classification records against lifetime production data across the breed’s database, and HAUSA’s own internal research consistently shows that extremely tall cattle don’t last as long as more moderate-stature animals. The functional traits — udders, feet and legs, capacity — drove the biggest lifetime differences, not raw frame. Height for height’s sake was never what paid. That’s the whole logic of the 2026 direction.
Where does a tall cow cost you before the classifier even arrives? Usually in the stalls and around the robot. Freestalls get sized for the typical mature Holstein. Push cows well past that, and you see more lameness, more hock rubs, more robot mis-attachments. Bigger cows also eat more to haul the extra frame — which is why the 2025 Net Merit revision cut Body Weight Composite to −11% and lifted Feed Saved, knocking roughly $57 off lifetime Net Merit for every extra point of Body Weight Composite.
Try the barn math — an illustration, not a herd average. Run 100 cows and say oversized cows push your lameness rate up by 5 cases a year. At $300 a case — a conservative figure; real cases often run higher — that’s $1,500. Small on its own. But stack it on that $57-per-point weight tax, faster culling, and now a classification hit, and it’s the math you’ve been putting off.
Cost driver
Where it hits
Illustrative annual cost (100-cow herd)
Body Weight Composite tax (2025 NM$)
Lifetime Net Merit, per extra BWC point
−$57 per point, per cow
Added lameness (oversized cows)
~5 extra cases/yr @ $300
−$1,500
Classification deduction (65″ cow)
Final Score → sale value
−1.20 pts (can move VG/EX line)
Faster culling / robot misses
Productive Life, throughput
Variable, compounding
HCC vs. PTAT: What’s the New Composite Reading?
Tall bulls keep sneaking into mating plans because of how the numbers are built. Stature is highly heritable, so it moves to daughters reliably. And here’s the trap Holstein USA spelled out plainly: rear udder height and width carry a high genetic correlation with stature — so if you lean on those udder traits, you unintentionally select for taller cows. A very tall bull can post a flattering udder composite that’s riding on frame, not genuine udder quality. Read it as one number, and you’d miss it.
That’s the gap HCC is built to close, and the design is aggressive about it. HCC is a composite of 18 linear conformation traits, weighted by how each relates to functional balance and longevity — not by Final Score. Stature carries the single highest weight at 15%, but it favors lower values: a bull transmitting moderate or shorter stature scores higher on HCC, all else equal. Strength gets 9%, Foot Angle and Udder Cleft 8% each, all favoring higher values.
The kicker is in the correlations. Holstein USA published that PTAT shows negative correlations with Productive Life, Livability, Feed Efficiency, and Cow Conception Rate — meaning the highest-type bulls, by the old measure, tend to work slightly against those functional traits. HCC shows near-zero to slightly positive correlations with the same traits. Put plainly: PTAT is the show picture, HCC is the barn picture.
Two things to keep straight. HCC values for active AI bulls were published before July 1, 2026, alongside PTAT, UDC, FLC, and BWC — it’s an added lens, not a replacement. And its move into TPI is under consideration, not decided: the committees will evaluate HCC performance and weigh incorporating it into TPI later in 2026. Treat it as a compass, not gospel. (Full 18-trait weighting breakdown coming in a follow-up — watch for it.)
Rosy-Lane Holsteins in Wisconsin has run a version of this playbook for years. Their published breeding strategy sorts bulls by Net Merit first, then discriminates against any bull over +2.0 for Stature — a two-filter approach that lines up almost exactly with where classification is now heading.
The Show Ring Is Reading the Same Room
Oakfield Solomon Sunset-ET EX-96 2E — Holstein USA’s 2025 Star of the Breed, bred and owned by the Lamb family of Oakfield Corners Dairy. Look at the depth, the spring of rib, that mammary — power and width, not extreme height. A 51,710-lb five-year-old, and exactly the cow the 2026 stature penalty was written to reward. (Photo: Andrew Hetke Photography)
Here’s the tell that this isn’t just committee talk. Holstein USA’s 2025 Star of the Breed is Oakfield Solomon Sunset-ET EX-96 2E, bred and owned by Jonathan and Alicia Lamb of Oakfield Corners Dairy in New York — a cow the family describes in almost exactly the language the new rules reward. Her production backs it: a five-year-old record of 51,710 lbs milk, 2,087 lbs fat (4.0%), 1,674 lbs protein (3.2%) on 2x 365-day, with more than 178,000 lbs lifetime milk.
Listen to how her breeders talk about her. “We don’t want to have the biggest, but we want to have the most correct — and we certainly want them to have plenty of width and power and strength,” Jonathan Lamb says. Her dam, Bella-Rosa GW Sara, wasn’t the prototypical tall show cow either — “she wasn’t super tall or extreme, but she was perfectly balanced, which is the kind we really appreciate,” per Alicia Lamb. That’s the breed’s highest type-and-production honor going to a cow explicitly bred for width and correctness over height. The award and the penalty are pointing the same direction.
Lovhill Sidekick Kandy Cane takes the handshake — the Lamb family’s five-year-old, tapped Grand Champion at the 2025 World Dairy Expo. Judge Aaron Eaton’s reasoning leaned on maturity, added width and power, not sheer height — the same vocabulary the 2026 classification card and HCC are now built to reward. What she’d measure on the stick is anyone’s guess; the language crowning her isn’t.
The ring itself said much the same thing at Madison. The same Lamb family owned the 2025 World Dairy Expo Grand Champion, the five-year-old Lovhill Sidekick Kandy Cane, whom Judge Aaron Eaton put to the top on her added width, and power rather than sheer height. Here’s the honest caveat: Kandy Cane’s exact classification stature isn’t public, so nobody can say whether she’d trip the new penalty — that’s an open question, not a prediction. But the language a top judge reaches for to crown a champion — width, power, balance — is now the same language the classification card and HCC are built to reward. When the show ring and the formula start using the same adjectives, the direction isn’t in doubt.
What Canada Already Figured Out
The Americans aren’t the first to draw a line on height. Canada’s classification system, run through Holstein Canada, has long treated its conformation composites so that extreme stature doesn’t buy its way into the score, and its evaluations are recognized worldwide for stability. If you sell semen or cattle across the border, or read Canadian proofs, you’ve already been living with a version of what the U.S. just adopted.
That matters for two reasons. First, the 2026 U.S. change isn’t a lone experiment — it’s the American system catching up to a direction others validated a while back. Second, if you use Canadian genetics, the bulls that look moderate and balanced under that stature-neutral math are the ones most likely to throw daughters who clear the new 60-inch lens cleanly. The systems are converging, not diverging — a rare thing in an industry where cross-border index differences usually cause headaches, not alignment.
What This Means for Your Operation
None of this makes tall cows worthless, or the show ring wrong. It means the barns, the economics, and the profit indexes have all shifted. Here’s how different herds can play it.
Run a 30-day sire audit. This month, pull your current bull list, sort by stature PTA, flag the tallest transmitters, then check Body Weight Composite, Productive Life, and now HCC on the ones you flagged. Costs nothing but an evening. Works for any herd — the single most concrete step available right now.
Gate on Net Merit, then cap stature. Best for commercial and dual-purpose herds chasing durability — the Rosy-Lane approach, essentially. It demands discipline to pass on a flashy tall bull. Where it backfires: pure show programs may find it narrows their pipeline of ring-competitive genetics.
Keep breeding show-type — but go in with eyes open. Makes sense if marketing show cattle is your business. What it demands: accept that a daughter measuring 64–65 inches now gives back nearly a full point of Final Score she’d have kept a year ago, which can move a sale price. Read individual linear traits, not just composites, when PTAT and HCC disagree.
Split your herd’s strategy. For larger operations, breed a show string one way and a commercial string another. It demands more record-keeping and a clear-eyed read of which cows earn their keep where.
The Big Picture: The steady stature decoupling in the evaluations, Canada’s long-standing “too-tall” stance, the 2024 scale shift, the 2025 Net Merit weight tax, the 2026 penalty, and a Star of the Breed bred for width over height are not separate events. They represent a decade of unified industry direction. Betting against it is a bet that economics and genetics will reverse course — and the data says they won’t.
Your 2026 Pre-Classification Audit
Run these three checks before your classifier’s next visit.
[ ] Identify the UDC/stature illusion. Flag bulls that are both exceptionally tall and high for udder composite — because rear udder height and width correlate strongly with stature, that composite may be riding on frame. Inspect the individual linear traits, and cross-check HCC, before buying more semen.
[ ] Recalculate your BAA expectations. Look at your aged, dry EX cows. Under the new 24-month rule (effective for May 2026 classifications and after), they’re temporarily out of your BAA calculation until they freshen again — expect a lower baseline herd figure.
[ ] Run the penalty table against your tallest cows. Measure — or estimate from prior classification — where your biggest cows sit. A 62-incher gives back 0.30; a 65-incher, 1.20. Know it before the classifier does, so a designation surprise doesn’t cost you at sale time.
One more if you buy across the border: lean on the stature-neutral Canadian proofs that already fit this direction. And if you’re already gating on Net Merit and capping stature, take the win — this is a tailwind, not a warning.
Key Takeaways
If your ideal cow measures over 60 inches, she now costs you classification points — 0.15 at 61″, climbing to 1.20 at 65″ and 3.45 at 70″ — but not one point of PTAT or stature PTA. The show-card hit and the genetic value no longer move together.
If you rely on PTAT and UDC alone, add HCC to the read. Holstein USA’s own data shows PTAT correlates negatively with Productive Life, Livability, and Feed Efficiency; HCC was built to flip that. Pull the individual linear traits when a tall bull’s udder composite looks great.
If you already gate on Net Merit and cap stature (the Rosy-Lane +2.0 rule), you’re ahead of the change, not behind it — the 2025 weight tax and the 2026 penalty both reward that discipline.
The show ring already moved. The 2025 Star of the Breed, Oakfield Solomon Sunset, was bred for width and correctness over height — the award and the penalty are pointing the same way.
Beyond the Ruler
The tall, angular cow ruled North American type for a generation, and by the measures of that era — tie-stalls, show strings, Final Score — she delivered. What’s shifted is the environment around her, not the quality of the cow. The breeders who feel the 2026 changes least are the ones who already moved toward moderate, durable, functional cattle — the Lambs, the Rosy-Lanes, anyone who decided years ago they didn’t want to milk the biggest cow in the barn. So here’s the question worth chewing on this week: if you measured your ten best-looking cows tomorrow, how many would clear that 60-inch line — and are they the same cows staying longest in your herd?
Learn More
140M Pounds in 45‑Inch Stalls: Why +Stature Sires Don’t Always Pay — Arms you with a diagnostic physical stall-fit check to stop selecting sires whose daughters outgrow your concrete. This guide exposes how squeezing 1,600-pound cows into 45-inch stalls silently costs up to 4.5 pounds of milk per cow daily.
Dairy Strength, Not Height: The Proof Rule Hiding in Every Holstein Pedigree — Dismantles the pedigree concentration tracing 99.84% of active Holstein AI sires back to just two foundation lines. You gain a 1:1 sire selection rule to actively counter narrow, frail genetics while prioritizing functional, deep-bodied strength over raw skeletal height.
The Sunday Read Dairy Professionals Don’t Skip.
Every week, thousands of producers, breeders, and industry insiders open Bullvine Weekly for genetics insights, market shifts, and profit strategies they won’t find anywhere else. One email. Five minutes. Smarter decisions all week.
Select Sires passed on her—her two-year-old milk didn’t clear their index. Bob Snow’s 35-cow herd bred her anyway. She threw three Gold Medal sons. The eye beat the formula.
Snow-N Denises Dellia, EX-95-2E-GMD-DOM, pauses at the water’s edge at Regancrest—a quiet echo of the sandy creek back at Bob Snow’s, whose grit nearly killed her two months after her 1991 grand championship. The cow Select Sires passed on threw three Gold Medal sons and 76 daughters.
The rain had quit by noon, and Frank Regan figured his fresh-cut hay was a lost cause anyway. So he loaded up the family and pointed the car toward West Salem for the 1989 Wisconsin Championship Show. They walked into the arena right as the senior two-year-olds were filing through the gate.
That’s when he saw her.
Snow-N Denises Dellia. A tall, jet-black cow—longer through the body than most Bell daughters, wider through the chest, carrying an udder that looked sculpted rather than grown. She moved through that gate like she owned the building. Regan said it to himself, half under his breath: “Wow. Who is that cow?”
Here’s the part nobody in that arena could have known: the big A.I. studs had already looked her over and taken a pass. Select Sires wasn’t interested. Yet this “nobody” cow, from a 35-head herd in the Wisconsin coulees, would go on to breed three Gold Medal sons, leave 76 registered daughters, and become the foundation of one of the most consequential Holstein families of the modern era.
Frank Regan just knew he couldn’t stop thinking about her.
Where the Sandy Creek Ran
To understand Dellia, you’ve got to understand Bob Snow’s place. His farm sat in the coulees of southwestern Wisconsin—hilly, modest, the kind of outfit where a man milked 35 head and knew every one by her walk. There was a creek behind the barn where the cattle waded in to drink. Remember that creek. It matters later.
Bob Snow’s dairy near Sparta, Wisconsin—the 35-cow outfit in the coulees where Snow-N Denises Dellia was bred. No franchise money, no famous address: just a modest hillside barn, a good plan followed with patience, and a sandy creek out back that would one day nearly cost Dellia her life.
Snow wasn’t chasing the sire-of-the-month. What he did was almost musical—follow a strength bull with a dairy one, then swing back toward strength, keeping the pendulum moving toward balance. Functional dairy type, always. He’d bought his foundation stock at the Adolph Buergi dispersal on August 24, 1970—the sale records name Buergi as the herd dispersed—bringing home a three-year-old, Ce-Buerg Creator Hartog Fobes, and her daughter, Ce-Buerg Creator Fobes Garnet. Two quiet cows from a quiet sale. Nobody wrote them up in the breed magazines. Nobody needed to. They’d become Dellia’s seventh and sixth dams.
Then came the patient work. From Garnet, Snow bred to Cedardale Corporal—chosen for one plain reason, calving ease on a virgin heifer. That gave him Snow-N Garnet Corporal Edith. Next, Harborcrest Happy Crusader, a bull who stamped strength, square rumps, and especially good udders. Then Arlinda Commander to clean up the bone and add stature. Then MD-Sunset-View RA Wonder, an Elevation son known for big frames, wide chests, and ample bone.
Here’s where most folks’ eyes glaze over—five generations of cows nobody’s heard of, bred by a man milking three dozen head in the hills. But the late Peter Blodgett, who spent decades tracking cow families inside the A.I. business, saw the architecture for what it was. As he was quoted as saying in the contemporary account of Dellia’s life, “It’s rare that you combine a bull like Wonder with Bell. The fact that those two bulls were combined is the work of a ‘master breeder’ for sure.”
Snow-N Ellas Dory, the Wonder daughter, was the cow who’d close the circle.
How Do You Breed a Dynasty Cow? It Started With Two Straws.
Winter of 1983. Bob Snow went to a barn meeting and won two units of Carlin-M Ivanhoe Bell semen. That was the whole prize. Two straws. He drove home and used them on his two best animals. One was Snow-N Ellas Dory, still a virgin at the time.
Think about that for a second. Two donated straws, won at a local meeting, used on a heifer from a 35-cow herd. No grand plan. No embryo-transfer syndicate. No six-figure purchase at a national sale. Just a working dairyman making a smart mating with exactly what he had in his hand.
Snow-N Dorys Denise, EX-90-2E-GMD-DOM—the Bell daughter that came of Bob Snow’s two donated straws, posed here with the strength and well-hung udder that ran in the family. Bred to Walkway Chief Mark, she gave one calf that changed everything: Dellia. Her own best record read 33,350 lbs of milk in 365 days. (Photo: Peters Photo)
The heifer that came of it was Snow-N Dorys Denise—a typey Bell daughter, but with more strength than most of her sire’s get, a shapely udder, correct feet and legs. And when John Steinhoff, a kid fresh out of high school who’d come to work for Snow, picked the next bull for Denise, he reached for Walkway Chief Mark. The Mark-Bell cross was already whispered about as one of the golden combinations in the breed—Mark bringing width, capacity, and udders; Carlin-M Ivanhoe Bell bringing those correct feet and legs.
On December 20, 1986, the resulting heifer calf was registered as Snow-N Denises Dellia.
That calf—the one from a barn-meeting prize—would change everything. Three Gold Medal sons, though no one in that barn could have dreamed it yet. Nobody saw it coming.
The Nobody From Nowhere
Steinhoff liked to show cattle, and he talked Snow into hauling a string out. The first animal they took anywhere was Dellia, as a winter yearling in 1988. Second in a class of 25 at the Wisconsin Champion Show under Howard Binder. Sixth in a class of 31 at Madison under Bert Stewart. Reserve All-Wisconsin senior yearling.
Not bad for a cow from a herd nobody’d heard of.
Snow figured she had something. He flushed her—and on that first flush, Dellia dropped a dozen embryos. Some went to Europe. Snow implanted others himself. Over time she’d be flushed to Blackstar twice and once to Nowerland Trifecta.
Then came the first sting. Select Sires took a look and passed. Their benchmark for a two-year-old back then ran 23,000 to 25,000 pounds of milk, and Dellia hadn’t hit that number yet. And that’s the thing about the late ’80s A.I. business—the studs were leaning hard on production indexes, PTA milk chief among them, to decide which cows were worth a bull contract. A cow got screened by her numbers on paper first. Dellia was a visual masterpiece with deep maternal architecture behind her, but a young cow who hadn’t yet posted a big milk figure didn’t light up a corporate index model. The eye saw a bull mother. The formula saw a two-year-old short of the milk cutoff. So the stud that would one day beg for her sons wanted nothing to do with her.
But the show ring was telling a different story. As a two-year-old in 1989, Dellia won grand at the Wisconsin District 2 show at Viroqua and again at the Wisconsin Spring Show. At the Championship Show that fall, under Loren Elsass, she stood second in a senior two-year-old class of 23—and walked out with the best udder award.
And that’s the day Frank Regan walked in out of the rain.
“Who Owns This Cow?”
Regan followed her back to the barn after the class. He found Bob Snow and asked what he wanted for her. The number was high—too high for a spur-of-the-moment buy. So Regan pivoted: Snow was flushing Dellia to Blackstar, so how about a Blackstar daughter instead? Snow agreed.
But Dellia had lit a fire. Sire analysts came calling. Visitors kept showing up at the farm. Snow started fielding offers. “I started at $10,000,” he recalled in the contemporary account. “And every so often I boosted it by $5,000. I got up past $50,000 pretty quick.”
Back home, Dellia classified VG-89 as a two-year-old. “We just about lived in the pen with her that day,” Snow remembered. “I always clipped and washed on classification day. I figured it was always worth an extra point or two. The initial impression is so important.”
The next year, 1990, Snow didn’t show her—she was busy being flushed. But Regan kept coming back. The Snow farm was only a hundred miles from his own place at Waukon. Cross the Mississippi at Prairie du Chien, drive an hour, and there you were. Regan was hunting a franchise cow—a herd-building female he could flush and build a program around. He’d looked hard at Dixie-Lee Chief Liza, who’d sold through the 1990 Top Ten Breeders Invitational with $106,000 in signed contracts. But it always circled back to the black cow at Bob Snow’s.
One visit, he found Dellia standing in a stanchion, due in December to Stardell Valiant Winken. He told Snow she was too big to be tied in a stall like that—it was apt to ruin her. The truth, of course, was simpler. He wanted her. And a couple of weeks before the 1991 Wisconsin Spring Show, the two men finally shook on a price. The deal: Snow would own her through the show, Regan would lead her, and afterward she’d ride home to Iowa.
The Night Before the Show
Now here’s where it gets interesting.
The day before the show, Orville Kemmink—a name that carried weight around Wisconsin—walked up to Regan and squinted at him. “Are you the kid who bought this cow?” Regan said he was. “Don’t you think you paid too much?” Kemmink pressed, pointing out that Dellia had been flushed several times already and a pile of embryos had gone out the door. “You won’t get your money back,” he warned.
That evening, Frank Regan and Bob Snow sat down to supper at a place called the Country Kitchen. Regan told Snow about Kemmink’s warning. The doubt was creeping in. This cow’s apt to embarrass me, he thought. So he asked Snow point-blank if he’d guarantee several embryos. Dellia had done right by Snow over the years, so he just said, “How many do you want?”
But the more immediate trouble was this: Dellia looked empty. Flawless udder—but she could go a little shallow in the body, and right then she looked more like a racehorse than a champion.
So Regan went and bought four bales of hay. Three of grassy hay, one of alfalfa, to fill her out. He hit a feed store for a bag of calf feed to mix into her grain. “She likes warm water with her beet pulp,” Snow told him.
He started feeding her that night. By morning she was straightening out. By ten a.m., people were drifting back to the far barn to look at her—back where the 4-H kids usually kept their calves. Word had gone through the aisles: there’s an outstanding cow back there. And instead of a racehorse, Dellia was starting to look like a winner.
Grand Champion — and Then, Three Gallons of Sand
With Niles Wendorf judging, Snow-N Denises Dellia topped the four-year-old class, took the best udder trophy, and was named grand champion of the 1991 Wisconsin Spring Show. Wendorf called her tall, sharp, clean, beautifully uddered, and trouble-free.
Snow-N Denises Dellia, EX-95-2E-GMD-DOM—Walkway Chief Mark out of Snow-N Dorys Denise, with Carlin-M Ivanhoe Bell as maternal grandsire. “Tall, sharp, clean, beautifully uddered, and trouble-free,” judge Niles Wendorf called her the day she stood grand champion at the 1991 Wisconsin Spring Show. This is the cow Select Sires had passed on. (Photo: Kathy DeBruin / Agri-Graphics)
Afterward, Bob Snow had to back his car right into the arena to fit all the hardware in the trunk. And plenty of folks weren’t happy about it—upset that a “nobody” could waltz in and clean up. So much so that Ray Kuehl came over to Regan and asked flat out, “Who owns this cow? A lot of people are talking about it.” Regan explained the arrangement. “That’s all I want to know,” Kuehl said, and walked off.
Dellia went home to Regancrest, the champion of Wisconsin. But a champion in the ring is one thing—a cow tough enough to build a dynasty is another, and the breed was about to find out which one Dellia really was. Two months later, she nearly died.
She took a crampy spell. Started kicking at her belly. The vet recommended surgery, and she looked like she might not pull through. So the veterinarian opened her up—and pulled three gallons of sand out of her stomach.
That creek behind Bob Snow’s barn. The cattle would wade in, stir the sandy bottom, and the cows drinking after them swallowed the grit. It had been settling into Dellia’s gut, silent, for years.
After the operation, she bounced right back. Of course she did. Dellia was never a cow who knuckled under.
Building the Dynasty at Regancrest
Now the real work started. Frank Regan chased bulls that sired good type, and he mated Dellia wide—76 registered daughters by 21 different sires. She averaged fifteen embryos a flush. One time she gave 25 on a single flush to Arlinda Melwood.
Not every cross worked, and here’s a lesson worth pinning to the barn wall: the Melwood and Maizefield Bellwood matings threw heifers that freshened with udders “like balloons,” as Regan put it. He sent them to the stockyard. No sentiment. A breeder who builds a dynasty knows exactly when to cull—even out of a great cow.
But when Dellia clicked, the results stopped people cold. Picture a Dellia daughter going down the alley on classification day—the classifier working her over slow, then straightening up and calling it: Excellent-94. Then another, by a different sire. Then another. Darlene classified EX-94. Della, Dolly, Denyse, Deborah down the line—daughter after daughter, each by a different bull, each stacking up records that’d be the pride of any herd. Think about what that took. Not one lucky nick. Different bulls, same result, over and over. Type and production, handed down like she couldn’t help herself.
Snow-N Dellias Darlene, EX-94-GMD-DOM—Dellia’s Blackstar daughter and, by Frank Regan’s own reckoning, maybe the finest cow the Regans ever led. She made 32,080 lbs at 4.1% fat as a two-year-old and bred Regancrest Jed Deborah, EX-95, before a twisted caecum took her early. Proof the type carried straight down the line.
Her Blackstar daughter, Snow-N Dellias Darlene (EX-94-GMD-DOM—Gold Medal Dam and Dam of Merit, the era’s marks for a cow who both scored high and transmitted it, back when those letters were earned the hard way over a whole string of daughters), might have been the finest cow the Regans ever led—32,080 pounds at 4.1% fat and 3.6% protein as a two-year-old, and dam of Regancrest Jed Deborah (EX-95), a cow Frank Regan flat-out called one of the nicest you’d ever see. But they lost Darlene to a twisted caecum. Even in a story like this one, the dairy business exacts its toll.
The others kept climbing. Regancrest Tesk Della (EX-90-GMD-DOM) made 35,510 pounds as a mature cow and produced the Gold Medal bull Regancrest RBK Die-Hard. Regancrest Leadman Dolly (EX-90-GMD-DOM). Regancrest Starbk Denyse (EX-92-3E). One after another, the Dellia daughters stacked up records that’d be the pride of any herd—and then they threw sons that went to A.I. studs around the world.
What Made Dellia’s Sons — Durham, Dundee, Derry — So Valuable?
Here’s what really set Dellia apart from every other great brood cow of her time. The bulls.
Forty-four of her sons were sampled in A.I. Three of them earned Gold Medals. And those three—Regancrest Elton Durham, Regancrest Dundee, and Regancrest Emory Derry—didn’t just make the lineup. They redrew it.
Durham, by Emprise Bell Elton, was proven at Select Sires—the very stud that had once passed on his dam. His Durham daughters were the kind commercial men dream about: good-uddered, trouble-free, the sort that blend into a herd and keep milking. Tim Abbott of A.B.S. Global summed up the barn-floor verdict this way in the contemporary account: “People consistently say their Durham daughters are trouble-free cows… The milk volume is lower but the fact is they last a little longer and have a little more stable type pattern.”
Dundee, by Marcrest Encore, was proven by A.B.S./St. Jacobs in Canada and scored an eye-popping EX-95-ST. He was a full brother to Regancrest Encore Dahlia (VG-89) and Regancrest Encore Darel (EX-91-GMD-DOM). Between the two of them, Durham and Dundee stamped a generation of Holsteins on two continents.
Derry, by MJR Blackstar Emory, went to Select Sires. A third Gold Medal bull, from the same cow, by a third sire. Most breeders go a whole lifetime without producing one Gold Medal sire. Dellia produced three.
“Dellia’s impact through her daughters has sent more dollars back into farmers’ pockets across the world than any other cow.” — Scott Culbertson, then sire analyst at Select Sires, in the contemporary published account.
And it was the Durham daughters above all—their longevity, their trouble-free udders—that turned that impact into dollars in working herds.
Sheeknoll Durham Arrow, EX-96—a Durham daughter, Grand Champion at the 2016 World Dairy Expo. Twenty-five years after Dellia took her own grand banner at a Wisconsin spring show, her son’s daughter stood atop the tanbark in a packed Coliseum. That’s the maternal architecture from Bob Snow’s coulees, still doing its quiet work.
And here’s what makes her more than a history lesson. Dellia’s influence didn’t stop when the genomic era arrived. The traits her sons and Regancrest daughters carried—sound feet and legs, stable, trouble-free udders, the kind of durability that keeps a cow in the string for extra lactations—are exactly the functional traits breeders still chase on today’s proof sheets. Every time a Durham-descended cow freshens quiet and lasts, that’s the same maternal architecture Bob Snow built in the coulees, still doing its quiet work three decades on.
DH Gold Chip Darling, EX-96—a European show champion said to trace back to the Dellia family. If the pedigree holds, she’s the far side of the story Bob Snow started: Durham and Dundee stamped Holsteins on two continents, and here’s that same architecture standing under the lights an ocean away.
And the pipeline didn’t stop with those three. Erbacres Damion (EX-94-GM). Regancrest-HHF Mac (EX-92-GM), out of her Rudolph daughter. England-Ammon Million, a Comestar Outside son from Mac’s full sister. In the year she died, a look through the 2001 Red Book turned up six of Dellia’s sons and four grandsons already graduated into A.I., with more waiting on proofs.
Snow-N Denises Dellia — The Record Final classification: EX-95-2E-GMD-DOM Lifetime production: 180,240 lbs milk · 7,108 lbs fat (3.9%) · 5,723 lbs protein (3.2%) Best lactation (6 yrs): 35,230 lbs milk at 4.0% fat Registered daughters: 76, by 21 different sires Sons sampled in A.I.: 44 — including three Gold Medal sires Born: December 20, 1986 · Died: December 8, 2001
December 8, 2001
Snow-N Denises Dellia died on December 8, 2001. She was nearly fifteen years old.
The record above tells you what she did. What it can’t quite capture: even nearing fifteen, she still walked on a perfect set of feet and legs—the same sound frame that carried her through a decade of flushing and never once let her down.
It was never just that she had those traits. It’s that she handed them down, generation after generation—and that’s the thing that set her apart from every contemporary she ever stood beside.
In her obituary that ran in Holstein World following her death in December 2001, the Regans wrote: “We at Regancrest have been blessed by God to have had the opportunity to work with such a unique animal… Her legacy will live on not only through her offspring but in the lesson she taught to many—that the demand for high type plus production never goes away.”
What Dellia’s Story Means for Your Barn
Strip away the show trophies and the Gold Medal sons, and Dellia leaves working breeders three plain lessons—as true in your barn today as they were in Bob Snow’s:
Breed for balance, not for the trait of the month. Snow’s patient pendulum—strength, then dairy, then strength—built a cow that transmitted. Look at your best cow’s whole mating history, not just her last score.
Judge a cow by what she throws, not just what she scores. Dellia’s EX-95 was lovely. Her transmitting ability was priceless. Ask what your donor’s daughters actually look like in second lactation.
Cull like you mean it—even out of your best. Regan shipped Dellia’s balloon-uddered daughters without a second thought.
And don’t ever let a fancy address decide for you. The best cow in your county might be standing in a 35-cow tie-stall right now, ignored by the big studs.
A Permanent Place
Here’s what a cow like Snow-N Denises Dellia teaches you about this breed, if you’re paying attention.
She didn’t come from money. She came from a sandy farm where the creek ran behind the barn, and a man won two straws of Bell at a meeting and used them wisely. She was bred by people whose names never rode the cover of a sale catalog, developed by a kid fresh out of high school who knew which bull to reach for, and sold to a man with the eye to see what she’d become. She stands today among one of the most consequential Holstein families the breed has ever known.
Durham. Dundee. Derry. Damion. Mac. Die-Hard. Read that roll call slow. Every one of those bulls traces to her. And every time a good-uddered Durham daughter freshens quiet in somebody’s parlor and goes to work, that’s Dellia—still milking, in a way, twenty-some years after they laid her to rest.
Snow-N Denises Dellia. EX-95-2E-GMD-DOM. Born December 20, 1986. Gone December 8, 2001. The black cow nobody wanted, who proved—for every breeder who ever looked at a plain barn and a plain pedigree and dared to see more—that greatness never did require a famous address. Just the right blood, the right hands, and the patience to let a good plan unfold.
So here’s the question worth chewing on tonight: who’s the unheralded cow standing in your barn right now—and are you breeding her the way Bob Snow bred Dellia?
Your turn. Did a “nobody” cow ever surprise you and build something real in your herd? Drop her name and her story in the comments—The Bullvine wants to hear about the next Dellia hiding in a tie-stall somewhere.
Key Takeaways
The best brood cow in your county might be standing in a 35-cow tie-stall right now. Snow-N Denises Dellia was home-bred nothing-special on paper—and she threw three Gold Medal sons.
Select Sires passed on her because her two-year-old milk didn’t clear their PTA-milk cutoff. A single number screened out a cow the eye would’ve kept. Watch what a formula alone might cost you.
Judge a cow by what she transmits, not just what she scores. Dellia’s value showed up in 76 daughters and 44 sampled sons—transmitting ability the index couldn’t see at two years old.
If you’ve got a cow the studs won’t sample but your gut won’t quit on, that’s the whole story here. Bob Snow flushed her anyway, and Durham, Dundee and Derry trace back to that call.
Continue the Story
Hanoverhill Tony Rae: The Story of a Legend – Built in the very same era when rigid production indexes threatened visual masterworks, this profile captures another legendary cow family that defied corporate formulas through pure, functional maternal architecture.
The 10 Greatest North American Holstein Brood Cows of All Time – Deepen your understanding of the fierce type-production debate that defined late-twentieth-century breeding circles, and see how Dellia’s transmitting ability earned her a permanent place alongside the absolute giants of the breed.
Regancrest S Chassity – 2012 Golden Dam Contest Finalist – Discover how the genetic line from Bob Snow’s coulee farm carried forward into the high-stakes genomics era through Dellia’s direct descendant, proving that her legendary foundation of sound feet and udders held true across generations.
The Sunday Read Dairy Professionals Don’t Skip.
Every week, thousands of producers, breeders, and industry insiders open Bullvine Weekly for genetics insights, market shifts, and profit strategies they won’t find anywhere else. One email. Five minutes. Smarter decisions all week.
At 9.99% inbreeding, every extra point can quietly strip up to $44 per cow — before you even argue TPI vs Net Merit.
Lovhill Sidekick Kandy Cane takes the fist-bump and the banner — Grand Champion of the International Holstein Show at World Dairy Expo. Bred by Michael and Jessica Lovich on 72 tie-stall cows in Balgonie, Saskatchewan, and later classified EX-97, she’s living proof that a deep, functional udder and real longevity still win the ring — the same traits a narrowing gene pool is quietly pricing every breeder out of.
Michael and Jessica Lovich milk 72 cows in a tie-stall barn in Balgonie, Saskatchewan. They mostly ignore genomics. They breed off cow families and their own eye. And they’ve now bred two separate World Dairy Expo Holstein Grand Champions — Lovhill Goldwyn Katrysha in 2015 and Lovhill Sidekick Kandy Cane in 2025. They’re the first and only breeders in history to pull that off. (Read more: Lovholm Holsteins: The Only Farm to Breed 2 World Dairy Expo Holstein Champions Milks 72 Cows in Tie-Stalls)
Here’s the part that should make you pause. The herd that walked away from the index list ended up breeding the kind of functional, long-lasting cows the commercial indices are quietly moving toward anyway. They succeeded by breeding out of a broader, more diverse gene pool — the exact opposite of where the rest of the industry is rushing. And while everyone keeps arguing about show cattle versus commercial cattle versus “just use the index,” a number nobody chose keeps climbing in the background: Holstein inbreeding hit 9.99% for Canadian heifers born in 2024 — the highest of the four major breeds, ahead of Jersey at 7.56%, and up from 9.61% the year before — according to Lactanet’s August 2025 update. That number lands on all three camps at once, no matter which side of the argument you stand on.
What’s Changing and Why
For thirty years, the dairy genetics argument has had two sides. One camp says the show ring proves what a valuable cow looks like. The other says the milk cheque does. This summer a third voice got loud enough to matter: “Both of you are wasting time — just breed off the top GTPI or Net Merit list.”
All three are answering different questions, and the numbers now prove it. In April 2026, Holstein Association USA changed its TPI formula to weight protein at 24% and fat at just 14%, up from a 19/19 split. CDCB’s Net Merit 2025 revision went the opposite direction — fat at 31.8%, protein down to 13.0%, with Feed Saved climbing to a combined 17.8% and Body Weight Composite at −11%. Two flagship indices, both claiming to describe a profitable cow, now point in genuinely opposite directions on fat versus protein.
Then there’s the classification change most show barns are still processing. Starting with the May 2026 run, HAUSA set 60 inches as the ideal stature and applied a sliding-scale penalty for cows taller than that — shaving points off the final classification score as height climbs past the limit, so a tall, extreme-framed cow that once scored well can now come in lower on paper for the exact trait that used to help her. The official language is about normalizing size. But underneath it is a harder admission: decades of breeding taller cows collided with feed cost, stall fit, and longevity. The breed association put a measurable penalty on the exact trait the show ring spent a generation chasing.
How This Plays Out on Real Farms
The Lovich story looks like a fairy tale until you read the fine print. They sold both champions. Katrysha went south, and Kandy Cane went to Oakfield Corners Dairy in New York as a four-year-old, well before she walked into Madison as a five-year-old and later reclassified EX-97. For a lot of small tie-stall herds, selling your best cows is how the barn stays viable — the premium on an elite animal funds the operation. And their cows tend to milk well past the age most Holsteins are culled, which flips the whole economics toward longevity rather than peak yield.
The tap that started a dynasty: Lovhill Goldwyn Katrysha is confirmed Grand Champion of the International Holstein Show at World Dairy Expo 2015. Her win put a 72-cow tie-stall herd in Balgonie, Saskatchewan on the map — the first of two World Dairy Expo Grand Champions Michael and Jessica Lovich would breed off cow families and their own eye, not a genomic list, while the rest of the breed narrowed toward it.
The number that reaches every barn is inbreeding, and it carries a real bill. The Virginia Tech research pegged it at $22 to $24 in lifetime net income per cow for each 1% rise in inbreeding — but that’s in 1999 dollars. Adjust it forward on cumulative inflation alone and the same drag lands near $44 per cow per 1% today (a Bullvine CPI-based estimate — layer in higher modern milk and feed values and the case for the top of that range only gets stronger). Run the math your own way. On a 200-cow herd that lets average inbreeding drift up four points, that’s roughly $35,000 in lost lifetime net income across the herd — not index points on a page, real money bleeding out of the barn. Newer Canadian work backs the mechanism: the Canadian Dairy Network found a cow that’s 10% inbred, versus 5%, loses about 92 kg of milk, 5.3 kg of fat, and 2.6 kg of protein per lactation, adds 1.4 days open, and loses roughly 65 days of productive life. It never shows up on a semen invoice. It hides in open days, mastitis cases, and calves that don’t make it.
Metric (per lactation unless noted)
5% Inbred Cow
10% Inbred Cow
Loss at 10%
Milk yield
Baseline
−92 kg
−92 kg
Fat
Baseline
−5.3 kg
−5.3 kg
Protein
Baseline
−2.6 kg
−2.6 kg
Days open
Baseline
+1.4 days
+1.4 days
Productive life
Baseline
−65 days
−65 days
That’s why this reaches every camp. The show breeder, the Net Merit devotee, and the top-50-list herd are all pulling from an increasingly related bull population, and the compounding cost lands the same way on all of them.
Think of it as three different experiments, not three answers to one question. Show-and-type selection asks whether breeding for conformation and classification produces cows that win and sell. The commercial camp runs a different test entirely: through Net Merit or LPI, does a cow throw the most profit under your actual costs? And the index-first crowd is betting on speed — trust the highest-ranked young bulls, shorten the generation interval, and try to outrun everyone else’s genetic gain.
None of those experiments settles the others, because each measures something different. A judge at World Dairy Expo isn’t scoring feed intake per day or days open. Net Merit ignores ring presence entirely. And the index itself isn’t neutral — it’s an editorial choice about what matters, built on national-average price assumptions that may not match your processor. So when TPI says protein and Net Merit says fat, a breeder who “just uses the index” without checking which one fits their cheque is quietly optimizing for someone else’s barn.
The inbreeding problem sits underneath all three. The top of any genomic list — GTPI or Net Merit — isn’t a random draw. It’s a tight cluster of high-relationship sires that trace back through a handful of grandsires, and the concentration is stark: research finds the vast majority of today’s Holstein AI bulls funnel back to just two ancestral sires, with a single foundation bull, Pawnee Farm Arlinda Chief, still echoing through the population decades later. Ride the list harder, and you stack that relationship faster. CDCB has confirmed its genetic base changes now include Expected Future Inbreeding (EFI) adjustments to account for future inbreeding, not just observed genetic trends — which is why individual PTAs no longer track the base change as cleanly as they once did. When the statisticians pre-discount the future, that tells you something.
How Much Does Sticking With the Wrong Index Actually Cost?
More than most herds realize, and the loss is invisible because it’s “index-approved.” A herd that keeps breeding off TPI out of habit, while getting paid on butterfat, can drift toward higher protein ratios its cheque doesn’t reward at current component prices. Bullvine’s own modeling of the 2026 TPI shift put the exposure as high as $17,500 for a mid-size herd chasing the protein signal in a fat-heavy market — a figure that depends on your herd size and your component spread, so treat it as a scenario, not a guarantee.
The mirror image is just as real. A cheese-plant herd still breeding off Net Merit’s fat signal can leave protein premiums on the table — a gap Bullvine modeled at roughly $134 per cow per lactation, or about $67,000 across 500 cows. Either way, nobody traces it back to the semen order. They blame feed, labor, the processor — everything except the objective function they never chose on purpose.
Barn Situation
Index Being Used
Where It Leaks
Modeled Cost Exposure
Fat-heavy market, chasing protein
HAUSA TPI (2026)
Higher protein ratios the cheque doesn’t reward
~$17,500 (mid-size herd)
Cheese plant, breeding for fat
CDCB Net Merit (2025)
Protein premiums left on the table
~$134/cow/lactation
Same, scaled to the barn
CDCB Net Merit (2025)
Compounded across the herd
~$67,000 (500 cows)
Any herd, wrong index by habit
Either
Blamed on feed, labor, processor — never the semen order
Maybe — and the tie-stall clock makes it more urgent for some. Canada’s updated code of practice requires that continuously tethered cows get untethered freedom of movement, with the key provisions phasing in by 2027.
Connect the dots and the three storylines turn out to be one. HAUSA’s 60-inch stature penalty isn’t an aesthetic call — it’s a structural necessity, because modern Holsteins have been outgrowing the physical dimensions of the tie-stalls and freestalls North American barns were built around. That’s the same logic driving Net Merit’s −11% Body Weight Composite: a bigger cow costs more to feed and fits the barn worse. The logic points one way — a shorter, more genetically diverse cow should fit a retrofitted stall better and carries less of the fertility and health drag that inbreeding stacks on, which is exactly what you want walking into the 2027 deadline. Head in tall and closely related, and you’re solving two problems at once, with only one of them showing up on your classification report.
Options and Trade-Offs for Farmers
Path 1: Pick your index deliberately, then match it to your pay stub. This is the 30-day move. Pull last year’s milk cheques and figure out your actual dollar-per-pound split on fat versus protein. If you’re component-heavy on butterfat, Net Merit’s 31.8% fat weighting likely fits better than TPI’s protein-heavy 2026 formula. It takes an afternoon with your statements and your rep. Skip it, and you leak margin for years while your cows look better on paper.
Path 2: Build an explicit inbreeding ceiling into your mating program. This one’s for any herd riding the top of the GTPI or Net Merit lists year after year. It means telling your mating software — or your rep — a hard limit and holding to it, even when a high-index bull is closely related to your cows. Lactanet notes the average inbreeding level today is roughly 9% and advises aiming matings below that average; its own tools flag %INB so you can screen out mates that push a calf too high. You may give up a few index points per mating. The payoff is not stacking that $22-to-$24-per-cow-per-percent bill — closer to $44 in today’s dollars — that you won’t feel for three years.
Path 3: Borrow across camps instead of picking a tribe. Take the show world’s eye for udders and legs, the commercial index’s discipline on feed efficiency and longevity, and genomic testing’s speed on sorting replacements. Works for most mid-size herds. The trap is doing it by accident — a little TPI, a little Net Merit, a little show type — and ending up with a bull battery optimized for nothing. Lovhill reached the top of the show ring twice by holding one clear standard, not by hedging across three — and that discipline is the part worth copying, whichever camp you land in.
Key Takeaways
If you don’t know your actual dollar-per-pound split on fat versus protein from last year’s cheques, run that number before your next semen order — it decides whether Net Merit or TPI fits your barn.
If your herd’s average inbreeding is at or above the 9% breed average, pull your number from your genetic-management software this month and ask your rep to project it forward before your next mating run.
If your cows skew tall, factor in that the May 2026 stature penalty and Net Merit’s −11% Body Weight Composite now both work against extreme size.
If you show and sell as part of your business model, be honest about whether your plan includes selling your best cows the way the Lovich family did — that’s what made their math work.
If your index “feels safe” because it’s familiar, remember the TPI and Net Merit formulas both changed in the last 18 months — familiarity isn’t the same as fit.
If you’re shipping to a cheese plant with a protein-to-fat ratio below 0.80, run the per-cow math on your own component prices — that’s the danger band where the wrong index quietly costs the most.
Here’s the uncomfortable question worth sitting with. The show breeder confuses a ring result with an economic verdict. The index-first herd confuses trusting the formula with running a strategy. Both outsourced their judgment — one to a judge, one to a formula — and neither stopped to ask whether the thing they trusted still fits the cows they actually need. So which one are you? And when did you last check whether the tool you rely on is optimizing for your barn, or for the average barn someone modeled years ago?
The short version: genetics is an economics question, and the only real mistake is not knowing which experiment you’re running. The longer version — the full cost-per-cow inbreeding math, broken down by herd size and index choice — is where the decisions actually get made. We’re running those numbers in next week’s Bullvine Weekly. If you want to map this to your own operation, that’s where the real math lives.
Hold-to-Proof Cost & Inbreeding Drag Simulator
Map the 2026 TPI/Net Merit formula updates and genetic drag directly to your herd’s bottom line.
200
9.5%
8.0%
Annual Inbreeding Penalty
$0
Annual Index Revenue Leak
$0
Total Invisible Annual Margin Leak
$0
Calculated using updated 2026 genetic values and modern inflationary baselines.
Complete references and supporting documentation are available upon request by contacting the editorial team at editor@thebullvine.com.
Learn More
Dairy Cattle Genetics Explained: TPI, NM$, GTPI and Genomics — Arms you with an immediate operational blueprint to navigate the 2026 formula divergence, showing exactly when to deploy TPI’s high-protein selection versus Net Merit’s aggressive butterfat and feed-efficiency weighting.
Net Merit 2025 — Exposes why national genetic indexes lag behind current marketplace realities, tracking the multi-year commodity averages that create a hidden financial mismatch between your tank’s actual value and your long-term breeding goal.
The Proof You Waited Three Years For Averaged a $72 Markdown — Delivers a brutal, data-driven reality check on daughter-proven strategies, demonstrating how holding famous bulls to proof stacks an expensive maintenance bill while sacrificing an entire generation of genetic velocity.
The Sunday Read Dairy Professionals Don’t Skip.
Every week, thousands of producers, breeders, and industry insiders open Bullvine Weekly for genetics insights, market shifts, and profit strategies they won’t find anywhere else. One email. Five minutes. Smarter decisions all week.
Two bulls born in the 1960s—Chief and Elevation—sit behind 99.84% of today’s AI sires. The gift: more milk, better udders. The bill: a 9.99% inbreeding tab now in your heifer pen.
Picture every Holstein in North America walking into one barn for Father’s Day dinner.
Millions of black-and-white cows, shoulder to shoulder, in a building the size of a county. They’ve come to toast their fathers, the way families do this time of year. And here’s the part that ought to stop you cold while you’re scraping the parlor this Sunday: almost every animal in that impossible room would be raising a glass to the same two dads.
Not two dozen. Not two hundred. Two.
Their names were Pawnee Farm Arlinda Chief and Round Oak Rag Apple Elevation. One arrived on an Indiana spring morning in 1962. The other showed up in 1965, on a modest Virginia farm nobody had heard of. Neither ever knew the other. And yet a Y-chromosome study that combed through 62,897 bulls born between 1950 and 2013 found that virtually every active North American Holstein AI bull traces its paternal line back to just these two grandfathers. The Bullvine’s own analysis of that work puts the figure at 99.84% of active AI bulls — split almost eerily down the middle, roughly half Chief and half Elevation.
Read that number again. Ninety-nine point eight four percent. It’s as if the entire breed flipped a coin sixty years ago and has been living with the result ever since.
So, before you pour your coffee and head out to check the fresh pen, let me properly introduce you to the two dads at the head of your herd’s table. Once you know their story, you’ll never look at your milking string the same way again.
The $4,300 gamble that started a dynasty
Pawnee Farm Arlinda Chief (1962–1982). The bull behind half the breed. From a dam who sold for $4,300, Chief sired 16,000 daughters and more than two million great-granddaughters—and carried a hidden HH1 recessive that the breed wouldn’t decode for fifty years. Read more: The $4,300 Gamble That Reshaped Global Dairy Industry: The Pawnee Farm Arlinda Chief Story
Start with the elder. In a family reunion, you always start with the elder.
Here’s the thing about Chief, though — the gamble that made him happened before he ever drew breath. At the Pawnee Farm dispersal, his dam, Pawnee Farm Glenvue Beauty (EX-90), crossed the auction block and sold for $4,300. Now, picture what that meant in 1962. You could buy a new car twice over. You could put serious money down on land. Somebody stood at that ring, looked at a cow, and decided she was worth more than a house lot.
They turned out to be right in a way nobody could have predicted.
Because Beauty’s son became a kind of one-animal continent. By the time the dust settled, Chief had produced 16,000 daughters, 500,000 granddaughters, and more than two million great-granddaughters. Stack that against the cow your grandfather was proud to own, and you start to feel the gravity of the thing. This wasn’t a good bull. This was a whole population’s worth of fatherhood compressed into one animal.
And his daughters could milk. The proof has a name — Beecher Arlinda Ellen. In 1975, on Harold Beecher’s farm near Rochester, Indiana, Ellen completed a lactation of 55,661 pounds, the first cow in the entire Holstein breed to crack 55,000 in a single year — a world record that would stand for nearly two decades.
Here’s the part worth sitting with. Reporters came calling, the way they do when a farm makes history, and asked what magic ration he’d been feeding her. By Harold Beecher’s own account, he hadn’t done anything special at all. Think about that for a second. A humble Indiana dairyman, a world record standing in his tie-stall, and his honest answer was a shrug. He knew what every good cowman knows — you don’t feed your way to a number like that. You breed your way there. Ellen wasn’t a fluke. She was Chief’s signature, written in the milk tank.
And here’s what made Chief’s story the hard one. This was the era before genomics — no DNA test to whisper which young bull was worth sampling. You bred him, you waited, and you milked his daughters for years before the herd finally told you whether you were holding a fortune or a flop. Chief’s people waited. And the daughters kept coming back with the same verdict, herd after herd, in barns that had never heard of Pawnee Farm: more milk, again, and again. A father proves himself slowly. Chief proved himself the only way the times allowed — and the breed was never the same after the proof came in.
When sons become legends in their own right
Great fathers don’t just have great children. They have children who become great fathers themselves — and that’s where Chief’s story gets bigger than one bull.
His most influential sons read like a roll call: Walkway Chief Mark, S-W-D Valiant, Glendell Arlinda Chief, and Milu Betty Ivanhoe Chief. Take Walkway Chief Mark. He was only ever sampled because his full brother died, and somebody needed a backup. The spare. That backup bull accounted for roughly 7% of every Holstein genome on this continent. (The Bullvine has told that whole strange, wonderful story in full in Walkway Chief Mark’s profile — it’s one of the great accidents in breeding history.)
Seven percent. From the understudy.
Walkway Chief Mark (VG-87 GM). The spare that ran the breed. Only sampled because his full brother died and Foster Walk’s Illinois herd needed a backup, Mark went on to account for roughly 7% of every Holstein genome in North America. Select Sires later named him an Impact Sire of the Breed. The understudy nobody saw coming. Photo: Remsberg. Read more: Walkway Chief Mark: The Backup Bull Behind Seven Percent of Every Holstein Cow
A powerful father’s influence doesn’t stop with his own kids. It compounds. It ripples down through sons, and their sons, until you can’t open a modern catalog without bumping into the old man’s name a dozen times over. Chief didn’t just have a big family. He had a big family that kept having big families, branch after branch — one line eventually threading down to To-Mar Blackstar, himself one of the most heavily used bulls in breed history. Generation after generation, the table just kept getting longer, and the gambler who paid $4,300 for a cow back in 1962 kept looking smarter.
To-Mar Blackstar. The branch that kept growing. Down one of Chief’s many lines, Blackstar became one of the most heavily used bulls in breed history—proof of how a great father’s influence doesn’t stop with his sons, but compounds, generation after generation, until you can’t open a catalog without bumping into the old man’s name. Photo: Remsberg. Read more: To-Mar Blackstar: The One-Embryo Holstein Sire Behind 15.8% of Today’s DNA – and the Genetic Debt in Your Herd
The B-team mating that produced the Bull of the Century
Round Oak Rag Apple Elevation (1965–1979). The Bull of the Century. He came from a fertility-troubled sire and a “B-team” dam nobody expected anything from—then sired over 10,000 AI sons across 45 countries and an estimated nine million descendants worldwide. The cousin’s hunch that built the barns at Select Sires. Photo: Remsberg. Read more: Round Oak Rag Apple Elevation: The Bull That Changed Everything
Now, meet the other grandfather. And get ready to be surprised, because Elevation’s beginning was the opposite of a sure thing.
Down on Round Oak Farm in the Virginia piedmont, Ronald A. Hope and his family were running a working dairy, not a genetics empire — the kind of modest operation you’d have driven past a hundred times without a second look. The mating that produced Elevation wasn’t some master plan off a proof sheet. It came from Ron Hope’s cousin, George Miller, who suggested the cross. Just a hunch, passed down within the family. Try this one.
And honestly, on paper, you’d have shrugged and moved on. The sire, Tidy Burke Elevation, had fertility trouble. The dam, Round Oak Ivanhoe Eve, had been shuffled onto the farm’s B-team because she matured too slowly. A questionable father. An overlooked mother. A cousin’s offhand suggestion.
What walked out of that barn in 1965 changed the world.
I don’t say that lightly. He would later be named the “Bull of the Century.” But forget the title for a second and walk into a parlor full of his daughters instead. Look up. There it is — the udder. High, wide, held tight to the body, still bolted on the way you’d want it two and three lactations after the cows around it had broken down and shipped. Watch one of those daughters walk: sound on her feet into her sixth lactation, settling back in calf as if it were nothing, walking up to milk at an age when her contemporaries were long gone. That’s what Elevation transmitted — and the remarkable thing is he transmitted it all at once: production, udder quality, mobility, fertility, and longevity, in one package, when breeders had spent generations trading one good trait away to get another.
Put numbers on it, and your cup goes down on the table. His daughters averaged about 29,500 pounds in their first lactation — roughly 15% above their contemporaries in the 1970s. And while the industry average was near 2.8 lactations per cow, Elevation’s daughters averaged 4.2.
Do the barn math on that. Your average cow leaves after 2.8 lactations. Your neighbor’s Elevation daughters are still walking into the parlor at 4.2. Same feed bill to raise the heifer, same calving, and he’s getting roughly half again the productive life out of every replacement. That’s not a show-ring statistic. That’s a mortgage payment. For the farmer living it, the whole thing came down to a simple difference: a cow you fought all year, versus one you forgot to worry about.
A father whose children fill 45 countries
If Chief built his dynasty through a few towering sons, Elevation built his through sheer abundance.
Over 10,000 of his sons became registered AI sires. His semen was shipped to 45 countries. And his descendants — brace yourself — run an estimated 8.8 to 9 million worldwide. There are whole nations with fewer people than this one bull has grandchildren.
Hanoverhill Starbuck (1979–1998). Elevation’s most famous son. A $2,500 calf whose semen would eventually sell for roughly $25 million, Starbuck sired over 200,000 daughters across 45 countries—and by the early 2000s, some 93% of Canadian Holsteins traced back to him. The Canadian Holstein Association called him, simply, “the Best.” Shown here at five. Photo: Jim Rose. Read more: Hanoverhill Starbuck’s DNA Dynasty: The Holstein Legend Bridging 20th-Century Breeding to Genomic Futures
The most famous of those children crossed the border into Canada and became a legend in his own right: Hanoverhill Starbuck, a $2,500 calf whose semen eventually sold for roughly $25 million. (Starbuck’s story deserves its own evening — The Bullvine has told it in full.) Through Starbuck and ten thousand other sons, Elevation became the patriarch at the head of dinner tables from Wisconsin to the Netherlands to Japan.
Johanna Rag Apple Pabst, Grand Champion, mid-1920s. Where the family tree begins. The “Rag Apple” buried in Chief’s name and the bloodline behind Elevation’s dam both run back to this one Wisconsin bull—undefeated in 1924 and the foundation ancestor whose name still rides in pedigrees a century on. Walk far enough up the tree, and both grandfathers shake hands here. Read more: The Bull Who Changed Everything: The Johanna Rag Apple Pabst Story
And here’s a detail that ties the whole tree together. Eve — the overlooked B-team mother nobody expected anything from — traced back twenty times to a foundation cow named Johanna Rag Apple Pabst. The “Rag Apple” buried in Chief’s name comes from the same deep well. These two grandfathers, born to different farms in different decades, weren’t strangers at all. Walk far enough up the family tree, and they shake hands. The reunion was always a family affair.
Northcroft Ella Elevation (EX-97 4E GMD DOM). Both grandfathers in one cow. Born February 26, 1974, Ella carried Elevation on top and an EX-91 Chief daughter underneath—the two bloodlines that fathered half the breed, shaking hands in a single pedigree. The reunion, made flesh. Photo: Remsberg.
Two fathers, two temperaments
Set the two old bulls down at the same table, and you’d have spotted the difference fast. They were nothing alike.
Chief was the quiet workhorse — a production sire whose genius announced itself in the milk tank, lactation after lactation, value measured in pounds and years rather than ribbons. Elevation was the showman with substance, one of the first proven bulls of the modern era who could put a daughter in the ring and fill the bulk tank. One made cows that paid. The other made cows that paid and turned heads on the colored shavings.
Elevation did something else, too — he changed the very machinery that moves genetics around the world. His semen, by one account, helped finance Select Sires and solidify it as a cooperative during its fragile early years. As his own breeder’s cousin, George Miller, put it: “It’s been said that Elevation built the barns at Sire Power and Select Sires.”
And his fingerprints are still all over the modern toolbox. Here’s the mind-bender: by The Bullvine’s analysis, Elevation’s DNA makes up about 8.3% of the CDCB’s genomic reference population — the very dataset that modern genomic predictions are trained on. Think about that the next time a young genomic bull’s numbers flash up on your screen. The math ranking him was partly based on his own great-great-grandfather.
The roots run deeper than you think
Speaking of walking up the tree, the story doesn’t actually start with these two.
Dr. Chad Dechow’s work shows that all the great 1960s pillars of the breed trace their male lines back to just two bulls born in the early 1880s: one called Neptune H, born in 1880, and one named Hulleman, born in 1881.
Sit with that. The Father’s Day table you’ve been picturing doesn’t have two chairs at the head — it has two chairs in this generation. Keep walking back, and the whole enormous family narrows again and again until, in the 1880s, it comes down to a pair of bulls who lived before the automobile, before the milking machine, before electricity reached most farms.
We like to think we’re steering. Our index, our matings, our careful selection — surely that puts us in the driver’s seat. And it does, a little. But we’re steering a river that’s been running in the same channel for nearly 140 years. Someday, a breeder none of us will ever meet will trace a herd back to a bull you used this week, and they’ll feel exactly the way you feel as you read these names right now. That’s the strange gift of a breed this old. You’re never just raising cattle. You’re handing something down.
The morning the numbers didn’t add up
Now comes the hard part of every honest Father’s Day — the part where you love somebody and still have to tell the truth about them.
It started, in a way, with researchers staring at a spreadsheet that made no sense.
In 2011, USDA scientists were studying haplotypes — long stretches of chromosome inherited as a single block — when they noticed something wrong on chromosome 5. A particular haplotype was common across the breed. Carriers were everywhere. By the plain arithmetic of inheritance, there should have been thousands of living animals carrying two copies of it. They went looking for those animals. There were none. Not a single one. The double-carriers weren’t dying young or growing up sickly — they were never being born at all.
Five years later, a team led by Heather Adams with USDA’s Paul VanRaden ran the cause to ground: a single “nonsense” mutation in a gene called APAF1, a typo that truncates more than half the protein it’s supposed to build.
One copy, and a calf is just a carrier — perfectly healthy. But breed a carrier to a carrier, which is heartbreakingly easy when half the breed descends from the same grandfather, and two copies quietly kill the embryo before it’s ever born.
They traced the haplotype straight back to Chief. And before anyone knew it was there, that single inherited flaw is estimated to have caused roughly half a million spontaneous abortions worldwide — and about $420 million in losses over 35 years. The flip side runs staggeringly in the other direction: the same researchers estimate that Chief’s beneficial genetics added about $30 billion in increased milk production. The gift and the bill, written into the same animal.
Half a million calves conceived and quietly lost. Half a million heat checks that came up empty — a farmer standing in the barn at dusk, wondering what went wrong, never knowing the answer had been written into the breed’s most celebrated father sixty years before he was born.
That’s no reason to resent Chief. A father doesn’t choose the genes he carries. But it’s the unavoidable math of a narrow family tree: when everyone shares the same grandfather, his hidden flaws stop being rare. The good news — once the mutation had a name, breeders could test for it and breed around it, and U.S. carrier frequency fell from roughly 8% to about 2% within a few years. The defect didn’t end Chief’s legacy. It just made us smarter about how we carry it forward.
The number landing in your heifer pen right now
Here’s where the history stops being history.
According to Lactanet’s August 2025 update, the average pedigree-based inbreeding of Canadian Holstein heifers born in 2024 hit 9.99%. Nearly ten percent. A generation ago, that figure would have set off alarms. Today it’s just Tuesday.
That’s what two grandfathers at the head of the table eventually costs a family. Every percentage point of inbreeding chips away at fertility, at calf vigor, at the very longevity that made Elevation famous in the first place. The traits these great fathers gave us are exactly the ones a too-narrow pedigree slowly takes back. By the USDA’s measure, Dr. Dechow puts both Chief and Elevation at a genetic relationship of about 14% to the modern Holstein cow. Two bulls, wearing different hides, make up a huge chunk of your herd. (The Bullvine has run the dollars-and-cents of where this is heading in its breakdown of Holstein’s inbreeding bill.)
Maxima de Bois Seigneur. Sixty years later, still in the room. A daughter of Stantons Chief—and a direct descendant of Pawnee Farm Arlinda Chief—Maxima stands in a Belgian farmyard as living proof that the old grandfather never left the table. Every time you see a modern cow like her, you’re looking at his influence. Photo: Guillaume Moy. Read more: From Laurie Sheik to Robotic Milking: Bois Seigneur Holstein’s Journey of Innovation
What this means for your operation
Here’s the good news in all of this: knowing the family history is exactly what lets you manage it. So you’ve met the grandfathers — what do you actually do with this on Monday morning? A few concrete things.
Run your matings through a genomic inbreeding tool, not just a pedigree check. With 99.84% of AI sires tracing to two bulls, pedigree alone hides how related your “outcross” really is. The genomic future inbreeding value tells the truth.
Check carrier status for HH1 (APAF1) before you breed a deep-Chief cow. Most catalogs list it. Avoiding carrier-to-carrier matings is the cheapest insurance you’ll ever buy against an empty calving pen.
Put a hard ceiling on expected progeny inbreeding. Many breeders aim to keep a mating under roughly 6–7%. With the Canadian average heifer already at 9.99%, every mating you pull below that line is a small win for the next generation.
Actively hunt the rare outcross lines. They exist. They’re harder to find, and they’re worth the search — the breed’s long-term fertility depends on the breeders who refuse to let the family tree narrow any further.
None of this is a knock on Chief or Elevation. You’d have made the same call any of those old breeders made — the production was real, the longevity was real, the money was real. This is simply the next chapter of stewardship: honoring what the grandfathers built while quietly widening the table for everyone who comes after.
The reunion, and what we owe the dads at the table
Come back to that impossible barn one last time.
The millions of cows. The two chairs at the head. The two old bulls who never met and yet fathered nearly all of it — one a $4,300 gamble out of Pawnee Farm, one a cousin’s hunch off a modest Virginia hillside that had no business working and changed everything anyway. Between them, they handed the dairy world more milk, better udders, longer-lasting cows, and a uniformity that built the modern industry. They also handed down a narrower gene pool and a few hidden flaws their children are still reckoning with. Both things are true. That’s what it means to inherit from a great father — the gifts and the burdens come in the same package, and the work of a lifetime is sorting out what to do with each.
So this Sunday, when somebody asks what you do for a living, tell them the truth. You’re raising the great-great-grandchildren of two bulls born in the 1960s — who themselves came down from a pair born in the 1880s — in a family reunion that has never once adjourned, and never will.
Pour a little extra in the cup. The grandfathers earned it.
Key Takeaways
That “outcross” bull on your mating list probably isn’t one — 99.84% of active AI sires trace to Chief or Elevation, so run matings through a genomic inbreeding tool, not just the pedigree.
Before you breed a deep-Chief cow, check HH1 (APAF1) carrier status on both sides; a carrier-to-carrier mating is the cheapest way to end up with an empty calving pen.
The traits these two gave us — milk, udders, longevity — are the same ones a narrow pedigree quietly takes back, so aim to keep expected progeny inbreeding under roughly 6–7%, against a breed-average heifer already at 9.99%.
The breed’s long-term fertility depends on the breeders who hunt and use the rare outcross lines — they’re harder to find, and they’re worth the search.
Methodology Note
This article uses several distinct measures of genetic influence that should not be conflated. The 99.84% figure is a paternal Y-chromosome lineage measure derived from Yue et al. (2015, Journal of Dairy Science 98(4):2738–2745, examining 62,897 bulls) — it describes male-line descent, not total genome share; the 99.84% / roughly-half-each breakdown is The Bullvine’s analysis of that dataset. The genetic relationship to the modern Holstein cow (~14% for both bulls) comes from Dr. Chad Dechow’s USDA-affiliated analysis, as reported in Hoard’s Dairyman. The Bullvine reports that Elevation accounts for approximately 8.3% of the CDCB genomic reference population. The HH1/APAF1 facts come from the 2011 USDA haplotype discovery (VanRaden et al., J. Dairy Sci. 94:6153–6161) and Adams et al. (2016, J. Dairy Sci. 99(8):6693–6701), which identified the causative APAF1 nonsense mutation. The estimates of roughly half a million abortions, about $420 million in losses over 35 years, and about $30 billion in beneficial milk production are reported by UC Davis (2016). The 9.99% inbreeding figure is a pedigree-based coefficient for Canadian Holstein heifers born in 2024 (Lactanet, August 2025) and may differ from U.S. CDCB genomic measures. National figures may not reflect your region or herd; verify carrier status and inbreeding values against current CDCB/Lactanet data for your own matings.
Questions, corrections, or a number you’d like us to double-check? Reach out to editor@thebullvine.com
Round Oak Rag Apple Elevation: The Bull That Changed Everything — Shines a deeper light on the world Ron Hope and George Miller were navigating, revealing how their B-team mating slowly overcame early show-ring skepticism to ultimately construct the physical foundation of the modern global industry.
Every week, thousands of producers, breeders, and industry insiders open Bullvine Weekly for genetics insights, market shifts, and profit strategies they won’t find anywhere else. One email. Five minutes. Smarter decisions all week.
U.S. dairies bought 45.8M semen units in 2025, down 6% — and NAAB’s Jay Weiker says that’s a win. Fewer straws settled the same cows. Here’s what your breeding mix should do next.
Jay Weiker has spent 40 years watching how dairy farmers breed cows. So when the president of the National Association of Animal Breeders sat down with CDCB CowCast host Katie Schmidt and was asked what’s behind the latest sales figures, his answer cut counter to the usual gloom. Total U.S. semen sales fell about 6% in 2025, down to 45.8 million units, and Weiker’s read is that part of that drop is a win. Dairies are settling cows with fewer straws because they’ve gotten better at reproduction. “If you’re doing a better job, you’re actually losing some of your market if you’re an AI company,” Schmidt said on the episode. “Putting ourselves out of business,” Weiker agreed — “but keeping dairymen in business.”
There’s the tension worth your time. The same skill that tightens your conception rates is shrinking a supplier’s order book. And the mix underneath that 45.8 million — sexed, beef, conventional — tells you exactly how fast your breeding calls are reshaping the calves that hit your barn floor. Weiker’s organization isn’t guessing at these numbers, either. NAAB members produce about 95% of the semen used in the U.S. and roughly 99% of what’s exported, and they report units quarterly.
What’s Changing and Why
Start with the headline number. Weiker reported 2025 sales of 45.8 million units, down about 6% from 2024 — though 2024 itself ran roughly 4% ahead of 2023. So this isn’t a collapse. It’s a herd that held steady and is now getting bred more efficiently.
Split that 45.8 million three ways and it sharpens. Just under 17 million units sold domestically — about 37% of all dairy semen. Exports accounted for the bigger share, at roughly 28 million units, or 63%. The rest was custom collection for non-members. Here’s the part to sit up for: over the past four or five years, domestic dairy semen use has been declining, which is why exports keep climbing as a share of the total.
Who’s affected? Just about every U.S. dairy that’s sharpened its repro program — which is most of them. Weiker pointed to three forces pulling straws-per-pregnancy down: producers selecting harder for female fertility, AI companies leaning into bulls with positive daughter pregnancy rate, and steady work on semen quality through the lab and bull health. Stack those on a herd that isn’t expanding, and the result is blunt. Weiker’s phrase: “It’s just a mathematical fact.” Fewer units to settle the same cows.
How This Plays Out on Real Farms
What producers are actually buying isn’t “less breeding” — it’s smarter sorting. Gender-selected (sexed) semen is now the top-selling dairy semen type in the country. It grew by about 6% last year and accounts for 64% of dairy units sold domestically. Producers genomic-test their cows and heifers, decide which females are worth raising replacements from, and put sexed semen on exactly those animals.
The flip side is the bottom of the herd. Beef-on-dairy held constant in 2025, Weiker said, but it’s still the number-two category — beating conventional dairy semen by 2.1 million units. Feedlots want a black-hided crossbred calf, not a purebred dairy steer. So conventional dairy semen erodes from both ends: sexed on the top cows, beef on the bottom.
How fast did that shift happen? Look at the national breeding record. USDA’s data shows beef semen used on dairy cows climbed from essentially a rounding error a decade ago to more than 8 million units a year by the mid-2020s, while dairy-cow numbers barely moved. That’s not a few early adopters — that’s the herd at large rewriting its own breeding sheet inside ten years. Weiker’s “equilibrium” comment is the key tell here: producers are now backing off the gas, doing the replacement math first and only then deciding how many cows go to a beef bull.
Here’s a barn-math moment you can map to your own parlor. Take a 100-cow herd that needs about 30 replacement heifers a year. If you can cover those 30 by aiming sexed semen at your top 35–40 genomic-tested cows over the breeding season — building in conception and the roughly 90% female skew sexed semen throws — every remaining breeding is freed up for beef. And that’s where the money moved. Through early 2026, Holstein bull calves that once brought $300–$450 have been running $700–$1,000 in stronger markets, while well-bred beef-cross calves topped $1,500–$1,750 in parts of Wisconsin and cleared $1,000 in Pennsylvania — a real premium spread of roughly $200 to $700 a head depending on quality and region. Push 30 to 40 crosses through in a year instead of dairy bull calves, and you’re swinging calf revenue well into five figures on a 100-cow herd.
But the same call quietly raises the cost of the heifers you didn’t make. Replacement heifers averaged $3,010 a head in USDA’s July 2025 Agricultural Prices report — a national figure — and quality heifers have been commanding $2,500–$3,000-plus into 2026, with top genetics nearer $4,000. The calf check you cash today is also a bet on what it’ll cost to refill your parlor in two years. Weiker and Schmidt kept circling that point: the beef decision you make this month is really a replacement-pipeline decision down the road.
The Mechanics Behind the Outcomes
The whole system runs on a sorting logic that genomics has unlocked. Asked which technology surprised him most in four decades, Weiker didn’t hesitate: genomic selection. Sexed semen was “a game changer” on its own, he said, but genomics “moved the needle much more than anything else.” It’s what lets you decide, with real confidence, which females become the next generation and which get bred beef.
Keep one thing straight, because it’s easy to muddle. Genetics and immediate semen savings are two different levers. When Weiker points to AI companies pushing bulls with positive Daughter Pregnancy Rate (DPR), that’s a long-game genetic trait. It shows up years out in how your daughters settle. The drop in straws-per-pregnancy you’re seeing right now is mostly due to near-term factors: service sire fertility, semen quality, and sharper heat detection on your end. Schmidt made the same point on the episode, noting how low the heritability of female reproductive traits is — meaning management and environment drive most of what you see this season. DPR builds the herd you’ll milk in 2029. Your protocol and the bull’s fertility are what led to fewer straws in fewer cows this year.
That confidence is why conventional semen keeps sliding. Why gamble on a coin-flip Holstein calf when you can aim for a heifer from your best cow or a marketable cross from the rest? One wrinkle most producers never see: a lot of that beef semen now ships as heterospermic straws — semen from several bulls mixed in one dose. And there’s a reason it caught on specifically for beef-on-dairy. Beef-cross conception can lag your dairy semen, partly because a beef bull collected for the dairy market can have an off day — a fever weeks before collection that never shows under a microscope. Motility looks fine; conception doesn’t. Mix several bulls in one straw, and the others cover for him, pulling the group’s conception close to the best bull in the dose instead of dragging on the worst.
You give up knowing the exact sire. For a calf bound for a feedlot, most producers take that trade to claw the fertility back. There’s a real cost, though, and Schmidt named it: without a sire ID on a beef-cross calf, the industry can’t easily learn which beef bulls produce the most productive crosses. That gap doesn’t close until parent verification gets cheap enough to genomic-test calves routinely — and it isn’t there yet.
How Much Is the China Closure Costing the Export Side?
If you want the number that genuinely jolts this story, it’s not domestic — it’s China. In February 2025, China closed its market to U.S. semen. Members had shipped maybe two months’ worth, Weiker said, then nothing for the 15 months since. China had been the number-one export market by both volume and dollar value in 2024. By 2025, it dropped to number 15. If it doesn’t reopen — and there’s no sign it will — it likely won’t even make the export list in 2026.
So how did total exports hold flat anyway? The rest of the world picked up the slack. Members export to more than 120 countries, with over 40 markets each importing more than $1 million in product in 2025. The current top 10 by dollar value: the UK at number one, then Italy, Mexico, Russia, Brazil, Canada, France, Japan, Australia, and Poland. Not every China unit found a new home — but enough did to keep the total steady. That’s resourcefulness, not luck.
Why does that matter to a producer who never exports a straw? Because export demand is part of what keeps a deep bull lineup commercially viable for the studs you buy from. When a top market vanishes overnight, it changes which bulls get sampled, housed, and marketed — and Weiker noted that some members are already weighing where they physically house bulls to avoid trade barriers. The semen catalog you order from doesn’t exist in a vacuum. It’s shaped by demand from 120 countries, and right now, one big buyer just walked off the board.
Is Your Herd’s Breeding Mix Keeping Up With the Country?
Pull your breeding records and run a quick count. What share of last year’s services were sexed, beef, and conventional? Hold it against the national pattern Weiker laid out: sexed at 64% of domestic dairy units and climbing, beef holding strong and beating conventional by 2.1 million units, conventional fading. If you’re still running a heavy book of conventional dairy semen on cows you’d never raise a replacement from, you’re breeding against the grain of where the data says the value sits.
Semen Type
Share of U.S. Domestic Dairy Units
2025 Direction
What It Signals for Your Book
Sexed (gender-selected)
64%
Rising (+6% in 2025)
Top genomic-tested cows — your replacement engine
Beef-on-dairy
~24% (beats conventional by 2.1M units)
Holding steady
Bottom of the herd → marketable feedlot calves
Conventional dairy
~12%
Declining (multi-year)
Needs a real outlet — “we’ve always done it” isn’t one
All dairy semen (total)
45.8M units (down ~6%)
Down on better repro
Fewer straws settling the same cows
That doesn’t make you wrong — your costs, your heifer needs, and your feedlot outlets all factor in. But it’s a question worth asking before your next semen order, not after. Weiker’s own read: conventional will likely continue to decline, sexed will likely continue to rise, and beef-on-dairy will settle into an equilibrium once producers finish calculating how many replacements they actually need versus how many cows they can hand to a beef bull. Worth noting one quirk he flagged — overseas, the mix runs backward, with roughly two-thirds of exported dairy units still conventional and only 13% sexed, mostly down to feedlot preferences and cheaper semen abroad.
Metric
U.S. Domestic
Export
Takeaway
Sexed share
64%
~13%
Mirror image — home sorts hard, world doesn’t
Conventional share
~12%
~67%
Cheaper semen + feedlot preferences abroad
Share of total units
~37% (~17.0M)
~63% (~28.0M)
Export now carries the volume
Top market shift
n/a
China #1 (2024) → #15 (2025)
Demand from 120+ countries shapes your catalog
Your 30-Day Playbook
Forget the long-range philosophizing. Here’s what to actually do this month and the trade-off for each move. Pull your breeding records and your last 12 months of calf-sale receipts before you read the table — you’ll need both.
Move
Do this in 30 days
When it pays
The catch
Count your real replacement need first
Run Penn State Extension’s replacement formula: herd size (milking + dry) × cull rate × (age at first calving ÷ 24) × (1 + heifer non-completion rate). Lock that number before you reorder
Always — every move below depends on it, and Weiker says beef-on-dairy equilibrium is being set by farms doing exactly this math
Guess high and you over-make heifers you can’t afford to raise; guess low and you’re bidding $3,010-plus to refill your parlor
Sexed on top, beef on the bottom
Map your sexed-vs-beef split against that replacement number; sexed on your top genomic-tested cows, beef on the rest
When you’ve genomic-tested enough to know your top females cold; 64% of domestic dairy units are already sexed
Over-breeding beef on viable dams trades away replacement value at $3,000-plus heifer prices
Audit the conventional book
Pull what share of last year’s services were straight conventional dairy, and on which cows
Only where you’ve got a real outlet for purebred dairy bull calves or a genuine cost case
Nationally it’s a multi-year decline — “we’ve always done it” isn’t an outlet
Price heterospermic vs. single-sire beef straws
Ask your rep for both and check your beef-cross conception trend
When your beef-cross conception’s been streaky and the calves are feedlot-bound
You lose sire ID — a real cost only if you’re building beef-on-dairy performance data
Key Takeaways
If conventional dairy semen still fills a big share of your book, ask what real outlet justifies it — nationally, it’s losing ground to sexed on top and beef on the bottom, and habit isn’t an outlet.
If you haven’t counted your exact annual replacement need lately, run the Penn State formula before your next order — the whole sexed-vs-beef ratio hangs on that one number.
If your beef-cross conception’s been streaky, price heterospermic against single-sire — but only accept the lost sire ID if you’re not trying to build beef-on-dairy performance data.
If any of your decisions touch your bull lineup or export marketing, watch China — a number-one market that went to number 15 in a year, with the rebound riding on 40-plus smaller markets, not one big buyer.
So here’s the question to carry into your next breeding meeting: does your sexed-beef-conventional split actually match the number of replacements your herd needs in 2027 — or are you breeding on last decade’s habits? Weiker’s been right about the direction for 40 years, and the direction is more sorting, not less. The farms that come out ahead are the ones that run their own ratios instead of guessing them.
Complete references and supporting documentation are available upon request by contacting the editorial team at editor@thebullvine.com.
Learn More
Beef-on-Dairy Math: $25200 Rides on Your Semen Order — Delivers a strict spreadsheet audit that converts your 21-day pregnancy rate and semen allocation into verifiable cash flow, protecting your replacement pipeline from expensive heifer shortages.
Every week, thousands of producers, breeders, and industry insiders open Bullvine Weekly for genetics insights, market shifts, and profit strategies they won’t find anywhere else. One email. Five minutes. Smarter decisions all week.
In the fall of 1972, a bright-red calf walked into a New York sale ring where the whole Holstein establishment still called his color a defect to be bred out. When the gavel cracked at $60,000—a world record—the barn erupted: “They paid WHAT for a red calf?” The ABS man holding the card had just blown clean past what his boss authorized. That calf was Triple Threat. And the bet everyone laughed at? It runs in your barn today.
The air in that old New York barn had the usual mix—coffee, tobacco smoke, sawdust, and the sharp warm smell of washed Holsteins standing under bright sale-ring lights. Men flipped through catalogs with rough thumbs, tracing pedigrees while the auctioneer’s voice bounced off the rafters. Then a calf stepped into the ring that didn’t belong.
Bright red in a sea of black-and-white fashion, he moved across the shavings as if he’d wandered into the wrong sale. Heads turned, not because the crowd wanted him, but because they wanted to see who would be foolish enough to pay serious money for a “defect.”
That calf was Hanover-Hill Triple Threat-Red.
The man holding the bidder’s card was Ken Young from American Breeders Service.
Young hadn’t come to Hanover Hill to become a story. He came with a job and a limit. Back in Wisconsin, Dr. Bob Walton had given him the go-ahead for a “certain price” on a red calf—enough to show ABS was serious about the color, not enough to gamble the company on a long shot .
Now, the thing about that era is simple: Red & Whites weren’t just unfashionable. The Holstein establishment still treated the red gene as undesirable. There wasn’t a Red & White program to build around. Red calves were the kind of thing breeders usually tried to breed out, not lean into.
So when the bidding started, most people in that barn treated it like a curiosity. The high money that day was supposed to go to black-and-white sons of great cow families. This red calf was just there to make people talk.
The number started to climb anyway.
Past what a sensible buyer should pay for a red calf. Beyond what anybody expected an AI company to risk on something the rulebook still called a mistake. Past the figure Walton had in mind when he’d hung up the phone.
Young kept his hand in the air.
You can almost hear the cadence change as the auctioneer leans into it—fifty… fifty-five… pushing into a range usually reserved for the very best black-and-white pedigrees. In the seats, you’d have seen raised eyebrows, quick head shakes, maybe a few muttered comments about ABS losing the plot.
When the gavel finally came down at 60,000 dollars—a world record for a Red & White calf at the time—the barn didn’t just hum. It erupted. Some men clapped. Some whistled. Quite a few turned in their seats and said, “They paid WHAT for a red calf?”
Think about that for a second.
Sixty thousand 1972 dollars, for a calf whose color pattern the establishment still called a defect. This was the kind of money farms and studs were putting into fashionable black-and-white sons of great cow families, not into a calf that looked wrong the moment he stepped into the ring.
Young walked out of that sale knowing two things. He had the calf. And he had gone beyond what his boss meant by “a certain price.”
According to ABS’s own retelling, Walton asked one simple question when Young got home: “How much did you pay?” The answer—60,000—was more than the number Walton had in his head when he’d said yes . The exact words that followed have been polished in every retelling, but the sentiment everyone remembers is the same:
Sometimes it’s easier to ask for forgiveness than to ask for permission.
One can imagine the silence on the other end of that line.
If Triple Threat had been a dud, that’s all Ken Young would be remembered for: the ABS buyer who blew 60,000 dollars on a calf the breed register still called defective.
What people don’t always realize is that this wasn’t a one-person gamble. Young’s bid was the last domino in a line that started years earlier, with a young Swiss breeder who got off a Greyhound bus three miles too early and walked toward a company that had no reason to take him seriously.
The Swiss Who Wouldn’t Take “No”
In 1968, a young Swiss dairyman named Jean-Louis Schrago boarded a Greyhound bus in Wisconsin with a problem in his head and not much more than a suitcase in his hand .
Back in Europe, Red & Whites weren’t a joke. Farmers liked them. Some markets preferred them. There was real demand for cows with red coats and Holstein capacity. The problem was brutal: the top Holstein genetics—the cows rewriting the record books on type and production—were almost all black-and-white.
Most of the world had shrugged and accepted that. Schrago hadn’t.
He and a Swiss friend rode that bus toward Madison, got off in DeForest—three miles too early—and, as ABS’s own history tells it, walked the rest of the way along the side of the road, two young foreigners hauling suitcases in a country they barely knew . They finally arrived at ABS’s door, tired and probably wondering if they looked as out of place as they felt.
Dr. Bob Walton could have brushed them off. Instead, he did something small that ended up mattering a lot. He picked them up. Took them to dinner. Then paid for their rooms at the YMCA in Madison .
The next day, over a table instead of a barn rail, Schrago laid out a plan that must have sounded crazy. He wanted ABS to help him build Red & Whites that didn’t look like second-rate Holsteins. To do that, he needed the very cow families that North America had spent a generation turning into global royalty.
That brought him to Hanover Hill Holsteins.
Hanover Hill, co-owned by R. Peter Heffering, was home to some of the most talked-about cows in the world. The Barb family, in particular, had become a signal of quality in every catalog they appeared in. The idea of “wasting” one of those pedigrees on a red-factor mating sounded like heresy.
On that first go-round, Schrago asked to use a top Barb cow on a red-factor mating. Heffering said no . In his world, that was the responsible answer. Why risk the reputation of your best cow family on a color the rulebook still calls undesirable?
Here’s what made Schrago different. He didn’t throw up his hands and go home for good. He went back to Switzerland, kept working, kept talking, kept pulling together data and demand from Europe. Then he came back. And came back again. Over the next three years—not the “decade” some versions claim, but three focused years between 1968 and 1971—he stayed on it .
By 1971, he had something new to put on the table.
He’d secured two units of semen from Canadian superstar Roybrook Telstar. Getting those two units took an international phone call that, according to ABS’s own records, cost 2,500 U.S. dollars in call charges alone . Two units. 2,500 dollars. In that era, that’s the kind of bill that makes accountants nervous.
This time, the target wasn’t just any Barb descendant. It was C Tara-Hills Pride Lucky Barb EX-94—the greatest daughter in that family at Hanover Hill. Different sources list her prefix slightly differently, but everyone agrees on two things: she was a Barb, and she was very, very good.
This is the cow that made the request sound like heresy. Pride Lucky Barb, EX-94—the greatest daughter of the Barb family at Hanover Hill, and exactly the kind of pedigree the establishment said you didn’t “waste” on a red-factor mating. Schrago wanted her bred to Telstar to make a red calf. Heffering’s first answer was no.
Suggesting a Telstar × Pride Lucky Barb mating to produce a red-factor calf wasn’t a polite request. It was a challenge.
Something shifted. Whether it was the picture Schrago painted of the European market, the credibility he’d built by showing up in person and not sulking after that first “no,” or simply the attraction of Telstar’s proof, Heffering finally said yes.
The moment that calf hit the straw in April 1972, a lot of quiet bets came due. A flat-coated red bull calf out of Pride Lucky Barb, by Telstar, in a barn that lived and breathed black-and-white fashion. On paper, he was one of the most daring matings Hanover Hill had ever made. In practice, he was a calf that didn’t fit any existing marketing plan.
Six months later, that calf walked into the Hanover Hill sale ring and into history.
By the time the gavel fell at 60,000 dollars and Ken Young walked out with Triple Threat on ABS’s account, three different people’s convictions had fused into one moment.
Schrago’s belief that red cattle deserved world-class genetics.
Heffering’s willingness to risk his best cow on a mating the rest of the industry mocked.
Young’s decision to blow past a “certain price” because his eye told him this calf was different.
Look at the depth, the udder, the sheer presence—then remember the establishment once wanted this color bred out. KHW Regiment Apple-Red-ET, the “Million Dollar Cow,” carries Triple Threat’s blood in her pedigree. The red calf nobody wanted in 1972 helped build a cow the whole world wanted half a century later.
Today, you can trace that line straight into cows every breeder knows by name. Triple Threat’s blood shows up throughout the modern Red & White population, including cows like KHW Regiment Apple-Red-ET—the Apple-Red who became known as the Million Dollar Cow and changed the way the world viewed red Holsteins. Every time you see a Red & White with type and production that can stand alongside the best black-and-whites, you’re looking, in part, at the shadow of that three-mile walk from DeForest and that $60,000 bid.
This is where that 1972 sale ring leads. A Red & White Holstein—the very color the establishment once called a defect to breed out—draped in the Supreme Champion banner, the highest honor the show ring offers. Ken Young bet his job on a red calf nobody wanted; generations later, red cattle don’t just compete with the best black-and-whites, they beat them.
The Farmer Who Wouldn’t Let Go
If Schrago’s story is about refusing to accept someone else’s limits, Aldo Panciera’s is about what it costs to trust your own.
April 26, 1952. Osborndale Farms in Derby, Connecticut.
A bull calf landed in the straw that morning, which did not look like anyone’s idea of a future legend. Too long in the legs, too short on strength, the kind of calf that makes a seasoned breeder mutter “too bad” under his breath and start thinking about the next one.
On paper, the mating had been special enough that Professor Osborn had reserved the calf before birth. He walked into the pen, took one look at the reality before him, and backed out of the deal.
That should have been the end of it.
The calf had one thing going for him: a pedigree that, even in that moment, couldn’t be undone by long pasterns and a narrow frame. The cows behind him had already proven they could transmit what the breed needed. Where most people saw disappointment, Aldo Panciera saw that paper and refused to ignore it.
He talked another breeder, Causey, into coming along for the ride. Between them, they bought quarter interests in the calf for 1,250 dollars each—a serious outlay in 1950s New England. For that kind of money, a young dairyman could have bought land, equipment, or a lot of feed. Instead, they bought a scrawny bull that almost everybody else had written off.
That calf grew into Osborndale Ivanhoe.
Hard to believe this is the same calf his breeder almost couldn’t give away. Osborndale Ivanhoe—long-legged and narrow at birth, rejected by the man who’d reserved him—grew into the bull that topped the U.S. Type-Production Sire Summary eight straight years, a run still unmatched. Read more: Osborndale Ivanhoe: How a “Scrawny Bull Calf” Revolutionized an Entire Breed
If this were a tidy story, Ivanhoe’s first daughters would have hit the ground looking like walking proofs, and Panciera’s neighbors would have been lining up to apologize. Reality was rougher.
The early daughters were nothing to brag about. As yearlings, they were as awkward as their sire had been. Narrow. Shallow. The kind of heifers that make AI reps shake their heads and say, “See? We told you.” The studs that had turned Ivanhoe down bragged publicly about their good judgment.
You can picture the coffee shop conversations.
“That’s the bull you spent your money on, Aldo?”
“Those Ivanhoe heifers of yours don’t look like much.”
Those years must have been heavy. Every new crop of mediocre yearlings was another round of evidence that Panciera had made an expensive mistake. There were no genomic evaluations to whisper “trust the process” to him. Just heifers, and the memories of a decision he couldn’t take back.
He didn’t bail.
Not because he was sure he was right, but because something in that pedigree and a few hints in those calves told him the story wasn’t finished yet. He held on long enough to see the daughters freshen.
That’s when everything changed.
The same heifers that had looked like poor yearling bets walked into the milking string with udders the breed badly needed—high, tightly attached, with quality and strength. They had the frame and power to go with them. They didn’t just avoid the cull rail; they started pulling up the herd average.
Here’s the answer to every coffee-shop crack about Aldo Panciera’s bet. Miss Ivanhoe Scranton, EX-94—Osborndale Ivanhoe’s standout show daughter—stood Grand Champion at the 1969 Central National and earned All-American Aged Cow honors that same year, all while milking well over 100,000 pounds in her lifetime. The scrawny calf had bred a champion who could fill a tank, too.
From 1964 through 1971, Osborndale Ivanhoe sat at the top of the U.S. Type-Production Sire Summary eight consecutive years—a run that, to this day, has never been matched. Eight years of data saying, “That scrawny calf you laughed at is the best sire in the business.”
The vindication was spectacular. But the heart of Panciera’s story isn’t the eight-year reign. It’s the quiet mornings in the middle, standing by fences looking at underwhelming heifers, knowing everyone thought he’d made a mistake, and choosing, day after day, to hold his ground.
If you’ve ever bred a group of heifers to a young bull that didn’t impress early, listened to the local commentary, and still decided to give those daughters another lactation, you’ve already walked a mile in his boots.
The Family Who Trusted What They Knew
By the late 1990s, the Holstein world was running on speed.
Shorter generation intervals. Young sires on the hottest heifers. Genomic testing was starting to whisper to breeders that they could see the future in a strand of hair. The line at many barns was, “Why waste semen on old cows when you can breed your best heifers to the newest #1?”
Inside that mindset, an eight-year-old cow might as well have been a piece of furniture.
Condon Aero Sharon didn’t look like furniture to the Pickford family at Spot Acre Grange near Stafford, England. She looked like the kind of cow most herds pray for—a Holstein who had come back, year after year, with a sound udder, decent feet and legs, and milk that kept the tank honest.
Condon Aero Sharon (EX-91) – The eight-year-old Canadian cow deemed “ancient by artificial insemination standards” whose breeding to Carol Prelude Mtoto defied every convention in the AI industry. When the Pickfords and Judges Choice program chose to “give excellence a chance” with this aging matriarch, on what would become “arguably the most powerful brood cow in United Kingdom history” – a gamble that produced Picston Shottle and revolutionized global Holstein genetics.
The Pickfords had been breeding Holsteins long enough to remember before TPI was a household term. Over kitchen tables and milking parlors, they’d seen hot young sires drop out of sight when the second or third proof came. They’d also seen “unfashionable” cow families quietly keep herds profitable.
Their records told a clear story about Sharon: years of solid production and trouble-free health. Visitors didn’t stop to take pictures of her. But when you watched her walk or looked at her udder attachments after that many lactations, you knew you were looking at something that mattered more than a moment in a show ring.
Here’s what most people don’t realize: when you’ve watched a cow like that hold herself together through that many calves, that’s data no proof sheet can match.
Around that time, many AI reps were pushing the same plan: flush your youngest high-index heifers to the latest genomic star. The Pickfords listened, nodded, and then did something different. Working with ABS’s Judges Choice program—a channel designed to find alternative pedigrees the mainline sampling pipeline might miss—they made the case that Sharon, an older cow well past the fashionable age, was exactly the kind of cow who deserved a shot.
By all accounts, the logic at their table the night they signed off ran something like this: they knew this cow, they’d watched her work, and if it didn’t pay they’d live with it—but if it did, it might be something special.
They bred her to Carol Prelude Mtoto, a bull with his own twist of irony. In the UK, Mtoto had been so lightly regarded at one point that he was sold as “The £40 failure”—forty pounds sterling for a bull who would later be recognized as one of the most important sires of his time. Pairing an unfashionable older cow with a bull that had been sold off for £40 wasn’t the mating a risk-averse herd makes.
Forty pounds sterling. That’s what this bull was sold for when the establishment decided he wasn’t worth keeping around. Carol Prelude Mtoto—”The £40 failure”—who turned out to be one of the most important sires of his era. The Pickfords were about to pair him with an old cow nobody else would have bothered to flush.
They did it anyway.
On July 23, 1999, that mating produced Picston Shottle.
The £40 bull’s son, out of a cow most breeders thought was past her prime. Picston Shottle went on to become a millionaire sire with EX daughters by the thousands worldwide—cows people remembered less for their scores than for the fact that they bred back, walked sound, and stayed out of the sick pen. Read more: From Depression-Era Auction to Global Dominance: The Picston Shottle Legacy
Looking back now, it’s easy to say “of course.” ABS called him a “world-famous” and “millionaire” sire. Holstein International and other analysts later ranked him among the most influential Holstein bulls in the world, one of the few European-based sires to crack that echelon in lists dominated by North American names.
His daughters piled up Excellent classifications by the thousands, all over the world—the kind of EX-daughter count that belongs in an official registry table, not a sentence pretending we re-counted it tonight. But whatever the exact tally, it was a flood of genuinely good cows.
Ask the people who milked them what they remember, and the answers sound familiar.
“They bred back.”
“They walked out sound.”
“They stayed out of the sick pen.”
This is what those words look like in the flesh: Huntsdale Shottle Crusade EX 95 3E, a Picston Shottle daughter, working the colored shavings at World Dairy Expo, where she was named Nasco International Type and Production Award Winner. Look at the udder—the same kind of attachment that kept Shottle daughters in the milking string long after the show banners were packed away.
In an era obsessed with squeezing one more notch on the genetic progress meter, Shottle’s story—and Sharon’s—reminds you of a simple truth: there’s real power in betting on the cows you know, not just the heifers with the newest numbers.
The Hard Lessons We Didn’t See Coming
Of course, not every bull that shaped this breed leaves you with a warm glow.
Hanoverhill Starbuck is a good place to start. On the surface, he’s an almost perfect success story. Farmers loved his daughters. They worked in commercial herds and looked the part on show strings. AI studs pushed him hard. By the time the dust settled, Holstein Canada analysis and follow-up reporting showed that more than 80 percent of North American Holsteins carried Starbuck’s DNA, and in Quebec, his influence in sequenced cows was in the mid-90 percent range by 2000.
Hanoverhill Starbuck (EX-Extra) at 15 years old with Carl Saucier in 1994, photographed at Mount Victoria Farm in Quebec—the same ground where his ancestor Johanna Rag Apple Pabst posed 66 years earlier. This legendary bull exemplifies Ivanhoe’s compound genetic influence: sired by Round Oak Rag Apple Elevation (EX-96 GM), whose dam was Round Oak Ivanhoe Eve, and out of Anacres Ivanhoe Astronaut (VG-88), a daughter of Hilltop Apollo Ivanhoe (VG-GM). With Ivanhoe genetics flowing through both sides of his pedigree, Starbuck generated his own revolution—siring over 200,000 daughters across 45 countries and establishing a lineage now present in over 80% of North American Holsteins. His extraordinary impact demonstrates how Ivanhoe’s genetic gifts continued to compound across generations, proving that the “earth-shaking” begun in 1952 reverberates through modern dairy herds worldwide. (Read more: Hanoverhill Starbuck’s DNA Dynasty: The Holstein Legend Bridging 20th-Century Breeding to Genomic Futures)
That’s the dream if you’re trying to build a global sire. It’s also a reminder of how quickly influence can become saturation.
When you lean that heavily on one bull, you’re not just getting more of his good traits. You’re squeezing your gene pool around him. Today, managing inbreeding back to Starbuck is basic mating-program hygiene.
Carlin-M Ivanhoe Bell tells a harder story.
Carlin-M Ivanhoe Bell. Big production, daughters that filled tanks, a milk check that told breeders to use him hard—so they did, all over the world. Nobody in this photo knew what he was also passing along, hidden in a single recessive gene. He wasn’t a villain. He was the best bull of his moment, doing exactly what the industry asked of him. Read more: Bell’s Paradox: The Worst Best Bull in Holstein History
Bell looked like the complete package for his time. Big jumps in production. Daughters who filled tanks. Breeders used him heavily because the milk checks said they should. For a while, it felt like you couldn’t afford to.
Then calves started coming wrong.
Stillborn. Twisted spines. Severe spinal deformities that punched you in the gut the second you saw them. It took years—and a lot of heartbreak—before geneticists identified Complex Vertebral Malformation, a lethal recessive mutation in the SLC35A3 gene, and traced its worldwide spread back to Bell.
If you’ve ever had to pull one of those calves, Bell’s name doesn’t feel theoretical. You remember the cow, the night, the smell in the pen. You remember the cost.
Pawnee Farm Arlinda Chief is a different kind of warning.
When UC Davis researchers examined the modern U.S. Holstein genome, they found that Chief and his son, Walkway Chief Mark, each account for about 7 percent of it. Taken together, that’s roughly 14 percent—nearly a sixth—of what we now call the Holstein gene pool tracing back to one sire line.
Walkway Chief Mark (VG-87-GM) — the backup bull from Foster Walk’s Neoga, Illinois herd whose genetics now account for roughly seven percent of every Holstein genome in North America. Named one of Select Sires’ “Impact Sires of the Breed,” his udder-transmitting brilliance and structural trade-offs shaped the modern Holstein in ways nobody saw coming when this photo was taken. Read more: Walkway Chief Mark: The Backup Bull Behind Seven Percent of Every Holstein Cow
Chief’s descendants gave the breed a lot of what it wanted. But now, decades later, you can’t sit down with mating software without constantly watching how often Chief and Mark show up in the background. Every time you see a high inbreeding number, you’re often looking at a pedigree that circles back to them too many times.
None of these bulls were villains.
They were outstanding sires used by breeders who, to a large extent, were doing their best with the information they had. It’s what happened afterward that matters.
Bell’s fallout pushed the industry to adopt routine genetic testing for lethal recessives. CVM, BLAD, DUMPS—those acronyms moved from obscure papers into sire cards and then into everyday farm talk. Chief and Mark’s dominance pushed conversations about diversity from genetics conferences into AI sampling rooms. Starbuck’s saturation made it impossible to ignore the need for tools that treat inbreeding as more than an afterthought.
The lesson isn’t “don’t use popular bulls.” The lesson is that every time we pile a generation’s hopes on a short list of sires, we’re not just shaping the next proof run—we’re deciding what the breed will look like a generation or two down the road.
Where We Are Now
Genomics was supposed to change everything.
In a lot of ways, it did.
Instead of staring at a yearling bull in a stud barn and trying to read his future off his legs and his head, you can stare at a screen full of numbers: GTPI, NM$, DPR, health traits, feed efficiency. You can make decisions on calves that don’t have a single daughter on the ground yet.
But the risk didn’t disappear. It just moved.
GenoSource Captain is a good example of what the new system looks like when it works as intended.
The proof sheet, made flesh: GenoSource Captain in front of a wall of his daughters’ udders—the first Holstein bull to top Holstein USA’s International TPI list for seven straight proof runs. But before any of those daughters existed, somebody had to look at his genomic numbers and decide to use him anyway. Same leap of faith Panciera and the Pickfords made—just with a screen full of data instead of a pedigree on paper. Read more: CAPTAIN: The Bull That Rewrote the Rules for Modern Breeding
By GenoSource’s own account, Captain became the first Holstein bull to sit #1 on Holstein USA’s Top 100 International TPI list for seven consecutive proof runs—a run that spans the genomic-young-sire-to-daughter-proven divide. As those daughters came in, he held his place among the breed’s elite for both overall merit and production, with reliability building on his core traits the way a proven sire’s does.
What does that mean when you’re standing in your own parlor?
It means that, in herds milking Captain daughters, you’re seeing cows that put extra milk in the tank compared to your herd average, convert feed into that milk more efficiently, and carry health and fertility traits that keep them out of the vet’s notebook and in the milking line. Those aren’t abstract gains. They’re dollars.
But here’s the part that feels a lot like the old stories: before anybody had proof sheets in hand on Captain’s daughters, somebody had to decide to use him anyway.
Sire analysts in AI offices and breeders in kitchen chairs looked at his genomic profile and chose to trust it. They didn’t have daughter pictures. They had numbers and a gut feeling about those numbers. They were doing, in a different key, exactly what Panciera did with Ivanhoe and what the Pickfords did with Sharon.
The tools have changed. The courage required to act on them hasn’t.
OCD Captain Rae 63785-ET: The genetic powerhouse behind RIPCORD. This exceptional Captain daughter isn’t just continuing her sire’s legacy – she’s amplifying it. As the dam of the high-ranking TPI sire RIPCORD (+3399 GTPI), Rae embodies the multi-generational impact of CAPTAIN’s genetics.
What These Stories Mean for Your Operation
It’s easy to treat this kind of history like something that belongs in breed books and old sale catalogs. The truth is, you’re living the same patterns every time you sit down with your mating list or flip through a sire directory.
Here’s what all of this looks like in your own barn:
Question what everyone else ignores. Every era has its “defects” and unfashionable traits. A2A2 before processors started paying attention. Polled before labor and welfare pressures made dehorning a hot topic. Today, it might be moderate-sized, high-health cow families that don’t photograph well. Before you ship those genetics, ask yourself if you’re walking past your own version of Triple Threat because the package doesn’t fit the current fashion.
Don’t confuse awkward with hopeless. Ivanhoe’s yearling daughters didn’t look like much. They became some of the best cows in the barn once they freshened. In a genomic world, there’s a temptation to make permanent decisions early. If a line comes from proven cows and the first calves are underwhelming, give them a fair trial through that first lactation before you write the family off.
Balance your sire lineup like a portfolio. Starbuck and Chief teach the same lesson from different angles: leaning too hard on a short list of bulls can paint you into a corner, even when those bulls are very good. Use your Captain-type sires. Use the ones that pencil out best for your goals. Just spread the risk. Check inbreeding coefficients honestly. Make sure your future herd isn’t hanging off the same branch of the family tree.
Make one deliberate “Sharon move” a year. Once a year, look around and pick out the cow that’s quietly done everything you’ve asked for six or eight lactations. The one who calves back, stays healthy, and raises daughters you don’t cuss at. Ask yourself what would happen if you flushed that cow or bred her to a complementary sire with your best semen, instead of always saving those doses for the newest heifer. Sharon says that kind of move can change things.
Use genomics as a tool, not a crutch. Bulls like Captain show that genomic predictions can nail it. Bell reminds us we can still miss things. Use your genomic tests. Use your proofs. Then stack them alongside what your cows are actually doing—days open, mastitis cases, feet and legs, cull reasons. Trust the math without firing your eyes and your gut.
Whether you’re milking eighty cows or eight hundred, you’re sitting in the same seat these people sat in decades ago: making calls that will still be walking your alleys long after this month’s milk price is forgotten.
The Heart Behind the Numbers
When you sit with these stories long enough, the numbers start to fall away, and the people remain.
A young Swiss breeder walking three miles from a DeForest bus stop after getting off the Greyhound too early, carrying an idea about red cows that nobody wanted to hear .
A Connecticut dairyman leaning on a fence while neighbors question his sanity over a skinny calf he can’t quite bring himself to give up.
An English family sitting at the table, looking at an older cow who’s been there for them every season and deciding, against the grain, that she deserves the best mating they can give her.
None of them had a guarantee.
Schrago didn’t know that Triple Threat, born in 1972 would help build a Red & White market where cows like Apple-Red could sell for six figures and win on the world stage. Panciera had no promise that Ivanhoe wouldn’t end up as a story people told about an expensive mistake. The Pickfords couldn’t see Shottle’s daughters filling herds far beyond Stafford when they bred Sharon to Mtoto.
They had pedigrees. Records. The evidence of their own eyes. And the willingness to live with the outcome.
Trust your judgment—but remember it’s not infallible.
Persist through doubt—but let real evidence change your mind when it comes.
And every so often, look hard at what’s standing right in front of you. Don’t let the hunt for the next big thing blind you to the quiet excellence that’s already working in your own barn.
Every time you choose a bull, keep or cull a cow, or decide which calf gets another chance, you’re writing a tiny piece of the breed’s future. Most of those decisions will never be famous. Some of them, though, will turn out to matter more than you can see from where you’re standing.
Somewhere today, a calf is lying in a pen that doesn’t look special yet. Maybe it’s out of a cow that your neighbors don’t notice. Maybe it’s by a bull that the coffee shop crowd doesn’t like. Maybe it carries a trait nobody’s paying much attention to.
Somebody’s going to see it anyway.
Somebody always does.
Key Takeaways
The genetics in your barn today came from people who bet on animals the experts wrote off—Triple Threat, Ivanhoe, and Shottle were all “mistakes” before they were legends.
Don’t cull a family on first impressions. Ivanhoe’s awkward yearlings became the breed’s best udders, so give daughters from proven cows an honest shot through that first lactation.
Make one deliberate “Sharon move” a year: flush or breed your best to the quiet cow who’s calved back and stayed sound for six-plus lactations, not just the newest high-index heifer.
Run your sires like a portfolio. Starbuck, Chief, and Mark show how fast a great bull becomes an inbreeding problem—spread the risk and check your coefficients honestly.
The Sunday Read Dairy Professionals Don’t Skip.
Every week, thousands of producers, breeders, and industry insiders open Bullvine Weekly for genetics insights, market shifts, and profit strategies they won’t find anywhere else. One email. Five minutes. Smarter decisions all week.
Roxy, Dellia, Blackrose and seven more didn’t just make famous pedigrees. They built the cow families still showing up in bull books, embryos and your best heifers.
Mother’s Day in the dairy business doesn’t look much like the card aisle.
It looks like a cow family that just keeps paying rent.
You know the kind. Pull up a pedigree in a good Holstein barn, go back four generations, then six, then eight, and suddenly there she is. Maybe it’s Roxy. Maybe Dellia. Maybe Blackrose, Laurie Sheik, Altitude, Missy, or Barbie.
And you catch yourself thinking: “There she is again.”
That’s the thing about great donor cows. They don’t really leave. They just stop standing in the barn and start showing up everywhere else.
This isn’t a show-cow ranking. It isn’t a prettiest-picture contest either, though some of these cows could stop you cold in a photograph. This is a Mother’s Day history piece about the cows that kept giving the breed daughters, sons, granddaughters, embryos, sale-ring moments, AI sires, and cow families breeders are still building around.
So pour the coffee. Let’s talk about ten mothers who helped build the Holstein breed.
Glenridge Citation Roxy: The Queen Who Made the Picture Famous
Glenridge Citation Roxy didn’t become a legend because of one perfect photo. The photo became famous because Roxy kept showing up where it mattered most: in daughters, cow families, bull books, and pedigrees breeders still recognize generations later. Read more: Glenridge Citation Roxy: The Legendary “Queen of the Breed”
There’s a famous story about Glenridge Citation Roxy getting photographed at Mil-R-Mor in Dundee, Illinois. Bob Miller took one shot. Just one. Roxy was clipped, filled, and standing like she knew exactly who she was.
But honestly, the photo didn’t make Roxy great.
Roxy made the photo great.
Born April 15, 1968, at Lorne Loveridge’s Glenridge herd in Saskatchewan, Roxy became one of those rare cows whose name moved from pedigree line to breed language. The Bullvine profile records her as EX-97-4E-GMD, a third-generation 200,000-pound milk producer, and the first Holstein cow reported to have ten Excellent daughters. She eventually had 16 Excellent daughters . A Holstein Plaza family report also lists Roxy as the dam of 16 Excellent daughters, seven of them Gold Medal daughters.
That’s not a cow family. That’s a franchise.
Her daughter Mil-R-Mor Roxette became Canada’s first 30-star brood cow. Branches through Roxette, Lana Rae, Tony Rae, Debutante Rae, and others kept sending the Roxy influence into type, production, red-carrier lines, sale-ring value, and modern pedigrees.
Roxy sits at the top because she wasn’t just a great individual. She became a structure the breed kept building on.
That’s what great mothers do. They don’t just have a moment. They create a direction.
Snow-N Denises Dellia: The Cow Who Ended the Either-Or Argument
Snow-N Denises Dellia looks almost quiet here, but her influence wasn’t. Through Durham, Die-Hard, Million and generations of daughters, she helped prove type and production didn’t have to live on opposite sides of the barn. Read more: Snow-N Denises Dellia: The Holstein Legend Who Redefined Dairy Genetics
Before Dellia, breeders loved to argue like type and production had to live on opposite sides of the barn.
Then Snow-N Denises Dellia walked in and made the argument feel a little tired.
Born in 1986 on Bob Snow’s Wisconsin farm, Dellia was a Walkway Chief Mark daughter from Snow-N Dorys Denise, a Bell-family cow with the kind of maternal depth breeders spend lifetimes trying to stack. ALH Genetics describes Dellia as the breeder of Regancrest Elton Durham and the source of influential cattle including Die-Hard, Million, and Altiota.
And then there was Durham.
Regancrest Elton Durham became one of those sires who connected eras. He had enough cow sense for breeders who still trusted their eyes, and enough transmitting power for the modern proof-sheet crowd. Through Durham, Die-Hard, Million, and the wider Dellia family, her influence spread through elite type, commercial usefulness, and genomic-era pedigrees.
The reason Dellia ranks this high is simple. She changed what breeders believed could come in one package.
She wasn’t just pretty. She wasn’t just productive. She wasn’t just useful.
She was all three, and she passed enough of it on that people had to stop treating balance like a compromise.
Stookey Elm Park Blackrose: The Bankruptcy Calf Who Became Genetic Gold
Some cow families start with perfect timing, polished facilities, and everyone already paying attention.
Blackrose didn’t get that kind of entrance.
The Bullvine’s Blackrose story starts in the middle of financial wreckage: Jack Stookey’s collapse, Curt Prange’s rescue work, and a calf that could easily have been scattered into history before anyone understood what she was . That calf was Stookey Elm Park Blackrose, a To-Mar Blackstar daughter from Nandette TT Speckle-Red.
And what a cow she became.
The Bullvine profile records Blackrose as EX-96, a 42,229-pound producer at five years old, All-American as a junior two-year-old and junior three-year-old, and Grand Champion at the 1995 Royal Winter Fair . Holstein Plaza also identifies her as EX-96-3E-GMD-DOM .
But Blackrose’s real Mother’s Day case isn’t one banner. It’s what came after.
Her family helped shape Red and White breeding through cattle like Indianhead Red-Marker and Lavender Ruby Redrose-Red, the Red and White cow who went on to become Supreme Champion at World Dairy Expo , .
That’s why Blackrose belongs here. She’s the reminder that breed history isn’t always tidy. Sometimes the cow that changes everything comes out of a mess, lands with people who can see past the noise, and spends the rest of her life proving them right.
Comestar Laurie Sheik: The Cow That Built an Empire
Comestar Laurie Sheik was already making people look twice at Madison in 1989. The bigger story came later, when that same cow became the foundation of a Comestar family that kept winning, breeding, and travelling far beyond Quebec. Read more: The Cow That Built an Empire: Comestar Laurie Sheik’s Unstoppable Genetic Legacy
Comestar Laurie Sheik didn’t begin as the obvious global answer.
That’s part of why her story is so good.
Marc Comtois bred Elysa Anthony Lea to Puget-Sound Sheik, and in December 1986, Comestar Laurie Sheik arrived . She would become VG-88-23*, the foundation of one of the most recognizable cow families in the world, and the cow behind a Comestar line that travelled far beyond Quebec .
Holstein International describes Laurie Sheik as the inaugural Canadian Cow of the Year in 1995. That same article notes that family member Comestar Lamadona Doorman EX-94 won Canadian Cow of the Year in 2022, which tells you something important: this wasn’t a one-generation firework .
Laurie Sheik’s family runs through cattle like Lylehaven Lila Z and Comestar Goldwyn Lilac, and through a wider maternal line that helped make the Comestar name feel almost like shorthand for balanced breeding , .
You don’t build that by accident.
Laurie Sheik belongs near the top because she did what only the best brood cows do. She made a prefix mean something. When breeders saw the name, they didn’t just see ancestry. They saw expectation.
Kamps-Hollow Altitude-ET RC: The Red Gene That Became a Revolution
Kamps-Hollow Altitude-ET RC carried red quietly, but her descendants made sure the breed noticed. Through Advent, Apple, Acme, Jotan and the generations that followed, she turned a recessive gene into a serious breeding lane. Read more: Kamps-Hollow Altitude: The Red-Carrying Cow Who Rewrote Breeding History
Kamps-Hollow Altitude carried red quietly.
Her descendants did not.
Altitude was a Durham daughter born January 11, 2000, later classified EX-95, and remembered as one of the defining brood cows in modern Red Holstein breeding . ALH Genetics reported that Kamps Hollow Durham Altitude RC EX-95 died at 15 years old and identified her as the mother of Advent, Acme, and Jotan, the grandmother of Amor Red, Absolute Red, Big Apple, and Armani, and the great-grandmother of Aikman and Addiction P Red .
And of course, there was Apple.
KHW Regiment Apple-Red was the daughter who made Altitude impossible to ignore. She took the red carrier story from pedigree talk to center ring, then sent it back into breeding programs through a cow family everyone wanted a piece of. Read more: KHW Regiment Apple-Red – Beauty, performance, and even more record accomplishments
ALH names KHW Regiment Apple Red EX-96 as Altitude’s best-known daughter . That alone would put Altitude in the conversation. But when you add Advent-Red, Acme, Jotan, Aiko, Absolute, Armani, Addiction P, and the later Apple branches, you get something bigger than one popular cow family , .
You get a turning point.
Altitude made the red factor feel less like a novelty and more like a serious breeding lane. She gave Red and White breeders style, marketability, type, and sons people actually wanted to use.
That’s why she’s here. In the right cow, behind the right udder, with the right people paying attention, a recessive trait stops being a footnote.
It becomes history.
Wesswood-HC Rudy Missy: The Phone Call That Rewired the Genomic Era
Wesswood-HC Rudy Missy didn’t need a show-ring spotlight to change the breed. One phone-call purchase put her in the right hands, and her family later surfaced through genomic-era names like Shauna, Supersire, Mogul, Silver and Balisto. Read more: The Phone Call That Built a Genetic Empire: The Wesswood-HC Rudy Missy Story
The Rudy Missy story has one of those scenes you can almost hear.
A sale. Buyers drifting. Interest softening. A cow that should have been getting more attention than she was.
Then a phone call.
The Bullvine profile tells the story of Matt Steiner buying Wesswood-HC Rudy Missy by phone and follows the family into Pine-Tree, Ammon-Peachey Shauna, Supersire, Mogul, Silver, and Balisto . Holstein International reports that Rudy Missy was selected as its Global Cow in 2014 after finishing second in 2012 and 2013 . The same article points to Mogul, Supersire, Silver, and Balisto as examples of her influence .
Missy’s power was not sentimental. It was practical. She hit the genomic era where it mattered: influential sires, high-use pedigrees, elite females, and commercial relevance.
That’s why she ranks ahead of some cows with more glamorous stories. Missy’s family didn’t just look good in a feature. It moved through breeding programs at scale.
The lesson is pretty simple, and a little uncomfortable.
The next great mother may not be the cow everyone is clapping for in the sale ring. She may be the one one person quietly refuses to let go cheap.
Larcrest Cosmopolitan: The Spotted Heifer From Minnesota
Larcrest Cosmopolitan never needed much noise to make her point. From a spotted Minnesota cow came a family that made Larcrest mean repeatability in bull books, embryo lists and the genomic-era pedigrees breeders kept coming back to. Read more: Larcrest Cosmopolitan: How a Spotted Minnesota Cow Built a Dynasty
Larcrest Cosmopolitan’s story doesn’t come at you with fireworks.
It sneaks up on you.
She was a Picston Shottle daughter born in September 2005 at Jon and Ann Larson’s Larcrest herd in Albert Lea, Minnesota . The Bullvine traces the family back through Larcrest Juror Chanel and the registered heifers Raymona Larson bought with her teacher’s retirement savings , .
That detail always gets me.
A teacher’s savings. A few heifers. A cow family that eventually becomes one of the most recognizable maternal lines of the genomic era.
Cosmopolitan turned that family into a brand. The Bullvine identifies Larcrest Crimson as her daughter and describes Crimson’s sons Calibrate, Camelot, Chavez, Conquest, Casual, and Cyclone as AI-stud staples . The same profile points to Larcrest Commander as another later family example with cross-border relevance in U.S. TPI and Canadian LPI conversations .
Cosmopolitan wasn’t loud. She didn’t need to be.
She made Larcrest mean repeatability. That’s a different kind of fame, and in many barns, a more useful one.
Harborcrest Rose Milly: The Cow Who Came Over the Hill
Harborcrest Rose Milly was the kind of cow that made people stop talking when she came over the hill. Her bigger legacy came through Paclamar Astronaut, turning one great cow into thousands of daughters and decades of Holstein influence. Read more: Harborcrest Rose Milly: From Pig Money to Holstein Royalty
Some cattle stories need a whole crowd.
Milly just needs one hill.
The Bullvine profile tells the scene from June 1961 in West Salem, Ohio: Dick Brooks visiting John Snoddy, cows coming over the rise, and Harborcrest Rose Milly walking at the head of the line . You can almost see it. The kind of cow that makes the conversation stop for a second.
Milly was later recorded as EX-97-GMD, a three-time All-American Aged Cow, and the dam of Paclamar Astronaut . The King Barn Dairy MOOseum also identifies Astronaut as born in early 1964 to Harborcrest Rose Milly and describes Milly as a widely known All-American cow with a strong dairy record .
Her legacy runs through Astronaut.
The Bullvine profile credits Astronaut with 59,949 tested daughters and connects his daughters to later breed-shaping lines including Hanoverhill Starbuck and Startmore Rudolph . ABS Global’s bull database identifies Paclamar Astronaut as a proven Holstein bull born January 19, 1964 .
We don’t need to overstate it. The verified story is strong enough.
Milly produced Astronaut. Astronaut carried her influence into thousands of daughters. Those daughters helped open pathways into some of the most important bloodlines that followed.
That is maternal influence at breed scale.
One son. Thousands of daughters. Decades of echo.
Plushanski Chief Faith: The Cow Her Owner Would Not Sell
The Bullvine profile frames Plushanski Chief Faith around Charlie refusing to sell her before mating her to Pawnee Farm Arlinda Chief . Faith was born in November 1968, classified EX-94-4E-GMD, and credited in the profile with lifetime production of 242,863 pounds of milk and 11,353 pounds of fat . Holstein Plaza also identifies Plushanski Chief Faith EX-94-4E-GMD as a foundation cow in the Quality Gibson Finsco pedigree .
Faith’s strength came through daughters.
The Bullvine identifies Plushanski Valiant Fran, Plushanski Job Fancy, Plushanski Dawn Fayne, and Plushanski Star Faith as daughters that carried different parts of the family forward . The profile also connects the Faith line to Quality BC Frantisco, the EX-96 cow who became a two-time Royal Winter Fair Grand Champion through the Fran branch , .
This one feels less like a glossy genetics story and more like something every breeder understands.
Sometimes the whole future turns on a cow you decide not to sell.
Charlie Plushanski didn’t know he was protecting history. He just knew enough to trust the cow in front of him.
That’s not luck. That’s stockmanship.
Regancrest-PR Barbie: The Brood Cow Who Made Type Personal
Regancrest-PR Barbie looked good enough to get attention.
Then her daughters made her impossible to ignore.
The Bullvine profile places Barbie at the 2004 Minnesota State Fair as Reserve Grand Champion and follows her into one of the most concentrated type-transmitting stories of the modern era . By 2010, the profile says Barbie had produced eight Excellent and 19 Very Good daughters, with all but one of her 27-plus daughters classified VG or better on first lactation . The Bullvine’s earlier Golden Dam finalist profile also treated Barbie as one of the defining donor females of her era .
That’s the kind of family where even people who don’t follow every branch still recognize the landmarks . Eurogenes has also continued to identify top PTAT animals tracing back to Regancrest-PR Barbie, which shows the family remained visible in modern type rankings .
Barbie ranks tenth here only because the first nine cows have longer historical arcs or wider breed-building records. In almost any other feature, she could be the headline.
That says more about this list than it does about Barbie.
What These Mothers Knew
There’s a funny habit in dairy history. We talk about the bulls.
The bull got the stud code. The bull got the proof sheet. The bull got the semen tank, the ad, the argument, the daughters counted in tidy rows.
But behind the bull was usually a cow someone believed in first.
Roxy gave the breed a family that reproduced excellence. Dellia made type and production feel less like enemies. Blackrose turned a financial wreck into Red and White power. Laurie Sheik made Comestar a global name. Altitude made red serious. Rudy Missy helped wire the genomic era. Cosmopolitan made Larcrest repeatable. Milly gave Astronaut the maternal base to move through the breed. Faith rewarded one farmer’s refusal to sell. Barbie reminded everyone that type still needed mothers.
That’s the real Mother’s Day story.
Not the soft-focus version. Not the greeting-card version.
The real story is quieter and better. It’s a breeder standing in a barn, looking at a cow, and thinking, “There’s something here.”
Sometimes they’re right.
And when they’re really right, the rest of us are still seeing that cow generations later. In the heifer pen. In the bull book. In the embryo catalog. In the sale ring. In the pedigree of the cow that just freshened better than expected.
So walk the barn a little slower this Mother’s Day.
Find the cow that always breeds back. The one whose daughters freshen right. The one nobody makes much noise about because she simply works.
Pull her pedigree. Go back far enough.
Odds are, one of these mothers is waiting there.
Key Takeaways
Don’t give the bull all the credit. The cow family behind him often tells you more about repeatability, risk, and long-term value.
Pull the pedigrees on your best heifers and look for the mothers that keep showing up. That’s where the next breeding decision starts.
Great cow families aren’t built from one perfect mating. They come from breeders who notice the right cow early and keep stacking the right daughters.
Legacy still has barn value. If a family keeps breeding back, classifying well, and making useful daughters, don’t let fashion talk you out of it.
Continue the Story
From Laurie Sheik to Robotic Milking: Bois Seigneur Holstein’s Journey of Innovation – While Laurie Sheik provided the maternal spark, Marc Comtois built the engine. Step into the Quebec barns where this exact historical timeline played out, proving what happens when visionary stockmanship meets the right foundation cow at the perfect moment.
Edward Young Morwick – Country Roads to Law Office – Every legendary sire in a stud book traces back to a mother someone refused to cull. Explore the bull side of this history through the eyes of a Master Breeder, where names like Astronaut and Durham pushed maternal foundations into millions of modern pedigrees.
KHW Regiment Apple-Red-ET – Everything and more – When Altitude made the red factor a serious breeding lane, she laid the groundwork for an absolute dynasty. Trace how her most recognizable daughter took that exact foundation and relentlessly dominated both the shavings and the global genomic era.
The Sunday Read Dairy Professionals Don’t Skip.
Every week, thousands of producers, breeders, and industry insiders open Bullvine Weekly for genetics insights, market shifts, and profit strategies they won’t find anywhere else. One email. Five minutes. Smarter decisions all week.
USDA set March protein at $2.0905/lb against butterfat at $2.0220. On a 500-cow Order 30 herd at 75 lbs/day, that tenth is worth $28,614 a year — $938 more than fat. First sustained flip in a decade.
At the March 2026 Federal Milk Marketing Order announcement, USDA AMS set the protein price at $2.0905/lbagainst butterfat at $2.0220/lb — the first sustained stretch in a major cycle where a pound of milk protein outvalues a pound of milk fat. For a 500-cow Wisconsin or Minnesota shipper into Order 30 moving 75 lbs/cow/day, a single tenth-of-a-percent gap in protein now runs $28,614 a year; fat lands close behind at $27,676.
That’s the stake for a mid-size Upper Midwest herd still calibrated to the old fat-premium world. The trap: a decade of fat-first genetics, fat-first rations, and fat-first contracts running headlong into roughly $10 billion in new cheese capacity that needs protein and doesn’t much care about the butter side anymore.
Dairy component economics 2026 isn’t a theme. It’s the math on your next milk check.
This is Issue #1 of The Bullvine Component Value Tracker — a monthly read translating the FMMO announcement into herd-specific dollar decisions, ranking nutrition break-evens against current prices, and scoring where the month’s highest-return component moves actually sit. May 2026 baseline: 58/100 — Maintain and Reposition Toward Protein.
The Signal the Market Already Sent
For eight of the ten years leading into 2025, butterfat paid more per pound than protein. Producers answered the signal. Genetics companies bred for fat. Nutritionists optimized rations for butterfat response. It worked — arguably too well.
U.S. butterfat climbed 0.58 points between 2015 and 2025, from 3.75% to a record 4.33%, per USDA NASS data compiled by FMMA30 — a 15.5% lift off the 2015 baseline. Over the same window, EU butterfat gained roughly 2.4% and New Zealand roughly 2.5%, per FMMA30’s international comparison. Protein climbed too — 3.11% to 3.29% — but that 5.8% gain only looks healthy until you stack it next to fat running at nearly triple the pace.
CoBank’s lead dairy economist Corey Geiger flagged the problem in the bank’s September 25, 2025 Knowledge Exchange brief, warning that excessive butterfat can compromise cheese quality and that cheesemakers target a protein-to-fat ratio near 0.80, with ratios significantly below that threshold reducing yield efficiency. At the time, the ratio sat at 0.77. Seven months later, with full-year 2025 butterfat averaging 4.33% against protein stuck at 3.29%, it’s dropped to 0.760 (3.29 ÷ 4.33 = 0.7598).
Over half of U.S. milk now moves into cheese. Those plants were calibrated for 0.82. The milk arriving at the dock doesn’t match the equipment on the other side.
Why Should Upper Midwest Producers Care About the 0.75 Threshold?
From 2000 to 2017, the U.S. protein-to-fat ratio held flat between 0.82 and 0.84, per CoBank’s Knowledge Exchange. That’s the band processors built their plants around. Starting in 2018, the line bent.
Year
P-to-F Ratio
Context
2000–2017
0.82–0.84
Stable — cheese plants calibrated here
2018
~0.81
Decline begins
2020
~0.80
Geiger’s “near 0.80” cheese-quality target
2023
~0.79
Decline accelerates
2025 full-year
0.760
FMMA30 / USDA NASS annual
Bullvine crisis threshold
0.75
Named in this issue
Projected arrival
Late 2027 (~16 months out)
Bullvine projection, ~0.008/year decline
The Bullvine is putting a stake in the ground: the U.S. protein-to-fat ratio crosses 0.75 within roughly 16 months at current decline rates, and that’s where standardization costs, whey-stream fat losses, and processor basis negotiations visibly reprice Upper Midwest milk checks. If the ratio turns upward before late 2027, the Tracker will say so in writing and retire the call. If it doesn’t, this stops being a chart. It’s the basis for a pricing correction that’s already started.
The structural driver keeping the ratio suppressed is genetics, and the indexes don’t agree on which way out. Holstein USA’s April 2026 TPI revision shifted production weights to 24% protein and 14% fat — a 5-point move in each direction. Top-10% bulls saw an average 34-point TPI decline, with 26.6 of those points attributable to the formula change itself rather than routine evaluation updates. USDA’s Net Merit 2025 moved the opposite direction — 31.8% fat, 13.0% protein. Two major indexes. Two opposite signals. One breeder trying to mate cows this week.
Running the Numbers: What 0.1% Is Worth on a 500-Cow Order 30 Herd
Before you read the rest of this issue, run this math on your own operation.
Scope. 500-cow Wisconsin or Minnesota shipper into FMMO Order 30. 75 lbs/cow/day rolling average. March 2026 FMMO prices.
Formula:
Incremental annual revenue = 0.001 × daily lbs/cow × number of cows × 365 × FMMO component price per lb
Where the $83,000–$140,000 bulk-tank gap comes from. A 500-cow Order 30 shipper at 4.0% fat against a 2025 national average of 4.33% is carrying a 0.33-point fat gap. Three 0.1% increments × $27,676 = roughly $83,000/year in fat alone. Add a 0.2-point protein gap (3.09% vs. 3.29% national), and 2 × $28,614 pulls another ~$57,000/year. The $140,000 upper bound is a composite of two gaps on two components, not one factor. The low end is fat alone.
That’s the money. Not theoretical. Sitting in the bulk tank every month it ships short of county average.
If you’re leveraged. On a 500-cow shop running DSCR closer to 1.1 than 1.3, a captured $56,290 from a combined 0.1%/0.1% component move is the difference between a lender conversation you choose when to have and one your lender chooses for you. Component revenue doesn’t carry the manure tax added volume does — no extra cow, no extra parlor time, no extra lagoon capacity. It’s the highest-leverage margin move currently on the table.
Run the Numbers on Your Herd: The Bullvine Component Value Tracker
Every calculation above is scoped to a 500-cow Wisconsin or Minnesota shipper at 75 lbs/cow/day against March 2026 FMMO prices. Your operation isn’t that one.
The Tracker runs the +0.1% value, the component-gap dollars, and the $17 Class III capital stress-test against your actual numbers — same methodology, your inputs. Plug in your cow count, production level, fat and protein tests, and the dollar numbers move in real time.
Launch the Tracker pre-loaded with this article’s May 2026 baseline — 500 cows, 75 lbs/day, 4.33% fat, 3.29% protein, $2.0220 fat price, $2.0905 protein price, $19.70 USDA all-milk forecast, $16.16 CME Class III futures:
Bookmark the result once you’ve loaded your own cow count, production, and last month’s component tests — that’s your personal Tracker baseline for the Issue #2 refresh against May FMMO prices.
Why Does Chasing a Better Protein-to-Fat Ratio Cost You Money?
Here’s the assumption the “protein market” headlines set up: the right sire in a protein-premium cycle is the one with the best protein-to-fat ratio. Run the dollars at March 2026 prices, and that logic breaks.
Two sires. Identical on everything else.
Sire
Fat PTA (lbs)
Protein PTA (lbs)
Fat Value
Protein Value
Total per Daughter/Lactation
Winner
Sire A
+45
+35
45 × $2.0220 = $90.99
35 × $2.0905 = $73.17
$164.16
✅ +$19.88
Sire B (prettier ratio)
+30
+40
30 × $2.0220 = $60.66
40 × $2.0905 = $83.62
$144.28
—
Sire B has the prettier protein-to-fat ratio. Sire A has the heavier check — by $19.88 per daughter per lactation, in a protein-premium market. Total CFP pounds drive the milk check. Ratio doesn’t.
The flip point isn’t where headline logic puts it. Setting Sire A’s value equal to Sire B’s and solving for protein against flat fat at $2.0220/lb:
(45 × $2.0220) + (35 × P) = (30 × $2.0220) + (40 × P) 15 × $2.0220 = 5 × P P = $6.07/lb protein
At flat fat, protein would have to triple from $2.09 to roughly $6/lb before Sire B’s ratio edge overcomes Sire A’s 15-lb CFP advantage. Sire A’s win isn’t marginal. It’s structural — the total-pounds gap is large enough that no realistic protein price flips it.
Picture a Brown County 500-cow operation — a hypothetical herd representative of Order 30 shippers we’ve modeled — that filtered its April sire list on protein-to-fat ratio and surfaced Sire B at the top. Across a typical replacement pipeline of 150 heifers/year and 2.8 lactations per cow in the milking string (Bullvine modeling assumption), that single $19.88/daughter/lactation delta compounds to roughly $8,350/year in steady-state drag once the selection cycles through the lactating herd (150 × 2.8 × $19.88). Filter-the-whole-sire-list style ratio-first selection — not just one sire swap — carries materially more drag; The Bullvine’s April 2026 TPI analysis modeled it at roughly $17,500/year for herds that filtered broadly on ratio across multiple placements.
The ruleset for this mating season:
Primary filter: Net Merit or Cheese Merit — both balance full economics, not just protein percent
Sort by: total CFP pounds
Tie-breaker: protein PTA, when CFP is equivalent
Don’t: select on protein-to-fat ratio at the expense of total CFP
There’s an interpretive tension inside TPI itself worth flagging — this is Bullvine analysis, not a Holstein USA position. Under the April 2026 formula, one pound of PTA protein carries roughly 1.7× the leverage of one pound of PTA fat in the index. TPI’s own Feed Efficiency formula still values fat at $1.86/lb against protein at $1.75/lb. Same index. Two signals. Trust the price on the milk check, not the coefficient on the ranking sheet.
Which Supplements Still Pencil at $2.09/lb Protein?
Component prices shifted. Not every ration has caught up. Break-evens below are scoped to a 500-cow, 75 lbs/cow/day Order 30 operation at March 2026 FMMO prices.
Rumen-Protected Methionine: Conditional Yes
A peer-reviewed meta-analysis in Animals (PMC9219501, 2022) puts RPM’s protein response range at +0.07% to +0.15%, with yield gains of 27–43 g/day. The 2025 combined RPLM paper (Animals, PMC12691028) confirms response is heavily dependent on basal diet and a roughly 3:1 lysine-to-methionine target.
At $0.10/cow/day, +0.05% response:
Extra protein: 0.0005 × 75 = 0.0375 lbs/cow/day
Break-even protein price: $0.10 ÷ 0.0375 = $2.67/lb
Current: $2.09/lb — marginally negative
At $0.10/cow/day, +0.10% response:
Extra protein: 0.075 lbs/cow/day
Break-even: $0.10 ÷ 0.075 = $1.33/lb
Margin vs. current: +$0.76/lb — strongly positive
Methionine pays when the cost is low and the response is real. It doesn’t pay when either assumption slips. That’s a ration-audit conversation, not a standing order.
Rumen-Protected Lysine: Don’t Spend
Commercial RPL response on Holsteins runs +0.03% to +0.08% protein at $0.08–$0.15/cow/day, per trial work summarized in PLOS ONE (pone.0243953, 2021).
At $0.10/cow/day, +0.05% response: break-even $2.67/lb
At $0.10/cow/day, +0.03% response: break-even $4.44/lb
Current protein: $2.09/lb. Unless you’ve got 30+ days of bulk-tank data proving outlier response on your herd, lysine’s a ration tax right now. Not a component strategy.
The flip point. Protein above $2.75/lb sustained before lysine pencils at typical commercial response — $0.66/lb of price movement away.
Rumen-Protected Fat: Hold
At March 2026 butterfat of $2.0220/lb, the break-even for RP fat lands at $2.67/lb (at $0.20/cow/day cost and a +0.10% response: $0.20 ÷ 0.075 = $2.667). Current butterfat sits $0.65 below that threshold. The math works only at lower cost or higher verified response — $0.15/cow/day against the same +0.10% response drops break-even to $2.00/lb, right at the current FMMO.
A year ago, with butterfat peaking at $2.95/lb in January 2025 before collapsing 46% to $1.58/lb by December 2025, the math worked early and not at all by year-end. Any response shortfall flips the decision today.
The flip point. Butterfat sustained above $2.67/lb at typical $0.20/cow/day cost, or contract RP fat below $0.15/cow/day with herd-specific +0.10% response confirmed.
Supplement
Cost/Cow/Day
Response Range
Break-Even (typical)
Current FMMO
Verdict
RP Lysine
$0.08–$0.15
+0.03–0.08% protein
~$2.67–$4.44/lb
$2.09/lb
Don’t spend
RP Methionine
$0.10–$0.14
+0.07–0.15% protein
$1.33–$2.67/lb (response-dependent)
$2.09/lb
Conditional yes — low cost + verified response only
RP Fat
$0.15–$0.30
+0.10–0.20% butterfat
$2.00–$4.00/lb (cost- and response-dependent)
$2.02/lb
Hold — break-even at or above current FMMO
Response ranges: Animals 2022 (PMC9219501); Animals 2025 (PMC12691028); PLOS ONE 2021 (pone.0243953). Herd response varies by basal ration, stage of lactation, and product specification.
How Much Does Your FMMO Order Change the Protein Payoff?
Same genetics move. Same ration tweak. Different milk check — because FMMO class utilization dictates how much the market pays for what you improved.
Order 30 (Upper Midwest) routes 83.9% of producer milk to Class III cheese use, per FMMA30 2025 annual data. Wisconsin contributes 69.6% of Order 30 volume; Minnesota adds 21.0%. In a cheese-heavy order, protein dominates.
FMMO / Region
Class Utilization
P-to-F
Priority
Upper Midwest (30)
83.9% Class III
0.759
Protein first at current FMMO prices — highest protein ROI among major orders
FMMA30 Upper Midwest 2025 annual; ratios derived from regional component averages in FMMO reporting.
Texas production ran +10.6% in 2025, Kansas +11.4%, per USDA NASS. Idaho regained the nation’s #3 spot at 18.26 billion lbs of milk, edging Texas’s 18.21 billion by roughly one day’s worth of production. The processing gravity wells driving that growth:
Hilmar Cheese, Dodge City, KS — $600M, operational since March 2025
Leprino Foods, Lubbock, TX — approximately $1B complex, ~600 employees, designed for ~1M lbs cheese/day
Valley Queen, Milbank, SD — expansion completed 2025, anchoring the I-29 corridor
Leprino, Lemoore East, CA — closing in 2026, driving California capacity losses
Early-2026 trade coverage of High Plains and I-29 corridor contract offers has flagged structural premium tiers rewarding herds that reach roughly 4.2% fat and 3.3% protein. The specific cwt figure varies heavily by plant, co-op, and volume commitment — verify premium language against your own contract before building the number into a budget. What matters here isn’t the exact number at any one plant. It’s that the premium structure exists where the cheese capacity is landing, and it didn’t exist 18 months ago.
California production ran -5.74% in 2025 (USDA NASS), on water scarcity, regulatory pressure, and lost processing capacity. For the dairies that stay, the shift from fat-heavy checks toward protein-relevant ones is a repositioning window. Not a crisis.
Trade-offs to Watch
Net Merit or Cheese Merit over TPI as your primary screen gives up benchmarking some buyers still reference for genetic marketing. You gain pricing accuracy on the milk check. You give up pedigree shorthand at the auction ring.
Locking 60–75% of feed at $3.90–$4.10 corn needs equal-weight milk-side coverage. One-sided hedging is worse than no hedge — if corn drops and milk drops with it, you’re paying above-market for feed into a weaker check.
Genomic-testing 100% of heifers at ~$40/head runs roughly $6,000/year on a 150-heifer pipeline. Payback only lives in the sorting decision. Testing without changing which heifers breed to elite component sires is a $6,000 data subscription.
What Does a 58/100 Component Opportunity Score Actually Tell You to Do?
Each Tracker issue compresses four market conditions into one score. May 2026 baseline:
Sub-Score
Weight
Reading
Score
Marginal Value ($/0.1% at current FMMO)
30%
$27,676 fat + $28,614 protein on 500-cow Order 30 — off 2025 peaks but meaningful
70
Forward Price Trajectory (CME 6-month)
25%
Butter and cheese in slight contango from depressed levels — stabilizing, not surging
65
Genetic Improvement Rate (CDCB trends)
20%
Fat PTA still outpacing protein PTA; April 2026 TPI starts the correction, pipeline lag is real
55
Nutrition ROI Opportunity
25%
Lysine negative; methionine conditional; RP fat break-even at or above current FMMO
Component premiums justify significant new nutrition + genetics spending
Maintain and Reposition
50–70
Premiums positive but compressed; genetics and market positioning carry highest forward returns
Hold
<50
Premiums don’t justify added investment
A 58 doesn’t mean spend everywhere. It means stay in the component game and be ruthless about which marginal dollar goes where. The 40 on nutrition reflects real margin compression — methionine’s the only consistent winner, and only at the low end of cost. The 55 on genetics reflects the lag between what the market wants and what the CDCB pipeline delivers today.
What pushes the score toward 80+: protein sustaining above $2.50/lb as new cheese plants come online; butterfat stabilizing above $2.25/lb; FMMO reform that increases component weight in pricing.
What drops it below 40: both prices falling below $1.75/lb; a feed-cost spike raising all break-evens; component tests plateauing nationally.
The 30/90/365-Day Playbook for a 500-Cow Order 30 Shipper
30-Day Actions
1. Pull last month’s milk check this week and run the 0.1% formula on your own numbers. Compare your protein test to the Order 30 average near 3.29%. The gap has a dollar sign in front of it — and at current prices, that gap’s worth more per pound than it was 18 months ago. Plug actual fat and protein tests into the embedded Tracker at March 2026 FMMO prices.
Requires: three milk statements, herd size, daily lbs/cow average.
Red-flag trigger: protein test more than 0.15 points below the Order 30 average = over $40,000/year on the table for a 500-cow herd at current prices. Urgent.
Watch for: seasonal variation. Compare trailing 12 months, not just last month.
2. Audit every rumen-protected supplement — and stop RP Lysine this month if response isn’t documented. Pull the invoice cost per cow per day. At $2.09/lb protein and typical commercial lysine response rates, the math is underwater by roughly $0.60 to $2.35/lb depending on your inputs. If you can’t show 30 days of bulk-tank data proving outlier response, it’s a ration tax.
Red-flag trigger: any supplement with implied break-even above $2.09/lb protein or $2.02/lb fat, and no 30-day before-and-after data proving the response — cost to eliminate.
Watch for: products bundled into larger mixes where per-cow-per-day cost is hard to isolate. Ask for it in writing.
3. Put a methionine kill switch in writing with your nutritionist. +0.05% protein minimum, $0.12/cow/day maximum. Review date on the calendar. No exceptions.
Red-flag trigger: either threshold violated for 30 consecutive days — pull the product, reset the ration, re-baseline before adding back.
Watch for: “the response will show up next month.” Put a review date on the calendar and hold it.
4. Before your next breeding decision, ask two questions. “What’s this bull’s total CFP in pounds?” Then: “What’s that worth per lactation at $2.0905 protein and $2.0220 fat?” That conversation surfaces the ratio trap before it ends up in your herd — at current prices, a 15-lb CFP gap between two sires is worth ~$20/daughter/lactation, and no realistic protein price flips that math.
Requires: current sire-list CFP data, March 2026 FMMO prices in the genetic advisor’s conversation.
Red-flag trigger: advisor defaults to protein-to-fat ratio or last year’s prices — stop the meeting and reset the reference numbers.
Watch for: marketing materials built on 2024 component prices. The math has moved.
90-Day Actions
5. Rebuild sire selection criteria around total CFP. Shift from protein-ratio filters to Net Merit or Cheese Merit as the primary screen. Sort by total CFP pounds. Protein PTA as tie-breaker only.
Requires: a conversation with your genetic advisor using March 2026 FMMO prices, not 2024’s. Bring current herd-average component tests.
Threshold: if your current bull lineup’s average CFP sits below the breed top 50% on the current CDCB run, you’re leaving component revenue on the table genetics-to-barn is slow to fix.
Watch for: over-tilting toward protein at the expense of health and fertility. Net Merit and Cheese Merit already hold that balance. Don’t override the index manually for ratio.
6. Stress-test every capital project at $17 Class III, not $19.70 all-milk. USDA’s March 2026 LDP-M-381 outlook projects 2026 all-milk at $19.70/cwt; CME Class III futures at the same moment traded closer to $16.16/cwt. A $3.54/cwt gap between the government forecast and the market’s own price signal is real-money exposure on any capital underwriting. On a 500-cow herd shipping roughly 136,875 cwt/year (500 × 75 × 365 ÷ 100), that’s approximately $484,540/year of revenue sensitivity between the two benchmarks — enough to break a project that only pencils at the USDA forecast. The gap between the government forecast and the futures board is the gap between a project that survives and one that breaks the operation.
Requires: your CPA or lender running sensitivity on barn, robot, and equipment purchases at $17 Class III.
Threshold: if a project’s DSCR drops below 1.2 at $17 milk for three consecutive months, treat as a luxury, not a necessity.
Watch for: contractors and equipment sellers pitching against the USDA forecast. The futures market is the one you hedge.
7. Lock in 60–75% of feed needs when corn projects at $3.90–$4.10/bu. Per the source economic analysis cited in this issue’s methodology, corn in that band yields roughly $11.56/cwt feed cost — manageable against current Class III.
Requires: cash flow for the hedging strategy, or a relationship with your co-op’s risk management service.
Threshold: corn in-band → lock. Corn above $4.25/bu with basis strengthening → wait for pullback or shorten coverage horizon.
Watch for: locking feed without also locking enough milk. You want both sides covered, not just the cost side.
365-Day Moves
8. Map your FMMO basis against the processing gravity wells. If you sit within draw radius of Lubbock, Dodge City, or an I-29 corridor plant, you have pricing leverage producers 200 miles farther out don’t. Structural demand from ~$10B in new cheese processing supports protein prices for the next two to three years. Renegotiate before capacity is fully committed.
Requires: 12 months of basis data against your plant vs. Order 30 statistical uniform price.
Opportunity signal: basis tightened to within $0.30/cwt of the Statistical Uniform Price while your component tests exceed county average — room to ask for contract improvements.
Watch for: short-term premiums written with pull-back triggers tied to volume. Read the basis-when-volumes-fall clause specifically. It’s the clause nobody reads until it triggers.
9. Track the 0.75 milestone quarterly. If the national ratio hits 0.75 on the late-2027 projected timeline, processor standardization costs accelerate and basis pressure increases on fat-heavy, protein-light herds. Herds repositioned 12–18 months ahead feel it least.
Requires: Tracker updates plus your own herd’s component trend line.
Opportunity signal: national ratio stabilizing above 0.76 for three consecutive months = evidence the market is self-correcting. Different strategy.
Watch for: short-term seasonal swings masking a trend reversal. Quarterly, not monthly.
10. Genomic-test for component direction, not just rank. At $30–$40/head, genomic testing identifies the top 20–30% of heifers worth breeding back to elite component sires. Bottom tier goes beef-on-dairy to capture beef-cross value while the pipeline tightens on components.
Requires: ~$40 × testing population + time to integrate results into breeding decisions.
Threshold: if your current replacement pipeline runs less than 25% genomic-tested heifers and you milk 500+, the sorting decision pays back within the replacement cycle at current component prices.
Watch for: testing without changing what you do with the data. ROI lives in the sorting decision, not the test itself.
The market already repriced. Your milk check is catching up. Every month the operation stays calibrated to the old fat-premium world is a month of compounding gap against herds that already moved. You gain cushion on components here. You give up flexibility on ration-by-habit there.
Two questions to take to your next milk meeting. What does your processor contract actually say about basis when Order 30 cheese utilization exceeds 85%? And what’s your real margin over feed per cwt this month versus 90 days ago — at $2.0905 protein, not last year’s number?
Key Takeaways
March 2026 FMMO flipped the component stack: protein at $2.0905/lb now beats butterfat at $2.0220, and on a 500-cow Order 30 herd at 75 lbs/day, every tenth of protein is worth $28,614 a year.
The national protein-to-fat ratio hit 0.760 in 2025 against cheese plants calibrated for 0.82; if you ship into Order 30, you’ve got roughly 16 months before the 0.75 line starts showing up in basis conversations.
At current prices, total CFP pounds drive the milk check — not protein-to-fat ratio. If your sire list is sorted on ratio, you’re leaving roughly $20 per daughter per lactation on the table and you won’t outrun that math until protein triples.
Stress-test every 2026 capital project at $16.16 CME Class III, not USDA’s $19.70 all-milk forecast. The $3.54/cwt gap is about $484,540/year of revenue sensitivity on a 500-cow herd — the difference between a project that survives and one that doesn’t.
Methodology and Sources
Scope. All barn math uses March 2026 USDA AMS FMMO component prices (protein .0905/lb, butterfat .0220/lb) on a 500-cow Wisconsin/Minnesota operation shipping into FMMO Order 30 at 75 lbs/cow/day, unless stated otherwise. Prices refresh with each month’s FMMO announcement. The interactive Component Value Tracker at thebullvine.com/tools lets readers substitute their own herd parameters against the same formulas and price inputs.
Bullvine projections, labeled as such. The 0.75 crisis threshold, the ~16-month timeline, the Component Opportunity Score methodology, the ~$8,350 Brown County single-sire-swap scenario, the $17,500 broad-filter ratio-trap estimate, and the 150-heifer/2.8-lactation replacement-pipeline assumptions are proprietary Bullvine modeling — published here for the first time.
External sources. USDA AMS FMMO March 2026 component prices; FMMA30 Upper Midwest 2025 annual class utilization and international component comparison; USDA NASS Milk Production Reports, February and March 2026; USDA ERS Livestock, Dairy, and Poultry Outlook, March 2026 (LDP-M-381); CoBank Knowledge Exchange, “While U.S. Leads Milk Component Growth, Butterfat May Be Growing Too Fast,” September 25, 2025; Holstein Association USA Geneticist Insights, April 2026; Select Sires / CDCB April 2025 Base Change documentation; Animals meta-analysis of rumen-protected methionine (PMC9219501, 2022); Animals combined RPLM supplementation study (PMC12691028, 2025); PLOS ONE rumen-protected methionine trial (pone.0243953, 2021).
Every week, thousands of producers, breeders, and industry insiders open Bullvine Weekly for genetics insights, market shifts, and profit strategies they won’t find anywhere else. One email. Five minutes. Smarter decisions all week.
Canada’s top ten Jersey sires average 99th-percentile LPI and 47th-percentile Reproduction. That 52-point gap sired 29% of 2025 registrations — and never shows up on a single catalog page.
Jersey Canada’s record registration year produced a top ten sire group with elite LPI and conformation. Yet a look under the hood, and the Reproduction and Milkability subindexes tell a very different story for the future cows filling Canadian barns.
When I sat down in March 2026 with Jersey Canada’s 2025 registration data and Lactanet’s December 2025 genetic evaluations, I expected to see what the catalog pages were already shouting. Record registrations, up 9.74% over the previous high. Ten sires averaging Lifetime Performance Index (LPI) at the 99th percentile. Conformation at the 97th. Every bull A2A2. On paper, the Canadian Jerseys looked like they were winning on every front.
Then I pulled the LPI subindex profile on that same top ten group. The Reproduction Index (RI) across those bulls averaged the 47th percentile — below breed average. Five of ten fell below the median for fertility. The Milkability Index (MI), Lactanet’s subindex covering milking speed, temperament, and mammary milking traits, sat at the 34th percentile. And the Health & Welfare Index (HWI) — the one that captures Metabolic Disease Resistance, Mastitis Resistance, and Cystic Ovaries — averaged just the 59th percentile, with four bulls below the 50th.
Let me say this plainly: neither the breed associations nor the A.I. companies are publishing or promoting subindexes, and very little has been published on understanding or using them. After six decades of breeding cattle and working on dairy cattle improvement — including the original Dollar Difference Formula and Holstein Canada’s Type Classification overhaul in the 1980s — I’m still pushing the industry to look past the numbers it celebrates and toward the economically important ones it quietly ignores.
That’s not breeders failing to read the fine print. That’s a system that never printed it.
What Do Canada’s Top 10 Jersey Sires Actually Look Like Genetically?
Let’s start with which sires are actually driving the breed.
The ten bulls leading Jersey Canada’s 2025 registrations — ToBeFamous and Ghost tied at No. 1, followed by Victorious, Skyfall, Xenial, Artemis, Goldorak, Honeymoon, Cinnamon, and Tekashi — averaging 402 registered daughters each. Together, they sired 29% of all Jersey registrations in Canada that year. Eight of the ten were genomic sires when used, and those eight alone account for 81% of the group’s registered daughters.
When eight genomic bulls shape roughly one in four registered calves in a country, their genetic profile isn’t just interesting. It’s the trajectory of the breed.
Here’s how the Lactanet December 2025 evaluations stack up for that top ten:
Index
Average
Percentile Rank
Range
Bulls Below 50th
LPI
1,918
99th
39th–99th
1 of 10
Pro$
$1,542
~97th
—
—
Production Index (PI)
—
81st
56th–99th
0 of 10
Longevity & Type (LTI)
—
91st
21st–99th
1 of 10
Health & Welfare (HWI)
—
59th
17th–88th
4 of 10
Reproduction (RI)
—
47th
19th–84th
5 of 10
Milkability (MI)
—
34th
2nd–90th
5 of 10
Milk
358 kgs
50th
−121 to 1,071
6 of 10
Fat
49 kgs
79th
12–84
2 of 10
Fat %
+0.37%
—
0.07–0.83
0 of 10
Protein
25 kgs
60th
12–52
4 of 10
Protein %
+0.16%
—
0.07–0.31
0 of 10
Conformation (CONF)
+11.4
97th
−2 to +18
1 of 10
The gap between the 99th-percentile LPI and the 47th-percentile RI — 52 percentile points — might be the most revealing number in this dataset. It also never shows up on a sire card.
Why Don’t Breeders See the Fertility and Milkability Gap?
The short version: nothing in the current sire selection pipeline forces RI, HWI, or MI onto the table when you’re actually ordering semen.
Fat percentage is loud. When a bull adds +0.83%F — the high end of this top ten’s range — the economic reward shows up on every milk settlement. The A2A2 and BB casein story works the same way: processors put a premium on paper, breeders respond, and by 2025, the breed hit 100% A2A2 and 90% BB kappa-casein among its most-used sires. That’s the market signal doing exactly what it’s supposed to do.
Fertility costs are quiet. When a cow takes an extra cycle or two to settle, the penalty spreads across the vet bill, the semen line, the replacement purchase, and a longer calving interval that drags down lifetime milk and drives up lifetime days dry. None of those line items show up with a bold “this is what 47th-percentile RI genetics cost you this month” stamped on them.
Timed AI programs like Double-Ovsynch and Presynch-Ovsynch deepen the blind spot. They override a cow’s own biology, delivering conception rates that hide genetic fertility deficits. The protocol works — but it costs more to maintain with every percentile point of genetic fertility you give away. More shots. Tighter labour timing. More resynchronization cycles.
The Milkability Index gap tells its own story. MI combines milking speed, temperament, and milking-related mammary traits — exactly the traits that determine how quickly and smoothly cows move through a parlour or a robot box. A 34th-percentile MI average means the daughters of the breed’s most popular sires are, on balance, below average for the traits that drive milking efficiency and robot throughput. That’s real money in labour and robot capacity, especially as more Canadian herds adopt automated milking.
Fat Gains Up, Fertility Drifting: Five Years of Jersey Genetic Trends
Zoom out to the five-year trend for the top ten registration sires from 2020 to 2025, and the selection pattern comes into focus:
Trait
Annual Gain (Top 10 Registration Sires, 2020–2025)
LPI
+44 points/year
Pro$
+$99/year
Milk Volume
−25 kgs/year
Fat Yield
+3 kgs/year
Fat %
+0.05%/year
Protein Yield
+1 kg/year
Protein %
+0.03%/year
Conformation
+0.8/year
Mammary System
+0.8/year
Dairy Strength
+0.90/year
Feet & Legs
+0.75/year
Rump
+0.66/year
Inbreeding
−0.28%/year
Milk volume is deliberately sliding while fat and protein percentages climb. That’s component pricing at work, and breeders are delivering exactly what processors reward.
What’s missing in that trend table are equivalent progress numbers for RI, HWI, or MI. The traits everyone tracks, publishes, and celebrates are the ones getting selected. The ones buried in PDF footnotes are drifting. The 47th-percentile RI average is a pretty good hint of which direction.
On the positive side, the inbreeding story is exactly what you’d hope to see. The average for the top ten drops from 9.77% in 2020 to 8.10% in 2025 — a reduction of 0.28% per year, with seven of ten bulls sitting under 9.0%. That proves something important: Canadian Jersey breeders can manage a trait that isn’t on the milk cheque when the industry makes it visible and gives them tools. It’s fair to ask why the same thing hasn’t happened for reproduction, health, and milkability yet.
The Barn Math Behind 47th-Percentile Fertility
Here’s where you can feel it in your own numbers.
A 200-cow Jersey herd turning over 35% annually needs about 70 replacement heifers a year. That’s just barn math: 200 × 0.35 = 70.
On the cost side, U.S. dairy replacement prices hit about $3,010 per head in July 2025, up 164% from the 2019 bottom of around $1,140, with top heifers bringing $4,000 or more in some auction barns. In Ontario, replacement heifers over 900 lbs were selling around $326–$328 per hundredweight at recent auctions — not the same absolute price, but the direction of travel is similar.
Now layer in genetics. If below-average RI bulls add even one extra service per conception across your dairy-bred matings, that’s more semen, more time open, and more risk that cows fall out of the dairy pipeline and into beef because they didn’t settle. It’s not just a $30–$50 sexed semen straw that didn’t stick. It’s a heifer that never existed, and a cow that probably gets bred to beef because everyone’s tired of missing her.
My read of the Production Index adds another twist. The PI averages the 81st percentile across the top ten — good, but notably lower than the LPI at the 99th and the LTI at the 91st.. In other words, the composite LPI for these bulls is being carried more by longevity and type than by yield. That raises a fair question: how much of that 1,918-point LPI reflects real lifetime profitability, and how much is the formula letting strong CONF and LTI paper override weak RI and MI?
Does 97th-Percentile Conformation Actually Drive Jersey Profitability?
On paper, this top ten group is a type breeder’s dream. The average conformation score sits at +11.4 — the 97th percentile — with a range from −2 to +18. Mammary system averages +8.9. Feet and legs average +8.5. Those are big numbers.
The real question is what those numbers actually buy you.
Canadian work from Agriculture and Agri-Food Canada on longevity found that udder depth and milking ease accounted for 84% of the total contribution of type traits to functional longevity, and that rear teat placement, udder depth, and udder texture had a significant influence on functional survival. Cows with tight, well-attached udders stayed in the herd longer.
Alcantara, Baes, de Oliveira Junior, and Schenkel (2022), in the Canadian Journal of Animal Science, put hard-dollar values on the type traits involved. Analyzing 9,351 proven Holstein bulls, they found heel depth had the strongest positive effect on Pro$ of any conformation trait, at +$79.13 per unit RBV increase.
In plain terms: heel depth pays you; extreme body depth costs you.
That same paper showed dairy capacity (especially body length) was also positive, at +$59.00 per unit RBV. More capacious, angular cows tended to stay productive longer. But body depth told the other side of the story: it had the largest negative effect on Pro$ at –$61.95 per unit RBV because deeper-bodied cows ate more, tended to lose condition more quickly after calving, and showed poorer fertility in later lactations.
The problem is that composite CONF rewards all of it. Stature, angularity, body capacity, and dairy character are assigned the same number as functional mammary and feet-and-legs traits. So, a bull could rank in the 97th percentile for CONF largely on height and style, while another sits in the 72nd percentile with rock-solid udders and feet. The composite score doesn’t tell you which one actually puts more money in your pocket over five lactations. And neither does the catalog page.
What Would a Balanced Jersey Sire Stack Look Like in 2026?
The 2025 data doesn’t say you need to blow up your sire list and start over. It says you need an index floor when selecting sires. And you need it on traits and subindexes where no one has put one to date.
Set a hard RI minimum at the 50th percentile for every bull in your stack. That’s not aggressive — it just means refusing to use sires whose daughters carry below-average fertility genetics. Apply this filter to the current top ten, and five of the ten drop out immediately. If you actually want to improve fertility, not just stop the slide, aim for RI in the 65th percentile or better. This month, pull the Lactanet subindex breakdown for every sire in your current mating plan. If any bull sits below the 50th-percentile for RI, flag him for replacement or for use only on your most fertile cows.
Give HWI a seat at the table. The top ten average just the 59th percentile for the Health & Welfare Index, with four bulls below the median. HWI is where Metabolic Disease Resistance, Mastitis Resistance, and Cystic Ovaries live in the modernized LPI. A 55th percentile floor keeps you from actively weakening your health genetics; 65th and up start building a real health advantage into your replacements.
Use MI as a robot and labour filter. With a 34th-percentile average, MI is the weakest subindex for this top ten group. Suppose you’re milking with robots — or thinking about it — milking speed, temperament, and teat placement matter just as much as litres. Even in a parlour, slow or difficult milkers chew up labour. Set your own MI floor at the 45th percentile, so you’re not selecting against milkability. In a robot environment, you might want a higher percentile.
Cap CONF expectations and target the right pieces. Instead of chasing 97th-percentile CONF across your whole stack, think in a 65th–80th percentile window and focus on mammary and feet-and-legs sub-scores. The Alcantara et al. work backs this up: heel depth and dairy capacity drive Pro$, while body depth drags it down. Select accordingly.
Use high-LPI/low-RI sires as specialty tools, not blanket-herd bulls. A bull sitting at 99th-percentile LPI with poor subindex scores might still earn a place, on the 15–20% of cows with outstanding fertility and health backgrounds where you can safely chase an outcross, special pedigree, or type shot. He shouldn’t be breeding 80% of the herd.
Before your fall semen order (90-day action), write a simple sire selection protocol. One page. Minimum RI and HWI percentiles. Plus a desired MI floor. Target range for CONF with mammary and feet/legs priorities. Share it with your AI rep and your genetic advisor. If they can’t work within it, that’s a data point too.
By spring 2027 (365-day action), pull services-per-conception data by sire group from your own herd records. That’s where you’ll see RI genetics and timed AI protocols separate. A bull who looks fine on paper but needs 3.2 services per conception in your barn is telling you something your sire catalog won’t.
What This Means for Your Operation
You don’t have to be running a big registered show string for this to matter. If you’re milking Jerseys and buying semen in Canada, you’re already living with the top ten bulls’ subindex profile. The only question is whether you’re steering it or just going along for the ride.
Run the subindex numbers on your current sire stack. Pull RI, HWI, and MI for every active bull you’re using. Calculate the weighted averages across your stack. If RI or HWI sits below the 50th percentile, you’ve quantified your genetic risk for fertility and health.
Decide what you’re actually willing to tolerate. A 47th-percentile RI average is what you get if you follow the registration leaderboard without asking questions. The minute you set a hard floor — even just at the 50th — you’re back in control.
Look at your conformation priorities through an economic lens. How much of your type selection pressure is going into the mammary system and feet/legs, and how much is chasing body depth and stature that the research says doesn’t pay? Adjust your eye accordingly.
If you’re running robots, treat MI as a non-negotiable. A 34th-percentile MI stack is basically selecting against robot efficiency. Put a line in the sand. Then ask yourself how many of your current sires clear it.
Double-check your replacement economics. On your own numbers, what does it cost to buy a bred Jersey heifer, with profit potential, right now? What’s your actual replacement rate? How much room do you have to play with fertility genetics before you start buying more herd replacements than you’d like?
Ask your AI rep better questions. Before you talk pedigrees or price, start with: “What are the RI, HWI, and MI percentiles on your top five Jersey sires for my herd?” If the answers come quickly — with printed subindex charts — you’re dealing with someone who’s reading the full proof sheet. If not, you’ve learned something about whose problems are being solved by that catalog page.
Key Takeaways
If half of the ten most-used Jersey sires in Canada sit below breed average for reproduction, the problem isn’t that breeders don’t care about fertility — it’s that the system never put RI, HWI, and MI on equal footing with LPI and CONF. I’ve been making that argument in one form or another for years: the numbers the industry promotes are the numbers that get selected. The numbers it buries get ignored.
The A2A2 success story proves breeders respond fast when the signal is clear. Processors put a premium on paper; within a few proof runs, the top ten registration bulls went 100% A2A2 and 90% BB. There’s no reason the same can’t happen for RI and MI once those numbers get the same font size in sire marketing and herd discussions.
The inbreeding trajectory shows it can be done. Dropping from 9.77% to 8.10% in five years didn’t happen by accident. It happened because inbreeding became visible and manageable. RI, HWI, and MI are sitting where inbreeding was a decade ago — important, but underused.
The Milkability Index might be the quietest and most expensive number on the page for robot herds. A 34th-percentile MI stack means you’re effectively selecting against milking speed and temperament in a system where every extra minute per cow at the robot is lost throughput. That’s not a small leak.
If you can write your sire selection protocol on one page — with hard subindex floors and a clear role for each bull — you’re ahead of most of the industry. The herds that do that over the next five years will be the ones with the replacements, the robot-friendly udders, and the health genetics that give them room to experiment elsewhere.
Five years from now, the real test of whether this analysis mattered won’t be on a Bullvine page. It’ll be in your own Lactanet login when you pull up your 2030 sire stack and see where your RI, HWI, and MI averages landed. Pull that same screen up tonight. What’s your average RI percentile — and are you honestly okay living with that number for the next five years?
Learn More
The Profit Index Paradox: Choosing Dollars Over Rankings — Arms you with the $869-per-cow lifetime profit gap data needed to override generic sire rankings. Rebuild your selection filter to prioritize Net Merit over LPI and stop leaving thousands on the table.
The Triple Cushion Trap: Why 2025’s Strong Margins Won’t Save You in 2026 — Dismantles the false security of 2025’s high margins by exposing the looming replacement heifer shortage. Prepares your operation for 2026 by mapping out critical moves for beef-on-dairy revenue and herd right-sizing.
Complete references and supporting documentation are available upon request by contacting the editorial team at editor@thebullvine.com.
The Sunday Read Dairy Professionals Don’t Skip.
Every week, thousands of producers, breeders, and industry insiders open Bullvine Weekly for genetics insights, market shifts, and profit strategies they won’t find anywhere else. One email. Five minutes. Smarter decisions all week.
Summer 2005, Lylehaven Lila Z on the block, gavel falls at $1.15M — first Holstein past seven figures in 20 years. But the real disruption wasn’t the price. It was what that cow became, and why the Canadian co-op system had to adjust its playbook to keep up with the man who sold her.
Fall of 1981. A heifer named A Brookview Tony Charity is booked into the Designer Fashion Sale, and Peter Heffering walks up to take a look. One glance at the hock — swollen up like a grapefruit — and most buyers would’ve been halfway back to the truck. Not Albert Cormier. He’d already seen past the swelling to the cow underneath.
A Brookview Tony Charity — the swollen-hock heifer Albert Cormier saw past in the fall of 1981, and the 1984 Royal Winter Fair Grand Champion he’d warned Peter Heffering he “might need to reconsider selling.” One glance, one grin, one cow that announced the kind of eye the whole Canadian Holstein industry would spend the next four decades catching up to.
A few months later, out in a summer pasture, that swelling had melted clean away. The heifer looked — well, she looked like 1984’s Royal Winter Fair Grand Champion in waiting. Albert, half-teasing, half-serious, told Heffering he “might need to reconsider selling her.” Heffering, the story goes, nearly came unglued. That little moment — the eye that saw past the hock, the grin that knew exactly what it was holding — is pure Cormier. It’s where any honest conversation about the man who pried Canadian Holstein genetics open to the world has to start.
Four decades on, the two men who took the keys from him — Dave Eastman at GenerVations, Yvon Chabot at Cormdale Exports — don’t reach for business-school adjectives when you ask about Albert. They reach for something plainer. “Positive. Tackle things head on — good and bad. Ability to switch gears, refocus, fast. Adaptable. Also a pile of energy,” Eastman says. Chabot nods from Quebec: “He was always very positive, about the markets, about the future of a cow or a new business venture. He believed in the dairy business, and that always improving genetics was the key to success.”
Albert Cormier leading Skys-the-Limit Claire ET to Intermediate Champion at World Dairy Expo, Madison, 1997 — the half-interest purchase that would change everything. Claire’s ET son, Calbrett-I HH Champion, hit #1 LPI in Canada five years later. This is the photo of a thesis being proven in real time: buy the elite female, stack her with the right mates, turn her sons into the bulls the co-op catalogues can’t beat. One banner in Madison. One bull out of her flush. One private Ontario program suddenly competing on the same stage as the institutions.
Honestly? If you want to understand how Canadian dairy got to where it is in 2026, you have to understand the P.E.I. kid with what his peers called “unmatched cow sense.” Albert refused to pick a lane between type and production. Between Ontario and Quebec. Between Canadian pride and European pedigrees. That refusal reshaped a whole breed.
Albert Cormier with Calbrett-I HH Champion — the ET son of Skys-the-Limit Claire who climbed to #1 LPI in Canada in 2002 and hit “Millionaire” sire status by 2007. A private Ontario stud’s bull, bred off a cow Albert bought a half-interest in, outpacing the co-op catalogues. Proof that the kid from St-Philippe had been right all along: type and production could go together, and a private operator could prove it on the national stage.
LEGACY AT A GLANCE
A Brookview Tony Charity — 1984 Royal Winter Fair Grand Champion
Calbrett-I HH Champion — #1 LPI sire in Canada, “Millionaire” sire status (2007)
Lylehaven Lila Z — $1.15M in 2005, first seven-figure Holstein in 20+ years; granddam of Lexor and Lavaman, 5th dam of Lambda
Calbrett Kingboy Miranda P — #1 heterozygous polled female for type and feet & legs in her era; the only cow ever named 2x Global Cow of the Year by Holstein International (and the first polled cow ever to take that honour), plus Polled Cow of the Year
Master Breeder Shields for Calbrett — 2002 and 2018
Certificate of Superior Accomplishment — Holstein Canada, 2017
International footprint: OGER partnership (France — early ’90s); customer barns in Holland, Italy, Germany, UK, U.S.
Why 2026 matters to this story
We’re sitting inside a genomics-driven, semen-and-embryo-exporting industry juggling a lot at once. Lactanet’s Methane Efficiency index for Holsteins is bedding into breeder programs. Feed-efficiency evaluations are working their way into commercial proofs. North American A.I. consolidation is rolling through another wave. And the export side is eyeing shifting U.S. trade posture and tighter EU BTV-3 health certificate paperwork.
Here’s the thing. If Albert were in the barn today, he wouldn’t be fighting the Methane Efficiency index. He’d be figuring out which cow family transmitted it best before the first proof was even published. That’s the whole point of this piece.
The Belfast Kitchen Table
Spring of 1983. Young Yvon Chabot picks up the phone at the family farm in Belfast, Quebec. An Ontarian wants to drive down and see a Marshfield Elevation Tony daughter — interesting pedigree, he’s heard.
By the time the sun goes down, that Ontarian — Albert Cormier, driving fast, asking faster — has crossed the province, talked his way into two barns, and bought two cows he hadn’t laid eyes on that morning. Beaucoise Tempo Kimo had just won her 2-year-old class at the Quebec Spring Show over at Les Fermes Turmel; Chabot pointed the way. The Tony heifer was at Ormstown. Done and done, both on the same trip.
“Both cows have done very well for him,” Chabot says, with the understatement of a man who’s seen a lot of cattle move.
What Chabot might not have clocked that day was that he’d just auditioned for a job. A few years later, as Cormdale’s consulting arm grew, Albert called again — this time to hire him full-time. That’s how Albert worked. Fast. Positive. Decisive. Actually — scratch the adjectives. Let me show you.
The Man in the Barn
Ask Chabot what Albert was actually like working a barn and the answer comes quick. “Patience, willing to share his experience and respect for other people’s opinion. Recognize efforts and success of others. Trust people working with you.” That’s the character sketch in the man’s own words. The physical memory lines up with it — not a big voice, a quick one, and a French that slid into English mid-sentence whenever a conformation point got him fired up, which was often. He didn’t linger. He moved. Every five minutes felt like the start of a new trip. People who only met him at sales describe a man with a half-grin and a notebook. People who rode shotgun between farms describe someone who’d hang up from a client in Saint-Hyacinthe and take the next call from Herefordshire without missing a beat.
That restlessness shaped how he dealt, not just how he drove.
The Deal Maker
Why He Never Got Attached to a Pedigree
Ever wonder why the Cormdale barn was famous as a hard place to walk out of without writing a cheque? Chabot has your answer.
“He loved to do business,” he says. “I very often saw him buying a calf or a cow at a sale and selling her the same day for sometime a not so important profit and sometime a bigger profit. He always said the best time to sell is when you have someone interested in buying.”
Read that again. That’s not a tactic — that’s a worldview.
Most breeders get attached. You nurse a heifer through classifications, wait for the big day, brag a little at the coffee shop. Albert’s line, the one Eastman still quotes: “Life is too short to breed them up and never be afraid to sell them.”Cattle should move. Money should roll. Pedigrees should land with people who’d push them further. In a breed culture where some folks sit on a cow family for three generations waiting for the perfect mating… it was borderline radical.
That ethos shaped the whole operation. Cormdale’s on-farm sales became the kind of auctions where a young Quebec consignor could drop a heifer on the sale card, watch Albert’s network push the price, and walk home with his prefix suddenly known in France and Germany. “With the many sales organized at the farm, many breeders purchased foundation animals, or as consignors got their name and prefix exposed to the world,” Chabot says. “It got many nice Master Breeders started that way.”
And when a deal went sideways? No lawyers, no grudges. “If a client is not happy with his purchase, for any reason, try to see what the problem was and if needed, do something to keep good relationship.” In an era when every other month brings another sale-barn contract dispute hitting the trade press, that one-liner still holds up.
The Million-Dollar Moment
Lylehaven Lila Z — the $1.15 million cow who broke a 20-year ceiling in the summer of 2005 and then kept paying out in pedigrees. Albert and Dave bought her from the Gen-I-Beq / Mary Inn / Yvon syndicate as a Junior Yearling in 2003, fresh off her All-Canadian win, classified her VG-89 at home, and marketed her like a Super Bowl spot. The gavel price was news for a week. The granddam of Lexor and Lavaman, fifth dam of Lambda — that was the thesis. A cow could be a show-ring beauty and a genomic powerhouse at the same time. Lila Z proved it.
Summer 2005. The cow on the block is Lylehaven Lila Z. Albert and Dave had bought her two years earlier from a syndicate (Gen-I-Beq / Mary Inn & Yvon), picking her up as a Junior Yearling right after she took All-Canadian Junior Yearling in 2003. They brought her home, classified her VG-89 — the highest first- or second-lactation score available under Holstein Canada’s classification system at the time — and built a marketing campaign around her the way Madison Avenue builds one around a Super Bowl spot.
The bidding crawled, then sprinted. And then:
$1.15 MILLION — first Holstein past seven figures in over 20 years.
People in the room remember the hush first. Then the whistle. Then the handshakes that didn’t stop for 20 minutes.
Here’s what most retellings miss. Lila Z wasn’t a price. She was a thesis. Albert had been arguing for years that a cow could be a show-ring beauty and a genomic powerhouse at the same time. Lila Z proved it — she went on to become the granddam of Lexor and Lavaman, top genomic sires that anchored the GenerVations lineup for a decade, and she sits as the 5th dam of Lambda. Lexor became the #1 genomic LPI sire in Canada. Calbrett-I HH Champion had already taken the #1 LPI crown and hit “Millionaire” sire status in 2007. The price was news for one week. The genomic result reshaped proofs for a decade.
Calbrett Goldwyn Layla-ET (EX-96-2E-1*) at the Royal Agricultural Winter Fair — the Durham daughter of Lylehaven Lila Z, 2013 Reserve All-Canadian Mature Cow, and living evidence that Albert’s thesis held two generations deep. Lila Z made the auction-block history. Layla made the showring answer to it. Same cow family, same Calbrett prefix, the complete cow Chabot always argued for — type and production, side by side, under the lights at the Royal.
The Fortress, and the Man Who Walked Through the Gate
Here’s where Albert’s story gets interesting — not because he was shut out of the Canadian system (he wasn’t; he sold plenty of bulls into it over the years) but because he forced it to broaden.
Through the ’80s and into the ’90s, Canada acted like a genetic fortress. Our cows were the best in the world — full stop — and the cooperative A.I. system was built to protect that story. The fortress argument officially leaned on sanitary and disease-control grounds. Every importing country has a rational stake in bluetongue, IBR, BVD, and the rest of the watchlist — that’s real. But under the sanitary logic sat a much more commercial motive. The Canadian co-ops had spent decades building the “Canadian Holstein” as a premium export brand, and a private Canadian operator importing Dutch, Italian, French, German, and American genetics straight back into the domestic market didn’t fit the brand story. It widened what a Canadian dairy farmer could put in the tank.
So when Cormier started doing exactly that… a few people got, let’s say, less than thrilled.
“When he started promoting the use of genetic index in breeding decisions and selecting animals with high production potential, and using American bulls or importing US cows to diversify bloodlines, it wasn’t well received by many here in Canada,” Chabot says. “Also, importing semen from foreign countries to distribute in Canada — and later creating an AI company — made a few people not very happy.”
Eastman puts it bluntly — Cormdale was “really at the forefront of Holstein globalization at the time.”
The resistance
Chabot remembers the early reception being frosty enough to need its own fridge. The established co-ops weren’t shy about passing the message that their rep network and their preferred distributors were expected to stick to the domestic catalogue. Private importers learned fast that certain barns were closed doors if the co-op fieldman got there first. Cormdale’s workaround was the thing that made them dangerous — they built their own rep network, ran their own on-farm sales, and shipped directly to the breeders who wanted the imported bloodlines, while still working with the co-ops wherever the bull lineup fit.
And here’s the part that made the old structure stretch. The Canadian A.I. system through that era ran on provincial lines — Eastgen (then EBI / WOBI / United), Eastern Breeders, and CIAQ carving up the east; Western Breeders and BCIA the prairies. A bilingual operator from P.E.I. who could work a Quebec kitchen table in French on Tuesday and an Ontario sale ring in English on Wednesday wasn’t just selling cattle across a provincial border. He was selling across a structural seam that the co-op system had historically used to keep territories tidy. That fluency wasn’t a soft skill. It was a competitive weapon.
Chabot has a line that sticks about the reception Albert got abroad versus at home. Travelling with him was an education, he says: “You could see the respect that people had for him. He was also well respected among other people in the industry in Canada and US as well — even among people that did not agree with him.” Walk a barn in Normandy with Albert and watch a French buyer treat him like a visiting cousin. Land in the UK filling an order of commercial females and watch a British importer already recognize his bull lineup before the handshake.
Albert refused the binary. He was one of the first in Canada to really lean into genetic indexing — American TPI, Canadian LPI — to keep his cattle marketable to commercial dairiesand A.I. companies at the same time.
“Cow families are extremely important,” Chabot says. “A Holstein cow should milk easily, so never neglect production and components when doing mating. Type and production can go together.”
Eastman has his own way of describing how Albert ran the sire side: “Fast to use new high-ranking bulls. Own and market from some of the highest daughters if possible. Advertise to create value and demand — great pictures.” And on the heifer side: “Started investing in females early on to better control, make bulls we wanted to sample — Lila Z, Oman Elita and her daughter Shottle Evett, examples of few.”
That short list is the whole strategy. Find the elite female, flush her early and often, stack her with the right mates, turn her sons into revenue, turn her daughters into the next elite females — and then do it all again.
“Life is too short to breed them up and never be afraid to sell them.” — Albert Cormier, via Dave Eastman
Here’s the part that lands hardest in 2026. Albert was an early, aggressive user of embryo transfer and IVF to multiply those elite females long before flushing was common practice. The whole industry’s current obsession — genetic-progress-per-cow, Lactanet’s methane-efficiency and feed-efficiency indexes, smaller herds producing more per head — sits on exactly the reproductive-tech foundation Albert was pushing when most Canadian breeders still thought IVF was exotic. When genomics hit in the late 2000s and the rest of the industry lurched into a new era, Cormier’s program didn’t lurch. It glided. Because he’d been obsessing over cow families, parent averages, and transmitting ability for twenty years. “When you have a cow family, you have genomics” was the operating theory. The data just confirmed what the pedigree already knew.
The Cliff Edges
GenerVations was never all smooth bidding floors and handshake deals. Eastman tells a story most people outside the boardroom never heard.
“Several times we lost close to 50% of our product line for semen from mergers, sales of companies,” he says. “Never lost reps. Key was distribution and motivated, loyal staff.”
The move that crystallized the whole operating model — and the one Albert would point to years later — was the OGER partnership in France in 1991 through Modern Sires. Picture Albert on one of those long flights out of Toronto. Sale book on his knee. A French phrasebook in the seat pocket he didn’t really need. By the time the wheels hit tarmac, he had a handshake deal to proof young sires simultaneously in Canada and France — effectively doubling the speed and reach of a young-sire program when no single Canadian co-op was structured to do it solo. A few years later he split the export and semen divisions, quietly laying the track for the succession that would change Eastman’s and Chabot’s lives.
Forty Miles of Gravel Road, Sixty Herds
Want to understand why Quebec breeders trusted Albert when plenty of Ontarians couldn’t find Trois-Rivières on a map? Look at 1988.
That’s the year Cormdale Consultant Ltd. went full steam, with Chabot and Ghyslain Coté running a consulting operation that at peak served over 60 Quebec herds — full-herd mating, classification, purchase advice, export sourcing. Sixty herds. Think about what that means in practice. Two guys in trucks, splitting the province, gravel roads in February, tourtière at the kitchen table, talking bull selections on fresh cows heading into their second lactation — and in between, filling orders for UK clients who wanted Canadian type grafted onto British herds.
Albert’s edge? He could sit at that kitchen table in either language. Truly bilingual. In an industry where Quebec is a massive slice of the elite Holstein market, where Anglo-Franco trust is earned one barn visit at a time, and where the co-op system itself had been built along provincial boundaries… that fluency wasn’t a soft skill. It was the whole ball game.
The Handshake Built to Last
Anyone who’s watched a private ag business change hands knows this — the succession is where legacy goes to die. Albert refused to let it.
Early 1997, he starts talking about slowing down. Picture one of those conversations you can almost smell — a Cormdale farm office, coffee going cold, sale-book pages fanned out across the desk, Albert leaning back and floating the word “partner” like he’s tossing a hay-hook onto a stack. Three businesses in play: the farm (Cormdale Genetics), the semen side (GenerVations and Sire Lodge), and the export arm (Cormdale Exports). Two lieutenants who’d earned something bigger. What he drew up was almost old-fashioned. A five-year buyout. No private-equity theatrics. No earn-out clawbacks. Partner up, work the plan, pay him out on schedule.
Dave Eastman and Albert Cormier with Calbrett-I HH Champion at Sire Lodge, Cardston, Alberta — the bull who put the GenerVations crest on Canada’s #1 LPI list in 2002 and hit Millionaire sire status by 2007. Two men, one bull, a five-year buyout quietly running in the background. The hand on the halter was the mentor’s. The hand on the shoulder was the successor’s. No earn-out clawbacks, no private-equity theatrics — just partner up, work the plan, pay him out on schedule. This is what a continuity machine looks like before anyone calls it one.
Eastman took the semen side. “Albert offered me chance to become partner in semen business, and that was when we started GenerVations together in 1999, with structure to buy him out over 5 years, which was in 2004,” he recalls. “At same time, Yvon Chabot offered same chance to take over export and embryo side of business as Cormdale Exports.”
Chabot’s version tracks: “I have been Albert’s partner for 5 years, the time I had repaid him in full for the complete control of it.”
“Smooth,” is how Eastman describes it. “I had worked with Cormdale Genetics before as sales manager, so easy transition.” That word undersells something important. What Albert built wasn’t an exit — it was a continuity machine. The reps stayed. The customers stayed. The international contacts kept taking the calls. Same year — 2004 — Albert and Eastman jointly bought Sire Lodge Inc. and expanded it into a 300-bull custom-housing facility in Cardston, Alberta, which became GenerVations’ production engine. Even in “retirement,” Albert was writing infrastructure cheques.
The operating principles both men carried forward are worth naming. Eastman, who’d worked inside several European and U.S. A.I. houses before Cormdale, came back with a conviction about flat organizations — “Key was involve reps in discussions, product, programs, as they were key to success. (Not sure it happens in many today).” Chabot boils his version down to four words: “Honesty and be loyal.” Then adds the rest — stand behind what you sell, give advice when asked, keep promises. Both cite the same mental model on tough calls: deal with it head-on, today, not next week. And both were pushed onto the world stage by a mentor who insisted on it. “Over the years he had given me confidence to meet people of the industry around the world and always encouraged me to pursue my judging career,” Chabot says. You can draw a line from that kind of mentorship straight to the next generation of marketers — Andrew Hunt, who founded The Bullvine, openly credits Albert and Dave for the “breeding ground” that shaped his instincts about how dairy cattle get sold to the world. Fair warning: a lot of the house style you’re reading right now has Cormdale DNA in it.
The Philosophy That Outlived His Voice
Here’s the single sentence that sums up Albert’s breeding worldview, courtesy of Chabot: “Type and production can go together.”
Sounds obvious today. Wasn’t then.
Through the ’80s and into the ’90s, Canadian Holstein breeders were sorted into two tribes — type breeders chasing Royal banners and production breeders chasing pounds of milk and butterfat numbers. Albert refused the split. He was one of the first in Canada to really lean into genetic indexing — American TPI, Canadian LPI — to keep his cattle marketable to commercial dairiesand A.I. companies at the same time.
Sit with that a second. You’re running a private A.I. company through the Canadian A.I. consolidation era that built today’s Semex footprint, and partnerships keep rearranging underneath anyone not at the head of the biggest co-op. Half your product line evaporates overnight. The bulls you were distributing are suddenly flowing through your competitor’s pipes. What do you do Monday morning?
You pick up the phone. You call the reps — the ones who’ve been out in the trucks selling for you for ten years, the ones whose kids you know, the ones whose loyalty was never actually to the catalogue. You tell them straight: here’s what we lost, here’s what we’re re-sourcing, here’s what I need from you this week. Eastman says not one of them walked. That’s not luck. That’s what Albert had taught him about who the company actually was.
Product comes and goes, but the two things mergers can’t take are your distribution network and your sales force. Protect those. Everything else you rebuild. That instinct — ride the staff, re-source the product — is exactly what a lot of smaller A.I. outfits are grappling with right now as another wave of consolidation works its way across North American genetics.
The 2014 sale of GenerVations to Select Sires wasn’t a surrender. By then Eastman had been sole owner for a decade — he’d completed the buyout in 2004 — and the deal was a calculated exit that gave the GenerVations lineup the global distribution runway it needed. The roots of that lineup, though, traced straight back to the cow-family investments Albert had set in motion years earlier. The sale wasn’t the end of his influence. It was the export of it.
The Legacy Sale
The hardware caught up eventually — two Holstein Canada Master Breeder Shields for Calbrett, in 2002 and again in 2018, a rare double that bridged the classical and genomic eras, plus the 2017 Certificate of Superior Accomplishment citing his “unmatched cow sense” and his work with Tony Charity and Lila Z. Plaques are nice. What happened two years before the second Shield was bigger.
Albert Cormier, flanked by family, accepting Calbrett’s second Holstein Canada Master Breeder Shield — presented at the 2019 National Convention on Prince Edward Island, the province he left as a young man and returned to, decades later, with two shields and a stroke that had taken his voice but not his grin. A rare double that bridged the classical and genomic eras: Shield #1 in 2002 for the cow-family program that built Calbrett-I HH Champion; Shield #2 in 2018 for the polled and genomic era that followed. The plaque in the photo is bronze. The real award was the room — the sons, the grandson, the family who’d watched him build it all — standing beside him while the industry finally said thank you out loud.
Cold day in 2015. Brubacher Sales Arena. The room fills up — Europeans, Americans, both Canadian coasts. A stroke had taken Albert’s speech by then, but not his stubbornness. The sale book was his autobiography written in pedigrees. The bidding was the industry’s way of saying thank you.
People who were there describe the same thing in different words. When Miranda P — that polled female Eastman calls one of the legacy’s finest achievements — went through the ring, the room got quiet in that specific way rooms get quiet when everyone realizes they just witnessed a handoff. Not a sale. A handoff. Someone coughed. Someone else wiped their eyes without pretending they weren’t. A couple of the French buyers in the front rows — men who’d built their herds on Cormdale embryos over two decades of OGER-era partnership — caught each other’s eyes and held the look a beat longer than usual. Albert watched from his seat. He couldn’t speak. He didn’t need to.
The Polled Bet, and Why It Matters More Now
Worth sitting with, because this one matters now more than it did then.
Albert was an early advocate for the polled (naturally hornless) gene in Holsteins, back when most of the industry treated polled animals as a novelty or a compromise. One of his crowning achievements there was Calbrett Kingboy Miranda P — the #1 heterozygous polled female for type and feet & legs in her era, and the only cow ever to be named Holstein International’s Global Cow of the Year twice. She was the first polled cow ever to take that honour, and she also claimed Polled Cow of the Year. Eastman flags her as one of the absolute highlights of the legacy: “Miranda would be one of best achievements. Sold in Legacy Sale in ’15, went on to do great things.”
Calbrett Kingboy Miranda-P-RC — the polled red-carrier heifer who retired the old “yeah, but you give up type” argument in a single generation. Top-selling lot at the 2015 Legacy Sale at $34,000 to Vogue Cattle Company, later named Holstein International’s Global Cow of the Year twice — the first polled cow ever to take that honour — plus Polled Cow of the Year. Elite type, feet and legs, components, and a naturally hornless head, all in the same animal. Albert’s earliest polled investments, bought when most of the industry treated the trait as a novelty, were suddenly the welfare-audit answer European retailers would be asking for a decade later.
“Great things” isn’t just sentiment. Miranda P represented the kind of polled female that proved breeders didn’t have to choose — you could have polled genetics and elite type, components, and feet and legs in the same animal. That proof of concept mattered. Before Miranda P’s generation, the polled conversation was often dismissed with “yeah, but you give up type.” After her, that argument got a lot harder to make in front of a well-informed buyer.
So what’s the deal in 2026? The welfare conversation around dehorning isn’t quietly going away. Several European buyers we’ve spoken with — operators navigating their own retailer and cooperative welfare-audit requirements — are showing noticeably more interest in polled lines from proven type-and-production cow families. Canadian retailers are asking harder questions too. And the NFACC Code of Practice review cycle has the Canadian dairy community itself debating where disbudding standards should land. The debate’s as heated as you’d expect, and it should be. Breeders who invested in polled genetics 15 and 20 years ago aren’t the early adopters anymore. They’re the suppliers. If you’re a mid-size family operation trying to think three breeding decisions ahead, Albert’s polled bet isn’t a quirky side note. It’s a case study.
Chabot, still active in the Quebec dairy industry and spending his judging weeks watching where type-and-production balance is headed, has been pretty clear with the next generation: keep improving genetics using every tool available, stay open to changes, and don’t be afraid to buy and sell. That’s a 2026 voice delivering a 1983 philosophy. The math still works.
What to Do With This in 2026
Here’s the part that matters for whoever’s reading this with a barn boot still on.
If you’re sitting on an ET-eligible heifer from a solid cow family right now, Albert’s playbook is almost embarrassingly simple.
Get involved. Buy a great foundation — embryo, heifer, cow — and develop her. Keep improving with every tool science gives you: classification, milk testing, genomics, IVF, whatever comes next. And right now “next” looks like Lactanet’s Methane Efficiency index, feed-efficiency genomics moving into commercial proofs, and polled lines earning premium interest from European buyers worried about their own welfare audits. Stay flexible when the market shifts. It will shift, probably by next quarter — ask anyone who’s tried to book a June embryo shipment into Germany lately, or anyone watching Class 4a and CUSMA-era TRQ language getting reargued every few months. And don’t be afraid to sell. Keep cattle moving. Stagnation is the real killer.
Walk into a barn in Quebec, France, or southern Alberta today and the odds are real good you’re looking at a cow carrying some Calbrett or GenerVations somewhere in her pedigree. Not sentimentality. Math. But the bigger legacy isn’t in the ear tags. It’s in the posture of the whole Canadian Holstein industry toward the world — from defensive sanctuary to confident exporter, from type-vs-production tribalism to the complete-cow synthesis, from co-op monoculture to a marketplace where private innovators can build global brands alongside the co-ops, not against them.
The Grand Champion He Never Got to Hang
Chabot drops one unrealized dream into the record — the goal he says is still chasing the next generation: “to breed or own a Royal Winter Fair Grand Champion.”
Brookview Tony Charity became the first 4X Grand Champion Holstein at the Royal Winter Fair in 1987,
Tony Charity did it for Hanoverhill and Romdale in 1984. Forty-two years later, that Grand Champion banner is still the crown the old man never got to achieve. Somebody’s going to finish that sentence. Might as well be someone who learned from him.
The hum of milking parlours from Orton to Ormstown to the OGER barns in France still carries something of Albert Cormier in every pulse.
So — which Albert Cormier bet are you making in your barn today?
The polled one? The imported-semen one? The sell-her-the-same-day-you-bought-her one? The flush-her-early-and-often one? Or the quieter one — the decision to treat the first-time Quebec consignor and the big French A.I. house with the same level of show-up?
Let us know in the comments. The next chapter of this story is being written in real Canadian barns right now, and we want to hear whose cow family is going to finish the sentence.
Continue the Story
From Show Ring Legend to Industry Innovator: The David Dyment Story — Dyment credits Albert Cormier with teaching him to “consider bloodlines others might overlook.” This is the story of another contrarian who wrestled with the same type-vs-production divide Albert refused to accept — and built AG3 Genetics on the other side of it.
Dad at 80: How Murray Hunt Revolutionized Canadian Dairy Genetics — Before Albert pushed LPI-based selection into commercial practice, Murray Hunt built the Dollar Difference Formula that made index thinking possible. This is the intellectual landscape Albert was navigating — and the generation of thinkers who made his bet on numbers over ribbons a viable one.
9.99% Inbreeding and Rising: How Blondin Sires Turned a Holstein Bottleneck into 75% Growth — Dann Brady and Simon Lalande couldn’t find the deep-pedigreed bulls they wanted in the big AI catalogues — so they built their own stud. A Quebec-rooted private AI company challenging the co-op establishment? That’s Albert’s playbook, updated for the genomic era, with Yvon Chabot’s Blondin name on the door.
The Sunday Read Dairy Professionals Don’t Skip.
Every week, thousands of producers, breeders, and industry insiders open Bullvine Weekly for genetics insights, market shifts, and profit strategies they won’t find anywhere else. One email. Five minutes. Smarter decisions all week.
Secretariat’s Derby record is 53 years old. U.S. milk-per-cow is up 248% since he was born. One industry weaponized artificial insemination and genomics. The other banned the tools. Where’s your calf crop in that gap?
Executive Summary: Secretariat’s Kentucky Derby record is 53 years old and U.S. milk-per-cow is up 248% since he was born — not because of biology, but because the Jockey Club still bans AI, IVF, and ET while dairy weaponized all three plus genomic selection since 2009. The annual rate of Holstein genetic gain jumped more than 40-fold inside one decade, from roughly $1.80/year in Net Merit pre-genomics to $79.20–$85.00/year by the CDCB 2016–2020 window. KHW Regiment Apple-Red-ET, bred by Kamps-Hollow Holsteins, now carries more than 350 direct progeny — more than an entire stable of thoroughbred mares will produce across their combined lifetimes. But the uncomfortable number for your operation is this: genetics advisors consistently see 35–45% of replacement heifers in genomic-testing herds coming from the bottom half of the dam distribution, meaning your sire lineup is compounding while your dam decisions sit flat. On a 300-cow Holstein illustration, a 200-point NM$ spread between top and bottom quartiles equals 2.5 years of industry-average progress sitting inside the same barn — and an 8-month OPU flush versus a first-lactation flush compresses or extends 2 years of generation interval per calf. Run the one-hour quartile diagnostic this month before the next proof run: pull your last two calf crops, match each heifer to her dam’s genomic rank at conception, and count the bottom half. If 35% or more of your heifers are coming from there, your decision architecture — not your tool access — is what’s capping your herd’s runway.
Churchill Downs, first turn — a field of three-year-olds under the Twin Spires chasing a record that’s stood since 1973. Same 65 years U.S. milk-per-cow climbed 248%. One industry banned the tools. The other weaponized them.
Somewhere in Louisville this afternoon, a three-year-old thoroughbred worth more than most dairy operations will leave the gate at Churchill Downs and run for roses. Odds are, the winner’s time won’t touch Secretariat’s 1:59.40 from May 1973 — a Derby record that’s now stood for 53 years across an industry awash in discretionary capital.
Meanwhile, the U.S. dairy cow has gotten 248% better at her job in roughly the same window — a gain built on artificial insemination, IVF, embryo transfer, and, since 2009, dairy genomic selection. That gap — flat racing clock, exponential milk curve — is the most useful lens available on Derby Day 2026 for a question most progressive Holstein breeders have never run the diagnostic on:
How much of dairy’s tool advantage is actually reaching your specific herd?
The Scoreboard on Derby Day 2026
Average U.S. milk production per cow climbed from roughly 7,029 pounds in 1960 to 24,117–24,390 pounds by 2023–2025 — the 248% increase that defines modern dairy genetic gain. Annual Net Merit $ gain for U.S. Holsteins went from about $1.80 per year pre-genomics to $79.20–$85.00 by the CDCB 2016–2020 evaluation window. The annual rate of genetic gain increased more than 40-fold inside one decade.
Secretariat, blue-and-white checks, crossing the wire at Churchill Downs in 1:59.40 on May 5, 1973 — the Kentucky Derby record that’s now 53 years old and counting. Same stretch of years U.S. milk-per-cow climbed 248%. The clock hasn’t moved because the rulebook won’t let it.
Now the Derby contrast. Secretariat’s record has held for 53 years — a winning time that has barely moved across a century of racing. Thoroughbred racing commands billions in discretionary capital, elite veterinary care, and the best training money can buy. The clock has barely moved with it.
The reason isn’t biology. It’s the Jockey Club rulebook. Live cover only. No AI. No IVF. No embryo transfer. A thoroughbred mare is biologically capped at roughly 10–15 offspring across her productive lifetime because she can only produce one foal per year.
KHW Regiment Apple-Red-ET, posed on the colored shavings at The Royal — bred by Kamps-Hollow Holsteins and credited with 350+ direct progeny and 280+ Excellent-scored daughters and descendants worldwide. A single thoroughbred mare is capped at 10–15 across her whole lifetime. The tools are the difference.Read more
Did You Know? KHW Regiment Apple-Red-ET — bred by Kamps-Hollow Holsteins — is widely recognized as a landmark donor cow of the Holstein breed. Estimates credit her with more than 350 direct progeny and more than 280 Excellent-scored daughters and descendants worldwide, with a single oocyte collection session reportedly yielding 50 viable oocytes. One cow. More registered offspring than an entire stable of thoroughbred mares will produce across their combined lifetimes.
The Jockey Club’s rules aren’t accidental. They’re designed to protect a specific definition of sporting integrity, and there are thoroughbred people who would rather see Secretariat’s record stand forever than see it beaten by a genetically optimized horse. That’s a legitimate choice. It’s just a choice with a visible genetic cost.
So when the gates open at Churchill Downs this afternoon, you’re watching the cleanest control group in animal agriculture. Same century. Same species of smart, well-capitalized breeders. Tools available on one side, banned on the other. The results are on the clock.
The 45% Problem in Your Barn
The Derby clock raises an uncomfortable question for every progressive Holstein herd:
You have every tool thoroughbreds don’t — so are you actually using them?
Here’s the diagnostic that answers it, and it takes about an hour.
Pull your last two calf crops, match each heifer back to her dam’s genomic ranking at conception, split the herd into quartiles, and count. Among U.S. Holstein operations that have been genomic testing at birth for three-plus years, the number genetics advisors most often describe seeing lands somewhere between 35% and 45%.
That’s the share of your future breeding herd coming from the half of the cows you’d cull first if you were being systematic. It isn’t a knowledge gap. It’s a gap in decision architecture. And it’s the quiet reason herds with the same tools, the same semen access, and the same genomic infrastructure end up with very different rates of genetic gain five years from now.
How Does a Healthy, Productive Cow End Up Dragging Your Genetic Mean Down?
Here’s the composite scenario most genetics advisors describe. She’s milking 85 pounds. She settled on the first service. She’s healthy, she’s cycling, she hasn’t had a vet call in eight months. Every visible signal your eye has been trained to read says keep her. The genomic report, which arrived six months ago and sits in a binder somewhere, says she’s in the bottom quartile.
Those two signals aren’t in conflict biologically. Moderate producers with good health traits exist throughout the genetic distribution. But they feel like a conflict — because one is abstract and the other is standing in front of you eating hay.
So she doesn’t get culled. She gets bred back, probably to a mid-tier sire, because the elite semen is being saved for the top end of the herd. She calves. The calf is a heifer. The heifer enters the breeding pool. Two years later, when you run the diagnostic on your most recent calf crop, that heifer is part of the 45%.
Nobody decided this would happen. The repro program was built to maximize pregnancy rate and minimize days open. It does that well. But it wasn’t built to connect repro priority to genomic rank, so it didn’t. The outcome isn’t a failure of the system — it’s exactly what the system was designed to produce, and the team running it deserves credit for the competence, not blame for the gap.
What Does the Breeder’s Equation Actually Cost When You Don’t Enforce It?
Every textbook on genetic improvement comes back to the breeder’s equation: ΔG = (i × r × σ_g) / L. Selection intensity, accuracy, genetic variation, generation interval. Dairy has optimized every variable at the industry level. AI lets breeders draw from a narrow band of the highest-ranked proven sires worldwide — something that was operationally impossible before frozen semen and international shipping. Genomic testing at birth delivers materially higher reliability on young-animal production indexes than pedigree alone — on the order of 70% versus 20–30%, depending on trait category. Genomic evaluation has compressed generation interval from the traditional 5–7 years under progeny testing to under 2 years.
Every one of those gains was unlocked at the industry level. Whether they’re unlocked inside your fence line depends on decisions made downstream of the data.
Here’s what the math looks like in a real barn. Take a 300-cow Holstein herd. For the sake of illustration — and this is illustrative, not a sourced herd-level distribution — say your top genomic quartile averages $800 NM$ and your bottom quartile averages $600 NM$, a 200-point spread. At the 2016–2020 CDCB annual Net Merit gain rate of roughly .20, that spread translates to about 2.5 years of industry-average genetic progress sitting inside the same barn. Every heifer calf born from the bottom quartile represents roughly 2.5 years of deferred progress compared to a calf born from the top quartile.
The second piece of math most breeders never run: flush an elite heifer at 8 months through OPU, and her daughter is born roughly 17–20 months later, once the embryo has been transferred to a recipient and carried to term. Wait until that same female completes her first lactation before flushing her, and the calf arrives roughly 44 months later. That’s 2 years of generation interval you’re either compressing or extending — and at roughly $79/year in NM$ gain, it’s a measurable number per calf, not a theoretical one.
How the Top Decile Actually Runs the Program
The operations that appear to compound consistently year over year tend to share four structural patterns, according to genetics advisors and herd-level genetic trend data published by CDCB. They don’t solve the 45% problem by working harder. They solve it by moving the genetic decisions upstream — out of the emotionally loaded moment of standing in front of a specific animal, and into a policy or schedule written when the stakes felt abstract.
A written genomic floor. A specific NM$ or LPI number — below it, no female is bred to a high-investment sire. The threshold is written down, the exception process requires documentation and a named approver, and the number is reviewed every proof run against the herd’s current distribution.
A standing heifer flush schedule. Candidates selected at birth based on genomic testing, OPU appointments booked as part of the herd health calendar at 7–8 months, not case-by-case. The question flips from “should we flush this heifer?” to “is there a reason to take her off the schedule?”
Two repro tracks, not one. A conception program for the working herd, optimized for pregnancy rate and days open. A multiplication program for the top tier, optimized for genomic advancement. Top-tier females get scheduled reproductive attention regardless of cycling convenience.
Breeding objectives written as decision rules. “We breed for components and fertility” is a preference. “No female below our written NM$ floor is eligible for the breeding herd” is a rule. One requires a decision every time. The other only requires one when you want an exception.
Every one of those moves has the same underlying effect: it changes what has to happen for the default to hold. In most herds, the default requires no decision and aggressive selection requires one. In top-decile herds, the reverse is true.
Options and Trade-Offs for Your Operation
There’s no single path out of the 45% pattern. The right one depends on herd size, cash position, and how much operational change the team can absorb in a single breeding cycle.
This month — run the quartile diagnostic. One hour, no commitment. Pull your last two calf crops, match each heifer to her dam’s genomic rank at conception, count the bottom half. The number is the intervention. Works for every herd size. Costs nothing. Backfires only if you look at the result and do nothing with it.
Set one genomic threshold for elite sire allocation. Pick your primary index, draw a line, and below it no female gets bred to a high-investment sire. Not a full culling policy yet. One constraint, applied consistently for one breeding cycle. Backfires if the threshold is set so low it doesn’t cut anyone you currently like — in which case it isn’t doing selection work
Schedule 8-month heifer OPU as standing protocol. Requires a relationship with an ET technician, recipient inventory or contracted recipients, and a lab that can handle variable volume. Fits operations with the scale and cash to maintain the infrastructure. Backfires when young stock nutrition or body condition isn’t supporting the protocol — fix the management environment first.
Separate repro priority from cycling priority. Most operations run one repro program for the whole herd. Top operations run two. Demands more management bandwidth but doesn’t require more labor — it reallocates the labor already there.
The trade-offs are real on all four. Culling productive cows hits next month’s milk cheque. Flushing heifers ties up cash before any daughter has been on the ground. Running two repro programs stretches whoever is managing them. Enforcing a written threshold means sometimes moving a cow you respect. None of that disappears because the math is sound. The math is just clearer than the discomfort.
What This Means for Your Operation
What percentage of your last two heifer calf crops came from the bottom half of your herd genomically?
If you don’t know, that’s the first number to pull this month. It reframes every other genetic decision you’ll make before the next proof run.
Is your repro program optimizing for pregnancy rate, or for the genomic rank of the calves it produces? Those are different objectives. When they’re not connected explicitly, the easier one wins every cycle.
Where is your genomic floor for the breeding herd, and when did you last enforce it on an animal you respected? A threshold that hasn’t cut anyone uncomfortable isn’t doing selection work.
How old is your average dam at first flush? If she’s a cow rather than a heifer, you’ve added years to your effective generation interval on the female side — the side the tools now let you compress.
Which cows are you keeping for reasons that have nothing to do with their genetics? Every operation has a few. Naming them explicitly is how you prevent the next generation of comfortable exceptions from quietly forming around the next set of animals.
When did you last cull a productive, healthy cow because her genomic rank disqualified her from the breeding pool? If never, your selection intensity on the dam side is near zero regardless of what your sire lineup looks like.
Is your breeding objective written as a trait preference list, or as decision rules with specific thresholds and a named person responsible for exceptions? Aspirational standards evaporate under production pressure. Enforceable ones survive because overrides require justification.
Key Takeaways
If 35% or more of your replacement heifers are coming from your bottom-half genomic distribution, your sire lineup is doing half the work of the breeder’s equation while your dam decisions are doing none of it. That asymmetry is the single biggest driver of the gap between top-decile and median-herd rates of genetic gain.
If your breeding objective lives in your head rather than on paper with specific thresholds, it’s a preference, not a program. Write the floor down. Name the person who can approve an exception. Require documentation when one gets made.
If you’ve been genomic testing for three-plus years and your herd’s genomic floor hasn’t risen meaningfully, the tool is doing its job. The decision architecture around it may be the piece still waiting to catch up.
If you can flush an elite heifer at 8 months instead of waiting for first lactation, you’re compressing roughly 2 years of generation interval per animal — and at roughly $79/year in NM$ gain, that’s a measurable outcome per calf, not a theoretical one.
If the first cow your new threshold disqualifies is one you respect, the threshold is set at the right level. If it doesn’t cut anyone uncomfortable, the line is in the wrong place.
Watching the Race, Reading Your Barn
When the 2026 Derby field hits the wire at Churchill Downs this evening, most of the barn talk afterward will be about the trip, the track, the trainer, the jockey. Nobody on the broadcast will say the quiet part: the winning time will be what it is today because the Jockey Club decided decades ago which tools their breeders can and can’t use. You have every tool they don’t — AI, IVF, genomic selection at birth, global semen access, compressed generation intervals, and the data infrastructure to act on all of it. The only thing making those tools unavailable inside your fence line is whether you decided how to use them before you walked into the barn this morning.
So here’s the Derby Day question for your operation:
Which one of the four structural moves is the one you’ve been putting off — and what would have to be true in the next proof run for you to stop?
Complete references and supporting documentation are available upon request by contacting the editorial team at editor@thebullvine.com.
The Next Frontier: What’s Really Coming for Dairy Cattle Breeding (2025-2030) — Capture a $3,000 to $5,000 per cow premium by aligning your genetic strategy with emerging designer casein milk markets. Maps the impending collision between traditional production volume goals and the rapid rollout of CRISPR gene-editing technologies.
The Sunday Read Dairy Professionals Don’t Skip.
Every week, thousands of producers, breeders, and industry insiders open Bullvine Weekly for genetics insights, market shifts, and profit strategies they won’t find anywhere else. One email. Five minutes. Smarter decisions all week.
Trevor Parrish in NSW started filtering sires on HT ABV in 2017. By August 2024, 197 Holstein Good Bulls cleared the threshold. CDCB’s April 2025 NM$ revision added none of it.
Executive Summary: Australia’s DataGene released a Heat Tolerance ABV in December 2017, and by the August 2024 run, 197 Holstein Good Bulls — roughly one in three — cleared the 100 threshold. CDCB’s April 2025 NM$ revision moved butterfat from 28.6 to 31.8 and dropped protein from 19.6 to 13, but added no heat tolerance trait; Lactanet hasn’t weighted it in LPI or Pro$ either, despite University of Guelph models hitting 0.97 rank correlation. The economic exposure for North American herds sits around $400/cow/year in heat-load regions — roughly $200,000 annually on a 500-cow dairy in southwestern Ontario or the Central Valley — based on the St-Pierre 2003 baseline adjusted for inflation and the 10% single-day, 25.6% 10-day cumulative milk losses documented in Science Advances (July 2025). Zoetis has peer-reviewed Milk_THI and CFS_THI traits in JDS (September and November 2025) that identify cows with measurably better rectal-temperature regulation. Select Sires’ ART program is now five Slick generations deep in Wisconsin, with parent averages tracking close to non-Slick matings and calves that still grow winter coat. The heifer you breed in May peaks in the early 2030s — waiting on CDCB locks in three more replacement cycles of thermal vulnerability, while DataGene’s Good Bulls App, Zoetis Clarifide, Australian proofs through Semex/Genex/ABS, and a 20–30% Slick allocation on your top cow families are all workable today. The question isn’t whether the margin math favours acting; it’s whether your AI rep can answer the HT question when you call tomorrow.
In late 2017, Holstein breeder Trevor Parrish of Kangaroo Valley, New South Wales, began weighting Heat Tolerance ABV into his sire selections — a decision still uncommon among his Australian peers at the time, according to DataGene’s adoption reporting and Parrish’s own May 2025 comments to Dairy News Australia. DataGene had just released the trait publicly: a quarterly-updated breeding value measuring how well a cow holds production when the Temperature-Humidity Index climbs past comfort. From that release forward, per his Dairy News Australia interview, Parrish treated Heat Tolerance as part of his standard sire-evaluation toolkit.
Eight years on, DataGene’s adoption data and Parrish’s published commentary tell the story of a breeder who treated the trait like calving ease — a filter you apply, not a debate you have. Meanwhile in Woodstock, Tulare, or Fond du Lac, no official North American genetic evaluation — not NM$, not TPI, not LPI — currently publishes a heat tolerance number at all. That gap has a dollar value. And it compounds every summer your replacement heifers come into the milking string.
What Australia Actually Did, Starting in 2017
DataGene released the Heat Tolerance ABV publicly in December 2017. The trait measures a cow’s ability to hold milk, fat, and protein output as THI rises past comfort thresholds. An ABV of 100 is breed average, and the trait sits inside the Balanced Performance Index (BPI) rather than floating as a standalone curiosity. A 2024 update lifted Holstein reliability by 10 percentage points and re-ranked the HT list more substantially for Holsteins than for Jerseys.
The adoption curve tells the more interesting story. In late 2016, during DataGene’s pilot work, only a handful of Good Bulls ranked meaningfully above 100 for HT. By the August 2024 ABV release, DataGene reported that one in three Holstein Good Bulls — 197 bulls — carried a Heat Tolerance ABV of 100 or above. That shift tracked a broader story of how climate pressure is reshaping dairy breeding priorities worldwide — but unlike most of the global picture, Australia already had the trait on the catalog page.
Speaking to Dairy News Australia in May 2025, Parrish framed the trait as part of a complete-cow picture: “Heat tolerance is part of that efficiency. As a breeder, you are trying to cover all the bases, and heat tolerance, now it has an ABV, is part of a solid, good quality cow.”
That isn’t a regulator’s decision. It’s a market filter, and it happened inside a decade.
Is the Science Strong Enough to Act On Without the Official Index?
Short answer: yes. And the research isn’t Australian-only. Three independent research pipelines — Australian, Canadian, and U.S. — now converge on the same conclusion: heat tolerance is a heritable, measurable, and economically significant trait in Holsteins.
Evidence stream
Metric
What it proves
Australia DataGene
197 Holstein Good Bulls at HT ABV ≥100 by Aug. 2024
Catalog-level selection signal exists
Canada Guelph / Lactanet-ready models
Rank correlations above 0.97 for Canadian Holstein bulls
Canadian evaluation framework is technically stable
U.S. Zoetis genomic traits
Milk_THI: -1.3 to 1.0 kg/day/THI; CFS_THI: -6.2 to 5.3 pts/THI
Heat tolerance can be genomically ranked in U.S. Holsteins
Slick allele field physiology
1.1°F lower vaginal temperature at noon–3 p.m.
Slick carriers regulate body temperature better under heat
The Three Scientific Proofs
Australia — University of Chicago Climate Impact Lab (Science Advances, July 2025). Gong, Hsiang, Moscona and collaborators drew on production records from more than 130,000 cows over 12 years. Cooling infrastructure only offsets about half of the damage on the hottest days — fans and soakers cut losses by roughly 50% at a 20°C wet bulb, less than half overall at the top of the range.
Bottom line: Milk yield falls up to 10% on days when wet-bulb temperature exceeds 26°C. Cumulative loss across the 10 days following a single hot day reaches 25.6% of a single day’s baseline output.
Canada — University of Guelph (Schenkel, Miglior et al., Journal of Dairy Science). The Guelph group developed a Canadian heat tolerance evaluation framework using test-day production records and reaction-norm models. A follow-up 2025 JDS paper validated alternate models. Methodology is Canadian-ready; what’s missing is integration into LPI and Pro$.
Bottom line: Alternate models produce rank correlations above 0.97 for Canadian Holstein bulls — Lactanet has a validated, publication-ready HT evaluation sitting on the shelf.
United States — Zoetis research team (Vukasinovic et al., Journal of Dairy Science, September 2025). The team published validated genomic breeding values for heat tolerance in U.S. Holsteins. The specific traits are Milk_THI (change in daily milk yield per unit of THI, ranging from -1.3 to 1.0 kg per day per THI unit) and CFS_THI (change in conception at first service per unit of THI, ranging from -6.2 to 5.3 percentage points). A November 2025 JDS validation confirmed that higher standardized transmitting abilities on both traits corresponded to reduced rectal temperatures during heat stress.
Bottom line: The cows the Zoetis model ranks as heat-tolerant actually regulate body temperature better in the barn — the trait does what it says on the label.
The traits exist and are peer-reviewed. Whether Zoetis has integrated Milk_THI and CFS_THI into its customer-facing Clarifide reports is a question for your Zoetis rep. The September 2025 JDS paper establishes the methodology, not the commercial rollout timeline.
What Does the Barn Math Actually Look Like?
Published heat stress loss estimates for U.S. dairy herds anchor around 4 per cow per year as the unmitigated baseline, from St-Pierre, Cobanov and Schnitkey’s work in Journal of Dairy Science (2003) — early-2000s dollars. Aggregate U.S. dairy losses are modeled near $897 million annually at minimum heat abatement intensity, pulling back toward $500–$600 million with optimum abatement.
For herds in southwestern Ontario or California’s Central Valley — regions carrying a heavier seasonal heat load than the historical “temperate” framing suggests — a working midpoint of roughly $400 per cow annually is a reasonable illustrative figure once the St-Pierre baseline is adjusted for two decades of inflation and the climate shift documented in the Science Advances work. It’s a modeled estimate, not a published regional number. Operations still trying to cool their way out of the problem should also read our companion piece on where cooling infrastructure stops paying back.
The table below is an illustrative model built from that midpoint and a modeled 50% reduction assumption — the upper end of what combined cooling investment, Australian-style HT selection, and targeted Slick matings can plausibly deliver together. Actual results will vary with climate zone, milk price, Slick adoption percentage, and the sire mix already in the tank.
Herd Size
Est. Annual Heat Loss (Conventional)
Blended HT Strategy (50% Reduction)
Year-1 Implementation Cost (Est.)
100 cows
~$40,000
~$20,000
~$10,000
500 cows
~$200,000
~$100,000
~$40,000
1,500 cows
~$600,000
~$300,000
~$115,000
Underlying inputs: $400/cow annual heat loss (modeled midpoint); 50% recovery assumption from combined cooling + HT selection + Slick matings; Year-1 costs scaled for genomic testing on replacement heifers and semen premium on targeted Slick matings.
On a 500-cow operation, the Year-1 cost sketch roughly covers genomic testing on replacement heifers plus a modest semen premium on about 150 targeted Slick matings (roughly a 30% allocation of annual breedings). Under those modeled assumptions, payback clears inside the second summer. The arithmetic isn’t the weak point. The inputs are. But the direction and order of magnitude hold up in almost any scenario a North American breeder plugs in.
Where CDCB and Lactanet Have — and Haven’t — Moved
The CDCB’s April 2025 evaluation revision implemented the every-five-year base change (moving from cows born in 2015 to cows born in 2020) and updated income and cost variables inside NM$, Cheese Merit $, Fluid Merit $, and Grazing Merit $. Butterfat weight moved from 28.6 to 31.8 and protein dropped from 19.6 to 13, per the official CDCB April 2025 evaluation change documentation and the USDA-AGIL technical report by VanRaden, Toghiani, Basiel, and Cole. No new traits were added. No heat tolerance number. Those weight shifts carry their own strategic implications — which we unpack in our analysis of the April 2025 Net Merit revision’s butterfat-protein trade-off.
CDCB’s caution isn’t inertia for its own sake — the national evaluation’s credibility rests on trait reliability, and adding a trait prematurely carries real costs. But the cost of waiting now has a measurable dollar value. Realistic integration of Heat Tolerance into NM$ sits several evaluation cycles out. Lactanet is in a comparable position. The Guelph group has produced usable Canadian methodology and the 2025 JDS work validates it — but no heat tolerance index is currently published as part of LPI or Pro$.
The replacement pipeline doesn’t care about governance timelines. A heifer bred this May enters the milking string in early 2029 and reaches peak production in the early 2030s — in a climate the Science Advances team projects will deliver materially more wet-bulb-26°C days across major dairy regions by midcentury, with 4% annual daily-yield losses baked in without adaptation. The genetic decision made this breeding cycle sets the thermal ceiling for that cow’s productive life.
The North American Program That’s Already Five Generations In
While CDCB hasn’t moved, Select Sires’ Aggressive Reproductive Technologies (ART) program has quietly been running the Slick playbook for years. Per an April 2026 blog authored by ART Program Manager Mark Kerndt, the program is now in its fifth generation of Slick calves, with all of them born in Wisconsin.
“We are breeding the horns out of the breed and are now also focusing on making the Holstein breed more heat tolerant, through the gradual introduction of the dominant slick allele into our cattle,” Kerndt wrote. “We expect several hundred potential slick calves to be born in our program in 2026 and the parent averages on these matings are very close to our non-slick matings.”
Two things worth holding onto from that. First: Wisconsin-born Slick calves grow hair in winter, which answers the most common North American objection before a breeder raises it. Kerndt again: “They do grow hair! Most people think slick advantage is only short hair, but research shows it is more than that.”
Second: parent averages on Slick matings sit close to non-Slick matings in the ART program. The production penalty breeders have long assumed isn’t showing up in the current generation. The piece of the picture North American breeders haven’t had — a named commercial program running the strategy long enough to produce fifth-generation data — is now on the record.
The piece still missing from the public record is the one that would close the circle: a named North American dairy producer, not an AI stud, who has been weighting HT or running Slick matings long enough to report two or three summers of their own production and fertility numbers. Those producers exist. Their data isn’t yet in the trade press. That’s the next story worth telling, and The Bullvine is actively reporting it — if you’re running one of these programs and willing to talk on the record, the editor’s line is open.
“But I Have -20°C Winters” — The Cold-Climate Objection That Isn’t Aging Well
The pushback from Ontario, Quebec, Wisconsin, and Minnesota breeders is almost always the same: “I don’t want a tropical cow in a -20°C barn.” Fair question. Until the data answers it.
Kerndt has answered it directly from Wisconsin, where January air temperatures regularly sit below -10°C. His fifth-generation Slick calves are born there, stay there, and — in his own words — “do grow hair!” The Slick allele isn’t producing tropical cattle incapable of holding coat in cold country. It’s producing cattle that thermoregulate more efficiently when THI climbs, while still growing a winter coat when the thermometer drops.
The framing error is calling it a “tropical gene” in the first place. Slick was characterized in Senepol cattle in tropical regions, yes — but the trait it delivers is heat dissipation efficiency, not tropical-only viability. And the climate the “temperate” label was built on doesn’t exist anymore. The Science Advances data shows that Ontario, the Upper Midwest, New York, and the Atlantic provinces are already accumulating enough wet-bulb-26°C days to put real dollars per cow per year on the table — the illustrative 0-per-cow midpoint in the Barn Math section lands squarely in those regions, not in Puerto Rico.
The decision has shifted. It used to be: “Is Slick worth the winter coat penalty?” The current data says: “Is holding onto an outdated temperate-climate mental model worth giving up 50% of the recoverable summer margin?”
Four Ways to Start Now — Without Waiting for CDCB
Active breeders split from waiters right here. Four approaches are already in use, each with a different cost, effort, and exposure profile. None require CDCB or Lactanet to move first.
MoveCost profileSignal usedBest fitDataGene Good Bulls AppFree lookupHT ABV; Holstein reliability around 48%Any breeder building a sire listZoetis Milk_THI / CFS_THI inquiryAccount / rep access dependentMilk-yield and first-service conception response to THILarge herds already using genomic servicesAustralian proof sheet requestRep request; sire coverage variesAustralian HT proof on eligible international siresHerds buying Semex, Genex, ABS or similar international geneticsCustom index layerGeneticist setup; usually 1–2 quartersNM$ or LPI floor plus HT as secondary filterOperations already using custom selection indexes
1. The Free Move — DataGene’s Good Bulls App. DataGene publishes HT ABVs quarterly in its freely available Good Bulls App. Pull it up, search a sire name, read the ABV. It costs nothing. DataGene’s own fact sheet recommends using a team of bulls because HT ABV reliability sits around 48% in Holsteins, lower than conventional production traits — but 48% on a trait that doesn’t exist in NM$ is still 48% more signal than you have today.
2. The Phone Call — Zoetis Milk_THI and CFS_THI. The Zoetis traits are peer-reviewed (Vukasinovic et al., JDS, September 2025; follow-up JDS validation, November 2025). Whether they’re accessible through Clarifide — and under what conditions — is a question for your Zoetis rep directly. Validation confirmed the traits identify cows that keep body temperature regulated during heat stress. Larger operations with existing account relationships are the ones most likely to get a useful answer first.
3. The Genetic Filter — Australian Proofs via International AI Partners. Sires distributed through international-facing AI partners — Semex, Genex, and ABS among them — may carry Australian proof data where their genetics are evaluated in the Australian system. Coverage varies by sire and stud. Ask your AI partner for the Australian proof sheet on specific bulls you’re considering. This is a phone call your rep can make today; no new account, no testing investment.
4. The Custom Index — Layering HT onto NM$ or LPI. For operations already running custom selection indexes, set NM$ or LPI as a floor and layer HT as a secondary filter — structurally how Australian farmers already use BPI alongside HT ABV. It takes a conversation with your AI partner’s geneticist and typically a quarter or two to implement cleanly. If you’re already building custom indexes, this is the obvious next add.
Slick Sires: What the Allele Actually Does — and Doesn’t
For operations ready to go further than a filter, weighting Slick sires into 20–30% of matings is the most direct structural play. Slick carriers are in commercial North American catalogs today, with Select Sires’ ART program the most openly documented pipeline — confirmed in the April 2026 Holstein Sire Directory. Swissgenetics also markets THERMO-ET P SL, the first European homozygous-polled Red carrier of the Slick gene. Coverage across other major studs varies; ask your AI partner what they currently carry or can source.
Here’s what the biology actually delivers. The Slick allele is a dominant mutation in the prolactin receptor gene that produces a short, sleek coat. University of Florida research by Dikmen and colleagues (Journal of Dairy Science, 2014) documented that Slick cows averaged 1.1°F lower vaginal temperatures at the hottest times of day (noon to 3 p.m.) compared with non-Slick herdmates housed in the same Florida freestall environment. And where summer-calving cows typically see a sharp first-90-day yield depression compared with winter-calving animals, that seasonal gap was substantially reduced in Slick carriers — Slick cows held closer to their winter-calving performance than wild-type animals in the same heat conditions. The regulatory and commercial path Slick has walked is worth comparing with how the PRLR-SLICK gene-edited variant stacks up on the 2029 milk cheque.
The strategy isn’t 100% Slick. It’s targeting Slick matings at your highest-producing cow families and summer-calving blocks, where heat stress hits the margin hardest. A 20–30% allocation blended with elite conventional sires selected on NM$ or LPI is where most breeders start. Per Select Sires’ own ART data, the production penalty Slick once carried isn’t showing up in the current generation.
Is Your Herd’s Genetic Strategy Already Behind Where Australia Was in 2019?
Not a rhetorical question. By the August 2024 ABV release, one in three Holstein Good Bulls cleared 100 for Heat Tolerance. Parrish told Dairy News Australia that Australian AI centres are moving toward filtering on HT the same way they already filter for calving ease: “AI centres won’t take bulls that aren’t good for Heat Tolerance. It will be like calving ease — now they won’t buy a bull that causes difficult calvings.”
That shift didn’t come from a regulator. It came from farmers like Parrish, year after year, building HT into what they asked their AI reps for.
North American studs respond to the same pressure. Kerndt has said plainly: “Heat tolerance is a valuable economic trait. By adding the slick trait to the elite genetic package offered by Select Sires, we can accomplish our goal of helping dairies everywhere become more profitable.”
When the conversation at the rep level shifts from “what’s your highest NM$ bull?” to “what’s your highest NM$ bull with Australian HT data above 100 or a validated Milk_THI value above zero?” — the catalogs move. Not in 2030. Sooner. The breeders best positioned will be the ones whose replacement heifers already carry heat-adapted genetics when that shift lands.
What This Means for Your Operation
If your herd regularly sees days with wet-bulb temperatures approaching or crossing 26°C, the Science Advances data says you’re already losing meaningfully on those days — even with fans and soakers running. Pull your summer milk-weight records against THI days from the last three years before your next breeding order.
If your replacement rate runs above 30%, you have enough genetic turnover to see measurable HT impact inside four years. Below 25%, stretch that timeline and adjust expectations accordingly.
If you already genomic-test 70% or more of your replacements, the incremental cost of adding HT screening at the sire level is effectively zero. The only reason not to add it is habit.
If your AI rep hasn’t raised heat tolerance in a sire presentation, that’s a conversation worth starting. The data exists. Whether your current stud has prioritized surfacing it is worth finding out before the next breeding order goes in.
If you breed for a specific milk market — components, cheese yield, A2A2 — weight HT as a filter on top of those targets, not a replacement for them. It stacks. It doesn’t substitute.
If you operate in what was traditionally called a “temperate” region — Ontario, Quebec, Upper Midwest, New York, Atlantic provinces — treat that label as historical, not current. The Science Advances midcentury projection work puts meaningful additional heat exposure in those regions.
If the winter-coat concern has kept you out of Slick matings: Select Sires’ fifth-generation Wisconsin-born Slick calves grow hair fine. The penalty isn’t what breeders have long assumed it was.
Key Takeaways
In the next 30 days: Pull your top 20 planned sires. Cross-reference each against DataGene’s Good Bulls App for HT ABV. Ask your Zoetis rep whether Milk_THI or CFS_THI values are accessible on those bulls. Request Select Sires’ April 2026 Holstein Sire Directory to identify current active Slick carriers. This is an afternoon’s work.
In the next 90 days: Identify your top-producing 20–30% of cow families and your May–July freshening block. Allocate Slick sire matings to those specific groups rather than broadcasting across the herd.
In the next 12 months: Begin documenting summer production and conception baselines now. When CDCB or Lactanet eventually integrates HT into NM$ or LPI, you’ll have your own performance delta in hand before your neighbor has results from their first Slick daughter.
If X, then Y: If your farm sits in a region that clears wet-bulb 26°C on more than a handful of days each summer and your replacement rate is above 30%, the cost of waiting another three years for CDCB exceeds the cost of starting a blended HT strategy now.
The wrong answers book-end the right one: 100% Slick is the wrong strategy for most North American herds in 2026. Zero Slick, in regions already carrying meaningful heat-day loads, is also the wrong strategy. The defensible position sits at 20–30%, targeted on your best, most heat-stressed genetics.
Parrish’s herd in Kangaroo Valley isn’t really the story. Select Sires’ fifth-generation Slick calves in Wisconsin aren’t quite it either. The story is that a producer in Woodstock, Tulare, or Fond du Lac could have started in 2019 or 2020 and closed most of the same distance by 2026. The tools have been sitting on the shelf. The question worth asking before the next breeding order goes in isn’t whether the climate will keep pressuring your margins. It’s whether the heifer you bred last Tuesday is built for the barn she’ll actually be milking in by the early 2030s — and if your AI rep can’t answer that question, what does that say about where the conversation needs to go next?
Complete references and supporting documentation are available upon request by contacting the editorial team at editor@thebullvine.com.
Transform Heat Stress into Your Carbon Strategy’s Secret Weapon — Follows the money on climate-linked regulatory risks, detailing how heat-stressed herds face a 23% methane penalty. Breaks down how selecting for heat-tolerant genomics secures your herd’s environmental compliance and long-term production floor.
Gene-Edited Cows Are Legal. Your 2029 Milk Cheque Isn’t Safe. — Exposes the massive regulatory shift making gene-edited Slick cattle a commercial reality. Highlights how PRLR-SLICK edits bypass decades of traditional breeding to deliver immediate thermal resilience and vital margin protection for the next decade.
The Sunday Read Dairy Professionals Don’t Skip.
Every week, thousands of producers, breeders, and industry insiders open Bullvine Weekly for genetics insights, market shifts, and profit strategies they won’t find anywhere else. One email. Five minutes. Smarter decisions all week.
Keigo Miwa and RESPECT HOLSTEIN of Gunma Prefecture captured their first Grand Champion title with the Hancock daughter.
RESPECT Lattes Hancock delivered a breakthrough win for Keigo Miwa and RESPECT HOLSTEIN of Gunma Prefecture, Japan, taking Grand Champion honors at the Central Japan Holstein Show.
The Hancock daughter started the day by winning the Five-Year-Old class. From there, she was named Senior Champion, then rose again to claim Grand Champion of the show.
For Miwa, it marked a first Grand Champion honor. That matters. In a show ring built on years of breeding decisions, daily work, and the nerve to bring one out when she is ready, first-time wins hit differently.
Lattes Hancock had the kind of day breeders chase. She moved from class winner to division champion to the final slap with no wasted steps. Mature cow power still counts, and this result proved it.
The show was evaluated by the Fukuya brothers. Hideto Fukuya of Elm-Lane Holsteins, Eniwa, Hokkaido, served as official judge, while Shigeo Fukuya of ST Genetics Japan, Obihiro, Hokkaido, served as associate judge. Both men previously trained at Indianhead Holsteins, adding another international layer to a Japanese show-ring result with deep global pedigree ties.
And the pedigree backs up the moment.
RESPECT Lattes Hancock is sired by Hancock and traces through Goldsun, Doorman, Godfrey Latitude Rose, Lightening, Gibson, Budjon-JK Encore Elegant EX-92-USA, and Krull Broker Elegance EX-96-USA GMD DOM.
That is not just a string of names. It is a maternal line with real show-ring gravity. The Elegance family has long been associated with the kind of dairy strength, frame, balance, and udder quality that still shows up when the championship banners are on the line.
For RESPECT HOLSTEIN, this was more than a good show. It was a statement win.
Show Highlights
Grand Champion: RESPECT Lattes Hancock Exhibitor: Keigo Miwa, RESPECT HOLSTEIN, Gunma Prefecture Class: First Place Five-Year-Old Division: Senior Champion Sire: Hancock Official Judge: Hideto Fukuya, Elm-Lane Holsteins, Eniwa, Hokkaido Associate Judge: Shigeo Fukuya, ST Genetics Japan, Obihiro, Hokkaido
Pedigree
RESPECT Lattes Hancock Hancock x Goldsun x Doorman x Godfrey Latitude Rose x Lightening x Gibson x Budjon-JK Encore Elegant EX-92-USA x Krull Broker Elegance EX-96-USA GMD DOM
Congratulations to Keigo Miwa, RESPECT HOLSTEIN, and all exhibitors at the Central Japan Holstein Show.
The Sunday Read Dairy Professionals Don’t Skip.
Every week, thousands of producers, breeders, and industry insiders open Bullvine Weekly for genetics insights, market shifts, and profit strategies they won’t find anywhere else. One email. Five minutes. Smarter decisions all week.
Jacobs High Octane Babe EX-96-2E-CAN 4* named 2025 Holstein Canada Cow of the Year at the AGM in Burnaby, BC — the second winner from the same Ferme Jacobs cow family in under a decade.
Honestly, if you had a shortlist for “modern Canadian Holstein perfection,” her name was probably at the top of it. Today at Holstein Canada’s Annual General Meeting, held during the 2026 National Holstein Convention in Burnaby, British Columbia, JACOBS HIGH OCTANE BABE EX-96-2E-CAN 4* was named the 2025 Holstein Canada Cow of the Year — adding the most coveted title in Canadian dairy to a résumé that already reads like a highlight reel.
Bred and owned by Ferme Jacobs, Cap-Santé, Quebec, Babe now joins the most elite roster in the breed — and keeps a piece of family history intact. Her dam, Jacobs Goldwyn Britany EX-96-2E 42*, earned the very same honour as the 2017 Cow of the Year. Mother and daughter, both Cow of the Year. That’s not a coincidence — that’s a cow family doing exactly what a great cow family is supposed to do.
Why Babe Won
Babe is the complete package: elite conformation, high production, show-ring presence, and a globe-spanning genetic footprint. A few of the numbers Holstein Canada voters couldn’t ignore.
Classification: EX-96-2E-CAN 4* with a conformation score of +11 — the kind of linear profile breeders draft their mating plans around.
Show résumé:B&O Champion and Reserve Grand Champion at The Royal Winter Fair 2022, and winner of the B&W Class at the National Holstein Show as a 5-Year-Old that same year.
Donor power: More than 230 embryos produced, with significant numbers sold internationally — putting the Jacobs prefix in barns on multiple continents.
Daughters on the ground:38 daughters, 14 already classified (1 EX, 10 VG, 3 GP), and daughters still stacking up wins. Jacobs Destiny Balla VG-89 was All-Canadian and Intermediate Champion at the 2023 National Holstein Show; Jacobs Lambda Baz VG-87 sold for USD $320,000 at the International Intrigue Sale and placed 2nd in the 4-Year-Old class at the 2025 World Dairy Expo; Jacobs Alligator Bawl was 1st Milking Yearling at WDE 2025.
Sons at stud:BRUINS, BULLDING, and BUBBLE are on rotation at Semex, carrying her influence into tens of thousands of matings worldwide.
Add it up and you get a cow who wins in the show ring, in the classification barn, in the flush tank, and on the proof sheet. That’s rare air.
Chanmar Adonis Miss Red EX-94-5E 4* — bred by Chanmar Holsteins & Glaustar Holsteins, owned by Century Star Holsteins (ON). Over 120,000 kg lifetime milk, still milking 40 L/day in her 7th lactation.
Hendercroft Winbrok Gummybear EX-95-4E 4* — bred by Hendercroft (ON). Nearly 90,000 kg lifetime milk and the 2023 All-Canadian Production Cow.
Vinbert Kingboy Birdy EX-95-4E 5* — bred by Ferme Vinbert (QC). Reigning Grand Champion at Le Suprême Laitier 2024.
Four cows, four different stories, one award. That’s what makes this vote matter.
A Win for Ferme Jacobs — and for a Cow Family
For Ferme Jacobs, this is now the second Cow of the Year title in eight years from the same maternal line — Britany in 2017, Babe in 2025. In a breed where great cows are hard to find and great cow families are harder still, the Jacobs program keeps proving that you don’t need to chase the catalogue if you’ve got the right dam behind the stall.
And for Babe herself? She’s a cow of character, as the Jacobs team likes to say — one of those rare ones that makes you stop what you’re doing and just watch her walk. Today, all of Canadian Holstein country is watching.
About the Award
The Holstein Canada Cow of the Year has recognized the most influential Canadian-bred Holsteins since its inception, with finalists evaluated on longevity, production, genetic merit, strength of pedigree, and ability to represent Canadian genetics on a global stage. Members cast their votes online and by mail; the 2025 winner was unveiled during Holstein Canada’s AGM at the National Holstein Convention, themed “Spirit of the West.”
Congratulations to Ferme Jacobs, to the Jacobs family, and to every breeder who had a hand in writing Babe’s story. Canada’s newest Hometown Hero is officially one for the ages.
The Sunday Read Dairy Professionals Don’t Skip.
Every week, thousands of producers, breeders, and industry insiders open Bullvine Weekly for genetics insights, market shifts, and profit strategies they won’t find anywhere else. One email. Five minutes. Smarter decisions all week.
Picard’s 148 proven RZG won’t win a headline contest — but it won’t re‑rank on you next December either.
Executive Summary: Germany’s April 2026 RZG top 10 didn’t reshuffle — it compressed. Connect holds at 167, but seven sires now sit at exactly 161, squeezing the #1-to-#10 band from 7 points to just 6. Every bull in that top 10 is a returner from December, and every one is still genomic-only — no daughter-proven sire cracks this tier. Picard leads the proven list at 148 RZG (+1 from December), offering run-to-run stability that the genomic cluster can’t yet deliver. The concentration problem is harder to ignore: RealSyn and Rome bloodlines account for at least half the top 10, and if your sire stack mirrors that, you’re building inbreeding pressure into your next generation. Pull your active bull list this month, cap your RealSyn/Rome exposure, and make sure Picard, MustHave, or a Red-carrier like SaturnRDC is in the rotation. When the index can’t separate seven bulls, the bloodline strategy becomes the tiebreaker.
Connect holds the line. Germany’s April 2026 RZG evaluation lands with the Comet son exactly where he stood in December — 167 RZG on both the Interbull and domestic genomic lists, unmoved run to run. All 10 Interbull genomic top‑10 sires return from December 2025 with no new entrants, so this is a stability run at the very top of German Holstein Black & White.
That stability is deceptive, though. The gap between Connect and the pack shrank: the #1‑to‑#10 band compressed from 7 points (167–160 RZG, December 2025) to just 6 (167–161 RZG, April 2026), with Remco climbing to 162 RZG from 161 and seven other sires all ticking from 160 to 161 over the same period. Meanwhile, the daughter‑proven world tells a different story — Picard edges up to 148 RZG in April 2026 from 147 in December, pulling Pattern, Zivet, Glarus, and Glenn into a tighter functional band that sits 13–19 points below the genomic elite but with far more reliability behind it. And in Red & White, HarmonicP arrives at 163 RZG in April 2026 (up from 161 in December 2025), suddenly competitive with half the B&W genomic top 10 and setting up the sharpest black‑vs‑red contrast this system has produced in recent runs.
April 2026 RZG (Holstein B&W, Interbull Genomics): Top 10 Sires
Rank
Bull
Index value + date
Previous value + date
Change
Stud
1
Connect
167 RZG, Apr 2026
167 RZG, Dec 2025
0
Synetics
2
Veterano
163 RZG, Apr 2026
163 RZG, Dec 2025
0
–
3
Remco
162 RZG, Apr 2026
161 RZG, Dec 2025
+1
Phönix
4
Realpower
161 RZG, Apr 2026
160 RZG, Dec 2025
+1
Synetics
5
Realside
161 RZG, Apr 2026
160 RZG, Dec 2025
+1
Synetics
6
TooHot
161 RZG, Apr 2026
160 RZG, Dec 2025
+1
Phönix
7
Carlito
161 RZG, Apr 2026
160 RZG, Dec 2025
+1
Phönix
8
Evenstar
161 RZG, Apr 2026
160 RZG, Dec 2025
+1
PHX/Qnet
9
RealSteel
161 RZG, Apr 2026
160 RZG, Dec 2025
+1
–
10
Romantiker
161 RZG, Apr 2026
160 RZG, Dec 2025
+1
Phönix
Connect stays #1 at 167 RZG in April 2026, after 167 RZG in December 2025, while the rest of the top 10 compresses tightly at 161–163 RZG.
All 10 are returning genomic sires; there are no new‑in‑top‑10 entrants in April 2026, and no December top‑10 drop‑outs.
The band from #1 to #10 is now just 6 RZG points (167 to 161) in April 2026 versus 7 points last run (167 to 160), indicating further tightening at the top.
Within the 161‑RZG pack, the +1 shifts from 160 RZG, December 2025, to 161 RZG, April 2026, signal micro‑re‑ranking rather than structural change.
Big RZG risers inside the top 10
Remco climbs from 161 RZG, December 2025, to 162 RZG, April 2026, picking up on already strong RZ Milch and RZ Fleisch and pairing that with a balanced RZ Gesund block — a neat “more of everything” move without obvious new holes; as a fully genomic sire, his reliability remains materially lower than the proven anchors.
Realpower steps from 160 RZG, December 2025, to 161 RZG, April 2026, with the profile leaning slightly more to RZ Milch and RZ Fruchtbarkeit than his RealSyn contemporaries, making him a marginally safer production‑plus‑fertility play in this cluster for herds wanting that tilt.
Realside follows the same 160 to 161 RZG, December 2025 to April 2026 uptick, but does it with a touch more RZ Exterieur at the expense of RZ Persistenz, suiting type‑conscious herds that can live with slightly less longevity.
TooHot also jumps from 160 to 161 RZG, December 2025 to April 2026, nudging up in RZ Gesundheit and RZ Kälberfit while accepting more modest RZ Exterieur, making him a health‑leaning option in the 161 group for herds prioritizing health over maximum type.
Big fallers / notable drop‑outs
There are no big fallers within this specific Interbull genomic top 10: all nine 161‑RZG sires move just +1, and Connect and Veterano remain static between December 2025 and April 2026.
Outside the top 10, MustHave holds 159 RZG, April 2026, after 159 RZG, December 2025, and therefore remains just outside the Interbull top 10; he retains clear strength in RZ Milch and RZ Fleisch, so still fits high‑component, index‑driven matings even if the headline rank hasn’t improved.
On the domestic genomic list, Topchamp sits at 158 RZG in April 2026, unchanged from 158 RZG in December 2025, with a fractionally weaker RZFit profile than the very top group but a clearly strong RZ Exterieur, retaining niche value in type‑oriented programs despite staying out of the Interbull top tier.
What this index is rewarding now
The current top 10 is clearly rewarding high RZ Milch combined with robust RZ Gesundheit and calf fitness: Connect sits at 120 RZ Milch, 113 RZ Gesundheit, and 135 RZGes, April 2026, while Remco (138 RZ Milch, 123 RZGes) and Realpower (117 RZ Milch, 118 RZGes) illustrate the “production + health” template.
Trade-off-wise, Realside and Carlito bring more RZ Exterieur and RZ Fundament at the cost of slightly lower RZ Persistenz and RZ Kalbeverlauf compared with Connect and Realpower, so they upgrade frames and feet‑and‑legs but are a shade more management‑sensitive regarding longevity and calving ease.
SaturnRDC shows how the system still pays for RZG in Red‑carrier packages when they can match B&W on RZ Milch and RZ Gesundheit, offering a color-flexible route into the same index logic for herds wanting that genetic option.
Stud and family concentration
Synetics dominates the Interbull genomic top 10 with Connect, Realpower, Realside, and Grafti (just outside at 155 RZG, April 2026), while Phönix owns Remco, TooHot, Carlito, Romantiker, and much of the domestic 99‑RZG band.
The RealSyn and Rome sire lines appear repeatedly (Realpower, Realside, RealSteel, RealLife, Roadhouse; Romantiker, Roadstar, Ramirez), making sire‑stacking around these brands a real inbreeding and diversity concern for anyone using multiple bulls from this cluster.
As outcross moves within this context, MustHave (AltaMuller × non‑RealSyn dam stack) and Attention(Adonis × Arizona) are two practical options to step out of the RealSyn/Rome saturation while remaining at or above 158 RZG in April 2026.
How stable is Germany’s RZG top tier right now?
All 10 Interbull genomic top‑10 bulls from December 2025 return in April 2026, with Connect and Veterano unchanged and the rest gaining just +1, so this is a low‑churn, low‑shock run at the elite end.
The compression from a 7‑point band (167–160 RZG, December 2025) to 6 points (167–161 RZG, April 2026) means breeders are deciding between very similar total‑merit levels and need to lean more on trait shape, reliability, and pedigree than on raw RZG gaps.
Because all of these sires are still genomic, the apparent stability shouldn’t be over‑interpreted as permanent; future daughter data could still significantly reshuffle this pack.
Volatility and reliability
All top‑10 Interbull B&W RZG bulls are genomic; there are zero daughter‑proven sires in this list, so the top is structurally volatile and still heavily genomic‑weighted in terms of reliability.
Connect at 167 RZG, April 2026, and Remco at 162 RZG, April 2026, are the key high‑index/low‑reliability volatility plays; both sit on moderate daughter numbers and heavy genomic weight, so large swings remain possible as daughter information accumulates.
On the proven side, Picard at 148 RZG, April 2026 (147 RZG, December 2025) and Pattern at 145 RZG, April 2026 (145 RZG, December 2025) are the obvious anchors, with full daughter‑proven reliability and stable multi‑run RZG.
Glenn and Glarus, both at 143 RZG in April 2026, with small negative or flat moves vs 143 RZG in December 2025, provide additional high‑reliability ballast for programs that want fewer surprises than the genomic cluster offers.
Domestic RZG B&W Genomics — A Different Top 10
Mini top‑5 table (domestic active genomic, April 2026)
Rank
Bull
RZG (Apr 2026)
Primary-index rank (Interbull)
1
Connect
167 RZG, Apr 2026
1
2
Remco
162 RZG, Apr 2026
3
3
Realpower
161 RZG, Apr 2026
4
4
Realside
161 RZG, Apr 2026
5
5
TooHot
161 RZG, Apr 2026
6
Connect, Remco, and Realpower lead both the Interbull and domestic genomic lists, so domestic usage aligns more closely with the global RZG picture in April 2026 than in December 2025.
Key movers here are the same as at Interbull: Remco, Realpower, Realside, and TooHot all add +1 RZG from December 2025 to April 2026, but their domestic rank order emphasizes local availability and stud alignment over raw value changes.
The domestic list adds nuance: SaturnRDC at 161 RZG, April 2026, and Roadhouse at 160 RZG, April 2026 (both unchanged from their December 2025 RZG levels) bring Red‑carrier and slightly more RZ Fruchtbarkeit and RZ Kalbeverlauf into the same band, which the Interbull headline table partially hides.
Overall, this index rewards roughly the same traits as Interbull RZG, but domestic ranks give extra weight to health and calving ease (SaturnRDC, SemianRDC) and to stud portfolio breadth.
Daughter‑Proven RZG B&W — Proven Power in a Genomic World
Mini top‑5 table (Interbull B&W daughter‑proven, April 2026)
Rank
Bull
RZG (Apr 2026)
1
Picard
148 RZG, Apr 2026
2
Pattern
145 RZG, Apr 2026
3
Zivet
144 RZG, Apr 2026
4
Glarus
143 RZG, Apr 2026
5
Glenn
143 RZG, Apr 2026
Picard leads the proven list at 148 RZG in April 2026, after 147 RZG in December 2025, while the genomic Connect/Remco/Realpower group sits 13–19 points higher but without his high daughter‑proven reliability.
Pattern stays solid at 145 RZG, April 2026 vs 145 RZG, December 2025, and Zivet edges up to 144 RZG, April 2026, from 143 RZG, December 2025, while keeping a very even mix of RZ Milch, RZ Exterieur, and RZ Gesundheit, making them calmer, all‑round options compared with the more aggressive genomic plays.
Glarus and Glenn hold at 143 RZG, April 2026, both offering strong RZ Exterieur and RZEuterus structure, so they remain go‑to options for herds wanting uniform udders and legs without giving away too much total RZG.
This index clearly rewards proven production plus functional traits over sheer RZG height: the top‑5 proven sires sit below the genomic elite but come with far tighter RZ and RZGes confidence bands.
Where the Indexes Agree — and Where They Don’t
Consensus sires
Connect is #1 on both Interbull genomic and domestic genomic RZG at 167 RZG, April 2026, so any RZG‑focused genomic program that down‑weights him is consciously stepping away from the system’s own consensus.
Remco sits #3 on Interbull genomic and #2 domestically at 162 RZG, April 2026, with almost identical trait shape in both systems, making him the logical high‑index “second pillar” behind Connect in RZG‑driven genomic stacks for herds comfortable with genomic risk.
On the proven side, Picard at 148 RZG, April 2026 (147 RZG, December 2025), and Pattern at 145 RZG, April 2026 (145 RZG, December 2025), appear consistently at or near the top of daughter‑proven lists, reflecting the cross‑index agreement that these are the current reliability kings.
Rank‑divergent sires (illustrative table)
Connect and Remco are true cross‑index leaders inside genomics, but they don’t appear on the proven tables yet; for breeders, that’s the classic “high reward, high volatility” trade: for herds prioritizing fast genetic gain and willing to tolerate future re‑ranking, they are obvious first‑line sires.
Realpower looks slightly better domestically (rank 3) than his Interbull rank (4) suggests, reflecting how his trait mix — particularly RZ Fruchtbarkeit and RZFit — is valued by German buyers; for herds prioritizing fertility within a high‑RZG genomic stack, he’s the more conservative complement to Connect and Remco.
SaturnRDC only appears as a domestic genomic 161‑RZG, April 2026 bull, and doesn’t touch the Interbull top 10, but his RZ Gesundheit and RZ Kalbeverlauf profile makes him valuable for herds with calving and heifer health issues, even though his headline rank lags the main B&W leaders.
Picard sits outside all genomic lists but dominates proven RZG at 148 RZG in April 2026; for risk‑averse programs and commercial daughters‑first herds, his lower index but higher reliability is a rational choice, especially where re‑ranking risk has a real economic cost.
Core tension
The core tension in this April 2026 German run is between a very tight cluster of 161–167 RZG Interbull genomics bulls — headed by Connect, Remco, and Realpower — and a slightly lower, but far more stable, proven layer anchored by Picard, Pattern, and Zivet. Genomic lists are converging rather than exploding: many bulls at 161 RZG, April 2026, with near‑identical trait profiles, making stud affiliation, pedigree, and management fit more decisive than raw index points. Proven lists, meanwhile, still edge up slowly in RZG (Picard +1, Zivet +1 between December 2025 and April 2026) but don’t threaten genomic heights, so breeders have to choose how much of their heifer and heifer‑dam matings they want to allocate to “167‑RZG genomic volatility” versus “145–148‑RZG proven stability.” Red & White adds a further layer: HarmonicP at 163 RZG, April 2026, and SkypeRed at 163 RZG, April 2026 are genuinely competitive with black‑and‑white indexes, but proven red sires still sit lower, amplifying the same risk‑reliability tension in another color.
How to Use These Sires This Season
Cross‑index genomic leaders (Connect, Remco, Realpower) For herds prioritizing maximum RZG gain and comfortable with genomic volatility, use Connect as the main sire of sons and heifers, backed by Remco and Realpower on cows, but cap any single bull at a modest share of matings to manage re‑ranking risk. For high‑input housed and robot herds that can fully exploit high RZ Milch and RZGes, this trio fits, while lower‑input or grazing‑leaning systems may want to temper their use with more moderate‑production sires.
High‑reliability anchors (Picard, Pattern, Zivet) For herds prioritizing predictability, udder consistency, and moderate calving risk over absolute index height, use Picard and Pattern on high‑value older cows and on problem‑free family lines where you want uniform, saleable daughters, then bring Zivet in to keep RZ Milch and RZGes balanced.
Health and fertility specialists (TooHot, SaturnRDC, Roadhouse) For herds targeting better fertility, calf survival, and trouble‑free calvings, deploy TooHot and SaturnRDC on heifers and health‑challenged cow families, while Roadhouse can be used where you want to hold RZG around 160, April 2026, but nudge RZ Fruchtbarkeit and RZ Kälberfit upward, giving up a few points vs Connect and Remco in exchange for more health insurance.
Type‑leaning sires (Realside, Carlito, Glarus, Glenn) For herds or show‑leaning segments prioritizing frames, udders, and legs, use Realside and Carlito in the genomic space, then Glarus and Glenn as proven follow‑up sires to lock in type once the pedigree and health package are acceptable.
Outcross / de‑stacking sires (MustHave, Attention, MustHave‑line sons) For herds worried about RealSyn/Rome saturation, rotate MustHave and Attention into matings on Connect/Realpower/Remco daughters, accepting a small RZG discount relative to the very top in exchange for more flexible future mating options.
Within 30 days, pull your current active sire list, mark all RealSyn, Rome, and Comet‑line bulls, and cap that group at a predefined percentage of matings while deliberately adding Picard, Pattern, MustHave, and at least one Red‑carrier like SaturnRDC or HarmonicP to diversify both pedigree and system risk.
Key Takeaways:
The top 10 is frozen but squeezed. All 10 Interbull genomic sires return from December, with Connect flat at 167 RZG, and the #1‑to‑#10 band narrowing from 7 points to 6 — raw index rank is no longer enough to pick between them.
RealSyn and Rome saturation are portfolio risks, not talking points. Those two sire lines account for roughly half the genomic top 10; herds using multiple bulls from this cluster are stacking the same pedigree and need MustHave, Attention, or a Red‑carrier like SaturnRDC to break the pattern.
Picard and Pattern are the only sires in this article that won’t surprise you next run. At 148 and 145 RZG (April 2026), they sit well below the genomic ceiling — but their daughter‑proven reliability means breeders aren’t betting on a number that could move 5+ points in either direction by December.
Health and fertility now separate the 161 pack. TooHot and SaturnRDC lean into RZ Gesundheit and RZ Kälberfit; Realside and Carlito lean into RZ Exterieur and RZ Fundament — same RZG, very different daughters, and the right pick depends on whether your problem cows need better immune function or better feet.
Your 30‑day move: audit your bloodline exposure. Mark every RealSyn, Rome, and Comet‑line bull on your active sire list, cap that group at a set percentage of matings, and deliberately slot in at least one proven anchor and one outcross genomic sire before the next mating round.
Every week, thousands of producers, breeders, and industry insiders open Bullvine Weekly for genetics insights, market shifts, and profit strategies they won’t find anywhere else. One email. Five minutes. Smarter decisions all week.
Powerhouse just picked up +119 TPI while Garza dumped −125 under the protein flip — if those two are in your tank, this run just changed your semen budget math.
Executive Summary: TPI 2026’s 24P:14F protein flip just moved real money: Powerhouse gains +119 TPI, Garza drops −125, and every high‑fat sire in your tank needs a second look. All 10 genomic USA Holstein TPI leaders in April 2026 are new names and squeezed into a 37‑point band, so chasing “#1” is now a high‑volatility hobby, not a plan. On the proven side, Sheepster still leads at +3480 TPI after losing 92 points, while Captain, Zuri, and Garza reshuffle as the formula rewards protein‑heavy profiles. Woodford (+3565 TPI, +1296 NM$) and Jitters/Sabotage‑type genomics line up TPI and NM$ so closely that your “index vs profit” debate is basically over for top heifers. R&W breeders get their own shake‑up: Okafor‑Red and Ocean‑Red hold near 3200 GTPI, while RC/RW PTAT bulls like Crypto PP at +2.82 PTAT force you to choose between show udders and milk cheque. The article walks through how to re‑tier matings by herd type (high‑input, grazing, type/show, R&W), how to spot Captain/Trooper/Alta line stacking, and which bulls to push or park for the next 30 days.
The hook for April 2026 is the TPI 2026 formula flip: more weight on protein, less on fat, which quietly reshuffled both genomic and daughter-proven lists and set up the kind of bulls that now rise to the top in the Holstein USA TPI, April 2026 run. The biggest structural change is that PTA Protein now carries 24% of TPI while PTA Fat drops to 14%, so a bull with the same total CFP but more of it in protein pounds now scores materially higher TPI than a more fat‑heavy counterpart. When you run the December 2025 Holstein USA TPI proofs through that new 24P:14F production slice, you immediately see “formula winners” and “formula losers” before a single new daughter is added.
In this April 2026 USA run, that protein‑first logic shows up very clearly: genomic bulls like Aurora Gs Woodford‑ETare almost purpose‑built for TPI 2026, and on the proven side, bulls such as Peak Powerhouse‑ET gain roughly +119 TPI going from +3329 TPI (Holstein USA TPI, December 2025) to +3448 TPI (Holstein USA TPI, April 2026). At the same time, fat‑leaning sires like SDG Cap Garza‑ET lose relative ground despite still being excellent cowside options.
What Changed at the Top?
Genomic TPI leaders – April 2026
On the genomic side, the top 10 Holstein USA TPI, April 2026 bulls are all new faces compared with the December 2025 genomic top 10, reflecting both the formula change and the usual churn of new young sires.
Genomic TPI top 10 – Holstein USA TPI, April 2026
Rank (TPI)
Bull (NAAB)
TPI Apr 2026
NM$ Apr 2026
PTA Milk
PTA Fat
PTA Pro
PTAT
PL
1
Aurora Gs Woodford-ET (551HO06782)
+3565
+1296
+1498
+142
+78
+0.37
+4.5
2
Beyond Mican Hagrid-ET (7HO18312)
+3562
+984
+1351
+128
+66
+2.24
+3.7
3
S-S-I Richard Chichester-ET (7HO18102)
+3560
+1059
+1228
+112
+63
+1.54
+5.8
4
Genosource Jitters-ET (551HO07177)
+3552
+1127
+1637
+123
+68
+0.74
+4.2
5
Ocd Whoops Sabotage-ET (796HO10329)
+3551
+1076
+1274
+119
+64
+1.49
+4.6
6
S-S-I Kingdom Formal-ET (7HO18241)
+3548
+1139
+528
+129
+54
+0.91
+5.4
7
S-S-I Stagger Baelum-ET (14HO18123)
+3547
+1124
+897
+122
+62
+0.64
+5.7
8
Siemers Ssi Bridgerton-ET (250HO18331)
+3539
+1071
+1515
+110
+71
+0.96
+3.4
9
Pen-Col Gs 86807-ET (551HO06686)
+3529
+1119
+1853
+129
+73
+1.23
+3.8
10
Welcome Gustavsson-ET (200HO13730)
+3528
+997
+848
+115
+54
+1.61
+5.6
The band from Woodford at +3565 down to Gustavsson at +3528 is extremely tight – just 37 TPI points separate #1 from #10 – and all ten are new entrants versus the December 2025 genomic top 10. That tells you two things:
The shape of the ideal genomic sire under TPI 2026 is clear (high milk, strong protein, good health, functional type), but
The names at the very top are volatile and will rotate as more calves and proofs arrive.
Proven TPI leaders – December 2025 vs April 2026
On the daughter‑proven side, the story is different: it’s movement, not churn. The top proven bulls are the same characters, but they reshuffle based on the formula change and the addition of fresh daughters.
Daughter‑proven TPI top 10 – Holstein USA TPI, April 2026 vs December 2025
Rank Apr 2026
Bull (NAAB)
TPI Apr 2026
TPI Dec 2025
Δ TPI
Verdict
PTA Milk
PTA Fat
PTA Pro
PTAT
1
OCD Trooper Sheepster-ET (7HO16276)
+3480
+3572
!DROP −92
Formula loser
+1359
+133
+67
+0.86
2
Peak Powerhouse-ET (1HO16089)
+3448
+3329
!HIGH +119
Formula winner
+1937
+113
+92
+0.09
3
SDG-PH Delux Dominance-ET (551HO04795)
+3437
+3458
−21
Slight loser
+1303
+135
+64
+0.07
4
La-Ca-De-Le T Isaac 8731-ET (7HO15966)
+3396
+3390
+6
Neutral
+1336
+111
+62
+2.07
5
Peak Momento-ET (1HO16144)
+3360
+3334
+26
Formula winner
+1223
+113
+53
+0.40
6
Genosource Captain-ET (551HO04119)
+3356
+3428
!DROP −72
Formula loser
+1789
+117
+64
+0.33
7
Terra-Calroy Zuri-ET (97HO42585)
+3355
+3375
−20
Slight loser
+854
+104
+52
+1.81
8
SDG Cap Garza-ET (551HO04474)
+3339
+3464
!DROP −125
!RISK Formula loser
+1369
+140
+50
+0.03
9
Denovo 3946 Elgin-ET (29HO20623)
+3337
Outside top 10
!HIGH New entry
Formula winner
+2635
+100
+68
+0.45
10
Welcome Sensei-ET (200HO12140)
+3333
Outside top 10
!HIGH New entry
Formula winner
+1627
+97
+73
+0.87
Sheepster loses 92 points but still leads the Holstein USA TPI, April 2026 proven list at +3480 TPI, while Powerhouse is the classic “formula winner,” jumping about +119 TPI between runs thanks to his milk and protein‑heavy profile. Captain, Zuri, and Garza all surrender some ground under the new production weights but remain within the elite band.
All these proven sires meet the Holstein USA “high‑ranking sire” reliability criteria (minimum 80 traditional or 85 genomic for production and 80 for type), and the leaders are sitting in the 95–99% range on production and type, so this is the high‑reliability layer.
What TPI 2026 Is Rewarding (and Penalizing)
Protein vs fat in the new formula
Holstein USA’s TPI 2026 formula allocates 24% weight to PTA Protein and 14% to PTA Fat, shifting 5 percentage points from fat to protein compared with the previous version. Because of how the sub‑indices are scaled, Bullvine’s analysis shows that one pound of PTA Protein now exerts about 71% more leverage inside TPI than one pound of PTA Fat, turning P‑strong bulls into index winners without any change in their actual proofs.
Running the December 2025 Holstein USA TPI values through the new matrix, Bullvine highlighted several clear patterns:
Bulls with high protein and balanced or strong P/F ratios gained TPI – example case studies include:
Peak Powerhouse‑ET (1HO16089) – big milk, strong protein, climbs from +3329 to +3448 TPI between December 2025 and April 2026.
Cookiecutter Horseshoe‑ET (208HO00356) – identified by Bullvine as jumping about 10 proven ranks under the 2026 formula, even on the same December proof set.
Multiple Captain‑line bulls like Captain himself and his sons.
Bulls whose component strengths skewed more to fat than protein lost a step:
SDG Cap Garza‑ET (551HO04474) – very strong on fat; surrenders roughly 125 TPI under the new weighting (from +3464 to +3339).
Some high‑fat Captain sons and Garza‑type profiles that were standout under the old 19F:19P balance.
Bull (NAAB)
Status
PTA Pro
PTA Fat
Pro:Fat Ratio
TPI Dec 2025
TPI Apr 2026
Δ TPI
Formula Verdict
Peak Powerhouse-ET (1HO16089)
Proven
+92
+113
0.81
+3329
+3448
!HIGH +119
Winner – protein-heavy relative to fat
Peak Momento-ET (1HO16144)
Proven
+53
+113
0.47
+3334
+3360
+26
Mild winner
Denovo 3946 Elgin-ET (29HO20623)
Proven
+68
+100
0.68
Outside top 10
+3337
New entry
Winner – protein:fat balanced
Welcome Sensei-ET (200HO12140)
Proven
+73
+97
0.75
Outside top 10
+3333
New entry
Winner
Aurora Gs Woodford-ET (551HO06782)
Genomic
+78
+142
0.55
—
+3565
—
Purpose-built for 2026 formula
OCD Trooper Sheepster-ET (7HO16276)
Proven
+67
+133
0.50
+3572
+3480
!DROP −92
Moderate loser
Genosource Captain-ET (551HO04119)
Proven
+64
+117
0.55
+3428
+3356
!DROP −72
Loser – fat-leaning relative to protein
SDG Cap Garza-ET (551HO04474)
Proven
+50
+140
0.36
+3464
+3339
!DROP −125
!RISK Biggest loser – extreme fat bias
SDG-PH Delux Dominance-ET (551HO04795)
Proven
+64
+135
0.47
+3458
+3437
−21
Slight loser
Trait profiles at the top – genomics
Looking at the Holstein USA TPI, April 2026 genomic top 10, the shared trait profile is obvious:
High PTA Milk – often +1200 to +1500 lb and beyond.
High PTA Fat and PTA Protein pounds, with a P/F balance that suits the 24P:14F weighting.
Strong health (PL, LIV, cow health/Health Index) and fertility, with SCS normally in a comfortable range.
Moderate positive type – enough PTAT and udder to build functional commercial cows, not extreme show type.
A few case studies:
Aurora Gs Woodford‑ET +3565 TPI (Holstein USA TPI, April 2026) and +1296 NM$ (Holstein USA NM$, April 2026), roughly +1498 PTA Milk, +142 PTA Fat, +120 PTA Protein, strong Health Index, and moderate but positive type.
Genosource Jitters‑ET +3552 TPI (Holstein USA TPI, April 2026), +1127 NM$ (Holstein USA NM$, April 2026); big CFP with strong survival and fertility.
Ocd Whoops Sabotage‑ET +3551 TPI (Holstein USA TPI, April 2026), +1076 NM$ (Holstein USA NM$, April 2026); high production and NM$ with solid type.
Kingdom Formal, Baelum, Bridgerton, Pen‑Col Gs 86807, and Gustavsson all sit in this same high‑protein, high‑pounds, good‑health box with minor flavor differences in pedigree and trait tilt.
Trait profiles at the top – proven
On the proven side, the Holstein USA TPI, April 2026 leader board is full of “TPI 2026‑friendly” production profiles with proven reliability.
Overall, the proven top 10 tends to run 150–250 TPI points below the genomic leaders, but with 95–99% reliabilities for production and type, making them much safer anchors.
AI Companies and Bloodlines: Who Owns the Top?
Across the Holstein USA TPI, April 2026 lists, there is a clear concentration by both AI company and sire line.
On the proven TPI top 10:
OCD appears prominently with Sheepster and several Trooper/Drive descendants in the extended top group.
Peak/Alta features strongly via Powerhouse and Momento, plus multiple AltaWheelhouse/AltaZazzle offspring.
Genosource delivers Captain and several Captain‑line sons (Garza, Capn Miguel, Capn Ramble) just inside or outside the top 10.
Denovo brings in Elgin under the Envy x Riveting cross.
Pedigree‑wise, a few sire lines are clearly over‑represented in the top 10 and just beyond:
Captain (and his sons) appear in multiple proven bulls’ pedigrees – Captain himself in the top 10, and Garza, Capn Miguel, Capn Ramble, Cap Diggory, etc., in the next band.
Trooper/Drive/Topdog influence shows through OCD sires like Sheepster, Shake, Draft, and Draft‑related bulls.
AltaZazzle/AltaWheelhouse/AltaMarius show up repeatedly in the background of Peak bulls.
For genomic users, this concentration means you cannot just buy “top‑10 genomic TPI” and assume diversity; a good proportion of those bulls will trace back to Captain‑line and AltaZazzle‑line sires. For proven users, it reinforces the need to spread semen across multiple companies and sire lines – e.g., pairing Captain‑line bulls with Envy/Riveting or Taos‑line bulls like Isaac – to manage inbreeding and diversify risk.
How Volatile Are These Rankings After the Protein Flip?
At the genomic level, volatility is a feature, not a bug.
All ten bulls in the Holstein USA genomic TPI top 10, April 2026, are new compared with the December 2025 genomic top 10.
The TPI gap from #1 to #10 compressed to just 37 points (3565–3528), which means minor reliability or data shifts can shuffle ranks by several positions without any real change in bull quality.
For genomic TPI users, this means rank volatility is high and shouldn’t be over‑interpreted; you want to treat the whole top band as a portfolio of similar bulls rather than betting on the “#1” name.
On the daughter‑proven side, the picture is much calmer.
The core of the top group is stable: Sheepster, Dominance, Captain, Momento, Zuri, and Garza were already high in December 2025, and remain in the top 10 in April 2026.
Typical movement is ±20–40 TPI as more daughters arrive, with bigger shifts (Powerhouse +119, Garza −125) explained largely by the formula change rather than an abrupt change in daughter performance.
With reliabilities at or near 99% for many of these bulls, the rank band is structurally stable; a few slots of shuffling don’t change their role as cow‑makers.
For decision‑making:
Treat genomic ranks as high‑gain but high‑volatility signals: great for fast genetic progress, especially on heifers, but you should spread risk across several programs and not assume any one bull will stay #1.
Treat proven ranks as high‑reliability anchors: ideal for herds that want predictable daughters and for large semen volumes on milking cows and donors.
NM$: Economics Lined Up with TPI
The Holstein USA NM$, April 2026 genomic file confirms that TPI 2026 and NM$ are largely pointing to the same bulls.
Genomic NM$ leaders vs TPI – Holstein USA, April 2026
NM$ Rank
Bull (NAAB)
NM$ Apr 2026
TPI Apr 2026
TPI Rank
Divergence Flag
Key Trait Tilt
1
Genosource Valkyrie-ET (551HO07040)
+1308
+3464
Outside top 10
!HIGH NM$, lower TPI
High CFP, strong health; fat-forward
2
Aurora Gs Woodford-ET (551HO06782)
+1296
+3565
#1 TPI
Aligned
Protein+milk+health; dual leader
3
Genosource Viper-ET (551HO07102)
+1296
+3494
Outside top 10
Slight NM$ lead
High milk, strong protein
4
Genosource Morten-ET (551HO06777)
+1282
+3490
Outside top 10
NM$ favored
Big milk +1888, strong CFP
5
Genosource Jitters-ET (551HO07177)
+1127
+3552
#4 TPI
Aligned
High milk, solid survival
6
Ocd Whoops Sabotage-ET (796HO10329)
+1076
+3551
#5 TPI
Aligned
High-NM$ all-rounder
7
S-S-I Richard Chichester-ET (7HO18102)
+1059
+3560
#3 TPI
Aligned
Protein-/health-tilted
8
Beyond Mican Hagrid-ET (7HO18312)
+984
+3562
#2 TPI
!RISK NM$ lag vs TPI
High PTAT +2.24; type premium, lower economics
9
San-Dan On Call-ET (551HO06544)
+1218
+3525
#12 TPI
NM$ favored
Big milk +1751, PL +3.6
10
S-S-I Kingdom Formal-ET (7HO18241)
+1139
+3548
#6 TPI
Aligned
High health index; balanced
For genomics, this means that choosing bulls on TPI alone is less risky than it used to be, because the top TPI list is now almost automatically high NM$ as well; NM$ is more of an economic cross‑check than a competing philosophy.
On the proven side, top TPI sires like Sheepster, Powerhouse, Captain, and Elgin also deliver competitive NM$, albeit a step lower than the very best genomics, which is exactly the reliability vs level trade‑off you expect.
PTAT and RC/R&W PTAT: Specialist Type Tools (with Top RC/RW PTAT Bulls)
The pure PTAT lists – black‑and‑white and Red/Red Carrier – are nearly a separate universe from the TPI/NM$ tables. From the Holstein USA PTAT, April 2026 file, top PTAT sires reach +3.5 to +4.0 PTAT, with huge udders and frames, but usually 150–200 TPI and several hundred NM$ below the Woodford/Jitters type of bull. In the Red Carrier/RW PTAT file, similar-type specialists exist for the Red Carrier and Red & White space.
If your herd prioritizes show and classification, these bulls are ideal when you have a top 5–10% type cow family and are willing to sacrifice some index and NM$ on a few matings to push udders and frames to the next level. If your herd prioritizes herd profitability, you should keep PTAT specialists under 5–10% of total matings and let TPI/NM$ leaders carry the main commercial load while PTAT bulls sculpt the show string and donor group.
Top RC/RW PTAT Bulls – April 2026 and How to Use Them
For herds that want show-ring udders and frames in the Red Carrier and Red & White space, the Holstein USA RC/RW PTAT, April 2026 list provides a small group of extreme‑type tools.
Highlighted RC/RW PTAT bulls – Holstein USA RC/RW PTAT, April 2026 (12‑month bulls)
Bull (NAAB)
PTAT (Holstein USA RC/RW PTAT, April 2026)
Notes
Ruann Karat‑45955‑ET (719HO45955)
+3.92 PTAT
Extreme frames and udders; very low production and index.
Redcarpet Story Arc‑ET (730HO00005)
+3.78 PTAT
High‑type RC bull; niche show sire.
Eskdale Hulu Shoutout‑ET (288HO00364)
+3.56 PTAT
Hulu‑line type for RC cows.
Ruann Archer‑23755‑ET (719HO23755)
+3.32 PTAT
Big frames, strong show pedigree.
Dg Santinus RC (551HO00612)
+3.31 PTAT
RC type bull with modest production.
Ski‑Brite Junior P RC‑ET (288HO00350)
+3.30 PTAT
Polled RC with high PTAT, lower index.
Shg Lazer‑ET (551HO00485)
+3.25 PTAT
Show‑oriented sire for udder and style.
Le‑O‑La Chisel‑ET (551HO06531)
+3.24 PTAT
High type, low production; pure show tool.
Siemers Lazer Hambitious‑ET (288HO00339)
+3.15 PTAT
Lazer son with modern show‑cow pattern.
Sunquest Holy Crypto PP‑ET (250HO18358)
+2.82 PTAT
Homozygous polled with strong PTAT and respectable TPI.
These RC/RW PTAT bulls are not designed to compete with Woodford‑style sires on TPI or NM$; most carry negative production PTAs and lower indexes. If your herd prioritizes show or classification in Red or RC lines, you can use them strategically:
On the top 5–10% of Red and RC cows and heifers from your best type families, especially where udders and frames are already strong, and you want to push for the next level.
For breeders who still need commercial performance in Reds, bulls like Sunquest Holy Crypto PP‑ET can be used on a slightly wider group, because he doesn’t step as far off the index cliff as some pure show sires.
If your herd prioritizes profit and components, keep RC/RW PTAT-specialist usage under 5–10% of matings, and let Red index leaders (Okafor‑Red, Ocean‑Red, etc.) carry the main R&W commercial load.
Red & White: Index and Type in the R&W Space
TPI 2026 doesn’t treat Red & White differently inside the formula, but the April 2026 USA Red & White GTPI tables show a similar protein‑forward pattern among top R&W bulls.
Top R&W TPI – Holstein USA GTPI, April 2026 (selected)
Bull (NAAB)
TPI (Holstein USA GTPI, April 2026)
NM$ (Holstein USA NM$, April 2026)
PTA Milk
PTA Fat
PTA Pro
PTAT
Notes
Denovo 21873 Okafor‑Red‑ET (29HO00951)
3194
+824
+2270
+73
+31
+1.24
High‑index Red, strong CFP, good health.
Aprilday Hrok Athens‑Red‑ET (250HO18217)
3180
+595
+956
+76
+16
+0.57
Protein‑friendly Red with solid health.
Stgen Ocean‑Red‑ET (551HO06846)
3179
+792
+1906
+69
+11
+1.12
NM$‑strong Red for commercial herds.
Ocd Morris Spirit‑Red‑ET (551HO06757)
3177
+872
+1536
+81
+11
−0.06
Big fat, good protein; strong fit for milk cheque.
Compared with December 2025, bulls like Okafor‑Red and Ocean‑Red hold their ground near the top while fat‑heavier R&W sires lose some relative shine; again, the protein‑leaning bulls are formula winners.
For type in the Red space, the Red Carrier/RW PTAT bulls above (e.g., Holy Crypto PP, Story Arc, Karat, Hulu Shoutout) provide show‑caliber udders and frames that you can layer on top of R&W index sires when you want Red daughters that still classify and show.
If your herd wants Red calves with a commercial index:
Look first at Okafor‑Red, Athens‑Red, Ocean‑Red, Spirit‑Red, and similar bulls at the top of the R&W GTPI and NM$ lists.
Use RC/RW PTAT specialists sparingly on top Red females where type is high-priority.
What This Means for Your Matings This Season
This is where the April 2026 USA Holstein proof run earns its keep: turning lists into portfolio and mating moves over the next 30 days.
High‑input, housed herds chasing milk cheque and NM$
If your herd is high‑input, housed, and paid strongly on volume plus components, consider:
Heifers and genomic donors
Use Aurora Gs Woodford‑ET, Genosource Jitters‑ET, and Ocd Whoops Sabotage‑ET heavily on your top 25–40% heifers and genomic donors to maximize TPI (Holstein USA TPI, April 2026) and NM$ (Holstein USA NM$, April 2026).
Layer in Beyond Mican Hagrid‑ET or S‑S‑I Richard Chichester‑ET where you need a different program or P/F bias to manage inbreeding.
Milking cows and ET recipients
Anchor matings with OCD Trooper Sheepster‑ET, Peak Powerhouse‑ET, and Genosource Captain‑ET to lock in high CFP, PL, and reliability on cows that are already working hard.
Accept slightly lower TPI vs genomics in exchange for near‑99% reliability – especially on older cows and donor dams.
Grazing / lower‑input or fertility‑sensitive herds
If your herd prioritizes fertility, survival, and robustness more than absolute production:
On heifers, lean more into genomic bulls like Chichester, Jitters, and Sabotage that balance components with very strong health and fertility, rather than chasing the last 50–80 pounds of milk.
On cows, emphasize proven sires with strong PL/LIV and fertility – e.g., Sheepster, Dominance, Zuri, Sensei– and limit the number of high‑milk but tougher‑fertility bulls like some Captain sons on cows that already struggle to breed back.
Type/show and classification‑focused herds
If your herd is type/show‑oriented, and you’re willing to give up some TPI/NM$:
Keep TPI/NM$ leaders (Woodford/Jitters/Sheepster) as the core for commercial matings, but
On the top 5–10% of your best type cows and heifers, layer in:
High PTAT black‑and‑white bulls from the Holstein USA PTAT, April 2026 file for udders and frames.
RC/R&W PTAT bulls like Sunquest Holy Crypto PP‑ET, Ruann Karat‑45955‑ET, or Redcarpet Story Arc‑ET on elite Red or RC families to upgrade type while maintaining some index.
You gain +3.0 to +4.0 PTAT udders and frames, but you typically give up 150–200 TPI and several hundred NM$, so keep these matings targeted.
Red & White focused herds.
If your herd prioritizes Red & White genetics:
Build your main Red program on Okafor‑Red, Athens‑Red, Ocean‑Red, Spirit‑Red, and similar high‑GTPI/NM$ R&W bulls from the Holstein USA GTPI R&W, April 2026 list.
Introduce RC/RW PTAT sires only on your top R&W cows and heifers, where show/classification is the priority.
Watch bloodline stacking – spreading semen across Denovo, STgen, OCD, and Aprilday R&W bulls helps keep Captain/Trooper/Alta lines from becoming too dense in your Red base.
30‑day action list
Within the next 30 days, for any USA Holstein program using TPI and NM$:
Audit your sire list against movement
Pull your current sire lineup and, using the December 2025 and April 2026 Holstein USA TPI lists, flag any proven bull that lost ≥80 TPI (e.g., Garza) and any that gained ≥80 TPI (e.g., Powerhouse).
Decide whether those “formula losers” still fit your herd’s fat vs protein economics and whether “formula winners” deserve a higher semen share.
Check bloodline concentration
Using the pedigrees in the April 2026 proven and genomic lists, highlight how many of your active bulls trace back to Captain, Trooper/Drive/Topdog, or AltaZazzle/AltaWheelhouse as sire or grandsire.
If a single line dominates, deliberately add a couple of strong non‑Captain/non‑Trooper bulls (e.g., Envy x Riveting like Elgin, Taos‑line bulls like Isaac) to create outcross options.
Re‑tier your matings by risk.
Re‑assign at least 60–70% of milk‑cow matings to proven bulls and the remaining 30–40% to genomics if your herd is risk‑averse; invert that on your top genomic heifers if you prioritize maximum genetic gain.
Make sure each mating segment explicitly matches your herd’s economics (milk pricing, fat/protein premiums) and management style (grazing vs housed, robot vs parlor).
Key Takeaways:
The 24P:14F TPI 2026 protein flip turns Powerhouse (+119 TPI) into a proven winner and knocks fat-heavy bulls like Garza (−125 TPI) down a tier, so your semen mix needs a hard audit.
All 10 genomic USA Holstein TPI leaders in April 2026 are new names within a 37‑point band, which means rank 1 vs rank 10 is noise, and you should buy portfolios, not “the” bull.
Proven sires like Sheepster (+3480 TPI), Powerhouse, Captain, and Elgin still anchor the list with 95–99% reliabilities, trading 150–250 TPI points for far less re‑ranking risk on cows and ET work.
For high‑input herds, Woodford/Jitters/Sabotage‑type genomics align top‑end TPI with +1,000+ NM$, while grazing and fertility‑sensitive herds should lean into health‑tilted sires and cap big‑milk, tougher‑fertility bulls.
Red & White programs now pivot around Okafor‑Red/Ocean‑Red for index and Crypto PP/RC PTAT sires for show type, forcing you to pick where each Red mating sits on the profit‑vs‑pretty spectrum.
Every week, thousands of producers, breeders, and industry insiders open Bullvine Weekly for genetics insights, market shifts, and profit strategies they won’t find anywhere else. One email. Five minutes. Smarter decisions all week.
Lorenzo just landed at +874 PLI while Powerhouse quietly took #1 proven — but the only bulls that balance PLI, TM, feet, and fertility are sitting well outside the headlines
Executive Summary: Lorenzo just landed at +874 PLI in the April 2026 UK run, while 70% of the genomic top 10 turned over, and not one of them appears in the TM genomic top 100. That means the bulls driving £PLI in the UK right now are mostly negative or marginal for Type Merit, so if you’re picking only off the PLI list, you’re probably not prioritizing udders and feet while chasing milk and health. On the proven side, Powerhouse moved to +768 PLI at #1, Severus crashed 168 points to +596, and MASERATI P jumped 80 points but brings -0.08 L&F, so some “safe” sires on old mating lists now look a lot riskier. The rare balanced sires — TROPHY at +769 PLI and +2.09 TM, Taos and RENEGADE with strong PLI, TM, and feet — sit just outside the headline slots and are easy to miss if you’re only scanning the top 10s. WWS now owns 7 of the top 10 proven TM spots off closely related Parfect/Renegade lines, which is great for type but a real inbreeding trap if your semen invoices already lean WWS-heavy. For your herd, this run says: cap exposure to any single genomic PLI rocket, audit how many cows are still booked to big droppers like COYOTE P and ALTAVALUEPACK, and make sure at least a few of your main sires live in the small overlap where PLI, TM, fertility, and feet all point in the same direction.
Seven of the top 10 genomic PLI positions turned over between December 2025 and April 2026 in the UK evaluation — one of the highest-churn runs in recent memory. DENOVO 22750 LORENZO, a brand-new entrant at +874 PLI (April 2026 UK evaluation, 66% reliability), seized the #1 genomic spot from DENOVO COYOTE P, who cratered 62 points from +871 to +809 PLI and fell from first to 13th. Meanwhile, PEAK POWERHOUSE climbed to #1 daughter-proven at +768 PLI (April 2026 UK evaluation, 78% reliability), displacing OCD TROOPER SHEEPSTER, who dropped 72 points.
But here is the run’s most provocative signal: the PLI and Type Merit indexes are pulling in opposite directions at the genomic level. Lorenzo’s +874 PLI comes with a -0.21 Type Merit. OCD MANNY, the new #1 Type Merit genomic bull at +2.90 TM (April 2026 UK evaluation, 53% TM reliability), carries just +662 PLI — too low to crack the PLI top 100. Zero bulls appear in both the PLI genomic top 10 and the Type Merit genomic top 100. For breeders who care about both production economics and structural longevity, this divergence demands attention.
What Changed at the PLI Genomic Top?
The December 2025 PLI genomic top 10 was tightly bunched: the #1-to-#10 spread was just 26 points (871 down to 845). April 2026 blew that band open to 58 points (874 down to 816), with only three bulls surviving from the previous top 10.
Rank (Apr 2026)
Bull
PLI (Apr 2026, UK PLI)
PLI (Dec 2025, UK PLI)
Change
PLI Rlb
AI Company
1
DENOVO 22750 LORENZO A2A2 KCBB
874
New
—
66%
GEN
2
PEAK ALTAROTATION A2A2 KCBB
867
New
—
66%
ALT
3
PEAK ALTAVAUGHN
853
New
—
66%
ALT
4
DENOVO 6856 HOTSHOT A2A2 KCBB
846
New
—
66%
GEN
5
GENOSOURCE JUDO A2A2 KCBB
845
New
—
66%
CBL
6
OCD SHEEPSTER MIKE
828
New
—
67%
WWS
7
ADAWAY BEYOND FAITHFUL KCBB
827
860 (#6)
-33
67%
SMX
8
OCD THORSON RIPCORD A2A2
822
New
—
67%
CBL
9
DENOVO 20723 COLUMBIA A2A2 KCBB
819
864 (#4)
-45
66%
GEN
10
BADGER SIEMERS DAY TRIP
816
870 (#2)
-54
67%
WWS
The three survivors all dropped: ADAWAY BEYOND FAITHFUL fell 33 points, COLUMBIA lost 45, and DAY TRIP slid 54 points between December 2025 and April 2026. When the anchors decline, and the new entrants arrive untested, breeders should treat this top group as a hypothesis, not a verdict.
The Big Movers: Up, Down, and Out
Biggest Drops Inside the PLI Genomic Top 100
The most consequential movement happened outside the top 10. Several bulls that were generating heavy semen demand in late 2025 took significant hits:
Bull
Dec 2025 Rank (UK PLI)
Dec 2025 PLI
Apr 2026 Rank (UK PLI)
Apr 2026 PLI
Change
DENOVO COYOTE P A2A2
1
871
13
809
-62
PROGENESIS PRESTON A2A2
3
867
16
805
-62
PEAK ALTAVALUEPACK KCBB
7
860
49
766
-94
PEAK ALTAMAXIMINO KCBB
15
832
92
723
-109
PEAK ALTAREGALCROWN
31
816
Dropped out
—
—
PEAK ALTACASANOVA
72
768
Dropped out
—
—
COYOTE P’s fall — from #1 at +871 PLI (December 2025 UK evaluation) to #13 at +809 PLI (April 2026 UK evaluation) — is a textbook reminder of what 66% reliability means in practice. Sixty-two points of movement in a single run. ALTAVALUEPACK’s 94-point decline from #7 to #49 is even sharper. ALTAMAXIMINO’s 109-point plunge from #15 to #92 dropped it from a semen-demand hot list to borderline irrelevance in one evaluation cycle.
Three Alta bulls (AltaValuepack, AltaMaximino, AltaRegalcrown) took the heaviest damage in this run. This pattern could reflect daughter data accumulating in a direction that doesn’t match the genomic prediction, or it could reflect the normal variance associated with sub-70% reliabilities. Either way, any breeder who loaded mating lists with these bulls in Q1 2026 should audit their exposure.
Risers to Watch
Not everything moved down. A few bulls that were already in the December 2025 list held their ground or entered with strong profiles:
PEAK ALTATALLTALE entered at #11 (+815 PLI, April 2026 UK evaluation, 66% reliability) with a balanced TM of +0.54 and +0.61 Mammary — one of the few new PLI top-20 entrants carrying positive conformation.
DENOVO 20771 SEGMENT A2A2 held at #12 (+812 PLI, April 2026 UK evaluation), essentially stable from December’s +844 at #11. A 32-point decline, but modest relative to the carnage around it.
OCD SHEEPSTER MIKE is the most interesting new PLI top-10 arrival from a dual-purpose perspective: +828 PLI (April 2026 UK evaluation, 67% reliability) with +1.16 TM, +0.83 Mammary, +1.66 Legs & Feet, and +1.59 Locomotion. That combination of structural soundness and high PLI is rare at this level.
What PLI Is Rewarding This Run
The April 2026 PLI genomic top group has tilted decisively toward production and health economics at the expense of conformation. Across the top 3 bulls:
Average Milk: +723 kg (Lorenzo +953, AltaRotation +745, AltaVaughn +471, April 2026 UK evaluation)
Average TM: -0.21 to +0.76 — two of three carry negative or barely positive Type Merit
Average Mammary: -0.14 to +0.54 — Lorenzo and AltaRotation both carry negative Mammary composites, AltaVaughn is modestly positive
Average Fertility Index: +137 to +174 — strong reproductive values for all three
Compare that to December 2025’s top 3 (Coyote P, Day Trip, Preston), which averaged +940 kg of Milk but carried modestly higher TM scores (+0.76, -0.40, +0.93, respectively, in the December 2025 UK evaluation). The shift isn’t dramatic in production volume, but the conformation trade-off has steepened. Lorenzo and AltaRotation both carry negative TM values (-0.21 each, April 2026 UK evaluation), meaning breeders selecting on PLI alone are now actively pulling Type Merit backward at the very top of the ranking.
The Legs & Feet and Locomotion picture has also shifted. Lorenzo carries +0.82 L&F and +0.86 Locomotion — adequate. AltaRotation carries just +0.08 L&F and +0.13 Locomotion. For robotic milking herds where foot health directly impacts fetch rates, AltaRotation’s PLI rank may overstate his practical value.
How Volatile Are the UK’s PLI Genomic Rankings Right Now?
The 70% top-10 turnover rate and the band expansion from 26 points to 58 points are the two numbers that matter most for calibrating confidence in this run.
When 7 of 10 positions turn over, and all 10 bulls carry 66–67% reliability, the ranking is better understood as a probability distribution than a fixed leaderboard. Lorenzo at +874 PLI is the best current estimate of his genetic merit — but at 66% reliability, his true value could plausibly sit anywhere in a range of roughly ±50 PLI points. That means he could be a +924 bull or a +824 bull, and we won’t know for several more runs.
The three surviving anchors all moved down (FAITHFUL -33, COLUMBIA -45, DAY TRIP -54), which suggests the December 2025 genomic top group was slightly inflated relative to where the data settled in April 2026. This is normal genomic regression, not a system failure — but it reinforces why single-run PLI rankings should never be treated as definitive sire selection tools in isolation.
Key risk metric: Every bull in the PLI genomic top 10 has a reliability below 70%. No exceptions. Treat accordingly.
Whether this 70% churn rate is historically elevated or within normal UK genomic variance would require a multi-run comparison; that’s a trend line we’ll track in future proof-run coverage.
Reliability
Example Bulls
Estimated PLI Range
Practical Interpretation
Season Strategy
50–60%
OCD Manny TM (53%)
±60+ pts
Hypothesis, not a score
Max 5% of matings
66–67%
Lorenzo, AltaRotation, Hotshot
±50 pts
Good guess, will move
Max 15–20% of matings
75–80%
Powerhouse (78%), Sheepster DP (79%)
±35 pts
Solidifying
Up to 25% of matings
85–90%
Maserati P (89%), Graziano (88%)
±20 pts
Nearly final
Routine use justified
95–99%
Captain (98%), Renegade (98–99%)
±8 pts
Done moving
No cap needed
PLI Daughter-Proven: Powerhouse Takes #1 as Sheepster and Severus Fall Hard
The daughter-proven PLI list tells a more stable story — but still contains surprises. Seven of the December 2025 top 10 held their positions in April 2026, compared to just three on the genomic side. The proven top is anchored, but several high-profile bulls took heavy hits.
Rank (Apr 2026)
Bull
PLI (Apr 2026, UK PLI)
PLI Rlb
PLI (Dec 2025, UK PLI)
Dec Rank
Change
1
PEAK POWERHOUSE A2A2
768
78%
746 (#3)
3
+22
2
GENOSOURCE CAPTAIN A2A2
726
98%
696 (#7)
7
+30
3
OCD TROOPER SHEEPSTER
711
79%
783 (#1)
1
-72
4
SDG-PH DELUX DOMINANCE A2A2
698
76%
744 (#4)
4
-46
5
PLAIN-KNOLL RENEGAD TROOPER
675
85%
710 (#5)
5
-35
6
WINSTAR GRAZIANO HH6C
669
88%
694 (#8)
8
-25
7
OCD DELUXE T REX A2A2
666
75%
704 (#6)
6
-38
8
WINSTAR MASERATI P A2A2 POC
665
89%
585 (#41)
41
+80
9
COGENT KOEPON ROCKY HH6C
662
84%
New to top 10
—
—
10
DENOVO 17121 SARGENT
649
86%
New to top 10
—
—
POWERHOUSE’s Rise to #1
PEAK POWERHOUSE gained 22 PLI points (+746 to +768, December 2025 to April 2026 UK evaluation) while most of his proven peers declined. At 78% reliability, he’s building confidence with each run. His profile is high-production, moderate-type: +1,111 kg Milk, +0.07 Fat %, +0.11 Prot %, but just +0.17 TM (April 2026 UK evaluation). His Mammary (+0.14) and Legs & Feet (+0.27) are minimal — he’s a PLI-efficiency bull, not a dual-purpose one.
GENOSOURCE CAPTAIN: The Quiet Climber
CAPTAIN’s +30 PLI gain (696 to 726, December 2025 to April 2026) on 98% reliability is arguably the most trustworthy number in the entire UK evaluation right now. At near-maximum reliability, his ranking is essentially final. His profile is balanced: +973 kg Milk, +1.09 Mammary, +0.73 Legs & Feet, +1.07 Locomotion, and +0.91 TM (April 2026 UK evaluation). Not flashy, but the data is done moving.
The Big Proven Losers
The December 2025 #1 and #2 both fell hard:
OCD TROOPER SHEEPSTER: -72 PLI (783 to 711, December 2025 to April 2026 UK evaluation), #1 to #3. His TM actually improved slightly (+1.07 to +1.22, December 2025 to April 2026), but production and health traits pulled his PLI down. At 79% reliability, this drop may stabilize — but the December #1 ranking now looks like the high-water mark.
PEAK ALTASEVERUS: -168 PLI (764 to 596, December 2025 to April 2026 UK evaluation), #2 to #22. This is the single largest PLI decline in the entire top group. ALTASEVERUS went from the second-highest proven bull in the UK to the 22nd in one run. At 88% reliability, this isn’t genomic noise — it’s daughter data correcting the prediction significantly downward. His TM moved from -2.64 (December 2025) to -2.53 (April 2026) — a marginal improvement but still deeply negative. Breeders who used Severus heavily in 2025 should review progeny performance.
PEAK ALTASOLACE: -111 PLI (683 to 572, December 2025 to April 2026 UK evaluation), #9 to #32. Another Alta proven bull with a triple-digit decline.
ALL.NURE WENDAT: -112 PLI (678 to 566, December 2025 to April 2026 UK evaluation), #10 to #35.
WINSTAR MASERATI P: The Biggest Proven Riser
MASERATI P surged 80 PLI points (585 to 665, December 2025 to April 2026 UK evaluation) to crack the top 10 at #8, jumping from #41 in December 2025. At 89% reliability, this gain carries weight. His profile is health-heavy: +0.38 SCC, +0.73 Mammary — solid for housed herds focused on cell count management — but his Legs & Feet of -0.08 is a red flag for any system where mobility matters. His TM of +0.55 and production of just +392 kg Milk mean he’s not a volume bull. He’s a cell-count-and-health play at a competitive PLI level, but herds needing structural soundness should look elsewhere.
Type Merit Genomic: OCD Manny Arrives at +2.90 TM — And the PLI Overlap Is Zero
The Type Merit genomic list runs on entirely different logic than PLI, and April 2026 makes that divergence impossible to ignore. OCD MANNY debuted at #1 with a +2.90 TM (53% TM reliability, April 2026 UK evaluation), the highest genomic Type Merit score in that evaluation. His PLI of +662 doesn’t appear in the PLI genomic top 100 (minimum threshold: +715 PLI, April 2026 UK evaluation).
TM Genomic Top 10: April 2026 vs December 2025
Rank (Apr 2026)
Bull
TM (Apr 2026, UK TM)
TM (Dec 2025, UK TM)
Change
PLI (Apr 2026, UK PLI)
AI
1
OCD MANNY
2.90
New
—
662
SMX
2
SYNERGY KICKSTART A2A2 KCBB
2.75
2.93 (#1)
-0.18
426
WWS
3
NORTH-POLLED MAXUM-P RED A2A2 POC
2.61
2.75 (#4)
-0.14
193
SMX
4
CLWCH RHAPSODY EX90
2.56
2.73 (#5)
-0.17
94
UKD
5
DG PHOENIX KCBB
2.49
2.65 (#8)
-0.16
480
CBL
6
MYSTIQUE ANIMATION KCBB RDC
2.46
2.75 (#3)
-0.29
385
SMX
7
WALNUTLAWN PG BENSON A2A2
2.45
2.66 (#7)
-0.21
148
SMX
8
COGENT DG ELBA
2.44
New to top 10
—
507
ALT
9
PROGENESIS KOMET
2.40
2.49 (#14)
-0.09
305
SMX
10
STGEN PARFT ROSEVILLE
2.39
2.60 (#10)
-0.21
456
CBL
Every returning bull dropped TM this run — no exceptions among the seven anchors. SYNERGY KICKSTART fell from #1 at +2.93 TM to #2 at +2.75, a -0.18 decline that also came with a -63 PLI drop (489 to 426, December 2025 to April 2026). MYSTIQUE ANIMATION took the steepest hit: -0.29 TM (2.75 to 2.46) and -75 PLI (460 to 385).
Three bulls exited the top 10. SHELAND PARFECT LOCK transitioned from the genomic TM list (#2 at +2.77 TM, December 2025, 71% PLI reliability) to the daughter-proven TM list (#6 at +2.42 TM, April 2026, 91% PLI reliability). His TM dropped 0.35 points during the genomic-to-proven transition — a useful reference point for anyone projecting how current genomic TM leaders might look once daughter data arrives.
What the TM Top Group Looks Like
The TM genomic top 10 is a conformation-first population. Average PLI across the top 10 is just +340 — less than half the PLI genomic top-10 average of +840. Five of the top 10 carry PLI below +400. CLWCH RHAPSODY EX90 at just +94 PLI would be essentially off the radar for any PLI-focused breeding program, despite being the UK’s #4 genomic Type Merit bull.
Mammary composites run high: OCD MANNY +2.99 MAM, MYSTIQUE ANIMATION +2.71, WALNUTLAWN PG BENSON +2.29 (April 2026 UK evaluation). Legs & Feet are likewise elevated, with MANNY at +1.73 L&F and BENSON at +2.16. These are structural bulls built for classification programs and longevity-first herds.
SMX dominates the TM genomic top 10, holding 5 of 10 positions (up from 4 in December 2025). CBL holds 2, with WWS, UKD, and ALT each at 1.
Type Merit Daughter-Proven: Rimrock Takes #1 as WWS Locks Down 7 of 10 Spots
The Type Merit daughter-proven list saw dramatic reshuffling. BOMAZ RIMROCK RDC, a GEN bull, rose to #1 at +2.88 TM (89% TM reliability, April 2026 UK evaluation). He was #20 in December 2025 at +2.33 TM — a gain of +0.55 TM points as daughter data accumulated.
The December 2025 TM DP #1, SANDY-VALLEY ESQUIRE (+3.02 TM, December 2025 UK evaluation), dropped out of the top 100 of the April 2026 dedicated Type Merit DP. AOT HAMPSHIRE, December’s #2 at +3.00 TM, fell to #3 at +2.63 TM (-0.37). SIEMERS RENGD PARFECT slipped from #3 at +2.97 to #2 at +2.74 (-0.23 TM).
The defining feature of the April 2026 TM DP top 10 is WWS’s dominance: 7 of the top 10 positions are WWS-marketed bulls. Positions #2 through #9 are all either Siemers, Sheland Parfect Lock, Winstar Parfect Cirrus P, AOT Parfect Harmony, Regan-Danhof Capone, or S-S-I PR Renegade — all distributed by WWS. The Parfect/Renegade bloodlines are heavily represented, suggesting concentration risk for herds sourcing exclusively from this list.
LEANINGHOUSE TAOS, at #13 on the TM DP list (+1.98 TM, 95% TM reliability, April 2026 UK evaluation) and #15 on the PLI DP list (+613 PLI, 96% reliability, April 2026), is one of the few daughter-proven bulls that appears near the top of both rankings — a genuine dual-index performer with the reliability to back it up.
The Cross-Index Divergence: PLI and Type Merit Are Selecting for Different Animals
This is the structural story of the April 2026 UK evaluation, and it warrants explicit treatment.
Genomic: Zero Overlap
Not a single bull in the PLI genomic top 10 appears in the Type Merit genomic top 100. Not a single bull in the TM genomic top 10 appears in the PLI genomic top 100. The two indices are selecting entirely non-overlapping populations at the extremes.
PLI Genomic #1 (Apr 2026 UK PLI)
TM Genomic #1 (Apr 2026 UK TM)
DENOVO LORENZO: +874 PLI, -0.21 TM
OCD MANNY: +2.90 TM, +662 PLI
Production-first, negative conformation
Conformation-first, moderate production
66% PLI reliability
53% TM reliability
GEN
SMX
The best cross-index genomic performer in the April 2026 evaluation is TROPHY A2A2 (+769 PLI at genomic rank #46, +2.09 TM at TM rank #29, April 2026 UK evaluation). He carries +504 kg Milk, +2.54 Mammary, +2.04 Legs & Feet, +2.01 Locomotion, and a Fertility Index of +174 — the rare bull who doesn’t force breeders to choose between PLI and Type Merit. His AI company, SYN, may limit availability in some markets.
BEYOND HI-PACE (+722 PLI at #93, +1.93 TM at #39, April 2026 UK evaluation) is another dual-index bull with +1.35 Mammary, +1.01 L&F, and +0.99 Locomotion, though his PLI sits near the bottom of the top 100 and his TM is mid-pack.
Bull
PLI Rank
PLI (£)
TM Rank
TM Score
Milk (kg)
Mammary
L&F
Locomotion
Fertility
Reliability
TROPHY A2A2
#46 Genomic
769
#29 Genomic
+2.09
+504
+2.54
+2.04
+2.01
+174
66% PLI
Sheepster Mike
#6 Genomic
828
Top 100
+1.16
n/a
+0.83
+1.66
+1.59
n/a
67% PLI
Beyond Faithful
#7 Genomic
827
Top 100
+1.23
n/a
+1.50
+0.63
+0.73
n/a
67% PLI
LEANINGHOUSE TAOS
#15 Proven
613
#13 Proven
+1.98
+896
+1.79
+2.42
+2.87
n/a
96% PLI
S-S-I PR RENEGADE
#27 Proven
583
#9 Proven
+2.25
n/a
+1.54
+2.41
+2.81
n/a
98% PLI
Beyond Hi-Pace
#93 Genomic
722
#39 Genomic
+1.93
n/a
+1.35
+1.01
+0.99
n/a
66% PLI
Daughter-Proven: Slightly More Overlap, But Still Divergent
At the proven level, the gap narrows slightly:
LEANINGHOUSE TAOS: PLI DP #15 (+613 PLI, 96% reliability), TM DP #13 (+1.98 TM, 95% reliability), April 2026 UK evaluation. The most balanced proven bull in the UK system right now. His +1.79 Mammary, +2.42 Legs & Feet, and +2.87 Locomotion make him a standout structural sire, while +896 kg Milk and strong health traits keep his PLI competitive.
S-S-I PR RENEGADE: PLI DP #27 (+583 PLI, 98% reliability), TM DP #9 (+2.25 TM, 99% reliability), April 2026 UK evaluation. Near-maximum reliability on both indexes. His +1.54 Mammary, +2.41 L&F, and +2.81 Locomotion are elite linear scores with legitimate PLI backing.
PEAK POWERHOUSE (PLI DP #1, +768 PLI, April 2026 UK evaluation) carries just +0.17 TM — not in the TM DP top 100.
BOMAZ RIMROCK RDC (TM DP #1, +2.88 TM, April 2026 UK evaluation) carries just +374 PLI — not in the PLI DP top 100.
The divergence is less extreme among proven bulls than genomics, but the principle holds: the #1 on each index doesn’t rank on the other.
AI Companies and Bloodlines: Who Owns the Top and What Changed
PLI Genomic Top 10
AI Company
Dec 2025 Top 10 (UK PLI YG)
Apr 2026 Top 10 (UK PLI YG)
Direction
GEN
5
3
↓
SMX
2
1
↓
ALT
2
2
—
CBL
0
2
↑
WWS
1
2
↑
GEN’s December dominance (5 of 10) contracted to 3 of 10 in April. CBL entered the top 10 for the first time with GENOSOURCE JUDO (#5) and OCD THORSON RIPCORD (#8). ALT held two spots, but both are untested first-run bulls (AltaRotation, AltaVaughn) — fragile positions. WWS gained through OCD SHEEPSTER MIKE and BADGER SIEMERS DAY TRIP.
PLI Daughter-Proven Top 10
The proven list is more diversified: WWS (3), CBL (2), GEN (2), UKD (1), SMX (1), ALT (0 — a notable absence from the proven top 10 given Alta’s heavy genomic marketing).
Type Merit Genomic Top 10
SMX dominates with 5 of 10 positions. For classification-focused breeders, SMX is the primary semen source at the genomic level. CBL holds 2 spots.
Type Merit Daughter-Proven Top 10
WWS controls 7 of 10 positions — the most concentrated company share across any of the four rankings. The Parfect/Renegade family line runs through multiple bulls in this group (Siemers Rengd Parfect, Sheland Parfect Lock, Winstar Parfect Cirrus P, AOT Parfect Harmony). Herds building mating lists exclusively from the TM DP top 10 risk significant bloodline overlap. Cross-referencing pedigrees before committing to multiple WWS type bulls from this list is essential.
What This Means for Your Matings This Season
For Housed, High-Input Herds Prioritizing PLI
If your breeding goal is maximum economic index in a housed TMR system, LORENZO (+874 PLI, April 2026 UK evaluation), ALTAROTATION (+867 PLI), and HOTSHOT (+846 PLI) sit at the top — but all carry 66% reliability and negative or barely positive TM. Use them as part of a diversified sire portfolio, not as blanket picks. Limit any single genomic bull to no more than 15–20% of matings until reliability crosses 75%.
If you want PLI with proven confidence, GENOSOURCE CAPTAIN (+726 PLI, 98% reliability, April 2026 UK evaluation) is the safest bet in the entire UK evaluation. His numbers aren’t moving. PEAK POWERHOUSE (+768 PLI, 78% reliability, April 2026) offers higher PLI but with less certainty.
For Grazing and Lower-Input Systems
Grazing herds that need moderate production with strong fertility and structural soundness should look at TROPHY A2A2 (+769 PLI, +2.09 TM, Fertility Index +174, +2.54 Mammary, +2.04 L&F, +2.01 Locomotion, April 2026 UK evaluation). He’s the best cross-index genomic bull in this run and carries the kind of balanced profile that holds up on pasture. His SYN distribution may require proactive sourcing.
At the proven level, LEANINGHOUSE TAOS (+613 PLI, +1.98 TM, 96% PLI reliability, 95% TM reliability, April 2026 UK evaluation) is the standout. His daughter’s proof is essentially confirmed, his Legs & Feet (+2.42) and Locomotion (+2.87) are outstanding for grazing longevity, and his +1.79 Mammary supports functional udder quality alongside +896 kg Milk.
For Robotic Milking Herds
Bull
PLI (£)
TM
Mammary
L&F
Locomotion
PLI Rlb
Best Use
S-S-I PR RENEGADE
583
+2.25
+1.54
+2.41
+2.81
98%
Elite foot/leg certainty
LEANINGHOUSE TAOS
613
+1.98
+1.79
+2.42
+2.87
96%
Best overall balance, proven
SHEEPSTER MIKE
828
+1.16
+0.83
+1.66
+1.59
67%
Highest PLI + structural genomic
BEYOND FAITHFUL
827
+1.23
+1.50
+0.63
+0.73
67%
PLI + udder; weaker feet
GENOSOURCE CAPTAIN
726
+0.91
+1.09
+0.73
+1.07
98%
Proven, balanced, stable
PEAK POWERHOUSE
768
+0.17 ⚠️
+0.14 ⚠️
+0.27 ⚠️
n/a
78%
PLI leader only; not a robot pick
MASERATI P
665
+0.55
+0.73
-0.08⚠️
n/a
89%
Cell count bull; avoid on mobility herds
LORENZO
874
-0.21 ⚠️
-0.14 ⚠️
+0.82
+0.86
66%
PLI rocket; structural cost
ALTAROTATION
867
-0.21 ⚠️
-0.14 ⚠️
+0.08⚠️
+0.13 ⚠️
66%
Worst feet in PLI top 3 for robots
If you’re running robots, screen for Mammary and Legs & Feet first, PLI second. OCD SHEEPSTER MIKE (+828 PLI, +1.16 TM, +0.83 Mammary, +1.66 L&F, +1.59 Locomotion, April 2026 UK evaluation) is the clear genomic standout for robot herds — strong enough PLI to justify the pick, with the foot and leg traits that reduce fetch failures. His Mammary at +0.83 is adequate though not elite; pair him with high-MAM maternal lines where udder attachment needs reinforcement.
If your herd’s primary bottleneck is udder conformation rather than locomotion, ADAWAY BEYOND FAITHFUL(+827 PLI, +1.23 TM, +1.50 Mammary, +0.63 L&F, +0.73 Locomotion, April 2026 UK evaluation) offers better Mammary but weaker feet — a different trade-off that suits herds where locomotion is already under control.
Among proven bulls, S-S-I PR RENEGADE (+583 PLI, +2.25 TM, 98% PLI reliability, +1.54 Mammary, +2.41 L&F, +2.81 Locomotion, April 2026 UK evaluation) combines elite structural proof with legitimate PLI backing for herds that can accept a lower PLI floor in exchange for near-certainty on feet and legs.
For Type and Classification Programs
If your primary goal is classification and a show-oriented type while keeping PLI respectable, OCD MANNY (+2.90 TM, +662 PLI, April 2026 UK evaluation) is the genomic TM leader but comes with a PLI trade-off compared with the extreme PLI bulls. His +2.99 Mammary is the highest in the TM top 10. Use him for targeted structural matings, not as a universal sire of sons.
If your herd needs type but can’t give up too much PLI, SYNERGY KICKSTART (+2.75 TM, +426 PLI, April 2026 UK evaluation) is the second-highest genomic TM bull, but his PLI of +426 is a substantial economic penalty. Reserve him for cows where conformation needs outweigh production targets.
At the proven level, BOMAZ RIMROCK RDC (+2.88 TM, +374 PLI, 89% TM reliability, April 2026 UK evaluation) is a high-confidence type sire. His Red Carrier status opens crossbreeding flexibility. SIEMERS RENGD PARFECT(+2.74 TM, +418 PLI, 95% TM reliability, April 2026) offers slightly more PLI with near-maximum type reliability.
For Beef-on-Dairy Cull Programs
If you’re using beef-on-dairy on the bottom of your herd, you want the remaining dairy matings concentrated on the highest-PLI or highest-TM bulls appropriate to your goals — and aligned with this run’s data. Any cow still allocated to ALTASEVERUS (now +596 PLI, April 2026 UK evaluation, down from +764 in December 2025) or ALTASOLACE (+572 PLI, April 2026, down from +683) should be reassigned before the next breeding round.
30-Day Action Item
Pull your current UK mating list and cross-check every sire against the April 2026 PLI and Type Merit rankings. Specifically:
Flag any bull that dropped >50 PLI points this run — particularly COYOTE P (-62), PRESTON (-62), ALTAVALUEPACK (-94), and ALTAMAXIMINO (-109). Review remaining inventory allocation before your next mating cycle.
Audit bloodline concentration in your WWS type bulls if you source heavily from the TM DP list. Seven of the top 10 TM DP bulls are distributed by WWS and share overlapping Parfect/Renegade pedigrees.
Rebalance your PLI-to-TM mix. If you’ve been selecting purely on PLI, the April 2026 top group is pushing TM backward. For herds that need structural maintenance alongside economic gain, consider adding TROPHY, SHEEPSTER MIKE, or FAITHFUL as dual-purpose anchors.
Key Takeaways:
Lorenzo debuts at +874 PLI and drives a 70% turnover in the UK genomic top 10, but none of those bulls make the TM genomic top 100, so pure-PLI selection now pushes type backward.
On the proven list, Powerhouse climbs to +768 PLI at #1 while Severus drops 168 points and MASERATI P rises to +665 PLI with -0.08 L&F, making several “trusted” sires much higher risk than they looked last run.
The best all‑rounders sit off the front page: TROPHY (+769 PLI, +2.09 TM), Taos and RENEGADE combine strong PLI, TM, and feet, and are the bulls most likely to keep both your milk cheque and your cull list happy.
WWS controls 7 of the top 10 proven TM spots off Parfect/Renegade blood, which is great for type but dangerous for inbreeding if a WWS-heavy semen bill is already running through your TMR herd.
Action this run: cap exposure to any one genomic PLI rocket, pull any leftover Severus/ALTAVALUEPACK/COYOTE P from routine matings, and make sure each herd segment has at least one sire where PLI, TM, fertility, and legs all point the same way.
Every week, thousands of producers, breeders, and industry insiders open Bullvine Weekly for genetics insights, market shifts, and profit strategies they won’t find anywhere else. One email. Five minutes. Smarter decisions all week.
The Pro$ ceiling dropped ~250 points for most top bulls. If your sire lineup hasn’t changed since December, your income math has.
Executive Summary: ROZLINE just lost 626 Canada Pro$ in one run (from +2664 in December 2025 to +2038 in April 2026), while PARFECT quietly gained 58 Canada LPI points to take #1 at +3914. PATTERN stays #1 on Canada Pro$ at +2974 but gives back 237 Pro$, and CABO trims 231 Pro$ to sit at +2877, which means the Pro$ ceiling on proven sires dropped ~200–250 points for most front‑end bulls. That’s a different risk picture if you’re budgeting semen off last run’s income numbers or counting on single‑bull exposure to carry your Pro$ average. The daughter‑proven LPI and Pro$ top 10s are still anchored by many of the same names, but the big Pro$ hits to ROZLINE and GRAZIANO and the new arrival of POWERSTAR at +2854 Pro$ show how quickly “go‑to” bulls can be repriced. Genomic GPA LPI and GPA Pro$ lists remain volatile, with new bulls rotating through the top 10, so stacking too many matings on a couple of young sires is still a higher‑beta play. If your herd prioritizes income, robot‑friendly type, or inbreeding control, this run gives you clear signals on which proven sires to keep as anchors, which to demote to niche roles, and where Red/polled or alternative‑family outcrosses can keep your milk cheque and future mating options safer.
In the April 2026 Canada Holstein proof run, SIEMERS RENGD PARFECT‑ET moves to #1 on Canada LPI at +3914 (Canada Holstein LPI, April 2026) after sitting at +3856 and #5 in December 2025 (Canada Holstein LPI, December 2025). At the same time, PROGENESIS PATTERN stays #1 on Canada Pro$ at +2974 (Canada Holstein Pro$, April 2026) but drops 237 Pro$ from +3211 (Canada Holstein Pro$, December 2025). The bigger hit belongs to SIEMERS RENEGADE ROZLINE‑ET: he falls from +2664 to +2038 (Canada Holstein Pro$, December 2025 vs April 2026), a −626 Pro$ change, and from +3947 to +3810 on Canada LPI, sliding from #1 to #9 (Canada Holstein LPI, December 2025 vs April 2026).
For elite breeders and AI programs, this April 2026 Canada Holstein run matters because it compresses the top of both Canada LPI and Pro$ rankings, trims the income ceiling on several headline bulls, and shifts which sires you should treat as portfolio anchors vs. specialists over the next 6–12 months. The daughter‑proven front edge looks more stable than the genomic lists, but the magnitude and pattern of Pro$ changes still carry real implications for how you weight income vs type at the very top.
What Changed at the Top?
On the daughter‑proven side, SIEMERS RENGD PARFECT‑ET moves from +3856 (Canada Holstein LPI, December 2025, rank #5) to +3914 (Canada Holstein LPI, April 2026, rank #1), gaining 58 LPI and jumping four spots. STANTONS REMOVER PP moves from +3831 (Canada Holstein LPI, December 2025, rank #9) to +3873 (Canada Holstein LPI, April 2026, rank #2), a +42 LPI move that pushes him into the top pair. December 2025’s #1, SIEMERS RENEGADE ROZLINE‑ET, drops from +3947 to +3810 (Canada Holstein LPI, December 2025 vs April 2026), losing 137 LPI and landing at #9 in April 2026.
PEAK ALTAINSCAPE‑ET shifts from +3897 (Canada Holstein LPI, December 2025, rank #2) to +3829 (Canada Holstein LPI, April 2026, rank #7), −68 LPI, and WINSTAR MELBY‑P‑ET moves out of the April 2026 LPI top 10 from +3838 (Canada Holstein LPI, December 2025, rank #7 tied), though he remains in the top 100. Overall, roughly seven of the December 2025 Canada Holstein LPI top 10 still sit in or immediately around the top 10 in April 2026, with 3–4 bulls rotating in and out.
On Canada Pro$, PROGENESIS PATTERN holds #1 but drops from +3211 to +2974 (Canada Holstein Pro$, December 2025 vs April 2026), a −237 Pro$ change. DENOVO 16034 CABO‑ET stays #2 but falls from +3108 to +2877 (Canada Holstein Pro$, December 2025 vs April 2026), −231 Pro$. A new face, PEAK POWERSTAR‑ET, appears at +2854 (Canada Holstein Pro$, April 2026, rank #3) after not featuring in the December 2025 Pro$ top 100, while December 2025’s #3, WINSTAR GRAZIANO‑ET, drops from +3099 to +2655 and from #3 to #81 tied (Canada Holstein Pro$, December 2025 vs April 2026).
The headline shift is clear: the LPI front is reshuffled but still anchored by broadly similar bulls, while the Pro$ ceiling has been lowered by roughly 200–250 points for most top‑end sires, with ROZLINE and GRAZIANO seeing much larger income hits.
Role: daughter‑proven, high‑type, balanced‑components LPI anchor for programs that want type and functional production and can live with mid‑band Pro$.
STANTONS REMOVER PP
LPI: +3831 (Canada Holstein LPI, December 2025, rank #9) → +3873 (Canada Holstein LPI, April 2026, rank #2), +42 LPI.
Pro$: +3070 (Canada Holstein Pro$, December 2025, rank #4) → +2771 (Canada Holstein Pro$, April 2026, rank #8), −299 Pro$.
Role: polled, high‑milk, high‑component proven bull who remains a Pro$ factor even after a trim; ideal where polled is non‑negotiable, and income still matters.
PEAK POWERSTAR‑ET
Pro$: not in December 2025 Canada Holstein Pro$ top 100 → +2854 (Canada Holstein Pro$, April 2026, rank #3), new entrant.
Role: still the Pro$ reference bull but now as part of a compressed top tier; an income anchor with sufficient type and health for large, efficiency‑driven herds.
DENOVO 16034 CABO‑ET
Pro$: +3108 (Canada Holstein Pro$, December 2025, rank #2) → +2877 (Canada Holstein Pro$, April 2026, rank #2), −231 Pro$.
LPI: +3707 (Canada Holstein LPI, December 2025, rank #33) → +3611 (Canada Holstein LPI, April 2026, rank #32), −96 LPI.
Role: still attractive where very high fat % and good management traits are prioritized; no longer a top‑band Pro$ pick for general use.
What Canada LPI and Pro$ Are Rewarding This Run
The April 2026 Canada Holstein LPI top group is rewarding production and components with strong, but not necessarily extreme, type. PARFECT at +3914 (Canada Holstein LPI, April 2026) shows +894 Milk, +85 Fat, +57 Protein, +0.39%F, +0.19%P, +10 Conf, MS +4, FL +15, DS +7 — a balanced yield and type profile. STANTONS REMOVER PP at +3873 (Canada Holstein LPI, April 2026) pushes more volume with +1793 Milk, +113 Fat, +81 Protein, +0.36%F, +0.23%P, +8 Conf, MS +5, FL +9. DUCKETT PFCT HAS IT ALL‑ET at +3843 (Canada Holstein LPI, April 2026) runs +2294 Milk, +52 Fat, +65 Protein, +0.30%F, +0.10%P, +15 Conf, MS +10, FL +10, DS +16, clearly prioritizing volume and show‑type.
On Canada Pro$, April 2026 favors bulls that convert fat and protein into net income with a solid, workmanlike type. PATTERN at +2974 (Canada Holstein Pro$, April 2026) sits at +1199 Milk, +106 Fat, +71 Protein, +0.47%F, +0.23%P, +3 Conf, HL 108, DCA 104. CABO at +2877 (Canada Holstein Pro$, April 2026) is +685 Milk, +117 Fat, +73 Protein, +0.56%F, +0.27%P, 0 Conf. POWERSTAR at +2854 (Canada Holstein Pro$, April 2026) combines +695 Milk, +109 Fat, +72 Protein, +0.55%F, +0.29%P, +4 Conf, HL 105, DCA 104.
Three contrasting case studies spell out the trade‑offs:
PAZZLE (SIEMERS RZ PAZZLE 34954‑ET) +3810 (Canada Holstein LPI, April 2026), +2038 (Canada Holstein Pro$, April 2026), +16 Conf. +191 Milk, +145 Fat, +34 Protein, +1.16%F, +0.23%P, MS +5, FL +13, DS +16. Trade‑off: extreme type and fat %, solid but mid‑band Pro$ — excellent for show‑leaning programs that still care about components.
DUCKETT PFCT HAS IT ALL‑ET +3843 (Canada Holstein LPI, April 2026), +1960 (Canada Holstein Pro$, April 2026), +15 Conf. +2294 Milk with moderate components and strong MS/FL — big‑volume, high‑type, mid‑Pro$. Trade‑off: ideal for herds that monetize type and pedigree; less suited as a primary income sire.
PROGENESIS PATTERN +2974 (Canada Holstein Pro$, April 2026), +3766 (Canada Holstein LPI, April 2026), +3 Conf. +1199 Milk, +106 Fat, +71 Protein, strong health composite. Trade‑off: less eye‑catching than the extreme type bulls, but a more efficient income engine for commercial‑style and large herds.
In short, April 2026 Canada LPI still pays strongly for type and functional conformation when coupled with components, while Canada Pro$ is unforgiving about the income math and will only carry high‑type bulls when their fat/protein profiles justify it.
Stud Power, Family Power, and Outcross Space
AI stud codes in the April 2026 Canada Holstein lists show a familiar pattern. Semex 200 code bulls (PROGENESIS PATTERN, PROGENESIS MONTREAL, PROGENESIS MONTEVERDI, PROGENESIS PRAGMATIC, and others) occupy multiple slots in both the LPI and Pro$ top 100 lists. Codes 0007, 0011, and 0029 (Select, Alta/Peak, and related groups) are also heavily represented: PEAK ALTAINSCAPE‑ET, PEAK ALTACRAZE‑ET, PEAK ALTAHOTHAND‑ET, PEAK POWERSTAR‑ET, and a large set of genomic BEYOND/SHEEPSTER and Rosemary‑line bulls lead the young‑sire lists.
Bloodline concentration is particularly evident in the top 100 genomic by GPA LPI and GPA Pro$. SIEMERS SSI ROSMRY TONKS‑ET leads GPA LPI at +4179 in April 2026 (Canada Holstein GPA LPI, April 2026), with several other Rosemary‑line sires close behind. On GPA Pro$, SIEMERS RIM COBOT‑ET at +3755 and KENYON‑HILL OLYOP‑ET at +3732 (Canada Holstein GPA Pro$, April 2026) again tie back into a handful of sire stacks.
Within the daughter‑proven lists, genuine outcross space still exists:
DROUNER KL AUGUSTUS P RED at +3786 (Canada Holstein LPI, April 2026) and +2145 (Canada Holstein Pro$, April 2026) brings a Dutch Red, polled, alternative pedigree into the top 100.
KOEPON OH ROBIN RED at +3576 (Canada Holstein LPI, April 2026) and +2302 (Canada Holstein Pro$, April 2026) offers another competitive Red option with different bloodlines from the main Renegade/Parfect and BEYOND/SHEEPSTER clusters.
For ET and AI programs heavily invested in Renegade/Parfect, BEYOND, and related families, these Red and polled proven bulls — plus a handful of non‑cluster foreign codes — are where the practical outcross opportunities live, even if they sit 1–2 index tiers below the absolute top of LPI or a couple hundred Pro$ points below PATTERN/CABO.
How Volatile Are Canada’s LPI and Pro$ Rankings Right Now?
Between December 2025 and April 2026, the daughter‑proven Canada Holstein LPI and Pro$ lists show more compression than chaos. Around seven of the December 2025 LPI top‑10 bulls remain in or near the top 10 in April 2026, and a similar proportion holds for Pro$, with PATTERN, CABO, REMOVER PP, ALTAHOTHAND‑ET, and others still occupying high ranks despite level changes. The top‑end Pro$ bulls mostly lose 200–250 points (PATTERN −237 Pro$, CABO −231 Pro$, ALTAINSCAPE −245 Pro$), while ROZLINE and GRAZIANO see much larger drops (−626 and −444 Pro$ respectively).
Reliabilities for these leading daughter‑proven sires are high and in the mid‑ to high‑90s for production and conformation in both runs, as shown in the official lists. For bulls like PATTERN, PARFECT, CABO, REMOVER PP, ALTAINSCAPE, and GRAZIANO, these shifts are less about sampling noise and more about model and economic rebalancing across traits. That’s important: a 200‑point Pro$ or 60‑point LPI change signals a reset in how the index values their trait mix, but it doesn’t make existing daughters suddenly “wrong.”
The genomic lists are more volatile. OCD MILAN‑ET at +4137 (Canada Holstein GPA LPI, December 2025) gives way to SIEMERS SSI ROSMRY TONKS‑ET at +4179 (Canada Holstein GPA LPI, April 2026), with several bulls rotating in and out of the top 10. On GPA Pro$, PEAK ALTAPURPOSE‑ET at +3947 (Canada Holstein GPA Pro$, December 2025) is replaced by SIEMERS RIM COBOT‑ET at +3755 and a different mix of bulls in the +3700–3800 band (Canada Holstein GPA Pro$, April 2026). With no or very few Canadian daughters behind these bulls, this volatility is precisely the risk premium you should expect from genomic evaluations.
For portfolio planning, treat the daughter‑proven LPI and Pro$ front edge as relatively stable anchors and the genomic lists as higher‑beta tools where you spread risk across several bulls rather than betting heavily on any single name.
What This Means for Your Matings This Season
This is the section where April 2026 turns into decisions.
High-Input, Housed, Income-Driven Herds
If your herd prioritizes net income per cow in high‑input, housed systems, your starting point is Canada Holstein Pro$.
If your herd prioritizes maximum Pro$ with solid type, keep PROGENESIS PATTERN (+2974, Canada Holstein Pro$, April 2026) and DENOVO 16034 CABO‑ET (+2877, Canada Holstein Pro$, April 2026) as key anchors, and add PEAK POWERSTAR‑ET (+2854, Canada Holstein Pro$, April 2026) as a new proven income sire.
If your herd already relies on bulls that lost >250 Pro$ — ROZLINE (−626), GRAZIANO (−444), REMOVER PP (−299), ALTAINSCAPE (−245) — keep using them, but narrow them to matings where their specific strengths (type, fat %, polled, or other traits) justify the reduced Pro$.
Within 30 days, pull your active service list and flag every bull that dropped more than 250 Canada Holstein Pro$ between December 2025 and April 2026; for each, decide whether he remains a mainline income sire or becomes a targeted, trait‑specific option.
Robot Herds and Udder/Feet Priority
If your herd is on robots or runs high milking frequency with tight udder/feet requirements, you’ll put more weight on Canada Holstein LPI and Conformation.
If your herd prioritizes functional type with good components, look hard at PARFECT (+3914 LPI, +10 Conf, Canada Holstein LPI & Conformation, April 2026) and ALTAHOTHAND‑ET (+3853 LPI, +10 Conf, MS +7, FL +10, Canada Holstein LPI & Conformation, April 2026) as daughter‑proven anchors.
If your herd wants type with enough Pro$ to keep the accountant calm, PAZZLE (+3810 LPI, +2038 Pro$, +16 Conf) and HAS IT ALL (+3843 LPI, +1960 Pro$, +15 Conf) give you show‑influenced cows that still rank decently on Pro$.
Be cautious using low‑Conf, low‑MS bulls as day‑to‑day sires in robot herds, even when they’re high on Pro$. PATTERN, CABO, and POWERSTAR are all safe on that front; some other high‑Pro$ bulls are not.
Type/Show-Focused Programs
If you live off classification sheets, sales, and show results, this run confirms that the Canada Holstein Conformation list is stable and well-stocked.
If your herd prioritizes maximum Conformation, bulls like MATTENHOF HARRIS (+18 Conf, +278 Pro$, Canada Holstein Conformation & Pro$, April 2026), SWEETVIEW GRINCH P (+17 Conf), HAS IT ALL (+15 Conf), and PAZZLE (+16 Conf) remain prime options.
If your herd wants show‑type without walking away from income, focus your main matings on bulls that pair high Conf with Pro$ north of +1900 — again, PAZZLE and HAS IT ALL are prime examples — and reserve lower‑Pro$ extreme type sires for donors and best cow families.
Avoid treating ROZLINE as a top‑end Pro$ sire after his drop to +2038 (Canada Holstein Pro$, April 2026); he now fits best as a type and components tool.
Inbreeding-Sensitive ET Programs and Outcross Management
If your ET work already stacks Renegade/Parfect, BEYOND, SHEEPSTER, and Rosemary‑line bulls, the April 2026 lists are a reminder that the top of Canada Holstein LPI, Pro$, GPA LPI, and GPA Pro$ is heavily concentrated around a few families.
If your herd prioritizes inbreeding control, deliberately work bulls like DROUNER KL AUGUSTUS P RED (+3786 LPI, +2145 Pro$, Canada Holstein LPI & Pro$, April 2026) and KOEPON OH ROBIN RED (+3576 LPI, +2302 Pro$, Canada Holstein LPI & Pro$, April 2026) into donor matings as Red, alternative‑family outcrosses.
If your ET program leans heavily on a handful of genomic GPA LPI or GPA Pro$ bulls sharing similar sires and grandsires, spread risk by adding slightly lower‑ranked genomic sires with less pedigree overlap, even if their GPA LPI or GPA Pro$ is 50–100 points lower.
Within 30 days, run a quick pedigree audit on your donors against your top five service sires; any donor‑sire combination that repeats the same 2–3 sires or grandsires on both sides should have at least one Red or alternative‑family option added to the mating plan.
Genomic-Heavy Portfolios (Studs and Large Herds)
If your program leans heavily on genomic bulls, the April 2026 Canada Holstein GPA LPI and GPA Pro$ lists highlight both opportunity and churn.
If your herd prioritizes fast gain with controlled risk, you can use bulls like SIEMERS SSI ROSMRY TONKS‑ET (+4179, Canada Holstein GPA LPI, April 2026) or WELCOME GUSTAVSSON‑ET (+4064, Canada Holstein GPA LPI, April 2026) as sire‑of‑sons and key donor mates, but you should spread that exposure over multiple genomic bulls rather than anchoring on one.
If your herd wants more stability, aim to keep at least 40–50% of matings on high‑reliability daughter‑proven anchors like PARFECT, PATTERN, CABO, REMOVER PP, and ALTAINSCAPE, and use genomic sires as the “top‑up” rather than the core.
A practical threshold: if more than 60–70% of your planned matings for the next proof interval are to bulls from the top 10 of the April 2026 GPA LPI or GPA Pro$ lists, you’re probably carrying more genomic volatility than necessary for the same level of genetic gain.
Key Takeaways:
ROZLINE’s profile has flipped: he’s still +16 Conf and +3810 Canada LPI (April 2026) but lost 626 Canada Pro$ vs December 2025, so he’s now a type specialist, not a Pro$ anchor.
PARFECT (+3914 Canada LPI, April 2026) and PATTERN (+2974 Canada Pro$, April 2026) are the key proven anchors, but both sit in a compressed top band where 40–60 LPI or 200–250 Pro$ moves can reshuffle ranks without changing cow‑side reality.
GRAZIANO (−444 Canada Pro$) and several other December 2025 headliners took meaningful Pro$ trims, while POWERSTAR arrives at +2854 Canada Pro$ (April 2026), so any sire lineup built on last run’s income numbers needs a fresh audit.
Genomic GPA LPI and GPA Pro$ tops are still churning, so herds with >60–70% of matings on a handful of young sires are running higher portfolio risk than the Canada Holstein daughter‑proven lists alone would suggest.
For herds prioritizing income, robots, show type, or inbreeding control, this run clearly separates which bulls stay as everyday service sires (PATTERN, CABO, PARFECT, POWERSTAR) and which move to niche roles or outcross use (ROZLINE, PAZZLE, HAS IT ALL, AUGUSTUS P RED, ROBIN RED).
Every week, thousands of producers, breeders, and industry insiders open Bullvine Weekly for genetics insights, market shifts, and profit strategies they won’t find anywhere else. One email. Five minutes. Smarter decisions all week.
Crisalis RF just added +67 gPFT and pulled his own son in behind him at #2 proven—while 5 fresh bulls quietly shoved veterans out of Italy’s top 10.
Executive Summary: Crisalis RF just tightened his grip on Italy’s April 2026 proven gPFT list, jumping +67 to gPFT 5247 while his son Boero debuts right behind him at #2. Half of the proven top 10 is new this run, and the proven top-10 average jumped +153 points, so anyone still mating off the December sheet is effectively working with a different lineup than ANAFIBJ’s current board. Ecbert and Rascasse still hold the domestic genomic 1–2, but that list has compressed into a 144‑point band, making “who’s #3 vs #8” more noise than signal. Vivify and Gladius blood is heavily represented and easy to over‑use on genomic and foreign lists, which is great for index but a real inbreeding trap if 30%+ of your recent matings already carry those lines. On the opportunity side, Boero, Glorydays, and Mantra give you proven‑tier options that actually out‑kicked their genomic calls, especially on components and IQC for cheese milk. The article walks through which bulls to anchor with, where the genomic risk sits, and how to patch fertility, type, or feet and legs without blowing up gPFT. If you’ve got more than 200 cows on Italian or MACE semen and haven’t audited your sire sheet since December, this run is big enough to justify a 30‑minute rethink.
Crisalis RF just widened the gap. The Gywer son added +67 gPFT points between the December 2025 and April 2026 Italian evaluations (ANAFIBJ, data updated April 1, 2026) to reach gPFT 5247 — and then his own son Boero graduated from the genomic list straight to #2 proven at gPFT 5162. That’s the first father-son 1-2 on Italy’s domestic daughter-proven gPFT ranking in recent memory, and it signals something bigger: the proven tier is no longer just catching up to genomic projections — it’s compressing hard toward them.
Across all four ANAFIBJ lists (domestic genomic, domestic proven, foreign genomic, foreign proven), this run reshuffled the proven ranks more aggressively than any Italian evaluation since early 2025. Five new bulls entered the domestic proven top 10. The proven top-10 average leaped +153 points (from 4934 to 5087, December 2025 vs April 2026 gPFT). Meanwhile, the domestic genomic top group barely moved (+61 points on average), and the spread between #1 and #10 compressed from 203 to just 144 points — making it harder than ever to separate genomic contenders on index alone.
Here’s what it all means for your matings this spring.
What Changed at the Top?
Domestic Genomic: Stability With Two New Faces
The domestic genomic top 10 is the calmest list this run. Eight of ten bulls held their positions from December 2025. Ecbert (Gladius × Dateline) remains #1, edging from gPFT 5349 to 5371 (+22, April 2026 Italian gPFT). Rascasse (Vivify × Geyser P) is again #2 at gPFT 5342 (+21).
The two new entrants both bring distinctive packages:
Bull
Sire × MGS
April 2026 gPFT
Key Trait Notes
Bangles(Isolabella)
Pacific × Royalflush
5310
Udder composite +2.68, Longevity 119, Fertility 111 — the health-and-type specialist in the top group
Mirosh (Go-Farm)
Reunion × Mookie
5296
+0.52% Fat, +111 Kg Fat, IQC 108 — a components-first bull
They replaced Stormur (dropped to gPFT 5216, rank ~11) and Enola (gPFT 5165, rank ~17). Neither dropped dramatically — this is normal genomic shuffling, not collapse.
Top-group compression is the real story. The gap between Ecbert (#1, gPFT 5371) and Jegolo (#10, gPFT 5227) is just 144 points, down from 203 in December 2025. With all ten bulls carrying Rk 99 (ANAFIBJ’s top reliability band for genomic sires), this tight clustering means the rank order within the top 10 could easily reshuffle in the next run. Treat positions 3–10 as essentially one band.
Domestic Proven: The Big Reshuffle
This is where the action is. Five of the December 2025 top 10 dropped out, and five new bulls entered — a 50% turnover rate that’s unusually high for Italy’s proven tier.
April 2026 Domestic Proven gPFT Top 10 (ANAFIBJ, data updated April 1, 2026):
Rank
Bull
Sire × MGS
gPFT Apr 2026
gPFT Dec 2025
Δ
AI Center
1
Crisalis RF (ZFZ)
Gywer × Mr Salvatore
5247
5180
+67
Intermizoo
2
Boero (Go-Farm)
Crisalis RF × Pursuit
5162
4932*
NEW
Intermizoo
3
Royal Inseme Carlomagno(Idevra)
Bramante × Tabasco
5140
5068
+72
Inseme
4
Gewiss (G-Plus)
Guitar × VH Crown
5120
—
NEW
Intermizoo
5
Smilodon
Bennie × Deluxe
5061
—
NEW
Intermizoo
6
Glorydays (GPlus FIS)
Gladius × Youngster
5056
4901**
+155
GPlus – IT
7
Distefano (Isolabella)
Hothand × Toohot
5053
4982
+71
Inseme
8
Noyz (Pine-Tree RUW)
Dublin × Legacy
5017
—
NEW
ABS Italia
9
Wendat (All Nure)
Einstein × Padawan
5008
4880
+128
Intermizoo
10
Mantra (Cirio Agricola Inseme)
Try Me × Yoda
5005
4969
+36
Inseme
* Boero was listed at gPFT 4932 on the December 2025 genomic domestic list; he has now transitioned to the proven list. ** Glorydays was on the December 2025 genomic domestic list at gPFT 4901; his proven debut at 5056 is a +155-point jump.
Dropped from the proven top 10: NT Isarco (was #6, gPFT 4871 Dec 2025 → gPFT 4951 Apr 2026, now rank ~12), SFH Redshift R (was #7 → gPFT 4941), Wilder Holocron (was #8 → gPFT 4937), KNO Ecuador P (was #9 → gPFT 4941), and Barone Rosso R (was #10 → gPFT 4885). Notably, most of these bulls gained points but still fell out of the top 10 — the new entrants pushed the floor higher.
The proven top-10 spread compressed from 346 points (December 2025: 5180 to 4834) to 242 points (April 2026: 5247 to 5005). That’s still wider than the top 10 in the genome, but the gap is closing fast.
The Big Movers: Up, Down, and In
Biggest Gainers (Proven Domestic)
Glorydays: +155 gPFT transitioning from genomic to proven debut at 5056 — his daughters confirmed a Gladius-line profile of solid ICS-PR (€957) with strong Longevity (111) and above-average Fertility (104), April 2026 Italian gPFT.
Wendat: +128 gPFT (4880 → 5008) — now carrying Rk 99 with a balanced Kg Milk (1182), components (Kg Fat 62, Kg Pr 70), and Longevity (110).
Royal Inseme Carlomagno: +72 gPFT (5068 → 5140) — held #3 and narrowed the gap to Boero by delivering higher Protein % (+0.26) and the best Kcas rating (BE) in the proven top 5.
Crisalis RF: +67 gPFT (5180 → 5247) — extended his #1 lead to +85 points over Boero, driven by improved SCS (107), while his production base held steady (Kg Milk 1189, Fat% +0.16, Pr% +0.20).
Genomic Graduates Worth Tracking
Boero and Glorydays both performed better than their genomic predictions. Boero’s December 2025 genomic gPFT was 4932; his April 2026 proven gPFT is 5162 — a +230-point gain that likely reflects an accumulation of more daughter data. Glorydays jumped from 4901 genomic to 5056 proven. Both are Rk 99 with high reliability — these are durable results, not noise.
Who Slid?
No dramatic collapses this run. The biggest relative loser in the proven top 20 is Sebulba (was gPFT 4786 in Dec 2025; no longer in the April 2026 top-20 visible range, with 93 bulls published). The drop-outs from the top 10 (NT Isarco, Redshift, Holocron, Ecuador, Barone Rosso) all actually gained 70–100+ points but were outpaced by the new entrants.
What Is Italy’s gPFT Rewarding This Run?
The April 2026 proven top 10 is skewed more heavily toward components and ICS-PR economic value than December’s list.
Trait Shift
Dec 2025 Proven Top-10 Profile
Apr 2026 Proven Top-10 Profile
Top-10 avg gPFT
4934
5087 (+153)
Avg ICS-PR (€)
~770
~870 (estimated from top-10 values)
Avg IQC
~106
~109 (higher cheese-yield emphasis)
Avg Longevity
~108
~109
Avg Fertility
~106
~105 (slight dip)
The top group now has higher averages for Kg Fat and Kg Protein, and IQC (cheese quality) has firmed up. This reflects Italy’s Parmigiano-Reggiano premium: the gPFT formula inherently rewards cheese-relevant traits, and the bulls whose daughters deliver high-component, high-casein milk are being rewarded disproportionately as more data accumulates.
On the genomic domestic side, the Vivify sons (Rascasse, Liverpool, Odino — three of the top 8) dominate the health-and-type sub-indexes: Liverpool carries Udder composite +1.96, Fertility 112, and Type 110 (April 2026 Italian gPFT). But Mirosh (Reunion × Mookie) breaks that mold with a pure components play: +0.52% Fat, 111 Kg Fat, and only average health traits (Fertility 108, Longevity 104). Ecbert (Gladius × Dateline) bridges both profiles — IQC 111, solid IES (€1148), and balanced health.
Trade-off to watch: The proven #1 Crisalis RF (gPFT 5247) carries the weakest Type score in the top 5 (Type 0.94 →his weakest area in the top 5). If your herd needs functional type improvement alongside index, look further down the list to Distefano (Type 1.75, Udder 2.81) or Glorydays (Type 0.46, F&L 0.88 — moderate but balanced).
AI Companies and Bloodlines: Who Owns the Italian Top?
AI Center Shifts
Intermizoo continues to dominate the domestic proven top 10, holding 5 of 10 slots in April 2026. But the notable shift is what’s happening with the Italian Genetics → Inseme transition. In December 2025, Distefano and Barone Rosso were listed under “ITALIAN GENETICS” as their AI center. In April 2026, Distefano now appears under “INSEME.” Similarly, on the genomic domestic list, both Stormur and Jegolo switched from Italian Genetics to Inseme between runs. This almost certainly reflects the Inseme rebrand/restructuring — not a marketing shift, but a real organizational consolidation that breeders sourcing Italian semen should note for ordering purposes.
April 2026 AI Center Share — Domestic Proven Top 10:
AI Center
Bulls in Top 10
Notable Names
Intermizoo
5
Crisalis RF, Boero, Gewiss, Wendat, Smilodon
Inseme
3
Royal Inseme Carlomagno, Distefano, Mantra
GPlus – IT
1
Glorydays
ABS Italia
1
Noyz
On the foreign genomic list, the distribution is broader. Novagen holds 4 of the top 10; Inseme has 2; Semex Italia has 2; and ABS Italia, Cosapam, and ST Gen Group hold 1 each. The Novagen concentration is driven by their Peak and Smartie P connections.
Bloodline Concentration
Vivify is the dominant sire in the domestic genomic top 10, with three sons (Rascasse, Liverpool, Odino) plus Stormur just outside at #11. This is a significant concentration risk for breeders relying heavily on this list for matings — if you’ve already used two Vivify sons, your next genomic pick from Italy’s top group is likely to be Ecbert (Gladius), Bangles (Pacific × Royalflush), or Mirosh (Reunion × Mookie).
Gladius has emerged as the cross-list anchor sire:
Ecbert (#1 domestic genomic, gPFT 5371) — sired by Gladius
Delta Morgan (#8 foreign genomic, gPFT 5446) — sired by Gladius
Gigantic (#3 foreign proven, gPFT 5212) — sired by Gladius
Gladius himself ranks #4 foreign proven at gPFT 5173
That’s four top-10 placements across three different lists for the Gladius sire line. Any breeding program that has used Gladius, Ecbert, Morgan, and Gigantic all needs to audit its mating list for inbreeding coefficient stacking.
Rad sons dominate the extended foreign genomic list (Lightsaber gPFT 5440 in the top 10, plus Judo gPFT 5421, Rad Lad gPFT 5406, Beige gPFT 5410, and Ballot gPFT 5266 in the top 20). However, most Rad sons carry below-average F&L (Feet & Legs) scores — Lightsaber at -0.99, Judo at -1.13, Rad Lad at -0.05. For herds with concrete-floor housing, that’s a real functional risk despite the index appeal.
Outcross space: Bangles (Pacific × Royalflush) and Mirosh (Reunion × Mookie) on the domestic side, and Smartie P (Sega P RDC × Arrozo) on the foreign side, offer the cleanest pedigree breaks from the Vivify-Gladius-Rad concentration.
How Volatile Are Italy’s gPFT Rankings Right Now?
Domestic genomic: Low volatility. 8 of 10 held, 2 entered, top-10 spread compressed from 203 to 144 points. The Ecbert-Rascasse 1-2 looks stable; both gained modest points. Genomic bulls at Rk 99 in Italy carry high reliability within the genomic framework, but these are still genomic predictions — treat any individual bull’s exact rank as provisional. The tight 144-point band means a ±50-point swing in the next run could significantly reshuffle positions 3–10.
Domestic proven: High volatility by Italian standards. 50% top-10 turnover, +153-point average gain, and multiple genomic-to-proven graduates entering the list. This isn’t instability in the system — it’s the proven tier catching up as large daughter groups report. The Rk 99 designation on all top-10 proven bulls means these evaluations are high-reliability. Crisalis RF at #1 is about as safe a bet as Italy’s proven list offers.
Foreign genomic: The top of this list is genomic-only and subject to the usual re-ranking risk. Locust (gPFT 5527, April 2026) leads by just 8 points over Tiberius (5519). Both are Rk 99, but with no Italian daughter data, their gPFT is MACE-derived from their home-country genomic predictions. International breeders should weigh these as directional rather than definitive for Italian conditions.
Foreign proven: Powerhouse (gPFT 5394) has a commanding 165-point lead over Percival (5229). Powerhouse is heavily daughter-proven globally; his Italian gPFT is among the most reliable numbers on any of these lists. Percival at #2 is also well-proven (Captain × Gymnast, Rk 99) with 2011 Kg Milk and strong Kg Fat (125) — a Volume + Fat specialist.
What This Means for Your Matings This Spring
All recommendations below reference April 2026 Italian gPFT evaluations (ANAFIBJ, data updated April 1, 2026). Every bull discussed is Rk 99 unless otherwise noted.
If Your Herd Prioritizes Cheese Yield and Component Value (Parmigiano-Reggiano / Grana Padano Herds)
The proven list gives you Crisalis RF (gPFT 5247, IQC 101, Kcas AA) and Boero (IQC 114, Kcas AA) as the obvious father-son pair — but watch the IQC gap: Boero’s 114 vs Crisalis’s 101 means Boero contributes more directly to cheese-quality economics. If you need casein kappa genetics, Mantra (IQC 113, Kcas BB, +0.46% Fat, +88 Kg Fat) is the proven-tier cheese specialist. On the genomic side, Mirosh (IQC 108, +0.52% Fat) and Saxony (IQC 108, +0.47% Fat) offer strong component packages.
Be cautious with: Locust and the Rad sons (foreign genomic) carry high milk volume but relatively lower IQC scores (106 and 107, respectively); for cheese-yield herds, volume without components can dilute vat efficiency.
If Your Herd Prioritizes Health, Longevity, and Fertility
Liverpool (genomic domestic, gPFT 5267, Fertility 112, Longevity 114, Udder +1.96) is the standout functional bull in Italy’s genomic top group. On the proven side, Distefano (Longevity 115, Fertility 110, Udder +2.81) has the best health-trait package in the proven top 10 — and he’s now fully daughter-proven at Rk 99.
If your conception rate is below 40%: Prioritize Fertility scores above 110. Liverpool, Distefano, and the genomic newcomer Faktor (Fertility 116, Longevity 117, gPFT 5152, April 2026) are your short list. Avoid Crisalis RF (Fertility 107 — solid but not a specialist) if fertility is your limiting factor.
If You Run a Robot Herd
Udder composite and milking speed (IMA) matter. On the domestic proven list, Distefano leads with Udder +2.81 and IMA 106. Crisalis RF carries Udder +1.76, IMA 107. On genomic, Bangles (Udder +2.68, IMA 106) is the robot-herd pick from the new entrants.
Avoid for robot herds: Mirosh (Udder -0.25) and any Rad son with negative F&L scores — lameness and poor udder attachment will cost you throughput in a robotic system.
If You Show or Sell Seedstock (Type-Focused Program)
Distefano (Type 1.75, Udder 2.81, F&L 1.12, proven gPFT 5053) is the clear type improver with a competitive index. On the genomic side, Bangles (Type 1.62, Udder 2.68, F&L 1.39) offers the Royalflush maternal line — useful for mating programs targeting both type and outcross pedigrees.
Trade-off: Crisalis RF (Type 1.25) and Boero (Type 1.01) are fine for commercial herds but won’t win you type competitions.
If You Want to Anchor With Proven Safety
Use Powerhouse (foreign proven #1, gPFT 5394, Rk 99 with deep global daughter data) as your portfolio anchor. His 1750 kg of milk, +136 kg of fat, and +102 kg of protein are among the highest absolute production numbers on any Italian list. Pair him with a health-trait specialist like Distefano or Liverpool to offset his weaker Fertility (97) and Type (F&L +0.36).
30-Day Action Items
Audit your Gladius and Vivify exposure. If more than 30% of your matings from the last 12 months trace to either sire line, flag those females for outcross matings using Bangles, Mirosh, or Smartie P this cycle.
Pull your current mating list and cross-check against the April 2026 proven movers. If you were using NT Isarco, Redshift, or Holocron based on their December rank, they haven’t collapsed — but the new entrants (Boero, Gewiss, Smilodon, Glorydays, Noyz) offer fresher daughter data and a higher index.
Re-evaluate any Rad-son heavy lineups for F&L risk, especially in housed herds on concrete. If you can’t give up the index, at a minimum, pair Rad sons with dams that carry positive F&L proofs.
If you source from Italian Genetics / Inseme: Confirm your ordering codes and semen inventory labels reflect the consolidated Inseme branding — some catalogs may still list these bulls under the old Italian Genetics name.
Key Takeaways:
Crisalis RF and his son Boero now sit 1–2 on Italy’s April 2026 proven gPFT, with Crisalis up +67 points and five new sires pushing into the proven top 10.
The proven top-10 average jumped +153 gPFT in four months, meaning a “safe” December sire lineup can now be 150+ index points off the pace in Italy.
Domestic genomic rankings stayed stable but compressed into a 144‑point band, so fine‑tuning off who’s #3 vs #8 makes less sense than picking by trait package and risk.
Vivify and Gladius blood heavily dominate the top genomic and foreign lists, creating real inbreeding risk if 30%+ of your recent matings already trace to those lines.
There’s genuine upside in this run—Boero, Glorydays, Mantra and a few others proved up better than their genomic calls, especially for high‑component and cheese‑milk herds.
Every week, thousands of producers, breeders, and industry insiders open Bullvine Weekly for genetics insights, market shifts, and profit strategies they won’t find anywhere else. One email. Five minutes. Smarter decisions all week.
A runner-up at the biggest Holstein show in Japan doesn’t usually get a second act. This one did.
Sakuland Hasit Loewe ET — a Has It All daughter bred and owned by Naoki Miyahara, Sakuland Holsteins, Miyazaki, Japan — lines up at a Japanese Holstein show. Two years old, and the udder and frame are already delivering everything the pedigree promised.
She wasn’t the one who won at All-Japan. She was the one who almost did.
Sakuland Hasit Loewe ET — a Has It All daughter — placed second in her class at the 2025 All-Japan Holstein Show, the event Japan holds once every five years. Impressive, but not the banner. Then she sold for $27,000 USD at the Golden National Sale, shipped south to Kyushu, and landed at Sakuland Holsteins in Miyazaki Prefecture.
At the All-Kyushu Black & White Show, the wait paid off. Loewe entered the 2-Year-Old Junior class, won it, and kept going — all the way to Grand Champion.
Both Rocket and Loewe trace their maternal line back to the same foundation: C Glenridge Citation Roxy EX-97-4E-GMD — born April 15, 1968, on Lorne Loveridge’s farm at Grenfell, Saskatchewan. The pathway runs through Mil-R-Mor Roxette, the branch of the Roxy family that Bob Miller developed after purchasing Roxy in 1973.
Roxy’s career lifetime production totaled 209,784 lbs of milk at 4.5% fat and 9,471 lbs of fat — a third-generation 200,000-lb producer. She was the first cow in the world to have ten daughters classified as Excellent. Sixteen eventually scored EX. She earned the title Queen of the Breed twice, was named Top Cow of the Century and International Cow of the Century, and was part of eight All-American and All-Canadian groups.
The Bullvine’s own research into the Roxy family has documented over 381 descendants achieving Excellent classification — branches producing Grand Champions, high-genomic sires, and elite donors across North America, Europe, and now Asia.
That a Roxy-family heifer just claimed Grand Champion in Kyushu — seven generations deep and half a world away from Saskatchewan — says more about the durability of that maternal line than any genomic printout ever could.
$27,000 Was a Read, not a Gamble
Here’s what’s easy to miss: this wasn’t a long shot. Loewe placed second at the biggest Holstein show in Japan, from one of the most documented cow families in breed history, and moved to a region where she could develop and compete.
In North American show circles, $27,000 USD for this kind of pedigree depth wouldn’t raise an eyebrow. In Japan’s intensely competitive but smaller-scale Holstein show culture, it was a deliberate, conviction-driven purchase — the kind of move that only makes sense if you trust the cow and trust the bloodline.
Six months later, the cow proved the read was right.
From Hokkaido to Kyushu — That Climate Jump Matters
Hokkaido is Japan’s northern dairy heartland: cool climate, large-scale operations, conditions that feel closer to Wisconsin or the Netherlands than to anything subtropical. Kyushu sits at the opposite end of the country. Heat, humidity, and conditions that stress Holsteins hard.
Loewe made the transition and went Grand. The Roxy family has now produced Excellent and Grand Champion females on four continents, across vastly different management systems and climates — from Grenfell, Saskatchewan, in 1968 to Kyushu in 2026.
What This Means for Your Breeding Program
Show banners don’t automatically translate to profit — we’ve said it before. But deep cow families with this kind of documented, multi-generational track record aren’t just show-ring nostalgia. Over 381 EX descendants across multiple countries and management systems is evidence that the genetic floor in this family is genuinely high.
If you’re building a donor program or evaluating embryo purchases, the Roxy family’s record is worth a look. And if someone tells you cow families don’t matter in the genomic era, point them to Kyushu.
Loewe placed second at All-Japan, sold for $27,000, and went Grand Champion at All-Kyushu. The pedigree — seven generations back to Roxy EX-97 — told you she would.
The Roxy legacy is real and still growing. Over 381 documented EX descendants. Sixteen Excellent daughters from one cow. Career lifetime production of 209,784 lbs at 4.5% fat. The family keeps delivering because the genetic floor is that high.
$27,000 bought a cow family, not a placing. There’s a difference between paying for a show result and paying for seven generations of proven maternal depth.
Loewe moved from Hokkaido-bred genetics into Kyushu’s subtropical heat and went Grand. Cow families that hold up across environments aren’t just show assets — they’re breeding stock that travels.
Learn More
Glenridge Citation Roxy: The Legendary “Queen of the Breed” – The full deep dive into the cow behind Loewe’s maternal line. Breaks down Roxy’s 381+ EX descendants, the Mil-R-Mor Roxette branch, and how one Saskatchewan-born cow’s genetics ended up dominating show rings on four continents.
Every week, thousands of producers, breeders, and industry insiders open Bullvine Weekly for genetics insights, market shifts, and profit strategies they won’t find anywhere else. One email. Five minutes. Smarter decisions all week.
A bull with +40 lbs protein and 0.00% protein % isn’t a protein sire — he’s a volume sire in a protein costume. TPI 2026 just made him harder to spot.
Executive Summary:Last week we flagged the $17,500 protein trap in TPI 2026. Here’s the 25‑year stress test — and why the deeper problem is pounds vs percent. Protein has never hit 3× fat in 25 years of Class III prices, but Holstein USA’s TPI 2026 now weights protein 24% and fat 14%, effectively asking component herds to bet on that ratio anyway. Our barn math shows a modeled “high‑TPI‑protein” cow can add about 2,500 lbs of milk and roughly 0/cow/year in feed — or ,000/year on 320 cows — while actually delivering less cheese per cwt than a dense‑component cow. Even in protein‑friendly scenarios, the high‑CFP, lower‑volume herd either wins or stands so close that the extra feed and risk don’t pencil unless protein jumps to break‑even ratios the market has never sustained. The deeper problem is structural: TPI rewards protein pounds driven mostly by milk volume, while cheese plants care about protein percent and casein yield per cwt — and the fix is straightforward: penalize low protein % the same way NM$ already penalizes excess volume. If your breeding plan only works when protein is worth double or triple fat on your check, you’ll want to run the 30/90/365‑day playbook here against your own component prices before you lock in another semen order.
When that April TPI run dropped, a 320‑cow Wisconsin Holstein herd shipping to a cheese plant did what a lot of sharp breeders did. They sat down with fresh proofs, their latest milk check, and one blunt question:
When “More TPI Protein” Mostly Means More Milk in the Tank
Holstein USA framed the new TPI weights as better aligned with processor demand and modern pricing, similar to how Lactanet adjusted LPI after seeing faster genetic progress in fat than protein. Over the last five years, Lactanet’s work shows Holstein fat yield gains outpacing protein yield gains, with a positive correlation between the two at the pounds level — largely because both depend on volume.
But correlation isn’t causation. Fat % and protein % have a much weaker genetic relationship, and high‑fat bulls with mediocre or low protein % aren’t hard to find on any sire summary. You can’t count on fat selection to drag protein concentration along for the ride. If you want protein %, you have to select for it directly.
On paper, the TPI story sounds tidy:
Processors say they want more protein.
Class III formulas pay for protein.
So you weight protein higher in the index, and genetics will follow.
A lot of those sires carried numbers like +40 lbs PTA Protein, +1,200 to +1,800 lbs PTA Milk, and 0.00% or slightly negative PTA Protein %. On a catalog spread, that looks like a protein sire. In the bulk tank, it’s a volume sire. Those extra protein pounds are hitching a ride on more milk, not richer milk.
Proof Trait
Volume Sire (Protein Costume)
True Casein Sire
Red Flag?
PTA Protein lbs
+40 lbs
+30 lbs
—
PTA Protein %
0.00%
+0.04%
Red if ≤ 0.00%
PTA Milk lbs
+1,400 lbs
+300 lbs
Red if > Prot lbs × 30
PTA Fat lbs
+52 lbs
+40 lbs
—
PTA Fat %
-0.02%
+0.03%
Watch
Dilution Test (Milk ÷ Prot lbs)
35×
10×
Red if > 30×
CFP Score (Fat + Prot lbs)
+92 lbs
+70 lbs
Floor: ≥ +90 lbs
Cheese/CWT Impact
↓ (more whey, less casein density)
↑ (more casein per cwt)
Red = wrong direction
If you ship to a cheese plant that cares about vat yield per cwt, that distinction isn’t academic. Plants care how much casein they get per hundredweight of milk they pay to haul and process — not how many total “protein pounds” arrive across extra volume. Casein is what becomes cheese; whey is mostly a by‑product.
That’s the protein paradox behind TPI 2026: the index rewards protein pounds, but the plants that supposedly drove the change really need casein density — protein percent and the right ratio to fat.
Does Class III Pricing Really Support 3× Protein?
Under a lot of the “protein will catch up” talk, there’s an unspoken bet: if you load up on protein‑heavy TPI bulls now, eventually protein will be worth far more than fat, and your herd will cash in.
For that to really bail you out, you’re basically assuming a world where protein is worth about three times as much as fat on your milk check.
USDA’s Class III component price announcements going back to 2000 don’t support that.
From roughly 2000 through 2014, protein frequently beat fat in the Class III calculation. Ratios above 1.0× were common, and strong months climbed well past 1.5×. The standout month: March 2014, when AMS reported $4.52/lb protein and $2.04/lb fat — about a 2.21× ratio. That’s the best protein month in a generation of Class III data.
Then the world flipped. Around 2016–2017, butterfat took off on the back of strong demand for butter and cream. From about 2017 through 2025, protein generally traded below butterfat on Class III, only occasionally flirting with parity.
Across the entire 2000–2025 Class III component series, there isn’t a single month where protein reaches 3× the butterfat price. The market’s had plenty of time to try. It just hasn’t gone there.
The closest it came recently was in late 2025. Butter prices slumped on heavy supplies while cheese held firmer. CoBank’s December 2025 report, “Protein will drive milk checks for the foreseeable future,” flagged how the protein‑to‑butterfat ratio in US milk had slipped from 0.82–0.84 down to 0.77, and noted that cheesemakers still aim to move it back closer to 0.80 for better efficiency. Corey Geiger’s coverage of the same data underscored how hard it is to change that ratio quickly at the plant level. Component price shifts in that window nudged protein ahead of fat for a short time — but nowhere near 3×, and the gap narrowed again as butter recovered.
There’s a structural reason. Cheese and butter are co‑products of the same milk. When milk is long, both streams feel it. When milk is tight, both get expensive. You may see a wobble for a few months — like late 2025 — when inventories diverge, but you don’t build a stable world where butter stays cheap, and cheese stays sky‑high. The co‑product math keeps pulling them back together.
So when someone leans on “protein will catch up” to justify a heavy protein‑TPI stack, they’re asking you to bet your genetic pipeline on a price ratio:
that 25 years of national Class III data haven’t produced once, and
The basic structure of milk markets makes it very hard to hold.
Where Is the Break‑Even for TPI 2026 vs a Component Herd?
Herds on cheese grids don’t make breeding decisions off theory. They look at margin.
To pressure‑test the TPI 2026 shift, the Wisconsin herd above modeled two herd profiles with their advisor — not their actual CDCB numbers, but realistic composite cows based on standard genetic responses. These are modeled cows so that you can plug in your own numbers, not a disguised case study.
One profile reflected the kind of cow you build if you follow TPI’s 24P:14F production weighting for 2–3 generations.
The other reflected a herd steered by Cheese Merit (CM$), where the priority is total component yield and density, not just more volume.
High‑TPI vs High‑CFP Herds at a Glance
Metric
High-TPI Protein Herd
High-CFP Dense Herd
Winner
Milk lbs/cow/yr
~26,500
~24,000
TPI (+2,500 lbs)
Fat %
3.85%
4.20%
CFP (+0.35 pts)
Fat lbs/cow/yr
~1,020
~1,008
TPI (marginal, +12 lbs)
Protein %
3.22%
3.38%
CFP (+0.16 pts)
Protein lbs/cow/yr
~853
~811
TPI (+42 lbs)
Protein:Fat ratio
0.834
0.805
CFP (cheese-plant ideal ~0.80)
Extra feed cost @ $0.12/lb
$300/cow/yr
—
CFP saves $300
Extra feed cost (320 cows)
$96,000/yr
—
CFP saves $96k
Van Slyke Cheddar yield
9.31 lbs/cwt
9.95 lbs/cwt
CFP (+0.64 lbs/cwt)
Break-even P/F needed
1.6–3.35× (varies by fat price)
Not required
CFP (no bet required)
Best for herd type
Volume/fluid contracts
Cheese-grid herds
Depends on your check
On paper, the high‑TPI herd ships a bit more fat and about 42 lbs more protein per cow per year. But it also ships 2,500 lbs more milk per cow.
That extra milk isn’t free.
Using a conservative marginal feed cost of $0.12 per lb of extra milk — which is where a lot of freestall herds land on incremental production — those extra 2,500 lbs cost about $300 per cow per year in feed. On a 320‑cow herd, that’s roughly $96,000 per year in extra feed tied directly to breeding for volume‑driven protein.
Once you see that, the real question becomes:
At your component prices and marginal feed cost, does this “high‑TPI‑protein” cow leave more income over feed — or less?
Quick Margin Check You Can Run at Home
Here’s how to do that same math with your numbers:
Take your current herd and the kind of daughters your sire stack is building. Estimate the difference in milk per cow and in fat % and protein %.
Write down your marginal feed cost per extra lb of milk. For most herds right now, that’s somewhere between $0.10 and $0.14.
Grab your own fat and protein prices from your last 12 months of milk checks.
Calculate the extra component income for the higher‑yield cow, then subtract the extra feed cost for the extra milk.
If the higher‑TPI cows only look better when you assume protein is way ahead of fat — or if the extra protein income barely covers the feed — your own barn is telling you how narrow that path is.
The Barn Math Behind the Break‑Even
In that Wisconsin modeling exercise, the advisor pushed the comparison further. They ran both composite herds across different fat prices and protein‑to‑fat ratios to see where the high‑TPI herd finally beats the high‑CFP herd on income over feed.
Three points matter:
At $1.50/lb fat — a cheap, low‑butter world — the high‑TPI herd needed roughly a 3.35× protein‑to‑fat ratio to catch up. That ratio doesn’t show up anywhere in the 2000–2025 Class III record.
At $2.50/lb fat — closer to “normal” recent Class III butterfat levels — the break‑even dropped to about 1.9×. Still higher than almost every month from 2017 to 2025.
At $2.91/lb fat, the actual December 2024 Class III butterfat price, the break‑even settled around 1.6×. That’s roughly where late 2025 briefly landed before butter prices corrected again.
In recent Class III months, plenty of milk checks have put protein somewhere around 1.3–1.6× fat. At those ratios, under realistic feed costs, the dense‑component, lower‑volume herd either wins outright or stands so close that the extra risk and feed bill of chasing volume doesn’t look like a good trade.
Then they took one more step and ran both modeled herds through a simplified Van Slyke Cheddar yield formula.
At 3.38% protein and 4.20% fat, the high‑CFP herd delivered roughly 9.95 lbs of Cheddar per cwt. At 3.22% protein and 3.85% fat, the high‑TPI‑protein herd came in closer to 9.31 lbs per cwt. That’s 0.64 lbs more cheese per cwt from the denser herd — with less milk to haul and process.
The high‑CFP herd’s protein‑to‑fat ratio — roughly 0.805 — sits right in the neighborhood of the ~0.80 ratio CoBank and others say US cheesemakers are still trying to achieve. The TPI‑protein herd isn’t delivering that. It’s delivering more tanker loads for less cheese per cwt.
“Processors Want Casein” — But Genetics Takes the Easy Path
Cheese plant managers aren’t asking for TPI points. They’re asking for casein, vat yield, and the right protein‑to‑fat ratio at the receiving bay.
Processors want two related things:
Commodity cheese plants want milk that hits a protein‑to‑fat ratio around 0.80, so they get more cheese per cwt without excess fat to discount or dispose of.
Ingredient plants making MPC, micellar casein, and high‑protein yogurts want a higher protein % because membrane and dryer efficiency depend on concentration.
None of them are saying, “Just send us more total protein pounds by shipping more milk.” They’re saying, “Send us richer milk.”
In Holstein USA’s published TPI formula, the production piece is driven by PTA Milk, PTA Fat (lbs), and PTA Protein (lbs). PTA Protein % is available on CDCB proofs, but it isn’t a weighted component in the core TPI calculation. That’s a design choice by Holstein USA and its advisors, but it means the index can only signal “more protein” through yield, not through richer milk.
The fix isn’t complicated. TPI could add a penalty for low protein % — the same way NM$ already applies negative economic value to excessive PTA Milk. A bull posting +40 protein lbs at 0.00% protein would take a hit; a bull posting +30 protein lbs at +0.04% would be rewarded. That single adjustment would push the formula away from rewarding dilution and toward rewarding concentration, without scrapping anything else in TPI’s structure. The mechanism exists. The math exists. Holstein USA already accepts this logic in other indexes. It just hasn’t been applied to the trait processors that they actually need.
Without that penalty, the genetic response tells you exactly where the selection pressure lands. In the three‑generation modeling example above, milk climbed by about 420 lbs per cow, protein yield improved by about 21 lbs, and protein % only crept up by about 0.012 percentage points. Almost all the “extra protein” came from extra volume, not richer milk. And because fat % and protein % don’t move in lockstep genetically, you can absolutely find high‑fat bulls sitting at flat or negative protein % — assuming one drags the other along is a correlation bet, not a genetic plan.
From a cheese plant’s point of view, that’s more milk to pump, pasteurize, and set for essentially the same casein density per cwt. A long way from the way cheese plants describe their ideal milk when they talk to producers and AI companies.
For herds shipping to fluid plants or on straight volume contracts without component premiums, that trade‑off looks different. TPI’s protein‑yield emphasis may still align with the revenue model in those systems. The analysis here is aimed squarely at cheese‑grid and component‑payment herds.
The Turn: When TPI Moves to the Back of the Stack
In meetings and kitchen‑table conversations this spring, you can hear a similar pattern from component‑grid herds in Idaho, Wisconsin, and across the Western US.
They’ve used TPI for years to build sire lists. They watched bulls jump or fall 200–300 TPI points in April off a formula change none of their cows had read. Immediately after those swings, several advisors started telling clients to stop letting TPI drive the bus.
That’s pushing a quiet shift in some breeding offices. Instead of throwing TPI away, some component‑grid herds we talk to are moving it to the back of the stack:
Let CM$ or NM$ steer the bus. USDA ARS documentation on the 2021 and 2025 Net Merit revisions shows greater emphasis on fat and less on protein, and penalties for excessive milk volume through negative economic value on PTA Milk. Those indexes are built directly from economic values and explicitly treat extra volume as a cost.
Use TPI as a filter, not the driver. Once a bull passes your CM bar — and your own thresholds for health and type — his TPI rank matters a lot less than how he lines up with your milk check.
Pull PTA Protein % on every “protein bull” you’re told to use. Big PTA Protein lbs paired with big PTA Milk and flat or negative PTA Protein % is a volume profile, not a casein profile, for cheese‑grid herds.
Your 30/90/365‑Day Playbook
You can’t fix FMMO pricing from your office. You can’t make Holstein USA rebuild TPI around protein % by next week. But you do decide which semen lands in your tank.
In the Next 30 Days: Fix the Steering Wheel
Before you finalize your spring order:
Resort your bull list by CM$, not TPI. Ask your AI rep for their top CM$ bulls and start from there. Use TPI mostly to screen for structural issues or extreme health outliers.
For every bull you’re serious about, pull four numbers: PTA Fat lbs, PTA Fat %, PTA Protein lbs, PTA Protein %.
Apply two simple dilution filters if you’re on a cheese grid:
CFP floor: PTA Fat lbs + PTA Protein lbs ≥ +90 lbs combined. Below that, you’re not moving components enough to make a difference.
Dilution test: PTA Milk lbs ≤ PTA Protein lbs × 30. Around 3.2% protein, anything above that says almost all the “protein gain” is just more milk.
Treat negative PTA Protein % as a hard flag if vat yield per cwt matters to your plant. Those bulls are diluting your cheese per cwt, no matter how strong their protein‑lbs number looks.
Ask Holstein USA the uncomfortable question: If NM$ already penalizes excessive milk volume, why doesn’t TPI penalize low protein %? The mechanism exists. The math exists. The only thing missing is the decision.
A bull with +40 lbs protein, +1,400 lbs milk, and 0.00% protein % is a volume sire in a protein costume. A bull with +30 lbs protein, +0.04% protein %, and only +200–600 lbs milk is actually improving concentration.
In the Next 90 Days: Line Up Genetics With Your Actual P/F Price
Pull 12 months of component prices from your milk checks. Don’t guess. What’s your actual protein‑to‑fat price ratio? In many recent Class III months, that’s been somewhere around 1.3–1.6×.
Set a genetic P/F band that matches your grid:
If fat clearly leads and protein is discounted, target a 0.50–0.55 genetic P/F band in your sire group.
If protein has been within about 20% of fat, slide to 0.55–0.60 as a sensible hedge.
If protein is consistently ahead in your region and contract, you can justify 0.58–0.65 — but no more without a written premium.
Audit your current sire stack. If the average P/F profile pushes above 0.65 while your check shows protein at roughly 1.3–1.6× fat, that’s less a hedge and more a bet on 2–3× protein.
Over the Next 365 Days: Push Where the Index Won’t
Build a simple Concentration Score into your proof sheets. One option: (PTA Protein % ÷ PTA Protein lbs) × 1,000. Within your CM$‑screened list, give at least half your matings to bulls in the stronger half of that score if you ship to cheese or ingredients.
Start a protein‑concentration conversation with your plant. Ask your field rep directly: “If I consistently deliver higher protein %, is there room in this grid or in over‑order premiums?” Canadian P5 boards have already moved toward pricing structures that reward solids‑to‑fat ratios with explicit incentives — a November 2025 policy update shows tier‑2 protein in the P5 SNF/BF payment policy paid at the monthly Class 4a price plus $3.00/kg, effective January 1, 2026. That’s a direct premium for concentration.
Track income over feed cost (IOFC) by component, not just per cwt. If your supposed “high‑protein” cows only look good because they pump out more volume — not because they deliver more margin per lb of fat and protein at today’s prices — your own ledger is telling you the breeding plan is off.
What This Means for Your Operation
Stop letting TPI 2026 steer if you’re on a component grid. Put CM$ or NM$ in the driver’s seat and treat TPI as a filter. That move alone lines your genetics up more closely with how USDA economics actually value fat and protein today.
Don’t confuse protein pounds with protein percent — or with casein. Big PTA Protein lbs plus big PTA Milk and flat/negative PTA Protein % means you’re mostly breeding for more whey in more milk, not more casein per cwt. If your plant pays for cheese yield per cwt, that’s the wrong direction.
Don’t assume fat % selection fixes your protein %. The genetic correlation between fat percent and protein percent is at most moderate. High‑fat bulls with flat or negative protein % are everywhere. If you want concentration, you have to select for it directly — not hope it arrives on the back of another trait.
Run your own break‑even, not the catalog’s. Take your marginal feed cost and your actual component prices. If your plan only looks smart when protein is 2–3× as much as fat, you’re relying on a price relationship that your own checks haven’t shown you.
Set P/F targets off your grid, not off headlines. A small shift toward protein is a hedge. A big shift is a bet on a 3× world that Class III data and co‑product logic don’t support.
Pick one bull you planned to use heavily and pull his PTA Protein %, PTA Milk, and PTA Fat %. Is the cow he sires richer, or just louder? If the answer is “louder,” fix your list before you lock in another breeding season.
Key Takeaways
If your breeding plan only pays off when protein hits 3× fat, you’re not hedging — you’re running a long‑shot bet that 25 years of USDA Class III data don’t support.
TPI 2026’s higher protein weight mostly comes from more milk, not richer, casein‑dense milk. That means more feed, more trucking, and more processing per pound of casein — the opposite of what cheese plants are asking for.
Fat % and protein % don’t move in lockstep. Assuming fat selection drags protein concentration along is a correlation bet, not a genetic plan. If you want protein %, select for it — TPI doesn’t, but you can.
The fix at the index level is simple: penalize low protein % the same way NM$ penalizes excess volume.Until Holstein USA makes that change, component‑grid herds need to screen for it themselves.
Your most honest signal isn’t the next proof run — it’s your IOFC by component. If your “high‑protein” cows don’t deliver more margin per lb of fat and protein at today’s prices, your proofs and your milk check are telling two different stories.
One Question Before You Order Semen
You can’t control what Holstein USA does with TPI or what USDA does with Class III formulas.
But you do control which proofs end up on your short list and which heifers stay in your string. Before you sign that next semen order, lay your proof sheets beside your most recent component check and ask one straight question:
The AI companies and index committees want you to buy the “Protein Revolution.” Your milk check is asking for a “Component Reality Check.” Don’t let a formula change at a desk in Ohio dictate whether your stalls are profitable in 2028 — your own numbers should do that.
Complete references and supporting documentation are available upon request by contacting the editorial team at editor@thebullvine.com.
U.S. Dairy Genetic Evaluations Set for Historic Reset in April 2025 – Secure a massive early-adopter advantage by positioning your genetic pipeline for sustainability-driven premiums. This deep dive breaks down the historic 2025 reset and reveals the 2028 roadmap for microbiome and methane indexes.
The Sunday Read Dairy Professionals Don’t Skip.
Every week, thousands of producers, breeders, and industry insiders open Bullvine Weekly for genetics insights, market shifts, and profit strategies they won’t find anywhere else. One email. Five minutes. Smarter decisions all week.
Trace Elevation back twenty dams and you land on a cow imported from North Holland in 1879. Starbuck goes back to the same farm. So does half your herd.
On a cold Massachusetts morning in the late 1850s, a small group of state men rode up the lane to Winthrop Chenery’s Belmont farm and walked straight past the house toward the barn. They weren’t there for coffee. They were there to shoot his cows.
Rinderpest—cattle plague—had slipped into his little group of Dutch black‑and‑whites, and the Commonwealth had ordered the whole lot destroyed, sparing only one young bull in a last attempt to salvage something from the wreck. By all accounts, Chenery was a big man—six‑foot‑four, three hundred pounds—and he’d already seen enough of these cattle to know they weren’t like the native stock he’d been dealing in. One of the cows from his later shipment, Texelaar 51 H.H.B., would go on to put up a 76 lb 5 oz day and 744 lbs 12 oz in ten days in 1865, but on that rinderpest morning he was watching an earlier group of Dutch cows hit the ground one by one.
Nobody wrote down what he said while the rifles cracked. The records just tell us that, the very day the cattle were condemned, he sent word back to Holland for another lot. That’s all we really need to know about what was going through his mind.
They rode past the farmhouse with rifles, came for his Dutch cows, and still, before the day was over, Winthrop Chenery had already ordered another load from Holland.
Now, the thing about that era is that the American dairy cow was still a compromise. The typical “dairy” animal was a dual‑purpose Shorthorn or local native—good enough to pull the wagon and fill a pail, but not built for specialized commercial dairying. The Erie Canal had already turned New York into a grain corridor. After the Civil War, when grain prices sagged, you suddenly had a whole region where dairying looked like the next way to make a living. A big, true dairy cow with a stomach like a cement mixer and an udder to match made a lot more sense than a do‑everything ox.
The Dutch had already built that cow. She was big and black‑and‑white, from Friesland and North Holland, and she could outmilk almost anything in America at the time, both in pounds of milk and in butter when you put her on a seven‑ or thirty‑day test. Chenery saw that early. When the state shot his first imports, he didn’t go back to Shorthorns. He doubled down.
That stubbornness, plus one quirky error in a government report, set the stage for everything that came next.
Act I – A New Kind of Cow in a New Kind of Country
After the 1861 shipment landed—a bull and four more cows that escaped disease—Chenery finally had a little nucleus of Dutch cattle anchored by that surviving bull, Dutchman 37. He called them “Dutch cattle” in his own catalogs and letters, but in 1864 he sent an article to the U.S. Department of Agriculture in which he quoted Professor T. Low about the “Dutch or Holstein” breed. Somewhere in the editing room, “Holstein” drifted out of the quotation and into the heading.
When the first Holstein herdbook was printed in 1872, the name had stuck. A Dutch scientist, G.H. Hengeveld, fired off a letter pointing out that Holstein cattle were a different type and that these cows were actually Friesland and North Holland animals. Chenery later said he’d used “Dutch” in his original manuscript and blamed the change on officials in Washington, but he never went to war over it. The name “Holstein” rolled forward anyway, and three casual words in a government document ended up on millions of ear tags.
Chenery’s own cattle didn’t become the dominant cow families themselves—the historical record is blunt about that. His real contribution was scattering those Dutch genes into the countryside. By 1870, herds based on his cattle were operating in Vermont, Rhode Island, Connecticut, New York, Pennsylvania, Ohio, Iowa, Oregon, California, and at home in Massachusetts. His farm proved the type. Other men would prove what the type could do.
And that brings us to New York State.
If Chenery lit the match, New York was the tinderbox. New York City was the port where European cattle came ashore. The Erie Canal funneled those cattle, and everything they stood for, straight into the heart of a farm economy that was already shifting from grain to milk. Some families went west and helped build the dairy industries of Michigan and Wisconsin. Others drifted to the cities. A lot stayed put and turned to cows.
The men who started importing Holsteins into that setting weren’t fly‑by‑night speculators. They were orchardists, nurserymen, landed families, storekeepers turned breeders. The principals of Smiths & Powell already ran big nursery and fruit operations along Onondaga Lake near Syracuse. T.G. Yeomans in Walworth had 150 acres of orchards knit together with sixty miles of tile drains, with a line running within five feet of every pear tree. Gerrit S. Miller farmed land his grandfather had carved out of Oneida territory and grew up in a world where people like John Brown turned up at the house to talk about ending slavery.
Most of them had enough money—or enough nerve—to take a real risk. It cost around $300 a head to bring cattle from Holland at a time when the average man was making about $1 a day. That’s not dabbling. That’s pushing chips to the middle of the table.
Before they filled herd books and proof sheets, the first Holsteins to matter here were seasick Dutch cows on wooden decks, gambling their way across the Atlantic in rough weather.
Gerrit S. Miller – Three Great Cows and a Herd Called Kriemhild
If Chenery proved the Dutch cow could make it in America, Gerrit S. Miller showed just how far she could go.
In the late 1860s, Miller was at Harvard, studying science and the liberal arts and captaining what’s credited as the first organized football team in the country. When he walked out from Cambridge for exercise, he kept noticing a herd of black‑and‑white cows near Belmont—Chenery’s cows—and they made enough of an impression that when he went home to Peterboro he asked his father to let his brother, Charles Dudley, bring some over from Holland.
Dudley found his way to a cattle market at Weiner in West Friesland, way up at the northern tip of the Netherlands, and bought four head: the bull Hollander and the cows Crown Princess, Dowager, and Fraulein. He rode the ship back with them, took them by train to Canastota, then drove them along an old plank road to the Miller farm. That 1869 load was only the third pure Dutch shipment to the U.S., after Chenery’s 1857 and 1859 importations.
A young Charles Dudley Miller walked into a West Friesland cattle market in 1869 and walked out with four black‑and‑whites that would change North American dairying.
Dowager completed the first full annual milk record in the United States—12,681 lbs 8 oz on a record closing March 10, 1871. In a letter to Holstein pioneer Frank N. Decker, Miller explained that in 1868 a cow that did 6,000 lbs a year and 12 lbs butter in seven days was still considered exceptional. Dowager did that and then some, on two‑a‑day milking, with no grain at all in June, July, and August and grain made half of wheat bran the rest of the year. Fifty pounds of milk was her biggest day on that early record, and she hit it twice in one lactation.
Miller kept importing and selecting. In 1878 he went to Holland “with the express purpose” of buying the best milk cow he could find. He found Johanna in the herd of K.J. Akkerman in North Holland, brought her over, and in 1880 she stood first as milk cow over all breeds and ages at the New York State Fair. She wasn’t perfect on paper—a sloping rump, lots of white with specks—but she had extreme dairy quality and a big engine. Miller used her hard in his breeding program.
Two years later, while she was still in full flight at Peterboro, he turned Johanna out with another star, Empress, in the lush pasture by the Mansion House. Both old cows pushed up to 88 lbs in a day. Over a thirty‑one‑day stretch, Johanna averaged 80 lbs a day and made 2,407 lbs of milk. While she was at that height, Wisconsin breeder W.J. Gillett stopped in to buy a cow. On August 24, 1881—Miller’s diary spells it out—he wrote, “sold Johanna to Gillett & More of Wis. for $500.00.” In Gillett’s herd at Rosendale, Johanna really left her mark.
If Johanna was the workhorse, Empress was the model. Imported in 1879, she became Miller’s ideal of Holstein type. He said flat‑out that she was “the type I have been trying ever since to reproduce.” Compared with his big bull Billy Boelyn—weighing around 2,300 lbs—Empress measured twelve inches longer in body, an inch taller, and larger in every measurement except around the neck and front legs. She carried a one‑day milk record of 109 lbs and a yearly record of 19,714.5 lbs, world‑class in that time.
Then there was Ondine. Imported in 1879, she had already taken first prize as a three‑year‑old at Rotterdam in 1878. Under Miller’s ownership, she walked into the ring at the 1880 New York State Fair and beat Smiths & Powell’s previously unbeaten Netherland Queen for the championship. She then became the first Holstein cow in America to give over 90 lbs in a day, with individual records of 90½ lbs in one day and 2,545½ lbs in 31 days.
Looking back, those three cows—Johanna, Empress, and Ondine—were Miller’s Triple Crown. Everything else he bred over the next sixty years, he built around them.
Miller’s sire battery matched the quality of his cows. The foundation bull, Billy Boelyn, was chosen by a Dutch dealer with twenty years’ experience, who called him the best young bull in the country. He had the classic Dutch markings—black head, white mark on the forehead—and became the backbone of Kriemhild linebreeding. Empress and Billy Boelyn combined to produce Empire, the bull Miller rated as his best sire.
There’s a little farmyard story from Holland that tells you as much about Miller as any statistic. One day, a Dutch farmer waved him and his brother over. He said he had nothing for sale, but he’d like to show them his cows. Miller watched the herd, listened to the man talk about the cheese he was making, and one heifer caught his eye. He bought her. Only when the bill of sale was signed did the farmer put his name to it: Gerrit Smit. He suggested naming the heifer after his little daughter, Annitje. At that point Miller told him his own name—Gerrit Smith Miller—and that his grandmother and sister were both named Anne. Registered here as Nannie Smit, that heifer later headed the two‑year‑old class at the 1880 State Fair and became a key piece of the Johanna Rue branch of the family.
From these cows and sires Miller stacked generations. Johanna’s granddaughter Ononis, out of Onyx and by Empire, was sold in calf to Frederick C. Stevens. The calf, Sir Henry of Maplewood, grew into the leading show sire of the 1890s and one of the great ancestors of the breed. Sir Henry’s grandson Colanthus Abbekerk became Canada’s premier early foundation sire.
And Ondine? Her female line kept right on transmitting. About eighty years later, a bull named Round Oak Rag Apple Elevation was born. Ondine is his twentieth dam on the bottom side of his pedigree. Elevation sits at the absolute top tier of Holstein history, and his blood runs through bulls like Hanoverhill Starbuck. Starbuck, in turn, traces back not just to Ondine through Elevation, but directly to Johanna on his maternal line.
Think about that for a second. You could walk through a Canadian barn in the 1980s, look at Elevation and Starbuck daughters, and not realize you were looking at Kriemhild cows talking across a century.
Smiths & Powell – Turning Great Cows into a Population
While Miller was working away at Peterboro, a pair of nurserymen down by Onondaga Lake were paying close attention.
Wing and Judson Smith had started in cattle a year or two earlier, looking mostly for manure for their orchards and nurseries. They’d heard about a man in Madison County with a shipment of “Dutch‑Friesians” that were beating their Milking Shorthorns and brindle crosses. So they drove over to Peterboro to see for themselves.
They bought the bull Uncle Tom and the cows Aegis, Iris, Juniata, and Sappho from Miller and took them back to their operation at Lakeside Stock Farm. Those cows did exactly what the rumors said they’d do in the milk pail. The Smiths saw two things immediately: this breed was special, and Miller was making very good money. They decided to cut out the middleman and go straight to Holland.
They teamed up with William Brown Smith and son‑in‑law Edward Powell as Smiths & Powell and, starting in 1878, began importing Holsteins on a scale nobody matched. Over the years they brought in 1,293 head—about one‑sixth of all pure Dutch Holsteins imported to North America.
But here’s what really set them apart: it isn’t the number that matters as much as the names.
Their first Holland trip brought thirteen females, including Netherland Queen, who stood first as a yearling and as a two‑year‑old at the New York State Fair in 1878 and 1879 and made a 2‑year‑old yearly record of 15,614 lbs of milk. A year later they brought in her dam Lady Netherland and Lady’s calf Netherland Prince, who had been born after purchase and before shipment. They already had Netherland Princess and Netherland Duchess in the barn and later added Netherland Dowager, the paternal granddam of Prince.
From that group they built the Netherland family, known for size, strong type, and big milk with good butterfat. The bull Netherland Prince took his place alongside Neptune (from Aaggie) and Miller’s Billy Boelyn as one of the three great imported foundation sires. Prince’s sons—Netherland Monk, Prince Imperial, Netherland Carl, Netherland Statesman, Netherland Alban, and others—spread his genetics all over.
Their second major family came from a cow whose name Holstein people still say with respect: Aaggie.
Imported in 1879 as a five‑year‑old, Aaggie went on yearly test in 1880 with Aegis (one of Miller’s cows now at Lakeside). Early in lactation Aegis hit 82 lbs in a day; Aaggie topped her at 84. Over 365 days, Aegis made 16,823 lbs. Aaggie finished at 18,004 lbs, the first cow in the United States to cross the 18,000‑lb mark on a yearly record.
Her daughter Aaggie 2d, imported as a calf by their kinsmen T.G. Yeomans & Sons, produced 17,746 lbs of milk as a two‑year‑old, beating all previous records except her dam’s. Aaggie and Aaggie 2d both traced to the Dutch bull Rooker, whose blood had also yielded the record cowLady Clifden. The Smiths & Powell crew scoured Holland for daughters and granddaughters of Rooker’s sons, naming them all with the Aaggie prefix. They ended up with about 100 “Aaggie” animals.
The third pillar at Lakeside was Clothilde. Born in 1879 and imported in 1880, she produced 26,021 lbs of milk in 1885, setting a world record and proving that Holsteins could compete with Jerseys for butter production when put on proper tests. She was large, strong, and transmitted those traits. Seven of her daughters were by Netherland Prince, and their sons spread Clothilde’s blood across North America.
You can see their reach today if you open an old herdbook and walk the pedigrees forward:
Gerster 1917 H.H.B., imported by Smiths & Powell in 1881 and sold to Chapman Bros. in Ohio, stands behind bulls like Cook‑Farm Starbuck Flip, Canyon‑Breeze Allen, and Whittier‑Farms Apollo Rocket.
Aaggie Ida 2600 H.H.B., imported in 1882, shows up behind cows like Donnandale Skychief Jemima, Riverside Boast Ormsby Dad, and Southwind Bell of Bar‑Lee.
La Polka 2d 2774 H.H.B., from their 1882 imports, is back in Homestead Susie Colantha and Marshline Ormsby Blossom.
It wasn’t just that they imported a lot of cows. They imported the right cows, tested them hard on milk and butter, and then sold their sons and daughters across the country.
What most people don’t realize is that many red‑and‑white Holsteins today trace their red genes back to these same herds. After Miller brought in outcross bulls like Clothilde Monk and later used Aaggie Cornelia 4th’s Clothilde, red and white calves started appearing. Those patterns increased when Smiths & Powell leaned into the Clothilde and Aaggie bloodlines. That history is still lurking in the pedigrees of today’s roan and red Holsteins.
Henry Stevens – Reading Cows by Feel
If Miller was the master cow man and Smiths & Powell were the big engine builders, Henry Stevens of Brookside Farm was the bull man.
Brookside sat just south of Lacona, New York, on land granted to Henry’s great‑grandfather for Revolutionary War service. Henry’s first Holsteins—cows May and Juno—were bought straight out of Miller’s herd for $300 apiece. From there he built his program around four foundation cows: DeKol 2d, Netherland Hengerveld, Belle Korndyke, and Helena Burke.
On paper, each of those cows made solid official records for their day—mid‑20‑lb butter tests, strong yearly numbers. Their real magic came through their sons:
DeKol 2d’s son DeKol 2d’s Butter Boy and grandson DeKol 2d’s Paul DeKol built the DeKol line.
Belle Korndyke produced Pontiac Korndyke, a key figure in the long Pontiac bull family.
Netherland Hengerveld’s line ran through Hengerveld DeKol, linking those families together.
Helena Burke’s son DeKol Burke led to the Burke family, which eventually produced bulls like Wisconsin Admiral Burke Lad.
The twist in Stevens’ story is that he did some of his best work after he lost his sight.
An illness in middle life left him blind, but he didn’t quit. People remembered him walking down the cow alley at Brookside with a hand on the halter rope, then turning loose and letting his fingers do the judging. He’d follow the curve of a rib, feel the spring in the barrel, test the pliability of an udder, even trace hair to tell where black gave way to white. His sons trusted his hands more than their own eyes when it came time to decide which heifers stayed and which bulls went out. The records back that faith up.
Blind before his best years as a breeder, Henry Stevens still “saw” cows better than most men with sight—reading frame, rib and udder with nothing but his hands.
DeKol 2d herself was imported by B.B. Lord & Son in 1885, sold to J.B. Dutcher & Son, and later bought by Henry Stevens & Sons, Lacona. From there, her descendants spread everywhere. Holstein historians calculate that her blood is shared in common with roughly 7.2% of the modern general herd—an astonishing saturation for one cow.
By the 1920s, Henry’s sons, trading as Stevens Bros.–Hastings Company at Liverpool, New York, were running what the Importers history calls “the most influential Holstein farm of the 1920s,” anchored by the bull King of the Pontiacs. The bull power that started with those four Brookside cows and a blind man’s hands helped carry Holsteins into the machinery era.
You see “DeKol” or “Pontiac” stacked three or four times in an older pedigree, and you’re looking straight back at Brookside and a breeder who literally felt his way into the future.
B.B. Lord & Son – A Bridge North
Head west across New York and you come to Sinclairville in Chautauqua County. Just south of the little bridge over Mill Creek lies what used to be Sinclairville Stock Farm, 110 acres owned and worked by Bela B. Lord and his son Clarence.
From 1882 to 1889, B.B. Lord & Son shipped 178 head of Holsteins to Canada—about 12.5% of all Canadian imports—and many of those animals ended up as foundation cows. Working in partnership with Michael Cook & Son of Aultsville, Ontario, they put together almost all the main building blocks of the Posch‑Abbekerk strain:
Tidy of Downie, dam of Tidy Abbekerk, one of the cornerstone cows.
Aaltje Posch 4th, foundation female of the Posch family.
Hiemke 3d, dam of Abbekerk Prince 2d.
Mercena, whose female line produced Pauline Colantha Posch and ultimately King Toitilla Acme.
From those cows came the Mount Victoria Farms herd at Hudson Heights, Quebec, and sires like Prince Colanthus Abbekerk Extra, Canada’s first Class Extra bull and a worldwide influence. Another Lord cow, Disone 6268 H.H.B., went to H.M. Williams and then to A.B. Mallory. Her descendants include May Echo Sylvia (seven world records in 1916), Re‑Echo May Burke EX (world champion in 1950 at 35,314 lbs milk and 1,261 lbs fat in an 11‑year‑old 3X record), and A.B.C. Reflection Sovereign EX‑Extra, sire of multiple All‑American get‑of‑sire groups.
Even Lord cows that stayed in the States made noise. Milly 5153 H.H.B., imported in 1883, shows up as sixth dam of May Walker Ollie Homestead, dam of Sir Inka May. That ties in Shadeland Daisy and other Shadeland blood further back.
Lord’s operation gradually drifted toward horses—French Coach, Percherons, Standardbred trotters—and Holsteins slid out of focus. But by then the cattle they’d picked and shipped were already planted all over Canada and the northern U.S. If you work with Posch‑Abbekerk descendants, Pauline Colantha Posch blood, or some of the old King Toitilla Acme lines, you’ve got a little bit of Sinclairville running in your herd.
Regional Pioneers – The Web Tightens
Once the big New York pipelines were flowing, a second wave of importers stepped in. Their names might not be as famous on the surface, but if you spend any time chasing deep pedigrees, you bump into them constantly.
Take Alonzo Bradley of Lee, Massachusetts. He was a lumberman before he turned to farming and made six trips to Holland between 1879 and 1884, picking cattle off the ground himself. Among his imports were Segis 5765 H.H.B.,Pietertje 2d 3273 H.F.H.B., and Aaltje Salo 5868 H.H.B. Those cows became the headwaters of the Segis, Pietertje, Rag Apple, and Ormsby families—names that echo later in bulls like King Segis and Johanna Rag Apple Pabst. Bradley sold just twelve young females to H. Rust & Bros. in Wisconsin. From that small group came, generations later, cattle like Hanover‑Hill Triple Threat and Snow‑N Denises Dellia and the cow families they started.
Protein would have to be worth 3× fat for this TPI shift to pay. Your milk check says it isn’t. Where does that leave the bulls you’ve been loading into your tank?
[Editor note: “Mark H.” and “Sara L.” in this article are composite characters built from real barn math and industry context to illustrate decisions many 500‑cow dairies face in 2026.]
The new TPI weights don’t just tweak your sire list. They push the Holstein breed in a new direction for the next 10–15 years. This isn’t a milk check issue alone; it quietly changes the fundamental type of cow the industry breeds for over the next decade.
Holstein USA’s April 2026 TPI formula doesn’t just nudge protein; it rewards the protein‑to‑fat ratio over total output. That’s a fundamentally different breeding goal from previous iterations that treated fat and protein more evenly in the production slice. If you follow that signal unthinkingly in a US Class III component grid, a 500‑cow herd can easily leave about $17,500 a year on the table.
Mark H., who milks 500 Holsteins in New York, only saw “five‑point tweaks” when Holstein USA shifted TPI production weights to 24% protein and 14% fat, and Lactanet moved Holstein LPI production to 40% fat, 60% protein. Under pressure from reps and neighbors, he leaned into the new high‑TPI, protein‑heavy bulls — and that’s where the barn math started to disagree with his milk check.
2026 TPI Formula Changes: A Directional Shift, Not a Tweak
Holstein USA’s 2026 TPI formula update increased the weighting on PTA Protein from 19 to 24 and decreased the weighting on PTA Fat from 19 to 14. That’s the headline change in the production slice.
By early 2025, Mark’s Federal Order milk check looked like most US Class III/IV component checks. USDA Class III and IV component reports through 2023 and into 2025 often show butterfat prices near the high‑$2.80s to low‑$3.00s per lb, with protein commonly in roughly the $1.80–$2.50 per lb range, depending on the month and year. In several recent months, that’s meant fat is worth more per pound than protein on his component line.
At the same time, the TPI formula did something very different inside the index. It moved the production weights from:
19% protein, 19% fat → to → 24% protein, 14% fat.
On the surface, you see a five‑point bump to protein and a five‑point cut to fat. Simple enough.
When Mark’s nutritionist and genetics advisor, Sara L., put a pen to it at his kitchen table, she wrote one line that changed the whole conversation:
Old protein:fat leverage = 19:19 = 1.0
New protein: fat leverage = 24:14 ≈ 1.71
Inside the production slice of TPI, one pound of PTA Protein now pulls like roughly 1.7 pounds of PTA Fat. That’s roughly a 70% increase in protein’s leverage over fat, even though Holstein USA’s own description says the formula is designed to yield “additional pounds of fat and protein, with slightly more emphasis on protein.”
Because protein yield is closely tied to milk volume in most Holstein evaluations, loading selection on the P/F ratio nudges herds — and over time the breed — toward higher‑volume, more fluid‑style cows, even while most plants continue to pay based on total fat + protein sold.
The formula isn’t creating more total components — it is redistributing emphasis. A hard P/F chase moves components away from fat instead of maximizing total pounds of fat + protein you sell. TPI is now quietly rewarding the ratio more than the total output. That’s a different breeding goal than the one that built the modern high‑component Holstein.
Lactanet did something similar but more transparent. Its April 2026 bulletin spells out that shifting Holstein LPI production from 60F:40P to 40F:60P is meant to “better reflect anticipated changes in milk pricing and processor demand, particularly the growing emphasis on protein,” and that it should cause only minor reranking among top animals. Canada’s move is explicitly anchored in its quota‑based pricing math and processor demand; it’s internally consistent with that market.
Holstein USA’s change, by contrast, is big enough to push fat‑heavy bulls down the list and protein‑heavy bulls up, even when no new daughters are added. The 24P:14F production weighting behaves more like a new rulebook for which cow wins — especially in how it reshuffles bulls with very different fat vs protein profiles. Mark saw that on the spring lists. He just hadn’t tied it back to dollars or to the kind of cow he was breeding for 2036.
2026 TPI vs Total CFP: Two Paths for the Same 500‑Cow Herd
To get past the rhetoric and the rankings, Sara asked Mark to walk through two very different five‑year futures off the same starting herd. Same cows today, different sire lists from 2026 through 2030.
They agreed on a realistic starting point for his 500‑cow Holstein herd:
Fat: 1,070 lb/cow/year
Protein: 840 lb/cow/year
Total components (CFP): 1,910 lb/cow/year
That’s roughly a 26,700‑lb Holstein at ~4.0% fat and 3.1% protein — very normal for a well‑managed commercial herd.
These gains are illustrative — built to show directional outcomes, not to predict any specific bull’s future proof. Actual genetic trends will vary by herd, sire choice, and whatever comes out of the April evaluations.
Path 1: Follow the 2026 TPI Formula — Chase the Ratio
If Mark listens to the new 24P:14F signal and leans into bulls that look fantastic on updated Holstein TPI 2026 lists, he’s going to pick a lot of sires that:
Carry high PTA Protein
Have only moderate PTA Fat
Sit at P/F ratios ≥0.60
Those are the profiles that jumped when TPI changed — protein‑strong, fat‑lighter bulls that TPI now likes roughly 1.7× more per pound of protein than per pound of fat.
Looking at typical genomic bull PTAs and recent trends, Sara used conservative, scenario‑level genetic gains for a herd that picks sires that way:
+6 lb PTA Fat per year
+8 lb PTA Protein per year
Over five years of bull selection, that’s +30 PTA Fat and +40 PTA Protein at the sire level. With a realistic ~2.5‑year lag from bull usage to milking cows, about half of that gain has flowed into the cow herd by Year 5:
+15 PTA Fat, +20 PTA Protein in the herd.
Translate PTAs to actual production (roughly 2 lb actual per lb PTA on mature daughters):
+30 lb fat, +40 lb protein per cow per year by Year 5.
So if Mark “follows TPI,” his Year‑5 average cow looks like this:
Fat: 1,070 + 30 = 1,100 lb
Protein: 840 + 40 = 880 lb
Total CFP: 1,980 lb
P/F ratio (by lb): 880 ÷ 1,100 ≈ 0.80
He’s now got a prettier P/F ratio and more protein. That’s what the formula rewards.
Path 2: Follow Total Output — Anchor on Combined Fat + Protein
The alternative is boring but powerful. Ignore the TPI noise and:
Filter bulls first on a profit index that actually starts from dollars — Net Merit (NM$), Cheese Merit, or a similar economic index.
Within that filtered list, sort bulls by Fat PTA + Protein PTA (total CFP).
Keep bulls with P/F in a sane band, roughly 0.50–0.60, so you’re not accidentally tanking protein.
That’s very similar to how Lactanet positions Pro$ and LPI: as profit‑oriented tools tuned to Canada’s component pricing and costs, with the production subindex explicitly anchored to fat and protein yields.
For a herd following that logic, Sara assumed slightly different gains:
+9 lb PTA Fat per year
+7 lb PTA Protein per year
Over five years, that’s +45 PTA Fat and +35 PTA Protein among the sires, or about half in the cow herd by Year 5:
+22.5 PTA Fat, +17.5 PTA Protein.
Translate to actual:
+45 lb fat, +35 lb protein per cow per year by Year 5.
Now Mark’s “CFP‑anchored” herd is at:
Fat: 1,070 + 45 = 1,115 lb
Protein: 840 + 35 = 875 lb
Total CFP: 1,990 lb
P/F ratio: 875 ÷ 1,115 ≈ 0.79
Notice what happened: the TPI‑driven path didn’t grow total CFP faster; it just redistributed pounds from fat to protein to achieve a prettier ratio. That is the “ratio over output” trap.
Because protein yield is closely tied to milk volume in most Holstein evaluations, selecting aggressively for the P/F ratio doesn’t just shift your component ratio — it tends to nudge herds toward higher‑volume, more fluid‑style cows. You’re nudging both your herd and, if enough herds follow, the breed toward a fluid‑market cow in a component‑driven system.
2026 Selection Paths for a 500‑Cow Herd (Year‑5 Scenario)
Metric (per cow/year)
Path 1: TPI Ratio Chase
Path 2: CFP Anchor
Difference
Fat yield (lb)
1,100
1,115
–15 lb
Protein yield (lb)
880
875
+5 lb
Total CFP (lb)
1,980
1,990
–10 lb
Fat revenue @ $3.00/lb
$3,300
$3,345
–$45
Protein revenue @ $2.00/lb
$1,760
$1,750
+$10
Total components revenue
$5,060
$5,095
–$35/cow
500-cow herd annual loss
—
—
–$17,500
The $17,500 Gap: Paper Cows vs Real Cows
To keep the math honest, Sara anchored everything to real US component prices.
USDA Class III and Class IV component reports through 2023 and into 2025 often show butterfat prices near the high‑$2.80s to low‑$3.00s per lb, with protein commonly in roughly the $1.80–$2.50 per lb range. In several recent months, that’s meant fat worth more per pound than protein on a Federal Order check.
For barn‑table math, she used simple, conservative averages:
$3.00/lb fat
$2.00/lb protein
She wasn’t trying to pick a magic month. She wanted Mark to see the difference.
Using the Year‑5 cows they just built:
Ratio herd (TPI‑driven)
Fat dollars: 1,100 lb × $3.00 = $3,300
Protein dollars: 880 lb × $2.00 = $1,760
Total components revenue: $5,060/cow/year
CFP herd (milk‑check‑driven)
Fat dollars: 1,115 lb × $3.00 = $3,345
Protein dollars: 875 lb × $2.00 = $1,750
Total components revenue: $5,095/cow/year
The difference:
$35/cow/year — in favor of the boring CFP herd.
At 500 cows:
$35 × 500 = $17,500/year.
On paper, the ratio‑focused herd “improved” faster. In the tank and on the check, the CFP herd won. That’s the danger of breeding for a mathematical ratio instead of real‑world output.
If your operation is already navigating tight margins under current milk prices, that $17,500 is serious money — the kind of structural bleed the Bullvine explored in “2025’s $21 Milk Reality: The 18‑Month Window to Transform Your Dairy Before Consolidation Decides for You,” which showed how a $21.60/cwt milk price could wipe out about $125,000 a year from a typical 500‑cow dairy’s profits if nothing changes.
Using the same 26,700 lb/cow:
26,700 lb ÷ 100 = 267 cwt/cow/year
Then:
Ratio herd: $5,060 ÷ 267 ≈ $18.95/cwt
CFP herd: $5,095 ÷ 267 ≈ $19.08/cwt
While 13¢/cwt may not feel like a crisis in year one, over a decade, it represents a meaningful directional bleed — and it points the herd toward a more fluid‑style cow while your plant still pays you on components sold.
What Does the 3× Protein Break‑Even Really Mean for Your Milk Check?
Mark’s next question is probably the same one you’re thinking: “Sure, that’s with today’s pricing. What if protein really outpaces fat?”
So they stacked the deck for protein. Lactanet’s April 2026 article is explicit that they expect more emphasis on protein in Canadian milk pricing because of processor demand and SNF‑heavy products, and that LPI’s tilt is intended to reflect those anticipated pricing changes. Some specialty protein markets and niche contracts already pay a heavier protein premium than the standard Federal Order grid. The question is whether your check looks like that.
To mirror a “protein‑friendly” future, Sara tried:
$2.80/lb fat
$3.50/lb protein
That’s a world where protein is worth ~25% more per lb than fat — much more protein‑heavy than many recent US Federal Order months, but not fantasy.
Run the Year‑5 cows again:
Ratio herd
Fat: 1,100 × 2.80 = $3,080
Protein: 880 × 3.50 = $3,080
Total: $6,160/cow/year
CFP herd
Fat: 1,115 × 2.80 = $3,122
Protein: 875 × 3.50 = $3,062.50
Total: $6,184.50/cow/year
Even in that protein‑leaning grid:
The CFP herd is still $24.50/cow/year ahead.
On 500 cows, that’s about $12,250/year.
The trade behind that number:
Fat lost vs CFP herd: 15 lb × $2.80 = $42
Protein gained vs CFP herd: 5 lb × $3.50 = $17.50
Net: $24.50 worse for the ratio herd.
The milk check still doesn’t care that TPI loves Mark’s higher P/F ratio.
Sara wrote the trade on the board:
Ratio herd vs CFP herd Year 5: –15 lb fat, +5 lb protein.
For the ratio herd to make more money on components, you’d need:
5 × protein price > 15 × fat price
So the break‑even is:
protein price ÷ fat price > 3.0
Unless your component grid effectively values protein at 3× the price of fat, you’re being paid to maximize total output, not to reshuffle the ratio.
Scenario
Fat Price ($/lb)
Protein Price ($/lb)
Protein÷Fat Ratio
TPI Path Winner?
Current US avg (2024–25)
$2.95
$2.33
0.79
❌ CFP wins by $35/cow
Protein-lean month
$3.00
$1.80
0.60
❌ CFP wins by $45+/cow
Protein-heavy scenario
$2.80
$3.50
1.25
❌ CFP still wins by $24.50/cow
Break-even threshold
$2.00
$6.00
3.0
= Tie
TPI math finally pays
$2.00
$6.50+
>3.0
✅ TPI path wins
USDA Federal Order Class III/IV component data through 2024 and early 2025 doesn’t show anything remotely like that. Protein moves around. Some months it’s close to fat. For many months, it’s been cheaper. But nowhere does it sustainably hit 3× fat per lb.
Who Benefits When TPI Chases Protein?
After the 3× math sank in, Mark asked the question every producer should be asking: “If this doesn’t make sense for my milk check, who decided to do it — and who does it make sense for?”
It’s a fair question. And Holstein USA’s own numbers make it sharper than you’d expect.
TPI’s Own Economics Say Fat Is Worth More
Holstein USA’s Feed Efficiency Dollar (FE$) formula — the economic engine inside TPI — uses these component values:
Fat: $1.86/lb
Protein: $1.75/lb
Milk: –$0.0025/lb
That’s straight from Holstein USA’s published TPI formula page. Protein ÷ fat = $1.75 ÷ $1.86 = 0.94. In their own economic model, fat is slightly more valuable than protein.
But in the TPI production weighting, protein gets 24% vs fat’s 14% — a ratio of 1.71 favoring protein.
Read that again. The economics inside the formula say fat ≥ protein. The weighting applied on top of those economics values protein at 71% more than fat. Those two things can’t both be right at the same time.
And those FE$ component prices? Holstein USA’s own TPI materials show FE$ component values of $1.86 for fat and $1.75 for protein, tied to updated cheese‑market economic assumptions released since 2021. Whatever exact update cycle you use, the current published FE$ values still favor fat over protein — $1.86 vs $1.75. And compared to the April 2021 FE$ values ($1.55 fat, $1.73 protein), fat’s advantage has actually grown: fat jumped 20% while protein barely moved. The formula’s own economics are drifting toward fat even as the production weighting lurches toward protein. The FE$ values are net of feed cost, so they’re not directly comparable to AMS spot prices — but the direction is the same. In January 2025, USDA reported butterfat at $2.9460/lb and protein at $2.3267/lb, a protein/fat ratio of just 0.79. Whether you look inside the formula or outside it, fat keeps winning. The 24P:14F weighting doesn’t reflect that.
By contrast, USDA’s Net Merit 2025 update used current AGIL data and moved toward fat and away from protein. Same data agency, different conclusion.
Is This a Processor’s Index or a Farmer’s Index?
Holstein USA’s stated rationale includes alignment with processor demand for casein and the observation that genetic gains for protein have lagged behind fat in recent years. That’s a processor‑supply argument — cheese plants absolutely want more casein per vat because it drives cheese yield.
But here’s where it gets uncomfortable: a farmer doesn’t get paid on cheese yield per vat. You get paid on the total pounds of fat and protein sold, at whatever the Federal Order grid says those pounds are worth. If TPI steers the breed toward protein at fat’s expense, processors get more of the component they want for cheese yield — while farmers may end up with fewer total component dollars per cow under the actual Class III grid.
The Bullvine’s own analysis of the component revolution showed that processors are already capturing a 12.5% cheese yield windfall from higher components, and asked the pointed question: Are farmers getting their fair share of that value?
That doesn’t mean there’s a conspiracy. It means TPI may be optimizing for a processor’s view of what the breed should look like, not necessarily for the farmer’s milk check. If you’re making breeding decisions based on TPI, you should know whose economics the formula is actually serving.
Why Such a Big Swing?
If the goal was to keep protein gains from falling too far behind fat genetically, a modest adjustment might make sense. Go from 19:19 to maybe 21:17. Nudge it.
The question Holstein USA hasn’t clearly answered: if your own FE$ economics say fat ≥ protein, and AMS prices have only reinforced that since 2021, why did the production weighting move this far in the other direction?
Net Merit vs TPI 2026: Two Models, Two Directions
Mark’s not operating in a vacuum. While TPI’s production slice is shifting toward protein, Net Merit 2025 explicitly moved the other way, increasing the emphasis on fat and reducing the emphasis on protein to match observed component price trends.
Bullvine’s Net Merit 2025 analysis in “Net Merit’s $57 ‘Weight Tax’: How to Pick Holstein Bulls That Still Pay”shows:
Protein’s share of NM$ dropping from 19.6% to 13.0%.
Fat’s share is increasing from 28.6% to 31.8%.
Feed Saved rising to a combined 17.8% of NM$ when you add Residual Feed Intake and the negative Body Weight Composite (a ‑11% emphasis that acts as a $57 “weight tax” per BWC point, per daughter).
In plain language:
NM$ 2025: rewards fat strongly and penalizes big cows, aiming for smaller, efficient, high‑component animals that fit real feed and component markets.
TPI 2026: increases protein leverage over fat within the production slice and continues to favor higher body weight more than NM$, nudging toward bigger, more fluid‑type cows.
Lactanet’s LPI shift for Holsteins back to 40F:60P is explicitly anchored to “evolving industry directions and milk pricing changes” in Canada and is expected to cause only “minor reranking” of top bulls. The Canadian system is internally consistent with its own pricing math.
The bottom line: the Canadian system is internally consistent with its market. NM$ 2025 is internally consistent with current USDA economics. TPI 2026’s production slice is inconsistent with its own FE$ values or recent AMS pricing data. That’s not a small discrepancy. It’s a question the industry should be asking out loud.
If thousands of herds follow this TPI signal, we don’t just change individual milk checks; we start re‑steering the Holstein breed toward more volume and less fat density over the next 10–15 years. That’s a directional shift for the whole breed, not just a personal quirk for one 500‑cow dairy.
Index
Fat Weight
Protein Weight
Body Size Emphasis
Market Anchor
NM$ 2025 (USDA)
+31.8%
+13.0%
–11% penalty
AGIL/Federal Order economics
TPI 2026 (Holstein USA)
+14%
+24%
+4% (slight favor)
Processor casein demand
LPI 2026 (Lactanet CA)
40%
60%
Neutral/moderate
Canadian quota pricing
Cheese Merit (USDA)
Higher than NM$
Lower than TPI
Negative (like NM$)
Class III cheese yield value
The Turn: When Mark Stopped Letting TPI Drive
By the end of that kitchen‑table session, Sara hadn’t told Mark to throw TPI in the garbage. She just forced a role change.
Before this spring, Mark treated TPI as the main definition of “good bull.” If a bull climbed the list, he needed him in the tank. If a bull slid, he wondered if he’d made a mistake.
The hardest part wasn’t the math. It was the social pressure.
When a bull is all over social media and climbing the TPI list, it feels like a mistake not to use him. That pressure is real. But a bull rising because a formula changed — not because his daughters produce more total components or more dollars under your grid — isn’t a signal. It’s noise.
After walking through the 70% protein leverage inside 24P:14F, the Year‑5 scenario math, the $35/cow/year gap at realistic component prices, the 3× protein/fat break‑even that the market’s never touched, the contradiction between TPI’s own FE$ economics and its production weighting, and the biological reality that high‑protein selection leans toward more volume, Mark could see one thing clearly:
“If I let TPI steer my breeding program, I’m not actually breeding for the cow my milk check pays best. I’m breeding for the cow the index designer likes.”
So he made three quiet decisions for 2026:
Pick his steering wheel. NM$ (or Cheese Merit for his Class III plant) now decides which bulls make it to the short list; TPI is a filter, not the boss. If you want to understand how NM$, Cheese Merit, and the other CDCB indexes actually work — and why the April 2025 NM$ update already shifted weight toward fat and away from protein — the Bullvine’s “Net Merit’s $57 ‘Weight Tax’: How to Pick Holstein Bulls That Still Pay” walks through the new weights and practical filters in detail.
Stay obsessed with total CFP. Every bull on his “heavy‑use” list has to be elite for fat + protein pounds, with P/F in the 0.50–0.60 band. The ratio‑pretty but mid‑pack CFP bulls get used carefully, not across the whole herd.
Let his milk check, not the buzz, define success. If a bull looks great on high‑TPI slide decks but doesn’t add more dollars per cow under Mark’s own fat and protein prices, he’s a luxury, not a core sire.
He didn’t burn down his program. He just stopped confusing a breed index with a cheque.
The Playbook: 30/90/365 Days to Get Out of the TPI Protein Ratio Trap
You don’t have to change everything overnight. You have to stop reinforcing the bias that’s quietly bleeding your components and reshaping your herd type.
In the Next 30 Days: Stop Digging
1. Audit your top bulls for P/F bias
Pull the 5–10 sires you’ve used the most in the last 12 months.
For each, jot down PTA Fat, PTA Protein, total CFP (fat+protein), and P/F (protein ÷ fat).
Count how many of your heavy‑use bulls are P/F ≥0.65 and not in the very top tier for total CFP.
If that’s more than a couple, you’re already leaning into the ratio side of the trap.
2. Freeze new orders on extreme ratio bulls
Any bull that’s P/F ≥0.65 and only average for CFP goes on a “no reorder” list until you’ve rebalanced.
Use remaining straws on lower‑value cows or recips if you like; don’t keep filling the tank.
3. Build a CFP‑first short list from a profit index
Tell your rep exactly what you want:
Filter bulls first on NM$, Cheese Merit, or your co‑op’s profit index, not TPI.
Within that filtered list, sort bulls by Fat PTA + Protein PTA.
Keep bulls with P/F roughly 0.50–0.60 and decent PL/DPR (or Herd Life/Fertility in Canada).
If a bull is high TPI and top‑end CFP under your grid, great. If he’s only high TPI because the formula loves his P/F, be cautious.
4. Check your actual fat and protein prices
Grab your last milk check and write down:
Fat price ($/lb)
Protein price ($/lb)
Then do one quick ratio: Protein ÷ Fat.
If that number is nowhere near 3.0, a pure P/F chase isn’t justified by your pay structure. In the most recent US Federal Order Class III/IV data from 2023–early 2025, it sits well under 2.0 and often between about 0.6 and 1.2.
In the Next 90 Days: Rebalance Without Blowing Up Your Program
5. Watch the cow type you’re breeding
Look at your last group of fresh heifers:
Are your best “new genetics” cows the ones with the highest components per cwt, or the highest volume?
Are you seeing more long, big‑framed, fluid‑type heifers in the pipeline than you expected?
If you’re on a component grid, your index choices shouldn’t slowly turn your herd into cows that fit a fluid market you don’t sell into.
6. Re‑tier your sires by role
Split your bull battery into:
Core sires (60–70% of matings): High profit index, high CFP, P/F in the 0.50–0.60 range, solid fitness.
Specialty sires (10–20%): Extreme type or high‑TPI ratio bulls you still want a little of — used intentionally, not across the board.
Clean‑out sires: Ratio‑heavy or weak‑CFP bulls; finish their straws on lower‑value cows or phase them out.
This keeps your main genetic direction pointed at components and cow style that actually pay, while still letting you play with a few favorites.
7. Re‑score your genomic heifers with a custom index
Ask your genetic provider to compute a simple custom score:
Use that score for replacement vs beef decisions and prioritizing heifers for sexed semen. If two heifers are similar, the one whose parents are genuine component earners under your grid wins over the one whose parents look good on P/F.
In the Next 365 Days: Let Your Own Data Judge the Indexes
8. Tag daughters by sire group and track components
Pick a few bulls as “test cases”:
Group R (ratio): 2–3 bulls with high P/F that gained TPI spots in April 2026.
Group C (CFP): 2–3 bulls with strong total fat + protein and balanced P/F.
For daughters freshening over the next year, tag them by sire group in your records and track fat lb, protein lb, and CFP over 305 days (or good projections). You’re not trying to do a PhD. You want enough signal to see whether your ratio group or your CFP group is doing more work for your cheque.
9. Do a simple “by‑sire” milk check sanity check
Once you’ve got at least a dozen daughters per group, use your actual component prices from the past 12 months:
Calculate $/cow/year from fat + protein for Group R vs Group C.
If Group C cows are clearly ahead by more than $20–30/cow/year on components and aren’t worse on fertility/survival, that’s your own proof that CFP bulls beat P/F bulls under your grid.
If Group R genuinely beats Group C under your grid and costs, you might be one of the rare operations where a strong protein tilt actually pays. Either way, you’re making decisions off your own data, not somebody else’s formula.
10. Build your own index — and stick to it
Sit down with your advisor or rep and formalize your own weights for fat, protein, fertility, longevity, and maybe feed efficiency. Have them build a custom index in their software that matches your milk check and cull costs rather than TPI’s 24P:14F weights. Commit: new bulls get chosen on that index first, then filtered by TPI, type, or show traits as needed.
At that point, you’re not arguing with Holstein USA or Lactanet. You’re just letting them have their opinion while you follow your money.
What This Means for Your Operation
Run the P/F sanity check on your lineup. This week, pull the main bulls you’re using and calculate P/F and CFP. If most of your semen is going to P/F ≥0.65 bulls who aren’t top‑end CFP, you’re not maximizing output — you’re redistributing it away from fat instead of maximizing total fat + protein sold.
Watch the cow type you’re breeding. Your sire choices today decide whether your 2036 herd is built for a fluid market or a component market. If your plant still pays more per pound for fat than protein, you don’t want your index pushing you toward big, fluid‑style cows.
Your milk check decides your index — not the other way around. A breed index can move toward protein without your grid ever justifying the shift. If your cheque still pays more per pound for fat than for protein, you’re being paid to maximize total components, not to chase a ratio.
Use the 3× rule as a hard brake. If protein on your check isn’t worth anywhere near three times fat per lb — and in most US Federal Order markets it won’t be — a strong P/F chase won’t pay under the kind of “15 fat for 5 protein” genetic trade the 24P:14F world incentivizes.
Ask whose economics the index is actually serving. Holstein USA’s own FE$ values put fat at $1.86 and protein at $1.75 — fat wins. But the production weights say protein is 71% more important. If the formula’s own economics don’t justify the weighting, ask who benefits from the direction the breed is being steered.
Don’t assume Canada’s direction validates the US move. Canada’s formula makes sense for Canadian quota‑based component pricing. Copying the protein pivot without copying the pricing logic is how you end up selecting for the wrong cow in the wrong market.
Do one contract‑check in the next 30 days. Before you order your next semen, pull your last 12 months of checks and write down average fat and protein prices. Divide protein by fat. If that ratio doesn’t look anything like the weights inside the index you’re following, adjust how you use that index.
Key Takeaways
Directional shift, not a tweak. If a 500‑cow herd follows the 24P:14F TPI signal hard for five years, scenario math shows it can give up around 15 lb fat per cow per year to gain only about 5 lb protein — and end up roughly $35/cow/year behind a CFP‑anchored strategy under realistic US Federal Order component prices.
Market vs formula mismatch. Protein would have to be worth more than 3× fat per pound for that kind of trade to win on components alone. Recent Class III/IV data from 2022–2024 haven’t come close.
The formula contradicts its own economics. TPI’s FE$ engine values fat at $1.86/lb and protein at $1.75/lb — fat wins. But the production weighting gives protein 71% more leverage than fat. The internal economics and the external weighting point in opposite directions.
Follow the incentives. TPI’s stated rationale includes processor demand for casein. That’s a cheese‑yield argument, not a farmer‑profitability argument. Your milk check pays on total fat + protein sold, not on cheese yield per vat.
Paper vs tank. It’s now possible for a herd to look better on paper without actually selling more total pounds of components. That’s exactly what happens when a formula rewards a ratio instead of total output.
The Bottom Line
One question matters more than any list or formula: What did your plant actually pay per pound for fat and per pound for protein over the last 12 months — and do the bulls you’re buying make more money under those numbers, or under someone else’s?
Complete references and supporting documentation are available upon request by contacting the editorial team at editor@thebullvine.com.
Learn More
The Holstein Bulls Bleed Pregnancies in Arizona Heat – Gain an immediate edge in your summer reproduction program. This breakdown delivers the specific DC305 filters needed to expose the high-NM$ bulls failing your herd in the heat, arming you with a $360-per-daughter reproductive rescue plan.
Gene Editing: The Next Frontier in Dairy Cattle Breeding – Prepare for the most significant disruption in a generation. This technical roadmap reveals how gene editing for heat tolerance and disease resistance could bypass decades of traditional breeding, delivering an unfair advantage to those ready to embrace the next frontier.
The Sunday Read Dairy Professionals Don’t Skip.
Every week, thousands of producers, breeders, and industry insiders open Bullvine Weekly for genetics insights, market shifts, and profit strategies they won’t find anywhere else. One email. Five minutes. Smarter decisions all week.
Holstein USA and Lactanet both shifted toward protein in the same proof round. Your mating list doesn’t know yet.
Executive Summary: HORSESHOE is the kind of bull most people had buried in the middle of the list; under the 2026 TPI formula, he jumps an estimated 10 spots while GARZA, the current #2, slides down the rankings on the same December proofs. Holstein USA is shifting TPI to 24% protein and 14% fat at the April 2026 run, and Lactanet is flipping Holstein LPI production from 60F:40P to 40F:60P, so both major indices are now paying more for protein than fat at the same time. Bullvine reran the December 2025 top‑25 daughter‑proven TPI sires through the new weights and found that fat‑heavy bulls like GARZA, RICHE, and RIVERA lose ground, while high P/F bulls like POWERHOUSE, HORSESHOE, and CAPN MIGUEL pick up points and rank before a single new daughter is added. If more than two of your top five service sires have P/F ratios under 0.5 and weak PL or DPR, you’re effectively breeding for the old formula while semen companies and processors are already repricing around protein and longevity. The immediate risk is over‑exposure to fat‑dominant sires you’re sitting on by the 100‑unit cane; the opportunity is to quietly pivot toward bulls whose component mix and PL match where TPI, LPI, and casein markets are actually headed. The article walks through the full “winners and losers” table, a simple P/F check you can run in five minutes, and a 30‑day plan to talk with your AI rep and adjust spring matings without panic.
Last Friday, GARZA sat comfortably as the #2 daughter-proven TPI sire in the Holstein breed — 3464 TPI, fat pounds through the roof, the kind of bull that makes a lineup card look impressive. By the time you read this, the formula that produced that ranking may no longer exists. Holstein Association USA’s board just moved PTA Protein from 19% to 24% of TPI and dropped PTA Fat from 19% to 14%, effective with next week’s April 2026 genetic evaluation.
That’s a 10-percentage-point swap between your two component traits. And it lands two weeks before proofs.
If you bred heavy to bulls like GARZA and RIVERA this winter, this is the week your stomach does a little flip. Nothing about their daughters changed. No new genes appeared. But the TPI formula 2026 update just tilted the math away from fat-dominant profiles and toward protein, Productive Life, and fertility — and it did it right before spring mating decisions lock in.
Across the border, Lactanet picked the same proof round to flip Holstein LPI’s production subindex from 60% Fat / 40% Protein to 40% Fat / 60% Protein. Two different countries. Two different committees. One unmistakable direction.
TPI (Holstein USA)
LPI Production (Lactanet)
Index owner
Holstein Association USA
Lactanet (Canada)
Effective date
April 2026 evaluation
April 2026 evaluation
Fat weight — before
19%
60%
Fat weight — after
14% (↓5pp)
40% (↓20pp)
Protein weight — before
19%
40%
Protein weight — after
24% (↑5pp)
60% (↑20pp)
Net direction
Protein > Fat
Protein > Fat
Stated rationale
Align with processor demand for casein; protein lags fat in pipeline
Milk pricing signals; butterfat doesn’t need more genetic push
Correlation with old formula
“Very highly correlated” (Holstein USA)
Structural, not incremental shift
Risk to fat-dominant programs
Moderate (−5pp swing)
High (−20pp swing on LPI)
Opportunity bulls
P/F ratio > 0.60 + strong PL
Same profile; protein-dominant cows stick around
Bullvine pulled the December 2025 top-25 daughter-proven TPI sires and ran their existing PTAs through the new 2026 weights. Same proofs. New formula. This isn’t a prediction of April proofs — new daughter data will still move bulls when those drop on April 7. But it’s a clean look at where the formula alone is pushing your favorite sires before that data even hits.
What Changed in the 2026 TPI Formula?
Strip it down to the parts that hit your tank.
Holstein USA’s board approved these changes for the April 2026 TPI formula:
PTA Protein weight jumps from 19% to 24% (+5 points).
PTA Fat weight drops from 19% to 14% (−5 points).
The Health & Fertility block maintains strong emphasis on Productive Life (PL) and the Fertility Index (FI)— which rolls up DPR, CCR, HCR, and EFC — carrying forward the longevity and reproduction tilt that’s been building since 2020.
Holstein USA says the new formula is very highly correlated with the old one. Across all bulls, TPI values barely budge. Single-digit points for the average sire.
But your top-25 list isn’t “average.”
Up at the top, bulls are bunched within a handful of points. Their component profiles — how much of their genetic value comes from protein vs. fat — are wildly different. When you crank protein up and pull fat down, some names that felt untouchable suddenly have the wind in their face. Others catch a tailwind they didn’t have last week.
The TPI Ranking Table Nobody Else Will Publish
Press releases are safe. They’ll tell you “more emphasis on protein” and “continued focus on health and fertility.” They won’t tell you what that does to GARZA, POWERHOUSE, HORSESHOE, RIVERA, and the rest of the short list you’ve been breeding to.
Bullvine did the part nobody else will print right now.
We took Holstein USA’s December 2025 top-25 daughter-proven Holstein sires by TPI and reran their December PTAs through the April 2026 TPI weights. That isolates the formula pressure — the shift caused by the new weighting alone — before any new daughter data moves anything on April 7.
Quick methodology: Base list is the top-25 daughter-proven Holstein sires by December 2025 TPI (Holstein USA). Inputs are December 2025 PTAs for protein, fat, and TPI. Outputs are the estimated rank and TPI shift under the 2026 formula. This is Bullvine internal modeling, not official April proofs. Treat every estimated number as directional.
Top 25 TPI Sires: December 2025 vs. 2026 Formula Pressure
Bull
Stud
Dec Rank
Est. Rank*
Move*
Dec TPI
Est. Shift*
PTA Protein (lb)
PTA Fat (lb)
P/F Ratio
SHEEPSTER
Select Sires
1
1
—
3572
+5
70
133
0.53
DOMINANCE
STgenetics
3
2
↑1
3458
−6
65
131
0.50
CAPTAIN
STgenetics
4
3
↑1
3428
+8
67
120
0.56
GARZA
STgenetics
2
~4
↓2
3464
~−40
51
145
0.35
ZURI
Alta
5
5
—
3375
−7
54
108
0.50
POWERHOUSE
Alta / Peak
7
~6
↑1
3329
~+39
81
104
0.78
TROOPER
Select Sires (CRI)
6
7
↓1
3334
+16
53
90
0.59
BOLT ACTION
Select Sires
9
8
↑1
3324
−11
38
93
0.41
JULIUS
STgenetics
11
9
↑2
3299
+10
64
110
0.58
UNDERTONE
Select Sires
10
10
—
3304
−2
54
108
0.50
POSITIVE DELUXE
STgenetics
8
~11
↓3
3325
~−25
56
129
0.43
POWERSTAR
Semex
14
12
↑2
3275
+22
49
79
0.62
MATTERHORN
Alta / Peak
12
13
↓1
3296
−2
45
98
0.46
HORSESHOE
GENEX
24
~14
↑10
3262
~+27
70
93
0.75
CAPN MIGUEL
STgenetics
21
~15
↑6
3263
+21
57
86
0.66
INNOVATION
ABS Global
19
~16
↑3
3266
+17
70
111
0.63
EVENT
Semex
20
~17
↑3
3265
+18
50
83
0.60
PERKY
Semex
13
~18
↓5
3292
−12
35
92
0.38
PIPELINE
STgenetics
18
~19
↓1
3268
+11
62
105
0.59
CAPN ELEMENT
STgenetics
23
~20
↑3
3263
+7
56
99
0.57
BENEFIT
ABS Global
15
~21
↓6
3273
−7
48
108
0.44
T REX
Select Sires
22
22
—
3263
−9
44
99
0.44
RICHE
Select Sires
16
~23
↓7
3272
~−24
35
100
0.35
RIVERA
STgenetics
17
~24
↓7
3269
~−31
35
111
0.32
CRUSHER
Select Sires
25
25
—
3250
~−24
42
118
0.36
Est. Rank, Move, and Est. Shifts are Bullvine’s internal projections that apply April 2026 TPI weights to December 2025 PTAs. They are not official April 2026 proofs. New daughter data on April 7 will further move these numbers.
Which Bulls Does the New Formula Lean On?
Start with the P/F Ratio column. It tells the story faster than anything else in the table.
GARZA (STgenetics) carries 51 lb protein and 145 lb fat — a 0.35 P/F ratio — with a December TPI of 3464. In the formula-only rerun, he gives back roughly 40 TPI points and slides from #2 to about #4. That’s exactly what a fat-heavy profile looks like when protein picks up 5 percentage points of weight.
RICHE (Select Sires) is the same math problem: 35P, 100F (0.35) — an estimated ~24-point drop and a seven-spot slide from 16th to around 23rd. RIVERA (STgenetics) is even more exposed: 35P, 111F (0.32, the lowest P/F ratio in the top 25) with a projected ~31-point loss and a similar seven-spot fall.
None of them suddenly became bad bulls. Their daughters are the same cows they were last month. But if your winter breeding list was built around fat-dominant profiles because the old 19:19 fat/protein balance made it look smart, the new math is less forgiving.
In the middle of the pack, PERKY (Semex) at 35P/92F (0.38) drops an estimated 12 points and falls from 13th to about 18th. BENEFIT (ABS Global) at 48P/108F (0.44) takes a smaller −7-point hit and moves from 15th to around 21st. Not dramatic. But enough to change who’s on your short list and who isn’t.
The Quiet Bulls Who Just Caught a Tailwind
Flip the lens.
POWERHOUSE (Alta/Peak) is the poster boy for this formula shift: 81 lb protein and 104 lb fat — a 0.78 P/F ratio, the highest in the top 25 — with a December TPI of 3329. Under the April 2026 weights, he picks up roughly +39 TPI points and edges into about 6th. That’s a bull whose protein strength was always there. The formula just started paying for it.
HORSESHOE (GENEX) is the sleeper worth watching. Sitting down on the 24th in December with 70P and 93F (0.75), the new formula gives him roughly +27 points and a 10-spot jump to around 14th. Ten spots. On formula alone. Nobody was talking about HORSESHOE as a top-15 bull two weeks ago.
CAPTAIN (STgenetics) — already a known story to Bullvine readers — has 67P and 120F (0.56) and quietly adds about +8 points, moving from 4th to around 3rd. Then there’s the cluster of CAPN MIGUEL, INNOVATION, EVENT, POWERSTAR, and PIPELINE — all carrying P/F ratios north of 0.6 — all picking up points and rank spots. (Read more: CAPTAIN: The Bull That Rewrote the Rules for Modern Breeding)
The pattern isn’t subtle: higher P/F ratios climb under this formula; lower P/F ratios slip. Before we even talk about how PL and DPR interact with April’s new daughter data.
Does the CAPTAIN/HOMECOMING Story Repeat Here?
If you’ve followed Bullvine through the last few proof runs, you know formula changes can set off ranking earthquakes that compound over time.
In our look back at the April 2020 genomic class, GENOSOURCE CAPTAIN gained 369 TPI points between April 2020 and December 2025 as his daughters came in and multiple formula tweaks, plus a base change, played in his favor. AOT HOMECOMING lost 414 points over that same window as fertility, health, and type corrections piled up.
Those swings didn’t happen in one proof run. They were biology — real daughters, real performance — combined with three or four rounds of index adjustments and a base reset.
The 2026 TPI update won’t blow 300 points off a bull overnight by itself. What it does is set the direction of the wind.The CAPTAIN profile — strong components tilted toward protein, respectable PL, workable type, and fertility — is now more aligned with where TPI is heading. The HOMECOMING profile — production without the backside to support it — faces a tougher formula and a tougher biological test as daughters age.
Why Did TPI and LPI Both Move Toward Protein at the Same Time?
You can write off one index committee as a quirk. You can’t shrug off two.
Lactanet’s April 2026 update is blunt about the rationale: Holstein LPI’s production piece is moving from 60% Fat / 40% Protein to 40% Fat / 60% Protein. They tie it directly to evolving milk pricing signals and the message from national pricing bodies that butterfat doesn’t need more genetic push. The Canadian dairy market is telling breeders: give us protein-dense milk from cows that stick around.
Against that, TPI’s shift to 24% Protein / 14% Fat looks like the US reading the same tea leaves. Processors want casein. Consumer products are shifting toward high-protein formats. And the genetic pipeline has been quietly overdelivering on fat for years, while protein gains have lagged.
This isn’t two committees having the same idea by coincidence. It’s a structural repricing signal. If your program has been aggressively stacking fat % and shrugging at protein, the formula change isn’t a one-off nuisance — it’s an early warning that your genetics are drifting from where both indexes, and probably your processor, are headed.
Should You Change Your Spring Matings — or Wait for April 7?
This is the real question. Not what changed in the formula. What do you do about it?
If you adjust now:
You start correcting a fat-heavy lineup before you add another crop of calves conceived under a formula that no longer exists.
You can steer semen orders toward bulls whose protein strength and PL fit the new incentives.
But you’re still working off December 2025 PTAs. Some bulls will move on April 7 because their daughter data changed — not just because the formula did.
If you wait until after April 7:
You get the combined effect of new proofs + new formula before making shifts.
You won’t overreact to an estimated shift that doesn’t match what actually happens.
But you spend another month of matings optimized for a world that TPI and LPI have both moved on from.
A realistic rule that won’t blow up your program: if your own rerun under the new formula shows three or more of your top five sires losing more than about 50 TPI points, book time with your breeding advisor before April proofs to identify some protein-plus-PL alternatives. If the shifts are smaller, mark the exposed bulls and let the April proofs settle before swapping anything wholesale.
What This Means for Your Operation
Run a P/F check on your top five sires. Divide each bull’s PTA Protein by PTA Fat. If more than two of your top five sit below roughly 0.5, your lineup leans fat-heavy relative to how both TPI and LPI now reward protein. Circle any that also carry weak PL or negative DPR — they’re taking a double hit. lactanet
Sort your semen inventory by exposure. Any bull with an estimated >50-point drop and a P/F ratio in the 0.35–0.4 range deserves a hard look if you’re holding 100+ units of him. That doesn’t mean dump him. It means ask yourself whether you want to keep stacking that profile into 2026 heifers.
Have a specific conversation with your AI rep. Don’t ask “what’s hot.” Show them your list. Ask: “Which of your bulls look more like POWERHOUSE and HORSESHOE on P/F and PL, and which look more like GARZA and RIVERA in this table?” Use the formula pressure as a starting point — then let April’s proofs confirm or contradict it.
Don’t chase every shiny name in April. The bulls that deserve more use are the ones that align with the new formula and show solid daughter performance under the new weights after a couple of proof runs. Use 2026 as the year you test which sires hold up under this TPI version, not the year you jump every time a list shuffles.
If you already bred this winter, don’t panic. Calves conceived in January and February don’t retroactively become worse animals because a formula changed. But do note which sires you used heavily and track how they land on April 7. That data tells you whether to continue or pivot for summer breeding.
Key Takeaways
If more than two of your top five sires carry P/F ratios under 0.5, your lineup is leaning into fat in a world where both TPI and LPI just shifted toward protein and longevity.
Bulls like POWERHOUSE (0.78 P/F) and HORSESHOE (0.75 P/F) are exactly the profiles the 2026 TPI formula rewards — even before new daughter data hits on April 7.
This table is a formula-only stress test on December 2025 proofs, not a crystal ball. Use it to see which bulls in your tank face a headwind or a tailwind, then let April proofs tell you which ones actually held.
The synchronized TPI and LPI protein shift isn’t a coincidence. It’s a structural market signal. Fat-dominant genetic programs that don’t adjust aren’t just chasing last year’s formula — they’re building toward a component mix that processors and pricing are moving away from.
The Bottom Line
When you rerun your own sire list under the new weights on April 7, how many of your “can’t-miss” bulls are still where you thought they were? And how many of the bulls you’d never considered just climbed into the conversation? That gap — between the list you had and the list you need — is the real story of this formula change. We’ll be tracking it through April proofs and beyond.
Complete references and supporting documentation are available upon request by contacting the editorial team at editor@thebullvine.com.
Every week, thousands of producers, breeders, and industry insiders open Bullvine Weekly for genetics insights, market shifts, and profit strategies they won’t find anywhere else. One email. Five minutes. Smarter decisions all week.
A 500-cow herd breeding 60% to beef at $8 a straw thinks they’re saving money. They’re $313 per cow underwater and 15 heifers short every year. The spreadsheet doesn’t lie.
Executive Summary: The gap between a cheap beef-on-dairy strategy and a disciplined one on a 500-cow Holstein herd is $156,600 a year — $313 per cow. Most of that margin vanishes into places nobody budgets for: a 15-heifer annual replacement shortfall at $3,010 each, higher calf mortality, and undocumented calves discounted $25–50 a head at the barn. CoBank’s heifer deficit data says the industry is 600,000–700,000 head short; every straw of unselected beef semen widens the hole on your farm while you think you’re pocketing ,700 in annual savings. Peer-reviewed carcass research shows well-selected beef × dairy crosses actually outmarble native beef — but random-sire crosses are sliding toward Holstein bull calf pricing. Three paths, three cost structures, and a 30/90/365-day audit that starts with one number: your real 21-day PR — not your target. If your replacement pipeline can’t survive your current beef percentage, that 6,600 gap isn’t a model. It’s your margin.
CoBank’s August 2025 analysis put a number on what a lot of producers already felt in their gut: the U.S. dairy industry was roughly 800,000 heifers short — a figure that updated NAAB year-end data released March 10, 2026, has since been revised closer to 600,000–700,000 head. The correction from sexed semen is running ahead of schedule. But the farm-gate math hasn’t softened, because replacement heifers tracked from $1,720 per head in April 2023 to $3,010 by July 2025 — a 75% jump in barely two years. And every straw of beef semen in your tank is a bet on which side of that deficit you land on.
So we modeled it. Three beef-on-dairy strategies run on an identical 500-cow Holstein herd in the Ontario/US Midwest market. Same parlor. Same turnover. Same pregnancy rate. The only variable: how seriously the operation treated the beef side of the business. The gap between the cheapest approach and the most disciplined one wasn’t a rounding error. It was $156,600 a year.
The Backdrop You Can’t Ignore
This isn’t a “should you use beef semen?” conversation. You already are. The question is whether those straws are building equity or quietly draining it — and whether there’s a genetic time bomb hiding in the fresh pen that you haven’t priced yet.
At the other end of the chain, the source analysis cites packers — including JBS — describing carcass conformation on early dairy-beef crosses as inconsistent: too narrow, undersized ribeyes, not enough muscling. Research from Texas Tech (Foraker et al., 2022) found that even well-selected beef × dairy crosses dressed about 1 percentage point lowerthan native beef (63.2% vs. 64.2%, P < 0.01) — and that’s with quality sires. Random or bottom-tier sire selection likely widens that gap further. Anonymous beef-on-dairy calves are drifting into the same pricing bucket Holstein bull calves used to occupy: commodity cattle, priced defensively.
The 500-Cow Showdown: Cheap vs. Disciplined
To make the economics concrete, the Beef-on-Dairy 2.0 analysis runs a modeled 500-cow Holstein herd through identical biological assumptions: 35% annual turnover, 30% 21-day pregnancy rate, and 79% heifer completion rate from birth to freshening.
One bull can reshape a breed’s trajectory over decades. In beef-on-dairy, one wrong sire decision reshapes your cash flow for 30 months. Here’s what that looks like at scale.
Metric
Path A: “Cheap & Easy”
Path C: “Integrated/Partnered”
Semen Cost
$8/straw
$25/straw
Annual Semen Spend (Beef)
$4,800
$12,500
Beef Conception Rate
48%
46%
Calf Sale Price
$1,150 (at 5–7 days)
$1,550 (at 21 days)
Calf Mortality to Sale
5.0%
2.5%
Beef Calves Sold/Year
~285
~293
Replacement Impact
−$12,900 (15-head deficit)
+$15,000 (surplus heifers sold)
Net Annual Income*
$300,050
$456,650
The Gap
—
+$156,600
*Net includes semen cost plus estimated mortality-related rearing losses not separately itemized in the model.
Path A thinks it’s saving $7,700 on semen compared to Path C. It’s actually losing $156,600 in total opportunity — calf price, mortality, documentation premiums, and the avoided cost of buying replacements because the breeding strategy was sloppy. That’s $313 per cow-year. At 500 cows, it’s a tractor payment.
What Happens When 15 Heifers Don’t Show Up?
Path A’s modeled herd doesn’t just lose on calf price. It bleeds replacement heifers. With a 35% cull rate, 79% heifer completion, and beef semen pushed to 60% of the herd, the model shows a 15-heifer annual shortfall — costing,900 per year at 2025 market prices to stand still.
Path C flips that number. Precise use of sexed semen on the top 30% of cows covers all replacement needs and leaves surplus heifers to sell as premium springers — a +,000 credit. That’s a $27,900 swing on replacements alonebefore you even talk about what the calves brought at the barn.
And if your actual 21-day PR is sitting closer to 20% instead of 30%? The deficit deepens fast. Your heifer breeding strategy determines how many calves you can afford to send to beef, and a thin PR doesn’t leave room for guessing. The analysis models that scenario bluntly:
In November 2025, Tyson Foods announced the closure of its Lexington, Nebraska, beef plant — a facility processing about 5,000 head per day, roughly 4.8% of U.S. daily beef slaughter. With capacity coming offline and overall beef production contracting, packers can afford to be selective. They want “predictable rail performance”: load lots of genetically similar cattle that hit specific weights and grades at the same time.
A random mix of whatever beef bull was on sale creates pens that are the opposite — some cattle ready at 14 months, some at 18, with carcasses that don’t match in length, thickness, or ribeye. If you’re selling into that market with undocumented calves from unknown sires, you’re not competing. You’re just filling a spot.
What Are Structured Genetics and Documentation Actually Worth?
The peer-reviewed data backs this up convincingly. In the Foraker et al. (2022) Texas Tech carcass study — 518 beef × dairy, 966 native beef, and 935 Holstein steers — well-selected beef × dairy crosses actually outmarbled native beef(marbling score 481 vs. 447, P < 0.05) while carrying 18% less back fat and 5% more ribeye area than straight Holsteins. Select Sires’ feedyard data tells a similar story: in well-managed yards, beef-on-dairy crosses are hitting more than 60% Prime and Choice.
The chasm between that outcome and the JBS “all over the board” complaint is almost entirely about sire selection and management. The analysis recommends filtering sires by terminal indexes — Angus-on-Holstein ($AxH), Igenity Terminal Index (ITI), or Holstein-Simmental (HOLSim) — using only bulls in the top 25% for carcass merit. If a bull can’t clear that bar, the math says he doesn’t belong in a terminal program even if the semen is free.
Path 1 — Stay Random, but Own the Trade-Off. You’re putting out bigger fires right now. Fine. Accept commodity status for your beef calves, and understand that part of your “good beef cheque” is already committed to future replacement purchases.
Path 2 — Structured Sires and Protocols (No Integration Yet). Shrink your beef sire list to 2–3 bulls for smaller herds, 3–5 for 500+ cows, all top-quartile on $AxH, ITI, or HOLSim. Write a one-page calf protocol. Use sexed dairy semen on your top 30% until your forward replacement model says you’re covered.
Path 3 — Integrated/Partnered (The Full Margin Engine). A defined relationship with one finisher or branded program. Full documentation on every calf. A data loop where you get ADG, days-on-feed, death loss, and carcass summaries back — and actually adjust sires and protocols based on those closeouts.
[ ] Pull your last 12 months of cull rate and actual 21-day pregnancy rate — not your target, your real number.
[ ] Calculate your annual heifer need using a 79% completion rate from birth to freshening at your current herd size.
[ ] Overlay your current beef semen percentage and model whether you’re headed for surplus, balance, or deficit on a three-year horizon.
[ ] If the model shows you in the red on replacements, stop and fix that before touching anything else.
☐ Within 90 Days
[ ] Tighten your beef sire list to the top 25% on a recognized terminal index ($AxH, ITI, or HOLSim). Drop every bull that’s only in the tank because he was cheap.
[ ] Write a one-page beef-calf protocol: colostrum timing, vaccination schedule, minimum sale age, and weight. Make sure everyone on the team follows it.
[ ] Call one serious calf buyer or finisher and ask what specs they’d want from a 50–100 head trial lot. You’ll learn more in that conversation than in a year of reading semen catalogues.
☐ Within 365 Days
[ ] Run at least one group of 50–100 calves through that buyer or program under your tightened sire list and documented protocol.
[ ] Get a basic closeout: ADG, days-on-feed, mortality, carcass weights/grades. That’s the only real scorecard for whether your genetics and management are earning a premium or just looking like they should.
[ ] Use those results to decide: commit to full Path C integration, or tighten Path 2 further and shop for a better buyer.
What This Means for Your Operation
If your 21-day PR is below 25% and your cull rate is above 30%, run your replacement model before you order another tank of beef semen. The deficit might already be there — you just haven’t priced it yet.
If you can’t name the terminal index ranking of every beef bull in your tank, you’re making a $313-per-cow decision on feel instead of data.
If you’ve never seen a closeout for calves from your farm, your opinion of their performance is based on what they look like at five days — not what they’re worth at fifteen months.
The $27,900 replacement swing between Path A and Path C happens before a single calf crosses the sale ring. That’s the hidden lever most operations never model.
If your 21-day PR is below 25% and you’re breeding more than 40% to beef, you’re likely already in a heifer deficit you haven’t priced. Run the replacement model before you reorder semen — at $3,010 per head, 15 missing heifers cost $12,900 a year to stand still.
Drop every beef sire that doesn’t rank in the top 25% on $AxH, ITI, or HOLSim — even free ones. Texas Tech carcass data shows well-selected beef × dairy crosses outmarble native beef at 481 vs. 447. Random-sire crosses are sliding toward commodity pricing.
Call your top calf buyer this month and ask for their preferred sire list. If they can’t give you one, they’re a middleman. Aligning 80% of your beef matings to a real finisher’s specs is the fastest path from $1,150 calves to $1,550 calves.
The $27,900 replacement swing between a cheap beef strategy and a disciplined one happens before a single calf crosses the sale ring. Your heifer pipeline — not your calf cheque — is the lever most operations never model.
The Bottom Line
Don’t wait for your next replacement bill to find out you’re in the red. Start your 30-day audit today — pull your real PR, your real cull rate, and your real beef semen percentage. Put them on paper. If the numbers look more like Path A than Path C, that $156,600 gap isn’t a hypothetical. It’s the margin you’re leaving on someone else’s table.
Complete references and supporting documentation are available upon request by contacting the editorial team at editor@thebullvine.com.
$3,010 Per Heifer. 800,000 Short. Your Beef-on-Dairy Bill Is Due. – Exposes the structural 800,000-head heifer deficit that is locking in high replacement costs through 2027. This analysis arms you with the market intelligence to navigate $4,000 price tags and secure processor partnerships before the supply window closes.
The Next Frontier: What’s Really Coming for Dairy Cattle Breeding (2025-2030) – Reveals the high-accuracy genomic breakthroughs and AI markers that will redefine herd value by 2030. This feature breaks down how advancements in casein selection and disease resistance can transform your breeding program into a high-margin protein factory.
The Sunday Read Dairy Professionals Don’t Skip.
Every week, thousands of producers, breeders, and industry insiders open Bullvine Weekly for genetics insights, market shifts, and profit strategies they won’t find anywhere else. One email. Five minutes. Smarter decisions all week.
From bachelor farmers to world-class photographers, meet the visionaries who trusted the maternal line when nobody else did — and reshaped the breed one daughter at a time. This is the story of seven of them. And of the breeders who recognized what they had before anyone else did.
One shot. That’s all they took that day.
It was sometime in the mid-1970s at Mil-R-Mor Farm in Dundee, Illinois, and the cow standing in front of that camera was Glenridge Citation Roxy — clipped, washed, full of milk after a visit from a group of Japanese buyers. Miller’s son held the halter. His wife worked the trunk. And in that single frame, Miller captured what many consider the finest Holstein photograph ever taken.
Glenridge Citation Roxy EX‑97‑4E — Queen of the Breed I & II, International Cow of the Century (1999), first cow in the breed with 10 Excellent daughters and more than 300 Excellent descendants, foundation of the only 4‑generation direct line with 11+ Excellents and the family behind 30* brood cow Mil‑R‑Mor Roxette, EX‑96 Tony Rae, EX‑97 Rustler‑Red and countless high‑production Roxy daughters worldwide.
But here’s the thing about that picture. It didn’t make Roxy famous. Roxy made the picture famous. Because behind that perfect broadside image stood a cow who would produce 16 Excellent daughters, generate 50 direct maternal lines of four-plus generations of Excellents, and earn more popular-vote titles — Queen of the Breed I, Queen of the Breed II, Top Cow of the Top Ten Cows of the Century, International Cow of the Century — than any Holstein before or since.
She wasn’t the only one. In the three decades between 1968 and 2001, a handful of Holstein cows emerged whose genetic impact was so profound and commercially transformative that calling them “great cows” doesn’t begin to do them justice. They were franchise cows — biological engines that didn’t just win shows or set records but built entire empires of daughters and sons that reshaped the breed worldwide. Good luck finding a sale catalogue without a Roxy on page three.
This is the story of seven of them. And of the three breeders — a bachelor farmer, a livestock photographer, a bankruptcy trustee’s unlikely partner — who recognized what they had before anyone else did.
I. The Photograph and the Cow Behind It
Glenridge Citation Roxy was born on April 15, 1968, on Lorne Loveridge’s farm at Grenfell, Saskatchewan — about as far from the corridors of North American Holstein power as you could get. Loveridge’s grandfather had milked Ayrshires. His father, Gordon, switched to Holsteins in the 1920s. When Lorne took over management in 1957, he changed the prefix from Norton Court to Glenridge and set about his life’s work.
Roxy’s sire was Rosafe Citation R. Her dam, Norton Court Model Vee (EX-6*), was a Star Brood cow whose own dam, Norton Court Reflection Vale (VG-4*), was a Roeland Reflection Sovereign daughter. That gave Roxy two close A.B.C. Reflection Sovereign crosses — and, possibly, the red factor that would surface generations later in one of her most celebrated descendants.
What the pedigree doesn’t tell you is what Roxy looked like in person. Andy Clawson, the classifier who scored her 96 points in 1976, said she was closer to perfection than any cow he’d ever scored. Avery Stafford, who gave her 97 two years later when she was ten, said the same thing. Between them, Clawson and Stafford had classified half a million cows.
R.F. Brown — Bob Brown, who owned Green Elms Echo Christina, a cow who ranked right up there with the best in any era — called Roxy the best he’d laid eyes on. Brown was known for fair assessments, not flattery.
And then there were Doug Blair and Lowell Lindsay. Blair owned Alta Genetics; Lindsay was the sire procurement officer for United Breeders. They’d visited the Loveridge farm a few months before Miller, seen Roxy, and been overwhelmed. They discussed buying her on a 50-50 basis. At the end of the day, they couldn’t come up with the kind of money Loveridge was asking. One has to wonder how long that decision haunted them.
The Move to Illinois
Miller, a transplanted Canadian from Brome, Quebec, worked part-time as a livestock photographer. In 1973, he was summoned to Grenfell to photograph Roxy and her dam. He’d been searching for a cow family for some time, and he had very specific requirements: type, production, and longevity. Roxy and her family met all three.
Loveridge, for his part, was beginning to realize that his farm’s remote location precluded visitors from seeing the cow. Miller’s Illinois base was better suited for promotion and merchandising. Within a year, Miller had bought Roxy and a half-interest in Vee and moved the pair to Dundee.
Even though embryo transfer was still in its infancy — this was the early 1970s, when flushing a cow was more gamble than science — Miller put Roxy on an ET program. Over the years, she produced 30 ET offspring and three natural calves. Twenty daughters. And she became the first cow in the world to have ten of those daughters classify Excellent. By the time the final tally came in, 16 daughters had earned the Excellent designation.
Bob and Kaye Miller at Mil‑R‑Mor’s Golden Anniversary Sale, standing beneath the iconic one‑shot photograph of Glenridge Citation Roxy that helped turn their quiet Illinois herd into one of the most influential cow families in Holstein history.
In Miller’s hands, Roxy made four records over 1,000 pounds of fat, reaching 26,470 pounds of 4.4% milk and 1,166 pounds of fat in her best year. Career total: 209,784 pounds of milk at 4.5% butterfat and 9,471 pounds of fat. She rounded out three generations of 200,000-pound producers — her dam and granddam had both hit that mark. At 12 years of age, she earned a 4E rating, and her show record included All-Illinois honors from 1976 through 1979, a win in the dry-aged class at the 1979 Central National Show, and membership in eight All-American, All-Canadian, or Reserve All-Canadian groups.
The Empire She Built
But the real story wasn’t what Roxy did. It was what her daughters did. And her granddaughters. And their daughters after them.
Seven of Roxy’s daughters earned Gold Medals. By 2004, according to Holstein World, 50 direct maternal lines of at least four generations of Excellents descended from Roxy, with Roxy appearing as the second Excellent dam in each. Her 16 Excellent daughters produced 34 Excellent daughters. Those 34 had 52. Those 52 had 48. That’s the kind of cow family that just keeps writing cheques your herd can cash.
Until 1977, Miller had never sold a Roxy daughter. He relented that year when he consigned Roxy’s Elevation daughter, Mil-R-Mor Roxette, born on Valentine’s Day the year before, to the National Convention Sale at Columbus, Ohio. Peter Heffering bought her for $25,000, the third-highest price of the sale, and took her to Hanover Hill Farms at Port Perry, Ontario.
The transaction nearly collapsed. Miller hadn’t understood his heifer would be sold on investor terms — one-third down and the balance over two years. But years later, Miller acknowledged he was glad Roxette ended up at Hanover Hill. She eventually became an Excellent Gold Medal Dam who lived into her late teens, produced over 100 pregnancies, left 13 Excellent daughters and eight Excellent sons, and added upwards of two million dollars to Hanover Hill coffers.
The Roxette daughters branched in every direction. There was Hanoverhill Star Roxy (EX-92-3E-GMD-DOM), a Starbuck daughter developed by the Conard family at Ridgedale Farm in Sharon Springs, New York, whose Leadman daughter produced a Milestone-Red granddaughter, who in turn produced Sir Ridgedal Rustler-Red (EX-95) at Trans-World Genetics. Rustler became enormously popular in Germany — so popular that grateful German breeders arranged an all-expense-paid trip for Wayne Conard and his wife in 2006.
There was Mil-R-Mor Toprox (EX-94-3E-GMD), Roxy’s highest-record daughter and one of the breed’s first 2,000-pound fat cows, who became the fountainhead of the Brigeen herd’s Roxy family. Mary Briggs of Brigeen Farms described the Roxys this way: “Healthy and fertile — the indexes around the world for somatic cell count, fertility and longevity highlight the family’s real strengths. They just go along doing their business,”
Liddlehome Beemer Rockstar ET EX‑92 — a modern, high‑type show cow whose pedigree runs Beemer × Durham Rhonda EX‑95 × Miss Ridgedale Rhonda EX‑92 × Hanover‑Hill‑R Rhonda EX‑94 × Hanover‑Hill Star Roxy ET EX‑92 × Mil‑R‑Mor Roxette EX‑90 × Glenridge Citation Roxy EX‑97, proof that Roxy’s maternal line is still throwing frame, udders, and banners generations later.
If you’ve ever bought into a cow family and watched it perform under your management the same way it did under theirs — no drama, no fuss, just daughters that score Excellent and milk like freight trains — you know exactly what that consistency feels like.
That’s the kind of cow Roxy was. And her daughters were the same. Wide through the rear end, correct in the rump, sound on their feet, and absolutely relentless at the milk pail. No drama. Just production and reproduction, generation after generation.
On July 8, 1984, Glenridge Citation Roxy died at 16 years of age. A stone monument on the Mil-R-Mor farm reads:
Glenridge Citation Roxy 4E-97-GMD. April 15, 1968 – July 8, 1984. Lifetime 209,784M-4.5%-9,471F. First cow in the world to have ten daughters classified Excellent. First cow in the world to accomplish 4E-97-GMD plus be a 3rd generation 200,000-lb. milk producer.
II. The Bachelor, the Sale Bill, and the Black Cow at Bob Snow’s
Snow‑N Denises Dellia EX‑95 — the quietly powerful brood cow behind Durham, Dundee and Derry, pictured here doing what she did best at Bob Snow’s farm: looking like “just another cow” while building one of the most profitable maternal lines the Holstein breed has ever seen.
Here’s how different the Dellia story is from Roxy’s. No livestock photographer. No Illinois showplace. No Japanese buyers. Just a bachelor farmer sitting in a kitchen corner while his mother made lunch, thumbing through the Holstein-Friesian World.
Robert Snow — “a sober man of direct gaze and resolute jaw; not a man who moves on a whim; reflective; prudent,” as one neighbor described him; “never a man to be anybody’s fool” — started farming in 1951 on a grade herd inherited from his father in Monroe County near Sparta, Wisconsin. The county extension workers pushed him toward purebreds, and Snow liked the idea. There was more to life, he felt, than milking a bunch of grades.
He chose his prefix early. “I wanted to use my last name,” Snow explained, “but I thought just plain ‘Snow’ was too simple. So I added an ‘N’. I can’t tell you why I chose the letter ‘N’. It doesn’t stand for anything. I could just as well have chosen X, Y, or Z. I just thought it sounded nice — ‘Snow-N’.”
That last week of July 1970, what caught Snow’s eye in the magazine was a sale advertisement for the Adolph Buergi dispersal, one of Barron County’s finest groups of registered Holsteins. Buergi had been at the game for 32 years. On the first page of the ad, below a banner headline touting “A Foundation Daughter of Creator Fobes Governor,” were four photographs of the same cow: Ce-Buerg Homestead Governor Jo. Broadside view. Three udder shots — left, right, and rear.
Rice Lake was 125 miles away, and Snow was of no mind to waste time and gasoline. “I wasn’t interested in the middle or the bottom,” he confided 35 years later. “If I was going to the sale, I would buy off the top.”
He picked up an old uncle who lived near Rice Lake and took him out for the day. They bought a sandwich and coffee at the sale, sat down, and watched the cattle come through. Snow bid only on the top animals, as promised. The high seller was the “Jo” cow at $2,800 — Snow was the runner-up bidder. By day’s end, he’d bought three head: an open two-year-old at $1,500, a yearling at $800, and Ce-Buerg Creator Hartog Fobes, an inbred three-year-old right up to calving who looked like a million dollars. Snow paid $2,500 for her.
Almost three decades later, Snow wasn’t entirely sure which of those three cattle was Dellia’s direct ancestor. Turned out he’d bought both dam and daughter — Hartog Fobes and her St. Croixco Pioneer daughter, Ce-Buerg Creator Fobes Garnet — and they became the seventh and sixth dams, respectively, in the maternal line of Snow-N Denises Dellia.
A Breeding Strategy Built on Balance
Now, the thing about Snow’s approach — and this is what made Dellia possible — was his alternating-sire philosophy. He’d follow a strength bull with a dairy one, then back to strength, always maintaining balance and striving for a functional dairy type. Garnet got Cedardale Corporal, a calving-ease sire. That daughter, Edith, got Harborcrest Happy Crusader — strength, substance, square rumps, particularly good udders. Crusader’s daughter, Ellen, inherited Arlinda Commander’s stature and clean bone. Commander’s daughter Ella got MD-Sunset-View R A Wonder — an Elevation son who sired large frames, wide chests, and ample bone.
Snow-N Denises Dellia, the legendary Holstein matriarch, sired by Walkway Chief Mark and out of Snow-N Dorys Denise, with maternal grand sire Carlin-M Ivanhoe Bell. This EX-95 cow revolutionized dairy genetics with her exceptional balance of production and type, leaving an indelible mark on the industry. Her legacy continues to shape modern Holsteins worldwide
Then, in the winter of 1983, Snow won two units of Carlin-M Ivanhoe Bell semen at a barn meeting. He used them on his two best animals. One was Snow-N Ellas Dory, a virgin. From that mating came Snow-N Dorys Denise — a typey cow with considerably more strength than the average Bell daughter, a shapely udder, and correct feet and legs.
Peter Blodgett later explained why the combination worked so well: “There have been thousands of Marks out of Bells, but I think the thing that makes Dellia different is MD-Sunset-View R A Wonder, her granddam’s sire. Wonder was one of those extreme bulls that sired a lot of bone. It’s rare that you combine a bull like Wonder with Bell. The fact that those two bulls were combined is the work of a ‘master breeder’ for sure.”
When it came time to breed Denise, Snow’s hired man, John Steinhoff — a young man just out of high school from the Tomah area who was “up” on his bulls — picked Walkway Chief Mark. The Mark-Bell combination was already considered one of the “golden crosses,” with Mark joining width, capacity, and udders to the correct feet and legs of Bell daughters.
The resulting heifer calf, born December 20, 1986, was registered as Snow-N Denises Dellia.
“Who Is That Cow?”
At the Wisconsin Championship Show, judged by Loren Elsass, Dellia placed second in the senior two-year-old class behind Miklin Starbuck Beth in a class of 23, but won best udder. Frank Regan, one of the partners at Regancrest Farms in Waukon, Iowa, happened to be at the show. It had rained early that morning, and when Frank looked out at his recently cut hay, he decided there’d be no haying that day and bundled up his family for the drive.
They arrived about noon. As Regan walked into the arena, they were starting the two-year-old class. He saw a black cow coming through the gate and said to himself, “Wow! Who is that cow?”
That’s the moment that changed everything — for Regan, for Dellia, and, it’s no exaggeration to say, for the Holstein breed.
After the class, Regan followed her back to the barn. He approached Bob Snow and asked his price. The figure was high, so Regan thought, we’ll get a daughter instead. Snow was flushing Dellia to Blackstar and agreed to sell a Blackstar daughter.
But Regan couldn’t let go. The truth was, he was looking for a herd-building kind of cow — a franchise dam he could flush and make some money on — and he’d looked at other Chief Marks. Dixie-Lee Chief Liza, others. It kept coming back to the black cow at Bob Snow’s. The farm was only a hundred miles away, so Regan made it his business to stop often.
“I started at $10,000,” Snow said. “And every so often, I boosted it by $5,000. I got up past $50,000 pretty quick.”
A couple of weeks before the Wisconsin Spring Show of 1991, Regan paid Snow another visit. Dellia was entered and looked like she might win. They settled on a price. Regan would lead her at the show; Snow would own the cow until after, then Regan would take her home.
The day before the show, Orville Kemmink came up to Regan. “Are you the kid who bought this cow?” Regan said he was. “Don’t you think you paid too much?” Kemmink asked. Dellia had been flushed several times, and a lot of embryos had been sold. “You won’t get your money back,” he warned.
That night, over supper, Regan asked Snow to guarantee a number of embryos. “How many do you want?” Snow replied.
But that night, Dellia looked empty. She had a perfect udder but was a little shallow in the body, and they needed to fill her out. So Regan bought four bales of hay — three grassy and one alfalfa — and a bag of calf feed to mix with her grain. “She likes warm water with her beet pulp,” Snow told him.
Regan started feeding her, and by the next morning, she began to straighten out. By ten o’clock, people were filing into the barn to see her. The word had spread. Instead of looking like a racehorse, Dellia had started to look like a winner.
With Niles Wendorf judging, Dellia topped the four-year-old class, won best udder, and was named grand champion of the Wisconsin Spring Show of 1991. After the show, Bob Snow had to back his car into the arena to load all the trophies.
“There were a lot of disgruntled people,” Snow recalls. “They were upset that a ‘nobody’ could come in and clean up.”
The Dellia Dynasty
What Regan and his partners built from that one cow defies easy summary. According to Regancrest records, Snow-N Denises Dellia produced 76 registered daughters by 21 different sires. Forty-four sons were A.I.-sampled. Three earned Gold Medals: Regancrest Elton Durham, Regancrest Dundee, and Regancrest Emory Derry. Official figures show 34 Excellent and 49 Very Good offspring. Dellia was very fertile, averaging 15 embryos per flush — she once produced 25 Melwood embryos in a single collection.
Sheeknoll Durham Arrow EX‑96, Grand Champion of the 2016 World Dairy Expo, celebrating on the colored shavings and showing exactly what Snow‑N Denises Dellia bred true for through Durham — balance, power, and the kind of udder that still wins when the announcer calls for champions.
Durham, by Emprise Bell Elton, went to Select Sires. Dundee, by Mar-Crest Encore, was proven by A.B.S./St. Jacobs in Canada and eventually scored EX-95. Derry, by MJR Blackstar Emory, landed at Select Sires as well. These three bulls, alongside grandsons like Erbacres Damion (EX-94-GM) and Regancrest-HHF Mac (EX-92-GM), flooded A.I. barns across North America and beyond.
Tim Abbott while at A.B.S. Global put it this way: “Dellia and her family are all about type — just everyday nice-uddered cows that people are happy with. People consistently say their Durham daughters are trouble-free cows. They’re good-uddered young cows that don’t cause any problems and just kind of blend with the herd.”
Scott Culbertson while at Select Sires went further: “Dellia’s impact through her daughters has sent more dollars back into farmers’ pockets across the world than any other cow.”
DH Gold Chip Darling EX‑96‑CH, Swiss Expo Champion and Dellia descendant, lighting up the ring and reminding everyone that Snow‑N Denises Dellia didn’t just make bull mothers — she bred the kind of balance, udder and ring presence that still wins under the brightest lights.
Two months after the Regans took Dellia home from the Wisconsin Spring Show, she took a crampy spell and started kicking at her belly. The vet recommended surgery, cut her open, and removed three gallons of sand from her stomach. Snow had a sandy farm with a creek behind the barn; cows sometimes stirred up the water and drank sand. After the operation, Dellia bounced right back. She was that kind of cow.
S‑S‑I Doc Have Not 8783‑ET EX‑92 — a modern proof that Snow‑N Denises Dellia still stamps cows the same way decades later: tall, sharp, snug‑uddered and built to work, carrying Dellia’s genetics into today’s high‑index, high‑production Holstein era.
She lived until December 8, 2001, with a lifetime record of 180,240 pounds of milk at 3.9% butterfat, 7,108 pounds of fat at 3.2% butterfat, and 5,723 pounds of protein. Even near 15 years old, she walked on a perfect set of legs and feet. The Regans’ tribute in Holstein World read: “She has influenced our lives in ways we never would have imagined. Her legacy will live on not only through her offspring but in the lesson she taught to many — that the demand for high type plus production never goes away.”
Now here’s a story that couldn’t have been invented.
Nandette TT Speckle‑Red EX‑93 — the red‑and‑white Triple Threat daughter whom judge David Houck called “a happy combination of strength, breed character, and sufficient angularity.” When the investor empire around her collapsed, Louis Prange saw what the bankruptcy trustees couldn’t: the cow who would become Blackrose’s dam.
Nandette TT Speckle-Red was bred by Burdette Holt of Delavan, Wisconsin, born November 11, 1978, sired by Hanover-Hill Triple Threat. She first showed up in the magazines in November 1981 when she placed sixth in the two-year-old class at Madison. Her owner at the time was Elm Park Farms Limited, Sheboygan Falls, Wisconsin — Louis Prange’s outfit.
A month later, Prange took Speckle to the Royal Winter Fair in Toronto. His string was tied beside the Browndale and Cher-Own herds of R.F. Brown and his son, David. Dave Brown took a shine to the heifer and helped get her ready. On show day, Prange got the bad news: Speckle was eight days too old for the two-year-old class. She had to show as a three-year-old and placed third.
Two months later, Dave Brown went down to Wisconsin and bought her. Prange’s price was $60,000, and Brown paid it. Title transferred to Browndale Farm.
Speckle aborted her calf and wasn’t shown in 1982, came back in 1983, placing sixth as a four-year-old at Madison, then was second at the Royal that fall behind Brookview Tony Charity, whom judge Doug Wingrove later made grand champion.
Then Jack Stookey showed up.
The Investor Era’s Wild Ride
Flush with investor money, Stookey bought Speckle from the Browns on investor terms: $275,000, one-third down and the balance in two annual payments. He paid the deposit and took her home.
What followed was textbook investor-era madness. Stookey went on a buying rampage, picking up top cows on similar contracts. Before long, he was taking home Premier Exhibitor banners at major shows, including Madison. Under Stookey’s ownership, Speckle showed as a five-year-old at the 1984 Wisconsin Spring Show, where judge David Houck made her grand champion, calling this red-and-white cow “a happy combination of strength, breed character, and sufficient angularity with plenty of chest and heart.”
But the stories were already starting. Some had truth; many were fiction. People whispered that an angry investor had dynamited the porch off Stookey’s house. That the Mafia was involved. That he was a smooth talker who couldn’t follow through.
The reality was messier but more mundane. Stookey’s books were a disaster — piles of paper two feet deep covered the office floor. He’d charge investors $750,000 for cows he’d bought for $250,000. When the returns didn’t materialize, investors stopped paying. Stookey couldn’t honor his own contracts with the breeders who’d sold him the cattle. By the late 1980s, it all collapsed. Bankruptcy. Creditors — including the Browns, who’d only ever seen the initial down payment on Speckle — received legal notices listing large debts and meager assets.
Most took one look and decided there was no point chasing it.
Prange’s Rescue
And this is where the story takes its most improbable turn. Louis Prange — the same man who’d originally owned Speckle before selling her to Brown — received an order for embryos from a Brazilian buyer who wanted the best. Prange knew Stookey’s cattle were now under the control of a bankruptcy trustee. So he went to Leesburg, Indiana, to talk.
He leased a dozen of the Stookey cows, took them home, and flushed them. After filling the Brazil order, he realized what a nucleus he had. He negotiated a longer-term arrangement: Prange would pay all expenses and take full ownership of male calves; all females had to be sold before age two, with sale proceeds divided half to Prange, a quarter to the bank, and a quarter to Stookey.
Stookey insisted on one thing: all calves had to carry the Stookey prefix. He still dreamed of someday returning and winning Premier Breeder banners.
He got his way.
Nandette TT Speckle was one of the cows in the Prange-Stookey ET program. Prange had visited To-Mar Farm in Iowa and been impressed with To-Mar Wayne Hay, dam of To-Mar Blackstar. He thought Blackstar would suit Speckle perfectly. Stookey’s preferred sires were Rosafe Citation R and Browndale Commissioner, and he pushed hard for them. Prange told him to send the semen.
A day or two later, Stookey called back: “Can’t send you the semen, Louie. My semen tank ran dry.”
So Speckle was flushed to Blackstar instead.
Stookey Elm Park Blackrose was born on March 24, 1990 — a cow who never would have existed if Jack Stookey had managed to keep his semen tank topped up.
From $5,400 to Show Ring Royalty
In December 1991, fitter and breeder Mark Rueth of Oxford, Wisconsin, was working the Elm Park Red Futures Sale. His friend Mark VanMersbergen of Lynden, Washington — a Guernsey man switching to Holsteins — was looking for brood cows. Rueth pointed him to an 18-month-old Blackstar heifer: deep-ribbed, wide-rumped, the kind that catches a cattleman’s eye.
They bought her for $5,400 — Rueth, VanMersbergen, and later Bob and Karyn Schauf of Indianhead Holsteins in Barron, Wisconsin, who took a one-third interest in exchange for housing her. The Schaufs were known for big-framed, deep-pedigreed cows and a low opinion of pure index breeding.
What happened next was extraordinary. Blackrose was voted All-American and All-Canadian junior two-year-old in 1992. All-American and All-Canadian junior three-year-old in 1993. In 1995, she became one of the few U.S.-bred cows to win grand champion at the Royal Winter Fair — and was named Reserve All-American and Reserve All-Canadian five-year-old. She came back in 1997 as a Reserve All-American and Reserve All-Canadian aged cow.
Even though she was a Blackstar daughter with two records over 40,000 pounds of milk, Blackrose was never really treated as an “index cow.” Her type credentials told a different story: +3.77 PTAT with udder and feet-and-leg composites of +2.78 and +2.87, making her the No. 1 type cow in the breed at that time.
Stookey Elm Park Blackrose EX — the $5,400 Blackstar daughter born from a bankrupt semen tank, whose massive frame, textbook udder, and +3.77 PTAT made her the No. 1 type cow in the breed and the foundation behind Talent, Advent‑Red, and the EX‑95 Supreme Champion Lavender Ruby Redrose‑Red.
A Brood Cow Without Equal
By 2004, Blackrose had 30 Excellent sons and daughters. Her sons included Markwell Kite (Skychief), marketed by St. Jacobs and A.B.S., who sired KHW Kite Advent-Red; Indianhead Red-Marker (Stardust), a former No. 1 type sire; Rosedale Reflection (Starbuck) at Foundation Sires; and Rosedale Big Sky (Skychief) at Semex. They were promoted under a line that summed it up: “At a time when our breed most needed an infusion of substance and strength, Blackrose and her sons were there.”
The culmination of a dynasty: Lavender Ruby Redrose-Red (EX-96). In 2005, she achieved the impossible, becoming the first and only Red & White cow ever named Supreme Champion at World Dairy Expo, proving the enduring magic of the Blackrose line.
The most remarkable branch came through Kinglea Leader, a red-factor son of Ca-Lill Standout Cavalier from a Conductor dam. Leader to Blackrose produced five Excellent daughters, two of whom — Rosedale Lea-Ann and Markwell Leader Rose — founded the family’s strongest branches. Leader Rose produced the Storm son Ladino Park Talent (EX-ST), a rump and udder specialist at Semex Australia who became one of the most popular red-factor sires of his era. And from Lea-Ann, through a Rudolph daughter named Northrose-I Lavender, came Lavender Ruby Redrose-Red (EX-95) — All-Breed Supreme Champion at World Dairy Expo in 2006.
Ladyrose Caught Your Eye EX‑96 — three consecutive World Dairy Expo Senior Champion titles, dam of champions and high‑demand A.I. sires — showing the rear‑udder width, substance, and sheer presence that trace straight back through the Blackrose dynasty born from a $5,400 bankruptcy‑sale heifer and an empty semen tank.
Speckle herself lived to 18, dying at TransOva in 1996. All nine of her daughters owned by Prange were eventually classified as Excellent. Stookey Elm Park Blackrose died at Alta Genetics in 2004, with seven Excellent daughters, 17 Very Good daughters, and offspring registered in Holland, England, Germany, and Japan.
Jack Stookey never did come back to win those Premier Breeder banners. After leaving the cattle business, he worked as a hospital administrator. His wife, Darla, studied for the ministry at Oral Roberts University and later served as a minister. Jack Stookey died in 2007. But those calves still carry his prefix — and the greatest of them was born because his semen tank ran dry.
IV. The Supporting Cast: Faith, Kaye, Pala, and the Hiawathas
Roxy, Dellia, and Blackrose were the headliners. But they weren’t the only franchise cows rewriting the Holstein playbook in those years. A handful of others — less celebrated, perhaps, but no less consequential — were building their own dynasties in their own quiet corners of the dairy world.
The Cow Charlie Plushanski Wouldn’t Sell
Plushanski Chief Faith EX‑94‑4E — the deep‑bodied, wide‑fronted brood cow Charlie Plushanski refused to sell in 1973, built on heavy‑duty production sires and an udder that defied Chief’s reputation, and whose four main branches would later dominate Locator Lists, fuel Japanese bull sales, and put cows like Quality B C Frantisco in the centre of the Royal ring.
Charlie Backus tried to get her consigned to the National Convention Sale. Pete Heffering, assembling the first cows for Hanover Hill, tried to buy her outright. Neither man could get it done.
When it came to Plushanski Chief Faith, Charlie Plushanski wouldn’t budge. It wasn’t about money. It went deeper.
Plushanski had come home from World War II — where he’d been a Marine Corps boxer who once had a ringside match stopped by none other than Jack Dempsey, who put on the gloves himself and knocked out the winner — and settled on a farm in Berks County, Pennsylvania, at a place called Kutztown. In the fall of 1965, his brother Henry, who worked for what would become Sire Power, told him about a dozen Kingpin daughters on Allen Yoder’s farm in Selinsgrove. Charlie bought the lot. One of them — Ady Whirlhill Frona, exactly one year old that day — became Faith’s dam.
Faith, born in November 1968, scored EX-94 with a 4E rating and piled up lifetime totals of 242,863 pounds of milk and 11,353 pounds of fat. Her early adulthood came just ahead of widespread ET use, so her first calves were natural — and that was fitting, because the Plushanski philosophy was never about show ring flash. The sires they used were heavy-duty production bulls. None of them would ever be accused of siring a show ring champion. They fathered solid type — dairy character, deep barrels, functional legs, and mammary systems — but they weren’t bulls who’d ever threaten to win Premier Sire at Madison.
The four main branches — through Astronaut Frolic (EX-DOM), Valiant Fran (EX-35*), Nugget Fobes (VG-88-GMD), and Job Fancy (VG-87-GMD) — spread across North America. When Plushanski sold Valiant Fran to Paul Ekstein of Quality Holsteins in Woodbridge, Ontario, it was to acquaint Canadians with what this family could do. Fran’s 35 Star Brood Cow points made her the highest-numbered Canadian brood cow, and her descendant Quality B C Frantisco was twice grand champion at the Royal Winter Fair, five times All-Canadian, and International Cow of the Year in 2005.
Quality B C Frantisco‑ET EX‑96‑3E 18* — the twice Royal Winter Fair grand champion and 2005 International Cow of the Year — carrying Plushanski Valiant Fran’s blood and proving just how far Plushanski Chief Faith’s family could climb when given a bigger stage.
By 1996, four of the top 20 animals on the national Locator List were from the Chief Faith family. When Charles Plushanski died in 1991, his obituary noted that more Plushanski-bred bulls had gone to Japan between 1985 and 1991 than from any other herd.
Fred Rice found the source of his family’s future contentment the old-fashioned way: he offered to do chores for an ailing neighbor.
Jay Knepper, down the road, called his place Terracelane. While Knepper recovered from surgery, Fred milked his cows. The first day, he noticed something. One bunch of cows, about five head, seemed to milk way better than the others. Milked their heads off, in fact. Fred checked them out. They were all related.
When Knepper later sold off his heifers, Fred and his brother Dale bought one: Terracelane Ideal Star. She scored 76 points as a two-year-old — nothing to write home about — but climbed to VG-88 at eight and piled up 207,000 pounds of milk lifetime. She was creating a family.
Several generations later, through Ricecrest Elevation Ella and Ricecrest Ned Boy Noreen, came Ricecrest Southwind Kaye — and the protein floodgates opened. Three dozen Kaye sons entered A.I. service. In September 1999, three of them — Ricecrest Lantz, Ricecrest Brett, and Ricecrest Marshall — all placed on the Top 100 TPI list simultaneously, with Lantz at number one. No other Holstein cow had ever accomplished that.
Ricecrest Southwind Kaye EX‑90 — the modest‑looking brood cow who quietly rewrote the TPI lists, dam of three Top 100 TPI sons that all hit No. 1 and the protein powerhouse behind the Ricecrest phenomenon.
Holstein International dubbed it “The Ricecrest Phenomenon.” The herd had placed 10 bulls on the TPI list. Detractors pointed to the family’s modest type scores. Elite sale selectors often walked right past them. “Just good milk bulls, that’s all,” said several anonymous insiders. But through Kaye’s full sister Ricecrest Southwind Amy’s descendants, and through Ricecrest Bwood Brianne at the Bauer brothers’ Sandy-Valley herd, came Sandy-Valley Bolton (EX-GM) — the Luke Hershel son who ranked No. 1 on TPI lists in 2006 and 2007, standing alongside Shottle and Goldwyn as one of the defining bulls of the 2000s.
Next time someone tells you type doesn’t matter, ask them who Bolton’s great-granddam was.
Kaye’s critics don’t have much to say about Bolton.
Jim and Nina Burdette started dairy farming in 1974 on a rented farm with 19 Ayrshires and four Holsteins. They bought cows other men didn’t want — animals with minor defects, maybe slow milking — as long as they had compensating features: strong frames, broad rumps, chest width. Burdette’s quick fix for subpar udders was Round Oak Rag Apple Elevation. On this type of animal, Elevation worked particularly well.
When Quality Ultimate’s daughters swept the four-year-old class at World Dairy Expo in 1983, Burdette rushed home and used Ultimate on two of his cows. One was Windy-Knoll-View Creek Pauline (VG-88). On March 14, 1985, she produced Windy-Knoll-View Ultimate Pala.
It dawned on Burdette how powerful Pala was when she produced Melvin twins, one of whom — Windy-Knoll-View Priss-Twin — was All-American summer yearling of 1990 and later scored EX-93. At the 1991 Pennsylvania Spring Show at Harrisburg, Pala accomplished something that had never been done before: she furnished four class-winning daughters by four different bulls. The five females — Pala and her daughters — won the produce of dam, dam-daughter, and best three females classes.
Three generations in one frame: Windy‑Knoll‑View Pledge‑ET EX‑95‑3E leads the way, followed by her dam Windy‑Knoll‑View Promis‑ET and the matriarch herself, Windy‑Knoll‑View Ultimate Pala EX‑94‑3E‑DOM — the cow who furnished four class winners by four different sires at Harrisburg and whose maternal line stretches 21 generations back to an 1884 Dutch import.
Over time, Pala produced 18 Excellent offspring and 33 Very Good. By 2007, she was dam, granddam, or great-granddam of 23 All-American or Junior All-American nominations. But the A.I. industry, deep in an index binge, wanted nothing to do with her sons because of Quality Ultimate so close in the pedigree.
It took Jim Burdette’s friend Jeff Resner and a marketing pitch called “My Three Grandsons” — brought to Dick Witter at Taurus Service in Mehoopany, Pennsylvania — to break through. Witter, who’d known the Burdettes for years and shared their conviction that the industry put too much emphasis on production indexes, liked the idea. Popular, Promote, and Powerhouse — all Outside grandsons — entered the Taurus lineup.
“The sire analysts focus on the sire stack,” Witter said, “which resulted in the overlooking of the Palas because of the presence of Quality Ultimate. At Taurus Service, we have always selected from a complementary mating sire standpoint and put extra weight on the maternal side of the pedigree.”
Pala’s maternal line goes back 21 generations to Xanthe 8793 H.H.B., imported from Holland in 1884. Sometimes the long view is the only view that matters.
The Hiawathas: A Half-Million-Dollar Heifer and the Kitchen-Table Breeder Who Made Her Possible
The Hiawatha family didn’t begin in the investor-era frenzy that made it famous. It began at a kitchen table in Hoosick Falls, New York, where Sherman Herrington sat with Bill Weeks, the developer of the aAa system, and hammered out a breeding philosophy. Herrington liked Weeks’ way of thinking, but he pushed it further. “I focused on longevity,” he explained. “In my view, a cow was at her best when she was 10 years of age.”
From Herrington’s Sher-Mar Farm came Sher-Mar Lee Mitzi (EX), top Honor List cow for 1979, and her daughter by the Marquis son Puget-Sound Highmark: Sher-Mar Highmark Hiawatha (EX-94-2E), the cow who gave the family its name. In 1981, Hiawatha claimed second position on the Honor List by producing 34,970 pounds of milk, 5.0% fat, and 1,763 pounds of fat as a six-year-old. The June 25, 1980, Holstein World even put a four-generation Hiawatha group on its cover — “these cows had everything,” one observer wrote, “production and pulchritude, both.”
Tyrbach Valiant Hiawatha EX‑94‑DOM — a powerful S‑W‑D Valiant daughter from Dreamstreet Rorae Hesper and Sher‑Mar Highmark Hiawatha, carrying the Sher‑Mar Hiawatha family from Sherman Herrington’s kitchen‑table breeding program into the big‑money investor era without losing the frame, udders, and longevity that made the line famous.
That was when George Morgan of Dreamstreet Holsteins in Walton, New York, stepped in. When news broke that Morgan was buying into the Hiawathas, people were strangely relieved. “This is good for the industry!” they said. “They’re bringing together some great cattle!” — the same people who, not long before, had muttered darkly about the whole investor craze.
Later in 1981, Dreamstreet sold Sher-Mar Highmark Hiawatha privately to Mansion-Valley Farm in South Kortright, New York, for $280,000, where Dave Rama was manager. At Mansion-Valley, Hiawatha produced Mansion-Valley Niagara, a daughter of Ocean-View Sexation born in September 1982. Niagara went through the Designer Fashion Sale of 1983 at the exact same $280,000 price her mother had brought. Hilltop-Hanover Farms, Yorktown Heights, New York, signed the cheque. At 95 points, Niagara became the highest-classified Sexation daughter in the breed and, later in life, completed an eleven-year-old record of 48,910 pounds of 4.0%, 3.0% milk — the highest record for age in North Carolina history under her then-owner Edgar Miller of Winston-Salem.
Back at Sher-Mar, Hiawatha had left more than one mark. She birthed six Excellent daughters, among them Mansion-Valley Precious (EX-94) by Mars Tony. Precious, in turn, was dam of the Blackstar daughter Clover-Mist Black Peach (EX-92), who left Excellent daughters in Ireland and the Netherlands. But it was Precious’s Elevation daughter, Dreamstreet Rorae Pocohontis (EX-93), who lit the biggest fire.
Pocohontis first went through the Designer Fashion Sale in 1981, selling at ten months of age for $225,000 to the Pocohontis Syndicate of Turner, Maine. Two years later, in the 1983 Designer Fashion Sale, she came back as a milking two-year-old and hammered down for $530,000. The buyer was William Ogden, a banker from Stamford, Connecticut. At the time, that price put her in the same rarefied air as the highest-valued cattle in Holstein history.
Ogden boarded Pocohontis at Golden Oaks Farm in Wauconda, Illinois. Golden Oaks’ owner, John Crown, was so impressed by the cow that he wanted a piece of the action himself. Rather than trying to buy her outright, he concentrated on her daughters. He bought Sexation and Valiant daughters from Pocohontis, and each one he took home eventually made an Excellent daughter for him.
One of those branches ran straight into Japan. Ogden Hanover Sexy Prudence (EX), a Sexation daughter from Pocohontis, was sold young to Japanese buyers. Before she left, though, Sexy Prudence dropped a Chief Mark daughter: Golden-Oaks Mark Prudence. As her dam was being exported, Prudence stood in the Golden Oaks heifer pen looking every inch the brood cow. They decided to flush Sexy Prudence to Chief Mark one more time. The flush resulted in four full sisters, among them Golden-Oaks Mark Marion (EX-92) and Golden-Oaks Mark Merle (EX), both of whom found their way to Don Mayer’s Mayerlane Farm in Bloomer, Wisconsin, while another sister went to California and became the dam of four Excellent Prelude daughters.
Mayer later bought Golden-Oaks Mark Prudence herself in the Golden Oaks Top 10 Sale. She’d already been flushed to Prelude and had left two daughters: Golden-Oaks Prelude Pru (EX), who went to Rolling Lawns Farms in Illinois, and Golden-Oaks Prelude Pie (EX), who stayed at Mayerlane. Then, under Mayer’s ownership, Mark Prudence set the world’s highest 3X milk record in December 1996: 62,981 pounds of milk in 365 days — just shy of the 2X record but a world record for three-times-a-day milking.
Ms Crushable Carolina, Reserve Intermediate Champion at World Dairy Expo 2022, carrying a stacked Golden-Oaks Rae family pedigree (Crushabull × Golden-Oaks By Charlotte EX‑90 × Golden-Oaks MCC Charlina EX‑90 × Golden-Oaks ATWD Charla EX‑93 × Golden-Oaks Champ Rae EX‑93) that proves the Roxy–Rae maternal line is still writing banners in the modern show ring.
By the late 2000s, Don Mayer was working with members of several famous maternal lines — Roxy, Dellia’s tribe, and the Hiawathas, among them. Asked to compare them, he didn’t hesitate. “We work with cows from several top families,” he said, “but the Hiawatha family is my absolute favorite. They have a lot in common with the Roxys, and we have a few of those in production here. Both families consistently produce cows with lots of frame and lots of milk.”
It was a neat kind of symmetry: a kitchen-table breeder obsessed with ten-year-old cows, an investor-era banker willing to write a half-million-dollar cheque, a Midwestern dairyman pushing cows to world records — all of them orbiting a family that, like Roxy’s, turned frame and longevity into a global brand.
V. The Long Shadow
What ties all these cows together isn’t just Excellent scores or Gold Medal dams or A.I. contracts worth hundreds of thousands of dollars — though there’s plenty of all that. Here’s the thing nobody wants to say out loud: the conviction, held by a handful of breeders against the prevailing wisdom of their eras, that the maternal line matters.
Bob Snow spent 35 years building toward Dellia — alternating strength sires with dairy sires, generation after generation, never rushing. Bob Miller searched for years before he found a cow family that met his requirements for type, production, and longevity. The Plushanskis used heavy-duty production bulls that would never win a show, but built a family that dominated TPI lists and shipped bulls to Japan. Fred Rice noticed five head that milked their heads off in a neighbor’s barn and had the sense to buy their relative. Jim and Nina Burdette bought cows that other men didn’t want and saw past Quality Ultimate when the rest of the industry couldn’t. Sherman Herrington bred ten-year-old cows while the world chased short-term numbers.
These weren’t accidents. These were philosophies, held with patience and executed over decades.
The Bottom Line
Today, you can’t pick up a sale catalogue without finding a Roxy descendant tracing back to her in the direct maternal line. You can’t look at a TPI list without seeing Dellia’s influence through Durham and Dundee and their sons. Blackrose’s type credentials echo in every Talent or Advent-Red daughter walking into a show ring. Bolton — Kaye’s great-grandson — helped define what a modern sire proof looks like. In Pennsylvania, Pala’s grandsons and great-grandsons are still siring the kind of udders that make a dairyman stop and stare in the milking parlor. And scattered from Illinois to Japan, the Hiawatha daughters and granddaughters carry forward that big-frame, big-milk profile that made them investor darlings in the first place.
Bob Miller took one photograph that afternoon at Mil-R-Mor. One shot, one cow, one moment caught in silver gelatin. But the cows in this story — Roxy, Dellia, Blackrose, Faith, Kaye, Pala, the Hiawathas — they weren’t one-shot wonders. They were the biological engines of a breed, the franchise mothers whose influence would outlast every index revision, every genomic recalculation, every shift in breeding fashion.
They go along doing their business. And the breed is better for it.
So the next time a sire analyst tells you a cow family doesn’t matter because the genomic index says otherwise, ask them one question: where do they think those indexes came from?”
KEY TAKEAWAYS
The maternal line is the most overlooked profit center in your herd. Every franchise cow here was built by breeders who invested decades in dam lines while the industry chased sire stacks. Roxy’s family is still producing Excellents 40 years after her death. Your current genomic rankings won’t be.
The best brood cows don’t announce themselves. Terracelane Ideal Star scored GP-76 as a two-year-old. Blackrose cost $5,400 from a bankruptcy sale. Bolton’s great-granddam was a cow elite sale selectors walked right past. Look harder at what’s already in your barn.
Bob Snow bred strength-dairy-strength-dairy for 35 years. The result was Dellia. One cow. Three Gold Medal A.I. sons. Seventy-six registered daughters. A family that, according to Select Sires’ Scott Culbertson, “sent more dollars back into farmers’ pockets across the world than any other cow.”
The type-vs.-production debate was settled by the cows themselves. Roxy: 97 points, 209,784 lbs lifetime milk. Dellia: EX-95, three Gold Medal sons. Kaye: modest type, three sons on Top 100 TPI at once. The answer was never either/or — it was knowing what your cow family does best and breeding to it.
When the hot sire of 2024 is forgotten by 2027, the brood cow who throws Excellents regardless of the bull she’s mated to is the one asset that holds its value. These seven families prove it. Cow families aren’t nostalgia. They’re the genetic insurance policy genomics can’t replace.
Continue the Story
The 10 Greatest North American Holstein Breeders of All Time – While Miller and Snow were carving out legacies with Roxy and Dellia, these masters were operating in that same high-stakes world. Discover the other visionaries who defined the golden age of pedigree breeding alongside them.
The 10 Most Influential Holstein Sires of All-Time – These franchise mothers didn’t work in a vacuum; they were mated to the giants. Deepen your understanding of the sire side of the era, exploring the genetic forces like Elevation and Starbuck that shaped these dynasties.
Snow-N Denises Dellia – The Empress of the Breed – Follow the thread from a single barn-meeting semen prize to the global dominance of Durham and Dundee. This feature traces how one cow’s influence carried forward to build the very foundation modern Holstein breeders stand upon today.
The Sunday Read Dairy Professionals Don’t Skip.
Every week, thousands of producers, breeders, and industry insiders open Bullvine Weekly for genetics insights, market shifts, and profit strategies they won’t find anywhere else. One email. Five minutes. Smarter decisions all week.
Holstein inbreeding hit 9.99%. Birkstead and North Florida took opposite paths to slash a $60–$ 100-per-cow leak without sacrificing genetic progress.
Executive Summary: Holstein heifers born in 2024 now average 9.99% inbreeding, and conservative barn‑math from peer‑reviewed studies puts the cost at roughly $60–$100 per cow per lactation. The article shows how that hit comes together — a little lost milk and protein, a few extra days open, shorter productive life — and why recent inbreeding does more damage than old pedigree overlap. It then uses two real herds as case studies: Birkstead Holsteins in Ontario, which pushed a 20% pregnancy rate higher and cut health problems by moving to a Holstein × Norwegian Red × Montbéliarde/Fleckvieh cross, and North Florida Holsteins, which stayed pure Holstein but built its own profit‑first index and capped how much any single bull could influence the herd. The core argument is that the real risk isn’t genomics itself, but letting catalog rankings quietly stack the same sire lines until inbreeding becomes a five‑figure annual leak. For a 300–600‑cow herd, the piece lays out a simple playbook: in the next 30 days, turn on and enforce an inbreeding ceiling in your mating program, over the next 90 days build a genuinely diverse bull team, and over the next breeding season stop raising replacements from the most inbred, lowest‑merit females. It’s written for owners and breeding decision‑makers who want to keep riding the top of the genetics wave without paying for 9.99% inbreeding on every proof run.
Canadian Holstein heifers born in 2024 now average 9.99% inbreeding, according to Lactanet’s August 2025 inbreeding update. That’s up from 9.61% the year before and the highest among the major dairy breeds in Canada. On paper, it’s just another number. In the barn, it’s the cows that don’t settle, don’t handle stress, and don’t stick around long enough to pay off their raising cost.
Thomas Wantenaar at Birkstead Holsteins in Elora, Ontario, was already seeing that drag in his own herd numbers. In 2008, with a purebred Holstein herd and a new robot barn, he was staring at an annual pregnancy rate of about 20% and, as he told Progressive Dairy, “spending half the morning just treating cows.” A thousand miles south at North Florida Holsteins, Don Bennink was looking at the same breed from the other end of the telescope: about 4,800 cows and 4,400 heifers on roughly 2,400 acres in Florida heat, and a classification and type evaluation system he publicly described as “180 degrees away from cattle that pay the bills.”
How Much Does 1% of Holstein Inbreeding Really Cost Per Cow?
You’ve heard for years that inbreeding costs money. That doesn’t help when you’re trying to decide whether one more high‑index bull out of the same sire line is worth it.
Lactanet and other summaries estimate that every 1% increase in inbreeding knocks roughly $60–$78 off a cow’s lifetime profit, once you add up lost milk, weaker fertility, and fewer productive days. Makanjuola and colleagues (2020) put a finer point on it for Canadian Holsteins: each 1% increase in genomic inbreeding cut 305‑day first‑lactation milk yield by about 40–50 kg. At typical Canadian milk prices, that’s over $40 per cow per lactationfrom milk volume alone.
That’s still fairly abstract. The real question is: if your herd is, say, 2 percentage points more inbred than you’d like, what’s the per‑cow, per‑lactation hit?
Step 1: Define “excess inbreeding”
Suppose you’d be comfortable with a herd average around 7.5% inbreeding. Instead, your young stock are coming in around 9.5%, which isn’t unusual given where Holsteins are heading. That’s 2 percentage points of excess inbreedingcompared with the level you’d like to be at.
Step 2: Milk and protein that never make it onto the truck
Doekes et al. (2019) and Makanjuola (2020) both found that each 1% increase in inbreeding reduced 305‑day milk by roughly 36–49 kg (80–108 lb). To stay conservative and easy to work with, call that about 100 lb of milk per 1%.
At 2 excess points: ~200 lb less milk per cow per lactation.
At $20/cwt: 200 ÷ 100 × $20 = $40 per cow per lactation from milk.
StrataGEN work suggests about 25 lb lifetime protein loss per 1% inbreeding, which averages out to roughly 6–7 lb per lactation. Use 6 lb per 1%.
At 2 excess points: 12 lb less protein per lactation.
At $3.50/lb: 12 × $3.50 = $42 per cow per lactation from protein.
Right there, you’re at around $82 per cow per lactation in very basic, conservative component math.
Step 3: Days open that hide inside your repro numbers
Genetic and economic work often uses about 1 extra day open per 1% inbreeding as a planning number, once you account for later first service, lower conception rates, and early embryonic loss. It’s not a hard rule, but it’s a realistic average.
At 2 excess points: assume 2.5 extra days open.
At $4 per day open (mid‑range of common $3–$5 estimates): 2.5 × $4 = $10 per cow per lactation.
You can argue the exact cost per day. You can’t honestly argue that it’s zero.
Step 4: Productive life and replacements
StrataGEN data show about 13 fewer productive days per 1% inbreeding; at 2 excess points, that’s around 26 fewer productive days in that cow’s lifetime.
Spread across a cow you expect to last around 3½ lactations, that’s about 7–8 fewer productive days per lactation. Put a conservative $10 per cow per lactation value on that in terms of extra replacement pressure, fewer older “easy money” cows, and more fresh‑heifer risk.
Step 5: Put the conservative math together
Conservative totals on 2 points of excess inbreeding per cow, per lactation:
Milk loss: ~$40
Protein loss: ~$42
Extra days open: ~$10
Shorter productive life/replacements: ~$10
That’s roughly $100 per cow per lactation.
Loss Category
Impact per 1% Inbreeding
Cost at 2% “Excess” (per lactation)
Milk Yield
~100 lb
$40.00
Protein
~6 lb
$42.00
Fertility (Days Open)
1.25 Days
$10.00
Productive Life
13 Days (Lifetime)
$10.00
ESTIMATED TOTAL
$102.00 per cow
If you squeeze every assumption down to the low end and ignore some of the lifetime effects, you can justify a smaller number in the $60–$70 per cow range. If you take the upper end of the published production losses and value days open closer to $5, you can also defend numbers over $100 without exaggerating.
Either way, on a 300‑cow milking herd, even a $60 per cow leak is around $18,000 per year until your mating strategy changes. On a 500‑cow herd, you’re looking at $30,000–$55,000 per year — not in theory, but in realistic, research‑based barn math.
At Birkstead, that money didn’t show up on a line called “inbreeding.” It showed up as a 20% pregnancy rate, more sick cows than they liked, and robots spending too much time fetching stubborn Holsteins. At North Florida Holsteins, it showed up in a Holstein system that rewarded the same narrow sire lines and type composites even as inbreeding climbed.
Why Recent Inbreeding Hurts More Than Old Inbreeding
One of the traps with inbreeding is treating all of it as doing the same damage. It doesn’t.
Doekes and co‑authors split inbreeding into “recent” (last few generations) and “ancient” (deeper in the pedigree) and then tracked what each type did to production and fitness in Holsteins. Each 1% of new inbreeding cuts fat yield by about 2.4 kg per lactation, while the oldest pedigree class had little to no negative effect — in some models, even a small positive one.
Makanjuola’s work on Canadian Holsteins using runs of homozygosity (ROH) told the same story: recent inbreeding reduced milk and protein yields, while ancient inbreeding had far weaker effects. When you turn that into dollars, you end up in that >$40 per lactation per 1% range for first‑lactation milk alone.
Why the difference?
Ancient inbreeding has already been through decades of selection. The worst double‑copy combinations have largely been purged from the population.
Recent inbreeding creates new double copies in parts of the genome that haven’t had enough generations under selection pressure, especially for fertility and health.
Irish Holstein‑Friesian work suggests that purging has been more effective for production traits than for fertility.We’ve been selecting hard for milk and components for a long time. Fertility and health only really got major index weight in the past 10–15 years. The harshest fertility and survival recessives haven’t been under the hammer as long.
Once you layer genomics on top, the curve steepens. Hansen showed that Holstein female inbreeding rose at about 0.12% per year from 2000 to 2012, then 0.25% per year from 2013 to 2016, and then around 0.4% per year as genomic selection really took over. By the early 2020s, average Holstein females were already in the 8–9% inbreeding range, and by 2024, Canadian Holstein heifers hit 9.99%.
Genomics helped us identify the top animals faster. It also helped us stack the same families faster than purging could clean up fertility and survival.
The Bottleneck Hiding Inside Every Bull Catalog
Talk about Elevation and Chief dominating Holstein pedigrees can sound like coffee‑shop folklore. The data back it up.
If your inbreeding is over 9.99% and FSAV isn’t on your proof sheet, Net Merit 2025 is using you — not the other way around.
Executive Summary: Net Merit 2025 added a $57‑per‑point “weight tax” on big Holsteins by cutting Body Weight Composite to ‑11% and lifting Feed Saved to 17.8% of NM$, pushing the breed toward smaller, feed‑efficient cows. Fat now carries 31.8% of the index, protein just 13%, and cow/heifer Livability has more pull, so the model rewards components and survival over sheer size. New calf‑health evaluations — CDCB’s DIAR/RESP and Lactanet’s Calf Health RBVs — reveal that daughters of top 5% sires stay healthy 15–18 percentage points more often than daughters of the worst bulls, and a single respiratory event costs about 121 kg in first‑lactation milk. Meanwhile, average inbreeding for Canadian Holstein heifers hit 9.99% in 2024, and JDS work shows recent inbreeding hurts longevity more than older, diluted inbreeding, raising real questions about how we’re using genomics. Rosy Lane Holsteins leans hard into NM$, FSAV, and calf‑wellness indexes, but still filters out extreme‑stature bulls and ignores classification that doesn’t help profit, showing how to use the system without letting it run the herd. The practical playbook: pair NM$ with reliability, make FSAV and calf health non‑negotiable filters, keep your top three bulls below ~40% of expected future inbreeding, and, in the next 30 days, sit down with your proofs to see if Net Merit’s priorities actually match how your farm makes money.
While you’re scraping stalls or checking heaters, three people you’ve never met just changed the value of every cow in your barn. In a quiet Maryland office park, the USDA recalculated the “ideal” Holstein — and if your cows are “too big” on Body Weight Composite, they just picked up a $57‑per‑point penalty for lifetime Net Merit.
The math lives in Beltsville. The consequences land in your parlour. The April 2025 Net Merit revision didn’t just shuffle a few bulls; it hard‑wired a new answer to a simple question: what kind of Holstein is worth breeding in 2026?
This is the story of the scientists who set that answer — and Rosy Lane Holsteins in Wisconsin, where Lloyd Holterman refuses to let those formulas be the whole story.
Quick Facts: What Changed in Net Merit 2025
Body Weight Composite (BWC): -11% emphasis in NM$.
Fat vs Protein: Fat 31.8%, Protein 13% of NM$ emphasis.
Feed costs in the model:58% of milk income (39% marginal, 19% maintenance).
“Weight tax”: +1.0 BWC = -$57 lifetime NM$ per daughter.
Genetic gain: Genomics roughly doubled NM$ gain per bull from $40 → $85/year.
Those aren’t trivia numbers. They’re the new rules your proof sheet is playing by.
From Coin, Iowa, to Every Proof Sheet in North America
The modern proof system didn’t start with DNA chips. It started with a kid from Page County, Iowa, who didn’t begin his animal breeding career until he was nearly 40.
Charles Roy Henderson grew up on a general livestock farm, served as an Army Nutrition Research Officer during World War II, and earned his PhD in genetics and animal breeding from Iowa State in 1948 at age 37. At Cornell, he developed best linear unbiased prediction — BLUP — the math that finally separated herd effect from genetic effect. It let evaluators ask: Is this cow actually superior, or just in a better barn?
USDA adopted Henderson’s herdmate comparison method in 1962, replacing the old daughter–dam comparisons. By 1989, BLUP‑based Animal Model evaluations were running in the U.S., with other countries following through the 1990s.
There was still a massive bottleneck. A young bull went into AI around two, his daughters calved, finished a lactation, and the proof didn’t publish until the bull was seven or eight. Only about 1 in 8–10 bulls “graduated” from progeny testing, and each active bull represented a $350,000–$400,000 investment in semen collection, daughter sampling, and promotion.
Genomics blew that up. Illumina’s 50K SNP BeadChip hit the market in 2007, the bovine reference sequence landed in Science in April 2009, and USDA’s Animal Genomics and Improvement Laboratory launched official genomic evaluations for Holsteins and Jerseys in January 2009. Generation interval collapsed — suddenly, you could get a genomic PTA on a bull before he was old enough to breed.
Paul VanRaden joined the USDA’s Animal Improvement Programs Laboratory after his Iowa State PhD in 1986. His name is on a long list of methods you see every time you open a proof sheet — but Net Merit is the one that hits your pocketbook most directly.
Henderson’s BLUP told you which cow was genetically better. VanRaden’s Net Merit dollar index (NM$) tells you which cow should make you more money over her lifetime. It rolls multiple production, fertility, health, and conformation traits into a single lifetime profit estimate — and every revision is another set of judgment calls about what matters, and how much.
Where the 2025 Change Hits Your Herd
The April 2025 NM$ revision increased the emphasis on butterfat and reduced the emphasis on protein, reflecting actual component price trends in recent years. It also shifted weight from Productive Life toward cow and heifer Livability, based on stronger cull cow and heifer calf markets.
The bigger jolt is in body weight and feed efficiency. New feed‑intake data from more than 8,500 Holstein and Jersey lactations showed that maintenance feed costs were higher than previous models assumed. In plain language: big cows cost more to keep milking than the old Net Merit math gave them “credit” for.
So BWC now sits at ‑11% emphasis in NM$. For every extra point of BWC, the model knocks about $57 off that cow’s lifetime Net Merit — mostly for maintenance feed, but also for housing and replacements.
Big cows = big feed bills the model sees no profit
Here’s the barn‑math version:
Your bull team averages +1.0 BWC over breed average.
NM$ says that’s about ‑$57 lifetime NM$ per daughter.
Across 100 daughters, that’s roughly $5,700 in lifetime NM$ drag for that sire choice compared to a BWC‑neutral bull.
You can argue with the model. But you can’t pretend it’s not there.
Why Did Fat Leapfrog Protein?
VanRaden’s team also re‑estimated the true genetic cost of components. Genomic and sire regressions suggested that, genetically, fat takes as much or more feed to produce than protein. That’s the opposite of what older phenotypic regressions implied when they just watched cows and feed trucks.
The feed‑side math behind this revision assumes feed costs equal 58% of milk income — 39% for marginal production and 19% for maintenance. Combine that with the new Feed Saved trait (FSAV), and you see where the wind is blowing:
FSAV is 17.8% of NM$ when you add its BWC and Residual Feed Intake components together.
If you’re not looking at FSAV on your proofs, you’re ignoring almost a fifth of the index you think you’re using.
The subtext is pretty clear: do more milk from less feed, land, and carbon, or get left behind.
Wiggans: The Infrastructure Nobody Sees
If VanRaden designed the engine, George Wiggans made sure it was street‑legal and still running when you opened your proofs this morning.
Theory doesn’t help anybody if it can’t be computed, delivered, and trusted. Wiggans spent his career sorting out genotype management, data quality control, and the nuts and bolts of turning millions of milk, type, and health records into evaluations that AI organizations can actually ship. He was central to the push that got Canadian AI studs to contribute DNA to a shared U.S.–Canada reference population before genomic proofs went live, which still underpins most North American Holstein genomic evaluations.
Every chip you send in has to survive that QC pipeline. The genotype is checked against reported parents, then against the entire database to catch swapped samples or mis‑ID’d animals. If it doesn’t add up, it doesn’t make it into the evaluations.
In a 2022 Frontiers in Genetics paper, Wiggans and Carrillo showed that the U.S. genomic‑selection era roughly doubled the rate of NM$ gain: from about $40 per bull per year (2005–2009) to roughly $85 per bull per year from 2010 onward. The genetic trend lines are real. Whether those gains match your own herd’s priorities is a different question.
What Kills Your Calves Before They Ever Milk?
John Cole is part of the generation pushing genomic evaluations into the ugly stuff that never makes it to the parlor: dead or wrecked calves.
Across multiple datasets, about 75% of preweaned calf mortality comes from just two buckets: diarrhea and respiratory disease. To put numbers on the genetics behind that, CDCB and partners pulled together 207,602 diarrhea records and 681,741 respiratory disease records from calves born between 2013 and 2024. Those data streams feed the new U.S. genomic evaluations for calf diarrhea (DIAR) and respiratory disease (RESP), officially launched in April 2026. Lactanet rolled out its own Calf Health RBVs for Holsteins in August 2025.
The heritability looks low at first glance: about 0.026 for diarrhea resistance and 0.022 for respiratory resistance. Translate that: only 2–3% of the variation in those health outcomes is explained by genetics in the current models. Zoetis’s earlier proprietary Calf Wellness index (CW$) reported slightly higher figures due to differences in traits, models, and data sources.
Cole’s message in presentations and industry pieces has been consistent: don’t let the low heritability numbers fool you. Once you’re doing the basics right on colostrum, hygiene, and housing, adding genetic resistance can still move many calves out of the treatment pen and into the parlor.
The Genetic Spread, in Real Daughters
Lactanet clearly summarized the genetic spread in an August 2025 calf health article and a companion presentation. Among officially proven Holstein sires:
For respiratory disease, daughters of the top 5% sires by calf health RBV stayed healthy (no recorded RESP case) about 71% of the time; daughters of the bottom 5% sires were healthy only about 54% of the time.
For diarrhea, daughters in the top 5% were healthy about 69% of the time, compared with roughly 53% for those in the bottom 5%.
That’s not “nice‑to‑have.” That’s a lot of treatments, mortalities, and delayed heifers tied directly to the bulls you pick.
Rosy Lane Holsteins saw similar real‑world spreads years earlier when it leaned heavily into Zoetis’s Calf Wellness index. A WW Sires case study reported that calves in the top 25% for CW$ at Rosy Lane logged about 50% fewer scours cases and roughly 32% fewer pneumonia cases than calves in the bottom 25% over a 12‑month window — tracked with ultrasound to catch subclinical pneumonia that never showed as a full‑blown “trainwreck.”
An often‑cited study summarized in Farmtario’s 2025 calf‑health coverage showed that heifers with a recorded respiratory disease event produced 121 kg less milk in first lactation. Stack that across a whole age group, and you feel it in the tank.
Genetics won’t fix sloppy colostrum or filthy hutches. But if you’re already holding preweaned mortality in the 3–4% range, calf health genetics is one of the few levers left to push toward that 1–2% elite zone.
What Data Actually Feeds Your Genomic Proof?
Data Source
What It Captures
Who Provides It
Key Blind Spot
DHI/DHIA test
Monthly production, components, SCC
Techs or automated meters
Only ~40% of U.S. herds on some form of official test
Classification
Linear type traits and composites
Breed‑association classifiers
In Canada, only first‑lactation scores feed official type proofs
Genomic labs
SNP genotypes (e.g., 50K → ~54,001 usable markers)
DNA from hair, blood, ear notch
Minor breeds have thin reference populations
Producer health records
Mastitis, metabolic disease, calf health events
Producers via herd software
Only a minority of farms consistently log calf health events
Those gaps matter. The DIAR and RESP national datasets are over 97% Holstein and Jersey — roughly 80% Holstein, 17% Jersey — which makes the models strong for those breeds and less robust for everyone else. If you’re milking registered Holsteins on test and logging health, the system sees you. If you’re off test, crossbred, or light on health records, you’re asking the index to guess.
Does the System See Your Herd — or Just the Average?
Genomic selection was intended to mitigate inbreeding. The sales pitch: if you can see exactly which genes each calf got, you can manage inbreeding smarter. In reality, progress has been messier.
Lozada‑Soto and co‑authors (2024, Journal of Dairy Science) showed that in Nordic Holstein and Jersey populations, yearly inbreeding rates increased after genomic selection took off, and the effective population size for Nordic Holsteins dropped from 54.3 to 42.8. Doekes et al. (2019, Journal of Dairy Science) found that recent inbreeding — long runs of homozygosity in the genome — hurts longevity more than older, “diluted” inbreeding.
You see that on‑farm, as good‑looking heifers that fall apart too soon for reasons you can’t fully blame on your nutritionist or hoof trimmer.
So you’re stuck with a double‑edged sword:
Genomics doubles genetic gain in traits the index rewards.
Key traits like heat tolerance, methane emissions, and temperament still don’t have official U.S. evaluations. The index can’t weigh what it doesn’t measure. If those matter on your farm, you’re into custom selection, not blind NM$ chasing.
On the Canadian side, Lactanet’s August 2025 inbreeding update pegged average inbreeding for Holstein heifers born in 2024 at 9.99% — a full percentage point higher than 2014. That’s your benchmark when you run your own mating reports.
Rosy Lane Holsteins: Using the System, Not Worshipping It
The Net Merit model is built for an “average” U.S. confinement herd. Rosy Lane Holsteins, just outside Watertown, Wisconsin, is one of the operations proving you can use that system aggressively without letting it run the show.
Lloyd Holterman and the Rosy Lane team have been clear for years: profit comes first because farming is a business.In a 2014 Bullvine profile and later Zoetis/WW Sires features, Holterman laid out a strategy that still makes some breeders twitch:
Sort bulls by NM$ first, not TPI or show‑ring appeal.
Avoid bulls that crank up Stature; favor moderate‑sized, wide, durable cows.
Stop classifying if the scores aren’t helping profit decisions.
When Rosy Lane compared its cows, Holterman told The Bullvine they found that shorter, wider, better‑conditioned cows “far outlived their higher‑scoring herd‑mates while having fewer foot problems and better fertility.” We later quoted his joking shorthand for what can happen when people chase pure type without thinking about fertility: cows that are “tall, pretty and infertile.” (Read more: ROSY-LANE HOLSTEINS – “Don’t Follow the Herd!”)
That line isn’t a scientific verdict on TPI. It’s one breeder’s sharp reminder that an index built for show cows and an index built for profit aren’t the same tool.
Rosy Lane also leaned early into Calf Wellness genetics. The Zoetis/WW Sires case study from their herd showed calves in the top quartile for CW$ had around half the scours and one third fewer pneumonia cases than bottom‑quartile calves — not because management changed, but because the sire list did. That’s exactly the kind of “make the data pay” story the Beltsville team hopes other herds can copy.
Holterman’s bottom line hasn’t changed: use the tools, but never forget your own milk cheque.
The Bullvine Verdict: Who Gets to Decide What a “Good” Holstein Looks Like?
Here’s the uncomfortable truth: if you don’t know how NM$, FSAV, and calf health evaluations work, someone else is making your breeding strategy — even if you’re the one signing the semen bill.
Beltsville’s job is to define an average profitable Holstein in 2025: moderate size, high components, better feed efficiency, fewer dead calves, and fewer young cows leaving early. That’s not a bad target.
But your farm isn’t average. Your milk contract might reward protein harder than fat. Your freestalls and robot boxes might punish tall, wide cows. Your land base might mean feed is your bottleneck, not cow numbers. Or you might be okay trading some NM$ for show‑ring presence or niche milk premiums.
Net Merit is a strong starting point. It’s just blunt. Rosy Lane is a live example of how a herd can lean hard into Net Merit, calf wellness, and FSAV — and still make their own calls about size, type, and classification.
The real question isn’t “Is Net Merit right?” It’s “Does Net Merit, as currently weighted, line up with the way money actually moves through your operation?”
What This Means for Your Operation
Always read NM$ with reliability beside it. An NM$ +1,000 bull at 75% reliability is a strong estimate; at 95% reliability, it’s a proven moneymaker relative to the base. They’re not interchangeable, and low‑reliability bulls can move 150+ NM$ in a run.
Match your index to your contract. If your cheque pays on components, CM$ or Pro$ might match better than NM$ if you’re fluid and volume-heavy. NM$ is still the best fit. The index choice isn’t a religion — it’s a business decision that should be revisited at least annually as prices shift.
Find FSAV on your sire summary — or ask why it’s missing. With 17.8% combined weight in NM$, FSAV is now a core trait, not a side note. A bull that looks good on milk and components but is weak on FSAV may not pencil once you factor in feed and maintenance.
Use genomics to diversify, not concentrate. Spreading risk across at least 5 genomic sires is cheap insurance. One young bull can re‑rank hard; a group of five rarely does. If your top 3 sires account for more than ~40% of your herd’s expected future inbreeding, that’s a practical red flag to add diversity.
Treat Net Merit as your first filter, not your only one. Rosy Lane uses NM$ as the gate, then rejects bulls that push Stature too high. You might do the same for calving ease, A2A2, polled, robot suitability, or grazing traits, depending on your system.
Put calf health on the table if you’re already nailing management. Once your basic colostrum, housing, and hygiene are solid, DIAR/RESP and tools like CW$ can start doing noticeable work in the background.
Key Takeaways
If your expected inbreeding is higher than 9.99%, it’s time to adjust your mating plan. That 9.99% is Lactanet’s average for Canadian Holstein heifers born in 2024. Run your own mating reports. If your next calf crop is well above that, add two or three outcross or lower‑inbreeding bulls before the next breeding cycle.
If a bull drops more than ~150 NM$ between proof runs, he should lose some tank share. That kind of swing is normal for low‑reliability genomic sires, but it’s your cue to slow his usage and bring in a replacement rather than riding him for another year, hoping he comes back.
If your top 3 bulls contribute more than ~40% of your herd’s expected future inbreeding, you’ve got a concentration problem. That number isn’t a magic line — it’s a simple threshold that tells you when you’ve leaned too hard on a couple of “hot” sires.
If FSAV isn’t in your sire selection process yet, you’re ignoring 17.8% of the index you think you’re using.That’s a lot of money and feed to leave on the table when you’re already fighting ration costs.
The Bottom Line
In the next month, carve out half an hour with your genetic advisor or semen rep. Pull up your proofs, look at BWC, FSAV, reliability, and expected inbreeding side by side — and ask one question: “Does the way I’m using these tools actually match how my farm makes money?”
Complete references and supporting documentation are available upon request by contacting the editorial team at editor@thebullvine.com.
Learn More
The $212,000 Bulk Tank Lie Hitting Upper Midwest Dairies – Exposes the high-test trap that’s quietly draining your bank account. You’ll gain a concrete 4-point playbook to stop chasing percentages and start shipping the component pounds that actually drive your 2026 milk check.
Every week, thousands of producers, breeders, and industry insiders open Bullvine Weekly for genetics insights, market shifts, and profit strategies they won’t find anywhere else. One email. Five minutes. Smarter decisions all week.
Beef‑on‑dairy made your calf cheque bigger. Did it also steal 29 heifers and $86K–$119K from your next two years?
Executive Summary: UW–Madison’s beef‑on‑dairy simulation says a sexed‑plus‑beef program earns about $51/cow/year at 20% preg rate — but that’s built on $570 calves and $2,355 heifers, not today’s prices. In 2026, beef‑on‑dairy calves are bringing roughly $1,200–$1,900, while replacement heifers often cost $3,000–$4,100+, which means the model’s revenue upside is bigger — and the replacement bill is brutal if repro slips. Run the same tiered breeding strategy on a 300‑cow group, and you get two very different outcomes: a high‑PR herd with a 17‑heifer surplus, and a low‑PR herd that’s 12 heifers short — a 29‑head swing worth $86,000–$119,000 a year at current heifer prices. The core takeaway is simple: beef‑on‑dairy is a reproduction strategy first and a calf‑marketing strategy second, and the economics only really work when your 21‑day PR is closer to 30–35% with solid heifer survival. UW–Madison’s most uncomfortable insight is that the optimal insemination window under these calf prices stretches out to around 260 days in milk, so cutting cows at 150–180 days quietly throws away pregnancies and future replacements. The article finishes with a 30/90‑day playbook: pull your PR and 24‑month replacement inventory, check whether your beef‑on‑dairy calves actually average close to 2× your dairy bull calves, and decide how far you can lean into beef‑on‑dairy before you’re forced to buy back heifers at the top of the market.
A replacement heifer that cost $2,355 in UW–Madison’s 2024 assumptions is now a $3,000–$4,100 line item in real markets. The same model valued beef‑on‑dairy calves at $570 — calves that now commonly bring $1,200–$1,900 at major auctions. On paper, the strategy adds $51/cow/year at low pregnancy rates. In the barn, the wrong breeding plan can torch $86,000–$119,000 per 300‑cow pen in replacement costs.
Price Component
UW–Madison Model (2024)
Real Market (Early 2026)
Variance
Impact
Beef × Dairy Calf
$570
$1,200–$1,900
+111% to +233%
Higher revenue (but see replacement crisis)
Dairy Bull Calf
$385
$900–$1,200
+134% to +212%
Narrows beef-on-dairy advantage vs. conventional
Replacement Heifer
$2,355
$3,000–$4,100
+27% to +74%
Replacement bill brutal if PR slips
Net Advantage (20% PR)
$51/cow/year
$264+/cow/year
+418%
Looks great—until you’re 12 heifers short
300-Cow Replacement Gap
29-head swing assumed manageable
29 heifers × new prices = $86K–$119K/year
—
The bill the calf cheque doesn’t cover
The Industry Sprint Toward the Calf Cheque
Corey Geiger, lead dairy economist at CoBank, summed up the last five years of beef‑on‑dairy in one line: “What happened was we pivoted too hard, too quick.” The industry didn’t just pivot. It sprinted toward the calf cheque and tripped over the empty heifer pens.
Eighty‑one percent of all beef semen sold domestically now goes into dairy herds — 7.9 million units out of 9.7 million, according to NAAB’s 2024 year‑end report. Conventional dairy semen sales shrank 46.5% in that same window. USDA’s January 2026 Cattle report shows U.S. dairy replacement heifers at 3.905 million head, the lowest since 1978. CoBank projects inventories will shrink by 357,490 head in 2025 and another 438,844 head in 2026 before rebounding by 285,387 head in 2027.
Those numbers mean the calves you’re selling today, and the heifers you’re not making will collide in your barn, not just in a spreadsheet.
The $4,100 Heifer vs. the $1,400 Calf
UW–Madison’s economic simulation — published in Journal of Dairy Science in late 2025/early 2026 — modeled a 1,000‑cow dairy using a tiered breeding program: top cows to sexed semen, middle to conventional, bottom to beef. Their default economics looked like this:
Beef × dairy crossbred calf: $570 per head.
Dairy bull calf: $385.
Dairy heifer calf: $167.50.
Replacement heifer rearing cost:$2,355.
Using those inputs, a herd at 20% 21‑day pregnancy rate (PR) with a 170‑day insemination eligibility period (IEP)earned about $51 more per cow per year from a sexed‑plus‑beef strategy than from an all‑conventional program. That’s the famous $51.
Now line that up with what you’re seeing in early 2026:
Premier Livestock’s February 12, 2026, report lists beef‑dairy cross calves at $1,200–$1,910 per head.
Abbotsford Stockyards’ January 14, 2026, report shows baby calves averaging $1,680 with a $500–$2,500 range and Holstein bull calves at $390–$680.
USDA’s January 2026 National Dairy Comprehensive Report has No. 1 bull calves (0–14 days) averaging $1,187.42/cwt and No. 2 at $1,094.10/cwt nationally.
CoBank’s heifer analysis and multiple auction summaries put replacement heifers consistently at $3,000–$4,000+, with some lots exceeding $4,100.
So the calf UW assumed was worth $570 is now worth closer to $1,400. The heifer priced at $2,355 is now more like $3,000–$4,100. The per‑cow advantage is better than $51 at current prices. The replacement exposure is a lot worse.
UW–Madison’s Simulation vs. Your Barn Math
Dr. Victor Cabrera’s 2021 work clarified why beef‑on‑dairy looked like free money. He defined ICOSC — income from calves over semen costs — and showed that beef‑on‑dairy pencils when the beef‑cross calf brings roughly 2× the dairy calf price in herds with at least a 20% 21‑day PR. That 2:1 ratio became gospel.
In 2026, the ratio’s not that clean:
Beef‑on‑dairy calves often bring $1,200–$1,900.
When you translate current cwt and regional reports, Holstein bull calves commonly sit at roughly $900–$1,200equivalent.
Some weeks you’re well past 2:1. Others you’re barely at 1.3–1.5:1. ICOSC advantage has turned into a local, week‑by‑week math problem — not a guaranteed win.
M.R. Lauber, Cabrera, and Paul Fricke went further in their JDS paper, building a discrete Markov‑chain simulation that looked at herd size, semen types, IEP, PR bands from 20–40%, and heifer survival from 75–90%. When they raised the beef‑cross calf value in the model from $570 to $1,125, the net return advantage at 20% PR climbed from $51/cow/year to $264/cow/year. That fits current markets.
Conventional matings: 75 cows × 46.7% female = ~35 heifer calves (Silva del Río et al. 2007 conventional estimate).
Beef matings: 105 calves = 0 replacements.
Total dairy heifers born: ~144. After 85% survival: ~122 replacements available.
You need 105. You’ve got a 17‑heifer cushion. That pen can absorb some calf‑barn losses and still hold herd size.
Scenario B — Low‑PR Herd (More Cows Drift to Beef)
Drop the 21‑day PR and something ugly happens. Fewer cows conceive in that early sexed‑semen window. They cycle back, enter later services, and more of them get bred to beef.
Total dairy heifers born: ~117. After 80% survival: ~93 replacements available.
You still need 105. Now you’re 12 heifers short. Every year. Same herd size. Same breeding plan on paper. The only difference is reproduction and survival.
The Dollar Hit
UW–Madison priced replacements at $2,355 based on 2020 rearing costs. CoBank and current sale data now peg them at around $3,000–$4,100. That 29‑heifer swing between Scenario A and Scenario B works out to:
29 heifers × $3,000 = $87,000.
29 heifers × $4,100 = $118,900.
Call it $86,000–$119,000 per year on a 300‑cow group. Double the group, double the bill.
That’s without counting lost milk from cows you culled sooner because you wouldn’t carry them open to 260 days, or the premium you’ll pay if you’re forced into the replacement market when everybody else is short, too.
Mid‑size herds — 200–600 cows running 33–36% replacement rates — are structurally more exposed than 3,000‑cow herds sitting closer to 28–31%. Same program, much less room to miss.
The Hidden Lever: 260‑Day IEP (The One Thing Most Herds Are Getting Wrong)
One of the quiet bombshells in Lauber, Cabrera, and Fricke’s modeling is their answer to a simple question: how long should a cow stay eligible for AI in a beef‑on‑dairy system? Not just “what’s your PR?” or “what semen are you using?” but “when do you stop trying?”
In their model, the optimal insemination eligibility period for sexed+beef herds typically sat around 200 days, and they tested windows all the way out to 260 days. The bigger message is that most herds are stopping far too early in a beef‑on‑dairy world.
Most of you are still removing cows from the breeding pool at 150–180 days in milk. That made sense when every extra breeding had limited upside and open‑cow days killed margin over feed. With beef‑on‑dairy in the mix, the upside of one more pregnancy looks very different.
Pro‑Tip: The 260‑Day Window
UW–Madison tested IEPs from 50 to 260 days and found that, at today‑equivalent calf values, extending eligibility beyond 170 days — often toward roughly 200 days for sexed+beef programs — moved net return up as long as replacement needs were covered.
Stopping at 170 days under a beef‑on‑dairy program leaves pregnancies — and replacement heifers — on the table.
The trade‑off is real: more open days means higher feed and housing costs per pregnancy. But at current beef‑cross prices, the model says those extra calves more than pay for the added days.
So if you’re obsessing over which beef bull to order while quietly chopping your IEP short, you’re probably solving the wrong problem.
Replacement Risk: The PR Table That Should Make You Pause
Strip away the modeling details, and what’s left is a simple grid: your 21‑day PR and how much replacement risk you’re buying.
Your 21‑Day PR
Net Return Advantage (Sexed+Beef vs. Conventional)
Replacement Risk
20% (low)
≈ $51/cow/yr at $570 calves; significantly higher at today’s $1,200–$1,900
High risk of replacement deficit if heifer survival slips below 80%.
25% (below avg)
~$51 + $10–$35/cow from better PR and tiered breedings
Still tight below 80% survival; little room for calf‑barn losses.
30% (average)
Meaningfully higher ICOSC margin and calf revenue
Replacement needs manageable with decent calf and heifer management.
35–40% (high)
Substantially higher; each PR point adds $2–$7/cow/yr, compounding at herd level
Comfortable surplus in most modeled scenarios, even with lower survival.
The punchline: beef‑on‑dairy is first a reproduction strategy and only then a calf‑marketing strategy. If you’re playing it at 20–24% PR, you’re taking a high‑wire act that the UW model already flagged as thin at old-heifer prices.
Has Beef‑on‑Dairy Already Peaked?
CattleFax projected beef‑on‑dairy calf production reaching 4–5 million head annually by 2026, putting it firmly into the core of the U.S. beef supply. Purina’s 2025 beef‑on‑dairy report suggests those volumes have “likely reached their peak,” with a gradual 300,000–400,000 head decline expected in the next few years.
Semen sales tell a similar story. CoBank’s August 2025 work shows beef semen sales essentially flat from 2023 to 2024, while gender‑sorted dairy semen sales jumped 17.9% — 1.5 million extra units in a single year. “Those calves hitting the ground will become milk cows in 2027,” Abbi Prins said. The replacement pipeline is refilling. Slowly.
USDA’s January 2026 National Dairy Comprehensive Report shows No. 1 bull calves at $1,187.42/cwt and No. 2 at $1,094.10/cwt. That $93/cwt spread tells you quality already matters in the calf barn — and some of the calves you’d love to ship are the ones you may need to keep.
What This Means for Your Operation
This is where the story stops being about “the industry” and starts being about your next breeding cycle.
This week: Put PR and replacements on the same page.
Pull two reports:
Your rolling 12‑month 21‑day pregnancy rate.
Your projected replacement heifer inventory 18–24 months out (bred heifers + open heifers + heifer calves × your real survival rate).
If you can’t get both out of your herd software or records, that’s the first problem to fix. You’re running a replacement‑sensitive strategy without a dashboard. For a deeper management lens, come back to Bullvine’s beef‑on‑dairy management playbook.
Within 90 days: Run a 24‑month replacement audit.
Calculate your two‑year replacement need: herd size × (cull rate + death loss) × 2.
Stack that against your heifer pipeline: breds + opens + calves × survival.
If the pipeline is under 105% of your two‑year replacement need, that’s a yellow light. Under 100%, it’s red. Your next breeding round should cut beef breedings on marginal cows and push more sexed/conventional semen until the pipeline is back above that 105% buffer.
By your next annual breeding review: Put beef‑on‑dairy on a cash basis.
Add up 12 months of beef‑on‑dairy calf revenue.
Add up 12 months of replacement heifer costs (purchased and fully costed home‑raised, to first calving).
Subtract the heifer cost from the calf revenue.
That net number — not your best calf‑sale week — is what beef‑on‑dairy is actually earning your operation.
This month: Run your own ICOSC check.
Take actual dairy bull calf and beef‑on‑dairy calf prices from the last 12 months.
If your beef‑cross calves aren’t averaging close to 2× your dairy bull calves, the ICOSC advantage Cabrera modeled at 20% PR gets thinner for your herd.
That doesn’t mean abandon beef‑on‑dairy. It just means the economics only really sing when reproduction has your back.
At your next repro strategy meeting: Talk about 260 days, not just “too many open cows.”
Ask your vet and nutritionist:
Which cows can realistically stay in the breeding pool to 260 DIM and still make sense in terms of production and health?
Which cows still need to leave earlier because of feet, legs, mastitis, or poor milk?
Model what happens if you extend the IEP from 170 to 220 to 260 days — how many pregnancies do you pick up, and what does that add in calf revenue vs. extra feed cost? UW’s model says the extra pregnancies pay at current prices; your numbers should verify that.
Budget off $1,200 calves, not $1,900.
If your plan only holds together when beef‑on‑dairy calves bring $1,800–$1,900, it’s not a plan — it’s hope. Build the math on $1,200 and let the good weeks be real upside.
Key Takeaways
If your 21‑day PR sits near 20%, beef‑on‑dairy is a high‑risk play. The UW model’s $51/cow/year advantage at 20% PR is based on $570 calves and $2,355 heifers. At today’s prices, the revenue is better — but the same model shows you can easily fall short on replacements if heifer survival sags or too many cows drift into beef breedings.
If you’re above 30% PR, the question isn’t “should we?” It’s “how hard do we lean?” Each PR point adds $2–$ 7 per cow per year to the breeding‑strategy advantage. On a 500‑cow herd, a 10‑point PR jump is $10,000–$35,000/year from semen strategy alone.
If you haven’t done a forward replacement count, you’re not managing beef‑on‑dairy — you’re hoping the bill isn’t too big. The same breeding plan can leave one 300‑cow group with a 17‑heifer surplus and another 12 heifers short, a 29‑head swing worth $86,000–$119,000 at current heifer prices.
If you’re still cutting breeding eligibility off at 150–180 days, you’re almost certainly leaving pregnancies and heifers on the table. UW–Madison’s work points to an optimal 260‑day IEP under current calf values. You gain more calves and replacements; you give up some feed efficiency. The money is in deciding where that trade‑off lands on your farm.
The Bottom Line
The calf cheque is immediate. The replacement bill is patient. Geiger’s warning about sprinting toward beef‑on‑dairy and Prins’s view that heifer prices haven’t peaked both land yet in the same place. UW–Madison, working off assumptions that now look cheap, still only found a $51/cow edge at low pregnancy rates.
You already know what your beef‑on‑dairy calves brought last week. The better question is simple and uncomfortable: how many heifers are you short 18–24 months from now, and what’s that really costing you?
Complete references and supporting documentation are available upon request by contacting the editorial team at editor@thebullvine.com.
Learn More
Beef-on-Dairy’s $6,215 Secret: Why 72% of Herds Are Playing It Wrong – Reclaim your herd’s profitability with a precision blueprint that stops the breeding guesswork. This breakdown reveals the specific reproductive “guard rails” that turn a $2,000 monthly gain into $6,000, arming you with a clear, performance-based strategy for your next pen.
$3,010 Per Heifer. 800,000 Short. Your Beef-on-Dairy Bill Is Due. – Secure your operation’s future against a structural 800,000-head heifer deficit. This analysis exposes the upcoming 2027 supply collision, delivering the market intelligence you need to navigate $4,000 price tags and lock in essential processor partnerships before the window slams shut.
Every week, thousands of producers, breeders, and industry insiders open Bullvine Weekly for genetics insights, market shifts, and profit strategies they won’t find anywhere else. One email. Five minutes. Smarter decisions all week.
Super Bowl LX will burn $8M a spot. Your sire picks can swing $869 per cow. Still letting someone else call the breeding plays?
Executive Summary: Top‑quartile genetics are already worth $869 more lifetime profit per cow, according to a nine‑year Zoetis study on 12,952 Holsteins across 11 US dairies. This article shows how that gap has widened with the 2025 NM$ revision, where a higher weight on Feed Saved and longevity – and a 11% hit on cow size – quietly killed the idea that a show‑ring cow is also the most profitable commercial cow. Framed against Super Bowl LX’s $8 million ad slots, it argues your sire choices deserve the same level of strategy, because they move far more money across a 200‑cow herd than any 30‑second commercial. You’ll get a concrete “game plan”: a four‑slot sire roster with named December 2025 bulls, a one‑page scorecard to run every bull through, and a simple starting plan for genomic testing on your next 20 heifers. Stories from Simon Vander Woude in California, the Baileys at Moorhouse Hall Farm in the UK, and DataGene focus farms in Australia show what happens when producers stop delegating sire selection and let the numbers challenge old habits. The core message is direct: over the next five years, genetics is shifting from “nice‑to‑optimize” to a structural survival factor for any dairy paid on components.
A nine-year Zoetis study tracking 12,952 Holsteins across 11 US dairies found that cows in the top 25% of genetic profitability generated $869 more in lifetime profit than cows in the bottom 25% (Zoetis, August 2022, ranked by Dairy Wellness Profit Index). On a 200-cow herd, that gap adds up to $173,800 per cow generation. On a 100-cow herd, $86,900. That’s not a model. It’s observed data from real operations over nearly a decade.
Tonight, brands paying $8 million for 30 seconds of Super Bowl LX airtime at Levi’s Stadium have stress-tested their campaigns for months — audience-segmented, ROI-modeled, every frame data-validated. Meanwhile, a 2010 reader survey found that 46% of producers simply use whatever mating program their A.I. company provides, and only 11% match sire traits to individual cow weaknesses. That survey is 16 years old now — and given the complexity genomics has added, the delegation rate may well be higher today.
Your sire selection deserves the same analytical rigor that advertisers bring to a 30-second spot.
The Widening Genetic Gap
Genomic selection has fundamentally accelerated genetic progress in US Holsteins. Before genomics took hold, from 2005 through 2009, the average Net Merit gain for marketed Holstein bulls was roughly $40 per year. Since 2011, that rate has more than doubled. Wiggans and Carrillo documented the acceleration in a 2022 review published in Frontiers in Genetics. CDCB’s own genomic impact data tells a similar story — $40.33 per year from 2005–2010, jumping to $79.20 per year from 2016–2020. The distance between elite and middle-of-the-pack genetics grows larger with each proof round, and if you’re not actively capturing that progress, you fall further behind every cycle.
The December 2025 US Holstein genetic evaluations made the concentration at the top impossible to ignore. Genosource now holds 22 of the top 30 NM$ positions — 73% of the industry’s elite profitability bracket. The number-one bull, GENOSOURCE RETROSPECT-ET, sits at +1,296 NM$. The NM$ true transmitting ability standard deviation is $228 (VanRaden et al., NM$, January 2025), which means a single standard deviation of difference between your sire battery and the industry average shows up as real dollars at the bulk tank. Every month. For years.
Mid-size operations — 100 to 500 cows — feel this most acutely. You’re large enough that genetic differences compound into serious money, but you probably don’t have a dedicated genetics manager parsing proof sheets three times a year.
What Producers Discovered When They Stopped Delegating
Alta Genetics has built its entire product philosophy around what they call the 4-EVENT COW — a cow whose card reads FRESH, BRED, PREGNANT, DRY, and nothing else. No treatments, no repros, no vet calls between those four entries. Their Alta CONCEPT PLUS sire fertility evaluation, built on real pregnancy check data from progressive dairies across North America since 2001, identifies bulls that create more pregnancies faster — CONCEPT PLUS DxD sires deliver a 2–5% conception rate advantage over the average conventional sire on cows, and CONCEPT PLUS 511 sires add 3–7% when using sexed semen on heifers (Alta Genetics, 2025). A mating program adjusts the consistency of type traits within your herd. Sire selection determines the genetic level of the herd itself. Delegate the selection, and no mating optimization closes the gap.
The Zoetis study made this concrete. The difference between top-quartile and bottom-quartile genetics wasn’t just dollars — it was 35% more milk, 44% fewer antibiotic treatments over their lifetimes, 5% less feed for maintenance, and an estimated 10% less enteric methane. And that gap held regardless of management quality across all 11 herds studied. That’s why the conversation has shifted from “genetics is about production” to “genetics is about total cost structure.”
Simon Vander Woude’s operation illustrates how the shift actually happens on a working farm. Vander Woude owns and operates three dairies totaling 6,000 cows near Merced, California, and has run over 10,000 genomic tests with Zoetis CLARIFIDE Plus. His team started genomic testing simply to identify bottom-end heifers to sell off and get heifer inventory in line with cow numbers. But the test results revealed something uncomfortable: they’d been chasing Daughter Pregnancy Rate as a standalone trait without evaluating how it connected to the rest of the animal. “We focused on DPR pretty heavily and kind of forgot about milk for a while,” Vander Woude shared in 2022. “We’ve stubbed our toes plenty along this path.” That honest reassessment reshaped their entire program. Today, they run IVF on top genomic females — 40 to 60 embryo calves born per month — sexed Holstein semen on the next tier, and Angus on everything else. A tiered system that didn’t exist before they let the data challenge their assumptions.
The Bailey family at Moorhouse Hall Farm in Cumbria, England, had a different trigger entirely. John, Kate, and their son Chris — a full-time vet — started genomic testing their heifers after hearing Nuffield Scholar Neil Easter describe how he’d built a herd with youngstock in the top 1% for Profitable Lifetime Index. As they tested, AHDB’s broader UK analysis revealed a startling finding: around 17% of calves had their recorded sires updated when genotypes were analysed — 7% because the wrong sire was recorded, another 10% because no sire was recorded at all (AHDB, 2024). The Baileys now genomic test every heifer, breed their top-performing animals to dairy sires and the bottom 10–20% to beef, and sit just shy of the top 1% nationally for £PLI in their youngstock. “We used to always find an excuse for why a certain cow should be bred,” John Bailey told AHDB. “But now with genomics, the data gives us much more confidence in identifying the bottom performers.”
The 2025 NM$ Revision: Why USDA Rewrote the Formula
Here’s where a lot of conventional wisdom about cow size and type starts to break down.
When USDA researchers ran genomic regressions on actual feed intake data from over 8,500 lactations of more than 6,600 dairy cows in US and Canadian research herds, the number that came back caught everyone off guard: real maintenance costs were 5.5 pounds of dry matter intake 1,000 per pound of body weight per lactation. That’s roughly twice the previously used phenotypic regression estimates. Every producer who’d been selecting for bigger, taller cows had been unknowingly selecting for higher maintenance costs than anyone calculated.
So USDA rebuilt the formula. Here’s what changed (VanRaden et al., NM$, January 2025):
Feed Saved now commands 17.8% combined emphasis — 11% from body weight composite and 6.8% from residual feed intake. Productive Life carries 13% emphasis at $30 per month, and when you add Cow Livability’s 5.9%, the durability complex totals 18.9% — making longevity the largest non-yield trait group in the index. The lifetime economic values driving NM$ are $5.01 per pound of fat PTA and $3.32 per pound of protein PTA, calculated across 2.70 average lifetime lactation equivalents for Holsteins.
And the traditional type-trait weightings? They dropped hard enough to change the conversation:
Trait Category
NM$ Emphasis
Direction
What Changed
Why It Matters for Your Herd
Feed Saved
+17.8%
↑
Real maintenance costs were 2× previous estimates; emphasis jumped from ~9% to 17.8%
Bigger cows now cost you more than the old formula calculated—select for efficiency, not size
Productive Life + Cow Livability
+18.9%
↑
PL at 13% ($30/month), Livability 5.9%—longevity is now the largest non-yield trait group
Cows that last five lactations beat cows that peak high and break down by lactation three
Udder Composite
1.3%
↓
Dropped from ~5%; two decades of selection finished the job
Further emphasis yields diminishing returns on work already done—udders are largely fixed
Feet & Legs Composite
0.4%
↓
Classifier scores correlated poorly with actual lameness and hoof health
Direct health traits predict lameness better than visual scores ever did
Body Weight Composite
−11.0%
↓↓
Active penalty—NM$ now selects against excess cow size
Every extra pound of body weight costs you 5.5 lbs DMI per lactation; the show-ring cow is now a commercial liability
The math is hard to argue with: NM$ has driven a permanent wedge between the show ring cow and the commercially profitable cow. For two decades, the industry could pretend the gap wasn’t that wide. With Udder Composite at 1.3%, Feet and Legs at 0.4%, and body weight penalized at −11%, that pretense is over. You can still breed show cattle. You can still win banners. But the economics now say, clearly and quantifiably, that the traits rewarded in the ring and the traits rewarded at the bulk tank have parted ways.
The type-to-health connection runs deeper than index weightings. Dechow et al. (2003, Journal of Dairy Science) documented a −0.73 genetic correlation between Body Condition Score and Dairy Form in first-lactation Holsteins — meaning cows that score high for angular dairy character are genetically predisposed to thin body condition at calving. That predisposition elevates ketosis risk.
The traits that actually drive longevity are functional: rear udder height, teat placement, and udder depth. Not the visual sharpness that wins ribbons.
One caveat worth stating plainly: if you market breeding stock, embryos, or show cattle, you may rationally weight type traits higher than a commercial herd optimizing for tank revenue. The NM$ recalibration reflects commercial profitability priorities. Seedstock economics are different — that’s a legitimate strategic choice, not a mistake. But don’t confuse the two. And don’t let anyone tell you that a cow that scores EX-95 is automatically more profitable than a VG-86 daughter who freshens easy, breeds back fast, and milks hard for five lactations. The numbers no longer support that story.
Your Game Plan: Three Strategies Producers Are Using Right Now
Build a Complementary Sire Roster — Not a Ranked List
Think of it like building a Super Bowl roster. You don’t field a team of four quarterbacks. You need depth at every position, and each player fills a specific role. Same with your sire lineup.
The instinct is to line up your top four NM$ bulls and start breeding. But a ranked list isn’t a roster. Four bulls who share the same weaknesses leave your herd exposed in exactly the same spots.
A complementary depth chart assigns each sire a defined role:
Adebayo-P is a functional specialist, not a production leader (56M, 54F, 33P per Holstein Association August 2025 TPI list)—that’s precisely why he fills a role your franchise and component bulls can’t. All rankings may shift at the April 2026 proof run.
Verrier et al. (1993, Journal of Dairy Science) showed that factorial mating designs — where dams see several different sires — produced significantly lower inbreeding rates relative to genetic gain than single-sire approaches. And the December 2025 rankings saw considerable reshuffling, including BEYOND SHPSTR GOLLEY-ET vaulting to #2 GTPI at 3,605. A diversified roster absorbs that kind of volatility. A single-sire strategy doesn’t.
Where this can fall short: It takes more time and familiarity with trait profiles than picking one bull. If reading sire summaries feels overwhelming, you can capture roughly 80% of the benefit by setting an NM$ floor and using three bulls from different sire lines — even without position-specific assignments. For more on building genetic selection resources, start with the evaluation archives.
Genomic young sires carry reliability of roughly 70–75%, compared to 95%+ for daughter-proven bulls. Using three or four sires instead of one hedges that reliability gap — another reason the roster approach outperforms going all-in.
Your Halftime Adjustments: The One-Page Sire Scorecard
Every team makes adjustments at the half based on what the first two quarters showed them. Your sire scorecard works the same way — it forces you to look at what your herd actually needs before your next breeding play.
Before you open a catalog or take a call from your rep, answer these questions and write down actual numbers:
What are your current fat and protein pounds per cow? Pull your last three DHIA milk recording reports.
What are your top three cull reasons over the past 12 months? Most DHI software generates this in minutes.
What’s your NM$ floor? With December 2025 bulls clearing $1,200+, there’s little reason to go below $900 on any roster sire.
What’s your maximum Expected Future Inbreeding? Most geneticists suggest keeping genomic inbreeding below 7–8%.
What functional traits does your facility specifically demand? Robotic milking needs teat placement and milking speed. Grazing operations weight feet-and-legs and body weight differently than freestalls.
Tape that sheet to the wall. Next time anyone recommends a bull — your rep, a catalog, a neighbor — run him through the scorecard first.
This doesn’t replace your A.I. rep. It redirects the relationship. You direct the strategy. They source bulls that fit your framework. That’s a fundamentally different conversation than “send me what you think is good.”
One index note: If your plant pays a cheese yield premium, consider weighting CM$ alongside NM$. Under CM$, protein carries $4.73/lb emphasis versus $3.32 in NM$ (VanRaden et al., NM$, 2025). If you’re on a Class I fluid contract, FM$ may be your better primary index. Know your market before you choose your yardstick.
Genomic Test Your Next 20 Replacement Heifers
You don’t have to test every animal tomorrow. Start with the next group approaching breeding age. UK data from the AHDB showed that herds genotyping 75–100% of their heifers had an average Profitable Lifetime Index of £430 per animal in their 2023 calf crop, compared to £237 for herds testing 0–25% of heifers. That £193 gap translates to roughly £19,300 in theoretical profit potential for a typical 175-head herd — but AHDB’s analysis of actual farm business accounts revealed the real advantage at that genetic difference to be over £50,000. Those aren’t projections. They’re margins from real accounts.
Genomic Testing Rate
Avg £PLI Per Animal
Theoretical Profit Potential (175-head herd)
Actual Profit Advantage (Farm Accounts)
0–25% Testing
£237
Baseline
Baseline
75–100% Testing
£430
+£19,300
+£50,000+
The Gap
+£193 per animal
—
Real margins from UK farm business accounts, not projections
Dave Erf, dairy technical services geneticist with Zoetis, offers three ground rules for getting started: have a plan for how you’ll use the results before you test, lay out a herd roadmap of where you’re strong and where you need to improve, and test all your heifers — not just the ones you think are best. “If you just test your best ones, you can’t make a culling decision, because you don’t know,” Erf shared.
The trade-off is real, though. Testing creates a two-tier system — dairy sires on your top genomic females, beef sires on the bottom. If you test but don’t actually follow through on that split, you’ve spent the money without capturing the value. And on very small herds under 50 cows with limited replacement needs, the per-head cost may not generate enough selection differential to justify universal testing. Start with 20 and scale from there.
The Five-Year Outlook: Marginal Edge or Structural Separation
Five years out, is disciplined sire selection a nice-to-have or a survival factor?
The evidence points toward structural separation. CoBank’s lead dairy economist Corey Geiger laid out the financial logic in a March 2025 Knowledge Exchange report: “there’s a clear financial incentive for producers given that multiple component pricing programs place nearly 90% of the milk check value on butterfat and protein.” And the genetic pipeline is delivering. Butterfat in US Holsteins hit a record 4.23% in 2024, and protein reached 3.29% — both per USDA/NASS data. Between 2011 and 2024, butterfat production surged 30.2% and protein by 23.6%, both outpacing the 15.9% growth in fluid milk volume (CoBank, March 2025). For a broader context on where this is heading, see the 2025 genetic evaluation updates.
“Selecting animals for highly heritable traits and having a market incentive to do so has formed a strong foundation for dairy producers to develop their herds to produce more butterfat and protein,” Geiger wrote. “Genetics should continue to gain momentum in the coming years.”
In the UK, 112,507 cows were genomically tested in 2024 — a 19% jump over the prior year. The adoption curve is accelerating. Marco Winters, head of animal genetics at AHDB, put it bluntly: “Improving genetics is probably the cheapest and most sustainable way of making long-term improvements to any herd, and when you’re using a genetic index which has been developed specifically to increase profitability, this feeds straight through to a farm’s bottom line.”
In Australia, DataGene’s ImProving Herds project — which tracked 27 Genetic Focus Farms and 7 Herd Test Focus Farms — found that every single case study farm adopting data-informed genetic decisions reported improved business performance, even during a severe milk price crash and drought (DataGene, 2023 final report). Six of seven Herd Test Focus Farms continued testing permanently. Once the feedback loop started working, going back felt reckless.
Here’s what makes genetics different from every other efficiency tool on your dairy. Feed systems, robotic milkers, and activity monitors — they all require ongoing capital and operating expense. Genetic gains are baked into the biology. They compound without additional spend. In a margin squeeze, the operation running genetically superior cows carries a fundamentally lower breakeven. Not because they manage better. Because their cows are biologically cheaper to run.
What This Means for Your Operation
Before your next semen order, build the one-page scorecard. Thirty minutes, five questions, taped to the wall. Every sire candidate is scored against your herd’s actual needs—not catalog rankings or rep recommendations.
This month, genomic test your next 20 breeding-age heifers. Use the results to split your replacement pipeline: dairy sires on top-tier females, beef sires on the rest. Test them all — not just the ones you think are best.
At your next rep conversation, hand them the scorecard and ask them to fill four roster positions—not just recommend their current favorites. Which bull addresses your top cull reason? What’s the Expected Future Inbreeding for each sire mated to your herd? Do they have outcross options from distinct sire lines?
Every proof round (April, August, December), revisit your roster. December 2025 reshuffled the rankings significantly. A lineup built in January may need adjusting by August.
If your herd averages over 1,600 lbs body weight, the NM$ maintenance cost recalibration means your feed costs per unit of production are likely higher than your old genetic plan accounted for. With BWC now carrying −11% emphasis in NM$, selecting for lower body weight composite and positive Feed Saved isn’t optional anymore.
If you market breeding stock or show cattle, recognize that NM$ reflects commercial priorities. Weighting type traits more heavily is a legitimate strategic choice — just make it with full awareness of the trade-off in commercial efficiency.
Questions to Ask Your Genetics Rep This Week
Print this. Bring it up in your next conversation about your semen order.
Can you show me trait profiles — not just index rankings — for every bull in my current lineup?
Which of my current sires directly addresses my top cull reason?
What is the Expected Future Inbreeding for each bull when mated to my herd?
Do you have outcross options from distinct sire lines and maternal grandsires?
How does my current lineup score on Feed Saved and body weight composite under the 2025 NM$ revision?
The Longest Game You Play
Tonight’s Super Bowl ends in four quarters. Your sire decisions don’t resolve for a decade.
Vander Woude has been at this for over a decade now. He wouldn’t still be testing 6,000 cows if he didn’t believe it paid for itself. “It’s really hard to quantify how it pays for itself,” he shared. “But I have a much better herd of cows.” Dave Erf, his Zoetis geneticist, was more specific: “I’ve never seen such a good reproduction performing herd… I think genetics helped them get there.”
Know your cows. Know your numbers. Match the bull to the need. That’s the whole shift in one sentence—and the data shows most of the industry still isn’t doing it.
Your semen tank is right there. The scorecard takes half an hour. And every daughter that walks into your parlor two years from now will be the commercial that plays on repeat, for better or worse, for the rest of the decade.
Key Takeaways
Your sire choices now move $869 per cow in lifetime profit, based on a nine‑year Zoetis study of 12,952 Holsteins on 11 US dairies — that’s $173,800 a generation on 200 cows.
The 2025 NM$ changes pay you more for Feed Saved and longevity and hit you for excess cow size (−11% BWC), so chasing big, showy cows is now a direct hit to commercial profitability.
You can upgrade from “favorite bulls” to a real breeding game plan by running a four‑slot sire roster: franchise profit bull, high‑component hammer, durability/fertility fixer, and an outcross to keep inbreeding in check.
A one‑page scorecard (NM$ floor, EFI cap, top three cull reasons, facility needs) plus genomic testing on your next 20 heifers is enough to start sorting dairy vs. beef matings with confidence.
If you’re getting paid on butterfat and protein, genetics is no longer a “nice extra” — it’s one of the few levers that can permanently pull your breakeven down while feed and labor keep marching up.
Complete references and supporting documentation are available upon request by contacting the editorial team at editor@thebullvine.com.
Learn More
The $1750 Calf: Is Your 2026 Breeding Plan Leaving $800 a Head on the Table? – Arms you with a 90-day blueprint to capitalize on the $1,750 beef-on-dairy market without hollowing out your future herd. This guide delivers the specific math you need to convert surplus pregnancies into immediate, high-margin revenue.
The Next Frontier: What’s Really Coming for Dairy Cattle Breeding (2025-2030) – Breaks down the 2025–2030 roadmap of AI-driven selection and microbiome markers that promise 70% labor reductions. This vision of the future delivers a massive early-adopter advantage for producers ready to move beyond traditional production metrics.
The Sunday Read Dairy Professionals Don’t Skip.
Every week, thousands of producers, breeders, and industry insiders open Bullvine Weekly for genetics insights, market shifts, and profit strategies they won’t find anywhere else. One email. Five minutes. Smarter decisions all week.
Spending $2,000 to raise a heifer because she’s got more white? Genomics says that’s a losing bet. Beef-on-dairy says there’s $4+/cwt on the table.
If we were sitting over coffee at a winter meeting in Ontario or Wisconsin, you’d probably hear someone say, “Those white cows just seem to last,” or “I like that kind of pattern; they’re my kind.” A lot of us grew up with that way of thinking. For decades, the way a Holstein looks—her color, pattern, and style—has sat right beside milk records, butterfat levels, and fresh cow management notes when we’ve made breeding decisions, just like breed associations and coat‑color labs still describe for Holsteins today, especially around the red factor and MC1R work coming out of places like the University of Saskatchewan and VHLGenetics.
Here’s what’s interesting in 2025. The ground under that old habit has shifted. Genomic evaluations, population‑genetics work on inbreeding, new heat‑stress research, and some pretty eye‑opening 2025 beef‑on‑dairy economics are all pointing in the same direction: your eye still matters a lot, but it’s no longer the sharpest tool for predicting which calves will pay back rearing costs and stay productive through multiple lactations. A big U.S. Holstein study in the journal Proceedings of the National Academy of Sciences showed that once genomic selection came in, the generation interval for sires of young bulls dropped from roughly seven years down to about two and a half, and the annual genetic gains for milk, fat, protein, fertility, and productive life basically doubled compared with the old progeny‑test era.
When you put that next to the economics, the stakes get very real. A Canadian study by CanFax and the Beef Cattle Research Council found that the average cost to raise a replacement heifer was about CA$2,904 in 2023, with a range of CA$1,900 to CA$3,800 across farms. North American dairy budgets generally put that in the US$1,800–2,500 range to get a heifer to calving, once you factor in feed, housing, labor, health, and breeding. At the same time, market analysis from HighGround Dairy in late 2025 estimated that, under strong beef markets and structured beef‑on‑dairy programs, cull cows and beef‑on‑dairy calves together could add more than US$4.00 per hundredweight of milk shipped on some operations, and in another model, they projected beef‑related income above US$4.50 per hundredweight, with several months over US$5.00.
So those breeding calls—who gets sexed Holstein, who gets beef, which heifers you raise—aren’t cosmetic anymore. They’re big‑ticket cash‑flow decisions.
What I’ve found, talking with progressive herds in Ontario, Wisconsin, the northern Plains, and over in parts of Europe, is that the farms making the most consistent progress are letting genomics and economics set the main breeding direction. Then they use their eye to manage cows and fine‑tune individual decisions, not the other way around.
As Kent Weigel, who teaches dairy cattle genetics at the University of Wisconsin–Madison and has spent years working with Holstein producers, likes to tell producer groups, genomics doesn’t replace good stockmanship; it just tells you things about a heifer you can’t see by looking at her—things like fertility, disease resistance, and how long she’s likely to stay in the herd. The eye still matters a lot for the day‑to‑day management side.
Looking at This Trend: What Color Really Tells You
Let’s start with the big myth on the coffee‑shop circuit: does coat color actually tell you anything reliable about a Holstein’s genetic merit for milk, fertility, or health?
On the black‑versus‑red side, a lot of the story runs through the melanocortin 1 receptor gene—MC1R—on chromosome 18. Geneticists have known for quite a while that MC1R is a central switch between black pigment and red/brown pigment across many species, and Holsteins fit right into that pattern. Holstein‑specific work from Canadian and U.S. labs shows that the main MC1R alleles—often called Dominant Black, Black/Red, wild‑type, and Recessive Red—largely determine whether a Holstein shows up as black‑and‑white or red‑and‑white on the outside.
A really interesting twist came in 2015, when a team publishing in PLOS ONE described a new Dominant Red coat pattern in Holsteins and tied it to a missense mutation in the COPA gene. They showed that this COPA variant acts through the pigment pathway and essentially overrides the usual MC1R signal, turning black areas red. The important point here is that their work was about coat color; they didn’t find evidence that COPA itself was a major driver of milk yield or fertility.
The classic black‑and‑white patch pattern has its own genetic story. Genome‑wide analyses in Holstein‑Friesians have repeatedly identified strong signals around the KIT gene on chromosome 6 and other pigmentation genes, such as MITF, as key players in spotting and patterning. That matches what many of us see in sire families—certain bulls stamp a recognizable pattern on their daughters.
Now, set that beside what we know about the heavy‑hitter milk genes. Large genome‑wide association studies in Holsteins, including recent work from Asia and Europe, continue to confirm major effects for milk yield, fat, and protein near DGAT1 on chromosome 14 and at several other regions. Reviews of milk‑trait genomics and meta‑analyses don’t flag MC1R or COPA as major milk‑yield QTL. They’re busy with DGAT1 and a suite of other production loci scattered around the genome.
So when you map this out, you see two fairly separate stories. One is the pigment story—MC1R, COPA, KIT, MITF. The other is the production story—DGAT1 and dozens of other loci that drive yield, fat, protein, and things like somatic cell score. Color genes just don’t show up as the big drivers of milk or fertility that we see in genomic evaluations.
That doesn’t mean you won’t find a cow family where “the red ones” or “the ones with more white” seem to be your better cows for a while. In a tight family, that absolutely happens. But genetically, what’s going on there is that you’re seeing a family package, not a universal rule. Across the breed, coat color by itself just isn’t a reliable shortcut to Net Merit, Pro$, or the overall profit indexes that matter to the milk cheque.
What Farmers Are Finding: Popular Sires and “Color Stories”
What farmers are finding, especially when you look back over a few decades of AI use, is that our “color stories” are usually really “family stories.”
Most of us can name the bulls that left a big genetic footprint in our barns: Shottle, Goldwyn, Planet, Mogul, Supersire, and now the current crop of genomic sires. Population geneticists call this “popular‑sire” or “founder” effect—when a relatively small number of bulls contribute a large share of the genes in a breed over a short period. A high‑density genomic study in Genetics Selection Evolution examined these selection signatures in Holstein‑Friesians and other breeds and found long stretches of DNA—haplotypes, where variation had been squeezed out by strong selection for milk, components, stature, and udder traits.
When you use a bull like that heavily, his daughters don’t just share his “under the hood” production package; they also share his visible stamp. So for a few generations, a particular pattern or “kind” can feel like it always goes with a particular level of performance. That’s real at the family level. But those haplotype blocks are made up of many linked genes, including both color and production loci. As time goes on and mating gets more diverse again, those blocks break up and recombine.
So inside a family, coat pattern can be a reasonable clue that you’re looking at daughters or granddaughters of a particular bull. At the breed level, the big studies just don’t support simple rules like “more white cows are always better cows.” The family resemblance is real; the population‑wide rule based on color is not.
Where Color Really Does Matter: Heat, Sun, and Lost Milk
Now, there is one place where coat color genuinely shows up in performance, and it has nothing to do with type scores or classification sheets. It’s heat.
Dark surfaces absorb more solar radiation than light surfaces; that’s just basic physics. Studies using thermal imaging and surface temperature sensors have shown that black patches of hair on cattle backs can run several degrees hotter than adjacent white patches when animals are in full sun. That extra absorbed heat adds to the load the cow has to get rid of.
A 2024 paper in the Journal of Dairy Science examined Holstein–Friesian crossbred cows in Tanzania and drew on earlier THI work on Holsteins. As the temperature‑humidity index moved into heat‑stress ranges, the researchers observed that rectal temperature, respiration rate, and panting scores all increased. At the same time, milk yield, milk fat percentage, and solids‑not‑fat percentage dropped. In other words, as cows got hotter, they gave less, and the component tests slipped too.
On pasture‑based systems in New Zealand and Australia, extension folks and researchers have seen the same basic pattern. Under heat stress, cows stand and pant more, graze less, and produce less milk unless they’ve got shade, water, and some form of cooling. Some work suggests that cows with lighter coats or slicker hair hold up a bit better under those conditions, which is why there’s been interest in breeding for heat tolerance in grazing systems.
One pretty eye‑catching example came out of CSIRO. Their team produced Holstein–Friesian calves from embryos edited at a coat‑dilution gene called PMEL. Those calves had lighter coats and, when they were put in the sun, took on less radiative heat than their darker‑coated herdmates. They’re strict research animals, not anything you’ll find on a commercial farm, but it shows how seriously some groups are taking the connection between coat, heat, and performance.
What This Means on Your Farm
Here’s how color and heat pencil out in different setups:
Your situation
Focus first on
Hot, high‑sun region or dry lot with limited shade (Central Valley, CA, parts of Texas/Florida, southern Europe)
Shade structures, fans, sprinklers, and good water access. Don’t count on breeding for more white to solve heat stress. Fix the environment first, because that’s where the biggest gains are.
Moderate climate with decent ventilation (Ontario, Wisconsin, Quebec, northern Europe)
Solid ventilation and transition‑period management first. Genomic testing and index‑based selection will move the needle more than fussing over color, though heat‑abating investments still pay on the worst days.
Pasture‑based with limited infrastructure (NZ‑style or U.S. grazing herds)
Shade and water access, careful grazing management on hot days, and—if the genetics are available—looking at heat‑tolerant and slick‑hair lines can help, especially as summers get hotter.
So yes, color does play a role in heat load, especially in hot, bright environments and in dry lot systems. It can absolutely show up as lost milk and tougher breeding if cows are constantly fighting heat stress. But even in those regions, coat color is one part of a bigger heat‑stress and cow‑comfort picture. It’s not a substitute for good ventilation, shade, or water, and it’s not a stand‑alone selection tool for profit.
What Genomics Has Actually Changed for Your Bottom Line
Now let’s talk about genomics, because that’s where the biggest shift has happened in how Holstein genetics translate into dollars.
When genomic evaluations came onto the scene in the U.S. and Canada around 2008–2010, the promise was pretty simple: use DNA information from young animals to predict their genetic merit before they have milking daughters, shorten generation intervals, and speed up genetic progress.
That big U.S. Holstein study in the National Academy Journal really put numbers to it. Once genomics was adopted, the sire‑of‑bull generation interval came down from roughly 6.8–6.9 years to about 2.4 years. Annual genetic gains for milk, fat, and protein almost doubled. For health and fertility traits such as somatic cell score, daughter pregnancy rate, and productive life, gains were three- to four‑fold.
More recent work, including a 2023 paper in the journal G3, has combined fertility traits into a single reproductive index and shown that there’s sufficient genomic signal to select for fertility, not just milk effectively. That lines up with what many of us have seen on real farms: herds that use genomic information well can walk that tightrope of driving production up while also improving fertility and udder health, rather than trading one off against the other.
So genomics gives you a much clearer window into traits your eye just can’t judge in a young heifer. You can’t see the daughter pregnancy rate or expected survival to third lactation by looking across the calf pen, but the DNA markers give you a probability estimate that, while not perfect, is a lot better than guessing.
The Cost Reality
Then there’s the math.
That Canadian heifer‑cost study we talked about pegged the average replacement cost at CA$2,904 per head, with many farms running well over CA$3,000. North American dairy budgets usually land in the US$1,800–2,500 range when you include feed for the entire rearing period, housing, labor, vet bills, and breeding costs.
On the testing side, commercial genomic panels—like CLARIFIDE and similar offerings—typically price out at US$35–50 per heifer in North America, depending on the panel and your volume.
Cost Component
Typical Range
Strategic Note
Feed (to 12–18 months)
$800–$1,200 USD
Largest single expense; improves with forage/commodity costs
Housing, bedding, utilities
$300–$500 USD
Per-heifer share of fixed barn and infrastructure
Labor (handling, health, records)
$250–$400 USD
Often underestimated; includes AI tech/vet time
Veterinary, vaccines, breeding
$200–$350 USD
Reproduction drugs, health treatments, AI straw(s)
TOTAL REARING COST (pre-calving)
$1,800–$2,500 USD
Average: ~$2,000 USD or ~$2,900 CAD per head
Genomic test (commercial panel)
$35–$50 USD
= 1.75–2.8% of total rearing cost
% of Heifers Typically Culled by Index (bottom 20–30%)
$360–$750 USD
Waste eliminated: cost of rearing low-index heifers avoided
Payoff: Genomi test cost recovered if you cull just 1–2 poor heifers per year
Break-even: ~$40–75 per year
Risk management, not a luxury
So when you step back, you’re talking about spending forty dollars to find out whether an animal is worth a two‑thousand‑dollar investment. For a lot of herds, that’s not a luxury; it’s basic risk management.
Looking at Inbreeding: Faster Progress, Tighter Gene Pools
Here’s where the story gets a bit uncomfortable. The same genomic tools that gave us faster gains have also made it very clear that tightening up the gene pool in Holsteins.
A North American Holstein study in BMC Genomics dug into runs of homozygosity—those long stretches of identical DNA on both chromosomes—and tracked them from animals born in 1990 through to 2016. They found that the average number of ROH segments at least 1 megabase long per animal went from around 57 in the 1990 cohort to about 82 in animals born by 2016. In the last five years of that period—right when genomic selection really took off—the yearly increase in these ROH segments was almost double what it had been earlier.
The authors made an important point: on a per‑generation basis, the increase in inbreeding wasn’t dramatic. But because the generation interval was so much shorter, you were stacking generations faster and building inbreeding per calendar year much more quickly.
Italian Holstein data tell a similar story. A 2022 paper in Frontiers in Veterinary Science looked at genetic diversity before and after genomic selection. Pedigree‑based inbreeding was around 7%, but genomic inbreeding, based on ROH, was clearly higher and rising faster, and the effective population size—a measure of how many “independent” genetic contributors you really have—was dropping. Follow‑up work linked higher genomic inbreeding to reduced stayability: more inbred cows simply didn’t stay in the herd as long.
So here’s the irony that’s worth sitting with for a minute. For years, a lot of us chased a very particular “look”—the Goldwyn kind, Shottle daughters, that tall, sharp cow. Then genomics came along, and many herds stopped worrying as much about that look and started chasing the top indexes instead. The data now say that in the process, we’ve pushed a lot harder on the same gene pool, faster, especially through very heavy use of a small number of elite bulls.
You look across your pens today, and the cows may not look as cookie‑cutter as those ‘90s flush families. But under the skin, genetically, they’re more closely related than most of us realize.
What You Can Do About It
The good news is that the same genomic tools that measure inbreeding can help you manage it.
A recent review from Italy on on‑farm genetic management describes how using genomic relationship matrices and “optimal contribution” strategies can balance genetic gain and inbreeding in dairy herds. What that means in practice is this: instead of just looking at pedigree inbreeding, you use the actual genomic relationships between your cows and potential sires to decide who should be the parents of the next crop of replacements.
On a real farm, that often comes down to:
Using mating programs that incorporate genomic relationship data, not just sire stacks and pedigree inbreeding.
Being careful about breeding a bull back too heavily to his own daughters and granddaughters.
Spreading your bull usage across a team of high‑index sires instead of hammering one or two “super sires.”
Sometimes, being willing to use a slightly lower‑index bull if he’s less related to your cow family and still meets your key trait goals.
It’s worth noting that no one is saying “stop selecting hard.” The point is to keep the inbreeding curve from getting too steep, so you don’t quietly paint yourself into a corner when it comes to health, fertility, or adaptability down the road.
Why the Eye Still Matters—and Where It Fits Now
So with all this talk about genomics and indexes, it’s fair to ask: where does your eye fit now?
In a lot of barns, what I’ve seen is that the role of the eye has shifted from being the primary genetic gatekeeper to being the primary management tool.
You know how this goes. You still need to walk pens and:
Spot a cow that’s just starting to limp before she’s three‑legged lame.
Watch body condition as cows move through the transition period to prevent crashes right after calving.
See how cows actually use stalls, bedding, waterers, robots, and feed lanes in your specific barn layout.
Catch fresh cows that are “just off” a bit before they show up in the software as a health case.
Genomic indexes and national evaluations can’t do that job. What they can do is take some of the guesswork out of which heifers you invest in and which cows you want daughters from.
At a genetics workshop in Ontario, one Holstein producer described that evolution nicely. He said he used to think his eye was the best tool he had. Now he sees it as his best management tool, while genomic tests tell him which heifers are actually worth raising. A lot of Midwestern and Quebec producers I’ve talked with would say something similar in their own words.
What This Means for Your Holstein Breeding Strategy
So let’s bring this back to your breeding plan, because that’s where all this needs to land.
Picture a 280‑cow Holstein freestall herd in Wisconsin or southwestern Ontario, shipping into a cheese market where butterfat and protein premiums really drive the cheque. Cows are averaging mid‑30s kilos per day with good components, the transition cows get a lot of attention, and the farm already uses some sexed semen and a bit of beef‑on‑dairy.
You could just as easily imagine a 120‑cow tie‑stall in Quebec or a 600‑cow dry lot system in California. The genetics math is the same; you just adjust the heat‑stress and housing parts.
Here’s what a practical, 2025‑ready strategy can look like.
1. Run a One‑Year Genomic Trial
One very low‑risk way to start is a “learn from your own data” trial over 12 months.
Test every heifer calf for a year. Take hair or tissue samples in the first week or two and send them to your preferred lab—Zoetis, Neogen, Lactanet, or your national provider—and ask for the main economic index your market uses, whether that’s Net Merit, Pro$, or LPI.
Keep making keep/cull and breeding decisions exactly the way you do now, based on dam performance, cow family, and what you see in the pen.
At the end of the year, sit down with your vet, nutritionist, or a genetics advisor and compare your actual decisions to the genomic rankings.
In many herds that have tried this, a familiar pattern pops up: there are some heifers you really liked visually that sit only middle‑of‑the‑pack on fertility and longevity indexes, and a few plainer heifers that rank near the top. Seeing that in your own animals tends to carry more weight than any sales pitch.
If your main criterion for keeping a heifer is how much white she has, what the genomic work and the big GWAS studies are saying is that you’re effectively betting a couple of thousand dollars on a trait that doesn’t even show up as a major driver in Net Merit or Pro$. That’s a tough bet to justify once you’ve seen your own data.
2. Let One Economic Index Be Your Compass
To keep it from being overwhelming, most herds do best if they pick one total merit index—Net Merit, Pro$, LPI, or the relevant national index—and let that act as the primary compass.
Heifer Tier (by Index Rank)
% of Herd
Semen Strategy
Expected Calf Outcome
Economic Note
Action
TOP 20–30% (High Index)
20–30%
Sexed Holstein(maximize daughters)
Female calves; all raised as dairy replacements (or top beef-cross if surplus)
Maximizes calf value ($400–600/head vs. $50–100 for dairy bull); eliminates low-merit dairy genetics; often breaks even or profitable on rearing cost
Fast-track to beef channel; NO heifer rearing; recoup heifer costs via calf value
PROBLEM COWS (repeat breeders, chronic mastitis, severe structural defects)
5–10%
Beef Semen
Crossbred calves to beef
Removes undesirable traits from breeding; converts problem cows into profitable calf source
Terminal decision; one more calf, then cull
Then you:
Rank all heifers and young cows by that index, high to low.
Decide on a cutoff—maybe the bottom 10–20% or a certain dollar amount below your herd average—below which you don’t raise heifers as dairy replacements.
Use that ranking to structure semen use:
Top tier: sexed Holstein semen on the females you want daughters from.
Middle tier: conventional Holstein semen.
Bottom tier and problem cows (chronic mastitis, very poor feet, reproduction issues): beef semen.
This is where the math really shows up. If you’re putting US$35–50 into a genomic test and US$1,800–2,500 into rearing a heifer, using that index ranking to decide who gets a replacement slot and who doesn’t will change your cost per hundredweight over the next few years.
3. Use Mating Programs to Manage Inbreeding
The next step is to ensure your mating program uses genomic data to mitigate inbreeding.
It’s worth asking your AI rep or mating service a couple of direct questions:
Are you using genomic relationship information, or just pedigree, to calculate inbreeding risk?
Can you show me the expected genomic inbreeding for each proposed mating?
Given that both the North American and Italian Holstein studies show faster increases in genomic inbreeding and more ROH in the genomic‑selection era, it makes sense to watch this. Some advisors suggest targeting expected genomic inbreeding for replacement heifers in the mid‑single digits, where practical, and only accepting higher values when you’re getting a very significant bump in other traits. The exact target will depend on your herd and sire options, but the principle is to avoid stacking closely related bulls on closely related cows over and over.
In practice, that often looks like still using the elite bulls, but spreading their use across more unrelated cow families, rotating between several high‑index sires instead of just one or two, and sometimes choosing the “second‑highest” bull on a list because he’s less related to your cows, while still very strong on your key traits.
4. Line Up Sexed and Beef Semen With Your Index and Markets
Genomics also helps answer a very practical question: which cows should make your next generation of Holstein replacements, and which should be making calves for the beef market?
Those HighGround Dairy numbers we talked about—over US$4.00 per hundredweight of milk in some scenarios from cull cow and beef‑on‑dairy calf revenue, and earlier projections with several months over US$5.00—show just how big that lever has become on the income side when beef markets are favorable. At the same time, semen‑sales trends and processor programs in North America and Europe show beef‑on‑dairy has become mainstream, especially where packers and branded programs pay up for black‑hided crossbred calves.
A genomics‑aligned plan that a lot of progressive herds are using looks like this:
Sexed Holstein semen on the top 20–40% of females by your chosen index—the ones you really want daughters from.
Conventional Holstein semen is on the middle group, where you still want some dairy bull calves and a share of replacements.
Beef semen on the bottom tier and on cows with traits you don’t want to multiply, such as chronic mastitis, repeat breeders, or severe structural issues.
Combine that with your heifer‑raising cost numbers and your local calf market, and you start to get a very clear picture of where your breeding dollars and semen investments are actually coming back to you.
5. Keep Your Eye in Its Best Role
Through all of this, your eye stays central. It’s just playing a different position on the team.
You know your cows. You know who milks through tough rations, who bounces back after a hard calving in the transition period, and who always seems to find trouble. That day‑to‑day cow sense is the piece no index can replicate.
What genomics does is help you decide which calves deserve the chance to become that kind of cow in the first place. It narrows the group, so you’re not putting full rearing costs into animals that were never likely to reach third or fourth lactation under your system.
Looking Ahead: Diversity, Climate, and the Holstein of 2050
If we zoom out past next year’s milk cheque and think about the Holstein cow of 2040 or 2050, three big forces keep coming up in both research papers and barn‑aisle conversations: genetic diversity, climate, and markets.
On the diversity side, the North American ROH work and the Italian Holstein studies send a pretty consistent message: genomic inbreeding is rising, and effective population size is shrinking in intensively selected Holstein populations. No one credible is predicting a sudden cliff, but there is a very real concern that if we keep pushing hard on a narrow gene pool, we could slowly chip away at the breed’s ability to adapt to new diseases, production systems, or environmental pressures.
On the climate side, more frequent heat waves and higher average summer temperatures are already a reality in parts of the U.S., southern Europe, and elsewhere. That 2024 Journal of Dairy Science review that pulled together heat‑stress studies put numbers on what many of you see in the barn: as THI climbs, cows eat less, energy‑corrected milk drops, and the strain shows up in both milk yield and reproduction. Some of the work digs into the biology—oxidative stress, rumen changes—but the bottom line is simple enough: hot cows don’t use feed efficiently and don’t breed as well.
On the market side, we’re seeing more beef‑on‑dairy programs, more milk cheques driven by components and quality premiums, and more processor attention to consistency and welfare. All of that favors cows that stay in the herd, handle stress, and breed back reliably, not just cows that peak high in first lactation.
What’s encouraging is that we’ve got better tools than ever to work with:
Genomic inbreeding and relationship data, not just pedigree estimates.
Mating strategies like optimal contribution that let you balance genetic gain and inbreeding.
Economic indexes that include fertility, udder health, productive life, and sometimes feed efficiency, alongside milk and butterfat.
A growing body of heat‑stress research to guide decisions on ventilation, shade, sprinklers, and water management.
Beef‑on‑dairy programs and pricing signals that can pay you properly for the right kind of crossbred calves.
The challenge is putting those tools together in a way that fits your herd size, your barns, your labor situation, and the markets you’re shipping into.
The Bottom Line
So if we’re back at that kitchen table and you ask, “Alright, what should I actually do with all this?”, here’s how I’d boil it down into concrete moves for the next year or two.
Run a one‑year genomic test trial on all heifer calves. Don’t change your decisions for that year—just compare what you did to what the index ranking suggests at the end and see where your eye and the DNA agree or disagree.
Pick one economic index—Net Merit, Pro$, LPI, or your national equivalent—and use it as your main compass to sort females into top, middle, and bottom tiers for semen strategy and replacement decisions.
Ask your mating program provider to show you genomic inbreeding for planned matings, not just pedigree inbreeding, and work together to avoid pushing replacement heifers into very high genomic inbreeding levels.
Line up sexed Holstein and beef semen use with both your index ranking and your real replacement needs, keeping today’s heifer‑raising costs and beef‑on‑dairy calf values in mind.
Take a hard look at your heat‑stress plan before next summer—especially if you’re in hot regions or dry lot systems—and ask whether your shade, fans, sprinklers, and water access match what the research and your own cows are telling you.
The herds that lean into this in the next five years will quietly build cows that last longer and earn more per stall. The ones that keep breeding by color and habit will feel it in higher heifer costs, more inbreeding‑related headaches, and fewer options when weather or markets shift on them.
What this whole development suggests is that the next chapter in Holstein breeding isn’t about arguing whether the eye or the computer is “right.” It’s about putting them in the right jobs and letting them work together.
And if we keep sharing what’s actually working—how herds are using genomic tests, indexes, mating programs, heat‑stress strategies, and beef‑on‑dairy opportunities—then, as a group, we’re in a strong position to keep Holsteins productive, profitable, and adaptable well into 2050.
As for color? It’ll probably always be part of how we talk about Holsteins and the kind of cow we like to look at. It just doesn’t need to be driving the bus anymore.
Key Takeaways:
Breeding by coat color won’t move your index. Pigment genes like MC1R and COPA are far from the major milk and fertility loci, so selecting heifers based on “more white” doesn’t reliably improve Net Merit or Pro$.
Genomics doubled genetic gain—and sped up inbreeding. Sire generation intervals dropped from ~7 years to ~2.5 years, nearly doubling annual progress, but genomic inbreeding and runs of homozygosity are climbing faster per calendar year as a result.
Color matters for heat stress, not genetic merit. In hot climates and dry lots, darker coats absorb more solar load, pushing cows into heat stress sooner and costing milk, components, and fertility when cooling falls short.
Beef-on-dairy can add $4+/cwt when done right. HighGround Dairy’s 2025 modelling shows well-structured beef programs can add more than US$4.00/cwt to margins in favorable markets—real money that changes breeding math.
A $40 genomic test protects a $2,000 bet on a heifer. With rearing costs often US$1,800–2,500, using index rankings to decide who gets sexed semen and a replacement slot is risk management, not a luxury. Your eye then shifts to its best role: daily cow management and fresh-cow troubleshooting.
Executive Summary:
Many Holstein herds are still quietly letting coat color and “kind” influence breeding decisions, even though pigment genes like MC1R and COPA sit on different parts of the genome than the big milk and fertility loci that large Holstein GWAS keep identifying. Genomic selection has roughly doubled genetic gain in U.S. Holsteins by cutting sire generation intervals from about 7 years to about 2.5 years, but North American and Italian data also make it clear that genomic inbreeding and runs of homozygosity are rising faster per calendar year as a result. New heat‑stress research backs up what producers in hot regions and dry lot systems see every summer—darker coats absorb more solar load, cows hit heat stress sooner, and milk and components slip—while 2025 modelling from HighGround Dairy shows well‑designed beef‑on‑dairy programs can contribute more than US$4.00 per hundredweight of milk shipped to margins when markets are favorable. With heifer‑raising costs often in the US$1,800–2,500 (or CA$2,000–3,000) range, spending about US$40 on a genomic test to decide which calves actually justify that investment is, in many cases, simple risk management rather than a luxury. This article gives producers a concrete playbook: run a one‑year “test every heifer” trial, use one economic index as the main compass, use genomic mating tools to manage inbreeding, and align sexed Holstein and beef semen use with both index rankings and true replacement needs. The core message is that if you stop breeding by color and start breeding by genomics, heat‑stress realities, and beef‑on‑dairy math, you give your Holstein herd a much better shot at stronger per‑stall margins between now and 2030.
Complete references and supporting documentation are available upon request by contacting the editorial team at editor@thebullvine.com.
Learn More
Selective Breeding: The Art and Science of Beef-on-Dairy – Stop guessing at the bunk and start capturing market premiums. This breakdown delivers a field-tested protocol for selecting terminal sires that guarantee the carcass quality beef buyers demand, transforming your bottom-tier cows into high-margin profit centers.
Navigating the 2025 Dairy Economy: Maximizing Margins in a Volatile Market – Master the shifting financial landscape by aligning your herd expansion goals with current global supply trends. This analysis arms you with the economic foresight to hedge against rising input costs while maximizing your milk-to-beef revenue ratio through 2028.
Gene Editing and the Dairy Industry: Beyond the Horizon – Break past traditional breeding limits by leveraging CRISPR and slick-gene technology to heat-proof your herd. This deep dive exposes the genetic advancements that will define cow comfort and performance as climate volatility becomes the new normal for global producers.
The Sunday Read Dairy Professionals Don’t Skip.
Every week, thousands of producers, breeders, and industry insiders open Bullvine Weekly for genetics insights, market shifts, and profit strategies they won’t find anywhere else. One email. Five minutes. Smarter decisions all week.
If your only beef-on-dairy metric is today’s calf cheque, you’re ignoring the $3,000 heifer bill with your name on it.
EXECUTIVE SUMMARY: Beef‑on‑dairy has been a cash‑flow hero for many herds, but the big math now flashing red is hard to ignore: 7.9 million beef straws into dairy cows, 800,000 fewer heifers ahead, and replacement prices already north of US$3,000 in many regions. USDA counts just 3.914 million dairy replacements as of January 1, 2025—the lowest since 1978—while CoBank projects inventories will shrink by about 800,000 head before recovering near 2027, right as roughly US$10 billion in new processing capacity comes online and needs milk. What’s interesting here is that the article shows reproduction, not semen color, is the real gatekeeper: herds under roughly 20% 21‑day PR that breed heavily to beef aren’t just “cashing in,” they’re effectively scheduling a heifer shortage and future cheques for someone else’s US$3,000 heifers. Drawing on economic modeling from Albert De Vries, PhD (University of Florida), and sector work by Jan Hulshof, PhD (Wageningen), it outlines practical “guard rails” for how much beef‑on‑dairy a herd can safely run at different PR levels, especially when combined with genomics and sexed semen on the top genetics. A five‑question framework then helps producers stress‑test their own program—repro, heifer pipeline, genomic use, calf/transition management, and calf marketing—so they can see whether they’re building a sustainable strategy or quietly writing a US$30,000–60,000‑a‑year heifer bill for 2027 and beyond. The takeaway is simple but not always comfortable: beef‑on‑dairy is a powerful profitability tool, but only when it sits on top of strong reproduction and disciplined heifer planning instead of short‑term calf prices.
If you sit down with dairy folks this winter—from big freestalls in Wisconsin to tie‑stalls in Ontario to those dry lot systems in the Texas Panhandle—you’ll hear a familiar line: “Beef‑on‑dairy really helped our cash flow… and now we’re wondering where the heifers went.”
What’s interesting is that this isn’t just coffee‑shop talk. The national numbers are telling the same story a lot of you are seeing when you walk past your heifer pens—and now we’re staring at US$3,000‑plus heifer tags when it comes time to fill the gaps.
The latest Regular Members Semen Sales Report from the National Association of Animal Breeders (NAAB) shows that in 2024, U.S. producers bought about 9.7 million units of beef semen, and roughly 7.9 million of those units were used in dairy herds, not beef herds. Industry reports indicate that more than 4 out of 5 beef straws in the U.S. now go into dairy cows.
At the same time, USDA’s January 1, 2025, cattle inventory report put the U.S. beef cow herd at about 27.86 million head. Analysts at Angus Journal and university extension have highlighted that the smallest U.S. beef cow herd since the early 1960s is down several million head from where it sat in 2019. So we’ve got record beef semen use in dairies sitting on top of the tightest beef cow numbers in more than half a century.
And here’s where the conversation really sharpens. CoBank’s dairy team, led by Corey Geiger, MBA, released a 2025 analysis showing that U.S. dairy replacement heifer inventories are already at about a 20‑year low and could shrink by an estimated 800,000 head over the next two years before starting to rebound closer to 2027. That same CoBank work highlights that roughly 10 billion dollars in new dairy processing capacity, much of it cheese and ingredient plants that live on butterfat performance and protein, is scheduled to be online by 2027. Those plants will need milk, and milk needs cows.
Year
Replacement Heifers (M)
New Capacity Online (USD B)
2023
3.951
$2.1
2024
3.914
$4.2
2025
3.85 (proj)
$6.8
2026
3.78 (proj)
$8.9
2027
3.81 (recovery begins)
$10.2 (peak)
2028
3.95
$10.2+ (operational)
So the real question isn’t just “Is beef‑on‑dairy a good idea?” It’s “Given where milk, beef, and heifer supplies are heading, is the way we’re using beef‑on‑dairy going to build our business—or back us into buying very expensive heifers a couple of years from now?”
Let’s walk through that together, the way we’d talk it through over coffee at the kitchen table.
How We Got Here: Three Big Shifts That Opened the Door
Looking at this trend, three big changes really opened the gate for beef‑on‑dairy: sexed semen that finally works well enough to plan around, genomics that actually drive decisions, and a beef cow herd that’s the smallest it’s been in decades.
1. Sexed semen finally got reliable enough to plan around
You probably remember the early days of sexed semen. Back in the late 2000s and early 2010s, university trials and extension bulletins regularly reported conception rates 25–30 percent lower than conventional semen in many herds, and that matched what plenty of us saw in our own breeding records. It was great when it worked, but too many repeats and open cows made it a tough sell outside a handful of show heifers or elite donors.
Over the last decade, that story has shifted. With improved sorting technology, better extenders, and higher sperm numbers per straw, modern sexed semen has narrowed the gap. Extension educators and field data now suggest that in well‑managed heifer programs, sexed semen often delivers conception rates in the mid‑40 percent range, sometimes approaching 50 percent in top herds, while conventional semen on the same heifers tends to run about 5–10 points higher. In cows, the difference is often similar or slightly wider, and it’s more sensitive to fresh-cow management and heat detection.
So in real‑world terms, what farmers are finding in solid heifer programs is that sexed semen now runs roughly 75–85 percent of conventional conception rates, with a few very dialed‑in herds creeping up closer to 90 percent. That aligns with the research summaries from land‑grant universities and industry meetings. It still demands good transition‑period care, sharp heat detection, and careful semen handling, but it’s finally good enough to build a replacement strategy around instead of just dabbling.
2. Genomics went from “nice‑to‑have” to “we actually use this”
The second big shift is genomics. Ten or twelve years ago, genotyping felt like something that happened in AI stud offices and a few elite Holstein barns. Today, millions of animals are genotyped, and research from USDA’s Agricultural Research Service (ARS) and the Council on Dairy Cattle Breeding (CDCB) shows that genomic evaluations for young heifers deliver substantially higher reliability than old‑style parent averages for traits like milk, fat, protein, daughter pregnancy rate, and some health traits.
What I’ve noticed, especially in Midwest and Ontario herds that are leaning into this, is that once producers start using genomic rankings, it changes the conversation around both beef‑on‑dairy and replacement rearing:
Heifer calves get genotyped through CDCB‑approved programs.
The herd ranks them on Net Merit, Pro$, or a custom index that weights production, components, fertility, mastitis resistance, and longevity in line with how their milk is priced.
The best group becomes the “sexed semen group,” a middle group is flexible, and a lower‑merit group is deliberately steered toward beef semen or not raised at all.
In an economic simulation published in JDS Communications, Albert De Vries, PhD, at the University of Florida, and colleagues modeled this kind of strategy—sexed semen on the top end, beef semen on the bottom, genomics guiding who’s who—and found that income from calves over semen and rearing costs improved compared with a simple “all dairy semen” approach. That finding lines up with what many progressive herds report: they raise fewer marginal heifers, capture more value from beef‑on‑dairy calves that never belonged in the milking string, and keep their replacement pipeline more intentional.
3. The beef cow herd shrank—and it’s not bouncing back quickly
The third piece is beef. USDA’s cattle inventory reports show the U.S. beef cow herd has dropped from around 31.7 million head in 2019 to 27.86 million as of January 1, 2025. Extension economists note this is the smallest beef cow herd the U.S. has seen since the early 1960s, driven by multi‑year drought in the Plains and West, high feed costs, and an aging rancher base that hasn’t rushed to rebuild.
Rabobank’s beef team analyzed cow–calf returns over the last decade and found that from 2013 to 2017, U.S. cow–calf operations averaged about 153 U.S. dollars per cow per year. From 2018 through 2022, those returns flipped negative, averaging roughly minus 21 dollars per head per year when revenue was stacked up against operating costs, labor, taxes, and insurance. When you put drought risk on top of that, it’s not surprising that a lot of ranchers were slow to restock.
On the dairy side, CoBank points out that U.S. dairy is in the midst of an historic processing build‑out—about $ 10 billion in new or expanded plants, largely focused on cheese and ingredients that reward butterfat and protein. Those plants will want milk, and they’ll want it relatively quickly over the next couple of years.
Meanwhile, industry sales data using CattleFax estimates show beef‑on‑dairy calves going from about 410,000 head in 2018 to around 2.6 million in 2022. An American Association of Bovine Practitioners (AABP) paper titled “The future of dairy‑beef in cattle production,” led by Daniel Grooms, DVM, PhD, at Michigan State University, projects that with widespread use of sexed semen, more than 3.5 million beef‑on‑dairy animals could be entering the U.S. fed beef supply annually in some scenarios.
So this development suggests a pretty clear story: fewer native beef calves, more dairy cows bred to beef, tight heifer numbers, and big new processors coming online. Beef‑on‑dairy has moved from side‑gig to structural pillar in a hurry.
Two Ways Herds Are Using Beef‑on‑Dairy—and Why the Outcomes Look So Different
Once you accept that the big‑picture economics support beef‑on‑dairy, the real question becomes: “How are we using it on our farm?” That’s where you start to see two very different paths.
The “surgical” approach: disciplined, data‑driven, and usually well‑rewarded
Picture a 750‑cow Holstein freestall in eastern Wisconsin or a 1,200‑cow dry lot herd in California’s Central Valley. They’re working with a herd veterinarian, a PhD nutritionist who lives in the fresh cow data, and a genetics adviser who knows their goals cold.
What farmers are finding in operations like this is that beef‑on‑dairy is treated like a scalpel, not a sledgehammer:
Almost every heifer calf is genotyped within 60 days of birth.
Twice a year, cows and heifers are ranked on a profit‑focused index (Net Merit, Pro$, or a custom index using CDCB and herd data).
Breeding decisions follow that ranking very closely:
Top 35–40 percent get sexed dairy semen on first service and often second.
A middle 20–30 percent is a “swing group” that may get sexed, conventional, or beef, depending on projected heifer needs.
The bottom 30–35 percent get beef semen exclusively.
On the beef side, they’re using bulls from programs built for beef‑on‑dairy—high calving ease, strong marbling and ribeye EPDs, moderate mature size, and documented performance on dairy crosses, drawing from Beef Improvement Federation guidelines and AI stud beef‑on‑dairy sire lists. They’re not just chasing black hides; they’re aiming for cattle that will grow, grade, and hang a carcass the packer wants.
Those calves usually aren’t disappearing into the local sale barn. Many go into integrated dairy‑beef programs in Nebraska, Kansas, and the High Plains. These programs typically require:
Recorded sire IDs and, ideally, dam information.
Colostrum measured by Brix refractometer, with documented volumes and timing.
Specific vaccination and weaning protocols.
Consistent shipping ages and weights.
In return, feedlots and packers share performance and carcass data, including average daily gain, health outcomes, liver scores, dressing percentage, quality, and yield grades. National Beef Quality Audit (NBQA) reports show that marbling scores and the share of carcasses grading Choice and Prime are at or near record highs, and dairy‑influenced cattle contribute to that when they’re managed appropriately. Research from Texas Tech and other universities has shown that when marbling levels and cooking conditions are matched, consumers generally rate steaks from dairy‑influenced cattle as comparable in tenderness and flavor to those from conventional beef breeds.
That’s why well‑documented dairy‑beef calves from known programs are often bringing a clear premium over generic calves at similar weights in recent sale reports. In herds that follow this “surgical” approach, beef‑on‑dairy fits cleanly into a bigger system: repro, genetics, calf care, and marketing all point in the same direction.
The “volume” approach: chasing calf prices, then feeling the heifer pinch
Now let’s think about a more typical picture for a lot of farms in the Northeast, Great Lakes, and Ontario: a 250‑ to 400‑cow herd, solid people, busy days, plenty going on.
In 2022 and 2023, many of these barns saw local auction reports and buyer bids showing very strong prices for crossbred beef‑on‑dairy calves—often several hundred U.S. dollars higher than straight Holstein bull calves of similar weight. In some U.S. regions and Canadian sales, top‑end dairy‑beef calves were creeping into the upper hundreds of dollars and, at times, flirting with four‑figure prices if they were the right type at the right time.
So they did what any rational business would do in that moment: they leaned into beef semen.
Maybe 50–60 percent of cows got bred to beef, often targeting older or softer cows, but usually without genomic data to define “bottom end.”
Heifers saw some sexed semen, more to “make sure we have enough heifers” than as part of a tightly modeled plan.
Calves were sold through local barns as beef crosses, with basic colostrum and vaccinations, but few records following them, and no integrated program specs.
For a year or two, those calf cheques looked great. Pens were busy. It felt like the right move.
Then, USDA and CoBank put some harder numbers to the national heifer picture. They highlighted that on January 1, 2025, the U.S. had just 3.914 million dairy replacement heifers—down from 3.951 million the year before and the lowest since 1978. CoBank’s report projected that inventories could shrink by around 800,000 head over the next two years before recovering in 2027, and that high‑quality heifers were already bringing record prices with potential to go “well above $3,000 per head” in many regions.
When these “volume” beef‑on‑dairy herds sat down with their advisors and laid out heifer inventories by age—0–6, 6–12, 12–18, 18–24 months—and rolled those forward against their normal cull rate, some discovered they were on track to be 20–40 heifers short of their usual replacement needs for 2026–2027. In the same breath, market reports in the U.S. and Canada showed quality replacements bringing about US$3,000 or more in tight U.S. areas and C$4,000–5,000 at special sales in parts of Ontario and Western Canada.
So the narrative quietly shifted from “Beef‑on‑dairy saved our cash flow” to “We might have to buy a truckload of very expensive heifers because we got ahead of our repro and replacement planning.”
On top of that, feedlots and packers have been vocal—through AABP sessions, NBQA debriefs, and trade press—about preferring calves from known herds with documented genetics and health histories, and discounting anonymous calves where they don’t know what they’re getting. That gap in value between “program calves” and “generic black calves” has widened as more dairy‑beef cattle hit the system.
Same toolbox: sexed semen, beef semen, genomics. Very different outcomes.
What Packers and Feedlots Are Really Saying About Dairy‑Beef
When you listen closely to packer reps and feedlot managers at meetings or in interviews, they’re not out to shut down dairy‑beef. What they want is cattle that work on their end of the ledger.
The good news: they like how it eats
From a meat‑quality standpoint, dairy‑influenced cattle can be a real asset:
The 2022 National Beef Quality Audit reported that marbling scores were the highest ever recorded in the NBQA series, with a larger share of carcasses grading Choice and Prime than in previous audits. Dairy‑influenced cattle, both Holstein and beef‑on‑dairy crosses, contribute to those marbling numbers when they’re fed and managed well.
Research at Texas Tech and other universities, summarized in dairy and beef industry media, has shown that when marbling and cooking conditions are similar, consumer taste panels often rate steaks from dairy‑cross and conventional beef cattle similarly for tenderness and flavor.
So from the consumer’s perspective—knife and fork in hand—well‑finished dairy‑beef can perform just fine.
The pain points: health, conformation, and dressing percentage
Where the challenges show up is in three familiar areas:
Liver health. NBQA findings and packer feedback point to liver abscesses as a persistent and costly issue, particularly in some high‑grain finishing programs, and the AABP dairy‑beef paper flags liver abscess rates as a key concern in some dairy‑beef pens. Each condemned liver is lost value and is usually a sign that subclinical health issues have already trimmed average daily gain.
Carcass conformation. Holsteins and many dairy crosses tend to be narrower and more framey than traditional beef steers at a given weight. Board‑invited reviews in Translational Animal Science have noted that this can make it harder to hit certain boxed beef and steak‑size specs, especially for programs that want a consistent ribeye size or steak portion.
Dressing percentage. Those same reviews and multiple feedlot trials show dairy‑influenced cattle generally dress lower than conventional beef steers. Even a couple of points difference in dressing percentage can mean a meaningful shift in dollars per head on most grids.
What’s encouraging is that none of this is a deal‑breaker. The AABP paper and extension work on dairy‑beef and surplus calf management emphasize that strong colostrum programs, consistent calf rearing, thoughtful step‑up rations, and smart sire selection can make dairy‑beef cattle very competitive. The key is whether those calves show up as part of a system that’s designed for that, or as random calves with unknown histories.
The 2026 Heifer Squeeze: A Lagging Result of 2023–2024 Choices
Now let’s swing back to replacements, because that’s where this all lands for most herds.
You already know the biology, but it helps to line it up with the calendar:
Breed a cow today, and if she settles, you get a calf in about nine months.
If that calf is a heifer and you raise her, she’ll freshen roughly 22–24 months later, depending on your heifer program.
So the heifers freshening in 2026 are mostly the product of what you bred in 2023 and early 2024—the exact period when beef‑on‑dairy semen use really spiked.
NAAB’s semen data shows that domestic beef semen sales hit new highs in 2023 and 2024, with about 9.7 million beef units sold in 2024 and 7.9 million of those going into dairy herds. USDA’s January 2025 cattle report pegged dairy replacement heifers at 3.914 million head, down from 3.951 million a year earlier and the lowest since 1978.
CoBank’s 2025 heifer report took those numbers, combined them with typical calving and culling patterns, and concluded that total replacement heifer inventories are likely to shrink by around 800,000 head over the next two years before starting to rebound near 2027. They also noted that high‑quality heifers have already reached record values—well above US$3,000 per head in some U.S. regions—and could move higher if supplies tighten as expected.
So if you’re looking at your heifer pens this winter and thinking, “This feels thinner than it should be,” you’re not alone—and you’re not imagining it. Part of that is the national picture. Part of it traces straight back to how aggressively you used beef semen in 2023–2024 relative to your reproduction and heifer‑raising performance.
How Much Beef‑on‑Dairy Can Your Herd Really Support?
Here’s where fresh cow management and reproduction quietly decide how far you can safely push beef‑on‑dairy.
Looking at this trend, the consistent message out of economic modeling and extension work is that the 21‑day pregnancy rate is the key gatekeeper. In a series of papers, De Vries and co‑authors showed that the higher the 21‑day PR, the more room a herd has to use beef semen without starving itself for replacements, especially when using sexed semen on the top genetics.
Putting it into everyday terms—and blending what the models say with what consultants see—these “guard rails” keep popping up:
21‑day PR under about 20 percent. For most herds in this band, it’s hard enough just to make enough replacement heifers with mostly dairy semen. Modeling and field experience suggest that if you’re in this range and breeding a big chunk of the herd to beef, you’re almost certainly scheduling a heifer shortage and future heifer purchases.
21‑day PR in the 20–25 percent range. At this level, there’s usually room for some beef‑on‑dairy—often something like 20–30 percent of matings—if you’re using sexed semen on your best cows and heifers and actually tracking your heifer pipeline by age group. But there’s not much slack for a spike in culls or a health event in the heifer program.
21‑day PR in the 25–30 percent range. Here, the economics and the farm‑level stories line up: many herds can support roughly 35–45 percent of breedings to beef semen and stay self‑replacing, provided they keep heifer losses modest and stick to a genomic or performance‑based ranking for who gets sexed semen.
21‑day PR consistently above 30 percent. Once herds reach 30 percent 21‑day PR, with solid transition performance and steady culling, they often have substantial flexibility. These herds can frequently breed around half—or a bit more—of their cows to beef semen and still maintain or even grow herd size, as long as they’re disciplined about using sexed semen on the right animals.
That 2023 Animals paper from Wageningen University & Research, led by Jan Hulshof, PhD, reached a similar conclusion in European modeling: beef‑on‑dairy improves efficiency and profitability when combined with sexed semen and strong reproduction, but it creates pressure on replacements and can raise welfare issues if used mainly to chase high calf prices without that foundation.
If you want the blunt version of what’s hiding in those graphs, it’s this: if your 21‑day PR is under 20 percent and roughly half your services are to beef, in most herds you don’t have a beef‑on‑dairy strategy—you have a scheduled heifer problem.
To make this more concrete, let’s run a quick example.
Say you run a 300‑cow herd with a 32 percent annual cull rate. That means you need about 96 replacement heifers freshening each year just to hold steady.
At 25 percent 21‑day PR, using a mix of dairy and sexed semen, you might reasonably expect to produce enough heifers to replace those 96 cows and keep a small buffer, as long as calf and heifer losses are modest. If 30 percent of your breedings are to beef semen, you’ll likely still be self‑replacing.
But if you push beef to 50 percent of services at that same 25 percent PR, simple spreadsheet math often shows a shortfall—maybe 10–20 heifers per year—that you’ll need to cover with purchases. At US$3,000 per head, that’s US$30,000–60,000 a year in heifer purchases that quietly offset a lot of those earlier calf cheques.
Now imagine that same herd at 30 percent 21‑day PR. With stronger repro and the same cull rate, the modeling and real‑world experience suggest you can often support 40–50 percent of matings to beef and still have enough heifers coming, especially if you’re steering sexed semen toward your best genetics and managing heifer losses tightly. That’s where beef‑on‑dairy becomes a sustainable part of the business rather than a short‑term cash grab.
For Canadian quota herds, where expansion room is limited, and every cow slot carries its own capital cost, this math gets even tighter. You can’t just “buy more quota” to cover a heifer shortfall the way a U.S. herd might buy more cows. Getting the beef‑on‑dairy balance wrong means either paying top dollar for scarce heifers or watching your production rights sit underutilized while you wait for replacements to catch up.
A Simple “Over‑Coffee” Framework to Check Your Own Program
When this topic comes up at winter meetings or around kitchen tables, we often end up sketching the same handful of questions on a napkin. Here’s a simple framework you can walk through with your own team.
Metric
Scenario A: Disciplined (30% Beef)
Scenario B: Aggressive (50% Beef)
Year-Over-Year Impact
Herd Size
300 cows
300 cows
—
21-Day PR
25%
25%
—
Annual Culls (32% rate)
96 cows
96 cows
—
Heifers Needed (replacement buffer)
96–100
96–100
—
Beef Semen %
30%
50%
—
Female Calves Born (annual)
~1,200
~1,200
—
Expected Dairy Heifer Calves
~588
~588
—
Heifers Raised to 24m
~540 (with 8% loss)
~540 (with 8% loss)
—
Heifers Freshening Annually
~102
~96
Shortage: 6 heifers
Cumulative 2-Year Shortage
0 (self-replacing)
16–20 heifers
—
Replacement Heifer Cost (2026–2027)
$0 (self-replacing)
$48,000–60,000 (at $3,000/head)
+$50,000/2 years
Avg. Annual Beef Calf Premium (2023–24)
$180/calf × 360 calves = $64,800
$220/calf × 600 calves = $132,000
+$67,200 gross
Premium Over 2 Years (2024–2025)
$129,600
$264,000
+$134,400
Less: Heifer Purchase Bill (2026–2027)
$0
–$54,000
–$54,000
Less: Heifer Management Opportunity Cost
~$12,000
~$18,000
–$6,000
Net Advantage After 3-Year Cycle
$129,600 cumulative
$186,400 cumulative
+$56,800
BUT: Scenario B at Risk If PR Drops or Culls Rise
Stable
Deficit grows fast
Vulnerable
1. Where’s your reproduction really at?
Start here, every time:
What’s your true rolling 12‑month 21‑day pregnancy rate—not just your best month last summer?
Are transition‑period problems like metritis, ketosis, and displaced abomasum dragging that number down more than semen choice is?
When did you last review voluntary waiting period, heat detection (visual plus activity systems), and AI timing with your vet or repro consultant?
Land‑grant extension programs from places like the University of Wisconsin, Penn State, and Cornell keep showing that investments in cow comfort, fresh cow management, and heat detection often deliver some of the strongest returns in dairy herds. Without that foundation, changing semen color won’t fix the underlying issue.
2. Do you truly know your heifer pipeline?
What farmers are finding is that a simple age‑structured heifer count is one of the most eye‑opening tools you can use:
How many heifers do you have today in each age band: 0–6, 6–12, 12–18, 18–24 months?
If you project those forward and apply your typical cull rate and target herd size, will you have enough first‑lactation cows to hold or grow your herd in 2027 and 2028?
If you assume you won’t buy heifers, what does your herd size look like three years out?
CoBank did this math on the national herd and came up with that projected 800,000‑head shortfall. Doing it on your own numbers will tell you very quickly whether your current beef‑on‑dairy level makes sense—or whether it’s quietly eating tomorrow’s replacements.
3. Is genomics actually changing your decisions?
Genomics is only worth paying for if it changes what you do:
Are genomic results directly influencing which animals get sexed semen, which get beef, and which aren’t raised?
Are there heifers that look “good” to the eye but that the genomic numbers clearly put at the bottom of the list, that you’re still raising?
CDCB, USDA‑ARS, and university researchers have shown that many herds raise more heifers than they truly need, and often not the right ones, when decisions are based only on pedigree and appearance. Using genomics to sort those heifers can free up dollars and space to focus on the replacements that will actually drive your herd forward.
4. How strong is your calf and transition program?
We can talk about semen and proofs all day, but colostrum and fresh cow management still set the ceiling:
Are you routinely checking colostrum quality with a Brix refractometer and ensuring the right volume is delivered to calves within the recommended timeframe?
Do your calf facilities provide the drainage, bedding, and ventilation that your vet and extension resources recommend, even when it’s cold, wet, or windy?
On the cow side, are your close‑up and fresh pens hitting targets for stocking density, bunk space, and stall design, or do those pens get crowded when you’re short on beds?
Research summarized in the Journal of Dairy Science and in calf‑raising guides from Penn State and UC Davis shows that calves with strong colostrum and early‑life care have lower morbidity, better growth, and better performance later in life—whether they end up as dairy cows or dairy‑beef cattle.
5. Where do your beef‑on‑dairy calves actually go?
Finally, follow the calf beyond your driveway:
Are you selling into a structured dairy‑beef program or to a regular buyer who lays out expectations and occasionally shares feedback on performance?
Or are most of your calves going through local sale barns as anonymous black calves with little information attached?
AABP’s dairy‑beef work and reports from feedlots in Kansas, Nebraska, and Texas suggest that as beef‑on‑dairy numbers grow, feedlots and packers are increasingly willing to pay premiums for calves with known backgrounds—from herds they trust—and are more cautious on price with unknown cattle. It’s worth noting that those premiums depend on meeting specific contract specs that can change quickly, so there’s some marketing risk to manage along with the opportunity.
If your only metric for beef‑on‑dairy success is this month’s calf cheque, you’re missing half the story.
Where This All Seems to Be Heading
When you stack up the NAAB semen trends, USDA herd numbers, CoBank’s heifer modeling, the beef‑on‑dairy research, and what vets and consultants are seeing across barns, a few patterns start to show through the noise.
In larger freestall and dry lot herds in the Upper Midwest, West, and Southwest, beef‑on‑dairy is quickly becoming part of the core business model. These herds are tying beef‑on‑dairy into their genetic strategy, fresh cow management, heifer planning, and marketing. They’re monitoring butterfat performance and components for the milk cheque, and calf contracts and feedlot relationships on the beef side.
In mid‑sized herds across the Northeast, Great Lakes, and Ontario, there’s a lot of recalibrating going on. Many of these farms enjoyed the bump from beef‑on‑dairy calf prices in 2022–2023, but they’re now staring at tighter heifer numbers and higher replacement costs. They’re asking tougher questions about how far to push beef semen, where to invest next—reproduction, genomics, heifer housing, or structured calf marketing—and how to balance short‑term cash flow with long‑term herd stability.
In smaller tie‑stall and grazing systems—from Vermont to Quebec to the Prairies—beef‑on‑dairy is often being used more selectively: beef semen on clearly lower‑merit cows, while day‑to‑day focus stays on forage quality, butterfat performance, cow longevity, and labor efficiency. Some of these farms are teaming up with a few trusted calf buyers or dairy‑beef programs so they can capture better value for calves without taking on all the logistics themselves.
The Wageningen University Animals paper and other sector‑level analyses in Europe and New Zealand point the same direction as what we’re seeing here: beef‑on‑dairy can be a powerful tool to improve profitability and resource use when it’s built on strong reproduction, sexed semen, and careful replacement planning, but it can create pressure on replacements and welfare if it’s used mainly as a way to ride high calf prices for a season or two.
The Bottom Line
What I’ve noticed, walking freestalls in Wisconsin, parlors in New York, dry lots in the High Plains, and tie‑stalls in Ontario, is that beef‑on‑dairy doesn’t really change what it takes to run a strong dairy. It just makes the strengths—and the cracks—a lot more visible.
Strong reproduction and fresh cow management buy you the freedom to use beef semen without starving your heifer pipeline. Genomics and thoughtful sire selection help you decide which animals should build your next generation of cows and which should produce high‑value beef calves. Good colostrum and calf care protect the value built into every pregnancy. And clear relationships with buyers and feedlots help turn those calves from “generic black crosses” into predictable, valued cattle in somebody’s beef chain.
So maybe the most useful question to bring back to your own kitchen table is this:
Are we using beef‑on‑dairy in a way that builds on the real strengths of our herd—reproduction, genetics, fresh cow and calf management, marketing—or are we leaning a bit too hard on strong calf prices to cover for things we already know we should fix?
If the honest answer is “a bit of both,” that’s actually a good place to start. It means you’ve already identified where your next management dollar is most likely to pay you back—in heifers you don’t have to buy, in calves that earn a premium instead of a discount, and in a herd that’s ready for whatever milk and beef markets throw at it between now and that 2027 wave of new processing capacity.
Diagnostic Criteria
✅ Sustainable Beef-on-Dairy
🔴 Scheduled Crisis (Hidden Bill Coming)
21-Day PR
25–30%+ (rolling 12-month average)
<20% or volatile 15–22%
Reliable base for 30–45% beef semen
Inadequate base; even 40% beef starves replacements
Basic colostrum; calf housing crowded or inconsistent; transition pens cramped when volume spikes
Strong colostrum sets all calves (dairy or beef) up for performance
Weak colostrum and housing drag down heifer health/growth
Beef Calf Marketing
Documented program: sire ID, dam info, colostrum, vaccination, weaning protocols; partner with known feedlot/dairy-beef program; receive performance/carcass feedback
Anonymous sale barn sales; minimal traceability; generic “black calf” pricing; no feedback loop
Earn $280–400/head premium over commodity; build brand
Leave $3,000–4,000 per truckload on the table; buyers discount unknown cattle
Overall Herd Status
Multi-year plan in place; beef-on-dairy as one tool, not the solution
Riding high calf prices now; financing 2027 heifer crisis later
Action This Week
Fine-tune; confirm heifer counts; adjust sexed % if needed
STOP; audit repro; model heifer shortage; plan heifer purchasing or pivot beef % down
This week, before you get too far into spring breeding decisions:
Check your 12‑month 21‑day PR.
Lay out your heifers by age band and run them against your cull rate.
Decide which cows truly deserve sexed semen—and which calves truly deserve a beef premium.
That’s the math that will tell you whether beef‑on‑dairy is working for your herd, or whether you’re quietly writing yourself a very expensive heifer cheque for 2027.
KEY TAKEAWAYS
The beef-on-dairy math has flipped. 7.9 million beef straws went into U.S. dairy herds in 2024, but USDA counts just 3.914 million replacement heifers—the lowest since 1978—and CoBank projects another 800,000-head shrink before inventories recover near 2027.
Reproduction is the gatekeeper, not semen color. Herds under 20% 21-day PR breeding heavily to beef aren’t cashing in—they’re scheduling a heifer shortage. Above 30% PR, many herds can safely run 40–50% beef and stay self-replacing.
The hidden bill adds up fast. A 300-cow herd at 25% PR pushing 50% beef could come up 10–20 heifers short annually. At US$3,000+ each, that’s US$30,000–60,000 per year quietly erasing those 2023 calf premiums.
Program calves earn premiums; anonymous calves get discounted. Feedlots and packers increasingly separate documented dairy-beef calves from generic “black calves” on price—and that gap is widening.
Your move this week: Check your 12-month 21-day PR, map heifers by age against your cull rate, and decide which cows truly deserve sexed semen. That math tells you whether beef-on-dairy is building your herd—or billing it.
Complete references and supporting documentation are available upon request by contacting the editorial team at editor@thebullvine.com.
Learn More
Beef-on-Dairy’s $6,215 Secret: Why 72% of Herds Are Playing It Wrong – Stop the guesswork and find your profit tier. This guide breaks down the specific reproductive “guard rails” that separate top-tier earners from those losing ground, providing a Monday-morning blueprint for maximizing monthly revenue.
The Next Frontier: What’s Really Coming for Dairy Cattle Breeding (2025-2030) – Unlock the next decade of genetic advantage. This feature reveals how breakthroughs in casein selection and AI-driven health markers can generate an extra $5,000 per cow, transforming your breeding program into a high-value protein factory.
The Sunday Read Dairy Professionals Don’t Skip.
Every week, thousands of producers, breeders, and industry insiders open Bullvine Weekly for genetics insights, market shifts, and profit strategies they won’t find anywhere else. One email. Five minutes. Smarter decisions all week.
Sick calves can drain $27,000/year from your herd. By 2026, genomics will let you stop breeding them. Here’s the playbook.
EXECUTIVE SUMMARY: USDA research now confirms what many producers have long suspected: calf scours and respiratory disease are partly genetic—and by 2026, you’ll be able to select against them. The numbers are hard to ignore. Sick calves can drain $27,000 a year from a 1,000-cow herd, while wrong breeding calls leave another $30,000-plus on the table in missed beef-on-dairy premiums and wasted heifer slots. With replacements at a 20-year low, beef-cross calves topping $1,000, and heifers costing north of $2,500 to raise, every semen straw now carries real economic weight. This article lays out a five-step breeding playbook—genomic testing, rule-based beef-versus-dairy decisions, calf-health sire screening, calving-pressure management, and ongoing market adjustments—that forward-thinking herds are already putting to work. Producers who start now can realistically expect to shift $50,000 or more in annual herd economics within 18-24 months.
You know how the talk goes once the parlor’s washed down and the coffee’s on. Somebody mentions a nasty run of scours or a bunch of calves that just won’t quit coughing in the group pen, and five minutes later, you’re into genomics, beef‑on‑dairy, heifer prices, and whether some cows should ever see a dairy straw again. That’s not small talk anymore. That’s survival planning.
What’s interesting right now is that the genetics and the economics are finally lining up with what a lot of you have been seeing in your own hutches. Some cow families just throw tougher calves. Others seem to live in the treatment book every winter. And those sick calves quietly eat money long before they get a chance to show what they can really do on butterfat performance, fertility, or longevity.
At the same time, beef‑on‑dairy has turned into serious money in a lot of sale barns and contract deals, right when replacement heifers have slid to the lowest levels we’ve seen in about 20 years and gotten expensive to either raise or buy. A 2025 CoBank report describes US dairy heifer inventories as sitting at roughly a 20‑year low and projects they could tighten by as much as 800,000 head before gradually rebounding after 2027 as roughly 10 billion dollars of new processing capacity comes online and needs milk. Analysts used USDA Cattle Inventory data to show that the number of dairy heifers over 500 pounds dropped from about 4.76 million in 2018 to roughly 4.06 million by early 2024—almost a 15% decline in the pool of future milkers.
Put all of that together, and the question changes from “How do we get fewer sick calves?” to something a lot sharper:
Which calves do you actually want to be making in 2026—and which ones are you better off never creating in the first place?
Let’s walk through what the newest science says about calf‑health genetics, how it connects to beef‑on‑dairy money and replacement economics, and what a practical breeding plan looks like on real dairies.
Looking at This Trend: What the New Calf‑Health Genetics Actually Show
If you’re going to let genetics influence how you think about scours and pneumonia, the first question is simple: are these traits heritable enough to move the needle?
A 2025 paper in the Journal of Dairy Science from USDA’s Animal Genomics and Improvement Laboratory went straight at that. The team led by geneticists Babu Neupane, PhD, and John B. Cole, PhD, pulled producer‑recorded calf health data from the National Cooperator Database and built what’s probably the most comprehensive calf‑health dataset we’ve ever seen for North American Holsteins and Jerseys.
Here’s what they worked with:
207,602 calf records for diarrhea between 3 and 60 days of age.
681,741 records for respiratory disease between 3 and 365 days.
Calves born from 2013 to 2024, with about 97.5% of the data coming from Holsteins and Jerseys.
When they summarized those records, they found that 14.46% of calves had a recorded case of diarrhea in that 3‑ to 60‑day window, and 16.05% had a recorded respiratory case between 3 and 365 days. If you’ve ever watched a damp March wind whistle through hutches in Wisconsin or Ontario, those numbers probably sound about right. Scours tends to bully the youngest calves; as they get older, respiratory problems slowly take over.
On the genetic side, they estimated heritabilities of 0.026 (2.6%) for resistance to diarrhea and 0.022 (2.2%) for resistance to respiratory disease. That’s modest, but it’s right in line with what’s been reported for cow‑health traits like clinical mastitis, metritis, and ketosis that we already include in Net Merit, Pro$, and other indexes. In plain language: calf‑health traits behave like other health traits we’re already comfortable breeding for.
Trait
Heritability
Similar Industry Trait
Top 5% Sires (% Healthy Calves)
Bottom 5% Sires (% Healthy Calves)
Practical Implication
Diarrhea Resistance
2.6%
Clinical Mastitis (1.5%–3%)
88%
71%
17 percentage-point spread; top sires prevent ~200+ sick-calf events per 1,000 calves born
Respiratory Resistance
2.2%
Ketosis (1–2%)
88%
70%
Same order of magnitude; respiratory RBV predicts > 1 fewer pneumonia case per 10–12 calves
Cow Mastitis
1.5%–3%
Industry standard
~85%
~72%
Calf-health heritability is comparable to traits we’ve been selecting on for 20+ years
Genetic Correlations
0.0 to -0.1
Low cross-trait pull
N/A
N/A
Improving calf health does not sacrifice milk, fat, protein, or fertility gains
What’s encouraging is that when USDA‑AGIL ran genomic evaluations for these traits, the genomic predictions were noticeably more reliable than simple parent averages, particularly for young bulls with no daughter data yet. They also found that genetic correlations between calf‑health traits and most other traits—production, fertility, cow health—were low, with only a modest link between diarrhea and respiratory resistance and very little pull against milk or component traits. That matters. It means you can add calf‑health traits into a balanced index without giving up the gains you’re making in milk, fat, protein, or cow fitness.
USDA‑ARS and the Council on Dairy Cattle Breeding (CDCB) have been presenting this work through ICAR and industry meetings. The consistent message has been that these calf‑health traits are ready for inclusion in US national genetic evaluations for Holsteins and Jerseys as soon as data quality and validation milestones are met, with 2026 targeted as the window for implementation. The exact month depends on final testing and governance, but the direction is clear.
So, from a genetics point of view, we’re not talking about “maybe someday” anymore. These are real traits with real proofs coming.
What Sick Calves Really Cost: From $25 Per Case to $27,000 Per Year
You probably don’t need a scientist to tell you that sick calves are expensive, but it helps to put some hard numbers behind your gut feel.
A 2023 study in JDS Communications examined health costs at 16 certified organic Holstein dairies in the US. The researchers, including Laura C. Hardie, MSc, used on‑farm treatment records and standardized cost estimates for veterinarian time, medications, and producer labor.
On the calf side, they found average direct costs of:
25.21 dollars per case of scours.
56.37 dollars per case of respiratory disease.
Those figures are just what you can see on the invoice—vet visits, drugs, and some labor. They don’t include slower growth, extra days on milk replacer or starter, extra days to breeding, or the way a rough start can nibble away at first‑lactation milk and component performance. Reviews on calf health and heifer rearing, along with herd‑level calf‑health investigations, keep showing what many of you have already noticed: calves that get hammered early often lag behind, even when they survive and make it into the milk string.
So it’s reasonable—based on those cost estimates and the documented performance impacts—to say that a serious pre‑weaning disease episode can trim a few hundred dollars off a heifer’s lifetime economic value on many farms once you add up treatment, extra rearing time, and lost milk later on. The exact figure will move with your feed costs, labor rate, housing system, and milk price, but the order of magnitude is real.
If you want to see how that plays out across a herd, let’s do some simple math. Picture a 1,000‑cow dairy calving about 900 heifers a year. Say 15% of those calves—135 animals—have a significant scours or respiratory event. If you assign a conservative 200‑dollar economic hit per case, combining Hardie’s direct treatment costs with some allowance for long‑term performance losses, you end up at:
135 calves × 200 dollars ≈ 27,000 dollars per year in calf‑health‑related losses.
Cost Component
Amount (USD)
Percentage of Total
Direct Vet & Drug Costs
5,100
19%
Producer Labor (extra time)
4,050
15%
Slow Growth & Extended Rearing
8,100
30%
Lost First-Lactation Milk/Components
9,750
36%
Total
$27,000
100%
That’s not a published national average—it’s a realistic illustrative example built from current cost data and what we know about early‑life disease. On herds with higher disease burden, more expensive inputs, or longer rearing periods, that number can easily climb into the higher tens of thousands.
And that’s before you count the extra time and stress your team spends on repeated treatments and nursing fragile calves through bad weather.
So when we say calf health isn’t a “minor line item,” that it’s a major factor in your annual profit and loss, that’s the level of math we’re talking about.
Beef‑on‑Dairy and Tight Heifer Numbers: Why Every Calf Turned Strategic
Now layer the beef‑on‑dairy story and the heifer shortage on top of that.
On the beef side, you’ve watched this play out: the US beef cow herd has been slow to rebuild, and beef supplies have been tight enough that packers and feedlots are looking harder at dairy‑origin cattle, especially high‑health dairy‑beef cross calves. At the same time, dairy herds have become much more consistent with reproduction—timed AI, sexed semen, improved fresh cow management through the transition period—so you have more control over whether a given pregnancy is a “dairy heifer” or a “beef‑on‑dairy” calf.
Economists who work with both dairy and beef have been frank about the impact. In a 2025 interview, Mike North, an economist and risk‑management advisor with Ever.Ag, who works with many Midwest dairies, explained that beef‑on‑dairy breeding programs are generating “upwards of two and a half dollars per hundredweight in revenue back to the farm just in beef breeding” on some operations. In that same segment, he pointed out that in the current market environment, it’s not unusual to see a well‑bred, three‑day‑old dairy‑beef cross calf bring more than 1,000 dollars at certain sales, which really changes how that calf looks compared to a straight Holstein bull calf.
On the replacement side, CoBank’s 2025 heifer‑inventory analysis describes a sector at a “unique inflection point,” with dairy heifer numbers already at a 20‑year low and not expected to rebound until around 2027, as new processing plants draw more milk and heifer demand slowly pulls numbers up again. USDA Cattle Inventory reports shows that heifers over 500 pounds dropped from roughly 4.76 million in 2018 to 4.06 million in early 2024, while noting that stronger milk prices and processing expansion could drive replacement values higher. At the same time extension economists have pointed out that the total cost to raise a replacement heifer—from birth to first calving—often sits somewhere between 1,600 and 2,400 dollars under pre‑inflation conditions, with more recent budgets and Canadian/US benchmarking suggesting that on many units today, full economic rearing cost runs in the 2,300–3,000‑dollar range per head once you factor in feed, labor, housing, and overhead.
So across North America right now:
Dairy‑beef cross calves commonly bring a few hundred dollars more than straight Holstein bull calves at auction, with recent reports showing crossbred calves trading around 600–700 dollars in some Midwest sales while conventional bull calves lag behind.
In certain barns and weeks, especially in strong markets, three‑day‑old beef‑on‑dairy calves have topped 1,000 dollars.
Replacement heifers are scarce and expensive by historic standards, with multiple analyses pointing to rearing costs comfortably north of 2,000 dollars per head and market values for springers often pushing into the upper‑2,000 to 3,000‑dollar range in tight regions.
This development suggests that calves have shifted from “fill the hutches” to “shape the balance sheet.” Whether a pregnancy produces a dairy heifer or a dairy‑beef calf now has a direct and significant impact on both your future herd and your short‑term cash flow.
What Farmers Are Finding: A Five‑Step Breeding Framework That Actually Works
Looking at this trend across herds in Ontario, Wisconsin, California, and the Northeast, what I’ve noticed is that the operations making this work aren’t doing anything mystical. They’re just being very deliberate and consistent.
Most of them follow some version of a five‑step framework:
Use genomics to see which cow families are truly driving your herd.
Make a clear, rule‑based beef‑versus‑dairy decision for each breeding.
For dairy matings, add calf‑health genetics to your sire criteria as those proofs become available.
Factor in gestation length and calving pressure so you don’t overload high‑stress windows.
Re‑run the economics regularly as calf prices, heifer values, and milk markets move.
Let’s unpack that in barn‑level terms.
Step 1: Use Genomics to See Which Families to Grow—and Which to Let Go
Most herds that are serious about this are genomic‑testing their heifer calves, and some have also done a one‑time pass on younger cows to avoid missing high‑value animals that might be hiding behind older genetics.
A good real‑world example comes from a 5,000‑cow Holstein herd in the western US profile in 2024. The dairy, managed by veterinarian and producer Dr. Sergio Lopes, began genomic testing heifers in 2016 when they realized they were simply overrun with replacements and needed a better way to decide which heifers were truly worth raising.
Genomic results showed them a few things very quickly:
Some cows they had always considered “average” based on current production actually had very strong genetic merit.
Some of their highest‑producing cows were benefiting more from management and environment than genetics.
There were identification problems—wrong semen recorded, calves linked to the wrong dams—that genomics helped uncover and correct.
After a couple of years of working with the data, Lopes said they were confident enough to change their breeding strategy completely. They dropped conventional semen, used sexed dairy semen only on their best families, and bred the rest to beef. Today, they have a background of roughly 12,000 dairy‑beef cross animals tied to their 5,000‑cow dairy and partner herds, with beef calves and fed cattle now a major income stream alongside milk.
On a 300‑ to 600‑cow family herd—say a free‑stall in Wisconsin or a tie‑stall in Ontario—the same pattern shows up on a smaller scale. Producers genomic‑test their heifer calves, rank them on the index that matters most—Net Merit, TPI, Pro$, LPI, maybe with extra weight on health—and discover they have:
A top group, often the top 20–30%, they absolutely want to build daughters and granddaughters from.
A middle group they can flex up or down based on heifer inventory and cash flow.
A bottom group that’s tough to justify raising to calving when replacements are expensive, and barn space is tight.
Once you see your herd laid out like that, it becomes a lot easier to say, “These families deserve sexed semen and more daughters,” and “These cows can contribute better through beef‑cross calves than through more low‑merit heifers.”
Step 2: Make Beef‑Versus‑Dairy Decisions Simple and Rule‑Based
Once you’ve got a handle on your cow families, the next step is to stop making beef‑versus‑dairy calls on the fly in the parlor and start following a simple rule you can execute every week.
A rule that’s working on a lot of herds looks something like this:
First‑ and second‑lactation cows whose most recent heifer ranks in the top 40% of your genomic list get bred to dairy semen, often sexed.
Cows whose daughters fall below that line, plus older cows without strong family backing, get bred to beef.
When herds stick to that for a full year, they usually end up with roughly 30–40% of cows getting dairy semen and 60–70% getting beef. That mix often covers replacement needs—because dairy semen is concentrated on the right cows—while generating a steady stream of well‑bred dairy‑beef calves.
Here’s where the big math starts to bite in your favor. In many Midwestern markets right now, it’s common to see a beef‑on‑dairy calf sell for a few hundred dollars more than a straight Holstein bull calf. For example, in early 2024, it was reported that crossbred calves were selling for around 675 dollars per head in some US sales, while conventional Holstein bull calves lagged far behind, and noted that “beef on dairy” was becoming a “big money” factor in the heifer shortage conversation. If you take 150 matings that would have produced low‑merit dairy calves and, instead, flip them to beef‑on‑dairy matings with a 250‑dollar average premium, you’re looking at:
Even if you trim that for calf‑price volatility or the occasional calf that doesn’t quite hit the premium, you’re still talking about tens of thousands of dollars per year from one simple change in breeding policy.
And on the cost side, you’re not spending all the feed, bedding, labor, and barn space to raise heifers from those bottom families. Long‑term work out of places like Cornell, Penn State, and western Canadian benchmarking suggests that when you spread all the costs out, total rearing cost per dairy heifer—from birth to first calving—often sits in the 2,000–3,000‑dollar range once you include feed, bedding, labor, health, and overhead, with the exact figure depending on system (confinement, pasture, dry lot) and region. So not raising heifers that were never likely to pay you back is a big part of this story, too.
Step 3: Add Calf‑Health Genetics to Your Dairy Sire List
Now bring calf‑health genetics back into the picture.
We’ve already seen that calf diarrhea and respiratory disease are heritable and can be evaluated genomically. Canada gives us a clear preview of how those traits can look in practice.
In August 2025, Lactanet—the national genetics and data organization for Canadian dairy producers—launched a Holstein calf‑health genetic evaluation that combines recorded cases of respiratory disease from birth to 180 days and diarrhea from birth to 60 days. The new trait is expressed as a Relative Breeding Value (RBV) centered at 100 with a standard deviation of 5. Higher RBVs indicate sires whose daughters are more likely to stay free of recorded calf‑health events in that early‑life window.
Lactanet geneticist Colin Lynch, MSc, explained in that a five‑point increase in calf‑health RBV corresponds to about 5.4% more healthy calves with no recorded diarrhea or respiratory problems. Their analysis showed that, among proven sires, the top 5% for calf‑health traits had around 88% healthy daughters, while the bottom 5% averaged closer to 70–71% healthy daughters—depending on whether you’re looking at diarrhea or respiratory disease. In real‑world terms, that’s the difference between a family where “most calves just start and go” and one where you feel like you’re forever pulling buckets and syringes.
Sire Rank
% Calves NO Diarrhea
% Calves NO Respiratory Disease
Combined Healthy Rate (Est.)
Per 100 Calves: Sick Events
Economic Cost per Cohort (100 calves)
Top 5%
92%
90%
~88%
~12 sick calves
$2,400 in direct treatment + losses
Middle 50%
87%
84%
~80%
~20 sick calves
$4,000 in treatment + losses
Bottom 5%
82%
76%
~70%
~30 sick calves
$6,000+ in treatment + losses
Spread (Top vs. Bottom)
+10 pts
+14 pts
+18 pts
+18 more sick calves
+$3,600 annually per 100-calf cohort
Here’s how herds are starting to use that kind of information:
For heifers and first‑calf cows, they insist on bulls that meet their production and cow‑health criteria and also clear a minimum calf‑health RBV. Bulls with poor calf‑health scores simply don’t get used on young animals.
For older cows, calf‑health RBV becomes a tie‑breaker among bulls with similar milk, components, fertility, and cow‑health profiles.
In regions with tough winter respiratory seasons—Wisconsin, Minnesota, Quebec, Northern New York—some producers are deliberately matching higher calf‑health bulls to matings that will calve into late winter and early spring, when pneumonia risk is highest.
Of course, these evaluations live or die on the quality of the health records behind them. A 2023 Canadian Journal of Animal Science case study on calf respiratory illness and diarrhea recording in Ontario found that the share of milk‑recorded herds logging calf disease rose from 2.6% in 2009 to 11.1% in 2020, but also pointed out several places where data can be lost or misclassified between the farm and the national database. Neupane and Cole have likewise emphasized in USDA‑ARS communications that clear, consistent on‑farm recording of calf health is critical if we want reliable calf‑health proofs.
So one very practical step you can take this year—before US calf‑health numbers even hit your AI catalogs—is to tighten how you record scours and pneumonia. Sit down with your vet, agree on what counts as a case, and make sure those events get logged consistently in your herd software. That way, when calf‑health proofs land, you can trust them more and know your herd is contributing good data.
Step 4: Factor in Gestation Length and Calving Pressure
You don’t need a statistician to tell you that what you do with calving‑ease and gestation length can make or break certain months. Stack too many long‑gestation, big‑calf bulls on heifers or smaller cows that all calve in a tight two‑week window, and you’ll see it in stillbirths, tough pulls, exhausted staff, and shaky fresh cow performance through the transition period.
Most modern proofs include calving‑ease and stillbirth rates, and many now list gestation length as well. Genetic evaluation organizations like CDCB and Lactanet have been gradually building more of these functional traits into their indexes and tools. They may not be as glamorous as milk or fat numbers, but they matter a lot when you’re planning calving pressure.
What farmers are doing, once they’ve set beef‑versus‑dairy and calf‑health rules, is using calving‑ease and gestation length as the next filter:
In herds with heavy winter or early‑spring calving in the Northeast, Great Lakes, and Upper Midwest, producers keep a short list of easy‑calving, shorter‑gestation bulls for dairy matings that will calve into February and March, when calving barns and fresh pens are under the most stress.
In Western dry lot systems, where summer heat is the big enemy, producers avoid long‑gestation bulls on matings that would calve into the hottest weeks and lean instead on sires with moderate gestation and favorable calving‑ease profiles.
You don’t need a complicated spreadsheet to manage this. Just mark a handful of bulls as “tight‑window sires” based on calving‑ease, gestation length, and acceptable production and health traits, and use them where the calendar and weather suggest you can’t afford added calving problems.
Step 5: Keep Re‑Running the Math as Markets Move
The last step—and this is the one that never really ends—is to keep re‑checking whether your thresholds still make sense as markets and costs move around.
Calf prices rise and fall with the beef cycle. Replacement heifer values swing with inventory, feed costs, and interest rates. Milk prices and component premiums fluctuate with supply, demand, and processor product mix. The herds that keep these breeding strategies working don’t treat them as set‑and‑forget decisions.
In practical terms, that looks like:
Watching local calf prices at sale barns, through order buyers, and with any calf contracts, so you know the current spread between dairy bull calves and dairy‑beef calves.
Tracking replacement heifer prices through USDA Cattle on Feed and Cattle Inventory reports, CoBank and other industry analysis, and local auctions, and comparing those numbers against your estimated cost per raised heifer.
Adjusting your beef‑versus‑dairy cutoff as those numbers shift. When dairy‑beef calves are bringing strong premiums and replacements are expensive, a lot of herds are comfortable breeding only the top 30% of cows and heifers (by genomic merit) to dairy semen; if the spread shrinks or they need more replacements, they might widen that to 40%.
One helpful thing about the new calf‑health traits is that USDA‑AGIL has designed them to slot into the same kind of multi‑trait indexes we already use. Because genetic correlations between calf‑health traits and production or fertility are low, you can improve calf health without sacrificing milk, components, or cow survival, as long as you keep using balanced indexes instead of chasing single traits.
What Year One Really Feels Like on the Farm
On a PowerPoint slide, all of this looks tidy. On your own farm, Year One feels a little different.
At the start, it’s mostly invoices and extra work:
You’re genomic‑testing heifer calves, and the lab bills arrive long before any calves from your new breeding plan hit the ground.
You’re tightening up calf‑health recording with your vet and staff, which means training, more detailed entries, and a few evenings spent cleaning up your database.
You’re adjusting semen orders—more sexed semen on the top families, more beef semen on the bottom end, fewer “just in case” dairy breedings on cows that were never likely to give you high‑value daughters.
In the calf barn, nothing magical happens overnight. Your heifer pens still look full. Calf checks look familiar. It’s easy to wonder if the effort and expense are worth it.
By mid‑year, a few things usually start to shift:
You may find yourself selling or culling more lower‑merit heifers earlier—especially if you’re long on replacements—which frees up feed, bedding, and barn space.
Pregnancies conceived under the new beef‑versus‑dairy rules are in gestation, but only a handful of calves have actually hit the ground.
On paper, your breeding lists and heifer rankings make more sense. In the parlor and calf barn, daily routines feel largely unchanged.
Late in Year One and into Year Two is where most producers say they start to feel real differences:
Beef‑on‑dairy calves begin arriving as a more uniform, intentional group. You see stronger buyer interest, better feedback from feedlots, and often better average prices.
Your heifer pens gradually tilt toward a more consistent, higher‑index group instead of a random mix of stars and passengers. When those heifers freshen, you notice differences in how they come through the transition period and what they do in first‑lactation milk and components.
If you’ve matched genetics with solid colostrum management, good housing and ventilation, and steady fresh cow management, you often see calf treatment rates and pre‑weaning mortality start to trend in the right direction, similar to what regional calf‑health and barn‑fogging projects have reported when calf environments improve.
Producers highlighted in university extension projects tend to say the same thing: these strategies pay, but the payoff shows up over 18–24 months, not two pay periods. So if you’re going to go down this road, it really helps to think in years instead of months.
Looking Ahead: Getting Ready for Calf‑Health Proofs in the US
Looking at where this is heading, timing matters if you want to be ready.
The USDA‑AGIL work in the Journal of Dairy Science has already shown that calf diarrhea and respiratory traits can be evaluated at a national genomic scale, with usable heritabilities and low correlations with other key traits. USDA‑ARS publications and ICAR genetic evaluation reports have laid out the models and confirm that these calf‑health traits are being prepared for inclusion in US national evaluations for Holsteins and Jerseys.
The Council on Dairy Cattle Breeding has indicated, through meetings and industry communications, that the goal is to add calf‑health traits to the US genetic evaluation system in 2026, once data quality, validation, and governance steps are complete. The exact date will depend on final testing, but the intent is clear enough that seedstock suppliers and AI companies are already watching those traits closely.
Meanwhile, Canada is already using calf‑health RBVs in everyday breeding decisions. Lactanet launched the trait in 2025 and is working it into the Lifetime Performance Index (LPI) and other tools, so Canadian producers now see calf‑health expectations right alongside production, fertility, and cow‑health numbers when picking sires.
If you think about how quickly somatic cell score, daughter fertility, and cow‑health traits became “just part of the proof” once they were introduced, it’s reasonable to expect something similar with calf health. Early on, there will probably be bulls that are quietly excellent on calf‑health traits without a big semen price premium for that advantage. Over time, as more herds use those bulls and see calf‑barn results, market demand and pricing will adjust.
The herds that stand to benefit most from the early years of calf‑health proofs are the ones that:
Already genomic‑test most or all of their heifer calves.
Already have a written rule for which cows get dairy semen and which get beef.
Already work from weekly breeding lists and can easily add one more column when calf‑health numbers show up.
A Practical Game Plan for 2025–2026
If you’re thinking, “This all adds up, but what do I actually do next?”, here’s a straightforward plan you can take back to the office or kitchen table.
1. Build your information base.
Genomic‑test your next one or two calf crops so you can see how big the gap really is between your best and worst heifers on your preferred index.
Sit down with your veterinarian and team and define what counts as a reportable scours case and a pneumonia case on your farm, then make sure those cases are consistently recorded in your herd software.
2. Put a simple beef‑versus‑dairy rule on paper.
For example: “Only cows whose most recent heifer ranks in the top 40% genomically get dairy semen; the rest get beef.”
Plan to revisit that 40% threshold once a year based on calf‑price spreads, replacement heifer values, and your own heifer needs.
3. Talk with your AI and genetics partners about calf‑health traits.
Ask when they expect US calf‑health proofs to show up in their catalogs and computerized mating programs.
Identify a short list of bulls that fit your production and cow‑health goals and are also likely to be above average on calf‑health traits once those numbers are official.
4. Build a weekly breeding list.
Include cows eligible to breed, days in milk, parity, last calving date, and the genomic rank or index of their most recent heifer.
Mark each cow as “dairy” or “beef” based on your rule, then assign bulls from a short list that meet your criteria for production, components, fertility, cow health, calf health (once proofs are live), calving ease, and gestation length.
5. Track a few key metrics over the next 24 months.
Calf diarrhea and respiratory treatment rates, ideally by season.
Pre‑weaning mortality.
Age at first calving for heifers bred under the new system.
First‑lactation milk and component yield, and major health events in that first lactation.
Number and average sale price of beef‑on‑dairy calves.
Total heifer inventory and your best estimate of cost per raised heifer.
If you’re tracking those numbers, you’ll be able to tell whether genomics, beef‑on‑dairy, and calf‑health traits are actually changing the economics on your own farm—not just in theory, but in your barn with your markets.
Different Regions, Different On‑Ramps—Same Core Question
It’s worth saying that not every region, or every herd size, is going to use these tools in exactly the same way.
In Wisconsin, Minnesota, and the Upper Midwest, long winters and naturally ventilated barns make respiratory disease a constant battle. Research supported by the Northern New York Agricultural Development Program and Cornell PRO‑DAIRY has shown that improvements in ventilation, barn‑fogging protocols, and calf‑barn layout can significantly reduce respiratory problems, with scours most common early in the rearing period and pneumonia more common later. Producers there are now layering calf‑health genetics on top of these management changes.
In Ontario and Quebec, where Lactanet calf‑health RBVs are already available, and LPI updates have brought more health and functional traits into the mix, many herds are simply adding calf health to breeding programs that already lean heavily on genomics.
In Western dry lot systems, such as those in California and the Southwest, heat and dust are greater challenges than cold. Work comparing confinement, dry‑lot, and pasture‑based heifer systems has shown that dry‑lot and pasture can lower some costs but demand strong management of shade, airflow, and group size. Producers there are combining calf‑health genetics with shade structures, better airflow, and early‑detection technologies for respiratory disease, plus close relationships with beef buyers who value uniform, high‑health dairy‑beef calves.
On smaller family herds in the Northeast or Great Lakes region, the most realistic first step might be to genomic‑test one year’s worth of heifers, use those results to decide which families get sexed dairy semen and which get beef, and then let the AI company’s mating program start incorporating calf‑health traits as they come into US proofs.
Different barns. Different weather. Different processor relationships and quota setups. But underneath all that, the strategic question you’re trying to answer is the same.
The Bottom Line
When you strip the jargon away, here’s where all of this leads.
We now have solid data showing that calf diarrhea and respiratory disease are common, costly, and heritable enough to improve through genetics. The same infrastructure that gave us cow‑health traits in our indexes is being used to bring calf‑health traits into US proofs, with Canada already showing how calf‑health RBVs can fit alongside production, fertility, and cow‑health information on a bull card.
We also have economic work on calf health, heifer rearing, and calf markets, telling us that:
Direct treatment costs per sick calf stack up quickly.
Serious early‑life disease can pull heifers off their full potential in growth, age at first calving, and first‑lactation performance.
Dairy‑beef cross calves can be a bright spot in the check when milk prices soften.
Replacement heifers are expensive enough that raising the wrong ones is a luxury most farms can’t really afford right now.
The tools—genomics, beef‑on‑dairy, calf‑health proofs—are all coming together just as those pressures peak. And you don’t need a PhD to use them. A simple, consistent five‑step approach—test, sort, decide beef vs dairy, add calf health and calving‑ease filters, and keep re‑running the math—will get you most of the way there.
What I’ve noticed, looking at both the research and what’s happening in real barns, is that we’re moving from a world where calf health was “just management” to one where genetics, markets, and management are all pulling in the same direction.
So maybe the real question for 2026 isn’t “Should I genomic‑test?” or “Should I try beef‑on‑dairy?” Those are just tools.
The bigger question—the one that can easily swing tens of thousands of dollars a year on many dairies—is this:
Given your barns, your local markets, your cash‑flow reality, and the calf‑health genetics coming into proofs, which calves do you truly want more of—and which calves are you better off never making in the first place?
If your breeding plan can answer that clearly, and you’re willing to line up your genetics, your fresh cow management, and your calf program behind that answer, then the next few years offer a real chance to tilt the math of your dairy in your favor quietly.
KEY TAKEAWAYS
Calf-health proofs hit US genetics in 2026. USDA data on 680,000+ calves confirms scours and respiratory resistance are heritable—and selectable.
Sick calves drain $27,000/year from a 1,000-cow herd. That’s treatment, slower growth, and daughters that never reach their genetic potential.
The breeding math has changed. Beef-cross calves are topping $1,000. Heifers cost $2,500+ to raise. Replacements just hit a 20-year low. Every straw matters.
Five steps shift the money your way. Genomic-test heifers. Set a hard beef-versus-dairy rule. Screen bulls for calf health. Manage calving pressure. Re-check the economics quarterly.
Act now, bank returns in 18-24 months. Herds implementing this playbook today can realistically add $50,000+ to their bottom line.
Complete references and supporting documentation are available upon request by contacting the editorial team at editor@thebullvine.com.
Every week, thousands of producers, breeders, and industry insiders open Bullvine Weekly for genetics insights, market shifts, and profit strategies they won’t find anywhere else. One email. Five minutes. Smarter decisions all week.
Did genomics really deliver what you think it did—or is that extra $238,000 in profit still stuck in your semen tank?
Let’s sit with a big number for a minute: a couple thousand dollars more lifetime profit per cow. That’s the kind of difference Lactanet uses in its Pro$ examples when it compares daughters of today’s high‑Pro$ sires to daughters of a decade older, lower‑ranking bulls, because Pro$ is built to reflect expected lifetime profit per cow based on real Canadian revenue and cost data up to six years of age or disposal.
If you spread that kind of genetic advantage across a few hundred cows over several breeding seasons, you’re quickly into tens of thousands of dollars in extra lifetime profit per year, the result of breeding decisions—assuming your fresh cow management, herd reproduction, and culling strategy actually lets those genetics show up in the tank.
That’s not hype. That’s the math behind Pro$, and it aligns with what genomic selection has achieved globally, where genetic progress in milk, fat, protein, health, and longevity has accelerated by 50–100% compared with the pre‑genomic era.
What’s interesting, though, is that when you start peeling back the layers on how we got here, you see both huge wins and some red flashing lights—especially around diversity, fertility, and hidden genetic risks.
That’s what this conversation is really about.
When Banners Steered the Breeding Bus
If you look back 15–20 years, you can probably still picture the late‑2000s bull lists. In Canada, Holstein Canada sire‑usage data from that era show a relatively tight group of sires—Goldwyn, Buckeye, Dolman, and their close relatives—accounting for a significant share of registrations.
In 2008, just three bulls (Dolman, Goldwyn, Buckeye) accounted for about 12% of all registered Holstein females in Canada, and the top five sires together made up roughly 15.7% of registrations. That kind of concentration perfectly reflected the breeding philosophy of the time: moderate yield, “true type” conformation, and pedigrees that lit up both classifier sheets and show‑ring banners, but not always the enterprise balance sheet.
On many commercial freestall and tie‑stall farms, those cows were often the ones that:
Struggled harder through the transition period
Needed more care of their feet and legs
Didn’t routinely make it to that profitable fourth or fifth lactation
That isn’t just coffee‑shop talk. Work from the University of Guelph and Agriculture and Agri‑Food Canada has consistently shown that lifetime profitability is closely tied to lifetime milk revenue, length of productive life, days dry, age at first calving, and reproductive-related interventions. Cows that leave early, spend more time open, racking up vet bills, and simply don’t deliver their potential lifetime profit—even if they look great and milk well in first lactation.
Producers like Don Bennink at North Florida Holsteins have been lightning rods on this topic for years. He’s been very blunt that high production, strong health traits, and feed efficiency are the bywords for breeding profitable cows—not show ribbons—and that genomics has “increased our progress at a rate we could never have dreamed of previously,” creating a huge profitability gap between herds that use genomic information and those that don’t.
So even before we talk about SNP chips and genomic proofs, there was already a clear split between what wins banners and what pays bills in freestalls, robots, parlors, and dry‑lot systems.
From Pedigree and Type to Profit and Function
The Canadian Holstein breeding landscape has gone through one of the most profound shifts in its history since about 2008. Over 16 years, selection has moved from pedigree‑driven, visually focused decisions to a much more complete “facts‑first” approach that prioritizes profitability, health, and functionality based on accurate animal and herd data.
You can see this change clearly in which sires actually sired the most daughters in Canada. In 2008, the most‑used 20 sires accounted for about 33.5% of all registered females, and the average “top‑sire” had over 4,300 daughters. By 2024, that share dropped to around 22.6%, and the average daughters per top sire fell to roughly 2,984. At the same time, the top five sires in 2024 (Pursuit, Alcove, Lambda, Fuel, Zoar) represented only about 9.1% of registrations—down from that 15.7% level in 2008.
Overview of Top Sires of Canadian Holstein Female Registrations
Category
2008
2012
2016
2020
2024
Total Female Registrations
257,040
272,264
273,785
297,192
263,149
Five Sires with Most Daughters
Dolman
Windbrook
Impression
Lautrust
Pursuit
Goldwyn
Fever
Superpower
Impression
Alcove
Buckeye
Steady
Jett Air
Alcove
Lambda
Frosty
Lauthority
Dempsey
Bardo
Fuel
Sept Storm
Jordan
Uno
Unix
Zoar
Percent of Registrations
– Top Five Sires
15.70%
14.80%
7.30%
7.50%
9.10%
– Top Ten Sires
23.70%
22.20%
13.50%
12.60%
14.90%
– Top Twenty Sires
33.50%
30.10%
22.20%
20.20%
22.60%
– Top Thirty Sires
39.90%
34.70%
28.10%
25.90%
28.70%
Top Twenty Sires – avg # Daus
4,309
4,093
3,035
3,001
2,984
Highest Ranking Genomic Sire
30th
27th
8th
6th
5th
No. Genomic Sires in Top Ten
0
0
1
4
5
Percent of Sires – A2A2
20%
25%
35%
50%
60%
That’s not a “bull of the month” world anymore. That’s breeders intentionally spreading genetic risk, targeting specific trait profiles, and using more bulls per herd for shorter periods, while still driving genetic gain.
The underlying philosophy has evolved from two narrow extremes—high‑conformation or high‑milk two‑lactation cows that were often culled early—to a more complete target: four‑plus‑lactation, healthy, fertile, self‑sufficient, high‑solids cows that can survive modern housing, automation, and economic pressure.
What Genomics Actually Changed
When genomic evaluations hit around 2008–2009, they blew the doors off the old progeny‑testing model. Researchers like Adriana García‑Ruiz and Paul VanRaden, working with US national Holstein data at USDA‑AGIL, showed that once genomics was adopted, sire‑of‑sons generation intervals were effectively cut in half, dropping from roughly 6–10 years down to around 2.5–3 years. Canadian data tracked the same pattern.
That shorter generation interval, combined with higher selection intensity and more accurate young‑animal evaluations, is exactly why genetic gains picked up speed. Analyses of Holstein breeding programs published in the Journal of Dairy Science and the Proceedings of the National Academy of Sciences report:
50–100% higher rates of genetic gain for milk, fat, and protein in the genomic era
3–4x higher genetic progress in some health and productive‑life traits between 2008 and 2014
Metric
2008 (Progeny-Testing Era)
2024 (Genomic Era)
Average LPI (Top 20 Sires)
1,985
3,531
Average Pro$ (Top 20 Sires)
-$1,558
+$1,978
Milk Proof (kg)
-578
+860
Fat Proof (kg)
-33 (-0.10%)
+85 (+0.31%)
Protein Proof (kg)
-27 (-0.07%)
+50 (+0.15%)
Top 5 Sires’ Market Share
15.7%
9.1%
Daughters per Top Sire
4,300
2,984
Top 20 Sires’ Market Share
33.5%
22.6%
Inbreeding (Top Sires’ Daughters)
~9.5%
11.5%
Canada’s own data comparing bull April 2025 indexes on the 20 most‑used sires, 2008 vs 2024, makes this very real:
The average LPI of those bulls climbed from about 1,985 in 2008 to around 3,531 in 2024—roughly +97 LPI points per year.
Pro$ swung from about –$1,558 in 2008 to about +$1,978 in 2024—roughly +$221 per year in predicted daughter lifetime profit.
Average proofs for those sires went from roughly –578 kg milk, –33 kg fat (–0.10%F), and –27 kg protein (–0.07%P) in 2008 to about +860 kg milk, +85 kg fat (+0.31%F), and +50 kg protein (+0.15%P) by 2024.
That works out to about +90 kg of milk, +7.4 kg of fat, and +4.8 kg of protein in genetic improvement per year in the bulls that Canadian Holstein breeders actually used the most.
Year
LPI
Pro$
2008
1,985
-$1,558
2010
2,180
-$980
2012
2,420
-$340
2014
2,690
+$230
2016
2,875
+$650
2018
3,045
+$1,040
2020
3,210
+$1,380
2022
3,375
+$1,680
2024
3,531
+$1,978
Put simply: genomics, combined with LPI and Pro$, did exactly what it was supposed to do in Canada—faster genetic gain for production and overall profit.
Indexes for Twenty Sires with the Most Registered Daughters
Year
LPI
Pro$
Milk
Fat / %F
Protein / %P
CONF
Mammary
Feet & Legs
D Strength
Rump
2008
1985
-1558
-578
-33 / -.10%
-27 / -.07%
-6
-6
-4
1
0
2012
2378
-728
-415
-14 / .01%
-17 / -.02%
1
-1
0
4
3
2016
2680
173
130
6 / .00%
2 / -.05%
1
0
1
2
3
2020
3054
1016
555
45 / .21%
25 / .04%
5
3
3
4
4
2024
3531
1978
860
85 / .31%
50 / .15%
8
6
8
7
5
Change/Year
97
221
90
7.4
4.8
0.88
0.75
0.75
0.38
0.31
*Lactanet Indexes Published in April 2025
Where biology pushes back is on which traits move fastest. Higher‑heritability traits like milk, fat, and protein, as well as major type traits, make faster genetic progress than lower‑heritability traits like fertility, health, and productive life. Genomics improves accuracy across the board, but when semen catalogs and marketing materials still lead with production and type, it’s easy for those traits to keep outrunning fertility and health on the genetic trend lines.
That’s how we end up with a proof landscape that shows: extreme strength in production and conformation, modest but improving gains in fertility and health, and some nagging functional issues that still frustrate producers.
The Diversity Question: Are We Painting Ourselves Into a Corner?
One major concern that doesn’t appear directly on a proof sheet is genetic diversity.
Geneticists talk about effective population size—the number of prominent sires contributing progeny, especially genomic sires entering AI programs and daughters being used as bull dams. Dutch and Italian Holstein genomic studies have examined this closely. In one well‑cited Dutch‑Flemish analysis, effective population size in AI bulls born between 1986 and 2015 ranged from about 50 to 115 prominent sires at different periods, with lower values during times of intense selection. Italian and Nordic Holstein work using both pedigree and SNP data has reported similar patterns—effective population sizes are often below 100, with prominent sires trending downward in the genomic era.
International guidelines from the FAO and genetic diversity experts generally suggest that an effective population size of 100 or more prominent sires is acceptable. Values below about 50 for prominent sires raise concerns about inbreeding depression and lost adaptability.
At the same time, genomic and pedigree analyses across multiple countries have shown that inbreeding is rising faster each year in the genomic era—often increasing by 0.3–0.5 percentage points annually. At current generation intervals, that can mean 1.5–2.5% per generation. Pedigree studies summarized by Chad Dechow at Penn State and reported in Hoard’s Dairyman have also highlighted how a disproportionate share of modern Holstein ancestry traces back to just a handful of bulls (Chief, Elevation, Ivanhoe), underlining how concentrated the global gene pool has become.
In the Canadian context, that broader story plays out in very practical ways. The 20 most‑used sires in 2024 have daughters with an average inbreeding coefficient of about 11.5%—above a Holstein breed average already considered uncomfortably high at around 10.6%. That means the bulls delivering the most genetic progress on paper are also nudging herds further into undesirable inbreeding territory.
Practically, if you always grab the top two or three bulls on the list:
You’ll quickly improve your herd’s genetic level.
While you’ll also make your heifers more closely related to each other, especially if those bulls also share cow families.
On farm, that’s when inbreeding starts to show up in ways you feel: more fertility trouble, more health events, and cows that don’t seem as robust as the previous generation—even while milk solids and type keep improving.
Hidden Passengers: Haplotype and Recessive Stories
Another layer that genomics exposed is fertility haplotypes and single‑gene defects.
Over the past decade, collaborations between the USDA’s Animal Genomics and Improvement Lab, European institutes, and AI organizations have identified several Holstein haplotypes—HH1, HH2, HH3, HH4, HH5, HH6—and defects like cholesterol deficiency (CD/HCD) that are tied to embryonic loss or weak calves.
The pattern is pretty straightforward:
These haplotypes are stretches of DNA where homozygous calves (same version from sire and dam) often die early in gestation or are born weak and fail to thrive.
Carrier frequencies in many national populations sit in the low single digits but can reach 5–10% for some haplotypes in certain birth years and cow families.
The cholesterol deficiency story is a good cautionary tale. CD traces back to lines including Maughlin Storm and involves a mutation affecting fat metabolism; affected calves often die within weeks due to diarrhea and failure to thrive, while carriers look normal and can be high‑index animals.
The good news:
Major AI studs routinely test their bulls for these defects, and they, their breeds, and genetic evaluation centers publish the carrier status of animals.
Mating programs can automatically avoid carrier × carrier matings once herd and sire statuses are known.
If you don’t use those tools, the math can quietly bite you. Even a few percent of pregnancies lost to lethal combinations in a 400–500 cow herd can mean thousands of dollars in dead calves, extra breedings, and longer calving intervals each year—losses that are largely avoidable with the data breeders already have access to.
The 2025 Modernized LPI: A Better Dashboard
All of this—faster genetic gain, tighter diversity, more trait data, and new environmental pressure—is why genetic evaluation systems are updating how they calculate and present information.
In Canada, Lactanet launched a modernized Lifetime Performance Index (LPI) framework in April 2025. The old three‑group structure (Production, Durability, Health & Fertility) was replaced with six subindexes for Holsteins and five subindexes for the other breeds:
Production Index (PI)
Longevity & Type Index (LTI)
Health & Welfare Index (HWI)
Reproduction Index (RI)
Milkability Index (MI)
Environmental Impact Index (EII)
For Holsteins, these subindexes carry specific weightings in the new LPI formula: about 40% on Production, 32% on Longevity & Type, 8% on Health & Welfare, 10% on Reproduction, 5% on Milkability, and 5% on Environmental Impact. As well, Lactanet has an online routine where breeders can rank bulls by assigning their own weightings for the subindexes.
Two important comfort points from Lactanet:
The correlation between the current and modernized LPI is expected to be around 0.98, so the bulls you like don’t suddenly become “bad”—their strengths and weaknesses just become more visible.
Splitting Health & Fertility into Health & Welfare and Reproduction, plus the creation of a separate Milkability subindex, allows new traits such as calving ability, daughter calving ability, milking speed, temperament, and environmental traits (such as feed and methane‑related efficiencies) to be properly handled in the indexing.
For a lot of producers, the practical value is this: you can now see at a glance where a bull stands not only on overall LPI or Pro$, but on:
Reproduction
Health & Welfare
Environmental footprint
On separate scales, without having to decode 20 individual trait proofs.
What the Top 2024 Sires Miss—and What That Means for 2026 Matings
Here’s where the Canadian sire usage data really tells a story.
April ’25 Indexes for Twenty 2024 Sires with Most Registered Daughters
Category
Avg Index
Index%RK
Range in %RK
% Sires Below AVG
Lifetime Performance Index (LPI)
3531
98%RK
81 – 99 %RK
0%
Production Subindex (PI)
659
93%RK
70 – 99 %RK
0%
Longevity & Type Subindex (LTI)
678
98%RK
57 – 99 %RK
0%
Health & Welfare Subindex (HWI)
500
50%RK
02 – 93 %RK
60%
Reproduction Subindex (RI)
450
29%RK
01 – 65 %RK
75%
Milkability Subindex (MI)
516
52%RK
10 – 92 %RK
45%
Environmental Impact Subindex (EII)
475
40%RK
02 – 96 %RK
75%
When you line up the 20 sires with the most registered daughters in 2024 and score them on the new subindexes, you get a clear pattern:
They’re elite for LPI, Pro$, the Production, and the combined Longevity & Type subindexes.
They’re roughly breed average for Health & Welfare and Milkability subindexes.
They’re significantly below the breed average for Reproduction and Environmental Impact subindexes.
Their daughters are running about 11.5% inbreeding vs a breed average of 10.6%.
In plain language:
We’ve done an excellent job selecting bulls that lead the pack in production, type, and overall profit indexes.
We’ve been less aggressive on fertility, cow survival under stress, and environmental footprint.
The bulls that did the most “work” in Canadian herds in 2024 also nudged inbreeding higher.
That sets up the key question for 2026: What are you going to do when you breed those daughters?
If you continue stacking similar high‑production, below‑average‑fertility, high‑relationship sires on top of them, you’ll keep moving LPI and Pro$ up—but you may also:
Push inbreeding higher.
Put more strain on reproduction and transition‑cow programs.
Lag on traits processors and regulators are starting to reward, like feed efficiency and methane‑related performance.
The alternative is to stay aggressive on genetic gain where it matters most for your herd, while using the new LPI subindexes and genomic tools to protect functional traits and diversity.
It’s worth noting that many AI companies are now actively promoting outcross or lower‑relationship bulls and subindex “balanced” sires to help address future genetic needs. Those options are on the semen delivery truck—it just comes down to whether we actually use them.
What Progressive Herds Are Doing Differently
Across Canadian Lactanet‑profiled herds, US herds highlighted in Hoard’s and Dairy Herd, and European setups facing tight environmental rules, the most progressive operations tend to do four things with their breeding programs.
1. They Don’t Stop at the Top Line Index
Most of us have, at some point, just circled the top two or three bulls on our preferred total merit index list—LPI, Pro$, Net Merit, etc.—and then called it a breeding plan. It’s quick—and to be fair, it used to work “well enough.”
The herds that are pulling ahead now ask:
What are my top three herd problems right now—reproduction, mastitis, lameness, culling age, transition disease?
How do those problems line up with the Reproduction, Health & Welfare, Longevity & Type, and Milkability subindexes?
Then they pick bulls that are high enough on LPI/Pro$/Net Merit and are very strong where their herd is weakest.
Examples:
A Western Canadian quota herd shipping into a butterfat‑heavy market may load more weight on fat %, reproductive efficiency, and Environmental Impact (feed efficiency, methane efficiency), because contract and policy pressures are moving in that direction.
A robot barn in Ontario may rank bulls first on Milkability (speed, temperament, udder/teat traits compatible with robots), then on LPI/Pro$, because slow‑milkers drag down box throughput.
The point is: the overall index gets you in the right ballpark; the subindexes and trait profiles decide whether you actually fix the problems that cost you money.
2. They Set Clear Inbreeding and Relationship Limits
Modern mating programs—whether through AI company software or integrated herd tools—let you set an expected inbreeding ceiling per mating.
A common approach:
Target: keeping individual matings under about 8% expected inbreeding (roughly “cousin‑level” or less).
Cap: avoid using any one sire providing more than 5–10% of replacements in a given year, so you don’t wake up in five years and realize half the herd traces back to only two bulls.
Genomic relationship data give much sharper views of how closely related bulls actually are, so herds and advisors are using it to:
Avoid stacking very closely related sires on the same cow families.
Balance high‑index sires across different lines to keep the gene pool wider.
This isn’t about avoiding genomics—it’s about using genomics to capture speed without painting yourself into a corner.
3. They Treat Haplotypes and Recessives as Standard Inputs
In 2026, ignoring fertility haplotype and genetic defect data is a bit like ignoring somatic cell counts. You can do it, but it will cost you.
The practical rule of thumb:
Carrier sires are okay if they bring needed strengths.
Carrier × carrier matings are not made.
On the farm, that means:
Genomically test all replacement heifers.
Make sure genomic testing and AI reports clearly identify carrier cows and bulls for known Holstein defects (HH1–HH6, CD/HCD, and others tracked by your provider).
Turn on “block carrier × carrier” in mating programs.
Review your herd’s carrier percentages; if a high proportion of heifers carry a given defect, re‑balance the sire lineup to avoid stacking that issue deeper.
Preventing even a handful of lost pregnancies or weak calves per year more than pays for the time it takes to configure those filters.
4. They Mix “Rocket Fuel” and “Workhorse” Genetics on Purpose
A pattern that shows up in data‑driven herds is deliberate stratification of matings.
For example:
Use a select group of very high‑index “rocket fuel” sires (top LPI/Pro$/Net Merit) on the very best genomic heifers and cow families to keep the top of the herd pushing forward fast.
Use a broader group of balanced “workhorse” sires—above average for Reproduction and Health & Welfare, solid for Longevity & Type—on the rest of the herd, especially family lines that have given you trouble on fertility or health.
That way, you:
Capture the upside of genomics where it pays the most.
Build a herd that isn’t full of fragile “one‑and‑done” cows that leave before third lactation.
A Quick Ontario Illustration
Imagine a 400‑cow Holstein herd.
The numbers say:
Too many cows are leaving before their fourth lactation.
Reproduction is “okay” but not great.
The current sire used list is heavy on very high LPI/Pro$ bulls that are below breed average for Reproduction Index and only average for Health & Welfare, with some matings up around 12–14% expected inbreeding.
A revised 3–4 year strategy might look like this:
Keep one or two of those elite genomic or proven sires for your best genomic heifers and highest‑index cows.
Add three to four “workhorse” genomic or proven less inbred bulls that are at or above breed average for Reproduction Index and Health & Welfare Index, and still have solid LPI/Pro$ numbers, even if they’re 200–300 points lower than the “rocket fuel” bulls.
Set an inbreeding ceiling goal of around 8% in the mating program.
Turn on avoidance for key haplotypes and genetic defects.
Over the next few years, you’re likely to see:
Modest improvement in pregnancy rate and fewer days open.
More cows are making it into fourth and fifth lactation without a parade of health or welfare events.
Slightly slower LPI/Pro$ progress on paper, but higher actual milk shipped per cow over a lifetime, because more cows stick around long enough to exceed paying back their rearing cost and reach peak productivity.
Here’s the rough math on that last point. If shifting your sire mix means an average cow stays an extra 0.3–0.5 lactations, and each additional lactation is worth roughly $1,500–$2,000 in net margin after feed and overhead, you’re looking at $450–$1,000 extra net income per cow over her lifetime. In a 400‑cow herd turning over 30–35% of cows per year, that trade‑off can easily be worth $50,000–$100,000+ per year on the income side—money that more than offsets a slightly slower climb on paper index.
Metric
“Rocket Fuel Only” Strategy
Balanced “Rocket + Workhorse” Strategy
Difference
Avg LPI/Pro$ Annual Gain
+110 LPI / +240PRO$
+85 LPI / +190PRO$
-25 LPI / -50PRO$
Avg Productive Life (Lactations)
2.8
3.3
+0.5 lactations
% Cows Reaching 4th Lactation
32%
48%
+16 percentage points
Avg Inbreeding (%)
12.8%
9.2%
-3.6 percentage points
Pregnancy Rate (21-day)
18.5%
22.0%
+3.5 points
Extra Net Income per Cow (Lifetime)
Baseline
+$650–$900
+$650–$900
400-Cow Herd (Annual Impact)
Baseline
+$65,000–$90,000/year
+$65,000–$90,000/year
3–5 Year Cumulative ROI
Baseline
$195,000–$450,000
$195,000–$450,000
That trade‑off—slightly less “flash” for more “cows that work longer and require less individual care”—is where the real money often sits.
Three Questions to Ask Your AI Rep This Spring
If you’re not sure where to start, these questions cut through the catalog noise fast:
“Which bulls in your lineup are above breed average for both Reproduction and Health & Welfare subindexes, and still strong on LPI/Pro$?” This forces the conversation beyond the very top LPI or Net Merit names.
“Can you run a report showing my herd’s average expected inbreeding and carrier status for major Holstein haplotypes and genetic defects?” This gives you a baseline for both diversity and hidden risk.
“If I wanted to balance my sire lineup between a few elite ‘rocket fuel’ bulls and more ‘workhorse’ functional sires, what would that look like for my herd?” This turns a product pitch into a strategy discussion tailored to your data.
A Straightforward Pre‑Order Checklist
Before your next semen order or breeding push, a simple checklist ties all of this together:
Pull the last 2 years of herd data.
Look at culling reasons and ages; how many cows leave before fourth lactation?
For each bull, jot down Production, Longevity & Type, Reproduction, Health & Welfare, Milkability, and Environmental Impact scores under the new LPI structure.
Flag bulls that are strong for Production but clearly below breed average for Reproduction or Health & Welfare.
Decide on an inbreeding ceiling and diversity plan.
Work with your advisor to set a mating target (e.g., an expected inbreeding level below 8%).
Consider setting limits on how much any single bull can contribute to replacements over the next 1–2 years.
Make sure haplotype and recessive filters are turned on.
Confirm your mating software blocks carrier × carrier matings for known Holstein haplotypes and genetic defects.
Ask for a herd‑level carrier summary so you know your starting point.
Balance your sire list.
Keep a select group of elite “rocket fuel” sires for the very top females.
Add at least one or two “workhorse” sires that are clearly strong for Reproduction and Health & Welfare to shore up your everyday cows.
If you remember nothing else, remember those three pillars: protect functional traits, manage diversity, and balance elite and workhorse genetics. Together, they do more for long‑term profitability than chasing any single proof list.
So, Did Genomics Deliver? The $238,000 Answer
If we’re honest, the answer is “yes—and.”
Yes, genomics delivered faster progress and more precise selection. Studies from the US, Canada, and Europe are very clear: genetic gains in production, health, fertility, and longevity traits are higher now than in the old progeny‑testing era.
And at the same time, genomics amplified both the strengths and the weak spots in our breeding goals:
We pushed production and type forward fast.
We made positive strides in some health and fertility traits, but they still lag behind production in terms of genetic gain rate.
We leaned hard on a relatively small set of sire and cow families, tightening the gene pool and increasing inbreeding.
We uncovered haplotypes and genetic defects hitchhiking on high‑index lineages, reminding us that progress always comes with complexity.
The good news is that the tools to manage those trade‑offs—modernized LPI, Pro$, genomic testing, mating software, and herd analytics—are better than ever.
The Bottom Line
Here’s the critical point: without genomics, there is no measurable ROI on genetic improvement. In the pre‑genomic era, you couldn’t reliably capture this kind of return because you couldn’t accurately identify high‑profit genetics early enough or fast enough. Today you can—and the math works out. A 400‑cow herd making smarter breeding decisions with genomic tools can realistically capture $50,000–$100,000+ per year in additional lifetime profit from cows that stay longer, breed back faster, and require less intervention. Over a typical planning horizon of three to five years, that’s the $238,000 question answered: genomics delivered the tools; your breeding decisions determine whether you actually capture that ROI.
Most of us aren’t in this to win a banner once and sell the herd. The goal is herds we actually like milking: cows that calve in with ease, handle transition without a parade of treatments, breed back on a reasonable schedule, stay sound on their feet, and survive long enough to make heifer raising pencil out positively.
The bulls you choose this year will still have daughters freshening in your barn in 2032. The closer those daughters are to the cows you actually want in your parlor—on reproduction records, on health reports, and on your balance sheet—the more of genomics’ promise you’ll actually capture.
Genomics gave us the speed. Now the job is making sure we’re steering it in the right direction for our own future dairy enterprise.
Key Takeaways
Genomics delivered: Genetic gains for milk, fat, protein, health, and longevity have roughly doubled since 2008—faster than progeny testing ever achieved.
But there’s a catch: Intense selection on a small elite group has pushed inbreeding past 11% and narrowed the gene pool, quietly eroding fertility and robustness.
New tools help you see the trade-offs: Lactanet’s six LPI subindexes show exactly where a bull stands on Reproduction, Health & Welfare, Milkability, and Environmental Impact—not just total merit.
Progressive herds are steering, not chasing: They mix “rocket fuel” and “workhorse” sires, cap inbreeding under 8%, and block carrier × carrier matings for haplotypes and defects.
The payoff is real: A 400-cow herd using these strategies can capture $50,000–$100,000+ per year in extra lifetime profit—that’s the $238,000 answer over 3–5 years.
Executive Summary:
Genomic selection has roughly doubled the rate of genetic gain for milk, fat, and protein, while also improving health and longevity traits compared with the old progeny‑testing era. Canadian data on the 20 most‑used Holstein sires show LPI and Pro$ values rising so fast since 2008 that daughters now generate several thousand dollars more lifetime profit per cow, adding up to $50,000–$100,000 or more per year in a well‑run 400‑cow herd. The flip side is that heavy reliance on a small group of elite families has increased inbreeding and reduced effective population size, which can chip away at fertility, health, and robustness if it’s ignored. Lactanet’s modernized LPI, with subindexes for Reproduction, Health & Welfare, Milkability, and Environmental Impact, gives breeders the dashboard they need to see those trade‑offs instead of just chasing one total merit number. Leading herds are using genomics to cap inbreeding, avoid carrier‑to‑carrier matings for haplotypes and defects, and deliberately mix a few high‑index “rocket fuel” sires with more balanced “workhorse” bulls that protect functional traits. In that context, the “$238,000 question” has a clear answer: genomics really can deliver that level of return over a few years, but only for farms that actively steer their breeding programs rather than letting the proof list do the driving.
Complete references and supporting documentation are available upon request by contacting the editorial team at editor@thebullvine.com.
Learn More
The Missing Piece in Genomic Selection: Why the Best Herds Still Walk the Pens – Stop the profit drain of early exits by identifying why cows leave before paying back their $2,600 rearing costs. This breakdown arms you with a tactical checklist to filter genomics through “cow sense” and secure more third-plus lactations.
2025 Dairy Year in Review: Ten Forces That Redefined Who’s Positioned to Thrive Through 2028 – Exposes the ten structural forces—from beef-on-dairy premiums to a shrinking replacement pipeline—shaping the next three years. It delivers the strategy to treat breeding as capital allocation, positioning your operation to thrive through the most volatile heifer market in 20 years.
Every week, thousands of producers, breeders, and industry insiders open Bullvine Weekly for genetics insights, market shifts, and profit strategies they won’t find anywhere else. One email. Five minutes. Smarter decisions all week.
What dairy breeders are discovering about the gap between traits that theoretically eliminate bulls and the ones that actually prevent collection and sale
EXECUTIVE SUMMARY: The traits that should disqualify bulls increasingly don’t—and that gap is costing commercial producers real money. While genomic screening has driven lethal haplotype carriers below 2% according to Lactanet data, problematic traits like elevated SCS and marginal udders now get marketed with management caveats rather than screened out. Operations ranging from small tie-stalls to 20,000-cow multi-state enterprises share a striking philosophical alignment: cow families and validation matter more than catalog numbers alone. GenoSource tracks cow families across generations—their matriarch, Miss OCD Robust Delicious, Holstein International Cow of the Year in 2018, still contributes embryos today. McCarty Family Farms discovered that roughly a quarter of their parentage records were incorrect before implementing systematic tracking that now achieves compliance in the mid-to-high 90s. Canadian operations like Walnutlawn, Lovholm, and Bosdale have bred World Dairy Expo champions while focusing on cow families rather than chasing the latest rankings. Their shared conviction: genomics tells you what genes an animal carries, but pedigree analysis reveals whether families actually transmit predictably. Commercial producers can close this gap through greater sire diversification, realistic expectations about young genomic predictions, and systematic tracking of what actually works in their own herds.
Here’s a number that caught my attention when I first saw it: according to a 2023 paper in Animals describing the BullVal$ decision-support model developed at the University of Wisconsin-Madison, when researchers applied their economic framework to actual AI company inventory, they recommended culling 49% of bulls because their projected net present value was negative.
Nearly half. That’s not a typo.
Whether those bulls were actually removed from service? The paper doesn’t say. And honestly, that gap between “should cull” and “actually culled” tells you a lot about how knockout traits really work today.
For decades, the industry operated on a pretty straightforward premise: certain genetic weaknesses could render an otherwise elite bull unmarketable. Terrible udders on a high-production bull? Knockout. Daughters that couldn’t get pregnant despite great indexes? Knockout. These single-trait failures were supposed to disqualify bulls regardless of their other merits.
But the reality has gotten more nuanced. The traits that actually prevent bull collection have narrowed considerably, while the traits that probably deserve more scrutiny often get marketed around rather than screened out. With component prices holding strong and butterfat premiums rewarding production efficiency, the economic stakes of genetic decisions have rarely been higher. Understanding this dynamic matters whether you’re running 200 cows in Vermont or 5,000 in the Central Valley.
What Actually Constitutes a Knockout Trait Today
Let’s start with what genuinely prevents a bull from being collected and marketed. Based on industry data and published research, true knockouts fall into surprisingly narrow categories.
Physical impossibilities remain absolute barriers. Bulls that can’t produce viable semen, have poor libido, or produce semen that doesn’t survive freezing simply can’t generate revenue. Studies on breeding bull disposal consistently show that subfertility issues—especially poor semen quality, inadequate libido, and poor semen freezability—are among the leading reasons bulls get culled from AI programs. These physical limitations account for the vast majority of young bull removals, not genetic trait concerns.
Genomically verifiable defects create binary decisions. Haplotypes like HH1 through HH6, which cause embryonic loss or calf mortality, are now routinely screened via genomic testing. Genetic evaluation centers like CDCB publish carrier status for these defects on most bulls marketed in North America—it’s become standard practice.
The screening has been effective. Lactanet reports that for Canadian Holsteins born between 2020 and 2023, carrier frequencies for HH1 through HH4 are now below the 2% level. HH5 carriers have dropped to close to 5%, and HH6—discovered only in 2019—has reached nearly 2% for 2023 births. The newer concern is Early Onset Muscle Weakness Syndrome (MW), which Lactanet added to its routinely published evaluations in 2024. Because it’s a more recent addition to screening panels, carrier frequency remains higher and warrants continued attention. But for the established haplotypes, genomic testing has largely solved the problem before bulls ever reach collection—exactly what the technology was supposed to do.
Trait Category
Industry Performance
Current Status
Feedback Loop Speed
Farmer Action Needed
Lethal Haplotypes (HH1-HH4)
✓ Solved
Below 2% carriers
Immediate (genomic test)
Trust genomic screening
HH5 Haplotype
⚠ Improving
~5% carriers
Immediate (genomic test)
Verify carrier status
Somatic Cell Score (SCS)
⚠ Unresolved
Bulls >3.00 SCS still marketed
1-2 lactations
Apply personal cutoffs
Inbreeding Accumulation
✗ Worsening
Doubling annually vs. pre-genomic era
3-5+ generations
Diversify bloodlines now
Young Bull Prediction Accuracy
✗ Overstated
Common 100+ NM$ downward drift
5-6 years (daughter proof)
Mentally discount 10-15%
Stature Extremes
✓ Self-corrected
Market shifted to moderate
1-2 lactations
Select <+2.0 stature
You either carry the mutation, or you don’t. There’s simply no gray zone to work around.
Market-specific requirements have emerged as conditional knockouts—and they vary more by geography than most North American producers realize.
For Jersey programs in some regions, sexed semen production capability has become nearly essential. In VikingJersey herds, sexed semen usage reached 72% of all dairy inseminations by March 2021, according to VikingGenetics. In Norway, 99% of VikingJersey semen sales are sexed. In the United States, the trend is growing but less dramatic—Journal of Dairy Science data shows Jersey sexed semen usage increased from 24.5% to 32.1% between 2019 and 2021. Still, a Jersey bull that can only produce conventional semen faces a shrinking market regardless of his genetic merit.
Market/Region
Breed
Sexed Semen Usage (%)
Implication for Bulls
Norway
Jersey
99%
Cannot produce sexed = unmarketable
VikingJersey Herds (Mar 2021)
Jersey
72%
Sexed capability near-essential
United States (2019)
Jersey
24.5%
Conventional bulls still viable
United States (2021)
Jersey
32.1%
Growing pressure for sexed capability
A2A2 status has become essential for producers targeting A2 milk premiums—a consideration that barely existed ten years ago.
In Dutch and Flemish markets, the NVI total merit index places substantially more weight on functional traits—longevity, health, udder health, fertility, and claw health—than on production, according to CRV documentation. That’s a fundamentally different emphasis than TPI’s production-heavy weighting. Buyers in these markets apply stricter thresholds for feet and legs, udder health, and milking speed than typical US selection criteria.
What does that fragmentation mean practically? A bull that ranks elite on TPI may look mediocre on NVI or RZG because those indexes weigh traits so differently. Getting a sire that fits all systems requires more, not less, due diligence, as genomic selection has expanded internationally.
The Gray Zone: Traits That Deserve Attention But Don’t Stop Collection
Experienced breeders often report similar patterns when it comes to somatic cell score. Bulls with SCS predictions around 3.00 or higher tend to leave daughters with noticeable cell count issues. The correlation isn’t perfect, but it’s consistent enough that many elite operations treat elevated SCS as a serious concern regardless of other merits.
You’ve probably noticed this in your own cows. Genetic evaluations consistently show that higher SCS breeding values are associated with a higher genetic predisposition to mastitis, which is why many breeders treat elevated SCS as a red-flag trait when choosing sires.
But here’s the market reality—elite genetics operations represent a small fraction of total semen purchases. When a breeder decides not to use a bull because of concerning SCS, the AI company’s sales numbers barely register the difference. They’ve already moved thousands of units to commercial operations that evaluated the NM$ ranking and placed orders.
Regional Threshold Differences
What constitutes a knockout varies substantially by market—and understanding those differences matters if you’re selling genetics internationally or evaluating bulls developed for other markets.
European buyers, particularly in the Netherlands and Belgium, tend to apply harder cutoffs on functional traits than North American selectors. The Dutch-Flemish NVI devotes substantial weighting to health, fertility, longevity, and conformation, with claw health and saved feed costs explicitly included since 2018. A bull borderline on udder health or feet and legs might move thousands of units in Wisconsin but struggle to gain traction in the Dutch-Flemish market. Conversely, some international markets still use raw milk volume as a primary screening threshold—which might seem outdated to producers focused on fat-plus-protein economics, but reflects local pricing structures.
The practical implication: when evaluating an imported bull or one heavily marketed for “global” appeal, check how he actually ranks in his home market’s index system. Elite TPI doesn’t guarantee elite LPI, RZG, or NVI performance—and the gaps can be substantial.
Industry geneticists at major AI companies acknowledge that severely negative mammary scores effectively disqualify bulls in most international markets. That sounds like a knockout trait. But what actually happens when an elite genomic bull tests at + with a slightly negative udder composite?
In practice, the marketing materials emphasize his exceptional production genetics and outstanding feet and legs. The udder concern gets mentioned—but perhaps framed as “best suited for herds with excellent management protocols.” Let me be direct about what that language means: when a catalog says a bull is “best suited for excellent management,” it’s a signal that his daughters will need him. The bull gets collected. The semen gets sold. And to be fair, in many well-managed operations, those daughters may perform just fine.
This isn’t meant as criticism of AI companies—they’re responding to market signals and customer demand. But it does mean commercial producers benefit from understanding that “knockout trait” and “marketed with management caveats” represent different categories.
The Stature Correction: How Trait Priorities Actually Shift
Perhaps no trait better illustrates how genetic priorities evolve—and why some corrections happen faster than others—than stature.
For decades, the dairy industry selected for taller cows. Show rings rewarded height. Classification systems scored it positively. The prevailing assumption was that a bigger frame meant bigger capacity for high production.
That’s changed. Tall bulls that would have commanded premiums a decade ago now face resistance in many markets—a change driven largely by commercial producer feedback rather than show ring preferences.
What changed wasn’t the underlying biology. What changed was that commercial producers—particularly those with freestall facilities—accumulated enough direct experience to question the institutional preference for height. Many breeders with freestall operations learned the same lesson independently: their tallest cows didn’t hold up as well in the stalls, often ending up moved to alternative housing or culled earlier than expected.
Research eventually caught up to what farmers were observing. A Canadian Dairy Network analysis found that stature had essentially no meaningful correlation with herd life compared with other functional traits—despite decades of positive selection for tall cows. European research has similarly shown that very heavy cows are often less efficient than moderate-weight animals, producing less milk per unit of feed intake at the extremes of body size.
Why did the stature correction actually work? A few key characteristics made the difference:
The problem was visible within individual herds. Farmers could see their tall cows go lame, struggle with stall fit, and get culled earlier. Attribution was relatively clear—tall cows had specific, observable problems that were harder to blame on nutrition or management alone. The solution was straightforward: select for moderate stature. And crucially, there was no competitive penalty—shorter bulls still carried high genetic merit for production.
This last point matters enormously. When you can address a problem without sacrificing production, the market tends to self-correct. When fixing a problem means accepting lower genetic merit… those corrections stall. Sometimes for decades.
The Problems That May Not Self-Correct
Here’s where the conversation gets more complicated—and more important for long-term planning.
Inbreeding rates are increasing. A 2022 study in Frontiers in Veterinary Science analyzing Italian Holstein populations found that genomic inbreeding has been increasing measurably since the adoption of genomic selection, with annual genomic inbreeding growth roughly doubling compared to the pre-genomic era. Studies in Dutch-Flemish, French, and North American populations show broadly similar patterns.
Why doesn’t this trigger a market correction like stature did? Probably because inbreeding depression manifests through diffuse symptoms—slightly lower fertility here, slightly higher disease incidence there, somewhat shorter productive life. No individual producer can easily identify inbreeding as the specific cause of their herd’s challenges. The effect appears real, but it’s invisible primarily at the individual farm level.
Genomic predictions for young bulls tend to be optimistic. Canadian and US evaluation centers have documented that daughter proofs for genomically preselected sires often drift downward relative to their original genomic predictions. The mechanism makes sense: when you genomically test millions of animals and select the absolute best fraction of a percent as bull mothers, you’re selecting from an already pre-selected population. The genomic model assumes something closer to random sampling. Reality works differently.
We’ve seen this pattern play out as daughter data accumulates. Several heavily-used young sires from 2021-2022 have come in meaningfully below their original predictions—in some cases by 100 points or more on NM$. The pattern isn’t universal—some bulls hold or even improve—but the downward drift is common enough that mentally discounting those catalog numbers reflects reality better than taking them at face value.
What does this mean practically? Consider this scenario: if you’re selecting bulls at +900NM$ expecting +$900 performance, but reality delivers something closer to +$720, that’s a meaningful gap in genetic merit you’re not capturing. Across 100 replacement heifers per year, that kind of shortfall adds up to real money—potentially tens of thousands of dollars annually in genetic value you expected but didn’t receive. That’s not a published industry average; it’s a realistic scenario producers should be prepared for when relying heavily on young genomic bulls.
Heat tolerance is becoming increasingly relevant. Genetic and management research has highlighted a tension between high production and heat tolerance. Higher-producing cows generate more metabolic heat, making them more vulnerable to heat stress in hot, humid conditions—a relationship that Lactanet and other organizations have flagged in their heat-tolerance extension materials.
This tension between genetic selection and climate adaptation may not self-correct through normal market mechanisms. The feedback is slow, attribution is difficult, and any producer who prioritizes heat tolerance typically accepts some trade-offs in production metrics. For operations in the Southeast or Southwest, this is already pressing. Upper Midwest operations have more runway, but increasingly intense summer heat events are changing that calculus.
The Feedback Loop Challenge
What really distinguishes problems that get market correction from problems that persist?
Stature got corrected because problems became visible in 1-2 lactations, cause-and-effect was reasonably clear, solutions didn’t require sacrificing production, and individual farmer decisions aggregated into a market signal.
Challenges like inbreeding accumulation, genomic prediction bias, and heat tolerance adaptation may persist because problems emerge gradually across 3-5+ lactations, attribution is genuinely difficult at the individual herd level, solutions often involve trade-offs against genetic merit, and there’s no clear mechanism for individual observations to aggregate into market pressure.
Here’s a concrete timeline that illustrates the problem: A bull marketed heavily in early 2021 produces daughters that start calving in late 2022. You get meaningful first-lactation performance data by mid-2024. By the time you have enough information to evaluate whether he delivered on his genomic promise—late 2025—you’ve already bred to his sons and grandsons for two or three generations. If there’s a problem, it’s already propagated through your herd before you knew it existed.
Genomic selection compressed generation intervals to 2.3 years—bulls have grandsons breeding before their daughters even finish first lactation. Meaningful validation requires 5-6 years, creating a catastrophic timing mismatch
Genomic selection now proceeds in 2-3 year cycles—generation intervals have dropped from around 5 years pre-genomic to as low as 2.3 years for some selection pathways. But daughter performance feedback still takes 5-6 years to accumulate. The math doesn’t work in the producer’s favor.
To be fair, genomics has delivered substantial progress on many traits—something AI company geneticists rightly point to when defending the system. US data from CDCB and Holstein USA show that rates of severe calving difficulty have dropped substantially over the past few decades as breeders have consistently selected for calving ease. But calving ease had characteristics that enabled rapid correction: immediate feedback, clear attribution, and universal agreement that it was worth addressing.
The traits that concern forward-thinking breeders today often lack those same characteristics.
What Elite Operations Do Differently
Two operations—one placing around 200 bulls into AI annually from a large Iowa herd, the other managing the largest registered Holstein herd in the United States across multiple states—share a striking philosophical alignment with smaller, elite breeders: cow families and validation matter more than catalog numbers alone.
The Genomic Validators
“We’re not afraid to mate apparent opposites. Progress requires calculated risks,” says Kyle Demmer, COO of GenoSource, a family-owned Iowa operation that’s become a global genetics powerhouse since eight families combined their herds in 2014. But those calculated risks aren’t blind bets on genomic numbers—they’re grounded in cow-family evaluation spanning generations.
When GenoSource CEO Tim Rauen discusses his favorite cow, the answer isn’t their highest-testing heifer. It’s T-Spruce Jaela 47718 VG-87. As Rauen explained in The Bullvine’s profile of the operation: “Out of her, already more than 50 sons, grandsons, and great-grandsons have left for AI, so she will truly have a lot of influence.” That’s not a genomic prediction—that’s multi-generational transmitting consistency you can actually verify.
Their legendary Miss OCD Robust Delicious proves the point even more dramatically. Named Holstein International Cow of the Year in 2018, this bovine matriarch still contributes valuable embryos to their program today. Her genetic fingerprint is evident across their top GTPI sires. Rauen notes that Delicious combines high genetic merit with strong mammary traits and efficiency, which is why her influence shows up in so many of GenoSource’s highest-ranking bulls. In an industry where youth often reigns supreme, Delicious demonstrates that longevity and productivity can validate genomic promise—but only if you’re tracking results long enough to see it.
GenoSource’s approach to show cattle reinforces this philosophy. Their three-time World Dairy Expo champion Ladyrose Caught Your Eye-ET isn’t just a show animal—sixteen of her daughters score VG-87 or higher and are productive members of working herds, according to The Bullvine’s coverage. That’s the kind of validation genomics alone can’t provide.
The operation tests a large number of bull candidates annually, placing around 200 in AI programs with companies such as Select Sires, Semex, ABS, and others. But what separates GenoSource from operations that simply chase genomic numbers is their insistence on tracking cow families across generations—verifying whether genomic promise translates into barn performance.
The Data-Driven Approach at Scale
At McCarty Family Farms—2025 World Dairy Expo Dairy Producers of the Year, operating the largest herd of registered Holsteins in the United States across Kansas, Nebraska, and Ohio—the approach scales differently, but the principle holds.
“Unlike managing by feel, we allow the data to drive many of our decisions,” Ken McCarty has explained. But critically, that data isn’t just genomic predictions—it’s actual performance systematically tracked across their operation.
When the McCartys first implemented comprehensive genomic testing, they discovered something sobering: roughly a quarter of recorded parentage in their herd was incorrect. As Ken reflected in interviews, how can you drive appropriate genetic progress or make the breeding decisions that will propel your business forward with that kind of foundational error? Today, after overhauling data capture and mating systems, their monthly compliance reports for mating recommendations consistently reach the mid-to-high 90% range.
McCarty’s standardization approach offers a template for commercial operations. Each farm operates the same synchronization protocols, treatment protocols, breeding strategies, and vaccination strategies. This consistency across their multi-site operation creates the statistical power to identify which sire families actually deliver—and which disappoint.
Since the early 2010s, they’ve increased both milk yield and overall output per cow substantially as the operation expanded, reflecting the combined impact of genetics, nutrition, and management changes. Their focus on genetic enhancement of milk protein content, which is notably harder to improve via diet than butterfat, serves both customer demand and sustainability goals.
Ken acknowledges they haven’t abandoned traditional cow sense—they’ve augmented it with technology and analytics. Being able to sharpen the focus on traits where the herd may be deficient has been transformational, he notes. Their newest facility in Rexford, Kansas, completed in 2023, reflects this commitment to both scale and precision management.
The Common Thread
What GenoSource and McCarty share with smaller elite breeders isn’t rejection of genomics—both operations embrace genomic testing extensively. What they share is a conviction that validation matters.
GenoSource tracks cow families across generations. Jaela’s 50+ descendants to AI, Delicious still producing and contributing embryos, Captain’s daughters showing up in global herds while his grandsons continue the legacy. McCarty standardizes protocols specifically to enable performance comparison—consistent data entry, identical definitions across locations, real-time feedback on what’s actually working. Both prioritize multi-generational transmitting consistency over single-point genomic tests.
Rauen captures the philosophy when discussing their flagship bull GenoSource Captain: “Captain’s consistency across generations is unprecedented. His daughters dominate global herds while his grandsons, like Garza, continue the legacy.” Consistency—that’s what genomic predictions alone can’t guarantee.
The practical application for commercial producers is clear: when evaluating bulls, verify how the cow family has performed across multiple generations and multiple environments. Check if daughters from that line actually delivered on the genomic promise in similar operations to yours. Elite operations at every scale don’t trust catalog numbers alone.
Proof of Concept From Small Herds
While operations like GenoSource and McCarty demonstrate these principles at commercial scale, it’s worth noting what smaller operations have accomplished. Recent Bullvine profiles have highlighted Canadian herds such as Walnutlawn, Lovholm, and Bosdale, which have bred World Dairy Expo champions and amassed impressive numbers of Excellent-classified cows relative to their herd sizes.
“Cow families are probably number one,” says Michael Lovich of Lovholm Holsteins. “If I don’t like the cow family the bull comes from, we won’t use him. When I see bulls that are out of three unscored dams, I don’t care what the numbers are.”
Their cows average considerably longer productive lives than the industry norm. When you can keep cows productive that much longer than average, your entire economic model shifts.
The common thread across all these operations—whether 72 cows or approaching 20,000—is disciplined focus on cow families and consistent transmission, not just chasing the latest bull rankings.
Practical Strategies for Commercial Operations
Given these market realities, what can commercial producers actually do? You can’t completely insulate yourself from system-wide dynamics—but you can meaningfully reduce your exposure.
Strategy
Bulls Used
Avg. Genetic Merit
Risk if 2 Bulls Disappoint
Annual Cost/Cow
Verdict
Concentrated “Elite”
4-6 bulls
Top rankings (+NM$)
$20,000-$40,000 lossacross 3-4 years(40-50% of breedings affected)
$0 genetic trade-off+ high disappointment risk
High risk
Diversified Insurance
10-15 bulls
85th-95th percentile(20-30 NM$ lower)
$4,000-$8,000 lossacross 3-4 years(15-20% of breedings affected)
Diversify more than conventional wisdom suggests. If you’re currently using 4-6 bulls, consider spreading across 10-15. The genetic merit trade-off is real—you might average 20-30 NM$ lower across breedings compared to concentrating in your top picks. On a 500-cow herd, that’s foregone genetic potential.
But here’s the math that matters: if two of your concentrated bulls disappoint significantly—which happens more often than catalog marketing suggests—you’ve absorbed that loss across a large portion of your herd. When you spread breedings across more sires, individual disappointments hurt less. The insurance usually wins.
Recognize which predictions deserve more confidence. Production traits (milk, fat, protein) and linear type traits have relatively strong genomic prediction accuracy—reliability often above 70%—because they’re highly heritable and measured on enormous reference populations.
Trait Category
Reliability(%)
Confidence Level
Milk production
75%
High – Trust prediction
Fat production
75%
High – Trust prediction
Protein production
73%
High – Trust prediction
Linear type traits
68%
High – Trust prediction
Somatic cell score
40%
Medium – Moderate confidence
Longevity
15%
Low – Skepticism warranted
Metabolic resilience
8%
Low – Skepticism warranted
Daughter fertility (DPR)
4%
Very Low – Near guesswork
Daughter fertility (heritability around 4%), metabolic resilience, and longevity have substantially lower prediction accuracy. When choosing between bulls with similar production indexes, consider breaking the tie based on proven functional traits from older bulls in the pedigree.
Develop your own red flag checklist:
SCS above +2.8 (potential mastitis pressure—could cost $100-200/cow annually based on university extension estimates)
Stature above +2.0 (mobility and facility-fit considerations)
Extreme production combined with a negative udder composite (potential antagonism)
Heavy concentration of single bloodlines in recent generations (inbreeding risk)
Consider the 85th-95th percentile rather than chasing top rankings. Bulls in the 85th-95th percentile typically deliver strong genetic gain without the extreme trait combinations that sometimes accompany absolute top rankings. You might sacrifice 50-100 pounds of milk per lactation—call it $8-15 per cow annually at current component prices—but potentially avoid antagonisms that accompany extreme selection.
Track performance systematically in your own herd. Most modern DHI programs and herd management software—DC305, PCDART, DairyComp, BoviSync—can generate sire-based performance reports when appropriately configured. After 3-4 years, you’ll start seeing patterns emerge. When three consecutive bulls from the same bloodline show similar problems in your operation, that’s a signal worth acting on.
Learn from operations that actually track results. McCarty’s discovery that roughly a quarter of their parentage records were incorrect before implementing systematic tracking should concern every producer who hasn’t verified their own data quality. Their subsequent improvement to compliance in the mid-to-high 90s shows what’s possible when you take data integrity seriously.
Use proven bulls strategically. You can’t use daughter-proven bulls exclusively without falling behind on genetic progress. But for your best cow families, your older cows that have already proven their value, and animals with reproductive challenges? The predictability of proven genetics has genuine worth.
What This Means for Your 2026 Breeding Decisions
With the spring breeding season approaching and proof updates coming in April and August, here’s how to put this analysis to work.
Before your next semen order: Pull your current bull lineup and honestly assess concentration. How many distinct sire lines are you actually using? If fewer than 8-10, you’re probably overconcentrated.
Apply realistic expectations. When evaluating young genomic bulls, remember that daughter proofs often come in below initial predictions. If a bull is still attractive, assuming some regression from his current numbers, proceed. If your enthusiasm depends entirely on that top-end number being accurate, that’s a warning sign.
Ask better questions of your AI rep. Instead of “who’s your hottest young bull,” try: “Which bulls have you seen daughters from, and how are they holding up?” Good reps appreciate being treated as consultants rather than order-takers.
For Southeast and Southwest operations: Heat tolerance should already be a significant factor in your bull selection. Don’t wait for more data—the direction is clear.
For Upper Midwest and Northeast operations: You have more runway on heat tolerance, but start tracking summer performance by sire now. The data you collect this year will inform decisions in 2027-2028.
For Canadian producers: The same principles apply to LPI—the prediction mechanics and preselection dynamics work the same way, even if the index construction differs.
Looking Ahead
Heat tolerance is transitioning from academic interest to practical necessity. Lactanet and other organizations are beginning to publish heat tolerance metrics worth monitoring.
Feed efficiency selection is entering mainstream genetic programs, which introduces complexity. French national research has highlighted the importance of preserving robustness and reproductive performance while pursuing efficiency gains—flagging concerns about excessive body condition loss during the transition period when cows are genetically selected for extreme efficiency.
Early data on residual feed intake shows it’s heritable (estimates generally range from 0.12 to 0.38), which means we can select for it. Whether aggressive selection before we fully understand the reproductive and health implications makes sense is worth careful consideration.
Regional data-sharing cooperatives represent one mechanism that could strengthen market feedback. If 10-15 commercial dairies in your area agreed to pool anonymized daughter performance data by sire, you’d collectively have enough statistical power to identify performance patterns years before official evaluations reflect them. Your local DHI cooperative or breed association can tell you what’s available in your region.
Six Things to Do This Breeding Season
The system won’t protect you from genetic disappointment. AI companies are doing their job: selling semen. Your job is the hard part—living with the results. A 72-cow tie-stall operation has bred World Dairy Expo champions by trusting cow families. A 20,000-cow operation discovered that a quarter of its parentage records were incorrect before fixing them. Your job is to find your own version of that balance: diversify against the bulls that won’t deliver, be realistic about predictions that may be optimistic, and track what actually works in your barn. That’s not cynicism. That’s what people who breed elite cattle have been doing all along.
This week: Pull your current bull lineup. Count distinct sire lines—if you’re under 8-10, start planning to diversify.
Before your next order: Be realistic about young bull predictions. If he’s still your pick, assuming some regression from catalog numbers, proceed with confidence.
This breeding season: Reserve your proven bulls for your top 20% cow families and any animals with reproduction challenges.
Within 90 days: Set up sire-based reporting in your herd management software. The capability is probably there—you just haven’t configured it yet.
This season: Verify your parentage data before trusting it for your genetic decisions. What McCarty found wasn’t unique; it’s what they found when they actually looked.
This year: Start a conversation with 3-4 neighboring operations about comparing sire performance informally. Shared observations over coffee can reveal patterns that help everyone.
Your cows are generating information about which genetics actually work in your operation. The question is whether you’re capturing that information systematically—and whether you trust it as much as you trust the marketing materials.
Key Takeaways
True knockouts have shrunk to physical impossibilities and verified genetic defects. Lactanet data shows haplotype carriers HH1-HH4 are now below 2% in recent Holstein births. Meanwhile, traits like elevated SCS and marginal udders get marketed with “best suited for excellent management” caveats—translation: his daughters will need it.
Be realistic about young bull predictions. Canadian and US evaluation centers have documented that genomic proofs for heavily preselected sires often decline when daughters are added. That gap between expectation and reality can cost you meaningful genetic progress over time.
Validation beats prediction at every scale. GenoSource tracks cow families across generations—Delicious is still contributing embryos after being named the 2018 Cow of the Year. McCarty discovered roughly a quarter of their parentage records were wrong before implementing mid-to-high 90s mating compliance. Canadian operations have bred WDE champions by focusing on cow families rather than catalog rankings. The common thread: multi-generational transmitting consistency.
Diversify harder than you think you should. Use 10-15 bulls, not 4-6. When concentrated bulls disappoint, you’ve absorbed that loss across a large portion of your herd. Spreading breedings means individual disappointments hurt less. The insurance math usually wins.
Your cows are generating data—use it. Elite operations from small tie-stalls to multi-state enterprises track sire performance systematically. The question isn’t whether that information exists; it’s whether you trust your barn data as much as the marketing materials.
Complete references and supporting documentation are available upon request by contacting the editorial team at editor@thebullvine.com.
The Year Dairy Lost $6.7 Billion: The Bullvine’s Top 15+ Articles of 2025 – Arms you with the “survival architecture” industry disruptors use to defy consolidation. This analysis exposes the GenoSource and McCarty playbook for collective investment and vertical integration, providing the blueprint for building a resilient, multi-generational business moat.
The Sunday Read Dairy Professionals Don’t Skip.
Every week, thousands of producers, breeders, and industry insiders open Bullvine Weekly for genetics insights, market shifts, and profit strategies they won’t find anywhere else. One email. Five minutes. Smarter decisions all week.
To provide the best experiences, we use technologies like cookies to store and/or access device information. Consenting to these technologies will allow us to process data such as browsing behavior or unique IDs on this site. Not consenting or withdrawing consent, may adversely affect certain features and functions.
Functional
Always active
The technical storage or access is strictly necessary for the legitimate purpose of enabling the use of a specific service explicitly requested by the subscriber or user, or for the sole purpose of carrying out the transmission of a communication over an electronic communications network.
Preferences
The technical storage or access is necessary for the legitimate purpose of storing preferences that are not requested by the subscriber or user.
Statistics
The technical storage or access that is used exclusively for statistical purposes.The technical storage or access that is used exclusively for anonymous statistical purposes. Without a subpoena, voluntary compliance on the part of your Internet Service Provider, or additional records from a third party, information stored or retrieved for this purpose alone cannot usually be used to identify you.
Marketing
The technical storage or access is required to create user profiles to send advertising, or to track the user on a website or across several websites for similar marketing purposes.
To provide the best experiences, we and our partners use technologies like cookies to store and/or access device information. Consenting to these technologies will allow us and our partners to process personal data such as browsing behavior or unique IDs on this site and show (non-) personalized ads. Not consenting or withdrawing consent, may adversely affect certain features and functions.
Click below to consent to the above or make granular choices. Your choices will be applied to this site only. You can change your settings at any time, including withdrawing your consent, by using the toggles on the Cookie Policy, or by clicking on the manage consent button at the bottom of the screen.
Functional
Always active
The technical storage or access is strictly necessary for the legitimate purpose of enabling the use of a specific service explicitly requested by the subscriber or user, or for the sole purpose of carrying out the transmission of a communication over an electronic communications network.
Preferences
The technical storage or access is necessary for the legitimate purpose of storing preferences that are not requested by the subscriber or user.
Statistics
The technical storage or access that is used exclusively for statistical purposes.The technical storage or access that is used exclusively for anonymous statistical purposes. Without a subpoena, voluntary compliance on the part of your Internet Service Provider, or additional records from a third party, information stored or retrieved for this purpose alone cannot usually be used to identify you.
Marketing
The technical storage or access is required to create user profiles to send advertising, or to track the user on a website or across several websites for similar marketing purposes.











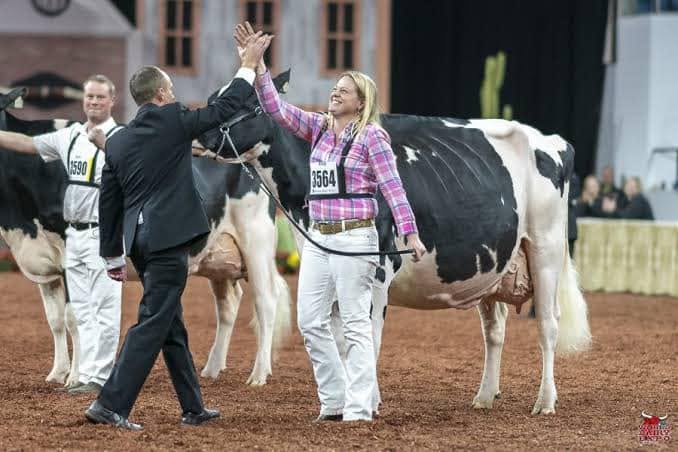

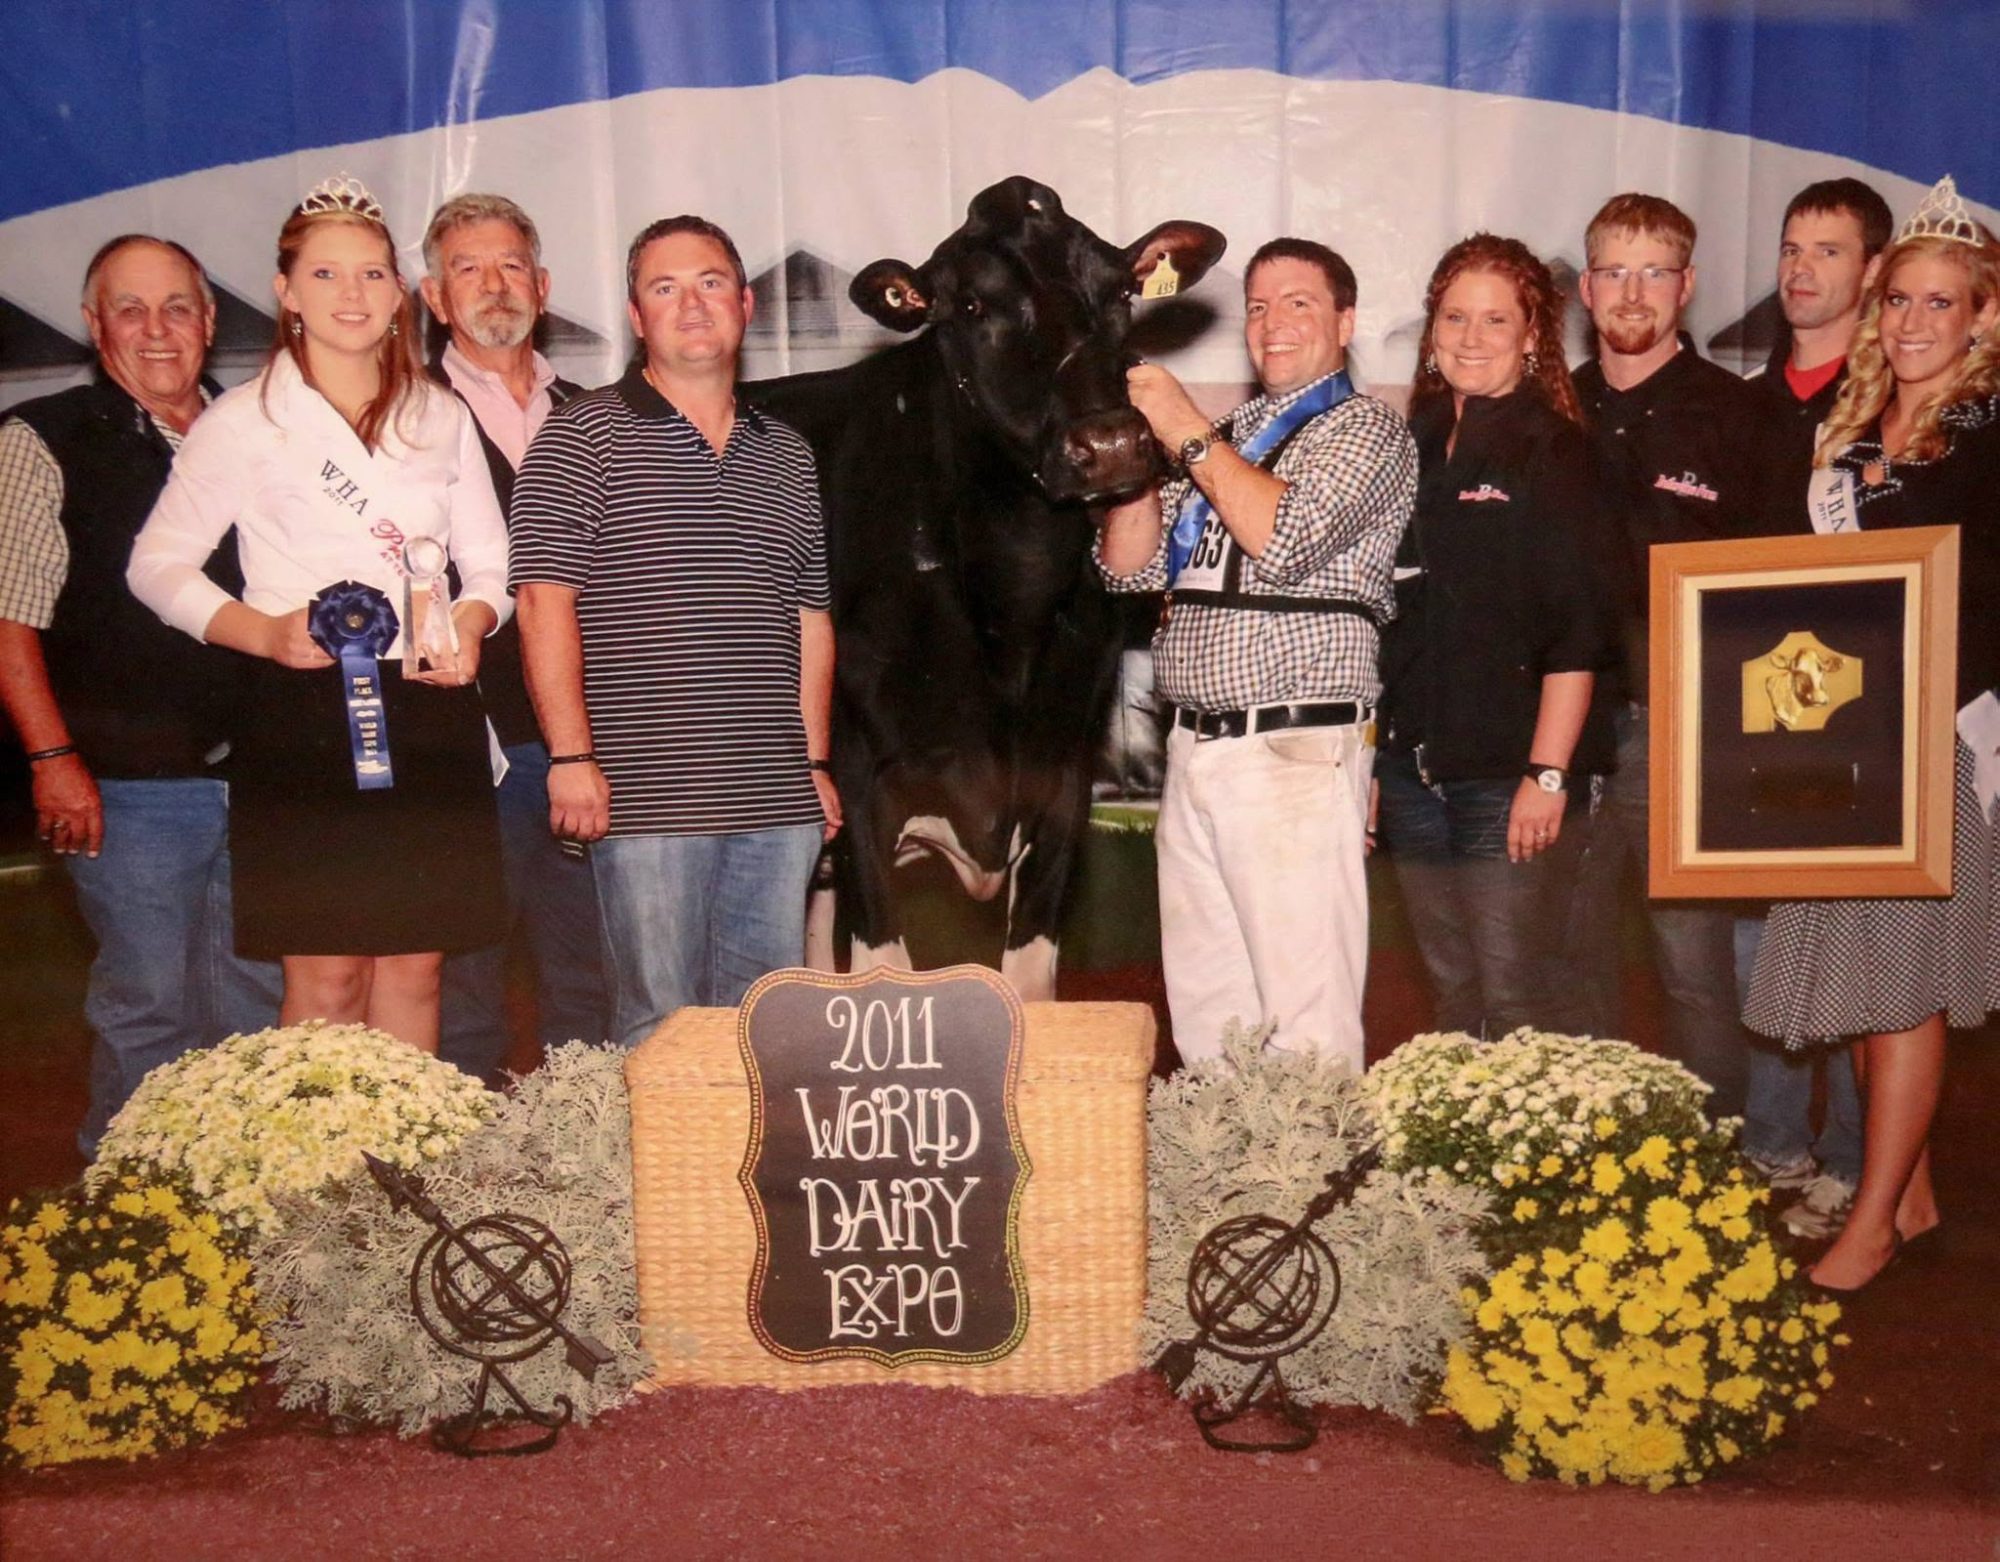
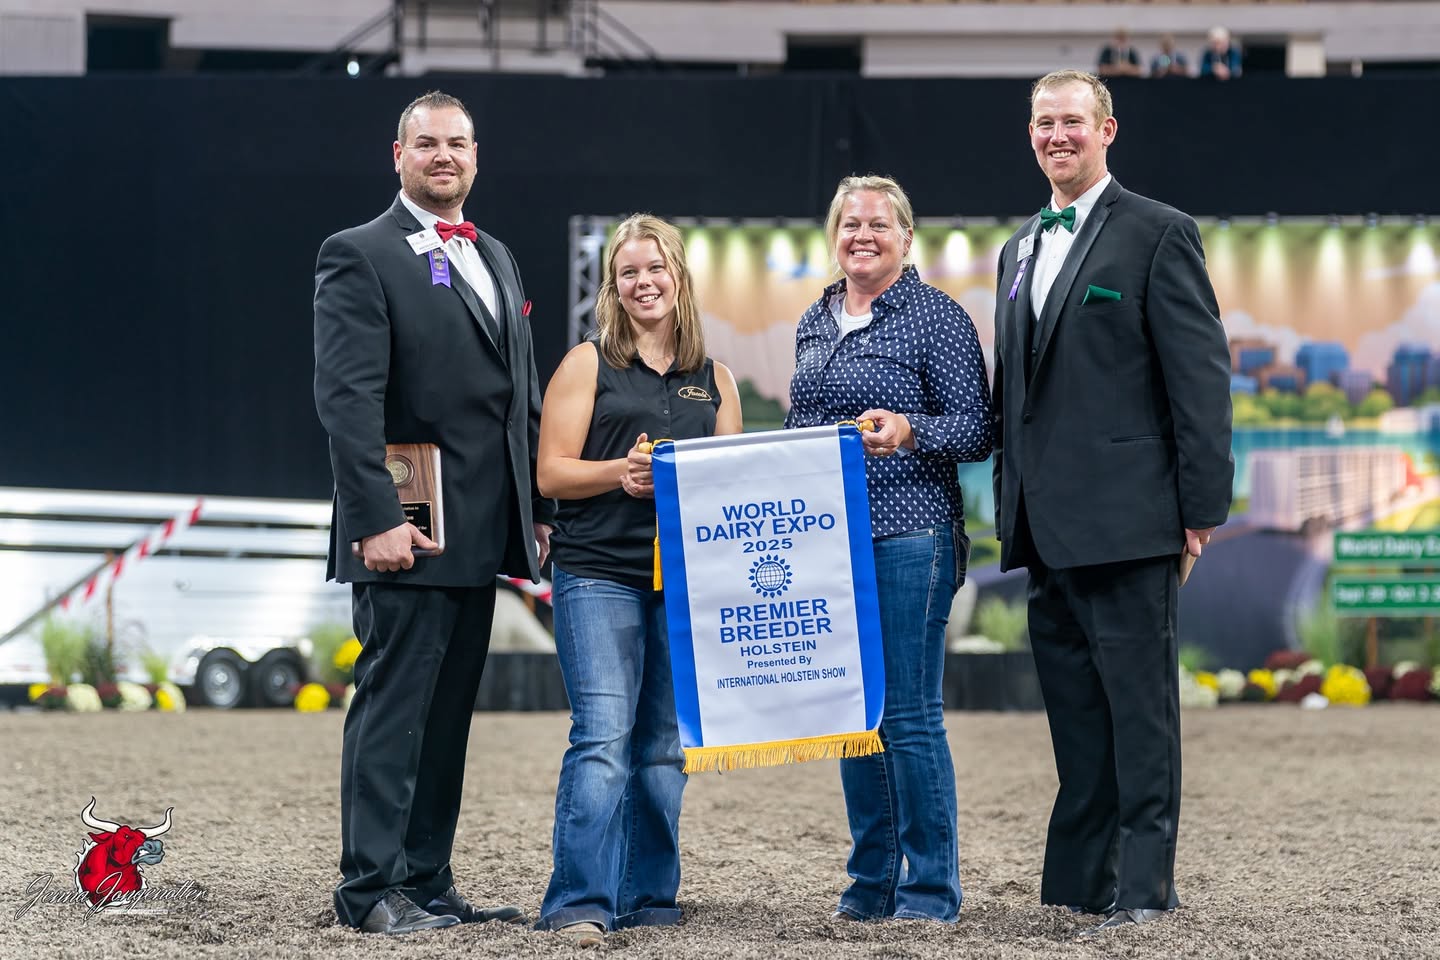
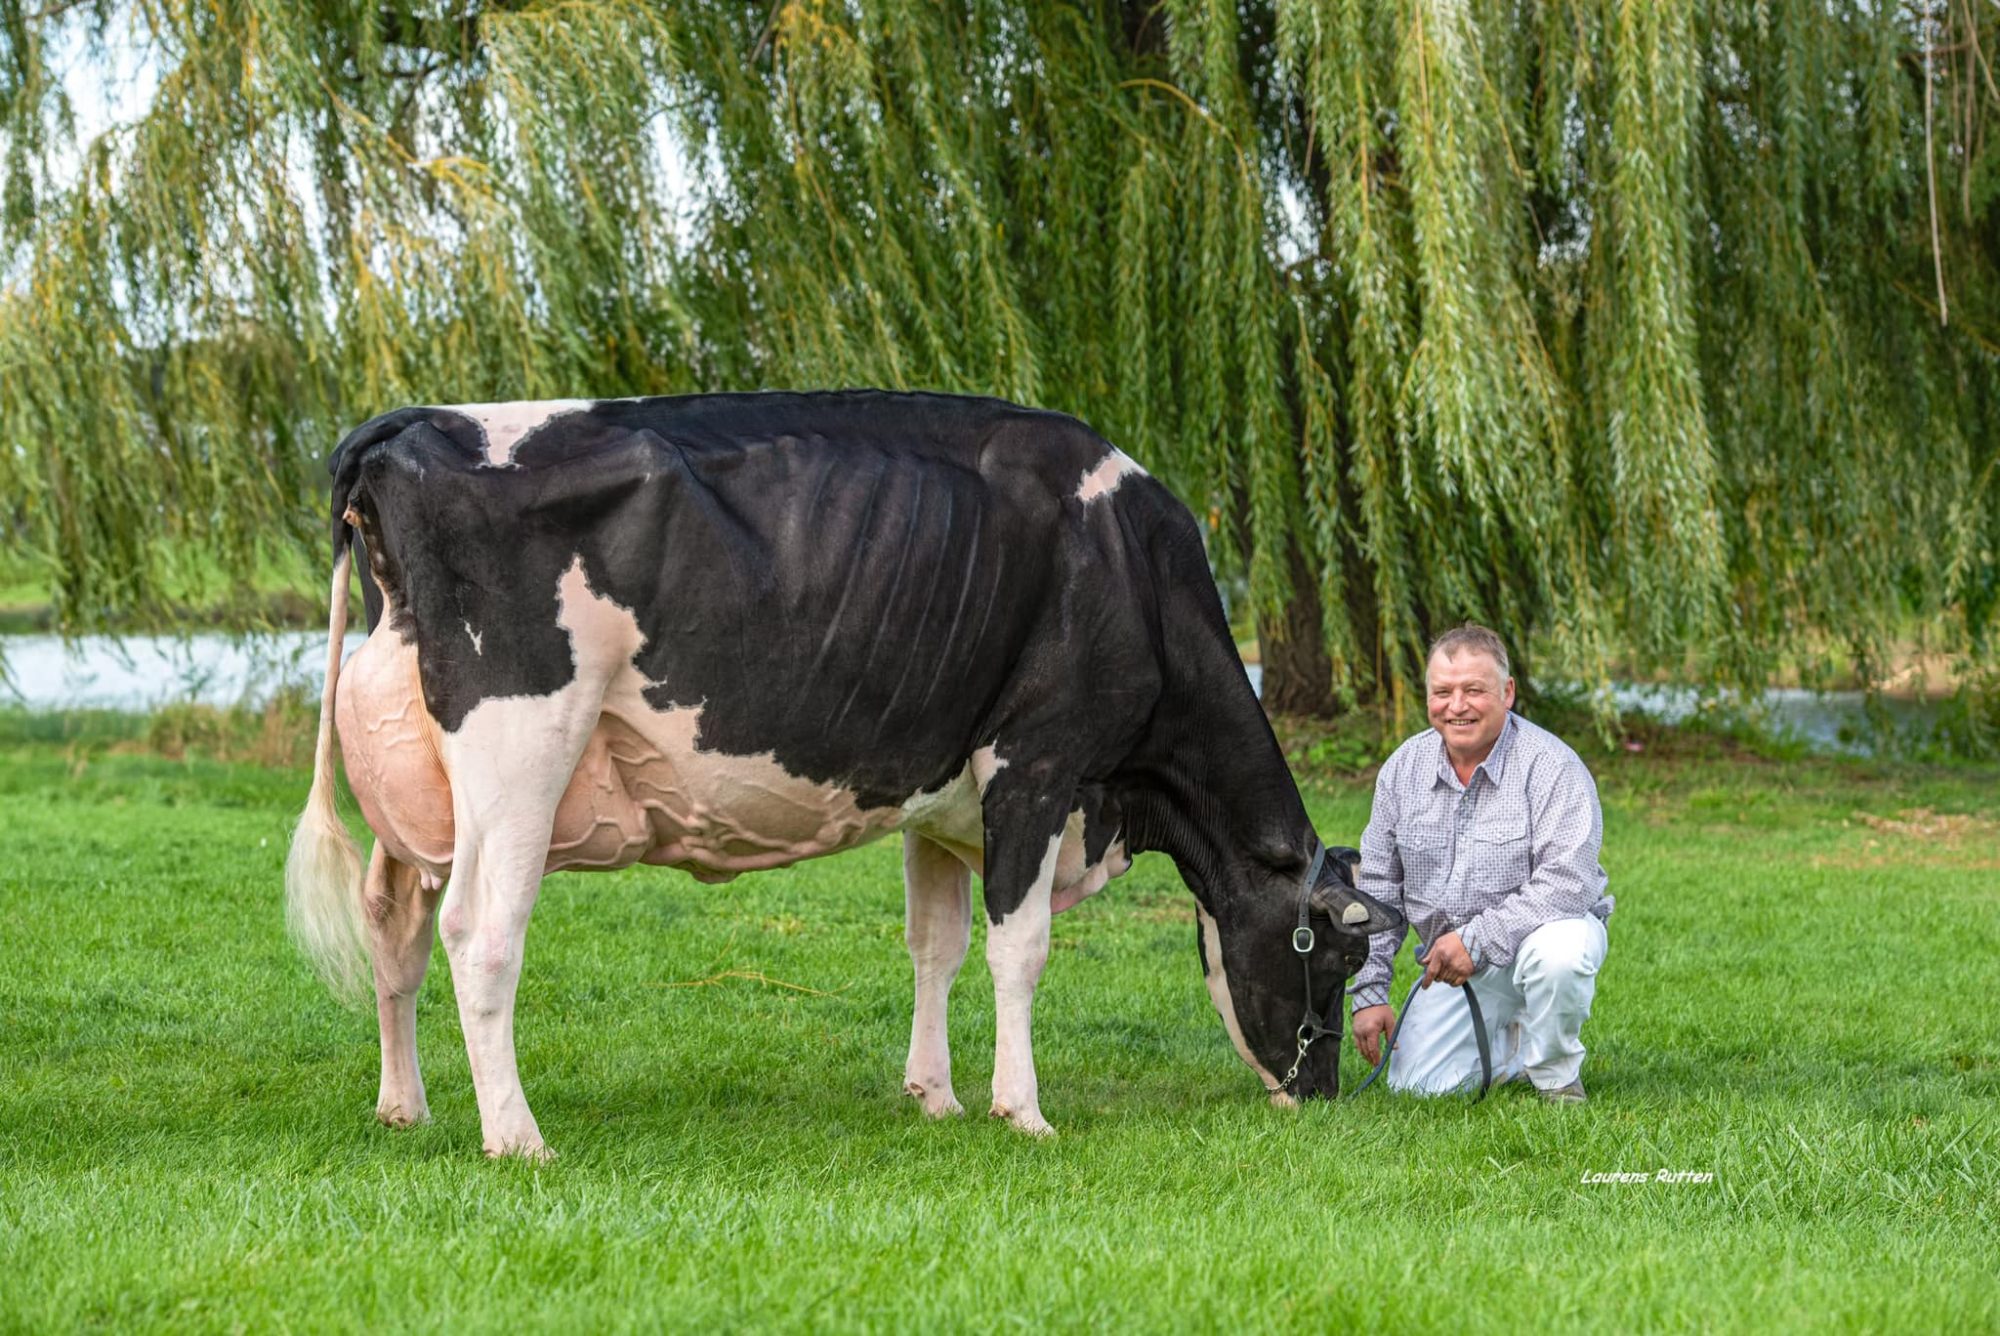
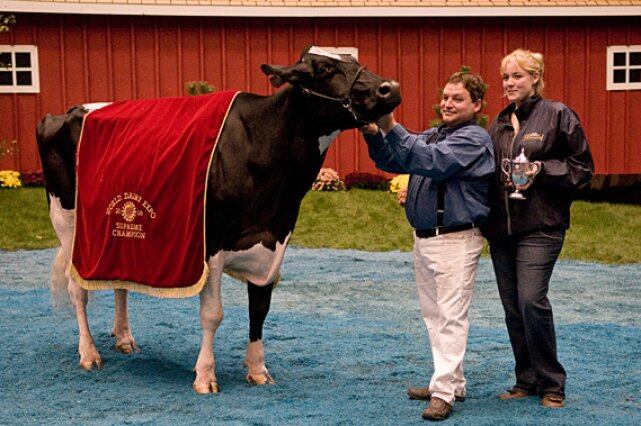
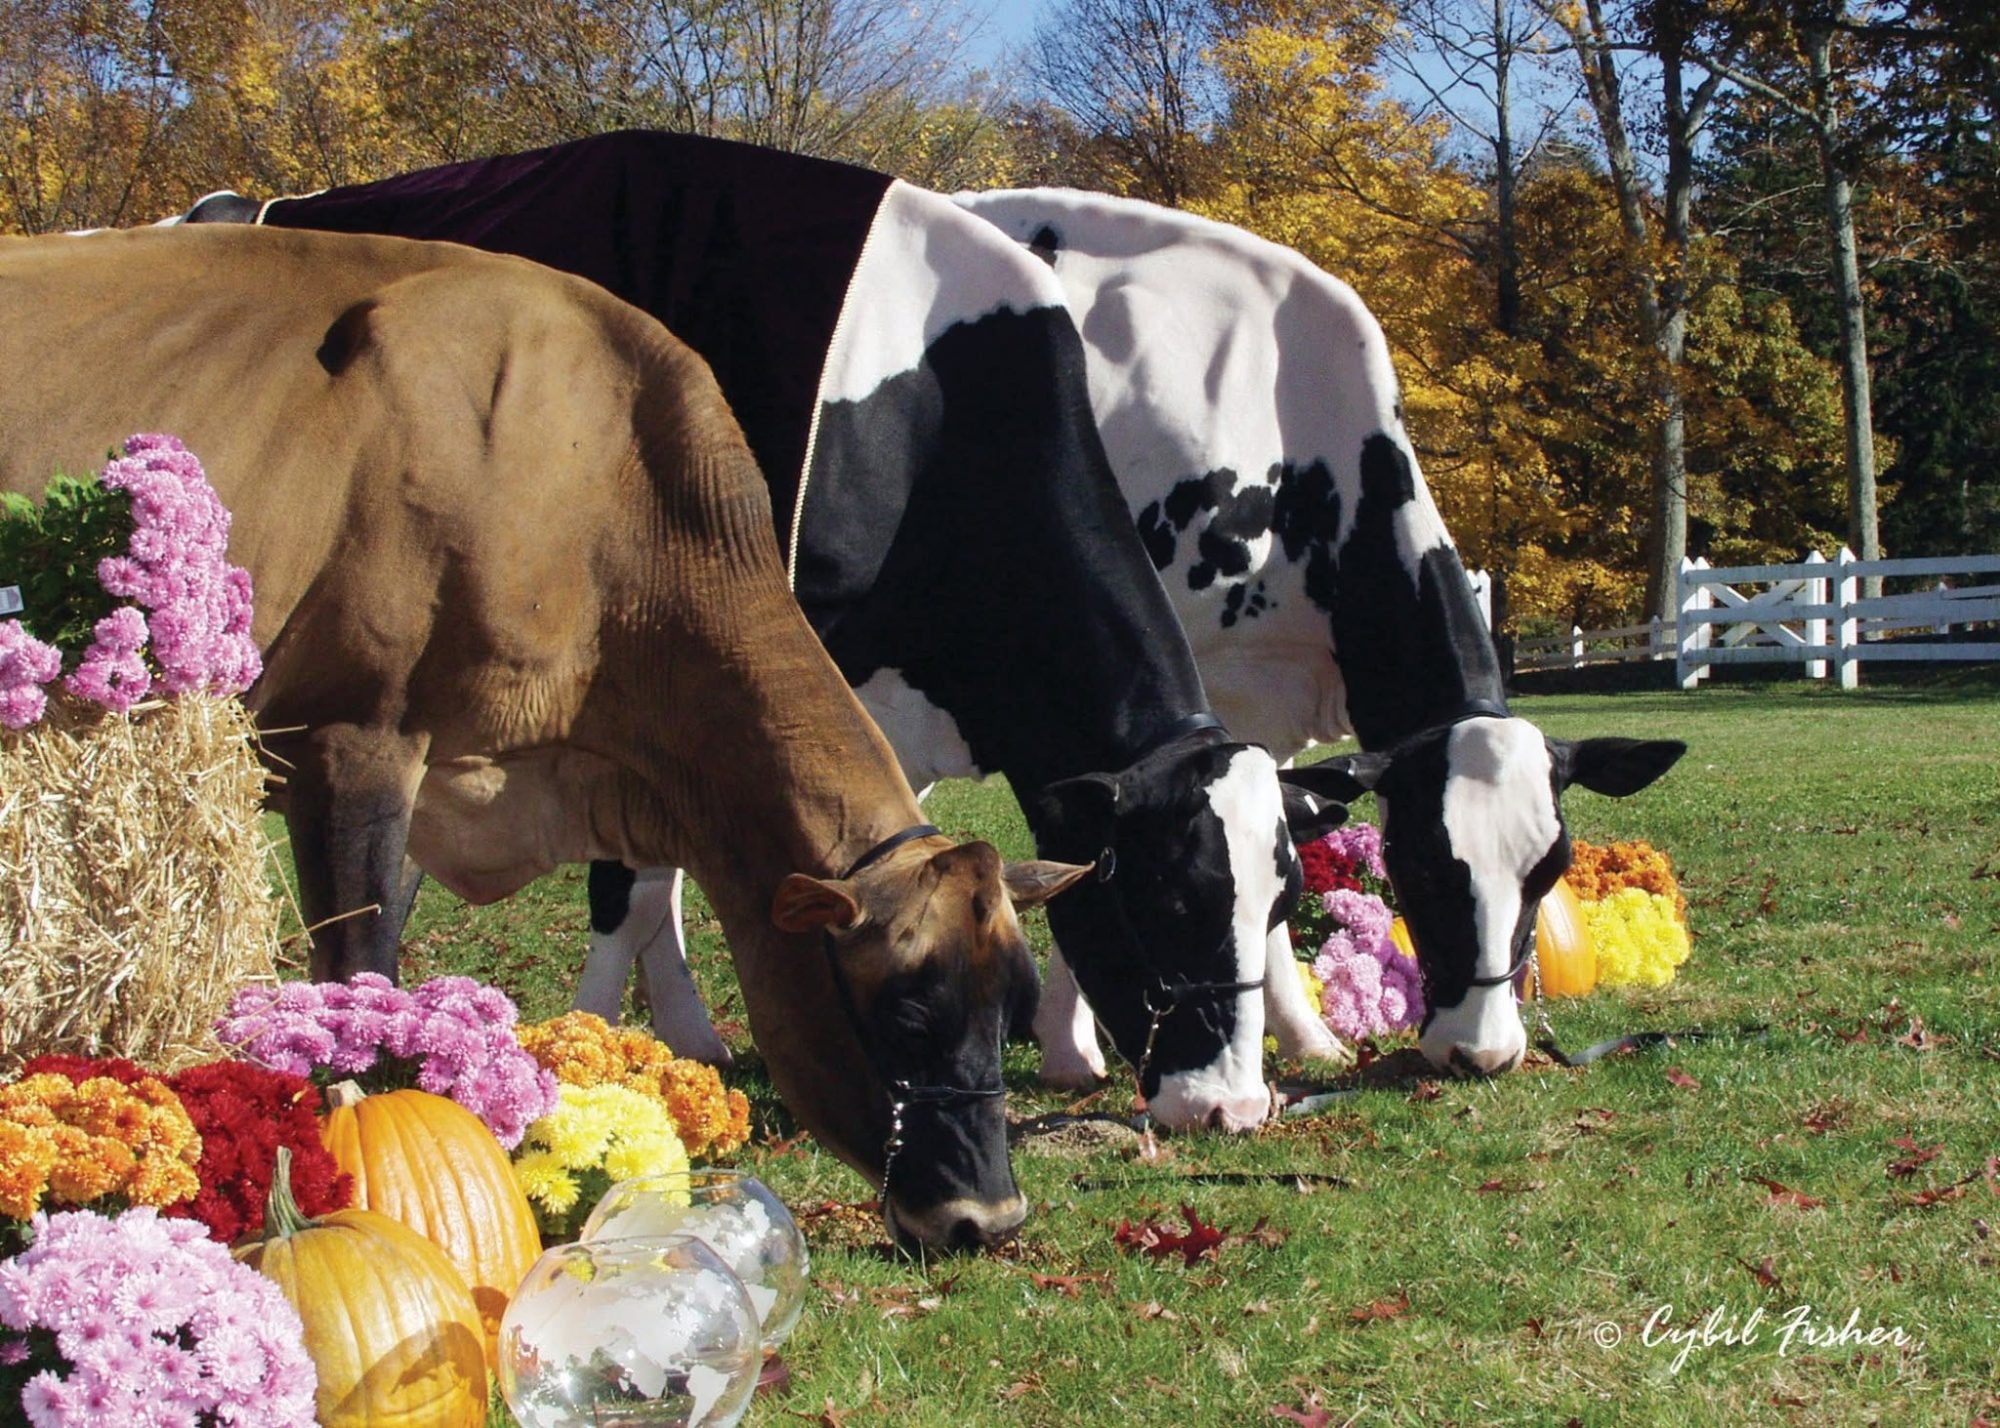
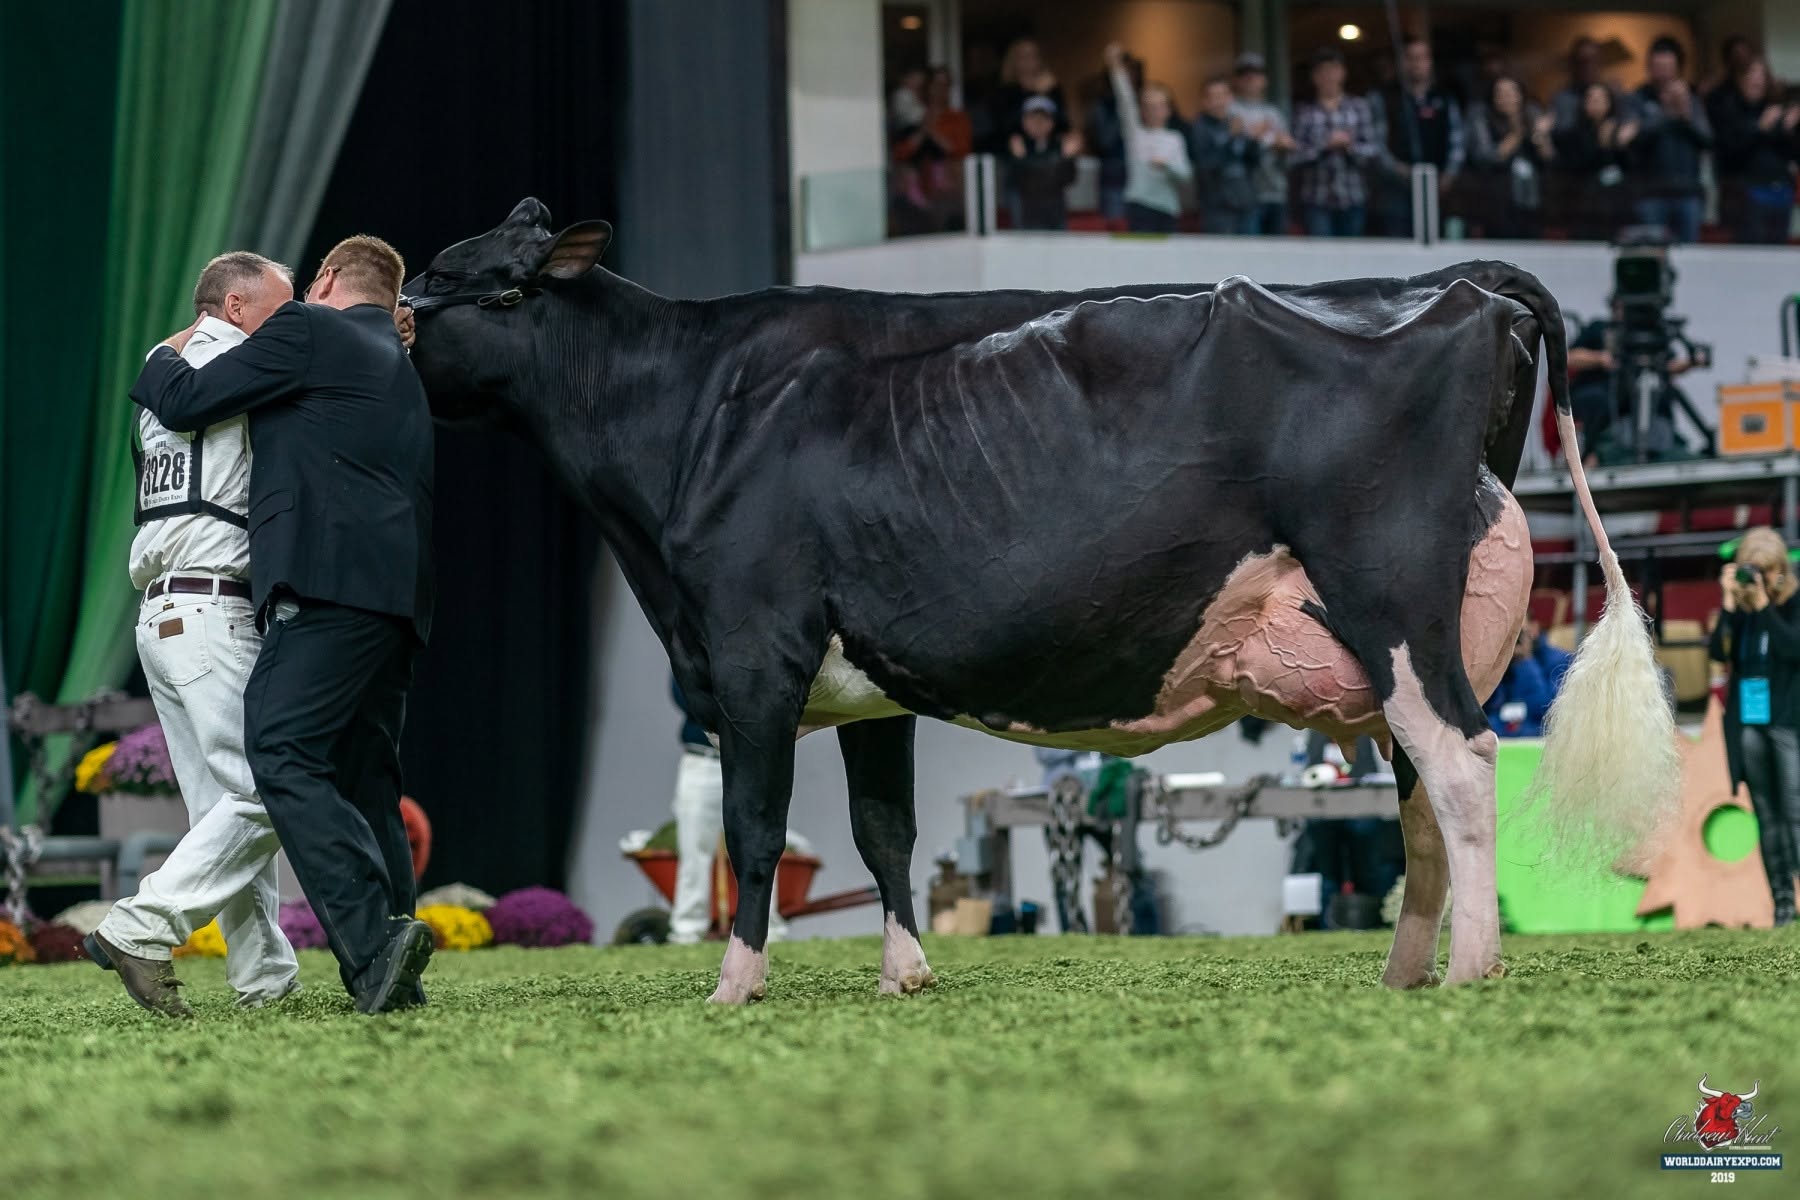
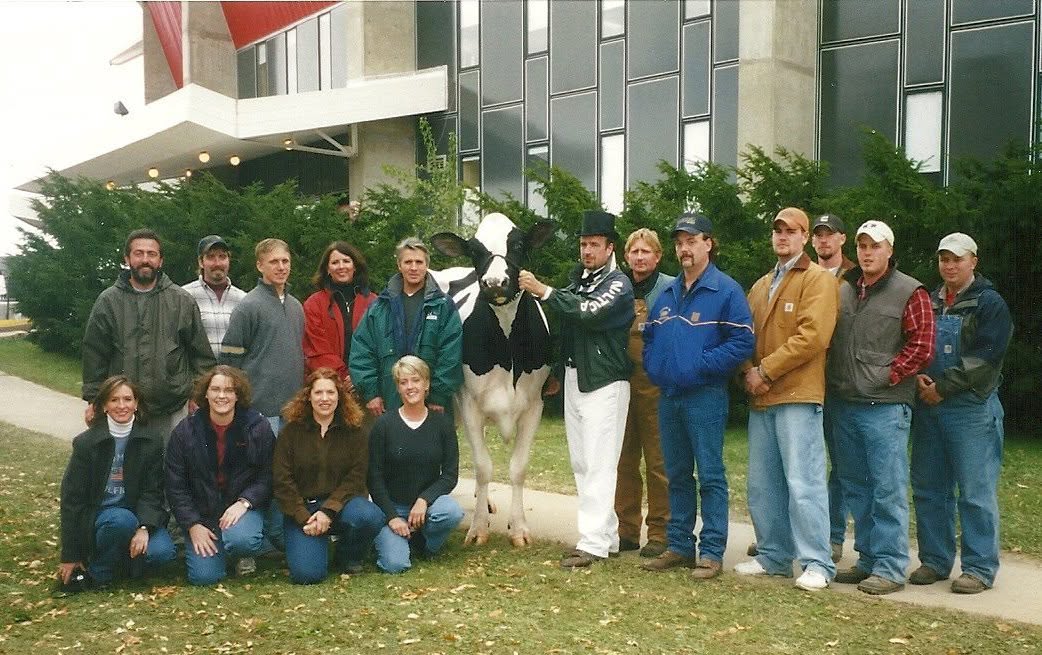
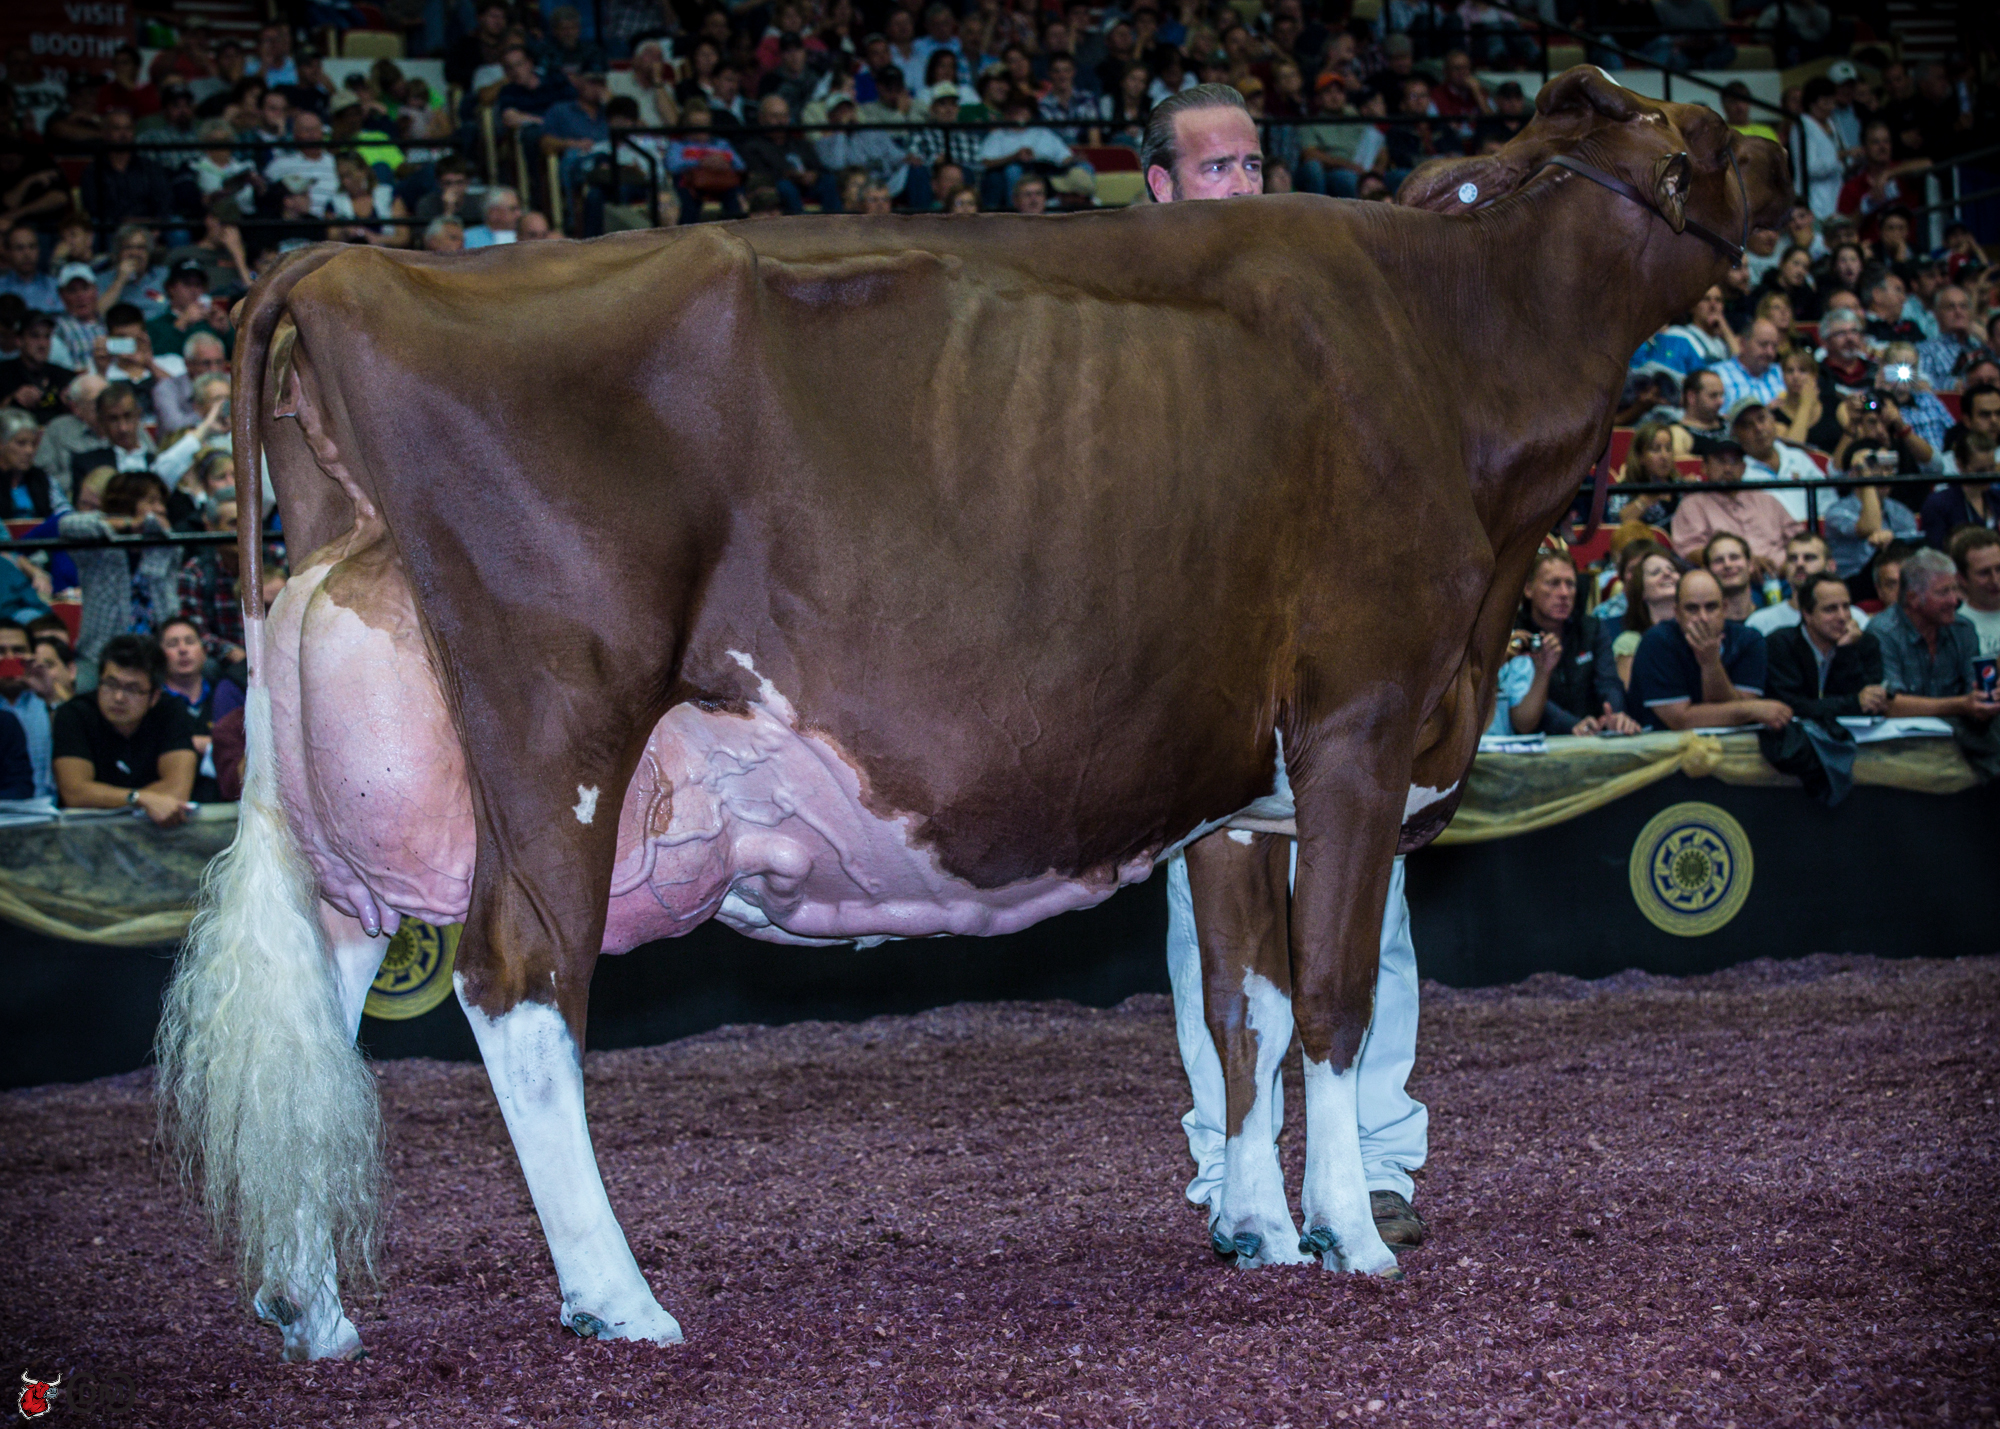
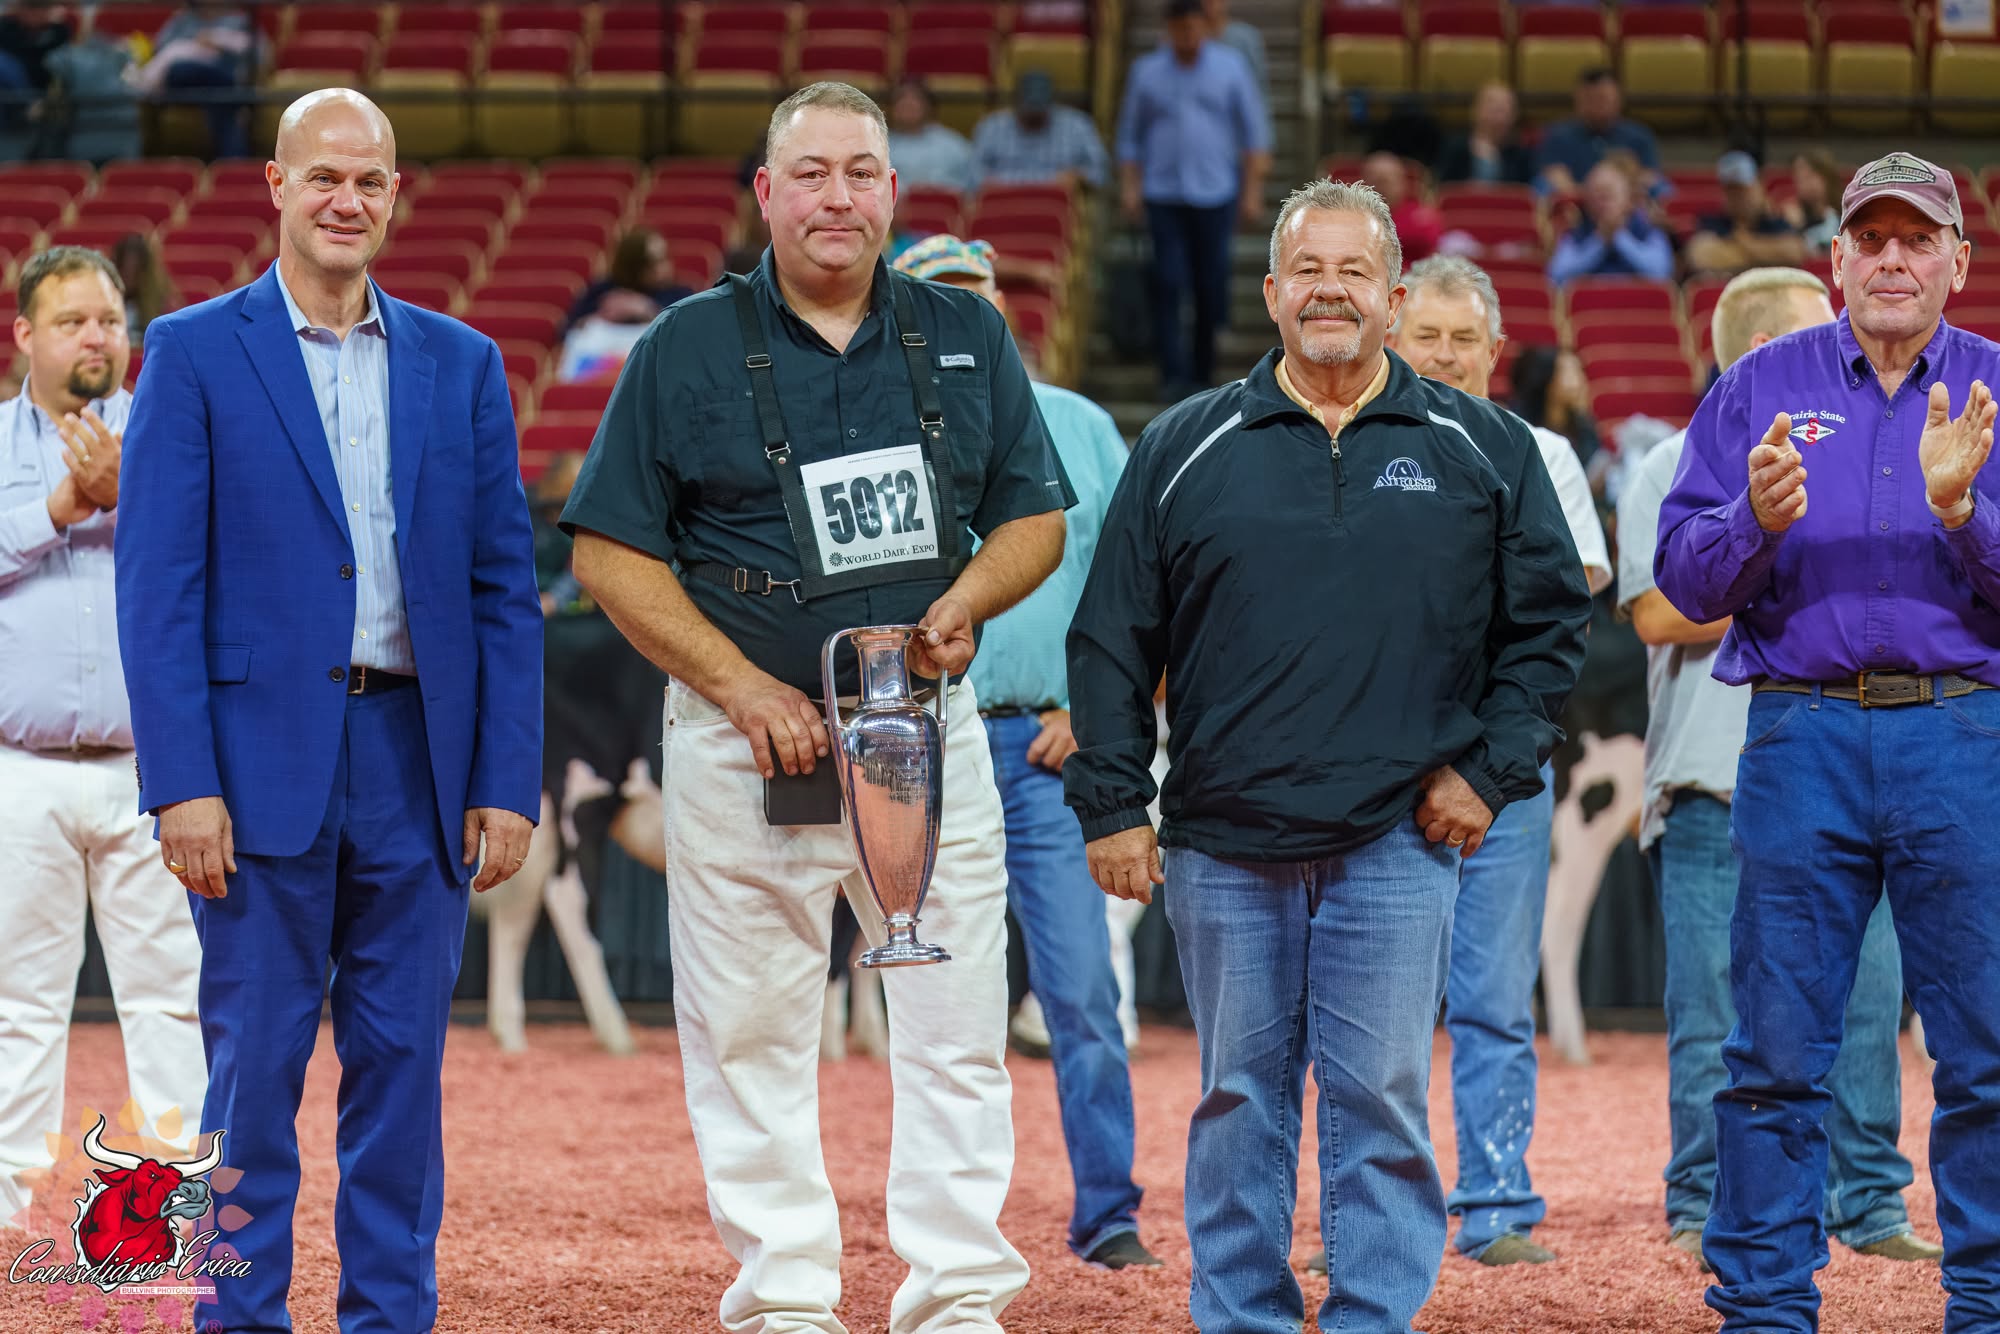
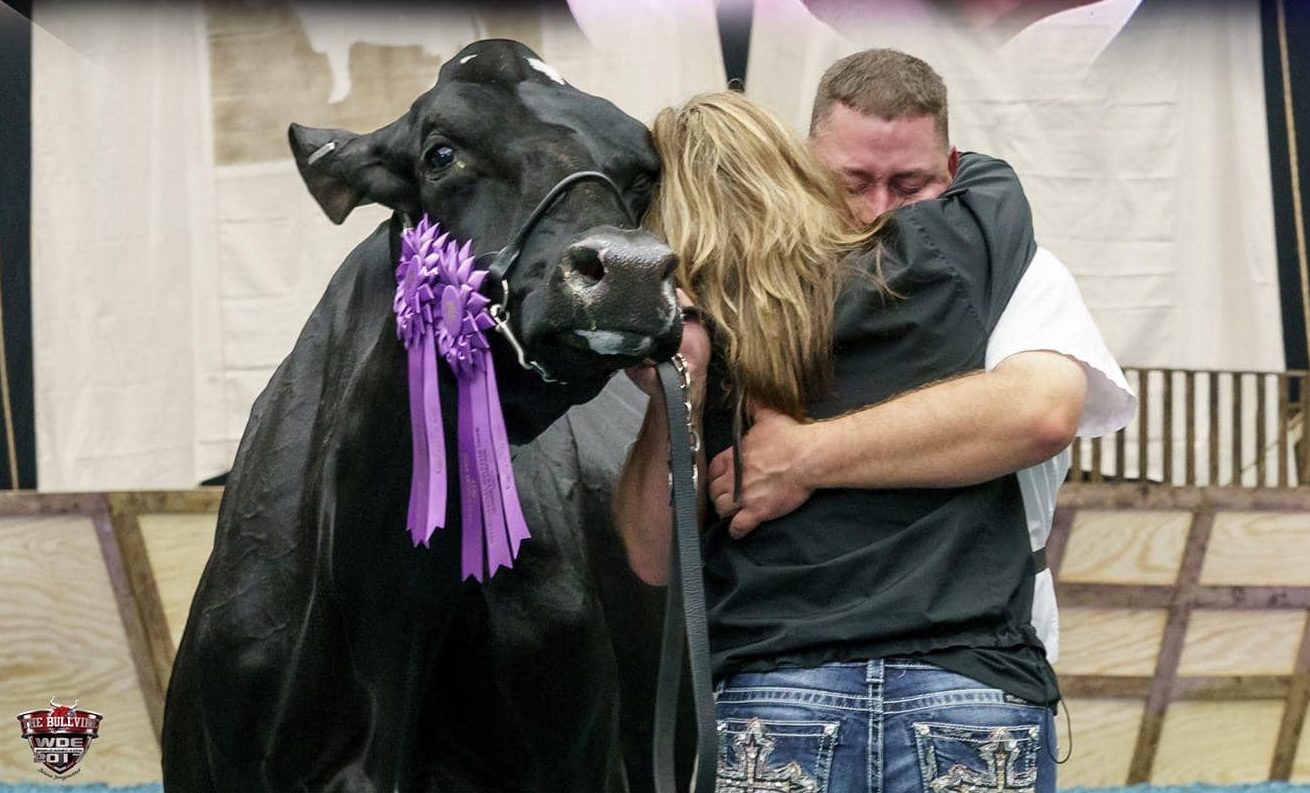
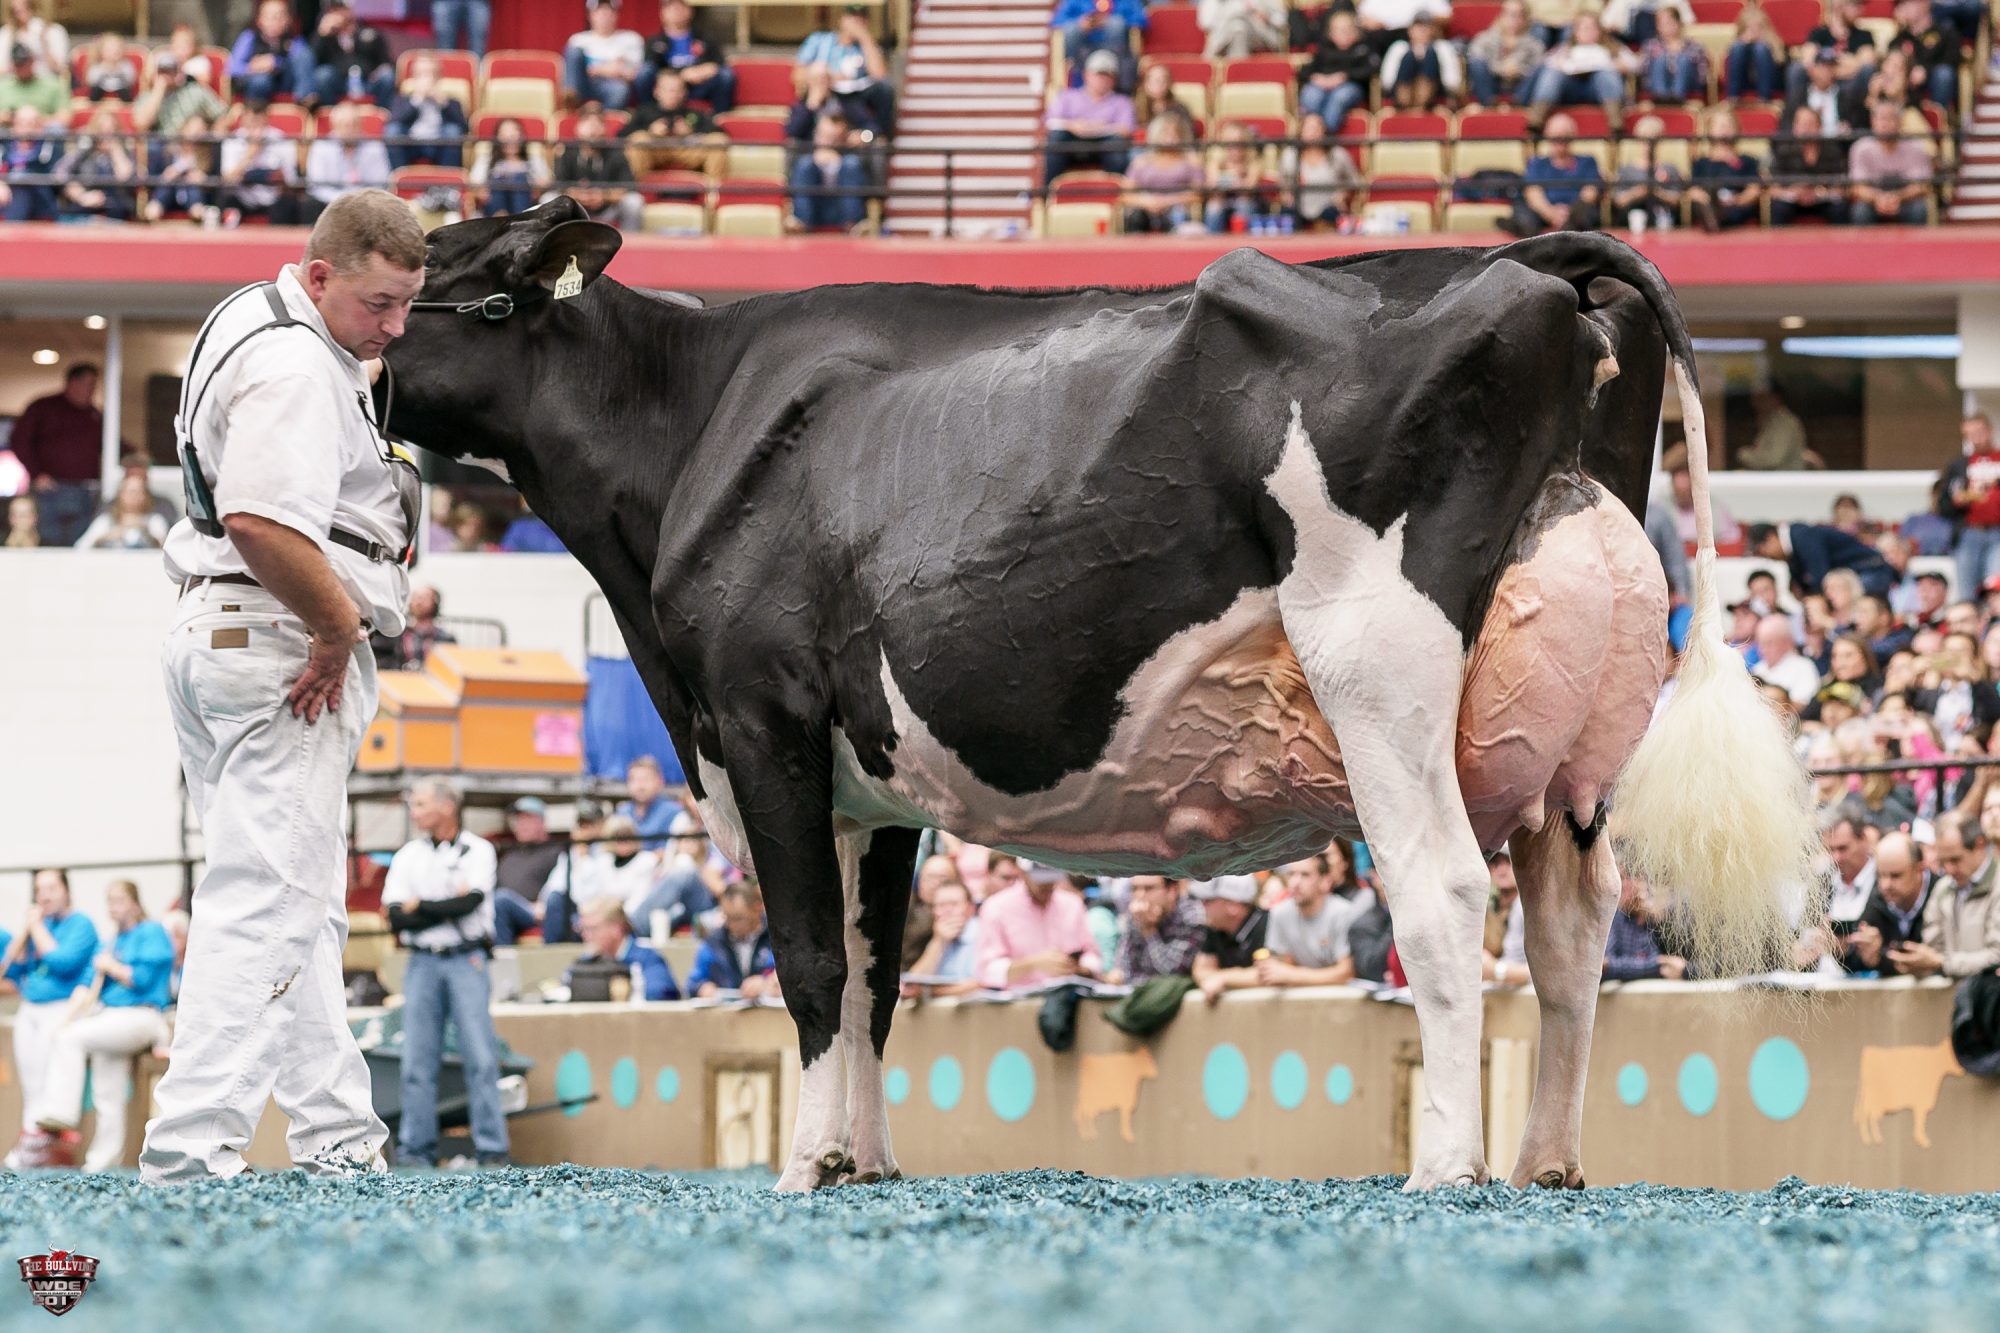
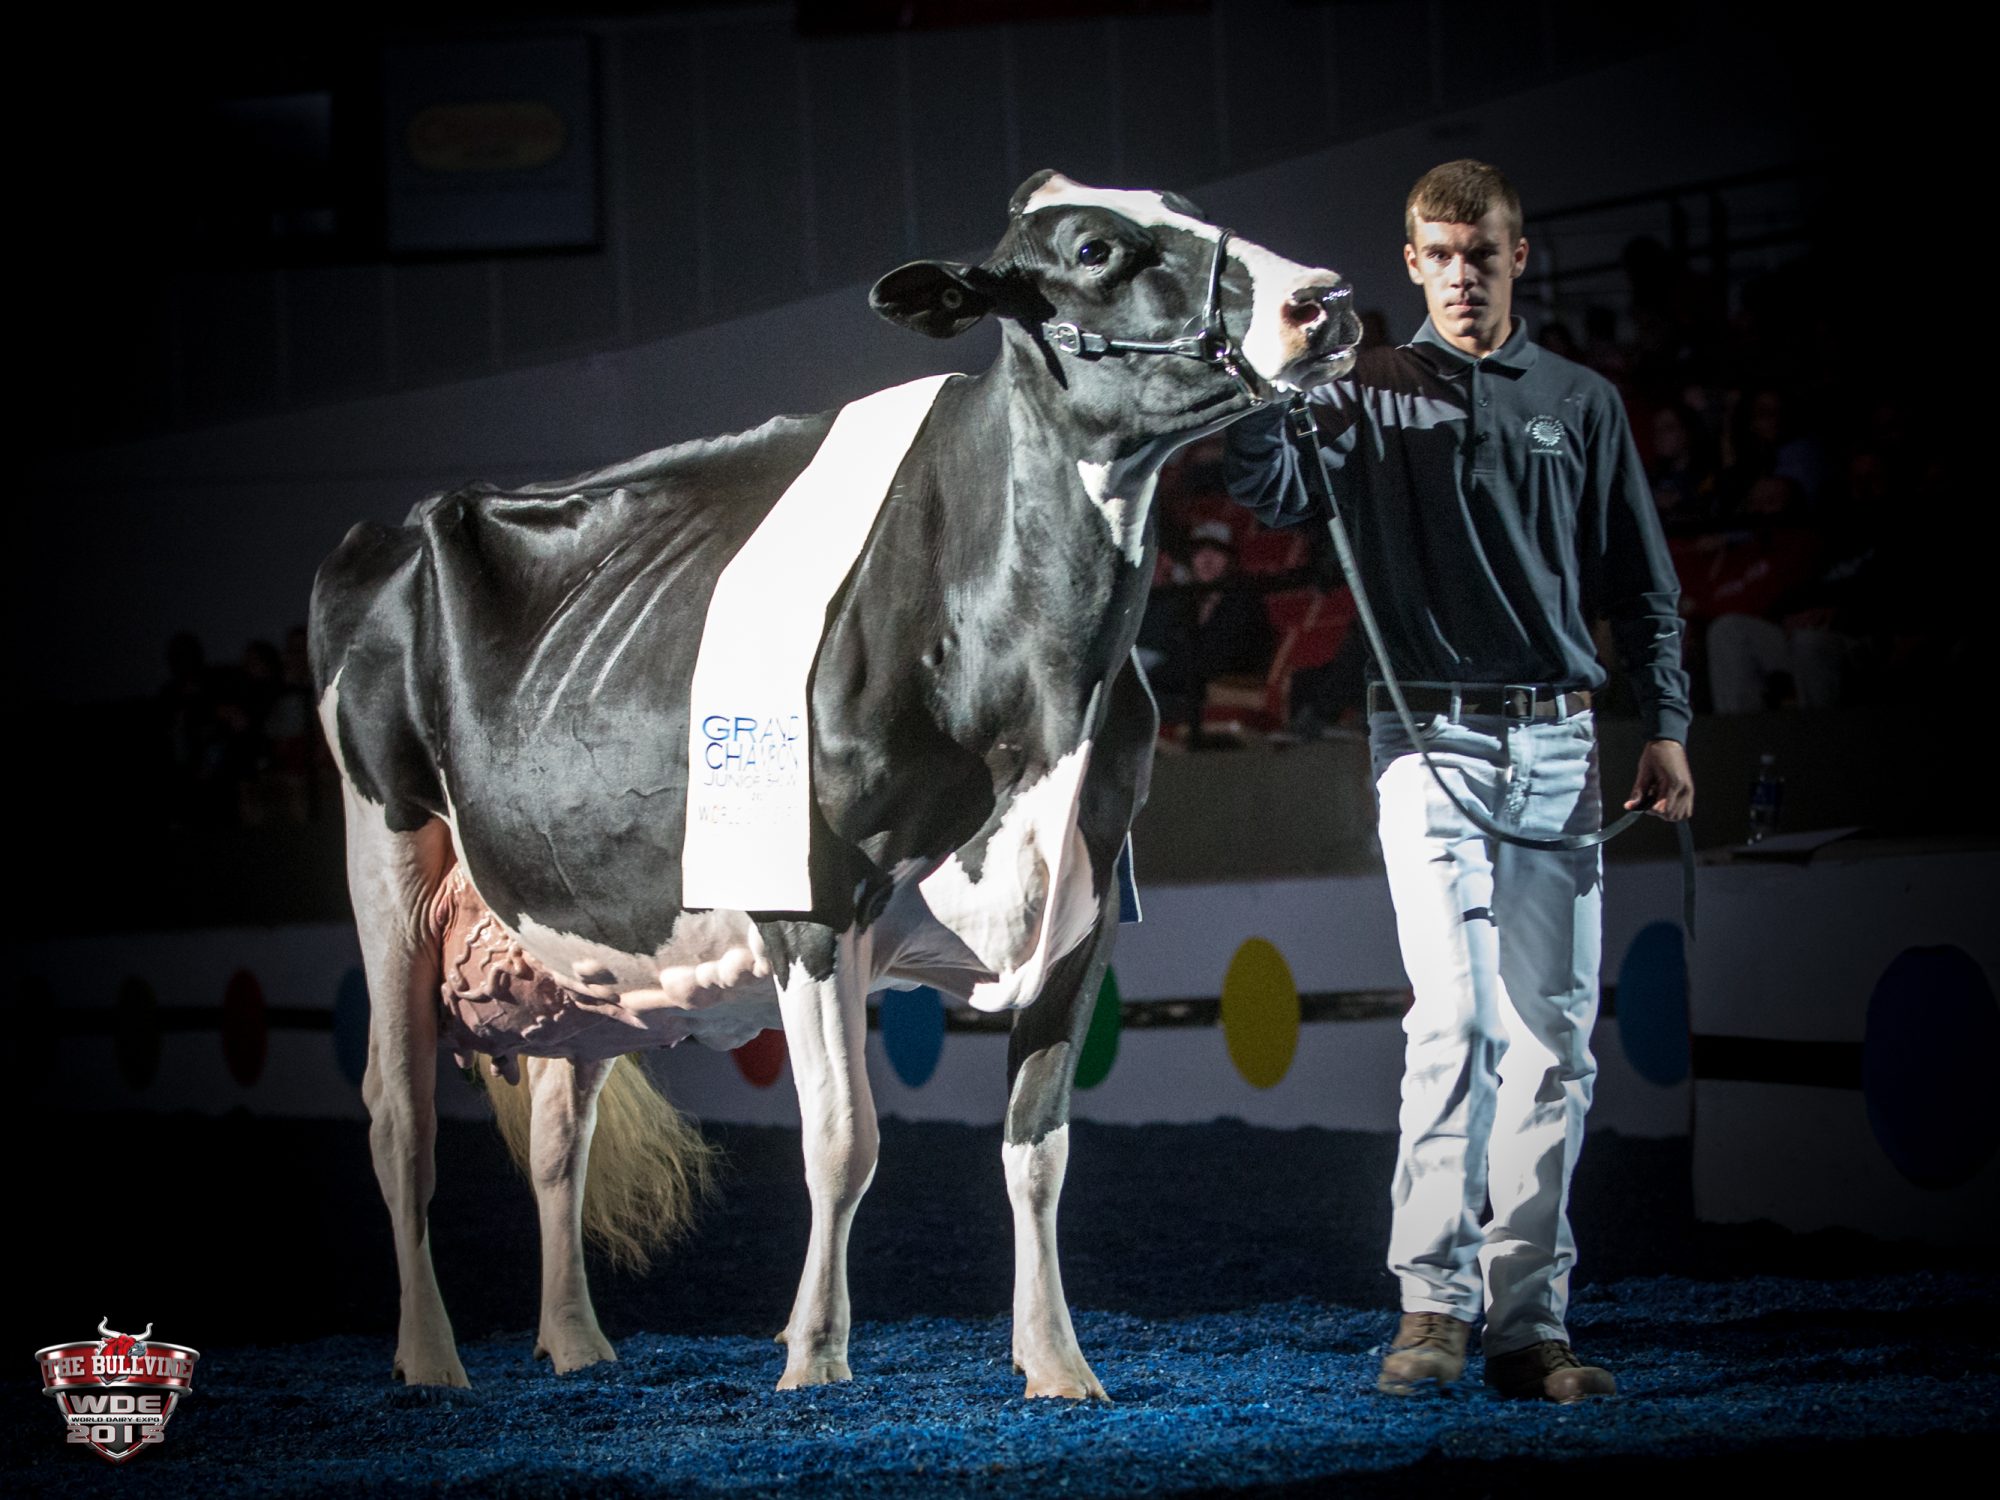
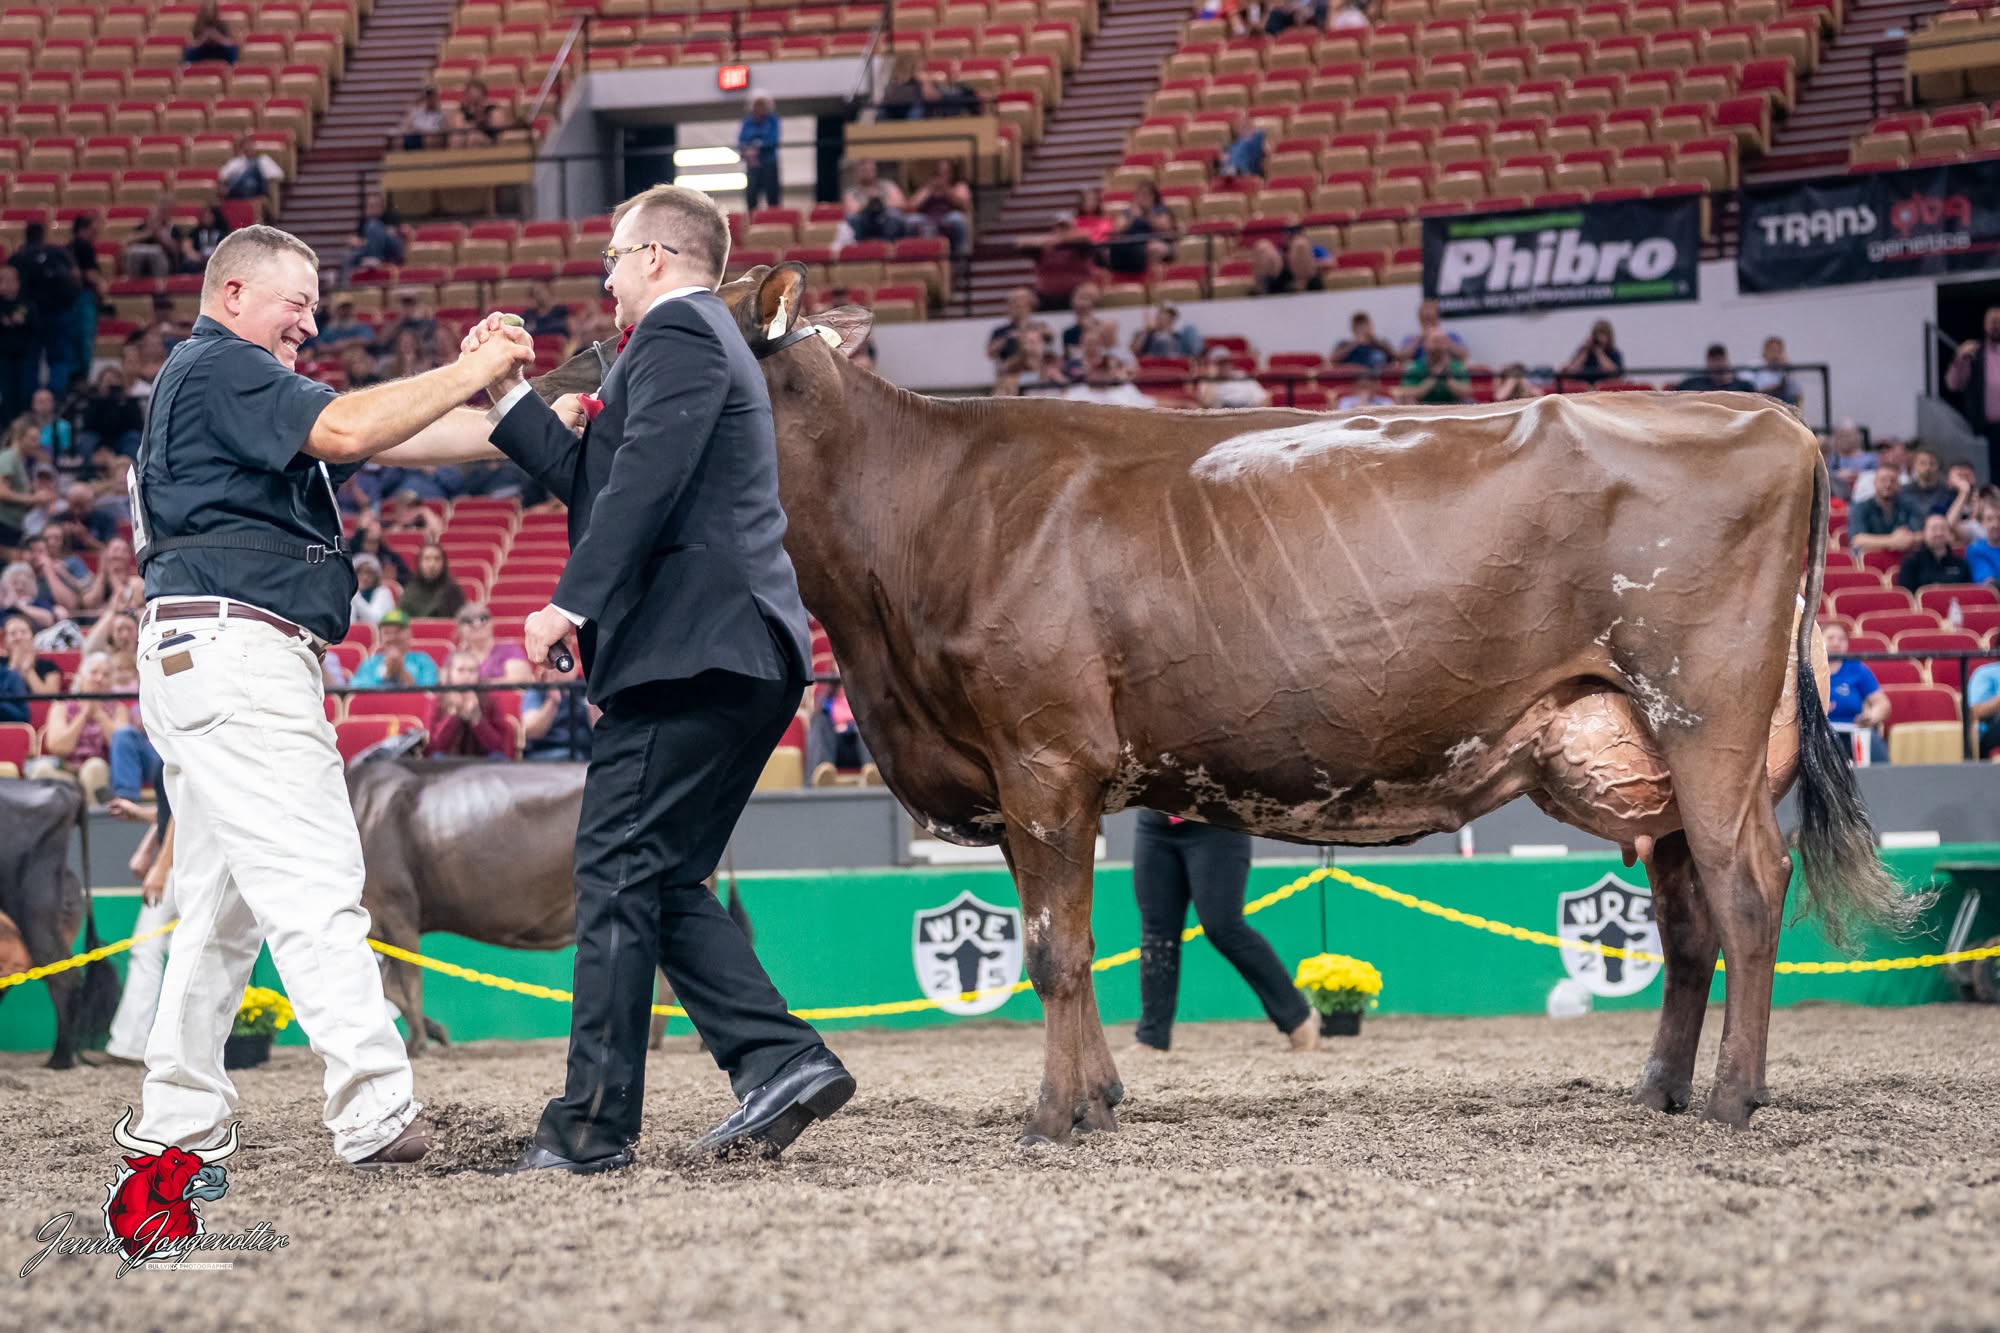

 The Sunday Read Dairy Professionals Don’t Skip.
 The Sunday Read Dairy Professionals Don’t Skip.