


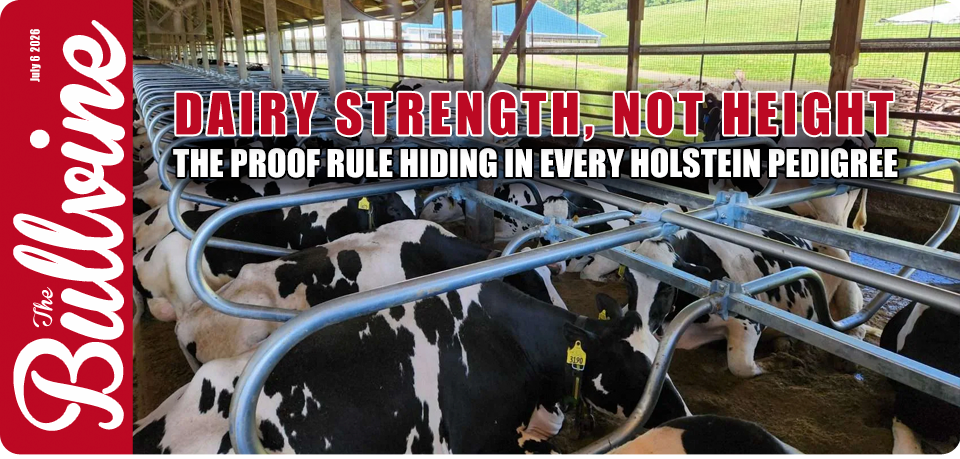








Holstein heifers just crossed 9.99% inbreeding — and the drift is quietly dragging money off every cow. Here’s the one linear rule that keeps “dairy strength” from turning into expensive frailty.
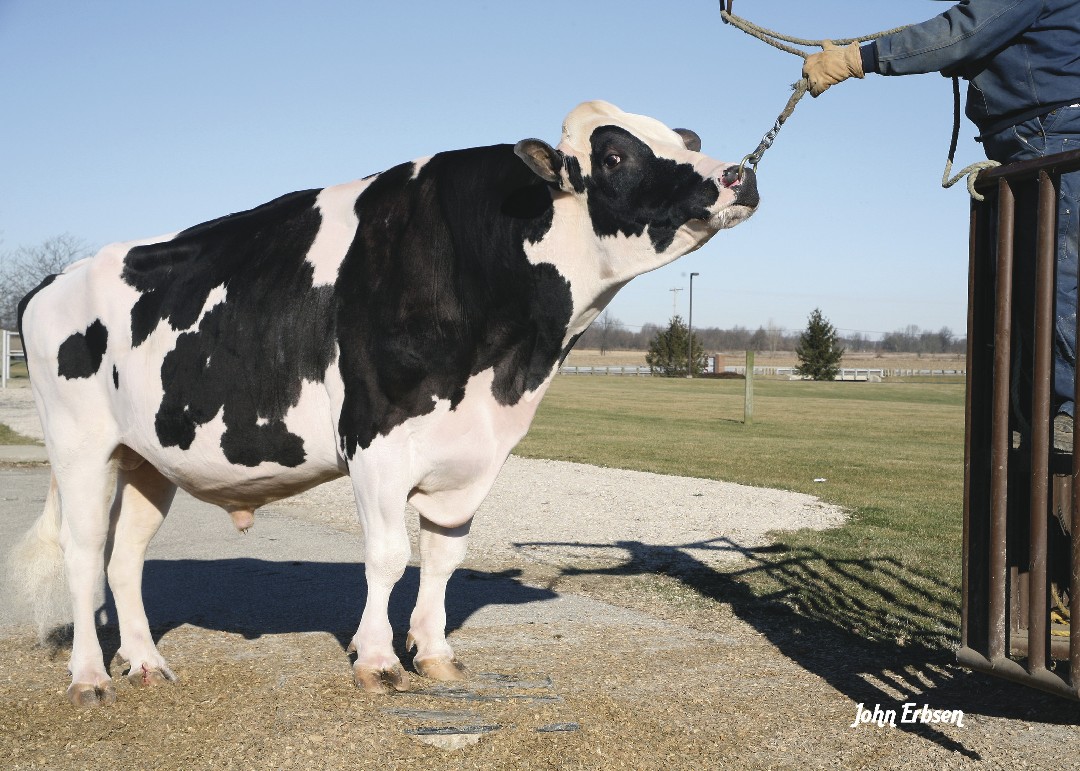
There was a stretch, not that long ago, when you could feel smart just rattling off O-Man’s proof. O-Bee Manfred Justice-ET. Fat, protein, health traits, calving ease — the exact toolkit the breed was starving for — wrapped around type nobody bragged about. He fixed real problems. So the industry did what it always does with a bull that fixes real problems. It bred him, his sons, and his grandsons into damn near everything.
And that’s the part nobody was pricing at the time. Somebody, somewhere, is at a bull catalog this morning stacking a mating a shade more inbred than the last one. Not on purpose. It never is.
The Bull the Breed Couldn’t Stop Using
O-Man was born in 2004. By the back half of that decade his sons stacked the top of the lists — Snowman, Man-O-Man, the whole run — while O-Man himself kept climbing on health and components long after most bulls his age had faded. And his daughters became brood-cow royalty: Seagull-Bay Oman Mirror, an O-Man daughter, went on to anchor a family that threads through modern sire stacks.
One semen order at a time, the breed wired one bull deep into nearly every pedigree. That’s not a knock on O-Man. He earned the demand. But here’s what should land differently than it would have five years ago: the bill for all that concentration is finally showing up on the milk check.
What’s Really at Stake
The problem and its price tag sit side by side. Here’s the bottleneck on the left, and the money it’s pulling off your cows on the right.
| Metric / Horizon | The Current Bottleneck (2025/2026) | The Invisible Economic Drag |
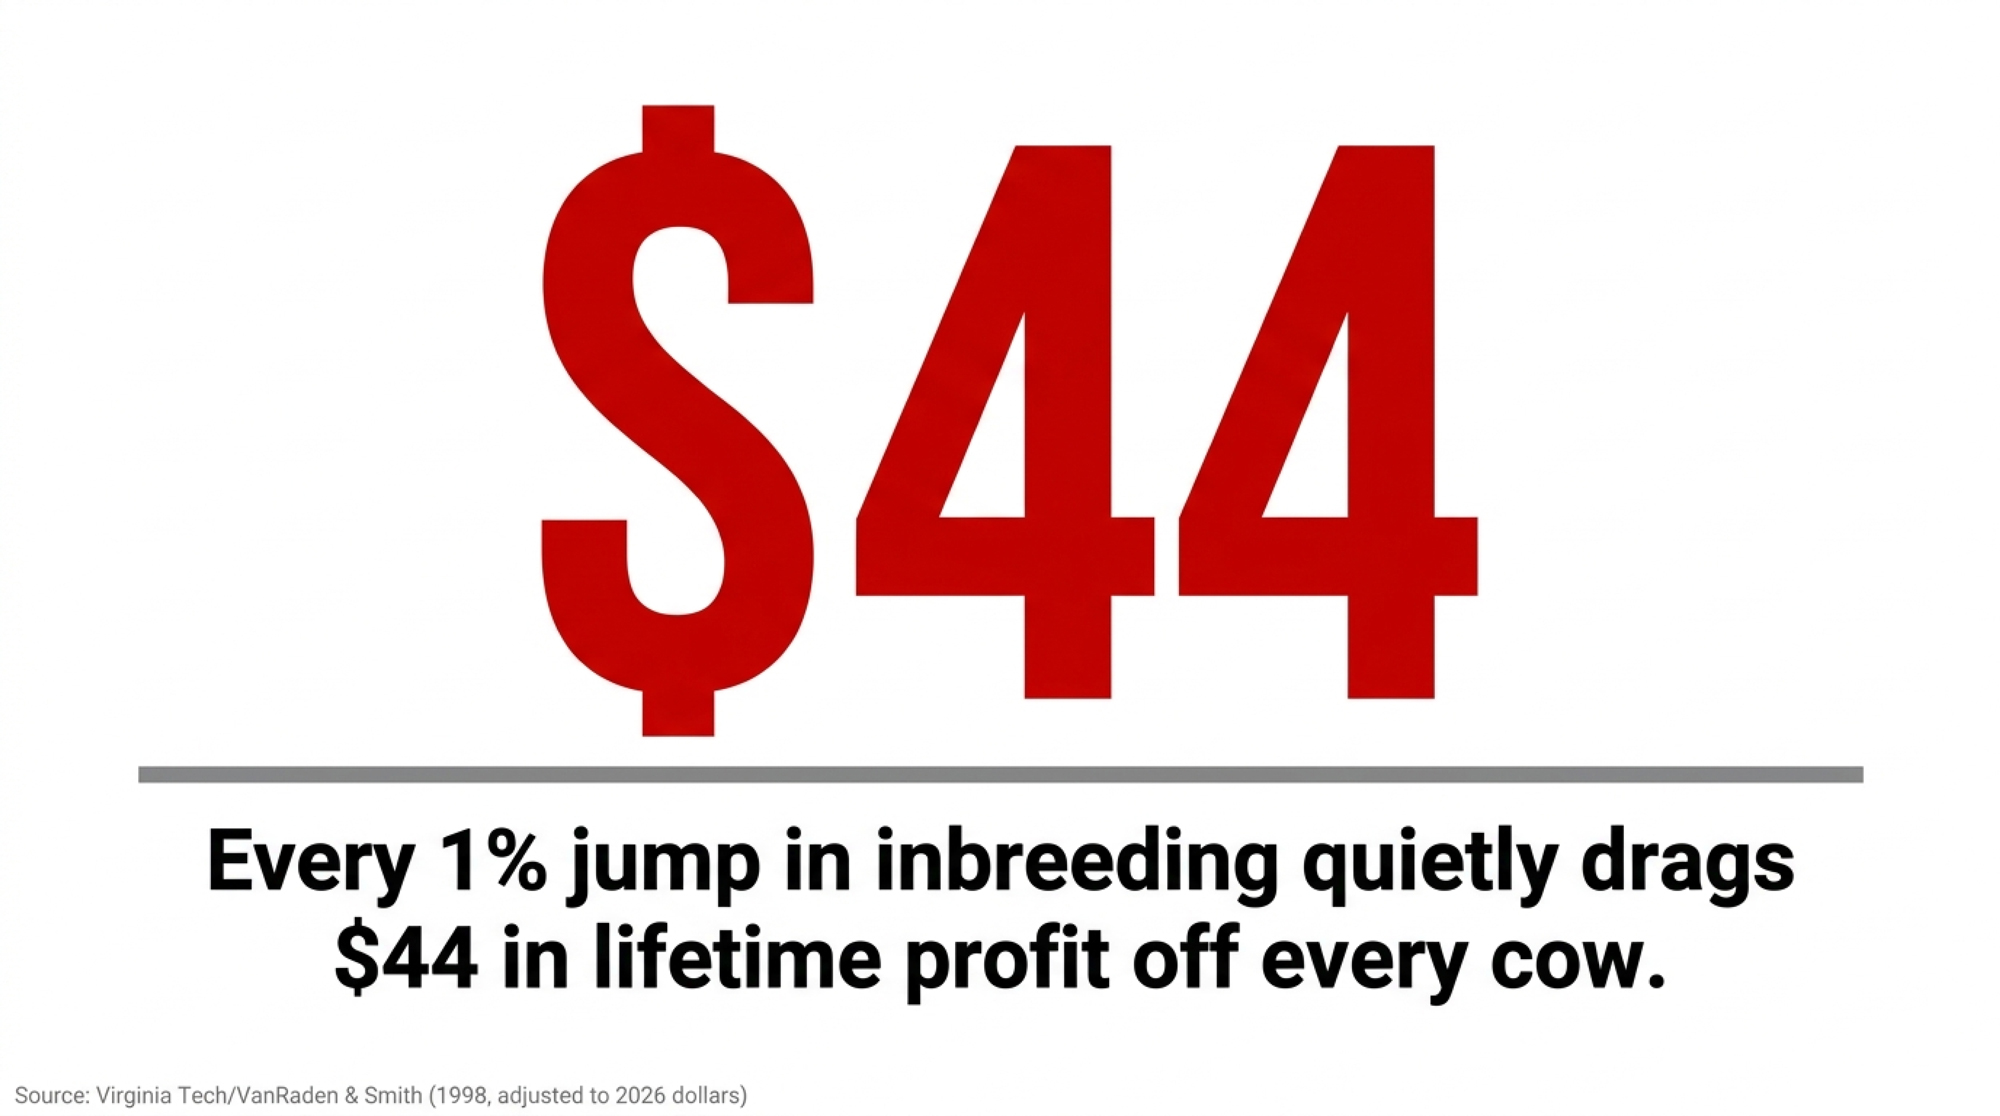
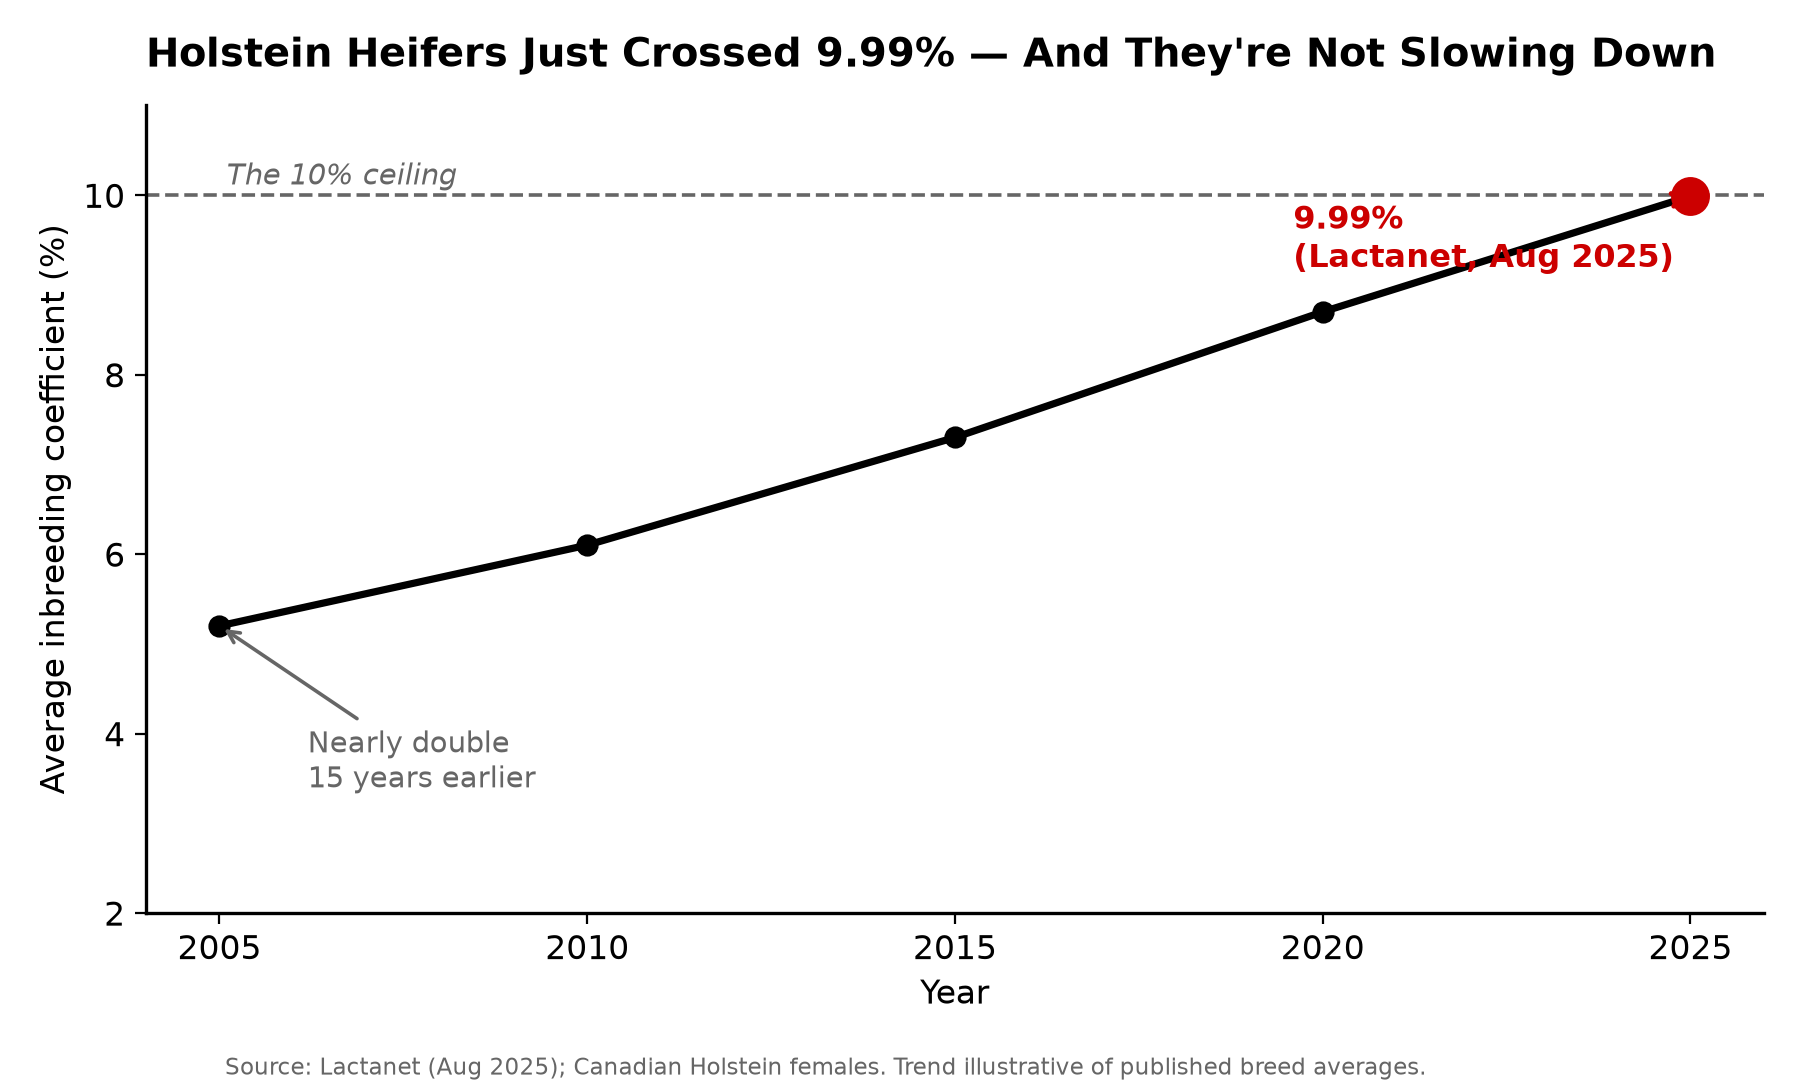
| Breed Baseline | Canadian Holstein heifers average 9.99%inbreeding (Lactanet, Aug 2025) | $44 per cow, per point in lifetime drag over baseline |
| AI Lineup Shrink | Female inbreeding now climbs ~3× fasterthan the pre-genomic era (~0.3–0.4%/yr) | $60 to $100 loss per cow, per lactation in high-inbreeding herds |
| Pedigree Core | 99.84% of active AI sires trace to just two male lines — Elevation and Chief | −92 kg milk, −65 days productive life per 5% inbreeding jump (CDN) |
That 9.99% is nearly double where the breed sat 15 years ago. And it’s not a Holstein-only story — the black-and-whites lead Jersey (7.56%), Brown Swiss (7.10%), and Ayrshire in the same 2024 crop. That Canadian figure from Lactanet tracks the same direction U.S. data shows through CDCB and Holstein USA, so this isn’t a border quirk.
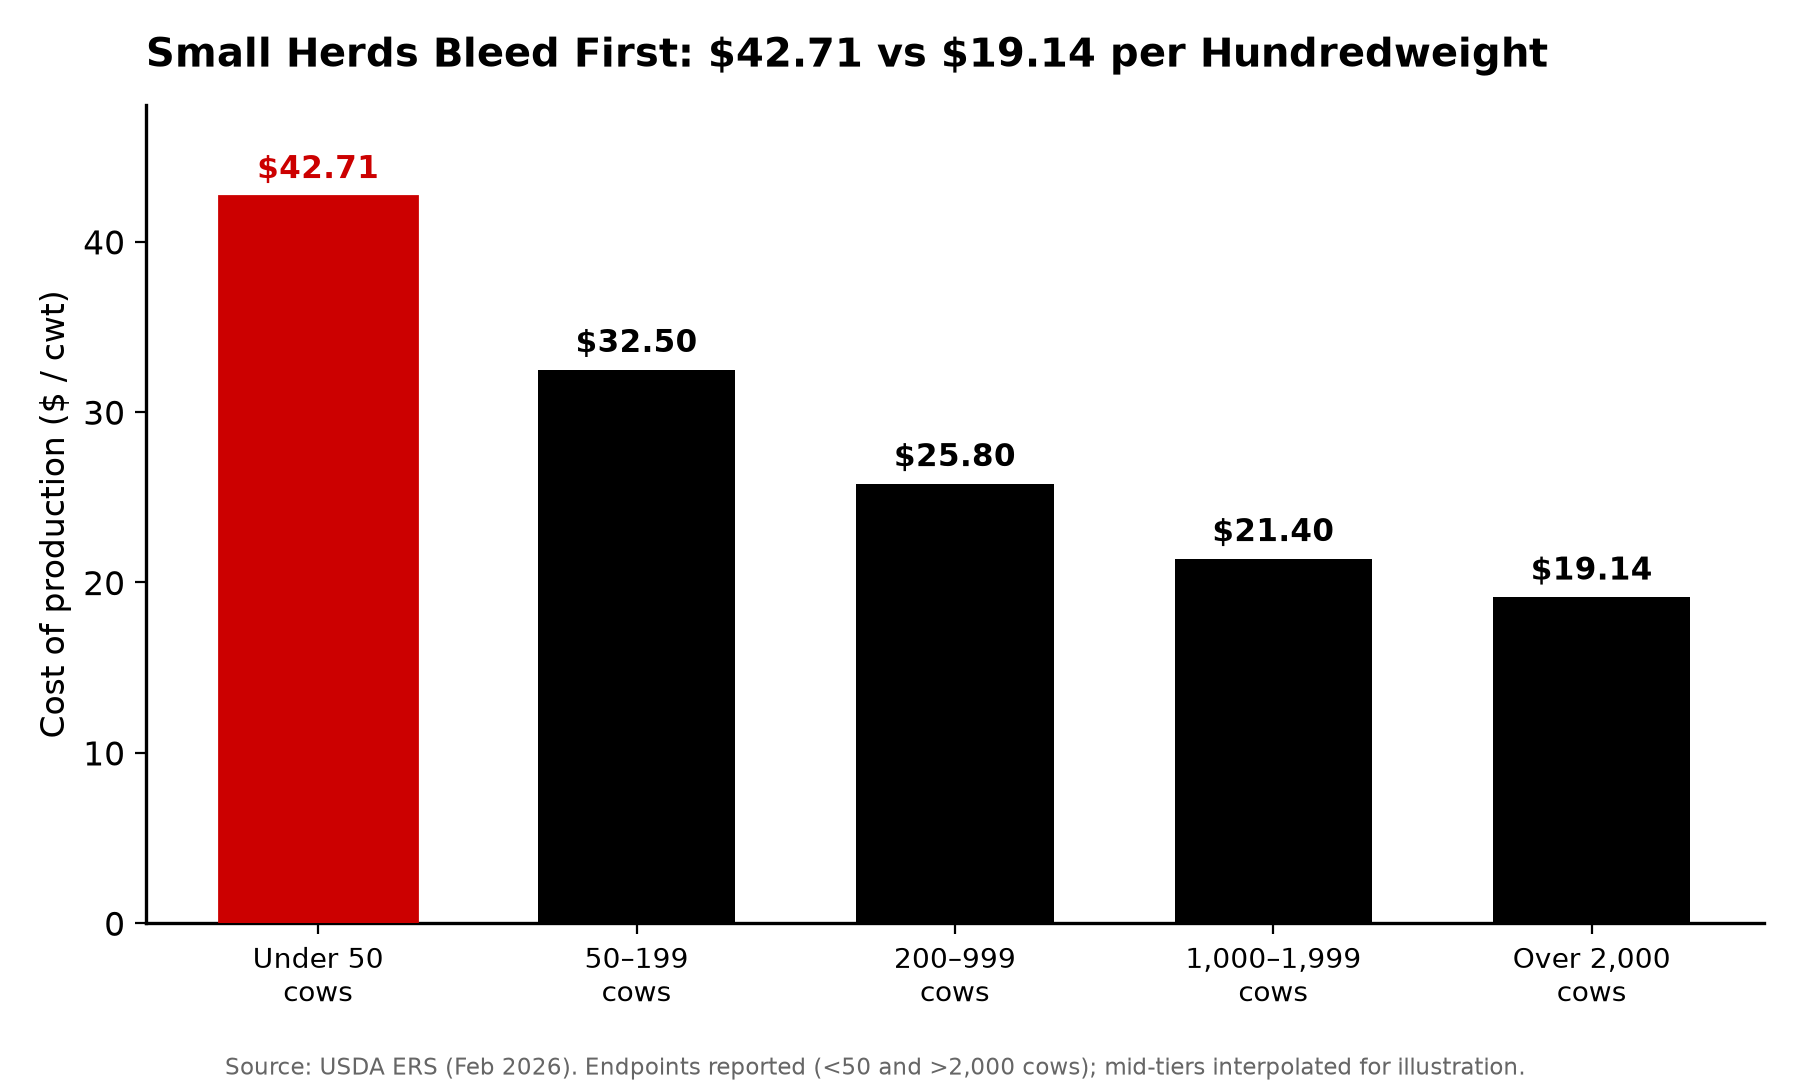
Who eats the cost first? The smaller and mid-size herds. USDA ERS reported in February 2026 that cost of production runs about $42.71 per hundredweight in herds under 50 cows versus $19.14 in herds over 2,000. When your breakeven’s already thin, this drift stings more.
Have You Ever Called a Cow “Too Strong”?
Inbreeding depression doesn’t knock. It’s the cow that milks fine but won’t settle. The calf that never quite thrives. The good one that leaves a lactation early. And it has a look — as inbreeding climbs, that depression tends to surface as narrow, frail cows that impress on height and wear out faster. Hold that thought. It’s the bridge between the DNA problem and the type sheet.
Ask yourself two questions standing at the pen. Have you described a cow recently as “too strong”? Have you seen cows that are “too frail”? Almost nobody says yes to the first. Everybody’s seen the second. That tells you which way the breed’s been drifting.
Here’s what a jump from 5% to 10% inbreeding costs on a single cow, every lactation, per Canadian Dairy Network:
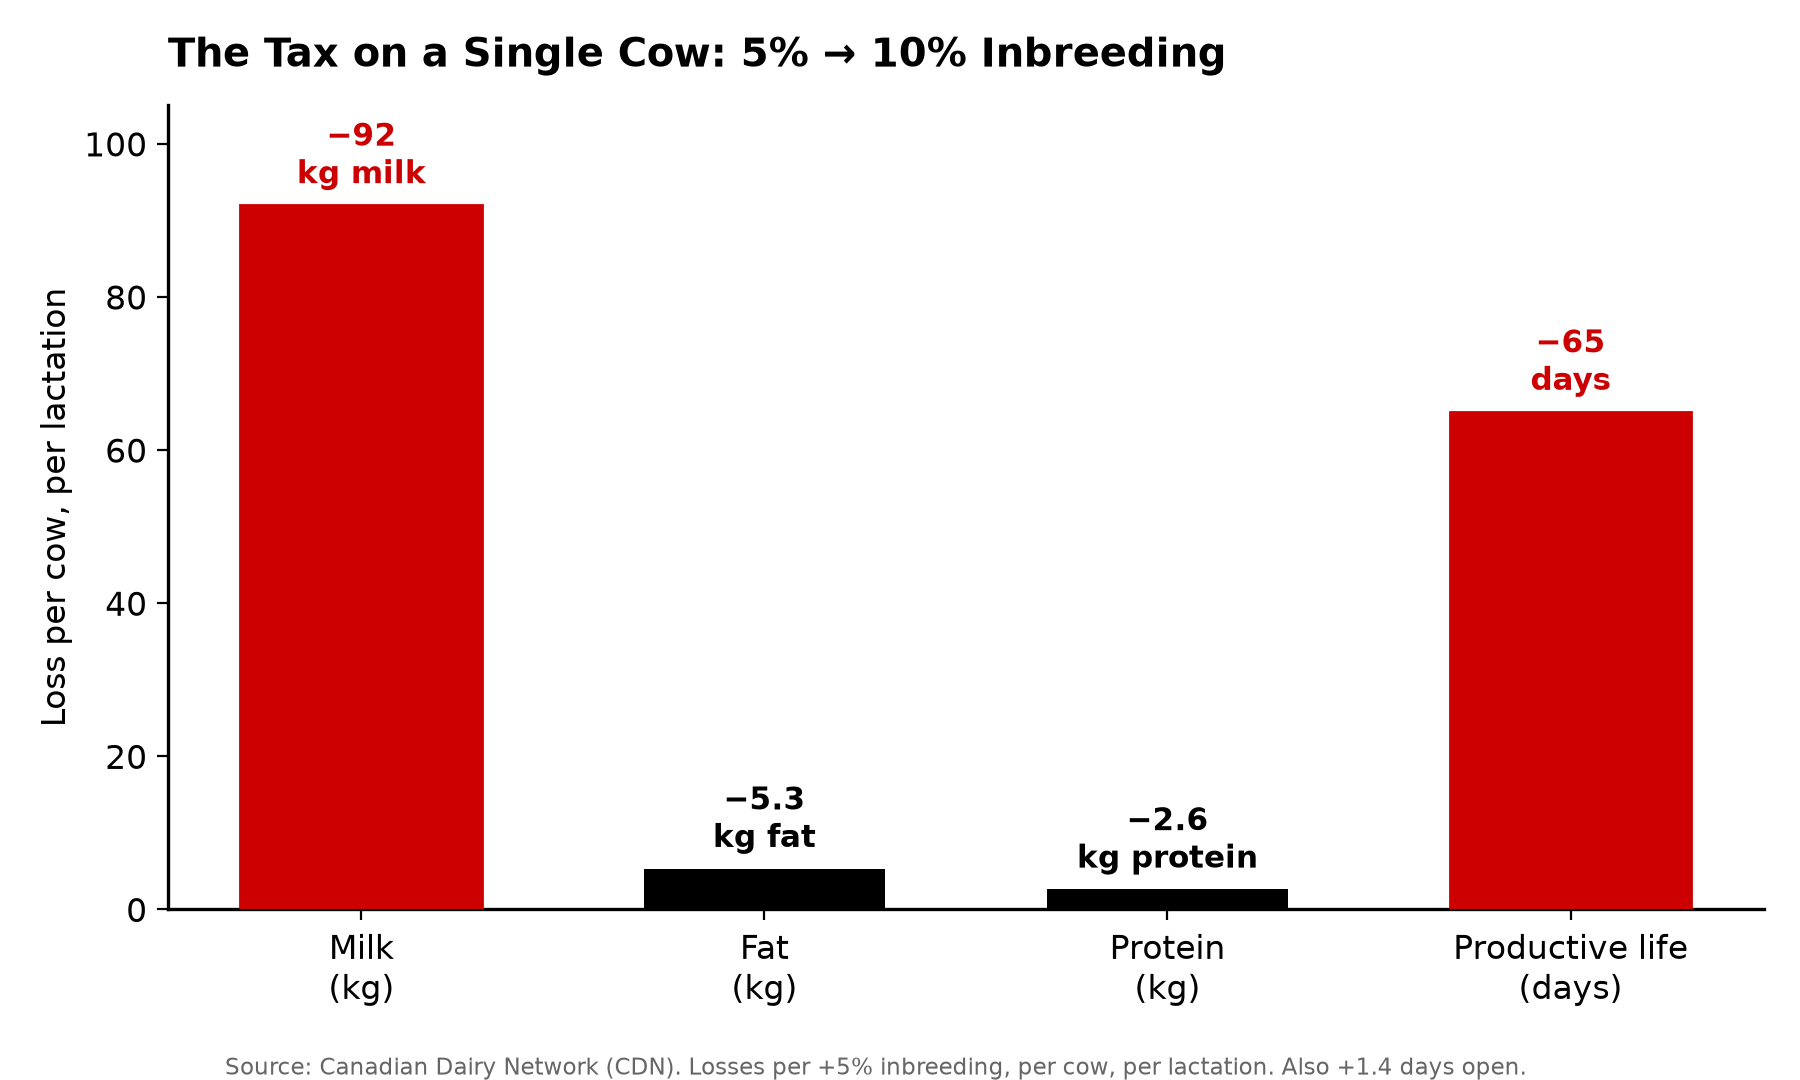
−92 kg milk · −5.3 kg fat · −2.6 kg protein · +1.4 days open · −65 days of productive life
None of those alone ends a cow. Stack them across a whole heifer crop, though, and you’re running a herd that milks a little lighter, breeds back a little slower, and turns over a little faster than the one your neighbor built off a wider gene pool. That’s the tax. It’s quiet, it’s cumulative, and it never sends an invoice.
The Barn Math: Two Numbers That Stack
You’ll bump into two different dollar figures, and they measure different windows. Don’t let them cancel out in your head — they add.
The lifetime number comes from Virginia Tech’s VanRaden and Smith (1998), who pegged the cost at $22 to $24 per cow for every 1% of inbreeding. Adjusted for inflation to 2026 dollars, that becomes roughly $44 per cow, per point — a lifetime figure, not an annual one. Run it on a real herd: a 200-cow herd that’s drifted from 6% to 10% — four points — carries about 200 × 4 × $44 = $35,200 in lifetime drag. Money you never see leave, because it never shows up as a line item.
The second figure is a per-year bleed, and it’s grounded in peer-reviewed production losses, not guesswork. Makanjuola and colleagues (2020) found each 1% jump in genomic inbreeding cut first-lactation 305-day milk by roughly 40–50 kg in Canadian Holsteins; Doekes et al. (2019) landed in the same range. Add lost protein, extra days open, and shorter productive life, and Bullvine’s worked barn-math lands at roughly $60 to $102 per cow, per lactation for a herd carrying about two points of excess. On a 300-cow herd, even the $60 floor is about $18,000 a year until your mating strategy changes.
Some herds have pushed back and watched it pay. Bullvine’s coverage of the Birkstead and North Florida operations documented both farms using tighter inbreeding management — tracking coefficients on every mating, steering clear of closely related sires — to stop that per-cow leak. The peer-reviewed research prices the cost of ignoring it. The herds show what managing it looks like.
Why the Gene Pool Keeps Shrinking
The root cause isn’t any one bull — not even O-Man. It’s a base that keeps narrowing. A Y-chromosome study of 62,897 bulls (Yue et al., 2015, Journal of Dairy Science) found virtually every active North American Holstein AI bull traces its paternal line to two grandfathers born in the 1960s: Round Oak Rag Apple Elevation and Pawnee Farm Arlinda Chief. Bullvine’s analysis of that dataset puts the figure at 99.84% — split almost evenly between the two.
Read that again. Nearly the entire active AI Holstein population funnels back through two bulls. Every “outcross” you order is, at the male-line level, probably a cousin of the last one. That’s the bottleneck O-Man got poured into. Not the cause of it.
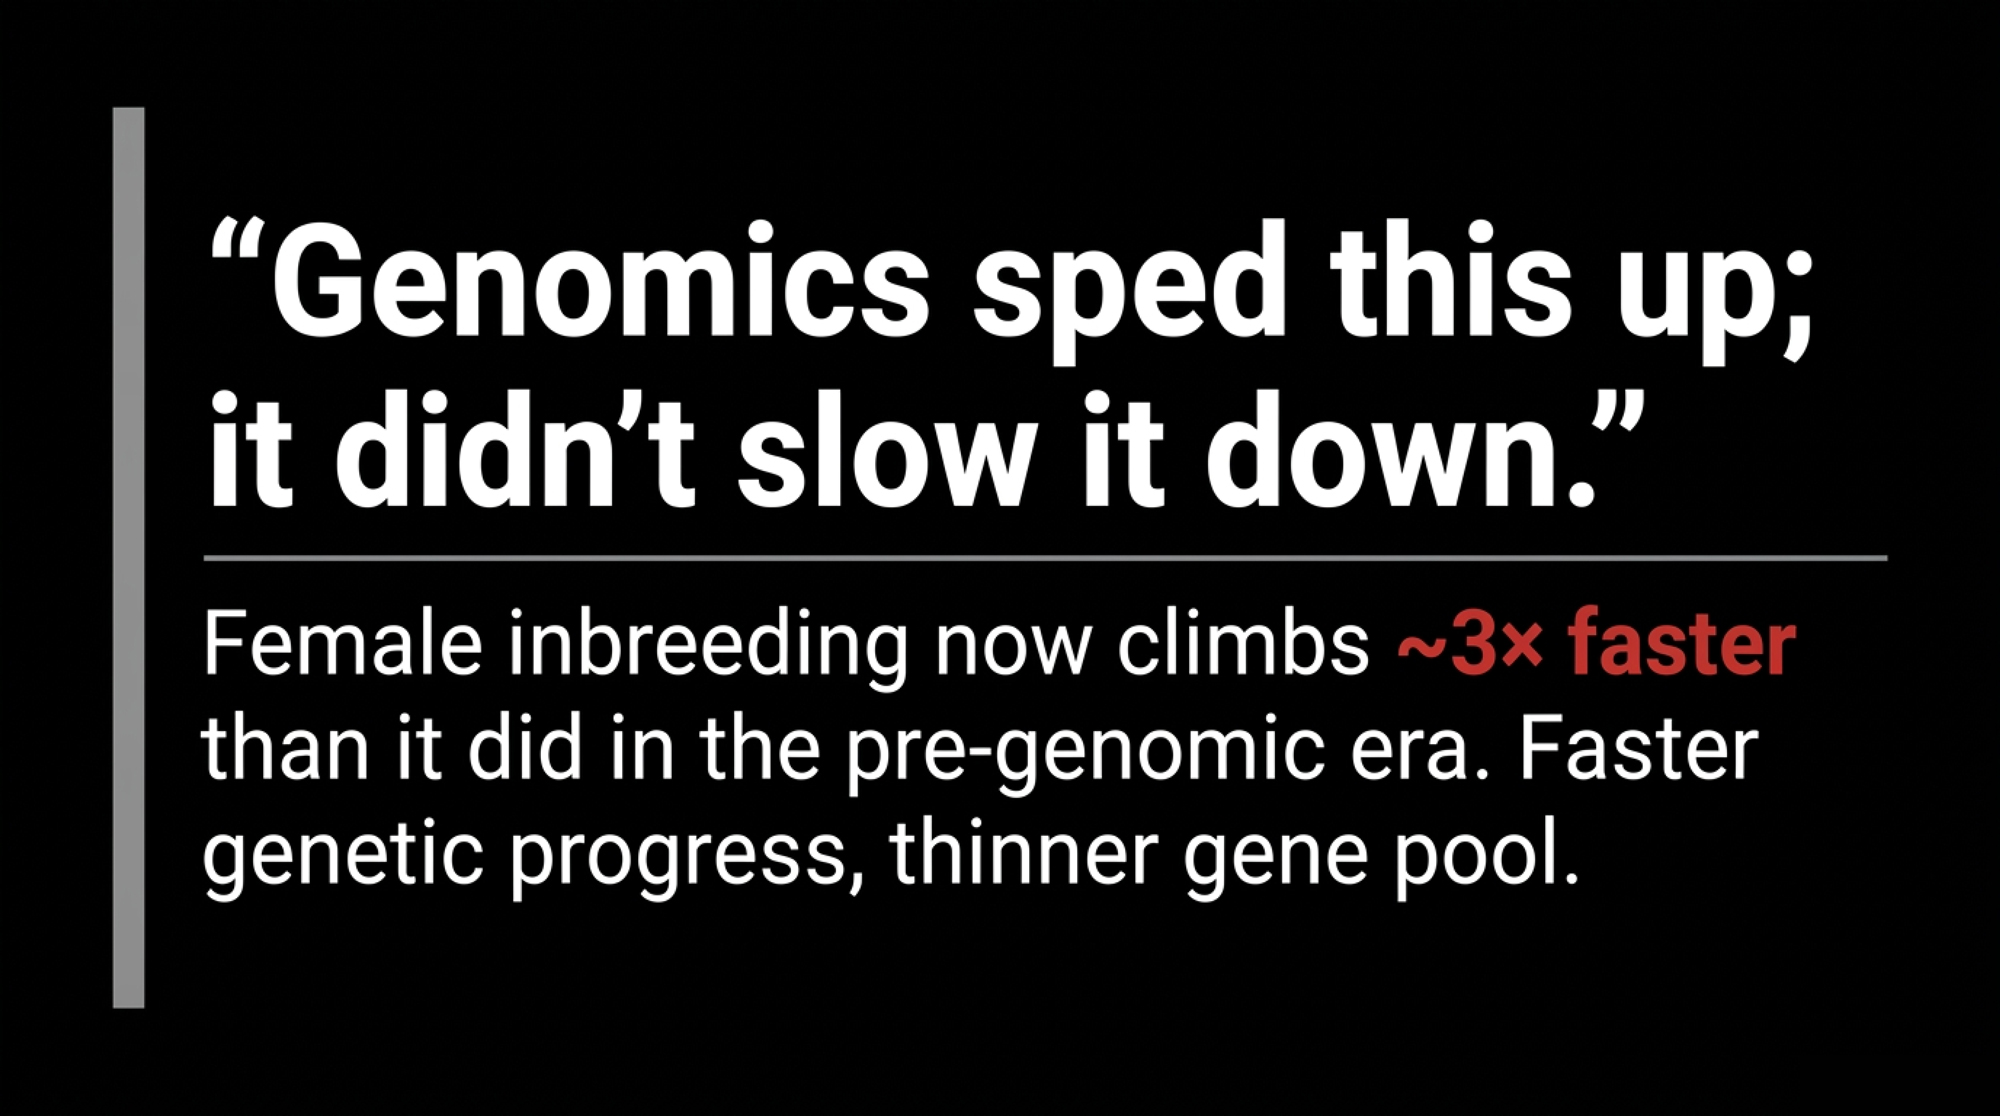
Genomics sped this up; it didn’t slow it down. Under progeny testing, a bull took years to prove out before he could flood the market — a brake nobody appreciated until it was gone. Now the sires of sons turn over in a fraction of that time, and female inbreeding climbs about three times faster than it did in the pre-genomic era. Faster genetic progress, thinner gene pool. Same coin, two sides.
And the index won’t rescue you. Net Merit added Daughter Pregnancy Rate in 2003 and Feed Saved in 2021, and NM$ 2025 cut Body Weight Composite to −11% emphasis while lifting Feed Saved to 17.8%. But catch the gap: Net Merit prices size and efficiency. It carries no penalty for inbreeding. That part lives entirely in your matings and your stud’s lineup.
Two Tools for Two Different Problems
Here’s where catalog decisions go sideways. The frail, hollow cow inbreeding produces is a physical symptom. But inbreeding itself is a pedigree problem. You need two separate tools, and one won’t cover for the other.
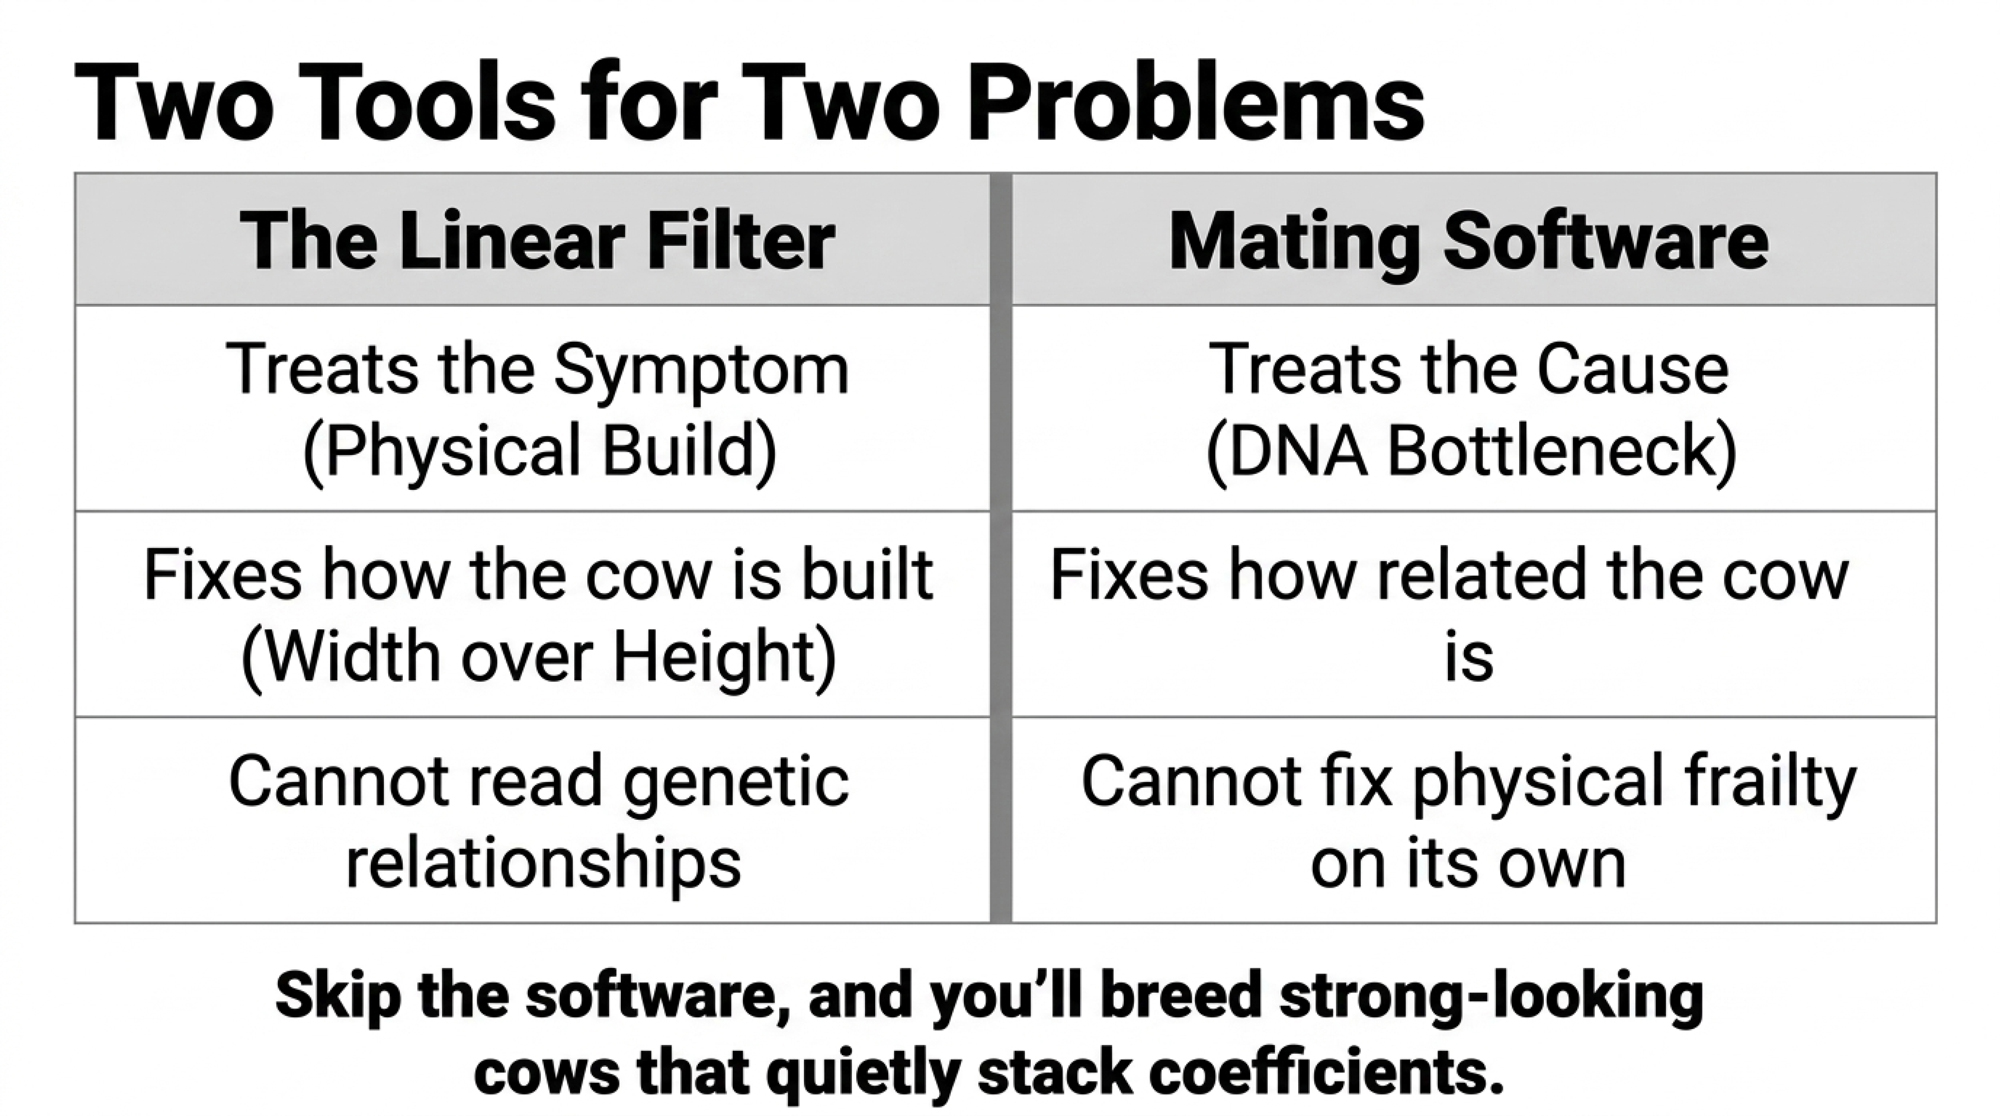
Tool 1 — the linear filter — treats the symptom. In the U.S. linear system, Body Weight Composite weights strength three times heavier than stature — 0.72 versus 0.23. A bull who’s tall but only moderately strong is building his daughters out of height, not working power.
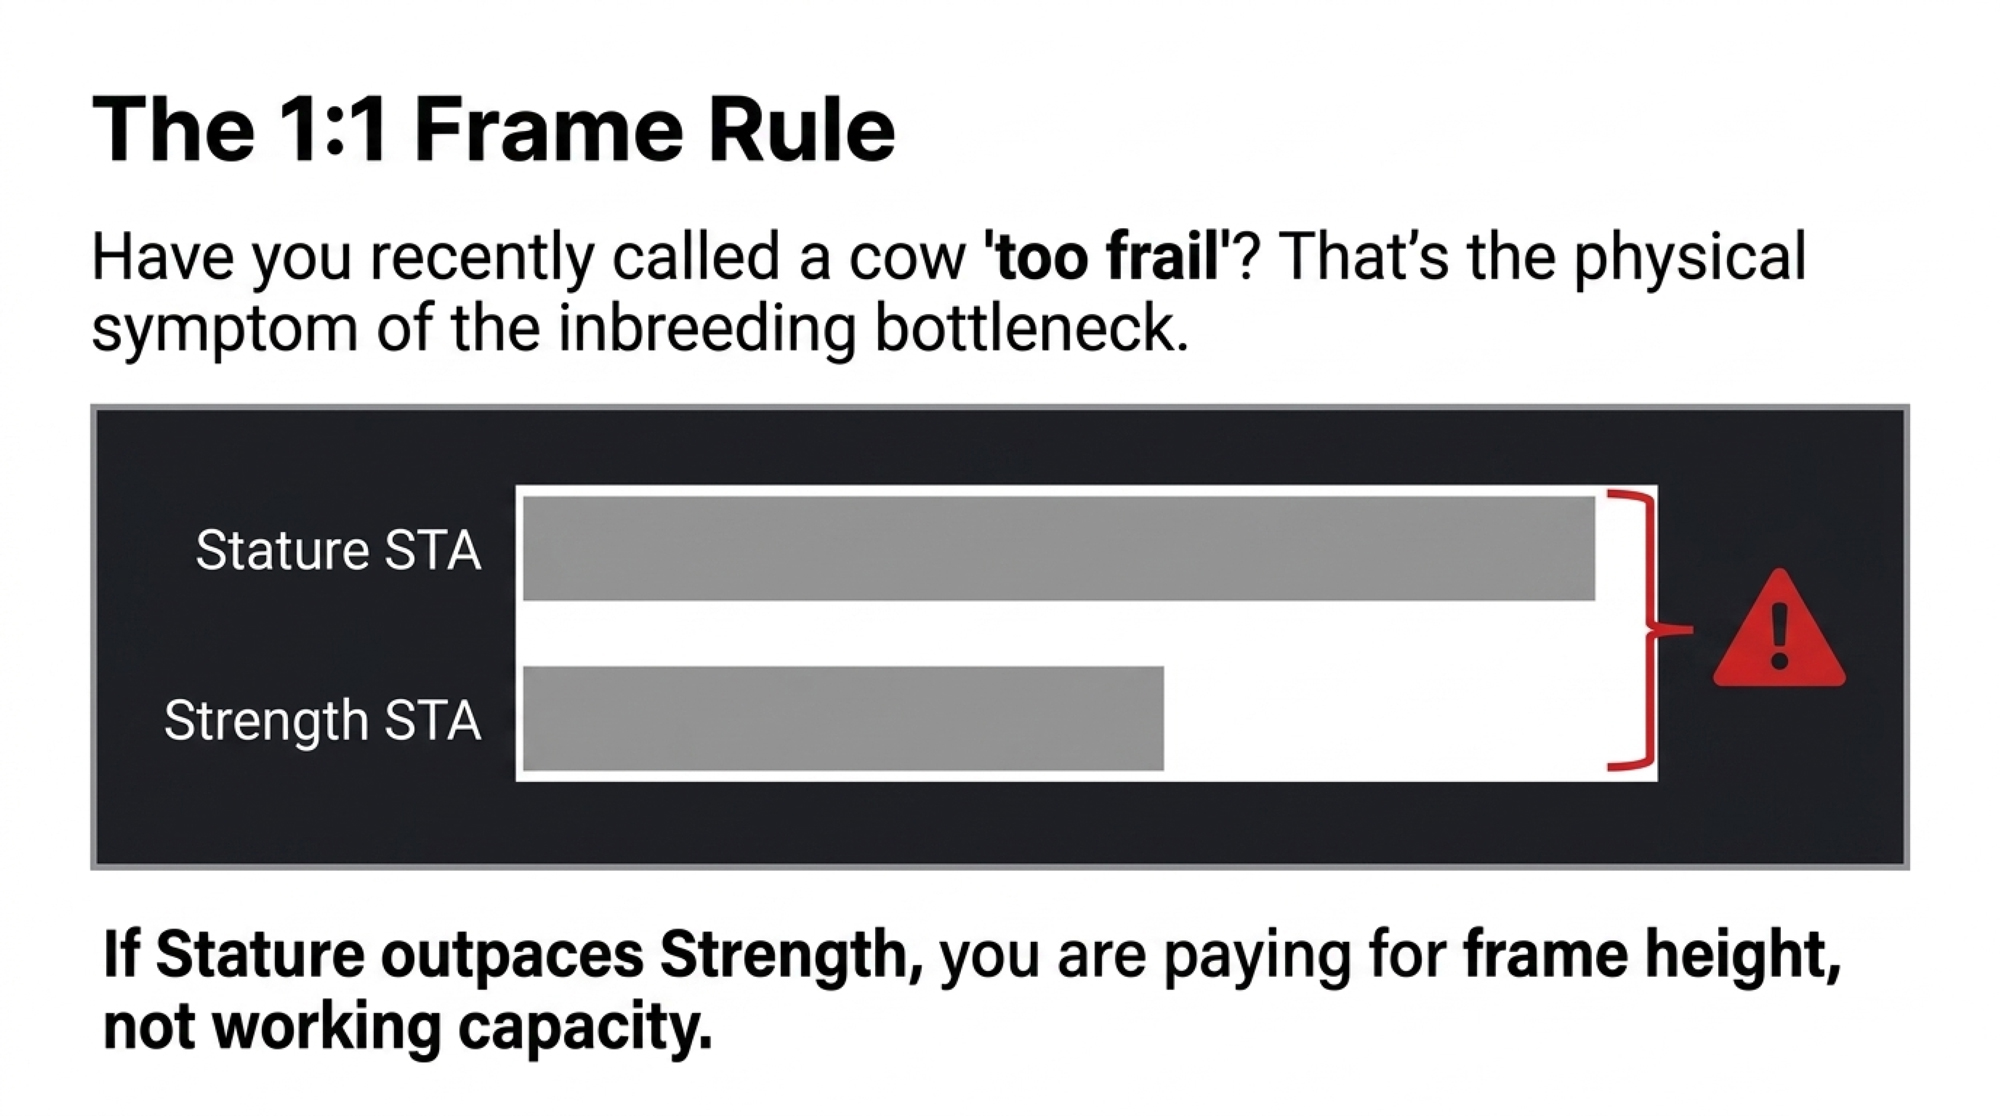
🛑 The 1:1 Frame Rule
If a bull’s Stature STA is higher than — or even equal to — his Strength STA, you’re paying for frame height, not working capacity. In an era of high beef-cross values on cull cows, you want a deep, powerful, wide-chested front end — not a hollow, tall cow that overshoots the stalls and breaks down early.
Tool 2 — pedigree mating software — treats the cause. The 1:1 Frame Rule can’t read relationship. Only a mating program running genomic inbreeding on each specific pairing catches the DNA bottleneck before you order semen. Run the linear filter to fix how the cow is built. Run the mating software to fix how related she is. Skip the second, and you’ll breed strong-looking cows that quietly stack coefficients.
So Where Do You Actually Find Strength?
Talk about strength long enough and it stays abstract. So here are four real, active sires, each run through both tools — the phenotype (does Strength beat Stature?) and the pedigree (how much of that narrow base is stacked in?).
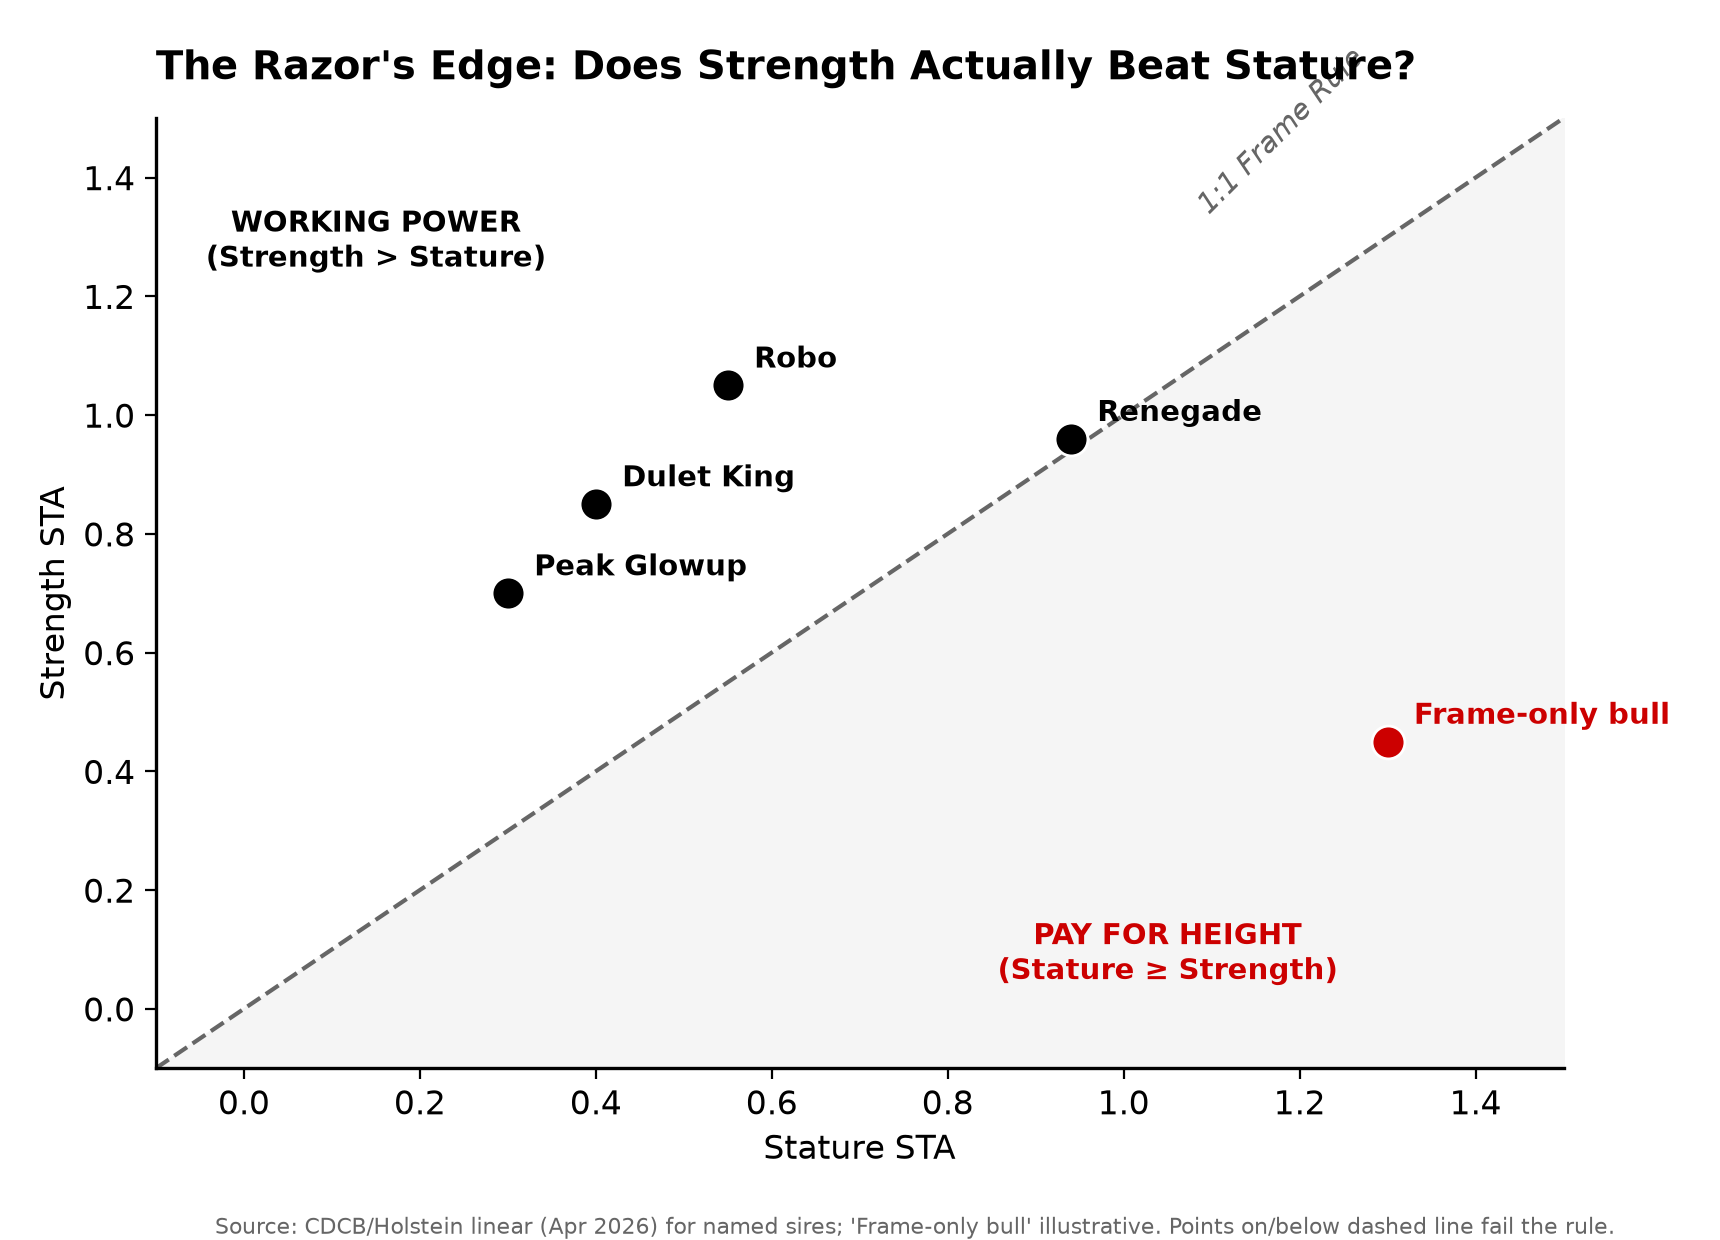
S-S-I PR Renegade (250HO14134) — The Baseline.
- Phenotype: Strength +0.96 barely edges Stature +0.94 (CDCB/Holstein, April 2026). He passes the physical test — just.
- Pedigree: His maternal line runs back through the Seagull-Bay Oman Mirror family, so there’s O-Man on the bottom of his pedigree. Use him with caution if your herd already runs close to the 9.99% ceiling.
Aurora Sheepster Robo (796HO10201) — The Trap.
- Phenotype: A genuine powerhouse — strength, milk, and teat placement in one package.
- Pedigree: The Renegade blood stacks in through his dam side — his MGS is Siemers Rengd Parfect, a Renegade son. For herds already deep in Renegade, that triggers immediate relationship flags on a big chunk of the cows you’d point him at.
Dulet King (799HO112) & Peak Glowup (1HO17864) — The Alternates.
- Phenotype: Both bring strength off a different profile — King is Alcove-sired and A2A2; Glowup leans health and components with lower milk. Pull each bull’s live linear card to confirm the strength-over-stature ratio matches your cows.
- Pedigree: Both sit off the Renegade line, which makes them genetic relief valves — a way to add strength without stacking the same family you’re already carrying.
The point isn’t “buy these four.” It’s the method. Renegade shows how thin the strength-over-stature margin can be even on a bull everyone calls strong. Robo shows a phenotypic powerhouse can still be the wrong bull once you run the relationship test. King and Glowup show you can hunt strength off a different family — if you verify the ratio yourself. Two tools, every time.
Options and Trade-Offs for Your Operation
No single move fixes this. A few are working right now.
- Cap inbreeding on every AI mating. Ask your mating program or rep to flag anything projected above your ceiling; many breeders aim to keep a mating under roughly 6–7%. Cheap and immediate. The catch: it protects your herd, not the breed, and you’ll pass on a hot bull now and then.
- Run the 1:1 Frame Rule. Best for herds fighting cows that overshoot the stalls and eat more without lasting longer. Costs nothing but discipline at the catalog. Where it backfires: it’s structure, not relationship, so pair it with the inbreeding check.
- Diversify your bull team on purpose. Makes most sense for herds with the scale to run several sire lines at once. Costs homework, and sometimes a few index points traded for lower future coancestry.
- Lean on Net Merit for commercial goals. NM$ 2025’s Feed Saved and BWC weights point at the moderate, efficient cow the economics now reward. The limit is blunt: even flawless NM$ selection won’t manage inbreeding for you.
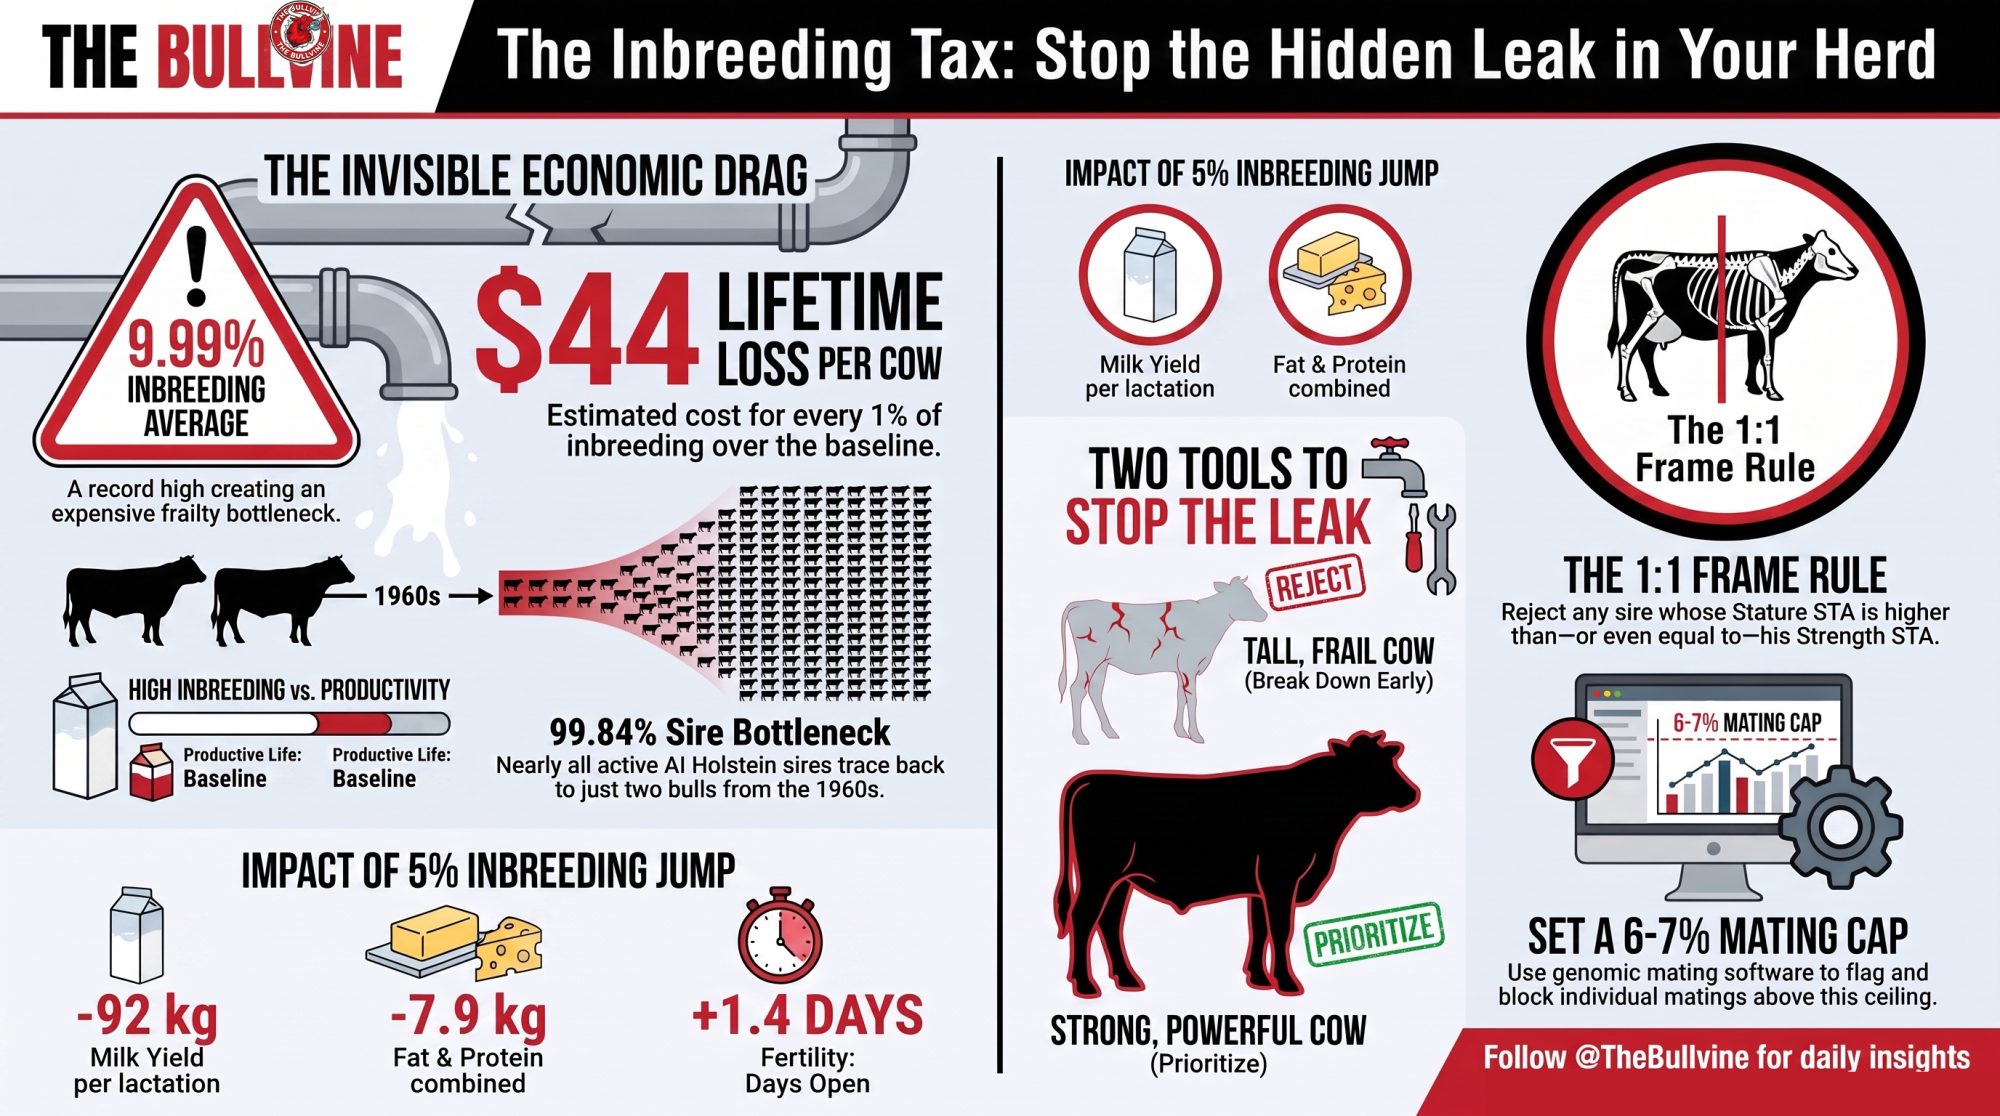
Three Things to Do Before You Order Semen Again
- Audit your tank (next 30 days). Pull your herd’s average inbreeding coefficient. If you’re hovering at or above 9.99%, set a hard mating ceiling in your software immediately — many breeders hold matings under 6–7%.
- Apply the strength filter. Reject any incoming catalog sire whose Stature outpaces — or even ties — his Strength. Even Renegade’s +0.96 over +0.94 is a razor’s-edge pass.
- Never let a line card substitute for software. A bull can look beautifully wide on paper and still be a first cousin to the heifer you’re trying to correct. Use linear filters to design the cow; use genomic mating tools to protect the pedigree.
O-Man’s real lesson isn’t that he got overused. It’s that the breed only noticed after the fact — years after the semen was in the tanks and the daughters were in the barns. So walk your holding pen some morning and count honestly: how many separate families are actually standing there, and how many are the same handful wearing different names? The studs decide how wide the pipeline runs. Your call at the catalog decides how much of that bottleneck your own cows carry. Which bull are you about to order — and do you actually know how related he is to the cow he’s going on?
Key Takeaways
- Canadian Holstein heifers hit 9.99% inbreeding — the drift costs about $44/cow per point over a lifetime, plus $60–100 per cow per lactation in the herds carrying the most of it. Pull your herd average before your next semen order.
- Run two separate tools, because they fix two different problems: the 1:1 Frame Rule (if Stature STA beats or ties Strength STA, you’re buying height, not cow) fixes how she’s built; genomic mating software fixes how related she is. Neither covers for the other.
- A strong bull can still be the wrong bull. Robo checks every phenotype box but stacks Renegade through his dam — and even Renegade’s own +0.96 strength over +0.94 stature is a razor-thin pass. Look off the line (King, Glowup) when your herd’s already near the ceiling.
The Invisible Invoice
Herd Inbreeding & Pedigree Bottleneck Auditor
Real-Time Financial Exposure Audit
Complete references and supporting documentation are available upon request by contacting the editorial team at editor@thebullvine.com.
Learn More
- The Shottle Legacy: A Lesson in Balance — Arms you with a masterclass in outcross selection by studying the precise sire line that resisted the O-Man onslaught, delivering a roadmap to inject structural soundness and functional width back into your stalls this week.
- The Genomic Revolution: 15 Years Later — Exposes the long-term structural blind spots created by aggressive turnaround times in young sires, positioning your 5-year mating strategy to survive the hidden coancestry collapse that current major index formulas completely ignore.
- Is Linebreeding Dead or Just Rebranded? — Dismantles standard catalog marketing by pulling back the curtain on modern “outcross” claims, revealing how elite operations leverage controlled relationships to lock in high-margin consistency without triggering catastrophic inbreeding depression.
The Sunday Read Dairy Professionals Don’t Skip.

Every week, thousands of producers, breeders, and industry insiders open Bullvine Weekly for genetics insights, market shifts, and profit strategies they won’t find anywhere else. One email. Five minutes. Smarter decisions all week.
